Embed Size (px)
Citation preview
Investigating Purchase-to-Pay process using Process
Mining in a multinational corporation
Business Process Intelligence Challenge 2019
Aleksandra Rząd, Joanna Wojnecka, Maciej Rutkowski, Mateusz Guliński
PwC Data Analytics in Assurance, Polna 11, 00-633 Warsaw, Poland
[aleksandra.rzad, joanna.wojnecka, maciej.rutkowski, mateusz.gulinski]@pwc.com
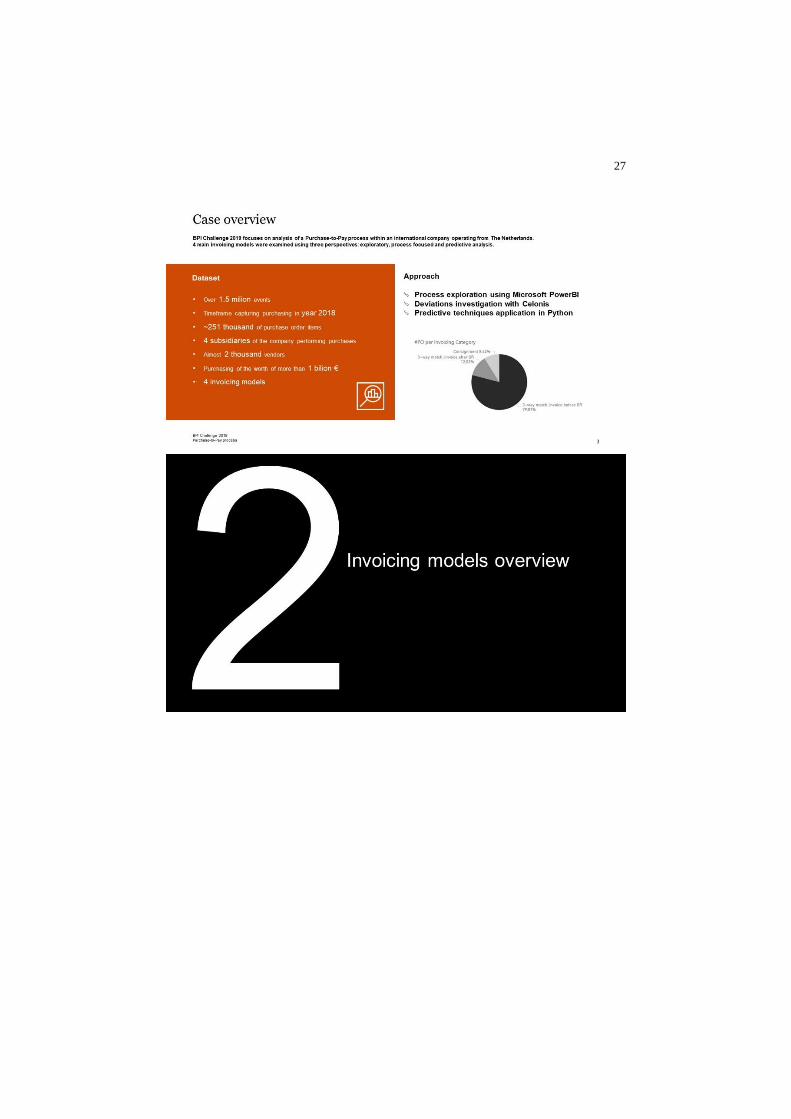
Abstract. The Business Process Intelligence Challenge 2019 focuses on the
compliance analysis of the Purchase-to-Pay process within a multinational
company operating from The Netherlands. The participants are provided with a
real-life event log data, which captures the information on the activities per-
formed within the process of purchasing. Along with the data, the process own-
er suggests the specific scope for an analysis, which covers examination of at
least 4 process models, throughput times of an invoicing process and spotting
potential deviations. To address the challenges the analysis were divided into
three main parts exploratory, process focused and predictive analysis, which
were performed using various data analytics and process mining techniques in-
cluding visualization tools, like SQL, PowerBI, Celonis and Python.
Keywords: process mining, purchase to pay, process discovery, data analysis,
process compliance, BPI Challenge, predictive analysis.
1 Introduction
Due to dynamic development of the Information Systems field in the past decades,
significant number of companies have made a decision to implement an IT system,
gathering relevant amount of data on a daily basis. In an operational life of a multina-
tional company, an integrated information system is a must. As a result, noticing the
potential in data recorded, a business need for taking the advantage of the gathered
data arises. In the times of Data Analysis, Data Mining and Business Intelligence
emerged a discipline of Process Mining, combining those flows together.[1] As a fact-
based insights provider, Process Mining do not require special means to collect the
data. It relies on event logs derived from various operational datasets from different
IT systems. Being a solution simple as such, dynamically growing popularity of the
use of Process Mining techniques is observed. They allow to discover the actual as-is
business processes and help to find potential inconsistencies, bottle-necks, noncon-
forming precedents, by providing a range of insights.
Within the Business Process Intelligence Challenge, a multinational company aim-
ing at implementing means of control and surveillance to optimize its processes
reaches out to Process Mining for a managerial support. Purchase-to-Pay process, as
2
one of the core business processes, appears to have a lot of potential for improving the
compliance within a company, ensuring it is in accordance with a prescribed set of
norms, standards and policies. [2] This year’s edition of BPI Challenge focuses on the
compliance check of the Purchase-to-Pay process in an internationally operating
company from The Netherlands, asking the participants to provide broad and unique
insights.
This paper is divided into two main parts, which are Challenge overview and
Analysis, conclusions and recommendations. The first part provides the necessary
introduction into BPI Challenge 2019. Following, the analysis chapter incorporates
the process of finding insights and growing conclusions. It is divided into 3 parts:
exploratory, process focused and predictive analysis.
2 Challenge overview
This chapter includes an overview of the BPI Challenge 2019 and the approach taken
towards its solution. Firstly, the case is briefly presented. Further on, the theoretical
background for the Purchase-to-Pay process is brought up. In the last part of the chap-
ter the approach towards the data is described, along with the tools overview and the
basic data processing actions.
2.1 Case presentation
The organizers of the BPI Challenge 2019 provide participants with a real-life event
log and ask them to analyze the data using techniques of a free choice. The process
owner suggests some challenges to address, although the participants are allowed to
provide a wide-range insights which reach outside of the given scope [3].
A company cooperating with the contest’s organizers, called process owner, is a
large multinational company operating from The Netherlands in the area of coatings
and paints. The process owner provides the contestants with the basic information on
the process, like the key flow of the data between Purchase Order creation, through
Goods Receipt, until Invoice clearing. The flows are presented in more detail in the
next subsection.
Challenges to address are focused on:
1. insights on the collection of 4 models corresponding to the 4 process flows men-
tioned above,
2. throughput times of the invoicing process,
3. deviations, rework activities, bottle-necks present in the process flows.
Despite being presented a set of suggestions, participants are free to analyze the
case from different perspectives, in order to encourage the originality and usefulness
of the outcome.
2.2 Theoretical background
Purchase-to-Pay process is recognized as one of the most important processes within
a company’s operational life. Purchasing provides core resources for leading a busi-
3
ness on a daily basis and strongly influences overall costs and timing of production.
Being based on the cooperation with suppliers, purchasing reaches out of a company’s
direct control. Due to the fact that the outer dependency is high, a great attention
should be paid towards a purchasing strategy development. Such a strategy can be
assessed using two factors. Whilst the first one is strategic importance of purchasing
in terms of its impact on profitability, the second factor points to the complexity of
the supply market and outer conditions. In order to reduce the risk of purchasing and
supply to an acceptable minimum those two factors should be addressed by the top
management and senior purchasing executives. [4] A discipline providing the support
in this procedure is Process Mining. Having a possibility to look deep down into a
process specificity potential issues can be discovered and addressed resulting in the
process improvements. Not only bottle-necks, but also non-compliance procedures
can be spotted. By pinpointing the development areas in the process it is possible to
put the most of the improvement effort exactly where it is needed the most.
The main component of a supply procedure is Purchase-to-pay process. It is a co-
ordinated and integrated set of actions taken to fulfill a requirement for goods or ser-
vices in a timely manner at a reasonable price. [5] It involves a number of sequential
steps, ranging from creating a purchase order, through goods delivery and paying an
invoice.
In the Business Process Management exists a general ideal sequence of activities in
the process, described as a desirable purchase process flow. However, there are sever-
al ways of confirming the compliance of the purchasing process. The organizers of
the Challenge provide the participants with the description of 4 models, which deter-
mine the desired actions flow in the case. The models represent procedures of pro-
cessing an invoice received from a supplier to ensure that a payment is complete and
accurate. The goal of implementing the different types of procedures is to have a more
precise control over the flows and highlight any discrepancies in the compliance be-
tween the three most important documents, which are purchase orders, goods receipts
and invoices. [6]
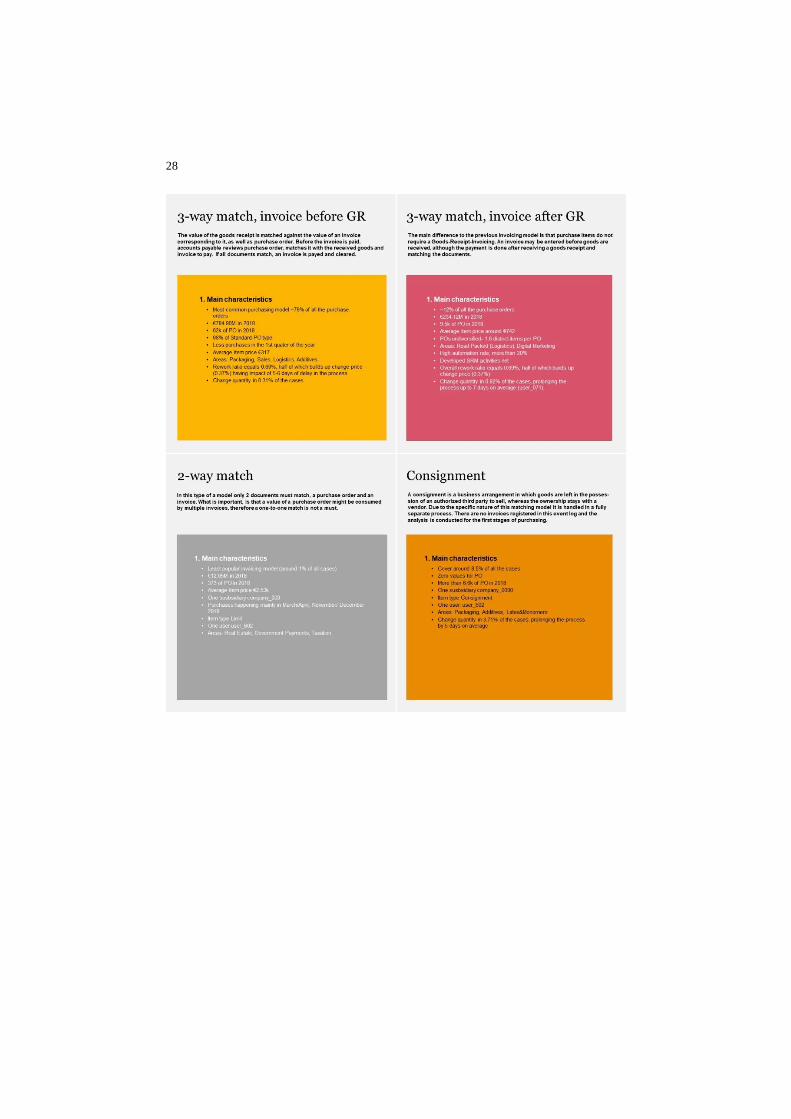
The first of the models is called 3-way matching, invoice after goods receipt. The
value of the goods receipt should match the value present in the invoice correspond-
ing to it, as well as purchase order item. Before the invoice is paid, accounts payable
reviews what is ordered (purchase order), matches it with the received goods (goods
receipt) and invoice to pay (invoice). If all documents are present and they match, an
invoice is paid and cleared. In the second model 3-way matching, invoice before
goods receipt, the main difference to the previous one is that purchase items do not
require a Goods-receipt invoicing. That means an invoice may be entered before
goods are received, although it has a block set. Upon a receipt of the goods and a
check if all of the three mentioned documents match, an invoice is unblocked and a
payment is done. The third invoicing model is 2-way matching (no goods receipt
needed). As the description suggests, in this type of a model only 2 documents must
match, a purchase order item and an invoice. What is important is that a value of a
purchase order might be consumed by multiple invoices, therefore a one-to-one match
is not a must. The last category is Consignment. The check of a match in this model of
invoicing is beyond the scope of the analyzed process, since it is handled in a fully
4
separate one. There are no invoices registered in this event log and the analysis is
conducted just for the first stages of purchasing. This model is mainly characterized
by the item type named consignment.
2.3 Data overview
The data consists of over 1.5 million events recorded in 2018 within the Purchase-to-
Pay process, without the workflow of the approval of POs and invoices. [7]
For the purpose of the contest, the dataset was anonymized. The company holds an
anonymization key, therefore it is possible to translate the results and use the worth of
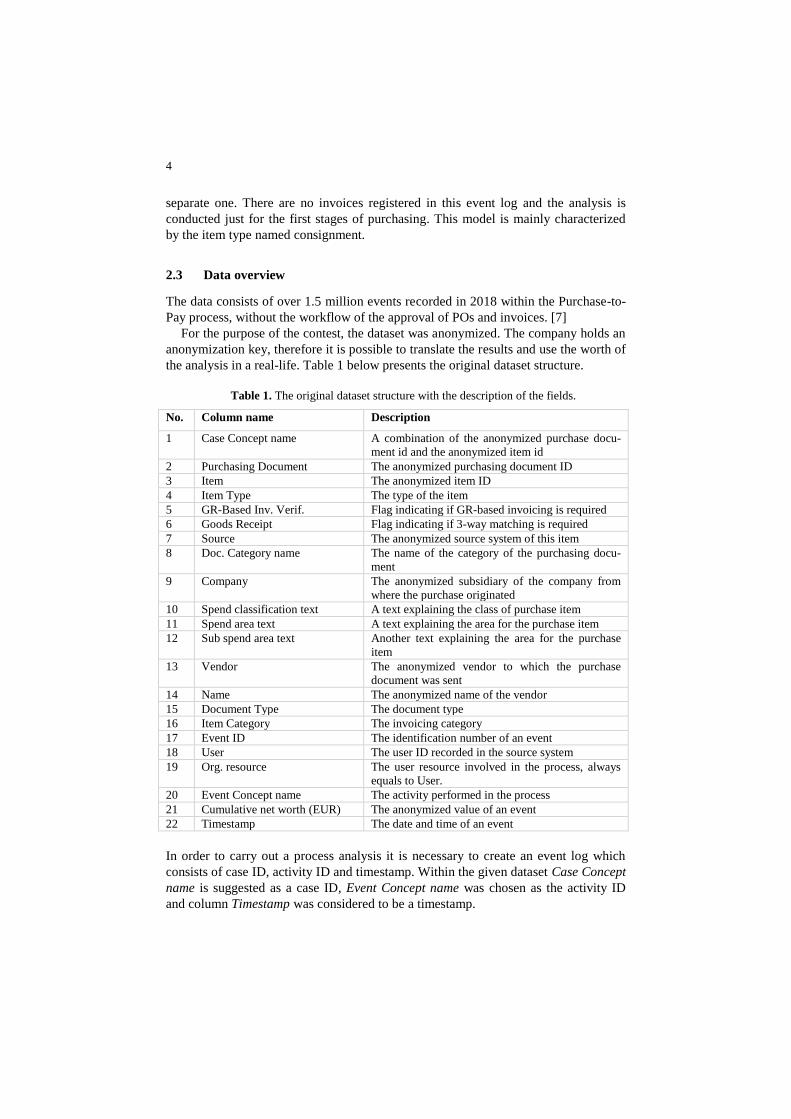
the analysis in a real-life. Table 1 below presents the original dataset structure.
Table 1. The original dataset structure with the description of the fields.
No. Column name Description
1 Case Concept name A combination of the anonymized purchase docu-
ment id and the anonymized item id
2 Purchasing Document The anonymized purchasing document ID
3 Item The anonymized item ID
4 Item Type The type of the item
5 GR-Based Inv. Verif. Flag indicating if GR-based invoicing is required
6 Goods Receipt Flag indicating if 3-way matching is required
7 Source The anonymized source system of this item
8 Doc. Category name The name of the category of the purchasing docu-
ment
9 Company The anonymized subsidiary of the company from
where the purchase originated
10 Spend classification text A text explaining the class of purchase item
11 Spend area text A text explaining the area for the purchase item
12 Sub spend area text Another text explaining the area for the purchase
item
13 Vendor The anonymized vendor to which the purchase
document was sent
14 Name The anonymized name of the vendor
15 Document Type The document type
16 Item Category The invoicing category
17 Event ID The identification number of an event
18 User The user ID recorded in the source system
19 Org. resource The user resource involved in the process, always
equals to User.
20 Event Concept name The activity performed in the process
21 Cumulative net worth (EUR) The anonymized value of an event
22 Timestamp The date and time of an event
In order to carry out a process analysis it is necessary to create an event log which
consists of case ID, activity ID and timestamp. Within the given dataset Case Concept
name is suggested as a case ID, Event Concept name was chosen as the activity ID
and column Timestamp was considered to be a timestamp.
5
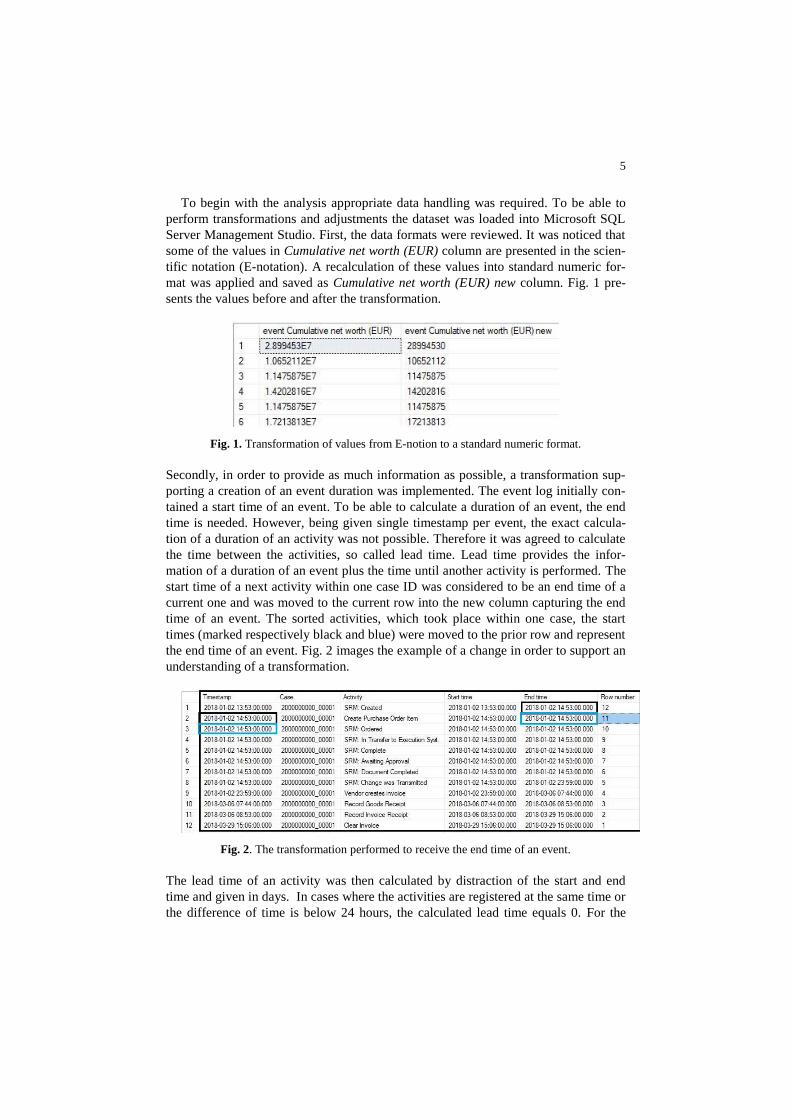
To begin with the analysis appropriate data handling was required. To be able to
perform transformations and adjustments the dataset was loaded into Microsoft SQL
Server Management Studio. First, the data formats were reviewed. It was noticed that
some of the values in Cumulative net worth (EUR) column are presented in the scien-
tific notation (E-notation). A recalculation of these values into standard numeric for-
mat was applied and saved as Cumulative net worth (EUR) new column. Fig. 1 pre-
sents the values before and after the transformation.
Fig. 1. Transformation of values from E-notion to a standard numeric format.
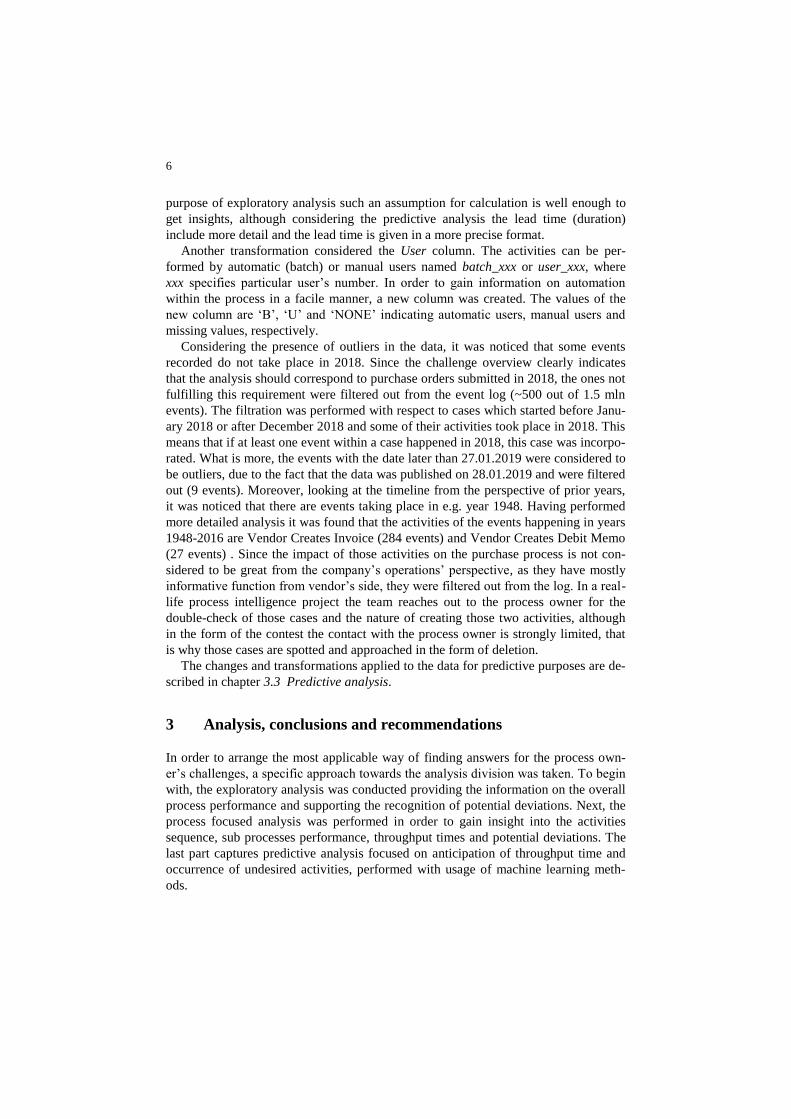
Secondly, in order to provide as much information as possible, a transformation sup-
porting a creation of an event duration was implemented. The event log initially con-
tained a start time of an event. To be able to calculate a duration of an event, the end
time is needed. However, being given single timestamp per event, the exact calcula-
tion of a duration of an activity was not possible. Therefore it was agreed to calculate
the time between the activities, so called lead time. Lead time provides the infor-
mation of a duration of an event plus the time until another activity is performed. The
start time of a next activity within one case ID was considered to be an end time of a
current one and was moved to the current row into the new column capturing the end
time of an event. The sorted activities, which took place within one case, the start
times (marked respectively black and blue) were moved to the prior row and represent
the end time of an event. Fig. 2 images the example of a change in order to support an
understanding of a transformation.
Fig. 2. The transformation performed to receive the end time of an event.
The lead time of an activity was then calculated by distraction of the start and end
time and given in days. In cases where the activities are registered at the same time or
the difference of time is below 24 hours, the calculated lead time equals 0. For the
6
purpose of exploratory analysis such an assumption for calculation is well enough to
get insights, although considering the predictive analysis the lead time (duration)
include more detail and the lead time is given in a more precise format.
Another transformation considered the User column. The activities can be per-
formed by automatic (batch) or manual users named batch_xxx or user_xxx, where
xxx specifies particular user’s number. In order to gain information on automation
within the process in a facile manner, a new column was created. The values of the
new column are ‘B’, ‘U’ and ‘NONE’ indicating automatic users, manual users and
missing values, respectively.
Considering the presence of outliers in the data, it was noticed that some events
recorded do not take place in 2018. Since the challenge overview clearly indicates
that the analysis should correspond to purchase orders submitted in 2018, the ones not
fulfilling this requirement were filtered out from the event log (~500 out of 1.5 mln
events). The filtration was performed with respect to cases which started before Janu-
ary 2018 or after December 2018 and some of their activities took place in 2018. This
means that if at least one event within a case happened in 2018, this case was incorpo-
rated. What is more, the events with the date later than 27.01.2019 were considered to
be outliers, due to the fact that the data was published on 28.01.2019 and were filtered
out (9 events). Moreover, looking at the timeline from the perspective of prior years,
it was noticed that there are events taking place in e.g. year 1948. Having performed
more detailed analysis it was found that the activities of the events happening in years
1948-2016 are Vendor Creates Invoice (284 events) and Vendor Creates Debit Memo
(27 events) . Since the impact of those activities on the purchase process is not con-
sidered to be great from the company’s operations’ perspective, as they have mostly
informative function from vendor’s side, they were filtered out from the log. In a real-
life process intelligence project the team reaches out to the process owner for the
double-check of those cases and the nature of creating those two activities, although
in the form of the contest the contact with the process owner is strongly limited, that
is why those cases are spotted and approached in the form of deletion.
The changes and transformations applied to the data for predictive purposes are de-
scribed in chapter 3.3 Predictive analysis.
3 Analysis, conclusions and recommendations
In order to arrange the most applicable way of finding answers for the process own-
er’s challenges, a specific approach towards the analysis division was taken. To begin
with, the exploratory analysis was conducted providing the information on the overall
process performance and supporting the recognition of potential deviations. Next, the
process focused analysis was performed in order to gain insight into the activities
sequence, sub processes performance, throughput times and potential deviations. The
last part captures predictive analysis focused on anticipation of throughput time and
occurrence of undesired activities, performed with usage of machine learning meth-
ods.
7
3.1 Exploratory analysis
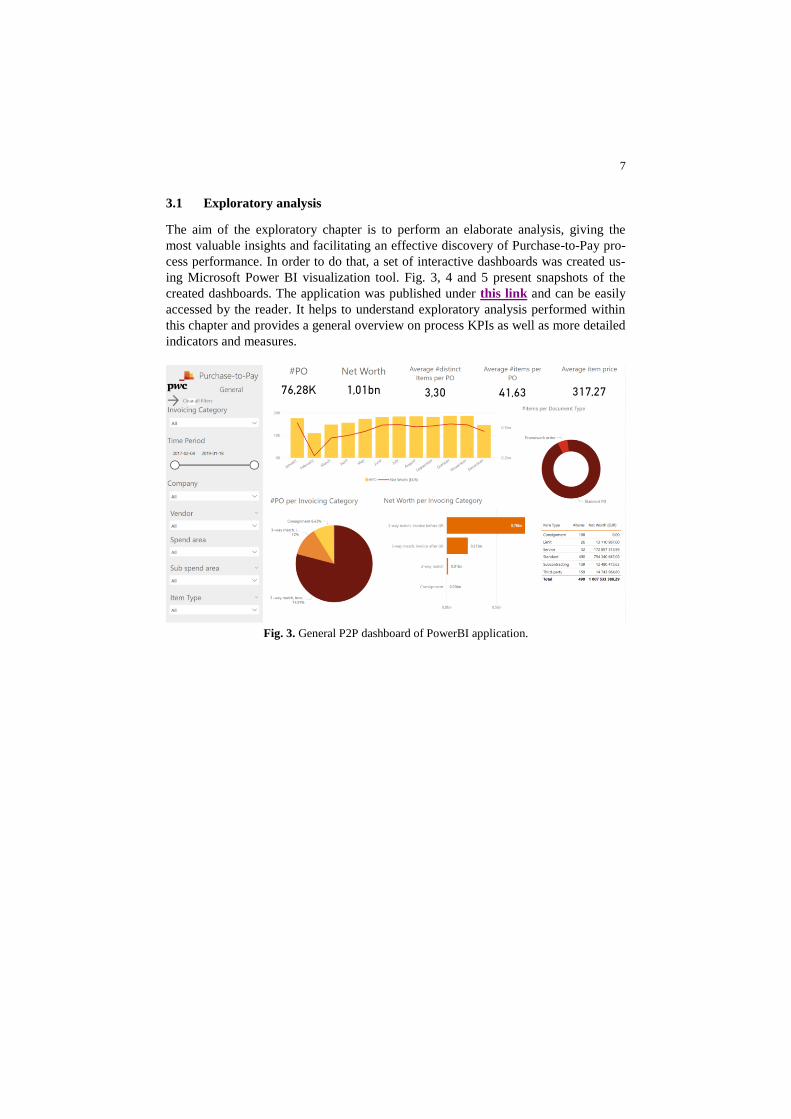
The aim of the exploratory chapter is to perform an elaborate analysis, giving the
most valuable insights and facilitating an effective discovery of Purchase-to-Pay pro-
cess performance. In order to do that, a set of interactive dashboards was created us-
ing Microsoft Power BI visualization tool. Fig. 3, 4 and 5 present snapshots of the
created dashboards. The application was published under this link and can be easily
accessed by the reader. It helps to understand exploratory analysis performed within
this chapter and provides a general overview on process KPIs as well as more detailed
indicators and measures.
Fig. 3. General P2P dashboard of PowerBI application.
8
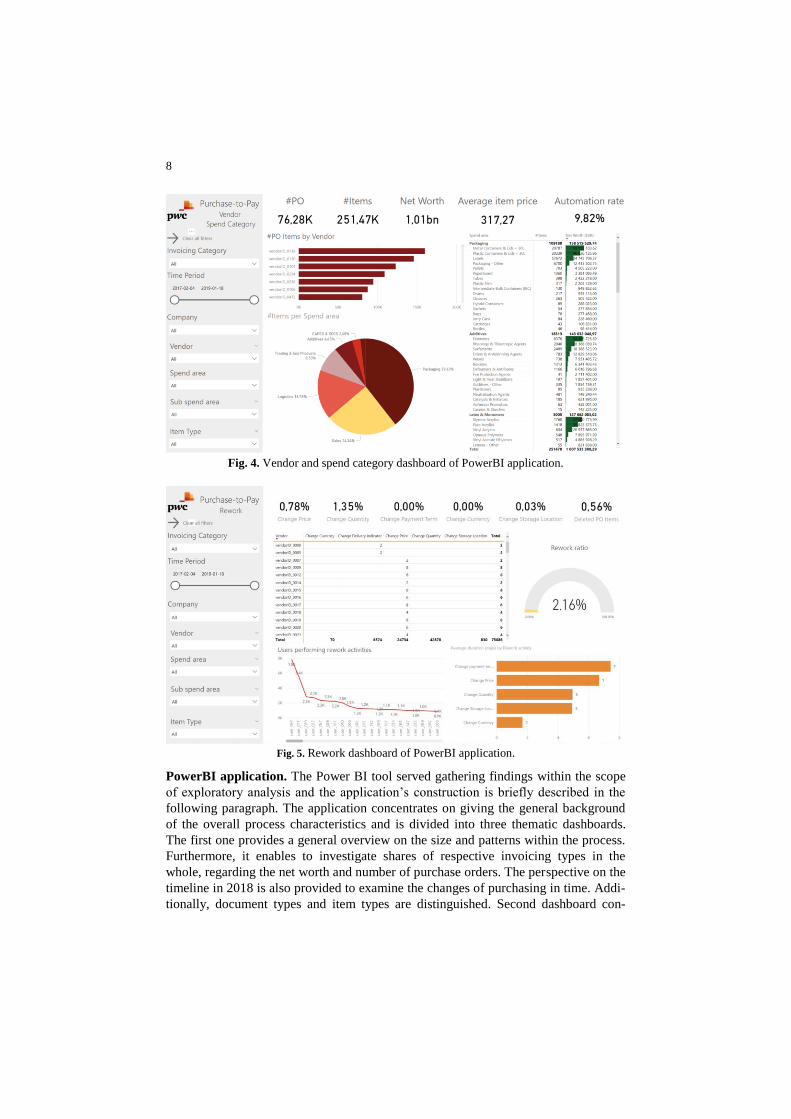
Fig. 4. Vendor and spend category dashboard of PowerBI application.
Fig. 5. Rework dashboard of PowerBI application.
PowerBI application. The Power BI tool served gathering findings within the scope
of exploratory analysis and the application’s construction is briefly described in the
following paragraph. The application concentrates on giving the general background
of the overall process characteristics and is divided into three thematic dashboards.
The first one provides a general overview on the size and patterns within the process.
Furthermore, it enables to investigate shares of respective invoicing types in the
whole, regarding the net worth and number of purchase orders. The perspective on the
timeline in 2018 is also provided to examine the changes of purchasing in time. Addi-
tionally, document types and item types are distinguished. Second dashboard con-
9
cerns vendors and spend categories. The diagrams give the possibility to find insights
on the importance of vendors, which the company collaborates with and spend areas
of purchasing. The purpose of this dashboard is to gain knowledge on the subject of
purchasing and the sources in terms of suppliers. The third dashboard is specifically
process oriented and deals with rework activities. Not only the ratios of most popular
rework activities are given, but also detailed visualizations of vendors and users per-
forming them. On top of that, an average duration time of rework activities is present-
ed in order to stress the impact they have on the time of a process.
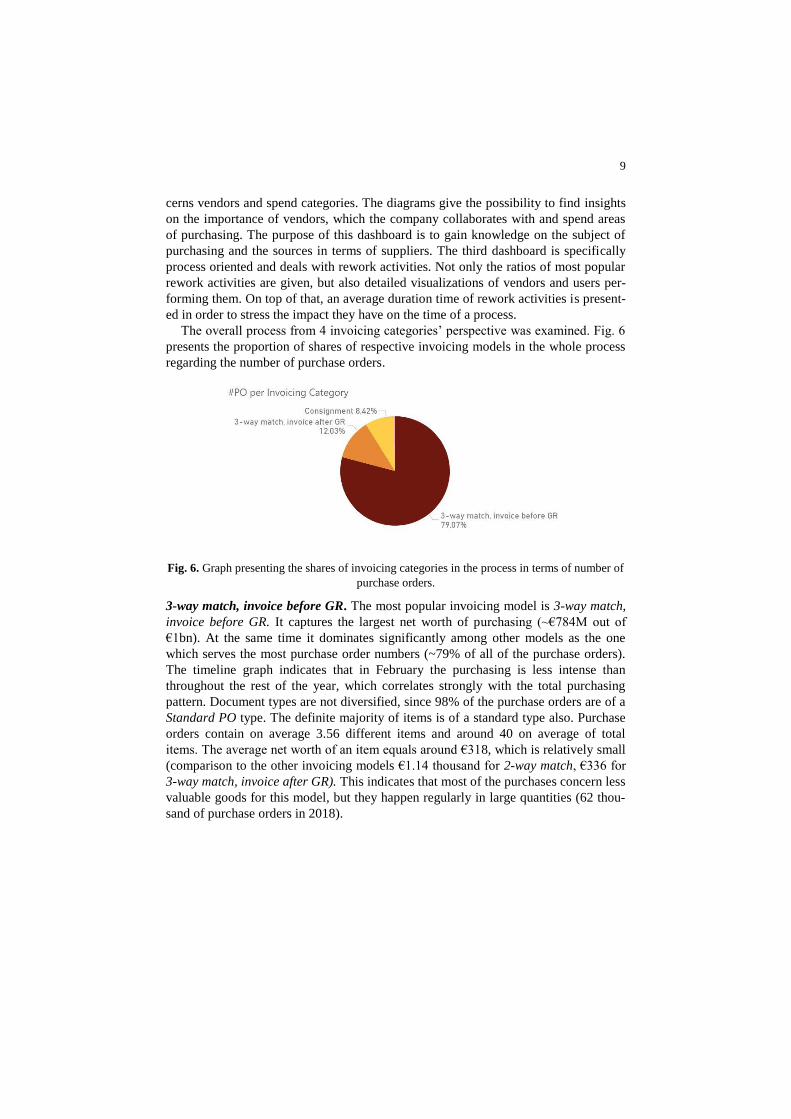
The overall process from 4 invoicing categories’ perspective was examined. Fig. 6
presents the proportion of shares of respective invoicing models in the whole process
regarding the number of purchase orders.
Fig. 6. Graph presenting the shares of invoicing categories in the process in terms of number of
purchase orders.
3-way match, invoice before GR. The most popular invoicing model is 3-way match,
invoice before GR. It captures the largest net worth of purchasing (~€784M out of
€1bn). At the same time it dominates significantly among other models as the one
which serves the most purchase order numbers (~79% of all of the purchase orders).
The timeline graph indicates that in February the purchasing is less intense than
throughout the rest of the year, which correlates strongly with the total purchasing
pattern. Document types are not diversified, since 98% of the purchase orders are of a
Standard PO type. The definite majority of items is of a standard type also. Purchase
orders contain on average 3.56 different items and around 40 on average of total
items. The average net worth of an item equals around €318, which is relatively small
(comparison to the other invoicing models €1.14 thousand for 2-way match, €336 for
3-way match, invoice after GR). This indicates that most of the purchases concern less
valuable goods for this model, but they happen regularly in large quantities (62 thou-
sand of purchase orders in 2018).
10
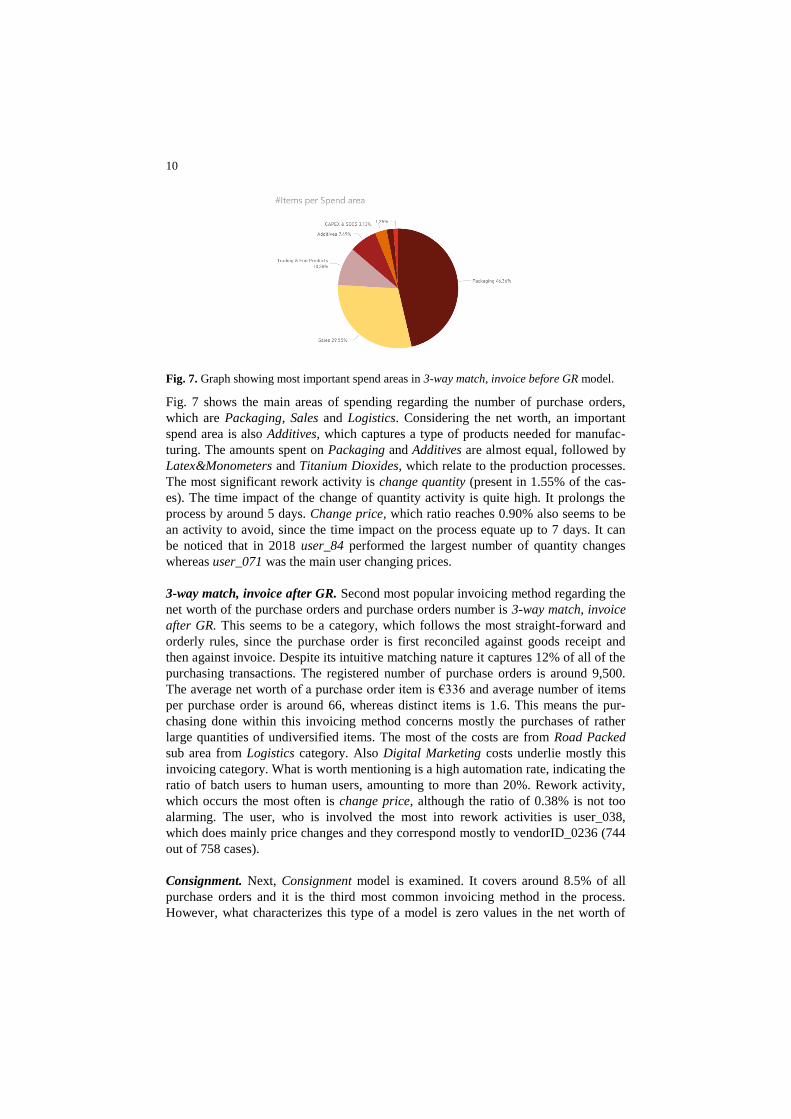
Fig. 7. Graph showing most important spend areas in 3-way match, invoice before GR model.
Fig. 7 shows the main areas of spending regarding the number of purchase orders,
which are Packaging, Sales and Logistics. Considering the net worth, an important
spend area is also Additives, which captures a type of products needed for manufac-
turing. The amounts spent on Packaging and Additives are almost equal, followed by
Latex&Monometers and Titanium Dioxides, which relate to the production processes.
The most significant rework activity is change quantity (present in 1.55% of the cas-
es). The time impact of the change of quantity activity is quite high. It prolongs the
process by around 5 days. Change price, which ratio reaches 0.90% also seems to be
an activity to avoid, since the time impact on the process equate up to 7 days. It can
be noticed that in 2018 user_84 performed the largest number of quantity changes
whereas user_071 was the main user changing prices.
3-way match, invoice after GR. Second most popular invoicing method regarding the
net worth of the purchase orders and purchase orders number is 3-way match, invoice
after GR. This seems to be a category, which follows the most straight-forward and
orderly rules, since the purchase order is first reconciled against goods receipt and
then against invoice. Despite its intuitive matching nature it captures 12% of all of the
purchasing transactions. The registered number of purchase orders is around 9,500.
The average net worth of a purchase order item is €336 and average number of items
per purchase order is around 66, whereas distinct items is 1.6. This means the pur-
chasing done within this invoicing method concerns mostly the purchases of rather
large quantities of undiversified items. The most of the costs are from Road Packed
sub area from Logistics category. Also Digital Marketing costs underlie mostly this
invoicing category. What is worth mentioning is a high automation rate, indicating the
ratio of batch users to human users, amounting to more than 20%. Rework activity,
which occurs the most often is change price, although the ratio of 0.38% is not too
alarming. The user, who is involved the most into rework activities is user_038,
which does mainly price changes and they correspond mostly to vendorID_0236 (744
out of 758 cases).
Consignment. Next, Consignment model is examined. It covers around 8.5% of all
purchase orders and it is the third most common invoicing method in the process.
However, what characterizes this type of a model is zero values in the net worth of
11
orders. The reason for it is the nature of consignment items. A consignment is a busi-
ness arrangement in which goods are left in the possession of an authorized third par-
ty to sell, while the ownership stays with the vendor. The goods bought within this
type of an arrangement are possessed by the company and purchase orders are issued,
they contain no value of the goods though. The invoicing process happens within a
separate process, there exists no invoices for Consignment items in the dataset. Most
of the purchases happen within Packaging spend area, followed by Additives and
Latex&Monomers. Most of the rework activities concern change quantity, that is in
3.72% of the cases.
2-way match. 2-way match model covers the least number of purchasing transactions
(not even 1% of all purchase orders). Just one item type occurs within it, which is
Limit and it is the item type that is only associated with 2-way match. It is a specific
type of an item, which does not have a price, but rather an upper financial limit set,
which can be spend on it. What is interesting, just one subsidiary companyID_0003
performs this type of a purchase. The Vendor/Spend Category dashboard unveils, that
the spend areas are Real Estate (Sub areas: Real estate services, Real estate brokers
or agents) and Others (Sub areas: Government Payments, Taxation), CAPEX &
SOCS, which explains the type of the invoicing method and the item type used. 2-way
match is namely used mostly in cases, where no physical goods are shipped and the
purchase order is matched against an invoice directly. No fixed price of an item is
therefore understandable in such cases. There is just one user user_602 responsible for
that model, who handles all the activities within it. Additionally, the only document
type used is Framework order. In the case of 2-way match and Consignment models
automation rates are kept on a low level, which is determined by the nature of those
purchasing types (0.38% for 2-way match and 1.90% for Consignment).
3.2 Process focused analysis
After having a glance on the characteristics of the process in the exploratory analysis
part, a process mining was incorporated to perform process focused analysis. The
software used for this purpose is Celonis. Not only the process maps available in Ce-
lonis were analyzed, but also the potential of its visualization capabilities were put to
use. Additionally, a conformance functionality served as a reference point for the root
cause analysis. The event log exists within the dataset, which exploratory analysis
was based on. The process of preparing the event log is described in the 2.3 Data
overview chapter.
Invoicing models’ processes comparison. To distinguish between 4 invoicing mod-
els the process analysis was split and compared in terms of the time performance.
Further on, however, the general common process map was analyzed regarding the
deviations.
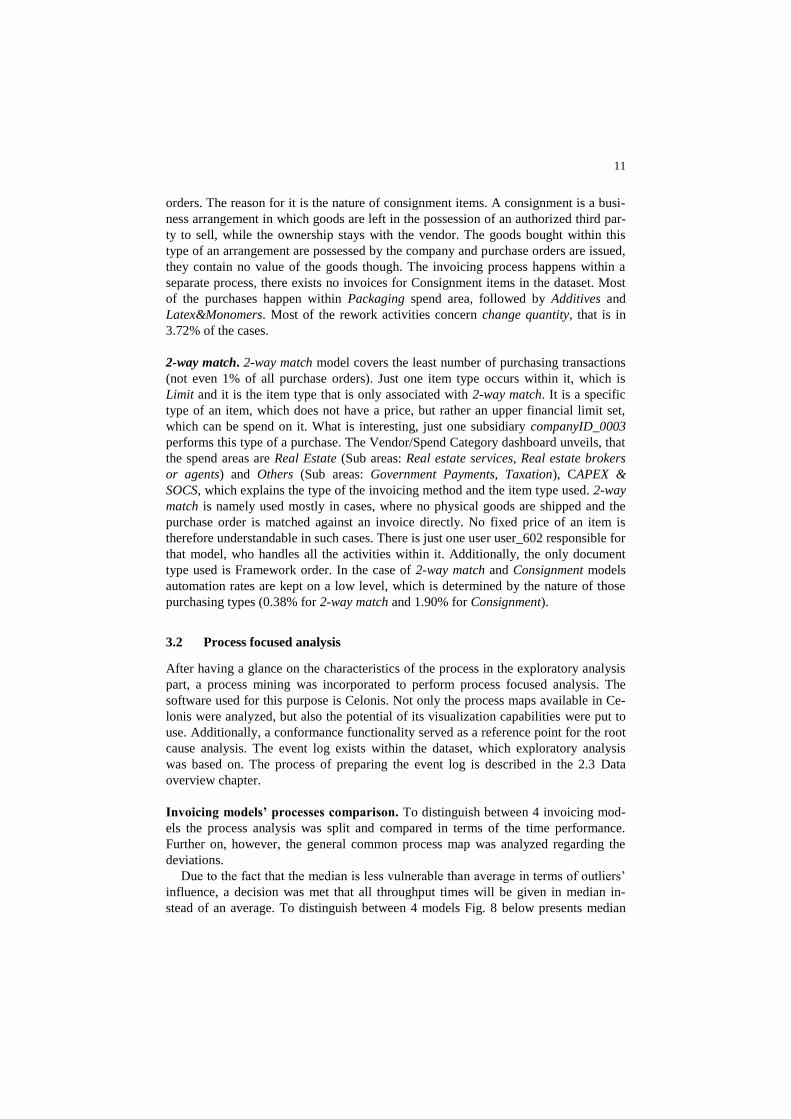
Due to the fact that the median is less vulnerable than average in terms of outliers’
influence, a decision was met that all throughput times will be given in median in-
stead of an average. To distinguish between 4 models Fig. 8 below presents median
12
throughput times for all of the 4 invoicing models. The most common category 3-way
match, invoice before GR takes the longest to process (72 days). 2-way match takes
62 days, it is the rarest category and at the same time the one that serves the most
complicated cases from purchasing perspective. 3-way match, invoice after GR is
performed much faster, its median throughout time is 30 days, which is more than a
half shorter than the similar “before” model. Consignment is characterized by rela-
tively short overall process time, which equals 21 days.
Fig. 8. Average process throughput times of invoicing categories.
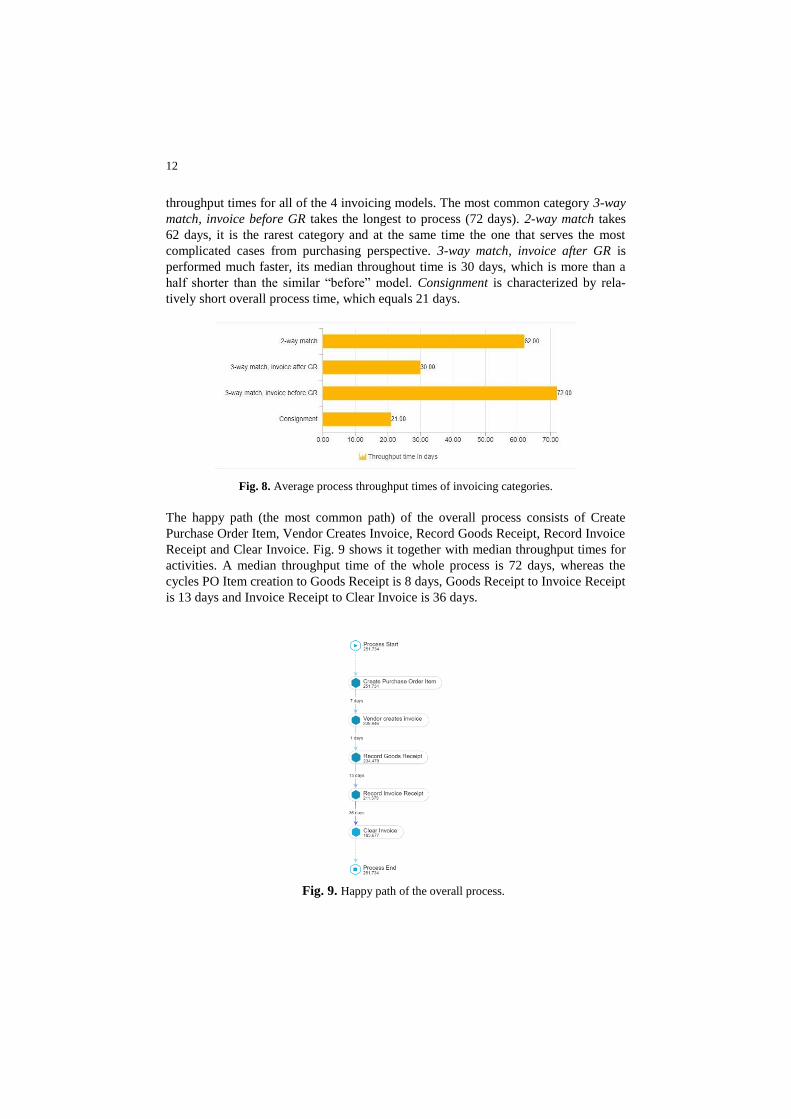
The happy path (the most common path) of the overall process consists of Create
Purchase Order Item, Vendor Creates Invoice, Record Goods Receipt, Record Invoice
Receipt and Clear Invoice. Fig. 9 shows it together with median throughput times for
activities. A median throughput time of the whole process is 72 days, whereas the
cycles PO Item creation to Goods Receipt is 8 days, Goods Receipt to Invoice Receipt
is 13 days and Invoice Receipt to Clear Invoice is 36 days.
Fig. 9. Happy path of the overall process.
13
Role of SRM in the process. In order to perform efficient and upright analysis, the
SRM activities are grouped into SRM group and kept aside the main flow of purchas-
ing. SRM stands for Supplier Relationship Management, which is a software support-
ing requisition system. It handles creating requisitions, monitors approvals and docu-
mentation and passes the information on purchase requisitions further until a creation
of a purchase order item. It is treated as an outer software solution, having a support-
ive role in the purchasing process. It serves 1,440 cases in the process and often hap-
pens in parallel to the creation of PO or Requisition Item (the same date of activities)
and is mostly automated. It does influence the process time overall, since it is shorter
in case of using SRM (median 65 days instead of 72). The process including SRM
shortens the cycle time between invoice receipt and invoice clearing up to 17 days
(versus 36 days with no SRM). However it doubles the goods receipt-invoice receipt
cycle in comparison to no SRM process (26 versus 13 days). The vendors, which are
associated with the developed SRM activities sequence are mainly vendorID_0003
and vendorID_0000. Those two vendors belong rather to the minor suppliers, since
the annual number of PO is 133 together (out of ~76 thousand number of PO in
2018).
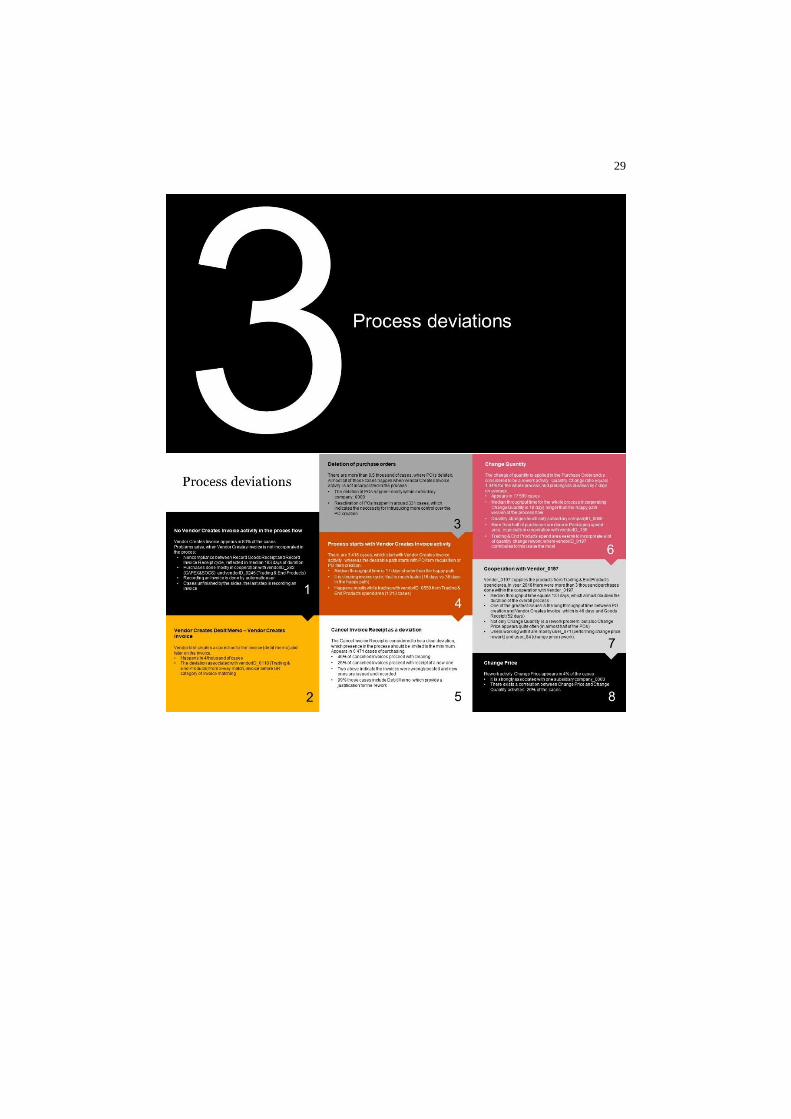
Vendor Creates Invoice activity. Vendor Creates Invoice is an activity, which is not
usually taken into consideration in a theoretical presentation of the process, it is not a
negative activity though. It appears in 83% of the cases and provides additional in-
formation on the process and it is assumed, that it happens in parallel to the shipment
of the goods, since the time difference between Create Purchase Order Item and Ven-
dor Creates Invoice is 7 days (median) and later until Record Goods Receipt it takes 1
day. In the cases where this step is not incorporated (41,788 cases) the process shows
noncompliance on the stage between Record Goods Receipt and Record Invoice Re-
ceipt, due to the fact that its median throughput time takes 183 days. While perform-
ing root cause analysis for this issue it appeared that most of those purchases are done
with cooperation with vendorID_282 (CAPEX&SOCS) and vendorID_0246 (Trading
& End Products). The activity of recording an invoice is mostly performed by
batch_01 automatic user. What is more, recording an invoice is the last step in the
process, which indicates it is not cleared. These cases are unfinished by the sides,
since there is no information from the vendor on the creation of an invoice, it takes
enormously a lot of time to record it, recording is done by automatic user and invoice
is not cleared. It was assured that the purchases of this type did take place throughout
the whole year, therefore it is not the case that they are still on-going in the sense of
being fresh (timestamps date back to January 2018).
An interesting phenomenon from the deviations’ spotting perspective is the
appearance of Vendor Creates Debit Memo and later directly Vendor Creates Invoice.
It happens in more than 4 thousand of cases, therefore it is quite often appearing se-
quence. Since the Debit Memo, considered to be a correction to the invoice, is created
before the actual invoice is prepared it seems to be an obvious inconsistency. The
vendor, which happens to be associated with it the most is vendorID_0118 (Trading
& End Products) from 3-way match, invoice before GR category.
14
Deletion of purchase orders. Another deviation occurring while no Vendor Creates
Invoice activity appears in the process flow is Delete Purchase Order Item. In 8,839
cases, where is deletion of PO, 8,530 happen while there is no information on creation
of an invoice from the vendor’s side. Therefore it can be concluded that the correla-
tion between those two is not accidental and information on creation of an invoice is
thought to be a confirmation of receiving an invoice. Deletion of POs happens mostly
within subsidiary company_0000 (just 31 cases come from another subsidiary). None
of the vendors or users seem to cause that much of these reworks so that it would be
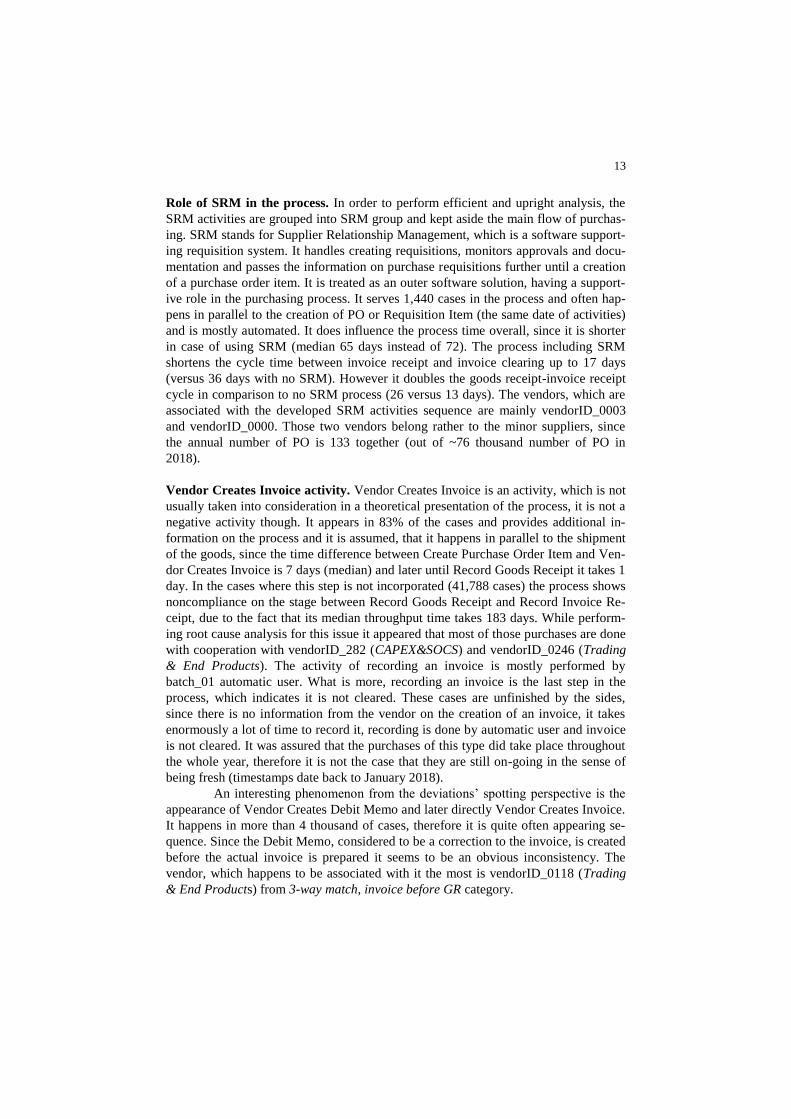
outstanding. On the other hand, a part of deleted POs is reactivated. Fig. 10 below
presents the sub process for reactivation of deleted POs. In reactivation the process
flow goes in a generally compliant way. After a reactivation of PO, goods are re-
ceived, invoice is created and recorded, then cleared. The only alarming point is the
duration of the flow between recording invoice and clearing it (47 days). It is not
much longer than the median throughput time in this cycle for the whole process
though. However, this time is not considered to be optimal and a potential in speeding
up this cycle is noticed.
Fig. 10. Sub process map for reactivation of deleted POs.
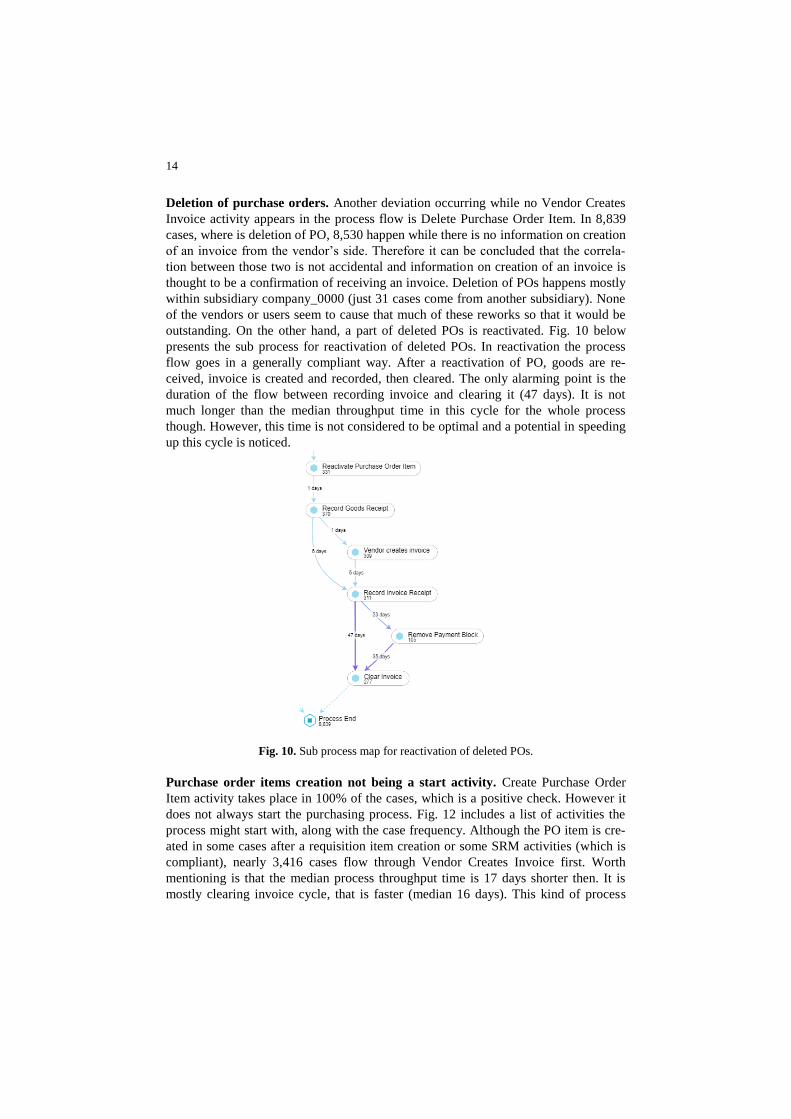
Purchase order items creation not being a start activity. Create Purchase Order
Item activity takes place in 100% of the cases, which is a positive check. However it
does not always start the purchasing process. Fig. 12 includes a list of activities the
process might start with, along with the case frequency. Although the PO item is cre-
ated in some cases after a requisition item creation or some SRM activities (which is
compliant), nearly 3,416 cases flow through Vendor Creates Invoice first. Worth
mentioning is that the median process throughput time is 17 days shorter then. It is
mostly clearing invoice cycle, that is faster (median 16 days). This kind of process
15
deviation happens mostly while trading with vendorID_0550 from Trading & End
Products spend area (1,213 cases).
Fig. 11. The snapshot of the list of the process start activities.
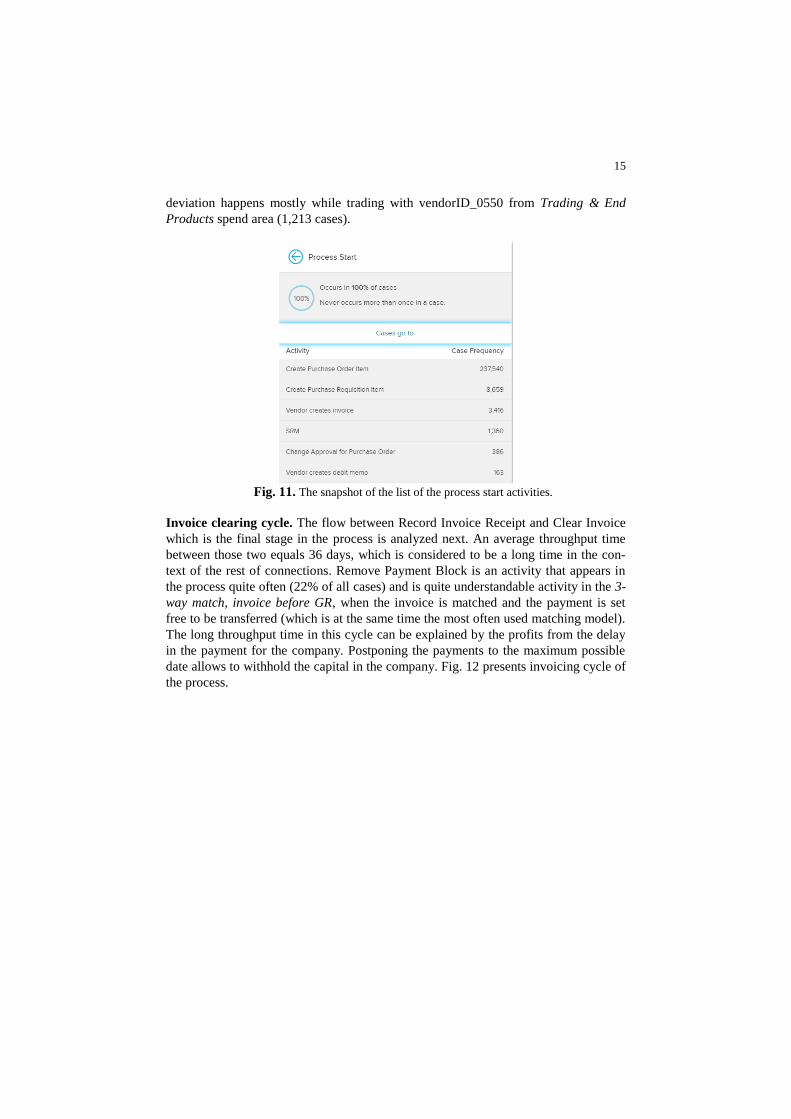
Invoice clearing cycle. The flow between Record Invoice Receipt and Clear Invoice
which is the final stage in the process is analyzed next. An average throughput time
between those two equals 36 days, which is considered to be a long time in the con-
text of the rest of connections. Remove Payment Block is an activity that appears in
the process quite often (22% of all cases) and is quite understandable activity in the 3-
way match, invoice before GR, when the invoice is matched and the payment is set
free to be transferred (which is at the same time the most often used matching model).
The long throughput time in this cycle can be explained by the profits from the delay
in the payment for the company. Postponing the payments to the maximum possible
date allows to withhold the capital in the company. Fig. 12 presents invoicing cycle of
the process.
16
Fig. 12. The part of the process flow presenting the invoicing stage, covering 99% of activities
and 56% of all connections.
Cancel Invoice Receipt is seen as a definite deviation. While exploring its connection
it is concluded that after a cancellation of an invoice it proceeds with clearing (2,960
cases, that is 46% of all cancelled invoices) and later on new invoice is recorded. On
the other hand the cases, which after cancellation of an invoice proceed with record-
ing invoice receipt amount to 26% of all cancelled invoices. This sequence indicates
that the invoices must be wrongly posted and new ones are issued by the vendor in
order to correct the issue and finalize the purchase process. Performing further analy-
sis on the issue it was discovered that in 99% of the cases, where invoice is cancelled
and a new one is recorded, a Debit Memo was created upfront by the vendor. Debit
Memo is thought to be a correcting, invoice based document, whose presence in the
process justifies the cancellation of an invoice. Cancelling an invoice is done together
with recording a new one and this cycle takes around 24 days. More governance of
debit memos issued by the vendors in the process would bring a benefit of speeding
up the process of multiple invoices handling and realization of payment in conse-
quence.
Rework activities. Significant problems take place on the second stage of the pro-
cess, namely between Create Purchase Order Item and Record Goods Receipt. Apart
from positive activities, such as Vendor Creates Invoice mentioned before and Re-
ceive Order Confirmation, some unnecessary changes are applied. Those changes
concern mostly quantity and price, which prolong the whole process by 7 days on
average each and their ratios are 1.34% of all cases for quantity change, and 0.78%
for change price. The overall rework ratio equals 2.15% and its scale is not alarming.
Although the presence of rework is considered to be negative in principle, in a real-
life they are hard to avoid. Changes in orders are considered as deviations, which
could be avoided if orders were made with more care and closer cooperation with
suppliers.

17
Change Quantity activity appears in 17,590 cases and the median throughput time
for the whole process (incorporating Change Quantity step) is 18 days longer, than the
initial one. Examining the root cause for presence of this rework in the process, it
appeared they only touch companyID_0000. All of the change quantity actions are
performed by manual users. More than half of purchases are done in Packaging spend
area, especially in cooperation with vendorID_136. Moreover, Trading & End Prod-
ucts spend area seems to incorporate a lot of quantity change rework, where ven-
dorID_0197 contributes to this issue the most. Fig. 13 presents the process map of
vendorID_0197.
Fig. 13. Process map for vendorID_0197, as a supplier causing rework issues and long
throughput times.
The median throughput time for supplier vendorID_0197 takes 133 days (versus 72 in
general). One of the main problems in a trade with this vendor is a long throughput
time between PO creation and the next step e.g. Vendor Creates Invoice (46 days).
Also it takes long until goods are received (52 days). Along with quantity changes
there are a lot of price changes applied (almost half of the POs). Users working with it
are mostly user_071 (performing change price rework) and user_84 (change price
rework).
Change Price rework appears in 4% of the cases. It happens in almost all of the
cases within one subsidiary, namely company_0000 and they also are performed only
by manual users. In the case of change price rework the most problems are caused by
vendorID_0197, presented in the previous paragraph. No other vendor seems to con-
tribute strongly to its presence. There exists a correlation between Change Price and
Change Quantity. In 20% of cases, where there is Change Price also Change Quantity
is present in the process.
18
Delete Purchase Order Item happens also on that stage of a process. It is natural
that such cases as deletion of an order will sometimes take place at some point in
purchasing. Due to the fact that it happens right after the creation of an item it does
not contribute to growing problems, as it could if it happened on the latter stages. It
can be treated as fairly acceptable then. Although aiming at the process excellence, if
deletion of order items happen, an extra governance over their creation should be
given.
Overall, more governance and control over purchase requesting would bring profits
on the coherence of the process. Additionally better communication and closer coop-
eration with vendors would be profitable and let the company avoid unnecessary
changes at different stages during the flow of the process.
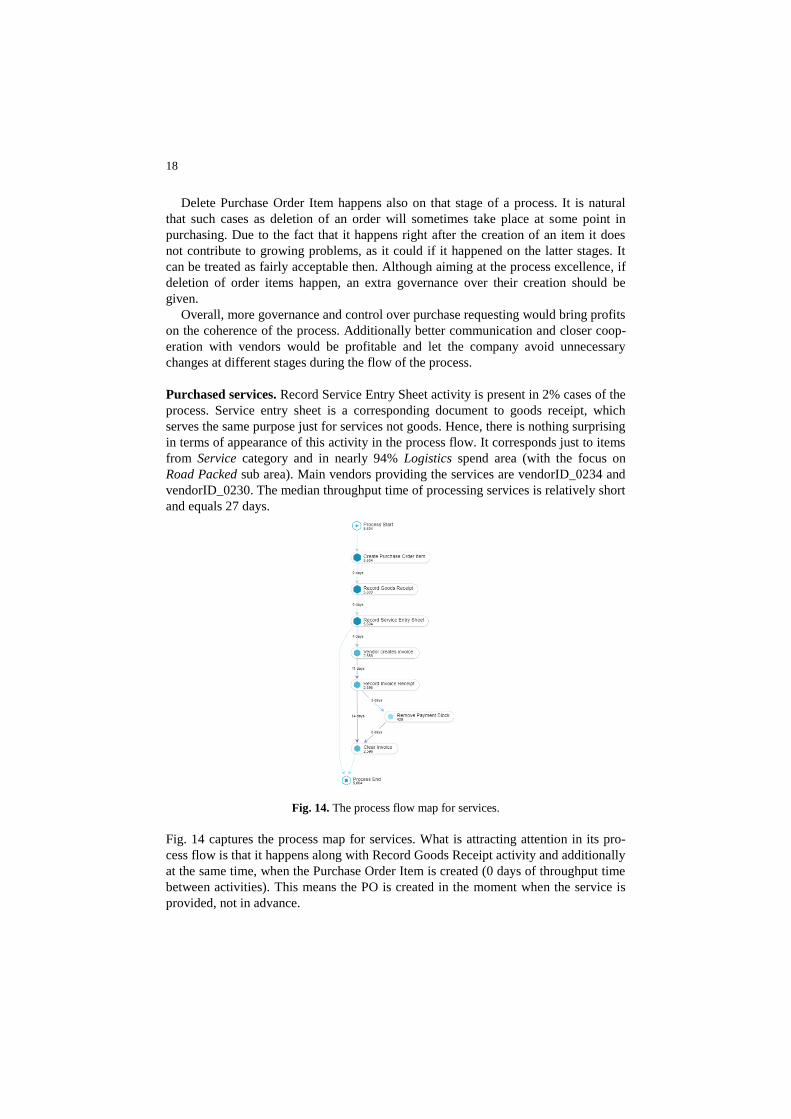
Purchased services. Record Service Entry Sheet activity is present in 2% cases of the
process. Service entry sheet is a corresponding document to goods receipt, which
serves the same purpose just for services not goods. Hence, there is nothing surprising
in terms of appearance of this activity in the process flow. It corresponds just to items
from Service category and in nearly 94% Logistics spend area (with the focus on
Road Packed sub area). Main vendors providing the services are vendorID_0234 and
vendorID_0230. The median throughput time of processing services is relatively short
and equals 27 days.
Fig. 14. The process flow map for services.
Fig. 14 captures the process map for services. What is attracting attention in its pro-
cess flow is that it happens along with Record Goods Receipt activity and additionally
at the same time, when the Purchase Order Item is created (0 days of throughput time
between activities). This means the PO is created in the moment when the service is
provided, not in advance.
19
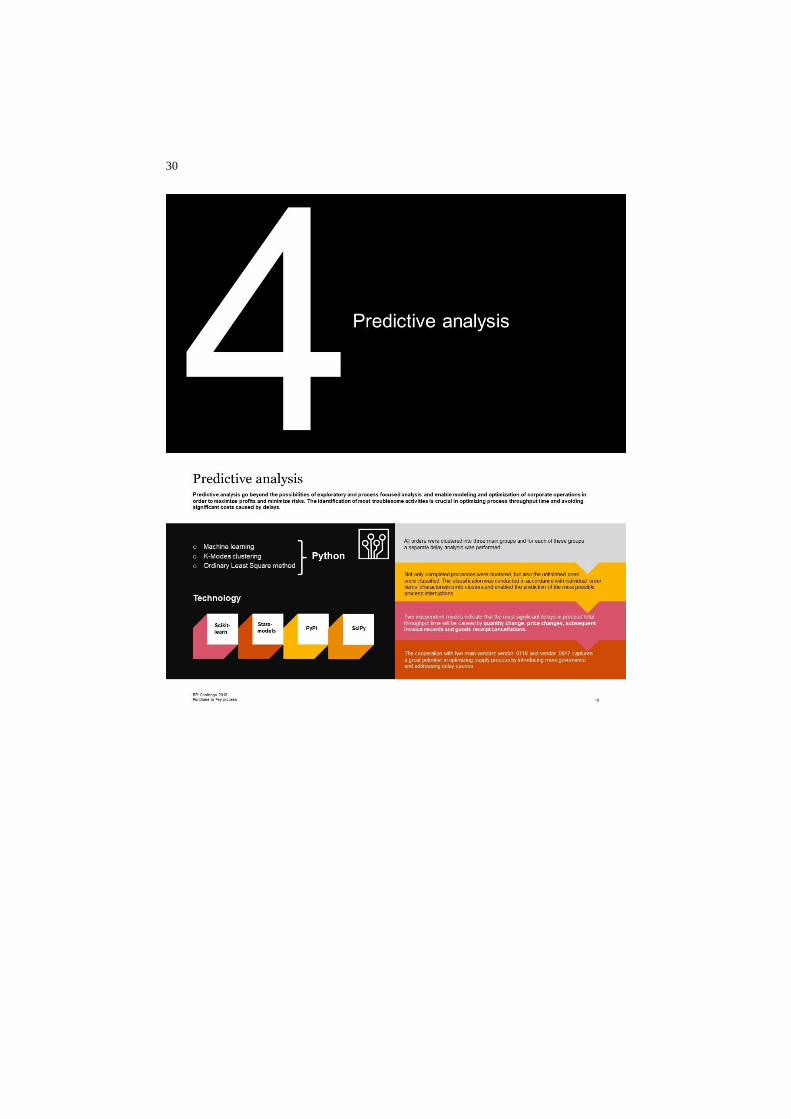
3.3 Predictive analysis
In the previous parts of the report the process itself was examined and the most signif-
icant anomalies and deviations were identified. The purpose of predictive analysis,
however, goes beyond the possibilities of exploratory and process focused analysis
and enables to model and optimize corporate operations in order to maximize profits
or minimize risks [6].
The aim of predictive analysis performed in the given project is to decide whether
certain activities within the process path have significant impact on the overall pro-
cess throughput time. It is reasonable to assume that different kinds of orders are be-
ing processed in different ways and potential delay causes may differ from one anoth-
er [7]. All orders were clustered into three main groups and for each of these groups a
separate delay analysis was performed. Undesired activities with the greatest impact
on overall process time were identified and recommendations on which order ele-
ments should be most carefully checked were formulated. The process of identifying
most troublesome activities is crucial in optimizing process throughput time and
avoiding significant costs caused by delays [7]. An example of analysis’ application
was also described in the current chapter: from the examined dataset all of the unfin-
ished processes were identified and classified into one of the clusters. It enabled to
formulate recommendations for the most recent purchase order items.
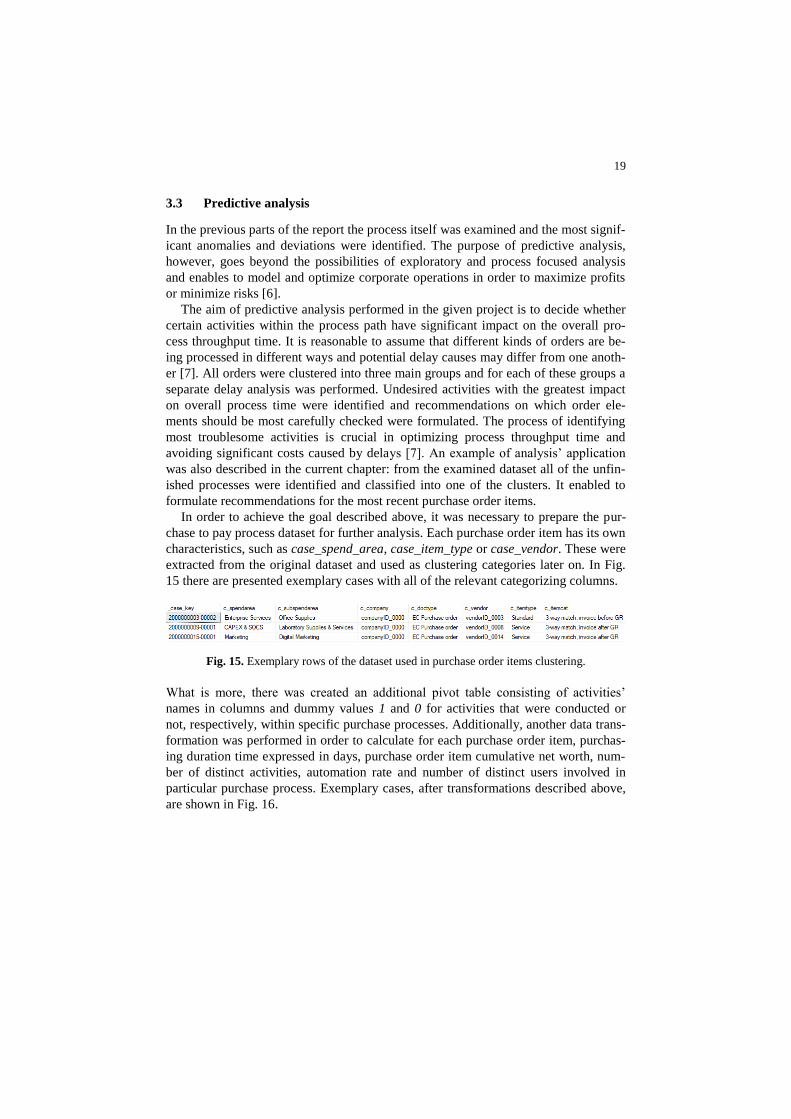
In order to achieve the goal described above, it was necessary to prepare the pur-
chase to pay process dataset for further analysis. Each purchase order item has its own
characteristics, such as case_spend_area, case_item_type or case_vendor. These were
extracted from the original dataset and used as clustering categories later on. In Fig.
15 there are presented exemplary cases with all of the relevant categorizing columns.
Fig. 15. Exemplary rows of the dataset used in purchase order items clustering.
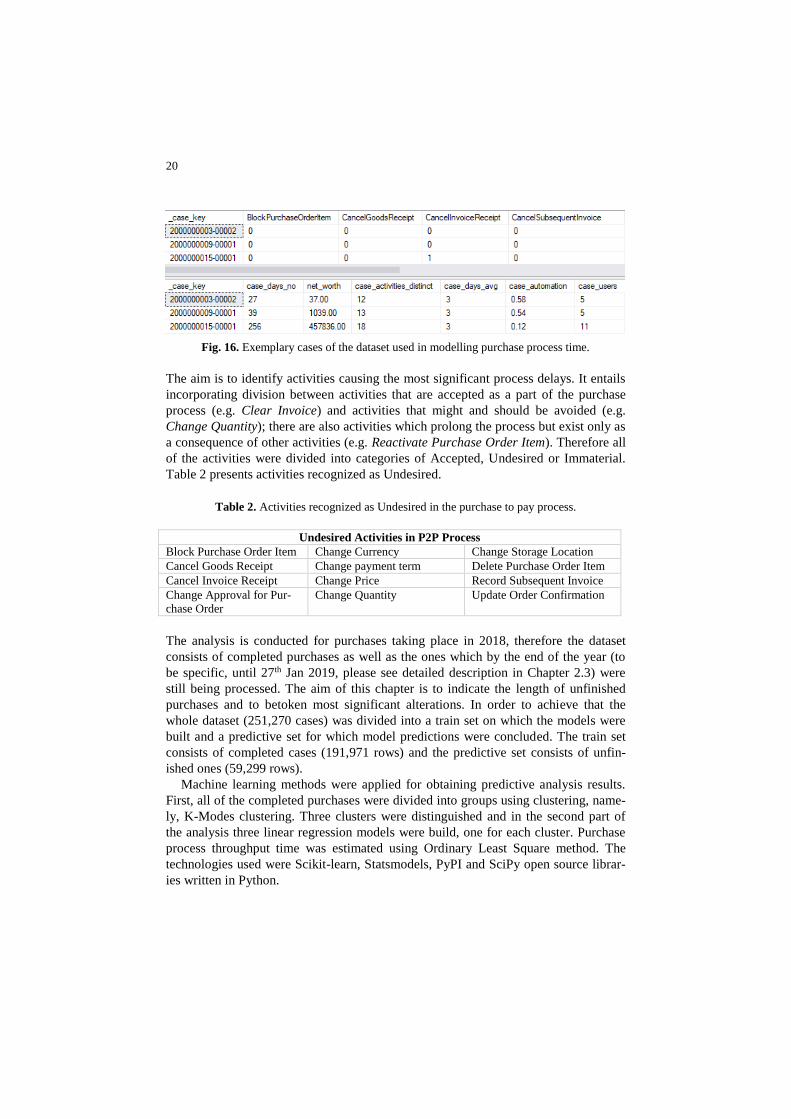
What is more, there was created an additional pivot table consisting of activities’
names in columns and dummy values 1 and 0 for activities that were conducted or
not, respectively, within specific purchase processes. Additionally, another data trans-
formation was performed in order to calculate for each purchase order item, purchas-
ing duration time expressed in days, purchase order item cumulative net worth, num-
ber of distinct activities, automation rate and number of distinct users involved in
particular purchase process. Exemplary cases, after transformations described above,
are shown in Fig. 16.
20
Fig. 16. Exemplary cases of the dataset used in modelling purchase process time.
The aim is to identify activities causing the most significant process delays. It entails
incorporating division between activities that are accepted as a part of the purchase
process (e.g. Clear Invoice) and activities that might and should be avoided (e.g.
Change Quantity); there are also activities which prolong the process but exist only as
a consequence of other activities (e.g. Reactivate Purchase Order Item). Therefore all
of the activities were divided into categories of Accepted, Undesired or Immaterial.
Table 2 presents activities recognized as Undesired.
Table 2. Activities recognized as Undesired in the purchase to pay process.
Undesired Activities in P2P Process
Block Purchase Order Item Change Currency Change Storage Location
Cancel Goods Receipt Change payment term Delete Purchase Order Item
Cancel Invoice Receipt Change Price Record Subsequent Invoice
Change Approval for Pur-
chase Order
Change Quantity Update Order Confirmation
The analysis is conducted for purchases taking place in 2018, therefore the dataset
consists of completed purchases as well as the ones which by the end of the year (to
be specific, until 27th Jan 2019, please see detailed description in Chapter 2.3) were
still being processed. The aim of this chapter is to indicate the length of unfinished
purchases and to betoken most significant alterations. In order to achieve that the
whole dataset (251,270 cases) was divided into a train set on which the models were
built and a predictive set for which model predictions were concluded. The train set
consists of completed cases (191,971 rows) and the predictive set consists of unfin-
ished ones (59,299 rows).
Machine learning methods were applied for obtaining predictive analysis results.
First, all of the completed purchases were divided into groups using clustering, name-
ly, K-Modes clustering. Three clusters were distinguished and in the second part of
the analysis three linear regression models were build, one for each cluster. Purchase
process throughput time was estimated using Ordinary Least Square method. The
technologies used were Scikit-learn, Statsmodels, PyPI and SciPy open source librar-
ies written in Python.
21
Purchase Order items clustering. Clustering is an unsupervised machine learning
approach used in variety of cases, ranging from customer segmentation to anomaly
detection [8]. It aims at finding similar objects in one cluster and dissimilar objects far
from one another. Clustering can be done in multiple ways based on the type of data
and business environment. In this analysis dataset contains categorical information
about purchase order items (spending area, spending subarea, company name, docu-
ment type, vendor name, item type, item category) therefore clustering K-modes
method was applied. Rather than calculating the distance between any two observa-
tions, it counts occurrences of the same values and clusters the most similar cases.
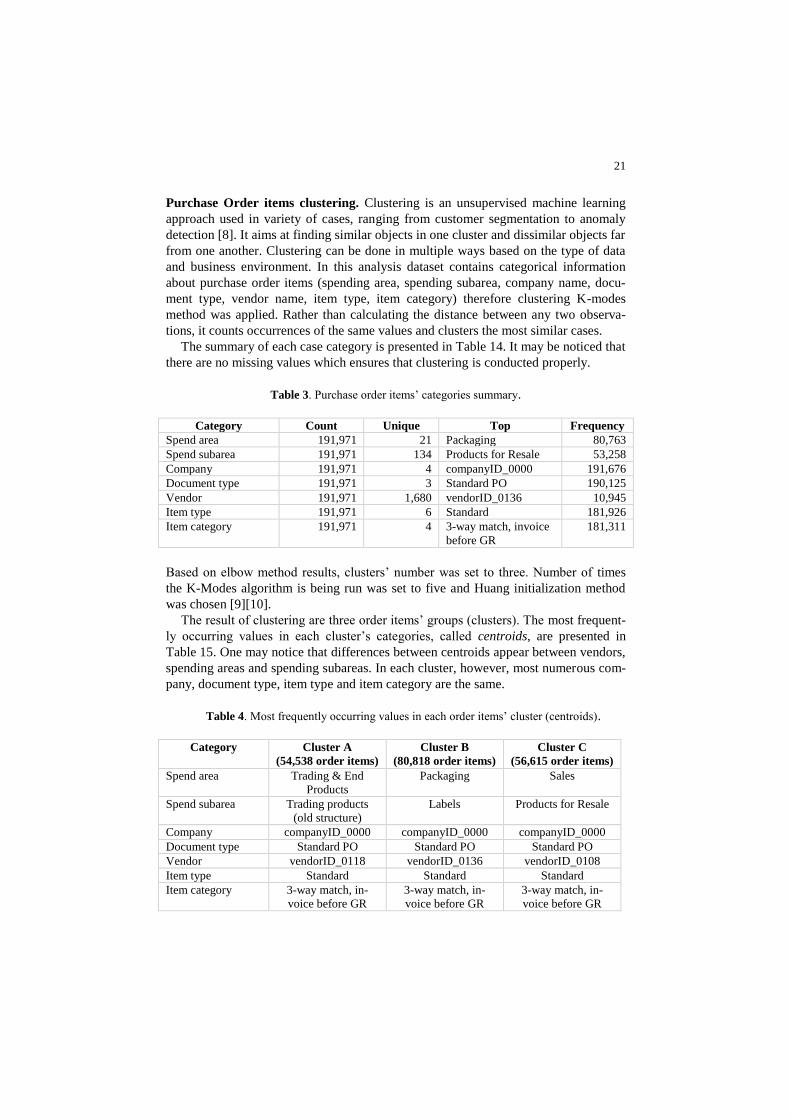
The summary of each case category is presented in Table 14. It may be noticed that
there are no missing values which ensures that clustering is conducted properly.
Table 3. Purchase order items’ categories summary.
Category Count Unique Top Frequency
Spend area 191,971 21 Packaging 80,763
Spend subarea 191,971 134 Products for Resale 53,258
Company 191,971 4 companyID_0000 191,676
Document type 191,971 3 Standard PO 190,125
Vendor 191,971 1,680 vendorID_0136 10,945
Item type 191,971 6 Standard 181,926
Item category 191,971 4 3-way match, invoice
before GR
181,311
Based on elbow method results, clusters’ number was set to three. Number of times
the K-Modes algorithm is being run was set to five and Huang initialization method
was chosen [9][10].
The result of clustering are three order items’ groups (clusters). The most frequent-
ly occurring values in each cluster’s categories, called centroids, are presented in
Table 15. One may notice that differences between centroids appear between vendors,
spending areas and spending subareas. In each cluster, however, most numerous com-
pany, document type, item type and item category are the same.
Table 4. Most frequently occurring values in each order items’ cluster (centroids).
Category Cluster A
(54,538 order items)
Cluster B
(80,818 order items)
Cluster C
(56,615 order items)
Spend area Trading & End
Products
Packaging Sales
Spend subarea Trading products
(old structure)
Labels Products for Resale
Company companyID_0000 companyID_0000 companyID_0000
Document type Standard PO Standard PO Standard PO
Vendor vendorID_0118 vendorID_0136 vendorID_0108
Item type Standard Standard Standard
Item category 3-way match, in-
voice before GR
3-way match, in-
voice before GR
3-way match, in-
voice before GR
22
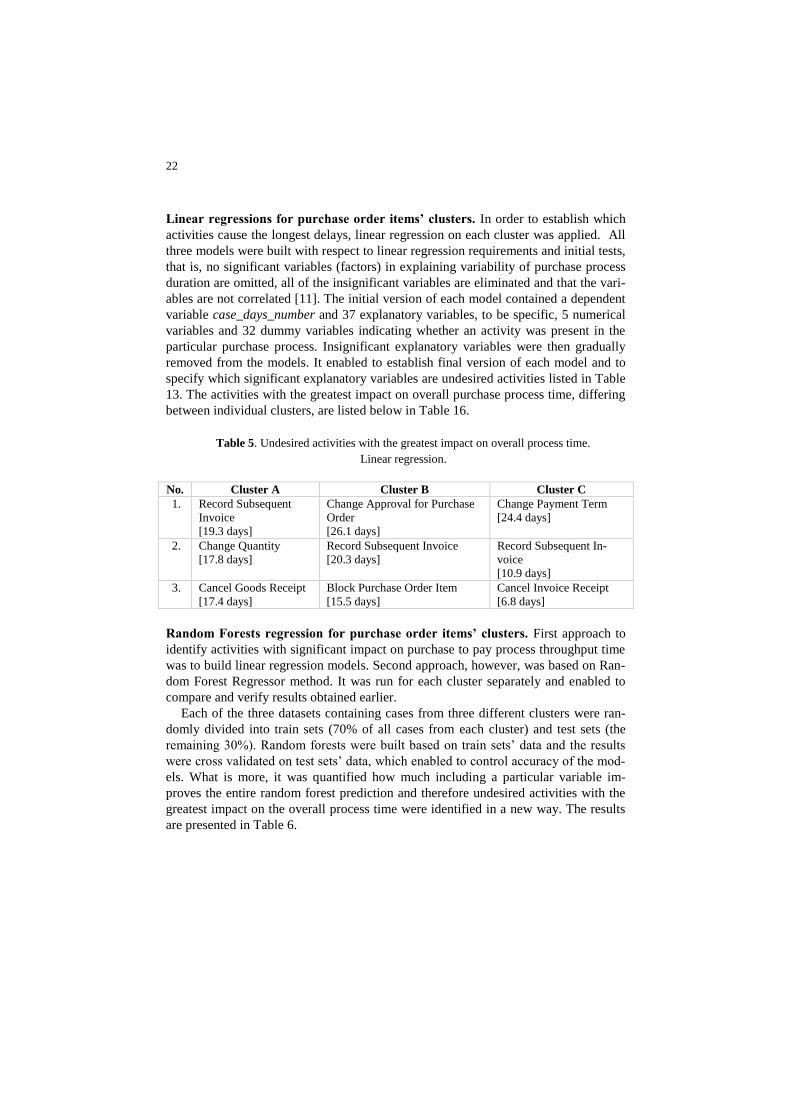
Linear regressions for purchase order items’ clusters. In order to establish which
activities cause the longest delays, linear regression on each cluster was applied. All
three models were built with respect to linear regression requirements and initial tests,
that is, no significant variables (factors) in explaining variability of purchase process
duration are omitted, all of the insignificant variables are eliminated and that the vari-
ables are not correlated [11]. The initial version of each model contained a dependent
variable case_days_number and 37 explanatory variables, to be specific, 5 numerical
variables and 32 dummy variables indicating whether an activity was present in the
particular purchase process. Insignificant explanatory variables were then gradually
removed from the models. It enabled to establish final version of each model and to
specify which significant explanatory variables are undesired activities listed in Table
13. The activities with the greatest impact on overall purchase process time, differing
between individual clusters, are listed below in Table 16.
Table 5. Undesired activities with the greatest impact on overall process time.
Linear regression.
No. Cluster A Cluster B Cluster C
1. Record Subsequent
Invoice
[19.3 days]
Change Approval for Purchase
Order
[26.1 days]
Change Payment Term
[24.4 days]
2. Change Quantity
[17.8 days]
Record Subsequent Invoice
[20.3 days]
Record Subsequent In-
voice
[10.9 days]
3. Cancel Goods Receipt
[17.4 days]
Block Purchase Order Item
[15.5 days]
Cancel Invoice Receipt
[6.8 days]
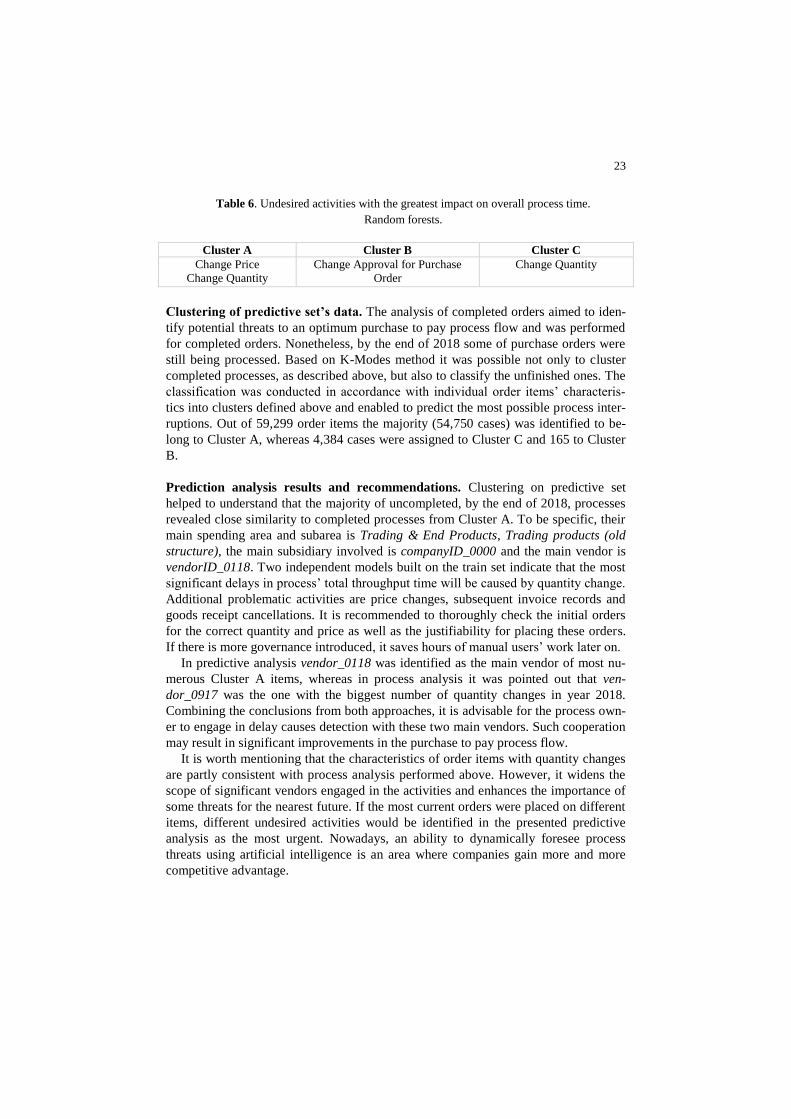
Random Forests regression for purchase order items’ clusters. First approach to
identify activities with significant impact on purchase to pay process throughput time
was to build linear regression models. Second approach, however, was based on Ran-
dom Forest Regressor method. It was run for each cluster separately and enabled to
compare and verify results obtained earlier.
Each of the three datasets containing cases from three different clusters were ran-
domly divided into train sets (70% of all cases from each cluster) and test sets (the
remaining 30%). Random forests were built based on train sets’ data and the results
were cross validated on test sets’ data, which enabled to control accuracy of the mod-
els. What is more, it was quantified how much including a particular variable im-
proves the entire random forest prediction and therefore undesired activities with the
greatest impact on the overall process time were identified in a new way. The results
are presented in Table 6.
23
Table 6. Undesired activities with the greatest impact on overall process time.
Random forests.
Cluster A Cluster B Cluster C
Change Price
Change Quantity
Change Approval for Purchase
Order
Change Quantity
Clustering of predictive set’s data. The analysis of completed orders aimed to iden-
tify potential threats to an optimum purchase to pay process flow and was performed
for completed orders. Nonetheless, by the end of 2018 some of purchase orders were
still being processed. Based on K-Modes method it was possible not only to cluster
completed processes, as described above, but also to classify the unfinished ones. The
classification was conducted in accordance with individual order items’ characteris-
tics into clusters defined above and enabled to predict the most possible process inter-
ruptions. Out of 59,299 order items the majority (54,750 cases) was identified to be-
long to Cluster A, whereas 4,384 cases were assigned to Cluster C and 165 to Cluster
B.
Prediction analysis results and recommendations. Clustering on predictive set
helped to understand that the majority of uncompleted, by the end of 2018, processes
revealed close similarity to completed processes from Cluster A. To be specific, their
main spending area and subarea is Trading & End Products, Trading products (old
structure), the main subsidiary involved is companyID_0000 and the main vendor is
vendorID_0118. Two independent models built on the train set indicate that the most
significant delays in process’ total throughput time will be caused by quantity change.
Additional problematic activities are price changes, subsequent invoice records and
goods receipt cancellations. It is recommended to thoroughly check the initial orders
for the correct quantity and price as well as the justifiability for placing these orders.
If there is more governance introduced, it saves hours of manual users’ work later on.
In predictive analysis vendor_0118 was identified as the main vendor of most nu-
merous Cluster A items, whereas in process analysis it was pointed out that ven-
dor_0917 was the one with the biggest number of quantity changes in year 2018.
Combining the conclusions from both approaches, it is advisable for the process own-
er to engage in delay causes detection with these two main vendors. Such cooperation
may result in significant improvements in the purchase to pay process flow.
It is worth mentioning that the characteristics of order items with quantity changes
are partly consistent with process analysis performed above. However, it widens the
scope of significant vendors engaged in the activities and enhances the importance of
some threats for the nearest future. If the most current orders were placed on different
items, different undesired activities would be identified in the presented predictive
analysis as the most urgent. Nowadays, an ability to dynamically foresee process
threats using artificial intelligence is an area where companies gain more and more
competitive advantage.
24
4 SUMMARY
In the digitalization era, the possibilities of implementing IT systems supporting Pro-
cess Mining techniques are constantly growing. Among different business processes
Purchase-to-Pay process has a lot of potential for an improvement. In the presented
report a thorough analysis was performed. With the usage of Power BI data visualiza-
tion tool exploratory analysis was conducted. Further on, process focused analysis
with the usage of Celonis Process Intelligence tool was described. The last part of the
report, carried out with the use of Python Machine Learning libraries, was predictive
analysis and recommendations.
In exploratory analysis four different invoice matching models were visualized and
described. For every invoicing model (3-way match, invoice before GR; 3-way match,
invoice after GR; Consignment; 2-way match) their characteristics were briefly de-
scribed, including spend areas and subareas, main vendors, seasonality and the most
common rework activities. The analysis enabled to learn main purchase to pay pro-
cess features, recognize differences and became useful in process focused analysis
conducted in the next chapter.
The main goal of process focused analysis was to describe process flow and to
identify process deviations. First, so-called happy path of the process was discovered
and further on its violations were identified. Possible explanations, root causes and
alarming points, derived from detailed analysis supported with Celonis application,
were also provided.
Predictive analysis aimed at identifying undesired activities with the greatest im-
pact on overall process throughput time and predicting the most possible threats for
the upcoming orders. All of the completed order items were divided into three clus-
ters, with order items’ categories different from one another as much as possible. For
these three clusters separate models were built and most influential (that is, causing
the longest delays) activities were identified. It enabled to recommend the most im-
portant precautions against purchase to pay process delays for the orders which were
already initialized but not yet completed.
In summary, the analysis presented significant insights into Purchase-to-Pay pro-
cess characteristics, identified process deviations and provided useful recommenda-
tions. If data provided is de-anonymized, the process owner may apply given results
and improve Purchase-to-Pay process flow which will result in significant cost reduc-
tion. Also, in the future, more accurate conclusions may be obtained with usage of
wider range of data, more specific analytical questions and possibility of communica-
tion between analysts and process owners.
25
5 REFERENCES
1. Van der Aalst, W.: Process Mining. Discovery, conformance and Enhance-
ment of Business Processes, Springer-Verlag Berlin Heidelberg (2011).
2. Sadiq, S., Governatori, G., Namiri, K.: Modeling Control Objectives for
Business Process Compliance, BPM 2007. Lecture Notes in Computer Sci-
ence, vol 4714. Springer, Berlin, Heidelberg (2007).
3. BPI Challenge 2019, 9th International Business Process Intelligence Chal-
lenge https://icpmconference.org/icpm-2019/contests-challenges/bpi-
challenge-2019/, last accessed 2019/04/17.
4. Kraljic, P.: Purchasing must become supply management. Harvard Business
Review (1983).
5. Bhuvaneswaran, Sh.: The Ultimate Guide to a Truly Effective Procure-to-
Pay Process, https://kissflow.com/procurement-process/guide-to-procure-to-
pay-process/, last accessed 2019/04/17.
6. Murphy, K.: 3-way matching process. Why it’s a critical Step in the Ac-
counts Payable Process, PurchaseControl (2017),
https://www.purchasecontrol.com/uk/blog/what-is-3-way-matching/.
7. Van Dongen, B.F., Dataset BPI Challenge 2019. 4TU.Centre for Research
Data. https://doi.org/10.4121/uuid:d06aff4b-79f0-45e6-8ec8-e19730c248f1,
last accessed 2019/04/17.
8. Van der Aalst W., Reijers H., Weijters A., Van Dongen B., Alves de Medei-
ros A., Song M., Verbeek H.: Business Process Mining: An Industrial Appli-
cation, Information Systems, 32(5), pp. 713-732.
9. Van der Aalst W., Schonenberg M., Song M.: Time Prediction Based on
Process Mining, BPM Center Report BPM-09-04 (2009), BPMcenter.org.
10. Singh P.: Machine Learning with PySpark: With Natural Language Pro-
cessing and Recommender Systems, Apress (2018).
11. Huang, Z.: Clustering large data sets with mixed numeric and categorical
values, Proceedings of the First Pacific Asia Knowledge Discovery and Data
Mining Conference, Singapore (1997), pp. 21-34.
12. Huang, Z.: Extensions to the k-modes algorithm for clustering large data sets
with categorical values, Data Mining and Knowledge Discovery (1998),
2(3), pp. 283-304.
13. Mycielski J.: Econometrics, University of Warsaw (2009).
26
6 APPENDIX
27
28
29
30
31


