Embed Size (px)
Citation preview
Int. J. Environ. Res. Public Health 2013, 10, 3217-3232; doi:10.3390/ijerph10083217
International Journal of
Environmental Research and
Public Health ISSN 1660-4601
www.mdpi.com/journal/ijerph
Article
Investigating Social Ecological Contributors to Diabetes within
Hispanics in an Underserved U.S.-Mexico Border Community
Jean Chang 1, Mignonne C. Guy
2, Cecilia Rosales
1, Jill G. de Zapien
1, Lisa K. Staten
3,
Maria L. Fernandez 1 and Scott C. Carvajal
1,*
1 Mel and Enid Zuckerman College of Public Health, Arizona Prevention Research Center,
University of Arizona, 1295 N. Martin Ave, Tucson, AZ 85724, USA;
E-Mails: [email protected] (J.C.); [email protected] (C.R.);
[email protected] (J.G.Z.); [email protected] (M.L.F.) 2 Mayo Clinic Arizona, Department of Health Sciences Research, 13400 E. Shea Blvd, Scottsdale,
AZ 85259, USA; E-Mail: [email protected] 3 Richard M. Fairbanks School of Public Health at IUPUI, Indiana University, 714 N. Senate Avenue
EF 250, Indianapolis, IN 46202, USA; E-Mail: [email protected]
* Author to whom correspondence should be addressed; E-Mail: [email protected];
Tel.: +1-520-626-9026; Fax: +1-520-626-8716.
Received: 18 June 2013; in revised form: 22 July 2013 / Accepted: 23 July 2013 /
Published: 31 July 2013
Abstract: Hispanics bear a disproportionate burden of diabetes in the United States,
yet relations of structural, socio-cultural and behavioral factors linked to diabetes are not
fully understood across all of their communities. The current study examines disparities
and factors associated with diabetes in adult Hispanics of Mexican-descent (N = 648)
participating in a population survey of an underserved rural U.S.-Mexico border community.
The overall rate of diabetes prevalence rate in the sample, based on self-report and a
glucose testing, was 21%; much higher than rates reported for U.S. adults overall, for all
Hispanic adults, or for Mexican American adults specifically. Acculturation markers and
social determinants of health indicators were only significantly related to diabetes in
models not accounting for age. Older age, greater BMI (>30), greater waist-to-hip ratio as
well as lower fruit and vegetable consumption were significantly related to increased
likelihood of diabetes when all structural, cultural, behavioral, and biological factors were
considered. Models with sets of behavioral factors and biological factors each significantly
improved explanation of diabetes relative to prior social ecological theory-guided models.
OPEN ACCESS
Int. J. Environ. Res. Public Health 2013, 10 3218
The findings show a critical need for diabetes prevention efforts in this community and
suggest that health promotion efforts should particularly focus on increasing fruit and
vegetable consumption.
Keywords: diabetes; hispanics; U.S.-Mexico border; obesity; underserved; socio-ecological
model; health disparities; health behaviors
1. Introduction
The World Health Organization (WHO) reports diabetes as the ninth leading cause of death
worldwide and a global epidemic affecting 347 million people [1]. In the U.S., there are an estimated
25.8 million people, or 8.3% of the population, with diabetes, approximately one-third of which are
undiagnosed [2]. Recent studies have projected that by 2050, the incident cases of diabetes are expected
to nearly double, and the prevalence will increase to between 21% and 33% of the U.S. population [3].
Diabetes is the seventh leading cause of death in the U.S. and current trends suggest that this widening
epidemic will continue and subsequent diabetes-related mortality will increase over time [2].
Although diabetes affects all groups in the U.S., non-White racial and ethnic populations suffer a
disproportionate burden of the disease, associated complications, and death [2,4]. In Hispanics, the
largest racial and ethnic minority group, rates of diabetes are almost twice that of Non-Hispanic-Whites [2]
(Note: the terms Hispanic and Latino are used interchangeably and now both are included in U.S.
government official designations of ethnic self-identity. These terms refer to people whose origins are
of Spanish-speaking origin or ancestry). In the largest sub-group of Hispanics, Mexican Americans,
the rate is further elevated [5]. This is not surprising as Mexico, like the U.S., also has one of the
highest rates of obesity in the World [6] and rising obesity and diabetes rates are recognized as primary
public health threats.
The prevalence of age-adjusted diagnosed diabetes in Mexican American adults in the U.S. is
13.3%, nearly double that of Non-Hispanic Whites (7.1%) [7]. Compared to a national age-adjusted
average of 8.2 per 1,000 persons, rates of incident diabetes nationwide are highest among Hispanic
men (13.2), Hispanic women (13.1), persons with less than high school education (15.1), those in
poverty (11.2), and those who are disabled (14.9) [8]. The high rate of Type-II diabetes in Hispanic
adults has been documented to contribute to substantive negative impacts on quality of life in addition
to premature mortality (e.g., the 5th overall leading cause of death; mortality rates due to diabetes are
60% higher than in non-Hispanic Whites) [9,10]. In fact, diabetes mortality and morbidities represent
Latino health disparities that are some of the strongest contraindications to the generally well
supported Hispanic/Latino Epidemiological Paradox–where despite the presence of many traditional
structural risk factors for disease such as being disproportionately of low income and low educational
attainment, their overall health outcomes are comparatively favorable [11].
Along the U.S.-Mexico border, diabetes rates in Hispanics have been further reported to be
double those in other parts of the USA [12–14]. Additionally, Mexican Americans living in rural and
unincorporated areas experience a further disproportionate burden of diabetes and associated
comorbidities when compared to Non-Hispanic Whites, or to Mexican Americans residing in other
Int. J. Environ. Res. Public Health 2013, 10 3219
regions of the USA [15–17]. Additionally, a recent study showed that obesity rates within the largest
U.S.-Mexico border state were highest in areas with high Hispanic concentration and low rates of
higher education [18].
While there are various ongoing research efforts with Hispanic and Mexican American populations
addressing factors related to obesity and diabetes, such as in the Hispanic Community Health Study [19],
there is a need for more current data on factors using representative surveys of rural [20] as well as
border-residing Hispanic communities. There is consistent evidence for excess rates of obesity and
diabetes in Hispanics residing along the U.S.-Mexico border, however, there is less evidence
concerning which factors are most linked to the prevalence of diabetes in this region—such knowledge
is critical to the development and effective targeting of health promotion efforts.
The present study sought to use a socio-ecological framework [21,22] to identify and model factors
related to diabetes in Hispanics residing in a border community. The current study was conducted as
part of a large, representative household survey recently conducted in Douglas, Cochise County,
Arizona. Aspects of this locale are important to understanding the context and implications of diabetes
there; this locale is federally recognized as rural [23], medically underserved, and has a documented
shortage of primary care, mental and dental health professionals [24].
Our social ecological approach to diabetes requires consideration of contextual influences, such as
social determinants (structural factors) and cultural factors, as well as behavioral and biological
factors [20–22]. Acculturation, generally expressed as exposure and adaptation to a new culture, is one
factor of focus in this study. Acculturation is recognized as an important socio-cultural variable related
to Hispanic health, and for illuminating health disparities within diverse ethnic groups that make up the
Hispanic population [25]. However, while greater acculturation is often related to higher prevalence of
diabetes in Hispanics in general [5,26,27] there are some contradictory findings with regards to
Mexican-origin Hispanics [5,28,29]. To understand acculturation-related health disparities, the
interpretations should also consider socio-economic and/or community background [30–33].
Consequently, the current study uses a panel of well-defined structural factors [33], in particular those
relating to health relevant resources, in addition to acculturation markers, to represent important
contextual influences.
Behavioral factors (behavioral reports and specific cognitions) [12,28,34] and adiposity indicators
(biological determinants [22]) will also be considered as explanatory factors in this study. Guided by the
larger theoretical framework, all explanatory factors will be examined individually, then jointly tested
with other variables of the same social ecological level of influence. Finally, a comprehensive model will
be tested with all relevant explanatory factors, with biological factors in the last modeling stage.
2. Methods
2.1. Design, Participants and Sampling
A cross-sectional research design was conducted to explore significant explanatory factors related
to diabetes in our target population. The current study’s participants were drawn from a randomized
cross-sectional community survey of 708 residents that was commissioned by an academic-community
partnership to collect community health needs and planning data. The survey was conducted between
Int. J. Environ. Res. Public Health 2013, 10 3220
October 2010 and September 2011, and is representative of the municipality of Douglas, Arizona
(17,387 residents) as well as the adjacent unincorporated area of Pirtleville, Arizona (1,744 residents) [35].
Census data from 2010 estimates that these municipalities have a combined total of 19,122 residents;
84% identified as Hispanic/Latino, 75% reported Spanish as the dominant language in their home,
32% reported living below the federal poverty level and 36% reported having less than a high school
education) [35]. Strata of census blocks were identified by ethnicity (Hispanic/non-Hispanic) and
socioeconomic status (SES) in order to ensure an accurate reflection of this locale’s socio-demographic
distribution. Occupied housing units were randomly chosen from the selected census areas.
Resident community health workers (“promotoras”/CHWs) who were experienced interviewers
were enlisted to recruit participants and collect all data. These promotoras received training on the
project protocol, survey administration, and if needed a refresher course on clinical measurement of
height, weight, and blood glucose. The promotoras visited each household to verify occupation and to
explain the purpose and scope of the study. Study objectives were explained in both English and
Spanish and informed consent was obtained by promotoras (all fully bilingual). All present residents
over the age of 18 of the randomly selected households were eligible and invited to participate. Upon
consent, measurements were conducted in participants’ homes. There was no monetary incentive for
participation in the survey. The participation rate was 86% (805 households were reached and 112 had
potential participants refuse). Only those participants who self-identified as being of Hispanic origin or
descent (Mexican, Mexican American, Latino/a, Latin American or Chicano/a) were included in the
current study (N = 648).
2.2. Measures
Explanatory variables included objectively measured anthropometric estimates as well as self-report
survey questionnaire data collected by the promotoras. Questionnaire data included acculturation
measures and other socio-demographic information (age, sex, marital status, education, and insurance).
Language acculturation was measured with two English language proficiency Likert-format items: one
about understanding spoken English and one on speaking English. These items were highly associated
(r = 0.99; α = 0.99) and thus summed (Mean, SD, range = 5.52, 2.71, 2–8). They were part of
four items selected from a well-validated orthogonal acculturation scale [36], though the Spanish
proficiency items were not used in further analysis due to ceiling effects—only three of the
respondents indicated “poor” or “very-poor” on either item. Length of residency and nativity questions
completed the acculturation descriptors [36].
Reports on smoking history, alcohol consumption, physical activity, diet, and beliefs about diabetes
were assessed, which all relate to individual level influences within a social ecological perspective.
Obesity status was represented by body mass index (BMI) and waist-to-hip ratio (WHR) recorded by
the interviewers. BMI was calculated using weight (kg)/(height (m))2 derived from medical grade
scales and stadiometers. For analysis and table presentation, the following BMI categories were used:
18–24.9; 25–29.9; 30 and above. Waist-to-hip Ratio was categorized by >0.99 for men and >0.92 for
women based on the optimal cardiovascular risk identification criteria for Mexican American
adults [37]. Current/former smoking (vs. never smoking) was measured by a “yes” or “no” response to
the question of “Have you smoked more than 100 cigarettes or five packs of cigarettes in your life?” [38].
Int. J. Environ. Res. Public Health 2013, 10 3221
Alcohol consumption was measured by number of drinks per year then categorized based on Dietary
Guidelines for Americans for “moderate” (or less) drinking as consuming up to two drinks per day for
men and up to one drink per day for women [39]. Vigorous/moderate exercise was determined from
whether respondents met the CDC’s guidelines in their responses to the brief version of the
International Physical Activity Questionnaire [40]: 150 min of moderate-intensity exercise per week or
75 min of vigorous-intensity exercise per week [41]. Inactivity (marker of sedentary status) was
determined by whether respondents reported 6 h or more of sitting per day [42]. Diet was assessed by
the fruit and vegetable consumption component of the CDC-Behavioral Risk Factor Surveillance
System (BRFSS). While the CDC recommends a minimum serving of three vegetables and two fruits
per day [43], the 2009 BRFSS shows that people who consume more than five fruits and vegetable per
day represent 23% nationwide [44] and in our study the estimate was a mere 3% of the population.
Thus, in our study we use the criteria of whether respondents ate three or more servings of fruits and
vegetables. Respondents were also asked to report “yes” or “no” to whether they believed that diabetes
was preventable (Table 1).
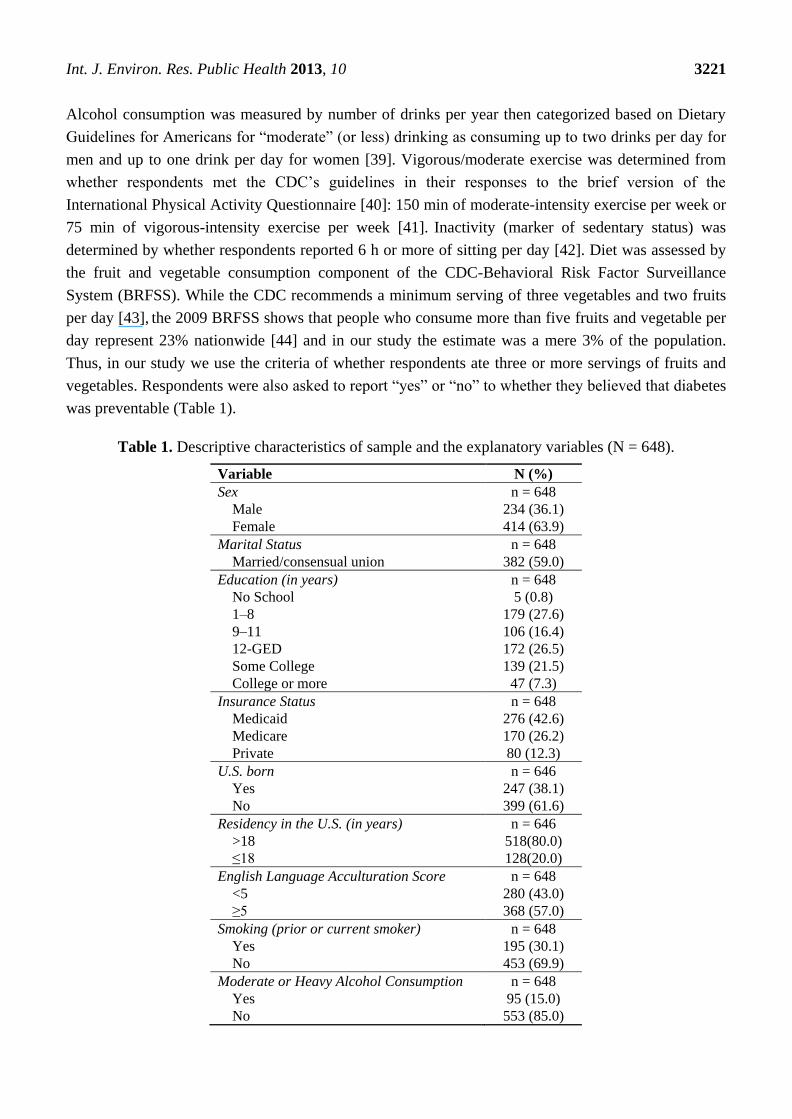
Table 1. Descriptive characteristics of sample and the explanatory variables (N = 648).
Variable N (%)
Sex n = 648
Male 234 (36.1)
Female 414 (63.9)
Marital Status n = 648
Married/consensual union 382 (59.0)
Education (in years) n = 648
No School 5 (0.8)
1–8 179 (27.6)
9–11 106 (16.4)
12-GED 172 (26.5)
Some College 139 (21.5)
College or more 47 (7.3)
Insurance Status n = 648
Medicaid 276 (42.6)
Medicare 170 (26.2)
Private 80 (12.3)
U.S. born n = 646
Yes 247 (38.1)
No 399 (61.6)
Residency in the U.S. (in years) n = 646
>18 518(80.0)
≤18 128(20.0)
English Language Acculturation Score n = 648
<5 280 (43.0)
≥5 368 (57.0)
Smoking (prior or current smoker) n = 648
Yes 195 (30.1)
No 453 (69.9)
Moderate or Heavy Alcohol Consumption n = 648
Yes 95 (15.0)
No 553 (85.0)
Int. J. Environ. Res. Public Health 2013, 10 3222
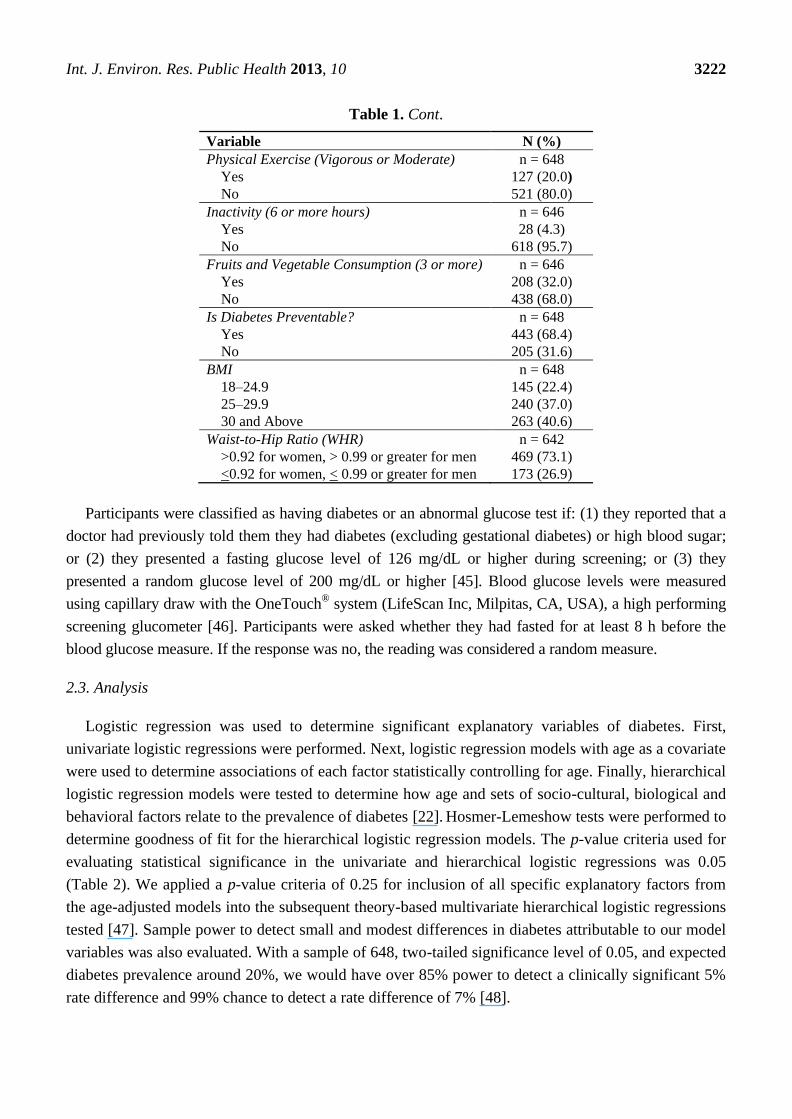
Table 1. Cont.
Variable N (%)
Physical Exercise (Vigorous or Moderate) n = 648
Yes 127 (20.0)
No 521 (80.0)
Inactivity (6 or more hours) n = 646
Yes 28 (4.3)
No 618 (95.7)
Fruits and Vegetable Consumption (3 or more) n = 646
Yes 208 (32.0)
No 438 (68.0)
Is Diabetes Preventable? n = 648
Yes 443 (68.4)
No 205 (31.6)
BMI n = 648
18–24.9 145 (22.4)
25–29.9 240 (37.0)
30 and Above 263 (40.6)
Waist-to-Hip Ratio (WHR) n = 642
>0.92 for women, > 0.99 or greater for men 469 (73.1)
<0.92 for women, < 0.99 or greater for men 173 (26.9)
Participants were classified as having diabetes or an abnormal glucose test if: (1) they reported that a
doctor had previously told them they had diabetes (excluding gestational diabetes) or high blood sugar;
or (2) they presented a fasting glucose level of 126 mg/dL or higher during screening; or (3) they
presented a random glucose level of 200 mg/dL or higher [45]. Blood glucose levels were measured
using capillary draw with the OneTouch® system (LifeScan Inc, Milpitas, CA, USA), a high performing
screening glucometer [46]. Participants were asked whether they had fasted for at least 8 h before the
blood glucose measure. If the response was no, the reading was considered a random measure.
2.3. Analysis
Logistic regression was used to determine significant explanatory variables of diabetes. First,
univariate logistic regressions were performed. Next, logistic regression models with age as a covariate
were used to determine associations of each factor statistically controlling for age. Finally, hierarchical
logistic regression models were tested to determine how age and sets of socio-cultural, biological and
behavioral factors relate to the prevalence of diabetes [22]. Hosmer-Lemeshow tests were performed to
determine goodness of fit for the hierarchical logistic regression models. The p-value criteria used for
evaluating statistical significance in the univariate and hierarchical logistic regressions was 0.05
(Table 2). We applied a p-value criteria of 0.25 for inclusion of all specific explanatory factors from
the age-adjusted models into the subsequent theory-based multivariate hierarchical logistic regressions
tested [47]. Sample power to detect small and modest differences in diabetes attributable to our model
variables was also evaluated. With a sample of 648, two-tailed significance level of 0.05, and expected
diabetes prevalence around 20%, we would have over 85% power to detect a clinically significant 5%
rate difference and 99% chance to detect a rate difference of 7% [48].
Int. J. Environ. Res. Public Health 2013, 10 3223
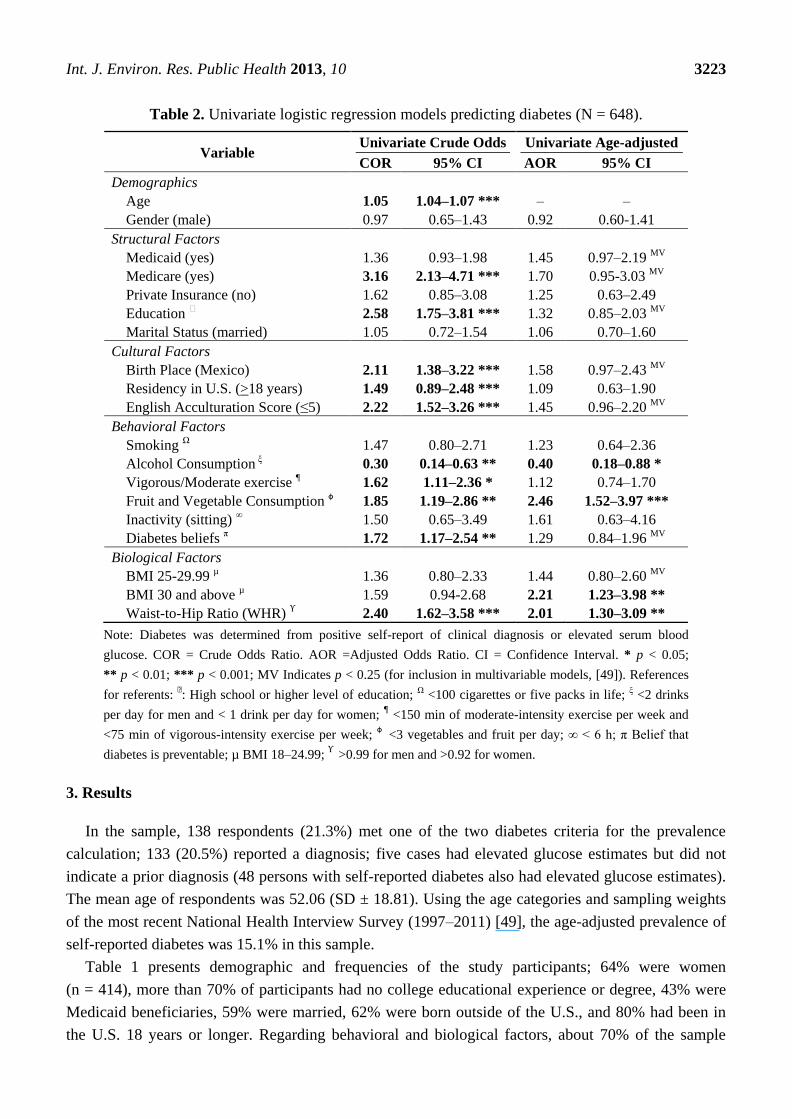
Table 2. Univariate logistic regression models predicting diabetes (N = 648).
Variable Univariate Crude Odds Univariate Age-adjusted
COR 95% CI AOR 95% CI
Demographics
Age 1.05 1.04–1.07 *** – –
Gender (male) 0.97 0.65–1.43 0.92 0.60-1.41
Structural Factors
Medicaid (yes) 1.36 0.93–1.98 1.45 0.97–2.19 MV
Medicare (yes) 3.16 2.13–4.71 *** 1.70 0.95-3.03 MV
Private Insurance (no) 1.62 0.85–3.08 1.25 0.63–2.49
Education Ͻ 2.58 1.75–3.81 *** 1.32 0.85–2.03 MV
Marital Status (married) 1.05 0.72–1.54 1.06 0.70–1.60
Cultural Factors
Birth Place (Mexico) 2.11 1.38–3.22 *** 1.58 0.97–2.43 MV
Residency in U.S. (>18 years) 1.49 0.89–2.48 *** 1.09 0.63–1.90
English Acculturation Score (≤5) 2.22 1.52–3.26 *** 1.45 0.96–2.20 MV
Behavioral Factors
Smoking Ω 1.47 0.80–2.71 1.23 0.64–2.36
Alcohol Consumption ξ 0.30 0.14–0.63 ** 0.40 0.18–0.88 *
Vigorous/Moderate exercise ¶ 1.62 1.11–2.36 * 1.12 0.74–1.70
Fruit and Vegetable Consumption ɸ 1.85 1.19–2.86 ** 2.46 1.52–3.97 ***
Inactivity (sitting) ∞ 1.50 0.65–3.49 1.61 0.63–4.16
Diabetes beliefs π 1.72 1.17–2.54 ** 1.29 0.84–1.96 MV
Biological Factors
BMI 25-29.99 µ 1.36 0.80–2.33 1.44 0.80–2.60 MV
BMI 30 and above µ 1.59 0.94-2.68 2.21 1.23–3.98 **
Waist-to-Hip Ratio (WHR) ϒ 2.40 1.62–3.58 *** 2.01 1.30–3.09 **
Note: Diabetes was determined from positive self-report of clinical diagnosis or elevated serum blood
glucose. COR = Crude Odds Ratio. AOR =Adjusted Odds Ratio. CI = Confidence Interval. * p < 0.05;
** p < 0.01; *** p < 0.001; MV Indicates p < 0.25 (for inclusion in multivariable models, [49]). References
for referents: Ͻ: High school or higher level of education; Ω <100 cigarettes or five packs in life; ξ <2 drinks
per day for men and < 1 drink per day for women; ¶ <150 min of moderate-intensity exercise per week and
<75 min of vigorous-intensity exercise per week; ɸ
<3 vegetables and fruit per day; ∞ < 6 h; π Belief that
diabetes is preventable; µ BMI 18–24.99; ϒ
>0.99 for men and >0.92 for women.
3. Results
In the sample, 138 respondents (21.3%) met one of the two diabetes criteria for the prevalence
calculation; 133 (20.5%) reported a diagnosis; five cases had elevated glucose estimates but did not
indicate a prior diagnosis (48 persons with self-reported diabetes also had elevated glucose estimates).
The mean age of respondents was 52.06 (SD ± 18.81). Using the age categories and sampling weights
of the most recent National Health Interview Survey (1997–2011) [49], the age-adjusted prevalence of
self-reported diabetes was 15.1% in this sample.
Table 1 presents demographic and frequencies of the study participants; 64% were women
(n = 414), more than 70% of participants had no college educational experience or degree, 43% were
Medicaid beneficiaries, 59% were married, 62% were born outside of the U.S., and 80% had been in
the U.S. 18 years or longer. Regarding behavioral and biological factors, about 70% of the sample
Int. J. Environ. Res. Public Health 2013, 10 3224
reported as having never smoked, with equal distributions (15%) of current and former smokers; 15%
reported moderate/heavy drinking. While less than 5% reported high inactivity, only 20% engaged in
moderate or vigorous exercise. About one-third (32%) of respondents consumed three or more fruits
and vegetables per day. Nearly 70% of respondents said diabetes is generally preventable. The mean
BMI was nearly 30 (Mean, SD = 29.55, 6.39). Approximately 40% were within the obese range in
BMI and 70% had elevated waist-to-hip (WHR) ratios.
Significant factors were initially identified using univariate logistic regressions producing crude
odds ratios and test statistics (Table 2). These results show that participants were more likely to have
diabetes if they were older, had less than a high school education, had Medicare, were born in Mexico,
had lived in the U.S. more than 18 years, and were less proficient in English. Regarding the behavioral
and biological factors, persons were more likely to have diabetes if they: reported less than moderate
alcohol consumption, fail to engage in moderate or more exercise, ate less than three servings of fruits
and vegetables per day, reported that diabetes was not preventable, and have high WHR (Table 2).
Next, each specific factor was examined in a model with age as a covariate. No demographic or
acculturation variable remained significantly associated with diabetes in these models (Note: models
with length of residency in 10 year intervals were also tested with logistic regression and the results
were similar to those with the previously described dichotomous coding of this explanatory variable.
The latter models are presented to restrict confounding of years of residency and participants’ age, and
to facilitate interpretation). When adjusted for age, two behavioral and two biological factors were
significantly associated with diabetes: those reporting lower alcohol consumption, those who ate less
than three servings of fruits and vegetables per day, those obese (BMI > 30), and those with high WHR
were more likely to have diabetes.
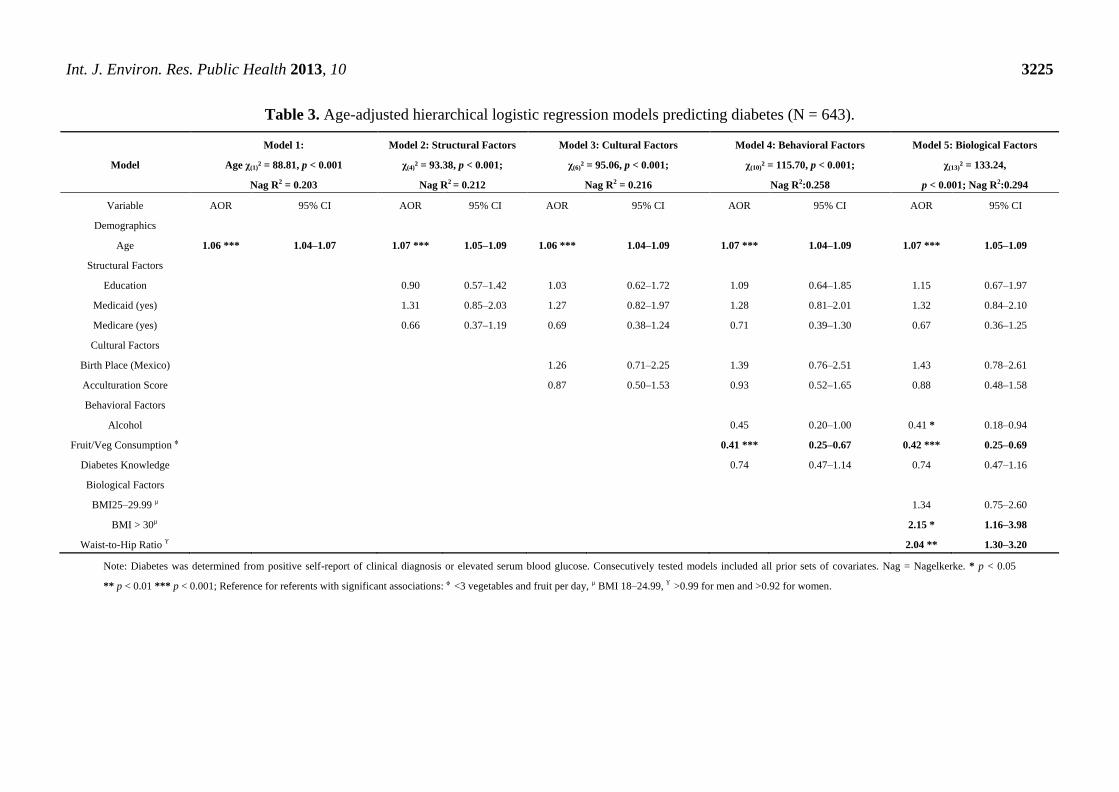
Hierarchical multivariable logistic regressions were then tested that included all age-adjusted
factors with probability values < 0.25, those that were not statistically significant though included in
later stages of modeling are indicated as “MV” in Table 2. Results from this model are presented in
Table 3. Blocks of structural factors (e.g., education, health insurance) and cultural factors (e.g.,
acculturation) did not significantly improve explanation of the prevalence of diabetes when age was
controlled (Δχ(3)² = 4.57 (p = 0.206); Δχ(2)² = 1.68 (p = 0.452)). Adding the set of behavioral factors,
however, did improve the fit of the model (Δχ(4)² = 20.64, p < 0.001). Fruit and vegetable consumption
and alcohol consumption remained significant in the model with behavioral factors and age also
considered. When biological factors were added as a last step in the hierarchical logistic regression,
fruit and vegetable consumption remained a significant along with age, BMI (>30) and WHR. Adding
the set of biological factors also significantly improved model fit (Δχ(3)² = 17.44, p = 0.001). The most
robust explanatory variables were eating fewer fruits and vegetable (p = 0.001), age (p = 0.001) and
higher waist-to-hip ratio (p = 0.003). BMI > 30 (p = 0.016) and lower alcohol consumption (p = 0.028)
were also identified as significant explanatory variables relating to diabetes status controlling for age,
social and cultural factors.
Int. J. Environ. Res. Public Health 2013, 10 3225
Table 3. Age-adjusted hierarchical logistic regression models predicting diabetes (N = 643).
Model
Model 1:
Age χ(1)² = 88.81, p < 0.001
Nag R2 = 0.203
Model 2: Structural Factors
χ(4)² = 93.38, p < 0.001;
Nag R2 = 0.212
Model 3: Cultural Factors
χ(6)² = 95.06, p < 0.001;
Nag R2 = 0.216
Model 4: Behavioral Factors
χ(10)² = 115.70, p < 0.001;
Nag R2:0.258
Model 5: Biological Factors
χ(13)² = 133.24,
p < 0.001; Nag R2:0.294
Variable AOR 95% CI AOR 95% CI AOR 95% CI AOR 95% CI AOR 95% CI
Demographics
Age 1.06 *** 1.04–1.07 1.07 *** 1.05–1.09 1.06 *** 1.04–1.09 1.07 *** 1.04–1.09 1.07 *** 1.05–1.09
Structural Factors
Education 0.90 0.57–1.42 1.03 0.62–1.72 1.09 0.64–1.85 1.15 0.67–1.97
Medicaid (yes) 1.31 0.85–2.03 1.27 0.82–1.97 1.28 0.81–2.01 1.32 0.84–2.10
Medicare (yes) 0.66 0.37–1.19 0.69 0.38–1.24 0.71 0.39–1.30 0.67 0.36–1.25
Cultural Factors
Birth Place (Mexico) 1.26 0.71–2.25 1.39 0.76–2.51 1.43 0.78–2.61
Acculturation Score 0.87 0.50–1.53 0.93 0.52–1.65 0.88 0.48–1.58
Behavioral Factors
Alcohol 0.45 0.20–1.00 0.41 * 0.18–0.94
Fruit/Veg Consumption ɸ 0.41 *** 0.25–0.67 0.42 *** 0.25–0.69
Diabetes Knowledge 0.74 0.47–1.14 0.74 0.47–1.16
Biological Factors
BMI25–29.99 µ 1.34 0.75–2.60
BMI > 30µ 2.15 * 1.16–3.98
Waist-to-Hip Ratio ϒ 2.04 ** 1.30–3.20
Note: Diabetes was determined from positive self-report of clinical diagnosis or elevated serum blood glucose. Consecutively tested models included all prior sets of covariates. Nag = Nagelkerke. * p < 0.05
** p < 0.01 *** p < 0.001; Reference for referents with significant associations: ɸ <3 vegetables and fruit per day, µ BMI 18–24.99, ϒ >0.99 for men and >0.92 for women.
Int. J. Environ. Res. Public Health 2013, 10 3226
4. Discussion
The current study presents data on diabetes-related factors in Hispanics, including social, cultural,
behavioral, and biological influences, from a recently completed community survey. Diabetes
prevalence was established both by a common marker in self-report surveillance studies as well as
from elevated capillary blood glucose readings above standard screening guidelines. The prevalence of
diabetes was 21% in the sample; all but 1% reflected in the self-report of a health professional’s
diagnosis. In terms of total diabetic burden for Hispanics in this Southeast Arizona community, this is
over 50% greater than the national rates for Hispanics or Mexican American adults [5], and higher than
the 15%–18% rates from other Hispanic border samples [11,13,16]. Also, the age adjusted rate was
about 25% greater than that indicated for Hispanics in the most recent national data [49]. Of further
note only 7% of these Hispanic adults, drawn from this proportional and randomized household
survey, had completed a college degree and about two-thirds had no insurance or had Medicaid. These
findings show there remains a critical need for more diabetes prevention and treatment services for the
residents of this predominantly Hispanic participating community, and based on reports from other
sparsely populated U.S.-Mexico border communities [14,17,50], this is likely evident for the wider
rural U.S.-Mexico border region.
Having lower education, being on Medicare, being married as well as all three acculturation
markers, were significantly associated with crude odds for diabetes. However, controlling for age
removed all statistically significant relationships among these contextual influences. This suggests the
former variables acted as proxies for sample age differences in our sample and care should be taken
when interpreting within Hispanic disparities from unadjusted diabetes prevalence estimates (most
commonly reported in surveillance studies). The lack of significant cultural and resource factors in the
age-adjusted models may also be due to the relative cultural homogeneity of Hispanics in the sample
(e.g., very little variation in Spanish linguistic acculturation despite using items from a well-validated
scale; few college graduates; few with private health insurance). These findings illustrate the
importance of interpreting acculturation and resource factors within community contexts; this may be
particularly true in border communities as well as others that are Hispanic enclaves (communities
concentrated in Hispanic residents and where Hispanic cultural influences are pervasive).
Along with age, the other factors significantly related to diabetes in the final model were behavioral
and biological ones from a social ecological perspective [22]. Body mass index, a standard measure of
obesity that reflects consumed calories and ties closely to diet and physical activity, was positively
associated with diabetes, but only at higher (obese) levels. Those with a BMI of 30 or above were
two times more likely to have diabetes than those with a BMI less than 25. However, the association
was stronger for an alternative measure of obesity, waist-to-hip (WHR) ratio. Currently there is debate
about the role of BMI in Hispanic health and mortality [51], and if our findings in the context of
explaining objectively measured diabetes are indicative, WHR may be a more important
obesity-related chronic disease risk indicator [37].
The findings also showed that eating fewer fruits and vegetables was associated with a higher
likelihood of diabetes in all models, and was along with age, the strongest explanatory variables. Of
note however, very few persons ate the recommended levels of five or more fruits and vegetables,
though respondents who reported eating less than three per day had over double the risk of a positive
Int. J. Environ. Res. Public Health 2013, 10 3227
diabetes status relative to those who eat at least three per day. Our results further confirm addressing
food choice as an important primary target for social ecological interventions to address
diabetes [21,22]. Future studies may also consider an environmental scan in underserved border
communities to examine the availability and affordability of fresh produce and more in-depth
qualitative investigations about other contexts [7]. Health promotion efforts addressing community
food environments may further contribute to improved dietary outcomes [20].
Low levels of physical activity and inactivity were not related to diabetes after adjustment for age or
other significant covariates in our models. While we did use a well-established measure, the International
Physical Activity Questionnaire, it should be noted we employed the shorter version in order to limit
overall participant burden. Perhaps the long version [40], which discriminates activity in various
domains (e.g., work, leisure, home) would have identified specific domains of physical activity of
importance. Also, other work has highlighted the importance of considering physical activity contexts
for Hispanic adults [21,31,34], and such attention may make physical activity assessments in this
population stronger predictors of their diabetes and other chronic diseases.
There are other important strengths and limitations within the current study. The randomized
household sampling of the parent project is a major strength. While we are limited in inferences to a
specific community, we have a relatively large and representative sample to generate prevalence
estimates with precision. Further, the larger study afforded measures of a broad range of factors related
to diabetes, and in turn their inclusion and the analytic models construction were guided by social
ecological theory. This data also well compliments other efforts to understand Hispanic health such as
an intensive ongoing study in four major urban environments [52]. It is important to note that the
response rate was outstanding, particularly for a study without monetary incentives. While many
studies have recognized the critical role of promotoras/CHWs in health promotion delivery
efforts [15,53,54], this study and others [15,50] also illustrate their effectiveness in contributing to high
quality data collected for community health and needs assessment surveillance efforts.
Another important limitation of the study is the cross-sectional design. While it is less plausible that
the socio-cultural factors were causally influenced by diabetes status, empirical evidence for temporal
precedence or causation cannot be generated from the current data. For instance, the fact that current
moderate or more drinking was associated with lower risk of diabetes (assuming the modest
association observed in this study, significant at the p < 0.05 level but not a more stringent criteria, is
replicable) may reflect behavioral changes post diagnosis and post clinical recommendations, rather
than any true protective effect of this level of drinking. Due to field and related data collection
constraints, we could not collect hemoglobin A1C in serum nor require fasting by participants for a
clinical diagnosis of diabetes [5]. Finally, were not able to assess all aspects of a social ecological
perspective on diabetes causal factors, such as family history of diabetes and genetic biomarkers that
are likely associated with additional diabetes risk, nor social support and social network variables that
may have protective associations [55].
5. Conclusions
The current study identified a high diabetes prevalence rate (over 20%) in Hispanics residing in an
underserved border community. There were also important disparities in diabetes associated with
Int. J. Environ. Res. Public Health 2013, 10 3228
socio-cultural and structural factors including acculturation markers, consistent with a social ecological
perspective. However, acculturation factors were not robust when considering age and structural
factors in our theory-guided models. This suggests that while they may be useful in identifying where
to target health promotion resources to high diabetes prevalence groups (e.g., creating materials and
diabetes-related messaging in Spanish, reaching the population through low-income community, senior
or health centers), acculturation change processes whining this community do not appear to be
contributing to diabetes onset. Older age, having high risk WHR, and eating few fruits and vegetables
per day were associated with diabetes across all models. Thus, health promotion and surveillance
efforts with border Hispanic populations should be particularly attuned to fruit and vegetable
consumption as well as adiposity indicators.
Acknowledgments
This project was supported by the Arizona Prevention Research Center (AzPRC), The Border
Health Commission, and the Mel & Enid Zuckerman College of Public Health’s Partner in Public
Health Fund. The AzPRC is a member of the Prevention Research Centers Program, supported by the
Centers for Disease Control and Prevention (U48DP001925). The authors are particularly grateful to
the promotoras whose participation made this project a success and to Noelle Miesfeld and Jennifer
Chaskavich for providing helpful comments on the manuscript.
Conflict of Interest
The authors declare no conflict of interest.
References
1. Fact Sheet 2011: The Top 10 Causes of Death; World Health Organization: Geneva, Switzerland,
2011.
2. The Top 10 Cause of Death. Available online: http://www.who.int/mediacentre/factsheets/
fs310/en/index.html (accessed on 1 June 2013).
3. Centers for Disease Control and Prevention. National Diabetes Fact Sheet: National Estimates
and General Information on Diabetes and Prediabetes in the U.S., 2011; Department of Health
and Human Services Center for Disease Control and Prevention: Atlanta, GA, USA, 2011.
4. Boyle, J.P.; Thompson, T.J.; Gregg, E.W.; Barker, L.E.; Williamson, D.F. Projection of the year
2050 burden of diabetes in the U.S. adult population: Dynamic modeling of incidence, mortality,
and prediabetes prevalence. Popul. Health Metr. 2010, 8, 29, doi:10.1186/1478-7954-8-29.
5. Borrell, L.N.; Crawford, N.D.; Dallo, F.J.; Baquero, M.C. Self-reported diabetes in Hispanic
subgroup, non-Hispanic black, and non-Hispanic white populations: National health interview
survey, 1997–2005. Public Health Rep. 2009, 124, 702–710.
6. Golden, S.H.; Brown, A.; Cauley, J.A.; Chin, M.H.; Gary-Webb, T.L.; Kim, C.; Sosa, J.A.;
Sumner, A.E.; Anton, B. Health disparities in endocrine disorders: Biological, clinical, and
nonclinical factors—An endocrine society scientific statement. J. Clin. Endocrinol. Metab. 2012,
97, 1579–1639.
Int. J. Environ. Res. Public Health 2013, 10 3229
7. Fontaine, K.R.; McCubrey, R.; Mehta, T.; Pajewski, N.M.; Keith, S.W.; Bangalore, S.S.;
Crespo, C.J.; Allison, D.B. Body mass index and mortality rate among Hispanic adults: A pooled
analysis of multiple epidemiologic data sets. Int. J. Obes. 2012, 36, 1121–1126.
8. World Health Organization. Global database on Body Mass Index. Available online:
http://apps.who.int/bmi/index.jsp (accessed on 1 June 2013).
9. CDC health disparities & inequalities report—United States, 2011. MMWR Surveill. Summ. 2011,
60, 1–116.
10. Hu, J.; Wallace, D.; Tesh, A. Physical activity, obesity, nutritional health and quality of life in
low-income hispanic adults with diabetes. J. Community Health Nurs. 2010, 27, 70–83.
11. Mier, N.; Bocanegra-Alonso, A.; Zhan, D.; Zuniga, M.A.; Acosta, R.I. Health-related quality of
life in a binational population with diabetes at the Texas-Mexico border. Rev. Panam. Salud
Publica 2008, 23, 154–163.
12. Thomson, E.F.; Nuru-Jeter, A.; Richardson, D.; Raza, F.; Minkler, M. The Hispanic paradox and
older adults’ disabilities: Is there a healthy migrant effect? Int. J. Environ. Res. Public Health
2013, 10, 1786–1814.
13. Martinez, N.; Bader, J. Analysis of behavioral risk factor surveillance system data to assess the
health of Hispanic Americans with diabetes in El Paso County, Texas. Diabetes Educ. 2007, 33,
691–699.
14. Robinson, K.L.; Ernst, K.C.; Johnson, B.L.; Rosales, C. Health status of southern Arizona border
counties: A Healthy Border 2010 midterm review. Rev. Panam. Salud Publica 2010, 28, 344–352.
15. Anders, R.L.; Olson, T.; Wiebe, J.; Bean, N.H.; DiGregorio, R.; Guillermina, M.; Ortiz, M.
Diabetes prevalence and treatment adherence in residents living in a colonia located on the
West Texas, USA/Mexico border. Nurs. Health Sci. 2008, 10, 195–202.
16. Balcázar, H.G.; de Heer, H.; Rosenthal, L.; Aguirre, M.; Flores, L.; Puentes, F.A.;
Cardenas, V.M.; Duarte, M.O.; Ortiz, M.; Schulz, L.O. A promotores de salud intervention to
reduce cardiovascular disease risk in a high-risk Hispanic border population, 2005–2008. Prev.
Chronic Dis. 2010, 7, A28 (Epub). Available online: http://www.cdc.gov/pcd/issues/2010/mar/
09_0106.htm (accessed on 1 June 2013).
17. Koopman, R.J.; Mainous, A.G., III; Geesey, M.E. Rural residence and Hispanic ethnicity: Doubly
disadvantaged for diabetes? J. Rural Health 2006, 22, 63–68.
18. Ory, M.G.; Conkling, M.; Bolin, J.N.; Prochaska, J.D.; Zhan, D.; Burdine, J.N.; Mier, N.
Sociodemographic and healthcare characteristics of Colonia residents: The role of life stage in
predicting health risks and diabetes status in a disadvantaged Hispanic population. Ethn. Dis.
2009, 19, 280–287.
19. Salinas, J.J.; Rocha, E.; Abdelbary, B.E.; Gay, J.; Sexton, K. Impact of Hispanic ethnic
concentration and socioeconomic status on obesity prevalence in Texas counties. Int. J. Environ.
Res. Public Health 2012, 9, 1201–1215.
20. Stoddard, P.; He, G.; Schillinger, D. Smoking behavior among Hispanic adults with diabetes on
the United States-Mexico border: A public health opportunity. Rev. Panam. Salud Publica 2010,
28, 221–229.
Int. J. Environ. Res. Public Health 2013, 10 3230
21. Kegler, M.C.; Swan, D.W.; Alcantara, I.; Feldman, L.; Glanz, K. The influence of rural home and
neighborhood environments on healthy eating, physical activity, and weight. Prev. Sci.
2013, Available online: http://link.springer.com/article/10.1007%2Fs11121-01-0349-3 (accessed
on 1 June 2013)
22. Barrera, M.; Strycker, L.A.; Mackinnon, D.P.; Toobert, D. Social-ecological resources as
mediators of two-year diet and physical activity outcomes in type 2 diabetes patients. Health
Psychol. 2008, 27, S118–S125.
23. Wittemore, R.; Melkus, G.D.; Grey, M. Applying the social ecological theory to type 2 diabetes
prevention and management. J. Community Health Nurs. 2004. 21, 87–99.
24. Health Resources and Services Administration, United States Department of Health and Human
Services. Rural Health Grants Eligibility Analyzer “Cochise County, AZ”. Available online:
http://datawarehouse.hrsa.gov/RuralAdvisor/RuralHealthAdvisor.aspx (accessed on 1 June 2013).
25. Health Resources and Services Administration (HRSA). U.S. Department of Health and Human
Services. HPSA & MUA/P by Address “1205 F Avenue, Douglas, Arizona, 85607”. Available
online: http://datawarehouse.hrsa.gov/geoadvisor/shortagedesignationadvisor.aspx (accessed on
1 June 2013).
26. Schwartz, S.J.; Unger, J.B.; Zamboanga, B.L.; Szapocznik, J. Rethinking the concept of
acculturation: Implications for theory and research. Am. Psychol. 2010, 65, 237–251.
27. Coronado, G.; Thompson, B.; Tejeda, S.; Godina, R.; Chen, L. Sociodemographic factors and
self-management practices related to type 2 diabetes among Hispanics and non-Hispanic Whites
in a rural setting. J. Rural Health 2007, 23, 49–54.
28. Mainous, A.G.; Majeed, A.; Koopman, R.J.; Baker, R.; Everett, C.J.; Tilley, B.C.; Diaz, V.A.
Acculturation and diabetes among Hispanics: Evidence from the 1999–2002 national health and
nutrition examination survey. Public Health Rep. 2006, 121, 60–66.
29. Ghaddar, S.; Brown, C.J.; Pagán, J.A.; Díaz, V. Acculturation and healthy lifestyle habits among
Hispanics in United States-Mexico border communities. Rev. Panam. Salud Publica 2010, 28,
190–197.
30. Moayad, N.; Balcázar, H.; Pedregón, V.; Velasco, L.; Bayona, M. Do acculturation and family
cohesiveness influence severity of diabetes among Mexican Americans? Ethn. Dis. 2006, 16,
452–459.
31. Carter-Pokras, O.; Zambrana, R.E.; Yankelvich, G.; Estrada, M.; Castillo-Salgado, C.;
Ortega, A.N. Health status of Mexican-origin persons: Do proxy measures of acculturation
advance our understanding of health disparities? J. Immigr. Minor. Health 2008, 10, 475–488.
32. De los Monteros, K.; Gallo, L.; Elder, J.; Talavera, G. Individual and area-based indicators of
acculturation and the metabolic syndrome among low- income Mexican American women living
in a border region. Am. J. Public Health 2008, 98, 1979–1986.
33. Weller, S.C.; Baer, R.D.; Garcia de Alba Garcia, J.; Salcedo Rocha, A.L. Explanatory models of
diabetes in the U.S. and Mexico: The patient-provider gap and cultural competence. Soc. Sci.
Med. 2012, 75, 1088–1096.
Int. J. Environ. Res. Public Health 2013, 10 3231
34. Fisher-Hoch, S.P.; Rentfro, A.R.; Salinas, J.J.; Pérez, A.; Brown, H.S.; Reininger, B.M.;
Restrepo, B.I.; Wilson, J.G.; Hossain, M.M.; Rahbar, M.H.; Hanis, C.M.; McCormick, J.B.
Socioeconomic status and prevalence of obesity and diabetes in a Mexican American community,
Cameron County, Texas, 2004–2007. Prev. Chronic Dis. 2010, 7, A53. Available online:
http://www.cdc.gov/pcd/issues/2010/May/09_0170.htm (accessed on 1 June 2013).
35. Martinez, S.; Ayala, G.; Patrick, K.; Arredondo, E.; Roesch, S.; Elder, J. Associated pathways
between neighborhood environment, community resource factors, and leisure-time physical
activity among Mexican-American adults in San Diego, California. Am. J. Health Promot. 2012,
26, 281–288.
36. United States Census Bureau. Douglas City, Arizona, 2010. Available online: http://factfinder2.
census.gov/faces/nav/jsf/pages/searchresults.xhtml?refresh=t (accessed on 1 June 2013)
37. Marín, G.; Gamba, G. A new measurement of acculturation for Hispanics: The bidimensional
acculturation scale for Hispanics (BAS). Hisp. J. Behav. Sci. 1996, 18, 297–316.
38. Herrera, V.M.; Casas, J.P.; Miranda, J.J. Interethnic difference in the accuracy of anthropometric
indicators of obesity in screening for high risk of coronary heart disease. Int. J. Obes. 2009, 33,
568–576.
39. Centers for Disease Control and Prevention. NCHS Data Brief, Number 34, April 2010. Available
online: www.cdc.gov/nchs/data/databriefs/db34.htm (accessed on 1 June 2013)
40. United States Department of Agriculture; U.S. Department of Health and Human Services.
Dietary Guidelines for Americans, 2010. Chapter 3—Foods and Food Components to Reduce, 7th
ed.; U.S. Government Printing Office: Washington, DC, USA, 2010; pp. 30–32. Available online:
http://www.cnpp.usda.gov/Publications/DietaryGuidelines/2010/PolicyDoc/Chapter3.pdf
(accessed on 1 June 2013)
41. Craig, C.L.; Marshall, A.L.; Sjöström, M.; Bauman, A.E.; Booth, M.L.; Ainsworth, B.E.;
Pratt, M.; Ekelund, U.; Yngve, A.; Sallis, J.F.; et al. International physical activity questionnaire:
12-country reliability and validity. Med. Sci. Sports Exerc. 2003, 35, 1381–1395.
42. U.S. Department of Health and Human Services. 2008 Physical Activity Guidelines for
Americans. Available online: www.health.gov/paguideline/pdf/paguide.pdf (accessed on 1 June
2013).
43. Ford, E.S.; Casperson, C.J. Sendentary behaviour and cardiovascular disease: A review of
prospective studies. Int. J. Epidemiol. 2012, 41, 1338–1353.
44. Centers for Disease Control and Prevention. Prevalence and Trends Data (2009). Available
online: http://apps.nccd.cdc.gov/brfss/ (accessed on 1 June 2013).
45. Centers for Disease Control and Prevention. Health People 2010 Final Review: Nutrition and
Overweight. Available online: http://www.cdc.gov/nchs/data/hpdata2010/hp2010_final_review_
focus_area_19.pdf (accessed on 1 June 2013).
46. World Health Organization. Definition and Diagnosis of Diabetes Mellitus and Intermediate
Hyperglycemia. Available online: http://www.who.int/diabetes/publications/Definition%20and
%20diagnosis%20of%20diabetes_new.pdf (accessed on 1 June 2013).
47. Pfützner, A.; Mitri, M.; Musholt, P.B.; Sachsenheimer, D.; Borchert, M.; Yap, A.; Forst, T.
Clinical assessment of the accuracy of blood glucose measurement devices. Curr. Med. Res. Opin.
2012, 28, 525–531.
Int. J. Environ. Res. Public Health 2013, 10 3232
48. Hosmer, D.; Lemeshow, S. Applied Logistic Regression, 2nd ed.; John Wiley & Sons, Inc.:
New York, NY, USA, 2000.
49. Faul, F.; Erdfelder, E.; Buchner, A.; Lang, A.-G. Statistical power analyses using G*Power 3.1:
Tests for correlation and regression analyses. Behav. Res. Methods 2009, 41, 1149–1160.
50. Centers for Disease Control and Prevention. National Health Interview Survey, 2011, Sample
Adult Core Component. Available online: http://www.cdc.gov/nchs/data/nhis/earlyrelease/
earlyrelease201206_14.pdf (accessed on 1 June 2013).
51. Carvajal, S.C.; Rosales, C.; Robio-Goldsmith, R. The border community and immigration stress
scale: A preliminary examination of a community responsive measure in two southwest samples.
J. Immigr. Minor. Health 2013, 15, 427–436.
52. Martínez, A.D. Reconsidering acculturation in dietary change research among Latino immigrants:
Challenging the preconditions of U.S. migration. Ethn. Health 2013, 18, 115–135.
53. Daviglus, M.L.; Talavera, G.A.; Avilés-Santa, M.L.; Allison, M.; Cai, J.; Criqui, M.H.;
Gellman, M.; Giachello, A.L.; Gouskova, N.; Kaplan, R.C.; et al. Prevalence of major
cardiovascular risk factors and cardiovascular diseases among Hispanic/Latino individuals of
diverse backgrounds in the United States. JAMA 2012, 308, 1775–1784.
54. Ryabov, I. The impact of community health workers on behavioral outcomes and glycemic
control of diabetes patients on the U.S.-Mexico border. Int. Q. Community Health Educ. 2010, 31,
387–399.
55. Finch, B.K.; Vega, W.A. Acculturation stress, social support, and self-rated health among Latinos
in California. J. Immigr. Health 2003, 5, 109–117.
© 2013 by the authors; licensee MDPI, Basel, Switzerland. This article is an open access article
distributed under the terms and conditions of the Creative Commons Attribution license
(http://creativecommons.org/licenses/by/3.0/).


