Embed Size (px)
Citation preview

International Conference on Applied Energy
ICAE 2013, Jul 1-4, 2013, Pretoria, South Africa
Paper ID: ICAE2013-182
INVESTIGATING THE ROLE OF HYBRID PHOTOVOLTAIC-DIESEL STAND-ALONE
SYSTEMS FOR THE ELECTRIFICATION OF REMOTE TELECOMMUNICATION
STATIONS IN GREECE
Papadopoulos G, Zafirakis D, Kavadias K, Kaldellis JK
Lab of Soft Energy Applications & Environmental Protection, TEI of Piraeus
P.O. Box 41046, Athens 12201, Greece, www.sealab.gr
ABSTRACT
Due to the rapid development of the telecommunication
(T/C) sector during the recent years, expansion of T/C
networks to remote areas as well requires installation of
T/C stations that normally are not suited for grid-
connection. To this end, such T/C stations comprise stand-
alone systems that usually operate on the basis of diesel-
power engines. Considering the above, the solution of a
hybrid, PV-based energy solution with the contribution of
diesel power and battery storage is currently examined. In
this context, an optimization algorithm is developed for the
sizing of the proposed solution that allows examination of
numerous configurations at different levels of fuel
consumption (i.e. diesel engine contribution) and that is
based on the optimization criterion of minimum long-term
electricity production cost. The developed algorithm is
accordingly applied to numerous areas of the Greek
territory, that also suggest regions of different quality solar
potential, with results obtained indicating the cost-
effectiveness of the proposed solution in comparison to
both stand-alone PV-based systems, employing extreme
battery capacity, and the diesel-only solution entailing
increased fuel consumption.
Keywords: telecommunication station; solar energy; lead-
acid batteries; diesel engine; electricity production cost
1. INTRODUCTION
Due to the rapid development of the telecommunication
(T/C) sector during the recent years [1], expansion of T/C
networks to remote areas as well requires installation of
T/C stations that normally are not suited for grid-
connection, owed also to the fact that antennas need to be
installed at considerably high elevations. To this end, such
T/C stations comprise stand-alone systems that usually
operate on the basis of diesel-power engines, which in turn
imply considerable fuel consumption and increased
maintenance and operation (M&O) costs.
At the same time, the mobile T/C sector in Greece has
presented rapid growth during the last years [2], reflected
by the operation of more than 5000 stations, similar to the
situation encountered in the rest of the developed world
[3]. The majority of these stations cover their electrification
needs through connection to the main grid. On the other
hand, there are several cases of T/C stations located far
away from the electrical grid, in order to cover the needs of
remote areas with their antennas. Actually, in Greece alone,
there are more than 500 non-interconnected T/C stations
placed in rural areas, small islands and mountainous
regions, covering their needs on the basis of small diesel-
electric generators; otherwise one should invest on
expensive grid-extensions, wherever possible.
The result of this solution is as already seen the high
operational cost of the remote T/C stations, mainly due to
the necessary fuel required by the operating internal
combustion engines. Alternatively, there are limited cases
where small PV generators along with an appropriate
energy storage system (usually lead-acid batteries) are
utilized, often in an experimental/pilot mode. Note at this
point that the entire Greek territory appreciates high-
quality solar potential [4,5] that ranges from 1300kWh/m2.a
to 1800kWh/m2.a (see also Figure 1). On the other hand, to
ensure 100% energy autonomy of a representative T/C
station during the entire year (i.e. no load rejection
encountered) both the PV generator and the system
batteries should be oversized. As a result, the respective
investments become capital intensive, although low M&O
needs of such systems should be noted [6].
Considering the above, the solution of a hybrid, PV-based
energy solution with the contribution of diesel power and
battery storage is currently examined, in terms of both

Paper ID: ICAE2013-182
2 Copyright © 2013 by ICAE2013
energy and economic performance [7-9]. In this context, an
optimization algorithm is developed for the sizing of the
proposed solution that allows examination of numerous
configurations at different levels of fuel consumption (i.e.
diesel engine contribution) and that is based on the
optimization criterion of minimum long-term electricity
production cost. The developed algorithm is accordingly
applied to numerous areas of the Greek territory, that also
suggest regions of different quality solar potential, with
results obtained indicating the cost-effectiveness of the
proposed solution in comparison to both stand-alone PV-
based systems employing extreme battery capacity and the
diesel-only solution entailing increased fuel consumption
[10].
Figure 1 Solar potential of the Greek territory
2. PROBLEM STATEMENT
2.1 Problem description
The problem to be solved in the current study concerns
the determination of optimum hybrid PV-based
configurations that also incorporate an appropriate lead-
acid battery bank in order to improve the system reliability.
The configurations examined should be able to cover the
energy requirements of a remote T/C station without load
rejections during an entire year period, while the proposed
system may also include a small diesel-electric generator,
used as a back up solution for long periods of low solar
irradiance. As a result, there are two extreme cases for the
proposed solution; the first corresponding to the diesel-only
system (with no PV modules) and the second considering a
stand-alone PV generator with zero diesel-oil contribution.
Accordingly, in an attempt to determine the optimum tilt
angle of the PV panels, one may also investigate the impact
of the PV panels’ tilt angle on the system dimensions, while
the proposed analysis is also focused on presenting the
influence of the annual diesel-oil consumption. In this
context, the main system parameters to be estimated are
the PV generator peak power, the lead-acid batteries’
storage capacity and the annual diesel-oil consumption.
Finally, as already mentioned, the main directions for
obtaining the optimum hybrid power station dimensions are
provided, taking also into consideration the energy
performance of the installations under investigation and a
specific optimization criterion set, currently being the long-
term electricity production cost of the system.
2.2 Input data
Initially, for the investigation of a typical T/C station one
needs the energy consumption time distribution of the
installation (see also Figure 2). More precisely, a
representative, small size T/C station includes the following:
• The air conditioning machines which are usually the
main energy consumers (up to 60%), especially during
summer, in order to maintain the T/C station
temperature within safe operation limits (14oC and
24oC).
• The T/C equipment which operates continuously, with
its contribution to the total energy demand of the T/C
station varying between 40% during the hot summer
days and 85% for the spring months of the year.
• The safety lights (e.g. 2 x 100W), operating at the top of
the antenna tower during the night for safety reasons;
average contribution 5-10%.
• Additional lighting used during the inspection and the
service of the T/C station along with the additional
auxiliary equipment.
To this end, the hourly average load demand of the
typical remote T/C station is provided in Figure 2, on a
monthly basis.
LOAD DEMAND OF THE REMOTE T/C STATION
2,0
2,5
3,0
3,5
4,0
4,5
1 2 3 4 5 6 7 8 9 10 11 12 13 14 15 16 17 18 19 20 21 22 23 24
Hours of Day
Pow
er
Dem
and (
KW
)
January FebruaryMarch AprilMay JuneJuly AugustSeptember OctoberNovember December
Figure 2 Load demand variation of the remote T/C station

Paper ID: ICAE2013-182
3 Copyright © 2013 by ICAE2013
According to the data available, the T/C station under
investigation presents a peak load demand "Nmax" of 4.2kW
(appearing during July) and a minimum load demand "Nmin"
equal to 2.4kW (actually appearing during April), while the
corresponding annual electricity consumption "Etot"
approaches 27.1MWh. Note that by adopting the diesel-
only solution one needs approximately 12 tons of diesel oil
(annual fuel consumption Mf=12185kg/year for diesel
calorific value Hu=40MJ/kg) in order to cover the above
mentioned electrical load demand, using a diesel-electric
generator of rated power "Nd" equal to 7.5kW (10PS) (total
electricity generation efficiency ηd=20%).
Accordingly, the solar radiation profile and the ambient
temperature at the PV station location are also required.
Taking into consideration the available solar potential
measurements, one may find in Figure 3 the solar potential
values for the Greek areas currently examined. More
precisely, to capture the solar potential variation across the
entire Greek territory, five different areas are considered
including Rhodes (1758kWh/m2), Sparti (1586kWh/m
2),
Zakynthos (1552kWh/m2), Larissa (1432kWh/m
2) and Kavala
(1363kWh/m2), for which hourly temperature data is also
used.
Daily Solar Energy on an Annual Basis for the Five Areas under Examination
0
1
2
3
4
5
6
7
8
9
0 20 40 60 80 100 120 140 160 180 200 220 240 260 280 300 320 340 360 380
Day of the Year
Daily
Sola
r E
nerg
y (
kW
h/m
2)
Rhodes
Sparti
Zakynthos
Larissa
Kavala
Figure 3 Solar potential of the areas examined
3. PROPOSED SYSTEM AND SIZING
METHODOLOGY
3.1 The proposed configuration
In more detail, the system configuration (see also Figure
4) comprises of the following components:
• A PV system of "z" panels ("No" being the max power of
every panel) connected appropriately ("z1" in parallel
and "z2" in series) to provide the charge controller with
the desired voltage.
• A lead acid battery storage system for "ho" hours of
autonomy, or equivalently with total capacity of "Qmax",
operation voltage "Ub" and minimum permitted
capacity "Qmin" (or otherwise maximum depth of
discharge "DODL").
• A DC/DC charge controller of "Nc" nominal power,
charge rate "Rch" and charging voltage "Ucc".
• A DC/AC inverter of maximum power "Np", able to
meet the consumption peak load demand "Nmax".
• A small internal combustion engine of "Nd" (kW) power,
able to match the consumption peak load demand
"Nmax", therefore Nd≥Nmax (including a safety margin of
30%).
Figure 4 The proposed hybrid configuration
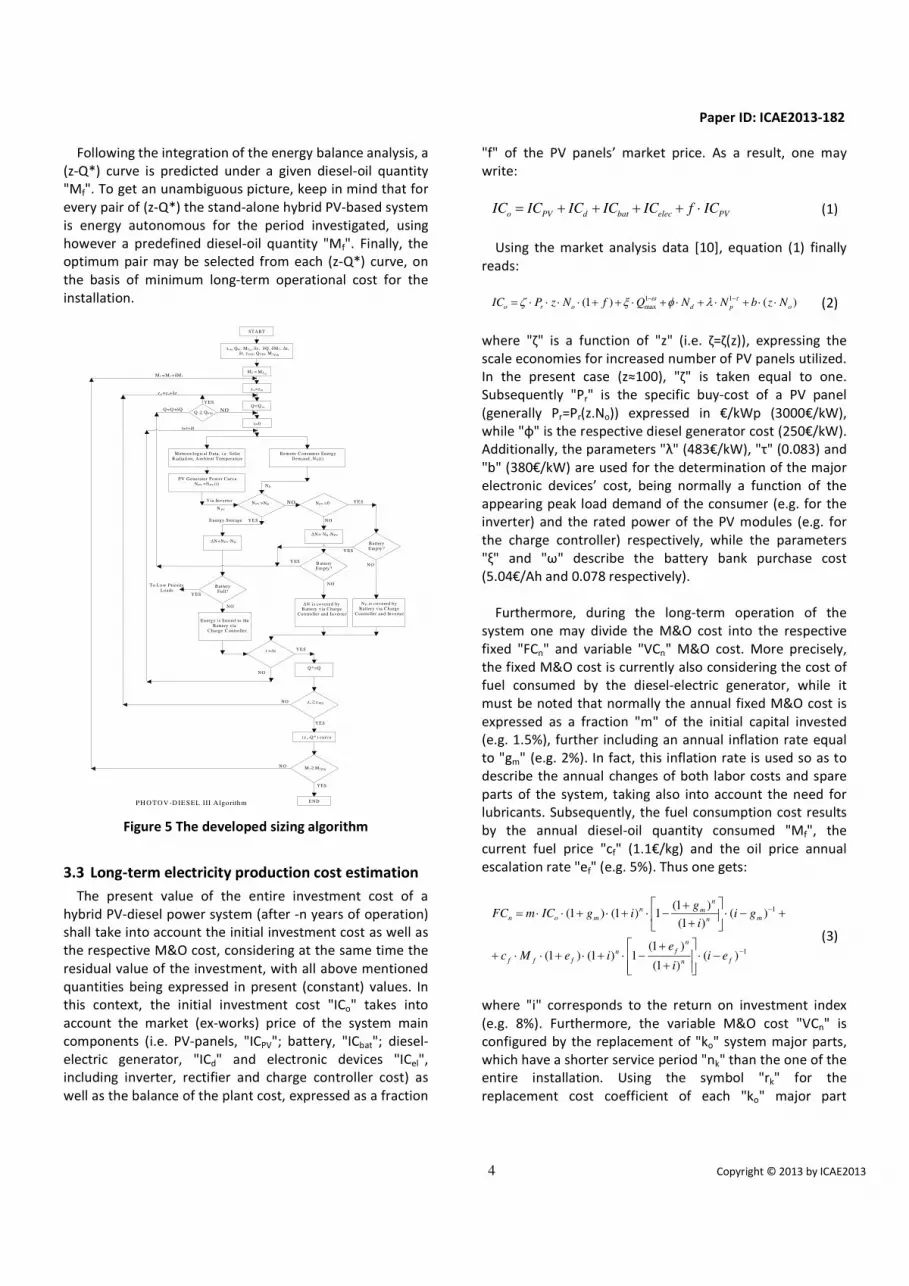
3.2 The sizing algorithm
For estimating the appropriate configuration of the
proposed PV-diesel hybrid system, three governing
parameters should be determined: the peak power "NPV" of
the PV generator used (or equivalently the number "z" of
the panels required, NPV=z.No), the maximum necessary
capacity of the battery "Qmax" and the annual diesel-oil
consumption "Mf".
To confront similar problems, a computational algorithm
"PV-DIESEL III" (see also Figure 5) is developed. This specific
numerical code is the extension of the already presented
"PHOTOV-III" numerical code [11,12] and is used to carry
out the necessary energy balance analysis on a given time
step (e.g. on an hourly basis). More precisely, given the "Mf"
value for each "z" and "Qmax" pair, the "PV-DIESEL III"
algorithm is executed for the entire time-period selected
(e.g. one month, six-months, one year or even for three
years), while emphasis is laid on obtaining zero-load
rejection operation. After calculating the appropriate (Mf, z,
Qmax) combinations that guarantee the stand-alone system
energy autonomy, one may proceed to analyze the
proposed PV-diesel hybrid installation energy balance in
detail.
Paper ID: ICAE2013-182
4 Copyright © 2013 by ICAE2013
Following the integration of the energy balance analysis, a
(z-Q*) curve is predicted under a given diesel-oil quantity
"Mf". To get an unambiguous picture, keep in mind that for
every pair of (z-Q*) the stand-alone hybrid PV-based system
is energy autonomous for the period investigated, using
however a predefined diesel-oil quantity "Mf". Finally, the
optimum pair may be selected from each (z-Q*) curve, on
the basis of minimum long-term operational cost for the
installation.
START
z o=z in
t=0
M eteorological Data, i.e. SolarR adiation, Am bient Tem perature
Rem ote Consum er Energy Dem and, N D(t)
PV Generator Power Curve NPV =NPV (t)
N PV >ND NPV =0
∆N=NPV -N D
∆N= ND -NPV
B attery Em pty?
Battery Empty?
ND is covered by Battery via Charge
Controller and Inverter
∆N is covered by B attery via C harge
Controller and Inverter
B attery Full?
Energy is S tored to the B attery via
C harge C ontroller
t >∆t
Q*=Q
z ≥
z in, Q in, M fin, δz, δQ, δM f , ∆t, δ t, z FIN, Q FIN, M f FIN
≥fM
FINfM
in
≥Q
inf
FINQ
FINz
YES
NO
NO
YES
N
o o
o
o
END
M f = M f +δM f
Q=Q+δQ
t= t+δt
V ia Inverter
PV
ND
YES
YES
Y ES
NO
YES
NO
NO
YES
NOYES
NO
Energy Storage
YES
To Low Priority Loads
NO
PH O TOV -D IESEL III Algorithm
(z -Q*) curve
NO
=
Q=Q
z =z +δz
fM M
Figure 5 The developed sizing algorithm
3.3 Long-term electricity production cost estimation
The present value of the entire investment cost of a
hybrid PV-diesel power system (after -n years of operation)
shall take into account the initial investment cost as well as
the respective M&O cost, considering at the same time the
residual value of the investment, with all above mentioned
quantities being expressed in present (constant) values. In
this context, the initial investment cost "ICo" takes into
account the market (ex-works) price of the system main
components (i.e. PV-panels, "ICPV"; battery, "ICbat"; diesel-
electric generator, "ICd" and electronic devices "ICel",
including inverter, rectifier and charge controller cost) as
well as the balance of the plant cost, expressed as a fraction
"f" of the PV panels’ market price. As a result, one may
write:
PVelecbatdPVo ICfICICICICIC ⋅++++= (1)
Using the market analysis data [10], equation (1) finally
reads:
)()1(11
max opdoro NzbNNQfNzPIC ⋅⋅+⋅+⋅+⋅++⋅⋅⋅⋅= −− τω λφξζ (2)
where "ζ" is a function of "z" (i.e. ζ=ζ(z)), expressing the
scale economies for increased number of PV panels utilized.
In the present case (z≈100), "ζ" is taken equal to one.
Subsequently "Pr" is the specific buy-cost of a PV panel
(generally Pr=Pr(z.No)) expressed in €/kWp (3000€/kW),
while "φ" is the respective diesel generator cost (250€/kW).
Additionally, the parameters "λ" (483€/kW), "τ" (0.083) and
"b" (380€/kW) are used for the determination of the major
electronic devices’ cost, being normally a function of the
appearing peak load demand of the consumer (e.g. for the
inverter) and the rated power of the PV modules (e.g. for
the charge controller) respectively, while the parameters
"ξ" and "ω" describe the battery bank purchase cost
(5.04€/Ah and 0.078 respectively).
Furthermore, during the long-term operation of the
system one may divide the M&O cost into the respective
fixed "FCn" and variable "VCn" M&O cost. More precisely,
the fixed M&O cost is currently also considering the cost of
fuel consumed by the diesel-electric generator, while it
must be noted that normally the annual fixed M&O cost is
expressed as a fraction "m" of the initial capital invested
(e.g. 1.5%), further including an annual inflation rate equal
to "gm" (e.g. 2%). In fact, this inflation rate is used so as to
describe the annual changes of both labor costs and spare
parts of the system, taking also into account the need for
lubricants. Subsequently, the fuel consumption cost results
by the annual diesel-oil quantity consumed "Mf", the
current fuel price "cf" (1.1€/kg) and the oil price annual
escalation rate "ef" (e.g. 5%). Thus one gets:
1
1
)()1(
)1(1)1()1(
)()1(
)1(1)1()1(
−
−
−⋅
+
+−⋅+⋅+⋅⋅+
+−⋅
++
−⋅+⋅+⋅⋅=
fn
n
fn
fff
mn
n
mn
mon
eii
eieMc
gii
gigICmFC
(3)
where "i" corresponds to the return on investment index
(e.g. 8%). Furthermore, the variable M&O cost "VCn" is
configured by the replacement of "ko" system major parts,
which have a shorter service period "nk" than the one of the
entire installation. Using the symbol "rk" for the
replacement cost coefficient of each "ko" major part

Paper ID: ICAE2013-182
5 Copyright © 2013 by ICAE2013
(battery, diesel-electric generator, inverter, charger, etc.)
the "VCn" term can be expressed as:
[ ] },)1()1()1({ )(
11
k
kko
nl
nlll
l
kk
kk
k
kon igrICVC⋅−
⋅=
=
=
=
+⋅−⋅+⋅⋅= ∑∑ ρ (4)
where "lk" is the integer part of [(n-1)/nk], while "gk" and
"ρk" describe the mean annual change of the price and the
corresponding technological improvement level for the k-th
major component of the system. In the present analysis one
may take into account the diesel-electric generator, the
battery bank and the inverter and charger replacement
every "nd" "nb" and "ne" years respectively (e.g. nd≈4÷6,
nb≈5÷7 and ne≈10 years). By applying the above set of
equations, taking also into account that the hybrid PV-diesel
system currently proposed has a service period of "n" years,
the corresponding total operational cost "Cn" of the
installation may be estimated, using both the initial cost and
the fixed and variable M&O cost, i.e.
nnnon YVCFCICC −++−⋅= )1( γ (5)
Note also that in equation (5), the symbol "Yn" stands for
the residual value of the investment, corresponding to
investment value that is recovered at the "n-th" year of the
system service period (e.g. value of buildings and land,
value of scrap or second hand equipment, etc.), considering
also any experience and technological know-how gained
from the system operation. Finally, symbol "γ" is used to
introduce State subsidy provided by the Greek State (e.g.
30%-50% of the initial investment), according to the
development law in force (e.g. 3522/2006) or the
corresponding National Operational Competitiveness
Program. Finally, using the analysis presented in [13]
regarding estimation of the current electricity marginal
production cost "ce", the following equation may be
applied, under the condition that the net present value
"NPV" of the investment becomes equal to the respective
residual value of the investment (NPV=Yn, where "Yn" may
be equal to zero) after -n years of operation, i.e.
( ) 1)1()1(−
−⋅⋅⋅−⋅= n
totne wwEwCc (6)
where w=(1+p)/1+i) and "p" is the produced electricity
mean annual escalation rate, e.g. p=3%. Besides, one should
also bear in mind that the proposed model also includes the
diesel-only solution (i.e. ICo=φ.Nd, z=0, Mf=Mfmax) as well as
the zero-diesel configuration (i.e. ICd=0, Mf=0).
4. APPLICATION RESULTS
The developed algorithm is accordingly applied in the five
areas of investigation, considering at the same time the
energy consumption characteristics of the typical remote
T/C station described earlier. Furthermore, application
results obtained first investigate the impact of different
panel tilt angle. Accordingly, energy autonomous
configurations are presented using the optimum tilt angle,
with energy results then used in order to evaluate the
proposed solution under economic terms. For this purpose,
optimum configurations are designated based on the
criterion of minimum, long-term electricity production cost
(see also [8,14] for the analysis of the long-term electricity
production cost estimation and the cost values adopted). In
this context, the PV panels’ cost is estimated at 3000€/kW
and the cost of fuel oil equal to 1.1€/kg, while State subsidy
is considered to be zero At the same time, different levels of
fuel contribution are also considered, allowing maximum
fuel participation of 3000kg per year.
4.1 Investigation of the optimum angle
According to the results of a previous study [8],
considering the island of Rhodes, it has been proved that
the optimum PV tilt angle providing the optimum solution
was equal to β=52.5ο. In the current research, Rhodes is the
area with the highest solar potential (1758 kWh/m2.a),
which also belongs to the highest solar potential zone of
Greece. Therefore, in order to verify and examine any
possible difference in terms of optimum panel inclination,
the area of Kavala is currently examined. Note that Kavala is
the area with the lowest solar potential (1363 kWh/m2.a)
and belongs to the lowest solar potential zone of the
country. So, if the optimum PV tilt angle is the same or
similar (+/- 5o) with the one of Rhodes, then it can be
assumed that the same is valid for all other areas found
between the minimum and maximum solar potential cases.
To this end, investigation of the optimum PV panel tilt angle
is based on the criterion of minimum electricity production
cost for a period of 20 years, with results obtained given in
Figure 6.
Electricity Production Cost for 20 Years of Operation in Kavala
0,3
0,4
0,5
0,6
0,7
0,8
0,9
1,0
1,1
1,2
1,3
1,4
350 550 750 950 1150 1350 1550 1750
Number of PV Panels
Pro
duction C
ost
(€/k
Wh)
β=0; Mf=0 β=15; Mf=0
β=30; Mf=0 β=45; Mf=0
β=47.5; Mf=0 β=52.5; Mf=0
β=57.5; Mf=0 β=60; Mf=0
β=75; Mf=0 β=0; Mf=250
β=15; Mf=250 β=30; Mf=250
β=45; Mf=250 β=47.5; Mf=250
β=52.5; Mf=250 β=57.5; Mf=250
β=60; Mf=250 β=75; Mf=250
β=0; Mf=1000 β=15; Mf=1000
β=30; Mf=1000 β=45; Mf=1000
β=47.5; Mf=1000 β=52.5; Mf=1000
β=57.5; Mf=1000 β=60; Mf=1000
β=75; Mf=1000 β=0; Mf=2000
β=15; Mf=2000 β=30; Mf=2000
β=45; Mf=2000 β=47.5; Mf=2000
β=52.5; Mf=2000 β=57.5; Mf=2000
β=60; Mf=2000 β=75; Mf=2000
β=0; Mf=3000 β=15; Mf=3000
β=30; Mf=3000 β=45; Mf=3000
β=47.5; Mf=3000 β=52.5; Mf=3000
β=57.5; Mf=3000 β=60; Mf=3000
β=75; Mf=3000 Diesel Only
Figure 6 Electricity cost of various configurations for the
area of Kavala

Paper ID: ICAE2013-182
6 Copyright © 2013 by ICAE2013
As it may be concluded, for every different diesel quantity
there is a different optimum tilt angle solution. The cost
effective solutions are those found below the cost of the
Mf=Mfmax line, which denotes the electricity production cost
corresponding to the diesel-only solution. Based on the
figures’ results, the optimum solution corresponds to the
combination of Mf=2000kg and β=52.5ο.
In order to have a more clear view of the optimum
solution, Figure 7 is next provided, including all optimum
solutions for various diesel quantities. In this context, taking
also into account the fact that cost uncertainties should be
considered, it can be seen that the most cost-effective
solution is the one denoted by the orange line.
For this solution the diesel quantity "Mf" is equal to
2000kg, the number of PV-panels is 550 and the tilt angle
"β" is equal to 52.5o. Finally, another way of presenting the
optimum solution is to have a comparison between the
electricity cost and the tilt angle, as shown in the next
Figure 8.
20-Year Minimum El. Production Cost Solutions - Case Study: Kavala
0,3
0,4
0,5
0,6
0,7
0,8
0,9
1,0
1,1
1,2
1,3
350 550 750 950 1150 1350 1550 1750
Number of Panels (z)
Ele
ctr
icity C
ost
(€/k
Wh)
Μf=0,β=52.5
Μf=250,β=57.5
Mf=1000,β=57.5
Mf=2000,β=52.5
Mf=3000,β=52.5
Mf=Mfmax
Figure 7 Minimum cost curves for Kavala in relation to the
number of PV panels used
20-Year Minimum El. Production Cost Solutions for Kavala in Relation to Panel Titl Angle
0,3
0,4
0,5
0,6
0,7
0,8
0,9
1,0
1,1
1,2
0 15 30 45 60 75
Panel Tilt Angle "β" (degrees)
Ele
ctr
icity C
ost
(€/k
Wh)
Mf=0kg Mf=250kg Mf=1000kg Mf=2000kg Mf=3000kg
Figure 8 Minimum cost curves for Kavala in relation to the
examined PV panel tilt angle
Similar to the previous figure, the above graphical
representation indicates that the 2000kg line (orange line)
provides the optimum solutions when the tilt angle is
between 45o-75
o. More specifically the lowest and optimum
point is as already seen at 52.5o.
Thus, based on the initial assumption that areas found
between the two extremes will also present the same
optimum tilt angle (provided that the two extremes present
similar optimum angles) the optimum tilt angle adopted for
the entire Greek territory is β=52.5o.
4.2 Energy autonomous configurations
By applying the developed algorithm for all five areas
examined, energy related results are first presented for the
group of solutions appreciating zero fuel contribution (see
also Figure 9). Moreover, for comparison purposes, panel
tilt angle variation (i.e. from β=15ο to β=75
ο) is also included
in order to determine its impact on the system size, while
for the rest of parameters involved, battery capacity is
allowed to reach a maximum of 70,000Ah and number of PV
panels is set not to exceed 1700 (each panel being of 51Wp).
Stand-Alone Hybrid PV-based Configurations (Mf=0)
7000
14000
21000
28000
35000
42000
49000
56000
63000
70000
400 500 600 700 800 9001000
11001200
13001400
15001600
17001800
Number of Panels (z)
Ba
ttery
Ca
pacity (
Ah
)
Rhodos-1758 kWh/m2,β=15 Rhodos-1758 kWh/m2,β=30 Rhodes-1758 kWh/m2,β=45Rhodos-1758 kWh/m2,β=52.5 Rhodes-1758 kWh/m2,β=60 Rhodos-1758 kWh/m2,β=75Sparti-1586 kWh/m2,β=15 Sparti-1586 kWh/m2,β=30 Sparti-1586 kWh/m2,β=45Sparti-1586 kWh/m2,β=52.5 Sparti-1586 kWh/m2,β=60 Sparti-1586 kWh/m2,β=75Zakynthos-1492 kWh/m2,β=15 Zakynthos-1492 kWh/m2,β=30 Zakynthos-1492 kWh/m2,β=45Zakynthos-1492 kWh/m2,β=52.5 Zakynthos-1492 kWh/m2,β=60 Zakynthos-1492 kWh/m2,β=75Larissa-1432 kWh/m2,β=15 Larissa-1432 kWh/m2,β=30 Larissa-1432 kWh/m2,β=45Larissa-1432 kWh/m2,β=52.5 Larissa-1432 kWh/m2,β=60 Larissa-1432 kWh/m2,β=75
Kavala-1363 kWh/m2,β=15 Kavala-1363 kWh/m2,β=30 Kavala-1363 kWh/m2,β=45Kavala-1363 kWh/m2,β=52.5 Kavala-1363 kWh/m2,β=60 Kavala-1363 kWh/m2,β=75
Figure 9 Energy autonomous PV-battery configurations for
the areas examined
From the graph, it can be seen that according to the solar
potential of the areas, there are differences in the
proportion between the battery capacity and the number of
PV panels used. For example, in the case of Kavala, which
has a low solar potential, the minimum number of 1200 PV
panels requires battery capacity of 65,000Ah in order to
cover the energy needs of the T/C station, while in the case
of Rhodes, the respective number of panels drops to almost
500.
At the same time, what is common among the different
curves is the vast reduction of battery capacity noted –up to

Paper ID: ICAE2013-182
7 Copyright © 2013 by ICAE2013
a point- with the increase of the installed PV panels.
Furthermore, as the tilt angle decreases the battery
capacity drop becomes steeper with the increase of PV
power, although the tilt angle impact seems to fade out for
angles that are greater than 45o.
Apart from the complete autonomous solution where
Mf=0kg, there are more solutions which suggest a
combination of a certain diesel quantity with different
number of PV panels. For example for a specific diesel
quantity of Mf=1000kg the possible energy autonomous
solutions can be seen in the next graph (Figure 10),
considering also the panel tilt angle variation as well. Based
on the figure’s results, it can be clearly seen that the region
of Kavala (which has the lowest solar irradiance – azure set
of lines) provides the worst solutions in comparison with
the other areas.
The area of Rhodes (with the biggest solar irradiance –
dark blue set of lines) provides the best energy solutions,
while the other four areas are overlapping each other (since
their solar potentials are not too different) depending on
the tilt angle "β" of the panels. At the same time, what may
also be noted is that use of even 1000kg of fuel contributes
considerably in the reduction of the required battery
capacity.
Stand Alone Hybrid PV-based Configurations (Mf=1000kg)
0
10000
20000
30000
40000
50000
60000
70000
400 500 600 700 800 900 1000 1100
Number of panels (z)
Battery
Capacity (
Ah)
Rhodes-1758 kWh/m2-β=15 Rhodes-1758 kWh/m2-β=30 Rhodes-1758 kWh/m2-β=45
Rhodes-1758 kWh/m2-β=52.5 Rhodes-1758 kWh/m2-β=60 Rhodes-1758 kWh/m2-β=75
Sparti-1586 kWh/m2-β=15 Sparti-1586 kWh/m2-β=30 Sparti-1586 kWh/m2-β=45
Sparti-1586 kWh/m2-β=52.5 Sparti-1586 kWh/m2-β=60 Sparti-1586 kWh/m2-β=75
Zakynthos-1492 kWh/m2-β=15 Zakynthos-1492 kWh/m2-β=30 Zakynthos-1492 kWh/m2-β=45Zakynthos-1492 kWh/m2-β=52.5 Zakynthos-1492 kWh/m2-β=60 Zakynthos-1492 kWh/m2-β=75
Larissa-1432 kWh/m2-β=15 Larissa-1432 kWh/m2-β=30 Larissa-1432 kWh/m2-β=45
Larissa-1432 kWh/m2-β=52.5 Larissa-1432 kWh/m2-β=60 Larissa-1432 kWh/m2-β=75
Kavala-1363 kWh/m2-β=15 Kavala-1363 kWh/m2-β=30 Kavala-1363 kWh/m2-β=45
Kavala-1363 kWh/m2-β=52.5 Kavala-1363 kWh/m2-β=60 Kavala-1363 kWh/m2-β=75
Figure 10 Hybrid energy autonomous configurations for the
areas examined (Mf=1000kg)
Accordingly, influence of fuel consumption variation
(from 250kg to 3000kg) is also studied, this time for the
optimum panel tilt angle of β=52.5ο, with results obtained
given in Figure 11. Based on the figure, there is a
considerable decrease of PV panels used (for Qmax=ct) as the
Mf value increases.
Stand alone Hybrid PV-based Configurations (β=52.5o)
0
10000
20000
30000
40000
50000
60000
70000
300 400 500 600 700 800 9001000
11001200
13001400
1500
Number of panels (z)
Batt
ery
Capacity (
Ah)
Rhodes-1758 kWh/m2-Mf=250 Rhodes-1758 kWh/m2-Mf=1000 Rhodes-1758 kWh/m2-Mf=2000
Rhodes-1758 kWh/m2-Mf=3000 Sparti-1586 kWh/m2-Mf=250 Sparti-1586 kWh/m22-Mf=1000
Sparti-1586 kWh/m2-Mf=2000 Sparti-1586 kWh/m2-Mf=3000 Zakynthos-1492 kWh/m2-Mf=250
Zakynthos-1492 kWh/m2-Mf=1000 Zakynthos-1492 kWh/m2-Mf=2000 Zakynthos-1492 kWh/m2-Mf=3000
Larissa-1432 kWh/m2-Mf=250 Larissa-1432 kWh/m2-Mf=1000 Larissa-1432 kWh/m2-Mf=2000
Larissa-1432 kWh/m2-Mf=3000 Kavala-1363 kWh/m2-Mf=250 Kavala-1363 kWh/m2-Mf=1000
Kavala-1363 kWh/m2-Mf=2000 Kavala-1363 kWh/m2-Mf=3000
Figure 11 Hybrid energy autonomous configurations for the
areas examined (β=52.5ο)
For example, this can be seen clearly for the Rhodes area
(dark blue lines), where at Mf=250kg the minimum battery
capacity solution needs about 550 panels, at Mf=1000kg
panels are reduced to 450, at Mf=2000kg they are further
reduced to 400 panels and finally for Mf=3000kg panels
required drop to 350 panels. In addition, what is also worth
mentioning is that as expected, considerable increase of
fuel consumption eliminates the impact of the solar
potential and produces similar results for all areas
examined.
4.3 Economic evaluation results
Next, energy-related results obtained are used in order to
determine the economic performance of various energy
autonomous hybrid configurations. In this context, as
already mentioned, the criterion of optimization currently
considered corresponds to the minimum long-term (20-
year) electricity production cost, considering purchase cost
of PV panels equal to 3000€/kW and fuel oil cost of 1.1€/kg
as well as the methodology analyzed in [8,14]. In this
context, minimum cost configurations are gathered in
Figure 12 for all areas examined in relation to the fuel
consumption variation and a fixed panel tilt angle of 52.5o.
According to the results obtained, Rhodes, Sparti and
Zakynthos pesent their optimum solutions when fuel
quantity of 1000kg is used, while Kavala and Larissa present
a minimum cost solution when 2000kg of fuel are used. At
the same time, Rhodes is as expected giving the overall
optimum solution (since it is the area with the highest solar
potential) and Kavala provides the overall "less optimum"
solution (since it is the area with the lowest solar potential).

Paper ID: ICAE2013-182
8 Copyright © 2013 by ICAE2013
Optimum Stand-Alone Configurations in Relation to Annual
Fuel Consumption (β=52.5ο)
0,3
0,4
0,5
0,6
0,7
0,8
0,9
0 500 1000 1500 2000 2500 3000
Annual Fuel Consumption (kg)
Ele
ctr
icity C
ost (€
/kW
h)
Kavala Larissa Zakynthos Sparti Rhodes Diesel-only
Figure 12 Minimum cost curves for all areas examined in
relation to fuel consumption (β=52.5ο)
Finally, as one may see, the diesel-only solution appears
to be more cost-effective only when compared to zero-fuel
configurations and only for the areas of Kavala and Larissa.
On the other hand, in the rest of areas, both PV-battery only
and hybrid configurations present a lower production cost
than the diesel-only option, while the same is valid for
Kavala and Larissa in case that fuel consumption is allowed
for the PV-based solution, even at a minimum level of
250kg.
5. CONCLUSIONS
Based on the application of a sizing algorithm for PV-
based hybrid stand-alone systems, electrification of typical
remote T/C stations was studied, for five different areas of
the Greek territory. In this context, areas selected captured
variation of the solar potential across the entire Greek
region. Given the constraint of zero load rejections during
the entire year for the T/C station examined, various
energy-autonomous configurations were produced by using
different quantities of fuel used on an annual basis.
Accordingly, such hybrid configurations were compared to
both the PV-only and the diesel-only solution, validating the
hypothesis that minimum cost is achieved if reducing the
diesel-only fuel consumption and at the same time
downsizing the battery component. More precisely, the
optimum fuel consumption for all cases examined was
found in the area of 1000kg to 2000kg per year, with higher
oil quantity required corresponding to the lower-quality
solar potential cases studied. Finally, it was only for the
cases of Kavala and Larissa that the diesel-only solution
proved to be slightly less expensive than the corresponding
zero-fuel option, with the rest of configurations however
presenting sound difference of electricity production cost,
in favor of PV-based solutions.
REFERENCES
[1] Lam PL, Shiu A. Economic growth, telecommunications
development and productivity growth of the
telecommunications sector: Evidence around the world.
Telecommun Policy 2010;34:185-99.
[2] Koufomichalis C, Bargotakis C, Kaldellis JK, Tsoutsos T.
Examples of RES applications in the telecommunications. In:
Proceedings of the 7th National Conference on the Soft
Energy Resources, Patras, Greece; 2002.
[3] Kenny Ch, Keremane R. Toward universal telephone
access: market progress and progress beyond the market.
Telecommun Policy 2007;31:155–63.
[4] Santamouris M, Katsoulis BD. Solar radiation over the
northwest part of Greece. Sol Wind Tech 1989;6:79-84.
[5] Zabara K. Estimation of the global solar radiation in
Greece. Sol Wind Tech 1986;3:267-72.
[6] Kaldellis JK, Zafirakis D, Stavropoulou V, Kaldelli El.
Optimum wind- and photovoltaic-based stand-alone
systems on the basis of life cycle energy analysis. Energ
Policy 2012;50:345-57.
[7] Kaldellis JK. Optimum hybrid photovoltaic-based solution
for remote telecommunication stations. Renew Energ
2010;35:2307-15.
[8] Kaldellis JK, Ninou I, Zafirakis D. Minimum long-term cost
solution for remote telecommunication stations on the
basis of photovoltaic-based hybrid power systems. Energ
Policy 2011;39:2512-27.
[9] Kaldellis JK, Ninou I. Energy balance analysis of combined
photovoltaic–diesel powered telecommunication stations.
Int J Elec Power 2011;33:1739-49.
[10] Kaldellis JK. Optimum technoeconomic energy
autonomous photovoltaic solution for remote consumers
throughout Greece. Energ Convers Manage 2004;45:2745-
60.
[11] Kaldellis JK, Kavadias KA, Koronakis PS. Comparing wind
and photovoltaic stand-alone power systems used for the
electrification of remote consumers. Renew Sust Energ Rev
2007;11:57–77.
[12] Kaldellis JK, Koronakis P, Kavadias K. Energy balance
analysis of a stand-alone photovoltaic system, including
variable system reliability impact. Renew Energ
2004;29:1161-80.
[13] Vlachos GTh, Kaldellis JK. Application of gas-turbine
exhaust gases for brackish water desalination: a techno-
economic evaluation. Appl Therm Eng 2004;24:2487-500.
[14] Kaldellis JK, Zafirakis D, Kavadias K, Kondili E. Optimum
PV-diesel hybrid systems for remote consumers of the
Greek territory. Appl Energ 2012;97:61-7.


