Embed Size (px)
Citation preview
Investor Presentation 2022
JUNE 2022
INVESTOR BRIEFING
Investor Relations contact:
Jim Ryan, VP Investor Relations
T: 704-869-4621
Investor Presentation 2022
SAFE HARBOR STATEMENT
Please note that the information provided in this presentation is accurate as of the date of the original presentation. The presentation will remain posted on this website from
one to twelve months following the initial presentation, but content will not be updated to reflect new information that may become available after the original presentation
posting. The presentation contains forward-looking statements within the meaning of Section 27A of the Securities Act of 1933, as amended ("Securities Act"), Section 21E of
the Securities Exchange Act of 1934, as amended ("Exchange Act"), and the Private Securities Litigation Reform Act of 1995. Such forward-looking statements only speak as
of the date of this report and Curtiss-Wright Corporation assumes no obligation to update the information included in this report. Such forward-looking statements include,
among other things, management's estimates of future performance, revenue, earnings, and free cash flow estimates, our management's growth projections, our
management’s ability to integrate our acquisitions and execute on our acquisition strategy, and management's ability to produce consistent operating improvements. These
forward-looking statements are based on expectations as of the time the statements were made only, and are subject to a number of risks and uncertainties which could cause
us to fail to achieve our then-current financial projections and other expectations, including the impact of a global pandemic or national epidemic.
This presentation also includes certain non-GAAP financial measures with reconciliations to GAAP financial measures being made available in the earnings release and this
presentation that are posted to our website and furnished with the SEC. We undertake no duty to update this information. More information about potential factors that could
affect our business and financial results is included in our filings with the Securities and Exchange Commission, including our Annual Reports on Form 10-K and Quarterly
Reports on Form 10-Q, including, among other sections, under the captions, "Risk Factors" and "Management's Discussion and Analysis of Financial Condition and Results of
Operations," which is on file with the SEC and available at the SEC's website at www.sec.gov.
2
Investor Presentation 2022
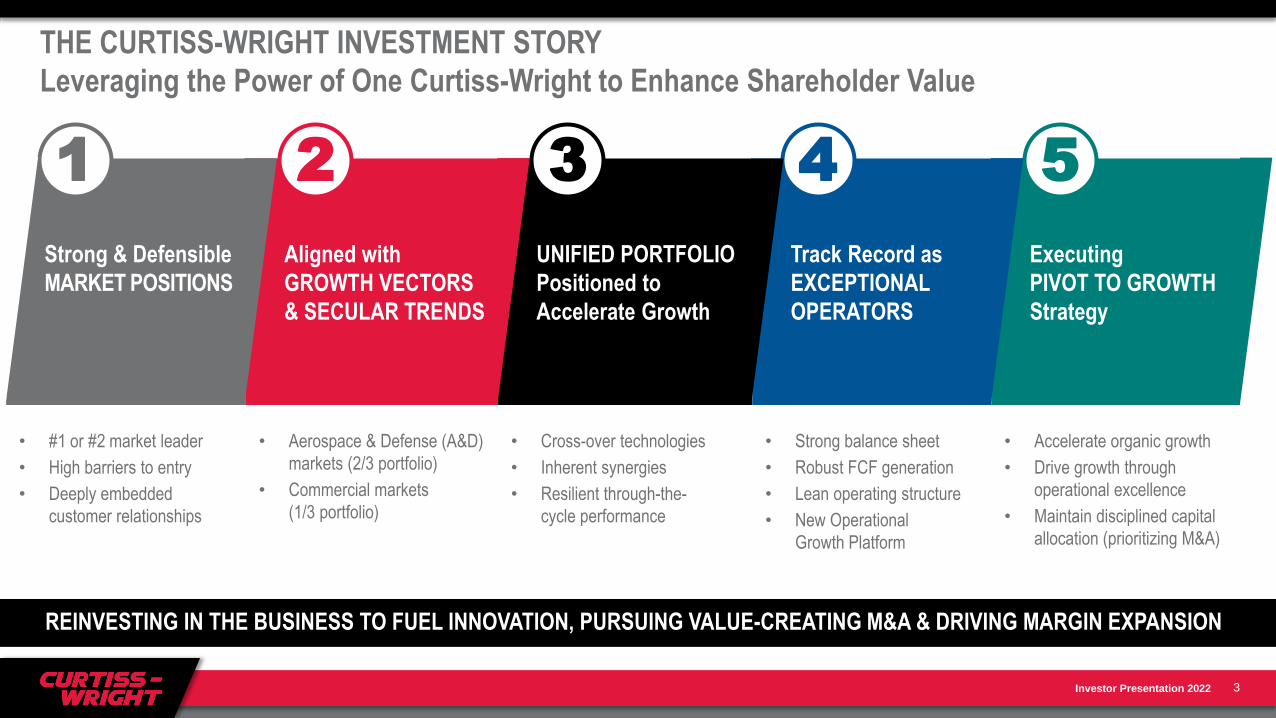
THE CURTISS-WRIGHT INVESTMENT STORY
Leveraging the Power of One Curtiss-Wright to Enhance Shareholder Value
3
REINVESTING IN THE BUSINESS TO FUEL INNOVATION, PURSUING VALUE-CREATING M&A & DRIVING MARGIN EXPANSION
Strong & Defensible
MARKET POSITIONS
Aligned with
GROWTH VECTORS
& SECULAR TRENDS
UNIFIED PORTFOLIO
Positioned to
Accelerate Growth
Track Record as
EXCEPTIONAL
OPERATORS
Executing
PIVOT TO GROWTH
Strategy
• #1 or #2 market leader
• High barriers to entry
• Deeply embedded
customer relationships
• Aerospace & Defense (A&D)
markets (2/3 portfolio)
• Commercial markets
(1/3 portfolio)
• Cross-over technologies
• Inherent synergies
• Resilient through-the-
cycle performance
• Strong balance sheet
• Robust FCF generation
• Lean operating structure
• New Operational
Growth Platform
• Accelerate organic growth
• Drive growth through
operational excellence
• Maintain disciplined capital
allocation (prioritizing M&A)
1 2 3 4 5
Investor Presentation 2022
34%
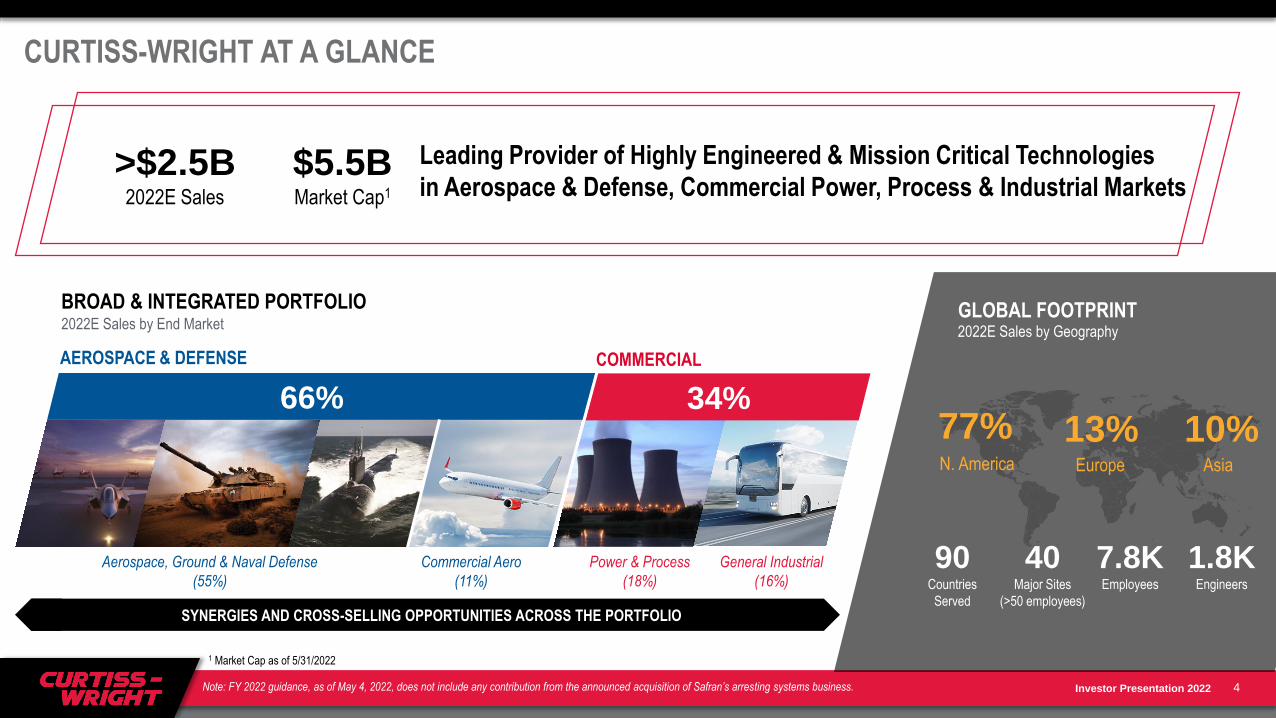
CURTISS-WRIGHT AT A GLANCE
4
>$2.5B $5.5B2022E Sales Market Cap1
BROAD & INTEGRATED PORTFOLIO
1 Market Cap as of 5/31/2022
GLOBAL FOOTPRINT
77% 13% 10% N. America Europe Asia
90 40 7.8K 1.8KCountries
Served
Major Sites
(>50 employees)
Employees Engineers
Leading Provider of Highly Engineered & Mission Critical Technologies
in Aerospace & Defense, Commercial Power, Process & Industrial Markets
2022E Sales by End Market
SYNERGIES AND CROSS-SELLING OPPORTUNITIES ACROSS THE PORTFOLIO
COMMERCIAL
Power & Process
(18%)
General Industrial
(16%)
AEROSPACE & DEFENSE
Commercial Aero
(11%)
Aerospace, Ground & Naval Defense
(55%)
66%
2022E Sales by Geography
Note: FY 2022 guidance, as of May 4, 2022, does not include any contribution from the announced acquisition of Safran’s arresting systems business.
Investor Presentation 2022
To better the world by enabling
strong national defenses, energy
independence, and sustainable
commercial applications through
our highly engineered, mission
critical solutions.
5
O U R A M B I T I O N
Investor Presentation 2022
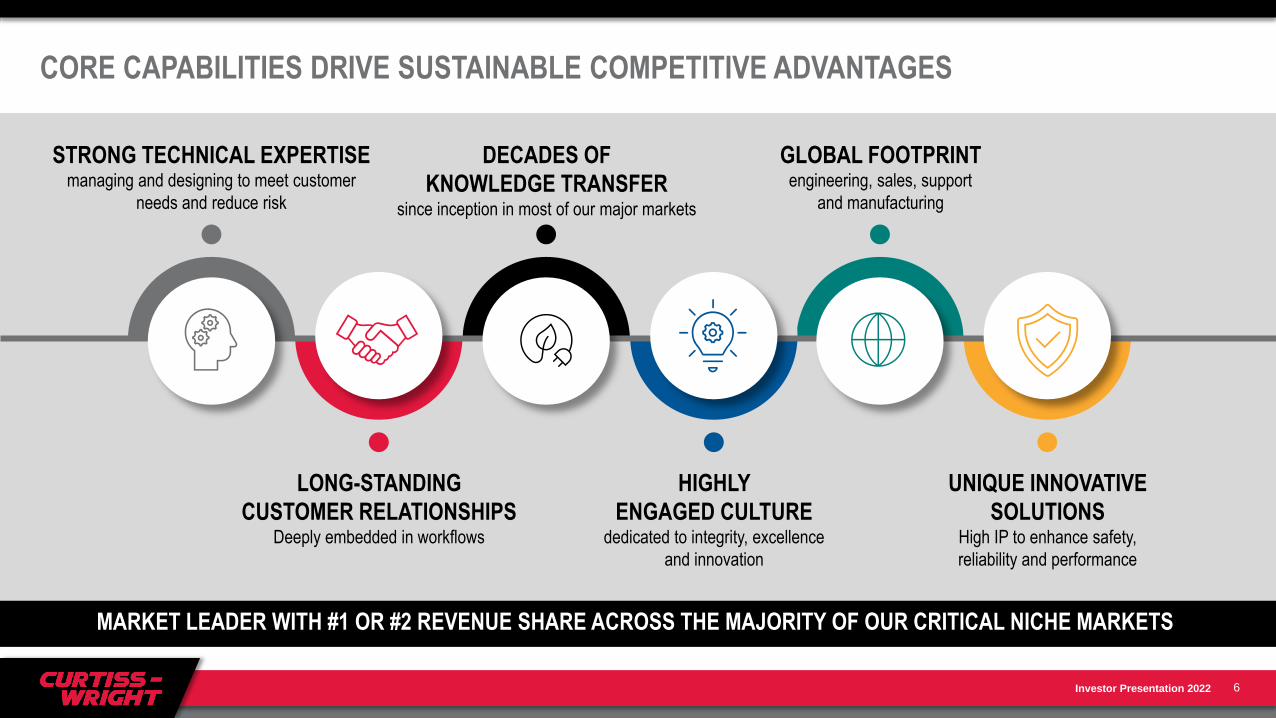
CORE CAPABILITIES DRIVE SUSTAINABLE COMPETITIVE ADVANTAGES
6
MARKET LEADER WITH #1 OR #2 REVENUE SHARE ACROSS THE MAJORITY OF OUR CRITICAL NICHE MARKETS
STRONG TECHNICAL EXPERTISEmanaging and designing to meet customer
needs and reduce risk
DECADES OF
KNOWLEDGE TRANSFER since inception in most of our major markets
GLOBAL FOOTPRINT engineering, sales, support
and manufacturing
LONG-STANDING
CUSTOMER RELATIONSHIPSDeeply embedded in workflows
HIGHLY
ENGAGED CULTURE dedicated to integrity, excellence
and innovation
UNIQUE INNOVATIVE
SOLUTIONS High IP to enhance safety,
reliability and performance
Investor Presentation 2022
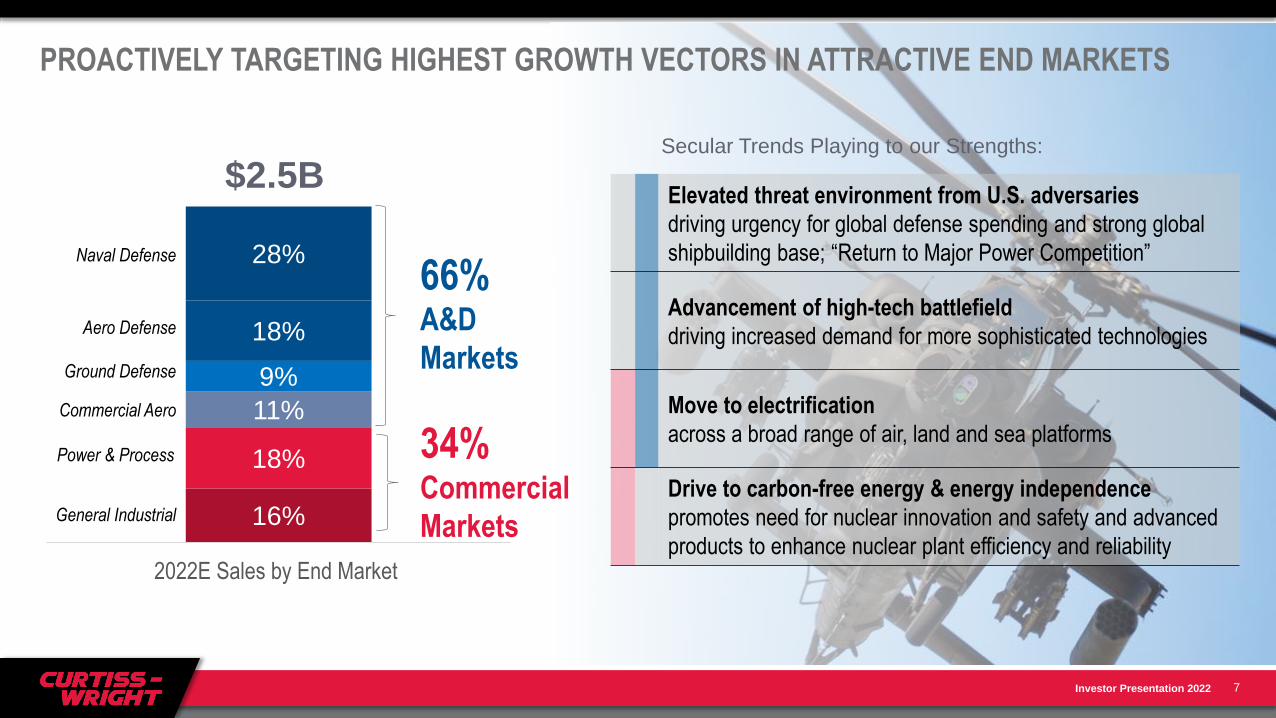
$2.5B
PROACTIVELY TARGETING HIGHEST GROWTH VECTORS IN ATTRACTIVE END MARKETS
7
16%
18%
11%
9%
18%
28%
2022E Sales by End Market
34%Commercial
Markets
66%A&D
Markets
Elevated threat environment from U.S. adversaries
driving urgency for global defense spending and strong global
shipbuilding base; “Return to Major Power Competition”
Advancement of high-tech battlefield
driving increased demand for more sophisticated technologies
Move to electrification
across a broad range of air, land and sea platforms
Drive to carbon-free energy & energy independence
promotes need for nuclear innovation and safety and advanced
products to enhance nuclear plant efficiency and reliability
Secular Trends Playing to our Strengths:
General Industrial
Power & Process
Commercial Aero
Ground Defense
Aero Defense
Naval Defense
Investor Presentation 2022
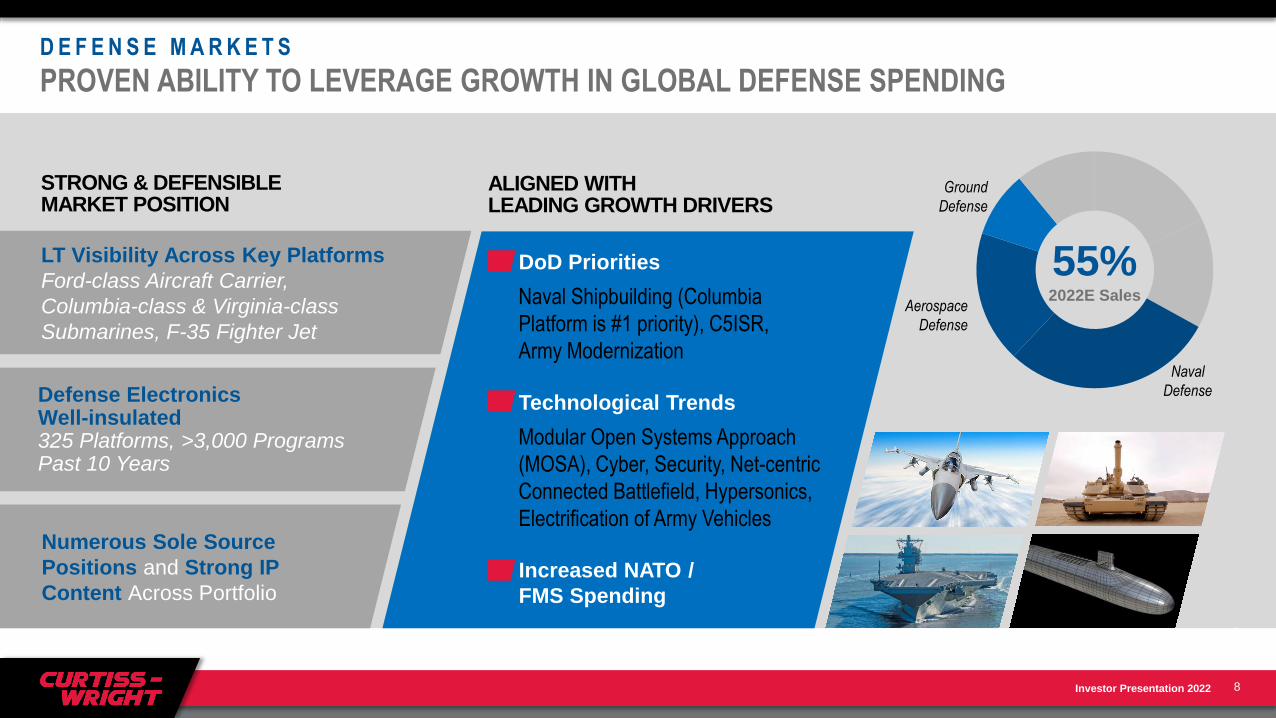
Ground
Defense
Aerospace
Defense
Naval
Defense
55%2022E Sales
D E F E N S E M A R K E T S
PROVEN ABILITY TO LEVERAGE GROWTH IN GLOBAL DEFENSE SPENDING
8
ALIGNED WITH LEADING GROWTH DRIVERS
STRONG & DEFENSIBLE MARKET POSITION
LT Visibility Across Key Platforms
Ford-class Aircraft Carrier,
Columbia-class & Virginia-class
Submarines, F-35 Fighter Jet
Defense Electronics Well-insulated 325 Platforms, >3,000 Programs Past 10 Years
Numerous Sole Source
Positions and Strong IP
Content Across Portfolio
• DoD Priorities
Naval Shipbuilding (Columbia
Platform is #1 priority), C5ISR,
Army Modernization
• Technological Trends
Modular Open Systems Approach
(MOSA), Cyber, Security, Net-centric
Connected Battlefield, Hypersonics,
Electrification of Army Vehicles
• Increased NATO /
FMS Spending
8
Investor Presentation 2022
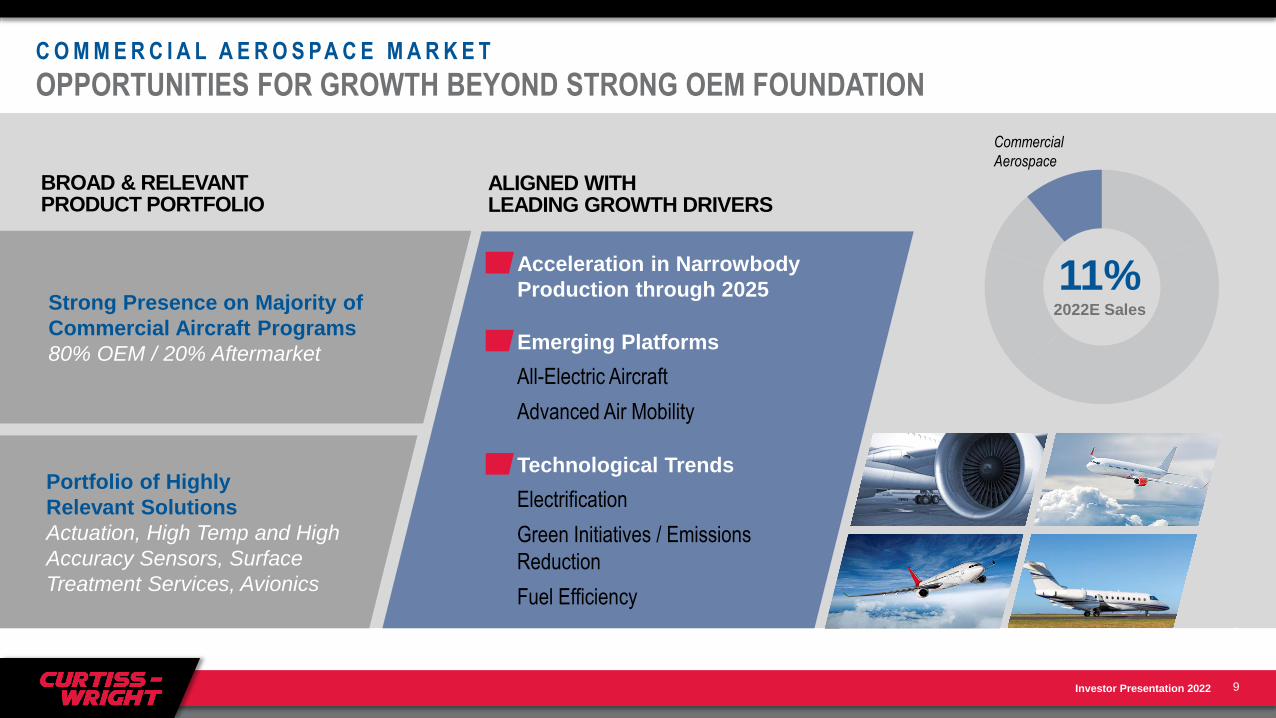
Strong Presence on Majority of
Commercial Aircraft Programs
80% OEM / 20% Aftermarket
18%
15%
29%
18%
9%
11%
C O M M E R C I A L A E R O S PA C E M A R K E T
OPPORTUNITIES FOR GROWTH BEYOND STRONG OEM FOUNDATION
9
BROAD & RELEVANT PRODUCT PORTFOLIO
➢ Acceleration in Narrowbody
Production through 2025
➢ Emerging Platforms
All-Electric Aircraft
Advanced Air Mobility
➢ Technological Trends
Electrification
Green Initiatives / Emissions
Reduction
Fuel Efficiency
Portfolio of Highly
Relevant Solutions
Actuation, High Temp and High
Accuracy Sensors, Surface
Treatment Services, Avionics
11%2022E Sales
Commercial
Aerospace
9
ALIGNED WITH LEADING GROWTH DRIVERS
Investor Presentation 2022
10
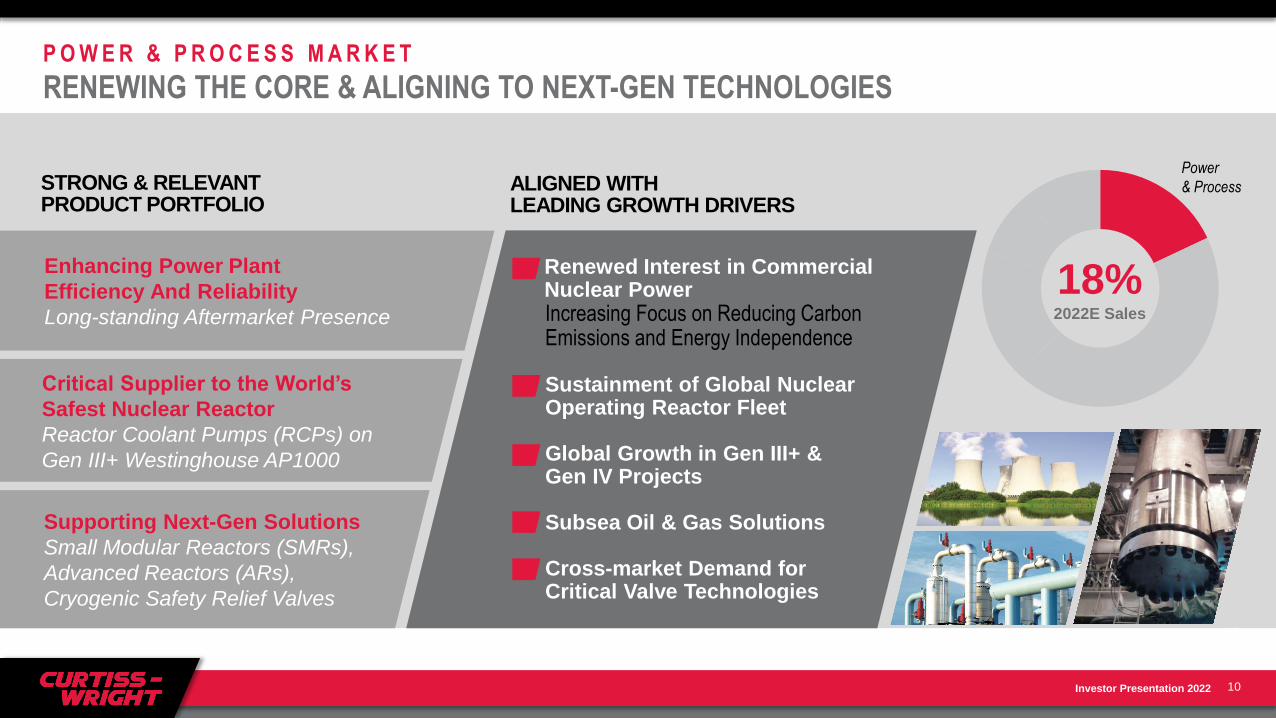
ALIGNED WITH LEADING GROWTH DRIVERS
STRONG & RELEVANT PRODUCT PORTFOLIO
• Renewed Interest in CommercialNuclear PowerIncreasing Focus on Reducing Carbon Emissions and Energy Independence
• Sustainment of Global Nuclear Operating Reactor Fleet
• Global Growth in Gen III+ & Gen IV Projects
• Subsea Oil & Gas Solutions
• Cross-market Demand for Critical Valve Technologies
Power
& Process
Critical Supplier to the World’s
Safest Nuclear Reactor
Reactor Coolant Pumps (RCPs) on
Gen III+ Westinghouse AP1000
Supporting Next-Gen Solutions
Small Modular Reactors (SMRs),
Advanced Reactors (ARs),
Cryogenic Safety Relief Valves
Enhancing Power Plant
Efficiency And Reliability
Long-standing Aftermarket Presence
P O W E R & P R O C E S S M A R K E T
RENEWING THE CORE & ALIGNING TO NEXT-GEN TECHNOLOGIES
10
18%2022E Sales
Investor Presentation 2022
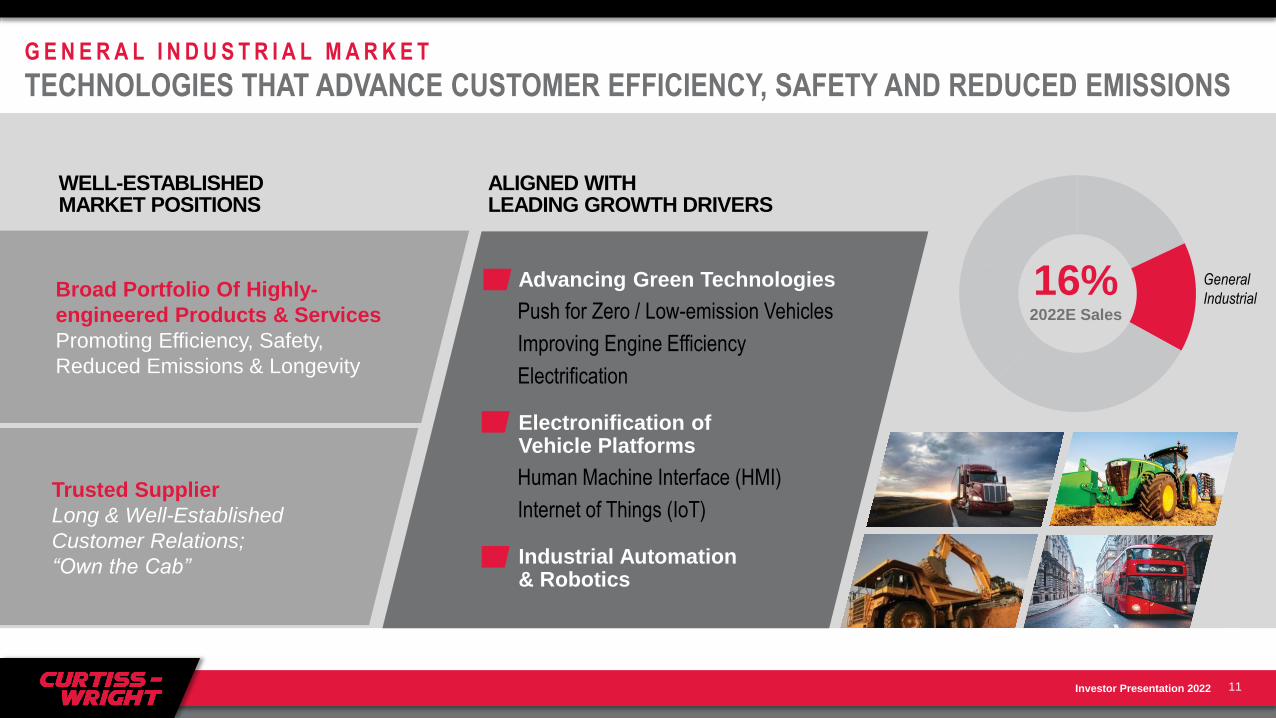
G E N E R A L I N D U S T R I A L M A R K E T
TECHNOLOGIES THAT ADVANCE CUSTOMER EFFICIENCY, SAFETY AND REDUCED EMISSIONS
11
ALIGNED WITH LEADING GROWTH DRIVERS
WELL-ESTABLISHED MARKET POSITIONS
• Advancing Green Technologies
Push for Zero / Low-emission Vehicles
Improving Engine Efficiency
Electrification
• Electronification of Vehicle Platforms
Human Machine Interface (HMI)
Internet of Things (IoT)
• Industrial Automation & Robotics
Trusted Supplier
Long & Well-Established
Customer Relations;
“Own the Cab”
Broad Portfolio Of Highly-
engineered Products & Services
Promoting Efficiency, Safety,
Reduced Emissions & Longevity
11
General
Industrial16%2022E Sales
Investor Presentation 2022
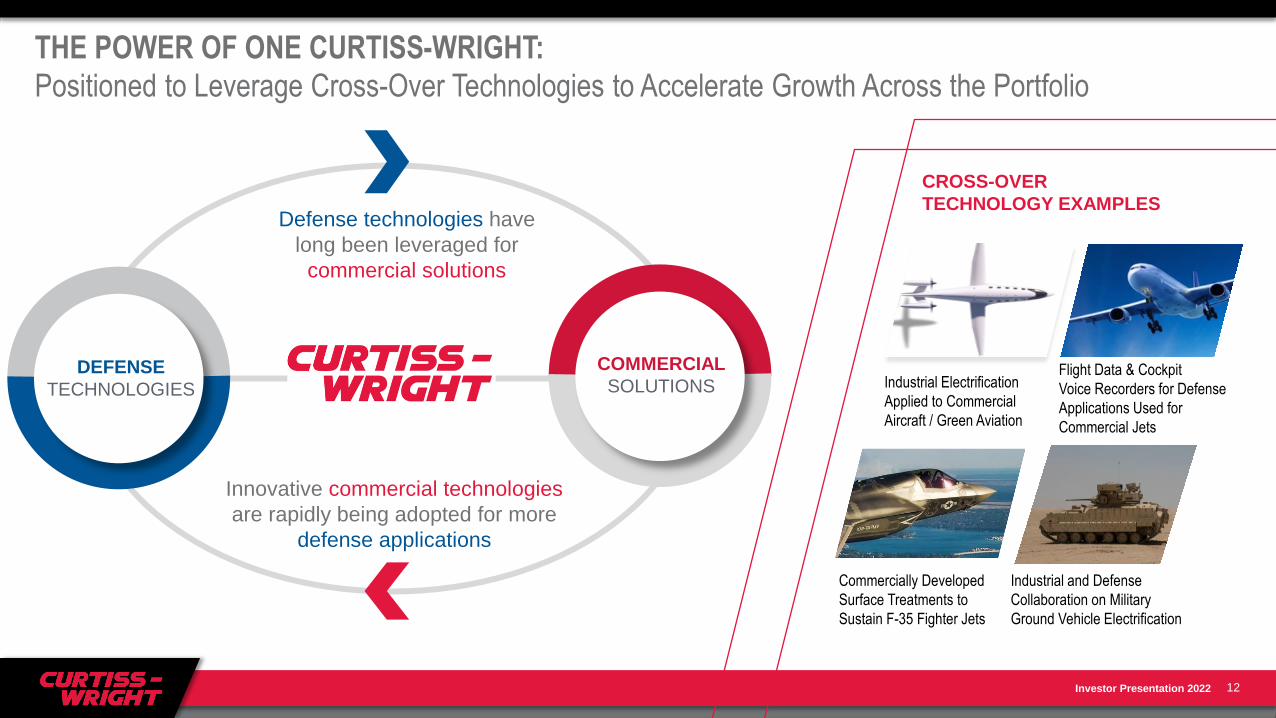
THE POWER OF ONE CURTISS-WRIGHT:
Positioned to Leverage Cross-Over Technologies to Accelerate Growth Across the Portfolio
12
Innovative commercial technologies
are rapidly being adopted for more
defense applications
CROSS-OVER
TECHNOLOGY EXAMPLES
COMMERCIAL
SOLUTIONSDEFENSE
TECHNOLOGIES
Defense technologies have
long been leveraged for
commercial solutions
Industrial Electrification
Applied to Commercial
Aircraft / Green Aviation
Flight Data & Cockpit
Voice Recorders for Defense
Applications Used for
Commercial Jets
Industrial and Defense
Collaboration on Military
Ground Vehicle Electrification
Commercially Developed
Surface Treatments to
Sustain F-35 Fighter Jets
Investor Presentation 2022
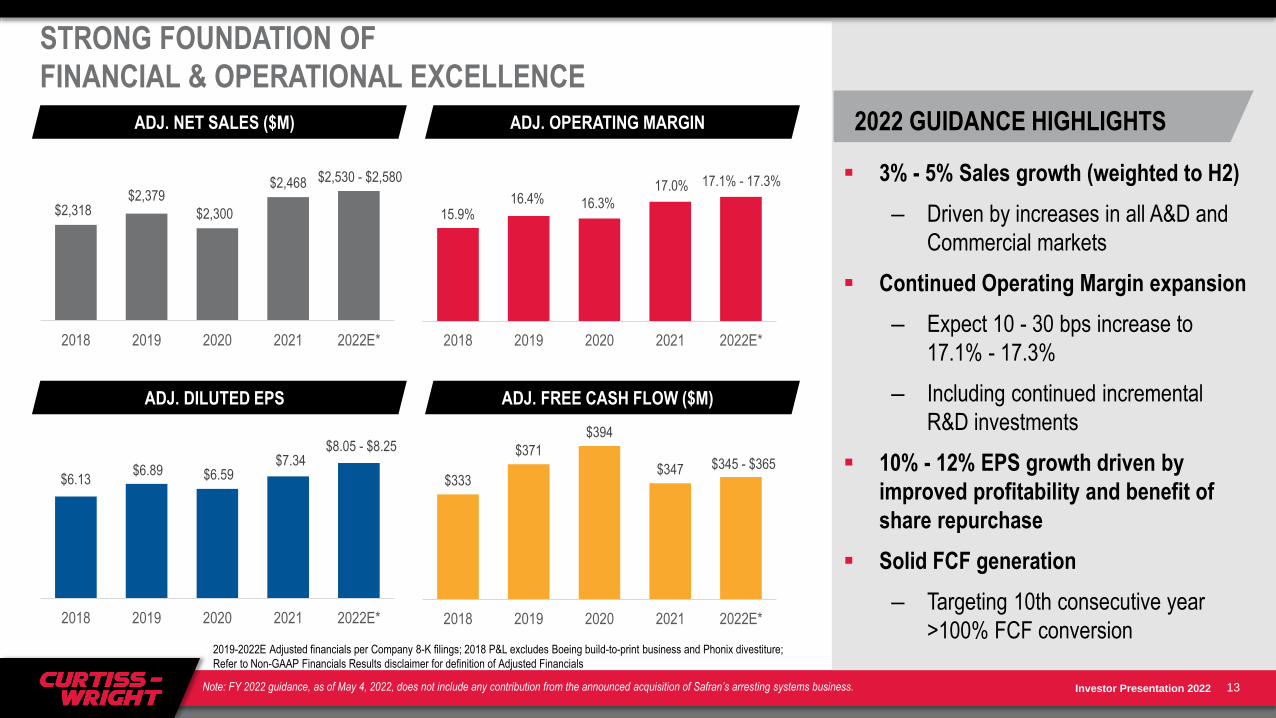
STRONG FOUNDATION OF
FINANCIAL & OPERATIONAL EXCELLENCE
$2,318$2,379
$2,300
$2,468 $2,530 - $2,580
2018 2019 2020 2021 2022E*
15.9%16.4% 16.3%
17.0% 17.1% - 17.3%
2018 2019 2020 2021 2022E*
$6.13$6.89 $6.59
$7.34$8.05 - $8.25
2018 2019 2020 2021 2022E*
$333
$371
$394
$347 $345 - $365
$200.00
$210.00
$220.00
$230.00
$240.00
$250.00
$260.00
$270.00
$280.00
$290.00
$300.00
$310.00
$320.00
$330.00
$340.00
$350.00
$360.00
$370.00
$380.00
$390.00
$400.00
2018 2019 2020 2021 2022E*
▪ 3% - 5% Sales growth (weighted to H2)
– Driven by increases in all A&D and
Commercial markets
▪ Continued Operating Margin expansion
– Expect 10 - 30 bps increase to
17.1% - 17.3%
– Including continued incremental
R&D investments
▪ 10% - 12% EPS growth driven by
improved profitability and benefit of
share repurchase
▪ Solid FCF generation
– Targeting 10th consecutive year
>100% FCF conversion
13
2019-2022E Adjusted financials per Company 8-K filings; 2018 P&L excludes Boeing build-to-print business and Phonix divestiture;
Refer to Non-GAAP Financials Results disclaimer for definition of Adjusted Financials
ADJ. FREE CASH FLOW ($M)ADJ. DILUTED EPS
ADJ. OPERATING MARGINADJ. NET SALES ($M) 2022 GUIDANCE HIGHLIGHTS
Note: FY 2022 guidance, as of May 4, 2022, does not include any contribution from the announced acquisition of Safran’s arresting systems business.
Investor Presentation 2022
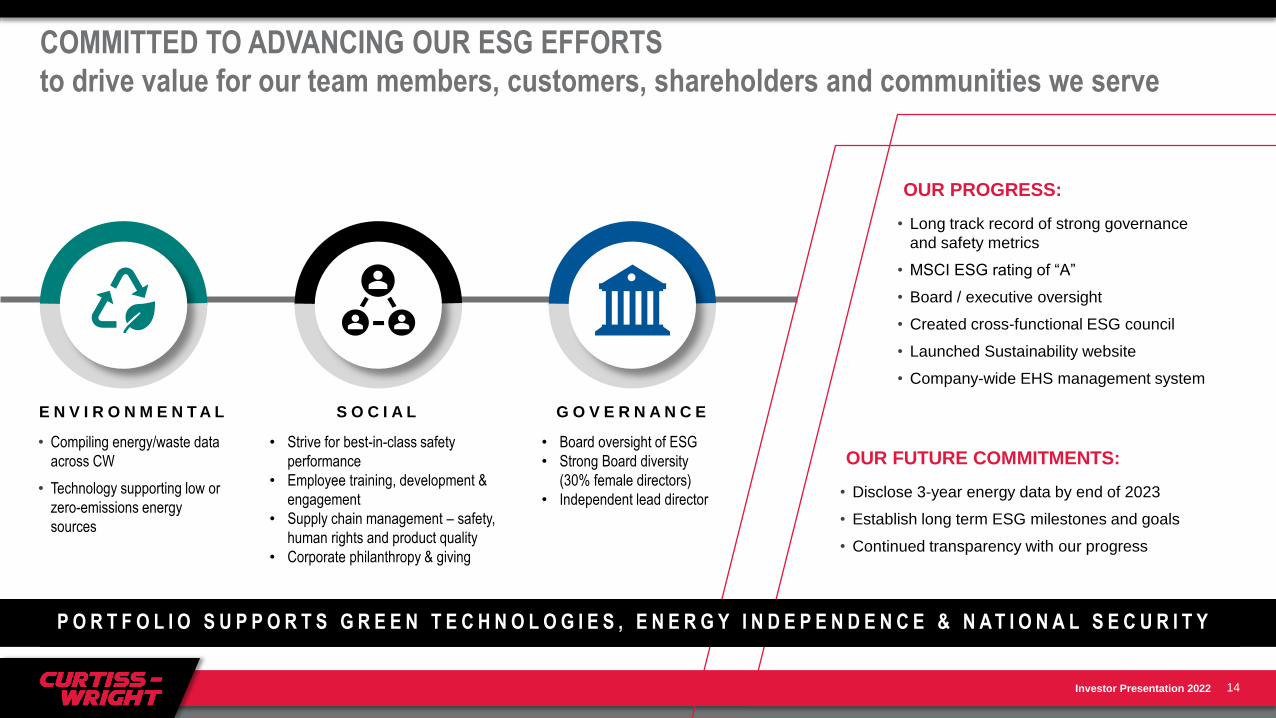
COMMITTED TO ADVANCING OUR ESG EFFORTS
to drive value for our team members, customers, shareholders and communities we serve
14
OUR PROGRESS:
• Long track record of strong governance
and safety metrics
• MSCI ESG rating of “A”
• Board / executive oversight
• Created cross-functional ESG council
• Launched Sustainability website
• Company-wide EHS management system
• Strive for best-in-class safety
performance
• Employee training, development &
engagement
• Supply chain management – safety,
human rights and product quality
• Corporate philanthropy & giving
E N V I R O N M E N T A L S O C I A L G O V E R N A N C E
OUR FUTURE COMMITMENTS:
• Disclose 3-year energy data by end of 2023
• Establish long term ESG milestones and goals
• Continued transparency with our progress
• Compiling energy/waste data
across CW
• Technology supporting low or
zero-emissions energy
sources
• Board oversight of ESG
• Strong Board diversity
(30% female directors)
• Independent lead director
P O R T F O L I O S U P P O R T S G R E E N T E C H N O L O G I E S , E N E R G Y I N D E P E N D E N C E & N A T I O N A L S E C U R I T Y
Investor Presentation 2022
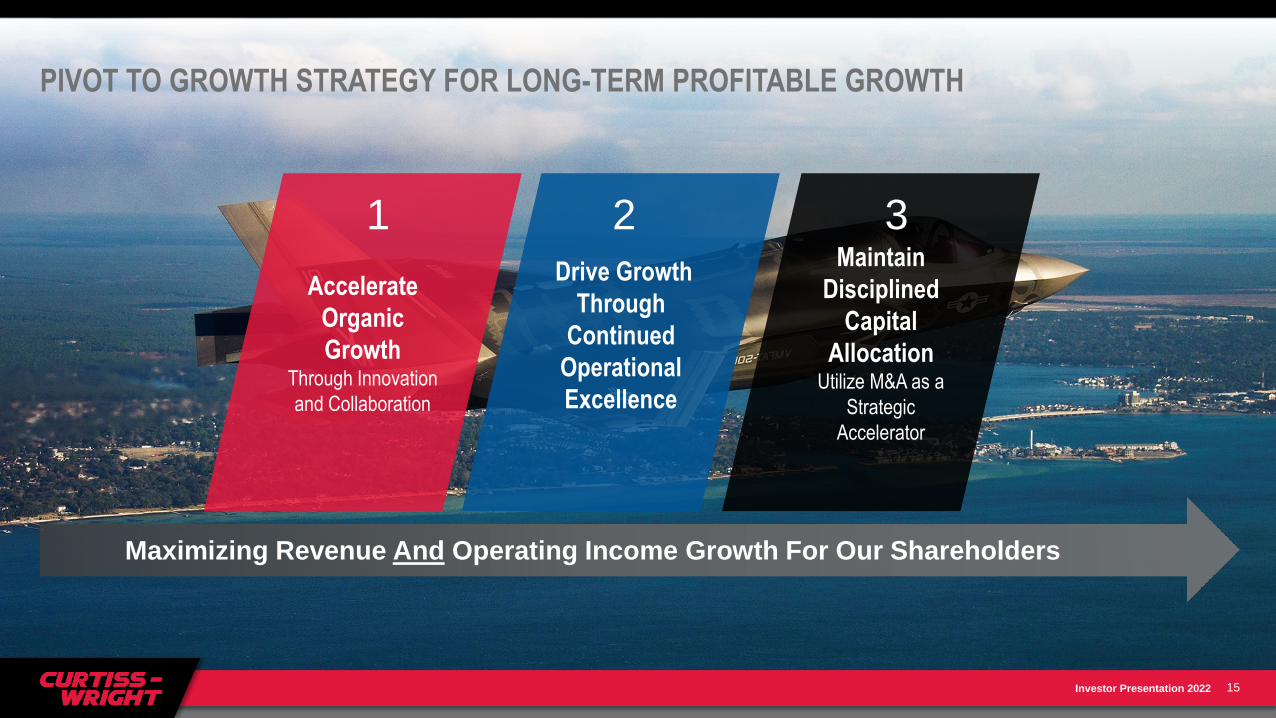
PIVOT TO GROWTH STRATEGY FOR LONG-TERM PROFITABLE GROWTH
15
Drive Growth
Through
Continued
Operational
Excellence
Accelerate
Organic
Growth Through Innovation
and Collaboration
Maintain
Disciplined
Capital
Allocation Utilize M&A as a
Strategic
Accelerator
1 2 3
Maximizing Revenue And Operating Income Growth For Our Shareholders
Investor Presentation 2022
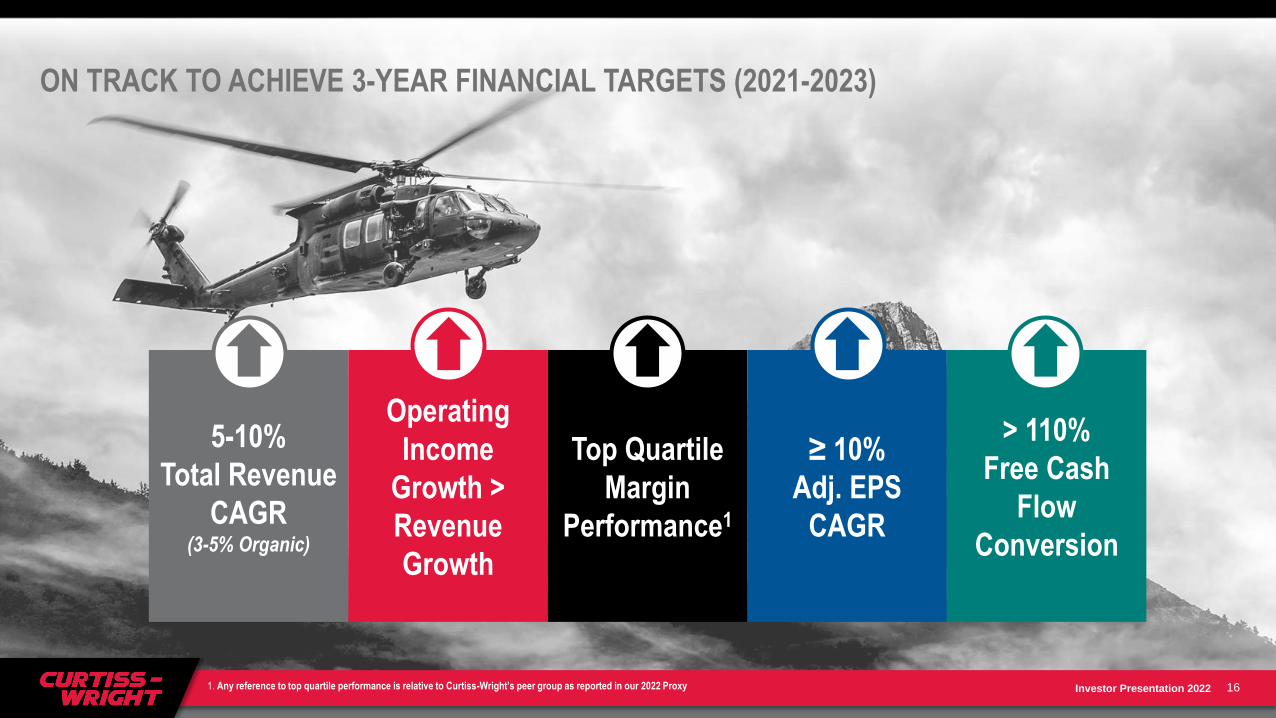
ON TRACK TO ACHIEVE 3-YEAR FINANCIAL TARGETS (2021-2023)
16
5-10%
Total Revenue
CAGR(3-5% Organic)
Operating
Income
Growth >
Revenue
Growth
Top Quartile
Margin
Performance1
≥ 10%
Adj. EPS
CAGR
> 110%
Free Cash
Flow
Conversion
1. Any reference to top quartile performance is relative to Curtiss-Wright’s peer group as reported in our 2022 Proxy
Investor Presentation 2022
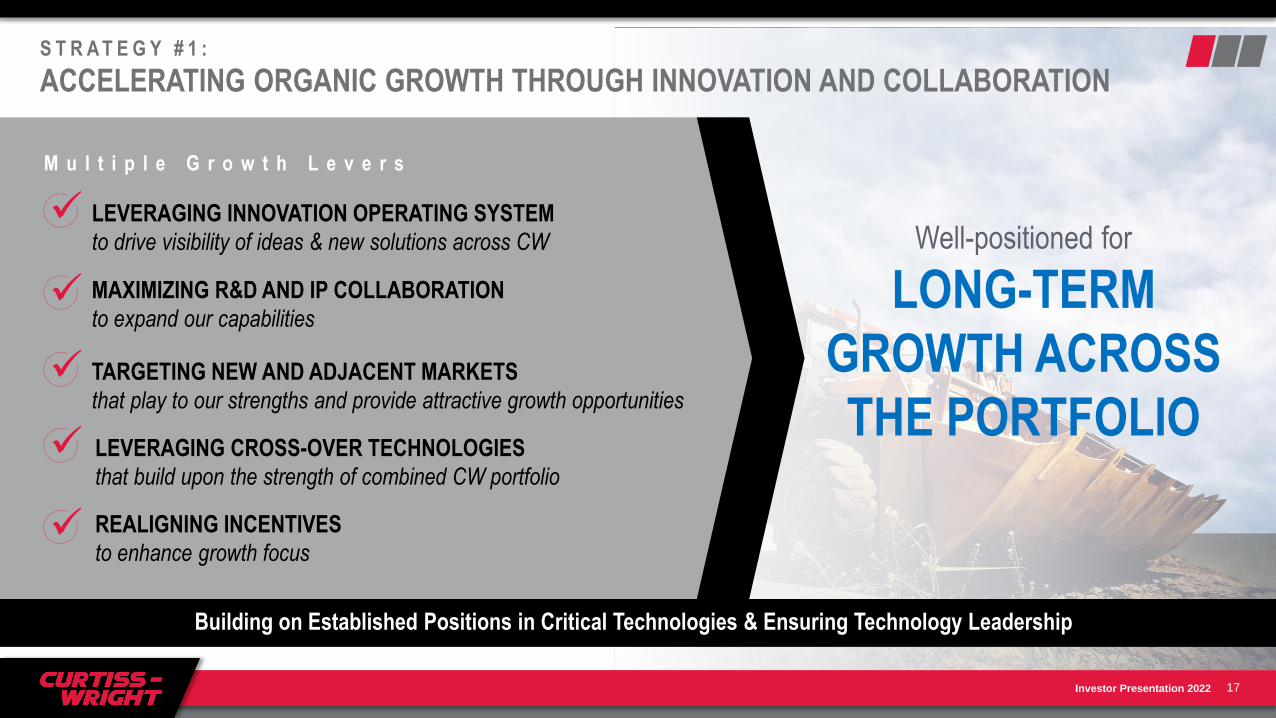
S T R A T E G Y # 1 :
ACCELERATING ORGANIC GROWTH THROUGH INNOVATION AND COLLABORATION
17
Building on Established Positions in Critical Technologies & Ensuring Technology Leadership
✓
✓
✓
✓
✓
LEVERAGING INNOVATION OPERATING SYSTEM
to drive visibility of ideas & new solutions across CW
MAXIMIZING R&D AND IP COLLABORATION
to expand our capabilities
LEVERAGING CROSS-OVER TECHNOLOGIES
that build upon the strength of combined CW portfolio
REALIGNING INCENTIVES
to enhance growth focus
M u l t i p l e G r o w t h L e v e r s
Well-positioned for
LONG-TERM
GROWTH ACROSS
THE PORTFOLIOTARGETING NEW AND ADJACENT MARKETS
that play to our strengths and provide attractive growth opportunities
Investor Presentation 2022
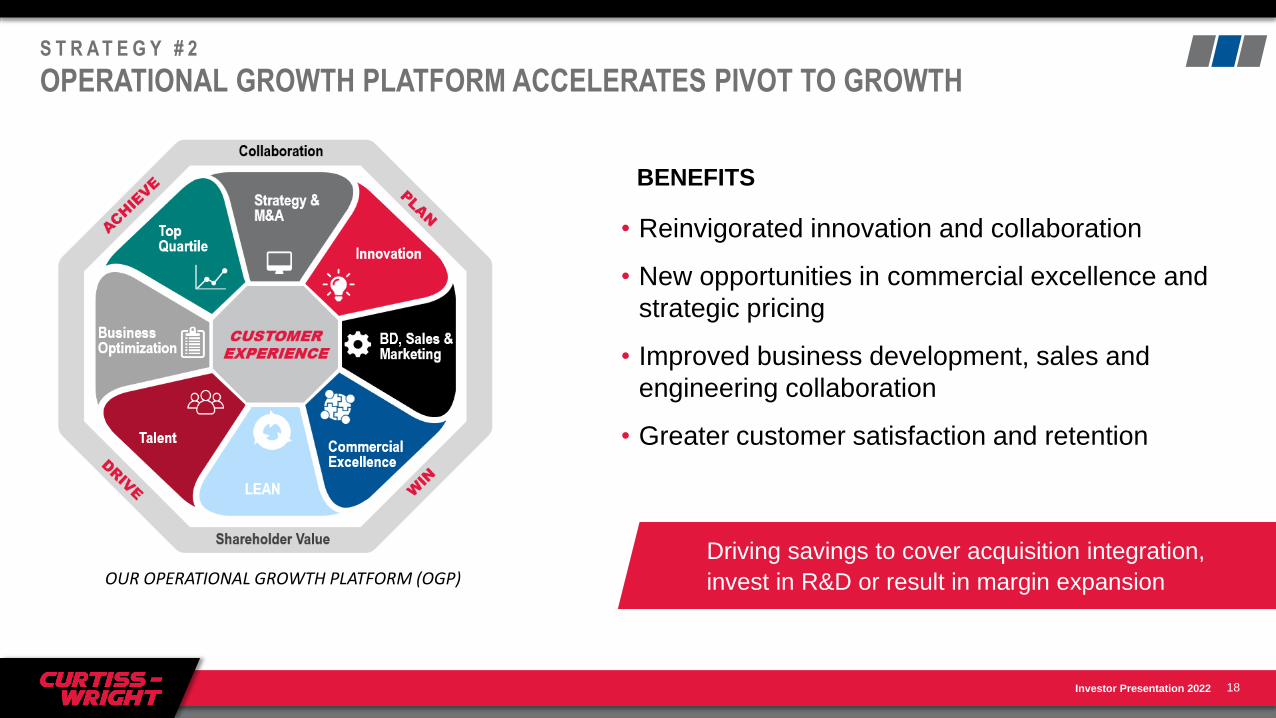
S T R A T E G Y # 2
OPERATIONAL GROWTH PLATFORM ACCELERATES PIVOT TO GROWTH
18
OUR OPERATIONAL GROWTH PLATFORM (OGP)
BENEFITS
• Reinvigorated innovation and collaboration
• New opportunities in commercial excellence and
strategic pricing
• Improved business development, sales and
engineering collaboration
• Greater customer satisfaction and retention
Driving savings to cover acquisition integration,
invest in R&D or result in margin expansion
Investor Presentation 2022
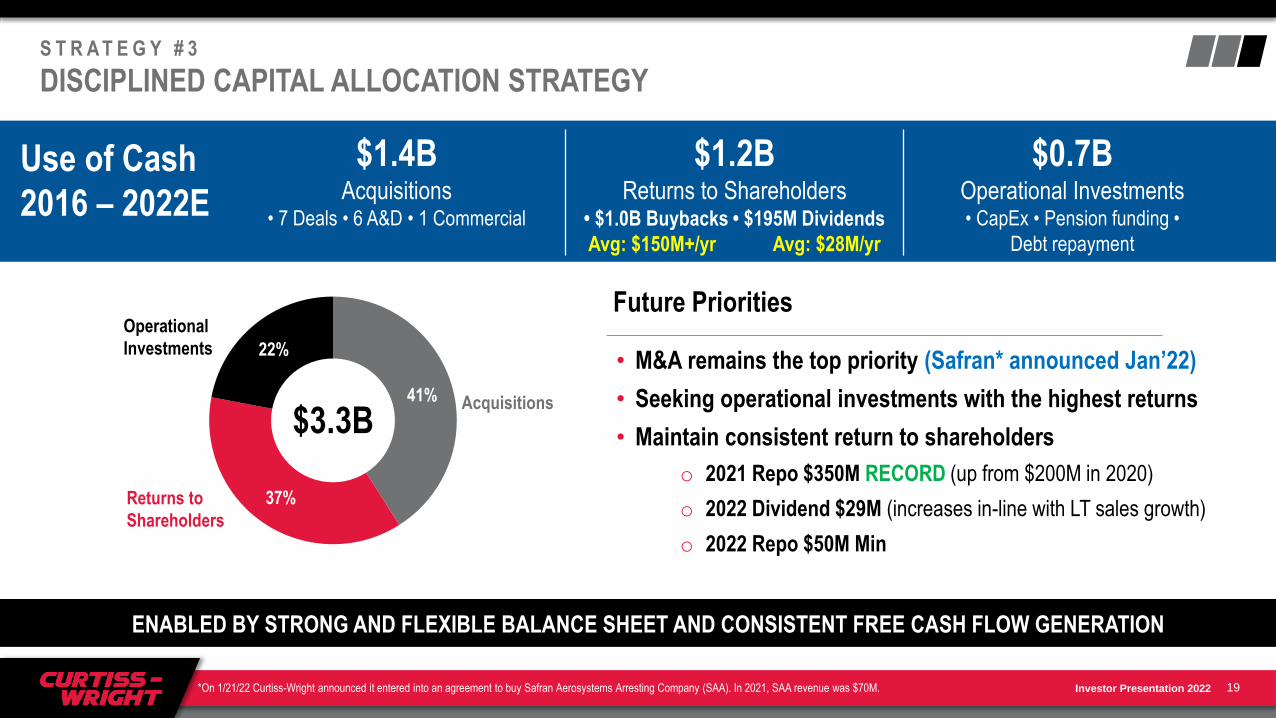
$1.4B $1.2B $0.7BAcquisitions Returns to Shareholders Operational Investments
• 7 Deals • 6 A&D • 1 Commercial • $1.0B Buybacks • $195M Dividends
Avg: $150M+/yr Avg: $28M/yr
• CapEx • Pension funding •
Debt repayment
S T R A T E G Y # 3
DISCIPLINED CAPITAL ALLOCATION STRATEGY
19
Use of Cash
2016 – 2022E
41%
37%
22%
$3.3BAcquisitions
Returns to
Shareholders
Operational
Investments• M&A remains the top priority (Safran* announced Jan’22)
• Seeking operational investments with the highest returns
• Maintain consistent return to shareholders
o 2021 Repo $350M RECORD (up from $200M in 2020)
o 2022 Dividend $29M (increases in-line with LT sales growth)
o 2022 Repo $50M Min
Future Priorities
ENABLED BY STRONG AND FLEXIBLE BALANCE SHEET AND CONSISTENT FREE CASH FLOW GENERATION
*On 1/21/22 Curtiss-Wright announced it entered into an agreement to buy Safran Aerosystems Arresting Company (SAA). In 2021, SAA revenue was $70M.
Investor Presentation 2022
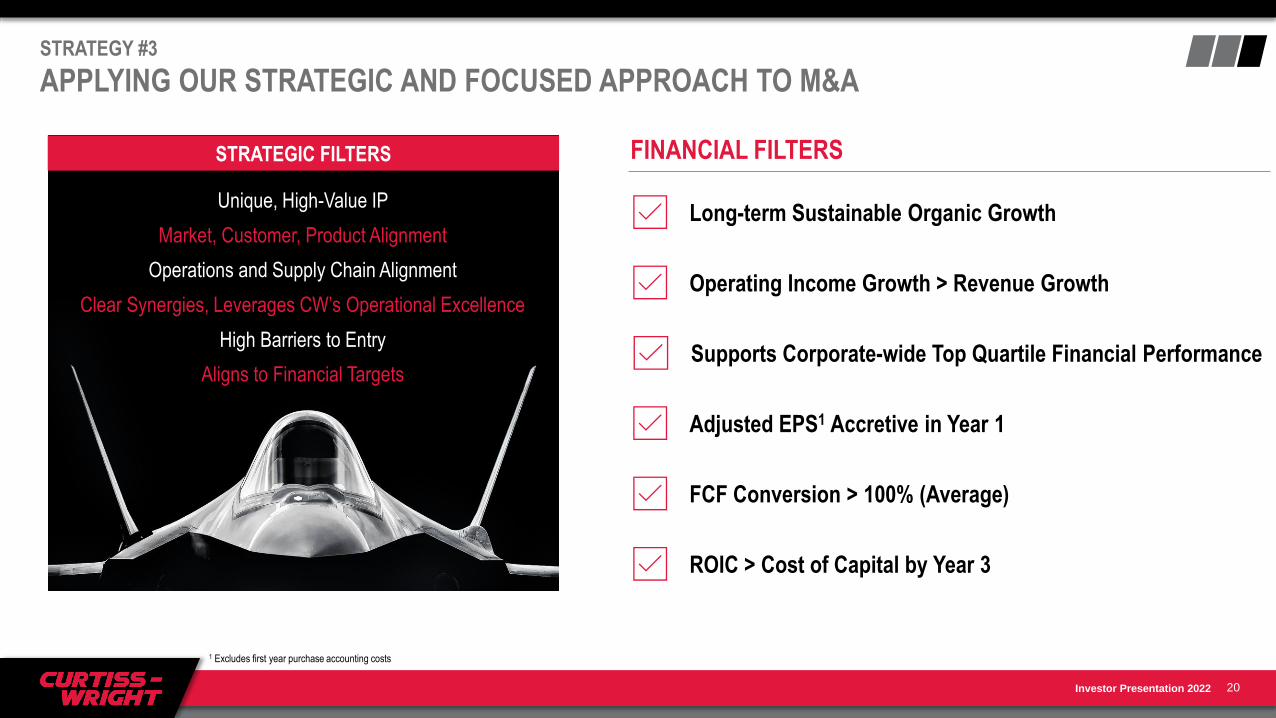
STRATEGY #3
APPLYING OUR STRATEGIC AND FOCUSED APPROACH TO M&A
20
FINANCIAL FILTERS
Long-term Sustainable Organic Growth
Operating Income Growth > Revenue Growth
Supports Corporate-wide Top Quartile Financial Performance
Adjusted EPS1 Accretive in Year 1
FCF Conversion > 100% (Average)
STRATEGIC FILTERS
ROIC > Cost of Capital by Year 3
Unique, High-Value IP
Market, Customer, Product Alignment
Operations and Supply Chain Alignment
High Barriers to Entry
Clear Synergies, Leverages CW’s Operational Excellence
Aligns to Financial Targets
1 Excludes first year purchase accounting costs
Investor Presentation 2022
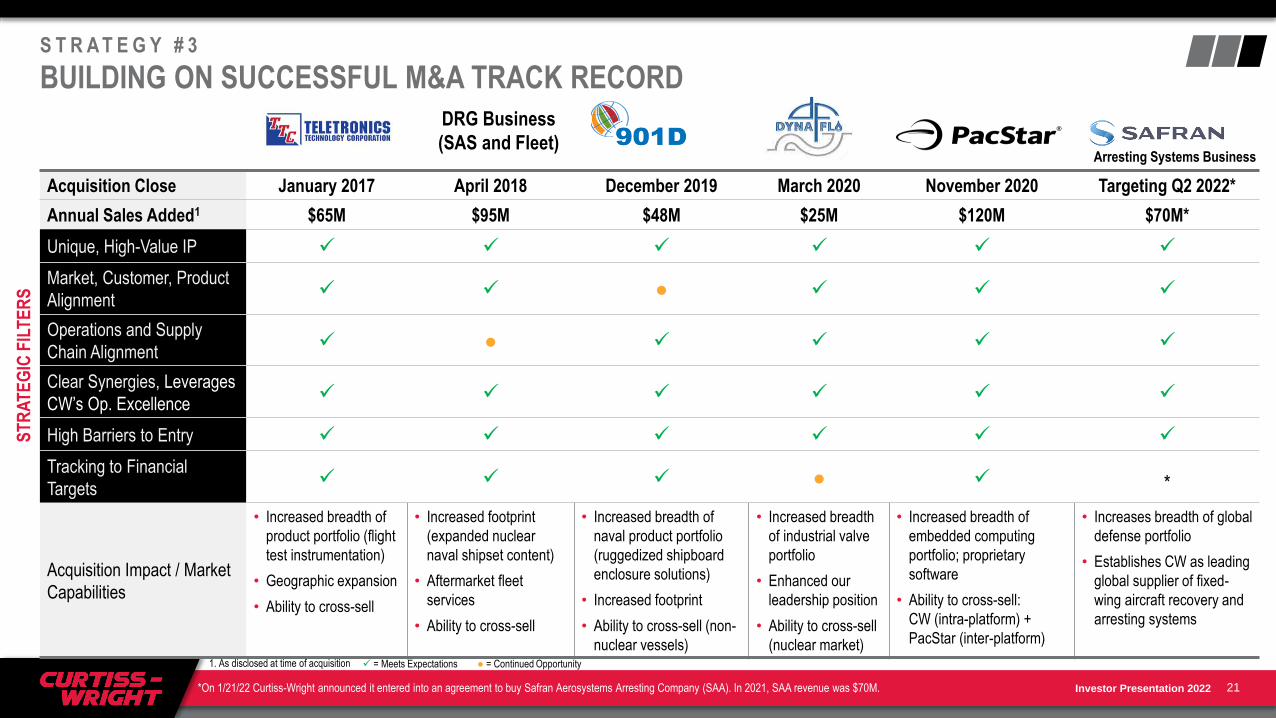
S T R A T E G Y # 3
BUILDING ON SUCCESSFUL M&A TRACK RECORD
Acquisition Close January 2017 April 2018 December 2019 March 2020 November 2020 Targeting Q2 2022*
Annual Sales Added1 $65M $95M $48M $25M $120M $70M*
Unique, High-Value IP ✓ ✓ ✓ ✓ ✓ ✓
Market, Customer, Product
Alignment✓ ✓ ● ✓ ✓ ✓
Operations and Supply
Chain Alignment ✓ ● ✓ ✓ ✓ ✓
Clear Synergies, Leverages
CW’s Op. Excellence✓ ✓ ✓ ✓ ✓ ✓
High Barriers to Entry ✓ ✓ ✓ ✓ ✓ ✓
Tracking to Financial
Targets✓ ✓ ✓ ● ✓ *
Acquisition Impact / Market
Capabilities
• Increased breadth of
product portfolio (flight
test instrumentation)
• Geographic expansion
• Ability to cross-sell
• Increased footprint
(expanded nuclear
naval shipset content)
• Aftermarket fleet
services
• Ability to cross-sell
• Increased breadth of
naval product portfolio
(ruggedized shipboard
enclosure solutions)
• Increased footprint
• Ability to cross-sell (non-
nuclear vessels)
• Increased breadth
of industrial valve
portfolio
• Enhanced our
leadership position
• Ability to cross-sell
(nuclear market)
• Increased breadth of
embedded computing
portfolio; proprietary
software
• Ability to cross-sell:
CW (intra-platform) +
PacStar (inter-platform)
• Increases breadth of global
defense portfolio
• Establishes CW as leading
global supplier of fixed-
wing aircraft recovery and
arresting systems
21
ST
RA
TE
GIC
FIL
TE
RS
1. As disclosed at time of acquisition ✓ = Meets Expectations ● = Continued Opportunity
DRG Business
(SAS and Fleet)
*On 1/21/22 Curtiss-Wright announced it entered into an agreement to buy Safran Aerosystems Arresting Company (SAA). In 2021, SAA revenue was $70M.
Arresting Systems Business

Investor Presentation 2022
THE CURTISS-WRIGHT INVESTMENT STORY
Leveraging the Power of One Curtiss-Wright to Enhance Shareholder Value
22
REINVESTING IN THE BUSINESS TO FUEL INNOVATION, PURSUING VALUE-CREATING M&A & DRIVING MARGIN EXPANSION
Strong & Defensible
MARKET POSITIONS
Aligned with
GROWTH VECTORS
& SECULAR TRENDS
UNIFIED PORTFOLIO
Positioned to
Accelerate Growth
Track Record as
EXCEPTIONAL
OPERATORS
Executing
PIVOT TO GROWTH
Strategy
• #1 or #2 market leader
• High barriers to entry
• Deeply embedded
customer relationships
• Aerospace & Defense (A&D)
markets (2/3 portfolio)
• Commercial markets
(1/3 portfolio)
• Cross-over technologies
• Inherent synergies
• Resilient through-the-
cycle performance
• Strong balance sheet
• Robust FCF generation
• Lean operating structure
• New Operational
Growth Platform
• Accelerate organic growth
• Drive growth through
operational excellence
• Maintain disciplined capital
allocation (prioritizing M&A)
1 2 3 4 5
Investor Presentation 2022
Appendix
23
Investor Presentation 2022
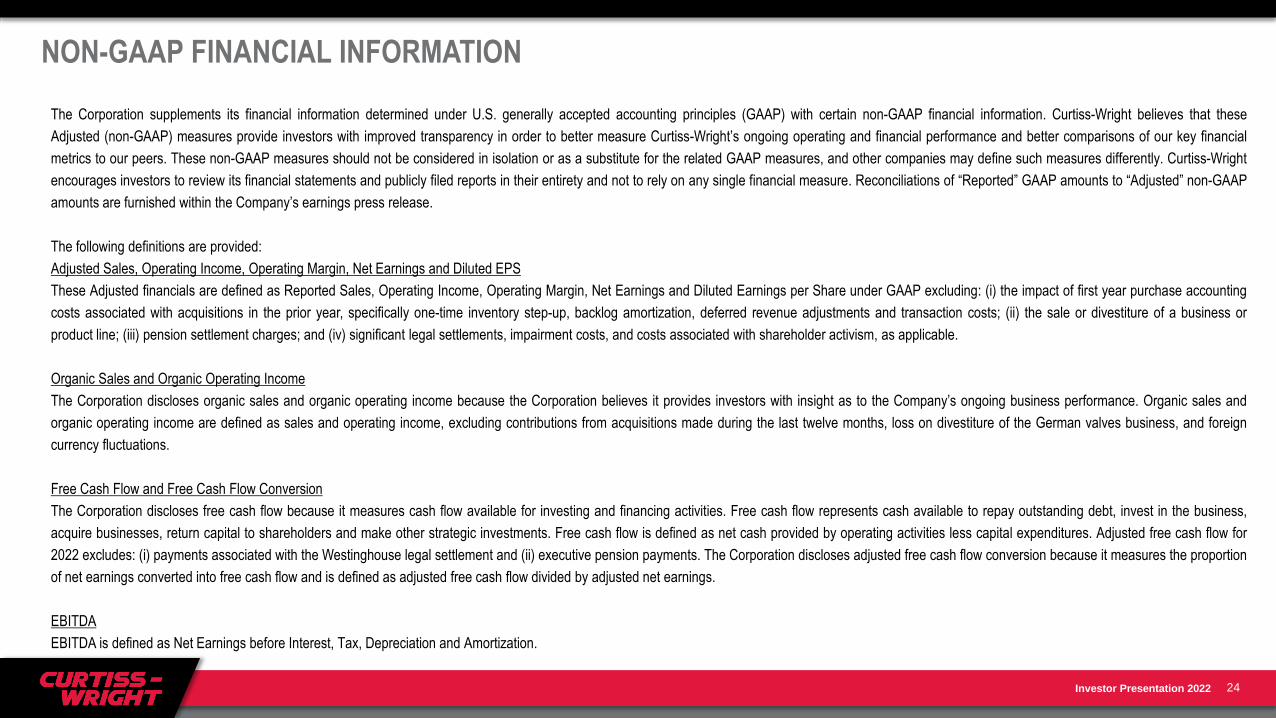
NON-GAAP FINANCIAL INFORMATION
The Corporation supplements its financial information determined under U.S. generally accepted accounting principles (GAAP) with certain non-GAAP financial information. Curtiss-Wright believes that these
Adjusted (non-GAAP) measures provide investors with improved transparency in order to better measure Curtiss-Wright’s ongoing operating and financial performance and better comparisons of our key financial
metrics to our peers. These non-GAAP measures should not be considered in isolation or as a substitute for the related GAAP measures, and other companies may define such measures differently. Curtiss-Wright
encourages investors to review its financial statements and publicly filed reports in their entirety and not to rely on any single financial measure. Reconciliations of “Reported” GAAP amounts to “Adjusted” non-GAAP
amounts are furnished within the Company’s earnings press release.
The following definitions are provided:
Adjusted Sales, Operating Income, Operating Margin, Net Earnings and Diluted EPS
These Adjusted financials are defined as Reported Sales, Operating Income, Operating Margin, Net Earnings and Diluted Earnings per Share under GAAP excluding: (i) the impact of first year purchase accounting
costs associated with acquisitions in the prior year, specifically one-time inventory step-up, backlog amortization, deferred revenue adjustments and transaction costs; (ii) the sale or divestiture of a business or
product line; (iii) pension settlement charges; and (iv) significant legal settlements, impairment costs, and costs associated with shareholder activism, as applicable.
Organic Sales and Organic Operating Income
The Corporation discloses organic sales and organic operating income because the Corporation believes it provides investors with insight as to the Company’s ongoing business performance. Organic sales and
organic operating income are defined as sales and operating income, excluding contributions from acquisitions made during the last twelve months, loss on divestiture of the German valves business, and foreign
currency fluctuations.
Free Cash Flow and Free Cash Flow Conversion
The Corporation discloses free cash flow because it measures cash flow available for investing and financing activities. Free cash flow represents cash available to repay outstanding debt, invest in the business,
acquire businesses, return capital to shareholders and make other strategic investments. Free cash flow is defined as net cash provided by operating activities less capital expenditures. Adjusted free cash flow for
2022 excludes: (i) payments associated with the Westinghouse legal settlement and (ii) executive pension payments. The Corporation discloses adjusted free cash flow conversion because it measures the proportion
of net earnings converted into free cash flow and is defined as adjusted free cash flow divided by adjusted net earnings.
EBITDA
EBITDA is defined as Net Earnings before Interest, Tax, Depreciation and Amortization.
24
Investor Presentation 2022
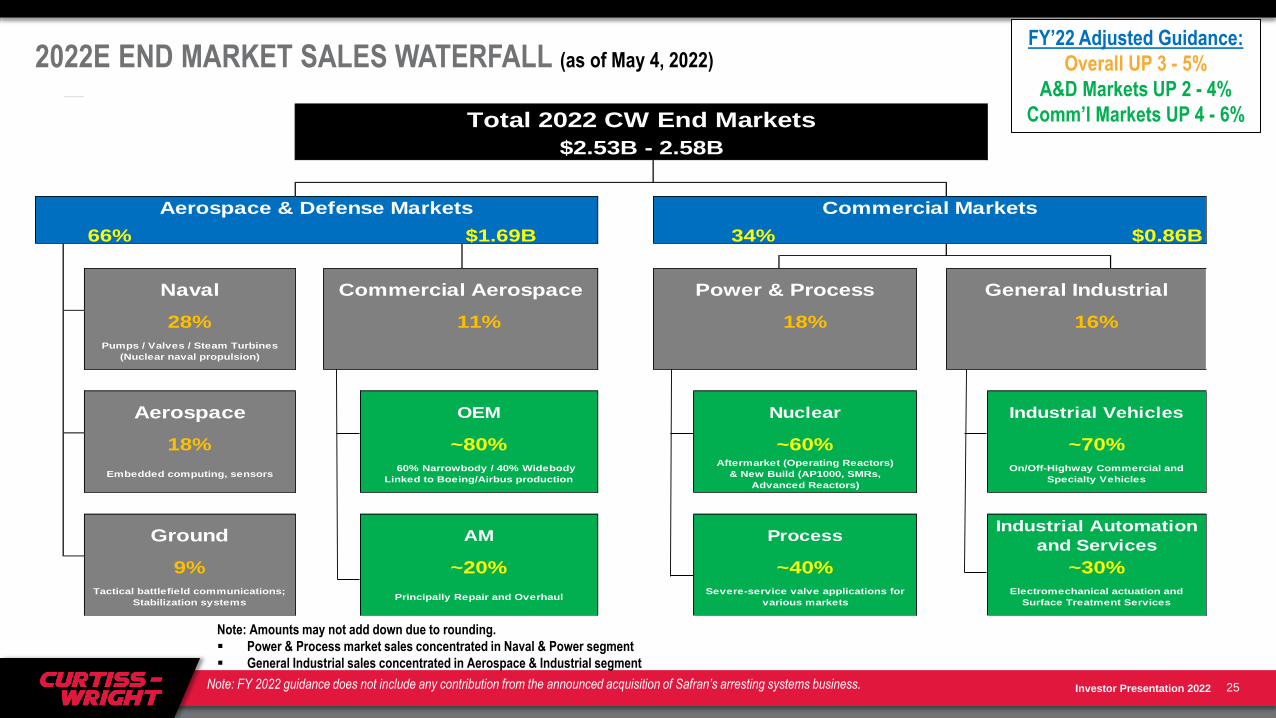
66% $1.69B 34% $0.86B
Industrial Vehicles
Tactical battlefield communications;
Stabilization systemsPrincipally Repair and Overhaul
Aerospace & Defense Markets Commercial Markets
28% 11%
18%
9%
~80%
~20%
Embedded computing, sensors 60% Narrowbody / 40% Widebody
Linked to Boeing/Airbus production
Aerospace OEM
Total 2022 CW End Markets
$2.53B - 2.58B
General IndustrialNaval Commercial Aerospace Power & Process
Pumps / Valves / Steam Turbines
(Nuclear naval propulsion)
Ground AM
~30%
18% 16%
~60%
Severe-service valve applications for
various markets
~70%
Electromechanical actuation and
Surface Treatment Services
Aftermarket (Operating Reactors)
& New Build (AP1000, SMRs,
Advanced Reactors)
On/Off-Highway Commercial and
Specialty Vehicles
Nuclear
Process Industrial Automation
and Services
~40%
2022E END MARKET SALES WATERFALL (as of May 4, 2022)FY’22 Adjusted Guidance:
Overall UP 3 - 5%
A&D Markets UP 2 - 4%
Comm’l Markets UP 4 - 6%
Note: Amounts may not add down due to rounding.
▪ Power & Process market sales concentrated in Naval & Power segment
▪ General Industrial sales concentrated in Aerospace & Industrial segment
25Note: FY 2022 guidance does not include any contribution from the announced acquisition of Safran’s arresting systems business.
Investor Presentation 2022
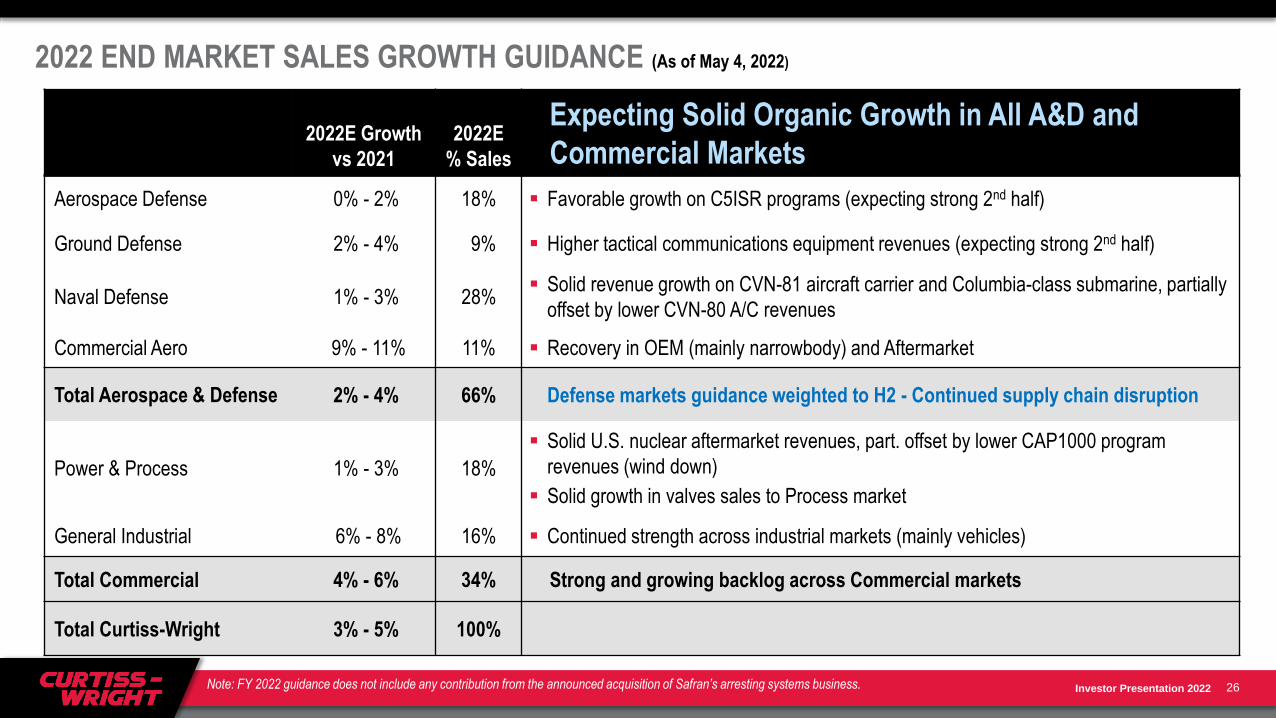
2022 END MARKET SALES GROWTH GUIDANCE (As of May 4, 2022)
2022E Growth
vs 2021
2022E
% Sales
Expecting Solid Organic Growth in All A&D and
Commercial Markets
Aerospace Defense 0% - 2% 18% ▪ Favorable growth on C5ISR programs (expecting strong 2nd half)
Ground Defense 2% - 4% 9% ▪ Higher tactical communications equipment revenues (expecting strong 2nd half)
Naval Defense 1% - 3% 28%▪ Solid revenue growth on CVN-81 aircraft carrier and Columbia-class submarine, partially
offset by lower CVN-80 A/C revenues
Commercial Aero 9% - 11% 11% ▪ Recovery in OEM (mainly narrowbody) and Aftermarket
Total Aerospace & Defense 2% - 4% 66% Defense markets guidance weighted to H2 - Continued supply chain disruption
Power & Process 1% - 3% 18%
▪ Solid U.S. nuclear aftermarket revenues, part. offset by lower CAP1000 program
revenues (wind down)
▪ Solid growth in valves sales to Process market
General Industrial 6% - 8% 16% ▪ Continued strength across industrial markets (mainly vehicles)
Total Commercial 4% - 6% 34% Strong and growing backlog across Commercial markets
Total Curtiss-Wright 3% - 5% 100%
26Note: FY 2022 guidance does not include any contribution from the announced acquisition of Safran’s arresting systems business.
Investor Presentation 2022
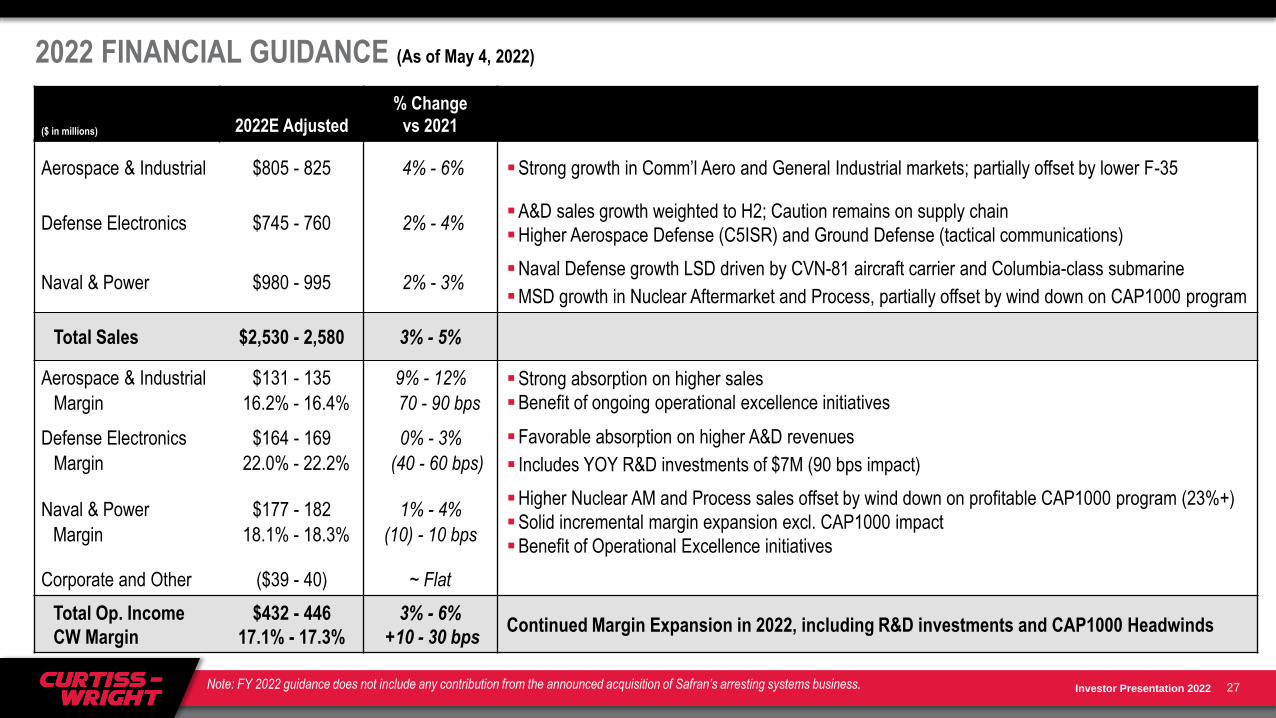
($ in millions) 2022E Adjusted
% Change
vs 2021
Aerospace & Industrial $805 - 825 4% - 6% ▪Strong growth in Comm’l Aero and General Industrial markets; partially offset by lower F-35
Defense Electronics $745 - 760 2% - 4%▪A&D sales growth weighted to H2; Caution remains on supply chain
▪Higher Aerospace Defense (C5ISR) and Ground Defense (tactical communications)
Naval & Power $980 - 995 2% - 3%▪Naval Defense growth LSD driven by CVN-81 aircraft carrier and Columbia-class submarine
▪MSD growth in Nuclear Aftermarket and Process, partially offset by wind down on CAP1000 program
Total Sales $2,530 - 2,580 3% - 5%
Aerospace & Industrial
Margin
$131 - 135
16.2% - 16.4%
9% - 12%
70 - 90 bps
▪Strong absorption on higher sales
▪Benefit of ongoing operational excellence initiatives
Defense Electronics
Margin
$164 - 169
22.0% - 22.2%
0% - 3%
(40 - 60 bps)
▪Favorable absorption on higher A&D revenues
▪ Includes YOY R&D investments of $7M (90 bps impact)
Naval & Power
Margin
$177 - 182
18.1% - 18.3%
1% - 4%
(10) - 10 bps
▪Higher Nuclear AM and Process sales offset by wind down on profitable CAP1000 program (23%+)
▪Solid incremental margin expansion excl. CAP1000 impact
▪Benefit of Operational Excellence initiatives
Corporate and Other ($39 - 40) ~ Flat
Total Op. Income
CW Margin
$432 - 446
17.1% - 17.3%
3% - 6%
+10 - 30 bpsContinued Margin Expansion in 2022, including R&D investments and CAP1000 Headwinds
2022 FINANCIAL GUIDANCE (As of May 4, 2022)
27Note: FY 2022 guidance does not include any contribution from the announced acquisition of Safran’s arresting systems business.
Investor Presentation 2022
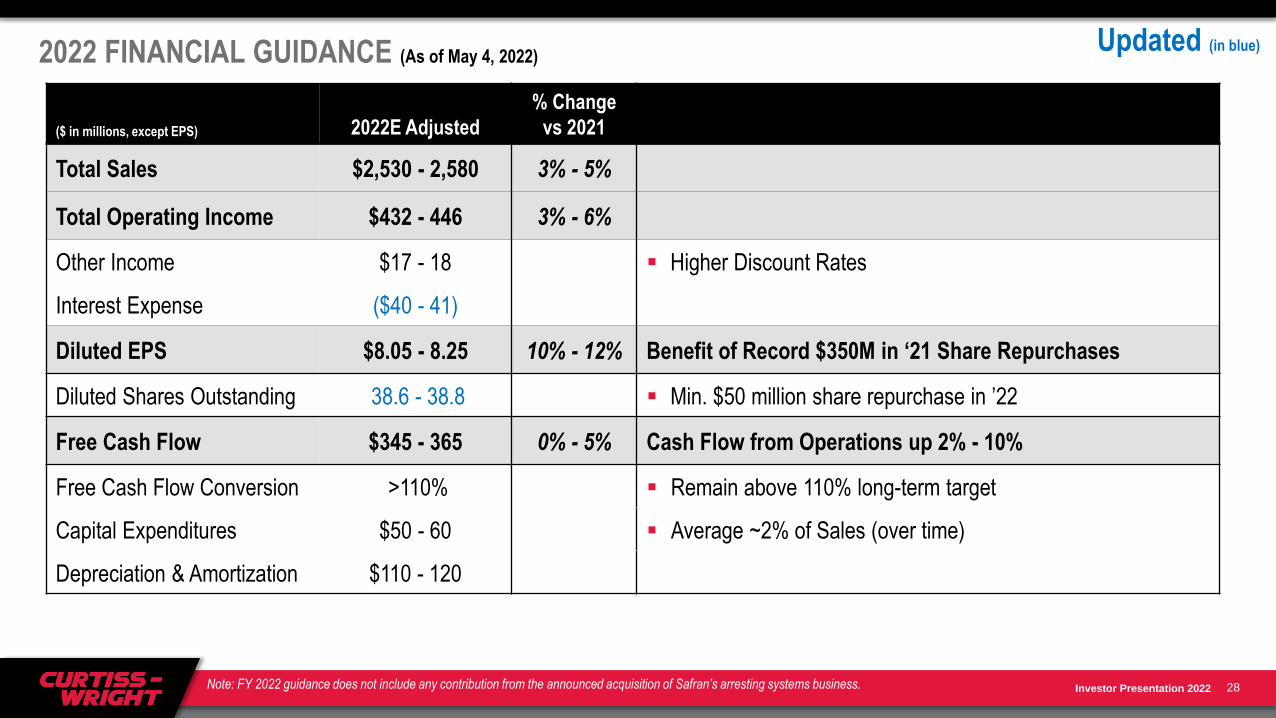
2022 FINANCIAL GUIDANCE (As of May 4, 2022)
($ in millions, except EPS) 2022E Adjusted
% Change
vs 2021
Total Sales $2,530 - 2,580 3% - 5%
Total Operating Income $432 - 446 3% - 6%
Other Income $17 - 18 ▪ Higher Discount Rates
Interest Expense ($40 - 41)
Diluted EPS $8.05 - 8.25 10% - 12% Benefit of Record $350M in ‘21 Share Repurchases
Diluted Shares Outstanding 38.6 - 38.8 ▪ Min. $50 million share repurchase in ’22
Free Cash Flow $345 - 365 0% - 5% Cash Flow from Operations up 2% - 10%
Free Cash Flow Conversion >110% ▪ Remain above 110% long-term target
Capital Expenditures $50 - 60 ▪ Average ~2% of Sales (over time)
Depreciation & Amortization $110 - 120
28
Updated (in blue)
Note: FY 2022 guidance does not include any contribution from the announced acquisition of Safran’s arresting systems business.
Investor Presentation 2022
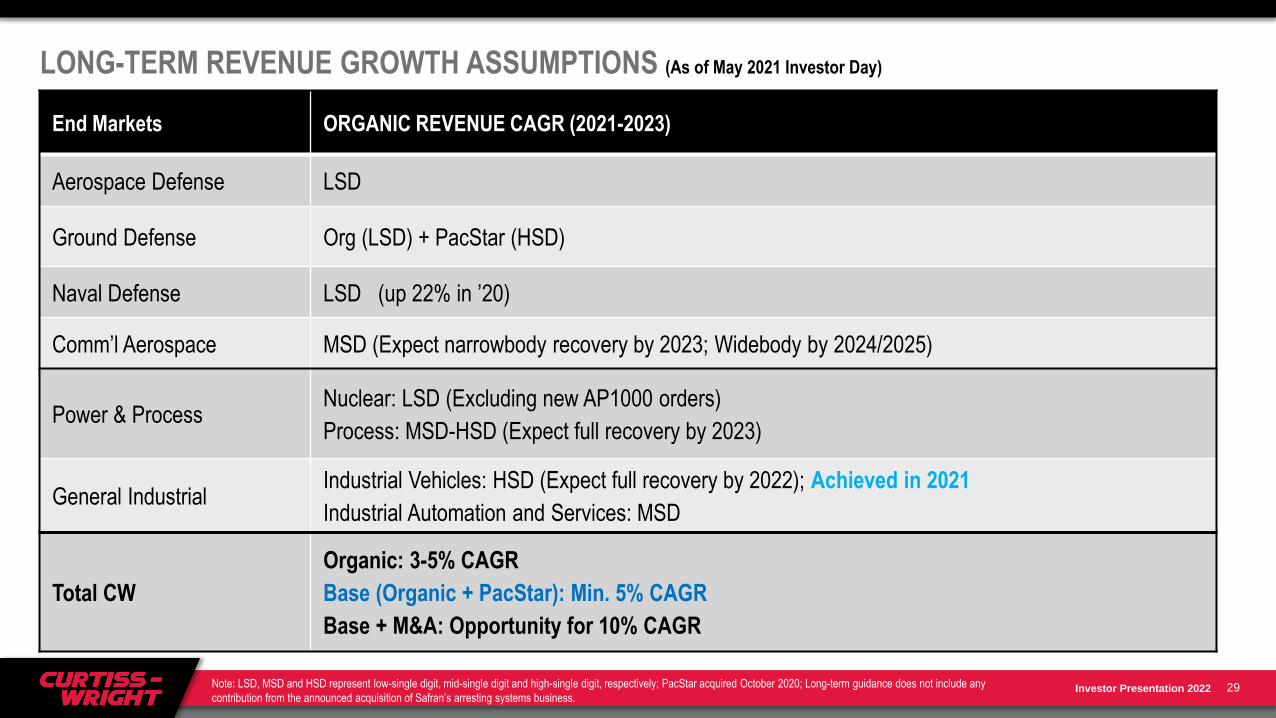
End Markets ORGANIC REVENUE CAGR (2021-2023)
Aerospace Defense LSD
Ground Defense Org (LSD) + PacStar (HSD)
Naval Defense LSD (up 22% in ’20)
Comm’l Aerospace MSD (Expect narrowbody recovery by 2023; Widebody by 2024/2025)
Power & ProcessNuclear: LSD (Excluding new AP1000 orders)
Process: MSD-HSD (Expect full recovery by 2023)
General IndustrialIndustrial Vehicles: HSD (Expect full recovery by 2022); Achieved in 2021
Industrial Automation and Services: MSD
Total CW
Organic: 3-5% CAGR
Base (Organic + PacStar): Min. 5% CAGR
Base + M&A: Opportunity for 10% CAGR
LONG-TERM REVENUE GROWTH ASSUMPTIONS (As of May 2021 Investor Day)
29Note: LSD, MSD and HSD represent low-single digit, mid-single digit and high-single digit, respectively; PacStar acquired October 2020; Long-term guidance does not include any
contribution from the announced acquisition of Safran’s arresting systems business.


