Embed Size (px)
Citation preview

FY17/3
TSE 1st Section, 6143
May 19, 2017
Results Briefing
Create Your Future

2
Contents
3
4
15
23
25
29
Key Points
. FY17/3 Financial Results Summary
. FY17/3 Financial Results Projections
. Shareholder Return
. Medium and Long-term Strategies and Projection
(Reference Materials)

Net sales: 61.812 billion yen (-3.333 billion yen or -5.1% year on year), Operating income: 5.236 billion yen(-1.116 billion yen or -17.6% year on year)
Net sales decreased, despite increases in unit sales of electrical discharge machines (EDMs) and injectionmolding machines, due mainly to the yen being stronger than the previous year. (Reference: Impact of changesin forex rate: about-4.8 billion yen year on year)
Operating income decreased due mainly to increased research and development expenses, and larger selling,general and administrative (SG&A) expenses for overseas subsidiaries.
Key Points
3
FY17/3 Financial Results Summary
FY17/12 Financial Results ProjectionsFor developed economies (Japan, North America and Europe), continued steadiness in business is expectedthrough the year with robust demand for capital investment in automotive, aerospace, and medicalequipment-related industries.
For China, with rising labor cost and consequent growth in demand for automation and high-precisionmachines, good performance is anticipated.
Our forecast is for sales of 55.8 billion yen and operating income of 5.3 billion yen.
* For irregular accounts of nine months FY17/12.
Medium and Long-term Growth StrategiesIn metal 3D printers, we will accelerate research and development and marketing activities with a view to quicklyturning metal 3D printers into a new profit center. At the same time, by launching new one-stop solution-drivenproduct lines, we intend to bring out multiplier effects with existing operations (Machine tool segment andindustrial machinery segment).
For FY19/12, we expect sales of 76.9 billion yen and operating income of 8.4 billion yen.

I. FY17/3 Financial Results Summary

Financial Results Highlights
5
FY16/3 FY17/3 Year-on-year change
Actual Incomemargin Actual Income
margin Amount % change
Net sales 65,146 — 61,812 — -3,333 -5.1%
Gross profit 23,777 36.5% 22,494 36.4% -1,282 -5.4%
Operatingincome 6,353 9.8% 5,236 8.5% -1,116 -17.6%
Ordinaryincome 5,719 8.8% 4,620 7.5% -1,098 -19.2%
Net income 4,167 6.4% 3,644 5.9% -522 -12.5%
ROE 8.4% 7.4%
Averageexchange rateover the period
USD 120.15 yen 108.34 yenEUR 132.60 yen 118.74 yenCNY 19.21 yen 16.32 yenTHB 3.44 yen 3.08 yen
Referenceinformation
Exchange rate at end of FY17/3 USD: 112.19 yen EUR: 119.79 yen CNY: 16.76 yen THB: 3.26 yenExchange rate at end of FY16/3 UDD: 112.68 yen EUR: 127.70 yen CNY: 18.36 yen THB: 3.19 yen
FY17/3
projections
61,100
—
5,350
4,550
3,500
104.19 yen116.26 yen16.00 yen2.96 yen
Net sales decreased, despite increases in unit sales of EDMs and injection molding machines, due mainly to theyen being stronger than in the previous year. (Reference: Impact of changes in forex rate: about -4.8 billion yen)Operating income decreased due mainly to increased research and development expenses, and larger SG&Aexpenses for overseas subsidiaries. (million yen)

Ratio of operating income to net sales (Quarterly)
6
(million yen)
Bar graph: Net sales Line graph: Operating income margin
Sales languished inthe backlash after the
sales tax rateincrease.
Sales wereweak due tothe ChineseNew Year.Sales increased
in the demandrush before thesales tax rate
increase.
Sales increased in responseto capital investment
demand in greater Chinaafter the end of the
Chinese New year vacation.
In the 1st quarter, sales in Japan were influenced by delayed purchase in expectation of executing the new capitalinvestment incentive program, and sales in Greater China also struggled to grow while, from the 2nd quarter onwards,continued strength in sales of high precision machines in Greater China drove up business.In the 4th quarter, with strength in Machine Tool segment, as well as growth in Industrial Machinery segment and FoodProcessing Machinery segment, sales and income both increased.
FY14/3 FY15/3 FY16/3 FY17/3
Operating
Income
Margin
NetSales

5,719
4,620
1,282
85 139 85 85 51 67 102 153 107 64
Factors Affecting Ordinary Income (Actual Results)
7
FY16/3(Actual)
FY17/3(Actual)
Despite increases in some items, such as research and development and advertising & salespromotion expenses , total SG&A expenses declined.Nonetheless, with a fall in gross profit, ordinary income decreased by 1,098 million yen.
Gross profitDecrease
PersonnelexpensesDecrease
Research andDevelopment
expensesIncrease
DepreciationDecrease
Other SG&AexpensesDecrease Foreign
exchangeloss
Decrease
Non-operatingincome
Decrease
Travel andtransportation expensesDecrease
Salescommissions
DecreaseAdvertisingand salespromotionexpensesIncrease
(million yen)
Other non-operatingexpensesDecrease

Financial Results by Segment
FY16/3 FY17/3 Year-on-year change
Actual Actual (amount) (percent)
Net sales
Machine toolsegment
47,789 43,355 -4,434 -9.3%
Industrialmachinerysegment
8,633 9,366 733 8.5%
Food processingmachinerysegment
3,562 3,429 -133 -3.7%
Other segments 5,161 5,661 500 9.7%
65,146 61,812 -3,333 -5.1%
Segmentincome
Machine toolsegment
7,113 6,213 -899 -12.6%
Industrialmachinerysegment
319 617 298 93.2%
Food processingmachinerysegment
492 159 -333 -67.6%
Other segments 813 859 46 5.7%
8,739 7,851 -888 -10.2%
Adjustment amounts -2,386 -2,614 -228 —
Total operating income 6,353 5,236 -1,116 -17.6%
(million yen)
In Japan, demand was strong for automotiveconnectors among automotive manufacturers.Among smartphone manufacturers, lenses andother high value-added components experiencedsteady demand.In Greater China and Asia, demand and sales wereboth strong among smartphone and automotivemanufacturers as well.
In Japan, business was generally stagnant despitedemand for automotive connectors, and electroniccomponents and lenses for smartphones, as delayedpurchase in expectation of implementation of the newcapital investment incentive program exerted someinfluence into the 2nd half of the fiscal year.In North America, demand was strong in theautomotive, aerospace, and medical equipmentindustries.In Europe, demand was steady in the automotive andaerospace industries though a plunge was seen inRussia, Turkey, etc.In Greater China, new orders and sales were bothstrong, especially in the automotive and smartphoneindustries, with growing demand for ultra-precisionmodels.In Asia, signs of recovery were seen in Thailand,Indonesia, etc.
Machine tool segment
Industrial machinery segment
Food processing machinery segment
Other segments
Demand came for capital investment forproducing higher quality noodles.Demand also grew outside the noodle industry,among confectionery companies andmanufacturers of packaging materials forprecooked rice, etc.Segment income declined with ad hoc cost forlaunching new products.
The high-precision mold and die machineryoperations, as well as ceramic products, sawstrong sales.
8

Maintenance service and suppliesFood processing machinery
7,427 8,202
1,205 1,163
0
5,000
10,000
15,000
20,000
2016 3 2017 3
37,71333,740
10,0759,615
0
5,000
10,000
15,000
20,000
25,000
30,000
35,000
40,000
45,000
50,000
2016 3 2017 3
9
Industrial machinery segment Food processing machinery segmentMachine tool segment
Machine toolssegment FY16/3 FY17/3
Machine tools sales 37,713 33,740Maintenance serviceand supplies 10,075 9,615
Total 47,789 43,355
Industrial machinerysegment FY16/3 FY17/3
Injection moldingmachine sales 7,427 8,202Maintenance serviceand supplies 1,205 1,163
Total 8,633 9,366
Food processingmachinery segment FY16/3 FY17/3
Food processingmachinery sales 2,971 2,803Maintenance serviceand supplies 590 625
Total 3,562 3,429
Maintenance services and supplies, a stable source of cash, accounted for about 20% of net sales.
2,971 2,803
590 625
0
1,000
2,000
3,000
4,000
5,000
6,000
7,000
8,000
9,000
10,000
2016 3 2017 3
Net Sales by Segment
Maintenance service and suppliesMachine tools
Maintenance service and suppliesIndustrial machinery
(million yen)(million yen)(million yen)
FY16/3 FY16/3 FY16/3FY17/3 FY17/3 FY17/3

Japan North and SouthAmerica Europe Greater China Asia
Overseas Sales Ratio by Segment
10
Sodick has been developing global operations with an overseas sales ratio of 62.7%.
FY16/3 Japan North and SouthAmerica Europe Greater China Asia Total
Machine tools 12,466 26.1% 6,562 13.7% 6,591 13.8% 15,757 33.0% 6,410 13.4% 47,789 73.3%Industrial machinery 3,983 46.2% 1,055 12.2% 72 0.8% 2,220 25.7% 1,301 15.1% 8,633 13.3%Food processing machinery 2,566 72.0% 349 9.8% - - 408 11.5% 237 6.7% 3,562 5.5%Other 4,558 88.3% - - - - 603 11.7% - - 5,161 7.9%Total 23,574 36.2% 7,967 12.2% 6,664 10.2% 18,990 29.2% 7,949 12.2% 65,146 100.0%
FY17/3 Japan North and SouthAmerica Europe Greater China Asia Total
Machine tools 11,238 25.9% 6,742 15.6% 5,792 13.4% 14,319 33.0% 5,262 12.1% 43,355 70.1%Industrial machinery 4,163 44.5% 591 6.3% 3 0.0% 2,512 26.8% 2,095 22.4% 9,366 15.2%Food processing machinery 2,631 76.7% 109 3.2% - - 653 19.1% 34 1.0% 3,429 5.5%Other 5,037 89.0% - - - - 624 11.0% - - 5,661 9.2%Total 23,071 37.3% 7,442 12.0% 5,796 9.4% 18,109 29.3% 7,392 12.0% 61,812 100.0%
Exchange rate impact -700 million yen -600 million yen -2,900 million yen -500 million yen -4,800 million yen
0
5,000
10,000
15,000
20,000
25,000
2016/3 2017/3 2016/3 2017/3 2016/3 2017/3 2016/3 2017/3 2016/3 2017/3FY16/3 FY16/3 FY16/3 FY16/3FY17/3 FY17/3 FY17/3 FY17/3 FY17/3
(million yen)
Machinetools
Industrialmachinery
Foodprocessingmachinery
Other
FY16/3 (million yen)

Exchange rate at end of FY17/3 USD: 112.19 yen EUR: 119.79 yen CNY: 16.76 yen THB: 3.26 yen
Exchange rate at end of FY16/3 UDD: 112.68 yen EUR: 127.70 yen CNY: 18.36 yen THB: 3.19 yen
49,758 48,710
33,826 40,953
16,136
19,607
0
20,000
40,000
60,000
80,000
100,000
120,000
109,271
99,722
FY16/3 FY17/3
including 8.0 billionyen in bonds withsubscription rights toshares
31,875 31,135
3,207 4,043
22,210 22,644
14,766 14,601
27,66336,847
0
20,000
40,000
60,000
80,000
100,000
120,000
2016 3 2017 34Q
Other currentassets
Balance Sheet
Assets Liabilities and net assets(million yen)
11
99,722
109,271
Interesting-bearing liabilities and cash & deposits significantly increased with 8.0 billion yen from issuance of bonds withsubscription rights to shares.Net assets slightly decreased due mainly to smaller foreign currency translation adjustments, mainly for conversion of equitycapital of overseas subsidiaries, with a stronger yen than at the previous year end, and purchase of treasury shares of 3.0billion yen.
Cash anddeposits
Accountsreceivable -
trade
Inventories
Non-currentassets
FY16/3 FY17/3
Other liabilities
Interest-bearingdebt
Total Net assets
(million yen)
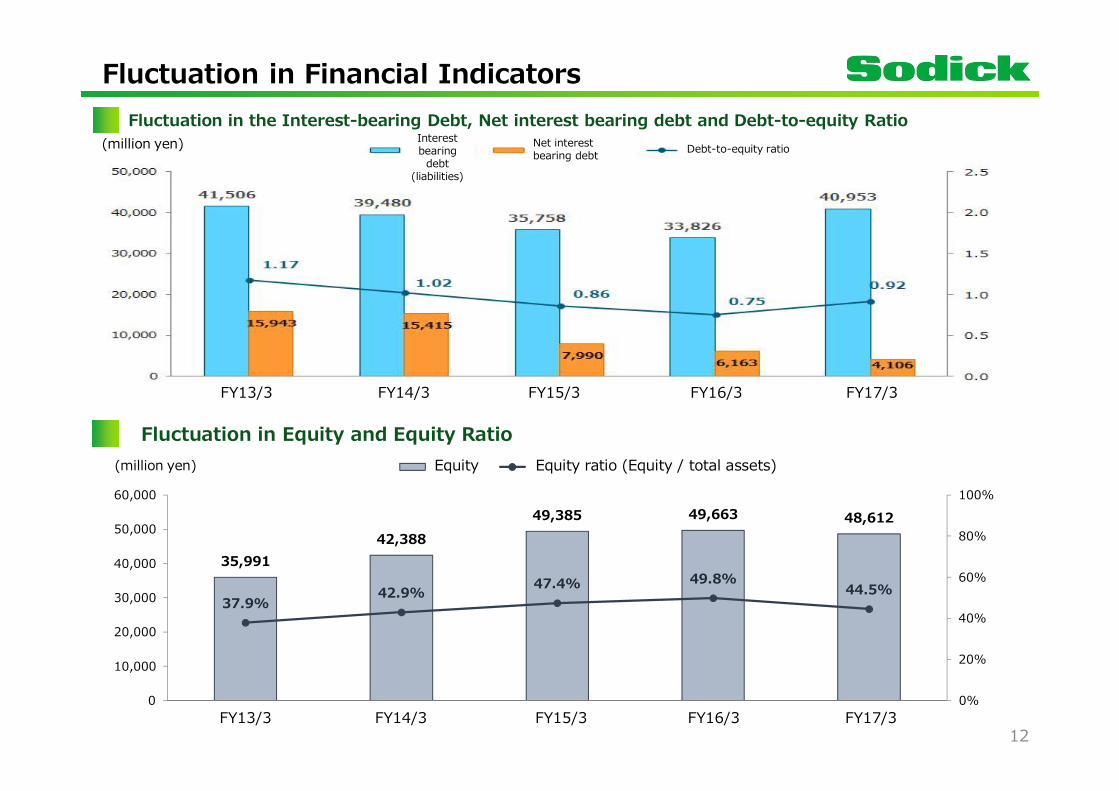
Fluctuation in Financial IndicatorsFluctuation in the Interest-bearing Debt, Net interest bearing debt and Debt-to-equity Ratio
Fluctuation in Equity and Equity Ratio
12
(million yen)
(million yen)
35,99142,388
49,385 49,663 48,612
37.9%42.9% 47.4% 49.8%
44.5%
0%
20%
40%
60%
80%
100%
0
10,000
20,000
30,000
40,000
50,000
60,000
2013/3 2014/3 2015/3 2016/3 2017/3
/
Interestbearing
debt(liabilities)
Net interestbearing debt Debt-to-equity ratio
FY13/3 FY14/3 FY15/3 FY16/3 FY17/3
Equity Equity ratio (Equity / total assets)
FY13/3 FY14/3 FY15/3 FY16/3 FY17/3

2,766
5,577
8,2986,579
8,373
-4,776-4,181
-144
-2,773 -2,132-2,010
1,396
8,154
3,806
6,241
-10,000
-5,000
0
5,000
10,000
2013/3 2014/3 2015/3 2016/3 2017/3
CF CF CF
Cash FlowFree cash flow marked a strongly positive balance at 6.241 billion yen (up 2.435 billion yen year on year).Cash and cash equivalents at the year-end significantly increased (up 8.709 billion yen year on year).
FY16/3 FY17/3 Main factors
Cash flows from operating activities 6,579 8,373Increase in inventories: -1,000 million yenIncrease in notes and accounts payable-trade:+2,400 million yen
Cash flows from investing activities -2,773 -2,132 Purchase of property, plant and equipment:-1,800 million yen (down 550 million year on year)
Cash flows from financing activities -2,854 3,134 Issuance of convertible bonds: +8,000 million yenPurchase of treasury shares: -3,000 million yen
Cash and cash equivalents at the end ofthe period 27,328 36,037
13
(million yen)
(million yen)
Operatingcash flow
Investingcash flow
Free cash flow (Operating cash flow +Investing cash flow)
FY13/3 FY14/3 FY15/3 FY16/3 FY17/3

1,832 2,0042,494
3,4083,518
0
500
1,000
1,500
2,000
2,500
3,000
3,500
4,000
2013/3 2014/3 2015/3 2016/3 2017/3
Facility Investment / Depreciation / R&D Expenses
14
Fluctuation in Facility Investments / Depreciation
Fluctuation in R&D Expenses(million yen)
(million yen)
Main facility investments
Semiconductor research anddevelopment facilities for next-generation elemental technologies
Depreciation
R&D expenses
Up about 100 million yen forincreased research anddevelopment expenses formetal 3D printers and otherbasic research
5,460
3,1792,232
2,887 2,5942,204
2,559 2,659 2,765 2,697
0
1,000
2,000
3,000
4,000
5,000
6,000
2013/3 2014/3 2015/3 2016/3 2017/3
Rebuilding and new-construction of plants
in Thailand afterflooding
A slight decline due mainly tovirtually completed depreciation ofsoftware (ERP)
Facilityinvestments
Depreciation
FY13/3 FY14/3 FY15/3 FY16/3 FY17/3
FY13/3 FY14/3 FY15/3 FY16/3 FY17/3

II. FY17/12 Financial Results Projections
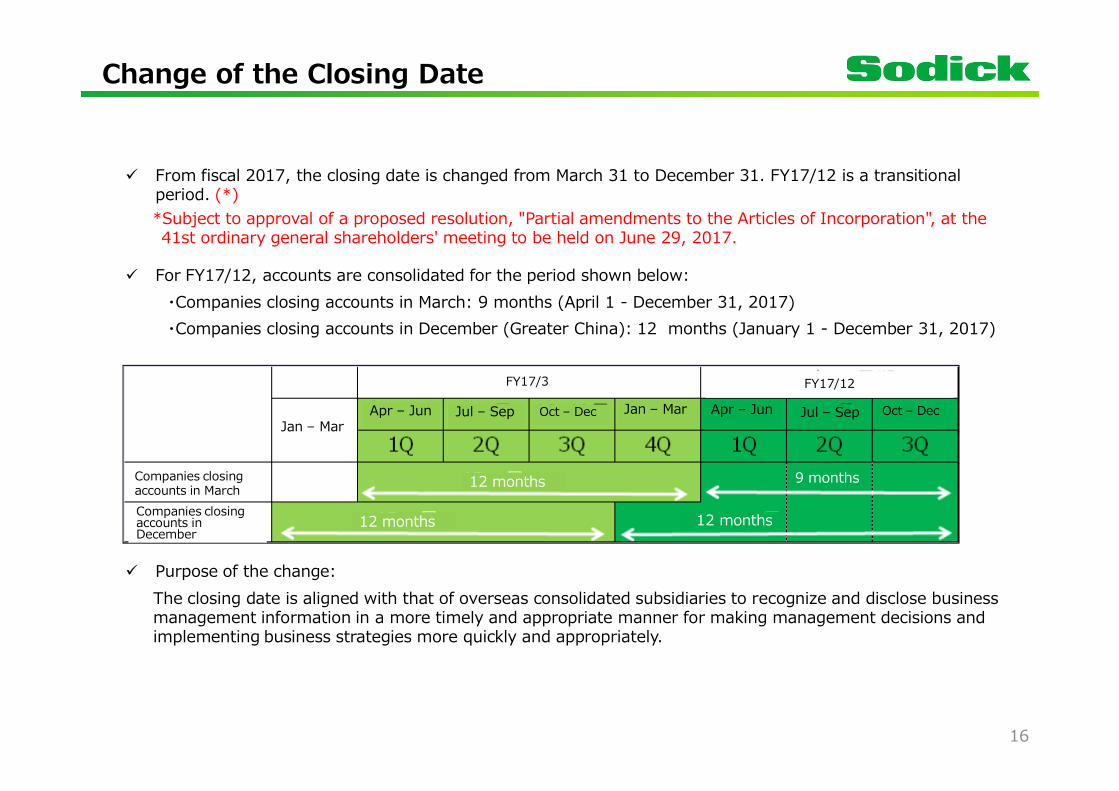
From fiscal 2017, the closing date is changed from March 31 to December 31. FY17/12 is a transitionalperiod. (*)
For FY17/12, accounts are consolidated for the period shown below:Companies closing accounts in March: 9 months (April 1 - December 31, 2017)Companies closing accounts in December (Greater China): 12 months (January 1 - December 31, 2017)
Purpose of the change:The closing date is aligned with that of overseas consolidated subsidiaries to recognize and disclose businessmanagement information in a more timely and appropriate manner for making management decisions andimplementing business strategies more quickly and appropriately.
Change of the Closing Date
16
*Subject to approval of a proposed resolution, "Partial amendments to the Articles of Incorporation", at the41st ordinary general shareholders' meeting to be held on June 29, 2017.
FY17/3 FY17/12
Jan – MarApr – Jun Jul – Sep Oct – Dec Jan – Mar Apr – Jun Jul – Sep Oct – Dec
Companies closingaccounts in March 12 months
12 months 12 months
9 months
Companies closingaccounts inDecember

Japan We expect sustained solid demand due to government subsidy programs and replacement demand due to facilityaging.
NorthAmerica
Although demand due to capital investments in the automotive, aerospace, and medical device industries isexpected to be firm and strong, the outlook is uncertain on account of many factors, including the impact of theeconomic policies of the new U.S. administration.
Europe Demand in the automotive and aerospace industries is expected to remain firm, but there is uncertainty about thefuture because of slower growth in demand in countries such as Russia and Turkey, and geopolitical risks,including Brexit and national elections in countries throughout Europe.
China
Asia
The pace of growth started to gather momentum again, helped by the government-driven active infrastructureinvestments and real estate transactions.It is expected that companies will introduce automation due to higher labor costs, etc., and that there will begreater demand for high-precision machinery.
There are signs of a recovery in countries such as Thailand and Indonesia, particularly in the automobile industry.
0
50
100
150
200
250
300
350
400
450
0
20,000
40,000
60,000
80,000
100,000
120,000
140,000
160,000
12/04 12/08 12/12 13/04 13/08 13/12 14/04 14/08 14/12 15/04 15/08 15/12 16/04 16/08 16/12
JMTBA Tool Orders (value)Sodick EDM Orders (units)
Increasingdemand in
China
Market Environment
17
(Units)(million yen)
Source: : JMTBA
Economicslowdown in China
Sodick EDM orders(units)
Source: JMTBA
Japan41%
China16%
OtherAsia10%
Europe14%
NorthAmerica
18%
Other1%
JMTBA Tool Orders by Region(cumulative for April 2016–Mar.
2017)
JMTBA orders(Japan)
JMTBA orders(overseas)

For FY17/12, despite a forecast of the yen being stronger than in the previous year, we expect improved profitability with plannedsales increases in new products, incl. metal 3D printers, put on the market the previous year, and anticipated growth in existingoperations, such as EDMs and injection molding machines.
FY17/12 Financial Results Projections*On a Financial Report Basis
18
(million yen)
FY17/3 FY17/12(April - December 2017: Irregular accounts of 9 months)
Actual Income margin Projections Income margin
Net sales 61,812 — 55,800 —
Operating income 5,236 8.5% 5,300 9.5%
Ordinary income 4,620 7.5% 5,200 9.3%
Net income 3,644 5.9% 3,700 6.6%
Comprehensiveincome 2,728
ROE 7.4%
Average exchange rate overthe period
USD 108.34 yen 105.00 yen
EUR 118.74 yen 116.00 yenCNY 16.32 yen 15.80 yenTHB 3.08 yen 3.16 yen
No change indicated for the irregular accounts for FY17/12 (9 months).

In Japan, steady earnings are expectedas companies wait for subsidies.Demand due to capital investments isexpected to be strong in both NorthAmerica and Europe.For Greater China, demand for high-precision tools used in the smartphoneand automotive industries is projected tocontinue to be firm.Although conditions in Southeast Asiaremain harsh, recovery is expectedparticularly in the automobile industriesin countries such as Thailand andIndonesia.
FY17/12 Financial Results Projections by Segment*On a Financial Report Basis
19
(million yen)Machine tool segment
Industrial machinery segment
Food processing machinerysegment
Other segmentsBoth the high-precision dies andmold business and external sales ofceramics are expected to remainstrong.
In Japan, demand is expected toremain firm, especially in theautomobile industry.In both Greater China and Asia, thereis growing demand for high-precisionmachinery used for smartphone partsand connectors, and the number ofnew orders received is expected tostay at a high level.
Demand for high quality noodles isexpected to remain strong, and moreinquiries are anticipated from othersectors, such as confectionerycompanies and manufacturers ofpackaging materials for precookedrice and delicatessens, etc.
FY17/3FY17/12
(April-Dec. 2017:Irregular accounts of 9
months)
Actual Projections
Net sales
Machine tool segment 43,355 38,400
Industrial machinerysegment 9,366 9,060
Food processingmachinery segment 3,429 3,800
Other segments 5,661 4,540
61,812 55,800
Segmentincome
Machine tool segment 6,213 5,380
Industrial machinerysegment 617 850
Food processingmachinery segment 159 370
Other segments 859 600
7,851 7,200
Adjustments -2,614 -1,900
Total operating income 5,236 5,300
No change indicated for the irregular accounts for FY17/12 (9 months).

FY17/12 Financial Results Projections*Comparisons for Reference (Adjusted)
20
(million yen)
FY17/3 FY17/12(January- December 2017)
Actual Income margin Projection Income margin
Net sales 61,812 — 67,900 —
Operating income 5,236 8.5% 6,900 10.2%
Ordinary income 4,620 7.5% 6,600 9.7%
Net income 3,644 5.9% 4,800 7.1%
Comprehensiveincome 2,728
ROE 7.4%
Average exchange rate overthe period
USD 108.34 yen 105.00 yen
EUR 118.74 yen 116.00 yen
CNY 16.32 yen 15.80 yen
THB 3.08 yen 3.16 yen

FY17/12 Financial Results Projections by Segment*Comparisons for Reference (Adjusted)
21
(million yen)
FY17/3 FY17/12(January-December 2017)
Actual Projections
Net sales
Machine tool segment 43,355 46,000
Industrial machinerysegment 9,366 11,300
Food processingmachinery segment 3,429 4,700
Other segments 5,661 5,900
61,812 67,900
Segment income
Machine tool segment 6,213 6,870
Industrial machinerysegment 617 1,400
Food processingmachinery segment 159 460
Other segments 859 730
7,851 9,460
Adjustments -2,614 -2,560
Total operating income 5,236 6,900

Projections for Facility Investments, Depreciation Charges,and R&D Expenses
22
Facilityinvestment
Capital investment is expected to be around 3.4 billion yen.New building for sales & marketing in US: 0.6 billion yenResearch and development building, Yokohama Head Office:0.5 billion yenThai Plant (production capacity enhancement): 0.4 billion yen
Depreciation Depreciation charges is expected to be around 2.1 billion yen.
R&D Expenses
R expenses of 3 billion yen continuing at a high level.Research and development related to metal 3D printersDevelopment of new electric power sources, next-generationCNC, and new modelsDevelopment of new models enabling high added-valuemolding and development of facilities of automated molding
For FY17/12, we have the following projections by item.

Shareholder Return
14 14
20
18 19 20
2.0%1.8%
2.4%
2.0% 2.0% 2.0%
0.0%
0.5%
1.0%
1.5%
2.0%
2.5%
3.0%
0
5
10
15
20
25
30
2013/3 2014/3 2015/3 2016/3 2017/3
1 DOE
2017/12
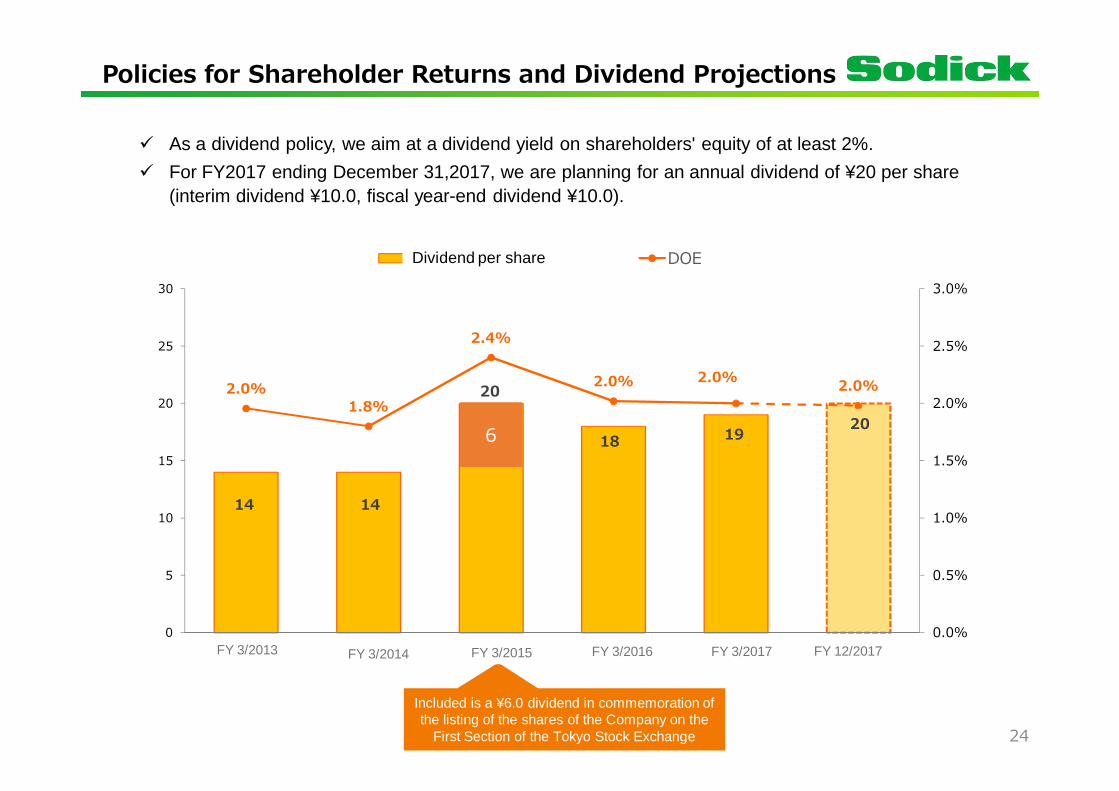
Policies for Shareholder Returns and Dividend Projections
24
6
Included is a ¥6.0 dividend in commemoration ofthe listing of the shares of the Company on the
First Section of the Tokyo Stock Exchange
As a dividend policy, we aim at a dividend yield on shareholders' equity of at least 2%.For FY2017 ending December 31,2017, we are planning for an annual dividend of ¥20 per share(interim dividend ¥10.0, fiscal year-end dividend ¥10.0).
FY 3/2017FY 3/2016FY 3/2015FY 3/2014FY 3/2013 FY 12/2017
Dividend per share

IV. Medium and Long-term Strategiesand Outlook

Metal 3D Printer Operations
3D
26
Progress of Metal 3D Printer Operations
Sales (to outside parties) forecast for 2017 (Jan - Dec): around 50 units; 2,500 million yen;Marketing efforts will be accelerated on a global scale to sell more units.(by augmenting sales personnel, increasing testing machines & demonstration printers at showrooms, andreinforcing the marketing setup)"MR 30", injection molding machine designed exclusively for metal-3D-printed molds, will be offered togetherto help our printers establish greater presence in the market of metal molding machines for plastic products.Expand the product lineup, improve processing performance & speed, and offer models capable of processinga greater variety of metal powder.
Statement of extraordinary losses (462 million yen of loss on valuation ofshares of subsidiaries and associates)
In October 2014, we put metal 3D printers on the market for the first time. The business, however, has grownmore slowly than originally planned primarily because benchmark tests for, and evaluation of, newmanufacturing techniques for the products take more time than assumed, and because procedures forobtaining permits for export, to China and other Asian countries, also take much time to complete.
Action to be taken for Metal 3D Operations
FY16/3 FY17/3Sales in units
(planned at beginning of fiscal year) more than 40 more than 50
Shipment in units (actual) more than 30(1/3 of which are sold to outside parties)
more than 30(1/2 of which are sold to outside parties)
Sales in yen (to outside parties) some 500 million yen some 800 million yen
To have the delay in the progress of the Metal 3D Printer Operations reflected in the financial statements forFY17/3, valuation losses are stated for shares of OPM Laboratory Co., a non-consolidated subsidiaryengaged in metal 3D printer processing by contract, consulting, software development, development ofmetal power materials, etc.

46,783
47,789 43,355 46,000 48,320 50,950
8,189 8,6339,366 11,300 11,980
13,7502,790 3,5623,429
4,7004,450
4,650
5,326 5,1615,661
5,9006,450
7,550
4,891
6,353
5,236
6,9007,000
8,400
0
1,000
2,000
3,000
4,000
5,000
6,000
7,000
8,000
9,000
10,000
11,000
0
10,000
20,000
30,000
40,000
50,000
60,000
70,000
80,000
90,000
2015/3 2016/3 2017/3 2017/12 2018/12 2019/12
65,14663,090
67,90071,200
76,900
61,812
Medium-term Management Plan
Targeting sales of 76.9 billion yen with operating income of 8.4 billion yenby FY19/12
27
Actual Plan
(million yen) (million yen)
NetSales
Operating
Income
* Figures for FY17/12 are those for 12 months from January to December 2017, indicated only for reference.
(*)
OthersFoodprocessingmachinerysegment
Industrialmachinerysegment
Machine toolsegment
Operation Income
FY15/3 FY16/3 FY17/3 FY17/12 (*) FY18/12 FY19/12

28
Management Strategies
Machine tool segment
Industrial machinery segment
Food processing machinery segment
Expansion of market shares in all regionsStrengthen sales of low-price "VL Series" machine models in the markets of emerging economiesIn the markets of industrialized countries, expand sales of high-precision "AL Series" wire electric dischargemachines, a main product line of Sodick
Accelerate sales and research and development in metal 3D printersInitiate full sales activities to markets in Greater China & AsiaExpand markets by enhancing object forming speed, maintenance properties, and the range of materials foruse with metal 3D printers
Reduce manufacturing costs through efficiency gains in production and through consolidation of models
Raise overseas sales ratio to at least 70%Reduce manufacturing costs, restructure sales systems, strengthen marketingDevelop and market injection molding machines adjusted to overseas users' needs
Create new demand by further expanding the product line-upDevelop new models adjusted to new materials and with enhanced forming methodsDevelop injection molding machines suited for use with metal 3D printers
Initiate efforts at cost of sales reduction projects aimed at strengthening earnings
Enhance earning power through new plant start-upsStrengthen product development and sales promotions by making the most of new showrooms andresearch facilities inaugurated in April 2016
Expand overseas sales through product development for overseas markets

(Reference Materials)

Domestic and Overseas Sites
30
Sodick America Corporation(San Jose)
Sodick Europe Ltd. (U.K.)
Sodick Deutschland GmbH(Germany)
Sodick (Thailand) Co. Ltd. Sodick SingaporePte. Ltd.
Sodick (H.K.)Co. Ltd.
Sodick AmoyCo. Ltd.
Sodick (Taiwan)Co. Ltd.
Suzhou SodickSpecial EquipmentCo. Ltd.
Fukui Plant
Head Office and Research andTechnology Center
Kaga PlantMiyazaki PlantSodick, Inc.(Chicago)
Tokyo Showroom
Shanghai SodickSoftware Co. Ltd.
Head Office Research and Development SiteProduction Site Sales and service sites

31
Sodick emphasizes proactive marketing with participation in trade fairs in Japan and overseas.
May 16 19 China Guangzhou CHINAPLAS 2017
Jun. 13 16 Japan Tokyo FOOMA JAPAN 2017
Jun. 13 16 China Shanghai DMC Die & Mold China) 2017
Jun. 21 24 Thailand Bangkok Intermold Thai
Jul. 4 7 Vietnam Ho Chi Minh MTA Vietnam(International Precision Engineering, Machine Tools andMetalworking Exhibition & Conference
Jul. 12 15 Indonesia Surabaya MachineTools&manufacturingIndonesia-Surabaya
Aug. 23 26 Philippines Manila PhilippineDie&MoldMachineTools
Sep. 12 14 US LA Westec2017
Sep.18 23 Germany Hannover EMO2017 One of the world's largestmachine tool exhibitions
Oct. 11 13 Vietnam Hanoi MTA Vietnam
Oct. 12 14 Vietnam Ho Chi Minh METALEX VIETNAM(Vietnam's International Machine Tool & Metalworking Solutions Expo)
Oct. 18 21 Japan Nagoya 2017
Oct. 24 28 Japan Chiba 2017
Nov. 22 25 Thailand Bangkok Metalex Thai (Thailand’s International Machine Tool & Metalworking Solutions Expo)
Nov.28 Dec. 1 China Dongguan Dongguan DMP2017 (Dongguan International Mold and Metalworking Exhibition)
Dec. 6 9 Indonesia Jakarta Machine Tools Indonesia
Information on Participation in Major Exhibitions

Disclaimer
This presentation material has been prepared exclusively for the purpose of providing information, the material was notcreated to advertise, solicit, market, etc., specific products or shares of the Company.This information included in this material is not required by the Financial Instruments and Exchange Act, Cabinet OfficeOrdinances, rules, and the listing regulations of the Tokyo Stock Exchange, and it is not disclosure material based on these.The presentation material includes certain future projections concerning the financial position, business results, andoperations of the Company, as well as statements concerning plans and objectives of the Company. Readers should beaware that statements concerning the future include inherent known and unknown risks, uncertainties, and other clearlystated and implied factors that may cause significant discrepancies between the actual results and the Company’s earnings.Future projections are based on various assumptions regarding the Company’s current and future business strategy andthe future political and economic environment that the Company operates in.Although all due care has been taken in compiling the information provided in this presentation, the Company does notguarantee its accuracy, reliability, appropriateness, and the impartiality of the provided information. Readers should beaware that the included information may be revised or retracted without prior announcement.
Contact for inquiries concerning this material
Management Administration Division, Sodick Co. Ltd.
3-12-1, Nakamachidai, Tsuzuki-ku, Yokohama, Kanagawa, 224-8522, Japan
TEL: +81-45-942-3111 FAX: +81-45-943-5835


