Embed Size (px)
Citation preview
Q1 2022
TD Bank Group
Investor Presentation
2
Caution Regarding Forward-Looking Statements From time to time, the Bank (as defined in this document) makes written and/or oral forward-looking statements, including in this document, in other filings with Canadian regulators or the United States (U.S.) Securities and Exchange Commission (SEC), and in other communications. In addition, representatives of the Bank may make forward-looking statements orally to analysts, investors, the media and others. All such statements are made pursuant to the “safe harbour” provisions of, and are intended to be forward-looking statements under, applicable Canadian and U.S. securities legislation, including the U.S. Private Securities Litigation Reform Act of 1995. Forward-looking statements include, but are not limited to, statements made in this document, the Management’s Discussion and Analysis (“2021 MD&A”) in the Bank’s 2021 Annual Report under the headings “Economic Summary and Outlook” and “The Bank’s Response to COVID-19”, under the headings “Key Priorities for 2022” and “Operating Environment and Outlook” for the Canadian Retail, U.S. Retail, and Wholesale Banking segments, and under the heading “Focus for 2022” for the Corporate segment, and in other statements regarding the Bank’s objectives and priorities for 2022 and beyond and strategies to achieve them, the regulatory environment in which the Bank operates, the Bank’s anticipated financial performance, and the potential economic, financial and other impacts of the Coronavirus Disease 2019 (COVID-19). Forward-looking statements are typically identified by words such as “will”, “would”, “should”, “believe”, “expect”, “anticipate”, “intend”, “estimate”, “plan”, “goal”, “target”, “may”, and “could”.
By their very nature, these forward-looking statements require the Bank to make assumptions and are subject to inherent risks and uncertainties, general and specific. Especially in light of the uncertainty related to the physical, financial, economic, political, and regulatory environments, such risks and uncertainties – many of which are beyond the Bank’s control and the effects of which can be difficult to predict – may cause actual results to differ materially from the expectations expressed in the forward-looking statements. Risk factors that could cause, individually or in the aggregate, such differences include: strategic, credit, market (including equity, commodity, foreign exchange, interest rate, and credit spreads), operational (including technology, cyber security, and infrastructure), model, insurance, liquidity, capital adequacy, legal, regulatory compliance and conduct, reputational, environmental and social, and other risks. Examples of such risk factors include the economic, financial, and other impacts of pandemics, including the COVID-19 pandemic; general business and economic conditions in the regions in which the Bank operates; geopolitical risk; the ability of the Bank to execute on long-term strategies and shorter-term key strategic priorities, including the successful completion of acquisitions and dispositions, business retention plans, and strategic plans; technology and cyber security risk (including cyber-attacks or data security breaches) on the Bank’s information technology, internet, network access or other voice or data communications systems or services; model risk; fraud activity; the failure of third parties to comply with their obligations to the Bank or its affiliates, including relating to the care and control of information, and other risks arising from the Bank’s use of third-party service providers; the impact of new and changes to, or application of, current laws and regulations, including without limitation tax laws, capital guidelines and liquidity regulatory guidance and the bank recapitalization “bail-in” regime; regulatory oversight and compliance risk; increased competition from incumbents and new entrants (including Fintechs and big technology competitors); shifts in consumer attitudes and disruptive technology; exposure related to significant litigation and regulatory matters; ability of the Bank to attract, develop, and retain key talent; changes to the Bank’s credit ratings; changes in currency and interest rates (including the possibility of negative interest rates); increased funding costs and market volatility due to market illiquidity and competition for funding; Interbank Offered Rate (IBOR) transition risk; critical accounting estimates and changes to accounting standards, policies, and methods used by the Bank; existing and potential international debt crises; environmental and social risk (including climate change); and the occurrence of natural and unnatural catastrophic events and claims resulting from such events. The Bank cautions that the preceding list is not exhaustive of all possible risk factors and other factors could also adversely affect the Bank’s results. For more detailed information, please refer to the “Risk Factors and Management” section of the 2021 MD&A, as may be updated in subsequently filed quarterly reports to shareholders and news releases (as applicable) related to any events or transactions discussed under the heading “Significant Acquisitions” or “Significant and Subsequent Events and Pending Acquisitions” in the relevant MD&A, which applicable releases may be found on www.td.com . All such factors, as well as other uncertainties and potential events, and the inherent uncertainty of forward-looking statements, should be considered carefully when making decisions with respect to the Bank. The Bank cautions readers not to place undue reliance on the Bank’s forward-looking statements.
Material economic assumptions underlying the forward-looking statements contained in this document are set out in the 2021 MD&A under the headings “Economic Summary and Outlook” and “The Bank’s Response to COVID-19”, under the headings “Key Priorities for 2022” and “Operating Environment and Outlook” for the Canadian Retail, U.S. Retail, and Wholesale Banking segments, and under the heading “Focus for 2022” for the Corporate segment, each as may be updated in subsequently filed quarterly reports to shareholders.
Any forward-looking statements contained in this document represent the views of management only as of the date hereof and are presented for the purpose of assisting the Bank’s shareholders and analysts in understanding the Bank’s financial position, objectives and priorities and anticipated financial performance as at and for the periods ended on the dates presented, and may not be appropriate for other purposes. The Bank does not undertake to update any forward-looking statements, whether written or oral, that may be made from time to time by or on its behalf, except as required under applicable securities legislation.
3
-
-
Caution regarding Forward-Looking Statements regarding Proposed Acquisition of First Horizon Corporation Forward-Looking Statements
This communication contains certain “forward-looking statements” within the meaning of the Private Securities Litigation Reform Act of 1995, Section 27A of the Securities Act of 1933, as amended (the “Securities Act”), and Section 21E of the Securities Exchange Act of 1934, as amended, (the “Exchange Act”) and applicable Canadian securities legislation, with respect to The Toronto-Dominion Bank’s (“TD Bank”) beliefs, plans, goals, expectations, and estimates. Forward-looking statements are not a representation of historical information, but instead pertain to future operations, strategies, financial results or other developments. The words “believe,” “expect,” “anticipate,” “intend,” “target”, “plan”, “estimate,” “should,” “likely,” “will,” “going forward” and other expressions that indicate future events and trends identify forward-looking statements.
Forward-looking statements are necessarily based upon estimates and assumptions that are inherently subject to significant business, operational, economic and competitive uncertainties and contingencies, many of which are beyond the control of TD Bank, and many of which, with respect to future business decisions and actions, are subject to change and which could cause actual results to differ materially from those contemplated or implied by forward-looking statements or historical performance. Examples of uncertainties and contingencies include factors previously disclosed in TD Bank’s respective reports filed with the U.S. Securities and Exchange Commission (the “SEC”), and TD Bank’s other filings with Canadian regulators, as well as the following factors, among others: the occurrence of any event, change or other circumstances that could give rise to the right of one or both of the parties to terminate the definitive merger agreement between First Horizon Corporation ("First Horizon") and TD Bank; the outcome of any legal proceedings that may be instituted against First Horizon or TD Bank, including potential litigation that may be instituted against First Horizon or its directors or officers related to the proposed transaction or the definitive merger agreement between First Horizon and TD Bank to the proposed transaction; the timing and completion of the transaction, including the possibility that the proposed transaction will not close when expected or at all because required regulatory, shareholder or other approvals are not received or other conditions to the closing are not satisfied on a timely basis or at all, or are obtained subject to conditions that are not anticipated; interloper risk; the risk that any announcements relating to the proposed combination could have adverse effects on the market price of the common stock of either or both parties to the combination; the possibility that the anticipated benefits of the transaction will not be realized when expected or at all, including as a result of the impact of, or problems arising from, the integration of the two companies or as a result of the strength of the economy and competitive factors in the areas where First Horizon and TD Bank do business; certain restrictions during the pendency of the merger that may impact the parties’ ability to pursue certain business opportunities or strategic transactions; the possibility that the transaction may be more expensive to complete than anticipated, including as a result of unexpected factors or events; diversion of management’s attention from ongoing business operations and opportunities; reputational risk and potential adverse reactions or changes to business or employee relationships, including those resulting from the announcement or completion of the transaction; First Horizon and TD Bank success in executing their respective business plans and strategies and managing the risks involved in the foregoing; currency and interest rate fluctuations; success of hedging activities; material adverse changes in economic and industry conditions, including the availability of short and long-term financing; general competitive, economic, political and market conditions; changes in asset quality and credit risk; the inability to sustain revenue and earnings growth; inflation; customer borrowing, repayment, investment and deposit practices; the impact, extent and timing of technological changes; capital management activities; other actions of the Board of Governors of the Federal Reserve System, the Office of the Comptroller of the Currency, the Federal Deposit Insurance Corporation and the Office of the Superintendent of Financial Institutions, legislative and regulatory actions and reforms; the pandemic created by the outbreak of COVID-19 and its variants, and resulting effects on economic conditions, restrictions imposed by public health authorities or governments, fiscal and monetary policy responses by governments and financial institutions, and disruptions to global supply chains; and other factors that may affect future results of First Horizon and TD Bank.
Assumptions about First Horizon and TD Bank's current and expected financial performance (including balance sheet, income statement and regulatory capital figures), expected capital availability for the proposed transaction, expected closing date of the proposed transaction, expected synergies (and timing to achieve), integration and restructuring costs, assumed purchase price accounting (including fair value marks), costs of financing, foreign exchange rates, and future regulatory capital requirements, including the Office of the Superintendent of Financial Institutions' announced Basel III reforms effective in the second quarter of fiscal 2023, were considered by TD Bank in estimating its expected return on invested capital, adjusted EPS accretion and/or TD Bank's expected regulatory capital ratios. Examples of material assumptions made by TD Bank in the forward-looking statements, including TD Bank's expectations regarding the costs and financial impact of the transaction, include assumptions regarding First Horizon's future net income, transaction costs, transaction process, timeline to close and/or integrate the acquisition, expected synergies, future TD Bank capitalization, tax rate, currency conversion rate, and financial results. Assumptions about TD Bank's integration plan, the efficiency and duration of integration and the alignment of organizational responsibilities were material factors TD Bank considered in estimating integration costs.
We caution that the foregoing list of important factors that may affect future results is not exhaustive. Additional factors that could cause results to differ materially from those contemplated by forward-looking statements can be found in TD Bank’s Annual Report on Form 40-F for the year ended October 31, 2021 filed with the SEC and available in the “Investor Relations” section of TD Bank’s website, www.td.com , under the heading “Regulatory Filings” and in other documents TD Bank files with the SEC (available at www.sec.gov ) and applicable securities regulators in Canada (available at www.sedar.com ). All such factors, as well as other uncertainties and potential events, and the inherent uncertainty of forward looking statements, should be considered carefully when making decisions with respect to TD Bank.
Any forward-looking statements contained in this document represent the views of management only as of the date hereof and are presented for the purpose of assisting TD Bank’s shareholders and analysts in understanding TD Bank's financial position, objectives and priorities and anticipated financial performance as at and for the periods ended on the dates presented, and may not be appropriate for other purposes. TD Bank does not undertake to update any forward- looking statements, whether written or oral, that may be made from time to time by or on its behalf, except as required under applicable securities legislation.
Non-GAAP Measures
TD Bank's results and measures in this document are presented on an International Financial Reporting Standard (IFRS) basis and on an U.S. Generally Accepted Accounting Principles (U.S. GAAP) basis for First Horizon. TD Bank refers to results prepared in accordance with IFRS and U.S. GAAP as the “reported” results. Non-GAAP financial measures and ratios used in this presentation are not defined terms under IFRS and, therefore, may not be comparable to similar terms used by other issuers. The forward-looking estimated adjusted results presented in this document are based on analyst consensus estimates of TD Bank's and First Horizon's future adjusted results, and we caution that the methodology applied by analysts to estimate those results may not be consistent with TD Bank's methodology. For illustrative purposes, an example of TD Bank's reconciliation of reported results to adjusted results is available in TD Bank's 2021 MD&A.
Important Other Information
In connection with the proposed transaction, First Horizon intends to file relevant materials with the SEC, including a proxy statement on Schedule 14A.
This communication does not constitute an offer to sell or a solicitation of an offer to buy any securities or a solicitation of any vote or approval. SHAREHOLDERS OF FIRST HORIZON ARE URGED TO READ, WHEN AVAILABLE, ALL RELEVANT DOCUMENTS (INCLUDING ANY AMENDMENTS OR SUPPLEMENTS THERETO) FILED WITH THE SEC, INCLUDING FIRST HORIZON’S PROXY STATEMENT, BECAUSE THEY WILL CONTAIN IMPORTANT INFORMATION ABOUT FIRST HORIZON AND THE PROPOSED TRANSACTION.
Investors and shareholders of First Horizon will be able to obtain a free copy of the proxy statement as well as other relevant documents filed with the SEC without charge at the SEC’s website ( http://www.sec.gov ). Copies of the proxy statement and the filings with the SEC that will be incorporated by reference in the proxy statement can also be obtained, without charge, by directing a request to Clyde A. Billings Jr., First Horizon, 165 Madison, Memphis, TN 38103, telephone (901) 523 4444.
Participants in the Solicitation
TD Bank and First Horizon and certain of its directors, executive officers and employees may be deemed to be participants in the solicitation of proxies in respect of the proposed transaction under the rules of the SEC. Information regarding First Horizon’s directors and executive officers is available in the proxy statement for its 2021 annual meeting of shareholders, which was filed with the SEC on March 15, 2021, and certain of its Current Reports on Form 8-K. Other information regarding the participants in the solicitation of proxies in respect of the proposed transaction and a description of their direct and indirect interests, by security holdings or otherwise, will be contained in the proxy statement and other relevant materials to be filed with the SEC. Free copies of these documents, when available, may be obtained as described in the preceding paragraph.
4
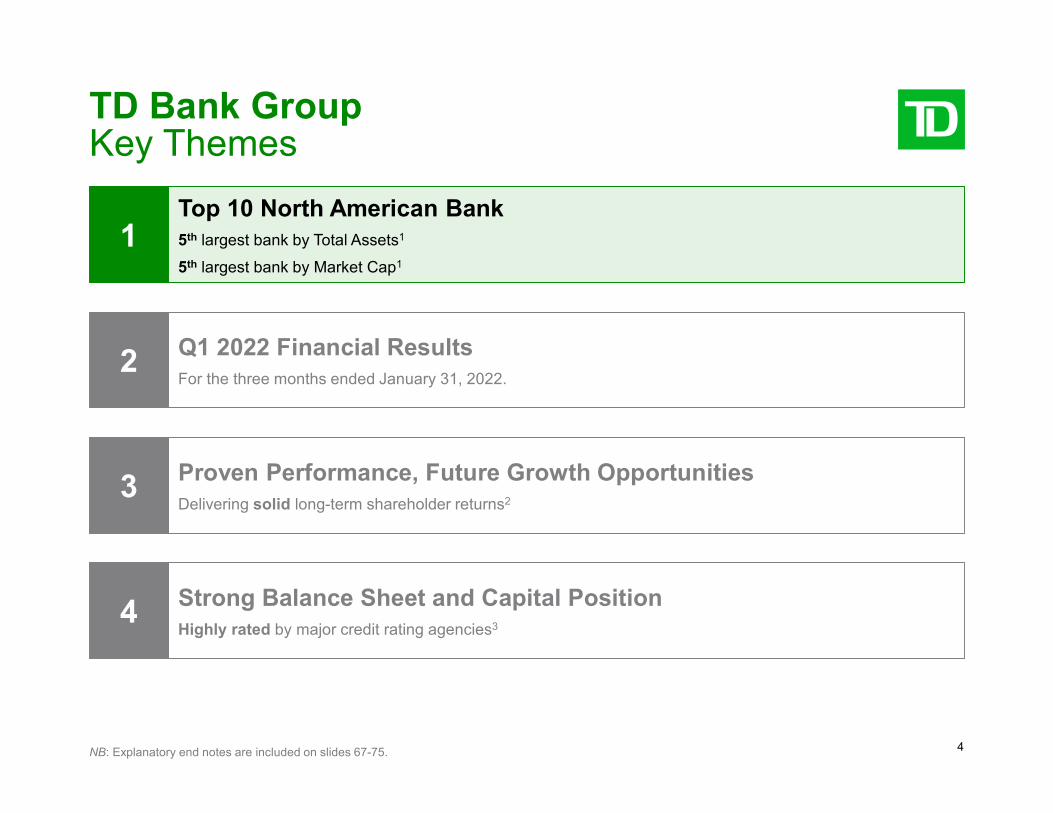
3 Proven Performance, Future Growth OpportunitiesDelivering solid long-term shareholder returns2
4 Strong Balance Sheet and Capital PositionHighly rated by major credit rating agencies3
2 Q1 2022 Financial ResultsFor the three months ended January 31, 2022.
TD Bank Group Key Themes
1 Top 10 North American Bank 5 th largest bank by Total Assets 1
5 th largest bank by Market Cap 1
NB: Explanatory end notes are included on slides 67-75.
5
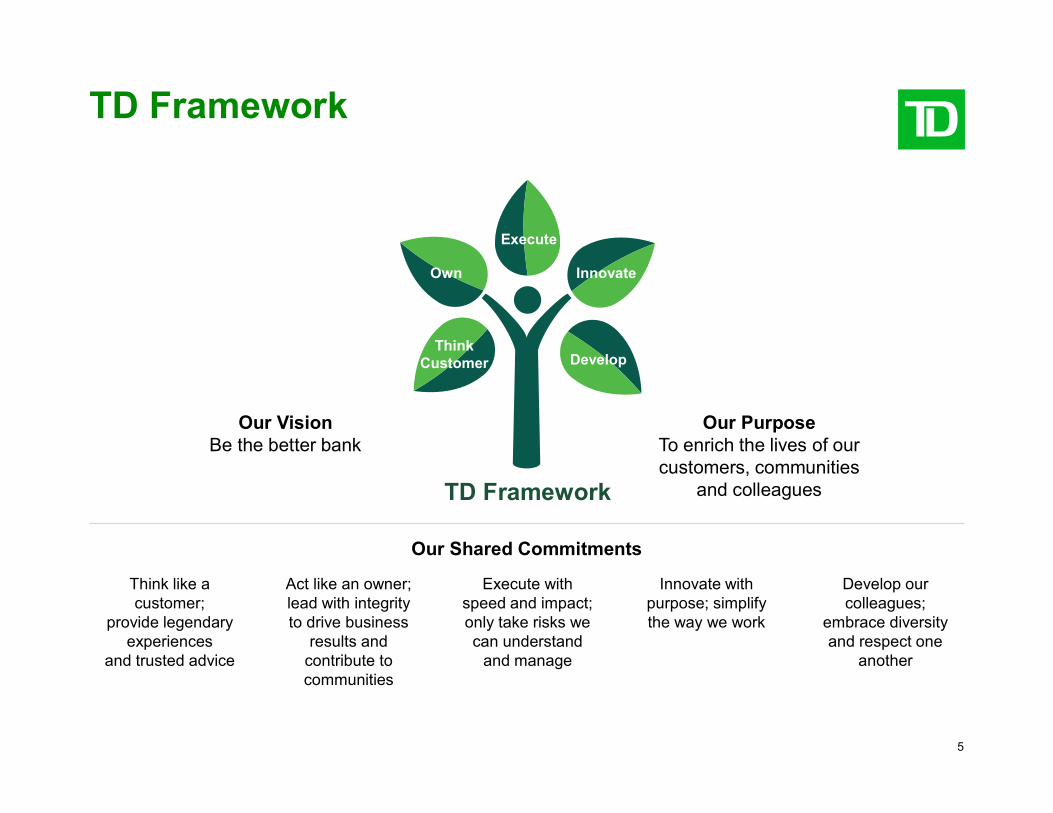
TD Framework
Develop our colleagues;
embrace diversity and respect one
another
Our Shared Commitments
Think like a customer;
provide legendary experiences
and trusted advice
Act like an owner;lead with integrity to drive business
results and contribute to communities
Execute withspeed and impact;only take risks we can understand
and manage
Innovate withpurpose; simplify the way we work
Our VisionBe the better bank
Our PurposeTo enrich the lives of our customers, communities
and colleaguesTD Framework
Execute
ThinkCustomer Develop
InnovateOwn
6
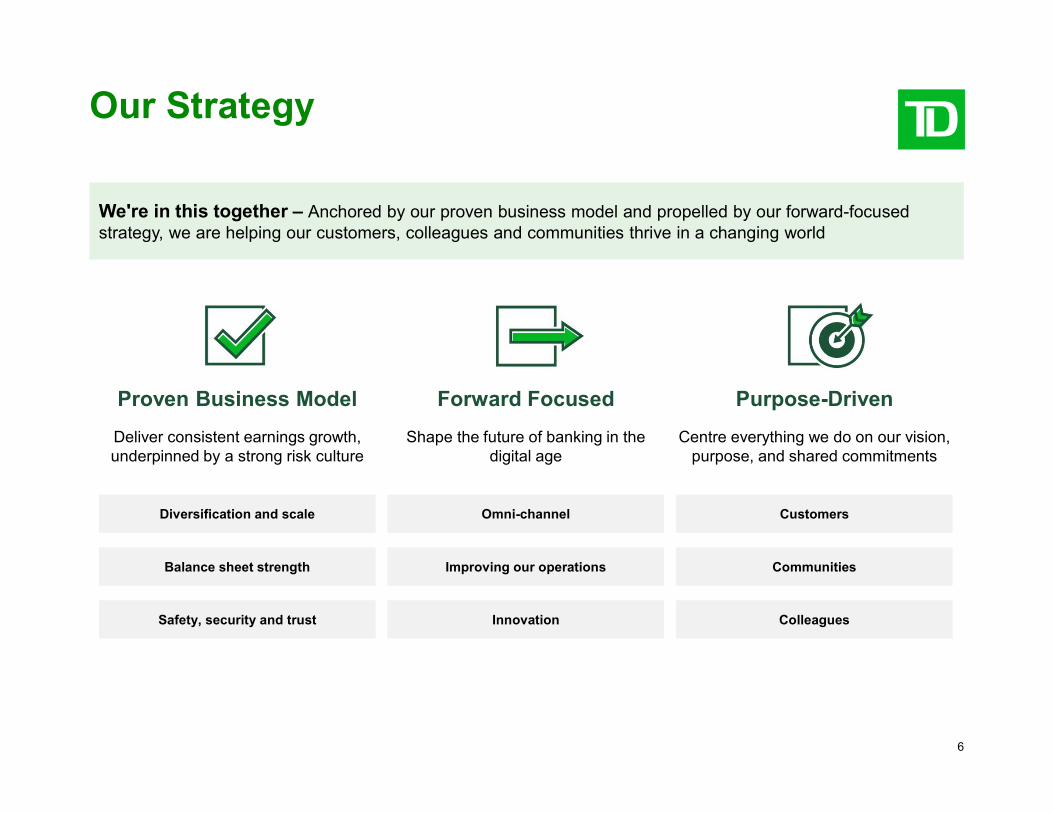
Our Strategy
We're in this together – Anchored by our proven business model and propelled by our forward-focused strategy, we are helping our customers, colleagues and communities thrive in a changing world
Proven Business Model
Deliver consistent earnings growth, underpinned by a strong risk culture
Diversification and scale
Balance sheet strength
Safety, security and trust
Forward Focused
Shape the future of banking in the digital age
Omni-channel
Improving our operations
Innovation
Purpose-Driven
Centre everything we do on our vision, purpose, and shared commitments
Customers
Communities
Colleagues
7
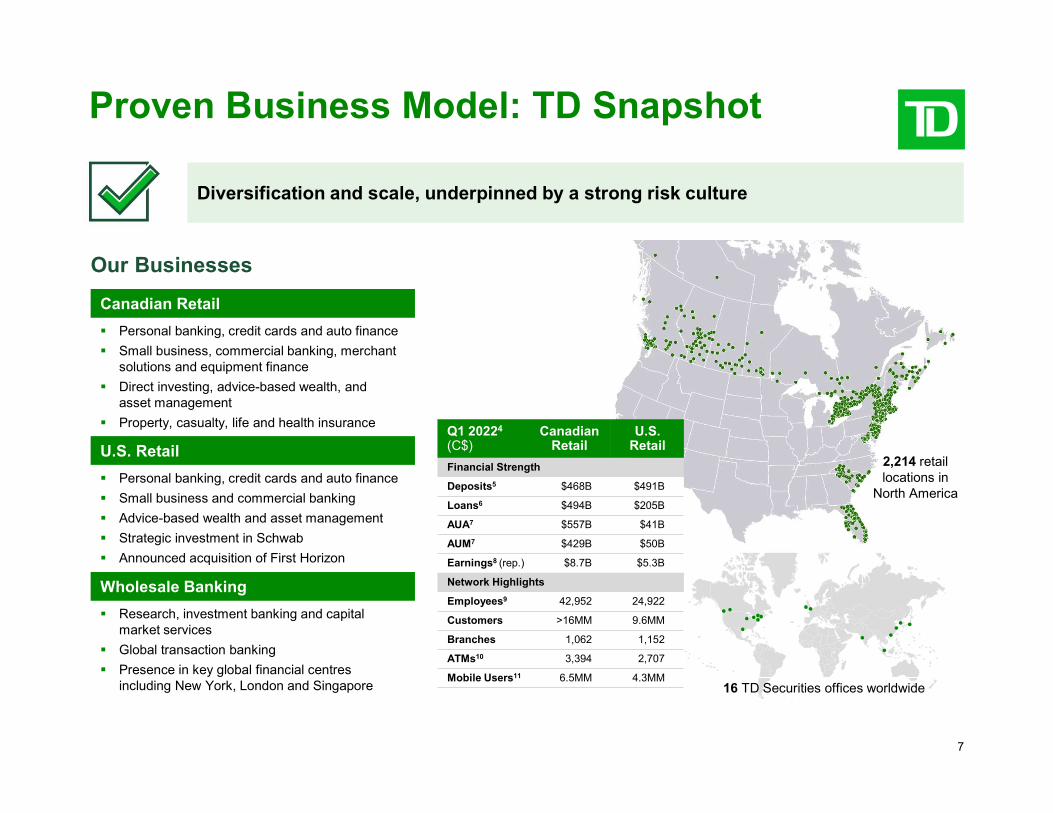
Proven Business Model: TD Snapshot
Diversification and scale, underpinned by a strong risk culture
Our Businesses
Canadian Retail Personal banking, credit cards and auto finance Small business, commercial banking, merchant
solutions and equipment finance Direct investing, advice-based wealth, and
asset management Property, casualty, life and health insurance
U.S. Retail Personal banking, credit cards and auto finance Small business and commercial banking Advice-based wealth and asset management Strategic investment in Schwab Announced acquisition of First Horizon
Wholesale Banking Research, investment banking and capital
market services Global transaction banking Presence in key global financial centres
including New York, London and Singapore
Q1 2022 4
(C$) Canadian
Retail U.S.
Retail Financial Strength
Deposits 5 $468B $491B
Loans 6 $494B $205B
AUA 7 $557B $41B
AUM 7 $429B $50B
Earnings 8 (rep.) $8.7B $5.3B
Network Highlights
Employees 9 42,952 24,922
Customers >16MM 9.6MM
Branches 1,062 1,152
ATMs 10 3,394 2,707
Mobile Users 11 6.5MM 4.3MM
2,214 retail locations in
North America
16 TD Securities offices worldwide
8
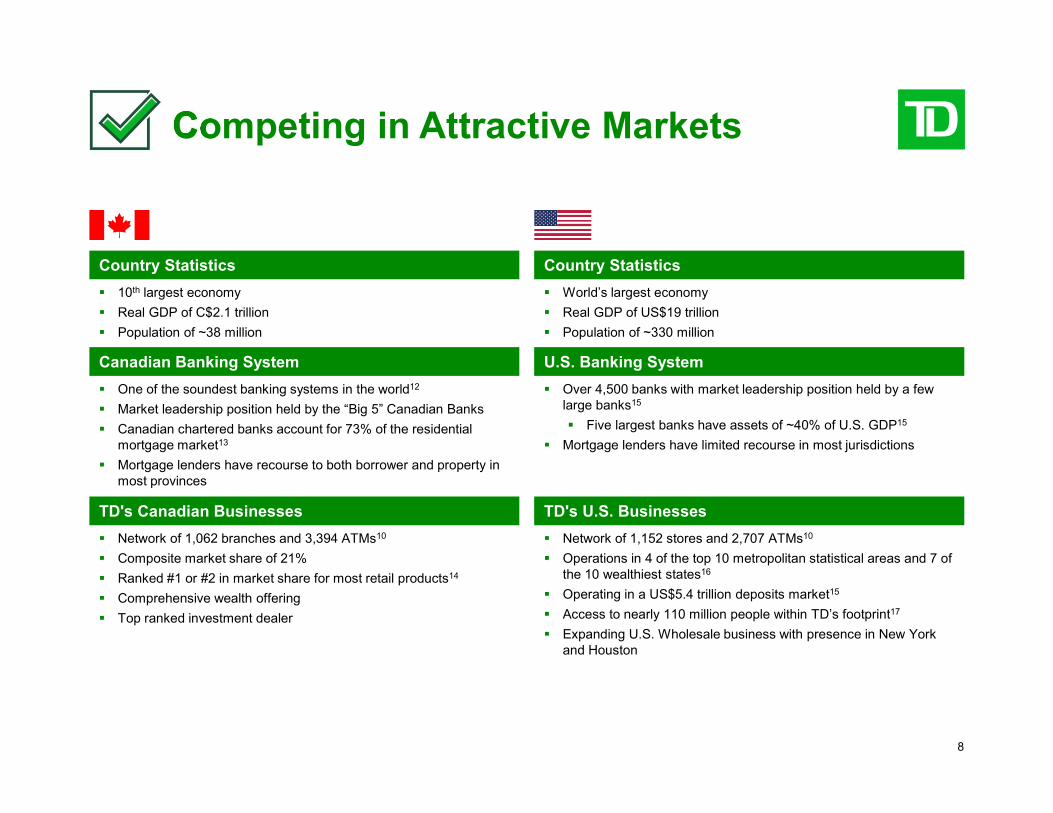
Country Statistics 10 th largest economy
Real GDP of C$2.1 trillion
Population of ~38 million
Canadian Banking System One of the soundest banking systems in the world 12
Market leadership position held by the “Big 5” Canadian Banks
Canadian chartered banks account for 73% of the residentialmortgage market 13
Mortgage lenders have recourse to both borrower and property inmost provinces
TD's Canadian Businesses Network of 1,062 branches and 3,394 ATMs 10
Composite market share of 21%
Ranked #1 or #2 in market share for most retail products 14
Comprehensive wealth offering
Top ranked investment dealer
Country Statistics World’s largest economy
Real GDP of US$19 trillion
Population of ~330 million
U.S. Banking System Over 4,500 banks with market leadership position held by a few
large banks 15
Five largest banks have assets of ~40% of U.S. GDP 15
Mortgage lenders have limited recourse in most jurisdictions
TD's U.S. Businesses Network of 1,152 stores and 2,707 ATMs 10
Operations in 4 of the top 10 metropolitan statistical areas and 7 ofthe 10 wealthiest states 16
Operating in a US$5.4 trillion deposits market 15
Access to nearly 110 million people within TD’s footprint 17
Expanding U.S. Wholesale business with presence in New Yorkand Houston
Competing in Attractive Markets
9
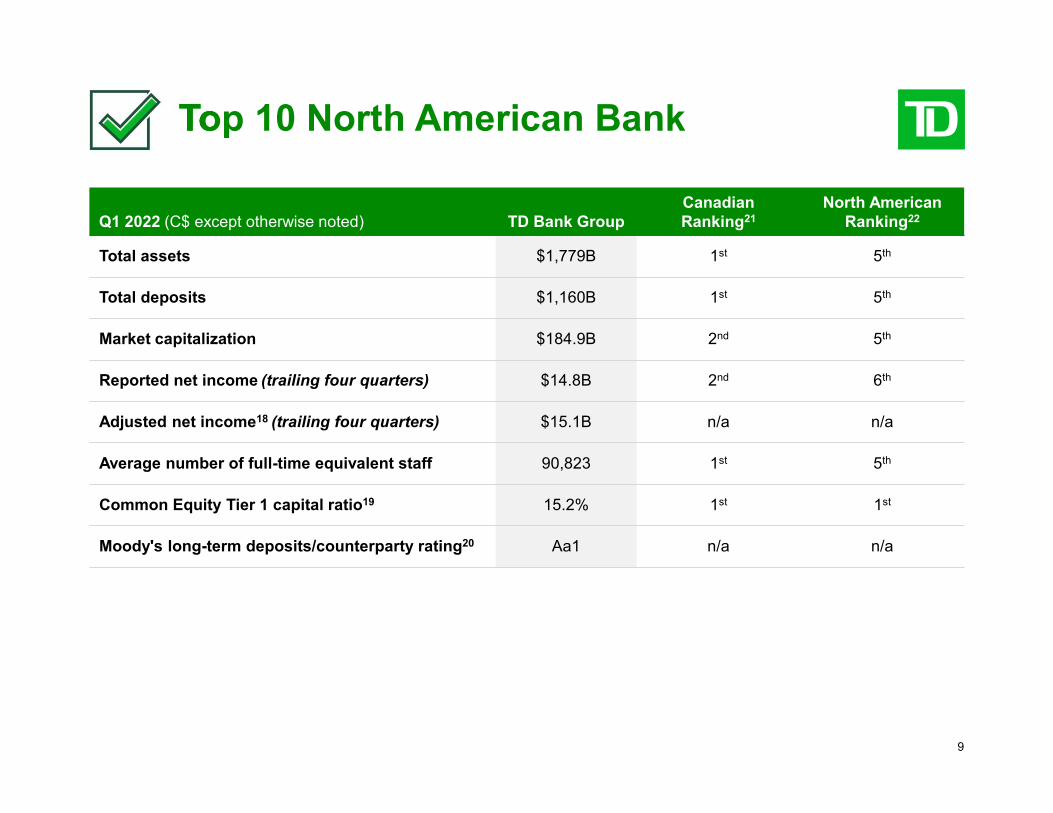
Q1 2022 (C$ except otherwise noted) TD Bank Group Canadian Ranking 21
North American Ranking 22
Total assets $1,779B 1 st 5 th
Total deposits $1,160B 1 st 5 th
Market capitalization $184.9B 2 nd 5 th
Reported net income (trailing four quarters) $14.8B 2 nd 6 th
Adjusted net income 18 (trailing four quarters) $15.1B n/a n/a
Average number of full-time equivalent staff 90,823 1 st 5 th
Common Equity Tier 1 capital ratio 19 15.2% 1 st 1 st
Moody's long-term deposits/counterparty rating 20 Aa1 n/a n/a
Top 10 North American Bank
10
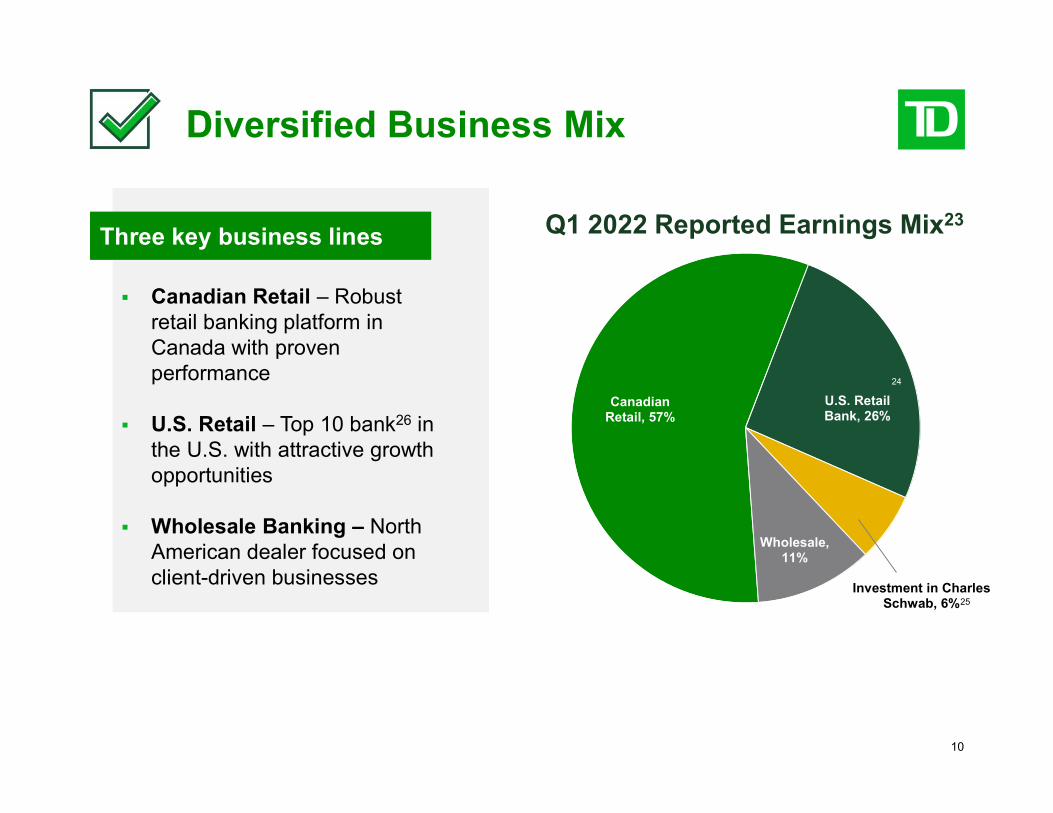
Three key business lines
Canadian Retail – Robustretail banking platform inCanada with provenperformance
U.S. Retail – Top 10 bank 26 inthe U.S. with attractive growthopportunities
Wholesale Banking – NorthAmerican dealer focused onclient-driven businesses
Q1 2022 Reported Earnings Mix 23
Canadian Retail, 57%
24
U.S. Retail Bank, 26%
Wholesale, 11%
Investment in Charles Schwab, 6% 25
Diversified Business Mix
11
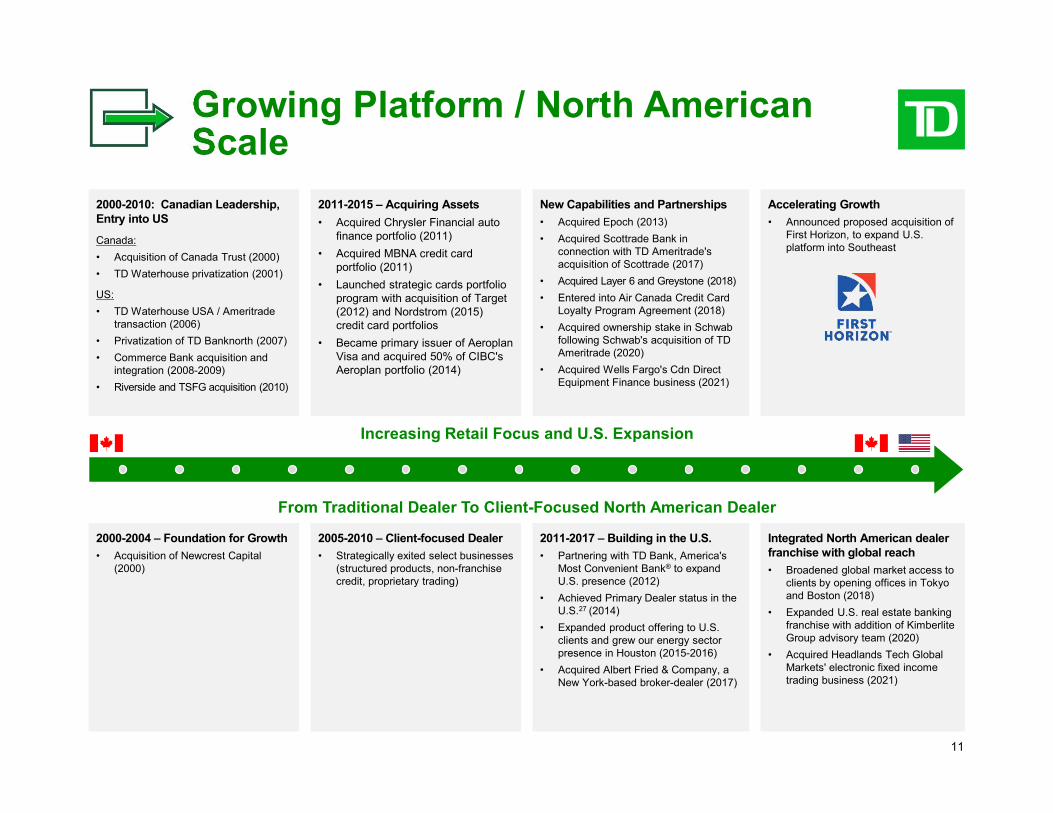
rowing Platform / North American cale
2000-2010: Canadian Leadership, Entry into US
Canada: • Acquisition of Canada Trust (2000) • TD Waterhouse privatization (2001)
US: • TD Waterhouse USA / Ameritrade
transaction (2006) • Privatization of TD Banknorth (2007) • Commerce Bank acquisition and
integration (2008-2009) • Riverside and TSFG acquisition (2010)
2011-2015 – Acquiring Assets • Acquired Chrysler Financial auto
finance portfolio (2011) • Acquired MBNA credit card
portfolio (2011) • Launched strategic cards portfolio
program with acquisition of Target (2012) and Nordstrom (2015) credit card portfolios
• Became primary issuer of Aeroplan Visa and acquired 50% of CIBC's Aeroplan portfolio (2014)
New Capabilities and Partnerships • Acquired Epoch (2013) • Acquired Scottrade Bank in
connection with TD Ameritrade's acquisition of Scottrade (2017)
• Acquired Layer 6 and Greystone (2018) • Entered into Air Canada Credit Card
Loyalty Program Agreement (2018) • Acquired ownership stake in Schwab
following Schwab's acquisition of TD Ameritrade (2020)
• Acquired Wells Fargo's Cdn Direct Equipment Finance business (2021)
Accelerating Growth • Announced proposed acquisition of
First Horizon, to expand U.S. platform into Southeast
Increasing Retail Focus and U.S. Expansion
From Traditional Dealer To Client-Focused North American Dealer
2000-2004 – Foundation for Growth • Acquisition of Newcrest Capital
(2000)
2005-2010 – Client-focused Dealer • Strategically exited select businesses
(structured products, non-franchise credit, proprietary trading)
2011-2017 – Building in the U.S. • Partnering with TD Bank, America's
Most Convenient Bank ® to expand U.S. presence (2012)
• Achieved Primary Dealer status in the U.S. (2014) 27
• Expanded product offering to U.S. clients and grew our energy sector presence in Houston (2015-2016)
• Acquired Albert Fried & Company, a New York-based broker-dealer (2017)
Integrated North American dealer franchise with global reach • Broadened global market access to
clients by opening offices in Tokyo and Boston (2018)
• Expanded U.S. real estate banking franchise with addition of Kimberlite Group advisory team (2020)
• Acquired Headlands Tech Global Markets' electronic fixed income trading business (2021)
12
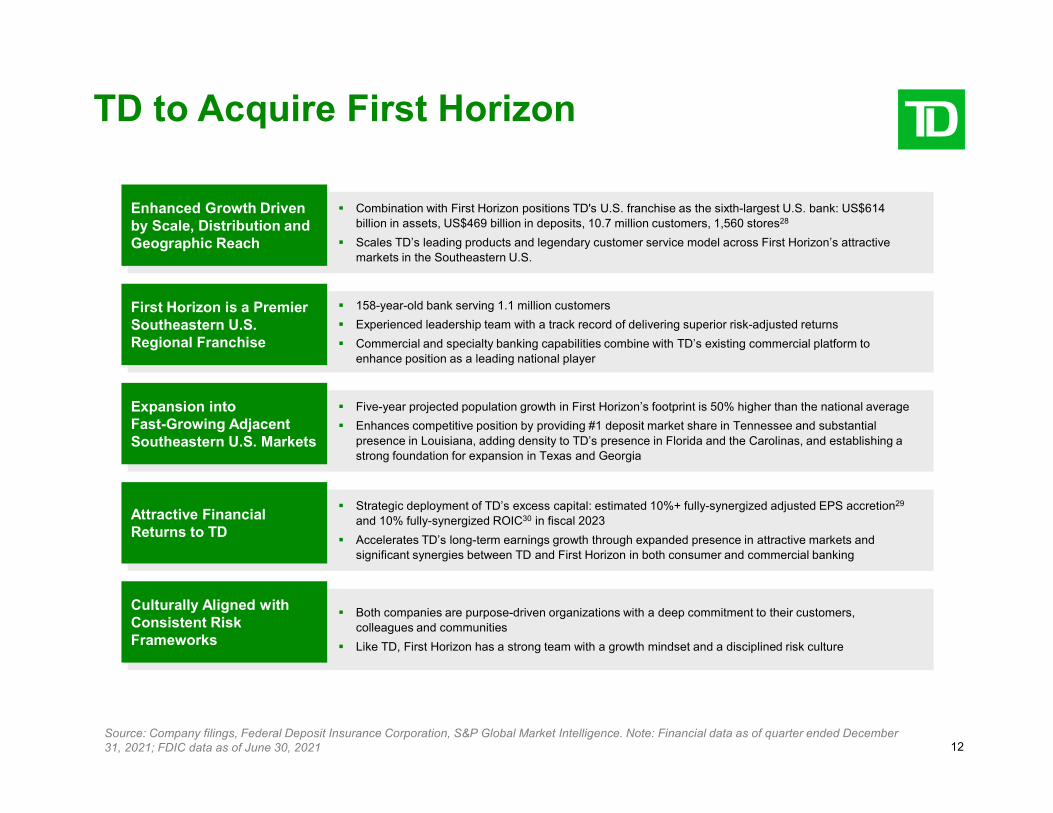
TD to Acquire First Horizon
Enhanced Growth Driven by Scale, Distribution and Geographic Reach
Combination with First Horizon positions TD's U.S. franchise as the sixth-largest U.S. bank: US$614 billion in assets, US$469 billion in deposits, 10.7 million customers, 1,560 stores 28
Scales TD’s leading products and legendary customer service model across First Horizon’s attractive markets in the Southeastern U.S.
First Horizon is a Premier Southeastern U.S. Regional Franchise
158-year-old bank serving 1.1 million customers Experienced leadership team with a track record of delivering superior risk-adjusted returns Commercial and specialty banking capabilities combine with TD’s existing commercial platform to
enhance position as a leading national player
Expansion into Fast-Growing Adjacent Southeastern U.S. Markets
Five-year projected population growth in First Horizon’s footprint is 50% higher than the national average Enhances competitive position by providing #1 deposit market share in Tennessee and substantial
presence in Louisiana, adding density to TD’s presence in Florida and the Carolinas, and establishing astrong foundation for expansion in Texas and Georgia
Attractive Financial Returns to TD
Strategic deployment of TD’s excess capital: estimated 10%+ fully-synergized adjusted EPS accretion 29
and 10% fully-synergized ROIC 30 in fiscal 2023 Accelerates TD’s long-term earnings growth through expanded presence in attractive markets and
significant synergies between TD and First Horizon in both consumer and commercial banking
Culturally Aligned with Consistent Risk Frameworks
Both companies are purpose-driven organizations with a deep commitment to their customers, colleagues and communities
Like TD, First Horizon has a strong team with a growth mindset and a disciplined risk culture
Source: Company filings, Federal Deposit Insurance Corporation, S&P Global Market Intelligence. Note: Financial data as of quarter ended December 31, 2021; FDIC data as of June 30, 2021
13
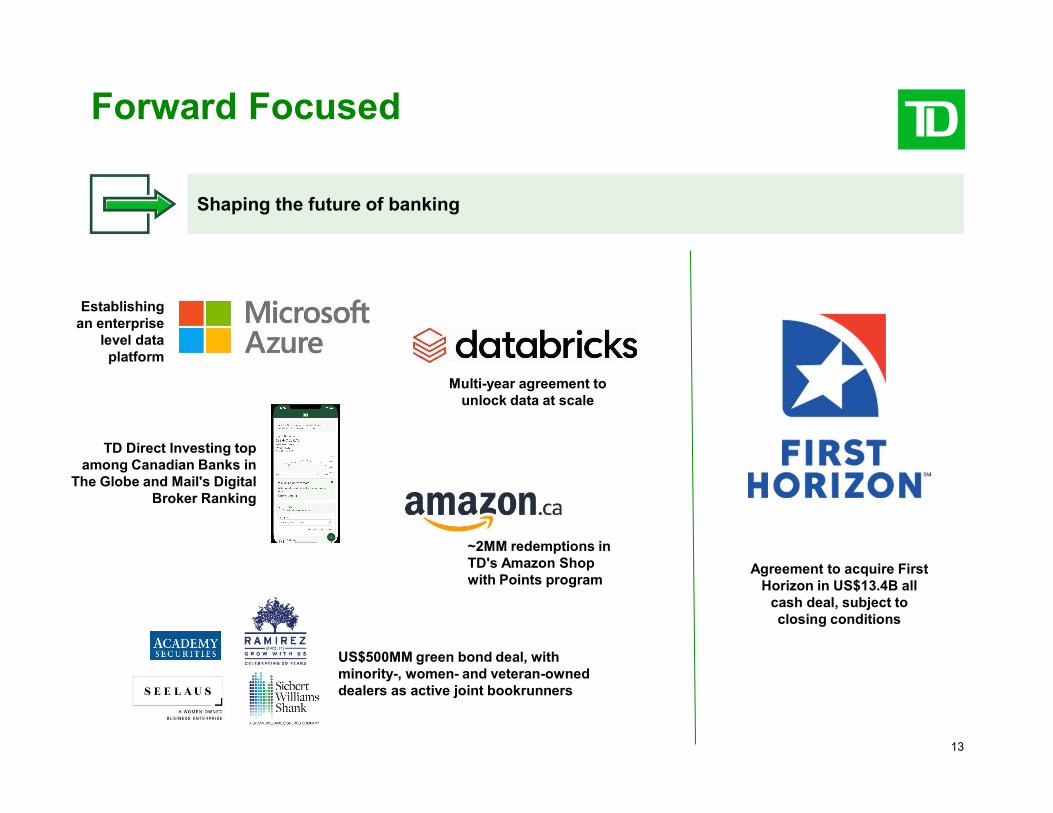
Forward Focused
Shaping the future of banking
Establishing an enterprise
level data platform
Multi-year agreement to unlock data at scale
TD Direct Investing top among Canadian Banks in
The Globe and Mail's Digital Broker Ranking
~2MM redemptions in TD's Amazon Shop with Points program
US$500MM green bond deal, with minority-, women- and veteran-owned dealers as active joint bookrunners
Agreement to acquire First Horizon in US$13.4B all
cash deal, subject to closing conditions
14
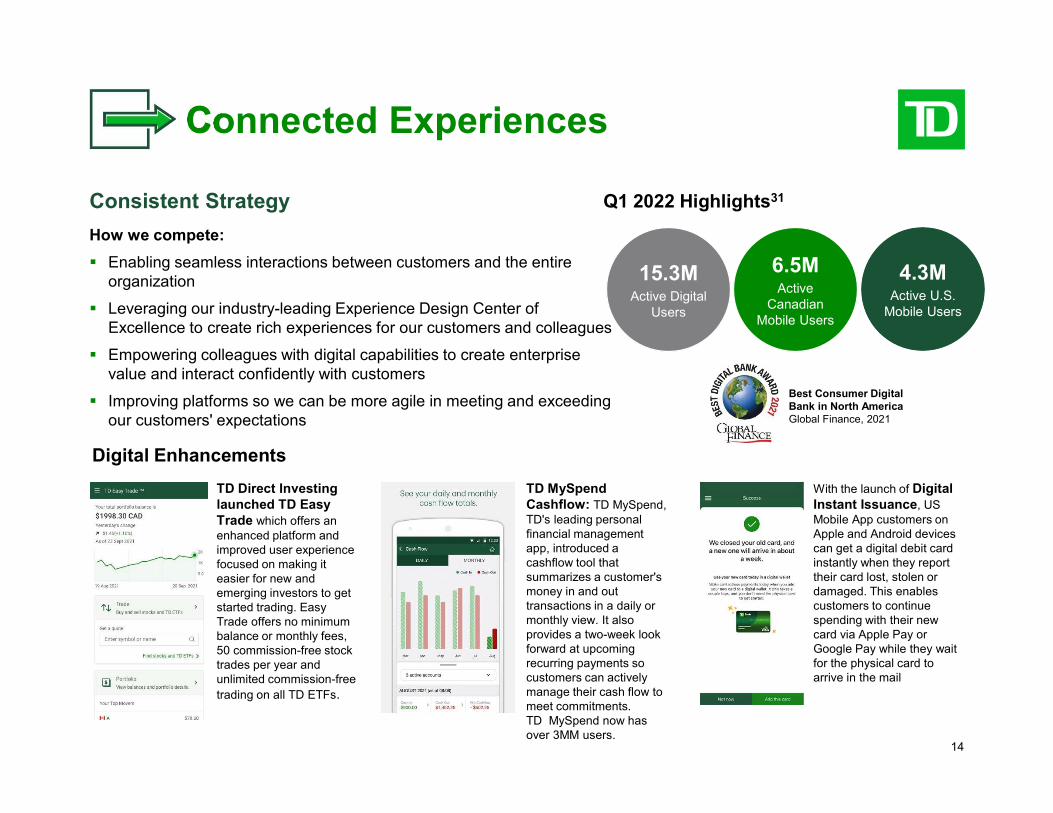
Consistent Strategy How we compete: Enabling seamless interactions between customers and the entire
organization
Leveraging our industry-leading Experience Design Center ofExcellence to create rich experiences for our customers and colleagues
Empowering colleagues with digital capabilities to create enterprisevalue and interact confidently with customers
Improving platforms so we can be more agile in meeting and exceedingour customers' expectations
Q1 2022 Highlights 31
15.3M Active Digital
Users
6.5M Active
Canadian Mobile Users
4.3M Active U.S.
Mobile Users
Best Consumer Digital Bank in North America Global Finance, 2021
Digital Enhancements TD Direct Investing launched TD Easy Trade which offers an enhanced platform and improved user experience focused on making it easier for new and emerging investors to get started trading. Easy Trade offers no minimum balance or monthly fees, 50 commission-free stock trades per year and unlimited commission-free trading on all TD ETFs.
TD MySpend Cashflow: TD MySpend, TD's leading personal financial management app, introduced a cashflow tool that summarizes a customer's money in and out transactions in a daily or monthly view. It also provides a two-week look forward at upcoming recurring payments so customers can actively manage their cash flow to meet commitments. TD MySpend now has over 3MM users.
With the launch of DigitalInstant Issuance, USMobile App customers onApple and Android devicescan get a digital debit cardinstantly when they reporttheir card lost, stolen ordamaged. This enablescustomers to continuespending with their newcard via Apple Pay orGoogle Pay while they waitfor the physical card toarrive in the mail
Connected Experiences
15
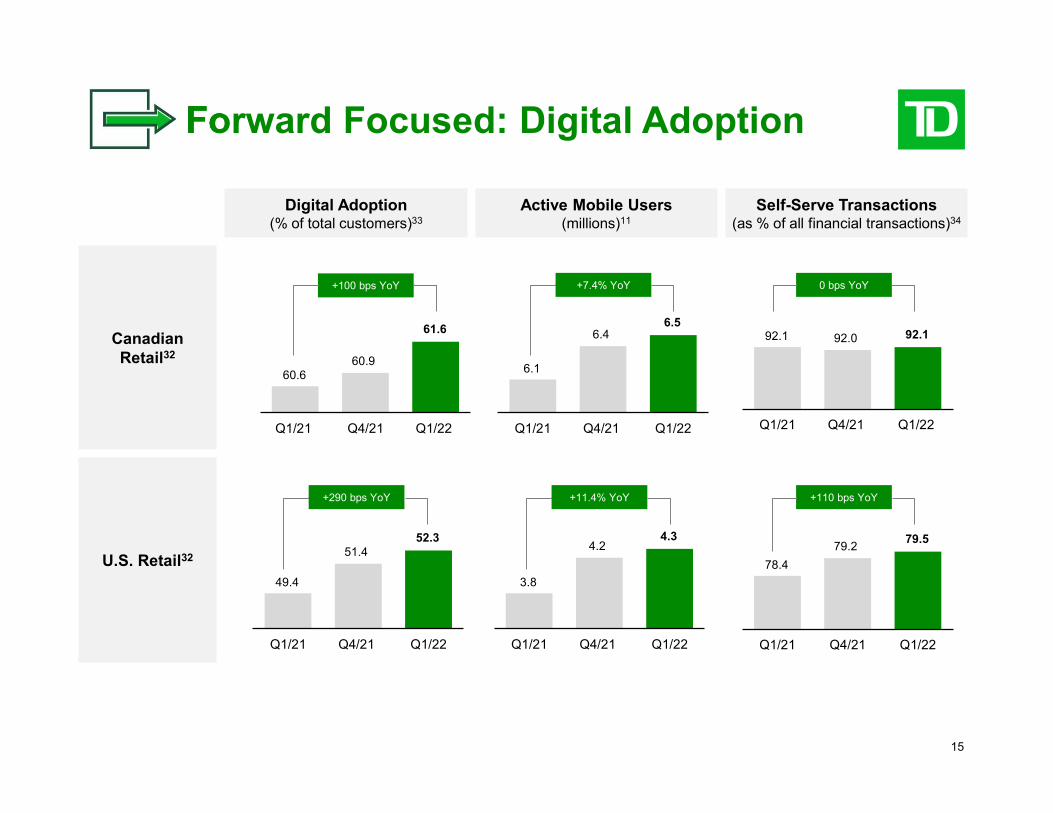
+100 bps YoY
Q1/21
60.6
Q4/21
60.9
Q1/22
61.6
+7.4% YoY
Q1/21
6.1
Q4/21
6.4
Q1/22
6.5
0 bps YoY
Q1/21
92.1
Q4/21
92.0
Q1/22
92.1
+290 bps YoY
Q1/21
49.4
Q4/21
51.4
Q1/22
52.3
+11.4% YoY
Q1/21
3.8
Q4/21
4.2
Q1/22
4.3
+110 bps YoY
Q1/21
78.4
Q4/21
79.2
Q1/22
79.5
Digital Adoption (% of total customers) 33
Active Mobile Users (millions) 11
Self-Serve Transactions (as % of all financial transactions) 34
Canadian Retail 32
U.S. Retail 32
Forward Focused: Digital Adoption
16
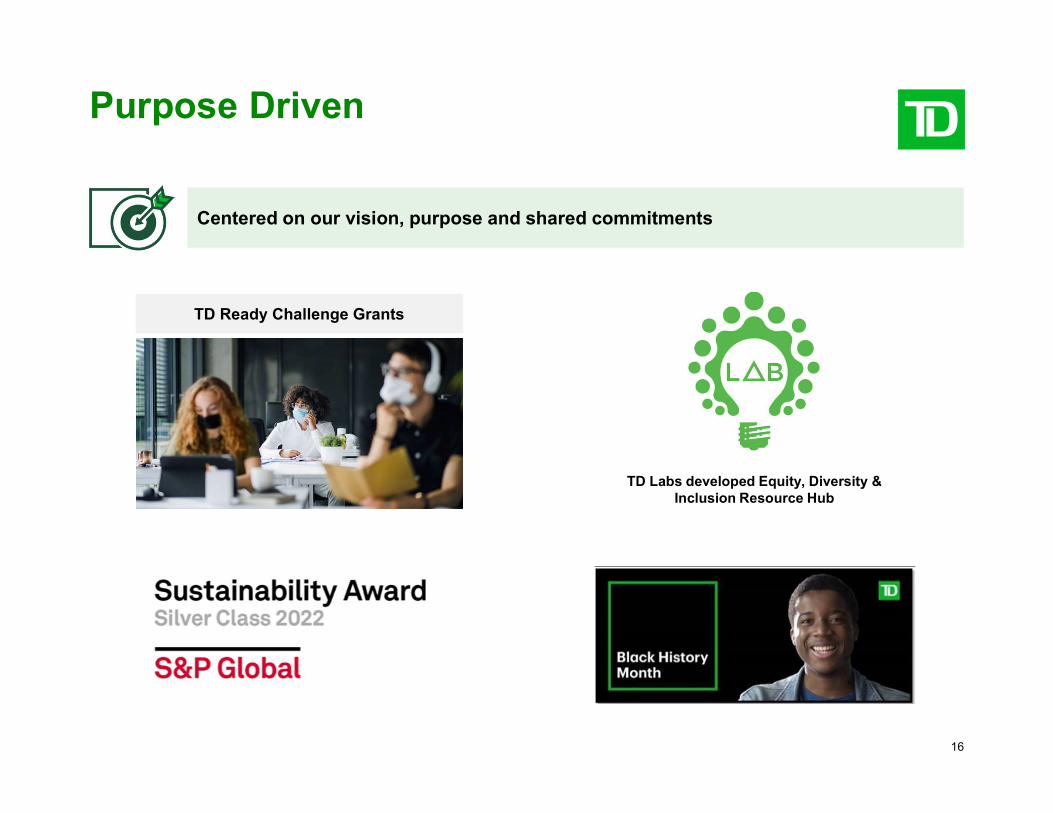
Purpose Driven
Centered on our vision, purpose and shared commitments
TD Ready Challenge Grants
TD Labs developed Equity, Diversity & Inclusion Resource Hub

17
17
18
-
-
-
-
Environment
– Announced our interim target for our operationalemissions to achieve an absolute reduction ingreenhouse gas (GHG) emissions from ouroperations (Scope 1 and 2 GHG emissions) by 25%by 2025, relative to a 2019 baseline.
– Developed a customized methodology for settingScope 3 financed emissions targets and set Scope3 targets for the Energy and Power Generationsectors to be met by 2030.
– Set a target to hold $15 to $20 billion in green,social, sustainability and pandemic bonds in ourTreasury investment portfolio by the end of2025.
– Achieved over $86 billion of our $100 billion low carbon economy target through low-carbonlending, financing, asset management and internal corporate programs in the last four years.
– Deployed a record $30 billion to support the low carbon economy in 2021. If similar marketconditions hold, we expect to achieve our $100billion target by the end of 2022, eight yearsahead of our plan.
– For the 8th consecutive year, listed on the DowJones Sustainability World Index, where we arethe top ranked North American-based bank.
Social
– Announced a US$100 million equity fund insupport of minority-owned small businesses inthe U.S., with US$25 million earmarked for Black and Latinx-owned small businesses.
– Invested over $125 million to support non-profitorganizations across our footprint, including throughthe TD Ready Commitment.
– Made a broader and longer-term commitment toincrease women in roles titled vice president andabove in Canada to 45% by end of 2025.
– On track to deliver on our 2020 commitments todouble the representation of Black executives bythe end of 2022 and increase Black, IndigenousPeoples and minority community representationat VP+ levels by 2025.
– Established an Asian Community SegmentStrategy with the goal of understanding andsupporting the needs of the Asian community inCanada by focusing on client and colleagueengagement, business development, and raisingawareness.
– Our First Nation Home Loan Program providesfinancing to First Nations members to purchase,renovate or construct single-family homes on FirstNations’ lands and settled lands.
Governance
– Formally established the ESG Centre of Expertiseto bring together the experience, expertise andtalent of colleagues working on ESG issues in orderto coordinate and streamline efforts and providethought leadership to support related decisionmaking.
– Introduced regular ESG education sessions withour Board of Directors and Senior ExecutiveTeam (SET) and incorporated ESG metrics intothe SET compensation plan.
– Developed a climate risk inventory to help identifythe impacts climate change may have on TD, ourassets and clients.
– Developed a heatmapping framework to supportphysical and transition climate risk identification andassessment (i.e., portfolios and industries mostsusceptible to climate change) as part of thedevelopment of our Environmental and Social (E&S)risk management approach.
– Established an ESG Credit Risk team responsiblefor identifying, assessing and mitigating the impactof ESG and climate change-related risks on TD’scredit portfolio.
– Winner of IR Magazine - Canada's award for BestESG Reporting, for the 3 rd year in a row.
Purpose DrivenESG Highlights
19
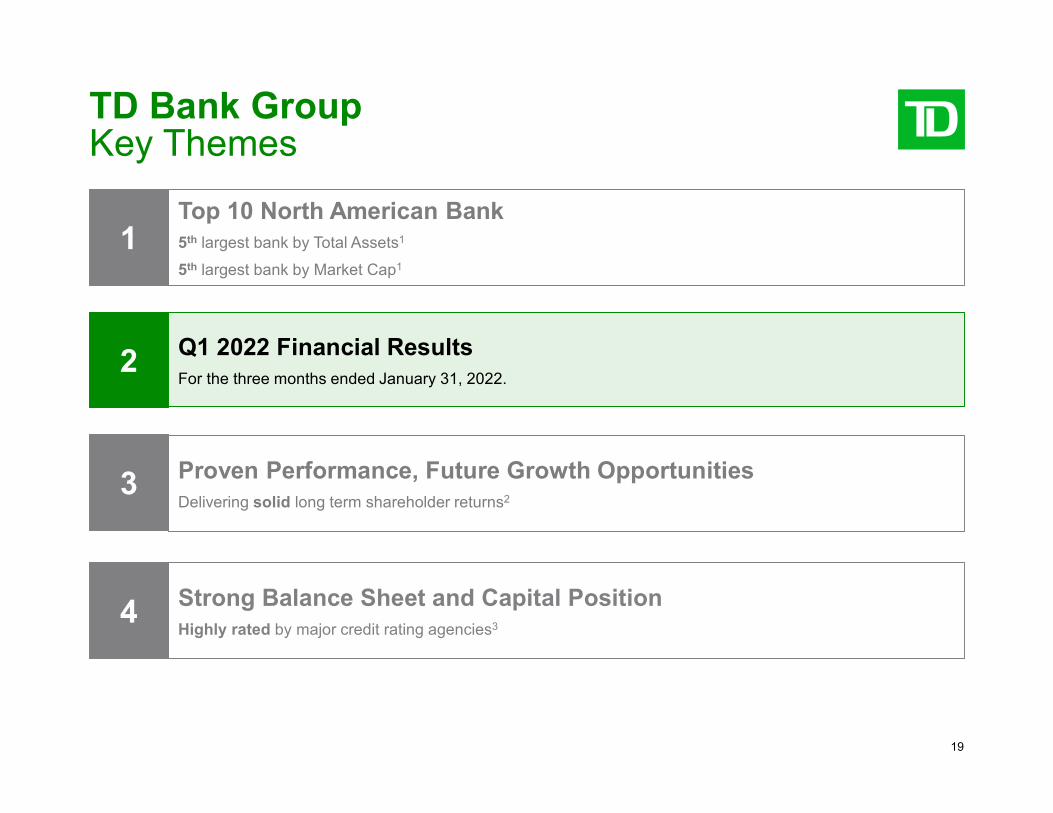
TD Bank GroupKey Themes
1Top 10 North American Bank5th largest bank by Total Assets1
5th largest bank by Market Cap1
4 Strong Balance Sheet and Capital PositionHighly rated by major credit rating agencies3
3 Proven Performance, Future Growth OpportunitiesDelivering solid long term shareholder returns2
2 Q1 2022 Financial Results For the three months ended January 31, 2022.
20
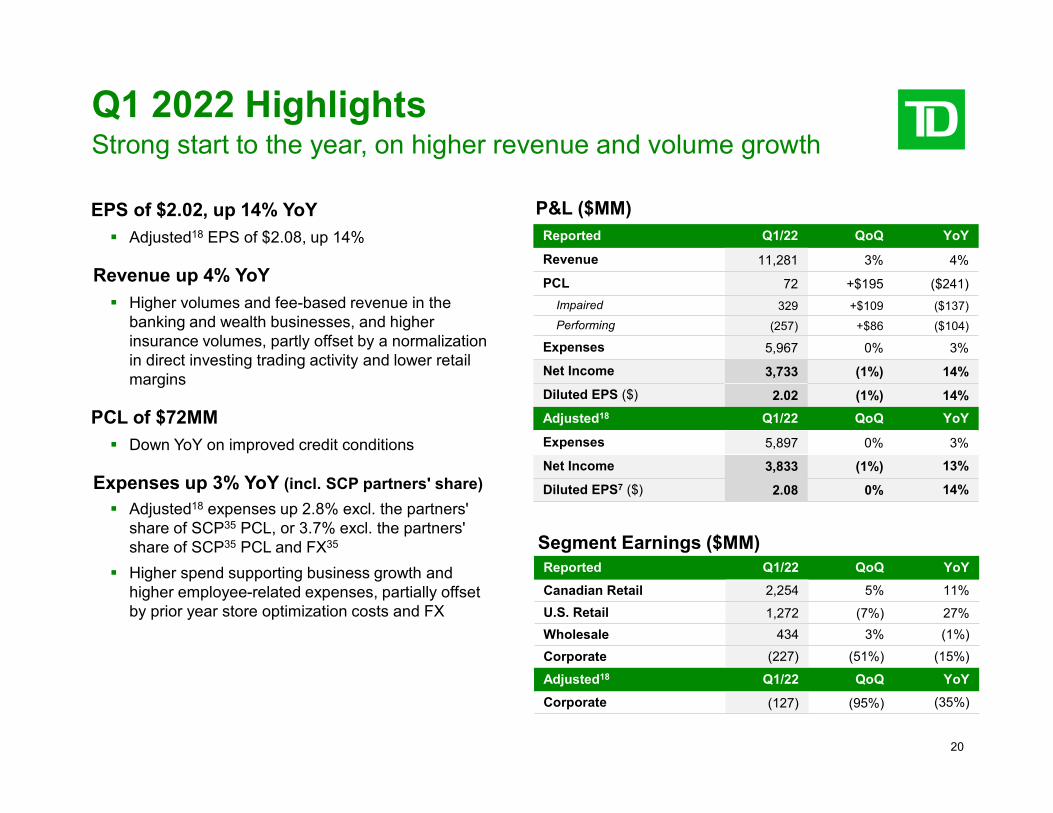
Q1 2022 Highlights Strong start to the year, on higher revenue and volume growth
EPS of $2.02, up 14% YoY Adjusted 18 EPS of $2.08, up 14%
Revenue up 4% YoY Higher volumes and fee-based revenue in the
banking and wealth businesses, and higher insurance volumes, partly offset by a normalization in direct investing trading activity and lower retail margins
PCL of $72MM Down YoY on improved credit conditions
Expenses up 3% YoY (incl. SCP partners' share) Adjusted 18 expenses up 2.8% excl. the partners'
share of SCP 35 PCL, or 3.7% excl. the partners' share of SCP 35 PCL and FX 35
Higher spend supporting business growth and higher employee-related expenses, partially offset by prior year store optimization costs and FX
P&L ($MM) Reported Q1/22 QoQ YoY
Revenue 11,281 3% 4%
PCL 72 +$195 ($241) Impaired 329 +$109 ($137) Performing (257) +$86 ($104)
Expenses 5,967 0% 3%
Net Income 3,733 (1%) 14%
Diluted EPS ($) 2.02 (1%) 14%
Adjusted 18 Q1/22 QoQ YoY
Expenses 5,897 0% 3%
Net Income 3,833 (1%) 13%
Diluted EPS 7 ($) 2.08 0% 14%
Segment Earnings ($MM) Reported Q1/22 QoQ YoY
Canadian Retail 2,254 5% 11% U.S. Retail 1,272 (7%) 27% Wholesale 434 3% (1%) Corporate (227) (51%) (15%)
Adjusted 18 Q1/22 QoQ YoY
Corporate (127) (95%) (35%)
21
-
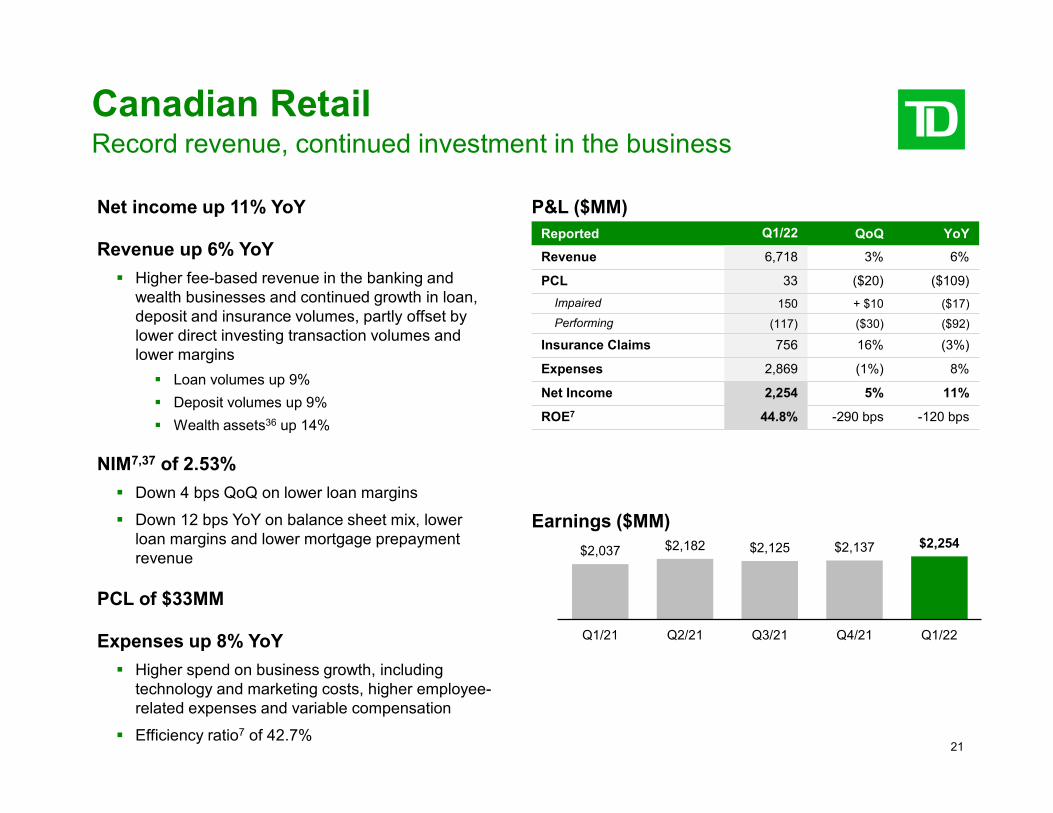
Canadian Retail Record revenue, continued investment in the business
Net income up 11% YoY
Revenue up 6% YoY Higher fee-based revenue in the banking and
wealth businesses and continued growth in loan, deposit and insurance volumes, partly offset by lower direct investing transaction volumes and lower margins
Loan volumes up 9% Deposit volumes up 9% Wealth assets 36 up 14%
NIM 7 ,37 of 2.53% Down 4 bps QoQ on lower loan margins Down 12 bps YoY on balance sheet mix, lower
loan margins and lower mortgage prepayment revenue
PCL of $33MM
Expenses up 8% YoY Higher spend on business growth, including
technology and marketing costs, higher employee related expenses and variable compensation
Efficiency ratio 7 of 42.7%
P&L ($MM) Reported Q1/22 QoQ YoY
Revenue 6,718 3% 6%
PCL 33 ($20) ($109) Impaired 150 + $10 ($17) Performing (117) ($30) ($92)
Insurance Claims 756 16% (3%)
Expenses 2,869 (1%) 8%
Net Income 2,254 5% 11%
ROE 7 44.8% -290 bps -120 bps
Earnings ($MM) $2,037 $2,182 $2,125 $2,137 $2,254
Q1/21 Q2/21 Q3/21 Q4/21 Q1/22
22
-
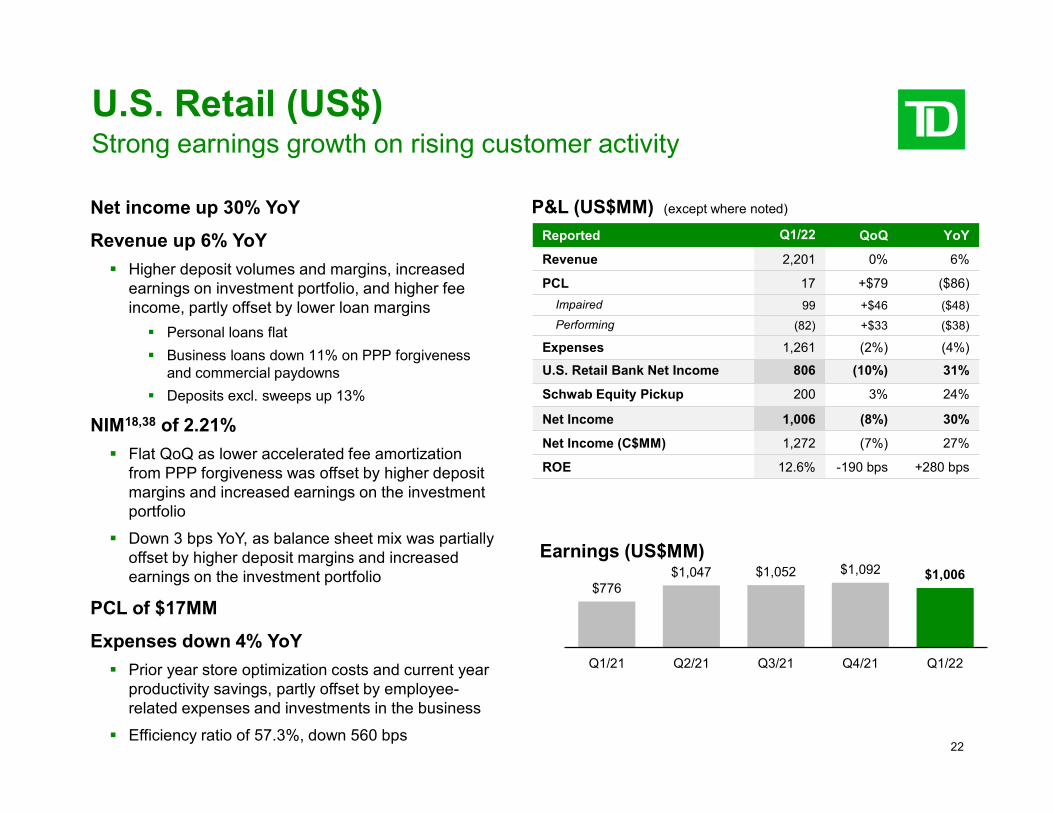
U.S. Retail (US$) Strong earnings growth on rising customer activity
Net income up 30% YoY
Revenue up 6% YoY Higher deposit volumes and margins, increased
earnings on investment portfolio, and higher fee income, partly offset by lower loan margins
Personal loans flat Business loans down 11% on PPP forgiveness
and commercial paydowns Deposits excl. sweeps up 13%
NIM 18 ,38 of 2.21% Flat QoQ as lower accelerated fee amortization
from PPP forgiveness was offset by higher deposit margins and increased earnings on the investment portfolio
Down 3 bps YoY, as balance sheet mix was partially offset by higher deposit margins and increased earnings on the investment portfolio
PCL of $17MM
Expenses down 4% YoY Prior year store optimization costs and current year
productivity savings, partly offset by employee related expenses and investments in the business
Efficiency ratio of 57.3%, down 560 bps
P&L (US$MM) (except where noted)
Reported Q1/22 QoQ YoY
Revenue 2,201 0% 6%
PCL 17 +$79 ($86) Impaired 99 +$46 ($48) Performing (82) +$33 ($38)
Expenses 1,261 (2%) (4%)
U.S. Retail Bank Net Income 806 (10%) 31%
Schwab Equity Pickup 200 3% 24%
Net Income 1,006 (8%) 30%
Net Income (C$MM) 1,272 (7%) 27%
ROE 12.6% -190 bps +280 bps
Earnings (US$MM)
$776 $1,047 $1,052 $1,092 $1,006
Q1/21 Q2/21 Q3/21 Q4/21 Q1/22
23
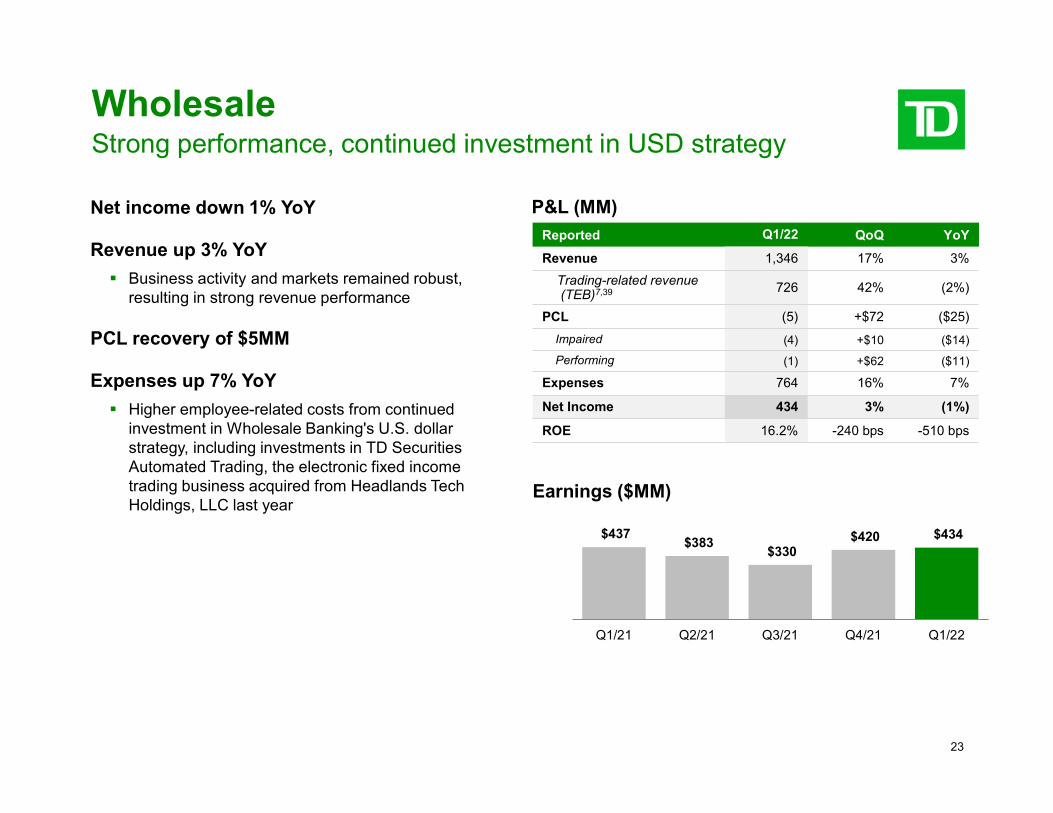
Wholesale Strong performance, continued investment in USD strategy
Net income down 1% YoY
Revenue up 3% YoY Business activity and markets remained robust,
resulting in strong revenue performance
PCL recovery of $5MM
Expenses up 7% YoY Higher employee-related costs from continued
investment in Wholesale Banking's U.S. dollar strategy, including investments in TD Securities Automated Trading, the electronic fixed income trading business acquired from Headlands Tech Holdings, LLC last year
P&L (MM) Reported Q1/22 QoQ YoY
Revenue 1,346 17% 3% Trading-related revenue (TEB) 7 ,39 726 42% (2%)
PCL (5) +$72 ($25) Impaired (4) +$10 ($14) Performing (1) +$62 ($11)
Expenses 764 16% 7%
Net Income 434 3% (1%)
ROE 16.2% -240 bps -510 bps
Earnings ($MM)
$437 $383
$330 $420 $434
Q1/21 Q2/21 Q3/21 Q4/21 Q1/22
24
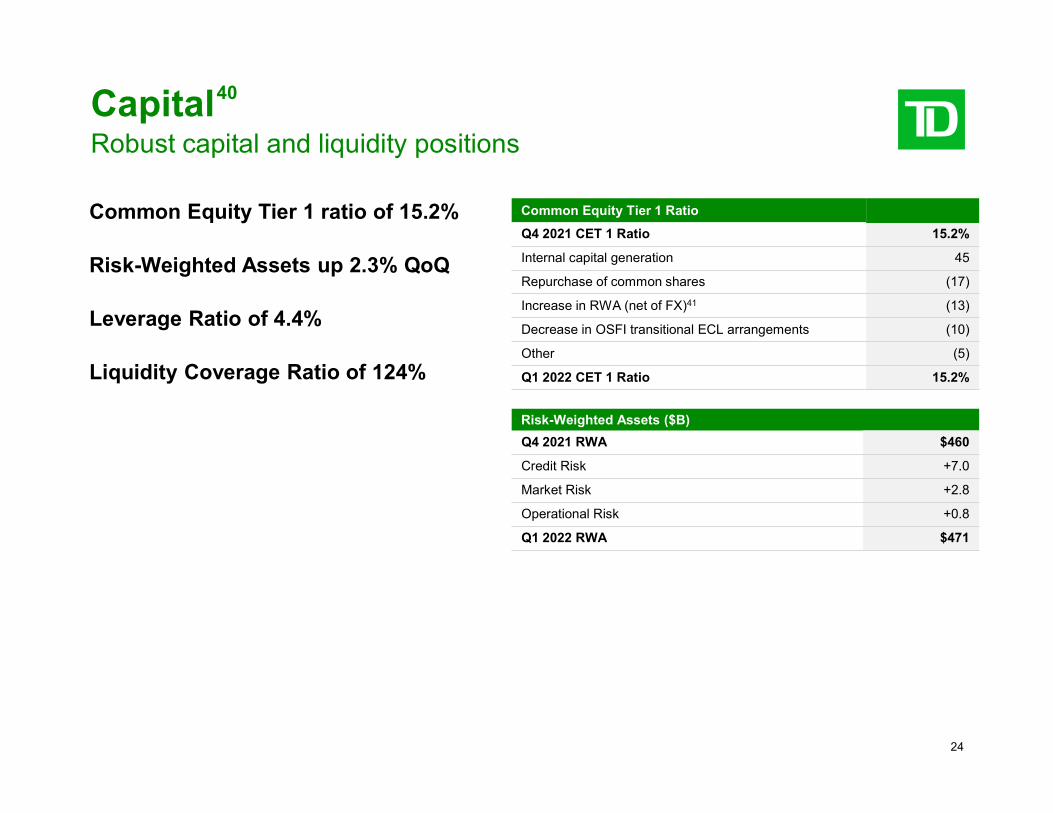
Capital 40
Robust capital and liquidity positions
Common Equity Tier 1 ratio of 15.2%
Risk-Weighted Assets up 2.3% QoQ
Leverage Ratio of 4.4%
Liquidity Coverage Ratio of 124%
Common Equity Tier 1 Ratio
Q4 2021 CET 1 Ratio 15.2%
Internal capital generation 45
Repurchase of common shares (17)
Increase in RWA (net of FX) 41 (13)
Decrease in OSFI transitional ECL arrangements (10)
Other (5)
Q1 2022 CET 1 Ratio 15.2%
Risk-Weighted Assets ($B) Q4 2021 RWA $460
Credit Risk +7.0
Market Risk +2.8
Operational Risk +0.8
Q1 2022 RWA $471
25
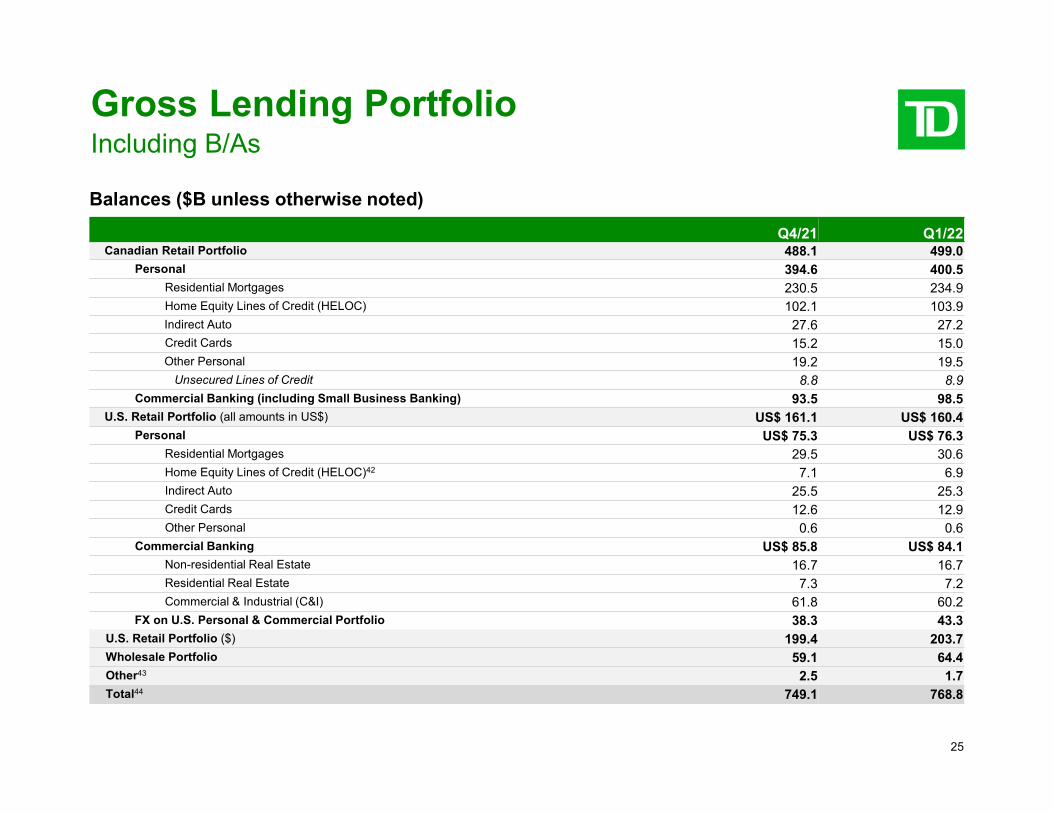
Gross Lending Portfolio Including B/As
Balances ($B unless otherwise noted)
Q4/21 Q1/22 Canadian Retail Portfolio 488.1 499.0
Personal 394.6 400.5 Residential Mortgages 230.5 234.9 Home Equity Lines of Credit (HELOC) 102.1 103.9 Indirect Auto 27.6 27.2 Credit Cards 15.2 15.0 Other Personal 19.2 19.5
Unsecured Lines of Credit 8.8 8.9 Commercial Banking (including Small Business Banking) 93.5 98.5
U.S. Retail Portfolio (all amounts in US$) US$ 161.1 US$ 160.4 Personal US$ 75.3 US$ 76.3
Residential Mortgages 29.5 30.6 Home Equity Lines of Credit (HELOC) 42 7.1 6.9 Indirect Auto 25.5 25.3 Credit Cards 12.6 12.9 Other Personal 0.6 0.6
Commercial Banking US$ 85.8 US$ 84.1 Non-residential Real Estate 16.7 16.7 Residential Real Estate 7.3 7.2 Commercial & Industrial (C&I) 61.8 60.2
FX on U.S. Personal & Commercial Portfolio 38.3 43.3 U.S. Retail Portfolio ($) 199.4 203.7 Wholesale Portfolio 59.1 64.4 Other 43 2.5 1.7 Total 44 749.1 768.8
26
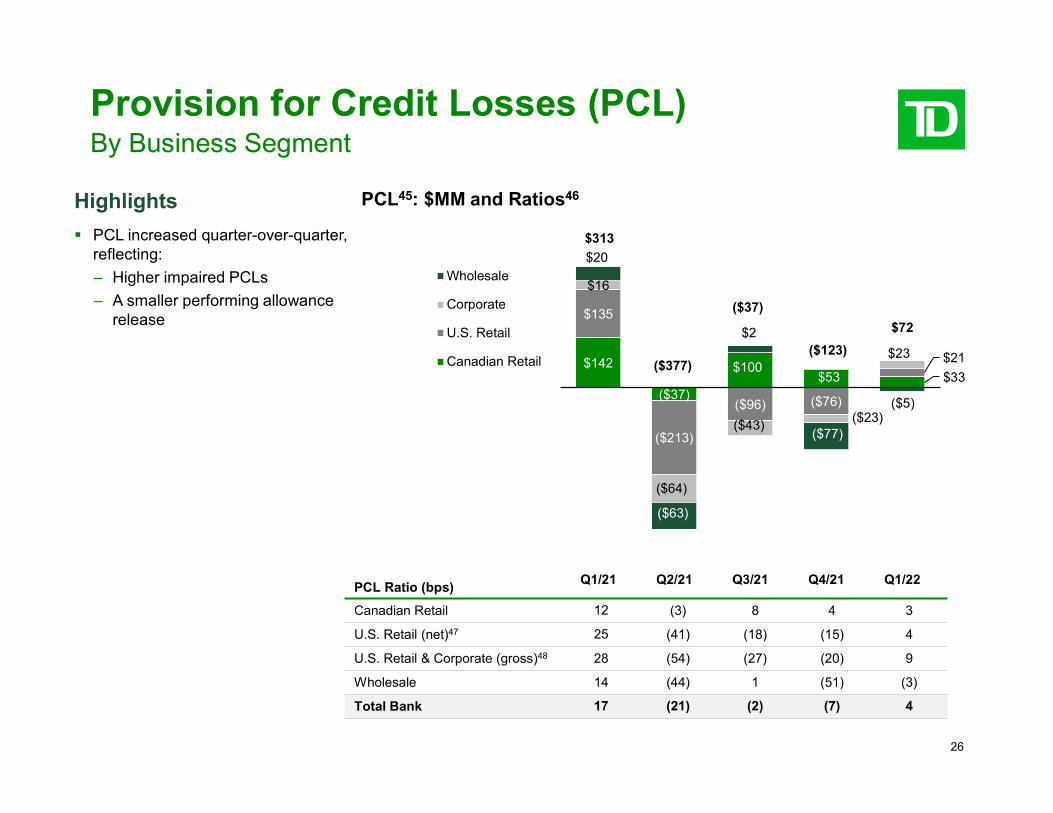
Provision for Credit Losses (PCL) By Business Segment
Highlights PCL increased quarter-over-quarter,
reflecting: – Higher impaired PCLs – A smaller performing allowance
release
PCL : $MM and Ratios 4645
$142
($37)
$100 $53 $33
$135
($213)
($96) ($76)
$21
$16
($64)
($43)($23)
$23
$20
($63)
$2
($77)
($5)
$313
($377)
($37)
($123)
$72
Wholesale
Corporate
U.S. Retail
Canadian Retail
PCL Ratio (bps) Q1/21 Q2/21 Q3/21 Q4/21 Q1/22
Canadian Retail 12 (3) 8 4 3
U.S. Retail (net) 47 25 (41) (18) (15) 4
U.S. Retail & Corporate (gross) 48 28 (54) (27) (20) 9
Wholesale 14 (44) 1 (51) (3)
Total Bank 17 (21) (2) (7) 4
27
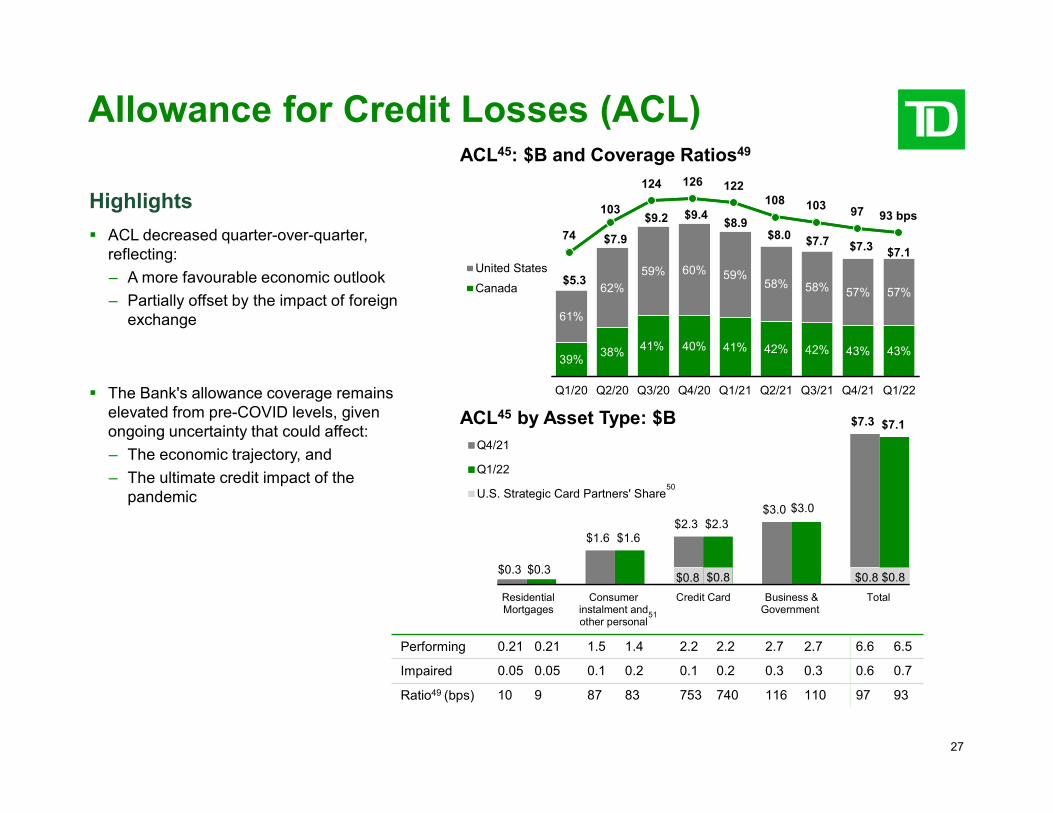
Allowance for Credit Losses (ACL)
Highlights ACL decreased quarter-over-quarter,
reflecting: – A more favourable economic outlook – Partially offset by the impact of foreign
exchange
The Bank's allowance coverage remains elevated from pre-COVID levels, given ongoing uncertainty that could affect: – The economic trajectory, and – The ultimate credit impact of the
pandemic
ACL 45 : $B and Coverage Ratios 49
74
103
124 126 122108 103 97 93 bps
39%38% 41% 40% 41% 42% 42% 43% 43%
61%
62%
59% 60% 59%58% 58% 57% 57%
$5.3
$7.9
$9.2 $9.4 $8.9
$8.0 $7.7 $7.3 $7.1
Q1/20 Q2/20 Q3/20 Q4/20 Q1/21 Q2/21 Q3/21 Q4/21 Q1/22
United States
Canada
ACL 45 by Asset Type: $B
$0.3
$1.6 $2.3
$3.0
$7.3
$0.8 $0.8 $0.3
$1.6 $2.3
$3.0
$7.1
$0.8 $0.8
Residential Mortgages
Consumer instalment and other personal
Credit Card Business & Government
Total
Q4/21
Q1/22
U.S. Strategic Card Partners' Share50
51
Performing 0.21 0.21 1.5 1.4 2.2 2.2 2.7 2.7 6.6 6.5
Impaired 0.05 0.05 0.1 0.2 0.1 0.2 0.3 0.3 0.6 0.7
Ratio 49 (bps) 10 9 87 83 753 740 116 110 97 93
28
TD Bank GroupKey Themes
1Top 10 North American Bank5th largest bank by Total Assets1
5th largest bank by Market Cap1
4 Strong Balance Sheet and Capital PositionHighly rated by major credit rating agencies3
2 Q1 2022 Financial ResultsFor the three months ended January 31, 2022.
3 Proven Performance, Future Growth Opportunities Delivering solid long term shareholder returns 2
29
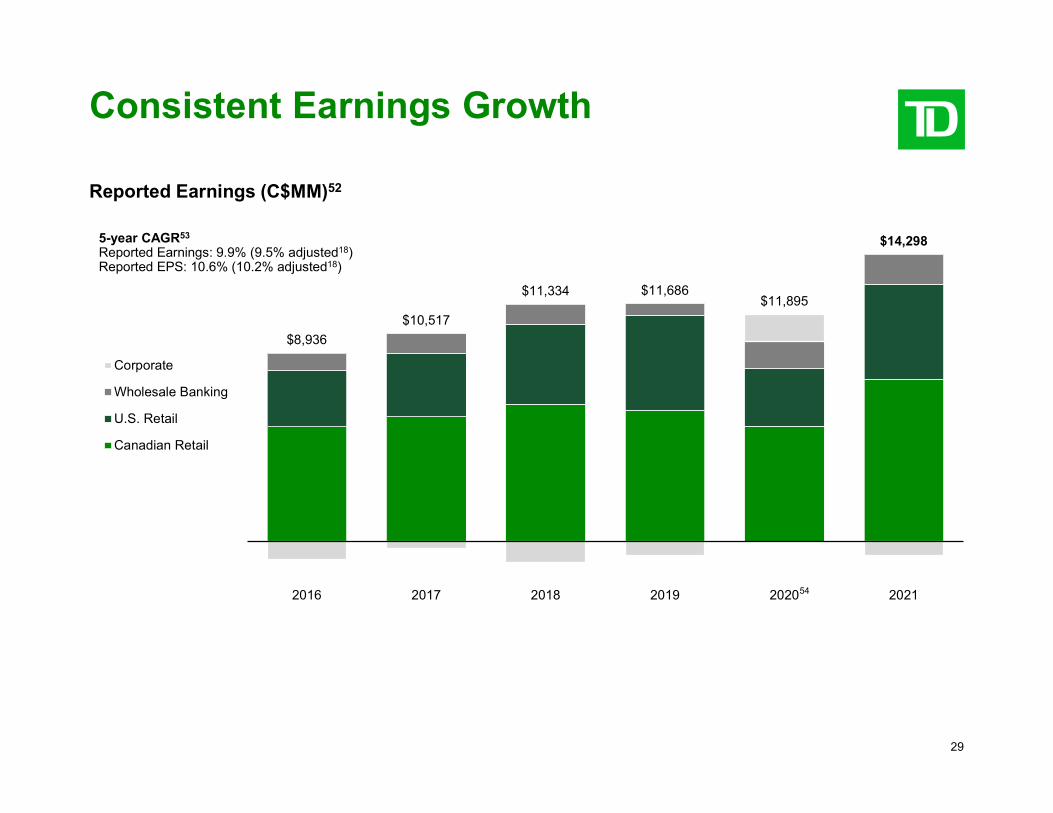
Consistent Earnings Growth
Reported Earnings (C$MM) 52
5-year CAGR 53
Reported Earnings: 9.9% (9.5% adjusted 18 )Reported EPS: 10.6% (10.2% adjusted 18 )
$8,936
$10,517
$11,334 $11,686 $11,895
$14,298
2016 2017 2018 2019 2020 2021
Corporate
Wholesale Banking
U.S. Retail
Canadian Retail
54
30
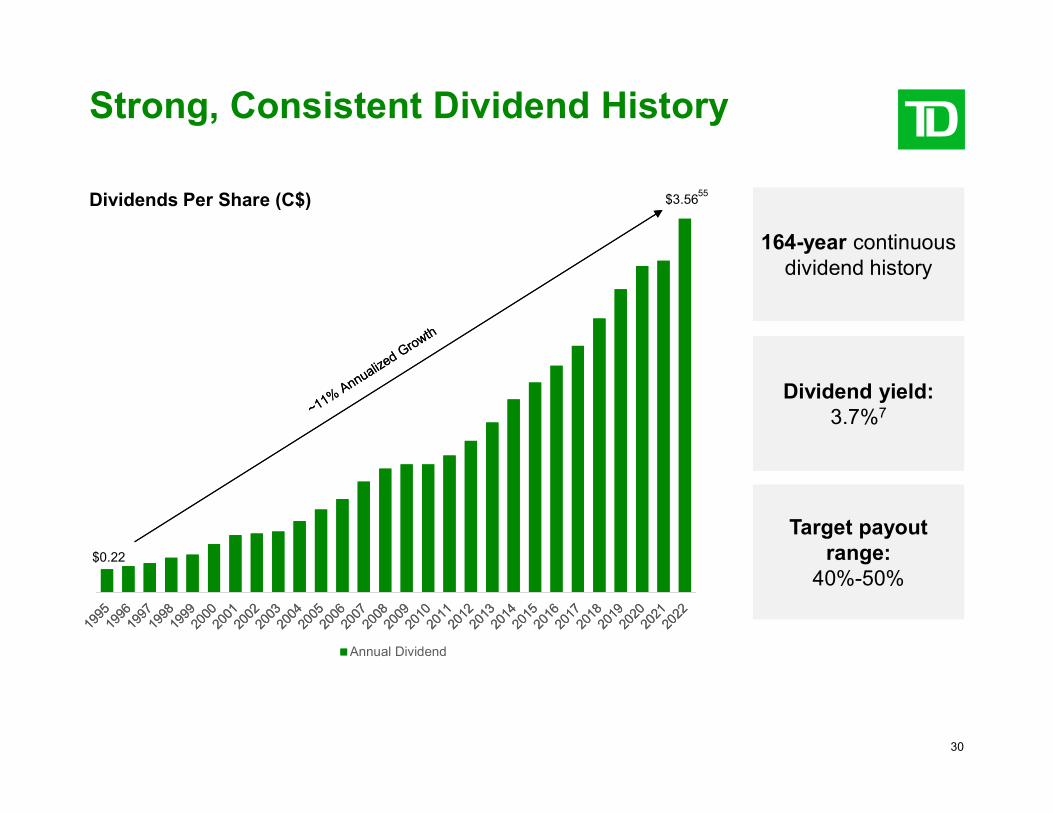
Strong, Consistent Dividend History
Dividends Per Share (C$)
$0.22
$3.56
Annual Dividend
55
164-year continuous dividend history
Dividend yield: 3.7% 7
Target payout range:
40%-50%
31
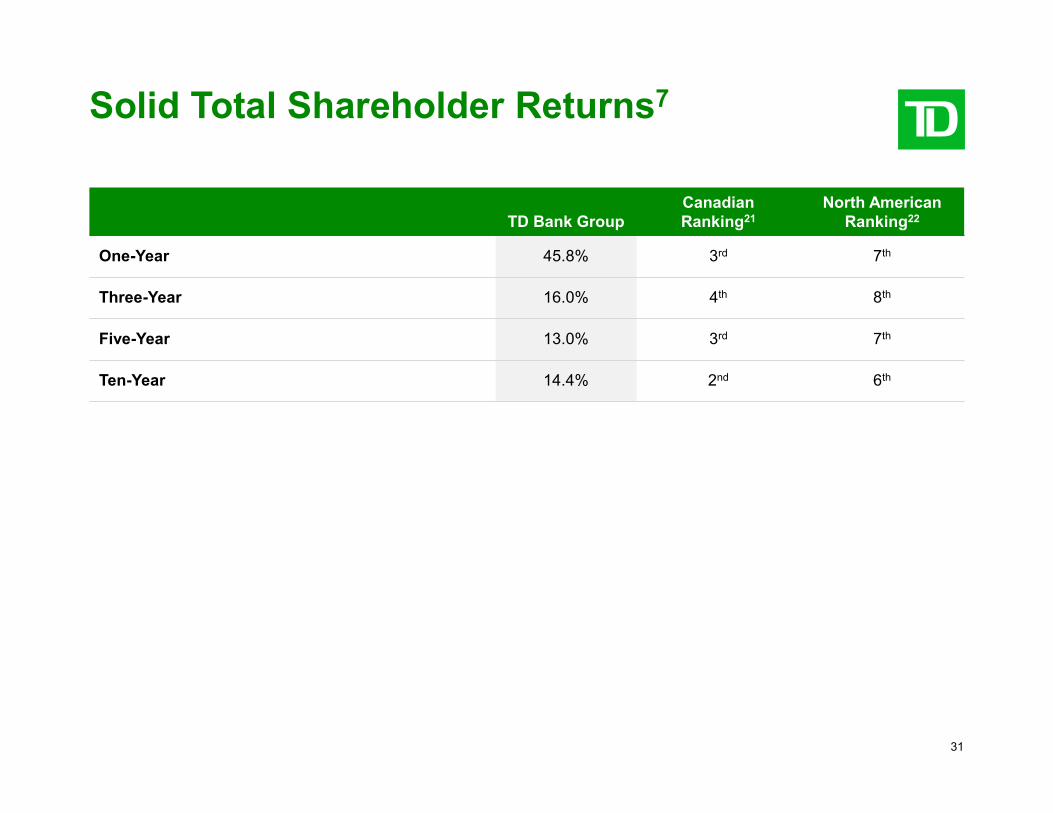
Solid Total Shareholder Returns 7
TD Bank Group Canadian Ranking 21
North American Ranking 22
One-Year 45.8% 3 rd 7 th
Three-Year 16.0% 4 th 8 th
Five-Year 13.0% 3 rd 7 th
Ten-Year 14.4% 2 nd 6 th
32
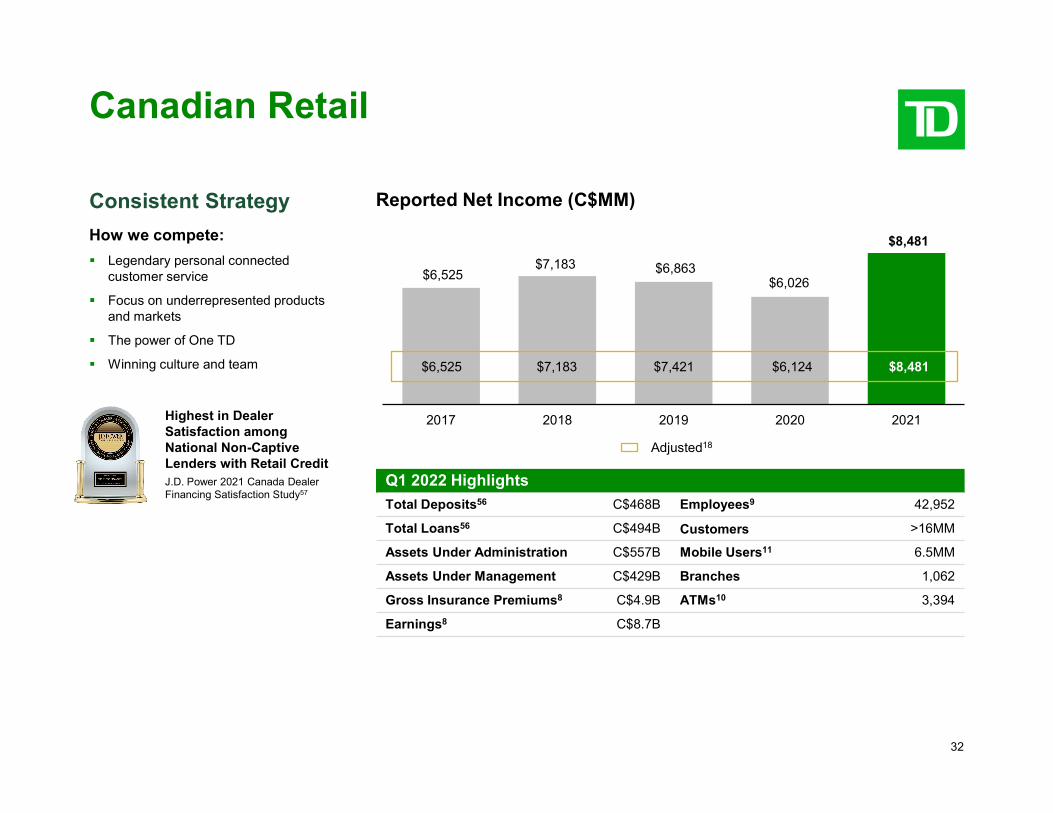
Reported Net Income (C$MM)
Canadian Retail
Consistent Strategy How we compete: Legendary personal connected
customer service
Focus on underrepresented products and markets
The power of One TD
Winning culture and team
Highest in Dealer Satisfaction among National Non-Captive Lenders with Retail Credit J.D. Power 2021 Canada Dealer Financing Satisfaction Study 57
$6,525 $7,183 $6,863
$6,026
$8,481
2017 2018 2019 2020 2021
$6,525 $7,183 $7,421 $6,124 $8,481
Adjusted18
Q1 2022 Highlights Total Deposits 56 C$468B
Total Loans 56 C$494B
Assets Under Administration C$557B
Assets Under Management C$429B
Gross Insurance Premiums 8 C$4.9B
Earnings 8 C$8.7B
Employees 9 42,952
Customers >16MM
Mobile Users 11 6.5MM
Branches 1,062
ATMs 10 3,394
33
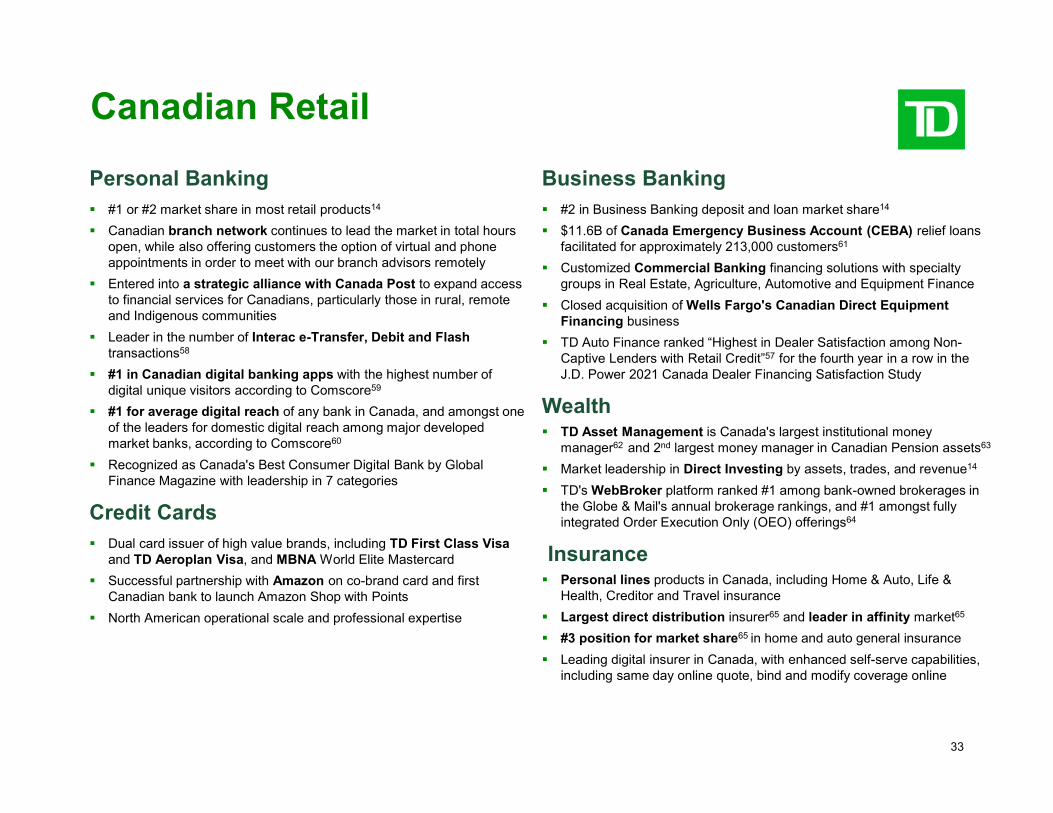
Canadian Retail
-
Personal Banking #1 or #2 market share in most retail products 14
Canadian branch network continues to lead the market in total hours open, while also offering customers the option of virtual and phone appointments in order to meet with our branch advisors remotely
Entered into a strategic alliance with Canada Post to expand access to financial services for Canadians, particularly those in rural, remote and Indigenous communities
Leader in the number of Interac e-Transfer, Debit and Flash transactions 58
#1 in Canadian digital banking apps with the highest number of digital unique visitors according to Comscore 59
#1 for average digital reach of any bank in Canada, and amongst one of the leaders for domestic digital reach among major developed market banks, according to Comscore 60
Recognized as Canada's Best Consumer Digital Bank by Global Finance Magazine with leadership in 7 categories
Credit Cards Dual card issuer of high value brands, including TD First Class Visa
and TD Aeroplan Visa, and MBNA World Elite Mastercard Successful partnership with Amazon on co-brand card and first
Canadian bank to launch Amazon Shop with Points North American operational scale and professional expertise
Business Banking #2 in Business Banking deposit and loan market share 14
$11.6B of Canada Emergency Business Account (CEBA) relief loans facilitated for approximately 213,000 customers 61
Customized Commercial Banking financing solutions with specialty groups in Real Estate, Agriculture, Automotive and Equipment Finance
Closed acquisition of Wells Fargo's Canadian Direct Equipment Financing business
TD Auto Finance ranked “Highest in Dealer Satisfaction among Non Captive Lenders with Retail Credit” for the fourth year in a row in the J.D. Power 2021 Canada Dealer Financing Satisfaction Study
57
Wealth TD Asset Management is Canada's largest institutional money
manager 62 and 2 nd largest money manager in Canadian Pension assets 63
Market leadership in Direct Investing by assets, trades, and revenue 14
TD's WebBroker platform ranked #1 among bank-owned brokerages in the Globe & Mail's annual brokerage rankings, and #1 amongst fully integrated Order Execution Only (OEO) offerings 64
Insurance Personal lines products in Canada, including Home & Auto, Life &
Health, Creditor and Travel insurance Largest direct distribution insurer 65 and leader in affinity market 65
#3 position for market share 65 in home and auto general insurance Leading digital insurer in Canada, with enhanced self-serve capabilities,
including same day online quote, bind and modify coverage online
34
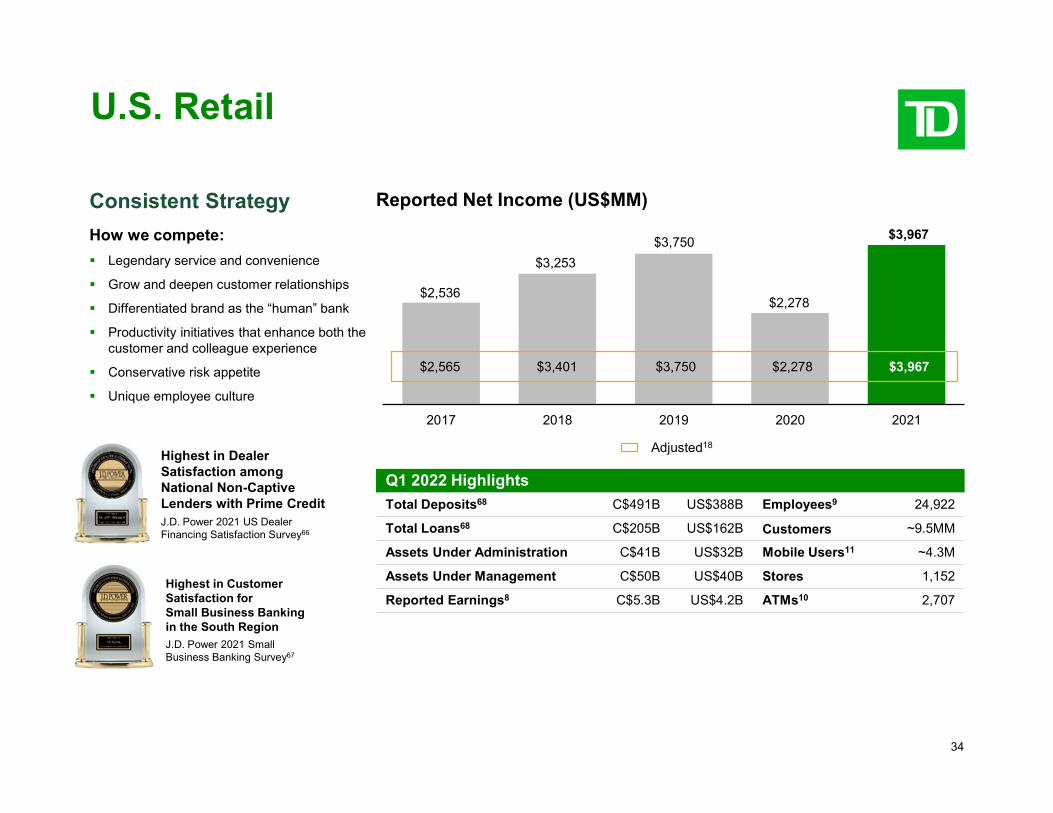
Reported Net Income (US$MM)
U.S. Retail
Consistent Strategy How we compete: Legendary service and convenience
Grow and deepen customer relationships
Differentiated brand as the “human” bank
Productivity initiatives that enhance both the customer and colleague experience
Conservative risk appetite
Unique employee culture
Highest in Dealer Satisfaction among National Non-Captive Lenders with Prime Credit J.D. Power 2021 US Dealer Financing Satisfaction Survey 66
Highest in Customer Satisfaction for Small Business Banking in the South Region J.D. Power 2021 Small Business Banking Survey 67
$2,536
$3,253
$3,750
$2,278
$3,967
2017 2018 2019 2020 2021
$2,565 $3,401 $3,750 $2,278 $3,967
Adjusted18
Q1 2022 Highlights Total Deposits 68 C$491B
Total Loans 68 C$205B
Assets Under Administration C$41B
Assets Under Management C$50B
Reported Earnings 8 C$5.3B
US$388B
US$162B
US$32B
US$40B
US$4.2B
Employees 9 24,922
Customers ~9.5MM
Mobile Users 11 ~4.3M
Stores 1,152
ATMs 10 2,707
35
U.S. Retail
-
-
Personal & Commercial Banking Top 10 bank 69 with over 9MM customers, operating retail stores in 15
states and the District of Columbia Offer online and mobile banking tools; instant debit card issuance,
mobile check-in available at stores, and point of sale and paymentssolutions for business, including direct integration with Autobooks tosupport online invoicing and payments or small business clients
Entered into a data access agreement with Akoya, a U.S. open banking utility, designed to enable customers to share data with Fintechs and aggregators
Introduced TD Essential Banking, a low-cost, no-overdraft-fee deposit account and announced overdraft policy changes to enhance access to financial services for underserved communities
Ranked #1 in total number of approved U.S. Small Business Administration (SBA) loan units in our Maine-to-Florida footprint for the fifth consecutive year in 2021
Ranked 7th nationwide for Paycheck Protection Program (PPP) financing, funding ~133,000 PPP loans and facilitating forgiveness of ~115,000 loans worth US$10B through January 31, 2022
Ranked #1 in the 2021 J.D. Power Small Business Banking Satisfaction Study in the South Region 67
Auto Lending Indirect retail lending through dealers across the country and
comprehensive solutions for dealers, including floor plan, commercial banking and wealth management
TD Auto Finance ranked “Highest in Dealer Satisfaction among Non Captive Lenders with Prime Credit” for the second year in a row in th e J.D. Power 2021 U.S. Dealer Financing Satisfaction Study
66
Credit Cards Private label and co-brand credit card offering for U.S. customers of
regional and nationwide retail partners, including Target and Nordstrom Issuer of TD branded credit cards for retail and small business
customers, including Double Up, a leading cash back offering thatenables customers to earn 1% on purchases and a bonus 1% whenpoints are redeemed as cash into a TD deposit account
Wealth Serve the wealth management needs of Mass Affluent, High Net
Worth and Institutional clients through a network of store-basedadvisors across the TD AMCB footprint and newly launched roboadvisor (TD Automated Investing) and robo/hybrid (TD AutomatedInvesting Plus) solutions
Advisor-led client discovery and goals-based planning, offering banking, investment management, trust, estate planning and insurance and annuity products
Acquired in 2013, Epoch Investment Partners expands overall product capabilities in the U.S. and Canada
Charles Schwab Largest shareholder in The Charles Schwab Corporation (Schwab)
following Schwab's acquisition of TD Ameritrade in October 2020
First Horizon Announced proposed acquisition of First Horizon on February 28,
2022, expanding TD AMCB into U.S. southeast; transaction expectedto close in the first quarter of fiscal 2023, subject to closing conditions
36
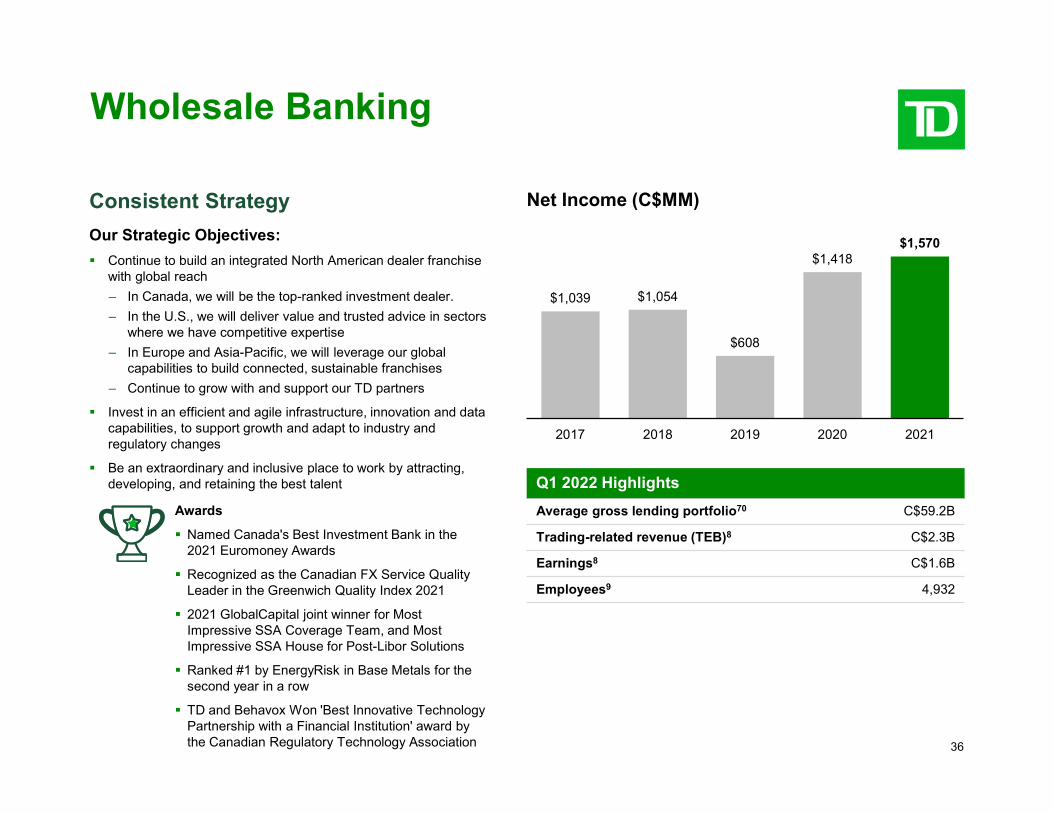
Net Income (C$MM)
Wholesale Banking
Consistent Strategy Our Strategic Objectives: Continue to build an integrated North American dealer franchise
with global reach – In Canada, we will be the top-ranked investment dealer. – In the U.S., we will deliver value and trusted advice in sectors
where we have competitive expertise – In Europe and Asia-Pacific, we will leverage our global
capabilities to build connected, sustainable franchises – Continue to grow with and support our TD partners
Invest in an efficient and agile infrastructure, innovation and data capabilities, to support growth and adapt to industry and regulatory changes
Be an extraordinary and inclusive place to work by attracting, developing, and retaining the best talent
Awards
Named Canada's Best Investment Bank in the 2021 Euromoney Awards
Recognized as the Canadian FX Service Quality Leader in the Greenwich Quality Index 2021
2021 GlobalCapital joint winner for Most Impressive SSA Coverage Team, and Most Impressive SSA House for Post-Libor Solutions
Ranked #1 by EnergyRisk in Base Metals for the second year in a row
TD and Behavox Won 'Best Innovative Technology Partnership with a Financial Institution' award by the Canadian Regulatory Technology Association
$1,039 $1,054
$608
$1,418$1,570
2017 2018 2019 2020 2021
Q1 2022 Highlights
Average gross lending portfolio 70 C$59.2B
Trading-related revenue (TEB) 8 C$2.3B
Earnings 8 C$1.6B
Employees 9 4,932
37
Wholesale Banking
Positioned for Growth Growing our Environmental, Social and Governance (ESG) capabilities as we bring advice, thought-leadership and products to our clients:
– Acted as co-lead green structuring agent and joint bookrunner for Bruce Power on its $500 million inaugural green bond, the world's first green bond to finance nuclear power
– Advisor to Clearway Energy, Inc. on its US$1.9 billion sale of Clearway Community Energy to KKR & Co Inc.
Continue to build an integrated North American dealer franchise with global reach: – Record quarter for underwriting investment-grade debt for Financial Institutions, including the largest-ever Australian bank and French bank
US$ debt offerings – Joint Bookrunner on US$2.35 billion senior notes for Athenahealth backing the buyout of the company by Bain Capital and Hellmann &
Friedman
Strong Operating Model Drive innovation and build data and analytical capabilities to improve end-to-end process efficiency and enhance client value Continue to lower our cost structure to reflect reduced margins and volumes in parts of our business and create capacity for additional
investments Maintain our focus on managing risk, capital, balance sheet, and liquidity
Investing in Our People Continue to be an extraordinary place to work with a focus on inclusion and diversity
38
TD Bank GroupKey Themes
1Top 10 North American Bank5th largest bank by Total Assets1
5th largest bank by Market Cap1
3 Proven Performance, Future Growth OpportunitiesDelivering solid long term shareholder returns2
2 Q1 2022 Financial ResultsFor the three months ended January 31, 2022.
4 Strong Balance Sheet and Capital Position Highly rated by major credit rating agencies 3
39
Leverage-Based TLAC Ratio73,74
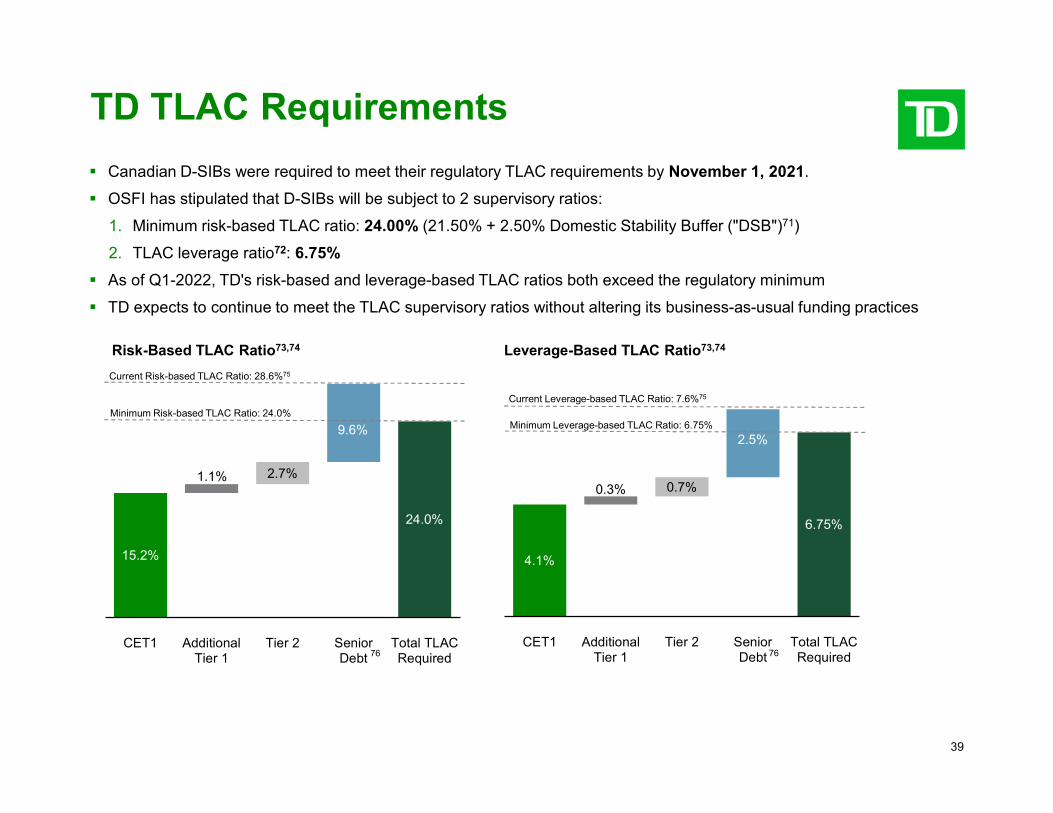
TD TLAC Requirements Canadian D-SIBs were required to meet their regulatory TLAC requirements by November 1, 2021. OSFI has stipulated that D-SIBs will be subject to 2 supervisory ratios:
1. Minimum risk-based TLAC ratio: 24.00% (21.50% + 2.50% Domestic Stability Buffer ("DSB") 71 )
2. TLAC leverage ratio 72 : 6.75% As of Q1-2022, TD's risk-based and leverage-based TLAC ratios both exceed the regulatory minimum TD expects to continue to meet the TLAC supervisory ratios without altering its business-as-usual funding practices
15.2%
24.0%
2.7%
9.6%
CET1 AdditionalTier 1
Tier 2 SeniorDebt
Total TLACRequired76
Current Risk-based TLAC Ratio: 28.6%75
Minimum Risk-based TLAC Ratio: 24.0%
1.1%
Risk-Based TLAC Ratio73,74
4.1%
6.75%
0.7%
2.5%
CET1 AdditionalTier 1
Tier 2 SeniorDebt
Total TLACRequired
Current Leverage-based TLAC Ratio: 7.6%75
Minimum Leverage-based TLAC Ratio: 6.75%
76
0.3%
40
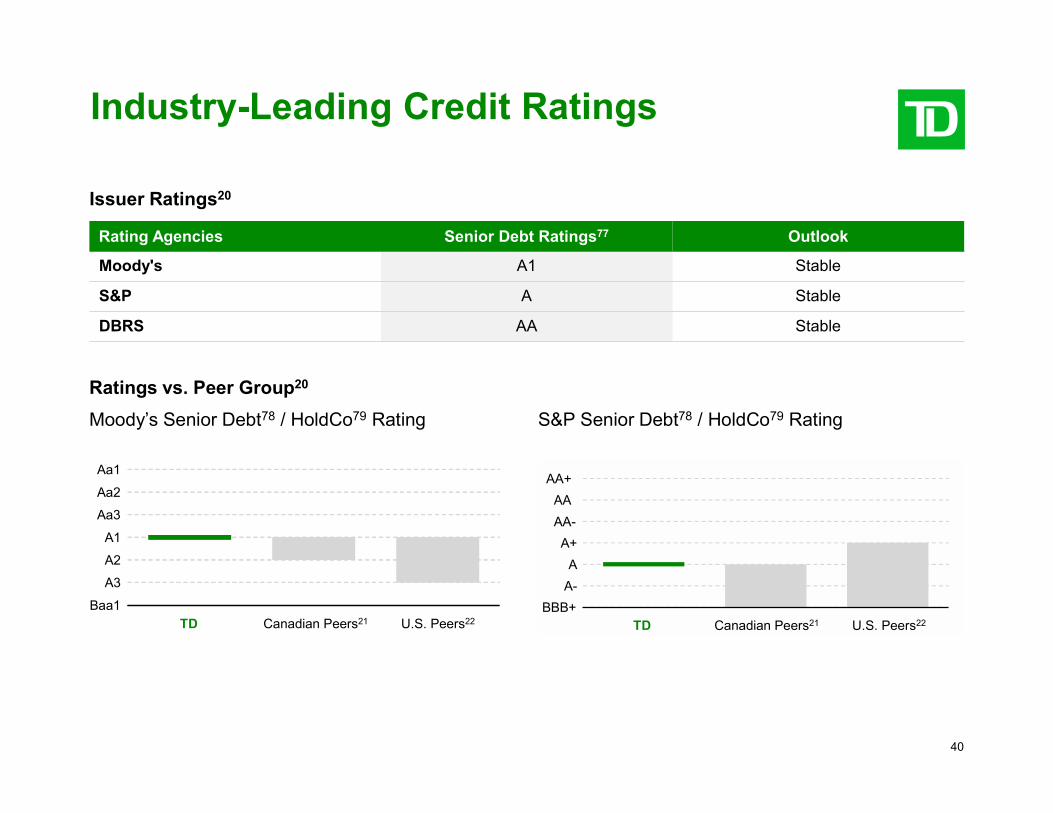
Industry-Leading Credit Ratings
Issuer Ratings 20
Rating Agencies Senior Debt Ratings 77 Outlook
Moody's A1 Stable
S&P A Stable
DBRS AA Stable
Ratings vs. Peer Group 20
Aa1
Aa2
Aa3
A1
A2
A3
Baa1TD Canadian Peers U.S. PeersTD Canadian Peers21 U.S. Peers22
Moody’s Senior Debt 78 / HoldCo 79 Rating S&P Senior Debt 78 / HoldCo 79 Rating
AA+
AA
AA-
A+
A
A-
BBB+TD Canadian Peers U.S. Peers
TD Canadian Peers21 U.S. Peers22
41
S
B
B
S&P
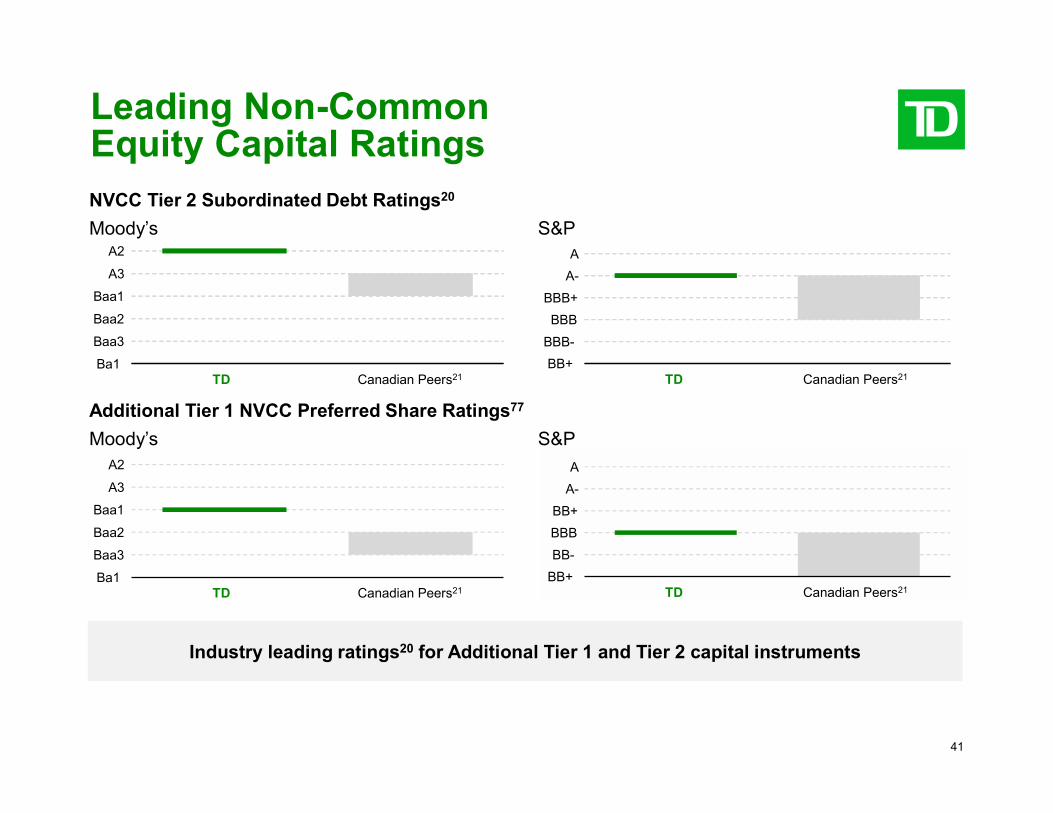
Leading Non-Common Equity Capital Ratings NVCC Tier 2 Subordinated Debt Ratings 20
Moody’sA2
A3
Baa1
Baa2
Baa3
Ba1TD Canadian PeersTD Canadian Peers21
A
A-
BBB+
BBB
BBB-
BB+TD Canadian Peers
TD Canadian Peers21
Additional Tier 1 NVCC Preferred Share Ratings 77
Moody’sA2
A3
Baa1
Baa2
Baa3
Ba1TD Canadian PeersTD Canadian Peers21
&P
A
A-
BB+
BBB
BB-
BB+TD Canadian Peers
TD Canadian Peers21
Industry leading ratings 20 for Additional Tier 1 and Tier 2 capital instruments
42
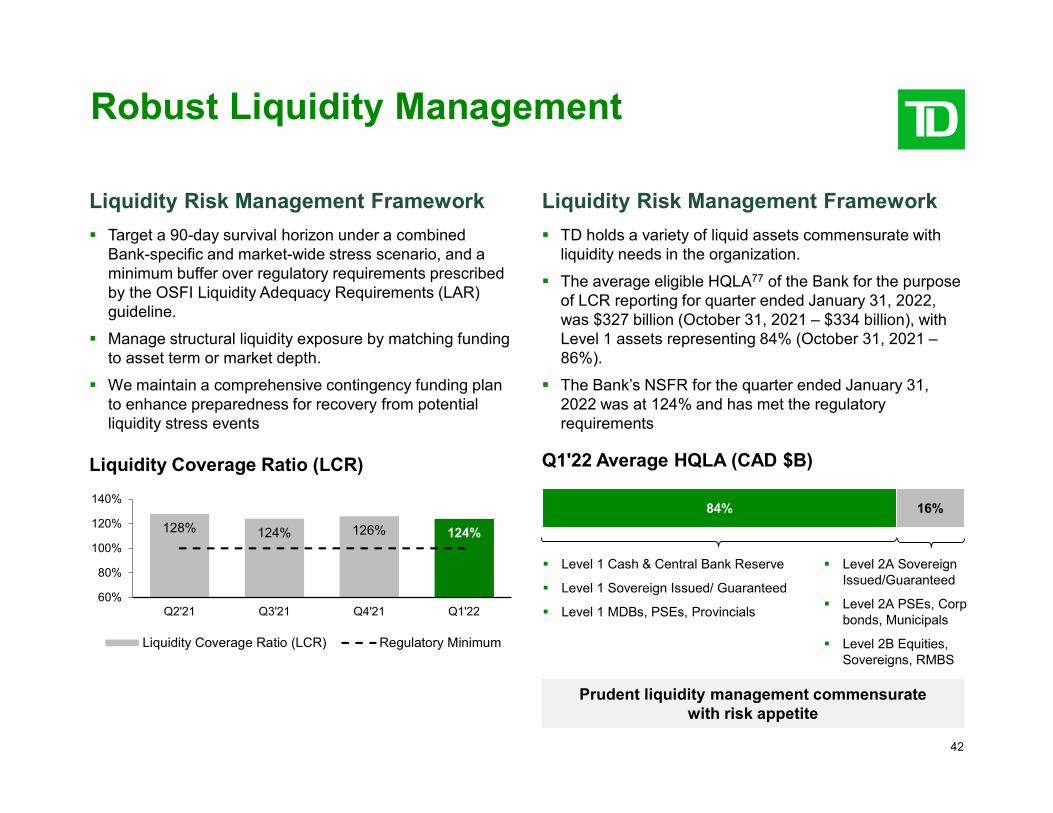
Robust Liquidity Management
Liquidity Risk Management Framework Target a 90-day survival horizon under a combined
Bank-specific and market-wide stress scenario, and a minimum buffer over regulatory requirements prescribed by the OSFI Liquidity Adequacy Requirements (LAR) guideline.
Manage structural liquidity exposure by matching funding to asset term or market depth.
We maintain a comprehensive contingency funding plan to enhance preparedness for recovery from potential liquidity stress events
Liquidity Coverage Ratio (LCR)
128% 124% 126% 124%
60%
80%
100%
120%
140%
Q2'21 Q3'21 Q4'21 Q1'22
Liquidity Coverage Ratio (LCR) Regulatory Minimum
Liquidity Risk Management Framework TD holds a variety of liquid assets commensurate with
liquidity needs in the organization. The average eligible HQLA 77 of the Bank for the purpose
of LCR reporting for quarter ended January 31, 2022, was $327 billion (October 31, 2021 – $334 billion), with Level 1 assets representing 84% (October 31, 2021 – 86%).
The Bank’s NSFR for the quarter ended January 31, 2022 was at 124% and has met the regulatory requirements
Q1'22 Average HQLA (CAD $B)
84%
Level 1 Cash & Central Bank Reserve
Level 1 Sovereign Issued/ Guaranteed
Level 1 MDBs, PSEs, Provincials
16%
Level 2A Sovereign Issued/Guaranteed
Level 2A PSEs, Corp bonds, Municipals
Level 2B Equities, Sovereigns, RMBS
Prudent liquidity management commensurate with risk appetite
43
10
20
30
40
50
Business & Government ($B)
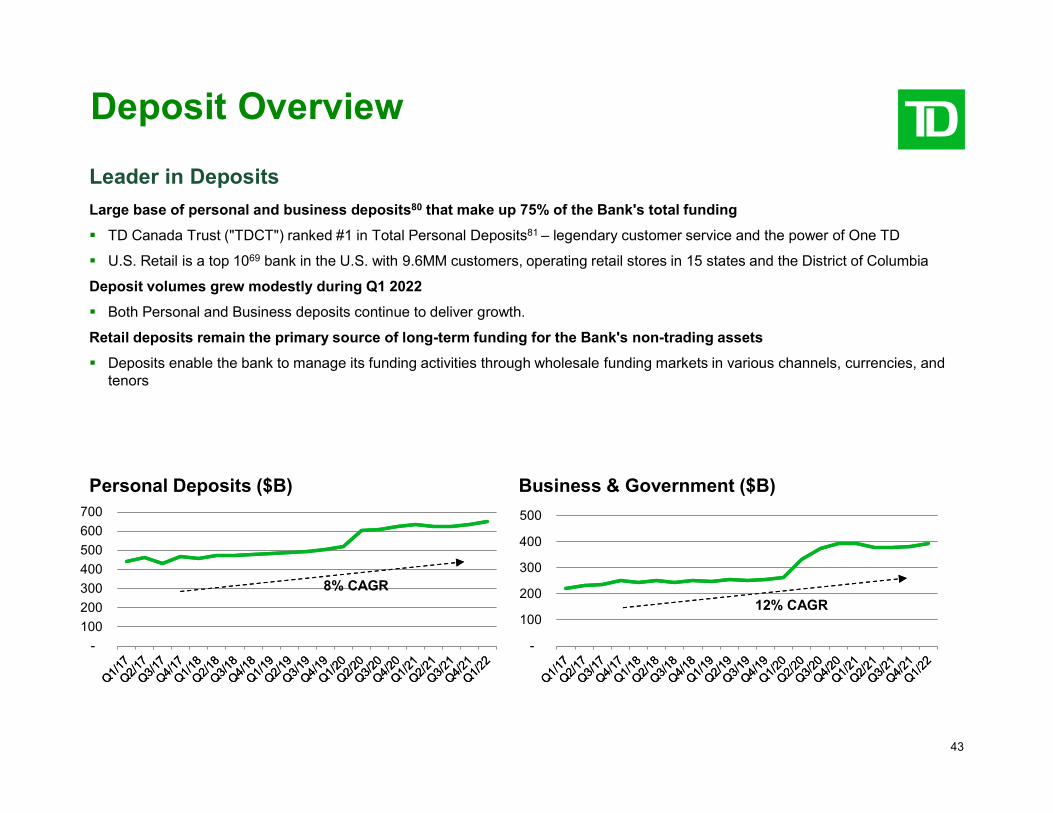
Deposit Overview
Leader in Deposits Large base of personal and business deposits 80 that make up 75% of the Bank's total funding
TD Canada Trust ("TDCT") ranked #1 in Total Personal Deposits 81 – legendary customer service and the power of One TD
U.S. Retail is a top 10 69 bank in the U.S. with 9.6MM customers, operating retail stores in 15 states and the District of Columbia
Deposit volumes grew modestly during Q1 2022
Both Personal and Business deposits continue to deliver growth.
Retail deposits remain the primary source of long-term funding for the Bank's non-trading assets
Deposits enable the bank to manage its funding activities through wholesale funding markets in various channels, currencies, and tenors
-
100
200
300
400
500
600
700
8% CAGR
Personal Deposits ($B)
-
0
0
0
0
0
12% CAGR
44
1
2
3
4
5
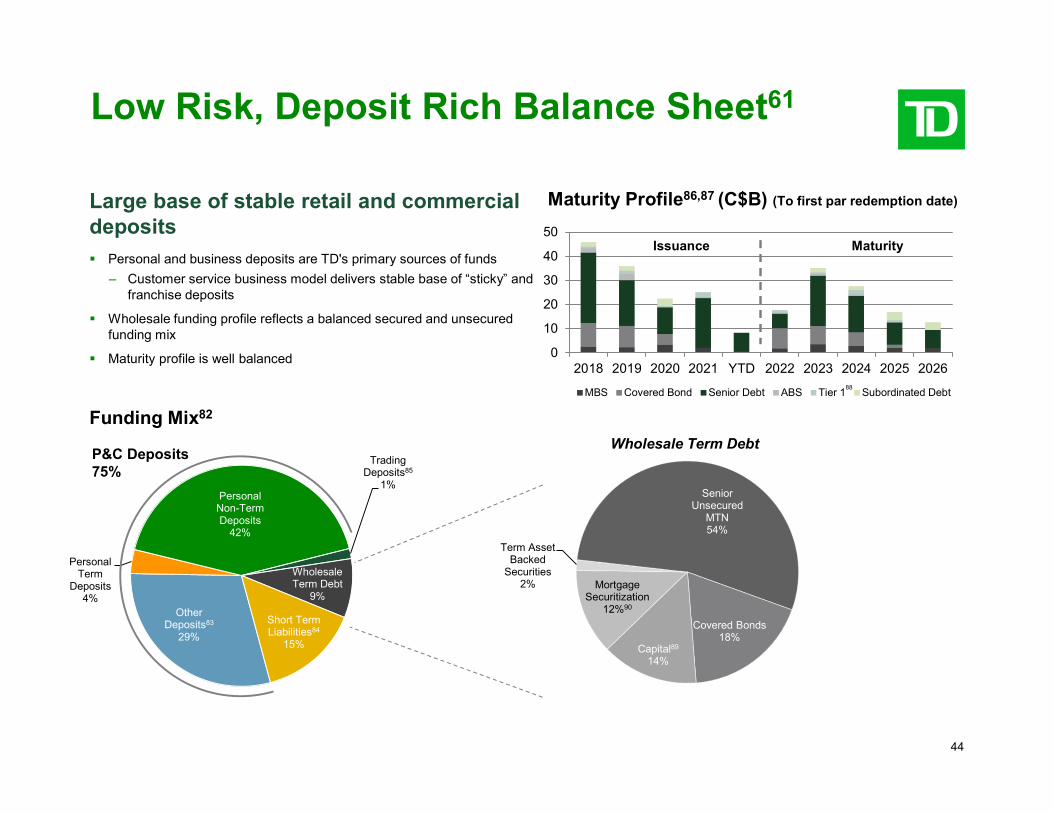
Low Risk, Deposit Rich Balance Sheet 61
Large base of stable retail and commercial deposits Personal and business deposits are TD's primary sources of funds
– Customer service business model delivers stable base of “sticky” and franchise deposits
Wholesale funding profile reflects a balanced secured and unsecured funding mix
Maturity profile is well balanced
Maturity Profile 86 ,87 (C$B) (To first par redemption date)
0
0
0
0
0
0
2018 2019 2020 2021 YTD 2022 2023 2024 2025 2026
MBS Covered Bond Senior Debt ABS Tier 1 Subordinated Debt
Issuance Maturity
88
Funding Mix 82
P&C Deposits 75%
Trading Deposits 85
1% Personal Non-Term Deposits
42%
Wholesale Term Debt
9%
Short Term Liabilities 84
15%
Other Deposits 83
29%
Personal Term
Deposits 4%
Wholesale Term Debt
Senior Unsecured
MTN 54%
Covered Bonds 18%
Capital 89
14%
Mortgage Securitization
12% 90
Term Asset Backed
Securities 2%
45
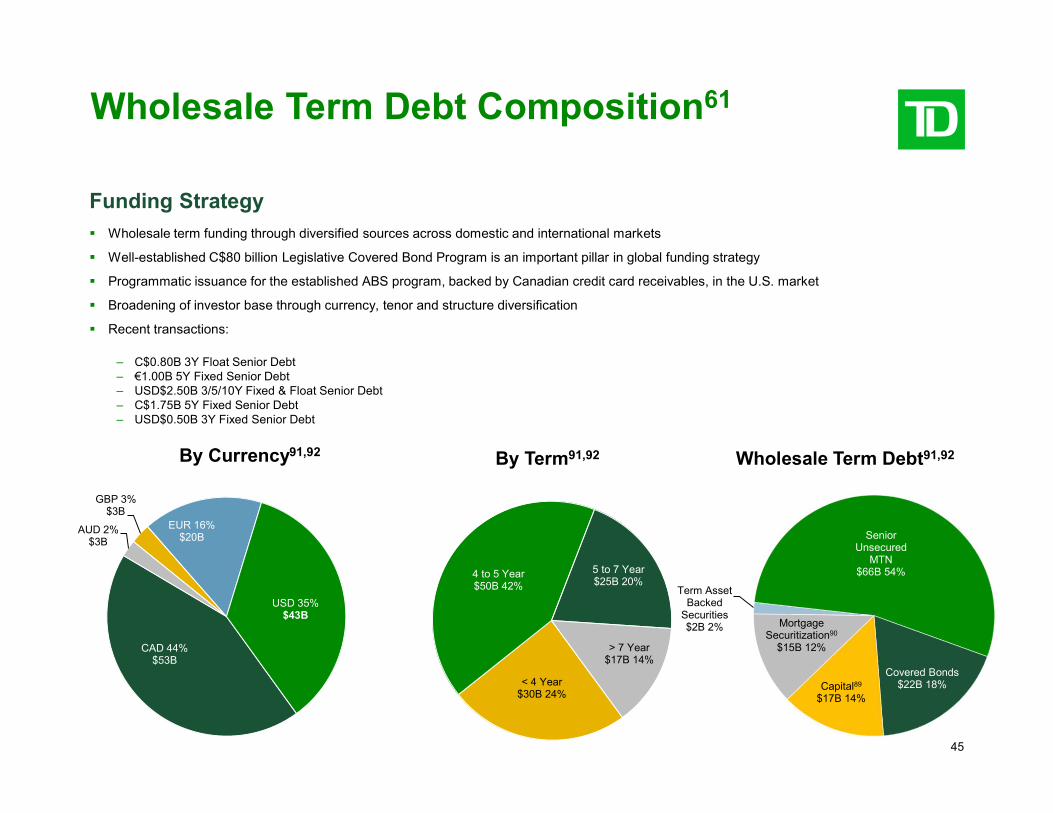
Wholesale Term Debt Composition 61
Funding Strategy Wholesale term funding through diversified sources across domestic and international markets
Well-established C$80 billion Legislative Covered Bond Program is an important pillar in global funding strategy
Programmatic issuance for the established ABS program, backed by Canadian credit card receivables, in the U.S. market
Broadening of investor base through currency, tenor and structure diversification
Recent transactions:
– C$0.80B 3Y Float Senior Debt – €1.00B 5Y Fixed Senior Debt – USD$2.50B 3/5/10Y Fixed & Float Senior Debt – C$1.75B 5Y Fixed Senior Debt – USD$0.50B 3Y Fixed Senior Debt
By Currency 91 ,92
EUR 16% $20B
USD 35% $43B
CAD 44% $53B
AUD 2% $3B
GBP 3% $3B
By Term 91 ,92
4 to 5 Year $50B 42%
5 to 7 Year $25B 20%
> 7 Year $17B 14%
< 4 Year $30B 24%
Wholesale Term Debt 91 ,92
Senior Unsecured
MTN $66B 54%
Covered Bonds $22B 18% Capital 89
$17B 14%
Mortgage Securitization 90
$15B 12%
Term Asset Backed
Securities $2B 2%
46
Canadian Registered Covered Bond Program Key Highlights Covered Bond Collateral Canadian residential real estate property with no more than 4 residential units
Uninsured conventional first lien assets with original loan to value ratio that is 80% or less
Housing Market Risks Latest property valuation shall be adjusted at least quarterly to account for subsequent price adjustments using the Indexation Methodology
Tests and Credit Enhancements
Asset Coverage Test Asset Percentage Amortization Test Reserve Fund Valuation Calculation Prematurity Liquidity Level of Overcollateralization OSFI limit 93
Required Ratings and Ratings Triggers
No less than one Rating Agency must at all times have current ratings assigned to bonds outstanding All Ratings Triggers must be set for:
− Replacement of other Counterparties − Establishment of the Reserve Fund − Pre-maturity ratings − Permitted cash commingling period
Interest Rate and Currency Risk
Management of interest rate and currency risk: − Interest rate swap − Covered bond swaps
Ongoing Disclosure Requirements
Monthly investor reports shall be posted on the program website Plain disclosure of material facts in the Public Offering Document
Audit and Compliance Annual specified auditing procedures performed by a qualified cover pool monitor Deliver an Annual Compliance Certificate to the Canada Mortgage and Housing Corporation ("CMHC")
47
Current LTV
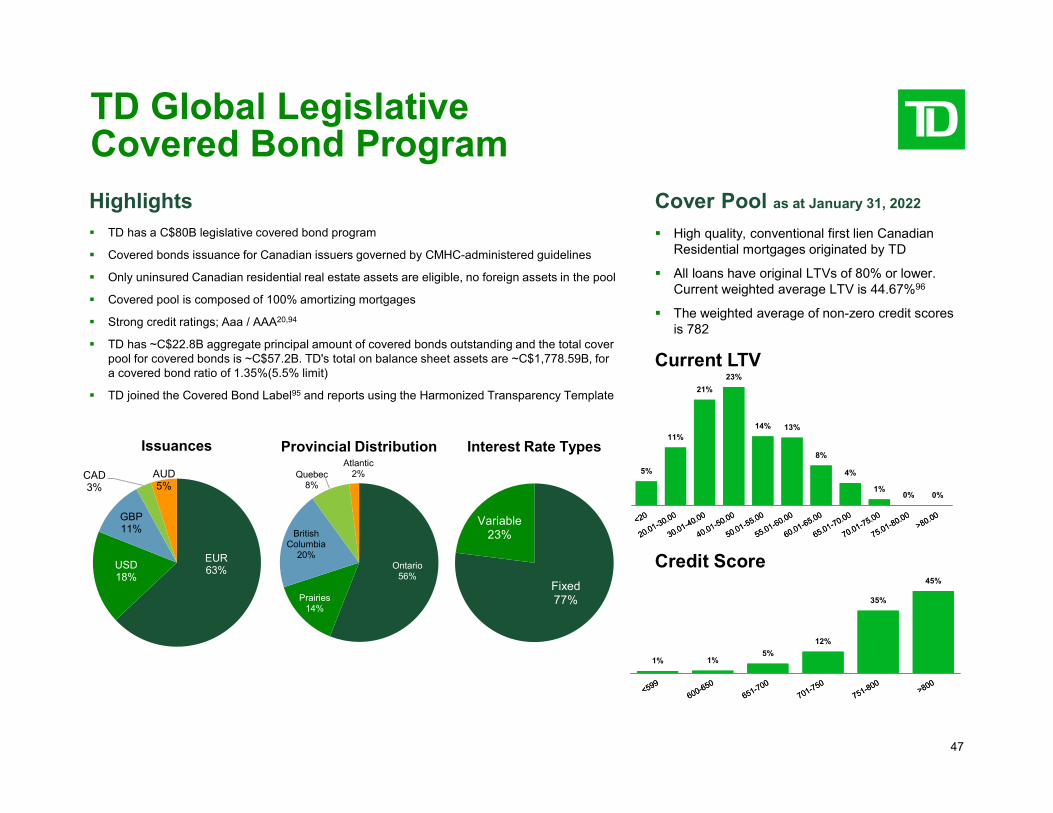
TD Global Legislative Covered Bond Program Highlights TD has a C$80B legislative covered bond program
Covered bonds issuance for Canadian issuers governed by CMHC-administered guidelines
Only uninsured Canadian residential real estate assets are eligible, no foreign assets in the pool
Covered pool is composed of 100% amortizing mortgages
Strong credit ratings; Aaa / AAA 20 ,94
TD has ~C$22.8B aggregate principal amount of covered bonds outstanding and the total coverpool for covered bonds is ~C$57.2B. TD's total on balance sheet assets are ~C$1,778.59B, fora covered bond ratio of 1.35%(5.5% limit)
TD joined the Covered Bond Label 95 and reports using the Harmonized Transparency Template
Issuances
CAD 3%
AUD 5%
EUR 63% USD
18%
GBP 11%
Provincial Distribution
Quebec 8%
Atlantic 2%
Ontario 56%
Prairies 14%
British Columbia
20%
Interest Rate Types
Variable 23%
Fixed 77%
Cover Pool as at January 31, 2022
High quality, conventional first lien Canadian Residential mortgages originated by TD
All loans have original LTVs of 80% or lower. Current weighted average LTV is 44.67% 96
The weighted average of non-zero credit scores is 782
5%
11%
21%
23%
14% 13%
8%
4%
1%0% 0%
Credit Score
1% 1%5%
12%
35%
45%
48
Bail-in Implementation
Regulation Overview On April 18, 2018, the Government of Canada published final regulations under the CDIC Act and the Bank Act providing
details of the bank recapitalization "bail-in" regime and final Total Loss Absorbing Capacity (TLAC) guideline.
The issuance regulations under the Bank Act and the conversion regulations under the CDIC Act came into force on September 23, 2018.
All Canadian Domestic Systemically Important Banks (D-SIBs) are required to comply with the TLAC guideline by November 1, 2021.
The legislation builds on CDIC's existing resolution toolkit to allow it to take temporary control of a failing D-SIB andgrants CDIC statutory powers to convert certain of the D-SIB's qualifying debt into common shares of the bank at thepoint of non-viability.
Pursuant to the TLAC guideline, the Bank is subject to a 1) minimum risk-based TLAC ratio of 24.00% of RWA (21.50% plus a 2.50% Domestic Stability Buffer 71 )
2) minimum TLAC leverage ratio of 6.75%
49
Bail-in Overview
Scope of Bail-in In Scope Liabilities. Senior unsecured long-term debt (original term to maturity of 400 or more days) that is tradable and
transferable (has a CUSIP, ISIN or other similar identification) and issued on or after September 23, 201897 . Unlike other jurisdictions, Canadian D-SIBs cannot elect to issue non bail-in unsecured senior debt.
Excluded Liabilities. Bank customers' deposits including chequing accounts, savings accounts and term deposits such as guaranteed investment certificates ("GICs"), secured liabilities (e.g., covered bonds), ABS or most structured notes 98 .
All in scope liabilities, including those governed by foreign law, are subject to conversion and must indicate in theircontractual terms that the holder of the liability is bound by the application of the CDIC Act.
Bail-in Conversion Terms Flexible Conversion Terms. CDIC has discretion in determining the proportion of bail-in debt that is converted, as well
as an appropriate conversion multiplier 99 which respects the creditor hierarchy and that is more favourable than the multiplier provided to NVCC capital investors.
No Contractual Trigger. Bail-in conversion is subject to regulatory determination of non-viability, not a fixed trigger. Full NVCC Conversion. There must be a full conversion of NVCC capital instruments before bail-in debt can be
converted. Through other resolution tools, holders of legacy non-NVCC capital instruments could also be subject tolosses, resulting in bail-in note holders being better off than such junior-ranking instruments.
No Creditor Worse Off. CDIC will compensate investors if they incur greater losses under bail-in than under a liquidationscenario. Bail-in debt holders rank pari passu with other senior unsecured obligations, including deposits, for thepurposes of the liquidation calculation.
Equity Conversion. Unlike some other jurisdictions, bail-in is affected through equity conversion only, with no write-down option.
Appendix Economic Outlook
51
TD Economics Update 100
Global Outlook: War in Ukraine tops downside risks to global outlook In addition to the humanitarian crisis, the war in Ukraine presents a meaningful downside risk to the
global economic outlook. Uncertainty is compounded by the rapid escalation in energy prices andincreasingly tight sanctions contributing to supply disruptions.
The impact of the war in Ukraine will primarily be felt in Europe through higher commodity prices,worsened supply chain shortages and tighter financial conditions. Expansionary fiscal policy is likely toprovide some offset, but not enough to offset the negative shock completely.
The impact on North America is likely to be milder. That said, an extended conflict is a meaningfuldownside risk to economic growth in the United States and Canada, especially if it leads to a broaderloss of confidence in financial markets.
U.S. Outlook: growth to continue; inflation and labor supply are challenges The U.S. economy accelerated to a robust 7.0% annualized in Q4 2021. Consumer spending declined
in the final month of last year but rebounded in January. Economic growth looks to have slowed in thefirst quarter of this year as Omicron weighed on activity but is showing signs of reacceleration.
Demand for workers remains strong, pushing down unemployment. Labor force participation should improve as robust wage growth provides added incentive to return to the workforce.
Canada Outlook: GDP to rebound as Covid restrictions lift, elevated inflation to prompt rate hikes The Canadian economy was slowed by the Omicron wave of the pandemic in early 2022 but looks set
to rebound as restrictions are lifted. Higher oil prices have worsened inflation but resulted in increased investment in the country's energy
sector. Elevated inflation and continued economic growth are likely to result in higher interest rates inthe year ahead.
52
Interest Rate Outlook 101
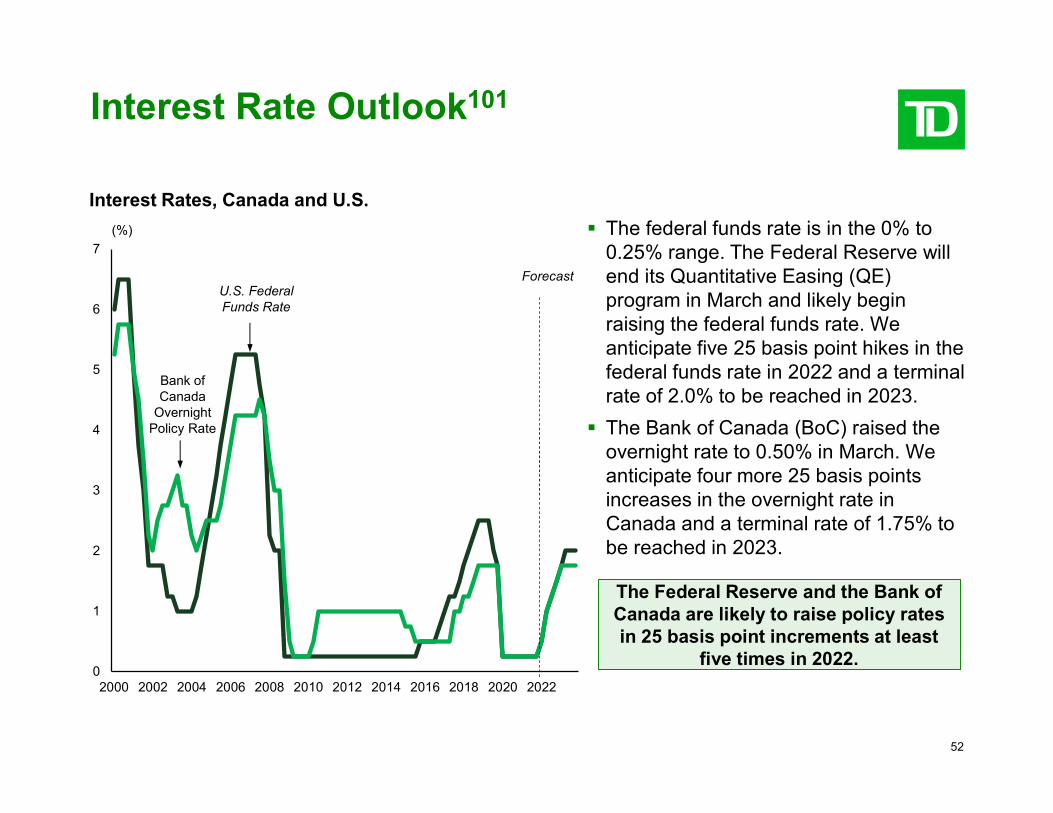
Interest Rates, Canada and U.S.
0
1
2
3
4
5
6
7
2000 2002 2004 2006 2008 2010 2012 2014 2016 2018 2020 2022
(%)
Forecast
Bank of Canada
Overnight Policy Rate
U.S. Federal Funds Rate
The federal funds rate is in the 0% to0.25% range. The Federal Reserve willend its Quantitative Easing (QE)program in March and likely beginraising the federal funds rate. Weanticipate five 25 basis point hikes in thefederal funds rate in 2022 and a terminalrate of 2.0% to be reached in 2023.
The Bank of Canada (BoC) raised the overnight rate to 0.50% in March. We anticipate four more 25 basis points increases in the overnight rate in Canada and a terminal rate of 1.75% to be reached in 2023.
The Federal Reserve and the Bank of Canada are likely to raise policy rates in 25 basis point increments at least
five times in 2022.
Appendix Credit Quality
54
-
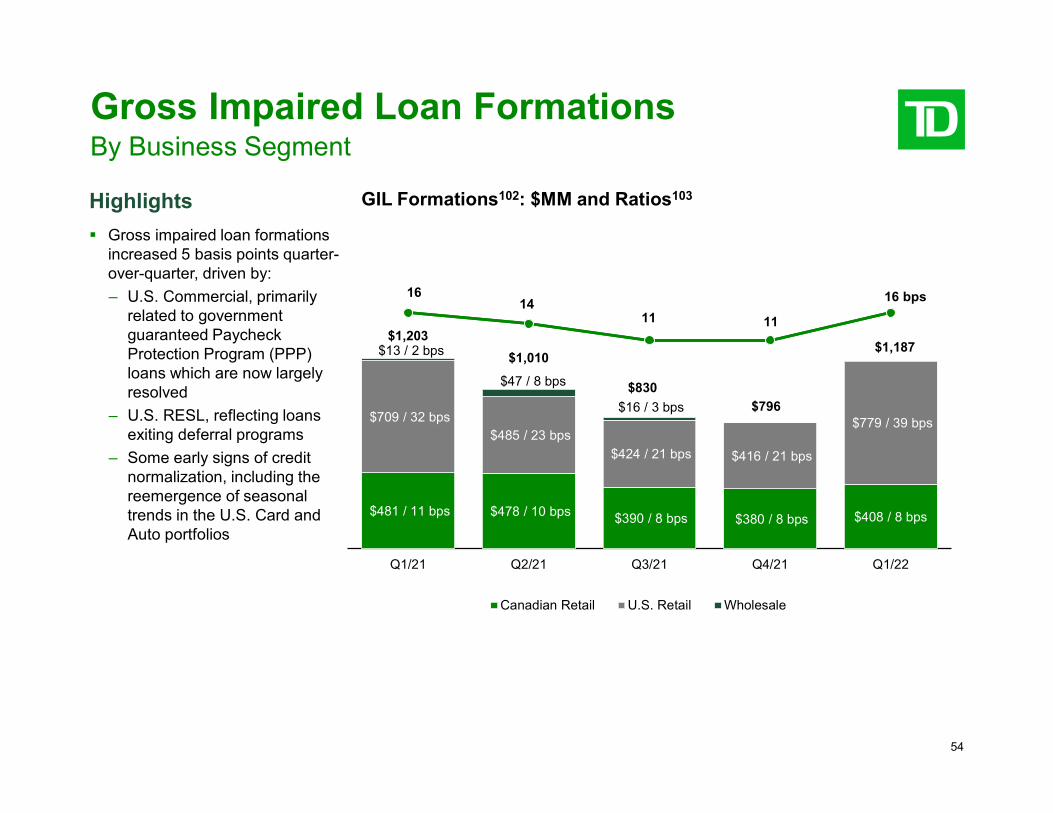
Gross Impaired Loan Formations By Business Segment
Highlights Gross impaired loan formations
increased 5 basis points quarter over-quarter, driven by: – U.S. Commercial, primarily
related to government guaranteed Paycheck Protection Program (PPP) loans which are now largely resolved
– U.S. RESL, reflecting loans exiting deferral programs
– Some early signs of credit normalization, including the reemergence of seasonal trends in the U.S. Card and Auto portfolios
GIL Formations : $MM and Ratios 103102
1614
11 11
16 bps
$481 / 11 bps $478 / 10 bps $390 / 8 bps $380 / 8 bps $408 / 8 bps
$709 / 32 bps$485 / 23 bps
$424 / 21 bps $416 / 21 bps
$779 / 39 bps
$13 / 2 bps
$47 / 8 bps
$16 / 3 bps
$1,203
$1,010
$830
$796
$1,187
Q1/21 Q2/21 Q3/21 Q4/21 Q1/22
Canadian Retail U.S. Retail Wholesale
55
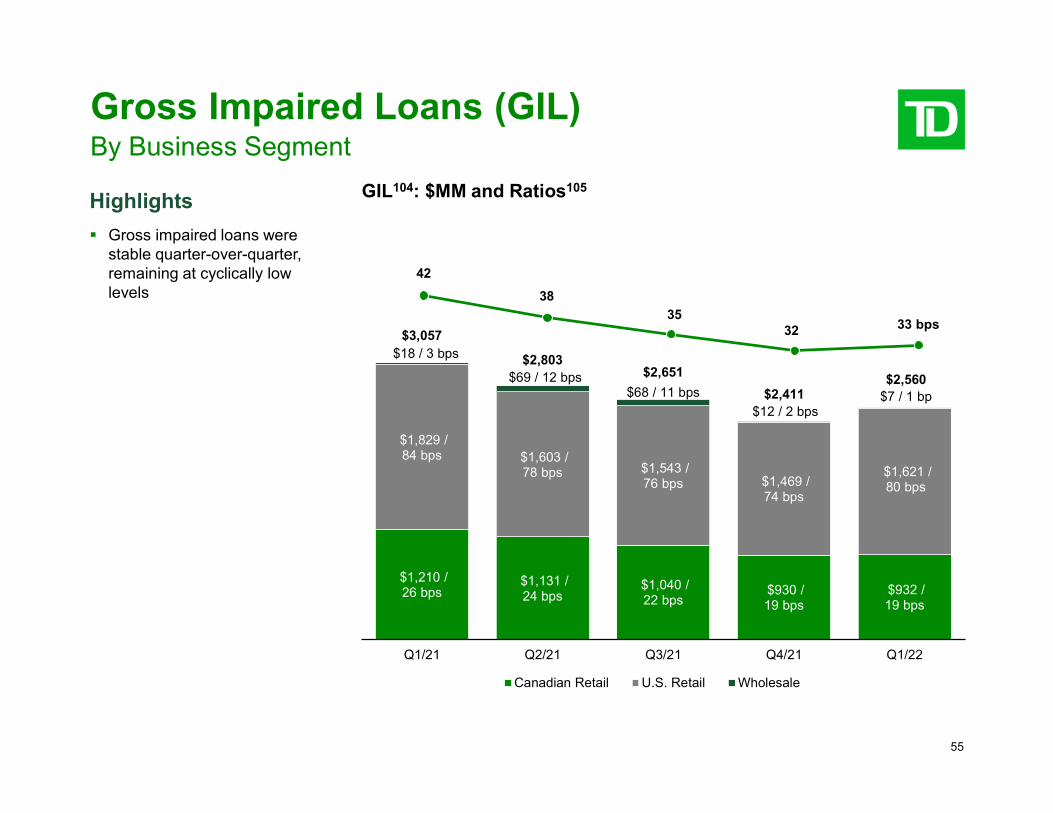
Gross Impaired Loans (GIL) By Business Segment
Highlights Gross impaired loans were
stable quarter-over-quarter, remaining at cyclically low levels
GIL 104 : $MM and Ratios 105
$1,210 / 26 bps
$1,131 / 24 bps
$1,040 / 22 bps
$930 / 19 bps
$932 / 19 bps
$1,829 / 84 bps $1,603 /
78 bps $1,543 / 76 bps $1,469 /
74 bps
$1,621 / 80 bps
$18 / 3 bps
$69 / 12 bps$68 / 11 bps
$12 / 2 bps$7 / 1 bp
$3,057
$2,803$2,651
$2,411$2,560
Q1/21 Q2/21 Q3/21 Q4/21 Q1/22
Canadian Retail U.S. Retail Wholesale
42
38
3532 33 bps
56
5
3
2
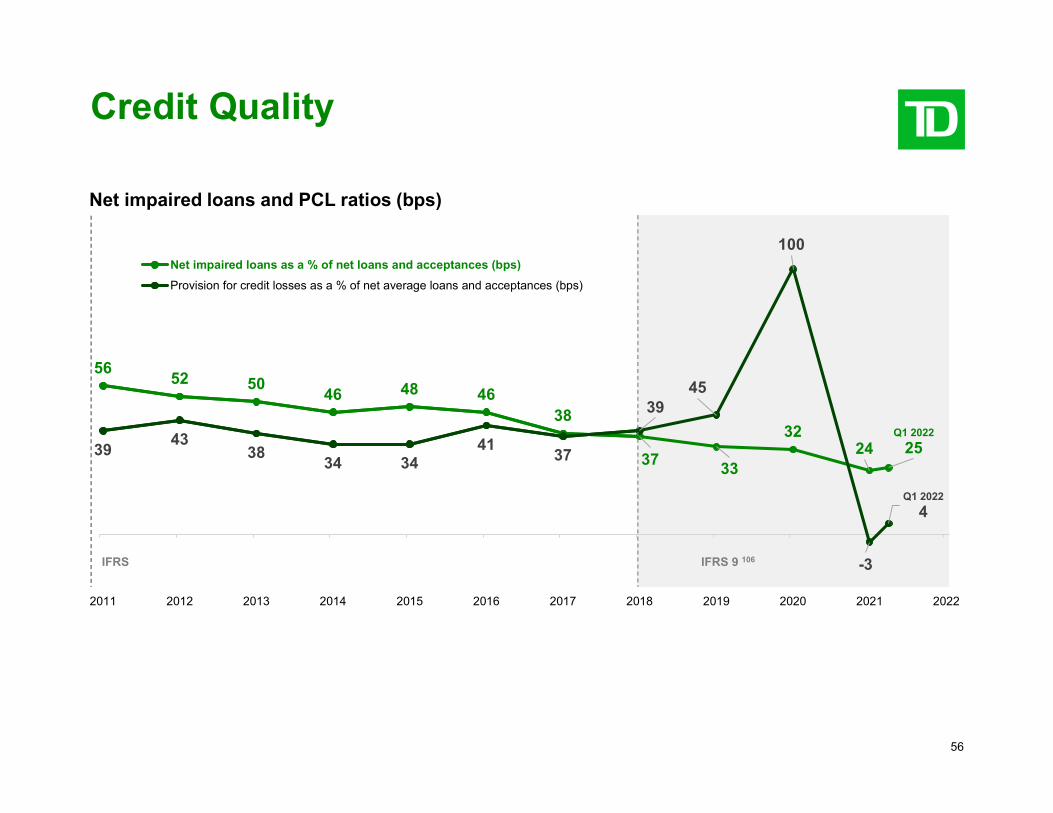
Credit Quality
Net impaired loans and PCL ratios (bps)
652 50
46 48 4638
3733
3224
Q1 2022
25943
3834 34
4137
3945
100
-3
Q1 2022
4
011 2012 2013 2014 2015 2016 2017 2018 2019 2020 2021 2022
Net impaired loans as a % of net loans and acceptances (bps)
Provision for credit losses as a % of net average loans and acceptances (bps)
IFRS IFRS 9 106
57
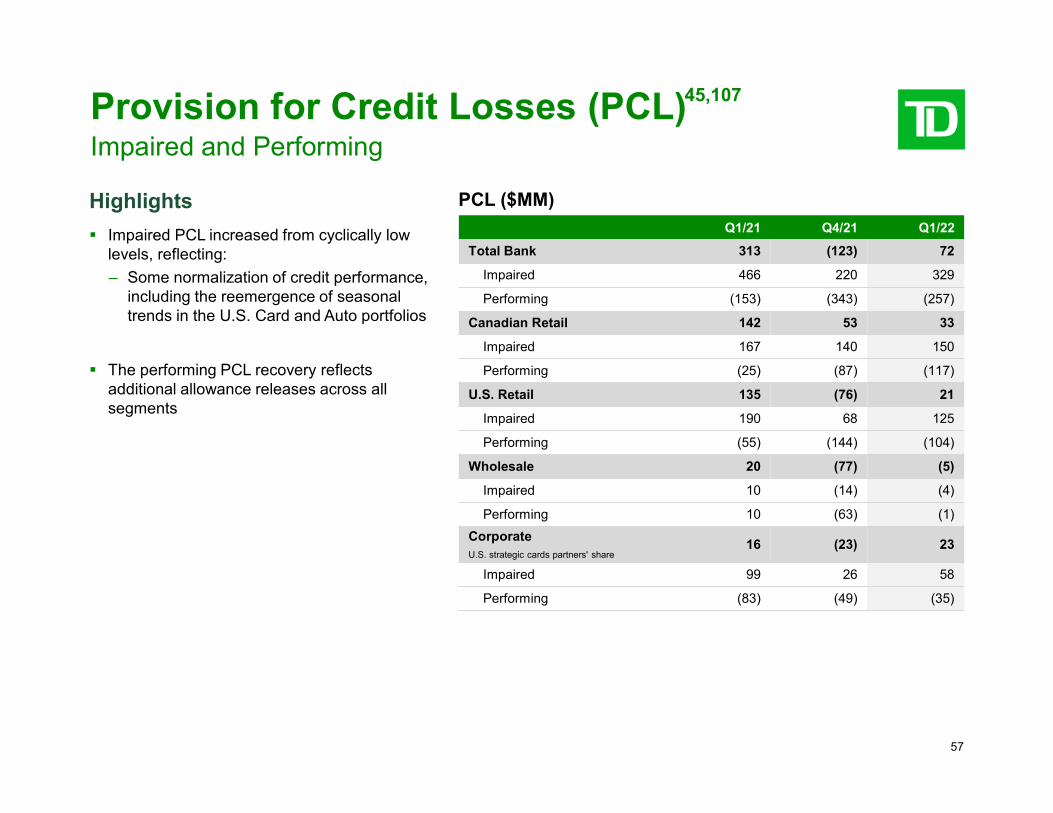
Provision for Credit Losses (PCL) 45 ,107
Impaired and Performing
Highlights Impaired PCL increased from cyclically low
levels, reflecting: – Some normalization of credit performance,
including the reemergence of seasonal trends in the U.S. Card and Auto portfolios
The performing PCL recovery reflects additional allowance releases across all segments
PCL ($MM) Q1/21 Q4/21 Q1/22
Total Bank 313 (123) 72
Impaired 466 220 329
Performing (153) (343) (257)
Canadian Retail 142 53 33
Impaired 167 140 150
Performing (25) (87) (117)
U.S. Retail 135 (76) 21
Impaired 190 68 125
Performing (55) (144) (104)
Wholesale 20 (77) (5)
Impaired 10 (14) (4)
Performing 10 (63) (1) Corporate U.S. strategic cards partners' share
16 (23) 23
Impaired 99 26 58
Performing (83) (49) (35)
58
Canadian Personal Banking
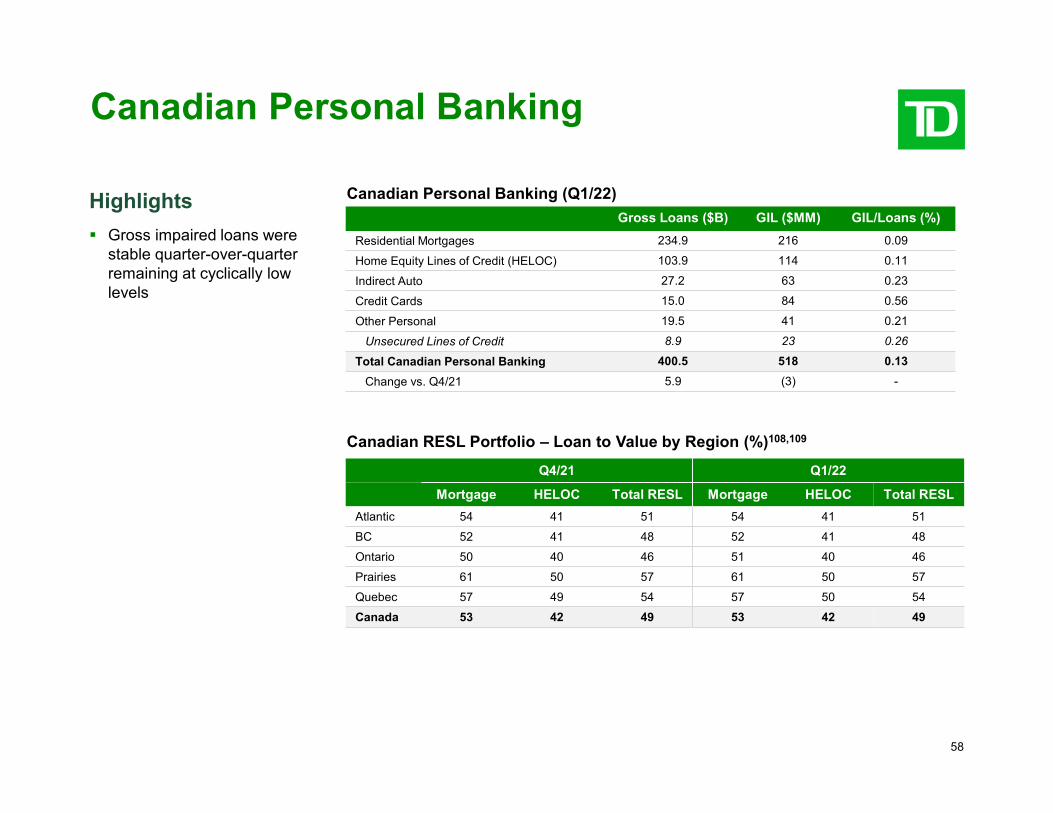
Highlights Gross impaired loans were
stable quarter-over-quarter remaining at cyclically low levels
Canadian Personal Banking (Q1/22) Gross Loans ($B) GIL ($MM) GIL/Loans (%)
Residential Mortgages 234.9 216 0.09
Home Equity Lines of Credit (HELOC) 103.9 114 0.11
Indirect Auto 27.2 63 0.23
Credit Cards 15.0 84 0.56
Other Personal 19.5 41 0.21
Unsecured Lines of Credit 8.9 23 0.26
Total Canadian Personal Banking 400.5 518 0.13
Change vs. Q4/21 5.9 (3) -
Canadian RESL Portfolio – Loan to Value by Region (%) 108 ,109
Q4/21 Q1/22
Mortgage HELOC Total RESL Mortgage HELOC Total RESL Atlantic 54 41 51 54 41 51 BC 52 41 48 52 41 48 Ontario 50 40 46 51 40 46 Prairies 61 50 57 61 50 57 Quebec 57 49 54 57 50 54 Canada 53 42 49 53 42 49
59
$182
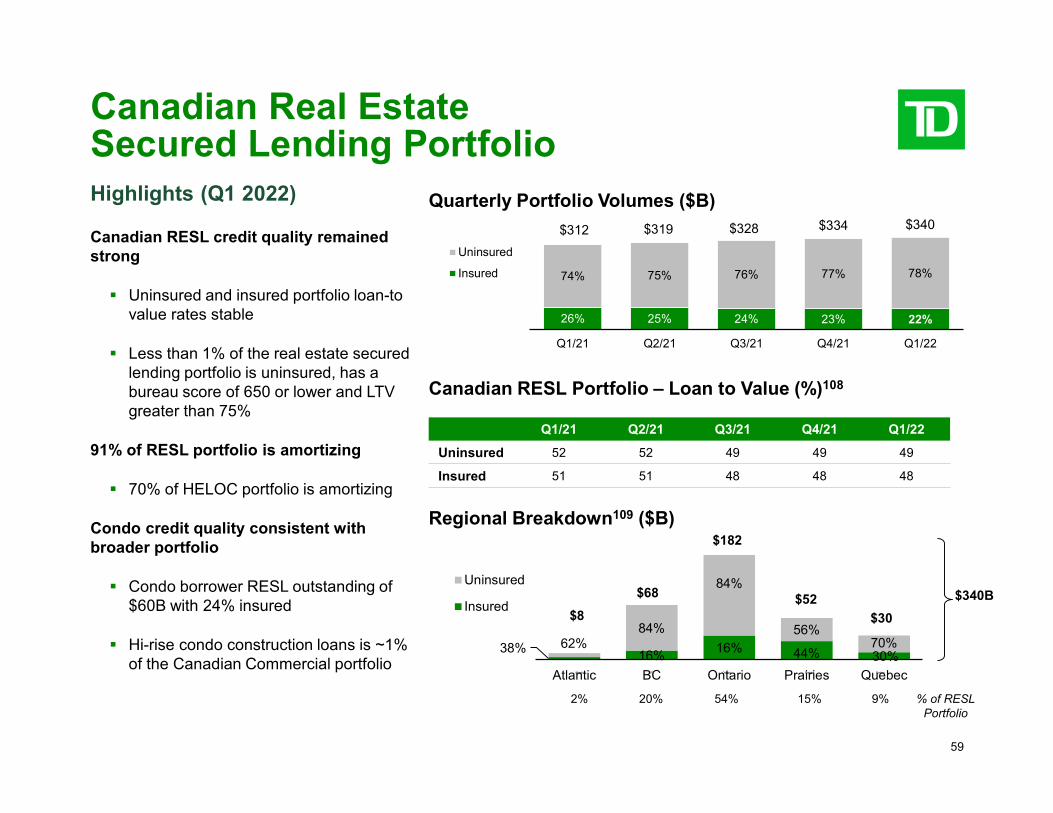
Canadian Real Estate Secured Lending Portfolio Highlights (Q1 2022)
Canadian RESL credit quality remained strong
Uninsured and insured portfolio loan-to value rates stable
Less than 1% of the real estate secured lending portfolio is uninsured, has a bureau score of 650 or lower and LTV greater than 75%
91% of RESL portfolio is amortizing
70% of HELOC portfolio is amortizing
Condo credit quality consistent with broader portfolio
Condo borrower RESL outstanding of $60B with 24% insured
Hi-rise condo construction loans is ~1% of the Canadian Commercial portfolio
Quarterly Portfolio Volumes ($B)
26% 25% 24% 23% 22%
74% 75% 76% 77% 78%
$312 $319 $328 $334 $340
Q1/21 Q2/21 Q3/21 Q4/21 Q1/22
Uninsured
Insured
Canadian RESL Portfolio – Loan to Value (%) 108
Q1/21 Q2/21 Q3/21 Q4/21 Q1/22
Uninsured 52 52 49 49 49
Insured 51 51 48 48 48
Regional Breakdown 109 ($B)
Atlantic BC Ontario Prairies Quebec
2% 20% 54% 15% 9% % of RESL Portfolio
38%16%
16% 44% 30%62%
84%
84%
56%70%
Atlantic BC Ontario Prairies Quebec
Uninsured
Insured$340B$52
$30
$68
$8
60
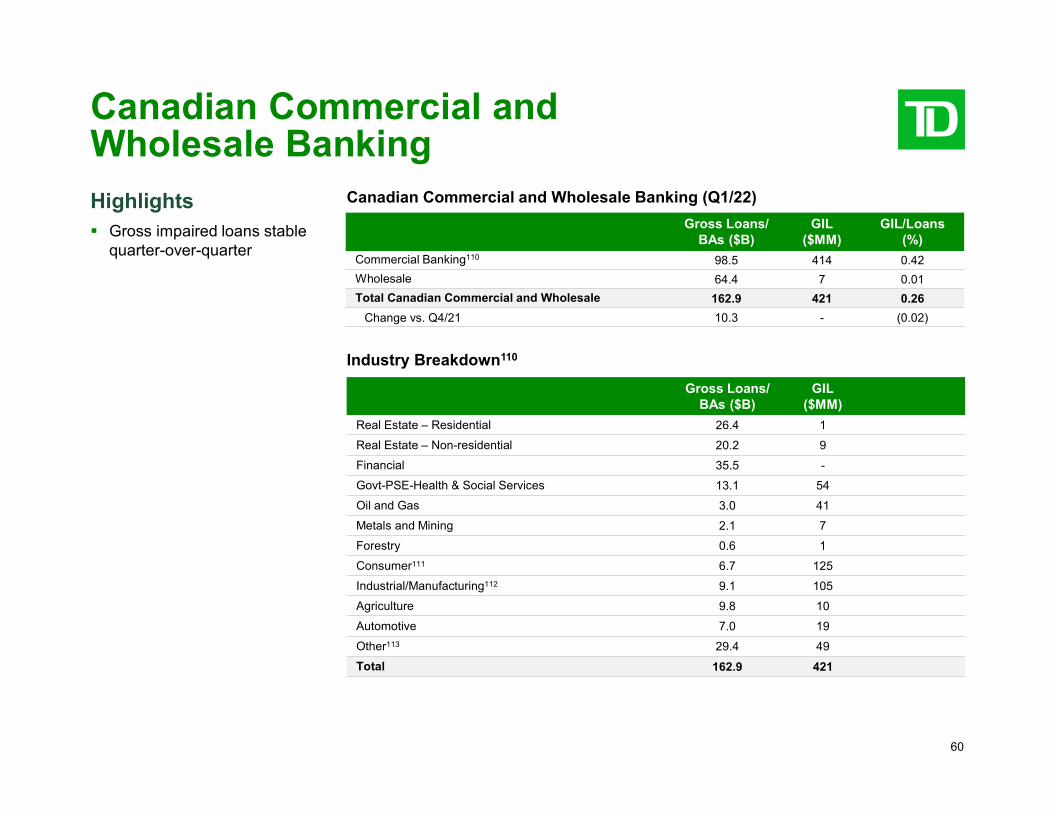
Canadian Commercial and Wholesale Banking Highlights Gross impaired loans stable
quarter-over-quarter
Canadian Commercial and Wholesale Banking (Q1/22) Gross Loans/
BAs ($B) GIL
($MM) GIL/Loans
(%) Commercial Banking 110 98.5 414 0.42 Wholesale 64.4 7 0.01 Total Canadian Commercial and Wholesale 162.9 421 0.26
Change vs. Q4/21 10.3 - (0.02)
Industry Breakdown 110
Gross Loans/ BAs ($B)
GIL ($MM)
Real Estate – Residential 26.4 1 Real Estate – Non-residential 20.2 9 Financial 35.5 -
Govt-PSE-Health & Social Services 13.1 54 Oil and Gas 3.0 41 Metals and Mining 2.1 7 Forestry 0.6 1 Consumer 111 6.7 125 Industrial/Manufacturing 112 9.1 105 Agriculture 9.8 10 Automotive 7.0 19 Other 113 29.4 49 Total 162.9 421
61
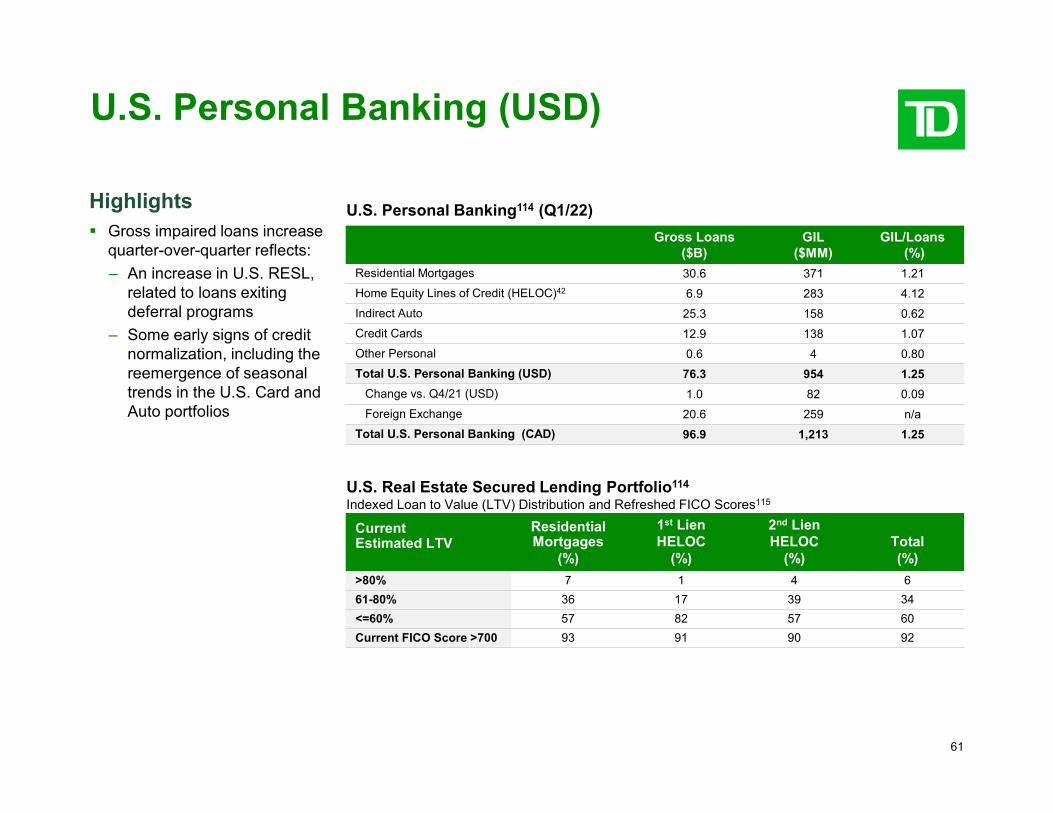
U.S. Personal Banking (USD)
Highlights Gross impaired loans increase
quarter-over-quarter reflects: – An increase in U.S. RESL,
related to loans exiting deferral programs
– Some early signs of credit normalization, including the reemergence of seasonal trends in the U.S. Card and Auto portfolios
U.S. Personal Banking 114 (Q1/22) Gross Loans
($B) GIL
($MM) GIL/Loans
(%) Residential Mortgages 30.6 371 1.21 Home Equity Lines of Credit (HELOC) 42 6.9 283 4.12 Indirect Auto 25.3 158 0.62 Credit Cards 12.9 138 1.07 Other Personal 0.6 4 0.80 Total U.S. Personal Banking (USD) 76.3 954 1.25
Change vs. Q4/21 (USD) 1.0 82 0.09 Foreign Exchange 20.6 259 n/a
Total U.S. Personal Banking (CAD) 96.9 1,213 1.25
U.S. Real Estate Secured Lending Portfolio 114
Indexed Loan to Value (LTV) Distribution and Refreshed FICO Scores 115
Current Estimated LTV
Residential Mortgages
(%)
1 st Lien HELOC
(%)
2 nd Lien HELOC
(%) Total (%)
>80% 7 1 4 6 61-80% 36 17 39 34 <=60% 57 82 57 60 Current FICO Score >700 93 91 90 92
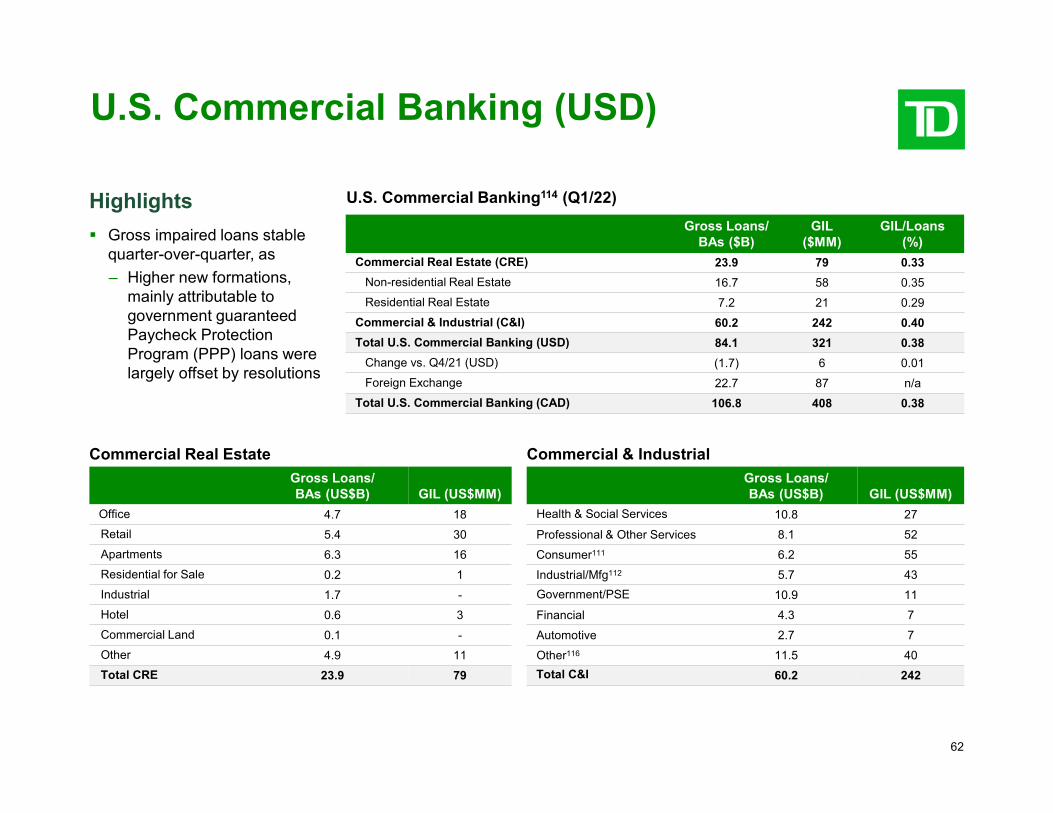
62
U.S. Commercial Banking (USD)
Highlights Gross impaired loans stable
quarter-over-quarter, as – Higher new formations,
mainly attributable to government guaranteed Paycheck Protection Program (PPP) loans were largely offset by resolutions
U.S. Commercial Banking 114 (Q1/22)
Gross Loans/ BAs ($B)
GIL ($MM)
GIL/Loans (%)
Commercial Real Estate (CRE) 23.9 79 0.33 Non-residential Real Estate 16.7 58 0.35 Residential Real Estate 7.2 21 0.29
Commercial & Industrial (C&I) 60.2 242 0.40 Total U.S. Commercial Banking (USD) 84.1 321 0.38
Change vs. Q4/21 (USD) (1.7) 6 0.01 Foreign Exchange 22.7 87 n/a
Total U.S. Commercial Banking (CAD) 106.8 408 0.38
Commercial Real Estate Gross Loans/ BAs (US$B) GIL (US$MM)
Office 4.7 18 Retail 5.4 30 Apartments 6.3 16 Residential for Sale 0.2 1 Industrial 1.7 -
Hotel 0.6 3 Commercial Land 0.1 -
Other 4.9 11 Total CRE 23.9 79
Commercial & Industrial Gross Loans/ BAs (US$B) GIL (US$MM)
Health & Social Services 10.8 27 Professional & Other Services 8.1 52 Consumer 111 6.2 55 Industrial/Mfg 112 5.7 43 Government/PSE 10.9 11 Financial 4.3 7 Automotive 2.7 7 Other 116 11.5 40 Total C&I 60.2 242
Appendix Additional Information
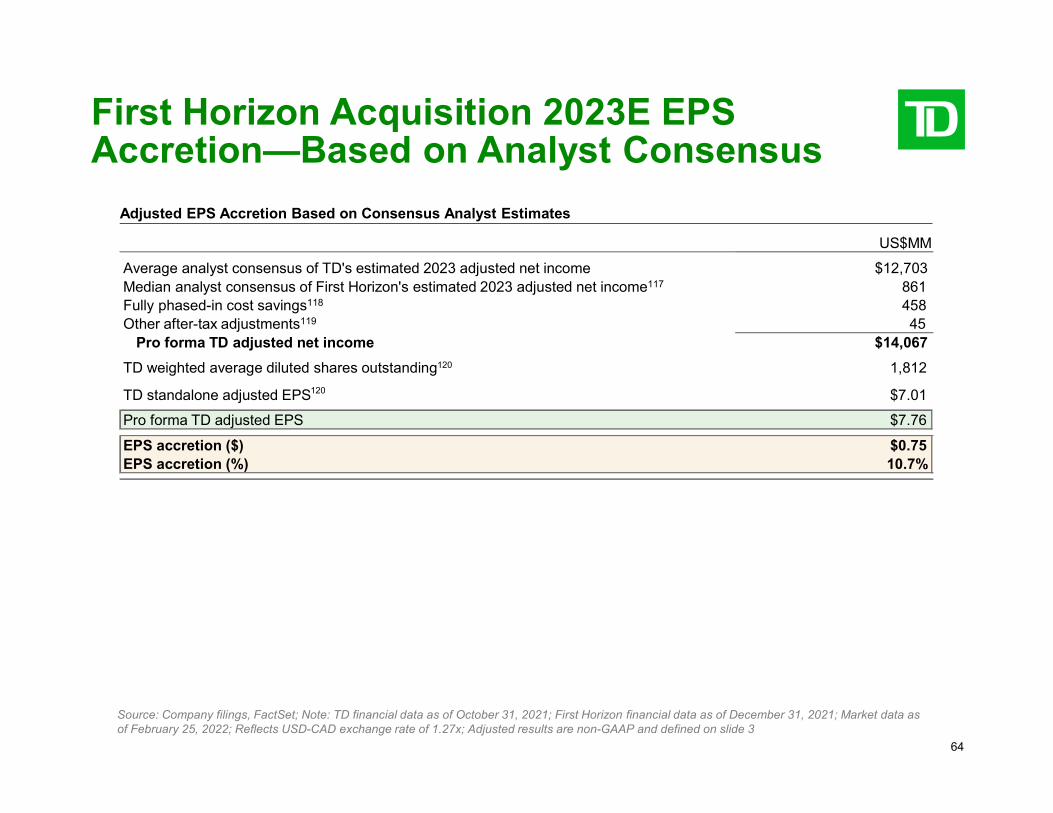
64
First Horizon Acquisition 2023E EPS Accretion—Based on Analyst Consensus
Adjusted EPS Accretion Based on Consensus Analyst Estimates
US$MM
Average analyst consensus of TD's estimated 2023 adjusted net income $12,703 Median analyst consensus of First Horizon's estimated 2023 adjusted net income 117 861 Fully phased-in cost savings 118 458 Other after-tax adjustments 119 45
Pro forma TD adjusted net income $14,067
TD weighted average diluted shares outstanding 120 1,812
TD standalone adjusted EPS 120 $7.01
Pro forma TD adjusted EPS $7.76
EPS accretion ($) $0.75 EPS accretion (%) 10.7%
Source: Company filings, FactSet; Note: TD financial data as of October 31, 2021; First Horizon financial data as of December 31, 2021; Market data asof February 25, 2022; Reflects USD-CAD exchange rate of 1.27x; Adjusted results are non-GAAP and defined on slide 3
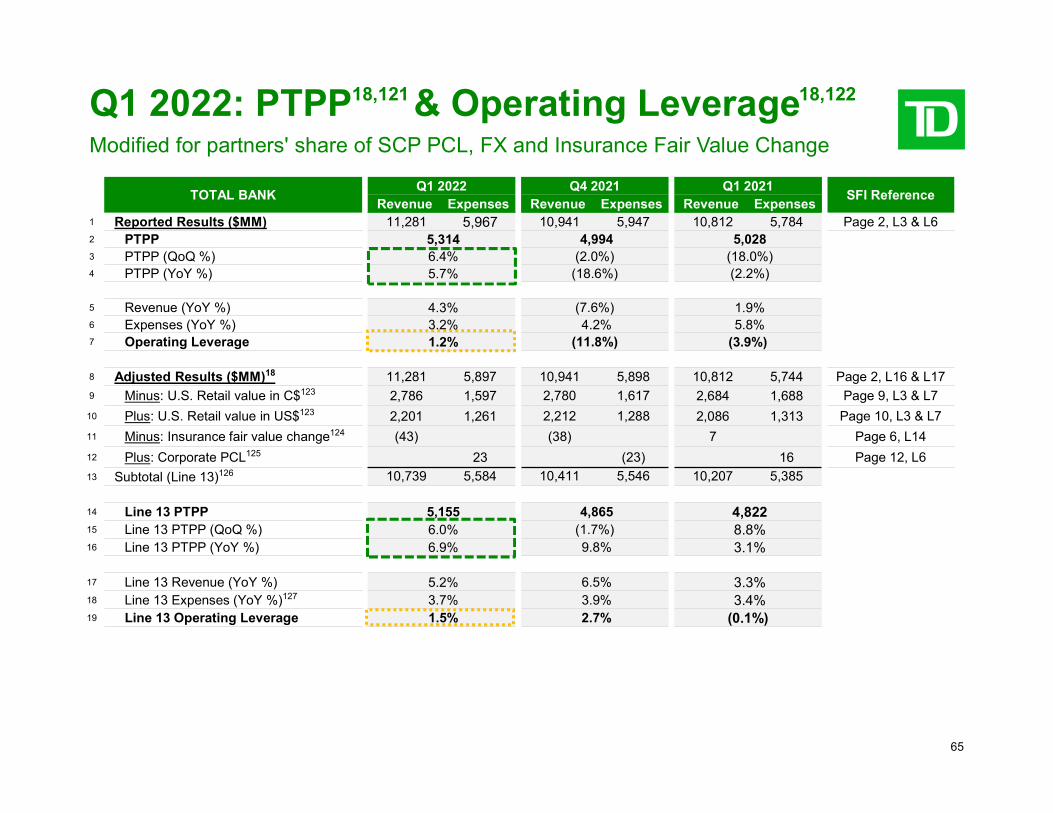
65
Q1 2022: PTPP 18 , 121 & Operating Leverage 18 ,122
Modified for partners' share of SCP PCL, FX and Insurance Fair Value Change
TOTAL BANK Q1 2022 Q4 2021 Q1 2021 SFI Reference
Revenue Expenses Revenue Expenses Revenue Expenses 1 Reported Results ($MM) 11,281 5,967 10,941 5,947 10,812 5,784 Page 2, L3 & L6 2 PTPP 5,314 4,994 5,028 3 PTPP (QoQ %) 6.4% (2.0%) (18.0%) 4 PTPP (YoY %) 5.7% (18.6%) (2.2%)
5 Revenue (YoY %) 4.3% (7.6%) 1.9% 6 Expenses (YoY %) 3.2% 4.2% 5.8% 7 Operating Leverage 1.2% (11.8%) (3.9%)
8 Adjusted Results ($MM) 18 11,281 5,897 10,941 5,898 10,812 5,744 Page 2, L16 & L17 9 Minus: U.S. Retail value in C$ 123 2,786 1,597 2,780 1,617 2,684 1,688 Page 9, L3 & L7 10 Plus: U.S. Retail value in US$ 123 2,201 1,261 2,212 1,288 2,086 1,313 Page 10, L3 & L7 11 Minus: Insurance fair value change 124 (43) (38) 7 Page 6, L14 12 Plus: Corporate PCL 125 23 (23) 16 Page 12, L6 13 Subtotal (Line 13) 126 10,739 5,584 10,411 5,546 10,207 5,385
14 Line 13 PTPP 5,155 4,865 4,822 15 Line 13 PTPP (QoQ %) 6.0% (1.7%) 8.8% 16 Line 13 PTPP (YoY %) 6.9% 9.8% 3.1%
17 Line 13 Revenue (YoY %) 5.2% 6.5% 3.3% 18 Line 13 Expenses (YoY %) 127 3.7% 3.9% 3.4% 19 Line 13 Operating Leverage 1.5% 2.7% (0.1%)

Endnotes
67
Endnotes
1. See slide 9.
2. See slide 31.
3. See slide 40.
4. Q1 2022 is the quarter comprising the period from November 1, 2021 to January 31, 2022.
5. Deposits based on total of average personal and business deposits during the quarter. U.S. Retail includes Schwab Insured Deposit Accounts (IDAs), Canadian Retail includes wealth deposits.
6. Total Loans based on total of average personal and business loans during the quarter.
7. For additional information about this metric, refer to the Glossary in the Bank's First Quarter 2022 MD&A (available at www.td.com/investor and www.sedar.com ), which is incorporated by reference.
8. For trailing four quarters.
9. Average number of full-time equivalent staff in these segments during the quarter.
10. Total ATMs includes branch / store, remote, mobile and TD Branded ATMs.
11. Active mobile users defined as TD customers who have logged in using the Canadian or U.S. mobile or tablet apps (applications) within the last90 days. Total ATMs include branch, remote, mobile and TD Branded ATMs.
12. World Economic Forum, Global Competitiveness Reports 2008-2020.
13. As per Canada Mortgage and Housing Corporation (CMHC) Residential Mortgage Industry Report (October 2021).
14. Market share ranking is based on most current data available from the Office of the Superintendent of Financial Institutions Canada (OSFI) forpersonal deposits and loans as at November 2021, from the Canadian Bankers Association for Real Estate Secured Lending as at September2021, from the Canadian Bankers Association for business deposits and loans as at September 2021, and from Strategic Insight for DirectInvesting asset, trades, and revenue metrics as at September 2021.
15. FDIC Institution Directory and 2021 FDIC Summary of Deposits (deposits capped at $500MM in every county within TD’s U.S. banking footprint).
16. State wealth based on Market Median Household Income.
17. Aggregate market population in each of the metropolitan statistical areas within TD’s U.S. banking footprint.
68
Endnotes
18. The Bank prepares its consolidated financial statements in accordance with International Financial Reporting Standards (IFRS), the currentgenerally accepted accounting principles (GAAP), and refers to results prepared in accordance with IFRS as the “reported” results. The Bankalso utilizes non-GAAP financial measures such as “adjusted” results (i.e., reported results excluding “items of note”) and non-GAAP ratios toassess each of its businesses and measure overall Bank performance. The Bank believes that non-GAAP financial measures and non-GAAPratios provide the reader with a better understanding of how management views the Bank’s performance. Non-GAAP financial measures andratios used in this presentation are not defined terms under IFRS and, therefore, may not be comparable to similar terms used by other issuers.See "How We Performed" in the Bank’s First Quarter 2022 MD&A, which is incorporated by reference, for further explanation, reported basisresults, a list of the items of note, and a reconciliation of adjusted to reported results.
19. This measure has been calculated in accordance with OSFI's Capital Adequacy Requirements guideline. See slide 24.
20. As of January 31, 2022. Credit ratings are not recommendations to purchase, sell, or hold a financial obligation in as much as they do notcomment on market price or suitability for a particular investor. Ratings are subject to revision or withdrawal at any time by the ratingorganization.
21. Canadian Peers – defined as other 4 big banks (RY, BMO, BNS and CM). All Peers are based on Q1 2022 results ended January 31, 2022.
22. North American Peers – defined as Canadian Peers and U.S. Peers. U.S. Peers – defined as C, TFC, BAC, JPM, WFC, PNC, USB, based on Q4/21 results ended December 31, 2021.
23. For the purpose of calculating contribution by each business segment, earnings from the Corporate segment are excluded. Numbers may not add to 100% due to rounding.
24. For financial reporting purposes, TD Ameritrade is part of the U.S. Retail business segment, but it is shown separately here for illustrative purposes.
25. On October 6, 2020, the Bank acquired an approximately 13.5% stake in Schwab following the completion of Schwab’s acquisition of TDAmeritrade Holding Corporation (“TD Ameritrade”) of which the Bank was a major shareholder (the “Schwab transaction”). For further details,refer to “How the Bank reports” in the “Financial Results Overview” section of the 2021 MD&A. The Bank’s share of Schwab's earnings isreported with a one-month lag and the Bank started recording its share of Schwab’s earnings on this basis in the first quarter of fiscal 2021.
26. Based on total assets. Source: SNL Financial, Top 50 US banks and Thrifts in the U.S.
27. Primary dealers serve as trading counterparties of the New York Fed in its implementation of monetary policy. For more information please visit https://www.newyorkfed.org/ .
69
Endnotes
28. TD Group US Holdings and First Horizon as of December 31, 2021. Pro forma metrics for customers and stores reflect latest reported figures.
29. Fully-Synergized Earnings Contribution is a non-GAAP financial measure calculated as adjusted earnings plus fully-phased in cost synergies ascalculated on slide 64. Adjusted results are non-GAAP and defined on slide 3; Fully synergized metrics are calculated on the basis that expectedcost synergies are fully realized and that the transaction closes on November 1, 2022.
30. Return on Invested Capital (ROIC) is a non-GAAP performance measure calculated by dividing adjusted net income attributable to commonshareholders by the average invested capital, which includes the required Common Equity Tier 1 (CET1) capital on risk weighted assets plusgoodwill and transaction-related intangibles, net of associated deferred tax liabilities. Calculated on the basis of the median analyst consensusestimate of First Horizon's adjusted net income. Fully synergized metrics are calculated on the basis that expected cost synergies are fullyrealized and that the transaction closes on November 1, 2022.
31. Enterprise active digital users include Canadian Personal and Commercial Banking, TD WebBroker, MBNA active users, TD Insurance activeusers, and U.S. Retail. Canadian active mobile users based on Canadian Personal and Commercial Banking. U.S. active mobile users based onU.S. Retail and Small Business Banking.
32. Canadian Retail: Digital Adoption based on Canadian Personal & Commercial Banking and Wealth. Active Mobile Users and Self-Serve Share ofFinancial Transactions based on Canadian Personal & Small Business Banking. U.S. Retail: based on U.S. Retail and Small Business Banking.
33. Active digital users as a percentage of total customer base. Active digital users are users who have logged in online or via their mobile device at least once in the last 90 days.
34. Self-serve share of transactions represents all financial transactions that are processed through unassisted channels (Online, Mobile, ATM, and Phone IVR).
35. FX impact solely related to the U.S. Retail Bank. Adjusted expenses excluding the partners' share of PCL for the U.S. SCP and adjustedexpenses excluding the partners' share of PCL and FX are non-GAAP financial measures. For further information about these non-GAAPfinancial measures, please see endnote 18.
36. Wealth assets includes assets under management (AUM) and assets under administration (AUA).
37. Net interest margin (NIM) is calculated by dividing net interest income by average interest-earning assets. Average interest-earning assets usedin the calculation of NIM is a non-GAAP financial measure. NIM and average interest-earning assets are not defined terms under IFRS and,therefore, may not be comparable to similar terms used by other issuers.
38. U.S. Retail NIM is calculated by dividing segment's net interest income by average interest-earning assets excluding the impact related to depositsweep arrangements and the impact of intercompany deposits and cash collateral, which management believes better reflects segmentperformance. In addition, the value of tax-exempt interest income is adjusted to its equivalent before-tax value. Net interest income and averageinterest-earning assets used in the calculation of this metric are non-GAAP financial measures.
70
Endnotes
39. Includes net interest income TEB of $525 million, and trading income of $198 million. Trading-related revenue (TEB) is a non-GAAP financialmeasure, which is not a defined term under IFRS and, therefore, may not be comparable to similar terms used by other issuers.
40. Capital and liquidity measures on slide 24 are calculated in accordance with OSFI's Capital Adequacy Requirements, Leverage Requirements, and Liquidity Adequacy Requirements guidelines.
41. FX impact on RWA has a negligible impact on the CET 1 ratio, because the CET 1 ratio is currency hedged.
42. U.S. HELOC includes Home Equity Lines of Credit and Home Equity Loans.
43. Includes acquired credit impaired loans and loans booked in the Corporate segment.
44. Includes loans measured at fair value through other comprehensive income.
45. Includes acquired credit impaired (ACI) loans. Prior periods have been restated to include ACI loans.
46. PCL Ratio: Provision for Credit Losses on a quarterly annualized basis/Average Net Loans & Acceptances.
47. Net U.S. Retail PCL ratio excludes credit losses associated with the retailer program partners' share of the U.S. Strategic Cards Portfolio, which is recorded in the Corporate Segment.
48. Gross U.S. Retail & Corporate PCL ratio includes the retailer program partners' share of the U.S. Strategic Cards Portfolio, which is recorded in the Corporate Segment.
49. Coverage Ratio: Total allowance for credit losses as a % of gross loans and acceptances.
50. U.S. Strategic Cards Partners' Share represents the retailer program partners' share of the U.S. Strategic Cards Portfolio ACL.
51. Consumer instalment and other personal includes the HELOC, Indirect Auto and Other Personal portfolios.
52. For the purpose of calculating contribution by each business segment, earnings from the Corporate segment are excluded.
53. Compound annual growth rate for the five-year period ended October 31, 2021.
54. Corporate results in 2020 include a net gain on sale of the Bank's investment in TD Ameritrade.
55. Based on quarterly dividend of $0.89 declared on December 2, 2021 annualized.
56. Total Deposits based on total of average personal, business and wealth deposits. Total Loans based on total of average personal and business loans.
57. J.D. Power 2021 Canada Dealer Financing Satisfaction Study of dealers' satisfaction. Visit www.jdpower.com/awards for more information
71
Endnotes
58. Market share ranking is based on most current data available from OSFI for personal deposits and loans as at August 2021, from QuarterlySupplemental Financial disclosures for credit cards as at July 2021, from the Canadian Bankers Association for Real Estate Secured Lending asat June 2021, from the Canadian Bankers Association for business deposits and loans as at March 2021, from the Canadian BankersAssociation for Auto & Indirect loans as at April 2021, from Investor Economics, a division of ISS Market Intelligence, for Direct Investing asset,trades, and revenue metrics as at June 2021, and from Investment Funds Institute of Canada for mutual funds when compared to the Big 6Banks as at September 2021. The Big 6 Banks consist of BMO, CN, NBF, RY, BNS and TD.
59. Source: Comscore Mobile Metrix®, Financial Services – Banking (Mobile Apps), Total Audience, 3-month average ending December 2021, Canada.
60. Source: Comscore MMX® Multi-Platform, Financial Services – Banking, Total audience, 3-month average ending December 2021, Canada, United States, Spain, France and UK.
61. As at January 31, 2022.
62. "Managed Money Advisory Service (as of June 30, 2021)" Investor Economics, Fall 2021.
63. "The Top 40 Money Managers (as of June 30, 2021)" Benefits Canada, November 2021.
64. "The 2022 Globe and Mail digital broker ranking: Does the zero-commission revolution flip the script on who’s best?" Globe and Mail, February 2022.
65. Based on Gross Written Premiums for Property and Casualty business. Ranks based on data available from OSFI, Insurers, Insurance Bureau of Canada, and Provincial Regulators as at December 31, 2020.
66. J.D. Power 2021 U.S. Dealer Financing Satisfaction Study of dealers' satisfaction; among companies between 375,000 and 910,000 transactions. Visit www.jdpower.com/awards for more information.
67. TD Bank ranked Highest in Customer Satisfaction with Small Business Banking in the South Region in the 2021 J.D. Power Small BusinessBanking Satisfaction Study. For J.D. Power 2021 award information visit www.jdpower.com/awards .
68. Total Deposits based on total of average personal deposits, business deposits and Schwab Insured Deposit Accounts (IDAs). Total Loans based on total of average personal and business loans.
69. Based on total deposits. Source: SNL Financial, Top 50 Banks and Thrifts in the U.S.
70. Includes gross loans and bankers' acceptances related to Wholesale Banking, excluding letters of credit, cash collateral, CDS, and allowance for credit losses.
72
Endnotes
71. On June 17, 2021, OSFI announced a 1.50% increase to the DSB, setting the DSB at 2.50%, effective October 31, 2021.
72. On August 12, 2021, OSFI confirmed that the exclusion of sovereign-issued securities from the leverage ratio exposure measure will not beextended past December 31, 2021. However, central bank reserves will continue to be excluded from the leverage ratio exposure measure.
73. Reflects debt outstanding as at, and converted at FX rate as at January 31, 2022.
74. Sums may not add up precisely due to rounding.
75. These measures have been calculated in accordance with OSFI's Total Loss Absorbing Capacity (TLAC) guideline.
76. Includes par value of outstanding senior unsecured long-term debt issued after September 23, 2018 with a remaining term to maturity of greaterthan 1 year. Senior unsecured long-term debt with original term to maturity less than 400 days will not be eligible for bail-in and would not qualifyas TLAC.
77. This measure has been calculated in accordance with OSFI's Liquidity Adequacy Requirements guideline.
78. Subject to conversion under the bank recapitalization "bail-in" regime.
79. Ratings reflect holding company senior unsecured ratings.
80. Business deposits exclude wholesale funding.
81. Market share ranking is based on internally produced reports.
82. Excludes certain liabilities: trading derivatives, other liabilities, wholesale mortgage trading business, non-controlling interest and certain equity capital such as common equity.
83. Bank, Business & Government Deposits less covered bonds and senior MTN notes.
84. Obligations related to securities sold short and sold under repurchase agreements.
85. Consists primarily of bearer deposit notes, certificates of deposit and commercial paper.
86. For wholesale term debt that has bullet maturities.
87. Based on first par redemption date. The timing of an actual redemption is subject to management’s view at the time as well as applicable regulatory and corporate governance approvals.
88. Includes Limited Recourse Capital Notes, Preferred Shares and Innovative T1.
73
Endnotes
89. Includes Limited Recourse Capital Notes, Preferred Shares and Subordinated Debt. Subordinated debt includes certain private placement notes.These instruments are not considered wholesale funding as they may be raised primarily for capital management purposes.
90. Represents mortgage-backed securities issued to external investors only.
91. Excludes certain private placement and structured notes.
92. In Canadian dollars equivalent.
93. On March 27, 2020, OSFI announced that the covered bond ratio limit is temporarily increased to 10% to enable access to Bank of Canadafacilities, while the maximum covered bond assets encumbered relating to market instruments remains limited to 5.5% of an issuer`s on-balancesheet assets. Effective October 21, 2020, the Bank of Canada no longer accepts own-name covered bonds for Term Repo operations. OSFI hasannounced the unwinding of the temporary increase to the covered bond limit effective April 6, 2021.
94. Ratings by Moody’s and DBRS, respectively, as at January 31, 2022.
95. The Covered Bond Label Foundation and its affiliates are not associated with and do not approve or endorse TD's covered bond products.
96. Current Loan to Value is calculated with the Teranet-National Bank House Price Index and weighted by balance.
97. Any non-NVCC preferred shares and non-NVCC subordinated debt issued after September 23, 2018 would also be in scope.
98. Term as defined in the bail-in regulations.
99. In determining the multiplier, CDIC must take into consideration the requirement in the Bank Act for banks to maintain adequate capital and thatequally ranking bail-in eligible instruments must be converted in the same proportion and receive the same number of common shares per dollarof claim.
100. Source: TD Economics, February 2022. For recent economic analysis and research please refer to https://economics.td.com .
101. Source: TD Economics, March 2022. For recent economic analysis and research please refer to https://economics.td.com .
102. Gross Impaired Loan formations represent additions to Impaired Loans & Acceptances during the quarter; excludes the impact of acquired credit-impaired loans.
103. GIL Formations Ratio: Gross Impaired Loan Formations/Average Gross Loans & Acceptances.
104. Gross Impaired Loans (GIL) excludes the impact of acquired credit-impaired loans.
105. GIL Ratio: Gross Impaired Loans/Gross Loans & Acceptances (both are spot) by portfolio.
74
Endnotes
106. Effective November 1, 2017, the Bank adopted IFRS 9, which replaces the guidance in IAS 39. The Bank made the decision not to restatecomparative period financial information and has recognized any measurement differences between the previous carrying amount and the newcarrying amount on November 1, 2017 through an adjustment to opening retained earnings. As such, fiscal 2018 and 2019 results reflectthe adoption of IFRS 9, while prior periods reflect results under IAS 39.
107. PCL-impaired represents Stage 3 PCL under IFRS 9, performing represents Stage 1 and Stage 2 on financial assets, loan commitments, and financial guarantees.
108. RESL Portfolio Loan to Value is calculated with the Teranet-National Bank House Price Index™ and weighted by the total exposure. TheTeranet-National Bank House Price Index™ is a trademark of Teranet Enterprises Inc. and National Bank of Canada and has been licensed forinternal use by The Toronto-Dominion Bank's Real Estate Secured Lending team only.
109. The territories are included as follows: Yukon is included in British Columbia; Nunavut is included in Ontario; and Northwest Territories is included in the Prairies region.
110. Includes Small Business Banking and Business Credit Cards.
111. Consumer includes: Food, Beverage and Tobacco; Retail Sector.
112. Industrial/Manufacturing includes: Industrial Construction and Trade Contractors; Sundry Manufacturing and Wholesale.
113. Other includes: Power and Utilities; Telecommunications, Cable and Media; Transportation; Professional and Other Services; Other.
114. Excludes acquired credit-impaired loans.
115. Loan To Value based on authorized credit limit and Loan Performance Home Price Index as of August 2021. FICO Scores updated September 2021.
116. Other includes: Agriculture; Power and utilities; Telecommunications, cable and media; Transportation; Resources; Other.
117. Calendarized for TD fiscal year ending October 31, 2023; Based on First Horizon 2022E and 2023E median analyst consensus net income estimates of $791MM and $875MM, respectively.
118. Estimated $610MM in pre-tax cost savings. Fully-synergized metrics are calculated on the basis that expected cost synergies are fully realized and that the transaction closes on November 1, 2022.
119. Includes cost of allocated financing, reversal of First Horizon intangible amortization, and accretion of gross credit mark and rate mark into earnings.
120. Assumes no standalone or pro forma share repurchases between announcement and fiscal year end 2023.
75
Endnotes
121. Pre-tax, pre-provision earnings (PTPP) is a non-GAAP financial measure that is typically calculated by subtracting expenses from revenues. Atthe total Bank level, TD calculates PTPP as the difference between revenue (U.S. Retail in $US) net of fair value changes in investmentssupporting insurance claims liabilities, and adjusted expenses (U.S. Retail in $US), grossed up by the retailer program partners' share of PCL forthe Bank's U.S. strategic card portfolio. Collectively, these adjustments provide a measure of PTPP that management believes is more reflectiveof underlying business performance.
122. Operating leverage is a non-GAAP ratio that is typically calculated by dividing revenue growth by expense growth. At the total bank level, TDcalculates operating leverage as the difference between the % change in adjusted revenue (U.S. Retail in source currency) net of fair valuechanges in investments supporting insurance claims liabilities, and the % change in adjusted expenses (U.S. Retail in source currency) grossedup by the retailer program partners' share of PCL for the Bank's U.S. strategic card portfolio. Collectively, these adjustments provide a measureof operating leverage that management believes is more reflective of underlying business performance.
123. Adjusts for the impact of foreign exchange on the U.S. Retail Bank by using source currency figures. These adjustments are done to reflectmeasures that the Bank believes are more reflective of underlying business performance.
124. Adjusts for fair value changes in investments supporting insurance claims liabilities, as reported on page 6, line 14 of the Bank's Q1 2022Supplementary Financial Information package (Income (loss) from Financial Instruments designated at FVTPL – Related to InsuranceSubsidiaries).
125. Adjusts for the impact of the accounting requirements for the U.S. strategic card portfolio. Subtracting the partners' share of the PCL removes asource of volatility that is not reflective of the Bank's underlying economic exposure. This can be done by adding Corporate PCL (which consistssolely of the partners' share of the PCL) back to non-interest expenses.
126. Line 13 metrics reflect the adjustments described in lines 9 through 12 on slide 65.
127. Excluding only the impact of the US Strategic Card Portfolio partners' share, year-over year expense growth would have been 2.8% ($5,760MMin Q1 2021 and $5,920MM in Q1 2022, representing a year-over-year increase of $160MM).

76
Investor Relations Contacts Phone:
(416) 308-9030 or 1 (866) 486-4826
Email:
Website:
www.td.com/investor


