Embed Size (px)
Citation preview
©Unichem Laboratories Ltd
UNICHEM
Unichem Laboratories Limited
Investor Presentation
Q2 & H1 FY 2017
1
©Unichem Laboratories Ltd
UNICHEM
Safe Harbor Statement
This presentation may include certain forward-looking statements and information
that involve risks, uncertainties and assumptions based on current expectations,
within the meaning of applicable laws and regulations. Forward-looking statements
are all statements that concern plans, objectives, goals, strategies, future events or
performance and underlying assumptions and other statements that are other than
statements of historical fact, including, but not limited to, those that are identified by
the use of words such as “anticipates,” “believes,” “estimates,” “expects,” “intends,”
“plans,” “predicts,” “projects” and similar expressions. Actual results could differ
materially from those projected in forward looking statements and the company does
not guarantee realization of these statements. Any forward looking statement or
information contained in this presentation speaks only as of the date of the
statements. The company also disclaims any obligation to revise any forward looking
statements.
No part of this presentation may be reproduced, quoted or circulated without the prior
approval from Unichem Laboratories Limited
2
©Unichem Laboratories Ltd
UNICHEM
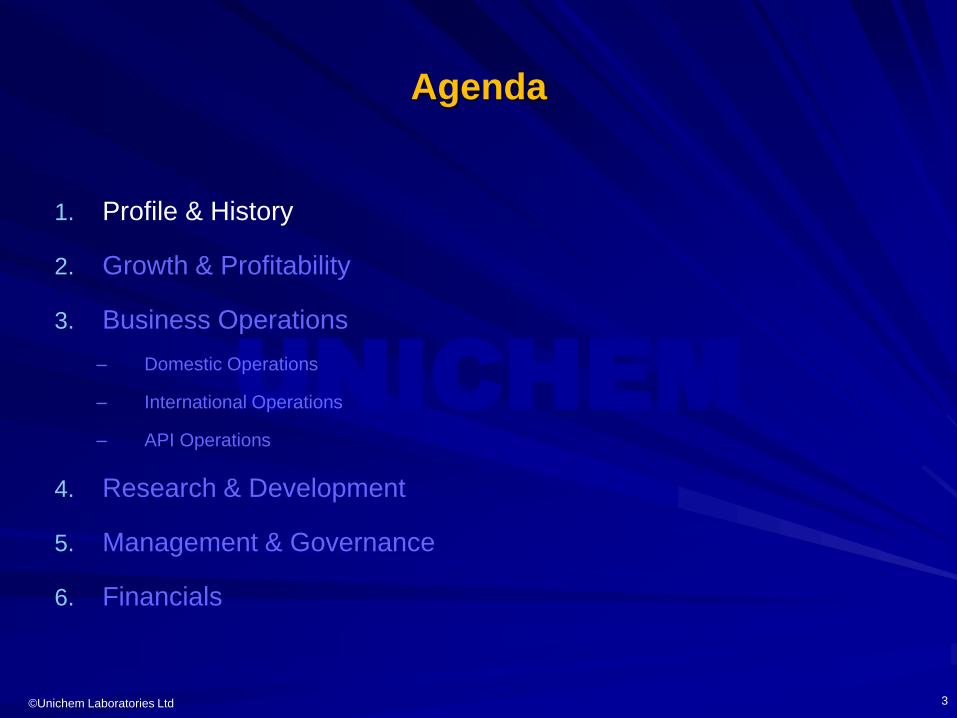
Agenda
1. Profile & History
2. Growth & Profitability
3. Business Operations
– Domestic Operations
– International Operations
– API Operations
4. Research & Development
5. Management & Governance
6. Financials
3
©Unichem Laboratories Ltd
UNICHEM
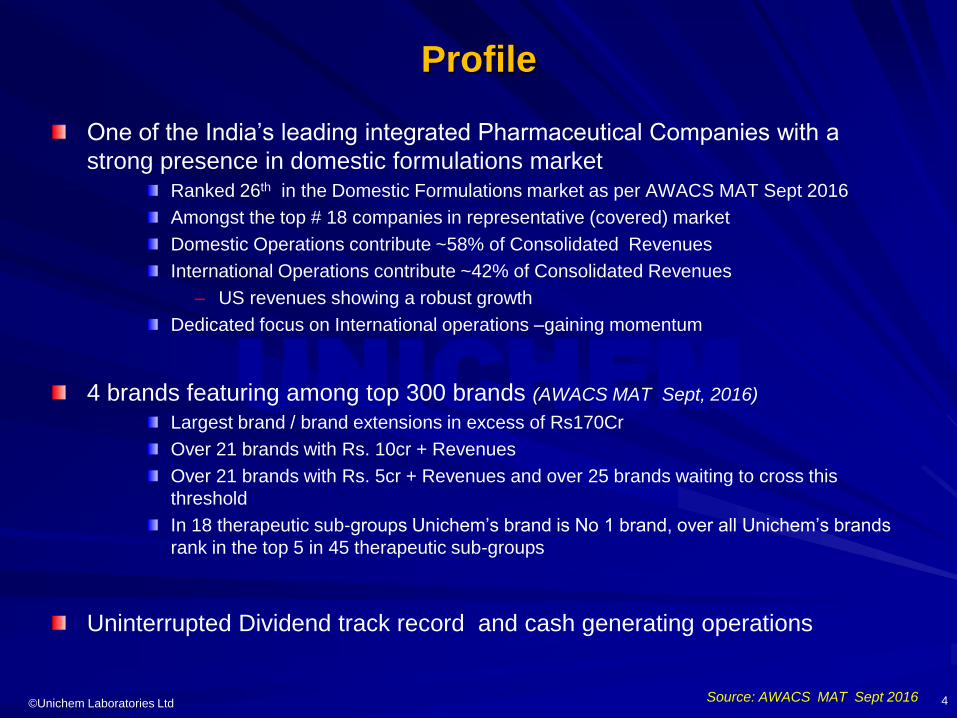
One of the India’s leading integrated Pharmaceutical Companies with a
strong presence in domestic formulations marketRanked 26th in the Domestic Formulations market as per AWACS MAT Sept 2016
Amongst the top # 18 companies in representative (covered) market
Domestic Operations contribute ~58% of Consolidated Revenues
International Operations contribute ~42% of Consolidated Revenues
– US revenues showing a robust growth
Dedicated focus on International operations –gaining momentum
4 brands featuring among top 300 brands (AWACS MAT Sept, 2016)
Largest brand / brand extensions in excess of Rs170Cr
Over 21 brands with Rs. 10cr + Revenues
Over 21 brands with Rs. 5cr + Revenues and over 25 brands waiting to cross this
threshold
In 18 therapeutic sub-groups Unichem’s brand is No 1 brand, over all Unichem’s brands
rank in the top 5 in 45 therapeutic sub-groups
Uninterrupted Dividend track record and cash generating operations
Profile
Source: AWACS MAT Sept 2016 4
©Unichem Laboratories Ltd
UNICHEM
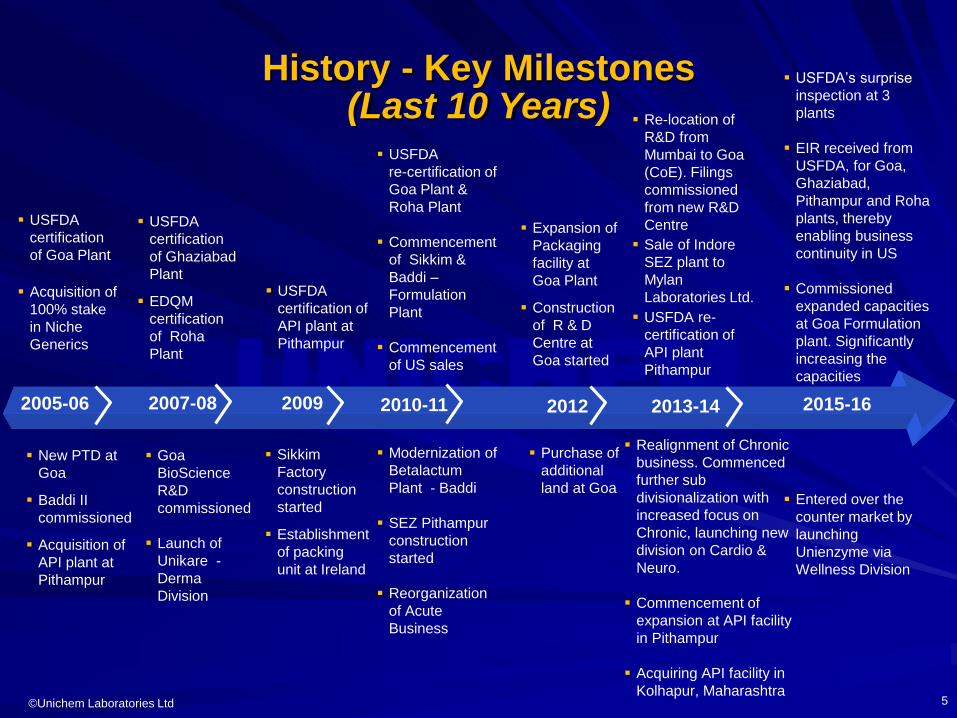
USFDA
re-certification of
Goa Plant &
Roha Plant
Commencement
of Sikkim &
Baddi –
Formulation
Plant
Commencement
of US sales
Modernization of
Betalactum
Plant - Baddi
SEZ Pithampur
construction
started
Reorganization
of Acute
Business
History - Key Milestones(Last 10 Years)
2005-06 2007-08 2009
New PTD at
Goa
Baddi II
commissioned
Acquisition of
API plant at
Pithampur
USFDA
certification
of Goa Plant
Acquisition of
100% stake
in Niche
Generics
Goa
BioScience
R&D
commissioned
Launch of
Unikare -
Derma
Division
USFDA
certification
of Ghaziabad
Plant
EDQM
certification
of Roha
Plant
Sikkim
Factory
construction
started
Establishment
of packing
unit at Ireland
5
2010-11 2012
Expansion of
Packaging
facility at
Goa Plant
Construction
of R & D
Centre at
Goa started
2013-14
Sale of Indore
SEZ plant to
Mylan
Laboratories Ltd.
Purchase of
additional
land at Goa
Realignment of Chronic
business. Commenced
further sub
divisionalization with
increased focus on
Chronic, launching new
division on Cardio &
Neuro.
Commencement of
expansion at API facility
in Pithampur
Acquiring API facility in
Kolhapur, Maharashtra
USFDA
certification of
API plant at
Pithampur
USFDA re-
certification of
API plant
Pithampur
Re-location of
R&D from
Mumbai to Goa
(CoE). Filings
commissioned
from new R&D
Centre
USFDA’s surprise
inspection at 3
plants
EIR received from
USFDA, for Goa,
Ghaziabad,
Pithampur and Roha
plants, thereby
enabling business
continuity in US
Commissioned
expanded capacities
at Goa Formulation
plant. Significantly
increasing the
capacities
Entered over the
counter market by
launching
Unienzyme via
Wellness Division
2015-16
©Unichem Laboratories Ltd
UNICHEM
Agenda
1. Profile & History
2. Growth & Profitability
3. Business Operations
– Domestic Operations
– International Operations
– API Operations
4. Research & Development
5. Management & Governance
6. Financials
6
©Unichem Laboratories Ltd
UNICHEM
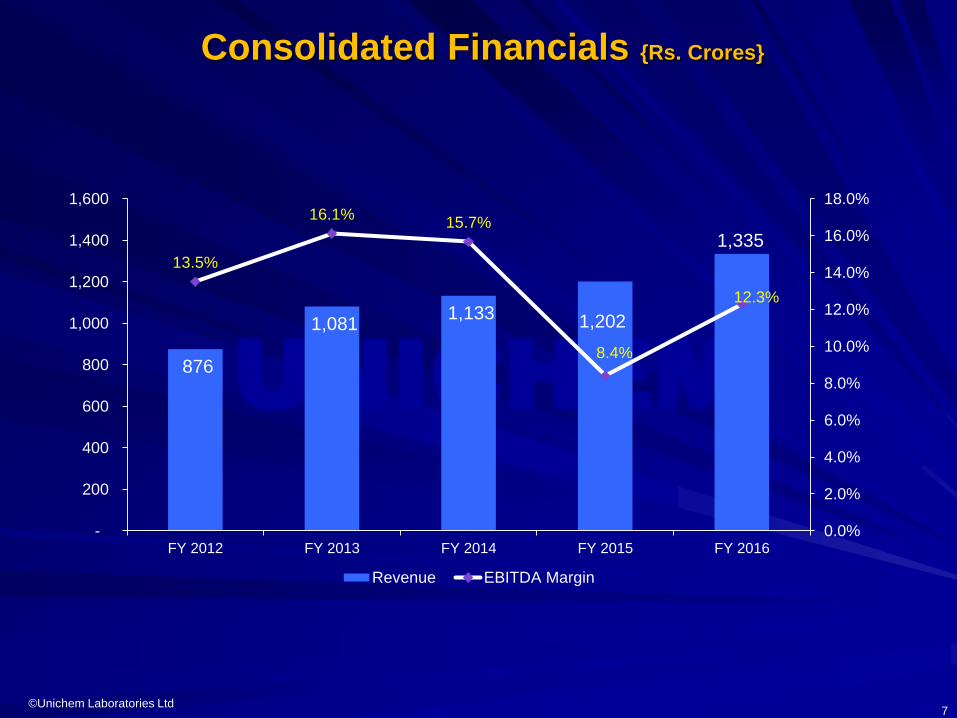
Consolidated Financials {Rs. Crores}
7
876
1,081 1,133 1,202
1,335 13.5%
16.1%15.7%
8.4%
12.3%
0.0%
2.0%
4.0%
6.0%
8.0%
10.0%
12.0%
14.0%
16.0%
18.0%
-
200
400
600
800
1,000
1,200
1,400
1,600
FY 2012 FY 2013 FY 2014 FY 2015 FY 2016
Revenue EBITDA Margin
©Unichem Laboratories Ltd
UNICHEM
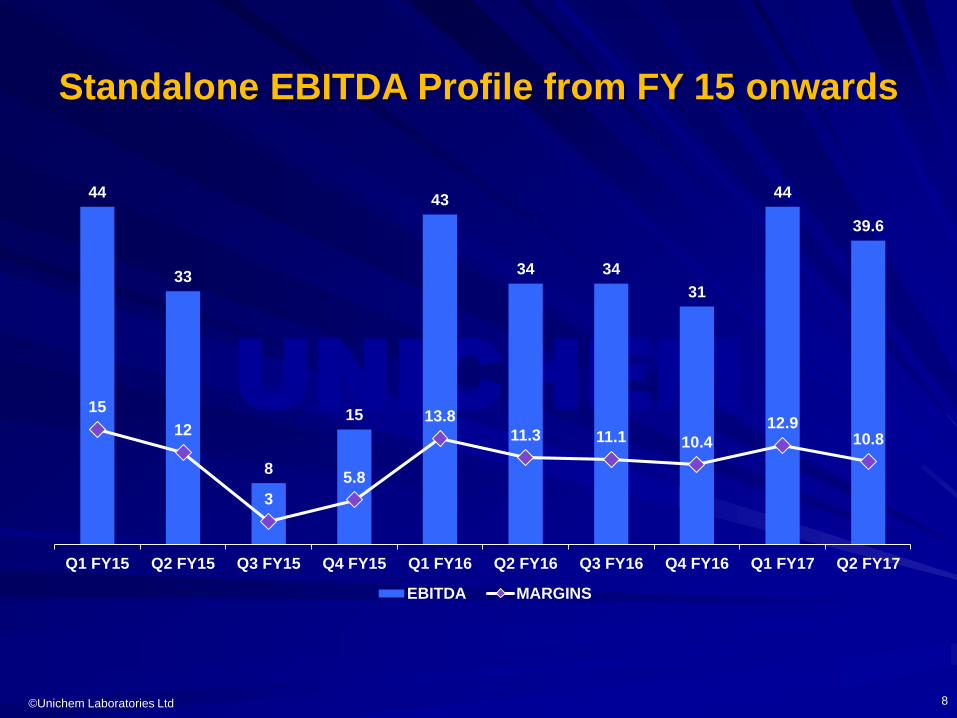
Standalone EBITDA Profile from FY 15 onwards
8
44
33
8
15
43
34 34
31
44
39.6
15
12
3
5.8
13.8
11.3 11.1 10.4
12.910.8
Q1 FY15 Q2 FY15 Q3 FY15 Q4 FY15 Q1 FY16 Q2 FY16 Q3 FY16 Q4 FY16 Q1 FY17 Q2 FY17
EBITDA MARGINS
©Unichem Laboratories Ltd
UNICHEM
Agenda
1. Profile & History
2. Growth & Profitability
3. Business Operations
– Domestic Operations
– International Operations
– API Operations
4. Research & Development
5. Management & Governance
6. Financials
9
©Unichem Laboratories Ltd
UNICHEM
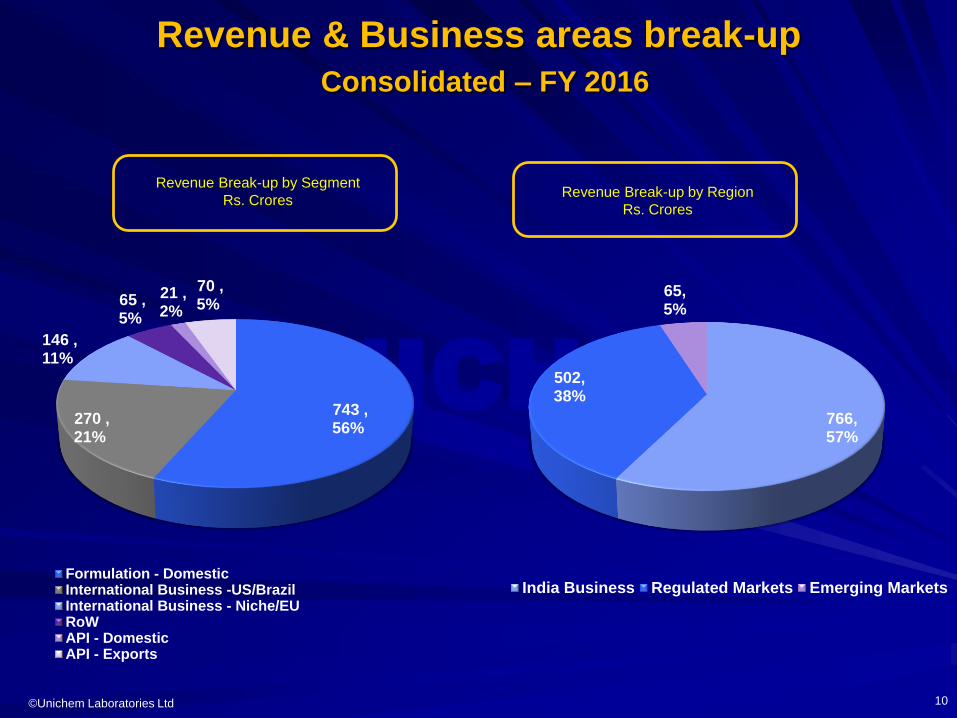
Revenue & Business areas break-up
Consolidated – FY 2016
Revenue Break-up by Segment
Rs. CroresRevenue Break-up by Region
Rs. Crores
10
766, 57%
502, 38%
65, 5%
India Business Regulated Markets Emerging Markets
743 , 56%
270 , 21%
146 , 11%
65 , 5%
21 , 2%
70 , 5%
Formulation - DomesticInternational Business -US/BrazilInternational Business - Niche/EURoWAPI - DomesticAPI - Exports
©Unichem Laboratories Ltd
UNICHEM
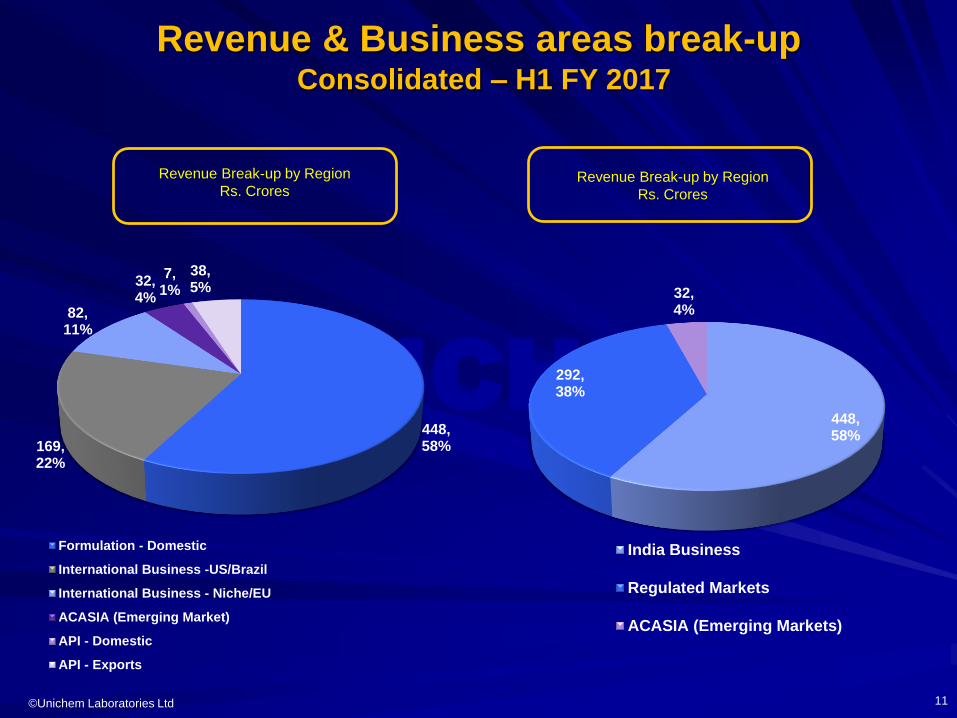
Revenue & Business areas break-upConsolidated – H1 FY 2017
Revenue Break-up by Region
Rs. Crores
11
448, 58%
292, 38%
32, 4%
India Business
Regulated Markets
ACASIA (Emerging Markets)
448, 58%169,
22%
82, 11%
32, 4%
7, 1%
38, 5%
Formulation - Domestic
International Business -US/Brazil
International Business - Niche/EU
ACASIA (Emerging Market)
API - Domestic
API - Exports
Revenue Break-up by Region
Rs. Crores
©Unichem Laboratories Ltd
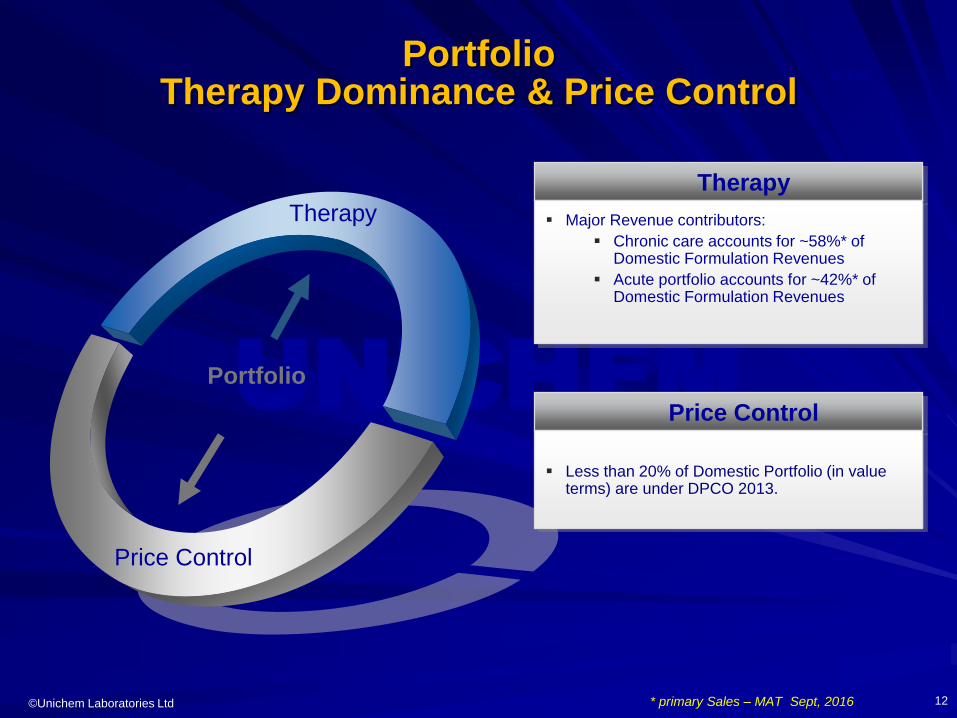
UNICHEMPortfolio
Therapy
Major Revenue contributors:
Chronic care accounts for ~58%* of Domestic Formulation Revenues
Acute portfolio accounts for ~42%* of Domestic Formulation Revenues
Price Control
Less than 20% of Domestic Portfolio (in value terms) are under DPCO 2013.
SCENEPortfolio
Therapy Dominance & Price Control
Price Control
Therapy
* primary Sales – MAT Sept, 2016 12
©Unichem Laboratories Ltd
UNICHEM
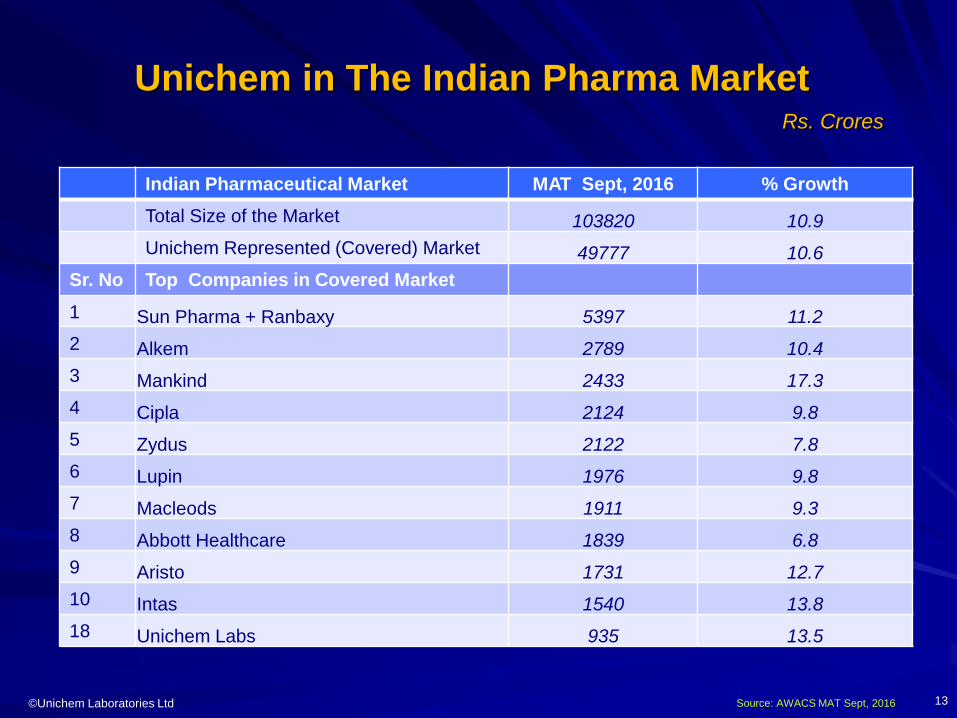
Unichem in The Indian Pharma Market
Indian Pharmaceutical Market MAT Sept, 2016 % Growth
Total Size of the Market 103820 10.9
Unichem Represented (Covered) Market 49777 10.6
Sr. No Top Companies in Covered Market
1 Sun Pharma + Ranbaxy 5397 11.2
2 Alkem 2789 10.4
3 Mankind 2433 17.3
4 Cipla 2124 9.8
5 Zydus 2122 7.8
6 Lupin 1976 9.8
7 Macleods 1911 9.3
8 Abbott Healthcare 1839 6.8
9 Aristo 1731 12.7
10 Intas 1540 13.8
18 Unichem Labs 935 13.5
Rs. Crores
13Source: AWACS MAT Sept, 2016
©Unichem Laboratories Ltd
UNICHEM
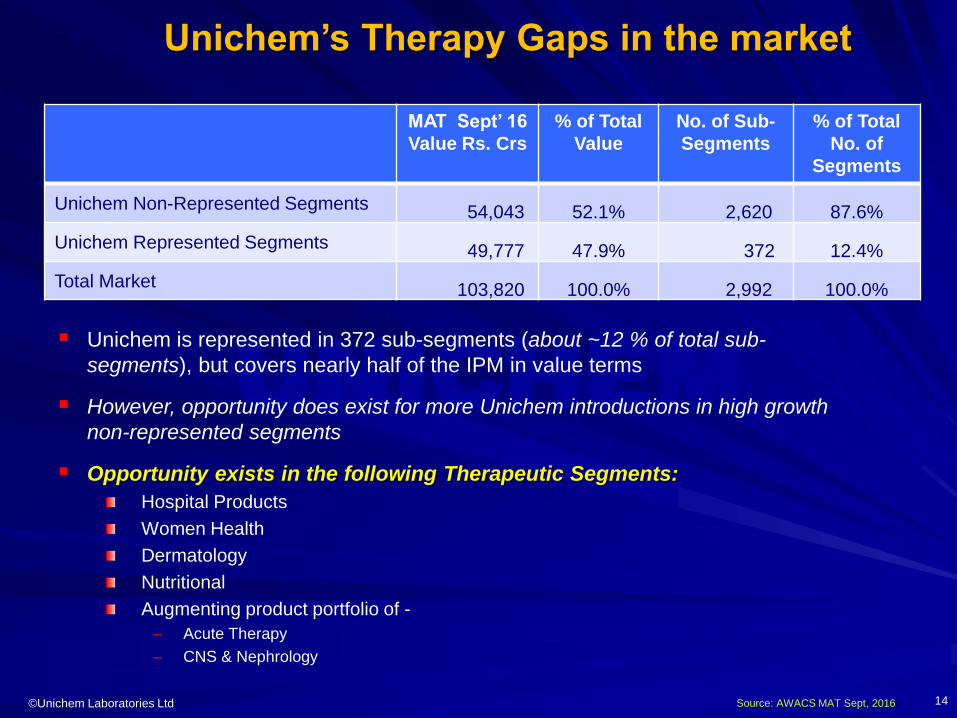
Unichem is represented in 372 sub-segments (about ~12 % of total sub-
segments), but covers nearly half of the IPM in value terms
However, opportunity does exist for more Unichem introductions in high growth
non-represented segments
Opportunity exists in the following Therapeutic Segments:
Hospital Products
Women Health
Dermatology
Nutritional
Augmenting product portfolio of -
– Acute Therapy
– CNS & Nephrology
Unichem’s Therapy Gaps in the market
MAT Sept’ 16
Value Rs. Crs
% of Total
Value
No. of Sub-
Segments
% of Total
No. of
Segments
Unichem Non-Represented Segments 54,043 52.1% 2,620 87.6%
Unichem Represented Segments 49,777 47.9% 372 12.4%
Total Market 103,820 100.0% 2,992 100.0%
14Source: AWACS MAT Sept, 2016
©Unichem Laboratories Ltd
UNICHEM
15
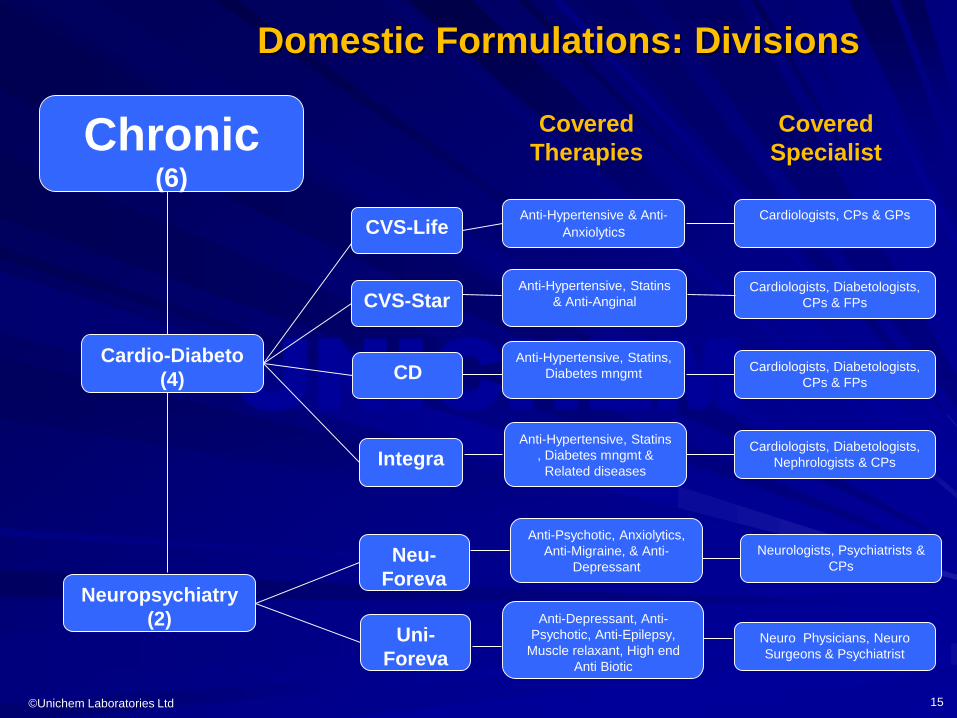
Domestic Formulations: Divisions
Chronic(6)
Cardio-Diabeto
(4)
Neuropsychiatry
(2)
CVS-Life
CVS-Star
CD
Integra
Neu-
Foreva
Uni-
Foreva
Anti-Hypertensive & Anti-
Anxiolytics
Cardiologists, CPs & GPs
Anti-Hypertensive, Statins
& Anti-AnginalCardiologists, Diabetologists,
CPs & FPs
Anti-Hypertensive, Statins,
Diabetes mngmtCardiologists, Diabetologists,
CPs & FPs
Anti-Hypertensive, Statins
, Diabetes mngmt &
Related diseases
Cardiologists, Diabetologists,
Nephrologists & CPs
Anti-Psychotic, Anxiolytics,
Anti-Migraine, & Anti-
Depressant
Neurologists, Psychiatrists &
CPs
Anti-Depressant, Anti-
Psychotic, Anti-Epilepsy,
Muscle relaxant, High end
Anti Biotic
Neuro Physicians, Neuro
Surgeons & Psychiatrist
Covered
Therapies
Covered
Specialist
©Unichem Laboratories Ltd
UNICHEM
16
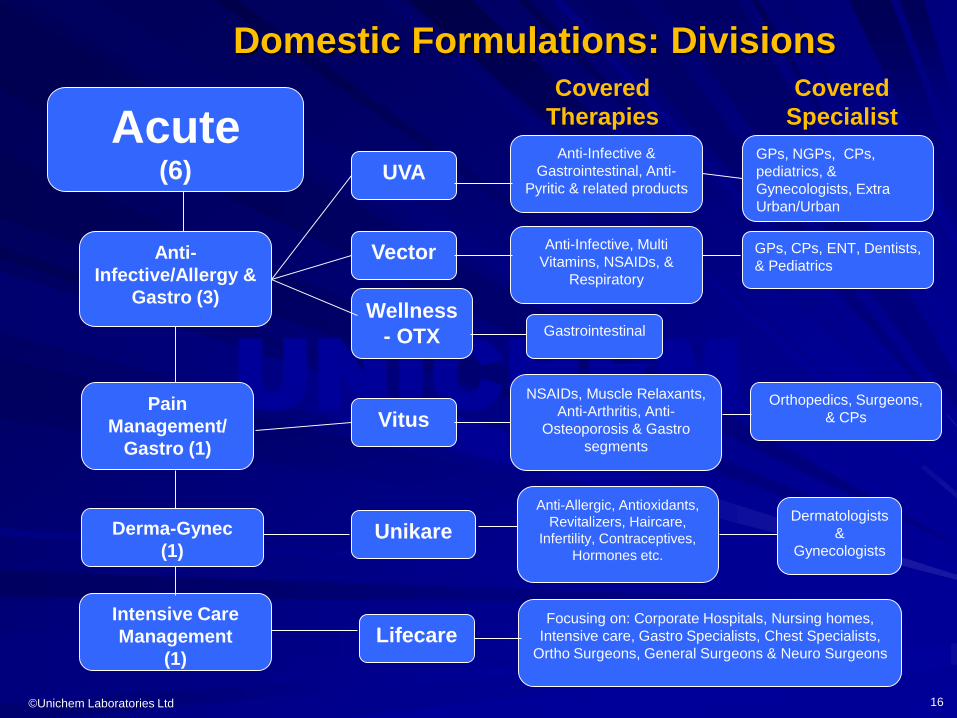
Domestic Formulations: Divisions
Acute(6)
Anti-
Infective/Allergy &
Gastro (3)
Pain
Management/
Gastro (1)
Intensive Care
Management
(1)
UVA
Vector
Vitus
Lifecare
Anti-Infective &
Gastrointestinal, Anti-
Pyritic & related products
GPs, NGPs, CPs,
pediatrics, &
Gynecologists, Extra
Urban/Urban
Anti-Infective, Multi
Vitamins, NSAIDs, &
Respiratory
GPs, CPs, ENT, Dentists,
& Pediatrics
NSAIDs, Muscle Relaxants,
Anti-Arthritis, Anti-
Osteoporosis & Gastro
segments
Orthopedics, Surgeons,
& CPs
Focusing on: Corporate Hospitals, Nursing homes,
Intensive care, Gastro Specialists, Chest Specialists,
Ortho Surgeons, General Surgeons & Neuro Surgeons
Covered
Therapies
Covered
Specialist
Derma-Gynec
(1)Unikare
Anti-Allergic, Antioxidants,
Revitalizers, Haircare,
Infertility, Contraceptives,
Hormones etc.
Dermatologists
&
Gynecologists
Wellness
- OTX Gastrointestinal
©Unichem Laboratories Ltd
UNICHEM
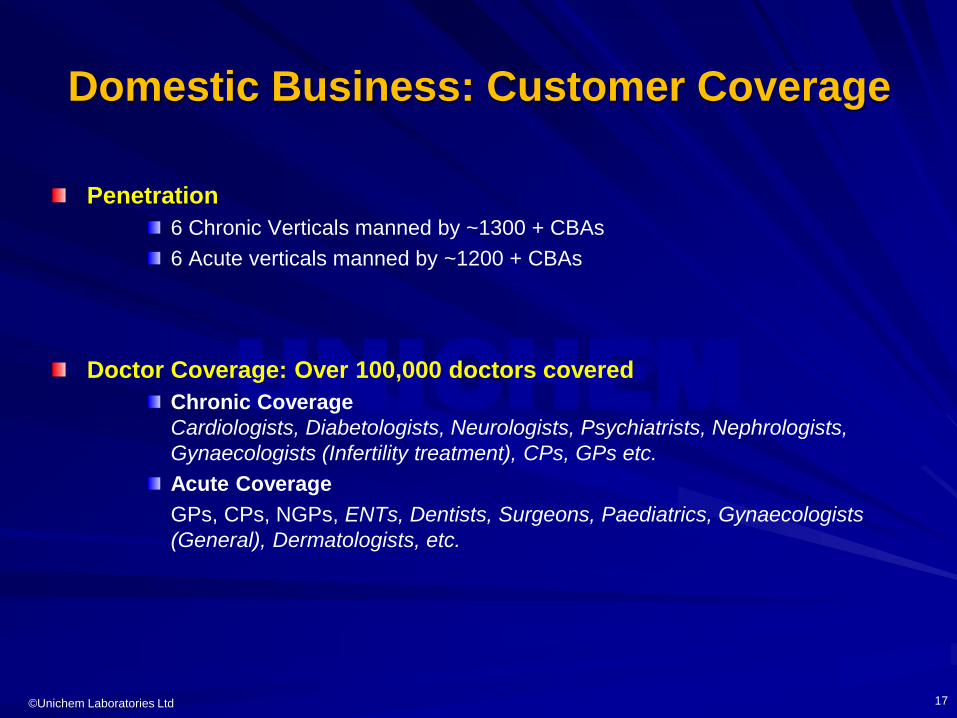
Domestic Business: Customer Coverage
17
Penetration
6 Chronic Verticals manned by ~1300 + CBAs
6 Acute verticals manned by ~1200 + CBAs
Doctor Coverage: Over 100,000 doctors covered
Chronic Coverage
Cardiologists, Diabetologists, Neurologists, Psychiatrists, Nephrologists,
Gynaecologists (Infertility treatment), CPs, GPs etc.
Acute Coverage
GPs, CPs, NGPs, ENTs, Dentists, Surgeons, Paediatrics, Gynaecologists
(General), Dermatologists, etc.
©Unichem Laboratories Ltd
UNICHEM
Domestic Formulations Business
Leadership position in key participated
segments
– Largest brand / brand extensions in excess
of Rs170cr
# 4 Brands in Top 300 brands
– Losar H, Ampoxin, Losar & Unienzyme
In 18 therapeutic groups Unichem’s
brand is No 1 brand
Over all Unichem’s brands rank in the
top 5 in 45 therapeutic sub-groups
Healthy balance between chronic
(~58%) & acute (~42%)
CVS, 42%
Anti Infective,
18%
CNS, 14%
GI, 12%
Musculo-Skeletal,
4%
Anti-Diabetic, 4%
Others, 7%
Therapeutic Segment-wise break-up
18Source: AWACS MAT Sept, 2016
©Unichem Laboratories Ltd
UNICHEM
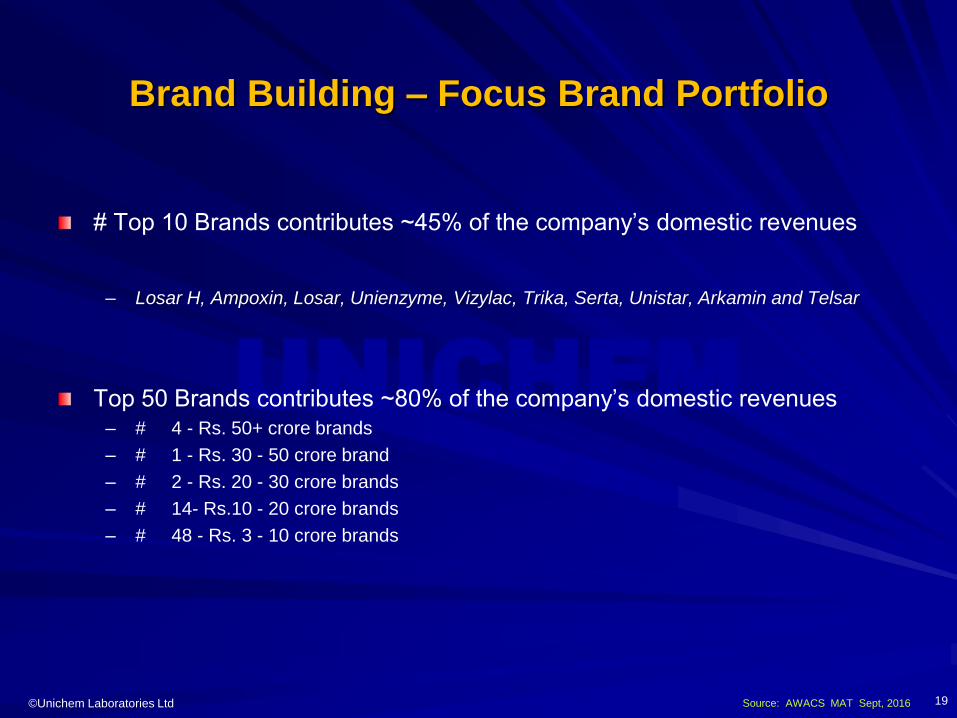
Brand Building – Focus Brand Portfolio
# Top 10 Brands contributes ~45% of the company’s domestic revenues
– Losar H, Ampoxin, Losar, Unienzyme, Vizylac, Trika, Serta, Unistar, Arkamin and Telsar
Top 50 Brands contributes ~80% of the company’s domestic revenues– # 4 - Rs. 50+ crore brands
– # 1 - Rs. 30 - 50 crore brand
– # 2 - Rs. 20 - 30 crore brands
– # 14- Rs.10 - 20 crore brands
– # 48 - Rs. 3 - 10 crore brands
19Source: AWACS MAT Sept, 2016
©Unichem Laboratories Ltd
UNICHEM
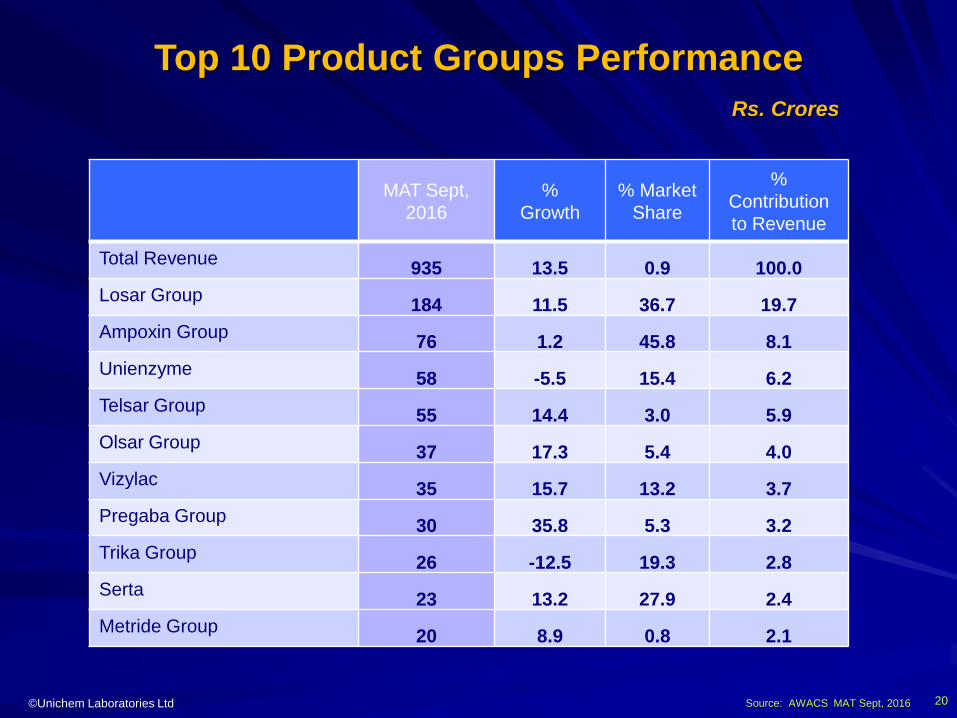
Top 10 Product Groups Performance
MAT Sept,
2016
%
Growth
% Market
Share
%
Contribution
to Revenue
Total Revenue935 13.5 0.9 100.0
Losar Group184 11.5 36.7 19.7
Ampoxin Group76 1.2 45.8 8.1
Unienzyme58 -5.5 15.4 6.2
Telsar Group55 14.4 3.0 5.9
Olsar Group37 17.3 5.4 4.0
Vizylac35 15.7 13.2 3.7
Pregaba Group30 35.8 5.3 3.2
Trika Group26 -12.5 19.3 2.8
Serta23 13.2 27.9 2.4
Metride Group20 8.9 0.8 2.1
Rs. Crores
Source: AWACS MAT Sept, 2016 20
©Unichem Laboratories Ltd
UNICHEM
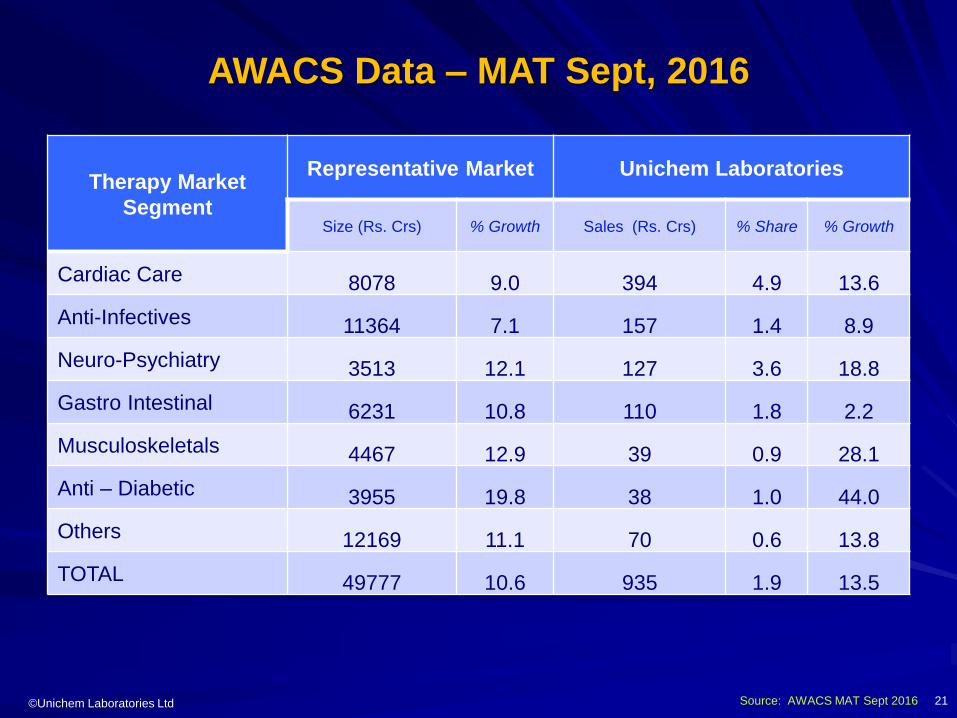
AWACS Data – MAT Sept, 2016
Therapy Market
Segment
Representative Market Unichem Laboratories
Size (Rs. Crs) % Growth Sales (Rs. Crs) % Share % Growth
Cardiac Care 8078 9.0 394 4.9 13.6
Anti-Infectives 11364 7.1 157 1.4 8.9
Neuro-Psychiatry 3513 12.1 127 3.6 18.8
Gastro Intestinal 6231 10.8 110 1.8 2.2
Musculoskeletals 4467 12.9 39 0.9 28.1
Anti – Diabetic 3955 19.8 38 1.0 44.0
Others 12169 11.1 70 0.6 13.8
TOTAL 49777 10.6 935 1.9 13.5
21Source: AWACS MAT Sept 2016
©Unichem Laboratories Ltd
UNICHEM
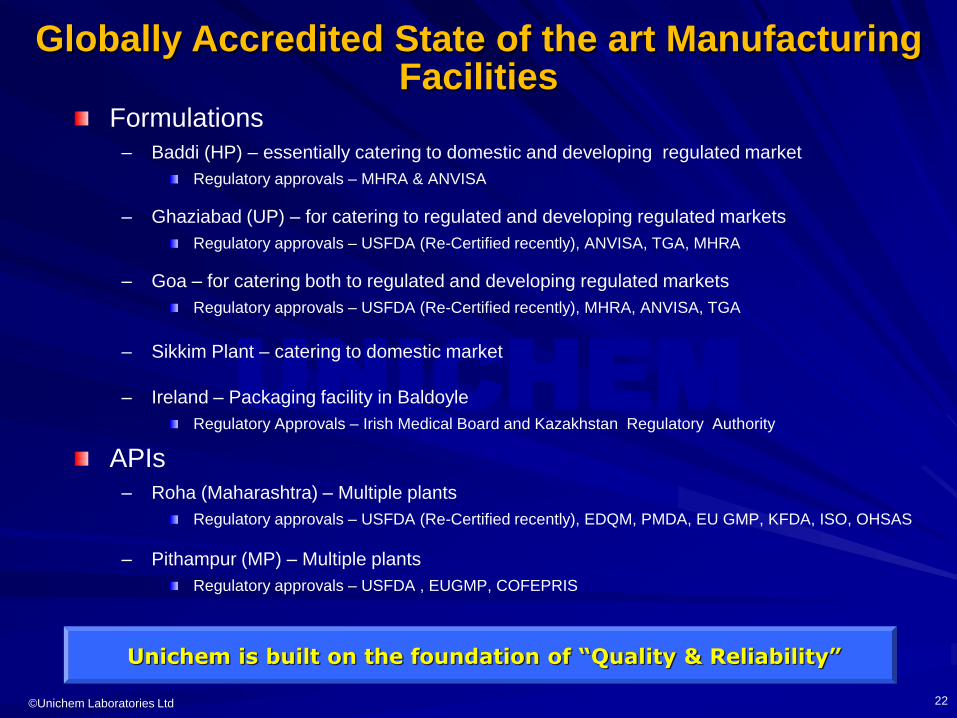
Globally Accredited State of the art Manufacturing Facilities
Formulations
– Baddi (HP) – essentially catering to domestic and developing regulated market
Regulatory approvals – MHRA & ANVISA
– Ghaziabad (UP) – for catering to regulated and developing regulated markets
Regulatory approvals – USFDA (Re-Certified recently), ANVISA, TGA, MHRA
– Goa – for catering both to regulated and developing regulated markets
Regulatory approvals – USFDA (Re-Certified recently), MHRA, ANVISA, TGA
– Sikkim Plant – catering to domestic market
– Ireland – Packaging facility in Baldoyle
Regulatory Approvals – Irish Medical Board and Kazakhstan Regulatory Authority
APIs
– Roha (Maharashtra) – Multiple plants
Regulatory approvals – USFDA (Re-Certified recently), EDQM, PMDA, EU GMP, KFDA, ISO, OHSAS
– Pithampur (MP) – Multiple plants
Regulatory approvals – USFDA , EUGMP, COFEPRIS
Unichem is built on the foundation of “Quality & Reliability”
22
©Unichem Laboratories Ltd
UNICHEM
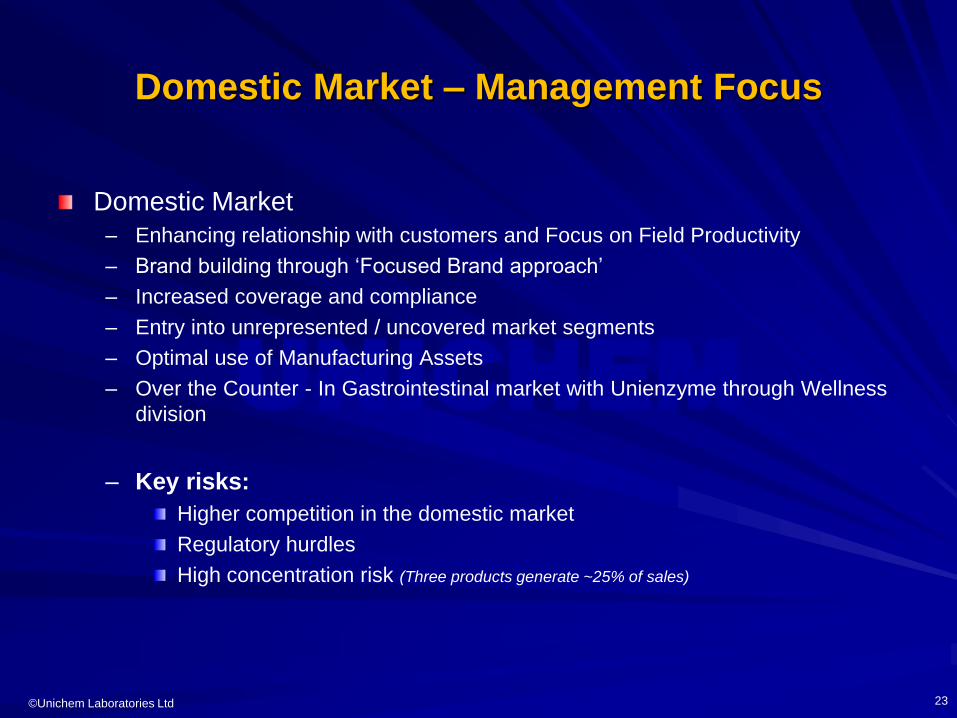
Domestic Market – Management Focus
Domestic Market
– Enhancing relationship with customers and Focus on Field Productivity
– Brand building through ‘Focused Brand approach’
– Increased coverage and compliance
– Entry into unrepresented / uncovered market segments
– Optimal use of Manufacturing Assets
– Over the Counter - In Gastrointestinal market with Unienzyme through Wellness
division
– Key risks:
Higher competition in the domestic market
Regulatory hurdles
High concentration risk (Three products generate ~25% of sales)
23

©Unichem Laboratories Ltd
UNICHEM
Agenda
1. Profile & History
2. Growth & Profitability
3. Business Operations
– Domestic Operations
– International Operations
– API Operations
4. Research & Development
5. Management & Governance
6. Financials
24
©Unichem Laboratories Ltd
UNICHEM
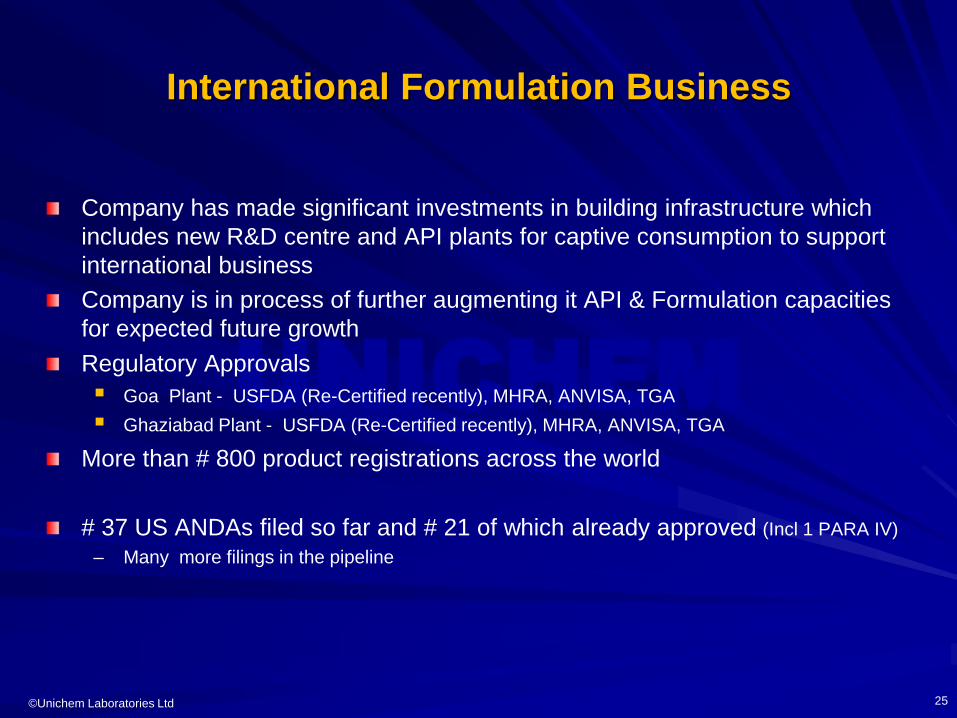
International Formulation Business
Company has made significant investments in building infrastructure which
includes new R&D centre and API plants for captive consumption to support
international business
Company is in process of further augmenting it API & Formulation capacities
for expected future growth
Regulatory Approvals
Goa Plant - USFDA (Re-Certified recently), MHRA, ANVISA, TGA
Ghaziabad Plant - USFDA (Re-Certified recently), MHRA, ANVISA, TGA
More than # 800 product registrations across the world
# 37 US ANDAs filed so far and # 21 of which already approved (Incl 1 PARA IV)
– Many more filings in the pipeline
25
©Unichem Laboratories Ltd
UNICHEM
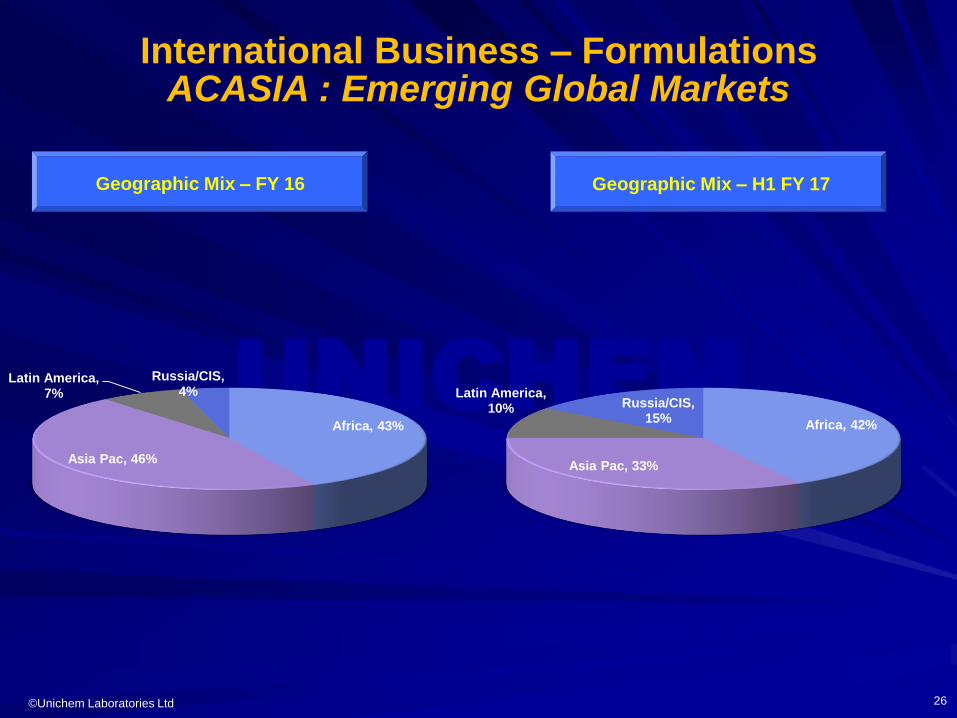
International Business – Formulations ACASIA : Emerging Global Markets
26
Geographic Mix – FY 16
Africa, 42%
Asia Pac, 33%
Latin America, 10% Russia/CIS,
15%
Geographic Mix – H1 FY 17
Africa, 43%
Asia Pac, 46%
Latin America, 7%
Russia/CIS, 4%
©Unichem Laboratories Ltd
UNICHEM
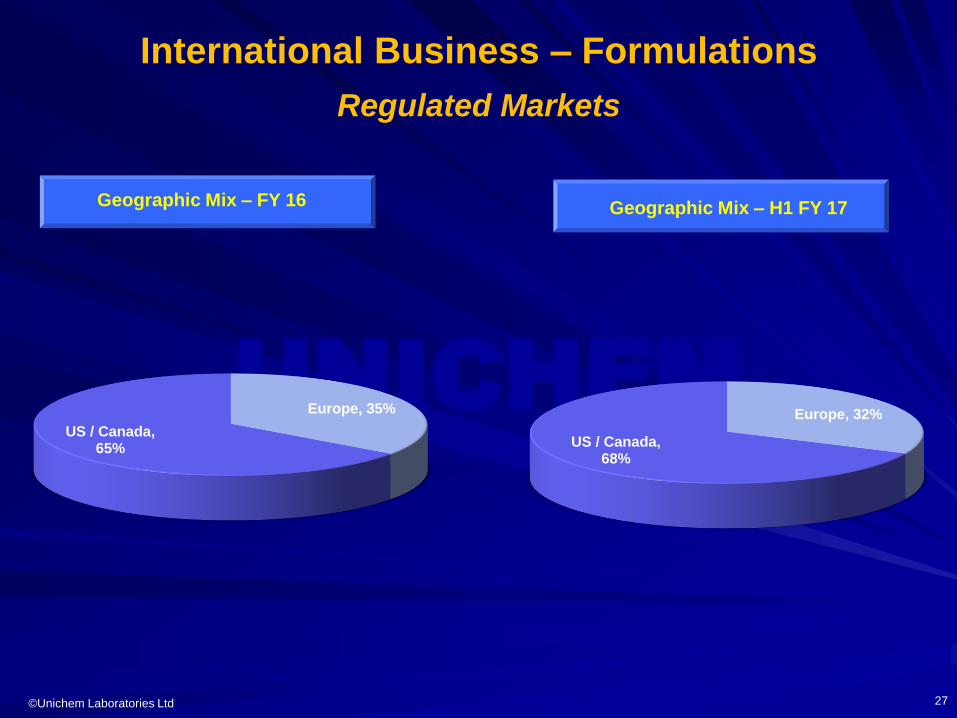
International Business – Formulations
Regulated Markets
27
Geographic Mix – FY 16 Geographic Mix – H1 FY 17
Europe, 32%
US / Canada, 68%
Europe, 35%
US / Canada, 65%
©Unichem Laboratories Ltd
UNICHEM
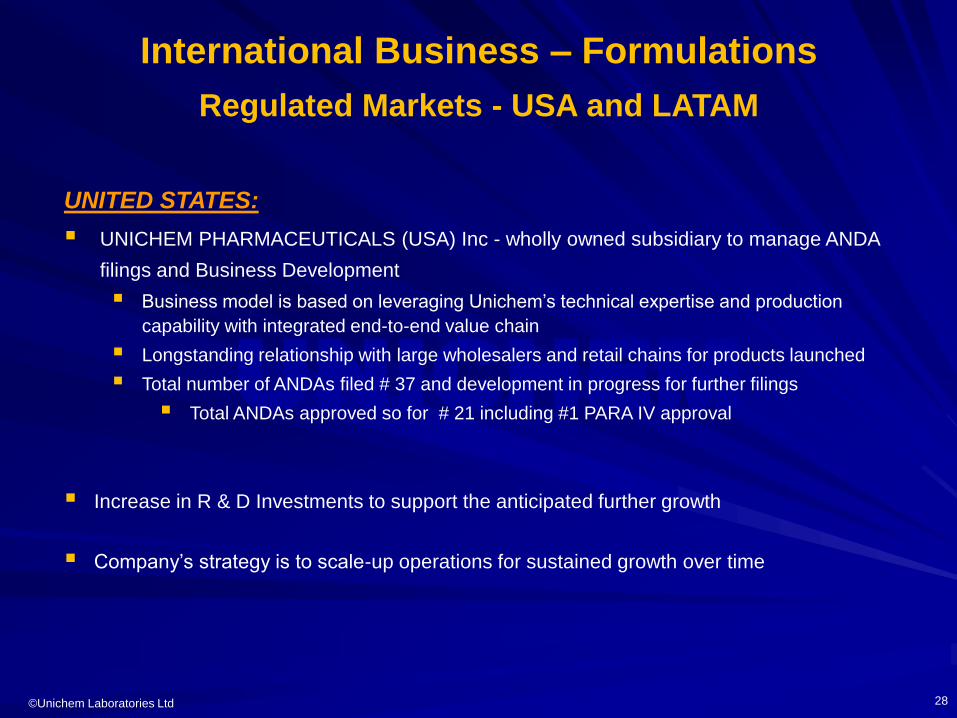
UNITED STATES:
UNICHEM PHARMACEUTICALS (USA) Inc - wholly owned subsidiary to manage ANDA
filings and Business Development
Business model is based on leveraging Unichem’s technical expertise and production
capability with integrated end-to-end value chain
Longstanding relationship with large wholesalers and retail chains for products launched
Total number of ANDAs filed # 37 and development in progress for further filings
Total ANDAs approved so for # 21 including #1 PARA IV approval
Increase in R & D Investments to support the anticipated further growth
Company’s strategy is to scale-up operations for sustained growth over time
International Business – Formulations
Regulated Markets - USA and LATAM
28
©Unichem Laboratories Ltd
UNICHEM
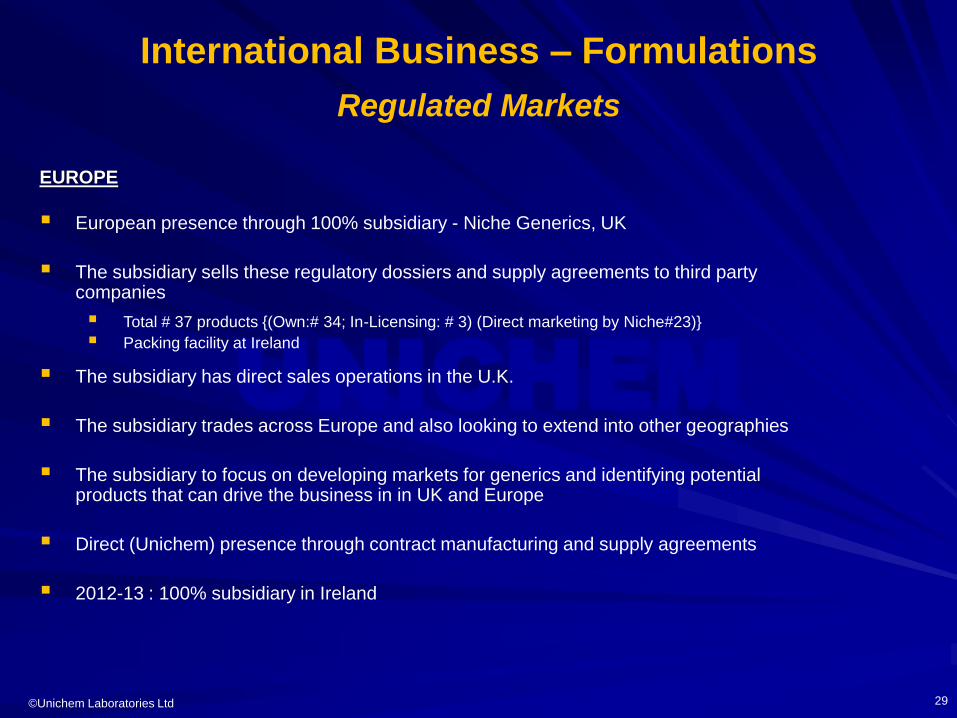
EUROPE
European presence through 100% subsidiary - Niche Generics, UK
The subsidiary sells these regulatory dossiers and supply agreements to third party companies
Total # 37 products {(Own:# 34; In-Licensing: # 3) (Direct marketing by Niche#23)}
Packing facility at Ireland
The subsidiary has direct sales operations in the U.K.
The subsidiary trades across Europe and also looking to extend into other geographies
The subsidiary to focus on developing markets for generics and identifying potential products that can drive the business in in UK and Europe
Direct (Unichem) presence through contract manufacturing and supply agreements
2012-13 : 100% subsidiary in Ireland
International Business – Formulations
Regulated Markets
29
©Unichem Laboratories Ltd
UNICHEM
Agenda
1. Profile & History
2. Growth & Profitability
3. Business Operations
– Domestic Operations
– International Operations
– API Operations
4. Research & Development
5. Management & Governance
6. Financials
30
©Unichem Laboratories Ltd
UNICHEM
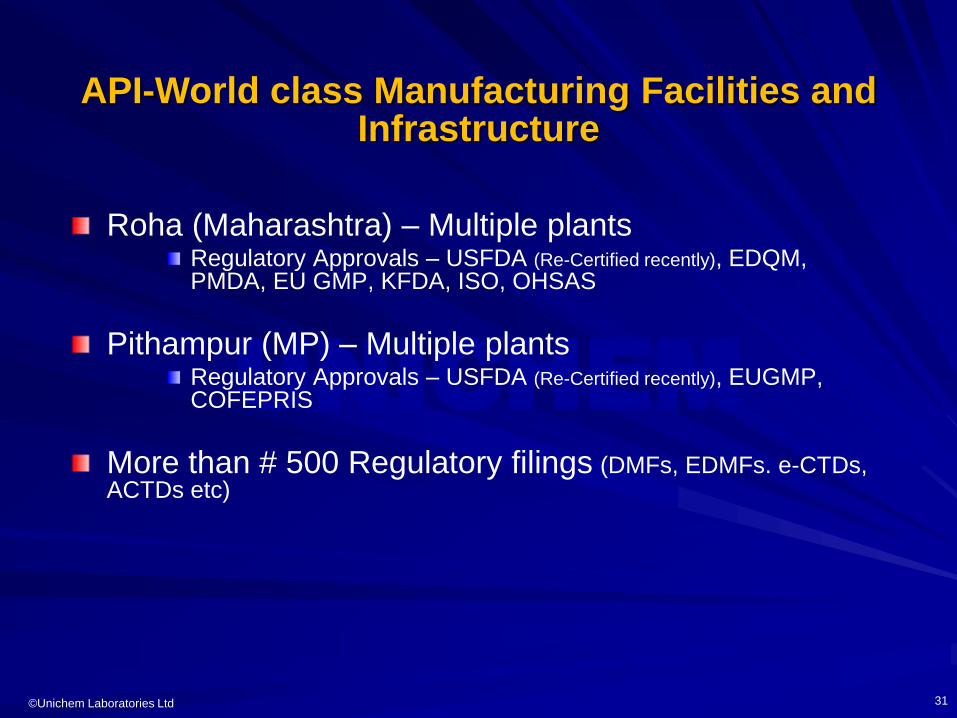
API-World class Manufacturing Facilities and Infrastructure
Roha (Maharashtra) – Multiple plantsRegulatory Approvals – USFDA (Re-Certified recently), EDQM, PMDA, EU GMP, KFDA, ISO, OHSAS
Pithampur (MP) – Multiple plantsRegulatory Approvals – USFDA (Re-Certified recently), EUGMP, COFEPRIS
More than # 500 Regulatory filings (DMFs, EDMFs. e-CTDs, ACTDs etc)
31
©Unichem Laboratories Ltd
UNICHEM
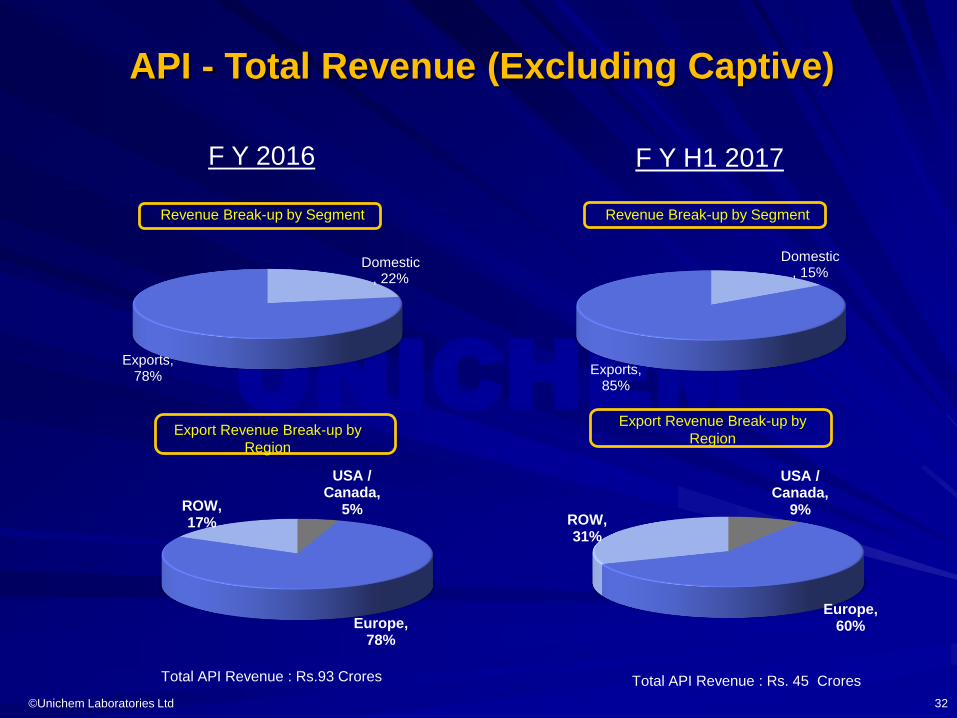
API - Total Revenue (Excluding Captive)
Revenue Break-up by Segment
Export Revenue Break-up by
Region
32
F Y 2016
Total API Revenue : Rs.93 Crores
USA / Canada,
9%
Europe, 60%
ROW, 31%
Domestic, 15%
Exports, 85%
Revenue Break-up by Segment
Total API Revenue : Rs. 45 Crores
Export Revenue Break-up by
Region
F Y H1 2017
Domestic, 22%
Exports, 78%
USA / Canada,
5%
Europe, 78%
ROW, 17%
©Unichem Laboratories Ltd
UNICHEM
Agenda
1. Profile & History
2. Growth & Profitability
3. Business Operations
– Domestic Operations
– International Operations
– API Operations
4. Research & Development
5. Management & Governance
6. Financials
33
©Unichem Laboratories Ltd
UNICHEM
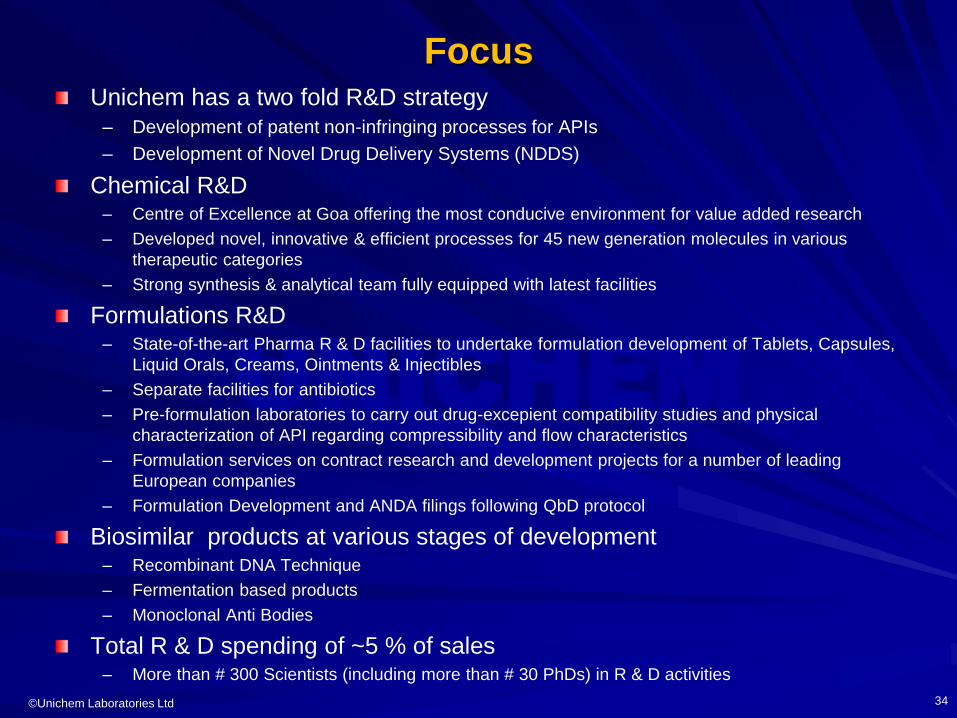
FocusUnichem has a two fold R&D strategy
– Development of patent non-infringing processes for APIs
– Development of Novel Drug Delivery Systems (NDDS)
Chemical R&D– Centre of Excellence at Goa offering the most conducive environment for value added research
– Developed novel, innovative & efficient processes for 45 new generation molecules in various
therapeutic categories
– Strong synthesis & analytical team fully equipped with latest facilities
Formulations R&D– State-of-the-art Pharma R & D facilities to undertake formulation development of Tablets, Capsules,
Liquid Orals, Creams, Ointments & Injectibles
– Separate facilities for antibiotics
– Pre-formulation laboratories to carry out drug-excepient compatibility studies and physical
characterization of API regarding compressibility and flow characteristics
– Formulation services on contract research and development projects for a number of leading
European companies
– Formulation Development and ANDA filings following QbD protocol
Biosimilar products at various stages of development– Recombinant DNA Technique
– Fermentation based products
– Monoclonal Anti Bodies
Total R & D spending of ~5 % of sales– More than # 300 Scientists (including more than # 30 PhDs) in R & D activities
34
©Unichem Laboratories Ltd
UNICHEM
Agenda
1. Profile & History
2. Growth & Profitability
3. Business Operations
– Domestic Operations
– International Operations
– API Operations
4. Research & Development
5. Management & Governance
6. Financials
35
©Unichem Laboratories Ltd
UNICHEM
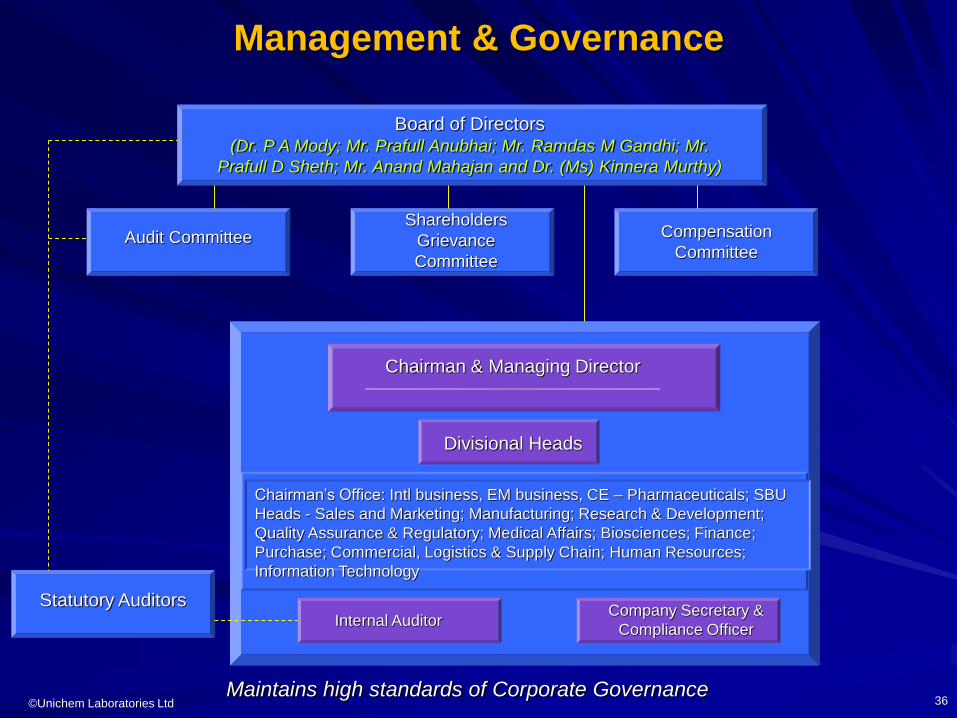
Management & Governance
Board of Directors(Dr. P A Mody; Mr. Prafull Anubhai; Mr. Ramdas M Gandhi; Mr.
Prafull D Sheth; Mr. Anand Mahajan and Dr. (Ms) Kinnera Murthy)
Audit CommitteeShareholders
Grievance
Committee
Compensation
Committee
Internal Auditor
Chairman & Managing Director
Divisional Heads
Statutory Auditors
Maintains high standards of Corporate Governance
Company Secretary &
Compliance Officer
Chairman’s Office: Intl business, EM business, CE – Pharmaceuticals; SBU
Heads - Sales and Marketing; Manufacturing; Research & Development;
Quality Assurance & Regulatory; Medical Affairs; Biosciences; Finance;
Purchase; Commercial, Logistics & Supply Chain; Human Resources;
Information Technology
36
©Unichem Laboratories Ltd
UNICHEM
Agenda
1. Profile & History
2. Growth & Profitability
3. Business Operations
– Domestic Operations
– International Operations
– API Operations
4. Research & Development
5. Management & Governance
6. Financials
37
©Unichem Laboratories Ltd
UNICHEM
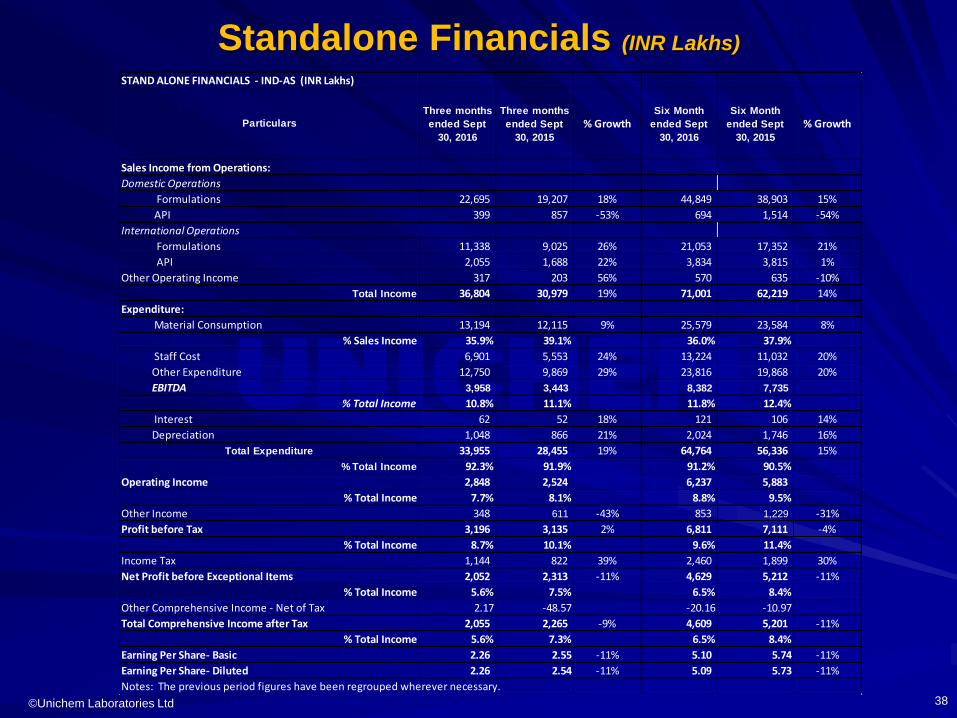
Standalone Financials (INR Lakhs)
38
Three months
ended Sept
30, 2016
Three months
ended Sept
30, 2015
% GrowthSix Month
ended Sept
30, 2016
Six Month
ended Sept
30, 2015
% Growth
Sales Income from Operations:
Domestic Operations
22,695 19,207 18% 44,849 38,903 15%
399 857 -53% 694 1,514 -54%
International Operations
11,338 9,025 26% 21,053 17,352 21%
2,055 1,688 22% 3,834 3,815 1%
Other Operating Income 317 203 56% 570 635 -10%
36,804 30,979 19% 71,001 62,219 14%
Expenditure:
13,194 12,115 9% 25,579 23,584 8%
35.9% 39.1% 36.0% 37.9%
6,901 5,553 24% 13,224 11,032 20%
12,750 9,869 29% 23,816 19,868 20%
3,958 3,443 8,382 7,735
10.8% 11.1% 11.8% 12.4%
62 52 18% 121 106 14%
1,048 866 21% 2,024 1,746 16%
33,955 28,455 19% 64,764 56,336 15%
92.3% 91.9% 91.2% 90.5%
Operating Income 2,848 2,524 6,237 5,883
7.7% 8.1% 8.8% 9.5%
Other Income 348 611 -43% 853 1,229 -31%
Profit before Tax 3,196 3,135 2% 6,811 7,111 -4%
8.7% 10.1% 9.6% 11.4%
Income Tax 1,144 822 39% 2,460 1,899 30%
Net Profit before Exceptional Items 2,052 2,313 -11% 4,629 5,212 -11%
5.6% 7.5% 6.5% 8.4%
2.17 -48.57 -20.16 -10.97
Total Comprehensive Income after Tax 2,055 2,265 -9% 4,609 5,201 -11%
5.6% 7.3% 6.5% 8.4%
Earning Per Share- Basic 2.26 2.55 -11% 5.10 5.74 -11%
Earning Per Share- Diluted 2.26 2.54 -11% 5.09 5.73 -11%
Notes: The previous period figures have been regrouped wherever necessary.
% Total Income
Other Comprehensive Income - Net of Tax
STAND ALONE FINANCIALS - IND-AS (INR Lakhs)
Particulars
Formulations
API
Formulations
API
Material Consumption
Total Income
% Sales Income
% Total Income
Staff Cost
Other Expenditure
EBITDA
Interest
Depreciation
% Total Income
% Total Income
% Total Income
Total Expenditure
% Total Income
©Unichem Laboratories Ltd
Thank You


