Embed Size (px)
Citation preview
1
NJC 2018 8823/01/Aug
Examiners’ Report for 2018 H1 Economics Prelims
Case Study 1 Suggested Answers:
Suggested Answers
Questions (a) Compare the cost of coal and natural gas for electric generating plants in the US
between 2002 and 2016.
[2]
Cost of natural gas rose from 2002 to 2008, and fell thereafter from 2009 to 2016 while cost of coal rose steadily from 2002 to 2016, [1]
Note: For trend of natural has, we can divide into 2 periods because start and end price is about the same and the trend is roughly symmetrical. Cost of natural gas was higher than cost of coal throughout the entire period
from 2002 to 2016. [1] Note: If the question is on “CHANGE in cost of coal and natural gas’, this answer will not be accepted already.
(b) With reference to Extract 1, and using supply and demand analysis, explain the impact of cheap natural gas and the shutdown of coal-fired power plants on the market for coal.
[6]
Explain 2 factors causing demand to change [2x2m] Factor 1: Lower price of natural gas result in increase in quantity demanded of
natural gas, ceteris paribus, based on law of demand. Since natural gas and coal are substitutes as they satisfy the same wants
(used as energy source), consumers will switch to relatively cheaper natural gas.
Hence, demand for coal falls, ceteris paribus.
2. Shutdown of coal-fired plants result in a fall in derived demand for coal as coal is a key factor of production used to fire the power plants, ceteris paribus.
Overall, demand for coal falls from D0 to D1 2m on PES and its application + final change in eqm P and eqm Q (qn is on impact on market)
Since supply of coal is price-inelastic given its long production period due to difficulty in extracting coal, fall in demand results in more than proportionate fall in P from P0 to P1 as compared to fall in Q from Q0 to Q1.
This explains the ‘prices crashed’ as mentioned in Extract 1
(c) With reference to Extract 2 and using a PPC diagram, explain and comment on the view that decarbonisation has gone hand-in-hand with economic growth.
[8]
Introduction Define economic growth; SR growth (actual growth) vs LR growth (potential
growth). Sustainable growth.
2
NJC 2018 8823/01/Aug
Define PPC: The Production Possibility Curve (PPC) shows the maximum attainable combinations of two goods and services that can be produced in an economy, when all the available resources are used fully and efficiently, at a given state of technology.
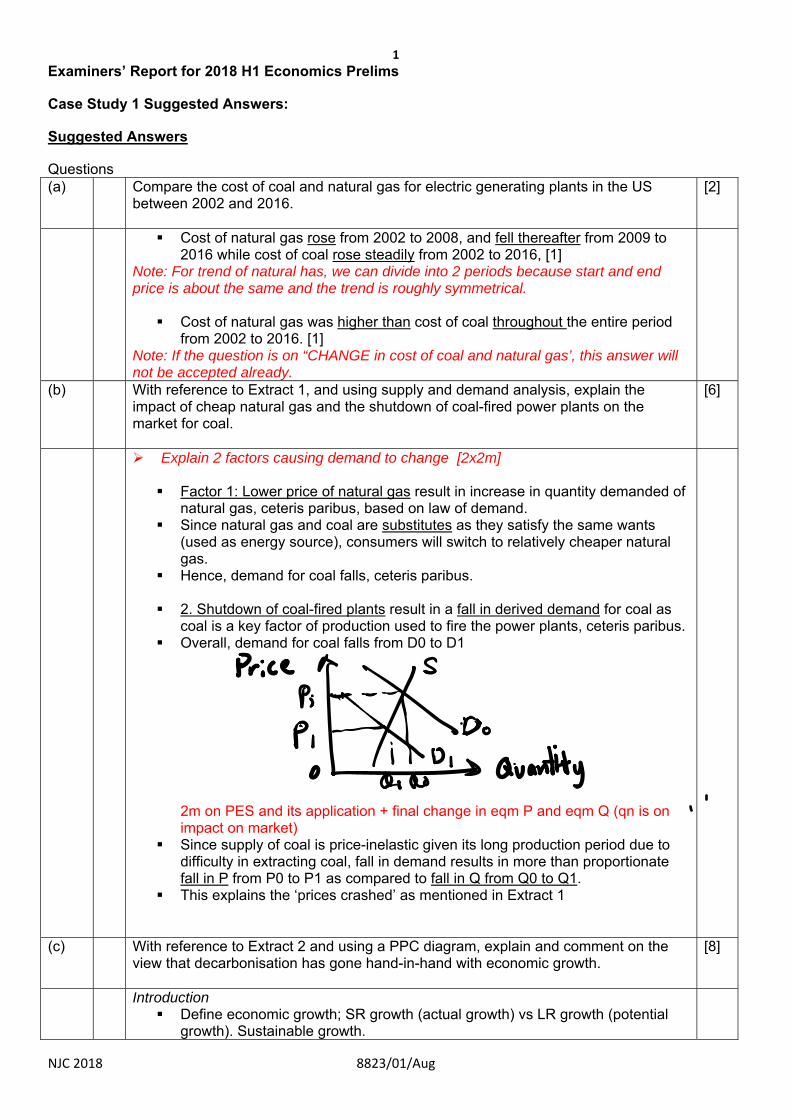
Explanation [4] how “decarbonisation has gone hand-in-hand with economic growth using the PPC. (no trade off between production of consumer & capital goods in the economy) “the government’s spending on low-carbon research and development (R&D)
of new technologies”. - shift of PPC from PPC1 to PPC2 (potential growth) more production of capital goods due to the increase expenditure on R&D
(i.e. investment) into new technologies will have impact on actual growth which could be shown by a movement from point A to point B.
Sustainable growth is also achieved as traditional energy sources like coal is a finite resource whereas solar and wind energy is infinite.
In fact, with potential growth, it allows for greater production of both consumer and capital goods without trade off as shown by Point C.
Note: Good reference must be made to the diagram below and evidence should be provided from the case materials when explaining the above points.
Comment [4] – any 2 points well-explained Dependent on government’s willingness and ability (budget) to engage in R&D
for renewable energy. Figure 1, the price of coal is still below that of natural gas (or if the price of coal
falls due to fall in demand and becomes even cheaper), producers might be tempted to burn coal for energy.
If prices of natural gas and renewables rise in the future due to increase in demand, cost of production for many goods and services in the economy will rise, resulting in higher GPL and reducing real GDP growth.
(d) (i) Explain two factors that a government should consider in making a rational decision
to subsidise electric vehicles.
[4]
A government would have to weigh the costs and benefits while making its decision whether to subsidise electric vehicles. The benefits have to outweigh the costs for the government to decide to subsidise electric vehicles. Benefits [2]: Reduction in MEC from the reduction in usage of traditional
vehicles and energy, more sustainable growth Costs [2]: Cost of financing the subsidy, opportunity cost
(ii) Explain one possible unintended consequence of subsidising electric vehicles.
[2]
PPC1
Consumer goods
Capital goods 0
PPC2
Fig 1: Effects of decarbonisation on economic growth
A
B
C
3
NJC 2018 8823/01/Aug
Explain the following. Potential incurrence of marginal external cost resulting from the usage of
electric vehicles. Low take-up rate due to lack of information.
Marking tip: any other reasonable answer will be accepted. Increase in consumption is NOT accepted.
(e) Extract 4 suggests that a ‘modest’ uniform carbon tax of £20 a tonne would have a negligible impact on consumer prices. Explain this claim, and comment on whether it is valid.
[7]
Explain this claim [4] Imposition of carbon tax (a tax on fossil fuels) will increase unit cost of production for firms who burn coal in their production (generation of electricity) such as the Big Six electricity generators. Aggregate supply of goods and services will fall, ceteris paribus. Consumer prices in the economy will increase. However, it will be negligible (increase in consumer prices by only 0.9%) as suggested in Extract 4. [1] This is because the carbon tax which increases unit cost of production and thus reduces profit margins would incentivise the firms to switch to other relatively cheaper forms of energy in their production. [1] To pay less carbon tax, firms would have to reduce their usage of fossil fuels and this may drive business innovation. Increase in unit cost of production may be dampen and thus consumer price may not rise by much. [1] If the government uses the revenues that they collect from the carbon tax to subsidise electricity or merit goods, these goods would be more affordable to consumers. [1] Comment [3] The extent of the increase in price depends on the relative values of the price
elasticity of demand and price elasticity of supply of different goods and services. (explain with examples)
Thus, producers may pass on the carbon tax to consumers in some cases. Hence, the claim that carbon tax has a negligible impact on consumer prices may not be valid.
(Note: 3 marks can be awarded for 1 point well-explained. Other reasonable points will be accepted. )
(f) (i) Explain how ‘the burning of coal’ results in market failure.
[4]
The burning of coal generates negative externalities such as “serious health conditions, 1,600 premature deaths, 68,000 additional days of medication, 363,266 working days lost and more than 1 million incidents of lower respiratory symptoms” to 3rd parties. The marginal external cost is “as much as £3.1bn each year in human health impacts”. [1]
Due to the presence of MEC, there is a divergence between the marginal private cost (MPC) and the marginal social cost (MSC), where MSC=MPC+MEC. [1] Assuming that the external benefit in the private exchange of the burning of coal is negligible, then MSB=MPB+MEB and MEB=0; MPB=MSB.
Private producers will burn up to 0QP units of coal, where MPB=MPC. [1] However, the socially optimal level of coal would be where MSB=MSC at the
4
NJC 2018 8823/01/Aug
level of 0QS units. The free market has resulted in an overproduction of coal by QSQP units. The additional cost to society of overproducing coal is greater than the
additional benefit to society resulting in a welfare loss to society. [1]
(ii) Using Extract 5, discuss the view that the implementation of tradable permits is the best way to solve the market failure arising from ‘the burning of coal’.
[12]
Introduction (KIA) Burning of coal generates negative externality and hence market failure as
mentioned in (i) We shall discuss if the implementation of tradable permits in the BEST way to
solve market failure. Explain how tradable permits works The system of tradable permits is a combination of command-and-control and
market-based system of resolving externalities. Each firm (Extract 5: “11,000 power stations and industrial plants) is given a permit to produce a given level of pollution. If the firm produces less pollution than what they are legally permitted to produce, the firm is given a credit. This credit can then be sold to another firm, allowing the other firm to exceed its original limit.
The main advantage of tradable permits is that the government can simply determine the total amount of permitted discharge according to the ability of the environment to absorb the pollutants; it can do this without any knowledge of the specific costs and benefits of individual firms.
Limitations of tradable permits For heavy polluters, if the costs of the permits is lower than their abatement
costs (costs of eliminating pollution), they would buy more permits to pollute. Another issue of this system is deciding how to allocate the permits to firms. If
there are many polluting firms, regulators would be concerned about the administrative costs.
It is also possible that one or two dominant firms may buy up permits in the market and refuse to trade them. This would then act like a barrier to entry for new firms and the permits could therefore contribute to non-competitive behaviour.
Explain how ONE other policy works Extract 5: Subsidies to green vehicles Direct subsidies given to buyers of green vehicles will make green vehicles
more affordable (lowers the price that buyers have to pay) and increase the quantity demanded, ceteris paribus. OR
Indirect subsidies given to producers of green vehicles will lower the cost of production and increase the supply of green vehicles, ceteris paribus. This will lower the price of green vehicles.
Price of green vehicles is relatively lower, hence consumers switch from traditional vehicles (or gasoline vehicles) to green vehicles as they are substitutes in consumption. Hence, demand for traditional/gasoline vehicles falls, ceteris paribus. Derived demand for gasoline/traditional energy falls, reducing the over-consumption of gasoline/traditional energy and reducing the welfare loss to society.
Limitations of other policy Extract 5 suggests that the subsidies given to green vehicles aren’t equal to
that of gasoline vehicles which received vast amount of subsidies. This suggests that price of gasoline vehicles might still be relatively cheaper as
5
NJC 2018 8823/01/Aug
compared to green vehicles. Explain how ONE other policy works Extract 5: Educating the public on climate issues will be essential Limitations of other policy must consider the duration needed for the effects of such measures to be felt,
especially if the problem of external cost is a serious one that must be dealt with in the short run.
Evaluative Conclusion Whether tradable permits is the best way to solve the market failure in (f)(i)
depends on how this system is implemented in terms of no. of permits, which could affect the price of permits. As mentioned, if the price is too low and hence below cost of abatement, tradable permits is definitely not the best way.
In a country where information could be obtained more accurately, it could be arguably the best way in short run as it can incentivise producers to switch to cleaner methods of production and it rewards greener firms with tradable permits (for sale). This is better than carbon taxes which could undermine the competitiveness of carbon intensive industries.
Nevertheless, education is still pertinent for long run as behavioural change is required for sustainability in cutting down the use of coal.
Note: To score high marks for EV, please provide JUDGEMENT. In this case, comparison of policies is required to determine is tradable permits in the best (in SR vs LR) Mark Scheme Level Descriptors
Level 3
7-9
For an answer that demonstrates knowledge, understanding, application and analysis of at least two policies. For full credit, discussion of 3 policies is preferred. EXCELLENT breadth that considers the following economic
concepts in explaining multiple and balanced perspectives, viewpoints, relationships and factors. ALL points chosen should be of relevance and significance in answering the question.
EXCELLENT depth in economic analysis that reflects the following in ALL explanations.
Accurate use of economic concepts, clear elaboration, and precise use of economic terminologies, language and phrasing.
The answer should also be supported by: Well-labelled and well-referred to diagram(s) drawn with precision
(where appropriate). Relevant examples and accurate use of facts. Logical structure.
Level 2
4-6
For an answer that demonstrates knowledge, understanding, application and analysis: At least GOOD breadth that considers the following economic
concepts in explaining multiple and balanced perspectives, viewpoints, relationships and factors. ALL points chosen should be
6
NJC 2018 8823/01/Aug
of relevance and significance in answering the question. At least GOOD depth in economic analysis that reflects the
following in ALL explanations. Accurate use of economic concepts, clear elaboration,
and precise use of economic terminologies, language and phrasing.
The answer should also be supported by: Well-labelled and well-referred to diagram(s) drawn with precision
(where appropriate). Relevant examples and accurate use of facts. Logical structure.
Level 1
1 – 3
For an answer that demonstrates knowledge but lacks understanding, application and analysis:
INSUFFICIENT breadth that considers the following economic concept(s). Point(s) chosen may be of relevance but may not be of significance in answering the question.
Only consider ONE policy INSUFFICIENT depth in economic analysis that may reflect the
following: Lack of accuracy in the use of economic concepts, lack
of clarity in elaboration, and lack of precision in the use of economic terminologies, language and phrasing.
Level Descriptors E2
3
For an evaluation that contains A synthesis of earlier economic arguments to arrive at relevant
judgements/decisions (i.e. answer the question). Evaluative comments supported by accurate, logical and clear
analysis Whether a policy is the best way depends on the effectiveness
(whether it tackles the root cause), appropriateness of the policy Combination or Mix of policies
E1
1-2
For an evaluation that contains Relevant judgement(s)/decision(s) (i.e. answer the question) that
may not follow from earlier economic arguments. Comment (s) may lack depth, clarity, and logic.
Case Study 2 Suggested Answers:
(a) Using information in Figure 2 and Table 1, compare the economic performance of Myanmar and Thailand in 2016.
[3]
In 2016,
Myanmar enjoyed a higher rate of growth compared to Thailand. (1) However, Myanmar suffered from higher rates of inflation (1) and unemployment (1)
compared to Thailand.
7
NJC 2018 8823/01/Aug
(b) With reference to the Figure 3 and Table 1,
(i) Explain the view that standard of living in Myanmar is lower than that of Thailand. [3]
Standard of living (SOL) refers to the level of economic welfare and social well-being of an individual or household. It includes the quantitative and qualitative aspects of living.
GDP per capita (given in Figure 2) provides an indication of the material SOL (1) while the statistics (given in Table 1) on adult literacy, access to safe drinking water, infant mortality rate and life expectancy provide some indication on non-material SOL. (1)
All the above indicators have consistently supported the view that SOL in Myanmar is lower than that in Thailand. (1)
(ii) Comment on the validity of this statement. [4]
2 marks for a comment on the measurement of GDP per capita measured in current prices and/or other limitations in the use of GDP per capita as a measure of material SOL.
Further 2 marks for another comment on the lack of exhaustive indicators on the material and/or non-material SOL. Any one of the following well explained could earn the full 2 marks.
(c) Explain the likely impact of ‘the significant weakening of the pound and euro against ASEAN currencies’ on the net exports of the ASEAN economies.
[5]
Export earnings for ASEAN economies is likely to fall. (1) With the pound and euro weakening, the purchasing power of the British and
Eurozone consumers also decreases. This will reduce their demand for exports from their main trading partners in ASEAN, including Malaysia, Singapore, Thailand and Vietnam. Hence export revenue of ASEAN economies decreases. (1)
Spending on imports by ASEAN economies is likely to increase. (1) ASEAN consumers will benefit from the cheaper British and Eurozone goods,
including services in high-demand sectors such as education. (1) The net exports of ASEAN economies is like to fall overall as export revenue
decreases and import expenditure increases. (1)
(d) With reference to Extract 7, and using AD/AS diagrams, explain the different impact on Singapore and Vietnam when ‘the United Kingdom became the first country in history to exit the European Union (EU)’.
[8]
Introduction: When ‘the United Kingdom became the first country in history to exit the European
Union (EU)’, Singapore and Vietnam are set to be affected since the EU is ASEAN’s second biggest trading partner.
Body: Impact on Singapore UK is Singapore’s top export market in the EU for services.
8
NJC 2018 8823/01/Aug
More than 41% of Singapore’s total services exports to the EU were destined for the UK in 2014.
According to Extract 7, UK is likely to experience an economic downturn and the main branches to suffer from this will include business process outsourcing and IT services.
This is likely to cause the export services from Singapore to the UK to fall as income falls in the UK.
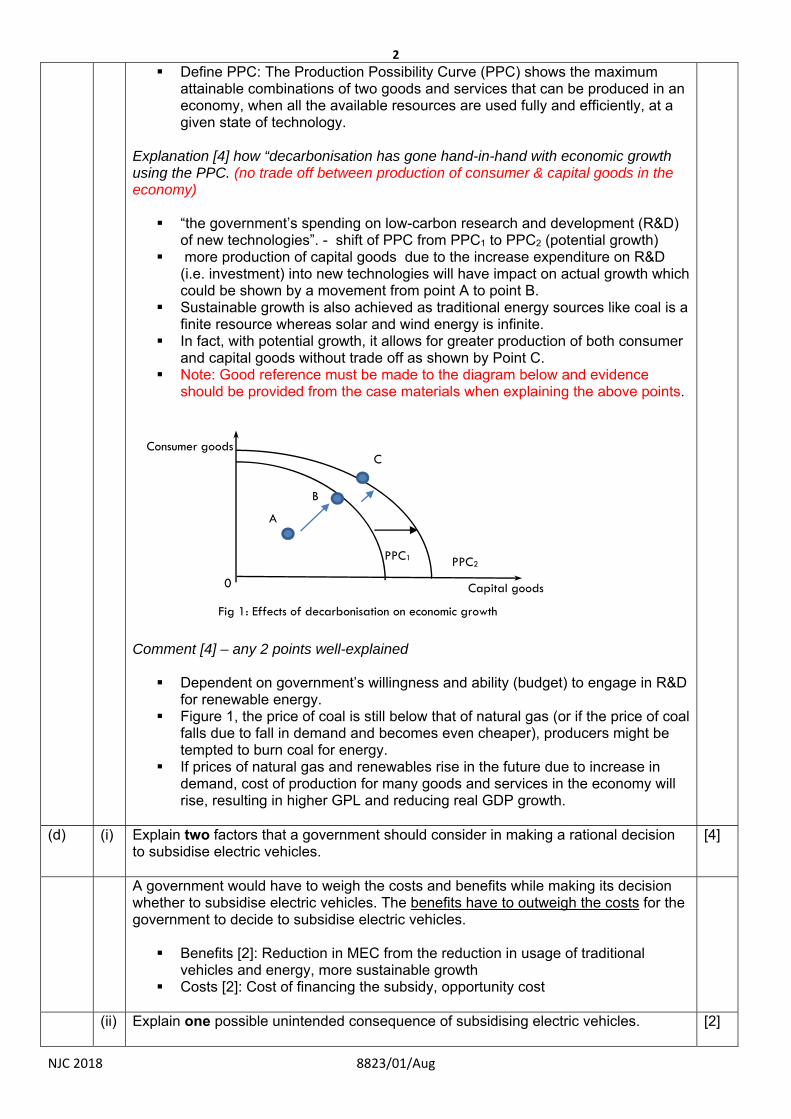
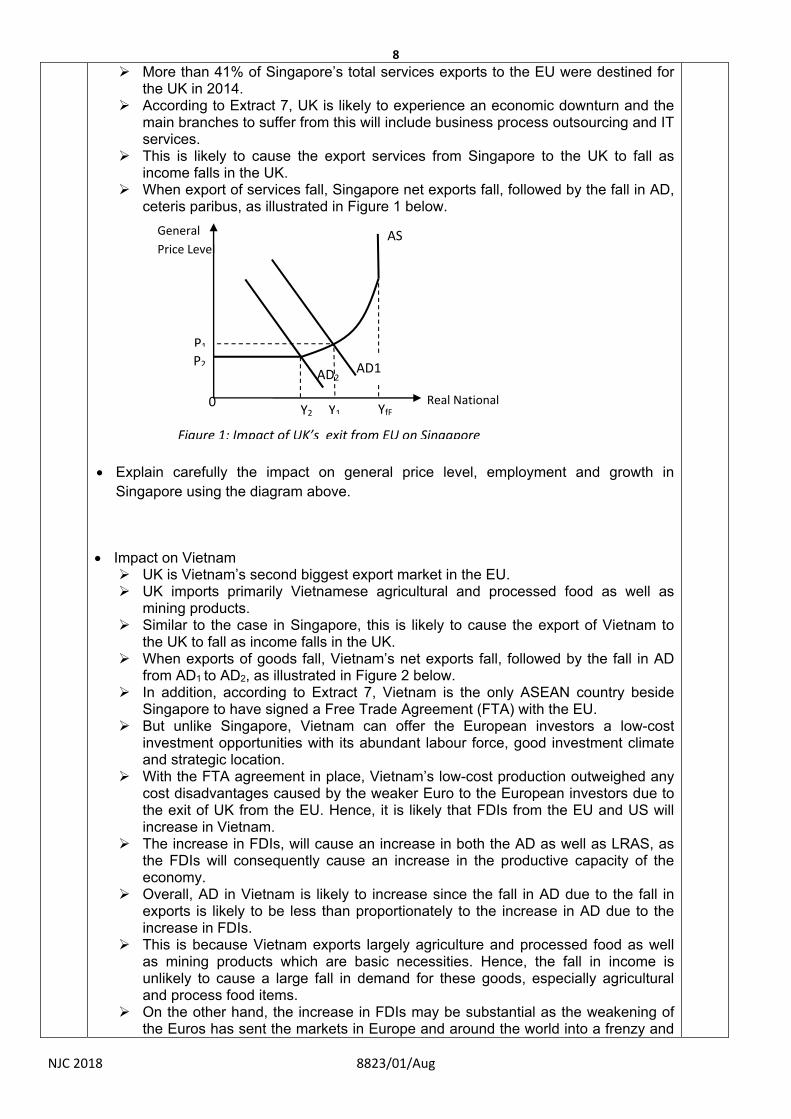
When export of services fall, Singapore net exports fall, followed by the fall in AD, ceteris paribus, as illustrated in Figure 1 below.
Explain carefully the impact on general price level, employment and growth in
Singapore using the diagram above.
Impact on Vietnam UK is Vietnam’s second biggest export market in the EU. UK imports primarily Vietnamese agricultural and processed food as well as
mining products. Similar to the case in Singapore, this is likely to cause the export of Vietnam to
the UK to fall as income falls in the UK. When exports of goods fall, Vietnam’s net exports fall, followed by the fall in AD
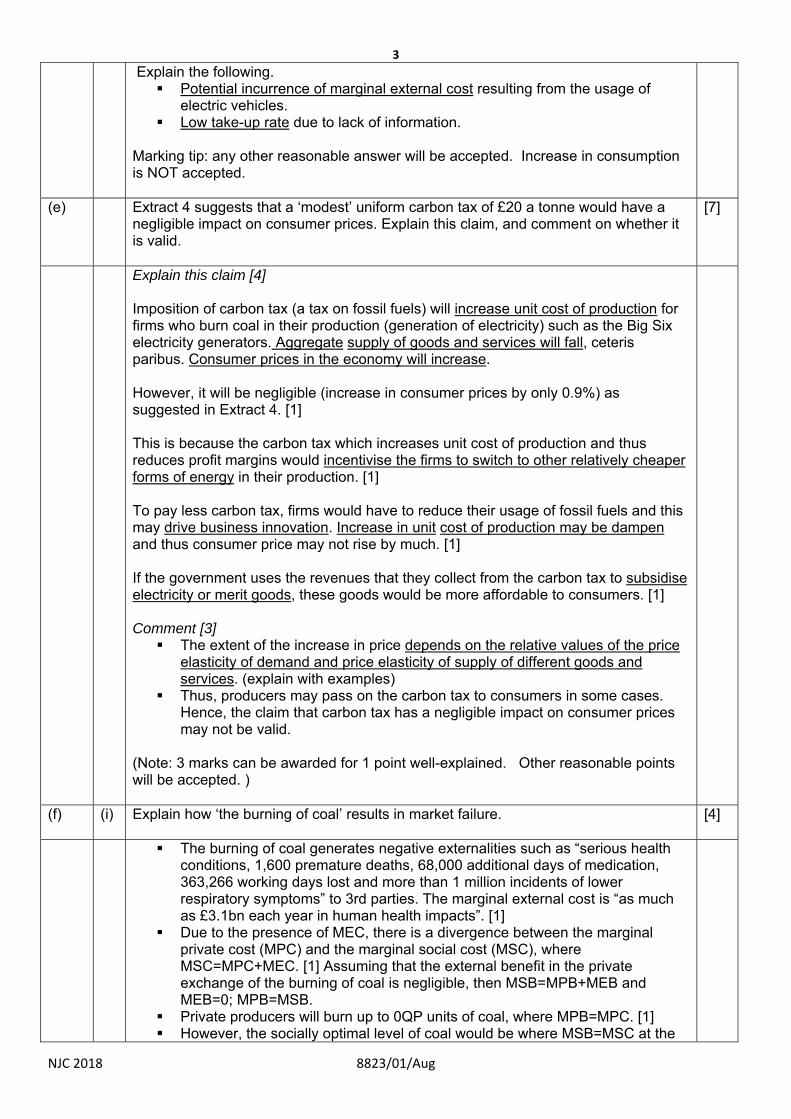
from AD1 to AD2, as illustrated in Figure 2 below. In addition, according to Extract 7, Vietnam is the only ASEAN country beside
Singapore to have signed a Free Trade Agreement (FTA) with the EU. But unlike Singapore, Vietnam can offer the European investors a low-cost
investment opportunities with its abundant labour force, good investment climate and strategic location.
With the FTA agreement in place, Vietnam’s low-cost production outweighed any cost disadvantages caused by the weaker Euro to the European investors due to the exit of UK from the EU. Hence, it is likely that FDIs from the EU and US will increase in Vietnam.
The increase in FDIs, will cause an increase in both the AD as well as LRAS, as the FDIs will consequently cause an increase in the productive capacity of the economy.
Overall, AD in Vietnam is likely to increase since the fall in AD due to the fall in exports is likely to be less than proportionately to the increase in AD due to the increase in FDIs.
This is because Vietnam exports largely agriculture and processed food as well as mining products which are basic necessities. Hence, the fall in income is unlikely to cause a large fall in demand for these goods, especially agricultural and process food items.
On the other hand, the increase in FDIs may be substantial as the weakening of the Euros has sent the markets in Europe and around the world into a frenzy and
P1 P2
Figure 1: Impact of UK’s exit from EU on Singapore
YfFY1Y2
AD2
AS
0
General
Price Level
Real National
AD1
9
NJC 2018 8823/01/Aug
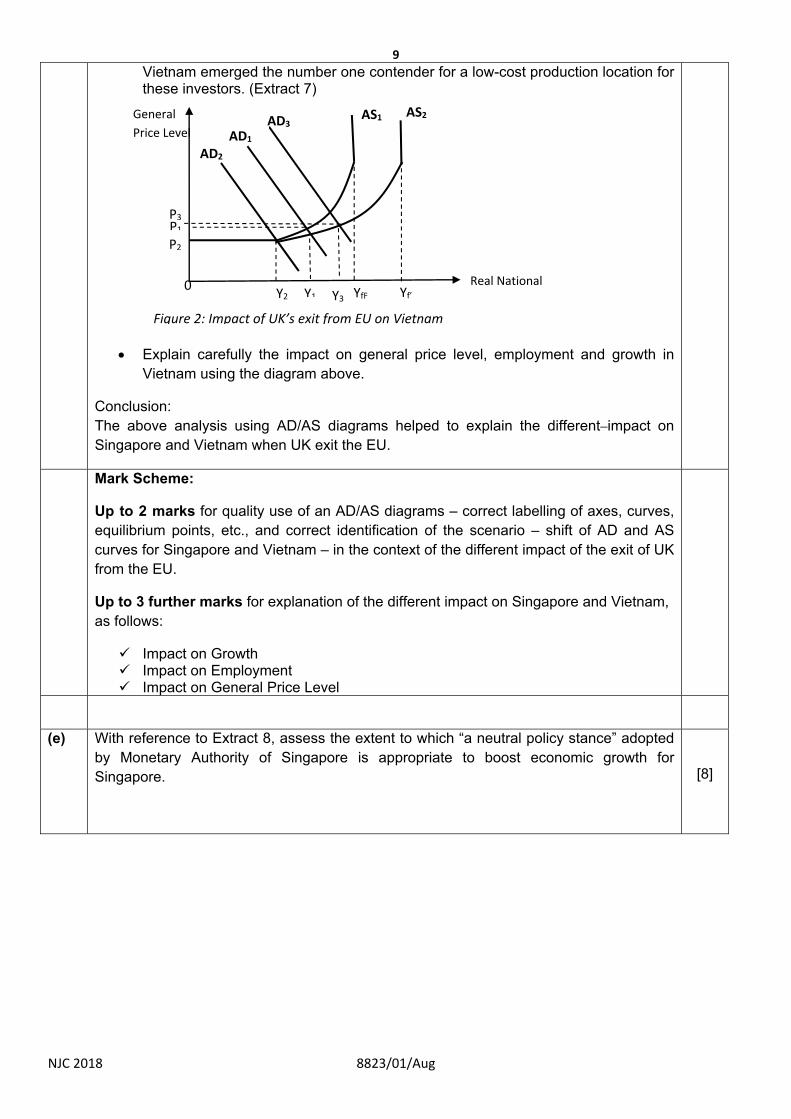
Vietnam emerged the number one contender for a low-cost production location for these investors. (Extract 7)
Explain carefully the impact on general price level, employment and growth in
Vietnam using the diagram above.
Conclusion: The above analysis using AD/AS diagrams helped to explain the different impact on Singapore and Vietnam when UK exit the EU.
Mark Scheme:
Up to 2 marks for quality use of an AD/AS diagrams – correct labelling of axes, curves, equilibrium points, etc., and correct identification of the scenario – shift of AD and AS curves for Singapore and Vietnam – in the context of the different impact of the exit of UK from the EU.
Up to 3 further marks for explanation of the different impact on Singapore and Vietnam, as follows:
Impact on Growth Impact on Employment Impact on General Price Level
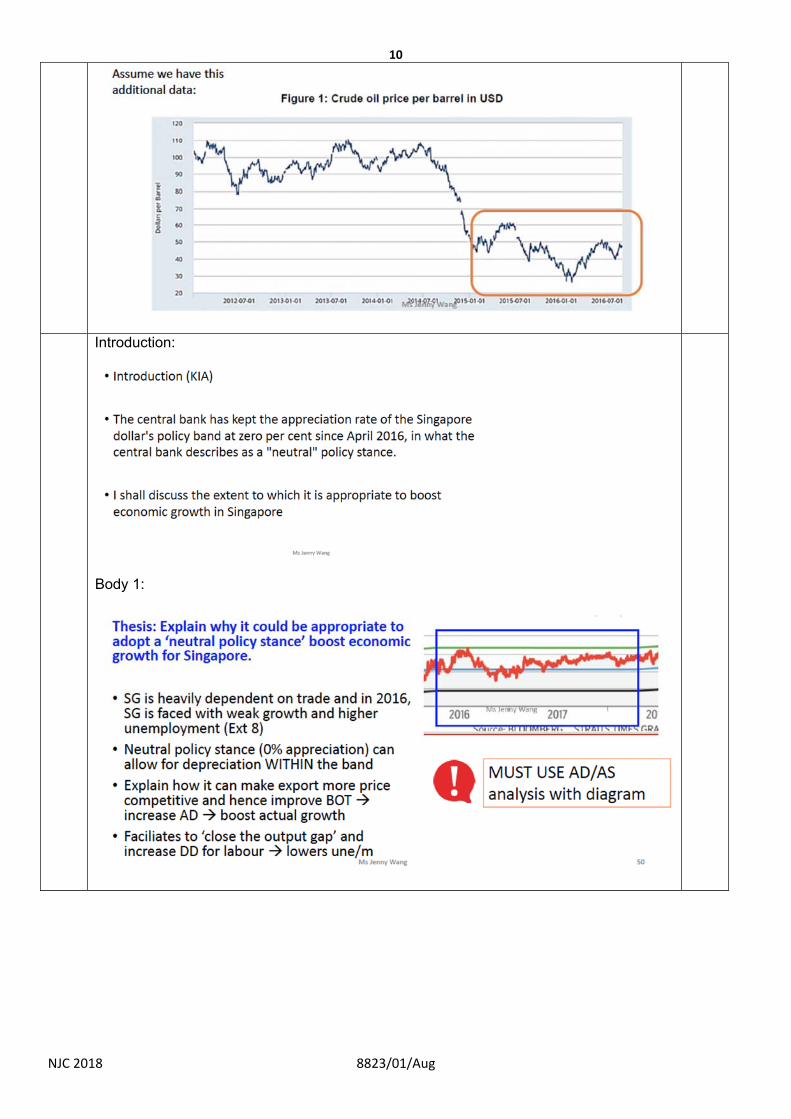
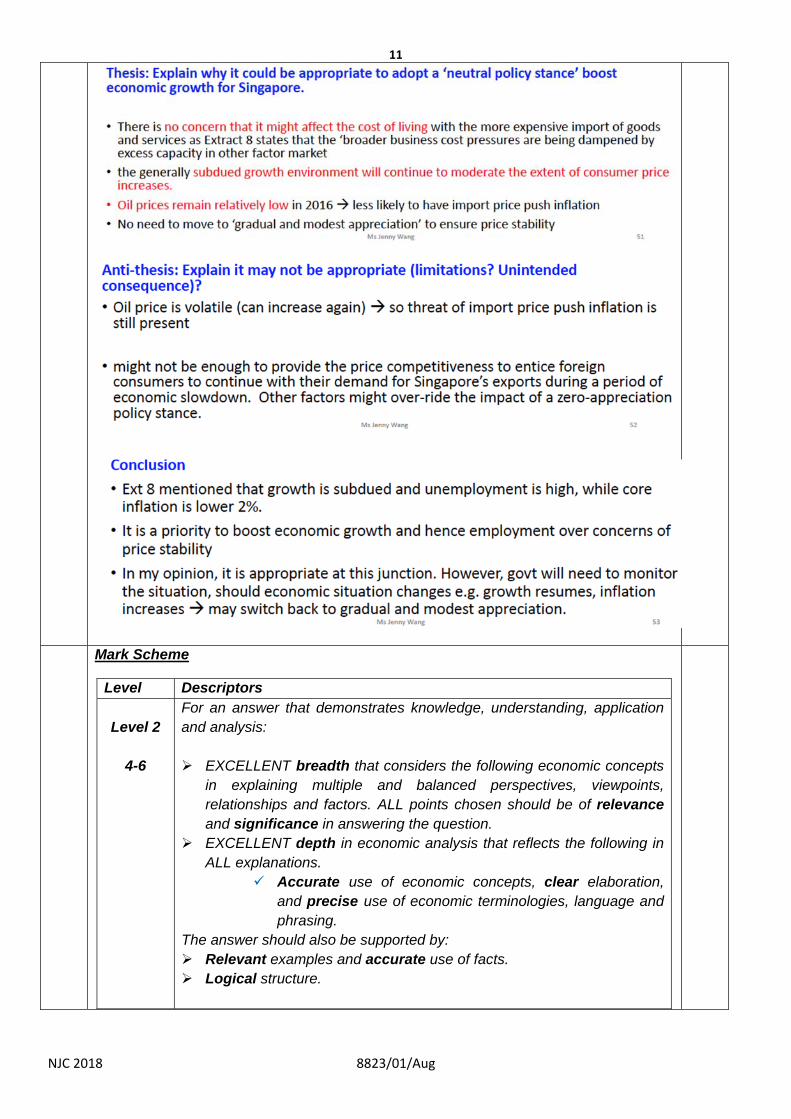
(e) With reference to Extract 8, assess the extent to which “a neutral policy stance” adopted by Monetary Authority of Singapore is appropriate to boost economic growth for Singapore.
[8]
P1 P2
Figure 2: Impact of UK’s exit from EU on Vietnam
YfFY1Y2
AD2
AS1
0
General
Price Level
Real National
AD1
Yf’
AS2
P3
Y3
AD3
10
NJC 2018 8823/01/Aug
Introduction:
Body 1:
11
NJC 2018 8823/01/Aug
Mark Scheme
Level Descriptors Level 2
4-6
For an answer that demonstrates knowledge, understanding, application and analysis: EXCELLENT breadth that considers the following economic concepts
in explaining multiple and balanced perspectives, viewpoints, relationships and factors. ALL points chosen should be of relevance and significance in answering the question.
EXCELLENT depth in economic analysis that reflects the following in ALL explanations.
Accurate use of economic concepts, clear elaboration, and precise use of economic terminologies, language and phrasing.
The answer should also be supported by: Relevant examples and accurate use of facts. Logical structure.
12
NJC 2018 8823/01/Aug
Level 1
1-3
For an answer that demonstrates knowledge, understanding, application and analysis: GOOD breadth that considers the following economic concepts in
explaining multiple and balanced perspectives, viewpoints, relationships and factors. ALL points chosen should be of relevance and significance in answering the question. .
GOOD depth in economic analysis that reflects the following in ALL
explanations. May lack accurate use of economic concepts, clear
elaboration, and precise use of economic terminologies, language and phrasing.
The answer should also be supported by: Example(s). Logical structure.
Level Descriptors
E2
2
For an evaluation that contains Evaluative comments supported by accurate, logical and clear
analysis The use of context to arrive at the conclusion is evident.
E1
1
For an evaluation that contains Relevant judgement(s)/decision(s) (i.e. answer the question) that may
not follow from earlier economic arguments. Comment (s) may lack depth, clarity, and logic.
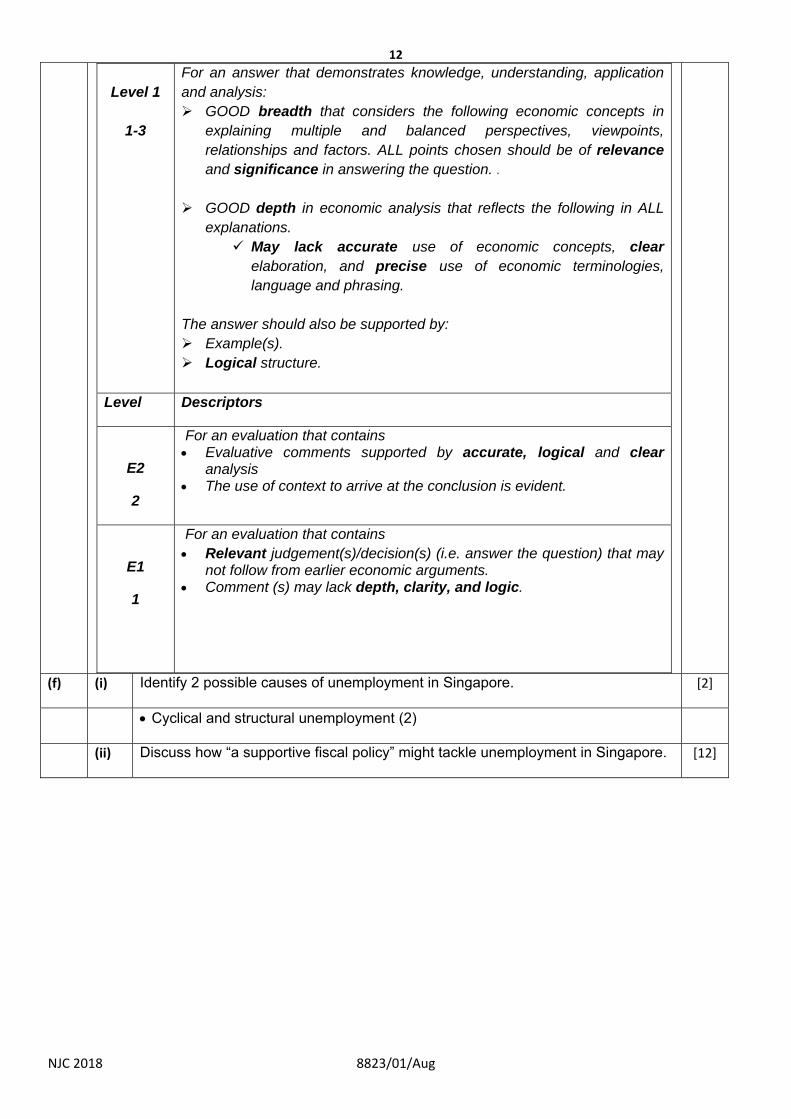
(f) (i) Identify 2 possible causes of unemployment in Singapore. [2]
Cyclical and structural unemployment (2)
(ii) Discuss how “a supportive fiscal policy” might tackle unemployment in Singapore. [12]
13
NJC 2018 8823/01/Aug
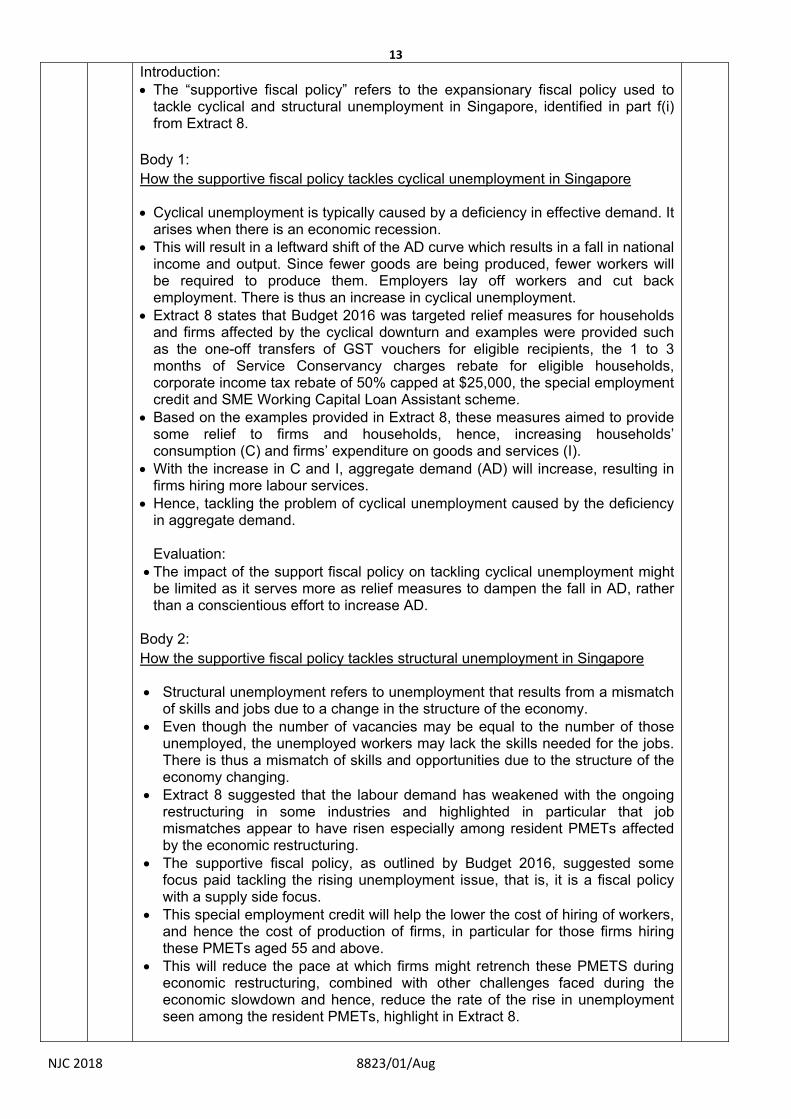
Introduction: The “supportive fiscal policy” refers to the expansionary fiscal policy used to
tackle cyclical and structural unemployment in Singapore, identified in part f(i) from Extract 8.
Body 1: How the supportive fiscal policy tackles cyclical unemployment in Singapore
Cyclical unemployment is typically caused by a deficiency in effective demand. It arises when there is an economic recession.
This will result in a leftward shift of the AD curve which results in a fall in national income and output. Since fewer goods are being produced, fewer workers will be required to produce them. Employers lay off workers and cut back employment. There is thus an increase in cyclical unemployment.
Extract 8 states that Budget 2016 was targeted relief measures for households and firms affected by the cyclical downturn and examples were provided such as the one-off transfers of GST vouchers for eligible recipients, the 1 to 3 months of Service Conservancy charges rebate for eligible households, corporate income tax rebate of 50% capped at $25,000, the special employment credit and SME Working Capital Loan Assistant scheme.
Based on the examples provided in Extract 8, these measures aimed to provide some relief to firms and households, hence, increasing households’ consumption (C) and firms’ expenditure on goods and services (I).
With the increase in C and I, aggregate demand (AD) will increase, resulting in firms hiring more labour services.
Hence, tackling the problem of cyclical unemployment caused by the deficiency in aggregate demand. Evaluation:
The impact of the support fiscal policy on tackling cyclical unemployment might be limited as it serves more as relief measures to dampen the fall in AD, rather than a conscientious effort to increase AD.
Body 2: How the supportive fiscal policy tackles structural unemployment in Singapore
Structural unemployment refers to unemployment that results from a mismatch of skills and jobs due to a change in the structure of the economy.
Even though the number of vacancies may be equal to the number of those unemployed, the unemployed workers may lack the skills needed for the jobs. There is thus a mismatch of skills and opportunities due to the structure of the economy changing.
Extract 8 suggested that the labour demand has weakened with the ongoing restructuring in some industries and highlighted in particular that job mismatches appear to have risen especially among resident PMETs affected by the economic restructuring.
The supportive fiscal policy, as outlined by Budget 2016, suggested some focus paid tackling the rising unemployment issue, that is, it is a fiscal policy with a supply side focus.
This special employment credit will help the lower the cost of hiring of workers, and hence the cost of production of firms, in particular for those firms hiring these PMETs aged 55 and above.
This will reduce the pace at which firms might retrench these PMETS during economic restructuring, combined with other challenges faced during the economic slowdown and hence, reduce the rate of the rise in unemployment seen among the resident PMETs, highlight in Extract 8.
14
NJC 2018 8823/01/Aug
Evaluation: The employment credit might help to lower the cost of hiring for firms. However, this amount might not be sufficient to influence firm’s decision to
retrench worker. Hence, there is limited impact in terms of tackling structural unemployment. Evaluative Conclusion: While the “supportive fiscal policy” serves as a relief measure to firms and
households during a period of economic slowdown, more might be required from the government to tackle both cyclical and structural unemployment in Singapore.
Government spending on goods and services must increase (increase G) more significantly to have a greater impact on AD. The increase in G and hence AD, will trigger the multiplier effect, on real national income and hence, tackle the problem of cyclical unemployment.
The employment credit is not sufficient to tackle structural unemployment effectively on a longer-term basis
Mark Scheme:
Level Descriptors
Level
3
6-9
For an answer that demonstrates knowledge, understanding, application and analysis: EXCELLENT breadth that considers the following economic concepts in
explaining multiple and balanced perspectives, viewpoints, relationships and factors. ALL points chosen should be of relevance and significance in answering the question.
EXCELLENT depth in economic analysis that reflects the following in ALL explanations. Accurate use of economic concepts, clear elaboration, and
precise use of economic terminologies, language and phrasing. The answer should also be supported by: Well-labelled and well-referred to diagram(s) drawn with precision (where
appropriate). Relevant examples and accurate use of facts. Logical structure.
Level
2
3-5
For an answer that demonstrates knowledge, understanding, application and analysis:
GOOD breadth that considers the following economic concepts in explaining multiple and balanced perspectives, viewpoints, relationships and factors. ALL points chosen should be of relevance and significance in answering the question.
GOOD depth in economic analysis that reflects the following in ALL explanations.
May lack accurate use of economic concepts, clear elaboration, and precise use of economic terminologies, language and phrasing.
The answer should also be supported by: Diagram(s) that may not be well-labelled, may not be well-referred to
and may not be drawn with precision (where appropriate). Example(s). Logical structure.
15
NJC 2018 8823/01/Aug
Level Descriptors
E2
2-3
For an evaluation that contains A synthesis of earlier economic arguments to arrive at relevant
judgements/decisions (i.e. answer the question). Evaluative comments supported by accurate, logical and clear analysis The use of context to arrive at the conclusion is evident.
E1
1
For an evaluation that contains Relevant judgement(s)/decision(s) (i.e. answer the question) that may
not follow from earlier economic arguments. Comment (s) may lack depth, clarity, and logic.
Level 1
1–2
For an answer that demonstrates knowledge but lacks understanding, application and analysis: INSUFFICIENT breadth that considers the following economic concept(s).
Point(s) chosen may be of relevance but may not be of significance in answering the question.
INSUFFICIENT depth in economic analysis that may reflect the following: Lack of accuracy in the use of economic concepts, lack of clarity
in elaboration, and lack of precision in the use of economic terminologies, language and phrasing.