Embed Size (px)
Citation preview

CPB Discussion Paper
The responsibility for the contents of this CPB Discussion Paper remains with the author(s)
No 40
October 2004
Is the American Model Miss World?
Choosing between the Anglo-Saxon model and a European-style
alternative
Henri L.F. de Groot, Richard Nahuis and Paul J.G. Tang

2
CPB Netherlands Bureau for Economic Policy Analysis
Van Stolkweg 14
P.O. Box 80510
2508 GM The Hague, the Netherlands
Telephone +31 70 338 33 80
Telefax +31 70 338 33 50
Internet www.cpb.nl
ISBN 90-5833-196-2
3
Abstract in English
In Lisbon, the European Union has set itself the goal to become the most competitive economy
in the world in 2010 without harming social cohesion and the environment. The motivation for
introducing this target is the substantially higher GDP per capita of US citizens. The difference
in income is mainly a difference in the number of hours worked per employee. In terms of
productivity per hour and employment per inhabitant, several European countries score equally
well or even better than the United States, while at the same time they outperform the United
States with a more equal distribution of income. The European social models are at least as
interesting as the US model that is often considered a role model.
In an empirical analysis for OECD countries, we aim to unravel ‘the secret of success’. Our
regression results show that income redistribution (through a social security system) does not
necessarily lead to lower participation and higher unemployment, provided that countries
supplement it with active labour market policies. Especially, spending on employment services
like job-search assistance and vocational guidance, seems effective. Furthermore, the results
suggest that generous unemployment benefits of short duration contribute to employment
without widening the income distribution.
Key words: welfare states, income inequality, unemployment, productivity, participation, labour
market policies
Abstract in Dutch
Volgens de Lissabon-doelstelling moet de Europese Unie in 2010 de meest competitieve
economie ter wereld worden, zonder de sociale samenhang en het milieu aan te tasten.
Aanleiding voor deze doelstelling is het substantieel hogere inkomen per hoofd van
Amerikanen. Dit verschil in inkomen per hoofd is vooral toe te schrijven aan een verschil in het
aantal gewerkte uren per werknemer. In termen van productiviteit per gewerkt uur en
werkgelegenheid in personen scoort menig EU land vergelijkbaar met of zelfs beter dan de VS.
Deze landen weten dit te combineren met een veel gelijkmatigere inkomensverdeling. Europese
sociale modellen zijn daarom minstens zo interessante voorbeelden als het Amerikaanse model.
Een empirische, vergelijkende analyse biedt meer inzicht in de determinanten van sociaal-
economisch succes van landen. We concluderen dat inkomensherverdeling via het
socialezekerheidsstelsel niet noodzakelijkerwijs gepaard gaat met lagere participatie en hogere
werkloosheid. Sommige landen bereiken betere combinaties door een actief arbeidsmarktbeleid.
Met name arbeidsbemiddeling lijkt effectief. Verder laten de resultaten zien dat hoge maar
kortdurende werkloosheidsuitkeringen de werkgelegenheid bevorderen zonder dat ze
inkomensongelijkheid doen toenemen.
Steekwoorden: welvaartsstaat, inkomensongelijkheid, werkloosheid, productiviteit,
arbeidsparticipatie, arbeidsmarktbeleid

4

5
Contents
Abstract in English 3
Abstract in Dutch 3
Contents 5
Extensive summary 7
1 Introduction 9
2 The income gap between the United States and Europe 13
2.1 How to close the income gap? 16
3 Trading off efficiency against equality 21
3.1 A first glance at the data 21
3.2 An empirical approach 22
3.3 How robust are the empirical results? 30
4 Conclusion 33
References 35
Appendix A. Data sources 39

6

7
Extensive summary
In Lisbon, the European Union has set itself the goal to become the most competitive economy
in the world without harming social cohesion and the environment. In this document, we
consider three elements that are relevant for assessing the possibilities to reach the Lisbon target
and for evaluating the success of policy reforms. First, we decompose the difference in GDP per
capita between the United States and its European counterparts in its main components, viz.
differences in employment, differences in productivity per hour worked and differences in the
number of hours worked per worker. Second, we identify the fundamental trade-offs that
(groups of) countries face in improving their economic performance. Finally, we explore the
effects of different labour market policies and institutions on economic performance.
A decomposition of the income differences between European countries and the United
States reveals that these are mainly caused by differences in the number of hours worked. In
terms of productivity per hour and employment per inhabitant, several European countries score
equally well as or even better than the United States, while at the same time they outperform the
United States with a more equal distribution of income. Hence, the United States cannot be the
exclusive role model.
In the second step of our analysis, we identify the fundamental trade-offs that (groups of)
countries face in improving their economic performance. Several countries combine a relatively
egalitarian income distribution with a relatively low participation. However, some countries
combine a relatively equal distribution with relatively high participation. So at first sight, the
trade-off between efficiency and equity does not show up for all countries. Apparently, several
countries are not on the equity-efficiency frontier, meaning that they can improve on both
dimensions. The question that we address is what mix of policies can move countries closer to
the frontier.
In order to unravel ‘the secret of success’, we perform a panel-data analysis for OECD
countries. Several determinants of unemployment, labour market participation and income
inequality are considered, such as the level and duration of unemployment benefits,
employment protection and active labour market policies. Furthermore, we consider the effects
of union coordination, union coverage and the tax wedge. The regression results show that
income redistribution (through a social security system) does not lead to lower participation and
higher unemployment as long as countries supplement it with active labour market policies. The
different types of active labour market policies are not equally effective. Most effective are
employment services and administration measures aimed at assisting non-participants in finding
jobs. Furthermore, the results suggest that relatively high benefit levels with a relatively short
duration may have had a favourable impact on participation without widening the income
distribution. These results are robust to a range of empirical sensitivity tests.

8

9
1 Introduction1
“France had the seventeenth century, Britain the nineteenth, and America the twentieth. It will
also have the twenty-first.” That was predicted in 1998 in Foreign Affairs. The author,
Mortimer B. Zuckerman, was jubilant about the American economic performance and saw a
happy marriage of the new economy and the older American culture. Indeed, in the second half
of the 1990s the United States productivity growth accelerated and employment expanded. The
contrast with Europe was sharp. Most European countries experienced a sluggish growth in
productivity and struggled with high unemployment rates.
Table 1.1 Production per capita and employment in Europe and the United States in 2003
Production per capita
indices, US=100
Employment rate
indices, US=100
United States 100.0 100.0
Ireland 90.7 94.1
Norway 89.6 104.2
Denmark 83.7 104.2
The Netherlands 77.9 105.3
Austria 77.4 96.2
Sweden 76.0 101.8
Belgium 74.7 80.8
Germany 73.2 91.2
Finland 73.1 95.5
United Kingdom 73.1 97.2
Italy 72.4 87.4
France 71.4 85.6
EU15 71.0 91.2
Spain 60.2 86.6
Portugal 50.8 104.7
Greece 50.4 78.4
Source: own computations based on GGDC: Total Economy Database 2004 (University of Groningen and the Conference Board). We refer to the
Appendix for an extensive description of the data sources.
A cursory look at the data suggests that Europe has indeed a lot to learn from the United States.
Table 1.1 ranks the United States and European countries according to production per head of
the population and shows the employment rate on labour markets.2 Clearly, the United States is
much richer than any of the European countries. The second on the list, Ireland, has
approximately 10% less income per capita (from production) than the United States. At the
1 The authors would like to thank Michèle Belot, Henk Don, Sjef Ederveen, Casper van Ewijk, Theo van de Klundert, Pierre
Koning, Ruud de Mooij and participants to the workshop ‘Competitiveness and Growth in Europe’ (Bonn, September 2004)
for discussions and comments. 2 We define the employment rate as the share of employed in the total population. A related but different indicator for
economic performance is the participation rate that is defined as the share of the labor force in the population aged between
15 and 65. Evidently, the employment rate is related to the participation rate, but note that the latter also includes the
unemployed in the numerator and neglects the people aged below 15 and above 65 in the denominator.

10
bottom of the list are countries in Southern Europe that entered the European Union relatively
recently. They are still significantly behind the European average.
Not only is the United States richer, it is also better at providing jobs than most European
countries. A few exceptions to this rule exist, though. Norway, Denmark, Sweden, the
Netherlands and also Portugal can rival the United States in this respect. But, generally, the
European welfare states lead to open and hidden unemployment and discourage labour market
participation.
The contrast between the two economic superpowers has led to a call for reform in Europe.
Barriers to competition in goods, capital and labour markets – the result of too much and too
diverse regulations across countries – are thought to stifle growth and to be one of the reasons
behind the persistent problem of unemployment. The European Council has backed this call for
reform. In Lisbon, it has drawn up an agenda for reform, which should make the European
economy in 2010 the most competitive in the world. It has reaffirmed this agenda on later
occasions. Nobel Prize winner Gary Becker (2002) sees a watershed in European economic
policies: “Until recent years, most continental European politicians and intellectuals dismissed
what they derisively called the British and American “Anglo-Saxon” model of competition and
price flexibility. Yet a quiet but enormous change may be taking place in European attitudes
toward competition in labour and other markets.”
With the emphasis on reform towards an “Anglo-Saxon” model comes the concern that
Europe will not only become more competitive but also more unequal. The income differences
within both the United States and the United Kingdom are generally larger than in continental
Europe, and have significantly grown in the 1980s and 1990s. Introducing competition and
flexibility, through deregulation and privatisation, could also introduce an “Anglo-Saxon”
society in which the winners are well off but the losers must work hard to get by. This is not in
line with European traditions. The European Union acknowledges this concern and stresses
social cohesion, which includes acceptable income differences.
This paper puts reforms, aiming to turn Europe into the most competitive economy, in
perspective. Two important points emerge from this. First, the United States is a not a leading
example for the European Union. The productivity difference between the United States and
Europe is not nearly as large as the data on income per capita suggest. We show that the most
important difference between the United States and (Western) Europe is not efficiency but the
number of hours worked. The prediction that America will ‘have’ the 21st century thus seems
somewhat haphazard, especially since Mortimer B. Zuckerman based it on ideas that
“accounting systems in the United States strive for clear corporate information” and that “the
United States is enjoying a [budget] surplus that looks likely to continue as far as the eye can
see”. Moreover, the employment rate of the population in the United States is relatively high
but so is (after-tax) income inequality. Europe has a relatively strong tradition in protecting the
poor and the sick from the whims of the markets. For those who care about equity and income

11
security,3 interesting role models are countries that score well on all three aspects: productivity,
employment and income inequality. Such countries are found in Europe.4
Second, we conclude that a trade-off exists between macroeconomic efficiency and social-
economic equality. The reform of European labour markets meets fierce resistance. An
important reason behind this resistance – apart from vested interests – is that the same
institutions that are held responsible for unemployment – strong trade unions, employment
protection, generous social security benefits, high and progressive taxes – yield equality in the
income distribution. Indeed, the empirical analysis in this paper reveals that a trade-off between
efficiency and equality exists. This implies that the net social gains of reforming labour markets
are not clear-cut. For example, unemployment benefits with a long duration have a negative
effect on the incentives to work – some people draw on them for a long time – but contribute to
a more equal distribution of income. The analysis also reveals that active labour market
policies, i.e. training of unemployed workers and assistance with job search, can escape this
trade-off up to a point.
Research on the relation between labour market institutions and indicators of economic
performance is already available. Characteristic for most of this literature, though, is that it
analyses the determinants of measures of economic performance more or less in isolation,
focusing on unemployment, productivity or participation separately. The most prominent
example of this literature – which also provides a good account of previous contributions – is
Nickell and Layard (1999).5 Their analysis is closely related to ours. We contribute to this
literature by analysing more dimensions of economic performance – in particular, income
inequality – in a unified framework. In doing so, our focus is on the impact of labour market
institutions on economic performance, including inequality. A second strand of literature takes
up the question as to what institutional setting serves best the goal of optimising economic
performance. An interesting example of this literature is Boeri (2002).6 He considers the
performance of four different ‘social policy models’, that he associates with groups of
countries, viz. the Nordics, the Anglo-Saxon, Continental Europe and the Mediterranean
countries. Performance is evaluated on the basis of income inequality, protection against labour
market risk and rewards to labour market participation. Based on cross-country comparisons
supplemented with microeconometric evidence, Boeri concludes that both the Nordic countries
as well as the Anglo-Saxon countries score well on all indicators and can compete with the
United States. Characterising countries in terms of their institutional framework and resulting
outcomes can thus provide useful information on the effectiveness of different policy
instruments. Our analysis aims to elaborate on this literature by systematically focusing on the
3 Equality can be valued for two principal reasons: the insurance motive in social security or egalitarian reasons per se. We
do not discuss this any further. 4 Boeri (2002) comes to the related conclusion that the social-economic equality is a major advantage of the European social
models over the Anglo-Saxon approach. 5 Other examples include Daveri and Tabellini (2000) and Scarpetta (1996). 6 See also Andersen (2004) for a more in-depth analysis of the Scandinavian welfare model.

12
impact of a wide range of labour market institutions on macroeconomic outcomes. Our analysis
expands on earlier approaches by considering a wide range of institutional characteristics and
their effect on macroeconomic outcomes using systematic econometric analysis exploiting both
cross-sectional as well as time-series variation. Despite the attractiveness of cross-country
analysis, the limitations of such approaches have to be acknowledged. These are concisely
summarised in Freeman (1998).7
We proceed in the following manner. In section 2, we compare productivity across time and
countries. This establishes that productivity differences between the United States and Europe
are not very large. Section 2 also reiterates the well-known fact that income inequality in the
United States is larger than almost anywhere else. Section 3 discusses trade-offs among various
indicators for economic performance. A central trade-off between participation and income
inequality emerges in section 4. It shows how the usual, traditional policy instruments – the
level of benefit income, employment protection and so on – affect the combination of the two,
but do not improve on the fundamental dilemma. In contrast, active labour market policies have
allowed some countries to achieve both higher participation as well as less income inequality.
7 Although Freeman acknowledges the usefulness of cross-sectional analyses as a complement to within-country studies
that exploit changes in institutions over time and comparisons of groups of workers that are covered by different institutions,
he points at two important drawbacks of cross-country analyses. Most importantly, he points at the possibility that countries
differ in many institutional dimensions, implying that differences in outcomes can be explained different ways. Furthermore,
he points at the possibility that institutions that work in one country need not work in another country because of other
differences in institutions that mutually interact. Acknowledging these drawbacks, we argue that macroeconomic cross-
country studies extended with time series analysis are a useful complement to more microeconomic-oriented studies.

13
2 The income gap between the United States and Europe
The United States is by far the richest economy in the world. Its production and income per
capita is unrivalled.8 Various factors can explain this advantage. One of them is that the United
States has a superior production technology, based on scope for entrepreneurship combined
with investments in R&D and ICT, and a better skilled labour force than any other country. An
altogether different explanation is that Americans work more (in terms of number of persons as
well as in number of hours). In other words, the American economy is rather labour-intensive.
To see which explanation holds ground, we decompose for various countries the production per
capita difference with the United States into three constituent factors, viz. the difference in
production per hour, the difference in the number of hours worked per worker, and the
difference in the number of workers relative to the total population.9 Figure 2.1 shows for four
relatively contrasting European countries – France, the Netherlands, Ireland and Finland – to
what extent these three factors have contributed historically to the relative difference in
production per capita with the United States.10 The small countries have fared reasonably well
in the nineties.
In 1950, the gap in production per capita was largely the result of a difference in
productivity per hour. Hours worked and employment in the four countries did not deviate
much from the United States. It was not the effective size of the labour force, but its average
productivity, which made the United States much richer than the four countries. The most
important historic reason was that Europe had only just started the process of reconstruction
after the Second World War, requiring huge investments in private and public capital, whereas
the United States had already made the change toward mass production of goods in the decades
before the war.
From the 1960s onwards, Europe caught up rather quickly (cf. De Groot and Van Schaik,
1997). It invested at a large scale and had the advantage that it could copy the new production
techniques developed in the United States. The four countries outpaced the United States in
growth of productivity per hour, although not to the same degree. In Ireland and Finland,
somewhat at the periphery of Europe and starting with lower levels of productivity, the
catching-up has continued up to now. In France and the Netherlands it continued until the early
1990s. In the second half of the 1990s they lost ground and experienced a decline in their
productivity per hour relative to the United States. 8 Actually, there exist some small countries that – for fairly specific reasons – have higher per capita income than the United
States, like Luxembourg. We do not include Luxembourg in the tables as this distracts attention from the main message. 9 More specifically, we use the definition Y/P = (Y/H)* (H/L)*(L/P), where Y is real GDP, P is the population, H is the number
of hours worked and L is employment. Taking logs and differences with the United States, we arrive at relative differences
between a country and the United States. In this decomposition, we could go one step further and decompose the
employment rate into employed as a fraction of the labour force, the labour force as a fraction of the working age population
(15-65) and working age population as a fraction of the total population. The results of such an analysis can be found in
Annex 2 to this paper, which is available at www.henridegroot.net/downloads.asp (under ‘notes and appendices’). 10 Similar figures for all other countries are available in Annex 1 to this paper, which is available at
www.henridegroot.net/downloads.asp (under ‘notes and appendices’).

14
-60
-40
-20
0
20
1950 1960 1970 1980 1990 2000
GDP per capita GDP per hour Hours Employment
The Netherlands
-100
-80
-60
-40
-20
0
20
40
1950 1960 1970 1980 1990 2000
GDP per capita GDP per hour Hours Employment
Finland
Production per capita did not keep track with productivity per hour. At the same time that the
growth in productivity per hour accelerated, the employment rate and the number of hours
worked started to fall (relative to the United States). With the exception of France, the
downward trend in the employment rate was reversed later on.
In the 1990s the Netherlands, Ireland and Finland were among the fastest growing countries
in the European Union. Measured by production per capita, they were able to keep up with the
United States, but for different reasons. The Netherlands was able to improve the employment
rate, Finland saw its productivity per hour increase further, and in Ireland both factors
contributed to a fast growth in production per capita.
Figure 2.1 The income gap of four European countries explained
The previous description of trends in relative economic performance of European countries
suggests that European workers are currently oftentimes as productive per hour worked as their
American colleagues. The fact that Americans are the richest in the world is by and large
caused by the fact that they work more (both in persons as well as in hours per worker).
Especially the number of hours worked per employed person is an important difference between
the two economic powers. Table 2.1 decomposes for a broader sample of (mainly European)
-80
-60
-40
-20
0
20
1950 1960 1970 1980 1990 2000
GDP per capita GDP per hour Hours Employment
France
-120
-100
-80
-60
-40
-20
0
20
40
1950 1960 1970 1980 1990 2000
GDP per capita GDP per hour Hours Employment
Ireland

15
countries the income gap with the United States in 2003. The countries are ranked from top to
bottom according to their relative GDP per capita.11 Ireland, Norway, Denmark, the
Netherlands, Belgium, Germany, and France outperform the United States in terms of
production per hour worked. Nevertheless, their gap in GDP per capita exceeds almost 10%.
This gap is largely caused by fewer hours worked. For most countries, low employment rates
further add to the gap with the United States. The Netherlands outperforms the United States in
terms of production per hour worked (by almost 5%) and employment (by about 5%) whereas
the number of hours worked per worker is about 35% less than in the United States, resulting in
a GDP per capita gap of about 25%.
Substantially lagging in productivity per hour are the Southern-European countries that have
joined the European Union relatively late: Spain, Greece and Portugal. Low productivity per
hour is the prime reason that the income per capita in these countries is below the European
average and far below the American level. On top of that, Spain and Greece also perform
particularly poor in terms of the employment rate as compared to the United States.
Table 2.1 The income gap with the United States explained: a decomposition, 2003
Percentage differences GDP per capita GDP per hour Hours per worker Employment rate
Ireland − 9.7 7.3 − 10.9 − 6.1
Norway − 11.0 18.0 − 33.1 4.1
Denmark − 17.8 0.2 − 22.2 4.1
The Netherlands − 25.0 5.0 − 35.2 5.2
Austria − 25.6 − 1.1 − 20.6 − 3.9
Sweden − 27.5 − 12.8 − 16.5 1.8
Belgium − 29.2 8.6 − 16.5 − 21.3
Germany − 31.2 3.8 − 25.8 − 9.2
Finland − 31.3 − 11.1 − 15.6 − 4.6
United Kingdom − 31.3 − 15.9 − 12.6 − 2.8
Italy − 32.4 − 4.6 − 14.2 − 13.5
France − 33.8 4.7 − 22.9 − 15.6
EU15 − 34.3 − 8.0 − 17.1 − 9.2
Spain − 50.8 − 33.2 − 3.2 − 14.4
Portugal − 67.8 − 63.9 − 8.4 4.5
Greece − 68.5 − 47.5 3.4 − 24.4
Observation
The United States is in GDP per capita terms richer than almost any country in the European
Union. The difference with Northern and Western Europe is largely explained by differences in
the number of hours worked, whereas the difference with Southern Europe largely results from
a difference in productivity per hour.
11 Note that the numbers in Table 1.1 and Table 2.1 are strongly related. In Table 1.1, we showed GDP per capita of a
country relative to that of the United States, whereas in Table 2.1 we decompose the difference between the log of GDP per
capita of a country and that of the United States into its components (see footnote 9 for the definition of GDP per capita
resulting in our decomposition).

16
The decomposition of income per capita (from production) into three factors – productivity per
hour, hours per worker and workers per inhabitant – would not be straightforward to interpret
when these three factors were interdependent. In particular, one might suspect that countries
with a relatively low employment rate will have – ceteris paribus – a relatively high
productivity (per worker as well as per hour). In such countries, workers with a below average
level of productivity are most likely not participating in the labour market, but rather draw upon
a social security benefit. This ‘selection mechanism’ would – ceteris paribus – have a positive
effect on average productivity measured over employed workers. Reassuringly, Cavelaars
(2003) does not find statistical evidence for a relationship between participation and
productivity per worker.12
One might also expect hours worked and productivity per hour to be related. Working more
hours by individual workers might run into decreasing returns giving rise to a negative
relationship. On the other hand, part-time workers earn less per hour than full-time workers,
suggesting a positive relationship. The latter also emerges from microeconometric estimates;
see for example Bell and Freeman (2001). Overall, the relationship between hours worked and
productivity per hour is ambiguous.
2.1 How to close the income gap?
The European Union has the ambition to be the most competitive economy in the world and to
close the income gap with the United States. How can it achieve this ambition? The discussion
thus far logically suggests three broad ways:
Increase the number of hours worked
For the richest members of the European Union, the main source for the income gap with the
United States is the number of hours worked (per worker). However, increasing this number has
serious drawbacks and does not unequivocally improve welfare. One drawback is that increases
in hours worked might partly be paid for with decreases in productivity per hour (although the
empirical evidence for such an effect is not strong; see before). A second, more important
drawback is that more labour time means less leisure time. The value of leisure does not appear
in income and production statistics, but this does not make this value any less real. Similarly,
official statistics ignore the value of household-production.
One needs to argue that the individual choice between labour and leisure (or household
production) is distorted to make the argument that an extra hour work is socially more valuable
than an additional hour of leisure.13 Income taxes could be a reason for such a distortion, since
they lower the financial revenue of extra work but not the benefits of extra leisure. However, 12 See also CPB (2004) for a more in-depth analysis of the relationship between productivity and participation for the
Netherlands. 13 Of course, in many jobs hours worked is not a choice variable. Hours worked are often institutionally constrained. Workers
whose constraint is binding might also face a different valuation at the margin.

17
this argument is not entirely clear-cut and convincing. Higher average income taxes not only
induce substitution of labour for leisure, but also decrease (after-tax) income, which raises the
incentive to work. Empirically the substitution and the income effect tend to cancel out; the
estimated effects of average income taxes on hours worked are rather low.14 On the other hand,
marginal tax rates which are higher than average tax rates, i.e. progression in the tax system,
could lead to significant distortion in the choice between labour and leisure.15
Increase employment
In many European countries, the unemployment rate is relatively high and the employment rate
of the labour force is relatively low.16 Specifically, unemployment is high and labour market
participation is low among the low productive workers. Of course, when more low-productive
workers participate in the labour market, this is expected to reduce the overall average
productivity per hour (a composition effect). But more easily than with the choice between
labour and leisure, one can argue that open and hidden unemployment is an important
distortion. Unemployment is often involuntary. And even if drawing an unemployment benefit
or other type of social benefit is voluntary, the social security arrangements do distort the
individual choice. An example may help to clarify this. The participation of workers older than
55 is strikingly low in many countries. The reason lies primarily in schemes for early
retirement, which give little incentive to continue working. People who retire early hardly
experience an income loss, while the close link between the last earned wage and old-age
benefits makes elderly workers reluctant to accept lower wages when getting older – even
though they are not as productive as they used to be. The social security system then provides
firms and workers a way to escape the conflict of interests.
Increase productivity (per hour)
A third way to raise income and production per capita is to increase the productivity per hour of
each worker. Figures 2.1 and 2.2 reveal that many European countries are not (far) behind the
United States in terms of productivity per hour. This indicates that the gap in skills or
technology between the two is small. Many European workers have invested heavily in training
and schooling, and European firms often operate at the technological frontier. This does not
apply to Southern-European countries, like Greece and Portugal, and a fortiori for those Eastern
European countries that have recently joined the European Union. These countries can still
14 Kimball and Shapiro (2003) write “One of the best-documented regularities in economics is that – when they affect all
members of a household proportionately – large, permanent differences in the real wage induce at most modest differences
in the quantity of labor supplied by a household. … The standard explanation is that the substitution and income effects of a
permanently higher real wage are of approximately the same size; (…)” 15 However, lowering tax progression is not without risks. It makes it more difficult to redistribute income but could also have
important side effects on productivity, especially in Europe. For example, progressive taxes help to moderate wage
demands (of trade unions) and in this way help to reduce unemployment. See for example Van Ewijk and Tang (2002) 16 For 14 OECD countries the simple coefficient of correlation between the average participation rate and the average
standardised unemployment rate in the period 1989–1994 is −0.83.

18
improve their productivity by learning to adapt existing technologies. The richer European
countries, however, have no alternative but to invest in new and better production methods and
products, although the return to shifting the technological frontier is uncertain.17
A general gap in technology and skills is not likely, but the European Union can still learn
from the United States in at least one area, viz. ICT. This does not immediately concern the
production of ICT goods and services. The United States is strong in computer and
communication hardware, but Europe is strong in telecommunication services. However,
Europe seems to be lagging in the effective application of the new technologies, especially in
domestic services (see, for example, Baily, 2001; de Mooij and Tang, 2003; Nahuis and van der
Wiel, 2004).
Institutional reform
Reducing the gap seems to require institutional reform. In this context, a much expressed
concern is that – in order to transform the European Union into the most competitive economy
in the world – a transformation towards an American-style society is required which might go at
the expense of the relatively equal distribution of income that characterises the European Union.
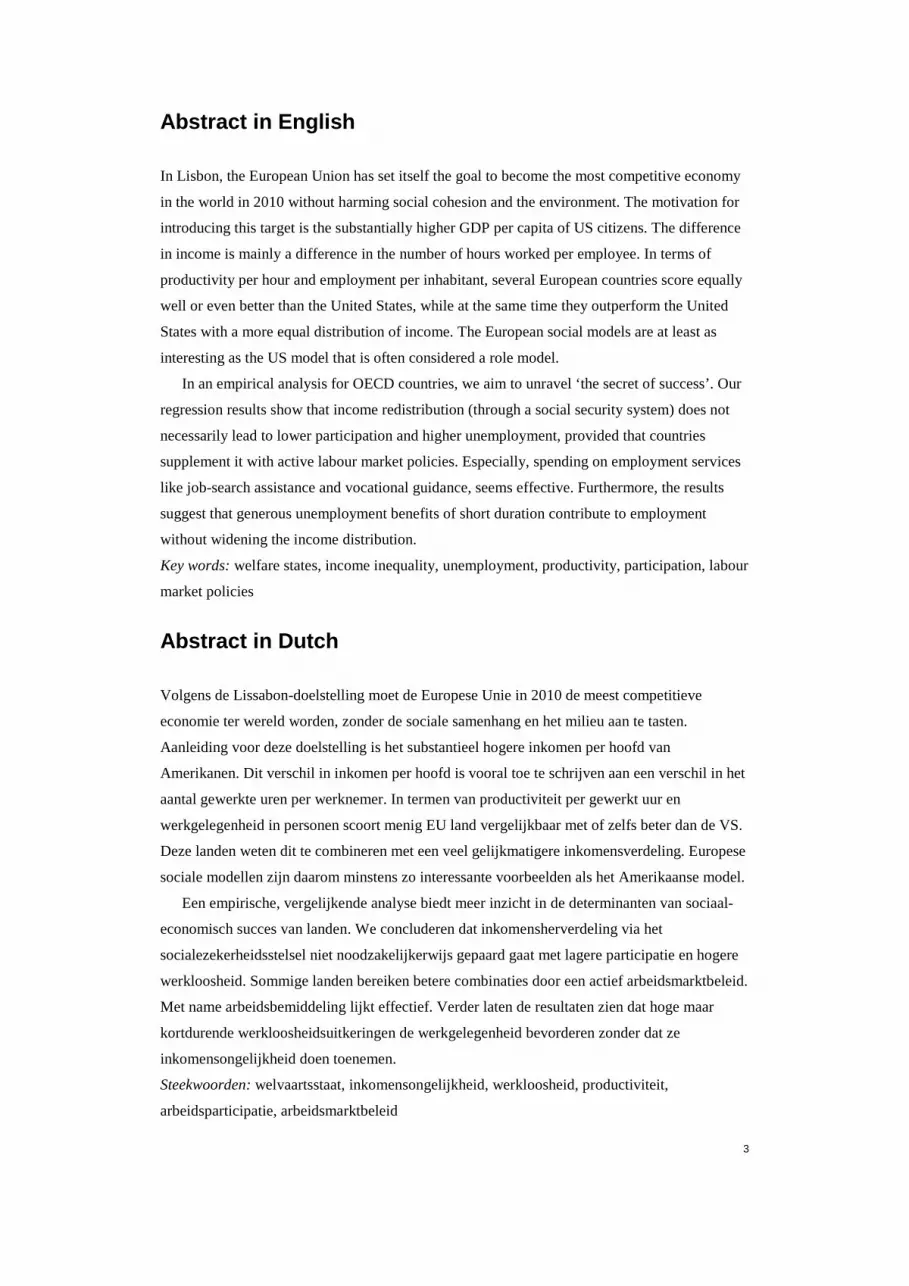
The source of this concern is found in Figure 2.3 which reveals for various countries the before-
tax and after-tax income inequality – measured by Gini coefficients – in the mid-1990s. At one
end of the spectrum, we see Sweden; at the other are the United States and the United Kingdom.
The relatively large inequality in the Anglo-Saxon countries does not fit well with continental
European traditions. The European Union has therefore stressed in the Lisbon agreement that
increased competitiveness should not harm social cohesion, which includes limited income
differentials in society.18 The twin goals of raising competitiveness (and thus income) and
maintaining social cohesion may be noble. However, it neglects the fact that a fundamental
trade-off between efficiency and equality may exist. For instance, to encourage participation of
low-productive workers, one could trim the social security systems (restricting eligibility,
limiting the duration or reducing the level of benefits), but this comes at the expense of larger
income differentials. The next section investigates the trade-off between efficiency and equity
or, more precisely, the trade-off between participation and income equality.
17 Two important asides have to be mentioned here. The first is that, strictly speaking, technological leadership is to be
established at a more disaggregate level (e.g., sectors). Second, the potential for catching up is strictly speaking not
determined by the gap between the average productivity in one country and the average productivity of the leader country,
but by the gap with the most productive firms in a leading country (see Bartelsman and De Groot, 2004, for an empirical
elaboration of these issues). 18 A third component of the Lisbon agenda concerns sustainable development, referring to the quality of the environment.
We do not explore here the trade-off between a clean environment and economic growth (see, for example, Van den Bergh
and De Mooij, 1999).
19
Figure 2.2 Country ranking according to after-tax income inequality in mid-nineties. Gini-coefficients for primary and secondary income distribution
0 5 10 15 20 25 30 35 40 45 50
Sweden
Denmark
Belgium
Norway
Finland
Netherlands
Canada
France
Germany
Australia
Switzerland
Italy
United States
United Kingdom
Gini primary distribution Gini secondary distribution
Source: Bradley et al. (2001).

20

21
3 Trading off efficiency against equality
3.1 A first glance at the data
The social models in continental Europe are better in delivering income equality but are worse
at providing jobs than the Anglo-Saxon model. The run-of-the-mill explanation is that in
Europe social security benefits and minimum wages provide a floor below which wage income
cannot fall. This compresses the income distribution but at the same time raises unemployment
and lowers the participation rate.19 Figure 3.1 does not give clear support to this explanation. It
plots for 12 countries in the period 1989-1994 the Gini-coefficient for the secondary income
distribution against the rate of participation. For both variables the percentage deviation from
the sample mean is shown in the figure. In Belgium and the Netherlands a below average
participation rate is combined with a below average degree of inequality, whereas countries like
the United Kingdom and the United States match high participation with a large income
inequality. This would point to a trade-off, were it not for countries in upper-left quadrant and
lower-right quadrant. The three largest economies in continental Europe – France, Germany and
Italy – perform worse on both counts. They have a below average participation that is not
compensated with a below average inequality, although inequality not as high as in the United
Kingdom and the United States. In contrast, the two countries in the lower-right quadrant,
Denmark and Sweden, perform better on both counts. These are the interesting examples; they
demonstrate that it is possible to have an important role for income redistribution, and at the
same time a high rate of participation.20
Figure 3.1 does not reveal a clear cut trade-off between participation and income equality. It
does, however, show that in order to improve economic performance, and in particular the rate
of participation, European countries do not necessarily have to embrace the Anglo-Saxon
model. The do’s and don’ts are found in Europe. A group of European countries performs about
as good as the United States in terms of productivity per hour and participation, but combines
this with a far lower inequality. This group includes Denmark and Sweden, but probably also
Finland and the Netherlands. On the other hand, a group of European countries performs
poorly, not so much in terms of productivity per hour but in terms of labour market
participation.
19 From this point onwards, in contrast to section 2, we use the participation rate instead of the employment rate as our
measure for economic performance reflecting the provision of jobs in the economy. The former is taken from Nickell and
Nunziata (2001) and defined as Total civilian employment normalised on the working age population (15-64). 20 The data apply to the period 1989-1994 and may not adequately characterise the current situation. However, since
participation in Denmark and Sweden is still high in 2001 (see Table 1.1) and since there are no clear signs that these two
countries have become much more unequal, they are likely still to outperform the United States. The Netherlands may have
joined these two, since the Dutch participation rate has increased substantially in the 1990s (see Figure 2.1)

22
Figure 3.1 Participation versus income inequality in 12 countries, 1989-1994
Source: Nickell and Nunziata (2001) for participation and Bradley et al. (2001) for the Gini-coefficients. The variables are
constructed as percentage deviations from the (unweighted) average of all countries in the sample.
Observation
A first look at the data does not suggest a simple trade-off between participation and inequality.
Instead, it leads to the conclusion that different European social models also provide useful
lessons on how to reform, and how not to reform.
3.2 An empirical approach
The level of unemployment benefits defines a lower bound in the wage distribution. The higher
this level is, the more even the wage distribution and the higher the rate of unemployment (or
the lower the rate of employment). A first glance at the data (in the previous section) does not
confirm this idea. However, the level of unemployment benefits in relation to the level of
wages, i.e. the replacement rate, is just one characteristic of national labour markets. Other
institutional factors are important as well for the performance of labour markets. These factors
include, for example, the duration of unemployment benefits and employment protection. They
may provide an explanation as to why a trade-off does not seem to appear and thus why some
(European) countries perform better than other (European) countries. The trade-off between
Sweden
DenmarkBelgium
FinlandNew Zealand
Netherlands
CanadaFrance
Germany Australia
Switzerland
United KingdomItaly United States
-30
-15
0
15
30
-30 -15 0 15 30
Participation
Inequality
Average

23
equality and participation may well be conditional on other factors. We therefore resort to a
multivariate analysis.
Central in this section are regressions in which the rate of participation and the degree of
income inequality are related to various institutional characteristics of national labour markets.
Our dataset covers 18 OECD-countries21 and averages for seven five-year periods from 1960 to
1995 which yields (at most) 126 observations.
Before turning to the regression results, we characterise our dataset. We do so by
characterising the economic performance of clusters of countries. In defining the clusters, we
follow Esping-Anderson (1999) who breaks down the group of rich countries into three
categories according to the social models that the countries have adopted: corporatist, social-
democratic and liberal. Broadly speaking, the first category includes countries in continental
Europe, the second Scandinavian countries and the third Anglo-Saxon countries.22
Figures 3.2 shows for each of the categories three indicators for labour market performance:
an estimated measure for inequality of disposable household income, the non-participation rate
(defined as 100 minus the participation rate) and the unemployment rate. The latter two
indicators are highly correlated, but not always interchangeable. On the axes is the measure of
economic performance of the respective group of countries divided by the average measure of
performance of all countries. A score of 100 thus means that the group of countries scores equal
to the average of all countries. Figure 3.2 clearly reveals that the corporatist countries are more
egalitarian but provide fewer jobs than liberal countries. Interestingly, a relatively low rate of
participation does not necessarily translate into a high rate of unemployment. The social-
democratic countries have the best score for equality and participation, but not for
unemployment.
Figure 3.3 shows for the same three groups of countries several characteristics of labour
market institutions. It is immediately clear that in the liberal countries the government
intervenes less in the labour market than in the other (groups of) countries. For example, the
level and duration of unemployment benefits are on average lower in the liberal countries than
elsewhere. Figure 3.3 also illustrates an interesting difference among the European countries.
The social-democratic countries have on average the highest benefit level (and the highest tax
wedge). They have a higher benefit level than the corporatist countries and combine this with
higher expenditures on active labour market policies, with shorter benefit duration and less
employment protection. This suggests that social security in the social-democratic countries is
more geared towards reintegration in the labour market than in the corporatist countries,
possibly explaining the difference in the participation rate between the two groups of countries.
21 These countries are Australia, Austria, Belgium, Canada, Denmark, Finland, France, Germany, Ireland, Italy, Japan, the
Netherlands, New Zealand, Norway, Sweden, Switzerland, United Kingdom and United States. 22 More specifically, the corporatist countries are Austria, Belgium, France, Germany, Italy, the Netherlands and Japan; the
social-democratic countries are Denmark, Sweden, Finland and Norway; and the liberal countries are Ireland, United
Kingdom, United States, Switzerland, Australia, Canada and New Zealand

24
Let us now turn to the regression analysis to see whether it confirms these notions derived from
a partial look at the data.
Figure 3.2 Performance in three Esping-Anderson groups (average 1989-1994)
Figure 3.3 Labour market characteristics in three Esping-Anderson groups (average 1989-1994)
80
100
120non-participation
inequalityunemployment
Corporatist Social Democrat Liberal
20
60
100
140
180benefit level
benefit duration
employment protection
active labour market policies
tax wedge
Corporatist Social Democrat Liberal

25
A complication for the regression analysis is that the labour market characteristics are mutually
correlated. The effect of a single factor is hard to isolate, since it affects not only the
performance of the labour market directly, but also the other institutional factors. For example,
a country with a strong position of trade unions is likely to have a high replacement rate and a
progressive tax system.
We proceed therefore in two steps. In the first step we include in the equation only variables
for which the mutual correlation is relatively limited. In doing so, we avoid potential problems
of multi-collinearity that might affect the results. Table 3.1 reports the correlation among the
explanatory variables for the average of the period 1989–1994. The correlation coefficients are
below 0.5 for four variables: benefit level or replacement rate, benefit duration, a measure for
employment protection and a measure for active labour market policies.23 In the second step we
separately include other variables of potential relevance in explaining differences in economic
performance across countries and over time. These are the tax wedge between the labour costs
for employers and the net wage for employees and the measures for the unions’ role on the
labour market, i.e. the degree of centralisation in wage bargaining (called coordination) and the
extent to which workers are covered by collective agreements (called coverage). The inclusion
of these variables exacerbates the potential problems with multi-collinearity and calls for a
careful interpretation of the results. The fact that the qualitative results (viz. the signs of the
coefficients) are not seriously affected by the inclusion of these variables gives confidence in
the presented results.24
Table 3.1 Correlations between policy instruments
Benefit
level
Benefit
duration
Employment
protection
Active LM
policies
Union
coordination
Union
coverage
Tax wedge
Benefit level 1 − 0.25 0.32 0.41 0.15 0.25 0.36
Benefit duration 1 0.03 − 0.26 0.27 0.42 − 0.07
Employment protection 1 0.47 0.55 0.52 0.55
Active LM policies 1 0.33 0.36 0.51
Union coordination 1 0.36 0.06
Union coverage 1 0.06
Tax wedge 1
23 Even for these variables, the mutual correlation is not negligible, meaning that a careful interpretation of the regression
results is called for. 24 There is too little time-series variation in the institutional variable, to be able to use fixed-effects to control for country-
specific fixed effects. For more on this, see Belot and Van Ours (2001).

26
Table 3.2 reports the estimation results.25,26 We first discuss the results of the first step, in
columns I, IV and VII. Later we shift attention to other columns. We discuss the results
presented in Table 3.2 horizontally, viz. we discuss the effect of each policy instruments on the
various indicators of economic performance separately.
• A higher replacement rate corresponds to less inequality (column VII) but to more
unemployment (column IV). For this policy instrument a trade-off between equity and
efficiency seems to result. The effect on the participation rate is positive although small and far
from statistically significant. Nickell (1997) comes up with a similar result. One explanation is
that the replacement rate has two opposing effects. A higher rate leads to less labour demand
and, thus, to more unemployment. It also encourages labour supply. A better insurance against
unemployment risk provides a higher incentive to enter the labour market. The net effect of the
replacement rate on participation is hence ambiguous.
• The duration of unemployment benefit has a similar impact on unemployment and inequality as
the level. Specifically, duration is positively related to unemployment and negatively to
inequality. In addition, it has a negative effect on participation. A trade-off arises for benefit
duration as well.
• Employment protection also has a negative effect on participation. Since it tends to reduce
inequality, a trade-off seems to arise. However, the effect on inequality is small and statistically
insignificant. Interestingly, employment protection does not have a clear impact on
unemployment. The main effect of employment protection is to reduce flows on the labour
market, from employment to unemployment and vice versa. This probably makes it more
important for the duration of unemployment than for the rate of unemployment. 27
• The results for active labour market policies are remarkable. Whereas the other three policy
instruments give rise to a trade-off, spending on active labour market policies (per unemployed)
does not. This type of spending boosts the rate of participation (column I), lowers the rate of
unemployment (column IV) and reduces income inequality (column VII). These results show
25 Our data for active labour market policies are taken from Nickell (1997). Their availability is restricted to the periods 1984–
1989 and 1989–1994. In order to optimally exploit the information in our dataset for the other variables and to avoid serious
biases in the estimates for active labour market policies, we have filled the non-availables for active labour market policies in
our dataset with the expenditures on active labour market policies in the closest period for which data are available.
Alternatively, we could have filled the non-availables with the average of expenditures on active labour market policies in the
sample. This has hardly any effect on the results (details are available upon request). We have subsequently analysed the
robustness of our results by (i) performing the analysis without filling the series for active labour market policies (and
accepting the loss of observations that results), (ii) by using data on active labour market policies from the OECD that cover
a longer time span, and (iii) by using active labour market policy one period lagged to address the potential problem of
endogeneity that may plague the results. These sensitivity tests are reported in section 3.3. 26 The data on benefit duration are taken from Nickell and Nunziata and contain a few zeros. We find these slightly
suspicious. The results in Table 4 are based on information on benefit duration in which the zeros have been replaced by
the value for benefit duration in the closest year for which information is available. As with active labour market policies, we
have done sensitivity analyses to establish the robustness of the results for this change in the original data. 27 Indeed, Nickell (1997) finds that employment protection has a positive effect on long-term unemployment and a negative
effect on short-term unemployment.

27
that some forms of active labour market policies are effective, helping those with a relatively
bad position on the labour market and a relatively low income. Of course, the results show only
the benefits of these policies, but not their budgetary costs. Moreover, it is unclear which types
of active labour market policies are effective. This is discussed later.
The results of the second step seem to fit the rule that creating jobs comes at the expense of
sharper inequality. The tax wedge reduces income differences and increases unemployment (the
effect on participation is insignificant). Also expected is the finding that the more workers fall
under collective wage agreements, the lower inequality but the higher unemployment and the
lower participation is. However, larger unions –with a broader coverage – do not necessarily
mean less employment: bargaining at a national level produces less wage compression and
more wage moderation than bargaining at industry or firm level. The reason is probably that
smaller than national unions do not (fully) take into account the negative, macroeconomic
effects of wage demands (cf. Calmfors and Driffil, 1988).
Including additional variables in the second step does not alter the result that active labour
market polices have allowed countries to achieve better combinations of equity and efficiency.
The coefficient for spending on unemployed workers is hardly affected. The tax wedge affects
the coefficients of the other variables much more than the indicators for role of unions.
Including the tax wedge reduces the effect of the replacement rate on unemployment and
inequality. This may not seem surprising, given that a higher replacement rate implies more
expenditure (on unemployment benefits) and a higher tax burden. However, including the tax
wedge magnifies the effect of benefit duration on unemployment as well as on inequality.
Besides, the effect of employment protection gets an unexpected sign.
For policy making, the results are interesting. Most European countries want to increase the rate
of overall participation. However, achieving that usually gives rise to a dilemma. As a rule, a
trade-off between participation and inequality emerges. Reducing benefit duration, for example,
has the effect of raising participation, but also brings about more income inequality. Not
surprisingly, this and similar measures often meet fierce social and political resistance and fuel
the fear for American-style society in which everyone works – because they have to – while
social-economic distinctions are sharp.
Exceptions to the rule are active labour market policies, which comprise among other things
assistance with job search and schooling of (unemployed) workers. This type of instrument is
effective in raising participation as well as reducing inequality. It seems to have allowed
countries like Denmark and Sweden to combine relatively generous social security systems
(when measured by the replacement rate) and limited inactivity among the labour force. The
regression analysis is perhaps not conclusive evidence, but it at least suggests that European
countries can improve participation while maintaining the income equality by investing in
active labour market policies.

28
Spending on unemployed workers is not the only difference between social-democratic and
corporatist countries. The first group has on average higher (but shorter) unemployment
benefits and less employment protection than the latter. This also explains why the social-
democratic countries have a higher rate of participation and a lower degree of income
inequality. The reason is that a high replacement rate does not have a strong (negative) effect on
participation and that employment protection does not have a strong (negative) effect on
inequality.
Table 3.2 Labour market policy and economic performance (1960-1995)
Dependent variable, logarithm
Participation rate Unemployment rate Inequality
I II III IV V VI VII VII IX
Replacement 0.012 0.013 0.016 1.281* 1.342** 0.722 − 0.080*** − 0.087*** − 0.032
rate (0.21) (0.24) (0.27) (1.95) (2.12) (1.15) (− 3.66) (− 3.70) (− 1.63)
Benefit − 0.060** − 0.032 − 0.032 0.456 0.466 0.818** − 0.051*** − 0.049** − 0.109***
duration (−2.08) (− 0.93) (− 0.96) (1.27) (1.12) (1.99) (− 3.1) (− 2.3) (− 6.43)
Employment − 0.042** − 0.032* − 0.040** − 0.120 − 0.105 − 0.303** − 0.006 − 0.007 0.018**
protection (− 2.59) (− 1.74) (− 2.41) (− 0.65) (− 0.5) (− 2.05) (− 0.65) (− 0.68) (2.17)
Active labour 0.0031*** 0.0037*** 0.0034*** − 0.0120* − 0.0097 −0.0159*** −0.0030*** −0.0030*** −0.0026***
market policies (4.81) (4.99) (4.71) (− 1.96) (− 1.33) (− 2.66) (− 13.75) (− 8.78) (− 10.61)
Union − 0.006 − 0.257* 0.015**
coordination (− 0.39) (− 1.91) (2.08)
Union − 0.023** 0.252*** − 0.018***
coverage (− 1.79) (2.65) (− 3.40)
Tax wedge − 0.021 2.518*** − 0.287***
(− 0.19) (2.66) (− 6.55)
Time trend 0.0001 0.0000 0.000 0.055*** 0.054*** 0.045*** 0.003*** 0.003*** 0.004***
( 0.15) (− 0.05) (− 0.17) (7.18) (6.89) (5.40) (5.46) (5.56) (7.19)
Constant 4.209 4.247 4.207 − 4.715 − 4.855 − 5.447 3.496 3.509 3.599
(154.5) (121.9) (85.0) (−9.9) (− 9.6) (− 8.4) (204.4) (161.4) (185.6)
R2 0.20 0.22 0.20 0.37 0.40 0.38 0.51 0.56 0.68
# observations 126 126 118 126 126 118 95 95 89
F-statistic 6.11 4.74 4.75 14.07 11.18 11.37 18.61 15.61 28.39
White heteroskedasticity consistent t-values are reported in brackets below the estimates. *,**, and *** denote statistical significance at
10%, 5% and 1% level.
Which types of active labour market policies are effective?
Active labour market policies involve various types of expenditures that should help the
unemployed with finding jobs or create them. In particular, active labour market polices fall
into five categories: training, employment services (e.g. assistance with job search), measures
for the young, measures for disabled and employment subsidies. In the period 1989−1994 the
largest amount was spent on training: 27% of the total expenditure, where the percentage is the

29
unweighted average for the countries in the sample. The smallest part went to youth measures:
11%. The data show substantial differences across countries. The Anglo-Saxon countries spend
29% of total expenditure on employment services, whereas the Scandinavian countries devote
only 11%. The latter countries use the funds for employment subsidies (31%), training (27%)
and the disabled (23%).
Not every form of active labour market policies is effective. The available evidence is scant
but already makes that clear (see, for example, Koning and Vollaard, 2000, and Martin, 2000).
The OECD (2001) concludes from the few available evaluations that some inexpensive policies,
like job-search assistance, are among the most cost-effective ones for a substantial number of
unemployed. Regressions give rise to a similar conclusion. We have entered the different types
of active labour market policies separately into the equations for participation, unemployment
and inequality for the period that data for these types of polices are available. The regression
results in Table 3.3 show that youth measures do not have statistically significant impact,
whereas the other types do. Most notable is that spending on employment services has a much
larger impact than the others. The impact from job-search assistance on unemployment is at
least three times as high as the impact from other types of spending, and the impact on
participation is two times larger. This underscores the cautious conclusion by the OECD.
Table 3.3 Different types of active labour market policies
Dependent variable, logarithm
Participation Unemployment Inequality
Labour market training 0.010*** −0.055*** − 0.006***
(3.1) (− 3.5) (− 3.1)
Youth measures − 0.002 0.029 − 0.009
(− 0.1) (0.4) (− 1.0)
Subsidised employment 0.004 − 0.033** − 0.004***
(1.1) (− 2.6) (− 3.2)
Employment measures for disabled 0.007*** − 0.072** − 0.003***
(3.4) (− 2.4) (− 3.5)
Employment services and administration 0.022*** − 0.232*** − 0.014***
(3.0) (− 5.4) (− 3.6) The coefficients are derived from equations that are similar to those in Table 3.2, but the coefficients for the other variables are
suppressed. White heteroskedasticity consistent t-values are reported in brackets below the estimates

30
3.3 How robust are the empirical results?
To test for the robustness of the regression results in Table 3.2, we have run regressions with
different data and another specification for the measure of active labour market policies. We
focus on these two robustness checks in this subsection. Table 3.4 presents the results. Besides,
the regressions have been rerun using a different sample of countries and using different data
for inequality. The results are verbally discussed at the end of this subsection.
Table 3.4 contains the results of the robustness analysis for active labour market policies. The
specifications are comparable to those in columns I, IV and VII in Table 3.2. The first three
columns show the results that are obtained when we do not fill the non-availables for active
labour market policies with the value in the closest year for which information is available. For
the analysis based on data taken from Nickell and Layard, this only leaves us with 24
observations. We subsequently use the OECD data on active labour market policies. To
construct a variable that comes close to the one used by Layard and Nickell, we have scaled the
expenditures on active labour market policies as a fraction of GDP with the unemployment rate.
The resulting variable thus measures expenditures per unemployed as a fraction of GDP per
number of people in the workforce.28 The coverage over time is better than for the Nickell and
Layard data. Finally, we address the potential problem of endogeneity of active labour market
policies. We do so by using active labour market policies one period lagged as explanatory
variable.29 Those results are contained in the last three columns. We have also scaled
expenditures on active labour market policies by the lagged unemployment rate rather than the
current unemployment rate. Those results are not reported, but are available upon request. Both
approaches to address the concern regarding endogeneity have limited effect on our estimated
coefficients, and reveal the robustness of our results on active labour market policies. The effect
of active labour market policies on our measures for economic performance is always of the
same sign as well as always statistically significant.
28 The correlation between the Layard and Nickell variable and our own-constructed measure is high, 0.92. 29 Ideally, one might like to perform IV-estimation, but it is hard to come up with instruments for active labour market policy.
Instead, we employ two simpler methods.

31
Table 3.4 Robustness of effects of active labour market policies (ALMP)
Dependent variable, logarithm
No filling of ALMP data ALMP data from OECD Lagged value for ALMP
P U I P U I P U I
Replacement 0.088 -0.079 -0.093** 0.086 0.707 -0.092** 0.027 1.181* -0.08***
rate (1,1) (-0,3) (-2,5) (0,9) (1,5) (-2,3) (0,5) (1,8) (-3,6)
Benefit duration 0.017 0.032 -0.093** -0.100* 0.341 -0.041 -0.056* 0.349 -0.051***
(0,4) (0,2) (-2,9) (-1,9) (1,0) (-1,6) (-1,7) (0,9) (-3,1)
Employment -0.165*** 0.227*** 0.004 -0.09*** 0.299 -0.017 -0.049*** -0.042 -0.007
protection (-9,7) (2,6) (0,4) (-2,8) (1,5) (-1,3) (-2,7) (-0,2) (-0,8)
Active labour 0.006*** -0.021*** -0.003*** 0.003*** -0.027*** -0.002*** 0.003*** -0.015** -0.003***
market policies (6,1) (-2,9) (-8,8) (3,5) (-4,0) (-4,1) (4,8) (-2,3) (-13,4)
Time trend -0.004 0.043 0.003 0.003 0.02 0.005*** 0.000 0.059*** 0.003***
(-0,7) (2,0) (0,9) (0,7) (0,9) (2,8) (0,3) (7,2) (5,3)
Constant 4.344 -3.652 3.522 4.152 -3.652 3.449 4.199 -4.762 3.497
(27.7) (-5.8) (41.7) (38.6) (-4.2) (61.9) (137.7) (-9.4) (202.5)
R2 0.71 0.61 0.75 0.33 0.34 0.62 0.22 0.37 0.5
# observations 24 24 22 43 43 38 108 108 95
F-statistic 8.84 5.67 9.6 3.62 3.87 10.41 5.77 12.06 18.06
P denotes participation, U unemployment and I inequality. White heteroskedasticity consistent t-values are reported in brackets below
the estimates.
Finally, two further changes complete the robustness analysis (details are available upon
request). First, we have excluded Sweden from the sample. Scarpetta (1996) finds that this has
an important effect on his regression results. The underlying reason is that spending per
unemployed worker is exceptionally high in Sweden. In contrast to Scarpetta, we find that
excluding Sweden does not drastically affect the results. Most seriously affected is the effect of
active labour market policies on inequality that becomes smaller and statistically insignificant.
In contrast, the estimated impact on the participation- and unemployment rates becomes larger.
Second, we have experimented with alternative data for inequality. This reduces the sample
substantially, since the number of time periods for which observations are available is limited.
Nevertheless, the regression results for inequality are hardly affected, at least qualitatively. This
is not surprising given the strong correlation between different available measures for inequality
(see Nahuis and De Groot, 2003 and Appendix A).

32

33
4 Conclusion
US citizens are on average far richer than Europeans. Production per capita is on average more
than 30% higher in the United States than in the European Union. This does not result from a
general gap in technology. In fact, in some European countries productivity per hour is higher
than in the United States. It does also not result from a general difference in participation on the
labour market. In fact, some European economies are better at providing jobs than the American
economy. Instead, the income difference arises from a difference in hours worked. Whereas the
Americans work on average 1865 hours per year, Europeans only work around 1600 hours:
there is difference in income per capita but not necessary in welfare, since income statistics
ignore the value of leisure and household production.
Behind the averages are important differences in Europe. In Southern Europe productivity
per hour is still significantly lower than in the United States (and thus in rest of the European
Union). Moreover, in continental Europe − Belgium, France, Italy and Germany − participation
is far lower than at the other side of the Atlantic. The usual explanation is the extensive social
security system in continental Europe. Making the systems more sober and austere would help
to make Europe more ‘competitive’ and would help to raise the rate of participation. The fear is
that this comes at the expense of larger, American-style income differences. Such a trade-off
between participation and inequality does not appear at first sight. The worst combination (a
below average participation and an above average inequality) is found in Europe, e.g., Italy.
The best combination is found there as well. Some small, mainly Scandinavian countries have
found ways to combine relatively high participation with relatively modest income differences.
This implies that the United States is not always the obvious role model.
A panel-data analysis for OECD countries aims to unravel the secret of success. Income
redistribution (through a social security system) does not necessarily lead to lower participation
and higher unemployment as long as countries supplement it with active labour market policies.
The different types of active labour market policies are not equally effective. Most effective are
employment services and administration measures aimed at assisting non-participants in finding
jobs. Furthermore, the results suggest that combining a higher benefit level with a shorter
duration may improve employment without widening the income distribution.
One should not overlook that a trade-off between participation and inequality is often
relevant. For example, shorter benefit duration is on average associated with higher
participation and less unemployment but also with more inequality. Once countries have
exploited their opportunities to achieve a better combination of participation and inequality,
they will again face the difficult choice between the two.

34

35
References
Aghion, Ph., E. Caroli and C. Garcia-Penalosa, 1999, Inequality and Economic Growth: The
Perspective of the New Growth Theories, Journal of Economic Literature, 37(4): 1615-60.
Andersen, T.M., 2004, Challenges to the Scandinavian Welfare Model, European Journal of
Political Economy, 20, pp. 743-754.
Baily, M.N., 2001, Macroeconomic Implications of the New Economy, The Federal Reserve
Bank, Kansas City.
Bartelsman, E.J. and H.L.F de Groot, 2004, Integrating Evidence on the Determinants of
Productivity, in: G. Gelauff, L. Klomp, S. Raes and T. Roelandt (eds), Fostering Productivity,
Elsevier, pp. 157-181.
Becker, G.S., 2002, The Continent Gets it, Business Week, April.
Bell, L.A. and R.B. Freeman, 2001, The Incentive for Working Hard: Explaining hours Worked
Differences in the US and Germany, Labour Economics, 8, pp. 181-202.
Belot, M., 2003, Labor Market Institutions in OECD Countries: Origins and Consequences,
Ph.D. thesis, CentER for Economic Research, Tilburg University, Tilburg.
Belot M. and J.C. Van Ours, 2001, Unemployment and labour market institutions in an
empirical analysis, Journal of Japanese and International Economies, 15(4), 403-418.
Bergh, J.C.J.M. van den and R.A. de Mooij, 1999, An assessment of the growth debate. In:
J.C.J.M. van den Bergh, (red.), Handbook of Environmental Resources, Edward Elgar,
Cheltenham, pp. 643-655.
Blanchard, O. and J. Wolfers, 2000, The Role of Shocks and Institutions in the Rise of
European Unemployment: The Aggregate Evidence, Economic Journal, 110(462): C1-33.
Boeri, T., 2002, Let Social Policy Models Compete and Europe Will Win, conference paper,
John F. Kennedy School of Government, April 11-12.
Bradley, D., E. Huber, S. Moller, F. Nielsen and J. Stephens, 2001, Distribution and
Redistribution in Post-industrial Democracies, Luxembourg Income Study Working Paper No.
265.

36
Calmfors, L. and J. Driffill, 1988, Bargaining Structure, Corporatism and Macroeconomic
Performance, Economic Policy, 6, pp. 13-62.
Cavelaars, P., 2003, Has the Tradeoff Between Productivity Gains and Job Growth
Disappeared?, MEB Serie, no. 2003-12, DNB, Amsterdam.
CPB, 2004, Macro Economische Verkenning 2005, CPB Netherlands Bureau for Economic
Policy Analysis, The Hague.
Daveri, F. and G. Tabellini, 2000, Unemployment, Growth and Taxation in Industrial
Countries, Economic Policy: A European Forum, 0(30): 47-88.
Esping-Andersen, G., 1999, Social Foundations of Post-industrial economics, Oxford: Oxford
University Press.
Ewijk, C. van en P.J.G. Tang, 2000, Efficient progressive taxes and education subsidies, CPB
Research Memorandum 170, The Hague
Freeman, R., 1998, War of the Models: Which Labour Market Institutions for the 21st
Century?, Labour Economics, 5(1): 1-24.
Galbraith, J.K. and Hyunsub Kum, 2003, Inequality and Economic Growth: Data Comparisons
and Econometric Tests, mimeo, University of Texas.
Groot, H. L. F. de and A. B. T. M. van Schaik , 1997, Unemployment and Caching-Up: Europe
vis-a-vis the USA, De Economist, 145, p. 179-201.
Kimball, M.S., and M.D. Shapiro, 2003, Labor Supply: Are Income and Substitution Effects
Both :Large or Both Small?, mimeo
Koning, P. and B. Vollaard , 2000, Arbeidsbemiddeling en -reïntegratie van werklozen: Welke
rol heeft de overheid te spelen?, CPB Document no. 118, CPB Netherlands Bureau for
Economic Policy Analysis, The Hague.
Lundberg, M. and L. Squire, 2003, The Simultaneous Evolution of Growth and Inequality,
Economic Journal, 113, 326-344.
Martin, J., 2000, What Works Among Active Labour Market Policies: Evidence from OECD
Countries’ Experiences, in: OECD, Policies Towards Full Employment; OECD, Paris.

37
Mooij, R.A. de, and P.J.G. Tang, 2003, Four Futures of Europe, CPB Netherlands Bureau for
Economic Policy Analysis, The Hague.
Nahuis, R. and H.L.F. de Groot, 2003, Rising Skill Premia: You Ain’t seen Nothing Yet?, CPB
Discussion Paper, no. 20, CPB Netherlands Bureau for Economic Policy Analysis, The Hague.
Nahuis, R. and H. van der Wiel, 2004, Europe’s ambition and the role of ICT. Should there be a
European ICT policy agenda?, CPB Document, forthcoming.
Nickell, S., 1997, Unemployment and Labor Market Rigidities, Journal of Economic
Perspectives, 11, p. 55-74.
Nickell, S. and R. Layard, 1999, Labour Market Institutions and Economic Performance, in: O.
Aschenfelter and D. Card, Handbook of Labor Economics, Volume 3, Elsevier Science.
Nickell, S. and L. Nunziata, 2001, Labour Market Institutions Database (version 2.00; 1960-
1995).
OECD, 2001, Employment Outlook 2001, OECD, Paris.
OECD, 2003, Social Expenditure Database, available via SourceOECD.org, OECD, Paris.
Scarpetta, S., 1996, Assessing the Role of Labour Market Policies and Institutional Settings on
Unemployment: A Cross-Country Study, OECD Economic Studies, 26 (2), p. 43-98.
Total Economy Database, 2004, Groningen Growth and Development Centre (GGDC),
University of Groningen and the Conference Board, Groningen.
Zuckerman, M.B., 1998, Debate: A Second American Century, Foreign Affairs, May/June.

38
39
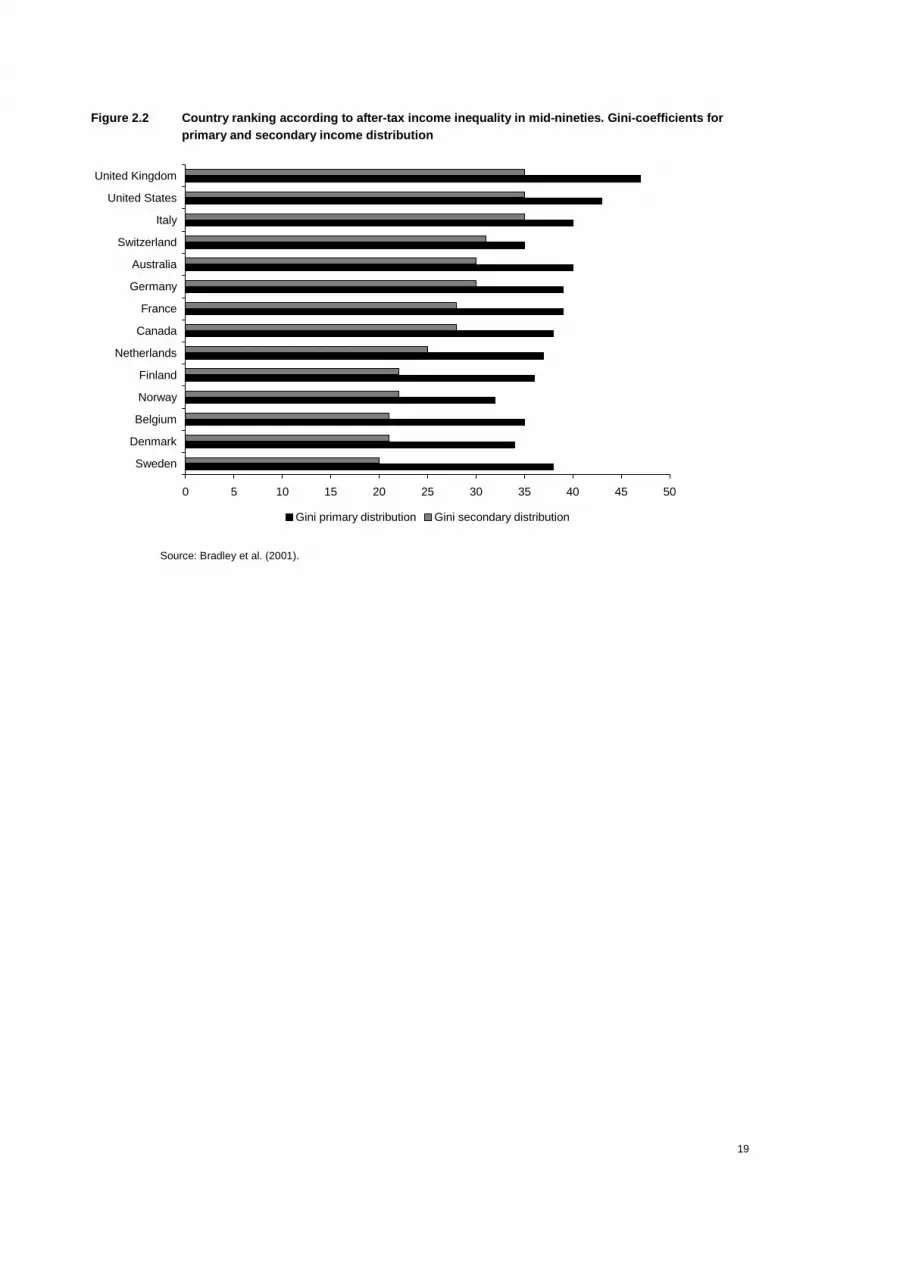
Appendix A Data sources
This Appendix describes the sources of the data used in this study. We describe the various
sources and the content.
Sources
Productivity per hour, participation, production per capita and hour per person.
These data are taken from GGDC Total Economy Database 2003 (University of Groningen and
the Conference Board, http://www.eco.rug.nl/ggdc). The database contains series for real GDP,
population, employment, annual working hours, GDP per capita, GDP per person employed and
GDP per hour. It covers 74 countries from 1950 onwards.
Inequality measures.
There is a plethora of empirical measures proxying for income inequality, each with its own
pros and cons. In this paper, we have used the Gini measures for income inequality as gathered
by the Luxemburg Income Survey (LIS) and by Deininger and Squire, percentile ratios gathered
by LIS, and Estimated Household Income measures that were estimated by Galbraith and Kum
(2003). Without going in detail on all these different measures, it is useful to characterise the
essential differences between these measures as they have motivated our choice for the
measures used in the main text. In order to provide some feeling for the differences (and
similarities) among these measures of (or proxies for) income inequality, we have constructed a
correlation matrix of all these measures for the year 1989. This matrix is contained in Table
A.1. The table reveals that almost all measures are highly correlated, with the exception of the
Gini measure from Deininger and Squire that is poorly correlated with the Estimated Household
Income measures. More details on income inequality measures can be found in Nahuis and De
Groot (2003).
Table A.1 Correlation matrix
GINI GINI_LIS PERC90_10 PERC90_50 PERC80_20 EH112 EH114
GINI 1 0.60 0.61 0.51 0.59 0.11 0.17
GINI_LIS 1 0.94 0.97 0.97 0.62 0.58
PERC90_10 1 0.89 0.97 0.57 0.51
PERC90_50 1 0.93 0.68 0.66
PERC80_20 1 0.57 0.50
EH112 1 0.81
EH114 1

40
Details on the sources for Table 3.2
• Participation: taken from Nickell and Nunziata (2001). Defined as total civilian employment
normalised on the working age population (15-64) (from CEP OECD data, updated by authors).
• Hours worked per worker: Own computations based on data taken from GGDC Total Economy
Database 2003 and 2004 (University of Groningen and the Conference Board; data are available
at www.eco.rug.nl/ggdc).
• Inequality: Estimated Household Income Inequality taken from Galbraith and Kum (2003). We
refer to Nahuis and De Groot (2003) for a more extensive discussion on available inequality
measures. An alternative though less attractive variable available for long time spans is the
Theil inequality measure provided by the University of Texas Inequality Project (UTIP). This
measure is based on pay inequality in the manufacturing sector. This variable is used for
robustness analysis.
• Standardised unemployment rate: taken from Belot (2003).
• Replacement rate: taken from Nickell and Nunziata (2001). They use Benefit Replacement
Rates data provided by OECD with one observation every two years for each country in the
sample. The data refer to first year of unemployment benefits, averaged over family types of
recipients, since in many countries benefits are distributed according to family composition.
The benefits are a percentage of average earnings before tax.
• Employment protection: taken from Nickell and Nunziata (2001). They use information from
Blanchard and Wolfers (2000) who an employment protection time varying variable from 1960
to 1995, each observation taken every 5 years. Range is {0,2} increasing with strictness of
employment protection.
• Benefit duration: An index. See Nickell and Nunziata (2001) for details.
• Active-labour-market policy: taken from Nickell (1997) and OECD.
• Coordination: taken from Belot (2003).
• Union coverage: taken from Belot (2003).
• Tax wedge: the sum of employers , employees and indirect taxes. See Nickell and Nunziata
(2001) for details.


