Embed Size (px)
Citation preview
Durham E-Theses
The Colour and Composition of Early Anglo-Saxon
Copper Alloy Jewellery
BAKER, JOCELYN,MARGARET
How to cite:
BAKER, JOCELYN,MARGARET (2013) The Colour and Composition of Early Anglo-Saxon Copper
Alloy Jewellery, Durham theses, Durham University. Available at Durham E-Theses Online:http://etheses.dur.ac.uk/10550/
Use policy
This work is licensed under a Creative Commons Attribution Non-commercial NoDerivatives 2.0 UK: England & Wales (CC BY-NC-ND)
Academic Support O�ce, Durham University, University O�ce, Old Elvet, Durham DH1 3HPe-mail: [email protected] Tel: +44 0191 334 6107
http://etheses.dur.ac.uk
The Colour and Composition of Early Anglo-Saxon
Copper Alloy Jewellery
Jocelyn Baker
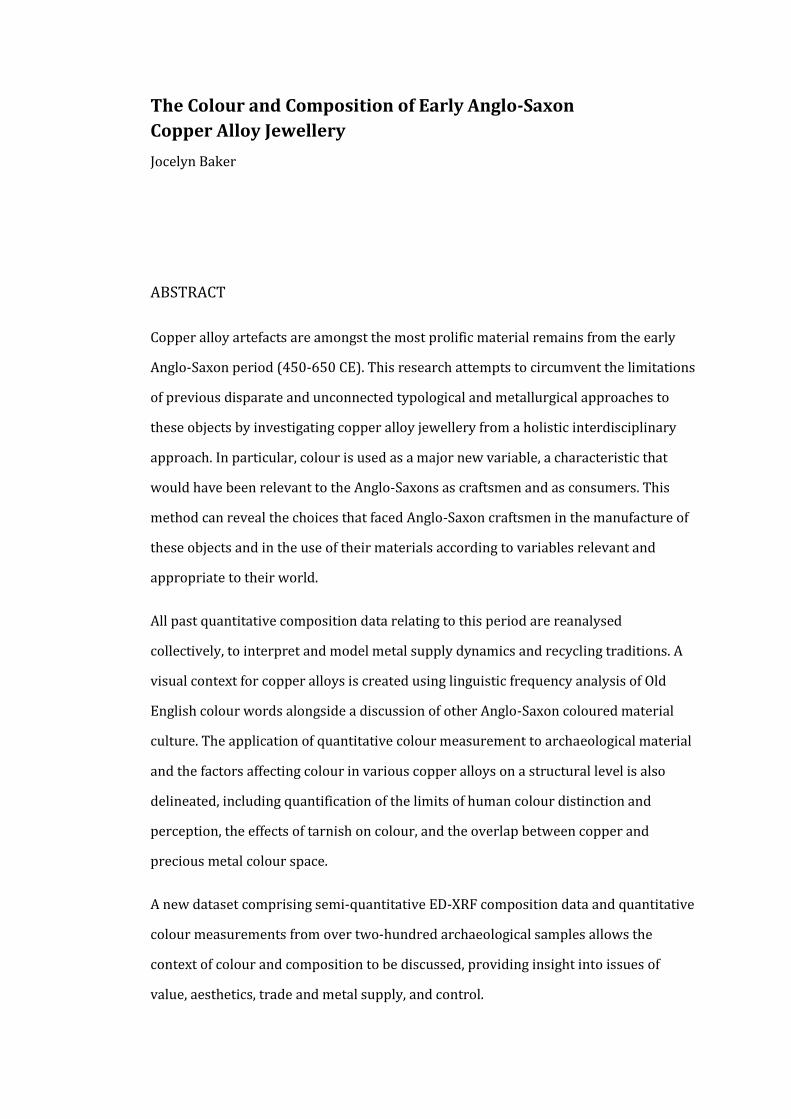
ABSTRACT
Copper alloy artefacts are amongst the most prolific material remains from the early
Anglo-Saxon period (450-650 CE). This research attempts to circumvent the limitations
of previous disparate and unconnected typological and metallurgical approaches to
these objects by investigating copper alloy jewellery from a holistic interdisciplinary
approach. In particular, colour is used as a major new variable, a characteristic that
would have been relevant to the Anglo-Saxons as craftsmen and as consumers. This
method can reveal the choices that faced Anglo-Saxon craftsmen in the manufacture of
these objects and in the use of their materials according to variables relevant and
appropriate to their world.
All past quantitative composition data relating to this period are reanalysed
collectively, to interpret and model metal supply dynamics and recycling traditions. A
visual context for copper alloys is created using linguistic frequency analysis of Old
English colour words alongside a discussion of other Anglo-Saxon coloured material
culture. The application of quantitative colour measurement to archaeological material
and the factors affecting colour in various copper alloys on a structural level is also
delineated, including quantification of the limits of human colour distinction and
perception, the effects of tarnish on colour, and the overlap between copper and
precious metal colour space.
A new dataset comprising semi-quantitative ED-XRF composition data and quantitative
colour measurements from over two-hundred archaeological samples allows the
context of colour and composition to be discussed, providing insight into issues of
value, aesthetics, trade and metal supply, and control.

THE COLOUR AND COMPOSITION OF
EARLY ANGLO-SAXON
COPPER ALLOY JEWELLERY
JOCELYN MARGARET BAKER
Thesis submitted for the
Degree of Doctor of Philosophy
Department of Archaeology
University of Durham
2013

1
TABLE OF CONTENTS
The Colour and Composition of Early Anglo-Saxon Copper Alloy Jewellery ............ 3
List of Figures .............................................................................................................................................. 6
List of Tables ............................................................................................................................................. 16
Acknowledgements .............................................................................................................. 1
CHAPTER 1 Introduction ............................................................................................................. 3
Historical context .................................................................................................................. 4
Past Approaches to Anglo-Saxon Copper Alloys ....................................................... 7
Colour as a new variable .................................................................................................... 8
CHAPTER 2 Early Anglo-Saxon Copper Alloys ................................................................... 13
Introduction .............................................................................................................................................. 13
Copper Alloys ........................................................................................................................ 14
Metalworking Tradition ....................................................................................................................... 18
Roman Tradition ................................................................................................................. 18
Early Saxon Metalworking Evidence .............................................................................................. 25
Evidence from Early Saxon England ............................................................................ 25
Metal Ore Resources .......................................................................................................... 29
Recycling ................................................................................................................................ 34
Copper Alloy use in Early Medieval England............................................................................... 35
Past Composition Studies ................................................................................................ 35
Contemporary Continental Composition Studies ................................................... 51
Copper Alloy Use ..................................................................................................................................... 53
Migration Period Alloys Elsewhere ............................................................................. 55
Before and After .................................................................................................................. 57
Alloy component distribution ........................................................................................ 62
CHAPTER 3 Recycling of Copper Alloys in the Early Saxon Period ............................. 71
The Recycling of Copper Alloys......................................................................................................... 71
Roman Recycling Practices ............................................................................................. 72
The Appearance of Recycled Alloys ............................................................................. 74
Issues with Zinc-Rich Alloys ........................................................................................... 75
The Fresh Metal Supply .................................................................................................... 79
Control in Alloying in the Early Saxon Period .......................................................... 82
Modelling Copper Alloy Recycling ................................................................................................... 86
Source Alloys within the Recycling Model ................................................................ 92
Results ..................................................................................................................................... 97
CHAPTER 4 Colour in the Anglo-Saxon World ................................................................ 112
Introduction ............................................................................................................................................ 112
Colour Terms in Language ................................................................................................................ 114
Universal Development of Colour Terms ............................................................... 114
Prototype Theory ............................................................................................................. 116
Old English Colour Terms and Use ............................................................................ 118
Frequency of Colour Words in Old English ............................................................ 128
Summary .................................................................................................................................................. 135
High-Status Dress Fittings ................................................................................................................. 138
The Colour of Precious Metals .................................................................................... 138
The Use of Precious Metals in Dress Fittings ........................................................ 143
The Colour of Associated Enamels, Gems and Inlays ......................................... 146
Summary ............................................................................................................................. 151
Textiles ...................................................................................................................................................... 152
Material ................................................................................................................................ 153
Dyes ....................................................................................................................................... 154
Colour of Textiles ............................................................................................................. 156
Summary ............................................................................................................................. 157
Beads .......................................................................................................................................................... 159
Issues with Bead Colour Analysis .............................................................................. 159
Colourants Used in Early Medieval Beads .............................................................. 161
Frequency of Bead Colours .......................................................................................... 162
Chronological Colour Trends ....................................................................................... 164
Regional Patterns ............................................................................................................. 165
Trade Access ...................................................................................................................... 167
Comparison of Specific Sites ........................................................................................ 168
Conclusions ........................................................................................................................ 174
Pigments and their Use in the Early Medieval Period ........................................................... 175
Painted Walls and Sculpture ........................................................................................ 175
Manuscripts ........................................................................................................................ 178
Conclusions ........................................................................................................................ 181
Summary of Anglo-Saxon Colour ................................................................................................... 183
CHAPTER 5 Colour, Colourimetry and Human Colour Perception .......................... 186
Introduction ............................................................................................................................................ 186
Background to Colour .................................................................................................... 187
Qualitative Colour Measurement ................................................................................................... 188
Spectrophotometers ....................................................................................................... 188
SCI and SCE ......................................................................................................................... 190
Previous Related Research ........................................................................................... 191
Colour Measurement Systems .................................................................................... 192
Human Sensitivity and Colour Perception ................................................................................. 194
Calculating Colour Differences.................................................................................... 195
Colour Vision Experiment ............................................................................................. 198
Summary .................................................................................................................................................. 217
CHAPTER 6 Metal Structure, Colour and Tarnish ......................................................... 218
Introduction ............................................................................................................................................ 218
How colour is created in metal ................................................................................... 218
Characterisation of the Colours of Archaeologically Significant Copper Alloys ......... 224
Copper-Tin ............................................................................................................................................... 228
Copper-Zinc ............................................................................................................................................. 234
Copper-Tin-Zinc Alloys .................................................................................................. 238
Copper-Lead ....................................................................................................................... 242
Iron in Copper Alloys ...................................................................................................... 247
Other Elements and L*A*B* change .......................................................................... 250
Tarnish ...................................................................................................................................................... 252
Common Short-term Corrosion Products .............................................................. 252
Tarnish and Expected Appearance – Golden Metal? .......................................... 263
CHAPTER 7 Analytical Methods and Parameters .......................................................... 265
ED-XRF ...................................................................................................................................................... 265
Semi-Quantitative ED-XRF Parameters ................................................................... 266
Error ...................................................................................................................................... 267
Spectrophotometer .............................................................................................................................. 269
Development of Methodology ..................................................................................... 269
Minimum Analyses Test ................................................................................................ 270
Sample Preparation ......................................................................................................... 272
Sources of Error .................................................................................................................................... 274
Variation in a sample ...................................................................................................... 274
Working Procedure .............................................................................................................................. 276
CHAPTER 8 Results ................................................................................................................... 278
Introduction ............................................................................................................................................ 278
Broughton lodge .................................................................................................................................... 286
Discussion ........................................................................................................................... 288
Fonaby ....................................................................................................................................................... 290
Discussion ........................................................................................................................... 292
Castledyke South ................................................................................................................................... 295
Discussion ........................................................................................................................... 299
Cleatham ................................................................................................................................................... 302
Discussion ........................................................................................................................... 305
Sewerby .................................................................................................................................................... 308
Discussion ........................................................................................................................... 311
West Heslerton ...................................................................................................................................... 314
Discussion ........................................................................................................................... 321
Summary – Copper Alloys by Site .................................................................................................. 324
CHAPTER 9 Annular Brooch Typology .............................................................................. 328
Introduction ............................................................................................................................................ 328
Previous Typologies ............................................................................................................................ 328
Dating & Distribution .......................................................................................................................... 330
Type F ................................................................................................................................... 330
Type G ................................................................................................................................... 332
Summary .................................................................................................................................................. 336
CHAPTER 10 Discussion .......................................................................................................... 337
Introduction ............................................................................................................................................ 337
Copper Alloys in Early Medieval England ................................................................................... 339
Chronology .............................................................................................................................................. 341
Use of Alloying Components over Time .................................................................. 341
Alloy Types over Time ................................................................................................... 346
Composition and Colour by Artefact Type ................................................................................. 349
Brooches .............................................................................................................................. 352
Annular Brooches ............................................................................................................ 353
Quoit Brooches: Broad-band Annular Brooches or Mock-quoit .................... 358
Openwork Brooches ....................................................................................................... 362
Penannular brooches ...................................................................................................... 366
Great and Square-Headed Brooches ......................................................................... 367
Cruciform Brooches ........................................................................................................ 371
Small-Long Brooches ...................................................................................................... 377
Buckles ................................................................................................................................. 382
Girdle-hangers ................................................................................................................... 388
Wrist Clasps........................................................................................................................ 394
Appearance of Copper Alloys ........................................................................................................... 400
Expected Appearance ..................................................................................................... 400
Surface Coatings ............................................................................................................... 407
Unusual Alloys ................................................................................................................... 410
Object Pairs......................................................................................................................... 414
Assemblage Appearance ............................................................................................... 421
Summary ............................................................................................................................. 421
Chapter Summary ................................................................................................................................. 423
CHAPTER 11 Conclusions ....................................................................................................... 425
Colour ........................................................................................................................................................ 427
Copper .................................................................................................................................. 428
Lead ....................................................................................................................................... 428
Girdle-Hangers .................................................................................................................. 429
Brass ...................................................................................................................................... 429
Copper Alloys within an Anglo-Saxon Colour Context ...................................... 430
The appearance of gold .................................................................................................. 431
Patterns in Alloy Use ........................................................................................................................... 432
Recycling and Metal Supply .............................................................................................................. 434
Future Research .................................................................................................................................... 436
Bibliography................................................................................................................................ 439
Appendix A The Recycling Model ........................................................................................ 455
Appendix B Recycling Recipes .............................................................................................. 469
Appendix C Annular Brooch Typology............................................................................... 474
Appendix D on CD-ROM:
The Recycling Model
Modelled Results and Recipes
Database of Anglo-Saxon copper alloy compositions
LIST OF FIGURES
FIGURE 2.1: COPPER ALLOYS BY TIN AND ZINC CONTENT, BASED ON MORTIMER 1990
WITH THE ADDITION OF LOW BRASS CATEGORIES. ................................................................................ 16
FIGURE 2.2: PROPORTIONS OF ROMAN ALLOY TYPES IN NORTHERN BRITAIN,
(REPRODUCED FROM DUNGWORTH 1995, 98). .......................................................................................... 20
FIGURE 2.3: TIN/GADOLINIUM AND LEAD/GADOLINIUM RATIOS FOR TOR ROYAL ON
DARTMOOR, PLOTTED AGAINST CALENDAR YEAR (REPRODUCED FROM MEHARG ET AL.
2012, 724). ........................................................................................................................................................................ 31
FIGURE 2.4: FREQUENCY OF ALLOY TYPES IN SAXON PINS. ................................................................. 43
FIGURE 2.5: PERCENTAGES OF ALLOY TYPES USED IN EACH ENGLISH BROOCH TYPE
(REPRODUCED FROM MORTIMER 1991, 163). ............................................................................................ 45
FIGURE 2.6: %COPPER CONTENT DISTRIBUTION IN COPPER ALLOYS BY PERIOD, FROM
BLADES 1995. .................................................................................................................................................................. 48
FIGURE 2.7: %ZINC CONTENT DISTRIBUTION IN COPPER ALLOYS BY PERIOD, FROM
BLADES 1995. .................................................................................................................................................................. 48
FIGURE 2.8: %TIN CONTENT DISTRIBUTION IN COPPER ALLOYS BY PERIOD, FROM
BLADES 1995. .................................................................................................................................................................. 49
FIGURE 2.9: %LEAD CONTENT IN COPPER ALLOYS BY PERIOD, FROM BLADES 1995. ........ 49
FIGURE 2.10: SHIELD FITTINGS FROM RAF LAKENHEATH, ERISWELL 104, GRAVE 245
(IMAGE PROVIDED BY MATT NICHOLAS). ...................................................................................................... 51
FIGURE 2.11: ALLOY FREQUENCY IN EARLY SAXON ENGLAND. ......................................................... 54
FIGURE 2.12: NON-ENGLISH MIGRATION PERIOD COPPER ALLOY FREQUENCY. .................... 56
FIGURE 2.13: ROMAN ALLOY FREQUENCY FROM BLADES 1995 (N = 66); REPRESENTING
THE FREQUENCY OF A WIDE VARIETY OF OBJECT TYPES. .................................................................... 57
FIGURE 2.14: ROMAN ALLOY FREQUENCY INCLUDING BAYLEY AND BUTCHER 2004 (N =
1127), THUS SKEWING THE FREQUENCY DRAMATICALLY IN FAVOUR OF BROOCH
COMPOSITIONS. AS A RESULT BRASS, TIN BRASS AND LEADED BRONZE ARE MORE
DOMINANT. ....................................................................................................................................................................... 58
FIGURE 2.15: BAR-CHART OF COPPER ALLOYS IN USE FROM THE ROMAN CONQUEST TO
THE INDUSTRIAL REVOLUTION (REPRODUCED FROM BAYLEY 2008 AND BASED ON DATA
FROM DUNGWORTH 1997 AND BLADES 1995). .......................................................................................... 59
FIGURE 2.16: ALLOY FREQUENCY IN THE MID-TO-LATE SAXON PERIOD. ................................... 60
FIGURE 2.17: TIN VS. ZINC IN EARLY SAXON ENGLAND. ......................................................................... 62
FIGURE 2.18: FREQUENCY OF ZINC CONTENT IN EARLY SAXON COPPER ALLOYS. ................. 63
FIGURE 2.19: ZINC CONTENT FREQUENCY IN GUNMETALS. ................................................................. 64
FIGURE 2.20: ZINC DISTRIBUTION IN ROMAN ALLOYS (REPRODUCED FROM DUNGWORTH
1995, 93). ........................................................................................................................................................................... 64
FIGURE 2.21: TIN CONTENT FREQUENCY IN EARLY SAXON COPPER ALLOYS. .......................... 65
FIGURE 2.22: TIN CONTENT FREQUENCY IN GUNMETALS. ................................................................... 66
FIGURE 2.23: DISTRIBUTION OF TIN CONTENTS IN ROMAN ALLOYS (REPRODUCED FROM
DUNGWORTH 1995, 93). ........................................................................................................................................... 66
FIGURE 2.24: LEAD CONTENT FREQUENCY IN EARLY SAXON COPPER ALLOYS. ...................... 67
FIGURE 2.25: FREQUENCY OF LOW LEAD CONTENT IN ZINC-RICH ALLOYS. .............................. 68
FIGURE 2.26: FREQUENCY OF LOW LEAD CONTENT IN BRONZE AND ZINC BRONZE
ALLOYS. ............................................................................................................................................................................... 68
FIGURE 2.27: DISTRIBUTION OF LEAD FREQUENCY IN ROMAN ALLOYS (REPRODUCED
FROM DUNGWORTH 1995, 94). ............................................................................................................................ 69
FIGURE 3.1: HOMOGENISATION OF COPPER ALLOYS BY TIN AND ZINC CONTENT IN A
SYSTEM WITHOUT FRESH METAL RESOURCES (USING 4 OBJECTS COMBINATIONS). TOP
LEFT SHOWS COMPOSITIONS AFTER ONE RECYCLING STAGE, TOP RIGHT AFTER TWO,
BOTH LEFT AFTER THREE AND BOTTOM RIGHT AFTER FOUR (REPRODUCED FROM
CAPLE 1986, 559-564). .............................................................................................................................................. 80
FIGURE 3.2: ALLOY FREQUENCY IN SMALL CAST OBJECTS. .................................................................. 83
FIGURE 3.3: ALLOY FREQUENCY IN LARGER CAST OBJECTS. ............................................................... 84
FIGURE 3.4: ALLOY FREQUENCY IN SHEET-WROUGHT OBJECTS. ..................................................... 84
FIGURE 3.5: TIN FREQUENCY IN ANGLO-SAXON BRONZE. ..................................................................... 94
FIGURE 3.6: TIN FREQUENCY IN ANGLO-SAXON ZINC BRONZE. ......................................................... 94
FIGURE 3.7: ALLOY DIVISIONS USED IN THE MODEL BY TIN AND ZINC CONTENT
(UNLEADED ALLOYS). ................................................................................................................................................. 97
FIGURE 3.8: (LEFT) TIN VS. ZINC CONTENT IN ANGLO-SAXON COPPER ALLOYS. .................... 99
FIGURE 3.9 (RIGHT) TIN VS. ZINC CONTENT IN MODELLED COPPER ALLOYS........................... 99
FIGURE 3.10: MODELLED DECLINE IN ZINC CONTENT FROM VOLATILISATION AFTER
REMELTING ACTS. ....................................................................................................................................................... 100
FIGURE 3.11: REQUIRED STOCK METAL INPUT AND PROPORTIONS. .......................................... 110
FIGURE 4.1: COLOUR WORD FREQUENCY IN BEOWULF (N = 65). ................................................... 133
FIGURE 4.2 ANGLO-SAXON COLOUR SPACE (ROUGHLY APPROXIMATE IN TERMS OF
FREQUENCY OF USE, BUT MORE AS A DIAGRAM OF INTERRELATEDNESS). ............................. 134
FIGURE 4.3: FIRESTEEL FROM GRAVE 341 IN THE CEMETERY AT MUCKING, ESSEX. SILVER
INLAY ON IRON; 8.2 X 2.5 CM (IMAGE FROM BRITISH MUSEUM; 1970,0406.247). .............. 141
FIGURE 4.4: PRECIOUS METAL JEWELLERY FROM THE BRITISH MUSEUM FEATURING
VARIOUS POPULAR FASHIONS OF THE PERIOD. THE BOTTOM LEFT BROOCH, FROM
HOWLETTS CEMETERY IN KENT, FEATURES GOLD, SILVER, GARNETS AND WHITE PASTE
DECORATION; FOR SCALE, DISC-ON-BOW BROOCH 9.4 CM IN LENGTH (IMAGE
REPRODUCED FROM THE BRITISH MUSEUM). ........................................................................................... 141
FIGURE 4.5: GOLD PENDANT FROM ACKLAM WOLD FEATURING WHITE PASTE BOSS AND
GARNETS WITH GRANULATION AND BEADED WIRE, 7TH CENTURY; 4 CM DIAMETER
(REPRODUCED FROM THE BRITISH MUSEUM; 1871,1207.1). .......................................................... 143
FIGURE 4.6: LATE 9TH CENTURY SPEARHEAD FROM THE RIVER THAMES WITH SILVER
AND COPPER WIRE INLAY; 2.3 CM WIDTH (REPRODUCED FROM THE BRITISH MUSEUM;
1893,0715.2). ................................................................................................................................................................. 144
FIGURE 4.7: BUCKLE FROM GRAVE 334, MUCKING, ESSEX; IRON WITH SILVER AND BRASS
WIRE INLAY; LOOP 4.9 X 2.9 CM, PLATE 5.5 X 4.6 CM (REPRODUCED FROM THE BRITISH
MUSEUM; 1970,0406.229). .................................................................................................................................... 145
FIGURE 4.8: SHOULDER CLASPS FROM SUTTON HOO MOUND 1. GOLD WITH CLOISONNÉ
GARNET AND BLUE GLASS INLAY, C.625. 5.4 CM WIDE, 12.7 LONG WITH BOTH HALVES
TOGETHER (REPRODUCED FROM THE BRITISH MUSEUM; 1939,1010.4.A). ........................... 147
FIGURE 4.9: GOLD AND SILVER BUCKLE FROM THE 7TH CENTURY, IN WHICH BLUE AND
GREENISH (CLEAR) GLASS IS SET WITHIN A FIELD OF GARNETS; LENGTH 8.1 CM
(REPRODUCED FROM THE BRITISH MUSEUM; 1862,0701.10). ....................................................... 148
FIGURE 4.10: (LEFT) 2ND-3RD CENTURY ROMAN WHEEL PLATE BROOCH FROM MARCHAM-
FRILFORD, OXFORDSHIRE. PHOTOGRAPH BY AUTHOR, APPROXIMATELY 4 CM DIAMETER.
................................................................................................................................................................................................ 150
FIGURE 4.11: (RIGHT) 2ND CENTURY ROMAN LOZENGE BROOCH FROM MARCHAM-
FRILFORD, OXFORDSHIRE. PHOTOGRAPH BY AUTHOR, APPROXIMATELY 7 CM LENGTH.
................................................................................................................................................................................................ 150
FIGURE 4.12: A) TABBY, B) EXTENDED TABBY, C) TABBY REPP, D) 2/2 TWILL, E) 2/1
TWILL, F) 2/2/ DIAMOND TWILL (FROM WALTON ROGERS 2007A, 64). .................................. 152
FIGURE 4.13: YELLOW AND GREEN GLASS BEADS FROM GRAVE 393, MORNING THORPE
(REPRODUCED FROM BRUGMANN 2004, 25). ............................................................................................ 160
FIGURE 4.14: BEAD COLOUR IN ANGLO-SAXON ENGLAND, INCLUDING AMBER. ................... 163
FIGURE 4.15: COLOUR OF ANGLO-SAXON GLASS BEADS. ..................................................................... 163
FIGURE 4.16: DISTRIBUTION OF YELLOW BEADS THROUGHOUT ANGLO-SAXON ENGLAND.
................................................................................................................................................................................................ 166
FIGURE 4.17: COLOUR OF BEADS AT PORTWAY, ANDOVER (AFTER COOK AND DACRE
1985). ................................................................................................................................................................................. 169
FIGURE 4.18: COLOUR OF BEADS FROM MUCKING, ESSEX (AFTER HIRST AND CLARK
2009). ................................................................................................................................................................................. 171
FIGURE 4.19: BEADS FROM CASTLEDYKE, LINCOLNSHIRE (LEFT) AND CLEATHAM,
LINCOLNSHIRE (RIGHT). ......................................................................................................................................... 174
FIGURE 4.20: INITIAL PAGE FROM THE ECHTERNACH GOSPELS FEATURING HEAVY USE
OF THICK BLACK LINES AND YELLOW AND RED INTERLACE (F.157, IMAGE FROM
HTTP://GALLICA.BNF.FR/ARK:/12148/BTV1B530193948/). ........................................................ 179
FIGURE 5.1: SENSITIVITY OF CONES IN THE HUMAN EYE TO DIFFERENT WAVELENGTHS
OF LIGHT. THE OVERLAP BETWEEN THE CONES IN THE GREEN REGION CONTRIBUTES TO
GREATER SENSITIVITY TO GREEN, AND THEN RED. THE HUMAN EYE IS LEAST SENSITIVE
TO BLUE (REPRODUCED FROM NAVE 2012). .............................................................................................. 187
FIGURE 5.2 SCI SETUP FOR SPECTROPHOTOMETER (REPRODUCED FROM MINOLTA 1998;
47). ....................................................................................................................................................................................... 189
FIGURE 5.3: SPECTRAL CURVE OF A BRONZE SAMPLE BY AUTHOR. ............................................. 189
FIGURE 5.4: CIELAB COLOUR SPACE (REPRODUCED FROM MINOLTA 1998, 19). ................. 193
FIGURE 5.5: COLOUR SPACE USING 2 DIMENSIONAL PLOTTING CIE XY 1976 FORMAT,
SHOWING DIFFERENT SIZES OF TOLERANCE ELLIPSES IN DIFFERENT REGIONS OF
COLOUR SPACE – HERE BLUE IS AT THE BOTTOM, GREEN TOWARDS THE TOP, RED TO
THE RIGHT. THE COMPARATIVE DIFFERENCES IN SENSITIVITIES ARE EASIER TO
IDENTIFY IN CIELAB COLOURSPACE (IMAGE REPRODUCED FROM WYSZECKI AND
FIELDER 1971, 1142). ............................................................................................................................................... 194
FIGURE 5.6: APPROXIMATION OF HOW TOLERANCES INCREASE AWAY FROM THE CENTER
OF CIELAB COLOUR SPACE (IMAGE FROM X-RITE 2007). .................................................................... 195
FIGURE 5.7: CIELCH TOLERANCE SHAPE ON A*B* PLOT (IMAGE FROM X-RITE 2000, 15).
................................................................................................................................................................................................ 197
FIGURE 5.8: RESULTS OF THE COLOUR VISION 'ODD ONE OUT' EXPERIMENT. ...................... 202
FIGURE 5.9: DIVISION OF SAMPLES INTO COLOUR GROUPS AS SEEN IN A*B* COLOUR
SPACE. ................................................................................................................................................................................. 202
FIGURE 5.10: (LEFT) FREQUENCY OF WHITE METALS CHOSEN AS 'SILVER' ON DAYS 1 AND
2. ............................................................................................................................................................................................ 204
FIGURE 5.11: (RIGHT) FREQUENCY OF WHITE METALS CHOSEN AS 'SILVER' ON DAYS 3
AND 4. ................................................................................................................................................................................. 204
FIGURE 5.12: DISTRIBUTION OF VARIOUS WHITE METALS IN A*B* COLOUR SPACE. ........ 205
FIGURE 5.13: FREQUENCY THAT ‘GOLDEN’ SAMPLES WERE CHOSEN IN A*B* COLOUR
SPACE. ................................................................................................................................................................................. 207
FIGURE 5.14: FREQUENCY OF CHOSEN SAMPLES AS RELATED TO THEIR A* VALUES. ....... 208
FIGURE 5.15: FREQUENCY OF CHOSEN SAMPLES AS RELATED TO THEIR B* VALUES. ....... 208
FIGURE 5.16: EXTENT OF THE DISTRIBUTION OF PRECIOUS METAL COLOUR IN A*B*
SPACE USING BINARY ALLOYS OF AU-AG, AU-CU AND AG-CU (MACCORMACK AND
BOWERS, 1981; ROBERTS AND CLARKE, 1979).. ...................................................................................... 209
FIGURE 5.17: EFFECT OF COPPER CONTENT ON PRECIOUS METAL ALLOY COLOUR FROM
BRITISH MUSEUM STANDARDS. COMPOSITIONS OF AU-AG ALLOYS INCREASE IN B* WITH
THE ADDITION OF GOLD, SO THE LOWEST POINT IS 90% AG, WITH EACH
PROGRESSIVELY YELLOWER DATA POINT REPRESENTING AN INCREMENT OF 10%, AND
THE LAST POINT BEING 95% AU, 5% AG. THE AU-CU VALUES INCREASE IN A* OR
REDNESS WITH THE ADDITION OF COPPER: THE FIRST (AND LOWEST A*) POINT IS 95%
AU, 5%CU; EACH PROGRESSIVE POINT FALLS AT 10% INCREMENTS, I.E. 90% AU, 10% CU.
THOSE ALLOYS WITH SET COPPER CONTENT ARE LABELLED BY (AU, AG). ............................ 210
FIGURE 5.18: LOCATION OF VARIOUS MODERN INTERNATIONALLY COMMON GOLD
CARATS WITHIN BOTH PRECIOUS METAL AND COPPER ALLOY COLOUR SPACE. ................ 212
FIGURE 5.19 RELATIONSHIP BETWEEN ACTUAL COMMON MODERN GOLD ALLOYS AND
THE FREQUENCY WITH WHICH INDIVIDUALS PICKED A COPPER ALLOY SAMPLE AS 'MOST
GOLDEN'. ........................................................................................................................................................................... 213
FIGURE 5.20: FREQUENCY OF GOLD CONTENT IN ANGLO-SAXON GOLD OBJECTS................ 215
FIGURE 5.21: : FREQUENCY OF COPPER CONTENT IN ANGLO-SAXON GOLD. ........................... 215
FIGURE 5.22: AREA OF COLOUR SPACE OCCUPIED BY MOST EARLY MEDIEVAL GOLD
OBJECTS. COLOURS WITHIN THE SHADED REGION WERE POSSIBLE GIVEN THE SPREAD
OF GOLD ALLOYS IN THE PERIOD; THE ESTIMATED POINTS REFLECT THE COLOUR OF
BRITISH MUSEUM STANDARDS OF SIMILAR COMPOSITION TO ANGLO-SAXON OBJECTS.
................................................................................................................................................................................................ 216
FIGURE 6.1: DIFFERENCES IN REFLECTIVITY CURVES FOR GOLD AND SILVER IN THE
SPECTRUM OF VISIBLE LIGHT (REPRODUCED FROM SAEGER AND RODIES 1977, 11). .... 219
FIGURE 6.2: SPECTRAL GRAPH OF COPPER SHOWING THE INCREASED REFLECTANCE AT
THE RED END OF THE SPECTRUM AND THE REFLECTANCE EDGE IN THE YELLOW REGION.
................................................................................................................................................................................................ 220
FIGURE 6.3: COPPER, BRONZE AND BRASS SPECTRAL CURVES. PURE COPPER HAS THE
SHARPEST EDGE, WHILE BRASS REFLECTS MUCH MORE OF THE YELLOW REGION, AND
BRONZE IS LOWER IN REFLECTANCE IN THE RED REGION BUT HIGHER WITHIN THE BLUE
REGION, INDICATING THAT LIGHT IS MORE EVENLY REFLECTED ACROSS THE SPECTRUM
AND THEREFORE LESS SATURATED. ............................................................................................................... 222
FIGURE 6.4: : SPECTRAL CURVES OF (LEFT) 8% TIN BRONZE AND (RIGHT) 30% ZINC
BRASS. NOTE THE FLATTENING OF THE CURVE WITH BRONZE AND THE SHIFT OF THE
EDGE IN BRASS TOWARDS THE YELLOW-GREEN REGION. ................................................................. 222
FIGURE 6.5: LOCATION OF COPPER ALLOYS IN 3D CIELAB COLOUR SPACE. ............................ 224
FIGURE 6.6: RELATIONSHIP BETWEEN L* AND COPPER CONTENT. .............................................. 226
FIGURE 6.7: COPPER ALLOY COLOUR SPACE BY TYPE OF ALLOYING COMPONENT. ............ 227
FIGURE 6.8: PHASE DIAGRAM FOR COPPER-TIN IN DIFFERENT CONDITIONS
(REPRODUCED FROM SCOTT 1991, 123). ..................................................................................................... 229
FIGURE 6.9: BRONZE MICROSTRUCTURES: TOP LEFT, 6% TIN BRONZE, QUENCHED; TOP
RIGHT, 10% TIN BRONZE, QUENCHED; MIDDLE LEFT, 15% TIN BRONZE, AIR-COOLED;
BOTTOM RIGHT, 45% REDUCTION FROM WORKING; BOTTOM LEFT, ANNEALED
MICROSTRUCTURE (REPRODUCED FROM WANG AND OTTAWAY 2004, APPENDIX 1;
IMAGE WIDTH 0.33MM FOR EACH). ................................................................................................................. 230
FIGURE 6.10: RATE OF A* CHANGE WITH TIN CONTENT, AS CAST. ............................................... 233
FIGURE 6.11: RATE OF B* COLOUR CHANGE IN BRONZE BY TIN CONTENT (WEIGHT %).
................................................................................................................................................................................................ 233
FIGURE 6.12: PHASE DIAGRAM FOR COPPER-ZINC ALLOYS (REPRODUCED FROM METALS
HANDBOOK V.3, 780). ............................................................................................................................................... 235
FIGURE 6.13: A* COLOUR CHANGE IN BRASS ALLOYS. ........................................................................... 236
FIGURE 6.14: B* COLOUR CHANGE IN BRASS ALLOYS. ........................................................................... 237
FIGURE 6.15: A* COLOUR CHANGE WITH COPPER CONTENT IN COPPER ALLOY
STANDARDS. ................................................................................................................................................................... 239
FIGURE 6.16: A* AND COPPER IN ARCHAEOLOGICAL SAMPLES SAMPLED IN THIS STUDY
(SEE CHAPTER 7 FOR METHODOLOGY AND CHAPTER 8 FOR REPORTED RESULTS). ........ 239
FIGURE 6.17: A* AND COPPER IN ARCHAEOLOGICAL SAMPLES SAMPLED IN THIS STUDY,
EXCLUDING LEADED ALLOYS................................................................................................................................ 240
FIGURE 6.18: PHASE DIAGRAM OF THE CU-PB SYSTEM (IMAGE FROM METALS
HANDBOOK, V.3, 755). .............................................................................................................................................. 243
FIGURE 6.19: : METALLOGRAPHIC SECTION OF A BRASS WITH 5% PB. THE GREY-SILVER
GLOBULES ARE LEAD AND THE DARK AREAS ARE POROSITY FROM GASES TRAPPED
FROM THE CASTING (IMAGE BY AUTHOR, 250X MAGNIFICATION). ............................................. 243
FIGURE 6.20: L* CHANGE IN ALLOYS CONTAINING LEAD. CHANGES ARE LIKELY DUE TO
THE PRESENCE OR LACK OF OTHER ALLOYING COMPONENTS RATHER THAN TO
INCREASING LEAD CONTENT. ............................................................................................................................... 244
FIGURE 6.21: CHANGE IN CHROMA IN ALLOYS CONTAINING LEAD. CHANGES ARE LIKELY
DUE TO THE PRESENCE OR LACK OF OTHER ALLOYING COMPONENTS RATHER THAN TO
INCREASING LEAD CONTENT. ............................................................................................................................... 245
FIGURE 6.22: A* CHANGE IN ALLOYS CONTAINING LEAD. CHANGES ARE LIKELY DUE TO
THE PRESENCE OR LACK OF OTHER ALLOYING COMPONENTS RATHER THAN TO
INCREASING LEAD CONTENT. ............................................................................................................................... 246
FIGURE 6.23: B* CHANGE IN ALLOYS CONTAINING LEAD. CHANGES ARE LIKELY DUE TO
THE PRESENCE OR LACK OF OTHER ALLOYING COMPONENTS RATHER THAN TO
INCREASING LEAD CONTENT. ............................................................................................................................... 246
FIGURE 6.24: PHASE DIAGRAM OF COPPER AND IRON BINARY SYSTEM. LITTLE IRON CAN
BE ABSORBED INTO COPPER AND GENERALLY ONLY AT HIGHER TEMPERATURES THAN
WOULD HAVE BEEN USED IN ANCIENT METALLURGY (METALS HANDBOOK V. 3, 734). . 248
FIGURE 6.25: CHANGE IN L* FROM THE PRESENCE OF IRON IN COPPER.................................... 248
FIGURE 6.26: CHANGE IN A* FROM THE PRESENCE OF IRON COPPER. ........................................ 249
FIGURE 6.27: CHANGE IN B* FROM THE PRESENCE OF IRON IN COPPER. .................................. 249
FIGURE 6.28: RATES OF COLOUR CHANGE DUE TO THE PRESENCE OF IRON IN COPPER. 249
FIGURE 6.29: SHORT-TERM TARNISH ACCRUAL ON COPPER. .......................................................... 255
FIGURE 6.30: SHORT-TERM TARNISH ACCRUAL ON 10% TIN BRONZE. ..................................... 255
FIGURE 6.31: SHORT-TERM TARNISH ACCRUAL ON 17% ZINC BRASS. ....................................... 256
FIGURE 6.32: THE SPECTRAL REFLECTANCE OF BRASS WHEN FRESHLY POLISHED, LEFT
UNPOLISHED FOR 120 DAYS, AND HEAVILY TARNISHED. .................................................................. 258
FIGURE 6.33: COLOUR CHANGE FROM TARNISH ON COPPER OVER TEN YEARS. THE POINT
WITH LOWEST A* AND B* IS FRESHLY POLISHED COPPER. EACH PROGRESSIVE POINT ON
THE LINE REFLECTS THE CHANGE IN COLOUR OVER INTERVALS OF SEVERAL WEEKS,
WITH THE PENULTIMATE POINT REPRESENTING THE COLOUR OF COPPER AFTER HALF A
YEAR OF TARNISH ACCRUAL: THE FINAL POINT REFLECTS THE COLOUR OF COPPER
AFTER APPROXIMATELY 10 YEARS OF TARNISHING. ........................................................................... 258
FIGURE 6.34: COLOUR CHANGE FROM TARNISH ON BRONZES OVER TEN YEARS. THE
POINTS AT THE LOW B*, LOW A* END OF EACH LINE INDICATE THE NEWLY POLISHED
COLOUR. EACH PROGRESSIVE POINT REFLECTS THE CHANGE IN COLOUR OVER THE
COURSE OF 1-2 ADDITIONAL WEEKS. THE PENULTIMATE POINT ON EACH LINE
REPRESENTS COLOUR CHANGE AFTER HALF A YEAR, WHILE THE FINAL POINT
REPRESENTS THE COLOUR OF THE STANDARD AFTER 10 YEARS OF TARNISH ACCRUAL.
................................................................................................................................................................................................ 259
FIGURE 6.35: COLOUR CHANGE FROM TARNISH IN BRASSES OVER TEN YEARS. THE
POINTS AT THE LOW B*, LOW A* END OF EACH LINE INDICATE THE NEWLY POLISHED
COLOUR. EACH PROGRESSIVE POINT REFLECTS THE CHANGE IN COLOUR OVER THE
COURSE OF 1-2 ADDITIONAL WEEKS. THE PENULTIMATE POINT ON EACH LINE
REPRESENTS COLOUR CHANGE AFTER HALF A YEAR, WHILE THE FINAL POINT
REPRESENTS THE COLOUR OF THE STANDARD AFTER 10 YEARS OF TARNISH ACCRUAL.
................................................................................................................................................................................................ 260
FIGURE 6.36: FORMATION OF ZNO AND CU2O ON THE SURFACE OF BRASS WITH SURFACE
HETEROGENEITY FROM AN AS-CAST MICROSTRUCTURE (REPRODUCED FROM QIU AND
LEYGRAF, 2011, 1240). ZNO FORMS PREFERENTIALLY, RETARDING GROWTH OF CUO
WHILE DEPLETING ZN ON THE SURFACE. THIS DEPLETION THEN PROMOTES THE
GROWTH OF AN ‘OVERLAYER’ OF CU2O OVER TIME, WHICH DOES NOT FORM AS THICKLY
AS ON PURE COPPER. MICROSTRUCTURES WITH MORE HOMOGENEITY WILL REACT IN
THIS SAME MANNER BUT MAY FORM THESE LAYERS AT A DIFFERENT RATE. ...................... 261
FIGURE 6.37: PRECIOUS AND COPPER ALLOY COLOUR SPACE WITH ESTIMATED
LOCATION OF TARNISHED APPEARANCE. .................................................................................................... 264
FIGURE 7.1: CHANGE IN MEAN STANDARD DEVIATIONS FOR A 16% ZINC BRASS. .............. 271
FIGURE 7.2: CHANGE IN MEAN STANDARD DEVIATION ON POLISHED GUNMETAL. ........... 272
FIGURE 7.3: NON-UNIFORM COLOUR DIFFERENCE BETWEEN POLISHED METAL COLOUR
AND THAT FROM DRILLINGS. ............................................................................................................................... 273
FIGURE 7.4: EXAMPLE OF A SAMPLED ARTEFACT, GIRDLE-HANGER 91.5 FROM
BROUGHTON LODGE, WITH 3MM DRILLED SAMPLING SURFACE ON THE BACK OF THE
OBJECT AT ITS THICKEST POINT. ...................................................................................................................... 277
FIGURE 8.1: LOCATIONS OF SITES FROM WHICH MATERIAL WAS SAMPLED (GOOGLE
EARTH). ............................................................................................................................................................................. 278
FIGURE 8.2: PER CENT OF SAMPLED OBJECTS DATING TO THE EARLY, MID AND LATE
PHASES AT EACH SITE. ............................................................................................................................................. 281
FIGURE 8.3: TRIGRAPHS SHOWING THE PROPORTIONAL SPREAD IN ALLOY COMPONENT
USE IN THE SAMPLED ARTEFACTS FROM EACH SITE. THE CLOSER A POINT IS TO A
CORNER, THE MORE OF THAT ELEMENT IS PRESENT; POINTS ALONG AN EXTERIOR LINE
HAVE NONE OF THE COMPONENT AT THE OPPOSITE CORNER, E.G. THE POINT ALONG
THE MIDDLE OF THE PB-SN LINE FOR FONABY CONTAINS NO ZINC BUT EQUAL PARTS
LEAD AND TIN. .............................................................................................................................................................. 283
FIGURE 8.4: RANGE AND CONCENTRATION OF COPPER CONTENT IN SAMPLED
ARTEFACTS BY SITE. .................................................................................................................................................. 284
FIGURE 8.5: RANGE AND CONCENTRATION OF ZINC CONTENT IN SAMPLED ARTEFACTS BY
SITE. ..................................................................................................................................................................................... 284
FIGURE 8.6: RANGE AND CONCENTRATION OF TIN CONTENT IN SAMPLED ARTEFACTS BY
SITE. ..................................................................................................................................................................................... 285
FIGURE 8.7: RANGE AND CONCENTRATION OF LEAD CONTENT IN SAMPLED ARTEFACTS
BY SITE............................................................................................................................................................................... 285
FIGURE 8.8: ALLOY FREQUENCY AT BROUGHTON LODGE. .................................................................. 288
FIGURE 8.9: TIN AND ZINC CONTENT IN ARTEFACTS FROM BROUGHTON LODGE............... 289
FIGURE 8.10: A*B* PLOT DEPICTING THE COLOUR OF ARTEFACTS FROM BROUGHTON
LODGE. ............................................................................................................................................................................... 289
FIGURE 8.11: ALLOY FREQUENCY OF COPPER ALLOYS SAMPLED FROM FONABY. ............... 292
FIGURE 8.12: TIN AND ZINC CONTENT IN ANALYSED ARTEFACTS FROM FONABY. ............. 294
FIGURE 8.13: A*B* PLOT DEPICTING THE COLOUR OF ARTEFACTS FROM FONABY. .......... 294
FIGURE 8.14: ALLOY FREQUENCY OF SAMPLED ARTEFACTS FROM CASTLEDYKE. .............. 299
FIGURE 8.15: TIN AND ZINC CONTENT IN ANALYSED ARTEFACTS FROM CASTLEDYKE. .. 300
FIGURE 8.16: A*B* PLOT DEPICTING THE COLOUR OF ANALYSED ARTEFACTS FROM
CASTLEDYKE. ................................................................................................................................................................. 301
FIGURE 8.17: ALLOY FREQUENCY OF SAMPLED ARTEFACTS FROM CLEATHAM. .................. 305
FIGURE 8.18: TIN AND ZINC CONTENT OF SAMPLED ARTEFACTS FROM CLEATHAM. ....... 306
FIGURE 8.19: A*B* PLOT DEPICTING THE COLOUR OF SAMPLED ARTEFACTS FROM
CLEATHAM. ..................................................................................................................................................................... 307
FIGURE 8.20: ALLOY FREQUENCY OF SAMPLED ARTEFACTS FROM SEWERBY. ..................... 311
FIGURE 8.21: TIN AND ZINC CONTENT FROM ANALYSED ARTEFACTS FROM SEWERBY. . 312
FIGURE 8.22: A*B* PLOT DEPICTING THE COLOUR OF ANALYSED ARTEFACTS FROM
SEWERBY. ......................................................................................................................................................................... 313
FIGURE 8.23: ALLOY FREQUENCY OF SAMPLED ARTEFACTS AT WEST HESLERTON. ......... 321
FIGURE 8.24: TIN AND ZINC CONTENT IN ANALYSED ARTEFACTS FROM WEST
HESLERTON. ................................................................................................................................................................... 322
FIGURE 8.25: A*B* PLOT DEPICTING THE COLOUR OF ANALYSED ARTEFACTS FROM WEST
HESLERTON. ................................................................................................................................................................... 323
FIGURE 9.1: (LEFT) TYPE F.1A ANNULAR BROOCH REPRODUCTION; (IMAGE FROM
DAEGRAD TOOLS, REPRODUCTION METALWORK, HTTP://DAEGRAD.CO.UK, 5.8 CM
DIAMETER), AND (RIGHT) A TYPE F.IIIA MOCK PENANNULAR BROOCH IN SILVER FROM
YORKSHIRE, 4.5 CM DIAMETER (IMAGE FROM BRITISH MUSEUM, 1888,0719.106). ......... 331
FIGURE 9.2: A TYPE F.IB BEAD-AND-REEL ANNULAR BROOCH PAIR, FROM GRAVE 158,
CASTLEDYKE; 3.6-3.7 CM DIAMETERS (REPRODUCED FROM DRINKALL AND FOREMAN,
1998, 187). ...................................................................................................................................................................... 331
FIGURE 9.3: A TYPE G.IA1A ANNULAR BROOCH, THE MOST COMMON FORM, FROM GRAVE
151, SLEAFORD, LINCOLNSHIRE, 5.2 CM DIAMETER (IMAGE FROM BRITISH MUSEUM,
1883,0401.303). ........................................................................................................................................................... 332
FIGURE 9.4: %FREQUENCY OF TYPE G.I AND II BAND FORMS BY CHRONOLOGICAL PHASE.
................................................................................................................................................................................................ 335
FIGURE 9.5: %FREQUENCY OF PIN ATTACHMENT METHODS ON TYPE G BROOCHES BY
CHRONOLOGICAL PHASE. ....................................................................................................................................... 335
FIGURE 10.1: ALLOY COMPONENT USE (WT%) FROM ARTEFACTS SAMPLED IN THIS
THESIS (LEFT); EARLY SAXON ALLOY COMPONENT USE FROM PREVIOUS COMPOSITION
RESEARCH (RIGHT). THE MIDDLE 50% OF DATA (INTERQUARTILE RANGE) IS
REPRESENTED BY THE BOX, WITH THE RANGE OF THE DATA DELINEATED BY THE
EXTENDING LINES. ...................................................................................................................................................... 339
FIGURE 10.2: ALLOY FREQUENCY OF COPPER ALLOYS IN EARLY ANGLO-SAXON ENGLAND.
................................................................................................................................................................................................ 340
FIGURE 10.3: ALLOY FREQUENCY OF COPPER ALLOYS IN NEW DATA FROM THIS STUDY.
................................................................................................................................................................................................ 340
FIGURE 10.4: RANGE AND CONCENTRATION OF COPPER CONTENT (LEFT) AND ZINC
CONTENT (RIGHT) IN SAMPLED ARTEFACTS, DIVIDED BY EARLY, MIDDLE AND LATE
CHRONOLOGICAL PHASE. ....................................................................................................................................... 342
FIGURE 10.5: RANGE AND CONCENTRATION OF TIN CONTENT (LEFT) AND LEAD
CONTENT (RIGHT) IN SAMPLED ARTEFACTS, DIVIDED BY EARLY, MIDDLE AND LATE
CHRONOLOGICAL PHASE. ....................................................................................................................................... 344
FIGURE 10.6: ALLOY FREQUENCY IN THE 5TH-EARLY 6TH CENTURIES (EARLY PHASE). 346
FIGURE 10.7: ALLOY FREQUENCY IN THE (MID) 6TH CENTURY (MID PHASE). ...................... 346
FIGURE 10.8: ALLOY FREQUENCY IN THE LATE 6TH-EARLY 7TH CENTURIES (LATE
PHASE). .............................................................................................................................................................................. 347
FIGURE 10.9: RANGE AND CONCENTRATION OF ZINC CONTENT BY OBJECT TYPE. ............. 350
FIGURE 10.10: RANGE AND CONCENTRATION OF TIN CONTENT BY OBJECT TYPE. ............ 350
FIGURE 10.11: RANGE AND CONCENTRATION OF LEAD CONTENT BY OBJECT TYPE. ........ 351
FIGURE 10.12: ALLOY FREQUENCY OF SAMPLED ANNULAR BROOCHES. ................................... 353
FIGURE 10.13: ALLOY FREQUENCY FOR TYPE G ANNULAR BROOCHES (LEFT) AND TYPE F
(RIGHT). ............................................................................................................................................................................ 354
FIGURE 10.14 CHANGE IN AVERAGE %ALLOY COMPONENT IN ANNULAR BROOCHES BY
CHRONOLOGICAL PHASE. ....................................................................................................................................... 355
FIGURE 10.15: TIN AND ZINC CONTENT IN ANNULAR BROOCHES, DIVIDED BY TYPE. ...... 356
FIGURE 10.16: A*B* PLOT DEPICTING THE RANGE OF COPPER ALLOY COLOUR EXHIBITED
BY ANNULAR BROOCHES (RED), COMPARED TO THE COLOUR OF OTHER OBJECT TYPES
(BLUE). ............................................................................................................................................................................... 357
FIGURE 10.17: MOCK-QUOIT BROOCH PAIR, GRAVE 29, CASTLEDYKE (REPRODUCED
FROM DRINKALL AND FOREMAN, 1998; 4.9 CM DIAMETERS). ........................................................ 358
FIGURE 10.18: TIN AND ZINC CONTENT OF THE SAMPLED QUOIT BROOCHES. ..................... 359
FIGURE 10.19: A*B* PLOT DEPICTING THE COLOUR OF SAMPLED MOCK-QUOIT
BROOCHES. THE ERROR BARS INDICATE 2 CIELAB UNITS OF TOLERANCE, OR THE LEVEL
OF HUMAN DISTINCTION. ....................................................................................................................................... 360
FIGURE 10.20: A*B* PLOT DEPICTING THE RANGE OF COPPER ALLOY COLOUR EXHIBITED
BY MOCK-QUOIT BROOCHES (RED), COMPARED TO THE COLOUR OF OTHER OBJECT
TYPES (BLUE). ............................................................................................................................................................... 361
FIGURE 10.21: SWASTIKA OPENWORK BROOCH PAIR, GRAVE 156, CASTLEDYKE
(REPRODUCED FROM DRINKALL AND FOREMAN, 1998, 187; 5.7 CM DIAMETER). ............. 363
FIGURE 10.22: TIN AND ZINC CONTENT IN SAMPLED OPENWORK BROOCHES. .................... 363
FIGURE 10.23: TIN AND ZINC CONTENT FOR OPENWORK/COGNATE BROOCHES FROM
THIS STUDY (BLUE), AND PREVIOUS STUDIES (RED). ........................................................................... 364
FIGURE 10.24: A*B* PLOT DEPICTING THE COLOUR OF OPENWORK BROOCHES, WITH
TOLERANCE ZONES INDICATING THEY ARE INDISTINGUISHABLE IN COLOUR. ..................... 365
FIGURE 10.25: A*B* PLOT DEPICTING THE RANGE OF COPPER ALLOY COLOUR EXHIBITED
BY OPENWORK BROOCHES (RED), COMPARED TO THE COLOUR OF OTHER OBJECT TYPES
(BLUE). ............................................................................................................................................................................... 365
FIGURE 10.26: A*B* PLOT DEPICTING THE COLOUR OF THE PENANNULAR BROOCH
(RED), COMPARED TO THE COLOUR OF OTHER OBJECT TYPES (BLUE). .................................... 366
FIGURE 10.27: TIN AND ZINC CONTENT IN SAMPLED GREAT AND SQUARE-HEADED
BROOCHES. ...................................................................................................................................................................... 368
FIGURE 10.28 TIN AND ZINC CONTENT FOR SQUARE-HEADED BROOCHES FROM THIS
STUDY (BLUE) AND PREVIOUS STUDIES (RED). ........................................................................................ 369
FIGURE 10.29: A*B* PLOT DEPICTING THE COLOUR OF SQUARE-HEADED BROOCHES,
WITH TOLERANCE ZONES SUGGESTING TWO WERE SIMILAR ENOUGH IN APPEARANCE TO
BE INDISTINGUISHABLE IN COLOUR. ............................................................................................................... 370
FIGURE 10.30: A*B* PLOT DEPICTING THE COLOUR OF SQUARE-HEADED BROOCHES
(RED), COMPARED TO THE COLOUR OF OTHER OBJECT TYPES (BLUE). .................................... 370
FIGURE 10.31: ALLOY FREQUENCY IN SAMPLED CRUCIFORM BROOCHES. ............................... 372
FIGURE 10.32: TIN AND ZINC CONTENT IN ANALYSED CRUCIFORM BROOCHES BY TYPE.
................................................................................................................................................................................................ 373
FIGURE 10.33: TIN AND ZINC CONTENT FOR CRUCIFORM BROOCHES FROM THIS STUDY
(BLUE) AND PREVIOUS STUDIES (RED). ........................................................................................................ 374
FIGURE 10.34: A*B* PLOT DEPICTING THE COLOUR OF CRUCIFORM BROOCHES, WITH
TOLERANCE ZONES INDICATING A ZINC BRONZE-BRONZE COLOUR CLUSTER AND A FEW
DISTINCTLY YELLOWER GUNMETAL EXAMPLES. ..................................................................................... 375
FIGURE 10.35: A*B* PLOT DEPICTING THE COLOUR OF CRUCIFORM BROOCHES (RED),
COMPARED TO THE COLOUR OF OTHER OBJECT TYPES (BLUE)..................................................... 376
FIGURE 10.36: ALLOY FREQUENCY IN SAMPLED SMALL-LONG BROOCHES. ............................. 378
FIGURE 10.37: TIN AND ZINC CONTENT IN SAMPLED SMALL-LONG BROOCHES. .................. 379
FIGURE 10.38: TIN AND ZINC CONTENT FOR SMALL-LONG BROOCHES FROM THIS STUDY
(BLUE), AND PREVIOUS STUDIES (RED). ....................................................................................................... 380
FIGURE 10.39: A*B* PLOT DEPICTING THE COLOUR OF SMALL-LONG BROOCHES;
COMPOSITIONAL SIMILARITY RESULTS IN SIMILAR COLOUR FOR NEARLY ALL EXAMPLES.
................................................................................................................................................................................................ 381
FIGURE 10.40: A*B* PLOT DEPICTING THE COLOUR OF CRUCIFORM BROOCHES (RED),
COMPARED TO THE COLOUR OF OTHER OBJECT TYPES (BLUE)..................................................... 381
FIGURE 10.41: ALLOY FREQUENCY IN SAMPLED BUCKLES. ............................................................... 383
FIGURE 10.42: TIN AND ZINC CONTENT IN SAMPLES BUCKLES. ...................................................... 384
FIGURE 10.43: TIN AND ZINC CONTENT FOR BUCKLES FROM THIS STUDY (BLUE), AND
PREVIOUS STUDIES (RED). ..................................................................................................................................... 385
FIGURE 10.44: A*B* PLOT DEPICTING THE COLOUR OF BUCKLES. THE BRASS, THE GILDED
(LOW TIN), AND THE HIGH-TIN BRONZE BUCKLES ARE VISUALLY DISTINCT FROM THE
OTHER COPPER ALLOY BUCKLES, AS IS ONE GUNMETAL (2.3, 18.5). ........................................... 386
FIGURE 10.45: A*B* PLOT DEPICTING THE COLOUR OF BUCKLES (RED), COMPARED TO
THE COLOUR OF OTHER OBJECT TYPES (BLUE). ...................................................................................... 387
FIGURE 10.46: GIRDLE-HANGER SET FROM GRAVE 143, SLEAFORD, LINCOLNSHIRE. THIS
GROUP INCLUDES TWO S2 AND ONE T3 EXAMPLE (IMAGE FROM BRITISH MUSEUM,
1883,0401.273). ........................................................................................................................................................... 389
FIGURE 10.47: ALLOY FREQUENCY FOR SAMPLED GIRDLE-HANGERS. ....................................... 390
FIGURE 10.48: TIN AND ZINC CONTENT FOR SAMPLED GIRDLE HANGERS. ............................. 390
FIGURE 10.49: TIN AND ZINC CONTENT FOR GIRDLE-HANGERS FROM THIS STUDY (BLUE)
AND FROM PREVIOUS STUDIES (RED). ........................................................................................................... 391
FIGURE 10.50: A*B* PLOT DEPICTING THE COLOUR OF GIRDLE-HANGERS. ............................ 392
FIGURE 10.51: A*B* PLOT DEPICTING THE COLOUR OF GIRDLE-HANGERS (RED),
COMPARED TO THE COLOUR OF OTHER OBJECT TYPES (BLUE)..................................................... 393
FIGURE 10.52: ALLOY FREQUENCY IN SAMPLED WRIST CLASPS. ................................................... 396
FIGURE 10.53: ADJUSTED ALLOY FREQUENCY, TAKING REPEATING DATA FROM SAMPLES
FROM DIFFERENT PARTS OF THE SAME OBJECT INTO ACCOUNT. ................................................. 396
FIGURE 10.54: TIN AND ZINC CONTENT IN WRIST CLASPS, BY TYPE. .......................................... 397
FIGURE 10.55: TIN AND ZINC CONTENT FOR WRIST CLASPS FROM THIS STUDY (BLUE)
AND PREVIOUS STUDIES (RED). .......................................................................................................................... 398
FIGURE 10.56: A*B* PLOT DEPICTING THE COLOUR OF WRIST CLASPS. ................................... 399
FIGURE 10.57: WRIST CLASP REPRODUCTION BY DANEGELD DARK AGE AND MEDIEVAL
JEWELLERY, 4 X 3.5 CM (DANEGELD.CO.UK) AND A HINES 18D WRIST CLASP FROM THE
PORTABLE ANTIQUITIES SCHEME FROM SUFFOLK; 3.2 X 3.5 CM AS SET (SF-225425). .... 401
FIGURE 10.58: CRUCIFORM BROOCH PAIR FROM EDIX HILL, BARRINGTON,
CAMBRIDGESHIRE; THE LEFT BROOCH IS AN ASYMMETRICAL, SLIGHTLY WARPED
VERSION OF THE RIGHT, AND HAS A MORE PRONOUNCED CURVE IN THE BOW; (L) 8,6 X

4.9 CM, (R) 8.6 X 4.8 CM (IMAGE FROM THE BRITISH MUSEUM; 1876,0212.68 AND
1876,0212.69). .............................................................................................................................................................. 404
FIGURE 10.59: SAUCER BROOCH PAIR FROM EAST SHEFFORD, HUNGERFORD,
BERKSHIRE. NOT ONLY ARE THE FACES DISTINCTLY DIFFERENT IN DETAIL, THE SEMI-
CIRCULAR ARCHES FLOWERING OUT FROM THE INNER CIRCLE VARY IN NUMBER OF
INCISED LINES, AND THE LEFT BROOCH IS LESS CIRCULAR IN SHAPE; BOTH 4.6 CM
DIAMETER (IMAGE FROM THE BRITISH MUSEUM: 1893,7-16,41; 1893,7-16,42). ............... 405
FIGURE 10.60: BUCKLE SET FROM SUTTON HOO; THE TWO STRAP ENDS HAVE SMALL
VARIATIONS IN GARNET CELL SIZE AND SHAPE DESPITE IDENTICAL DESIGN; EACH
APPROXIMATELY 3 X 1.5 CM (IMAGE FROM BRITISH MUSEUM 1939,1010.14). ................... 405
FIGURE 10.61: ALLOY FREQUENCY IN SURFACE-COATED COPPER ALLOY OBJECTS. .......... 408
LIST OF TABLES
TABLE 2.1: DEFINITIONS OF COPPER ALLOYS. ............................................................................................ 12
TABLE 2.2: ROMAN ALLOYS BY FABRICATION METHOD, REPRODUCED FROM BLADES
1995, 139. .......................................................................................................................................................................... 16
TABLE 2.3: AVERAGE ALLOY CONTENT (PERCENTAGE) OF CAST AND WROUGHT
ALLOYS. ............................................................................................................................................................................... 16
TABLE 3.1: SOURCE ALLOYS IN THE RECYCLING MODEL ....................................................................... 84
TABLE 3.2: ALLOY DIVISIONS USED IN THE MODEL AND FREQUENCYS. ...................................... 88
TABLE 3.3: EXCERPT FROM RECYCLING MODELLING .............................................................................. 90
TABLE 3.4: ZINC FREQUENCY IN BRONZE ....................................................................................................... 96
TABLE 4.1: FREQUENCY OF COLOUR TERMS IN OLD ENGLISH AND MODERN INDO-
EUROPEAN LANGUAGES .......................................................................................................................................... 120
TABLE 4.2: FREQUENCY OF COLOUR WORDS IN OLD ENGLISH AND INDO-EUROPEAN
LANGUAGES, INCLUDING OTHERS ..................................................................................................................... 121
TABLE 4.3: FREQUENCY OF PRECIOUS METAL AND DECORATIVE COATING USE AT
VARIOUS SITES .............................................................................................................................................................. 134
TABLE 4.4: MONOCHROME GLASS BEADS AT MUCKING....................................................................... 159
TABLE 4.5: POLYCHROME GLASS BEADS AT MUCKING ......................................................................... 159
TABLE 5.1: RESULTS OF THE COLOUR VISION EXPERIMENT BY COLOUR GROUP. ............... 191
TABLE 6.1: RATE OF COLOUR CHANGE IN BRONZE BY %WEIGHT TIN ........................................ 218
TABLE 6.2: RATE OF COLOUR CHANGE IN COPPER-ZINC ALLOYS ................................................... 221
TABLE 6.3: RATES OF COLOUR CHANGE DUE TO THE PRESENCE OF IRON IN COPPER...... 233
TABLE 6.4: AVERAGE L*A*B* COLOUR CHANGE FROM 77 COPPER ALLOY COIN
SAMPLES ........................................................................................................................................................................... 240
TABLE 7.1: ELEMENTS SOUGHT BY ED-XRF; THOSE REPORTED IN RESULTS ARE IN
BOLD. .................................................................................................................................................................................. 249
TABLE 7.2: COMPOSITION OF STANDARDS AND MEASURED RESULTS....................................... 250
TABLE 7.3: PRECISION FOR GUNMETAL STANDARD C71X11. .......................................................... 251
TABLE 7.4: MEAN STANDARD DEVIATION IN TARNISHED AND POLISHED SAMPLES. ....... 255
TABLE 7.5: STANDARD DEVIATION AND ERROR IN L*A*B* MEASUREMENTS. ....................... 257
TABLE 7.6: STANDARD DEVIATIONS IN COLOUR MEASUREMENT DATA FROM DIFFERENT
REGIONS OF COLOUR SPACE. ................................................................................................................................ 258
TABLE 8.1: SITE DETAILS AND PREVALENCE OF CERTAIN MATERIALS AND DECORATIVE
TECHNIQUES ................................................................................................................................................................... 262
TABLE 8.2: DETAILS OF SITES AND ARTEFACTS SAMPLED. ............................................................... 263
TABLE 8.3: RESULTS FROM CASTLEDYKE ..................................................................................................... 265
TABLE 8.4: RESULTS FROM CLEATHAM ......................................................................................................... 270
TABLE 8.5: RESULTS FROM FONABY ................................................................................................................ 273
TABLE 8.6: RESULTS FROM BROUGHTON LODGE .................................................................................... 275
TABLE 8.7: RESULTS FROM WEST HESLERTON ......................................................................................... 278
TABLE 8.8: RESULTS FROM SEWERBY ............................................................................................................ 284
TABLE 9.1: AVERAGE DIFFERENCE IN A*B* COLOUR SPACE BETWEEN TWO OBJECTS ..... 318
TABLE 9.2: FREQUENCY OF AMBER AND PRECIOUS METAL OR SURFACE COATED OBJECTS
BY SITE............................................................................................................................................................................... 319
TABLE 9.3: AVERAGE ALLOY COMPONENT USE IN EARLY SAXON AND GILT OBJECTS ....... 385
TABLE 9.4: CALCULATED DIFFERENCES IN A*B* VALUES BETWEEN CRUCIFORM
BROOCHES ....................................................................................................................................................................... 391

TABLE 9.5: EXAMPLES OF ΔCOMPOSITION VALUES WITH ASSOCIATED COMPOSITIONS OF
PAIRS. ................................................................................................................................................................................. 393
TABLE 9.6: RESULTS OF PAIRED OBJECT COLOUR COMPARISON................................................... 394
TABLE 9.7: SUMMARY OF PAIRED OBJECT COLOUR RESULTS BY % MATCHING BY 2.0 AND
1.5 CIELAB UNIT MARGINS AT EACH SITE. ................................................................................................... 395
TABLE 9.8: NUMBER OF MATCHING AND NON-MATCHING PAIRS BY OBJECT TYPE. .......... 395
TABLE A.1: COPPER ALLOY RECYCLING MODEL ........................................................................................ 424
TABLE B.1: LETTERS DESIGNATING SPECIFIC INPUT ALLOYS FROM THE RECYCLING
MODEL. .............................................................................................................................................................................. 437
TABLE B.2: RECIPES FOR COPPER ALLOYS ................................................................................................... 438
The copyright of this thesis rests with the author. No quotation from it should be
published without the author's prior written consent and information derived from it
should be acknowledged.
1
ACKNOWLEDGEMENTS
The undertaking of this PhD would not have succeeded without the inspiration and
support of my amazing supervisors, Dr. Chris Caple and Dr. Sarah Semple; I am
incredibly grateful for your insight and patience. This PhD would not have been
possible without financial support from the Isabel Fleck Fellowship and the University
College Travel Bursary.
Special thanks to the museums and curators from whom material was borrowed and
analysed, twice, particularly Rose Nicholson of North Lincolnshire Museum Service,
Professor Dominic Powlesland and Christine Haughton at the Landscape Research
Center, Dr. David Marchant and the East Riding of Yorkshire Council, and Ann Inscker
of Nottingham City Museums & Galleries. Also special thanks to Sue La Niece at the
British Museum for her prompt and helpful assistance.
I would like to express gratitude to the researchers who have assisted me throughout
this PhD, particularly Dr. Peter Northover, Dr. Cath Mortimer, Neal Smith Brodsky, Bart
Ankersmit, Professor Stephen Westland, Dr. Roland Schwab, Professor David Scott and
Chris Salter. Thanks also to Jen Jones for her conservation expertise, materials, and
workspace. Thanks to Eddie and Gary on the helpline at Oxford Instruments for being
eternally patient, and Ross Barnett for finally acquiring a machine that worked.
Much of this PhD would not have been possible without the moral and mathsy support
of Ross Bland, whose practical approach to theoretical problems and superhuman
mastery of Excel was particularly invaluable. Thanks to Ed Burton for wiring a
daylight-equivalent light-fixture, and suffering mild electrocution, on my behalf. Thanks
to Emma Cunliffe, who persevered to the end alongside me: without your support and
endless coffee supply I would never have finished ‘on time.’ Thanks also to Ellis
Bridgers, Dr. Hilary Paterson, Matt Nicholas, Dr. Toby Martin, and Brian Buchanan for
being academically helpful as well as generally awesome. Thanks to Lisa Brundle for
always letting me steal her books, to Laine Clark-Balzan for access to Oxford theses by
covert means, to Chris Cunliffe my chauffeur, and to Toni Tasić, Dr. Maryann Noonan
and Chelsea Budd for London and Oxford accommodation. And thanks to all my friends
in the Archaeology Department – we all do reach the end, eventually.
Thanks also to my parents, for everything; to my grandparents and the rest of my
family, for being interested; and to my brother, who is genuinely far too fascinated by
my work.

2
3
CHAPTER 1
INTRODUCTION
“Jewellery is, above all things, a mirror to life itself. It reflects the sense and beliefs, the skill, the leisure and material comfort and the aesthetic taste of its makers and owners, and helps us to place them in their proper perspective in the general historic scene. It is moreover an exact and particular guide to the state of trade and commerce, to the spread of ideas and the trend of fashion, a criterion even of the nature and extent of folk movement and of the survival of ancient cultures. Its distribution and use may mark, still more, the incidence of peace and war. It is, with truth, a footnote to history.”
(Jessup, 1974, 17)
The study of Anglo-Saxon jewellery has often focused on the aesthetic and what it can
reveal about cultural and economic exchange in the Migration period (450-650 CE).
The evolution of zoomorphic design; the influence on style from Rome, Merovingian
France, the Celtic west and Scandinavia; the development of gold-and-garnet jewellery
throughout the barbarian west; these all reflect the appearance of a small number of
objects owned by the elite, and often made in the latter part of this period. The same is
often true for the importance of metalwork as evidence of trade: much is known about
the path that gold coins from Byzantium followed through Western Europe and their
distribution in England, and this is used to evidence elite exchange and limited trade
contact with the Antique world (Bruce-Mitford and Evans, 1978; Hawkes et al., 1966;
Hill and Metcalf, 1984; Metcalf, 1978; Oddy, 1983). Meanwhile, little is known about the
production of copper and its alloying components in this period, with many theorising
that the production of fresh metal and the trade of copper alloys disappeared entirely
in post-Roman England (Fleming, 2012; Mortimer, 1990; Oddy, 1983).
The exchange of elite goods between rulers is not so much evidence of trade as it is of
political contact and the cultural practice of gift-giving. The metal supply and the
aesthetics of copper alloy jewellery enable the issues of cultural taste, trade access, and
4
scavenging and subsistence metalworking strategies to be explored. This provides the
opportunity for insight into the dynamics of the economy and material value of the
post-Roman world in a way that the study of neither gold nor silver can provide. It
enables a more central understanding of the lives of the early Anglo-Saxon people. This
thesis will use an interdisciplinary approach, including analysis of a new dataset
comprised of composition data and quantitative colour measurements from over two-
hundred archaeological samples This will allow the context of colour and composition
to be discussed, providing insight into issues of value, aesthetics, trade and metal
supply, and control.
HISTORICAL CONTEXT
By the late 4th century, Roman Britain was already in decline. Political unrest after a
series of usurpers unsettled the region; frequent raids from the Irish, Picts, and Saxons
ravaged the shores, and barbarian incursions into Gaul and the West led to severe
disruption of trade routes (Christie, 2010, 39-41; Faulkner, 2000, 161; James, 2001, 87-
92). “For early fifth-century Britain… the loss of coin, the collapse of a villa economy,
the dissolution of town living” (Christie, 2010, 229), contributed to the chronic decline
in towns, with a loss of nearly all urban activity by the late 5th century (Hills, 2003, 86;
Roskams, 1996, 265; Higham, 1993, 50). The lack of trade and of the organisation,
manpower, supply and demand for mass production led to a collapse of the major
production industries; pottery, glass, iron and non-ferrous metalworking all suffered
(Fleming, 2012; Hills, 2003, 85-86; McCormick, 2001; Wickham, 1998, 282). Even in
the Eastern Empire production, which initially increased to supply western demand,
also began to founder, further evidence of the widespread disruption to trade. In
Britain, rural subsistence farming and dependence on organic material goods in the
fifth century make the post-Roman period difficult to detect archaeologically, and little
survives to supplement the disappearance of historical sources (Hamerow, 2012, 1;
Hines 2004, 49; Hodges and Bowden, 1998; Arnold, 1997).
The mid 6th century witnessed a series of disastrous events. These included a famine
following the unusually cold summer of 536 (probably the result of a major volcanic
eruption or asteroid), which was documented in annals from Ireland to China. This was
5
followed by a violent plague epidemic in 541 (the ‘Plague of Justinian’) that may have
wiped out a quarter of the European population, seriously disrupted ship-borne trade
as, “the contagion was transmitted by the very ships which for centuries had bound the
Mediterranean together,” and which reoccurred every generation for the next 200
years (McCormick, 2001, 109). The only mention of plague in the Anglo-Saxon
Chronicle dates to c.664, one of the later outbreaks (Coleridge, 1997).
These events form a picture of a period of unrest and uncertainty, where self-
sufficiency was a necessity of survival. The way of life for the Romano-British would
have drastically altered within a few generations (Faulkner, 2000, 180; Hills, 2003, 85).
The ‘conquest’ or relative peacefulness of the influx of Germanic peoples throughout
the 5th century is debated, as is the actual size of the population that immigrated to
Britain, the degree of displacement of Britons, and the actual ethnic identity and
diversity of the population (James 2001, 108; Lucy, 2000, 177; Dark, 1994, 217). By the
6th century, surviving material evidence from burial contexts indicates that the
population of England had largely adopted the Anglo-Saxon manner of dress, with
Anglian areas also featuring dress accessories such as wrist clasps, an item worn by
Scandinavian women (Higham, 1993, 75; Hines, 1994, 50).
The suitability of Anglo-Saxon cultural practice to the post-Roman world could explain
a widespread assimilation of the native Romano-British to rural self-sustaining
agricultural in a Germanic tradition. Additionally, as the material culture of the 6th
century also incorporates Roman, British, continental and Scandinavian elements, this
argues for a cultural hybridisation in which ‘Anglo-Saxon’ is perhaps the most visually
distinct (Hills, 2003, 106).
It is likely that the majority of trade was conducted on a local or regional level in Early
Saxon England (Clarke, 2009, 58, 63). Many of the ‘imported’ artefacts uncovered
archaeology may rather be “a direct reflection of immigrant people,” rather than trade
(Lucy, 2000, 15). The effects of the 6th century disasters on Anglo-Saxon England is not
documented, but the probable decline in population and the disruption to already
reduced trade may have heaped additional constraints on an already limited metal
production system (Hemer et al., 2013, 2358). However, Frisia and some Anglo-Saxon
6
kings began to mint silver coins around 600 CE; they found the need for a coin-based
economy, which has been linked to increases in population and trade (Kelleher, 2013,
251), and imported objects appear more often within later burial contexts (Coatsworth
and Pinder, 2002, 231).This suggests that long-distance trade, which may have
primarily emanated from the Rhine region, increased towards the end of the 6th
century despite the widespread setbacks to reliable trade in the middle of the century
(Astill, 1985, 220; Guido, 1999; Mortimer, 1990). Smaller ships could be landed on
beaches where temporary or seasonal trading may have occurred, and these ships
frequently put into shore along their journey, facilitating low-level regional trade
(McCormick, 2001, 422). In the 6th century, “it seems that economic development,
trade, a new emphasis on surplus, and the desire for exotic commodities were driving
crucial changes in English social structures” (Fleming, 2012, 29). The ability to acquire
goods beyond those regionally producible and to access foreign markets demonstrates
control and power, which is expressed through personal adornment and the display of
exotic materials (Fleming, 2012; Hinton, 2005; Hodges, 1989). Scandinavian influence
is particularly apparent in 6th century Anglian regions in the use of sleeve clasps and
the increasingly large and elaborate great square-headed brooches; combined with
large quantities of amber (whether locally produced or from the Baltic), personal
adornment becomes synonymous with a conspicuous projected identity connected
with the wider North Sea littoral.
A key question is how did this change in the organisation of society and the destruction
of Roman systems of contact and production affect the use of metals? Several authors
have discussed the importance of metals to the economic wealth of a society, primarily
concentrating on iron (Fleming, 2012; Loveluck, 1996; McCormick, 2001, 49-50).The
main source of archaeological evidence in the 5th-6th centuries, particularly copper alloy
evidence, comes from furnished burials. Generally speaking, men were more likely to
be buried with weapons, belt-fittings and utilitarian tools such as knives (Hadley, 2012,
116). Female grave goods more often consisted of display items such as glass or amber
beads and copper alloy jewellery, as well as knives and other tools, including symbols
of position within the household such as weaving batons and keys; however, many
7
graves are sexed by grave goods alone (e.g. West Heslerton) and the gender
associations of various artefact types are debated (Klein, 2012, Nugent, 2011;
Harrington, 2008; Hills, 2003, 88; Knüsel and Ripley, 2001; Lucy, 2000; Haughton and
Powlesland, 1999; Lucy, 1998, 32; Webster and Backhouse, 1991; Härke, 1990). Some
grave goods are more likely to occur in the graves of mature individuals, such as
swords or great square-headed brooches, and children’s graves were less likely to be
furnished (Hadley 2012, 127; Williams, 2010, 51; Hines, 1997). Many grave goods,
particularly those made from copper alloy, are both functional and aesthetic; these
items of jewellery not only fastened clothing, but were also a means of social display.
Copper alloys, as the material possessions of a larger proportion of the population,
represent better than gold and silver the aesthetic and economic pulse of Anglo-Saxon
society. Iron and copper alloys can both fulfil the same practical functions, but copper
alloys are inherently appealing and decorative in a way that iron is not. Many copper
alloy fittings such as brooches are large and highly decorated, and these large brooches
in particular increase in size and embellishment throughout the 6th century, indicating
their aesthetic role. The reason for copper alloy use in jewellery over iron is clear; the
lustre and colour of copper alloys and their resistance to corrosion allows the objects
to maintain their decorative appearance. Additionally, copper alloys can mimic the
colour of precious metals and can easily be coated to give the illusion of gold and silver.
PAST APPROACHES TO ANGLO-SAXON COPPER ALLOYS
Previous archaeometallurgical research has sought to identify cultural patterns in
copper alloy composition use, and found some in contemporary cultures outside of
England (Werner, 1967; Bruce-Mitford and Evans, 1978; Oddy, 1983; Craddock, 1979;
Craddock 1998). They have sought to identify regional patterns of use indicative of
access and trade, and to relate this to the divisions of Germanic tribes ascribed by the
Venerable Bede (Bede, 2008; Hills, 2003, 26; Hines, 1994). What has been found are
homogenous frequencies throughout most regions of England, with a nearly
indecipherable array of alloy combinations giving little evidence to support the
separate identities of Jutes, Angles and Saxons at the time of the migration (Blades,
1995; Mortimer, 1990, 1988). Others have explored composition by object type, which
8
displays the same inexplicable variability of alloy frequency whether by type or
subtype (Brownsword and Hines, 1993; Hines, 1997; Mortimer, 1990).
Some studies have suggested that colour was a key component of alloy selection, while
the same researchers have in other contexts concluded that no control was exercised
or possible (Mortimer, 1990; Mortimer et al., 1986). The use of copper alloys has been
called ‘largely intractable’ and random, and reflects a ‘fiendishly complicated’ system of
metal use, likely dependent on extensive recycling of scrap metal (Brownsword and
Hines, 1993, 2; Mortimer, 1990, 446). Simply adding more analyses to this will not
solve these problems; a different approach is needed, one that combines analysis with
an assessment of aesthetic tastes and take-up of this material, thus modelling a
complex system to understand its dynamics.
COLOUR AS A NEW VARIABLE
Minute variations in composition would be meaningless to the metal smiths who
manufactured these objects. Ancient metalworkers operated by tradition, which
depended on the identification of materials by colour, density, and even taste
(Craddock, 1978; Dungworth, 1995; Mortimer et al., 1986). Colour in other
contemporary material has been discussed in glass beads (Guido, 1999; Brugmann,
2004), pigments (Clarke, 2004), textiles (Walton Rogers, 2007a, 2003), and literature
(Biggam, 2010; Mead, 1899). Despite colour being cited in several studies as an
important variable in copper alloys, it is often mentioned in passing and not fully
developed within the cultural context (Mortimer, 1988; Gage, 1999; Jones and
MacGregor, 2002; Keates, 2002; Chapman, 2002; Hirst and Clark, 2009).
This new variable could mean elucidation of patterns previously unidentified in
existing datasets – patterns more characteristic of the actual intentions of those who
produced them. Indeed, as, “the changes in the common alloy used at any period may
have had as much to do with fashion as with availability of supplies,” both colour and
metal availability are central to understanding the use of copper alloys in this period
(Bayley and Butcher, 2004, 16). The addition of colour to this discussion therefore
9
allows for relevant questions to be approached within the context of metallurgical
practice and cultural taste.
RESEARCH APPROACH
This thesis sets out specifically to explore the relationship between copper alloys in the
Early Anglo-Saxon period, their composition, and how this may relate to their colour
and appearance. In order to explore colour in the context of copper alloys
manufactured in this era, a holistic approach is necessary, including cultural context as
well as quantitative colour and composition measurement of the alloys themselves.
222 artefacts from six cemetery sites in what was north-eastern Anglia are sampled for
both colour and composition to provide quantitative colour and compositional data,
using spectrophotometry and ED-XRF methods. This data can then provide an
additional colour variable by which the corpus of previous compositional data can be
re-examined. Colour and composition will be discussed within a broad cultural context,
to fully explore the relevant issues of metal use, recycling and the aesthetics of colour.
After an introduction to copper alloy metallurgy, Chapter 2 will discuss the relevant
past research concerning Anglo-Saxon copper alloy metalwork. An overview of the
metallurgical history will give context to metalworking traditions in use, restricted or
lost. Copper alloy use patterns identified in past research and the difficulties of
interpreting the data will be discussed to combine and reanalyse previous findings.
This will give context to the issues inherent in Early Saxon copper metallurgical
research and the current state of research in the field. Additionally, all previous
compositional data from this period are examined as a complete corpus for the first
time.
Chapter 3 focuses on the issue of metal recycling, and how this can be explored using
the pre-existing copper alloy composition corpus. It will explore how detailed
reanalysis of past compositional data can illuminate subtle frequency patterns, which
can then be explained through a new application of recycling modelling. This modelling
approach will elucidate the necessary metal supply variables and recycling practices,
10
allowing for the dynamics of the metal system and the nature of economic constraints
and resulting metal use tactics to be explored.
Chapter 4 will consider the wider cultural context and use of colour in the Anglo-Saxon
world. A discussion of all relevant colour-related fields will provide as complete a
context as possible for the exploration of the aesthetics of copper alloy jewellery. The
use, meaning and popularity of contemporary colour words will be explored through
examination of Old English colour lexemes within a linguistic theoretical framework.
The use of colour in precious metals and other relevant material manifestations will
also be examined, with emphasis on the aesthetic values important to Anglo-Saxon
culture. Although the written sources used here post-date the objects under discussion,
they remain relevant as a way of capturing a sense of Anglo-Saxon aesthetics in terms
of colour and light. Many sources, notably Beowulf, date from the late Anglo-Saxon
period but largely survive from a much earlier oral tradition, possibly the late 6th-7th
century, and therefore may give particular insight into the importance of colour in the
Early Saxon period (Fulk, 2010; Dumville, 1993, 135; Newton, 1993 18-53). The use of
colour in other surviving materials is also considered, to provide a visual context
against which copper alloy metalwork would have been viewed.
Chapter 5 explores the application of quantitative colour measurement to
archaeological metals. As quantitative colour data has rarely been used in archaeology
and never to explore the limits of human distinction between colours, several
experiments were conducted to provide error margins and human vision contexts to
the data collected from artefacts. This chapter uses this new data to delineate the
comparative limits of human perception and distinction of colour, and explore the
potential overlap of copper alloy colour space with that of gold and silver.
Chapter 6 explores the cause of colour in metal, particularly in copper and its various
alloys. The contribution of alloying components and metallic phases to colour change
will be explored and quantified, as will the alteration of copper alloy colour by tarnish
accumulation. The influence of tarnish on the perceived appearance of copper alloys,
particularly in relation to precious metal alloys, will also be explored.
11
Chapter 7 explains the specific methods used to semi-quantitatively measure
composition and quantitatively measure colour in archaeological copper alloys. It will
include a discussion of sources of error as calculated from metal standards as well as
explain the methodology applied in sampling Anglo-Saxon artefacts.
Chapter 8 provides background to the sites from which artefacts were sampled, as well
as the results of the quantitative and semi-quantitative investigative methods. These
results are discussed in the context of the sites from which they derive, and are
compared to wider regional patterns of copper alloy use.
Chapter 9 examines the annular brooch form. Annular brooches are the most numerous
brooch type in Anglian England and within the corpus of analysed artefacts in this PhD,
but they have outdated and limited typological divisions and are infrequently discussed
in past research. A new typology is devised (Appendix C) and the annular brooches
from this research are discussed in reference to this classification system, particularly
in terms of chronology and regional distribution.
Chapter 10 will explore the new colour and composition data in the context of past
research, with particular focus on chronology, the colour of objects, and the
connotations of particular metallurgical choices in alloy use. Chronological trends will
be examined to delineate the use of copper alloys throughout the period as well as the
nature of the metal supply and recycling practices. The division of the newly analysed
data by object type is explored to investigate how type and function may influence
alloying choices, and how this relates to appearance. The use of copper alloys in
relation to colour will also be examined, with emphasis on identifying deliberate
control in alloying for aesthetic purposes within the theoretical framework and cultural
context discussed in Chapter 4. In particular, the use of specific alloys where they
would be unseen, the use of unusual alloys such as high tin bronze, copper, and
particularly brass, and the use of matching alloys in paired objects will be discussed.
Finally, Chapter 11 will discuss the implications of the new data within the Anglo-Saxon
copper alloy corpus and how this approach has furthered understanding of the use of
copper alloys in the period. Specifically, it will explore how colour and composition can
12
be examined to elucidate how aesthetic taste and economic constraints affected the use
and selection of copper alloys in the Early Anglo-Saxon period. It will synthesise the
variety of approaches utilised within this PhD to produce a more cohesive picture of
copper alloys in this period and demonstrate the value of a holistic interdisciplinary
approach to traditionally archaeometallurgical questions.
13
CHAPTER 2
EARLY ANGLO-SAXON COPPER ALLOYS
INTRODUCTION
The study of early medieval copper alloy compositions has grown to include
composition data for over 2500 objects, with more than 1100 quantitatively analysed
from England for the period 450-650 CE (Blades, 1995; Brown and Schweizer, 1973;
Brownsword and Hines, 1993; Brownsword, 2004; Brownsword et al., 1984; Caple,
2010, 1986; Cook and Dacre, 1985; Eagles and Mortimer, 1993; Hawkes et al., 1966;
Hill and Metcalf, 1984; Hirst and Clark, 2009; Lamm, 1978; Manser, 1977; Metcalf and
Gilmore, 1980; Metcalf, 1978; Mortimer and Wilthew, 1998; Mortimer, 1990, 1988;
Mortimer et al., 1986; Oddy et al., 1979; Parfitt and Brugmann, 1997; Wilthew, 1985).
However, in the context of how much material has been excavated this number is small
and has had limited influence on the understanding of the archaeology of the period.
There has been less interest in compositional research in the past decade compared
with biological investigation such as isotopic studies on diet and migration and on
ancient DNA, which have become the focus of archaeological science, as any recent
issue of Archaeometry or Journal of Archaeological Science demonstrates. Meanwhile,
artefact analysis has stood relatively still, with the insight possible from material
analysis seemingly lacking in relevance. Part of this may lie in the disorganised state
and often poor quality of existing data, with little of it published or digitised and much
difficult to obtain. Additionally, as little has been done since the mid-90s, to date the
ease with which data can be digitally analysed has not been fully exploited.
This chapter will explore the entirety of the current composition corpus of the Early
Saxon period, bringing together all previously established patterns in order discuss and
reinforce their implications for non-ferrous metalworking. Regional and chronological
alloy trends will be revisited, as well as patterns of alloy use within specific artefact
14
types. This discussion will provide context for understanding the technology and
working practice of Anglo-Saxon metalworkers and for a new recycling model that will
explore the dynamics and requirements in order to characterise the metal supply.
COPPER ALLOYS
This section will outline the terminology concerning archaeological copper alloys that
will be used throughout this thesis (table 2.1). Many of the terms used to describe
copper alloys by archaeometallurgists are not relevant to non-specialists or even
modern metallurgy. In the Early Saxon context, copper alloys fall into two broad
categories, bronze and brass. ‘Bronze’ denotes an alloy made from copper and tin,
while ‘brass’ indicates an alloy made from copper and zinc. Bronze is the more ancient
alloy type as it has been used since the Bronze Age (the earliest tin bronzes c. late 4th-
early 3rd millennium BCE), while brass was not widely produced until the Roman
period (Bayley et al., 2008; Craddock, 1998, 1978, Yenner, 1993, 208). Bronze is light-
yellow-orange in colour, while brass is far yellower, with high-zinc examples having a
greenish tinge (see Chapters 5 & 6). Table 2.1 and figure 2.1 outline the compositional
ranges of various copper alloys used in this study. ‘Pure’ copper metal contains less
than 4% of other elements or impurities and is easily worked, but is relatively soft and
quickly tarnishes.1
BRONZE
Bronzes generally have between 7-12% tin, but can have as little as 3%; above 18%
they are considered high tin bronze, which is an uncommon alloy with very different
properties (discussed in Chapter 6; Bayley and Butcher, 2004, 15-16). At 15% tin, the
colour of bronze is paler and the metal harder and more brittle as higher-tin phases
begin to form, making bronzes with lower tin better for working (Oddy, 1983; Smythe,
1937, 383; Tottle, 1984). Bronze can be used for a variety of purposes including
wrought working or casting; wrought alloys generally contain less tin, while cast alloys
contain more in order to lower the melting temperature.
1 Within this thesis unless otherwise stated, all metal composition percentages are by weight rather than atomic per cent.
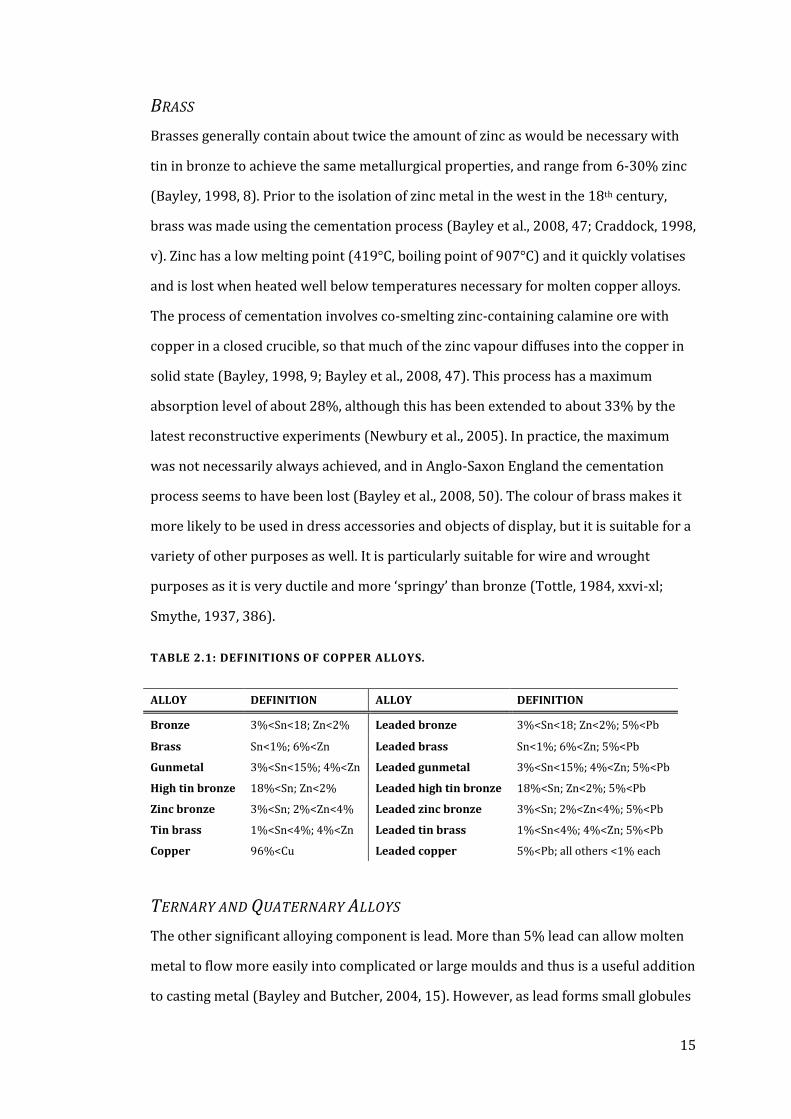
15
BRASS
Brasses generally contain about twice the amount of zinc as would be necessary with
tin in bronze to achieve the same metallurgical properties, and range from 6-30% zinc
(Bayley, 1998, 8). Prior to the isolation of zinc metal in the west in the 18th century,
brass was made using the cementation process (Bayley et al., 2008, 47; Craddock, 1998,
v). Zinc has a low melting point (419°C, boiling point of 907°C) and it quickly volatises
and is lost when heated well below temperatures necessary for molten copper alloys.
The process of cementation involves co-smelting zinc-containing calamine ore with
copper in a closed crucible, so that much of the zinc vapour diffuses into the copper in
solid state (Bayley, 1998, 9; Bayley et al., 2008, 47). This process has a maximum
absorption level of about 28%, although this has been extended to about 33% by the
latest reconstructive experiments (Newbury et al., 2005). In practice, the maximum
was not necessarily always achieved, and in Anglo-Saxon England the cementation
process seems to have been lost (Bayley et al., 2008, 50). The colour of brass makes it
more likely to be used in dress accessories and objects of display, but it is suitable for a
variety of other purposes as well. It is particularly suitable for wire and wrought
purposes as it is very ductile and more ‘springy’ than bronze (Tottle, 1984, xxvi-xl;
Smythe, 1937, 386).
TABLE 2.1: DEFINITIONS OF COPPER ALLOYS.
ALLOY DEFINITION ALLOY DEFINITION
Bronze 3%<Sn<18; Zn<2% Leaded bronze 3%<Sn<18; Zn<2%; 5%<Pb
Brass Sn<1%; 6%<Zn Leaded brass Sn<1%; 6%<Zn; 5%<Pb
Gunmetal 3%<Sn<15%; 4%<Zn Leaded gunmetal 3%<Sn<15%; 4%<Zn; 5%<Pb
High tin bronze 18%<Sn; Zn<2% Leaded high tin bronze 18%<Sn; Zn<2%; 5%<Pb
Zinc bronze 3%<Sn; 2%<Zn<4% Leaded zinc bronze 3%<Sn; 2%<Zn<4%; 5%<Pb
Tin brass 1%<Sn<4%; 4%<Zn Leaded tin brass 1%<Sn<4%; 4%<Zn; 5%<Pb
Copper 96%<Cu Leaded copper 5%<Pb; all others <1% each
TERNARY AND QUATERNARY ALLOYS
The other significant alloying component is lead. More than 5% lead can allow molten
metal to flow more easily into complicated or large moulds and thus is a useful addition
to casting metal (Bayley and Butcher, 2004, 15). However, as lead forms small globules
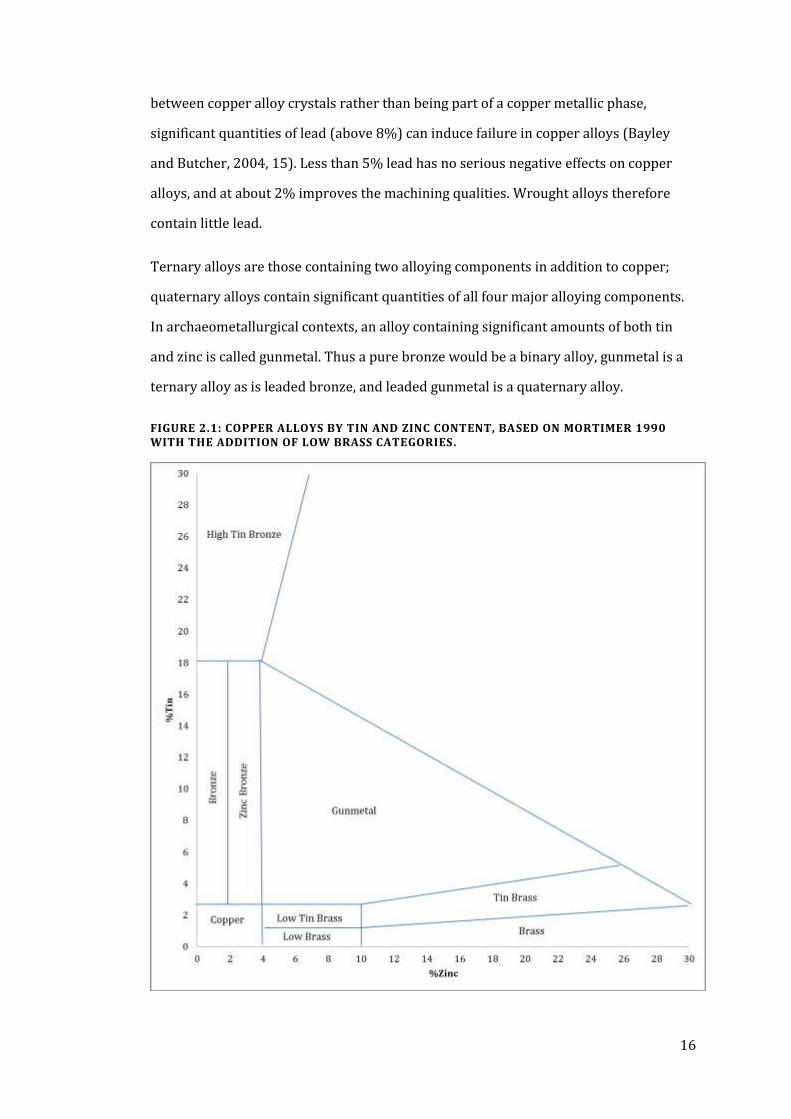
16
between copper alloy crystals rather than being part of a copper metallic phase,
significant quantities of lead (above 8%) can induce failure in copper alloys (Bayley
and Butcher, 2004, 15). Less than 5% lead has no serious negative effects on copper
alloys, and at about 2% improves the machining qualities. Wrought alloys therefore
contain little lead.
Ternary alloys are those containing two alloying components in addition to copper;
quaternary alloys contain significant quantities of all four major alloying components.
In archaeometallurgical contexts, an alloy containing significant amounts of both tin
and zinc is called gunmetal. Thus a pure bronze would be a binary alloy, gunmetal is a
ternary alloy as is leaded bronze, and leaded gunmetal is a quaternary alloy.
FIGURE 2.1: COPPER ALLOYS BY TIN AND ZINC CONTENT, BASED ON MORTIMER 1990 WITH THE ADDITION OF LOW BRASS CATEGORIES.
17
The divisions are slightly arbitrary, but are based on some metallurgical characteristics
and those divisions established by previous research (e.g., Mortimer, 1990). In
archaeological material and particularly in the Early Saxon period, it is useful to make
further divisions of alloy types to describe the frequency of alloy use observed. In
particular, Mortimer’s divisions of zinc bronze and tin brass are utilised to describe
bronze and brass alloys where a small but significant amount of zinc or tin respectively
are also present at concentrations above a possible natural inclusion in the copper ore.
Additionally, brasses with between 6-10% zinc were here further separated as ‘low
brass’ as these would have had different properties and appearance from other
brasses. These are infrequent but can be interesting as a sub-set of brass.
SURFACE COATINGS
Surface decoration techniques were employed on Early Saxon objects, inherited from
earlier Roman and Celtic metalworking traditions. Gilding, or coating the surface of a
baser metal with gold, was popular in this period as it allowed for an economical use of
gold that would maximise its aesthetic qualities. Gold was applied to silver or copper
alloy surfaces by fire gilding as it had been in the earlier Roman period. Fire gilding, or
mercury gilding, is a method in which ground flakes of gold were dissolved in mercury,
spread over the surface and then heated, evaporating most of the mercury and leaving
behind a very thin layer of gold (Northover and Anheuser, 2000; Oddy, 1993, 1977).
Silver plating was sometimes applied to copper alloys, particularly in conjunction with
gilding to produce a bichrome effect. Silvering as opposed to silver plating is less
frequent, although amalgam silvering of coins occurred in the Roman period and
despite the more economical use of silver metal (Vlachou et al, 2007). Tinning could
also be used to produce a silver-like surface appearance; the easiest and most
economical method requires the object to be heated and then rubbed with tin, and as
tin has a low melting point a layer melts and can be spread over the base metal surface
(Meeks, 1993; Oddy, 1977). Tinning occurs on artefacts from La Tene late Bronze Age
contexts and throughout the Roman period, an example of a continuous metalworking
tradition (Oddy, 1977, 129).
18
METALWORKING TRADITION
Early Saxon metalworking practices developed to some degree out of the technology
and traditions in place during the earlier Roman period. In order to understand Early
Saxon metallurgy in terms of metal use and alloying practices, it is necessary to
examine the potential influences whose continuity may comprise the practices in place.
Conversely, differences identifiable from earlier practices may indicate cultural
practice unique to the Early Saxons or the nature of external metallurgical constraints
and the dynamics of supply and demand in the period. In order to understand Early
Saxon copper alloy use, it therefore must first be put into context with its past.
ROMAN TRADITION
Roman copper alloys have been widely studied, notably by Smythe (1937), Caley
(1955), Craddock (1998, 1978, 1977, 1976, 1975), Bayley (2004; 1998, 1988), Caple
(1986), Blades (1995), and Dungworth (1995). The Roman Empire was the first
civilisation to use brass on a large scale, and for many copper alloy objects certain
alloys were used over others. This section will outline the different uses of copper
alloys, the major patterns and changes of this use over time, and the frequency of
copper alloys used in Britain.
The use of specific copper alloys for suitable purposes has been identified in every
study on Roman copper alloys. Bronze was the most common and versatile copper
alloy used (figure 2.2). Many non-dress items were made from bronze, particularly
leaded bronze for cast objects, or a ternary or quaternary alloy, while brooches and
other dress items have a higher frequency of brass (Bayley and Butcher, 2004; Bayley,
1998; Blades, 1995). Mixed alloys were probably the result of scrap metal recycling and
appear in objects where a specific alloy is not needed (Blades, 1995; Dungworth, 1995).
Leaded alloys were nearly always bronze or gunmetal, and were limited to cast objects
where the lead content would be beneficial (Craddock, 1975). Leaded high tin bronze
was used to make highly reflective mirrors (Craddock, 1975; Dungworth, 1995; Scott,
1991).
19
Table 2.2 demonstrates the use of specific alloys in Blades’s Roman samples for
different manufacturing processes (Blades, 1995). The largest cast objects (here only
four in number) are frequently leaded gunmetal, while smaller cast objects are
predominantly leaded bronze. Wrought objects could be from bronze, brass or
gunmetal, but rarely contained lead. Bronze or copper was preferentially used for
sheet, although again there are few samples. Impure copper was limited in use to sheet
or wire, where the softness of the alloy would be beneficial.
TABLE 2.2: ROMAN ALLOYS BY FABRICATION METHOD, REPRODUCED FROM BLADES 1995, 139.
TABLE 2.3: AVERAGE ALLOY CONTENT (PERCENTAGE) OF CAST AND WROUGHT ALLOYS, REPRODUCED FROM DUNGWORTH 1995, 95.
Table 2.3 demonstrates the average alloying component content of cast and wrought
objects; wrought objects from northern Britain were more likely to have higher zinc
and lower tin content, with no lead (Dungworth, 1995). The distribution of alloy use
was variable depending on the region or type of objects analysed, with the frequency of
alloy use in northern Britain, the most relevant for this study, demonstrated in figure
2.2.
Prior to the Roman period, tin bronze, copper, and leaded varieties of the two were the
available choices for copper alloying. In the first century BCE, zinc cementation for
brass production came into regular use in the eastern Mediterranean, probably in
Alloy Waste Large Cast Small Cast Wrought Sheet Wire Total
Bronze 6 0 1 8 3 4 22
Leaded Bronze 8 0 15 2 2 0 27
Gunmetal 2 0 2 7 1 5 17
Leaded Gunmetal 2 3 6 0 0 0 11
Brass 0 1 0 8 0 4 13
Leaded Brass 0 0 1 1 0 1 3
Impure Copper 1 0 0 0 2 2 5
Total 19 4 22 32 8 16 98
Zinc Tin Lead
Cast 5.4 6.6 6.7
Wrought 7.3 4.7 0.7
20
Anatolia where large quantities of ancient calamine ores originate (Bayley, 1998; Pliny,
1635). Around this time Rome conquered much of the Eastern Mediterranean, making
this technology and ore accessible to the Empire. It was soon in use for Roman coinage
(by 29 BCE) and military gear, largely due to its impressive golden colour and
resistance to wear and corrosion, and the technology spread through the Empire
probably on the heels of the army (Bayley, 1998, 7, Craddock, 1978; Craddock, 1976).
FIGURE 2.2: PROPORTIONS OF ROMAN ALLOY TYPES IN NORTHERN BRITAIN, (REPRODUCED FROM DUNGWORTH 1995, 98).
In Britain, brass appears not long before the Roman invasion and under Roman rule it
became a frequently used alloy into the 1st and 2nd centuries CE, particularly in coinage
and for dress items such as brooches as well as for wrought items. “The scale of the
Roman Empire indicates that brass must have been manufactured on an enormous
scale” (Bayley et al., 2008, 47). By the 4th century, an estimated 30-40% of objects
contained zinc, but only 20% of those containing zinc were ‘true’ brasses, i.e. zinc rich
and binary (Bayley, 1998; Craddock, 1978, 14). As dress items are more frequently
analysed than utilitarian objects, this estimate may overestimate the contribution of
brass to copper alloy use (Gliozzo et al., 2011).
Bayley and Butcher (2004) explored the compositions of over 3000 Roman brooches,
many of which were cast using a two-piece mould. The most popular decoration on
Roman brooches was enamel (which was most often red or blue), with tinning also a
frequent choice. It is suggested that brass was preferentially used for brooches because
21
of its golden colour, and those brooches with added surface decoration are more likely
to be made from this alloy, indicating a correlation between elaborate, multi-coloured
decoration and brass (Bayley and Butcher, 2004, 41).
THE PRODUCTION AND DECLINE OF BRASS
The association with brass and state-run industries such as coin-minting and military
equipment has led to the suggestion that brass was a restricted commodity produced
only by the state (Bayley, 1998). Much metal production was protected by the state to
some degree, but while the state may have encouraged or financed brass production, it
was not limited to official contexts as its quick uptake as a dress accessory alloy
demonstrates (Dungworth, 1995, 157; McCormick, 2001).
Caley (1955) noted the decline in zinc content in coinage over time. In part this may be
due to the better working qualities of a softer, lower-zinc alloy, but it is probably due to
the loss of zinc during remelting (discussed in Chapter 3). One of the more notable
chronological trends in Roman period copper metallurgy is the decline of zinc and
brass and the increase in the use of ternary and quaternary mixed alloys (Dungworth,
1997, 907). “Remelting of scrap metal may have been important throughout the Roman
period,” but the frequency of gunmetals in the 3rd and 4th centuries attests to the rise in
recycling of bronze with brass (Dungworth, 1995, 145). Smythe (1937) notes that out
of the twenty-seven artefacts analysed for composition in his study, the highest zinc
content was only 12.3%, and all of the zinc-rich alloys had up to 5% tin and no lead. As
this study examined metallographic samples, it was possible to identify that all of the
‘brass’ objects were wrought, as brass is, “the favoured material for the making of pins
and small appliances like tweezers, where spring is required” (Tottle, 1984; Smythe,
1937, 386). By the beginning of the 5th century, brass was common but less frequent
than in previous centuries (Craddock et al., 1998, 73). The fall of the Western Empire
led to the loss of many specialist industries which no longer had the economic contacts
or markets to sell their products, leading to a collapse of mining and the loss of
cementation technology in Britian (Bayley, 1988; Fleming, 2012; McCormick, 2001;
Mortimer, 1990).
22
CHANGE IN PRODUCTION
Other changes in the late Roman/post-Roman transition period include the way in
which copper alloys were manufactured. In the Roman period, metal objects were
often mass produced in urban workshops, as trade was focused on central places. With
the collapse of the Empire, town life was largely abandoned and this method of
production could no longer be supported by either supply of resources or economic
demand (Fleming, 2012, 10; McCormick, 2001). This post-Roman Britain had different
metallurgical needs, and the metal smiths adapted to this as well as to the possible lack
or unreliability of the fresh metal supply; indeed, cheap scrap supplementation to the
metal supply occurred long before the fall of the Roman province (Dungworth, 1995;
Fleming, 2012). It is thought that in the immediate post-Roman period, metalworkers
became itinerant craftsmen, traveling from settlement to settlement and repairing or
making new objects largely from Roman scrap or old material provided by the client
(Clarke, 2009, 72, Coatsworth and Pinder, 2002, 22; Hinton, 2000; Mortimer, 1990).
This concept is partially based on the lack of archaeological evidence for any
substantial metalworking or workshops in Britain in the 5th and 6th centuries. However,
as the Roman economy, “was based on central places,” while the Germanic economy,
“focused on central persons,” it seems likely that metalworking adapted to this new
socio-economic system and, like the elites of the period, were not stationary, and could
have been associated with the traveling elites as some evidence suggests (Hodges,
1989, 29; Fleming, 2012; Wright, 2010, 131; Clarke, 2009, 72).
Finally, it is important to stress that recycling metal scrap as a major resource in the
Early Saxon period is not necessarily a departure from the Roman tradition. Recycling
of copper alloys was frequent in the Roman period and increased into the 3rd and 4th
century, possibly because after several centuries of mass production there was a large
quantity of material available for reuse, which made for a cheaper and more efficient
stock (Blades, 1995; Craddock, 1975; Dungworth, 1995; Smythe, 1937). Anglo-Saxon
recycling practices may be a form of technological continuity in metal reuse from the
Roman period, not a deviation from the status quo from loss of a steady fresh metal
supply.
23
EXTRAPOLATING PRACTICE FROM LATER TEXTS
In addition to analysis of artefacts, Early Saxon metalworking can be approached from
later metalworking manuals, such as the Mappae Clauvicula (early 9th century) and De
Diversis Artibus by Theophilus (early 12th century) (Hawthorne and Stanley Smith,
1979; Stanley Smith and Hawthorne, 1974). These texts compile primarily decorative
metallurgical techniques, some of which can be traced to earlier Roman works, and
thus may have in part represented metallurgical knowledge available to Anglo-Saxon
smiths (Stanley Smith and Hawthorne, 1974, 3).
In particular these works are useful for describing the process by which certain
techniques were employed, such as the process of amalgam gilding and other surface
decoration techniques. A tenth of the recipes in Mappae Clauvicula describe methods of
coating things in gold, or making them appear to be gold (Raub, 1993, 104). One
surface treatment described in both works is how to colour tinning to look like gold
(tin leaf); this could be evidence of tinning in Anglo-Saxon contexts being used to
imitate gold rather than silver, although since the patination process involves only
organic compounds, it would be impossible to identify examples archaeologically
(Hawthorne and Stanley Smith, 1979, 24; Raub, 1993, 106; Stanley Smith and
Hawthorne, 1974, 44).
Theophilus, thought to the Benedictine monk Roger of Helmsmarshausen, covers a
wider range of craft techniques including pigment, enamel, and glass making
(Hawthorne and Stanley Smith, 1979, xv). He also wrote about metalworking on a fairly
comprehensive scale, starting with how to construct and organise a workshop,
chapters on a wide variety of tools, their purposes, and how best to make them, as well
as manipulating metals themselves and applying various surface decorations including
gilding and niello. There are chapters on melting and refining precious metals and
copper, as well as one on the process of brass cementation (Hawthorne and Stanley
Smith, 1979, 140). Cementation is also covered more briefly in Mappae Clauvicula
(recipe 74) (Stanley Smith and Hawthorne, 1974).
24
Although the practical applications of many of these recipes are questionable, they
exhibit the importance of the appearance of metalwork. They also demonstrate the
numerous methods of manipulating the surface of an object to appear like either gold
or silver or to take on various colours. While it is unclear how many of these recipes
would have been known to Anglo-Saxon metalworkers, these texts provide evidence of
the longstanding metalworking traditions that survived since the Roman period, at
least on the continent.
Skeuomorphism, or the use of a material to imitate the appearance of another material
(Vickers, 1989), occurs in many materials in the Anglo-Saxon period, for example the
use of red glass and enamel to imitate garnets, including a few examples of red glass
replacing missing garnets (Coatsworth and Pinder, 2002, 150). Tinning is also a
frequent and inexpensive method of coating an object in tin to give the appearance of
silver (Oddy, 1977, 129). Craddock (1978) notes that the appearance of brass to the
ancients was often indistinguishable from gold. The frequent use of brass for
decorative items was well established in the Roman period (Bayley and Butcher, 2004;
Bayley, 1998). The potential for the use of skeuomorphs is an important variable in
considering the aesthetic use of copper alloys, particularly in a system of limited
resources.
25
EARLY SAXON METALWORKING EVIDENCE
There is very little archaeological evidence of non-ferrous metalworking activity in the
Early Saxon period, with much of the non-ferrous Saxon evidence deriving from the
later 9th-11th centuries (Bayley, 1991). The lack of workshop evidence and the move
from the Roman town-based central economies to a scattered rural economy has led to
the suggestion that smiths in the Early Saxon period were itinerant (Bayley, 1991;
Caple, 1986; Hinton, 2005; Mortimer, 1990). This is supported by the one possible
excavated workshop at Yeavering in Northumberland, which is associated with a
seasonally occupied royal site (Tinniswood and Harding, 1991). However, in addition
to the scarcity of workshop evidence, there is also none for metal supply (e.g. metal
ingots, smelting, or mining) and few production remnants such as crucibles and
moulds. Much of what is assumed for Early Saxon metalworking practice is
extrapolated from the objects themselves and from a small number of contemporary
finds primarily from outside England (Leahy, 2003, 135).
EVIDENCE FROM EARLY SAXON ENGLAND
Metalworking evidence from Early Saxon England is exceedingly limited in scope. Most
metalworking evidence is ferrous in nature and is still limited in number. No ingots
have been found, and only a handful of objects to date relating to copper alloy object
production (Bayley, 1991; Hinton, 2005). One reason for this dearth of evidence is the
scarcity of excavated early settlements, although little has been found at those that
have been excavated. Much of what is assumed about metalworking during this period
is derived from contemporary practice elsewhere, or from later Middle Saxon
metalworking evidence.
MOULDS
Many objects such as brooches were probably cast using a two-piece clay mould, which
would allow for thin and therefore more economical objects to be produced
(Coatsworth and Pinder, 2002, 81). The settlement site of Mucking in Essex provides
rare examples of mould fragments and a crucible. Two fragments of one great square-
headed brooch clay piece mould found at Mucking are, “the first of its date to have been
26
found in England,” although similar moulds for such castings have also been at roughly
contemporary sites elsewhere (Jones, 1977, 119). It is likely that such moulds were the
method of casting the objects produced in Early Saxon England.
The scarcity of moulds may be explained by the quality of clay used. If indeed smiths
were itinerant, they may not have often had access to clay of a high quality for mould
making, and moulds may not have survived archaeologically due to a more friable,
structurally weak consistency. “Pieces of fired clay with variable sand content are
frequent finds of all periods at Mucking, so more mould fragments which have not
retained clear surface evidence of their function might still be confirmed” (Jones, 1977,
119). Other materials may also have been used; Jessup (1974, 47) suggests that casting
in, “a fine facing sand,” may account for the lack of moulds, but suitable sand would not
be available in most areas. Ingot moulds from other contexts and from later periods
were sometimes made “from reused Roman brick or tile” (Bayley, 1991, 118). Thus a
variety of materials could be used as moulds for copper alloys. A theme occurring
throughout copper alloy production in this period, the manufacture of moulds may
have been done using available local resources as they would be difficult to transport
en masse; the non-ideal nature of this practice led to the use of materials that were less
robust and therefore do not survive in the archaeological record.
MODELS
In order to produce a mould for casting, a model of the intended object is first made.
This can be out of a variety of materials, such as wood, bone, or (commonly in other
periods) wax. Three lead fragments of unknown provenance were probable lead
models of Saxon brooches (Mortimer, 1994). Examination of these indicates that they
were possibly a secondary model, derived from an initial model made in another
material such as wax, and then cast from a mould made from that primary model. The
lead model would provide a solid and more durable object for final touches to the
design as well as an example for potential customers as to the type of object that could
be produced. This could also allow for personalised design features to be added to the
final casting.
27
CRUCIBLES
Crucibles were probably made from locally available clays that were then mixed with
sand in order to withstand the high temperatures necessary (Coatsworth and Pinder,
2002, 66). Fragments of crucibles have been found at a few sites, although none have
been complete enough to determine the form of the vessel or if it were covered.
“Crucibles were small and handmade with capacities up to 20ml being typical” (Bayley,
1991, 117). This small crucible size is indicative of the types of casting objects in the
Early Saxon period; crucible size grew dramatically (up to five times larger) in later
Saxon contexts (Bayley, 1991, 117).
Twelve crucible fragments of probable Anglo-Saxon date have been recovered from the
metalworking site at Yeavering, one of which features a ‘greenish copper oxide’ stain
(Tinniswood and Harding, 1991, 103). All of these sherds were too fragmentary to be
diagnostic of a particular shape, although one may have come from a thumb-pot sized
crucible. XRF of the crucibles provides limited insight into their use as little was
detected, although copper was universally present and some tin was also identified,
indicating copper alloy metallurgy (Tinniswood and Harding, 1991, 105).
In the crucible excavated at Mucking, XRF analysis detected copper, zinc, lead and tin
residues in the ceramic fabric, confirming it was used to melt copper alloys
(Dungworth, 2000, 84). A crucible fragment was also found at Spong Hill in Norfolk
(Bayley, 1991, 121). Pear-shaped crucibles have been found at Hartlepool from c.700
CE, although these indicated use for silver melting rather than copper alloy (Bayley,
1988). Metalworking debris were found at West Heslerton but these were primarily
related to iron slag; “there is only one crucible from the site suggesting that any non-
ferrous metal working at West Heslerton was extremely limited or non-existent”
(Powlesland, 1999, 4.11.2). This is consistent with the concept of an itinerant smith,
visiting settlements occasionally to produce a small number of objects.
28
OTHER CONTEMPORARY EVIDENCE
There are several sites throughout northwest Europe that date to the migration period.
This is not an exhaustive discussion of contemporary evidence, but demonstrates the
sorts of finds common at other sites and the evidence that can be derived from them. It
is likely that similar technology was in use in Anglo-Saxon England, especially where
similar artefact production occurred.
Among these is the excavated metalworking workshop at Helgö in Sweden, which has
produced, “almost 50kg of mould fragments and about 300 kg of complete and
fragmentary crucibles” as well as several ingots and a host of other non-ferrous
metalworking evidence, dating from the late 5th- 9th century, with a concentration of 6th
century metalworking activity (Lamm, 1973, 1; Waller, 2002). The majority of the
crucibles were lidded, which would allow for greater retention of zinc in recycled
metal; such lidded crucibles are also found in other Scandinavian contexts and in
Ireland but few such examples have been found on the continent (Lamm, 1973, 2). The
moulds and crucibles are all constructed from the same ‘clay mixed with quartz’, a lack
of distinction between materials that may also have occurred in Saxon metalworking;
however, more quartz was included in the crucible fabric to increase the refractory
properties of the ceramic, while less was used in the moulds to enable casting details to
be preserved (Lamm, 1973, 2, 5). The c. 10,000 mould fragments are also of the two-
piece variety and many were for casting square-headed brooches, a form also common
in Anglian areas; it is possible that similar casting technology was utilised (Lamm,
1978, 105, 1973, 3). All of the decoration already was cast in the mould, indicating that
beyond simple finishing processes these brooches were not worked after casting
(Lamm, 1973, 3).
One of the more interesting aspects of the material recovered at Helgö is the
composition of the copper-alloy ingots. Four bar ingots as well as three rods were
analysed for composition. One rod may have been fairly pure copper, but three of the
bar ingots were brass, one rod was gunmetal, and the remaining ingot and rod were
both leaded gunmetals (Lamm, 1973, 7). The lack of pure ingredients and the
29
prefabricated nature of bulk metal used at this site may be indicative of wider practices
in metal trade (see Chapter 3).
At the Mote of Mark in Scotland, 6th-7th century non-ferrous metalworking evidence
was found in the form of crucible fragments. Surface XRF of these fragments detected
copper, tin, zinc, lead, silver and iron. It was speculated that this could be evidence of
brass-making continuity from the Roman period, but it is more likely to simply be
evidence of the alloys remelted and recycled in the crucibles (Swindells and Laing,
1977, 123). There were few copper alloys found on site, but these were all bronze and
leaded bronze in composition, supporting the idea that the presence of zinc was from
scrap rather than deliberate brass production (Swindells and Laing, 1977, 124). Trade
links between the Mediterranean and the Mote of Mark and other sites along the
‘Atlantic West’ such as Dinas Powys and Tintagel certainly existed up through the 7th
century and may have involved continental metalwork (Campbell, 2007, 140), but the
Celtic West continued to work predominantly in bronze throughout the period.
Lidded, pear-shaped crucibles have been found from 7th century contexts at Dinas
Powys in Wales, with both tin and zinc traces detected within them (Alcock, 1963).
Similar examples have also bee found in contemporary Dunadd in Argyll, along with
several other forms (and several hundred mould fragments) (Bayley, 1988; Coatsworth
and Pinder, 2002, 38). These date from between the 6th-9th centuries, with specific uses
associated with particular shapes, i.e. lidded crucibles with silver and the thicker,
hemispherical thimble-shaped crucibles used for copper alloys, with zinc being
detected more in the deeper examples (Bayley, 1988).
METAL ORE RESOURCES
The scarcity of trade evidence in the 5th-6th centuries compounds the difficulty of
identifying metal extraction and production. “With little evidence for primary
production of the raw metals until quite late in our period the jewellers… must have
secured supplies for themselves” (Brown, 1986, 333). There is evidence of contact if
not some trade with the continent, especially with Merovingian France (for Kent
30
particularly) and areas along the North Sea coast, including the Germanic homelands
and Scandinavia (Blades, 1995, 197, 223).
Roman production sites in Gaul may have continued to operate under Merovingian
rule, but there is no evidence yet of continental mining activity (Mortimer, 1990, 407;
Oddy, 1983). Though there is no evidence of metal being traded with the Anglo-Saxons,
it is thought that tin continued to be exported from Cornwall to the continent in this
period (Mortimer, 1990, 329; Oddy, 1983). In the west, there are no instances of
confirmed continued mining activities after the 4th century; some mining continued in
the eastern Empire, and some shipwrecks indicate a trade in metal from east to the
western Mediterranean, but even these seem to disappear by the 6th century
(McCormick, 2001, 44, 51).
Non-ferrous metal ore in Britain lies in the west, primarily in Wales and in Cornwall
and Devon, where any mining and trading of raw metal would have been controlled by
the Romano-Celtic population. It is likely that this region continued to exploit these
ores into the early medieval period (Leahy, 2003, 136). Brass was not known in Ireland
during the Roman period, and the combination of a Celtic tradition in bronze, the
hypothetical availability of tin from Cornwall led to a domination of bronze objects in
the west. Outside of the assumed tin and copper production of western Britain, “no
Scandinavian or continental evidence of primary metal extraction has been found
dating to this period” (Mortimer, 1990, 407). In addition to the lack of primary
extraction evidence in the West at this time, the vast majority of copper alloy
composition data from the Early Saxon period is of insufficient precision for trace
elemental analysis and has yet to produce significant evidence of any signature ore
source.
This situation has not improved in the past twenty years, although a recent study
examining metal deposition in peat bogs near historic mining sites in Devon and
Cornwall indicates a continued if low production of tin in this period, although the
authors did not identify this period as having any production (Meharg et al., 2012,
726). As figure 2.3 demonstrates, production of tin in southwest Britain decreased
rapidly from about 375 CE as control over the Roman province weakened, falling to a
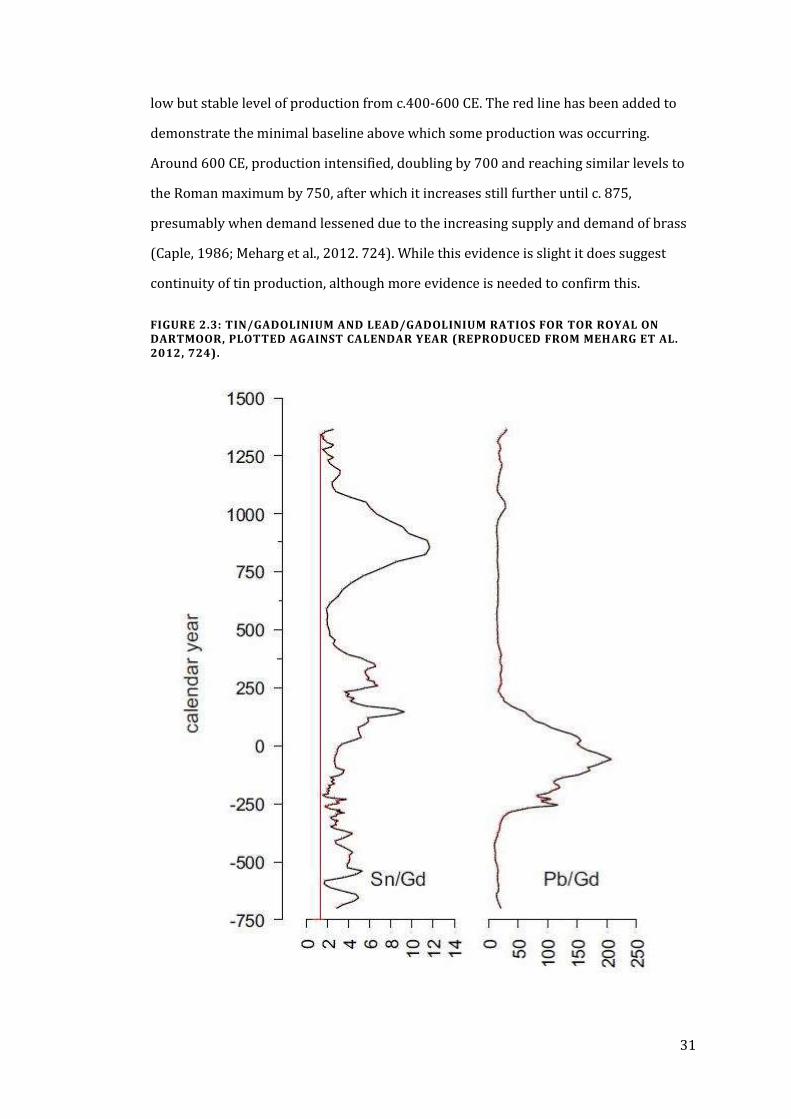
31
low but stable level of production from c.400-600 CE. The red line has been added to
demonstrate the minimal baseline above which some production was occurring.
Around 600 CE, production intensified, doubling by 700 and reaching similar levels to
the Roman maximum by 750, after which it increases still further until c. 875,
presumably when demand lessened due to the increasing supply and demand of brass
(Caple, 1986; Meharg et al., 2012. 724). While this evidence is slight it does suggest
continuity of tin production, although more evidence is needed to confirm this.
FIGURE 2.3: TIN/GADOLINIUM AND LEAD/GADOLINIUM RATIOS FOR TOR ROYAL ON DARTMOOR, PLOTTED AGAINST CALENDAR YEAR (REPRODUCED FROM MEHARG ET AL. 2012, 724).
32
Comparatively it is clear that lead production in this region disappeared by the mid 3rd
century and was not re-established during the Saxon period. As copper’s boiling point
is so much higher than tin and lead, it is, “less readily entrained atmospherically,” and
copper production cannot be identified in the peat bog cores until the industrial
revolution (Meharg et al., 2012, 725). However, higher silver trace amounts have been
identified in Early to Late Saxon metalwork compared to the Roman period, which is
consistent with copper ores from this area; this could indicate that copper mining
coincided with tin extraction in this region (Blades, 1995, 193). Additionally, as some of
these copper ores can produce ‘copper-derived lead’ it is possible that a low lead
content persisted in the copper produced, which could hypothetically account for
observed lead levels (Meharg et al., 2012, 726).
While copper production in southwest Britain cannot be concretely identified, evidence
from this study supports the hypothesis that tin production did continue throughout
the period, and interestingly suggests that lead was not being produced at all. It is likely
that copper was being produced somewhere in northwest Europe if not in southwest
Britain, although at a much lower rate than in the Roman period. If this region were the
source of copper and tin in this period, it could be because local production was only
partially linked to Roman occupation and was less disrupted as a result of the fall of the
Western Empire. Indeed, the Celtic West continued to have trade contact with the
Mediterranean into the 7th century, suggesting that the infrastructure necessary to
produce tradable goods (potentially including metal ore) was less affected than in
other regions (Hemer et al., 2013, 2358; Loveluck, 2012; Campbell, 2007).
Evidence for trade contacts with eastern England may be indicated by later patterns,
with trade in the 7th-9th century dominated by the Frisians, operating out of the
Rhineland by the late 6th century if not earlier (Hodges, 1989, 87). The shift from the
Rhône to the Rhine as a major communications artery between the west and the
Mediterranean in the 6th-8th century supports the premise that many goods from
farther afield, including the Byzantine world, travelled along this path (McCormick,
2001, 79). In general, the primary trade arteries during the migration period from the
continent emanated from the major riverine networks into the North Sea, with the sea
33
route from the Mediterranean probably only a ‘minor’ contributor, as much of such
trade was focused on the ‘Atlantic West’ (Campbell, 2007, 140; McCormick, 2001, 95).
It is possible that Early Saxon trade also primarily emanated from this direction, and
that fresh metal resources reached Anglo-Saxon regions via this pathway regardless of
its geographical origins. However, without further evidence of trade let alone
characterisation of possible ore sources in use at the time (for which there is no
evidence let alone analysis), it is impossible to specify a likely source of the copper
alloy metal supply, or even a probable region of origin.
Mortimer (1990, 358, 373) hypothesised that artefacts from the Anglo-Saxon west
would have higher tin and bronze frequency due to proximity to Celtic metal resources
(as Kent does have higher zinc averages due to proximity with Merovingian Gaul and
continental trade), but she found that this was not the case; indeed, the opposite is
somewhat indicated. The same could be hypothesised for the frequency of tinning
decoration, but again this is not backed by the data. If tinning was desirable and tin was
readily available as a pure metal, then it could be expected that both tinning and copper
alloys with lower tin contents would occur more frequently. Instead, the prevalence of
tinning occurs along major trade routes, with particular concentrations along the
Thames at places like Mucking, where larger quantities of metal would have been in
demand either locally or for disbursement farther upriver, and therefore where a
greater variety of metal resources may have been accessible (Hirst and Clark, 2009).
As pure metals, “lead and tin are found in small quantities” (Hinton, 2005, 36). While
lead was reportedly used to roof York Minster in 700, there are few leaded copper
alloys, and even objects with soldering are rare in Anglian areas (Hodges, 1989, 127).
Lead use is more prevalent at Mucking, where ingots have been found made from lead,
which was probably scavenged from nearby Roman villa ruins (Fleming, 2012, 21).
Lead extraction in Derbyshire is known from the Mid-Late Saxon (c.845) and lead was
used primarily as a solder, to roof churches, and to refine silver for coinage; however,
all of the archaeological evidence and indeed the use of silver coins and the presence of
churches in Anglo-Saxon England all date to the Mid-Late Saxon as well, and the Early
Saxon uses of lead remain comparatively scarce (Bayley 1992, 6-7).
34
Given the lack of production evidence for lead, its potential availability from Roman
sites, and its lack of use in most copper alloys in the period, lead does not appear to
have been in great demand as a raw material, at least not for use in copper alloys (its
use for other purposes, such as silver cupellation, is likely). It is possible that the
primary use of lead in metalworking was as secondary models for casting, since its
addition to the types of copper alloys in use would not necessarily improve
metallurgical properties, and for silver extraction.
RECYCLING
A major metal resource for copper alloy production was probably Roman scrap metal.
As trade routes disappeared or were not dependable, local self-sufficiency and efficient
materials management would have become a necessity. Recycling scrap metal would be
the sensible course of action, especially as the remains of a mass-producing empire
were widely available and metal recycling was already an established practice
(Dungworth, 1995; Mortimer, 1990, 406; Pliny, 1635). The grave of a possible metal-
smith from the seventh century contains a wide variety of scrap metal awaiting
remelting (Hinton, 2000). It was, “easier to acquire metal by scavenging than it was to
mine, make charcoal and smelt,” especially when significant scrap metal was readily
available (Fleming, 2012, 35). The use of scrap metal and the practice of recycling in
the Early Saxon period will be explored in Chapter 3.
35
COPPER ALLOY USE IN EARLY MEDIEVAL ENGLAND
The decline of metal production, the change in subsistence practices and the influence
of non-Romanised Germanic immigrants led to a change in the use of copper alloys in
post-Roman England. Large cast objects were no longer produced and indeed were no
longer in demand. The primary use of copper alloys became small cast or wrought
dress accessories, with most objects requiring both an aesthetic and utilitarian
function.
The abandonment of towns, the deterioration of trade routes and mass production of
resources led to other significant changes in the manufacture of copper alloy objects.
The population became ruralised and the metal production industry collapsed.
Specialisation of metalworking skills would likewise have diminished to a small group
of metalworkers who adapted to the new system, potentially travelling from settlement
to settlement producing small number of objects largely with locally available scrap.
The concept of an itinerant smith fits well with the lack of workshop evidence and the
crudity of the few surviving mould fragments; copper alloy manufacture shifted to a
more basic on-demand and geographically flexible system. The change in the
production and demand of copper alloys also has profound implications for strategies
of metal resource exploitation, leading to a shift in alloy compositions utilised. This
section will explore the conclusions reached in prior Early Saxon compositional
studies, and what these reveal about cultural and chronological alloy use.
PAST COMPOSITION STUDIES
A number of compositional studies have been conducted, mostly in the 1970s, 80s and
early 90s, with few contributions in the last fifteen years. Ironically, in 1991 Catherine
Mortimer stated that, “the study of early medieval copper alloys is in its infancy”
(Mortimer 1991, 105). Since then, only a handful of analyses have been done, and few
of these have been published. The majority of information about early medieval copper
alloys is derived from analyses over twenty years old. Indeed, the last time a major
investigation into Early Saxon metallurgy was attempted, it was still difficult to
36
examine data digitally; reappraisal of it is therefore a potentially enlightening
endeavour as the data has never been examined as a complete corpus.
LIMITATIONS OF PRIOR STUDIES
The earliest studies were limited in scope due to destructive investigative procedures,
and often the objects analysed came with little or no archaeological context, restricting
comparative discussions of chronology in particular. Many of these early studies also
sought only a few elements, often excluding major components such as tin or lead, or in
copper alloys, not looking for gold or silver where modern investigators may suspect to
find them. This lack of precision in methodology makes comparing this data to that
obtained with current methodology difficult. Additionally, a significant number of
studies were done qualitatively with surface XRF; while knowing what basic alloy the
objects are probably made of is more useful than no information, it can also be
misleading due to surface enrichment or assumptions on the part of the original
investigator. Another issue is that many studies (even excluding doctoral theses)
remain unpublished for up to 30 years. These limitations will be discussed in the
context of the specific confines of each study.
GOLD AND SILVER COINAGE
Several of the first early medieval period composition studies were on later silver
(sceattas) and gold (thrysmas) coins (Brown and Schweizer 1973, Hawkes et al 1966,
Merrick et al 1966, Metcalf et al 1980, Metcalf 1978). All of these were conducted using
XRF or milliprobe XRF. Unfortunately, many of these studies were those who sought a
limited number of elements, often excluding lead and occasionally tin or zinc. Few of
these studies on silver coinage sought tin because of the overlap of the K-α peak with
silver, making the data qualitative at best (Metcalf and Gilmore, 1980; Mortimer,
1986).
While it is to be expected that silver coins were often debased with copper, many
actually were debased with brass and bronze, probable in an attempt to add ‘white
metal’ to the mixture to cancel out the reddening effect of copper. Tin was widely used
to whiten debased silver coins, especially in sceattas from the south of England. In
37
Northumbria, brass was used to debase silver coins in the 9th century (Metcalf and
Gilmore, 1980). Although it is assumed that cementation technology necessary for the
production of brass was not in use in Britain after the Roman period until the late
medieval period, compositional data from Northumbrian coinage suggests that local
production of brass may have occurred from the reign of Eanred (Metcalf et al 1980,
Day 1998, Hawthorne 1979). King Eanred struck an estimated 8-9 million coins during
his reign (of at least 30 years in the first half of the 9th century), “calling for at least 10
tonnes of brass” (Metcalf et al 1980, 83). This brass was probably imported en masse
but it is also possible, as an important commodity controlled by the state, that it was
produced within the kingdom, possibly using calamine ores from the Mendips (Smythe,
1937).
This practice of debasing precious metal with copper alloy rather than copper alone
was not limited to coins, also occurring in Ostrogothic buckles and brooches in Italy
(Oddy, 1983). Thus the use of adding a copper alloy rather than copper alone to
improve the appearance of debased silver was a widespread phenomenon in later
Saxon and continental contexts.
38
SUTTON HOO
The analysis of copper alloy objects from Sutton Hoo was one of the early
compositional studies examining metalwork from the Early Saxon period and remains
the most influential concerning cultural alloy use. XRF on cleaned surfaces was used to
characterise the composition of copper alloys from Sutton Hoo as well as a number of
contemporary artefacts from the British Museum and the Ashmolean to provide
cultural context (Oddy, 1983). Cultural context is indeed what was found. Coptic
objects were found to be brass, the Celtic objects bronze, and the Anglo-Saxon objects
varied between the two. High tin bronze only occurs on the Celtic bowls as decorative
attachments meant to contrast with the colour of the base metal, with non-high tin
bronze attachments often tinned instead, and occasionally contrasted with brass foils
(Oddy, 1983, 303).
It is possible that the stag on the sceptre was a different alloy from the rest of the object
so as to contrast in colour, and that this was a deliberate action on the part of the
metalworker. Hughes states regarding the sceptre’s stag, “a 15% tin bronze is unusual.
The alloy is fairly hard, and would be a slightly different colour from the other
components of the sceptre” (Hughes et al 1979, 390). The other components are all
quaternary in composition, and although variable, “in all cases the rather yellowish
colour of the alloy would be very similar” (Hughes et al 1979, 390). The contrast
between a pale bronze of the stag and the yellower hue of gunmetal supports the idea
that the metal smith was able to select the alloy for the purpose of obtaining a specific
colour.
Other important observations from Sutton Hoo include the negative correlation
between zinc and tin, and the tendency of Anglo-Saxon objects to nearly universally
have both components present in significant amounts. As bronze, brass or gunmetal
are all functional alloys for the casting and working properties needed by Anglo-Saxon
metalworkers, little control was necessary. The most important conclusion to arise out
of the Sutton Hoo analyses is that there appears to be a clear, cultural distinction
between alloys used between the contemporary Celtic west and the Byzantine east.
39
This pattern of use is not unexpected given local availabilities of tin and brass to each
area, but there is no such distinction apparent in Early Saxon composition data.
QUALITATIVE STUDIES
There have been several qualitative studies conducted on copper alloy material from
the Early Saxon period. These were all done by surface XRF without cleaning the
surface of corrosion so as to be entirely non-destructive. The usefulness of this data is
questionable at best due to the influence of selective corrosion of components
migrating to the surface, making corroded surfaces nearly meaningless as sampling
surfaces (Dungworth, 1995, 195).
Qualitative data collected in the late 1970s and 1980s was published mostly in a
number of site reports such as Southampton, Hampshire; Spong Hill, Norfolk; Mucking,
Essex; Finglesham, Kent; Castledyke South, Lincolnshire; Hod Hill, Dorset; and Portway,
Andover, Hampshire (Cook and Dacre, 1985; Eagles and Mortimer, 1993; Hirst and
Clark, 2009; Manser, 1977; Mortimer and Wilthew, 1998; Wilthew, 1985, 1984). Such
data is usually relegated to the back of the site report or on microfiche and is not
incorporated into the general discussion.
The interpretation of already questionable qualitative data is not always reliable,
especially in the case of Finglesham. On several occasions objects are given a
descriptive alloy term that is blatantly incorrect or misleading (i.e. calling objects
bronze when zinc is a major component and no tin is present, not referring to an object
as gilded when significant gold is detected, arbitrary variability in terming things
leaded or not) (Wilthew, 1985, 371-380). The information from Spong Hill is not very
useful, as 59% can only be described as ‘unknown quaternary alloy.’ There is no
indication as to whether or not these objects contain enough lead to be leaded or
enough zinc or tin to be termed gunmetal, tin brass or zinc bronze, and little discussion
of the data to provide insight into the limited and unclear results. This inconsistency in
reporting and discussing the data makes the validity of any assumptions derived from
qualitative data even more untenable.
40
Despite these issues, some useful conclusions have been drawn from qualitative data.
The identification of silver or tin coatings or of gilding confirms the use of these surface
decoration techniques on many artefacts. Investigation of copper alloy pins found that
multiples of a single form were produced together in one location, allowing for more
unusual forms to all derive from one or only a few melting acts of a specific
composition (Wilthew, 1984). The simplest of pin types are the most variable in
composition, which could indicate that they were produced at several sites or over a
span of time. Suggesting deliberate control over alloying, however, is stretching the
limits of this data.
AVON VALLEY
A variety of brooch types from the Avon Valley were analysed by quantitative XRF of
metal drillings (Brownsword et al., 1984). These brooches, few of which were specified
by type in the article, come from grave contexts from the 5th-7th century. Eleven of the
73 brooches were gilded, two of which were also silvered or tinned, though as no
surface analysis was done neither are confirmed. Several of these samples were also
discussed in later publications (Brownsword and Hines, 1993; Carver et al., 2009).
Most of the brooches from the Avon Valley contain zinc at or below 2% and tin between
4-7%, with lead usually ranging between 1-5%. This conforms to a pattern of low-zinc
bronzes in England during this period. Brownsword suggests that this compositional
spread points towards recycling of scrap Roman brass, but as fifty-one of the brooches
have 2% or less brass, it is also possible that many of the alloys contain naturally
occurring zinc from the copper ore. Whether or not the composition of gilt brooches
was significantly different to those without decorative surface layers was not specified.
WATCHFIELD, OXFORDSHIRE
The Anglo-Saxon cemetery at Watchfield, Oxfordshire was excavated in the early
1980s, and semi-quantitative ED-XRF was done on the partially-cleaned surfaces of
forty copper alloy objects (Mortimer et al., 1986). The sampled objects comprise of
brooches, buckles, belt studs, strap ends, and various other metal fittings. Some surface
enrichment is certainly present in the handful of objects containing 30% or more tin,
41
but most of the data appears relatively sound. The high-tin objects may be tinned,
although the uniformity of the layer over pitting suggests they may be high-tin bronze
with some surface enrichment from corrosion.
All of the objects from Watchfield contained some zinc and tin, with a few potential
high tin bronzes and one fairly pure brass containing 24% zinc. Few objects have
significant lead but low levels are common. Mortimer suggests that the high zinc
content of this material, especially the brass, “points to the easy availability of brass of
some description at this time” (Mortimer et al., 1986, 40). The presence of a single
brass object does not particularly support this argument. Many of these objects contain
zinc in an amount compatible with the product of recycled Roman brass. Also, the one
high zinc alloy is a pair of tweezers, which could be an heirloom item dating to the
Roman period.
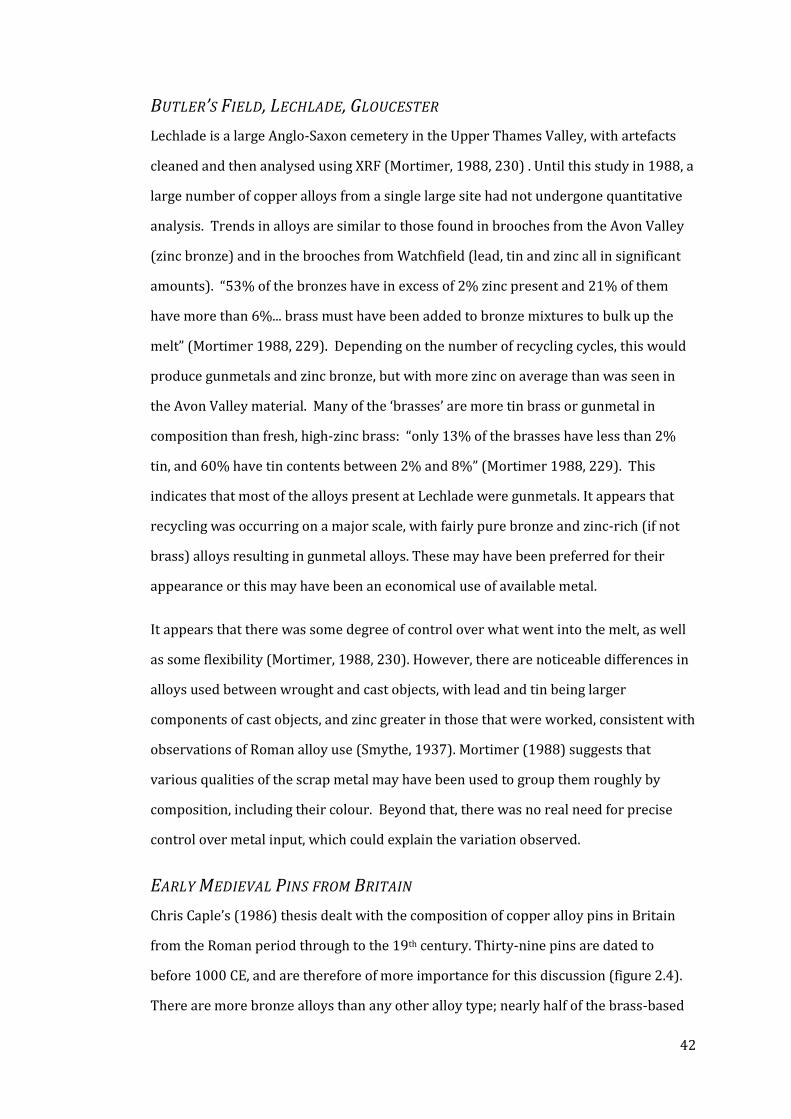
42
BUTLER’S FIELD, LECHLADE, GLOUCESTER
Lechlade is a large Anglo-Saxon cemetery in the Upper Thames Valley, with artefacts
cleaned and then analysed using XRF (Mortimer, 1988, 230) . Until this study in 1988, a
large number of copper alloys from a single large site had not undergone quantitative
analysis. Trends in alloys are similar to those found in brooches from the Avon Valley
(zinc bronze) and in the brooches from Watchfield (lead, tin and zinc all in significant
amounts). “53% of the bronzes have in excess of 2% zinc present and 21% of them
have more than 6%... brass must have been added to bronze mixtures to bulk up the
melt” (Mortimer 1988, 229). Depending on the number of recycling cycles, this would
produce gunmetals and zinc bronze, but with more zinc on average than was seen in
the Avon Valley material. Many of the ‘brasses’ are more tin brass or gunmetal in
composition than fresh, high-zinc brass: “only 13% of the brasses have less than 2%
tin, and 60% have tin contents between 2% and 8%” (Mortimer 1988, 229). This
indicates that most of the alloys present at Lechlade were gunmetals. It appears that
recycling was occurring on a major scale, with fairly pure bronze and zinc-rich (if not
brass) alloys resulting in gunmetal alloys. These may have been preferred for their
appearance or this may have been an economical use of available metal.
It appears that there was some degree of control over what went into the melt, as well
as some flexibility (Mortimer, 1988, 230). However, there are noticeable differences in
alloys used between wrought and cast objects, with lead and tin being larger
components of cast objects, and zinc greater in those that were worked, consistent with
observations of Roman alloy use (Smythe, 1937). Mortimer (1988) suggests that
various qualities of the scrap metal may have been used to group them roughly by
composition, including their colour. Beyond that, there was no real need for precise
control over metal input, which could explain the variation observed.
EARLY MEDIEVAL PINS FROM BRITAIN
Chris Caple’s (1986) thesis dealt with the composition of copper alloy pins in Britain
from the Roman period through to the 19th century. Thirty-nine pins are dated to
before 1000 CE, and are therefore of more importance for this discussion (figure 2.4).
There are more bronze alloys than any other alloy type; nearly half of the brass-based
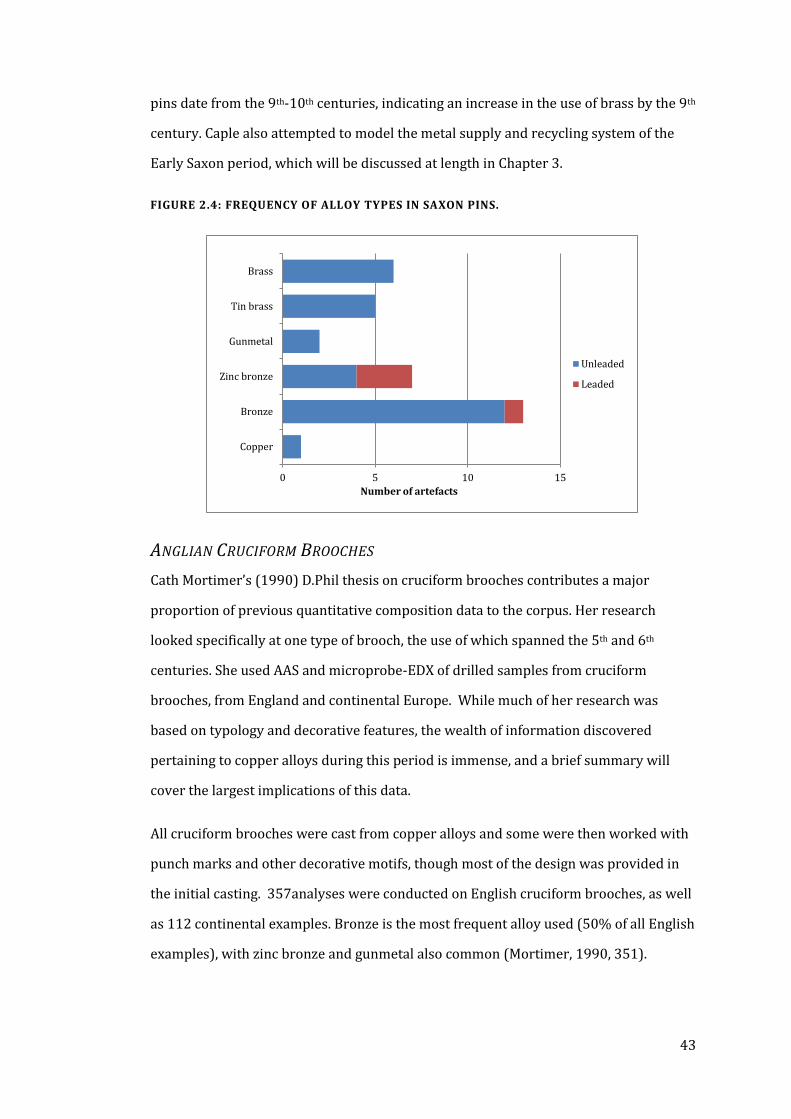
43
pins date from the 9th-10th centuries, indicating an increase in the use of brass by the 9th
century. Caple also attempted to model the metal supply and recycling system of the
Early Saxon period, which will be discussed at length in Chapter 3.
FIGURE 2.4: FREQUENCY OF ALLOY TYPES IN SAXON PINS.
ANGLIAN CRUCIFORM BROOCHES
Cath Mortimer’s (1990) D.Phil thesis on cruciform brooches contributes a major
proportion of previous quantitative composition data to the corpus. Her research
looked specifically at one type of brooch, the use of which spanned the 5th and 6th
centuries. She used AAS and microprobe-EDX of drilled samples from cruciform
brooches, from England and continental Europe. While much of her research was
based on typology and decorative features, the wealth of information discovered
pertaining to copper alloys during this period is immense, and a brief summary will
cover the largest implications of this data.
All cruciform brooches were cast from copper alloys and some were then worked with
punch marks and other decorative motifs, though most of the design was provided in
the initial casting. 357analyses were conducted on English cruciform brooches, as well
as 112 continental examples. Bronze is the most frequent alloy used (50% of all English
examples), with zinc bronze and gunmetal also common (Mortimer, 1990, 351).
0 5 10 15
Copper
Bronze
Zinc bronze
Gunmetal
Tin brass
Brass
Number of artefacts
Unleaded
Leaded
44
There are some divisions in alloy use by type of cruciform brooch, which may be
indicative of chronological changes in metal availability (figure 2.5). “Each of the major
typological groupings… have some examples of each of the common alloy types,” while
the style of brooches changed over time the metal supply and usage pattern did not
change significantly (Mortimer 1990, 377). Despite this, some chronological trends do
emerge. Early type A brooches were usually leaded bronze, perhaps following the
tradition of Roman cast alloys, with some brass and gunmetal examples as well. A shift
from purer bronzes and brasses in the early period towards a more mixed range of
alloys by the 6th century is evident, which could be the effect of a heightened level of
metal recycling; zinc bronze was not used in early brooches but is the second most
common alloy type in the later examples. Additionally, the observed reduction of lead
in later brooches is likely tied to the frequent use of gilding, tinning and silvering on Z
types; the use of impure copper and more copper-rich alloys for these gilt examples
could be linked to the fact that the underlying metal was not seen and copper was the
cheapest available metal (Mortimer, 1990, 378).
Some regional patterns were identified. The main distribution of cruciform brooches
extends from East Anglia through the midlands and south of England, with a few
brooches in Kent and in Anglian Northumbria. While types of alloys remain fairly
constant throughout, brooches in Kent contain more zinc on average than elsewhere,
possibly due to trade links with and proximity to the continent (Mortimer, 1990, 372).
However, other objects from Kent (i.e. from Finglesham and Mill Hill) are not especially
zinc-rich, though this may be a result of the limited potential of qualitative data, a bias
from specific artefact types, and dezincification of corroded surfaces.
There are very few ‘true bronzes’ from the west and the Midlands, disproving the
heightened availability hypothesised from proximity to Celtic tin-producing regions
(Mortimer, 1990, 373). However, while the data suggests this, the sample size from the
west is small and statistically inconclusive; further data from the Saxon West is needed
to clarify this trend. On a more local scale, certain sites have concentrations of
particular alloys; for example, the majority of cruciform brooches from Highdown Hill
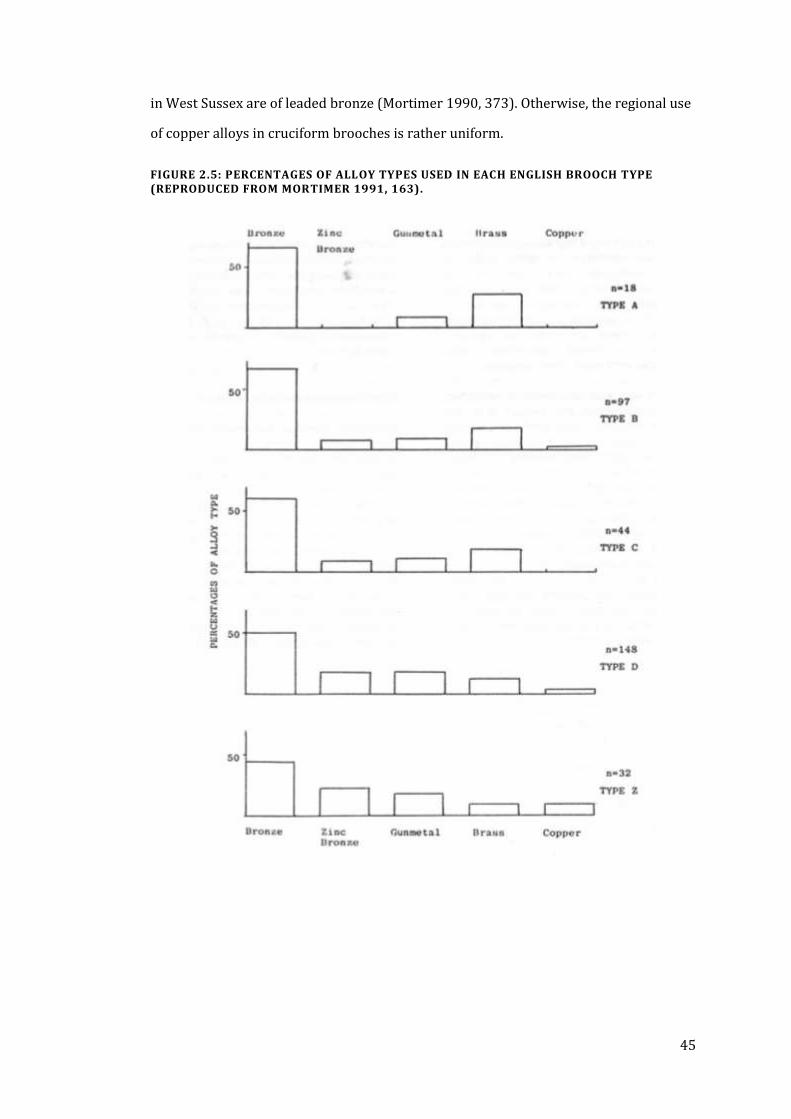
45
in West Sussex are of leaded bronze (Mortimer 1990, 373). Otherwise, the regional use
of copper alloys in cruciform brooches is rather uniform.
FIGURE 2.5: PERCENTAGES OF ALLOY TYPES USED IN EACH ENGLISH BROOCH TYPE (REPRODUCED FROM MORTIMER 1991, 163).
46
GREAT SQUARE-HEADED BROOCHES
Square-headed brooches date from roughly the same period and geographical area as
cruciform brooches and were manufactured in a similar way. 110 square-headed and
great square-headed brooches were analysed by Brownsword (Brownsword and
Hines, 1993; Hines, 1997). Several of the brooch pairs have compositions quite similar
even at the trace element level, indicating that they were cast from the same melt,
while others are more variable. The other brooch pairs may have been part of one melt,
with segregation of some of the elements, and some pairs are obviously made from
different metal. This is the same patterning of brooch pair alloys seen in cruciform and
saucer brooch data (Caple, 2010; Mortimer, 1990). Compositionally, these brooches are
usually bronze or bronze with 2-6% zinc. Brass is infrequent but a few examples do
occur. Despite their large size, none of these brooches contain over 5% lead, which is
likely related to the typically gilt and silvered surfaces of these brooches.
Great square-headed brooches tend to be found in groups, with certain cemeteries
containing many, while others within the region have few or none. This could be
evidence that disbursement of this brooch type occurred through practices of gift-
giving or inter-regional marriage, or that brooches were produced in batches,
consistent with the concept of an itinerant smith. Itinerant production is not reflected
in any similarity of alloy use in brooches from a single site, although this could simply
be the consequence of the large quantity of metal necessary for the size of these
brooches necessitating the use of various recycled sources (Hines, 1997, 308).
Compared to the work done by Bayley and Butcher (2004) on Roman brooch types,
which found that alloy use was usually fairly homogenous within a specific type, the
compositions of cruciform and great square-headed brooches suggests a deviation
from Roman patterns of brooch production. These Anglo-Saxon brooch types do not
have homogenous compositions even within subtypes, indicating that such control was
either not possible or not important. However, it must be considered that many of the
brooch types featuring such homogeneity occur within a short timespan and in the
earlier part of the Roman period, when there was more distinction between binary
alloys and less mixed recycling. The heterogeneity of Anglo-Saxon brooches is
47
consistent with much of late Roman metal recycling and is not necessarily a departure
in the use of copper alloys for display items.
NIGEL BLADES
Nigel Blades (1995) was the last to conduct compositional analysis on a large number
of Early Saxon artefacts. His work represents a substantial contribution of analyses, but
with few conclusions beyond broad chronological trends. The range of object types
represented in his corpus is considerable, with everything from copper alloy dress
items to metalworking waste materials and ingots from the Late Roman to the Post-
Medieval period.
Figures 2.6-2.9 display the range and spread of alloying component content by time
period from Blades’s data. The Roman material has a smaller range in all alloying
components than is typical in later periods. This may reflect a greater awareness of the
materials used to create objects and the acceptable ranges of alloys for specific
purposes. However, if this is the case, the later material exhibits similar symptoms of
‘control’ in that the majority of objects were generally more similar and possibly
therefore more controlled in terms of intended compositional outcome.
The copper content in copper alloys reveals similarity between the Roman and Middle
Saxon periods, with copper making up 75% or more of most copper alloy objects and a
similar average spread from 78% to 88% copper (figure 2.6). As brass generally
contains more zinc than bronze does tin, the contraction of the copper interquartile
range in the Early Saxon period reflects the scarcity of zinc-rich alloys.
Figure 2.7 reveals the effect of recycling on average zinc content. The Romans
produced fresh brass and brass was certainly produced during the Middle Saxon period
with increased continental and Scandinavian contact, but there is no evidence of new
brass being made in Britain in the years 450-650. Thus while a few artefacts (imports)
have brass-level zinc content, there is a very tight grouping in this period between 2-
4% zinc. Few artefacts from this period have no zinc or zinc above about 6-7% besides
those that are clearly imported. The effect of metal recycling is reflected by this
compositional spread, which Blades credits to the use of Roman scrap (Blades, 1995,
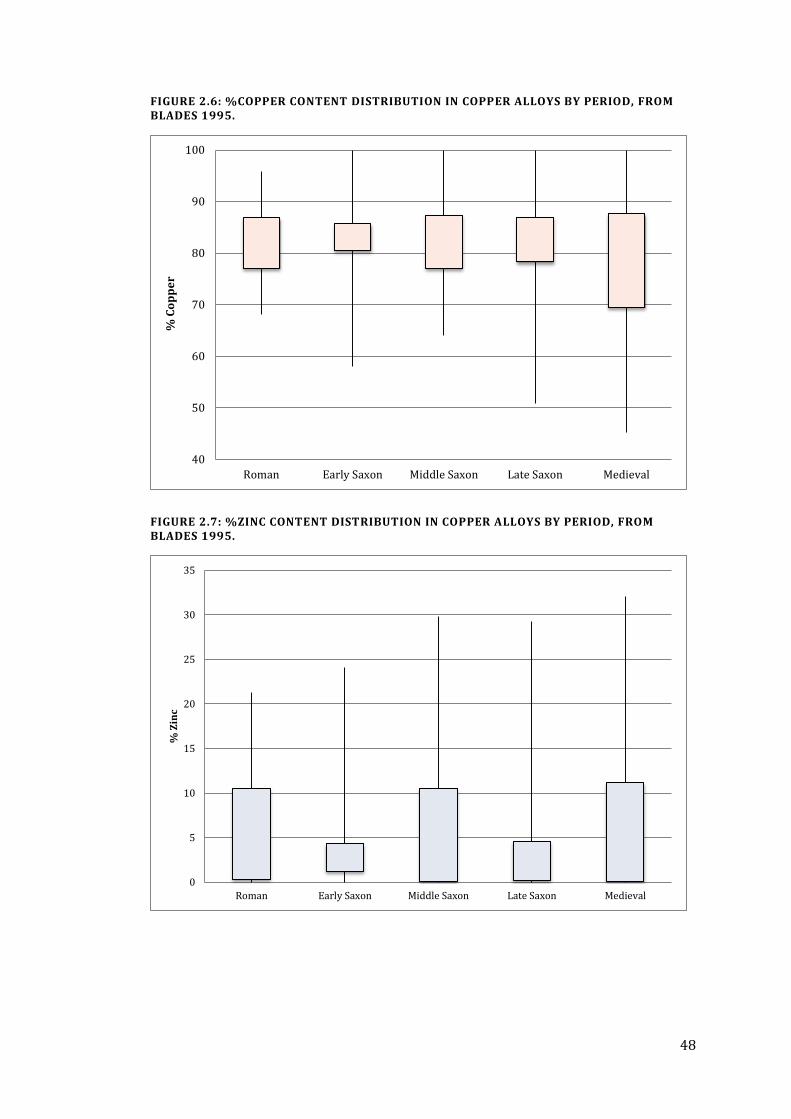
48
FIGURE 2.6: %COPPER CONTENT DISTRIBUTION IN COPPER ALLOYS BY PERIOD, FROM BLADES 1995.
FIGURE 2.7: %ZINC CONTENT DISTRIBUTION IN COPPER ALLOYS BY PERIOD, FROM BLADES 1995.
40
50
60
70
80
90
100
Roman Early Saxon Middle Saxon Late Saxon Medieval
% C
op
pe
r
0
5
10
15
20
25
30
35
Roman Early Saxon Middle Saxon Late Saxon Medieval
% Z
inc
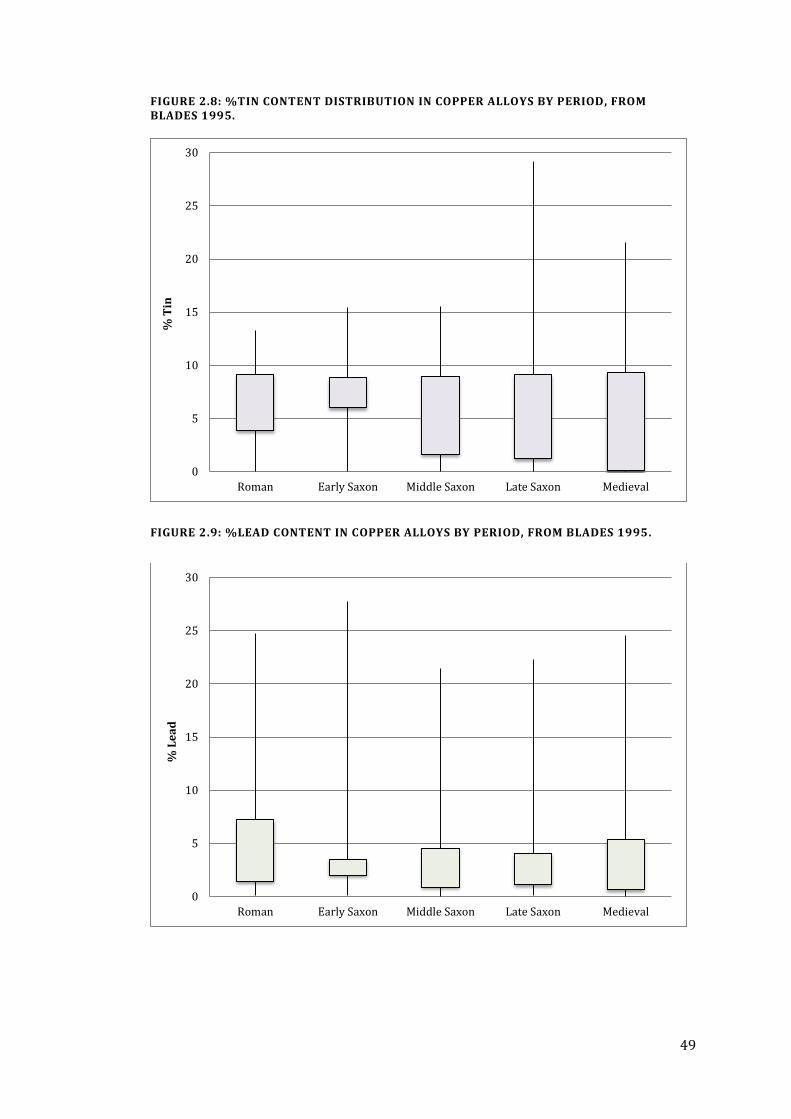
49
FIGURE 2.8: %TIN CONTENT DISTRIBUTION IN COPPER ALLOYS BY PERIOD, FROM BLADES 1995.
FIGURE 2.9: %LEAD CONTENT IN COPPER ALLOYS BY PERIOD, FROM BLADES 1995.
0
5
10
15
20
25
30
Roman Early Saxon Middle Saxon Late Saxon Medieval
% T
in
0
5
10
15
20
25
30
Roman Early Saxon Middle Saxon Late Saxon Medieval
% L
ea
d
50
145-6). The clustering of Early Saxon zinc content above 0% marks a departure from
zinc content in all other periods and is indicative of the lack of pure bronze.
Blades also notes that there is less of a distinction between Early Saxon uses of lead in
wrought and cast alloys compared to all other periods; what he does not specify is that
this results not in the use of leaded alloys in inappropriate fabrication situations, but in
a lack of lead in the majority of alloys (figure 2.9; Blades, 1995, 220). This is indicative
not of a lack of control in alloying, but of the absence of lead in the metal supply system,
which given it is likely to be heavily dependent on the recycling of Roman alloys could
reflect a deliberate avoidance of lead-rich alloys.
BUCKLES FROM MILL HILL IN KENT
Twenty-nine copper alloy buckles from the 5th-7th century cemetery at Mill Hill, Deal,
Kent were analysed by AAS and SEM-EDAX (Parfitt and Brugmann, 1997, 261-266).
The composition of these buckles fits well with established trends with the exception
that lead is more frequently present than usual, with over 60% with over 5% lead and
five samples containing over 10% lead. This is far more than is usually seen in copper
alloys in the period and may indicate local access to lead; however, the high tin content
in many of these also may suggest that tin and lead enrichment from corrosion is a
factor. Copper content in these brooches decreased later in the period, which seems to
be tied to tin content as the tin to lead ratio increases (Parfitt and Brugmann, 1997,
265). However, with such a small sample it is difficult to draw any statistically sound
conclusions regarding these observations.
SAUCER BROOCHES – ANCESTOR ARTEFACTS
Caple (2010) discusses the composition of saucer brooch pairs analysed by Northover
in the 1980s, which were previously unpublished. This sample group consists of
twenty-six brooches comprising thirteen pairs. The similarity of composition between
pairs was a focus of the discussion, particularly the similarity of zinc content between
pairs of otherwise variable composition. This consistency in zinc use was suggested to
be from the splitting of an ‘ancestor’ or heirloom object between the metal being
remelted for the casting. This article will be discussed more fully in Chapters 3 and 10.
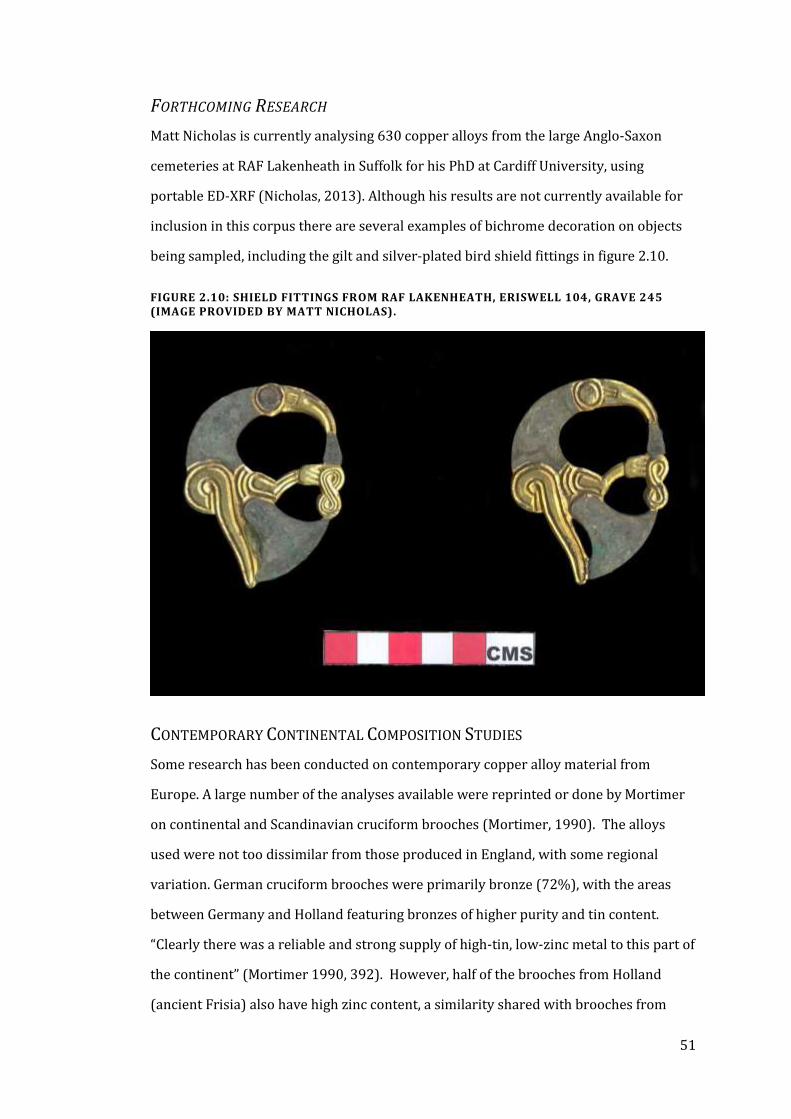
51
FORTHCOMING RESEARCH
Matt Nicholas is currently analysing 630 copper alloys from the large Anglo-Saxon
cemeteries at RAF Lakenheath in Suffolk for his PhD at Cardiff University, using
portable ED-XRF (Nicholas, 2013). Although his results are not currently available for
inclusion in this corpus there are several examples of bichrome decoration on objects
being sampled, including the gilt and silver-plated bird shield fittings in figure 2.10.
FIGURE 2.10: SHIELD FITTINGS FROM RAF LAKENHEATH, ERISWELL 104, GRAVE 245 (IMAGE PROVIDED BY MATT NICHOLAS).
CONTEMPORARY CONTINENTAL COMPOSITION STUDIES
Some research has been conducted on contemporary copper alloy material from
Europe. A large number of the analyses available were reprinted or done by Mortimer
on continental and Scandinavian cruciform brooches (Mortimer, 1990). The alloys
used were not too dissimilar from those produced in England, with some regional
variation. German cruciform brooches were primarily bronze (72%), with the areas
between Germany and Holland featuring bronzes of higher purity and tin content.
“Clearly there was a reliable and strong supply of high-tin, low-zinc metal to this part of
the continent” (Mortimer 1990, 392). However, half of the brooches from Holland
(ancient Frisia) also have high zinc content, a similarity shared with brooches from
52
across the Channel in Kent. This suggests that the Rhineland may have been trading
with Cornwall for tin, while the area around the Meuse and Merovingian France had
access to calamine ore and a continuing production of fresh brass. However, little can
be said with confidence on the basis of a handful of analyses; further compositional
work in this region could be particularly illuminating.
EKETORP, SWEDEN
Thirty-one brooches were analysed from Eketorp, Öland, Sweden (Näsman, 1973).
Traces of copper alloy casting were found at this site, though there was no evidence for
a permanent caster on site, implying that metalworking may have been conducted by
an itinerant smith (Näsman 1973). The compositions of the brooches were highly
variable, supporting the idea that limited scrap metal was being used as available
(Näsman 1973, 100). Scrap metal was certainly available in Scandinavia and the use of
scrap metal reflects the use of copper alloys in contemporary England (Mortimer, 1990,
406).
BELGIAN BOWLS
Werner (1967) analysed twenty bowls dating from the 4th-5th century from Haillot and
other sites in Belgium. All of these Belgic bowls are bronze, though those from Haillot
contain much more lead (12-20% compared to 0.2-5% elsewhere). These bowls do not
contain the trace amounts of zinc characteristic of contemporary Saxon bronze. Werner
infers that these artefacts were made from recycled Roman material, “reclaimed from
the ruins and tombs of the Romans,” as the compositions are so similar to those seen in
the Roman period (own translation; Werner, 1967, 314). If true, there was decent
control over the input of scrap metal as there is no zinc present in any of the bowls. It is
also possible that fresh metal resources were available in Belgium into the 5th century.
53
COPPER ALLOY USE
The use of copper alloys can help define the dynamics of the system in terms of
available metal, both in the form of fresh metal and the scrap left over from previous
generations. This section explores the corpus of previous quantitative compositional
data in full in order to compare it to the preceding and following periods in an effort to
explain the potential metallurgical or cultural constraints.
Combining all previous quantitative data from the early medieval period, there are
1091 quantitatively analysed copper alloy artefacts from Early Saxon England (Blades,
1995; Brownsword and Hines, 1993; Brownsword et al., 1984; Bruce-Mitford and
Evans, 1978; Caple, 2010, 1986; Craddock et al., 2010; Hines, 1997; Mortimer and
Anheuser, 1998; Mortimer, 1986, 1998, 1990; Oddy, 1983; Oddy et al., 1986, 1979;
Parfitt and Brugmann, 1997; Werner, 1967). While the divisions are largely arbitrary,
there are three main alloy types in use in the Early Saxon period (figure 2.11): bronze
(41% of copper alloys), zinc bronze (26%), and gunmetal (25%). Copper alloys with
zinc as the major alloying component (i.e., variations on brasses) are scarce and zinc
content even in these is often low. Leaded alloys occur within each of these groups, but
more so in bronzes particularly, as well as in the other high-frequency alloys. Of the
most frequently used copper alloy types, the underlying commonality is bronze; all
three require bronze in some form, and the high frequency of relatively pure bronze
implies some form of fresh metal supply was available.
If there was brass production in Roman Britain as Bayley (1984, 1) suggests, the lack of
pure brasses is evidence towards the loss of cementation technology in Britain during
this period. There are only forty-three brasses containing over 15% zinc from Anglo-
Saxon England. This is only 3.9% of copper alloys compared to 14% in the Roman
Period and13%% in the Mid-to-Late Saxon (Blades, 1995; Caple, 1986; Oddy et al.,
1986; White, 1982). Even including lower zinc brasses and tin brasses (5-15% Zn, with
up to 3% tin present), this proportion only increases to 6.2% of copper alloys. In this
study, only four samples had over 15% zinc (and all were from a single site), which
would qualify less than 2% of these artefacts as high-zinc brass, making them slightly
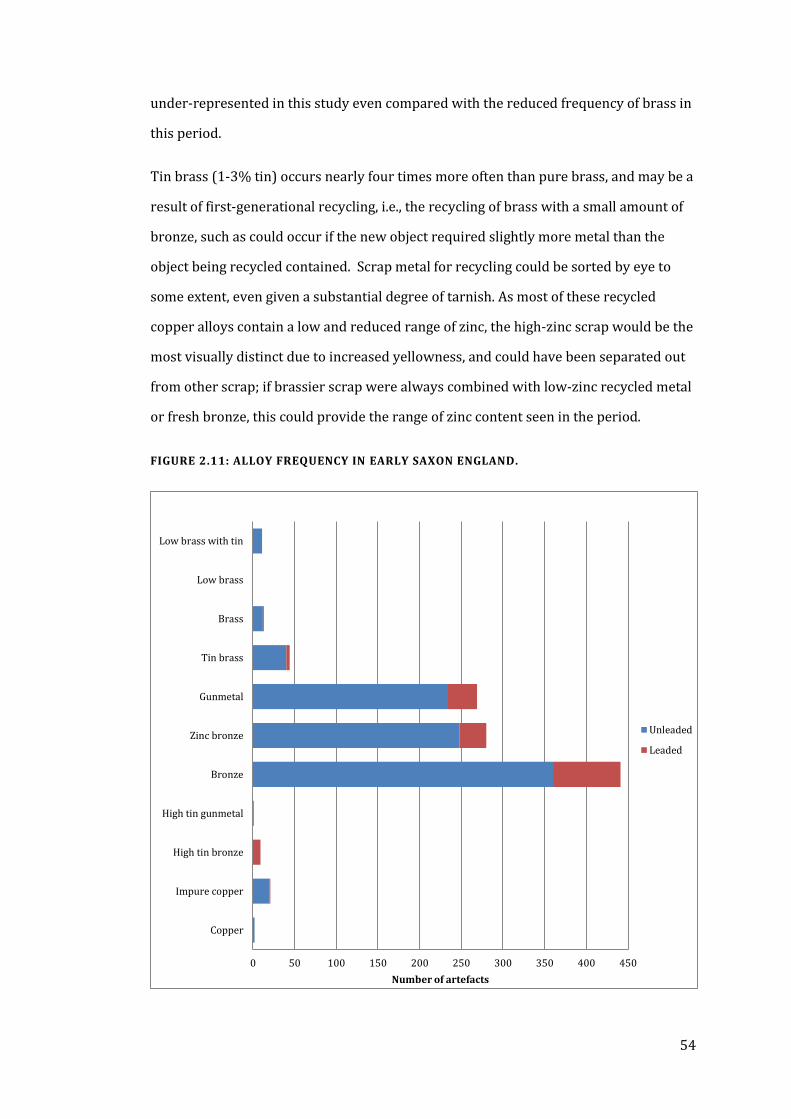
54
under-represented in this study even compared with the reduced frequency of brass in
this period.
Tin brass (1-3% tin) occurs nearly four times more often than pure brass, and may be a
result of first-generational recycling, i.e., the recycling of brass with a small amount of
bronze, such as could occur if the new object required slightly more metal than the
object being recycled contained. Scrap metal for recycling could be sorted by eye to
some extent, even given a substantial degree of tarnish. As most of these recycled
copper alloys contain a low and reduced range of zinc, the high-zinc scrap would be the
most visually distinct due to increased yellowness, and could have been separated out
from other scrap; if brassier scrap were always combined with low-zinc recycled metal
or fresh bronze, this could provide the range of zinc content seen in the period.
FIGURE 2.11: ALLOY FREQUENCY IN EARLY SAXON ENGLAND.
0 50 100 150 200 250 300 350 400 450
Copper
Impure copper
High tin bronze
High tin gunmetal
Bronze
Zinc bronze
Gunmetal
Tin brass
Brass
Low brass
Low brass with tin
Number of artefacts
Unleaded
Leaded
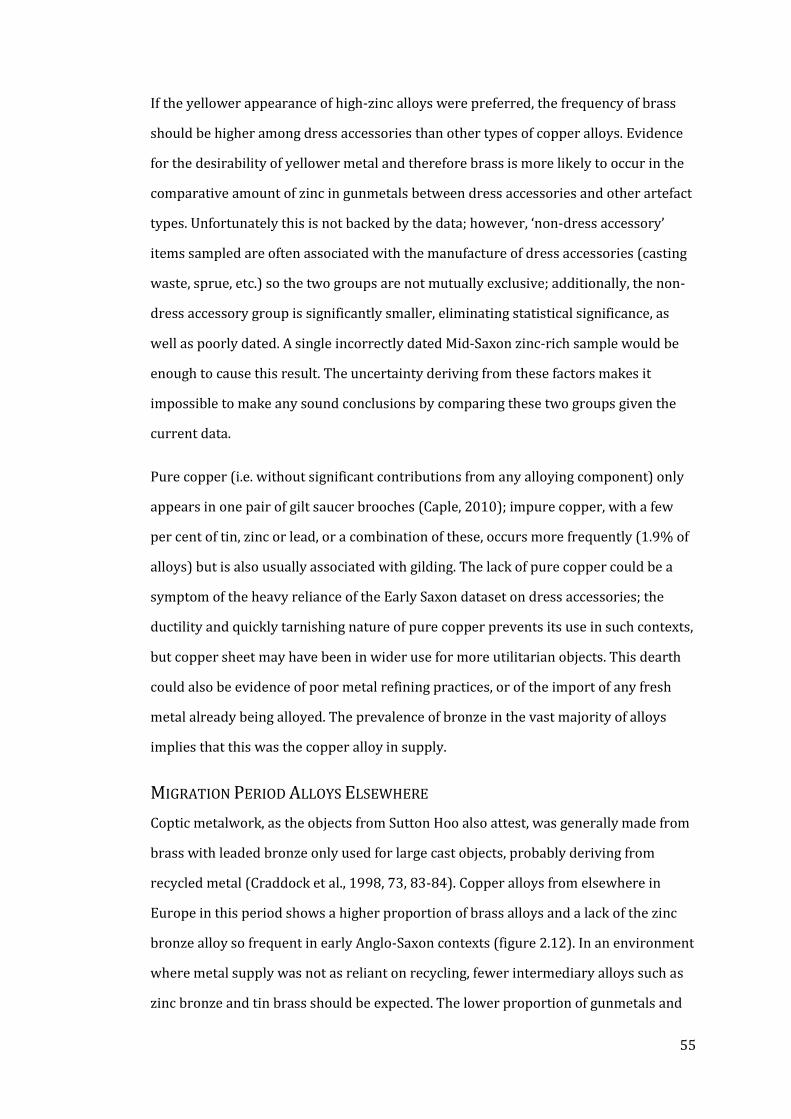
55
If the yellower appearance of high-zinc alloys were preferred, the frequency of brass
should be higher among dress accessories than other types of copper alloys. Evidence
for the desirability of yellower metal and therefore brass is more likely to occur in the
comparative amount of zinc in gunmetals between dress accessories and other artefact
types. Unfortunately this is not backed by the data; however, ‘non-dress accessory’
items sampled are often associated with the manufacture of dress accessories (casting
waste, sprue, etc.) so the two groups are not mutually exclusive; additionally, the non-
dress accessory group is significantly smaller, eliminating statistical significance, as
well as poorly dated. A single incorrectly dated Mid-Saxon zinc-rich sample would be
enough to cause this result. The uncertainty deriving from these factors makes it
impossible to make any sound conclusions by comparing these two groups given the
current data.
Pure copper (i.e. without significant contributions from any alloying component) only
appears in one pair of gilt saucer brooches (Caple, 2010); impure copper, with a few
per cent of tin, zinc or lead, or a combination of these, occurs more frequently (1.9% of
alloys) but is also usually associated with gilding. The lack of pure copper could be a
symptom of the heavy reliance of the Early Saxon dataset on dress accessories; the
ductility and quickly tarnishing nature of pure copper prevents its use in such contexts,
but copper sheet may have been in wider use for more utilitarian objects. This dearth
could also be evidence of poor metal refining practices, or of the import of any fresh
metal already being alloyed. The prevalence of bronze in the vast majority of alloys
implies that this was the copper alloy in supply.
MIGRATION PERIOD ALLOYS ELSEWHERE
Coptic metalwork, as the objects from Sutton Hoo also attest, was generally made from
brass with leaded bronze only used for large cast objects, probably deriving from
recycled metal (Craddock et al., 1998, 73, 83-84). Copper alloys from elsewhere in
Europe in this period shows a higher proportion of brass alloys and a lack of the zinc
bronze alloy so frequent in early Anglo-Saxon contexts (figure 2.12). In an environment
where metal supply was not as reliant on recycling, fewer intermediary alloys such as
zinc bronze and tin brass should be expected. The lower proportion of gunmetals and
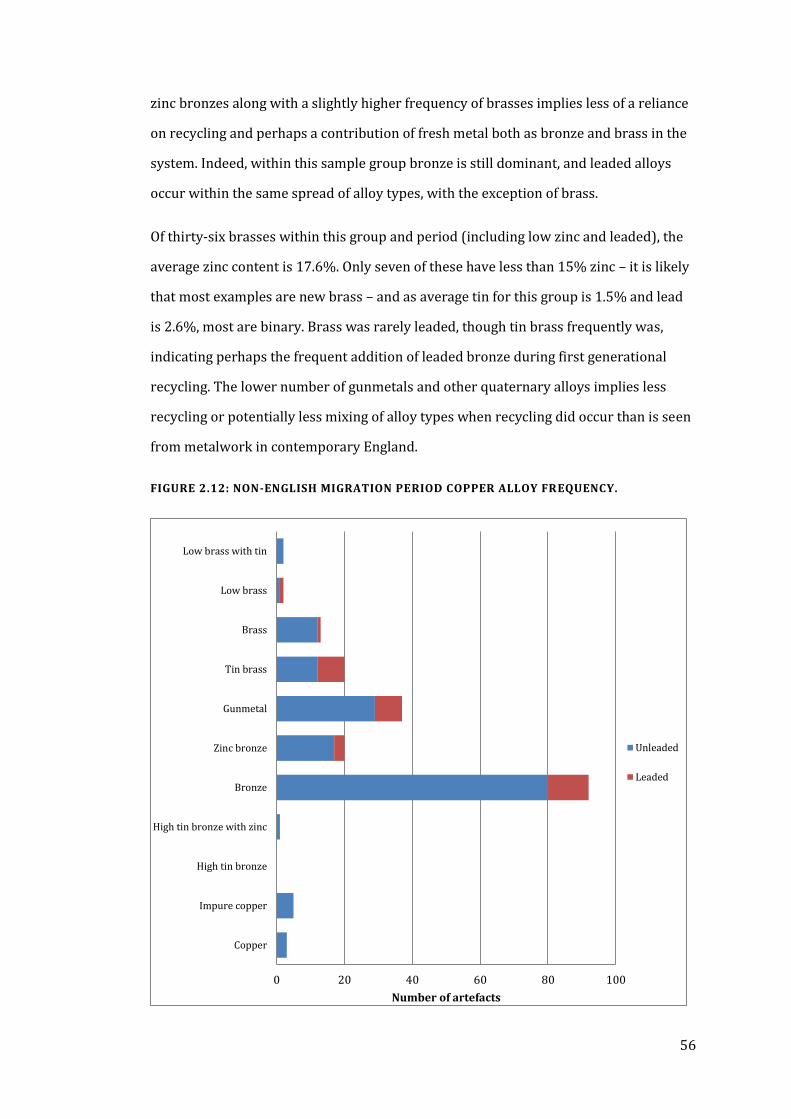
56
zinc bronzes along with a slightly higher frequency of brasses implies less of a reliance
on recycling and perhaps a contribution of fresh metal both as bronze and brass in the
system. Indeed, within this sample group bronze is still dominant, and leaded alloys
occur within the same spread of alloy types, with the exception of brass.
Of thirty-six brasses within this group and period (including low zinc and leaded), the
average zinc content is 17.6%. Only seven of these have less than 15% zinc – it is likely
that most examples are new brass – and as average tin for this group is 1.5% and lead
is 2.6%, most are binary. Brass was rarely leaded, though tin brass frequently was,
indicating perhaps the frequent addition of leaded bronze during first generational
recycling. The lower number of gunmetals and other quaternary alloys implies less
recycling or potentially less mixing of alloy types when recycling did occur than is seen
from metalwork in contemporary England.
FIGURE 2.12: NON-ENGLISH MIGRATION PERIOD COPPER ALLOY FREQUENCY.
0 20 40 60 80 100
Copper
Impure copper
High tin bronze
High tin bronze with zinc
Bronze
Zinc bronze
Gunmetal
Tin brass
Brass
Low brass
Low brass with tin
Number of artefacts
Unleaded
Leaded
57
BEFORE AND AFTER
In the preceding and following periods, copper alloy use is markedly different. Brass
was more frequently used in the Roman period although Blades (1995, 143) noted that
by the 3rd-4th centuries it rarely contained the maximum limit of zinc, with brass often
below 20%, indicating that recycling was already occurring even if the alloy types were
not as mixed in the process (figure 2.13). “Both the brasses and bronzes are pure
enough to suggest that they were made from first generation metal, or carefully sorted
scrap – otherwise one would expect more gunmetals to be present” (Blades, 1995,
141). Brasses were reserved for display items, wrought work, or wire, with only one
large cast Roman brass and no small cast examples in Blades’ corpus. If Bayley and
Butcher’s massive corpus of brooch compositions is added, the alloy frequency is
drastically changed (figure 2.14).
FIGURE 2.13: ROMAN ALLOY FREQUENCY FROM BLADES 1995 (N = 66); REPRESENTING THE FREQUENCY OF A WIDE VARIETY OF OBJECT TYPES.
0 5 10 15 20 25 30
Impure copper
Bronze
Zinc bronze
Gunmetal
Tin brass
Brass
Number of artefacts
Unleaded
Leaded
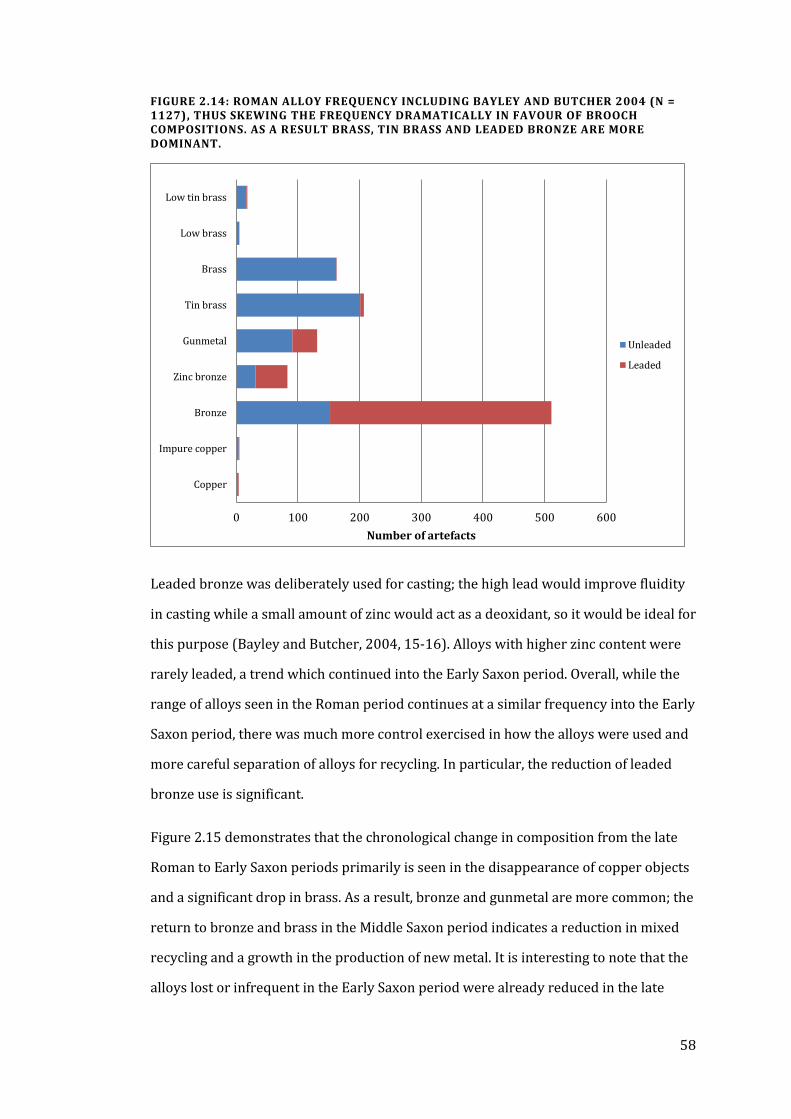
58
FIGURE 2.14: ROMAN ALLOY FREQUENCY INCLUDING BAYLEY AND BUTCHER 2004 (N = 1127), THUS SKEWING THE FREQUENCY DRAMATICALLY IN FAVOUR OF BROOCH COMPOSITIONS. AS A RESULT BRASS, TIN BRASS AND LEADED BRONZE ARE MORE DOMINANT.
Leaded bronze was deliberately used for casting; the high lead would improve fluidity
in casting while a small amount of zinc would act as a deoxidant, so it would be ideal for
this purpose (Bayley and Butcher, 2004, 15-16). Alloys with higher zinc content were
rarely leaded, a trend which continued into the Early Saxon period. Overall, while the
range of alloys seen in the Roman period continues at a similar frequency into the Early
Saxon period, there was much more control exercised in how the alloys were used and
more careful separation of alloys for recycling. In particular, the reduction of leaded
bronze use is significant.
Figure 2.15 demonstrates that the chronological change in composition from the late
Roman to Early Saxon periods primarily is seen in the disappearance of copper objects
and a significant drop in brass. As a result, bronze and gunmetal are more common; the
return to bronze and brass in the Middle Saxon period indicates a reduction in mixed
recycling and a growth in the production of new metal. It is interesting to note that the
alloys lost or infrequent in the Early Saxon period were already reduced in the late
0 100 200 300 400 500 600
Copper
Impure copper
Bronze
Zinc bronze
Gunmetal
Tin brass
Brass
Low brass
Low tin brass
Number of artefacts
Unleaded
Leaded
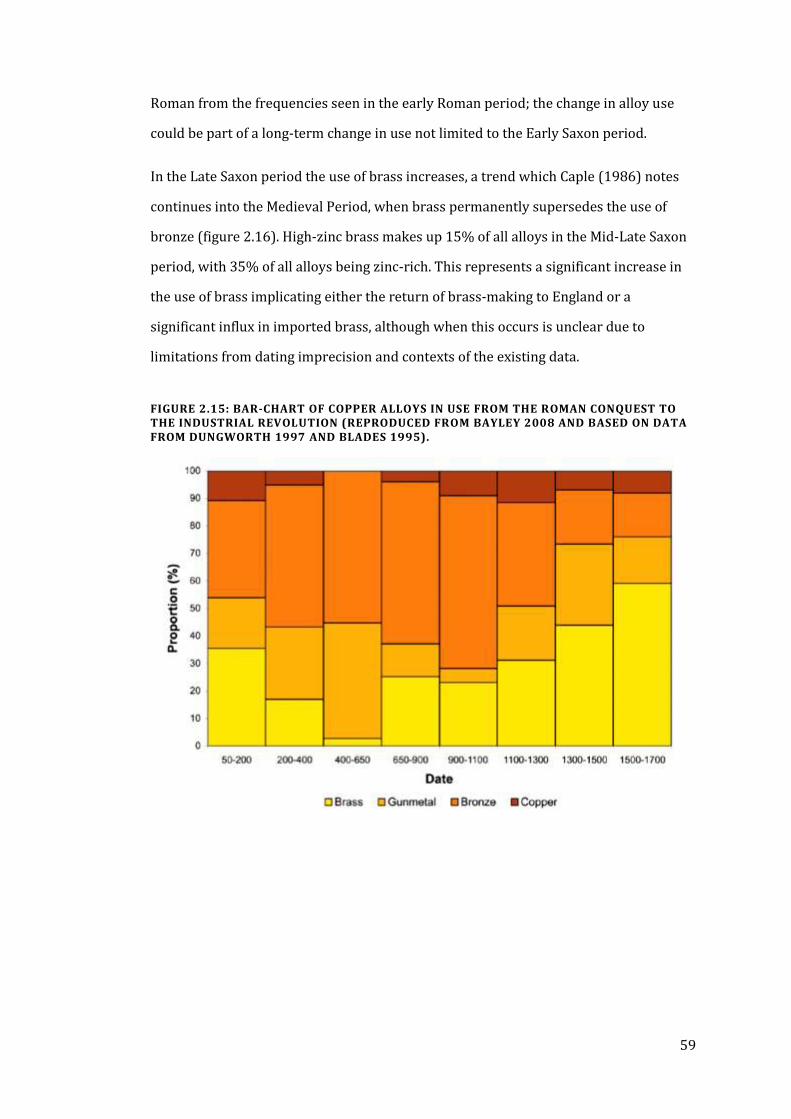
59
Roman from the frequencies seen in the early Roman period; the change in alloy use
could be part of a long-term change in use not limited to the Early Saxon period.
In the Late Saxon period the use of brass increases, a trend which Caple (1986) notes
continues into the Medieval Period, when brass permanently supersedes the use of
bronze (figure 2.16). High-zinc brass makes up 15% of all alloys in the Mid-Late Saxon
period, with 35% of all alloys being zinc-rich. This represents a significant increase in
the use of brass implicating either the return of brass-making to England or a
significant influx in imported brass, although when this occurs is unclear due to
limitations from dating imprecision and contexts of the existing data.
FIGURE 2.15: BAR-CHART OF COPPER ALLOYS IN USE FROM THE ROMAN CONQUEST TO THE INDUSTRIAL REVOLUTION (REPRODUCED FROM BAYLEY 2008 AND BASED ON DATA FROM DUNGWORTH 1997 AND BLADES 1995).
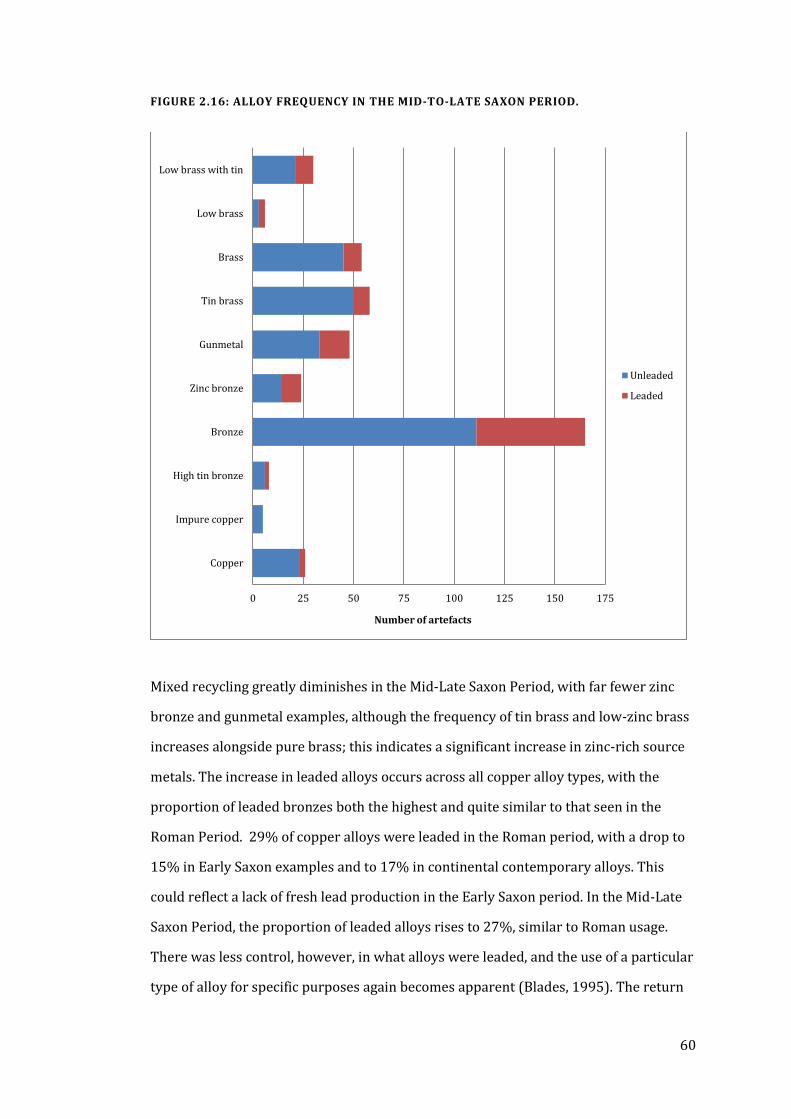
60
FIGURE 2.16: ALLOY FREQUENCY IN THE MID-TO-LATE SAXON PERIOD.
Mixed recycling greatly diminishes in the Mid-Late Saxon Period, with far fewer zinc
bronze and gunmetal examples, although the frequency of tin brass and low-zinc brass
increases alongside pure brass; this indicates a significant increase in zinc-rich source
metals. The increase in leaded alloys occurs across all copper alloy types, with the
proportion of leaded bronzes both the highest and quite similar to that seen in the
Roman Period. 29% of copper alloys were leaded in the Roman period, with a drop to
15% in Early Saxon examples and to 17% in continental contemporary alloys. This
could reflect a lack of fresh lead production in the Early Saxon period. In the Mid-Late
Saxon Period, the proportion of leaded alloys rises to 27%, similar to Roman usage.
There was less control, however, in what alloys were leaded, and the use of a particular
type of alloy for specific purposes again becomes apparent (Blades, 1995). The return
0 25 50 75 100 125 150 175
Copper
Impure copper
High tin bronze
Bronze
Zinc bronze
Gunmetal
Tin brass
Brass
Low brass
Low brass with tin
Number of artefacts
Unleaded
Leaded
61
to the use of leaded alloys may also be indicative of an increase in the size of many cast
objects, which would require such an alloy and which were not produced in the Early
Saxon period.
Throughout all of these periods, bronze is the most common copper alloy and is also
the most frequently leaded. Only in Early Anglo-Saxon England is any other alloy type
close to approaching the frequency of bronze, a testament to the dominance of
recycling to copper alloy manufacture in this period. The mechanics of recycling and
the potential motivations that metal smiths may have had in their use of a constrained
metal supply could aid in determining why and how particular copper alloys were used
in Early Anglo-Saxon England.
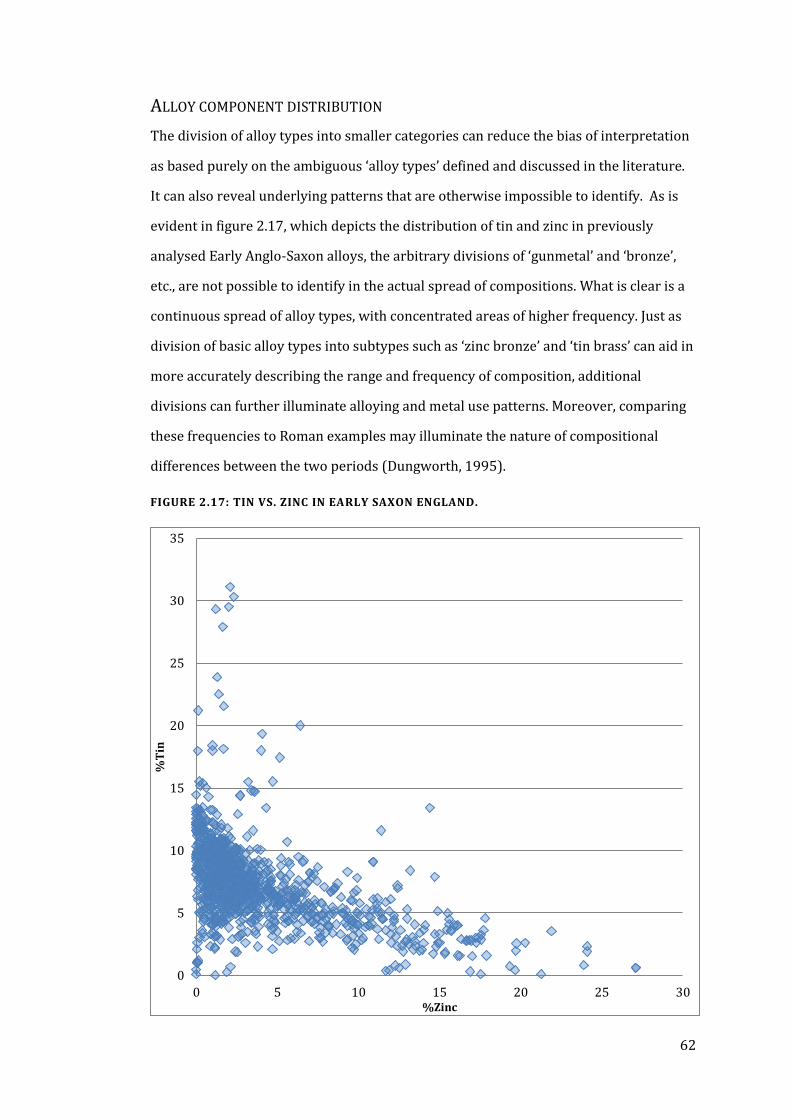
62
ALLOY COMPONENT DISTRIBUTION
The division of alloy types into smaller categories can reduce the bias of interpretation
as based purely on the ambiguous ‘alloy types’ defined and discussed in the literature.
It can also reveal underlying patterns that are otherwise impossible to identify. As is
evident in figure 2.17, which depicts the distribution of tin and zinc in previously
analysed Early Anglo-Saxon alloys, the arbitrary divisions of ‘gunmetal’ and ‘bronze’,
etc., are not possible to identify in the actual spread of compositions. What is clear is a
continuous spread of alloy types, with concentrated areas of higher frequency. Just as
division of basic alloy types into subtypes such as ‘zinc bronze’ and ‘tin brass’ can aid in
more accurately describing the range and frequency of composition, additional
divisions can further illuminate alloying and metal use patterns. Moreover, comparing
these frequencies to Roman examples may illuminate the nature of compositional
differences between the two periods (Dungworth, 1995).
FIGURE 2.17: TIN VS. ZINC IN EARLY SAXON ENGLAND.
0
5
10
15
20
25
30
35
0 5 10 15 20 25 30
%T
in
%Zinc
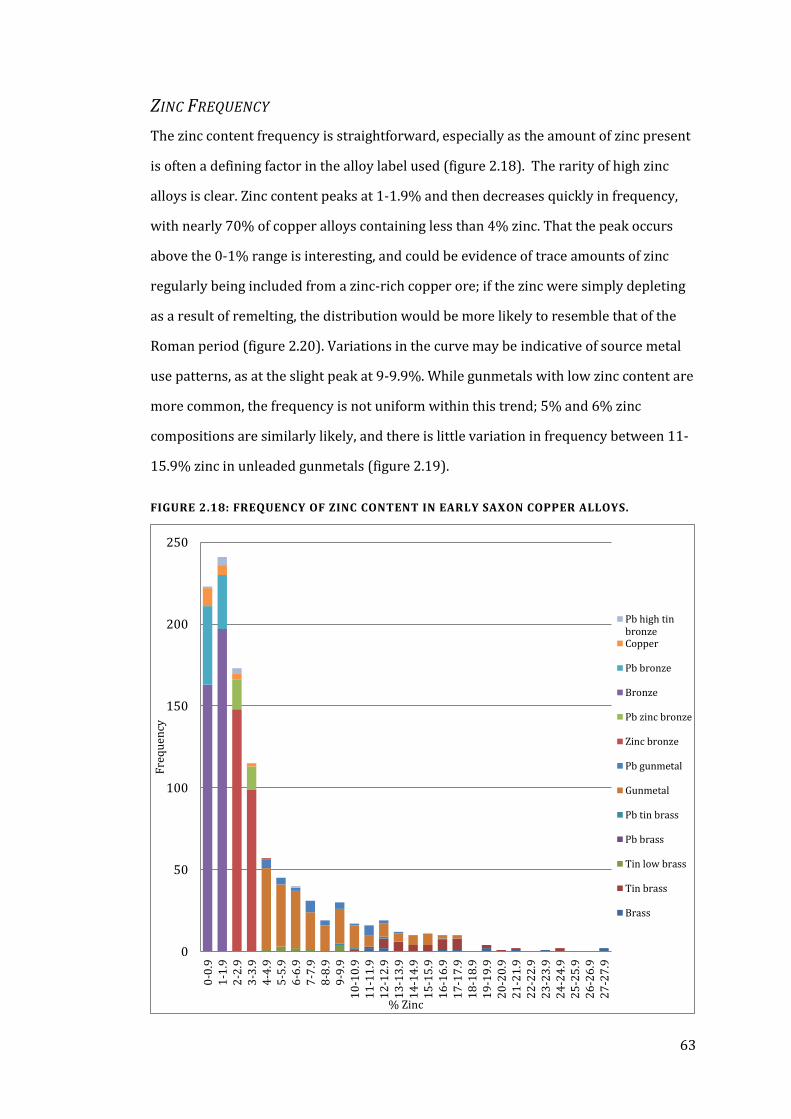
63
ZINC FREQUENCY
The zinc content frequency is straightforward, especially as the amount of zinc present
is often a defining factor in the alloy label used (figure 2.18). The rarity of high zinc
alloys is clear. Zinc content peaks at 1-1.9% and then decreases quickly in frequency,
with nearly 70% of copper alloys containing less than 4% zinc. That the peak occurs
above the 0-1% range is interesting, and could be evidence of trace amounts of zinc
regularly being included from a zinc-rich copper ore; if the zinc were simply depleting
as a result of remelting, the distribution would be more likely to resemble that of the
Roman period (figure 2.20). Variations in the curve may be indicative of source metal
use patterns, as at the slight peak at 9-9.9%. While gunmetals with low zinc content are
more common, the frequency is not uniform within this trend; 5% and 6% zinc
compositions are similarly likely, and there is little variation in frequency between 11-
15.9% zinc in unleaded gunmetals (figure 2.19).
FIGURE 2.18: FREQUENCY OF ZINC CONTENT IN EARLY SAXON COPPER ALLOYS.
0
50
100
150
200
250
0-0
.91
-1.9
2-2
.93
-3.9
4-4
.95
-5.9
6-6
.97
-7.9
8-8
.99
-9.9
10
-10
.91
1-1
1.9
12
-12
.91
3-1
3.9
14
-14
.91
5-1
5.9
16
-16
.91
7-1
7.9
18
-18
.91
9-1
9.9
20
-20
.92
1-2
1.9
22
-22
.92
3-2
3.9
24
-24
.92
5-2
5.9
26
-26
.92
7-2
7.9
Fre
qu
ency
% Zinc
Pb high tinbronzeCopper
Pb bronze
Bronze
Pb zinc bronze
Zinc bronze
Pb gunmetal
Gunmetal
Pb tin brass
Pb brass
Tin low brass
Tin brass
Brass
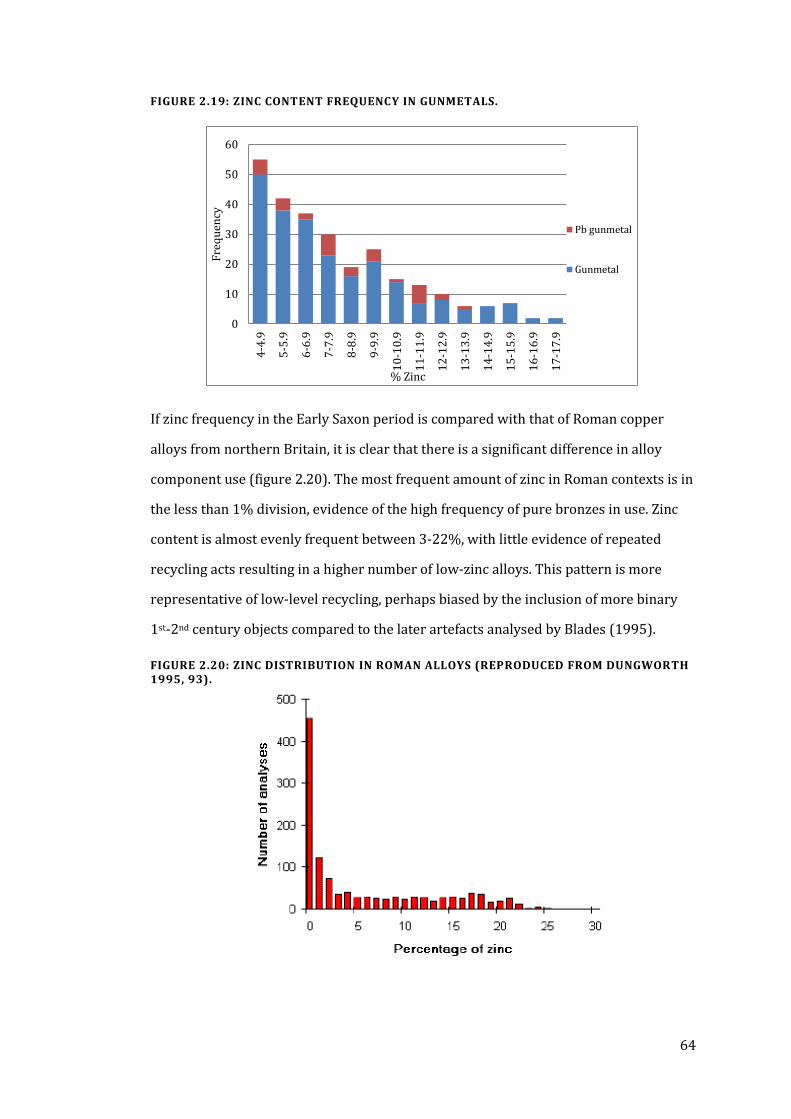
64
FIGURE 2.19: ZINC CONTENT FREQUENCY IN GUNMETALS.
If zinc frequency in the Early Saxon period is compared with that of Roman copper
alloys from northern Britain, it is clear that there is a significant difference in alloy
component use (figure 2.20). The most frequent amount of zinc in Roman contexts is in
the less than 1% division, evidence of the high frequency of pure bronzes in use. Zinc
content is almost evenly frequent between 3-22%, with little evidence of repeated
recycling acts resulting in a higher number of low-zinc alloys. This pattern is more
representative of low-level recycling, perhaps biased by the inclusion of more binary
1st-2nd century objects compared to the later artefacts analysed by Blades (1995).
FIGURE 2.20: ZINC DISTRIBUTION IN ROMAN ALLOYS (REPRODUCED FROM DUNGWORTH 1995, 93).
0
10
20
30
40
50
60
4-4
.9
5-5
.9
6-6
.9
7-7
.9
8-8
.9
9-9
.9
10
-10
.9
11
-11
.9
12
-12
.9
13
-13
.9
14
-14
.9
15
-15
.9
16
-16
.9
17
-17
.9
Fre
qu
ency
% Zinc
Pb gunmetal
Gunmetal
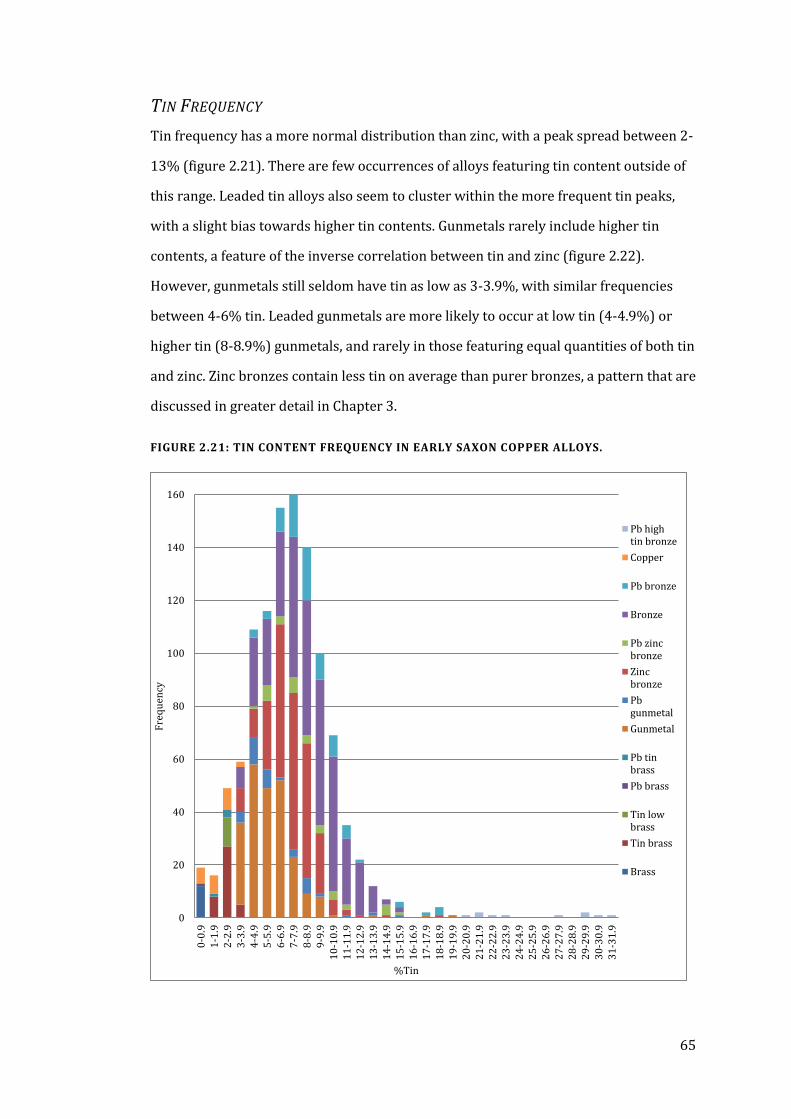
65
TIN FREQUENCY
Tin frequency has a more normal distribution than zinc, with a peak spread between 2-
13% (figure 2.21). There are few occurrences of alloys featuring tin content outside of
this range. Leaded tin alloys also seem to cluster within the more frequent tin peaks,
with a slight bias towards higher tin contents. Gunmetals rarely include higher tin
contents, a feature of the inverse correlation between tin and zinc (figure 2.22).
However, gunmetals still seldom have tin as low as 3-3.9%, with similar frequencies
between 4-6% tin. Leaded gunmetals are more likely to occur at low tin (4-4.9%) or
higher tin (8-8.9%) gunmetals, and rarely in those featuring equal quantities of both tin
and zinc. Zinc bronzes contain less tin on average than purer bronzes, a pattern that are
discussed in greater detail in Chapter 3.
FIGURE 2.21: TIN CONTENT FREQUENCY IN EARLY SAXON COPPER ALLOYS.
0
20
40
60
80
100
120
140
160
0-0
.91
-1.9
2-2
.93
-3.9
4-4
.95
-5.9
6-6
.97
-7.9
8-8
.99
-9.9
10
-10
.91
1-1
1.9
12
-12
.91
3-1
3.9
14
-14
.91
5-1
5.9
16
-16
.91
7-1
7.9
18
-18
.91
9-1
9.9
20
-20
.92
1-2
1.9
22
-22
.92
3-2
3.9
24
-24
.92
5-2
5.9
26
-26
.92
7-2
7.9
28
-28
.92
9-2
9.9
30
-30
.93
1-3
1.9
Fre
qu
ency
%Tin
Pb hightin bronze
Copper
Pb bronze
Bronze
Pb zincbronze
Zincbronze
Pbgunmetal
Gunmetal
Pb tinbrass
Pb brass
Tin lowbrass
Tin brass
Brass
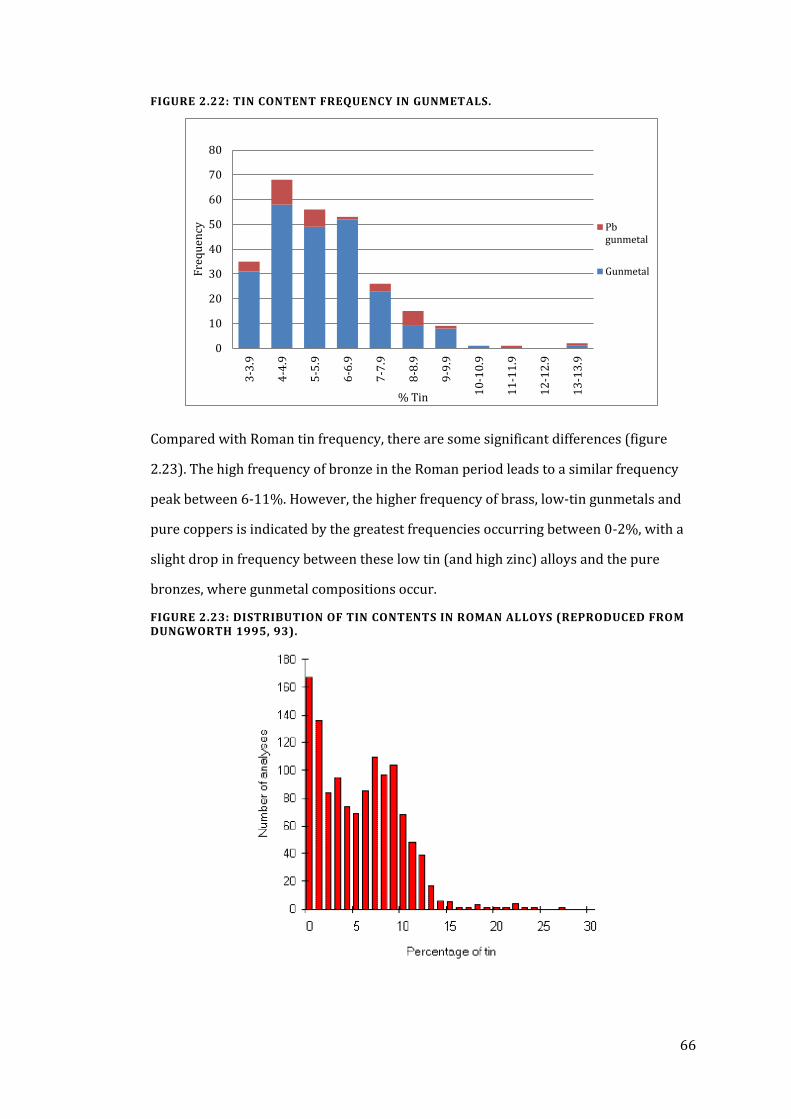
66
FIGURE 2.22: TIN CONTENT FREQUENCY IN GUNMETALS.
Compared with Roman tin frequency, there are some significant differences (figure
2.23). The high frequency of bronze in the Roman period leads to a similar frequency
peak between 6-11%. However, the higher frequency of brass, low-tin gunmetals and
pure coppers is indicated by the greatest frequencies occurring between 0-2%, with a
slight drop in frequency between these low tin (and high zinc) alloys and the pure
bronzes, where gunmetal compositions occur.
FIGURE 2.23: DISTRIBUTION OF TIN CONTENTS IN ROMAN ALLOYS (REPRODUCED FROM DUNGWORTH 1995, 93).
0
10
20
30
40
50
60
70
80
3-3
.9
4-4
.9
5-5
.9
6-6
.9
7-7
.9
8-8
.9
9-9
.9
10
-10
.9
11
-11
.9
12
-12
.9
13
-13
.9
Fre
qu
ency
% Tin
Pbgunmetal
Gunmetal
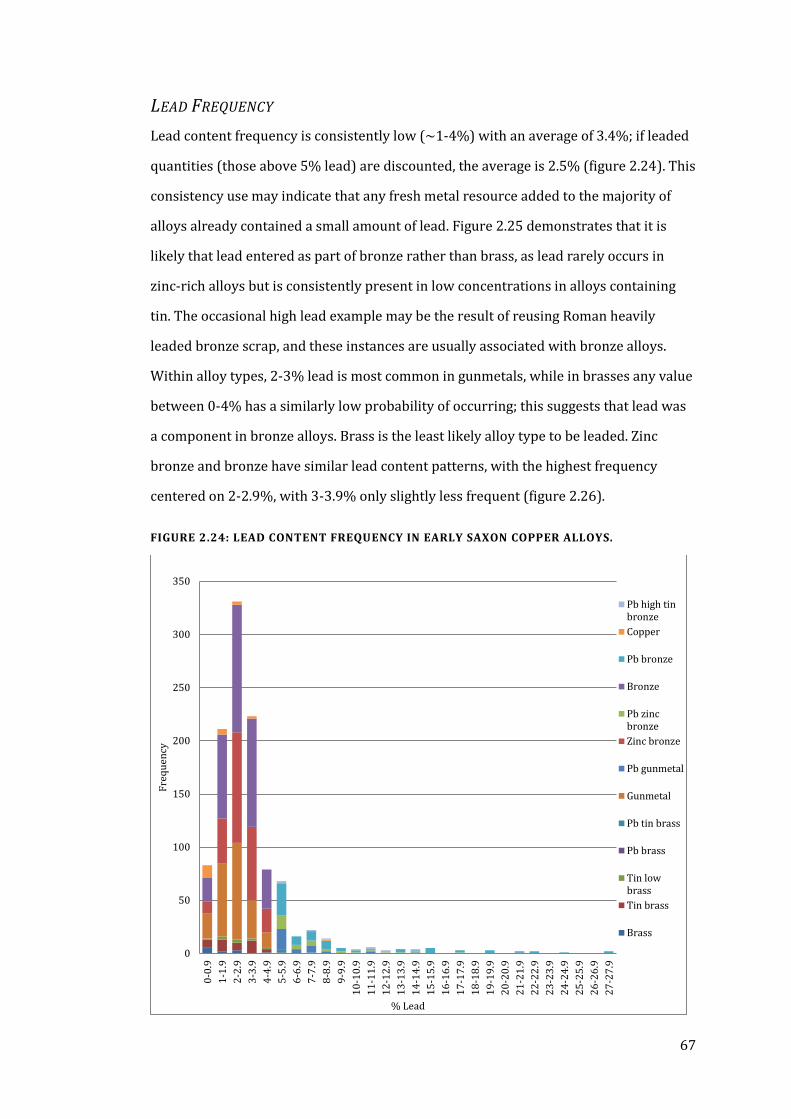
67
LEAD FREQUENCY
Lead content frequency is consistently low (~1-4%) with an average of 3.4%; if leaded
quantities (those above 5% lead) are discounted, the average is 2.5% (figure 2.24). This
consistency use may indicate that any fresh metal resource added to the majority of
alloys already contained a small amount of lead. Figure 2.25 demonstrates that it is
likely that lead entered as part of bronze rather than brass, as lead rarely occurs in
zinc-rich alloys but is consistently present in low concentrations in alloys containing
tin. The occasional high lead example may be the result of reusing Roman heavily
leaded bronze scrap, and these instances are usually associated with bronze alloys.
Within alloy types, 2-3% lead is most common in gunmetals, while in brasses any value
between 0-4% has a similarly low probability of occurring; this suggests that lead was
a component in bronze alloys. Brass is the least likely alloy type to be leaded. Zinc
bronze and bronze have similar lead content patterns, with the highest frequency
centered on 2-2.9%, with 3-3.9% only slightly less frequent (figure 2.26).
FIGURE 2.24: LEAD CONTENT FREQUENCY IN EARLY SAXON COPPER ALLOYS.
0
50
100
150
200
250
300
350
0-0
.9
1-1
.9
2-2
.9
3-3
.9
4-4
.9
5-5
.9
6-6
.9
7-7
.9
8-8
.9
9-9
.9
10
-10
.9
11
-11
.9
12
-12
.9
13
-13
.9
14
-14
.9
15
-15
.9
16
-16
.9
17
-17
.9
18
-18
.9
19
-19
.9
20
-20
.9
21
-21
.9
22
-22
.9
23
-23
.9
24
-24
.9
25
-25
.9
26
-26
.9
27
-27
.9
Fre
qu
ency
% Lead
Pb high tinbronze
Copper
Pb bronze
Bronze
Pb zincbronze
Zinc bronze
Pb gunmetal
Gunmetal
Pb tin brass
Pb brass
Tin lowbrass
Tin brass
Brass
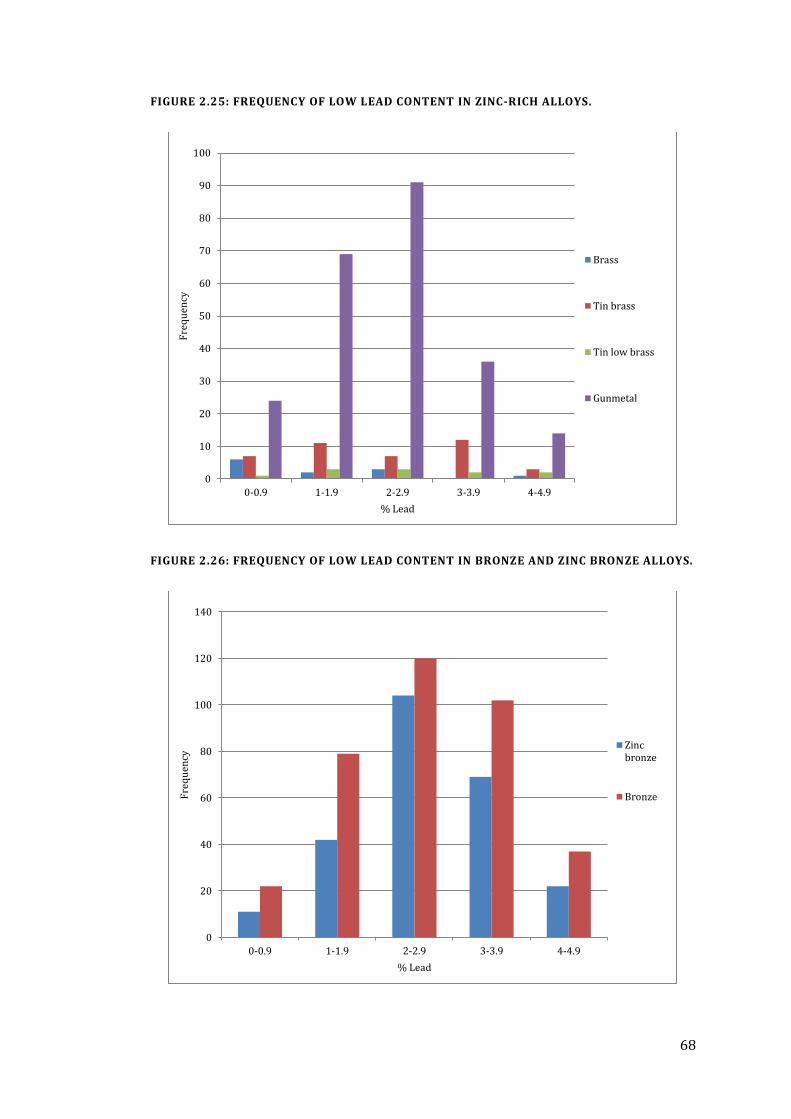
68
FIGURE 2.25: FREQUENCY OF LOW LEAD CONTENT IN ZINC-RICH ALLOYS.
FIGURE 2.26: FREQUENCY OF LOW LEAD CONTENT IN BRONZE AND ZINC BRONZE ALLOYS.
0
10
20
30
40
50
60
70
80
90
100
0-0.9 1-1.9 2-2.9 3-3.9 4-4.9
Fre
qu
ency
% Lead
Brass
Tin brass
Tin low brass
Gunmetal
0
20
40
60
80
100
120
140
0-0.9 1-1.9 2-2.9 3-3.9 4-4.9
Fre
qu
ency
% Lead
Zincbronze
Bronze
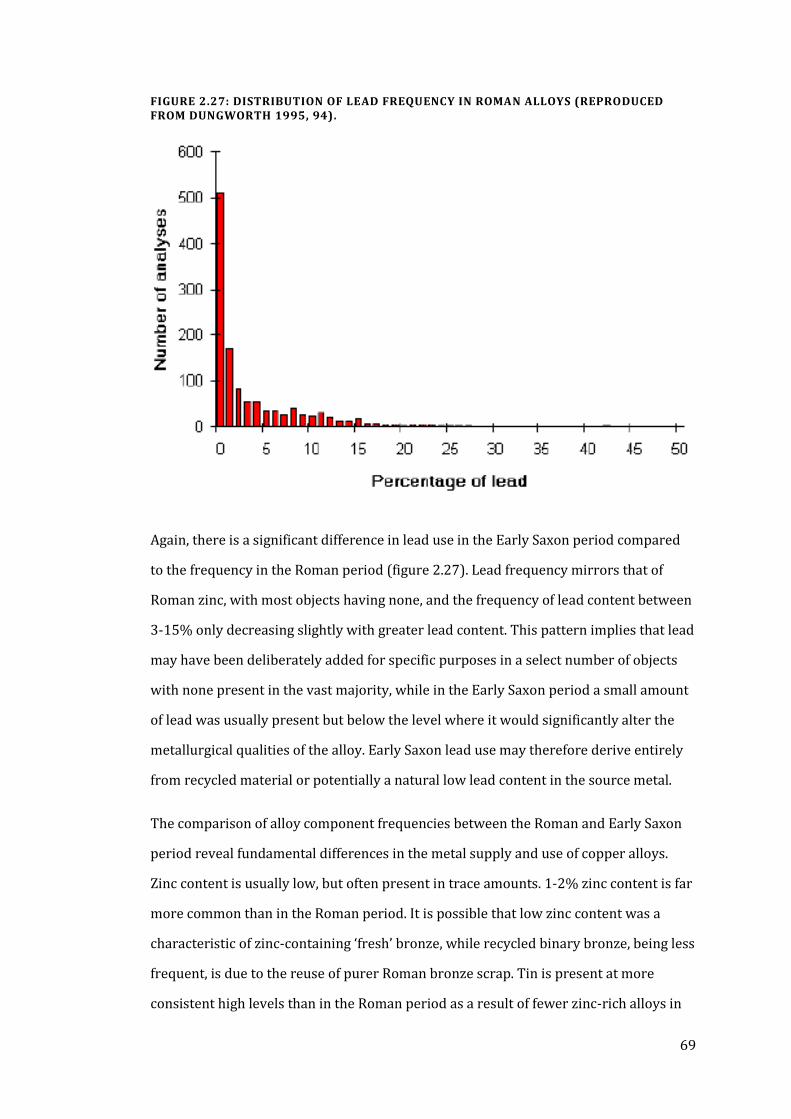
69
FIGURE 2.27: DISTRIBUTION OF LEAD FREQUENCY IN ROMAN ALLOYS (REPRODUCED FROM DUNGWORTH 1995, 94).
Again, there is a significant difference in lead use in the Early Saxon period compared
to the frequency in the Roman period (figure 2.27). Lead frequency mirrors that of
Roman zinc, with most objects having none, and the frequency of lead content between
3-15% only decreasing slightly with greater lead content. This pattern implies that lead
may have been deliberately added for specific purposes in a select number of objects
with none present in the vast majority, while in the Early Saxon period a small amount
of lead was usually present but below the level where it would significantly alter the
metallurgical qualities of the alloy. Early Saxon lead use may therefore derive entirely
from recycled material or potentially a natural low lead content in the source metal.
The comparison of alloy component frequencies between the Roman and Early Saxon
period reveal fundamental differences in the metal supply and use of copper alloys.
Zinc content is usually low, but often present in trace amounts. 1-2% zinc content is far
more common than in the Roman period. It is possible that low zinc content was a
characteristic of zinc-containing ‘fresh’ bronze, while recycled binary bronze, being less
frequent, is due to the reuse of purer Roman bronze scrap. Tin is present at more
consistent high levels than in the Roman period as a result of fewer zinc-rich alloys in
70
the system, such as tin brass. Lead content is also quite different in the Early Saxon
period, with few examples containing no lead, and fewer examples of leaded alloys.
This could be the result of a lack of lead in the system, and the presence of a small
amount of lead in the majority of alloys was possibly derived from recycling or from an
impure fresh metal supply. The dominance of bronze in all alloys suggests this was a
common input in recycling copper alloys. The effects of different alloy combinations,
zinc depletion, and the potential metal supply are key to understanding the use of
copper alloys in the period.
71
CHAPTER 3
RECYCLING OF COPPER ALLOYS IN THE
EARLY SAXON PERIOD
THE RECYCLING OF COPPER ALLOYS
Copper alloys are an easily recyclable material and they have been reused in this way
since the Bronze Age (Needham et al., 1989). Since the advent of metal recycling, the
trace element and isotope signals of source ores have been combined, limiting the
ability of metallurgists to trace metal supply. The addition of brass to the range of
copper alloys in the 1st century BCE further extended the potential range of recycled
alloys. The unique properties of brass, such as suitability for wrought-working and its
golden-yellow colour, caused it to be preferentially used for specific purposes in the
Roman world, particularly the visual. The addition of brass to the copper alloy
recycling system increased the impetus for alloy use for aesthetic colour effects, as well
as its technical properties.
Understanding the recycling practices in the preceding Roman period could therefore
provide context for the continuity of certain patterns in alloy use and reuse. The issues
of alloy component loss upon re-melting as well as the likely form of metal resources
and evidence for control in the use of those resources will also be discussed. These
aspects will then provide context for the modelling of Anglo-Saxon copper alloy
compositions in terms of recycling practices and the potential contemporary metal
supply, which will attempt to mimic the composition distribution of the period in order
to understand necessary inputs and metal use strategies.
72
ROMAN RECYCLING PRACTICES
The widespread recycling of copper alloys in the Roman period and the decline of zinc
content in brass alloys from the 1st century CE onwards has long been apparent since
Caley’s (1955) analysis of Roman brass coinage. The waning contribution of zinc to
brass coinage over the course of the 1st-2nd centuries was attributed to the recycling of
brass coins, as “even if the Roman coiners had added a considerable proportion of new
brass on remelting, the resulting coinage brass would generally have contained less
zinc than the worn coins,” due to the combination of zinc volatilisation during heating
and the manufacture of brass being limited to about 28-30% zinc by the cementation
process (Newbury et al, 2005; Caley, 1955, 138). Thus since brass recycling was first
studied, the problem of zinc volatilisation was known and credited with the observed
declines in high-zinc usage.
Recycling practice has been discussed in previous research, notably by Dungworth
(1995, 125). In summary of his findings, with my own emphasis:
The survey of the Roman copper alloys provided by Dungworth (1995) shows that from the 1st century AD, this ternary [gunmetal] alloy (leaded or unleaded) was increasingly used, together with leaded bronze, provoking a decreasing amount of brass and leaded brass objects… brass was rarely recycled on its own but mixed with bronze (instead of Sn) and that lead was mainly introduced by bronze itself instead of being separately added. In the analysed objects, recycling must have been frequent, given that lead contents are below the limit of the intentional addition in most cases (Gliozzo et al., 2011, 283).
This picture of Roman recycling practice reveals three important factors: that brass
was significantly declining in frequency before the Saxon period, that brass and bronze
were alloyed together during recycling (thus the high frequency of gunmetals and not
intermediate mixed alloys), and that lead primarily entered the system not as an
independent metal, but as a component of bronze, either from recycled leaded bronze
or as a natural impurity. Throughout the Roman world, quaternary alloys became a
significant proportion of copper alloys in use by the 3rd-4th centuries. Brasses with less
than 10% zinc do not occur, and zinc bronzes are rare beyond leaded examples used
for casting, indicating a controlled recycling practice with deliberate mixing of only
certain alloy types.
73
Further evidence of the potentially deliberate and widespread nature of Roman
recycling practices from long before the 3rd-4th centuries can be found in Pliny (writing
in the 1st century CE), who “mentions the use of scrap metal, but this rarely forms more
than a third of the alloy in any recipe,” but was regularly added (after being specifically
chosen “to give… the kind of seasoning… which peculiarly it requires)” to freshly made
metal (Dungworth, 1995, 130; Pliny, 1635, Book XXXIV, Ch. IX; 505). Thus metal scrap
was habitually added to fresh metal in casting to improve the metallurgical qualities of
the alloy. Whether or not this minimal but potentially consistent recycling practice
continued into the Saxon period would be interesting to detect, if proportions of input
metals could be confirmed.
The method of identifying the scrap composition was probably due to the metal’s
appearance, especially as other Roman metal recipes were identified by their colour
(Craddock, 1978; Pliny, 1635, Book XXXIV, Ch. IX; 505). The yellower colour of brass
would have made it easier to separate from other copper alloy scrap, thus allowing for
the clearer divisions in alloy types, i.e. the lack of zinc bronzes (Blades, 1995, 34). Some
ancient sources refer to methods of distinguishing brass from gold by taste or odour;
additionally, the density of lead would make heavily leaded alloys distinguishable by
weight (Craddock, 1978, 8). Between brass and bronze, however, colour is the easiest
method of distinguishing between the two alloys, and colour may have been the
motivating factor for the production of gunmetal.
Craddock (1978, 12) notes that besides pure, fresh brass, a large number of zinc-rich
alloys contain 4-20% zinc, i.e. gunmetal and tin brass, with a normal distribution
centered on 13% zinc. He suggests that this frequent 13% zinc content is the result of
alloying binary bronze with binary brass and was a deliberate and desirable alloy, with,
“the approximate zinc content of modern Pinchbeck or gilding metal, widely used now,
as in Roman times, for decorative metal” (Craddock, 1978, 12; Shenton, 2004;
Thornton, 2000).
The high percentage of ‘fresh’ metal (i.e. inputs made from new resources as an ingot or
unmixed binary scrap metal) used in recycling processes would also indicate that zinc-
rich alloys in particular would be necessary additions to result in high gunmetal
74
frequency. Thus the colour of brass was likely used to separate it from other metal
scrap, preserving the higher zinc content of gunmetals as well as a more golden colour
in resulting new objects. This may have been a practical recycling consideration, or a
deliberate attempt to economically produce an aesthetically pleasing alloy.
Another aspect to be kept in mind when considering the potential metal system in the
Saxon period are the frequencies of Roman alloy types, which were then available in
that form for recycling. Brasses comprise between 12-18% of Roman alloys (dependent
on sample region, 12% in North Africa, over 20% in the Eastern Mediterranean and
18% in North Britain) (Craddock, 1979, 73; Dungworth, 1995, 98; Gliozzo et al., 2011,
283). Gunmetals form between 33-48% of Roman copper alloys, bronze from 20-42%,
and copper from 8-20% (Dungworth, 1995, 98; Gliozzo et al., 2011, 283). Blades (1995,
220) notes that the composition of Roman alloys, if castings, wire and sheet are
combined, are similar to the median values in the Saxon period; zinc in particular,
however, is too low in this Roman average to fully account for zinc content in the Early
Saxon period, especially after loss from volatilisation. This indicates that high zinc
alloys were preferentially being recycled.
THE APPEARANCE OF RECYCLED ALLOYS
‘Brass’ and ‘bronze’ are modern terms; the distinction between these copper alloys in
the past was not necessarily made, and if there was no fresh metal supply, copper alloy
objects would be made from whatever scrap was available. Sorting by colour could
have occurred, and this is probably how Roman metal smiths maintained divisions
between alloy types, thus the scarcity of tin brass and zinc bronze even in the latter
part of that period (Blades, 1995, 34). This would, however, require a supply of pure
brass and bronze alloys to maintain gunmetal rather than tin brass and zinc bronze
component levels.
The matching of the colour of copper alloys could be an aim in the manufacture of
paired objects as they would be viewed together. Pairs would also not usually be made
from recycling a single object due to the larger metal requirements of two castings;
some attempt may have been made to match the colour of paired objects by careful
75
selection of the alloys used in each. In a period where the majority of items were small
castings, this is the only instance besides pins and wrought items where control of the
alloy used is likely to have been attempted and therefore to be observed.
Caple (2010) suggests that the compositions of pairs of Saxon saucer brooches reveal a
brass or zinc-rich ‘ancestor artefact’ that was divided between the two castings, evident
in the similarity of zinc contents between pairs even when other components are
variable. As saucer brooches were gilded, the resulting appearance of these brooches
was not the cause of this equal division, and although Caple argues convincingly for a
social purpose behind this action, there are practical reasons for it as well. It may have
been general practice to recycle zinc-rich objects with fresh metal when possible,
perhaps for the resulting yellower colour or for an improvement in working properties.
Such a practice would explain the high prevalence of zinc bronzes and gunmetals in the
period, but would not be as important a consideration for gilt objects. It may simply
have been more common to recycle copper alloys of unknown composition with fresh
bronze to minimise the chance that the resultant alloy would be inappropriate for
casting purposes. In this case, a high-zinc alloy would be less likely to have significant
lead, and would therefore be easily identified from other copper alloy scrap as a ‘safe’
addition to any copper alloy. This could also explain why the other components in
saucer brooch pairs are more variable, as other random scrap could be more freely
utilised with a known quality alloy in the mix. It is possible that was the practice used
with fresh bronze and scrap as well, as discussed below; such a tactic would maximise
metal supply usage and maintain object quality, even when combined with a variety of
scrap metal.
ISSUES WITH ZINC-RICH ALLOYS
It is probable that the co-smelting requirements of cementation led to brass production
being primarily (but not universally) concentrated near calamine ore sources, which
would explain the lower frequency of brass in outlying areas of the Roman world
(Gliozzo et al., 2011, 283). “It is generally accepted that much of the output of Anglo-
Saxon metalworkers was made from recycled material and that, after the Roman
76
period, brass was not produced in England until [at least] the eighth century AD”
(Mortimer, 1991, 162). The specialisation and potentially centralisation of cementation
brass production could also explain the disappearance of fresh brass from Britain in
the post-Roman period, as any small scale local production became unfeasible due to
limited resources and trade contacts with brass-making regions were interrupted. It is
also possible that brass-making was expensive and no longer economically practicable.
Although Anglo-Saxon metal smiths did not produce fresh brass, it appears that they
followed the Roman method of recycling where possible; brasses and zinc-rich alloys
were combined with fresh bronze, resulting in the observed high frequency of
gunmetals (Chapter 2, figure 2.11). Due to the lack of fresh brass to add to the system,
after a few generations of metal recycling and zinc volatilisation (or if not, addition of
more fresh bronze) the zinc content in a large number of objects would be at the zinc
bronze level of 2-4%. The high frequency of zinc bronzes may reflect the decline in zinc
content from a prevalence of repeated recycling as a method of alloy manufacture.
However, If all Anglo-Saxon objects were made from entirely recycled metal, over time
we should expect to see a decrease in average zinc content, which does not occur; some
purer resources, either fresh brass metal or un-recycled scrap, must have been
available throughout the period.
As there was a limited supply of zinc-rich metals, and following the earlier practice of
bronze and leaded bronze use in small castings, fresh bronze could be used on its own
(as its predominance in the frequency tables attests, figure 2.11 in Chapter 2). If fresh
bronze did come into the system without being recycled with any scrap whatsoever, it
too would need to have 0.5-2% zinc to account for its low but consistent presence in
the copper alloys of the period, as even bronzes had some zinc present. The only
exception to this is a very small group of higher tin bronzes, which will be discussed
further below.
However, if the copper ore were not fully refined during smelting, it is possible that
volatile impurities such as zinc could remain in the copper up to a few per cent
(Tylecote, R.F., 1977, 7). In experimentation, sulphide ores with a starting 4% ZnO
contained between 1.2-2% zinc in the resulting smelted metal (Tylecote, R.F., 1977, 6-
77
7). The same situation can arise in oxide ores as well, particularly as they require less
smelting to begin with and as oxide ores are more likely to contain more zinc. If there
was minimal refining of the ore and the ore contained ZnO, it is possible that between
2-3% Zn would be in the copper produced. When this metal is again remelted and tin
was added, this would be reduced proportionally and potentially from further
oxidation and volatilisation of the zinc; such an ore-producing regime could account for
the 0.5-1.5% range that consistently appears in the ‘pure’ bronzes. This would,
however, entirely depend on the copper ore used, for which there is no real evidence in
this period.
It has been suggested that the high frequency of zinc bronze could be the result of using
a copper resource naturally containing about 2% zinc, such as that which was used in
the Late Bronze Age artefacts from Breiddin hill-fort in the Welsh Marches, but it could
also easily be the result of recycling (Mortimer, 1990, 357; Oddy, 1983). The results
from that Late Bronze Age study are not quantitative for zinc, so comparison of zinc
content between copper from the LBA and the Early Saxon period cannot be directly
compared (Northover, 1982).
Another possible source of low zinc content in bronze is from reused crucibles, as is
likely the case for itinerant smiths who would not always be near to suitable crucible-
making materials. 1-2% zinc can be absorbed from the fabric of the crucible, or indeed
from a reused mould (Barnes et al., n.d.). Conversely, the most common alloy in the
period could be made from low-zinc gunmetal combined with fresh bronze, resulting in
the characteristic low zinc content. This would be difficult to consistently produce,
however, so the low zinc presence in Early Saxon alloys is more likely a result of one or
many of these potential causes.
QUANTIFYING COMPONENT LOSS THROUGH VOLATILISATION
The problem of zinc volatilisation has been known for centuries and has been an issue
in archaemetallurgy since Caley (1955). Gibbs Free Energy values (i.e., the energy
required for a chemical transformation) indicate that all of the alloying components in
copper alloys (tin, zinc and lead), “are more easily oxidised than copper and that zinc is
78
the most easily oxidised of all the alloy elements” (Dungworth, 1995, 131-2). This is
also the case for element volatility, and thus these alloying elements, particularly zinc,
are more likely to be depleted in remelting.
As a result, alloying components and especially zinc are depleted to varying degrees
when the metal is remelted. Absolute losses range, “from 0.5-12%” for zinc in modern
contexts, necessitating that, “typically 4 to 5% extra zinc must be added to compensate
for metal losses” (American Society for Metals, 1970, 422). Basset (1912, 164) cites a
zinc loss of 6% during brass casting in fairly modern conditions, with a respondent to
his article (Mr. Parsons) claiming a loss of 7-10% of the zinc used in reverbatory
furnaces. Actual quantitative metal recycling experiments using ancient technology
have never been conducted, so the 10% loss hypothesised by Craddock (1978) is
theoretical.
Dungworth (1995, 133) did experiment with the degree of zinc lost to volatilisation
using modern equipment. Re-melting without crucible covers in a modern furnace can
result in a huge range of zinc loss, from 5-35% depending on starting zinc content,
temperature, and length of heating (Dungworth, 1995, 133). A rough estimate of 10%
is therefore reasonable given the unknown furnace and crucible conditions;
additionally, as Dungworth does not indicate in his zinc volatilisation results how much
zinc (which was specified as varying between 10-30%) was present in the heated
samples, it is not possible to determine if the relative amount of zinc loss changes when
there is more or less zinc present (1995, 133). Whether or not a remnant 2-4% of zinc
naturally persists or is more resistant to further loss, even after several re-melts, would
be crucial to understanding the high frequency of zinc at this level in the period.
With each re-melting event, roughly 10% of the zinc in the alloy volatilises out of the
metal, but this loss is not limited to zinc: possibly around 1% of tin could volatilise as
well, although there is less observed evidence of this more minor potential effect
(American Society for Metals, 1970, 422; Dungworth, 1995, 134). Additionally, a few
per cent of zinc could enter a bronze from the use of a crucible or mould where zinc
volatilisation previously occurred (Barnes et al., n.d.; Bassett, 1912; Dungworth, 1995,
79
134). These losses and potential gains are important factors to consider when
assessing the metal supply and alloy frequencies within the Early Saxon period.
THE FRESH METAL SUPPLY
Caple (1986, 559) notes that there has always been some supply of fresh metals or the
compositions of new artefacts made from scrap alone would change drastically in a
short period of time. He does not, however, remark on how frequently this fresh metal
would likely be added during the manufacture of copper alloys, or that it could be
added in varying quantities, or that this fresh metal resource may have been variable in
composition over time; issues that make identifying such an alloy more difficult. There
may have been more than one ‘fresh’ bronze supply available, either regionally,
temporally, or both. However, without this fresh supply, recycling of the available scrap
metal would quickly result in a homogenisation of compositions that is not observed
(Caple, 1986, 559). As demonstrated in figure 3.1 which assumes random combinations
of four objects, with no fresh metal sources in the system the alloys present become
exceedingly homogenised within three or four recycling stages (n.b., zinc and tin axes
are opposite from those used in this research; no component loss was calculated in
Caple’s model).
Dungworth (1995, 125) suggests that, following Caple’s inferences, changes in the
composition distributions over time reflect either changes in the fresh metal supply or
in the way in which metal was being recycled. As there is an increase in gunmetals and
other ternary and quaternary alloys in the Early Saxon period, a change in metal
recycling practice seems the more likely culprit for these changes, possibly related to
limitations on the supply of either fresh or scrap metal, or both.
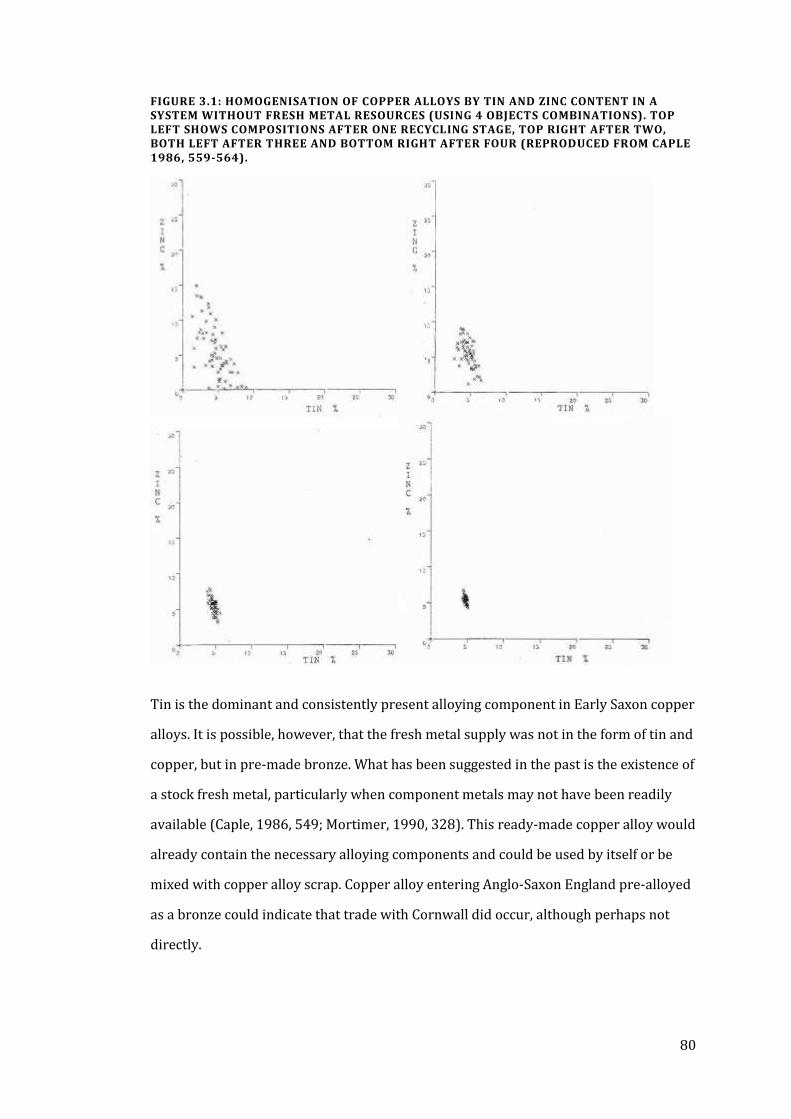
80
FIGURE 3.1: HOMOGENISATION OF COPPER ALLOYS BY TIN AND ZINC CONTENT IN A SYSTEM WITHOUT FRESH METAL RESOURCES (USING 4 OBJECTS COMBINATIONS). TOP LEFT SHOWS COMPOSITIONS AFTER ONE RECYCLING STAGE, TOP RIGHT AFTER TWO, BOTH LEFT AFTER THREE AND BOTTOM RIGHT AFTER FOUR (REPRODUCED FROM CAPLE 1986, 559-564).
Tin is the dominant and consistently present alloying component in Early Saxon copper
alloys. It is possible, however, that the fresh metal supply was not in the form of tin and
copper, but in pre-made bronze. What has been suggested in the past is the existence of
a stock fresh metal, particularly when component metals may not have been readily
available (Caple, 1986, 549; Mortimer, 1990, 328). This ready-made copper alloy would
already contain the necessary alloying components and could be used by itself or be
mixed with copper alloy scrap. Copper alloy entering Anglo-Saxon England pre-alloyed
as a bronze could indicate that trade with Cornwall did occur, although perhaps not
directly.
81
READY-MADE ALLOYS
In order to understand why a ‘ready-made’ bronze would be a preferable form, let us
consider the economic and practical realities of operating as a metal smith in early
Anglo-Saxon England. It is probable that metal smiths in this period were itinerant,
travelling between various rural settlements to supply a limited demand; limited, in
that the use of copper alloys became restricted in this period to small dress items, with
the demand for large cast or wrought vessels or statuary defunct (Fleming, 2012;
Hinton, 2000; Wright, 2010). In part, this may be due to the restricted metal supply
causing raw materials to be more expensive, but in part it also due to a difference in
cultural traditions in the use of materials. What supply of fresh metal did survive would
have to be as a product of convenience to fit the needs of this new demand.
Given the comparatively low and limited demand of copper alloy objects, the itinerant
smith would have no need to carry several types of raw metal, since all objects could be
cast or wrought out of most any copper alloy. Additionally, since it is unlikely they
would work in a permanent forge, it would be far easier to melt a pre-made copper
alloy or bit of scrap metal and cast from that than to bother with measuring out specific
amounts of various components. As far as supply of raw materials is concerned, it
would be easier for a smith to buy a pre-made copper alloy ingot than to worry about
whether or not they would have enough tin to go with the copper they had until the
next time they could acquire more metal, especially if supply were not always reliable.
From a supply viewpoint, beyond the attractiveness of the premade-product within a
limited market, it would also ensure that wherever the metal was traded it would be in
demand, while providing just tin or just copper would not ensure this, especially given
the availability of recyclable scrap. “The smith had to use what metal he could get”
(Hinton, 2005, 35, 2000; Mortimer et al., 1986; Wright, 2010). The true benefit of the
pre-made alloy is not just convenience, it is its reliability; if the alloy was consistently
the right composition for either direct use or combination with any scrap, with minimal
failure of any resulting alloy, it would be adaptable to any copper alloy manufacturing
situation. This would especially be the case if recycling practices continued from
Roman times, with only up to a third of the alloy usually consisting of scrap metal; if
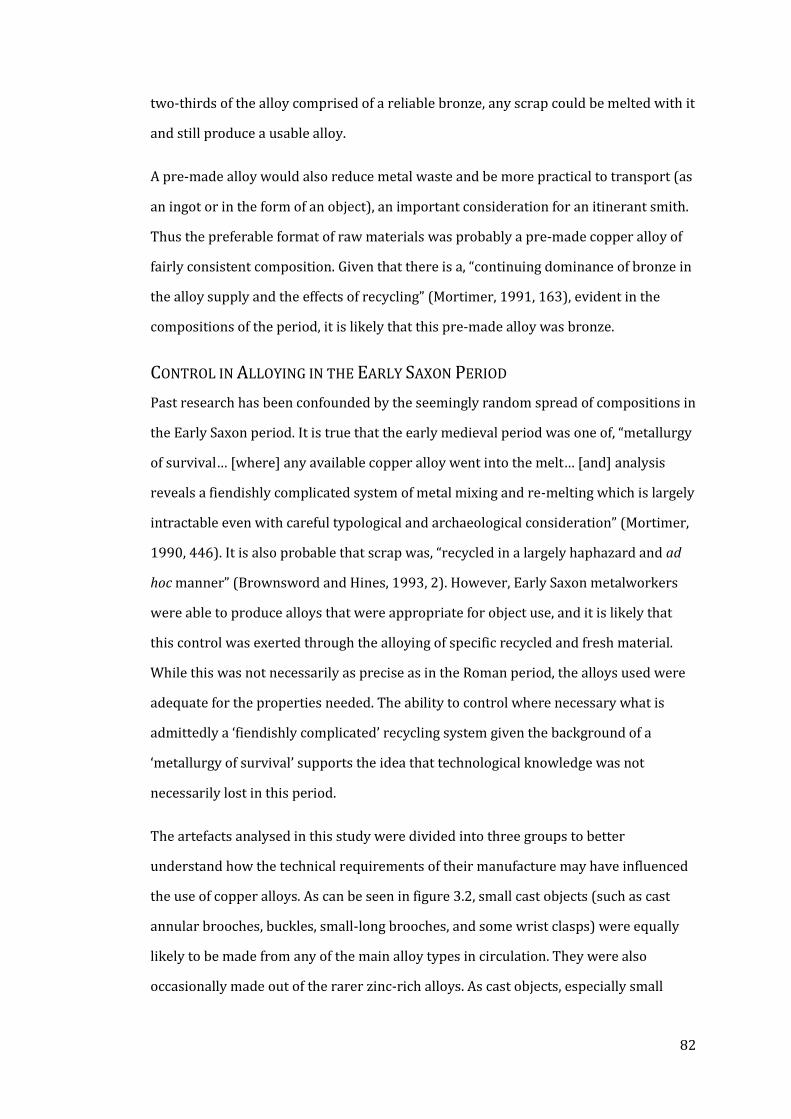
82
two-thirds of the alloy comprised of a reliable bronze, any scrap could be melted with it
and still produce a usable alloy.
A pre-made alloy would also reduce metal waste and be more practical to transport (as
an ingot or in the form of an object), an important consideration for an itinerant smith.
Thus the preferable format of raw materials was probably a pre-made copper alloy of
fairly consistent composition. Given that there is a, “continuing dominance of bronze in
the alloy supply and the effects of recycling” (Mortimer, 1991, 163), evident in the
compositions of the period, it is likely that this pre-made alloy was bronze.
CONTROL IN ALLOYING IN THE EARLY SAXON PERIOD
Past research has been confounded by the seemingly random spread of compositions in
the Early Saxon period. It is true that the early medieval period was one of, “metallurgy
of survival… [where] any available copper alloy went into the melt… [and] analysis
reveals a fiendishly complicated system of metal mixing and re-melting which is largely
intractable even with careful typological and archaeological consideration” (Mortimer,
1990, 446). It is also probable that scrap was, “recycled in a largely haphazard and ad
hoc manner” (Brownsword and Hines, 1993, 2). However, Early Saxon metalworkers
were able to produce alloys that were appropriate for object use, and it is likely that
this control was exerted through the alloying of specific recycled and fresh material.
While this was not necessarily as precise as in the Roman period, the alloys used were
adequate for the properties needed. The ability to control where necessary what is
admittedly a ‘fiendishly complicated’ recycling system given the background of a
‘metallurgy of survival’ supports the idea that technological knowledge was not
necessarily lost in this period.
The artefacts analysed in this study were divided into three groups to better
understand how the technical requirements of their manufacture may have influenced
the use of copper alloys. As can be seen in figure 3.2, small cast objects (such as cast
annular brooches, buckles, small-long brooches, and some wrist clasps) were equally
likely to be made from any of the main alloy types in circulation. They were also
occasionally made out of the rarer zinc-rich alloys. As cast objects, especially small
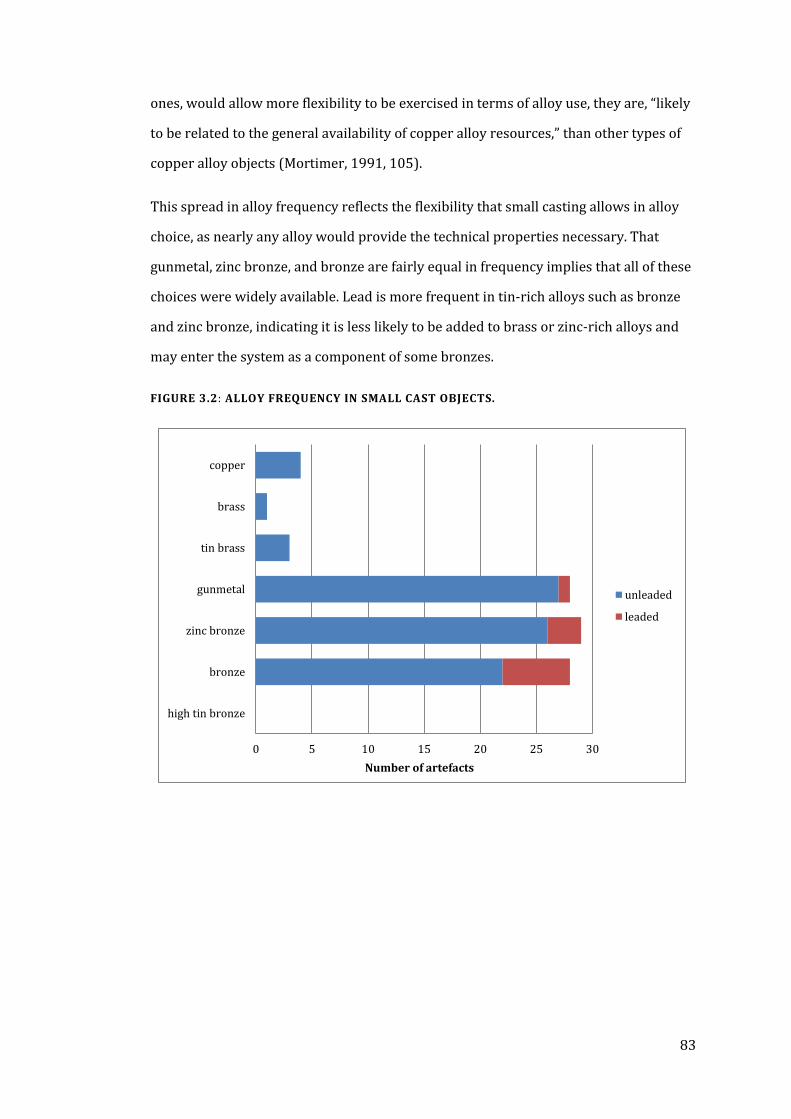
83
ones, would allow more flexibility to be exercised in terms of alloy use, they are, “likely
to be related to the general availability of copper alloy resources,” than other types of
copper alloy objects (Mortimer, 1991, 105).
This spread in alloy frequency reflects the flexibility that small casting allows in alloy
choice, as nearly any alloy would provide the technical properties necessary. That
gunmetal, zinc bronze, and bronze are fairly equal in frequency implies that all of these
choices were widely available. Lead is more frequent in tin-rich alloys such as bronze
and zinc bronze, indicating it is less likely to be added to brass or zinc-rich alloys and
may enter the system as a component of some bronzes.
FIGURE 3.2: ALLOY FREQUENCY IN SMALL CAST OBJECTS.
0 5 10 15 20 25 30
high tin bronze
bronze
zinc bronze
gunmetal
tin brass
brass
copper
Number of artefacts
unleaded
leaded
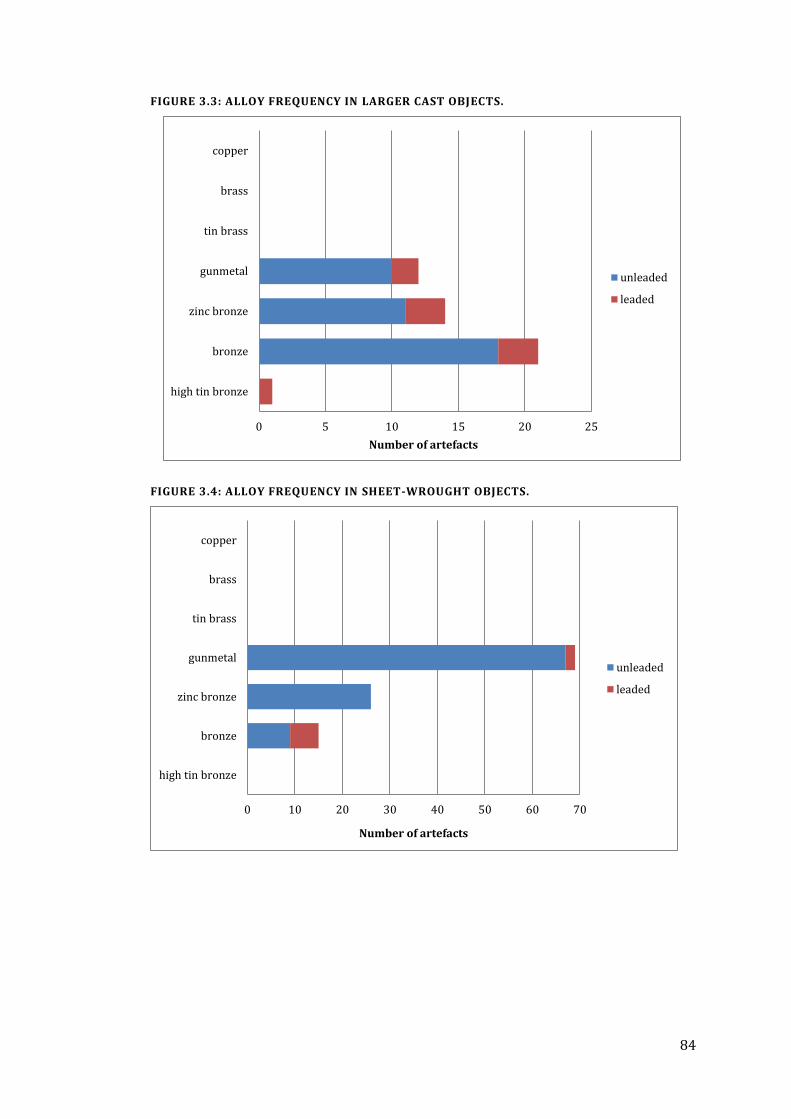
84
FIGURE 3.3: ALLOY FREQUENCY IN LARGER CAST OBJECTS.
FIGURE 3.4: ALLOY FREQUENCY IN SHEET-WROUGHT OBJECTS.
0 5 10 15 20 25
high tin bronze
bronze
zinc bronze
gunmetal
tin brass
brass
copper
Number of artefacts
unleaded
leaded
0 10 20 30 40 50 60 70
high tin bronze
bronze
zinc bronze
gunmetal
tin brass
brass
copper
Number of artefacts
unleaded
leaded
85
The low zinc levels present in these two alloy types would also be beneficial in
reducing the appearance of small pinholes from escaping gases, as zinc is a deoxidant, a
quality that would be beneficial in elaborate decorative castings as well as for surfaces
that might feature gilding (Bayley and Butcher, 2004, 16). The slightly higher frequency
of leaded alloys across all alloy types for larger castings could derive from the need for
larger quantities of molten metal to fill the larger and more complex moulds. As leaded
alloys have lower viscosity, this would be an advantageous quality.
Finally, objects wrought from (cast) sheet, such as the flat annular brooches or sheet-
made wrist clasps, were far more frequently made of gunmetal than any other copper
alloy type (figure 3.4). Few sheet objects have significant lead, as lead would make the
sheet more brittle and therefore more difficult to work. Mortimer (1990, 356) also
noted the lack of lead in sheet metal in this period, and the frequency of the use of brass
in wrought work in the Roman period may explain the prevalence of higher-zinc alloys
(Blades, 1995, 139). Thus despite the seemingly random and exceedingly complicated
spread of alloys in use in the Early Saxon period, metalworkers still exercised control
over the alloys used in various object types to create technically appropriate alloys for
specific manufacturing processes. What is unclear is the form of the available metal
supply and how it was used to create these objects.
86
MODELLING COPPER ALLOY RECYCLING
Although no quantitative experimental work has been done to test the effects of
recycling on the resultant copper alloys, it is possible to estimate the effect of various
combinations to explore possible metal supplies that would be necessary within the
system to account for actual observed compositional results. Caple (1986, 528-565)
attempted to model the possible metal sources used in the early medieval period, using
the composition of Roman scrap as well as a fresh brass and fresh leaded bronze (with
8% lead) as potential components, but with little success. He concluded that a leaded
bronze with 4% lead was a more likely the source of fresh metal, but this does not
entirely account for the large number of unleaded bronzes, or those with only small
amounts. Additionally, his results invariably led to the conclusion that fresh metal had
to be continuously entering the system to account for the variety of alloy types in use,
or within a short period of time all copper alloys would become very similar in
composition (Caple, 1986, 559).
The inherent problem with the previous model was that it did not allow for repeated
additions of fresh metal through various stages of the recycling process, and did not
include other potential fresh metal resources, such as bronze without a significant
leaded component. The effect of volatilisation and component loss was also not
included in previous models, nor the potential uptake of zinc into an alloy from a
reused crucible, variables discussed by Dungworth but taken no further in terms of
modelling (1995, 132-134). These factors significantly change the effects of recycling
and re-melting of copper alloys from the simple addition of two or more alloys
together. The amount of each resource type needed to produce the observed alloy
frequencies is a further variable that has been overlooked previously, and is an
important factor in understanding the necessary dynamics of the metal supply system
as well as recycling policies.
Core to this modelling exercise is the tenet that the simplest explanation for the spread
of compositions is the most likely one. Given this, there are certain assumptions that
87
must be made in order to explain the system; these are in part based on Caple’s (1986,
531) metallurgical and human constraints. In brief, these constraints consist of:
1. Metallurgical constraints: the limitations enforced by the use of the metal,
such as limiting lead or tin content to prevent object breakage, or what was
technically possible to produce. Within this category for the Early Saxon period
is the limitation of the loss of cementation technology. Thus:
a. Copper alloys will be limited in tin and lead content, particularly in non-
cast and worked objects.
b. High-zinc alloys will be rare, and likely occur only in imported objects
or where Roman scrap has been recycled.
2. Human constraints: restrictions on the system due to social or human-
induced limitations. Caple’s (1986, 531) order of human constraints also
reflects the likely magnitude of such limitations on the system:
a. Economic: in practical terms, the cost of metal resources will be the
primary determinant as to how the metal supply is utilised. This is
particularly the case in the Early Saxon period as the supply of fresh
metal has not been determined and trade in general was drastically
reduced. An economy of convenience is likely to have surpassed other
human-based constraints.
b. Technical: although not as clear-cut as Roman copper alloy use, the
previous section suggests that certain alloys were more likely to be
used for particular object types, dependent on the size of casting or if
the object were made from sheet. The higher proportion of leaded
alloys used in sheet objects in the Early Saxon period is evidence
supporting that economic considerations were more limiting on the
system than other factors.
c. Aesthetic: admittedly less of a constraint than the above factors, the
ability to create a visually appealing product must be a concern when
88
the majority of copper alloy use is in the form of dress accessories. The
lack of aesthetic considerations is easier to identify, such as when the
metal used was covered in a decorative layer and went unseen; the
aesthetic goal of copper alloys can be identified by examining not only
instances where appearance is controlled, but where it is not. Aesthetic
considerations will be discussed further in later sections.
d. Tradition: despite the previous limitations, the prevalence of
gunmetals could reflect a continuation of Roman recycling practices
wherein brass and bronze were remelted together. This also could be
related to other practical constraints such as limiting the likelihood of a
recycled alloy failing by mitigating unknowns. Additionally, such
‘traditions’ in recycling could derive from a desire to achieve a
particular colour of metal. This constraint is difficult to determine the
underlying factors of and may fall within previous categories; however,
it is impossible to prove this.
e. Superstition: as with traditional constraints, superstitious limitations
are impossible to define but may act upon the system. Additionally,
traditional and superstitious practices may ultimately derive from
passed down knowledge concerning the creation of the best working
properties or physical appearance. These last two constraints are
therefore important to consider while not being entirely independent
from other limitations, as well as being beyond the scope of this study
to explain. These two categories may also account for the lack of certain
recycling combinations, or for the reuse of a single object between two
new objects as in the idea of ancestor objects (Caple, 2010). However, it
is likely that the effect of tradition and superstition on copper alloys will
be unseen; the ephemeral nature of these social constraints defies the
attempt to account for or identify them.
In addition to these constraints, Caple’s modelling includes the important variables of
metal supply, both fresh metal and recycled source material (1986, 531). He concluded
89
that some fresh metal supply must always have been available to account for the
consistency in copper alloy composition over time, therefore in this model a fresh
metal supply of relatively stable composition is assumed. Roman scrap metal resources
are known to have been available in the later Saxon period, so the other source
material can also be described using the compositional averages of various alloy types
(Mortimer, 1990, 406). Dungworth (1995, 134) noted the potential effects of
volatilisation on the loss of zinc and tin content, as well as uptake of zinc from reused
crucibles, variables that were not part of Caple’s original model but which are included
here.
In this new model, further assumptions about the system are made, some of which are
clearly evident in the data while others are more difficult to identify:
1. An estimate of 10% zinc is lost from volatilisation from the alloy each time it is
remelted.
2. 1% tin is also lost from the alloy during each remelting act.
3. As fresh brass could not be locally produced brass is not in great supply and
high-zinc alloys will therefore be uncommon.
4. Tin and lead are not necessarily present in Anglo-Saxon England as pure,
independent metals; although of course at some point they would have been
derived from ingots, tin and lead in Anglo-Saxon alloys need not have been
added directly to pure copper prior to casting, but may have entered the system
in an earlier stage of alloying. Tin and lead content can always be accounted for
by a pre-existing alloy similar to Roman averages, and bronze may enter the
Anglo-Saxon system as a pre-mixed ingot. Potential exceptions and rarer high-
tin and high-lead alloys are accounted for in the model thusly:
a. High-tin bronze derives from Roman scrap, and is therefore rare.
b. Leaded alloys are primarily a result of recycling Roman leaded bronze,
which has a low tin content.
90
5. 1-2% zinc may be absorbed into a copper alloy if it is melted in a reused
crucible, which may account for the frequency of low zinc contents.
6. In terms of simplicity of testing the system only one fresh metal supply is
assumed, and given the unreliability of trade in the period (factors discussed
above) this fresh metal is most likely pre-alloyed bronze.
7. Alloys made from fewer remelting acts will be more frequent. Or rather, the
simplest method of reaching an alloy is the most likely way, where several
possible recipes can explain an alloy; these simpler recipes (with fewer
remelting acts) will be more frequent unless other restrictions apply.
8. Alloys with fewer necessary source ingredients will be more frequent (e.g. an
alloy requiring bronze + brass will be more likely than one requiring bronze +
brass + copper + leaded bronze).
9. Alloys with source components more readily available or economically
practical will be more frequent. Thus, if source alloy X is cheaper and more
readily available, it will be a more frequent addition to copper alloys if other
restrictions do not apply.
10. In terms of proportions of metals used, in many instances an alloy requiring
two remelting stages to reach its composition, where A + B is then added in
equal proportion to more of A (e.g. 3A + B is the recipe for the alloy), can
usually be done directly in a single stage (with some exceptions, primarily those
with high zinc content which is then significantly reduced upon remelting a
second time).
These assumptions were checked against the evidence where possible to confirm that
these constraints were factors affecting the system. Points 7-9 are based on principles
of Occam’s razor, that the simplest explanations are more likely to be the correct ones,
although more complicated explanations for alloying recipes are also explored. In the
process of examining the copper alloy system, certain questions were considered with
91
the aim of identifying locations within the data where they could be explored. These
objectives include:
1. What was the composition of the typical fresh metal in supply, if one is
necessary?
2. How often was fresh metal added to the mix to account for the spread in
compositions observed?
3. Was fresh metal more reliable and/or economical (in quality or availability)
than recycled scrap? If so copper alloy combinations with more fresh metal
than scrap would be more frequent.
4. In what proportion were source metals usually combined? Do these reflect
earlier Roman recycling practice?
5. Are specific recycling choices being made? Are certain alloys never mixed
together, or is bronze always added, etc.? How do these decisions reflect the
metallurgical and human constraints?
6. Would lead and tin be necessary as independent components for any or many
of the compositions analysed? Is there need for pure metals to explain the
spread in composition, outside of tinning?
In order to explore these objectives and using the constraints as listed above, a
minimum number of source metals were used to reproduce the compositional spread
of alloys in the Early Saxon period. Given the spread of alloys as described above, it is
evident that any fresh metal supply would consist of some form of bronze. Other source
metals were defined by Roman scrap metal averages derived from data collected by
Dungworth (1995), Blades (1995), Caple (1986), and Craddock (1975) and tested for
appropriateness of use within the model. Some source metal compositions are
shorthand for a common middle-stage alloy which may have been in more ready
supply than the purer source metal from which it derives (i.e., brass with 20% zinc
rather than fresh brass with 28% zinc). The eight source metals used within this model
are listed in table 3.1.
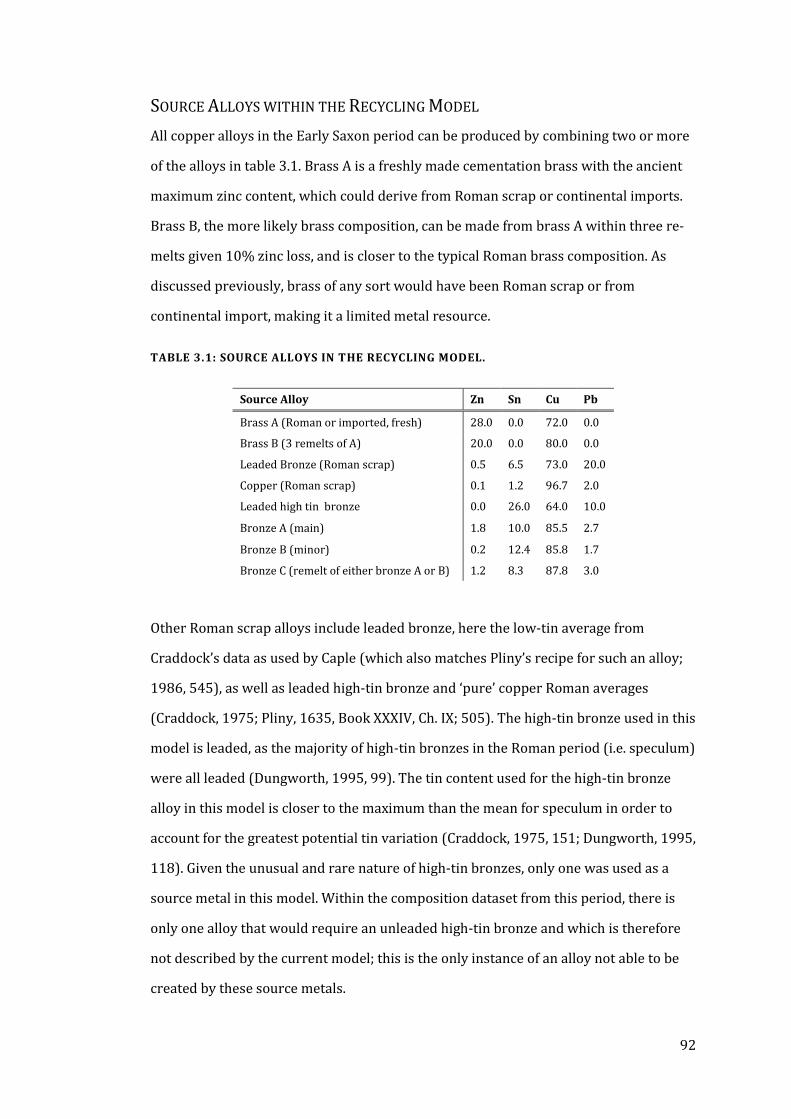
92
SOURCE ALLOYS WITHIN THE RECYCLING MODEL
All copper alloys in the Early Saxon period can be produced by combining two or more
of the alloys in table 3.1. Brass A is a freshly made cementation brass with the ancient
maximum zinc content, which could derive from Roman scrap or continental imports.
Brass B, the more likely brass composition, can be made from brass A within three re-
melts given 10% zinc loss, and is closer to the typical Roman brass composition. As
discussed previously, brass of any sort would have been Roman scrap or from
continental import, making it a limited metal resource.
TABLE 3.1: SOURCE ALLOYS IN THE RECYCLING MODEL.
Source Alloy Zn Sn Cu Pb
Brass A (Roman or imported, fresh) 28.0 0.0 72.0 0.0
Brass B (3 remelts of A) 20.0 0.0 80.0 0.0
Leaded Bronze (Roman scrap) 0.5 6.5 73.0 20.0
Copper (Roman scrap) 0.1 1.2 96.7 2.0
Leaded high tin bronze 0.0 26.0 64.0 10.0
Bronze A (main) 1.8 10.0 85.5 2.7
Bronze B (minor) 0.2 12.4 85.8 1.7
Bronze C (remelt of either bronze A or B) 1.2 8.3 87.8 3.0
Other Roman scrap alloys include leaded bronze, here the low-tin average from
Craddock’s data as used by Caple (which also matches Pliny’s recipe for such an alloy;
1986, 545), as well as leaded high-tin bronze and ‘pure’ copper Roman averages
(Craddock, 1975; Pliny, 1635, Book XXXIV, Ch. IX; 505). The high-tin bronze used in this
model is leaded, as the majority of high-tin bronzes in the Roman period (i.e. speculum)
were all leaded (Dungworth, 1995, 99). The tin content used for the high-tin bronze
alloy in this model is closer to the maximum than the mean for speculum in order to
account for the greatest potential tin variation (Craddock, 1975, 151; Dungworth, 1995,
118). Given the unusual and rare nature of high-tin bronzes, only one was used as a
source metal in this model. Within the composition dataset from this period, there is
only one alloy that would require an unleaded high-tin bronze and which is therefore
not described by the current model; this is the only instance of an alloy not able to be
created by these source metals.
93
Bronze A, from which it is possible to make nearly all other alloys in the period given
the availability of various scrap, was a composition derived from trial and error. The tin
and lead content reflects the ideal composition values for the production of actual Early
Saxon alloys and fits well within the high frequency bronze alloys. Additionally, 10%
tin in bronze is approximately the amount given by Pliny’s recipe for bronze, which
required 12 ½ pounds of tin per 100 pounds of copper (giving c.11% tin) (Pliny, 1635,
Book XXXIV, Ch. IX; 505). A small amount of lead in the main alloying source metal
would be necessary to account for the high frequency of lead between 1-3%. This alloy
also contains 1.8% zinc, just above the average content for bronzes. Small amounts of
zinc are present in most bronzes in this period and may derive from the copper ore, or
from remnant zinc content after multiple recycling acts, or possibly from an uptake of
zinc from reused crucibles, as discussed above. Due to zinc volatilisation, a small
amount of zinc would disappear upon remelting, a situation that is not observed in the
data as a high proportion of alloys are zinc bronze throughout the period. In order for
the model to reproduce the zinc contents observed, a small amount must be present in
the stock metal (regardless of the form of its entry into the system). Given the variety of
alloys in use in the Early Saxon period, the consistency of a zinc presence may imply
that such zinc content in a standard alloy is not an unreasonable assumption,
regardless of its source.
Bronze A was given a zinc content of 1.8%; more was deemed unnecessary as zinc
bronzes could not have been the major bronze metal input in the period. Anglo-Saxon
zinc bronzes do not have as much tin on average as binary bronze, and therefore could
not produce the bronze alloys of the period (figures 3.5 and 3.6; Appendix D). Zinc
bronze was therefore determined to be the result of recycling rather than a distinct
fresh metal source.
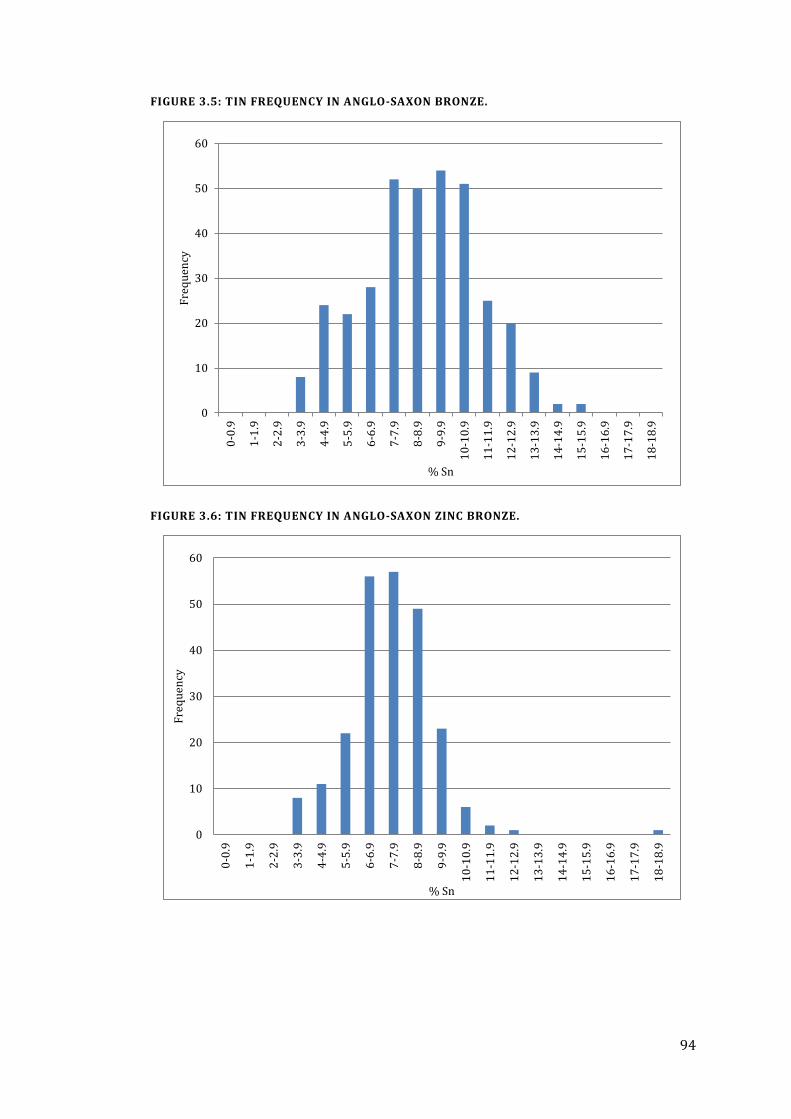
94
FIGURE 3.5: TIN FREQUENCY IN ANGLO-SAXON BRONZE.
FIGURE 3.6: TIN FREQUENCY IN ANGLO-SAXON ZINC BRONZE.
0
10
20
30
40
50
60
0-0
.9
1-1
.9
2-2
.9
3-3
.9
4-4
.9
5-5
.9
6-6
.9
7-7
.9
8-8
.9
9-9
.9
10
-10
.9
11
-11
.9
12
-12
.9
13
-13
.9
14
-14
.9
15
-15
.9
16
-16
.9
17
-17
.9
18
-18
.9
Fre
qu
ency
% Sn
0
10
20
30
40
50
60
0-0
.9
1-1
.9
2-2
.9
3-3
.9
4-4
.9
5-5
.9
6-6
.9
7-7
.9
8-8
.9
9-9
.9
10
-10
.9
11
-11
.9
12
-12
.9
13
-13
.9
14
-14
.9
15
-15
.9
16
-16
.9
17
-17
.9
18
-18
.9
Fre
qu
ency
% Sn
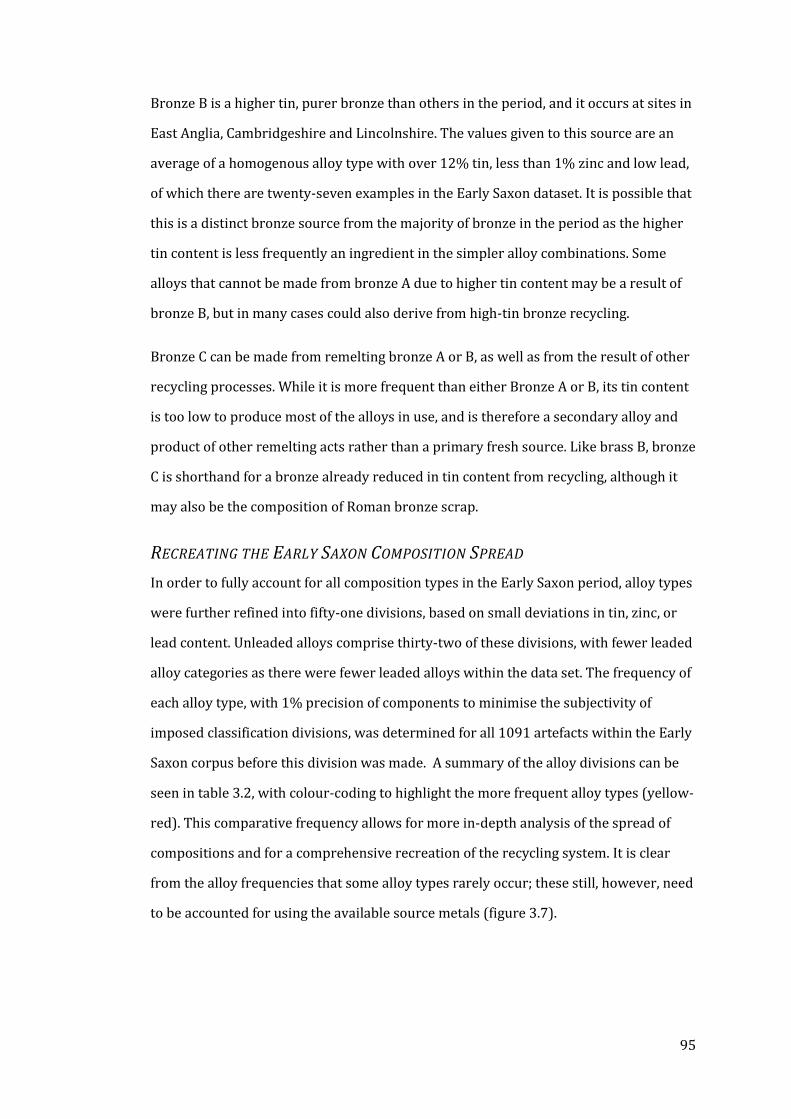
95
Bronze B is a higher tin, purer bronze than others in the period, and it occurs at sites in
East Anglia, Cambridgeshire and Lincolnshire. The values given to this source are an
average of a homogenous alloy type with over 12% tin, less than 1% zinc and low lead,
of which there are twenty-seven examples in the Early Saxon dataset. It is possible that
this is a distinct bronze source from the majority of bronze in the period as the higher
tin content is less frequently an ingredient in the simpler alloy combinations. Some
alloys that cannot be made from bronze A due to higher tin content may be a result of
bronze B, but in many cases could also derive from high-tin bronze recycling.
Bronze C can be made from remelting bronze A or B, as well as from the result of other
recycling processes. While it is more frequent than either Bronze A or B, its tin content
is too low to produce most of the alloys in use, and is therefore a secondary alloy and
product of other remelting acts rather than a primary fresh source. Like brass B, bronze
C is shorthand for a bronze already reduced in tin content from recycling, although it
may also be the composition of Roman bronze scrap.
RECREATING THE EARLY SAXON COMPOSITION SPREAD
In order to fully account for all composition types in the Early Saxon period, alloy types
were further refined into fifty-one divisions, based on small deviations in tin, zinc, or
lead content. Unleaded alloys comprise thirty-two of these divisions, with fewer leaded
alloy categories as there were fewer leaded alloys within the data set. The frequency of
each alloy type, with 1% precision of components to minimise the subjectivity of
imposed classification divisions, was determined for all 1091 artefacts within the Early
Saxon corpus before this division was made. A summary of the alloy divisions can be
seen in table 3.2, with colour-coding to highlight the more frequent alloy types (yellow-
red). This comparative frequency allows for more in-depth analysis of the spread of
compositions and for a comprehensive recreation of the recycling system. It is clear
from the alloy frequencies that some alloy types rarely occur; these still, however, need
to be accounted for using the available source metals (figure 3.7).
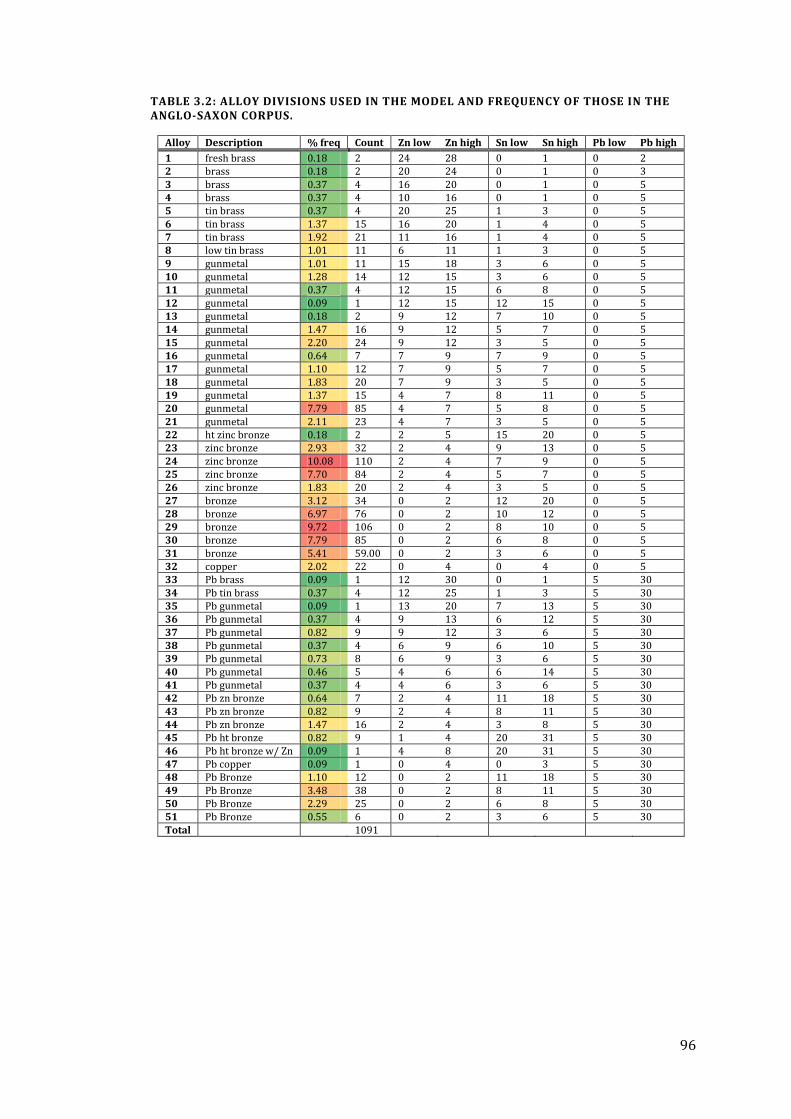
96
TABLE 3.2: ALLOY DIVISIONS USED IN THE MODEL AND FREQUENCY OF THOSE IN THE ANGLO-SAXON CORPUS.
Alloy Description % freq Count Zn low Zn high Sn low Sn high Pb low Pb high
1 fresh brass 0.18 2 24 28 0 1 0 2 2 brass 0.18 2 20 24 0 1 0 3 3 brass 0.37 4 16 20 0 1 0 5 4 brass 0.37 4 10 16 0 1 0 5 5 tin brass 0.37 4 20 25 1 3 0 5 6 tin brass 1.37 15 16 20 1 4 0 5 7 tin brass 1.92 21 11 16 1 4 0 5 8 low tin brass 1.01 11 6 11 1 3 0 5 9 gunmetal 1.01 11 15 18 3 6 0 5 10 gunmetal 1.28 14 12 15 3 6 0 5 11 gunmetal 0.37 4 12 15 6 8 0 5 12 gunmetal 0.09 1 12 15 12 15 0 5 13 gunmetal 0.18 2 9 12 7 10 0 5 14 gunmetal 1.47 16 9 12 5 7 0 5 15 gunmetal 2.20 24 9 12 3 5 0 5 16 gunmetal 0.64 7 7 9 7 9 0 5 17 gunmetal 1.10 12 7 9 5 7 0 5 18 gunmetal 1.83 20 7 9 3 5 0 5 19 gunmetal 1.37 15 4 7 8 11 0 5 20 gunmetal 7.79 85 4 7 5 8 0 5 21 gunmetal 2.11 23 4 7 3 5 0 5 22 ht zinc bronze 0.18 2 2 5 15 20 0 5 23 zinc bronze 2.93 32 2 4 9 13 0 5 24 zinc bronze 10.08 110 2 4 7 9 0 5 25 zinc bronze 7.70 84 2 4 5 7 0 5 26 zinc bronze 1.83 20 2 4 3 5 0 5 27 bronze 3.12 34 0 2 12 20 0 5 28 bronze 6.97 76 0 2 10 12 0 5 29 bronze 9.72 106 0 2 8 10 0 5 30 bronze 7.79 85 0 2 6 8 0 5 31 bronze 5.41 59.00 0 2 3 6 0 5 32 copper 2.02 22 0 4 0 4 0 5 33 Pb brass 0.09 1 12 30 0 1 5 30 34 Pb tin brass 0.37 4 12 25 1 3 5 30 35 Pb gunmetal 0.09 1 13 20 7 13 5 30 36 Pb gunmetal 0.37 4 9 13 6 12 5 30 37 Pb gunmetal 0.82 9 9 12 3 6 5 30 38 Pb gunmetal 0.37 4 6 9 6 10 5 30 39 Pb gunmetal 0.73 8 6 9 3 6 5 30 40 Pb gunmetal 0.46 5 4 6 6 14 5 30 41 Pb gunmetal 0.37 4 4 6 3 6 5 30 42 Pb zn bronze 0.64 7 2 4 11 18 5 30 43 Pb zn bronze 0.82 9 2 4 8 11 5 30 44 Pb zn bronze 1.47 16 2 4 3 8 5 30 45 Pb ht bronze 0.82 9 1 4 20 31 5 30 46 Pb ht bronze w/ Zn 0.09 1 4 8 20 31 5 30 47 Pb copper 0.09 1 0 4 0 3 5 30 48 Pb Bronze 1.10 12 0 2 11 18 5 30 49 Pb Bronze 3.48 38 0 2 8 11 5 30 50 Pb Bronze 2.29 25 0 2 6 8 5 30 51 Pb Bronze 0.55 6 0 2 3 6 5 30 Total 1091
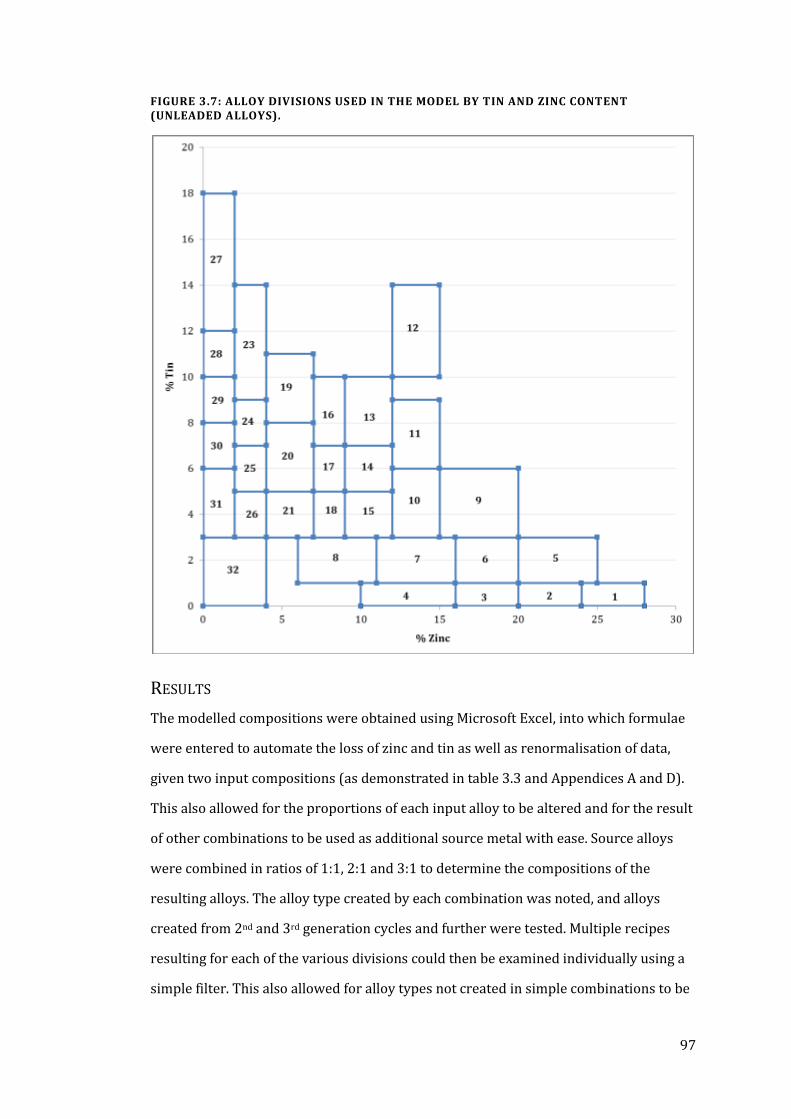
97
FIGURE 3.7: ALLOY DIVISIONS USED IN THE MODEL BY TIN AND ZINC CONTENT (UNLEADED ALLOYS).
RESULTS
The modelled compositions were obtained using Microsoft Excel, into which formulae
were entered to automate the loss of zinc and tin as well as renormalisation of data,
given two input compositions (as demonstrated in table 3.3 and Appendices A and D).
This also allowed for the proportions of each input alloy to be altered and for the result
of other combinations to be used as additional source metal with ease. Source alloys
were combined in ratios of 1:1, 2:1 and 3:1 to determine the compositions of the
resulting alloys. The alloy type created by each combination was noted, and alloys
created from 2nd and 3rd generation cycles and further were tested. Multiple recipes
resulting for each of the various divisions could then be examined individually using a
simple filter. This also allowed for alloy types not created in simple combinations to be
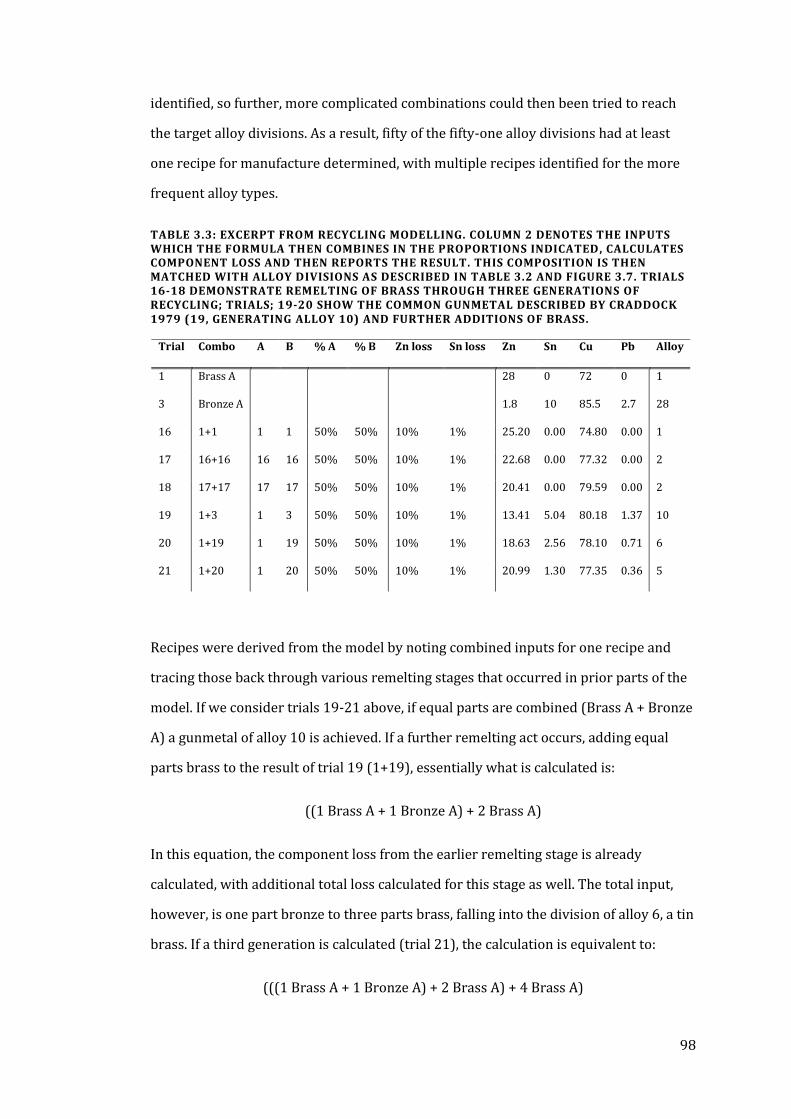
98
identified, so further, more complicated combinations could then been tried to reach
the target alloy divisions. As a result, fifty of the fifty-one alloy divisions had at least
one recipe for manufacture determined, with multiple recipes identified for the more
frequent alloy types.
TABLE 3.3: EXCERPT FROM RECYCLING MODELLING. COLUMN 2 DENOTES THE INPUTS WHICH THE FORMULA THEN COMBINES IN THE PROPORTIONS INDICATED, CALCULATES COMPONENT LOSS AND THEN REPORTS THE RESULT. THIS COMPOSITION IS THEN MATCHED WITH ALLOY DIVISIONS AS DESCRIBED IN TABLE 3.2 AND FIGURE 3.7. TRIALS 16-18 DEMONSTRATE REMELTING OF BRASS THROUGH THREE GENERATIONS OF RECYCLING; TRIALS; 19-20 SHOW THE COMMON GUNMETAL DESCRIBED BY CRADDOCK 1979 (19, GENERATING ALLOY 10) AND FURTHER ADDITIONS OF BRASS.
Recipes were derived from the model by noting combined inputs for one recipe and
tracing those back through various remelting stages that occurred in prior parts of the
model. If we consider trials 19-21 above, if equal parts are combined (Brass A + Bronze
A) a gunmetal of alloy 10 is achieved. If a further remelting act occurs, adding equal
parts brass to the result of trial 19 (1+19), essentially what is calculated is:
((1 Brass A + 1 Bronze A) + 2 Brass A)
In this equation, the component loss from the earlier remelting stage is already
calculated, with additional total loss calculated for this stage as well. The total input,
however, is one part bronze to three parts brass, falling into the division of alloy 6, a tin
brass. If a third generation is calculated (trial 21), the calculation is equivalent to:
(((1 Brass A + 1 Bronze A) + 2 Brass A) + 4 Brass A)
Trial Combo A B % A % B Zn loss Sn loss Zn Sn Cu Pb Alloy
1 Brass A
28 0 72 0 1
3 Bronze A
1.8 10 85.5 2.7 28
16 1+1 1 1 50% 50% 10% 1% 25.20 0.00 74.80 0.00 1
17 16+16 16 16 50% 50% 10% 1% 22.68 0.00 77.32 0.00 2
18 17+17 17 17 50% 50% 10% 1% 20.41 0.00 79.59 0.00 2
19 1+3 1 3 50% 50% 10% 1% 13.41 5.04 80.18 1.37 10
20 1+19 1 19 50% 50% 10% 1% 18.63 2.56 78.10 0.71 6
21 1+20 1 20 50% 50% 10% 1% 20.99 1.30 77.35 0.36 5
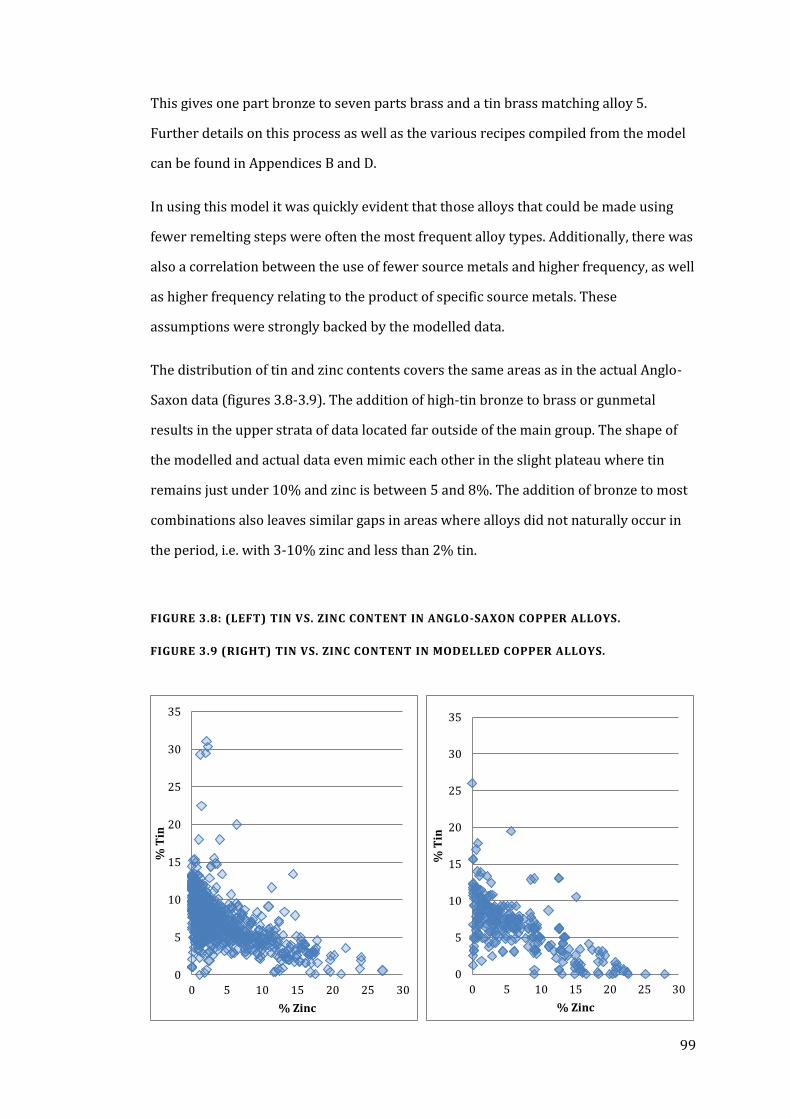
99
This gives one part bronze to seven parts brass and a tin brass matching alloy 5.
Further details on this process as well as the various recipes compiled from the model
can be found in Appendices B and D.
In using this model it was quickly evident that those alloys that could be made using
fewer remelting steps were often the most frequent alloy types. Additionally, there was
also a correlation between the use of fewer source metals and higher frequency, as well
as higher frequency relating to the product of specific source metals. These
assumptions were strongly backed by the modelled data.
The distribution of tin and zinc contents covers the same areas as in the actual Anglo-
Saxon data (figures 3.8-3.9). The addition of high-tin bronze to brass or gunmetal
results in the upper strata of data located far outside of the main group. The shape of
the modelled and actual data even mimic each other in the slight plateau where tin
remains just under 10% and zinc is between 5 and 8%. The addition of bronze to most
combinations also leaves similar gaps in areas where alloys did not naturally occur in
the period, i.e. with 3-10% zinc and less than 2% tin.
FIGURE 3.8: (LEFT) TIN VS. ZINC CONTENT IN ANGLO-SAXON COPPER ALLOYS.
FIGURE 3.9 (RIGHT) TIN VS. ZINC CONTENT IN MODELLED COPPER ALLOYS.
0
5
10
15
20
25
30
35
0 5 10 15 20 25 30
% T
in
% Zinc
0
5
10
15
20
25
30
35
0 5 10 15 20 25 30
% T
in
% Zinc
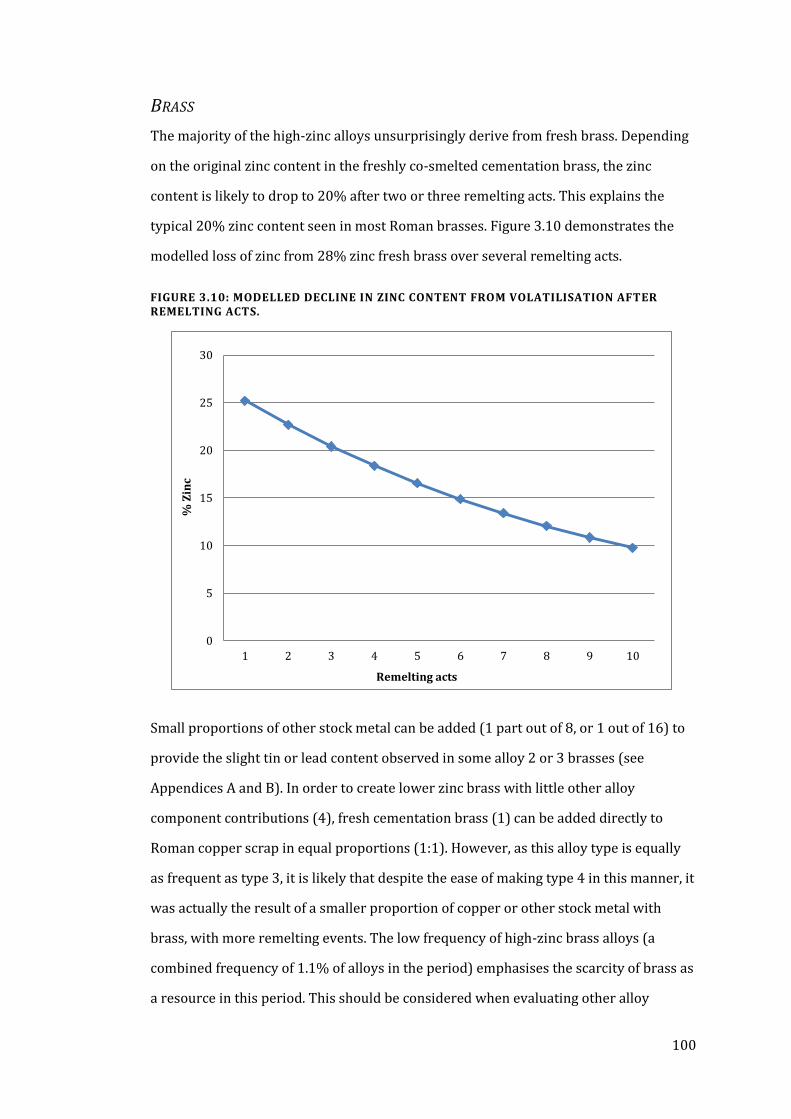
100
BRASS
The majority of the high-zinc alloys unsurprisingly derive from fresh brass. Depending
on the original zinc content in the freshly co-smelted cementation brass, the zinc
content is likely to drop to 20% after two or three remelting acts. This explains the
typical 20% zinc content seen in most Roman brasses. Figure 3.10 demonstrates the
modelled loss of zinc from 28% zinc fresh brass over several remelting acts.
FIGURE 3.10: MODELLED DECLINE IN ZINC CONTENT FROM VOLATILISATION AFTER REMELTING ACTS.
Small proportions of other stock metal can be added (1 part out of 8, or 1 out of 16) to
provide the slight tin or lead content observed in some alloy 2 or 3 brasses (see
Appendices A and B). In order to create lower zinc brass with little other alloy
component contributions (4), fresh cementation brass (1) can be added directly to
Roman copper scrap in equal proportions (1:1). However, as this alloy type is equally
as frequent as type 3, it is likely that despite the ease of making type 4 in this manner, it
was actually the result of a smaller proportion of copper or other stock metal with
brass, with more remelting events. The low frequency of high-zinc brass alloys (a
combined frequency of 1.1% of alloys in the period) emphasises the scarcity of brass as
a resource in this period. This should be considered when evaluating other alloy
0
5
10
15
20
25
30
1 2 3 4 5 6 7 8 9 10
% Z
inc
Remelting acts
101
recipes where zinc content is key; zinc may have been more frequently added in the
form of gunmetal than in a pure form.
TIN BRASS
Tin brasses comprise 4.7% of Early Saxon copper alloys. Of the four tin brass alloy
divisions, two are far more likely to occur than the others. This is likely because for
type 5 a minimum of three melting acts is needed, making it a less likely result. Type 8
can be made in a single melting act of brass B and copper scrap, but as there are half as
many of these alloys as types 6 or 7 this presumably was not often done in practice.
The lower frequency of alloy 8 may also be related to the combined limited availability
of copper scrap and brass.
Types 6 and 7 can be made in a single remelting act, using brass A and bronze A or B
(6) or brass B and bronze A or B (7). The higher frequency of type 7 is consistent with
the presumed more common nature of lower zinc brass Roman scrap within the
system. A further consideration is that in two or three melting acts, these alloys can
also be achieved. In these other recipes, similar proportions of the resulting alloy
remain the same (i.e. 3 brass B:1 bronze A) but what is actually being combined may be
a high-zinc gunmetal (brass B + bronze C, which is gunmetal alloy 10) with the addition
of more brass. Thus it is possible that tin brass was made by combining already zinc-
rich metal with brass.
If the modelled compositions are compared to actual composition distributions, it is
clear that the actual brass source used in making alloy 6 must contain zinc between the
two stock brasses within this model, as zinc varies from 15-17% and the modelled
values are at 18-20%. The tin values, however, best match those provided by mixing
with bronze A rather than the higher tin bronze B, evidence towards bronze A being
the fresh metal in supply. Type 7 alloy recipes using bronze A within one or two
remelting acts best match the actual data, which supports not only the use of bronze A
but also that more frequent alloys are those made from fewer remelting acts.
102
GUNMETAL
There were twelve alloy divisions made within the gunmetal compositional range,
comprising 21.5% of Early Saxon alloys. Frequency within gunmetals is highly variable,
with single instances in some alloy divisions and others containing nearly 8% of
sampled alloys. This appears to be directly related to the source metals involved and
the number of common combinations leading to corresponding alloys. Generally high-
zinc gunmetals are less frequent than low-zinc examples, with the exception of alloy 21,
which contains both low zinc and low tin (and for which all recipes require the addition
of copper scrap). The lower frequencies associated with higher zinc content reflect the
limitation on zinc-rich source metals, as well as the greater availability of bronze.
The lowest frequency gunmetals are alloys 11-13. There are four instances of alloy 11,
which necessitates mixing high-zinc brass with bronze B, or an awkward proportion of
brass A with high-tin bronze. As all three potential stock inputs are uncommon, this
accounts for the low frequency despite only a single mixing act being required to form
it. Alloy 12, which is that of a belt stud from Watchfield, Oxfordshire (which may have
been tinned gunmetal or brass originally), is also the composition of the strange girdle
hanger from West Heslerton discussed in Chapter 9 and could only have been made
from equal proportions of fresh brass and high-tin (low lead) bronze (Mortimer et al.,
1986). Alloy 13 only occurs in Early Saxon data twice, and requires a highly complex
mixture of brasses as well as high-tin bronze and bronze B (see Appendices A and B). In
practice, it was probably made using high-tin and high-zinc stock with slightly different
tin and zinc values than in the eight source metals in this model; however, its rarity
implies that these variations were also rare.
Gunmetals with higher tin contents that would be easier to make using bronze B are
always lower in frequency than those where bronze A can be used. This is also the case
where the simpler recipes involve brass A as a component rather than brass B. For
example, one of the lower frequency gunmetals is alloy 16, which requires roughly
equal tin and zinc content between 7-9%. All recipes for this alloy require bronze B as
well as small amounts of high-zinc brass A, thus the lower frequency. Gunmetal 17,
which has the same composition parameters but with only 5-7% tin, can be made with
103
bronze C instead, as well as occasionally brass B, and as a result it occurs nearly twice
as often. This is also the case for gunmetal 19, with high tin requirements, compared to
gunmetal 20, which can be made from a huge number of combinations most of which
involve bronze A or even C.
The most frequent gunmetal alloy (20, 7.8%) is due to it being the natural result of
many different remelting combinations, given the composition of probable inputs.
While the recipes within this model are obviously not exhaustive of all possible
combinations, it is interesting to note that gunmetal 20 was the result of four single-
melt combinations as well as eight two-stage and four three-stage melting
combinations, among others even more complicated (see Appendix B). Given the
probable metal supply resources, copper alloy recycling naturally leads to
compositions within this range far more often than other gunmetal alloys. It can also be
made not only from the stock metals, but from higher zinc gunmetals with the addition
of bronze A, and most potential stock inputs can lead to alloy 20 compositions given the
right combination of other metals.
Another frequent gunmetal (15, 2.2%) can be made in a single melting act from bronze
A, C, or leaded bronze scrap (which also has low tin); despite the lower frequency of
bronze C and leaded bronze in the metal supply, the variety of easy recipes to create
this alloy make it more frequent. As brass B + bronze A can be used to make this
gunmetal as well as alloy 14, the expected higher frequency of this alloy is split
between the two alloy divisions. The high frequency within this region of composition
lies between the two, at 4-6% tin.
ZINC BRONZE
Zinc bronze comprises 22.6% of Early Saxon alloys and has been divided into four
categories by tin content. No zinc bronze can be made from a single melting act using
the inputs in this model, indicating that the prevalence of this alloy type (and any
increase in its frequency in time or space) is most likely though not necessarily tied to
recycling practices. Unsurprisingly, the average tin contents in these alloys are most
frequently just below those of bronzes, as they are essentially bronze mixed with
104
gunmetal. However, due to the limited zinc requirements for this category, there are a
wide variety of potential recipes that can be used to create them, which can include any
stock metal type.
The least frequent zinc bronze type is alloy 26, which contains between 3-5% tin. All
recipes for this alloy type would require copper scrap to comprise half of the mixture,
which would otherwise be made from bronze A or C and a small proportion (1/8) of
brass. Brass generally forms one eighth or less of the recipe and would have been
mixed into gunmetal in a previous melting stage. Most zinc bronze recipes require a
large proportion of the bronze to be added at the final melting stage. Mixtures of more
than one bronze type are not uncommon within the recipes, although this does not
mean that such recipes themselves were often if ever produced. Of the fifty-one recipes
identified, thirty-three contain bronze A in some quantity (60%). 54% of second-stage
melting recipes, those which would be more likely, contained bronze A. This further
supports evidence that an alloy similar to bronze A was in fresh supply, as it is
necessary to create the majority of frequently occurring alloys types.
BRONZE
Bronzes comprise 33% of Early Saxon alloys and have been divided into five alloy
groups based on tin content. It is not surprising that so many alloys would be bronze if
indeed the fresh metal available was of this description. Bronze 31 can be made with
equal parts of bronze A and copper scrap, or from repeated recycling events; the
hypothetical rarity of copper metal in this period is supported by the lower frequency
of this form of bronze. Alloy 27 is bronze B, but can also be made from a single stage
melt of three parts bronze A to one part high-tin bronze. It is more likely, however, that
this alloy type represents a less frequent higher-tin fresh metal variation. The lower
frequency of this type compared to other bronzes as well as the incompatibility of such
high tin content with recipes in other frequent alloy types indicates that this was never
the major fresh metal source.
Bronze 28 and 29 are the most frequently occurring. Bronze 28 is essentially bronze A,
and bronze 29 is bronze C. As was mentioned in the description above of these two
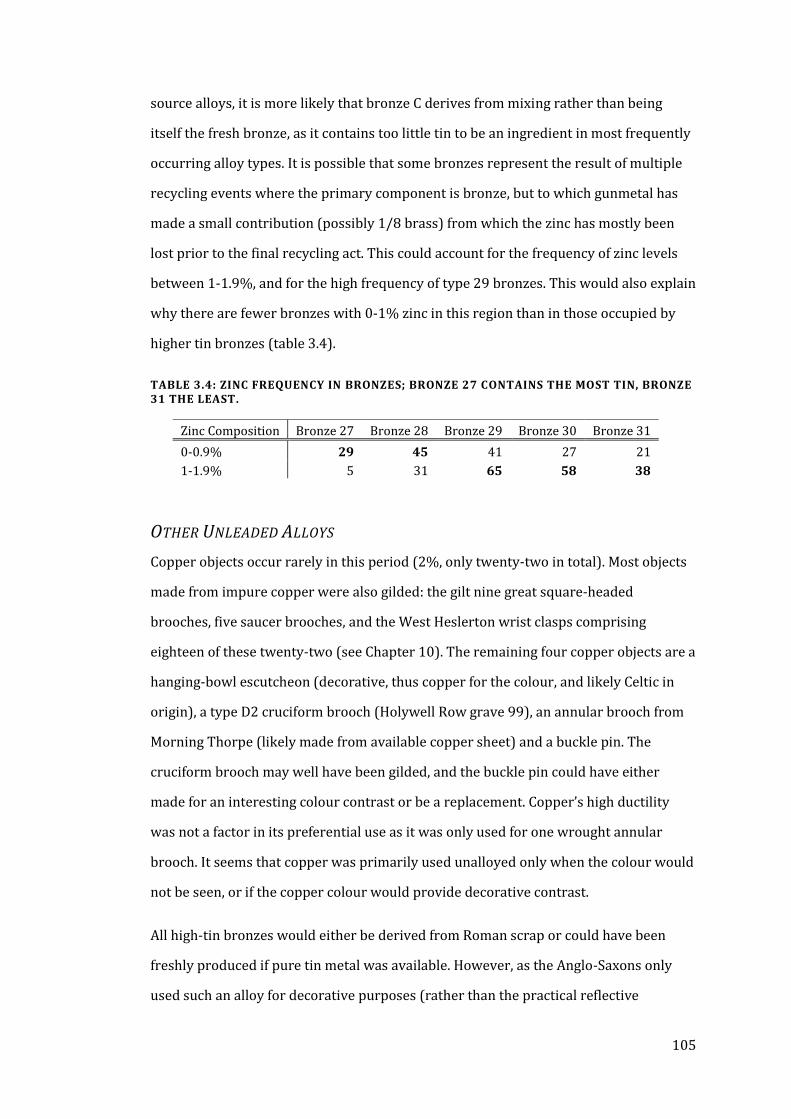
105
source alloys, it is more likely that bronze C derives from mixing rather than being
itself the fresh bronze, as it contains too little tin to be an ingredient in most frequently
occurring alloy types. It is possible that some bronzes represent the result of multiple
recycling events where the primary component is bronze, but to which gunmetal has
made a small contribution (possibly 1/8 brass) from which the zinc has mostly been
lost prior to the final recycling act. This could account for the frequency of zinc levels
between 1-1.9%, and for the high frequency of type 29 bronzes. This would also explain
why there are fewer bronzes with 0-1% zinc in this region than in those occupied by
higher tin bronzes (table 3.4).
TABLE 3.4: ZINC FREQUENCY IN BRONZES; BRONZE 27 CONTAINS THE MOST TIN, BRONZE 31 THE LEAST.
OTHER UNLEADED ALLOYS
Copper objects occur rarely in this period (2%, only twenty-two in total). Most objects
made from impure copper were also gilded: the gilt nine great square-headed
brooches, five saucer brooches, and the West Heslerton wrist clasps comprising
eighteen of these twenty-two (see Chapter 10). The remaining four copper objects are a
hanging-bowl escutcheon (decorative, thus copper for the colour, and likely Celtic in
origin), a type D2 cruciform brooch (Holywell Row grave 99), an annular brooch from
Morning Thorpe (likely made from available copper sheet) and a buckle pin. The
cruciform brooch may well have been gilded, and the buckle pin could have either
made for an interesting colour contrast or be a replacement. Copper’s high ductility
was not a factor in its preferential use as it was only used for one wrought annular
brooch. It seems that copper was primarily used unalloyed only when the colour would
not be seen, or if the copper colour would provide decorative contrast.
All high-tin bronzes would either be derived from Roman scrap or could have been
freshly produced if pure tin metal was available. However, as the Anglo-Saxons only
used such an alloy for decorative purposes (rather than the practical reflective
Zinc Composition Bronze 27 Bronze 28 Bronze 29 Bronze 30 Bronze 31
0-0.9% 29 45 41 27 21
1-1.9% 5 31 65 58 38
106
properties of such an alloy as used by the Romans for mirrors), it seems unlikely that
fresh high-tin bronze was made, at least with any regularity. As most high-tin bronzes
in this period are also leaded and leaded alloys are otherwise rare, it is more likely that
they are Roman in origin.
LEADED ALLOYS
Copper alloys with significant lead are infrequent in the Early Saxon period, with only
15% of alloys falling within this description. Due to the wide variety of potential tin and
zinc compositions, tin and zinc were divided as in unleaded alloys but into fewer
categories, thus only nineteen leaded divisions were used. The frequencies are often
very low within leaded types, with only four (alloys 44, 48, 49 and 50) representing
more than 1% of Early Saxon alloys.
Generally, the more frequent leaded alloys overlap in zinc and tin content with those
alloys with high unleaded frequency, such as gunmetal 15 and leaded gunmetal 37,
gunmetals 17-18 and leaded gunmetal 39, zinc bronze 24-25 and leaded zinc bronze
44, and bronzes 28-30 with leaded bronzes 49 and 50. However, other leaded alloys
with heightened frequency do not correspond with similar unleaded alloys, and these
are always related to high-tin alloys. This implies that a major source of significant lead
content in copper alloys was from leaded high-tin bronze.
Leaded bronze 50 corresponds with the average composition of leaded bronze scrap
that was used as a stock metal in the model. The existence of such a stock is supported
by the relatively high frequency of alloys matching this type (2.3%). Additionally,
adding this leaded bronze alloy to bronze A or B (in a proportion of 1:1 to 1:3, with
bronze A modelled recipes most accurately recreating the correct compositional
spread) results in alloy 49, the most frequent leaded bronze type. All leaded
compositions can be created using Roman leaded bronze or high-tin leaded bronze
scrap, supporting the idea that pure lead as a separate ingredient was not necessarily
needed. In addition, despite the often high lead content of Roman leaded alloys, when
these alloys are mixed with bronze and gunmetal the leaded content matches well with
observed data.
107
SUMMARY
First, the assumptions made within this model need to be addressed in terms of the
model output. It seems that including 10% zinc and 1% tin loss allowed the model to
mimic actual composition distribution with considerable precision. The lack of brass
and zinc-rich alloys is evident from alloy frequency, but it is interesting to note that
mixed alloys requiring a higher zinc input, such as fresh cementation brass, do occur
less often as well. Tin and lead were not needed independently of the stock metals to
reproduce any of the Early Saxon alloys; Roman scrap metals could account for all
leaded alloys in the period.
Including 1.8% zinc in the primary bronze stock metal was sufficient to account for the
zinc levels observed in many bronzes, although it is still unclear as to if low zinc
entered the system through the fresh metal ore, through uptake from reused ceramics,
or from the remnants of heavy recycling. Bronze A could be used to produce nearly all
alloy types, supporting the premise than a single fairly consistent fresh bronze alloy
was in supply.
In the actual modelling of alloy mixing, those alloy types requiring fewer remelting acts
were often more frequent than those requiring further melting stages or more than two
stock metals. However, when the stock metals required for simpler recipes are less
frequent than more complicated processes, this supports the idea that these stock
metals are more limited in availability, whether in terms of supply or due to
technological or human constraints.
FRESH METAL COMPOSITION
In terms of the objectives, the model was able to resolve some and suggest possibilities
for others. The model confirms that the likely fresh metal supply was a bronze with
about 10% tin, which would have been an easy composition to produce proportionally.
Some variation in this over time would not greatly change the results of the model, as
long as tin content remained between 9-11%. A small amount of lead around the
average of 2.7% accounts for most lead content observed in the data, though small
amounts may have entered from more variable scrap metal as well. It is likely,
108
however, that some minimal lead was present in the fresh metal supply for the spread
of frequency observed.
FREQUENCY OF FRESH METAL ADDITIONS
The amount of fresh metal entering the system cannot be precisely estimated due to
the number of possible recipes for many of the alloys. 50% of all recipes in the model
contain bronze A as a component, though it is difficult to account for how frequent this
would then occur with the actual data. Bronze A is not an ingredient in any recipe for
twenty of the alloy types, but these account for only 6.9% of objects in the period. This
means that over 90% of copper alloys in the Early Saxon period could have contained
bronze A, or fresh metal, within a certain number of remelting stages. Some of those
other alloys could have fresh bronze as part of the mix in the form of bronze B rather
than A. However, this means that less than 4% of Early Saxon alloys could not have
contained any fresh bronze, indicating that it was a widespread and regular addition to
the metal supply.
CHANGE IN RECYCLING PRACTICE
Most modelled recipes involved adding equal proportions of two input alloys. In some
cases, two-stage mixes could be done in one stage and result in a similar alloy, if the
zinc loss from the first stage was not too significant. Other combinations were only
achievable in simple steps by changing the proportions to 1:2 or 1:3. Some, however,
including many high frequency alloys and very specific infrequent alloys, must have
been created using equal proportions of both input metals.
If Roman recycling practice involved always adding a maximum of a 1/3 scrap metal,
then varying this to half scrap, or all scrap (of two different types), would be a
significant departure from early traditions (assuming that earlier practices were
consistent). This could account for the change in alloy type frequency from the Roman
to the Early Saxon period, as divisions between alloy types and the limited use of scrap
metal declined. This fits well with the concept of a ‘metallurgy of survival’ as all
available metal would be used to the best of the smith’s abilities. Generally, this would
be done by mitigating the unknowns from scrap contribution with a reliable and
consistent bronze, with the result of a higher number of intermediary alloys.
109
What is truly interesting is the apparent increase in zinc content in the system in the
late 6th-early 7th century (Chapter 10 - Chronology; Mortimer, 1991). This change
appears both in the heightened frequency of gunmetals and zinc bronze and decrease
in ‘pure’ bronze. Given the limited nature of zinc-rich alloys in general during this
period, there is not enough zinc in the system to account for this change. It is not simply
a matter of alloys becoming less binary as average zinc content overall rises; the only
explanation is an increase in brass or zinc-rich stock supply, especially as zinc content
is depleted during remelting.
PROPORTION OF SOURCE METALS USED
Understanding the necessary stock inputs for an alloy composition can reveal why
certain compositions are more or less frequent. When examined in terms of
proportions, it also can roughly indicate how much of a stock metal type must have
been available to account for such compositions seen in the period. Figure 3.11
demonstrates how various compositional ranges required certain stock or fresh metal
inputs. It is clear that many alloys require a significant brass component at some stage
in their manufacture.
If the zinc bronzes are considered as an example, an eighth of the metal would have
been brass; as there are 246 unleaded zinc bronzes from this period that have been
analysed, this would mean roughly an eighth of that, or thirty-one objects worth (or
half of this, as half an object’s worth of brass would be necessary in the first melting
stage), would have had to be brass. As this is far more than the actual number than
occur in the period, it is likely that most high-zinc metal was already in gunmetal form.
It is also possible that brass scrap was nearly always recycled with bronze to spread
the qualities of zinc further, like the economical use of gold through gilding. This could
also explain why brass objects were split between pairs, as was done with saucer
brooches (Caple, 2010). Preferential recycling of heirloom objects of Roman
origination, whether for technical, aesthetic, or traditional reasons, could explain zinc
content in Anglo-Saxon objects.
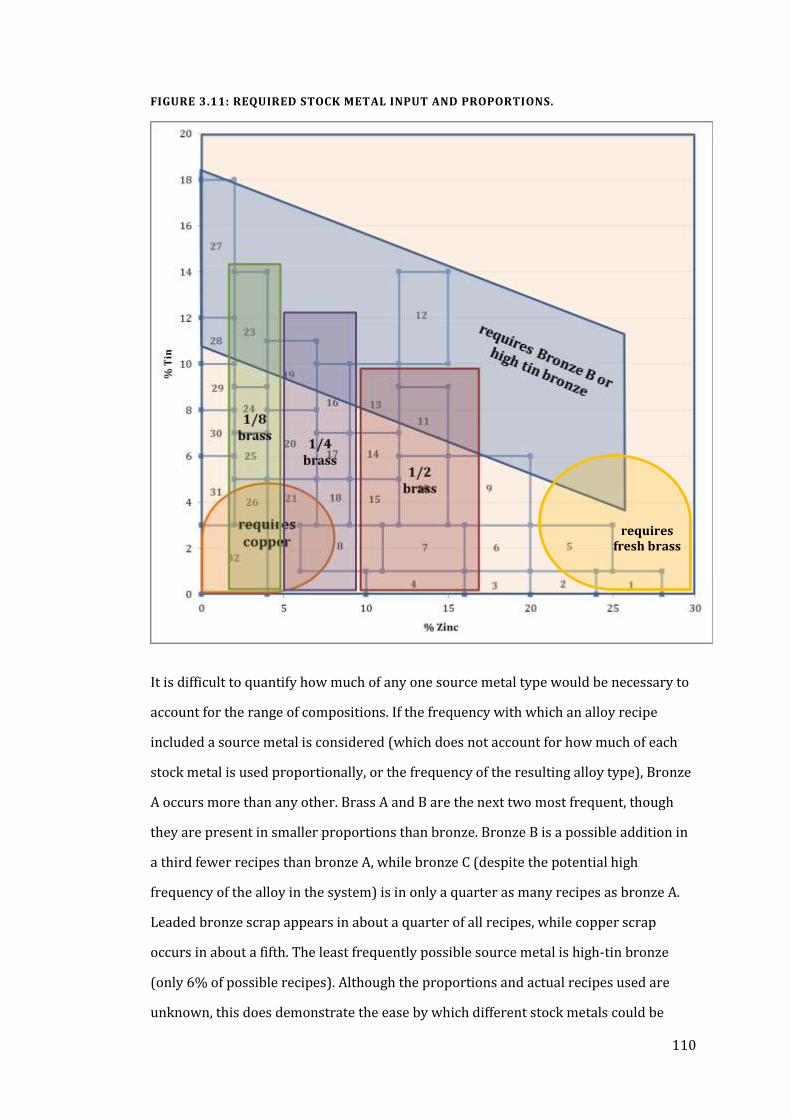
110
FIGURE 3.11: REQUIRED STOCK METAL INPUT AND PROPORTIONS.
It is difficult to quantify how much of any one source metal type would be necessary to
account for the range of compositions. If the frequency with which an alloy recipe
included a source metal is considered (which does not account for how much of each
stock metal is used proportionally, or the frequency of the resulting alloy type), Bronze
A occurs more than any other. Brass A and B are the next two most frequent, though
they are present in smaller proportions than bronze. Bronze B is a possible addition in
a third fewer recipes than bronze A, while bronze C (despite the potential high
frequency of the alloy in the system) is in only a quarter as many recipes as bronze A.
Leaded bronze scrap appears in about a quarter of all recipes, while copper scrap
occurs in about a fifth. The least frequently possible source metal is high-tin bronze
(only 6% of possible recipes). Although the proportions and actual recipes used are
unknown, this does demonstrate the ease by which different stock metals could be
requires
fresh brass
111
utilised to produce copper alloys. Fresh bronze and some zinc-rich source are central to
most recipes, and mixing these two alloy types represents the typical recycling
practice.
RECYCLING CHOICES
The wide range of copper alloy compositions in the Early Saxon period supports the
idea of a metal system when no scrap went to waste (with the exception of deposition
of select objects in burials); however, certain alloys were used for specific choices. This
is particularly evident for high-copper samples, as objects made from 95% copper or
more were generally not meant to have the surface seen (i.e. gilding would cover the
base metal) or were deliberately made from copper to provide colour contrast with the
rest of the object.
The method that was used to determine recycling choices is likely tied to the colour of
the source metals to be mixed. In this way, copper scrap would not be added to already
low-tin bronze, and strange compositions such as the West Heslerton girdle hanger
were probably the result of an attempt to mitigate alloy extremes by adding pale high-
tin bronze with yellow high-zinc brass. Leaded alloys were not added to brass unless a
significant amount of tin was also in the mix, so leaded brasses remain rare. Due to the
limited availability of high-zinc alloys in this period as well as the limited metal
resources in general there is a departure from earlier Roman recycling practices, and
higher proportions of already mixed or scrap metals were added to fresh bronze,
resulting in an increase in zinc bronze alloys.
112
CHAPTER 4
COLOUR IN THE ANGLO-SAXON WORLD
INTRODUCTION
Colour is an important and often subtle variable that shapes human experience and
perception of the world. Colour is an abstract concept and as such is subject to personal
and cultural interpretation dependent on categorisation and use of language. It is a
variable often overlooked in archaeology, only relatively recently becoming a focus of
archaeological discussion (e.g. Jones and MacGregor, 2002; Gage, 1999b, 109).
However, “one cannot interpret a single metal any more than a single colour without
seeing it in its full context with other colours and materials” (Herbert 1984, 295), and
so any discussion of the colour of metal artefacts must be within the context of
contemporary material culture. Understanding the use of colour can also be
approached from a linguistic direction, as the way we categorise and use language can
shape our perception of our world (Hines, 2004; Jones and MacGregor 2002).
Fashion and colour use can be quite specific and shape in subtle ways how we view a
culture or period of time. Colour usage can have temporally specific and reactionary
trends: ‘avocado’ green and ‘harvest gold’ dominated the 1970s as a reaction against
the widespread use of synthetic colours of the 1960s (Steer, 2009, 22). Culturally
specific preferences for colours are common throughout history, such as red being
favoured as a lucky colour in China. Schmitt (1995, 33) notes that in the corporate
world, blue is preferred in America while it has, “connotations of evil or sinister
behaviour,” in China. Understanding the symbolic underpinnings that govern choice is
therefore important in understanding the use of colours within various contexts.
113
Symbolic values associated with colour, as well as fashion, govern their desirability and
use. However, while, “color and fashion are intimately linked... surprisingly, color use
data are scarce and available for only a few products over long periods of time”
(Pashigan, 1988, 941). The variable of colour, which dominates the visual appearance
of any ensemble or material culture, has the potential to reveal much about the culture
and period from which it derives.
In order to understand how the appearance of copper alloy jewellery was appreciated
or managed by the culture that created it, we must try to understand how colour itself
was perceived (Jones and MacGregor, 2002). The aesthetic tastes of the Anglo-Saxons
have not been holistically approached (Frantzen, 2012, 1), nor can they truly be as
much of their material culture does not survive. While it is impossible to fully
reconstruct the visual understanding of a past culture, clues to how colour was
experienced can be derived from how colour words were used within the
contemporary language. The uses and distinctions within language shape how we
perceive and categorise the world, and so establishing this is crucial to understanding a
culture’s material culture. If we then also consider other material culture from the
Anglo-Saxon period and how colour is used on various media, this can further
illuminate where and how metal objects fit in a cultural colour context. This chapter
therefore examines the use of colour in metalworking techniques and metal objects,
and sets this in the context of the colours used in other material culture types, as well
as examining the way in which colour was defined and described in the written and
spoken word.
114
COLOUR TERMS IN LANGUAGE
"The limits of my language mean the limits of my world"
(Wittgenstein, 2001, 5.6, trans. Pears and McGuinness).
Language allows us to shape reality and to understand it through categorisation
(Edwards, 1991). Past colour words and categories carry different semantic intents and
symbolic meanings which are only apparent through contemporary literature and
linguistic use. “Colour-perception and colour-language turn out to be closely bound up
with each other, since symbolizing is essentially a linguistic function, the available
colour-vocabulary must have a decisive role in the creation of any language of colour-
symbols” (Gage, 1993, 79). Thus examining the use of colour words in Old English, the
contexts in which they often occur, and the frequency of use allows the reconstruction
of Anglo-Saxon colour space and the implied semantic qualities of each term. This can
then be applied as a context in which the colour of contemporary material culture can
be viewed.
UNIVERSAL DEVELOPMENT OF COLOUR TERMS
Colour is an abstract concept shaped by human use and intent. The evolution of this
abstract set of adjectives has been widely studied by a variety of academic disciplines.
Berlin and Kay’s (1991) theory of colour term development is based on detailed study
of numerous modern languages, describing an evolution of colour words within a
language through an ordered series of term additions. In languages with the simplest
colour terminology, colour terms are limited to ‘black’ and ‘white’ equivalencies, with
all dark/cool and light/warm hues falling into either category (e.g. Danian, from
Highland New Guinea; Berlin and Kay, 1991, 23-25). In these early systems, hue is not
as important as relative brightness; it is not so much a colour system divided into
‘white’ and ‘black’ as lightness-brightness and darkness-dullness.
If one considers the environment in which colour is perceived, the lack of importance
of hue could be tied to its inconstancy in nature (Boric, 2002). The sky or sea may be
generally described as blue, but can also be grey, purple, green, or any number of other
115
hues. Green leaves turn yellow, orange, red and brown; fruit ripens from green to
yellow or red or black and then rots to brown and black. The famous Tyrian purple
dye, a symbol of royalty and power in the ancient world, could range in hue from blue
to purple to red depending on the species of murex utilised (Gleba and Mannering,
2012, 20). Even in the processes of deriving dyes and coloured glass in the ancient and
early medieval world, the substances could change colour dramatically depending on
the length of processing time or other conditions (Barber, 1991; Gage, 1999a, 69). Hue
is therefore a transient attribute that is less distinct than contrasts in brightness. Thus
in the development of language, the relative brightness or darkness of a colour is more
noticeable and the semantic intent first defined by lexemes.
In all instances, the next colour to be added to a vocabulary is red. ‘Red’ in this sense
comprises all reds, oranges, pinks, and occasionally other overlapping areas such as
purples and yellows. When four colour terms exist, the next area defined is either
‘yellow’ or ‘green’ with either one including the other, as well as tawny colours and
browns, and depending on whether the term added is yellow or green, oranges or
green-blues respectively (Berlin and Kay, 1991). Following the yellow-green term
introduction is the separation of this into green and yellow, then blue, followed by
brown, purple, pink and orange, with grey emerging, “as a ‘wild card’ at any stage”
(MacLaury, 1992, 138).
This theory of colour term evolution has been criticised as the introduction of colour
lexemes after the yellow/green stage is anything but universal. In particular, blue is
problematic, especially in its evolution in Old English as it does not appear until the
10th century (Biggam, 1997). MacLaury (1992) refined Berlin and Kay’s theory by
specifying not an order of hues, but the evolution of colour terms from a system
dominated by brightness terms to one based on hue. Within this framework, “since red
and yellow are perceived to be more distinct than green and blue, the warm category
will always divide prior to the cool category in the evolutionary sequence” (MacLaury,
1992, 141). Thus red still emerges first, followed by yellow (inclusive of part of the
green area of colour space) and then the cool, dark colours. The focus of the cool
116
category eventually skews towards green, potentially leaving blue unnamed and
grouped still with ‘dark’.
The system into which Old English falls must by default be at least ‘Stage III’ (i.e., white,
black, red and yellow have developed) under Berlin and Kay’s model as it is descended
from Indo-European roots. As there are root words deriving from Indo-European for
red (*reudh-) and yellow (*ĝhel-) from which numerous other languages inherited their
colour terms, this puts all Indo-European languages at least at Stage III (Biggam, 2010,
245; Slocum, 2011). However, as, “no common roots for white and black can be
ascribed to the proto-language,” the development of these widespread root colour
words is still unclear (Shields, 1996, 94). It may be that, as in Old English (OE), there
were a variety of words used for lightness and darkness and that certain words were
developed by later cultures while others were used by other cultures; Certainly OE
sweart derives from the Proto-Indo-European (PIE) *suordo-s, both being words for
dark, from which the Modern English ‘swarthy’ originates. OE mirc and PIE *mer-,
provide another example of dark words passed down, giving us the ME ‘murky’
(Slocum, 2011). As lightness and darkness are different than white and black and carry
different connotations, the development of words denoting different qualities of these
two contrasting concepts can be seen in the wide variety of words covering the
lightness and darkness spectrum.
PROTOTYPE THEORY
In terms of development, the distinction of red prior to other colours is dependent on
two factors. Firstly, physiologically, humans can more easily distinguish the red area of
the colour spectrum (Barber, 1991, 230). Red is also a colour of danger or importance,
a meaning likely tied to red being associated with fire and blood (Scarre, 2002, 228), as
‘red’ (Modern English), ‘rot’ (German), ruber (Latin), eruthrós (Greek), etc., derive from
an Indo-European root word *reudh thought to mean ‘blood’, like the Sanskrit rudhirā
(Gage, 1999a, 110). This link between red and blood is an example of another colour
term development theory discussed by Wierzbicka (2006) and Biggam (2010, 2004), in
which colour terms derive from a prototype. In prototype theory, colour words develop
in stages as abstract qualities of the surroundings take on importance, probably
117
dependent on a survival-based need for a colour distinction. Thus the potential
prototype for red could be ‘blood’ or ‘fire’, both embodying primal concepts of red and
potential indicators of danger that would have been important to distinguish verbally.
It has been argued that red ochre was used since the Paleolithic, and more so in the
Mesolithic, to represent blood in burials, providing archaeological evidence of the
linguistic evolution of red from the prototype of blood (Jones and MacGregor, 2002, 8;
Scarre, 2002, 228).
Other instances of red in the landscape, leading to the abstraction of the term, could
also have been things that early humans may have found the need to distinguish and
identify by colour; the red of ochre certainly had its uses in prehistory (and later as an
identifier of iron ore), and the red of the poppy may have been an identifier of its
medicinal value. In later Anglo-Saxon contexts, the colour of a medicinal material was
of significance: blue-dyed cloth was used on wounds as, “the woad plant has vulnerary
and styptic properties, aiding in the healing of wounds and the staunching of blood”
(Biggam, 2006a, 6). Thus red, the colour standing out the most in the landscape, is also
a colour associated with various useful things, which may have led to its widespread
and early use and its abstraction as a colour word from the original prototype.
The slow development of abstract colour words over time, or not at all in some
instances, is a reflection of that culture’s need to make colour distinctions, even if “the
material use of colour precedes its linguistic description and categorization” (Kerttula,
2007; Jones and MacGregor, 2002, 7). The root word for yellow (*ghel-) also appears in
Indo-European, unlike any other colour words besides red, indicating it too is an early
development which Biggam (2010, 246) suggests dates to the Neolithic and the
agricultural revolution, where the distinction between unripe and ripe cereal crops
became important. Other yellow things in a landscape, such as various flowers or even
gold, may have aided in the absorption of the concept into ancient language. Certainly
the association between gold and the sun, surprisingly missing from the discussion of a
yellow prototype, occurred by the Neolithic, as can be seen on the Nebra sky disc found
in Germany (Pasztor and Roslund, 2007, 267). It is possible that ‘golden’ is a more
suitable prototype for the origins of yellow, with abstraction occurring with the
118
transference of the term to the sun, light, and even the ripening crops suggested by
Biggam (2010, 246).
The use of precious material lexemes (such as lapis lazuli and amethyst) as abstract
colour terms certainly did occur in non-PIE languages. The Egyptian for amethyst,
ḥsmn, was borrowed by Semetic and Akkadian for their (abstract) word for purple
(Warburton, 2007, 242; Baines, 1985). Other materials used as colours include other
stones such as turquoise and jasper, and the precious metals gold and silver.
Thus, colour words and the impetus for their abstraction can arise from a need for
distinction brought on by technological development (Chapman, 2002, 52), such as
controlling fire or managing crops, as well as from exotic prototypical coloured
materials such as amethyst or the orange fruit. However, the widespread adoption of a
colour word in its abstract sense (i.e., a basic colour term) only arises from a need to
apply the concept over a variety of materials important to that society (Kerttula 2007).
OLD ENGLISH COLOUR TERMS AND USE
Understanding the colour terms used in the Anglo-Saxon world may help to understand
their perception of colour and explain patterns of use. Certainly the concept of colour
space can vary significantly between cultures; even within the modern world there are
several ways of depicting colour, including 3D colour space, 2D chromaticity diagrams,
a colour wheel or even the linear electromagnetic spectrum order of colours. In the
early medieval mind-set, the concept of how colours related may have been similarly
variable, although there is little evidence for how colours were viewed in comparison
to each other.
One interesting although much later account offers an insight into the placement of
green within the spectrum of colours. Innocent III (late 12th century - early 13th
century), “justified the use of green vestments for minor feasts on the rather puzzling
ground that it was intermediate (medius) between white, black and red” (Gage, 1999a,
71). Purple was also placed in a different location than in modern colour space, as it
was considered full of lustre and therefore considered a bright colour despite its dark
hue, “thus the linking of purple with red, and hence with light” (Gage, 1999a, 73). In
119
addition to these variables, colour words were also not always used to describe specific
hues. Latin glosses often described a spectrum of Latin colour words that can be
implied by a single Old English word, such as one instance of OE brun, meaning brown,
red, purple or black.
Many words which could describe colour are also used to describe other aspects, such
as hār meaning both grey and aged, from which we get the modern ‘hoary’. The context
of the word may indicate that it was not meant to denote colour in that instance, but
another symbolic characteristic embodied by the lexeme, such as in the phrase ‘world’s
light’ (wuldres leoht), which appears numerous times in various Christian Old English
texts usually (but not always) depicting Christ (Clubb, 1972). Thus context is an
important consideration in all instances of colour word usage.
LIGHT AND DARK
As specifying a particular hue is a secondary development in colour terminologies, the
focus of early colour systems in language are inevitably lightness and darkness. These
two essential contrasts are the first to develop specific terminology and are the most
frequently used in Anglo-Saxon literature; indeed, “when we take out these two groups
of words, we have comparatively little color left” (Mead, 1899, 175). However, it must
also be considered that light and dark were heavily used in Christian texts to
symbolically represent good and evil, and the majority of literature that has been
examined in terms of colour is poetry, where archaic and primeval words abound. In
this sense, the words are often not denoting colour so much as symbolic values
associated with a colour concept. Also, light and dark colour words are still the most
frequently used in all modern Indo-European languages, and their frequency may
indicate nothing more than a normal human tendency to describe varying degrees of
visibility over other abstract characteristics (Pawlowski, 2006, 48).
It also must be remembered that lightness and darkness are not necessarily denoting
colour in other instances besides the symbolic, and the context of many uses of these
words reveals that colour was often not the concept being expressed, an issue that
most ignore when discussing the frequency of these terms in Old English. Indeed, each
120
scholar has used different variables in the definition of brightness in particular, leading
to inconsistency in the discussion of this group of terms in the literature and further
convoluting the already complicated problem (Biggam, 2007, 171). However, the sheer
number of lightness and darkness words capable of indicating these colour qualities
greatly outnumber other colour terms in Old English. The confusion surrounding the
use and implications of these terms necessitates that they only be discussed here in the
broadest of terms.
LIGHTNESS TERMS
The suggested evolutionary primacy of lightness and darkness in colour development
led to the development of many related words, and eventually the more hue-specific
‘white’ and ‘black’. ‘Bright’ OE beorht and ‘light’ OE lēoht and compound words
containing these dominate the lightness category, with the more hue-centric OE hwīt,
scir, blanc, and blāc for white, to name a few. The majority of uses of brightness terms
come from religious poetry where it is symbolically aligned with God, holiness, Christ
and generally good. Blāc comes from blīcan ‘to shine’ and was used to describe fire,
stars, lightning or a ghastly sort of pale, evidence that the ‘white’ words have a strong
brightness component (Mead, 1899, 177). The shining white of silver is described by
hwīt (Gen. 2731, in Mead, 1899, 179). “Compounds of OE hwīt ‘white’ with terms for
water... suggest that it could also mean ‘clear,’ while the frequency with which it
combines with OE cirice ‘church’ and other terms for buildings... suggests a particular
association with stone buildings” (Hough, 2006, 184). The church association may also
be due to the aforementioned Christian symbolism, or with the use of limestone or lime
wash on such buildings. Regardless of the numerous symbolic associations, the
dominance of bright and light colour terms in Old English implies that in some
circumstances this quality was valued above others, particularly in the context of
Christian literature.
DARKNESS TERMS
There are a similarly large number of terms denoting darkness. “To the black group
belong blæc, sweart, sweatian, (ge)sweorcan, gesweorc, wann, salowigpād, earp,” as well
as deorc, dim, drysmian, heolstor, mirc, niht, nīpan, sceadu, scuwa, swearcan, and
121
þēostre” (Mead, 1899, 175, 181). Generally, black and darkness describes night, smoke,
gloom, water, ravens, adders, armour and hell. Mead (1899) calculated that there are
half as many terms for darkness as those used to denote brightness, but this may be
due to his inclusion of some ‘bright’ words that may not indicate colour. Also, as he only
looked at poetry (most of which is Christian), this may be another reason for his
smaller number of darkness terms. The use of dark colour words in literature is equally
symbolic to that of bright:
We may not very inaptly describe Old English religious poetry as a series of studies in black and white, or, rather, darkness and light, the darkness applying to hell and devils, and the light, to heaven and angels and saints (Mead, 1899, 175).
Though this is a revealing interpretation of the place of lightness and darkness in the
mind-set of Old English speakers, it must be remembered that this is in reference to
Christian religious poetry and therefore not directly applicable to much of the period in
question (while thoroughly researched the author’s viewpoint is also quite dated, with
the following sentence containing the phrase ‘the primitive Germanic mind’). In
everyday use, words for darkness and lightness would not necessarily have carried
connotations of good and evil, especially outside an ecclesiastical context and in the
pre-Christian era. Indeed, the influence of the Church on the use of colour terms in
surviving Old English literature must be considered. There should be significant
differences between the pre-Christian and lay uses of colour words and those of a Latin
religion and culture. Indeed, as ,“the literal and symbolic uses of the word are not in all
cases kept sharply apart,” the use of brightness and darkness as colour in literature is
challenging to identify (Mead, 1899, 183).
Colour words are surprisingly sparse in the earliest Old English literature, that which is
considered to have origins in oral traditions predating Old English writing, which was
itself produced largely by Christian monks. This Christian origin of the surviving
written evidence also may indicate a foreign influence on the use of colour words in Old
English and potentially the adaptation and escalation of use of such terms from
translation to and from Latin, at least within one part of the population.
122
RED
As it is suggested that red is the first colour isolated as a hue descriptor in languages, it
is not surprising that it is one of the most frequently used in Old English literature. The
most common word for ‘red’ is rēad or rēod, with other terms including rudu, rēadbasu,
rosen, rudig, teafor, and wād. Purple words overlap with red, indicating a crimson-
purple area of colour space, and generally are limited to describing dyes or fabrics.
These words include basu, brunbasu, purpur or purpul variations (directly borrowed
from Latin), fellrēad, and deag, wealoc and wurma (the actual dye from the murex itself)
(Venezky, 1980). As purple overlaps with red so frequently and is semantically limited
to specific textile-related contexts, it is not a ‘basic colour term’ in Old English and
generally should be included within a greater ‘red’ area of colour space.
Red is often a compound word with terms for blood or fire, its prototypical and archaic
ancestors. The semantic relationship between red and blood is readily apparent in Old
English, particularly in Beowulf. More earthy reds also exist, with red, “also
characteristically applied to rocks, soil and foliage, none of which would ordinarily be
described as ‘red’ today (Hough, 2006, 185).” This is a reoccurring theme in Old
English; colour terms (and other words, as in the riddles of the period) tend to overlap
in meaning in ways that modern speakers would not anticipate.
Red is also used to describe fire and in four instances gold, as, “this is a familiar
convention of the Middle Ages, which may be due to the face that the gold of that time
was often darker than that of our own, and contained a considerable alloy of copper”
(Mead, 1899, 195). Red is also used to describe gold in Old Icelandic, but colour words
are almost non-existent in Old High German and Old Saxon, indicating that perhaps this
tradition derived from Scandinavian influences, or organically in Anglo-Saxon England
and thence into Nordic languages (Mead, 1899, 202-204). There is little evidence in the
composition of Anglo-Saxon gold to back up this claim, as the Anglo-Saxons preferred
to debase gold with silver to the point of achieving white gold rather than to add
significant copper (see Chapter 5). This illustrates how important a literary context can
be in understanding conventions within a culture that would otherwise not be
apparent from the material culture alone.
123
GOLD AND YELLOW
Gold and yellow are discussed together because of the obvious overlaps in hue as well
as the frequency of the use of golden as a colour word, indicating that it may have
denoted that area of colour space rather than ‘yellow’ as we would use it today. Indeed,
geolo only appears in Old English poetry four times, three times to describe a linden
shield (twice as a compound word) and once for a fine cloth, probably silk (Casson and
Gardner, 1992, 198; Mead, 1899, 396). Other instances of the word are often in Latin
glosses and are defined as croceus or flauum i fuluum rubeum, translating to
‘yellow/golden/saffron/scarlet’ and ‘yellow/golden, tawny reddish yellow, red (like
oxen and domestic animals or wheat)’ (Venezky, 1980, G025, 116; Whitaker, 2007).
The more common fealu ranges into the reddish-brown area:
Fealu as: ‘a colour-term of varied meaning; the corpus yields the most evidence for a colour basically yellow but variously tinted with shades of red, brown or grey, often pale but always unsaturated, i.e. not vivid; hence ‘tawny’, ‘yellowed’, ‘yellowish-red’, ‘yellowish-brown’, yellowish-grey’ all appear as translations; the Modern English reflex ‘fallow’ is now obsolute except of the coat of an animal (Hough, 2006, 184).
Biggam (1998, 44) also states that, “fealu can mean yellow as well as grey, [which]
suggests these were related concepts for the Anglo-Saxons.” Thus as yellow was wide-
ranging colour term, often tawny or unsaturated with frequent overlaps into the red
area of colour space, it is possible that gold was a more primary or basic colour term
than geolo or fealu and may have filled its place in terms of hue in the perception of
colour groupings in this early period. In other words, the colour that would be the focus
point of yellow in modern colour space may have been more akin to ‘golden’ than the
more unsaturated, variable and earthy geolo or fealu.
‘Golden’ was a more frequently used term within the modern understanding of yellow
colour space. The use of gold as denoting colour rather than the material is not always
possible to discern. OE for golden is gylden and there are several terms for gilded:
goldfyld, gullisc, gegyld, ofergyld and ofergylden. The many terms for gilded may reveal
either that gilding was a far more common thing than simply gold (which is backed by
the archaeological evidence) or simply that ‘gilded’ denoted a golden-like colour and
124
therefore those terms represent the defined hue in this area of Anglo-Saxon colour
space.
There is also potentially an overlap in semantic intent with the brightness of
yellow/golden and silver, as the OE word scilfor is defined in one Latin gloss as flaua,
meaning ‘yellow, golden or glittering’ (Venezky, 1980, SO08, 45; Whitaker, 2007).
Another example of this connection between gold and light can be seen in Beowulf:
And he saw too a standard, entirely of gold, hanging high over the hoard, a masterpiece of filigree; it glowed with light (Beowulf l.2767-2769, trans. Heaney, 2000).
However, there are also the compound words implying that gold and red were related
concepts. This closeness of yellow and red in the lexemes utilised may indicate that
‘red’ and ‘yellow’ were foci within a macro red-yellow colour, which had still not
become fully distinct in semantic use. When the aspects of brightness and glittering are
added to this conceptualisation, considerable overlap in semantic intent when using
colour words in Old English is evident and even a word with simple and clear-cut
qualities in modern English such as ‘golden’ take on a variety of associated meanings in
past interpretations of the same word. Such issues are often overlooked in modern
interpretations of the literature and material culture and are not limited to this
particular lexeme.
Gold is never called ‘yellow’ in Old English. A tantalising Old English phrase, reád gold,
literally ‘red gold,’ could indicate that Saxon gold was regularly debased with
significant quantities of copper. Semantically, however, reád gold implies a valuable
type of gold of high purity. The context of a further, if later, instance of reád gold
emphasises the connection between redness and the purity of gold: “all these
goldsmiths say that they never before saw such pure and such red gold” (from Homl.
Th. i.64, in Bosworth, 1898, 484). If pure gold was ‘red’, this could either that reád was
a non-distinct macro-colour and the colour of gold would therefore fall within this area
of colour space, or that ‘red’ implies brightness and brilliance, and could therefore be
referring to the intensity and vividness of the colour, or the bright or shimmering
125
quality of the metal. It could also indicate that pure gold could literally be redder in
colour than the debased gold of the period (see Chapter 5).
This macro-red-yellow colour space without complete distinction between the foci is
not only important in terms of the frequency of its use in Old English, but also in how it
may reflect how metals were visually understood in the period. Certainly the concepts
of brightness and shining and shimmering are those embodied by metal. Gylden was
more of a basic colour concept than geolo, and semantically imparted brightness,
redness, and yellowness, and even overlapped occasionally with scilfor. In this sense,
the place of copper alloys is paramount in the colour scheme of the Anglo-Saxon world,
as all of these areas of colour space can be achieved through the pure and alloyed
appearance of metals.
GREEN
Green is an interesting colour word in that it almost always appears in Christian
contexts and is only used to describe hue. “Old English grene ‘green’ was a pure-hue
term and seems not to have denoted brightness. Among the referents described as
grene in Old English poetry are the earth, fields, grass, trees and hills” (Casson and
Gardner, 1992, 396). The purely hue-describing nature of this term and its association
with Christian contexts may be an indication of its addition to the language later than
the brightness-and–hue qualifying terms such as rēad and geolo. Indeed, while its
existence before the migration is evident from its root developing in Old Germanic and
therefore being present in all the Germanic languages (and indeed in Indo-European:
ghre- meaning growing, green), it may not have developed into a basic colour term
until the time of the Christian conversion in the 7th century (Biggam, 2010, 249).
Additionally, as its use is limited to describing growing things, as its Indo-European
word root primarily imparts this meaning, even its frequency in Christian contexts
many not be proof of its widespread adaption as a basic colour word in later Old
English.
126
BLUE
Blue is an interesting colour in the early medieval period as there was no word for it
until presumably late in the development of Old English, and it is only used in Old
English poetry as a colour once. This single occurrence involves the OE hæwen, which,
“was probably a cool macrocolour, denoting blue, grey and even green” (Biggam,
2006b, 160). This term is limited primarily to glosses where translating the Latin for
blue is necessary (Biggam, 1997, 1995, 214). Also within the blue colour category is
blæwen, which, “was primarily a brightness term but also had a fixed blue sense”
(Biggam, 1997, 92; Casson and Gardner, 1992, 396). This term was limited to
describing luxury items and is similar to the Old French blewe that replaced it after the
Norman Conquest (Biggam, 1997, 92; Casson and Gardner, 1992).
The lack of a blue term may seem perplexing given its popularity in modern Indo-
European languages and as it is frequently used in early medieval material culture, but
one must consider that blue was not perceived as a separate colour (Pawlowski, 2006,
41). “In the early Middle Ages blue was seen as akin to darkness – it is even associated
with the dark angel of evil in a sixth century mosaic panel in S. Apollinare Nuovo,
Ravenna” (Gage, 1999a, 57). In this sense, blue may have been more akin to grey in the
Anglo-Saxon mind-set, with the variable darkness or lightness of the blue hue
determining whether it was considered part of the lightness or darkness colour
categories.
GREY
Grey is likely to have derived from a word relating to a pyrotechnology, perhaps from a
prototype for ‘ash-coloured’ in Proto-Germanic (*grawa-), and is most commonly græg
in Old English (Biggam, 2010). Besides the achromantic modern meaning of grey, OE
græg also included dull, dirty, old, and various related hue qualities throughout all
areas of colour space. This is particularly the case with another grey word, hār, which
more often than not indicates white-grey, but also includes thirty-eight instances
where the semantic intent was yellow, thirty to forty brown, twenty-six pink, sixteen
green, ten red, seven blue-green, etc; even one instance where purple may have been
implied (Biggam, 1998, 124-125). Thus it often implies a dull or unsaturated
127
appearance of a hue. The other lexeme for grey is hasu, occurring much less frequently
but with a similar spread of dull hue implications.
Grey is used to describe old things, grey hair, wolves and other animals, the sea, the sky
and in terms of metals, (dull, old rusty?) iron. “It looks as if the early significance of
græg was ‘dirty,’ and that, used of hues, it indicated a dirty, dull, greyish or ‘adulterated’
hue, which is now technically described as unsaturated” (Biggam, 1998, 83). Thus yet
again, while hue is certainly a primary aspect of the descriptive quality of ‘grey,’ it did
not necessarily refer to a single, distinct focus point in colour space but rather a range
of related variables, primarily dullness.
BRUN
Brun is the etymological ancestor of modern ‘brown’ but also was used to describe a
larger region of colour space than its current meaning. As mentioned before, brun
contains semantic qualities of red, yellow, tawny, purple and dark as well as brown,
and occurs as a compound word with other Old English colour lexemes from these
regions, though generally most overlap is in the tawny/earthen coloured area of colour
space. One of the more confusing instances of brun is in the compound ecg brun in
Beowulf, combining ‘shining edge’ (sword) and brown, an occurrence that has led some
scholars to hypothesise that brun could be shiny. If we think of the use
of walnut burrwood for high-status cups and bowls, this may be a shiny-brun hue as
the golden and swirling luminescent, even metallic appearance lends itself to a similar
notion of colour (Bruce-Mitford and Evans, 1978; Hook, 2010, 158). However, it is
more likely that this term implies a surface treatment, such as ‘burnished’ and that
shine was not meant to be semantically imparted (Biggam, 2010, 257). Generally, brun
is an earthy-coloured word, with overlaps into other earthen tones. Along with the root
for græg, the root word for brun, OG *bruna-, is often used to described iron and
animals. In terms of metals, brun can mean rust-coloured, and may have etymological
or prototypical links along with grey in pyrotechnology (Biggam, 1997, 62-63).
128
FREQUENCY OF COLOUR WORDS IN OLD ENGLISH
Much of Old English literature was written long after the period in question, and it
must be considered how the literature may represent a changed or further evolved
language than existed in the 5th-7th centuries. In particular, the influence of the church
and therefore Latin and continental concepts of colour must be considered, especially
as Christian scribes wrote most of the extant manuscripts. It is likely that Latin had
some influence on Anglo-Saxon colour words, at least in Christian literature. However,
Christianity may not have been the only linguistic influence on Old English. Certainly in
Old Welsh, the 5th-6th centuries are credited with being the period in which most
phonetic changes occur, and although there are few loan words from Welsh in Old
English (none of which pertain to colour), such influences must be considered
(Hencken, 1974; Coates et al, 2000). The migration period was one of rapid change, and
the Germanic language brought over from the continent underwent several changes in
these essential early years, changes that would affect the formation of English identity
(Hines 1994).
The written sources for Old English are later, but the striking lack of colour words in
the earliest works is notable. Perhaps, even if the words themselves were not adapted,
the influence of colour word use in Christian literature may have inspired an increase
in the use of Old English colour words. The craft-working in metals, glass, textiles and
pigment use certainly increased due to monastic production, and it is possible that this
was mirrored in the adaptation of related word use in the lay population. However, in
secular contexts, the brun-fealu-geolo-grene range of colours would have been utilised
more than in literature as its practical applications lay in describing the agricultural
way of life. Conversely, this area of colour space may not have even been developed in
the 5th century, as certain words span the Old Germanic-Old English divide. These are
all factors that must be kept in mind when examining the frequency of word use in Old
English literature, especially as the written evidence is already biased by its later date
and Christian origins. It is therefore useful to consider the evolutionary pattern of
colour term acquisition and use when reconstructing colour word use in the earlier
period.
129
By examining the frequency of colour word use with these limitations and biases in
mind, and (as seen above) the contexts in which they were utilised, one can begin to
reconstruct how colour was understood by the Anglo-Saxons. W. E. Mead (1899)
exhaustively undertook to account for every usage of a colour term in Old English;
granted, further manuscripts have been found since then, his corpus was limited to
poetry, and he is inconsistent in reporting his results, but his findings do reveal
interesting patterns of word usage that may be indicative of the importance of certain
colours in the Anglo-Saxon world. However, his work was far from quantitative or
exhaustive and so a new quantitative frequency survey was conducted.
QUANTITATIVE FREQUENCY ANALYSIS
Pawlowski (2006) sought to determine whether a methodology based on colour term
frequency within a language could support a universality or relativism approach to
colour term evolution. He compared the frequency of different colour terms within
eleven Indo-European languages and applied various statistical approaches and
concluded that while the frequency of most terms between languages is significantly
similar, languages do not have a universal pattern of term evolution. Given that this
was the result of comparing languages with a known common linguistic ancestor in
Indo-European, such a conclusion is influential when considering other languages.
The Microfiche Concordance to Old English was used to quantitatively account for
every instance of a word in Old English with a definite colour implication, using those
listed in the Old English Thesaurus (Roberts et al., 1995, 144-147; Venezky, 1980). The
frequency of Old English colour terms was then compared to that in Pawlowski’s study
in tables 4.1 and 4.2.
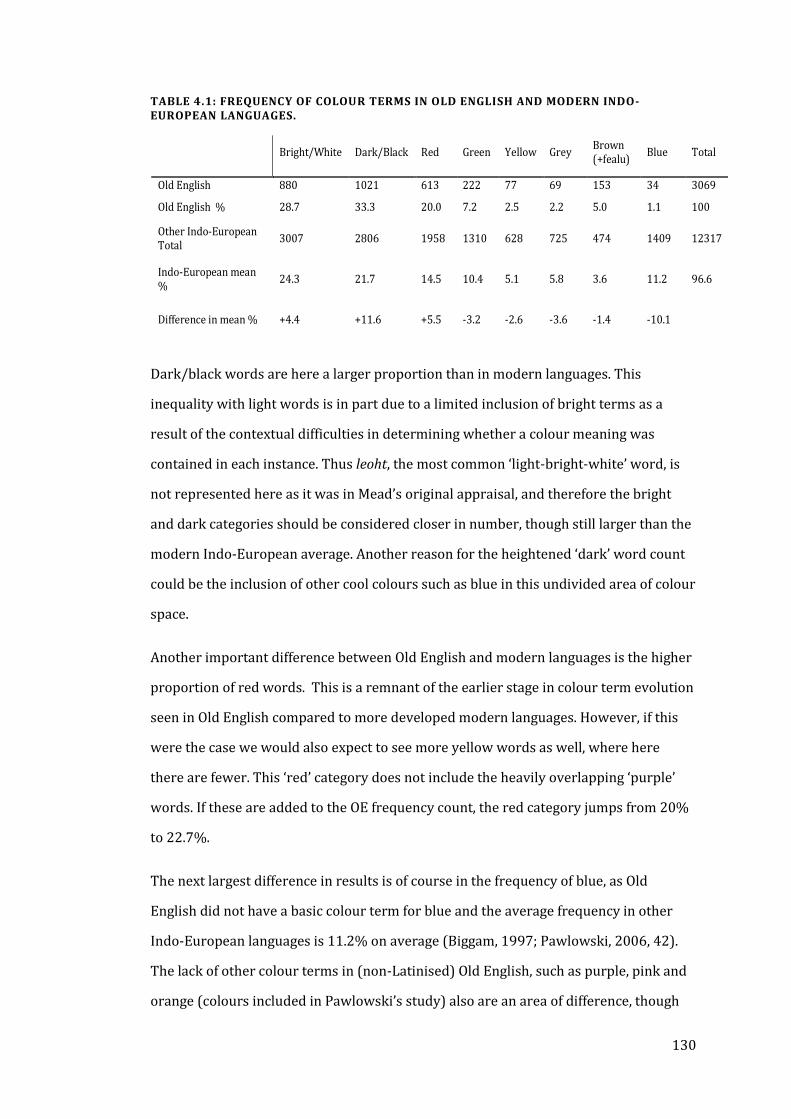
130
TABLE 4.1: FREQUENCY OF COLOUR TERMS IN OLD ENGLISH AND MODERN INDO-EUROPEAN LANGUAGES.
Dark/black words are here a larger proportion than in modern languages. This
inequality with light words is in part due to a limited inclusion of bright terms as a
result of the contextual difficulties in determining whether a colour meaning was
contained in each instance. Thus leoht, the most common ‘light-bright-white’ word, is
not represented here as it was in Mead’s original appraisal, and therefore the bright
and dark categories should be considered closer in number, though still larger than the
modern Indo-European average. Another reason for the heightened ‘dark’ word count
could be the inclusion of other cool colours such as blue in this undivided area of colour
space.
Another important difference between Old English and modern languages is the higher
proportion of red words. This is a remnant of the earlier stage in colour term evolution
seen in Old English compared to more developed modern languages. However, if this
were the case we would also expect to see more yellow words as well, where here
there are fewer. This ‘red’ category does not include the heavily overlapping ‘purple’
words. If these are added to the OE frequency count, the red category jumps from 20%
to 22.7%.
The next largest difference in results is of course in the frequency of blue, as Old
English did not have a basic colour term for blue and the average frequency in other
Indo-European languages is 11.2% on average (Biggam, 1997; Pawlowski, 2006, 42).
The lack of other colour terms in (non-Latinised) Old English, such as purple, pink and
orange (colours included in Pawlowski’s study) also are an area of difference, though
Bright/White Dark/Black Red Green Yellow Grey Brown (+fealu)
Blue Total
Old English 880 1021 613 222 77 69 153 34 3069
Old English % 28.7 33.3 20.0 7.2 2.5 2.2 5.0 1.1 100
Other Indo-European Total
3007 2806 1958 1310 628 725 474 1409 12317
Indo-European mean %
24.3 21.7 14.5 10.4 5.1 5.8 3.6 11.2 96.6
Difference in mean % +4.4 +11.6 +5.5 -3.2 -2.6 -3.6 -1.4 -10.1
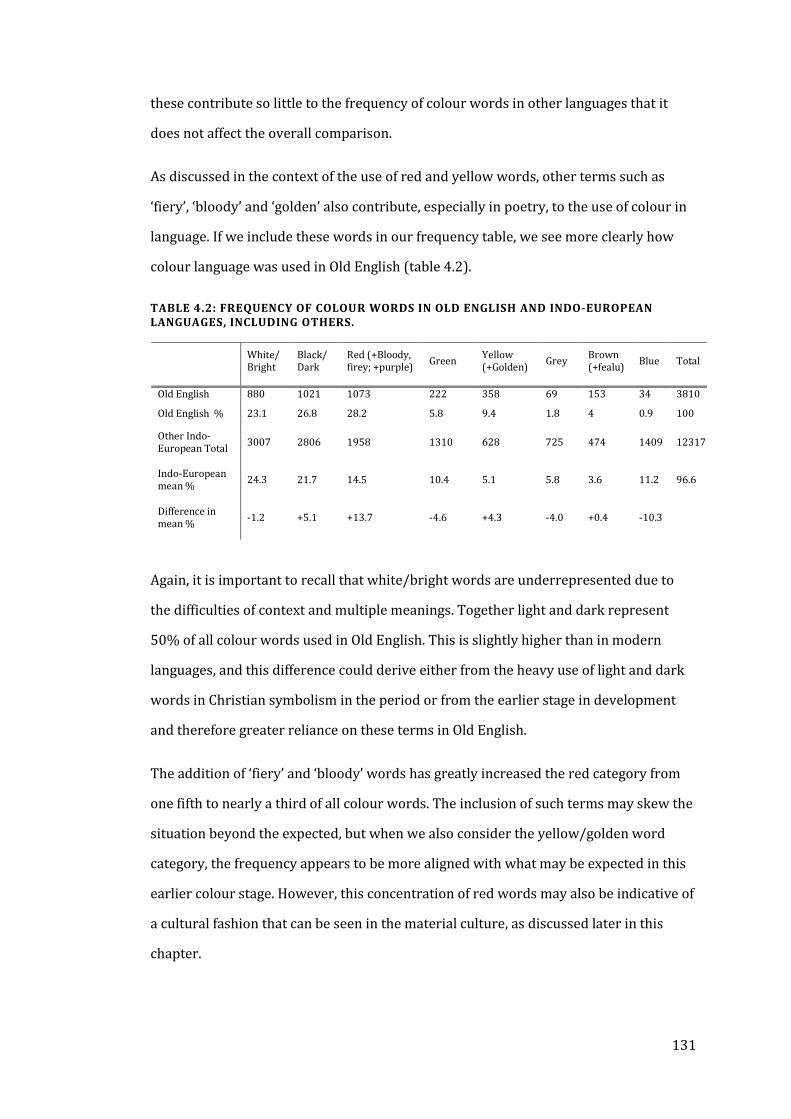
131
these contribute so little to the frequency of colour words in other languages that it
does not affect the overall comparison.
As discussed in the context of the use of red and yellow words, other terms such as
‘fiery’, ‘bloody’ and ‘golden’ also contribute, especially in poetry, to the use of colour in
language. If we include these words in our frequency table, we see more clearly how
colour language was used in Old English (table 4.2).
TABLE 4.2: FREQUENCY OF COLOUR WORDS IN OLD ENGLISH AND INDO-EUROPEAN LANGUAGES, INCLUDING OTHERS.
Again, it is important to recall that white/bright words are underrepresented due to
the difficulties of context and multiple meanings. Together light and dark represent
50% of all colour words used in Old English. This is slightly higher than in modern
languages, and this difference could derive either from the heavy use of light and dark
words in Christian symbolism in the period or from the earlier stage in development
and therefore greater reliance on these terms in Old English.
The addition of ‘fiery’ and ‘bloody’ words has greatly increased the red category from
one fifth to nearly a third of all colour words. The inclusion of such terms may skew the
situation beyond the expected, but when we also consider the yellow/golden word
category, the frequency appears to be more aligned with what may be expected in this
earlier colour stage. However, this concentration of red words may also be indicative of
a cultural fashion that can be seen in the material culture, as discussed later in this
chapter.
White/ Bright
Black/ Dark
Red (+Bloody, firey; +purple)
Green Yellow (+Golden)
Grey Brown (+fealu)
Blue Total
Old English 880 1021 1073 222 358 69 153 34 3810
Old English % 23.1 26.8 28.2 5.8 9.4 1.8 4 0.9 100
Other Indo-European Total
3007 2806 1958 1310 628 725 474 1409 12317
Indo-European mean %
24.3 21.7 14.5 10.4 5.1 5.8 3.6 11.2 96.6
Difference in mean %
-1.2 +5.1 +13.7 -4.6 +4.3 -4.0 +0.4 -10.3
132
Grey and green are halved from their modern frequencies, but brown (including fealu,
which tends to fall more into this category than into yellow) is comparable to how
often it is used today. This may simply reflect the need for its use in an agricultural
rural society, or it may be due to the inclusion of boundary terms such as fealu. The lack
of blue is again striking, and the increase in dark words should be remembered as a
potential beneficiary of this lack of term distinction. The high frequency of
red/bloody/fiery and yellow/golden along with the slightly more frequent light and
dark words not only reflects a language reaching out of a stage III development into
one in which grey, brown and green are also used, but also how central these colours
were in the visualisation of the Anglo-Saxon world.
If we consider Beowulf, the quintessential Old English epic, spawned in a Germanic oral
tradition predating the conversion (tentatively dated to the 6th-7th century) and later
recorded with a Christian hand, we see these four major areas dominating the visual
landscape of the poem (figure 4.1; Fulk, 2010; Dumville, 1993, 135; Newton, 1993, 53).
This does not include within ‘golden’ the many occurrences of ‘gold’ itself, which
appears fifty-five times, nearly as many times as there are colour word occurrences
within the entire poem. What is interesting is that when Beowulf was written down,
gold was not in supply and silver was the metal of choice and availability, and yet
‘silver’ does not appear a single time in the poem (Brown and Schweizer, 1973, 182;
Hawkes et al., 1966, 101).
Evidentially the earlier heroic tradition and tastes inherent within that past society-
real, glorified or stereotyped- are preserved within the language used. Colour words do
not appear often in other early ‘pagan’ or orally transmitted works, indicating that in
Beowulf the scenery may be painted as later generations considered as archetypal and
defining for the preceding period. In other words, they have exemplified the stereotype
in the style in which it was written.
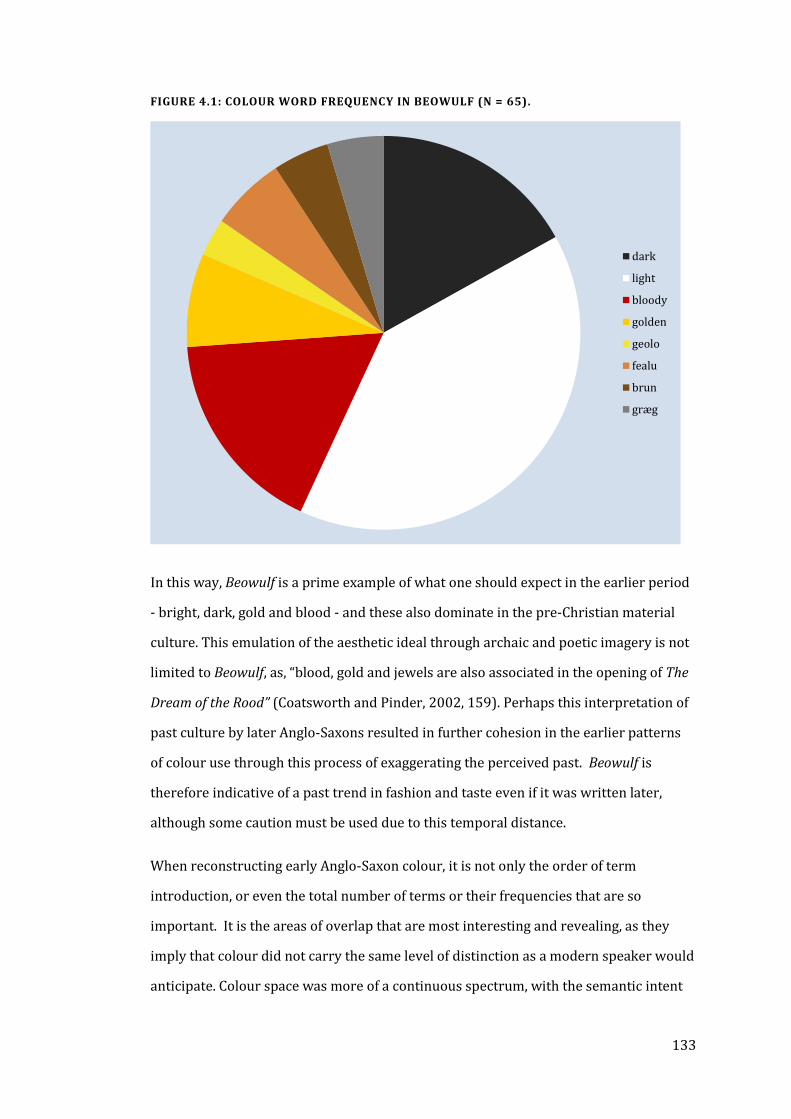
133
FIGURE 4.1: COLOUR WORD FREQUENCY IN BEOWULF (N = 65).
In this way, Beowulf is a prime example of what one should expect in the earlier period
- bright, dark, gold and blood - and these also dominate in the pre-Christian material
culture. This emulation of the aesthetic ideal through archaic and poetic imagery is not
limited to Beowulf, as, “blood, gold and jewels are also associated in the opening of The
Dream of the Rood” (Coatsworth and Pinder, 2002, 159). Perhaps this interpretation of
past culture by later Anglo-Saxons resulted in further cohesion in the earlier patterns
of colour use through this process of exaggerating the perceived past. Beowulf is
therefore indicative of a past trend in fashion and taste even if it was written later,
although some caution must be used due to this temporal distance.
When reconstructing early Anglo-Saxon colour, it is not only the order of term
introduction, or even the total number of terms or their frequencies that are so
important. It is the areas of overlap that are most interesting and revealing, as they
imply that colour did not carry the same level of distinction as a modern speaker would
anticipate. Colour space was more of a continuous spectrum, with the semantic intent
dark
light
bloody
golden
geolo
fealu
brun
græg
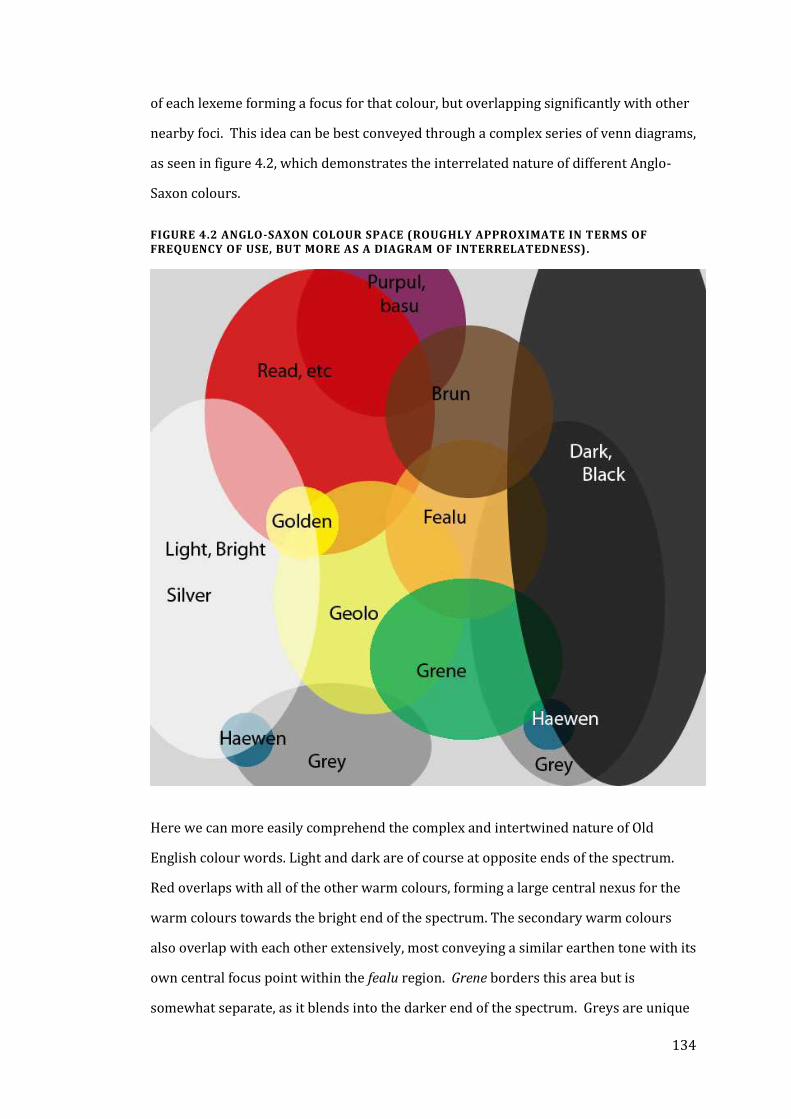
134
of each lexeme forming a focus for that colour, but overlapping significantly with other
nearby foci. This idea can be best conveyed through a complex series of venn diagrams,
as seen in figure 4.2, which demonstrates the interrelated nature of different Anglo-
Saxon colours.
FIGURE 4.2 ANGLO-SAXON COLOUR SPACE (ROUGHLY APPROXIMATE IN TERMS OF FREQUENCY OF USE, BUT MORE AS A DIAGRAM OF INTERRELATEDNESS).
Here we can more easily comprehend the complex and intertwined nature of Old
English colour words. Light and dark are of course at opposite ends of the spectrum.
Red overlaps with all of the other warm colours, forming a large central nexus for the
warm colours towards the bright end of the spectrum. The secondary warm colours
also overlap with each other extensively, most conveying a similar earthen tone with its
own central focus point within the fealu region. Grene borders this area but is
somewhat separate, as it blends into the darker end of the spectrum. Greys are unique
135
in that they can be used to describe an unsaturated hue within any other area of colour
space, but with particular focus along the white-grene-fealu-brun-black range. Even
red can be described with grey, but this only in one instance and in the pink region
rather than in its typical bright meaning (Biggam, 1998, 276). Blue appears in two
areas, within a dark-to-grey region and within the bright-to-grey area as hæwen.
Within the bright-red-yellow area of colour space we can find most metal colours
(white metals, gold and copper/copper alloys), with the rusty and old iron or lead
colours towards the darker, more unsaturated earthen regions.
It is evident that red and warm colours are more central and frequently used area of
colour space, defining the landscape of the entire spectrum. The frequency of bright,
dark and red words far outweighs all others, representing nearly 80% of all colour
words; with the inclusion of yellow/golden words this becomes nearly 90%. The use of
the natural world and cool colour words may have been greater in the vernacular, but
as the language was probably less developed in the 5th-7th century the bias of context
may not be too severe. The frequencies and overlapping of colour words in Old English
provide a tantalising linguistic view of how different the idea of ‘colour’ was in the
Anglo-Saxon mind.
SUMMARY
The Old English language in the early medieval period had not fully developed certain
colour words as basic colour terms in their full abstract sense. This can be seen in the
limited context of use, the lack of distinction between one word and a range of Latin
counterparts, and the low frequency of their appearance in various types of literature.
Additionally, prototype colour words such as ‘fiery’, ‘bloody’ or ‘golden’ appear often,
particularly in the more poetic and archaic language. These are used often as
compounds with other colour words and reveal the intertwined semantics of colour
space, particularly within those areas important to describing metals. This lack of
colour term distinction, particularly early on, is well known in Old English research:
136
“colour terms were poorly differentiated before the 7th century” (Walton Rogers,
2007a, 63).
Within this system bright, dark, red and gold are by far the more frequently used terms,
potentially disclosing how the Anglo-Saxons valued specific colours as well as the stage
of development of colour terminology. Red is far more frequently used in Old English
than in modern languages, due to the stage of colour term evolution and perhaps a
cultural preference. Golden and gilded seem to have replaced yellow in colour space,
with yellow rarely used and generally as a descriptor of more earthy, ochre-like hues.
Blue was not identified separately from darkness (or lightness) until quite late, not
emerging as a basic colour term until the influence of Norman French in the 11th
century. Green seems to have developed later than the other colour words as it only
denotes hue or growth and only appears in later Christian contexts. Brun, græg and
fealu occupy a space overlapping with red, yellow, green, dark, and even purple,
comprising a smaller and ill-defined ‘natural’ or ‘earthen’ hued area of colour space.
It may not be the evolutionary order of colour terms that really matters, but the, “scale
of values which seem to underlie such an evolution,” or rather, why particular colours
were made distinct from the spectrum with a specific colour term prior to others (Gage,
1999a, 68). The fascination with light and dark in Old English literature is dependent
on both the developing structure of Anglo-Saxon colour space from a primitive
brightness-dominated term system as well as the traditional lightness and darkness
symbolism of Christianity. The heavy use of blood-red imagery in a warrior society is
always a stirring and emphatic symbol of strength, sacrifice and of course, drama.
Combining this with frequent shining lightness and gold terms gives credence to the
Lucian’s account of the Germanic ‘barbarian’ tastes as dominated by gold (Dodwell,
1982, 24).
What is quite interesting about colour perception is how metals play a major role in the
language’s depiction of colour. “The Anglo-Saxon poets and writers were so hypnotised
by the crafts of the jewellers and goldsmiths that they turned naturally to them for
their similes and metaphors... the poets were not dreaming up gilded visions by
delineating the tastes of the world around” (Dodwell, 1982, 27-30). Perhaps

137
understanding early conceptions of colour in Old English is more dependent on the
shine and lustre and overall brightness of materials than on hue. The ability of metals
to characterise any hue within the majority of colour space used in language allows the
use of metal in material culture to be particularly evocative of the perception of colour
and reflects the importance of metal colour in fashion.
138
HIGH-STATUS DRESS FITTINGS
It is common for the greater masses to derive their concepts of fashion and material
value on that of the elites; the imitation of valuable materials and possessions in
cheaper materials has occurred throughout history (Vickers, 1995, 185). The
appearance of value is, in many cases, nearly as important as possessing something
that truly is valuable. Elite metalwork in the Anglo-Saxon period was highly elaborate
and ostentatious and among the finest crafted metalwork ever made. “The intensive
use of color and the extensive covering of surfaces with ornamental detail were
designed to reflect light and to call attention to the wearer - priorities for jewelry
meant to be noticed” (Dubin, 2009, 73). It would be surprising if such material were
not imitated in less precious materials, and there is evidence that this was to some
degree attempted. Decorative motifs found on gold and silver objects were also cast in
copper alloy, and tinning was more widespread than silvering. However, in order to
fully understand why such imitations were popular, one must first explore the
aesthetics of high status dress fitting styles in the period and how they contribute to
our understanding of Anglo-Saxon colour perception.
THE COLOUR OF PRECIOUS METALS
Until the modern period, the colour of metals has been relatively limited. As pure
metals, only gold and copper possess a colour, with all other metals describable as
‘white metals’, although the natural whiteness of metals is highly dependent on the
type of metal and the patina developed in various natural conditions (Cretu and Van
der Lingen, 1999, 31). Zinc and lead, for example, have slight bluish tinges, and while
both aluminium and silver are ‘white,’ they are easily discernible from one another
through minor differences of tone and lustre.
Thus the yellow of gold and the red of copper provide the basis for most colour
manipulation that occurs in metal objects in the early medieval period. Alloying can
alter these colours, with gold-silver and gold-silver-copper alloys ranging from pale
139
yellow to pink to a pale greenish colour. Patination can also alter the colour of metals,
as is discussed below.
THE COLOUR OF GOLD
In the early medieval period, gold was scarce as the metal supply was derived from
gold coins from Byzantium, which may have been re-minted in Gaul before arriving in
Britain (Brown and Schweizer, 1973, 182; Hawkes et al., 1966, 101). Byzantine coins
were increasingly debased and eventually disappeared in the West, resulting in many
surprisingly pale gold alloys (Leahy, 2003, 153, Northover and Anheuser, 2000). The
gold content in coins was down to just 30% in Gallic coins by 656/7, indicating how
debased the coinage had become by the mid 7th century (Hawkes et al., 1966, 101). As
the gold supply was so dependent on coinage, the composition of a gold object in this
period can in some ways date the terminus post quem of its manufacture (Brown and
Schweizer, 1973, 182; Hawkes et al., 1966, 101). Gilding was exclusively achieved using
the fire gilding technique in the Anglo-Saxon period, with trace mercury detected on
many analysed objects (Oddy, 1977, 129). A thin coating of gilding over the surface of a
baser metal allowed maximum visual impact from small amount of gold (Coatsworth
and Pinder, 2002, 87). Gilding was not necessarily executed from pure gold; gold leaf
composition from ancient Egypt contain up to 21% silver (Raub, 1993, 103), and
presumably the composition of gilding is similar to the range found in the available
coin-based supply, although no compositional analysis of Anglo-Saxon gilding has been
conducted to date.
RED GOLD
In the 12th century, Theophilus describes ‘Arabian gold’ as highly desirable, being a
metal regarded as, “very precious and of exceptional red color. The use of it is often
found in very ancient vessels” (Hawthorne and Stanley Smith, 1979, 119). Reddish
gold was both recognised as a desirable material, and also appears to have been
popular in the past. In ancient Egypt, pink or red gold was reserved for royal burials,
indicating the value of its hue (Ogden, 1993, 40). Gold debased with copper was
therefore not necessarily less desirable to the Anglo-Saxons.
140
Analysis of Anglo-Saxon jewellery compositions indicate that “most of the pieces of
jewellery did not contain more than 3% copper,” with one exception out of the thirty
objects sampled (Brown and Schweizer, 1973, 187). Red gold was not common in the
Anglo-Saxon period: of 119 total analyses of ‘gold’ objects from this period, the
majority have between 2-6% copper, with none over 10% even in the highly debased
objects (see Chapter 5; Brown and Schweizer, 1973; Hawkes et al., 1966; Mortimer and
Anheuser, 1998). While the copper content in gold object surfaces is less than the
interior metal due to selective corrosion, it appears that copper was never a significant
addition to Anglo-Saxon gold (see Chapter 5). Silver, however, was added in increasing
quantities in the 7th century, up to 70-80% in some objects such as the mid 7th century
looped Frankish tremissis of Marsal found at Sibertswold (48-68% Ag, Liverpool
Museum M.6531; Hawkes et al., 1966).
THE COLOUR OF SILVER
Silver is the quintessential white metal, and in most cases it seems that it was meant to
be seen as such. However, when silver is exposed to air over time a black patina of
silver sulphides appears. There is some debate as to whether or not some ancient
silver work was deliberately darkened, and indeed the 9th-12th century Mappae
Clavicula, “includes recipes for colouring silver with sulphides, the methods of gilding,
and the application of niello” (Hughes and Rowe, 1991, 15). The fact that both
colouring with sulphides and niello (a silver sulphide compound) is mentioned
indicates that this first method was not a process of applying niello but a deliberate
darkening of the silver. Thus literary evidence from a slightly later context would
suggest that some silver objects were meant to be dark rather than white and shiny,
and tarnished silver has perceived as more valuable in other cultures (Vickers, 1985,
109). Various iron objects were decorated with silver inlay, such as the firesteel or
pursemount from Mucking (figure 4.3; Hirst and Clark 2009). As Ogden argues, “clearly
silver will not show up against polished iron, or gold against many copper alloys.
Presumably the silver was blackened or the iron blued or rusted” (1993, 41). Thus due
to the colour of these two metals and the obvious decorative intent of the silver, one or
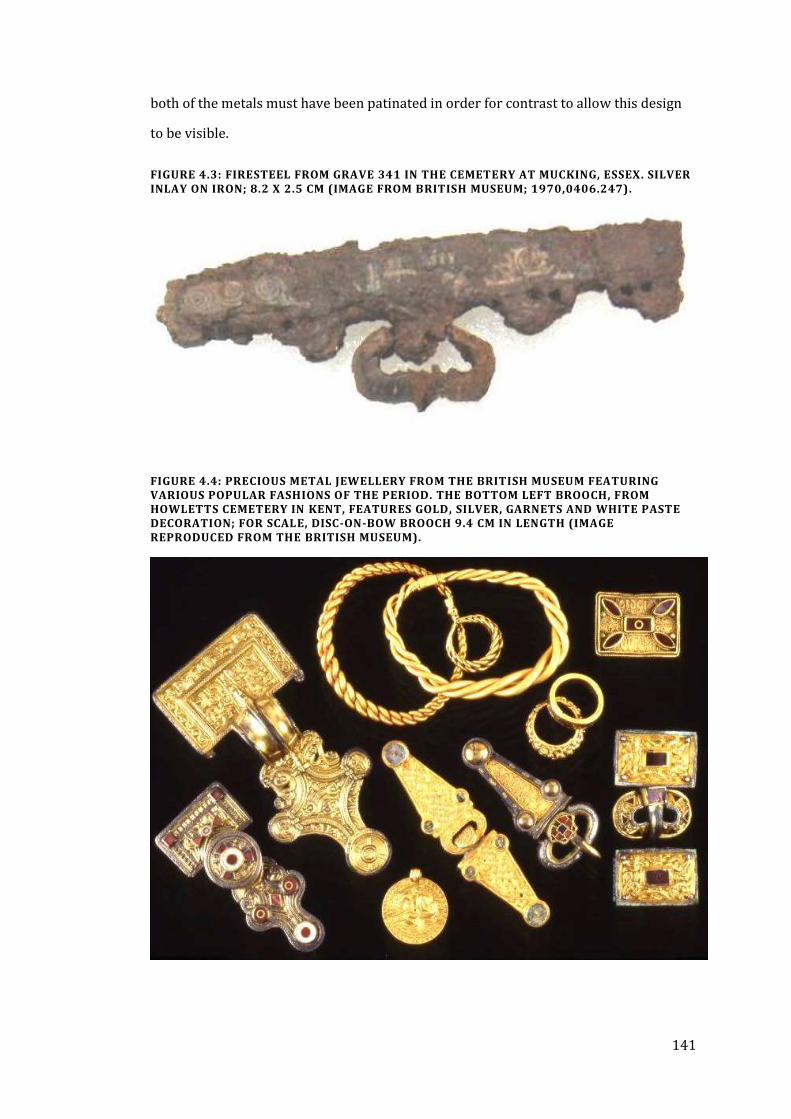
141
both of the metals must have been patinated in order for contrast to allow this design
to be visible.
FIGURE 4.3: FIRESTEEL FROM GRAVE 341 IN THE CEMETERY AT MUCKING, ESSEX. SILVER INLAY ON IRON; 8.2 X 2.5 CM (IMAGE FROM BRITISH MUSEUM; 1970,0406.247).
FIGURE 4.4: PRECIOUS METAL JEWELLERY FROM THE BRITISH MUSEUM FEATURING VARIOUS POPULAR FASHIONS OF THE PERIOD. THE BOTTOM LEFT BROOCH, FROM HOWLETTS CEMETERY IN KENT, FEATURES GOLD, SILVER, GARNETS AND WHITE PASTE DECORATION; FOR SCALE, DISC-ON-BOW BROOCH 9.4 CM IN LENGTH (IMAGE REPRODUCED FROM THE BRITISH MUSEUM).
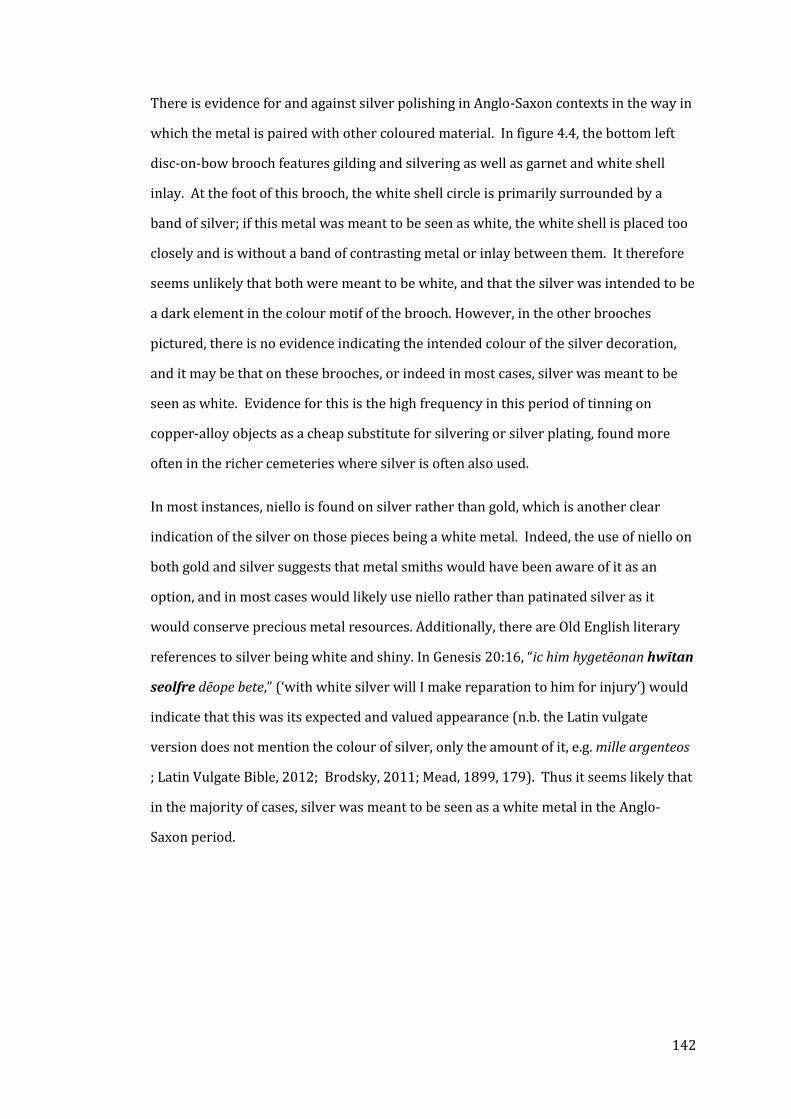
142
There is evidence for and against silver polishing in Anglo-Saxon contexts in the way in
which the metal is paired with other coloured material. In figure 4.4, the bottom left
disc-on-bow brooch features gilding and silvering as well as garnet and white shell
inlay. At the foot of this brooch, the white shell circle is primarily surrounded by a
band of silver; if this metal was meant to be seen as white, the white shell is placed too
closely and is without a band of contrasting metal or inlay between them. It therefore
seems unlikely that both were meant to be white, and that the silver was intended to be
a dark element in the colour motif of the brooch. However, in the other brooches
pictured, there is no evidence indicating the intended colour of the silver decoration,
and it may be that on these brooches, or indeed in most cases, silver was meant to be
seen as white. Evidence for this is the high frequency in this period of tinning on
copper-alloy objects as a cheap substitute for silvering or silver plating, found more
often in the richer cemeteries where silver is often also used.
In most instances, niello is found on silver rather than gold, which is another clear
indication of the silver on those pieces being a white metal. Indeed, the use of niello on
both gold and silver suggests that metal smiths would have been aware of it as an
option, and in most cases would likely use niello rather than patinated silver as it
would conserve precious metal resources. Additionally, there are Old English literary
references to silver being white and shiny. In Genesis 20:16, “ic him hygetēonan hwītan
seolfre dēope bete,” (‘with white silver will I make reparation to him for injury’) would
indicate that this was its expected and valued appearance (n.b. the Latin vulgate
version does not mention the colour of silver, only the amount of it, e.g. mille argenteos
; Latin Vulgate Bible, 2012; Brodsky, 2011; Mead, 1899, 179). Thus it seems likely that
in the majority of cases, silver was meant to be seen as a white metal in the Anglo-
Saxon period.
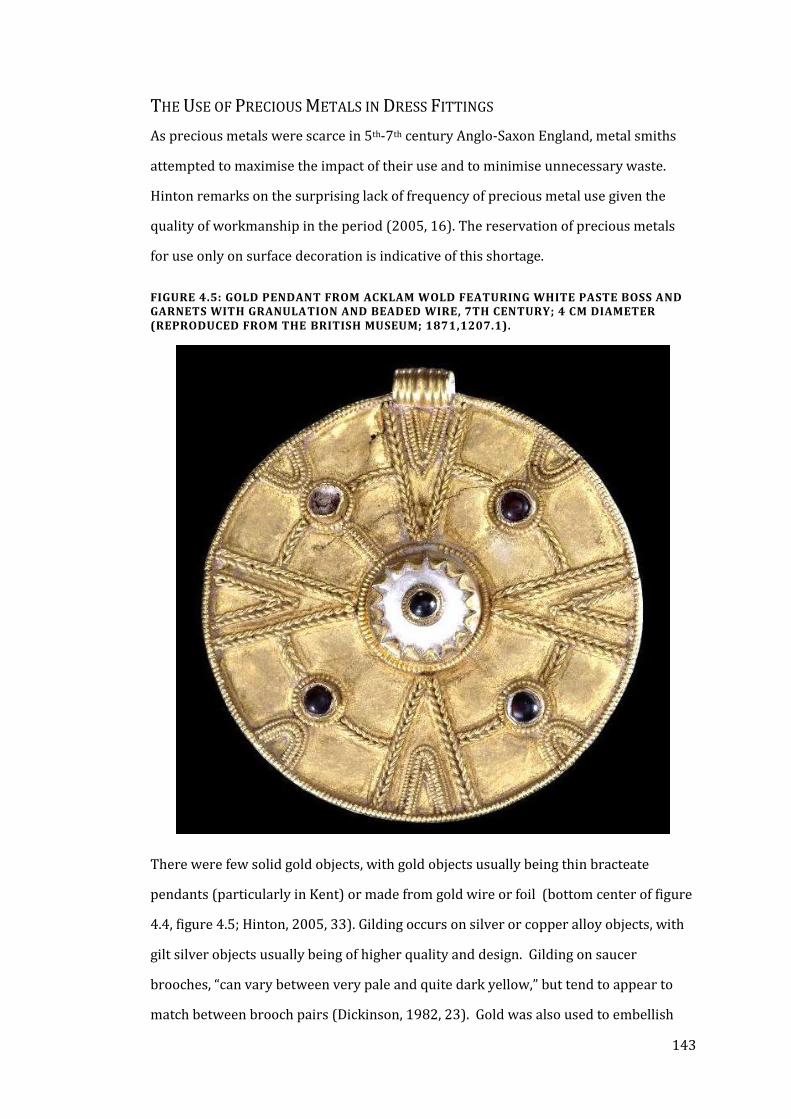
143
THE USE OF PRECIOUS METALS IN DRESS FITTINGS
As precious metals were scarce in 5th-7th century Anglo-Saxon England, metal smiths
attempted to maximise the impact of their use and to minimise unnecessary waste.
Hinton remarks on the surprising lack of frequency of precious metal use given the
quality of workmanship in the period (2005, 16). The reservation of precious metals
for use only on surface decoration is indicative of this shortage.
FIGURE 4.5: GOLD PENDANT FROM ACKLAM WOLD FEATURING WHITE PASTE BOSS AND GARNETS WITH GRANULATION AND BEADED WIRE, 7TH CENTURY; 4 CM DIAMETER (REPRODUCED FROM THE BRITISH MUSEUM; 1871,1207.1).
There were few solid gold objects, with gold objects usually being thin bracteate
pendants (particularly in Kent) or made from gold wire or foil (bottom center of figure
4.4, figure 4.5; Hinton, 2005, 33). Gilding occurs on silver or copper alloy objects, with
gilt silver objects usually being of higher quality and design. Gilding on saucer
brooches, “can vary between very pale and quite dark yellow,” but tend to appear to
match between brooch pairs (Dickinson, 1982, 23). Gold was also used to embellish
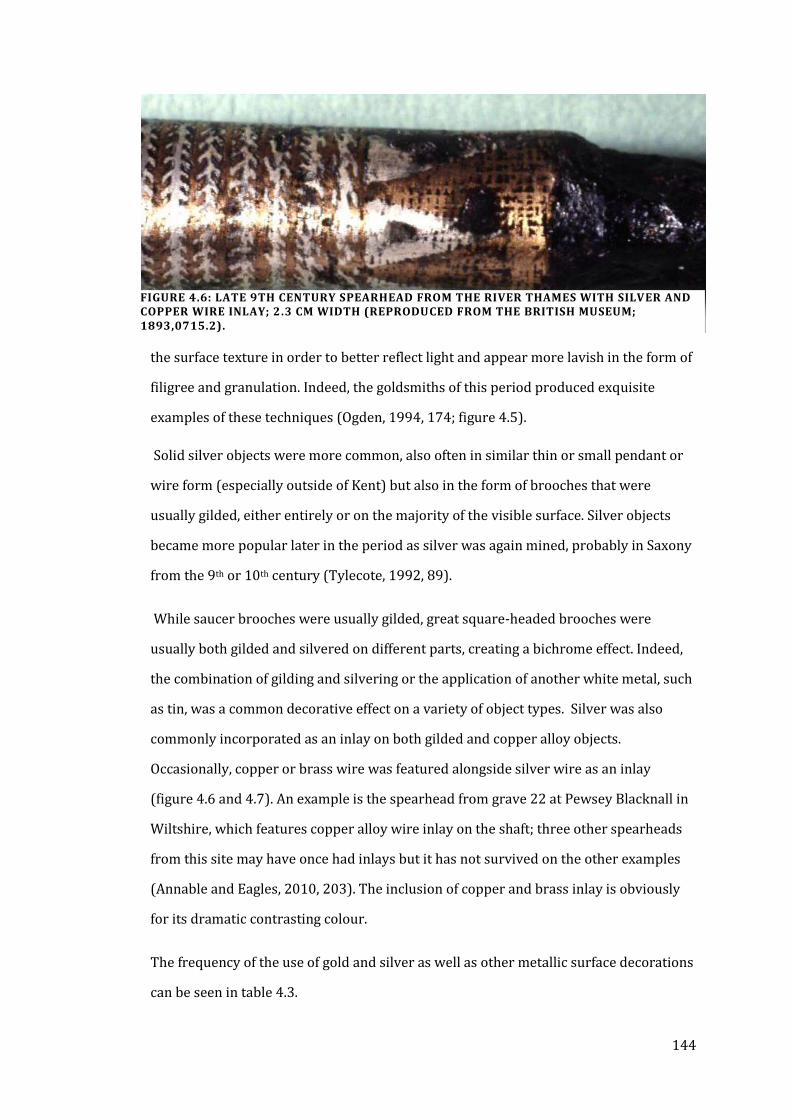
144
the surface texture in order to better reflect light and appear more lavish in the form of
filigree and granulation. Indeed, the goldsmiths of this period produced exquisite
examples of these techniques (Ogden, 1994, 174; figure 4.5).
Solid silver objects were more common, also often in similar thin or small pendant or
wire form (especially outside of Kent) but also in the form of brooches that were
usually gilded, either entirely or on the majority of the visible surface. Silver objects
became more popular later in the period as silver was again mined, probably in Saxony
from the 9th or 10th century (Tylecote, 1992, 89).
While saucer brooches were usually gilded, great square-headed brooches were
usually both gilded and silvered on different parts, creating a bichrome effect. Indeed,
the combination of gilding and silvering or the application of another white metal, such
as tin, was a common decorative effect on a variety of object types. Silver was also
commonly incorporated as an inlay on both gilded and copper alloy objects.
Occasionally, copper or brass wire was featured alongside silver wire as an inlay
(figure 4.6 and 4.7). An example is the spearhead from grave 22 at Pewsey Blacknall in
Wiltshire, which features copper alloy wire inlay on the shaft; three other spearheads
from this site may have once had inlays but it has not survived on the other examples
(Annable and Eagles, 2010, 203). The inclusion of copper and brass inlay is obviously
for its dramatic contrasting colour.
The frequency of the use of gold and silver as well as other metallic surface decorations
can be seen in table 4.3.
FIGURE 4.6: LATE 9TH CENTURY SPEARHEAD FROM THE RIVER THAMES WITH SILVER AND COPPER WIRE INLAY; 2.3 CM WIDTH (REPRODUCED FROM THE BRITISH MUSEUM; 1893,0715.2).
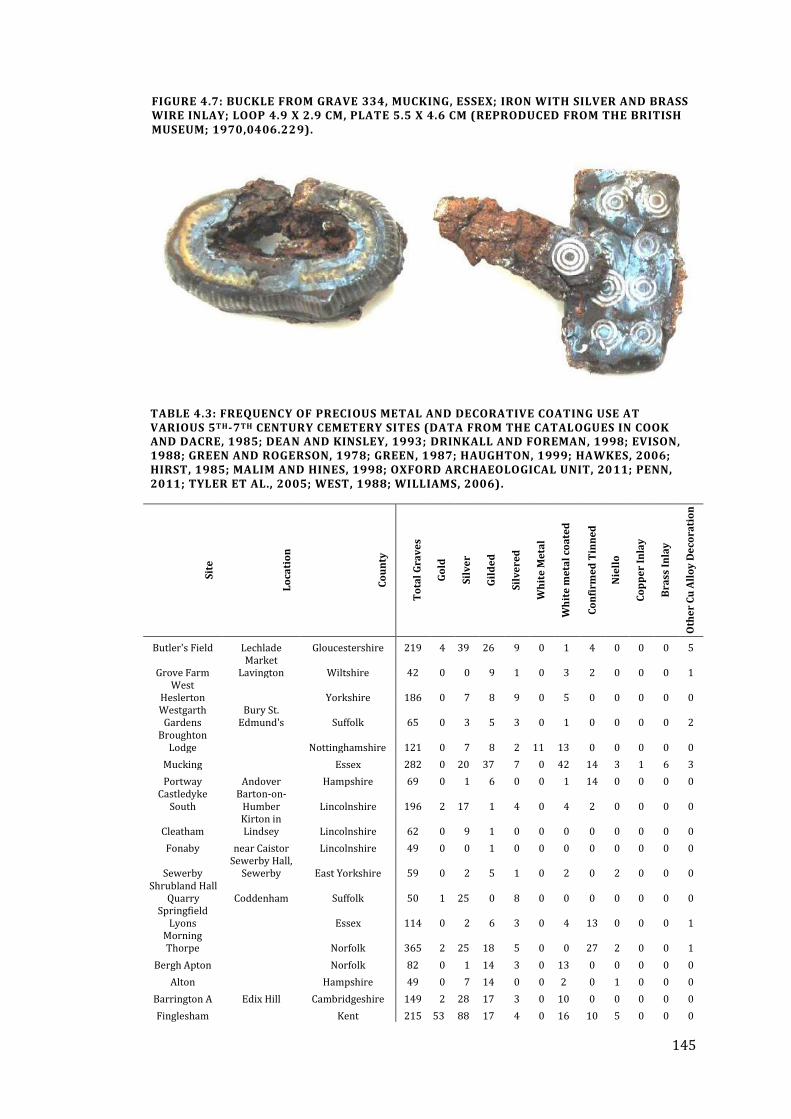
145
TABLE 4.3: FREQUENCY OF PRECIOUS METAL AND DECORATIVE COATING USE AT VARIOUS 5TH-7TH CENTURY CEMETERY SITES (DATA FROM THE CATALOGUES IN COOK AND DACRE, 1985; DEAN AND KINSLEY, 1993; DRINKALL AND FOREMAN, 1998; EVISON, 1988; GREEN AND ROGERSON, 1978; GREEN, 1987; HAUGHTON, 1999; HAWKES, 2006; HIRST, 1985; MALIM AND HINES, 1998; OXFORD ARCHAEOLOGICAL UNIT, 2011; PENN, 2011; TYLER ET AL., 2005; WEST, 1988; WILLIAMS, 2006).
Sit
e
Lo
cati
on
Co
un
ty
To
tal
Gra
ve
s
Go
ld
Sil
ve
r
Gil
de
d
Sil
ve
red
Wh
ite
Me
tal
Wh
ite
me
tal
coa
ted
Co
nfi
rme
d T
inn
ed
Nie
llo
Co
pp
er
Inla
y
Bra
ss I
nla
y
Oth
er
Cu
All
oy
De
cora
tio
n
Butler's Field Lechlade Gloucestershire 219 4 39 26 9 0 1 4 0 0 0 5
Grove Farm Market
Lavington Wiltshire 42 0 0 9 1 0 3 2 0 0 0 1 West
Heslerton
Yorkshire 186 0 7 8 9 0 5 0 0 0 0 0 Westgarth
Gardens Bury St.
Edmund's Suffolk 65 0 3 5 3 0 1 0 0 0 0 2 Broughton
Lodge
Nottinghamshire 121 0 7 8 2 11 13 0 0 0 0 0
Mucking
Essex 282 0 20 37 7 0 42 14 3 1 6 3
Portway Andover Hampshire 69 0 1 6 0 0 1 14 0 0 0 0 Castledyke
South Barton-on-
Humber Lincolnshire 196 2 17 1 4 0 4 2 0 0 0 0
Cleatham Kirton in Lindsey Lincolnshire 62 0 9 1 0 0 0 0 0 0 0 0
Fonaby near Caistor Lincolnshire 49 0 0 1 0 0 0 0 0 0 0 0
Sewerby Sewerby Hall,
Sewerby East Yorkshire 59 0 2 5 1 0 2 0 2 0 0 0 Shrubland Hall
Quarry Coddenham Suffolk 50 1 25 0 8 0 0 0 0 0 0 0 Springfield
Lyons
Essex 114 0 2 6 3 0 4 13 0 0 0 1 Morning Thorpe
Norfolk 365 2 25 18 5 0 0 27 2 0 0 1
Bergh Apton
Norfolk 82 0 1 14 3 0 13 0 0 0 0 0
Alton
Hampshire 49 0 7 14 0 0 2 0 1 0 0 0
Barrington A Edix Hill Cambridgeshire 149 2 28 17 3 0 10 0 0 0 0 0
Finglesham
Kent 215 53 88 17 4 0 16 10 5 0 0 0
FIGURE 4.7: BUCKLE FROM GRAVE 334, MUCKING, ESSEX; IRON WITH SILVER AND BRASS WIRE INLAY; LOOP 4.9 X 2.9 CM, PLATE 5.5 X 4.6 CM (REPRODUCED FROM THE BRITISH MUSEUM; 1970,0406.229).
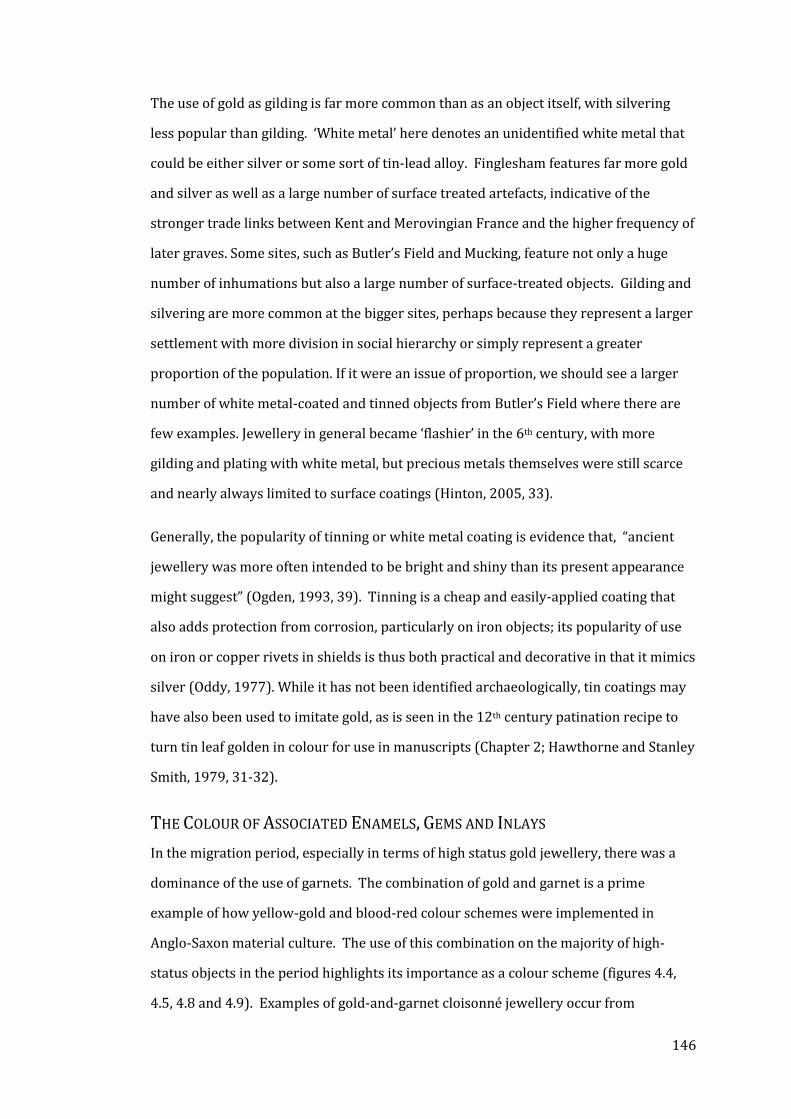
146
The use of gold as gilding is far more common than as an object itself, with silvering
less popular than gilding. ‘White metal’ here denotes an unidentified white metal that
could be either silver or some sort of tin-lead alloy. Finglesham features far more gold
and silver as well as a large number of surface treated artefacts, indicative of the
stronger trade links between Kent and Merovingian France and the higher frequency of
later graves. Some sites, such as Butler’s Field and Mucking, feature not only a huge
number of inhumations but also a large number of surface-treated objects. Gilding and
silvering are more common at the bigger sites, perhaps because they represent a larger
settlement with more division in social hierarchy or simply represent a greater
proportion of the population. If it were an issue of proportion, we should see a larger
number of white metal-coated and tinned objects from Butler’s Field where there are
few examples. Jewellery in general became ‘flashier’ in the 6th century, with more
gilding and plating with white metal, but precious metals themselves were still scarce
and nearly always limited to surface coatings (Hinton, 2005, 33).
Generally, the popularity of tinning or white metal coating is evidence that, “ancient
jewellery was more often intended to be bright and shiny than its present appearance
might suggest” (Ogden, 1993, 39). Tinning is a cheap and easily-applied coating that
also adds protection from corrosion, particularly on iron objects; its popularity of use
on iron or copper rivets in shields is thus both practical and decorative in that it mimics
silver (Oddy, 1977). While it has not been identified archaeologically, tin coatings may
have also been used to imitate gold, as is seen in the 12th century patination recipe to
turn tin leaf golden in colour for use in manuscripts (Chapter 2; Hawthorne and Stanley
Smith, 1979, 31-32).
THE COLOUR OF ASSOCIATED ENAMELS, GEMS AND INLAYS
In the migration period, especially in terms of high status gold jewellery, there was a
dominance of the use of garnets. The combination of gold and garnet is a prime
example of how yellow-gold and blood-red colour schemes were implemented in
Anglo-Saxon material culture. The use of this combination on the majority of high-
status objects in the period highlights its importance as a colour scheme (figures 4.4,
4.5, 4.8 and 4.9). Examples of gold-and-garnet cloisonné jewellery occur from
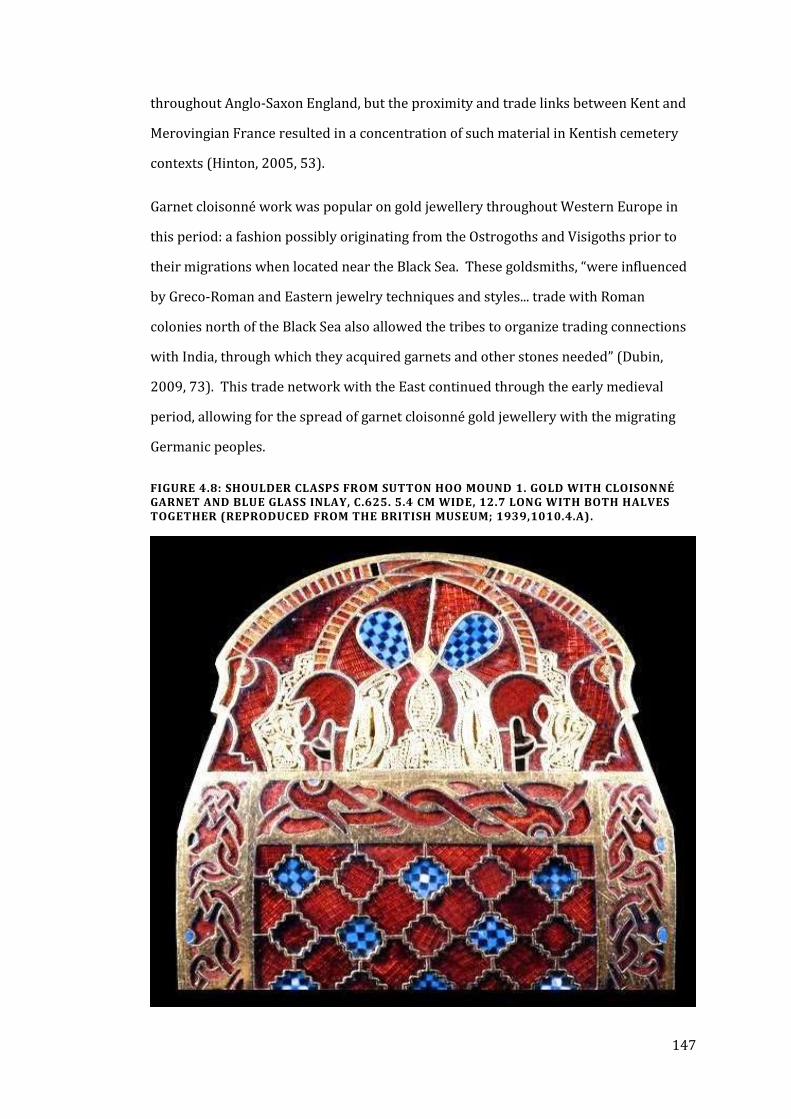
147
throughout Anglo-Saxon England, but the proximity and trade links between Kent and
Merovingian France resulted in a concentration of such material in Kentish cemetery
contexts (Hinton, 2005, 53).
Garnet cloisonné work was popular on gold jewellery throughout Western Europe in
this period: a fashion possibly originating from the Ostrogoths and Visigoths prior to
their migrations when located near the Black Sea. These goldsmiths, “were influenced
by Greco-Roman and Eastern jewelry techniques and styles... trade with Roman
colonies north of the Black Sea also allowed the tribes to organize trading connections
with India, through which they acquired garnets and other stones needed” (Dubin,
2009, 73). This trade network with the East continued through the early medieval
period, allowing for the spread of garnet cloisonné gold jewellery with the migrating
Germanic peoples.
FIGURE 4.8: SHOULDER CLASPS FROM SUTTON HOO MOUND 1. GOLD WITH CLOISONNÉ GARNET AND BLUE GLASS INLAY, C.625. 5.4 CM WIDE, 12.7 LONG WITH BOTH HALVES TOGETHER (REPRODUCED FROM THE BRITISH MUSEUM; 1939,1010.4.A).
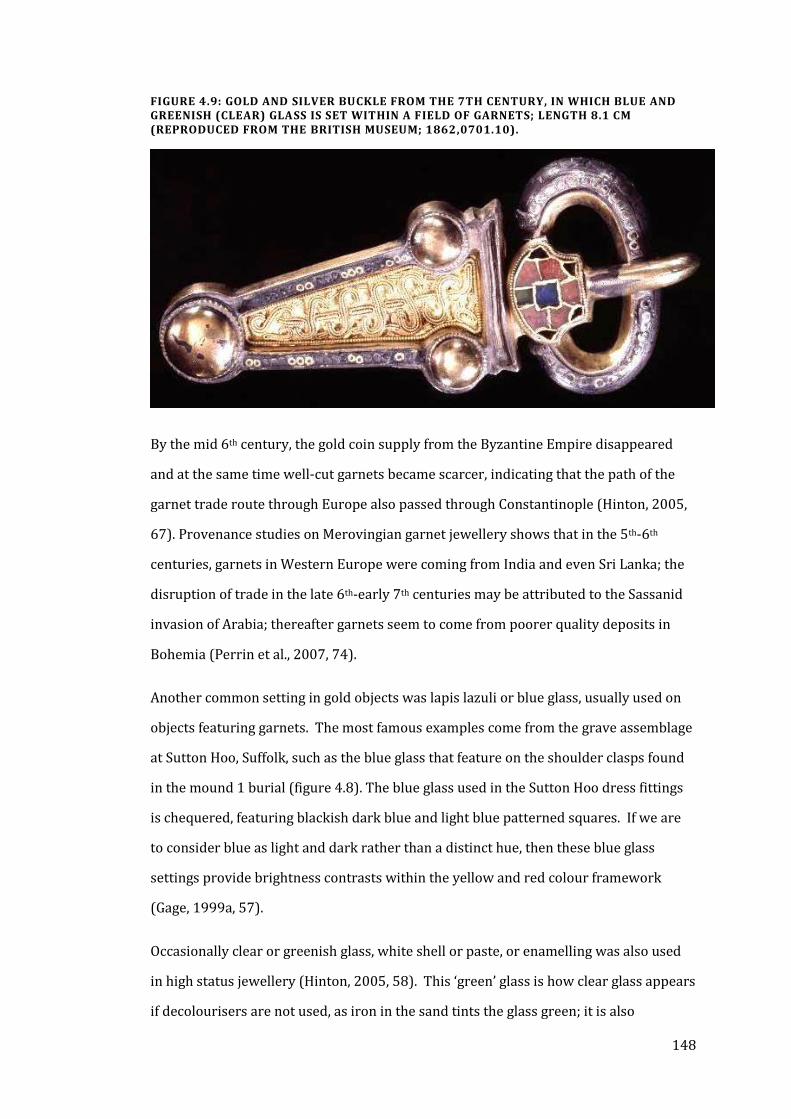
148
FIGURE 4.9: GOLD AND SILVER BUCKLE FROM THE 7TH CENTURY, IN WHICH BLUE AND GREENISH (CLEAR) GLASS IS SET WITHIN A FIELD OF GARNETS; LENGTH 8.1 CM (REPRODUCED FROM THE BRITISH MUSEUM; 1862,0701.10).
By the mid 6th century, the gold coin supply from the Byzantine Empire disappeared
and at the same time well-cut garnets became scarcer, indicating that the path of the
garnet trade route through Europe also passed through Constantinople (Hinton, 2005,
67). Provenance studies on Merovingian garnet jewellery shows that in the 5th-6th
centuries, garnets in Western Europe were coming from India and even Sri Lanka; the
disruption of trade in the late 6th-early 7th centuries may be attributed to the Sassanid
invasion of Arabia; thereafter garnets seem to come from poorer quality deposits in
Bohemia (Perrin et al., 2007, 74).
Another common setting in gold objects was lapis lazuli or blue glass, usually used on
objects featuring garnets. The most famous examples come from the grave assemblage
at Sutton Hoo, Suffolk, such as the blue glass that feature on the shoulder clasps found
in the mound 1 burial (figure 4.8). The blue glass used in the Sutton Hoo dress fittings
is chequered, featuring blackish dark blue and light blue patterned squares. If we are
to consider blue as light and dark rather than a distinct hue, then these blue glass
settings provide brightness contrasts within the yellow and red colour framework
(Gage, 1999a, 57).
Occasionally clear or greenish glass, white shell or paste, or enamelling was also used
in high status jewellery (Hinton, 2005, 58). This ‘green’ glass is how clear glass appears
if decolourisers are not used, as iron in the sand tints the glass green; it is also
149
commonly seen in examples of clear glass that have deteriorated and been coloured by
green corrosion products from adjacent copper alloy metal (figure 4.9; La Niece, 2012;
Newton and Davison, 1989, 59). The white shells used in jewellery were the rarest
element, as they come from the Red Sea (Hinton, 2005, 53). Enamels from Anglo-Saxon
contexts are usually red, although other colours certainly could have been achieved,
especially as they were often made through the remelting of Roman glass (Dane, 2012;
Freestone, 2011). Enamelling occurs mostly in 6th century Anglian contexts, “with a
particularly dense concentration of examples known from the cemeteries of the Larle
Valle and the fen-edge of Suffolk and eastern Cambridgeshire” (Scull, 1985, 117). This
appears to be survival of the native Romano-British tradition, as enamelling does not
usually occur on continental artefacts in the migration period (Scull, 1985).
In the Roman period yellow and green enamels were not uncommon, as in the instance
of the wheel plate brooch and lozenge brooches from Marcham-Frilford, Oxfordshire in
figures 4.10 and 4.11. Red, yellow, green and blue were all frequently used in the
period preceding the Anglo-Saxon migration (Scull, 1985, 119). Nearly all examples of
Anglo-Saxon enamelling, as opposed to that from the Celtic West, are red, with a
handful of yellow and a number of unconfirmed deteriorated examples (often
appearing yellow or green, but usually deteriorated red)(Dane, 2012). Of the eight
Anglo-Saxon enamelled objects in the British Museum catalogue with images, six have
red enamel while two others have a white ‘inlay’ which is not confirmed as enamel or
some other material (British Museum, 2012). The five enamelled Anglo-Saxon pieces in
the Cambridge Archaeology Museum catalogue (again, with images), include four red
and one possible green, though again the green tends to be deteriorated red with
contamination by copper corrosion (Cambridge Museum of Archaeology &
Anthropology, 2012).
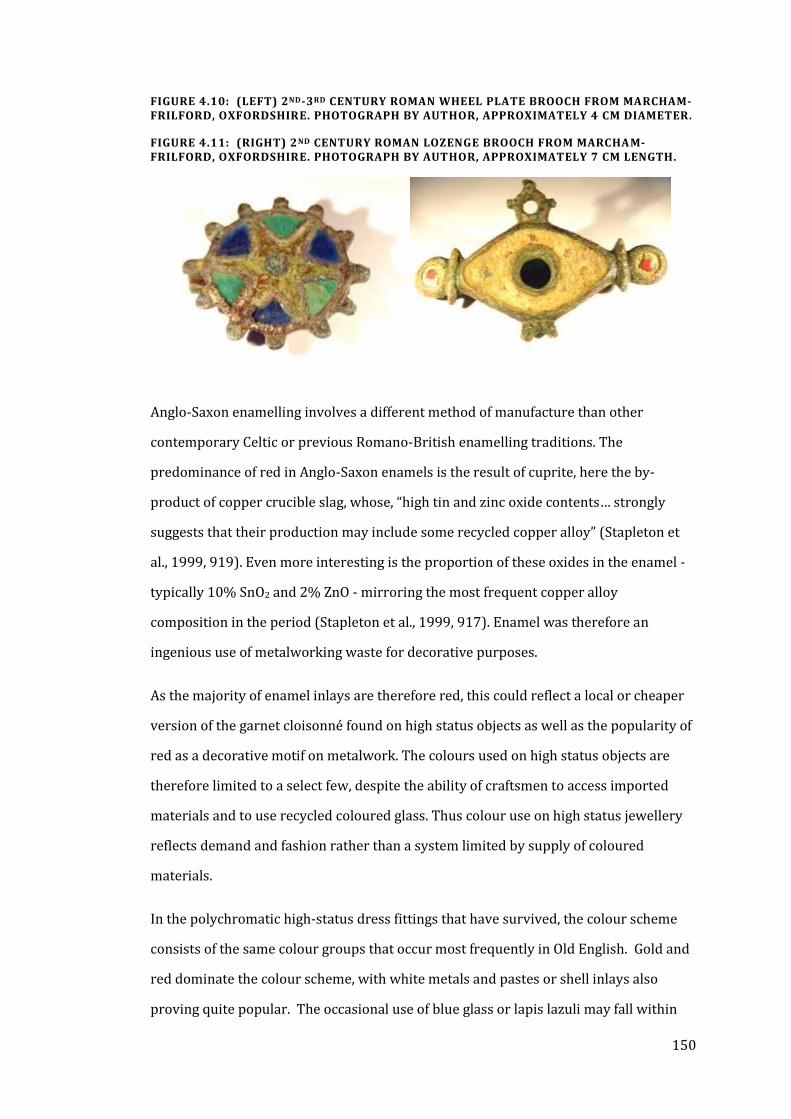
150
FIGURE 4.10: (LEFT) 2ND-3RD CENTURY ROMAN WHEEL PLATE BROOCH FROM MARCHAM-FRILFORD, OXFORDSHIRE. PHOTOGRAPH BY AUTHOR, APPROXIMATELY 4 CM DIAMETER.
FIGURE 4.11: (RIGHT) 2ND CENTURY ROMAN LOZENGE BROOCH FROM MARCHAM-FRILFORD, OXFORDSHIRE. PHOTOGRAPH BY AUTHOR, APPROXIMATELY 7 CM LENGTH.
Anglo-Saxon enamelling involves a different method of manufacture than other
contemporary Celtic or previous Romano-British enamelling traditions. The
predominance of red in Anglo-Saxon enamels is the result of cuprite, here the by-
product of copper crucible slag, whose, “high tin and zinc oxide contents… strongly
suggests that their production may include some recycled copper alloy” (Stapleton et
al., 1999, 919). Even more interesting is the proportion of these oxides in the enamel -
typically 10% SnO2 and 2% ZnO - mirroring the most frequent copper alloy
composition in the period (Stapleton et al., 1999, 917). Enamel was therefore an
ingenious use of metalworking waste for decorative purposes.
As the majority of enamel inlays are therefore red, this could reflect a local or cheaper
version of the garnet cloisonné found on high status objects as well as the popularity of
red as a decorative motif on metalwork. The colours used on high status objects are
therefore limited to a select few, despite the ability of craftsmen to access imported
materials and to use recycled coloured glass. Thus colour use on high status jewellery
reflects demand and fashion rather than a system limited by supply of coloured
materials.
In the polychromatic high-status dress fittings that have survived, the colour scheme
consists of the same colour groups that occur most frequently in Old English. Gold and
red dominate the colour scheme, with white metals and pastes or shell inlays also
proving quite popular. The occasional use of blue glass or lapis lazuli may fall within
151
the early medieval understanding of blue as lightness or darkness. Other colours, such
as green, orange, purple or (non-golden) yellow, are rare. This may be the result of a
lack of resource for certain techniques and raw materials; however, the white shell
used in settings was possibly imported from the Mediterranean, lapis lazuli from
Afghanistan and the garnets from India and later on Bohemia, so where demand
dictated there was obviously some means of supply (Calligaro, 2005, 111; La Niece,
1988, 238; Perrin et al., 2007, 111). Freestone’s (2008, 40) analysis of Anglo-Saxon
glass in the British Museum indicates that Anglo-Saxon glass was not all recycled
Roman material, signifying that glass supply from the eastern Mediterranean continued
to some degree. Regardless, recycled material would still have included all colours
found in Roman glassmaking and so all colours found in the Roman period could
conceivably be created in the early medieval period as well.
SUMMARY
Gold and silver were precious and limited in supply in Western Europe during the early
medieval period. The lack of raw materials led metal smiths to use gold and silver
primarily as surface coatings on base metal cast objects. In the 6th century, gold and
cloisonné garnet work dominated Anglo-Saxon elite fashion, with silver inlay or plating
also common. Silver, copper and brass wire were occasionally used as decorative
inlays, usually on weapons. Settings other than garnet were primarily of blue or clear
glass or white shell, occasionally as pastes or enamels. Other coloured settings are rare
in this period. Generally, the gold and blood-red colour dominance seen in language is
also apparent in Anglo-Saxon high-status jewellery. White or bright is also common,
with the frequent combination of these elements with silver and the popularity of other
white metal coatings such as tinning. Despite the use of niello and dark blue glass, there
is a noticeable lack of the ‘dark’ category, indicating perhaps that we should expect to
find black patinated copper alloys, darkened silver or even blued iron. However, this
aspect of the four major colour groups of the period may have been fulfilled by a
different part of the costume.
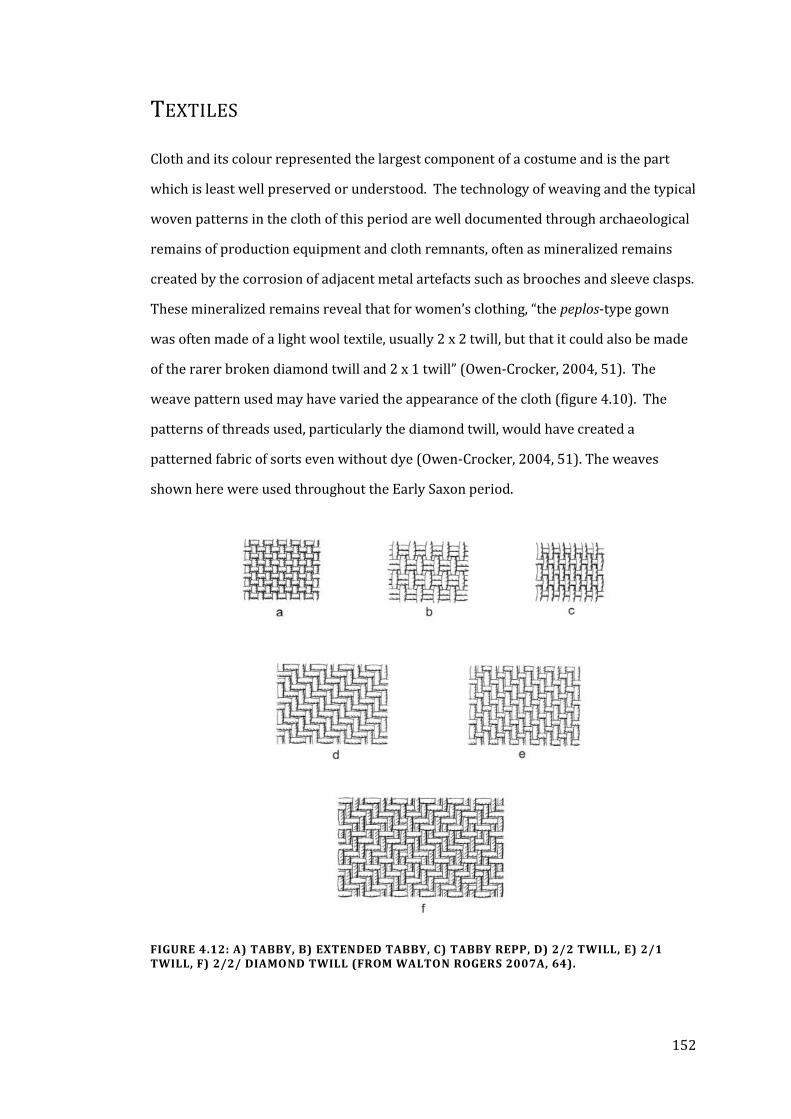
152
TEXTILES
Cloth and its colour represented the largest component of a costume and is the part
which is least well preserved or understood. The technology of weaving and the typical
woven patterns in the cloth of this period are well documented through archaeological
remains of production equipment and cloth remnants, often as mineralized remains
created by the corrosion of adjacent metal artefacts such as brooches and sleeve clasps.
These mineralized remains reveal that for women’s clothing, “the peplos-type gown
was often made of a light wool textile, usually 2 x 2 twill, but that it could also be made
of the rarer broken diamond twill and 2 x 1 twill” (Owen-Crocker, 2004, 51). The
weave pattern used may have varied the appearance of the cloth (figure 4.10). The
patterns of threads used, particularly the diamond twill, would have created a
patterned fabric of sorts even without dye (Owen-Crocker, 2004, 51). The weaves
shown here were used throughout the Early Saxon period.
FIGURE 4.12: A) TABBY, B) EXTENDED TABBY, C) TABBY REPP, D) 2/2 TWILL, E) 2/1 TWILL, F) 2/2/ DIAMOND TWILL (FROM WALTON ROGERS 2007A, 64).
153
While patterned weaves were popular, there is little evidence for two-coloured cloth.
Bold colour changes in stripes and checks are only rarely a feature of early Anglo-Saxon textiles. Patterns in the surviving material are generally subtle textured effects, produced by manipulating the weave or by varying the yarn... [and] patterned fabrics seem to have been a little more common in graves with large numbers of grave goods, while juveniles were generally buried in plain fabrics: this may indicate that patterned textiles are some reflection of social rank (Walton Rogers, 1999, 148-154).
Patterning in textured weaves, if not colourfully executed, was probably a preferred
appearance as it would create textures of light and dark contrast, and thus it was
reserved for women of status or maturity.
MATERIAL
The type of thread used to make the fabric may have been linked to wealth, with linen
being rarer, less rough and probably reserved for use by those of higher status. At
Castledyke, seven women wore linen when they were buried and, “at this site at least,
linen may have been a status symbol” (Owen-Crocker, 2004, 51). However, linen
became more common in the 7thcentury, particularly in the graves of women possibly
due to the Christian conversion and the symbolism of white as purity (Walton Rogers,
2007a, 244-245). Thus these burials may simply be dated from a later period.
In the later Middle Saxon period, linen was often worn as an undergarment for the
purpose of increased comfort over wearing wool and, “was considered more luxurious
than wool, for Bede records that St Etheldreda chose to wear wool rather than linen as
a deliberate mortification of the flesh” (Owen-Crocker, 2004, 156). Wool is certainly
more common in the early medieval period among textiles samples where thread type
could be identified. However, a large number of examined textiles are mineralized and
the thread material unidentified, so the use of flax and hemp may be under represented
in the archaeological record, especially as cellulose fibres decay faster and therefore
are less likely to be preserved.
Flax is generally found in more high-status burials and is less common than wool at
most sites, with an exception being Castledyke where, of 106 textile remains, 24 are
154
wool, 18 are flax, and a further fifteen are either flax or hemp. Six others are also hemp
and one more of unidentified plant fibre, with the 39 remaining samples
undistinguished beyond ‘mineralized’ (Walton Rogers, 2007b). Throughout England in
the early medieval period, flax has been identified 106 times, and hemp seventeen, so
this is a significant proportion. As these plant fibres produce cloth which is “extremely
difficult to dye permanently,” there are only a few instances where such textiles were
dyed (Barber, 1999, 118).
There is little indication that particular fibres were associated with gender, further
indicating that the use of linen over wool was in some sense related to the value of the
cloth. "Men and women seem to have had access to the same types of cloth and there is
no evidence that either sex had a greater preference for patterned fabrics or finer
materials than the other. Decorative braids and edgings, however, were only found in
female graves, while animal skins were only identified with certainty in male graves”
(Walton Rogers, 1999, 154). However, decorative edges were also found on men’s
tunics around the neck, though the majority of evidence for this comes from the
continent and therefore may not be applicable to Britain (Owen-Crocker, 2004, 112). At
Castledyke, “decorative edgings, such as patterned braids, have proved to be less
common than in other, earlier, Anglian cemeteries” (Drinkall and Foreman, 1998, 242).
This is interesting in light of the higher proportion of linen on site, which would have
been undyed or bleached, indicating little colour in the textiles of any sort worn at this
settlement. Thus the textile itself may not be determined by gender but it may have had
connotations of status, and the accessories such as borders and furs were more likely
to reflect a gender distinction. The undyed appearance of the linen burial costume may
have been Christian symbolise of purity or holiness in death in these later examples.
DYES
The dyes used in the early medieval period are primarily the same as those used
throughout the ancient world. Madder or kermes was used for red. Kermes, “the unlaid
eggs of a tiny insect the approximate size and shape of a lady bug,” may have been used
for red as there are literary references to its use, though this has not yet been found
through scientific analysis (Barber, 1999, 230; Walton and Taylor, 1991).
155
In the majority of cases where a red dye could be identified, a wild and species of the
madder plant (Rubia tinctorum L.) was used, which does not produce as vibrant a
colour as ‘dyer’s madder’ (Walton Rogers, 2007b). “The 7th-century examples [of ‘dyer’s
madder’] from England are from well-furnished burials and probably from an early
phase of its reintroduction, before it filtered down the social scale and became the very
common dye that it was in the late Anglo-Saxon period” (Walton Rogers, 2007a, 63). As
‘dyer’s madder’ was only identified on high-status textiles such as those from Sutton
Hoo, the plant may not have been grown locally anymore (it was not native to Northern
Europe) and the superior dye giving bright and deep reds (or cloth dyed using this
form) was imported along with other high-status items (Walton and Taylor, 1991, 7).
This form of madder was not reintroduced until later in the period: “Britain was well
known for her use of red dye by the 11th century, a fact confirmed by the archaeological
evidence” (Walton Rogers, 1997, 1769). Indeed, evidence from Anglo-Scandinavian
Coppergate in York shows that 244 contexts with madder were found, with 189 dyer’s
greenweed and 22 weld (yellows), and 57 woad (blue) (Walton Rogers, 1997). Thus at
least by the latter part of the Anglo-Saxon period, the use of madder to produce bright
reds surpassed all other dyes.
Woad was used for blue and has been in documented use in Britain since the Iron Age,
when the Celtic warriors were said to have painted their bodies with woad so that they
appeared the, “color of Ethiopians” (translating Pliny, Nat. Hist. 22.2.2, in Barber, 1991,
234). The presence of blue dye in analysed cloth in this period argues for a continuity
of local woad exploitation. Green and black can be made from a mixture of woad and
greenweed or weld, but black was a more expensive colour to produce as it required
several applications. Indeed, “in many areas the only way to approximate black cloth
was through repeated dunking in blue dye; so blue was often isochromous with black”
(Barber, 1999, 119). This fits well with the inclusion of blue within ‘dark’ colour space
in Old English. A combination of woad and some yellow for green was found on threads
in a metal relic box at Uncleby (YE8 G29) and Snape (Sf8 G16), and woad and a tannin
to make black was identified on a veil at Scorton (YN4 G112) (Walton Rogers, 2007a,
63-64).
156
Weld (Reseda luteola L.) and greenweed (Genista tinctoria L.) were possibly used for
yellow, as the chemical luteolin is in both and has been identified in some samples
(Walton and Taylor, 1991, 6). However, as most yellows, browns and oranges would
likely have been produced with tannins from things like tree bark, shrubs (young fustic,
Cotinus coggyria L., in particular) and nuts, it is often impossible to distinguish between
deliberate dyes and tannins absorbed naturally in the burial environment (Walton and
Taylor, 1991, 6). These colours are therefore potentially seriously underrepresented in
the analytical record as in many cases a suspected dye cannot be confirmed (Walton
Rogers, 2007a, 64).
Lichen was used for purple and has been identified on three examples from the period,
from a fine wool twill from Kempston, a tablet weave from Snape, and from two tablet
weaves and one piled weave from Broomfield Barrow (Walton Rogers, 2007a, 63).
Purple from the murex has not been found in any samples from this period, which is
not surprising given that it would have been imported from the Middle East and as
there are so few surviving textiles let alone examples that can undergo dye
identification analysis. However, knowledge of such a dye existed, at least in the later
Anglo-Saxon religious community.
COLOUR OF TEXTILES
Only 111 Anglo-Saxon samples from the 5th-7th centuries have been analysed for dyes
or pigmentation. This small corpus seems to indicate that two-thirds of large pieces of
cloth, such as those used for dresses or cloaks, were undyed, though admittedly this
may discount a proportion that were dyed with tannins. The majority of large dyed
pieces of cloth were blue, yellow and brown, and supposedly green. However, the use
of green on the main part of the garment is not substantiated by the evidence acquired
from analysis. For example, Uncleby YE8 G29, consisting of green and blue threads
may have been embroidery or tablet weave rather than a large piece of cloth. Another
three green examples from Snape are all tablet weave borders, implying that green may
have been reserved to borders like red and purple (Walton Rogers, 2007a, 64, 2007b,
1997, 235). No other examples are mentioned in Penelope Walton Roger’s discussion,
nor are any others listed on her online database of analysed textiles.
157
In nearly all instances where dyes or natural pigments were detected in analysis the
material is wool; only 2 flax samples were dyed. Of these two exceptions, one is a flax-
wool fabric dyed with madder, unusual anyway at this time, and the other is described
only as ‘two-colour’ (Walton Rogers, 2007b). The lack of dyes detected in flax may be
due to its lack of colourfastness, but the lack of dyes in wool is interesting. “Perhaps
Anglo-Saxon women at this period contented themselves with naturally pigmented
wool and plain linen, apart from their brightly coloured braids” (Owen-Crocker, 2004,
51). These were often a decorative edging around the neckline and occasionally parts
of this tablet weave or embroidered edging are preserved. However, Owen-Crocker
believes that every-day gowns may have been simpler in design, again begging the
question as to whether colour was an important aspect of the textile worn at this time,
particularly in certain social contexts such as burial costume.
SUMMARY
This small sample size is not large enough to be representative of the period and as
certain dye processes such as those involving tannins cannot be detected easily, it is
difficult to draw any firm conclusions about the colour of early Anglo-Saxon clothing.
Dyes appear to have been used sparingly in the earliest part of the period particularly
as madder was imported, with the result that bright colours such as red, purple or
green were limited to the brightly decorated tablet-woven borders (Walton Rogers,
2007a, 64). While colour and contrast was evidentially an important aspect of costume,
this may have been largely restricted to metal jewellery and bead necklace displays.
There are a few tantalizing exceptions to this which may indicate that bright and varied
coloured patterns existed on textiles, but the scarcity of such evidence may suggest that
the average person was contented with simpler natural browns, off-whites and whites.
The prevalence at Castledyke of high-status women wearing linen, a cloth that was
rarely dyed, may indicate that the fashion of the rich valued the plain white of this
fabric, and that the bright decorative colours we might expect were even here limited
to braids and tablet weave panels along garment edges. Or, as occurs in later periods,
perhaps linen was simply the fabric used as an undergarment, and the remains of outer
garments have not been preserved (Pritchard, 2003, 377). Again, all this may also be
158
dependent on dating, as linen became more popular as a burial textile in the 7th
century.
At this time no attempt will be made to include the colour of the cloth in the
reconstruction of the burial ensemble, although it is admittedly a large proportion of it.
As the majority of large textiles were undyed or of an earthy, natural colour, it may be
safe to assume in most cases that the colour of jewellery was the visual focus of the
costume. However, as female garments often had a coloured border, the impact of this
contrast may have been the focus of the ensemble or complimented the colour of beads
or metalwork also worn. Certainly the colour of beads would show up best on white or
black cloth, and black was difficult and expensive to produce.
If the majority of dyed large pieces of cloth in this period seem to have been blue,
yellow or brown, with possibly two-thirds of all clothing undyed or light in colour, it
seems that the appropriate colour of clothing fell into a category of ‘bright’. Those dyes
most likely to have disappeared through decay processes would result in yellows and
browns, so it is likely that the brun-fealu colour component is underrepresented. The
blue cloth may have been either bright or dark, depending on the number of
immersions in the dye. Darker cloth would have been more expensive and therefore
rarer due to the amount of dying necessary to achieve darker colours, which may be a
major factor in the lack of such clothing having been identified in the archaeological
record.
Red, green and purple seem to have been reserved for the edgings of clothing and it is
not until the latter part of the early medieval period that red becomes the most popular
clothing colour. This may be evidence that the high frequency use of red as a colour
word may be a result of its use in the mid to late Saxon period rather than the earlier
migration period, though this is in many ways counterintuitive to the linguistic
evidence. However, this may be another example of the ‘Anglo-Saxon’ identity being
solidified long after the migration, as were the regional ancestral identities as
described by Bede, or that the literary evidence simply does not fully describe the
practical use of colour in that society (Hinton, 2005, 26-27; Walton Rogers, 1997,
1869).
159
BEADS
Beads, along with metal dress-fittings and clothing, make up the typical costume of
Anglo-Saxon women. Beads occur in the majority of female graves in the early
medieval period, even in those that are otherwise unfurnished, giving them a
ubiquitous quality that could hypothetically allow for a wider characterisation of
contemporary fashion and colour usage than other material remains. While the colour
of a bead does change over time with the deterioration of the glass or amber, the
intended colour in a general sense is often obvious and some conclusions concerning
colour usage may be drawn from such inference.
ISSUES WITH BEAD COLOUR ANALYSIS
There is no set way of describing the colour of beads, with site reports varying greatly
in the amount of detail given concerning a bead’s appearance. Only two studies have
been conducted on Anglo-Saxon beads, approaching the material in different ways in
order to fine-tune typologies, which regrettably renders their databases incompatible.
Guido (1999) first looked at the beads by colour and unfortunately never had the
chance to analyse her data fully, or even approach the issue of quantifying the beads.
Brugmann (2004) realised the flaws inherent in such a method of classification for this
material and approached forming a typology of Anglo-Saxon beads largely by
manufacturing technique, a process which did allow her to refine the dating of beads
but which still did not reveal any regional and very few temporal colour trends.
Even major trends can appear to be localised; if one considers only the sites from
Brugmann’s research, blue beads seem to be comparatively rare in Kent, but when the
data from Guido’s study is added no such absence can be detected. The inclusion or
exclusion of even a single site containing glass beads can drastically alter the apparent
regional bead colour patterns. No study has included all excavated sites, and
disappointingly Brugmann did not build off Guido’s material. Due to the differences in
typology established by each and the variation in sites included, as well as other sites
not included in both, it is impossible to even roughly estimate how many beads have
been found, let alone how many of each colour.
160
While colour is discussed here in modern English terms, interesting patterns emerge
from where there have been disagreements concerning the description of bead colour.
“Human variations in description of colours seem to arise in particular with: yellow and
green, green and blue and blue and black. The only colours most individuals easily
agree upon seem to be ‘orange’ and ‘red’ beads” (Brugmann, 2004, 24). As can be seen
in figure 4.13, the variations in hue in some colour groups, such as those mentioned by
Brugmann, create difficulties in objectively describing the colours seen by the Anglo-
Saxon consumer. ‘Yellow’ or ‘green’ beads are not limited to a single focus point, but
rather can appear anywhere within the spectrum of colour. This is likely a symptom of
the difficulty of manipulating the glass to achieve a set hue and the apathy of the
consumer over such slight differences, perhaps because their understanding of colour
divisions in those regions was less distinct.
FIGURE 4.13: YELLOW AND GREEN GLASS BEADS FROM GRAVE 393, MORNING THORPE (REPRODUCED FROM BRUGMANN 2004, 25).
161
It seems that the truth of the matter will be tied to economics more than fashion.
Simply put, a bead type (often but not always in various colours) is produced, its
popularity grows and then wanes dependent on demand, and the distribution of the
bead is directly related not to regional trends as much as to interregional trade
networks or the movement of people, perhaps through marriage. This may account for
the distribution of bead types that are more prevalent in Kent and the Thames valley,
or those that dominate the Anglian north and east, while still accounting for the
widespread and surprisingly even distribution of bead colours throughout Anglo-Saxon
England.
COLOURANTS USED IN EARLY MEDIEVAL BEADS
In order to understand the use of coloured beads in the early medieval period, the
technology and the limitations of material must be understood. The glass-making
technology available to the Anglo-Saxons built off that from the Roman period, though
production was on a much smaller scale and some specialist knowledge may have been
lost. Merovingian glass workshops, established under the Romans, continued to
produce glass beads in both the Roman and Germanic traditions (Dubin, 2009, 73).
Most colourants could be derived from common materials and so would not have been
limited by disruptions in trade, and glass recycling of earlier material, particularly
Roman glass mosaic tiles, was also likely (Freestone, 2011).
Small quantities of oxides result in coloured glass. Cobalt can be used for blue or
bluish-purple, iron for green or yellow, manganese for purple, copper for green or
greenish-blue or opaque red. “The production of colours in glass depends not only
upon the inclusion of a specific metal oxide (such as cobalt to produce blue glass), but
also upon the presence of other oxides in the batch, and the temperature and state of
oxidation or reduction in the kiln” (Newton and Davison, 1989, 7). For example, FeO
creates a blue colour in a glass, but if the mixture is further oxidised, Fe2O3 is formed in
greater amounts, causing the glass to turn brownish or yellowish. The combination of
both these oxides, which is usually what occurs, results in a green glass (Newton and
Davison, 1989). “With lead oxide, copper oxide will produce greens; with sodium or
potassium oxide the colour will be turquoise blue. Under reducing conditions copper
162
oxide will produce a dull red colour” (Newton and Davison, 1989, 58). Other
combinations result in other colours as well, with manganese and iron oxides resulting
in black. Antimony was used to create opaque white glass, and tin oxide was used in
later contexts (Newton and Davison, 1989 59).
Thus a wide gamut of glass colour was achievable given the knowledge of kiln and
ingredient manipulation and these colourants continued to be used in the early
medieval period. Lack of hue specificity in some colours may be a result of unknowing
mixture of oxides through recycling or variation as a result of kiln control, thus creating
the yellow-greens and the blue-greens potentially unintentionally. However, the lack of
distinction in contemporary language could also have predicated such indefinite
spreads of bead colour.
FREQUENCY OF BEAD COLOURS
If one considers the colour of beads empirically, the frequency of bead colour is more
apparent and some insight into the prevalence of different colours in the period can be
derived. Brugmann (2004) looked at about 14,000 glass beads, but did not use colour
as an important variable in her typology. Guido’s (1999) research often did not give an
exact number of beads at a site and her schedule of beads left out some of the larger
types such as the small blue beads so popular early in the period. As Brugmann also
saw this type as distinct, it was possible to add the locations and quantities of her blue
beads to Guido’s database, resulting in nearly 7,000 glass beads from the combined
studies for which a colour is known. This is only half of Brugmann’s sample size but is
large enough for statistical purposes. If one looks only at the primary colour of a bead,
i.e. excluding other colours in polychrome examples for the sake of brevity, patterns of
colour use do emerge.
Despite being limited in chronology to the 6th century, amber beads are by far the most
common type of bead in the Anglo-Saxon world (figure 4.14). Nearly three-quarters of
all beads from Anglo-Saxon contexts are amber. The distinctive orange-red colour of
amber dominated the necklaces of the 6th century and must be considered an important
component of Anglo-Saxon fashion. Combining amber with the other red bead colours,
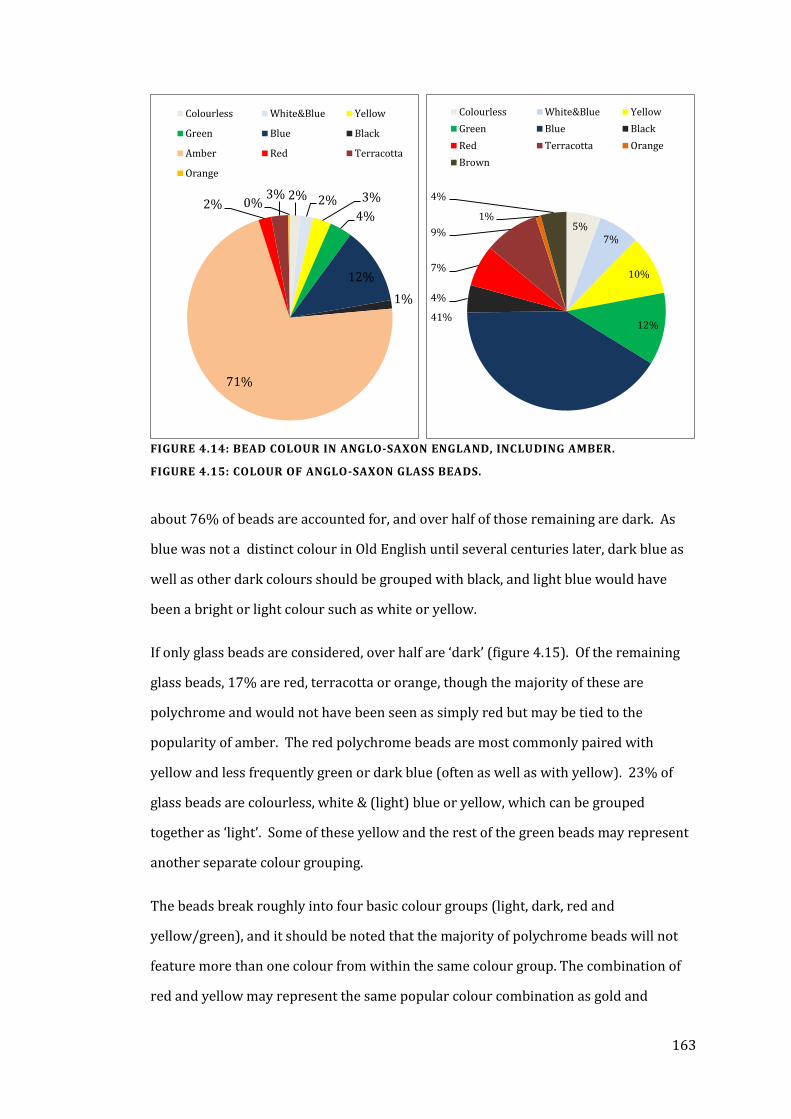
163
about 76% of beads are accounted for, and over half of those remaining are dark. As
blue was not a distinct colour in Old English until several centuries later, dark blue as
well as other dark colours should be grouped with black, and light blue would have
been a bright or light colour such as white or yellow.
If only glass beads are considered, over half are ‘dark’ (figure 4.15). Of the remaining
glass beads, 17% are red, terracotta or orange, though the majority of these are
polychrome and would not have been seen as simply red but may be tied to the
popularity of amber. The red polychrome beads are most commonly paired with
yellow and less frequently green or dark blue (often as well as with yellow). 23% of
glass beads are colourless, white & (light) blue or yellow, which can be grouped
together as ‘light’. Some of these yellow and the rest of the green beads may represent
another separate colour grouping.
The beads break roughly into four basic colour groups (light, dark, red and
yellow/green), and it should be noted that the majority of polychrome beads will not
feature more than one colour from within the same colour group. The combination of
red and yellow may represent the same popular colour combination as gold and
FIGURE 4.14: BEAD COLOUR IN ANGLO-SAXON ENGLAND, INCLUDING AMBER.
FIGURE 4.15: COLOUR OF ANGLO-SAXON GLASS BEADS.
2% 2% 3%
4%
12%
1%
71%
2% 3%
0%
Colourless White&Blue Yellow
Green Blue Black
Amber Red Terracotta
Orange
5% 7%
10%
12% 41%
4%
7%
9%
1%
4%
Colourless White&Blue Yellow
Green Blue Black
Red Terracotta Orange
Brown
164
garnets. Also, as red and yellow are the two earliest colours to have likely been singled
out as distinct colours, these beads along with the large number of dark beads (and
potentially the usually undyed light cloth they would have been viewed against) would
have represented nearly all of the spectrum of Anglo-Saxon colour space.
The popularity of each colour group is interesting. Dark beads are by far the largest
glass bead group, chronologically earlier in popularity as they are most common in the
5th century and represent a continuation of Roman style. If amber is considered with
this data, however, the ‘red’ category far outweighs any other. Again, this is to some
degree chronologically limited, specifically to the 6th century, occurring after the ‘dark’
bead trend, with little overlap between them. A decline in amber coincides with the
limited introduction of orange glass beads in the 7th century, by far the least popular by
quantity of any bead colour. Yellow/green and light coloured beads are far less
numerous than red or dark but consistently appear in a small number at every site.
However, it must be remembered that the distribution of specific colours of beads is
independent from the existence of appropriate terminology or even a cultural
distinction between hues. The colorants used in the manufacture of glass beads belong
to a continuing glassmaking tradition carried over from the Romans. The polychrome
beads exemplify a taste for dramatic contrasts, with more subtle combinations of
similar hues possible but not in demand. This could be evidence of either aesthetic
preference or the reduction of colour distinction made in language by those producing
beads, limiting combinations to the primary colours of the period.
CHRONOLOGICAL COLOUR TRENDS
There are few universal trends in colour in the early medieval period that can be seen
in glass bead use. The few exceptions are a continuation in the 5th and 6th century of
what was probably late Roman fashion dominated by small monochrome dark beads,
primarily blue in colour (but also frequently brown, black and dark green, i.e. dark),
followed in the 6th century by the widespread use of large numbers of amber beads.
The introduction of orange beads in the 7th century follows the decline in amber. These
may have been replacements for amber, though the reasons for why amber was no
165
longer in use are unclear and the lack of popularity enjoyed by orange beads, as
evidenced by their scarcity, may indicate a wider decline in interest in beads of that
colour (Brugmann, 2004, 43).
Within a chronological viewpoint, the influence of the native Romano-British
population on the style and tastes of the 5th century must be considered. However,
since the 5th century was dominated by a continuation of late Roman-style dark beads
throughout the continent as well as Britain, a trend which tapers away in the 6th
century, it seems that bead tastes throughout Western Europe were fairly uniform
during the early part of this period despite a variety of cultural influences.
REGIONAL PATTERNS
Regional trends in bead colour are rare and difficult to identify. The only clearly
regional bead trend can be found in East Anglia, which was the only place to have
bichrome beads of yellow and green, indicating that these were likely produced locally
(Guido, 1999, 40). This particular choice of colours is interesting as it demonstrates
that yellow and green were regarded at separate colours by the mid 6th century (as
opposed to lighter and darker variants of the same colour). The regionality of this
colour combination may entirely rest on local production, limited trade beyond East
Anglia, or to local taste.
Bead colour is well distributed throughout Anglo-Saxon England. Slight regional
patterns and trends can be discerned; although the sample is far from complete and all
sites feature all colours of beads, there is often huge variation from the average
distribution. However, some colours are less or more likely to originate from different
geographical regions.
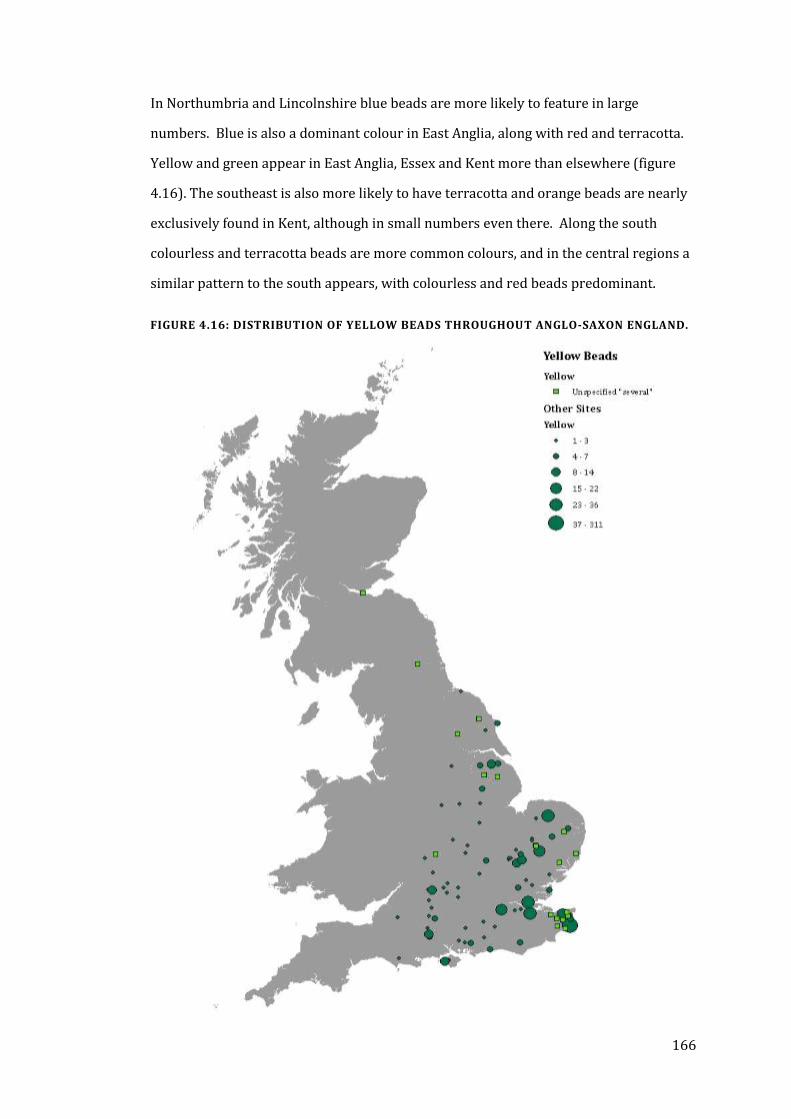
166
In Northumbria and Lincolnshire blue beads are more likely to feature in large
numbers. Blue is also a dominant colour in East Anglia, along with red and terracotta.
Yellow and green appear in East Anglia, Essex and Kent more than elsewhere (figure
4.16). The southeast is also more likely to have terracotta and orange beads are nearly
exclusively found in Kent, although in small numbers even there. Along the south
colourless and terracotta beads are more common colours, and in the central regions a
similar pattern to the south appears, with colourless and red beads predominant.
FIGURE 4.16: DISTRIBUTION OF YELLOW BEADS THROUGHOUT ANGLO-SAXON ENGLAND.
167
However, it must be stressed that these are slight regional biases rather than
overwhelming trends and that there is very little regionality in bead colour frequency.
For example, East Anglia, which features higher than average yellow, blue, red and
terracotta, still has half of the total beads comprising of amber and a further quarter
‘darkish’. These patterns and variations are very slight indeed and perhaps were not
meaningful to the early medieval eye.
TRADE ACCESS
There is some evidence that more isolated sites may have had less access to trade of
goods and therefore fewer beads would have reached them. The majority of beads,
particularly early in the period, would have been imported from France and the Low
Countries (Brugmann, 2004, 3; Guido, 1999). This is clearly a determining variable
between the sites of Castledyke, Barton-on-Humber and Cleatham, the former located
on the Humber River and the latter a few miles inland from waterways and roads.
The large number of amber beads and other imported objects at Castledyke are strong
evidence of trade, and the relative scarcity of beads or other luxury items such as gold
or silver at Cleatham would argue against such access. The proximity of Castledyke to
the Humber and thus to interregional trade indicates that the primary means of
acquisition and dispersion of bead types, particularly amber, is unlikely to be heavily
influenced by gift-giving and intermarriage, although this certainly could explain the
irregularity of distribution of less frequent bead types.
However, as Cleatham is slightly earlier, much of this may be related not just to location
but more to the introduction of amber as a popular luxury item in the 6th century, after
most of the burials at Cleatham, and most of all to the overall increase in trade in the 6th
century. Also, nearly all of the excavated sites featuring any beads are located on the
coast, on rivers or rarely only on a Roman road, giving them all some means of trade
access.
168
COMPARISON OF SPECIFIC SITES
As Brugmann and Guido use different systems to categorize beads, looking at the
reported bead colours from specific sites can indicate not only the frequency of colour
at the sites and in regions but also how the colours were used as part of an ensemble.
Variability in bead colour frequency is high between sites despite being similar
regionally.
PORTWAY, ANDOVER
This cemetery site of sixty-nine inhumations and eighty-four cremations features 324
beads of which nearly half (159) are amber (figure 4.17; Cook and Dacre, 1985). Dark
beads make up nearly a quarter and red beads about 6%, while the light beads
(including metal as most are a tin-lead or leaded bronze alloy), shell, bone, colourless
and white beads, provide a larger proportion than at some sites. Yellow beads are few
in number, with far more contributed to this colour group by the gold-in-glass beads.
Shell and rock crystal examples are the rarest, reflective of their frequency throughout
Anglo-Saxon England. This site follows the national average frequencies quite well.
However, as, “the practice of including Roman coins in necklaces was widespread, but
was obviously most prevalent in areas with nearby Roman occupation,” larger numbers
of coins as necklace fittings are recorded here than at some comparable sites (10% of
graves) (Cook and Dacre, 1985, 87).
XRF of the Portway beads reveals that opaque blue contains cobalt, while opaque white
is the result of tin. Yellow is a result of lead, red of iron and copper, black of iron and
manganese, and green from copper. The ingredients used to create colour in these
beads is wide-ranging, possibly indicating a variety of glass-making traditions or glass
recycling. At the least, there is a, “wide range of titanium contents suggesting a variety
of silica sources for making the glass,” so either the beads come from a variety of places
or recycling of glass was of regular occurrence (Cook and Dacre, 1985, 85).
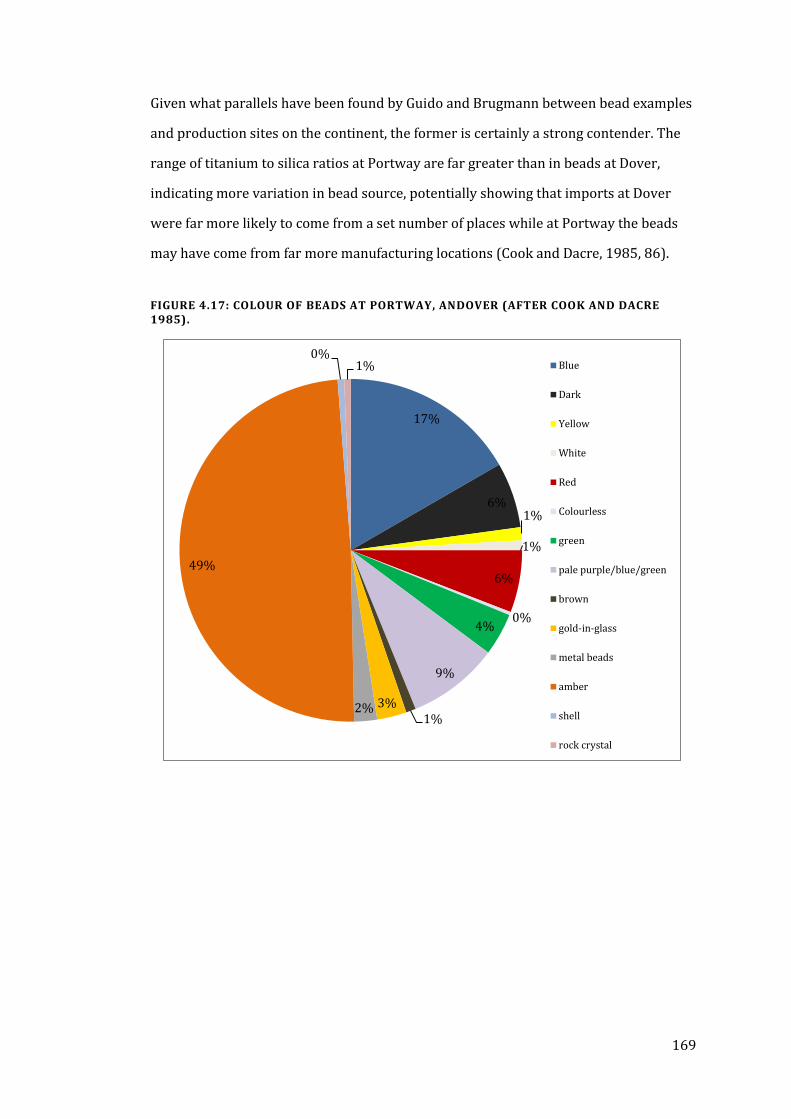
169
Given what parallels have been found by Guido and Brugmann between bead examples
and production sites on the continent, the former is certainly a strong contender. The
range of titanium to silica ratios at Portway are far greater than in beads at Dover,
indicating more variation in bead source, potentially showing that imports at Dover
were far more likely to come from a set number of places while at Portway the beads
may have come from far more manufacturing locations (Cook and Dacre, 1985, 86).
FIGURE 4.17: COLOUR OF BEADS AT PORTWAY, ANDOVER (AFTER COOK AND DACRE 1985).
17%
6% 1%
1%
6%
0% 4%
9%
1% 3% 2%
49%
0% 1% Blue
Dark
Yellow
White
Red
Colourless
green
pale purple/blue/green
brown
gold-in-glass
metal beads
amber
shell
rock crystal
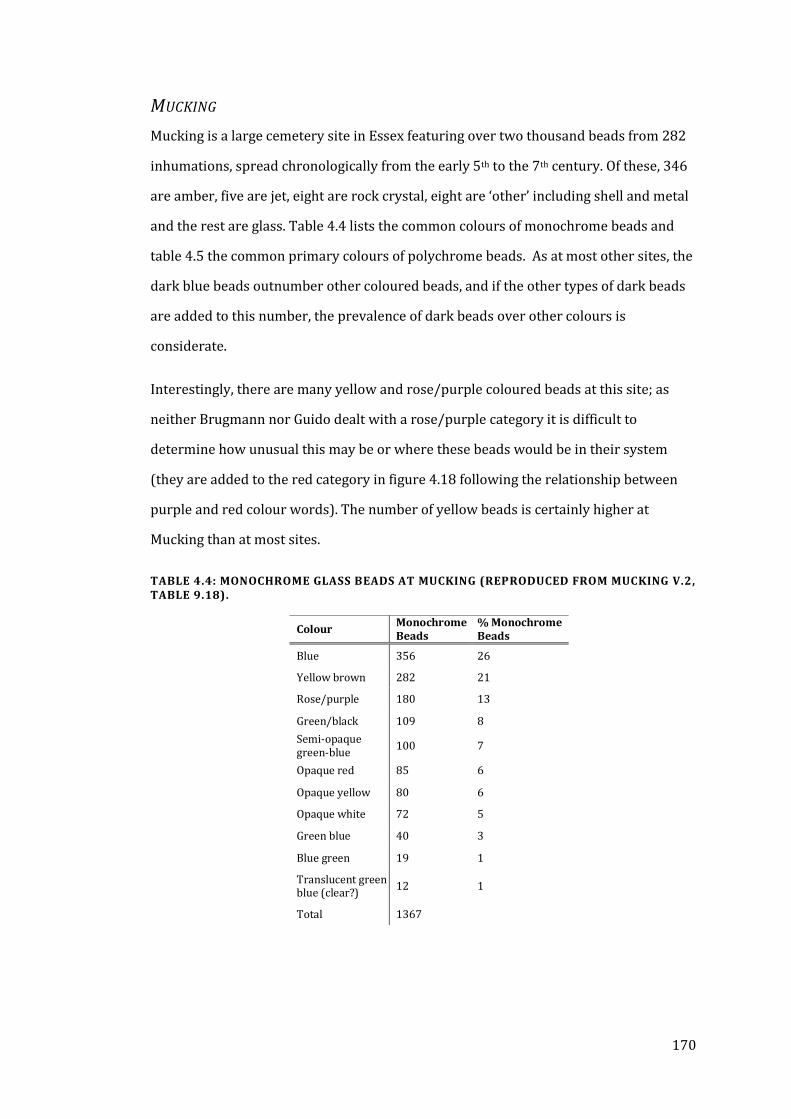
170
MUCKING
Mucking is a large cemetery site in Essex featuring over two thousand beads from 282
inhumations, spread chronologically from the early 5th to the 7th century. Of these, 346
are amber, five are jet, eight are rock crystal, eight are ‘other’ including shell and metal
and the rest are glass. Table 4.4 lists the common colours of monochrome beads and
table 4.5 the common primary colours of polychrome beads. As at most other sites, the
dark blue beads outnumber other coloured beads, and if the other types of dark beads
are added to this number, the prevalence of dark beads over other colours is
considerate.
Interestingly, there are many yellow and rose/purple coloured beads at this site; as
neither Brugmann nor Guido dealt with a rose/purple category it is difficult to
determine how unusual this may be or where these beads would be in their system
(they are added to the red category in figure 4.18 following the relationship between
purple and red colour words). The number of yellow beads is certainly higher at
Mucking than at most sites.
TABLE 4.4: MONOCHROME GLASS BEADS AT MUCKING (REPRODUCED FROM MUCKING V.2, TABLE 9.18).
Colour Monochrome Beads
% Monochrome Beads
Blue 356 26
Yellow brown 282 21
Rose/purple 180 13
Green/black 109 8
Semi-opaque green-blue
100 7
Opaque red 85 6
Opaque yellow 80 6
Opaque white 72 5
Green blue 40 3
Blue green 19 1
Translucent green blue (clear?)
12 1
Total 1367
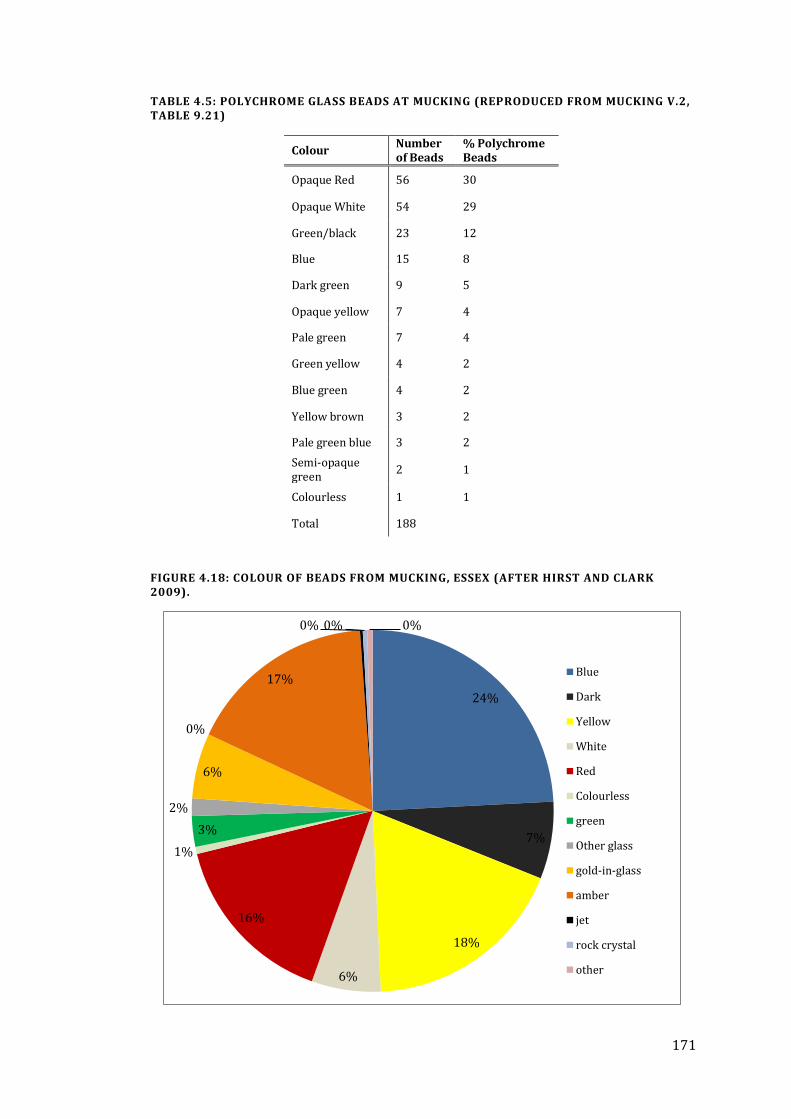
171
TABLE 4.5: POLYCHROME GLASS BEADS AT MUCKING (REPRODUCED FROM MUCKING V.2, TABLE 9.21)
FIGURE 4.18: COLOUR OF BEADS FROM MUCKING, ESSEX (AFTER HIRST AND CLARK 2009).
Colour Number of Beads
% Polychrome Beads
Opaque Red 56 30
Opaque White 54 29
Green/black 23 12
Blue 15 8
Dark green 9 5
Opaque yellow 7 4
Pale green 7 4
Green yellow 4 2
Blue green 4 2
Yellow brown 3 2
Pale green blue 3 2
Semi-opaque green
2 1
Colourless 1 1
Total 188
24%
7%
18%
6%
16%
1%
3%
2%
6%
0%
17%
0% 0% 0%
Blue
Dark
Yellow
White
Red
Colourless
green
Other glass
gold-in-glass
amber
jet
rock crystal
other
172
The polychrome beads are dominated by red and white grounds, with a fair scattering
of dark coloured beads and a wider range of single-occurrences in yellows and greens.
In both polychrome and monochrome beads, the least frequent colour is clear glass.
Whether this is due to a lack of popularity or if it was meant to imitate valuable rock
crystal, and therefore rarity and prestige, is unknown. There are far fewer amber beads
at Mucking than at most cemetery sites, despite the obvious ability of the inhabitants of
the area to access high status material. This may be in part due to increases in
cremation burials compared to inhumations in the late 5th to 6th centuries, but even
then the high number of yellow beads is striking (Hirst and Clark, 2009, 727).
Alternatively, this suggests that supply and shortages as variables of difference are only
visible at the level of a specific site, while on a larger scale a surprising degree of
consistency is seen.
BEAD STRINGS
The arrangement of complete bead strings was examined at Mucking, providing insight
into how the beads were displayed together as part of the ensemble. Generally in a
string of beads, the smaller beads are at the top and they increase gradually in size
towards the lower hanging part of the necklace with variegated effects created by
grouping colours of beads by three or four similar beads in a row (Hirst and Clark,
2009, 524). This could potentially be to increase the visual effect of each colour in the
string or create symmetry.
In total, there were thirty-five strings of more than six beads. Of these, five were
primarily amber, with gold-in-glass beads occasionally occurring within four of these
strings (Hirst and Clark, 2009, 524). “The 23 bead strings with predominantly
monochrome glass beads are often dominated by a particular colour and/or type, most
commonly blue annular beads” (Hirst and Clark, 2009, 516). Thus the blue beads were
not only the most popular colour; they were usually the dominant colour in a single
string of beads.
173
CASTLEDYKE
If one looks at the range of colour represented by the beads from Castledyke, certain
patterns that may reflect the current 6th-century spectrum of colour as discussed
previously can be identified (figure 4.19). Firstly, there is the large number of amber
beads, with some necklaces containing scores of them, some with no other bead types
present. There were 672 beads found at Castledyke, of which 414 were amber (62%).
If you add to this ‘red’ category the other red and terracotta glass beads – a further
sixteen – it is clear that the major visual characteristic of the necklaces was a
predominately red appearance.
Over 20% of the beads are dark, with the remaining being primarily white, yellow or
silvery (the ‘light’ category). It may seem strange that the ‘dark’ and ‘light’ beads are
not more balanced in number until one considers the colour of the metalwork at either
side of the necklace, which surely would have been viewed alongside it. The colours of
copper alloys would fall within a light/silver or golden/yellow area of colour space,
providing contrast when viewed with the dark beads. The frequency of ‘light’ beads
being iridescent and the use of silver and gold as beads and pendants as well may
further reflect the connection between lightness and metal.
CLEATHAM
Unfortunately, the colours of beads from Cleatham cannot be categorised as precisely
as little differentiation of bead colour is mentioned in the site report, obscuring the
relative darkness or lightness of the beads. However, if the frequency of each colour of
glass bead is examined, a similar pattern emerges, with a higher number of ‘dark’ beads
than ‘light’ than at Castledyke (figure 4.19). The higher percentage of
terracotta/red/polychrome at Cleatham may be a result of the surprising scarcity of
amber beads.
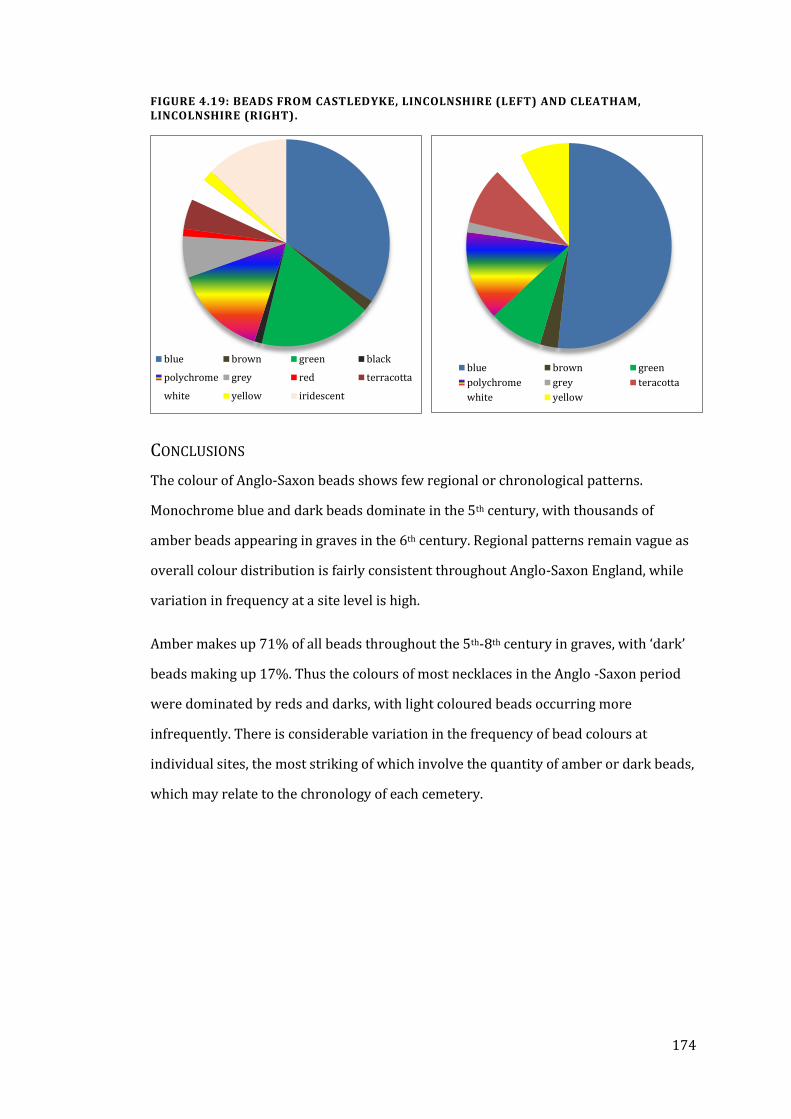
174
FIGURE 4.19: BEADS FROM CASTLEDYKE, LINCOLNSHIRE (LEFT) AND CLEATHAM, LINCOLNSHIRE (RIGHT).
CONCLUSIONS
The colour of Anglo-Saxon beads shows few regional or chronological patterns.
Monochrome blue and dark beads dominate in the 5th century, with thousands of
amber beads appearing in graves in the 6th century. Regional patterns remain vague as
overall colour distribution is fairly consistent throughout Anglo-Saxon England, while
variation in frequency at a site level is high.
Amber makes up 71% of all beads throughout the 5th-8th century in graves, with ‘dark’
beads making up 17%. Thus the colours of most necklaces in the Anglo -Saxon period
were dominated by reds and darks, with light coloured beads occurring more
infrequently. There is considerable variation in the frequency of bead colours at
individual sites, the most striking of which involve the quantity of amber or dark beads,
which may relate to the chronology of each cemetery.
blue brown green black
polychrome grey red terracotta
white yellow iridescent
blue brown green
polychrome grey teracotta
white yellow
175
PIGMENTS AND THEIR USE IN THE EARLY MEDIEVAL
PERIOD
A wide variety of plant and mineral resources were used as pigments in the early
medieval period, though certain types were used only on particular media. Most
surviving instances of pigment are from a small basic group of colours, which were
used in specific ways and occasionally combined to create particular effects. The
frequency of use of different pigments may indicate the importance or value of
particular colours in the Anglo-Saxon world.
PAINTED WALLS AND SCULPTURE
Paint from wall paintings or decorated stone sculpture rarely survives, and many of the
examples identified have not been scientifically analysed to determine the type of
pigment used. All Anglo-Saxon painted walls and sculptures are from later Christian
contexts, and as such tend to date later (8th-10th century) than the material discussed in
this thesis. The most common pigment used on either wall paintings or sculpture is
haematite (red ochre) (Eastaugh et al., 2004a). Yellow ochre was used for yellow,
charcoal for black and lime for white on both surface types. Generally these were the
primary pigments in use, as, “the palette consists of red and yellow ochres, lime white
and charcoal black, combined to produce a good range of tones, such as blue-grey, pink
and cream” (Drury, 1990, 117). No other pigments have as yet been identified (Cather
et al., 1990, xv).
USE ON SCULPTURE
Often the only evidence that remains of paint on sculpture is the base coat of gesso,
which could either be white or black and may have been visible in places as a
contrasting colour. A black base coat may indicate a Scandinavian influence, as red and
black is a common motif on stone sculpture in that region (Tweddle, 1990, 151). On
occasion other colours have been identified but not confirmed as a particular pigment.
Green, dark blue and orange have been found on stone crosses but none of these have
been successfully analysed (Lang, 1990, 136, 140; Tweddle, 1990, 148). An
176
unidentified purple was found at St. Albans but the dating of its context is uncertain
(Biddle and Kjølbye-Biddle, 1990a, 76). In one instance, a blue pigment made from,
“azurite in a proteinaceous medium... [in a binder of] animal or fish glue,” was
confirmed on an ivory figure of the Virgin and Child at the Victoria and Albert Museum,
but the paint may not be contemporary with the object’s manufacture (Williamson and
Webster, 1990, 182).
Theophilus describes processes of dying ivory or bone with a madder lake to turn it red
(Hawthorne and Stanley Smith, 1979, 188; Williamson and Webster, 1990, 181).
Vermilion or cinnabar red would have been unlikely, as it would have had to be
imported, very expensive, and can turn black if exposed to sunlight, making it
unsuitable for use on outdoor sculpture such as stone crosses (Eastaugh et al., 2004b,
105; Lang, 1990). Yellow ochre or orpiment was used for yellow, but only on a single
wooden sculpture fragment from Denmark, where the colour was likely original as it
occurred in a sealed context dated to c.950. Orpiment pigment, also imported and
therefore expensive, has been found in the Anglo-Scandinavian Coppergate site in York,
but not on an associated object (Tweddle, 1990, 152). As holes for metal appliqués are
common and the occasional trace of gilding has been found, it seems that these
materials were used rather than yellow paint on stone sculpture.
Though few examples of painted sculpture exist (i.e., only twelve of 202 in southeast
England have paint remaining), the frequency of paint colours can be revealing
(Tweddle, 1990, 147). There are single examples of orange, purplish-black and green,
two of blue, and the remaining nine examples are red (Drury, 1990; Rodwell, 1990;
Tweddle, 1990). One of the blue examples, the fragments of a cross from Reculver, was
primarily red with some dark blue on the draperies of carved figures (Tweddle, 1990,
148). The purplish-black painted example from Breamore was also combined with
reddish-brown, making both polychrome examples red and a dark colour, again
perhaps evidence of Scandinavian influence (Rodwell, 1990, 165). However, there is no
way to date the paint on these examples and the surviving colour schemes may
originate from a later period. Leland’s 1770 description of the cross at Reculver implies
177
that the painted appearance was in good condition, indicating that the scheme present
was fairly recent (Tweddle, 1990, 148).
The Lichfield Angel, a stone sculpture buried in the late 10th century and thus with a
terminus ante quem in the Anglo-Saxon period, features several pigments. Carbon black,
chalk white and red and yellow oxides (probably from ochres) have all been identified,
with the possibility of lead white (Howe, 2006). However, the issue of when a stone
object was painted is certainly problematic for this discussion.
USE ON WALL PAINTINGS
The colour schemes found on painted wall surfaces are dominated by whitewash and
various shades of red, usually in the form of painted lines probably in the style of
Roman wall painting, and occur exclusively in Christian religious buildings. Often, such
as at Jarrow and the old Minster at Winchester, the plaster on which paint appears was
pink from the mixing of brick dust with the plaster to improve its resistance to
moisture (in the Roman fashion, a technology brought from Merovingian France), but
in most cases this pink plaster was painted over white with lime wash before paint was
applied (Biddle and Kjølbye-Biddle, 1990b, 42; Cramp and Cronyn, 1990, 25). This is
more often the case in earlier buildings, from the 7th and 8th centuries. However, the
majority of building interiors were painted white with no further painted decoration
(Biddle and Kjølbye-Biddle, 1990b; Cramp and Cronyn, 1990).
Black, white and red paint were found at Winchester on grounds of white, pink and
yellow plaster in 7th century contexts (Biddle and Kjølbye-Biddle, 1990b, 41). White,
yellow, red, pink, grey-tan and black paint occur at Colchester Castle (Drury, 1990,
119). Despite the array of colours found, in all instances red paint (including the
reddish-browns and pinks as well) is by far the most common. This may be a
continuation of a Roman religious building tradition that used red since it was the
colour of light (Gage, 1993, 25). Only a few later examples (10th-11th century), such as
the painting of four flying angels at Nether Wallop, have evidence of painted figures or
scenes (Tudor-Craig 1990). On occasion red lettering has been found indicating a
painted inscription, such as at the 9th-10th century phase of the chapel to St. Patrick in
178
Heysham (Higgit, 1990, 33; Tudor-Craig, 1990, 89). However, wall painting seems to
have been reserved to basic framing, perhaps of objects hung on the wall.
MANUSCRIPTS
Different pigments were used on manuscripts than on walls and sculpture, as
resistance to moisture, weathering and cost of the pigment were not considerations
and each developed from different traditions. Smaller quantities were needed to
illuminate a book than to paint a room and the brilliance and vibrancy of colour were of
paramount concern. Gold and occasionally silver pigments, made from powdered
metal in egg-yolk and/or mercury (for gold) were used on some manuscripts to
heighten the richness of the decoration (Eastaugh et al., 2004b, 171, 342).
In all Insular manuscript illumination, white (from chalk or white lead) and black (from
charcoal) were complimented by red lead and yellow orpiment (arsenic sulphide).
Verdigris (copper (II) acetate) was used for green and indigo blue was probably
produced from local sources of the woad plant (Eastaugh et al. 2004b, Backhouse 1995,
29). As orpiment reacts with lead and copper-based pigments, particularly verdigris, it
is unlikely to be placed directly next to such pigments (Eastaugh et al., 2004b, 285).
Orpiment would likely have been imported from Italy or another volcanic geological
region; its use when cinnabar has not been found as a pigment is interesting as they
often form together, and thus access to one would support the premise that there was
access to the other as well (Eastaugh et al., 2004b, 105). Cinnabar has not yet been
identified analytically on Insular manuscripts from the early medieval period (despite
its popularity on later manuscripts) though the vibrancy of the colour of this pigment
would have made it ideal (Eastaugh et al., 2004b, 105).
As in wall painting, various shades and hues were achievable using these pigments
although their use, especially in early manuscripts, was almost wholly uniform and
pure. The Lindisfarne Gospels introduced a wider range of pigments to the spectrum
used for illuminating manuscripts, including kermes red, and blue from lapis lazuli “as
costly as gold” and imported from Afghanistan (Backhouse, 1995, 29; Howard, 2003,
27; Brown, 2003).
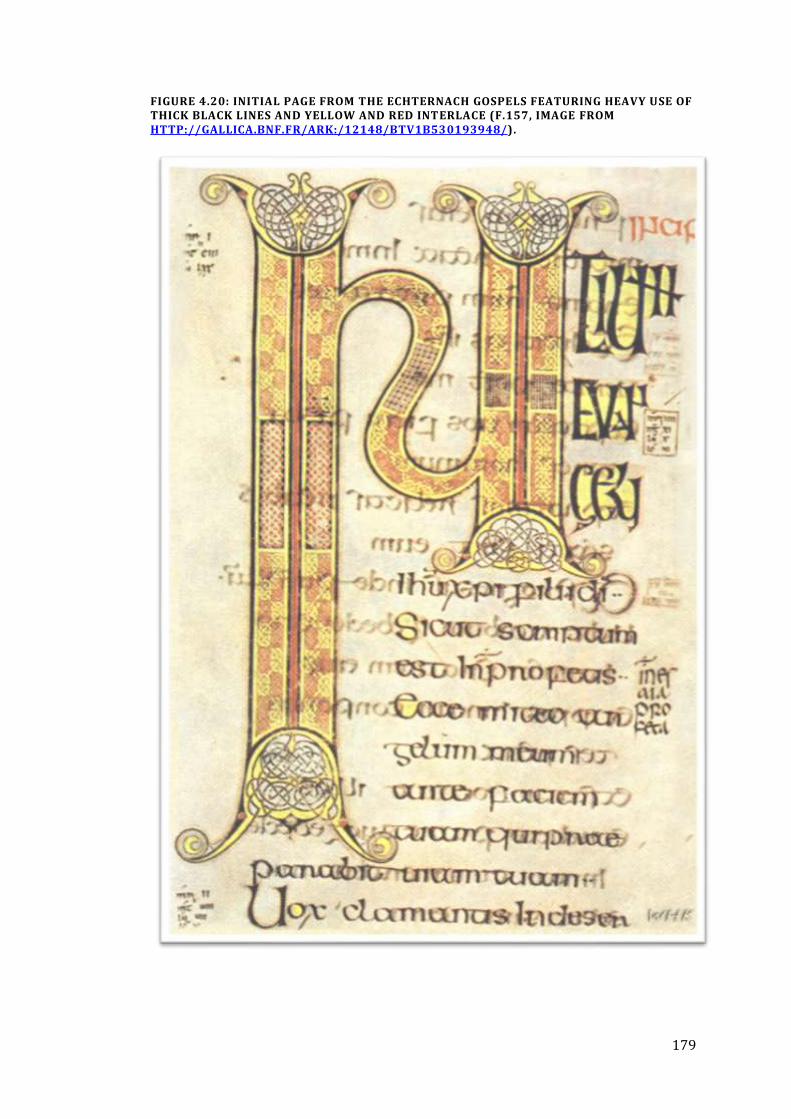
179
FIGURE 4.20: INITIAL PAGE FROM THE ECHTERNACH GOSPELS FEATURING HEAVY USE OF THICK BLACK LINES AND YELLOW AND RED INTERLACE (F.157, IMAGE FROM HTTP://GALLICA.BNF.FR/ARK:/12148/BTV1B530193948/).
180
USE ON MANUSCRIPTS
In Late Antique examples, the colours used in the illumination of early Christian
manuscripts were rich and varied (Grabar, 1957; Weitzmann, 1977). The range of
pigments in use becomes more limited in the early medieval period, whether from a
lack of access to the ingredients or the loss of technology. By examining the colours
used in different regions of the post-Roman west, some insight into the style and taste
of different areas can be discovered.
In Spain there are more deep greens, blues and purples, as well as pink and a very
vibrant red-orange, though the artistic execution of illumination is more primitive than
in other areas (“Nouv.Acq. Lat. 2334,” late 6th-early 7th century, f.6, f.9, f.25).
Merovingian manuscripts in the 7th and 8th centuries feature red, orange, green and a
darkish-dull blue, with some pale pinks and very few instances of yellow (“MS
Reginensis 316,” 8th century, “Paris, Bibl. Nat., 9427,” 7th century). In the Carolingian
period, there is a predominance of red, green, blue and yellow, though often gilding is
used instead of yellow (“Coronation Sacramentary,” 9th century).
In the early Insular illuminated manuscripts, besides white and black patterning, red
and yellow are the primary if not only colours used. For example, the Gospel of St.
Willibrord (figure 4.20; “Gospel of St. Willibrord (Echternach Gospels),” 690) is
illuminated with heavy lines of black and vibrant red and yellow, and the Lichfield
Gospels (or the Gospels of St. Chad) have only black, white, red and sparing use of
yellow on most pages, with some featuring blue or green but rarely both (“Lichfield
Gospels (Gospel of St. Chad),” mid 8th century; Nordenfalk, 1977, 50-53). The Book of
Durrow is entirely red and yellow with green as is the Durham Cassiodorus, while the
Durham Gospel features red and yellow with some blue or green, depending on the
page (Bede, 8th century; “Book of Durrow,” 680, “Durham Gospels,” 700; Nordenfalk,
1977, 84-86).
A general pattern of colour use in these insular manuscripts is heavy use of red and
yellow (indeed, far more use of yellow than in the rest of the Christian West) and
usually sparing use of either green or blue. Later Insular manuscripts feature heavier
181
use of green and blue, creating a vibrant scheme of primary colours. Until the
Lindisfarne Gospels, pigments used on manuscripts were limited to these four colours
(“British Library Cotton MS Nero D.IV,” 715). Later, the use of more exotic colours such
as purple, which occasionally was used to dye entire pages that were then written on in
gold and silver, appears on select high-quality manuscripts such as the Canterbury
Codex Aureus (“Swedish Royal Library, MS A. 35,” mid 8th century).
Red is most common as a solid framing colour, though yellow does appear in framing as
well. Patterned areas often feature combinations of colour that enhance contrast and
therefore the detailing of the design, with black, blue and green used primarily in
negative spaces. The heavy use of red throughout Insular manuscripts is not unique to
the region but certainly an aspect of style. The greater use of yellow in Insular
manuscripts may be a reflection of the desire for a golden appearance in the
illuminations where gilding is not used; indeed, yellow is often featured where one
might expect gilding and its use is noticeably miniscule on pages with gold paint
(“Coronation Sacramentary,” 9th century, “Cotton Vespasian A. I,” 820). The vibrant
yellow-and-red colour scheme of most manuscripts is therefore similar in design to the
gold-and-garnet metalwork of the time (Rosenblitt 2005, Youngs 2009). Indeed, “the
Anglo-Saxon poets and writers were so hypnotised by the crafts of the jewellers and
goldsmiths that they turned naturally to them for their similes and metaphors,” and
apparently in all other coloured decoration (Dodwell, 1982, 27).
CONCLUSIONS
Surviving pigments in sculpture, buildings, and manuscripts, all date to the later
Christian phase of the early medieval period. The use of pigments and particular
colours is likely to derive from a Merovingian or Christian tradition and is therefore
further culturally distanced from the Early Saxon material. Their relevance is therefore
limited in the discussion of colour in the Early Saxon period, but certain patterns may
be indicative of prior colour use trends, if not at least the potential colours available in
these mediums. The stylistic associations between Insular manuscripts of the 8th-9th
century and Anglo-Saxon metalwork of the 6th-7th centuries may be evidence of a
182
continuance of aesthetics, which could indicate that manuscript colour use was also
influenced by earlier trends(Rosenblitt 2005, Youngs 2009).
Red is the most frequently used colour in all forms of painting in the early medieval
period due to the popularity of the colour, its Christian religious associations with light,
and the abundance of red pigment materials compared to some other colours. Red is of
primary importance and is found more frequently on wall painting and sculpture than
any other colour and is a major component of colour in every page of illuminated
manuscripts. The combination of yellow and red is principal in manuscript colour
schemes, which otherwise feature ‘gem tone’ deep greens and blues. The interior of
church buildings, with walls framed in red, may have also been adorned with golden-
coloured metalwork or textiles, and indeed the literature abounds with descriptions of
the material wealth of such places.
The stone crosses often feature drilled holes which may have held metal appliqués of
bronze or brass, again forming a colour scheme of red and yellow (Tweddle, 1990).
Thus while a variety of colours were in use as pigments, in the earliest part of the early
medieval period there does seem to be a predominance of red and yellow. While this
may be due to some extent to the availability of and access to pigment resources, it
seems likely that these colours were also of importance and value to the Anglo-Saxons
in the perception of their world. However, the later date of all of these pigment
examples must be treated with caution when considering how any pigments may have
been used, if at all, in the Early Saxon period. The prevalence of a similar colour palette
in the Middle-Late Saxon period and the ease of access to such pigments compared to
that of other colours would indicate that red, yellow, white, and black are the most
likely colours to have been used in the earlier period if pigments were utilised at all.
183
SUMMARY OF ANGLO-SAXON COLOUR
Early Anglo-Saxon colour terminology focused on the warm area of colour space and
was better defined and distinguished in that region in Old English. The major difference
between modern colour space and that of the Anglo-Saxons was in the level of
precision in the distinctions made between the foci of colour words, as all areas of
colour space in the Anglo-Saxon world frequently overlapped. This may also imply that
small distinctions in colour would not be as important as it may have been in later
centuries. It may also reflect approaches to colour use in technology.
The material culture of the Anglo-Saxons reflects much of what is revealed in their use
of colour words. Red garnets and gilded surfaces adorn the high status metalwork, with
silver or tinned surfaces and niello also frequently used. Textiles in the 5th-7th centuries
were usually undyed or naturally coloured, with some woad-dyed light blues also being
favoured, probably as the dye was produced as a continuation of traditional Roman or
Celtic colour traditions. The textile colours widely used were ‘bright’ or fairly neutral,
with the more intense colours appearing in decorative borders.
The darker colours such as blue and green rely on the same repetitive dying process as
results in black, so there may not have been much separation within the dying process
between various blue-green-dark hues, representative of how it seems dark and cool
colours were perceived through language. Certainly as more dying applications were
required to produce the darker colours, the amount of dye used would be more and
therefore darker coloured cloth would be more valuable. Indeed, the black veil from
Scorton came from a grave featuring multiple gilded great square-headed brooches.
Conversely, at Castledyke it is the undyed white linens that feature in more prominent
graves (Walton Rogers 2007); the cost of the material, whether dyed or undyed, gave it
value in terms of social status, making bright and dark the two most desirable textile
types.
In beads, the early popularity of dark blue beads followed by the overwhelming
frequency of red amber highlights how the dark and red categories were emphasised.
184
These dark and red bead colours would have contrasted the lighter or natural-hued
textiles of the period. While the frequency of bead colours varies from site to site, there
are no regional differences or trends of note. The lack of specific and easily-discernible
(to the modern colour perceiver) bead colours, especially in monochrome examples,
adds to this picture of less distinction in hue. The combination of colours in
polychrome beads again emphasizes which colours were seen as distinct, with the later
East Anglian yellow and green beads perhaps indicative of the division of yellow and
green into distinct colour groups in this region before others, or more likely simply a
regional preference.
In the much later manuscripts and paintings, there are far more distinct and unblended
colours used; however, there is a significant chronological and cultural divide between
the material on which pigments have been preserved and the early Anglo-Saxons. All of
the documented uses of pigments in the period occur in Christian contexts, whether in
a church or monastery, on a cross, or in an illuminated manuscript. The church,
working in Latin and originating from and maintaining strong connections with the
continent and Ireland, had not only different access to materials but also a different
system of colour language. What is interesting is the continuing prevalence of white,
black, red and yellow or gold on manuscripts and the dominance of red-based paints on
other media. While other colours were available and used, such as green, blue and
purple, the same colour groups that dominate in Old English are still more frequent.
Indeed, the English preference for gold and red over other colours can be seen in
Insular manuscripts when compared to contemporary productions from elsewhere.
In the Tiberius Bede, produced in either Merica or Kent in the early 9th century, “the use
of interlace in white against a black ground, are highly reminiscent of silver-niello
Trewhiddle-style metalwork” (Webster and Backhouse, 1991, 215). Certainly the art in
manuscripts produced in Anglo-Saxon monasteries imitates the forms and contrasts of
colour seen on metalwork (Rosenblitt, 2005). The influence of metalworkers from the
early part of the Anglo-Saxon period on the artwork seen in the middle-to-late Saxon
period emphasizes the importance of metalwork on people’s perceptions of their world
(Youngs, 2009, 46).
185
Given what can be obtained from examining contemporary colour language and the
gold-and-garnet fashion of the 6th century, it seems likely that the imitation of gold or
silver, and the inclusion of red stones and enamels would be trends carried over from
high-status metalworking to the copper alloys. However, it must be remembered that,
“it may be false to assume that everyone will seek to emulate those with greater
resources” (Hinton, 2005, 6). The appearance of copper alloy metalwork could not have
entirely revolved around gold as a lack of a fresh supply of brass and the loss of the
cementation process in Britain prevented the truly yellow alloys from being regularly
manufactured.
The Old English colour words that are most frequently used also can describe
metalwork, especially copper alloys. Gold and brass fit the yellow-gold term, while
copper and garnet inlays fulfil red. Silver, tin, and high-tin bronze can be described as
white, and niello and potentially Corinthian bronze and silver patination as black. The
lack of distinction in colour terms may indicate a lack of visual distinction between
materials and alloys in this early period as well.
Metal supply and fashion are major factors which may or may not limit or improve the
ability or desire to control alloy colour. Quaternary alloys are perfectly suitable for use
in cast objects, so the lack of specific colour appearance as a goal may have been an
important factor in 5th-6th century object manufacture. It is possible that the majority of
copper alloy colours we see in the period were valued for that very nondescript bronze
colour that is produced by most compositions in use at the time, either as a shiny-
bright colour (potentially gold-like) or a tawny fealu colour. If this is the case, then we
might expect a greater variety of controlled alloy types in later artefacts when the
vocabulary for colour became more precise and when metal supply became less
restricted.
186
CHAPTER 5
COLOUR, COLOURIMETRY AND HUMAN
COLOUR PERCEPTION
INTRODUCTION
Colour is an integral aspect of how humans perceive the world. It is a variable that
allows us to distinguish and categorise and often holds symbolic importance. Colour is
therefore an important tool in displaying wealth or status or as a means of
differentiation. It is also likely that Anglo-Saxon smiths used colour as a primary means
of sorting and identifying metals. However, despite these factors, past
archaeometallurgical research has looked at composition but not at colour and the
study of colour elsewhere in archaeology rarely includes quantitative colour data.
Colour science is a discipline in its own right. This chapter intends to briefly outline the
fundamental concepts of human colour perception and how it is measured. This will
include a discussion of different relevant colour measurement systems and how these
have been used in past archaeologically relevant applications. This chapter also covers
the measurement system used in this project and how the resulting data can be
understood in terms of human eye sensitivity, and how this relates to the perception of
copper alloys and precious metals.
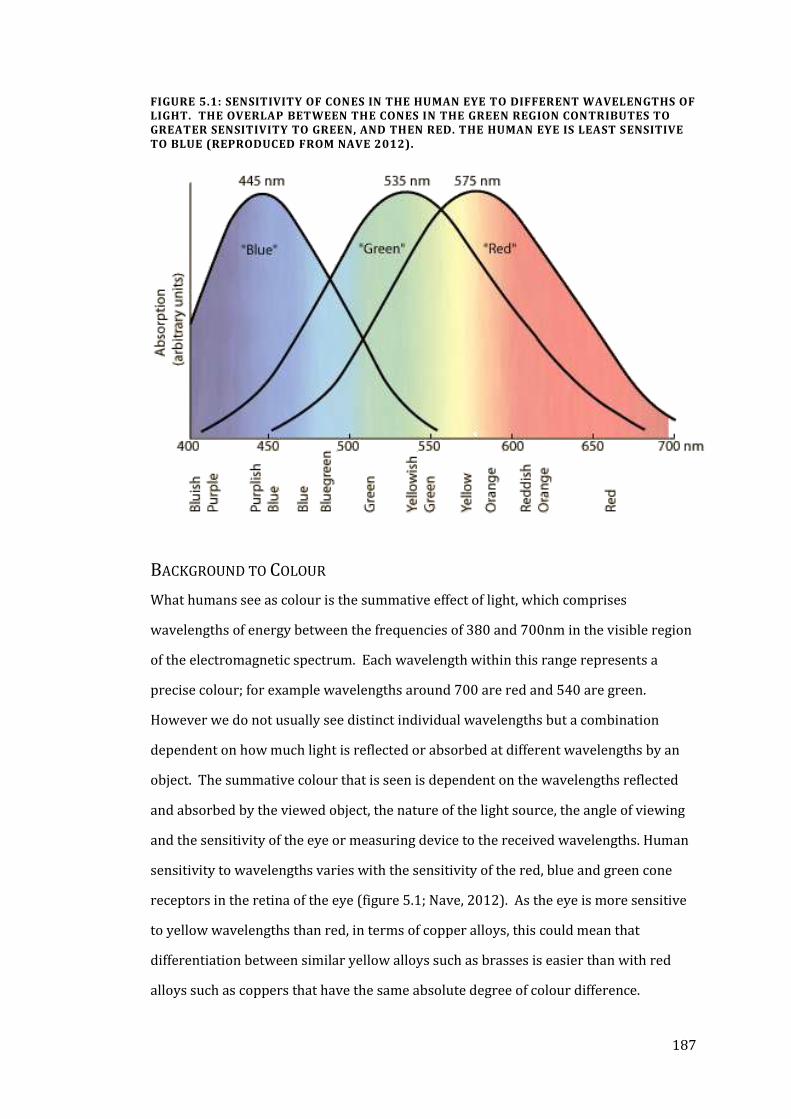
187
FIGURE 5.1: SENSITIVITY OF CONES IN THE HUMAN EYE TO DIFFERENT WAVELENGTHS OF LIGHT. THE OVERLAP BETWEEN THE CONES IN THE GREEN REGION CONTRIBUTES TO GREATER SENSITIVITY TO GREEN, AND THEN RED. THE HUMAN EYE IS LEAST SENSITIVE TO BLUE (REPRODUCED FROM NAVE 2012).
BACKGROUND TO COLOUR
What humans see as colour is the summative effect of light, which comprises
wavelengths of energy between the frequencies of 380 and 700nm in the visible region
of the electromagnetic spectrum. Each wavelength within this range represents a
precise colour; for example wavelengths around 700 are red and 540 are green.
However we do not usually see distinct individual wavelengths but a combination
dependent on how much light is reflected or absorbed at different wavelengths by an
object. The summative colour that is seen is dependent on the wavelengths reflected
and absorbed by the viewed object, the nature of the light source, the angle of viewing
and the sensitivity of the eye or measuring device to the received wavelengths. Human
sensitivity to wavelengths varies with the sensitivity of the red, blue and green cone
receptors in the retina of the eye (figure 5.1; Nave, 2012). As the eye is more sensitive
to yellow wavelengths than red, in terms of copper alloys, this could mean that
differentiation between similar yellow alloys such as brasses is easier than with red
alloys such as coppers that have the same absolute degree of colour difference.
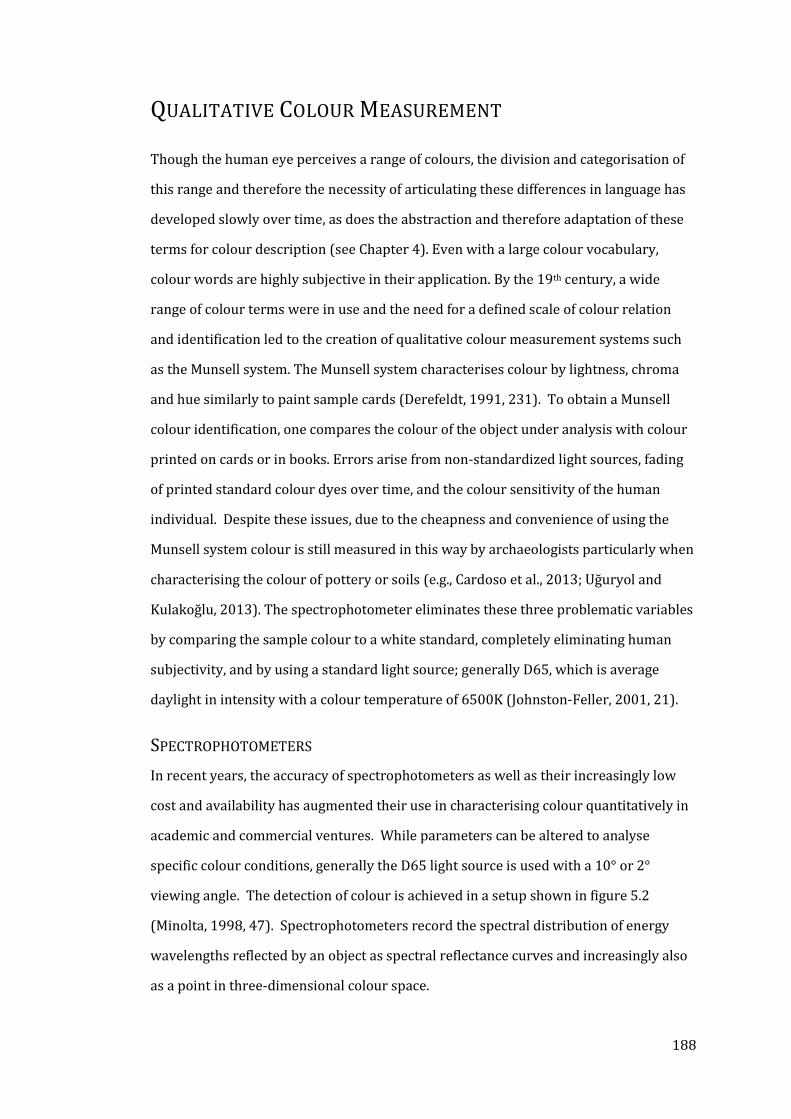
188
QUALITATIVE COLOUR MEASUREMENT
Though the human eye perceives a range of colours, the division and categorisation of
this range and therefore the necessity of articulating these differences in language has
developed slowly over time, as does the abstraction and therefore adaptation of these
terms for colour description (see Chapter 4). Even with a large colour vocabulary,
colour words are highly subjective in their application. By the 19th century, a wide
range of colour terms were in use and the need for a defined scale of colour relation
and identification led to the creation of qualitative colour measurement systems such
as the Munsell system. The Munsell system characterises colour by lightness, chroma
and hue similarly to paint sample cards (Derefeldt, 1991, 231). To obtain a Munsell
colour identification, one compares the colour of the object under analysis with colour
printed on cards or in books. Errors arise from non-standardized light sources, fading
of printed standard colour dyes over time, and the colour sensitivity of the human
individual. Despite these issues, due to the cheapness and convenience of using the
Munsell system colour is still measured in this way by archaeologists particularly when
characterising the colour of pottery or soils (e.g., Cardoso et al., 2013; Uğuryol and
Kulakoğlu, 2013). The spectrophotometer eliminates these three problematic variables
by comparing the sample colour to a white standard, completely eliminating human
subjectivity, and by using a standard light source; generally D65, which is average
daylight in intensity with a colour temperature of 6500K (Johnston-Feller, 2001, 21).
SPECTROPHOTOMETERS
In recent years, the accuracy of spectrophotometers as well as their increasingly low
cost and availability has augmented their use in characterising colour quantitatively in
academic and commercial ventures. While parameters can be altered to analyse
specific colour conditions, generally the D65 light source is used with a 10° or 2°
viewing angle. The detection of colour is achieved in a setup shown in figure 5.2
(Minolta, 1998, 47). Spectrophotometers record the spectral distribution of energy
wavelengths reflected by an object as spectral reflectance curves and increasingly also
as a point in three-dimensional colour space.
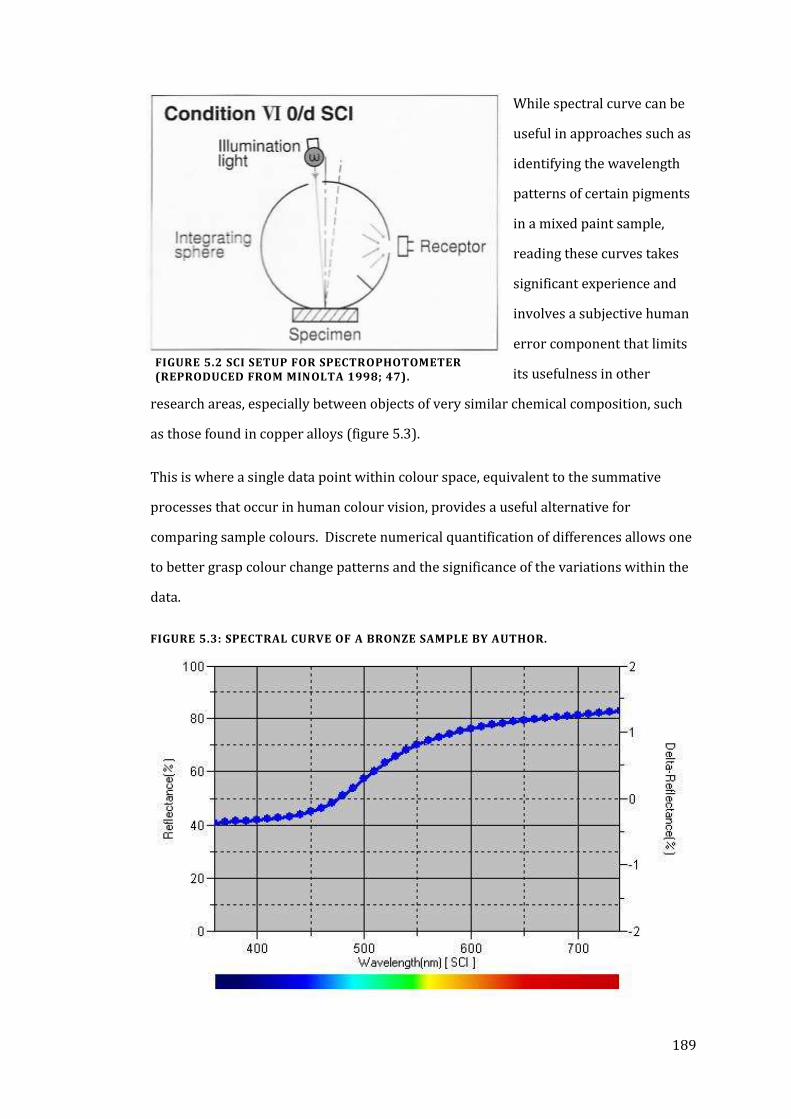
189
While spectral curve can be
useful in approaches such as
identifying the wavelength
patterns of certain pigments
in a mixed paint sample,
reading these curves takes
significant experience and
involves a subjective human
error component that limits
its usefulness in other
research areas, especially between objects of very similar chemical composition, such
as those found in copper alloys (figure 5.3).
This is where a single data point within colour space, equivalent to the summative
processes that occur in human colour vision, provides a useful alternative for
comparing sample colours. Discrete numerical quantification of differences allows one
to better grasp colour change patterns and the significance of the variations within the
data.
FIGURE 5.3: SPECTRAL CURVE OF A BRONZE SAMPLE BY AUTHOR.
FIGURE 5.2 SCI SETUP FOR SPECTROPHOTOMETER (REPRODUCED FROM MINOLTA 1998; 47).
190
GEOMETRY
Spectrophotometry is designed to measure light reflected under ideal circumstances,
and so some irregularities in measured values can occur when analysing a surface that
is not entirely flat and uniform. In order to overcome this inevitable variability it is
recommended that, “…in general, one should measure total reflectance using the
smallest area of view possible and make a number of measurements” (Johnston-Feller,
2001, 243). Smaller sampling areas may not fully represent the variability of a surface,
but this is not an issue when dealing with bulk metallic surfaces.
SCI AND SCE
In metals, the colour we see is a result of a different process than with most materials.
Generally colour is a combination of directly reflected light and diffuse light. Metals
themselves are not inherently coloured materials, and the colour we perceive is created
by, “selective reflection at the air-metal interface,” so the colour is entirely dependent
on ‘gloss’ or directly reflected light (Johnston-Feller, 2001, 159). In colour
measurement, spectrophotometers generally measure in two formats, SCI (specular
reflectance included) and SCE (specular reflectance excluded). SCI accounts for
directional and diffuse light from glossy surfaces, while SCE measures only diffuse light.
Thus on a perfectly polished metal surface, SCE will give a colour reading of 0, 0, 0
despite what colour may be directly reflected. SCI is therefore is used when measuring
metal colour. As demonstrated by Fang (2004), using SCE on metals results in such
anomalies as gold registering as blue, since the directly reflected light is not measured.
SCE RATIOS
SCE can still be useful in colour measurement of metals. As Johnston-Feller asserts, “if
the metal to be measured is not perfectly polished... some of the light is reflected at the
surface at angles other than the specular angle. If the specular reflectance is coloured,
regardless of the angles, however, this scattered surface reflectance is probably also
coloured, through lower in chroma” (Johnston-Feller, 2001, 160). Thus some colour is
seen by SCE when looking at metals, though it is generally much closer to zero in all
planes of colour space than the actual colour seen. If this paler SCE value is compared
to SCI, however, the smoothness of the metal surface can be determined. A simplified
191
version of the equation generally used to determine the SCE ratio is S = SCI-SCE at
every wavelength measured (Johnston-Feller, 2001, 160). The closer this number is to
zero, the more mirror-like the polish is on the metal surface.
This method was used periodically to test the quality of questionable sample surfaces
achieved in this study. As the SCE values are shown along with SCI on the
spectrophotometer screen immediately after each measurement is taken, generally it
was possible to determine if a sample surface needed to be improved by deeper or
wider drilling when the SCE values were quite similar to SCI, without further
calculation. SCE ratios are also useful in identifying the progress of corrosion as, “one
of the first changes that occurs on metals when they are exposed to the elements is an
increase in the diffuse reflectance – that is, an increase in the ratio of SCE/S” (Johnston-
Feller, 2001, 160). Thus as the metal surface becomes more irregular with increasing
accretions forming through oxidation or other processes, more diffuse light is reflected.
However, low L* or brightness values also are indicative of the presence of corrosion
products, a much easier method of quality control.
PREVIOUS RELATED RESEARCH
Published work on the colour of archaeological or museum metal artefacts has been
limited until recent years to monitoring colour change due to accumulation of tarnish
in conservation research, and the colour of different bronze alloys from Chinese vases
(Ankersmit et al., 2001; Chase, 1994). Recently, Lien Fang of Bradford University
concentrated on establishing the precise change of metal colour in copper alloys,
examining how this compares to gold and silver and how casting or working the metal
effects colour, which included valuable colour data from bronze alloys made for her
study (Fang and McDonnell, 2011). Despite her data being collected from the same
model of spectrophotometer and same settings as was used in this research, there were
significant differences in colour data produced, necessitating conversion using common
data points as controls (see Chapter 6). Fang also dealt with the issue of colour in high
tin bronze metallurgy (2004). The settings used on her spectrophotometer at that time,
however, prevent those results being used as comparable data (she used SCE only, as
discussed above). The colour of gold-silver-copper alloys has also been characterised
192
by spectrophotometer, but with a viewing angle and, more importantly, a light source
that is no longer the standard for such analyses and is therefore incompatible with this
study as well (Roberts and Clarke, 1979). However, using this data alongside new data
measured with modern parameters can help estimate behaviour in areas unaccounted
for otherwise.
As spectrophotometers can measure in various colour measurement systems these
studies are not readily reconcilable with each other without conversion, which can be
very time consuming, if at all possible. Lack of uniformity in the reported results is
thus an issue in encouraging further research in the area, although a trend in recent
years towards using CIELAB over other measurement systems is a welcome
development (Ankersmit et al., 2001; Fang and McDonnell, 2011; Fang, 2004). Even
then, conversion is necessary as spectrophotometers appear to have greater variability
between them than the extent of variation in a sample group. A plethora of jargon also
prevents the translation of results to non-specialist audiences in other disciplines, as
colour science is a highly developed field of research with a vast technical vocabulary.
COLOUR MEASUREMENT SYSTEMS
CIELCH
This method of describing colour space numerically is based on the Munsell system,
with lightness, chroma and hue being the measurement variables used. This system
plots colours in colour space by polar coordinates, with lightness (L*) as the y axis,
chroma (C*) or saturation indicated by the distance from the center, and hue (H*)
indicated by the angle. CIELCH is still used in many contexts. Chase’s (1994)
publication on the colour of Chinese bronze vessels used the older CIEXYZ system but
did notice the dulling effect of lead on the colour of bronze though decreasing chroma
values, a feature that would be evident in the CIELCH system. Chase meant to follow up
this discovery with further investigation and quantification of this effect but has not
published on the topic since (Chase, 1994. 94-95). CIELCH is also useful in plotting the
perceptibility tolerances of individual colours, as plotting the ellipse shape on polar
coordinates greatly simplifies the process and best replicates the geometry of actual
colour space, as will be discussed later in this chapter.
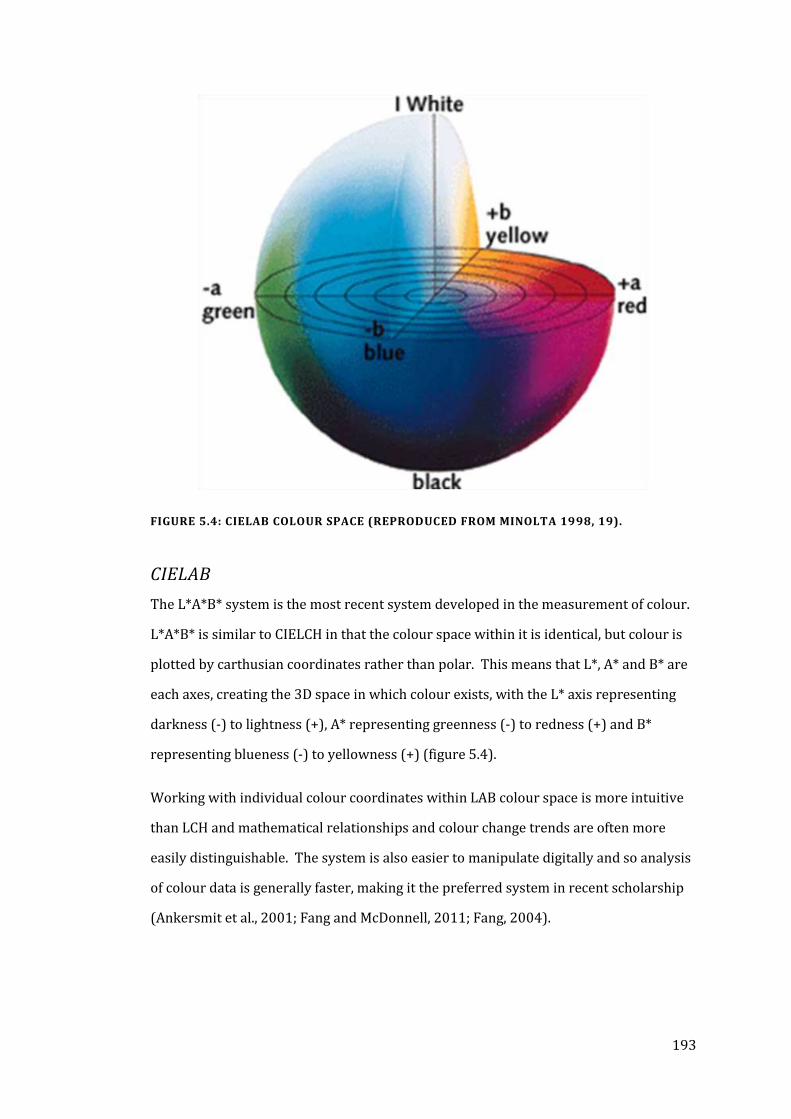
193
FIGURE 5.4: CIELAB COLOUR SPACE (REPRODUCED FROM MINOLTA 1998, 19).
CIELAB
The L*A*B* system is the most recent system developed in the measurement of colour.
L*A*B* is similar to CIELCH in that the colour space within it is identical, but colour is
plotted by carthusian coordinates rather than polar. This means that L*, A* and B* are
each axes, creating the 3D space in which colour exists, with the L* axis representing
darkness (-) to lightness (+), A* representing greenness (-) to redness (+) and B*
representing blueness (-) to yellowness (+) (figure 5.4).
Working with individual colour coordinates within LAB colour space is more intuitive
than LCH and mathematical relationships and colour change trends are often more
easily distinguishable. The system is also easier to manipulate digitally and so analysis
of colour data is generally faster, making it the preferred system in recent scholarship
(Ankersmit et al., 2001; Fang and McDonnell, 2011; Fang, 2004).
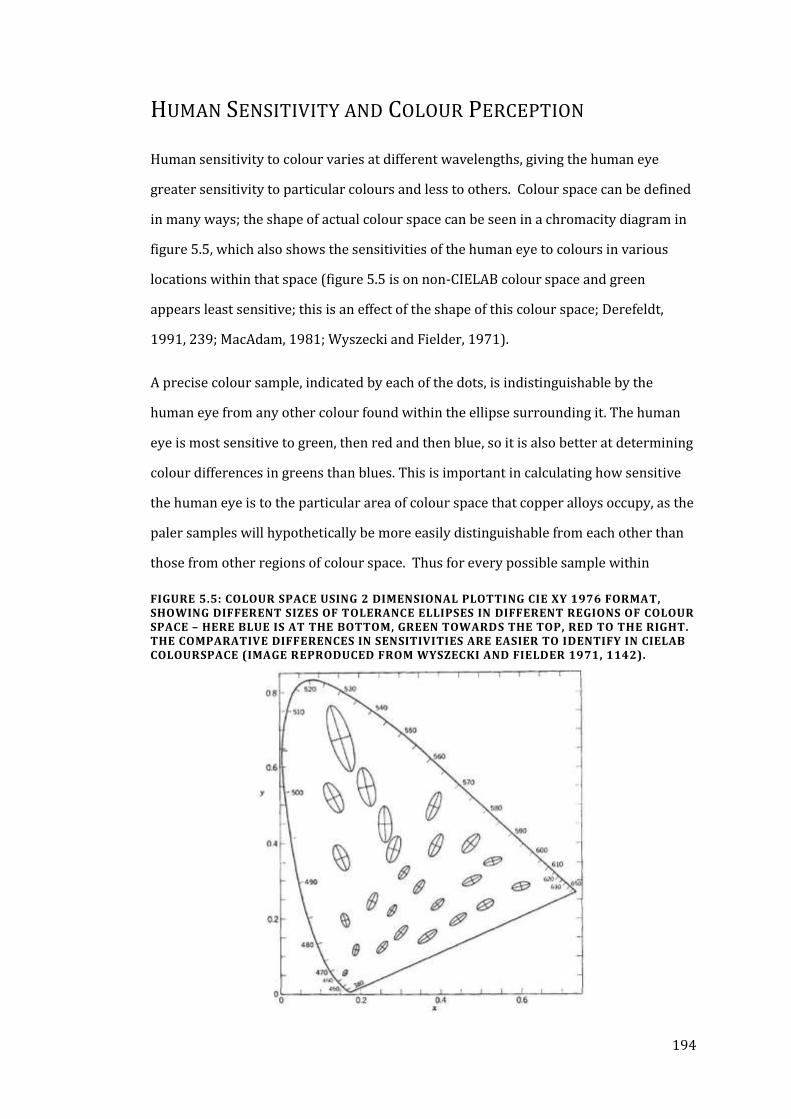
194
HUMAN SENSITIVITY AND COLOUR PERCEPTION
Human sensitivity to colour varies at different wavelengths, giving the human eye
greater sensitivity to particular colours and less to others. Colour space can be defined
in many ways; the shape of actual colour space can be seen in a chromacity diagram in
figure 5.5, which also shows the sensitivities of the human eye to colours in various
locations within that space (figure 5.5 is on non-CIELAB colour space and green
appears least sensitive; this is an effect of the shape of this colour space; Derefeldt,
1991, 239; MacAdam, 1981; Wyszecki and Fielder, 1971).
A precise colour sample, indicated by each of the dots, is indistinguishable by the
human eye from any other colour found within the ellipse surrounding it. The human
eye is most sensitive to green, then red and then blue, so it is also better at determining
colour differences in greens than blues. This is important in calculating how sensitive
the human eye is to the particular area of colour space that copper alloys occupy, as the
paler samples will hypothetically be more easily distinguishable from each other than
those from other regions of colour space. Thus for every possible sample within
FIGURE 5.5: COLOUR SPACE USING 2 DIMENSIONAL PLOTTING CIE XY 1976 FORMAT, SHOWING DIFFERENT SIZES OF TOLERANCE ELLIPSES IN DIFFERENT REGIONS OF COLOUR SPACE – HERE BLUE IS AT THE BOTTOM, GREEN TOWARDS THE TOP, RED TO THE RIGHT. THE COMPARATIVE DIFFERENCES IN SENSITIVITIES ARE EASIER TO IDENTIFY IN CIELAB COLOURSPACE (IMAGE REPRODUCED FROM WYSZECKI AND FIELDER 1971, 1142).
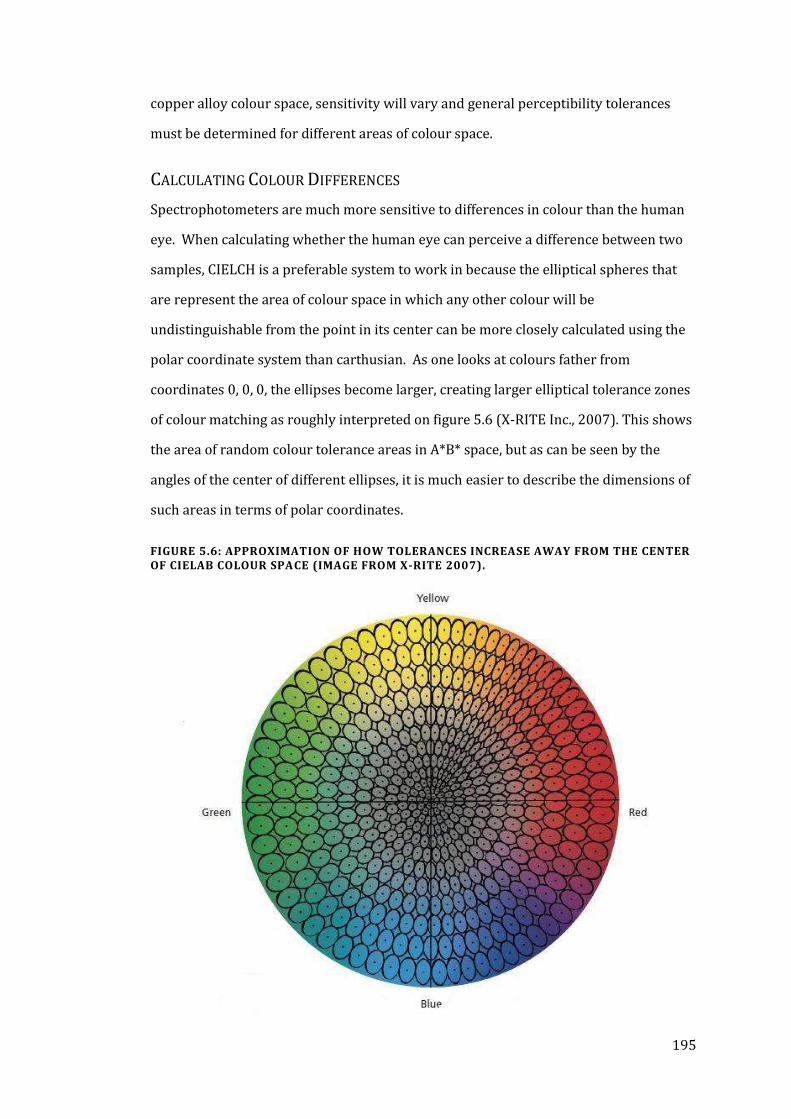
195
copper alloy colour space, sensitivity will vary and general perceptibility tolerances
must be determined for different areas of colour space.
CALCULATING COLOUR DIFFERENCES
Spectrophotometers are much more sensitive to differences in colour than the human
eye. When calculating whether the human eye can perceive a difference between two
samples, CIELCH is a preferable system to work in because the elliptical spheres that
are represent the area of colour space in which any other colour will be
undistinguishable from the point in its center can be more closely calculated using the
polar coordinate system than carthusian. As one looks at colours father from
coordinates 0, 0, 0, the ellipses become larger, creating larger elliptical tolerance zones
of colour matching as roughly interpreted on figure 5.6 (X-RITE Inc., 2007). This shows
the area of random colour tolerance areas in A*B* space, but as can be seen by the
angles of the center of different ellipses, it is much easier to describe the dimensions of
such areas in terms of polar coordinates.
FIGURE 5.6: APPROXIMATION OF HOW TOLERANCES INCREASE AWAY FROM THE CENTER OF CIELAB COLOUR SPACE (IMAGE FROM X-RITE 2007).
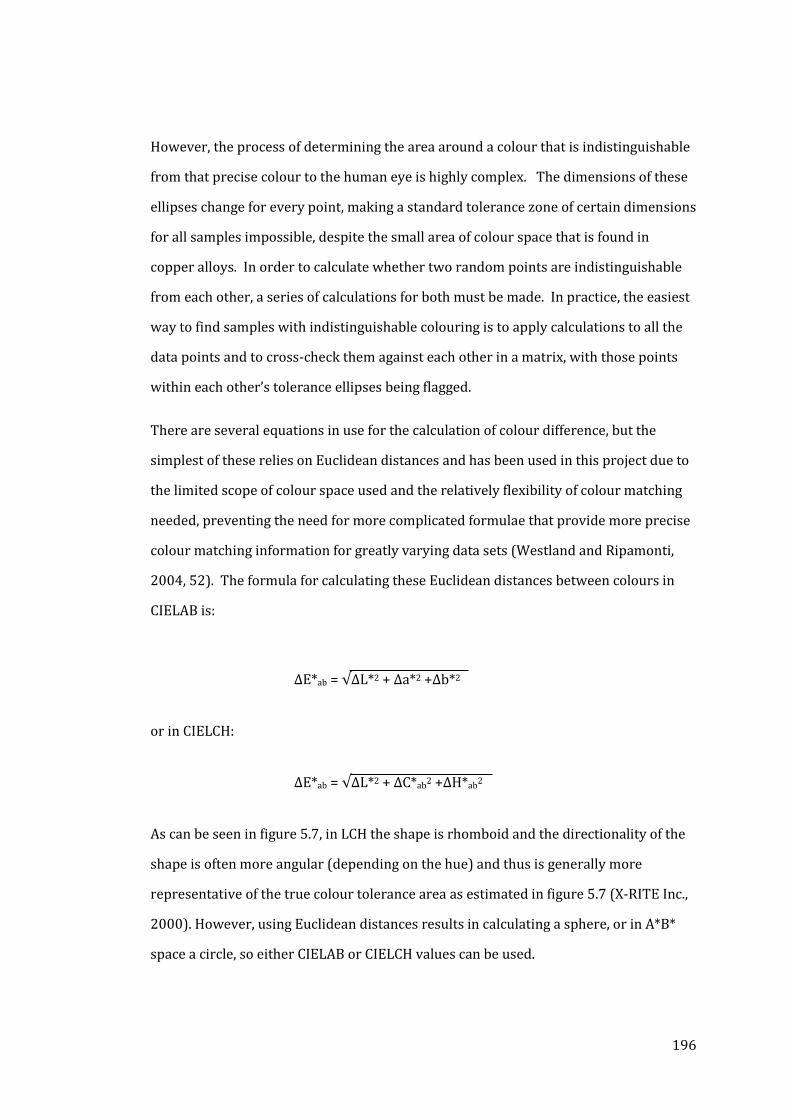
196
However, the process of determining the area around a colour that is indistinguishable
from that precise colour to the human eye is highly complex. The dimensions of these
ellipses change for every point, making a standard tolerance zone of certain dimensions
for all samples impossible, despite the small area of colour space that is found in
copper alloys. In order to calculate whether two random points are indistinguishable
from each other, a series of calculations for both must be made. In practice, the easiest
way to find samples with indistinguishable colouring is to apply calculations to all the
data points and to cross-check them against each other in a matrix, with those points
within each other’s tolerance ellipses being flagged.
There are several equations in use for the calculation of colour difference, but the
simplest of these relies on Euclidean distances and has been used in this project due to
the limited scope of colour space used and the relatively flexibility of colour matching
needed, preventing the need for more complicated formulae that provide more precise
colour matching information for greatly varying data sets (Westland and Ripamonti,
2004, 52). The formula for calculating these Euclidean distances between colours in
CIELAB is:
ΔE*ab = √ΔL*2 + Δa*2 +Δb*2
or in CIELCH:
ΔE*ab = √ΔL*2 + ΔC*ab2 +ΔH*ab2
As can be seen in figure 5.7, in LCH the shape is rhomboid and the directionality of the
shape is often more angular (depending on the hue) and thus is generally more
representative of the true colour tolerance area as estimated in figure 5.7 (X-RITE Inc.,
2000). However, using Euclidean distances results in calculating a sphere, or in A*B*
space a circle, so either CIELAB or CIELCH values can be used.
197
As human colour perception is more sensitive in some areas than others, a specific
tolerance range must be applied to sample points in order to be accurate for that area
of colour space. Using these values calculated in the experiment described below, the
tolerance ranges for each point were calculated using the formula above and compared
to all other sample points using a matrix. When a specific sample is indistinguishable
in colour from another sample, that occurrence is highlighted and colour matches can
therefore be easily identified.
.
FIGURE 5.7: CIELCH TOLERANCE SHAPE ON A*B* PLOT (IMAGE FROM X-RITE 2000, 15).
198
COLOUR VISION EXPERIMENT
Colour tolerance values are usually established by commercial or industrial sectors and
are not necessarily relevant to everyday vision let alone an application to metal
surfaces. Additionally, tolerance values generally include L* as part of their
calculations, a variable not relevant to this research. In order to accurately determine
tolerance ranges for *A*B* of metals, an experiment was developed and conducted to
gather data concerning the sensitivity of the human eye to minute differences in metal
colour.
OBJECTIVES
To determine what tolerance values should be used when comparing the
colour of copper alloy metals.
To determine whether different tolerance values are needed for samples
in the different areas of copper alloy colour space.
To examine preconceptions of precious metal colours by modern viewers.
PARAMETERS AND METHOD
In order to meet these objectives, a group of Roman and other old coins with varying
known compositions and colours were entirely cleaned of corrosion on one side. The
coins featured a polished but not entirely smooth surface, with some tarnish allowed to
accrue. These were then mounted on black card, with a viewing area of 1 cm2 cut out of
the middle to allow the sample to appear uniform in size and shape. Due to the size of
the card mounts over the samples, there was a minimum of 4 cm between samples;
however, when viewed by participants this distance was 10-20 cm.
The polished coins were re-measured for colour by spectrophotometer after every day
the experiment was run and this data was compared in a tolerance matrix to determine
the degree of distance tested; this was necessary to account for the changes due to
tarnish accruing on the metal surfaces. The metal samples were viewed using a
daylight-equivalent Sylvania T8 Activa 172 light bulb (using 70W, 60 cm length, 4600
lumens), achieving 98% accurate colour rendering to actual daylight, so as to best
match the colour measurement conditions of a spectrophotometer.
199
Groups of metal samples ‘matching’ in colour (close in Euclidean distance), were found
in the different regions of copper alloy colour space. These matching groups were
combined with an ‘odd one out’ sample which varied from the group by a small and
measurable amount, generally 1 to 3 CIELAB units. The degree of difference between
the odd sample and the others varied by group and indeed by day as tarnish changed
the colour noticeably between experiment days.
PARTICIPANT PREPARATION
The colour vision of each participant was tested using a standard colour blindness test;
not to eliminate anyone but in order to be aware of any potential anomalies. They were
asked to complete a short questionnaire about their vision and colour awareness,
questioning whether in their opinion they had good vision or not (glasses, etc.), and
whether they thought they were good at distinguishing differences in colour. They
were also asked to identify what colour term they would use to describe samples
displayed to them, in order to test for how the results related to his or her development
of colour language use (i.e. is this blue, blue-green, teal, turquoise, cerulean, etc.).
The participants viewed the coins on a table top while standing. This gave
approximately one meter average distance between the viewer and the experiment.
Lighting was by necessity from above using the daylight equivalent light bulb in an
otherwise darkened room (some artificial and natural light may have been present at
times, but this did not seem to influence the participants). In total, there were 83
participants in this experiment.
A series of determination tests were presented to the participants, 20 on day one and
15 on the three other days. These tests were given in quick succession with a 30
second time limit on each. In these tests, the participants were told to specify a single
sample that ‘didn’t match’, which of two samples did match a group, or which sample
was most similar to a precious metal. The first of these test types, the ‘odd one out’
determination, created the most useful data in terms of calculating tolerance values for
human colour vision, as the other test involved what amounted to a 50/50 chance and
results were unreliable.
200
PRECIOUS METAL TEST
In order to fulfil the third objective, participants were asked to identify which sample
out of a group of nine brasses was ‘most golden in colour’ and which was ‘most silvery,
most like silver’ in colour from a group of three white metal samples. Due to the limited
number of white metal samples and the quickly tarnished surface of one of these, one
sample was replaced with aluminium foil on the last two days of the experiment to
provide a better ‘silver’ group.
RESULTS
L*A*B* VS. A*B* DIFFERENCES
It should be mentioned that because the L* values seem to be more tied to the quality
of sample surface more than alloy, the L* values were not used in the calculation of
colour difference. The error margins on the L* values vary extensively depending
primarily on the smoothness of the surface. It was felt that the inclusion of ΔL* would
inhibit the identification of colour matches and it is therefore not used in the
calculations.
To test the validity of this decision, a comparison was made where ‘correct’ answers
varied from L*A*B* to A*B* only results, a situation which occurred twenty times over
the course of the four days. In these situations where the answer was different
depending on whether or not L* was included, 75% of the time more people chose the
answer given by A*B*. Thus 75% of the time, it is the colour of the metal that people
notice more than the relative shine or brightness of L*, so only A*B* measurements
were used to calculate colour tolerance values.
TOLERANCE VALUES
The main objective of this experiment was to determine the tolerance values that
should be used when calculating whether or not two samples are indistinguishable
from each other to an average viewer. The industrial standard tolerances, “usually are
about 1.0 CIELAB units,” though this would be inclusive of L* as well (Westland and
Ripamonti, 2004, 53). If all three axes are equally influential for humans in
determining colour differences, we would expect a level of around 0.67 CIELAB units if
excluding L*; however, as the above test demonstrated and thus validated the exclusion
201
of L* as a variable for metal colour determination, A* and B* are the components within
which the human eye is best at detecting differences. This results in the threshold of
visible difference falling closer to 0.8 as will be demonstrated by the results of this
experiment.
The data was organised by the variables of ‘margin of error between the odd sample
and the group’ and ‘per cent of participants who correctly identified the odd sample’ for
each test. This provided a group of data for which n=40, and while this is significantly
condensed from the original output of the experiment, this format allowed for error
tolerances to be determined from a statistically sound dataset.
If we look at the results from the experiment (figure 5.8), below a certain threshold
around 0.8 there is no correlation between the level of difference and the per cent of
participants who correctly identified the odd sample. Within the range of 0-0.79
margin of difference between the odd sample and the group, the correlation coefficient
is r2= 0.16. The correlation coefficient from 0.80 and above is much higher, with r2=
0.60. This reflects the ability of particularly observant above-average viewers to
identify differences at a human limitation of around 0.8, a value which agrees with
what could be expected from the industrial standard value of 1 including L*.
With this threshold for the ability of the human eye, a value can be calculated for which
an average viewer could be expected to correctly identify a colour difference. For this,
it was necessary to divide the data above the 0.80 margin of difference line into three
groups characterised by the area of colour space of that sample (yellow, mid-range and
red). For the yellow group, which was easiest for participants to correctly identify, the
0.80 threshold was not used as it reduced the number of data points drastically. The
division of these groups occurred quite naturally in colour space (figure 5.9).
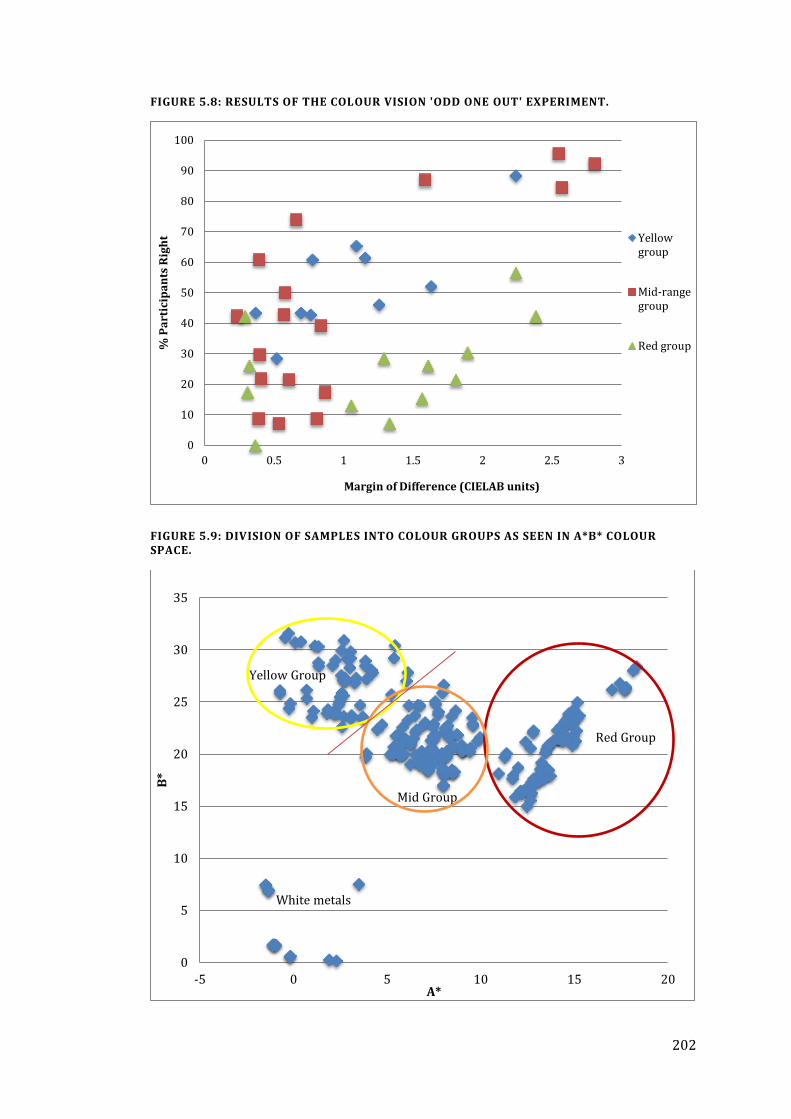
202
FIGURE 5.8: RESULTS OF THE COLOUR VISION 'ODD ONE OUT' EXPERIMENT.
FIGURE 5.9: DIVISION OF SAMPLES INTO COLOUR GROUPS AS SEEN IN A*B* COLOUR SPACE.
0
10
20
30
40
50
60
70
80
90
100
0 0.5 1 1.5 2 2.5 3
% P
art
icip
an
ts R
igh
t
Margin of Difference (CIELAB units)
Yellowgroup
Mid-rangegroup
Red group
Mid Group
Yellow Group
White metals
Red Group
0
5
10
15
20
25
30
35
-5 0 5 10 15 20
B*
A*
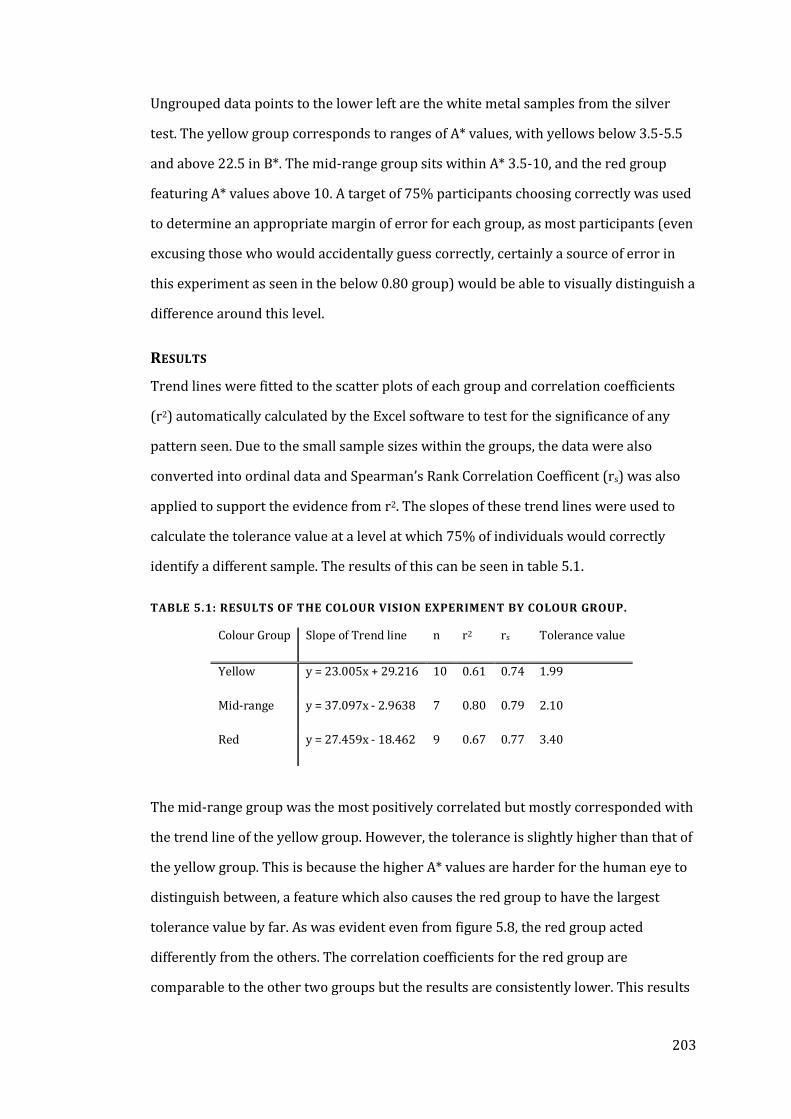
203
Ungrouped data points to the lower left are the white metal samples from the silver
test. The yellow group corresponds to ranges of A* values, with yellows below 3.5-5.5
and above 22.5 in B*. The mid-range group sits within A* 3.5-10, and the red group
featuring A* values above 10. A target of 75% participants choosing correctly was used
to determine an appropriate margin of error for each group, as most participants (even
excusing those who would accidentally guess correctly, certainly a source of error in
this experiment as seen in the below 0.80 group) would be able to visually distinguish a
difference around this level.
RESULTS
Trend lines were fitted to the scatter plots of each group and correlation coefficients
(r2) automatically calculated by the Excel software to test for the significance of any
pattern seen. Due to the small sample sizes within the groups, the data were also
converted into ordinal data and Spearman’s Rank Correlation Coefficent (rs) was also
applied to support the evidence from r2. The slopes of these trend lines were used to
calculate the tolerance value at a level at which 75% of individuals would correctly
identify a different sample. The results of this can be seen in table 5.1.
TABLE 5.1: RESULTS OF THE COLOUR VISION EXPERIMENT BY COLOUR GROUP.
The mid-range group was the most positively correlated but mostly corresponded with
the trend line of the yellow group. However, the tolerance is slightly higher than that of
the yellow group. This is because the higher A* values are harder for the human eye to
distinguish between, a feature which also causes the red group to have the largest
tolerance value by far. As was evident even from figure 5.8, the red group acted
differently from the others. The correlation coefficients for the red group are
comparable to the other two groups but the results are consistently lower. This results
Colour Group Slope of Trend line n r2 rs Tolerance value
Yellow y = 23.005x + 29.216 10 0.61 0.74 1.99
Mid-range y = 37.097x - 2.9638 7 0.80 0.79 2.10
Red y = 27.459x - 18.462 9 0.67 0.77 3.40
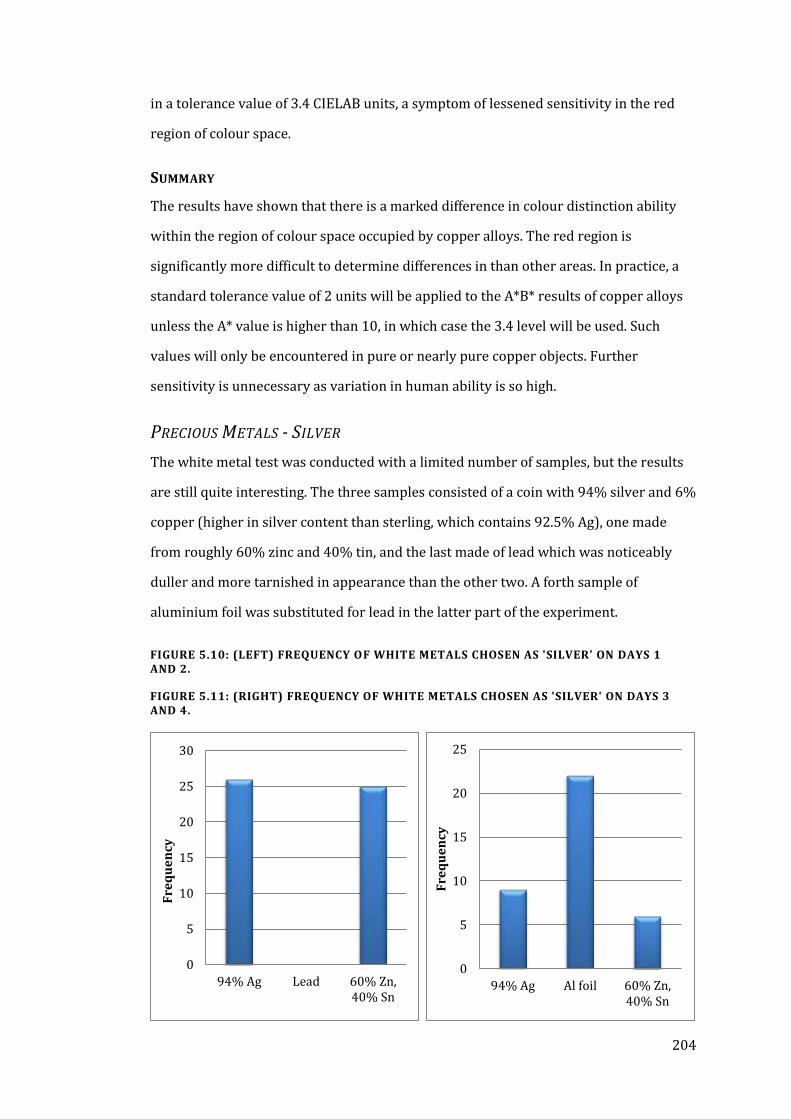
204
in a tolerance value of 3.4 CIELAB units, a symptom of lessened sensitivity in the red
region of colour space.
SUMMARY
The results have shown that there is a marked difference in colour distinction ability
within the region of colour space occupied by copper alloys. The red region is
significantly more difficult to determine differences in than other areas. In practice, a
standard tolerance value of 2 units will be applied to the A*B* results of copper alloys
unless the A* value is higher than 10, in which case the 3.4 level will be used. Such
values will only be encountered in pure or nearly pure copper objects. Further
sensitivity is unnecessary as variation in human ability is so high.
PRECIOUS METALS - SILVER
The white metal test was conducted with a limited number of samples, but the results
are still quite interesting. The three samples consisted of a coin with 94% silver and 6%
copper (higher in silver content than sterling, which contains 92.5% Ag), one made
from roughly 60% zinc and 40% tin, and the last made of lead which was noticeably
duller and more tarnished in appearance than the other two. A forth sample of
aluminium foil was substituted for lead in the latter part of the experiment.
0
5
10
15
20
25
94% Ag Al foil 60% Zn,40% Sn
Fre
qu
en
cy
0
5
10
15
20
25
30
94% Ag Lead 60% Zn,40% Sn
Fre
qu
en
cy
FIGURE 5.10: (LEFT) FREQUENCY OF WHITE METALS CHOSEN AS 'SILVER' ON DAYS 1 AND 2.
FIGURE 5.11: (RIGHT) FREQUENCY OF WHITE METALS CHOSEN AS 'SILVER' ON DAYS 3 AND 4.
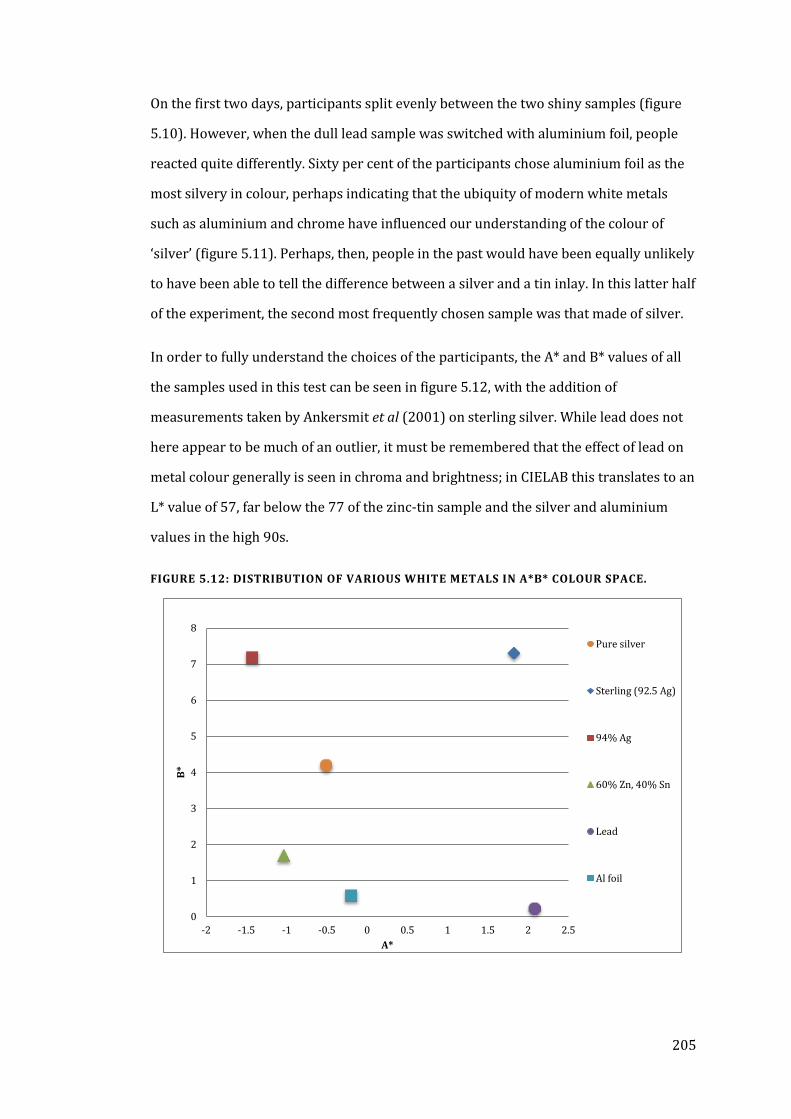
205
On the first two days, participants split evenly between the two shiny samples (figure
5.10). However, when the dull lead sample was switched with aluminium foil, people
reacted quite differently. Sixty per cent of the participants chose aluminium foil as the
most silvery in colour, perhaps indicating that the ubiquity of modern white metals
such as aluminium and chrome have influenced our understanding of the colour of
‘silver’ (figure 5.11). Perhaps, then, people in the past would have been equally unlikely
to have been able to tell the difference between a silver and a tin inlay. In this latter half
of the experiment, the second most frequently chosen sample was that made of silver.
In order to fully understand the choices of the participants, the A* and B* values of all
the samples used in this test can be seen in figure 5.12, with the addition of
measurements taken by Ankersmit et al (2001) on sterling silver. While lead does not
here appear to be much of an outlier, it must be remembered that the effect of lead on
metal colour generally is seen in chroma and brightness; in CIELAB this translates to an
L* value of 57, far below the 77 of the zinc-tin sample and the silver and aluminium
values in the high 90s.
FIGURE 5.12: DISTRIBUTION OF VARIOUS WHITE METALS IN A*B* COLOUR SPACE.
0
1
2
3
4
5
6
7
8
-2 -1.5 -1 -0.5 0 0.5 1 1.5 2 2.5
B*
A*
Pure silver
Sterling (92.5 Ag)
94% Ag
60% Zn, 40% Sn
Lead
Al foil
206
The silver samples vary greatly in A*due to the difference in copper content of 1.5%,
indicating that the change in silver colour when alloyed with increasing copper may be
considerable, at least with high Ag samples. Both have a B* value around 7, with the
other white metals hovering around 0. Pure silver lies between these areas: close to a
neutral white but with a slight yellow tint. The spread of frequencies with which the
shiny white metals were chosen is interesting, as in days one and two people are
equally likely to go for the shiniest (silver) or the whitest (Zn-Sn). When something
that fulfils both the shiny and white category is added as a choice, people are more
likely to choose it over the other two options. However, those who did not choose
aluminium are slightly more likely to go with actual silver than the Zn-Sn sample,
indicating that the shine of the material is of paramount importance and the A*B*
colour is for the appearance of ‘silver’ more subjective.
PRECIOUS METALS - GOLD
In order to cover a wide spectrum of possible ‘golden’ brasses, on the first day two
separate sets of nine samples were displayed. This proved to be too time-consuming
and awkward to manage with the quick succession of tests necessitating the reordering
of brasses into other groups and this number was reduced on the other three days to a
single set of nine. As a large number of brasses were used as part of this golden colour
test, and the colour of brass tarnishes quickly, it was not possible to simply add up the
most frequently chosen sample’s counts at the end of each day and add it to the
previous results. To deal with this issue, samples were divided into frequency groups,
i.e., if that sample was chosen over 30% of the time, or if it was chosen 10-15% of the
time, to give relative frequencies from across all of the days of the experiment.
The spread of A*B* values of these samples and the relative frequency with which they
were chosen can be seen in figure 5.13. From this, it is difficult to pick out many
patterns with the exception that those most likely to be deemed ‘golden’ generally are
high B* and low A*, and those less likely to be chosen are at the opposite end of the
spectrum, with higher A* and lower B*. However, there is considerable overlap
throughout, with examples that were not chosen at all occurring closely alongside mid-
range and high frequency choices.
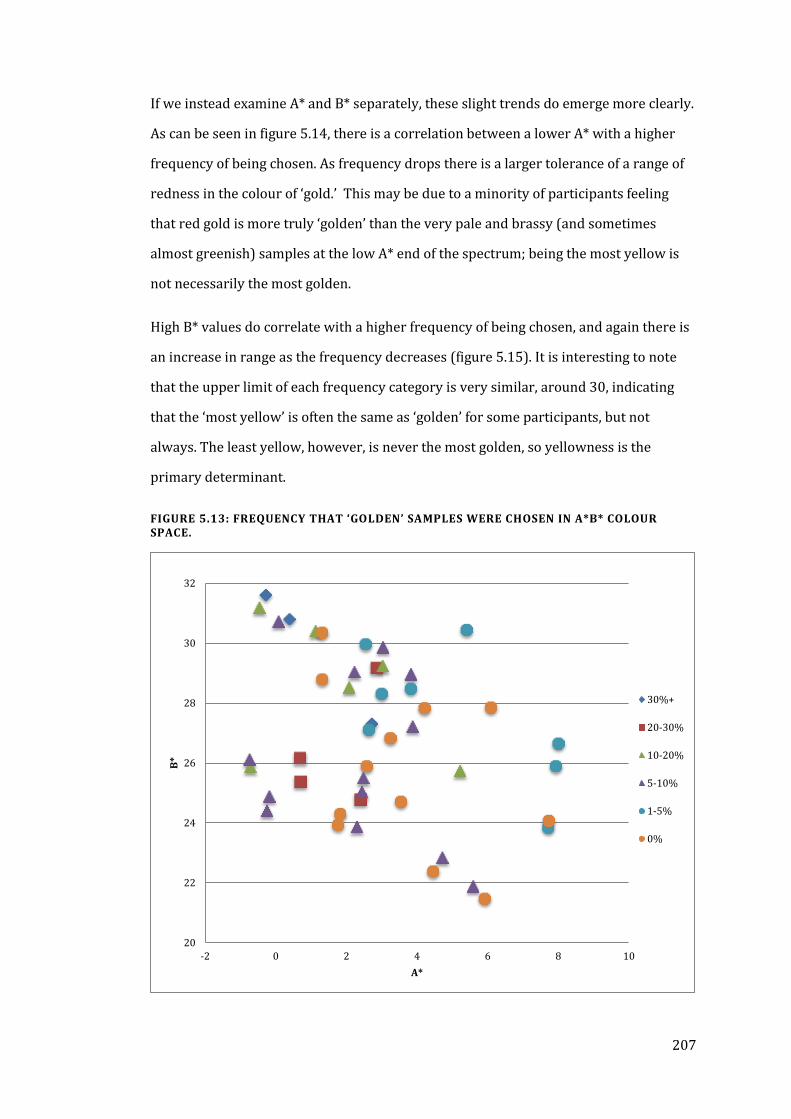
207
If we instead examine A* and B* separately, these slight trends do emerge more clearly.
As can be seen in figure 5.14, there is a correlation between a lower A* with a higher
frequency of being chosen. As frequency drops there is a larger tolerance of a range of
redness in the colour of ‘gold.’ This may be due to a minority of participants feeling
that red gold is more truly ‘golden’ than the very pale and brassy (and sometimes
almost greenish) samples at the low A* end of the spectrum; being the most yellow is
not necessarily the most golden.
High B* values do correlate with a higher frequency of being chosen, and again there is
an increase in range as the frequency decreases (figure 5.15). It is interesting to note
that the upper limit of each frequency category is very similar, around 30, indicating
that the ‘most yellow’ is often the same as ‘golden’ for some participants, but not
always. The least yellow, however, is never the most golden, so yellowness is the
primary determinant.
FIGURE 5.13: FREQUENCY THAT ‘GOLDEN’ SAMPLES WERE CHOSEN IN A*B* COLOUR SPACE.
20
22
24
26
28
30
32
-2 0 2 4 6 8 10
B*
A*
30%+
20-30%
10-20%
5-10%
1-5%
0%
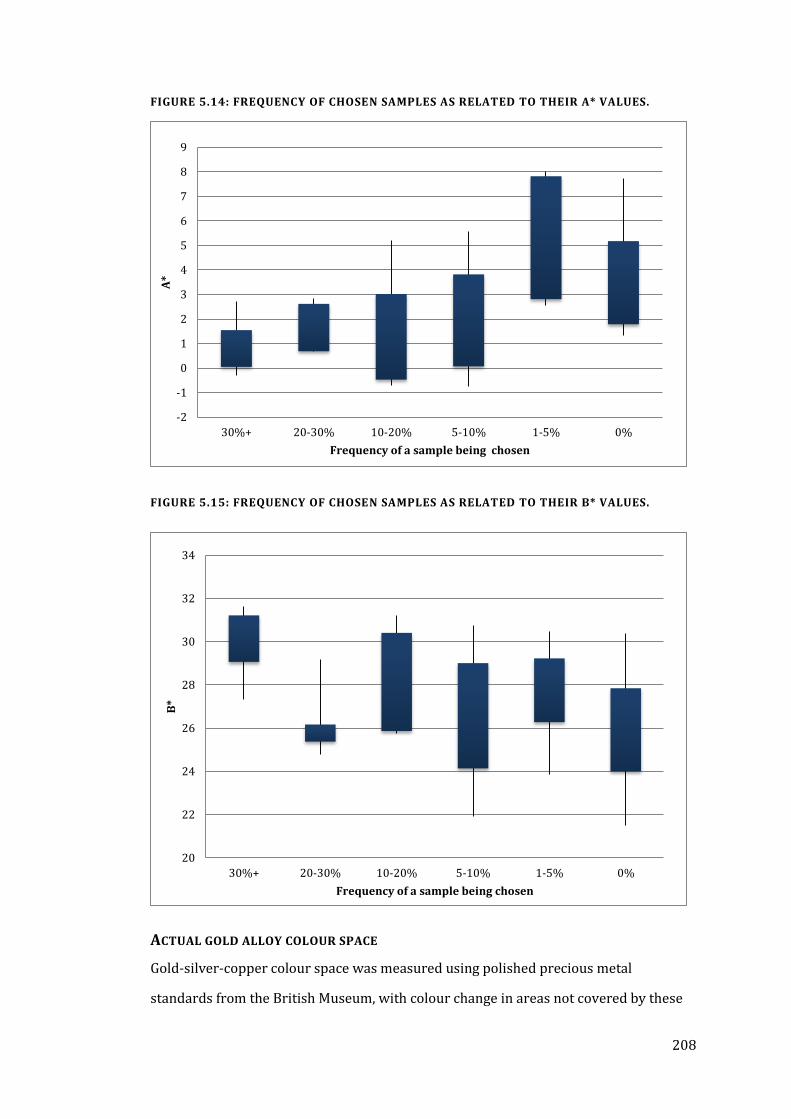
208
FIGURE 5.14: FREQUENCY OF CHOSEN SAMPLES AS RELATED TO THEIR A* VALUES.
FIGURE 5.15: FREQUENCY OF CHOSEN SAMPLES AS RELATED TO THEIR B* VALUES.
ACTUAL GOLD ALLOY COLOUR SPACE
Gold-silver-copper colour space was measured using polished precious metal
standards from the British Museum, with colour change in areas not covered by these
-2
-1
0
1
2
3
4
5
6
7
8
9
30%+ 20-30% 10-20% 5-10% 1-5% 0%
A*
Frequency of a sample being chosen
20
22
24
26
28
30
32
34
30%+ 20-30% 10-20% 5-10% 1-5% 0%
B*
Frequency of a sample being chosen
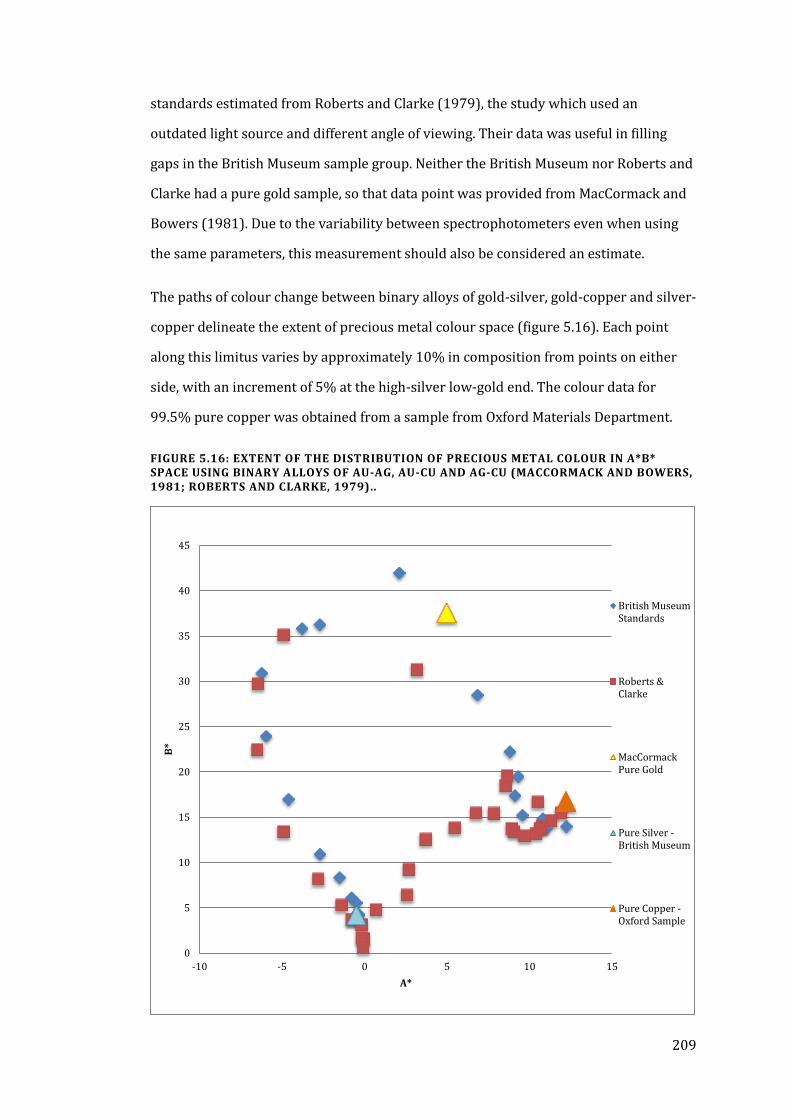
209
standards estimated from Roberts and Clarke (1979), the study which used an
outdated light source and different angle of viewing. Their data was useful in filling
gaps in the British Museum sample group. Neither the British Museum nor Roberts and
Clarke had a pure gold sample, so that data point was provided from MacCormack and
Bowers (1981). Due to the variability between spectrophotometers even when using
the same parameters, this measurement should also be considered an estimate.
The paths of colour change between binary alloys of gold-silver, gold-copper and silver-
copper delineate the extent of precious metal colour space (figure 5.16). Each point
along this limitus varies by approximately 10% in composition from points on either
side, with an increment of 5% at the high-silver low-gold end. The colour data for
99.5% pure copper was obtained from a sample from Oxford Materials Department.
FIGURE 5.16: EXTENT OF THE DISTRIBUTION OF PRECIOUS METAL COLOUR IN A*B* SPACE USING BINARY ALLOYS OF AU-AG, AU-CU AND AG-CU (MACCORMACK AND BOWERS, 1981; ROBERTS AND CLARKE, 1979)..
0
5
10
15
20
25
30
35
40
45
-10 -5 0 5 10 15
B*
A*
British MuseumStandards
Roberts &Clarke
MacCormackPure Gold
Pure Silver -British Museum
Pure Copper -Oxford Sample
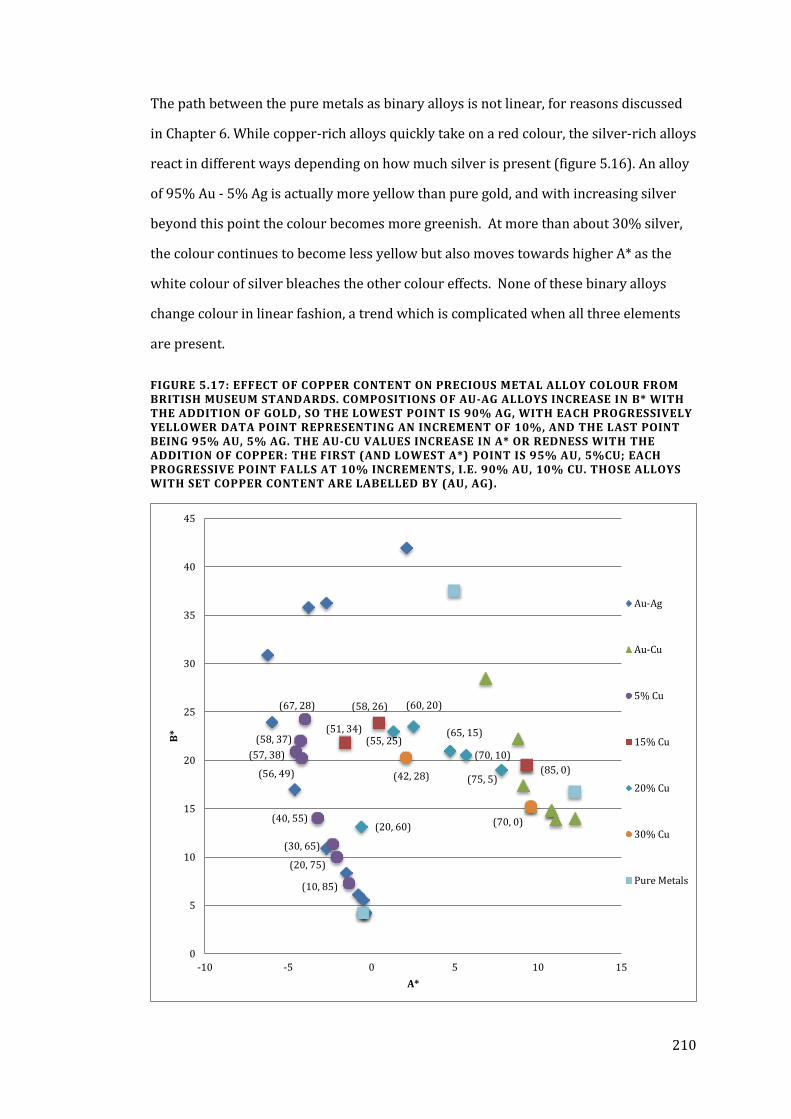
210
The path between the pure metals as binary alloys is not linear, for reasons discussed
in Chapter 6. While copper-rich alloys quickly take on a red colour, the silver-rich alloys
react in different ways depending on how much silver is present (figure 5.16). An alloy
of 95% Au - 5% Ag is actually more yellow than pure gold, and with increasing silver
beyond this point the colour becomes more greenish. At more than about 30% silver,
the colour continues to become less yellow but also moves towards higher A* as the
white colour of silver bleaches the other colour effects. None of these binary alloys
change colour in linear fashion, a trend which is complicated when all three elements
are present.
FIGURE 5.17: EFFECT OF COPPER CONTENT ON PRECIOUS METAL ALLOY COLOUR FROM BRITISH MUSEUM STANDARDS. COMPOSITIONS OF AU-AG ALLOYS INCREASE IN B* WITH THE ADDITION OF GOLD, SO THE LOWEST POINT IS 90% AG, WITH EACH PROGRESSIVELY YELLOWER DATA POINT REPRESENTING AN INCREMENT OF 10%, AND THE LAST POINT BEING 95% AU, 5% AG. THE AU-CU VALUES INCREASE IN A* OR REDNESS WITH THE ADDITION OF COPPER: THE FIRST (AND LOWEST A*) POINT IS 95% AU, 5%CU; EACH PROGRESSIVE POINT FALLS AT 10% INCREMENTS, I.E. 90% AU, 10% CU. THOSE ALLOYS WITH SET COPPER CONTENT ARE LABELLED BY (AU, AG).
(10, 85)
(20, 75)
(30, 65)
(40, 55)
(67, 28)
(57, 38)
(58, 37)
(56, 49) (85, 0)
(58, 26)
(51, 34)
(75, 5)
(70, 10)
(65, 15)
(60, 20)
(55, 25)
(20, 60) (70, 0)
(42, 28)
0
5
10
15
20
25
30
35
40
45
-10 -5 0 5 10 15
B*
A*
Au-Ag
Au-Cu
5% Cu
15% Cu
20% Cu
30% Cu
Pure Metals
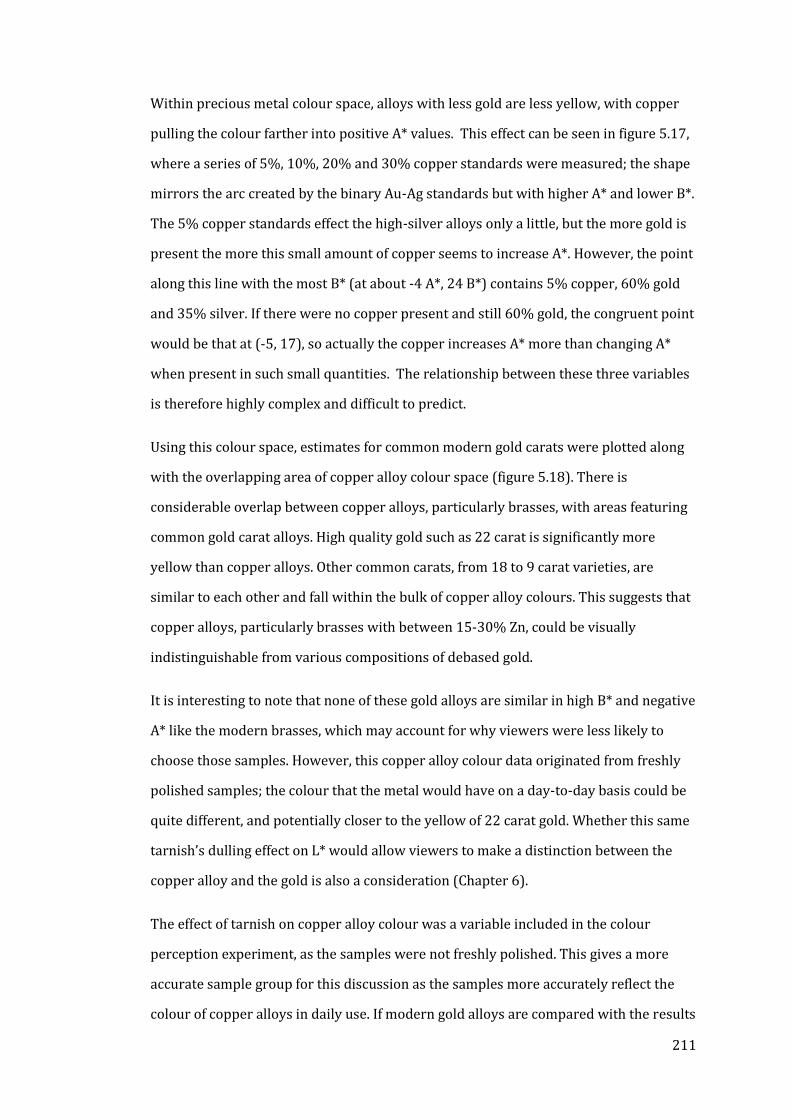
211
Within precious metal colour space, alloys with less gold are less yellow, with copper
pulling the colour farther into positive A* values. This effect can be seen in figure 5.17,
where a series of 5%, 10%, 20% and 30% copper standards were measured; the shape
mirrors the arc created by the binary Au-Ag standards but with higher A* and lower B*.
The 5% copper standards effect the high-silver alloys only a little, but the more gold is
present the more this small amount of copper seems to increase A*. However, the point
along this line with the most B* (at about -4 A*, 24 B*) contains 5% copper, 60% gold
and 35% silver. If there were no copper present and still 60% gold, the congruent point
would be that at (-5, 17), so actually the copper increases A* more than changing A*
when present in such small quantities. The relationship between these three variables
is therefore highly complex and difficult to predict.
Using this colour space, estimates for common modern gold carats were plotted along
with the overlapping area of copper alloy colour space (figure 5.18). There is
considerable overlap between copper alloys, particularly brasses, with areas featuring
common gold carat alloys. High quality gold such as 22 carat is significantly more
yellow than copper alloys. Other common carats, from 18 to 9 carat varieties, are
similar to each other and fall within the bulk of copper alloy colours. This suggests that
copper alloys, particularly brasses with between 15-30% Zn, could be visually
indistinguishable from various compositions of debased gold.
It is interesting to note that none of these gold alloys are similar in high B* and negative
A* like the modern brasses, which may account for why viewers were less likely to
choose those samples. However, this copper alloy colour data originated from freshly
polished samples; the colour that the metal would have on a day-to-day basis could be
quite different, and potentially closer to the yellow of 22 carat gold. Whether this same
tarnish’s dulling effect on L* would allow viewers to make a distinction between the
copper alloy and the gold is also a consideration (Chapter 6).
The effect of tarnish on copper alloy colour was a variable included in the colour
perception experiment, as the samples were not freshly polished. This gives a more
accurate sample group for this discussion as the samples more accurately reflect the
colour of copper alloys in daily use. If modern gold alloys are compared with the results
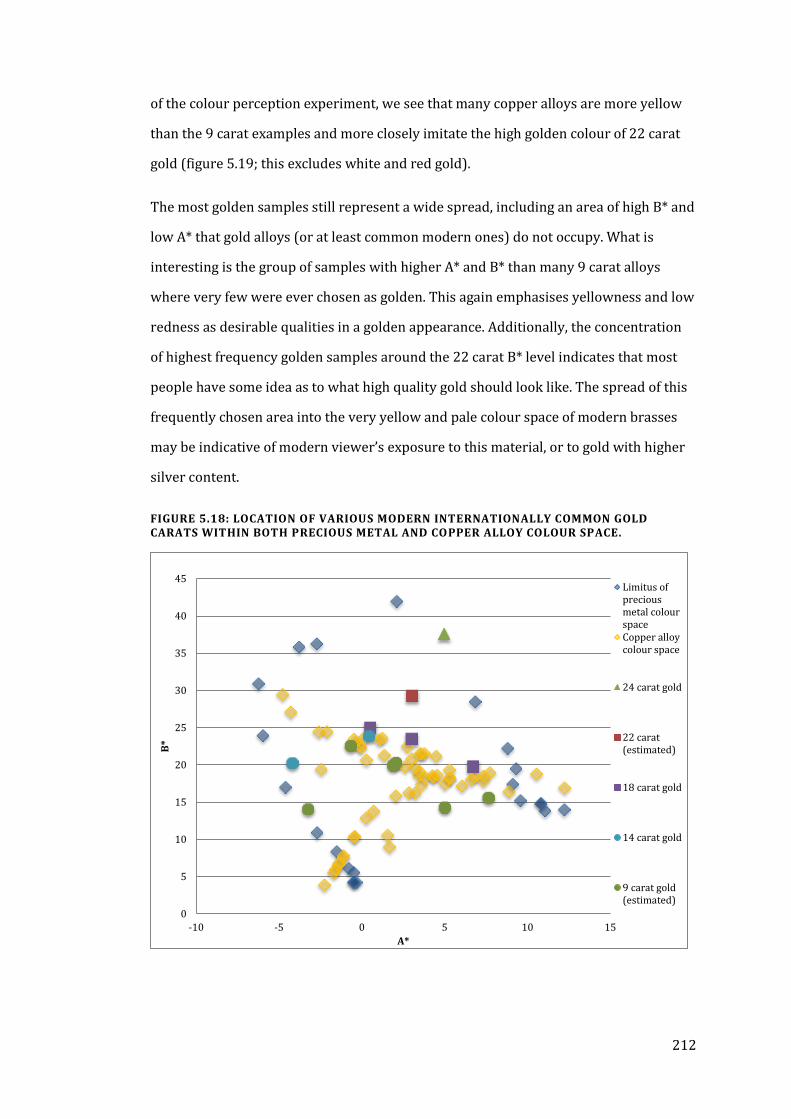
212
of the colour perception experiment, we see that many copper alloys are more yellow
than the 9 carat examples and more closely imitate the high golden colour of 22 carat
gold (figure 5.19; this excludes white and red gold).
The most golden samples still represent a wide spread, including an area of high B* and
low A* that gold alloys (or at least common modern ones) do not occupy. What is
interesting is the group of samples with higher A* and B* than many 9 carat alloys
where very few were ever chosen as golden. This again emphasises yellowness and low
redness as desirable qualities in a golden appearance. Additionally, the concentration
of highest frequency golden samples around the 22 carat B* level indicates that most
people have some idea as to what high quality gold should look like. The spread of this
frequently chosen area into the very yellow and pale colour space of modern brasses
may be indicative of modern viewer’s exposure to this material, or to gold with higher
silver content.
FIGURE 5.18: LOCATION OF VARIOUS MODERN INTERNATIONALLY COMMON GOLD CARATS WITHIN BOTH PRECIOUS METAL AND COPPER ALLOY COLOUR SPACE.
0
5
10
15
20
25
30
35
40
45
-10 -5 0 5 10 15
B*
A*
Limitus ofpreciousmetal colourspaceCopper alloycolour space
24 carat gold
22 carat(estimated)
18 carat gold
14 carat gold
9 carat gold(estimated)
213
FIGURE 5.19 RELATIONSHIP BETWEEN ACTUAL COMMON MODERN GOLD ALLOYS AND THE FREQUENCY WITH WHICH INDIVIDUALS PICKED A COPPER ALLOY SAMPLE AS 'MOST GOLDEN'.
18
20
22
24
26
28
30
32
34
36
38
-2 0 2 4 6 8 10
B*
A*
30%+
20-30%
10-20%
5-10%
1-5%
0%
Commongold alloys
214
PERCEPTION, GOLD, AND COPPER ALLOYS IN THE EARLY SAXON PERIOD
Gold in the Early Saxon period was exceedingly rare and probably was not something
the average person would see very often. Most golden objects were gilded rather than
solid gold, and gilt objects could, “vary between very pale and quite dark yellow”
(Dickinson, 1982, 23). 243 analyses have been conducted on gold from this period, with
most objects having little copper present but with a wide variety of gold and silver
content (Brown and Schweizer, 1973; Bruce-Mitford and Evans, 1978; Turner-Walker
et al., 1985; Craddock et al., 2010; Hawkes et al., 1966; Mortimer and Anheuser, 1998;
Williams and Powell, 2009). The frequency of gold content in figure 5.20 demonstrates
this variability. Copper content is far more regular: a few per cent is always present
(except for in the pure gold items, in which only a trace amount occurs) but rarely
occurs over 5% and never as much as 10% (figure 5.21).
Gold alloys are variable in composition throughout this period as the major gold
resource in the west, Byzantine coins, were increasingly debased and eventually
disappeared (Hawkes et al., 1966, 101). The high-silver examples date from the mid 6th
to 7th century. The low copper content puts the colour of most gold in this period at
either very yellow or pale-to-green. In figure 5.22, the area of colour space the majority
of early medieval precious metal alloys would occupy is indicated by the shaded region.
What should be noted here is the greener gold colour of Saxon gold compared to
modern gold compositions (i.e., figure 5.18). This may be due to the selective corrosion
of copper out of the alloy, making gold and silver contents artificially high; however,
this should not drastically alter the compositional results, especially as the data comes
from cleaned surfaces which presumably are less affected by selective corrosion than
the patinated surface layer. Claims in the literature that gold was reddish in this period
(as compared to any other period) due to extensive debasement are baseless
regardless of underestimated copper, as there would need to be significantly more
copper present to account for a reddish appearance and no such examples have yet
been analysed (Mead, 1899, 195). The effect of different light sources on the
appearance of metalwork, such as firelight, also may have been a factor concerning the
valued appearance and description of gold.
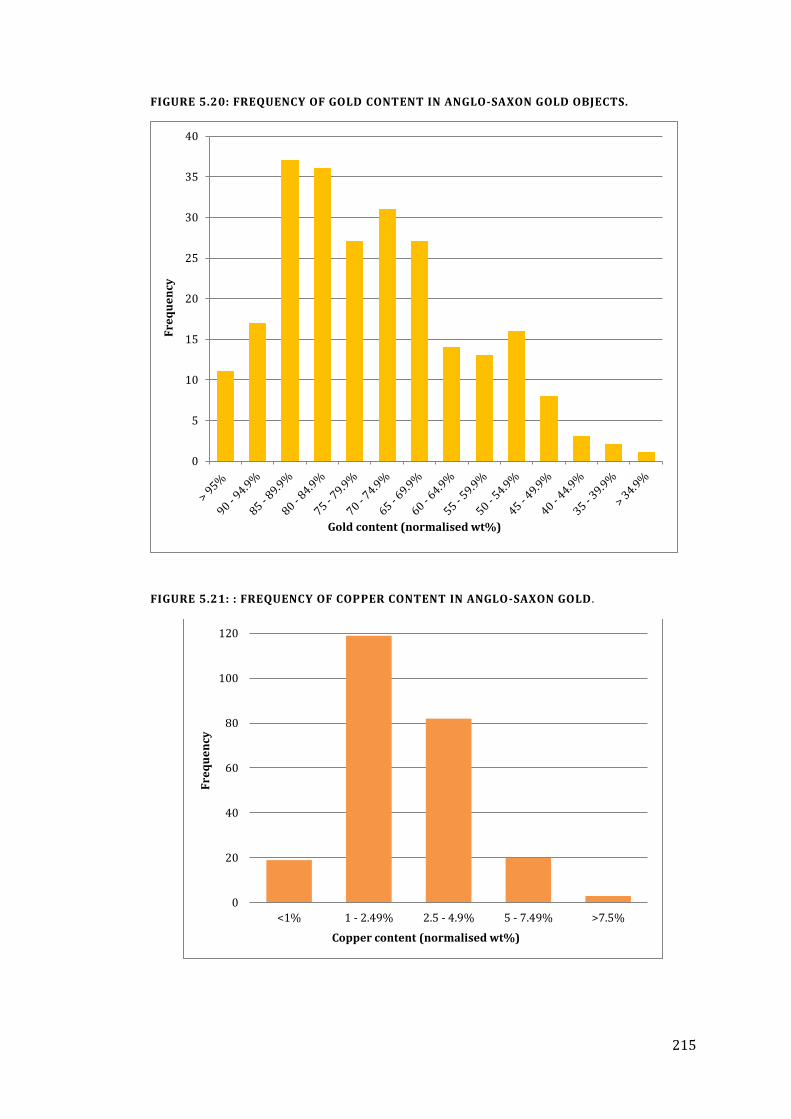
215
FIGURE 5.20: FREQUENCY OF GOLD CONTENT IN ANGLO-SAXON GOLD OBJECTS.
FIGURE 5.21: : FREQUENCY OF COPPER CONTENT IN ANGLO-SAXON GOLD .
0
5
10
15
20
25
30
35
40
Fre
qu
en
cy
Gold content (normalised wt%)
0
20
40
60
80
100
120
<1% 1 - 2.49% 2.5 - 4.9% 5 - 7.49% >7.5%
Fre
qu
en
cy
Copper content (normalised wt%)
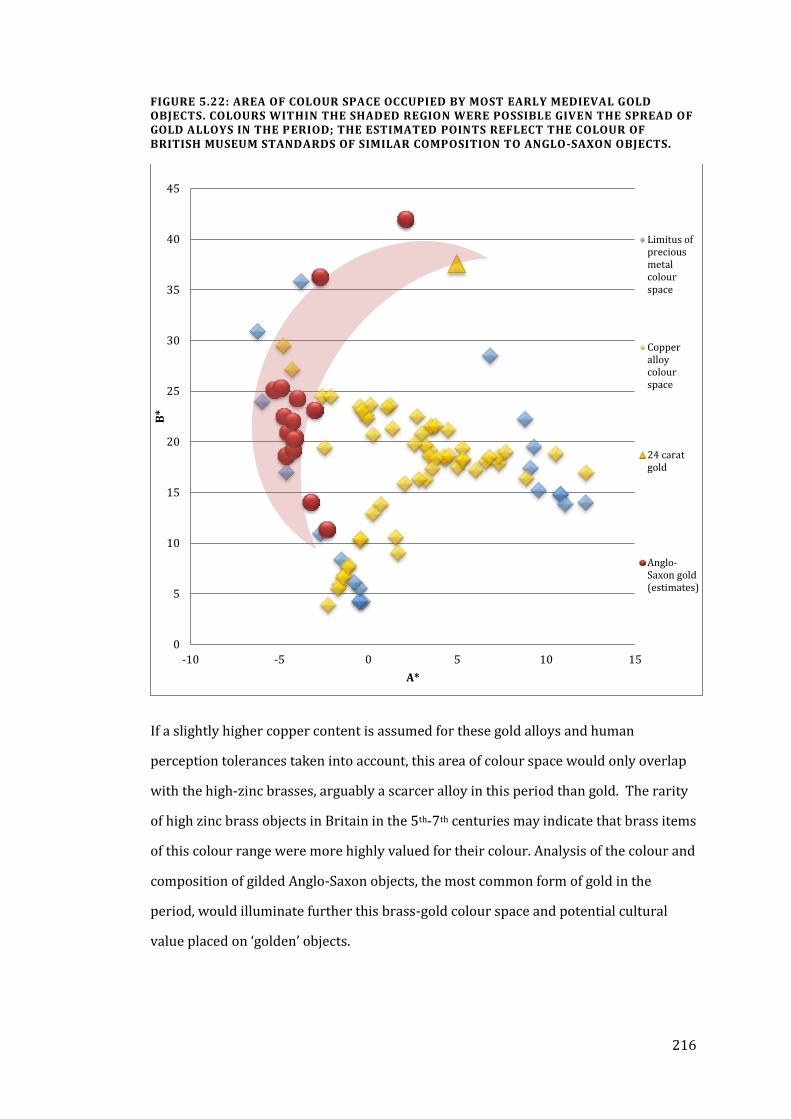
216
FIGURE 5.22: AREA OF COLOUR SPACE OCCUPIED BY MOST EARLY MEDIEVAL GOLD OBJECTS. COLOURS WITHIN THE SHADED REGION WERE POSSIBLE GIVEN THE SPREAD OF GOLD ALLOYS IN THE PERIOD; THE ESTIMATED POINTS REFLECT THE COLOUR OF BRITISH MUSEUM STANDARDS OF SIMILAR COMPOSITION TO ANGLO-SAXON OBJECTS.
If a slightly higher copper content is assumed for these gold alloys and human
perception tolerances taken into account, this area of colour space would only overlap
with the high-zinc brasses, arguably a scarcer alloy in this period than gold. The rarity
of high zinc brass objects in Britain in the 5th-7th centuries may indicate that brass items
of this colour range were more highly valued for their colour. Analysis of the colour and
composition of gilded Anglo-Saxon objects, the most common form of gold in the
period, would illuminate further this brass-gold colour space and potential cultural
value placed on ‘golden’ objects.
0
5
10
15
20
25
30
35
40
45
-10 -5 0 5 10 15
B*
A*
Limitus ofpreciousmetalcolourspace
Copperalloycolourspace
24 caratgold
Anglo-Saxon gold(estimates)
217
SUMMARY
Quantitative colourimetry is a relatively new tool in analysing archaeological metals. A
lack of conformity in methodologies and high variation in spectrophotometer
calibration can make synthesising data from past research difficult. This chapter has
outlined how this data can be applied to the perceptive abilities of human viewers and
how human perception of precious metals relates to actual composition and metal
colour space. Human colour sensitivity is far less than that of colorimeters, a factor that
needs to be addressed when interpreting colour data. Silver is perceived as white,
though in reality it has a slight yellowish tinge; this could be relevant when considering
the prevalence and popularity of tinning on Anglo-Saxon artefacts. The similarity in
colour of many Anglo-Saxon gold alloys to high-zinc brass, especially examples that
have some tarnish on the surface, may have influenced the value of imported brass
objects in the period. However, Old English evidence indicates that the valued
appearance of gold was that of pure gold, which has a much higher A* value than any of
the gold alloys of the period. The colour of slightly tarnished gunmetal may have been
indistinguishable from (or at least the closest in appearance to) the expected colour of
gold, which has important connotations for the aesthetic value of recycled copper
alloys.
218
CHAPTER 6
METAL STRUCTURE, COLOUR
AND TARNISH
INTRODUCTION
The reflection of light as colour occurs differently in metal than in other materials.
Understanding the structure of metals and how this structure changes within alloys can
clarify why certain alloys take on their characteristic appearances. Within metallic
phases, different properties and colours can occur, influencing the use of alloys and
manufacturing techniques in order to achieve particular colours.
This chapter discusses metal structure in terms of colour and exposes the complexities
of these structures within alloy phases. Quantitative colour and composition data can
be used to map these phase shifts and to predict the effect of composition on colour.
Change in colour due to the accrual of tarnish on metal surfaces is also discussed in
terms of its variability, trends in the direction of colour change, and the effect tarnish
has on the perception of a metal.
HOW COLOUR IS CREATED IN METAL
Metals reflect all visible light wavelengths in all directions as ‘luster,’ which is why most
are ‘white metals’ in appearance, the exceptions being gold and copper. Even white
metals, however, are not completely neutral in hue; pure silver and tin have a slightly
yellowish tinge, while lead and zinc are somewhat blue-grey in colour. When metals are
alloyed they can appear a variety of colours, as demonstrated by the extent of precious
metal and copper alloy colour space described in Chapter 5.
The colour of a metal is related to the process by which energy (here light) is absorbed
and then reflected. Incident light is reflected more or less equally across the spectrum
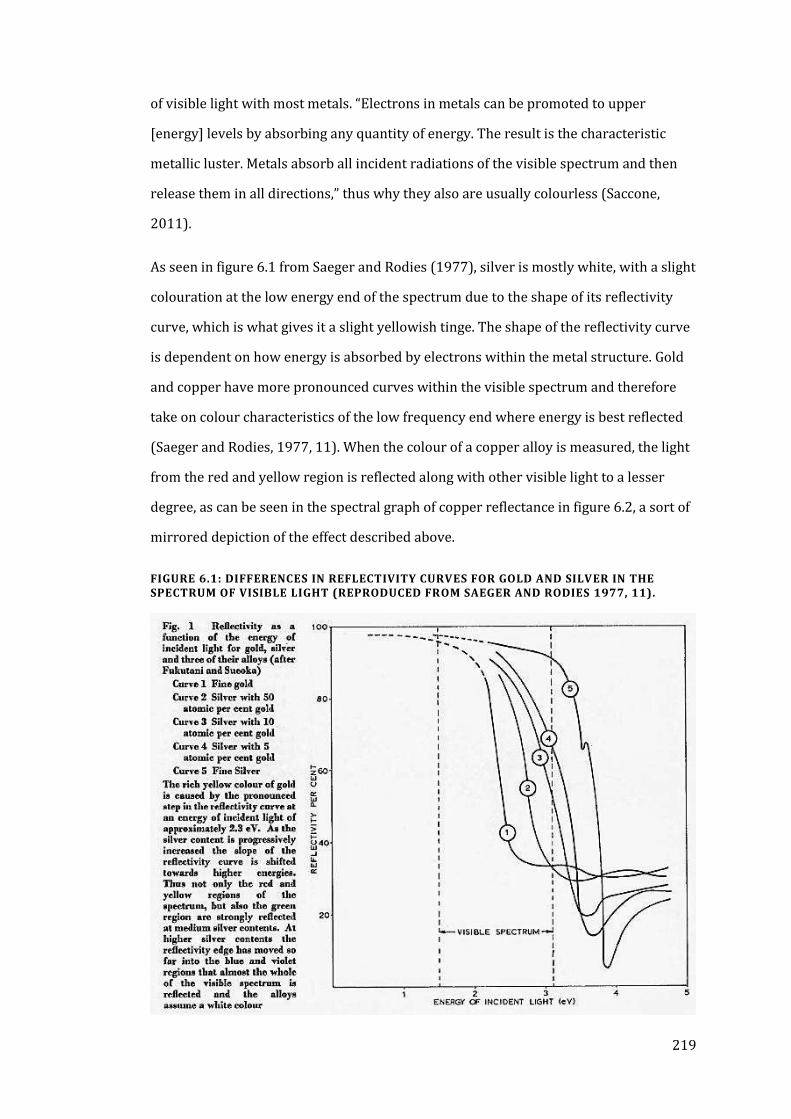
219
of visible light with most metals. “Electrons in metals can be promoted to upper
[energy] levels by absorbing any quantity of energy. The result is the characteristic
metallic luster. Metals absorb all incident radiations of the visible spectrum and then
release them in all directions,” thus why they also are usually colourless (Saccone,
2011).
As seen in figure 6.1 from Saeger and Rodies (1977), silver is mostly white, with a slight
colouration at the low energy end of the spectrum due to the shape of its reflectivity
curve, which is what gives it a slight yellowish tinge. The shape of the reflectivity curve
is dependent on how energy is absorbed by electrons within the metal structure. Gold
and copper have more pronounced curves within the visible spectrum and therefore
take on colour characteristics of the low frequency end where energy is best reflected
(Saeger and Rodies, 1977, 11). When the colour of a copper alloy is measured, the light
from the red and yellow region is reflected along with other visible light to a lesser
degree, as can be seen in the spectral graph of copper reflectance in figure 6.2, a sort of
mirrored depiction of the effect described above.
FIGURE 6.1: DIFFERENCES IN REFLECTIVITY CURVES FOR GOLD AND SILVER IN THE SPECTRUM OF VISIBLE LIGHT (REPRODUCED FROM SAEGER AND RODIES 1977, 11).
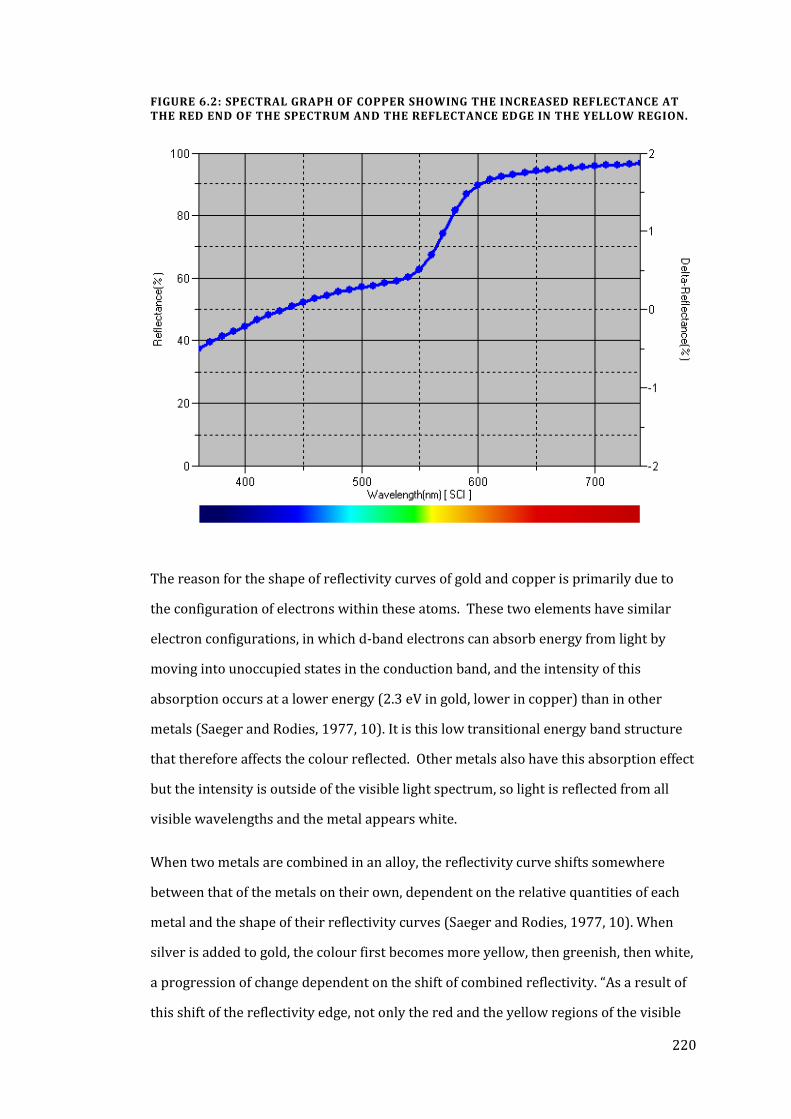
220
FIGURE 6.2: SPECTRAL GRAPH OF COPPER SHOWING THE INCREASED REFLECTANCE AT THE RED END OF THE SPECTRUM AND THE REFLECTANCE EDGE IN THE YELLOW REGION.
The reason for the shape of reflectivity curves of gold and copper is primarily due to
the configuration of electrons within these atoms. These two elements have similar
electron configurations, in which d-band electrons can absorb energy from light by
moving into unoccupied states in the conduction band, and the intensity of this
absorption occurs at a lower energy (2.3 eV in gold, lower in copper) than in other
metals (Saeger and Rodies, 1977, 10). It is this low transitional energy band structure
that therefore affects the colour reflected. Other metals also have this absorption effect
but the intensity is outside of the visible light spectrum, so light is reflected from all
visible wavelengths and the metal appears white.
When two metals are combined in an alloy, the reflectivity curve shifts somewhere
between that of the metals on their own, dependent on the relative quantities of each
metal and the shape of their reflectivity curves (Saeger and Rodies, 1977, 10). When
silver is added to gold, the colour first becomes more yellow, then greenish, then white,
a progression of change dependent on the shift of combined reflectivity. “As a result of
this shift of the reflectivity edge, not only the red and the yellow regions of the visible
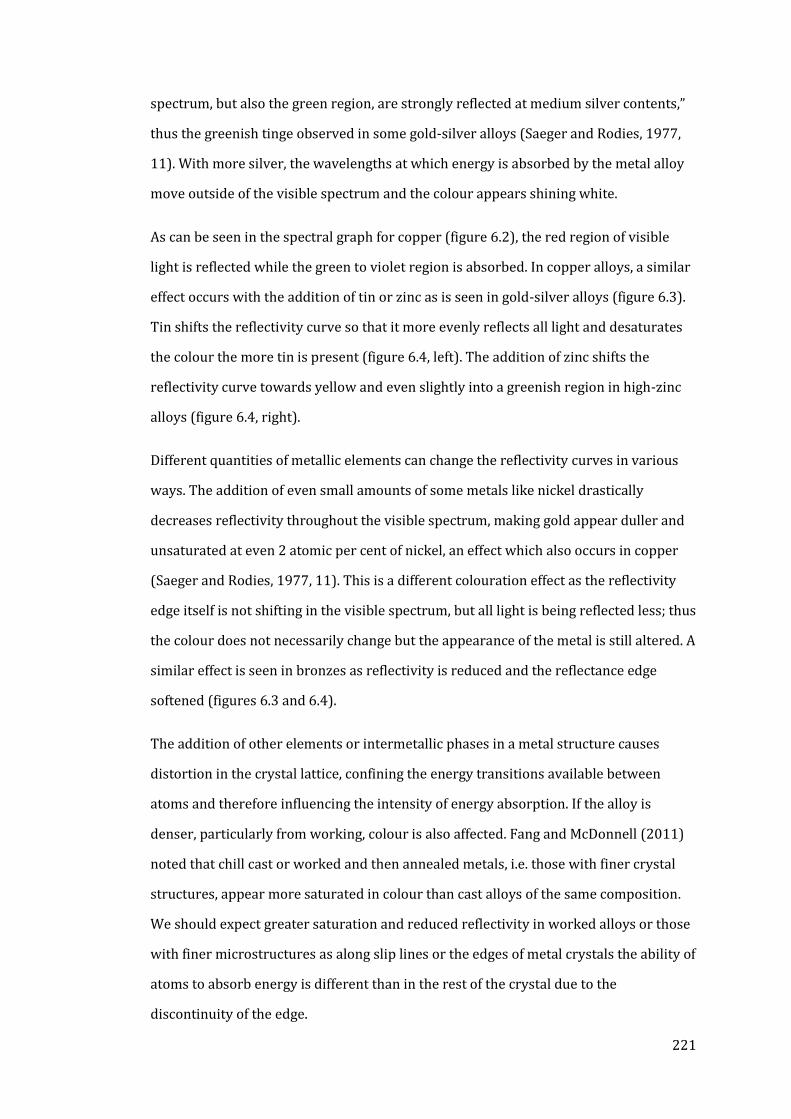
221
spectrum, but also the green region, are strongly reflected at medium silver contents,”
thus the greenish tinge observed in some gold-silver alloys (Saeger and Rodies, 1977,
11). With more silver, the wavelengths at which energy is absorbed by the metal alloy
move outside of the visible spectrum and the colour appears shining white.
As can be seen in the spectral graph for copper (figure 6.2), the red region of visible
light is reflected while the green to violet region is absorbed. In copper alloys, a similar
effect occurs with the addition of tin or zinc as is seen in gold-silver alloys (figure 6.3).
Tin shifts the reflectivity curve so that it more evenly reflects all light and desaturates
the colour the more tin is present (figure 6.4, left). The addition of zinc shifts the
reflectivity curve towards yellow and even slightly into a greenish region in high-zinc
alloys (figure 6.4, right).
Different quantities of metallic elements can change the reflectivity curves in various
ways. The addition of even small amounts of some metals like nickel drastically
decreases reflectivity throughout the visible spectrum, making gold appear duller and
unsaturated at even 2 atomic per cent of nickel, an effect which also occurs in copper
(Saeger and Rodies, 1977, 11). This is a different colouration effect as the reflectivity
edge itself is not shifting in the visible spectrum, but all light is being reflected less; thus
the colour does not necessarily change but the appearance of the metal is still altered. A
similar effect is seen in bronzes as reflectivity is reduced and the reflectance edge
softened (figures 6.3 and 6.4).
The addition of other elements or intermetallic phases in a metal structure causes
distortion in the crystal lattice, confining the energy transitions available between
atoms and therefore influencing the intensity of energy absorption. If the alloy is
denser, particularly from working, colour is also affected. Fang and McDonnell (2011)
noted that chill cast or worked and then annealed metals, i.e. those with finer crystal
structures, appear more saturated in colour than cast alloys of the same composition.
We should expect greater saturation and reduced reflectivity in worked alloys or those
with finer microstructures as along slip lines or the edges of metal crystals the ability of
atoms to absorb energy is different than in the rest of the crystal due to the
discontinuity of the edge.
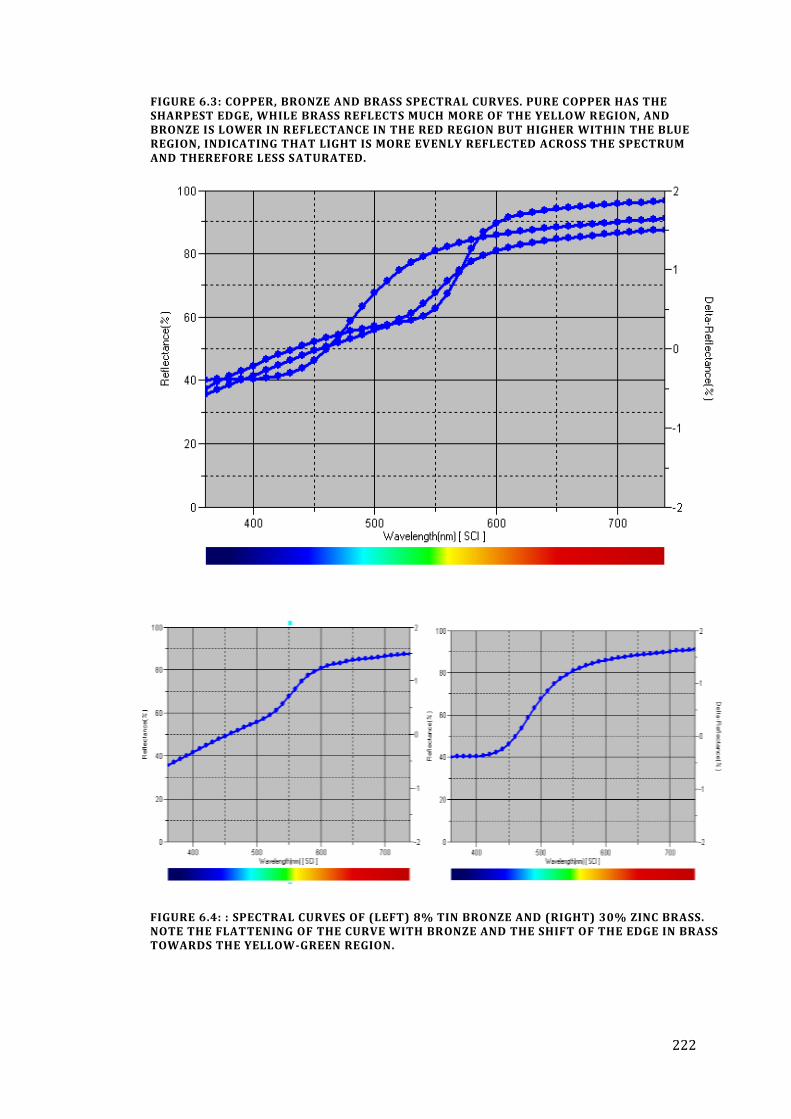
222
FIGURE 6.3: COPPER, BRONZE AND BRASS SPECTRAL CURVES. PURE COPPER HAS THE SHARPEST EDGE, WHILE BRASS REFLECTS MUCH MORE OF THE YELLOW REGION, AND BRONZE IS LOWER IN REFLECTANCE IN THE RED REGION BUT HIGHER WITHIN THE BLUE REGION, INDICATING THAT LIGHT IS MORE EVENLY REFLECTED ACROSS THE SPECTRUM AND THEREFORE LESS SATURATED.
FIGURE 6.4: : SPECTRAL CURVES OF (LEFT) 8% TIN BRONZE AND (RIGHT) 30% ZINC BRASS. NOTE THE FLATTENING OF THE CURVE WITH BRONZE AND THE SHIFT OF THE EDGE IN BRASS TOWARDS THE YELLOW-GREEN REGION.
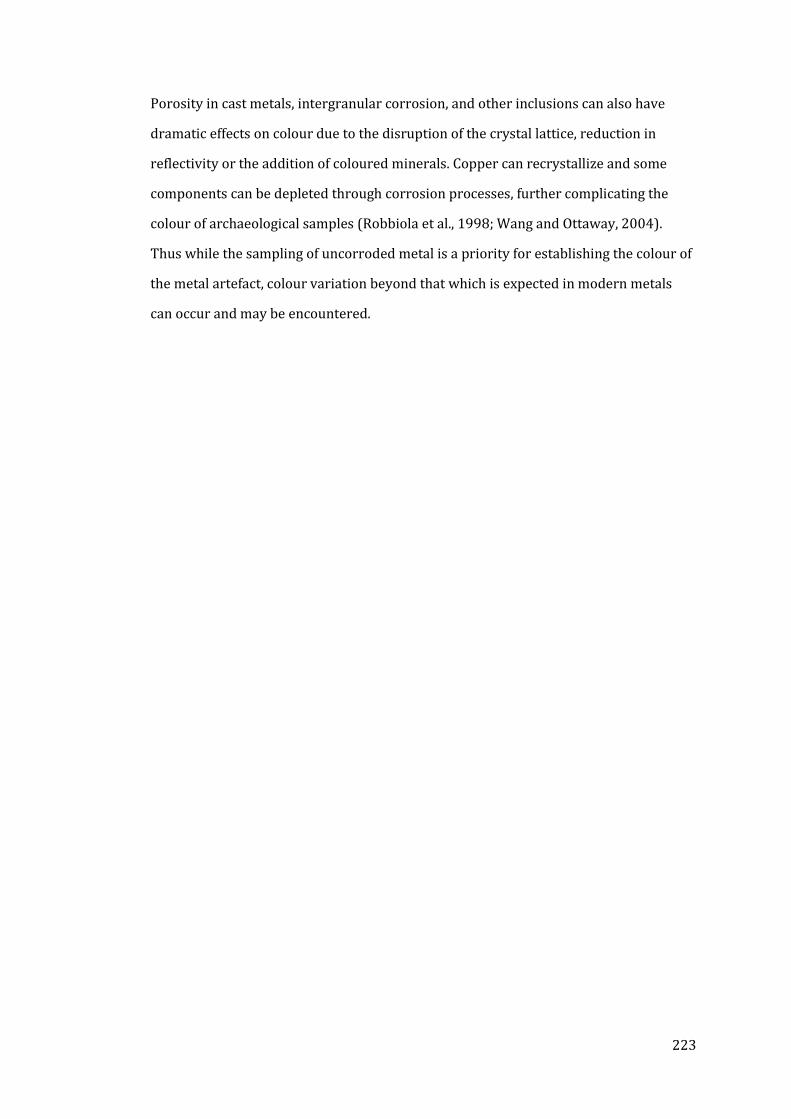
223
Porosity in cast metals, intergranular corrosion, and other inclusions can also have
dramatic effects on colour due to the disruption of the crystal lattice, reduction in
reflectivity or the addition of coloured minerals. Copper can recrystallize and some
components can be depleted through corrosion processes, further complicating the
colour of archaeological samples (Robbiola et al., 1998; Wang and Ottaway, 2004).
Thus while the sampling of uncorroded metal is a priority for establishing the colour of
the metal artefact, colour variation beyond that which is expected in modern metals
can occur and may be encountered.
224
CHARACTERISATION OF THE COLOURS OF
ARCHAEOLOGICALLY SIGNIFICANT COPPER ALLOYS
Copper alloys fit within a distinct area of CIELAB colour space, as outlined in figure 6.5.
This space was determined using metal standards, metallographic samples and metal
samples custom-made for Fang’s doctoral research (2011). The samples included range
from pure copper to modern brasses, from a range of bronzes and gunmetals to the
rarer high tin bronzes. Fang’s (2011) colorimetric work features high tin bronzes,
which allows for more accurate definition of the pale area of copper alloy colour space
than could otherwise be provided. However, archaeological metals tend to have
impurities and more complicated compositions than those found in this dataset, so
archaeological copper alloy colour space is slightly larger, particularly in the area
occupied here by a handful of gunmetal samples.
FIGURE 6.5: LOCATION OF COPPER ALLOYS IN 3D CIELAB COLOUR SPACE.
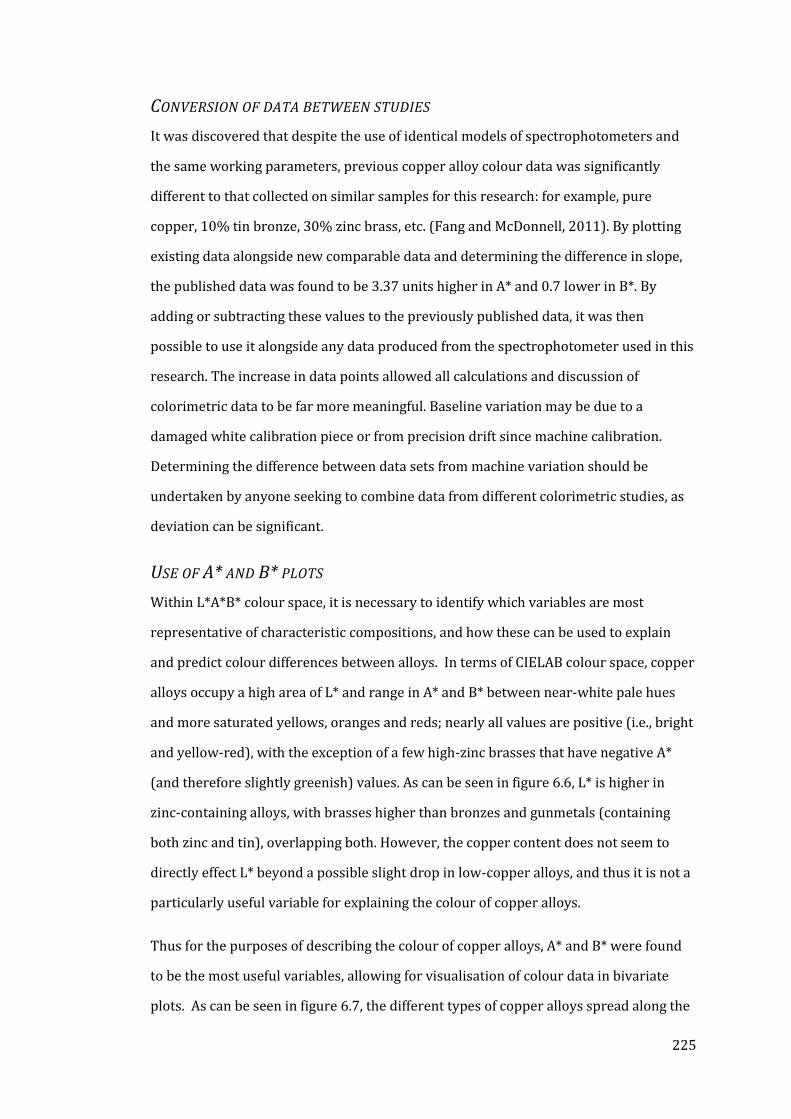
225
CONVERSION OF DATA BETWEEN STUDIES
It was discovered that despite the use of identical models of spectrophotometers and
the same working parameters, previous copper alloy colour data was significantly
different to that collected on similar samples for this research: for example, pure
copper, 10% tin bronze, 30% zinc brass, etc. (Fang and McDonnell, 2011). By plotting
existing data alongside new comparable data and determining the difference in slope,
the published data was found to be 3.37 units higher in A* and 0.7 lower in B*. By
adding or subtracting these values to the previously published data, it was then
possible to use it alongside any data produced from the spectrophotometer used in this
research. The increase in data points allowed all calculations and discussion of
colorimetric data to be far more meaningful. Baseline variation may be due to a
damaged white calibration piece or from precision drift since machine calibration.
Determining the difference between data sets from machine variation should be
undertaken by anyone seeking to combine data from different colorimetric studies, as
deviation can be significant.
USE OF A* AND B* PLOTS
Within L*A*B* colour space, it is necessary to identify which variables are most
representative of characteristic compositions, and how these can be used to explain
and predict colour differences between alloys. In terms of CIELAB colour space, copper
alloys occupy a high area of L* and range in A* and B* between near-white pale hues
and more saturated yellows, oranges and reds; nearly all values are positive (i.e., bright
and yellow-red), with the exception of a few high-zinc brasses that have negative A*
(and therefore slightly greenish) values. As can be seen in figure 6.6, L* is higher in
zinc-containing alloys, with brasses higher than bronzes and gunmetals (containing
both zinc and tin), overlapping both. However, the copper content does not seem to
directly effect L* beyond a possible slight drop in low-copper alloys, and thus it is not a
particularly useful variable for explaining the colour of copper alloys.
Thus for the purposes of describing the colour of copper alloys, A* and B* were found
to be the most useful variables, allowing for visualisation of colour data in bivariate
plots. As can be seen in figure 6.7, the different types of copper alloys spread along the

226
range of values in a way that allows some distinction and separation of alloy types by
colour alone. The samples with primarily copper and little else can be found at the far
right, with high A* and mid-range B*. The brasses are grouped to the upper left, with
low A* and high B*, and the bronzes span a wide range of A* depending on how much
tin is present and with much lower B* values with higher tin content. In the middle of
the three groups can exist alloys that contain both zinc and tin in some amount, and in
this area of overlap trends are more difficult to decipher. Silver and gold alloys can also
be found within this colour space as is discussed in Chapter 5.
FIGURE 6.6: RELATIONSHIP BETWEEN L* AND COPPER CONTENT.
83
84
85
86
87
88
89
90
91
92
93
60 65 70 75 80 85 90 95 100
L*
% Copper
Brass
Bronze
Gunmetal
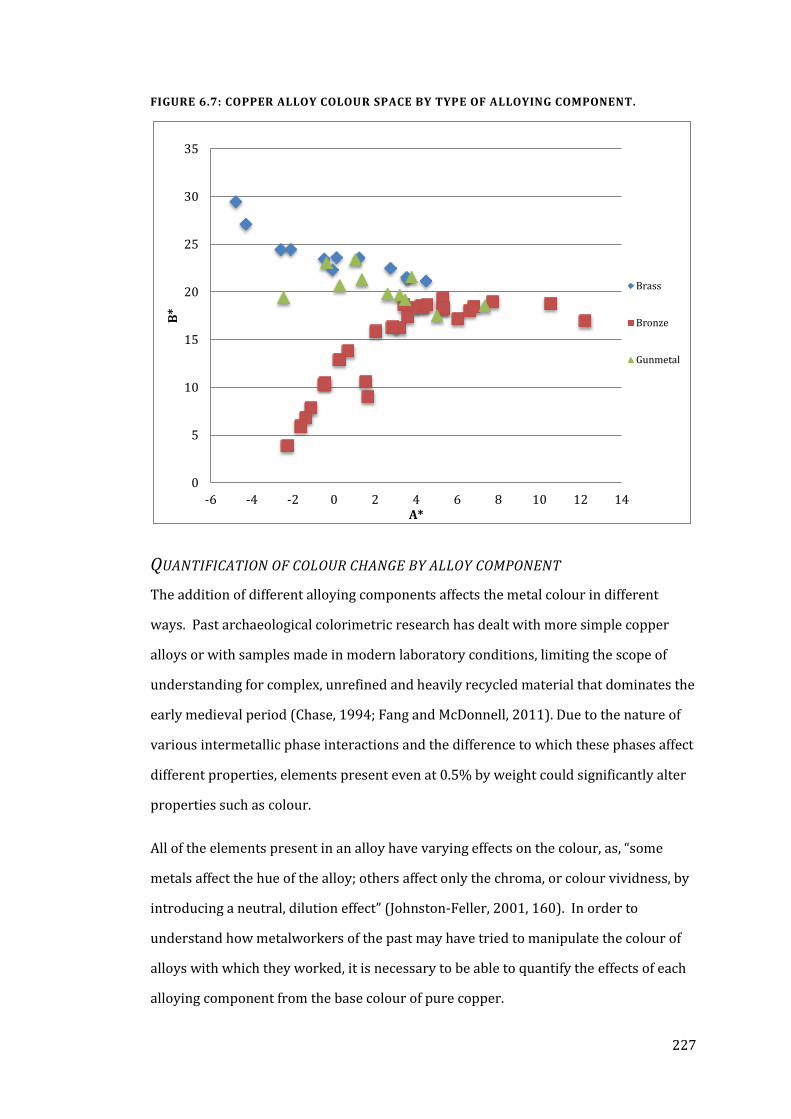
227
FIGURE 6.7: COPPER ALLOY COLOUR SPACE BY TYPE OF ALLOYING COMPONENT.
QUANTIFICATION OF COLOUR CHANGE BY ALLOY COMPONENT
The addition of different alloying components affects the metal colour in different
ways. Past archaeological colorimetric research has dealt with more simple copper
alloys or with samples made in modern laboratory conditions, limiting the scope of
understanding for complex, unrefined and heavily recycled material that dominates the
early medieval period (Chase, 1994; Fang and McDonnell, 2011). Due to the nature of
various intermetallic phase interactions and the difference to which these phases affect
different properties, elements present even at 0.5% by weight could significantly alter
properties such as colour.
All of the elements present in an alloy have varying effects on the colour, as, “some
metals affect the hue of the alloy; others affect only the chroma, or colour vividness, by
introducing a neutral, dilution effect” (Johnston-Feller, 2001, 160). In order to
understand how metalworkers of the past may have tried to manipulate the colour of
alloys with which they worked, it is necessary to be able to quantify the effects of each
alloying component from the base colour of pure copper.
0
5
10
15
20
25
30
35
-6 -4 -2 0 2 4 6 8 10 12 14
B*
A*
Brass
Bronze
Gunmetal
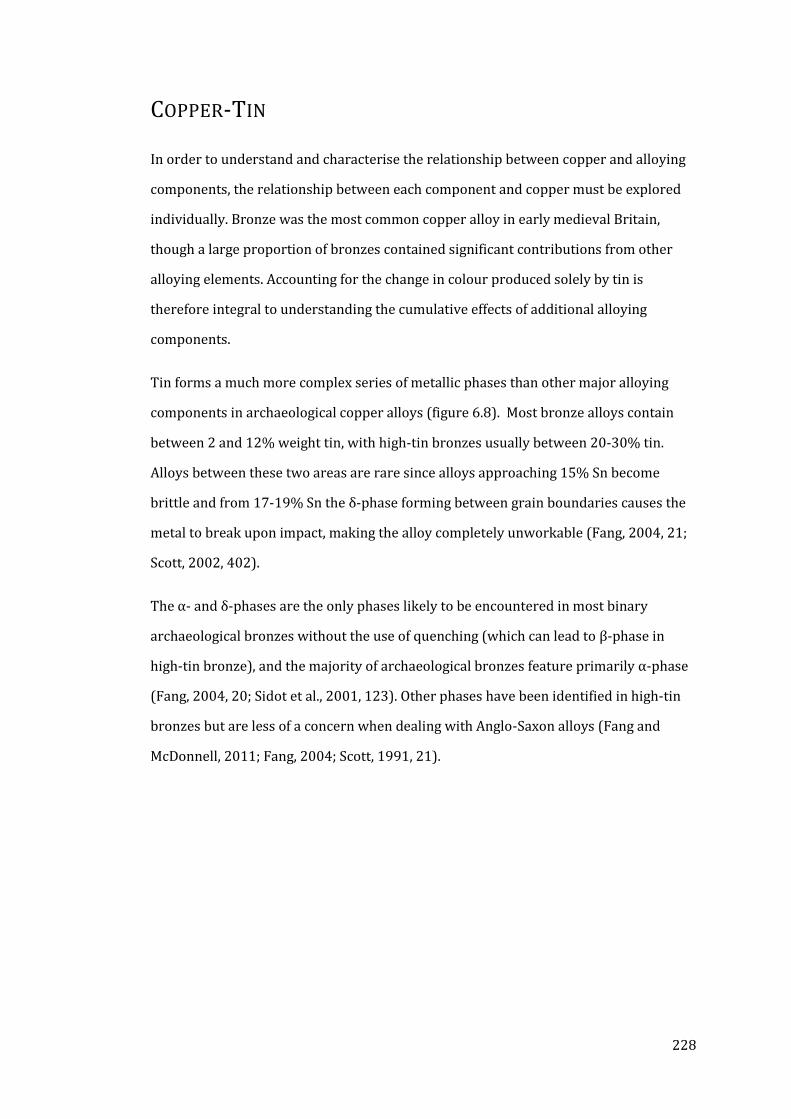
228
COPPER-TIN
In order to understand and characterise the relationship between copper and alloying
components, the relationship between each component and copper must be explored
individually. Bronze was the most common copper alloy in early medieval Britain,
though a large proportion of bronzes contained significant contributions from other
alloying elements. Accounting for the change in colour produced solely by tin is
therefore integral to understanding the cumulative effects of additional alloying
components.
Tin forms a much more complex series of metallic phases than other major alloying
components in archaeological copper alloys (figure 6.8). Most bronze alloys contain
between 2 and 12% weight tin, with high-tin bronzes usually between 20-30% tin.
Alloys between these two areas are rare since alloys approaching 15% Sn become
brittle and from 17-19% Sn the δ-phase forming between grain boundaries causes the
metal to break upon impact, making the alloy completely unworkable (Fang, 2004, 21;
Scott, 2002, 402).
The α- and δ-phases are the only phases likely to be encountered in most binary
archaeological bronzes without the use of quenching (which can lead to β-phase in
high-tin bronze), and the majority of archaeological bronzes feature primarily α-phase
(Fang, 2004, 20; Sidot et al., 2001, 123). Other phases have been identified in high-tin
bronzes but are less of a concern when dealing with Anglo-Saxon alloys (Fang and
McDonnell, 2011; Fang, 2004; Scott, 1991, 21).
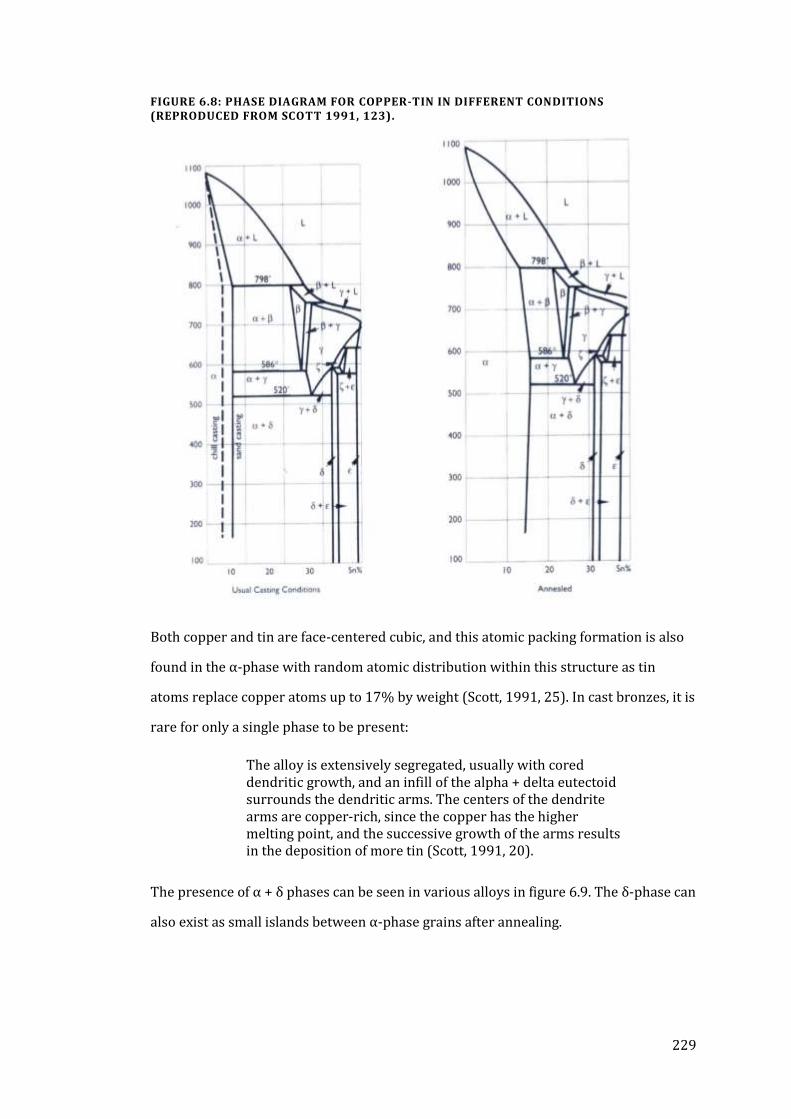
229
FIGURE 6.8: PHASE DIAGRAM FOR COPPER-TIN IN DIFFERENT CONDITIONS (REPRODUCED FROM SCOTT 1991, 123).
Both copper and tin are face-centered cubic, and this atomic packing formation is also
found in the α-phase with random atomic distribution within this structure as tin
atoms replace copper atoms up to 17% by weight (Scott, 1991, 25). In cast bronzes, it is
rare for only a single phase to be present:
The alloy is extensively segregated, usually with cored dendritic growth, and an infill of the alpha + delta eutectoid surrounds the dendritic arms. The centers of the dendrite arms are copper-rich, since the copper has the higher melting point, and the successive growth of the arms results in the deposition of more tin (Scott, 1991, 20).
The presence of α + δ phases can be seen in various alloys in figure 6.9. The δ-phase can
also exist as small islands between α-phase grains after annealing.
230
FIGURE 6.9: BRONZE MICROSTRUCTURES: TOP LEFT, 6% TIN BRONZE, QUENCHED; TOP RIGHT, 10% TIN BRONZE, QUENCHED; MIDDLE LEFT, 15% TIN BRONZE, AIR-COOLED; BOTTOM RIGHT, 45% REDUCTION FROM WORKING; BOTTOM LEFT, ANNEALED MICROSTRUCTURE (REPRODUCED FROM WANG AND OTTAWAY 2004, APPENDIX 1; IMAGE WIDTH 0.33MM FOR EACH).
231
This combination of α and δ microstructure is more significant in alloys containing
more than 10% tin, with a higher proportion of eutectoid existing in alloys with higher
tin content. The δ phase will also be more evident in alloys that have been quenched;
despite the fact that all tin can exist within the α-dendrites or grains when present in
quantities under 5%, if quenched eutectoid islands can still be found (figure 6.9, top
left). Microstructures with α + δ phase microstructures are also highly resistant to
corrosion (Chase and Franklin, 1979, 219).
In high-tin bronzes (~20% weight tin or higher) the δ-phase forms; this phase is ‘mid
grey-blue’ or ‘light blue’ in appearance (Fang, 2004, 20; Scott, 1991, 21). The δ-phase is
Cu31Sn8, with tin ranging from 32-33% weight (Fang, 2004, 20). At this concentration of
tin the reflectance curve has shifted towards universal reflectance in the visible
spectrum, with perhaps higher reflectance within the blue region.
The effect of annealing on colour was mentioned briefly above. In high tin bronze, this
saturation effect is likely due to the formation of yellow β-phase, which pulls the B* up
in particular (Fang and McDonnell 2011). In low-tin bronzes, annealing allows α-phase
grains to grow, which could increase hue saturation by reducing the presence of
eutectoid and the edge effects of smaller, stressed grains.
TIN CONTENT AND A*B* CHANGE
For the characterisation of the effects of specific alloying elements on copper colour,
only standards, metallographic samples and converted data from Fang (2011) were
used. Fang’s data was by far the most wide-ranging group with regular intervals
between increments of increased tin content, allowing for a trend line to be fit to the
data with a high correlation value (R2 = 0.985 for A* and 0.995 for B*). The other
sample types also fit this curve well, with slight variations occurring where small
amounts of other alloying components were present. Equations estimating the rate of
colour change at a given tin composition can be found in table 6.1.
A* values decrease quickly from pure copper as the reflectance of light becomes
uniformly high along the visible spectrum with the addition of tin (figure 6.10). As the
amount of tin increases and the alloy becomes whiter, this bleaching effect begins to
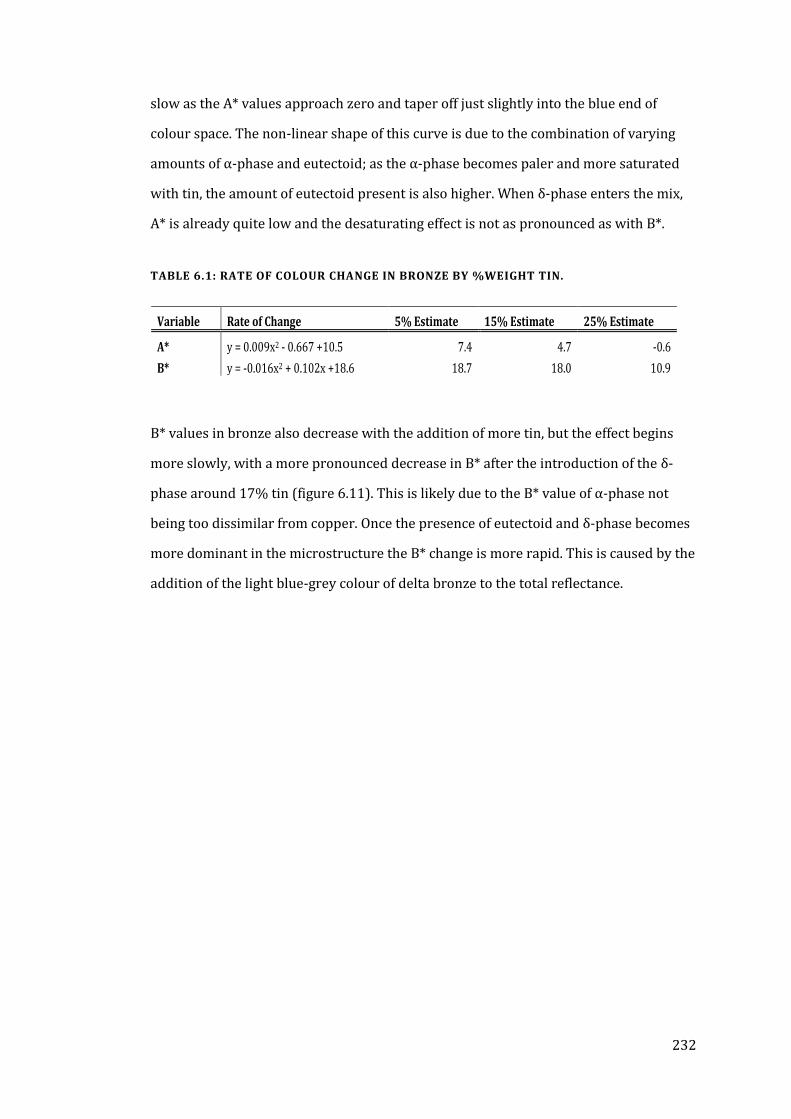
232
slow as the A* values approach zero and taper off just slightly into the blue end of
colour space. The non-linear shape of this curve is due to the combination of varying
amounts of α-phase and eutectoid; as the α-phase becomes paler and more saturated
with tin, the amount of eutectoid present is also higher. When δ-phase enters the mix,
A* is already quite low and the desaturating effect is not as pronounced as with B*.
TABLE 6.1: RATE OF COLOUR CHANGE IN BRONZE BY %WEIGHT TIN.
B* values in bronze also decrease with the addition of more tin, but the effect begins
more slowly, with a more pronounced decrease in B* after the introduction of the δ-
phase around 17% tin (figure 6.11). This is likely due to the B* value of α-phase not
being too dissimilar from copper. Once the presence of eutectoid and δ-phase becomes
more dominant in the microstructure the B* change is more rapid. This is caused by the
addition of the light blue-grey colour of delta bronze to the total reflectance.
Variable Rate of Change 5% Estimate 15% Estimate 25% Estimate
A* y = 0.009x2 - 0.667 +10.5 7.4 4.7 -0.6
B* y = -0.016x2 + 0.102x +18.6 18.7 18.0 10.9
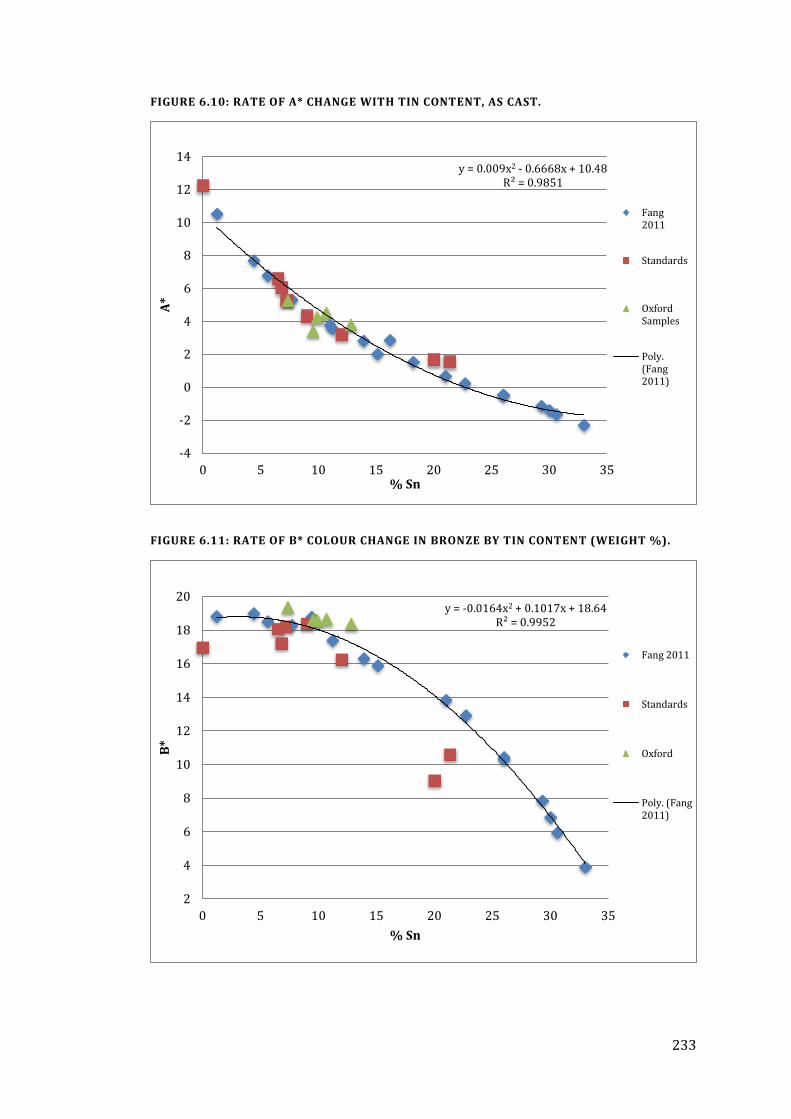
233
FIGURE 6.10: RATE OF A* CHANGE WITH TIN CONTENT, AS CAST.
FIGURE 6.11: RATE OF B* COLOUR CHANGE IN BRONZE BY TIN CONTENT (WEIGHT %).
y = 0.009x2 - 0.6668x + 10.48 R² = 0.9851
-4
-2
0
2
4
6
8
10
12
14
0 5 10 15 20 25 30 35
A*
% Sn
Fang2011
Standards
OxfordSamples
Poly.(Fang2011)
y = -0.0164x2 + 0.1017x + 18.64 R² = 0.9952
2
4
6
8
10
12
14
16
18
20
0 5 10 15 20 25 30 35
B*
% Sn
Fang 2011
Standards
Oxford
Poly. (Fang2011)
234
COPPER-ZINC
Zinc is the other major alloying component of copper and brass has been popular
throughout history for its distinctive golden colour. Zinc is itself a white metal, but in
the ancient world it could only be alloyed with copper either as part of an ore through
the cementation process or if it was naturally occurring in the copper ore itself and
processed in covered crucibles. Zinc has about half the alloying effect on copper as tin
and therefore is usually found in larger quantities, with most archaeological brasses
having 10-25% zinc (Bayley 1988, 8). However, in Anglo-Saxon England the technology
of the cementation process was lost and there are very few instances of artefacts with
zinc at these levels, and those that are brasses are often identifiable as continental
imports.
Cementation has an upper limit of zinc absorption into copper around 30% weight zinc
(Newbury et al., 2005, 80). The copper-rich α-phase is therefore the only phase of
interest archaeologically (figure 6.12; Bauccio, 1993, v.3, 780). As with tin, brass with
less than 35% Zn is comprised of an α-phase, which forms as zinc replaces copper in
the FCC matrix; this phase becomes yellower the more zinc is present. Unlike tin, the
nature of the colour change from this zinc replacement shifts the reflection edge into
the yellow region of the visible spectrum; the more zinc is present in the alloy, the more
this shift occurs. In brass containing more than about 22% zinc, the A* value drops into
negative numbers, meaning that the colour being reflected has a slight greenish tinge
quite similar to gold-silver alloys containing 20-30% silver. Again, this is due to the
shift of the reflection edge farther into the yellow-green region of visible light.
From observation of the colour of modern copper-zinc alloys above the ancient limit of
c.30% Zn, it is clear that the addition of a β-phase changes the degree by which the
alloy becomes yellower and less red; however, as this area is not of interest for this
study nor were there enough modern brasses available to accurately quantify this
effect, nothing further will be ventured on that subject.
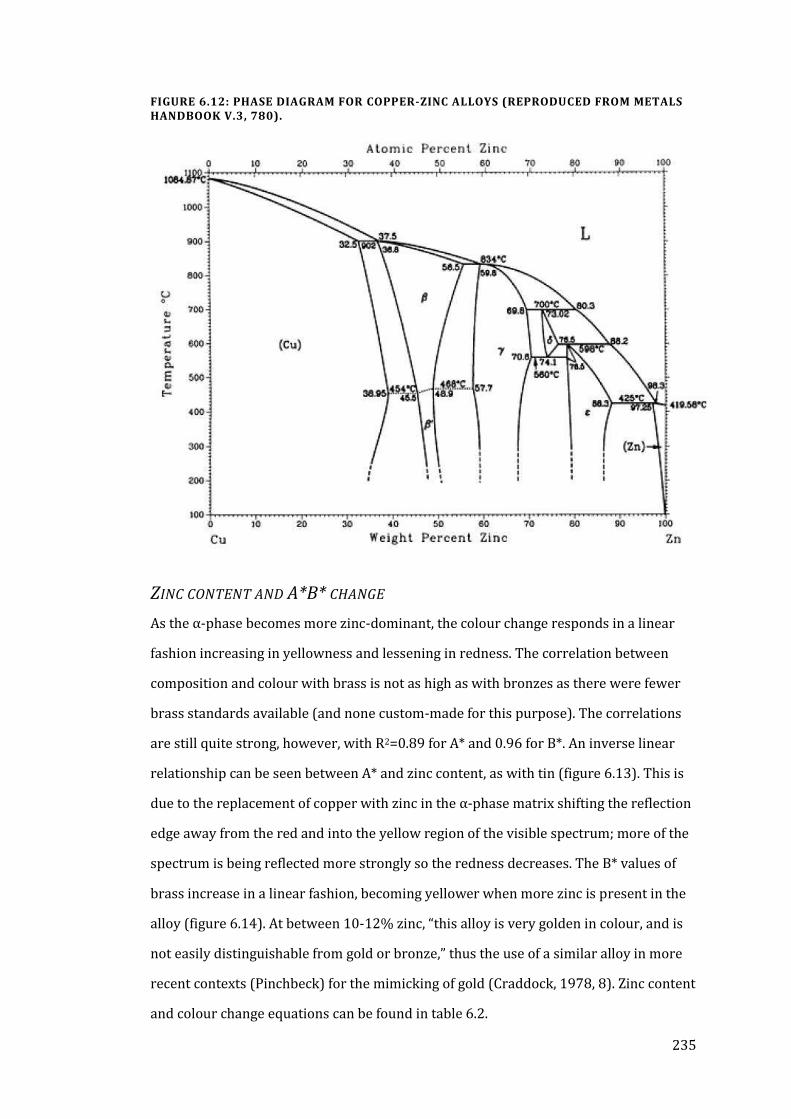
235
FIGURE 6.12: PHASE DIAGRAM FOR COPPER-ZINC ALLOYS (REPRODUCED FROM METALS HANDBOOK V.3, 780).
ZINC CONTENT AND A*B* CHANGE
As the α-phase becomes more zinc-dominant, the colour change responds in a linear
fashion increasing in yellowness and lessening in redness. The correlation between
composition and colour with brass is not as high as with bronzes as there were fewer
brass standards available (and none custom-made for this purpose). The correlations
are still quite strong, however, with R2=0.89 for A* and 0.96 for B*. An inverse linear
relationship can be seen between A* and zinc content, as with tin (figure 6.13). This is
due to the replacement of copper with zinc in the α-phase matrix shifting the reflection
edge away from the red and into the yellow region of the visible spectrum; more of the
spectrum is being reflected more strongly so the redness decreases. The B* values of
brass increase in a linear fashion, becoming yellower when more zinc is present in the
alloy (figure 6.14). At between 10-12% zinc, “this alloy is very golden in colour, and is
not easily distinguishable from gold or bronze,” thus the use of a similar alloy in more
recent contexts (Pinchbeck) for the mimicking of gold (Craddock, 1978, 8). Zinc content
and colour change equations can be found in table 6.2.
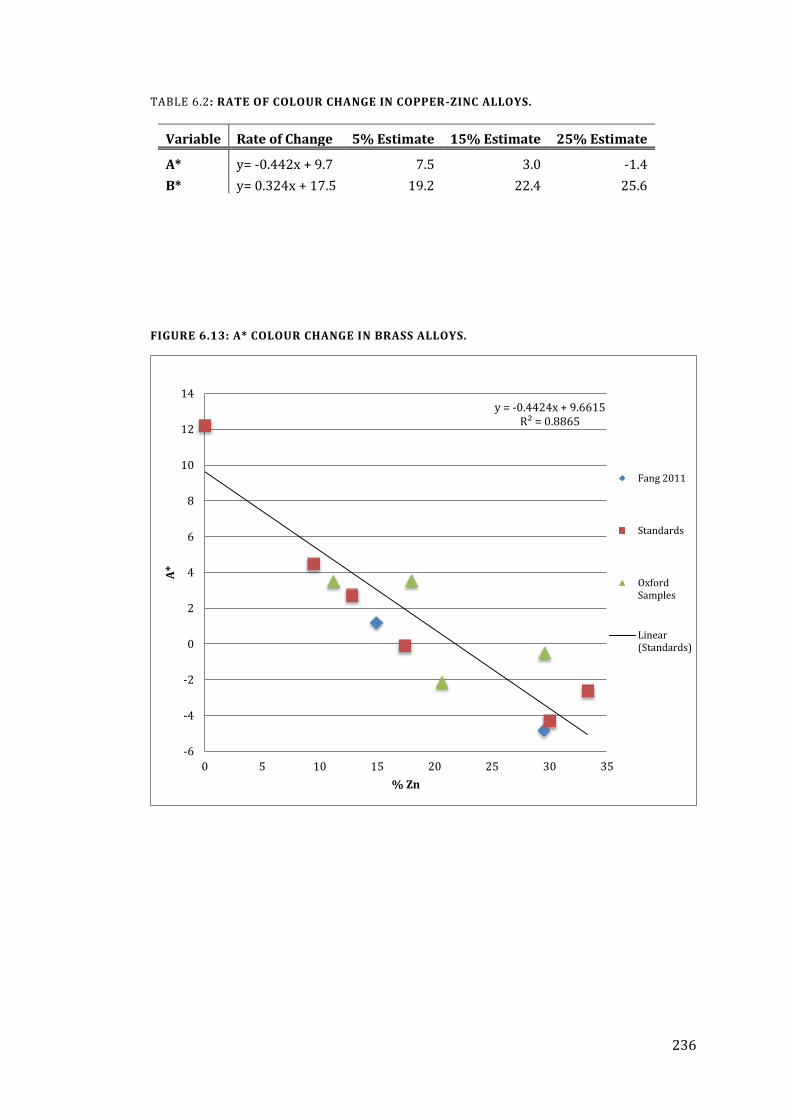
236
TABLE 6.2: RATE OF COLOUR CHANGE IN COPPER-ZINC ALLOYS.
FIGURE 6.13: A* COLOUR CHANGE IN BRASS ALLOYS.
Variable Rate of Change 5% Estimate 15% Estimate 25% Estimate
A* y= -0.442x + 9.7 7.5 3.0 -1.4
B* y= 0.324x + 17.5 19.2 22.4 25.6
y = -0.4424x + 9.6615 R² = 0.8865
-6
-4
-2
0
2
4
6
8
10
12
14
0 5 10 15 20 25 30 35
A*
% Zn
Fang 2011
Standards
OxfordSamples
Linear(Standards)
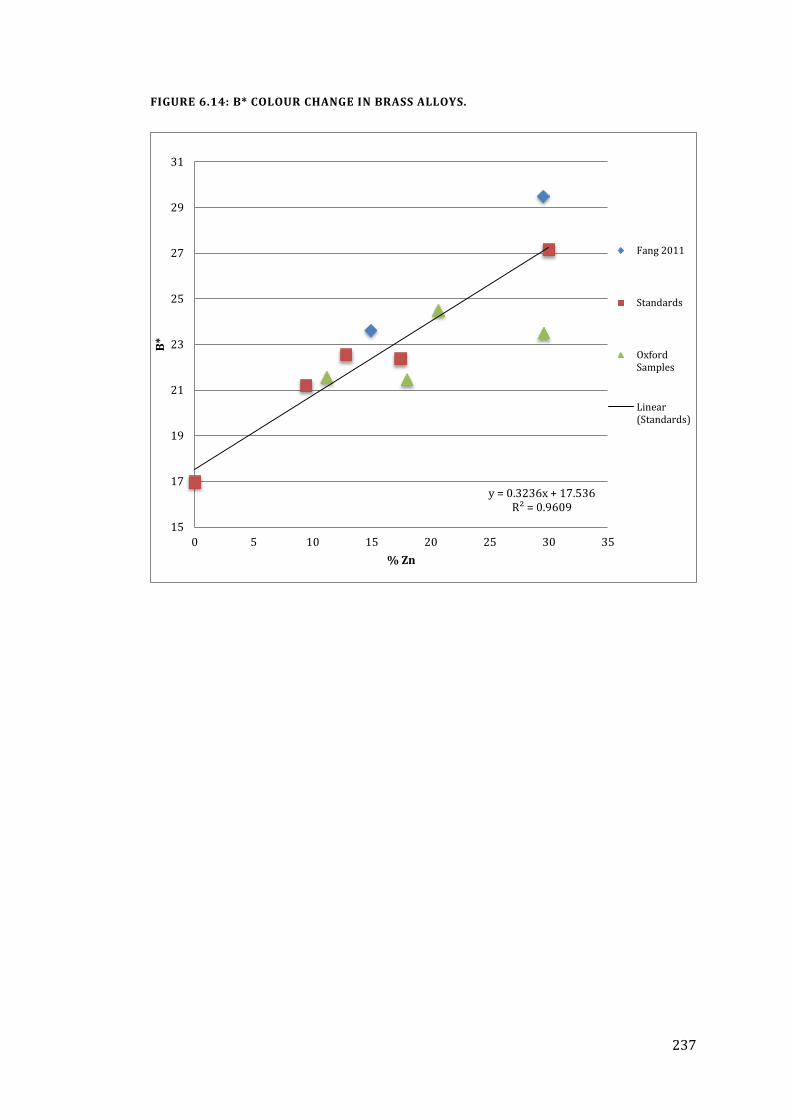
237
FIGURE 6.14: B* COLOUR CHANGE IN BRASS ALLOYS.
y = 0.3236x + 17.536 R² = 0.9609
15
17
19
21
23
25
27
29
31
0 5 10 15 20 25 30 35
B*
% Zn
Fang 2011
Standards
OxfordSamples
Linear(Standards)
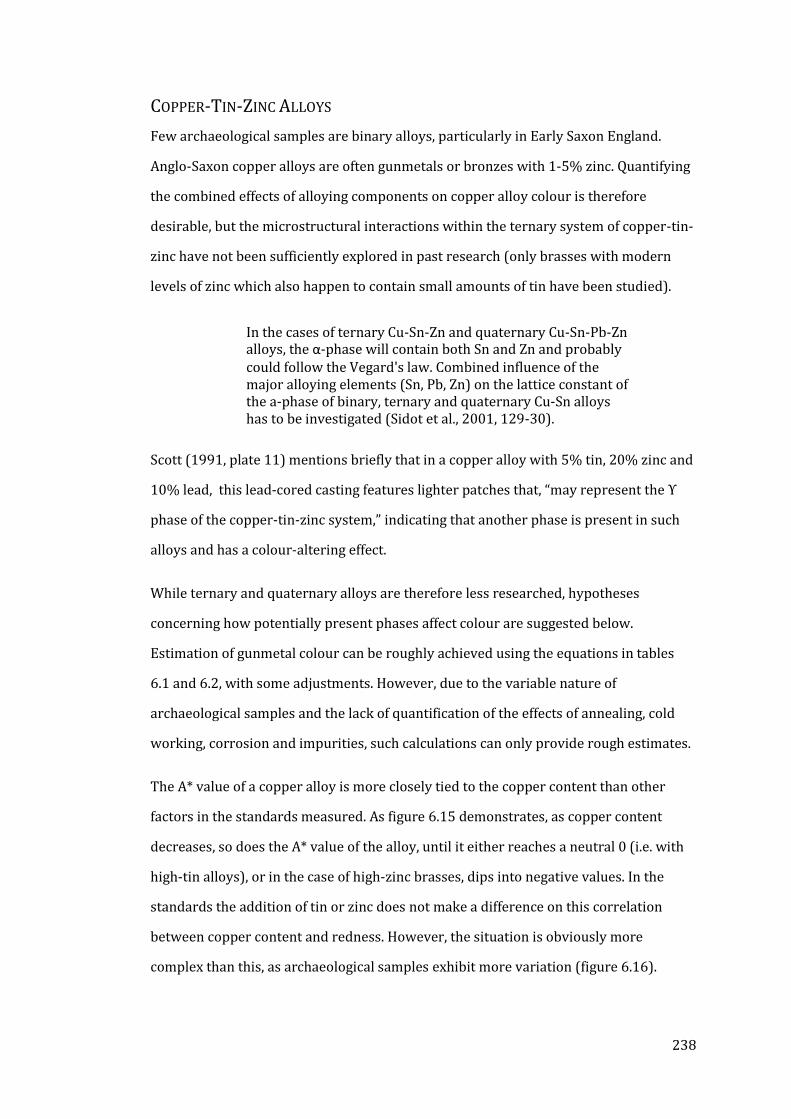
238
COPPER-TIN-ZINC ALLOYS
Few archaeological samples are binary alloys, particularly in Early Saxon England.
Anglo-Saxon copper alloys are often gunmetals or bronzes with 1-5% zinc. Quantifying
the combined effects of alloying components on copper alloy colour is therefore
desirable, but the microstructural interactions within the ternary system of copper-tin-
zinc have not been sufficiently explored in past research (only brasses with modern
levels of zinc which also happen to contain small amounts of tin have been studied).
In the cases of ternary Cu-Sn-Zn and quaternary Cu-Sn-Pb-Zn alloys, the α-phase will contain both Sn and Zn and probably could follow the Vegard's law. Combined influence of the major alloying elements (Sn, Pb, Zn) on the lattice constant of the a-phase of binary, ternary and quaternary Cu-Sn alloys has to be investigated (Sidot et al., 2001, 129-30).
Scott (1991, plate 11) mentions briefly that in a copper alloy with 5% tin, 20% zinc and
10% lead, this lead-cored casting features lighter patches that, “may represent the ϒ
phase of the copper-tin-zinc system,” indicating that another phase is present in such
alloys and has a colour-altering effect.
While ternary and quaternary alloys are therefore less researched, hypotheses
concerning how potentially present phases affect colour are suggested below.
Estimation of gunmetal colour can be roughly achieved using the equations in tables
6.1 and 6.2, with some adjustments. However, due to the variable nature of
archaeological samples and the lack of quantification of the effects of annealing, cold
working, corrosion and impurities, such calculations can only provide rough estimates.
The A* value of a copper alloy is more closely tied to the copper content than other
factors in the standards measured. As figure 6.15 demonstrates, as copper content
decreases, so does the A* value of the alloy, until it either reaches a neutral 0 (i.e. with
high-tin alloys), or in the case of high-zinc brasses, dips into negative values. In the
standards the addition of tin or zinc does not make a difference on this correlation
between copper content and redness. However, the situation is obviously more
complex than this, as archaeological samples exhibit more variation (figure 6.16).
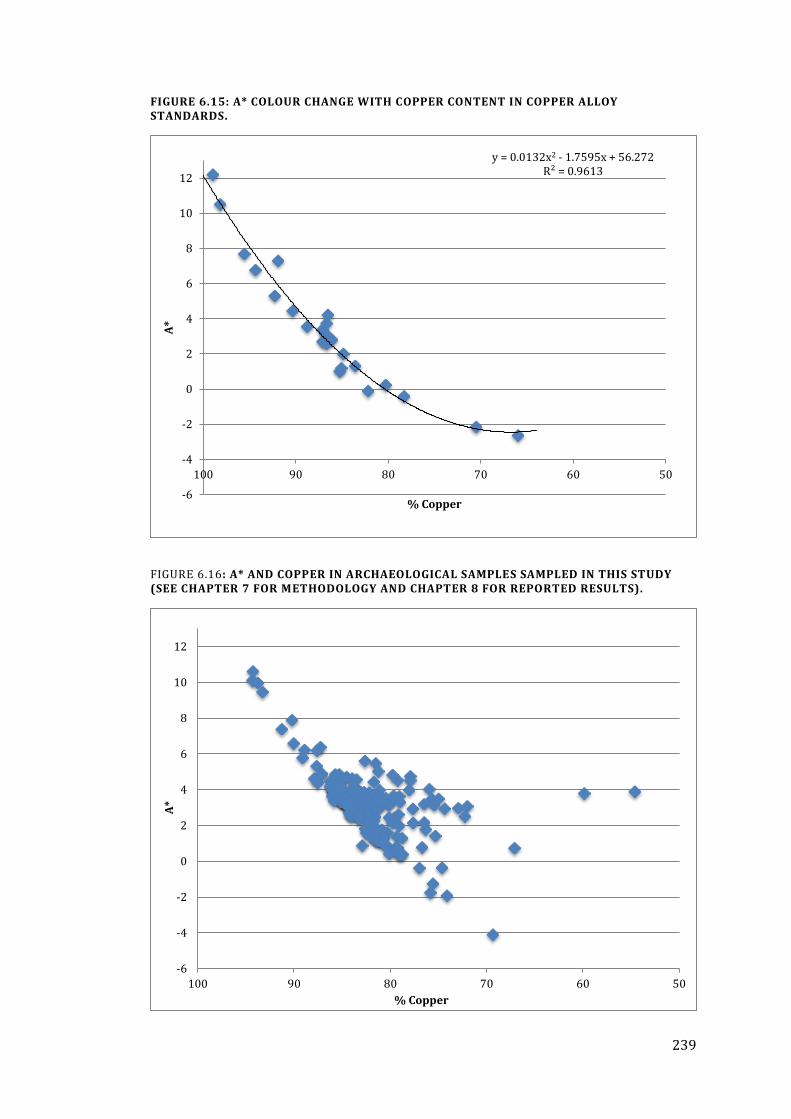
239
FIGURE 6.15: A* COLOUR CHANGE WITH COPPER CONTENT IN COPPER ALLOY STANDARDS.
FIGURE 6.16: A* AND COPPER IN ARCHAEOLOGICAL SAMPLES SAMPLED IN THIS STUDY (SEE CHAPTER 7 FOR METHODOLOGY AND CHAPTER 8 FOR REPORTED RESULTS).
y = 0.0132x2 - 1.7595x + 56.272 R² = 0.9613
-6
-4
-2
0
2
4
6
8
10
12
5060708090100
A*
% Copper
-6
-4
-2
0
2
4
6
8
10
12
5060708090100
A*
% Copper
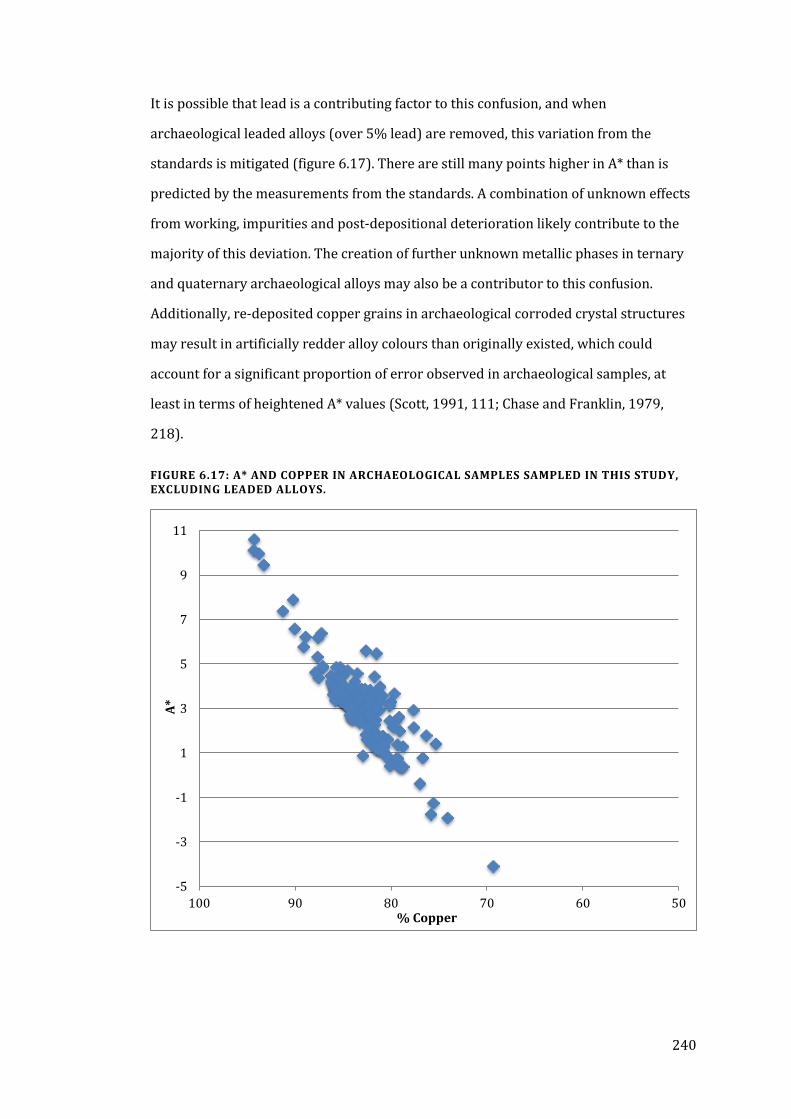
240
It is possible that lead is a contributing factor to this confusion, and when
archaeological leaded alloys (over 5% lead) are removed, this variation from the
standards is mitigated (figure 6.17). There are still many points higher in A* than is
predicted by the measurements from the standards. A combination of unknown effects
from working, impurities and post-depositional deterioration likely contribute to the
majority of this deviation. The creation of further unknown metallic phases in ternary
and quaternary archaeological alloys may also be a contributor to this confusion.
Additionally, re-deposited copper grains in archaeological corroded crystal structures
may result in artificially redder alloy colours than originally existed, which could
account for a significant proportion of error observed in archaeological samples, at
least in terms of heightened A* values (Scott, 1991, 111; Chase and Franklin, 1979,
218).
FIGURE 6.17: A* AND COPPER IN ARCHAEOLOGICAL SAMPLES SAMPLED IN THIS STUDY, EXCLUDING LEADED ALLOYS.
-5
-3
-1
1
3
5
7
9
11
5060708090100
A*
% Copper
241
The B* value of a copper alloy is dependent on the relative quantities of tin and zinc
present. Zinc increases B* roughly twice as much as tin reduces it when tin quantities
are under 15%. Fang noted that, “the effect of zinc additions on the colour is more
significant in the 4% tin gunmetals than in the 10% tin samples” (2011, 57), perhaps as
more α-brass is present, causing it to be more yellow, while there is little tin to
counteract this by pulling the B* values down. In 10% tin gunmetals, the less saturated
bronze component is more dominant and the addition of yellow brass to the mix only
reduces this desaturation in B* slightly. As the quantities of zinc and tin, the degree to
which each component yellows or blues the combined colour, and therefore the effect
of each relative to each other vary considerably in gunmetals, the situation can quickly
become complicated. The B* of gunmetals (and leaded gunmetals) can be roughly
estimated in the following manner:
Where B*Sn and B*Zn are first calculated from the equations in tables 6.1 and 6.2. For
most samples, this equation will provide a B* value ± 2 (2σ) of the actual colour.
However, if the total quantity of alloying components is more than 25% of the alloy, the
variation in colour can be larger.
If we consider how the addition of multiple alloying components affects the metal
structure, the reason for this is clear. The α-phase of bronze can absorb all tin up until
about 15% weight tin (although the δ-phase can appear at lower quantities as well),
and the α-phase of brass can contain about 30% zinc; in ternary alloys the α-phase
contains both zinc and tin (Sidot et al., 2001, 129). When both tin and zinc are present,
both replace copper within the FCC structure and form α-phases. As the copper can
only absorb so much of each, if certain quantities of either are present it can cause
other phases of brass and bronze to form at lower zinc or tin compositions
respectively. Additionally, if lead is present this can further shift these ratios as there is
more zinc or tin to replace the available copper.
(%wt Sn x B*Sn)+ (%wt Zn x B*Zn)
(%wt Sn+% wt Zn)
B* =
242
If the combined tin, zinc and lead component of an alloy is above about 25%, other
phases begin to influence the B* value and the error when using the above equation is
much higher. In gunmetals with fairly even quantities of tin and zinc, the actual B*
value will often (but not always) be about 2 units higher than the estimated value; this
could be due to the formation of some β-brass causing the yellowness to be higher than
with α-brass. If the alloying components are primarily zinc with a small amount of tin,
this often reduces the B* by up to 3 or 4 units; a small amount of tin has a more
significant whitening effect on brass than on copper, and thus could make an alloy
appear to be brassier than its zinc content would suggest.
The causes for these effects are not known though some potential reasons have been
suggested. There has been very little metallographic work done on gunmetals and the
copper-tin-zinc system and so the range of potential interactions between various
phases within this alloy group is unknown. Further research into this area, particularly
on already more variable archaeological examples, could help explain inconsistencies
and reduce errors in estimates of colour, but this is beyond the scope of this project.
COPPER-LEAD
Lead is a dullish blue-grey white metal and as such should be expected to desaturate
copper alloy colour and reduce L*. Lead is insoluble in copper beyond a few per cent by
weight and exists within the metal microstructure primarily as lead (and thus lead-
coloured) globules (figures 6.19 and 6.20). Alloys with more than 4% lead may
therefore experience some bluing, whitening or dulling in colour and reflectance. As
worked alloys seem to have a slight increase in saturation, the effect of lead on colour
may only be noticeable with high amounts of lead and/or with an as-cast or annealed
microstructure.
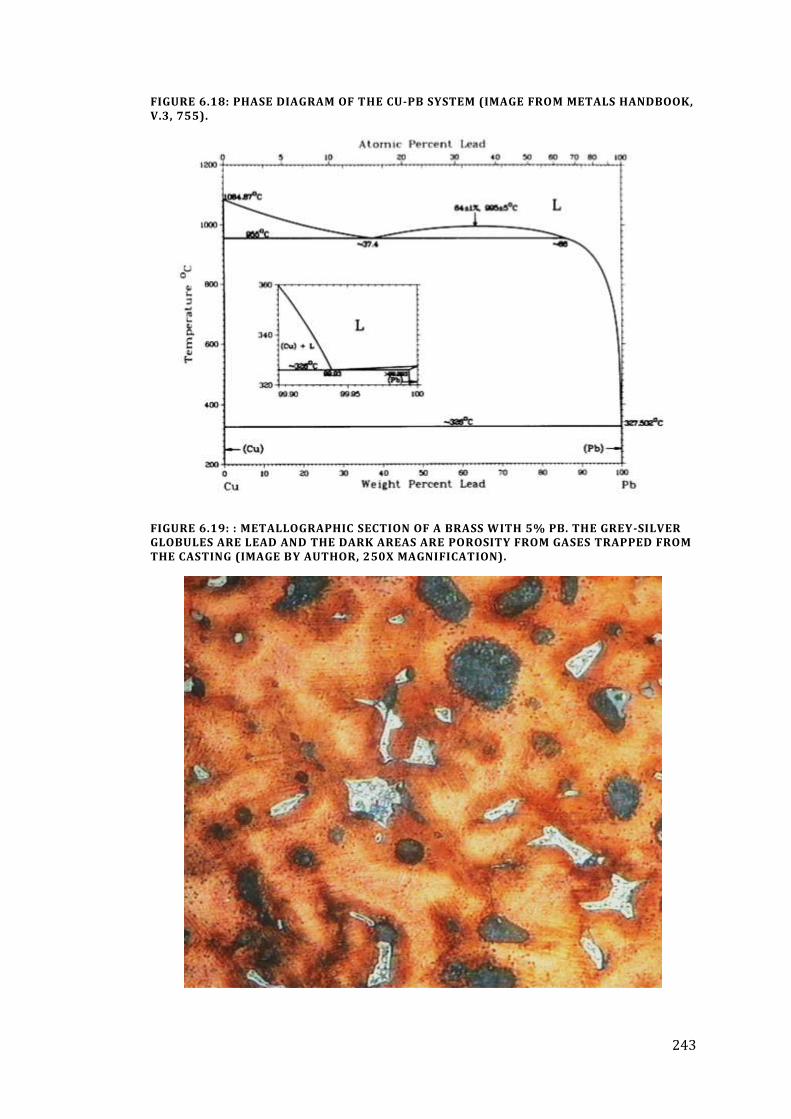
243
FIGURE 6.18: PHASE DIAGRAM OF THE CU-PB SYSTEM (IMAGE FROM METALS HANDBOOK, V.3, 755).
FIGURE 6.19: : METALLOGRAPHIC SECTION OF A BRASS WITH 5% PB. THE GREY-SILVER GLOBULES ARE LEAD AND THE DARK AREAS ARE POROSITY FROM GASES TRAPPED FROM THE CASTING (IMAGE BY AUTHOR, 250X MAGNIFICATION).
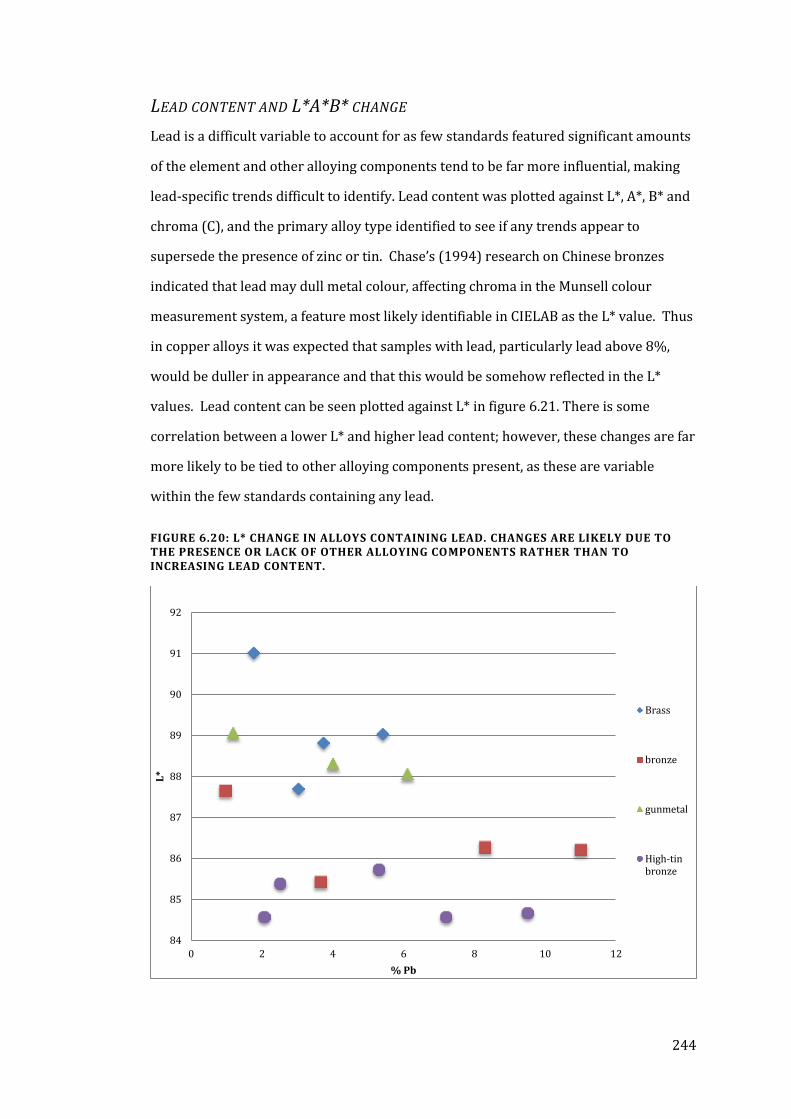
244
LEAD CONTENT AND L*A*B* CHANGE
Lead is a difficult variable to account for as few standards featured significant amounts
of the element and other alloying components tend to be far more influential, making
lead-specific trends difficult to identify. Lead content was plotted against L*, A*, B* and
chroma (C), and the primary alloy type identified to see if any trends appear to
supersede the presence of zinc or tin. Chase’s (1994) research on Chinese bronzes
indicated that lead may dull metal colour, affecting chroma in the Munsell colour
measurement system, a feature most likely identifiable in CIELAB as the L* value. Thus
in copper alloys it was expected that samples with lead, particularly lead above 8%,
would be duller in appearance and that this would be somehow reflected in the L*
values. Lead content can be seen plotted against L* in figure 6.21. There is some
correlation between a lower L* and higher lead content; however, these changes are far
more likely to be tied to other alloying components present, as these are variable
within the few standards containing any lead.
FIGURE 6.20: L* CHANGE IN ALLOYS CONTAINING LEAD. CHANGES ARE LIKELY DUE TO THE PRESENCE OR LACK OF OTHER ALLOYING COMPONENTS RATHER THAN TO INCREASING LEAD CONTENT.
84
85
86
87
88
89
90
91
92
0 2 4 6 8 10 12
L*
% Pb
Brass
bronze
gunmetal
High-tinbronze
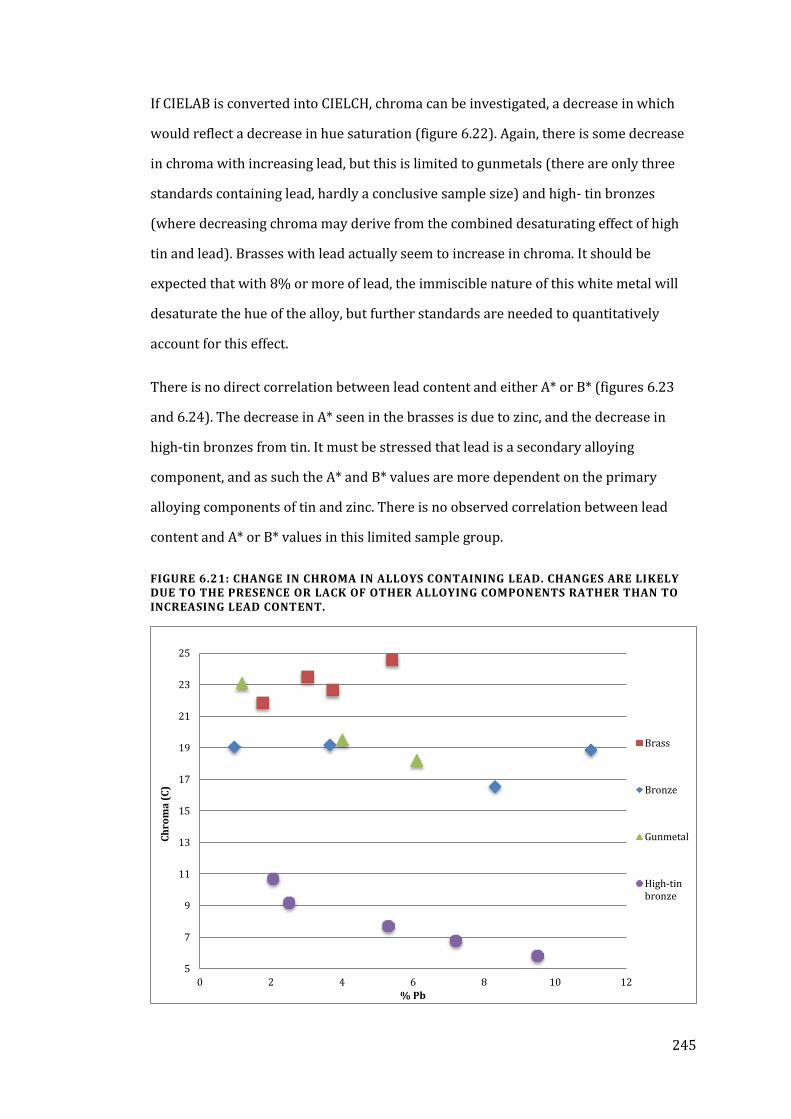
245
If CIELAB is converted into CIELCH, chroma can be investigated, a decrease in which
would reflect a decrease in hue saturation (figure 6.22). Again, there is some decrease
in chroma with increasing lead, but this is limited to gunmetals (there are only three
standards containing lead, hardly a conclusive sample size) and high- tin bronzes
(where decreasing chroma may derive from the combined desaturating effect of high
tin and lead). Brasses with lead actually seem to increase in chroma. It should be
expected that with 8% or more of lead, the immiscible nature of this white metal will
desaturate the hue of the alloy, but further standards are needed to quantitatively
account for this effect.
There is no direct correlation between lead content and either A* or B* (figures 6.23
and 6.24). The decrease in A* seen in the brasses is due to zinc, and the decrease in
high-tin bronzes from tin. It must be stressed that lead is a secondary alloying
component, and as such the A* and B* values are more dependent on the primary
alloying components of tin and zinc. There is no observed correlation between lead
content and A* or B* values in this limited sample group.
FIGURE 6.21: CHANGE IN CHROMA IN ALLOYS CONTAINING LEAD. CHANGES ARE LIKELY DUE TO THE PRESENCE OR LACK OF OTHER ALLOYING COMPONENTS RATHER THAN TO INCREASING LEAD CONTENT.
5
7
9
11
13
15
17
19
21
23
25
0 2 4 6 8 10 12
Ch
rom
a (
C)
% Pb
Brass
Bronze
Gunmetal
High-tinbronze
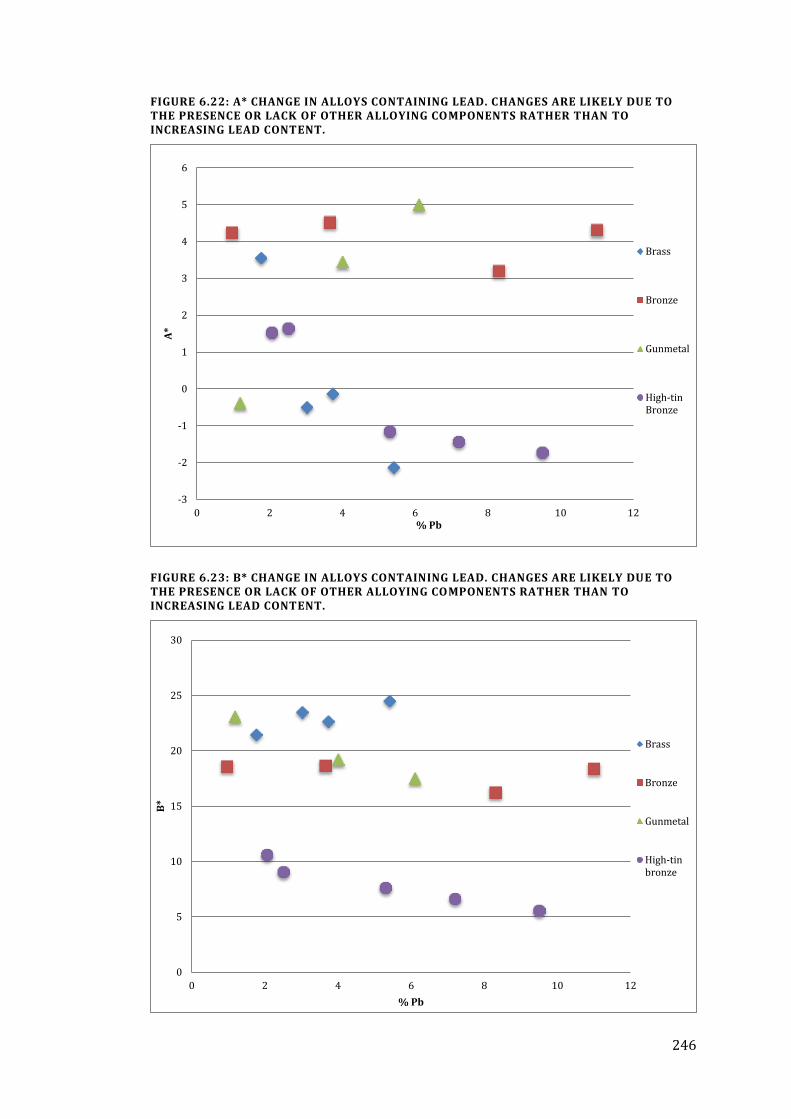
246
FIGURE 6.22: A* CHANGE IN ALLOYS CONTAINING LEAD. CHANGES ARE LIKELY DUE TO THE PRESENCE OR LACK OF OTHER ALLOYING COMPONENTS RATHER THAN TO INCREASING LEAD CONTENT.
FIGURE 6.23: B* CHANGE IN ALLOYS CONTAINING LEAD. CHANGES ARE LIKELY DUE TO THE PRESENCE OR LACK OF OTHER ALLOYING COMPONENTS RATHER THAN TO INCREASING LEAD CONTENT.
-3
-2
-1
0
1
2
3
4
5
6
0 2 4 6 8 10 12
A*
% Pb
Brass
Bronze
Gunmetal
High-tinBronze
0
5
10
15
20
25
30
0 2 4 6 8 10 12
B*
% Pb
Brass
Bronze
Gunmetal
High-tinbronze
247
IRON IN COPPER ALLOYS
Iron is not an element usually encountered in modern copper alloys but it can occur as
an impurity or more typically as an indicator of corrosion and the inclusion of soil
components in archaeological composition data. In order to account for the potential
colour effect of iron on archaeological samples copper coins with only iron impurities
were measured with the spectrophotometer. Like lead, iron is not soluble in copper
above a few per cent and even then only at high melting temperatures (figure 6.25).
However, iron is not usually found in archaeological samples above about 1% so iron, if
included in the melting process, would exist within the copper crystal matrix and
perhaps have a slight desaturating colour effect, in that its inclusion would disrupt the
structure and move the reflectance curve towards more reflection of white light.
It is likely that most instances of significant iron (above 1%) found in archaeological
metals is the result of corrosion processes, as corrosion products fill structural gaps
where metal has corroded out, in which case iron would be present in mineral form.
Iron oxides would affect the colour very differently than iron metal, possibly reddening
and dulling the appearance as less light would be reflected than from metal (figure
6.26). If present as iron oxides, the colour effect could be an increase in A* as rust
would contribute towards reddening the alloy. However, in practice the interference in
the copper matrix may be more significant as A* reduction with iron content is often
observed (figure 6.27).
IRON CONTENT AND L*A*B* CHANGE
Pure copper coins with iron impurities were used to measure change in colour from
iron. The colour change effect of a few per cent of iron on copper can be seen in figures
6.25-27. There are only a few data points but there is a strong indication of a
significant and dramatic inverse correlation between iron content and L*, A* and B*. L*
decreases the most per weight per cent of iron, and A* the least, unsurprising given the
relationship between A* and copper content in other alloys. This desaturation should
be the result of the inclusion of iron as a metal rather than as corrosion products,
however, the rapid decrease in L* in these samples may indicate that the iron is present
as corrosion. In table 6.3 the change in colour for copper with iron is roughly
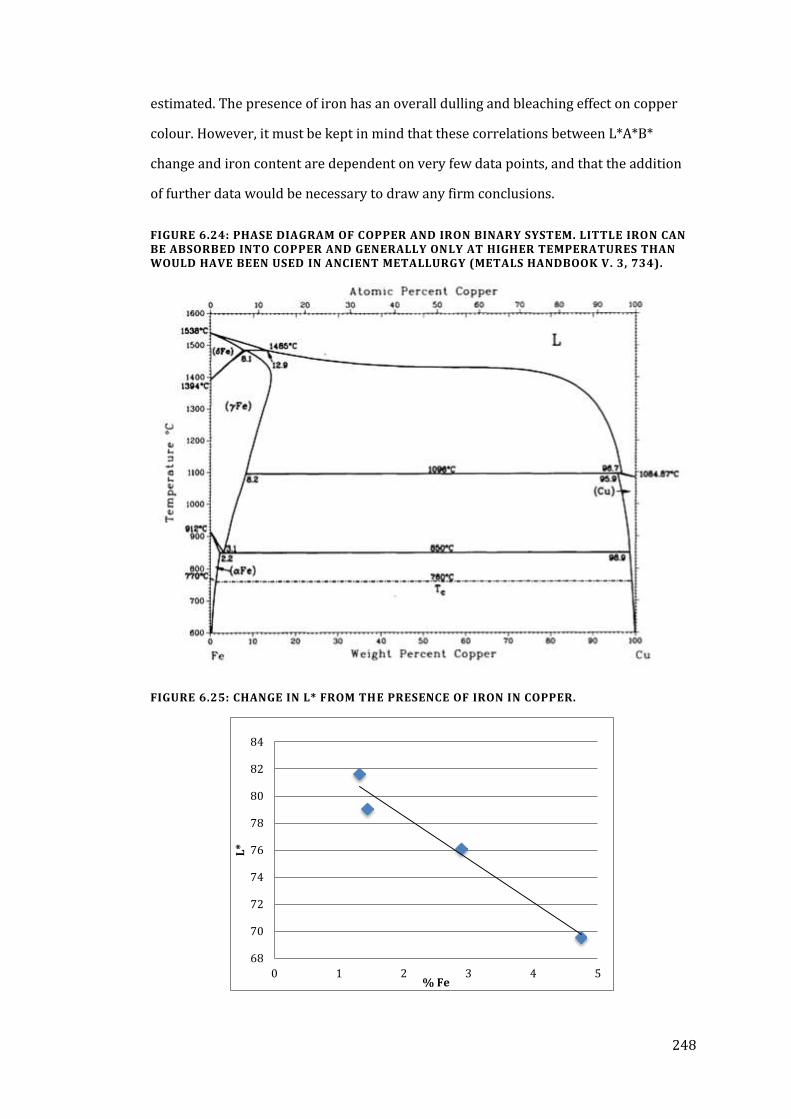
248
estimated. The presence of iron has an overall dulling and bleaching effect on copper
colour. However, it must be kept in mind that these correlations between L*A*B*
change and iron content are dependent on very few data points, and that the addition
of further data would be necessary to draw any firm conclusions.
FIGURE 6.24: PHASE DIAGRAM OF COPPER AND IRON BINARY SYSTEM. LITTLE IRON CAN BE ABSORBED INTO COPPER AND GENERALLY ONLY AT HIGHER TEMPERATURES THAN WOULD HAVE BEEN USED IN ANCIENT METALLURGY (METALS HANDBOOK V. 3, 734).
FIGURE 6.25: CHANGE IN L* FROM THE PRESENCE OF IRON IN COPPER.
68
70
72
74
76
78
80
82
84
0 1 2 3 4 5
L*
% Fe
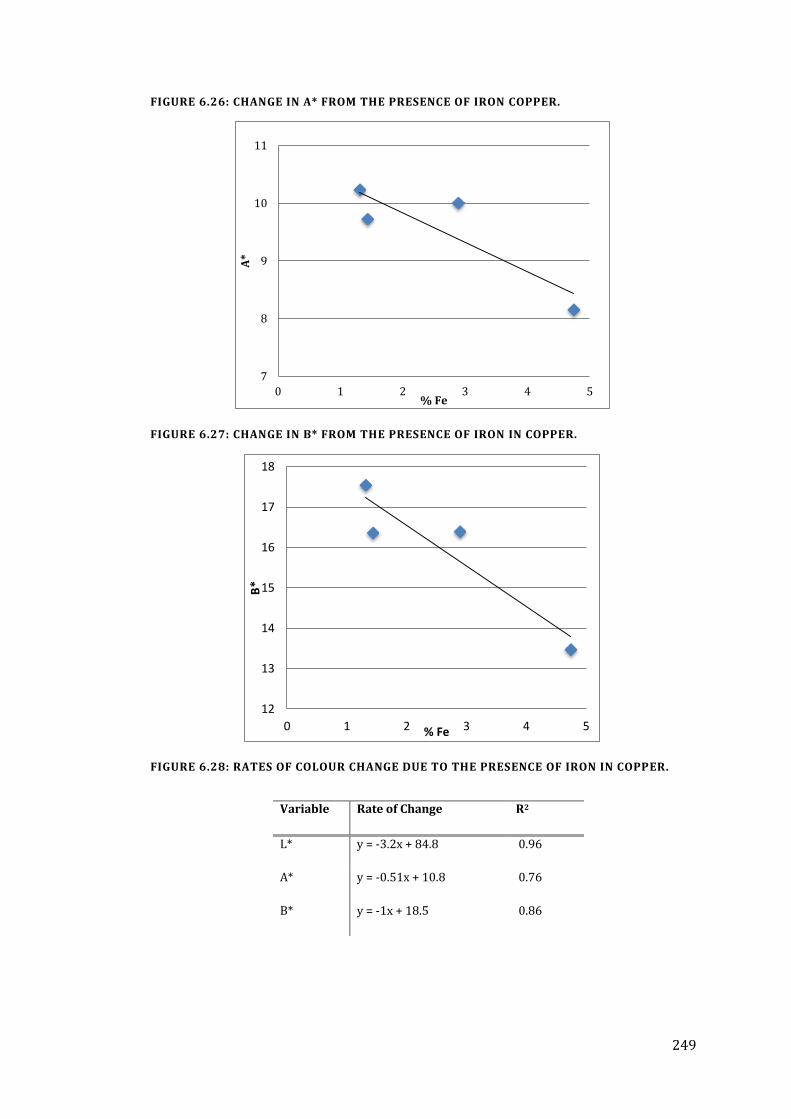
249
FIGURE 6.26: CHANGE IN A* FROM THE PRESENCE OF IRON COPPER.
FIGURE 6.27: CHANGE IN B* FROM THE PRESENCE OF IRON IN COPPER.
FIGURE 6.28: RATES OF COLOUR CHANGE DUE TO THE PRESENCE OF IRON IN COPPER.
7
8
9
10
11
0 1 2 3 4 5
A*
% Fe
12
13
14
15
16
17
18
0 1 2 3 4 5
B*
% Fe
Variable Rate of Change R2
L* y = -3.2x + 84.8 0.96
A* y = -0.51x + 10.8 0.76
B* y = -1x + 18.5 0.86
250
OTHER ELEMENTS AND L*A*B* CHANGE
Few elements besides those already discussed will be present above 0.5-1% in most
Anglo-Saxon copper alloys. However, archaeological material often contains
impurities, and it is possible that various other elements such as arsenic, gold and
silver may appear in an alloy as a result of recycling old material that either contained
that element or was decoratively treated. Nickel is often present in trace amounts
higher than is usually found in modern copper alloys and nickel has significant
bleaching and dulling effects in 2%-5% amounts in gold (Saeger and Rodies, 1977, 12).
Nickel often appears as a trace element in archaeological material in larger quantities
than would be seen in modern material unless deliberately added. It appears in one
leaded bronze standard at about 2.2% and may decrease the B* value by 2 or 3, though
the leaded bronzes are a varied group. In most samples, however, the nickel content
will be well below 1% and should not contribute significantly to the colour of the alloy.
Some elements, such as phosphorous and aluminium appear in small amounts in
modern copper alloys but are highly unlikely to be encountered in archaeological
contexts. In general, it is good to have an understanding of how these can alter colour,
though in practical terms this knowledge may not be necessary. Briefly, phosphorus
appears in only one standard with 0.7% phosphorous in an otherwise bronze alloy.
The L*A*B* values of this sample are not different in any perceivable way from the
other bronzes, so no significant colour change from the addition of phosphorous is
suspected. Aluminium appears in significant amounts in four standards, and in these
the A* values appear normal when compared to similar alloys without aluminium, and
perhaps slightly raised in B*.
In addition to the effects of corrosion on copper crystal re-deposition, archaeological
samples feature potentially significant colour-changing inclusions as impurities. The
form of interaction between impurities in general and archaeological copper alloy
metal is often in the form of slag particles, which may disrupt the unit cell. Such
particles interrupt colour reflectance by forming dark and unreflecting gaps between
metal crystals; however, a more significant potential interruption of the crystal
251
structure occurs from gaps forms by gases trapped during casting, such as in figure
6.20. The nature of colour change as a result of impurities and porosity has not yet
been quantified; it is likely that the greatest change is in lowering L*, as heavily
corroded metals (i.e. those containing less reflective metal) display this trend.
Saturation and (more often) desaturation effects could also occur; the largest
contributor to colour data deviating from those patterns established on standards
could be the effect of such impurities. Quantifying these various effects and further
metallography is especially important as shifts in crystal structure and phase
separations, which could significantly affect colour, may also occur in archaeological
metal alloys over time (Seruya and Griffiths, 1997, 132).
252
TARNISH
‘Tarnish’ refers to the thin layer of corrosion usually comprised of oxides that forms on
exposed metal surfaces. Tarnish can be desirable as the formation of such a patina can
allow passivating minerals to form, preventing further corrosion. Tarnish in the form of
a ‘patina’ can also be an aesthetic addition to an object, as it can be formed by minerals
of a variety of colours. The metal colour discussion thus far has focused on the
appearance of freshly polished copper alloy samples. Polished samples were used as a
reproducible colour baseline because when metal surfaces begin to oxidise even a thin
oxide layer can significantly affect the reflectance of light and therefore the colour.
While a freshly-polished appearance is unlikely for used objects, it would also not
necessarily be the most ideal in terms of colour. The colour of the metal appears more
saturated with a thin layer of tarnish, which could have increased the aesthetic appeal.
Understanding the extent and direction of colour change that occurs due to tarnish as
well as the rate at which tarnish accrues is important in understanding the actual seen
colour of copper alloys. This requires the identification of the various types of
corrosion products likely to have been developed on objects exposed to the air and
handling, and an estimation of how far this change may have been allowed to proceed
before being polished.
COMMON SHORT-TERM CORROSION PRODUCTS
While scientific analysis to identify the minerals in tarnish was not within the scope of
this project, discussing the potential minerals likely to be involved in tarnish is
important for understanding the changes in colour that occur through the oxidation of
the metal surface. The formation of mineral compounds on the metal-air interface
interferes with the reflectivity of the metal surface. The colour of the corrosion
products present, their thickness and opacity, and the degree to which they reflect light
rather than the metal itself will alter the total reflectance and the perceived colour of
the object.
Common copper corrosion products range in colour from red to black, green, blue and
brown, but not all of these will form as ‘tarnish’. Cuprite (Cu2O) is the first copper
253
mineral to form from oxidation of the metal surface and is red in colour (Robbiola et al.,
1998, 2104; Chase and Franklin, 1979, 218). Common tin corrosion forms range in
colour from black (SnO, SnS) to white (Sn3O2(OH)2, SnO2), with grey and yellow brown
sulphides in between (Selwyn, 2004, 60). White-coloured cassiterite (SnO2) is the most
common of these and the first to form in oxidation of the metal surface (Robbiola et al.,
1998, 2104). All of the corrosion products of zinc are also white in colour, though the
likely mineral to form from surface oxidation is ZnO (Qiu and Leygraf, 2011, 1240;
Selwyn, 2004, 60). Lead is not present in large enough quantities to be likely to
contribute to the tarnish layer formation, though lead oxides are also white.
It seems that most alloying component corrosion products will therefore be white,
with possibly a yellowish contribution from tin sulphide (the presence of this pre-
modern air pollution seems unlikely). As copper is the primary component of the alloys
under discussion, it is likely that copper corrosion, specifically cuprite, will be the
largest contributor to the colour of the tarnish layer. The speed of cuprite and other
oxide formation will also be an important factor in understanding the actual perceived
colour of a copper alloy.
SHORT-TERM COLOUR CHANGE DUE TO TARNISH
The rate at which tarnish accrues and how this relates to mineral formation and colour
change are important variables to establish, particularly when discussing the probable
appearance of a copper alloy during its use. Short-term colour change from tarnish can
indicate which minerals are being formed and how quickly. Additionally, it is important
to note how significant colour change is immediately after a surface is polished for the
purposes of producing repeatable measurements from metal surfaces.
To monitor the rate and direction of colour change after polishing, copper (99% Cu),
bronze (10% Sn), and brass (17% Zn) standards were polished using 1 µm diamond
grit and immediately measured with the spectrophotometer. They were then re-
measured after 5 minutes, 10 minutes, 20 minutes, and then every 20 minutes
thereafter up to 200 minutes after initially polished. The changes in each variable from
254
the polished values were plotted against time to show the direction of colour change
(figures 6.29-6.31).
The relationship between the formation of tarnish and changes in colour are primarily
seen in the decrease in L* and increasing irregularity of the colour of the object surface
(thus the oscillations observed in the data – the formation of specific oxides will
depend on localised free energy). A* and B* both increase as L* decreases; as all tarnish
reduces reflectivity, this is demonstrated in reduced L*, while the hue becomes more
noticeable as a result of the accrual of coloured oxidation minerals. There appears to be
an inverse correlation with L* and A* B*; when L* decreases, A* and B* go up, but if a
measurement records a higher L* value, A* and B* decrease at that point. This is
particularly evident in the data recorded at 140 minutes for bronze and 160 minutes in
brass, but as the correlation is not exact throughout and the increase in B* is far more
than is seen in A*, the colour change must also be related to the growth of coloured
corrosion minerals. The observed increase in A* and B* are therefore partially related
to the formation of corrosion minerals on the metal-air interface.
A* increases in all samples by 0.5 CIELAB units, probably due to the formation of
cuprite. The increase in B* is more significant in the copper alloys than in pure copper,
indicating that a portion of this tarnish layer is comprised of SnO2 and ZnO respectively,
rather than only cuprite. However, the similarity in direction and magnitude of change
implies that the primary corrosion product present is cuprite, with only some of the
increase in yellowness deriving from tin and zinc corrosion products. Rather than any
of these minerals being yellow, the increase in yellow reflectance can be accounted for
by a shift in the reflectance curve towards more uniform wavelength reflectance as is
seen in copper-zinc alloys.
Using error margins (L* 0.9, A* 0.2, B* 0.4; Chapter 7) and what the average human
viewer can detect as different (Chapter 5, about 2 CIELAB unit between A* and B*),
colour change from tarnish is significant after 100 minutes for copper, 80 minutes for
bronze, but in only about 15 minutes on brass as B* initially increases much faster.
Thus measuring copper alloy colour immediately after polishing is necessary in order
to avoid significant variations from tarnish.
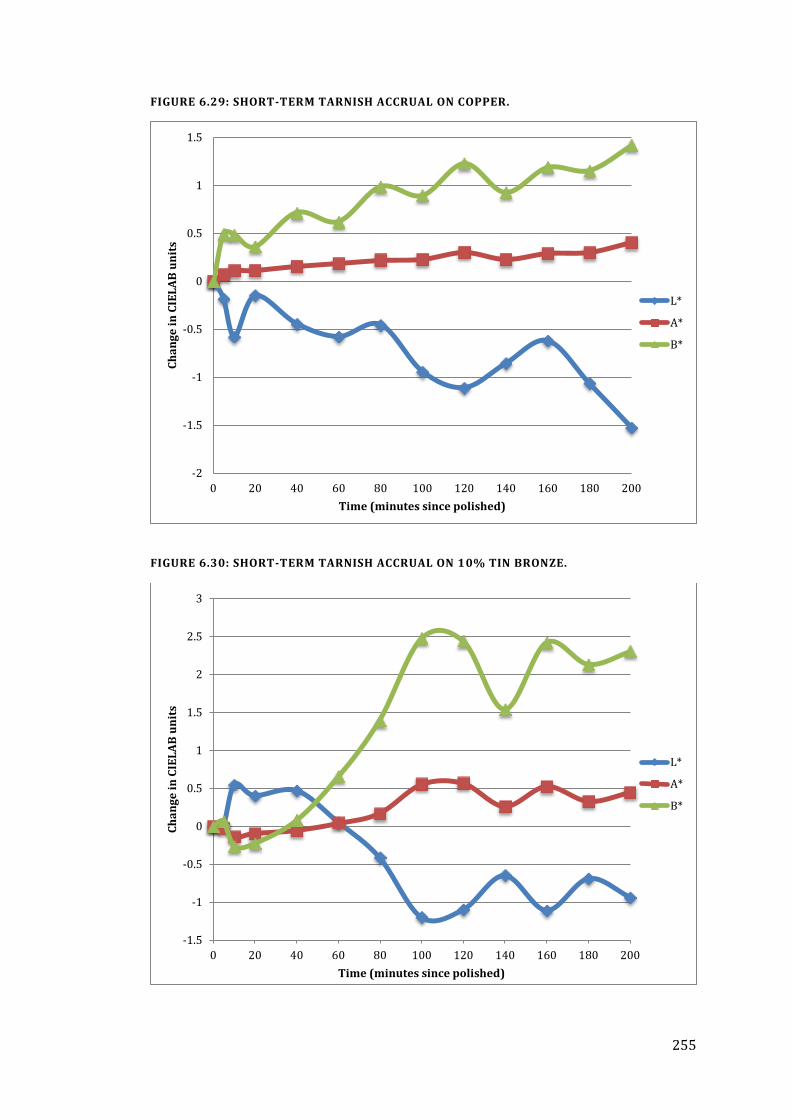
255
FIGURE 6.29: SHORT-TERM TARNISH ACCRUAL ON COPPER.
FIGURE 6.30: SHORT-TERM TARNISH ACCRUAL ON 10% TIN BRONZE.
-2
-1.5
-1
-0.5
0
0.5
1
1.5
0 20 40 60 80 100 120 140 160 180 200
Ch
an
ge
in
CIE
LA
B u
nit
s
Time (minutes since polished)
L*
A*
B*
-1.5
-1
-0.5
0
0.5
1
1.5
2
2.5
3
0 20 40 60 80 100 120 140 160 180 200
Ch
an
ge
in
CIE
LA
B u
nit
s
Time (minutes since polished)
L*
A*
B*
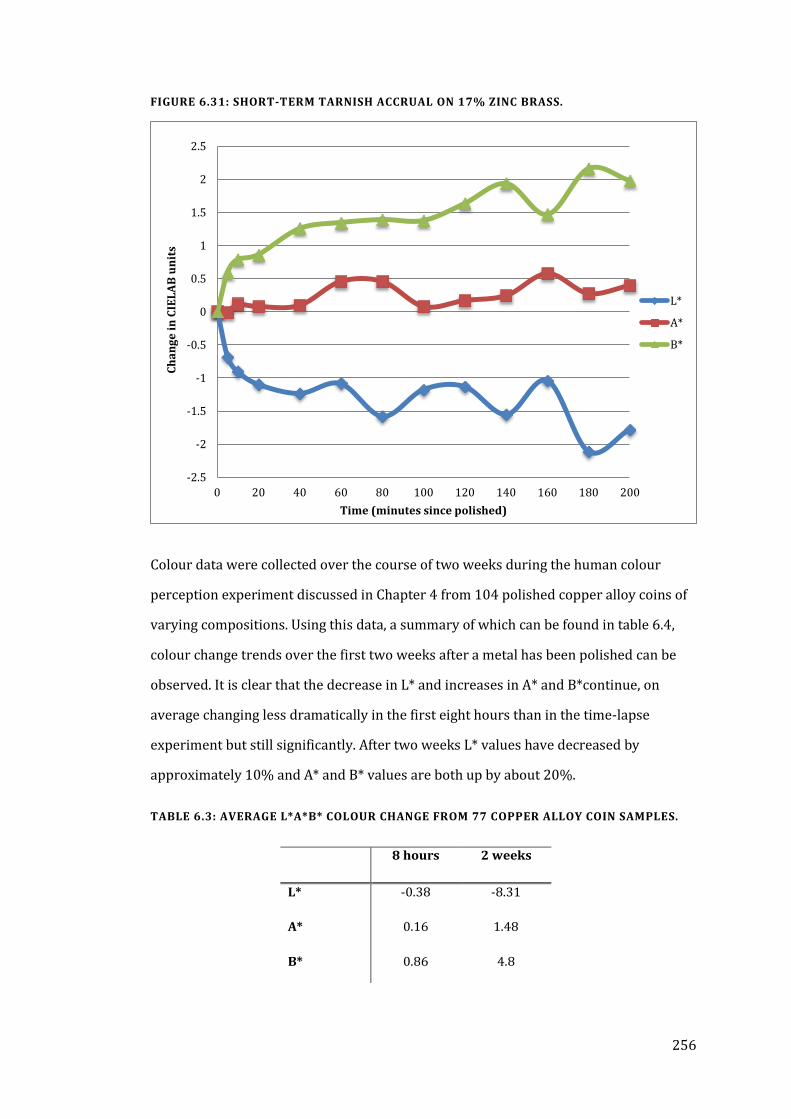
256
FIGURE 6.31: SHORT-TERM TARNISH ACCRUAL ON 17% ZINC BRASS.
Colour data were collected over the course of two weeks during the human colour
perception experiment discussed in Chapter 4 from 104 polished copper alloy coins of
varying compositions. Using this data, a summary of which can be found in table 6.4,
colour change trends over the first two weeks after a metal has been polished can be
observed. It is clear that the decrease in L* and increases in A* and B*continue, on
average changing less dramatically in the first eight hours than in the time-lapse
experiment but still significantly. After two weeks L* values have decreased by
approximately 10% and A* and B* values are both up by about 20%.
TABLE 6.3: AVERAGE L*A*B* COLOUR CHANGE FROM 77 COPPER ALLOY COIN SAMPLES.
-2.5
-2
-1.5
-1
-0.5
0
0.5
1
1.5
2
2.5
0 20 40 60 80 100 120 140 160 180 200
Ch
an
ge
in
CIE
LA
B u
nit
s
Time (minutes since polished)
L*
A*
B*
8 hours 2 weeks
L* -0.38 -8.31
A* 0.16 1.48
B* 0.86 4.8
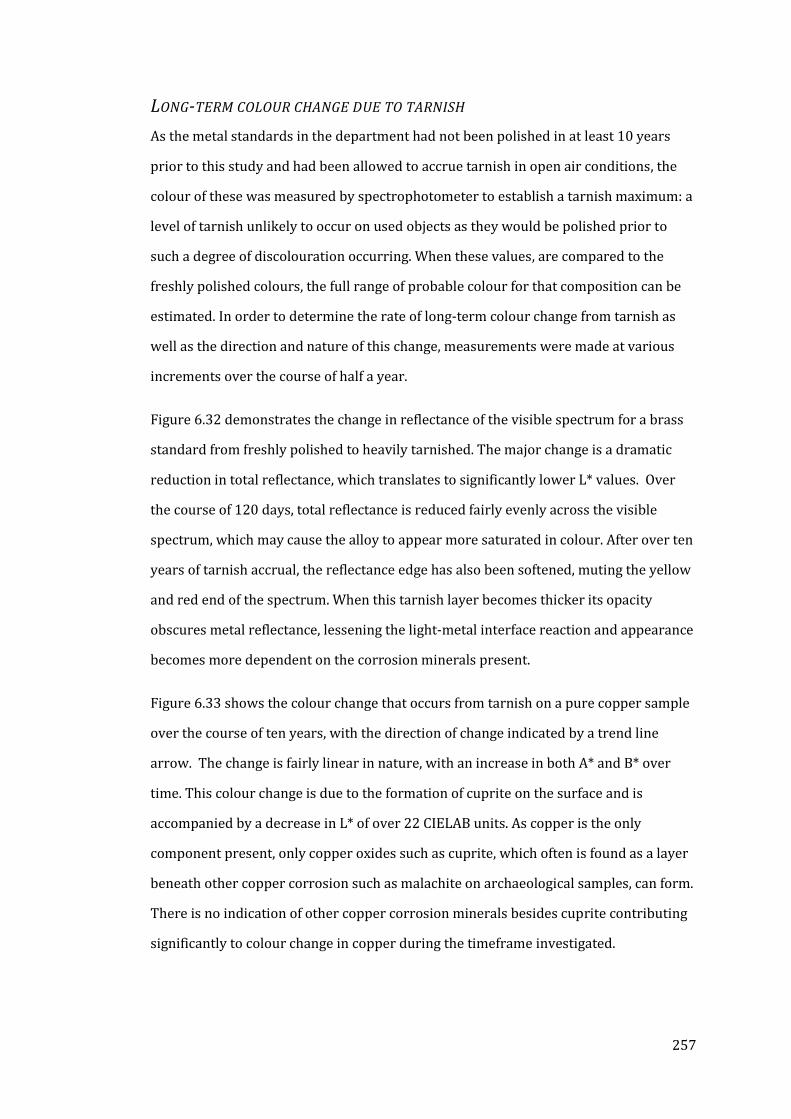
257
LONG-TERM COLOUR CHANGE DUE TO TARNISH
As the metal standards in the department had not been polished in at least 10 years
prior to this study and had been allowed to accrue tarnish in open air conditions, the
colour of these was measured by spectrophotometer to establish a tarnish maximum: a
level of tarnish unlikely to occur on used objects as they would be polished prior to
such a degree of discolouration occurring. When these values, are compared to the
freshly polished colours, the full range of probable colour for that composition can be
estimated. In order to determine the rate of long-term colour change from tarnish as
well as the direction and nature of this change, measurements were made at various
increments over the course of half a year.
Figure 6.32 demonstrates the change in reflectance of the visible spectrum for a brass
standard from freshly polished to heavily tarnished. The major change is a dramatic
reduction in total reflectance, which translates to significantly lower L* values. Over
the course of 120 days, total reflectance is reduced fairly evenly across the visible
spectrum, which may cause the alloy to appear more saturated in colour. After over ten
years of tarnish accrual, the reflectance edge has also been softened, muting the yellow
and red end of the spectrum. When this tarnish layer becomes thicker its opacity
obscures metal reflectance, lessening the light-metal interface reaction and appearance
becomes more dependent on the corrosion minerals present.
Figure 6.33 shows the colour change that occurs from tarnish on a pure copper sample
over the course of ten years, with the direction of change indicated by a trend line
arrow. The change is fairly linear in nature, with an increase in both A* and B* over
time. This colour change is due to the formation of cuprite on the surface and is
accompanied by a decrease in L* of over 22 CIELAB units. As copper is the only
component present, only copper oxides such as cuprite, which often is found as a layer
beneath other copper corrosion such as malachite on archaeological samples, can form.
There is no indication of other copper corrosion minerals besides cuprite contributing
significantly to colour change in copper during the timeframe investigated.
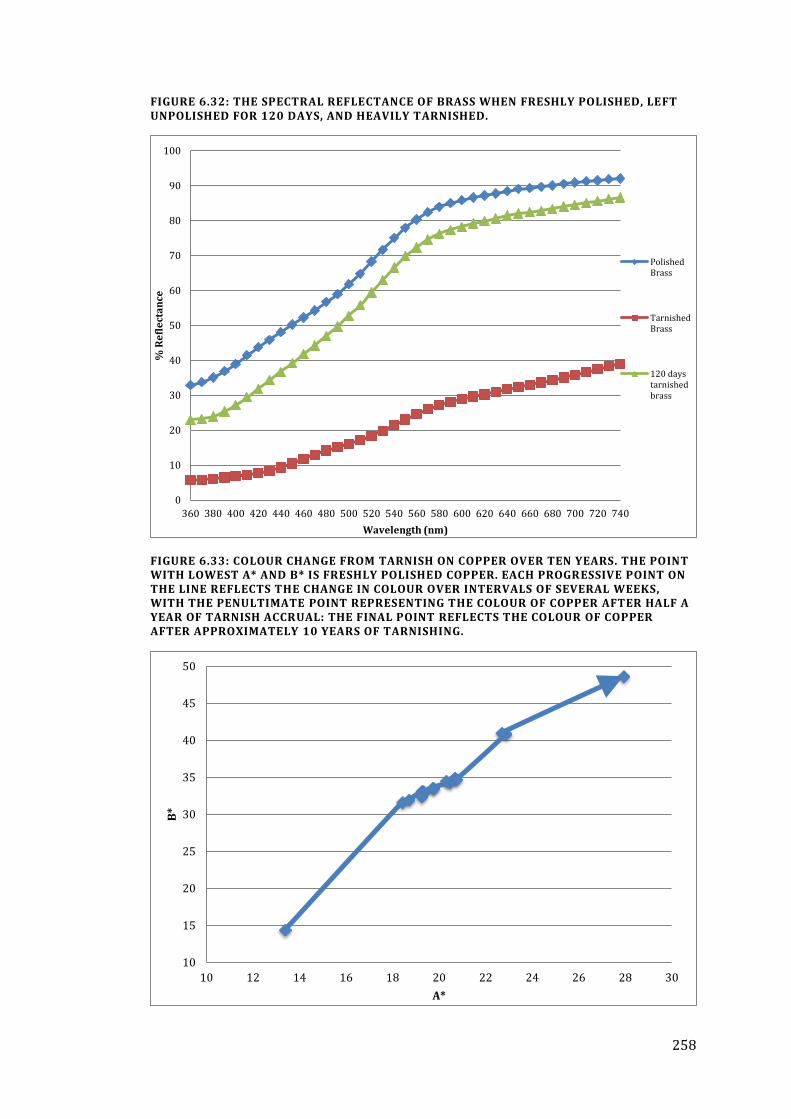
258
FIGURE 6.32: THE SPECTRAL REFLECTANCE OF BRASS WHEN FRESHLY POLISHED, LEFT UNPOLISHED FOR 120 DAYS, AND HEAVILY TARNISHED.
FIGURE 6.33: COLOUR CHANGE FROM TARNISH ON COPPER OVER TEN YEARS. THE POINT WITH LOWEST A* AND B* IS FRESHLY POLISHED COPPER. EACH PROGRESSIVE POINT ON THE LINE REFLECTS THE CHANGE IN COLOUR OVER INTERVALS OF SEVERAL WEEKS, WITH THE PENULTIMATE POINT REPRESENTING THE COLOUR OF COPPER AFTER HALF A YEAR OF TARNISH ACCRUAL: THE FINAL POINT REFLECTS THE COLOUR OF COPPER AFTER APPROXIMATELY 10 YEARS OF TARNISHING.
0
10
20
30
40
50
60
70
80
90
100
360 380 400 420 440 460 480 500 520 540 560 580 600 620 640 660 680 700 720 740
% R
efl
ect
an
ce
Wavelength (nm)
PolishedBrass
TarnishedBrass
120 daystarnishedbrass
10
15
20
25
30
35
40
45
50
10 12 14 16 18 20 22 24 26 28 30
B*
A*
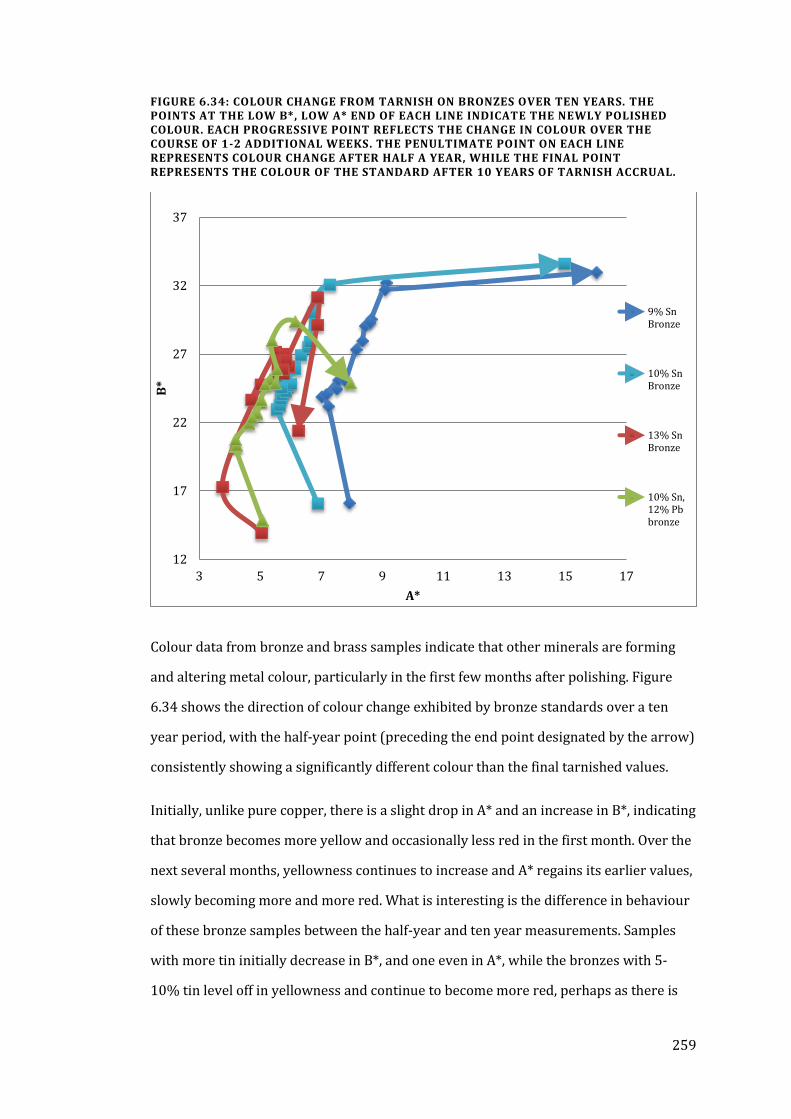
259
FIGURE 6.34: COLOUR CHANGE FROM TARNISH ON BRONZES OVER TEN YEARS. THE POINTS AT THE LOW B*, LOW A* END OF EACH LINE INDICATE THE NEWLY POLISHED COLOUR. EACH PROGRESSIVE POINT REFLECTS THE CHANGE IN COLOUR OVER THE COURSE OF 1-2 ADDITIONAL WEEKS. THE PENULTIMATE POINT ON EACH LINE REPRESENTS COLOUR CHANGE AFTER HALF A YEAR, WHILE THE FINAL POINT REPRESENTS THE COLOUR OF THE STANDARD AFTER 10 YEARS OF TARNISH ACCRUAL.
Colour data from bronze and brass samples indicate that other minerals are forming
and altering metal colour, particularly in the first few months after polishing. Figure
6.34 shows the direction of colour change exhibited by bronze standards over a ten
year period, with the half-year point (preceding the end point designated by the arrow)
consistently showing a significantly different colour than the final tarnished values.
Initially, unlike pure copper, there is a slight drop in A* and an increase in B*, indicating
that bronze becomes more yellow and occasionally less red in the first month. Over the
next several months, yellowness continues to increase and A* regains its earlier values,
slowly becoming more and more red. What is interesting is the difference in behaviour
of these bronze samples between the half-year and ten year measurements. Samples
with more tin initially decrease in B*, and one even in A*, while the bronzes with 5-
10% tin level off in yellowness and continue to become more red, perhaps as there is
12
17
22
27
32
37
3 5 7 9 11 13 15 17
B*
A*
9% SnBronze
10% SnBronze
13% SnBronze
10% Sn,12% Pbbronze
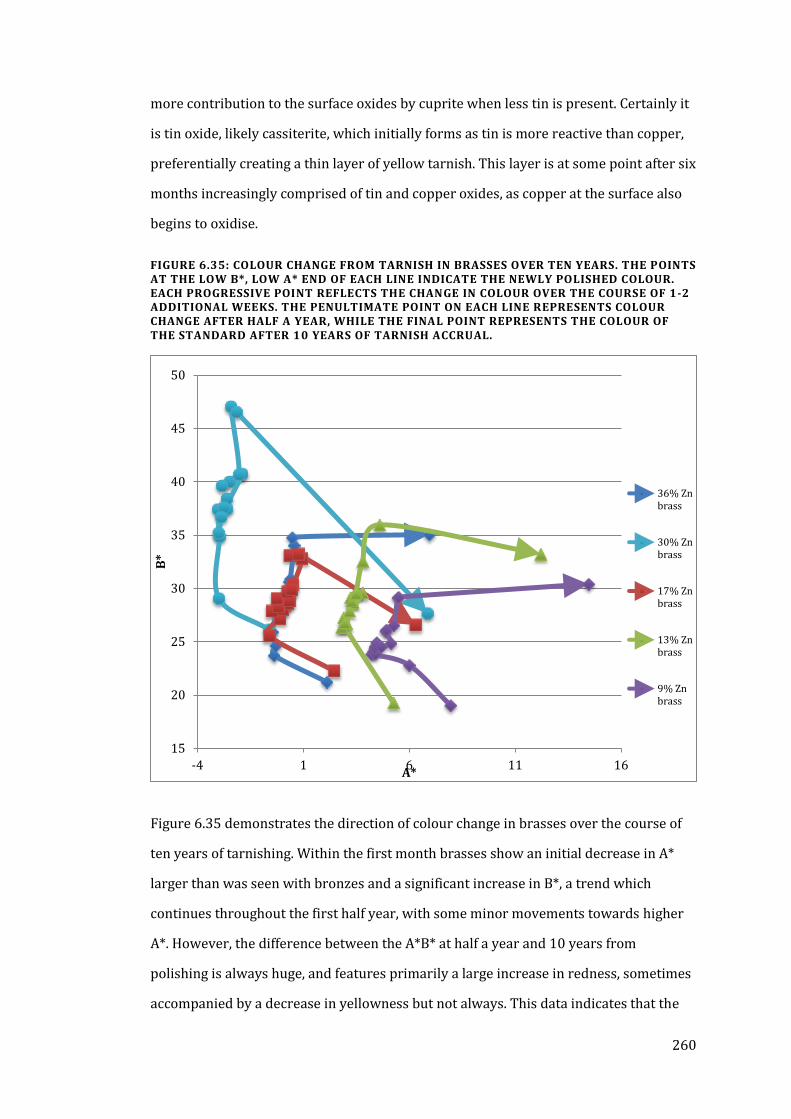
260
more contribution to the surface oxides by cuprite when less tin is present. Certainly it
is tin oxide, likely cassiterite, which initially forms as tin is more reactive than copper,
preferentially creating a thin layer of yellow tarnish. This layer is at some point after six
months increasingly comprised of tin and copper oxides, as copper at the surface also
begins to oxidise.
FIGURE 6.35: COLOUR CHANGE FROM TARNISH IN BRASSES OVER TEN YEARS. THE POINTS AT THE LOW B*, LOW A* END OF EACH LINE INDICATE THE NEWLY POLISHED COLOUR. EACH PROGRESSIVE POINT REFLECTS THE CHANGE IN COLOUR OVER THE COURSE OF 1-2 ADDITIONAL WEEKS. THE PENULTIMATE POINT ON EACH LINE REPRESENTS COLOUR CHANGE AFTER HALF A YEAR, WHILE THE FINAL POINT REPRESENTS THE COLOUR OF THE STANDARD AFTER 10 YEARS OF TARNISH ACCRUAL.
Figure 6.35 demonstrates the direction of colour change in brasses over the course of
ten years of tarnishing. Within the first month brasses show an initial decrease in A*
larger than was seen with bronzes and a significant increase in B*, a trend which
continues throughout the first half year, with some minor movements towards higher
A*. However, the difference between the A*B* at half a year and 10 years from
polishing is always huge, and features primarily a large increase in redness, sometimes
accompanied by a decrease in yellowness but not always. This data indicates that the
15
20
25
30
35
40
45
50
-4 1 6 11 16
B*
A*
36% Znbrass
30% Znbrass
17% Znbrass
13% Znbrass
9% Znbrass
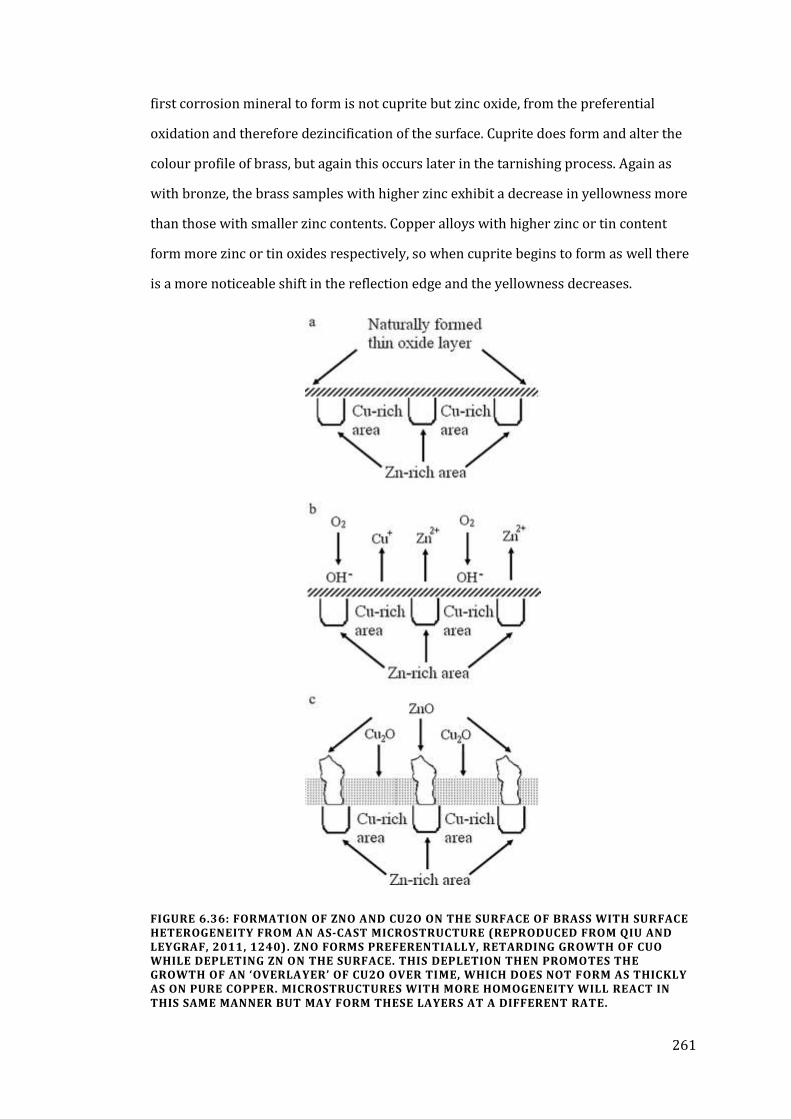
261
first corrosion mineral to form is not cuprite but zinc oxide, from the preferential
oxidation and therefore dezincification of the surface. Cuprite does form and alter the
colour profile of brass, but again this occurs later in the tarnishing process. Again as
with bronze, the brass samples with higher zinc exhibit a decrease in yellowness more
than those with smaller zinc contents. Copper alloys with higher zinc or tin content
form more zinc or tin oxides respectively, so when cuprite begins to form as well there
is a more noticeable shift in the reflection edge and the yellowness decreases.
FIGURE 6.36: FORMATION OF ZNO AND CU2O ON THE SURFACE OF BRASS WITH SURFACE HETEROGENEITY FROM AN AS-CAST MICROSTRUCTURE (REPRODUCED FROM QIU AND LEYGRAF, 2011, 1240). ZNO FORMS PREFERENTIALLY, RETARDING GROWTH OF CUO WHILE DEPLETING ZN ON THE SURFACE. THIS DEPLETION THEN PROMOTES THE GROWTH OF AN ‘OVERLAYER’ OF CU2O OVER TIME, WHICH DOES NOT FORM AS THICKLY AS ON PURE COPPER. MICROSTRUCTURES WITH MORE HOMOGENEITY WILL REACT IN THIS SAME MANNER BUT MAY FORM THESE LAYERS AT A DIFFERENT RATE.
262
The formation of specific corrosion products in this order as is indicated by the colour
data is backed by other research into tarnish layers. Qiu and Leygraf report that:
…brass oxidized in air at room temperature has shown that preferential oxidation of Zn to ZnO takes place initially with a concomitant zinc depletion layer in the surface region of brass. This promotes an overlayer of Cu2O to form which has been reported to be thinner than on pure Cu (2011, 1240).
This supports the evidence drawn from spectrophotometer measurements of brass,
and is likely also the case with bronze, that zinc and tin oxides are the first to form
(figure 6.36). Additionally, the formation of ZnO from zinc-rich areas on the surface,
which are then overlaid by cuprite, explains why there is a significant decrease in
yellowness observed after ten years, especially in zinc-rich alloys.
One last observation is that while the composition of the alloy will determine the
direction of colour change over time, the total colour change is unpredictable. It does
not appear possible to predict with any accuracy the colour of a copper alloy after
significant time has passed since it was polished. It is likely that the perceived colour
of a copper alloy was considerably more yellow than its freshly polished appearance.
However, as it is unknown as to how long objects would go before being polished, and
how great of a range of colour would therefore be seen, it is difficult to account for the
actual ‘working’ colour of copper alloys. An increase in B* of 5 to 15 CIELAB units is
reasonable, given the data collected from brasses and bronzes over the course of 6
months. Whether or not these alloys would become significantly more yellow before
the formation of cuprite begins to become evident is as yet unknown.
263
TARNISH AND EXPECTED APPEARANCE – GOLDEN METAL?
The perceived colours of copper alloys can be now be estimated, allowing
reconsideration of the idea of copper alloys being a skeuomorph for contemporary
precious metals. In figure 6.37, the limitus of the range of precious metals are
indicated by the blue diamonds and the probable range of Anglo-Saxon gold alloy
colours by the orange crescent. Polished copper alloy colour is indicated by the yellow
diamonds, and the estimated colour range of these alloys when tarnished from
between one to six months by the orange ellipse (roughly 5-15 CIELAB units higher in
B*).
The colour of copper alloys, as would actually be seen on a daily basis, is therefore
much closer to that of high-purity gold (18 carat and above). However, as the A* values
are effected relatively insignificantly by short-term tarnish, copper alloys besides high-
zinc brasses would still be considerably more red than contemporary precious metal
alloys. Most gold in this period that would have been visible would have been as
gilding, which may or may not have been purer than the gold used to make objects.
Pure gold is considerably higher in A* than the contemporary gold alloys, and so
copper alloys were closer to reproducing gold colour than debased (18 carat and
lower) gold of the period.
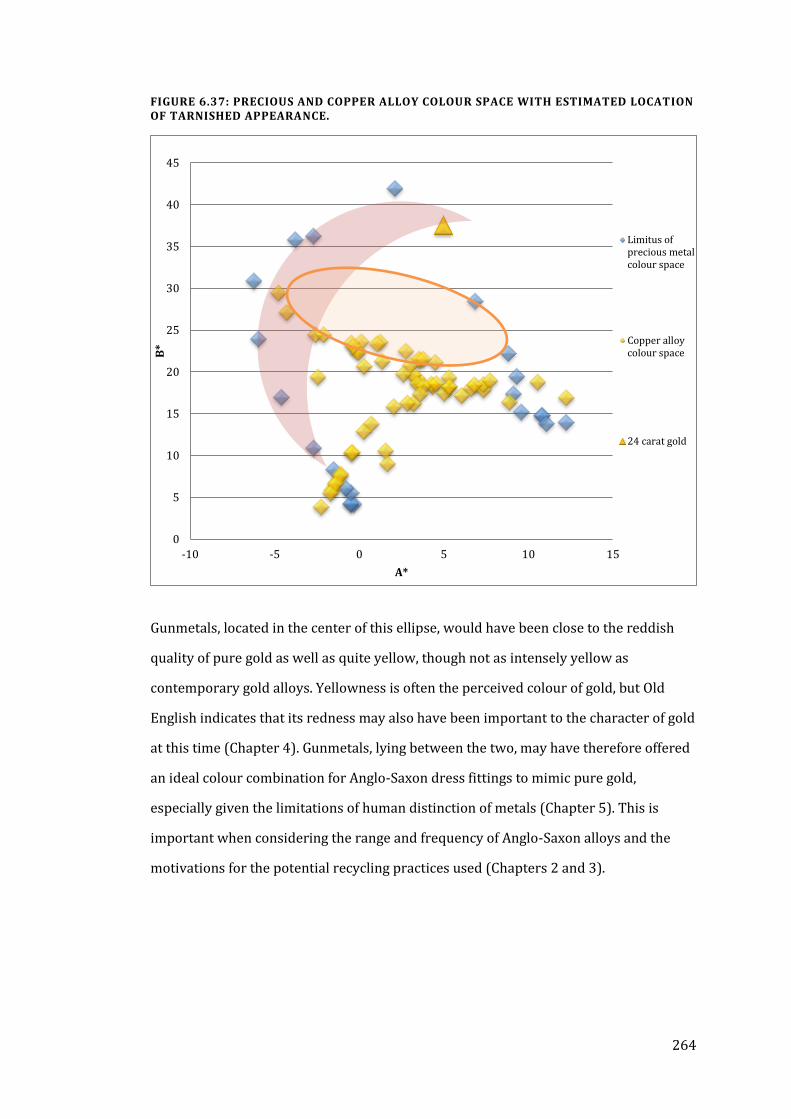
264
FIGURE 6.37: PRECIOUS AND COPPER ALLOY COLOUR SPACE WITH ESTIMATED LOCATION OF TARNISHED APPEARANCE.
Gunmetals, located in the center of this ellipse, would have been close to the reddish
quality of pure gold as well as quite yellow, though not as intensely yellow as
contemporary gold alloys. Yellowness is often the perceived colour of gold, but Old
English indicates that its redness may also have been important to the character of gold
at this time (Chapter 4). Gunmetals, lying between the two, may have therefore offered
an ideal colour combination for Anglo-Saxon dress fittings to mimic pure gold,
especially given the limitations of human distinction of metals (Chapter 5). This is
important when considering the range and frequency of Anglo-Saxon alloys and the
motivations for the potential recycling practices used (Chapters 2 and 3).
0
5
10
15
20
25
30
35
40
45
-10 -5 0 5 10 15
B*
A*
Limitus ofprecious metalcolour space
Copper alloycolour space
24 carat gold
265
CHAPTER 7
ANALYTICAL METHODS AND
PARAMETERS
ED-XRF
Energy dispersive x-ray fluorescence has been used for several decades as a non-
destructive method of composition analysis for archaeological and museum objects
(Brown and Schweizer, 1973; e.g. Brownsword and Hines, 1993; Brownsword, 2004;
Brownsword et al., 1984; Caple, 1986; Craddock et al., 2010; Dungworth, 1995; Hall,
1960; Hawkes, 2006; Hawkes et al., 1966; Lachance and Claisse, 1995; Lamm, 1973;
Milazzo and Cicardi, 1997; Mortimer and Wilthew, 1998; Mortimer, 1990; Mortimer et
al., 1986; Nasman, 1973; Oddy et al., 1986, 1979; Panter, 1998; Wardley, 1984; White,
1982).
In this method, an x-ray beam irradiates the surface of an object, ejecting electrons
from the inner shells of atoms near the object surface (Hall, 1960, 29; Lachance and
Claisse, 1995, 9; Williams, 1987). Electrons from the outer levels (L, M, N) are then
redistributed to the inner vacant position in the K or L shells, releasing or ‘fluorescing’
energy distinctive to the distance in energy levels of the shells at a wavelength
characteristic to that particular element (Hall, 1960, 29; Jenkins, 1981; Lachance and
Claisse, 1995, 10). The machine detects these emissions, counting the number of
instances of fluorescence, which are compiled into peaks along the electromagnetic
spectrum representative of the relative contribution of each element present. The
software, which also accounts for secondary and tertiary fluorescence and peak
overlaps, then normalises this data to 100%.
As ED-XRF characterises only the first 1-10 microns of an object’s surface and
corrosion can reach depths of a millimetre, a cleaned, uncorroded surface is necessary
266
for accurate data to be collected from archaeological artefacts (Dungworth, 1995, 195;
Oddy, 1983, 299). Quantitative or semi-quantitative ED-XRF is therefore usually done
by analysing the drillings from the interior bulk metal, or by cleaning a small part of the
surface down to the bulk metal. As a small, polished surface was also necessary for the
acquisition of spectrophotometric data, a 3mm round, polished surface was used to
provide ED-XRF data free of the influence of corrosion; chlorine, sulphur and iron
content was checked as markers of corrosion inclusion and if significant levels were
detected the sample was reanalysed or re-drilled. To better ensure that only the drilled
area of the sample was analysed, the location of the beam was pinpointed using an
integral camera system.
SEMI-QUANTITATIVE ED-XRF PARAMETERS
The Hitachi High Tech SEA1200VX ED-XRF machine has a small, air-cooled rhodium
target X-ray tube with thin beryllium window and a Vortex silicon semiconductor
detector. This machine features a 1mA current and 1mm collimator for greater
accuracy during sample acquisition. Four fixed conditions were run at 15kV, 30kV,
40kV, and 50kV for 100 seconds for each condition to calculate element peaks
throughout the spectrum. Data output was calculated and normalised with the HSEASY
software provided. A vacuum was not used as comparison of data collected with and
without vacuum revealed no significant difference in reported results as few light
elements were sought; those elements sought can be found in table 7.1. Machine
standards were run prior to data collection in addition to the metal standards.
TABLE 7.1: ELEMENTS SOUGHT BY ED-XRF; THOSE REPORTED IN RESULTS ARE IN BOLD.
Copper Zinc Tin Lead Iron
Gold Silver Arsenic Antimony Mercury
Nickel Cobalt Manganese Chromium Aluminium
Chlorine Sulphur Titanium Strontium Cadmium
Bismuth Zirconium Gallium Vanadium Iodine
Niobium Molybdenum Tellurium Indium
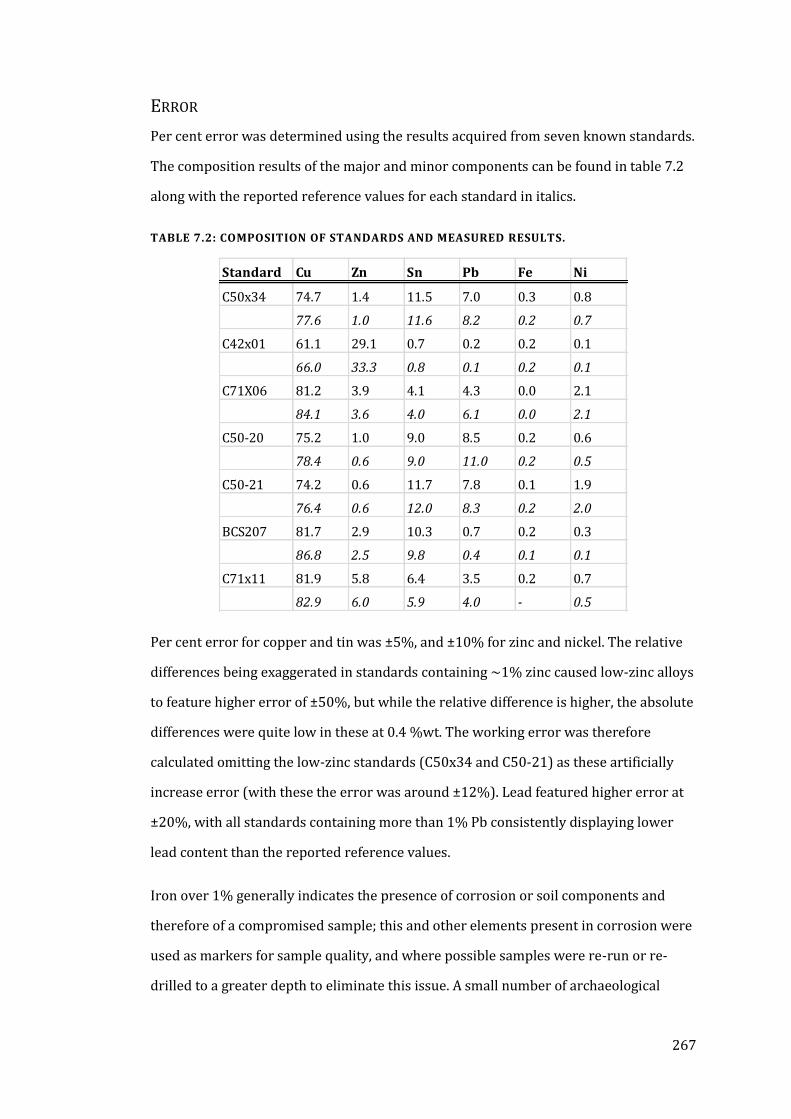
267
ERROR
Per cent error was determined using the results acquired from seven known standards.
The composition results of the major and minor components can be found in table 7.2
along with the reported reference values for each standard in italics.
TABLE 7.2: COMPOSITION OF STANDARDS AND MEASURED RESULTS.
Per cent error for copper and tin was ±5%, and ±10% for zinc and nickel. The relative
differences being exaggerated in standards containing ~1% zinc caused low-zinc alloys
to feature higher error of ±50%, but while the relative difference is higher, the absolute
differences were quite low in these at 0.4 %wt. The working error was therefore
calculated omitting the low-zinc standards (C50x34 and C50-21) as these artificially
increase error (with these the error was around ±12%). Lead featured higher error at
±20%, with all standards containing more than 1% Pb consistently displaying lower
lead content than the reported reference values.
Iron over 1% generally indicates the presence of corrosion or soil components and
therefore of a compromised sample; this and other elements present in corrosion were
used as markers for sample quality, and where possible samples were re-run or re-
drilled to a greater depth to eliminate this issue. A small number of archaeological
Standard Cu Zn Sn Pb Fe Ni
C50x34 74.7 1.4 11.5 7.0 0.3 0.8
77.6 1.0 11.6 8.2 0.2 0.7
C42x01 61.1 29.1 0.7 0.2 0.2 0.1
66.0 33.3 0.8 0.1 0.2 0.1
C71X06 81.2 3.9 4.1 4.3 0.0 2.1
84.1 3.6 4.0 6.1 0.0 2.1
C50-20 75.2 1.0 9.0 8.5 0.2 0.6
78.4 0.6 9.0 11.0 0.2 0.5
C50-21 74.2 0.6 11.7 7.8 0.1 1.9
76.4 0.6 12.0 8.3 0.2 2.0
BCS207 81.7 2.9 10.3 0.7 0.2 0.3
86.8 2.5 9.8 0.4 0.1 0.1
C71x11 81.9 5.8 6.4 3.5 0.2 0.7
82.9 6.0 5.9 4.0 - 0.5
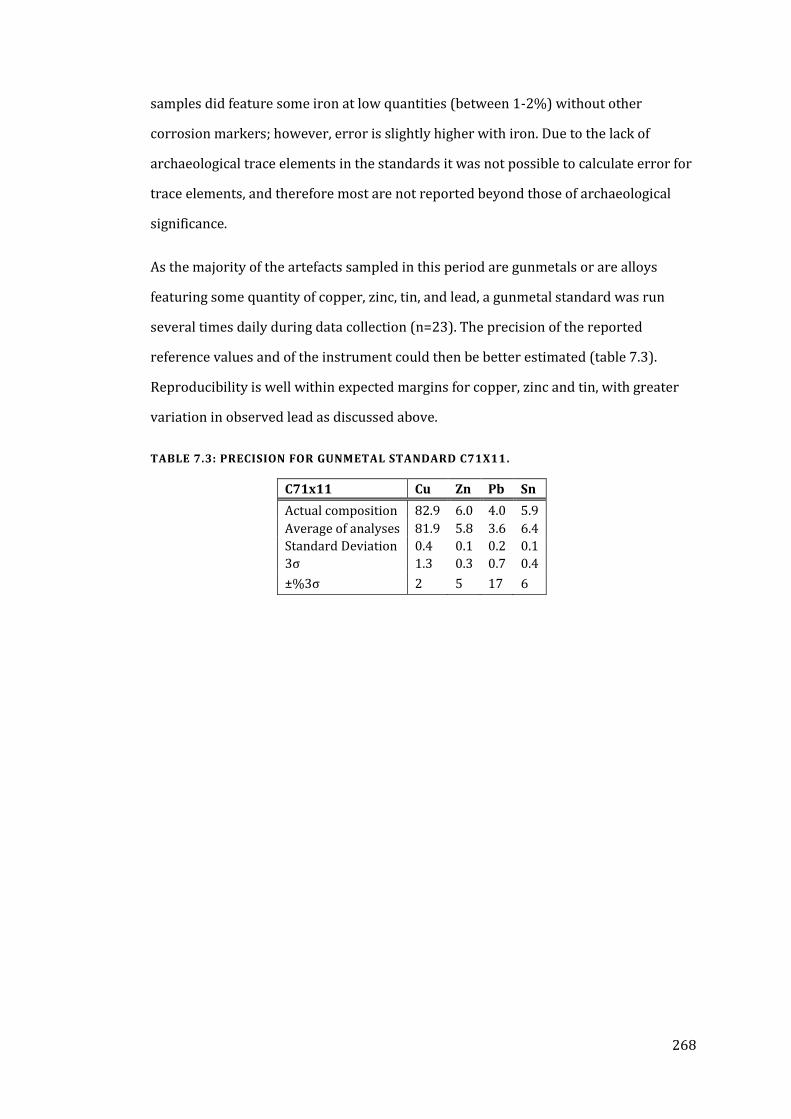
268
samples did feature some iron at low quantities (between 1-2%) without other
corrosion markers; however, error is slightly higher with iron. Due to the lack of
archaeological trace elements in the standards it was not possible to calculate error for
trace elements, and therefore most are not reported beyond those of archaeological
significance.
As the majority of the artefacts sampled in this period are gunmetals or are alloys
featuring some quantity of copper, zinc, tin, and lead, a gunmetal standard was run
several times daily during data collection (n=23). The precision of the reported
reference values and of the instrument could then be better estimated (table 7.3).
Reproducibility is well within expected margins for copper, zinc and tin, with greater
variation in observed lead as discussed above.
TABLE 7.3: PRECISION FOR GUNMETAL STANDARD C71X11.
C71x11 Cu Zn Pb Sn
Actual composition 82.9 6.0 4.0 5.9
Average of analyses 81.9 5.8 3.6 6.4
Standard Deviation 0.4 0.1 0.2 0.1
3σ 1.3 0.3 0.7 0.4
±%3σ 2 5 17 6
269
SPECTROPHOTOMETER
The spectrophotometer used in this research was a Minolta CM-2600d
spectrophotometer, with a silicon photodiode array detector, 52 mm integrating
sphere and three pulsed xenon lamp light sources. Instrument repeatability of spectral
reflectance reaches within standard deviation of 0.1% for 380 to 740 nm wavelengths
and 0.2% for wavelengths of 360 to 380 nm.
The light sources were set to produce daylight (D65) with 100% ultraviolet
illumination, and a colour temperature of 6504k (Standard D65 has a colour
temperature of 6500k). Both SCI and SCE illumination were recorded, though only SCI
(total illumination) measurements were used to characterise the colour (Johnston-
Feller, 2001, see Chapter 5). The spectrophotometer takes measurements every 10 nm
wavelength and from an observer angle of 10° using the CIELAB system. The
spectrophotometer was calibrated to a white standard issued by the manufacturer and
protected from change due to exposure to light over time with an opaque cover. These
parameters are consistent with recent published research (Ankersmit et al., 2001; Fang
and McDonnell, 2011).
DEVELOPMENT OF METHODOLOGY
As spectrophotometry has not been widely applied to archaeological copper alloys, a
methodology for its use on archaeological material needed to be devised. To this end,
several issues needed to be resolved in order to develop a reliable and repeatable
standard operating procedure for sample analysis:
Establish margins of error for repeat analyses to determine the
minimum needed to accurately characterise a sample.
Quantify margins of error in the colour of a sample.
Quantify error from sampling varying surfaces.
Establish a uniform procedure for sample preparation.
270
MINIMUM ANALYSES TEST
Object surfaces, particularly larger surfaces, are not always uniform in colour. The
minimum number of analyses necessary to accurately describe a surface was calculated
to reduce any effect of surface variability on the data collected. This was done by using
tarnished samples first, as they feature a more varied surface appearance than polished
samples.
TARNISHED SURFACES
Tarnished samples of different copper alloy types were measured thirty times with a
spectrophotometer, with the viewed surface changed to different areas of the surface
between measurements to capture the total potential colour variations present on the
surface. The mean standard deviation of these results was calculated for each
consecutive measurement and averaged, and these were graphed to identify after how
many measurements the standard deviation stops changing. That number of
measurements was therefore the minimum needed represent the average colour of the
actual tarnished sample, as seen in the example of one sample in figure 7.1. The
variability in standard deviations levels for each colour measurement variable evened
out around eight or nine measurements, so ten was deemed an appropriate number for
characterizing the tarnished metal surface colour accurately. There were no significant
differences in this pattern between alloy types.
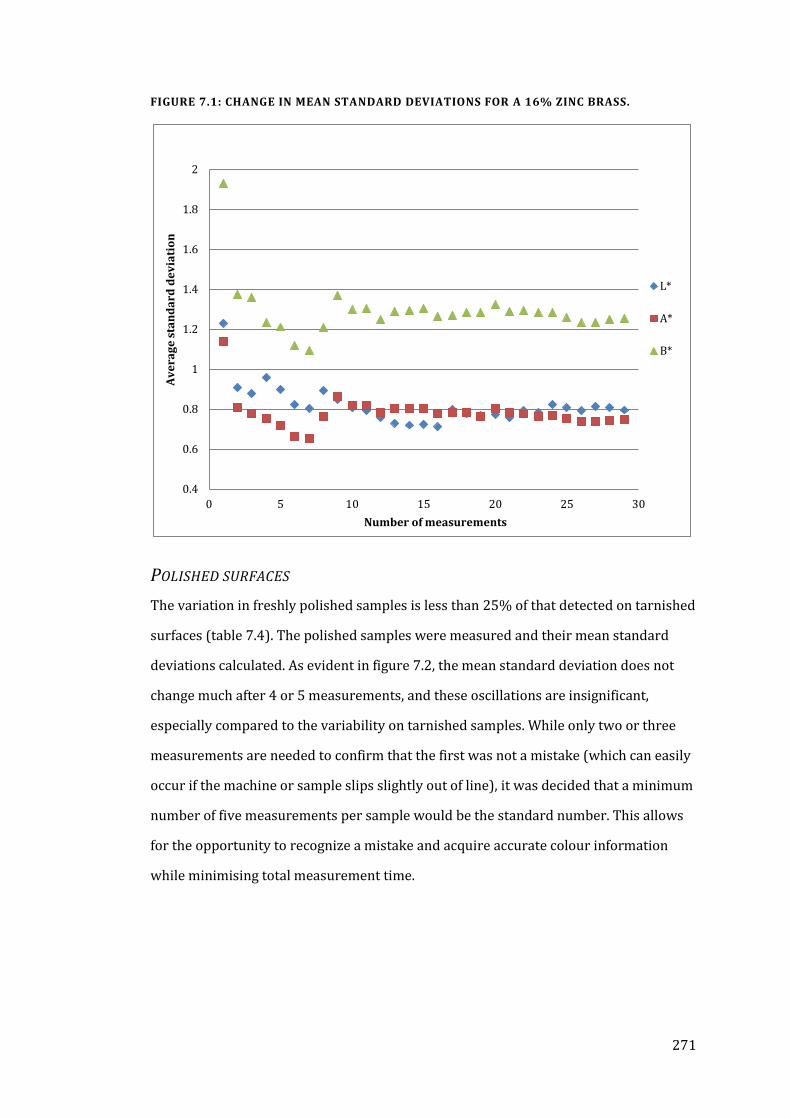
271
FIGURE 7.1: CHANGE IN MEAN STANDARD DEVIATIONS FOR A 16% ZINC BRASS.
POLISHED SURFACES
The variation in freshly polished samples is less than 25% of that detected on tarnished
surfaces (table 7.4). The polished samples were measured and their mean standard
deviations calculated. As evident in figure 7.2, the mean standard deviation does not
change much after 4 or 5 measurements, and these oscillations are insignificant,
especially compared to the variability on tarnished samples. While only two or three
measurements are needed to confirm that the first was not a mistake (which can easily
occur if the machine or sample slips slightly out of line), it was decided that a minimum
number of five measurements per sample would be the standard number. This allows
for the opportunity to recognize a mistake and acquire accurate colour information
while minimising total measurement time.
0.4
0.6
0.8
1
1.2
1.4
1.6
1.8
2
0 5 10 15 20 25 30
Av
era
ge
sta
nd
ard
de
via
tio
n
Number of measurements
L*
A*
B*
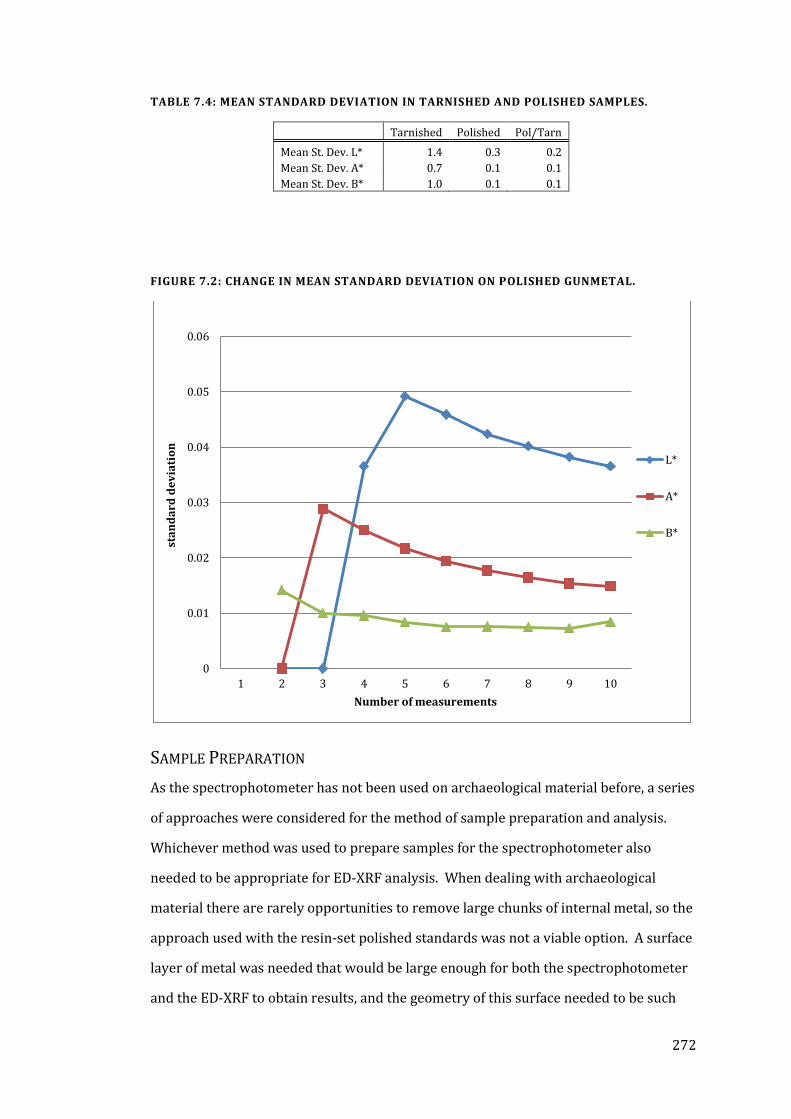
272
TABLE 7.4: MEAN STANDARD DEVIATION IN TARNISHED AND POLISHED SAMPLES.
FIGURE 7.2: CHANGE IN MEAN STANDARD DEVIATION ON POLISHED GUNMETAL.
SAMPLE PREPARATION
As the spectrophotometer has not been used on archaeological material before, a series
of approaches were considered for the method of sample preparation and analysis.
Whichever method was used to prepare samples for the spectrophotometer also
needed to be appropriate for ED-XRF analysis. When dealing with archaeological
material there are rarely opportunities to remove large chunks of internal metal, so the
approach used with the resin-set polished standards was not a viable option. A surface
layer of metal was needed that would be large enough for both the spectrophotometer
and the ED-XRF to obtain results, and the geometry of this surface needed to be such
Tarnished Polished Pol/Tarn
Mean St. Dev. L* 1.4 0.3 0.2
Mean St. Dev. A* 0.7 0.1 0.1
Mean St. Dev. B* 1.0 0.1 0.1
0
0.01
0.02
0.03
0.04
0.05
0.06
1 2 3 4 5 6 7 8 9 10
sta
nd
ard
de
via
tio
n
Number of measurements
L*
A*
B*
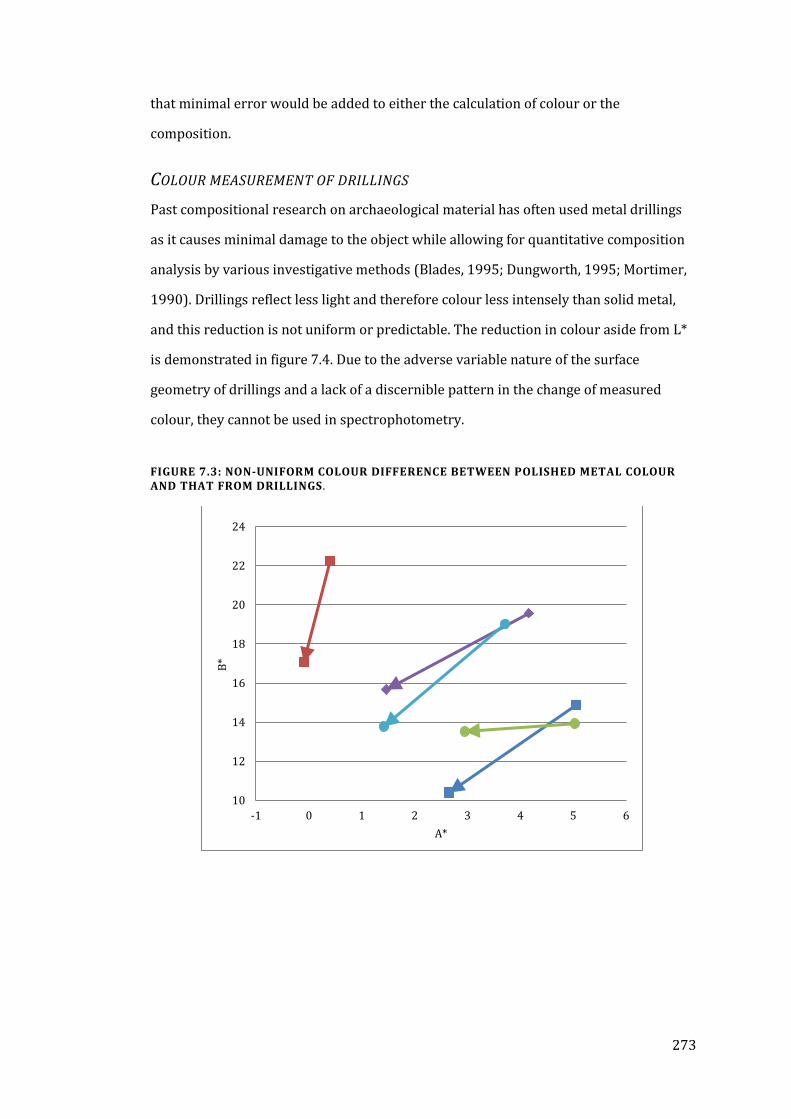
273
that minimal error would be added to either the calculation of colour or the
composition.
COLOUR MEASUREMENT OF DRILLINGS
Past compositional research on archaeological material has often used metal drillings
as it causes minimal damage to the object while allowing for quantitative composition
analysis by various investigative methods (Blades, 1995; Dungworth, 1995; Mortimer,
1990). Drillings reflect less light and therefore colour less intensely than solid metal,
and this reduction is not uniform or predictable. The reduction in colour aside from L*
is demonstrated in figure 7.4. Due to the adverse variable nature of the surface
geometry of drillings and a lack of a discernible pattern in the change of measured
colour, they cannot be used in spectrophotometry.
FIGURE 7.3: NON-UNIFORM COLOUR DIFFERENCE BETWEEN POLISHED METAL COLOUR AND THAT FROM DRILLINGS .
10
12
14
16
18
20
22
24
-1 0 1 2 3 4 5 6
B*
A*
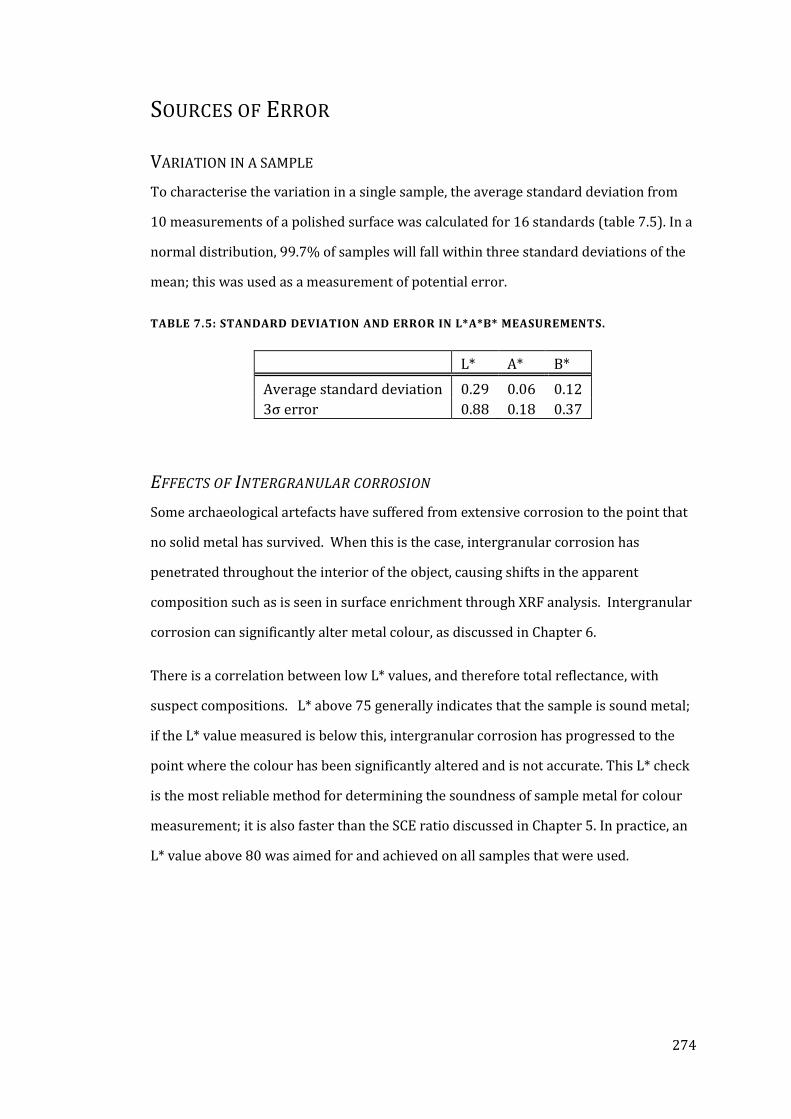
274
SOURCES OF ERROR
VARIATION IN A SAMPLE
To characterise the variation in a single sample, the average standard deviation from
10 measurements of a polished surface was calculated for 16 standards (table 7.5). In a
normal distribution, 99.7% of samples will fall within three standard deviations of the
mean; this was used as a measurement of potential error.
TABLE 7.5: STANDARD DEVIATION AND ERROR IN L*A*B* MEASUREMENTS.
EFFECTS OF INTERGRANULAR CORROSION
Some archaeological artefacts have suffered from extensive corrosion to the point that
no solid metal has survived. When this is the case, intergranular corrosion has
penetrated throughout the interior of the object, causing shifts in the apparent
composition such as is seen in surface enrichment through XRF analysis. Intergranular
corrosion can significantly alter metal colour, as discussed in Chapter 6.
There is a correlation between low L* values, and therefore total reflectance, with
suspect compositions. L* above 75 generally indicates that the sample is sound metal;
if the L* value measured is below this, intergranular corrosion has progressed to the
point where the colour has been significantly altered and is not accurate. This L* check
is the most reliable method for determining the soundness of sample metal for colour
measurement; it is also faster than the SCE ratio discussed in Chapter 5. In practice, an
L* value above 80 was aimed for and achieved on all samples that were used.
L* A* B*
Average standard deviation 0.29 0.06 0.12
3σ error 0.88 0.18 0.37
275
UNUSUAL SURFACE GEOMETRY
Minimising damage to artefacts is of primary importance and so it is necessary to
produce a surface that, while fairly smooth and reflective, will not incur much damage.
This necessitates drilling a small hole through the corrosion to the underlying metal,
wide enough in diameter to alloy for spectrophotometry measurements; however, a
drilled surface is not flat or smooth in texture and will not reflect light in a uniform
manner. A drill bit that will produce the most uniform and reflective surface should be
used and several options for this were tested. The spectrophotometer was not designed
to measure non-flat surfaces, and differences resulting from this unusual surface
geometry must be investigated and accounted for in the estimated error margins.
OPTIMIZATION OF SAMPLE SURFACE
The drill bit producing the best surface for reproducing the true colour of the metal
would be that which most closely produces the flat, smooth surface for which the
spectrophotometer was designed to measure. Three drill bit types were tested, two
made from aluminium-oxide grinding stone and the other a round, steel engraving drill
bit (Dremel type 107 2.4mm engraving bit). The rounded bit creates a dome-shaped
depression in the metal surface which is much smoother than the potentially flatter
surfaces created by the rough aluminium-oxide grinding stones.
ERROR RESULTING FROM THE SAMPLING SURFACE
An experiment was conducted to determine how spectrophotometry results from a
curved surface differed from those from an ideal, flat polished surface. Several
standards were measured with the spectrophotometer on both freshly polished and
curved, drilled surfaces. In two-thirds of tested metal surfaces, the round engraving bit
produced the highest L* value (as well as A* and B*), and therefore allows the greatest
total reflectance. This drill bit also produced cleaner sampling surfaces, as the smooth
metal does not hold colour-altering and L*-reducing corrosion dust. Smooth rounded
surfaces are more homogenous and give higher reflectance than rough flat surfaces as
more light is being uniformly reflected and thus it provides a better resulting
measurement despite some surface curvature. However, for samples with hard, thick
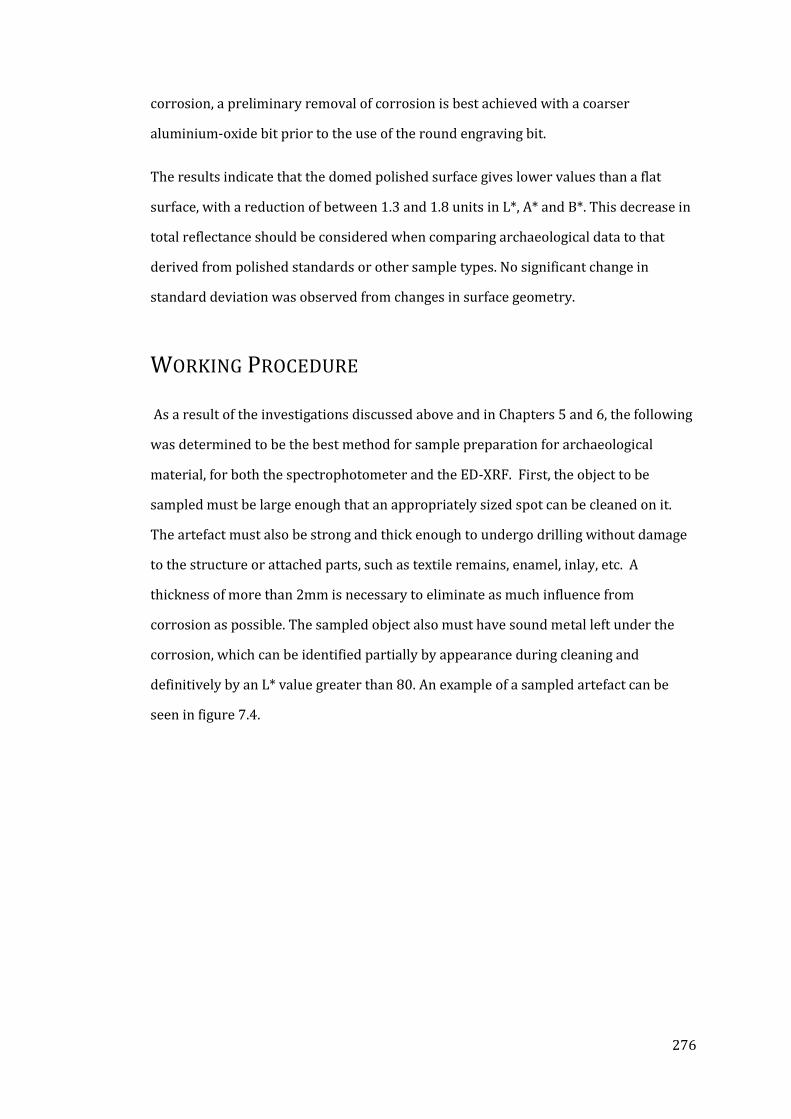
276
corrosion, a preliminary removal of corrosion is best achieved with a coarser
aluminium-oxide bit prior to the use of the round engraving bit.
The results indicate that the domed polished surface gives lower values than a flat
surface, with a reduction of between 1.3 and 1.8 units in L*, A* and B*. This decrease in
total reflectance should be considered when comparing archaeological data to that
derived from polished standards or other sample types. No significant change in
standard deviation was observed from changes in surface geometry.
WORKING PROCEDURE
As a result of the investigations discussed above and in Chapters 5 and 6, the following
was determined to be the best method for sample preparation for archaeological
material, for both the spectrophotometer and the ED-XRF. First, the object to be
sampled must be large enough that an appropriately sized spot can be cleaned on it.
The artefact must also be strong and thick enough to undergo drilling without damage
to the structure or attached parts, such as textile remains, enamel, inlay, etc. A
thickness of more than 2mm is necessary to eliminate as much influence from
corrosion as possible. The sampled object also must have sound metal left under the
corrosion, which can be identified partially by appearance during cleaning and
definitively by an L* value greater than 80. An example of a sampled artefact can be
seen in figure 7.4.
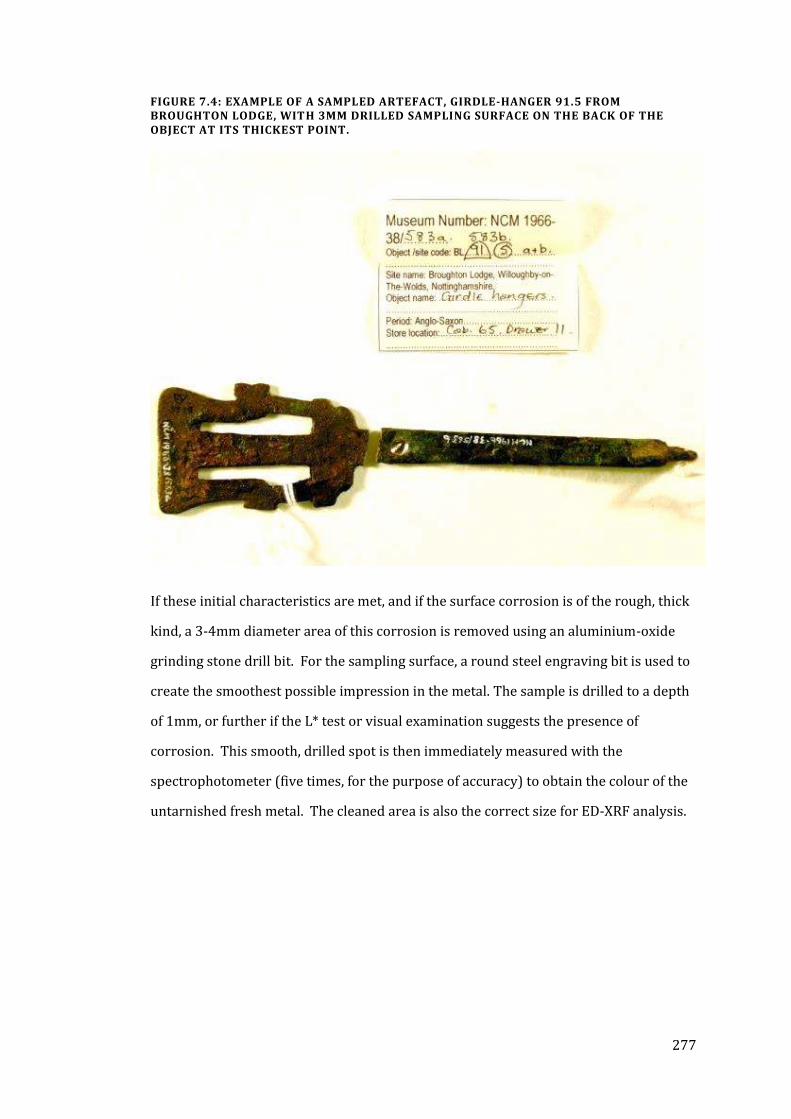
277
FIGURE 7.4: EXAMPLE OF A SAMPLED ARTEFACT, GIRDLE-HANGER 91.5 FROM BROUGHTON LODGE, WITH 3MM DRILLED SAMPLING SURFACE ON THE BACK OF THE OBJECT AT ITS THICKEST POINT.
If these initial characteristics are met, and if the surface corrosion is of the rough, thick
kind, a 3-4mm diameter area of this corrosion is removed using an aluminium-oxide
grinding stone drill bit. For the sampling surface, a round steel engraving bit is used to
create the smoothest possible impression in the metal. The sample is drilled to a depth
of 1mm, or further if the L* test or visual examination suggests the presence of
corrosion. This smooth, drilled spot is then immediately measured with the
spectrophotometer (five times, for the purpose of accuracy) to obtain the colour of the
untarnished fresh metal. The cleaned area is also the correct size for ED-XRF analysis.
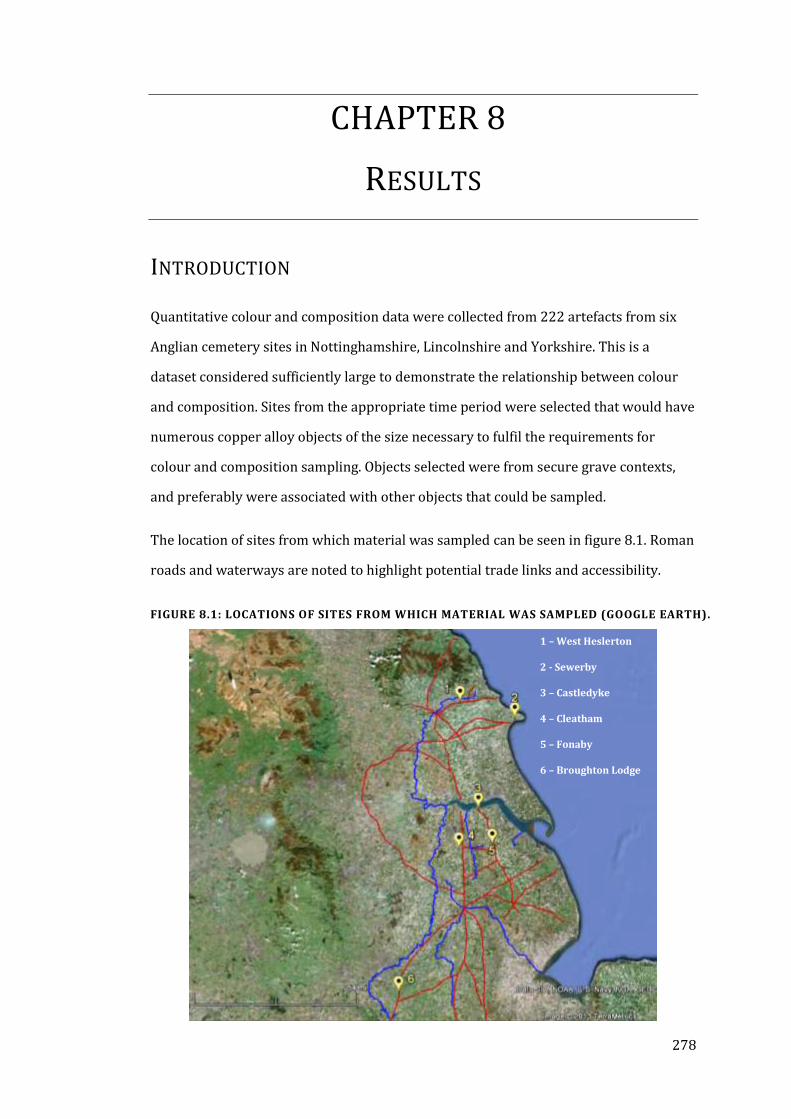
278
CHAPTER 8
RESULTS
INTRODUCTION
Quantitative colour and composition data were collected from 222 artefacts from six
Anglian cemetery sites in Nottinghamshire, Lincolnshire and Yorkshire. This is a
dataset considered sufficiently large to demonstrate the relationship between colour
and composition. Sites from the appropriate time period were selected that would have
numerous copper alloy objects of the size necessary to fulfil the requirements for
colour and composition sampling. Objects selected were from secure grave contexts,
and preferably were associated with other objects that could be sampled.
The location of sites from which material was sampled can be seen in figure 8.1. Roman
roads and waterways are noted to highlight potential trade links and accessibility.
FIGURE 8.1: LOCATIONS OF SITES FROM WHICH MATERIAL WAS SAMPLED (GOOGLE EARTH).
1 – West Heslerton
2 - Sewerby
3 – Castledyke
4 – Cleatham
5 – Fonaby
6 – Broughton Lodge
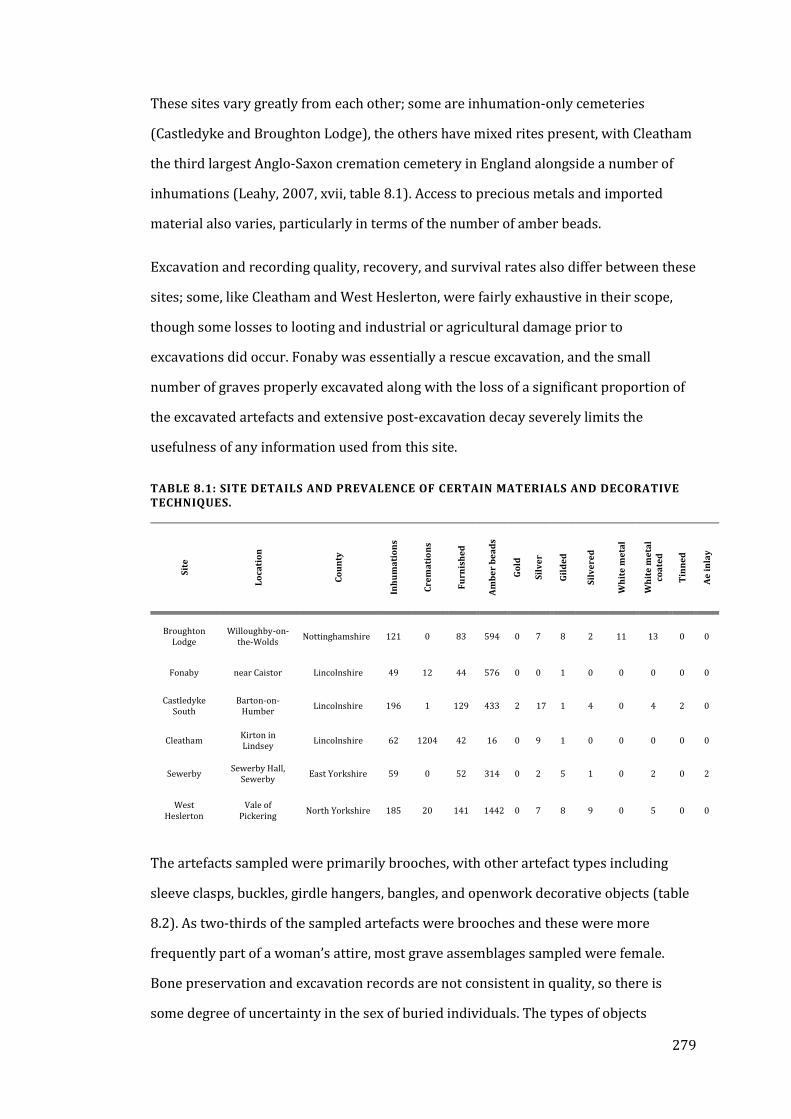
279
These sites vary greatly from each other; some are inhumation-only cemeteries
(Castledyke and Broughton Lodge), the others have mixed rites present, with Cleatham
the third largest Anglo-Saxon cremation cemetery in England alongside a number of
inhumations (Leahy, 2007, xvii, table 8.1). Access to precious metals and imported
material also varies, particularly in terms of the number of amber beads.
Excavation and recording quality, recovery, and survival rates also differ between these
sites; some, like Cleatham and West Heslerton, were fairly exhaustive in their scope,
though some losses to looting and industrial or agricultural damage prior to
excavations did occur. Fonaby was essentially a rescue excavation, and the small
number of graves properly excavated along with the loss of a significant proportion of
the excavated artefacts and extensive post-excavation decay severely limits the
usefulness of any information used from this site.
TABLE 8.1: SITE DETAILS AND PREVALENCE OF CERTAIN MATERIALS AND DECORATIVE TECHNIQUES.
Sit
e
Lo
cati
on
Co
un
ty
Inh
um
ati
on
s
Cre
ma
tio
ns
Fu
rnis
he
d
Am
be
r b
ea
ds
Go
ld
Sil
ve
r
Gil
de
d
Sil
ve
red
Wh
ite
me
tal
Wh
ite
me
tal
coa
ted
Tin
ne
d
Ae
in
lay
Broughton Lodge
Willoughby-on-the-Wolds
Nottinghamshire 121 0 83 594 0 7 8 2 11 13 0 0
Fonaby near Caistor Lincolnshire 49 12 44 576 0 0 1 0 0 0 0 0
Castledyke South
Barton-on-Humber
Lincolnshire 196 1 129 433 2 17 1 4 0 4 2 0
Cleatham Kirton in Lindsey
Lincolnshire 62 1204 42 16 0 9 1 0 0 0 0 0
Sewerby Sewerby Hall,
Sewerby East Yorkshire 59 0 52 314 0 2 5 1 0 2 0 2
West Heslerton
Vale of Pickering
North Yorkshire 185 20 141 1442 0 7 8 9 0 5 0 0
The artefacts sampled were primarily brooches, with other artefact types including
sleeve clasps, buckles, girdle hangers, bangles, and openwork decorative objects (table
8.2). As two-thirds of the sampled artefacts were brooches and these were more
frequently part of a woman’s attire, most grave assemblages sampled were female.
Bone preservation and excavation records are not consistent in quality, so there is
some degree of uncertainty in the sex of buried individuals. The types of objects
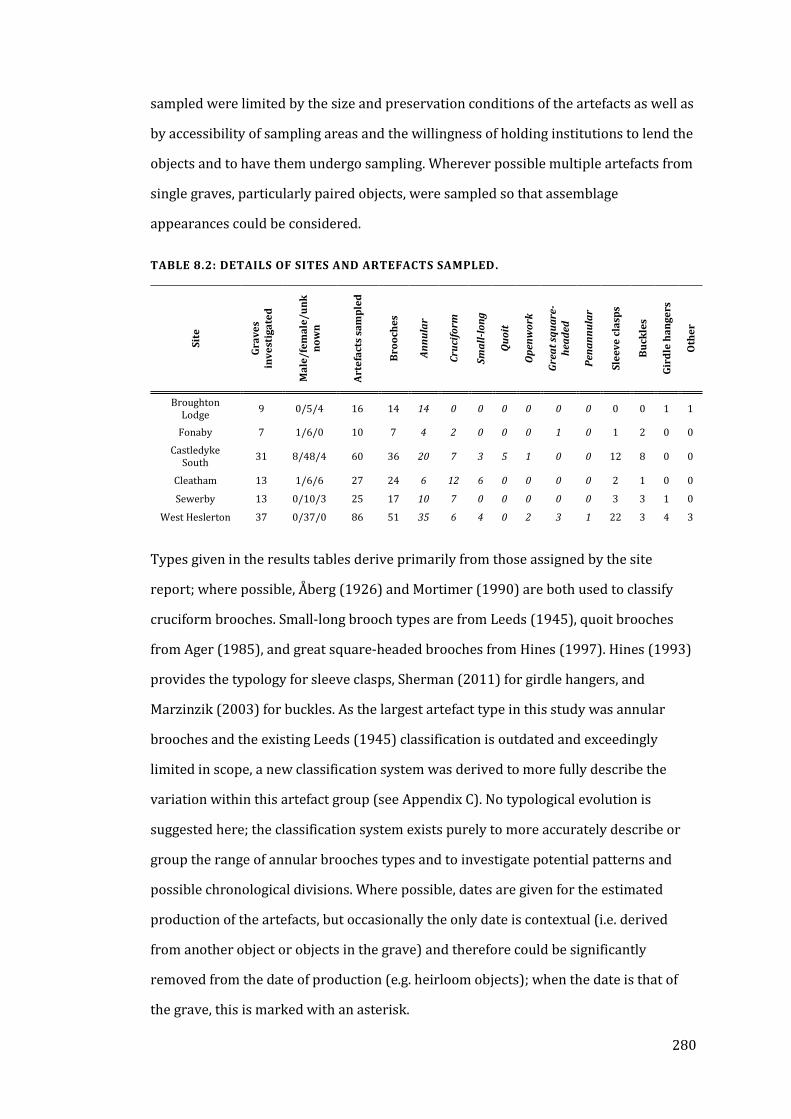
280
sampled were limited by the size and preservation conditions of the artefacts as well as
by accessibility of sampling areas and the willingness of holding institutions to lend the
objects and to have them undergo sampling. Wherever possible multiple artefacts from
single graves, particularly paired objects, were sampled so that assemblage
appearances could be considered.
TABLE 8.2: DETAILS OF SITES AND ARTEFACTS SAMPLED.
Sit
e
Gra
ve
s in
ve
stig
ate
d
Ma
le/f
em
ale
/un
kn
ow
n
Art
efa
cts
sam
ple
d
Bro
och
es
An
nu
lar
Cru
cifo
rm
Sm
all
-lo
ng
Qu
oit
Op
enw
ork
Gre
at
squ
are
-h
ead
ed
Pen
an
nu
lar
Sle
ev
e c
lasp
s
Bu
ckle
s
Gir
dle
ha
ng
ers
Oth
er
Broughton Lodge
9 0/5/4 16 14 14 0 0 0 0 0 0 0 0 1 1
Fonaby 7 1/6/0 10 7 4 2 0 0 0 1 0 1 2 0 0
Castledyke South
31 8/48/4 60 36 20 7 3 5 1 0 0 12 8 0 0
Cleatham 13 1/6/6 27 24 6 12 6 0 0 0 0 2 1 0 0
Sewerby 13 0/10/3 25 17 10 7 0 0 0 0 0 3 3 1 0
West Heslerton 37 0/37/0 86 51 35 6 4 0 2 3 1 22 3 4 3
Types given in the results tables derive primarily from those assigned by the site
report; where possible, Åberg (1926) and Mortimer (1990) are both used to classify
cruciform brooches. Small-long brooch types are from Leeds (1945), quoit brooches
from Ager (1985), and great square-headed brooches from Hines (1997). Hines (1993)
provides the typology for sleeve clasps, Sherman (2011) for girdle hangers, and
Marzinzik (2003) for buckles. As the largest artefact type in this study was annular
brooches and the existing Leeds (1945) classification is outdated and exceedingly
limited in scope, a new classification system was derived to more fully describe the
variation within this artefact group (see Appendix C). No typological evolution is
suggested here; the classification system exists purely to more accurately describe or
group the range of annular brooches types and to investigate potential patterns and
possible chronological divisions. Where possible, dates are given for the estimated
production of the artefacts, but occasionally the only date is contextual (i.e. derived
from another object or objects in the grave) and therefore could be significantly
removed from the date of production (e.g. heirloom objects); when the date is that of
the grave, this is marked with an asterisk.
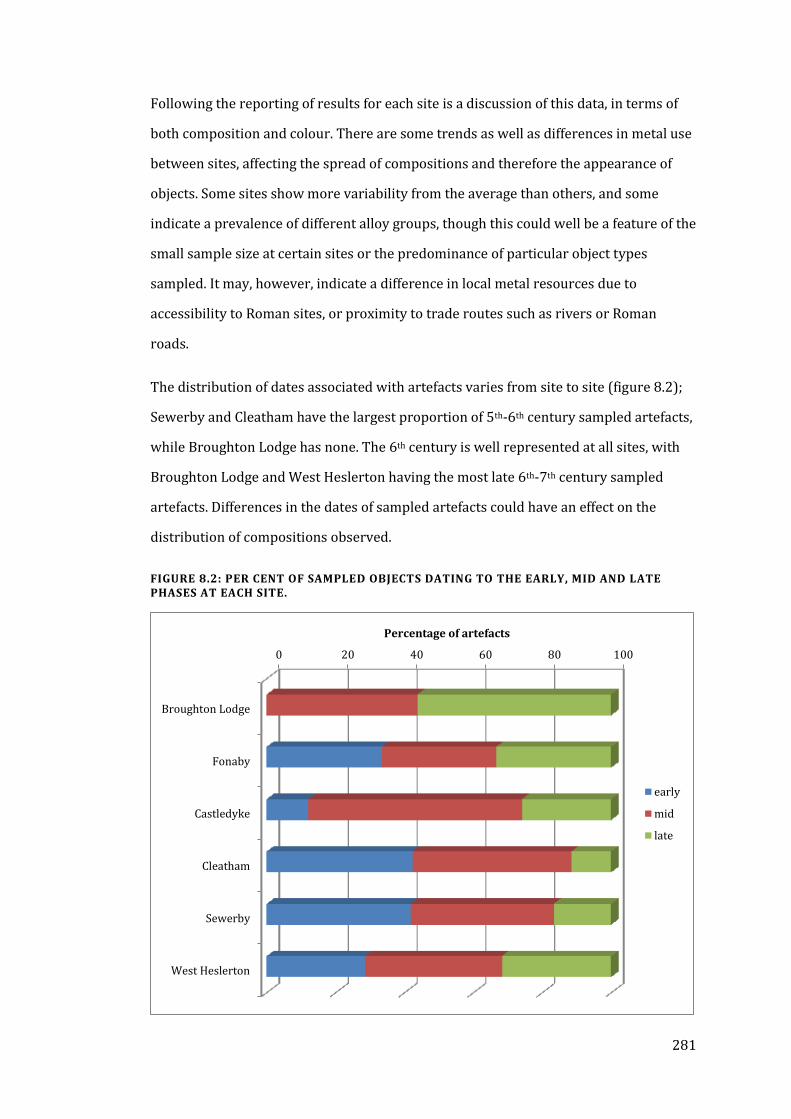
281
Following the reporting of results for each site is a discussion of this data, in terms of
both composition and colour. There are some trends as well as differences in metal use
between sites, affecting the spread of compositions and therefore the appearance of
objects. Some sites show more variability from the average than others, and some
indicate a prevalence of different alloy groups, though this could well be a feature of the
small sample size at certain sites or the predominance of particular object types
sampled. It may, however, indicate a difference in local metal resources due to
accessibility to Roman sites, or proximity to trade routes such as rivers or Roman
roads.
The distribution of dates associated with artefacts varies from site to site (figure 8.2);
Sewerby and Cleatham have the largest proportion of 5th-6th century sampled artefacts,
while Broughton Lodge has none. The 6th century is well represented at all sites, with
Broughton Lodge and West Heslerton having the most late 6th-7th century sampled
artefacts. Differences in the dates of sampled artefacts could have an effect on the
distribution of compositions observed.
FIGURE 8.2: PER CENT OF SAMPLED OBJECTS DATING TO THE EARLY, MID AND LATE PHASES AT EACH SITE.
0 20 40 60 80 100
Broughton Lodge
Fonaby
Castledyke
Cleatham
Sewerby
West Heslerton
Percentage of artefacts
early
mid
late
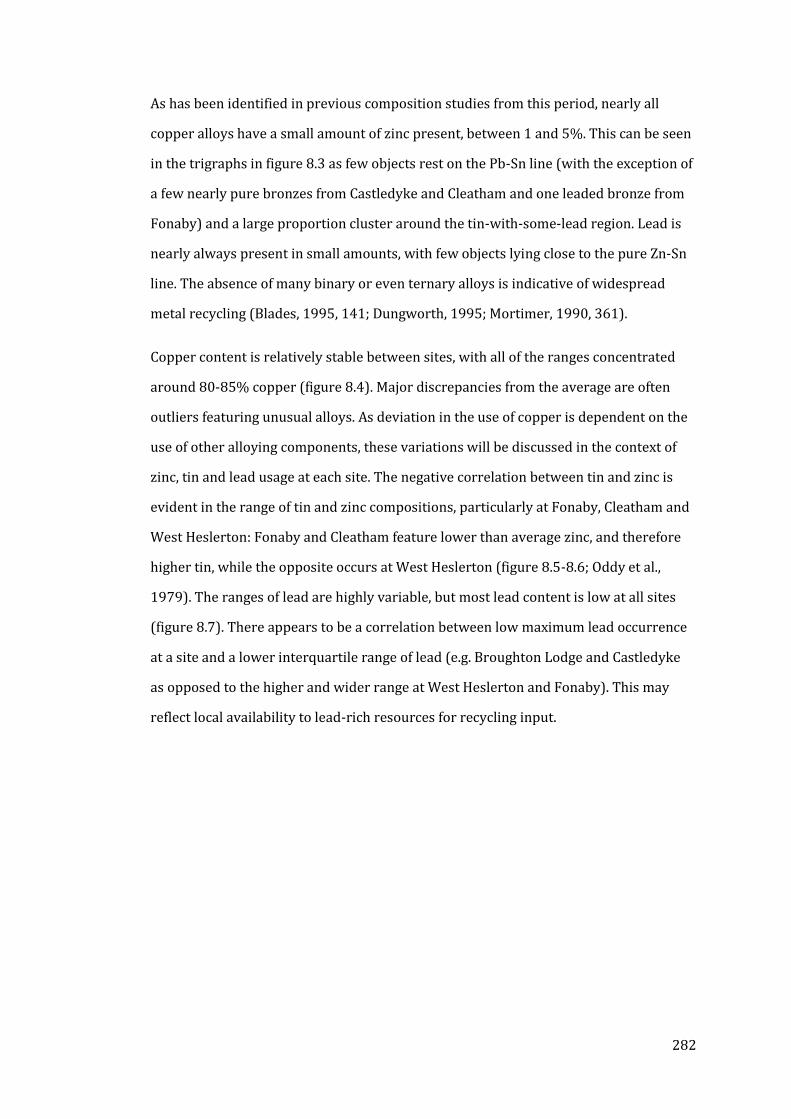
282
As has been identified in previous composition studies from this period, nearly all
copper alloys have a small amount of zinc present, between 1 and 5%. This can be seen
in the trigraphs in figure 8.3 as few objects rest on the Pb-Sn line (with the exception of
a few nearly pure bronzes from Castledyke and Cleatham and one leaded bronze from
Fonaby) and a large proportion cluster around the tin-with-some-lead region. Lead is
nearly always present in small amounts, with few objects lying close to the pure Zn-Sn
line. The absence of many binary or even ternary alloys is indicative of widespread
metal recycling (Blades, 1995, 141; Dungworth, 1995; Mortimer, 1990, 361).
Copper content is relatively stable between sites, with all of the ranges concentrated
around 80-85% copper (figure 8.4). Major discrepancies from the average are often
outliers featuring unusual alloys. As deviation in the use of copper is dependent on the
use of other alloying components, these variations will be discussed in the context of
zinc, tin and lead usage at each site. The negative correlation between tin and zinc is
evident in the range of tin and zinc compositions, particularly at Fonaby, Cleatham and
West Heslerton: Fonaby and Cleatham feature lower than average zinc, and therefore
higher tin, while the opposite occurs at West Heslerton (figure 8.5-8.6; Oddy et al.,
1979). The ranges of lead are highly variable, but most lead content is low at all sites
(figure 8.7). There appears to be a correlation between low maximum lead occurrence
at a site and a lower interquartile range of lead (e.g. Broughton Lodge and Castledyke
as opposed to the higher and wider range at West Heslerton and Fonaby). This may
reflect local availability to lead-rich resources for recycling input.
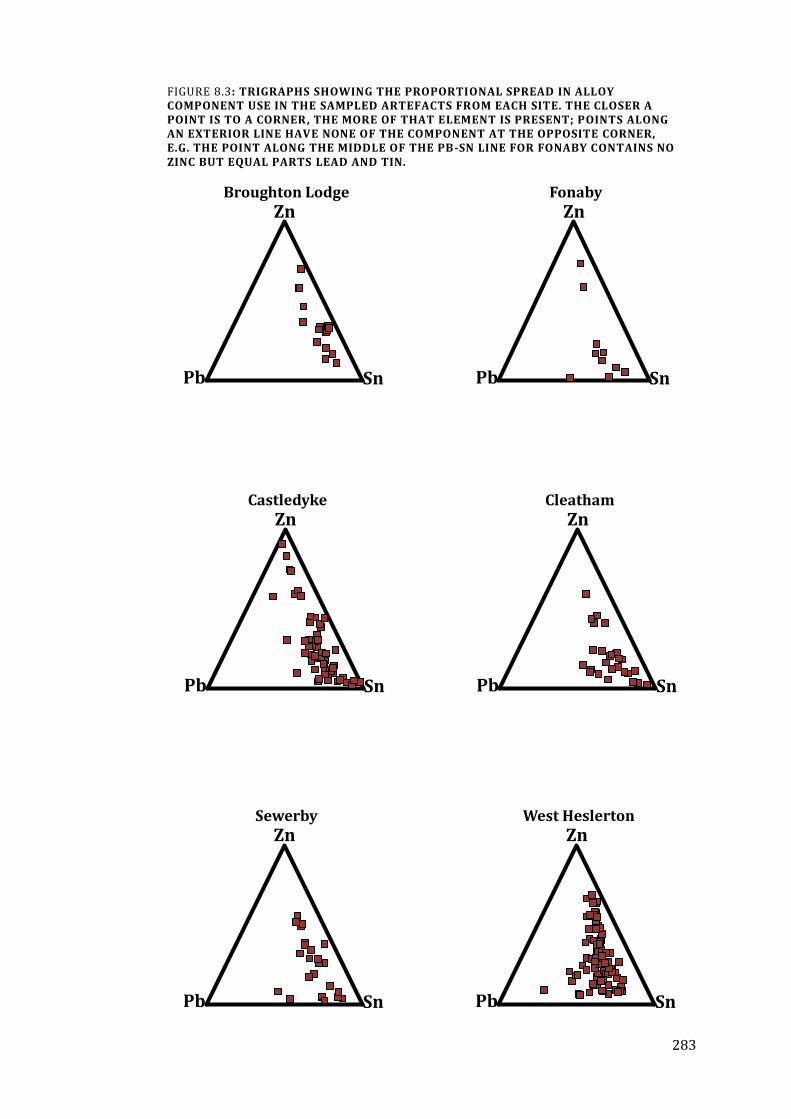
283
Fonaby
Zn
Pb Sn
Broughton Lodge
Zn
Pb Sn
Castledyke
Zn
Pb Sn
Cleatham
Zn
Pb Sn
Sewerby
Zn
Pb Sn
West Heslerton
Zn
Pb Sn
FIGURE 8.3: TRIGRAPHS SHOWING THE PROPORTIONAL SPREAD IN ALLOY COMPONENT USE IN THE SAMPLED ARTEFACTS FROM EACH SITE. THE CLOSER A POINT IS TO A CORNER, THE MORE OF THAT ELEMENT IS PRESENT; POINTS ALONG AN EXTERIOR LINE HAVE NONE OF THE COMPONENT AT THE OPPOSITE CORNER, E.G. THE POINT ALONG THE MIDDLE OF THE PB-SN LINE FOR FONABY CONTAINS NO ZINC BUT EQUAL PARTS LEAD AND TIN.
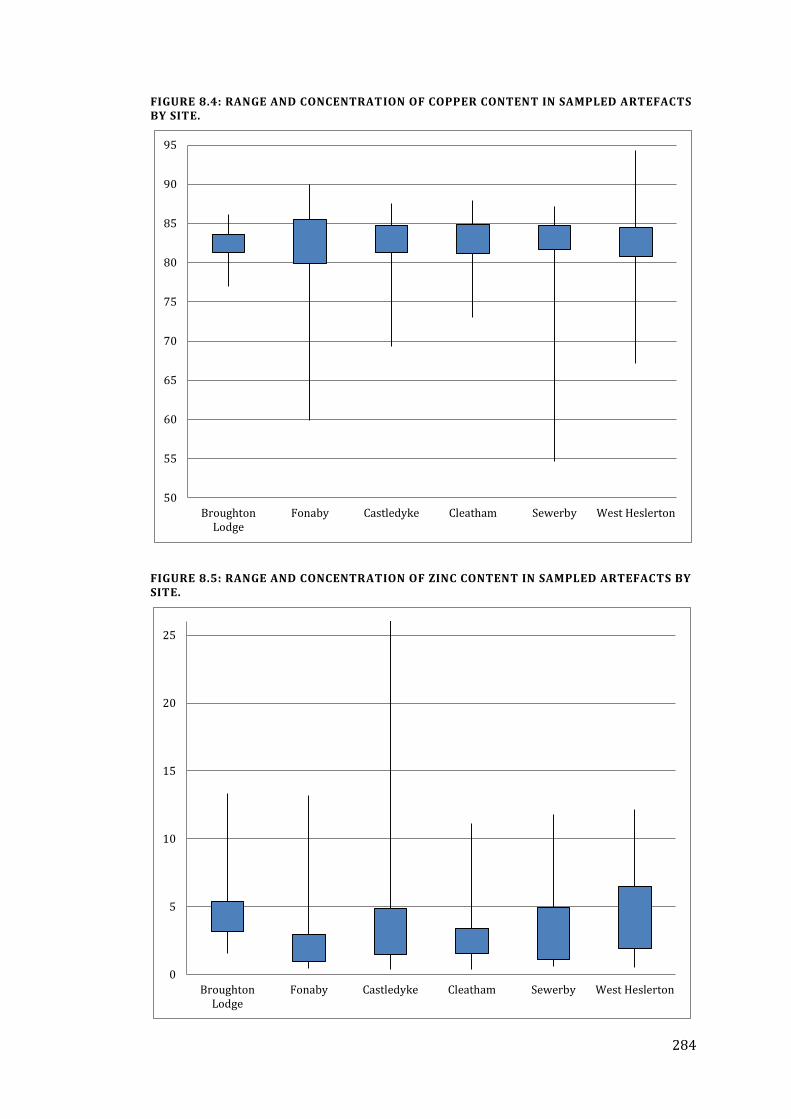
284
FIGURE 8.4: RANGE AND CONCENTRATION OF COPPER CONTENT IN SAMPLED ARTEFACTS BY SITE.
FIGURE 8.5: RANGE AND CONCENTRATION OF ZINC CONTENT IN SAMPLED ARTEFACTS BY SITE.
50
55
60
65
70
75
80
85
90
95
BroughtonLodge
Fonaby Castledyke Cleatham Sewerby West Heslerton
0
5
10
15
20
25
BroughtonLodge
Fonaby Castledyke Cleatham Sewerby West Heslerton
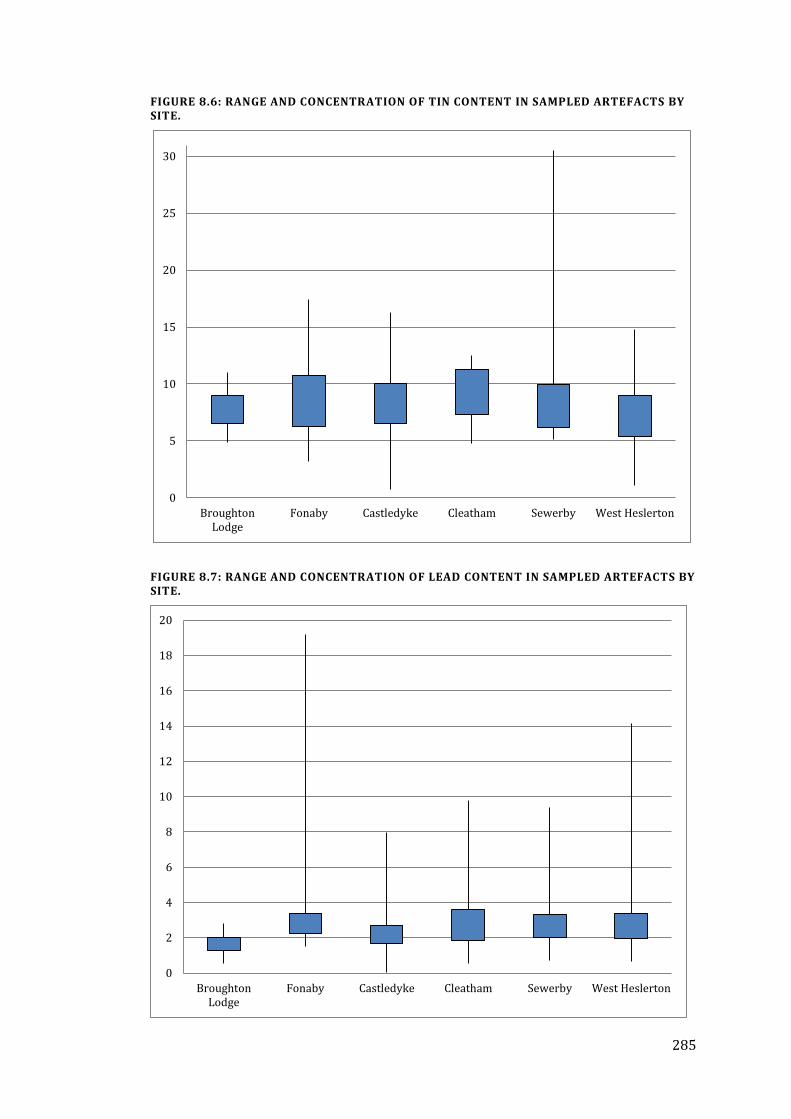
285
FIGURE 8.6: RANGE AND CONCENTRATION OF TIN CONTENT IN SAMPLED ARTEFACTS BY SITE.
FIGURE 8.7: RANGE AND CONCENTRATION OF LEAD CONTENT IN SAMPLED ARTEFACTS BY SITE.
0
5
10
15
20
25
30
BroughtonLodge
Fonaby Castledyke Cleatham Sewerby West Heslerton
0
2
4
6
8
10
12
14
16
18
20
BroughtonLodge
Fonaby Castledyke Cleatham Sewerby West Heslerton
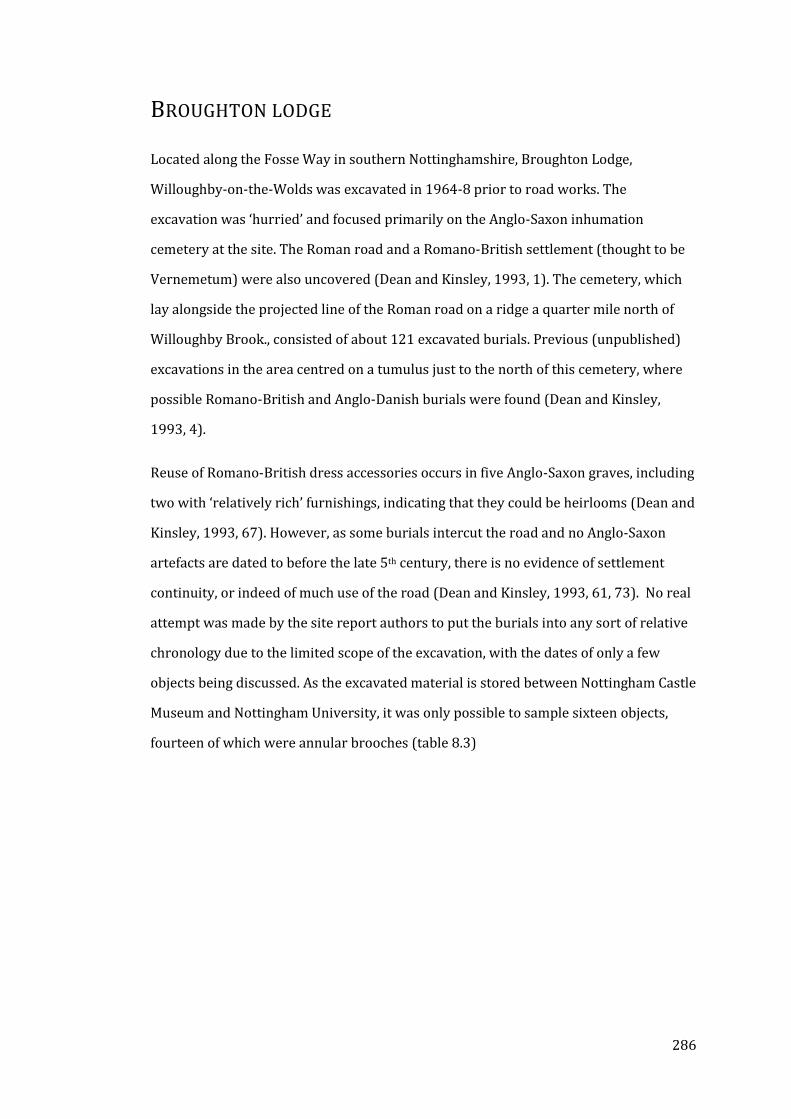
286
BROUGHTON LODGE
Located along the Fosse Way in southern Nottinghamshire, Broughton Lodge,
Willoughby-on-the-Wolds was excavated in 1964-8 prior to road works. The
excavation was ‘hurried’ and focused primarily on the Anglo-Saxon inhumation
cemetery at the site. The Roman road and a Romano-British settlement (thought to be
Vernemetum) were also uncovered (Dean and Kinsley, 1993, 1). The cemetery, which
lay alongside the projected line of the Roman road on a ridge a quarter mile north of
Willoughby Brook., consisted of about 121 excavated burials. Previous (unpublished)
excavations in the area centred on a tumulus just to the north of this cemetery, where
possible Romano-British and Anglo-Danish burials were found (Dean and Kinsley,
1993, 4).
Reuse of Romano-British dress accessories occurs in five Anglo-Saxon graves, including
two with ‘relatively rich’ furnishings, indicating that they could be heirlooms (Dean and
Kinsley, 1993, 67). However, as some burials intercut the road and no Anglo-Saxon
artefacts are dated to before the late 5th century, there is no evidence of settlement
continuity, or indeed of much use of the road (Dean and Kinsley, 1993, 61, 73). No real
attempt was made by the site report authors to put the burials into any sort of relative
chronology due to the limited scope of the excavation, with the dates of only a few
objects being discussed. As the excavated material is stored between Nottingham Castle
Museum and Nottingham University, it was only possible to sample sixteen objects,
fourteen of which were annular brooches (table 8.3)
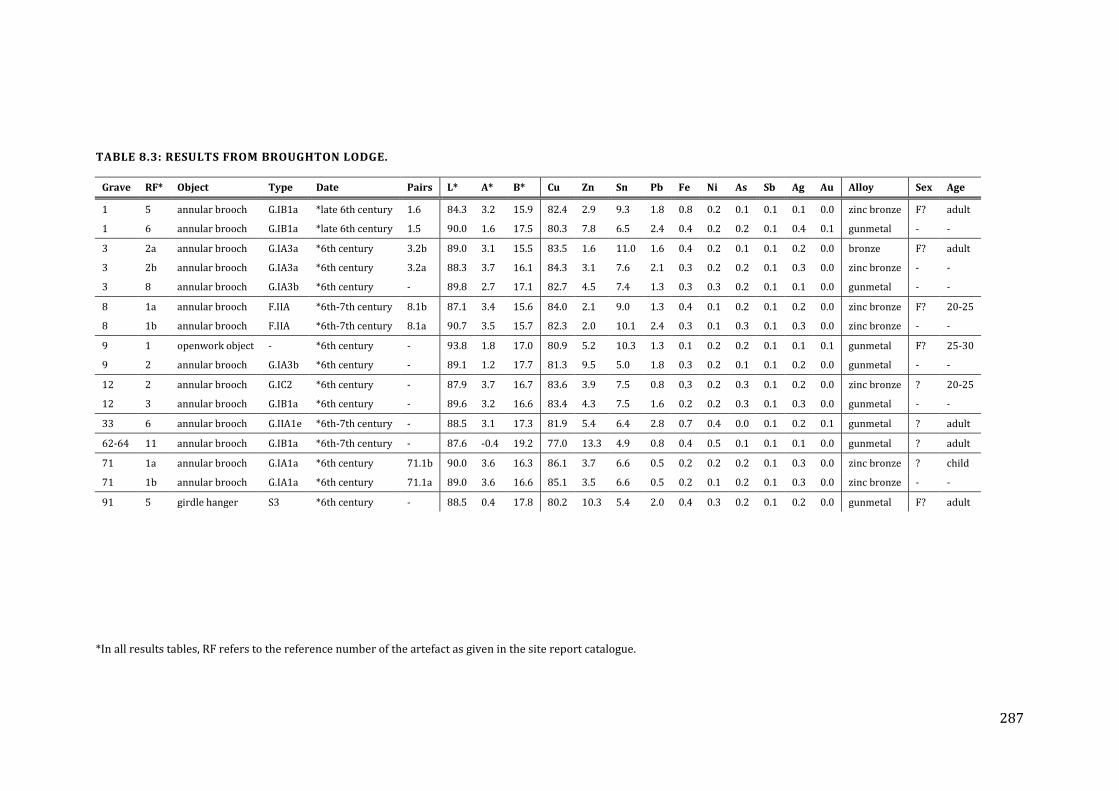
287
TABLE 8.3: RESULTS FROM BROUGHTON LODGE.
Grave RF* Object Type Date Pairs L* A* B* Cu Zn Sn Pb Fe Ni As Sb Ag Au Alloy Sex Age
1 5 annular brooch G.IB1a *late 6th century 1.6 84.3 3.2 15.9 82.4 2.9 9.3 1.8 0.8 0.2 0.1 0.1 0.1 0.0 zinc bronze F? adult
1 6 annular brooch G.IB1a *late 6th century 1.5 90.0 1.6 17.5 80.3 7.8 6.5 2.4 0.4 0.2 0.2 0.1 0.4 0.1 gunmetal - -
3 2a annular brooch G.IA3a *6th century 3.2b 89.0 3.1 15.5 83.5 1.6 11.0 1.6 0.4 0.2 0.1 0.1 0.2 0.0 bronze F? adult
3 2b annular brooch G.IA3a *6th century 3.2a 88.3 3.7 16.1 84.3 3.1 7.6 2.1 0.3 0.2 0.2 0.1 0.3 0.0 zinc bronze - -
3 8 annular brooch G.IA3b *6th century - 89.8 2.7 17.1 82.7 4.5 7.4 1.3 0.3 0.3 0.2 0.1 0.1 0.0 gunmetal - -
8 1a annular brooch F.IIA *6th-7th century 8.1b 87.1 3.4 15.6 84.0 2.1 9.0 1.3 0.4 0.1 0.2 0.1 0.2 0.0 zinc bronze F? 20-25
8 1b annular brooch F.IIA *6th-7th century 8.1a 90.7 3.5 15.7 82.3 2.0 10.1 2.4 0.3 0.1 0.3 0.1 0.3 0.0 zinc bronze - -
9 1 openwork object - *6th century - 93.8 1.8 17.0 80.9 5.2 10.3 1.3 0.1 0.2 0.2 0.1 0.1 0.1 gunmetal F? 25-30
9 2 annular brooch G.IA3b *6th century - 89.1 1.2 17.7 81.3 9.5 5.0 1.8 0.3 0.2 0.1 0.1 0.2 0.0 gunmetal - -
12 2 annular brooch G.IC2 *6th century - 87.9 3.7 16.7 83.6 3.9 7.5 0.8 0.3 0.2 0.3 0.1 0.2 0.0 zinc bronze ? 20-25
12 3 annular brooch G.IB1a *6th century - 89.6 3.2 16.6 83.4 4.3 7.5 1.6 0.2 0.2 0.3 0.1 0.3 0.0 gunmetal - -
33 6 annular brooch G.IIA1e *6th-7th century - 88.5 3.1 17.3 81.9 5.4 6.4 2.8 0.7 0.4 0.0 0.1 0.2 0.1 gunmetal ? adult
62-64 11 annular brooch G.IB1a *6th-7th century - 87.6 -0.4 19.2 77.0 13.3 4.9 0.8 0.4 0.5 0.1 0.1 0.1 0.0 gunmetal ? adult
71 1a annular brooch G.IA1a *6th century 71.1b 90.0 3.6 16.3 86.1 3.7 6.6 0.5 0.2 0.2 0.2 0.1 0.3 0.0 zinc bronze ? child
71 1b annular brooch G.IA1a *6th century 71.1a 89.0 3.6 16.6 85.1 3.5 6.6 0.5 0.2 0.1 0.2 0.1 0.3 0.0 zinc bronze - -
91 5 girdle hanger S3 *6th century - 88.5 0.4 17.8 80.2 10.3 5.4 2.0 0.4 0.3 0.2 0.1 0.2 0.0 gunmetal F? adult
*In all results tables, RF refers to the reference number of the artefact as given in the site report catalogue.
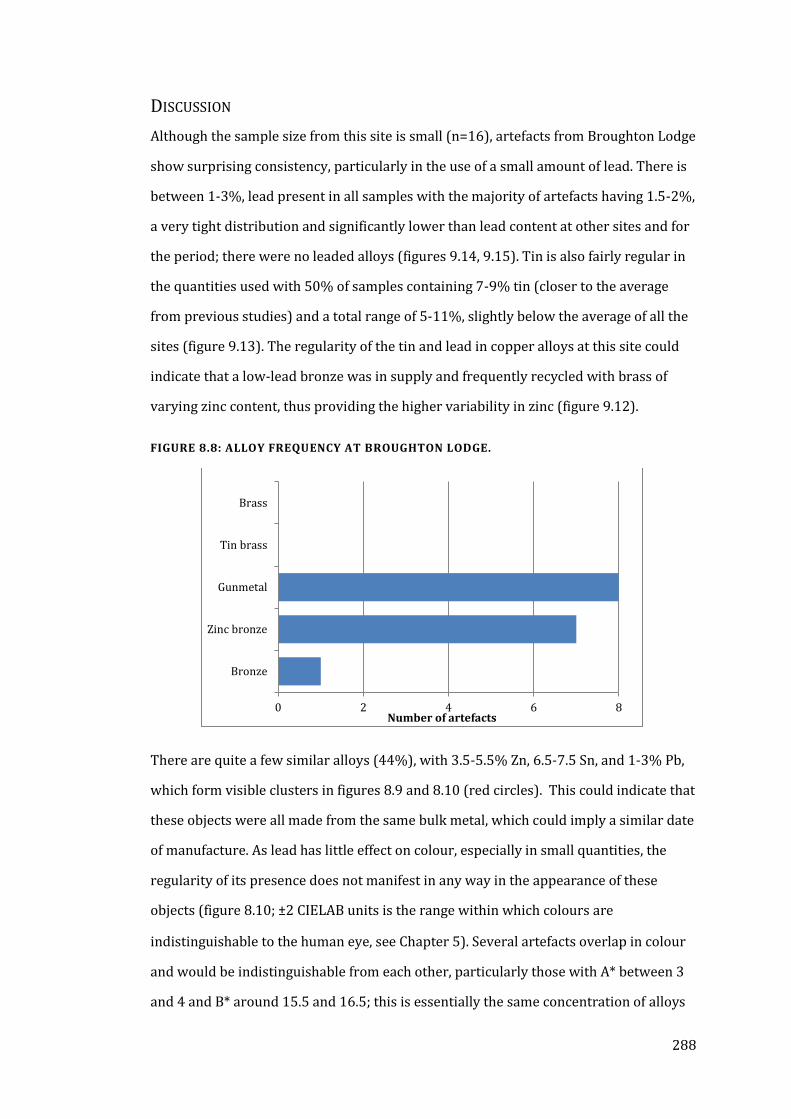
288
DISCUSSION
Although the sample size from this site is small (n=16), artefacts from Broughton Lodge
show surprising consistency, particularly in the use of a small amount of lead. There is
between 1-3%, lead present in all samples with the majority of artefacts having 1.5-2%,
a very tight distribution and significantly lower than lead content at other sites and for
the period; there were no leaded alloys (figures 9.14, 9.15). Tin is also fairly regular in
the quantities used with 50% of samples containing 7-9% tin (closer to the average
from previous studies) and a total range of 5-11%, slightly below the average of all the
sites (figure 9.13). The regularity of the tin and lead in copper alloys at this site could
indicate that a low-lead bronze was in supply and frequently recycled with brass of
varying zinc content, thus providing the higher variability in zinc (figure 9.12).
FIGURE 8.8: ALLOY FREQUENCY AT BROUGHTON LODGE.
There are quite a few similar alloys (44%), with 3.5-5.5% Zn, 6.5-7.5 Sn, and 1-3% Pb,
which form visible clusters in figures 8.9 and 8.10 (red circles). This could indicate that
these objects were all made from the same bulk metal, which could imply a similar date
of manufacture. As lead has little effect on colour, especially in small quantities, the
regularity of its presence does not manifest in any way in the appearance of these
objects (figure 8.10; ±2 CIELAB units is the range within which colours are
indistinguishable to the human eye, see Chapter 5). Several artefacts overlap in colour
and would be indistinguishable from each other, particularly those with A* between 3
and 4 and B* around 15.5 and 16.5; this is essentially the same concentration of alloys
0 2 4 6 8
Bronze
Zinc bronze
Gunmetal
Tin brass
Brass
Number of artefacts
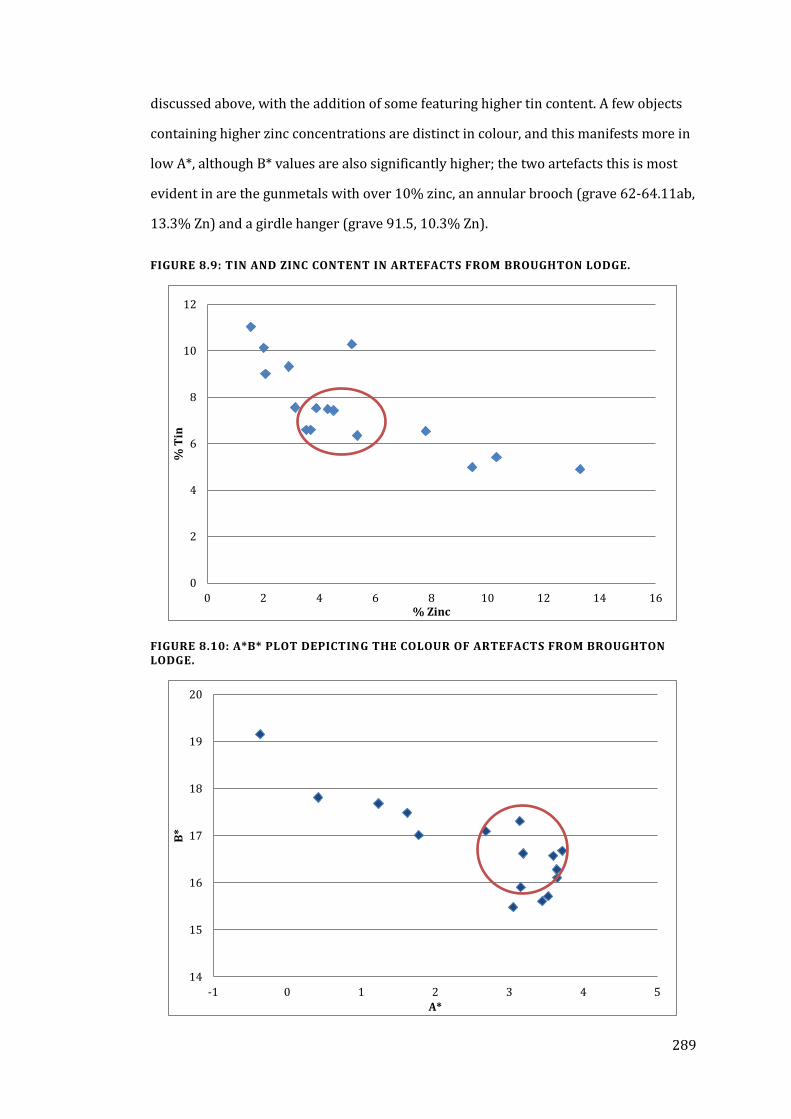
289
discussed above, with the addition of some featuring higher tin content. A few objects
containing higher zinc concentrations are distinct in colour, and this manifests more in
low A*, although B* values are also significantly higher; the two artefacts this is most
evident in are the gunmetals with over 10% zinc, an annular brooch (grave 62-64.11ab,
13.3% Zn) and a girdle hanger (grave 91.5, 10.3% Zn).
FIGURE 8.9: TIN AND ZINC CONTENT IN ARTEFACTS FROM BROUGHTON LODGE.
FIGURE 8.10: A*B* PLOT DEPICTING THE COLOUR OF ARTEFACTS FROM BROUGHTON LODGE.
0
2
4
6
8
10
12
0 2 4 6 8 10 12 14 16
% T
in
% Zinc
14
15
16
17
18
19
20
-1 0 1 2 3 4 5
B*
A*
290
FONABY
Fonaby, located just over a mile north of the Roman walled town of Caistor just east of
the longstanding track-way known as High Street in North Lincolnshire, was a rescue
excavation between 1956-8 during and in advance of quarrying of sand on the site
(Cook, 1981, 14). Though records were made and an index of material from the
cemetery compiled at that time, the site report was not published until 1981, at which
time a significant number of the finds were missing or mislabelled, some probably
amongst the unstratified material. There are very few skeletal remains, and the details
from the site notebooks are limited in scope (Cook, 1981, 16).
Of the forty-two inhumations from this site, the locations of only twenty-eight were
recorded, with approximate locations areas given for the rest (Cook, 1981, 74). It is
thought that a significant number of graves were lost to quarrying prior to the
excavations, and the extent of the cemetery is not known, but given fifteen unstratified
annular brooch finds (usually found in pairs) there could have been at least another
seven inhumations in the immediate area. Despite the quality of the excavated remains,
many of the graves were richly furnished; over fifty beads were found in four separate
graves, and the number of amber beads from the site is comparable with the number
from Broughton Lodge, which had more than double the number of graves (Cook, 1981,
81, table 8.1). The site can only be loosely dated, given the limited evidence, to the late
5th to early 7th centuries.
Only the cruciform brooches were analysed previously (Mortimer, 1990), and indeed it
is unlikely that any further metallurgical investigation will occur due to the advanced
state of corrosion on metalwork from Fonaby. The compositions of the two previously
analysed brooches are consistent with data collected in this study. Only ten artefacts
were sampled from Fonaby due to the extremity of corrosion damage (table 8.4).
Originally far more artefacts from Fonaby were intended to be sampled as part of this
study, but many objects now consist only of corrosion, and those with surviving metal
were often far too fragile to sample safely.
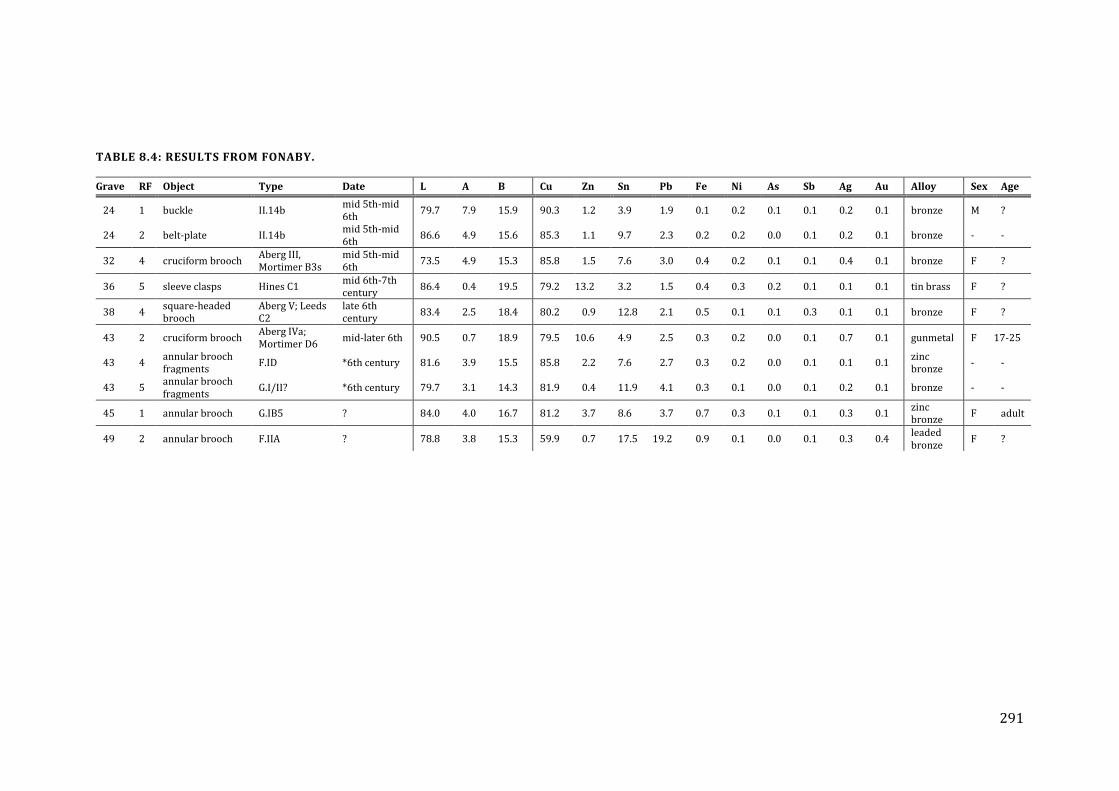
291
TABLE 8.4: RESULTS FROM FONABY.
Grave RF Object Type Date L A B Cu Zn Sn Pb Fe Ni As Sb Ag Au Alloy Sex Age
24 1 buckle II.14b mid 5th-mid 6th
79.7 7.9 15.9 90.3 1.2 3.9 1.9 0.1 0.2 0.1 0.1 0.2 0.1 bronze M ?
24 2 belt-plate II.14b mid 5th-mid 6th
86.6 4.9 15.6 85.3 1.1 9.7 2.3 0.2 0.2 0.0 0.1 0.2 0.1 bronze - -
32 4 cruciform brooch Aberg III, Mortimer B3s
mid 5th-mid 6th
73.5 4.9 15.3 85.8 1.5 7.6 3.0 0.4 0.2 0.1 0.1 0.4 0.1 bronze F ?
36 5 sleeve clasps Hines C1 mid 6th-7th century
86.4 0.4 19.5 79.2 13.2 3.2 1.5 0.4 0.3 0.2 0.1 0.1 0.1 tin brass F ?
38 4 square-headed brooch
Aberg V; Leeds C2
late 6th century
83.4 2.5 18.4 80.2 0.9 12.8 2.1 0.5 0.1 0.1 0.3 0.1 0.1 bronze F ?
43 2 cruciform brooch Aberg IVa; Mortimer D6
mid-later 6th 90.5 0.7 18.9 79.5 10.6 4.9 2.5 0.3 0.2 0.0 0.1 0.7 0.1 gunmetal F 17-25
43 4 annular brooch fragments
F.ID *6th century 81.6 3.9 15.5 85.8 2.2 7.6 2.7 0.3 0.2 0.0 0.1 0.1 0.1 zinc bronze
- -
43 5 annular brooch fragments
G.I/II? *6th century 79.7 3.1 14.3 81.9 0.4 11.9 4.1 0.3 0.1 0.0 0.1 0.2 0.1 bronze - -
45 1 annular brooch G.IB5 ? 84.0 4.0 16.7 81.2 3.7 8.6 3.7 0.7 0.3 0.1 0.1 0.3 0.1 zinc bronze
F adult
49 2 annular brooch F.IIA ? 78.8 3.8 15.3 59.9 0.7 17.5 19.2 0.9 0.1 0.0 0.1 0.3 0.4 leaded bronze
F ?
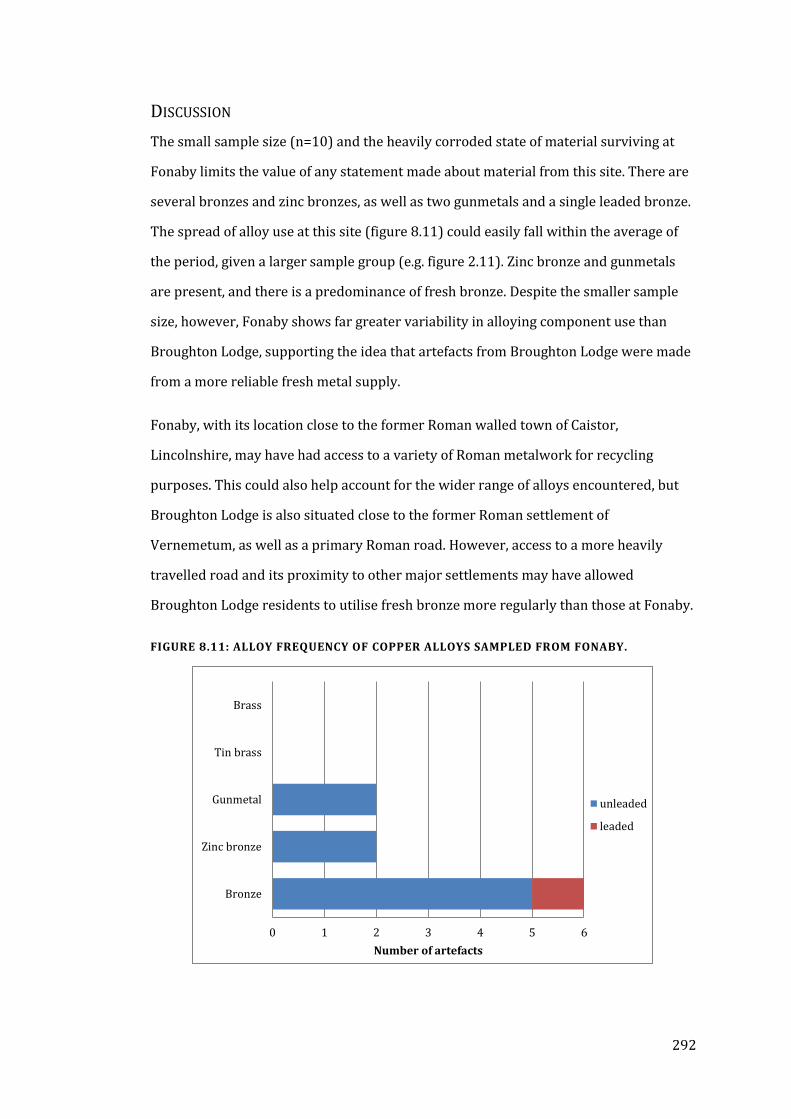
292
DISCUSSION
The small sample size (n=10) and the heavily corroded state of material surviving at
Fonaby limits the value of any statement made about material from this site. There are
several bronzes and zinc bronzes, as well as two gunmetals and a single leaded bronze.
The spread of alloy use at this site (figure 8.11) could easily fall within the average of
the period, given a larger sample group (e.g. figure 2.11). Zinc bronze and gunmetals
are present, and there is a predominance of fresh bronze. Despite the smaller sample
size, however, Fonaby shows far greater variability in alloying component use than
Broughton Lodge, supporting the idea that artefacts from Broughton Lodge were made
from a more reliable fresh metal supply.
Fonaby, with its location close to the former Roman walled town of Caistor,
Lincolnshire, may have had access to a variety of Roman metalwork for recycling
purposes. This could also help account for the wider range of alloys encountered, but
Broughton Lodge is also situated close to the former Roman settlement of
Vernemetum, as well as a primary Roman road. However, access to a more heavily
travelled road and its proximity to other major settlements may have allowed
Broughton Lodge residents to utilise fresh bronze more regularly than those at Fonaby.
FIGURE 8.11: ALLOY FREQUENCY OF COPPER ALLOYS SAMPLED FROM FONABY.
0 1 2 3 4 5 6
Bronze
Zinc bronze
Gunmetal
Tin brass
Brass
Number of artefacts
unleaded
leaded
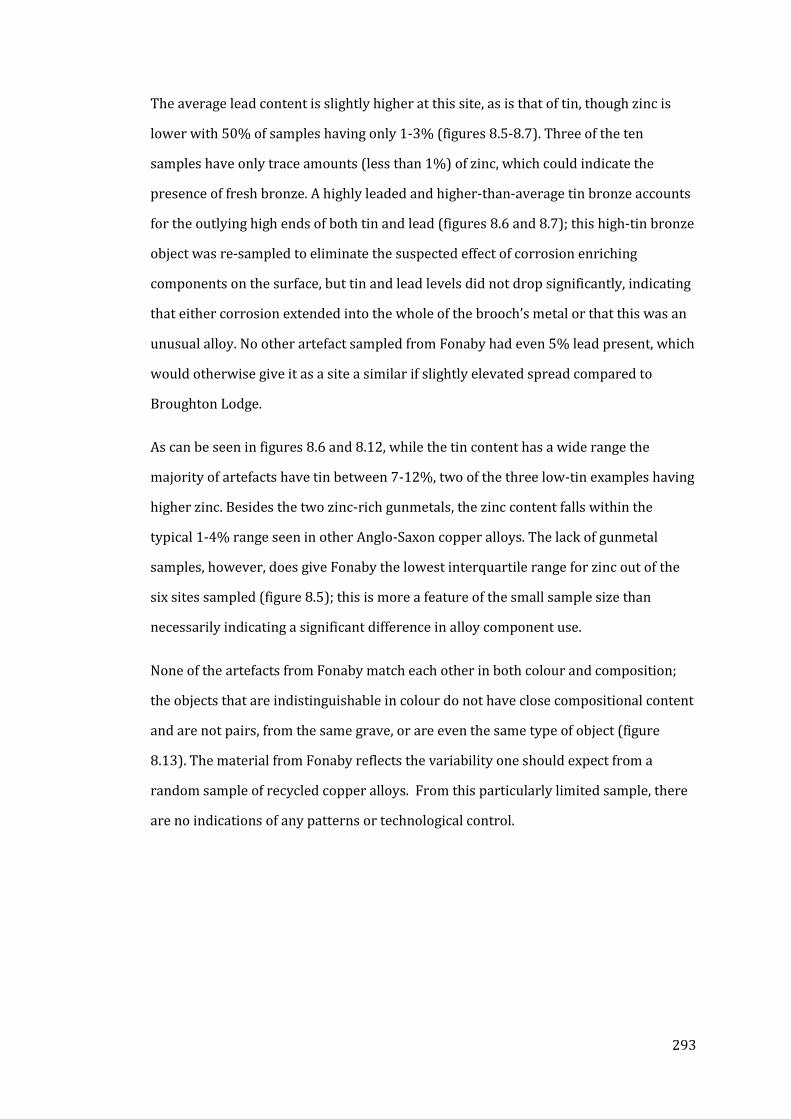
293
The average lead content is slightly higher at this site, as is that of tin, though zinc is
lower with 50% of samples having only 1-3% (figures 8.5-8.7). Three of the ten
samples have only trace amounts (less than 1%) of zinc, which could indicate the
presence of fresh bronze. A highly leaded and higher-than-average tin bronze accounts
for the outlying high ends of both tin and lead (figures 8.6 and 8.7); this high-tin bronze
object was re-sampled to eliminate the suspected effect of corrosion enriching
components on the surface, but tin and lead levels did not drop significantly, indicating
that either corrosion extended into the whole of the brooch’s metal or that this was an
unusual alloy. No other artefact sampled from Fonaby had even 5% lead present, which
would otherwise give it as a site a similar if slightly elevated spread compared to
Broughton Lodge.
As can be seen in figures 8.6 and 8.12, while the tin content has a wide range the
majority of artefacts have tin between 7-12%, two of the three low-tin examples having
higher zinc. Besides the two zinc-rich gunmetals, the zinc content falls within the
typical 1-4% range seen in other Anglo-Saxon copper alloys. The lack of gunmetal
samples, however, does give Fonaby the lowest interquartile range for zinc out of the
six sites sampled (figure 8.5); this is more a feature of the small sample size than
necessarily indicating a significant difference in alloy component use.
None of the artefacts from Fonaby match each other in both colour and composition;
the objects that are indistinguishable in colour do not have close compositional content
and are not pairs, from the same grave, or are even the same type of object (figure
8.13). The material from Fonaby reflects the variability one should expect from a
random sample of recycled copper alloys. From this particularly limited sample, there
are no indications of any patterns or technological control.
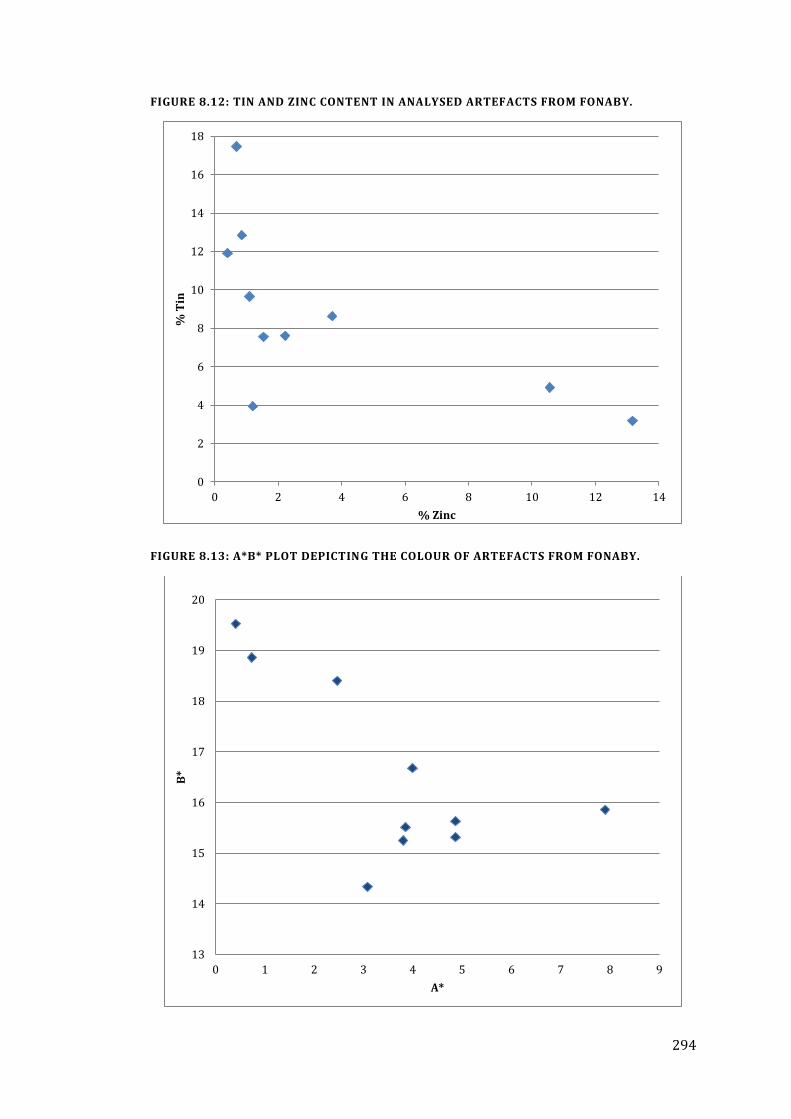
294
FIGURE 8.12: TIN AND ZINC CONTENT IN ANALYSED ARTEFACTS FROM FONABY.
FIGURE 8.13: A*B* PLOT DEPICTING THE COLOUR OF ARTEFACTS FROM FONABY.
0
2
4
6
8
10
12
14
16
18
0 2 4 6 8 10 12 14
% T
in
% Zinc
13
14
15
16
17
18
19
20
0 1 2 3 4 5 6 7 8 9
B*
A*
295
CASTLEDYKE SOUTH
Castledyke South, Barton-on-Humber, was a large inhumation cemetery site dating
from the late 5th to the late 7th century (Drinkall and Foreman 1998). The site is
described as one indicating a, “respectable, rather than a rich, material culture,” though
trade contact with the continent and other parts of Britain via the Humber River is
evident through a variety of imported objects, such as cowrie shells, ivory, porphyry,
amber, a hanging bowl, quern stones from the Pennines, and a quern stone made from
volcanic rock from Roman or Libyan regions (Drinkall and Foreman, 1998, xxi,
catalogue).
The site was partially excavated between 1975 and 1990. 201 graves and a single
cremation urn were uncovered in total, with remains of 227 individuals and an
estimated population over the course of the period of c.400 people (Drinkall and
Foreman, 1998, xxi). Preservation of both bone and metalwork was good, and some
textile impressions from mineralized remains attached to metalwork have also
survived. Some composition analysis was conducted previously, including the
cruciform brooches as and some surface XRF of a small proportion of the copper alloy
metalwork, often to determine the presence of silvering on the surface (Mortimer and
Wilthew 1998, D6-D10). The semi-quantitative data concerning the cruciform brooches
was incorrectly reported at that time; the compositions reported are inconsistent
between the previous data and that collected in this study and it appears that the
published reference numbers were switched around. Special care was therefore taken
in reanalysing these to confirm the reference numbers and the appearance with the
illustrations from the site report. Fifty-nine objects from thirty-one graves were
sampled in this study, predominately brooches from female graves (table 8.5).
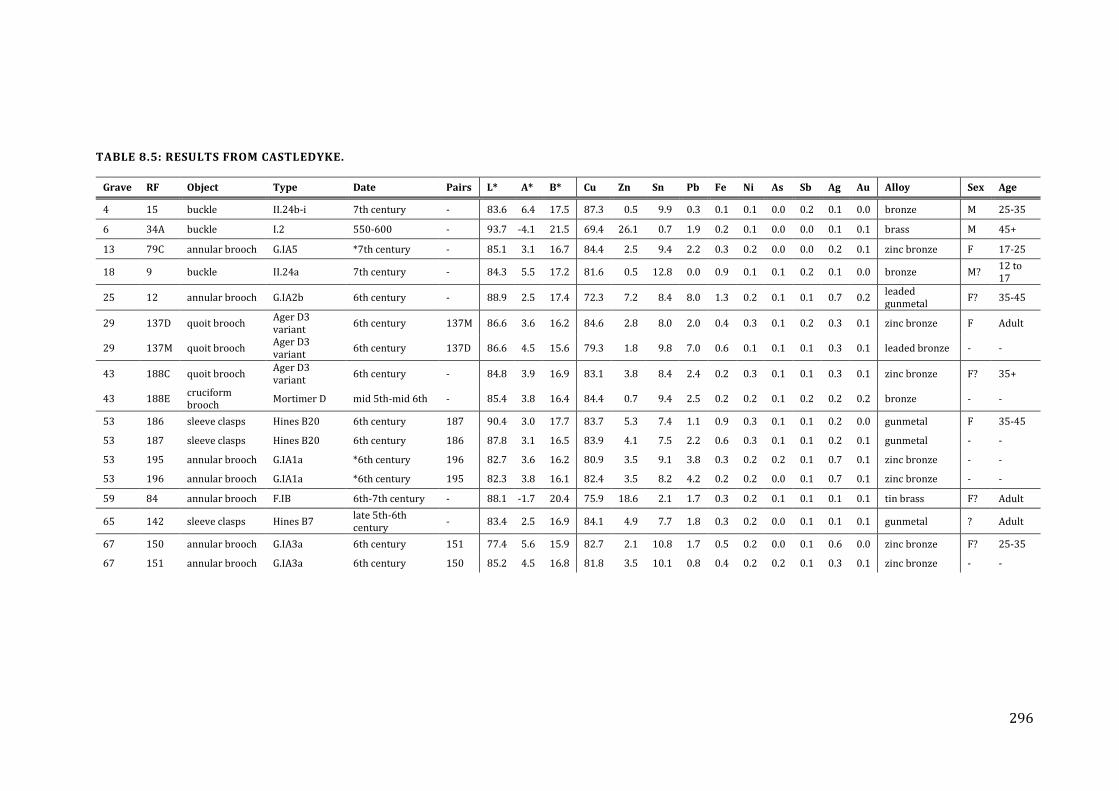
296
TABLE 8.5: RESULTS FROM CASTLEDYKE.
Grave RF Object Type Date Pairs L* A* B* Cu Zn Sn Pb Fe Ni As Sb Ag Au Alloy Sex Age
4 15 buckle II.24b-i 7th century - 83.6 6.4 17.5 87.3 0.5 9.9 0.3 0.1 0.1 0.0 0.2 0.1 0.0 bronze M 25-35
6 34A buckle I.2 550-600 - 93.7 -4.1 21.5 69.4 26.1 0.7 1.9 0.2 0.1 0.0 0.0 0.1 0.1 brass M 45+
13 79C annular brooch G.IA5 *7th century - 85.1 3.1 16.7 84.4 2.5 9.4 2.2 0.3 0.2 0.0 0.0 0.2 0.1 zinc bronze F 17-25
18 9 buckle II.24a 7th century - 84.3 5.5 17.2 81.6 0.5 12.8 0.0 0.9 0.1 0.1 0.2 0.1 0.0 bronze M? 12 to 17
25 12 annular brooch G.IA2b 6th century - 88.9 2.5 17.4 72.3 7.2 8.4 8.0 1.3 0.2 0.1 0.1 0.7 0.2 leaded gunmetal
F? 35-45
29 137D quoit brooch Ager D3 variant
6th century 137M 86.6 3.6 16.2 84.6 2.8 8.0 2.0 0.4 0.3 0.1 0.2 0.3 0.1 zinc bronze F Adult
29 137M quoit brooch Ager D3 variant
6th century 137D 86.6 4.5 15.6 79.3 1.8 9.8 7.0 0.6 0.1 0.1 0.1 0.3 0.1 leaded bronze - -
43 188C quoit brooch Ager D3 variant
6th century - 84.8 3.9 16.9 83.1 3.8 8.4 2.4 0.2 0.3 0.1 0.1 0.3 0.1 zinc bronze F? 35+
43 188E cruciform brooch
Mortimer D mid 5th-mid 6th - 85.4 3.8 16.4 84.4 0.7 9.4 2.5 0.2 0.2 0.1 0.2 0.2 0.2 bronze - -
53 186 sleeve clasps Hines B20 6th century 187 90.4 3.0 17.7 83.7 5.3 7.4 1.1 0.9 0.3 0.1 0.1 0.2 0.0 gunmetal F 35-45
53 187 sleeve clasps Hines B20 6th century 186 87.8 3.1 16.5 83.9 4.1 7.5 2.2 0.6 0.3 0.1 0.1 0.2 0.1 gunmetal - -
53 195 annular brooch G.IA1a *6th century 196 82.7 3.6 16.2 80.9 3.5 9.1 3.8 0.3 0.2 0.2 0.1 0.7 0.1 zinc bronze - -
53 196 annular brooch G.IA1a *6th century 195 82.3 3.8 16.1 82.4 3.5 8.2 4.2 0.2 0.2 0.0 0.1 0.7 0.1 zinc bronze - -
59 84 annular brooch F.IB 6th-7th century - 88.1 -1.7 20.4 75.9 18.6 2.1 1.7 0.3 0.2 0.1 0.1 0.1 0.1 tin brass F? Adult
65 142 sleeve clasps Hines B7 late 5th-6th century
- 83.4 2.5 16.9 84.1 4.9 7.7 1.8 0.3 0.2 0.0 0.1 0.1 0.1 gunmetal ? Adult
67 150 annular brooch G.IA3a 6th century 151 77.4 5.6 15.9 82.7 2.1 10.8 1.7 0.5 0.2 0.0 0.1 0.6 0.0 zinc bronze F? 25-35
67 151 annular brooch G.IA3a 6th century 150 85.2 4.5 16.8 81.8 3.5 10.1 0.8 0.4 0.2 0.2 0.1 0.3 0.1 zinc bronze - -
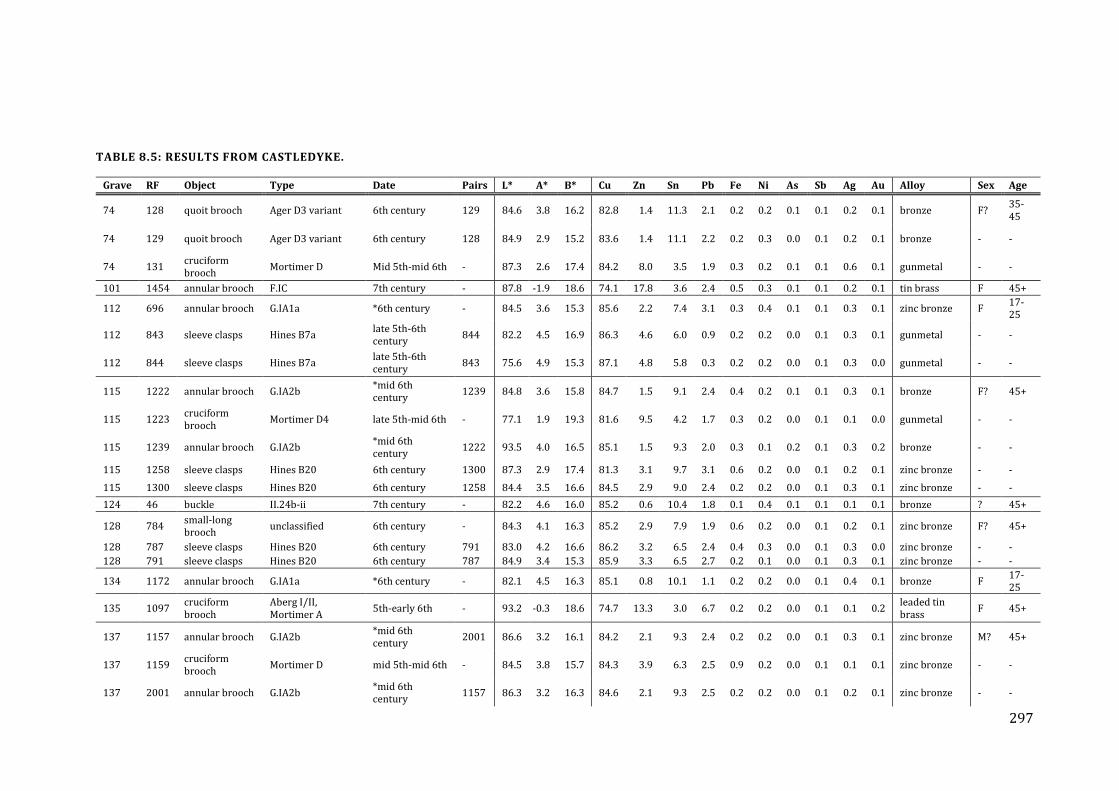
297
TABLE 8.5: RESULTS FROM CASTLEDYKE.
Grave RF Object Type Date Pairs L* A* B* Cu Zn Sn Pb Fe Ni As Sb Ag Au Alloy Sex Age
74 128 quoit brooch Ager D3 variant 6th century 129 84.6 3.8 16.2 82.8 1.4 11.3 2.1 0.2 0.2 0.1 0.1 0.2 0.1 bronze F? 35-45
74 129 quoit brooch Ager D3 variant 6th century 128 84.9 2.9 15.2 83.6 1.4 11.1 2.2 0.2 0.3 0.0 0.1 0.2 0.1 bronze - -
74 131 cruciform brooch
Mortimer D Mid 5th-mid 6th - 87.3 2.6 17.4 84.2 8.0 3.5 1.9 0.3 0.2 0.1 0.1 0.6 0.1 gunmetal - -
101 1454 annular brooch F.IC 7th century - 87.8 -1.9 18.6 74.1 17.8 3.6 2.4 0.5 0.3 0.1 0.1 0.2 0.1 tin brass F 45+
112 696 annular brooch G.IA1a *6th century - 84.5 3.6 15.3 85.6 2.2 7.4 3.1 0.3 0.4 0.1 0.1 0.3 0.1 zinc bronze F 17-25
112 843 sleeve clasps Hines B7a late 5th-6th century
844 82.2 4.5 16.9 86.3 4.6 6.0 0.9 0.2 0.2 0.0 0.1 0.3 0.1 gunmetal - -
112 844 sleeve clasps Hines B7a late 5th-6th century
843 75.6 4.9 15.3 87.1 4.8 5.8 0.3 0.2 0.2 0.0 0.1 0.3 0.0 gunmetal - -
115 1222 annular brooch G.IA2b *mid 6th century
1239 84.8 3.6 15.8 84.7 1.5 9.1 2.4 0.4 0.2 0.1 0.1 0.3 0.1 bronze F? 45+
115 1223 cruciform brooch
Mortimer D4 late 5th-mid 6th - 77.1 1.9 19.3 81.6 9.5 4.2 1.7 0.3 0.2 0.0 0.1 0.1 0.0 gunmetal - -
115 1239 annular brooch G.IA2b *mid 6th century
1222 93.5 4.0 16.5 85.1 1.5 9.3 2.0 0.3 0.1 0.2 0.1 0.3 0.2 bronze - -
115 1258 sleeve clasps Hines B20 6th century 1300 87.3 2.9 17.4 81.3 3.1 9.7 3.1 0.6 0.2 0.0 0.1 0.2 0.1 zinc bronze - -
115 1300 sleeve clasps Hines B20 6th century 1258 84.4 3.5 16.6 84.5 2.9 9.0 2.4 0.2 0.2 0.0 0.1 0.3 0.1 zinc bronze - -
124 46 buckle II.24b-ii 7th century - 82.2 4.6 16.0 85.2 0.6 10.4 1.8 0.1 0.4 0.1 0.1 0.1 0.1 bronze ? 45+
128 784 small-long brooch
unclassified 6th century - 84.3 4.1 16.3 85.2 2.9 7.9 1.9 0.6 0.2 0.0 0.1 0.2 0.1 zinc bronze F? 45+
128 787 sleeve clasps Hines B20 6th century 791 83.0 4.2 16.6 86.2 3.2 6.5 2.4 0.4 0.3 0.0 0.1 0.3 0.0 zinc bronze - -
128 791 sleeve clasps Hines B20 6th century 787 84.9 3.4 15.3 85.9 3.3 6.5 2.7 0.2 0.1 0.0 0.1 0.3 0.1 zinc bronze - -
134 1172 annular brooch G.IA1a *6th century - 82.1 4.5 16.3 85.1 0.8 10.1 1.1 0.2 0.2 0.0 0.1 0.4 0.1 bronze F 17-25
135 1097 cruciform brooch
Aberg I/II, Mortimer A
5th-early 6th - 93.2 -0.3 18.6 74.7 13.3 3.0 6.7 0.2 0.2 0.0 0.1 0.1 0.2 leaded tin brass
F 45+
137 1157 annular brooch G.IA2b *mid 6th century
2001 86.6 3.2 16.1 84.2 2.1 9.3 2.4 0.2 0.2 0.0 0.1 0.3 0.1 zinc bronze M? 45+
137 1159 cruciform brooch
Mortimer D mid 5th-mid 6th - 84.5 3.8 15.7 84.3 3.9 6.3 2.5 0.9 0.2 0.0 0.1 0.1 0.1 zinc bronze - -
137 2001 annular brooch G.IA2b *mid 6th century
1157 86.3 3.2 16.3 84.6 2.1 9.3 2.5 0.2 0.2 0.0 0.1 0.2 0.1 zinc bronze - -
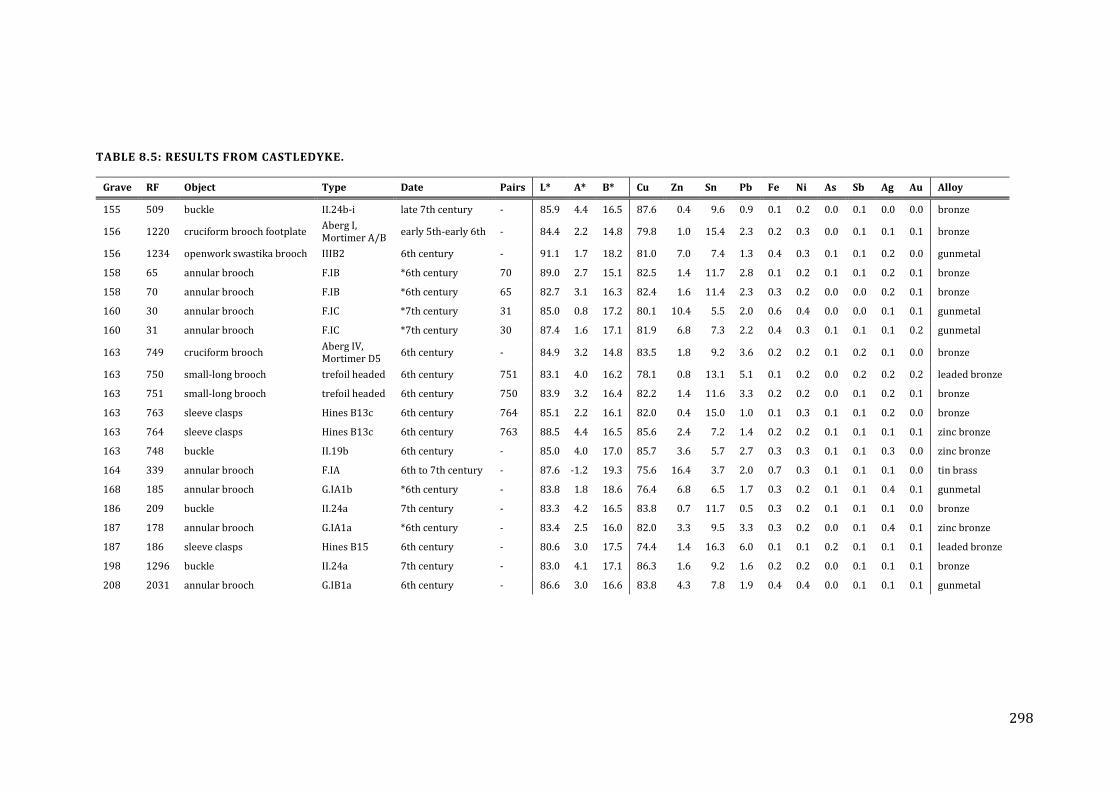
298
TABLE 8.5: RESULTS FROM CASTLEDYKE.
Grave RF Object Type Date Pairs L* A* B* Cu Zn Sn Pb Fe Ni As Sb Ag Au Alloy
155 509 buckle II.24b-i late 7th century - 85.9 4.4 16.5 87.6 0.4 9.6 0.9 0.1 0.2 0.0 0.1 0.0 0.0 bronze
156 1220 cruciform brooch footplate Aberg I, Mortimer A/B
early 5th-early 6th - 84.4 2.2 14.8 79.8 1.0 15.4 2.3 0.2 0.3 0.0 0.1 0.1 0.1 bronze
156 1234 openwork swastika brooch IIIB2 6th century - 91.1 1.7 18.2 81.0 7.0 7.4 1.3 0.4 0.3 0.1 0.1 0.2 0.0 gunmetal
158 65 annular brooch F.IB *6th century 70 89.0 2.7 15.1 82.5 1.4 11.7 2.8 0.1 0.2 0.1 0.1 0.2 0.1 bronze
158 70 annular brooch F.IB *6th century 65 82.7 3.1 16.3 82.4 1.6 11.4 2.3 0.3 0.2 0.0 0.0 0.2 0.1 bronze
160 30 annular brooch F.IC *7th century 31 85.0 0.8 17.2 80.1 10.4 5.5 2.0 0.6 0.4 0.0 0.0 0.1 0.1 gunmetal
160 31 annular brooch F.IC *7th century 30 87.4 1.6 17.1 81.9 6.8 7.3 2.2 0.4 0.3 0.1 0.1 0.1 0.2 gunmetal
163 749 cruciform brooch Aberg IV, Mortimer D5
6th century - 84.9 3.2 14.8 83.5 1.8 9.2 3.6 0.2 0.2 0.1 0.2 0.1 0.0 bronze
163 750 small-long brooch trefoil headed 6th century 751 83.1 4.0 16.2 78.1 0.8 13.1 5.1 0.1 0.2 0.0 0.2 0.2 0.2 leaded bronze
163 751 small-long brooch trefoil headed 6th century 750 83.9 3.2 16.4 82.2 1.4 11.6 3.3 0.2 0.2 0.0 0.1 0.2 0.1 bronze
163 763 sleeve clasps Hines B13c 6th century 764 85.1 2.2 16.1 82.0 0.4 15.0 1.0 0.1 0.3 0.1 0.1 0.2 0.0 bronze
163 764 sleeve clasps Hines B13c 6th century 763 88.5 4.4 16.5 85.6 2.4 7.2 1.4 0.2 0.2 0.1 0.1 0.1 0.1 zinc bronze
163 748 buckle II.19b 6th century - 85.0 4.0 17.0 85.7 3.6 5.7 2.7 0.3 0.3 0.1 0.1 0.3 0.0 zinc bronze
164 339 annular brooch F.IA 6th to 7th century - 87.6 -1.2 19.3 75.6 16.4 3.7 2.0 0.7 0.3 0.1 0.1 0.1 0.0 tin brass
168 185 annular brooch G.IA1b *6th century - 83.8 1.8 18.6 76.4 6.8 6.5 1.7 0.3 0.2 0.1 0.1 0.4 0.1 gunmetal
186 209 buckle II.24a 7th century - 83.3 4.2 16.5 83.8 0.7 11.7 0.5 0.3 0.2 0.1 0.1 0.1 0.0 bronze
187 178 annular brooch G.IA1a *6th century - 83.4 2.5 16.0 82.0 3.3 9.5 3.3 0.3 0.2 0.0 0.1 0.4 0.1 zinc bronze
187 186 sleeve clasps Hines B15 6th century - 80.6 3.0 17.5 74.4 1.4 16.3 6.0 0.1 0.1 0.2 0.1 0.1 0.1 leaded bronze
198 1296 buckle II.24a 7th century - 83.0 4.1 17.1 86.3 1.6 9.2 1.6 0.2 0.2 0.0 0.1 0.1 0.1 bronze
208 2031 annular brooch G.IB1a 6th century - 86.6 3.0 16.6 83.8 4.3 7.8 1.9 0.4 0.4 0.0 0.1 0.1 0.1 gunmetal
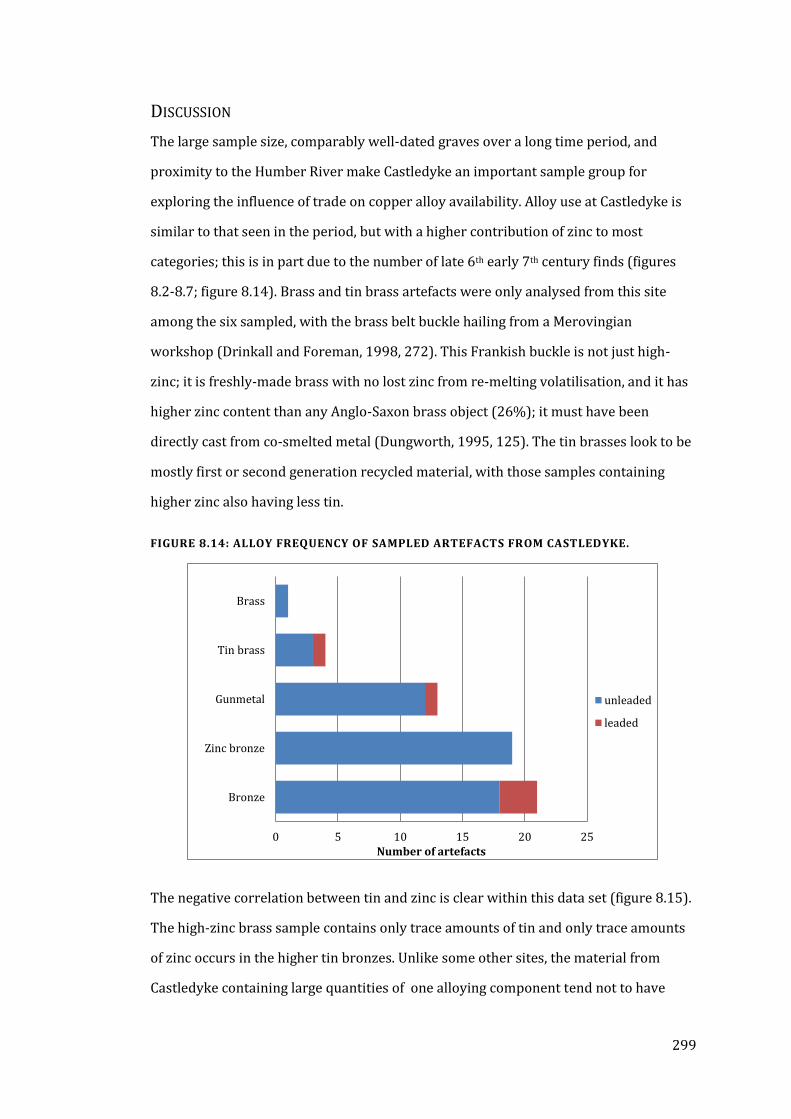
299
DISCUSSION
The large sample size, comparably well-dated graves over a long time period, and
proximity to the Humber River make Castledyke an important sample group for
exploring the influence of trade on copper alloy availability. Alloy use at Castledyke is
similar to that seen in the period, but with a higher contribution of zinc to most
categories; this is in part due to the number of late 6th early 7th century finds (figures
8.2-8.7; figure 8.14). Brass and tin brass artefacts were only analysed from this site
among the six sampled, with the brass belt buckle hailing from a Merovingian
workshop (Drinkall and Foreman, 1998, 272). This Frankish buckle is not just high-
zinc; it is freshly-made brass with no lost zinc from re-melting volatilisation, and it has
higher zinc content than any Anglo-Saxon brass object (26%); it must have been
directly cast from co-smelted metal (Dungworth, 1995, 125). The tin brasses look to be
mostly first or second generation recycled material, with those samples containing
higher zinc also having less tin.
FIGURE 8.14: ALLOY FREQUENCY OF SAMPLED ARTEFACTS FROM CASTLEDYKE.
The negative correlation between tin and zinc is clear within this data set (figure 8.15).
The high-zinc brass sample contains only trace amounts of tin and only trace amounts
of zinc occurs in the higher tin bronzes. Unlike some other sites, the material from
Castledyke containing large quantities of one alloying component tend not to have
0 5 10 15 20 25
Bronze
Zinc bronze
Gunmetal
Tin brass
Brass
Number of artefacts
unleaded
leaded
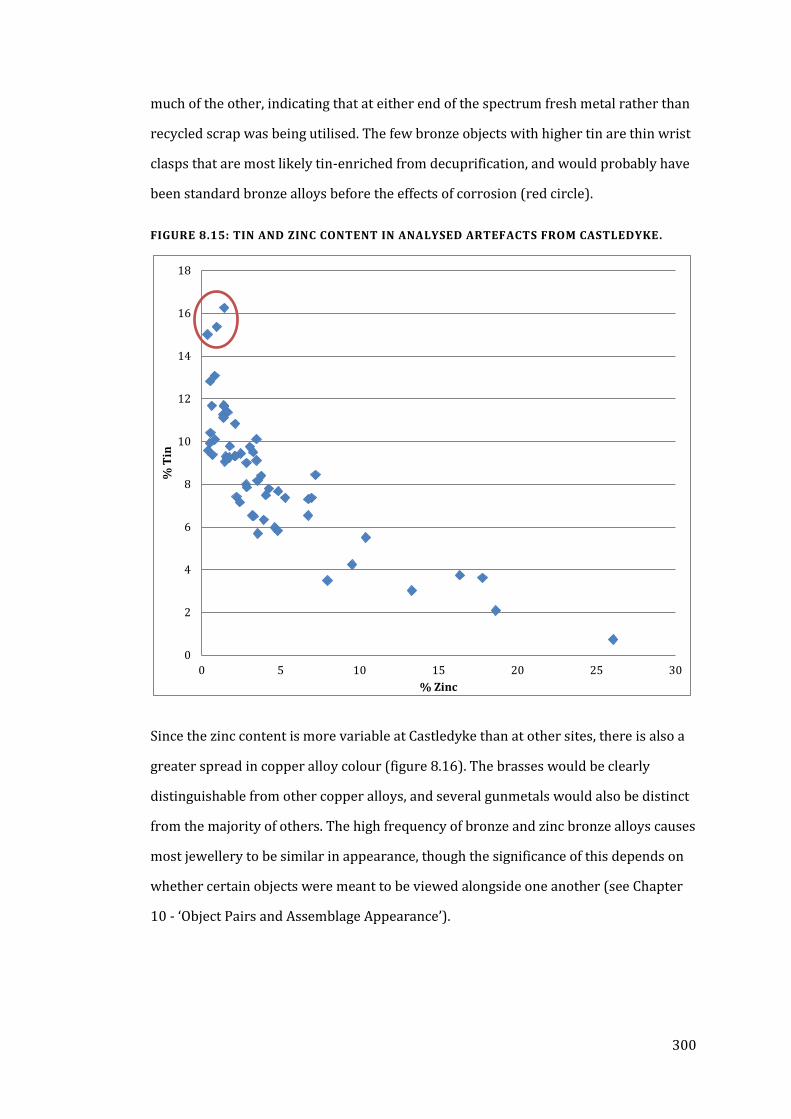
300
much of the other, indicating that at either end of the spectrum fresh metal rather than
recycled scrap was being utilised. The few bronze objects with higher tin are thin wrist
clasps that are most likely tin-enriched from decuprification, and would probably have
been standard bronze alloys before the effects of corrosion (red circle).
FIGURE 8.15: TIN AND ZINC CONTENT IN ANALYSED ARTEFACTS FROM CASTLEDYKE.
Since the zinc content is more variable at Castledyke than at other sites, there is also a
greater spread in copper alloy colour (figure 8.16). The brasses would be clearly
distinguishable from other copper alloys, and several gunmetals would also be distinct
from the majority of others. The high frequency of bronze and zinc bronze alloys causes
most jewellery to be similar in appearance, though the significance of this depends on
whether certain objects were meant to be viewed alongside one another (see Chapter
10 - ‘Object Pairs and Assemblage Appearance’).
0
2
4
6
8
10
12
14
16
18
0 5 10 15 20 25 30
% T
in
% Zinc
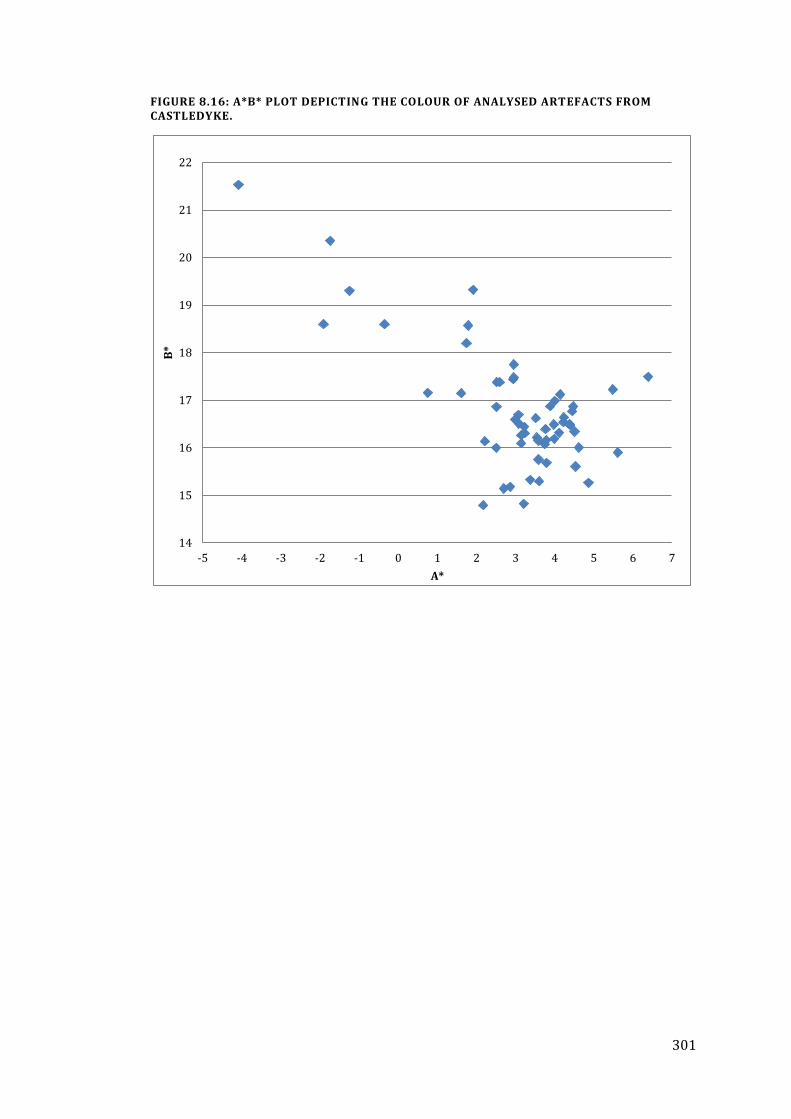
301
FIGURE 8.16: A*B* PLOT DEPICTING THE COLOUR OF ANALYSED ARTEFACTS FROM CASTLEDYKE.
14
15
16
17
18
19
20
21
22
-5 -4 -3 -2 -1 0 1 2 3 4 5 6 7
B*
A*
302
CLEATHAM
Cleatham is a mixed rites cemetery originally discovered in the mid 19th century. It was
systematically excavated between 1984-9 (Leahy, 2007, 2). The cemetery site is located
on a limestone ridge 7 km west of the river Ancholme, 10 km east of the river Trent,
and 22 km south of the Humber (Leahy, 2007, 3). The cemetery is also just over 2 km
from Ermine Street, the major north-south Roman road. Settlement in the area is
postulated to be at Kirton in Lindsey to the south or nearby in Manton, the parish in
which Cleatham now lies (Leahy, 2007, 4).
The dated inhumations range from the 5th through to the 7th century, though the bead
type distribution (mainly the lack of amber beads) implies an earlier date for the
furnished inhumations – indeed, two-thirds of datable inhumations are prior to 550 CE
(Leahy, 2007, 31, 228). However, cremations were the dominant burial form from the
mid 5th century and through the 6th until the 7th century when only inhumation was
practiced. A total of twenty-seven artefacts from thirteen graves were examined,
primarily brooches (table 8.6). The only previous investigation of metalwork at this site
is from Mortimer (1990), who analysed some of the cruciform brooches from this site
(from graves 9, 30 and 34 only; the new data is consistent with that previously
collected).
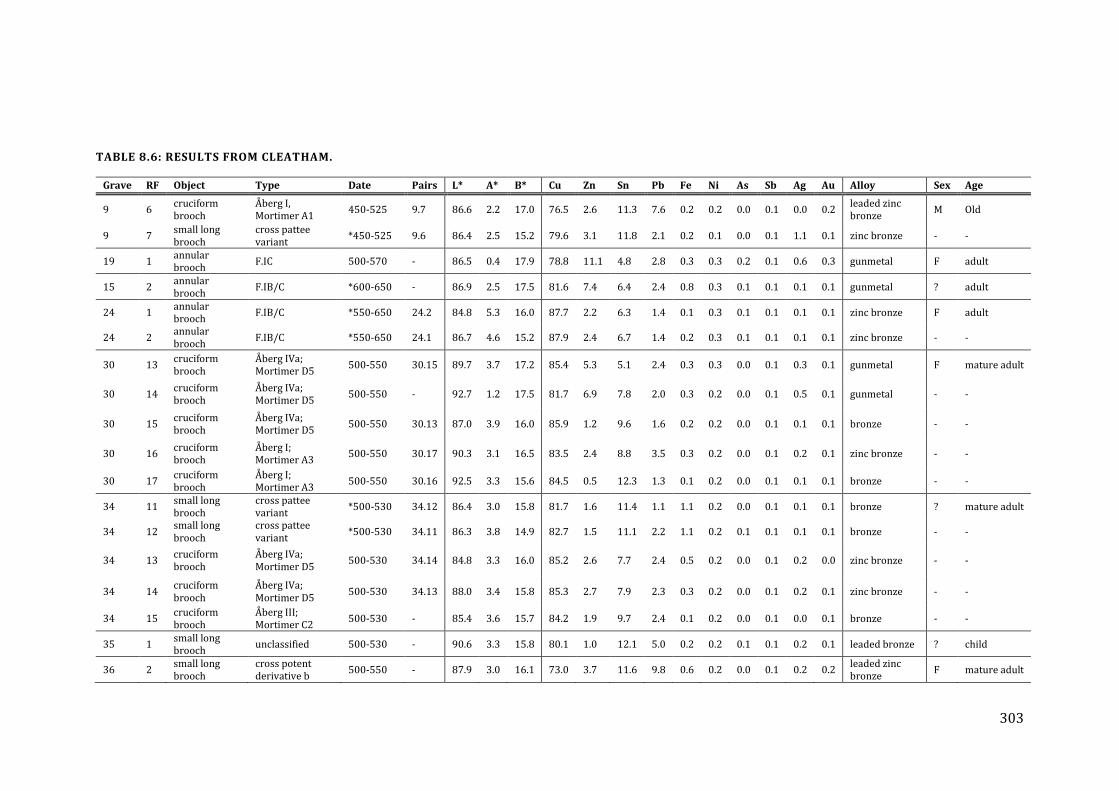
303
TABLE 8.6: RESULTS FROM CLEATHAM.
Grave RF Object Type Date Pairs L* A* B* Cu Zn Sn Pb Fe Ni As Sb Ag Au Alloy Sex Age
9 6 cruciform brooch
Åberg I, Mortimer A1
450-525 9.7 86.6 2.2 17.0 76.5 2.6 11.3 7.6 0.2 0.2 0.0 0.1 0.0 0.2 leaded zinc bronze
M Old
9 7 small long brooch
cross pattee variant
*450-525 9.6 86.4 2.5 15.2 79.6 3.1 11.8 2.1 0.2 0.1 0.0 0.1 1.1 0.1 zinc bronze - -
19 1 annular brooch
F.IC 500-570 - 86.5 0.4 17.9 78.8 11.1 4.8 2.8 0.3 0.3 0.2 0.1 0.6 0.3 gunmetal F adult
15 2 annular brooch
F.IB/C *600-650 - 86.9 2.5 17.5 81.6 7.4 6.4 2.4 0.8 0.3 0.1 0.1 0.1 0.1 gunmetal ? adult
24 1 annular brooch
F.IB/C *550-650 24.2 84.8 5.3 16.0 87.7 2.2 6.3 1.4 0.1 0.3 0.1 0.1 0.1 0.1 zinc bronze F adult
24 2 annular brooch
F.IB/C *550-650 24.1 86.7 4.6 15.2 87.9 2.4 6.7 1.4 0.2 0.3 0.1 0.1 0.1 0.1 zinc bronze - -
30 13 cruciform brooch
Åberg IVa; Mortimer D5
500-550 30.15 89.7 3.7 17.2 85.4 5.3 5.1 2.4 0.3 0.3 0.0 0.1 0.3 0.1 gunmetal F mature adult
30 14 cruciform brooch
Åberg IVa; Mortimer D5
500-550 - 92.7 1.2 17.5 81.7 6.9 7.8 2.0 0.3 0.2 0.0 0.1 0.5 0.1 gunmetal - -
30 15 cruciform brooch
Åberg IVa; Mortimer D5
500-550 30.13 87.0 3.9 16.0 85.9 1.2 9.6 1.6 0.2 0.2 0.0 0.1 0.1 0.1 bronze - -
30 16 cruciform brooch
Åberg I; Mortimer A3
500-550 30.17 90.3 3.1 16.5 83.5 2.4 8.8 3.5 0.3 0.2 0.0 0.1 0.2 0.1 zinc bronze - -
30 17 cruciform brooch
Åberg I; Mortimer A3
500-550 30.16 92.5 3.3 15.6 84.5 0.5 12.3 1.3 0.1 0.2 0.0 0.1 0.1 0.1 bronze - -
34 11 small long brooch
cross pattee variant
*500-530 34.12 86.4 3.0 15.8 81.7 1.6 11.4 1.1 1.1 0.2 0.0 0.1 0.1 0.1 bronze ? mature adult
34 12 small long brooch
cross pattee variant
*500-530 34.11 86.3 3.8 14.9 82.7 1.5 11.1 2.2 1.1 0.2 0.1 0.1 0.1 0.1 bronze - -
34 13 cruciform brooch
Åberg IVa; Mortimer D5
500-530 34.14 84.8 3.3 16.0 85.2 2.6 7.7 2.4 0.5 0.2 0.0 0.1 0.2 0.0 zinc bronze - -
34 14 cruciform brooch
Åberg IVa; Mortimer D5
500-530 34.13 88.0 3.4 15.8 85.3 2.7 7.9 2.3 0.3 0.2 0.0 0.1 0.2 0.1 zinc bronze - -
34 15 cruciform brooch
Åberg III; Mortimer C2
500-530 - 85.4 3.6 15.7 84.2 1.9 9.7 2.4 0.1 0.2 0.0 0.1 0.0 0.1 bronze - -
35 1 small long brooch
unclassified 500-530 - 90.6 3.3 15.8 80.1 1.0 12.1 5.0 0.2 0.2 0.1 0.1 0.2 0.1 leaded bronze ? child
36 2 small long brooch
cross potent derivative b
500-550 - 87.9 3.0 16.1 73.0 3.7 11.6 9.8 0.6 0.2 0.0 0.1 0.2 0.2 leaded zinc bronze
F mature adult
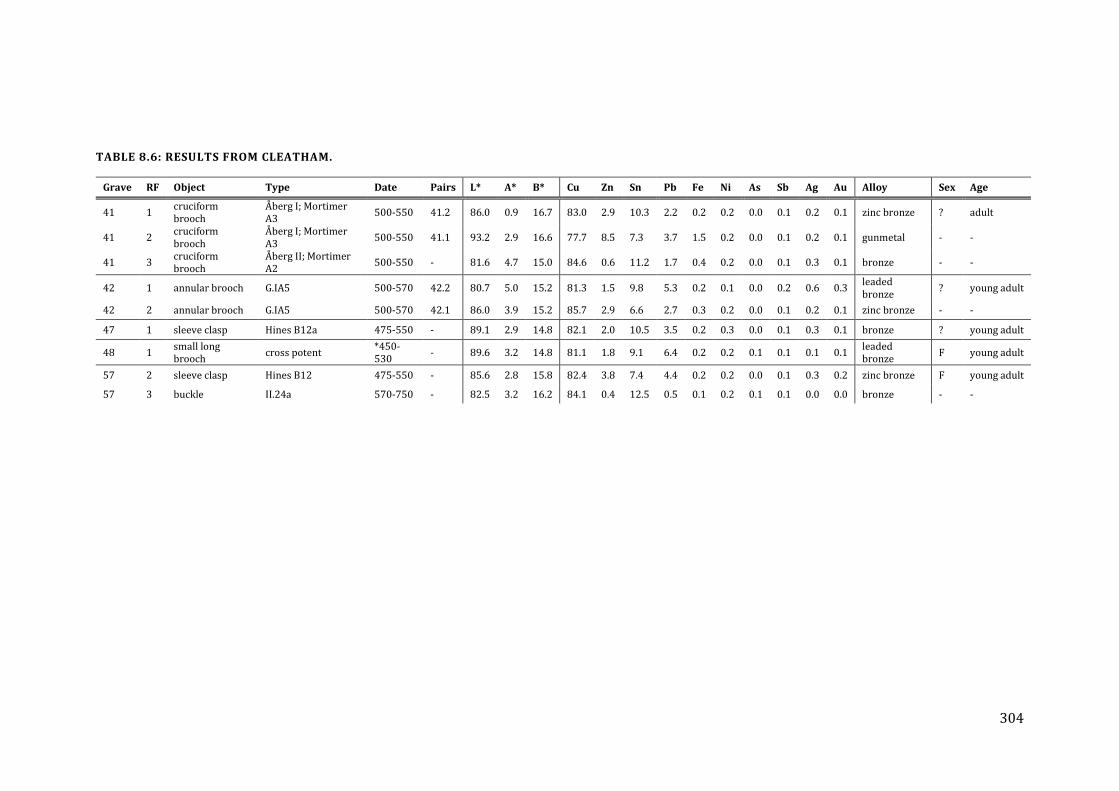
304
TABLE 8.6: RESULTS FROM CLEATHAM.
Grave RF Object Type Date Pairs L* A* B* Cu Zn Sn Pb Fe Ni As Sb Ag Au Alloy Sex Age
41 1 cruciform brooch
Åberg I; Mortimer A3
500-550 41.2 86.0 0.9 16.7 83.0 2.9 10.3 2.2 0.2 0.2 0.0 0.1 0.2 0.1 zinc bronze ? adult
41 2 cruciform brooch
Åberg I; Mortimer A3
500-550 41.1 93.2 2.9 16.6 77.7 8.5 7.3 3.7 1.5 0.2 0.0 0.1 0.2 0.1 gunmetal - -
41 3 cruciform brooch
Åberg II; Mortimer A2
500-550 - 81.6 4.7 15.0 84.6 0.6 11.2 1.7 0.4 0.2 0.0 0.1 0.3 0.1 bronze - -
42 1 annular brooch G.IA5 500-570 42.2 80.7 5.0 15.2 81.3 1.5 9.8 5.3 0.2 0.1 0.0 0.2 0.6 0.3 leaded bronze
? young adult
42 2 annular brooch G.IA5 500-570 42.1 86.0 3.9 15.2 85.7 2.9 6.6 2.7 0.3 0.2 0.0 0.1 0.2 0.1 zinc bronze - -
47 1 sleeve clasp Hines B12a 475-550 - 89.1 2.9 14.8 82.1 2.0 10.5 3.5 0.2 0.3 0.0 0.1 0.3 0.1 bronze ? young adult
48 1 small long brooch
cross potent *450-530
- 89.6 3.2 14.8 81.1 1.8 9.1 6.4 0.2 0.2 0.1 0.1 0.1 0.1 leaded bronze
F young adult
57 2 sleeve clasp Hines B12 475-550 - 85.6 2.8 15.8 82.4 3.8 7.4 4.4 0.2 0.2 0.0 0.1 0.3 0.2 zinc bronze F young adult
57 3 buckle II.24a 570-750 - 82.5 3.2 16.2 84.1 0.4 12.5 0.5 0.1 0.2 0.1 0.1 0.0 0.0 bronze - -
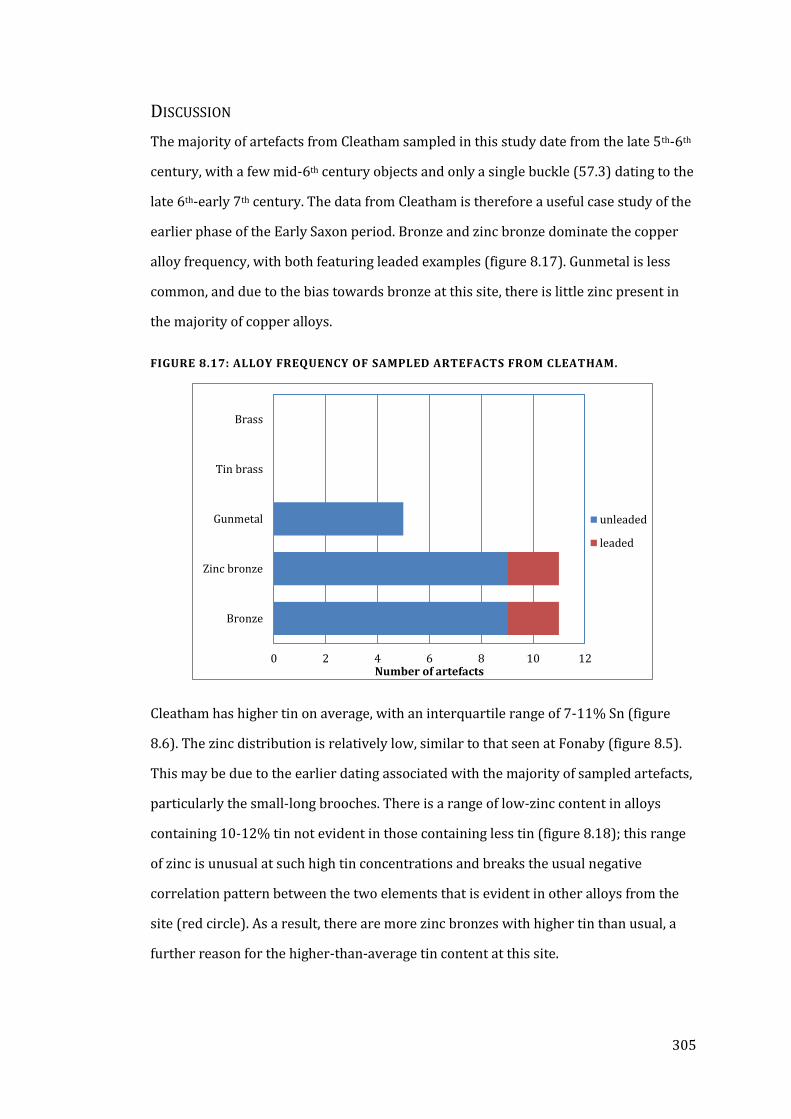
305
DISCUSSION
The majority of artefacts from Cleatham sampled in this study date from the late 5th-6th
century, with a few mid-6th century objects and only a single buckle (57.3) dating to the
late 6th-early 7th century. The data from Cleatham is therefore a useful case study of the
earlier phase of the Early Saxon period. Bronze and zinc bronze dominate the copper
alloy frequency, with both featuring leaded examples (figure 8.17). Gunmetal is less
common, and due to the bias towards bronze at this site, there is little zinc present in
the majority of copper alloys.
FIGURE 8.17: ALLOY FREQUENCY OF SAMPLED ARTEFACTS FROM CLEATHAM.
Cleatham has higher tin on average, with an interquartile range of 7-11% Sn (figure
8.6). The zinc distribution is relatively low, similar to that seen at Fonaby (figure 8.5).
This may be due to the earlier dating associated with the majority of sampled artefacts,
particularly the small-long brooches. There is a range of low-zinc content in alloys
containing 10-12% tin not evident in those containing less tin (figure 8.18); this range
of zinc is unusual at such high tin concentrations and breaks the usual negative
correlation pattern between the two elements that is evident in other alloys from the
site (red circle). As a result, there are more zinc bronzes with higher tin than usual, a
further reason for the higher-than-average tin content at this site.
0 2 4 6 8 10 12
Bronze
Zinc bronze
Gunmetal
Tin brass
Brass
Number of artefacts
unleaded
leaded
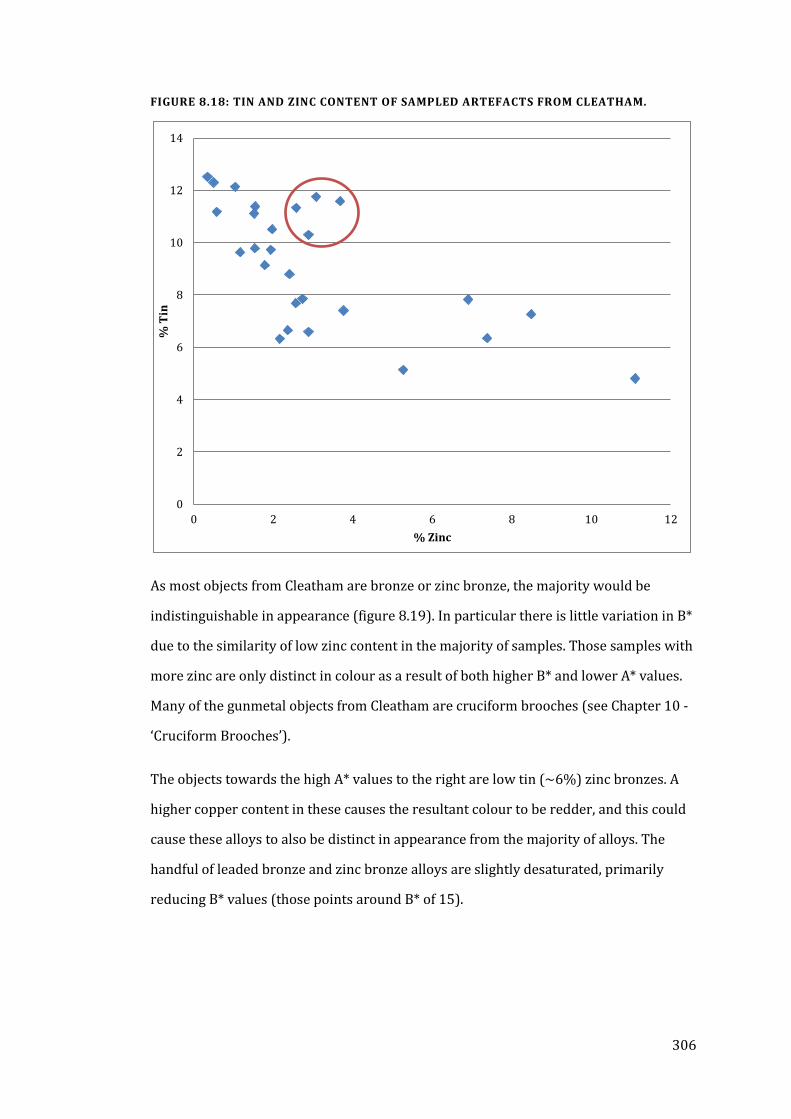
306
FIGURE 8.18: TIN AND ZINC CONTENT OF SAMPLED ARTEFACTS FROM CLEATHAM.
As most objects from Cleatham are bronze or zinc bronze, the majority would be
indistinguishable in appearance (figure 8.19). In particular there is little variation in B*
due to the similarity of low zinc content in the majority of samples. Those samples with
more zinc are only distinct in colour as a result of both higher B* and lower A* values.
Many of the gunmetal objects from Cleatham are cruciform brooches (see Chapter 10 -
‘Cruciform Brooches’).
The objects towards the high A* values to the right are low tin (~6%) zinc bronzes. A
higher copper content in these causes the resultant colour to be redder, and this could
cause these alloys to also be distinct in appearance from the majority of alloys. The
handful of leaded bronze and zinc bronze alloys are slightly desaturated, primarily
reducing B* values (those points around B* of 15).
0
2
4
6
8
10
12
14
0 2 4 6 8 10 12
% T
in
% Zinc
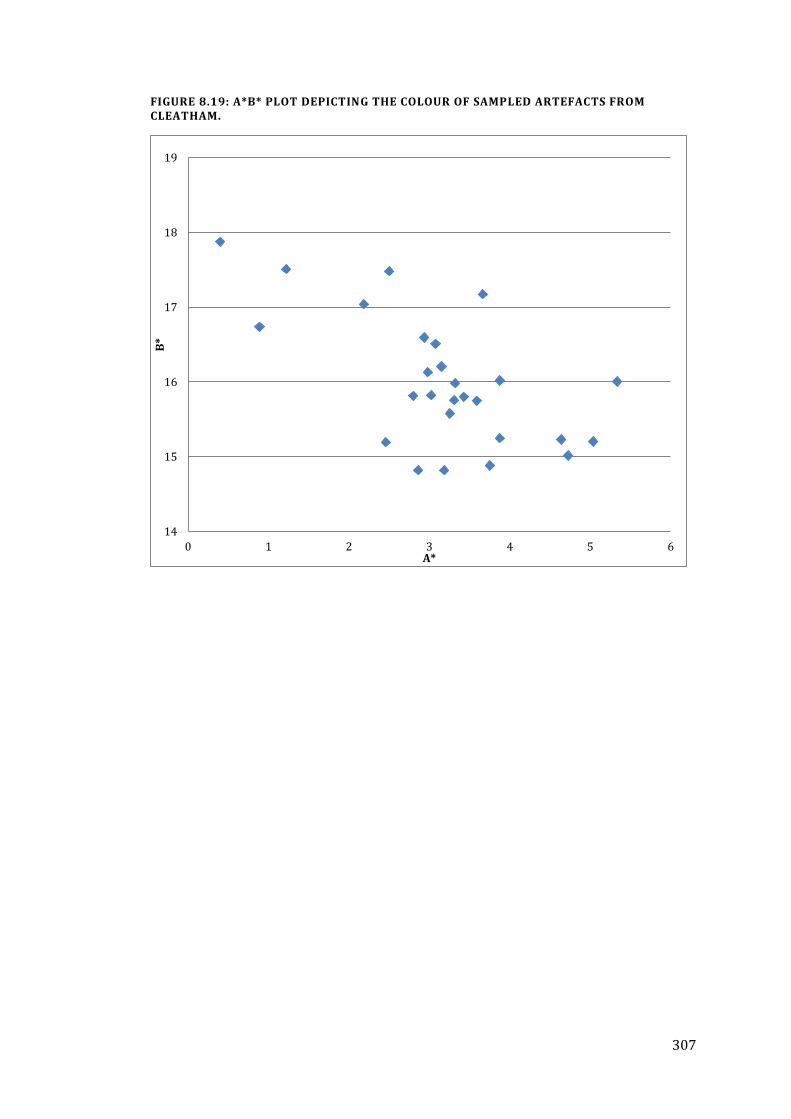
307
FIGURE 8.19: A*B* PLOT DEPICTING THE COLOUR OF SAMPLED ARTEFACTS FROM CLEATHAM.
14
15
16
17
18
19
0 1 2 3 4 5 6
B*
A*
308
SEWERBY
Excavated in 1959 and 1974, Sewerby’s Anglian inhumation cemetery was discovered
on the grounds of Sewerby Hall, just east of Bridlington in East Yorkshire. It is thought
to have been located near the old Roman road running from York potentially to
Flamborough Head (where there may have been a signal station) and is not far from
the cliffs overlooking the North Sea, over which a Roman fort has now been lost
(English Heritage, 2007; Hirst, 1985, 1). The location of the associated Anglo-Saxon
settlement is unknown. Fifty-nine graves were uncovered and more are presumed to
remain unexcavated (Hirst, 1985, 17). The cemetery was in use from the late 5th to
early 7th centuries, with some notable wealthy female graves dating to the 6th century.
Bone preservation at Sewerby was variable but often poor; metal was well preserved
as were a number of mineralised examples of textile.
A total of twenty-five artefacts from thirteen graves were analysed (table 8.7). Most are
brooches, predominantly annular and cruciform. The number of objects sampled at this
site was limited by many being on display and therefore unavailable for extended loan.
The brooches from grave 41 are those associated with an unusual ‘live’ prone burial of
a mature woman, which was located directly above and contemporaneously with the
richly furnished burial of a younger woman (Hirst, 1985, 38).
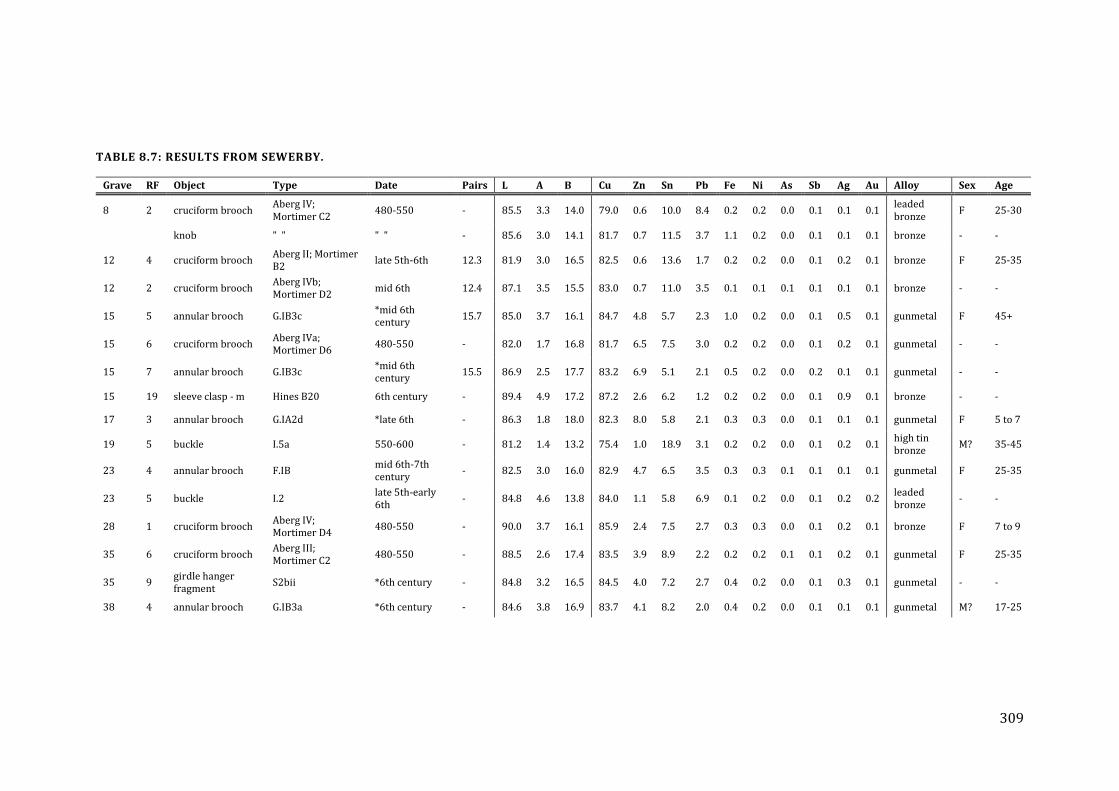
309
TABLE 8.7: RESULTS FROM SEWERBY.
Grave RF Object Type Date Pairs L A B Cu Zn Sn Pb Fe Ni As Sb Ag Au Alloy Sex Age
8 2 cruciform brooch Aberg IV; Mortimer C2
480-550 - 85.5 3.3 14.0 79.0 0.6 10.0 8.4 0.2 0.2 0.0 0.1 0.1 0.1 leaded bronze
F 25-30
knob " " " " - 85.6 3.0 14.1 81.7 0.7 11.5 3.7 1.1 0.2 0.0 0.1 0.1 0.1 bronze - -
12 4 cruciform brooch Aberg II; Mortimer B2
late 5th-6th 12.3 81.9 3.0 16.5 82.5 0.6 13.6 1.7 0.2 0.2 0.0 0.1 0.2 0.1 bronze F 25-35
12 2 cruciform brooch Aberg IVb; Mortimer D2
mid 6th 12.4 87.1 3.5 15.5 83.0 0.7 11.0 3.5 0.1 0.1 0.1 0.1 0.1 0.1 bronze - -
15 5 annular brooch G.IB3c *mid 6th century
15.7 85.0 3.7 16.1 84.7 4.8 5.7 2.3 1.0 0.2 0.0 0.1 0.5 0.1 gunmetal F 45+
15 6 cruciform brooch Aberg IVa; Mortimer D6
480-550 - 82.0 1.7 16.8 81.7 6.5 7.5 3.0 0.2 0.2 0.0 0.1 0.2 0.1 gunmetal - -
15 7 annular brooch G.IB3c *mid 6th century
15.5 86.9 2.5 17.7 83.2 6.9 5.1 2.1 0.5 0.2 0.0 0.2 0.1 0.1 gunmetal - -
15 19 sleeve clasp - m Hines B20 6th century - 89.4 4.9 17.2 87.2 2.6 6.2 1.2 0.2 0.2 0.0 0.1 0.9 0.1 bronze - -
17 3 annular brooch G.IA2d *late 6th - 86.3 1.8 18.0 82.3 8.0 5.8 2.1 0.3 0.3 0.0 0.1 0.1 0.1 gunmetal F 5 to 7
19 5 buckle I.5a 550-600 - 81.2 1.4 13.2 75.4 1.0 18.9 3.1 0.2 0.2 0.0 0.1 0.2 0.1 high tin bronze
M? 35-45
23 4 annular brooch F.IB mid 6th-7th century
- 82.5 3.0 16.0 82.9 4.7 6.5 3.5 0.3 0.3 0.1 0.1 0.1 0.1 gunmetal F 25-35
23 5 buckle I.2 late 5th-early 6th
- 84.8 4.6 13.8 84.0 1.1 5.8 6.9 0.1 0.2 0.0 0.1 0.2 0.2 leaded bronze
- -
28 1 cruciform brooch Aberg IV; Mortimer D4
480-550 - 90.0 3.7 16.1 85.9 2.4 7.5 2.7 0.3 0.3 0.0 0.1 0.2 0.1 bronze F 7 to 9
35 6 cruciform brooch Aberg III; Mortimer C2
480-550 - 88.5 2.6 17.4 83.5 3.9 8.9 2.2 0.2 0.2 0.1 0.1 0.2 0.1 gunmetal F 25-35
35 9 girdle hanger fragment
S2bii *6th century - 84.8 3.2 16.5 84.5 4.0 7.2 2.7 0.4 0.2 0.0 0.1 0.3 0.1 gunmetal - -
38 4 annular brooch G.IB3a *6th century - 84.6 3.8 16.9 83.7 4.1 8.2 2.0 0.4 0.2 0.0 0.1 0.1 0.1 gunmetal M? 17-25
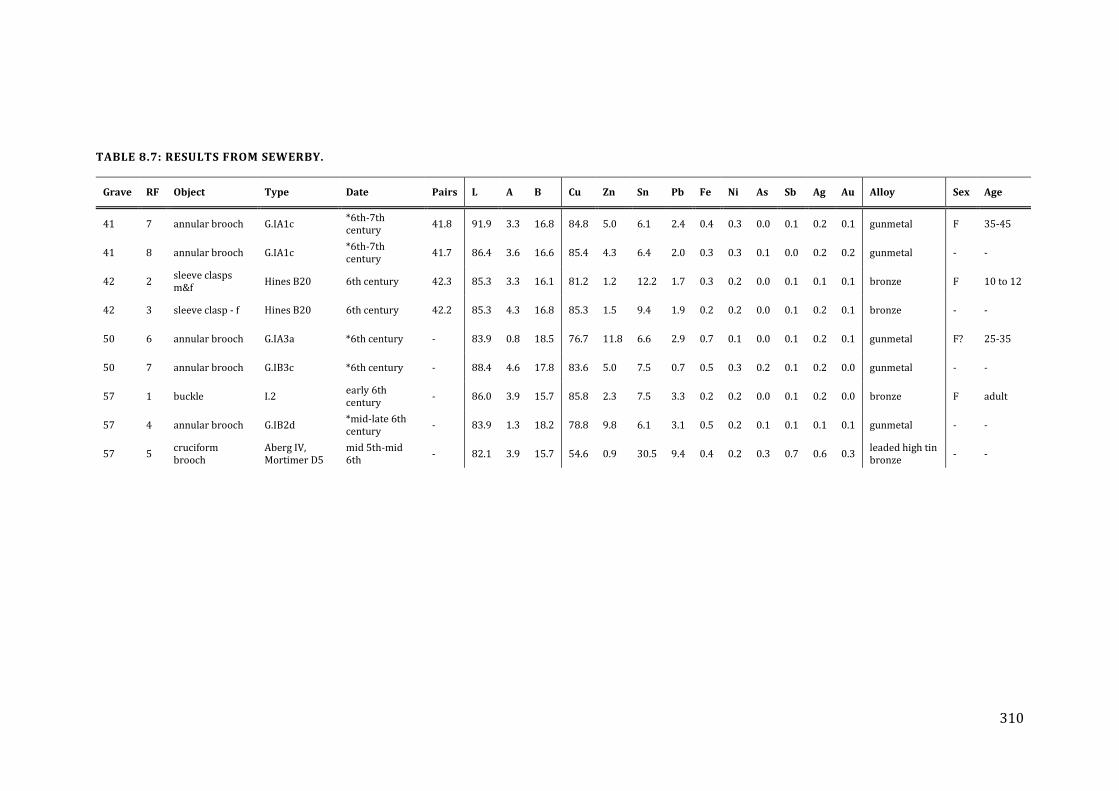
310
TABLE 8.7: RESULTS FROM SEWERBY.
Grave RF Object Type Date Pairs L A B Cu Zn Sn Pb Fe Ni As Sb Ag Au Alloy Sex Age
41 7 annular brooch G.IA1c *6th-7th century
41.8 91.9 3.3 16.8 84.8 5.0 6.1 2.4 0.4 0.3 0.0 0.1 0.2 0.1 gunmetal F 35-45
41 8 annular brooch G.IA1c *6th-7th century
41.7 86.4 3.6 16.6 85.4 4.3 6.4 2.0 0.3 0.3 0.1 0.0 0.2 0.2 gunmetal - -
42 2 sleeve clasps m&f
Hines B20 6th century 42.3 85.3 3.3 16.1 81.2 1.2 12.2 1.7 0.3 0.2 0.0 0.1 0.1 0.1 bronze F 10 to 12
42 3 sleeve clasp - f Hines B20 6th century 42.2 85.3 4.3 16.8 85.3 1.5 9.4 1.9 0.2 0.2 0.0 0.1 0.2 0.1 bronze - -
50 6 annular brooch G.IA3a *6th century - 83.9 0.8 18.5 76.7 11.8 6.6 2.9 0.7 0.1 0.0 0.1 0.2 0.1 gunmetal F? 25-35
50 7 annular brooch G.IB3c *6th century - 88.4 4.6 17.8 83.6 5.0 7.5 0.7 0.5 0.3 0.2 0.1 0.2 0.0 gunmetal - -
57 1 buckle I.2 early 6th century
- 86.0 3.9 15.7 85.8 2.3 7.5 3.3 0.2 0.2 0.0 0.1 0.2 0.0 bronze F adult
57 4 annular brooch G.IB2d *mid-late 6th century
- 83.9 1.3 18.2 78.8 9.8 6.1 3.1 0.5 0.2 0.1 0.1 0.1 0.1 gunmetal - -
57 5 cruciform brooch
Aberg IV, Mortimer D5
mid 5th-mid 6th
- 82.1 3.9 15.7 54.6 0.9 30.5 9.4 0.4 0.2 0.3 0.7 0.6 0.3 leaded high tin bronze
- -
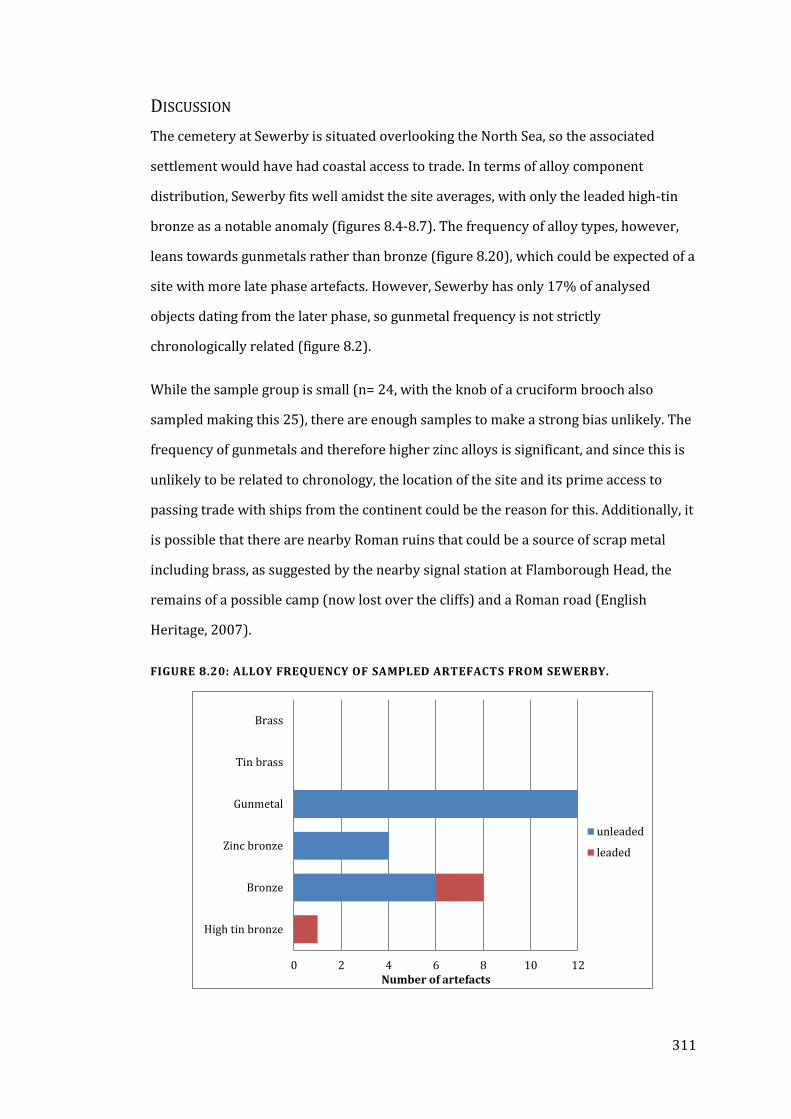
311
DISCUSSION
The cemetery at Sewerby is situated overlooking the North Sea, so the associated
settlement would have had coastal access to trade. In terms of alloy component
distribution, Sewerby fits well amidst the site averages, with only the leaded high-tin
bronze as a notable anomaly (figures 8.4-8.7). The frequency of alloy types, however,
leans towards gunmetals rather than bronze (figure 8.20), which could be expected of a
site with more late phase artefacts. However, Sewerby has only 17% of analysed
objects dating from the later phase, so gunmetal frequency is not strictly
chronologically related (figure 8.2).
While the sample group is small (n= 24, with the knob of a cruciform brooch also
sampled making this 25), there are enough samples to make a strong bias unlikely. The
frequency of gunmetals and therefore higher zinc alloys is significant, and since this is
unlikely to be related to chronology, the location of the site and its prime access to
passing trade with ships from the continent could be the reason for this. Additionally, it
is possible that there are nearby Roman ruins that could be a source of scrap metal
including brass, as suggested by the nearby signal station at Flamborough Head, the
remains of a possible camp (now lost over the cliffs) and a Roman road (English
Heritage, 2007).
FIGURE 8.20: ALLOY FREQUENCY OF SAMPLED ARTEFACTS FROM SEWERBY.
0 2 4 6 8 10 12
High tin bronze
Bronze
Zinc bronze
Gunmetal
Tin brass
Brass
Number of artefacts
unleaded
leaded
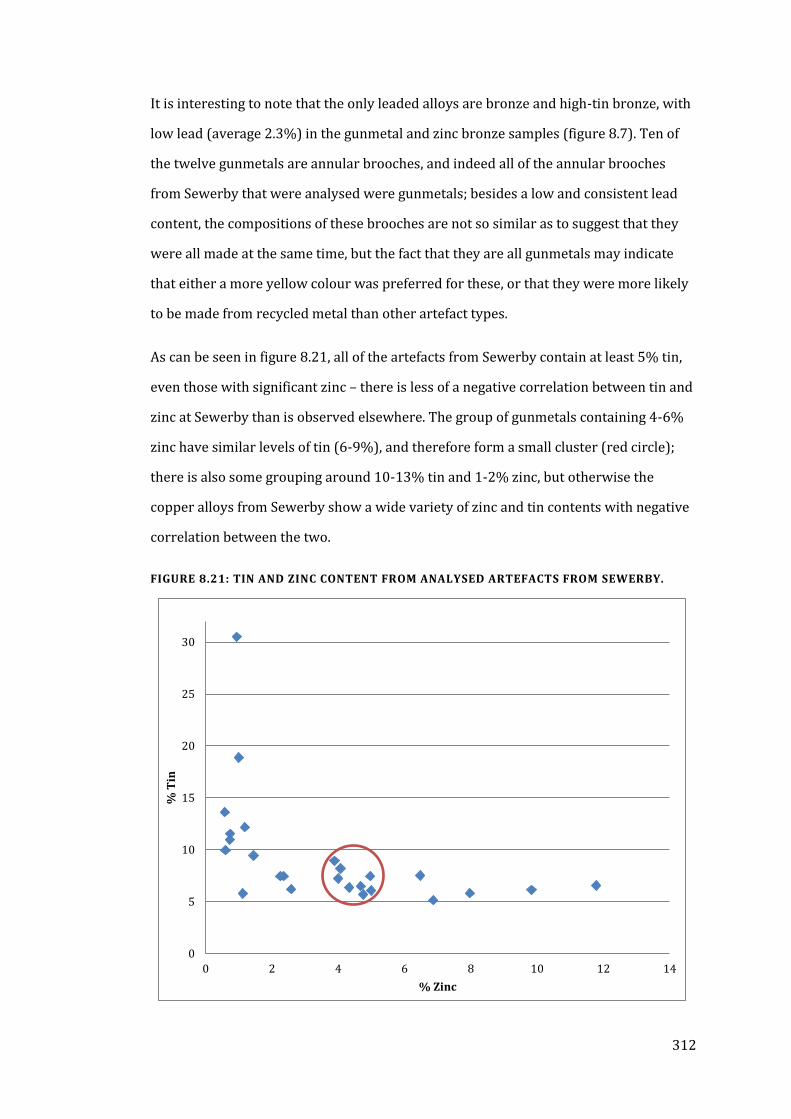
312
It is interesting to note that the only leaded alloys are bronze and high-tin bronze, with
low lead (average 2.3%) in the gunmetal and zinc bronze samples (figure 8.7). Ten of
the twelve gunmetals are annular brooches, and indeed all of the annular brooches
from Sewerby that were analysed were gunmetals; besides a low and consistent lead
content, the compositions of these brooches are not so similar as to suggest that they
were all made at the same time, but the fact that they are all gunmetals may indicate
that either a more yellow colour was preferred for these, or that they were more likely
to be made from recycled metal than other artefact types.
As can be seen in figure 8.21, all of the artefacts from Sewerby contain at least 5% tin,
even those with significant zinc – there is less of a negative correlation between tin and
zinc at Sewerby than is observed elsewhere. The group of gunmetals containing 4-6%
zinc have similar levels of tin (6-9%), and therefore form a small cluster (red circle);
there is also some grouping around 10-13% tin and 1-2% zinc, but otherwise the
copper alloys from Sewerby show a wide variety of zinc and tin contents with negative
correlation between the two.
FIGURE 8.21: TIN AND ZINC CONTENT FROM ANALYSED ARTEFACTS FROM SEWERBY.
0
5
10
15
20
25
30
0 2 4 6 8 10 12 14
% T
in
% Zinc
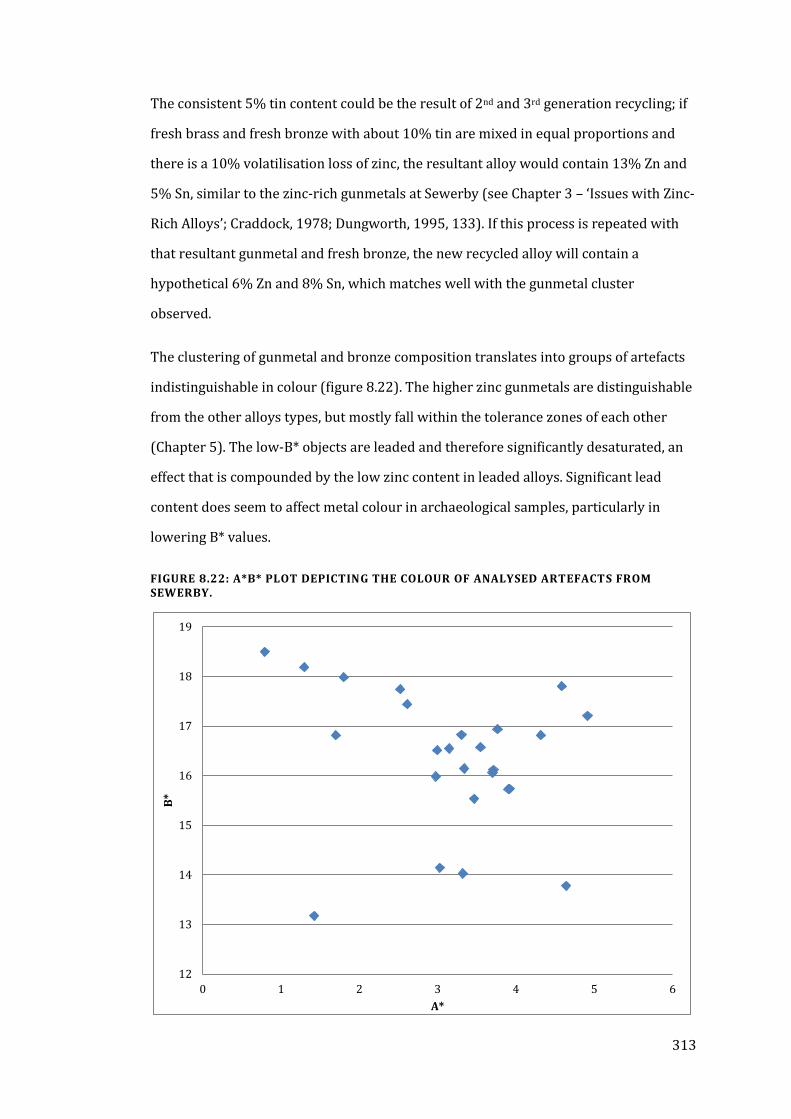
313
The consistent 5% tin content could be the result of 2nd and 3rd generation recycling; if
fresh brass and fresh bronze with about 10% tin are mixed in equal proportions and
there is a 10% volatilisation loss of zinc, the resultant alloy would contain 13% Zn and
5% Sn, similar to the zinc-rich gunmetals at Sewerby (see Chapter 3 – ‘Issues with Zinc-
Rich Alloys’; Craddock, 1978; Dungworth, 1995, 133). If this process is repeated with
that resultant gunmetal and fresh bronze, the new recycled alloy will contain a
hypothetical 6% Zn and 8% Sn, which matches well with the gunmetal cluster
observed.
The clustering of gunmetal and bronze composition translates into groups of artefacts
indistinguishable in colour (figure 8.22). The higher zinc gunmetals are distinguishable
from the other alloys types, but mostly fall within the tolerance zones of each other
(Chapter 5). The low-B* objects are leaded and therefore significantly desaturated, an
effect that is compounded by the low zinc content in leaded alloys. Significant lead
content does seem to affect metal colour in archaeological samples, particularly in
lowering B* values.
FIGURE 8.22: A*B* PLOT DEPICTING THE COLOUR OF ANALYSED ARTEFACTS FROM SEWERBY.
12
13
14
15
16
17
18
19
0 1 2 3 4 5 6
B*
A*
314
WEST HESLERTON
This Anglian cemetery was excavated from 1977-87 after its discovery during mineral
extraction at Cook’s Sand Quarry in the Vale of Pickering, East Yorkshire (Haughton
and Powlesland, 1999, 3). The A64 cuts through the cemetery site, and it is likely that
several inhumations lie underneath. The Roman road to Scarborough from York must
pass nearby but has not yet been archaeologically identified; however, a Roman
settlement has been found to the north of the A64 and east of the village of Sherburn
(not far to the east of West Heslerton), suggesting that the road may have lain to the
north of the current route (English Heritage, 2013).
While the A64 prevented excavation of the entire cemetery, its limits were established
on all sides (Haughton and Powlesland, 1999, 78). The site is directly to the east of a
former stream channel and lies north of the contemporary settlement, which has also
been excavated (Haughton and Powlesland, 1999, 10). There was earlier archaeological
activity in the area, with the cemetery reusing some late Neolithic and Bronze Age
features, including several barrows with surviving graves and a hengiform enclosure.
The cemetery features 185 inhumations, a horse burial, and twenty cremations, four of
which are prehistoric rather than early medieval (Haughton, 1999, 334). The
cremations were found only near the barrow and hengiform enclosure, the majority
inside one of these features or in the surrounding ditch. Several of the inhumations
were also located within the barrows or the surrounding ditches. Bone survival was
poor in most of the graves, with only approximately 15% of the graves containing 50%
or more of the skeleton and many graves featuring only a body stain in the soil; most
graves were therefore sexed by grave goods alone (Haughton and Powlesland, 1999,
18). Ninety-seven graves features mineralised textile, with fifty-two wool and twenty-
nine linen identified by Penelope Walton Rogers, including spin-patterning, an effect
also identified at Sewerby (Haughton and Powlesland, 1999, 146-9).
315
The thoroughness of the excavation and the site report provide a more complete
picture of the activity on the site than those of the other sites included in this corpus,
allowing for far more precise relative dating of the graves. A total of eighty-six artefacts
were analysed from thirty-seven graves from this site, and while again these are
predominantly annular brooches, other artefacts types were also represented including
twenty-two sleeve clasps (table 8.8). Thirty-two artefacts in this group were analysed
previously by Blades and the composition data collected is reasonably consistent
between the two studies (1995).
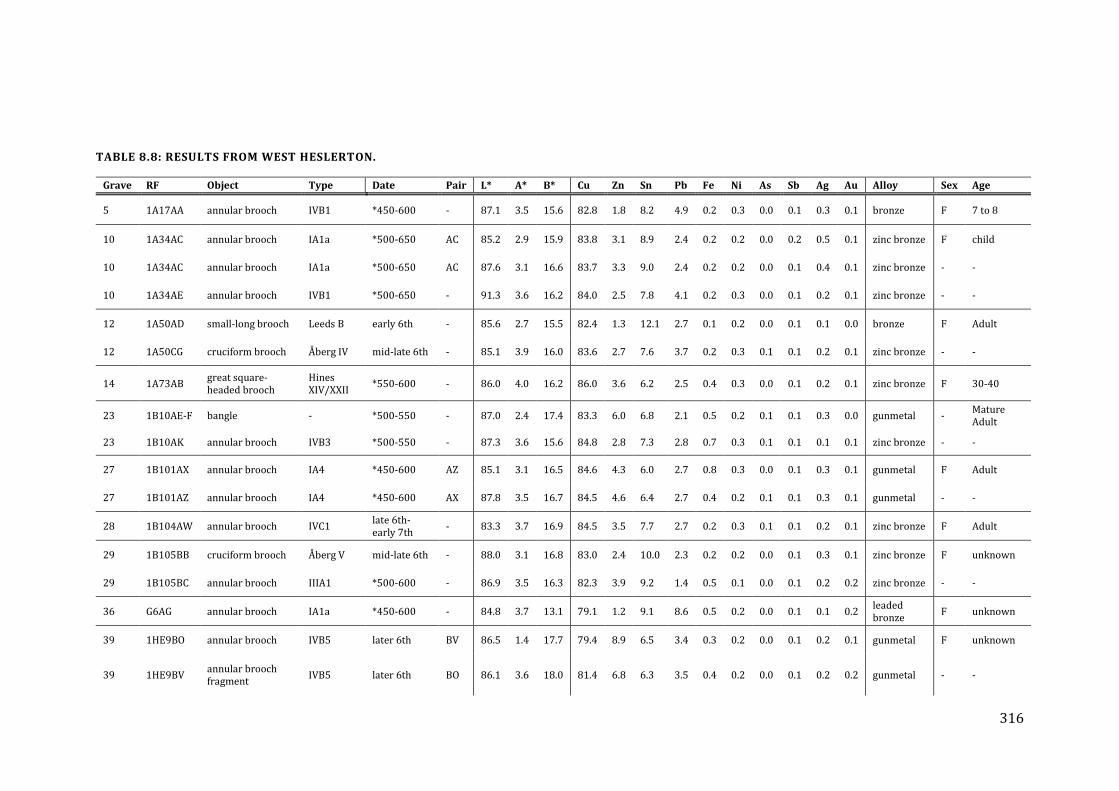
316
TABLE 8.8: RESULTS FROM WEST HESLERTON.
Grave RF Object Type Date Pair L* A* B* Cu Zn Sn Pb Fe Ni As Sb Ag Au Alloy Sex Age
5 1A17AA annular brooch IVB1 *450-600 - 87.1 3.5 15.6 82.8 1.8 8.2 4.9 0.2 0.3 0.0 0.1 0.3 0.1 bronze F 7 to 8
10 1A34AC annular brooch IA1a *500-650 AC 85.2 2.9 15.9 83.8 3.1 8.9 2.4 0.2 0.2 0.0 0.2 0.5 0.1 zinc bronze F child
10 1A34AC annular brooch IA1a *500-650 AC 87.6 3.1 16.6 83.7 3.3 9.0 2.4 0.2 0.2 0.0 0.1 0.4 0.1 zinc bronze - -
10 1A34AE annular brooch IVB1 *500-650 - 91.3 3.6 16.2 84.0 2.5 7.8 4.1 0.2 0.3 0.0 0.1 0.2 0.1 zinc bronze - -
12 1A50AD small-long brooch Leeds B early 6th - 85.6 2.7 15.5 82.4 1.3 12.1 2.7 0.1 0.2 0.0 0.1 0.1 0.0 bronze F Adult
12 1A50CG cruciform brooch Åberg IV mid-late 6th - 85.1 3.9 16.0 83.6 2.7 7.6 3.7 0.2 0.3 0.1 0.1 0.2 0.1 zinc bronze - -
14 1A73AB great square-headed brooch
Hines XIV/XXII
*550-600 - 86.0 4.0 16.2 86.0 3.6 6.2 2.5 0.4 0.3 0.0 0.1 0.2 0.1 zinc bronze F 30-40
23 1B10AE-F bangle - *500-550 - 87.0 2.4 17.4 83.3 6.0 6.8 2.1 0.5 0.2 0.1 0.1 0.3 0.0 gunmetal - Mature Adult
23 1B10AK annular brooch IVB3 *500-550 - 87.3 3.6 15.6 84.8 2.8 7.3 2.8 0.7 0.3 0.1 0.1 0.1 0.1 zinc bronze - -
27 1B101AX annular brooch IA4 *450-600 AZ 85.1 3.1 16.5 84.6 4.3 6.0 2.7 0.8 0.3 0.0 0.1 0.3 0.1 gunmetal F Adult
27 1B101AZ annular brooch IA4 *450-600 AX 87.8 3.5 16.7 84.5 4.6 6.4 2.7 0.4 0.2 0.1 0.1 0.3 0.1 gunmetal - -
28 1B104AW annular brooch IVC1 late 6th- early 7th
- 83.3 3.7 16.9 84.5 3.5 7.7 2.7 0.2 0.3 0.1 0.1 0.2 0.1 zinc bronze F Adult
29 1B105BB cruciform brooch Åberg V mid-late 6th - 88.0 3.1 16.8 83.0 2.4 10.0 2.3 0.2 0.2 0.0 0.1 0.3 0.1 zinc bronze F unknown
29 1B105BC annular brooch IIIA1 *500-600 - 86.9 3.5 16.3 82.3 3.9 9.2 1.4 0.5 0.1 0.0 0.1 0.2 0.2 zinc bronze - -
36 G6AG annular brooch IA1a *450-600 - 84.8 3.7 13.1 79.1 1.2 9.1 8.6 0.5 0.2 0.0 0.1 0.1 0.2 leaded bronze
F unknown
39 1HE9BO annular brooch IVB5 later 6th BV 86.5 1.4 17.7 79.4 8.9 6.5 3.4 0.3 0.2 0.0 0.1 0.2 0.1 gunmetal F unknown
39 1HE9BV annular brooch fragment
IVB5 later 6th BO 86.1 3.6 18.0 81.4 6.8 6.3 3.5 0.4 0.2 0.0 0.1 0.2 0.2 gunmetal - -
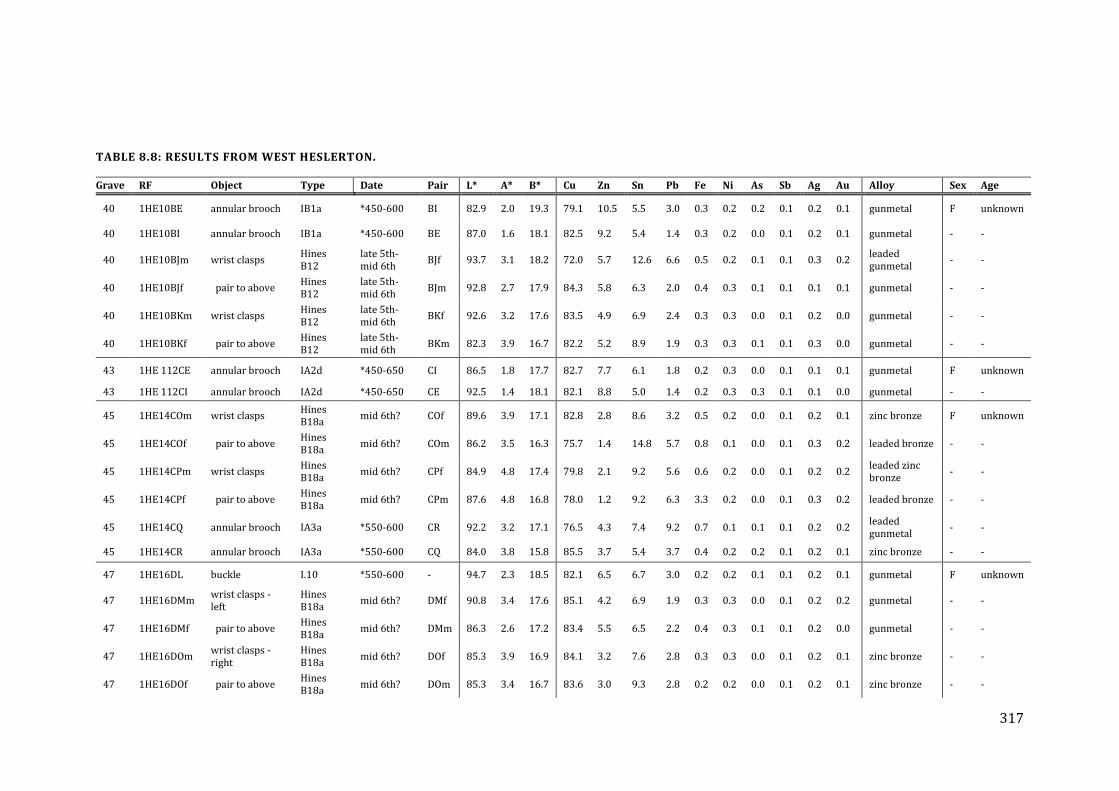
317
TABLE 8.8: RESULTS FROM WEST HESLERTON.
Grave RF Object Type Date Pair L* A* B* Cu Zn Sn Pb Fe Ni As Sb Ag Au Alloy Sex Age
40 1HE10BE annular brooch IB1a *450-600 BI 82.9 2.0 19.3 79.1 10.5 5.5 3.0 0.3 0.2 0.2 0.1 0.2 0.1 gunmetal F unknown
40 1HE10BI annular brooch IB1a *450-600 BE 87.0 1.6 18.1 82.5 9.2 5.4 1.4 0.3 0.2 0.0 0.1 0.2 0.1 gunmetal - -
40 1HE10BJm wrist clasps Hines B12
late 5th-mid 6th
BJf 93.7 3.1 18.2 72.0 5.7 12.6 6.6 0.5 0.2 0.1 0.1 0.3 0.2 leaded gunmetal
- -
40 1HE10BJf pair to above Hines B12
late 5th-mid 6th
BJm 92.8 2.7 17.9 84.3 5.8 6.3 2.0 0.4 0.3 0.1 0.1 0.1 0.1 gunmetal - -
40 1HE10BKm wrist clasps Hines B12
late 5th-mid 6th
BKf 92.6 3.2 17.6 83.5 4.9 6.9 2.4 0.3 0.3 0.0 0.1 0.2 0.0 gunmetal - -
40 1HE10BKf pair to above Hines B12
late 5th-mid 6th
BKm 82.3 3.9 16.7 82.2 5.2 8.9 1.9 0.3 0.3 0.1 0.1 0.3 0.0 gunmetal - -
43 1HE 112CE annular brooch IA2d *450-650 CI 86.5 1.8 17.7 82.7 7.7 6.1 1.8 0.2 0.3 0.0 0.1 0.1 0.1 gunmetal F unknown
43 1HE 112CI annular brooch IA2d *450-650 CE 92.5 1.4 18.1 82.1 8.8 5.0 1.4 0.2 0.3 0.3 0.1 0.1 0.0 gunmetal - -
45 1HE14COm wrist clasps Hines B18a
mid 6th? COf 89.6 3.9 17.1 82.8 2.8 8.6 3.2 0.5 0.2 0.0 0.1 0.2 0.1 zinc bronze F unknown
45 1HE14COf pair to above Hines B18a
mid 6th? COm 86.2 3.5 16.3 75.7 1.4 14.8 5.7 0.8 0.1 0.0 0.1 0.3 0.2 leaded bronze - -
45 1HE14CPm wrist clasps Hines B18a
mid 6th? CPf 84.9 4.8 17.4 79.8 2.1 9.2 5.6 0.6 0.2 0.0 0.1 0.2 0.2 leaded zinc bronze
- -
45 1HE14CPf pair to above Hines B18a
mid 6th? CPm 87.6 4.8 16.8 78.0 1.2 9.2 6.3 3.3 0.2 0.0 0.1 0.3 0.2 leaded bronze - -
45 1HE14CQ annular brooch IA3a *550-600 CR 92.2 3.2 17.1 76.5 4.3 7.4 9.2 0.7 0.1 0.1 0.1 0.2 0.2 leaded gunmetal
- -
45 1HE14CR annular brooch IA3a *550-600 CQ 84.0 3.8 15.8 85.5 3.7 5.4 3.7 0.4 0.2 0.2 0.1 0.2 0.1 zinc bronze - -
47 1HE16DL buckle I.10 *550-600 - 94.7 2.3 18.5 82.1 6.5 6.7 3.0 0.2 0.2 0.1 0.1 0.2 0.1 gunmetal F unknown
47 1HE16DMm wrist clasps - left
Hines B18a
mid 6th? DMf 90.8 3.4 17.6 85.1 4.2 6.9 1.9 0.3 0.3 0.0 0.1 0.2 0.2 gunmetal - -
47 1HE16DMf pair to above Hines B18a
mid 6th? DMm 86.3 2.6 17.2 83.4 5.5 6.5 2.2 0.4 0.3 0.1 0.1 0.2 0.0 gunmetal - -
47 1HE16DOm wrist clasps - right
Hines B18a
mid 6th? DOf 85.3 3.9 16.9 84.1 3.2 7.6 2.8 0.3 0.3 0.0 0.1 0.2 0.1 zinc bronze - -
47 1HE16DOf pair to above Hines B18a
mid 6th? DOm 85.3 3.4 16.7 83.6 3.0 9.3 2.8 0.2 0.2 0.0 0.1 0.2 0.1 zinc bronze - -
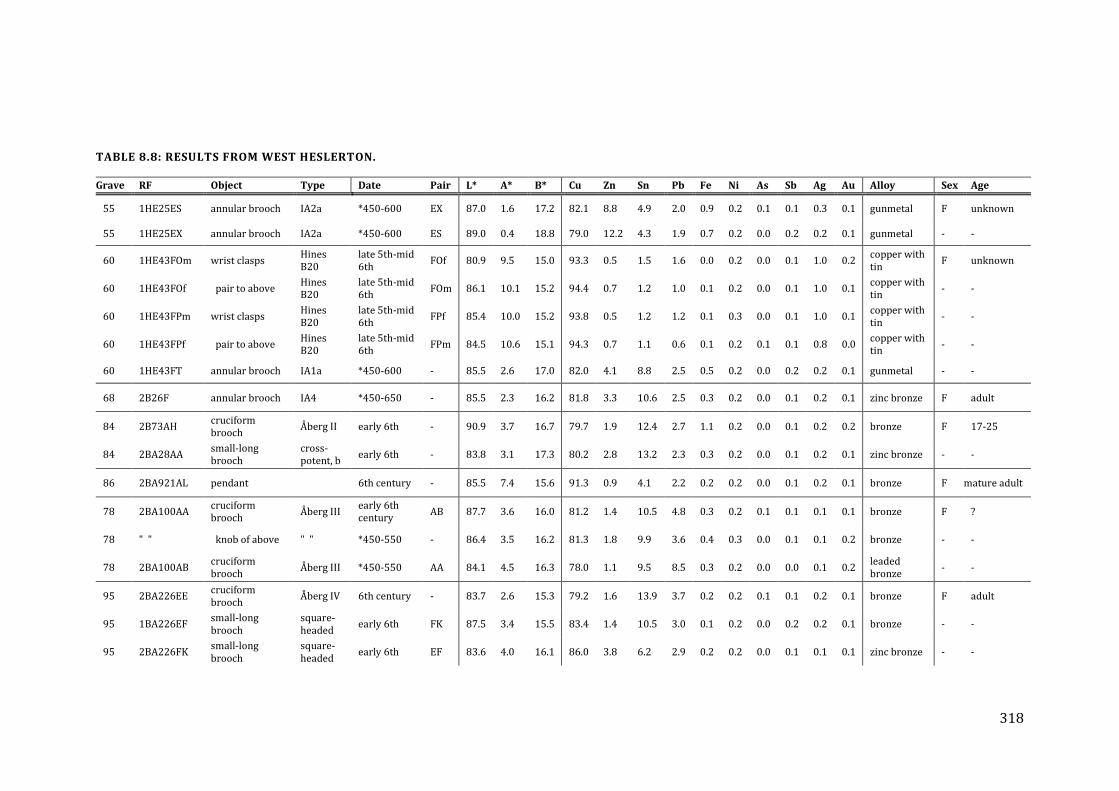
318
TABLE 8.8: RESULTS FROM WEST HESLERTON.
Grave RF Object Type Date Pair L* A* B* Cu Zn Sn Pb Fe Ni As Sb Ag Au Alloy Sex Age
55 1HE25ES annular brooch IA2a *450-600 EX 87.0 1.6 17.2 82.1 8.8 4.9 2.0 0.9 0.2 0.1 0.1 0.3 0.1 gunmetal F unknown
55 1HE25EX annular brooch IA2a *450-600 ES 89.0 0.4 18.8 79.0 12.2 4.3 1.9 0.7 0.2 0.0 0.2 0.2 0.1 gunmetal - -
60 1HE43FOm wrist clasps Hines B20
late 5th-mid 6th
FOf 80.9 9.5 15.0 93.3 0.5 1.5 1.6 0.0 0.2 0.0 0.1 1.0 0.2 copper with tin
F unknown
60 1HE43FOf pair to above Hines B20
late 5th-mid 6th
FOm 86.1 10.1 15.2 94.4 0.7 1.2 1.0 0.1 0.2 0.0 0.1 1.0 0.1 copper with tin
- -
60 1HE43FPm wrist clasps Hines B20
late 5th-mid 6th
FPf 85.4 10.0 15.2 93.8 0.5 1.2 1.2 0.1 0.3 0.0 0.1 1.0 0.1 copper with tin
- -
60 1HE43FPf pair to above Hines B20
late 5th-mid 6th
FPm 84.5 10.6 15.1 94.3 0.7 1.1 0.6 0.1 0.2 0.1 0.1 0.8 0.0 copper with tin
- -
60 1HE43FT annular brooch IA1a *450-600 - 85.5 2.6 17.0 82.0 4.1 8.8 2.5 0.5 0.2 0.0 0.2 0.2 0.1 gunmetal - -
68 2B26F annular brooch IA4 *450-650 - 85.5 2.3 16.2 81.8 3.3 10.6 2.5 0.3 0.2 0.0 0.1 0.2 0.1 zinc bronze F adult
84 2B73AH cruciform brooch
Åberg II early 6th - 90.9 3.7 16.7 79.7 1.9 12.4 2.7 1.1 0.2 0.0 0.1 0.2 0.2 bronze F 17-25
84 2BA28AA small-long brooch
cross-potent, b
early 6th - 83.8 3.1 17.3 80.2 2.8 13.2 2.3 0.3 0.2 0.0 0.1 0.2 0.1 zinc bronze - -
86 2BA921AL pendant 6th century - 85.5 7.4 15.6 91.3 0.9 4.1 2.2 0.2 0.2 0.0 0.1 0.2 0.1 bronze F mature adult
78 2BA100AA cruciform brooch
Åberg III early 6th century
AB 87.7 3.6 16.0 81.2 1.4 10.5 4.8 0.3 0.2 0.1 0.1 0.1 0.1 bronze F ?
78 " " knob of above " " *450-550 - 86.4 3.5 16.2 81.3 1.8 9.9 3.6 0.4 0.3 0.0 0.1 0.1 0.2 bronze - -
78 2BA100AB cruciform brooch
Åberg III *450-550 AA 84.1 4.5 16.3 78.0 1.1 9.5 8.5 0.3 0.2 0.0 0.0 0.1 0.2 leaded bronze
- -
95 2BA226EE cruciform brooch
Åberg IV 6th century - 83.7 2.6 15.3 79.2 1.6 13.9 3.7 0.2 0.2 0.1 0.1 0.2 0.1 bronze F adult
95 1BA226EF small-long brooch
square-headed
early 6th FK 87.5 3.4 15.5 83.4 1.4 10.5 3.0 0.1 0.2 0.0 0.2 0.2 0.1 bronze - -
95 2BA226FK small-long brooch
square-headed
early 6th EF 83.6 4.0 16.1 86.0 3.8 6.2 2.9 0.2 0.2 0.0 0.1 0.1 0.1 zinc bronze - -
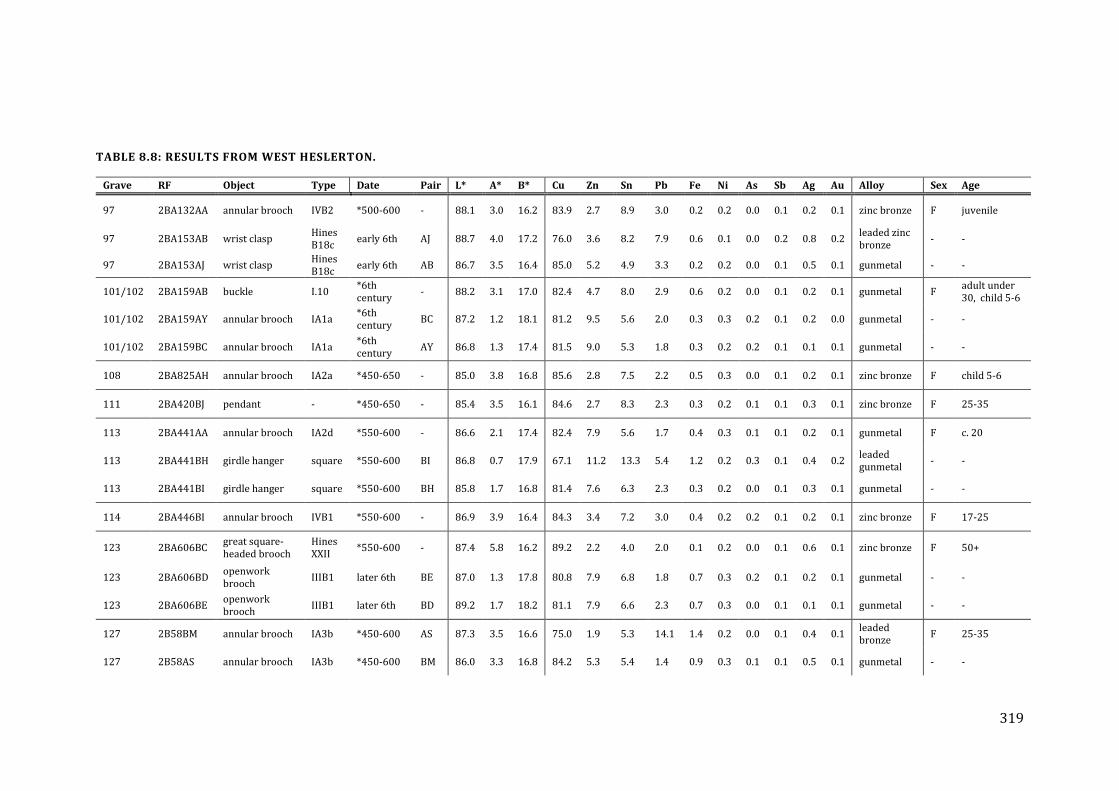
319
TABLE 8.8: RESULTS FROM WEST HESLERTON.
Grave RF Object Type Date Pair L* A* B* Cu Zn Sn Pb Fe Ni As Sb Ag Au Alloy Sex Age
97 2BA132AA annular brooch IVB2 *500-600 - 88.1 3.0 16.2 83.9 2.7 8.9 3.0 0.2 0.2 0.0 0.1 0.2 0.1 zinc bronze F juvenile
97 2BA153AB wrist clasp Hines B18c
early 6th AJ 88.7 4.0 17.2 76.0 3.6 8.2 7.9 0.6 0.1 0.0 0.2 0.8 0.2 leaded zinc bronze
- -
97 2BA153AJ wrist clasp Hines B18c
early 6th AB 86.7 3.5 16.4 85.0 5.2 4.9 3.3 0.2 0.2 0.0 0.1 0.5 0.1 gunmetal - -
101/102 2BA159AB buckle I.10 *6th century
- 88.2 3.1 17.0 82.4 4.7 8.0 2.9 0.6 0.2 0.0 0.1 0.2 0.1 gunmetal F adult under 30, child 5-6
101/102 2BA159AY annular brooch IA1a *6th century
BC 87.2 1.2 18.1 81.2 9.5 5.6 2.0 0.3 0.3 0.2 0.1 0.2 0.0 gunmetal - -
101/102 2BA159BC annular brooch IA1a *6th century
AY 86.8 1.3 17.4 81.5 9.0 5.3 1.8 0.3 0.2 0.2 0.1 0.1 0.1 gunmetal - -
108 2BA825AH annular brooch IA2a *450-650 - 85.0 3.8 16.8 85.6 2.8 7.5 2.2 0.5 0.3 0.0 0.1 0.2 0.1 zinc bronze F child 5-6
111 2BA420BJ pendant - *450-650 - 85.4 3.5 16.1 84.6 2.7 8.3 2.3 0.3 0.2 0.1 0.1 0.3 0.1 zinc bronze F 25-35
113 2BA441AA annular brooch IA2d *550-600 - 86.6 2.1 17.4 82.4 7.9 5.6 1.7 0.4 0.3 0.1 0.1 0.2 0.1 gunmetal F c. 20
113 2BA441BH girdle hanger square *550-600 BI 86.8 0.7 17.9 67.1 11.2 13.3 5.4 1.2 0.2 0.3 0.1 0.4 0.2 leaded gunmetal
- -
113 2BA441BI girdle hanger square *550-600 BH 85.8 1.7 16.8 81.4 7.6 6.3 2.3 0.3 0.2 0.0 0.1 0.3 0.1 gunmetal - -
114 2BA446BI annular brooch IVB1 *550-600 - 86.9 3.9 16.4 84.3 3.4 7.2 3.0 0.4 0.2 0.2 0.1 0.2 0.1 zinc bronze F 17-25
123 2BA606BC great square-headed brooch
Hines XXII
*550-600 - 87.4 5.8 16.2 89.2 2.2 4.0 2.0 0.1 0.2 0.0 0.1 0.6 0.1 zinc bronze F 50+
123 2BA606BD openwork brooch
IIIB1 later 6th BE 87.0 1.3 17.8 80.8 7.9 6.8 1.8 0.7 0.3 0.2 0.1 0.2 0.1 gunmetal - -
123 2BA606BE openwork brooch
IIIB1 later 6th BD 89.2 1.7 18.2 81.1 7.9 6.6 2.3 0.7 0.3 0.0 0.1 0.1 0.1 gunmetal - -
127 2B58BM annular brooch IA3b *450-600 AS 87.3 3.5 16.6 75.0 1.9 5.3 14.1 1.4 0.2 0.0 0.1 0.4 0.1 leaded bronze
F 25-35
127 2B58AS annular brooch IA3b *450-600 BM 86.0 3.3 16.8 84.2 5.3 5.4 1.4 0.9 0.3 0.1 0.1 0.5 0.1 gunmetal - -
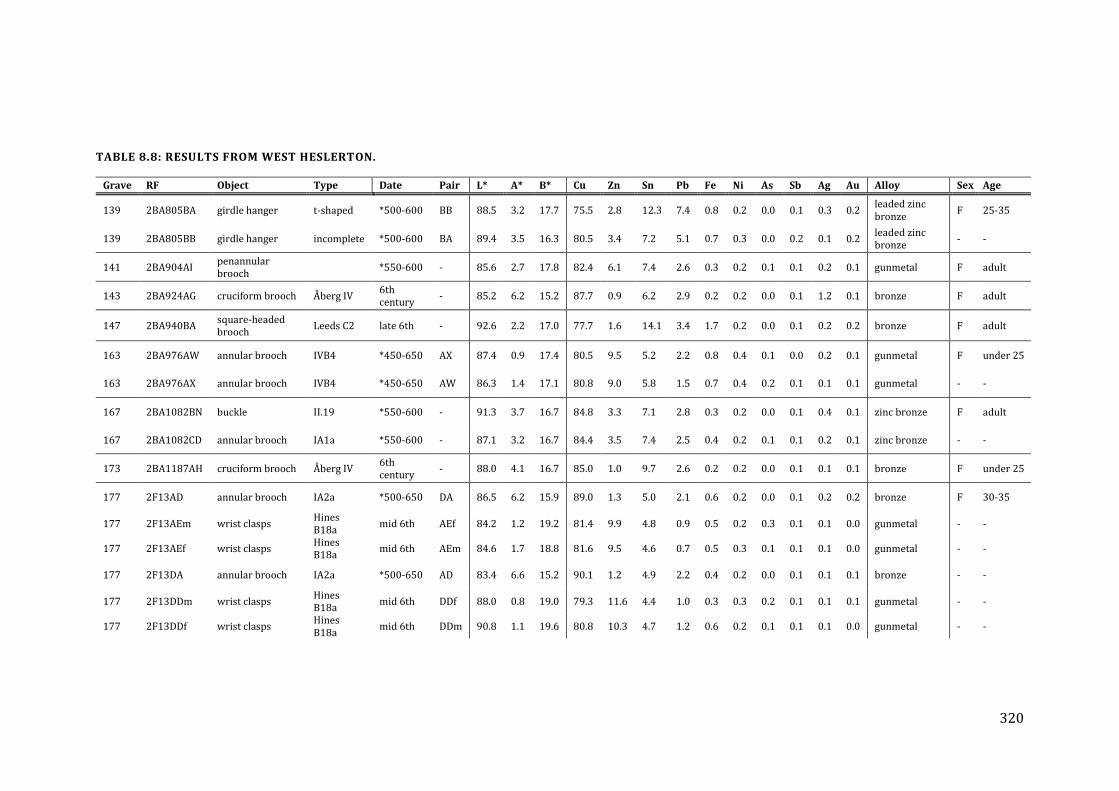
320
TABLE 8.8: RESULTS FROM WEST HESLERTON.
Grave RF Object Type Date Pair L* A* B* Cu Zn Sn Pb Fe Ni As Sb Ag Au Alloy Sex Age
139 2BA805BA girdle hanger t-shaped *500-600 BB 88.5 3.2 17.7 75.5 2.8 12.3 7.4 0.8 0.2 0.0 0.1 0.3 0.2 leaded zinc bronze
F 25-35
139 2BA805BB girdle hanger incomplete *500-600 BA 89.4 3.5 16.3 80.5 3.4 7.2 5.1 0.7 0.3 0.0 0.2 0.1 0.2 leaded zinc bronze
- -
141 2BA904AI penannular brooch
*550-600 - 85.6 2.7 17.8 82.4 6.1 7.4 2.6 0.3 0.2 0.1 0.1 0.2 0.1 gunmetal F adult
143 2BA924AG cruciform brooch Åberg IV 6th century
- 85.2 6.2 15.2 87.7 0.9 6.2 2.9 0.2 0.2 0.0 0.1 1.2 0.1 bronze F adult
147 2BA940BA square-headed brooch
Leeds C2 late 6th - 92.6 2.2 17.0 77.7 1.6 14.1 3.4 1.7 0.2 0.0 0.1 0.2 0.2 bronze F adult
163 2BA976AW annular brooch IVB4 *450-650 AX 87.4 0.9 17.4 80.5 9.5 5.2 2.2 0.8 0.4 0.1 0.0 0.2 0.1 gunmetal F under 25
163 2BA976AX annular brooch IVB4 *450-650 AW 86.3 1.4 17.1 80.8 9.0 5.8 1.5 0.7 0.4 0.2 0.1 0.1 0.1 gunmetal - -
167 2BA1082BN buckle II.19 *550-600 - 91.3 3.7 16.7 84.8 3.3 7.1 2.8 0.3 0.2 0.0 0.1 0.4 0.1 zinc bronze F adult
167 2BA1082CD annular brooch IA1a *550-600 - 87.1 3.2 16.7 84.4 3.5 7.4 2.5 0.4 0.2 0.1 0.1 0.2 0.1 zinc bronze - -
173 2BA1187AH cruciform brooch Åberg IV 6th century
- 88.0 4.1 16.7 85.0 1.0 9.7 2.6 0.2 0.2 0.0 0.1 0.1 0.1 bronze F under 25
177 2F13AD annular brooch IA2a *500-650 DA 86.5 6.2 15.9 89.0 1.3 5.0 2.1 0.6 0.2 0.0 0.1 0.2 0.2 bronze F 30-35
177 2F13AEm wrist clasps Hines B18a
mid 6th AEf 84.2 1.2 19.2 81.4 9.9 4.8 0.9 0.5 0.2 0.3 0.1 0.1 0.0 gunmetal - -
177 2F13AEf wrist clasps Hines B18a
mid 6th AEm 84.6 1.7 18.8 81.6 9.5 4.6 0.7 0.5 0.3 0.1 0.1 0.1 0.0 gunmetal - -
177 2F13DA annular brooch IA2a *500-650 AD 83.4 6.6 15.2 90.1 1.2 4.9 2.2 0.4 0.2 0.0 0.1 0.1 0.1 bronze - -
177 2F13DDm wrist clasps Hines B18a
mid 6th DDf 88.0 0.8 19.0 79.3 11.6 4.4 1.0 0.3 0.3 0.2 0.1 0.1 0.1 gunmetal - -
177 2F13DDf wrist clasps Hines B18a
mid 6th DDm 90.8 1.1 19.6 80.8 10.3 4.7 1.2 0.6 0.2 0.1 0.1 0.1 0.0 gunmetal - -
321
DISCUSSION
The largest sampled site in this study, the material from West Heslerton totalled eighty-
six samples from seventy-five different artefacts. The artefacts sampled are fairly
equally distributed between the different dating phases and have the second largest
proportion of late 6th -7th century artefacts (figure 8.2). West Heslerton has the highest
average zinc and the lowest average tin contents of the six sites (figures 8.5, 8.6).
FIGURE 8.23: ALLOY FREQUENCY OF SAMPLED ARTEFACTS AT WEST HESLERTON.
Gunmetal is the most frequent alloy type, followed by a large number of zinc bronzes
(figure 8.23). Bronzes are still more likely to be leaded than other alloy types, but zinc
bronze and gunmetals both have leaded examples. There are a number of low tin
bronzes that deviate from the usual tin-zinc negative correlation, most of which have 1-
2% zinc (figure 8.24, green circle). A cluster of similar tin and zinc compositions occurs
in the zinc bronze region between 7-9% tin (red circle). Almost all alloys at West
Heslerton have at least 4% tin present, indicating that recycling was prevalent. Alloy
anomalies from West Heslerton are the pair of gilt copper wrist clasps (from grave 60,
HE143 FO and FP, orange circle) and an unusual gunmetal girdle hanger (grave 113,
2BA441BH) containing 11% Zn as well as 13% Sn (see Chapter 10 – ‘Unusual Alloys ‘).
These explain the large copper content range seen in figure 9.11.
0 10 20 30 40
Impure copper
Bronze
Zinc bronze
Gunmetal
Tin brass
Brass
Number of artefacts
unleaded
leaded
322
FIGURE 8.24: TIN AND ZINC CONTENT IN ANALYSED ARTEFACTS FROM WEST HESLERTON.
The colour of West Heslerton artefacts can be broken into groups (figure 8.25). The
copper wrist clasps form the high A* group (orange circle), but as these were gilt this
colour was not visible. The next group, also distinct from the main group by higher A*
of ~6-7, are low-tin bronzes (green circle). These feature 4-6% tin and less than 2%
zinc, and consist of an annular brooch pair (grave 177), a cruciform brooch (grave 143)
and a gilt pendant (grave 86). The low B* outlier is a leaded bronze annular brooch that
would have been significantly paler than other copper alloys (g.36, G6AG).
0
2
4
6
8
10
12
14
16
0 2 4 6 8 10 12 14
% T
in
% Zinc
323
FIGURE 8.25: A*B* PLOT DEPICTING THE COLOUR OF ANALYSED ARTEFACTS FROM WEST HESLERTON.
12
13
14
15
16
17
18
19
20
0 2 4 6 8 10 12
B*
A*
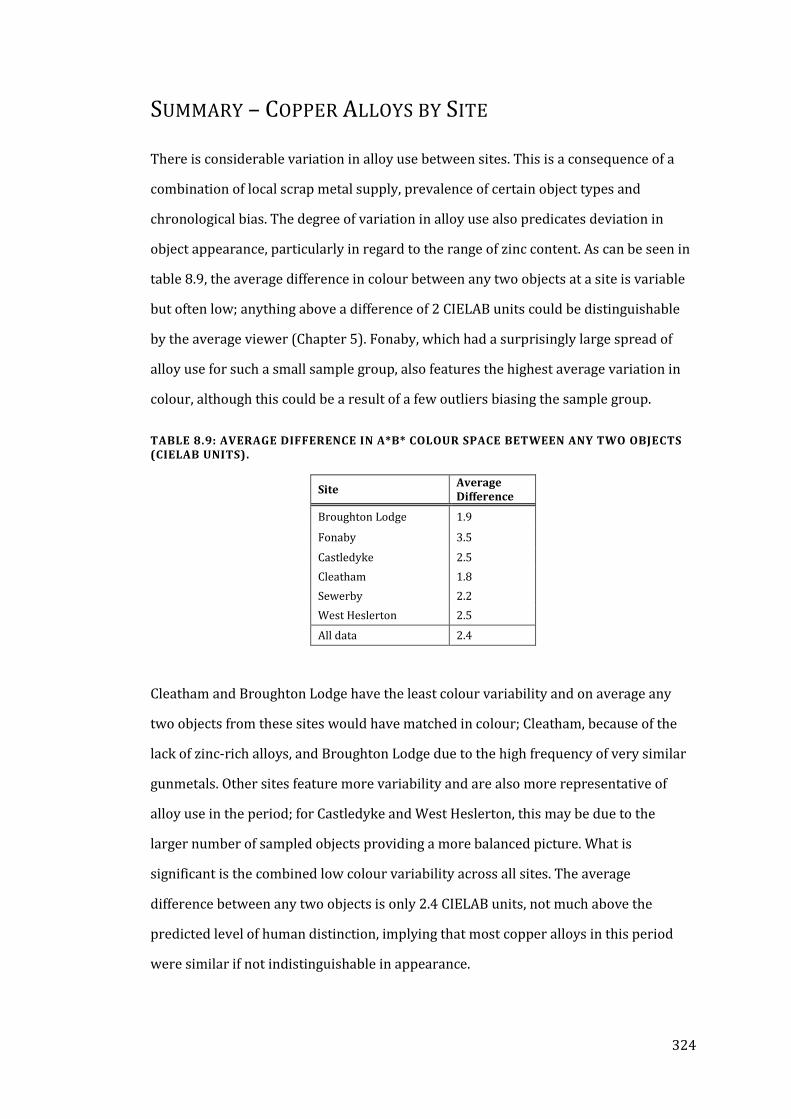
324
SUMMARY – COPPER ALLOYS BY SITE
There is considerable variation in alloy use between sites. This is a consequence of a
combination of local scrap metal supply, prevalence of certain object types and
chronological bias. The degree of variation in alloy use also predicates deviation in
object appearance, particularly in regard to the range of zinc content. As can be seen in
table 8.9, the average difference in colour between any two objects at a site is variable
but often low; anything above a difference of 2 CIELAB units could be distinguishable
by the average viewer (Chapter 5). Fonaby, which had a surprisingly large spread of
alloy use for such a small sample group, also features the highest average variation in
colour, although this could be a result of a few outliers biasing the sample group.
TABLE 8.9: AVERAGE DIFFERENCE IN A*B* COLOUR SPACE BETWEEN ANY TWO OBJECTS (CIELAB UNITS).
Site Average Difference
Broughton Lodge 1.9
Fonaby 3.5
Castledyke 2.5
Cleatham 1.8
Sewerby 2.2
West Heslerton 2.5
All data 2.4
Cleatham and Broughton Lodge have the least colour variability and on average any
two objects from these sites would have matched in colour; Cleatham, because of the
lack of zinc-rich alloys, and Broughton Lodge due to the high frequency of very similar
gunmetals. Other sites feature more variability and are also more representative of
alloy use in the period; for Castledyke and West Heslerton, this may be due to the
larger number of sampled objects providing a more balanced picture. What is
significant is the combined low colour variability across all sites. The average
difference between any two objects is only 2.4 CIELAB units, not much above the
predicted level of human distinction, implying that most copper alloys in this period
were similar if not indistinguishable in appearance.
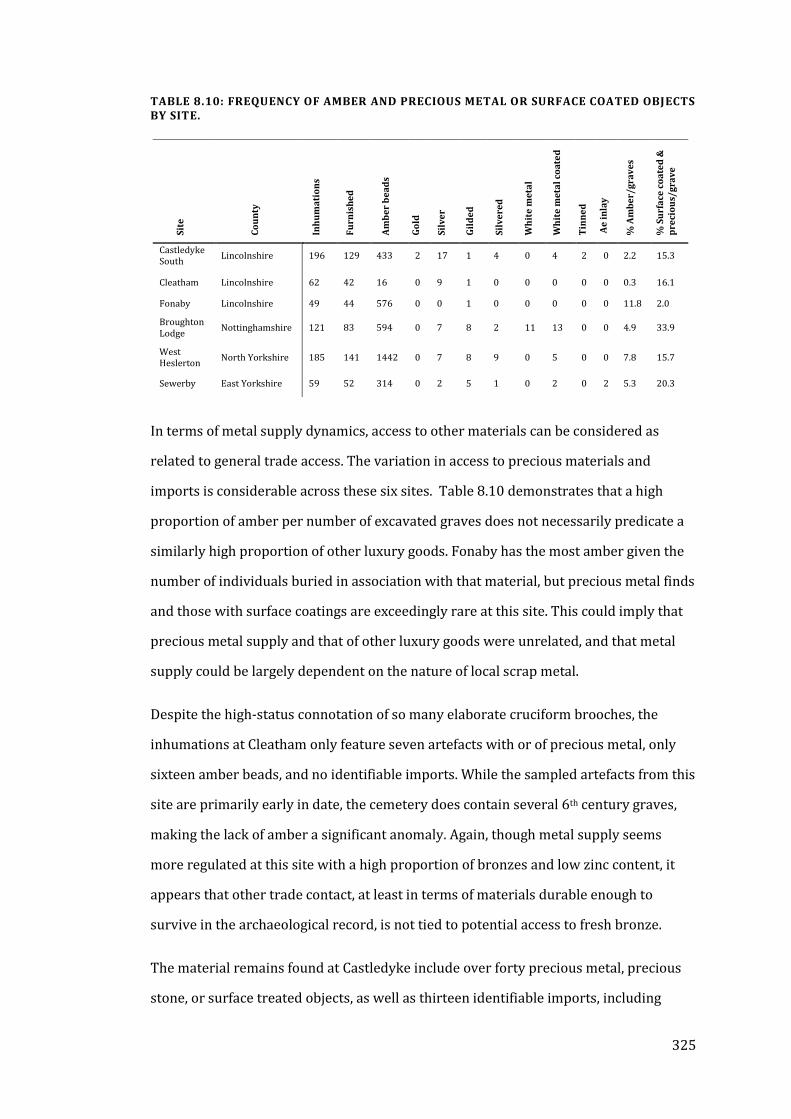
325
TABLE 8.10: FREQUENCY OF AMBER AND PRECIOUS METAL OR SURFACE COATED OBJECTS BY SITE.
In terms of metal supply dynamics, access to other materials can be considered as
related to general trade access. The variation in access to precious materials and
imports is considerable across these six sites. Table 8.10 demonstrates that a high
proportion of amber per number of excavated graves does not necessarily predicate a
similarly high proportion of other luxury goods. Fonaby has the most amber given the
number of individuals buried in association with that material, but precious metal finds
and those with surface coatings are exceedingly rare at this site. This could imply that
precious metal supply and that of other luxury goods were unrelated, and that metal
supply could be largely dependent on the nature of local scrap metal.
Despite the high-status connotation of so many elaborate cruciform brooches, the
inhumations at Cleatham only feature seven artefacts with or of precious metal, only
sixteen amber beads, and no identifiable imports. While the sampled artefacts from this
site are primarily early in date, the cemetery does contain several 6th century graves,
making the lack of amber a significant anomaly. Again, though metal supply seems
more regulated at this site with a high proportion of bronzes and low zinc content, it
appears that other trade contact, at least in terms of materials durable enough to
survive in the archaeological record, is not tied to potential access to fresh bronze.
The material remains found at Castledyke include over forty precious metal, precious
stone, or surface treated objects, as well as thirteen identifiable imports, including
Site
Co
un
ty
Inh
um
ati
on
s
Fu
rnis
he
d
Am
be
r b
ea
ds
Go
ld
Silv
er
Gil
de
d
Silv
ere
d
Wh
ite
me
tal
Wh
ite
me
tal
coa
ted
Tin
ne
d
Ae
in
lay
% A
mb
er/
gra
ve
s
% S
urf
ace
co
ate
d &
p
reci
ou
s/g
rav
e
Castledyke South
Lincolnshire 196 129 433 2 17 1 4 0 4 2 0 2.2 15.3
Cleatham Lincolnshire 62 42 16 0 9 1 0 0 0 0 0 0.3 16.1
Fonaby Lincolnshire 49 44 576 0 0 1 0 0 0 0 0 11.8 2.0
Broughton Lodge
Nottinghamshire 121 83 594 0 7 8 2 11 13 0 0 4.9 33.9
West Heslerton
North Yorkshire 185 141 1442 0 7 8 9 0 5 0 0 7.8 15.7
Sewerby East Yorkshire 59 52 314 0 2 5 1 0 2 0 2 5.3 20.3
326
material from as close as the Lake District and as far as France, Africa and India
(Drinkall and Foreman, 1998). There were also 414 amber beads (in 63% of graves).
Given the number of individuals buried at Castledyke, the number of amber beads is
actually quite low per person compared to any other site other than Cleatham.
Considering the high frequency of amber among fewer individuals at the inland site of
Fonaby, precious and imported material access has no discernible regional patterning
either within general areas or given proximity to various potential trade routes. Coastal
proximity could be a factor in precious metal access, as Castledyke and Sewerby have
several instances of gilding and silver objects, but Broughton Lodge and West
Heslerton also have a significant number of precious metals as well.
The large amount of data from East Anglian and Cambridgeshire copper alloy objects
(e.g. the data sets from Blades, 1995, and Mortimer, 1990) may impart a south-eastern
Anglian bias to the previous corpus of data. The lower frequency of binary bronze in
the more northern data collected in this study may indicate that East Anglian sites may
have had greater access to fresh bronze supplies. The consistency of alloy composition
at the most southerly of the sites in this study, Broughton Lodge, could support this
idea, as its proximity to East Anglia/Cambridgeshire could have been a factor in its
access to fresh metal. However, at Broughton Lodge gunmetal is still predominant; the
effect of fresh metal on the system is observable only in the regularity of the alloy
compositions created from controlled recycling practices.
Heightened access to pure metal supplies is also demonstrated by a higher frequency of
tinned objects in the Anglian southeast and around the Thames (e.g. Mucking and
Springfield Lyons in Essex; Barrington in Cambridgeshire; and Morning Thorpe and
Bergh Apton in Norfolk; see Chapter 4, table 4.3; Marzinzik 2003, 56). White metal
coating and tinning are far more frequent at Broughton Lodge than at more northern
locations, indicating that it may have had access to more East Anglian and
Cambridgeshire-related trade networks, through which tin as a separate metal was
more commonly available. Beyond this, specific regional patterns cannot be identified.
Alloy use is more dependent on local scrap availability or on the manufacturing
properties of the object type.
327
This localised dependency on scrap metal, especially outside of the southeast, is an
angle warranting further investigation. Each site has characteristics relating to
potential scrap as well as extra-regional trade access that affect the alloys used. The
range of compositions used at a site may correlate with proximity to former Roman
settlements (reflecting a higher level of variability as a range of scrap material is
recycled, i.e. Fonaby), to connections to the continent (as evidenced by other imported
materials and perhaps brass, i.e. Castledyke), or to connections with an unknown
source of tin and bronze supply (and therefore more regular compositions as well as
higher frequency of tinned objects, i.e. Broughton Lodge). The combination of several
factors leads to trends in alloy use at each site, trends which may become clearer with
the addition of further sites to the discussion and using larger data sets, and which
could illuminate the dynamics of scrap metal resource exploitation. What these limited
results indicate is that there was a level of local self-sufficiency in metal resource
management and even acquisition that was dependent on the location of the settlement
and its access to wider trade arteries, particularly (given the location and evidence of
this small data set) along key rivers and the major Roman roads.
328
CHAPTER 9
ANNULAR BROOCH TYPOLOGY
INTRODUCTION
The most numerous artefact type in this study are annular brooches (40% of artefacts
in this study), and the current limited typology was insufficient to fully explore the data
collected. A more in-depth classification system was designed to explore annular
brooch types in more detail, with the hope that the dating and regional distribution of
this abundant brooch type could be refined (Appendix C). This new system was built
around the existing Leeds typology for the sake of simplicity and continuity. A brief
discussion will be made of the regional and chronological patterns that can be derived
from this new classification. This classification system should be viewed as a work in
process, as annular brooches, “are the products of numerous locally-based
metalworkers, all using a similar repertoire of techniques,” with local or regional
variations that complicate any classification system (Boulter and Walton Rogers, 2012,
99). The system outlined in Appendix C works well with the current northern Anglian
dataset, though further categories are necessary when the dataset is expanded beyond
the sites discussed below.
PREVIOUS TYPOLOGIES
The annular brooch is among the least discussed brooch forms in prior research,
despite its high frequency in Anglian regions. Only two publications have attempted to
fit these brooches into a typology, Leeds (1945, 46-49) and Ager (1985), though Leeds
only gives a short list of basic types, focusing on exotic Kentish examples, and Ager
focuses only on the quoit brooch form (Hirst, 1985, 55). Leeds divided annular
brooches into eight groups, the first three of which are only found in Kent and the
south, are considerably larger, and are actually penannular in form. Types D and E
329
consist of broad, flat, and often highly decorated bands referred to as quoit brooches
and are also usually highly decorated (Ager, 1985). Thus the first five annular brooch
categories out of eight are not actually ‘annular brooches’.
Leeds type F annular brooches are cast, narrow in band, and semi-circular or round in
profile, and Leeds (1945, 48) divided this group into either plain or with moulded
‘bead-and-reel’ decoration, though there are several other cast forms. The most
common form of annular brooch is Leeds type G, characterised by being large (between
5 mm and 1cm broad in the band) and flat in profile (though many are actually slightly
dished rather than flat); this type is usually cut from sheet metal rather than cast.
Despite being the most numerous form of annular brooch, no further classification of
this type has previously been made. The final type H, not part of the original Leeds
series, consists of very small annular brooches. These are cast bands only about an inch
in diameter with a narrow, round cross-section (Leeds, 1945, 49). These include
penannular examples of similar size. Type H annular brooches have been dated mostly
to 7th century contexts though some (Cleatham, graves 1, 17 and 20) may be from the
late 6th century (Geake, 1999, 213; Hirst, 1985, 55; Leahy, 2007, 228; Leeds, 1936, 98).
Annular and quoit brooches as a form have their origins, “in a group of openwork
bronze annular brooches produced in late Roman workshops,” with several annular
brooch forms occurring on the continent and in Scandinavia from the Roman period
onwards (Evison, 1965, 49; Hirst, 1985, 56). They appear in Anglo-Saxon graves from
the 5th through the 7th century, with many forms seemingly persisting throughout the
entire period. Only a few specific variations within the types F-G have any relative
dating associated (Jørgensen, 1992). The dearth of literature and research on annular
brooches leaves the largest Anglian brooch type a veritable untapped resource for
archaeological investigation of the period.
330
DATING & DISTRIBUTION
The dating and distribution data was supplemented by inclusion of unsampled
brooches from the studied sites, as well as from several sites outside of this study
(Evison, 1994; Evison, 1988; Green and Rogerson, 1978; Green, 1987; Hawkes, 2006;
Lucy, 2009; Malim and Hines, 1998; Penn, 1998; Timby, 1996; Tyler and Major, 2005;
West, 1988). These add several sites to the annular brooch corpus south of
Lincolnshire, allowing for some regional comparisons of type distributions to be made.
TYPE F
This annular brooch type was divided into four sub-types primarily dependent on the
shape of the cast band in section, the first of which (I: D-sectioned or half-round cast)
are the most numerous (Appendix C). Type F.II brooches have irregular cross-sections
and band width, F.IIIs are flattish and mimic penannular brooches, and IVs are round in
section and are essentially earlier, larger versions of Type H.
Type F.Ia, cast annular brooches (with narrow bands and discrete zones of transverse
incised lines) tend to be the earliest Type F’s, and these seem to date primarily to the
early 6th century (e.g. West Heslerton 1B10AK; figure 9.1, left). These may be the
forerunners of other cast forms, such as the most common bead-and-reel form (F.IB,
figure 9.2). All other cast type F brooches seem to date from the late 6th-7th century; two
examples (West Heslerton 1B10AK and Cleatham 19.1; only 9% of this type) date from
the early 6th-mid 6th century, so it is possible that early type F’s developed in the early
6th century but did not become widely produced until later. Type F.IIIa, the mock-
penannular brooches with serpent or beast-headed ‘terminals’, date from the mid 6th-
7th centuries (figure 9.1, right; Geake, 1999, 213). The most securely dated cast annular
brooches are F.IIa, which date to the second half of the 6th century (Hirst, 1985, 57).
Currently, too few examples have been examined to determine any further
chronological grouping or whether there are any regional patterns of form distribution.
This additional typology, however, does allow for more in-depth discussion about cast
annular brooches, and the trend towards later dates associated with these brooches is
reflected in those from this study.
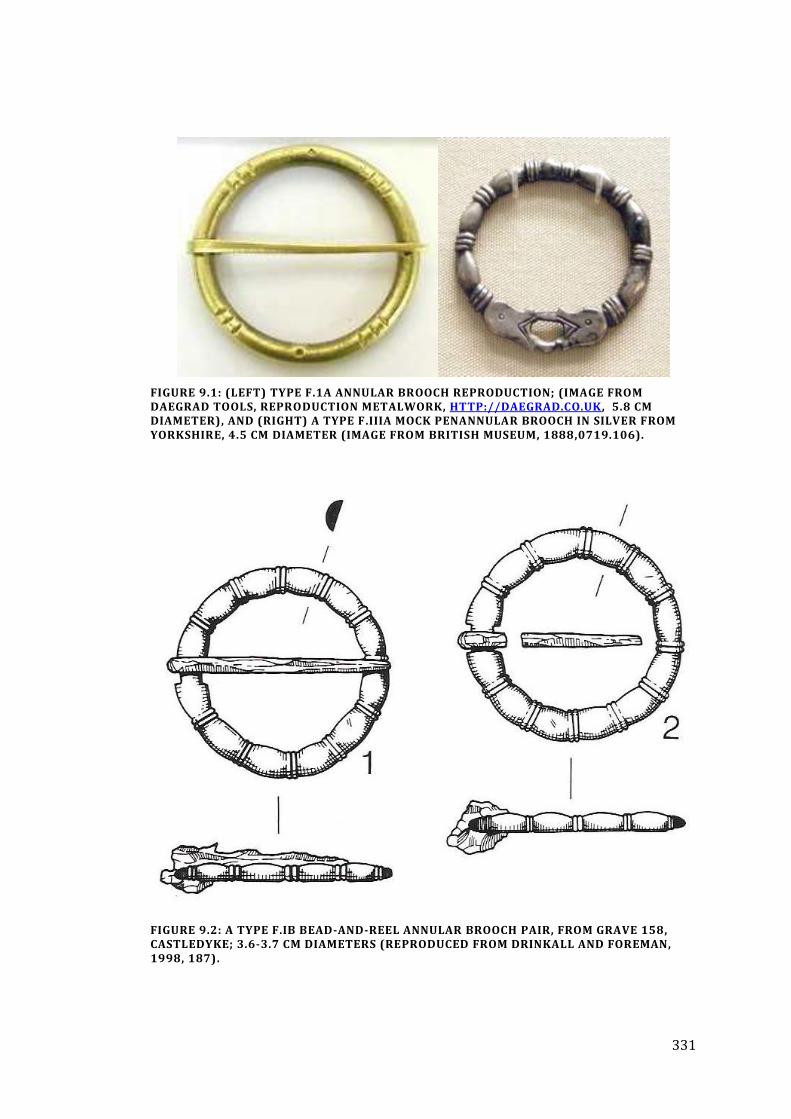
331
FIGURE 9.1: (LEFT) TYPE F.1A ANNULAR BROOCH REPRODUCTION; (IMAGE FROM DAEGRAD TOOLS, REPRODUCTION METALWORK, HTTP://DAEGRAD.CO.UK, 5.8 CM DIAMETER), AND (RIGHT) A TYPE F.IIIA MOCK PENANNULAR BROOCH IN SILVER FROM YORKSHIRE, 4.5 CM DIAMETER (IMAGE FROM BRITISH MUSEUM, 1888,0719.106).
FIGURE 9.2: A TYPE F.IB BEAD-AND-REEL ANNULAR BROOCH PAIR, FROM GRAVE 158, CASTLEDYKE; 3.6-3.7 CM DIAMETERS (REPRODUCED FROM DRINKALL AND FOREMAN, 1998, 187).
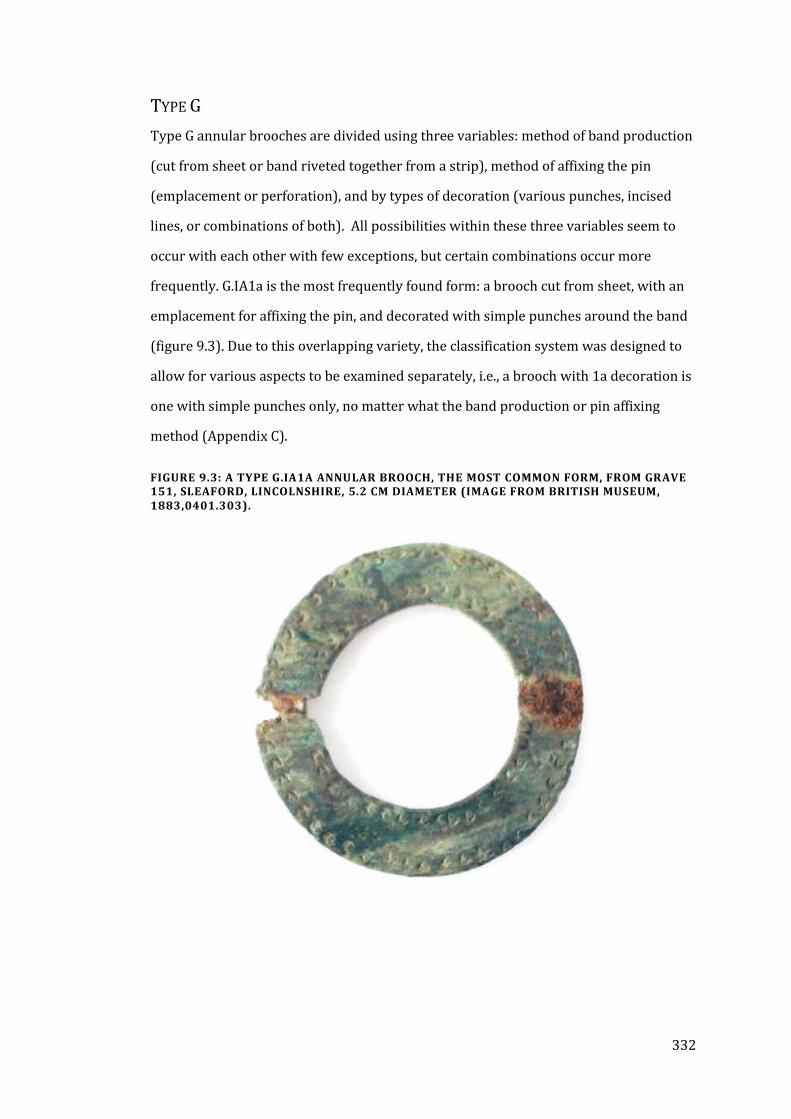
332
TYPE G
Type G annular brooches are divided using three variables: method of band production
(cut from sheet or band riveted together from a strip), method of affixing the pin
(emplacement or perforation), and by types of decoration (various punches, incised
lines, or combinations of both). All possibilities within these three variables seem to
occur with each other with few exceptions, but certain combinations occur more
frequently. G.IA1a is the most frequently found form: a brooch cut from sheet, with an
emplacement for affixing the pin, and decorated with simple punches around the band
(figure 9.3). Due to this overlapping variety, the classification system was designed to
allow for various aspects to be examined separately, i.e., a brooch with 1a decoration is
one with simple punches only, no matter what the band production or pin affixing
method (Appendix C).
FIGURE 9.3: A TYPE G.IA1A ANNULAR BROOCH, THE MOST COMMON FORM, FROM GRAVE 151, SLEAFORD, LINCOLNSHIRE, 5.2 CM DIAMETER (IMAGE FROM BRITISH MUSEUM, 1883,0401.303).
333
Denis Riley (2010), a reproduction metalworker (Daegrad Tools), undertook
experimental reconstruction of manufacturing methods for type G annular brooches.
He concluded that G.I brooches were faster to make and required less skill, but as metal
was cut out from around and inside the band, it was far more wasteful of metal
resources (Riley, 2010, 23). G.II strip-formed annular brooches required more skill to
make but were ‘robust’ as they were hot-worked into a rounded shape. These took
longer to manufacture than G.I forms (depending on the method of riveting: 2-2.75
hours as opposed to 2 hours) but created much less metal waste (Riley, 2010, 25-30).
Of course, any ‘waste’ metal could be remelted and reused, but this would require more
effort overall and therefore G.I forms would have been less economical to produce.
REGIONAL PATTERNS
Type G.I brooches, are more common in northern Anglian contexts, while G.II brooches,
occur more often in Cambridgeshire and East Anglia (though never as frequently as
form I’s, of which there are twice as many instances across all sites). All of the brooches
from Castledyke, Fonaby and West Heslerton are form I. Pins can be affixed by
fastening them around a narrowed emplacement (A) or through a hole punched
through the band (B). The two forms of pin affixation occur with fairly equal frequency,
with more B’s associated with form II’s and therefore higher frequency in southern
Anglian regions. Annular brooches with riveted bands and a pin perforation are
therefore more characteristic of a southern Anglian annular brooch tradition, and
indeed these only occur within this study at Broughton Lodge (two examples, not
sampled), closest to East Anglia/Cambridgeshire, and surprisingly at Sewerby (a
further two examples, not sampled).
Regional patterns of decoration are difficult to identify, especially as many decorative
motifs have a limited number of occurrences within the current dataset. For example,
form 3d (transverse lines only at the pin catch, with punches) only seems to occur in
East Anglia and Cambridgeshire, but as there are currently only four examples in the
dataset this may not be significant. A variety of simple punches (1a; n=99) are
ubiquitous throughout the Anglian region as well as the most frequent decorative
motif. The more examples there are of a decorative type, the more difficult regional
334
patterns (or any patterns for that matter) are to identify. It is likely that common
motifs, like 1a and 3a, are found in all regions because so many were made; the less
popular decorative patterns are more likely to represent local innovation. Riley’s
(2010, 32) hypothesis that decoration was applied to blank brooches at the point-of-
sale to a customer’s taste and therefore would be rushed (although it would not take
more than five minutes to add) is an interesting one when regarding the wide spread
and number of patterns used, and the occasional undecorated example.
CHRONOLOGICAL PATTERNS
There are few clear instances of an annular brooch type G form being limited to a short
period of time. Both forms I/II and A/B occur throughout the Early Saxon period, and
most decorative motifs either date from throughout as well or too few examples exist
to draw definite conclusions. General trends and the occasionally clear-cut case are all
that can be currently discussed.
The dating system mentioned above was applied to the annular brooch data to provide
broad dating contexts, as the precision of any associated date is often poor. Most type G
brooches are form I, and in the early phase they make up nearly 90% of flat annular
brooches, but this frequency decreases steadily over time while remaining the most
popular form (figure 9.4). The riveted annular brooch form (II) increase over time,
from 11% of all annular brooches in the early phase to 30% in the late phase. This
could be linked to more economical use of the available metal supply, possibly due to
increased restriction.
The use of emplacements (form A) decreases over time, with perforations superseding
them in frequency by the late phase (figure 9.5). The popularity of perforations in later
brooches is partially linked with the increase in form II construction. The lack of any
specialised area for pin attachment (form C) appears to be an uncommon and early
phenomenon.
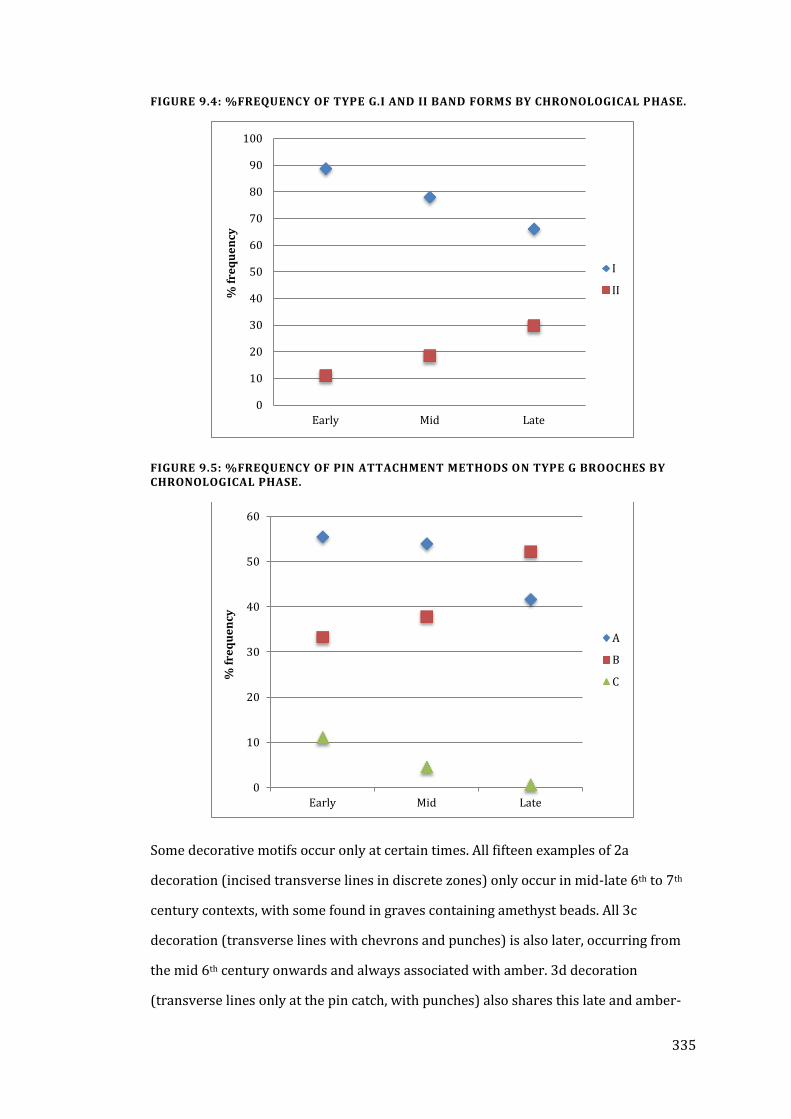
335
FIGURE 9.4: %FREQUENCY OF TYPE G.I AND II BAND FORMS BY CHRONOLOGICAL PHASE.
FIGURE 9.5: %FREQUENCY OF PIN ATTACHMENT METHODS ON TYPE G BROOCHES BY CHRONOLOGICAL PHASE.
Some decorative motifs occur only at certain times. All fifteen examples of 2a
decoration (incised transverse lines in discrete zones) only occur in mid-late 6th to 7th
century contexts, with some found in graves containing amethyst beads. All 3c
decoration (transverse lines with chevrons and punches) is also later, occurring from
the mid 6th century onwards and always associated with amber. 3d decoration
(transverse lines only at the pin catch, with punches) also shares this late and amber-
0
10
20
30
40
50
60
70
80
90
100
Early Mid Late
% f
req
ue
ncy
I
II
0
10
20
30
40
50
60
Early Mid Late
% f
req
ue
ncy
A
B
C
336
associated context, as well as a geographical limitation to East Anglian sites. Again, it is
far easier to identify chronological patterns in the less numerous decorative motifs; the
popular patterns seem to occur throughout the period.
SUMMARY
As the manufacture of annular brooches is unlikely to have been done in different ways
at the same workshop, the regional and chronological patterning of I/II and A/B forms
may be indicative of the output of particular workshops or craftsmen. Further patterns
may arise with the addition of more data; currently, aspects such as decoration often
have few examples, limiting the statistical significance of regional or chronological
patterns. Many of these infrequent decorative patterns may be examples of regional
innovation by a particular metalsmith, and their distribution could demonstrate links
between Anglian communities.
337
CHAPTER 10
DISCUSSION
INTRODUCTION
This study seeks to put new data into its contemporary context, examining macro and
microtrends in alloy use and the possible reasons for these patterns. Possible regional
patterns have already been explored in Chapter 8, and the data indicates that local
scrap resources often contribute the most to inter-site variability, with south-eastern
Anglian sites having better access to fresh bronze. Additionally, within a site there is a
high degree of similarity in the colour of any two copper alloy objects, suggesting that
the frequency of quaternary or ternary recycled metals led to a homogenisation of
copper that could make most objects indistinguishable in colour. Other variables that
may have affected alloy use are explored in this chapter, such as temporal changes in
metal supply, artefact type, or aesthetic appearance.
Dating is difficult in this period, especially with many graves containing no grave goods
and others undiagnostic, preventing a precise date from being legitimately assigned.
Few objects can be dated to even a fifty-year period, and many are simple described as
‘early medieval’ or ‘5th-7th century’, vagueness that can cover the entire period in
question. Chronological trends can therefore only be investigated through comparison
of heavily overlapping and imprecise date ranges; however, distinction between the
early, middle, and later phases of this period are made for most objects in this study.
This allows for changes in alloy use over time to be examined.
Many of the patterns discernible in the data are related to the method of manufacture
use for each object type (Chapters 2 and 3). Analysis of copper alloy use and the range
of colour within object types can provide evidence of specification or control and the
motivations for these actions. The data from this study is compared by artefact type to
data from previous studies to extend the relevance of the discussion.
338
As discussed in Chapters 2 and 3, bronze appears to have been available as a fresh
metal throughout the Early Saxon period, and recycling practices at some point altered
from Roman traditions, resulting in a lack of distinction between tin-rich and zinc-rich
alloys. The use of zinc is a key variable in understanding copper alloys within this
period due to its simultaneous scarcity and presence, as well as its significant yellowing
effect on the appearance of an alloy. New data from this study illuminates patterns in
alloy use and extends these into the existing corpus of compositional data. The
aesthetics of copper alloy colour provide a cultural motivation context for copper alloy
selection, an aspect explored here in the context of the empirical data (Chapter 4).
Spectrophotometric colour data provides an additional variable to explore questions
concerning the production, trade, use, and context of copper alloys in the Anglo-Saxon
world.
Colour is an aspect considered peripherally in previous archaeometallurgical research,
but it would have been central to the motivations behind copper alloy use, particularly
in dress items. Aspects of copper alloy colour may have been desirable (such as
imitation of precious metal), indicated by deliberate control for the purpose of colour
manipulation (Chapters 5 and 6). In particular, the use of unseen copper alloys, such as
those covered by a decorative surface layer, may be particularly informative about
control and aesthetic value. Other potential instances of control for the purpose of
colour are in the matching of paired objects, and in the colour of multiple objects within
a single grave context.
The data will be discussed from these various angles to fully explore the evidence and
provide a deeper analysis of previous compositional research. The framework built
from exploring recycling practices, cultural colour and fashion preferences,
contemporary material culture, human perception and the structure and colour of the
metals themselves will be combined in the context of the new data. Questions of trade,
technology and chronology in particular will be explored, as well as the importance of
colour in regards to alloy use, object pairs and dress ensembles. The relevance of brass
is central to all of these issues in terms of both issues of metal supply and the aesthetic
outcome.
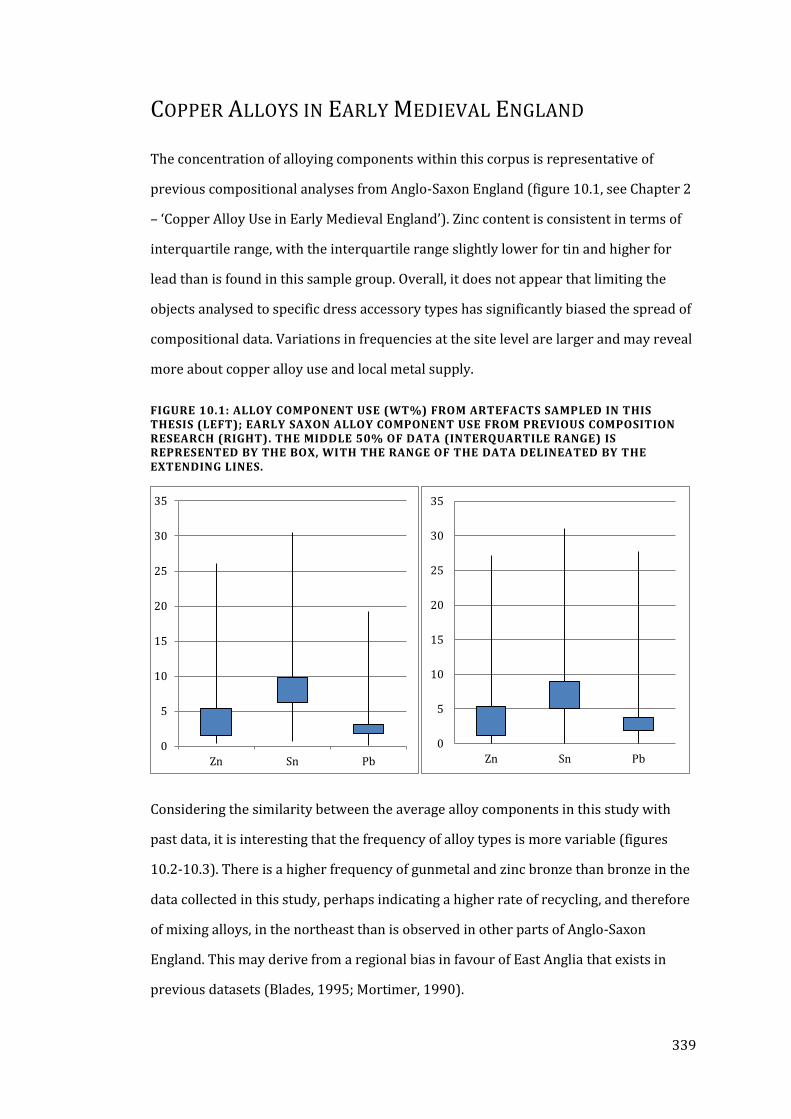
339
COPPER ALLOYS IN EARLY MEDIEVAL ENGLAND
The concentration of alloying components within this corpus is representative of
previous compositional analyses from Anglo-Saxon England (figure 10.1, see Chapter 2
– ‘Copper Alloy Use in Early Medieval England’). Zinc content is consistent in terms of
interquartile range, with the interquartile range slightly lower for tin and higher for
lead than is found in this sample group. Overall, it does not appear that limiting the
objects analysed to specific dress accessory types has significantly biased the spread of
compositional data. Variations in frequencies at the site level are larger and may reveal
more about copper alloy use and local metal supply.
FIGURE 10.1: ALLOY COMPONENT USE (WT%) FROM ARTEFACTS SAMPLED IN THIS THESIS (LEFT); EARLY SAXON ALLOY COMPONENT USE FROM PREVIOUS COMPOSITION RESEARCH (RIGHT). THE MIDDLE 50% OF DATA (INTERQUARTILE RANGE) IS REPRESENTED BY THE BOX, WITH THE RANGE OF THE DATA DELINEATED BY THE EXTENDING LINES.
Considering the similarity between the average alloy components in this study with
past data, it is interesting that the frequency of alloy types is more variable (figures
10.2-10.3). There is a higher frequency of gunmetal and zinc bronze than bronze in the
data collected in this study, perhaps indicating a higher rate of recycling, and therefore
of mixing alloys, in the northeast than is observed in other parts of Anglo-Saxon
England. This may derive from a regional bias in favour of East Anglia that exists in
previous datasets (Blades, 1995; Mortimer, 1990).
0
5
10
15
20
25
30
35
Zn Sn Pb
0
5
10
15
20
25
30
35
Zn Sn Pb
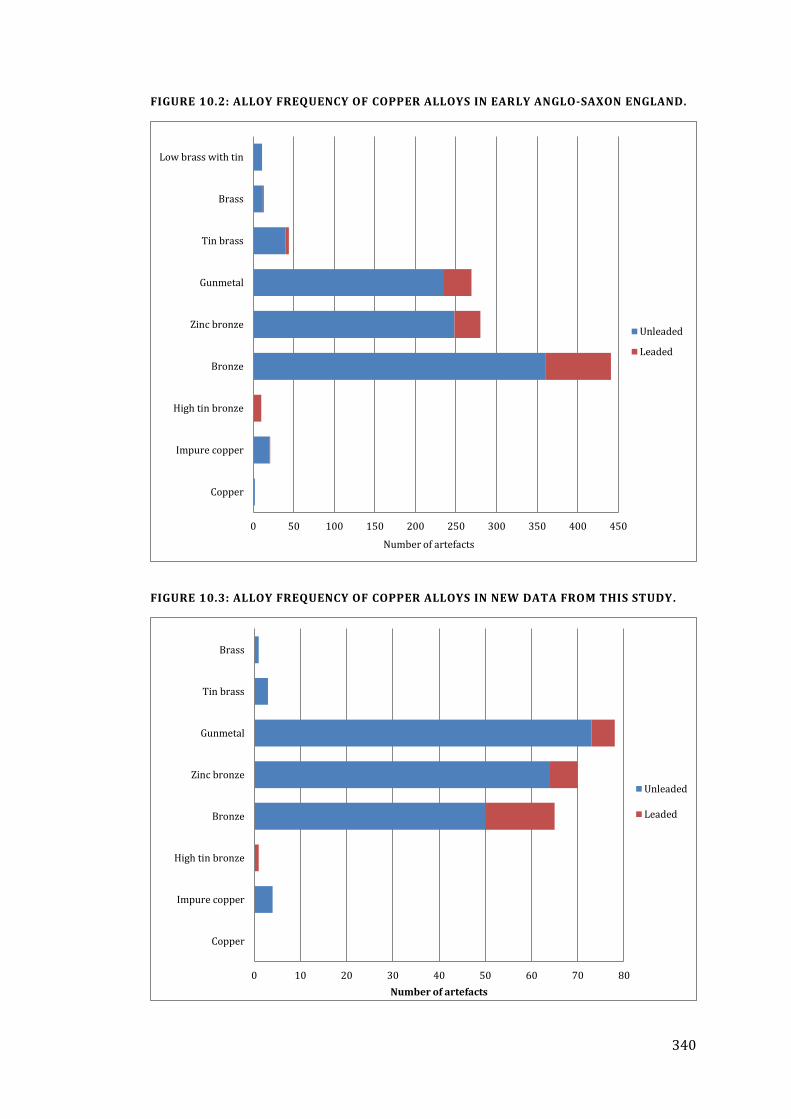
340
FIGURE 10.2: ALLOY FREQUENCY OF COPPER ALLOYS IN EARLY ANGLO-SAXON ENGLAND.
FIGURE 10.3: ALLOY FREQUENCY OF COPPER ALLOYS IN NEW DATA FROM THIS STUDY.
0 50 100 150 200 250 300 350 400 450
Copper
Impure copper
High tin bronze
Bronze
Zinc bronze
Gunmetal
Tin brass
Brass
Low brass with tin
Number of artefacts
Unleaded
Leaded
0 10 20 30 40 50 60 70 80
Copper
Impure copper
High tin bronze
Bronze
Zinc bronze
Gunmetal
Tin brass
Brass
Number of artefacts
Unleaded
Leaded
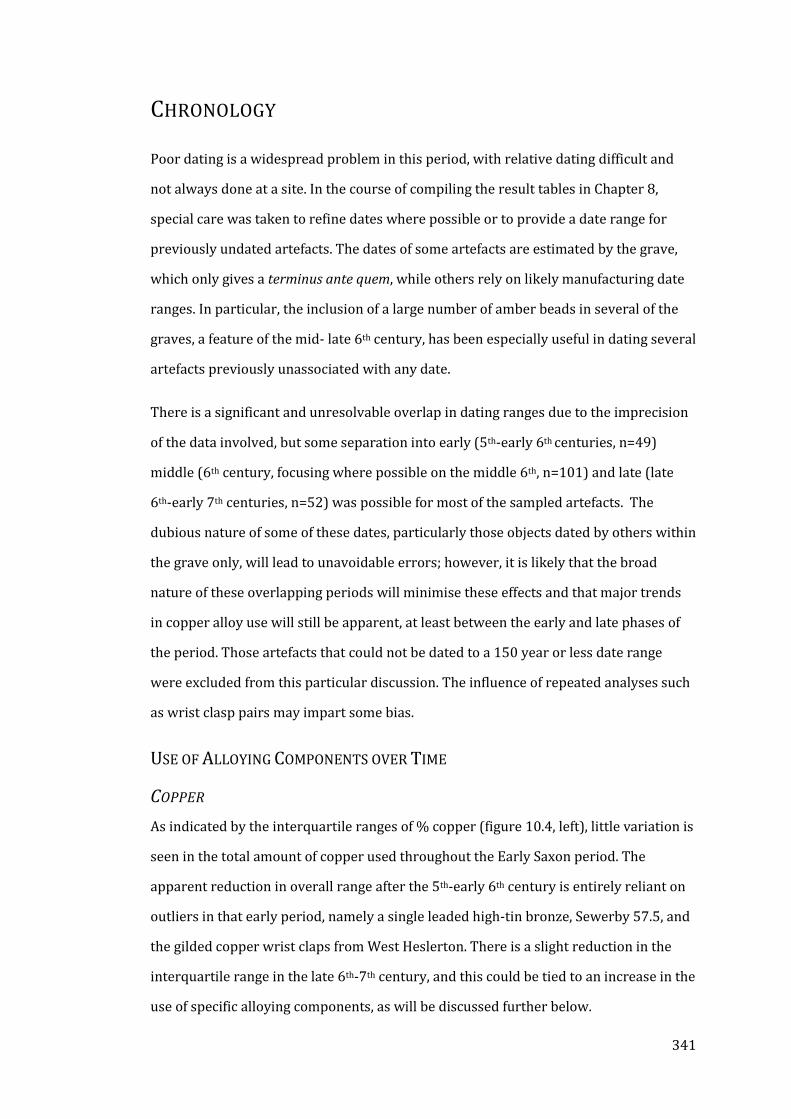
341
CHRONOLOGY
Poor dating is a widespread problem in this period, with relative dating difficult and
not always done at a site. In the course of compiling the result tables in Chapter 8,
special care was taken to refine dates where possible or to provide a date range for
previously undated artefacts. The dates of some artefacts are estimated by the grave,
which only gives a terminus ante quem, while others rely on likely manufacturing date
ranges. In particular, the inclusion of a large number of amber beads in several of the
graves, a feature of the mid- late 6th century, has been especially useful in dating several
artefacts previously unassociated with any date.
There is a significant and unresolvable overlap in dating ranges due to the imprecision
of the data involved, but some separation into early (5th-early 6th centuries, n=49)
middle (6th century, focusing where possible on the middle 6th, n=101) and late (late
6th-early 7th centuries, n=52) was possible for most of the sampled artefacts. The
dubious nature of some of these dates, particularly those objects dated by others within
the grave only, will lead to unavoidable errors; however, it is likely that the broad
nature of these overlapping periods will minimise these effects and that major trends
in copper alloy use will still be apparent, at least between the early and late phases of
the period. Those artefacts that could not be dated to a 150 year or less date range
were excluded from this particular discussion. The influence of repeated analyses such
as wrist clasp pairs may impart some bias.
USE OF ALLOYING COMPONENTS OVER TIME
COPPER
As indicated by the interquartile ranges of % copper (figure 10.4, left), little variation is
seen in the total amount of copper used throughout the Early Saxon period. The
apparent reduction in overall range after the 5th-early 6th century is entirely reliant on
outliers in that early period, namely a single leaded high-tin bronze, Sewerby 57.5, and
the gilded copper wrist claps from West Heslerton. There is a slight reduction in the
interquartile range in the late 6th-7th century, and this could be tied to an increase in the
use of specific alloying components, as will be discussed further below.
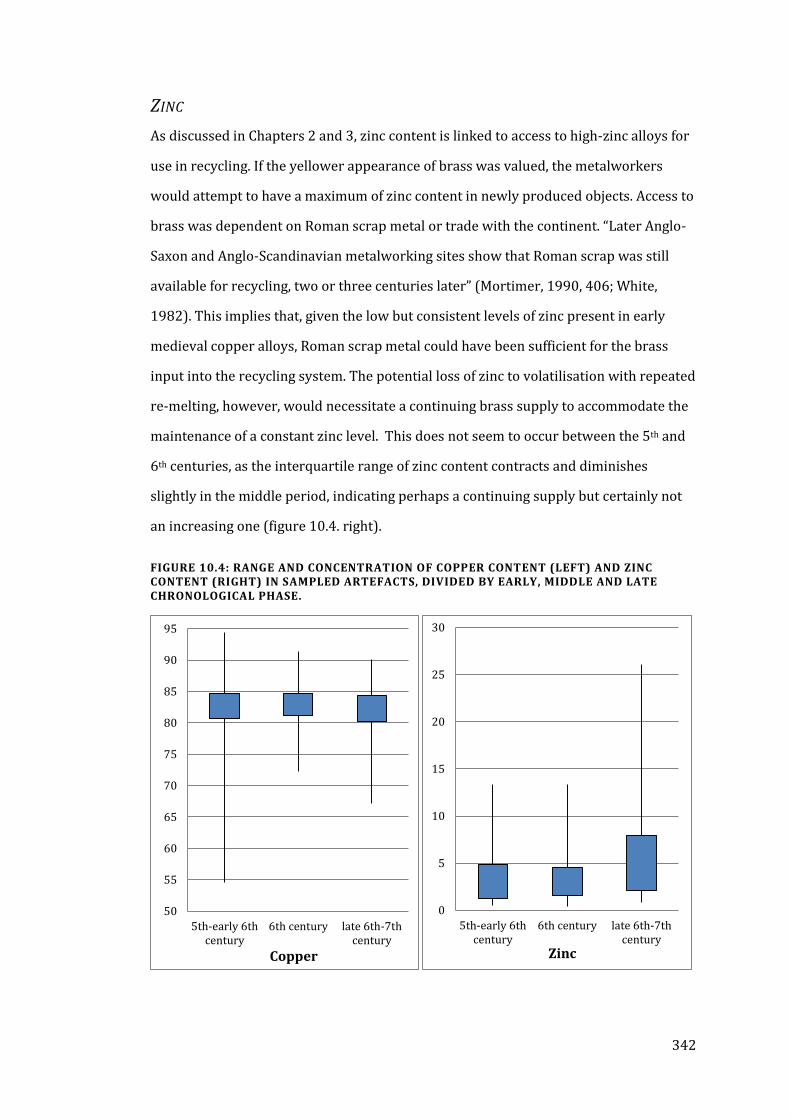
342
ZINC
As discussed in Chapters 2 and 3, zinc content is linked to access to high-zinc alloys for
use in recycling. If the yellower appearance of brass was valued, the metalworkers
would attempt to have a maximum of zinc content in newly produced objects. Access to
brass was dependent on Roman scrap metal or trade with the continent. “Later Anglo-
Saxon and Anglo-Scandinavian metalworking sites show that Roman scrap was still
available for recycling, two or three centuries later” (Mortimer, 1990, 406; White,
1982). This implies that, given the low but consistent levels of zinc present in early
medieval copper alloys, Roman scrap metal could have been sufficient for the brass
input into the recycling system. The potential loss of zinc to volatilisation with repeated
re-melting, however, would necessitate a continuing brass supply to accommodate the
maintenance of a constant zinc level. This does not seem to occur between the 5th and
6th centuries, as the interquartile range of zinc content contracts and diminishes
slightly in the middle period, indicating perhaps a continuing supply but certainly not
an increasing one (figure 10.4. right).
FIGURE 10.4: RANGE AND CONCENTRATION OF COPPER CONTENT (LEFT) AND ZINC CONTENT (RIGHT) IN SAMPLED ARTEFACTS, DIVIDED BY EARLY, MIDDLE AND LATE CHRONOLOGICAL PHASE.
50
55
60
65
70
75
80
85
90
95
5th-early 6thcentury
6th century late 6th-7thcentury
Copper
0
5
10
15
20
25
30
5th-early 6thcentury
6th century late 6th-7thcentury
Zinc
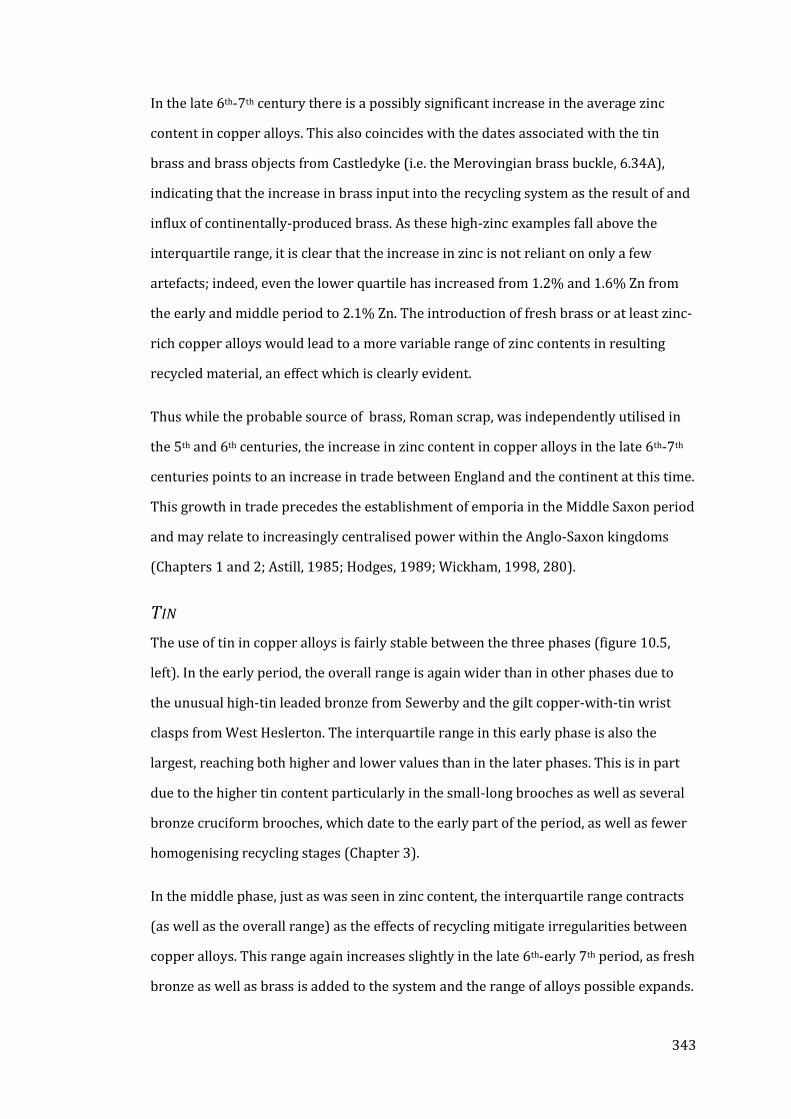
343
In the late 6th-7th century there is a possibly significant increase in the average zinc
content in copper alloys. This also coincides with the dates associated with the tin
brass and brass objects from Castledyke (i.e. the Merovingian brass buckle, 6.34A),
indicating that the increase in brass input into the recycling system as the result of and
influx of continentally-produced brass. As these high-zinc examples fall above the
interquartile range, it is clear that the increase in zinc is not reliant on only a few
artefacts; indeed, even the lower quartile has increased from 1.2% and 1.6% Zn from
the early and middle period to 2.1% Zn. The introduction of fresh brass or at least zinc-
rich copper alloys would lead to a more variable range of zinc contents in resulting
recycled material, an effect which is clearly evident.
Thus while the probable source of brass, Roman scrap, was independently utilised in
the 5th and 6th centuries, the increase in zinc content in copper alloys in the late 6th-7th
centuries points to an increase in trade between England and the continent at this time.
This growth in trade precedes the establishment of emporia in the Middle Saxon period
and may relate to increasingly centralised power within the Anglo-Saxon kingdoms
(Chapters 1 and 2; Astill, 1985; Hodges, 1989; Wickham, 1998, 280).
TIN
The use of tin in copper alloys is fairly stable between the three phases (figure 10.5,
left). In the early period, the overall range is again wider than in other phases due to
the unusual high-tin leaded bronze from Sewerby and the gilt copper-with-tin wrist
clasps from West Heslerton. The interquartile range in this early phase is also the
largest, reaching both higher and lower values than in the later phases. This is in part
due to the higher tin content particularly in the small-long brooches as well as several
bronze cruciform brooches, which date to the early part of the period, as well as fewer
homogenising recycling stages (Chapter 3).
In the middle phase, just as was seen in zinc content, the interquartile range contracts
(as well as the overall range) as the effects of recycling mitigate irregularities between
copper alloys. This range again increases slightly in the late 6th-early 7th period, as fresh
bronze as well as brass is added to the system and the range of alloys possible expands.
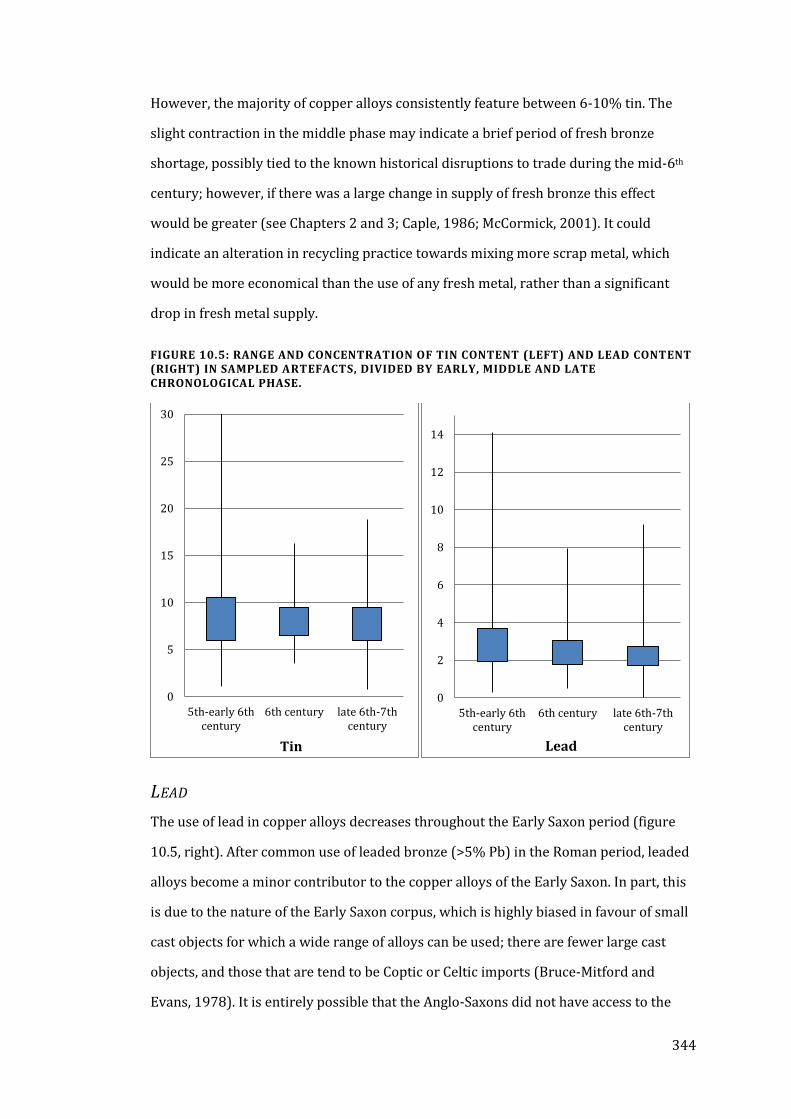
344
However, the majority of copper alloys consistently feature between 6-10% tin. The
slight contraction in the middle phase may indicate a brief period of fresh bronze
shortage, possibly tied to the known historical disruptions to trade during the mid-6th
century; however, if there was a large change in supply of fresh bronze this effect
would be greater (see Chapters 2 and 3; Caple, 1986; McCormick, 2001). It could
indicate an alteration in recycling practice towards mixing more scrap metal, which
would be more economical than the use of any fresh metal, rather than a significant
drop in fresh metal supply.
FIGURE 10.5: RANGE AND CONCENTRATION OF TIN CONTENT (LEFT) AND LEAD CONTENT (RIGHT) IN SAMPLED ARTEFACTS, DIVIDED BY EARLY, MIDDLE AND LATE CHRONOLOGICAL PHASE.
LEAD
The use of lead in copper alloys decreases throughout the Early Saxon period (figure
10.5, right). After common use of leaded bronze (>5% Pb) in the Roman period, leaded
alloys become a minor contributor to the copper alloys of the Early Saxon. In part, this
is due to the nature of the Early Saxon corpus, which is highly biased in favour of small
cast objects for which a wide range of alloys can be used; there are fewer large cast
objects, and those that are tend to be Coptic or Celtic imports (Bruce-Mitford and
Evans, 1978). It is entirely possible that the Anglo-Saxons did not have access to the
0
5
10
15
20
25
30
5th-early 6thcentury
6th century late 6th-7thcentury
Tin
0
2
4
6
8
10
12
14
5th-early 6thcentury
6th century late 6th-7thcentury
Lead
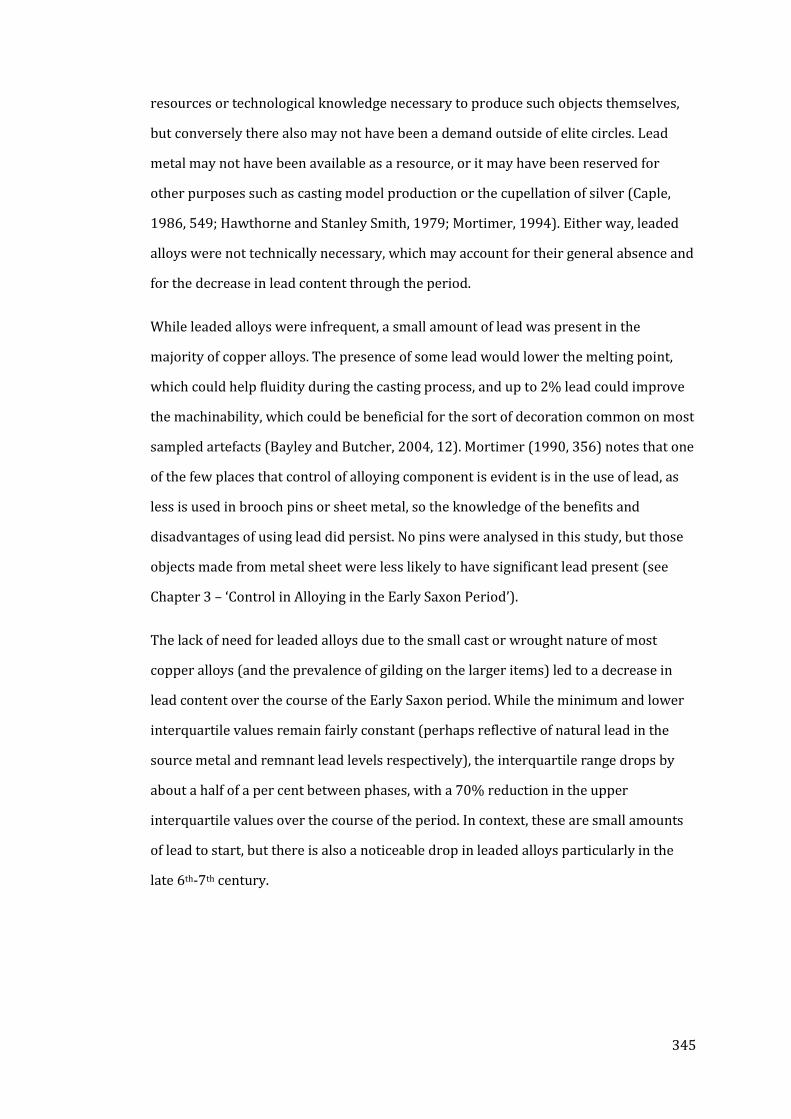
345
resources or technological knowledge necessary to produce such objects themselves,
but conversely there also may not have been a demand outside of elite circles. Lead
metal may not have been available as a resource, or it may have been reserved for
other purposes such as casting model production or the cupellation of silver (Caple,
1986, 549; Hawthorne and Stanley Smith, 1979; Mortimer, 1994). Either way, leaded
alloys were not technically necessary, which may account for their general absence and
for the decrease in lead content through the period.
While leaded alloys were infrequent, a small amount of lead was present in the
majority of copper alloys. The presence of some lead would lower the melting point,
which could help fluidity during the casting process, and up to 2% lead could improve
the machinability, which could be beneficial for the sort of decoration common on most
sampled artefacts (Bayley and Butcher, 2004, 12). Mortimer (1990, 356) notes that one
of the few places that control of alloying component is evident is in the use of lead, as
less is used in brooch pins or sheet metal, so the knowledge of the benefits and
disadvantages of using lead did persist. No pins were analysed in this study, but those
objects made from metal sheet were less likely to have significant lead present (see
Chapter 3 – ‘Control in Alloying in the Early Saxon Period’).
The lack of need for leaded alloys due to the small cast or wrought nature of most
copper alloys (and the prevalence of gilding on the larger items) led to a decrease in
lead content over the course of the Early Saxon period. While the minimum and lower
interquartile values remain fairly constant (perhaps reflective of natural lead in the
source metal and remnant lead levels respectively), the interquartile range drops by
about a half of a per cent between phases, with a 70% reduction in the upper
interquartile values over the course of the period. In context, these are small amounts
of lead to start, but there is also a noticeable drop in leaded alloys particularly in the
late 6th-7th century.
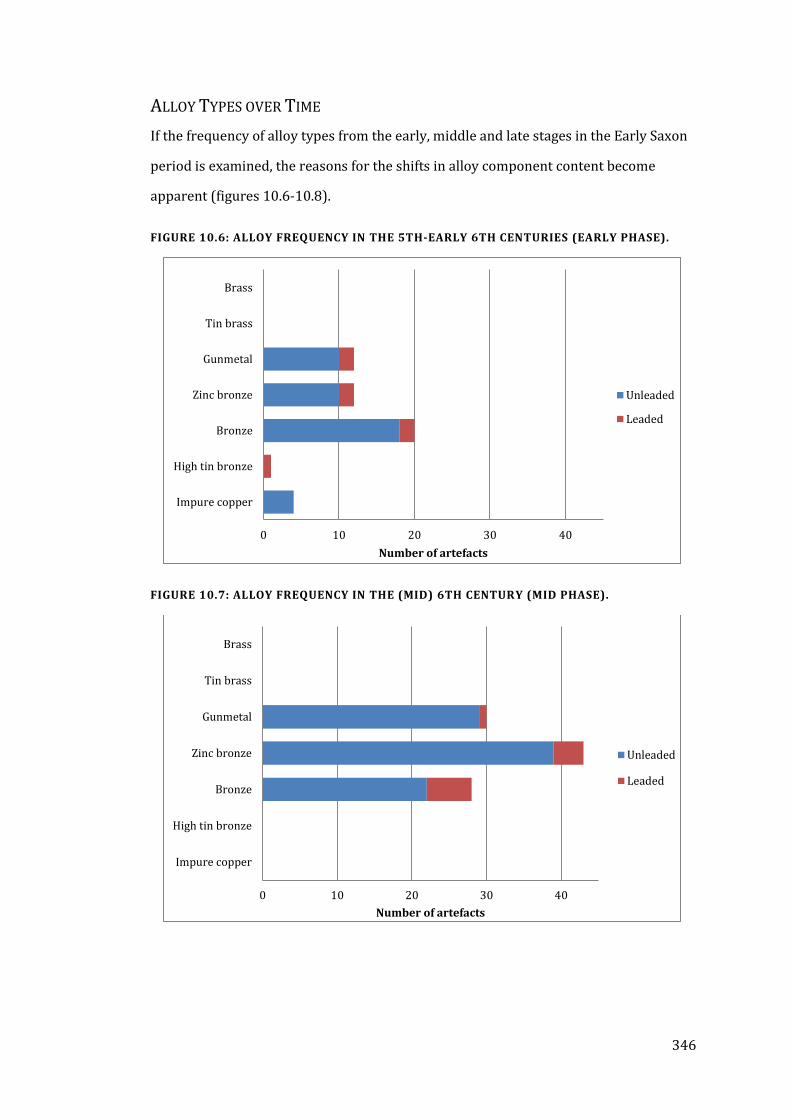
346
ALLOY TYPES OVER TIME
If the frequency of alloy types from the early, middle and late stages in the Early Saxon
period is examined, the reasons for the shifts in alloy component content become
apparent (figures 10.6-10.8).
FIGURE 10.6: ALLOY FREQUENCY IN THE 5TH-EARLY 6TH CENTURIES (EARLY PHASE).
FIGURE 10.7: ALLOY FREQUENCY IN THE (MID) 6TH CENTURY (MID PHASE).
0 10 20 30 40
Impure copper
High tin bronze
Bronze
Zinc bronze
Gunmetal
Tin brass
Brass
Number of artefacts
Unleaded
Leaded
0 10 20 30 40
Impure copper
High tin bronze
Bronze
Zinc bronze
Gunmetal
Tin brass
Brass
Number of artefacts
Unleaded
Leaded
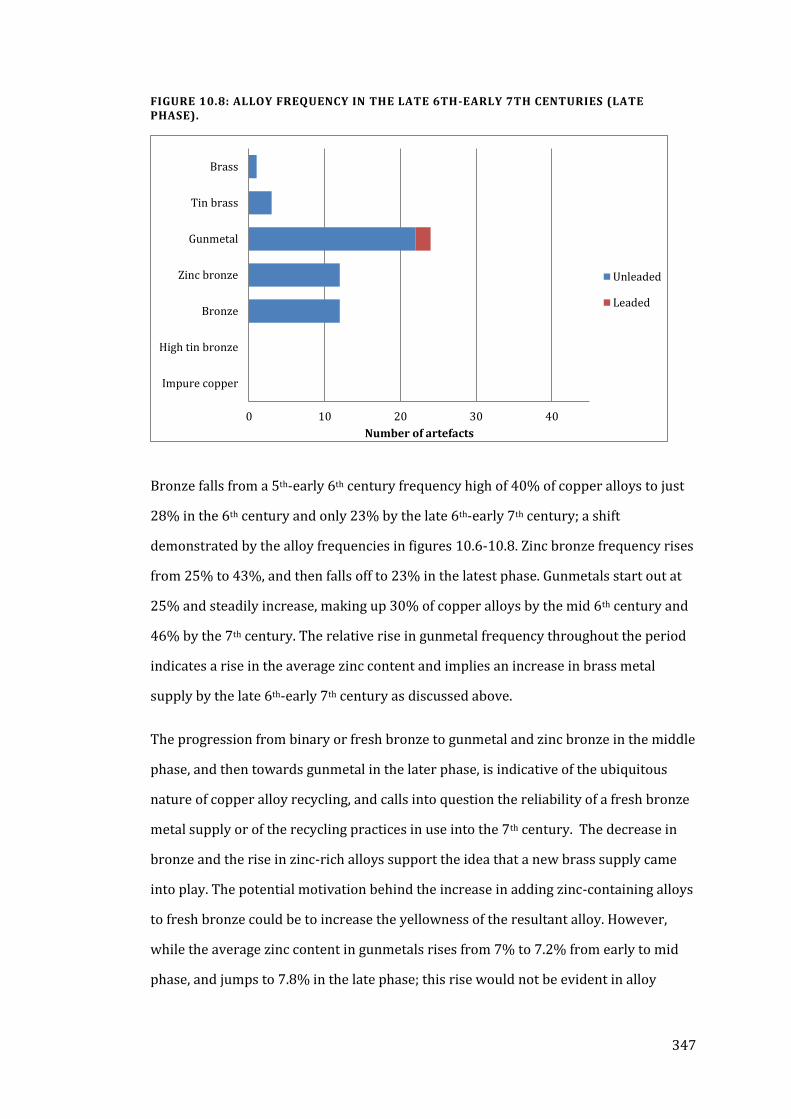
347
FIGURE 10.8: ALLOY FREQUENCY IN THE LATE 6TH-EARLY 7TH CENTURIES (LATE PHASE).
Bronze falls from a 5th-early 6th century frequency high of 40% of copper alloys to just
28% in the 6th century and only 23% by the late 6th-early 7th century; a shift
demonstrated by the alloy frequencies in figures 10.6-10.8. Zinc bronze frequency rises
from 25% to 43%, and then falls off to 23% in the latest phase. Gunmetals start out at
25% and steadily increase, making up 30% of copper alloys by the mid 6th century and
46% by the 7th century. The relative rise in gunmetal frequency throughout the period
indicates a rise in the average zinc content and implies an increase in brass metal
supply by the late 6th-early 7th century as discussed above.
The progression from binary or fresh bronze to gunmetal and zinc bronze in the middle
phase, and then towards gunmetal in the later phase, is indicative of the ubiquitous
nature of copper alloy recycling, and calls into question the reliability of a fresh bronze
metal supply or of the recycling practices in use into the 7th century. The decrease in
bronze and the rise in zinc-rich alloys support the idea that a new brass supply came
into play. The potential motivation behind the increase in adding zinc-containing alloys
to fresh bronze could be to increase the yellowness of the resultant alloy. However,
while the average zinc content in gunmetals rises from 7% to 7.2% from early to mid
phase, and jumps to 7.8% in the late phase; this rise would not be evident in alloy
0 10 20 30 40
Impure copper
High tin bronze
Bronze
Zinc bronze
Gunmetal
Tin brass
Brass
Number of artefacts
Unleaded
Leaded
348
colour, and may be more indicative of the desirability of brass as an input alloy and of
trade access (Chapter 6).
Leaded alloys occur at about the same frequency in gunmetal, zinc bronzes, and bronze
in the early phase and are similarly distributed throughout the 6th century, though
more appear in bronze and zinc bronze. The lack of leaded artefacts in the late 6th-7th
centuries is apparent (only 4% of copper alloys, down from 12% in the early and 11%
in the middle phase), with only a few quaternary objects containing a significant
amount of lead.
349
COMPOSITION AND COLOUR BY ARTEFACT TYPE
Mortimer (1990, 446-7) noted the, “danger of missing significant patterns,” if
composition data were viewed entirely as an overview. All possible variables should be
explored to understand the potential motivations behind copper alloy use in a period
where the necessities of a ‘metallurgy of survival’ imposes limitations on the value of
macroanalysis of data (Mortimer, 1990, 446). Investigation within object types may
reveal subtle patterns of alloy use and control either specific to the type or illuminated
by a limited context of that type (Bayley and Butcher, 2004).
In addition to the potential regional bias (as compared to previous analyses), the
prevalence of annular brooches within the current study may be a major factor in
observed copper alloy frequency differences. In order to understand the copper alloy
use dynamics, their use was examined by individual artefact type. This also allows for
some chronological links to be made between comparable materials.
Although some object types have limited sample sizes (e.g. openwork brooches), there
are differences in the compositions utilised. Zinc use varies considerably between
brooch types, and girdle hangers have the largest (and highest) interquartile range
(figure 10.9). Small-long brooches feature consistently higher-than-average tin content,
although some square-headed examples contain a similarly high amount; again, girdle
hangers are highly variable (figure 10.10). Lead use is low throughout the data set, with
small-long brooches and girdle hangers containing more than other object types (figure
10.11). The composition spread of each type and the resulting colours associated with
these objects will be discussed individually.
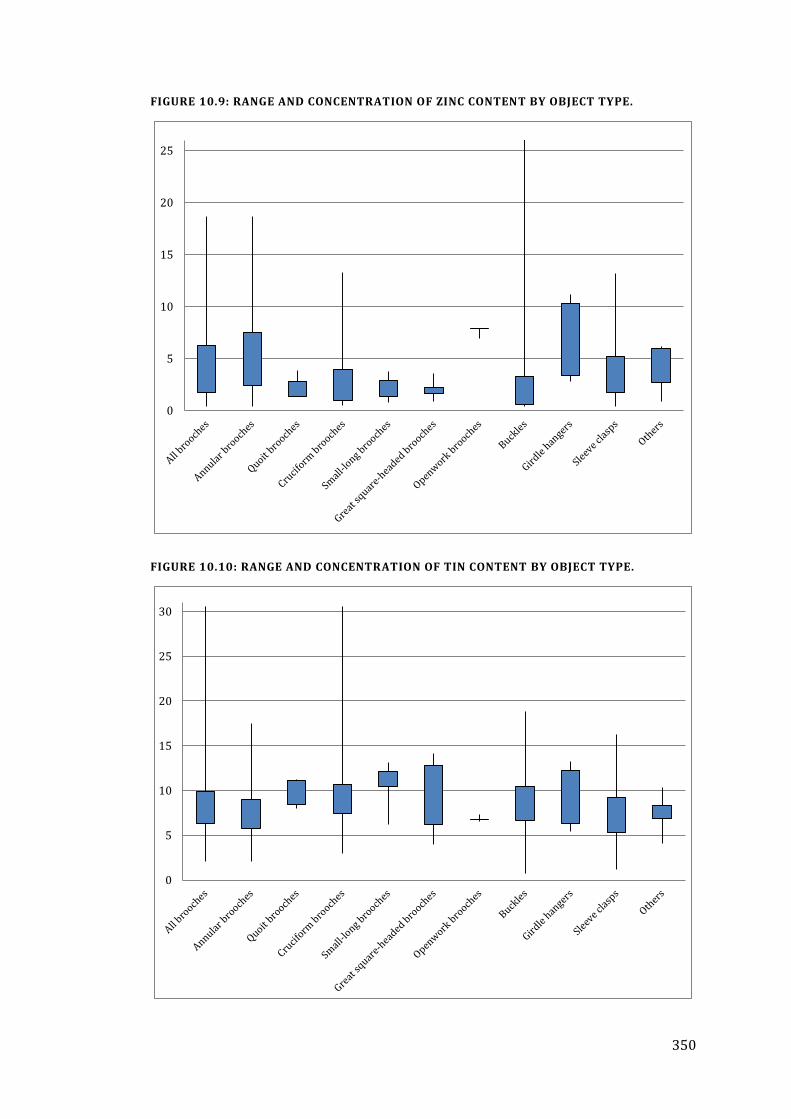
350
FIGURE 10.9: RANGE AND CONCENTRATION OF ZINC CONTENT BY OBJECT TYPE.
FIGURE 10.10: RANGE AND CONCENTRATION OF TIN CONTENT BY OBJECT TYPE.
0
5
10
15
20
25
0
5
10
15
20
25
30
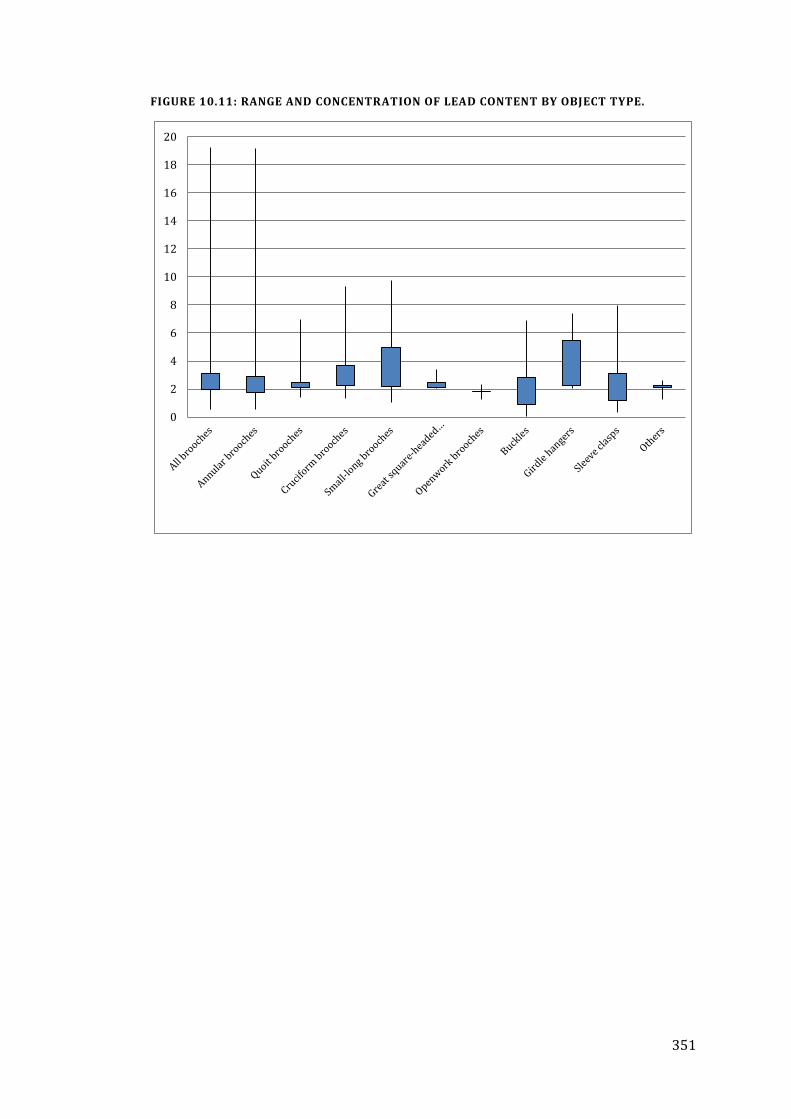
351
FIGURE 10.11: RANGE AND CONCENTRATION OF LEAD CONTENT BY OBJECT TYPE.
0
2
4
6
8
10
12
14
16
18
20
352
BROOCHES
Brooches are clothes-fastening accessories that in the Early Saxon period were often
but not exclusively worn as part of the female costume (Jessup, 1974, 61). Many
furnished women’s graves contain brooches, worn either singly (perhaps to fasten a
cloak), as a pair fastening the peplos-style dress at the shoulders, or both (Owen-
Crocker, 2004, 75; Walton Rogers, 2007b, 167). A few ensembles feature more than
three brooches, but these are rare and occur usually in only very high-status graves
(e.g. Cleatham graves 30 and 34).
Most brooches were made from copper alloy but with most featuring an iron pin for
greater functional strength (Bayley and Butcher, 2004). Some brooches were made of
iron, lead, or silver. Certain types, such as annular or penannular brooches, as simpler
and probably cheaper examples, are more likely to be made from iron or lead. Disc and
cruciform brooches are more likely than other types to be silver, and some types such
as saucer, great square-headed, and button brooches were usually gilded.
Brooches were functional as well as decorative dress accessories, and as brooches
often carry evidence of wear or repair, “these items were part of the interred
individual’s everyday dress. They were not token items created just for burial, and
neither were they reserved for special occasions” (Martin, 2011, 259). Depending on
brooch type, different manufacturing techniques would have been used. Most brooches were
cast, although many annular brooches, the most common brooch form in Anglian regions,
were wrought from sheet metal. Certain brooch types occur earlier (small-long brooches)
while others are later (cast annular brooches, great square-headed brooches), and many occur
throughout the period. It is therefore more likely to derive information concerning the use of
copper alloys in brooches by examining each brooch type individually.
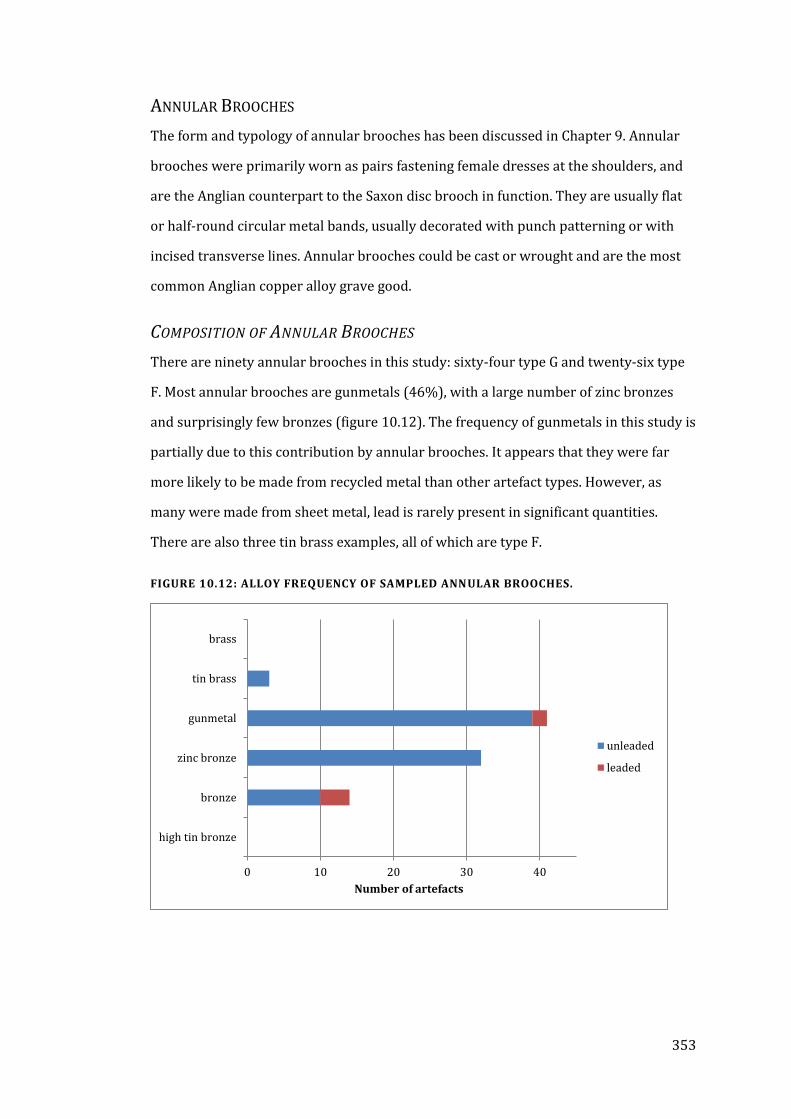
353
ANNULAR BROOCHES
The form and typology of annular brooches has been discussed in Chapter 9. Annular
brooches were primarily worn as pairs fastening female dresses at the shoulders, and
are the Anglian counterpart to the Saxon disc brooch in function. They are usually flat
or half-round circular metal bands, usually decorated with punch patterning or with
incised transverse lines. Annular brooches could be cast or wrought and are the most
common Anglian copper alloy grave good.
COMPOSITION OF ANNULAR BROOCHES
There are ninety annular brooches in this study: sixty-four type G and twenty-six type
F. Most annular brooches are gunmetals (46%), with a large number of zinc bronzes
and surprisingly few bronzes (figure 10.12). The frequency of gunmetals in this study is
partially due to this contribution by annular brooches. It appears that they were far
more likely to be made from recycled metal than other artefact types. However, as
many were made from sheet metal, lead is rarely present in significant quantities.
There are also three tin brass examples, all of which are type F.
FIGURE 10.12: ALLOY FREQUENCY OF SAMPLED ANNULAR BROOCHES.
0 10 20 30 40
high tin bronze
bronze
zinc bronze
gunmetal
tin brass
brass
Number of artefacts
unleaded
leaded
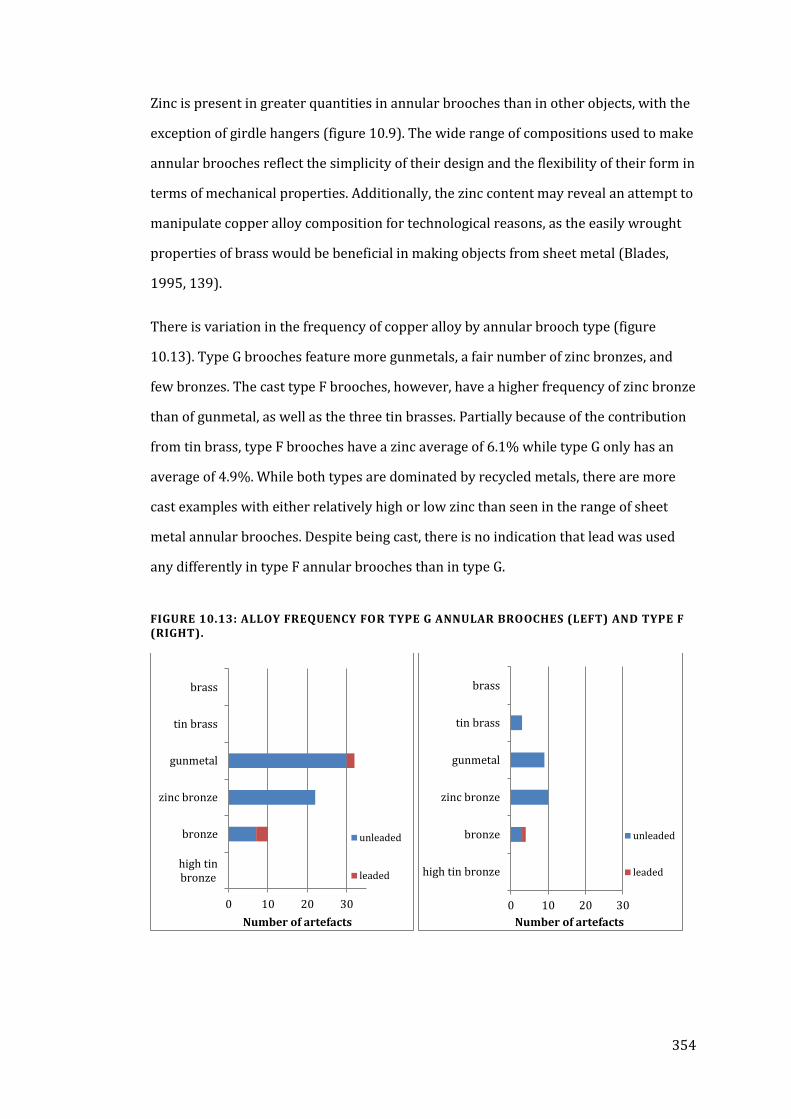
354
Zinc is present in greater quantities in annular brooches than in other objects, with the
exception of girdle hangers (figure 10.9). The wide range of compositions used to make
annular brooches reflect the simplicity of their design and the flexibility of their form in
terms of mechanical properties. Additionally, the zinc content may reveal an attempt to
manipulate copper alloy composition for technological reasons, as the easily wrought
properties of brass would be beneficial in making objects from sheet metal (Blades,
1995, 139).
There is variation in the frequency of copper alloy by annular brooch type (figure
10.13). Type G brooches feature more gunmetals, a fair number of zinc bronzes, and
few bronzes. The cast type F brooches, however, have a higher frequency of zinc bronze
than of gunmetal, as well as the three tin brasses. Partially because of the contribution
from tin brass, type F brooches have a zinc average of 6.1% while type G only has an
average of 4.9%. While both types are dominated by recycled metals, there are more
cast examples with either relatively high or low zinc than seen in the range of sheet
metal annular brooches. Despite being cast, there is no indication that lead was used
any differently in type F annular brooches than in type G.
FIGURE 10.13: ALLOY FREQUENCY FOR TYPE G ANNULAR BROOCHES (LEFT) AND TYPE F (RIGHT).
0 10 20 30
high tinbronze
bronze
zinc bronze
gunmetal
tin brass
brass
Number of artefacts
unleaded
leaded
0 10 20 30
high tin bronze
bronze
zinc bronze
gunmetal
tin brass
brass
Number of artefacts
unleaded
leaded
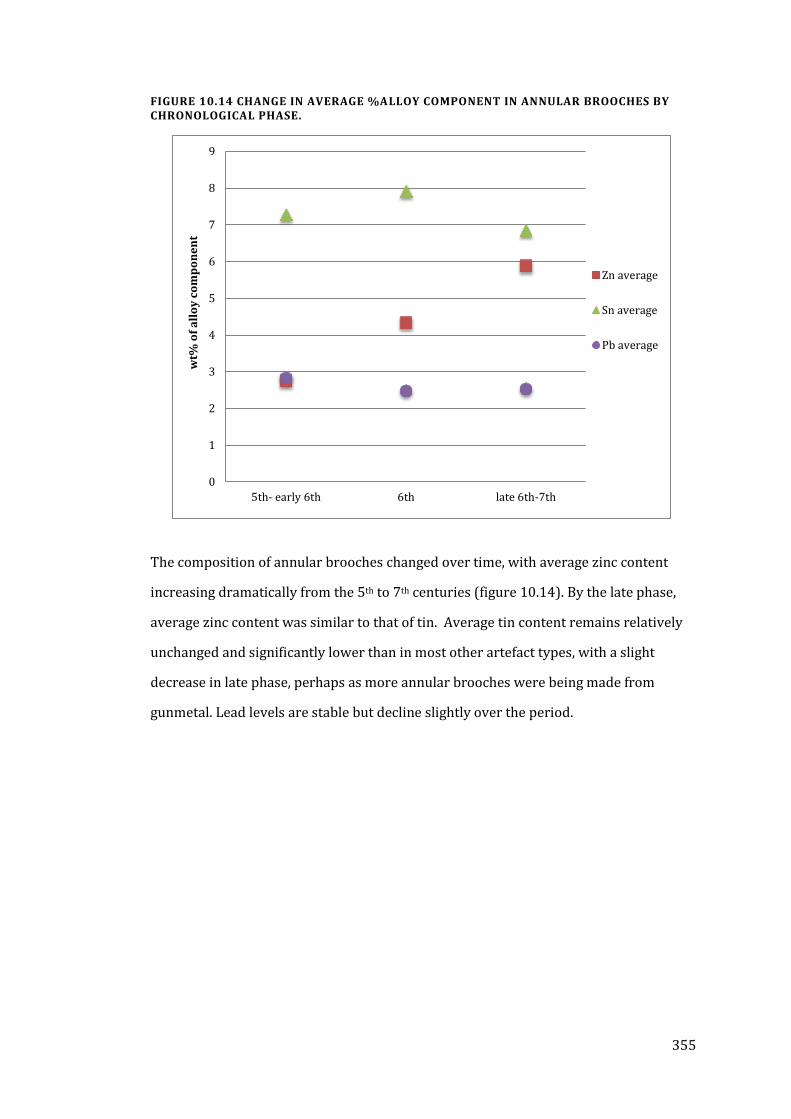
355
FIGURE 10.14 CHANGE IN AVERAGE %ALLOY COMPONENT IN ANNULAR BROOCHES BY CHRONOLOGICAL PHASE.
The composition of annular brooches changed over time, with average zinc content
increasing dramatically from the 5th to 7th centuries (figure 10.14). By the late phase,
average zinc content was similar to that of tin. Average tin content remains relatively
unchanged and significantly lower than in most other artefact types, with a slight
decrease in late phase, perhaps as more annular brooches were being made from
gunmetal. Lead levels are stable but decline slightly over the period.
0
1
2
3
4
5
6
7
8
9
5th- early 6th 6th late 6th-7th
wt%
of
all
oy
co
mp
on
en
t
Zn average
Sn average
Pb average
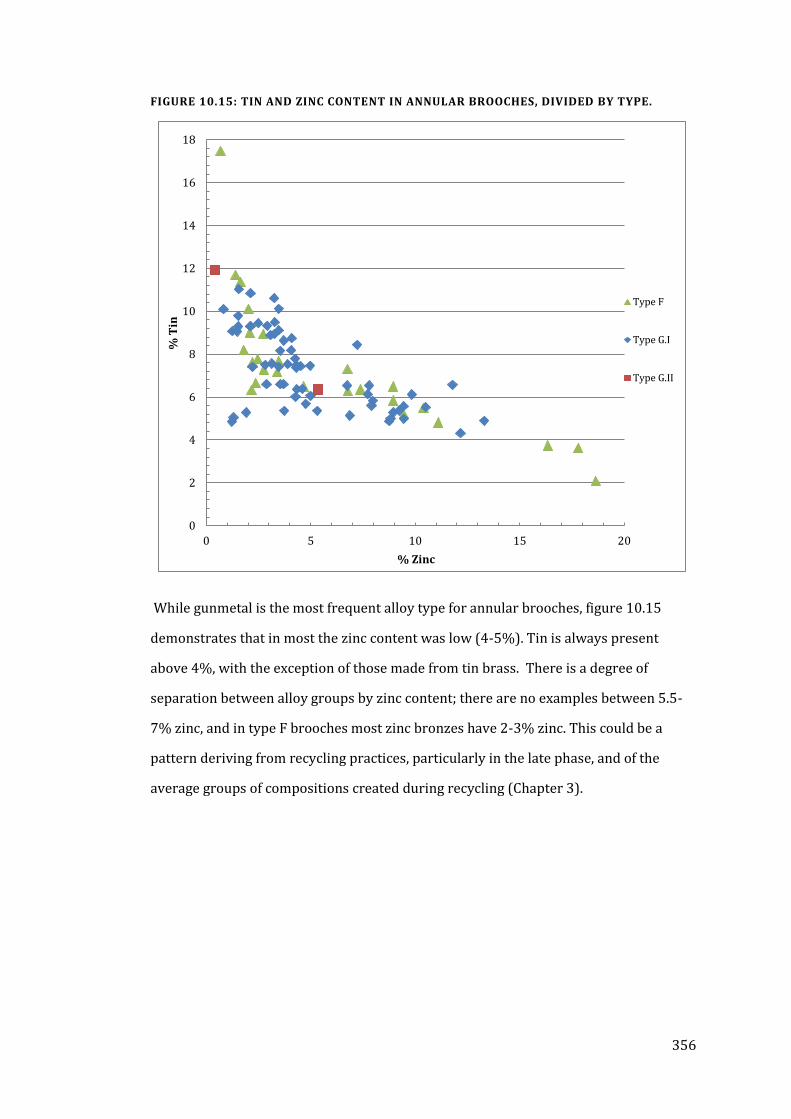
356
FIGURE 10.15: TIN AND ZINC CONTENT IN ANNULAR BROOCHES, DIVIDED BY TYPE.
While gunmetal is the most frequent alloy type for annular brooches, figure 10.15
demonstrates that in most the zinc content was low (4-5%). Tin is always present
above 4%, with the exception of those made from tin brass. There is a degree of
separation between alloy groups by zinc content; there are no examples between 5.5-
7% zinc, and in type F brooches most zinc bronzes have 2-3% zinc. This could be a
pattern deriving from recycling practices, particularly in the late phase, and of the
average groups of compositions created during recycling (Chapter 3).
0
2
4
6
8
10
12
14
16
18
0 5 10 15 20
% T
in
% Zinc
Type F
Type G.I
Type G.II
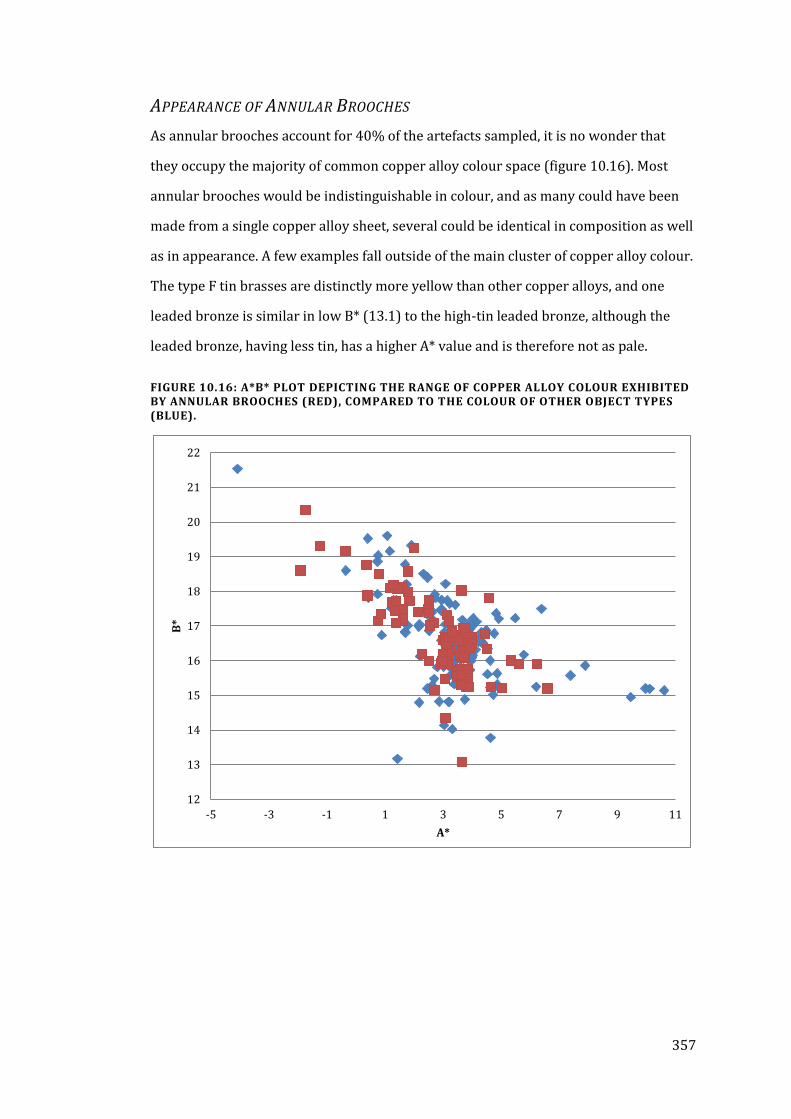
357
APPEARANCE OF ANNULAR BROOCHES
As annular brooches account for 40% of the artefacts sampled, it is no wonder that
they occupy the majority of common copper alloy colour space (figure 10.16). Most
annular brooches would be indistinguishable in colour, and as many could have been
made from a single copper alloy sheet, several could be identical in composition as well
as in appearance. A few examples fall outside of the main cluster of copper alloy colour.
The type F tin brasses are distinctly more yellow than other copper alloys, and one
leaded bronze is similar in low B* (13.1) to the high-tin leaded bronze, although the
leaded bronze, having less tin, has a higher A* value and is therefore not as pale.
FIGURE 10.16: A*B* PLOT DEPICTING THE RANGE OF COPPER ALLOY COLOUR EXHIBITED BY ANNULAR BROOCHES (RED), COMPARED TO THE COLOUR OF OTHER OBJECT TYPES (BLUE).
12
13
14
15
16
17
18
19
20
21
22
-5 -3 -1 1 3 5 7 9 11
B*
A*
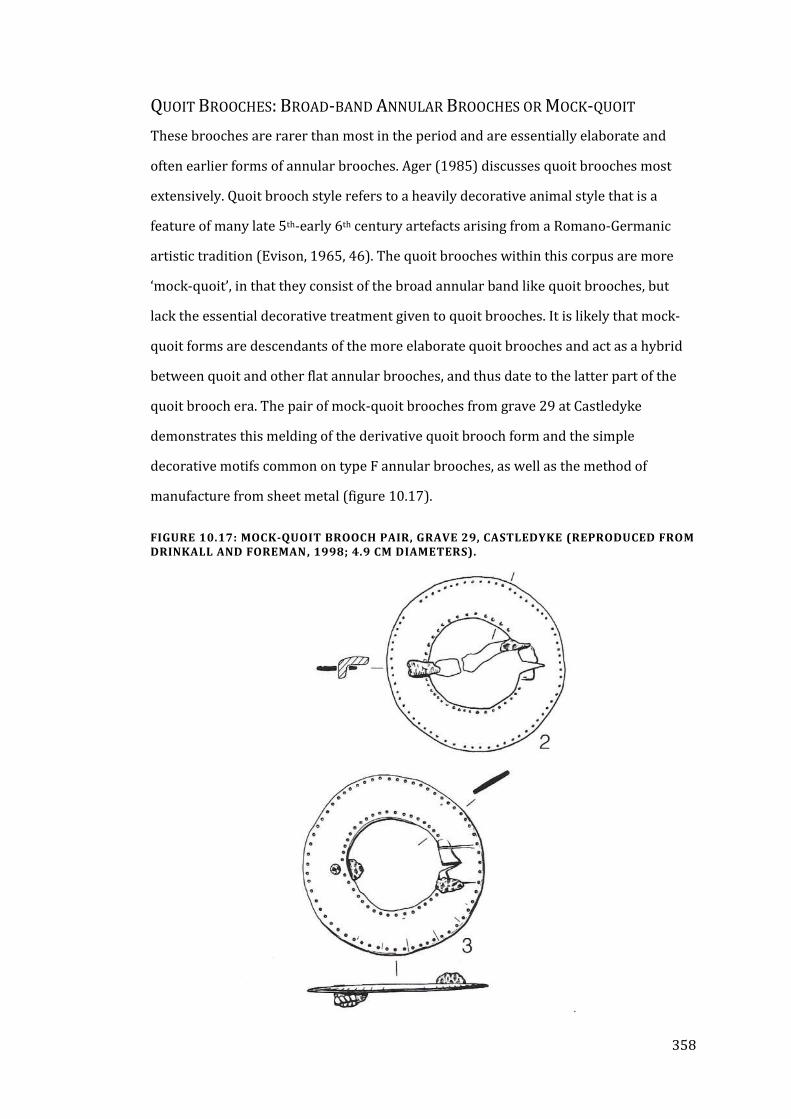
358
QUOIT BROOCHES: BROAD-BAND ANNULAR BROOCHES OR MOCK-QUOIT
These brooches are rarer than most in the period and are essentially elaborate and
often earlier forms of annular brooches. Ager (1985) discusses quoit brooches most
extensively. Quoit brooch style refers to a heavily decorative animal style that is a
feature of many late 5th-early 6th century artefacts arising from a Romano-Germanic
artistic tradition (Evison, 1965, 46). The quoit brooches within this corpus are more
‘mock-quoit’, in that they consist of the broad annular band like quoit brooches, but
lack the essential decorative treatment given to quoit brooches. It is likely that mock-
quoit forms are descendants of the more elaborate quoit brooches and act as a hybrid
between quoit and other flat annular brooches, and thus date to the latter part of the
quoit brooch era. The pair of mock-quoit brooches from grave 29 at Castledyke
demonstrates this melding of the derivative quoit brooch form and the simple
decorative motifs common on type F annular brooches, as well as the method of
manufacture from sheet metal (figure 10.17).
FIGURE 10.17: MOCK-QUOIT BROOCH PAIR, GRAVE 29, CASTLEDYKE (REPRODUCED FROM DRINKALL AND FOREMAN, 1998; 4.9 CM DIAMETERS).
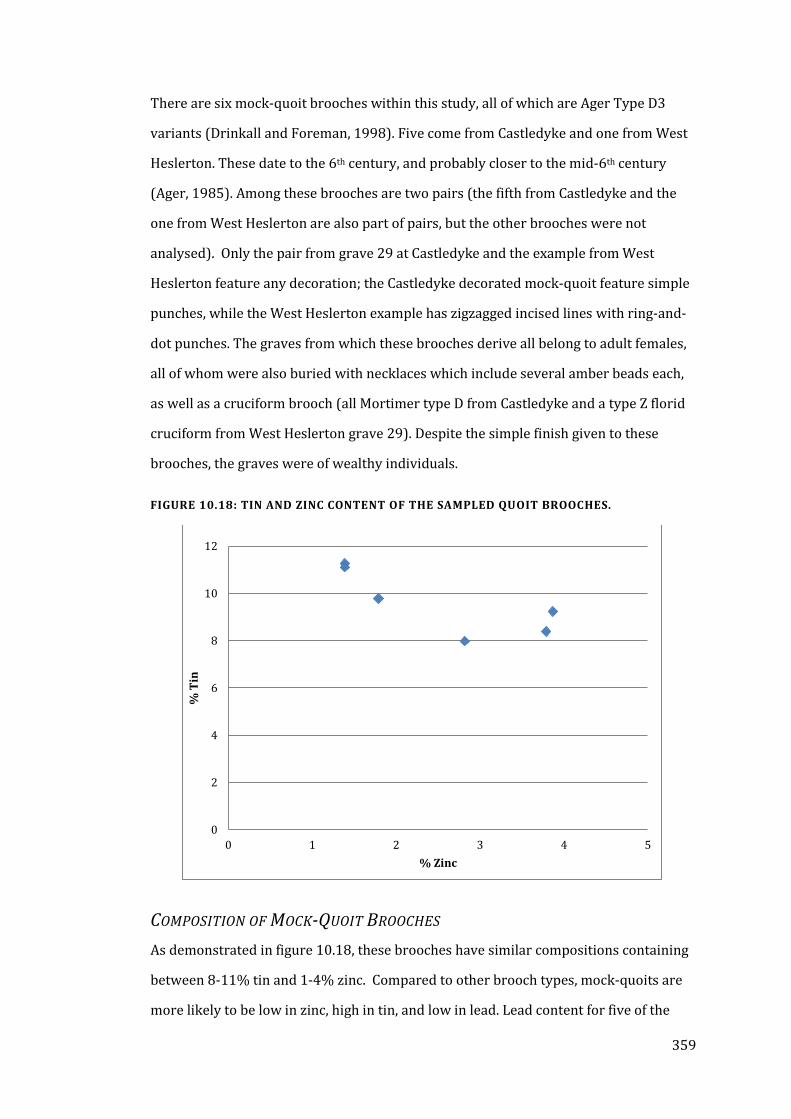
359
There are six mock-quoit brooches within this study, all of which are Ager Type D3
variants (Drinkall and Foreman, 1998). Five come from Castledyke and one from West
Heslerton. These date to the 6th century, and probably closer to the mid-6th century
(Ager, 1985). Among these brooches are two pairs (the fifth from Castledyke and the
one from West Heslerton are also part of pairs, but the other brooches were not
analysed). Only the pair from grave 29 at Castledyke and the example from West
Heslerton feature any decoration; the Castledyke decorated mock-quoit feature simple
punches, while the West Heslerton example has zigzagged incised lines with ring-and-
dot punches. The graves from which these brooches derive all belong to adult females,
all of whom were also buried with necklaces which include several amber beads each,
as well as a cruciform brooch (all Mortimer type D from Castledyke and a type Z florid
cruciform from West Heslerton grave 29). Despite the simple finish given to these
brooches, the graves were of wealthy individuals.
FIGURE 10.18: TIN AND ZINC CONTENT OF THE SAMPLED QUOIT BROOCHES.
COMPOSITION OF MOCK-QUOIT BROOCHES
As demonstrated in figure 10.18, these brooches have similar compositions containing
between 8-11% tin and 1-4% zinc. Compared to other brooch types, mock-quoits are
more likely to be low in zinc, high in tin, and low in lead. Lead content for five of the
0
2
4
6
8
10
12
0 1 2 3 4 5
% T
in
% Zinc
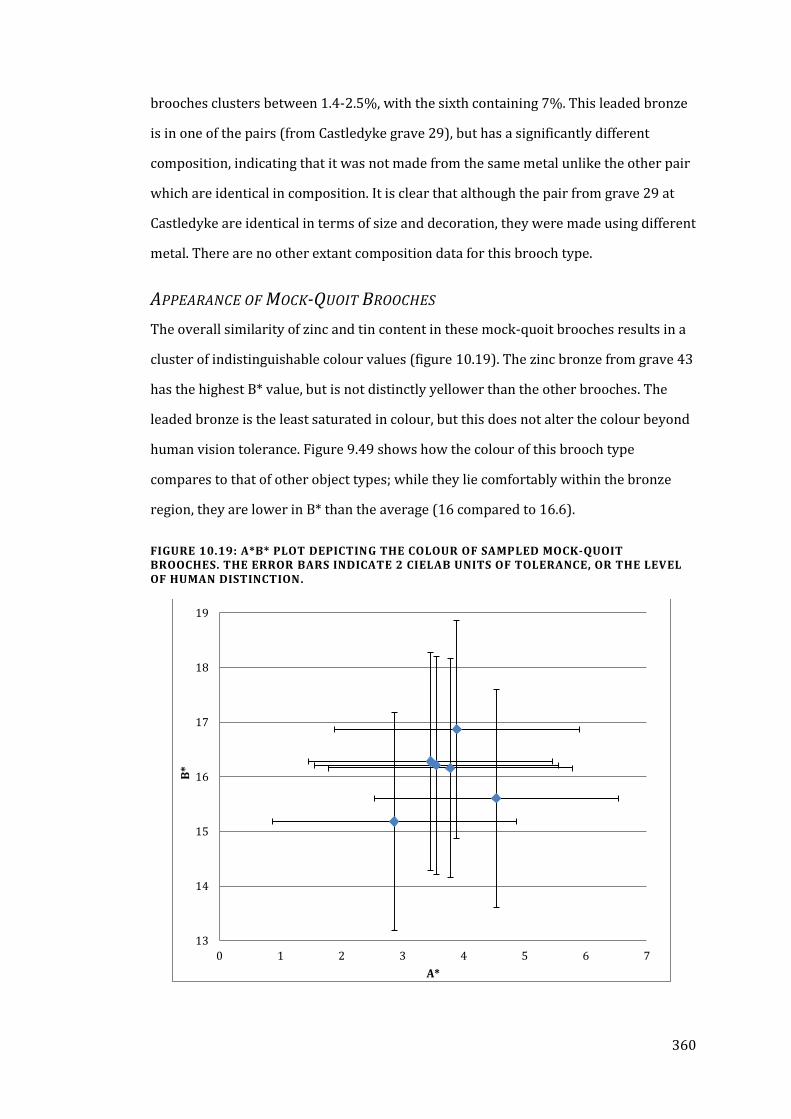
360
brooches clusters between 1.4-2.5%, with the sixth containing 7%. This leaded bronze
is in one of the pairs (from Castledyke grave 29), but has a significantly different
composition, indicating that it was not made from the same metal unlike the other pair
which are identical in composition. It is clear that although the pair from grave 29 at
Castledyke are identical in terms of size and decoration, they were made using different
metal. There are no other extant composition data for this brooch type.
APPEARANCE OF MOCK-QUOIT BROOCHES
The overall similarity of zinc and tin content in these mock-quoit brooches results in a
cluster of indistinguishable colour values (figure 10.19). The zinc bronze from grave 43
has the highest B* value, but is not distinctly yellower than the other brooches. The
leaded bronze is the least saturated in colour, but this does not alter the colour beyond
human vision tolerance. Figure 9.49 shows how the colour of this brooch type
compares to that of other object types; while they lie comfortably within the bronze
region, they are lower in B* than the average (16 compared to 16.6).
FIGURE 10.19: A*B* PLOT DEPICTING THE COLOUR OF SAMPLED MOCK-QUOIT BROOCHES. THE ERROR BARS INDICATE 2 CIELAB UNITS OF TOLERANCE, OR THE LEVEL OF HUMAN DISTINCTION.
13
14
15
16
17
18
19
0 1 2 3 4 5 6 7
B*
A*
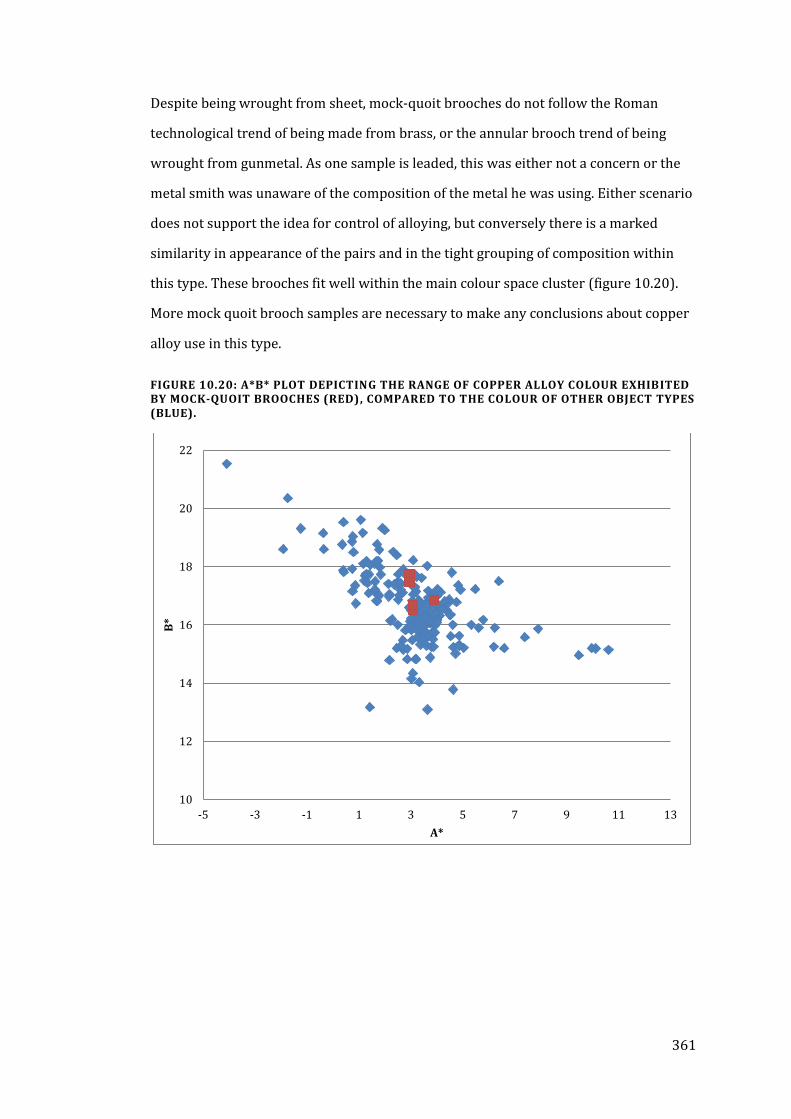
361
Despite being wrought from sheet, mock-quoit brooches do not follow the Roman
technological trend of being made from brass, or the annular brooch trend of being
wrought from gunmetal. As one sample is leaded, this was either not a concern or the
metal smith was unaware of the composition of the metal he was using. Either scenario
does not support the idea for control of alloying, but conversely there is a marked
similarity in appearance of the pairs and in the tight grouping of composition within
this type. These brooches fit well within the main colour space cluster (figure 10.20).
More mock quoit brooch samples are necessary to make any conclusions about copper
alloy use in this type.
FIGURE 10.20: A*B* PLOT DEPICTING THE RANGE OF COPPER ALLOY COLOUR EXHIBITED BY MOCK-QUOIT BROOCHES (RED), COMPARED TO THE COLOUR OF OTHER OBJECT TYPES (BLUE).
10
12
14
16
18
20
22
-5 -3 -1 1 3 5 7 9 11 13
B*
A*
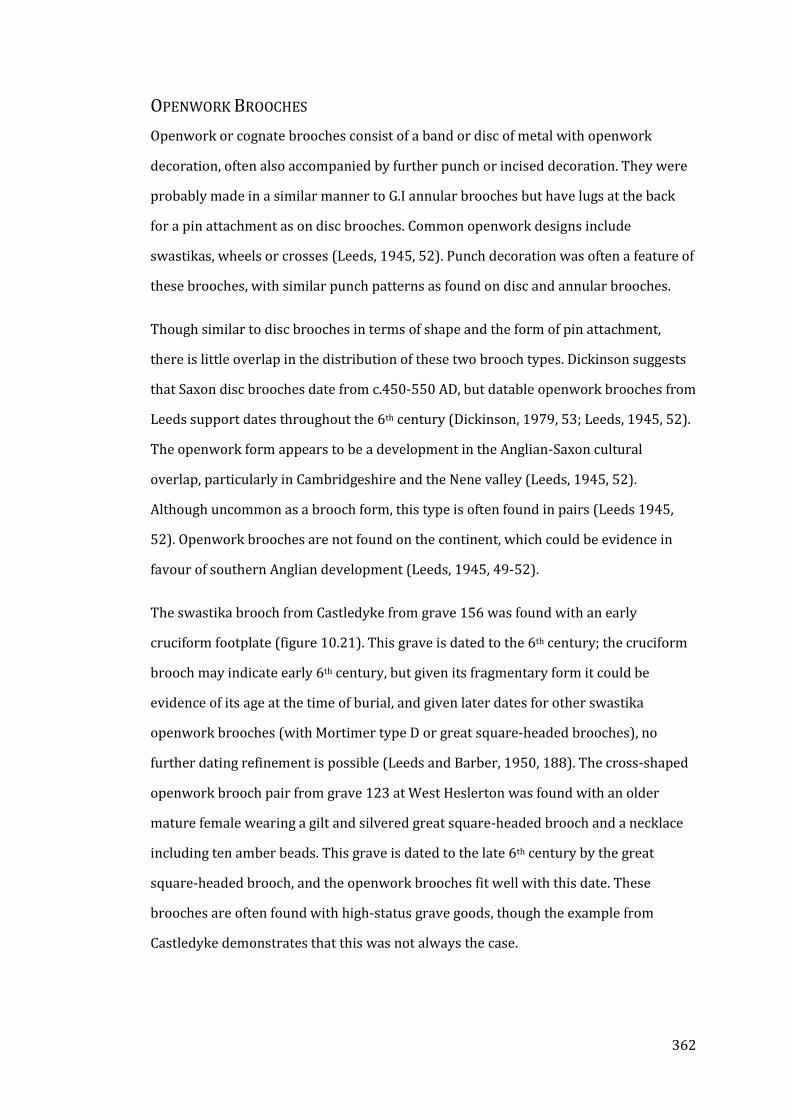
362
OPENWORK BROOCHES
Openwork or cognate brooches consist of a band or disc of metal with openwork
decoration, often also accompanied by further punch or incised decoration. They were
probably made in a similar manner to G.I annular brooches but have lugs at the back
for a pin attachment as on disc brooches. Common openwork designs include
swastikas, wheels or crosses (Leeds, 1945, 52). Punch decoration was often a feature of
these brooches, with similar punch patterns as found on disc and annular brooches.
Though similar to disc brooches in terms of shape and the form of pin attachment,
there is little overlap in the distribution of these two brooch types. Dickinson suggests
that Saxon disc brooches date from c.450-550 AD, but datable openwork brooches from
Leeds support dates throughout the 6th century (Dickinson, 1979, 53; Leeds, 1945, 52).
The openwork form appears to be a development in the Anglian-Saxon cultural
overlap, particularly in Cambridgeshire and the Nene valley (Leeds, 1945, 52).
Although uncommon as a brooch form, this type is often found in pairs (Leeds 1945,
52). Openwork brooches are not found on the continent, which could be evidence in
favour of southern Anglian development (Leeds, 1945, 49-52).
The swastika brooch from Castledyke from grave 156 was found with an early
cruciform footplate (figure 10.21). This grave is dated to the 6th century; the cruciform
brooch may indicate early 6th century, but given its fragmentary form it could be
evidence of its age at the time of burial, and given later dates for other swastika
openwork brooches (with Mortimer type D or great square-headed brooches), no
further dating refinement is possible (Leeds and Barber, 1950, 188). The cross-shaped
openwork brooch pair from grave 123 at West Heslerton was found with an older
mature female wearing a gilt and silvered great square-headed brooch and a necklace
including ten amber beads. This grave is dated to the late 6th century by the great
square-headed brooch, and the openwork brooches fit well with this date. These
brooches are often found with high-status grave goods, though the example from
Castledyke demonstrates that this was not always the case.
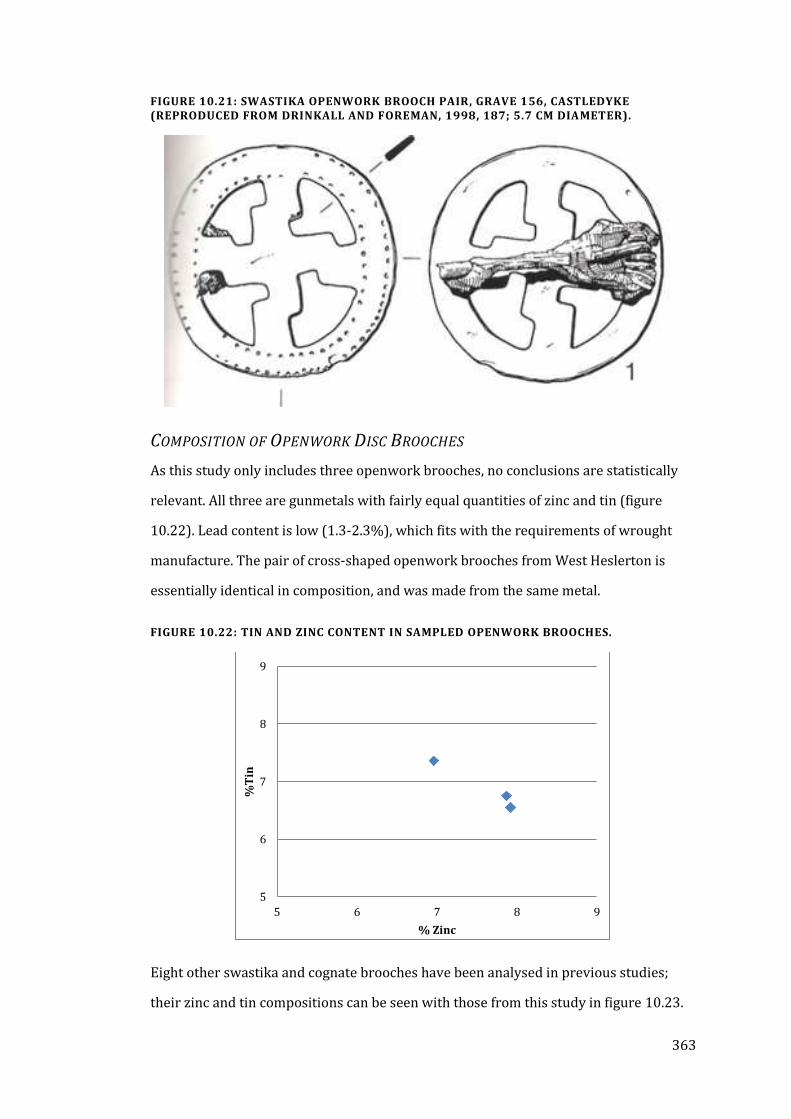
363
FIGURE 10.21: SWASTIKA OPENWORK BROOCH PAIR, GRAVE 156, CASTLEDYKE (REPRODUCED FROM DRINKALL AND FOREMAN, 1998, 187; 5.7 CM DIAMETER).
COMPOSITION OF OPENWORK DISC BROOCHES
As this study only includes three openwork brooches, no conclusions are statistically
relevant. All three are gunmetals with fairly equal quantities of zinc and tin (figure
10.22). Lead content is low (1.3-2.3%), which fits with the requirements of wrought
manufacture. The pair of cross-shaped openwork brooches from West Heslerton is
essentially identical in composition, and was made from the same metal.
FIGURE 10.22: TIN AND ZINC CONTENT IN SAMPLED OPENWORK BROOCHES.
Eight other swastika and cognate brooches have been analysed in previous studies;
their zinc and tin compositions can be seen with those from this study in figure 10.23.
5
6
7
8
9
5 6 7 8 9
%T
in
% Zinc
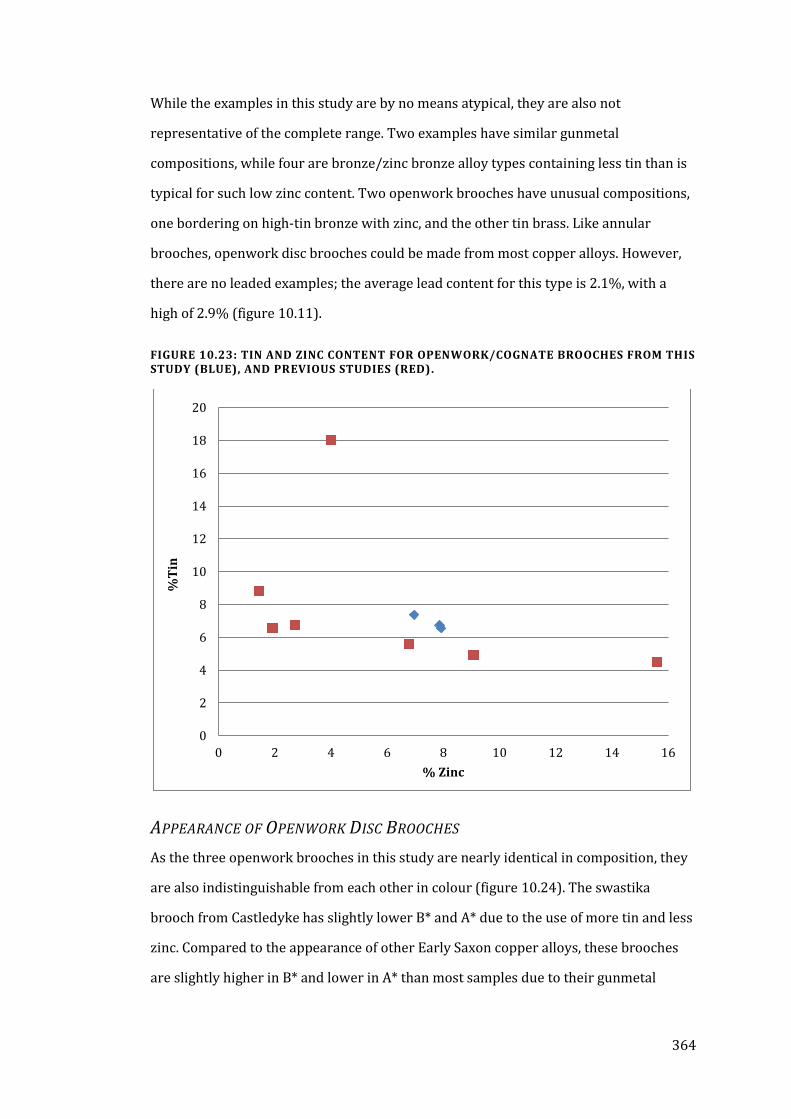
364
While the examples in this study are by no means atypical, they are also not
representative of the complete range. Two examples have similar gunmetal
compositions, while four are bronze/zinc bronze alloy types containing less tin than is
typical for such low zinc content. Two openwork brooches have unusual compositions,
one bordering on high-tin bronze with zinc, and the other tin brass. Like annular
brooches, openwork disc brooches could be made from most copper alloys. However,
there are no leaded examples; the average lead content for this type is 2.1%, with a
high of 2.9% (figure 10.11).
FIGURE 10.23: TIN AND ZINC CONTENT FOR OPENWORK/COGNATE BROOCHES FROM THIS STUDY (BLUE), AND PREVIOUS STUDIES (RED).
APPEARANCE OF OPENWORK DISC BROOCHES
As the three openwork brooches in this study are nearly identical in composition, they
are also indistinguishable from each other in colour (figure 10.24). The swastika
brooch from Castledyke has slightly lower B* and A* due to the use of more tin and less
zinc. Compared to the appearance of other Early Saxon copper alloys, these brooches
are slightly higher in B* and lower in A* than most samples due to their gunmetal
0
2
4
6
8
10
12
14
16
18
20
0 2 4 6 8 10 12 14 16
%T
in
% Zinc
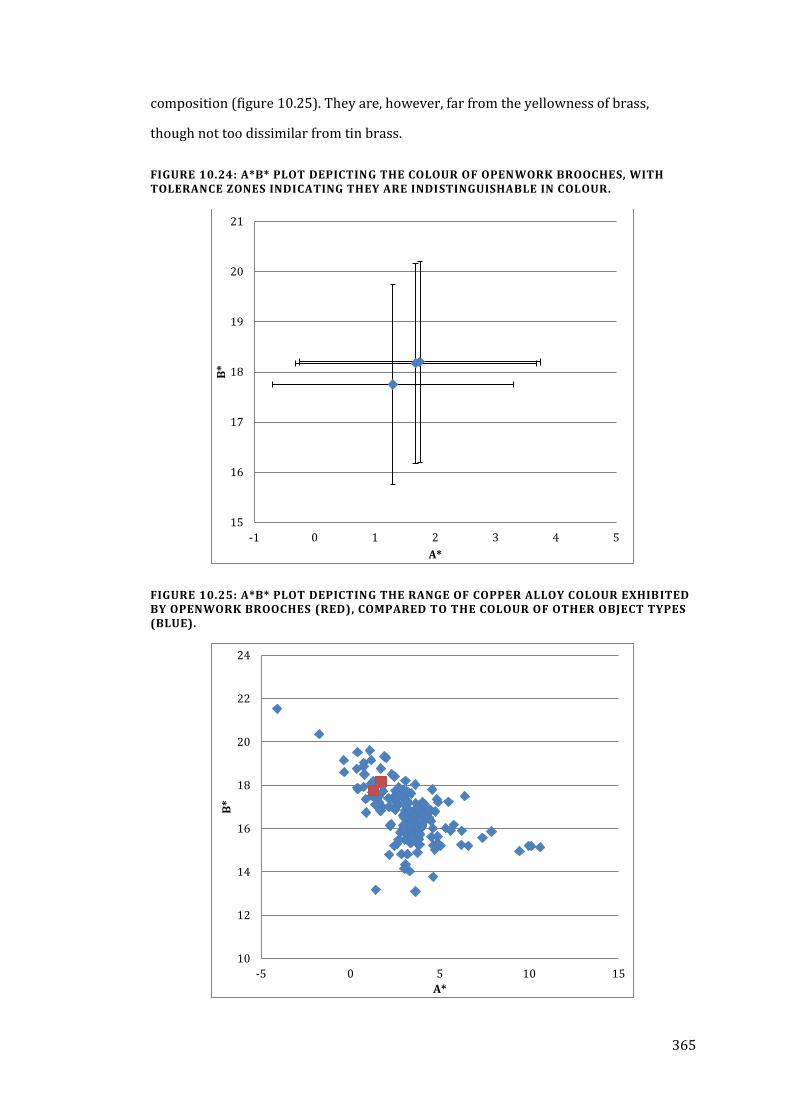
365
composition (figure 10.25). They are, however, far from the yellowness of brass,
though not too dissimilar from tin brass.
FIGURE 10.24: A*B* PLOT DEPICTING THE COLOUR OF OPENWORK BROOCHES, WITH TOLERANCE ZONES INDICATING THEY ARE INDISTINGUISHABLE IN COLOUR.
FIGURE 10.25: A*B* PLOT DEPICTING THE RANGE OF COPPER ALLOY COLOUR EXHIBITED BY OPENWORK BROOCHES (RED), COMPARED TO THE COLOUR OF OTHER OBJECT TYPES (BLUE).
15
16
17
18
19
20
21
-1 0 1 2 3 4 5
B*
A*
10
12
14
16
18
20
22
24
-5 0 5 10 15
B*
A*
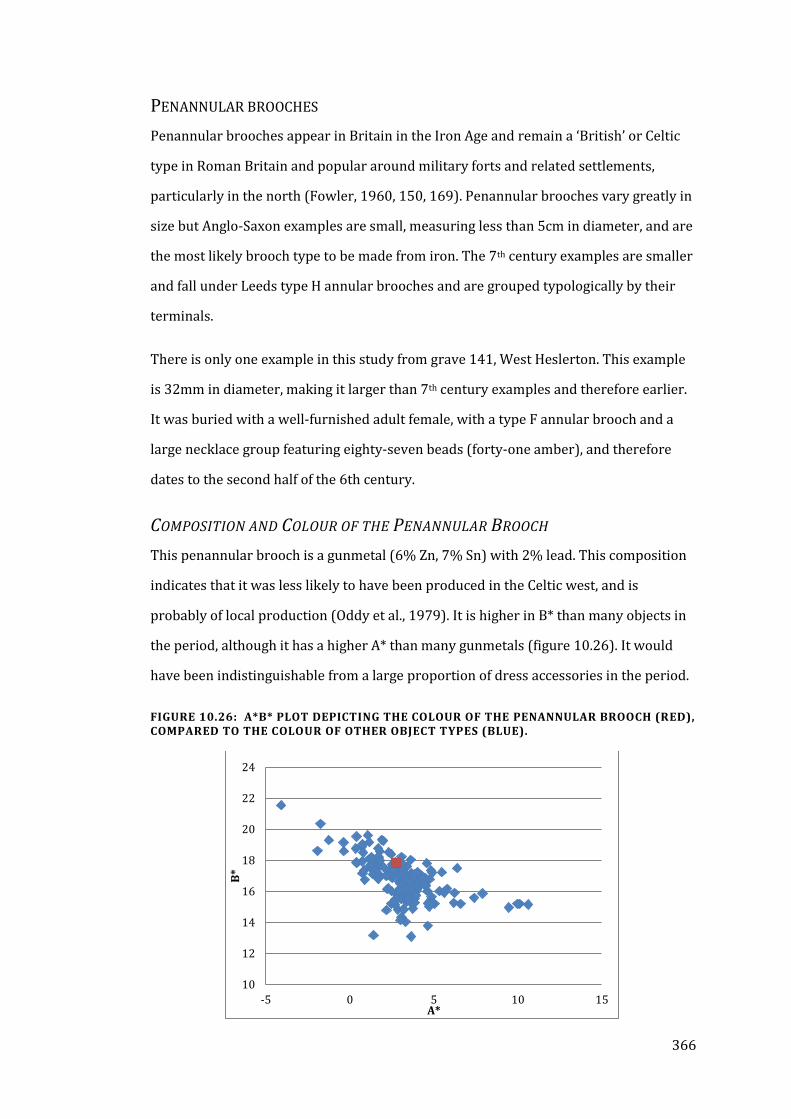
366
PENANNULAR BROOCHES
Penannular brooches appear in Britain in the Iron Age and remain a ‘British’ or Celtic
type in Roman Britain and popular around military forts and related settlements,
particularly in the north (Fowler, 1960, 150, 169). Penannular brooches vary greatly in
size but Anglo-Saxon examples are small, measuring less than 5cm in diameter, and are
the most likely brooch type to be made from iron. The 7th century examples are smaller
and fall under Leeds type H annular brooches and are grouped typologically by their
terminals.
There is only one example in this study from grave 141, West Heslerton. This example
is 32mm in diameter, making it larger than 7th century examples and therefore earlier.
It was buried with a well-furnished adult female, with a type F annular brooch and a
large necklace group featuring eighty-seven beads (forty-one amber), and therefore
dates to the second half of the 6th century.
COMPOSITION AND COLOUR OF THE PENANNULAR BROOCH
This penannular brooch is a gunmetal (6% Zn, 7% Sn) with 2% lead. This composition
indicates that it was less likely to have been produced in the Celtic west, and is
probably of local production (Oddy et al., 1979). It is higher in B* than many objects in
the period, although it has a higher A* than many gunmetals (figure 10.26). It would
have been indistinguishable from a large proportion of dress accessories in the period.
FIGURE 10.26: A*B* PLOT DEPICTING THE COLOUR OF THE PENANNULAR BROOCH (RED), COMPARED TO THE COLOUR OF OTHER OBJECT TYPES (BLUE).
10
12
14
16
18
20
22
24
-5 0 5 10 15
B*
A*
367
GREAT AND SQUARE-HEADED BROOCHES
Great square-headed brooches, the largest brooches in the period, have Scandinavian
roots but were also produced in Anglian and Saxon areas between c.500-570 CE (Hines,
1997, 1). They are elaborately cast as chip-carved (as brooch moulds from Helgö,
Sweden, attest), and so would have required more time and resources to produce than
other copper alloy objects (Lamm, 1973, 109-11). Great square-headed brooches are
likely the highest status copper alloy objects as over 75% were gilt, if not also silvered,
decorated with enamel, garnet, glass or niello (Hines, 1997, 214). Despite the size of
this brooch type, some were cast in silver and then gilded (Hines, 1997, 212).
“Brooches were a means employed to demonstrate access to precious materials,” and
nowhere is this more evident (Marzinzik, 2003, 57). As these brooches require more
metal, larger casts, and an alloy suitable for gilding and silvering adhesion, it is likely
more care was taken to select a specific alloy for this artefact type.
Square-headed brooches are not as large and do not feature as much or as refined
decoration as the ‘great’ versions. For example, the square-headed brooches in this
study did not have any surface treatments, while the ‘greats’ have gilding and silver
plating. Both square-headed brooch varieties were used primarily as cloak or shawl
fasteners (Hines, 1997, 283).There are two great square-headed brooch and two
square-headed brooch examples in this study. One square-headed brooch is from
Fonaby, and the other three all come from West Heslerton. All four date to the last half
of the 6th century and were accompanied by multiple amber beads, although none of
the associated graves were examples of the wealthiest in terms of other grave goods.
Great square-headed brooches were worn by women, and those in this study were all
from female graves (Hines, 1997, 280). The two individuals that could be aged were
mature females, which could indicate that such brooches were often the belongings of
older women of high social status.
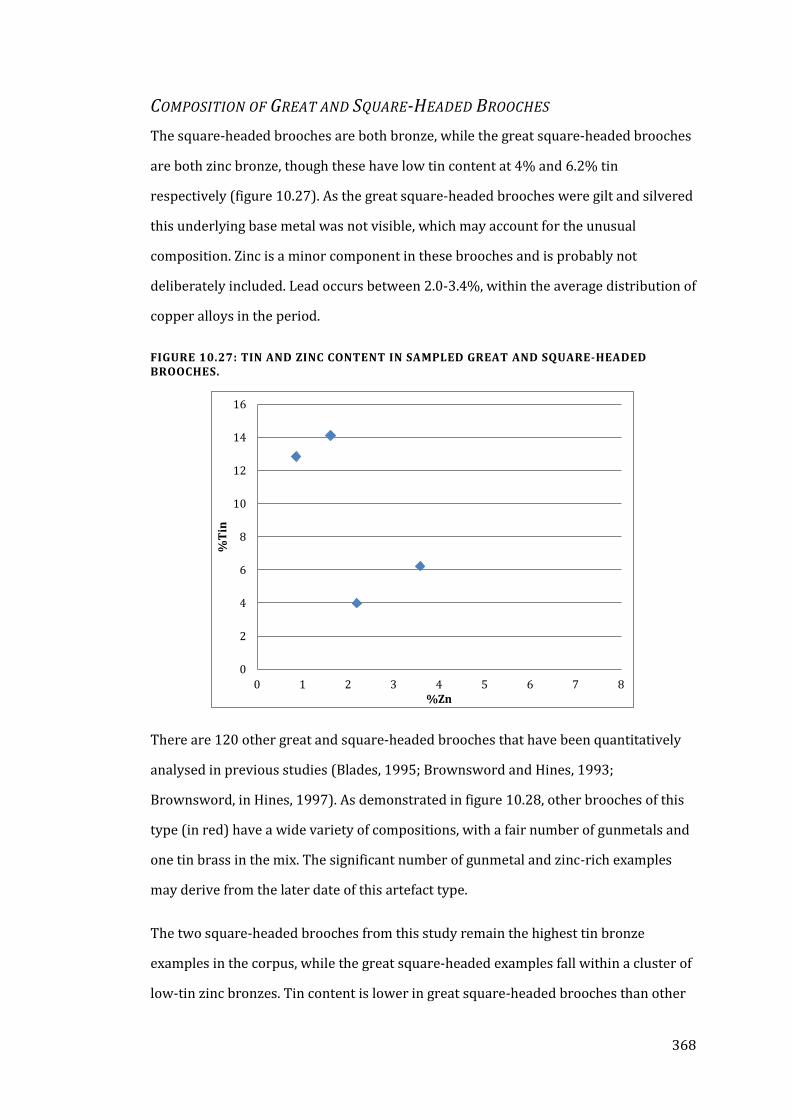
368
COMPOSITION OF GREAT AND SQUARE-HEADED BROOCHES
The square-headed brooches are both bronze, while the great square-headed brooches
are both zinc bronze, though these have low tin content at 4% and 6.2% tin
respectively (figure 10.27). As the great square-headed brooches were gilt and silvered
this underlying base metal was not visible, which may account for the unusual
composition. Zinc is a minor component in these brooches and is probably not
deliberately included. Lead occurs between 2.0-3.4%, within the average distribution of
copper alloys in the period.
FIGURE 10.27: TIN AND ZINC CONTENT IN SAMPLED GREAT AND SQUARE-HEADED BROOCHES.
There are 120 other great and square-headed brooches that have been quantitatively
analysed in previous studies (Blades, 1995; Brownsword and Hines, 1993;
Brownsword, in Hines, 1997). As demonstrated in figure 10.28, other brooches of this
type (in red) have a wide variety of compositions, with a fair number of gunmetals and
one tin brass in the mix. The significant number of gunmetal and zinc-rich examples
may derive from the later date of this artefact type.
The two square-headed brooches from this study remain the highest tin bronze
examples in the corpus, while the great square-headed examples fall within a cluster of
low-tin zinc bronzes. Tin content is lower in great square-headed brooches than other
0
2
4
6
8
10
12
14
16
0 1 2 3 4 5 6 7 8
%T
in
%Zn
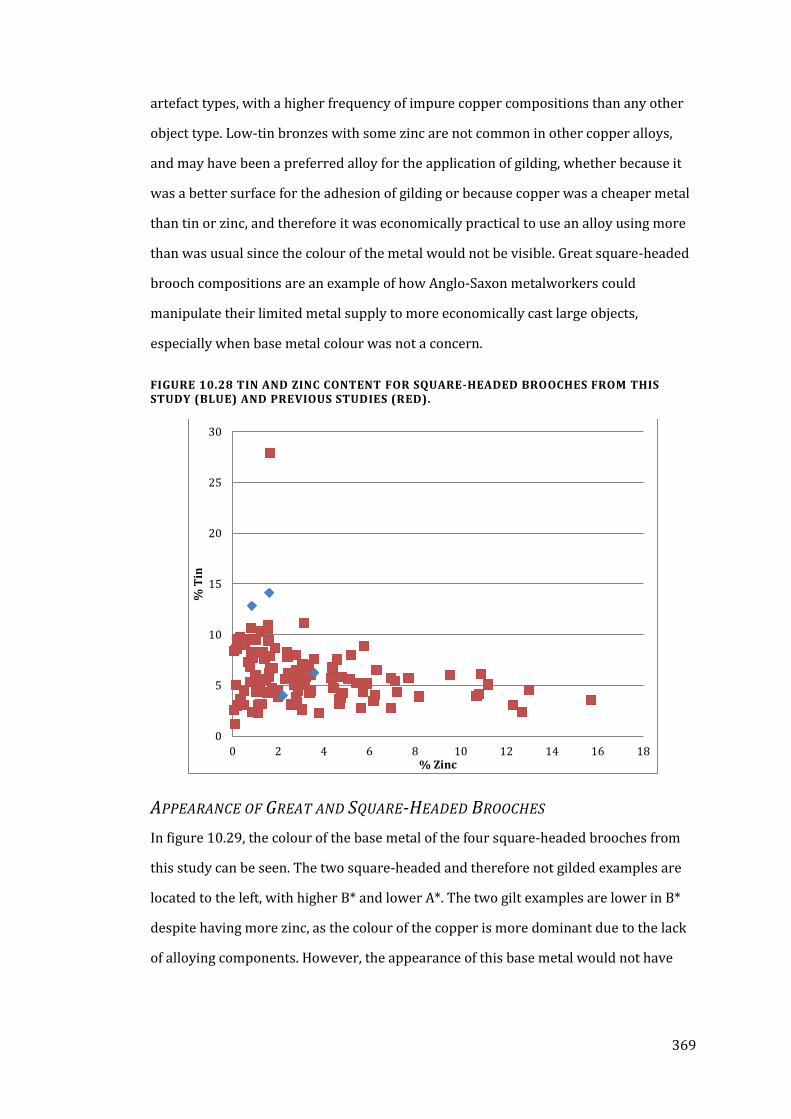
369
artefact types, with a higher frequency of impure copper compositions than any other
object type. Low-tin bronzes with some zinc are not common in other copper alloys,
and may have been a preferred alloy for the application of gilding, whether because it
was a better surface for the adhesion of gilding or because copper was a cheaper metal
than tin or zinc, and therefore it was economically practical to use an alloy using more
than was usual since the colour of the metal would not be visible. Great square-headed
brooch compositions are an example of how Anglo-Saxon metalworkers could
manipulate their limited metal supply to more economically cast large objects,
especially when base metal colour was not a concern.
FIGURE 10.28 TIN AND ZINC CONTENT FOR SQUARE-HEADED BROOCHES FROM THIS STUDY (BLUE) AND PREVIOUS STUDIES (RED).
APPEARANCE OF GREAT AND SQUARE-HEADED BROOCHES
In figure 10.29, the colour of the base metal of the four square-headed brooches from
this study can be seen. The two square-headed and therefore not gilded examples are
located to the left, with higher B* and lower A*. The two gilt examples are lower in B*
despite having more zinc, as the colour of the copper is more dominant due to the lack
of alloying components. However, the appearance of this base metal would not have
0
5
10
15
20
25
30
0 2 4 6 8 10 12 14 16 18
% T
in
% Zinc
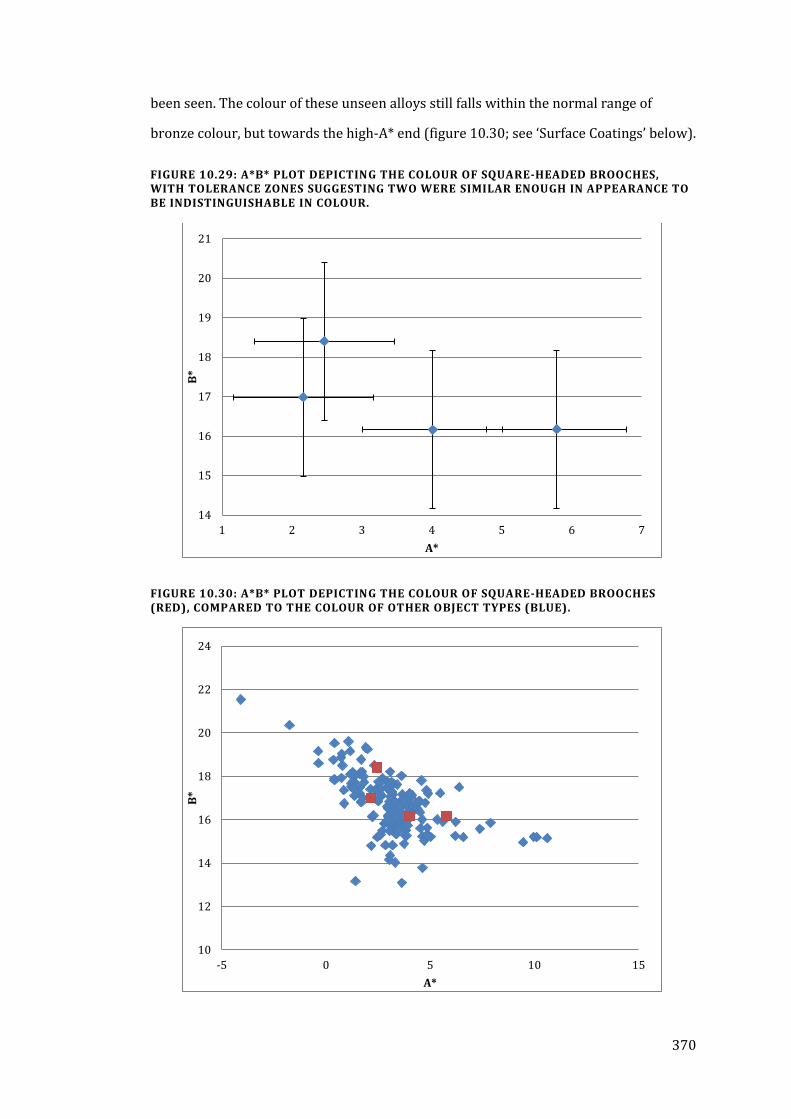
370
been seen. The colour of these unseen alloys still falls within the normal range of
bronze colour, but towards the high-A* end (figure 10.30; see ‘Surface Coatings’ below).
FIGURE 10.29: A*B* PLOT DEPICTING THE COLOUR OF SQUARE-HEADED BROOCHES, WITH TOLERANCE ZONES SUGGESTING TWO WERE SIMILAR ENOUGH IN APPEARANCE TO BE INDISTINGUISHABLE IN COLOUR.
FIGURE 10.30: A*B* PLOT DEPICTING THE COLOUR OF SQUARE-HEADED BROOCHES (RED), COMPARED TO THE COLOUR OF OTHER OBJECT TYPES (BLUE).
14
15
16
17
18
19
20
21
1 2 3 4 5 6 7
B*
A*
10
12
14
16
18
20
22
24
-5 0 5 10 15
B*
A*
371
CRUCIFORM BROOCHES
Cruciform brooches are a large, often ornately decorated Anglian brooch type found
throughout the east, center and north of England. They originate from the Germanic
homeland but were also made in great numbers in Anglo-Saxon England and
Scandinavia. Primarily associated with female dress, they are less frequent than
annular brooches but occur within similar regional distributions. This brooch form has
been extensively studied by Åberg (1926), Leeds (1945), Mortimer (1990) and Martin
(2011).
Most cruciform brooches were worn by women and could appear singly, in pairs, or in
other quantities (Cleatham grave 30 contained five) and were, “most frequently
combined with other types of brooch fastening different layers of garment” (Martin,
2011, 260). The early cruciform brooches were produced in the 5th century, with the
latest florid forms found in late 6th century contexts. Like square-headed brooches,
cruciform brooches are large and often decorated with chip-carved and as-cast motifs,
and occasionally are gilded. Their size and decorated form make them somewhat
interchangeable in function with square-headed brooches, although if both types occur
in a single grave the cruciform brooches are less of a display item and more functional,
much as annular brooches were when worn alongside cruciform brooches.
Åberg was the first to examine these typologically, dividing them into five groups (I-V)
based primarily on the type of knobs extending from the head-plate and by associated
decorative features (Åberg, 1926, 33). Mortimer (1990) investigated this brooch type
from a compositional as well as typological approach. Her typology grouped cruciform
brooches into four major types (A-D), with an additional fifth type (Z) for the florid
form. Generally these correspond closely with the five types laid out by Åberg but with
more subtypes to better describe each example.
There are thirty-six cruciform brooches in this study from five of the sites sampled. If
the mis-reported analyses from Castledyke are not included, thirteen of the cruciform
brooches in this study were analysed previously (eleven by Mortimer, two by Blades).
One cruciform brooch was buried with an older male, while all other sexed graves
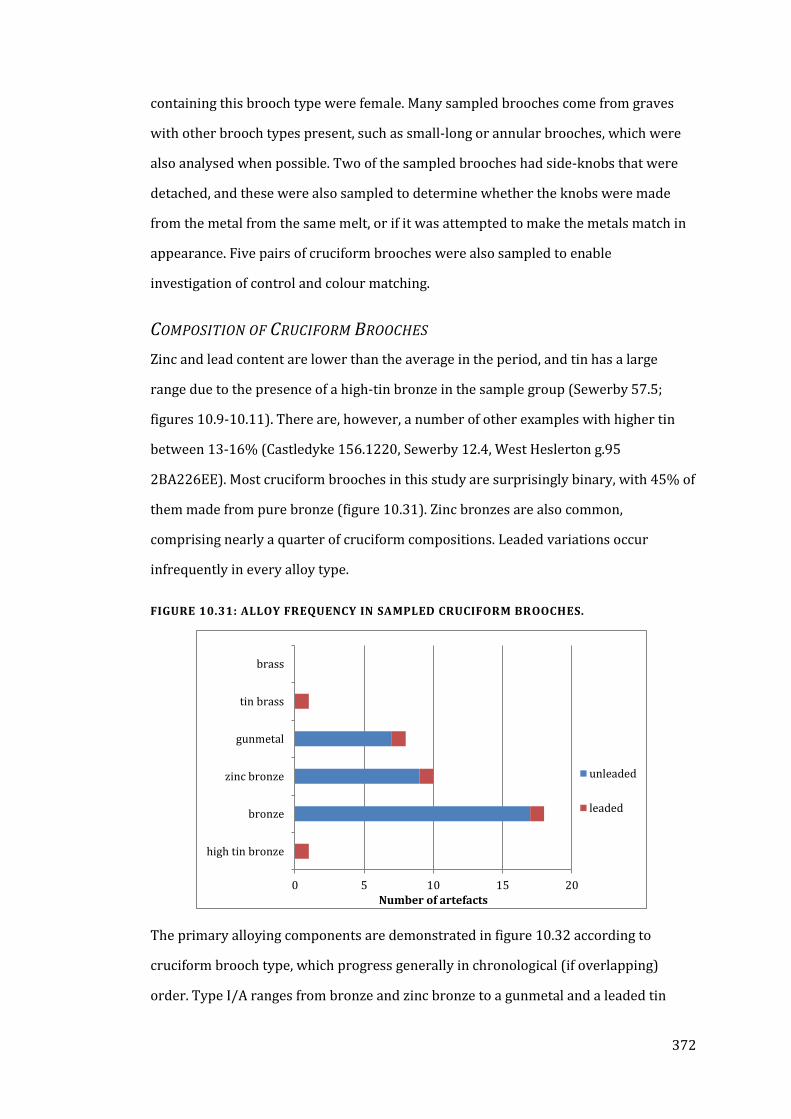
372
containing this brooch type were female. Many sampled brooches come from graves
with other brooch types present, such as small-long or annular brooches, which were
also analysed when possible. Two of the sampled brooches had side-knobs that were
detached, and these were also sampled to determine whether the knobs were made
from the metal from the same melt, or if it was attempted to make the metals match in
appearance. Five pairs of cruciform brooches were also sampled to enable
investigation of control and colour matching.
COMPOSITION OF CRUCIFORM BROOCHES
Zinc and lead content are lower than the average in the period, and tin has a large
range due to the presence of a high-tin bronze in the sample group (Sewerby 57.5;
figures 10.9-10.11). There are, however, a number of other examples with higher tin
between 13-16% (Castledyke 156.1220, Sewerby 12.4, West Heslerton g.95
2BA226EE). Most cruciform brooches in this study are surprisingly binary, with 45% of
them made from pure bronze (figure 10.31). Zinc bronzes are also common,
comprising nearly a quarter of cruciform compositions. Leaded variations occur
infrequently in every alloy type.
FIGURE 10.31: ALLOY FREQUENCY IN SAMPLED CRUCIFORM BROOCHES.
The primary alloying components are demonstrated in figure 10.32 according to
cruciform brooch type, which progress generally in chronological (if overlapping)
order. Type I/A ranges from bronze and zinc bronze to a gunmetal and a leaded tin
0 5 10 15 20
high tin bronze
bronze
zinc bronze
gunmetal
tin brass
brass
Number of artefacts
unleaded
leaded
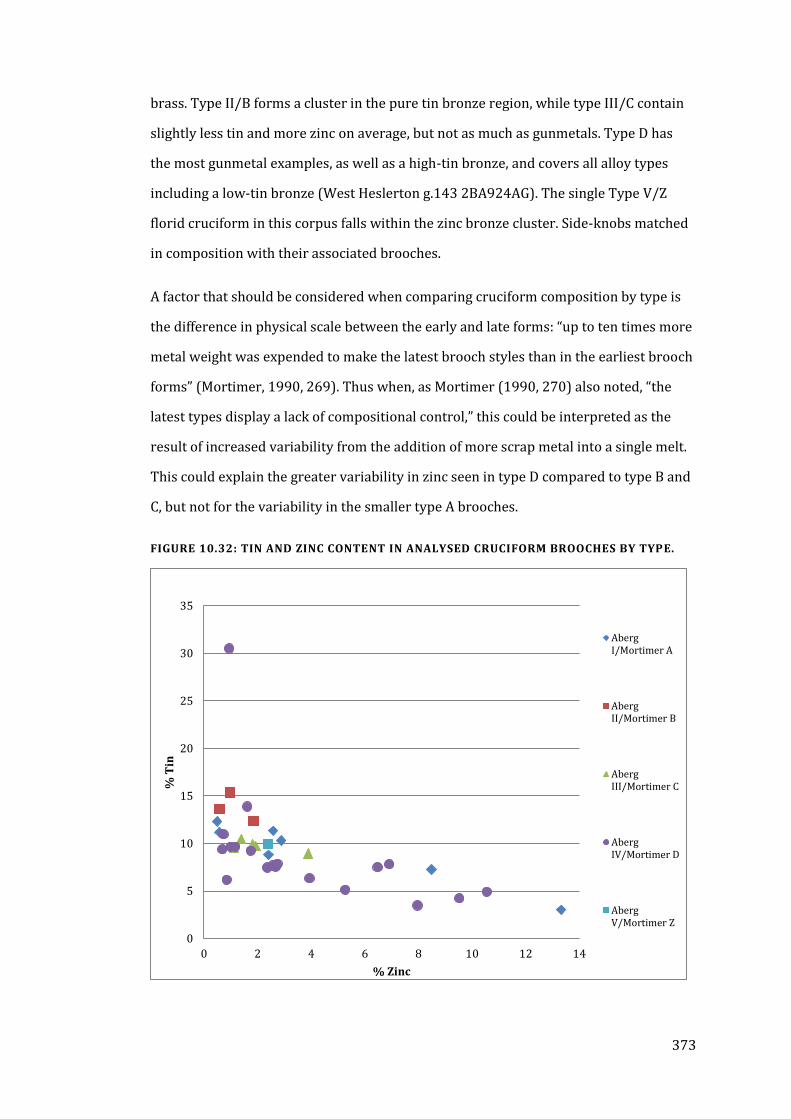
373
brass. Type II/B forms a cluster in the pure tin bronze region, while type III/C contain
slightly less tin and more zinc on average, but not as much as gunmetals. Type D has
the most gunmetal examples, as well as a high-tin bronze, and covers all alloy types
including a low-tin bronze (West Heslerton g.143 2BA924AG). The single Type V/Z
florid cruciform in this corpus falls within the zinc bronze cluster. Side-knobs matched
in composition with their associated brooches.
A factor that should be considered when comparing cruciform composition by type is
the difference in physical scale between the early and late forms: “up to ten times more
metal weight was expended to make the latest brooch styles than in the earliest brooch
forms” (Mortimer, 1990, 269). Thus when, as Mortimer (1990, 270) also noted, “the
latest types display a lack of compositional control,” this could be interpreted as the
result of increased variability from the addition of more scrap metal into a single melt.
This could explain the greater variability in zinc seen in type D compared to type B and
C, but not for the variability in the smaller type A brooches.
FIGURE 10.32: TIN AND ZINC CONTENT IN ANALYSED CRUCIFORM BROOCHES BY TYPE.
0
5
10
15
20
25
30
35
0 2 4 6 8 10 12 14
% T
in
% Zinc
AbergI/Mortimer A
AbergII/Mortimer B
AbergIII/Mortimer C
AbergIV/Mortimer D
AbergV/Mortimer Z
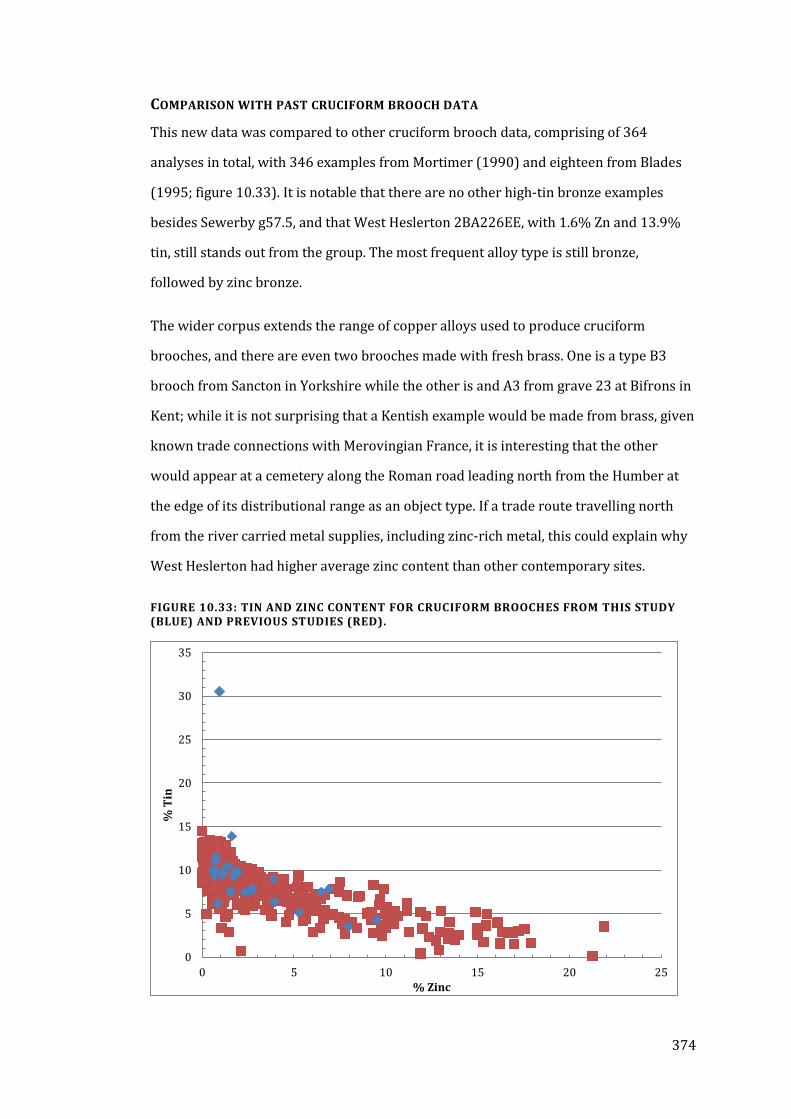
374
COMPARISON WITH PAST CRUCIFORM BROOCH DATA
This new data was compared to other cruciform brooch data, comprising of 364
analyses in total, with 346 examples from Mortimer (1990) and eighteen from Blades
(1995; figure 10.33). It is notable that there are no other high-tin bronze examples
besides Sewerby g57.5, and that West Heslerton 2BA226EE, with 1.6% Zn and 13.9%
tin, still stands out from the group. The most frequent alloy type is still bronze,
followed by zinc bronze.
The wider corpus extends the range of copper alloys used to produce cruciform
brooches, and there are even two brooches made with fresh brass. One is a type B3
brooch from Sancton in Yorkshire while the other is and A3 from grave 23 at Bifrons in
Kent; while it is not surprising that a Kentish example would be made from brass, given
known trade connections with Merovingian France, it is interesting that the other
would appear at a cemetery along the Roman road leading north from the Humber at
the edge of its distributional range as an object type. If a trade route travelling north
from the river carried metal supplies, including zinc-rich metal, this could explain why
West Heslerton had higher average zinc content than other contemporary sites.
FIGURE 10.33: TIN AND ZINC CONTENT FOR CRUCIFORM BROOCHES FROM THIS STUDY (BLUE) AND PREVIOUS STUDIES (RED).
0
5
10
15
20
25
30
35
0 5 10 15 20 25
% T
in
% Zinc
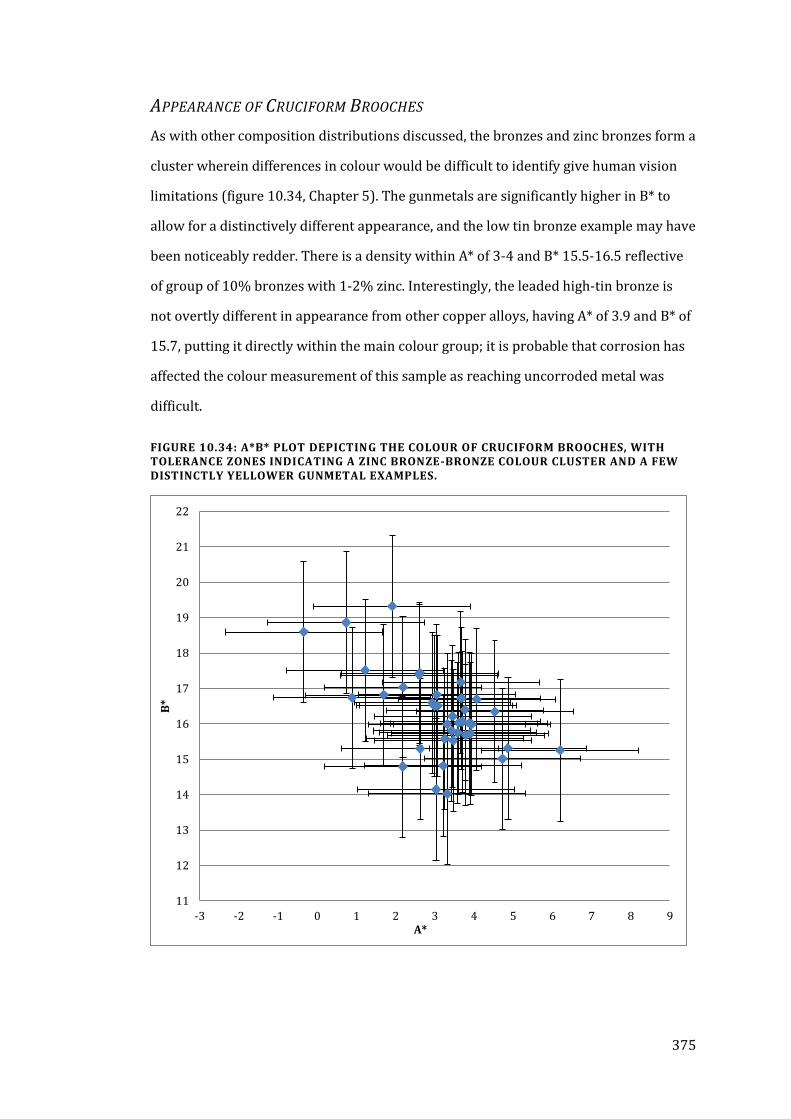
375
APPEARANCE OF CRUCIFORM BROOCHES
As with other composition distributions discussed, the bronzes and zinc bronzes form a
cluster wherein differences in colour would be difficult to identify give human vision
limitations (figure 10.34, Chapter 5). The gunmetals are significantly higher in B* to
allow for a distinctively different appearance, and the low tin bronze example may have
been noticeably redder. There is a density within A* of 3-4 and B* 15.5-16.5 reflective
of group of 10% bronzes with 1-2% zinc. Interestingly, the leaded high-tin bronze is
not overtly different in appearance from other copper alloys, having A* of 3.9 and B* of
15.7, putting it directly within the main colour group; it is probable that corrosion has
affected the colour measurement of this sample as reaching uncorroded metal was
difficult.
FIGURE 10.34: A*B* PLOT DEPICTING THE COLOUR OF CRUCIFORM BROOCHES, WITH TOLERANCE ZONES INDICATING A ZINC BRONZE-BRONZE COLOUR CLUSTER AND A FEW DISTINCTLY YELLOWER GUNMETAL EXAMPLES.
11
12
13
14
15
16
17
18
19
20
21
22
-3 -2 -1 0 1 2 3 4 5 6 7 8 9
B*
A*
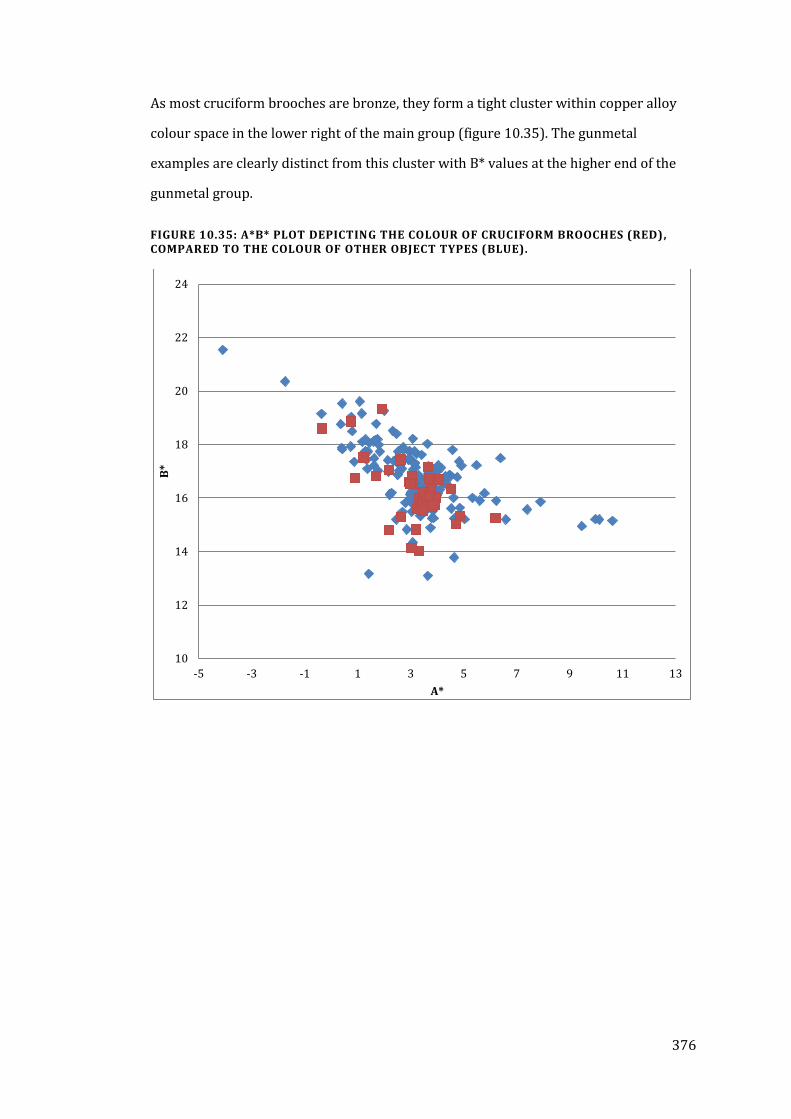
376
As most cruciform brooches are bronze, they form a tight cluster within copper alloy
colour space in the lower right of the main group (figure 10.35). The gunmetal
examples are clearly distinct from this cluster with B* values at the higher end of the
gunmetal group.
FIGURE 10.35: A*B* PLOT DEPICTING THE COLOUR OF CRUCIFORM BROOCHES (RED), COMPARED TO THE COLOUR OF OTHER OBJECT TYPES (BLUE).
10
12
14
16
18
20
22
24
-5 -3 -1 1 3 5 7 9 11 13
B*
A*
377
SMALL-LONG BROOCHES
Small-long brooches are small bow-brooches occurring throughout Anglo-Saxon
England, with a heavier concentration in Anglian regions. “They occur in western
Scandinavia, Holstein, and Friesland, but nowhere do they appear as numerously as in
England, where they even exceed cruciform brooches in number” (Åberg, 1926, 57).
They are in many ways quite similar in form to cruciform brooches, or in some
instances small square-headed brooches, although small-long brooches are
considerably smaller. Vierck notes that, “these brooches constitute groups, which are
only in part typologically independent from the cruciform and great square-headed
groups,” although this connection between brooch types has never been fully explored
(Vierck, 1972, 78).
They consist of a foot, often triangular or spatulate in shape; a bow; and a head-plate,
often rectangular in form but frequently with divisions, “into a centre-piece and wings’
with the ‘wings’ being on either side and above the head-plate, much like the knobs on
cruciform brooches (Åberg, 1926, 57). Despite the similarities in decoration and form,
they are not as well-studied as the larger cruciform brooches and have not been
reclassified since Leeds (1945). Small-long brooches date from the early 5th century
into the early 6th century, but are not well dated; however, they are generally earlier
than many of the other artefact types in this study (Leeds, 1945).
Small-long brooches were usually worn in pairs in a similar manner to annular
brooches, with one on each shoulder. When worn with other brooch types, they often
occur with cruciform brooches (the larger brooches being the central cloak-clasp). The
pair from grave 34 at Cleatham was found with three cruciform brooches, one of which
was overlying one of the small-long brooches, indicating that the small-long brooch
form was used on the underlying dress (Leahy, 2007, 45). There are twelve small-long
brooches in this study; one, worn as a pair with a small cruciform brooch in grave 9 at
Cleatham, was previously analysed by Mortimer (1990). More small-long brooches
were unable to be sampled due to the small surface area accessible on the rear of these
artefacts inhibiting spectrophotometry and ED-XRF access and alignment.
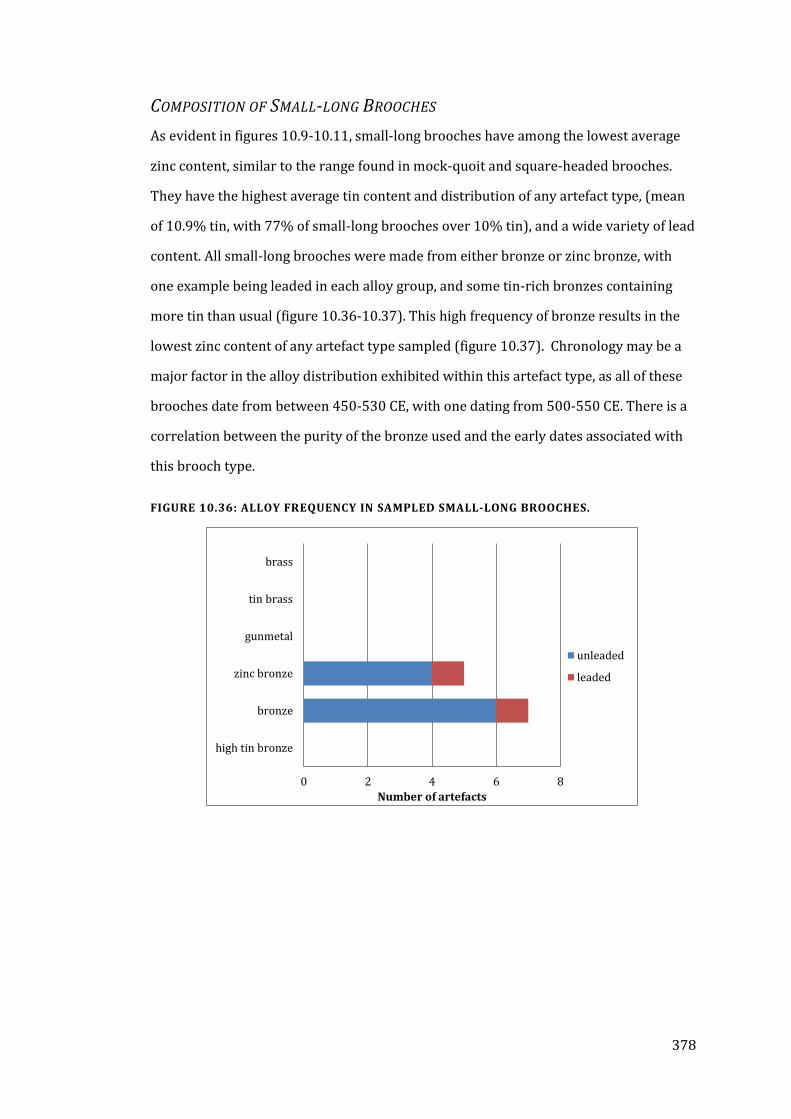
378
COMPOSITION OF SMALL-LONG BROOCHES
As evident in figures 10.9-10.11, small-long brooches have among the lowest average
zinc content, similar to the range found in mock-quoit and square-headed brooches.
They have the highest average tin content and distribution of any artefact type, (mean
of 10.9% tin, with 77% of small-long brooches over 10% tin), and a wide variety of lead
content. All small-long brooches were made from either bronze or zinc bronze, with
one example being leaded in each alloy group, and some tin-rich bronzes containing
more tin than usual (figure 10.36-10.37). This high frequency of bronze results in the
lowest zinc content of any artefact type sampled (figure 10.37). Chronology may be a
major factor in the alloy distribution exhibited within this artefact type, as all of these
brooches date from between 450-530 CE, with one dating from 500-550 CE. There is a
correlation between the purity of the bronze used and the early dates associated with
this brooch type.
FIGURE 10.36: ALLOY FREQUENCY IN SAMPLED SMALL-LONG BROOCHES.
0 2 4 6 8
high tin bronze
bronze
zinc bronze
gunmetal
tin brass
brass
Number of artefacts
unleaded
leaded
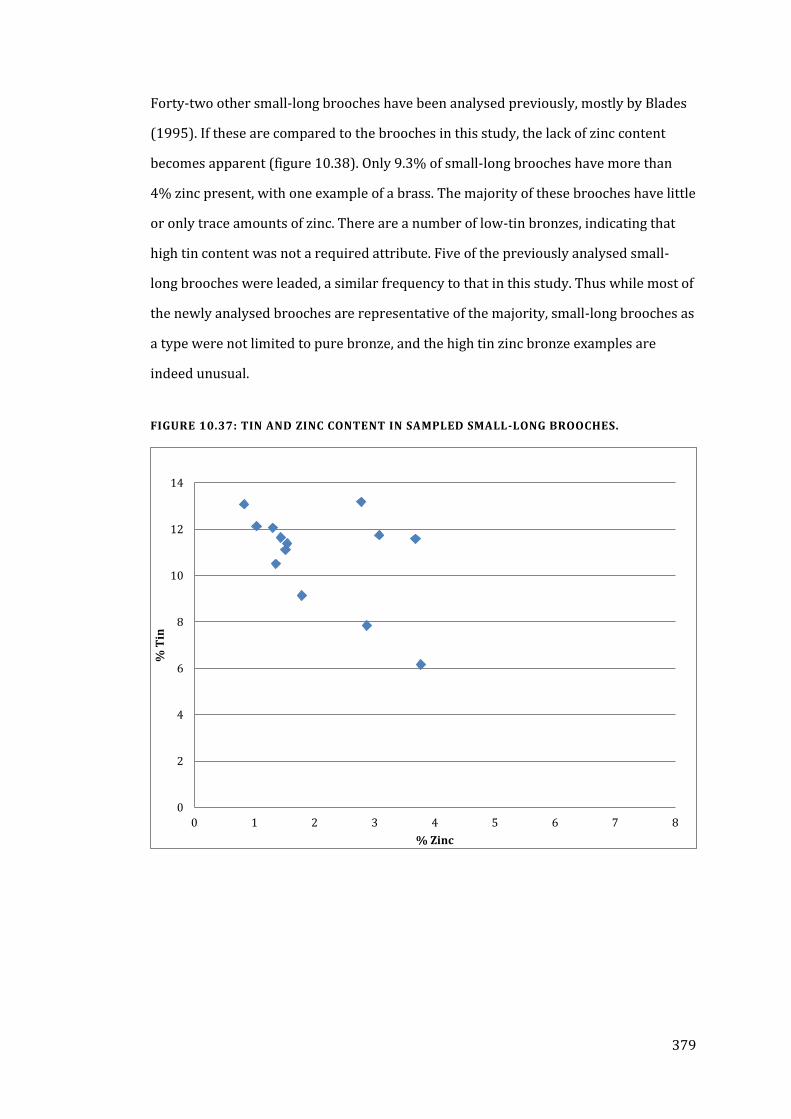
379
Forty-two other small-long brooches have been analysed previously, mostly by Blades
(1995). If these are compared to the brooches in this study, the lack of zinc content
becomes apparent (figure 10.38). Only 9.3% of small-long brooches have more than
4% zinc present, with one example of a brass. The majority of these brooches have little
or only trace amounts of zinc. There are a number of low-tin bronzes, indicating that
high tin content was not a required attribute. Five of the previously analysed small-
long brooches were leaded, a similar frequency to that in this study. Thus while most of
the newly analysed brooches are representative of the majority, small-long brooches as
a type were not limited to pure bronze, and the high tin zinc bronze examples are
indeed unusual.
FIGURE 10.37: TIN AND ZINC CONTENT IN SAMPLED SMALL-LONG BROOCHES.
0
2
4
6
8
10
12
14
0 1 2 3 4 5 6 7 8
% T
in
% Zinc
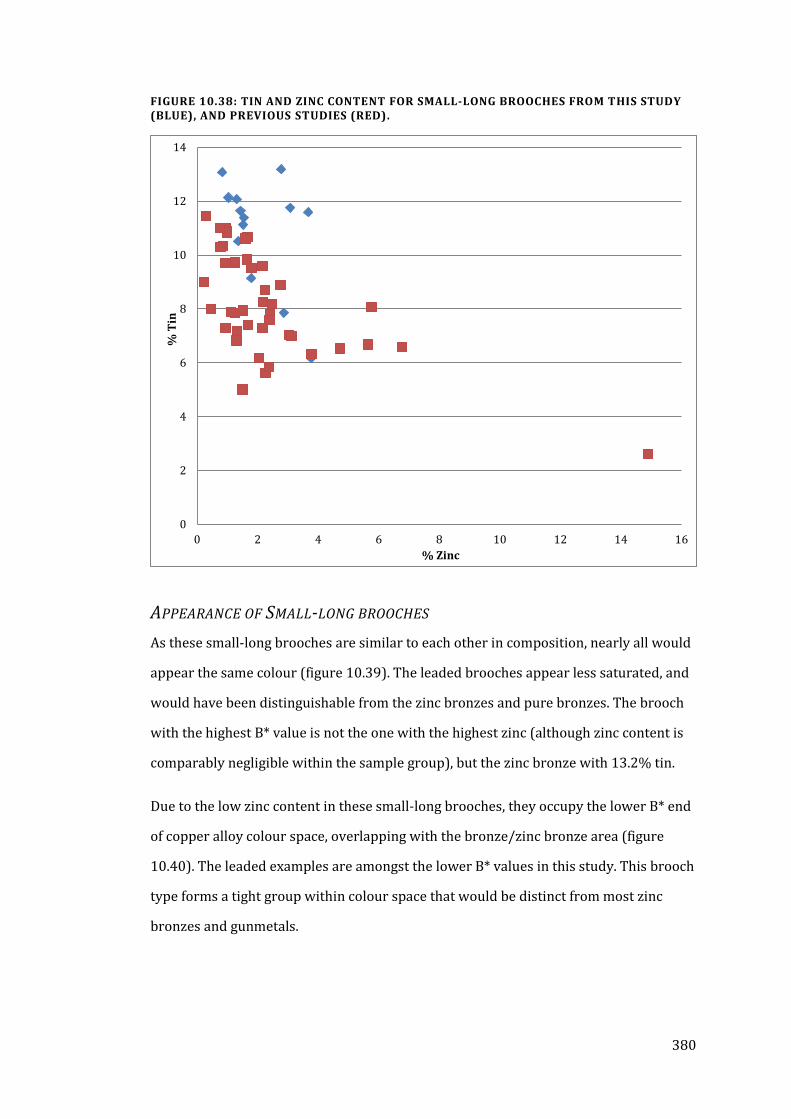
380
FIGURE 10.38: TIN AND ZINC CONTENT FOR SMALL-LONG BROOCHES FROM THIS STUDY (BLUE), AND PREVIOUS STUDIES (RED).
APPEARANCE OF SMALL-LONG BROOCHES
As these small-long brooches are similar to each other in composition, nearly all would
appear the same colour (figure 10.39). The leaded brooches appear less saturated, and
would have been distinguishable from the zinc bronzes and pure bronzes. The brooch
with the highest B* value is not the one with the highest zinc (although zinc content is
comparably negligible within the sample group), but the zinc bronze with 13.2% tin.
Due to the low zinc content in these small-long brooches, they occupy the lower B* end
of copper alloy colour space, overlapping with the bronze/zinc bronze area (figure
10.40). The leaded examples are amongst the lower B* values in this study. This brooch
type forms a tight group within colour space that would be distinct from most zinc
bronzes and gunmetals.
0
2
4
6
8
10
12
14
0 2 4 6 8 10 12 14 16
% T
in
% Zinc
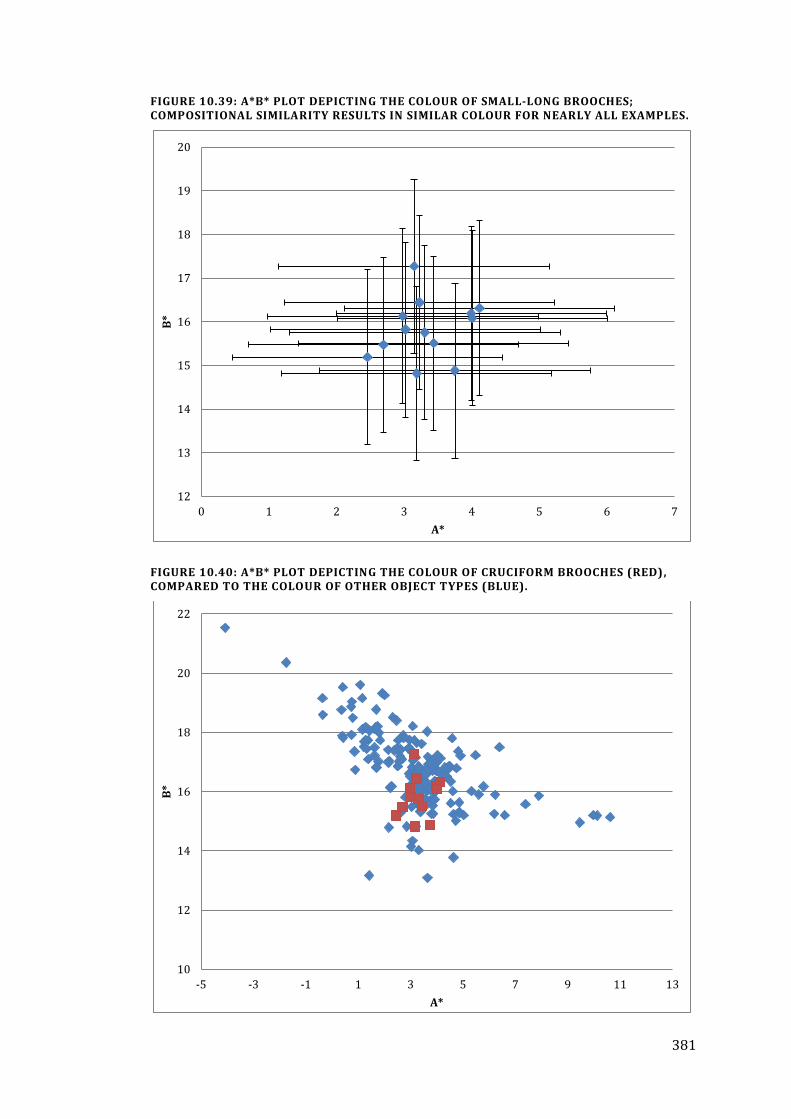
381
FIGURE 10.39: A*B* PLOT DEPICTING THE COLOUR OF SMALL-LONG BROOCHES; COMPOSITIONAL SIMILARITY RESULTS IN SIMILAR COLOUR FOR NEARLY ALL EXAMPLES.
FIGURE 10.40: A*B* PLOT DEPICTING THE COLOUR OF CRUCIFORM BROOCHES (RED), COMPARED TO THE COLOUR OF OTHER OBJECT TYPES (BLUE).
12
13
14
15
16
17
18
19
20
0 1 2 3 4 5 6 7
B*
A*
10
12
14
16
18
20
22
-5 -3 -1 1 3 5 7 9 11 13
B*
A*
382
BUCKLES
Marzinzink’s (2003) typology of buckles has identified that in the early to mid Saxon
period, 70% of buckles were made from iron and 25% from copper alloy, making the
examples analysed in this study a minority in terms of material construction. Buckles
were predominantly worn on belts encircling the waist, though some examples come
from sword or knife straps or even chatelaines (Marzinzik, 2003, 54). Typologically,
buckles can be broken into two main groups, consisting of buckles with belt plates and
those without. Kidney-shaped examples descending from the Roman forms are earliest,
with elaborately decorated plates becoming more frequent in the 5th century
(Marzinzik, 2003, 54). In copper alloy examples, buckle size is large in the 6th century
and tiny in the 7th century, with most late examples only a couple centimeters in loop
and belt plate size, as the belts themselves became thinner.
Buckles from sites such as Mucking and Finglesham feature wire inlays that probably
would have created dramatic colour contrasts (Chapter 4, Finglesham g.25). Many
buckles feature tinning or other surface treatments; they are the only copper alloy
dress accessory commonly worn by men that had this degree of visual display, and
indeed the examples with such decoration are more often found in male burials. As
buckles were often made from iron, these surface treatments and inlays also occur
frequently on iron examples.
The sixteen buckles and one buckle plate in this corpus have the largest chronological
range of the artefact types, with associated dates from the mid 5th-late 7th century. They
are the only artefact type sampled that is regularly found in male graves, with seven
from male graves, eight from female graves, and two from unsexed individuals. The age
of individuals buried with buckles ranges from juveniles to older mature adults; it is an
artefact type used ubiquitously within the population. Buckles were sampled from five
of the six sites; eight from Castledyke, three each from Sewerby and West Heslerton,
and one from Cleatham and Fonaby, with the Fonaby example including a belt plate.
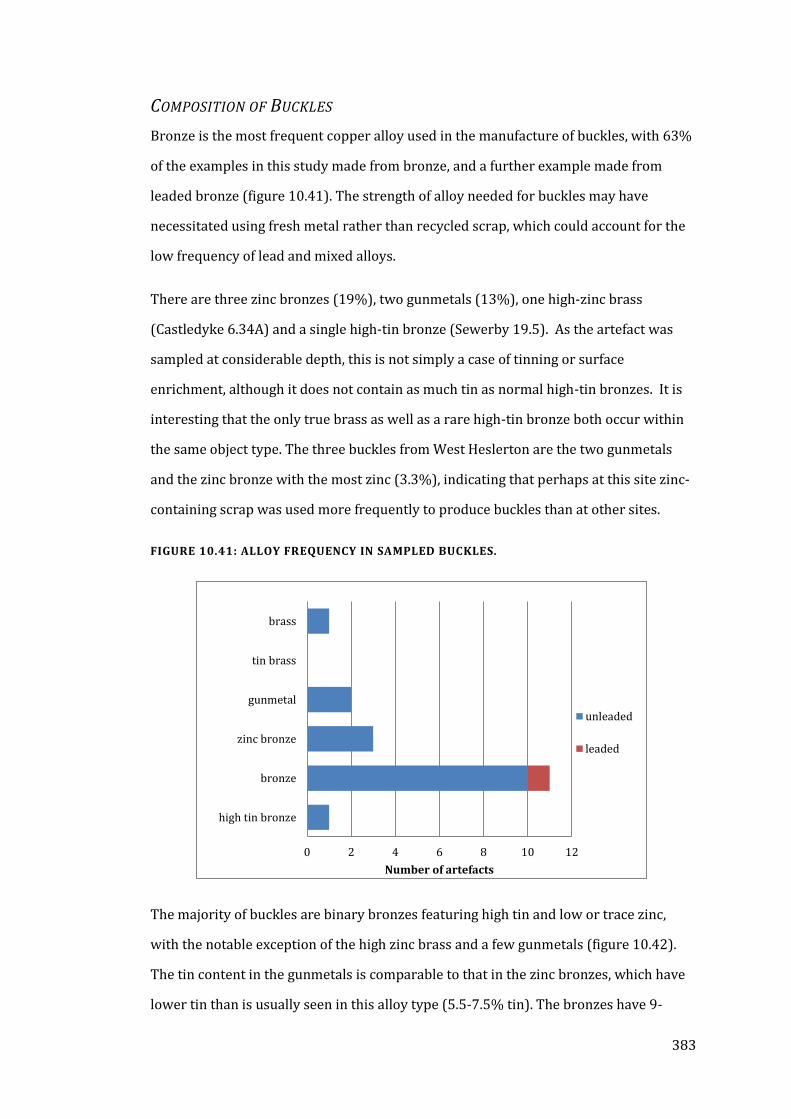
383
COMPOSITION OF BUCKLES
Bronze is the most frequent copper alloy used in the manufacture of buckles, with 63%
of the examples in this study made from bronze, and a further example made from
leaded bronze (figure 10.41). The strength of alloy needed for buckles may have
necessitated using fresh metal rather than recycled scrap, which could account for the
low frequency of lead and mixed alloys.
There are three zinc bronzes (19%), two gunmetals (13%), one high-zinc brass
(Castledyke 6.34A) and a single high-tin bronze (Sewerby 19.5). As the artefact was
sampled at considerable depth, this is not simply a case of tinning or surface
enrichment, although it does not contain as much tin as normal high-tin bronzes. It is
interesting that the only true brass as well as a rare high-tin bronze both occur within
the same object type. The three buckles from West Heslerton are the two gunmetals
and the zinc bronze with the most zinc (3.3%), indicating that perhaps at this site zinc-
containing scrap was used more frequently to produce buckles than at other sites.
FIGURE 10.41: ALLOY FREQUENCY IN SAMPLED BUCKLES.
The majority of buckles are binary bronzes featuring high tin and low or trace zinc,
with the notable exception of the high zinc brass and a few gunmetals (figure 10.42).
The tin content in the gunmetals is comparable to that in the zinc bronzes, which have
lower tin than is usually seen in this alloy type (5.5-7.5% tin). The bronzes have 9-
0 2 4 6 8 10 12
high tin bronze
bronze
zinc bronze
gunmetal
tin brass
brass
Number of artefacts
unleaded
leaded
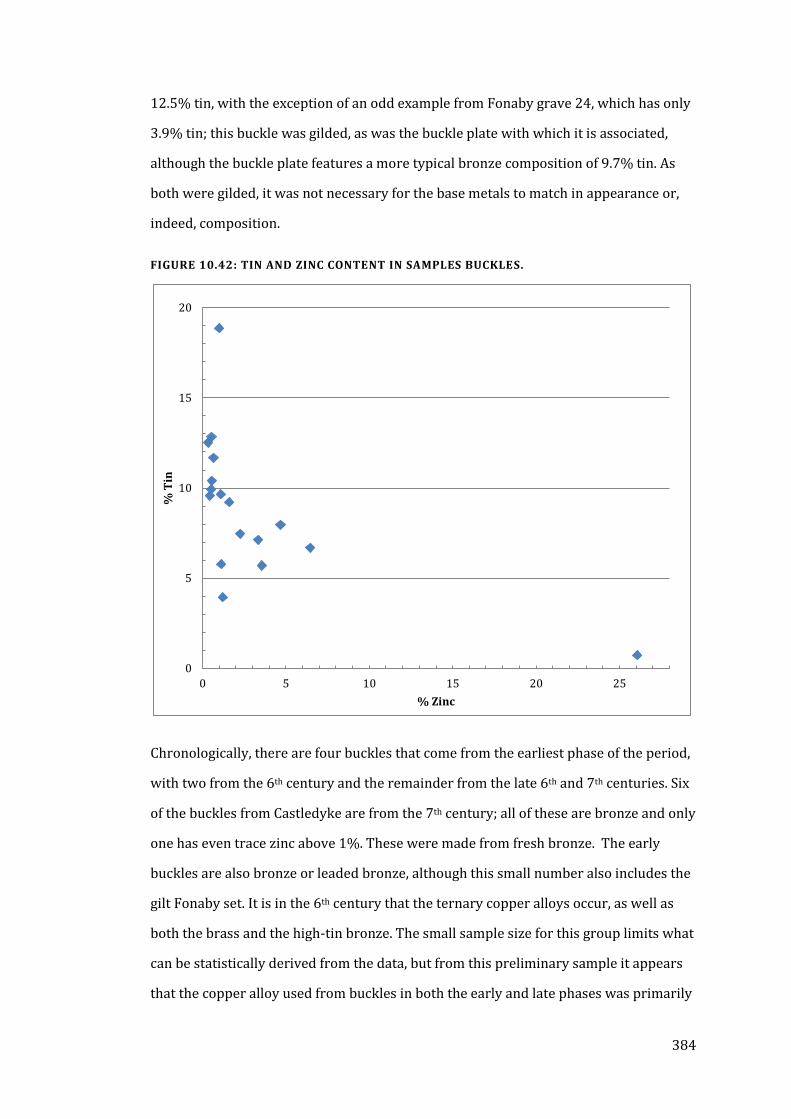
384
12.5% tin, with the exception of an odd example from Fonaby grave 24, which has only
3.9% tin; this buckle was gilded, as was the buckle plate with which it is associated,
although the buckle plate features a more typical bronze composition of 9.7% tin. As
both were gilded, it was not necessary for the base metals to match in appearance or,
indeed, composition.
FIGURE 10.42: TIN AND ZINC CONTENT IN SAMPLES BUCKLES.
Chronologically, there are four buckles that come from the earliest phase of the period,
with two from the 6th century and the remainder from the late 6th and 7th centuries. Six
of the buckles from Castledyke are from the 7th century; all of these are bronze and only
one has even trace zinc above 1%. These were made from fresh bronze. The early
buckles are also bronze or leaded bronze, although this small number also includes the
gilt Fonaby set. It is in the 6th century that the ternary copper alloys occur, as well as
both the brass and the high-tin bronze. The small sample size for this group limits what
can be statistically derived from the data, but from this preliminary sample it appears
that the copper alloy used from buckles in both the early and late phases was primarily
0
5
10
15
20
0 5 10 15 20 25
% T
in
% Zinc
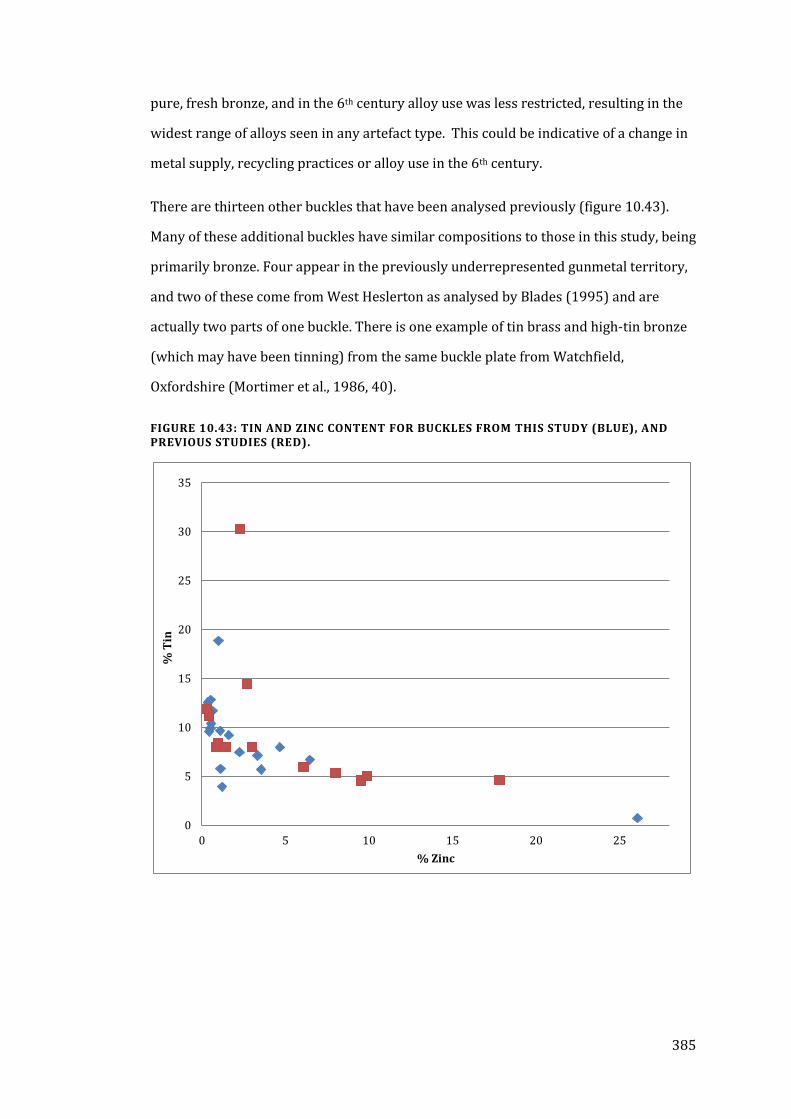
385
pure, fresh bronze, and in the 6th century alloy use was less restricted, resulting in the
widest range of alloys seen in any artefact type. This could be indicative of a change in
metal supply, recycling practices or alloy use in the 6th century.
There are thirteen other buckles that have been analysed previously (figure 10.43).
Many of these additional buckles have similar compositions to those in this study, being
primarily bronze. Four appear in the previously underrepresented gunmetal territory,
and two of these come from West Heslerton as analysed by Blades (1995) and are
actually two parts of one buckle. There is one example of tin brass and high-tin bronze
(which may have been tinning) from the same buckle plate from Watchfield,
Oxfordshire (Mortimer et al., 1986, 40).
FIGURE 10.43: TIN AND ZINC CONTENT FOR BUCKLES FROM THIS STUDY (BLUE), AND PREVIOUS STUDIES (RED).
0
5
10
15
20
25
30
35
0 5 10 15 20 25
% T
in
% Zinc
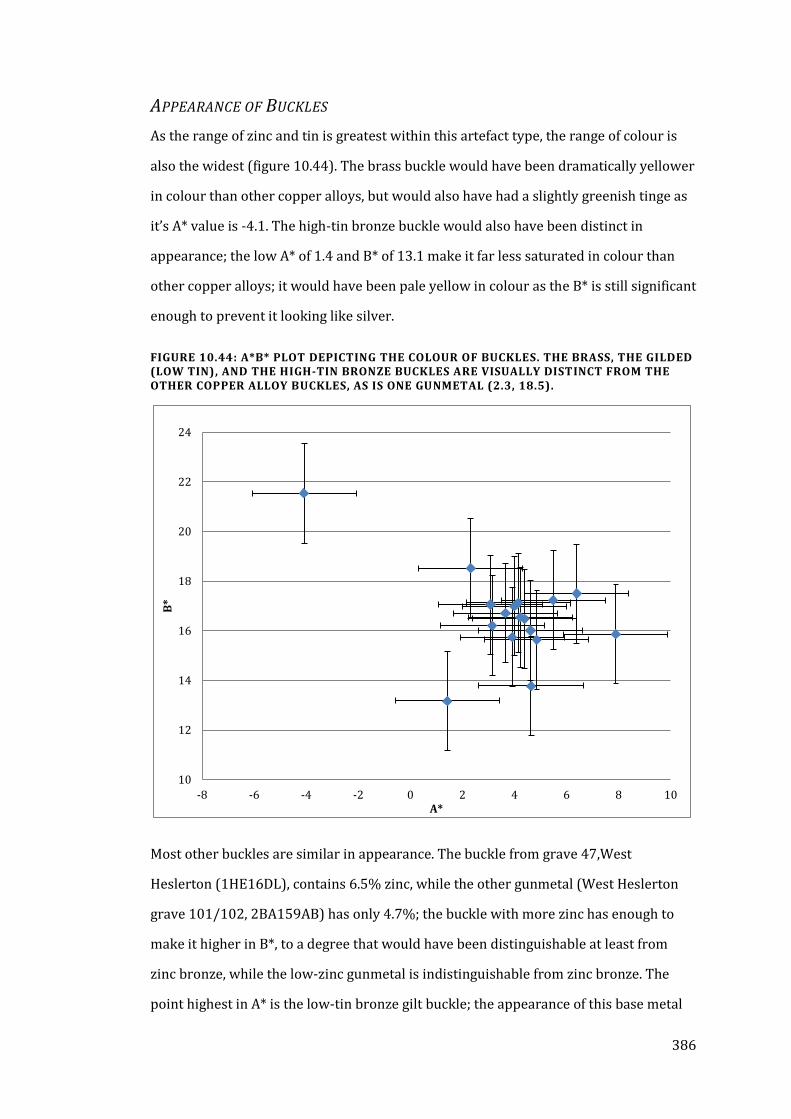
386
APPEARANCE OF BUCKLES
As the range of zinc and tin is greatest within this artefact type, the range of colour is
also the widest (figure 10.44). The brass buckle would have been dramatically yellower
in colour than other copper alloys, but would also have had a slightly greenish tinge as
it’s A* value is -4.1. The high-tin bronze buckle would also have been distinct in
appearance; the low A* of 1.4 and B* of 13.1 make it far less saturated in colour than
other copper alloys; it would have been pale yellow in colour as the B* is still significant
enough to prevent it looking like silver.
FIGURE 10.44: A*B* PLOT DEPICTING THE COLOUR OF BUCKLES. THE BRASS, THE GILDED (LOW TIN), AND THE HIGH-TIN BRONZE BUCKLES ARE VISUALLY DISTINCT FROM THE OTHER COPPER ALLOY BUCKLES, AS IS ONE GUNMETAL (2.3, 18.5).
Most other buckles are similar in appearance. The buckle from grave 47,West
Heslerton (1HE16DL), contains 6.5% zinc, while the other gunmetal (West Heslerton
grave 101/102, 2BA159AB) has only 4.7%; the buckle with more zinc has enough to
make it higher in B*, to a degree that would have been distinguishable at least from
zinc bronze, while the low-zinc gunmetal is indistinguishable from zinc bronze. The
point highest in A* is the low-tin bronze gilt buckle; the appearance of this base metal
10
12
14
16
18
20
22
24
-8 -6 -4 -2 0 2 4 6 8 10
B*
A*
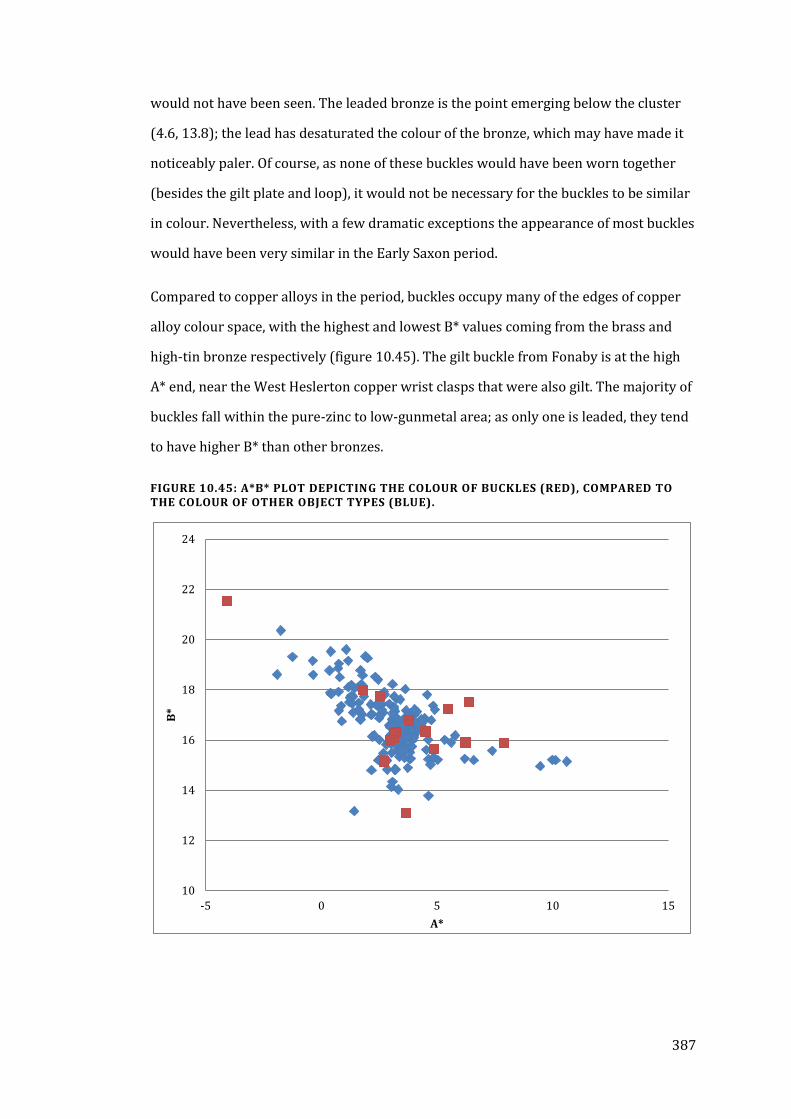
387
would not have been seen. The leaded bronze is the point emerging below the cluster
(4.6, 13.8); the lead has desaturated the colour of the bronze, which may have made it
noticeably paler. Of course, as none of these buckles would have been worn together
(besides the gilt plate and loop), it would not be necessary for the buckles to be similar
in colour. Nevertheless, with a few dramatic exceptions the appearance of most buckles
would have been very similar in the Early Saxon period.
Compared to copper alloys in the period, buckles occupy many of the edges of copper
alloy colour space, with the highest and lowest B* values coming from the brass and
high-tin bronze respectively (figure 10.45). The gilt buckle from Fonaby is at the high
A* end, near the West Heslerton copper wrist clasps that were also gilt. The majority of
buckles fall within the pure-zinc to low-gunmetal area; as only one is leaded, they tend
to have higher B* than other bronzes.
FIGURE 10.45: A*B* PLOT DEPICTING THE COLOUR OF BUCKLES (RED), COMPARED TO THE COLOUR OF OTHER OBJECT TYPES (BLUE).
10
12
14
16
18
20
22
24
-5 0 5 10 15
B*
A*
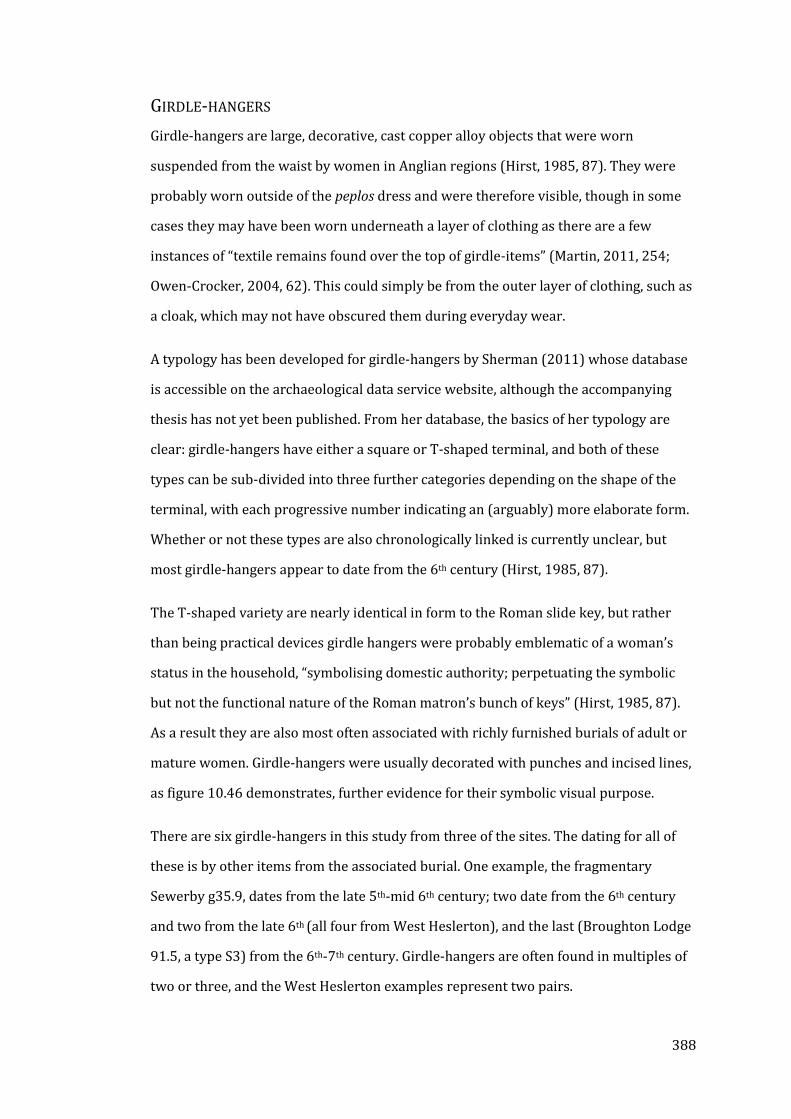
388
GIRDLE-HANGERS
Girdle-hangers are large, decorative, cast copper alloy objects that were worn
suspended from the waist by women in Anglian regions (Hirst, 1985, 87). They were
probably worn outside of the peplos dress and were therefore visible, though in some
cases they may have been worn underneath a layer of clothing as there are a few
instances of “textile remains found over the top of girdle-items” (Martin, 2011, 254;
Owen-Crocker, 2004, 62). This could simply be from the outer layer of clothing, such as
a cloak, which may not have obscured them during everyday wear.
A typology has been developed for girdle-hangers by Sherman (2011) whose database
is accessible on the archaeological data service website, although the accompanying
thesis has not yet been published. From her database, the basics of her typology are
clear: girdle-hangers have either a square or T-shaped terminal, and both of these
types can be sub-divided into three further categories depending on the shape of the
terminal, with each progressive number indicating an (arguably) more elaborate form.
Whether or not these types are also chronologically linked is currently unclear, but
most girdle-hangers appear to date from the 6th century (Hirst, 1985, 87).
The T-shaped variety are nearly identical in form to the Roman slide key, but rather
than being practical devices girdle hangers were probably emblematic of a woman’s
status in the household, “symbolising domestic authority; perpetuating the symbolic
but not the functional nature of the Roman matron’s bunch of keys” (Hirst, 1985, 87).
As a result they are also most often associated with richly furnished burials of adult or
mature women. Girdle-hangers were usually decorated with punches and incised lines,
as figure 10.46 demonstrates, further evidence for their symbolic visual purpose.
There are six girdle-hangers in this study from three of the sites. The dating for all of
these is by other items from the associated burial. One example, the fragmentary
Sewerby g35.9, dates from the late 5th-mid 6th century; two date from the 6th century
and two from the late 6th (all four from West Heslerton), and the last (Broughton Lodge
91.5, a type S3) from the 6th-7th century. Girdle-hangers are often found in multiples of
two or three, and the West Heslerton examples represent two pairs.
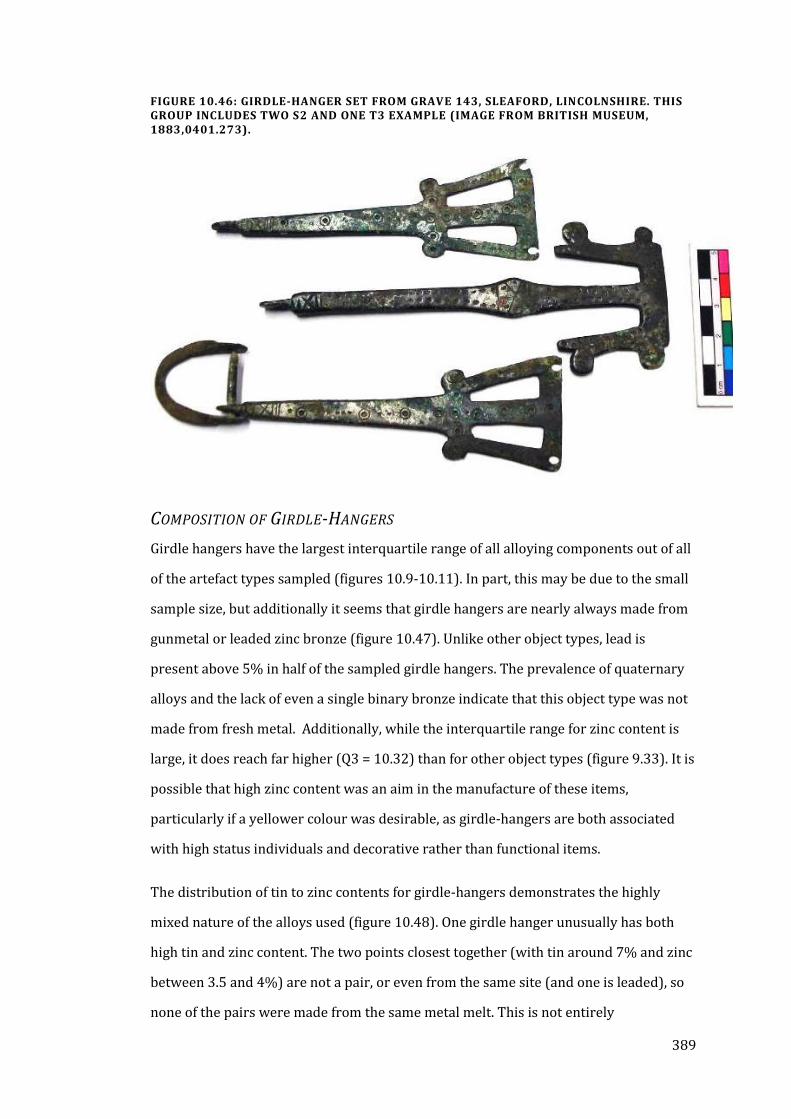
389
FIGURE 10.46: GIRDLE-HANGER SET FROM GRAVE 143, SLEAFORD, LINCOLNSHIRE. THIS GROUP INCLUDES TWO S2 AND ONE T3 EXAMPLE (IMAGE FROM BRITISH MUSEUM, 1883,0401.273).
COMPOSITION OF GIRDLE-HANGERS
Girdle hangers have the largest interquartile range of all alloying components out of all
of the artefact types sampled (figures 10.9-10.11). In part, this may be due to the small
sample size, but additionally it seems that girdle hangers are nearly always made from
gunmetal or leaded zinc bronze (figure 10.47). Unlike other object types, lead is
present above 5% in half of the sampled girdle hangers. The prevalence of quaternary
alloys and the lack of even a single binary bronze indicate that this object type was not
made from fresh metal. Additionally, while the interquartile range for zinc content is
large, it does reach far higher (Q3 = 10.32) than for other object types (figure 9.33). It is
possible that high zinc content was an aim in the manufacture of these items,
particularly if a yellower colour was desirable, as girdle-hangers are both associated
with high status individuals and decorative rather than functional items.
The distribution of tin to zinc contents for girdle-hangers demonstrates the highly
mixed nature of the alloys used (figure 10.48). One girdle hanger unusually has both
high tin and zinc content. The two points closest together (with tin around 7% and zinc
between 3.5 and 4%) are not a pair, or even from the same site (and one is leaded), so
none of the pairs were made from the same metal melt. This is not entirely
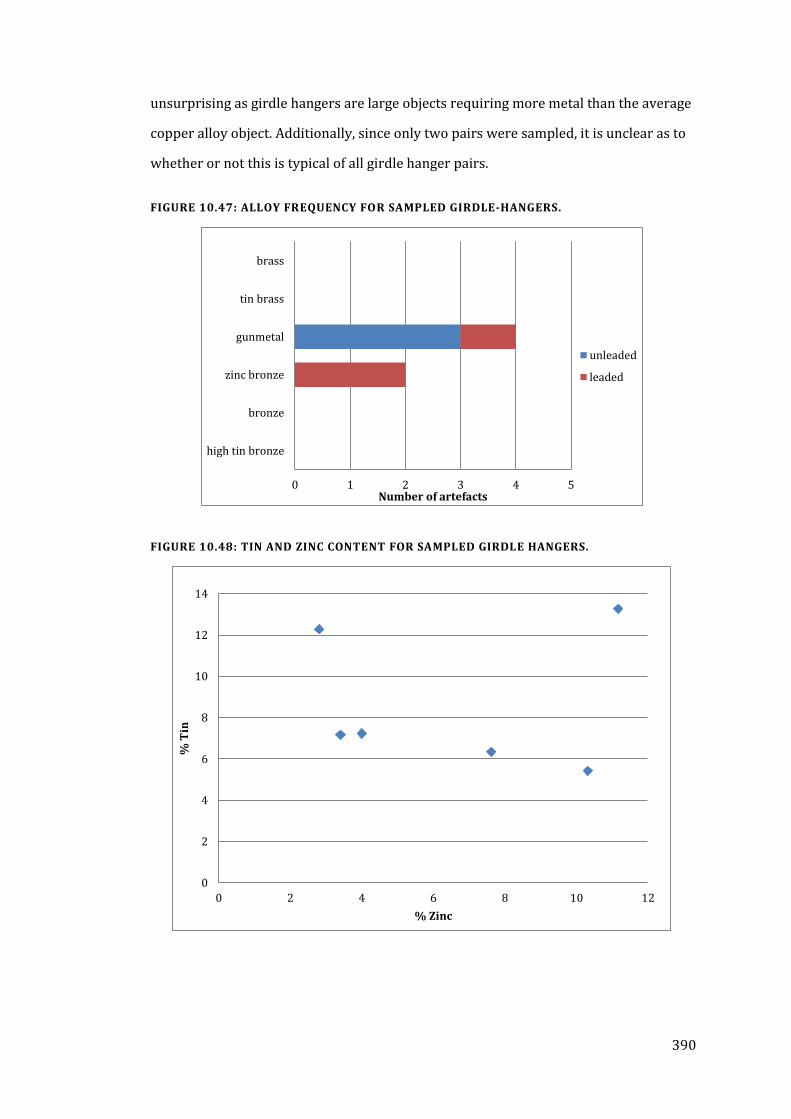
390
unsurprising as girdle hangers are large objects requiring more metal than the average
copper alloy object. Additionally, since only two pairs were sampled, it is unclear as to
whether or not this is typical of all girdle hanger pairs.
FIGURE 10.47: ALLOY FREQUENCY FOR SAMPLED GIRDLE-HANGERS.
FIGURE 10.48: TIN AND ZINC CONTENT FOR SAMPLED GIRDLE HANGERS.
0 1 2 3 4 5
high tin bronze
bronze
zinc bronze
gunmetal
tin brass
brass
Number of artefacts
unleaded
leaded
0
2
4
6
8
10
12
14
0 2 4 6 8 10 12
% T
in
% Zinc
391
There are nineteen other girdle-hangers analysed previously by Blades (1995). As
demonstrated in figure 10.49, girdle-hangers usually contain between 4 and 8.5% tin,
and with one exception have more than 2% zinc. Zinc bronze is more frequent as an
alloy throughout the type, but the use of pure bronze is still significantly below the
period average and this could reflect deliberate use of zinc-rich alloys for this specific
object type.
FIGURE 10.49: TIN AND ZINC CONTENT FOR GIRDLE-HANGERS FROM THIS STUDY (BLUE) AND FROM PREVIOUS STUDIES (RED).
0
2
4
6
8
10
12
14
0 2 4 6 8 10 12
% T
in
% Zinc
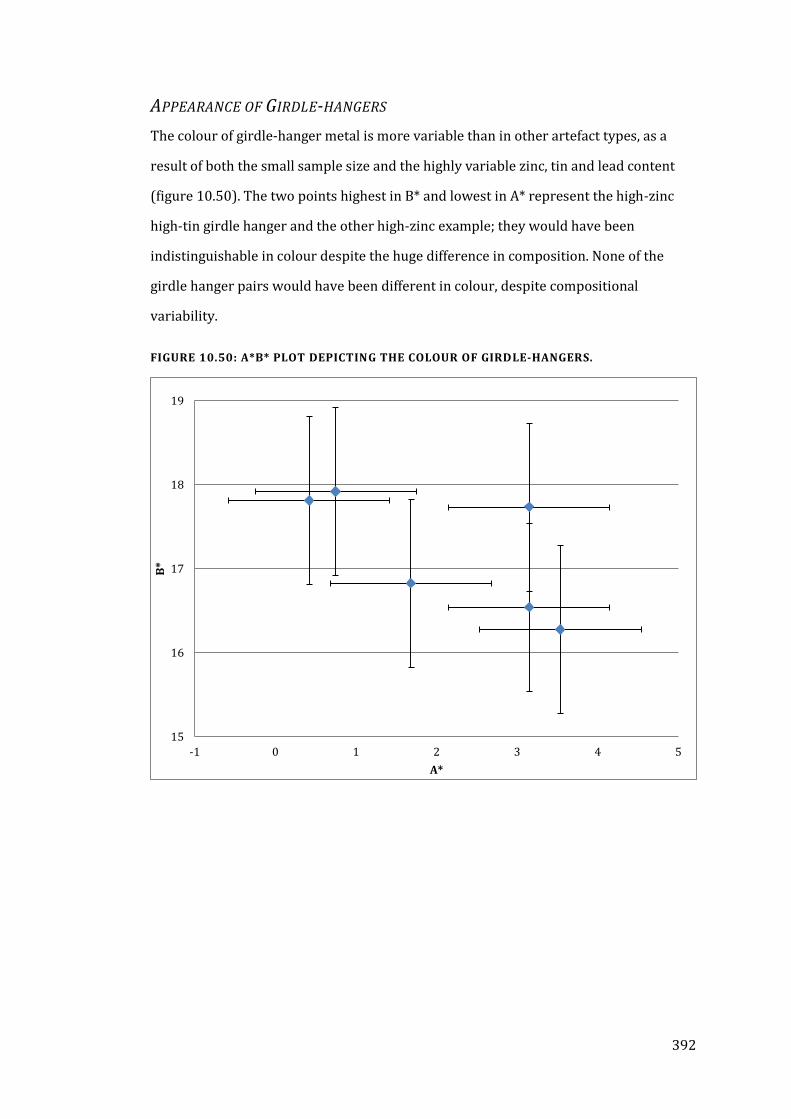
392
APPEARANCE OF GIRDLE-HANGERS
The colour of girdle-hanger metal is more variable than in other artefact types, as a
result of both the small sample size and the highly variable zinc, tin and lead content
(figure 10.50). The two points highest in B* and lowest in A* represent the high-zinc
high-tin girdle hanger and the other high-zinc example; they would have been
indistinguishable in colour despite the huge difference in composition. None of the
girdle hanger pairs would have been different in colour, despite compositional
variability.
FIGURE 10.50: A*B* PLOT DEPICTING THE COLOUR OF GIRDLE-HANGERS.
15
16
17
18
19
-1 0 1 2 3 4 5
B*
A*
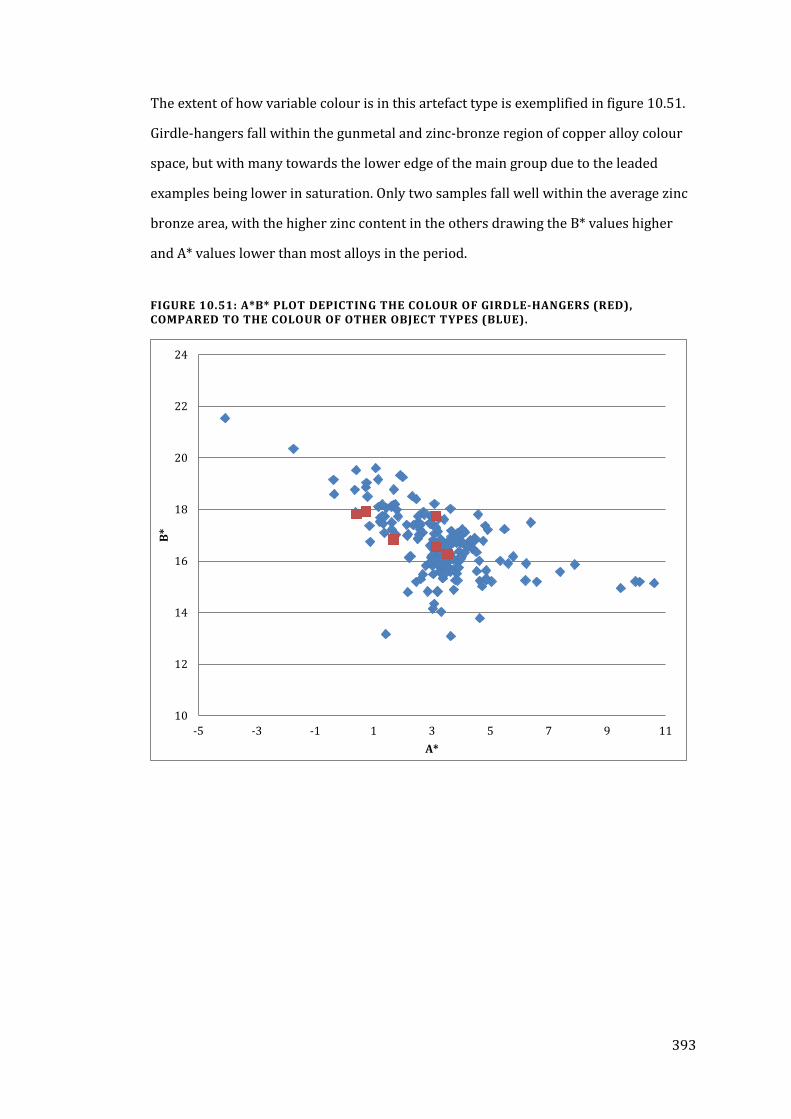
393
The extent of how variable colour is in this artefact type is exemplified in figure 10.51.
Girdle-hangers fall within the gunmetal and zinc-bronze region of copper alloy colour
space, but with many towards the lower edge of the main group due to the leaded
examples being lower in saturation. Only two samples fall well within the average zinc
bronze area, with the higher zinc content in the others drawing the B* values higher
and A* values lower than most alloys in the period.
FIGURE 10.51: A*B* PLOT DEPICTING THE COLOUR OF GIRDLE-HANGERS (RED), COMPARED TO THE COLOUR OF OTHER OBJECT TYPES (BLUE).
10
12
14
16
18
20
22
24
-5 -3 -1 1 3 5 7 9 11
B*
A*
394
WRIST CLASPS
Wrist clasps, or sleeve clasps, are metal hooks sewn or fastened onto the bottom of
sleeves to secure open ends together, much like buttons or cufflinks on modern shirts
(Jessup, 1974, 67). They are found throughout the late Roman to Early Medieval
periods in Anglo-Scandinavian regions, are made from silver or copper alloy and are
occasionally gilt or tinned (Hines, 1993, 2). While wrist clasps were worn on male and
female dress in Scandinavia, they are a female-specific dress accessory in Britain
(Haughton and Powlesland, 1999, 105). The earliest clasps, Hines class A, consist of
spirals of wire with hook or loop at the center. The most common and variable form,
Hines class B, are, “formed of one or more of three basic elements, a plate, buttons or a
bar” (Hines, 1993, 2). Class C are cast ornate clasps and are later in date, from after 550
until the 7th century (Leeds 1945, 61).
A number of wrist clasp forms were included in this study: thirty-nine samples from
class B and one example of class C (Fonaby g.36.5). Three of the Castledyke samples
come from B7 or B7a clasps, a type made from thin sheet with embossed dot
decoration, which may have been in use in the late 5th century but usually are dated to
the 6th century almost entirely in English contexts (Hines, 1993, 41). A single B15
sample, also from Castledyke, is similar to B7 in form but with no decoration, and as a
type dates to the 6th century. A pair of B13c clasps from Castledyke, consisting of a thin
copper alloy plate with a repoussé decorative panel soldered on top, also dates to the
6th century. As B7, B13 and B15 forms are quite thin corrosion may have a detrimental
effect on the composition and colour data. One B13 and one B15 are likely slightly tin-
enriched from decuprification (Castledyke 163.763 and 187.186).
There are six examples of B12 clasps in this study (though four of these samples come
from the same set), a type entirely consisting of copper alloy examples and having the
form of a cast bar with projecting lugs along the outer sides, which often are perforated
to enable the clasps to be sewn onto clothing. B12 clasps are occasionally gilt or
silvered and date from the late 5th to the mid 6th century (Hines, 1993, 47).
395
The most numerous clasp forms in this study are B18c and B20, which have fourteen
and thirteen examples respectively, although the B18c examples derive from only four
graves and the B20 from six (both halves of both pairs were sampled for most, or one
from each pair). B18 clasps are larger cast bars with, “a row of conjoined knobs along
the rear edge,” and often feature surface coatings or Style I decoration, making them a
more elaborate form than most other wrist clasp types (Hines, 1993, 59). The examples
in this study date from the early-mid 6th century. Finally, B20 clasps date from the late
5th-6th centuries and consist of a plate and raised bar cast together.
Eleven graves containing wrist clasps had more than one clasp analysed, allowing for
numerous paired objects to be examined. Additionally, examples from four graves from
West Heslerton had both halves of both pairs analysed. Due to the related nature of the
sampled artefacts, more grouping is to be expected in the compositional, typological
and colour data.
COMPOSITION OF WRIST CLASPS
As demonstrated in figure 10.52, most wrist clasps analysed were gunmetal, with zinc
bronze also occurring frequently. Bronze wrist clasps were infrequent but often leaded.
The gilt copper wrist clasp set adds copper to the alloy groups, and demonstrates how
much this data can be biased by the inclusion of several data points from parts of
essentially one artefact. If matching pairs and sets are counted as a single occurrence of
that alloy type (only when the composition for parts matches), the alloy frequency
within wrist clasps is different (figure 10.53). Not all sets or even pairs were made from
the same copper alloy type, but the total included in this revised alloy frequency is
reduced to n=25.
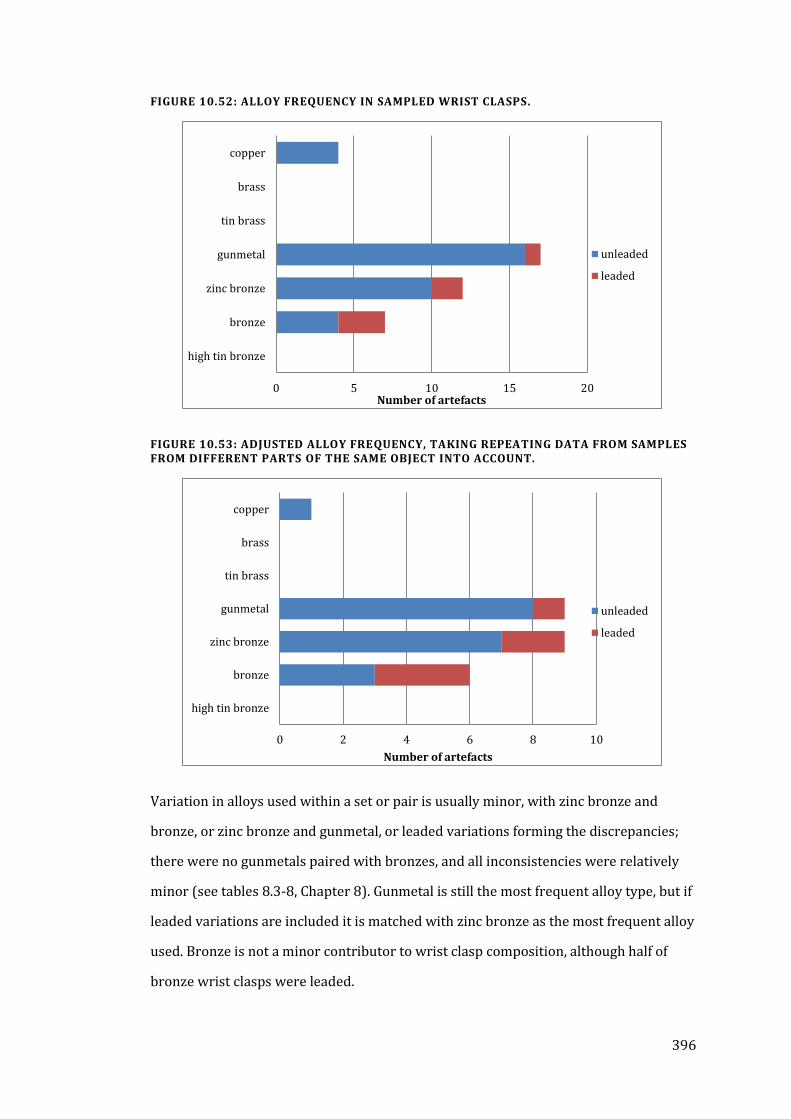
396
FIGURE 10.52: ALLOY FREQUENCY IN SAMPLED WRIST CLASPS.
FIGURE 10.53: ADJUSTED ALLOY FREQUENCY, TAKING REPEATING DATA FROM SAMPLES FROM DIFFERENT PARTS OF THE SAME OBJECT INTO ACCOUNT.
Variation in alloys used within a set or pair is usually minor, with zinc bronze and
bronze, or zinc bronze and gunmetal, or leaded variations forming the discrepancies;
there were no gunmetals paired with bronzes, and all inconsistencies were relatively
minor (see tables 8.3-8, Chapter 8). Gunmetal is still the most frequent alloy type, but if
leaded variations are included it is matched with zinc bronze as the most frequent alloy
used. Bronze is not a minor contributor to wrist clasp composition, although half of
bronze wrist clasps were leaded.
0 5 10 15 20
high tin bronze
bronze
zinc bronze
gunmetal
tin brass
brass
copper
Number of artefacts
unleaded
leaded
0 2 4 6 8 10
high tin bronze
bronze
zinc bronze
gunmetal
tin brass
brass
copper
Number of artefacts
unleaded
leaded
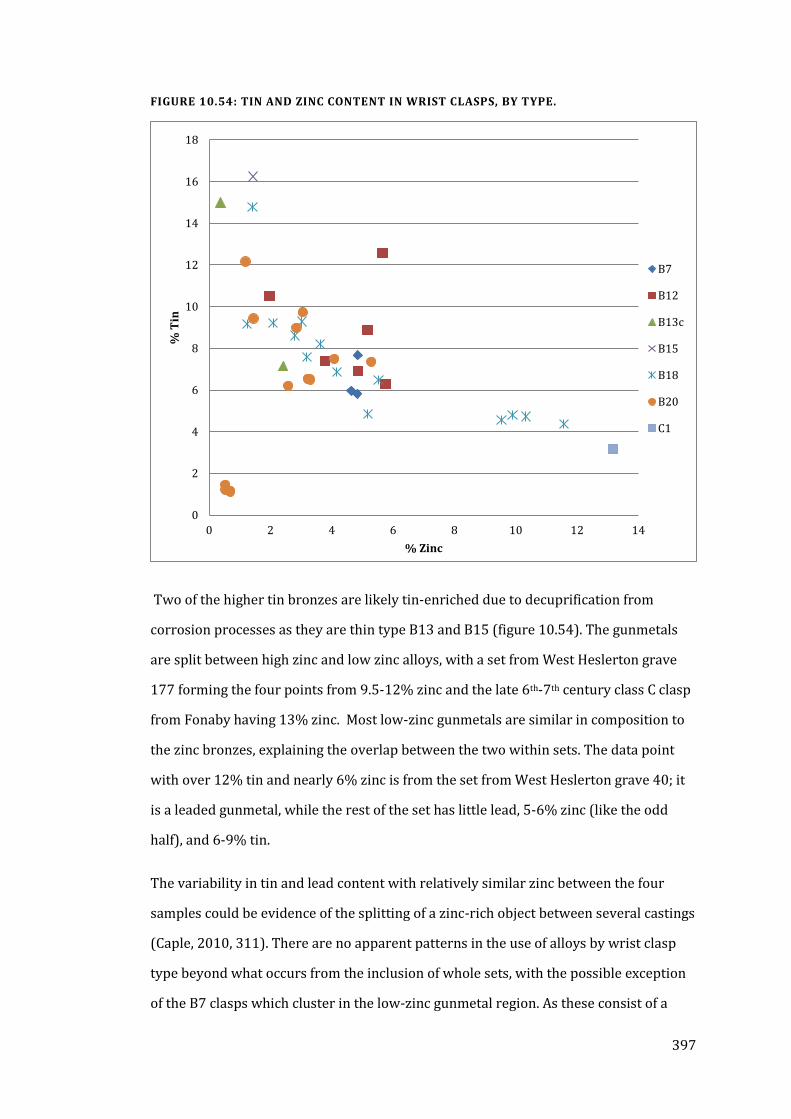
397
FIGURE 10.54: TIN AND ZINC CONTENT IN WRIST CLASPS, BY TYPE.
Two of the higher tin bronzes are likely tin-enriched due to decuprification from
corrosion processes as they are thin type B13 and B15 (figure 10.54). The gunmetals
are split between high zinc and low zinc alloys, with a set from West Heslerton grave
177 forming the four points from 9.5-12% zinc and the late 6th-7th century class C clasp
from Fonaby having 13% zinc. Most low-zinc gunmetals are similar in composition to
the zinc bronzes, explaining the overlap between the two within sets. The data point
with over 12% tin and nearly 6% zinc is from the set from West Heslerton grave 40; it
is a leaded gunmetal, while the rest of the set has little lead, 5-6% zinc (like the odd
half), and 6-9% tin.
The variability in tin and lead content with relatively similar zinc between the four
samples could be evidence of the splitting of a zinc-rich object between several castings
(Caple, 2010, 311). There are no apparent patterns in the use of alloys by wrist clasp
type beyond what occurs from the inclusion of whole sets, with the possible exception
of the B7 clasps which cluster in the low-zinc gunmetal region. As these consist of a
0
2
4
6
8
10
12
14
16
18
0 2 4 6 8 10 12 14
% T
in
% Zinc
B7
B12
B13c
B15
B18
B20
C1
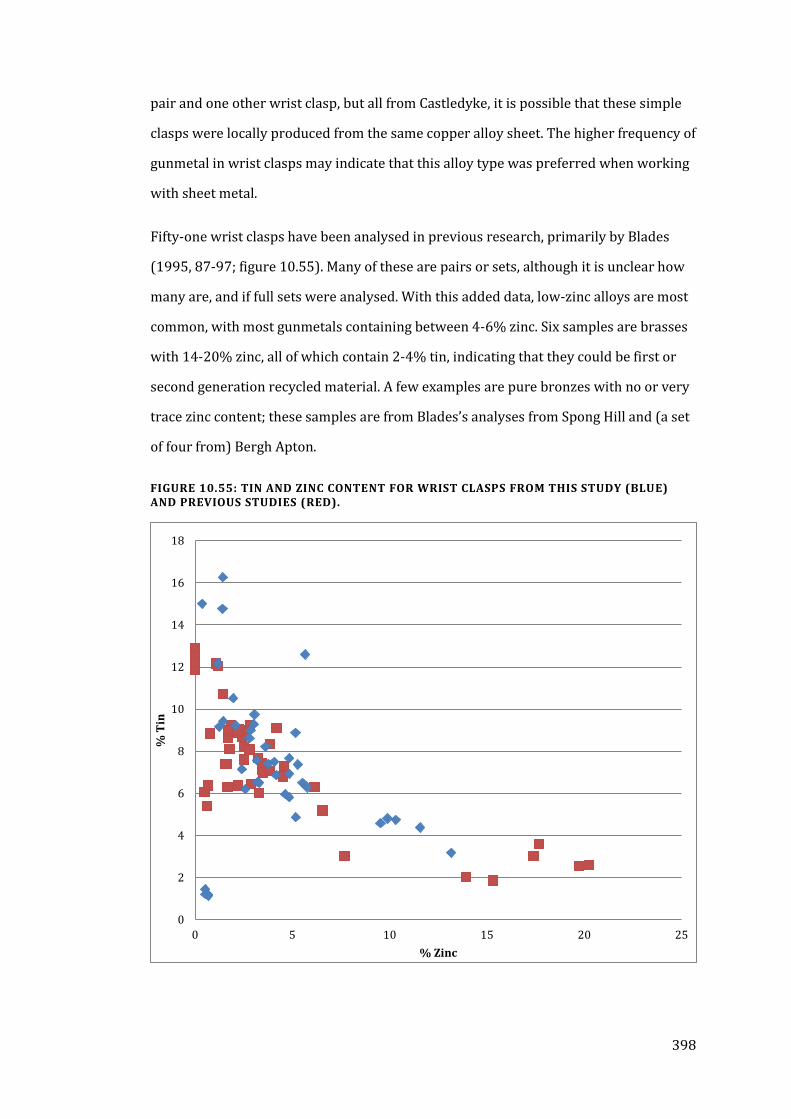
398
pair and one other wrist clasp, but all from Castledyke, it is possible that these simple
clasps were locally produced from the same copper alloy sheet. The higher frequency of
gunmetal in wrist clasps may indicate that this alloy type was preferred when working
with sheet metal.
Fifty-one wrist clasps have been analysed in previous research, primarily by Blades
(1995, 87-97; figure 10.55). Many of these are pairs or sets, although it is unclear how
many are, and if full sets were analysed. With this added data, low-zinc alloys are most
common, with most gunmetals containing between 4-6% zinc. Six samples are brasses
with 14-20% zinc, all of which contain 2-4% tin, indicating that they could be first or
second generation recycled material. A few examples are pure bronzes with no or very
trace zinc content; these samples are from Blades’s analyses from Spong Hill and (a set
of four from) Bergh Apton.
FIGURE 10.55: TIN AND ZINC CONTENT FOR WRIST CLASPS FROM THIS STUDY (BLUE) AND PREVIOUS STUDIES (RED).
0
2
4
6
8
10
12
14
16
18
0 5 10 15 20 25
% T
in
% Zinc
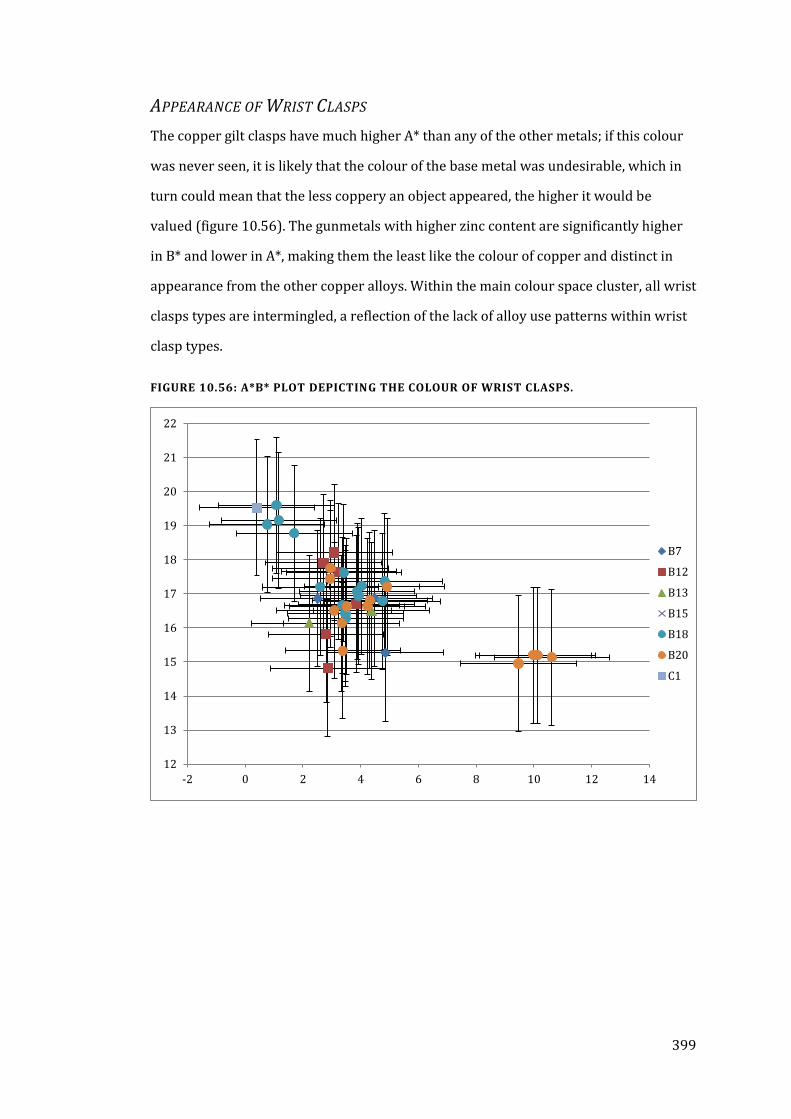
399
APPEARANCE OF WRIST CLASPS
The copper gilt clasps have much higher A* than any of the other metals; if this colour
was never seen, it is likely that the colour of the base metal was undesirable, which in
turn could mean that the less coppery an object appeared, the higher it would be
valued (figure 10.56). The gunmetals with higher zinc content are significantly higher
in B* and lower in A*, making them the least like the colour of copper and distinct in
appearance from the other copper alloys. Within the main colour space cluster, all wrist
clasps types are intermingled, a reflection of the lack of alloy use patterns within wrist
clasp types.
FIGURE 10.56: A*B* PLOT DEPICTING THE COLOUR OF WRIST CLASPS.
12
13
14
15
16
17
18
19
20
21
22
-2 0 2 4 6 8 10 12 14
B7
B12
B13
B15
B18
B20
C1
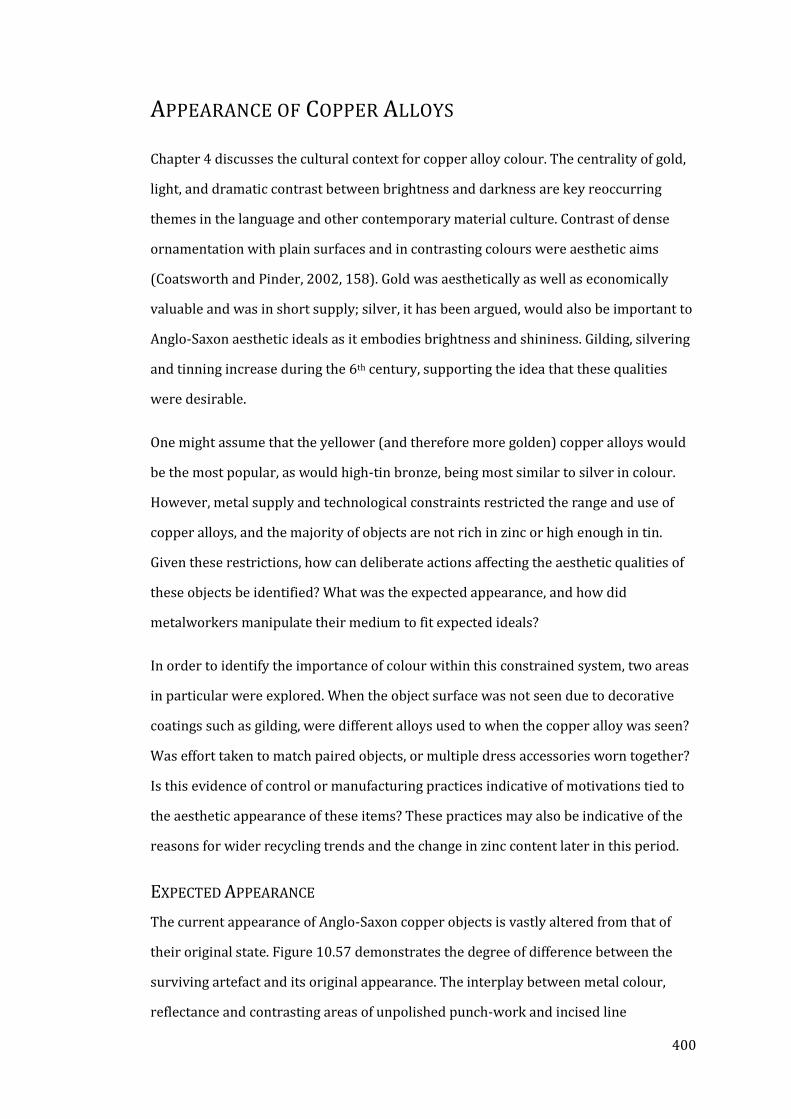
400
APPEARANCE OF COPPER ALLOYS
Chapter 4 discusses the cultural context for copper alloy colour. The centrality of gold,
light, and dramatic contrast between brightness and darkness are key reoccurring
themes in the language and other contemporary material culture. Contrast of dense
ornamentation with plain surfaces and in contrasting colours were aesthetic aims
(Coatsworth and Pinder, 2002, 158). Gold was aesthetically as well as economically
valuable and was in short supply; silver, it has been argued, would also be important to
Anglo-Saxon aesthetic ideals as it embodies brightness and shininess. Gilding, silvering
and tinning increase during the 6th century, supporting the idea that these qualities
were desirable.
One might assume that the yellower (and therefore more golden) copper alloys would
be the most popular, as would high-tin bronze, being most similar to silver in colour.
However, metal supply and technological constraints restricted the range and use of
copper alloys, and the majority of objects are not rich in zinc or high enough in tin.
Given these restrictions, how can deliberate actions affecting the aesthetic qualities of
these objects be identified? What was the expected appearance, and how did
metalworkers manipulate their medium to fit expected ideals?
In order to identify the importance of colour within this constrained system, two areas
in particular were explored. When the object surface was not seen due to decorative
coatings such as gilding, were different alloys used to when the copper alloy was seen?
Was effort taken to match paired objects, or multiple dress accessories worn together?
Is this evidence of control or manufacturing practices indicative of motivations tied to
the aesthetic appearance of these items? These practices may also be indicative of the
reasons for wider recycling trends and the change in zinc content later in this period.
EXPECTED APPEARANCE
The current appearance of Anglo-Saxon copper objects is vastly altered from that of
their original state. Figure 10.57 demonstrates the degree of difference between the
surviving artefact and its original appearance. The interplay between metal colour,
reflectance and contrasting areas of unpolished punch-work and incised line
401
decoration fulfil several aesthetic values within the Anglo-Saxon colour scheme.
Yellowness and brightness, shining light and dull, contrasting darkness, all could be
embodied even on the simplest of copper alloy dress items.
FIGURE 10.57: WRIST CLASP REPRODUCTION BY DANEGELD DARK AGE AND MEDIEVAL JEWELLERY, 4 X 3.5 CM (DANEGELD.CO.UK) AND A HINES 18D WRIST CLASP FROM THE PORTABLE ANTIQUITIES SCHEME FROM SUFFOLK; 3.2 X 3.5 CM AS SET (SF-225425).
These qualities of light and colour associations with gold and silver occur more
obviously where metal supply makes this possible.
The importance of appearance as opposed to actual metal content in this period is clear form the occurrence of copper alloys which are deliberately alloyed to produce gold-like or silver-like materials (e.g. the use of brass and high-tin bronze in the buckles from Watchfield) (Mortimer, 1988, 233).
The most exemplary grave goods featuring these alloys are those of the possible smith
(grave 67, Watchfield). The range of alloys found in the objects from this grave include
several gunmetals with more than 10% zinc as well as several possible high-tin bronze
decorative studs, which may rather have been tinned. The tinned or high-tin belt studs
were inlayed with high zinc gunmetal, thus yellow metal inlayed in white metal, an
effort that could only have been aesthetic and an attempt to mimic the colours of gold
and silver (Mortimer et al., 1986, 40). It is notable that the zinc-rich alloy utilised in this
402
golden-silvery imitation is not brass; either a higher zinc alloy was not available or 10-
15% zinc is sufficiently golden, a definite possibility given later brass gold imitations
such as Pinchbeck (Thornton, 2000).
As metal supply was limited, however, so were the opportunities to create such colour
combinations. The high prevalence of recycled copper alloys resulted in the majority of
objects being quite similar in colour. A significant discrepancy in compositions between
objects, particularly in zinc content, would be necessary to result in noticeably different
appearances. Since 5-10% zinc content is sufficient to produce a reasonably golden
appearance in modern copper alloys, this could explain the high frequency of mixing
gunmetals with other alloys and the slight increase in zinc usage by the 7th century
(Chapters 5 and 6; Tottle, 1984). As gunmetals are often indistinguishable from zinc
bronze, perhaps the majority of copper alloys fit the perceived golden aesthetic, which
could explain why there are fewer pure bronzes in the middle and later phases.
Jewellery in general became more ostentatious in the 6th century, with artefacts such as
great square-headed brooches featuring gilding and silver plating as well as
occasionally enamel, garnet inlay and niello (Hinton, 2005, 33). As discussed in Chapter
4, enamels in this period were limited in distribution and predominantly red in colour,
produced as a possible by-product of copper alloy recycling (Stapleton et al., 1999,
919). Copper alloy supply does not seem to alter significantly throughout the period,
and yet brooches become bigger, requiring more metal (Hines, 1997; Mortimer, 1990,
269). “The contrast with the restricted style range and more technically-advanced
Norwegian production is a powerful reason to state that in Anglian England, the
primary interest seems to have been in the appearance of the brooch, not the manner
in which it was manufactured” (Mortimer, 1990, 434). Thus in Scandinavia, when
brooches became bigger they also became thinner, while in England this was not a
concern. The largest brooches continued to be made in a wide variety of alloys with
only slight alterations, despite the widespread use of gilding and silver plating on the
largest types. Metal supply was therefore not so limited as to necessitate the thinner
large brooch forms developed in Scandinavia, but perhaps the conspicuous use of metal
in itself was a symbol of status. The simplest solution was certainly not always taken in
403
Anglo-Saxon metalwork production, but this need not be a symptom of technological
simplicity.
UNIQUENESS
A common theme in all forms of copper alloy jewellery in the Early Anglo-Saxon period
is the seemingly determined avoidance of exactly duplicating objects. “Identical
artefacts… do not exist during this period” (Mortimer, 1990, 207). A subtle lack of
symmetry or even a deliberate asymmetry persists in all instances. It is a peculiarly
Anglo-Saxon concept, to create variation in similar objects for the sake of disrupting the
pattern or adding a enigma to the decorative motif. Leigh (1984, 34-40) notes that
square-headed brooch decoration incorporates human masks that when rotated
become animal masks, forming ‘visual riddles’ and that:
…this ambiguity would exactly mirror what we know of the poetic tradition, which relies so heavily on literary devices conveying multiple meanings, such as metaphors, kennings and riddles. The identification of this trait in not just one, but two, the two major surviving art forms points to an underlying characteristic of early Anglo-Saxon thinking.
Even ‘identical’ paired objects consistently feature a slight variation in patterning,
alignment or shape, despite the obvious skill of metalworkers in this period to produce
highly refined and complicated patterns, many of which were cast presumably using
the same initial model (figures 10.58-10.60).
This aversion to exact duplication went beyond simple issues of control and care in
decoration of objects (Rosenblitt, 2005). “An apparent determination to avoid exact
reduplication of brooches means that the brooch-makers did not produce brooches by
the simplest means” (Hines, 1997, 211). Part of these variations did originate from
using separate castings, but if the same model were used to make each mould then
these should be more negligible than is seen. Variation between pairs could be a result
of slight damage to the model when removed from the first clay impression, but this
still does not fully account for the observed differences(Coatsworth and Pinder, 2002,
77); most instances “involve an insertion, addition or active change of pattern”
(Rosenblitt, 2005, 110). Even with the simpler objects such as type G annular brooches,
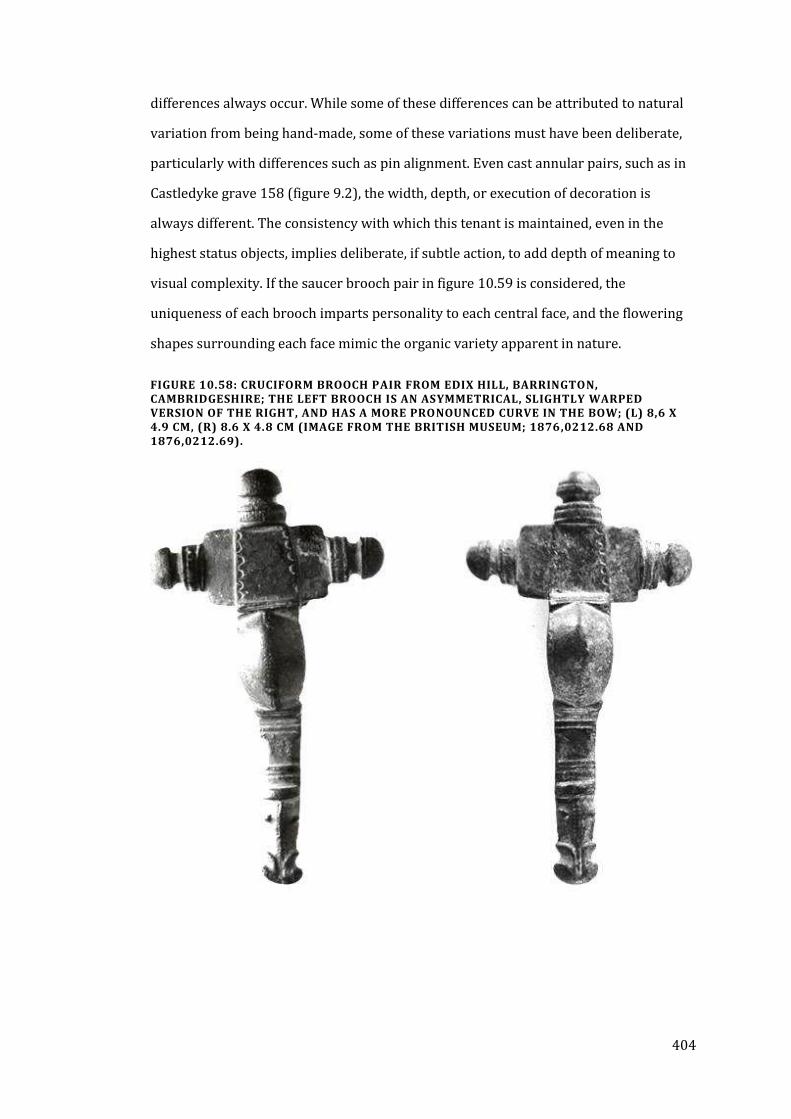
404
differences always occur. While some of these differences can be attributed to natural
variation from being hand-made, some of these variations must have been deliberate,
particularly with differences such as pin alignment. Even cast annular pairs, such as in
Castledyke grave 158 (figure 9.2), the width, depth, or execution of decoration is
always different. The consistency with which this tenant is maintained, even in the
highest status objects, implies deliberate, if subtle action, to add depth of meaning to
visual complexity. If the saucer brooch pair in figure 10.59 is considered, the
uniqueness of each brooch imparts personality to each central face, and the flowering
shapes surrounding each face mimic the organic variety apparent in nature.
FIGURE 10.58: CRUCIFORM BROOCH PAIR FROM EDIX HILL, BARRINGTON, CAMBRIDGESHIRE; THE LEFT BROOCH IS AN ASYMMETRICAL, SLIGHTLY WARPED VERSION OF THE RIGHT, AND HAS A MORE PRONOUNCED CURVE IN THE BOW; (L) 8,6 X 4.9 CM, (R) 8.6 X 4.8 CM (IMAGE FROM THE BRITISH MUSEUM; 1876,0212.68 AND 1876,0212.69).
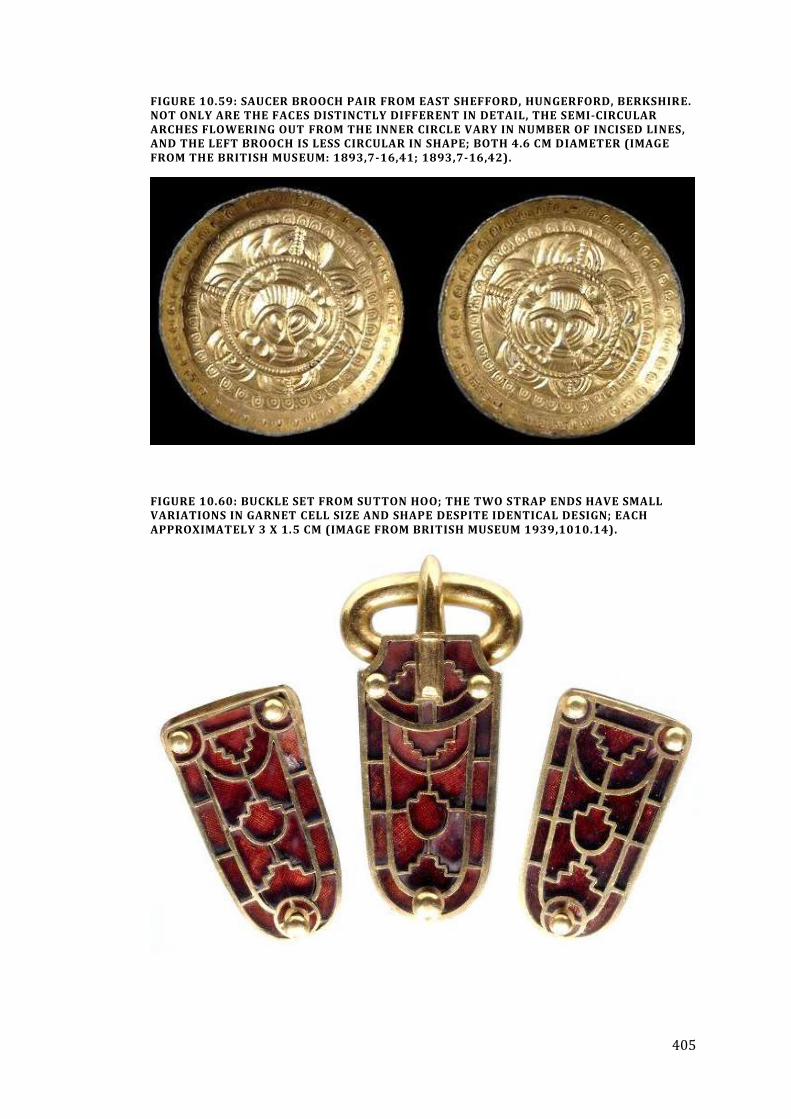
405
FIGURE 10.59: SAUCER BROOCH PAIR FROM EAST SHEFFORD, HUNGERFORD, BERKSHIRE. NOT ONLY ARE THE FACES DISTINCTLY DIFFERENT IN DETAIL, THE SEMI-CIRCULAR ARCHES FLOWERING OUT FROM THE INNER CIRCLE VARY IN NUMBER OF INCISED LINES, AND THE LEFT BROOCH IS LESS CIRCULAR IN SHAPE; BOTH 4.6 CM DIAMETER (IMAGE FROM THE BRITISH MUSEUM: 1893,7-16,41; 1893,7-16,42).
FIGURE 10.60: BUCKLE SET FROM SUTTON HOO; THE TWO STRAP ENDS HAVE SMALL VARIATIONS IN GARNET CELL SIZE AND SHAPE DESPITE IDENTICAL DESIGN; EACH APPROXIMATELY 3 X 1.5 CM (IMAGE FROM BRITISH MUSEUM 1939,1010.14).
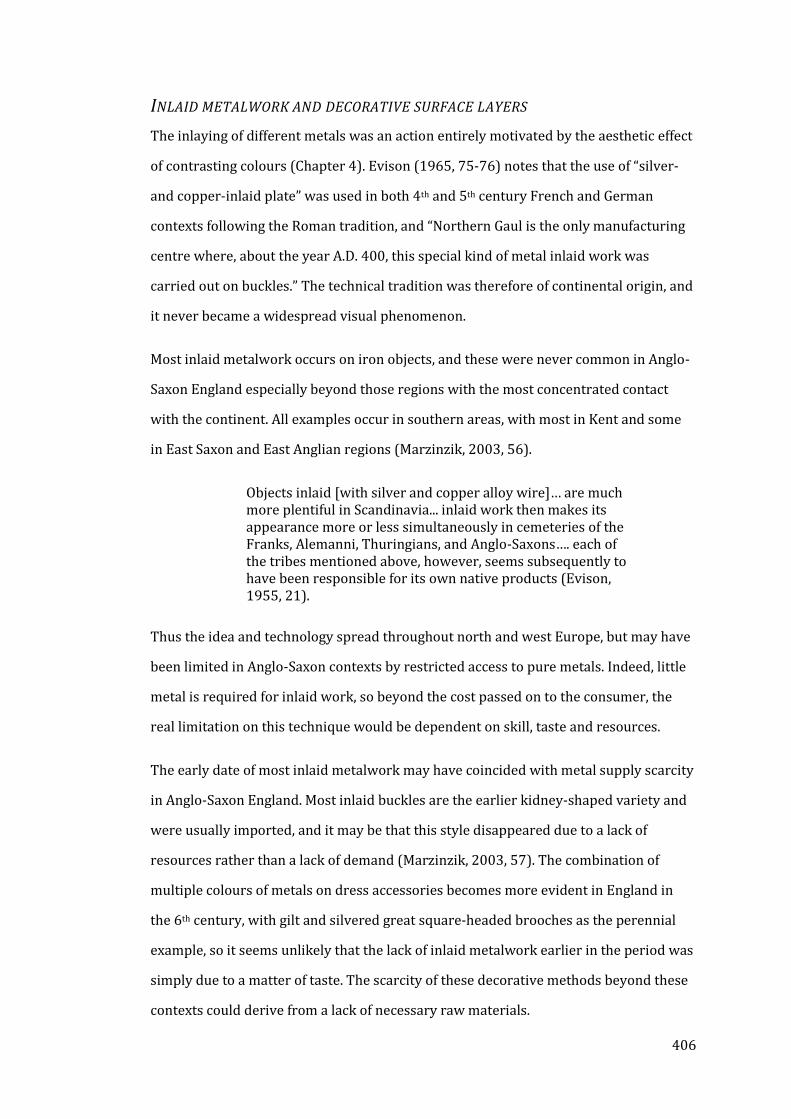
406
INLAID METALWORK AND DECORATIVE SURFACE LAYERS
The inlaying of different metals was an action entirely motivated by the aesthetic effect
of contrasting colours (Chapter 4). Evison (1965, 75-76) notes that the use of “silver-
and copper-inlaid plate” was used in both 4th and 5th century French and German
contexts following the Roman tradition, and “Northern Gaul is the only manufacturing
centre where, about the year A.D. 400, this special kind of metal inlaid work was
carried out on buckles.” The technical tradition was therefore of continental origin, and
it never became a widespread visual phenomenon.
Most inlaid metalwork occurs on iron objects, and these were never common in Anglo-
Saxon England especially beyond those regions with the most concentrated contact
with the continent. All examples occur in southern areas, with most in Kent and some
in East Saxon and East Anglian regions (Marzinzik, 2003, 56).
Objects inlaid [with silver and copper alloy wire]… are much more plentiful in Scandinavia... inlaid work then makes its appearance more or less simultaneously in cemeteries of the Franks, Alemanni, Thuringians, and Anglo-Saxons…. each of the tribes mentioned above, however, seems subsequently to have been responsible for its own native products (Evison, 1955, 21).
Thus the idea and technology spread throughout north and west Europe, but may have
been limited in Anglo-Saxon contexts by restricted access to pure metals. Indeed, little
metal is required for inlaid work, so beyond the cost passed on to the consumer, the
real limitation on this technique would be dependent on skill, taste and resources.
The early date of most inlaid metalwork may have coincided with metal supply scarcity
in Anglo-Saxon England. Most inlaid buckles are the earlier kidney-shaped variety and
were usually imported, and it may be that this style disappeared due to a lack of
resources rather than a lack of demand (Marzinzik, 2003, 57). The combination of
multiple colours of metals on dress accessories becomes more evident in England in
the 6th century, with gilt and silvered great square-headed brooches as the perennial
example, so it seems unlikely that the lack of inlaid metalwork earlier in the period was
simply due to a matter of taste. The scarcity of these decorative methods beyond these
contexts could derive from a lack of necessary raw materials.
407
Tinning occurs on buckles most often in the East Midlands, East Anglia, the Upper
Thames and Essex. In the more southern kingdoms such as Kent, the Isle of Wight and
Saxon regions, gilding and silvering were more common (Marzinzik, 2003, 56;
Mortimer, 1990, 297). While gilding was less frequent outside of Kent and the south,
East Anglia appears to have had more access to precious metal resources than other
Anglian areas (Marzinzik, 2003, 246).
It has been suggested that the use of gilding, tinning, jewel-setting, etc., “may have been
partially related to an attempt to disguise the slightly more coppery colour of the base
metal” (Mortimer, 1991, 167). The lack of fresh brass in particular could have inspired
those seeking a golden-appearance on their metalwork to gild. Zinc loss from
volatilisation during remelting can be considerable, and tin and lead also were likely
depleted to a much lesser extent by this process (American Society for Metals, 1970,
422; Dungworth, 1995, 134). If this were true, then loss of alloying components
through re-melting would result in an overall increase in average copper content over
time if there were no fresh metal supply, which not only does not occur – in fact the
opposite occurs on a minor scale (figure 10.4 above). Higher copper content is only
observed in those objects that were gilt, as will be discussed below. The constancy of
copper content throughout the 5th-7th centuries indicates that fresh metal must have
been available to counteract remelting losses and so the colour of artefacts could not
have become ‘more coppery’. Indeed, the increase in the use of alloying components
and the slight increase in zinc content would argue that in particular more brass had
become available in this later phase.
SURFACE COATINGS
Gilt, silvered or tinned artefacts may feature specific underlying alloys as appearance
was not a concern; they may also have different compositions to enable better surfaces
for the adhesion of decorative layers. Tinning requires less of an underlying copper
alloy than gilding, but as there are few analysed examples it is unclear as to whether or
not the method of surface treatment affected alloying choices (Mortimer, 1988, 231).
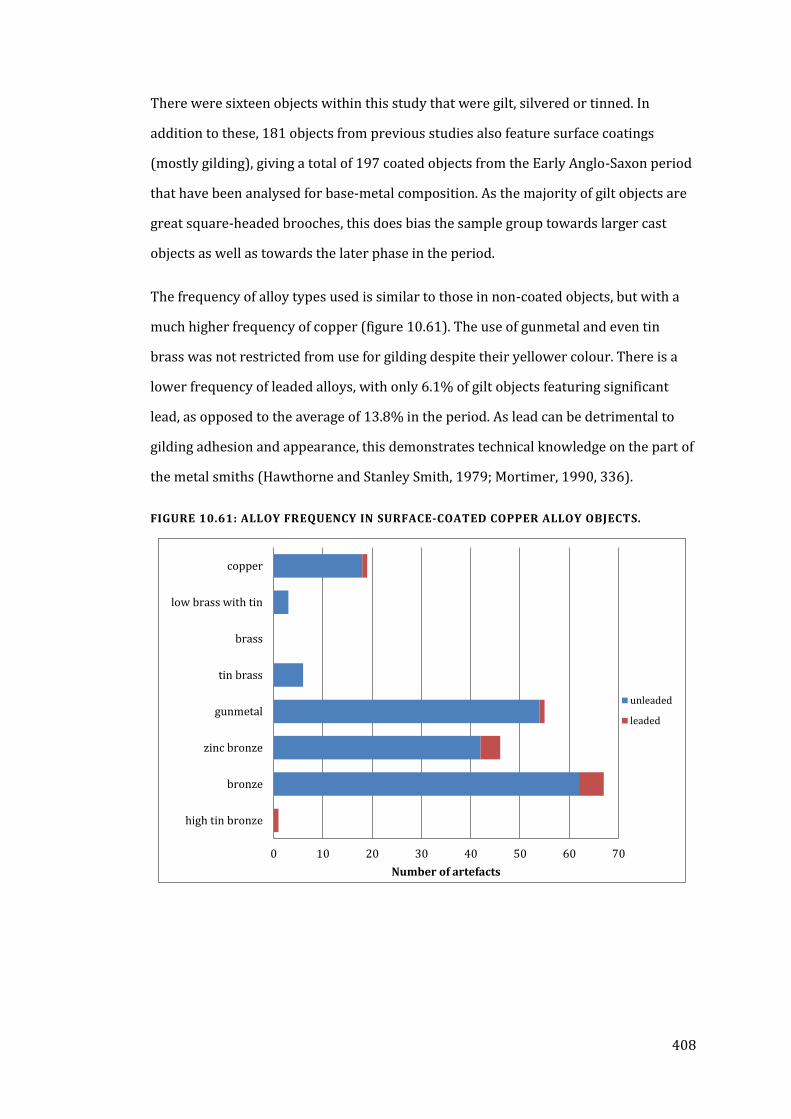
408
There were sixteen objects within this study that were gilt, silvered or tinned. In
addition to these, 181 objects from previous studies also feature surface coatings
(mostly gilding), giving a total of 197 coated objects from the Early Anglo-Saxon period
that have been analysed for base-metal composition. As the majority of gilt objects are
great square-headed brooches, this does bias the sample group towards larger cast
objects as well as towards the later phase in the period.
The frequency of alloy types used is similar to those in non-coated objects, but with a
much higher frequency of copper (figure 10.61). The use of gunmetal and even tin
brass was not restricted from use for gilding despite their yellower colour. There is a
lower frequency of leaded alloys, with only 6.1% of gilt objects featuring significant
lead, as opposed to the average of 13.8% in the period. As lead can be detrimental to
gilding adhesion and appearance, this demonstrates technical knowledge on the part of
the metal smiths (Hawthorne and Stanley Smith, 1979; Mortimer, 1990, 336).
FIGURE 10.61: ALLOY FREQUENCY IN SURFACE-COATED COPPER ALLOY OBJECTS.
0 10 20 30 40 50 60 70
high tin bronze
bronze
zinc bronze
gunmetal
tin brass
brass
low brass with tin
copper
Number of artefacts
unleaded
leaded
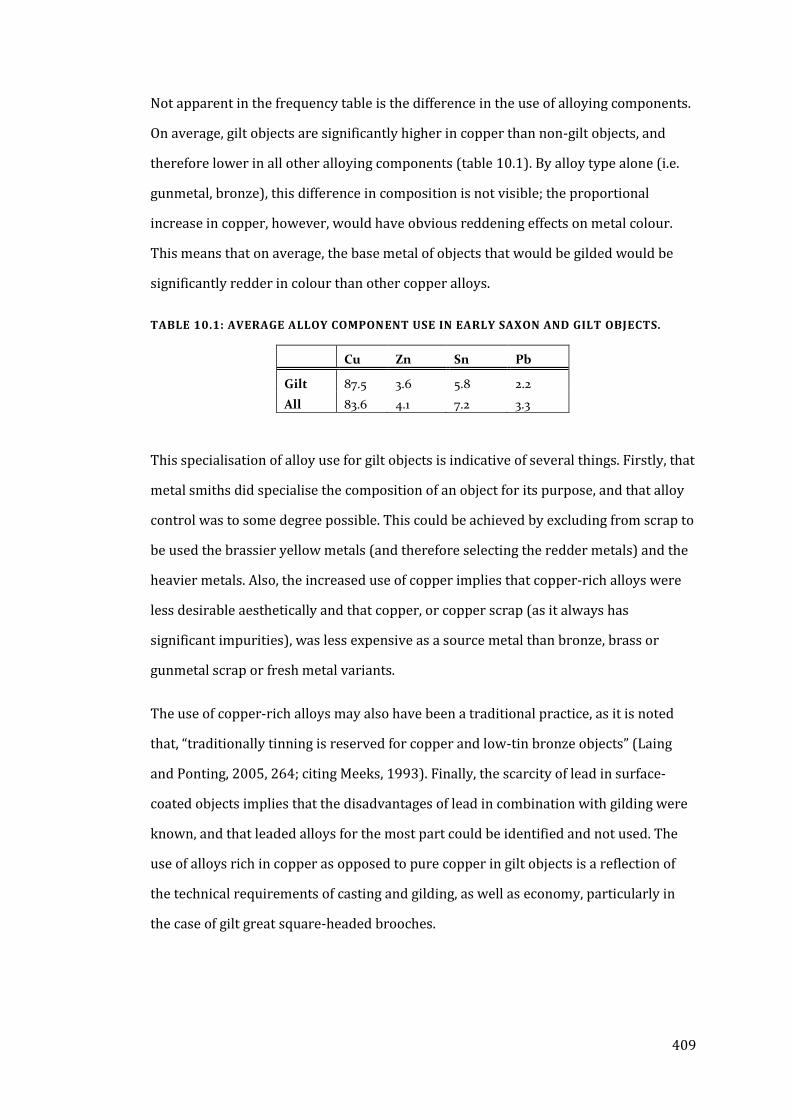
409
Not apparent in the frequency table is the difference in the use of alloying components.
On average, gilt objects are significantly higher in copper than non-gilt objects, and
therefore lower in all other alloying components (table 10.1). By alloy type alone (i.e.
gunmetal, bronze), this difference in composition is not visible; the proportional
increase in copper, however, would have obvious reddening effects on metal colour.
This means that on average, the base metal of objects that would be gilded would be
significantly redder in colour than other copper alloys.
TABLE 10.1: AVERAGE ALLOY COMPONENT USE IN EARLY SAXON AND GILT OBJECTS.
This specialisation of alloy use for gilt objects is indicative of several things. Firstly, that
metal smiths did specialise the composition of an object for its purpose, and that alloy
control was to some degree possible. This could be achieved by excluding from scrap to
be used the brassier yellow metals (and therefore selecting the redder metals) and the
heavier metals. Also, the increased use of copper implies that copper-rich alloys were
less desirable aesthetically and that copper, or copper scrap (as it always has
significant impurities), was less expensive as a source metal than bronze, brass or
gunmetal scrap or fresh metal variants.
The use of copper-rich alloys may also have been a traditional practice, as it is noted
that, “traditionally tinning is reserved for copper and low-tin bronze objects” (Laing
and Ponting, 2005, 264; citing Meeks, 1993). Finally, the scarcity of lead in surface-
coated objects implies that the disadvantages of lead in combination with gilding were
known, and that leaded alloys for the most part could be identified and not used. The
use of alloys rich in copper as opposed to pure copper in gilt objects is a reflection of
the technical requirements of casting and gilding, as well as economy, particularly in
the case of gilt great square-headed brooches.
Cu Zn Sn Pb
Gilt 87.5 3.6 5.8 2.2
All 83.6 4.1 7.2 3.3
410
UNUSUAL ALLOYS
The heavy recycling of copper alloys mitigates major deviations from compositional
norms. However, in some instances unusual compositions have been found and these
can shed light on the use of copper alloy resources and the motivations behind alloying
choices. The use of copper-rich alloys for gilding demonstrates the economical use of
metal resources when the appearance of the alloy was not a concern. Likewise, other
uncommon compositions occur where appearance and unknown qualities are
motivating factors.
High zinc alloys are rare in Early Saxon England and would have been easily
distinguishable from the bulk of contemporary metalwork. Brass is absent beyond a
scattering of imported objects, and the scarcity of high zinc gunmetals also indicates
that such source material was unusual. High-zinc alloys may have been even rarer than
gilding, and the appearance of such may have been equally as valuable. The division of
zinc-rich alloys between pairs of saucer brooches may have been a ritual practice
demonstrating the value placed on such objects (Caple, 2010).
UNUSUAL GUNMETALS
The most unusual composition in this study comes from the girdle-hanger 2BA441BH
from West Heslerton, grave 113. This object contains 13.3% tin, 11.2% zinc, and 5.4%
lead, and could only have been made by mixing equal proportions of leaded high-tin
bronze with fresh brass (Chapter 3, appendices A, B and D). It was found paired with
another gunmetal girdle-hanger with more typical alloy component proportions.
Interestingly, the huge difference in composition (the largest combined difference of
any pair of objects in this study) did not result in a strange appearance, as this unusual
gunmetal provided colour data within reasonable proximity to that of its pair to be
matching, with a difference of only 1.4 CIELAB units.
It is unclear as to whether or not this pair was intended to match in appearance or if it
were accidentally achieved. Certainly a motivation behind mixing a pale high-tin
bronze and a yellow high-zinc brass would be to mitigate potential unknown problems
of using two such visually unusual source metals, and to create a metal colour more
411
consistent with expected copper alloy appearance (and the appearance of its pair).
Indeed, what is odd is why these unusual source metals were mixed specifically with
each other rather than predictable fresh bronze. Perhaps high-tin bronze and brass and
their properties were understood and identified, and the metal smith who recycled
them together knew that it would be better to mix high-tin scrap with metal low in tin,
i.e. brass. If so, this alloy could be evidence of controlled manipulation of difficult scrap
resources.
HIGH-TIN BRONZE
Contemporary Celtic metal smiths used high-tin bronze for its colour contrast with
other copper alloys, such as in the escutcheon frames on the large hanging bowl from
Sutton Hoo (Oddy, 1983). It is otherwise a rare alloy, as tinning would have been a
more convenient method of imparting a pale, silvery colour without the potentially
negative technical properties of a high-tin alloy.
There are only seven high-tin bronzes from all of Early Saxon England that have been
analysed. Most of these examples may actually be tinned or coated in a lead-tin alloy;
this seems more likely with the artefacts that in addition to high lead and tin also
feature significant zinc. One sample comes from a vessel binding, which could imply
that a lead-tin solder was analysed. Five come from a single grave context (and six
from the same site: Watchfield, Oxfordshire). Three are belt studs (two of which have
zinc around 2%), likely candidates for tinning. Another is a buckle pin, and the last a
box binding, also a likely candidate for tinning or soldering (Mortimer et al., 1986). The
only convincing high-tin bronze in prior research is a great square-headed brooch from
Barrington A in Cambridgeshire, which had 28% tin and 11% lead (uc:ii; Hines, 1997).
There are five instances of supposed high-tin bronze in the data from this study; three
(a thin, heavily corroded annular brooch 49.2 from Fonaby; a damaged and heavily
corroded cruciform brooch foot 156.1220 and thin sleeve clasps 187.186 from
Castledyke) are likely tin-enriched from decuprification from corrosion, with between
15-17% tin – one of these also contains 20% lead, another potential indicator of this
corrosive process. Thus these samples, though containing more tin than normal, are
412
probably not intended to have the properties and appearance of high-tin bronze. They
could also be the product of recycling a high-tin bronze with other copper alloys, thus
the higher-than-average tin content. Sewerby 19.5 is a belt buckle with 18% tin, and is
not simple enriched by decuprification as the tin levels stayed stable after resampling;
this artefact may have higher than average tin, but not enough to give the appearance
of high-tin alloys. However, as, “a 15% tin bronze is unusual… the alloy is fairly hard,
and would be a slightly different colour,” the colour difference may have been
significant (Oddy et al., 1979, 390).
Unlike these other examples, Sewerby 57.5 is an actual leaded high-tin bronze; this
artefact is a cruciform brooch (Mortimer D5) dated to the mid 5th to mid 6th centuries.
This brooch was re-drilled and reanalysed to confirm its composition and, with 30% tin
and 9% lead, can firmly be described as a leaded high-tin bronze, making it one of only
two convincing examples from Anglo-Saxon England thus far. However, this sample
may also suffer from intergranular corrosion as colour data indicates (i.e. it is not
silvery in colour as composition dictates), so this composition may exhibit some error.
BRASS
As cementation technology was lost and brass was not produced in Early Saxon
England, brass certainly qualifies as an unusual copper alloy. Brass, especially with
more than 20% zinc, is exceedingly rare; only five objects contain such high levels of
zinc out of all quantitatively analysed artefacts from the period. These high-zinc
brasses consist of two rivets from the Sutton Hoo shield, a piece of sheet metal from
grave 78 at Barrington A, a type A3 cruciform brooch from Bifrons in Kent, and the
Frankish buckle from Castledyke analysed in this study (which, arguably, is therefore
not even Anglo-Saxon).
The ramifications of this rarity concerning the use and value of brass in Anglo-Saxon
England are significant. The colour of high-zinc brass would have been one of the few
visually distinct copper alloys in the period due to its low A* and high B* values, and as
discussed in Chapter 5, it would have been indistinguishable in hue from the majority
413
of contemporary gold alloys. The frequency of high-zinc brass is so low that it is
actually rarer than gold, supporting that it could have been viewed as a precious metal.
The scarcity of even high-zinc gunmetals implies that binary brass was rarely recycled
as a major ingredient despite the potential availability of the alloy from scavenged
Roman metal. An association with the Roman past may have added to the heirloom
value of objects containing this alloy (Caple, 2010). Brass was added sparingly and
deliberately to alloys in order to spread its properties (physical, visual, symbolic, or a
combination of these) throughout a greater quantity of copper alloy material. The lack
of reserving this rare metal for purely decorative purposes implies that its value was
not limited to its yellowy appearance, and that zinc loss from remelting was also a
significant issue in reusing this metal.
The rarity of brass and its unusual golden colour may have led to more frequent
recycling of high-zinc alloys for the manufacture of new objects. This would explain not
only the lack of brass or high-zinc artefacts in burial contexts, but also the lack of high-
zinc alloys despite potential Roman scrap resources. Frequent recycling of such alloys
would quickly deplete zinc levels to those of gunmetals and explains the rise in this
alloy type in the period. Additionally, this rapid recycling of zinc-rich alloys supports
that brass was highly valued. While the increase in zinc content in gunmetal would not
have been visually apparent by the early 7th century in comparison to earlier
gunmetals, these later gunmetals would be significantly more yellow on average than
zinc bronze and bronze, creating a visually distinct copper alloy group. The increase in
gunmetal use coincides with the rise in frequency of gilded object types, indicating that
an inherent component in the value of brass was its golden appearance.
SUMMARY
There are no patterns chronologically or geographically in the occurrence of unusual
alloys in this study beyond an increase in the use of gunmetal and zinc-rich alloys
towards the end of the period; the high-tin bronze and gilt copper objects in this study
occur early but other examples of these occur later, and the unusual gunmetal girdle
414
hanger is likely late 6th century in date. One aspect is a constant among these unusual
alloys: colour is an important characteristic.
For the copper wrist clasps, colour is not a discernible issue, and therefore the easily
tarnished and redder appearance of copper is not an aesthetic concern, also shedding
light on the lower economic value of copper as a source metal. High zinc alloys are rare
and may have been associated with continental contact or heirloom objects, and their
reuse with fresh metal would impart a more golden colour than was otherwise possible
to achieve, a result that cannot be separated from aesthetic choice. The use of high-tin
bronze in two high status brooches where such a composition could be detrimental to
object strength is interesting but may not indicate that this alloy or its appearance was
highly valued; indeed, the great square-headed high-tin bronze would have been
concealed by gilding. It is possible that for the cruciform brooch example from
Sewerby, this alloy drew aesthetic associations to tinned alloys, assuming its original
composition was indeed a high-tin alloy.
OBJECT PAIRS
If colour was a factor in copper alloy metalworking in the Early Saxon period
metalworkers may have attempted to match in colour pairs of objects or items meant
to be worn together, whether or not they were made at the same time or shared other
decorative motifs. Other causes for alloy matching could derive from specific recycling
practices. In particular, the division of an ancestor object between two new objects
would allow the resulting pair to be similar in composition to some degree (Caple,
2010). This would be a motivation potentially independent of appearance but which
affected colour, and it may have been regulated by the use of certain coloured metals as
identified for these purposes.
Mortimer (1990, 399) noted that only half of the cruciform brooch pairs that she
analysed also matched in composition, which led her to conclude that a matching
appearance was either not important or that control or metal supply or both was
insufficient to allow the brooches to be matched. Examining whether or not two
artefacts were distinguishable from each other in colour to the human eye may indicate
415
that there was an attempt at alloy control and if appearance were central to this
attempt. However, other factors such as distance that objects were worn apart, the
colour of the cloth against which the objects were viewed, and a potential difference in
human distinction and perception of colour all may play a role in whether or not metal
colour matching occurred or was observed.
APPLYING COLOUR TOLERANCE VALUES
In order to determine whether or not pairs of objects matched, the difference between
A*B* values for the two objects is calculated and if the difference is below the value that
the human eye can detect, the colour is indistinguishable. L* was not considered as it
has little effect on human perception of metal colour unless one object were
significantly different, and that would be tied to polish and tarnishing rather than the
metal itself. The tolerance values of 2 CIELAB units used were calculated from the
human vision experiment in Chapter 5.
Table 10.2 demonstrates how the differences between objects were calculated, here
between objects in an assemblage group. The Euclidean distance equation from
Chapter 4 was applied to each sample, allowing every sample to have a comparative
similarity value. The example in table 10.2 displays the differences between the colours
of the five cruciform brooches from grave 30 at Cleatham; the distance between
measured colour points is indicated in a manner similar to distances between cities, as
often included in road maps. Brooches 1 and 3 are a pair, as are 4 and 5. These four
objects all match well with each other, but the non-paired brooch, number 2, is most
different from all the others and would have been noticeably different in colour with
tolerance values above 2 CIELAB units (Chapter 5). The reason for this difference in
appearance is unclear, as none of the brooches, even the pairs, have identical
compositions, and the odd-coloured brooch is closer in composition to brooch 1 than
its actual pair. This variability between composition and colour was not observed in
measured standards and may be an effect of corrosion, the result of combined α-phases
from the presence of both tin and zinc in the alloy, how the metal has been worked or
annealed, or from the presence of impurities not encountered in metal standards
(Chapter 6).
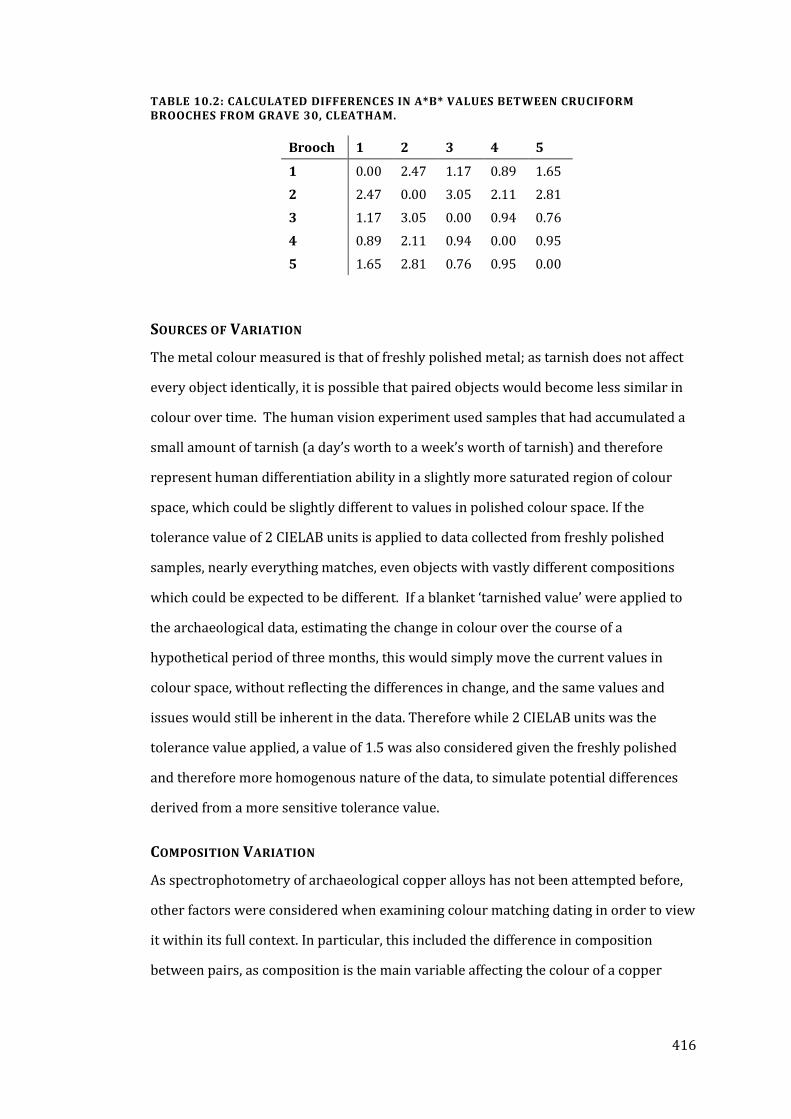
416
TABLE 10.2: CALCULATED DIFFERENCES IN A*B* VALUES BETWEEN CRUCIFORM BROOCHES FROM GRAVE 30, CLEATHAM.
SOURCES OF VARIATION
The metal colour measured is that of freshly polished metal; as tarnish does not affect
every object identically, it is possible that paired objects would become less similar in
colour over time. The human vision experiment used samples that had accumulated a
small amount of tarnish (a day’s worth to a week’s worth of tarnish) and therefore
represent human differentiation ability in a slightly more saturated region of colour
space, which could be slightly different to values in polished colour space. If the
tolerance value of 2 CIELAB units is applied to data collected from freshly polished
samples, nearly everything matches, even objects with vastly different compositions
which could be expected to be different. If a blanket ‘tarnished value’ were applied to
the archaeological data, estimating the change in colour over the course of a
hypothetical period of three months, this would simply move the current values in
colour space, without reflecting the differences in change, and the same values and
issues would still be inherent in the data. Therefore while 2 CIELAB units was the
tolerance value applied, a value of 1.5 was also considered given the freshly polished
and therefore more homogenous nature of the data, to simulate potential differences
derived from a more sensitive tolerance value.
COMPOSITION VARIATION
As spectrophotometry of archaeological copper alloys has not been attempted before,
other factors were considered when examining colour matching dating in order to view
it within its full context. In particular, this included the difference in composition
between pairs, as composition is the main variable affecting the colour of a copper
Brooch 1 2 3 4 5
1 0.00 2.47 1.17 0.89 1.65
2 2.47 0.00 3.05 2.11 2.81
3 1.17 3.05 0.00 0.94 0.76
4 0.89 2.11 0.94 0.00 0.95
5 1.65 2.81 0.76 0.95 0.00
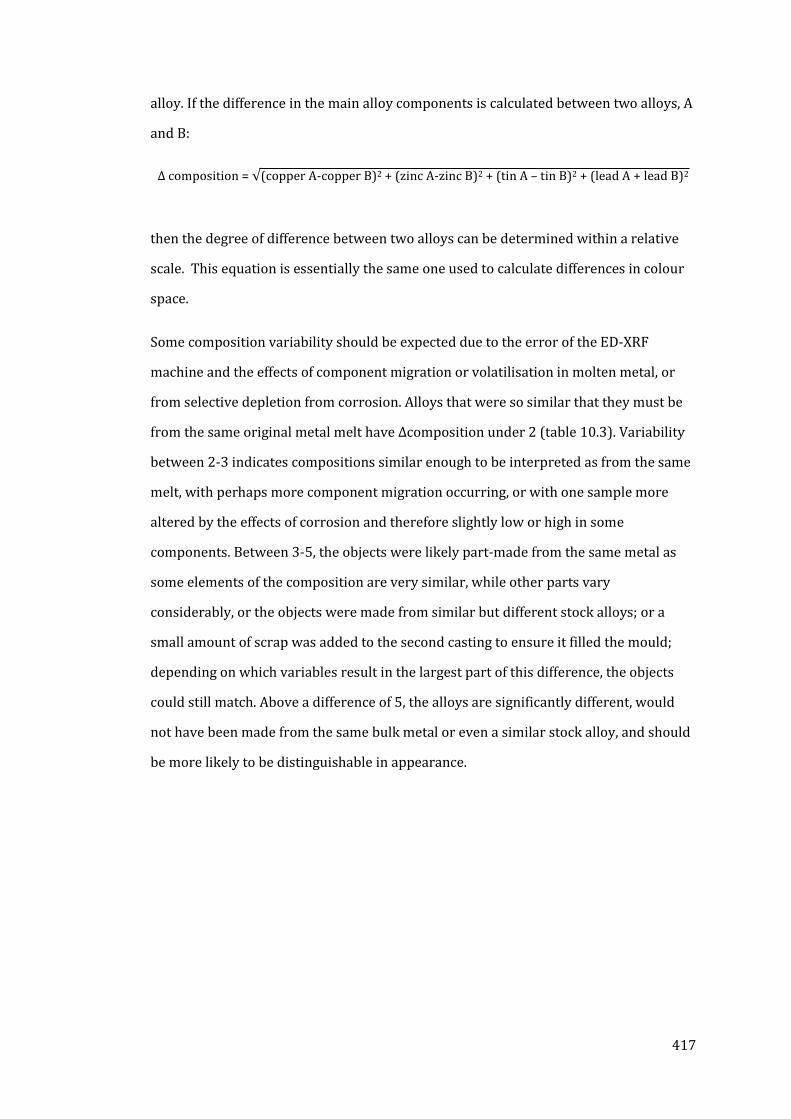
417
alloy. If the difference in the main alloy components is calculated between two alloys, A
and B:
Δ composition = √(copper A-copper B)2 + (zinc A-zinc B)2 + (tin A – tin B)2 + (lead A + lead B)2
then the degree of difference between two alloys can be determined within a relative
scale. This equation is essentially the same one used to calculate differences in colour
space.
Some composition variability should be expected due to the error of the ED-XRF
machine and the effects of component migration or volatilisation in molten metal, or
from selective depletion from corrosion. Alloys that were so similar that they must be
from the same original metal melt have Δcomposition under 2 (table 10.3). Variability
between 2-3 indicates compositions similar enough to be interpreted as from the same
melt, with perhaps more component migration occurring, or with one sample more
altered by the effects of corrosion and therefore slightly low or high in some
components. Between 3-5, the objects were likely part-made from the same metal as
some elements of the composition are very similar, while other parts vary
considerably, or the objects were made from similar but different stock alloys; or a
small amount of scrap was added to the second casting to ensure it filled the mould;
depending on which variables result in the largest part of this difference, the objects
could still match. Above a difference of 5, the alloys are significantly different, would
not have been made from the same bulk metal or even a similar stock alloy, and should
be more likely to be distinguishable in appearance.
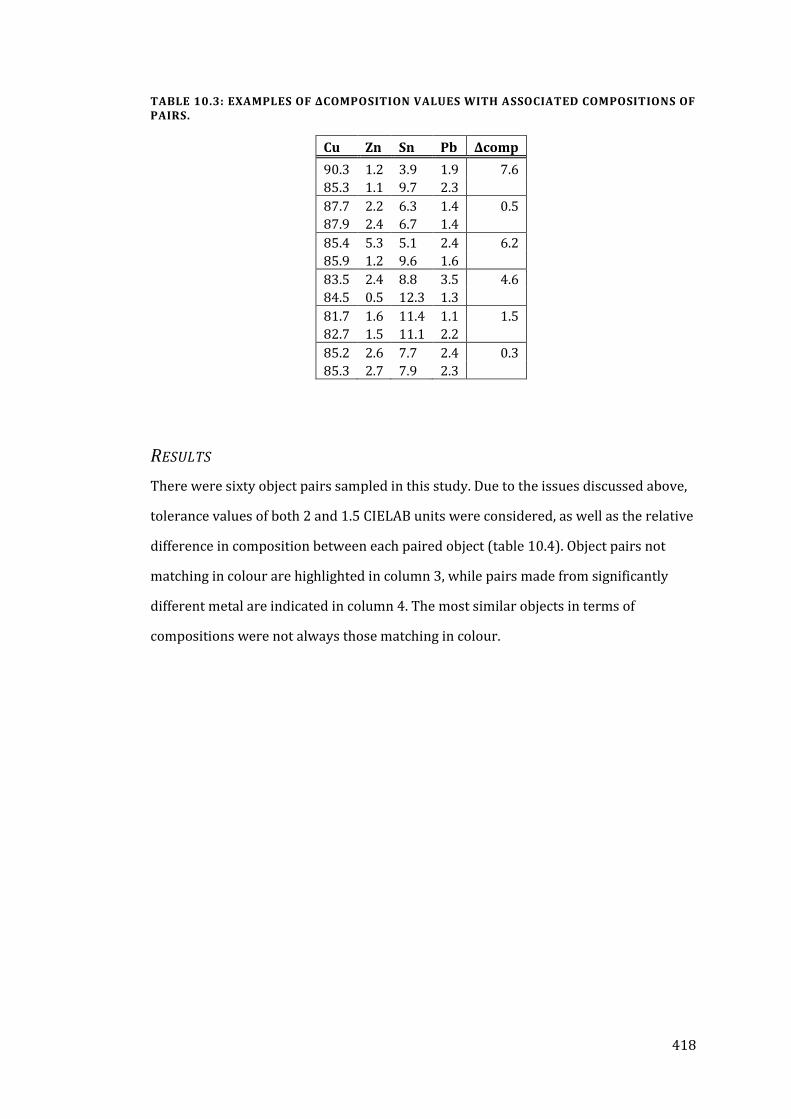
418
TABLE 10.3: EXAMPLES OF ΔCOMPOSITION VALUES WITH ASSOCIATED COMPOSITIONS OF PAIRS.
RESULTS
There were sixty object pairs sampled in this study. Due to the issues discussed above,
tolerance values of both 2 and 1.5 CIELAB units were considered, as well as the relative
difference in composition between each paired object (table 10.4). Object pairs not
matching in colour are highlighted in column 3, while pairs made from significantly
different metal are indicated in column 4. The most similar objects in terms of
compositions were not always those matching in colour.
Cu Zn Sn Pb Δcomp
90.3 1.2 3.9 1.9 7.6
85.3 1.1 9.7 2.3
87.7 2.2 6.3 1.4 0.5
87.9 2.4 6.7 1.4
85.4 5.3 5.1 2.4 6.2
85.9 1.2 9.6 1.6
83.5 2.4 8.8 3.5 4.6
84.5 0.5 12.3 1.3
81.7 1.6 11.4 1.1 1.5
82.7 1.5 11.1 2.2
85.2 2.6 7.7 2.4 0.3
85.3 2.7 7.9 2.3
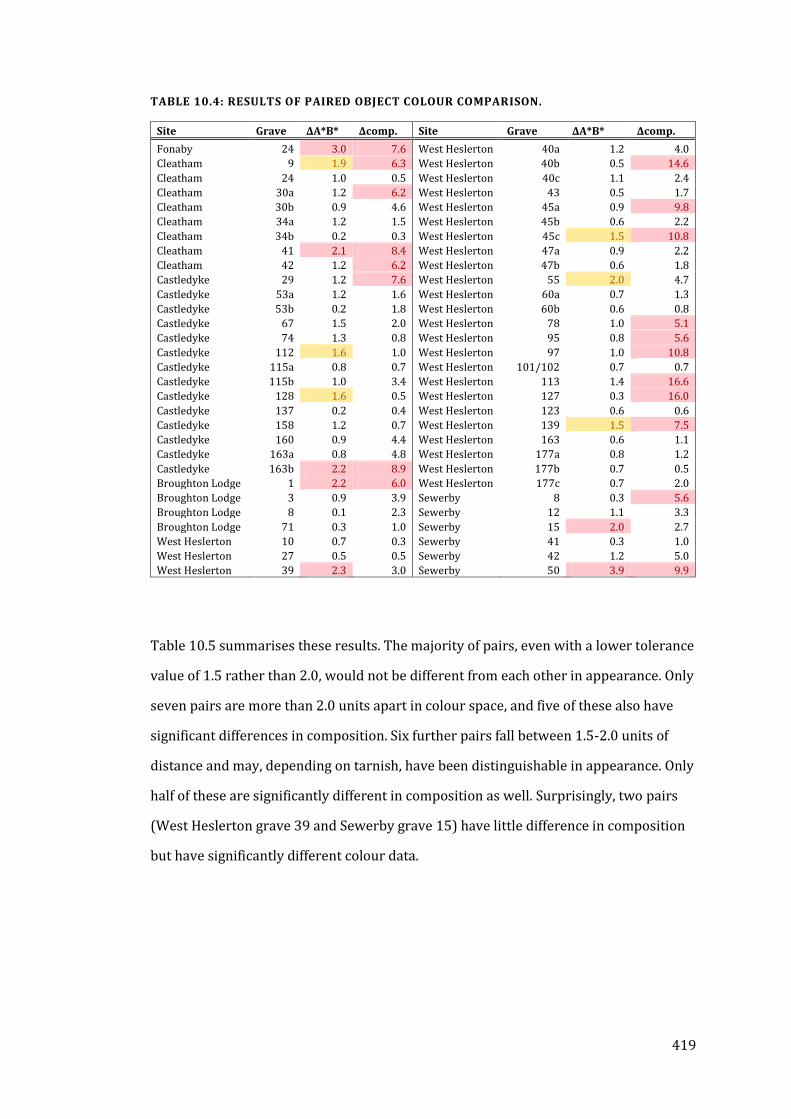
419
TABLE 10.4: RESULTS OF PAIRED OBJECT COLOUR COMPARISON.
Table 10.5 summarises these results. The majority of pairs, even with a lower tolerance
value of 1.5 rather than 2.0, would not be different from each other in appearance. Only
seven pairs are more than 2.0 units apart in colour space, and five of these also have
significant differences in composition. Six further pairs fall between 1.5-2.0 units of
distance and may, depending on tarnish, have been distinguishable in appearance. Only
half of these are significantly different in composition as well. Surprisingly, two pairs
(West Heslerton grave 39 and Sewerby grave 15) have little difference in composition
but have significantly different colour data.
Site Grave ΔA*B* Δcomp. Site Grave ΔA*B* Δcomp.
Fonaby 24 3.0 7.6 West Heslerton 40a 1.2 4.0
Cleatham 9 1.9 6.3 West Heslerton 40b 0.5 14.6
Cleatham 24 1.0 0.5 West Heslerton 40c 1.1 2.4
Cleatham 30a 1.2 6.2 West Heslerton 43 0.5 1.7
Cleatham 30b 0.9 4.6 West Heslerton 45a 0.9 9.8
Cleatham 34a 1.2 1.5 West Heslerton 45b 0.6 2.2
Cleatham 34b 0.2 0.3 West Heslerton 45c 1.5 10.8
Cleatham 41 2.1 8.4 West Heslerton 47a 0.9 2.2
Cleatham 42 1.2 6.2 West Heslerton 47b 0.6 1.8
Castledyke 29 1.2 7.6 West Heslerton 55 2.0 4.7
Castledyke 53a 1.2 1.6 West Heslerton 60a 0.7 1.3
Castledyke 53b 0.2 1.8 West Heslerton 60b 0.6 0.8
Castledyke 67 1.5 2.0 West Heslerton 78 1.0 5.1
Castledyke 74 1.3 0.8 West Heslerton 95 0.8 5.6
Castledyke 112 1.6 1.0 West Heslerton 97 1.0 10.8
Castledyke 115a 0.8 0.7 West Heslerton 101/102 0.7 0.7
Castledyke 115b 1.0 3.4 West Heslerton 113 1.4 16.6
Castledyke 128 1.6 0.5 West Heslerton 127 0.3 16.0
Castledyke 137 0.2 0.4 West Heslerton 123 0.6 0.6
Castledyke 158 1.2 0.7 West Heslerton 139 1.5 7.5
Castledyke 160 0.9 4.4 West Heslerton 163 0.6 1.1
Castledyke 163a 0.8 4.8 West Heslerton 177a 0.8 1.2
Castledyke 163b 2.2 8.9 West Heslerton 177b 0.7 0.5
Broughton Lodge 1 2.2 6.0 West Heslerton 177c 0.7 2.0
Broughton Lodge 3 0.9 3.9 Sewerby 8 0.3 5.6
Broughton Lodge 8 0.1 2.3 Sewerby 12 1.1 3.3
Broughton Lodge 71 0.3 1.0 Sewerby 15 2.0 2.7
West Heslerton 10 0.7 0.3 Sewerby 41 0.3 1.0
West Heslerton 27 0.5 0.5 Sewerby 42 1.2 5.0
West Heslerton 39 2.3 3.0 Sewerby 50 3.9 9.9
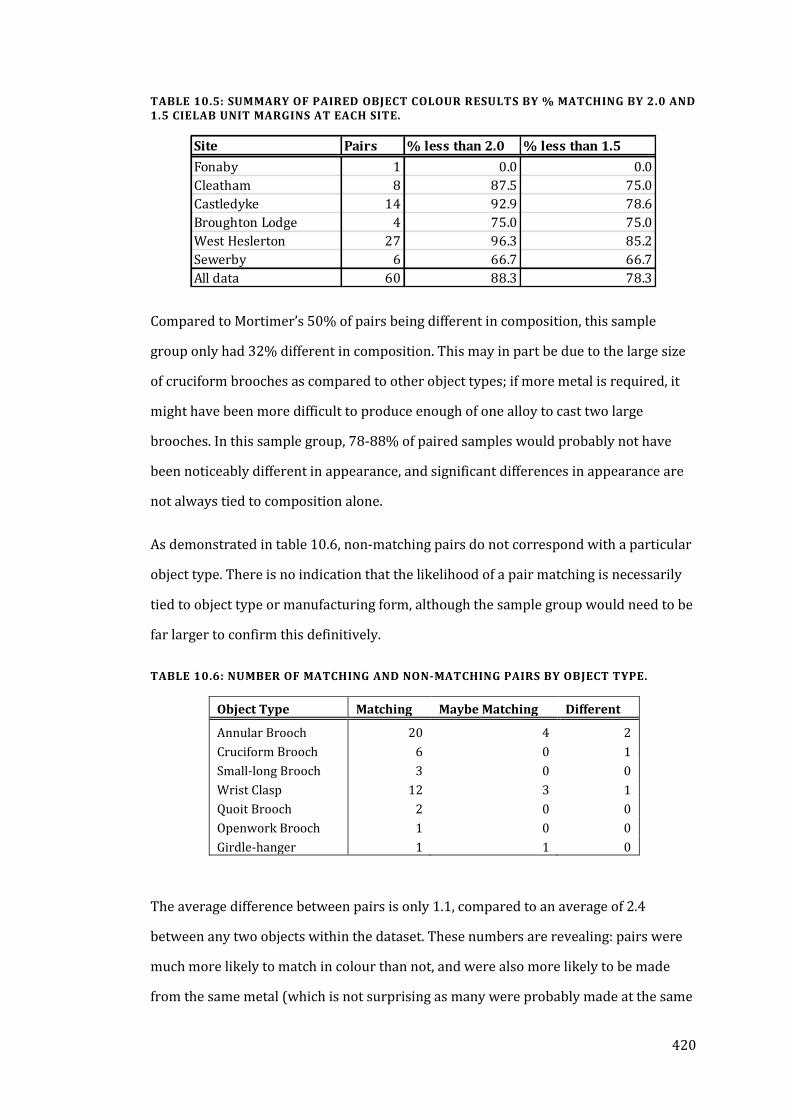
420
TABLE 10.5: SUMMARY OF PAIRED OBJECT COLOUR RESULTS BY % MATCHING BY 2.0 AND 1.5 CIELAB UNIT MARGINS AT EACH SITE.
Compared to Mortimer’s 50% of pairs being different in composition, this sample
group only had 32% different in composition. This may in part be due to the large size
of cruciform brooches as compared to other object types; if more metal is required, it
might have been more difficult to produce enough of one alloy to cast two large
brooches. In this sample group, 78-88% of paired samples would probably not have
been noticeably different in appearance, and significant differences in appearance are
not always tied to composition alone.
As demonstrated in table 10.6, non-matching pairs do not correspond with a particular
object type. There is no indication that the likelihood of a pair matching is necessarily
tied to object type or manufacturing form, although the sample group would need to be
far larger to confirm this definitively.
TABLE 10.6: NUMBER OF MATCHING AND NON-MATCHING PAIRS BY OBJECT TYPE.
The average difference between pairs is only 1.1, compared to an average of 2.4
between any two objects within the dataset. These numbers are revealing: pairs were
much more likely to match in colour than not, and were also more likely to be made
from the same metal (which is not surprising as many were probably made at the same
Site Pairs % less than 2.0 % less than 1.5
Fonaby 1 0.0 0.0
Cleatham 8 87.5 75.0
Castledyke 14 92.9 78.6
Broughton Lodge 4 75.0 75.0
West Heslerton 27 96.3 85.2
Sewerby 6 66.7 66.7
All data 60 88.3 78.3
Object Type Matching Maybe Matching Different
Annular Brooch 20 4 2
Cruciform Brooch 6 0 1
Small-long Brooch 3 0 0
Wrist Clasp 12 3 1
Quoit Brooch 2 0 0
Openwork Brooch 1 0 0
Girdle-hanger 1 1 0
421
time). Additionally, the low average difference within the whole dataset implies that
colour matching many not have been a priority since the odds were that any two
objects would have been fairly similar in appearance. The recycling methods employed
in the period provided an alloy with consistent visual properties, which may or may not
have been a motivation. A shift away from this visual homogeneity begins towards the
end of this period with the increase in zinc content in gunmetals.
ASSEMBLAGE APPEARANCE
Differences between each object were calculated for each grave in this study featuring
two or more sampled objects (as in table 10.4), using a tolerance value of 2 CIELAB
units. 65% of sixty-two graves had dress accessory groups (i.e. all objects sampled) that
would have matched in colour. However, the high frequency of only paired objects
within this dataset could contribute a bias to the results. Without those assemblages
entirely comprising of a single pair of objects (n=39), matching metalwork drops to
54%, still over half. If those graves (n=33) containing objects that were gilt are
excluded (as the base copper alloy would not be visible), this matching frequency
jumps back up to 60%. Thus more often than not, the appearance of all copper alloys
worn together would have matched in colour. However, as the average difference
between all sampled objects was only 2.4 CIELAB units, this may not have been the
result of a deliberate action.
SUMMARY
Copper alloys were capable of fulfilling the golden ideal, and it is possible that only a
small amount of zinc was necessary within an alloy to provide sufficient yellowness to
achieve a golden appearance. The Anglo-Saxon aesthetic of gold, blood, brightness and
darkness could be achieved through the use of simple punched and incised decoration,
contrasting with the polished metal. Red enamel and amber are likely the ‘red’
components in this colour scheme, as the colour of copper metal was less desirable. Its
increased use in gilt and tinned objects not only indicates the lesser value attached to
the colour of this metal; it also demonstrates the lower value of the raw material.
422
Control did occur in copper alloys beyond that of simple production methods. Lead
content was significantly lower in gilded objects. Patterns of recycling high zinc alloys
with fresh bronze could be a tactic for maximising the yellowing effect of a limited
brass resource, much as gilding maximised the visual effect of a limited gold supply.
The high frequency of bronze as a large component of most alloys could also indicate a
process of regulating the scrap supply to mitigate issues from unknown metal reuse. In
terms of appearance, both motivations could work in tandem to produce reliable
metalwork of regular appearance with a yellower colour than the fresh bronze alone
could provide. An effect of these tactics, for whatever purpose, is a degree of colour
homogeneity not seen in copper alloys in the previous or following periods, allowing
most dress accessories to match in appearance regardless of their time or place of
manufacture. However, as composition variation in gilded objects reveals, copper alloy
composition and colour could deviate from this homogenous norm when the metal was
not seen. While the appearance is primarily reflective of the nature of metal supply and
recycling practices, the composition of visible copper alloys were selected differently
than those that were hidden.
423
CHAPTER SUMMARY
Limitations in the quality of dating of artefacts and unexplained variability in some of
the colour data prevent clarity in some of the conclusions drawn. Further well-dated
samples are needed to confirm the increase in zinc content in artefacts in the late 6th-7th
century, which may be indicative of a change in metal supply. It also could be reflective
of the demands of a people for whom gold was central to ideas of status, wealth and
power. Acquiring high-zinc alloys to mix with a probable bronze metal supply has little
technical practicality and the use of specifically high-zinc alloys at all is unnecessary in
small dress items. Thus an increase in zinc content over time in a system where zinc
was by far the most limited variable is significant, and motivated by factors beyond
simply economy and convenience.
There are no clear regional trends to copper alloy use in Anglian England, although
more fresh bronze may have been available in East Anglia than in the northeast. Use at
a site may be far more variable than it was regionally, given local scrap resources and a
potentially sporadic fresh metal supply. In this way it is similar to variation seen in
bead frequencies (Chapter 4). Broughton Lodge is most consistent in alloy use and also
has the highest frequency of tinned objects, indicating that it may have enjoyed more
access to a greater range of metal resources than the other sites sampled in this study;
this corresponds well with the location of this site, which is the closest to East Anglia.
Alloy use trends are difficult to identify within object types and are often related to
method of manufacture or chronological range. Buckles in particular are primarily
binary alloys, and small-long brooches also tend towards purer bronze; other object
types are more mixed. There is evidence of copper alloy control for specific
manufacturing methods such as sheet-wrought or cast, as seen in the annular and
openwork brooches. Buckles, which are the most often sampled artefact type to be
worn by men, do not follow the zinc-enriching trend, and this may be due to the
majority of buckles being made from iron and thus exempting them as an object type
from as many aesthetic pressures. Some alloying control was exercised when
necessary, but this was primarily limited to technical constraints with particular
424
manufacturing processes. The restricted nature of the limited metal supply hinders our
ability to discern patterns just as it must have hindered the metal smiths’ ability to
produce objects more akin to the aesthetic ideal.
The colour of the majority of copper alloys may have been considered golden. Alloys
higher in copper that were therefore redder in appearance were less valued, as these
compositions usually occur underneath decorative surface layers. The increase in zinc
content in the later phase may have coincided with the spread of gilding and a desire
on the part of the consumer to own a more golden-appearing dress accessory; while
later gunmetals were not necessarily more golden than previous gunmetals, they may
have been distinctly more yellow than the low-zinc alloys of the time. Unusual alloys,
while by definition rare, occur for specifically aesthetic reasons.
An aspect requiring further investigation is the quality of uniqueness in Anglo-Saxon
metalwork, and the deliberate use of time-consuming or metal-wasting processes.
Considering the economical reuse of copper alloys through recycling, such practices are
significant: the prevalence of wasteful type F.I annular brooches, the thickness of
progressively larger brooches, and the use of separate casting models (or deformation
of these models) even for paired objects. These could be indicative of subtle cultural or
traditional practices not derived simply from technological ignorance, but from choice.
Central to these are aesthetic and material values, rather than practical considerations.
425
CHAPTER 11
CONCLUSIONS
Past research too often has focused on divisions and classifications of objects by
characteristics determined as significant by modern science and society, rather than
how they were likely to have been perceived in their own time. Anglo-Saxon metal
smiths would have had a different contextual understanding of their materials, their
uses and the technological processes used. The interdisciplinary methodology of this
thesis has attempted to circumvent issues encountered by previous approaches by
considering variables in terms of their relevance to the Anglo-Saxons. In particular,
colour is explored, a characteristic that would have been relevant to the Anglo-Saxons
as craftsmen and as consumers.
At first glance the Early Anglo-Saxon period (450-650 CE) seems not the ideal time or
place to investigate the importance of colour in copper alloy metallurgy. This was a
particularly turbulent period on the continent, which had wide-reaching repercussions
on trade. In England, urban settlement contracted as did the economy, necessitating a
greater level of self-sufficiency amongst an increasingly agrarian society (Chapters 1
and 2). This post-Roman system saw the collapse of mass producing industries such as
metalworking, leading to small-scale, localised production by potentially itinerant
craftsmen, who fulfilled their resource requirements through sporadic fresh metal
supplies and by recycling scrap from Roman contexts (Chapter 3).
The Anglo-Saxon copper smiths in many ways were more limited than those who came
before and after in terms of both metal supply and the demand for copper alloy
products. Despite these constraints they found ways of creating functional objects and
achieving desired visual effects by efficiently manipulating the metal available. The lack
426
of physical properties required for the majority of copper alloys in the period, (i.e. the
disappearance of large cast objects), removed this requirement from the metalworking
process, resulting in only economic and aesthetic considerations in the use of the metal
available.
As copper alloy artefacts are amongst the most prolific material remains in the period,
they represent a key form of social display for the majority of Anglo-Saxons, as even
most high-status jewellery was usually copper alloy with a precious metal coating. The
majority of copper alloy objects were those of personal adornment, a role which
reinforces the visual importance of the materials used. This period is therefore ideally
suited for exploring the importance of colour.
This chapter will provide a synthesis of the conclusions drawn in this research. The
integration of the findings from various interdisciplinary approaches enables the first
holistic picture of colour of composition in this period, providing insight into issues of
value, aesthetics, trade and metal supply, and control.
427
COLOUR
The colour of copper alloys directly correlates with the quantity of alloying
components present, but the relationship between colour and composition is not
entirely straight forward, particularly when characterising archaeological metals. As
discussed in Chapter 6, the colour of copper alloys derives from the influence of
alloying elements on the reflectance of incident light due to the configuration of
electrons within the atoms, which shifts the reflectivity edge of copper. The presence of
different metallic phases influences the total reflectance at various wavelengths. The
structure and therefore the colour of a metal is not solely dependent on the amount of
alloying components present, it is also dependent on the working and heat treatment
applied. Fang and McDonnell (2011) discuss the significant effect that metalworking
treatment can have on colour, and this is clearly visible in the colour of archaeological
copper alloy objects. Whether or not an object was wrought or cast results in
significant variation in colour in similar alloys.
The influence of tarnish on the perceived colour of metals is an important variable to
consider within the context of copper alloy colour, and one that has not been
investigated previously. Time-lapse data indicates that the colour of copper alloys,
especially brass, significantly changes within a matter of minutes after polishing; this
means that the perceived colour would always have been more saturated and
specifically more yellow, as well as changeable (Chapter 6). The shifting of copper alloy
colour from tarnish parallels the lack of distinction made between colours in the
period; coupled with the low sensitivity of human distinction ability and the lack of
precision in the expected appearance of metals, it is likely that most copper alloys
objects in the Early Saxon period would have appeared remarkably similar in colour
(Chapters 4, 5 and 9).
The ability of the human eye to distinguish between colours in the region of colour
space occupied by copper and gold alloys is another important variable that has not
been quantified previously, and the data collected indicates that the majority of copper
alloys in the Early Saxon period would have been indistinguishable in appearance
428
(Chapters 5 and 10). Perhaps more importantly, there is significant overlap between
copper and gold alloy colour space, particularly with tarnished copper alloys, indicating
that such base objects could act as accurate colour skeuomorphs of high status alloys.
Accuracy in the characterisation of composition data is therefore meaningless in the
context of appearance, which is the variable most likely to have been significant to
those who made and used these objects; when analysing compositional data, we must
do so from a macro level if relevant conclusions as to alloy use are to be reached. The
importance of colour to manufacturing processes is demonstrated by the significant
frequency of matching object pairs; while many of these matches result from the use of
a single source metal, others are indistinguishable in appearance despite variable
composition. The example of the girdle hanger pair from grave 113 from West
Heslerton demonstrates that even significantly different compositions could be
matched, and indicates that colour manipulation was a consideration when selecting
metal for recycling (Chapter 10).
COPPER
The lack of importance given to copper and its appearance is clear from the frequent
use of copper-rich alloys for gilt objects (Chapter 10). As copper-rich alloys have a
higher melting point than those containing more of alloying components, the use of
such alloys for the purpose of casting makes the process more difficult; the motivation
for the use of high copper alloys is therefore an economic one, and indicative of the
aversion to these redder, more easily tarnished alloys when the true metal surface is
visible. Copper was therefore a less valued metal compared to bronze, brass or
gunmetal for both aesthetic and economic reasons.
LEAD
A significant difference in alloy use in the Early Saxon period is the reduction of leaded
alloys (Chapter 2). In part, this dearth derives from the scarcity of large cast objects
necessitating the use of lead. Lead does not seem to have been produced in this period,
although certain sites such as Mucking with proximity to Roman buildings seem to
have scavenged lead from these ruins, and its use may have been primarily in silver
429
cupellation rather than in copper alloys (Caple, 1986; Fleming, 2012, 21). The amount
of lead in copper alloys decreases over the course of the period, implying that it was
not often added to the melt, and indeed recycling modelling demonstrates that the
leaded alloys in the Early Saxon period could easily have been made entirely using
Roman leaded bronze scrap (Chapter 3).
As the properties of leaded alloys were not necessary and would in fact be detrimental
to wrought objects, lead was not a desirable addition. The influence of lead on colour
may have also been a motivation for the lack of its use; the desaturating effect of lead,
particularly on B* and therefore yellowness, could explain the drop in the frequency of
leaded alloys in Early Saxon England from the rate seen in the late Roman period
(Chapters 6 and 9). The use of lead, or rather the aversion to its use, demonstrates the
technical control and knowledge of Early Saxon smiths.
GIRDLE-HANGERS
The aesthetic role of copper alloys is best demonstrated by girdle-hangers, as these
artefacts are more symbolic than practical utilitarian objects and have a visual role in
shaping the perceived identity of the wearer. It is notable that in girdle-hangers in
particular, there is a heightened level of zinc and therefore of yellowness; of all copper
alloy object types, the symbolic girdle-hanger is the most likely to appear golden,
evidence of the aesthetic ideal deliberately mimicked by gunmetal.
BRASS
The rarity of brass in Early Saxon England exceeds even that of gold. That it is not
found more frequently is surprising, given the potential availability of zinc-rich alloys
from Roman scrap. The practice of recycling zinc-rich alloys with fresh bronze is
evident in the compositions observed in the period, and it is likely that zinc-rich alloys
were preferentially selected for recycling purposes.
As they would have been most easily identified by their yellower appearance, it is also
likely that a primary motivation in their use was to alter the colour (Chapters 3, 5, 6,
10). Preferential recycling of brass and zinc-rich objects would explain the lack of such
source metals in the archaeological record as well as the increase in zinc content
430
observed in the late 6th-7th centuries (Chapter 10). Given the depletion of zinc content
from remelting, this could only derive from new external sources of brass (see Chapter
3; Caley, 1952; Dungworth, 1995).
The Frankish brass buckle from Castledyke is late, as are the tin brass annular brooches
from the same site; it seems possible that a continental source of fresh brass was
beginning to find its way into the areas with proximity to major trade arteries, such as
along the Humber, by the late 6th century (Chapter 10). The establishment of emporia
in the Middle Saxon period, tied to the centralisation of the power of Anglo-Saxon
kings, is preceded by this economic growth hinted at by the rise of zinc-rich alloys in
the late 6th century; the composition of Early Saxon alloys reveals the earlier
developments towards centralising power in the period in which such kingdoms were
rapidly being consolidated.
COPPER ALLOYS WITHIN AN ANGLO-SAXON COLOUR CONTEXT
Old English colour word frequency and context emphasise the importance of gold and
red, as well as white, black, and qualities of vividness and brightness in the colour
vocabulary of the Anglo-Saxons (Chapter 4). Copper alloy jewellery was both functional
and aesthetic, its colour prompting associations with the golden ideal. The patterning
of light and dark, shiny and dull in simply–created punched motifs, or on more
complicated chip-carved and bichrome surfaces, recall the essential aesthetic values
proclaimed in the oral traditions that originate in this period.
While a decorative focus of Anglo-Saxon costume, metal dress accessories are only one
surviving vestige of the ensemble. The combination of these ‘golden’ dress fittings with
necklaces of dark, multi-coloured or amber beads, worn against unknown-coloured
clothing possibly edged with bright reds, green and purples, is likely to have been one
in which the copper alloys were a major emphasis (Chapter 4). The increasing size and
elaborate decoration of copper alloy brooches through the 6th century belies the
importance of these objects as visual symbols of conspicuous consumption, of wealth
and of access to limited or imported materials, or as symbols of important kin
connections.
431
THE APPEARANCE OF GOLD
The centrality of gold to the Anglo-Saxon colour scheme is evident from literature,
word frequency and its profusion in material culture. The literary evidence is
enlightening concerning the expected colour and value of gold; not only is gold likely
the primary colour lexeme for the yellow region of colour space in Old English, the
preferred and more valued colour of gold was redder (and purer) than most Anglo-
Saxon gold. This may indicate that zinc-rich alloys such as gunmetal may have been
preferred over brass as its colour is closer to pure gold than either brass or the colour
of most Anglo-Saxon gold.
Present-day human beings demonstrate a surprising lack of consistency and precision
in estimating the colour of gold; similarly the Anglo-Saxons would have accepted a
range of colours as ‘golden’ and this may have allowed a large range of copper alloys
fulfil the visual expectations of gold (Chapter 5). The homogeneity of Early Saxon
copper alloy colour (when tarnished), in addition to occupying the region of colour
space close to pure gold, suggests that the typical alloy of the period (zinc bronze or
gunmetal) would have been ideally suited to fulfilling the aesthetic ideal of ‘golden’
(Chapter 6). Gunmetals and low-zinc brasses have modern precedents for use as golden
skeuomorphs as most gold alloys are a more saturated reddish-yellow than high-zinc
brass (Chapters 3 and 5; Craddock, 1978, 12). The role of gunmetal is therefore not just
the result of economical reuse of scrap metal, but as a potentially desirable aesthetic
alloy deliberately created to mimic the colour of the golden ideal.
432
PATTERNS IN ALLOY USE
Patterns in alloy use are present but primarily relate to the method of manufacture
(Chapter 3). Beyond the low lead requirements of wrought objects, control over the
alloy composition was not an issue for object functionality. Certain object types exhibit
less variety: buckles are mostly binary alloys in the early and late phases, although
some alloy mixing does occur in the 6th century (Chapter 10). This could be indicative
of a change in metal supply or recycling practices in the 6th century, but since the
pattern of alloy use returns to more binary alloys in the later phase, metal supply is
more likely. This is one of the clearer instances of the decrease in available fresh metal
resources in the 6th century, which coincides with a period witness to devastating
events on the continent, a reflection of the effects of famine and plague on trade
(Chapter1).
This 6th century constraint on metal supply can also be observed in the method of
manufacture adopted for certain object types. The increasing number of F.II annular
brooches (those made from a riveted band of wrought metal) in the later phase is
indicative of economical use of metal supply; these brooches produce less metal waste
but would have taken more time to make and are less artistically executed. As this
metal waste could easily be recycled and this practice grows alongside the
development of larger cruciform brooches and great square-headed brooches, the need
for such frugality is brought into question. This discrepancy may derive from the
widening gap between social strata as local elites consolidated power over regions and
their resources.
The nature of the manufacturing process used determines to some degree what copper
alloy was used. As few properties were necessary in the majority of copper alloys, little
control was necessary, but the survival of certain alloying practices and technical
knowledge is evident. Larger cast objects were more likely to contain fresh metal or
lead. The inclusion of lead was for improved physical properties, while the higher
frequency of fresh bronze could indicate that bronze was cheaper (and therefore more
was used when more metal was required) or, more likely, fresh metal was used
433
because it was perceived as more valuable, and large objects were usually higher
status. The higher frequency of gunmetals for wrought objects may derive from a
conscious effort to increase the springiness of the alloy, or to create a more visually
appealing metal colour (Tottle, 1984; Smythe, 1937). The lack of lead in wrought
objects, specifically those that had to derive from recycling (gunmetals) is indicative of
the level of control that Early Saxon metalworkers could exercise when necessary.
434
RECYCLING AND METAL SUPPLY
In the range and variability of Early Saxon alloys, the ‘metallurgy of survival’ is evident;
much of the metal supply was certainly derived from recycled Roman scrap (Chapters 2
and 3). Simple combination ratios of 1:1, 1:2 and 1:3 using typical Roman copper alloy
compositions can account for nearly all of the alloys seen in the period; however, the
composition of Early Saxon bronze is not simply the result of recycling scrap. The need
for fresh metal in the system to account for the compositions seen has been discussed
(Chapter 3), and the recycling model suggests that this new metal was a bronze,
possibly with low levels of lead and zinc, and probably pre-alloyed much like the ingots
of low-zinc brass and gunmetal found at Helgö (Lamm, 1973).
The composition of copper alloys is not consistent throughout the period. The Late
Roman period saw the rise of the use of gunmetals in an effort to economically reuse
scrap metal, a practice which intensified in post-Roman Britain as access to fresh metal
supplies became unreliable. The 6th century intensification of recycling may reflect the
extent of unrest rife in the continent at that time, with dwindling or intermittent supply
reflecting the troubled state of the small-scale production industry and plague-ravaged
trade network. The resurgence of bronze and higher-zinc gunmetals in the late 6th-7th
century suggests the increase in fresh metal supplies and mirrors the start of the
revival of organised trade; the introduction of coinage to various Anglo-Saxon
kingdoms c.600 CE further attests to this process (Chapter 2).
The production of appropriately coloured and functional metalwork was achieved
despite the difficulties of acquiring appropriate metal. Recycling strategies appear to
have including the nearly universal practice of recycling scrap metal with some amount
of fresh bronze, a tradition established as early as the 1st century CE and continued if
intensified from the late Roman period. A minimum of 4% tin occurs in nearly all
objects, even those with higher zinc, indicating the prevalence of adding bronze to
nearly all recycling mixes (Chapters 3 and 10). This creates not only a reliable copper
alloy for all purposes, it also homogenises the colour.
435
The practice of metal recycling was not as regulated in terms of input or proportions as
the practice described by early Roman sources, but this need not be a departure from
late Roman tradition. This practice derives from unreliable or limited fresh metal
access and from economical and practical uses of the existing supply for a limited
demand. Change in practice is therefore linked to a change, or more specifically a
constraint, in supply, as Early Saxon copper alloys may contain higher proportions of
scrap metal. The frequent selection of tin brasses or gunmetals to combine with fresh
bronze represents a strategy reflective of convenience and economy, mitigation of
unknowns, and improving the physical properties of the metal for general usage. As
well as this, and perhaps most importantly to the Saxon wearer, this produces a metal
colour similar to the majority of copper alloys in circulation, which, when slightly
tarnished, is most like the colour of pure gold of any copper or precious metal alloy
available at the time.
Local fluctuation in alloy frequency derives from inconsistencies in local scrap and
fresh metal access. The mirroring of local variation with regional homogeneity in
frequency, as with beads, arises from the sporadic and transient nature of trade in the
period (Chapters 4 and 10). What is seen is not a ‘metallurgy of survival,’ producing
copper alloy objects of inferior execution or quality of materials; it is rather a period of
a ‘metallurgy of convenience’ in which practicality in the managing of resources
through recycling strategies coincided with subtle manipulation of the available metal
supply for aesthetically motivated purposes. Technical and economic considerations
remained paramount in alloying choice, but the aesthetic ideal of gunmetal was
achieved with increasing frequency towards the end of the period when other
constraints lessened.
436
FUTURE RESEARCH
As is always the case when conducting large scale research projects, especially in those
that are so heavily interdisciplinary, as soon as one question is answered several new
ones crop up in their place. Many of these led to unexpected and fruitful experiments
and discussions within this text while others were unfortunately outside of the scope of
this thesis.
It is not yet possible to consistently estimate the colour of an archaeological copper
alloy by its composition alone as the full range of contributing elements and the effects
of working, heat treatment, impurities and long-term intergranular corrosion led in
many cases to deviation from the CIELAB values predicted by modern metal standards.
Quantification of these variables is needed prior to applying colour prediction
equations to archaeological composition data.
The lack of research defining the metallic phases present in gunmetals prevents a full
characterisation of the effects of composition on colour to be predicted, and this was
clearly evident with archaeological ternary and quaternary alloys. Metallographic
investigation is necessary to explore these variables fully, particularly the potentially
altering effects of intergranular corrosion. Characterisation of these variables would
enable the estimation of the colour of an alloy by its composition and mode of
manufacture, which could open up the discussion of metal colour to all extant copper
alloy compositional data.
The development of oxidation layers can be detected using spectrophotometry long
before they could be by other means (such as XRD), signifying a potential investigative
method for further corrosion and tarnish research. This could be particularly useful in
conservation contexts, and indeed spectrophotometry has already been used to
monitor long-term tarnish development on silver (Ankersmit et al., 2001).
A reconstructive experimental approach could contribute to the refinement of metal
recycling models. Recycling experiments using ancient technology are necessary to
quantify zinc volatilisation loss as well as the loss or retention of other alloying
437
components. In particular, a comparison of the retention of zinc in copper alloys with
and without crucible covers, in a variety of contemporary crucible forms, in the
presence of zinc, and with the reuse of crucibles is needed. This would help elucidate
the mechanics of the recycling process and to explain potential techniques metal
smiths would have used to either minimise component loss or to improve the resulting
metal quality. The influence of a few per cent of zinc on the working or long-term visual
properties of copper alloys could also supplement the data from this study.
Further improvements to the interpretation of recycling practice and metal supply
fluctuations could reveal important developments in the growth of trade in the Early
Saxon period. This will only be possible with better dating precision of sampled
artefacts. Refinement of typologies, particularly those for annular brooches, is also
necessary to improve relative dating. Such chronological refinement could also
elucidate changing colour fashion through other associated material such as beads and
help identify the effects of external cultural influences.
The application of colourimetry to copper alloys can be applied to other chronological
and cultural circumstances. Roman artefacts could show direct effects of colour and
alloy selection as metal availability would allow for this; however, the requirements of
copper alloys are more regulated due to the variability of object types. If the colour
prediction equations could be refined to better estimate archaeological artefact colour,
a corpus such as Bayley and Butcher’s (2004) composition data on brooches would be
an ideal starting place to investigate the importance of metal colour in Roman
jewellery. The colour and composition of gilding in the Anglo-Saxon period compared
with other periods could indicate other technological patterns or alterations of
metalworking practice and could be influential in forming a comprehensive visual
context for gold and metal colour in the Early Anglo-Saxon period.

438
439
BIBLIOGRAPHY
Åberg, N., 1926. The Anglo-Saxons in England during the early centuries after the
migration. W. Heffer & Sons, Ltd., Cambridge. Ager, B., 1985. “The smaller variants of the Anglo-Saxon quoit brooch.” Anglo-Saxon
Studies in Archaeology and. History. 4, 1–58. Alcock, L., 1963. Dinas Powys: an Iron Age, Dark Age and early medieval settlement in
Glamorgan. University of Wales, The Board of Celtic Studies, Cardiff. American Society for Metals (Ed.), 1970. Metals handbook: Forging and Casting, 8th ed.
ed. American Society for Metals,, Metals Park, Ohio. Ankersmit, H.A., Carbo, A.D., Tennent, N.A., 2001. “Tarnishing of silver: evaluation by
colour measurements,” in: Proceedings of the ICOM Committee for Conservation Metals Working Groups: Metal 2001. pp. 157–166.
Annable, F.K., Eagles, B., 2010. The Anglo-Saxon Cemetery at Blacknall Field, Pewsey, Wiltshire. Wiltshire Archaeological and Natural History Society, Devizes, Wiltshire.
Arnold, C.J., 1997. An archaeology of the early Anglo-Saxon kingdoms, New ed. Routledge, London.
Ashburnham Pentateuch, c.late 6th-early 7th century. Nouv. Acq. Lat. 2334. Paris, Bibliotheque Nationale.
Astill, G., 1985. “Archaeology, Economics and Early Medieval Europe.” Oxford Journal of Archaeology, 4, p. 215–231.
Backhouse, J., 1995. The Lindisfarne Gospels: A masterpiece of book painting. The British Library, London.
Baines, J., 1985. “Color terminology and color classification: ancient Egyptian color terminology and polychromy.” American Anthropologist, 87, pp.282-297.
Barber, E.J.W., 1991. Prehistoric Textiles: The Development of Cloth in the Neolithic and Bronze Ages with Special Reference to the Aegean. Princeton University Press, Princeton.
Barber, E.J.W., 1999. “Colour in Early Cloth and Clothing.” Cambridge Archaeology Journal, 9, p. 117–120.
Barnes, I., Bryce, T., Tate, J.,” The analysis and recreation of bronzes and brass mould residues.” Unpublished report. Laboratory of the National Museum of Antiquities of Scotland, 2, 40–46.
Bassett, W.H., 1912. “Zinc Losses.” Journal of Industrial and Engineering Chemistry, 4, pp. 164–167.
Bauccio, M., 1993. Metals Reference Book, Third Edition. ASM International, Materials Park, OH.
Bayley, J., 1984. “Copper Alloys and their Use in Iron Age and Roman Britain,” Presented at the 1984 Symposium on Archaeometry, Smithsonian Institution, Washington, D.C., pp. 1–24.
Bayley, J., 1988. “Non-ferrous metal working: continuity and change,” in: Slater, E.A., Tate, J.O. (Eds.), Science and Archaeology Glasgow 1987: Proceedings of a Conference on the Application of Scientific Techniques to Archaeology; Glasgow, September 1987, BAR British Series. BAR, Oxford, pp. 193–208.
Bayley, J., 1991. “Anglo-Saxon Non-Ferrous Metalworking: A Survey.” World Archaeology, 23, 1, pp. 115-130.
440
Bayley, J., 1992. “Lead Metallurgy in Late Saxon and Viking England,” in: Willies, L., Cranstone, D. (Eds.), Boles and Smeltmills : Report of a Seminar on the History and Archaeology of Lead Smelting Held at Reeth, Yorkshire, 15-17 May 1992. Historical Metallurgy Society, Matlock Bath, pp. 6–8.
Bayley, J., 1998. “The Production of Brass in Antiquity with Particular Reference to Roman Britain,” in: Craddock, P.T. (Ed.), 2000 Years of Zinc and Brass, British Museum Occasional Paper. British Museum, London, pp. 7–26.
Bayley, J., Butcher, S., 2004. Roman Brooches in Britain: A Technological and Typological Study based on the Richborough Collection, Reports of the Research Committee of the Society of Antiquaries of London. English Heritage, London.
Bayley, J., Crossley, D., Ponting, M., 2008. Metals and Metalworking: A research framework for archaeometallurgy, HMS Occasional Publication. Historical Metallurgy Society, Wakefield.
Bede, c.8th century. Durham Cassiodorus. Durham, Cathedral Library, MS B. II. 30. Bede, 2008. The ecclesiastical history of the English people, Oxford world’s classics.
Oxford University Press, Oxford. Berlin, B., Kay, P., 1991. Basic Color Terms: Their Universality and Evolution. University
of California Press, Berkeley. Biddle, M., Kjølbye-Biddle, B., 1990a. “Early Painted Wall Plaster from St. Albans
Abbey,” in: Cather, S., Williamson, P. (Eds.), Early Medieval Wall Painting and Painted Sculpture in England. British Archaeological Reports, Oxford, pp. 73–74.
Biddle, M., Kjølbye-Biddle, B., 1990b. “Painted Wall Plaster from the Old and New Minster in Winchester,” in: Cather, S. P. (Ed.), Early Medieval Wall Painting and Painted Sculpture in England. British Archaeological Reports, Oxford, pp. 41–44.
Biggam, C.P., 1995. “Sociolinguistic aspects of Old English colour lexemes.” Anglo-Saxon England, 24, pp. 51–65.
Biggam, C.P., 1997. Blue in Old English: An Interdisciplinary Semantic Study. Rodopi B. V., Amsterdam.
Biggam, C.P., 1998. Grey in Old English: An Interdisciplinary Study. Runetree Press, London.
Biggam, C.P., 2004. “Prototypes and foci in the encoding of colour,” in: Kay, C.J., Smith, J.J. (Eds.), Categorization in the History of English. John Benjamins Pub., Amsterdam, pp. 19–40.
Biggam, C.P., 2006a. “Old English color lexemes used of textiles in Anglo-Saxon England,” in: Caie, G.D., Hough, C., Wotherspoon, I. (Eds.), The Power of Words: Essays in Lexicography, Lexicology & Semantics. Rodopi, Amsterdam, pp. 1–21.
Biggam, C.P., 2006b. “Political Upheaval and a Disturbance in the Colour Vocabulary of Early English,” in: Biggam, C.P. and K. (Ed.), Progress in Colour Studies: Language and Culture. John Benjamins Publishing Company, Amsterdam, pp. 159–179.
Biggam, C.P., 2007. “The ambiguity of brightness (with special reference to Old English) and a new model for color description in semantics,” in: MacLaury, R.E., Paramei, G.U., Dedrick, D. (Eds.), Anthropology of Color: Interdisciplinary Multilevel Modeling. John Benjamins Publishing Co., Amsterdam, pp. 171–188.
Biggam, C.P., 2010. “The Development of the Basic Colour Terms of English,” in: Hall, A., Timofeeva, O., Kiricsi, A., Fox, B. (Eds.), Interfaces Between Language and Culture in Medieval England. Brill, Leiden, pp. 231–266.
Blades, N., 1995. Copper alloys from English archaeological sites 400-1600 AD : an analytical study using ICP-AES. Unpublished PhD Thesis, University of London, London.
Book of Durrow, 680. Dublin, Trinity College Library, MS A. 4. 5. (f.57). Boric, D., 2002. “Apotropaism and the temporality of colours: colourful mesolithic-
neolithic seasons in the Danube gorges,” in: Jones, A., MacGregor, G. (Eds.), Colouring the Past: The Significance of Colour in Archaeological Research. Berg, Oxford ; New York, pp. 23–43.
441
Bosworth, J., 1898. An Anglo-Saxon Dictionary: Based on the Manuscript Collections of the Late Joseph Bosworth. Clarendon Press, Oxford.
Boulter, S., and Walton Rogers, P. 2012. Circles and cemeteries: excavations at Flixton, East Anglian archaeology report. Archaeological Service, Suffolk County Council, Bury St Edmunds.
British Museum, 2012. “Collection Database Search.” http://www.britishmuseum.org/research/search_the_collection_database.aspx (accessed 17/01/2013).
Brodsky, N.S., 2011. “Old English translations.” Personal Commication. Brown, K., 1987. The development of metalworking in England and the North Sea littoral
from the late Roman Iron Age to the early Medieval Period. Unpublished D.Phil thesis, University of Oxford, Oxford.
Brown, P.D.C., Schweizer, F., 1973. “X-Ray Fluorescent Analysis of Anglo Saxon Jewellery.” Archaeometry 15, pp. 175–192.
Brown, M.P., 2003. Painted Labyrinth: The world of the Lindisfarne Gospels. The British Library, London.
Brownsword, R., 2004. “Medieval metalwork: an analytical study of copper-alloy objects.” Journal of Historical Metallurgy, 38, pp. 84–105.
Brownsword, R., Ciufifini, T., Carey, R., 1984. “Metallurgical analysis of Anglo-Saxon jewellery from the Avon Valley.” West Midlands Archaeology, 27, pp. 101–112.
Brownsword, R., Hines, J., 1993. “The Alloys of a Sample of Anglo-Saxon Great Square-Headed Brooches.” Antiquity Journal, 73, pp. 1–10.
Bruce-Mitford, R., Evans, A.C., 1978. The Sutton Hoo ship-burial: Vol. 2. Arms, armour and regalia. British Museum, London.
Brugmann, B., 2004. Glass Beads from Early Anglo-Saxon Graves. Oxbow Books, Oxford. Budd, P. (Ed.), 1991. Archaeological Sciences 1989: proceedings of a conference on the
application of scientific techniques to archaeology, Bradford, September 1989, Oxbow monograph. Oxbow, Oxford.
Caley, E.R., 1952. “Estimation of Composition of Ancient Metal Objects Utility of Specific Gravity Measurements.” Analytical Chemistry, 24, 4, pp. 676-681.
Caley, E.R., 1955. “On the existence of chronological variations in the composition of Roman brass.” Ohio Journal of Science, 55, pp. 137–140.
Calligaro, T., 2005. “The Origin of Ancient Gemstones Unveiled by PIXE, PIGE and µ-Raman Spectrometry,” in: Uda, M., Demorier, G., Nakai, I. (Eds.), X-rays for Archaeology. Springer, Dordrecht, pp. 101–112.
Cambridge Museum of Archaeology & Anthropology, 2012. “Catalogue Search” http://maa.cam.ac.uk/home/index.php?a=40&b=catalogue&c=32 (accessed 01/11/2012).
Campbell, E., 2007. Continental and Mediterranean imports to Atlantic Britain and Ireland, AD 400-800, CBA research report. Council for British Archaeology, York.
Canterbury Codex Aureus, c.mid 8th century. Swedish Royal Library, MS A. 35, Stockholm.
Caple, C., 1986. An analytical appraisal of copper alloy pin production, 400-1600 AD : The development of the copper alloy, pin industry in Britain during the post-Roman period, based on analytical, metallographic and typological examination. Unpublished PhD thesis, University of Bradford, Archaeology, Bradford.
Caple, C., 2010. Ancestor Artefacts – Ancestor Materials. Oxf. J. Archaeol. 29, 305–318. Cardoso, I., Macedo, M.F., Vermeulen, F., Corsi, C., Santos Silva, A., Rosado, L., Candeias,
A., Mirao, J., 2013. “A Multidisciplinary Approach to the Study of Archaeological Mortars from the Town of Ammaia in the Roman Province of Lusitania (Portugal).” Archaeometry (in press, online preview).
Carver, M.O.H., Hills, C., Scheschkewitz, J., 2009. Wasperton : a Roman, British and Anglo-Saxon community in central England. Boydell Press,, Woodbridge, Suffolk.
442
Casson, R.W., Gardner, P.M., 1992. “On Brightness and Color Categories: Additional Data.” Current Anthropology, 33, pp. 395–399.
Cather, S., Park, D., Williamson, P., 1990. Early Medieval Wall Painting and Painted Sculpture in England, British Series. British Archaeological Reports, Oxford.
Chapman, J., 2002. “Colourful Prehistories: The Problem with the Berlin and Kay Colour Paradigm,” in: Jones, A., MacGregor, G. (Eds.), Colouring the Past: The Significance of Colour in Archaeological Research. Berg, Oxford, pp. 45–72.
Chase, W.T., Franklin, U.M., 1979. “Early Chinese Black Mirrors and Pattern-Etched Weapons.” Ars Orientalis, 11, pp. 215–258.
Chase, W.T., 1994. “Chinese Bronzes: Casting, Finishing, Patination and Corrosion,” in: Scott, D.A. (Ed.), Ancient and Historic Metals: Conservation and Scientific Research: Proceedings of a Symposium Organized by the J. Paul Getty Museum and the Getty Conservation Institute, November 1991. Getty Conservation Institute, Marina del Rey, pp. 85–182.
Christie, N., 2010. The fall of the Western Roman Empire: archaeology, history and the decline of Rome, Historical endings. Bloomsbury Academic, London.
Clarke, H.B., 2009. “Economy,” in: Stafford, P. (Ed.), A Companion to the Early Middle Ages: Britain and Ireland C.500-1100, Blackwell Companions to British History. Wiley-Blackwell, Chichester, West Sussex, pp. 57–75.
Clarke, M., 2004. “Anglo-Saxon Manuscript Pigments.” Studies in Conservation, 49, pp. 231–244.
Clubb, M.D., 1972. Christ and Satan: An Old English Poem. Archon Books, Hamden, Conn. Coates, R., Breeze, A., Horovitz, D., 2000. Celtic Voices English Places: Studies of the Celtic
Impact on Place-Names in England. Shaun Tyas, Stamford, Lincolnshire. Coatsworth, E., Pinder, M., 2002. The art of the Anglo-Saxon goldsmith: fine metalwork in
Anglo-Saxon England: its practice and practitioners. Boydell Press, Woodbridge. Coleridge, S.T., 1997. The Anglo-Saxon Chronicle. Dent, London. Cook, A.M., 1981. The Anglo-Saxon cemetery at Fonaby, Lincolnshire. The Society for
Lincolnshire History and Archaeology, Sleaford. Cook, A.M., Dacre, M.W., 1985. Excavations at Portway, Andover 1973-1975. Oxford
University Committee for Archaeology, Oxford. Coronation Sacramentary, 9th century. Sacramentary of Charles the Bald, Bibliotheque
Nationale de France, Manuscrits, Latin 1141 (f.6v). Craddock, P.T., 1975. The Composition of Copper Alloys in the Classical World.
Unpublished PhD thesis. University of London, London. Craddock, P.T., 1976. “The Composition of the Copper Alloys used by the Greek,
Etruscan and Roman Civilizations 1: The Greeks before the Archaic Period.” Journal of Archaeological Science, 3, pp. 93–113.
Craddock, P.T., 1977. “The Composition of the Copper Alloys used by the Greek, Etruscan and Roman Civilisations 2: The Archaic, Classical and Hellenistic Greeks.” Journal of Archaeological Science, 4, pp. 103–123.
Craddock, P.T., 1978. “The Composition of the Copper Alloys used by the Greek, Etruscan and Roman Civilizations: 3: The Origins and Early Use of Brass.” Journal of Archaeological Science, 5, pp. 1–16.
Craddock, P.T., 1979. “The copper alloys of the Medieval Islamic world - inheritors of the classical tradition.” World Archaeology, 11, pp. 68–79.
Craddock, P.T., 1998. 2000 Years of Zinc and Brass, British Museum Occasional Paper. British Museum, London.
Craddock, P.T., Cowell, M., Hook, D.R., La Niece, S., Meeks, N.D., 2010. Change and Stasis: the technology of Dark Age metalwork from the Carpathian Basin. British Museum, London.
Craddock, P.T., La Niece, S.C., Hook, D.R., 1998. “Brass in the Medieval Islamic World,” in: Craddock, P.T. (Ed.), 2000 Years of Zinc and Brass. British Museum, London, pp. 72–113.
443
Cramp, R.J., Cronyn, J., 1990. “Anglo-Saxon Polychrome Plaster and Other Materials from the Excavations of Monkwearmouth and Jarrow: an interim report,” in: Cather, S. P. (Ed.), Early Medieval Wall Painting and Painted Sculpture in England. British Archaeological Reports, Oxford, pp. 17–27.
Cretu, C., Van der Lingen, E., 1999. “Coloured Gold Alloys.” Gold Bulletin, 32, pp. 115-126.
Dane, C., 2012. Early Anglo-Saxon Enamelling. Unpublished PhD thesis, Bangor University, Bangor, Wales.
Dark, K.R., 1994. Civitas to kingdom: British political continuity, 300-800. Leicester University Press, Leicester ; New York.
Dean, M.J., Kinsley, A.G., 1993. Broughton Lodge : excavations on the Romano-British settlement and Anglo-Saxon cemetery at Broughton Lodge, Willoughby-on-the-Wolds, Nottinghamshire 1964-8, Nottingham archaeological monographs. University of Nottingham, Department of Classical and Archaeological Studies, Nottingham.
Derefeldt, G., 1991. “Colour Appearance Systems,” in: Vision and Visual Dysfunction. Macmillan, Basingstoke, pp. 218–261.
Dickinson, T.M., 1979. “On the Origin and Chronology of the Early Anglo-Saxon Disc Brooch,” in: Hawkes, S.C. (Ed.), Anglo-Saxon Studies in Archaeology and History 1. British Archaeological Reports Series, Oxford, pp. 39–80.
Dickinson, T.M., 1982. “Ornament variation in pairs of cast saucer brooches: A case study from the Upper Thames region,” in: Webster, L. (Ed.), Aspects of Production and Style in Dark Age Metalwork: Selected Papers Given to the British Museum Seminar on Jewellery AD 500-600. British Museum Occasional Paper, London, pp. 21–48.
Dodwell, C.R., 1982. Anglo-Saxon Art: A New Perspective. Manchester University Press, Manchester.
Drinkall, G., Foreman, M., 1998. The Anglo-Saxon Cemetery at Castledyke South, Barton-on-Humber, Sheffield Excavation Reports 6. Humber Archaeology Partnership, Sheffield.
Drury, P.J., 1990. “Anglo-Saxon Painted Plaster Excavated at Colchester Castle, Essex,” in: Cather, S. P. (Ed.), Early Medieval Wall Painting and Painted Sculpture in England. British Archaeological Reports, Oxford, pp. 111–122.
Dubin, L.S., 2009. The Worldwide History of Beads. Thames & Hudson, London. Dumville, D.N., 1993. Britons and Anglo-Saxons in the early Middle Ages, Variorum
collected studies series. Variorum, Aldershot. Dungworth, D., 1995. Iron Age and Roman Copper Alloys from Northern Britain.
Unpublished PhD thesis, Durham University, Durham. Dungworth, D., 1997. “Roman Copper Alloys: Analysis of Artefacts from Northern
Britain.” Journal of Archaeological Science, 24, pp. 901–910. Dungworth, D., 2000. “A note on the analysis of crucibles and moulds.” Journal of
Historical Metallurgy, 34, pp. 83–86. Durham Gospels, c.700. (MS A.II.17), Durham Cathedral Library. Eagles, B., Mortimer, C., 1993. “Early Anglo-Saxon Artefacts from Hod Hill Dorset.”
Antiquity Journal, 73, pp. 132–140. Eastaugh, N., Walsh, V., Chaplin, T., Siddall, R., 2004a. The Pigment Compendium: Optical
Microscopy of Historical Pigments. Elsevier Butterworth Heinemann, London. Eastaugh, N., Walsh, V., Chaplin, T., Siddall, R., 2004b. The Pigment Compendium : a
dictionary of historical pigments. Elsevier Butterworth-Heinemann, Oxford. Edwards, D., 1991. “Categories are for Talking: On the Cognitive and Discursive Bases
of Categorization.” Theory Psychology, 1, pp. 515–542. English Heritage, 2007. “Monument no. 81809 (No. 81809).”
http://www.pastscape.org.uk/hob.aspx?hob_id=81809 (accessed 14/04/2013).
444
English Heritage, 2013. “Archaeology Data Service: Roman Settlement East of Sherburn Church (National Monuments Record 636014).” Archaeological Data Service. http://archaeologydataservice.ac.uk/archsearch/record.jsf?titleId=1857416 (accessed 20/04/2013).
Evison, V.I., 1955. “Early Anglo-Saxon inlaid metalwork.” Antiquity Journal, 35, pp. 20–45.
Evison, V.I., 1965. The fifth-century invasions south of the Thames. Athlone Press, London.
Evison, V.I., 1988. An Anglo-Saxon cemetery at Alton, Hampshire, (Hampshire Field Club and Archaeological Society). Hampshire Field Club, Southampton.
Evison, V.I., 1994. An Anglo-Saxon cemetery at Great Chesterford, Essex, Council for British Archaeology research report. Council for British Archaeology, York.
Fang, J.-L., 2004. Colour and Working Properties of High-tin Bronzes. Unpublished masters dissertation, University of Bradford, Bradford.
Fang, J.-L., McDonnell, G., 2011. “The Colour of Copper Alloys.” Journal of Historical Metallurgy, 45, pp. 52–61.
Faulkner, N., 2000. The decline and fall of Roman Britain. Tempus, Stroud. Fleming, R., 2012. “Recycling in Britain after the Fall of Rome’s Metal Economy.” Past &
Present, 217, pp. 3–45. Fowler, E., 1960. “The Origins and Development of the Penannular Brooch in Europe.”
Proceedings of the Prehistoric Society, xxvi, 149–177. Frantzen, A.J., 2012. Anglo-Saxon Keywords. John Wiley & Sons: Malden, MA. Freestone, I., 2011. “Something old, something new? Glass production and supply in the
1st millennium AD.” Association for the History of Glass Conference: Neighbours and Successors of Rome. Kings Manor, York, 19/05/2011.
Freestone, I., Hughes, M.J., Stapleton, C., 2008. “The Composition and Production of Anglo-Saxon Glass,” in: Evison, V.I. (Ed.), Catalogue of Anglo-Saxon Glass in the British Museum, British Museum Research Publication 167. Trustees of the British Museum, London, pp. 29–46.
Fulk, R.D. (Ed.), 2010. The Beowulf manuscript: complete texts ; and The fight at Finnsburg, Dumbarton Oaks medieval library. Harvard University Press, Cambridge, MA.
Gage, J., 1993. Colour and Culture: Practice and Meaning from Antiquity to Abstraction. Thames and Hudson, London.
Gage, J., 1999a. Colour and Meaning: Art, Science and Symbolism. Thames and Hudson, London.
Gage, J., 1999b. “What Meaning had Colour in Early Societies?” Cambridge Archaeological Journal, 9, pp. 109–126.
Geake, H., 1999. “Invisible kingdoms: the use of grave-goods in seventh-century England.” Anglo-Saxon Studies in Archaeology and History 10, pp. 203–215.
Gelasian Sacrementary, 8th century. MS Reginensis 316, Vatican Library. Gleba, M., Mannering, U. (Eds.), 2012. Textiles & textile production in Europe: from
prehistoryto AD 400, Ancient textiles series. Oxbow, Oxford. Gliozzo, E., Kockelmann, W., Bartoli, L., Tykot, R.H., 2011. “Roman bronze artefacts from
Thamusida (Morocco): Chemical and phase analyses.” Nuclear Instruments and Methods in Physics Research Section B: Beam Interactions with Materials and Atoms, 269, pp. 277–283.
Gospel of St. Willibrord (Echternach Gospels), 690. Bibliothèque National, Paris, 9389. Grabar, A., 1957. Early Medieval Painting: from the fourth to the eleventh century.
Editions d’Art Albert Skira, Paris. Green, B., 1987. The Anglo-Saxon cemetery at Morning Thorpe, Norfolk, East Anglian
archaeology report. Norfolk Archaeology Unit, Gressenhall. Green, B., Rogerson, A., 1978. The Anglo-Saxon Cemetery at Bergh Apton, Norfolk:
Catalogue, Report. Norfolk Archaeological Unit, Gressenhall, Norfolk.
445
Guido, M., 1999. The Glass Beads of Anglo-Saxon England c.AD 400-700. The Boydell Press for The Society of Antiquaries of London, London.
Hadley, D.M., 2012. “Masculinity,” in: Stodnick, J.A., Trilling, R.R. (Eds.), A Handbook of Anglo-Saxon Studies. Blackwell, Chichester, pp. 115–132.
Hall, E.T., 1960. “X-Ray Fluorescent Analysis Applied to Archaeology.” Archaeometry, 3, pp. 29–35.
Hamerow, H., 2012. Rural Settlements and Society in Anglo-Saxon England. Oxford University Press, Oxford.
Härke, H., 1990. “’Warrior Graves’? The Background of the Anglo-Saxon Weapon Burial Rite.” Past & Present, 126, pp. 22–43.
Harrington, S., 2008. Aspects of Gender Identity and Craft Production in the European Migration Period: Iron weaving beaters and associated textile making tools from England, Norway and Alamannia, British Archaeological Reports International Series. BAR, Oxford.
Haughton, C., 1999. West Heslerton: The Anglian Cemetery: Catalogue of the Anglian Graves and Associated Assemblages. English Heritage, Yedingham, North Yorkshire.
Haughton, C., Powlesland, D., 1999. West Heslerton: The Anglian Cemetery: The Excavation and Discussion of the Evidence. English Heritage, Yedingham, North Yorkshire.
Hawkes, S.C., 2006. The Anglo-Saxon cemetery at Finglesham, Kent, Oxford University School of Archaeology monographs. Oxford University School of Archaeology, Oxford.
Hawkes, S.C., Merrick, J.M., Metcalf, D.M., 1966. “X-ray Fluorescent Analysis of Some Dark Age Coins and Jewellery.” Archaeometry, 9, pp. 98–138.
Hawthorne, J.G., Stanley Smith, C., 1979. Theophilus: On Divers Arts. Dover Publications, Inc, New York.
Heaney, S., 2000. Beowulf: A New Verse Translation. W. W. Norton & Company, Inc., New York.
Hemer, K.A., Evans, J.A., Chenery, C.A., Lamb, A.L., 2013. “Evidence of early medieval trade and migration between Wales and the Mediterranean Sea region.” Journal of Archaeological Science, 40, pp. 2352–2359.
Hencken, H., 1974. Indo-European Languages and Archaeology, American Anthropological Association, memoir no. 84. Kraus Reprint Co., Millwood, NY.
Herbert, E.W., 2003. Red Gold of Africa: Copper in Precolonial History and Culture. University of Wisconsin Press: Madison, WI.
Higgit, J., 1990. “Anglo-Saxon Painted Lettering at St. Patrick’s Chapel, Heysham,” in: Cather, S. P. (Ed.), Early Medieval Wall Painting and Painted Sculpture in England. British Archaeological Reports, Oxford, pp. 31–40.
Higham, N., 1993. The Kingdom of Northumbria, AD 350-1100. A. Sutton, Stroud; Dover, NH.
Hill, D., Metcalf, D.M., 1984. Sceattas in England and on the Continent: The seventh Oxford symposium on coinage and monetary history, British Archaeology Reports British Series. British Archaeology Reports, Oxford.
Hills, C., 2003. The origins of the English, Duckworth debates in archaeology. Duckworth, London.
Hines, J., 1993. Clasps, hektespenner, agraffen: Anglo-Scandinavian clasps of classes A-C of the 3rd to 6th centuries A.D.: typology, diffusion and function. Kungl. Vitterhets historie och antikvitets akademien, Stockholm.
Hines, J., 1994. “The Becoming of the English: Identity, Material Culture and Language in Early Anglo-Saxon England,” in: Anglo-Saxon Studies in Archaeology and History 7. B.A.R, Oxford, pp. 49–59.
Hines, J., 1997. A New Corpus of Anglo-Saxon Great Square-Headed Brooches. Boydell Press, London.
446
Hinton, D.A., 2000. A smith in Lindsey: the Anglo-Saxon grave at Tattershall Thorpe, Lincolnshire, Society for Medieval Archaeology monograph. Society for Medieval Archaeology, London.
Hinton, D.A., 2005. Gold & Gilt, Pots & Pins: Possessions and People in Medieval Britain. Oxford University Press, Oxford.
Hirst, S., 1985. An Anglo-Saxon Inhumation Cemetery at Sewerby, East Yorkshire. W. S. Maney and Son Ltd., York.
Hirst, S., Clark, D., 2009. Excavations at Mucking: Volume 3, the Anglo-Saxon Cemeteries. Museum of London Archaeology, London.
Hodges, R., 1989. Dark Age Economics: The Origins of Towns and Trade. Duckworth, London.
Hodges, R. and Bowden, W. 1998. The sixth century: production, distribution and demand: The transformation of the Roman world. Brill, Leiden.
Hook, D.R., 2010. Trees in Anglo-Saxon England: literature, lore and landscape. Boydell & Brewer, Woodbridge.
Hough, C., 2006. “Colours of the Landscape: Old English Colour Terms in Place-names,” in: Biggam, C.P. and K. (Ed.), Progress in Colour Studies: Language and Culture. John Benjamins Publishing Company, Amsterdam, pp. 181–198.
Howard, H., 2003. Pigments of English Medieval Wall Painting. Archetype Publications, London.
Howe, E., 2006. “A Technical Study of the Polychromy of the Lichfield Angel.” Dean and Chapter of Lichfield Cathedral, Lichfield.
Hughes, R., Rowe, M., 1991. The colouring, bronzing, and patination of metals : a manual for the fine metalworker and sculptor : cast bronze, cast brass, copper and copper-plate, gilding metal, sheet yellow brass, silver and silver-plate. Watson-Guptill Publications : Whitney Library of Design, New York, N.Y.
James, E., 2001. Britain in the first millennium, Britain and Europe. Arnold, London. Jenkins, R., Gould, R.W., Gedcke, D., 1981. Quantitative X-Ray Spetrometry. Marcel
Dekker, Inc., New York. Jessup, R.F., 1974. Anglo-Saxon Jewellery, Shire Archaeology. Shire Publications,
Aylesbury. Johnston-Feller, R., 2001. Color Science in the Examination of Museum Objects:
Nondestructive Procedures. The Getty Conservation Institute, Los Angeles. Jones, A., MacGregor, G., 2002. Colouring the Past: The significance of colour in
archaeological research. Berg, Oxford. Jones, M.U., 1977. “Metallurgical finds from a multi-period settlement at Mucking,
Essex,” in: Oddy, W.A. (Ed.), Aspects of Early Metallurgy. Historical Metallurgy Society and the British Museum Research Laboratory, London, pp. 117–120.
Jørgensen, L. (Ed.), 1992. Chronological studies of Anglo-Saxon England, Lombard Italy and Vendel period Sweden. Institute of Prehistoric and Classical Archaeology, University of Copenhagen, Copenhagen.
Keates, S., 2002. “The Flashing Blade: Copper, Colour and Luminosity ni North Italian Copper Age Society,” in: Jones, A., MacGregor, G. (Eds.), Colouring the Past: The Significance of Colour in Archaeological Research. Berg, Oxford, pp. 109–126.
Kelleher, R., 2013. Coins, Monetisation and re-use in Medieval England and Wales: new interpretations made possible by the Portable Antiquities Scheme. (PhD thesis). Durham University, Durham.
Kerttula, S., 2007. “Relative basicness of color terms,” in: MacLaury, R.E., Paramei, G.U., Dedrick, D. (Eds.), Anthropology of Color: Interdisciplinary Multilevel Modeling. John Benjamins Publishing Co., Amsterdam, pp. 151–169.
Klein, S.S., 2012. “Gender,” in: Stodnick, J.A., Trilling, R.R. (Eds.), A Handbook of Anglo-Saxon Studies. Blackwell, Chichester, pp. 39–54.
447
Knüsel, C., Ripley, K., 2001. “The Berdache or Man-woman in Anglo-Saxon England and Early Medieval Europe,” in: Frazer, W.O., Tyrrell, A. (Eds.), Social Identity in Early Medieval Britain. Continuum, London. pp. 157–191.
La Niece, S., 1988. “White Inlays in Anglo-Saxon Jewellery,” in: Slater, E.A., Tate, J.O. (Eds.), Science and Archaeology Glasgow 1987: Proceedings of a Conference on the Application of Scientific Techniques to Archaeology; Glasgow, September 1987, BAR British Series. British Archaeological Reports, Oxford, pp. 235–246.
La Niece, S., 2012. Anglo-Saxon glass colours in the British Museum. Personal communication, 16/2/2012.
Lachance, G.R., Claisse, F., 1995. Quantitative X-Ray Fluorescence Analysis: Theory and Application. John Wiley & Sons Ltd, Chichester.
Laing, L., Ponting, M., 2005. “Some Anglo-Saxon Artefacts from Nottinghamshire,” in: Anglo-Saxon Studies in Archaeology and History 13. B.A.R, Oxford, pp. 80–96.
Lamm, K., 1973. “The Manufacture of Jewellery during the Migration Period at Helgö, Sweden.” Journal of Historical Metallurgy, 7, pp.1–7.
Lamm, K., 1977. “Early Medieval Metalworking on Helgö in Central Sweden,” in: W. A. Oddy (Ed.), Aspects of Early Metallurgy. Historical Metallurgy Society and the British Museum Research Laboratory, London, pp. 97– 116.
Lang, J., 1990. “The Painting of Pre-Conquest Sculpture in Northumbria,” in: Cather, S. P. (Ed.), Early Medieval Wall Painting and Painted Sculpture in England. British Archaeological Reports, Oxford, pp. 135–146.
Latin Vulgate Bible, 2012. . Latin Vulgate .com. http://www.latinvulgate.com/lv/verse.aspx?t=0&b=1&c=20 (accessed 11.6.12).
Leahy, K., 2003. Anglo-Saxon Crafts. Tempus Publishing, Ltd., Stroud, Gloucestershire. Leahy, K., 2007. Interrupting the Pots: The excavation of Cleatham Anglo-Saxon
Cemetery. Council for British Archaeology, York. Leeds, E.T., 1936. Early Anglo-Saxon Art and Archaeology. Clarendon Press, Oxford. Leeds, E.T., 1945. “The Distribution of the Angles and Saxons Archaeologically
Considered.” Archaeologia 91, pp. 1–106. Leeds, E.T., Barber, J.L., 1950. “An Anglian Cemetery at Glaston, Rutland.” Antiquity
Journal, 30, pp. 185–189. Leigh, D., 1984. “Ambiguity in Anglo-Saxon Style I Art.” Antiquity Journal, 64, pp. 34–42. Lichfield Gospels (Gospel of St. Chad), c.mid 8th century. Lichfield Cathedral, Lichfield. Lindisfarne Gospels,c. 715. London, British Library (Cotton MS Nero D.IV). Loveluck, C.P., 1996. “The Development of the Anglo-Saxon Landscape, Economy and
Society “On Driffield”, East Yorkshire, 400-750 AD,” in: Anglo-Saxon Studies in Archaeology and History 9. B.A.R, Oxford, pp. 25–48.
Lucy, S., 2009. The Anglo-Saxon settlement and cemetery at Bloodmoor Hill, Carlton Colville, Suffolk, East Anglian archaeology report. Cambridge Archaeological Unit, Cambridge.
Lucy, S., 1998. The early Anglo-Saxon cemeteries of east Yorkshire: an analysis and reinterpretation, BAR. Archaeopress, Oxford.
Lucy, S., 2000. The Anglo-Saxon way of death: burial rites in early England. Sutton, Thrupp, Gloucestershire.
Luxeuil Lectionary, c.7th century. Paris, Bibliotheque Nationale de France, 9427. (f.144). MacAdam, D.L., 1981. Color Measurement: Theme and Variation, Springer Series in
Optical Sciences. Springer-Verlag, Berlin. MacCormack, B.I., Bowers, J.E., 1981. “New White Gold Alloys.” Gold Bulletin, 14, pp. 19–
24. MacLaury, R.E., 1992. “From Brightness to Hue: an explanatory model of color-category
evolution.” Current Anthropology, 33, pp. 137-182.
448
Malim, T., Hines, J., 1998. The Anglo-Saxon Cemetery at Edix Hill (Barrington A), Cambridgeshire, Council for British Archaeology Research Report. Council for British Archaeology, York.
Manser, J., 1977. A technological study of the “bronze” brooches excavated at Spong Hill, Norfolk, 1972-1976. Unpublished dissertation, University of London.
Martin, T., 2011. Identity and the Cruciform Brooch in Early Anglo-Saxon England: An Investigation of Style, Mortuary Context, and Use. PhD thesis, University of Sheffield, Sheffield.
Marzinzik, S., 2003. Early Anglo-Saxon belt buckles (late 5th to early 8th centuries A.D.): their classification and context. Archaeopress, Oxford.
McCormick, M., 2001. The origins of the European economy: communications and commerce, A.D. 300-900. Cambridge University Press, Cambridge.
Mead, W.E., 1899. “Color in Old English Poetry.” Publications of the Modern Language Association of America, xiv/vii, pp. 169–206.
Meeks, N.D., 1993. “Surface characterization of tinned bronze, high-tin bronze, tinned iron and arsenical bronze,” in: La Niece, S. (Ed.), Metal Plating and Patination: Cultural, Technical & Historical Developments. Butterworth-Heinemann Ltd., Oxford, pp. 247–275.
Meharg, A.A., Edwards, K.J., Schofield, J.E., Raab, A., Feldmann, J., Moran, A., Bryant, C.L., Thornton, B., Dawson, J.J.C., 2012. “First comprehensive peat depositional records for tin, lead and copper associated with the antiquity of Europe’s largest cassiterite deposits.” Journal of Archaeological Science, 39, pp. 717–727.
Metcalf, D.M., 1978. “Chemical Analysis of English Sceattas.” British Numismatic Journal, 40, pp. 12–19.
Metcalf, D.M., Gilmore, G.R., 1980. “The Alloy of the Northumbrian Coinage in the Mid-Ninth Century,” in: Metcalf, D.M. and O. (Ed.), Metallurgy in Numismatics. Royal Numismatics Society, London, pp. 83–99.
Milazzo, M., Cicardi, C., 1997. “Simple Methods for Quantitative X-Ray Fluorescence Analysis of Ancient Metal Objects of Archaeological Interest.” X-Ray Spectrometry, 26, pp. 211–216.
Minolta, 1998. Precise Colour Communication: colour control from perception to instrumentation. Minolta Co. Ltd., Japan.
Mortimer, C., 1986. “Early Use of Brass in Silver Alloys.” Oxford Journal of Archaeology, 5, pp. 233–242.
Mortimer, C., 1988. “Anglo-Saxon copper alloys from Lechlade, Gloucestershire.” Oxford Journal of Archaeology, 7, pp. 227–233.
Mortimer, C., 1990. Some aspects of early medieval copper-alloy technology, as illustrated by a study of the Anglian cruciform brooch. Unpublished D.Phil thesis, University of Oxford, Research Laboratory for Art History and Archaeology, Oxford.
Mortimer, C., 1991. “Northern European metalworking traditions in the fifth and sixth centuries AD,” in: Budd, P. (Ed.), Archaeological Sciences 1989. Oxbow Monograph 9, Oxford, pp. 162–168.
Mortimer, C., 1991. “Notes and news - A descriptive classification of early Anglo-Saxon copper-alloy compositions: Towards a general typology of Early Medieval copper alloys.” Medieval Archaeology VL , pp. 104–107.
Mortimer, C., 1994. “Lead-Alloy Models for Three Early Anglo-Saxon Brooches,” in: Anglo-Saxon Studies in Archaeology and History 7. B.A.R, Oxford, pp. 27–33.
Mortimer, C., 1998. “Analysis of cruciform brooches from Castledyke,” in: Drinkall, G. (Ed.), The Anglo-Saxon Cemetery at Castledyke, Barton-on-Humber, Sheffield Excavation Reports 6. Humber Archaeology Partnership, Sheffield, pp. E1–E8.
Mortimer, C., Anheuser, K., 1998. “Non-ferrous metalwork,” in: Malim, T., Hines, J. (Eds.), The Anglo-Saxon Cemetery at Edix Hill (Barrington A), Cambridgeshire, CBA Research Report. Council of British Archaeology, York.
449
Mortimer, C., Pollard, A.M., Scull, C., 1986. “XRF Analyses of some Anglo-Saxon copper alloy finds from Watchfield, Oxfordshire.” Journal of Historical Metallurgy, 20, pp. 36–42.
Mortimer, C., Wilthew, P., 1998. “XRF of Castledyke grave goods 1982-3,” in: Drinkall, G. (Ed.), The Anglo-Saxon Cemetery at Castledyke South, Barton-on-Humber, Sheffield Excavation Reports 6. Humber Archaeology Partnership, Sheffield, pp. D6–D10.
Nasman, U., 1973. “Metal-Supply in Eketorp.” Early Medieval Studies, 6, pp. 97–103. Nave, C.R., 2012. “HyperPhysics: The Color-Sensitive Cones.” HyperPhysics: Department
of Physics and Astronomy, Georgia State University. http://hyperphysics.phy-astr.gsu.edu/hbase/vision/colcon.html (accessed 11.7.12).
Needham, S.P., Leese, M.N., Hook, D.R., Hughes, M.J., 1989. “Developments in the Early Bronze Age metallurgy of southern Britain.” World Archaeology, 20, pp. 383–402.
Newbury, B.D., Notis, M.R., Newbury, D.E., 2005. “Revisiting the zinc composition limit of cementation brass.” Journal of Historical Metallurgy, 39, pp. 75–81.
Newton, R., Davison, S., 1989. Conservation of Glass. Butterworths, London. Newton, S., 1993. The origins of Beowulf and the pre-Viking kingdom of East Anglia. D.S.
Brewer, Woodbridge. Nicholas, M., 2013. Composition analysis of copper alloys from RAF Lakenheath.
Unpublished PhD thesis in process, University of Cardiff. Nordenfalk, C., 1977. Celtic and Anglo-Saxon Painting: Book Illumination in the British
Isles 600-800. Chatto & Windus, London. Northover, J.P., Anheuser, K., 2000. “Gilding in Britain: Celtic, Roman and Saxon,” in:
Drayman-Weisser, T. (Ed.), Gilded Metals: History, Technology and Conservation. Archetype Publications Ltd., London, pp. 109–121.
Northover, P., 1982. “The Metallurgy of the Wilburton Hoards.” Oxford Journal of Archaeology, 1, pp. 69–109.
Nugent, R., 2011. “I got soul, but I’m not a soldier”: Exploring the “other” Anglo-Saxon male and his corpse." Conference paper presented at Early Medieval Archaeology Student Symposium (EMASS) 2011. Glasgow, University of Glasgow, May 25-27.
Oddy, W.A., 1980. Aspects of Early Metallurgy. Historical Metallurgy Society and the British Museum Research Laboratory, London.
Oddy, W.A., 1977. “Gilding and Tinning in Anglo-Saxon England,” in: Oddy, W.A. (Ed.), Symposium on Early Metallurgy. Historical Metallurgy Society and the British Museum Research Laboratory, pp. 129–134.
Oddy, W.A., 1983. “Bronze Alloys in Dark-Age Europe,” in: Bruce-Mitford, R. and E. (Ed.), The Sutton Hoo Ship Burial. British Museum, London.
Oddy, W.A., 1993. “Gilding of Metals in the Old World,” in: La Niece, S., Craddock, P.T. (Eds.), Metal Plating and Patination: Cultural, Technical & Historical Developments. Butterman Heinemann, Oxford, pp. 171–181.
Oddy, W.A., Hughes, M.J., Werner, A.E., 1979. “Scientific Examination of the Stag Assembly and the Bronze Fitments of the Stone Bar,” in: Bruce-Mitford, R. (Ed.), The Sutton Hoo Ship Burial. British Museum Publications, London, pp. 385–393.
Oddy, W.A., LaNiece, S.C., Stratford, N., 1986. Romanesque Metalwork: Copper Alloys and their Decoration. British Museum Publications, Ltd., London.
Ogden, J., 1993. “Aesthetic and technical considerations regarding the colour and texture of ancient goldwork,” in: Craddock, P.T. and L. (Ed.), Metal Plating and Patination: Cultural, Technical & Historical Developments. Butterworth Heinemann, Oxford, pp. 39–49.
Ogden, J., 1994. “The Technology of Medieval Jewelry,” in: Scott, D.A. (Ed.), Ancient and Historic Metals: Conservation and Scientific Research: Proceedings of a Symposium Organized by the J. Paul Getty Museum and the Getty Conservation
450
Institute, November 1991. Getty Conservation Institute, Marina Del Ray, pp. 153–182.
Owen-Crocker, G.R., 2004. Dress in Anglo-Saxon England. The Boydell Press, Woodbridge.
Oxford Archaeological Unit, 2011. The Anglo-Saxon cemetery at Butler’s Field, Lechlade, Gloucestershire, Thames Valley landscapes monograph. Oxford Archaeology, Oxford.
Panter, I., 1998. “XRF of Castledyke grave goods 1989-90,” in: Drinkall, G. (Ed.), The Anglo-Saxon Cemetery at Castledyke South, Barton-on-Humber. Sheffield Excavation Reports 6. Humber Archaeology Partnership, Sheffield, pp. D11–D14.
Parfitt, K., Brugmann, B., 1997. The Anglo-Saxon cemetery on Mill Hill, Deal, Kent, The Society for Medieval Archaeology Monograph Series. The Society for Medieval Archaeology, London.
Pashigan, P., 1988. “Demand Uncertainty and Sales: A Study of Fashion and Markdown Pricing.” American Economical Review, 78, pp. 936–953.
Pasztor, E., Roslund, C., 2007. “An interpretation of the Nebra disc.” Antiquity 81, pp. 267–278.
Pawlowski, A., 2006. “Quantitative linguistics in the study of colour terminology,” in: Biggam, C.P., Kay, C.J. (Eds.), Progress in Colour Studies: Volume I, Language and Culture. John Benjamins Publishing Company, Amsterdam, pp. 37–56.
Penn, K., 1998. An Anglo-Saxon cemetery at Oxborough, West Norfolk: excavations in 1990, Occasional paper (East Anglian Archaeology). Norfolk Museums Service Field Archaeological Service, Dereham.
Penn, K., 2011. The Anglo-Saxon cemetery at Shrubland Hall Quarry, Coddenham, Suffolk, East Anglian archaeology report. Suffolk County Council Archaeological Service in conjunction with ALGAO East, Bury St. Edmunds.
Perrin, P., Calligaro, T., Vallet, F., Poirot, J.-P., Bagault, D., 2007. “Provenancing Merovingian garnets by PIXE and µ-Ramen Spectrometry,” in: Henning, J. (Ed.), Post-Roman Towns, Trade and Settlement in Europe and Byzantium: V.1 The Heirs of the Roman West. Walter de Gruyter, Berlin, pp. 69–76.
Pliny, 1635. The historie of the vvorld: commonly called, the naturall historie of C. Plinius Secundus. Translated into English by Philemon Holland Doctor of Physicke. The first [-second] tome. Adam Islip, and Iohn Grismond; ProQuest Information and Learning Company, London.
Portable Antiquities Scheme. 2012. “Record ID: SF-225425 - Early Medieval sleeve clasp.” http://finds.org.uk/database/artefacts/record/id/406714 (accessed 12/04/13).
Powlesland, D., 1999. “The West Heslerton Assessment.” Internet Archaeology 5. http://intarch.ac.uk/journal/issue5/westhes/toc.htm (Accessed 19/04/2013).
Pritchard, F., 2003. “The use of textiles, c. 1000-1500,” in: Jenkins, D. (Ed.), The Cambridge History of Western Textiles. Cambridge University Press, Cambridge, pp. 355–377.
Qiu, P., Leygraf, C., 2011. “Initial oxidation of brass induced by humidified air.” Applied Surface Science, 258, pp. 1235–1241.
Raub, C., 1993. “How to coat objects with gold - Pliny, Leyden Papyrus X, Mappae Clavicula and Theophilus seen with a modern chemist’s eyes,” in: Eluere, C. (Ed.), utils et Ateliers D’orfevres Des Temps Anciens. Soci t des amis du us e des anti uit s nationales et du ch teau de Saint-Germain-en-Laye, Saint-Germain-en-Laye, France, pp. 101–110.
Riley, D., 2010. “Manufacturing Classification and Production Methods of Early Anglo-Saxon Annular Brooches: 5th-7th century.” Daegrad Tools, Sheffield. http://daegrad.co.uk/page29.php (Accessed 15/4/2013).
451
Robbiola, L., Blengino, J.M., Fiaud, C., 1998. “Morphology and Mechanisms of Formation of Natural Patinas on Archaeological Cu-Sn Alloys.” Corrosion Science, 40, pp. 2083–2111.
Roberts, E.F.I., Clarke, K.M., 1979. “The Colour Characteristics of Gold Alloys.” Gold Bulletin, pp. 9–19.
Roberts, J., Kay, C.J., Grundy, L., 1995. A Thesaurus of Old English. King’s College London, London.
Rodwell, W., 1990. “Anglo-Saxon Painted Sculpture at Wells, Breamore and Barton-on-Humber,” in: Cather, S. P. (Ed.), Early Medieval Wall Painting and Painted Sculpture in England. British Archaeological Reports, Oxford, pp. 161–175.
Rosenblitt, J.A., 2005. “The Lindisfarne Gospels and the Aesthetics of Anglo-Saxon Art,” in: Anglo-Saxon Studies in Archaeology and History 13. British Archaeological Reports, Oxford, pp. 105–117.
Roskams, S., 1996. “Urban Transition in Early Medieval Britain: the case of York,” in: Christie, N. (Ed.), Towns in Transition: Urban Evolution in Late Antiquity and the Early Middle Ages. Ashgate, Aldershot, pp. 262–288.
Saccone, A., 2011. “Chemistry and Properties of Metals.” Unpublished paper presented at 1st Thematic School on Metallic Materials for Cultural Heritage, Genoa, Italy.
Saeger, K.E., Rodies, J., 1977. “The Colour of Gold and its Alloys: The mechanism of variation in optical properties.” Gold Bulletin, 10, pp. 10–14.
Scarre, C., 2002. Epilogue: Colour and Materiality in Prehistoric Society,” in: Jones, A., MacGregor, G. (Eds.), Colouring the Past: The Significance of Colour in Archaeological Research. Berg, Oxford, pp. 227–242.
Schmitt, B.H., 1995. “Language and visual imagery: Issues of corporate identity in East Asia.” Columbia Journal of World Business, 30, pp. 28–36.
Scott, D.A., 1991. Metallography and Microstructure of Ancient and Historic Metals. The J. Paul Getty Trust, Los Angeles.
Scott, D.A., 2002. Copper and bronze in art : corrosion, colorants, conservation. Getty Conservation Institute, Los Angeles, Califorinia.
Scull, C., 1985. “Further evidence from East Anglia for enamelling on early Anglo-Saxon metalwork,” in: Anglo-Saxon Studies in Archaeology and History 4, pp. 117–124.
Selwyn, L., 2004. Metals and Corrosion: a handbook for the conservation professional. Canadian Conservation Institute, Ottawa.
Seruya, A.I., Griffiths, D., 1997. “Ageing Processes in Gold-Copper-Silver Alloys,” in: Sinclair, A., Slater, E.A., Gowlett, J. (Eds.), Archaeological Sciences 1995: Proceedings of a Conference on the Application of Scientific Techniques to the Study of Archaeology, Liverpool, July 1995, Oxbow Monograph. Oxbow, Oxford, pp. 132–135.
Shenton, R., 2004. “Pinchbeck family (c.1720-1783).” In Oxford Dictionary of National Biography. Oxford University Press. http://www.oxforddnb.com/view/article/50051 (accessed 23/01/2013).
Sherman, D., 2011. “Unlocking Early Anglo-Saxon Girdle-Hangers.” Archaeological Data Service. http://dx.doi.org/10.5284/1000410 (Accessed 18/01/2013).
Shields, K.C., 1996. “Typological Inconsistencies in the Indo-European Color Lexicon: A Cosmic Connection?,” in: Indogermanische Forshugen. Walter de Gruyter, Berlin, 101, pp. 94–98.
Sidot, E., Berthelin, S., Kahn-Harari, A., Robbiola, L., 2001. “Structural characterization of copper-tin based alloys: Evolution of the unit cell constant of alpha bronze with tin content,” in: Proceedings of the ICOM Committee for Conservation Metals Working Group: Metals 2001. Western Australian Museum, Perth, pp. 123–130.
Slater, E.A., Tate, J.O., 1988. Science and Archaeology Glasgow 1987: Proceedings of a conference on the application of scientific techniques to archaeology, BAR British Series. BAR, Glasgow.
452
Slocum, J., 2011. “Proto-Indo-European Etyma.” Linguistic Research Center http://www.utexas.edu/cola/centers/lrc/iedocctr/ie-ling/ie-sem/SP/SP_DC.html (Accessed 17/01/2013).
Smythe, J.A., 1937. “Roman objects of Copper and Iron from the North of England.” Proceedings of the University of Durham Philosophical Society, 9, pp. 382–405.
Stanley Smith, C., Hawthorne, J.G., 1974. “Mappae Clavicula: A Little Key to the World of Medieval Techniques.” Transactions of the American Philosophical Society, New Series, 64, pp. 1–128.
Stapleton, C.P., Freestone, I.C., Bowman, S.G.E., 1999. “Composition and Origin of Early Mediaeval Opaque Red Enamel from Britain and Ireland.” Journal of Archaeological Science, 26, pp. 913–921.
Steer, D.C., 2009. The 1980s and 1990s, Costume and Fashion Source Books. Infobase Publishers, New York.
Swindells, N., Laing, L., 1977. “Metalworking at the Mote of Mark, Kirkcudbright in the 6th-7th centuries AD,” in: Oddy, W.A. (Ed.), Aspects of Early Metallurgy. Historical Metallurgy Society and the British Museum Research Laboratory, London, pp. 121–128.
Thornton, J., 2000. “All That Glitters is not Gold: Other Surfaces that Appear to be Gilded,” in: Drayman-Weisser, T. (Ed.), Gilded Metals: History Technology and Conservation. Archetype Publications Ltd, London, pp. 307–318.
Timby, J., 1996. The Anglo-Saxon cemetery at Empingham II, Rutland: excavations carried out between 1974-1975, Oxbow monograph. Oxbow, Oxford.
Tinniswood, A., Harding, A., 1991. “Anglo-Saxon Occupation and Industrial Features in the Henge Monument at Yeavering, Northumberland.” Durham Archaeological Journal: transactions of the Architectural and Archaeological Society of Durham and Northumberland, 7, pp. 93–108.
Tottle, C.R., 1984. An Encyclopaedia of Metallurgy and Materials. Macdonald and Evans Ltd., Plymouth.
Tudor-Craig, P., 1990. “Nether Wallop Reconsidered,” in: Cather, S. P. (Ed.), Early Medieval Wall Painting and Painted Sculpture in England. British Archaeological Reports, Oxford, pp. 89–104.
Turner-Walker, G., Hamerow, H., Caple, C., Clogg, P., 1995. “The Gold Anglo-Saxon Pendant: Technical, analytical and stylistic attributes,” in: Ivens, R., Busby, P., Shepherd, N. (Eds.), Tattenhoe & Westbury: Two Deserted Medieval Settlements in Milton Keynes. Buckinghamshire Archaeological Society, Aylesbury, pp. 397–403.
Tweddle, D., 1990. “Paint on Pre-Conquest Sculpture in South-East England,” in: Cather, S. P. (Ed.), Early Medieval Wall Painting and Painted Sculpture in England. British Archaeological Reports, Oxford, pp. 147–159.
Tylecote, R.F., 1992. The Migration Period and Medieval Period, in: A History of Metallurgy. The Institute of Materials, London, pp. 75–94.
Tylecote, R.F., 1977. “Summary of Results of Experimental Work on Early Copper Smelting,” in: Oddy, W.A. (Ed.), Aspects of Early Metallurgy. British Museum Occasional Paper no. 17, British Museum Research Laboratory, London, pp. 5–12.
Tyler, S., Major, H., 2005. The Early Anglo-Saxon Cemetery and Later Saxon Settlement at Springfield Lyons, Essex. Essex County Council Heritage Conservation, Chelmsford.
Uğuryol, M., Kulakoğlu, F., 2013. “A preliminary study for the characterization of Kültepe’s adobe soils with the purpose of providing data for conservation and archaeology.” Journal of Cultural Heritage (in press), available online as corrected proof 07/02/2013.
Venezky, R.L., 1980. A Microfiche Concordance to Old English. University of Delaware, Newark, Delaware.
453
Vespasian Psalter, c.820. Cotton Vespasian A. I. The British Library, London, (f.31). Vickers, M., 1989. “The Cultural Context of Ancient Greek Ceramics: An Essay in
Skeuomorphism,” in: McGovern, P.E. and Notis, M.D. (Eds.) Cross-Craft and Cross-Cultural Interactions in Ceramics, Ceramics and Civilization. The American Ceramics Society, Inc.: Westerville pp. 45–63.
Vickers, M., 1985. The Cultural Context of Ancient Greek Ceramics: An Essay in Skeuomorphism, in: Cross-Craft and Cross-Cultural Interactions in Ceramics, Ceramics and Civilization. pp. 45–63.
Vierck, H., 1972. “The date and origin of a small-long brooch,” in: Excavations at Shakenoak Farm. Privately printed by A.C.C. Brodribb, pp. 210–214.
Vlachou-Mogire, C., Stern, B., McDonnell, J.G., 2007. “The application of LA-ICP-MS in the examination of the thin plating layers found in late Roman coins.” Nuclear Instruments and Methods in Physics Research Section B: Beam Interactions with Materials and Atoms, 265, pp. 558–568.
Waller, J., 2002. “Published and unpublished moulds at Helgö - a brief overview. Central Places in the Migration and Merovingian Periods, 5, pp. 215–218.
Walton, P., Taylor, G., 1991. “The Characterisation of Dyes in Textiles from Archaeological Excavations.” Chromatography and Analysis, 17, pp. 5–7.
Walton Rogers, P., 1997. “Textile Production at 16-22 Coppergate,” The Archaeology of York. Council for British Archaeology, York.
Walton Rogers, P., 1999. “The Textiles,” in: Haughton, C. (Ed.), West Heslerton: The Anglian Cemetery: The Excavation and Discussion of the Evidence. English Heritage, Yedingham, North Yorkshire.
Walton Rogers, P., 2003. “Dyes and Dyeing,” in: Jenkins, D. (Ed.), The Cambridge History of Western Textiles. Cambridge University Press, Cambridge, pp. 25–29.
Walton Rogers, P., 2007a. Cloth and Clothing in Early Anglo-Saxon England. Council for British Archaeology, York.
Walton Rogers, P., 2007b. “Cloth and Clothing in Early Anglo-Saxon England: Table 11.” http://ads.ahds.ac.uk/catalogue/resources.html?clothing_eh_2007 (Accessed 07/08/2010).
Wang, Q., Ottaway, B.S., 2004. Casting Experiments and Microstructures of Archaeologically Relevant Bronzes, British Archaeological Reports, International Series. Archaeopress, Oxford.
Warburton, D.A., 2007. “Basic color term evolution in light of ancient evidence from the Near East”, in: MacLaury, R.E., Paramei, G.U., Dedrick, D. (Eds.), Anthropology of Color: Interdisciplinary Multilevel Modeling. John Benjamins Publishing Co., Amsterdam, pp. 229–246.
Wardley, K., 1984. “X-ray fluorescence analysis of the bronze inhumation grave-goods,” in: The Anglo-Saxon Cemetery at Spong Hill, North Elmham. Norfolk Archaeological Unit, Gressenhall, Norfolk pp. 38–40.
Webster, L., Backhouse, J., 1991. The Making of England: Anglo-Saxon Art and Culture AD 600-900. British Museum Press, London.
Weitzmann, K., 1977. Late Antique and Early Christian Book Illumination. Chatto & Windus, London.
Werner, J., 1967. “Les Bossins en bronze de tombes III, VI, XII et XIV,” in: Brever, J. and R. (Ed.), Le Cimetiere Franc de Haillot. Archaeologica Belgica, pp. 312–315.
West, S.E., 1988. The Anglo-Saxon Cemetery at Westgarth Gardens, Bury St Edmunds, Suffolk. Suffolk Planning Department, Bury St Edmunds.
Westland, S., Ripamonti, C., 2004. Computational Colour Science Using MATLAB. John Wiley & Sons Ltd, Chichester.
Whitaker, W., 2007. Words Latin Dictionary. http://lysy2.archives.nd.edu/cgi-bin/words.exe (Accessed 20/06/2009).
454
White, R., 1982. Non-ferrous metalworking on Flaxengate, Lincoln, from the ninth to the eleventh centuries (unpublished Dip Cons thesis). Institute of Archaeology, UCL, London.
Wickham, C., 1998. “Overview: Production, Distribution and Demand,” in: Hodges, R., Bowden, W. (Eds.), The Sixth Century: Production, Distribution and Demand. Brill, Leiden, pp. 279–292.
Wierzbicka, A., 2006. “The Semantics of Colour: A new paradigm,” in: Biggam, C.P., Kay, C.J. (Eds.), Progress in Colour Studies I: Languages and Culture. John Benjamins Publishing Co., Amsterdam, pp. 1–24.
Williams, G., Powell, M., 2009. Analysis of a gold mancus of Coenwulf of Mercia and other comparable coins. The British Museum, London.
Williams, K.L., 1987. Introduction to X-Ray Spectrometry. Allen & Unwin, Boston. Williams, H., 2010. Death and memory in early medieval Britain, Cambridge studies in
archaeology. Cambridge University Press, Cambridge. Williamson, P., Webster, L., 1990. “The Coloured Decoration of Anglo-Saxon Ivory
Carvings,” in: Cather, S. P. (Ed.), Early Medieval Wall Painting and Painted Sculpture in England. British Archaeological Reports, Oxford, pp. 177–194.
Wilthew, P., 1984. Analysis of Pins and Other Middle Saxon Copper Alloy Objects from Southampton. English Heritage, Hampshire.
Wilthew, P., 1985. “Analysis of non-ferrous metal objects,” in: Hawkes, S.C. (Ed.), The Anglo-Saxon Cemetery at Finglesham, Kent. Oxford School of Archaeology, Oxford, pp. 371–381.
Wittgenstein, L., 2001. Tractatus Logico-Philosophicus. Routledge, London. Wright, D., 2010. “Tasting Misery Among Snakes: The Situation of Smiths in Anglo-
Saxon Settlements.” Papers of the Institute of Archaeology, 20, 131–136. Wyszecki, G., Fielder, G.H., 1971. “New Color-Matching Ellipses.” Journal of the Optical
Society of America, 61, 1135–1152. X-RITE Inc., 2000. “A Guide to Understanding Colour Communication.”
http://biology.duke.edu/johnsenlab/pdfs/tech/colorcommunication.pdf (Accessed 23/04/2013).
X-RITE Inc., 2007. “CIELAB Tolerancing.” http://www.xrite.com/documents/literature/en/L10-281_LeadGenPoster_en.pdf (Accessed 23/04/2013).
Yener, K.A., Vandiver, P.B., 1993. “Tin Processing at Göltepe, an Early Bronze Age Site in Anatolia.” American Journal of Archaeology, 97, pp. 207–238.
Youngs, S.M., 2009. “From Metalwork to Manuscript: Some Observations on the Use of Celtic Art in Insular Manuscripts,” in: Crawford, S., Hamerow, H., Webster, L. (Eds.), Form and Order in the Anglo-Saxon World, AD 600-1100, Anglo-Saxon Studies in Archaeology and History. Oxford University School of Archaeology, Oxford, pp. 45–64.
455
APPENDIX A
THE RECYCLING MODEL
Microsoft Excel was used to model the combination of various input metals to provide
the range of copper alloys observed in the Early Anglo-Saxon period (as discussed in
Chapter 3). When a number from the first column (table A.1) is added to another in the
‘inputs’ column, the formula automatically calculates the values of each component
from that input as well as the one it is added to (columns ‘Sample A’ and ‘Sample B’), in
the proportions dictated (‘% Sample A’ and & ‘Sample B’). These proportions were
generally 1:1 ratios for simplicity, although some alloy divisions required other ratios
of input alloys to be made and these are in bold for ease of identification (these are
generally 1:2 and 1:3 ratios). The loss of zinc (10%) is calculated from this combined
sum, and then the estimated loss of tin (1%). The adjusted sum is then reported, and
the copper alloy division this falls under is recorded manually (‘Alloy’ column; see
Chapter 3).
This data is more easily manipulated in Excel and is therefore also provided on the CD-
ROM Appendix D; the filter function on the alloy column can enable viewing of all
possible combinations identified for each alloy division. Due to the size of this dataset,
some repeats occur where it made more sense to have all steps together from the
original inputs (1-8) to the final modelled alloy, and these are clearly labelled in the
‘Alloy’ column. If a modelled alloy did not exist in the Early Anglo-Saxon composition
range (e.g. leaded brass), this is marked by an ‘x’ in the ‘Alloy’ column.
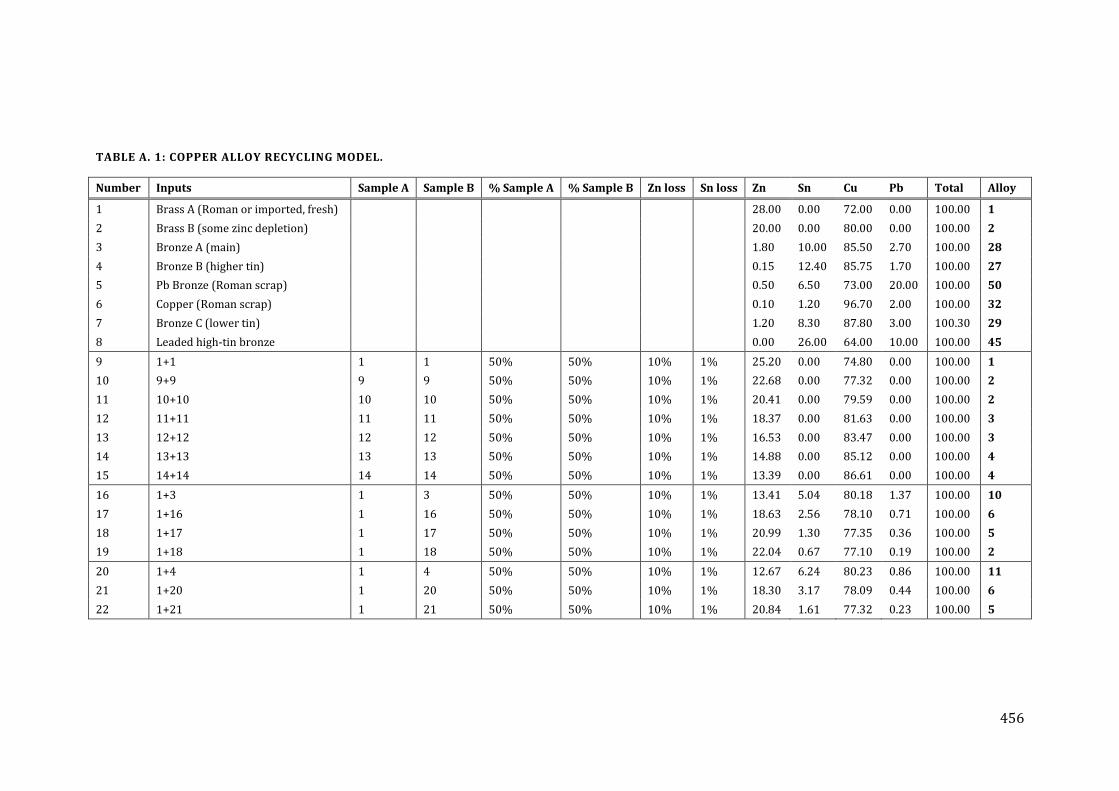
456
TABLE A. 1: COPPER ALLOY RECYCLING MODEL.
Number Inputs Sample A Sample B % Sample A % Sample B Zn loss Sn loss Zn Sn Cu Pb Total Alloy
1 Brass A (Roman or imported, fresh) 28.00 0.00 72.00 0.00 100.00 1
2 Brass B (some zinc depletion) 20.00 0.00 80.00 0.00 100.00 2
3 Bronze A (main) 1.80 10.00 85.50 2.70 100.00 28
4 Bronze B (higher tin) 0.15 12.40 85.75 1.70 100.00 27
5 Pb Bronze (Roman scrap) 0.50 6.50 73.00 20.00 100.00 50
6 Copper (Roman scrap) 0.10 1.20 96.70 2.00 100.00 32
7 Bronze C (lower tin) 1.20 8.30 87.80 3.00 100.30 29
8 Leaded high-tin bronze 0.00 26.00 64.00 10.00 100.00 45
9 1+1 1 1 50% 50% 10% 1% 25.20 0.00 74.80 0.00 100.00 1
10 9+9 9 9 50% 50% 10% 1% 22.68 0.00 77.32 0.00 100.00 2
11 10+10 10 10 50% 50% 10% 1% 20.41 0.00 79.59 0.00 100.00 2
12 11+11 11 11 50% 50% 10% 1% 18.37 0.00 81.63 0.00 100.00 3
13 12+12 12 12 50% 50% 10% 1% 16.53 0.00 83.47 0.00 100.00 3
14 13+13 13 13 50% 50% 10% 1% 14.88 0.00 85.12 0.00 100.00 4
15 14+14 14 14 50% 50% 10% 1% 13.39 0.00 86.61 0.00 100.00 4
16 1+3 1 3 50% 50% 10% 1% 13.41 5.04 80.18 1.37 100.00 10
17 1+16 1 16 50% 50% 10% 1% 18.63 2.56 78.10 0.71 100.00 6
18 1+17 1 17 50% 50% 10% 1% 20.99 1.30 77.35 0.36 100.00 5
19 1+18 1 18 50% 50% 10% 1% 22.04 0.67 77.10 0.19 100.00 2
20 1+4 1 4 50% 50% 10% 1% 12.67 6.24 80.23 0.86 100.00 11
21 1+20 1 20 50% 50% 10% 1% 18.30 3.17 78.09 0.44 100.00 6
22 1+21 1 21 50% 50% 10% 1% 20.84 1.61 77.32 0.23 100.00 5
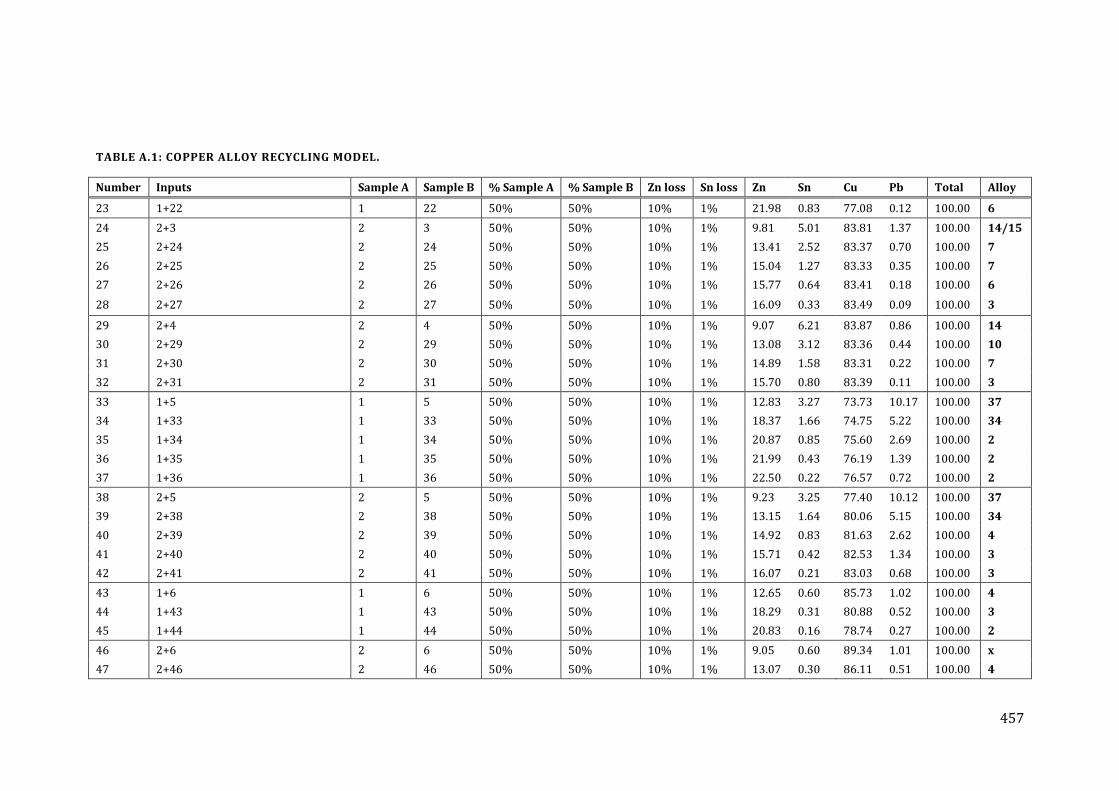
457
TABLE A.1: COPPER ALLOY RECYCLING MODEL.
Number Inputs Sample A Sample B % Sample A % Sample B Zn loss Sn loss Zn Sn Cu Pb Total Alloy
23 1+22 1 22 50% 50% 10% 1% 21.98 0.83 77.08 0.12 100.00 6
24 2+3 2 3 50% 50% 10% 1% 9.81 5.01 83.81 1.37 100.00 14/15
25 2+24 2 24 50% 50% 10% 1% 13.41 2.52 83.37 0.70 100.00 7
26 2+25 2 25 50% 50% 10% 1% 15.04 1.27 83.33 0.35 100.00 7
27 2+26 2 26 50% 50% 10% 1% 15.77 0.64 83.41 0.18 100.00 6
28 2+27 2 27 50% 50% 10% 1% 16.09 0.33 83.49 0.09 100.00 3
29 2+4 2 4 50% 50% 10% 1% 9.07 6.21 83.87 0.86 100.00 14
30 2+29 2 29 50% 50% 10% 1% 13.08 3.12 83.36 0.44 100.00 10
31 2+30 2 30 50% 50% 10% 1% 14.89 1.58 83.31 0.22 100.00 7
32 2+31 2 31 50% 50% 10% 1% 15.70 0.80 83.39 0.11 100.00 3
33 1+5 1 5 50% 50% 10% 1% 12.83 3.27 73.73 10.17 100.00 37
34 1+33 1 33 50% 50% 10% 1% 18.37 1.66 74.75 5.22 100.00 34
35 1+34 1 34 50% 50% 10% 1% 20.87 0.85 75.60 2.69 100.00 2
36 1+35 1 35 50% 50% 10% 1% 21.99 0.43 76.19 1.39 100.00 2
37 1+36 1 36 50% 50% 10% 1% 22.50 0.22 76.57 0.72 100.00 2
38 2+5 2 5 50% 50% 10% 1% 9.23 3.25 77.40 10.12 100.00 37
39 2+38 2 38 50% 50% 10% 1% 13.15 1.64 80.06 5.15 100.00 34
40 2+39 2 39 50% 50% 10% 1% 14.92 0.83 81.63 2.62 100.00 4
41 2+40 2 40 50% 50% 10% 1% 15.71 0.42 82.53 1.34 100.00 3
42 2+41 2 41 50% 50% 10% 1% 16.07 0.21 83.03 0.68 100.00 3
43 1+6 1 6 50% 50% 10% 1% 12.65 0.60 85.73 1.02 100.00 4
44 1+43 1 43 50% 50% 10% 1% 18.29 0.31 80.88 0.52 100.00 3
45 1+44 1 44 50% 50% 10% 1% 20.83 0.16 78.74 0.27 100.00 2
46 2+6 2 6 50% 50% 10% 1% 9.05 0.60 89.34 1.01 100.00 x
47 2+46 2 46 50% 50% 10% 1% 13.07 0.30 86.11 0.51 100.00 4
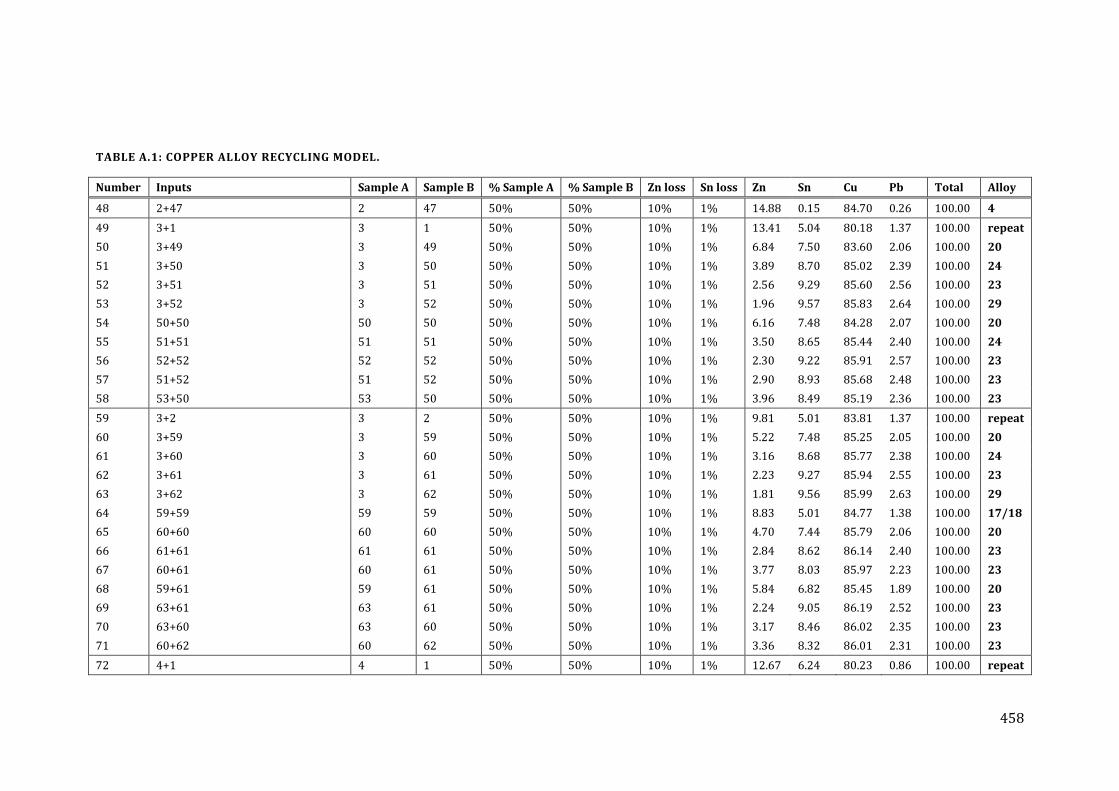
458
TABLE A.1: COPPER ALLOY RECYCLING MODEL.
Number Inputs Sample A Sample B % Sample A % Sample B Zn loss Sn loss Zn Sn Cu Pb Total Alloy
48 2+47 2 47 50% 50% 10% 1% 14.88 0.15 84.70 0.26 100.00 4
49 3+1 3 1 50% 50% 10% 1% 13.41 5.04 80.18 1.37 100.00 repeat
50 3+49 3 49 50% 50% 10% 1% 6.84 7.50 83.60 2.06 100.00 20
51 3+50 3 50 50% 50% 10% 1% 3.89 8.70 85.02 2.39 100.00 24
52 3+51 3 51 50% 50% 10% 1% 2.56 9.29 85.60 2.56 100.00 23
53 3+52 3 52 50% 50% 10% 1% 1.96 9.57 85.83 2.64 100.00 29
54 50+50 50 50 50% 50% 10% 1% 6.16 7.48 84.28 2.07 100.00 20
55 51+51 51 51 50% 50% 10% 1% 3.50 8.65 85.44 2.40 100.00 24
56 52+52 52 52 50% 50% 10% 1% 2.30 9.22 85.91 2.57 100.00 23
57 51+52 51 52 50% 50% 10% 1% 2.90 8.93 85.68 2.48 100.00 23
58 53+50 53 50 50% 50% 10% 1% 3.96 8.49 85.19 2.36 100.00 23
59 3+2 3 2 50% 50% 10% 1% 9.81 5.01 83.81 1.37 100.00 repeat
60 3+59 3 59 50% 50% 10% 1% 5.22 7.48 85.25 2.05 100.00 20
61 3+60 3 60 50% 50% 10% 1% 3.16 8.68 85.77 2.38 100.00 24
62 3+61 3 61 50% 50% 10% 1% 2.23 9.27 85.94 2.55 100.00 23
63 3+62 3 62 50% 50% 10% 1% 1.81 9.56 85.99 2.63 100.00 29
64 59+59 59 59 50% 50% 10% 1% 8.83 5.01 84.77 1.38 100.00 17/18
65 60+60 60 60 50% 50% 10% 1% 4.70 7.44 85.79 2.06 100.00 20
66 61+61 61 61 50% 50% 10% 1% 2.84 8.62 86.14 2.40 100.00 23
67 60+61 60 61 50% 50% 10% 1% 3.77 8.03 85.97 2.23 100.00 23
68 59+61 59 61 50% 50% 10% 1% 5.84 6.82 85.45 1.89 100.00 20
69 63+61 63 61 50% 50% 10% 1% 2.24 9.05 86.19 2.52 100.00 23
70 63+60 63 60 50% 50% 10% 1% 3.17 8.46 86.02 2.35 100.00 23
71 60+62 60 62 50% 50% 10% 1% 3.36 8.32 86.01 2.31 100.00 23
72 4+1 4 1 50% 50% 10% 1% 12.67 6.24 80.23 0.86 100.00 repeat
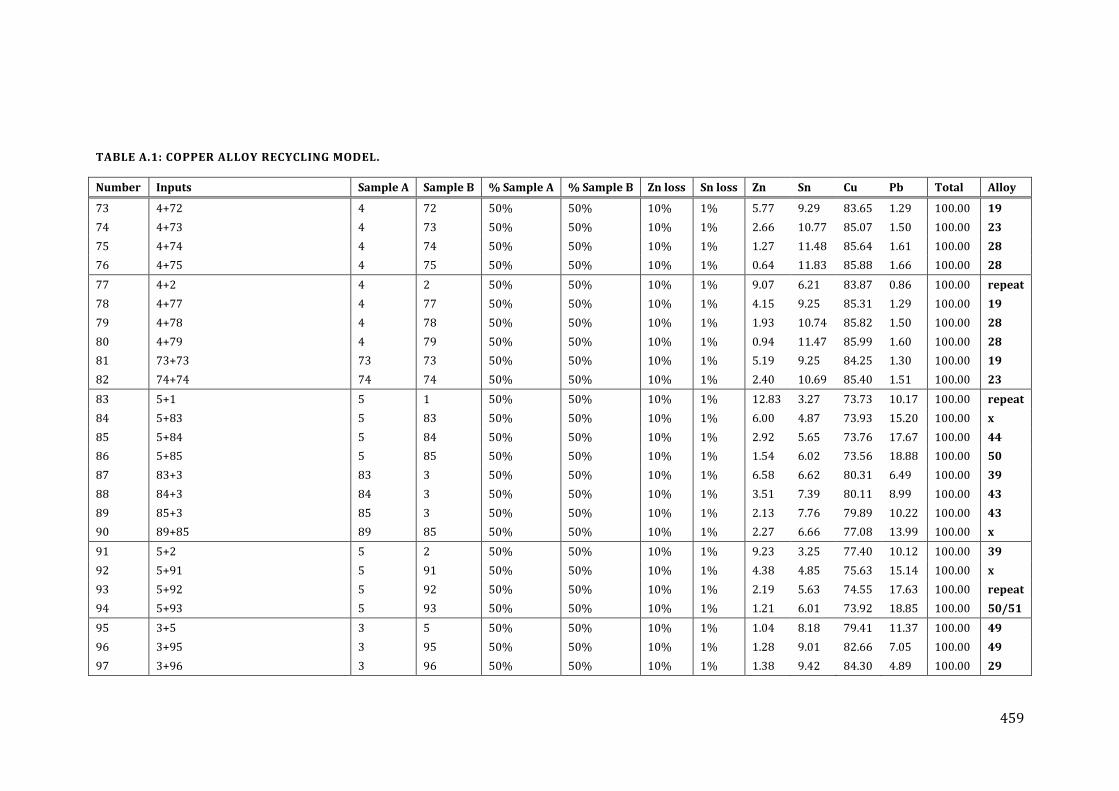
459
TABLE A.1: COPPER ALLOY RECYCLING MODEL.
Number Inputs Sample A Sample B % Sample A % Sample B Zn loss Sn loss Zn Sn Cu Pb Total Alloy
73 4+72 4 72 50% 50% 10% 1% 5.77 9.29 83.65 1.29 100.00 19
74 4+73 4 73 50% 50% 10% 1% 2.66 10.77 85.07 1.50 100.00 23
75 4+74 4 74 50% 50% 10% 1% 1.27 11.48 85.64 1.61 100.00 28
76 4+75 4 75 50% 50% 10% 1% 0.64 11.83 85.88 1.66 100.00 28
77 4+2 4 2 50% 50% 10% 1% 9.07 6.21 83.87 0.86 100.00 repeat
78 4+77 4 77 50% 50% 10% 1% 4.15 9.25 85.31 1.29 100.00 19
79 4+78 4 78 50% 50% 10% 1% 1.93 10.74 85.82 1.50 100.00 28
80 4+79 4 79 50% 50% 10% 1% 0.94 11.47 85.99 1.60 100.00 28
81 73+73 73 73 50% 50% 10% 1% 5.19 9.25 84.25 1.30 100.00 19
82 74+74 74 74 50% 50% 10% 1% 2.40 10.69 85.40 1.51 100.00 23
83 5+1 5 1 50% 50% 10% 1% 12.83 3.27 73.73 10.17 100.00 repeat
84 5+83 5 83 50% 50% 10% 1% 6.00 4.87 73.93 15.20 100.00 x
85 5+84 5 84 50% 50% 10% 1% 2.92 5.65 73.76 17.67 100.00 44
86 5+85 5 85 50% 50% 10% 1% 1.54 6.02 73.56 18.88 100.00 50
87 83+3 83 3 50% 50% 10% 1% 6.58 6.62 80.31 6.49 100.00 39
88 84+3 84 3 50% 50% 10% 1% 3.51 7.39 80.11 8.99 100.00 43
89 85+3 85 3 50% 50% 10% 1% 2.13 7.76 79.89 10.22 100.00 43
90 89+85 89 85 50% 50% 10% 1% 2.27 6.66 77.08 13.99 100.00 x
91 5+2 5 2 50% 50% 10% 1% 9.23 3.25 77.40 10.12 100.00 39
92 5+91 5 91 50% 50% 10% 1% 4.38 4.85 75.63 15.14 100.00 x
93 5+92 5 92 50% 50% 10% 1% 2.19 5.63 74.55 17.63 100.00 repeat
94 5+93 5 93 50% 50% 10% 1% 1.21 6.01 73.92 18.85 100.00 50/51
95 3+5 3 5 50% 50% 10% 1% 1.04 8.18 79.41 11.37 100.00 49
96 3+95 3 95 50% 50% 10% 1% 1.28 9.01 82.66 7.05 100.00 49
97 3+96 3 96 50% 50% 10% 1% 1.38 9.42 84.30 4.89 100.00 29
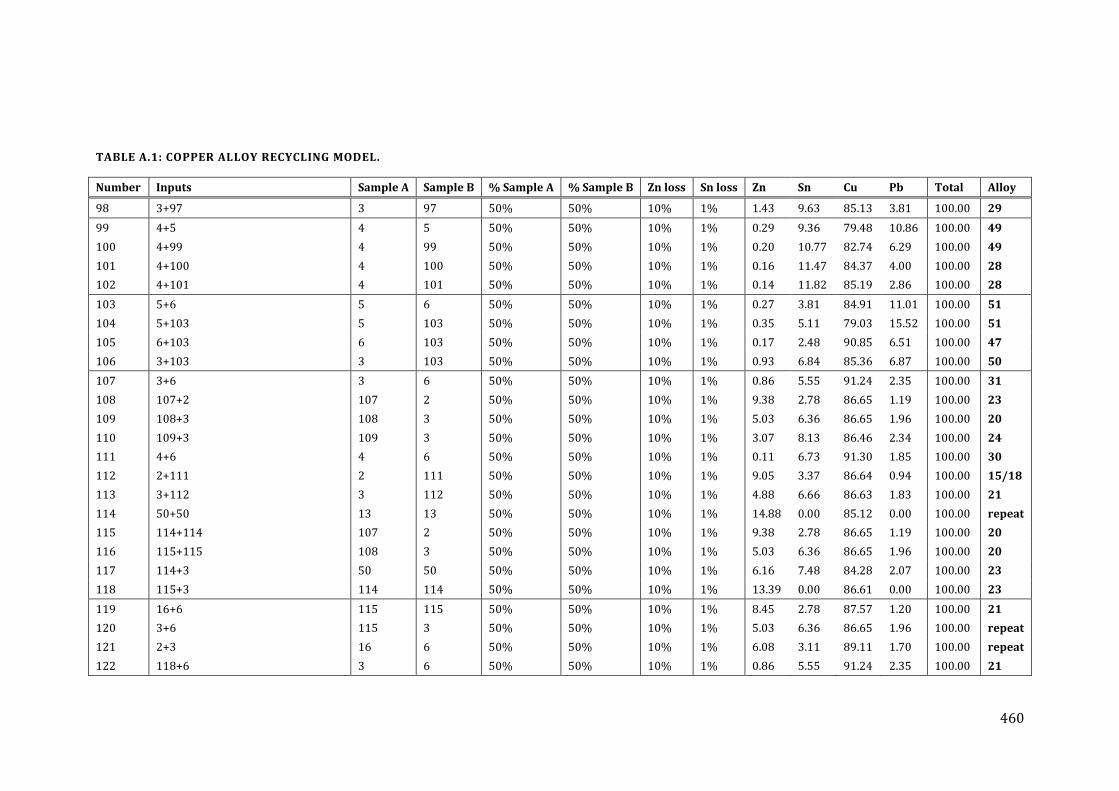
460
TABLE A.1: COPPER ALLOY RECYCLING MODEL.
Number Inputs Sample A Sample B % Sample A % Sample B Zn loss Sn loss Zn Sn Cu Pb Total Alloy
98 3+97 3 97 50% 50% 10% 1% 1.43 9.63 85.13 3.81 100.00 29
99 4+5 4 5 50% 50% 10% 1% 0.29 9.36 79.48 10.86 100.00 49
100 4+99 4 99 50% 50% 10% 1% 0.20 10.77 82.74 6.29 100.00 49
101 4+100 4 100 50% 50% 10% 1% 0.16 11.47 84.37 4.00 100.00 28
102 4+101 4 101 50% 50% 10% 1% 0.14 11.82 85.19 2.86 100.00 28
103 5+6 5 6 50% 50% 10% 1% 0.27 3.81 84.91 11.01 100.00 51
104 5+103 5 103 50% 50% 10% 1% 0.35 5.11 79.03 15.52 100.00 51
105 6+103 6 103 50% 50% 10% 1% 0.17 2.48 90.85 6.51 100.00 47
106 3+103 3 103 50% 50% 10% 1% 0.93 6.84 85.36 6.87 100.00 50
107 3+6 3 6 50% 50% 10% 1% 0.86 5.55 91.24 2.35 100.00 31
108 107+2 107 2 50% 50% 10% 1% 9.38 2.78 86.65 1.19 100.00 23
109 108+3 108 3 50% 50% 10% 1% 5.03 6.36 86.65 1.96 100.00 20
110 109+3 109 3 50% 50% 10% 1% 3.07 8.13 86.46 2.34 100.00 24
111 4+6 4 6 50% 50% 10% 1% 0.11 6.73 91.30 1.85 100.00 30
112 2+111 2 111 50% 50% 10% 1% 9.05 3.37 86.64 0.94 100.00 15/18
113 3+112 3 112 50% 50% 10% 1% 4.88 6.66 86.63 1.83 100.00 21
114 50+50 13 13 50% 50% 10% 1% 14.88 0.00 85.12 0.00 100.00 repeat
115 114+114 107 2 50% 50% 10% 1% 9.38 2.78 86.65 1.19 100.00 20
116 115+115 108 3 50% 50% 10% 1% 5.03 6.36 86.65 1.96 100.00 20
117 114+3 50 50 50% 50% 10% 1% 6.16 7.48 84.28 2.07 100.00 23
118 115+3 114 114 50% 50% 10% 1% 13.39 0.00 86.61 0.00 100.00 23
119 16+6 115 115 50% 50% 10% 1% 8.45 2.78 87.57 1.20 100.00 21
120 3+6 115 3 50% 50% 10% 1% 5.03 6.36 86.65 1.96 100.00 repeat
121 2+3 16 6 50% 50% 10% 1% 6.08 3.11 89.11 1.70 100.00 repeat
122 118+6 3 6 50% 50% 10% 1% 0.86 5.55 91.24 2.35 100.00 21
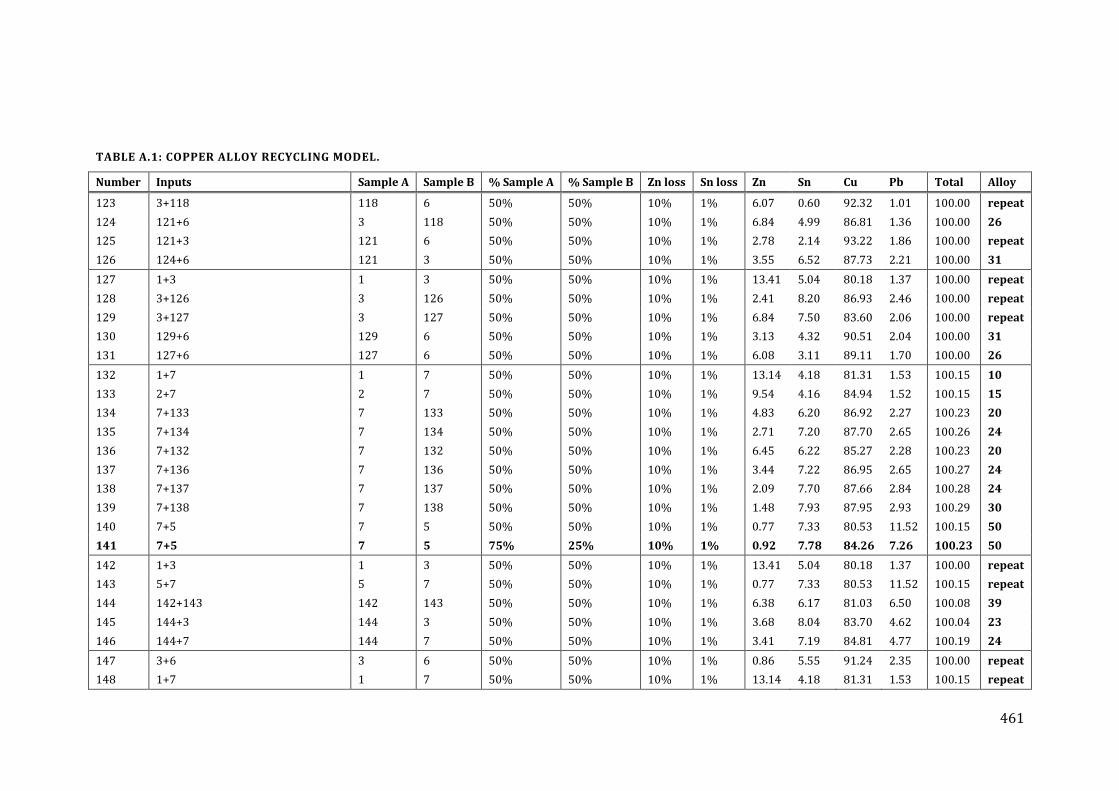
461
TABLE A.1: COPPER ALLOY RECYCLING MODEL.
Number Inputs Sample A Sample B % Sample A % Sample B Zn loss Sn loss Zn Sn Cu Pb Total Alloy
123 3+118 118 6 50% 50% 10% 1% 6.07 0.60 92.32 1.01 100.00 repeat
124 121+6 3 118 50% 50% 10% 1% 6.84 4.99 86.81 1.36 100.00 26
125 121+3 121 6 50% 50% 10% 1% 2.78 2.14 93.22 1.86 100.00 repeat
126 124+6 121 3 50% 50% 10% 1% 3.55 6.52 87.73 2.21 100.00 31
127 1+3 1 3 50% 50% 10% 1% 13.41 5.04 80.18 1.37 100.00 repeat
128 3+126 3 126 50% 50% 10% 1% 2.41 8.20 86.93 2.46 100.00 repeat
129 3+127 3 127 50% 50% 10% 1% 6.84 7.50 83.60 2.06 100.00 repeat
130 129+6 129 6 50% 50% 10% 1% 3.13 4.32 90.51 2.04 100.00 31
131 127+6 127 6 50% 50% 10% 1% 6.08 3.11 89.11 1.70 100.00 26
132 1+7 1 7 50% 50% 10% 1% 13.14 4.18 81.31 1.53 100.15 10
133 2+7 2 7 50% 50% 10% 1% 9.54 4.16 84.94 1.52 100.15 15
134 7+133 7 133 50% 50% 10% 1% 4.83 6.20 86.92 2.27 100.23 20
135 7+134 7 134 50% 50% 10% 1% 2.71 7.20 87.70 2.65 100.26 24
136 7+132 7 132 50% 50% 10% 1% 6.45 6.22 85.27 2.28 100.23 20
137 7+136 7 136 50% 50% 10% 1% 3.44 7.22 86.95 2.65 100.27 24
138 7+137 7 137 50% 50% 10% 1% 2.09 7.70 87.66 2.84 100.28 24
139 7+138 7 138 50% 50% 10% 1% 1.48 7.93 87.95 2.93 100.29 30
140 7+5 7 5 50% 50% 10% 1% 0.77 7.33 80.53 11.52 100.15 50
141 7+5 7 5 75% 25% 10% 1% 0.92 7.78 84.26 7.26 100.23 50
142 1+3 1 3 50% 50% 10% 1% 13.41 5.04 80.18 1.37 100.00 repeat
143 5+7 5 7 50% 50% 10% 1% 0.77 7.33 80.53 11.52 100.15 repeat
144 142+143 142 143 50% 50% 10% 1% 6.38 6.17 81.03 6.50 100.08 39
145 144+3 144 3 50% 50% 10% 1% 3.68 8.04 83.70 4.62 100.04 23
146 144+7 144 7 50% 50% 10% 1% 3.41 7.19 84.81 4.77 100.19 24
147 3+6 3 6 50% 50% 10% 1% 0.86 5.55 91.24 2.35 100.00 repeat
148 1+7 1 7 50% 50% 10% 1% 13.14 4.18 81.31 1.53 100.15 repeat
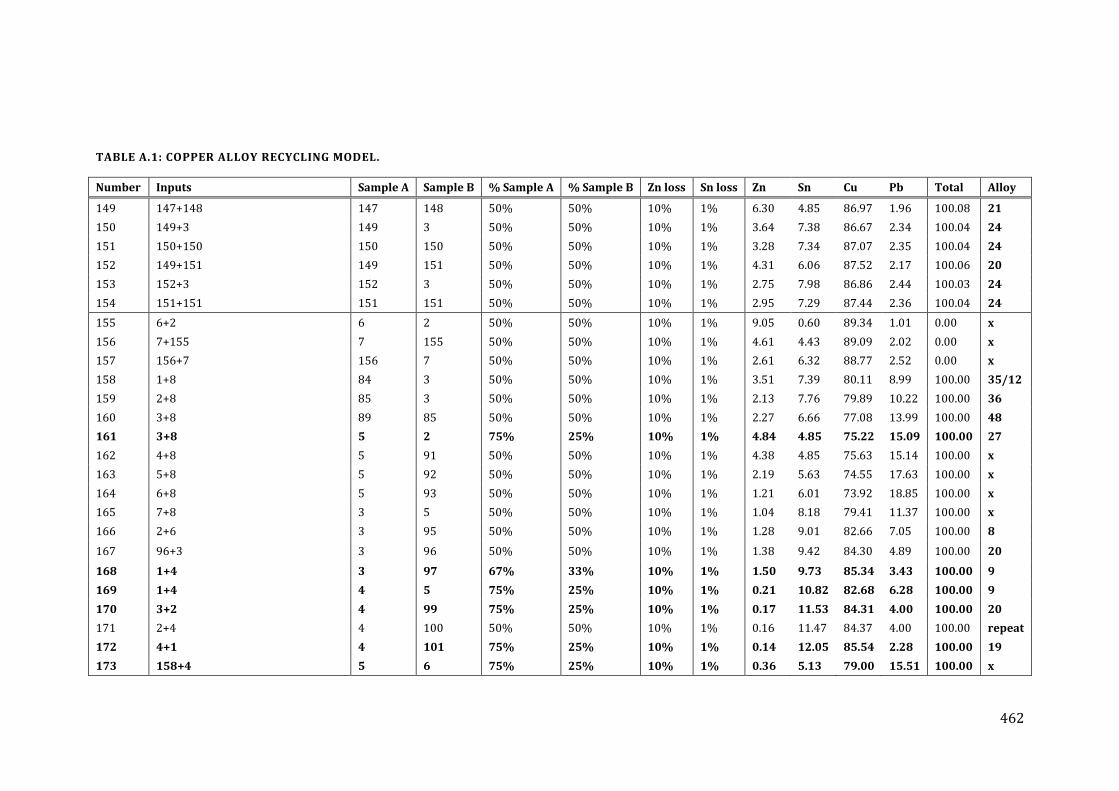
462
TABLE A.1: COPPER ALLOY RECYCLING MODEL.
Number Inputs Sample A Sample B % Sample A % Sample B Zn loss Sn loss Zn Sn Cu Pb Total Alloy
149 147+148 147 148 50% 50% 10% 1% 6.30 4.85 86.97 1.96 100.08 21
150 149+3 149 3 50% 50% 10% 1% 3.64 7.38 86.67 2.34 100.04 24
151 150+150 150 150 50% 50% 10% 1% 3.28 7.34 87.07 2.35 100.04 24
152 149+151 149 151 50% 50% 10% 1% 4.31 6.06 87.52 2.17 100.06 20
153 152+3 152 3 50% 50% 10% 1% 2.75 7.98 86.86 2.44 100.03 24
154 151+151 151 151 50% 50% 10% 1% 2.95 7.29 87.44 2.36 100.04 24
155 6+2 6 2 50% 50% 10% 1% 9.05 0.60 89.34 1.01 0.00 x
156 7+155 7 155 50% 50% 10% 1% 4.61 4.43 89.09 2.02 0.00 x
157 156+7 156 7 50% 50% 10% 1% 2.61 6.32 88.77 2.52 0.00 x
158 1+8 84 3 50% 50% 10% 1% 3.51 7.39 80.11 8.99 100.00 35/12
159 2+8 85 3 50% 50% 10% 1% 2.13 7.76 79.89 10.22 100.00 36
160 3+8 89 85 50% 50% 10% 1% 2.27 6.66 77.08 13.99 100.00 48
161 3+8 5 2 75% 25% 10% 1% 4.84 4.85 75.22 15.09 100.00 27
162 4+8 5 91 50% 50% 10% 1% 4.38 4.85 75.63 15.14 100.00 x
163 5+8 5 92 50% 50% 10% 1% 2.19 5.63 74.55 17.63 100.00 x
164 6+8 5 93 50% 50% 10% 1% 1.21 6.01 73.92 18.85 100.00 x
165 7+8 3 5 50% 50% 10% 1% 1.04 8.18 79.41 11.37 100.00 x
166 2+6 3 95 50% 50% 10% 1% 1.28 9.01 82.66 7.05 100.00 8
167 96+3 3 96 50% 50% 10% 1% 1.38 9.42 84.30 4.89 100.00 20
168 1+4 3 97 67% 33% 10% 1% 1.50 9.73 85.34 3.43 100.00 9
169 1+4 4 5 75% 25% 10% 1% 0.21 10.82 82.68 6.28 100.00 9
170 3+2 4 99 75% 25% 10% 1% 0.17 11.53 84.31 4.00 100.00 20
171 2+4 4 100 50% 50% 10% 1% 0.16 11.47 84.37 4.00 100.00 repeat
172 4+1 4 101 75% 25% 10% 1% 0.14 12.05 85.54 2.28 100.00 19
173 158+4 5 6 75% 25% 10% 1% 0.36 5.13 79.00 15.51 100.00 x
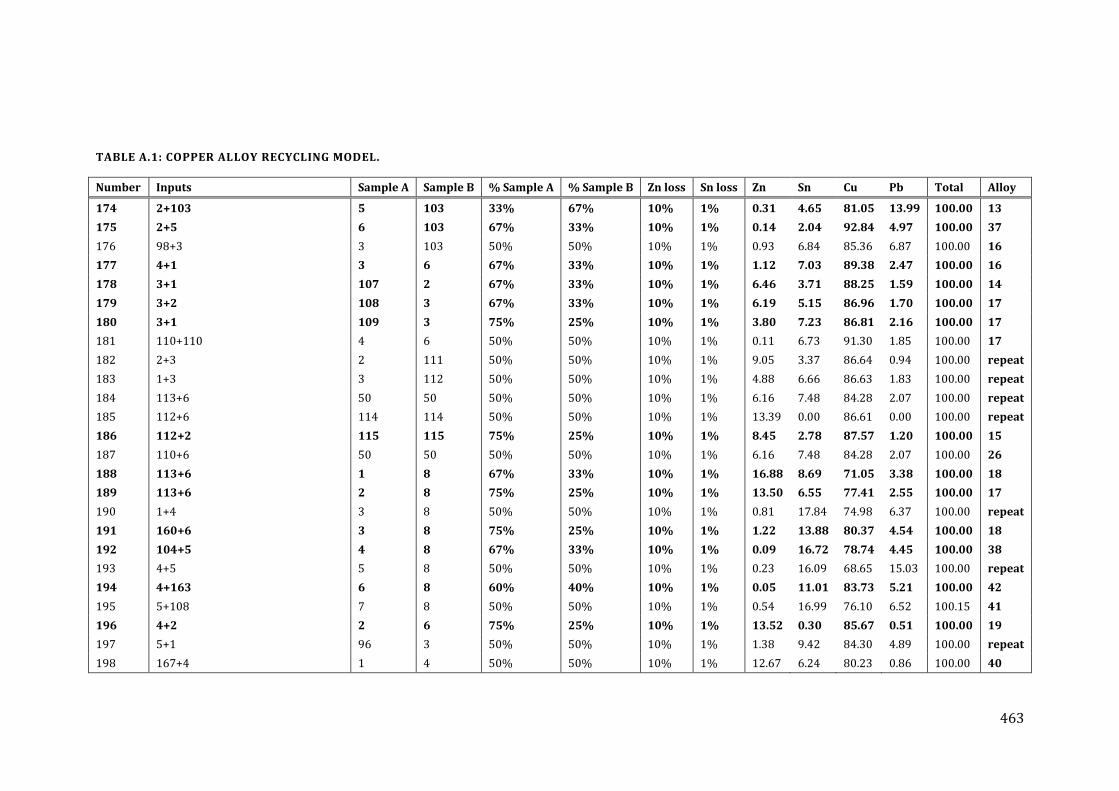
463
TABLE A.1: COPPER ALLOY RECYCLING MODEL.
Number Inputs Sample A Sample B % Sample A % Sample B Zn loss Sn loss Zn Sn Cu Pb Total Alloy
174 2+103 5 103 33% 67% 10% 1% 0.31 4.65 81.05 13.99 100.00 13
175 2+5 6 103 67% 33% 10% 1% 0.14 2.04 92.84 4.97 100.00 37
176 98+3 3 103 50% 50% 10% 1% 0.93 6.84 85.36 6.87 100.00 16
177 4+1 3 6 67% 33% 10% 1% 1.12 7.03 89.38 2.47 100.00 16
178 3+1 107 2 67% 33% 10% 1% 6.46 3.71 88.25 1.59 100.00 14
179 3+2 108 3 67% 33% 10% 1% 6.19 5.15 86.96 1.70 100.00 17
180 3+1 109 3 75% 25% 10% 1% 3.80 7.23 86.81 2.16 100.00 17
181 110+110 4 6 50% 50% 10% 1% 0.11 6.73 91.30 1.85 100.00 17
182 2+3 2 111 50% 50% 10% 1% 9.05 3.37 86.64 0.94 100.00 repeat
183 1+3 3 112 50% 50% 10% 1% 4.88 6.66 86.63 1.83 100.00 repeat
184 113+6 50 50 50% 50% 10% 1% 6.16 7.48 84.28 2.07 100.00 repeat
185 112+6 114 114 50% 50% 10% 1% 13.39 0.00 86.61 0.00 100.00 repeat
186 112+2 115 115 75% 25% 10% 1% 8.45 2.78 87.57 1.20 100.00 15
187 110+6 50 50 50% 50% 10% 1% 6.16 7.48 84.28 2.07 100.00 26
188 113+6 1 8 67% 33% 10% 1% 16.88 8.69 71.05 3.38 100.00 18
189 113+6 2 8 75% 25% 10% 1% 13.50 6.55 77.41 2.55 100.00 17
190 1+4 3 8 50% 50% 10% 1% 0.81 17.84 74.98 6.37 100.00 repeat
191 160+6 3 8 75% 25% 10% 1% 1.22 13.88 80.37 4.54 100.00 18
192 104+5 4 8 67% 33% 10% 1% 0.09 16.72 78.74 4.45 100.00 38
193 4+5 5 8 50% 50% 10% 1% 0.23 16.09 68.65 15.03 100.00 repeat
194 4+163 6 8 60% 40% 10% 1% 0.05 11.01 83.73 5.21 100.00 42
195 5+108 7 8 50% 50% 10% 1% 0.54 16.99 76.10 6.52 100.15 41
196 4+2 2 6 75% 25% 10% 1% 13.52 0.30 85.67 0.51 100.00 19
197 5+1 96 3 50% 50% 10% 1% 1.38 9.42 84.30 4.89 100.00 repeat
198 167+4 1 4 50% 50% 10% 1% 12.67 6.24 80.23 0.86 100.00 40
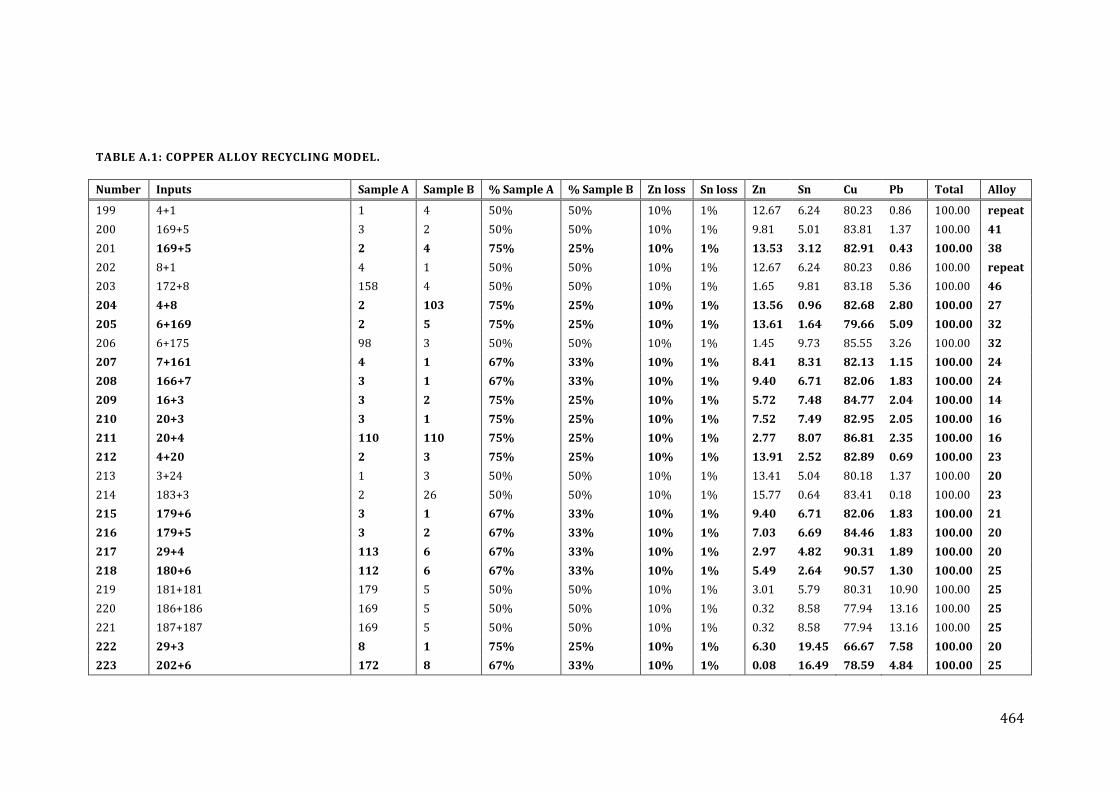
464
TABLE A.1: COPPER ALLOY RECYCLING MODEL.
Number Inputs Sample A Sample B % Sample A % Sample B Zn loss Sn loss Zn Sn Cu Pb Total Alloy
199 4+1 1 4 50% 50% 10% 1% 12.67 6.24 80.23 0.86 100.00 repeat
200 169+5 3 2 50% 50% 10% 1% 9.81 5.01 83.81 1.37 100.00 41
201 169+5 2 4 75% 25% 10% 1% 13.53 3.12 82.91 0.43 100.00 38
202 8+1 4 1 50% 50% 10% 1% 12.67 6.24 80.23 0.86 100.00 repeat
203 172+8 158 4 50% 50% 10% 1% 1.65 9.81 83.18 5.36 100.00 46
204 4+8 2 103 75% 25% 10% 1% 13.56 0.96 82.68 2.80 100.00 27
205 6+169 2 5 75% 25% 10% 1% 13.61 1.64 79.66 5.09 100.00 32
206 6+175 98 3 50% 50% 10% 1% 1.45 9.73 85.55 3.26 100.00 32
207 7+161 4 1 67% 33% 10% 1% 8.41 8.31 82.13 1.15 100.00 24
208 166+7 3 1 67% 33% 10% 1% 9.40 6.71 82.06 1.83 100.00 24
209 16+3 3 2 75% 25% 10% 1% 5.72 7.48 84.77 2.04 100.00 14
210 20+3 3 1 75% 25% 10% 1% 7.52 7.49 82.95 2.05 100.00 16
211 20+4 110 110 75% 25% 10% 1% 2.77 8.07 86.81 2.35 100.00 16
212 4+20 2 3 75% 25% 10% 1% 13.91 2.52 82.89 0.69 100.00 23
213 3+24 1 3 50% 50% 10% 1% 13.41 5.04 80.18 1.37 100.00 20
214 183+3 2 26 50% 50% 10% 1% 15.77 0.64 83.41 0.18 100.00 23
215 179+6 3 1 67% 33% 10% 1% 9.40 6.71 82.06 1.83 100.00 21
216 179+5 3 2 67% 33% 10% 1% 7.03 6.69 84.46 1.83 100.00 20
217 29+4 113 6 67% 33% 10% 1% 2.97 4.82 90.31 1.89 100.00 20
218 180+6 112 6 67% 33% 10% 1% 5.49 2.64 90.57 1.30 100.00 25
219 181+181 179 5 50% 50% 10% 1% 3.01 5.79 80.31 10.90 100.00 25
220 186+186 169 5 50% 50% 10% 1% 0.32 8.58 77.94 13.16 100.00 25
221 187+187 169 5 50% 50% 10% 1% 0.32 8.58 77.94 13.16 100.00 25
222 29+3 8 1 75% 25% 10% 1% 6.30 19.45 66.67 7.58 100.00 20
223 202+6 172 8 67% 33% 10% 1% 0.08 16.49 78.59 4.84 100.00 25
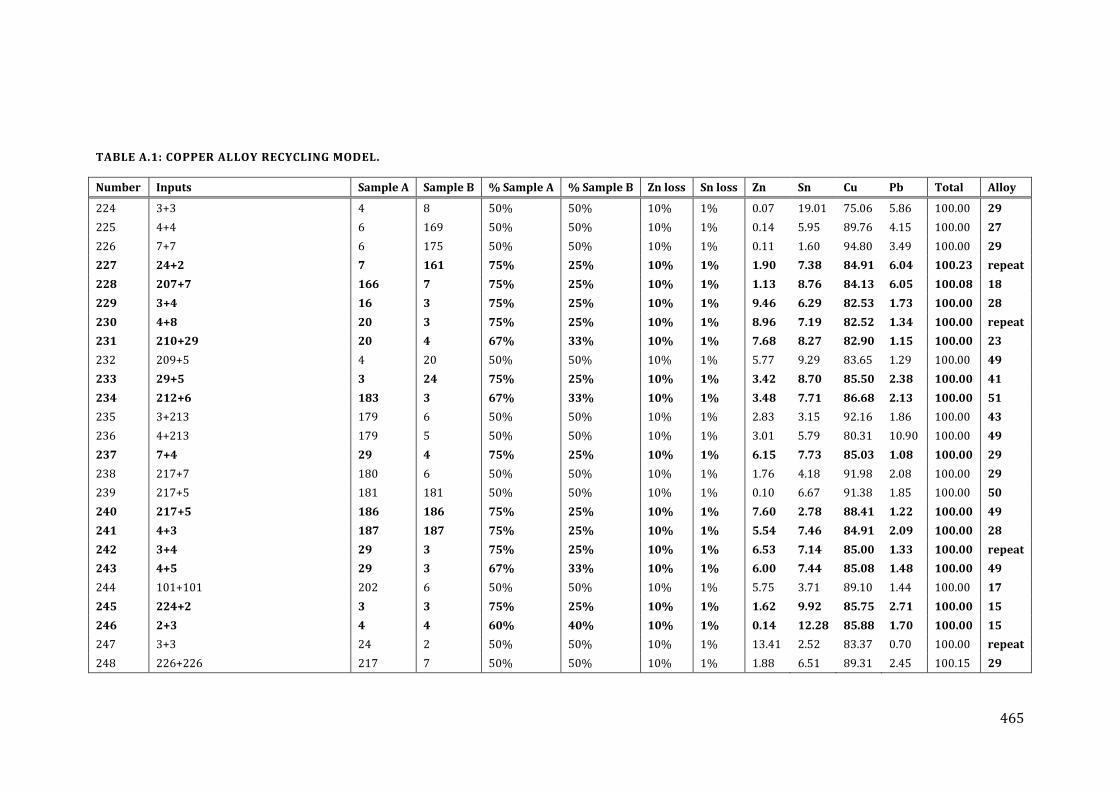
465
TABLE A.1: COPPER ALLOY RECYCLING MODEL.
Number Inputs Sample A Sample B % Sample A % Sample B Zn loss Sn loss Zn Sn Cu Pb Total Alloy
224 3+3 4 8 50% 50% 10% 1% 0.07 19.01 75.06 5.86 100.00 29
225 4+4 6 169 50% 50% 10% 1% 0.14 5.95 89.76 4.15 100.00 27
226 7+7 6 175 50% 50% 10% 1% 0.11 1.60 94.80 3.49 100.00 29
227 24+2 7 161 75% 25% 10% 1% 1.90 7.38 84.91 6.04 100.23 repeat
228 207+7 166 7 75% 25% 10% 1% 1.13 8.76 84.13 6.05 100.08 18
229 3+4 16 3 75% 25% 10% 1% 9.46 6.29 82.53 1.73 100.00 28
230 4+8 20 3 75% 25% 10% 1% 8.96 7.19 82.52 1.34 100.00 repeat
231 210+29 20 4 67% 33% 10% 1% 7.68 8.27 82.90 1.15 100.00 23
232 209+5 4 20 50% 50% 10% 1% 5.77 9.29 83.65 1.29 100.00 49
233 29+5 3 24 75% 25% 10% 1% 3.42 8.70 85.50 2.38 100.00 41
234 212+6 183 3 67% 33% 10% 1% 3.48 7.71 86.68 2.13 100.00 51
235 3+213 179 6 50% 50% 10% 1% 2.83 3.15 92.16 1.86 100.00 43
236 4+213 179 5 50% 50% 10% 1% 3.01 5.79 80.31 10.90 100.00 49
237 7+4 29 4 75% 25% 10% 1% 6.15 7.73 85.03 1.08 100.00 29
238 217+7 180 6 50% 50% 10% 1% 1.76 4.18 91.98 2.08 100.00 29
239 217+5 181 181 50% 50% 10% 1% 0.10 6.67 91.38 1.85 100.00 50
240 217+5 186 186 75% 25% 10% 1% 7.60 2.78 88.41 1.22 100.00 49
241 4+3 187 187 75% 25% 10% 1% 5.54 7.46 84.91 2.09 100.00 28
242 3+4 29 3 75% 25% 10% 1% 6.53 7.14 85.00 1.33 100.00 repeat
243 4+5 29 3 67% 33% 10% 1% 6.00 7.44 85.08 1.48 100.00 49
244 101+101 202 6 50% 50% 10% 1% 5.75 3.71 89.10 1.44 100.00 17
245 224+2 3 3 75% 25% 10% 1% 1.62 9.92 85.75 2.71 100.00 15
246 2+3 4 4 60% 40% 10% 1% 0.14 12.28 85.88 1.70 100.00 15
247 3+3 24 2 50% 50% 10% 1% 13.41 2.52 83.37 0.70 100.00 repeat
248 226+226 217 7 50% 50% 10% 1% 1.88 6.51 89.31 2.45 100.15 29
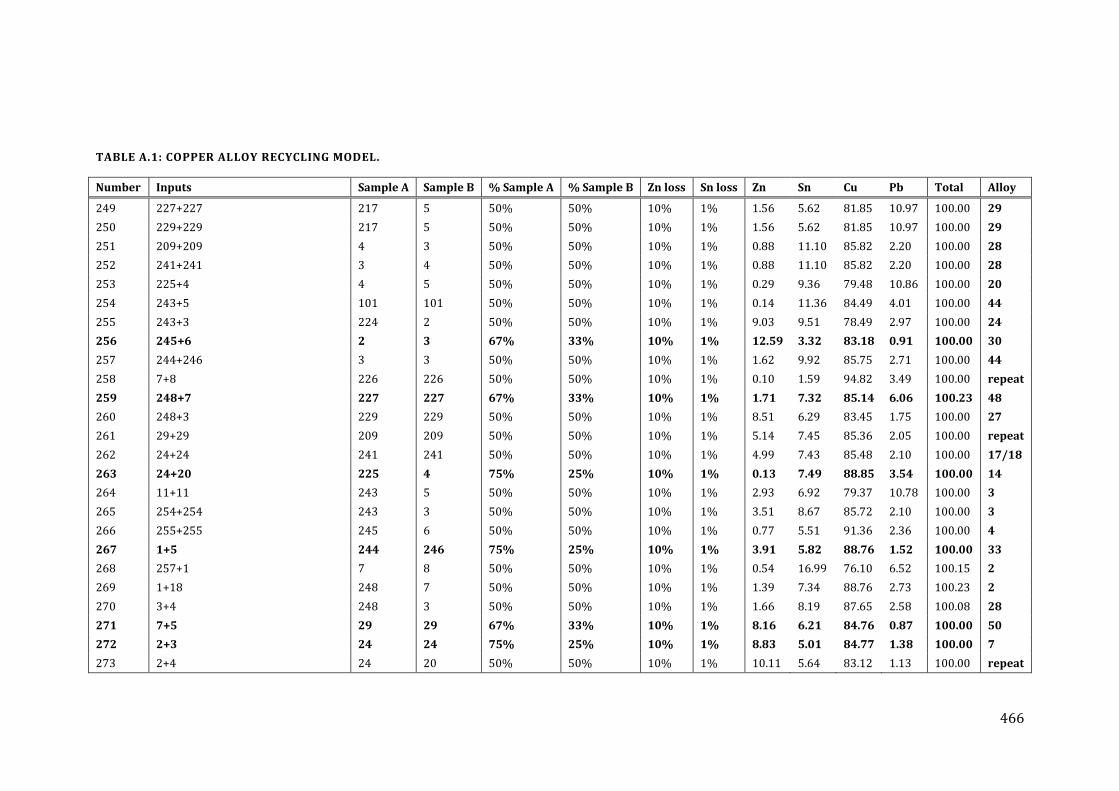
466
TABLE A.1: COPPER ALLOY RECYCLING MODEL.
Number Inputs Sample A Sample B % Sample A % Sample B Zn loss Sn loss Zn Sn Cu Pb Total Alloy
249 227+227 217 5 50% 50% 10% 1% 1.56 5.62 81.85 10.97 100.00 29
250 229+229 217 5 50% 50% 10% 1% 1.56 5.62 81.85 10.97 100.00 29
251 209+209 4 3 50% 50% 10% 1% 0.88 11.10 85.82 2.20 100.00 28
252 241+241 3 4 50% 50% 10% 1% 0.88 11.10 85.82 2.20 100.00 28
253 225+4 4 5 50% 50% 10% 1% 0.29 9.36 79.48 10.86 100.00 20
254 243+5 101 101 50% 50% 10% 1% 0.14 11.36 84.49 4.01 100.00 44
255 243+3 224 2 50% 50% 10% 1% 9.03 9.51 78.49 2.97 100.00 24
256 245+6 2 3 67% 33% 10% 1% 12.59 3.32 83.18 0.91 100.00 30
257 244+246 3 3 50% 50% 10% 1% 1.62 9.92 85.75 2.71 100.00 44
258 7+8 226 226 50% 50% 10% 1% 0.10 1.59 94.82 3.49 100.00 repeat
259 248+7 227 227 67% 33% 10% 1% 1.71 7.32 85.14 6.06 100.23 48
260 248+3 229 229 50% 50% 10% 1% 8.51 6.29 83.45 1.75 100.00 27
261 29+29 209 209 50% 50% 10% 1% 5.14 7.45 85.36 2.05 100.00 repeat
262 24+24 241 241 50% 50% 10% 1% 4.99 7.43 85.48 2.10 100.00 17/18
263 24+20 225 4 75% 25% 10% 1% 0.13 7.49 88.85 3.54 100.00 14
264 11+11 243 5 50% 50% 10% 1% 2.93 6.92 79.37 10.78 100.00 3
265 254+254 243 3 50% 50% 10% 1% 3.51 8.67 85.72 2.10 100.00 3
266 255+255 245 6 50% 50% 10% 1% 0.77 5.51 91.36 2.36 100.00 4
267 1+5 244 246 75% 25% 10% 1% 3.91 5.82 88.76 1.52 100.00 33
268 257+1 7 8 50% 50% 10% 1% 0.54 16.99 76.10 6.52 100.15 2
269 1+18 248 7 50% 50% 10% 1% 1.39 7.34 88.76 2.73 100.23 2
270 3+4 248 3 50% 50% 10% 1% 1.66 8.19 87.65 2.58 100.08 28
271 7+5 29 29 67% 33% 10% 1% 8.16 6.21 84.76 0.87 100.00 50
272 2+3 24 24 75% 25% 10% 1% 8.83 5.01 84.77 1.38 100.00 7
273 2+4 24 20 50% 50% 10% 1% 10.11 5.64 83.12 1.13 100.00 repeat
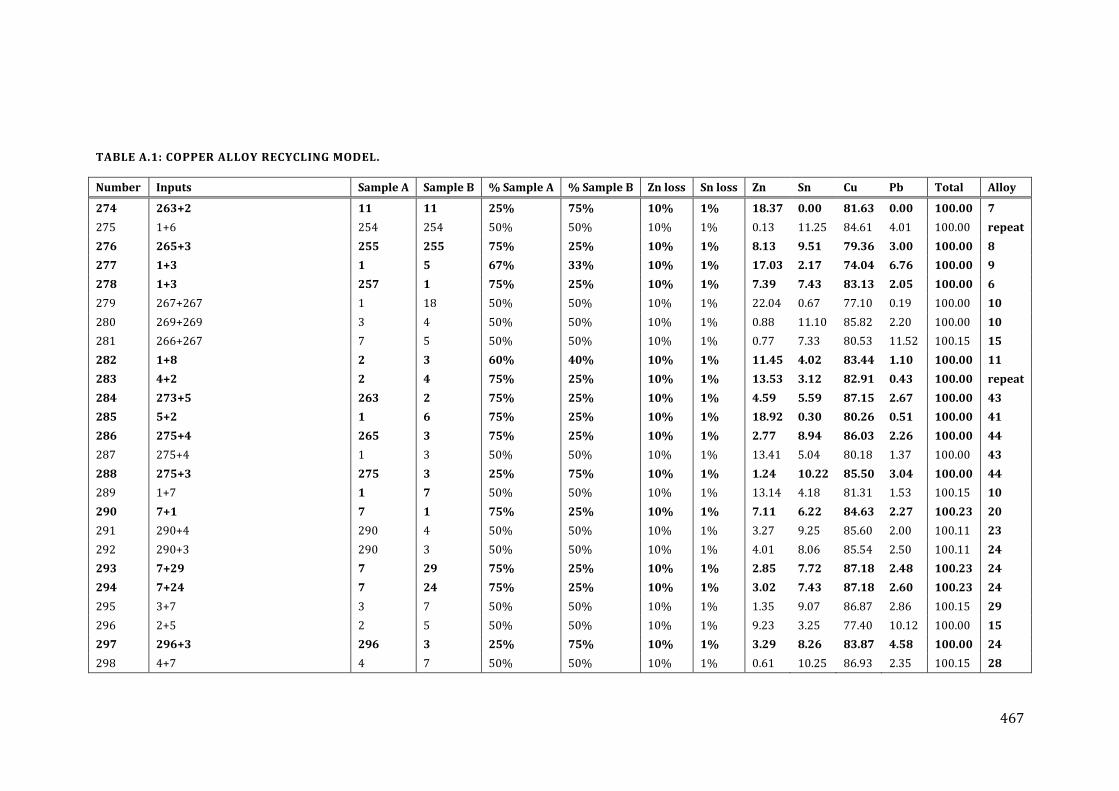
467
TABLE A.1: COPPER ALLOY RECYCLING MODEL.
Number Inputs Sample A Sample B % Sample A % Sample B Zn loss Sn loss Zn Sn Cu Pb Total Alloy
274 263+2 11 11 25% 75% 10% 1% 18.37 0.00 81.63 0.00 100.00 7
275 1+6 254 254 50% 50% 10% 1% 0.13 11.25 84.61 4.01 100.00 repeat
276 265+3 255 255 75% 25% 10% 1% 8.13 9.51 79.36 3.00 100.00 8
277 1+3 1 5 67% 33% 10% 1% 17.03 2.17 74.04 6.76 100.00 9
278 1+3 257 1 75% 25% 10% 1% 7.39 7.43 83.13 2.05 100.00 6
279 267+267 1 18 50% 50% 10% 1% 22.04 0.67 77.10 0.19 100.00 10
280 269+269 3 4 50% 50% 10% 1% 0.88 11.10 85.82 2.20 100.00 10
281 266+267 7 5 50% 50% 10% 1% 0.77 7.33 80.53 11.52 100.15 15
282 1+8 2 3 60% 40% 10% 1% 11.45 4.02 83.44 1.10 100.00 11
283 4+2 2 4 75% 25% 10% 1% 13.53 3.12 82.91 0.43 100.00 repeat
284 273+5 263 2 75% 25% 10% 1% 4.59 5.59 87.15 2.67 100.00 43
285 5+2 1 6 75% 25% 10% 1% 18.92 0.30 80.26 0.51 100.00 41
286 275+4 265 3 75% 25% 10% 1% 2.77 8.94 86.03 2.26 100.00 44
287 275+4 1 3 50% 50% 10% 1% 13.41 5.04 80.18 1.37 100.00 43
288 275+3 275 3 25% 75% 10% 1% 1.24 10.22 85.50 3.04 100.00 44
289 1+7 1 7 50% 50% 10% 1% 13.14 4.18 81.31 1.53 100.15 10
290 7+1 7 1 75% 25% 10% 1% 7.11 6.22 84.63 2.27 100.23 20
291 290+4 290 4 50% 50% 10% 1% 3.27 9.25 85.60 2.00 100.11 23
292 290+3 290 3 50% 50% 10% 1% 4.01 8.06 85.54 2.50 100.11 24
293 7+29 7 29 75% 25% 10% 1% 2.85 7.72 87.18 2.48 100.23 24
294 7+24 7 24 75% 25% 10% 1% 3.02 7.43 87.18 2.60 100.23 24
295 3+7 3 7 50% 50% 10% 1% 1.35 9.07 86.87 2.86 100.15 29
296 2+5 2 5 50% 50% 10% 1% 9.23 3.25 77.40 10.12 100.00 15
297 296+3 296 3 25% 75% 10% 1% 3.29 8.26 83.87 4.58 100.00 24
298 4+7 4 7 50% 50% 10% 1% 0.61 10.25 86.93 2.35 100.15 28
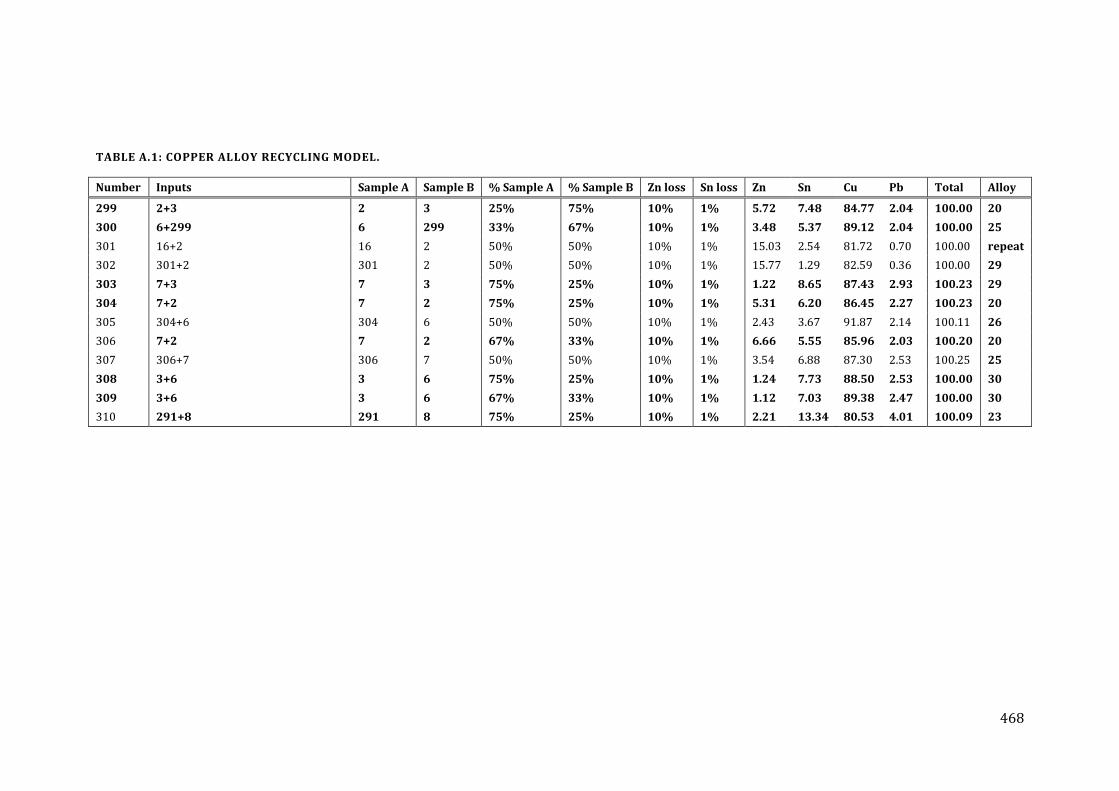
468
TABLE A.1: COPPER ALLOY RECYCLING MODEL.
Number Inputs Sample A Sample B % Sample A % Sample B Zn loss Sn loss Zn Sn Cu Pb Total Alloy
299 2+3 2 3 25% 75% 10% 1% 5.72 7.48 84.77 2.04 100.00 20
300 6+299 6 299 33% 67% 10% 1% 3.48 5.37 89.12 2.04 100.00 25
301 16+2 16 2 50% 50% 10% 1% 15.03 2.54 81.72 0.70 100.00 repeat
302 301+2 301 2 50% 50% 10% 1% 15.77 1.29 82.59 0.36 100.00 29
303 7+3 7 3 75% 25% 10% 1% 1.22 8.65 87.43 2.93 100.23 29
304 7+2 7 2 75% 25% 10% 1% 5.31 6.20 86.45 2.27 100.23 20
305 304+6 304 6 50% 50% 10% 1% 2.43 3.67 91.87 2.14 100.11 26
306 7+2 7 2 67% 33% 10% 1% 6.66 5.55 85.96 2.03 100.20 20
307 306+7 306 7 50% 50% 10% 1% 3.54 6.88 87.30 2.53 100.25 25
308 3+6 3 6 75% 25% 10% 1% 1.24 7.73 88.50 2.53 100.00 30
309 3+6 3 6 67% 33% 10% 1% 1.12 7.03 89.38 2.47 100.00 30
310 291+8 291 8 75% 25% 10% 1% 2.21 13.34 80.53 4.01 100.09 23
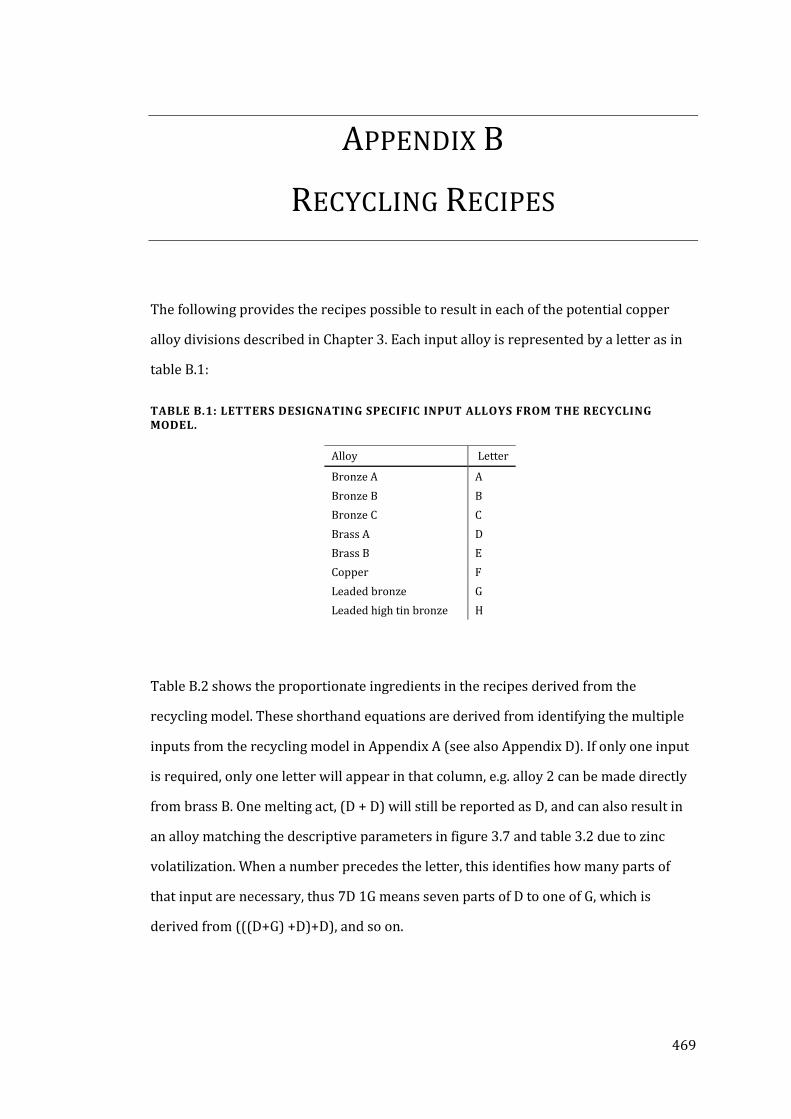
469
APPENDIX B
RECYCLING RECIPES
The following provides the recipes possible to result in each of the potential copper
alloy divisions described in Chapter 3. Each input alloy is represented by a letter as in
table B.1:
TABLE B.1: LETTERS DESIGNATING SPECIFIC INPUT ALLOYS FROM THE RECYCLING MODEL.
Table B.2 shows the proportionate ingredients in the recipes derived from the
recycling model. These shorthand equations are derived from identifying the multiple
inputs from the recycling model in Appendix A (see also Appendix D). If only one input
is required, only one letter will appear in that column, e.g. alloy 2 can be made directly
from brass B. One melting act, (D + D) will still be reported as D, and can also result in
an alloy matching the descriptive parameters in figure 3.7 and table 3.2 due to zinc
volatilization. When a number precedes the letter, this identifies how many parts of
that input are necessary, thus 7D 1G means seven parts of D to one of G, which is
derived from (((D+G) +D)+D), and so on.
Alloy Letter
Bronze A A
Bronze B B
Bronze C C
Brass A D
Brass B E
Copper F
Leaded bronze G
Leaded high tin bronze H
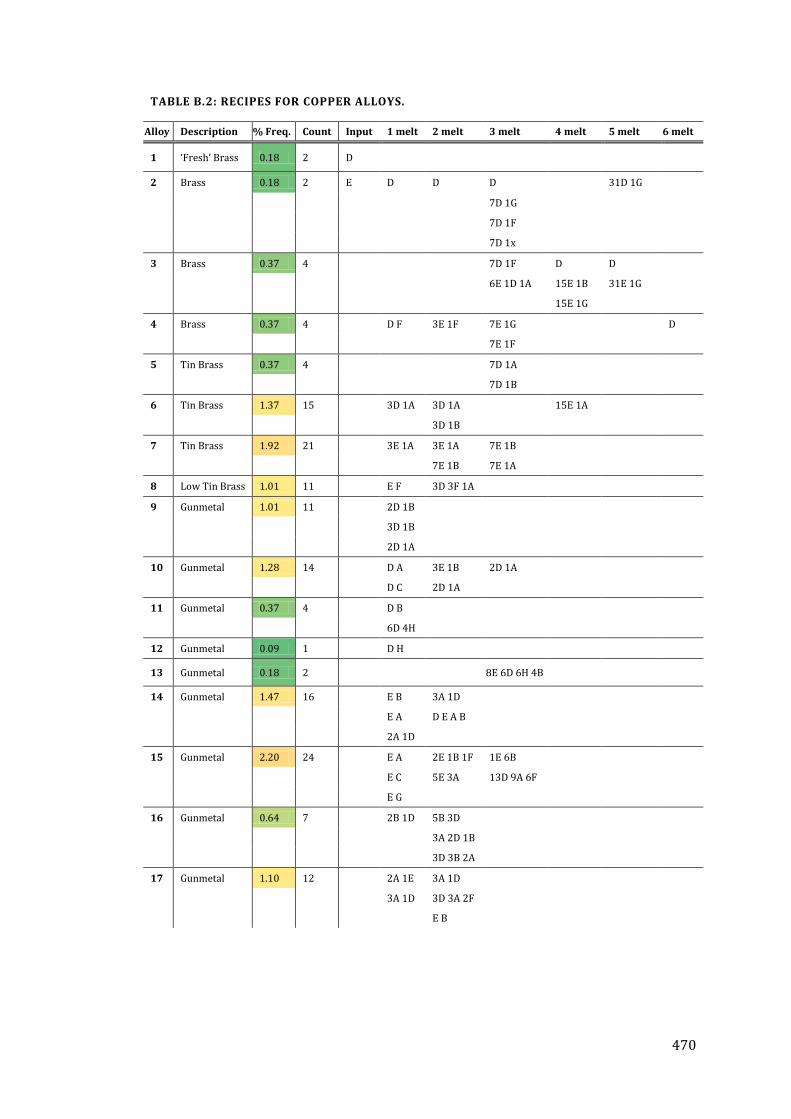
470
TABLE B.2: RECIPES FOR COPPER ALLOYS.
Alloy Description % Freq. Count Input 1 melt 2 melt 3 melt 4 melt 5 melt 6 melt
1 ‘Fresh’ Brass 0.18 2 D
2 Brass 0.18 2 E D D D 31D 1G
7D 1G
7D 1F
7D 1x
3 Brass 0.37 4 7D 1F D D
6E 1D 1A 15E 1B 31E 1G
15E 1G
4 Brass 0.37 4 D F 3E 1F 7E 1G D
7E 1F
5 Tin Brass 0.37 4 7D 1A
7D 1B
6 Tin Brass 1.37 15 3D 1A 3D 1A 15E 1A
3D 1B
7 Tin Brass 1.92 21 3E 1A 3E 1A 7E 1B
7E 1B 7E 1A
8 Low Tin Brass 1.01 11 E F 3D 3F 1A
9 Gunmetal 1.01 11 2D 1B
3D 1B
2D 1A
10 Gunmetal 1.28 14 D A 3E 1B 2D 1A
D C 2D 1A
11 Gunmetal 0.37 4 D B
6D 4H
12 Gunmetal 0.09 1 D H
13 Gunmetal 0.18 2 8E 6D 6H 4B
14 Gunmetal 1.47 16 E B 3A 1D
E A D E A B
2A 1D
15 Gunmetal 2.20 24 E A 2E 1B 1F 1E 6B
E C 5E 3A 13D 9A 6F
E G
16 Gunmetal 0.64 7 2B 1D 5B 3D
3A 2D 1B
3D 3B 2A
17 Gunmetal 1.10 12 2A 1E 3A 1D
3A 1D 3D 3A 2F
E B
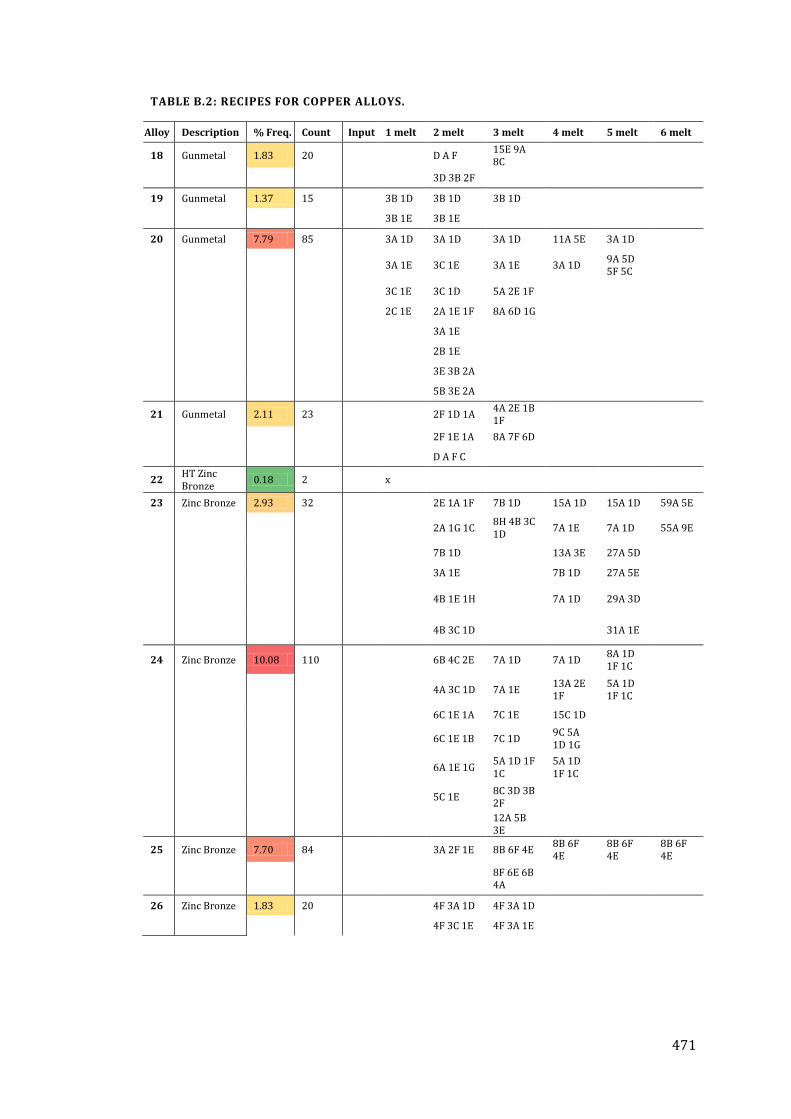
471
TABLE B.2: RECIPES FOR COPPER ALLOYS.
Alloy Description % Freq. Count Input 1 melt 2 melt 3 melt 4 melt 5 melt 6 melt
18 Gunmetal 1.83 20 D A F 15E 9A 8C
3D 3B 2F
19 Gunmetal 1.37 15 3B 1D 3B 1D 3B 1D
3B 1E 3B 1E
20 Gunmetal 7.79 85 3A 1D 3A 1D 3A 1D 11A 5E 3A 1D
3A 1E 3C 1E 3A 1E 3A 1D
9A 5D 5F 5C
3C 1E 3C 1D 5A 2E 1F
2C 1E 2A 1E 1F 8A 6D 1G
3A 1E
2B 1E
3E 3B 2A
5B 3E 2A
21 Gunmetal 2.11 23 2F 1D 1A 4A 2E 1B 1F
2F 1E 1A 8A 7F 6D
D A F C
22 HT Zinc Bronze
0.18 2 x
23 Zinc Bronze 2.93 32 2E 1A 1F 7B 1D 15A 1D 15A 1D 59A 5E
2A 1G 1C
8H 4B 3C 1D
7A 1E 7A 1D 55A 9E
7B 1D
13A 3E 27A 5D
3A 1E
7B 1D 27A 5E
4B 1E 1H
7A 1D 29A 3D
4B 3C 1D
31A 1E
24 Zinc Bronze 10.08 110 6B 4C 2E 7A 1D 7A 1D 8A 1D 1F 1C
4A 3C 1D 7A 1E
13A 2E 1F
5A 1D 1F 1C
6C 1E 1A 7C 1E 15C 1D
6C 1E 1B 7C 1D
9C 5A 1D 1G
6A 1E 1G
5A 1D 1F 1C
5A 1D 1F 1C
5C 1E
8C 3D 3B 2F
12A 5B 3E
25 Zinc Bronze 7.70 84 3A 2F 1E 8B 6F 4E 8B 6F 4E
8B 6F 4E
8B 6F 4E
8F 6E 6B 4A
26 Zinc Bronze 1.83 20 4F 3A 1D 4F 3A 1D
4F 3C 1E 4F 3A 1E
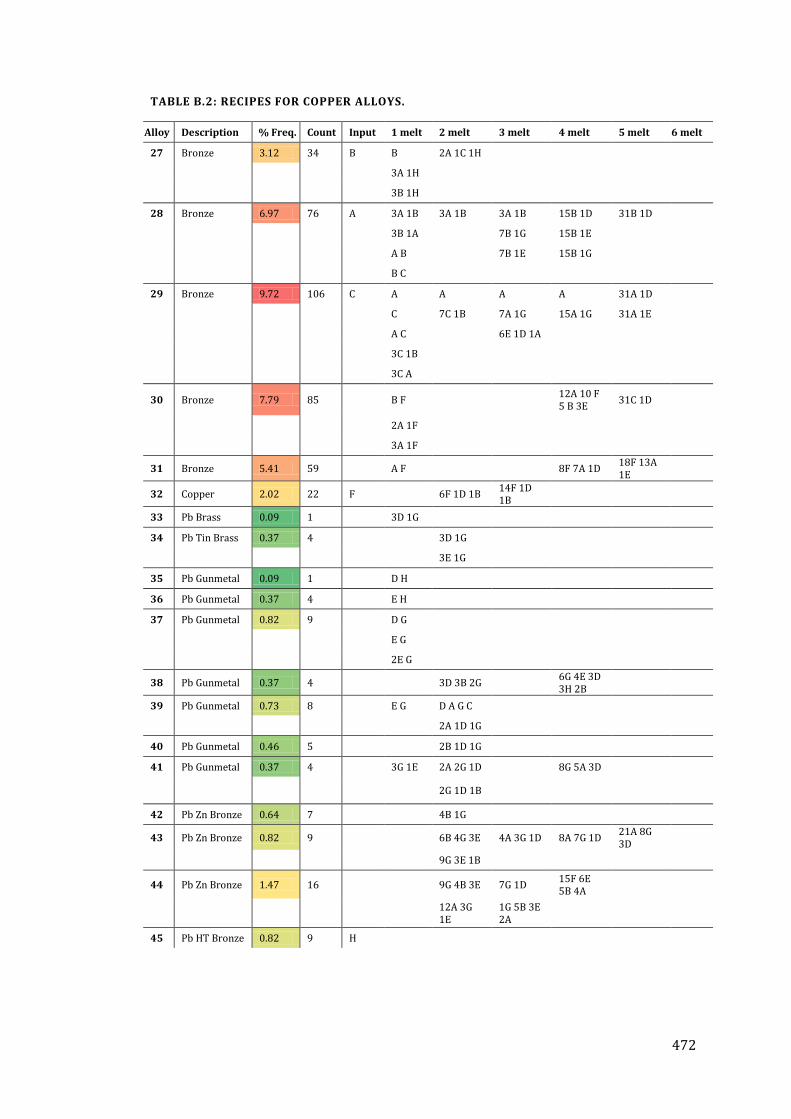
472
TABLE B.2: RECIPES FOR COPPER ALLOYS.
Alloy Description % Freq. Count Input 1 melt 2 melt 3 melt 4 melt 5 melt 6 melt
27 Bronze 3.12 34 B B 2A 1C 1H
3A 1H
3B 1H
28 Bronze 6.97 76 A 3A 1B 3A 1B 3A 1B 15B 1D 31B 1D
3B 1A
7B 1G 15B 1E
A B
7B 1E 15B 1G
B C
29 Bronze 9.72 106 C A A A A 31A 1D
C 7C 1B 7A 1G 15A 1G 31A 1E
A C
6E 1D 1A
3C 1B
3C A
30 Bronze 7.79 85 B F 12A 10 F 5 B 3E
31C 1D
2A 1F
3A 1F
31 Bronze 5.41 59 A F 8F 7A 1D 18F 13A 1E
32 Copper 2.02 22 F 6F 1D 1B 14F 1D 1B
33 Pb Brass 0.09 1 3D 1G
34 Pb Tin Brass 0.37 4 3D 1G
3E 1G
35 Pb Gunmetal 0.09 1 D H
36 Pb Gunmetal 0.37 4 E H
37 Pb Gunmetal 0.82 9 D G
E G
2E G
38 Pb Gunmetal 0.37 4 3D 3B 2G 6G 4E 3D 3H 2B
39 Pb Gunmetal 0.73 8 E G D A G C
2A 1D 1G
40 Pb Gunmetal 0.46 5 2B 1D 1G
41 Pb Gunmetal 0.37 4 3G 1E 2A 2G 1D 8G 5A 3D
2G 1D 1B
42 Pb Zn Bronze 0.64 7 4B 1G
43 Pb Zn Bronze 0.82 9 6B 4G 3E 4A 3G 1D 8A 7G 1D 21A 8G 3D
9G 3E 1B
44 Pb Zn Bronze 1.47 16 9G 4B 3E 7G 1D 15F 6E 5B 4A
12A 3G 1E
1G 5B 3E 2A
45 Pb HT Bronze 0.82 9 H
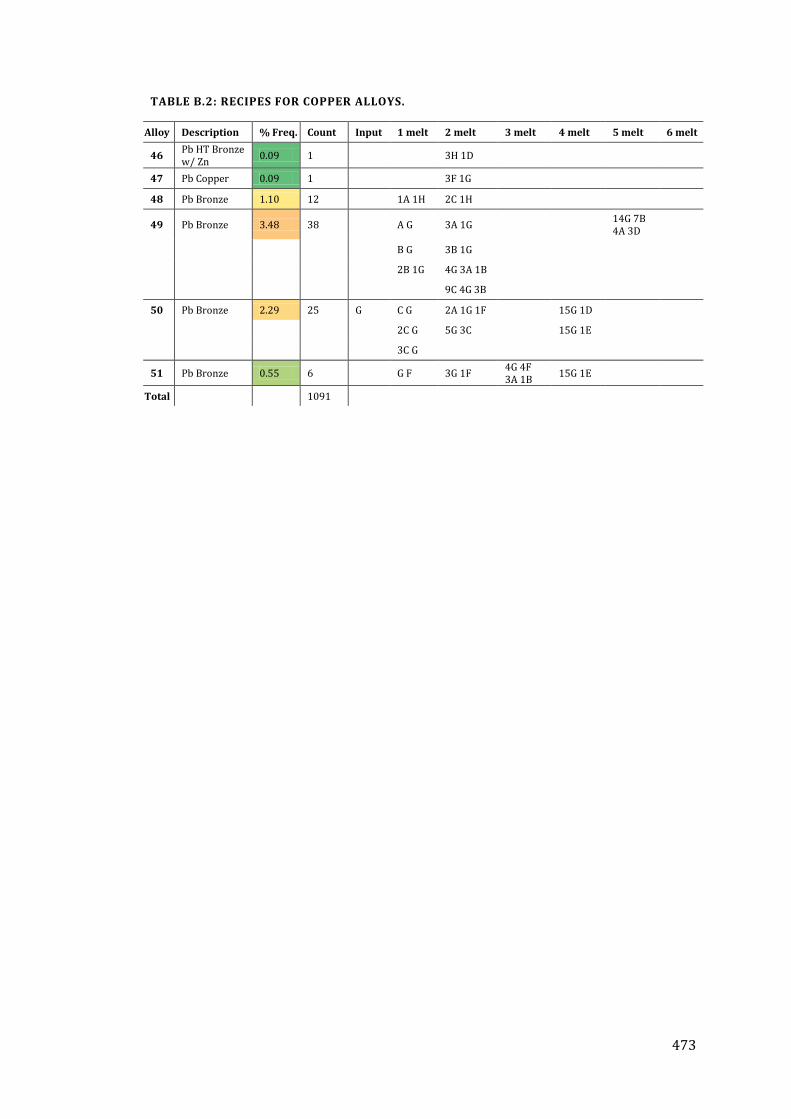
473
TABLE B.2: RECIPES FOR COPPER ALLOYS.
Alloy Description % Freq. Count Input 1 melt 2 melt 3 melt 4 melt 5 melt 6 melt
46 Pb HT Bronze w/ Zn
0.09 1 3H 1D
47 Pb Copper 0.09 1 3F 1G
48 Pb Bronze 1.10 12 1A 1H 2C 1H
49 Pb Bronze 3.48 38 A G 3A 1G 14G 7B 4A 3D
B G 3B 1G
2B 1G 4G 3A 1B
9C 4G 3B
50 Pb Bronze 2.29 25 G C G 2A 1G 1F 15G 1D
2C G 5G 3C
15G 1E
3C G
51 Pb Bronze 0.55 6 G F 3G 1F 4G 4F 3A 1B
15G 1E
Total 1091
474
APPENDIX C
ANNULAR BROOCH TYPOLOGY
The following outlines a new system of annular brooch classification based on the
initial typology of Leeds (1945) and as applied to the brooches in this project. This
includes mock-quoit or broad-banded annular brooches (Type E), cast annular
brooches, flat, sheet-wrought annular brooches, and small cast annular brooches. This
system is meant as a new framework around which a new typology can be formed, and
does not include all possible forms, especially if particular forms did not occur in this
study or within the sample group.
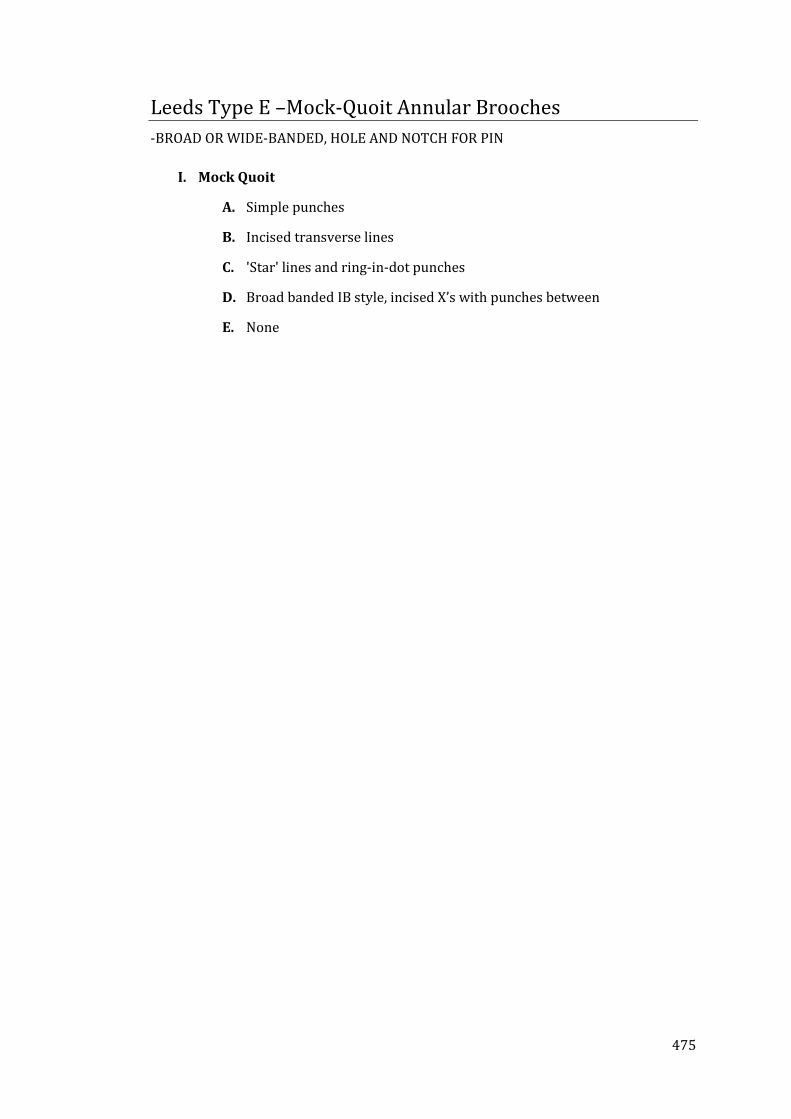
475
Leeds Type E –Mock-Quoit Annular Brooches
-BROAD OR WIDE-BANDED, HOLE AND NOTCH FOR PIN
I. Mock Quoit
A. Simple punches
B. Incised transverse lines
C. 'Star' lines and ring-in-dot punches
D. Broad banded IB style, incised X’s with punches between
E. None
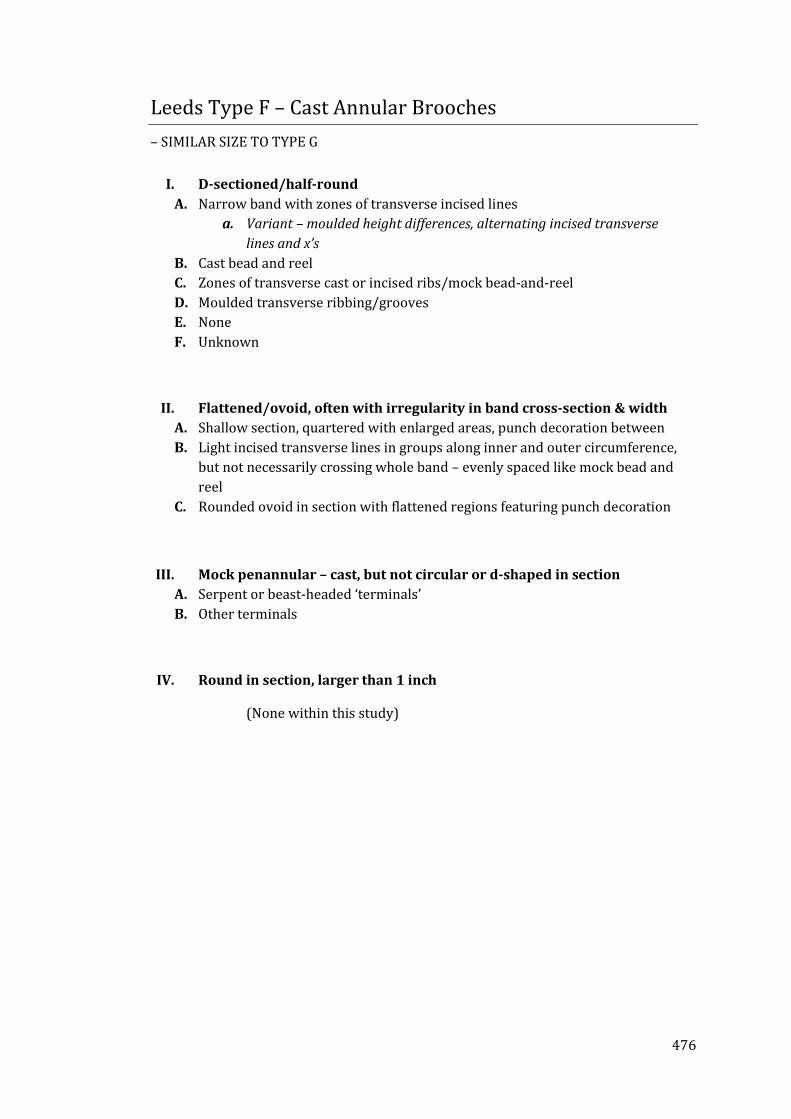
476
Leeds Type F – Cast Annular Brooches
– SIMILAR SIZE TO TYPE G
I. D-sectioned/half-round
A. Narrow band with zones of transverse incised lines
a. Variant – moulded height differences, alternating incised transverse
lines and x’s
B. Cast bead and reel
C. Zones of transverse cast or incised ribs/mock bead-and-reel
D. Moulded transverse ribbing/grooves
E. None
F. Unknown
II. Flattened/ovoid, often with irregularity in band cross-section & width
A. Shallow section, quartered with enlarged areas, punch decoration between
B. Light incised transverse lines in groups along inner and outer circumference,
but not necessarily crossing whole band – evenly spaced like mock bead and
reel
C. Rounded ovoid in section with flattened regions featuring punch decoration
III. Mock penannular – cast, but not circular or d-shaped in section
A. Serpent or beast-headed ‘terminals’
B. Other terminals
IV. Round in section, larger than 1 inch
(None within this study)
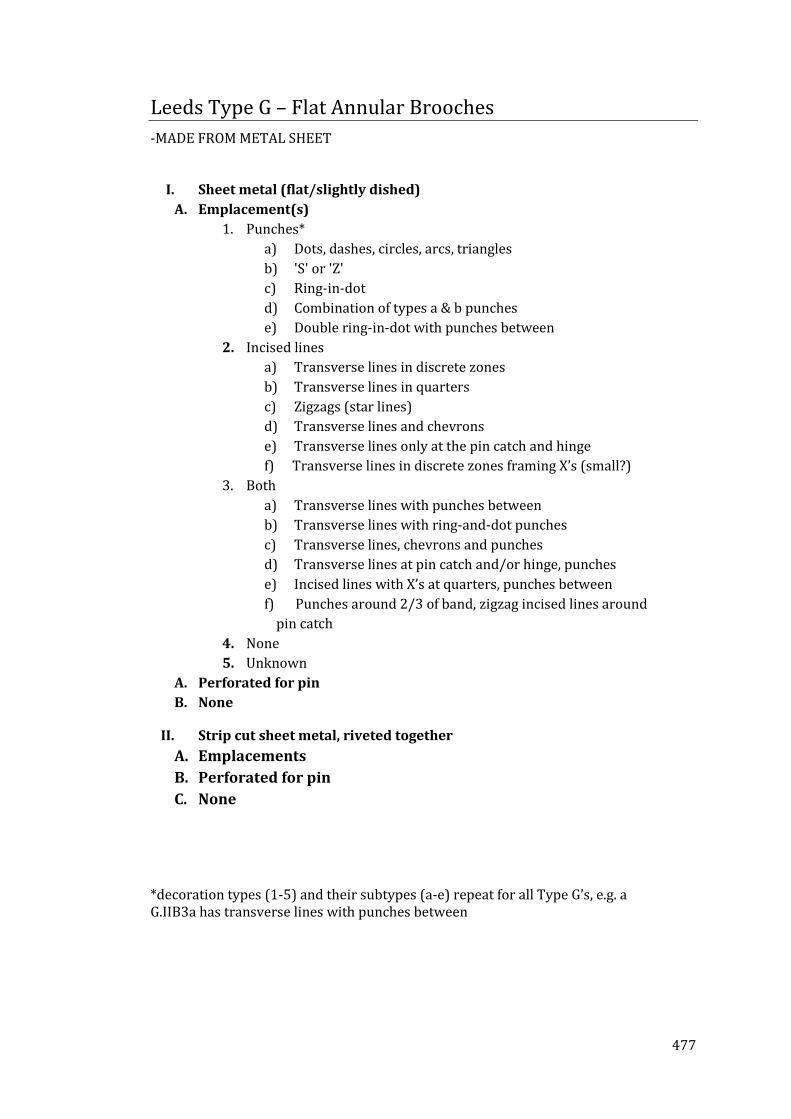
477
Leeds Type G – Flat Annular Brooches
-MADE FROM METAL SHEET
I. Sheet metal (flat/slightly dished)
A. Emplacement(s)
1. Punches*
a) Dots, dashes, circles, arcs, triangles
b) 'S' or 'Z'
c) Ring-in-dot
d) Combination of types a & b punches
e) Double ring-in-dot with punches between
2. Incised lines
a) Transverse lines in discrete zones
b) Transverse lines in quarters
c) Zigzags (star lines)
d) Transverse lines and chevrons
e) Transverse lines only at the pin catch and hinge
f) Transverse lines in discrete zones framing X’s (small?)
3. Both
a) Transverse lines with punches between
b) Transverse lines with ring-and-dot punches
c) Transverse lines, chevrons and punches
d) Transverse lines at pin catch and/or hinge, punches
e) Incised lines with X’s at quarters, punches between
f) Punches around 2/3 of band, zigzag incised lines around
pin catch
4. None
5. Unknown
A. Perforated for pin
B. None
II. Strip cut sheet metal, riveted together
A. Emplacements
B. Perforated for pin
C. None
*decoration types (1-5) and their subtypes (a-e) repeat for all Type G’s, e.g. a G.IIB3a has transverse lines with punches between
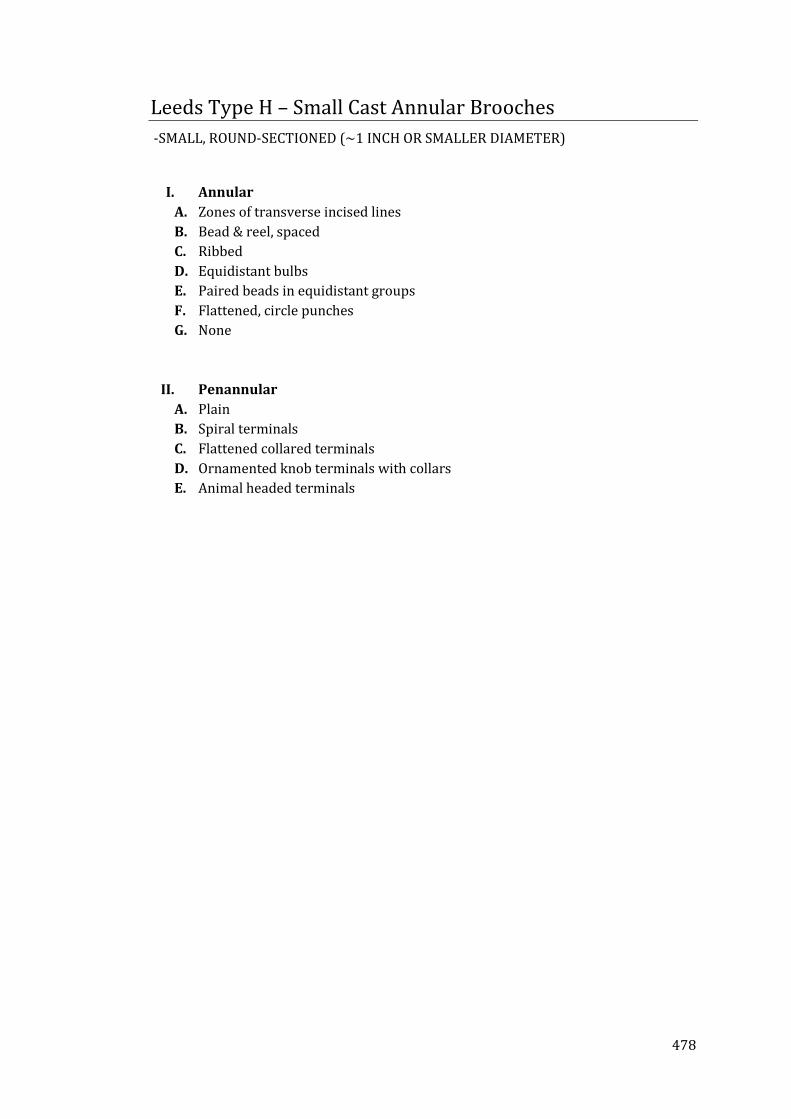
478
Leeds Type H – Small Cast Annular Brooches
-SMALL, ROUND-SECTIONED (~1 INCH OR SMALLER DIAMETER)
I. Annular
A. Zones of transverse incised lines
B. Bead & reel, spaced
C. Ribbed
D. Equidistant bulbs
E. Paired beads in equidistant groups
F. Flattened, circle punches
G. None
II. Penannular
A. Plain
B. Spiral terminals
C. Flattened collared terminals
D. Ornamented knob terminals with collars
E. Animal headed terminals
![Elfrico grammatico e l'insegnamento linguistico nell'Inghilterra anglosassone ['Ælfric as a Grammarian and Language Teaching in Anglo-Saxon England'] [1991]](https://img.pdfslide.net/doc/110x75/6351db48ba4994660704eb3e/elfrico-grammatico-e-linsegnamento-linguistico-nellinghilterra-anglosassone-alfric.jpg)


![Nacjonalizm i jego badacze (z perspektywy anglosaskiej). Przegląd literatury [Nationalism and Its Students: A Bibliographical Essay (from the Anglo-Saxon Perspective)] (pp 121-146)](https://img.pdfslide.net/doc/110x75/635574e3f4b7d3d11c0ca897/nacjonalizm-i-jego-badacze-z-perspektywy-anglosaskiej-przeglad-literatury-nationalism.jpg)