Embed Size (px)
Citation preview
© 2004 CEIS, Fondazione Giacomo Brodolini and Blackwell Publishing Ltd, 9600 Garsington Rd., Oxford OX4 2DQ, UK and 350 Main St., Malden, MA 02148, USA.
Is the Swiss Labor Market Segmented? An Analysis Using Alternative Approaches
Alfonso Sousa-Poza
Abstract. In this paper, three common empirical methods encountered in thesegmentation literature are used in order to establish whether or not the Swiss labormarket is segmented: (i) a hierarchical cluster analysis; (ii) a switching model withunknown regime; and (iii) an analysis of low-wage mobility with a bivariate probitmodel with endogenous selection. According to method (i), segmentation canhardly be observed. Method (ii) shows that the Swiss labor market is dualistic innature. Method (iii) reveals that a certain degree of persistence exists in low-wagejobs. Whether or not the Swiss labor market is segmented thus depends on thechoice of method, i.e. on the definition and understanding of segments. In anycase, none of the methods used in this study point to the existence of a large andwell-defined secondary segment.
1. Introduction
The theoretical foundations of labor market segmentation dateback several decades and have been a topic of analysis in severaldifferent ideological strains (see Leontaridi, 1998). In fact, theanalysis of labor market segmentation originated as a criticism ofthe neoclassical apparatus and has been strongly influenced by in-stitutionalists and Marxists. It was argued that neoclassical theorycould not provide adequate explanations for the existence of severallabor market flaws, especially wage inequality and discrimination
Alfonso Sousa-Poza, University of St Gallen, FAA-HSG, Guisanstrasse 92,9010 St Gallen, Switzerland. E-mail: [email protected].
The author would like to thank Fred Henneberger, Hedwig Prey, and an anony-mous referee for valuable comments on an earlier version of this paper. Financialassistance from the Swiss National Science Foundation for its funding of theproject ‘Labor Market Segmentation in Switzerland’ is also gratefully acknowl-edged. The usual disclaimer applies.
LABOUR 18 (1) 131–161 (2004) JEL J16, J31, J41

(Taubman, Wachter, 1986). Labor market segmentation theorystates that segmentation in the labor market is a main cause of theseproblems. It also postulates that the labor market is not (as isassumed in the neoclassical tradition) a homogeneous entity, but,instead, is composed of two or more independent segments. Theunderlying mechanisms and structures at work with regard topayment, promotion, job security, etc. differ fundamentally amongsegments. In its original form, labor market segmentation theorydistinguished two segments: a secondary and a primary sector. Thisis the well-known dual labor market hypothesis. The secondarysegment is characterized by low-wage jobs, no returns to humancapital, and a high degree of job insecurity. The primary sector,on the other hand, is characterized by high-wage jobs, returns tohuman capital, large firms, and job security. Furthermore, mobilitybetween the sectors is severely restricted, and jobs in the primarysector are rationed (due to high wages) (e.g. Doeringer, Piore, 1971).Thus, one of the main implications of labor market segmentationtheory is that individuals of equal productivity will receive differ-ent wages. Although neoclassical theory also acknowledges that different segments exist according to specific socio-demographiccharacteristics, the main difference is that labor market segmenta-tion theory questions the pure maximizing behavior of firms andindividuals whereas neoclassical theory does not (see Sengenberger,1987a, b; Wachter, 1974; Wagner, 1985). One implication of this isthat the price mechanism does not function in all segments of thelabor market. There are a number of reasons (according to labormarket segmentation theory) why segmentation may occur, themain one being that the primary market substitutes marketprocesses with institutional rules. According to Piore (1975), labormarket segmentation arises due to uncertainty in the market. Morespecifically, the primary sector is organized in such a way as toshelter workers and firms from uncertainty, i.e. from market fluc-tuations.1 This is not the case in the secondary segment, wheremarket forces are felt. The main consequences are job rationing inthe primary sector, different compensation mechanisms between thesectors, different unemployment and poverty probabilities betweenthe sectors, and general allocative inefficiency.
In recent years an increased interest in research on labor marketsegmentation has taken place. One of the reasons for this resurgenceis that labor market conditions deteriorated in the 1990s (Orr, 1997);poverty, welfare, and unemployment thus re-entered public debate.This is especially the case in Switzerland, where unemployment and
132 Alfonso Sousa-Poza
© CEIS, Fondazione Giacomo Brodolini and Blackwell Publishing Ltd 2004.

poverty, in particular, increased in the 1990s. Labor market seg-mentation theory postulates that these ills are, to a certain extent,a result of segmented labor markets (for an overview see Leontaridi,1998; Taubman, Wachter, 1986). Establishing whether or not a labormarket is segmented is therefore by no means a trivial undertaking.First, it questions the (albeit simplistic) theoretical notion that onlyone labor market exists, in which remuneration adheres to thehuman capital model. Second, revealing the existence of segmentswith precarious employment conditions is important as this couldallow for adequate (and well-directed) policy measures that may‘upgrade’ these segments. Thus, knowing whether segmentationexists is essential in possibly understanding and solving manyimportant labor market problems such as recidivist unemployment,poverty, and discrimination.
Despite the obvious benefits of knowing the existence and char-acteristics of different segments within a country’s labor market,identifying segments is problematic. The main problem is that definitions of segments vary substantially and, once segments havebeen defined, proving that these segments are the results of entrybarriers in certain (better) segments is often difficult. It is thereforenot surprising that several methodological approaches have beendeveloped in order to define and prove the existence of segmenta-tion (see Leontaridi, 1998).
The aim of this paper is to apply three common empiricalmethods encountered in the segmentation literature in order to tryand determine whether or not the Swiss labor market is segmented.First, a hierarchical cluster analysis is implemented, where jobs(characterized as industry/occupation pairs) are allocated to clus-ters according to a selection of explanatory variables. The approachused in this paper is similar to that of Anderson et al. (1987).Second, the dual labor market hypothesis is tested with the aid ofa switching model with unknown regime. The same method wasused by Dickens and Lang (1985). Third, low-wage mobility is ana-lyzed using the methodology described in Stewart and Swaffield(1999), i.e. by estimating a bivariate probit model with endogenousselection.
It should be mentioned that very little research exists on labormarket segmentation in Switzerland. Lewin (1982) and Meier(1983) made a first attempt at analyzing segmentation in Switzer-land. However, their methodological approach and data sets wererelatively elementary. Furthermore, both studies are outdated andwere conducted at a time when few problems existed in relation to
Is the Swiss Labor Market Segmented? 133
© CEIS, Fondazione Giacomo Brodolini and Blackwell Publishing Ltd 2004.

the labor market in Switzerland. In a more recent study, de Coulon(1999) analyzed data from the 1994 Wage Structure Survey and the1995 Swiss Labor Force Survey in order to investigate the potentialsegmentation of the foreign workforce in Switzerland. Sousa-Poza(2002) analyzed the relationship between labor market segmenta-tion and the magnitude of the wage differential with data from the1998 Wage Structure Survey. It is argued that a typical secondarysegment is more exposed to competitive market forces and/or lesslikely to be embedded in large internal labor markets (ILMs), whichshould facilitate discrimination, and that this will influence the magnitude of the gender wage gap.
Perhaps the main reason for the lack of research on labor marketsegmentation is that Switzerland has (at least in comparison toother countries) experienced very few problems in the past in rela-tion to the labor market. The situation changed in the last decade,however, with the unemployment rate peaking in 1997 at 5.2percent, i.e. its highest level since the 1930s. Moreover, Switzerlandis an interesting country in which to study labor market segmenta-tion as it has a small and open economy with weak unions and, byContinental European standards, loose employment protection legislation.2 Thus, it is not very surprising that Switzerland also hasvery few labor disputes and, in an international setting, very fewlost days due to strikes (see IW, 1999, p. 154). One could assumethat these are ideal conditions for the development of typical sec-ondary segments, characterized by, among other things, job inse-curity and low wages.3 In particular, the relatively weak unions inSwitzerland would make us assume that ILMs are not as abundantor well developed as in other countries.4
The paper is structured as follows: Section 2 discusses themethodological issues, and Section 3 the data. Section 4 presentsthe results and Section 5 concludes.
2. Methodological issues
2.1 A cluster analysis
The most popular methods used to define segments are based ona priori allocations of jobs to segments. These allocations use jobcharacteristics (e.g. Flatau, Lewis, 1993; Theodossiou, 1995), in-dustry or occupational characteristics (e.g. Edwards et al., 1975;Fichtenbaum et al., 1994; Khandker, 1992; Osberg et al., 1987),
134 Alfonso Sousa-Poza
© CEIS, Fondazione Giacomo Brodolini and Blackwell Publishing Ltd 2004.

or subjective measures (e.g. Osterman, 1975). One of the mainproblems with ex ante allocations is that this allocating mechanismis rather arbitrary. One way of overcoming this arbitrary definitionof segments is by performing a cluster analysis. Cluster analysis (inthe context of this paper) is an approach of assigning jobs (usuallyon the basis of occupation and industry classifications) into rela-tively homogeneous groups with respect to a given set of variables.The main advantage of this method is that it can establish into howmany clusters the observations fall, without having to force the datainto a predetermined number of segments.5 Such an approach hasbeen used by Anderson et al. (1987), Cutcher-Gershenfeld (1991),and Drago (1995).
In this paper, a hierarchical cluster analysis is implemented inorder to sort jobs into clusters. These jobs are classified by indus-try and occupation. In the original sample, 17 industries and 45occupations were available. This would give rise to a maximum of765 jobs. Of these 765 industry–occupation categories, only 211appear in the data set. The following nine variables were used todefine the clusters:6
• Gender: labor market segregation exists in Switzerland, andtypical secondary segment tasks that require low skills are oftenperformed by women (see Sousa-Poza, 2002).
• Unemployment rate: according to labor market segmentationtheory, unemployment levels in secondary segments are higherthan in primary segments.
• Tenure: job fluctuations are more common in the secondary segmentand, thus, tenure should be lower in these segments, on average.
• Education: a standard observation in the segmentation literatureis that secondary segments are typically characterized by lowlevels of education, since investments in human capital are notrewarded.
• Hourly wage: secondary segment jobs have a low level of wagesand a flat wage profile, while primary segment jobs have a higherlevel and a steep profile.
• Foreigners: foreign workers in Switzerland are most likely to beemployed in typical secondary segments (see de Coulon, 1999).
• On-the-job training: primary segment jobs are often character-ized by more frequent on-the-job training than jobs in the sec-ondary segment (see Drago, 1995).
• Searching for a new job: since, according to the segmentation literature, job fluctuations are more common in the secondary
Is the Swiss Labor Market Segmented? 135
© CEIS, Fondazione Giacomo Brodolini and Blackwell Publishing Ltd 2004.

segment, one could also expect this segment to have a largerportion of workers searching for a new job.
• Absenteeism due to accident or illness: due to the often precari-ous working conditions in typical secondary segment jobs, onecould expect higher absence due to accidents or illnesses.
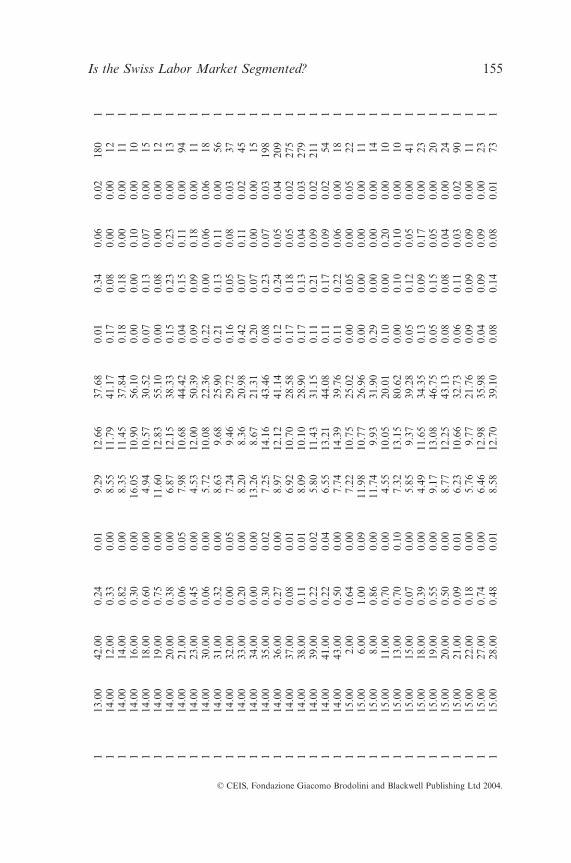
The industry–occupation pairs and variable definitions are pre-sented in the Appendix.
There are several algorithms available in conventional statisticalsoftware packages for choosing clusters. In this study, an averagelinkage measure between groups was used (see, for example, Jobson,1992, p. 510). A further aspect to take into account is the decisionwhen to stop agglomerating clusters. In this study, two conventionalstopping rules were used: an upper tail rule and a moving averagerule (see, for example, Jobson, 1992, p. 546).
2.2 A switching model with unknown regime
One important contribution to the empirical segmentation litera-ture was made by Dickens and Lang (1985). They developed aninnovative approach for defining segments by explicitly endogeniz-ing segmental choice between two sectors (i.e. they proposed a testfor the dual labor market hypothesis). This method has the advan-tage (as is also the case in the cluster analysis) that segments aretreated as unknown a priori. Dickens and Lang (1985) argue that theusual a priori classifications misclassify many workers since evenwithin the same firm (industry or occupation) one encounters bothprimary and secondary segment type workers. Consequently, sampleseparation is a priori unknown. A similar approach to that taken inDickens and Lang (1985) has also been used by Basch and Paredes-Molina (1996), de Coulon (1999), Pailhé (2003), and Rebitzer andRobinson (1991). This model — a switching model with unknownregime — is based on the following three-equation regression model:
where Wi is the individual’s wage, Xi and Zi are vectors of charac-teristics associated with the ith individual, bp, bs and ba are vectorsof parameters, and uip, uis and uia are normally distributed error
Y Z ui i a ia* ,= ¢ +b
W X ui i s is= ¢ +b
W X ui i p ip= ¢ +b
136 Alfonso Sousa-Poza
© CEIS, Fondazione Giacomo Brodolini and Blackwell Publishing Ltd 2004.

terms. Y*i is a latent variable measuring the tendency for the ith indi-vidual to be in the primary segment, and the subscripts p and s indicate primary and secondary segments. The first equationdepicts the wage function for primary segment workers, the seconddepicts the wage function for secondary segment workers, and thethird equation is the switching equation. Note that Y*i cannot beobserved, but if it is positive then the individual is in the primarysegment (otherwise in the secondary segment). Thus, the individualworks in the primary segment if and only if
The variables included in X are the usual human-capital variables:EDU (number of years of schooling), EXPR (number of years ofjob experience), and EXPR2 (experience squared). W is the naturallogarithm of the hourly wage rate. The variables in Z include thevariables in the wage equations and also MARRIED (dummy vari-able equal to one if the respondent is married) and FOREIGN(dummy variable equal to one if the respondent is a foreigner). Inaccordance with the segmentation theory, one would expect theprobability of being in the primary segment to increase with ahigher level of education, more work experience, being married,7
and Swiss nationality.The likelihood function for this model is the following:
If it is assumed that the error terms are normally distributed, thenthe log-likelihood function for this model is given by:
where f (.) and F(.) are the normal density and cumulative distribu-tions; spa and ssa are covariances between up and ua and between us
and ua, respectively. spp and sss are variances, and saa is normalizedto one. Four basic optimization algorithms were relied upon: (i)
1
1
1
12
12 2
12
-- ¢ -Ê
ËÁˆ¯̃
-ÊËÁ
ˆ¯̃
È
Î
ÍÍÍÍÍ
˘
˚
˙˙˙˙˙
( )
È
Î
ÍÍÍÍÍ
˘
˚
˙˙˙˙˙
+- ¢ -Ê
ˈ¯
-ÊË
ˆ¯
È
Î
ÍÍÍÍÍ
˘
˚
˙˙˙˙˙
FZ
s us
ss
f u FZ
s us
ss
i apa ip
pp
pa
pp
ip
i asa is
ss
sa
ss
b bff uis
i
n
( )
Ê
Ë
ÁÁÁÁÁ
ˆ
¯
˜˜˜˜̃=
’1
,
Pr , , Pr , , .u Z Z X u f u u Z Z X u f uia i a i i ip ip ia i a i i ip isi
n
> ¢[ ] ( ) + £ - ¢[ ] ( )( )=
’ b b1
u Zia i a> - ¢b .
Is the Swiss Labor Market Segmented? 137
© CEIS, Fondazione Giacomo Brodolini and Blackwell Publishing Ltd 2004.

Davidon–Fletcher–Powell (DFP); (ii) steepest ascent; (iii) Newton’s;and (iv) Berndt–Hall–Hall-Hausman (BHHH).8 Of these, the mostsuitable ones in the context of this study were the DFP and BHHHalgorithms, the latter being the most expedient.
In order to test whether or not a two-equation model fits the databetter than a single-equation model, a log-likelihood test as used by Dickens and Lang (1985) is applied here. Note that the single-equation model is nested in the switching model if the latter is constrained to yield a single-equation model. This leaves severalparameters unidentified. Monte Carlo results suggest, however,that one can use a log-likelihood test to determine whether a two-equation model fits the data better than a single model by settingthe degrees of freedom equal to the number of constraints plus thenumber of unidentified parameters (Goldfeld, Quandt, 1975). Inthis way, twice the difference between the log-likelihood values for the two models yields a conservative test using a chi-squared distribution.
Although this model is elegant and does not rely on a priori defini-tions of segments, it tests only the dual labor market hypothesis, i.e.only two segments can be distinguished. The other two methodsdescribed above do not have this limitation. In the Germanic world, inparticular, the existence of more than two segments is often assumed(see Biehler, Brandes, 1981; Lutz, 1987; Sengenberger, 1987a, b).9
2.3 Low-wage mobility
Another way of analyzing labor market segmentation is by takinga look at wage mobility (Leontaridi, 1998). According to labormarket segmentation theory, jobs in the (high-wage) primarysegment are rationed and thus one should, in the presence of labormarket segmentation, observe persistence in low-wage jobs. Oneway of analyzing this topic is with a bivariate probit model withendogenous selection as developed by Meng and Schmidt (1985)and used in the context of a low-wage mobility study by Stewartand Swaffield (1999), Cappellari (2000), and de Coulon andZürcher (2001). More specifically, assume that individual earningsin year t - 1 are generated by the process:10
where y*it-1 is hourly earnings at the survey point in year t - 1, xit-1
is a vector of earnings-determining characteristics and g1 is a suit-
g y xit it i1 1 1 1* * ,- -( ) = ¢ +b e
138 Alfonso Sousa-Poza
© CEIS, Fondazione Giacomo Brodolini and Blackwell Publishing Ltd 2004.

able monotonic transformation such that ei1 is distributed N(0, 1).Assuming the low-pay threshold to be equal to lt-1, and defining an indicator variable yit-1 = 1 if the ith individual is low paid andyit-1 = 0 otherwise, then
where F is the standard normal cumulative distribution function.If one is not interested in the intercept in b* then the model can beestimated as
Assume that an individual’s earnings in t depend on the individual’sstate in t - 1. More specifically, suppose that an individual’s earn-ings in t depend on whether or not the individual was low paid inyear t - 1. Assume that if yit-1 = 1, then the process determining anindividual’s wage is equal to
where zit is a vector of characteristics that determine the wagechange. The distribution of (ei1, ei2) is assumed to be bivariate stan-dard normal with correlation r. The conditional probability of beinglow paid in year t, given being low paid in year t - 1, is given by
Clearly, if r = 0, i.e. the initial condition is assumed to be exoge-nous, then the problem boils down to a simple probit model definedon a sample of individuals for which yit-1 = 1. If the initial condi-tion is assumed to be endogenous, then the problem can be modeledby a bivariate probit model with endogenous selection, as describedin Meng and Schmidt (1985).11 The log-likelihood contribution forindividual i is given by
An important point to note in this model is that, in order to guarantee identification, some variables included in xit-1 must be
ln ln , ; ln , ;
ln .
L y y x z y y x z
y xi it it it it it it it it
it it
= ¢ ¢( ) + -( ) ¢ - ¢ -( )+ -( ) - ¢( )
- - - -
- -
1 2 1 1 2 1
1 2 1
1
1
F FF
b g r b g rb
P y yx z
xit it
it it
it
= =[ ] =¢ ¢{ }
¢{ }--
-1 11
2 1
1
FF
b g rb
, ;.
g y zit it i2 2( *) * ,= ¢ +g e
P y xit it- -=[ ] = ¢{ }1 11 F b* .
P y P y g xit it t t it- - - - -=[ ] = <[ ] = ( ) - ¢{ }1 1 1 1 1 11 * * ,l l bF
Is the Swiss Labor Market Segmented? 139
© CEIS, Fondazione Giacomo Brodolini and Blackwell Publishing Ltd 2004.

excluded in zit. The instruments should influence the initial state but not the subsequent change of state. The obvious choice for such instrumentals are parental background information (e.g.Cappellari, 2000; Stewart, Swaffield, 1999). In this paper, the fol-lowing information on the respondent’s childhood is used, andwhere ‘childhood’ refers to the individual’s situation at the age of15: one-parent household, father non-employed, father unskilledlaborer, mother employed, mother’s education low. Other variablesincluded in xit-1 (and zit) are: male, age, educational level, childrenin household, foreigner status, unskilled laborer. As in de Coulonand Zürcher (2001), two measures for the low-pay threshold areused: two-thirds and half of the median hourly wage.
3. Data
Data from the Swiss Labor Force Survey (SLFS) for the year2000 are used for the cluster analysis and for the switching modelwith unknown regime. The SLFS is a nation-wide and representa-tive survey conducted annually by the Swiss Federal StatisticalOffice. With telephone interviews lasting approximately 20 minutes,individuals are questioned on a number of topics related to thelabor market. The first SLFS survey was conducted in 1991, andthe sample size was approximately 16,000 individuals (see Bundesamt für Statistik, 1996). We restrict our analysis to salariedemployees between the ages of 18 and 62.
The wage data of the SLFS have been used in numerous studies.Despite their widespread acceptance, a word of caution is war-ranted: the SLFS wage data are (due to the survey methodology)characterized by relatively large non-response rates and a ‘heap-ing’ on certain rounded values. Although in Sousa-Poza and Henneberger (2000) it is shown that there does not appear to be asystematic bias in the reporting of wage data (i.e. the item non-responses do not bias the estimated coefficients of the wage equa-tions), the unit non-responses and the concentration on certainrounded values remain a potential problematic aspect of this dataset. Nevertheless, for the analysis conducted in this paper no otheradequate data set exists in Switzerland. Furthermore, this is not aunique problem of the SLFS, but one associated with most laborforce surveys.
The analysis of wage mobility is undertaken with data from thefirst three waves of the Swiss Household Panel (SHP). The first wave
140 Alfonso Sousa-Poza
© CEIS, Fondazione Giacomo Brodolini and Blackwell Publishing Ltd 2004.

was conducted in 1999. The SHP is a longitudinal panel survey and data are gathered annually. For the first wave, a representativesample of 5,074 households from the Swiss population wasrecruited and interviewed in the autumn of 1999. Our analysis isrestricted to individuals aged 18–65. The sample size for the panelof individuals who reported all relevant variables for the analysis ofwage mobility (especially wages) is equal to 2,030 individuals. Themain advantage of the SHP compared to the SLFS is that it col-lects data on family-related issues such as the level of education andemployment status of the respondents’ parents. These are impor-tant variables which are usually needed as instruments in order toestimate the initial state.
4. Results
4.1 Cluster analysis
In this section, the results of the hierarchical cluster analysisdescribed in Section 2.1 are presented. Corresponding to the resultsin Anderson et al. (1987), as clustering proceeded, a large clusterformed and then expanded by absorbing the other occupation–industry pairs. No clear evidence of a dual or multiple-segmentedlabor market exists. As was discussed above, an upper tail rule anda moving average rule were used in order to decide when to stopagglomeration in the hierarchical cluster analysis. The upper tailrule gave rise to seven clusters and the moving average rule gave riseto six clusters. The number of industry–occupation pairs in eachcluster is depicted in Table 1. A more detailed description of theclusters and the industry–occupation pairs can be found in theAppendix.
In Table 2, the average characteristics of the different clusters(determined by the moving average rule) are depicted. As was men-tioned above, the overwhelming majority of occupation–industrypairs were allocated to one segment. This segment therefore reflectsthe average labor market characteristics in Switzerland. It is inter-esting to note that cluster 2 does correspond to a typical secondarysegment: high female participation rate, high levels of unem-ployment, low education, low wage rate, and a large proportion offoreign workers. However, this cluster represents only a very smallfraction of the labor force. The male (albeit, very small) cluster 3also has some typical characteristics of a secondary segment:
Is the Swiss Labor Market Segmented? 141
© CEIS, Fondazione Giacomo Brodolini and Blackwell Publishing Ltd 2004.

relatively low wages, low average tenure, low education, and a largeproportion of foreign workers.12
Thus, the evidence obtained with this method is that the Swisslabor market is not partitioned into more than one large segment.Note that different subsets of the dependent variables and differentalgorithms for choosing the clusters were also applied. In no casecould a clear segmentation into two or more (numerically) mean-ingful clusters be observed. This conclusion is in accordance withthe observation made by Anderson et al. (1987).
4.2 A switching model with unknown regime
The results of the switching model with unknown regime for themale sample are depicted in Table 3. The results correspond in partto those of de Coulon (1999), who estimated a similar model withdata from the 1995 SLFS. The results in Table 3 show that Swiss(as opposed to foreign) males are more likely to be in the primarysegment. The other coefficients in the switching equation are notsignificant — despite having the expected sign — at conventionallevels. The log-likelihood test reveals that the two-equation modelclearly fits the data better than the single-equation model (99percent critical value of a chi-squared distribution with 13 degreesof freedom is equal to 4.107). The coefficients of the wage equations for the two segments correspond to those of similarstudies. More specifically, the intercepts are larger in the secondarysector than in the primary sector,13 and returns to schooling and
142 Alfonso Sousa-Poza
© CEIS, Fondazione Giacomo Brodolini and Blackwell Publishing Ltd 2004.
Table 1. Observed clusters according to two stopping rules
Number of Number ofindustry– industry–
Cluster numbera occupation pairs Cluster numberb occupation pairs
1 196 1 1962 5 2 53 1 3 14 4 4 45 1 5 16 1 6 47 3
Notes: a Stopping rule according to the upper tail rule.b Stopping rule according to the moving average rule.

Is the Swiss Labor Market Segmented? 143
© CEIS, Fondazione Giacomo Brodolini and Blackwell Publishing Ltd 2004.
Tab
le 2
.A
vera
ge c
hara
cter
isti
cs o
fcl
uste
rs
Abs
ence
due
Obs
erva
tion
sC
lust
erH
ourl
yS
eeki
ngto
illn
ess,
in u
nder
lyin
gnu
mbe
rM
ale
Une
mpl
oym
ent
Tenu
reS
choo
ling
wag
eFo
reig
ners
Tra
inin
gem
ploy
men
tin
jury
sam
ple
10.
550.
018.
8911
.26
37.0
50.
120.
110.
060.
0212
,515
20.
270.
1210
.20
9.50
26.3
90.
260.
070.
050.
0077
31.
000.
005.
639.
8225
.62
0.47
0.18
0.06
0.00
174
0.81
0.03
12.8
410
.25
40.0
10.
080.
080.
020.
0968
50.
800.
109.
4813
.25
144.
850.
200.
200.
200.
0010
60.
440.
038.
0815
.15
51.9
70.
140.
100.
240.
0163
Not
e:R
esul
ts b
ased
on
a m
ovin
g av
erag
e st
oppi
ng r
ule.

experience are higher in the primary segment than in the secondarysegment. Similar results and the same argumentation as in the malesample can also be observed in the female sample (see Table 4). Inboth the male and the female samples, the log-likelihood statisticclearly indicates that the two-equation model fits the data betterthan the single-equation model. Although such a result wouldsuggest a dualistic labor market, it can be seen that the estimatedwage functions for the secondary segment do not resemble typicalsecondary-segment remuneration practices since returns to school-ing (although being smaller in the primary segment) are by nomeans insignificant.
4.3 Low-wage mobility
The cross-tabulation for low-wage mobility between the years1999 and 2001 is shown in Tables 5 and 6. Table 5 uses the ‘50percent of the median hourly wage’ criterion as the low-pay thresh-
144 Alfonso Sousa-Poza
© CEIS, Fondazione Giacomo Brodolini and Blackwell Publishing Ltd 2004.
Table 3. Switching regression model — males
OLS Primary Secondary Selection
Constant 2.578*** 2.473*** 2.678*** 0.449**(0.029) (0.207) (0.282) (0.205)
Schooling (years) 0.060*** 0.078*** 0.044*** 0.002(0.002) (0.012) (0.020) (0.015)
Experience 0.024*** 0.032*** 0.016 0.015(0.002) (0.010) (0.017) (0.013)
Exp.2 ¥ 10-2 -0.034*** -0.059** -0.013 -0.034(0.004) (0.023) (0.039) (0.028)
Foreigner -0.052***(0.047)
Married 0.014(0.012)
Covariance with 0.565*** 0.452***switching error (0.095) (0.097)
Standard error 0.359*** 0.320*** 0.205** a
(0.108) (0.088)
N 4,089 4,089Log-likelihood -2,159 -1,704Adj. R2 0.235
Notes: ***, ** and *: significant at the 1 percent, 5 percent and 10 percent levels, respec-tively. Standard errors in parentheses.a Normalized to 1.

Is the Swiss Labor Market Segmented? 145
© CEIS, Fondazione Giacomo Brodolini and Blackwell Publishing Ltd 2004.
Table 4. Switching regression model — females
OLS Primary Secondary Selection
Constant 2.562*** 2.366*** 2.800*** 0.340(0.033) (0.233) (0.173) (0.296)
Schooling (years) 0.055*** 0.055*** 0.050*** -0.011(0.003) (0.019) (0.013) (0.024)
Experience 0.019*** 0.026** 0.013 0.022(0.002) (0.013) (0.011) (0.018)
Exp.2 ¥ 10-2 -0.031*** -0.058 -0.010 -0.034(0.006) (0.037) (0.032) (0.052)
Foreigner -0.041***(0.060)
Married 0.007(0.032)
Covariance with 0.722*** 0.814***switching error (0.119) (0.001)
Standard error 0.419*** 0.530*** 0.663** a
(0.171) (0.001)
N 3,908 3,908Log-likelihood -2,148 -1,684Adj. R2 0.125
Notes: ***, ** and *: significant at the 1 percent, 5 percent and 10 percent levels, respec-tively. Standard errors in parentheses.a Normalized to 1.
Table 5. Cross-tabulations of low wages in 1999 and 2001 — 50 per centof median hourly wages
High wage 2001 Low wage 2001
High wage 1999 Observed: 1,802 (97.2%) Observed: 52 (2.8%)Expected: 1,742 (95.0%) Expected: 112 (5.0%)
Low wage 1999 Observed: 105 (59.7%) Observed: 71 (40.3%)Expected: 165 (93.8) Expected: 11 (6.2%)
Note: Pearson c2 = 398.
old. Nearly 60 percent of all individuals who had low-paid jobs in1999 managed to change their status between 1999 and 2001. If the‘67 percent of the median hourly wage’ criterion is used (see Table6) to define low-paid jobs, then about 44 percent manage to exit lowpayment. These results show that a fair share of mobility out oflow-paid jobs exists, and that upward mobility is much more likely
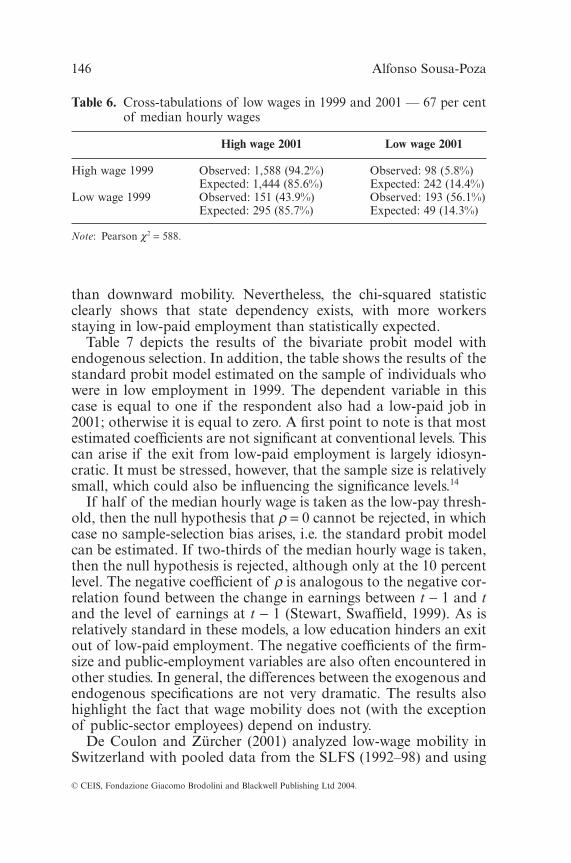
than downward mobility. Nevertheless, the chi-squared statisticclearly shows that state dependency exists, with more workersstaying in low-paid employment than statistically expected.
Table 7 depicts the results of the bivariate probit model withendogenous selection. In addition, the table shows the results of thestandard probit model estimated on the sample of individuals whowere in low employment in 1999. The dependent variable in thiscase is equal to one if the respondent also had a low-paid job in2001; otherwise it is equal to zero. A first point to note is that mostestimated coefficients are not significant at conventional levels. Thiscan arise if the exit from low-paid employment is largely idiosyn-cratic. It must be stressed, however, that the sample size is relativelysmall, which could also be influencing the significance levels.14
If half of the median hourly wage is taken as the low-pay thresh-old, then the null hypothesis that r = 0 cannot be rejected, in whichcase no sample-selection bias arises, i.e. the standard probit modelcan be estimated. If two-thirds of the median hourly wage is taken,then the null hypothesis is rejected, although only at the 10 percentlevel. The negative coefficient of r is analogous to the negative cor-relation found between the change in earnings between t - 1 and tand the level of earnings at t - 1 (Stewart, Swaffield, 1999). As isrelatively standard in these models, a low education hinders an exitout of low-paid employment. The negative coefficients of the firm-size and public-employment variables are also often encountered inother studies. In general, the differences between the exogenous andendogenous specifications are not very dramatic. The results alsohighlight the fact that wage mobility does not (with the exceptionof public-sector employees) depend on industry.
De Coulon and Zürcher (2001) analyzed low-wage mobility inSwitzerland with pooled data from the SLFS (1992–98) and using
146 Alfonso Sousa-Poza
© CEIS, Fondazione Giacomo Brodolini and Blackwell Publishing Ltd 2004.
Table 6. Cross-tabulations of low wages in 1999 and 2001 — 67 per centof median hourly wages
High wage 2001 Low wage 2001
High wage 1999 Observed: 1,588 (94.2%) Observed: 98 (5.8%)Expected: 1,444 (85.6%) Expected: 242 (14.4%)
Low wage 1999 Observed: 151 (43.9%) Observed: 193 (56.1%)Expected: 295 (85.7%) Expected: 49 (14.3%)
Note: Pearson c2 = 588.

Is the Swiss Labor Market Segmented? 147
© CEIS, Fondazione Giacomo Brodolini and Blackwell Publishing Ltd 2004.
Table 7. Determinants of low-wage mobility: P[low-waget+1 | low-waget]
1/2 Median 2/3 Median
Exogenous Endogenous Exogenous Endogenous
Constant -0.094 -0.315 0.660** 0.652**(0.359) (0.215) (0.275) (0.270)
Male -0.024 -0.063 -0.142 -0.037(0.243) (0.265) (0.177) (0.187)
Age -0.006 -0.017 -0.014** -0.002(0.009) (0.013) (0.006) (0.010)
Low education 1.115** 1.315*** 0.803** 0.547*(0.456) (0.454) (0.313) (0.323)
Child in household -0.065 -0.111 -0.111 -0.269(0.224) (0.241) (0.180) (0.189)
Foreigner 0.150 0.099 -0.102 -0.745(0.300) (0.290) (0.225) (0.213)
Unskilled laborer -0.426 -0.458 0.252 0.258(0.490) (0.454) (0.357) (0.337)
Part time 0.046 0.110 0.238 0.170(0.270) (0.278) (0.190) (0.191)
Firm fewer than 20 0.154 0.163 0.189 0.171employees (0.221) (0.226) (0.165) (0.163)
Firm more than 100 -0.736** -0.788* -0.637*** -0.529**employees (0.353) (0.451) (0.202) (0.213)
Manufacturing -0.351 -0.376 -0.157 -0.122(0.328) (0.356) (0.237) (0.232)
Construction 0.064 0.034 -0.260 -0.200(0.567) (0.692) (0.465) (0.541)
Hotels, restaurants, -0.124 -0.134 0.686 0.570catering (0.493) (0.457) (0.430) (0.461)
Real estate, IT -0.367 -0.326 -0.416* -0.386(0.344) (0.366) (0.246) (0.236)
Public administration -0.189 -0.279 -0.628*** -0.527**(0.340) (0.370) (0.226) (0.244)
r 0.327 -0.380*(0.310) (0.212)
Log-likelihood -107 -561 -205 -920N 176 2,030 344 2,030
Notes: ***, ** and *: significant at the 1 per cent, 5 per cent and 10 per cent levels, respec-tively. Standard errors in parentheses.

the same methodological approach as in this paper. Their study hadthe advantage that, due to the pooling of the SLFS, the sample sizewas substantially larger. This most probably explains their gener-ally more significant results. However, due to the lack of parentalbackground information, they used nationality, complementaryincome, and presence of children in the household as instruments.Although their instruments appear to be valid, it seems difficult toaccept that at least nationality and children do not influence changesin gross hourly wages.15 The advantage of the SHP is that it doesprovide information on parental background. Despite these differ-ences, the results are not all that different. They also show that,depending on the threshold used, between 56 and 64 percent of low-paid workers manage to exit low-paid employment within a 3 yeartimespan, which corresponds well to the results obtained in thisstudy.
These results on low-wage mobility are, on the one hand, diffi-cult to reconcile with the existence of a secondary labor marketsegment, in which certain unskilled laborers in certain groups of thepopulation — such as foreigners and women — are barred fromentering the primary segment. On the other hand, the estimatedcoefficient for the firm-size, public-sector employee, and educationvariables are compatible with labor market segmentation theories.In general, however, the reasons for wage mobility appear to be very idiosyncratic, which is in itself compatible with segmentationtheory. Ultimately, the question of whether or not entry barriersexit remains unanswered.
5. Summary and concluding comments
The aim of this paper was to determine whether or not the Swiss labor market is segmented. In other words, do distinct labormarkets exist, which exhibit different characteristics, such as lengthof tenure, socio-demographic composition and the like? Further-more, does the human-capital model apply equally well to all seg-ments? And, is wage mobility restricted in any way? Three commonmethodological approaches encountered in the segmentation liter-ature were used in order to try to answer these questions: (i) a hierarchical cluster analysis; (ii) a switching model with unknownregime; and (iii) an analysis of low-wage mobility. The somewhatunsatisfactory (although by no means surprising) answer to the
148 Alfonso Sousa-Poza
© CEIS, Fondazione Giacomo Brodolini and Blackwell Publishing Ltd 2004.

question posed in the title of this paper is that it depends very muchon the method being used, i.e. on the understanding and definitionof segmentation.
The results of the cluster analysis show quite clearly that seg-mentation did not occur. Although the cluster analysis gave rise to(at the most) seven clusters, well over 98 percent of all Swiss salariedemployees fell into the same cluster. In only one of these clusterscould something resembling a secondary segment be identified. Thissegment, however, covers only a small fraction of the Swiss laborforce. The switching model with unobserved regime revealed that a dual labor market specification fits the data considerably betterthan a single-equation model. This conclusion applies to both themale and female samples. Although such a result would suggest adualistic labor market, it was also shown that the estimated wagefunctions for the secondary segment did not resemble typical sec-ondary-segment remuneration practices, since returns to schooling(although being substantially smaller in the primary segment) wereby no means insignificant. An analysis of low-wage mobilityshowed that, over a 3 year period, a fair share of persistency in low-wage jobs exists. Nevertheless, upward mobility is much more likelythan downward mobility. Although some variables such as educa-tional level and firm size can account for part of the inclination toremain in low-paid employment, it is fair to state that a large degreeof idiosyncrasy remains. Whether or not entry barriers are thereason for persistence in low-wage employment remains open.
Although the answer to the question posed in the title of thispaper is partially driven by the choice of method, this paper doesshow that, with the common methods implemented here, the exis-tence of a relatively large and well-defined typical secondary seg-ment in the male sample does not appear to exist. Although theanalysis conducted in this paper cannot definitely conclude that asecondary segment does not exist in the Swiss male labor market,the methods used here find little evidence for a pronounced typicalsecondary segment. This finding in no way contradicts a casualobserver’s sense of reality. It is interesting to note, however, that inthe female sample the evidence is not as clear cut. The hierarchicalcluster analysis does identify one (albeit small) women-dominatedcluster, which strongly resembles a typical secondary segment. Con-sidering the fact that women are more likely than men to performlow-skill-requirement tasks, it should also be more likely toencounter women in a typical secondary segment.
Is the Swiss Labor Market Segmented? 149
© CEIS, Fondazione Giacomo Brodolini and Blackwell Publishing Ltd 2004.

App
endi
x
The
indu
stry
–occ
upat
ion
pair
s us
ed in
the
hie
rarc
hica
l clu
ster
ana
lysi
s ar
e de
pict
ed in
Tab
le A
1.
150 Alfonso Sousa-Poza
© CEIS, Fondazione Giacomo Brodolini and Blackwell Publishing Ltd 2004.
Tab
le A
1.In
dust
ry–o
ccup
atio
n pa
irs
used
in t
he c
lust
er a
naly
sis
CL
U6
IND
US
TO
CC
UP
MA
LE
UN
EM
PL
TE
N_Y
ED
U_Y
HW
AG
EF
OR
EIG
TR
AIN
LO
OK
LE
SS
WN
CL
U7
11.
001.
000.
620.
0019
.63
9.50
23.6
80.
010.
050.
020.
0433
11
11.
002.
000.
690.
0012
.44
10.0
625
.53
0.05
0.07
0.06
0.01
122
11
4.00
3.00
0.74
0.00
10.1
910
.18
27.6
60.
210.
100.
080.
0362
11
4.00
4.00
0.38
0.00
15.1
79.
0725
.68
0.31
0.01
0.00
0.03
681
14.
005.
000.
940.
116.
999.
4430
.18
0.28
0.06
0.00
0.00
181
14.
006.
000.
880.
0010
.10
9.88
26.7
60.
240.
080.
050.
0359
11
4.00
7.00
0.64
0.00
9.25
9.71
30.8
30.
210.
000.
000.
0014
11
4.00
8.00
0.76
0.03
9.40
9.63
25.5
00.
300.
060.
060.
0126
91
14.
009.
000.
880.
0312
.27
10.0
130
.41
0.17
0.10
0.06
0.01
184
11
4.00
10.0
00.
940.
0210
.05
9.99
24.8
30.
180.
070.
060.
0210
11
14.
0011
.00
0.68
0.01
12.0
410
.38
30.3
40.
100.
090.
060.
0168
11
4.00
12.0
00.
660.
0012
.82
10.1
435
.05
0.17
0.08
0.05
0.02
931
14.
0013
.00
0.97
0.00
7.86
15.1
747
.66
0.17
0.13
0.04
0.01
981
14.
0014
.00
0.89
0.01
10.9
810
.90
33.1
60.
170.
140.
070.
0117
81
14.
0015
.00
0.52
0.04
7.52
10.7
740
.95
0.04
0.09
0.09
0.04
561
14.
0016
.00
0.72
0.01
9.61
11.0
639
.12
0.17
0.11
0.08
0.00
901
14.
0018
.00
0.52
0.04
5.16
13.4
841
.06
0.04
0.13
0.04
0.00
231
14.
0019
.00
0.85
0.00
15.9
913
.02
57.8
10.
080.
080.
100.
0071
11
4.00
20.0
00.
810.
029.
9512
.30
47.2
60.
070.
160.
050.
0258
11
4.00
21.0
00.
140.
019.
7910
.32
28.3
20.
110.
100.
070.
0323
11
14.
0023
.00
0.55
0.00
10.1
111
.31
56.4
00.
070.
150.
050.
0474
11
4.00
24.0
00.
700.
036.
2811
.52
38.2
40.
170.
200.
030.
0030
11
4.00
25.0
00.
740.
0110
.87
9.67
26.1
60.
210.
030.
090.
0668
1

Is the Swiss Labor Market Segmented? 151
© CEIS, Fondazione Giacomo Brodolini and Blackwell Publishing Ltd 2004.
14.
0027
.00
0.90
0.00
15.0
612
.40
66.9
60.
100.
100.
000.
0010
11
4.00
28.0
00.
610.
008.
1213
.88
37.0
30.
160.
110.
080.
0038
11
4.00
29.0
00.
650.
0011
.27
10.6
432
.63
0.09
0.09
0.04
0.02
461
14.
0031
.00
0.20
0.00
9.47
9.40
68.1
90.
100.
200.
100.
0010
11
4.00
36.0
00.
650.
0012
.67
10.0
034
.02
0.06
0.06
0.00
0.06
171
14.
0043
.00
0.96
0.00
12.9
515
.67
48.8
70.
220.
090.
040.
0023
11
4.00
44.0
00.
630.
039.
879.
6625
.20
0.18
0.04
0.09
0.01
801
15.
006.
001.
000.
0011
.16
10.5
026
.80
0.07
0.00
0.00
0.00
151
15.
008.
000.
920.
0010
.33
10.0
830
.60
0.00
0.00
0.17
0.00
121
15.
0014
.00
0.85
0.00
15.0
411
.00
39.1
20.
000.
200.
150.
0020
11
5.00
21.0
00.
200.
0011
.73
9.90
41.9
00.
100.
100.
100.
0010
11
6.00
5.00
1.00
0.00
10.0
09.
8931
.58
0.27
0.04
0.05
0.00
163
11
6.00
6.00
0.98
0.02
10.0
19.
9725
.87
0.23
0.03
0.06
0.04
297
11
6.00
8.00
0.96
0.00
10.8
19.
5028
.14
0.28
0.04
0.00
0.00
251
16.
0010
.00
1.00
0.00
9.64
10.5
833
.71
0.17
0.04
0.00
0.00
241
16.
0013
.00
1.00
0.04
11.0
215
.37
43.3
00.
040.
190.
040.
0427
11
6.00
14.0
00.
940.
0010
.82
9.95
30.7
50.
210.
060.
030.
0171
11
6.00
19.0
00.
820.
0014
.17
11.5
243
.99
0.05
0.09
0.05
0.00
221
16.
0021
.00
0.16
0.00
8.63
10.5
432
.75
0.06
0.07
0.04
0.02
961
16.
0023
.00
0.40
0.00
10.2
911
.25
40.5
20.
000.
100.
100.
0010
11
6.00
25.0
00.
950.
0012
.26
10.0
029
.58
0.21
0.00
0.16
0.00
191
17.
002.
000.
380.
098.
3310
.38
21.6
50.
120.
120.
090.
0334
11
7.00
3.00
0.68
0.00
8.82
9.84
27.5
30.
130.
080.
040.
0372
11
7.00
4.00
0.29
0.00
8.99
9.46
19.7
60.
250.
040.
040.
0428
11
7.00
5.00
1.00
0.00
7.65
10.4
529
.01
0.27
0.09
0.18
0.00
111
17.
006.
001.
000.
008.
0710
.43
29.4
90.
300.
100.
070.
0330
11
7.00
8.00
0.93
0.01
11.4
410
.02
26.3
80.
190.
090.
030.
0115
01
17.
009.
000.
890.
1113
.13
10.4
631
.47
0.25
0.14
0.00
0.04
281
17.
0010
.00
0.82
0.00
9.20
11.7
716
.15
0.27
0.00
0.00
0.00
111
17.
0013
.00
0.90
0.00
5.31
14.2
645
.20
0.10
0.10
0.00
0.00
211
17.
0014
.00
0.92
0.03
9.06
11.0
737
.50
0.14
0.17
0.06
0.00
361
17.
0015
.00
0.21
0.02
7.01
9.90
23.1
70.
120.
060.
060.
0155
71
17.
0016
.00
0.46
0.01
10.2
210
.64
30.1
90.
110.
100.
070.
0128
31
17.
0018
.00
0.47
0.00
7.49
11.2
335
.06
0.09
0.13
0.06
0.00
321

152 Alfonso Sousa-Poza
© CEIS, Fondazione Giacomo Brodolini and Blackwell Publishing Ltd 2004.
Tab
le A
1.C
onti
nued
CL
U6
IND
US
TO
CC
UP
MA
LE
UN
EM
PL
TE
N_Y
ED
U_Y
HW
AG
EF
OR
EIG
TR
AIN
LO
OK
LE
SS
WN
CL
U7
17.
0019
.00
0.64
0.02
11.7
311
.70
51.5
00.
140.
120.
030.
0566
11
7.00
20.0
00.
560.
057.
4311
.61
35.5
60.
090.
170.
050.
0175
11
7.00
21.0
00.
170.
038.
3210
.66
32.4
20.
070.
100.
070.
0122
91
17.
0023
.00
0.44
0.02
9.32
11.0
241
.10
0.08
0.14
0.06
0.04
501
17.
0024
.00
0.97
0.03
4.49
12.4
337
.60
0.03
0.24
0.13
0.00
381
17.
0025
.00
0.72
0.06
11.1
99.
7323
.98
0.13
0.06
0.08
0.00
531
17.
0026
.00
0.13
0.06
8.21
10.6
622
.68
0.13
0.06
0.06
0.00
161
17.
0029
.00
0.38
0.00
9.84
10.7
223
.57
0.07
0.17
0.14
0.07
291
17.
0030
.00
0.00
0.00
6.22
8.68
20.7
20.
180.
180.
180.
0011
11
7.00
31.0
00.
560.
068.
649.
9225
.84
0.33
0.06
0.06
0.00
181
17.
0033
.00
0.26
0.00
4.01
8.53
22.4
80.
260.
000.
110.
0019
11
7.00
35.0
00.
140.
0010
.31
12.3
426
.46
0.05
0.14
0.03
0.03
581
17.
0036
.00
0.62
0.00
10.1
711
.00
33.9
10.
000.
150.
000.
0013
11
7.00
41.0
00.
360.
097.
6211
.68
43.8
70.
180.
270.
090.
0011
11
7.00
44.0
00.
770.
026.
249.
5725
.07
0.35
0.03
0.14
0.00
661
18.
0015
.00
0.00
0.00
5.71
10.1
020
.57
0.13
0.07
0.07
0.00
151
18.
0016
.00
0.25
0.00
7.65
9.75
22.3
30.
170.
170.
080.
0812
11
8.00
21.0
00.
270.
094.
6011
.59
85.2
70.
090.
090.
000.
0011
11
8.00
30.0
00.
160.
065.
119.
2419
.90
0.23
0.03
0.07
0.01
166
11
8.00
31.0
00.
470.
046.
869.
9223
.59
0.18
0.03
0.13
0.01
161
11
8.00
33.0
00.
100.
007.
207.
1033
.90
0.10
0.10
0.00
0.10
101
19.
008.
000.
970.
039.
8110
.78
31.3
60.
100.
170.
030.
0330
11
9.00
9.00
1.00
0.00
10.2
110
.47
33.3
20.
170.
060.
060.
0018
11
9.00
13.0
01.
000.
009.
0615
.13
48.1
50.
160.
050.
000.
0019
11
9.00
15.0
00.
640.
094.
9810
.77
36.5
70.
000.
550.
090.
0011
11
9.00
16.0
00.
430.
007.
5011
.64
31.1
00.
210.
000.
210.
0014
11
9.00
18.0
00.
240.
036.
5211
.29
29.6
80.
240.
140.
070.
0029
11
9.00
19.0
00.
900.
009.
6212
.24
38.9
00.
100.
100.
050.
0021
11
9.00
20.0
00.
550.
057.
3211
.50
40.5
00.
100.
000.
050.
0020
11
9.00
21.0
00.
170.
048.
7710
.28
25.5
90.
070.
120.
070.
0169
1

Is the Swiss Labor Market Segmented? 153
© CEIS, Fondazione Giacomo Brodolini and Blackwell Publishing Ltd 2004.
19.
0023
.00
0.67
0.00
7.98
10.9
438
.55
0.11
0.11
0.00
0.00
271
19.
0024
.00
0.85
0.00
7.94
12.2
342
.78
0.08
0.08
0.15
0.08
131
19.
0025
.00
0.81
0.01
12.3
510
.33
34.7
20.
080.
080.
070.
0326
51
19.
0026
.00
0.45
0.00
12.7
310
.25
32.2
30.
060.
080.
030.
0318
71
19.
0033
.00
0.19
0.00
16.3
68.
4426
.41
0.38
0.00
0.13
0.00
161
19.
0044
.00
0.82
0.06
10.5
810
.94
29.5
70.
120.
000.
000.
0017
11
10.0
013
.00
0.92
0.00
7.37
14.7
151
.58
0.25
0.08
0.17
0.00
121
110
.00
16.0
00.
480.
048.
8011
.43
41.7
10.
040.
220.
040.
0023
11
10.0
017
.00
0.51
0.02
9.07
11.1
538
.70
0.08
0.10
0.03
0.00
244
11
10.0
018
.00
0.75
0.01
7.91
12.0
650
.21
0.09
0.20
0.06
0.03
129
11
10.0
019
.00
0.95
0.00
10.5
514
.65
83.6
50.
100.
200.
000.
0020
11
10.0
020
.00
0.47
0.00
7.85
11.2
351
.49
0.00
0.13
0.07
0.00
151
110
.00
21.0
00.
230.
027.
4010
.80
30.6
30.
080.
150.
070.
0217
11
110
.00
23.0
00.
670.
006.
5912
.69
57.4
30.
110.
280.
060.
0618
11
10.0
024
.00
0.88
0.00
7.65
11.9
648
.86
0.20
0.18
0.06
0.00
511
110
.00
27.0
00.
670.
004.
8615
.46
57.4
70.
080.
170.
000.
0012
11
10.0
043
.00
0.83
0.00
8.60
15.3
874
.46
0.00
0.33
0.00
0.00
121
111
.00
4.00
0.40
0.00
7.10
9.80
23.4
90.
300.
000.
100.
0010
11
11.0
06.
000.
930.
0013
.74
10.5
338
.16
0.20
0.00
0.07
0.00
151
111
.00
8.00
0.93
0.00
10.6
711
.25
33.9
00.
070.
070.
140.
0014
11
11.0
09.
000.
730.
0012
.79
9.91
26.7
10.
000.
090.
090.
0011
11
11.0
011
.00
0.69
0.00
7.52
10.5
839
.38
0.00
0.08
0.08
0.00
131
111
.00
12.0
00.
500.
0611
.35
9.94
28.5
70.
220.
110.
000.
0618
11
11.0
013
.00
0.93
0.00
10.2
615
.25
41.5
50.
110.
130.
080.
0313
31
111
.00
14.0
00.
820.
018.
1210
.80
28.5
10.
080.
070.
070.
0310
71
111
.00
15.0
00.
330.
063.
6410
.78
28.9
30.
060.
170.
000.
0018
11
11.0
016
.00
0.75
0.00
7.09
11.3
637
.00
0.06
0.08
0.03
0.03
361
111
.00
18.0
00.
660.
017.
1912
.81
56.0
30.
070.
160.
050.
0213
41
111
.00
19.0
00.
750.
057.
6013
.50
57.1
80.
140.
050.
050.
0044
11
11.0
020
.00
0.57
0.00
4.20
12.6
041
.88
0.03
0.26
0.11
0.00
351
111
.00
21.0
00.
120.
016.
4810
.71
32.7
30.
060.
080.
060.
0121
71
111
.00
23.0
00.
450.
007.
5110
.95
37.7
70.
050.
150.
030.
0474
11
11.0
024
.00
0.84
0.00
5.42
12.3
246
.25
0.12
0.11
0.08
0.04
901

154 Alfonso Sousa-Poza
© CEIS, Fondazione Giacomo Brodolini and Blackwell Publishing Ltd 2004.
Tab
le A
1.C
onti
nued
CL
U6
IND
US
TO
CC
UP
MA
LE
UN
EM
PL
TE
N_Y
ED
U_Y
HW
AG
EF
OR
EIG
TR
AIN
LO
OK
LE
SS
WN
CL
U7
111
.00
25.0
00.
520.
049.
619.
4328
.16
0.11
0.07
0.04
0.00
271
111
.00
26.0
00.
090.
004.
1110
.86
26.6
30.
000.
090.
000.
0011
11
11.0
027
.00
0.78
0.00
7.40
14.8
441
.41
0.09
0.17
0.09
0.02
541
111
.00
28.0
00.
290.
008.
7414
.18
51.1
60.
240.
060.
060.
0017
11
11.0
029
.00
0.61
0.00
12.5
511
.18
27.3
50.
110.
210.
030.
0338
11
11.0
033
.00
0.29
0.02
5.34
9.25
25.0
20.
310.
090.
110.
0494
11
11.0
041
.00
0.45
0.00
3.27
11.9
157
.94
0.09
0.09
0.09
0.00
111
111
.00
43.0
00.
850.
005.
5916
.66
41.3
00.
210.
060.
120.
0334
11
11.0
044
.00
0.67
0.05
9.35
10.0
227
.05
0.05
0.00
0.10
0.05
211
112
.00
13.0
00.
910.
0010
.20
15.8
050
.70
0.04
0.09
0.09
0.04
231
112
.00
14.0
00.
790.
009.
5810
.79
34.6
50.
050.
320.
050.
0519
11
12.0
018
.00
0.53
0.00
5.73
12.7
964
.08
0.00
0.16
0.11
0.05
191
112
.00
20.0
00.
580.
028.
9012
.10
45.3
70.
030.
230.
050.
0260
11
12.0
021
.00
0.21
0.04
8.60
10.3
631
.88
0.03
0.12
0.07
0.03
153
11
12.0
022
.00
0.47
0.00
10.6
711
.60
40.6
90.
030.
090.
080.
0011
61
112
.00
23.0
00.
500.
0012
.69
10.5
369
.40
0.00
0.33
0.00
0.00
181
112
.00
24.0
00.
720.
009.
9112
.86
43.8
10.
110.
330.
000.
0618
11
12.0
027
.00
0.79
0.01
10.9
712
.26
39.3
30.
010.
080.
050.
0114
51
112
.00
28.0
00.
600.
006.
9414
.50
36.6
80.
100.
100.
100.
0010
11
12.0
033
.00
0.27
0.06
8.23
9.14
25.7
70.
210.
030.
090.
0333
11
12.0
039
.00
0.31
0.12
5.49
12.0
634
.95
0.04
0.35
0.19
0.00
261
112
.00
41.0
00.
250.
087.
4614
.46
85.7
40.
080.
170.
080.
0012
11
12.0
043
.00
0.80
0.00
10.6
716
.00
52.4
10.
000.
200.
070.
0015
11
12.0
044
.00
0.94
0.00
14.1
211
.19
33.3
70.
060.
130.
000.
0016
11
13.0
013
.00
0.85
0.00
5.49
16.2
746
.81
0.23
0.00
0.08
0.00
131
113
.00
21.0
00.
030.
037.
5310
.13
32.4
10.
060.
290.
060.
0031
11
13.0
033
.00
0.44
0.00
11.1
29.
1428
.94
0.21
0.00
0.05
0.00
431
113
.00
39.0
00.
420.
007.
9013
.21
31.1
00.
160.
160.
110.
0519
11
13.0
041
.00
0.39
0.00
9.48
14.3
244
.87
0.05
0.25
0.08
0.01
481
1
Is the Swiss Labor Market Segmented? 155
© CEIS, Fondazione Giacomo Brodolini and Blackwell Publishing Ltd 2004.
113
.00
42.0
00.
240.
019.
2912
.66
37.6
80.
010.
340.
060.
0218
01
114
.00
12.0
00.
330.
008.
5511
.79
41.1
70.
170.
080.
000.
0012
11
14.0
014
.00
0.82
0.00
8.35
11.4
537
.84
0.18
0.18
0.00
0.00
111
114
.00
16.0
00.
300.
0016
.05
10.9
056
.10
0.00
0.00
0.10
0.00
101
114
.00
18.0
00.
600.
004.
9410
.57
30.5
20.
070.
130.
070.
0015
11
14.0
019
.00
0.75
0.00
11.6
012
.83
55.1
00.
000.
080.
000.
0012
11
14.0
020
.00
0.38
0.00
6.87
12.1
538
.33
0.15
0.23
0.23
0.00
131
114
.00
21.0
00.
060.
057.
9810
.68
44.4
20.
040.
150.
110.
0094
11
14.0
023
.00
0.45
0.00
4.53
12.0
050
.39
0.09
0.09
0.18
0.00
111
114
.00
30.0
00.
060.
005.
7210
.08
22.3
60.
220.
000.
060.
0618
11
14.0
031
.00
0.32
0.00
8.63
9.68
25.9
00.
210.
130.
110.
0056
11
14.0
032
.00
0.00
0.05
7.24
9.46
29.7
20.
160.
050.
080.
0337
11
14.0
033
.00
0.20
0.00
8.20
8.36
20.9
80.
420.
070.
110.
0245
11
14.0
034
.00
0.00
0.00
13.2
68.
6721
.31
0.20
0.07
0.00
0.00
151
114
.00
35.0
00.
300.
027.
2514
.16
43.4
60.
080.
230.
070.
0319
81
114
.00
36.0
00.
270.
008.
9712
.12
41.1
40.
120.
240.
050.
0420
91
114
.00
37.0
00.
080.
016.
9210
.70
28.5
80.
170.
180.
050.
0227
51
114
.00
38.0
00.
110.
018.
0910
.10
28.9
00.
170.
130.
040.
0327
91
114
.00
39.0
00.
220.
025.
8011
.43
31.1
50.
110.
210.
090.
0221
11
114
.00
41.0
00.
220.
046.
5513
.21
44.0
80.
110.
170.
090.
0254
11
14.0
043
.00
0.50
0.00
7.74
14.3
939
.76
0.11
0.22
0.06
0.00
181
115
.00
2.00
0.64
0.00
7.22
10.7
525
.02
0.00
0.05
0.00
0.05
221
115
.00
6.00
1.00
0.09
11.9
810
.77
26.9
60.
000.
000.
000.
0011
11
15.0
08.
000.
860.
0011
.74
9.93
31.9
00.
290.
000.
000.
0014
11
15.0
011
.00
0.70
0.00
4.55
10.0
520
.01
0.10
0.00
0.20
0.00
101
115
.00
13.0
00.
700.
107.
3213
.15
80.6
20.
000.
100.
100.
0010
11
15.0
015
.00
0.07
0.00
5.85
9.37
39.2
80.
050.
120.
050.
0041
11
15.0
018
.00
0.39
0.00
4.49
11.6
534
.35
0.13
0.09
0.17
0.00
231
115
.00
19.0
00.
550.
009.
1713
.08
46.7
50.
050.
150.
050.
0020
11
15.0
020
.00
0.50
0.00
8.77
12.2
543
.13
0.08
0.08
0.04
0.00
241
115
.00
21.0
00.
090.
016.
2310
.66
32.7
30.
060.
110.
030.
0290
11
15.0
022
.00
0.18
0.00
5.76
9.77
21.7
60.
090.
090.
090.
0011
11
15.0
027
.00
0.74
0.00
6.46
12.9
835
.98
0.04
0.09
0.09
0.00
231
115
.00
28.0
00.
480.
018.
5812
.70
39.1
00.
080.
140.
080.
0173
1

156 Alfonso Sousa-Poza
© CEIS, Fondazione Giacomo Brodolini and Blackwell Publishing Ltd 2004.
Tab
le A
1.C
onti
nued
CL
U6
IND
US
TO
CC
UP
MA
LE
UN
EM
PL
TE
N_Y
ED
U_Y
HW
AG
EF
OR
EIG
TR
AIN
LO
OK
LE
SS
WN
CL
U7
115
.00
29.0
00.
520.
0210
.30
12.1
329
.13
0.18
0.17
0.09
0.05
661
115
.00
31.0
00.
060.
005.
6410
.50
19.4
60.
120.
000.
000.
0017
11
15.0
033
.00
0.13
0.00
6.82
8.88
22.7
50.
250.
020.
070.
0560
11
15.0
034
.00
0.18
0.02
10.1
310
.16
24.8
50.
170.
110.
050.
0613
01
115
.00
36.0
00.
090.
006.
7611
.45
33.9
40.
090.
360.
000.
0011
11
15.0
039
.00
0.10
0.03
6.71
10.2
222
.24
0.03
0.07
0.10
0.07
291
115
.00
40.0
00.
470.
0010
.94
13.7
211
0.57
0.08
0.24
0.03
0.00
381
115
.00
41.0
00.
360.
005.
9311
.67
54.5
50.
090.
180.
110.
0044
11
15.0
044
.00
0.47
0.00
3.68
10.6
833
.67
0.18
0.12
0.00
0.06
171
116
.00
2.00
0.90
0.00
20.7
69.
0024
.79
0.00
0.00
0.00
0.00
101
116
.00
32.0
00.
000.
0010
.01
8.68
26.6
20.
120.
240.
020.
0041
11
16.0
033
.00
0.10
0.00
9.02
8.52
27.9
90.
270.
020.
060.
0051
11
16.0
039
.00
0.00
0.00
3.03
9.63
52.1
60.
040.
120.
080.
0426
12
4.00
33.0
00.
300.
1010
.65
8.10
26.2
60.
300.
000.
050.
0020
22
6.00
33.0
00.
210.
146.
098.
7921
.59
0.43
0.07
0.00
0.00
142
27.
0012
.00
0.45
0.18
10.9
310
.14
31.7
60.
360.
090.
180.
0011
22
15.0
04.
000.
090.
0912
.45
10.4
118
.93
0.18
0.18
0.00
0.00
112
215
.00
16.0
00.
290.
1010
.89
10.0
733
.39
0.05
0.00
0.00
0.00
212
36.
009.
001.
000.
005.
639.
8225
.62
0.47
0.18
0.06
0.00
173
49.
006.
001.
000.
1011
.72
10.6
534
.25
0.00
0.20
0.00
0.10
104
49.
0014
.00
0.89
0.00
16.1
610
.96
37.0
30.
180.
110.
040.
0728
44
11.0
034
.00
0.70
0.00
11.5
210
.20
24.3
20.
000.
000.
000.
1010
44
15.0
025
.00
0.65
0.00
11.9
59.
2064
.45
0.15
0.00
0.05
0.10
204
510
.00
41.0
00.
800.
109.
4813
.25
144.
850.
200.
200.
200.
0010
56
13.0
036
.00
0.21
0.00
8.03
13.4
553
.64
0.32
0.26
0.21
0.05
196
613
.00
43.0
00.
650.
058.
6817
.25
41.0
90.
150.
150.
250.
0020
76
15.0
023
.00
0.46
0.08
10.1
313
.00
73.8
70.
080.
000.
310.
0013
76
15.0
043
.00
0.45
0.00
5.46
16.9
139
.27
0.00
0.00
0.18
0.00
117
Is the Swiss Labor Market Segmented? 157
© CEIS, Fondazione Giacomo Brodolini and Blackwell Publishing Ltd 2004.
• CLU6: cluster number (moving average stopping rule);• INDUST: industry code (17 values);• OCCUP: occupation code (45 values);• MALE: proportion of males;• UNEMPL: proportion unemployed;• TEN_Y: years of tenure;• EDU_Y: years of schooling;• HWAGE: hourly wage;• FOREIG: proportion of foreign workers;• TRAIN: proportion receiving training;• LOOK: proportion looking for a new job;• LESSW: proportion of individuals who worked less in the previ-
ous week due to accident or illness;• N: number of observations;• CLU7: cluster number (upper tail rule).
Notes
1 An issue also put forward by Galbraith (1967).2 In fact, according to the OECD, Switzerland has the least strict employment
protection legislation among the Continental European countries that it analyzes.Among the non-Continental European countries analyzed, only the USA andGreat Britain have looser employment protection legislation (see OECD, 1999).
3 On the issue of job stability and security in Switzerland, see Sousa-Poza (2004).4 ‘The early ILM literature suggested that the formation and character of ILMs
reflected the influence of unions’ (Creedy, Whitfield, 1988, p. 248).5 ‘The problem with [such a priori methods] is that the sample separation is
unknown in general. If we have wage data and other observable traits such asschooling and experience we do not know “a priori” which observations belong towhich market’ (Basch, Paredes-Molina, 1996, p. 300f.).
6 Each variable was scaled to have the same mean and variance, in order to avoidinordinate weights being given to any variable.
7 Since family formation is usually associated with stable earnings of at least onepartner. Secondary-segment jobs are often assumed to be unstable.
8 These optimizations were conducted with LIMDEP V. 7.0 (see Greene, 1995).9 ‘. . . we do not propose that the labor market consists of exactly two distinct seg-
ments. Only that dualism is a useful simplification’ (Dickens, Lang, 1988, p. 131).10 The following is based on Stewart and Swaffield (1999) who, to my knowledge,
were the first to implement this model for an analysis of wage mobility.11 See also Heckman (1981).12 At this stage it is worthwhile pointing out that if something akin to a sec-
ondary segment were to exist in Switzerland, then it would most probably be dom-inated by either female or foreign workers. One drawback of the SLFS is thatforeign workers (and especially those in typical secondary employment) are, dueto the survey methodology, underrepresented. Either foreign workers are difficult

to locate (due to their seasonal fluctuations in and out of the country), or theirpoor command of the language hinders their participation in the survey. For adetailed analysis of the labor market situation of foreigners in Switzerland, see deCoulon (1999).
13 The usual explanation for this observation is that workers in the primarysegment receive more on-the-job training than workers in the secondary segment,thereby justifying the lower wages at the beginning of their career.
14 It is interesting to note that the results are very similar to those of Cappellari(2000), who used data from the Bank of Italy’s Survey on Household Income andWealth for the years 1993–95. The sample size in the probit model with endoge-nous selection is equal to 2,148 observations.
15 With regard to the presence of children, the effect on gross hourly wages couldbe influenced by child subsidies (so-called ‘Kinderzulagen’). Furthermore, as somedegree of wage discrimination exists with foreigners, one should be cautious aboutthe use of nationality as an instrument.
References
Anderson K. H., Butler J. S. and Sloan F. A. (1987) ‘Labor Market Segmentation:A Cluster Analysis of Job Groupings and Barriers to Entry’, Southern Economic Journal 53: 571–590.
Basch M. and Paredes-Molina R. D. (1996) ‘Are There Dual Labor Markets in Chile?: Empirical Evidence’, Journal of Development Economics 50:297–312.
Biehler H. and Brandes W. (1981) Arbeitsmarktsegmentation in der Bundesrepub-lik Deutschland, Frankfurt/Main: Campus.
Bundesamt für Statistik (1996) Die Schweizerische Arbeitskräfteerhebung (SAKE): Konzepte, methodische Grundlagen, praktische Ausführung, Bern:Bundesamt für Statistik.
Cappellari L. (2000) ‘Low-wage Mobility in the Italian Labour Market’, Interna-tional Journal of Manpower 21: 264–290.
Creedy J. and Whitfield K. (1988) ‘The Economic Analysis of Internal LabourMarkets’, Bulletin of Economic Research 40: 247–269.
Cutcher-Gershenfeld J. (1991) ‘The Impact of Economic Performance of a Trans-formation in Workplace Relations’, Industrial and Labor Relations Review44: 241–260.
de Coulon A. (1999) ‘Swiss Immigration Policy and the Segmentation of the LaborForce’ in ‘Four Essays on the Labor Market Assimilation of Immigrants inSwitzerland’, PhD dissertation, University of Geneva.
de Coulon A. and Zürcher B. A. (2001) ‘Low-pay Mobility in the Swiss LaborMarket’, Working Paper No. 447, Department of Economics, Queen Mary,University of London.
Dickens W. T. and Lang K. (1985) ‘A Test of Dual Labor Market Theory’,American Economic Review 75: 792–805.
Dickens W. T. and Lang K. (1988) ‘The Re-emergence of Segmented Labor MarketTheory’, American Economic Review 78: 129–134.
Doeringer P. B. and Piore M. J. (1971) Internal Labor Markets and ManpowerAnalysis, Lexington, MA: D.C. Heath.
158 Alfonso Sousa-Poza
© CEIS, Fondazione Giacomo Brodolini and Blackwell Publishing Ltd 2004.

Is the Swiss Labor Market Segmented? 159
© CEIS, Fondazione Giacomo Brodolini and Blackwell Publishing Ltd 2004.
Drago R. (1995) ‘Divide and Conquer in Australia: A Study of Labor Segmenta-tion’, Review of Radical Political Economics 27: 25–70.
Edwards R. C., Reich M. and Gordon D. M. (1975) Labor Market Segmentation,Lexington, MA: D.C. Heath.
Fichtenbaum R., Gyimah-Brempong K. and Olson P. (1994) ‘New Evidence onthe Labor Market Segmentation Hypothesis’, Review of Social Economy52: 20–39.
Flatau P. R. and Lewis P. E. T. (1993) ‘Segmented Labour Markets in Australia’,Applied Economics 25: 285–294.
Galbraith J. K. (1967) The New Industrial State, New York: Penguin.Goldfeld S. M. and Quandt R. E. (1975) ‘Estimation in a Disequilibrium Model
and the Value of Information’, Journal of Econometrics 3: 325–348.Greene W. H. (1995) LIMDEP Version 7.0, Econometric Software, Castle Hill.Heckman J. J. (1981) ‘The Incidental Parameters Problem and the Problem of
Initial Conditions in Estimating a Discrete-time Data Stochastic Process’in Manski C. F. and McFadden D. (eds.) Structural Analysis of DiscreteData with Econometric Applications, Cambridge, MA: MIT Press.
Institut der deutschen Wirtschaft Köln (IW) (Hrsg.) (1999) Zahlen zurwirtschaftlichen Entwicklung der Bundesrepublik Deutschland. Ausgabe 1999,Cologne: Institut der deutschen Wirtschaft Köln.
Jobson J. D. (1992) Applied Multivariate Data Analysis, Vol. II, New York: Springer.Khandker S. R. (1992) ‘Earnings, Occupational Choice, and Mobility in Seg-
mented Labor Markets in India’, World Bank Discussion Paper No. 154,Washington, DC.
Leontaridi M. R. (1998) ‘Segmented Labour Markets: Theory and Evidence’,Journal of Economic Surveys 12: 63–101.
Lewin R. (1982) ‘Arbeitsmarkt und Lohnstruktur. Konkurrierende Theorien undihre Überprüfung am Beispiel der Schweiz’, Ph.D. dissertation, Universityof Basel.
Lutz B. (1987) Arbeitsmarktstruktur und betriebliche Arbeitskräfteschlange.Eine theoretisch-historische Skizze zur Entstehung betriebszentrierterArbeitsmarktsegmentation, Frankfurt/Main: Campus.
Meier C. (1983) Lebenszyklus und ökonomische Ungleichheit: Eine Analyse der Einkommens- und Vermögensdynamik anhand von Längsschnittdaten,Freiburg.
Meng C.-L. and Schmidt P. (1985) ‘On the Cost of Partial Observability in theBivariate Probit Model’, International Economic Review 26: 71–85.
OECD (1999) ‘Employment Protection Legislation’ in Employment Outlook, Paris:OECD.
Orr D. V. (1997) ‘An Index of Segmentation in Local Labour Markets’, Interna-tional Review of Applied Economics 11: 229–247.
Osberg L., Apostle R. and Clairmont D. (1987) ‘Segmented Labour Markets andthe Estimation of Wage Functions’, Applied Economics 19: 1603–1624.
Osterman P. (1975) ‘An Empirical Analysis of Labor Market Segmentation’, Indus-trial and Labor Relations Review 28: 508–523.
Pailhé A. (2003) ‘Labour Market Segmentation in Central Europe during the FirstYears of Transition’, Labour 17: 127–152.
Piore M. J. (1975) ‘Notes for a Theory of Labour Market Stratification’ in Edwards R. et al. (eds.) Labour Market Segmentation, Lexington, MA: D.C.Heath.

Rebitzer J. B. and Robinson M. D. (1991) ‘Employer Size and Dual Labor Markets:A Note’, Review of Economics and Statistics 73: 710–715.
Sengenberger W. (1987a) Struktur und Funktionsweise von Arbeitsmärkten: DieBundesrepublik Deutschland im internationalen Vergleich, Frankfurt/Main:Campus.
Sengenberger W. (1987b) ‘Arbeitsmarktsegmentation und Macht’ in Buttler F.,Gerlach K. and Schmiede R. (eds.) Arbeitsmarkt und Beschäftigung,Frankfurt/Main: Campus.
Sousa-Poza A. (2002) ‘Labor Market Segmentation and the Gender Wage Gap:An Industry-level Analysis for Switzerland’, Cahiers Economiques de Brux-elles 45: 91–118.
Sousa-Poza A. (2004) ‘Job Stability and Job Security: A Comparative Perspectiveon Switzerland’s Experience in the 1990s’, European Journal of IndustrialRelations 10: 31–49.
Sousa-Poza A. and Henneberger H. (2000) ‘Wage Data Collected by TelephoneInterviews: An Empirical Analysis of the Item Nonresponse Problem andits Implications for the Estimation of Wage Functions’, Swiss Journal ofEconomics and Statistics 136: 79–98.
Stewart M. B. and Swaffield J. K. (1999) ‘Low Pay Dynamics and Transition Prob-abilities’, Economica 66: 23–42.
Taubman P. and Wachter M. L. (1986) ‘Segmented Labor Markets’ in Ashenfelter O. and Layard R. (eds.) Handbook of Labor Economics,Vol. II, Amsterdam: Elsevier: pp. 1183–1217.
Theodossiou I. (1995) ‘Wage Determination for Career and Non-career Workersin the UK: Is There Labour Market Segmentation?’, Economica 62:195–211.
Wachter M. L. (1974) ‘Primary and Secondary Labor Markets: A Critique of theDual Approach’, Brookings Papers on Economics Activity 3: 637–680.
Wagner J. (1985) ‘Arbeitsmarktsegmentation und Beschäftigung imweltwirtschafts-induzierten Strukturwandel’, Mitteilungen aus der Arbeits-markt- und Berufsforschung 18: 356–368.
160 Alfonso Sousa-Poza
© CEIS, Fondazione Giacomo Brodolini and Blackwell Publishing Ltd 2004.


