Embed Size (px)
Citation preview

Jakarta Property Market Report
Research &
Forecast Report
Q4 2015
Accelerating success.
2 Research & Forecast Report | Q4 2015 | Highlight | Colliers International
Office SectorThe sq m of office space actually completed in 2015 was less than previously projected in early 2015 because developers delayed the completion of their projects in light of the predicted oversupply of space. The actual figure was 77% (462,553 sq m) of that projected for the CBD and 91% (302,506 sq m) of that projected outside the CBD. The abundance of supply and modest office space inquiries have led to a “tenant market” situation where YoY occupancy has already dropped from 95.7% to 89.4% in the CBD and 93.2% to 87.9% in outside the CBD. The YoY average asking base rental rate was also down by 4.4% (IDR332,309 / sq m / month) in the CBD. In contrast, average asking base rents outside the CBD rose by 6.7% YoY to IDR238,381 / sq m / month due to the influx of new buildings in TB Simatupang quoting higher rental rates.
Apartment SectorThe number of completed apartment units which came on the market in 2015 was only 47% of our initial projection of a total 29,758 units made at the beginning of last year. The apparent reason for the delays by developers are slower than projected sales. Looking ahead, the market will receive around 82,000 units in the next four years, which will increase the cumulative supply of apartment units in Jakarta by around 50% to more than 239,000 in 2019. The average apartment asking price grew 13.5% YoY in Rupiah terms during 2014 - 2015, lower than the 20.5% annual growth during 2010 - 2013. Average asking prices per sq m were recorded at IDR47.2 million in the CBD, IDR35.4 million in South Jakarta and IDR22.9 million in other non-prime areas.
HighlightExpat HousingSince the beginning of 2015, the expatriate housing market has increasingly become a tenant market as reflected in the 25% drop in enrolment at international schools during the same period. One of the reasons for the shrinking expatriate population is the difficulty experienced by some multinational companies in obtaining working permits. The plummet in the global oil prices has further shrunk the demand for expat housing since the oil and gas industry has been the primary demand generator. In light of current market conditions, landlords of expatriate housing have become more accommodating and cooperative in entertaining additional requests from lessees and are attuned to the needs and trends in the market.
Retail SectorTwo shopping malls have confirmed a rescheduling of their openings until early 2016 and One Belpark therefore was the only new shopping centre completed in DKI Jakarta in 2015 adding 23,650 sq m of new retail space to DKI’s cumulative supply in of 4.45 million sq m. Going forward, DKI Jakarta is expected to witness 12 new shopping centres totalling of 444,000 sq m opening in 2016 – 2018. Similarly, only one shopping centre, Aeon Mall BSD, began operating in BoDeTaBek in 2015 bringing the cumulative supply to 2.34 million sq m in this area. More than 585,000 sq m of new retail spare will be available in BoDeTaBek during 2016 – 2018. The occupancy rate in DKI Jakarta stabilised at 86.8% while in BoDeTaBek it was registered at 83.0%. The average rental rate for all classes of shopping centres in DKI Jakarta was IDR535,285 / sq m / month, growing at 5.5% YoY, while a higher growth of 12.1% YoY was experienced by shopping centres in the BoDeTaBek which recorded the average rental rate at IDR344,353 / sq m/ month.
3 Research & Forecast Report | Q4 2015 | Highlight | Colliers International
Industrial SectorDuring 2015, only one industrial estate in Bekasi added to the supply of industrial land with 20 additional hectares. Nevertheless, a large amount of additional industrial land is expected to be available over the next two years in Jabodetabek, Serang and Karawang. Total land sales for the whole of 2015 were 347.51 ha or about 79% of the total sales in 2014. Of this, almost 50% of industrial land sales was underpinned by substantial sales concluded at Modern Cikande Industrial Estate. None of the operating industrial estates made price adjustments this quarter. Quite a few developers said that their sales targets for 2015 were unachievable and thus they preferred to maintain the current prices.
Hotel SectorBy the end of 2015, the total room supply of star-rated hotels in DKI Jakarta was 37,648 rooms in 179 hotels. Jakarta is anticipating a substantial amount of new hotel rooms during 2016 – 2018 with additional 10,509 rooms in 51 new hotels. The overall Average Occupancy Rate in DKI Jakarta was recorded at 59.1% which was lower than the 2014 figure of 64.8%. This was the result of the reduced number of corporate guests from the Indonesian government after the regulation that officially banned civil servants from having meeting in hotels. Likewise the Average Daily Rate also dropped YoY from USD95.04 in 2014 to USD82.02 in 2015
OFFICE SECTOROffice Spaces Offered For Lease
Supply
CBD
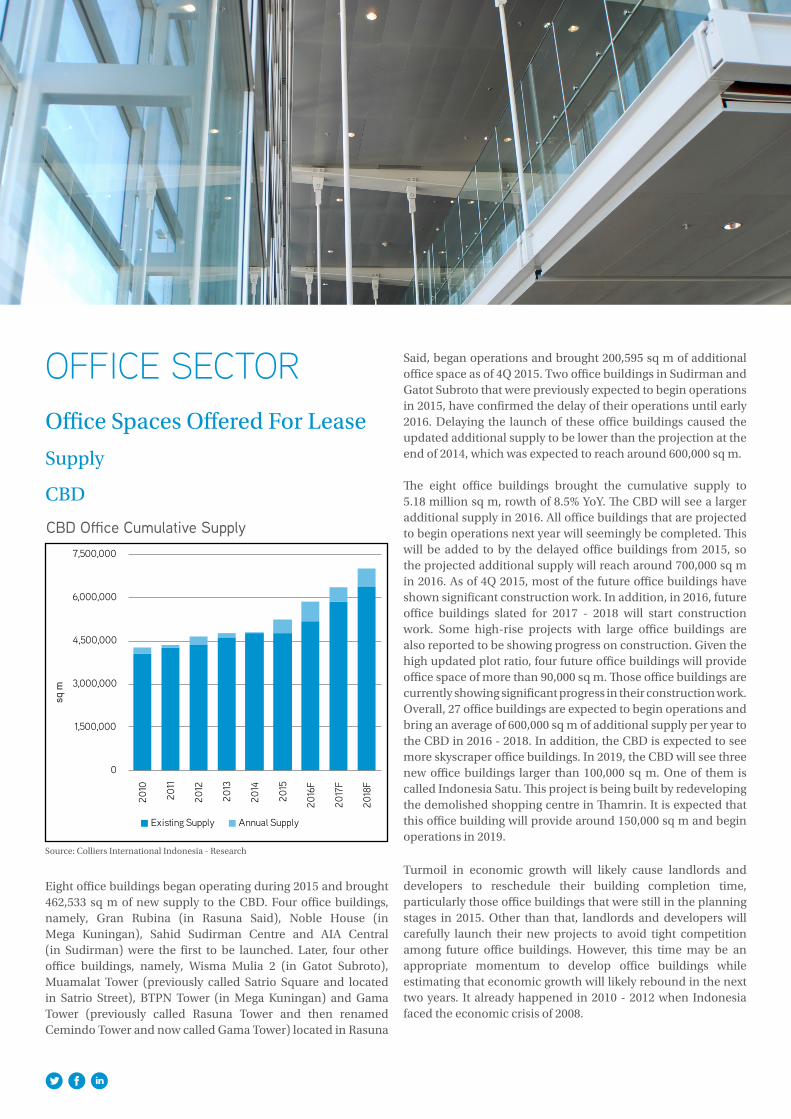
CBD Office Cumulative Supply
Source: Colliers International Indonesia - Research
Eight office buildings began operating during 2015 and brought 462,533 sq m of new supply to the CBD. Four office buildings, namely, Gran Rubina (in Rasuna Said), Noble House (in Mega Kuningan), Sahid Sudirman Centre and AIA Central (in Sudirman) were the first to be launched. Later, four other office buildings, namely, Wisma Mulia 2 (in Gatot Subroto), Muamalat Tower (previously called Satrio Square and located in Satrio Street), BTPN Tower (in Mega Kuningan) and Gama Tower (previously called Rasuna Tower and then renamed Cemindo Tower and now called Gama Tower) located in Rasuna
Said, began operations and brought 200,595 sq m of additional office space as of 4Q 2015. Two office buildings in Sudirman and Gatot Subroto that were previously expected to begin operations in 2015, have confirmed the delay of their operations until early 2016. Delaying the launch of these office buildings caused the updated additional supply to be lower than the projection at the end of 2014, which was expected to reach around 600,000 sq m.
The eight office buildings brought the cumulative supply to 5.18 million sq m, rowth of 8.5% YoY. The CBD will see a larger additional supply in 2016. All office buildings that are projected to begin operations next year will seemingly be completed. This will be added to by the delayed office buildings from 2015, so the projected additional supply will reach around 700,000 sq m in 2016. As of 4Q 2015, most of the future office buildings have shown significant construction work. In addition, in 2016, future office buildings slated for 2017 - 2018 will start construction work. Some high-rise projects with large office buildings are also reported to be showing progress on construction. Given the high updated plot ratio, four future office buildings will provide office space of more than 90,000 sq m. Those office buildings are currently showing significant progress in their construction work. Overall, 27 office buildings are expected to begin operations and bring an average of 600,000 sq m of additional supply per year to the CBD in 2016 - 2018. In addition, the CBD is expected to see more skyscraper office buildings. In 2019, the CBD will see three new office buildings larger than 100,000 sq m. One of them is called Indonesia Satu. This project is being built by redeveloping the demolished shopping centre in Thamrin. It is expected that this office building will provide around 150,000 sq m and begin operations in 2019.
Turmoil in economic growth will likely cause landlords and developers to reschedule their building completion time, particularly those office buildings that were still in the planning stages in 2015. Other than that, landlords and developers will carefully launch their new projects to avoid tight competition among future office buildings. However, this time may be an appropriate momentum to develop office buildings while estimating that economic growth will likely rebound in the next two years. It already happened in 2010 - 2012 when Indonesia faced the economic crisis of 2008.
0
1,500,000
3,000,000
4,500,000
6,000,000
7,500,000
2010
2011
2012
2013
2014
2015
2016
F
2017
F
2018
F
sq m
Existing Supply Annual Supply
5 Research & Forecast Report | Q4 2015 | Office | Colliers International
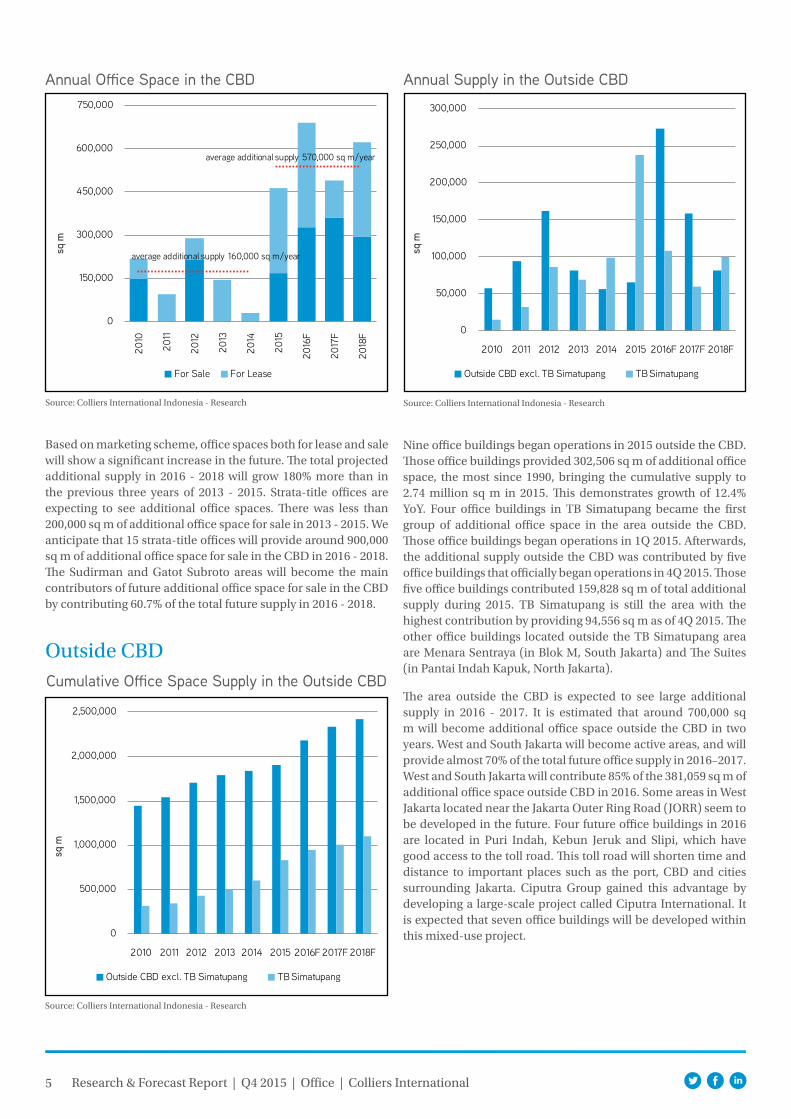
Annual Office Space in the CBD
Source: Colliers International Indonesia - Research
Based on marketing scheme, office spaces both for lease and sale will show a significant increase in the future. The total projected additional supply in 2016 - 2018 will grow 180% more than in the previous three years of 2013 - 2015. Strata-title offices are expecting to see additional office spaces. There was less than 200,000 sq m of additional office space for sale in 2013 - 2015. We anticipate that 15 strata-title offices will provide around 900,000 sq m of additional office space for sale in the CBD in 2016 - 2018. The Sudirman and Gatot Subroto areas will become the main contributors of future additional office space for sale in the CBD by contributing 60.7% of the total future supply in 2016 - 2018.
0
150,000
300,000
450,000
600,000
750,000
2010
2011
2012
2013
2014
2015
2016
F
2017
F
2018
F
sq m
For Sale For Lease
average additional supply 570,000 sq m/year
average additional supply 160,000 sq m/year
Outside CBDCumulative Office Space Supply in the Outside CBD
Source: Colliers International Indonesia - Research
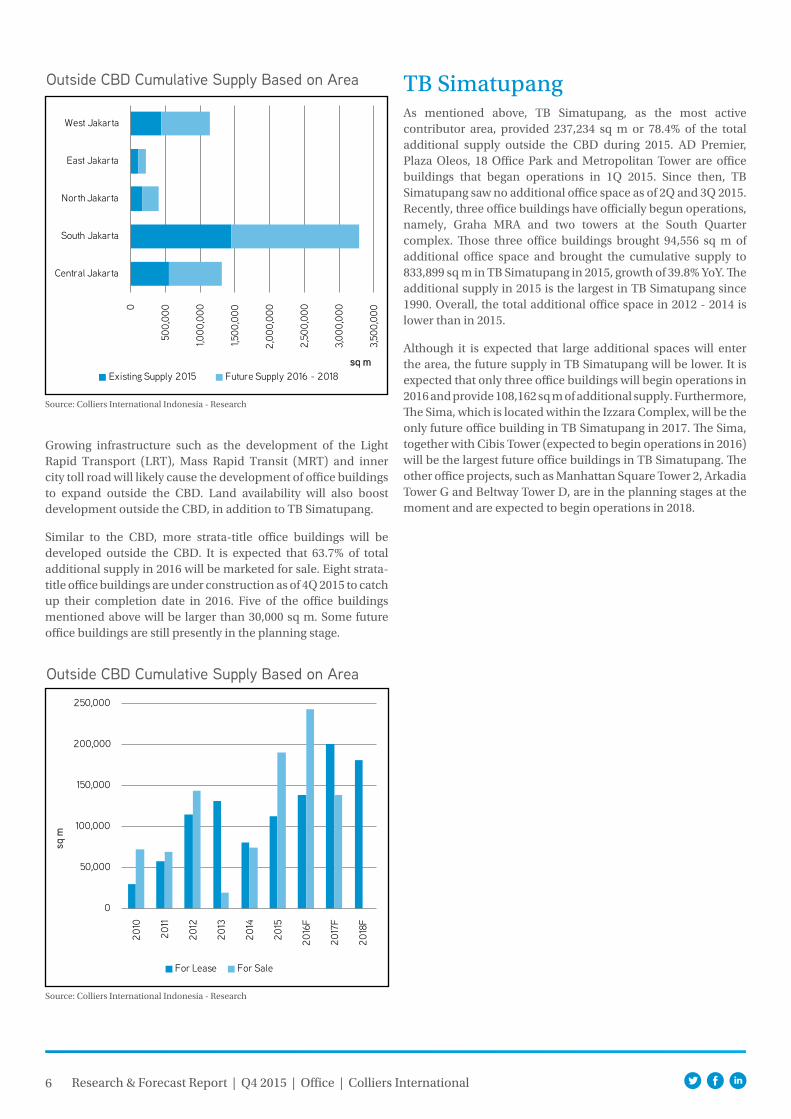
Annual Supply in the Outside CBD
Source: Colliers International Indonesia - Research
Nine office buildings began operations in 2015 outside the CBD. Those office buildings provided 302,506 sq m of additional office space, the most since 1990, bringing the cumulative supply to 2.74 million sq m in 2015. This demonstrates growth of 12.4% YoY. Four office buildings in TB Simatupang became the first group of additional office space in the area outside the CBD. Those office buildings began operations in 1Q 2015. Afterwards, the additional supply outside the CBD was contributed by five office buildings that officially began operations in 4Q 2015. Those five office buildings contributed 159,828 sq m of total additional supply during 2015. TB Simatupang is still the area with the highest contribution by providing 94,556 sq m as of 4Q 2015. The other office buildings located outside the TB Simatupang area are Menara Sentraya (in Blok M, South Jakarta) and The Suites (in Pantai Indah Kapuk, North Jakarta).
The area outside the CBD is expected to see large additional supply in 2016 - 2017. It is estimated that around 700,000 sq m will become additional office space outside the CBD in two years. West and South Jakarta will become active areas, and will provide almost 70% of the total future office supply in 2016–2017. West and South Jakarta will contribute 85% of the 381,059 sq m of additional office space outside CBD in 2016. Some areas in West Jakarta located near the Jakarta Outer Ring Road (JORR) seem to be developed in the future. Four future office buildings in 2016 are located in Puri Indah, Kebun Jeruk and Slipi, which have good access to the toll road. This toll road will shorten time and distance to important places such as the port, CBD and cities surrounding Jakarta. Ciputra Group gained this advantage by developing a large-scale project called Ciputra International. It is expected that seven office buildings will be developed within this mixed-use project. 0
500,000
1,000,000
1,500,000
2,000,000
2,500,000
2010 2011 2012 2013 2014 2015 2016F 2017F 2018F
sq m
Outside CBD excl. TB Simatupang TB Simatupang
0
50,000
100,000
150,000
200,000
250,000
300,000
2010 2011 2012 2013 2014 2015 2016F 2017F 2018F
sq m
Outside CBD excl. TB Simatupang TB Simatupang
6 Research & Forecast Report | Q4 2015 | Office | Colliers International
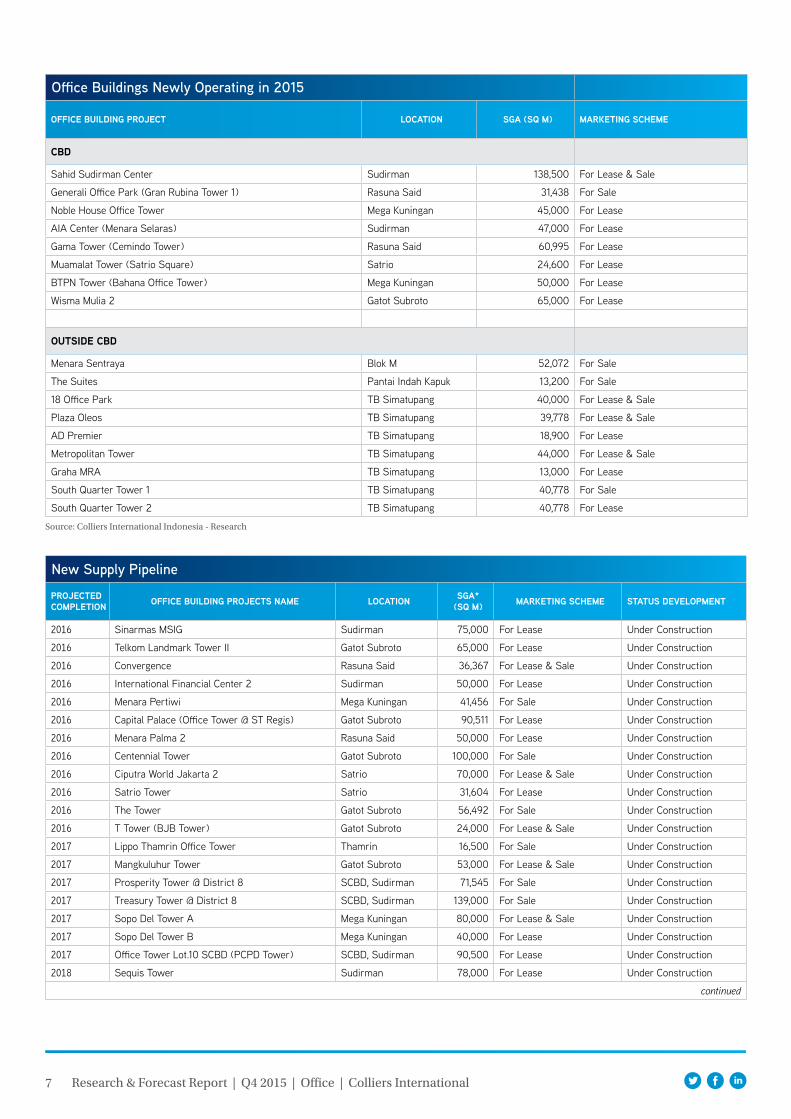
Outside CBD Cumulative Supply Based on Area
Source: Colliers International Indonesia - Research
0
500,
000
1,000
,000
1,500
,000
2,00
0,00
0
2,50
0,00
0
3,00
0,00
0
3,50
0,00
0
Central Jakarta
South Jakarta
North Jakarta
East Jakarta
West Jakarta
sq mExisting Supply 2015 Future Supply 2016 - 2018
Growing infrastructure such as the development of the Light Rapid Transport (LRT), Mass Rapid Transit (MRT) and inner city toll road will likely cause the development of office buildings to expand outside the CBD. Land availability will also boost development outside the CBD, in addition to TB Simatupang.
Similar to the CBD, more strata-title office buildings will be developed outside the CBD. It is expected that 63.7% of total additional supply in 2016 will be marketed for sale. Eight strata-title office buildings are under construction as of 4Q 2015 to catch up their completion date in 2016. Five of the office buildings mentioned above will be larger than 30,000 sq m. Some future office buildings are still presently in the planning stage.
Outside CBD Cumulative Supply Based on Area
Source: Colliers International Indonesia - Research
0
50,000
100,000
150,000
200,000
250,000
2010
2011
2012
2013
2014
2015
2016
F
2017
F
2018
F
sq m
For Lease For Sale
As mentioned above, TB Simatupang, as the most active contributor area, provided 237,234 sq m or 78.4% of the total additional supply outside the CBD during 2015. AD Premier, Plaza Oleos, 18 Office Park and Metropolitan Tower are office buildings that began operations in 1Q 2015. Since then, TB Simatupang saw no additional office space as of 2Q and 3Q 2015. Recently, three office buildings have officially begun operations, namely, Graha MRA and two towers at the South Quarter complex. Those three office buildings brought 94,556 sq m of additional office space and brought the cumulative supply to 833,899 sq m in TB Simatupang in 2015, growth of 39.8% YoY. The additional supply in 2015 is the largest in TB Simatupang since 1990. Overall, the total additional office space in 2012 - 2014 is lower than in 2015.
Although it is expected that large additional spaces will enter the area, the future supply in TB Simatupang will be lower. It is expected that only three office buildings will begin operations in 2016 and provide 108,162 sq m of additional supply. Furthermore, The Sima, which is located within the Izzara Complex, will be the only future office building in TB Simatupang in 2017. The Sima, together with Cibis Tower (expected to begin operations in 2016) will be the largest future office buildings in TB Simatupang. The other office projects, such as Manhattan Square Tower 2, Arkadia Tower G and Beltway Tower D, are in the planning stages at the moment and are expected to begin operations in 2018.
TB Simatupang
7 Research & Forecast Report | Q4 2015 | Office | Colliers International
Source: Colliers International Indonesia - Research
Office Buildings Newly Operating in 2015
Office Building PrOject lOcatiOn Sga (Sq m) marketing Scheme
cBd
Sahid Sudirman Center Sudirman 138,500 For Lease & Sale
Generali Office Park (Gran Rubina Tower 1) Rasuna Said 31,438 For Sale
Noble House Office Tower Mega Kuningan 45,000 For Lease
AIA Center (Menara Selaras) Sudirman 47,000 For Lease
Gama Tower (Cemindo Tower) Rasuna Said 60,995 For Lease
Muamalat Tower (Satrio Square) Satrio 24,600 For Lease
BTPN Tower (Bahana Office Tower) Mega Kuningan 50,000 For Lease
Wisma Mulia 2 Gatot Subroto 65,000 For Lease
OutSide cBd
Menara Sentraya Blok M 52,072 For Sale
The Suites Pantai Indah Kapuk 13,200 For Sale
18 Office Park TB Simatupang 40,000 For Lease & Sale
Plaza Oleos TB Simatupang 39,778 For Lease & Sale
AD Premier TB Simatupang 18,900 For Lease
Metropolitan Tower TB Simatupang 44,000 For Lease & Sale
Graha MRA TB Simatupang 13,000 For Lease
South Quarter Tower 1 TB Simatupang 40,778 For Sale
South Quarter Tower 2 TB Simatupang 40,778 For Lease
New Supply Pipeline
PrOjected cOmPletiOn Office Building PrOjectS name lOcatiOn Sga*
(Sq m) marketing Scheme StatuS develOPment
2016 Sinarmas MSIG Sudirman 75,000 For Lease Under Construction
2016 Telkom Landmark Tower II Gatot Subroto 65,000 For Lease Under Construction
2016 Convergence Rasuna Said 36,367 For Lease & Sale Under Construction
2016 International Financial Center 2 Sudirman 50,000 For Lease Under Construction
2016 Menara Pertiwi Mega Kuningan 41,456 For Sale Under Construction
2016 Capital Palace (Office Tower @ ST Regis) Gatot Subroto 90,511 For Lease Under Construction
2016 Menara Palma 2 Rasuna Said 50,000 For Lease Under Construction
2016 Centennial Tower Gatot Subroto 100,000 For Sale Under Construction
2016 Ciputra World Jakarta 2 Satrio 70,000 For Lease & Sale Under Construction
2016 Satrio Tower Satrio 31,604 For Lease Under Construction
2016 The Tower Gatot Subroto 56,492 For Sale Under Construction
2016 T Tower (BJB Tower) Gatot Subroto 24,000 For Lease & Sale Under Construction
2017 Lippo Thamrin Office Tower Thamrin 16,500 For Sale Under Construction
2017 Mangkuluhur Tower Gatot Subroto 53,000 For Lease & Sale Under Construction
2017 Prosperity Tower @ District 8 SCBD, Sudirman 71,545 For Sale Under Construction
2017 Treasury Tower @ District 8 SCBD, Sudirman 139,000 For Sale Under Construction
2017 Sopo Del Tower A Mega Kuningan 80,000 For Lease & Sale Under Construction
2017 Sopo Del Tower B Mega Kuningan 40,000 For Lease Under Construction
2017 Office Tower Lot.10 SCBD (PCPD Tower) SCBD, Sudirman 90,500 For Lease Under Construction
2018 Sequis Tower Sudirman 78,000 For Lease Under Construction
continued

8 Research & Forecast Report | Q4 2015 | Office | Colliers International
*SGA: Semi Gross AreaSource: Colliers International Indonesia - Research
PrOjected cOmPletiOn Office Building PrOjectS name lOcatiOn Sga*
(Sq m) marketing Scheme StatuS develOPment
continuation
2018 Sudirman 7.8 (ex Nugra Santana) Sudirman 52,000 For Sale Under Construction
2018 Tower Two at The City Center Mas Mansyur 101,260 For Lease Under Construction
2018 World Trade Center III Sudirman 70,000 For Lease Under Construction
2018 Tower 2 @ Ciputra World Jakarta 1 Satrio 70,000 For Lease & Sale Under Construction
2018 Thamrin Nine Thamrin 97,500 For Lease Under Construction
2018 Astra Tower Sudirman 80,000 For Lease Under Construction
2018 World Capital Tower Mega Kuningan 72,000 For Lease & Sale Under Construction
OutSide cBd eXcluding tB SimatuPang
2016 ST Moritz Office Tower Puri Indah 19,500 For Sale Under Construction
2016 Harton Tower Kelapa Gading 8,000 For Lease Under Construction
2016 Nariba Office Suites Mampang 4,200 For Lease Under Construction
2016 Puri Indah Financial Tower Puri Indah 38,500 For Sale Under Construction
2016 Gallery West Kebun Jeruk 29,000 For Sale Under Construction
2016 L'Office Pasar Minggu 41,597 For Sale Under Construction
2016 Sky 18 Tower Pasar Minggu 27,500 For Sale Under Construction
2016 Soho Capital Slipi 36,000 For Sale Under Construction
2016 Altira Sunter 40,000 For Sale Under Construction
2016 Tamansari Parama Wahid Hasyim 10,800 For Sale Under Construction
2016 One Belpark Office Pondok Labu 17,800 For Lease Under Construction
2017 Soho Pancoran Pancoran 30,000 For Sale Under Construction
2017 BKP Office Tower Sunter 16,000 For Lease Under Construction
2017 Hermina Office Building Kemayoran 20,000 For Sale Under Construction
2017 One Tower Kemayoran 21,400 For Sale Under Construction
2017 MNC Tower II Kebon Sirih 20,000 For Lease In Planning
2017 Lippo Tower Holland Village Cempaka Putih 27,000 For Sale In Planning
2017 Ciputra Business District Kemayoran Tower 1 Kemayoran 40,000 For Sale In Planning
2017 Ciputra Business District Kemayoran Tower 2 Kemayoran 40,000 For Lease In Planning
2017 Ciputra International Puri 1 Phase 1 Puri 15,000 For Lease In Planning
2017 Ciputra International Puri 2 Phase 1 Puri 20,000 For Lease In Planning
2017 Ciputra International Puri 3 Phase 1 Puri 30,000 For Lease In Planning
2018 Jakarta Box Tower Kebon Sirih 36,000 For Lease In Planning
2018 Ciputra International Puri Phase 2 Puri 15,000 For Lease In Planning
2018 Ciputra International Puri 1 Phase 3 Puri 15,000 For Lease In Planning
2018 Ciputra International Puri 2 Phase 3 Puri 15,000 For Lease In Planning
tB SimatuPang
2016 South Quarter Tower 3 40,778 For Lease Under Construction
2016 Zuria 6,584 For Lease Under Construction
2016 Cibis Tower 60,800 For Lease Under Construction
2017 The Sima 60,000 For Lease Under Construction
2018 Beltway Office Park Tower 4 30,839 For Lease In Planning
2018 Arkadia Tower G 30,000 For Lease In Planning
2018 The Manhattan Square Tower 2 39,375 For Lease & Sale In Planning
9 Research & Forecast Report | Q4 2015 | Office | Colliers International
Source: Colliers International Indonesia - Research
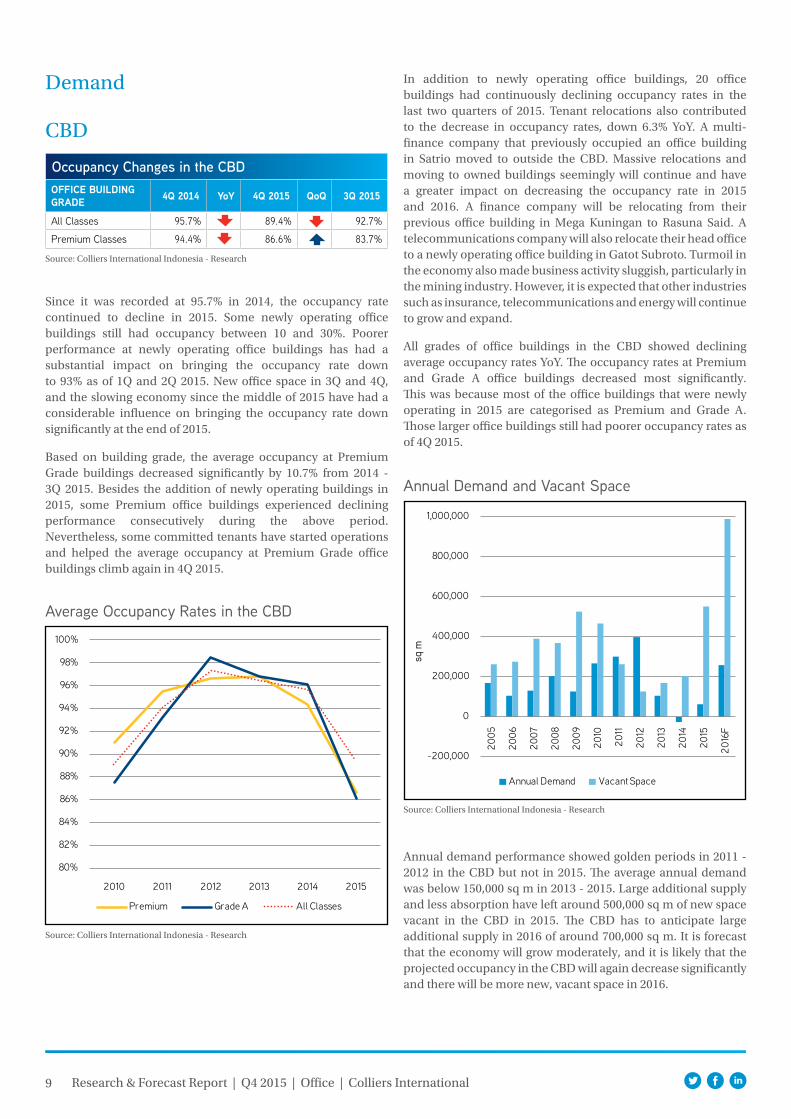
Occupancy Changes in the CBDOffice Building grade 4q 2014 YoY 4q 2015 qoq 3q 2015
All Classes 95.7% 89.4% 92.7%
Premium Classes 94.4% 86.6% 83.7%
Demand
CBD
Since it was recorded at 95.7% in 2014, the occupancy rate continued to decline in 2015. Some newly operating office buildings still had occupancy between 10 and 30%. Poorer performance at newly operating office buildings has had a substantial impact on bringing the occupancy rate down to 93% as of 1Q and 2Q 2015. New office space in 3Q and 4Q, and the slowing economy since the middle of 2015 have had a considerable influence on bringing the occupancy rate down significantly at the end of 2015.
Based on building grade, the average occupancy at Premium Grade buildings decreased significantly by 10.7% from 2014 - 3Q 2015. Besides the addition of newly operating buildings in 2015, some Premium office buildings experienced declining performance consecutively during the above period. Nevertheless, some committed tenants have started operations and helped the average occupancy at Premium Grade office buildings climb again in 4Q 2015.
Annual Demand and Vacant Space
Source: Colliers International Indonesia - Research
Average Occupancy Rates in the CBD
Source: Colliers International Indonesia - Research
80%
82%
84%
86%
88%
90%
92%
94%
96%
98%
100%
2010 2011 2012 2013 2014 2015
Premium Grade A All Classes
In addition to newly operating office buildings, 20 office buildings had continuously declining occupancy rates in the last two quarters of 2015. Tenant relocations also contributed to the decrease in occupancy rates, down 6.3% YoY. A multi-finance company that previously occupied an office building in Satrio moved to outside the CBD. Massive relocations and moving to owned buildings seemingly will continue and have a greater impact on decreasing the occupancy rate in 2015 and 2016. A finance company will be relocating from their previous office building in Mega Kuningan to Rasuna Said. A telecommunications company will also relocate their head office to a newly operating office building in Gatot Subroto. Turmoil in the economy also made business activity sluggish, particularly in the mining industry. However, it is expected that other industries such as insurance, telecommunications and energy will continue to grow and expand.
All grades of office buildings in the CBD showed declining average occupancy rates YoY. The occupancy rates at Premium and Grade A office buildings decreased most significantly. This was because most of the office buildings that were newly operating in 2015 are categorised as Premium and Grade A. Those larger office buildings still had poorer occupancy rates as of 4Q 2015.
Annual demand performance showed golden periods in 2011 - 2012 in the CBD but not in 2015. The average annual demand was below 150,000 sq m in 2013 - 2015. Large additional supply and less absorption have left around 500,000 sq m of new space vacant in the CBD in 2015. The CBD has to anticipate large additional supply in 2016 of around 700,000 sq m. It is forecast that the economy will grow moderately, and it is likely that the projected occupancy in the CBD will again decrease significantly and there will be more new, vacant space in 2016.
-200,000
0
200,000
400,000
600,000
800,000
1,000,000
2005
2006
2007
2008
2009
2010
2011
2012
2013
2014
2015
2016
F
sq m
Annual Demand Vacant Space
10 Research & Forecast Report | Q4 2015 | Office | Colliers International
Commitments to Space at Office Buildings for Lease in 2015 - 2016
Source: Colliers International Indonesia - Research
Source: Colliers International Indonesia - Research
TB Simatupang
0 100,000 200,000 300,000 400,000
2015
2016F
sq mSpace Absorbed Space Unabsorbed
Source: Colliers International Indonesia - Research
Occupancy Changes in the Outside CBDOffice Building grade 4q 2014 YoY 4q 2015 qoq 3q 2015
All Classes 93.2% 87.9% 91.2%
Outside CBD
Occupancy Changes in TB SimatupangOffice Building grade 4q 2014 YoY 4q 2015 qoq 3q 2015
All Classes 88.9% 81.8% 86.0%
Averages Occupancy Rates in Outside the CBD and TB Simatupang
Source: Colliers International Indonesia - Research
0%
10%
20%
30%
40%
50%
60%
70%
80%
90%
100%
2010 2011 2012 2013 2014 2015
Outside CBD TB Simatupang
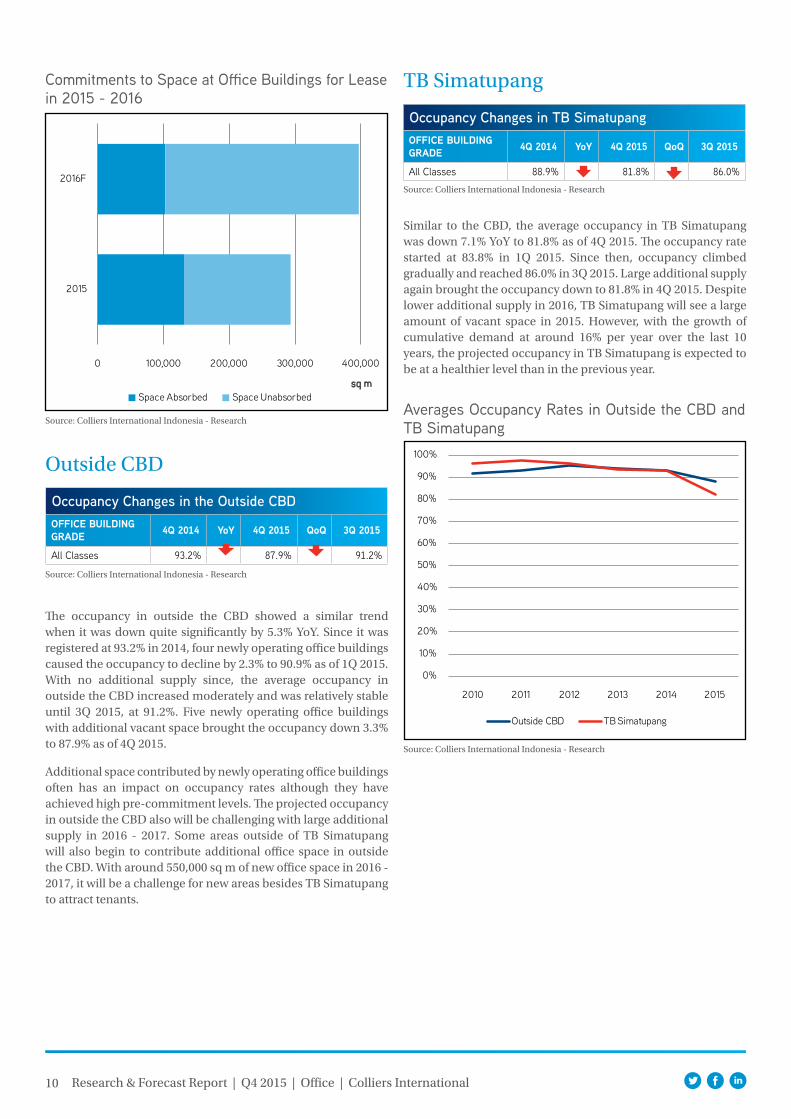
Similar to the CBD, the average occupancy in TB Simatupang was down 7.1% YoY to 81.8% as of 4Q 2015. The occupancy rate started at 83.8% in 1Q 2015. Since then, occupancy climbed gradually and reached 86.0% in 3Q 2015. Large additional supply again brought the occupancy down to 81.8% in 4Q 2015. Despite lower additional supply in 2016, TB Simatupang will see a large amount of vacant space in 2015. However, with the growth of cumulative demand at around 16% per year over the last 10 years, the projected occupancy in TB Simatupang is expected to be at a healthier level than in the previous year.
The occupancy in outside the CBD showed a similar trend when it was down quite significantly by 5.3% YoY. Since it was registered at 93.2% in 2014, four newly operating office buildings caused the occupancy to decline by 2.3% to 90.9% as of 1Q 2015. With no additional supply since, the average occupancy in outside the CBD increased moderately and was relatively stable until 3Q 2015, at 91.2%. Five newly operating office buildings with additional vacant space brought the occupancy down 3.3% to 87.9% as of 4Q 2015.
Additional space contributed by newly operating office buildings often has an impact on occupancy rates although they have achieved high pre-commitment levels. The projected occupancy in outside the CBD also will be challenging with large additional supply in 2016 - 2017. Some areas outside of TB Simatupang will also begin to contribute additional office space in outside the CBD. With around 550,000 sq m of new office space in 2016 - 2017, it will be a challenge for new areas besides TB Simatupang to attract tenants.
11 Research & Forecast Report | Q4 2015 | Office | Colliers International
Committed Space at Office Buildings for Lease in 2015 - 2016 in the Outside CBD
Source: Colliers International Indonesia - Research
Average Asking Rental Rates for Office Occupation in the CBD
Source: Colliers International Indonesia - Research
0 50,000 100,000 150,000 200,000 250,000
TB Simatupang
Outside CBD excl. TB Simatupang
sq mSpace Absorbed Space Unabsorbed
Asking Rents
USD0.00
USD10.00
USD20.00
USD30.00
USD40.00
IDR0
IDR100,000
IDR200,000
IDR300,000
IDR400,000
2010 2011 2012 2013 2014 2015
IDR Aggregate USD
Average Asking Rental Rates for Office Occupation in the CBD at Premium and Grade A Office Buildings
Source: Colliers International Indonesia - Research
USD0.00
USD10.00
USD20.00
USD30.00
USD40.00
USD50.00
IDR0
IDR100,000
IDR200,000
IDR300,000
IDR400,000
IDR500,000
2010 2011 2012 2013 2014 2015
IDR Aggregate USD
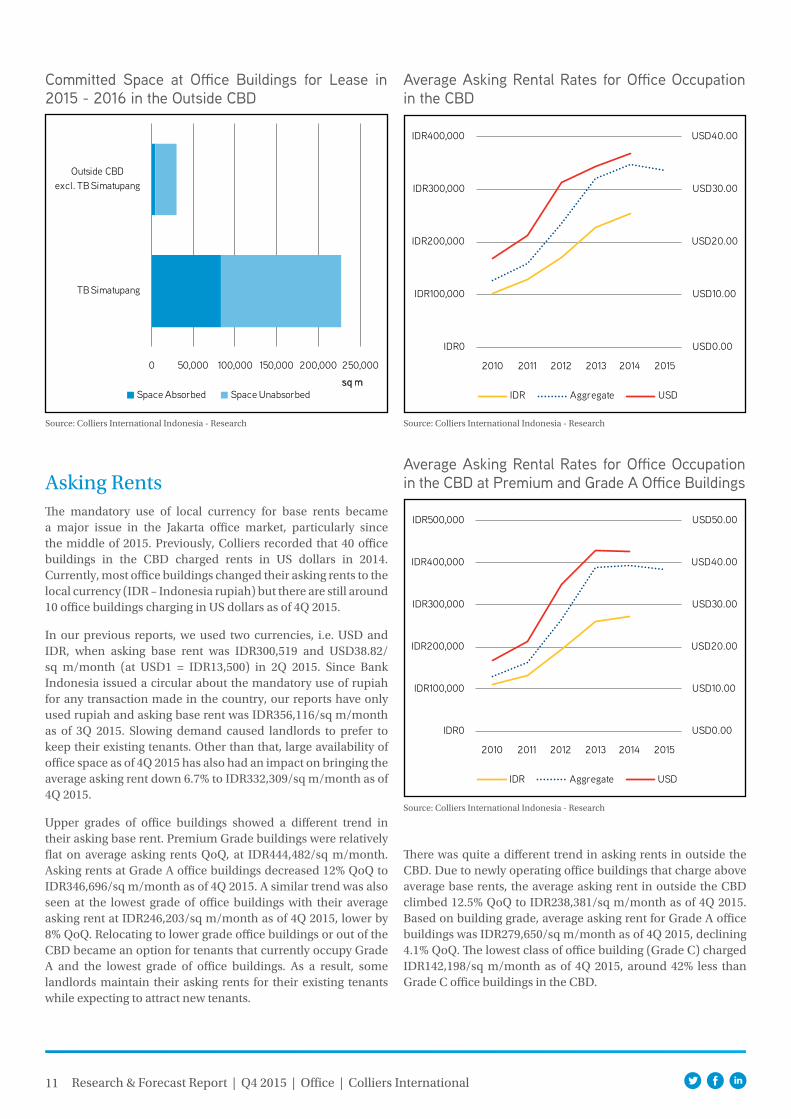
The mandatory use of local currency for base rents became a major issue in the Jakarta office market, particularly since the middle of 2015. Previously, Colliers recorded that 40 office buildings in the CBD charged rents in US dollars in 2014. Currently, most office buildings changed their asking rents to the local currency (IDR – Indonesia rupiah) but there are still around 10 office buildings charging in US dollars as of 4Q 2015.
In our previous reports, we used two currencies, i.e. USD and IDR, when asking base rent was IDR300,519 and USD38.82/sq m/month (at USD1 = IDR13,500) in 2Q 2015. Since Bank Indonesia issued a circular about the mandatory use of rupiah for any transaction made in the country, our reports have only used rupiah and asking base rent was IDR356,116/sq m/month as of 3Q 2015. Slowing demand caused landlords to prefer to keep their existing tenants. Other than that, large availability of office space as of 4Q 2015 has also had an impact on bringing the average asking rent down 6.7% to IDR332,309/sq m/month as of 4Q 2015.
Upper grades of office buildings showed a different trend in their asking base rent. Premium Grade buildings were relatively flat on average asking rents QoQ, at IDR444,482/sq m/month. Asking rents at Grade A office buildings decreased 12% QoQ to IDR346,696/sq m/month as of 4Q 2015. A similar trend was also seen at the lowest grade of office buildings with their average asking rent at IDR246,203/sq m/month as of 4Q 2015, lower by 8% QoQ. Relocating to lower grade office buildings or out of the CBD became an option for tenants that currently occupy Grade A and the lowest grade of office buildings. As a result, some landlords maintain their asking rents for their existing tenants while expecting to attract new tenants.
There was quite a different trend in asking rents in outside the CBD. Due to newly operating office buildings that charge above average base rents, the average asking rent in outside the CBD climbed 12.5% QoQ to IDR238,381/sq m/month as of 4Q 2015. Based on building grade, average asking rent for Grade A office buildings was IDR279,650/sq m/month as of 4Q 2015, declining 4.1% QoQ. The lowest class of office building (Grade C) charged IDR142,198/sq m/month as of 4Q 2015, around 42% less than Grade C office buildings in the CBD.
12 Research & Forecast Report | Q4 2015 | Office | Colliers International
Average Asking Rental Rates for Office Occupation in Outside the CBD
Source: Colliers International Indonesia - Research
USD0.00
USD5.00
USD10.00
USD15.00
USD20.00
USD25.00
USD30.00
IDR0
IDR50,000
IDR100,000
IDR150,000
IDR200,000
IDR250,000
IDR300,000
2010 2011 2012 2013 2014 2015
IDR Aggregate USD
Average Asking Rental Rates for Office Occupation in TB Simatupang
Source: Colliers International Indonesia - Research
USD0.00
USD5.00
USD10.00
USD15.00
USD20.00
USD25.00
USD30.00
IDR0
IDR50,000
IDR100,000
IDR150,000
IDR200,000
IDR250,000
IDR300,000
2010 2011 2012 2013 2014 2015
IDR Aggregate USD
Service Charges
Range of Service Charges in Jakarta
Source: Colliers International Indonesia - Research
IDR0
IDR30,000
IDR60,000
IDR90,000
IDR120,000
IDR150,000
Tham
rin
Sudi
rman
Rasu
na S
aid
Meg
a Ku
ning
an
Gato
t Sub
roto
Satr
io
Cent
ral J
akar
ta
Sout
h Ja
kart
a
Nor
th J
akar
ta
East
Jak
arta
Wes
t Jak
arta
TB S
imat
upan
g
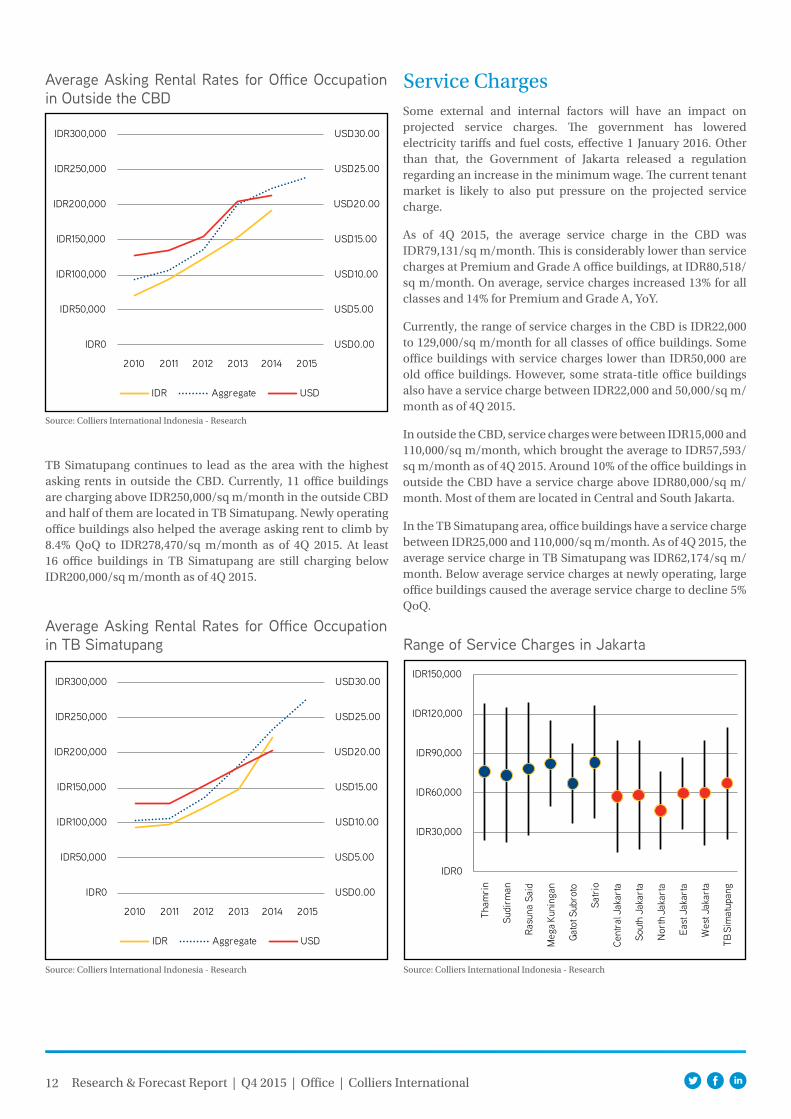
TB Simatupang continues to lead as the area with the highest asking rents in outside the CBD. Currently, 11 office buildings are charging above IDR250,000/sq m/month in the outside CBD and half of them are located in TB Simatupang. Newly operating office buildings also helped the average asking rent to climb by 8.4% QoQ to IDR278,470/sq m/month as of 4Q 2015. At least 16 office buildings in TB Simatupang are still charging below IDR200,000/sq m/month as of 4Q 2015.
Some external and internal factors will have an impact on projected service charges. The government has lowered electricity tariffs and fuel costs, effective 1 January 2016. Other than that, the Government of Jakarta released a regulation regarding an increase in the minimum wage. The current tenant market is likely to also put pressure on the projected service charge.
As of 4Q 2015, the average service charge in the CBD was IDR79,131/sq m/month. This is considerably lower than service charges at Premium and Grade A office buildings, at IDR80,518/sq m/month. On average, service charges increased 13% for all classes and 14% for Premium and Grade A, YoY.
Currently, the range of service charges in the CBD is IDR22,000 to 129,000/sq m/month for all classes of office buildings. Some office buildings with service charges lower than IDR50,000 are old office buildings. However, some strata-title office buildings also have a service charge between IDR22,000 and 50,000/sq m/month as of 4Q 2015.
In outside the CBD, service charges were between IDR15,000 and 110,000/sq m/month, which brought the average to IDR57,593/sq m/month as of 4Q 2015. Around 10% of the office buildings in outside the CBD have a service charge above IDR80,000/sq m/month. Most of them are located in Central and South Jakarta.
In the TB Simatupang area, office buildings have a service charge between IDR25,000 and 110,000/sq m/month. As of 4Q 2015, the average service charge in TB Simatupang was IDR62,174/sq m/month. Below average service charges at newly operating, large office buildings caused the average service charge to decline 5% QoQ.
13 Research & Forecast Report | Q4 2015 | Office | Colliers International
Two strata-title office buildings for sale, namely Sahid Sudirman Centre and Gran Rubina, began operations in 1Q 2015 in the CBD. By offering 169,938 sq m of new office space for sale, those buildings brought the cumulative supply of strata-title offices to 986,767 sq m. Since then, the CBD saw no additional office space for sale by 4Q 2015. The CBD will see almost one million square metres of additional office space for sale in the three years ahead. Six office buildings are expected to begin operations and bring 328,315 sq m of new office space for sale in 2016. Half of those future office buildings in 2016 will be larger than 50,000 sq m. Gatot Subroto will become the greatest contributor area by providing 55% of the total additional office space for sale in 2016. Sudirman will still contribute the most office space for sale in 2016 - 2018. Four strata-title office buildings will bring 363,805 sq m of additional space for sale in Sudirman during that period.
Five office buildings officially began operations in 2015 in outside the CBD. TB Simatupang still continues as the main contributor area since 2014. Three newly operating office buildings that provided 124,778 sq m of additional office space for sale brought the cumulative supply to 214,354 sq m as of 4Q 2015. Despite being the main contributor of office space in TB Simatupang in 2014 - 2015, South Quarter, which began operations in 4Q 2015, will become the latest strata-title office building for sale in TB Simatupang. This is due, at least until the end of 2015, to landlords and developers having not yet launched or announced the development of new strata-title office buildings in TB Simatupang.
Apart from TB Simatupang, Menara Sentraya (in South Jakarta) and The Suites (in North Jakarta) began operating and brought 65,272 sq m of new office space for sale in outside the CBD as of 4Q 2015. Those two office buildings brought the cumulative supply to 467,626 sq m in 2015. It is expected that 13 future office buildings will bring around 380,000 sq m of additional office space for sale in 2016 - 2017 in outside the CBD; 60% of that future supply will be contributed by eight office buildings in 2016.
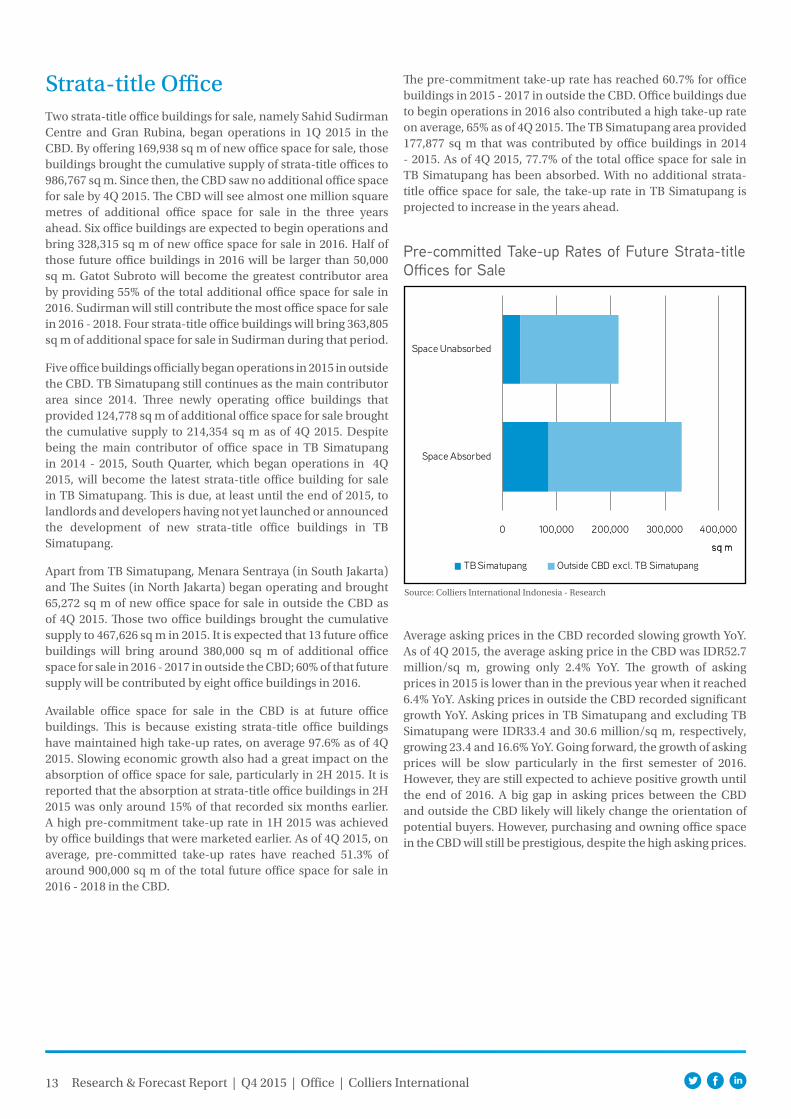
Available office space for sale in the CBD is at future office buildings. This is because existing strata-title office buildings have maintained high take-up rates, on average 97.6% as of 4Q 2015. Slowing economic growth also had a great impact on the absorption of office space for sale, particularly in 2H 2015. It is reported that the absorption at strata-title office buildings in 2H 2015 was only around 15% of that recorded six months earlier. A high pre-commitment take-up rate in 1H 2015 was achieved by office buildings that were marketed earlier. As of 4Q 2015, on average, pre-committed take-up rates have reached 51.3% of around 900,000 sq m of the total future office space for sale in 2016 - 2018 in the CBD.
The pre-commitment take-up rate has reached 60.7% for office buildings in 2015 - 2017 in outside the CBD. Office buildings due to begin operations in 2016 also contributed a high take-up rate on average, 65% as of 4Q 2015. The TB Simatupang area provided 177,877 sq m that was contributed by office buildings in 2014 - 2015. As of 4Q 2015, 77.7% of the total office space for sale in TB Simatupang has been absorbed. With no additional strata-title office space for sale, the take-up rate in TB Simatupang is projected to increase in the years ahead.
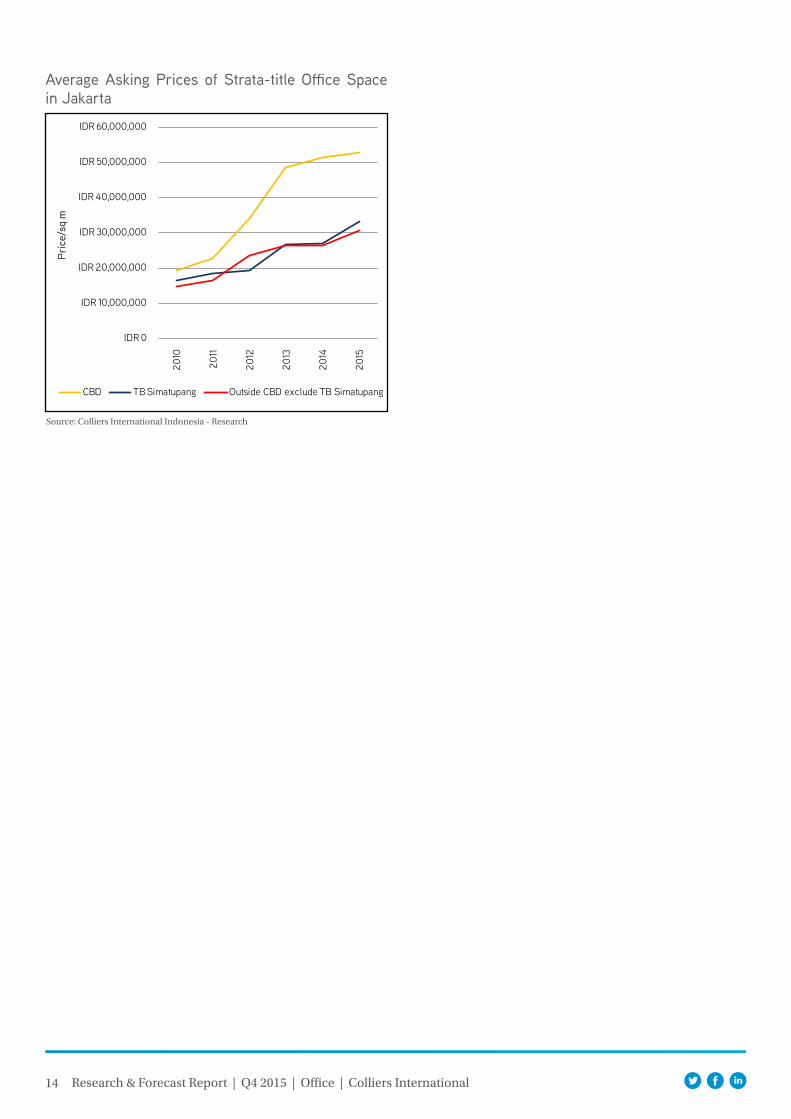
Average asking prices in the CBD recorded slowing growth YoY. As of 4Q 2015, the average asking price in the CBD was IDR52.7 million/sq m, growing only 2.4% YoY. The growth of asking prices in 2015 is lower than in the previous year when it reached 6.4% YoY. Asking prices in outside the CBD recorded significant growth YoY. Asking prices in TB Simatupang and excluding TB Simatupang were IDR33.4 and 30.6 million/sq m, respectively, growing 23.4 and 16.6% YoY. Going forward, the growth of asking prices will be slow particularly in the first semester of 2016. However, they are still expected to achieve positive growth until the end of 2016. A big gap in asking prices between the CBD and outside the CBD likely will likely change the orientation of potential buyers. However, purchasing and owning office space in the CBD will still be prestigious, despite the high asking prices.
Strata-title Office
Pre-committed Take-up Rates of Future Strata-title Offices for Sale
Source: Colliers International Indonesia - Research
0 100,000 200,000 300,000 400,000
Space Absorbed
Space Unabsorbed
sq m
TB Simatupang Outside CBD excl. TB Simatupang
14 Research & Forecast Report | Q4 2015 | Office | Colliers International
Average Asking Prices of Strata-title Office Space in Jakarta
Source: Colliers International Indonesia - Research
IDR 0
IDR 10,000,000
IDR 20,000,000
IDR 30,000,000
IDR 40,000,000
IDR 50,000,000
IDR 60,000,000
2010
2011
2012
2013
2014
2015
Pri
ce/s
q m
CBD TB Simatupang Outside CBD exclude TB Simatupang
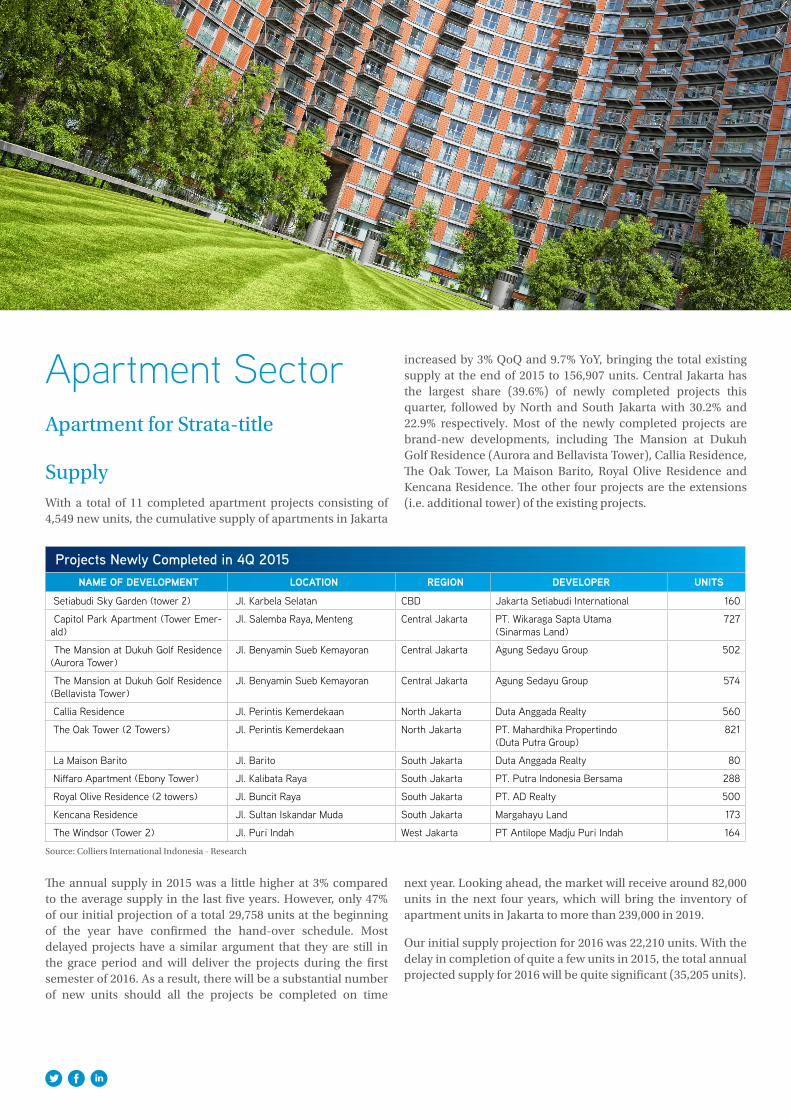
Apartment SectorApartment for Strata-title
SupplyWith a total of 11 completed apartment projects consisting of 4,549 new units, the cumulative supply of apartments in Jakarta
Projects Newly Completed in 4Q 2015name Of develOPment lOcatiOn regiOn develOPer unitS
Setiabudi Sky Garden (tower 2) Jl. Karbela Selatan CBD Jakarta Setiabudi International 160
Capitol Park Apartment (Tower Emer-ald)
Jl. Salemba Raya, Menteng Central Jakarta PT. Wikaraga Sapta Utama (Sinarmas Land)
727
The Mansion at Dukuh Golf Residence (Aurora Tower)
Jl. Benyamin Sueb Kemayoran Central Jakarta Agung Sedayu Group 502
The Mansion at Dukuh Golf Residence (Bellavista Tower)
Jl. Benyamin Sueb Kemayoran Central Jakarta Agung Sedayu Group 574
Callia Residence Jl. Perintis Kemerdekaan North Jakarta Duta Anggada Realty 560
The Oak Tower (2 Towers) Jl. Perintis Kemerdekaan North Jakarta PT. Mahardhika Propertindo (Duta Putra Group)
821
La Maison Barito Jl. Barito South Jakarta Duta Anggada Realty 80
Niffaro Apartment (Ebony Tower) Jl. Kalibata Raya South Jakarta PT. Putra Indonesia Bersama 288
Royal Olive Residence (2 towers) Jl. Buncit Raya South Jakarta PT. AD Realty 500
Kencana Residence Jl. Sultan Iskandar Muda South Jakarta Margahayu Land 173
The Windsor (Tower 2) Jl. Puri Indah West Jakarta PT Antilope Madju Puri Indah 164
Source: Colliers International Indonesia - Research
increased by 3% QoQ and 9.7% YoY, bringing the total existing supply at the end of 2015 to 156,907 units. Central Jakarta has the largest share (39.6%) of newly completed projects this quarter, followed by North and South Jakarta with 30.2% and 22.9% respectively. Most of the newly completed projects are brand-new developments, including The Mansion at Dukuh Golf Residence (Aurora and Bellavista Tower), Callia Residence, The Oak Tower, La Maison Barito, Royal Olive Residence and Kencana Residence. The other four projects are the extensions (i.e. additional tower) of the existing projects.
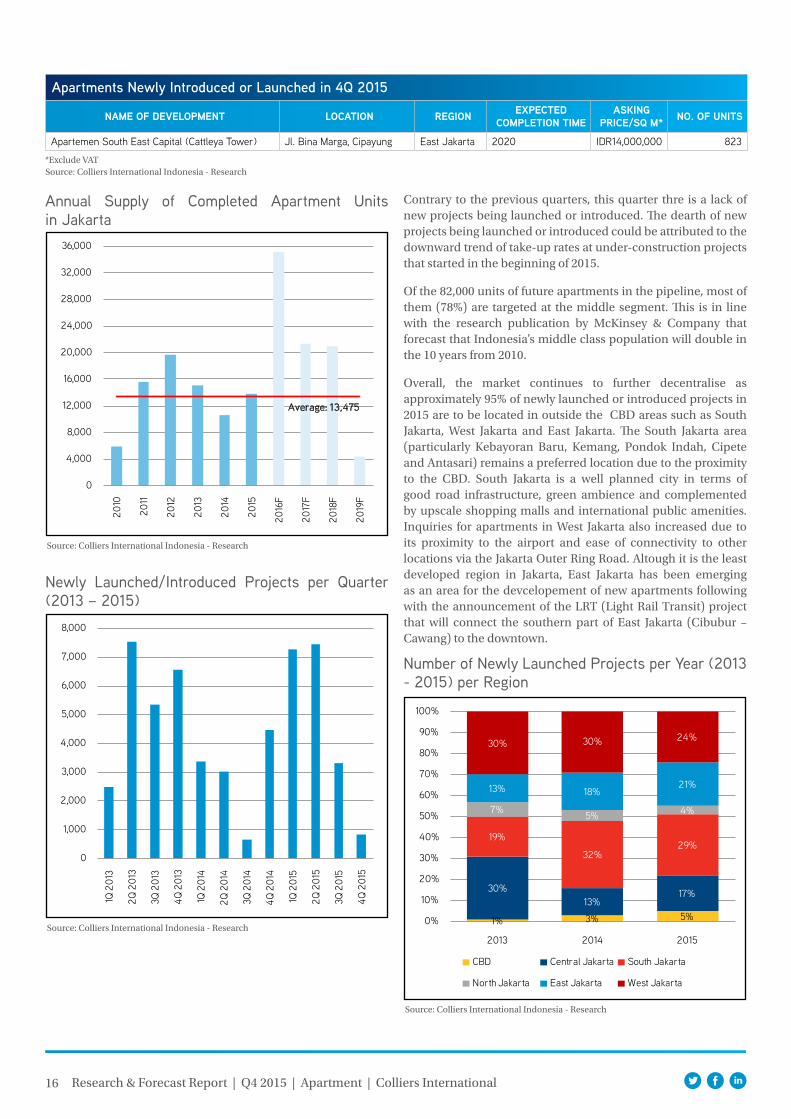
The annual supply in 2015 was a little higher at 3% compared to the average supply in the last five years. However, only 47% of our initial projection of a total 29,758 units at the beginning of the year have confirmed the hand-over schedule. Most delayed projects have a similar argument that they are still in the grace period and will deliver the projects during the first semester of 2016. As a result, there will be a substantial number of new units should all the projects be completed on time
next year. Looking ahead, the market will receive around 82,000 units in the next four years, which will bring the inventory of apartment units in Jakarta to more than 239,000 in 2019.
Our initial supply projection for 2016 was 22,210 units. With the delay in completion of quite a few units in 2015, the total annual projected supply for 2016 will be quite significant (35,205 units).
16 Research & Forecast Report | Q4 2015 | Apartment | Colliers International
Apartments Newly Introduced or Launched in 4Q 2015
name Of develOPment lOcatiOn regiOn eXPected cOmPletiOn time
aSking Price/Sq m* nO. Of unitS
Apartemen South East Capital (Cattleya Tower) Jl. Bina Marga, Cipayung East Jakarta 2020 IDR14,000,000 823
Newly Launched/Introduced Projects per Quarter (2013 – 2015)
Source: Colliers International Indonesia - Research
Contrary to the previous quarters, this quarter thre is a lack of new projects being launched or introduced. The dearth of new projects being launched or introduced could be attributed to the downward trend of take-up rates at under-construction projects that started in the beginning of 2015.
Of the 82,000 units of future apartments in the pipeline, most of them (78%) are targeted at the middle segment. This is in line with the research publication by McKinsey & Company that forecast that Indonesia’s middle class population will double in the 10 years from 2010.
Overall, the market continues to further decentralise as approximately 95% of newly launched or introduced projects in 2015 are to be located in outside the CBD areas such as South Jakarta, West Jakarta and East Jakarta. The South Jakarta area (particularly Kebayoran Baru, Kemang, Pondok Indah, Cipete and Antasari) remains a preferred location due to the proximity to the CBD. South Jakarta is a well planned city in terms of good road infrastructure, green ambience and complemented by upscale shopping malls and international public amenities. Inquiries for apartments in West Jakarta also increased due to its proximity to the airport and ease of connectivity to other locations via the Jakarta Outer Ring Road. Altough it is the least developed region in Jakarta, East Jakarta has been emerging as an area for the devcelopement of new apartments following with the announcement of the LRT (Light Rail Transit) project that will connect the southern part of East Jakarta (Cibubur – Cawang) to the downtown.
*Exclude VATSource: Colliers International Indonesia - Research
Annual Supply of Completed Apartment Units in Jakarta
Source: Colliers International Indonesia - Research
0
4,000
8,000
12,000
16,000
20,000
24,000
28,000
32,000
36,000
2010
2011
2012
2013
2014
2015
2016
F
2017
F
2018
F
2019
F
Average: 13,475
0
1,000
2,000
3,000
4,000
5,000
6,000
7,000
8,000
1Q 2
013
2Q 2
013
3Q 2
013
4Q 2
013
1Q 2
014
2Q 2
014
3Q 2
014
4Q 2
014
1Q 2
015
2Q 2
015
3Q 2
015
4Q 2
015
Number of Newly Launched Projects per Year (2013 - 2015) per Region
Source: Colliers International Indonesia - Research
1% 3% 5%
30%13%
17%
19%
32%29%
7% 5% 4%
13% 18%21%
30% 30% 24%
0%
10%
20%
30%
40%
50%
60%
70%
80%
90%
100%
2013 2014 2015
CBD Central Jakarta South Jakarta
North Jakarta East Jakarta West Jakarta
17 Research & Forecast Report | Q4 2015 | Apartment | Colliers International
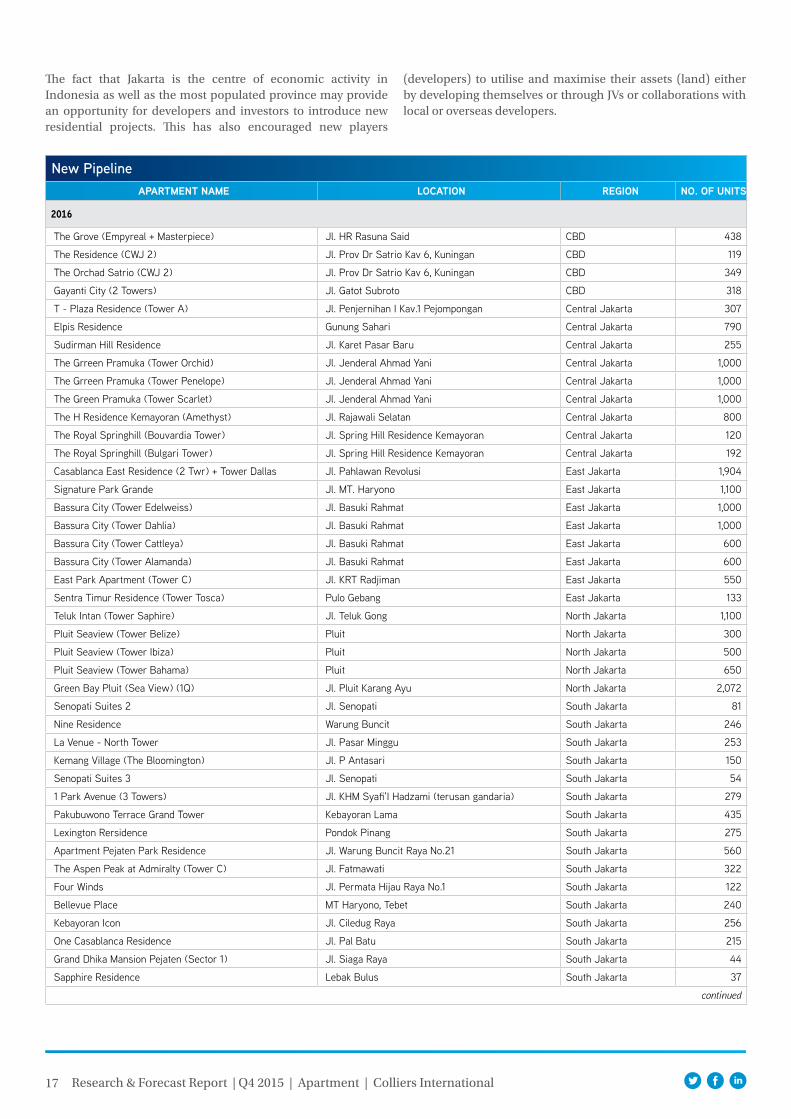
New PipelineaPartment name lOcatiOn regiOn nO. Of unitS
2016
The Grove (Empyreal + Masterpiece) Jl. HR Rasuna Said CBD 438
The Residence (CWJ 2) Jl. Prov Dr Satrio Kav 6, Kuningan CBD 119
The Orchad Satrio (CWJ 2) Jl. Prov Dr Satrio Kav 6, Kuningan CBD 349
Gayanti City (2 Towers) Jl. Gatot Subroto CBD 318
T - Plaza Residence (Tower A) Jl. Penjernihan I Kav.1 Pejompongan Central Jakarta 307
Elpis Residence Gunung Sahari Central Jakarta 790
Sudirman Hill Residence Jl. Karet Pasar Baru Central Jakarta 255
The Grreen Pramuka (Tower Orchid) Jl. Jenderal Ahmad Yani Central Jakarta 1,000
The Grreen Pramuka (Tower Penelope) Jl. Jenderal Ahmad Yani Central Jakarta 1,000
The Green Pramuka (Tower Scarlet) Jl. Jenderal Ahmad Yani Central Jakarta 1,000
The H Residence Kemayoran (Amethyst) Jl. Rajawali Selatan Central Jakarta 800
The Royal Springhill (Bouvardia Tower) Jl. Spring Hill Residence Kemayoran Central Jakarta 120
The Royal Springhill (Bulgari Tower) Jl. Spring Hill Residence Kemayoran Central Jakarta 192
Casablanca East Residence (2 Twr) + Tower Dallas Jl. Pahlawan Revolusi East Jakarta 1,904
Signature Park Grande Jl. MT. Haryono East Jakarta 1,100
Bassura City (Tower Edelweiss) Jl. Basuki Rahmat East Jakarta 1,000
Bassura City (Tower Dahlia) Jl. Basuki Rahmat East Jakarta 1,000
Bassura City (Tower Cattleya) Jl. Basuki Rahmat East Jakarta 600
Bassura City (Tower Alamanda) Jl. Basuki Rahmat East Jakarta 600
East Park Apartment (Tower C) Jl. KRT Radjiman East Jakarta 550
Sentra Timur Residence (Tower Tosca) Pulo Gebang East Jakarta 133
Teluk Intan (Tower Saphire) Jl. Teluk Gong North Jakarta 1,100
Pluit Seaview (Tower Belize) Pluit North Jakarta 300
Pluit Seaview (Tower Ibiza) Pluit North Jakarta 500
Pluit Seaview (Tower Bahama) Pluit North Jakarta 650
Green Bay Pluit (Sea View) (1Q) Jl. Pluit Karang Ayu North Jakarta 2,072
Senopati Suites 2 Jl. Senopati South Jakarta 81
Nine Residence Warung Buncit South Jakarta 246
La Venue - North Tower Jl. Pasar Minggu South Jakarta 253
Kemang Village (The Bloomington) Jl. P Antasari South Jakarta 150
Senopati Suites 3 Jl. Senopati South Jakarta 54
1 Park Avenue (3 Towers) Jl. KHM Syafi'I Hadzami (terusan gandaria) South Jakarta 279
Pakubuwono Terrace Grand Tower Kebayoran Lama South Jakarta 435
Lexington Rersidence Pondok Pinang South Jakarta 275
Apartment Pejaten Park Residence Jl. Warung Buncit Raya No.21 South Jakarta 560
The Aspen Peak at Admiralty (Tower C) Jl. Fatmawati South Jakarta 322
Four Winds Jl. Permata Hijau Raya No.1 South Jakarta 122
Bellevue Place MT Haryono, Tebet South Jakarta 240
Kebayoran Icon Jl. Ciledug Raya South Jakarta 256
One Casablanca Residence Jl. Pal Batu South Jakarta 215
Grand Dhika Mansion Pejaten (Sector 1) Jl. Siaga Raya South Jakarta 44
Sapphire Residence Lebak Bulus South Jakarta 37
continued
The fact that Jakarta is the centre of economic activity in Indonesia as well as the most populated province may provide an opportunity for developers and investors to introduce new residential projects. This has also encouraged new players
(developers) to utilise and maximise their assets (land) either by developing themselves or through JVs or collaborations with local or overseas developers.
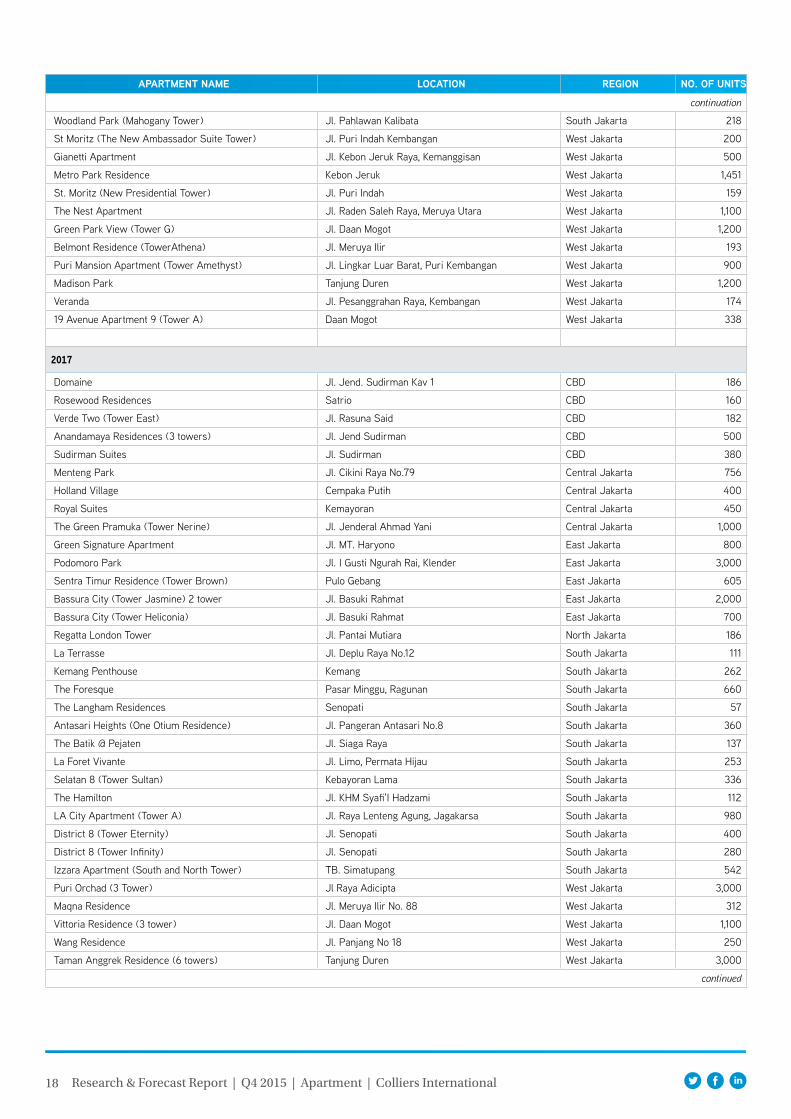
18 Research & Forecast Report | Q4 2015 | Apartment | Colliers International
aPartment name lOcatiOn regiOn nO. Of unitS
continuation
Woodland Park (Mahogany Tower) Jl. Pahlawan Kalibata South Jakarta 218
St Moritz (The New Ambassador Suite Tower) Jl. Puri Indah Kembangan West Jakarta 200
Gianetti Apartment Jl. Kebon Jeruk Raya, Kemanggisan West Jakarta 500
Metro Park Residence Kebon Jeruk West Jakarta 1,451
St. Moritz (New Presidential Tower) Jl. Puri Indah West Jakarta 159
The Nest Apartment Jl. Raden Saleh Raya, Meruya Utara West Jakarta 1,100
Green Park View (Tower G) Jl. Daan Mogot West Jakarta 1,200
Belmont Residence (TowerAthena) Jl. Meruya Ilir West Jakarta 193
Puri Mansion Apartment (Tower Amethyst) Jl. Lingkar Luar Barat, Puri Kembangan West Jakarta 900
Madison Park Tanjung Duren West Jakarta 1,200
Veranda Jl. Pesanggrahan Raya, Kembangan West Jakarta 174
19 Avenue Apartment 9 (Tower A) Daan Mogot West Jakarta 338
2017
Domaine Jl. Jend. Sudirman Kav 1 CBD 186
Rosewood Residences Satrio CBD 160
Verde Two (Tower East) Jl. Rasuna Said CBD 182
Anandamaya Residences (3 towers) Jl. Jend Sudirman CBD 500
Sudirman Suites Jl. Sudirman CBD 380
Menteng Park Jl. Cikini Raya No.79 Central Jakarta 756
Holland Village Cempaka Putih Central Jakarta 400
Royal Suites Kemayoran Central Jakarta 450
The Green Pramuka (Tower Nerine) Jl. Jenderal Ahmad Yani Central Jakarta 1,000
Green Signature Apartment Jl. MT. Haryono East Jakarta 800
Podomoro Park Jl. I Gusti Ngurah Rai, Klender East Jakarta 3,000
Sentra Timur Residence (Tower Brown) Pulo Gebang East Jakarta 605
Bassura City (Tower Jasmine) 2 tower Jl. Basuki Rahmat East Jakarta 2,000
Bassura City (Tower Heliconia) Jl. Basuki Rahmat East Jakarta 700
Regatta London Tower Jl. Pantai Mutiara North Jakarta 186
La Terrasse Jl. Deplu Raya No.12 South Jakarta 111
Kemang Penthouse Kemang South Jakarta 262
The Foresque Pasar Minggu, Ragunan South Jakarta 660
The Langham Residences Senopati South Jakarta 57
Antasari Heights (One Otium Residence) Jl. Pangeran Antasari No.8 South Jakarta 360
The Batik @ Pejaten Jl. Siaga Raya South Jakarta 137
La Foret Vivante Jl. Limo, Permata Hijau South Jakarta 253
Selatan 8 (Tower Sultan) Kebayoran Lama South Jakarta 336
The Hamilton Jl. KHM Syafi'I Hadzami South Jakarta 112
LA City Apartment (Tower A) Jl. Raya Lenteng Agung, Jagakarsa South Jakarta 980
District 8 (Tower Eternity) Jl. Senopati South Jakarta 400
District 8 (Tower Infinity) Jl. Senopati South Jakarta 280
Izzara Apartment (South and North Tower) TB. Simatupang South Jakarta 542
Puri Orchad (3 Tower) Jl Raya Adicipta West Jakarta 3,000
Maqna Residence Jl. Meruya Ilir No. 88 West Jakarta 312
Vittoria Residence (3 tower) Jl. Daan Mogot West Jakarta 1,100
Wang Residence Jl. Panjang No 18 West Jakarta 250
Taman Anggrek Residence (6 towers) Tanjung Duren West Jakarta 3,000
continued
19 Research & Forecast Report | Q4 2015 | Apartment | Colliers International
aPartment name lOcatiOn regiOn nO. Of unitS
continuation
19 Avenue Apartment (Tower B) Daan Mogot West Jakarta 416
Sycamore Suite Puri Botanical, Joglo West Jakarta 125
2018
Verde Two (Tower West) Jl. Rasuna Said CBD 152
Lavie Jl. Denpasar Raya CBD 302
South Hill Jl. Denpasar Raya CBD 611
Le' Parc Jl. Thamrin CBD 100
Regent Residences (tower 1) Semanggi CBD 100
The Hundred Residence Mega Kuningan CBD 100
The Elements Epicentrum (2 Towers) Rasuna Said CBD 372
Capitol Suites Jl. Prapatan Raya Central Jakarta 327
Holland Village (Phase II) Cempaka Putih Central Jakarta 230
Sahid Garden Residence Ciracas East Jakarta 476
Gold Coast Apartment (Atlantic Tower) Pantai Indah Kapuk North Jakarta 568
Regatta Apartment (Tower New York) Pantai Mutiara North Jakarta 186
Sedayu City (Tower Melbourne) Jl. Pegangsaan Dua Raya North Jakarta 912
Sedayu City (Tower Darwin) Jl. Pegangsaan Dua Raya North Jakarta 936
The Kensington Royal Suites (4 Tower) Kelapa Gading North Jakarta 790
Jaya Ancol Seafront - Oceana Tower Pademangan, Ancol North Jakarta 524
Gold Coast Apartment (Bahama Tower) Pantai Indah Kapuk North Jakarta 600
Gold Coast Apartment (Carribean Tower) Pantai Indah Kapuk North Jakarta 600
Gold Coast Apartment (Honolulu Tower) Pantai Indah Kapuk North Jakarta 600
Grand Marina Ancol Ancol North Jakarta 672
The Aspen Peak at Admiralty (Tower D) Jl. Fatmawati South Jakarta 322
Casa Grande Residence 2 (Tower Angelo) Jl. Casablanca South Jakarta 350
Casa Grande Residence 2 (Tower Bella) Jl. Casablanca South Jakarta 350
Casa Grande Residence 2 (Tower Chianti) Jl. Casablanca South Jakarta 350
Pondok Indah Residences (3 Towers) Pondok Indah South Jakarta 880
Selatan 8 (Tower Prabu) Jl. Raya Ulujami South Jakarta 344
45 Antasari (2 Tower) Antasari South Jakarta 1,924
Arzuria Apartment Jl. Tendean South Jakarta 210
Pakubuwono Spring (2 towers) Jl. Teuku Nyak Arief No.9 South Jakarta 545
Branz Simatupang (2 tower) TB. Simatupang South Jakarta 381
Synthesis Residence Kemang (3 towers) Jl. Ampera Raya No.17 South Jakarta 1,100
The Ease Brawijaya Jl. Taman Brawijaya III Kebayoran Baru South Jakarta 54
Ciputra International Puri Indah (Tower Amsterdam) Jl. Lingkar Luar Barat West Jakarta 412
Grand Madison Park Tanjung Duren West Jakarta 300
Citra Lake Suites (Tower Rosewood) Jl. Raya Kresek West Jakarta 104
Citra Lake Suites (Tower Greenwood) Jl. Raya Kresek West Jakarta 126
Citra Lake Suites (Tower Oakwood) Jl. Raya Kresek West Jakarta 117
Citra Lake Suites (Tower Sherwood) Jl. Raya Kresek West Jakarta 122
Aerium Taman Permata Buana (2 towers) Taman Permata Buana West Jakarta 491
Ciputra International Puri Indah (Tower Barcelona) Jl. Lingkar Luar Barat West Jakarta 335
Puri Mansion Apartment (Tower Crystal) Jl. Lingkar Luar Barat, Puri Kembangan West Jakarta 700
West Vista (2 towers) Jl. Lingkar Luar Barat No.8, Duri Kosambi West Jakarta 2,840
Citra Living Apartment (Somerset Tower) Jl. Citra 7, Kalideres West Jakarta 312
Citra Living Apartment (Orchad Tower) Jl. Citra 7, Kalideres West Jakarta 312
continued
20 Research & Forecast Report | Q4 2015 | Apartment | Colliers International
aPartment name lOcatiOn regiOn nO. Of unitS
continuation
Citra Living Apartment (Newton Tower) Jl. Citra 7, Kalideres West Jakarta 312
Gallery West Jl. Panjang No 5 West Jakarta 280
2019
The Suite (W Hotel Tower) Jl. Prof. Dr. Satrio CBD 200
Menara Jakarta (Tower Equinox) Kemayoran Central Jakarta 396
Menara Jakarta (Tower Azure) Kemayoran Central Jakarta 860
The Linq Kemayoran (2 towers) Kemayoran Central Jakarta 1,020
Menteng 37 Jl. Menteng 37 Central Jakarta 99
Arandra Residence (was Sentosa Residence) Cempaka Putih Central Jakarta 687
Orient Residence Jl. Yos Sudarso, No 76 North Jakarta 225
Fatmawati City Center - Corona Park Suite Tower Fatmawati South Jakarta 900
Royal Park at Kebayoran (Arlington Tower) Jl. Cileduk Raya 18, Cipulir South Jakarta 630
Ratu Prabu 3 Residences TB. Simatupang South Jakarta 61
The Residence Gatot Subroto Jl. Gatot Subroto South Jakarta 188
Ammi Residence Dharmawangsa South Jakarta 136
Green Sedayu Apartment (Tower Pasadena) Jl. Kamal Raya, Cengkareng West Jakarta 896
Source: Colliers International Indonesia - Research
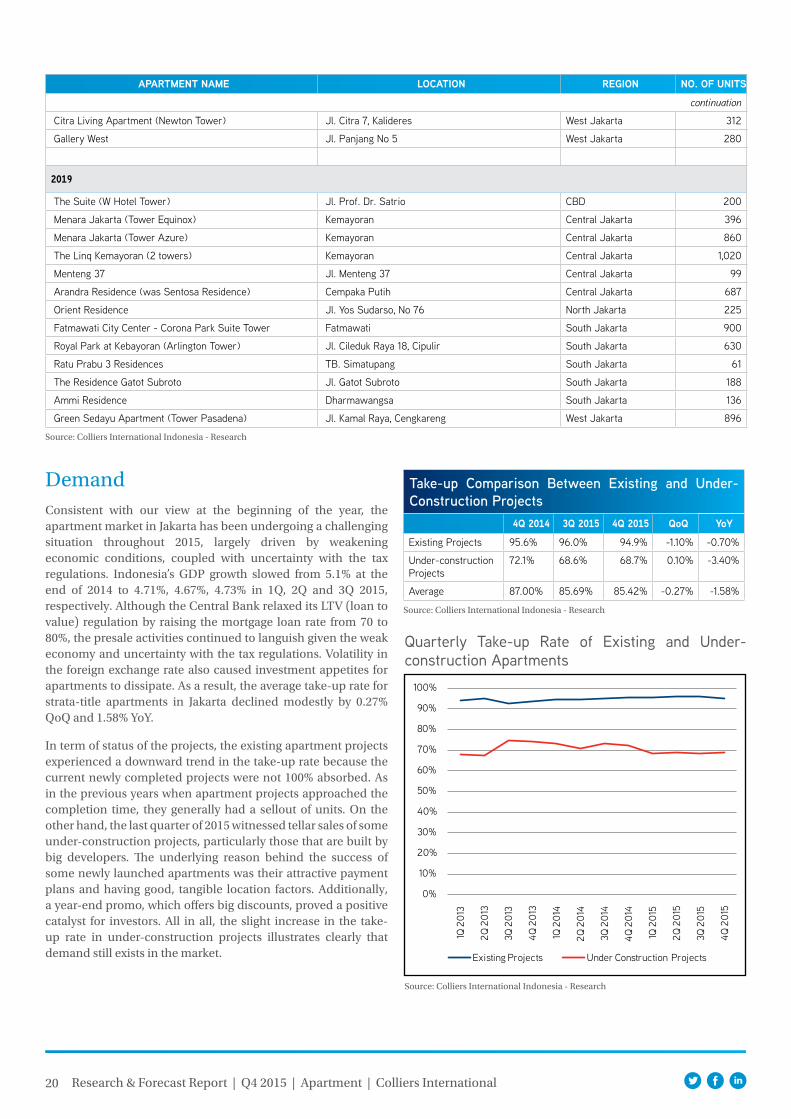
DemandConsistent with our view at the beginning of the year, the apartment market in Jakarta has been undergoing a challenging situation throughout 2015, largely driven by weakening economic conditions, coupled with uncertainty with the tax regulations. Indonesia’s GDP growth slowed from 5.1% at the end of 2014 to 4.71%, 4.67%, 4.73% in 1Q, 2Q and 3Q 2015, respectively. Although the Central Bank relaxed its LTV (loan to value) regulation by raising the mortgage loan rate from 70 to 80%, the presale activities continued to languish given the weak economy and uncertainty with the tax regulations. Volatility in the foreign exchange rate also caused investment appetites for apartments to dissipate. As a result, the average take-up rate for strata-title apartments in Jakarta declined modestly by 0.27% QoQ and 1.58% YoY.
In term of status of the projects, the existing apartment projects experienced a downward trend in the take-up rate because the current newly completed projects were not 100% absorbed. As in the previous years when apartment projects approached the completion time, they generally had a sellout of units. On the other hand, the last quarter of 2015 witnessed tellar sales of some under-construction projects, particularly those that are built by big developers. The underlying reason behind the success of some newly launched apartments was their attractive payment plans and having good, tangible location factors. Additionally, a year-end promo, which offers big discounts, proved a positive catalyst for investors. All in all, the slight increase in the take-up rate in under-construction projects illustrates clearly that demand still exists in the market.
Source: Colliers International Indonesia - Research
Take-up Comparison Between Existing and Under-Construction Projects
4q 2014 3q 2015 4q 2015 qoq YoY
Existing Projects 95.6% 96.0% 94.9% -1.10% -0.70%
Under-construction Projects
72.1% 68.6% 68.7% 0.10% -3.40%
Average 87.00% 85.69% 85.42% -0.27% -1.58%
Quarterly Take-up Rate of Existing and Under-construction Apartments
Source: Colliers International Indonesia - Research
0%
10%
20%
30%
40%
50%
60%
70%
80%
90%
100%
1Q 2
013
2Q 2
013
3Q 2
013
4Q 2
013
1Q 2
014
2Q 2
014
3Q 2
014
4Q 2
014
1Q 2
015
2Q 2
015
3Q 2
015
4Q 2
015
Existing Projects Under Construction Projects
21 Research & Forecast Report | Q4 2015 | Apartment | Colliers International
Source: Colliers International Indonesia - Research
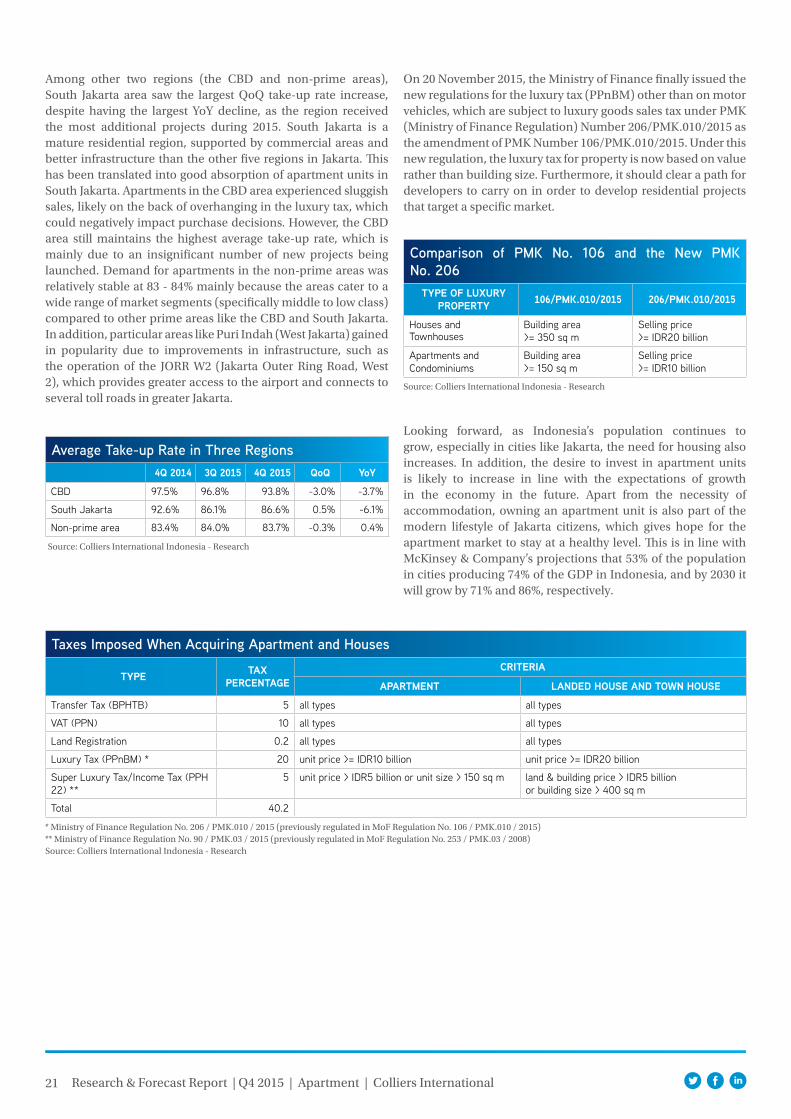
Average Take-up Rate in Three Regions4q 2014 3q 2015 4q 2015 qoq YoY
CBD 97.5% 96.8% 93.8% -3.0% -3.7%
South Jakarta 92.6% 86.1% 86.6% 0.5% -6.1%
Non-prime area 83.4% 84.0% 83.7% -0.3% 0.4%
On 20 November 2015, the Ministry of Finance finally issued the new regulations for the luxury tax (PPnBM) other than on motor vehicles, which are subject to luxury goods sales tax under PMK (Ministry of Finance Regulation) Number 206/PMK.010/2015 as the amendment of PMK Number 106/PMK.010/2015. Under this new regulation, the luxury tax for property is now based on value rather than building size. Furthermore, it should clear a path for developers to carry on in order to develop residential projects that target a specific market.
Among other two regions (the CBD and non-prime areas), South Jakarta area saw the largest QoQ take-up rate increase, despite having the largest YoY decline, as the region received the most additional projects during 2015. South Jakarta is a mature residential region, supported by commercial areas and better infrastructure than the other five regions in Jakarta. This has been translated into good absorption of apartment units in South Jakarta. Apartments in the CBD area experienced sluggish sales, likely on the back of overhanging in the luxury tax, which could negatively impact purchase decisions. However, the CBD area still maintains the highest average take-up rate, which is mainly due to an insignificant number of new projects being launched. Demand for apartments in the non-prime areas was relatively stable at 83 - 84% mainly because the areas cater to a wide range of market segments (specifically middle to low class) compared to other prime areas like the CBD and South Jakarta. In addition, particular areas like Puri Indah (West Jakarta) gained in popularity due to improvements in infrastructure, such as the operation of the JORR W2 (Jakarta Outer Ring Road, West 2), which provides greater access to the airport and connects to several toll roads in greater Jakarta.
Source: Colliers International Indonesia - Research
Comparison of PMK No. 106 and the New PMK No. 206
tYPe Of luXurY PrOPertY 106/Pmk.010/2015 206/Pmk.010/2015
Houses and Townhouses
Building area >= 350 sq m
Selling price >= IDR20 billion
Apartments and Condominiums
Building area >= 150 sq m
Selling price >= IDR10 billion
Looking forward, as Indonesia’s population continues to grow, especially in cities like Jakarta, the need for housing also increases. In addition, the desire to invest in apartment units is likely to increase in line with the expectations of growth in the economy in the future. Apart from the necessity of accommodation, owning an apartment unit is also part of the modern lifestyle of Jakarta citizens, which gives hope for the apartment market to stay at a healthy level. This is in line with McKinsey & Company’s projections that 53% of the population in cities producing 74% of the GDP in Indonesia, and by 2030 it will grow by 71% and 86%, respectively.
Taxes Imposed When Acquiring Apartment and Houses
tYPe taX Percentage
criteria
aPartment landed hOuSe and tOWn hOuSe
Transfer Tax (BPHTB) 5 all types all types
VAT (PPN) 10 all types all types
Land Registration 0.2 all types all types
Luxury Tax (PPnBM) * 20 unit price >= IDR10 billion unit price >= IDR20 billion
Super Luxury Tax/Income Tax (PPH 22) **
5 unit price > IDR5 billion or unit size > 150 sq m land & building price > IDR5 billion or building size > 400 sq m
Total 40.2
* Ministry of Finance Regulation No. 206 / PMK.010 / 2015 (previously regulated in MoF Regulation No. 106 / PMK.010 / 2015)** Ministry of Finance Regulation No. 90 / PMK.03 / 2015 (previously regulated in MoF Regulation No. 253 / PMK.03 / 2008)Source: Colliers International Indonesia - Research
22 Research & Forecast Report | Q4 2015 | Apartment | Colliers International
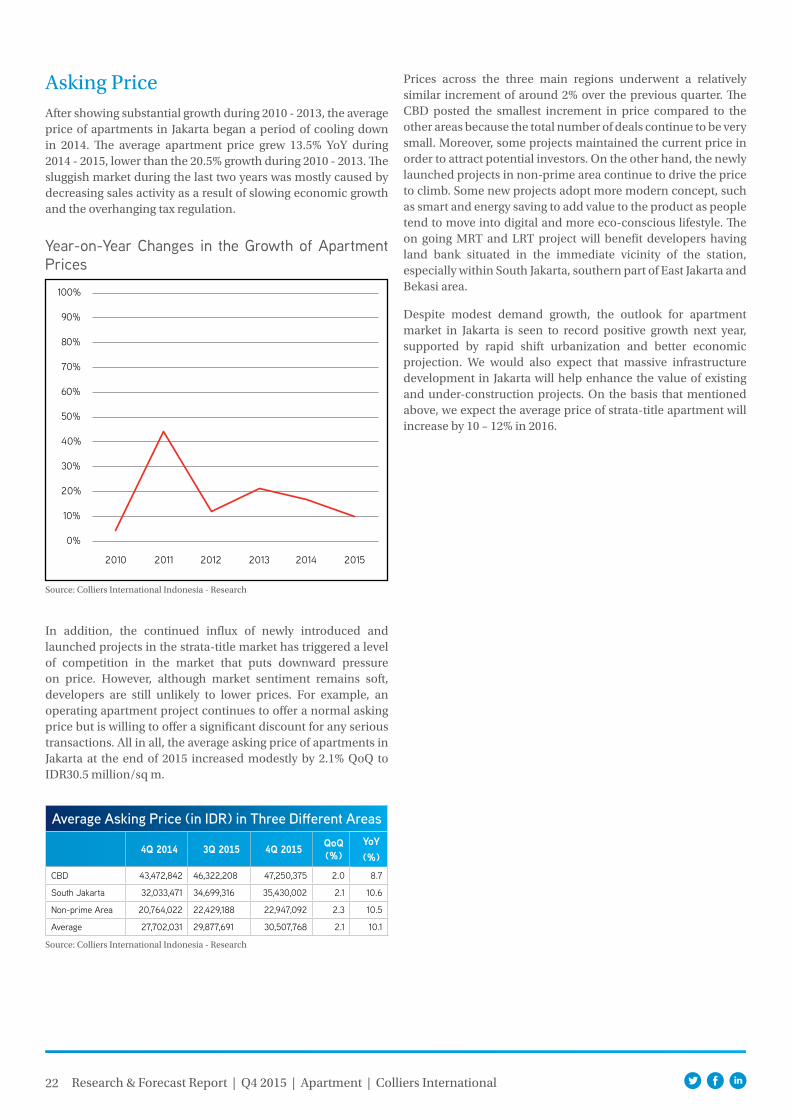
Asking PriceAfter showing substantial growth during 2010 - 2013, the average price of apartments in Jakarta began a period of cooling down in 2014. The average apartment price grew 13.5% YoY during 2014 - 2015, lower than the 20.5% growth during 2010 - 2013. The sluggish market during the last two years was mostly caused by decreasing sales activity as a result of slowing economic growth and the overhanging tax regulation.
Year-on-Year Changes in the Growth of Apartment Prices
Source: Colliers International Indonesia - Research
In addition, the continued influx of newly introduced and launched projects in the strata-title market has triggered a level of competition in the market that puts downward pressure on price. However, although market sentiment remains soft, developers are still unlikely to lower prices. For example, an operating apartment project continues to offer a normal asking price but is willing to offer a significant discount for any serious transactions. All in all, the average asking price of apartments in Jakarta at the end of 2015 increased modestly by 2.1% QoQ to IDR30.5 million/sq m.
Source: Colliers International Indonesia - Research
Average Asking Price (in IDR) in Three Different Areas
4q 2014 3q 2015 4q 2015 qoq (%)
YoY (%)
CBD 43,472,842 46,322,208 47,250,375 2.0 8.7
South Jakarta 32,033,471 34,699,316 35,430,002 2.1 10.6
Non-prime Area 20,764,022 22,429,188 22,947,092 2.3 10.5
Average 27,702,031 29,877,691 30,507,768 2.1 10.1
0%
10%
20%
30%
40%
50%
60%
70%
80%
90%
100%
2010 2011 2012 2013 2014 2015
Prices across the three main regions underwent a relatively similar increment of around 2% over the previous quarter. The CBD posted the smallest increment in price compared to the other areas because the total number of deals continue to be very small. Moreover, some projects maintained the current price in order to attract potential investors. On the other hand, the newly launched projects in non-prime area continue to drive the price to climb. Some new projects adopt more modern concept, such as smart and energy saving to add value to the product as people tend to move into digital and more eco-conscious lifestyle. The on going MRT and LRT project will benefit developers having land bank situated in the immediate vicinity of the station, especially within South Jakarta, southern part of East Jakarta and Bekasi area.
Despite modest demand growth, the outlook for apartment market in Jakarta is seen to record positive growth next year, supported by rapid shift urbanization and better economic projection. We would also expect that massive infrastructure development in Jakarta will help enhance the value of existing and under-construction projects. On the basis that mentioned above, we expect the average price of strata-title apartment will increase by 10 – 12% in 2016.
23 Research & Forecast Report | Q4 2015 | Apartment | Colliers International
Apartment For Lease
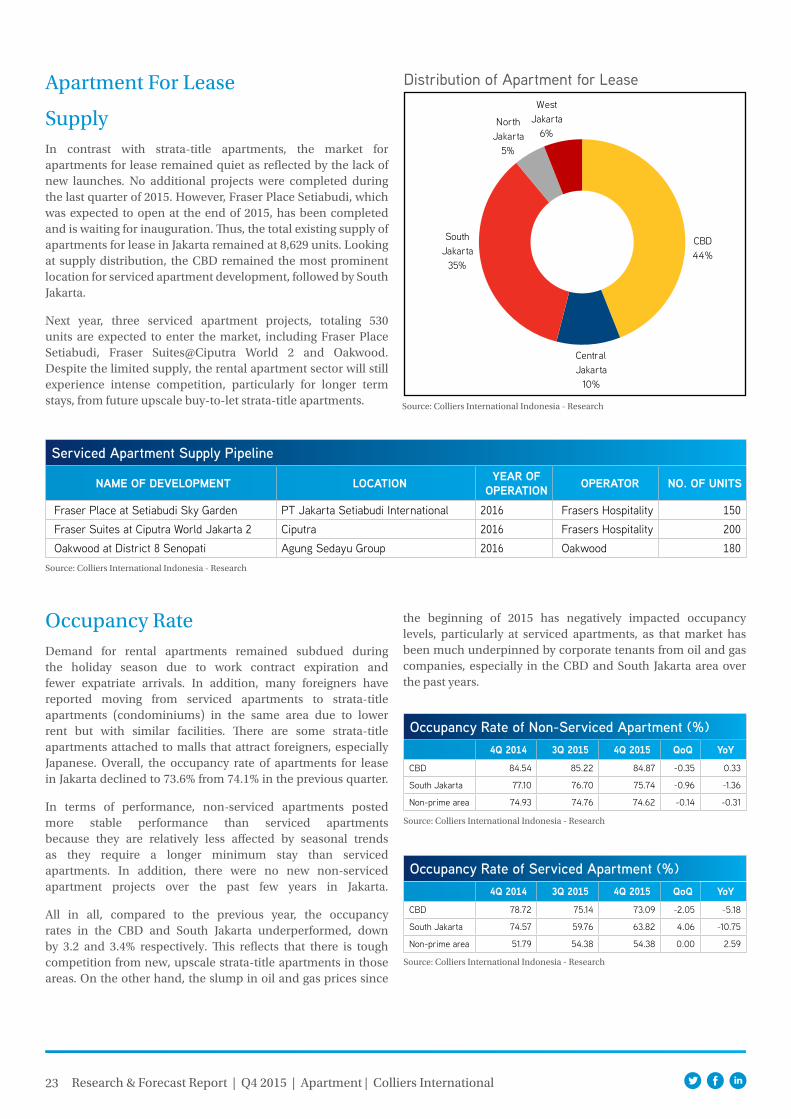
SupplyIn contrast with strata-title apartments, the market for apartments for lease remained quiet as reflected by the lack of new launches. No additional projects were completed during the last quarter of 2015. However, Fraser Place Setiabudi, which was expected to open at the end of 2015, has been completed and is waiting for inauguration. Thus, the total existing supply of apartments for lease in Jakarta remained at 8,629 units. Looking at supply distribution, the CBD remained the most prominent location for serviced apartment development, followed by South Jakarta.
Next year, three serviced apartment projects, totaling 530 units are expected to enter the market, including Fraser Place Setiabudi, Fraser Suites@Ciputra World 2 and Oakwood. Despite the limited supply, the rental apartment sector will still experience intense competition, particularly for longer term stays, from future upscale buy-to-let strata-title apartments.
Distribution of Apartment for Lease
Source: Colliers International Indonesia - Research
Source: Colliers International Indonesia - Research
Serviced Apartment Supply Pipeline
name Of develOPment lOcatiOn Year Of OPeratiOn OPeratOr nO. Of unitS
Fraser Place at Setiabudi Sky Garden PT Jakarta Setiabudi International 2016 Frasers Hospitality 150 Fraser Suites at Ciputra World Jakarta 2 Ciputra 2016 Frasers Hospitality 200 Oakwood at District 8 Senopati Agung Sedayu Group 2016 Oakwood 180
Occupancy RateDemand for rental apartments remained subdued during the holiday season due to work contract expiration and fewer expatriate arrivals. In addition, many foreigners have reported moving from serviced apartments to strata-title apartments (condominiums) in the same area due to lower rent but with similar facilities. There are some strata-title apartments attached to malls that attract foreigners, especially Japanese. Overall, the occupancy rate of apartments for lease in Jakarta declined to 73.6% from 74.1% in the previous quarter.
In terms of performance, non-serviced apartments posted more stable performance than serviced apartments because they are relatively less affected by seasonal trends as they require a longer minimum stay than serviced apartments. In addition, there were no new non-serviced apartment projects over the past few years in Jakarta.
All in all, compared to the previous year, the occupancy rates in the CBD and South Jakarta underperformed, down by 3.2 and 3.4% respectively. This reflects that there is tough competition from new, upscale strata-title apartments in those areas. On the other hand, the slump in oil and gas prices since
Source: Colliers International Indonesia - Research
CBD44%
Central Jakarta
10%
South Jakarta
35%
North Jakarta
5%
West Jakarta
6%
the beginning of 2015 has negatively impacted occupancy levels, particularly at serviced apartments, as that market has been much underpinned by corporate tenants from oil and gas companies, especially in the CBD and South Jakarta area over the past years.
Occupancy Rate of Non-Serviced Apartment (%)4q 2014 3q 2015 4q 2015 qoq YoY
CBD 84.54 85.22 84.87 -0.35 0.33
South Jakarta 77.10 76.70 75.74 -0.96 -1.36
Non-prime area 74.93 74.76 74.62 -0.14 -0.31
Source: Colliers International Indonesia - Research
Occupancy Rate of Serviced Apartment (%)4q 2014 3q 2015 4q 2015 qoq YoY
CBD 78.72 75.14 73.09 -2.05 -5.18
South Jakarta 74.57 59.76 63.82 4.06 -10.75
Non-prime area 51.79 54.38 54.38 0.00 2.59
24 Research & Forecast Report | Q4 2015 | Apartment | Colliers International
Looking forward, decreasing occupancy rates at apartments for lease are expected to continue due to intense competition from strata-title apartments, although there are only a few new serviced apartment projects that will be added to the market in the future. As such, we predict that the average occupancy level of apartments for lease will be corrected to 72 - 74% in the upcoming years.
Source: Colliers International Indonesia - Research
Average Occupancy Rate of Apartment for Lease Based on Region (%)
4q 2014 3q 2015 4q 2015 qoq YoY CBD 81.4 79.5 78.2 -1.3 -3.2
South Jakarta 76.6 73.1 73.2 0.1 -3.4
Non-prime area 69.6 70.0 69.9 -0.1 0.3
Rental RatesThe rental rates for serviced and non-serviced apartments in the CBD area were relatively stable. A minor adjustment occurred during the quarter mainly due to the correction of the rupiah value against the US dollar. On the other hand, some apartments in South Jakarta have renovated their units, causing rents to rise slightly.
During 4Q 2015, the average asking rental rate in the CBD was IDR361,290/sq m/month, moderately down by less than 1% compared to the previous quarter. The average asking rental rate in South Jakarta including the non-prime area was IDR221,310/sq m/month, which represents an increase of 4.2% compared to the previous quarter.
Source: Colliers International Indonesia - Research
Average Rental Rate of Apartment for Lease Based on Region
3q 2015 4q 2015 YoY CBD 362,471 361,290 -0.3%
South Jakarta (Inc. Non-Prime area) 212,478 221,310 4.2%
Based on our survey, most non-serviced apartments did not increase the rent in order to attract tenants, while several serviced apartment buildings, mostly those operated by international hotel chains, signalled an increase in the rental rate. We expect that the average rental rate will continue to increase in the years ahead, albeit at a slower pace compared to previous years. Yearly inflation adjustment is the most common reason that management will raise the rental rate next year, by 3 to 5%.
OutlookThe apartment sector remained firm during 2015 despite several factors that managed to slow growth over the past two years, including the regulation on LTV in 2013, a high interest rate and tax regulations. Currently, investors are generally opting to place their money into projects with a proven track record, a proven concept and a good location.
The middle-class projects are expected to face more headwinds next year compared to other classes as the impact of a slowing economy as well as tight competition among the under-construction projects is likely to weaken apartment absorption. Developers may cope with these drawbacks by offering more incentives, such as more installments (up to six years), balloon payments or other marketing gimmicks to attract potential investors.
However, brisker Indonesian economic activities are expected, likely in the second semester next year, given the following considerations: 1) the realisation of government spending is expected to increase, so that its contribution to economic growth will be more significant; and 2) the implementation of several economic packages is likely to make macroeconomic improvements.
Furthermore, some of the easing measures announced in the last quarter of 2015 including new luxury tax regulations, assignment of a special economic zone and the removal of double taxation for REIT transactions will probably take some time to start having a real positive impact on the market.
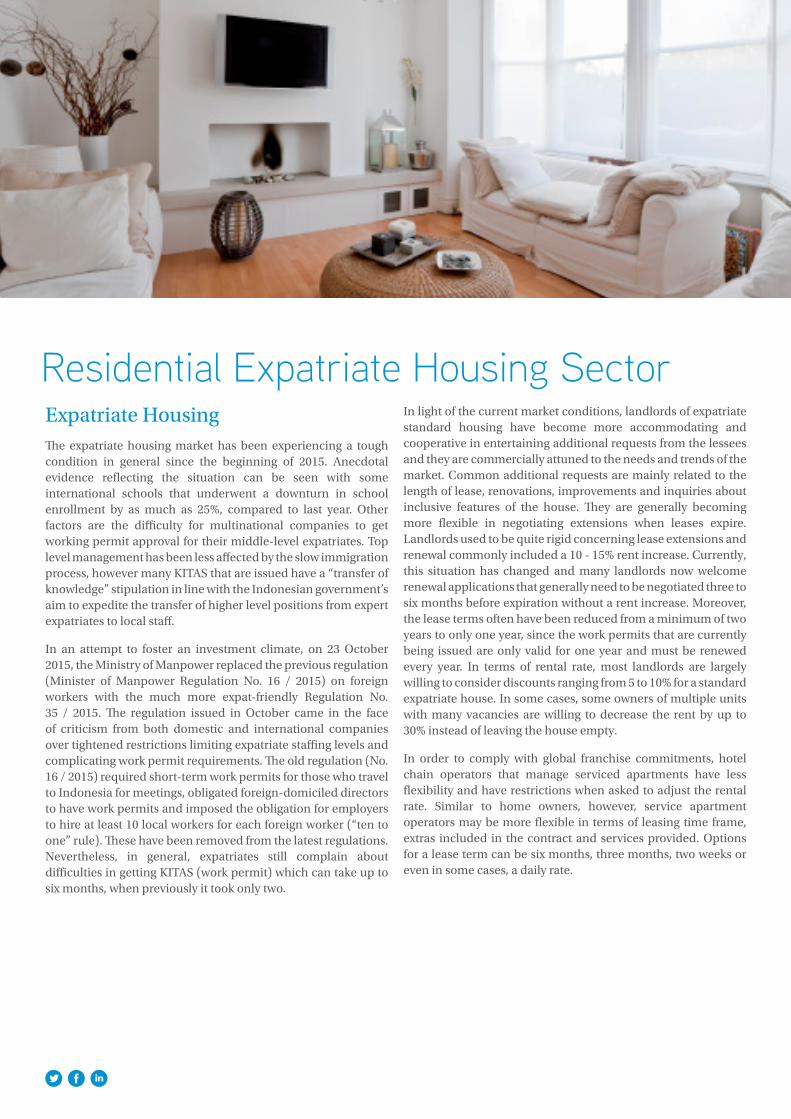
Residential Expatriate Housing SectorExpatriate HousingThe expatriate housing market has been experiencing a tough condition in general since the beginning of 2015. Anecdotal evidence reflecting the situation can be seen with some international schools that underwent a downturn in school enrollment by as much as 25%, compared to last year. Other factors are the difficulty for multinational companies to get working permit approval for their middle-level expatriates. Top level management has been less affected by the slow immigration process, however many KITAS that are issued have a “transfer of knowledge” stipulation in line with the Indonesian government’s aim to expedite the transfer of higher level positions from expert expatriates to local staff.
In an attempt to foster an investment climate, on 23 October 2015, the Ministry of Manpower replaced the previous regulation (Minister of Manpower Regulation No. 16 / 2015) on foreign workers with the much more expat-friendly Regulation No. 35 / 2015. The regulation issued in October came in the face of criticism from both domestic and international companies over tightened restrictions limiting expatriate staffing levels and complicating work permit requirements. The old regulation (No. 16 / 2015) required short-term work permits for those who travel to Indonesia for meetings, obligated foreign-domiciled directors to have work permits and imposed the obligation for employers to hire at least 10 local workers for each foreign worker (“ten to one” rule). These have been removed from the latest regulations. Nevertheless, in general, expatriates still complain about difficulties in getting KITAS (work permit) which can take up to six months, when previously it took only two.
In light of the current market conditions, landlords of expatriate standard housing have become more accommodating and cooperative in entertaining additional requests from the lessees and they are commercially attuned to the needs and trends of the market. Common additional requests are mainly related to the length of lease, renovations, improvements and inquiries about inclusive features of the house. They are generally becoming more flexible in negotiating extensions when leases expire. Landlords used to be quite rigid concerning lease extensions and renewal commonly included a 10 - 15% rent increase. Currently, this situation has changed and many landlords now welcome renewal applications that generally need to be negotiated three to six months before expiration without a rent increase. Moreover, the lease terms often have been reduced from a minimum of two years to only one year, since the work permits that are currently being issued are only valid for one year and must be renewed every year. In terms of rental rate, most landlords are largely willing to consider discounts ranging from 5 to 10% for a standard expatriate house. In some cases, some owners of multiple units with many vacancies are willing to decrease the rent by up to 30% instead of leaving the house empty.
In order to comply with global franchise commitments, hotel chain operators that manage serviced apartments have less flexibility and have restrictions when asked to adjust the rental rate. Similar to home owners, however, service apartment operators may be more flexible in terms of leasing time frame, extras included in the contract and services provided. Options for a lease term can be six months, three months, two weeks or even in some cases, a daily rate.
26 Research & Forecast Report | Q4 2015 | Apartment | Colliers International
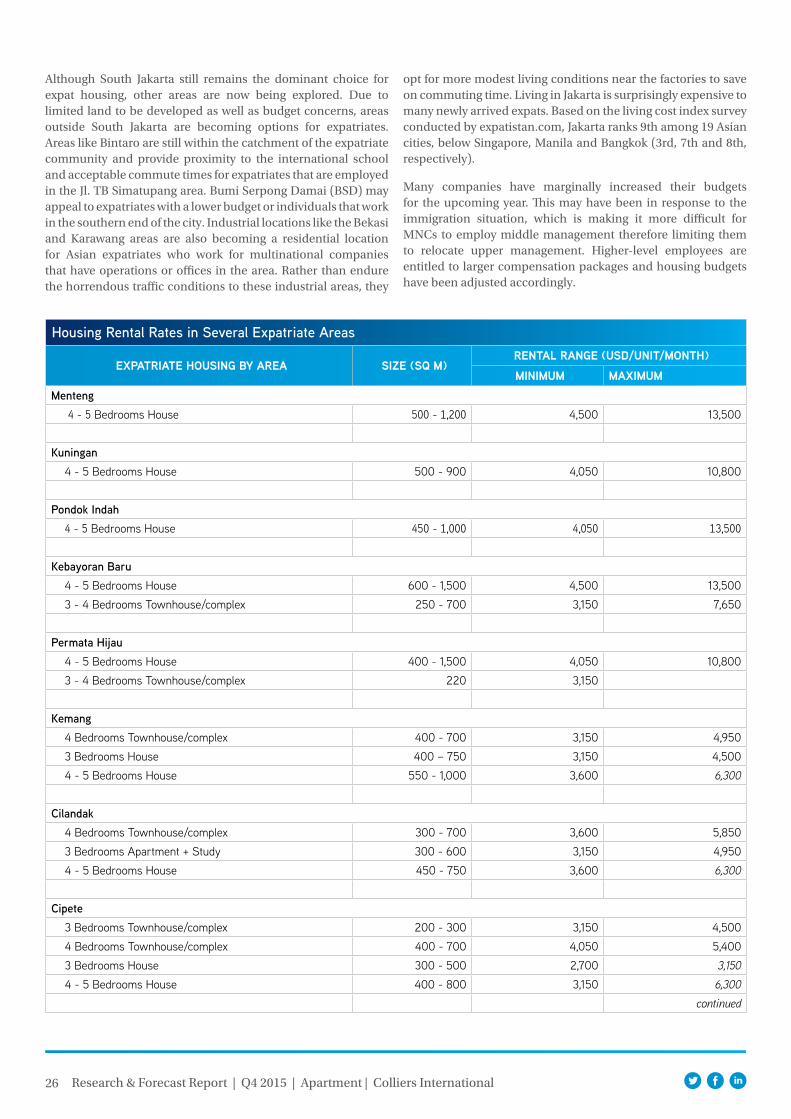
Housing Rental Rates in Several Expatriate Areas
eXPatriate hOuSing BY area Size (Sq m)rental range (uSd/unit/mOnth)minimum maXimum
Menteng 4 - 5 Bedrooms House 500 - 1,200 4,500 13,500
Kuningan 4 - 5 Bedrooms House 500 - 900 4,050 10,800
Pondok Indah 4 - 5 Bedrooms House 450 - 1,000 4,050 13,500
Kebayoran Baru 4 - 5 Bedrooms House 600 - 1,500 4,500 13,500 3 - 4 Bedrooms Townhouse/complex 250 - 700 3,150 7,650
Permata Hijau 4 - 5 Bedrooms House 400 - 1,500 4,050 10,800 3 - 4 Bedrooms Townhouse/complex 220 3,150
Kemang 4 Bedrooms Townhouse/complex 400 - 700 3,150 4,950 3 Bedrooms House 400 – 750 3,150 4,500 4 - 5 Bedrooms House 550 - 1,000 3,600 6,300
Cilandak 4 Bedrooms Townhouse/complex 300 - 700 3,600 5,850 3 Bedrooms Apartment + Study 300 - 600 3,150 4,950 4 - 5 Bedrooms House 450 - 750 3,600 6,300
Cipete 3 Bedrooms Townhouse/complex 200 - 300 3,150 4,500 4 Bedrooms Townhouse/complex 400 - 700 4,050 5,400 3 Bedrooms House 300 - 500 2,700 3,150 4 - 5 Bedrooms House 400 - 800 3,150 6,300
continued
Although South Jakarta still remains the dominant choice for expat housing, other areas are now being explored. Due to limited land to be developed as well as budget concerns, areas outside South Jakarta are becoming options for expatriates. Areas like Bintaro are still within the catchment of the expatriate community and provide proximity to the international school and acceptable commute times for expatriates that are employed in the Jl. TB Simatupang area. Bumi Serpong Damai (BSD) may appeal to expatriates with a lower budget or individuals that work in the southern end of the city. Industrial locations like the Bekasi and Karawang areas are also becoming a residential location for Asian expatriates who work for multinational companies that have operations or offices in the area. Rather than endure the horrendous traffic conditions to these industrial areas, they
opt for more modest living conditions near the factories to save on commuting time. Living in Jakarta is surprisingly expensive to many newly arrived expats. Based on the living cost index survey conducted by expatistan.com, Jakarta ranks 9th among 19 Asian cities, below Singapore, Manila and Bangkok (3rd, 7th and 8th, respectively).
Many companies have marginally increased their budgets for the upcoming year. This may have been in response to the immigration situation, which is making it more difficult for MNCs to employ middle management therefore limiting them to relocate upper management. Higher-level employees are entitled to larger compensation packages and housing budgets have been adjusted accordingly.
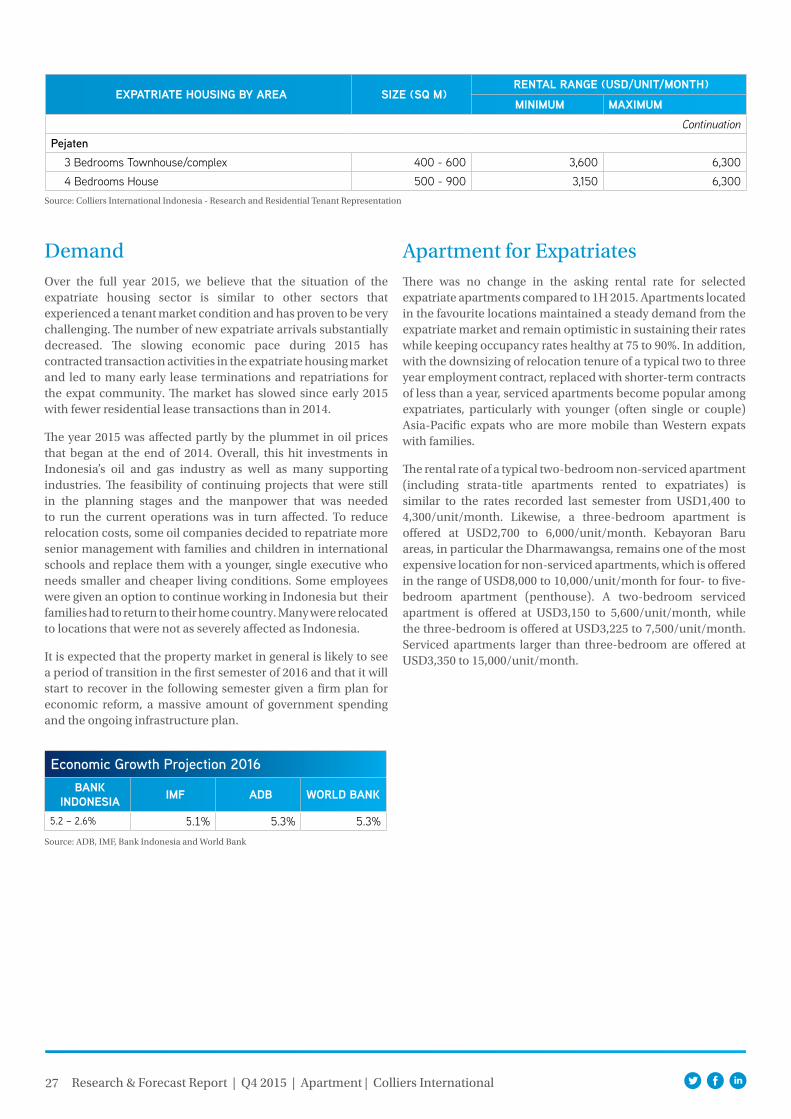
27 Research & Forecast Report | Q4 2015 | Apartment | Colliers International
Source: Colliers International Indonesia - Research and Residential Tenant Representation
eXPatriate hOuSing BY area Size (Sq m)rental range (uSd/unit/mOnth)minimum maXimum
ContinuationPejaten 3 Bedrooms Townhouse/complex 400 - 600 3,600 6,300 4 Bedrooms House 500 - 900 3,150 6,300
DemandOver the full year 2015, we believe that the situation of the expatriate housing sector is similar to other sectors that experienced a tenant market condition and has proven to be very challenging. The number of new expatriate arrivals substantially decreased. The slowing economic pace during 2015 has contracted transaction activities in the expatriate housing market and led to many early lease terminations and repatriations for the expat community. The market has slowed since early 2015 with fewer residential lease transactions than in 2014.
The year 2015 was affected partly by the plummet in oil prices that began at the end of 2014. Overall, this hit investments in Indonesia’s oil and gas industry as well as many supporting industries. The feasibility of continuing projects that were still in the planning stages and the manpower that was needed to run the current operations was in turn affected. To reduce relocation costs, some oil companies decided to repatriate more senior management with families and children in international schools and replace them with a younger, single executive who needs smaller and cheaper living conditions. Some employees were given an option to continue working in Indonesia but their families had to return to their home country. Many were relocated to locations that were not as severely affected as Indonesia.
It is expected that the property market in general is likely to see a period of transition in the first semester of 2016 and that it will start to recover in the following semester given a firm plan for economic reform, a massive amount of government spending and the ongoing infrastructure plan.
Economic Growth Projection 2016Bank
indOneSia imf adB WOrld Bank
5.2 – 2.6% 5.1% 5.3% 5.3%
Source: ADB, IMF, Bank Indonesia and World Bank
Apartment for ExpatriatesThere was no change in the asking rental rate for selected expatriate apartments compared to 1H 2015. Apartments located in the favourite locations maintained a steady demand from the expatriate market and remain optimistic in sustaining their rates while keeping occupancy rates healthy at 75 to 90%. In addition, with the downsizing of relocation tenure of a typical two to three year employment contract, replaced with shorter-term contracts of less than a year, serviced apartments become popular among expatriates, particularly with younger (often single or couple) Asia-Pacific expats who are more mobile than Western expats with families.
The rental rate of a typical two-bedroom non-serviced apartment (including strata-title apartments rented to expatriates) is similar to the rates recorded last semester from USD1,400 to 4,300/unit/month. Likewise, a three-bedroom apartment is offered at USD2,700 to 6,000/unit/month. Kebayoran Baru areas, in particular the Dharmawangsa, remains one of the most expensive location for non-serviced apartments, which is offered in the range of USD8,000 to 10,000/unit/month for four- to five-bedroom apartment (penthouse). A two-bedroom serviced apartment is offered at USD3,150 to 5,600/unit/month, while the three-bedroom is offered at USD3,225 to 7,500/unit/month. Serviced apartments larger than three-bedroom are offered at USD3,350 to 15,000/unit/month.
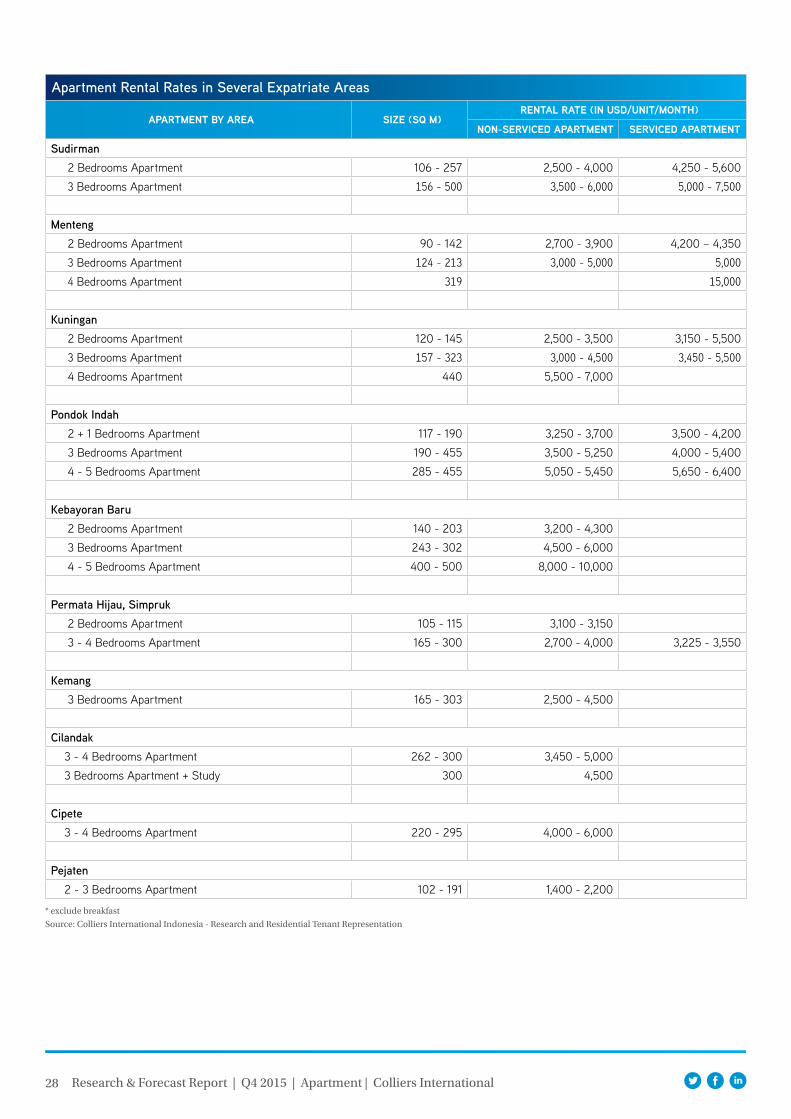
28 Research & Forecast Report | Q4 2015 | Apartment | Colliers International
Apartment Rental Rates in Several Expatriate Areas
aPartment BY area Size (Sq m)rental rate (in uSd/unit/mOnth)
nOn-Serviced aPartment Serviced aPartment
Sudirman 2 Bedrooms Apartment 106 - 257 2,500 - 4,000 4,250 - 5,600 3 Bedrooms Apartment 156 - 500 3,500 - 6,000 5,000 - 7,500
Menteng 2 Bedrooms Apartment 90 - 142 2,700 - 3,900 4,200 – 4,350 3 Bedrooms Apartment 124 - 213 3,000 - 5,000 5,000 4 Bedrooms Apartment 319 15,000
Kuningan 2 Bedrooms Apartment 120 - 145 2,500 - 3,500 3,150 - 5,500 3 Bedrooms Apartment 157 - 323 3,000 - 4,500 3,450 - 5,500 4 Bedrooms Apartment 440 5,500 - 7,000
Pondok Indah 2 + 1 Bedrooms Apartment 117 - 190 3,250 - 3,700 3,500 - 4,200 3 Bedrooms Apartment 190 - 455 3,500 - 5,250 4,000 - 5,400 4 - 5 Bedrooms Apartment 285 - 455 5,050 - 5,450 5,650 - 6,400
Kebayoran Baru 2 Bedrooms Apartment 140 - 203 3,200 - 4,300 3 Bedrooms Apartment 243 - 302 4,500 - 6,000 4 - 5 Bedrooms Apartment 400 - 500 8,000 - 10,000
Permata Hijau, Simpruk 2 Bedrooms Apartment 105 - 115 3,100 - 3,150 3 - 4 Bedrooms Apartment 165 - 300 2,700 - 4,000 3,225 - 3,550
Kemang 3 Bedrooms Apartment 165 - 303 2,500 - 4,500
Cilandak 3 - 4 Bedrooms Apartment 262 - 300 3,450 - 5,000 3 Bedrooms Apartment + Study 300 4,500
Cipete 3 - 4 Bedrooms Apartment 220 - 295 4,000 - 6,000
Pejaten 2 - 3 Bedrooms Apartment 102 - 191 1,400 - 2,200
* exclude breakfast
Source: Colliers International Indonesia - Research and Residential Tenant Representation
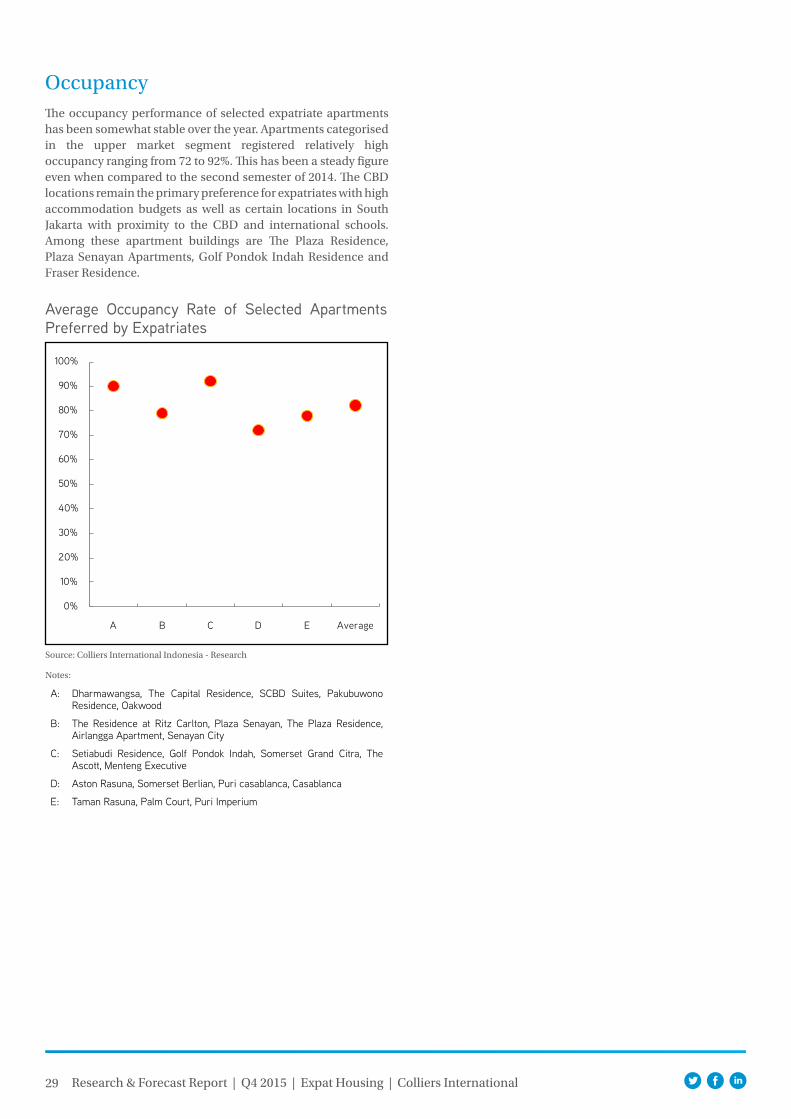
29 Research & Forecast Report | Q4 2015 | Expat Housing | Colliers International
OccupancyThe occupancy performance of selected expatriate apartments has been somewhat stable over the year. Apartments categorised in the upper market segment registered relatively high occupancy ranging from 72 to 92%. This has been a steady figure even when compared to the second semester of 2014. The CBD locations remain the primary preference for expatriates with high accommodation budgets as well as certain locations in South Jakarta with proximity to the CBD and international schools. Among these apartment buildings are The Plaza Residence, Plaza Senayan Apartments, Golf Pondok Indah Residence and Fraser Residence.
Average Occupancy Rate of Selected Apartments Preferred by Expatriates
Source: Colliers International Indonesia - Research
Notes:
A: Dharmawangsa, The Capital Residence, SCBD Suites, Pakubuwono Residence, Oakwood
B: The Residence at Ritz Carlton, Plaza Senayan, The Plaza Residence, Airlangga Apartment, Senayan City
C: Setiabudi Residence, Golf Pondok Indah, Somerset Grand Citra, The Ascott, Menteng Executive
D: Aston Rasuna, Somerset Berlian, Puri casablanca, Casablanca
E: Taman Rasuna, Palm Court, Puri Imperium
0%
10%
20%
30%
40%
50%
60%
70%
80%
90%
100%
A B C D E Average
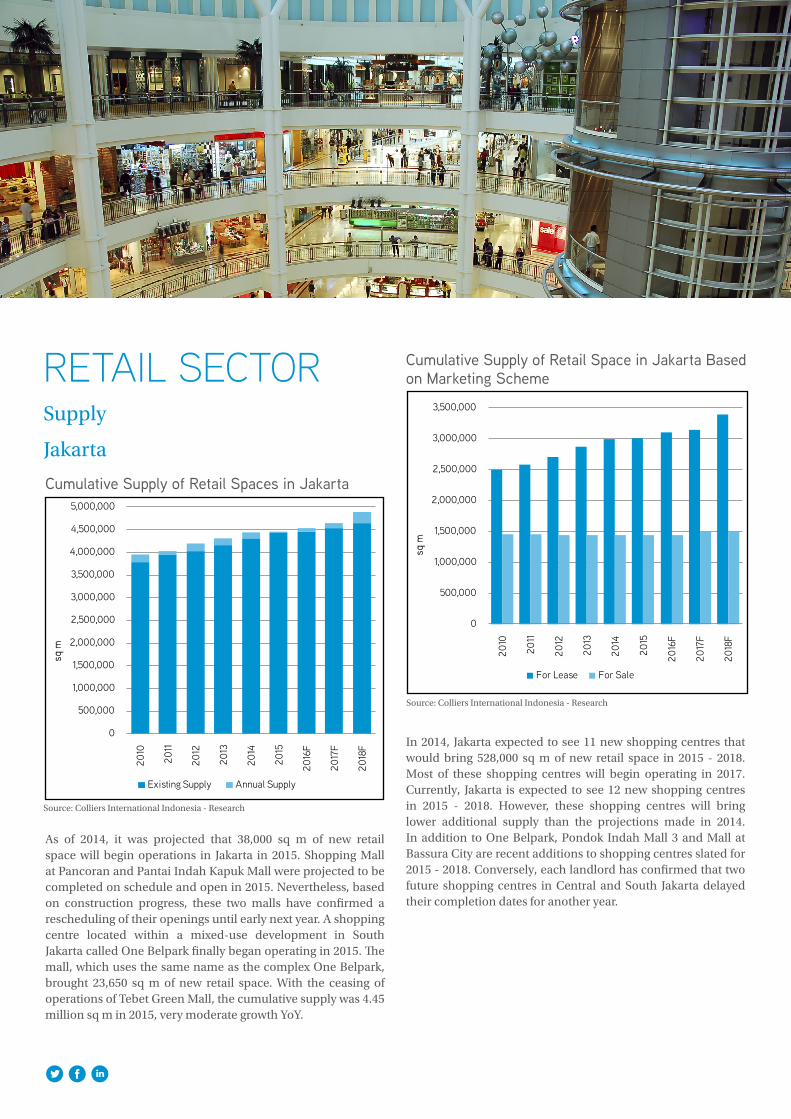
Supply
Jakarta
Cumulative Supply of Retail Spaces in Jakarta
Source: Colliers International Indonesia - Research
RETAIL SECTOR Cumulative Supply of Retail Space in Jakarta Based on Marketing Scheme
Source: Colliers International Indonesia - Research
As of 2014, it was projected that 38,000 sq m of new retail space will begin operations in Jakarta in 2015. Shopping Mall at Pancoran and Pantai Indah Kapuk Mall were projected to be completed on schedule and open in 2015. Nevertheless, based on construction progress, these two malls have confirmed a rescheduling of their openings until early next year. A shopping centre located within a mixed-use development in South Jakarta called One Belpark finally began operating in 2015. The mall, which uses the same name as the complex One Belpark, brought 23,650 sq m of new retail space. With the ceasing of operations of Tebet Green Mall, the cumulative supply was 4.45 million sq m in 2015, very moderate growth YoY.
In 2014, Jakarta expected to see 11 new shopping centres that would bring 528,000 sq m of new retail space in 2015 - 2018. Most of these shopping centres will begin operating in 2017. Currently, Jakarta is expected to see 12 new shopping centres in 2015 - 2018. However, these shopping centres will bring lower additional supply than the projections made in 2014. In addition to One Belpark, Pondok Indah Mall 3 and Mall at Bassura City are recent additions to shopping centres slated for 2015 - 2018. Conversely, each landlord has confirmed that two future shopping centres in Central and South Jakarta delayed their completion dates for another year.
0
500,000
1,000,000
1,500,000
2,000,000
2,500,000
3,000,000
3,500,000
4,000,000
4,500,000
5,000,000
2010
2011
2012
2013
2014
2015
2016
F
2017
F
2018
F
sq m
Existing Supply Annual Supply
0
500,000
1,000,000
1,500,000
2,000,000
2,500,000
3,000,000
3,500,000
2010
2011
2012
2013
2014
2015
2016
F
2017
F
2018
F
sq m
For Lease For Sale
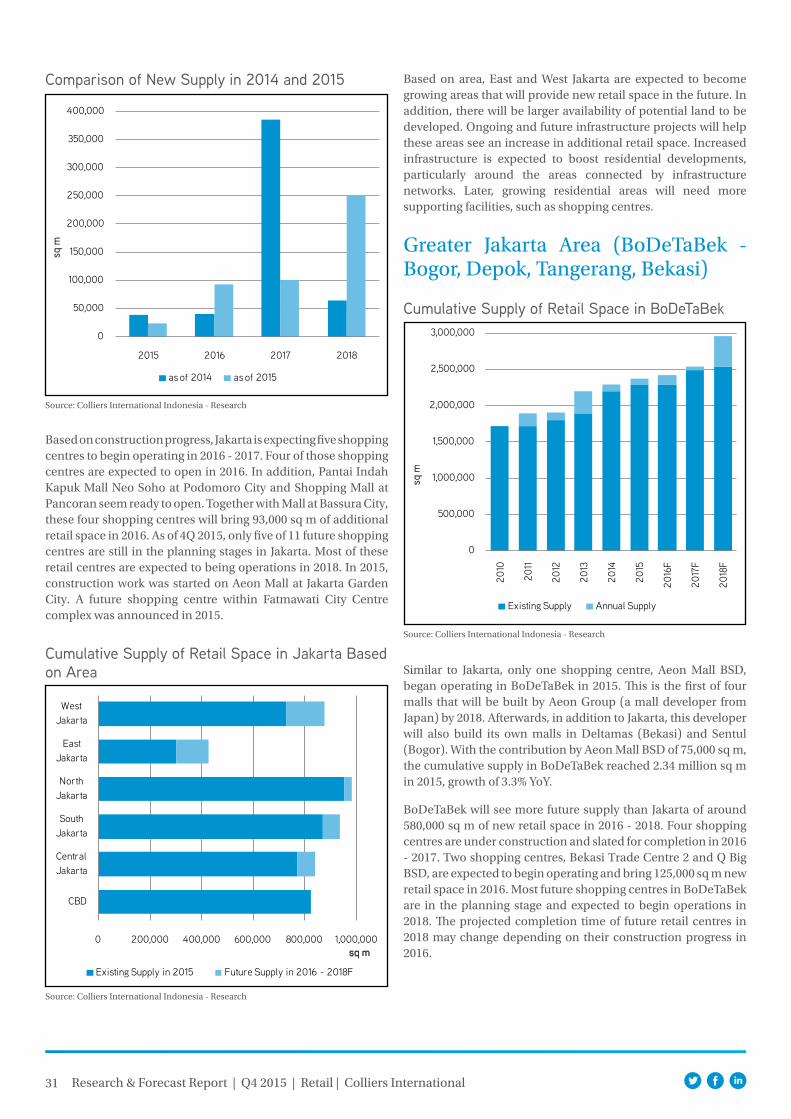
31 Research & Forecast Report | Q4 2015 | Retail | Colliers International
Comparison of New Supply in 2014 and 2015
Source: Colliers International Indonesia - Research
0
50,000
100,000
150,000
200,000
250,000
300,000
350,000
400,000
2015 2016 2017 2018
sq m
as of 2014 as of 2015
Based on construction progress, Jakarta is expecting five shopping centres to begin operating in 2016 - 2017. Four of those shopping centres are expected to open in 2016. In addition, Pantai Indah Kapuk Mall Neo Soho at Podomoro City and Shopping Mall at Pancoran seem ready to open. Together with Mall at Bassura City, these four shopping centres will bring 93,000 sq m of additional retail space in 2016. As of 4Q 2015, only five of 11 future shopping centres are still in the planning stages in Jakarta. Most of these retail centres are expected to being operations in 2018. In 2015, construction work was started on Aeon Mall at Jakarta Garden City. A future shopping centre within Fatmawati City Centre complex was announced in 2015.
Based on area, East and West Jakarta are expected to become growing areas that will provide new retail space in the future. In addition, there will be larger availability of potential land to be developed. Ongoing and future infrastructure projects will help these areas see an increase in additional retail space. Increased infrastructure is expected to boost residential developments, particularly around the areas connected by infrastructure networks. Later, growing residential areas will need more supporting facilities, such as shopping centres.
Cumulative Supply of Retail Space in Jakarta Based on Area
Source: Colliers International Indonesia - Research
0 200,000 400,000 600,000 800,000 1,000,000
CBD
Central Jakarta
South Jakarta
North Jakarta
East Jakarta
West Jakarta
sq m
Existing Supply in 2015 Future Supply in 2016 - 2018F
Greater Jakarta Area (BoDeTaBek - Bogor, Depok, Tangerang, Bekasi)
Cumulative Supply of Retail Space in BoDeTaBek
Source: Colliers International Indonesia - Research
Similar to Jakarta, only one shopping centre, Aeon Mall BSD, began operating in BoDeTaBek in 2015. This is the first of four malls that will be built by Aeon Group (a mall developer from Japan) by 2018. Afterwards, in addition to Jakarta, this developer will also build its own malls in Deltamas (Bekasi) and Sentul (Bogor). With the contribution by Aeon Mall BSD of 75,000 sq m, the cumulative supply in BoDeTaBek reached 2.34 million sq m in 2015, growth of 3.3% YoY.
BoDeTaBek will see more future supply than Jakarta of around 580,000 sq m of new retail space in 2016 - 2018. Four shopping centres are under construction and slated for completion in 2016 - 2017. Two shopping centres, Bekasi Trade Centre 2 and Q Big BSD, are expected to begin operating and bring 125,000 sq m new retail space in 2016. Most future shopping centres in BoDeTaBek are in the planning stage and expected to begin operations in 2018. The projected completion time of future retail centres in 2018 may change depending on their construction progress in 2016.
0
500,000
1,000,000
1,500,000
2,000,000
2,500,000
3,000,000
2010
2011
2012
2013
2014
2015
2016
F
2017
F
2018
F
sq m
Existing Supply Annual Supply
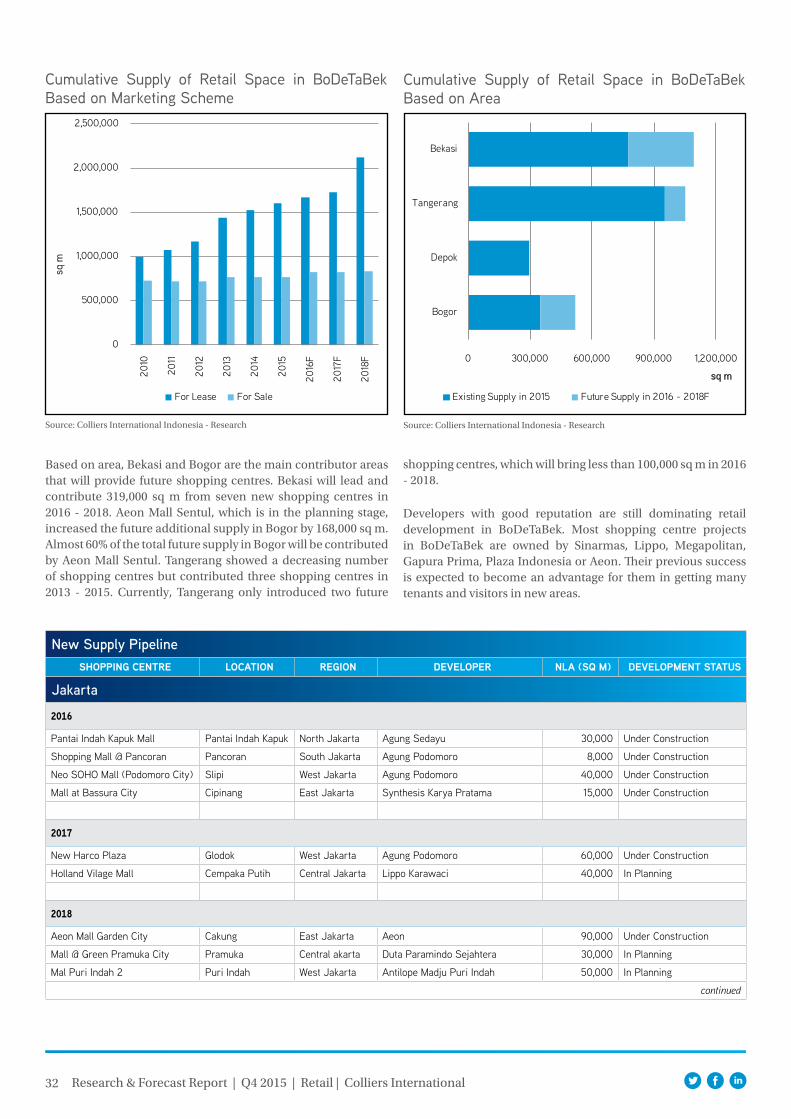
32 Research & Forecast Report | Q4 2015 | Retail | Colliers International
Cumulative Supply of Retail Space in BoDeTaBek Based on Marketing Scheme
Source: Colliers International Indonesia - Research
Based on area, Bekasi and Bogor are the main contributor areas that will provide future shopping centres. Bekasi will lead and contribute 319,000 sq m from seven new shopping centres in 2016 - 2018. Aeon Mall Sentul, which is in the planning stage, increased the future additional supply in Bogor by 168,000 sq m. Almost 60% of the total future supply in Bogor will be contributed by Aeon Mall Sentul. Tangerang showed a decreasing number of shopping centres but contributed three shopping centres in 2013 - 2015. Currently, Tangerang only introduced two future
Cumulative Supply of Retail Space in BoDeTaBek Based on Area
Source: Colliers International Indonesia - Research
0
500,000
1,000,000
1,500,000
2,000,000
2,500,000
2010
2011
2012
2013
2014
2015
2016
F
2017
F
2018
F
sq m
For Lease For Sale
0 300,000 600,000 900,000 1,200,000
Bogor
Depok
Tangerang
Bekasi
sq m
Existing Supply in 2015 Future Supply in 2016 - 2018F
shopping centres, which will bring less than 100,000 sq m in 2016 - 2018.
Developers with good reputation are still dominating retail development in BoDeTaBek. Most shopping centre projects in BoDeTaBek are owned by Sinarmas, Lippo, Megapolitan, Gapura Prima, Plaza Indonesia or Aeon. Their previous success is expected to become an advantage for them in getting many tenants and visitors in new areas.
New Supply PipelineShOPPing centre lOcatiOn regiOn develOPer nla (Sq m) develOPment StatuS
Jakarta
2016
Pantai Indah Kapuk Mall Pantai Indah Kapuk North Jakarta Agung Sedayu 30,000 Under Construction
Shopping Mall @ Pancoran Pancoran South Jakarta Agung Podomoro 8,000 Under Construction
Neo SOHO Mall (Podomoro City) Slipi West Jakarta Agung Podomoro 40,000 Under Construction
Mall at Bassura City Cipinang East Jakarta Synthesis Karya Pratama 15,000 Under Construction
2017
New Harco Plaza Glodok West Jakarta Agung Podomoro 60,000 Under Construction
Holland Vilage Mall Cempaka Putih Central Jakarta Lippo Karawaci 40,000 In Planning
2018
Aeon Mall Garden City Cakung East Jakarta Aeon 90,000 Under Construction
Mall @ Green Pramuka City Pramuka Central akarta Duta Paramindo Sejahtera 30,000 In Planning
Mal Puri Indah 2 Puri Indah West Jakarta Antilope Madju Puri Indah 50,000 In Planning
continued
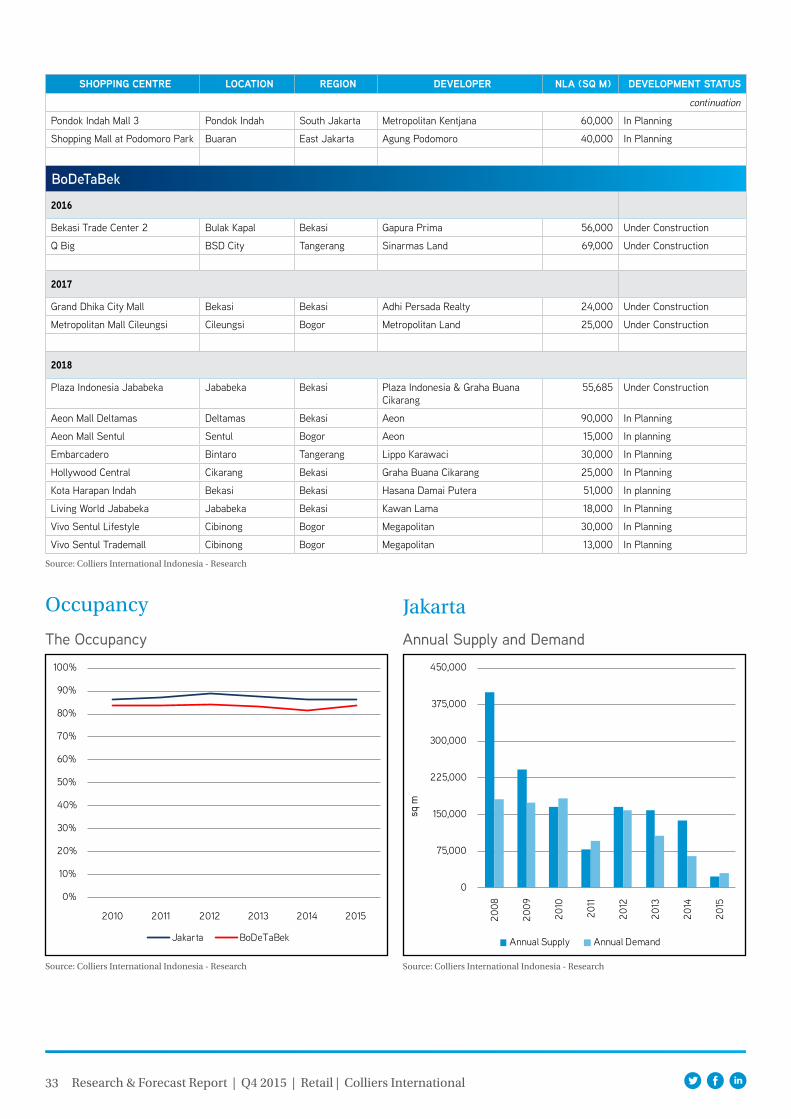
33 Research & Forecast Report | Q4 2015 | Retail | Colliers International
ShOPPing centre lOcatiOn regiOn develOPer nla (Sq m) develOPment StatuS
continuation
Pondok Indah Mall 3 Pondok Indah South Jakarta Metropolitan Kentjana 60,000 In Planning
Shopping Mall at Podomoro Park Buaran East Jakarta Agung Podomoro 40,000 In Planning
BoDeTaBek
2016
Bekasi Trade Center 2 Bulak Kapal Bekasi Gapura Prima 56,000 Under Construction
Q Big BSD City Tangerang Sinarmas Land 69,000 Under Construction
2017
Grand Dhika City Mall Bekasi Bekasi Adhi Persada Realty 24,000 Under Construction
Metropolitan Mall Cileungsi Cileungsi Bogor Metropolitan Land 25,000 Under Construction
2018
Plaza Indonesia Jababeka Jababeka Bekasi Plaza Indonesia & Graha Buana Cikarang
55,685 Under Construction
Aeon Mall Deltamas Deltamas Bekasi Aeon 90,000 In Planning
Aeon Mall Sentul Sentul Bogor Aeon 15,000 In planning
Embarcadero Bintaro Tangerang Lippo Karawaci 30,000 In Planning
Hollywood Central Cikarang Bekasi Graha Buana Cikarang 25,000 In Planning
Kota Harapan Indah Bekasi Bekasi Hasana Damai Putera 51,000 In planning
Living World Jababeka Jababeka Bekasi Kawan Lama 18,000 In Planning
Vivo Sentul Lifestyle Cibinong Bogor Megapolitan 30,000 In Planning
Vivo Sentul Trademall Cibinong Bogor Megapolitan 13,000 In Planning
Source: Colliers International Indonesia - Research
Occupancy
The Occupancy
Source: Colliers International Indonesia - Research
0%
10%
20%
30%
40%
50%
60%
70%
80%
90%
100%
2010 2011 2012 2013 2014 2015
Jakarta BoDeTaBek
Annual Supply and Demand
Source: Colliers International Indonesia - Research
0
75,000
150,000
225,000
300,000
375,000
450,000
2008
2009
2010
2011
2012
2013
2014
2015
sq m
Annual Supply Annual Demand
Jakarta
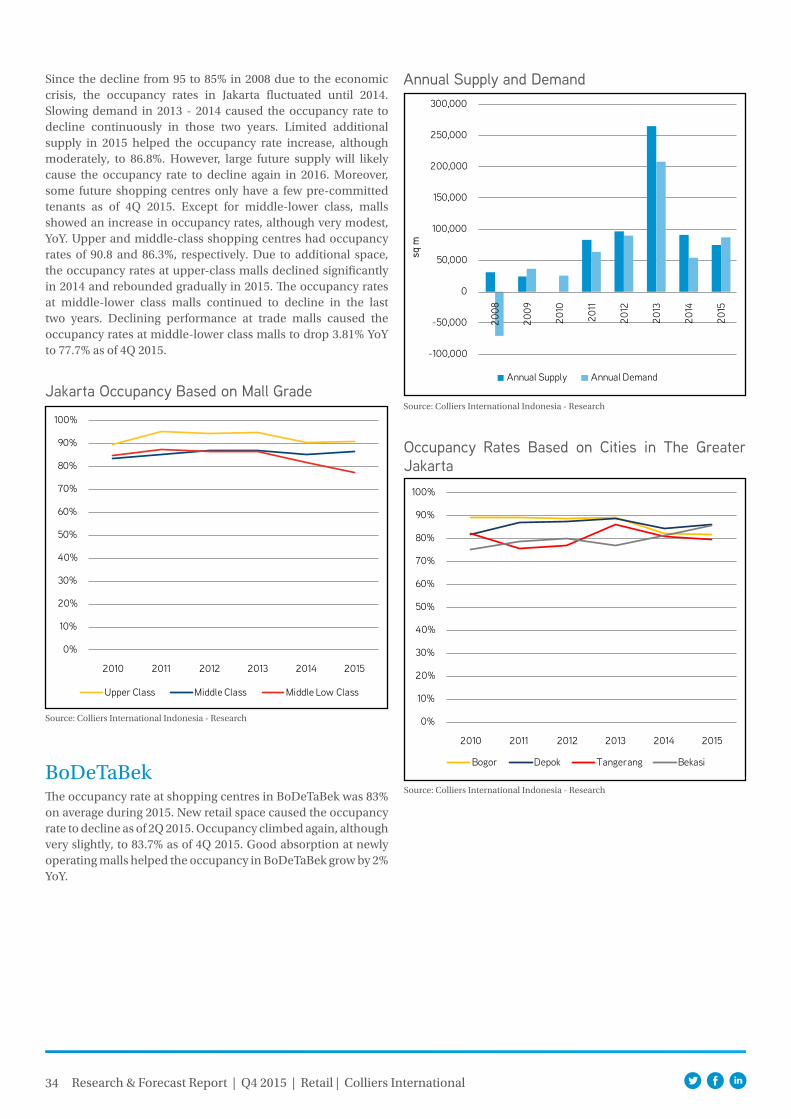
34 Research & Forecast Report | Q4 2015 | Retail | Colliers International
Jakarta Occupancy Based on Mall Grade
Source: Colliers International Indonesia - Research
Since the decline from 95 to 85% in 2008 due to the economic crisis, the occupancy rates in Jakarta fluctuated until 2014. Slowing demand in 2013 - 2014 caused the occupancy rate to decline continuously in those two years. Limited additional supply in 2015 helped the occupancy rate increase, although moderately, to 86.8%. However, large future supply will likely cause the occupancy rate to decline again in 2016. Moreover, some future shopping centres only have a few pre-committed tenants as of 4Q 2015. Except for middle-lower class, malls showed an increase in occupancy rates, although very modest, YoY. Upper and middle-class shopping centres had occupancy rates of 90.8 and 86.3%, respectively. Due to additional space, the occupancy rates at upper-class malls declined significantly in 2014 and rebounded gradually in 2015. The occupancy rates at middle-lower class malls continued to decline in the last two years. Declining performance at trade malls caused the occupancy rates at middle-lower class malls to drop 3.81% YoY to 77.7% as of 4Q 2015.
0%
10%
20%
30%
40%
50%
60%
70%
80%
90%
100%
2010 2011 2012 2013 2014 2015
Upper Class Middle Class Middle Low Class
Annual Supply and Demand
Source: Colliers International Indonesia - Research
BoDeTaBek
-100,000
-50,000
0
50,000
100,000
150,000
200,000
250,000
300,000
2008
2009
2010
2011
2012
2013
2014
2015
sq m
Annual Supply Annual Demand
The occupancy rate at shopping centres in BoDeTaBek was 83% on average during 2015. New retail space caused the occupancy rate to decline as of 2Q 2015. Occupancy climbed again, although very slightly, to 83.7% as of 4Q 2015. Good absorption at newly operating malls helped the occupancy in BoDeTaBek grow by 2% YoY.
Occupancy Rates Based on Cities in The Greater Jakarta
Source: Colliers International Indonesia - Research
0%
10%
20%
30%
40%
50%
60%
70%
80%
90%
100%
2010 2011 2012 2013 2014 2015
Bogor Depok Tangerang Bekasi
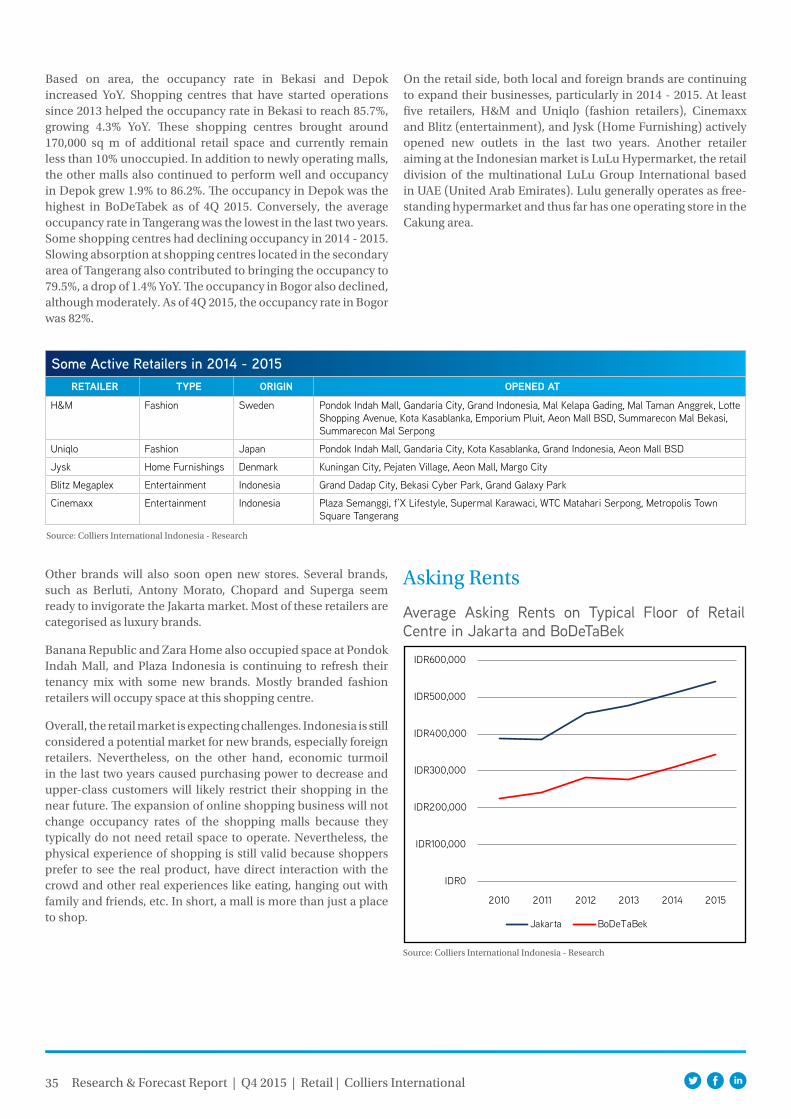
35 Research & Forecast Report | Q4 2015 | Retail | Colliers International
Based on area, the occupancy rate in Bekasi and Depok increased YoY. Shopping centres that have started operations since 2013 helped the occupancy rate in Bekasi to reach 85.7%, growing 4.3% YoY. These shopping centres brought around 170,000 sq m of additional retail space and currently remain less than 10% unoccupied. In addition to newly operating malls, the other malls also continued to perform well and occupancy in Depok grew 1.9% to 86.2%. The occupancy in Depok was the highest in BoDeTabek as of 4Q 2015. Conversely, the average occupancy rate in Tangerang was the lowest in the last two years. Some shopping centres had declining occupancy in 2014 - 2015. Slowing absorption at shopping centres located in the secondary area of Tangerang also contributed to bringing the occupancy to 79.5%, a drop of 1.4% YoY. The occupancy in Bogor also declined, although moderately. As of 4Q 2015, the occupancy rate in Bogor was 82%.
Some Active Retailers in 2014 - 2015retailer tYPe Origin OPened at
H&M Fashion Sweden Pondok Indah Mall, Gandaria City, Grand Indonesia, Mal Kelapa Gading, Mal Taman Anggrek, Lotte Shopping Avenue, Kota Kasablanka, Emporium Pluit, Aeon Mall BSD, Summarecon Mal Bekasi, Summarecon Mal Serpong
Uniqlo Fashion Japan Pondok Indah Mall, Gandaria City, Kota Kasablanka, Grand Indonesia, Aeon Mall BSD
Jysk Home Furnishings Denmark Kuningan City, Pejaten Village, Aeon Mall, Margo City
Blitz Megaplex Entertainment Indonesia Grand Dadap City, Bekasi Cyber Park, Grand Galaxy Park
Cinemaxx Entertainment Indonesia Plaza Semanggi, f’X Lifestyle, Supermal Karawaci, WTC Matahari Serpong, Metropolis Town Square Tangerang
Source: Colliers International Indonesia - Research
Other brands will also soon open new stores. Several brands, such as Berluti, Antony Morato, Chopard and Superga seem ready to invigorate the Jakarta market. Most of these retailers are categorised as luxury brands.
Banana Republic and Zara Home also occupied space at Pondok Indah Mall, and Plaza Indonesia is continuing to refresh their tenancy mix with some new brands. Mostly branded fashion retailers will occupy space at this shopping centre.
Overall, the retail market is expecting challenges. Indonesia is still considered a potential market for new brands, especially foreign retailers. Nevertheless, on the other hand, economic turmoil in the last two years caused purchasing power to decrease and upper-class customers will likely restrict their shopping in the near future. The expansion of online shopping business will not change occupancy rates of the shopping malls because they typically do not need retail space to operate. Nevertheless, the physical experience of shopping is still valid because shoppers prefer to see the real product, have direct interaction with the crowd and other real experiences like eating, hanging out with family and friends, etc. In short, a mall is more than just a place to shop.
On the retail side, both local and foreign brands are continuing to expand their businesses, particularly in 2014 - 2015. At least five retailers, H&M and Uniqlo (fashion retailers), Cinemaxx and Blitz (entertainment), and Jysk (Home Furnishing) actively opened new outlets in the last two years. Another retailer aiming at the Indonesian market is LuLu Hypermarket, the retail division of the multinational LuLu Group International based in UAE (United Arab Emirates). Lulu generally operates as free-standing hypermarket and thus far has one operating store in the Cakung area.
Asking Rents
Average Asking Rents on Typical Floor of Retail Centre in Jakarta and BoDeTaBek
Source: Colliers International Indonesia - Research
IDR0
IDR100,000
IDR200,000
IDR300,000
IDR400,000
IDR500,000
IDR600,000
2010 2011 2012 2013 2014 2015
Jakarta BoDeTaBek
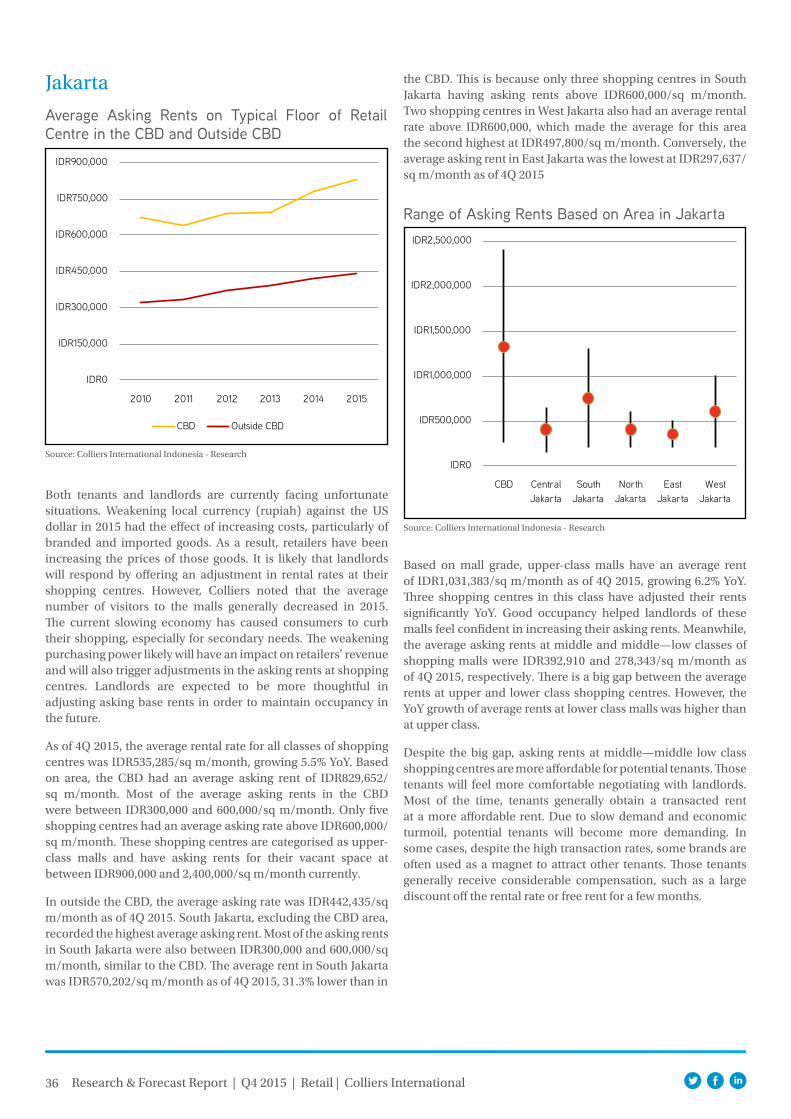
36 Research & Forecast Report | Q4 2015 | Retail | Colliers International
Average Asking Rents on Typical Floor of Retail Centre in the CBD and Outside CBD
Source: Colliers International Indonesia - Research
Jakarta
IDR0
IDR150,000
IDR300,000
IDR450,000
IDR600,000
IDR750,000
IDR900,000
2010 2011 2012 2013 2014 2015
CBD Outside CBD
the CBD. This is because only three shopping centres in South Jakarta having asking rents above IDR600,000/sq m/month. Two shopping centres in West Jakarta also had an average rental rate above IDR600,000, which made the average for this area the second highest at IDR497,800/sq m/month. Conversely, the average asking rent in East Jakarta was the lowest at IDR297,637/sq m/month as of 4Q 2015
Both tenants and landlords are currently facing unfortunate situations. Weakening local currency (rupiah) against the US dollar in 2015 had the effect of increasing costs, particularly of branded and imported goods. As a result, retailers have been increasing the prices of those goods. It is likely that landlords will respond by offering an adjustment in rental rates at their shopping centres. However, Colliers noted that the average number of visitors to the malls generally decreased in 2015. The current slowing economy has caused consumers to curb their shopping, especially for secondary needs. The weakening purchasing power likely will have an impact on retailers’ revenue and will also trigger adjustments in the asking rents at shopping centres. Landlords are expected to be more thoughtful in adjusting asking base rents in order to maintain occupancy in the future.
As of 4Q 2015, the average rental rate for all classes of shopping centres was IDR535,285/sq m/month, growing 5.5% YoY. Based on area, the CBD had an average asking rent of IDR829,652/sq m/month. Most of the average asking rents in the CBD were between IDR300,000 and 600,000/sq m/month. Only five shopping centres had an average asking rate above IDR600,000/sq m/month. These shopping centres are categorised as upper-class malls and have asking rents for their vacant space at between IDR900,000 and 2,400,000/sq m/month currently.
In outside the CBD, the average asking rate was IDR442,435/sq m/month as of 4Q 2015. South Jakarta, excluding the CBD area, recorded the highest average asking rent. Most of the asking rents in South Jakarta were also between IDR300,000 and 600,000/sq m/month, similar to the CBD. The average rent in South Jakarta was IDR570,202/sq m/month as of 4Q 2015, 31.3% lower than in
Range of Asking Rents Based on Area in Jakarta
Source: Colliers International Indonesia - Research
Based on mall grade, upper-class malls have an average rent of IDR1,031,383/sq m/month as of 4Q 2015, growing 6.2% YoY. Three shopping centres in this class have adjusted their rents significantly YoY. Good occupancy helped landlords of these malls feel confident in increasing their asking rents. Meanwhile, the average asking rents at middle and middle—low classes of shopping malls were IDR392,910 and 278,343/sq m/month as of 4Q 2015, respectively. There is a big gap between the average rents at upper and lower class shopping centres. However, the YoY growth of average rents at lower class malls was higher than at upper class.
Despite the big gap, asking rents at middle—middle low class shopping centres are more affordable for potential tenants. Those tenants will feel more comfortable negotiating with landlords. Most of the time, tenants generally obtain a transacted rent at a more affordable rent. Due to slow demand and economic turmoil, potential tenants will become more demanding. In some cases, despite the high transaction rates, some brands are often used as a magnet to attract other tenants. Those tenants generally receive considerable compensation, such as a large discount off the rental rate or free rent for a few months.
IDR0
IDR500,000
IDR1,000,000
IDR1,500,000
IDR2,000,000
IDR2,500,000
CBD Central Jakarta
South Jakarta
North Jakarta
East Jakarta
West Jakarta
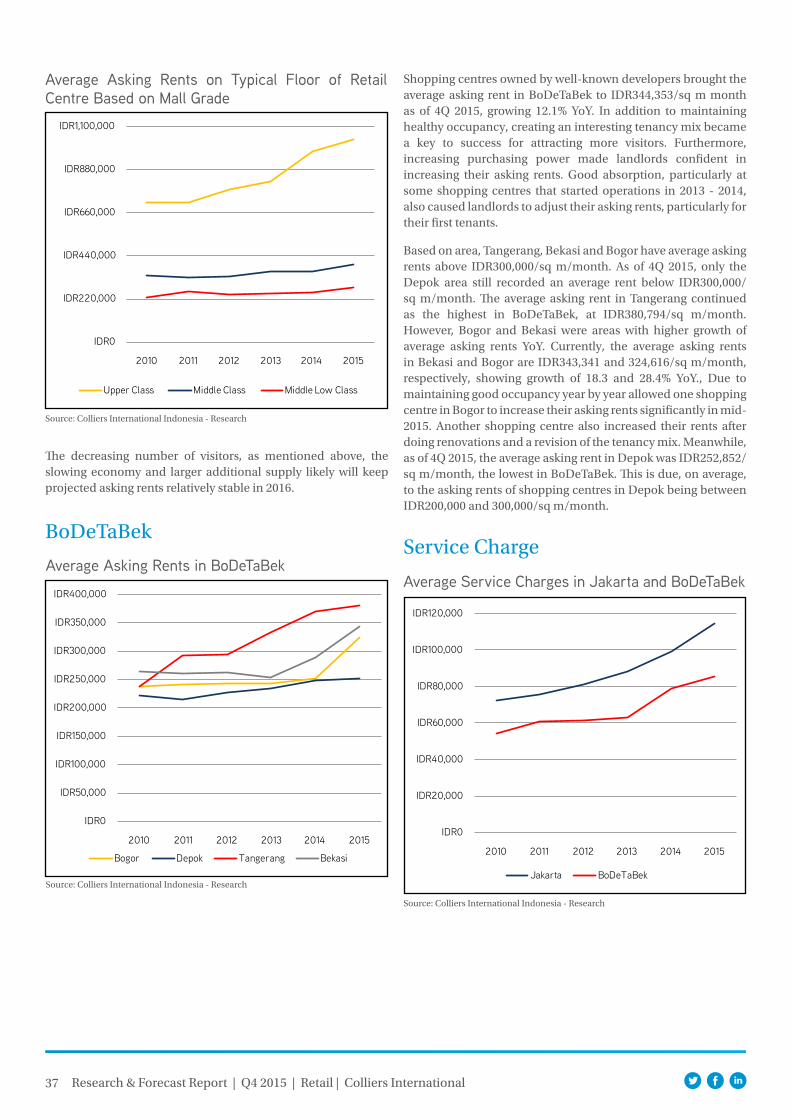
37 Research & Forecast Report | Q4 2015 | Retail | Colliers International
Average Asking Rents on Typical Floor of Retail Centre Based on Mall Grade
Source: Colliers International Indonesia - Research
The decreasing number of visitors, as mentioned above, the slowing economy and larger additional supply likely will keep projected asking rents relatively stable in 2016.
Average Asking Rents in BoDeTaBek
Source: Colliers International Indonesia - Research
IDR0
IDR220,000
IDR440,000
IDR660,000
IDR880,000
IDR1,100,000
2010 2011 2012 2013 2014 2015
Upper Class Middle Class Middle Low Class
BoDeTaBek
IDR0
IDR50,000
IDR100,000
IDR150,000
IDR200,000
IDR250,000
IDR300,000
IDR350,000
IDR400,000
2010 2011 2012 2013 2014 2015
Bogor Depok Tangerang Bekasi
Shopping centres owned by well-known developers brought the average asking rent in BoDeTaBek to IDR344,353/sq m month as of 4Q 2015, growing 12.1% YoY. In addition to maintaining healthy occupancy, creating an interesting tenancy mix became a key to success for attracting more visitors. Furthermore, increasing purchasing power made landlords confident in increasing their asking rents. Good absorption, particularly at some shopping centres that started operations in 2013 - 2014, also caused landlords to adjust their asking rents, particularly for their first tenants.
Based on area, Tangerang, Bekasi and Bogor have average asking rents above IDR300,000/sq m/month. As of 4Q 2015, only the Depok area still recorded an average rent below IDR300,000/sq m/month. The average asking rent in Tangerang continued as the highest in BoDeTaBek, at IDR380,794/sq m/month. However, Bogor and Bekasi were areas with higher growth of average asking rents YoY. Currently, the average asking rents in Bekasi and Bogor are IDR343,341 and 324,616/sq m/month, respectively, showing growth of 18.3 and 28.4% YoY., Due to maintaining good occupancy year by year allowed one shopping centre in Bogor to increase their asking rents significantly in mid-2015. Another shopping centre also increased their rents after doing renovations and a revision of the tenancy mix. Meanwhile, as of 4Q 2015, the average asking rent in Depok was IDR252,852/sq m/month, the lowest in BoDeTaBek. This is due, on average, to the asking rents of shopping centres in Depok being between IDR200,000 and 300,000/sq m/month.
Service Charge
Average Service Charges in Jakarta and BoDeTaBek
Source: Colliers International Indonesia - Research
IDR0
IDR20,000
IDR40,000
IDR60,000
IDR80,000
IDR100,000
IDR120,000
2010 2011 2012 2013 2014 2015
Jakarta BoDeTaBek
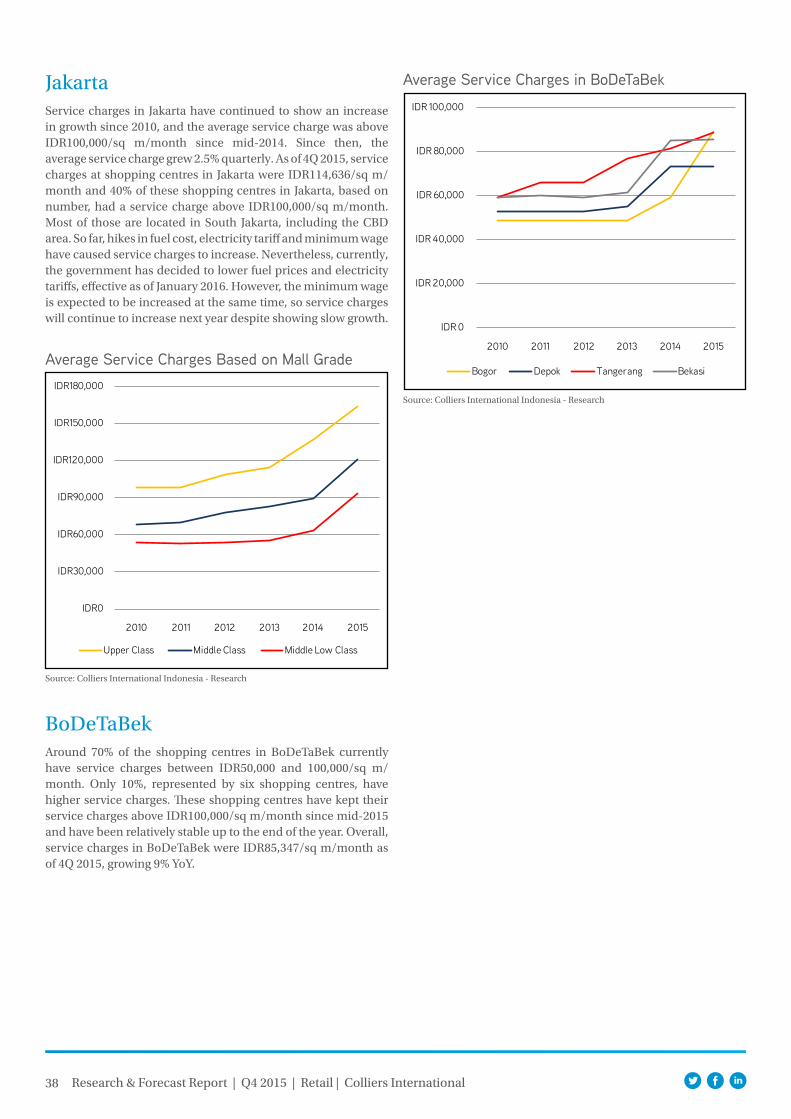
38 Research & Forecast Report | Q4 2015 | Retail | Colliers International
Average Service Charges Based on Mall Grade
Source: Colliers International Indonesia - Research
JakartaService charges in Jakarta have continued to show an increase in growth since 2010, and the average service charge was above IDR100,000/sq m/month since mid-2014. Since then, the average service charge grew 2.5% quarterly. As of 4Q 2015, service charges at shopping centres in Jakarta were IDR114,636/sq m/month and 40% of these shopping centres in Jakarta, based on number, had a service charge above IDR100,000/sq m/month. Most of those are located in South Jakarta, including the CBD area. So far, hikes in fuel cost, electricity tariff and minimum wage have caused service charges to increase. Nevertheless, currently, the government has decided to lower fuel prices and electricity tariffs, effective as of January 2016. However, the minimum wage is expected to be increased at the same time, so service charges will continue to increase next year despite showing slow growth.
IDR0
IDR30,000
IDR60,000
IDR90,000
IDR120,000
IDR150,000
IDR180,000
2010 2011 2012 2013 2014 2015
Upper Class Middle Class Middle Low Class
BoDeTaBekAround 70% of the shopping centres in BoDeTaBek currently have service charges between IDR50,000 and 100,000/sq m/month. Only 10%, represented by six shopping centres, have higher service charges. These shopping centres have kept their service charges above IDR100,000/sq m/month since mid-2015 and have been relatively stable up to the end of the year. Overall, service charges in BoDeTaBek were IDR85,347/sq m/month as of 4Q 2015, growing 9% YoY.
Average Service Charges in BoDeTaBek
Source: Colliers International Indonesia - Research
IDR 0
IDR 20,000
IDR 40,000
IDR 60,000
IDR 80,000
IDR 100,000
2010 2011 2012 2013 2014 2015
Bogor Depok Tangerang Bekasi
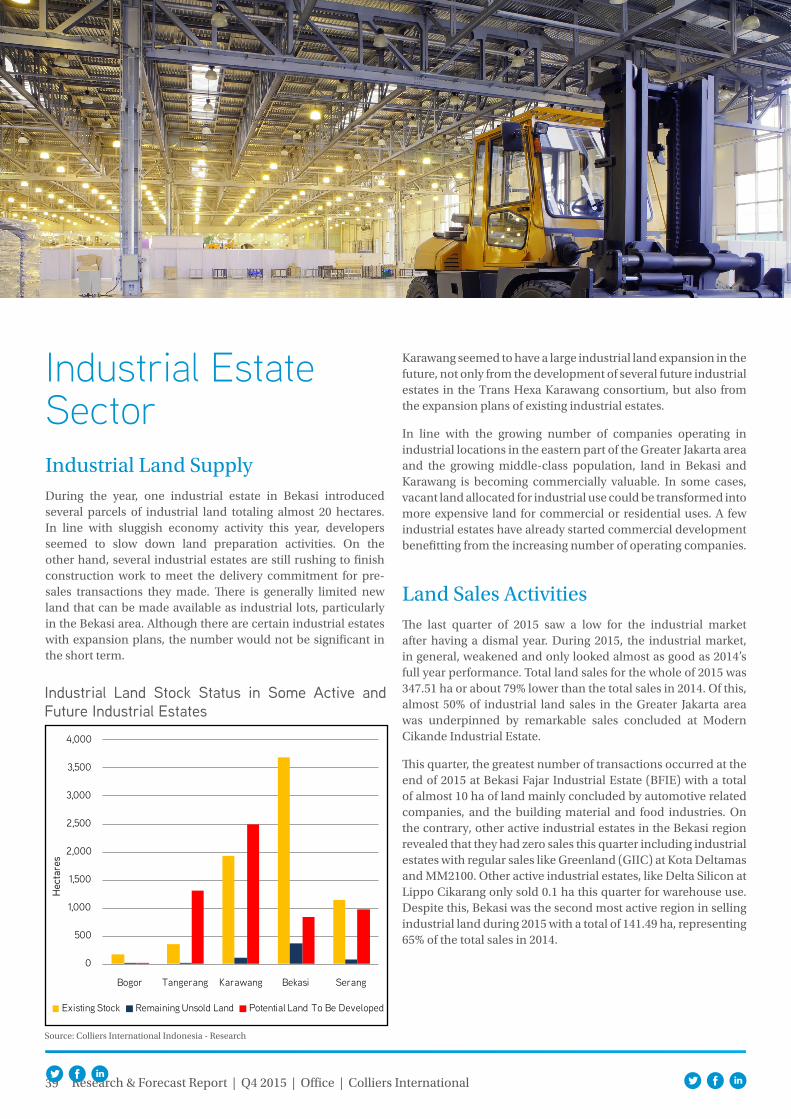
39 Research & Forecast Report | Q4 2015 | Office | Colliers International
Industrial Estate SectorIndustrial Land SupplyDuring the year, one industrial estate in Bekasi introduced several parcels of industrial land totaling almost 20 hectares. In line with sluggish economy activity this year, developers seemed to slow down land preparation activities. On the other hand, several industrial estates are still rushing to finish construction work to meet the delivery commitment for pre-sales transactions they made. There is generally limited new land that can be made available as industrial lots, particularly in the Bekasi area. Although there are certain industrial estates with expansion plans, the number would not be significant in the short term.
Source: Colliers International Indonesia - Research
Industrial Land Stock Status in Some Active and Future Industrial Estates
Land Sales ActivitiesThe last quarter of 2015 saw a low for the industrial market after having a dismal year. During 2015, the industrial market, in general, weakened and only looked almost as good as 2014’s full year performance. Total land sales for the whole of 2015 was 347.51 ha or about 79% lower than the total sales in 2014. Of this, almost 50% of industrial land sales in the Greater Jakarta area was underpinned by remarkable sales concluded at Modern Cikande Industrial Estate.
This quarter, the greatest number of transactions occurred at the end of 2015 at Bekasi Fajar Industrial Estate (BFIE) with a total of almost 10 ha of land mainly concluded by automotive related companies, and the building material and food industries. On the contrary, other active industrial estates in the Bekasi region revealed that they had zero sales this quarter including industrial estates with regular sales like Greenland (GIIC) at Kota Deltamas and MM2100. Other active industrial estates, like Delta Silicon at Lippo Cikarang only sold 0.1 ha this quarter for warehouse use. Despite this, Bekasi was the second most active region in selling industrial land during 2015 with a total of 141.49 ha, representing 65% of the total sales in 2014.
Karawang seemed to have a large industrial land expansion in the future, not only from the development of several future industrial estates in the Trans Hexa Karawang consortium, but also from the expansion plans of existing industrial estates.
In line with the growing number of companies operating in industrial locations in the eastern part of the Greater Jakarta area and the growing middle-class population, land in Bekasi and Karawang is becoming commercially valuable. In some cases, vacant land allocated for industrial use could be transformed into more expensive land for commercial or residential uses. A few industrial estates have already started commercial development benefitting from the increasing number of operating companies.
0
500
1,000
1,500
2,000
2,500
3,000
3,500
4,000
Bogor Tangerang Karawang Bekasi Serang
Hec
tare
s
Existing Stock Remaining Unsold Land Potential Land To Be Developed
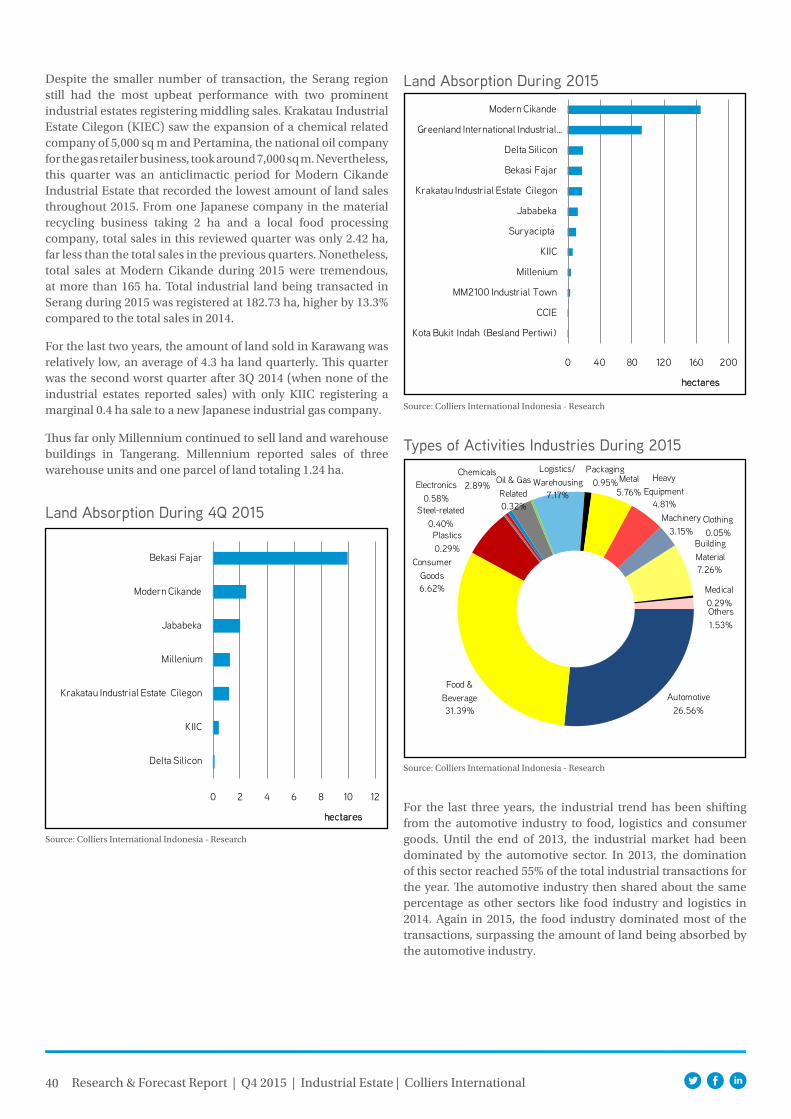
40 Research & Forecast Report | Q4 2015 | Industrial Estate | Colliers International
Land Absorption During 4Q 2015
Source: Colliers International Indonesia - Research
Despite the smaller number of transaction, the Serang region still had the most upbeat performance with two prominent industrial estates registering middling sales. Krakatau Industrial Estate Cilegon (KIEC) saw the expansion of a chemical related company of 5,000 sq m and Pertamina, the national oil company for the gas retailer business, took around 7,000 sq m. Nevertheless, this quarter was an anticlimactic period for Modern Cikande Industrial Estate that recorded the lowest amount of land sales throughout 2015. From one Japanese company in the material recycling business taking 2 ha and a local food processing company, total sales in this reviewed quarter was only 2.42 ha, far less than the total sales in the previous quarters. Nonetheless, total sales at Modern Cikande during 2015 were tremendous, at more than 165 ha. Total industrial land being transacted in Serang during 2015 was registered at 182.73 ha, higher by 13.3% compared to the total sales in 2014.
For the last two years, the amount of land sold in Karawang was relatively low, an average of 4.3 ha land quarterly. This quarter was the second worst quarter after 3Q 2014 (when none of the industrial estates reported sales) with only KIIC registering a marginal 0.4 ha sale to a new Japanese industrial gas company.
Thus far only Millennium continued to sell land and warehouse buildings in Tangerang. Millennium reported sales of three warehouse units and one parcel of land totaling 1.24 ha.
0 2 4 6 8 10 12
Delta Silicon
KIIC
Krakatau Industrial Estate Cilegon
Millenium
Jababeka
Modern Cikande
Bekasi Fajar
hectares
Land Absorption During 2015
Source: Colliers International Indonesia - Research
0 40 80 120 160 200
Kota Bukit Indah (Besland Pertiwi)
CCIE
MM2100 Industrial Town
Millenium
KIIC
Suryacipta
Jababeka
Krakatau Industrial Estate Cilegon
Bekasi Fajar
Delta Silicon
Greenland International Industrial …
Modern Cikande
hectares
Types of Activities Industries During 2015
Source: Colliers International Indonesia - Research
Automotive26.56%
Food & Beverage31.39%
ConsumerGoods6.62%
Plastics0.29%
Steel-related0.40%
Electronics0.58%
Chemicals2.89% Oil & Gas
Related0.32%
Logistics/Warehousing
7.17%
Packaging0.95%Metal
5.76%Heavy
Equipment4.81%
Machinery3.15%
Clothing0.05%
Building Material7.26%
Medical0.29%Others1.53%
For the last three years, the industrial trend has been shifting from the automotive industry to food, logistics and consumer goods. Until the end of 2013, the industrial market had been dominated by the automotive sector. In 2013, the domination of this sector reached 55% of the total industrial transactions for the year. The automotive industry then shared about the same percentage as other sectors like food industry and logistics in 2014. Again in 2015, the food industry dominated most of the transactions, surpassing the amount of land being absorbed by the automotive industry.
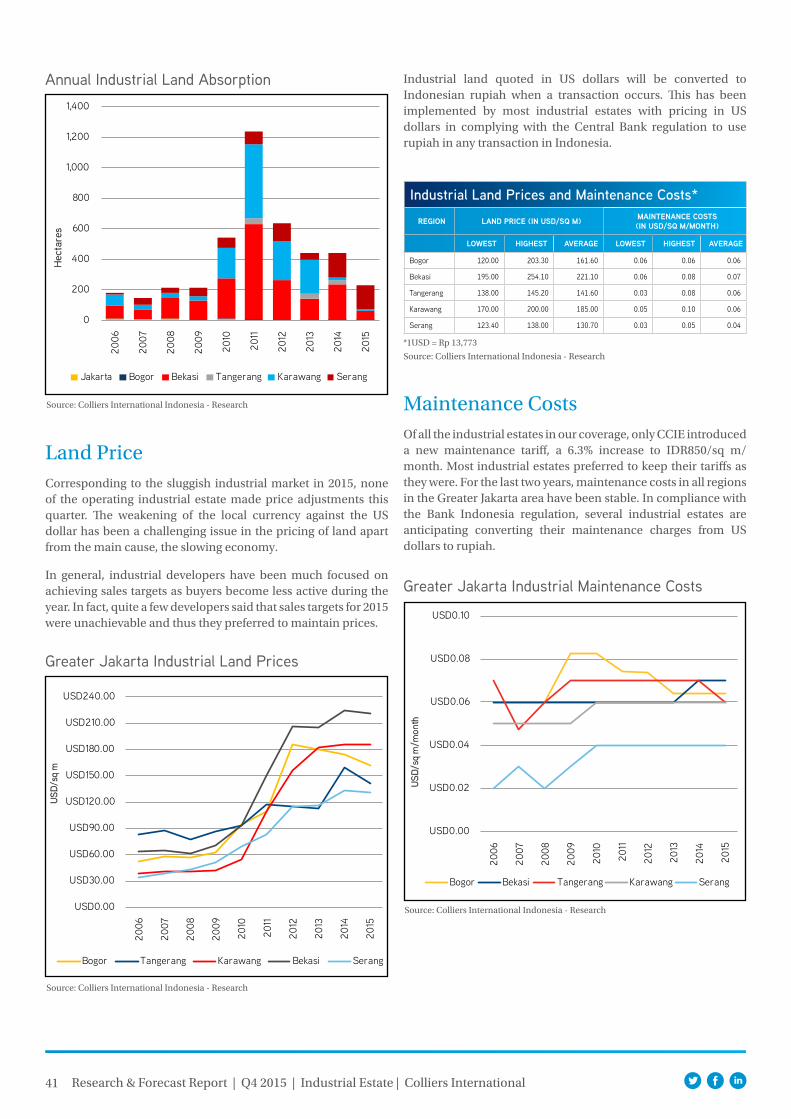
41 Research & Forecast Report | Q4 2015 | Industrial Estate | Colliers International
Land Price Corresponding to the sluggish industrial market in 2015, none of the operating industrial estate made price adjustments this quarter. The weakening of the local currency against the US dollar has been a challenging issue in the pricing of land apart from the main cause, the slowing economy.
In general, industrial developers have been much focused on achieving sales targets as buyers become less active during the year. In fact, quite a few developers said that sales targets for 2015 were unachievable and thus they preferred to maintain prices.
Source: Colliers International Indonesia - Research
*1USD = Rp 13,773
Industrial Land Prices and Maintenance Costs*regiOn land Price (in uSd/Sq m) maintenance cOStS
(in uSd/Sq m/mOnth)
lOWeSt higheSt average lOWeSt higheSt average
Bogor 120.00 203.30 161.60 0.06 0.06 0.06
Bekasi 195.00 254.10 221.10 0.06 0.08 0.07
Tangerang 138.00 145.20 141.60 0.03 0.08 0.06
Karawang 170.00 200.00 185.00 0.05 0.10 0.06
Serang 123.40 138.00 130.70 0.03 0.05 0.04
Annual Industrial Land Absorption
Source: Colliers International Indonesia - Research
Greater Jakarta Industrial Land Prices
Source: Colliers International Indonesia - Research
Industrial land quoted in US dollars will be converted to Indonesian rupiah when a transaction occurs. This has been implemented by most industrial estates with pricing in US dollars in complying with the Central Bank regulation to use rupiah in any transaction in Indonesia.
USD0.00
USD30.00
USD60.00
USD90.00
USD120.00
USD150.00
USD180.00
USD210.00
USD240.00
2006
2007
2008
2009
2010
2011
2012
2013
2014
2015
USD/
sq m
Bogor Tangerang Karawang Bekasi Serang
Maintenance Costs Of all the industrial estates in our coverage, only CCIE introduced a new maintenance tariff, a 6.3% increase to IDR850/sq m/month. Most industrial estates preferred to keep their tariffs as they were. For the last two years, maintenance costs in all regions in the Greater Jakarta area have been stable. In compliance with the Bank Indonesia regulation, several industrial estates are anticipating converting their maintenance charges from US dollars to rupiah.
Greater Jakarta Industrial Maintenance Costs
Source: Colliers International Indonesia - Research
USD0.00
USD0.02
USD0.04
USD0.06
USD0.08
USD0.10
2006
2007
2008
2009
2010
2011
2012
2013
2014
2015
USD/
sq m
/mon
th
Bogor Bekasi Tangerang Karawang Serang
0
200
400
600
800
1,000
1,200
1,40020
06
2007
2008
2009
2010
2011
2012
2013
2014
2015
Hec
tare
s
Jakarta Bogor Bekasi Tangerang Karawang Serang
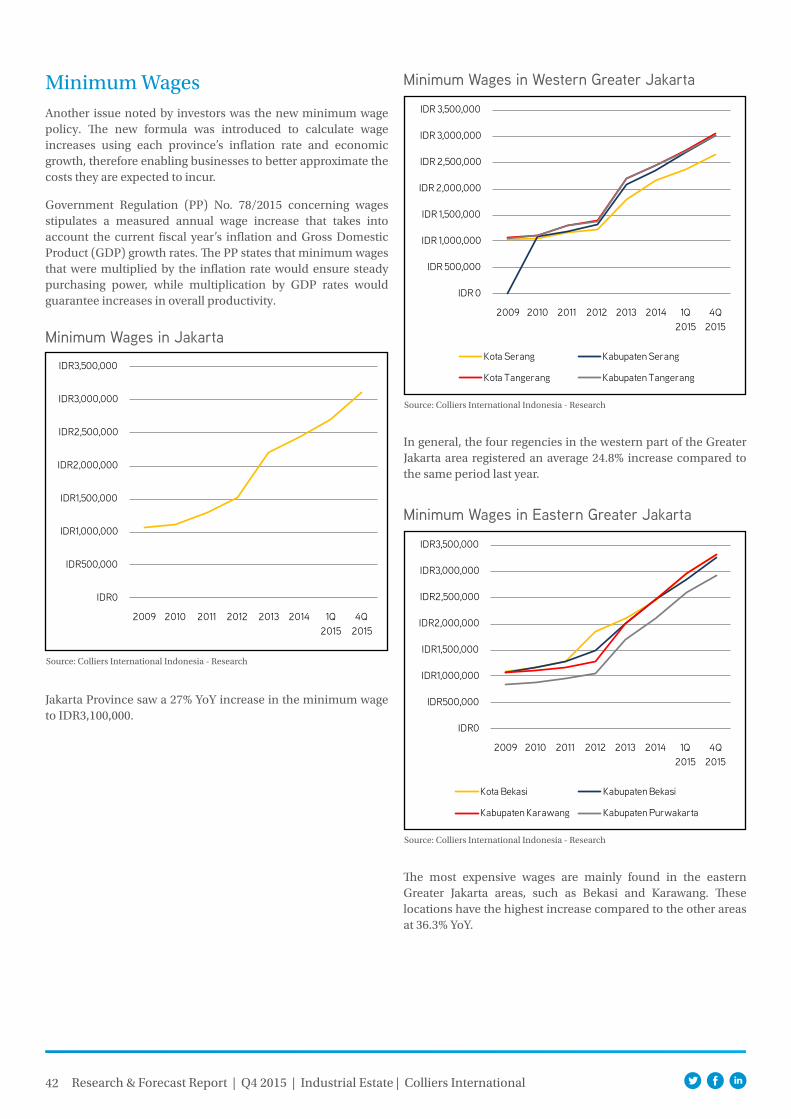
42 Research & Forecast Report | Q4 2015 | Industrial Estate | Colliers International
Minimum WagesAnother issue noted by investors was the new minimum wage policy. The new formula was introduced to calculate wage increases using each province’s inflation rate and economic growth, therefore enabling businesses to better approximate the costs they are expected to incur.
Government Regulation (PP) No. 78/2015 concerning wages stipulates a measured annual wage increase that takes into account the current fiscal year’s inflation and Gross Domestic Product (GDP) growth rates. The PP states that minimum wages that were multiplied by the inflation rate would ensure steady purchasing power, while multiplication by GDP rates would guarantee increases in overall productivity.
Minimum Wages in Jakarta
Source: Colliers International Indonesia - Research
Jakarta Province saw a 27% YoY increase in the minimum wage to IDR3,100,000.
Minimum Wages in Western Greater Jakarta
Source: Colliers International Indonesia - Research
In general, the four regencies in the western part of the Greater Jakarta area registered an average 24.8% increase compared to the same period last year.
IDR 0
IDR 500,000
IDR 1,000,000
IDR 1,500,000
IDR 2,000,000
IDR 2,500,000
IDR 3,000,000
IDR 3,500,000
2009 2010 2011 2012 2013 2014 1Q 2015
4Q 2015
Kota Serang Kabupaten Serang
Kota Tangerang Kabupaten Tangerang
Minimum Wages in Eastern Greater Jakarta
Source: Colliers International Indonesia - Research
The most expensive wages are mainly found in the eastern Greater Jakarta areas, such as Bekasi and Karawang. These locations have the highest increase compared to the other areas at 36.3% YoY.
IDR0
IDR500,000
IDR1,000,000
IDR1,500,000
IDR2,000,000
IDR2,500,000
IDR3,000,000
IDR3,500,000
2009 2010 2011 2012 2013 2014 1Q 2015
4Q 2015
Kota Bekasi Kabupaten Bekasi
Kabupaten Karawang Kabupaten Purwakarta
IDR0
IDR500,000
IDR1,000,000
IDR1,500,000
IDR2,000,000
IDR2,500,000
IDR3,000,000
IDR3,500,000
2009 2010 2011 2012 2013 2014 1Q 2015
4Q 2015
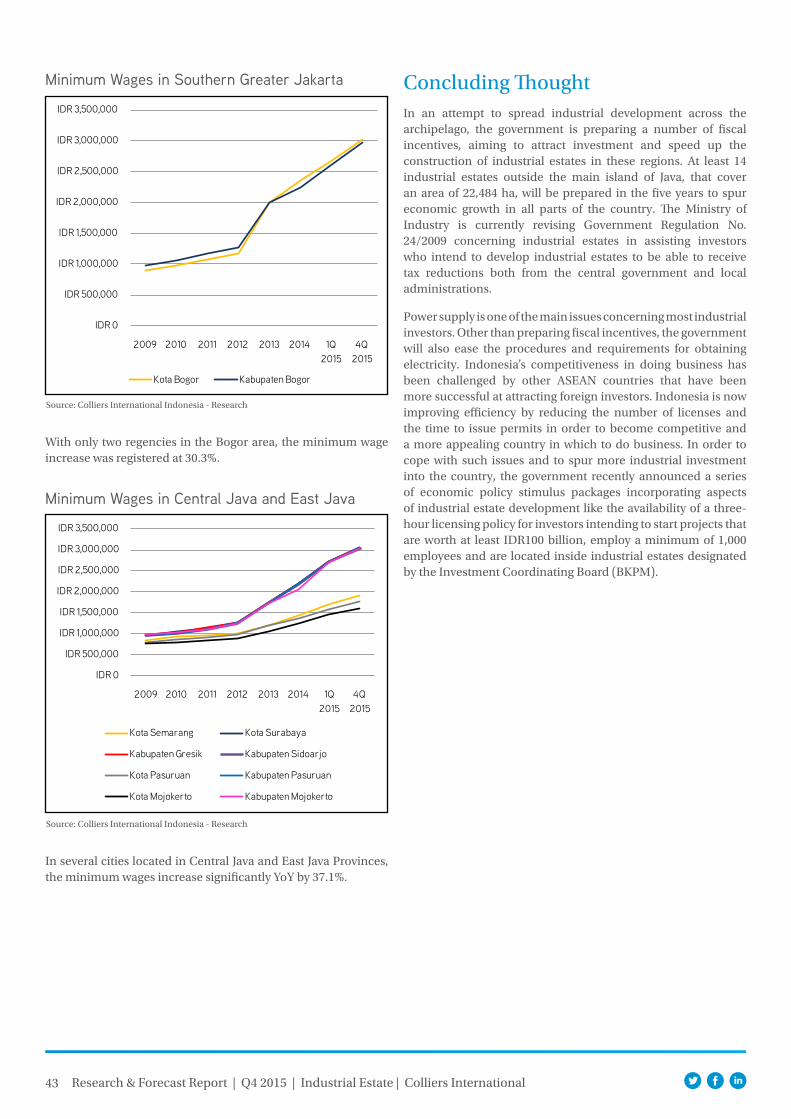
43 Research & Forecast Report | Q4 2015 | Industrial Estate | Colliers International
Concluding ThoughtIn an attempt to spread industrial development across the archipelago, the government is preparing a number of fiscal incentives, aiming to attract investment and speed up the construction of industrial estates in these regions. At least 14 industrial estates outside the main island of Java, that cover an area of 22,484 ha, will be prepared in the five years to spur economic growth in all parts of the country. The Ministry of Industry is currently revising Government Regulation No. 24/2009 concerning industrial estates in assisting investors who intend to develop industrial estates to be able to receive tax reductions both from the central government and local administrations.
Power supply is one of the main issues concerning most industrial investors. Other than preparing fiscal incentives, the government will also ease the procedures and requirements for obtaining electricity. Indonesia’s competitiveness in doing business has been challenged by other ASEAN countries that have been more successful at attracting foreign investors. Indonesia is now improving efficiency by reducing the number of licenses and the time to issue permits in order to become competitive and a more appealing country in which to do business. In order to cope with such issues and to spur more industrial investment into the country, the government recently announced a series of economic policy stimulus packages incorporating aspects of industrial estate development like the availability of a three-hour licensing policy for investors intending to start projects that are worth at least IDR100 billion, employ a minimum of 1,000 employees and are located inside industrial estates designated by the Investment Coordinating Board (BKPM).
Minimum Wages in Southern Greater Jakarta
Source: Colliers International Indonesia - Research
With only two regencies in the Bogor area, the minimum wage increase was registered at 30.3%.
IDR 0
IDR 500,000
IDR 1,000,000
IDR 1,500,000
IDR 2,000,000
IDR 2,500,000
IDR 3,000,000
IDR 3,500,000
2009 2010 2011 2012 2013 2014 1Q 2015
4Q 2015
Kota Bogor Kabupaten Bogor
Minimum Wages in Central Java and East Java
Source: Colliers International Indonesia - Research
In several cities located in Central Java and East Java Provinces, the minimum wages increase significantly YoY by 37.1%.
IDR 0
IDR 500,000
IDR 1,000,000
IDR 1,500,000
IDR 2,000,000
IDR 2,500,000
IDR 3,000,000
IDR 3,500,000
2009 2010 2011 2012 2013 2014 1Q 2015
4Q 2015
Kota Semarang Kota Surabaya
Kabupaten Gresik Kabupaten Sidoarjo
Kota Pasuruan Kabupaten Pasuruan
Kota Mojokerto Kabupaten Mojokerto
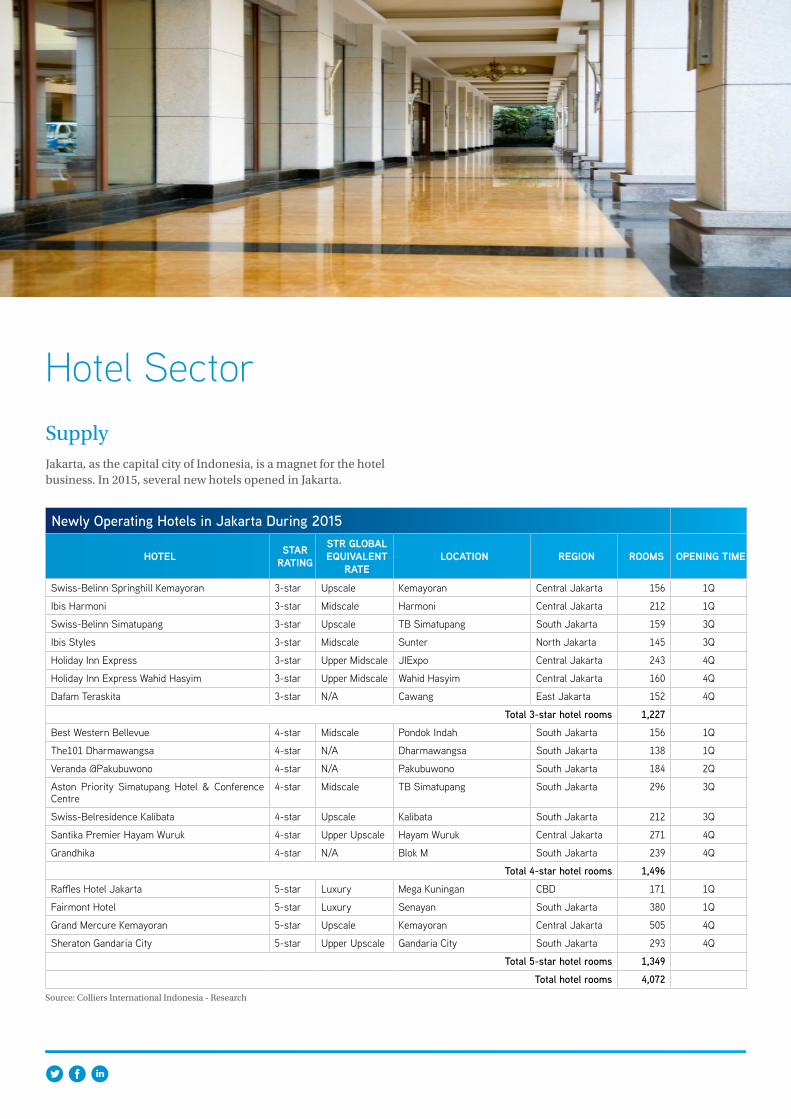
Hotel SectorSupplyJakarta, as the capital city of Indonesia, is a magnet for the hotel business. In 2015, several new hotels opened in Jakarta.
Newly Operating Hotels in Jakarta During 2015
hOtel Star rating
Str glOBal equivalent
ratelOcatiOn regiOn rOOmS OPening time
Swiss-Belinn Springhill Kemayoran 3-star Upscale Kemayoran Central Jakarta 156 1Q
Ibis Harmoni 3-star Midscale Harmoni Central Jakarta 212 1Q
Swiss-Belinn Simatupang 3-star Upscale TB Simatupang South Jakarta 159 3Q
Ibis Styles 3-star Midscale Sunter North Jakarta 145 3Q
Holiday Inn Express 3-star Upper Midscale JIExpo Central Jakarta 243 4Q
Holiday Inn Express Wahid Hasyim 3-star Upper Midscale Wahid Hasyim Central Jakarta 160 4Q
Dafam Teraskita 3-star N/A Cawang East Jakarta 152 4Q
Total 3-star hotel rooms 1,227
Best Western Bellevue 4-star Midscale Pondok Indah South Jakarta 156 1Q
The101 Dharmawangsa 4-star N/A Dharmawangsa South Jakarta 138 1Q
Veranda @Pakubuwono 4-star N/A Pakubuwono South Jakarta 184 2Q
Aston Priority Simatupang Hotel & Conference Centre
4-star Midscale TB Simatupang South Jakarta 296 3Q
Swiss-Belresidence Kalibata 4-star Upscale Kalibata South Jakarta 212 3Q
Santika Premier Hayam Wuruk 4-star Upper Upscale Hayam Wuruk Central Jakarta 271 4Q
Grandhika 4-star N/A Blok M South Jakarta 239 4Q
Total 4-star hotel rooms 1,496
Raffles Hotel Jakarta 5-star Luxury Mega Kuningan CBD 171 1Q
Fairmont Hotel 5-star Luxury Senayan South Jakarta 380 1Q
Grand Mercure Kemayoran 5-star Upscale Kemayoran Central Jakarta 505 4Q
Sheraton Gandaria City 5-star Upper Upscale Gandaria City South Jakarta 293 4Q
Total 5-star hotel rooms 1,349
Total hotel rooms 4,072Source: Colliers International Indonesia - Research
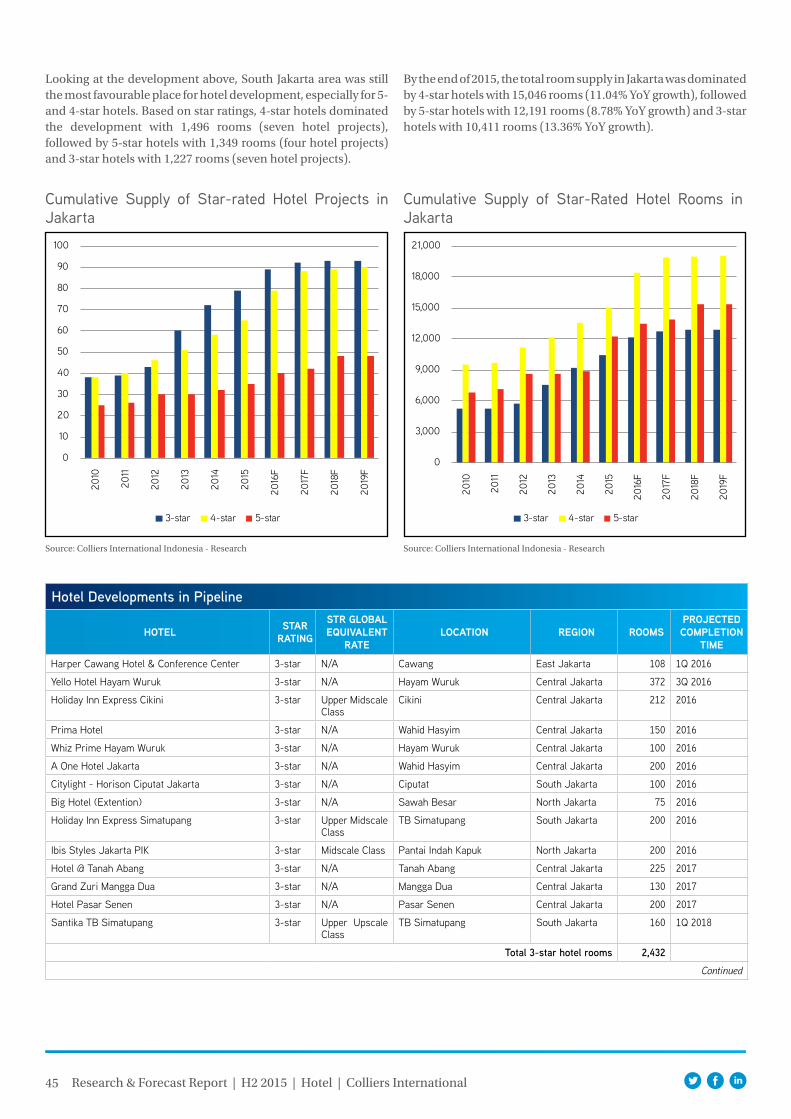
45 Research & Forecast Report | H2 2015 | Hotel | Colliers International
Looking at the development above, South Jakarta area was still the most favourable place for hotel development, especially for 5- and 4-star hotels. Based on star ratings, 4-star hotels dominated the development with 1,496 rooms (seven hotel projects), followed by 5-star hotels with 1,349 rooms (four hotel projects) and 3-star hotels with 1,227 rooms (seven hotel projects).
Cumulative Supply of Star-Rated Hotel Rooms in Jakarta
Source: Colliers International Indonesia - Research
Cumulative Supply of Star-rated Hotel Projects in Jakarta
Source: Colliers International Indonesia - Research
By the end of 2015, the total room supply in Jakarta was dominated by 4-star hotels with 15,046 rooms (11.04% YoY growth), followed by 5-star hotels with 12,191 rooms (8.78% YoY growth) and 3-star hotels with 10,411 rooms (13.36% YoY growth).
Hotel Developments in Pipeline
hOtel Star rating
Str glOBal equivalent
ratelOcatiOn regiOn rOOmS
PrOjected cOmPletiOn
time
Harper Cawang Hotel & Conference Center 3-star N/A Cawang East Jakarta 108 1Q 2016
Yello Hotel Hayam Wuruk 3-star N/A Hayam Wuruk Central Jakarta 372 3Q 2016
Holiday Inn Express Cikini 3-star Upper Midscale Class
Cikini Central Jakarta 212 2016
Prima Hotel 3-star N/A Wahid Hasyim Central Jakarta 150 2016
Whiz Prime Hayam Wuruk 3-star N/A Hayam Wuruk Central Jakarta 100 2016
A One Hotel Jakarta 3-star N/A Wahid Hasyim Central Jakarta 200 2016
Citylight - Horison Ciputat Jakarta 3-star N/A Ciputat South Jakarta 100 2016
Big Hotel (Extention) 3-star N/A Sawah Besar North Jakarta 75 2016
Holiday Inn Express Simatupang 3-star Upper Midscale Class
TB Simatupang South Jakarta 200 2016
Ibis Styles Jakarta PIK 3-star Midscale Class Pantai Indah Kapuk North Jakarta 200 2016
Hotel @ Tanah Abang 3-star N/A Tanah Abang Central Jakarta 225 2017
Grand Zuri Mangga Dua 3-star N/A Mangga Dua Central Jakarta 130 2017
Hotel Pasar Senen 3-star N/A Pasar Senen Central Jakarta 200 2017
Santika TB Simatupang 3-star Upper Upscale Class
TB Simatupang South Jakarta 160 1Q 2018
Total 3-star hotel rooms 2,432
Continued
0
3,000
6,000
9,000
12,000
15,000
18,000
21,000
2010
2011
2012
2013
2014
2015
2016
F
2017
F
2018
F
2019
F
3-star 4-star 5-star
0
10
20
30
40
50
60
70
80
90
100
2010
2011
2012
2013
2014
2015
2016
F
2017
F
2018
F
2019
F
3-star 4-star 5-star
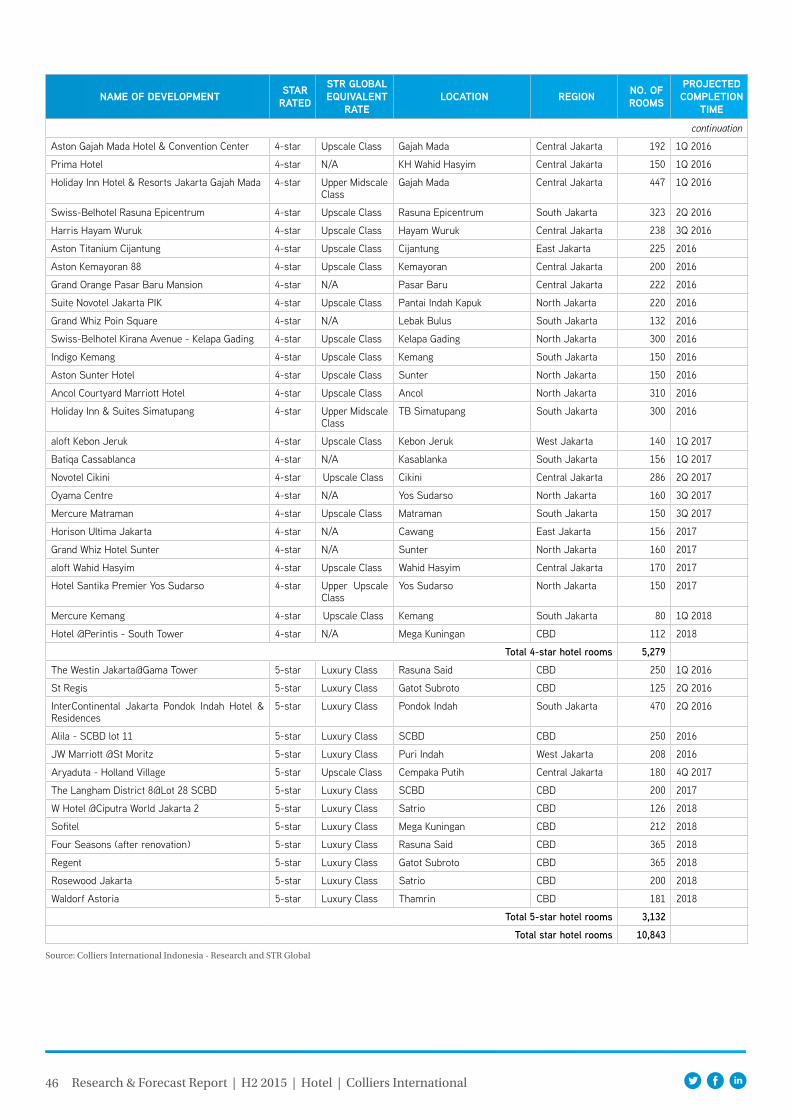
46 Research & Forecast Report | H2 2015 | Hotel | Colliers International
name Of develOPment Star rated
Str glOBal equivalent
ratelOcatiOn regiOn nO. Of
rOOmS
PrOjected cOmPletiOn
time
continuation
Aston Gajah Mada Hotel & Convention Center 4-star Upscale Class Gajah Mada Central Jakarta 192 1Q 2016
Prima Hotel 4-star N/A KH Wahid Hasyim Central Jakarta 150 1Q 2016
Holiday Inn Hotel & Resorts Jakarta Gajah Mada 4-star Upper Midscale Class
Gajah Mada Central Jakarta 447 1Q 2016
Swiss-Belhotel Rasuna Epicentrum 4-star Upscale Class Rasuna Epicentrum South Jakarta 323 2Q 2016
Harris Hayam Wuruk 4-star Upscale Class Hayam Wuruk Central Jakarta 238 3Q 2016
Aston Titanium Cijantung 4-star Upscale Class Cijantung East Jakarta 225 2016
Aston Kemayoran 88 4-star Upscale Class Kemayoran Central Jakarta 200 2016
Grand Orange Pasar Baru Mansion 4-star N/A Pasar Baru Central Jakarta 222 2016
Suite Novotel Jakarta PIK 4-star Upscale Class Pantai Indah Kapuk North Jakarta 220 2016
Grand Whiz Poin Square 4-star N/A Lebak Bulus South Jakarta 132 2016
Swiss-Belhotel Kirana Avenue - Kelapa Gading 4-star Upscale Class Kelapa Gading North Jakarta 300 2016
Indigo Kemang 4-star Upscale Class Kemang South Jakarta 150 2016
Aston Sunter Hotel 4-star Upscale Class Sunter North Jakarta 150 2016
Ancol Courtyard Marriott Hotel 4-star Upscale Class Ancol North Jakarta 310 2016
Holiday Inn & Suites Simatupang 4-star Upper Midscale Class
TB Simatupang South Jakarta 300 2016
aloft Kebon Jeruk 4-star Upscale Class Kebon Jeruk West Jakarta 140 1Q 2017
Batiqa Cassablanca 4-star N/A Kasablanka South Jakarta 156 1Q 2017
Novotel Cikini 4-star Upscale Class Cikini Central Jakarta 286 2Q 2017
Oyama Centre 4-star N/A Yos Sudarso North Jakarta 160 3Q 2017
Mercure Matraman 4-star Upscale Class Matraman South Jakarta 150 3Q 2017
Horison Ultima Jakarta 4-star N/A Cawang East Jakarta 156 2017
Grand Whiz Hotel Sunter 4-star N/A Sunter North Jakarta 160 2017
aloft Wahid Hasyim 4-star Upscale Class Wahid Hasyim Central Jakarta 170 2017
Hotel Santika Premier Yos Sudarso 4-star Upper Upscale Class
Yos Sudarso North Jakarta 150 2017
Mercure Kemang 4-star Upscale Class Kemang South Jakarta 80 1Q 2018
Hotel @Perintis - South Tower 4-star N/A Mega Kuningan CBD 112 2018
Total 4-star hotel rooms 5,279
The Westin Jakarta@Gama Tower 5-star Luxury Class Rasuna Said CBD 250 1Q 2016
St Regis 5-star Luxury Class Gatot Subroto CBD 125 2Q 2016
InterContinental Jakarta Pondok Indah Hotel & Residences
5-star Luxury Class Pondok Indah South Jakarta 470 2Q 2016
Alila - SCBD lot 11 5-star Luxury Class SCBD CBD 250 2016
JW Marriott @St Moritz 5-star Luxury Class Puri Indah West Jakarta 208 2016
Aryaduta - Holland Village 5-star Upscale Class Cempaka Putih Central Jakarta 180 4Q 2017
The Langham District 8@Lot 28 SCBD 5-star Luxury Class SCBD CBD 200 2017
W Hotel @Ciputra World Jakarta 2 5-star Luxury Class Satrio CBD 126 2018
Sofitel 5-star Luxury Class Mega Kuningan CBD 212 2018
Four Seasons (after renovation) 5-star Luxury Class Rasuna Said CBD 365 2018
Regent 5-star Luxury Class Gatot Subroto CBD 365 2018
Rosewood Jakarta 5-star Luxury Class Satrio CBD 200 2018
Waldorf Astoria 5-star Luxury Class Thamrin CBD 181 2018
Total 5-star hotel rooms 3,132
Total star hotel rooms 10,843
Source: Colliers International Indonesia - Research and STR Global
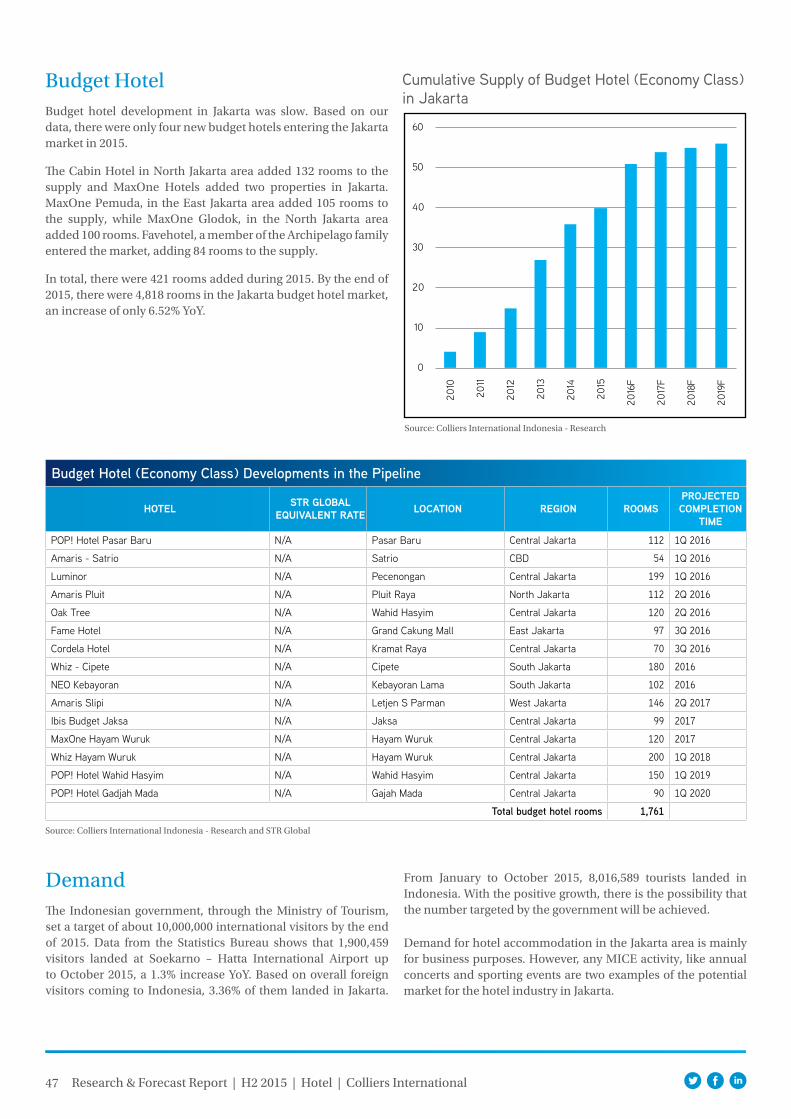
47 Research & Forecast Report | H2 2015 | Hotel | Colliers International
Budget HotelBudget hotel development in Jakarta was slow. Based on our data, there were only four new budget hotels entering the Jakarta market in 2015.
The Cabin Hotel in North Jakarta area added 132 rooms to the supply and MaxOne Hotels added two properties in Jakarta. MaxOne Pemuda, in the East Jakarta area added 105 rooms to the supply, while MaxOne Glodok, in the North Jakarta area added 100 rooms. Favehotel, a member of the Archipelago family entered the market, adding 84 rooms to the supply.
In total, there were 421 rooms added during 2015. By the end of 2015, there were 4,818 rooms in the Jakarta budget hotel market, an increase of only 6.52% YoY.
Cumulative Supply of Budget Hotel (Economy Class) in Jakarta
Source: Colliers International Indonesia - Research
Source: Colliers International Indonesia - Research and STR Global
Budget Hotel (Economy Class) Developments in the Pipeline
hOtel Str glOBal equivalent rate lOcatiOn regiOn rOOmS
PrOjected cOmPletiOn
time
POP! Hotel Pasar Baru N/A Pasar Baru Central Jakarta 112 1Q 2016
Amaris - Satrio N/A Satrio CBD 54 1Q 2016
Luminor N/A Pecenongan Central Jakarta 199 1Q 2016
Amaris Pluit N/A Pluit Raya North Jakarta 112 2Q 2016
Oak Tree N/A Wahid Hasyim Central Jakarta 120 2Q 2016
Fame Hotel N/A Grand Cakung Mall East Jakarta 97 3Q 2016
Cordela Hotel N/A Kramat Raya Central Jakarta 70 3Q 2016
Whiz - Cipete N/A Cipete South Jakarta 180 2016
NEO Kebayoran N/A Kebayoran Lama South Jakarta 102 2016
Amaris Slipi N/A Letjen S Parman West Jakarta 146 2Q 2017
Ibis Budget Jaksa N/A Jaksa Central Jakarta 99 2017
MaxOne Hayam Wuruk N/A Hayam Wuruk Central Jakarta 120 2017
Whiz Hayam Wuruk N/A Hayam Wuruk Central Jakarta 200 1Q 2018
POP! Hotel Wahid Hasyim N/A Wahid Hasyim Central Jakarta 150 1Q 2019
POP! Hotel Gadjah Mada N/A Gajah Mada Central Jakarta 90 1Q 2020
Total budget hotel rooms 1,761
DemandThe Indonesian government, through the Ministry of Tourism, set a target of about 10,000,000 international visitors by the end of 2015. Data from the Statistics Bureau shows that 1,900,459 visitors landed at Soekarno – Hatta International Airport up to October 2015, a 1.3% increase YoY. Based on overall foreign visitors coming to Indonesia, 3.36% of them landed in Jakarta.
From January to October 2015, 8,016,589 tourists landed in Indonesia. With the positive growth, there is the possibility that the number targeted by the government will be achieved.
Demand for hotel accommodation in the Jakarta area is mainly for business purposes. However, any MICE activity, like annual concerts and sporting events are two examples of the potential market for the hotel industry in Jakarta.
0
10
20
30
40
50
60
2010
2011
2012
2013
2014
2015
2016
F
2017
F
2018
F
2019
F
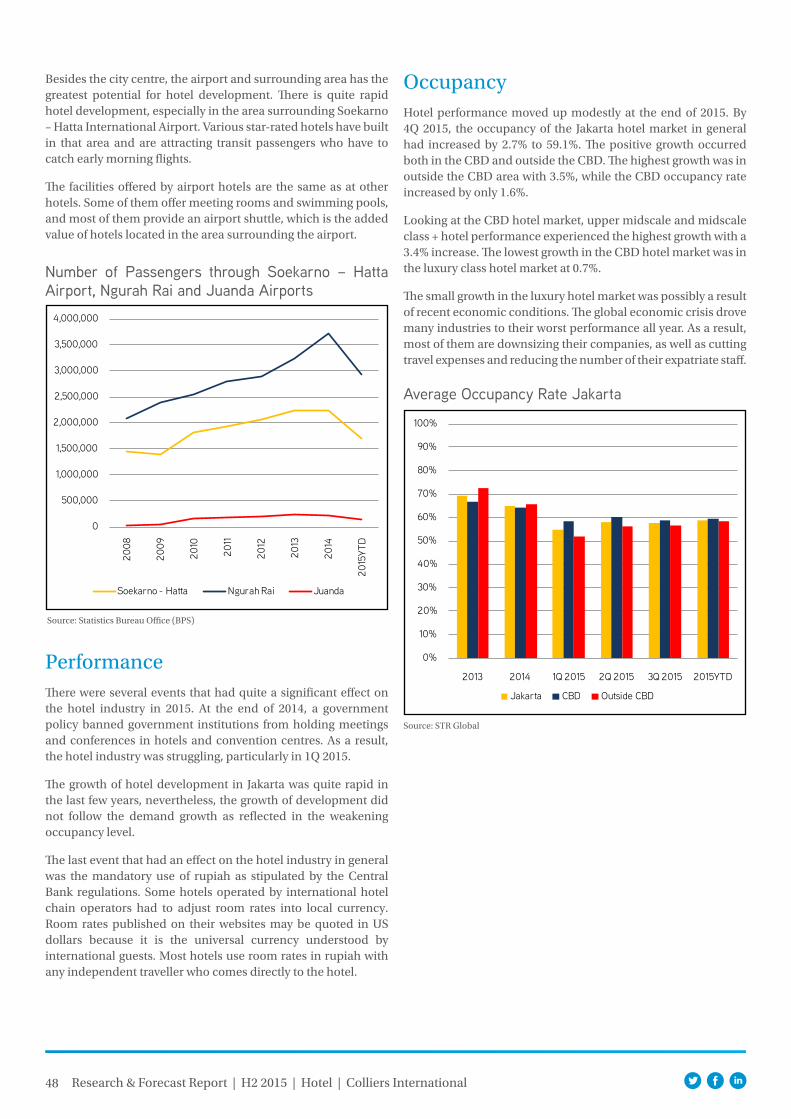
48 Research & Forecast Report | H2 2015 | Hotel | Colliers International
Number of Passengers through Soekarno – Hatta Airport, Ngurah Rai and Juanda Airports
Source: Statistics Bureau Office (BPS)
PerformanceThere were several events that had quite a significant effect on the hotel industry in 2015. At the end of 2014, a government policy banned government institutions from holding meetings and conferences in hotels and convention centres. As a result, the hotel industry was struggling, particularly in 1Q 2015.
The growth of hotel development in Jakarta was quite rapid in the last few years, nevertheless, the growth of development did not follow the demand growth as reflected in the weakening occupancy level.
The last event that had an effect on the hotel industry in general was the mandatory use of rupiah as stipulated by the Central Bank regulations. Some hotels operated by international hotel chain operators had to adjust room rates into local currency. Room rates published on their websites may be quoted in US dollars because it is the universal currency understood by international guests. Most hotels use room rates in rupiah with any independent traveller who comes directly to the hotel.
Average Occupancy Rate Jakarta
Source: STR Global
Besides the city centre, the airport and surrounding area has the greatest potential for hotel development. There is quite rapid hotel development, especially in the area surrounding Soekarno – Hatta International Airport. Various star-rated hotels have built in that area and are attracting transit passengers who have to catch early morning flights.
The facilities offered by airport hotels are the same as at other hotels. Some of them offer meeting rooms and swimming pools, and most of them provide an airport shuttle, which is the added value of hotels located in the area surrounding the airport.
0
500,000
1,000,000
1,500,000
2,000,000
2,500,000
3,000,000
3,500,000
4,000,000
2008
2009
2010
2011
2012
2013
2014
2015
YTD
Soekarno - Hatta Ngurah Rai Juanda
OccupancyHotel performance moved up modestly at the end of 2015. By 4Q 2015, the occupancy of the Jakarta hotel market in general had increased by 2.7% to 59.1%. The positive growth occurred both in the CBD and outside the CBD. The highest growth was in outside the CBD area with 3.5%, while the CBD occupancy rate increased by only 1.6%.
Looking at the CBD hotel market, upper midscale and midscale class + hotel performance experienced the highest growth with a 3.4% increase. The lowest growth in the CBD hotel market was in the luxury class hotel market at 0.7%.
The small growth in the luxury hotel market was possibly a result of recent economic conditions. The global economic crisis drove many industries to their worst performance all year. As a result, most of them are downsizing their companies, as well as cutting travel expenses and reducing the number of their expatriate staff.
0%
10%
20%
30%
40%
50%
60%
70%
80%
90%
100%
2013 2014 1Q 2015 2Q 2015 3Q 2015 2015YTD
Jakarta CBD Outside CBD
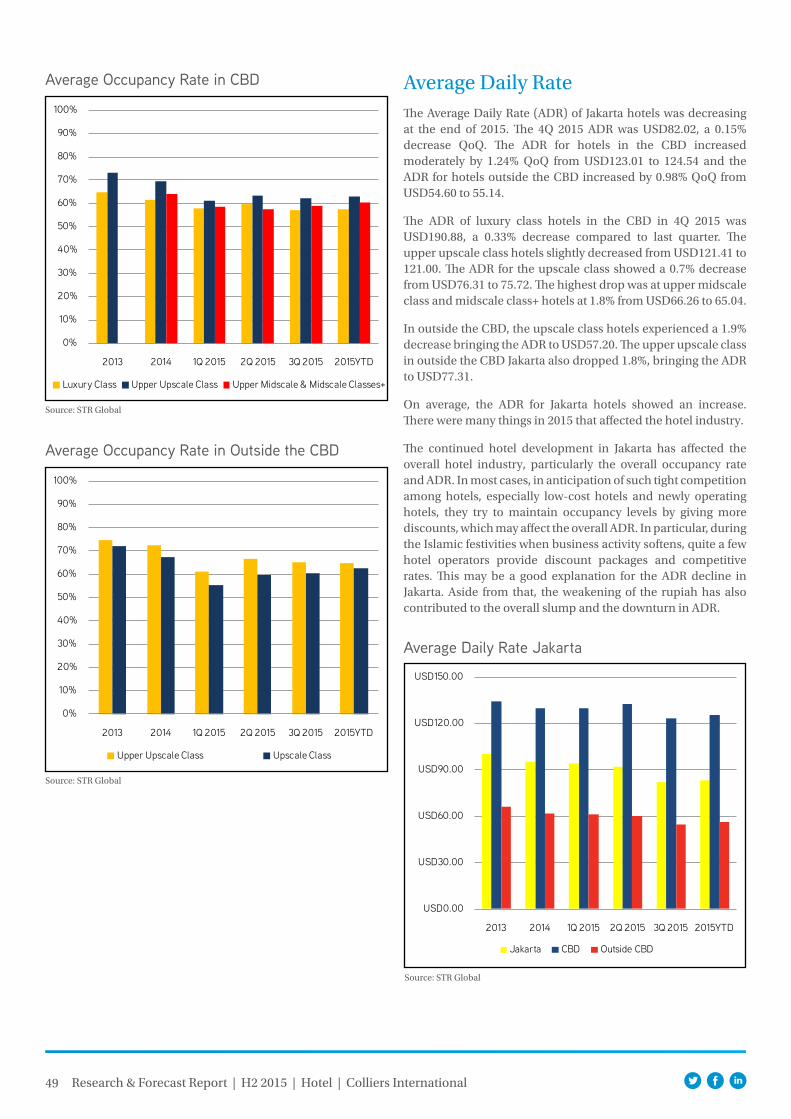
49 Research & Forecast Report | H2 2015 | Hotel | Colliers International
Average Daily RateThe Average Daily Rate (ADR) of Jakarta hotels was decreasing at the end of 2015. The 4Q 2015 ADR was USD82.02, a 0.15% decrease QoQ. The ADR for hotels in the CBD increased moderately by 1.24% QoQ from USD123.01 to 124.54 and the ADR for hotels outside the CBD increased by 0.98% QoQ from USD54.60 to 55.14.
The ADR of luxury class hotels in the CBD in 4Q 2015 was USD190.88, a 0.33% decrease compared to last quarter. The upper upscale class hotels slightly decreased from USD121.41 to 121.00. The ADR for the upscale class showed a 0.7% decrease from USD76.31 to 75.72. The highest drop was at upper midscale class and midscale class+ hotels at 1.8% from USD66.26 to 65.04.
In outside the CBD, the upscale class hotels experienced a 1.9% decrease bringing the ADR to USD57.20. The upper upscale class in outside the CBD Jakarta also dropped 1.8%, bringing the ADR to USD77.31.
On average, the ADR for Jakarta hotels showed an increase. There were many things in 2015 that affected the hotel industry.
The continued hotel development in Jakarta has affected the overall hotel industry, particularly the overall occupancy rate and ADR. In most cases, in anticipation of such tight competition among hotels, especially low-cost hotels and newly operating hotels, they try to maintain occupancy levels by giving more discounts, which may affect the overall ADR. In particular, during the Islamic festivities when business activity softens, quite a few hotel operators provide discount packages and competitive rates. This may be a good explanation for the ADR decline in Jakarta. Aside from that, the weakening of the rupiah has also contributed to the overall slump and the downturn in ADR.
Average Occupancy Rate in CBD
Source: STR Global
0%
10%
20%
30%
40%
50%
60%
70%
80%
90%
100%
2013 2014 1Q 2015 2Q 2015 3Q 2015 2015YTD
Luxury Class Upper Upscale Class Upper Midscale & Midscale Classes+
Average Occupancy Rate in Outside the CBD
Source: STR Global
0%
10%
20%
30%
40%
50%
60%
70%
80%
90%
100%
2013 2014 1Q 2015 2Q 2015 3Q 2015 2015YTD
Upper Upscale Class Upscale Class
Average Daily Rate Jakarta
Source: STR Global
USD0.00
USD30.00
USD60.00
USD90.00
USD120.00
USD150.00
2013 2014 1Q 2015 2Q 2015 3Q 2015 2015YTD
Jakarta CBD Outside CBD
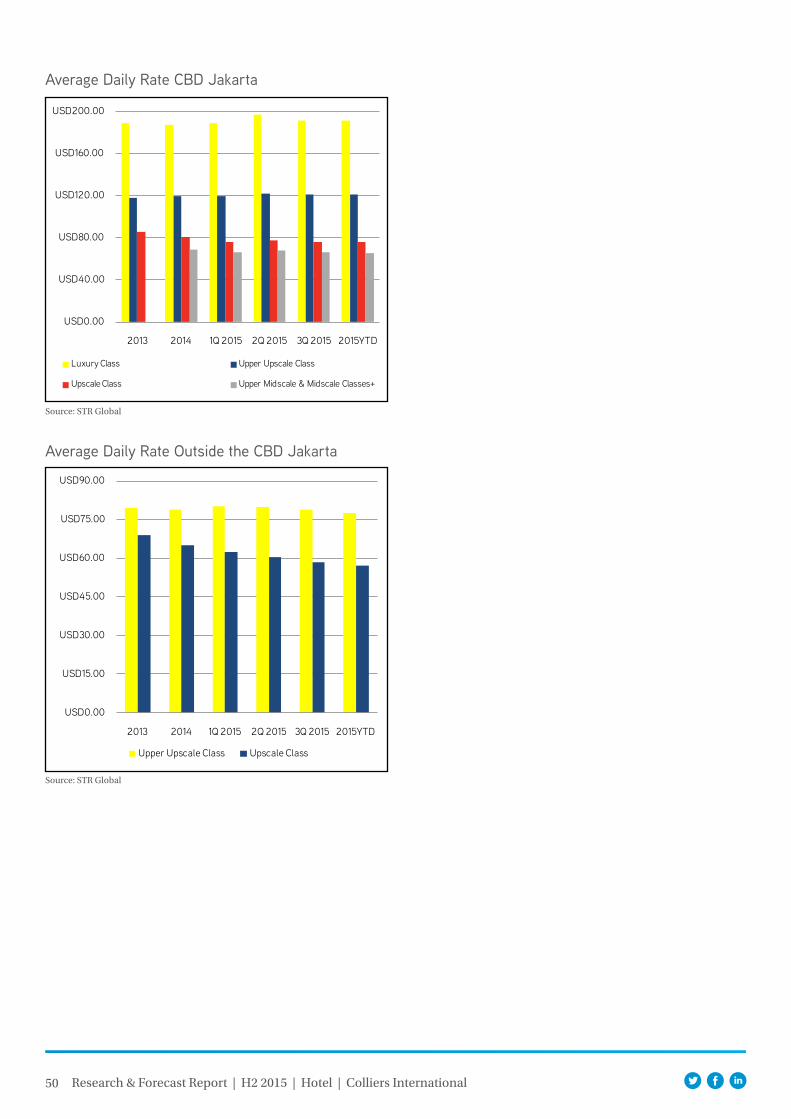
50 Research & Forecast Report | H2 2015 | Hotel | Colliers International
Average Daily Rate Outside the CBD Jakarta
Source: STR Global
Average Daily Rate CBD Jakarta
Source: STR Global
USD0.00
USD40.00
USD80.00
USD120.00
USD160.00
USD200.00
2013 2014 1Q 2015 2Q 2015 3Q 2015 2015YTD
Luxury Class Upper Upscale Class
Upscale Class Upper Midscale & Midscale Classes+
USD0.00
USD15.00
USD30.00
USD45.00
USD60.00
USD75.00
USD90.00
2013 2014 1Q 2015 2Q 2015 3Q 2015 2015YTD
Upper Upscale Class Upscale Class
Copyright © 2013 Colliers International.
The information contained herein has been obtained from sources deemed reliable. While every reasonable effort has been made to ensure its accuracy, we cannot guarantee it. No responsibility is assumed for any inaccuracies. Readers are encouraged to consult their professional advisors prior to acting on any of the material contained in this report.
About Colliers International Group Inc.
Colliers International Group Inc. (NASDAQ: CIGI; TSX: CIG) is a global leader in commercial real estate services with more than 16,300 professionals operating from 502 offices in 67 countries. With an enterprising culture and significant insider ownership, Colliers professionals provide a full range of services to real estate occupiers, owners and investors worldwide. Services include brokerage, global corporate solutions, investment sales and capital markets, project management and workplace solutions, property and asset management, consulting, valuation and appraisal services, and customized research and thought leadership. Colliers International has been ranked among the top 100 outsourcing firms by the International Association of Outsourcing Professionals’ Global Outsourcing for 10 consecutive years, more than any other real estate services firm.
colliers.com/indonesia
Primary Authors:Ferry SalantoAssociate Director | Jakarta62 21 3043 [email protected]
Colliers International IndonesiaWorld Trade Centre 10th & 14th FloorsJalan Jenderal Sudirman Kav. 29 - 31Jakarta 12920Indonesia
TEL 62 21 3043 6888
Accelerating success.
502 offices in 67 countries on 6 continentsUnited States: 140 Canada: 31 Latin America: 24 Asia: 39 ANZ: 160 EMEA: 108
$2.3billion in annual revenue
158million square meters managed
16,300professionals and staff

Colliers QuarterlyQ2 201714 August 2017
JAKARTA PROPERTY MARKET REPORT
Accelerating success.
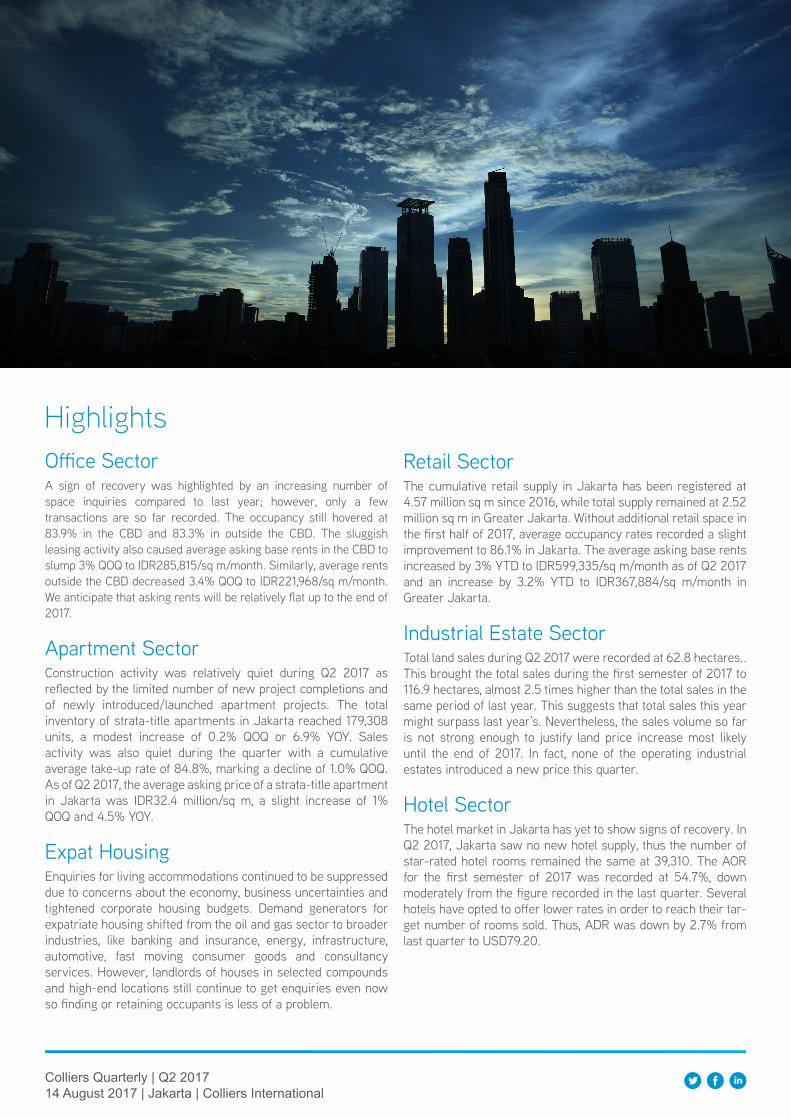
Colliers Quarterly | Q2 201714 August 2017 | Jakarta | Colliers International
Office SectorA sign of recovery was highlighted by an increasing number of space inquiries compared to last year; however, only a few transactions are so far recorded. The occupancy still hovered at 83.9% in the CBD and 83.3% in outside the CBD. The sluggish leasing activity also caused average asking base rents in the CBD to slump 3% QOQ to IDR285,815/sq m/month. Similarly, average rents outside the CBD decreased 3.4% QOQ to IDR221,968/sq m/month. We anticipate that asking rents will be relatively flat up to the end of 2017.
Apartment SectorConstruction activity was relatively quiet during Q2 2017 as reflected by the limited number of new project completions and of newly introduced/launched apartment projects. The total inventory of strata-title apartments in Jakarta reached 179,308 units, a modest increase of 0.2% QOQ or 6.9% YOY. Sales activity was also quiet during the quarter with a cumulative average take-up rate of 84.8%, marking a decline of 1.0% QOQ. As of Q2 2017, the average asking price of a strata-title apartment in Jakarta was IDR32.4 million/sq m, a slight increase of 1% QOQ and 4.5% YOY.
Expat HousingEnquiries for living accommodations continued to be suppressed due to concerns about the economy, business uncertainties and tightened corporate housing budgets. Demand generators for expatriate housing shifted from the oil and gas sector to broader industries, like banking and insurance, energy, infrastructure, automotive, fast moving consumer goods and consultancy services. However, landlords of houses in selected compounds and high-end locations still continue to get enquiries even now so finding or retaining occupants is less of a problem.
HighlightsRetail SectorThe cumulative retail supply in Jakarta has been registered at 4.57 million sq m since 2016, while total supply remained at 2.52 million sq m in Greater Jakarta. Without additional retail space in the first half of 2017, average occupancy rates recorded a slight improvement to 86.1% in Jakarta. The average asking base rents increased by 3% YTD to IDR599,335/sq m/month as of Q2 2017 and an increase by 3.2% YTD to IDR367,884/sq m/month in Greater Jakarta.
Industrial Estate SectorTotal land sales during Q2 2017 were recorded at 62.8 hectares.. This brought the total sales during the first semester of 2017 to 116.9 hectares, almost 2.5 times higher than the total sales in the same period of last year. This suggests that total sales this year might surpass last year’s. Nevertheless, the sales volume so far is not strong enough to justify land price increase most likely until the end of 2017. In fact, none of the operating industrial estates introduced a new price this quarter.
Hotel SectorThe hotel market in Jakarta has yet to show signs of recovery. In Q2 2017, Jakarta saw no new hotel supply, thus the number of star-rated hotel rooms remained the same at 39,310. The AOR for the first semester of 2017 was recorded at 54.7%, down moderately from the figure recorded in the last quarter. Several hotels have opted to offer lower rates in order to reach their tar-get number of rooms sold. Thus, ADR was down by 2.7% from last quarter to USD79.20.
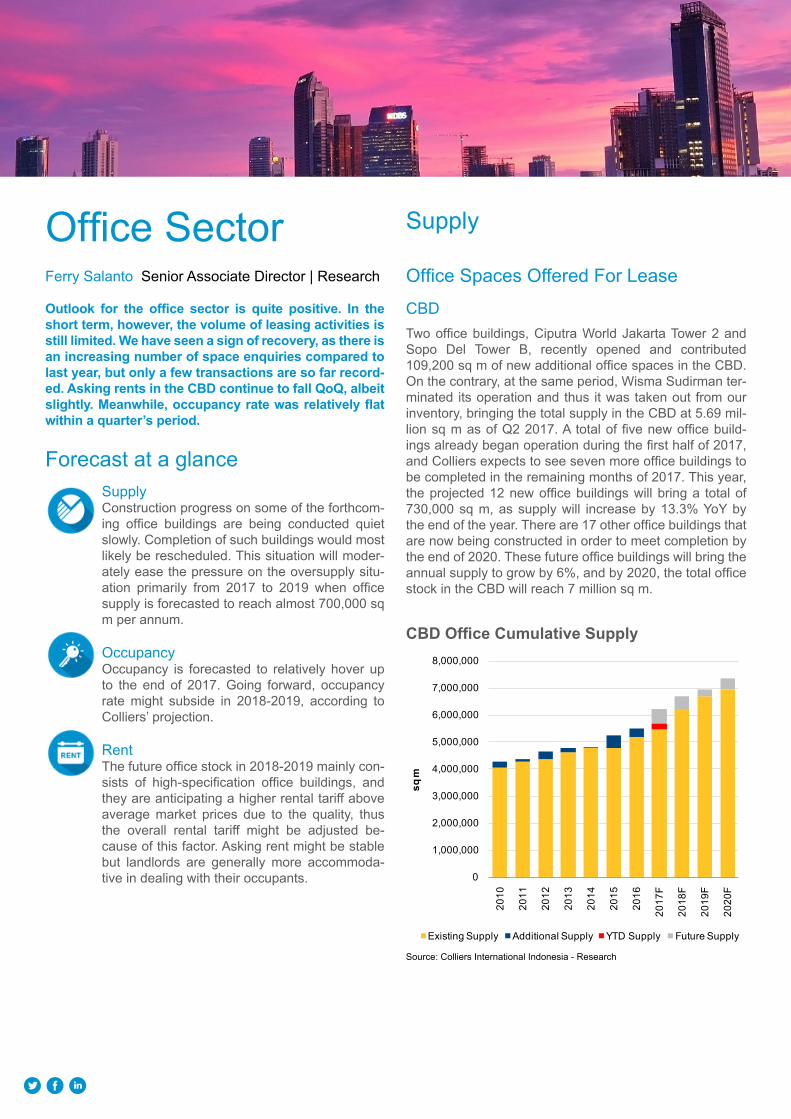
Supply
Office Spaces Offered For Lease
CBD
Source: Colliers International Indonesia - Research
CBD Office Cumulative Supply
Two office buildings, Ciputra World Jakarta Tower 2 and Sopo Del Tower B, recently opened and contributed 109,200 sq m of new additional office spaces in the CBD. On the contrary, at the same period, Wisma Sudirman ter-minated its operation and thus it was taken out from our inventory, bringing the total supply in the CBD at 5.69 mil-lion sq m as of Q2 2017. A total of five new office build-ings already began operation during the first half of 2017, and Colliers expects to see seven more office buildings to be completed in the remaining months of 2017. This year, the projected 12 new office buildings will bring a total of 730,000 sq m, as supply will increase by 13.3% YoY by the end of the year. There are 17 other office buildings that are now being constructed in order to meet completion by the end of 2020. These future office buildings will bring the annual supply to grow by 6%, and by 2020, the total office stock in the CBD will reach 7 million sq m.
SupplyConstruction progress on some of the forthcom-ing office buildings are being conducted quiet slowly. Completion of such buildings would most likely be rescheduled. This situation will moder-ately ease the pressure on the oversupply situ-ation primarily from 2017 to 2019 when office supply is forecasted to reach almost 700,000 sq m per annum.
OccupancyOccupancy is forecasted to relatively hover up to the end of 2017. Going forward, occupancy rate might subside in 2018-2019, according to Colliers’ projection.
RentThe future office stock in 2018-2019 mainly con-sists of high-specification office buildings, and they are anticipating a higher rental tariff above average market prices due to the quality, thus the overall rental tariff might be adjusted be-cause of this factor. Asking rent might be stable but landlords are generally more accommoda-tive in dealing with their occupants.
Office SectorFerry Salanto Senior Associate Director | Research
Outlook for the office sector is quite positive. In the short term, however, the volume of leasing activities is still limited. We have seen a sign of recovery, as there is an increasing number of space enquiries compared to last year, but only a few transactions are so far record-ed. Asking rents in the CBD continue to fall QoQ, albeit slightly. Meanwhile, occupancy rate was relatively flat within a quarter’s period.
Forecast at a glance
0
1,000,000
2,000,000
3,000,000
4,000,000
5,000,000
6,000,000
7,000,000
8,000,000
2010
2011
2012
2013
2014
2015
2016
2017
F
2018
F
2019
F
2020
F
sq m
Existing Supply Additional Supply YTD Supply Future Supply
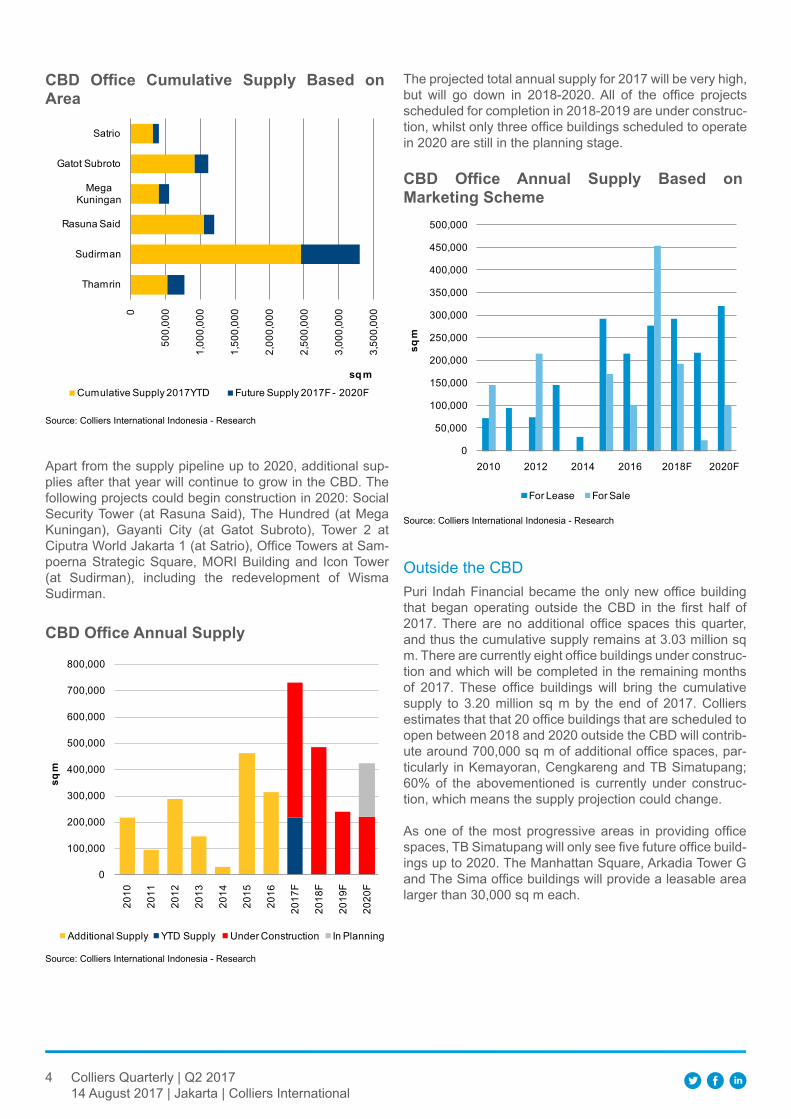
4 Colliers Quarterly | Q2 201714 August 2017 | Jakarta | Colliers International
Source: Colliers International Indonesia - Research
CBD Office Annual Supply
Source: Colliers International Indonesia - Research
CBD Office Cumulative Supply Based on Area
Apart from the supply pipeline up to 2020, additional sup-plies after that year will continue to grow in the CBD. The following projects could begin construction in 2020: Social Security Tower (at Rasuna Said), The Hundred (at Mega Kuningan), Gayanti City (at Gatot Subroto), Tower 2 at Ciputra World Jakarta 1 (at Satrio), Office Towers at Sam-poerna Strategic Square, MORI Building and Icon Tower (at Sudirman), including the redevelopment of Wisma Sudirman.
Source: Colliers International Indonesia - Research
CBD Office Annual Supply Based on Marketing Scheme
0
500,
000
1,00
0,00
0
1,50
0,00
0
2,00
0,00
0
2,50
0,00
0
3,00
0,00
0
3,50
0,00
0
Thamrin
Sudirman
Rasuna Said
Mega Kuningan
Gatot Subroto
Satrio
sq mCumulative Supply 2017YTD Future Supply 2017F - 2020F
0
100,000
200,000
300,000
400,000
500,000
600,000
700,000
800,000
2010
2011
2012
2013
2014
2015
2016
2017
F
2018
F
2019
F
2020
F
sq m
Additional Supply YTD Supply Under Construction In Planning
The projected total annual supply for 2017 will be very high, but will go down in 2018-2020. All of the office projects scheduled for completion in 2018-2019 are under construc-tion, whilst only three office buildings scheduled to operate in 2020 are still in the planning stage.
0
50,000
100,000
150,000
200,000
250,000
300,000
350,000
400,000
450,000
500,000
2010 2012 2014 2016 2018F 2020F
sq m
For Lease For Sale
Outside the CBDPuri Indah Financial became the only new office building that began operating outside the CBD in the first half of 2017. There are no additional office spaces this quarter, and thus the cumulative supply remains at 3.03 million sq m. There are currently eight office buildings under construc-tion and which will be completed in the remaining months of 2017. These office buildings will bring the cumulative supply to 3.20 million sq m by the end of 2017. Colliers estimates that that 20 office buildings that are scheduled to open between 2018 and 2020 outside the CBD will contrib-ute around 700,000 sq m of additional office spaces, par-ticularly in Kemayoran, Cengkareng and TB Simatupang; 60% of the abovementioned is currently under construc-tion, which means the supply projection could change.
As one of the most progressive areas in providing office spaces, TB Simatupang will only see five future office build-ings up to 2020. The Manhattan Square, Arkadia Tower G and The Sima office buildings will provide a leasable area larger than 30,000 sq m each.
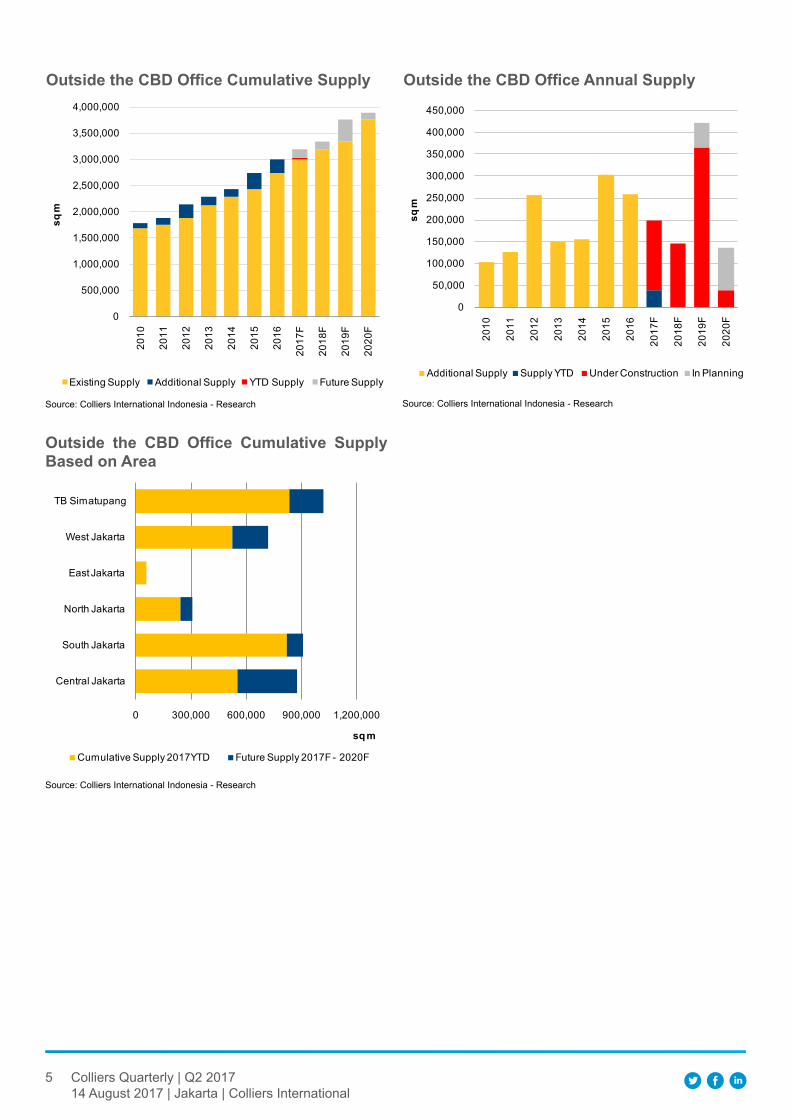
5 Colliers Quarterly | Q2 201714 August 2017 | Jakarta | Colliers International
Outside the CBD Office Cumulative Supply
Source: Colliers International Indonesia - Research
Outside the CBD Office Cumulative Supply Based on Area
Source: Colliers International Indonesia - Research
0
500,000
1,000,000
1,500,000
2,000,000
2,500,000
3,000,000
3,500,000
4,000,000
2010
2011
2012
2013
2014
2015
2016
2017
F
2018
F
2019
F
2020
F
sq m
Existing Supply Additional Supply YTD Supply Future Supply
0 300,000 600,000 900,000 1,200,000
Central Jakarta
South Jakarta
North Jakarta
East Jakarta
West Jakarta
TB Simatupang
sq m
Cumulative Supply 2017YTD Future Supply 2017F - 2020F
Source: Colliers International Indonesia - Research
Outside the CBD Office Annual Supply
0
50,000
100,000
150,000
200,000
250,000
300,000
350,000
400,000
450,000
2010
2011
2012
2013
2014
2015
2016
2017
F
2018
F
2019
F
2020
F
sq m
Additional Supply Supply YTD Under Construction In Planning
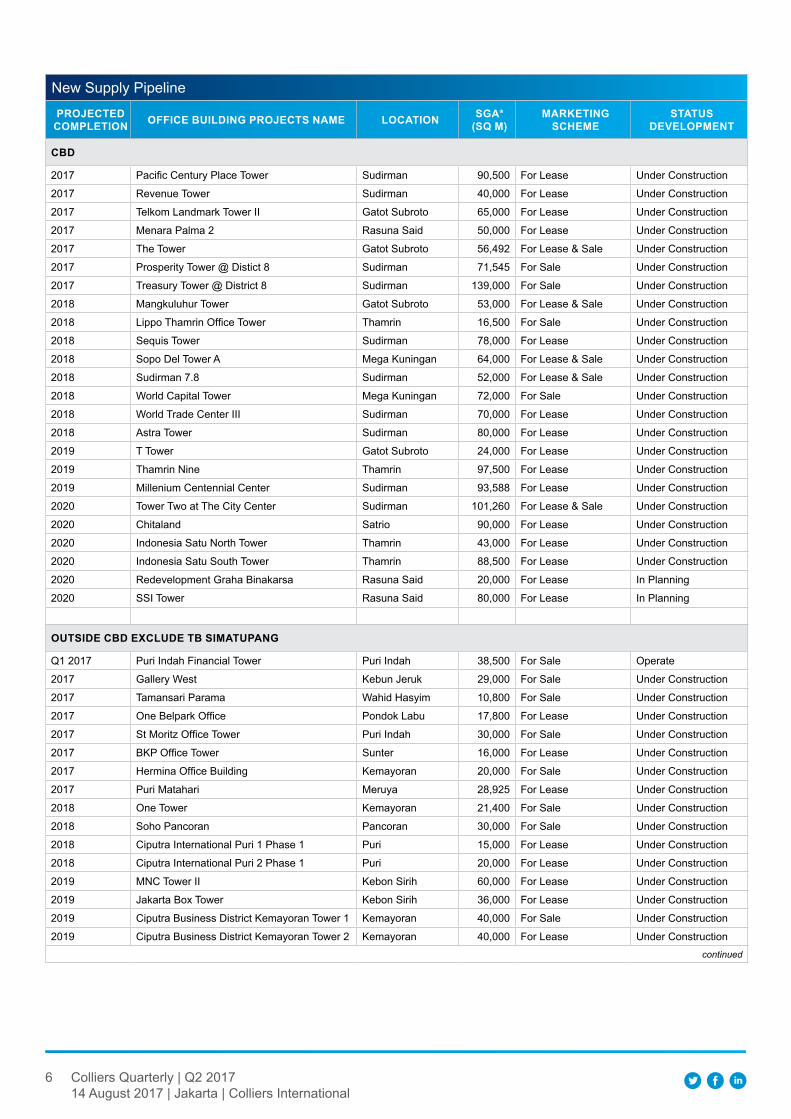
6 Colliers Quarterly | Q2 201714 August 2017 | Jakarta | Colliers International
New Supply Pipelineprojected
COMpletIOn OffICe BuIlDIng prOjeCtS nAMe lOCAtIOn SgA* (SQ M)
MArketIng SCheMe
StAtuS DevelOpMent
cBd
2017 Pacific Century Place Tower Sudirman 90,500 For Lease Under Construction
2017 Revenue Tower Sudirman 40,000 For Lease Under Construction
2017 Telkom Landmark Tower II Gatot Subroto 65,000 For Lease Under Construction
2017 Menara Palma 2 Rasuna Said 50,000 For Lease Under Construction
2017 The Tower Gatot Subroto 56,492 For Lease & Sale Under Construction
2017 Prosperity Tower @ Distict 8 Sudirman 71,545 For Sale Under Construction
2017 Treasury Tower @ District 8 Sudirman 139,000 For Sale Under Construction
2018 Mangkuluhur Tower Gatot Subroto 53,000 For Lease & Sale Under Construction
2018 Lippo Thamrin Office Tower Thamrin 16,500 For Sale Under Construction
2018 Sequis Tower Sudirman 78,000 For Lease Under Construction
2018 Sopo Del Tower A Mega Kuningan 64,000 For Lease & Sale Under Construction
2018 Sudirman 7.8 Sudirman 52,000 For Lease & Sale Under Construction
2018 World Capital Tower Mega Kuningan 72,000 For Sale Under Construction
2018 World Trade Center III Sudirman 70,000 For Lease Under Construction
2018 Astra Tower Sudirman 80,000 For Lease Under Construction
2019 T Tower Gatot Subroto 24,000 For Lease Under Construction
2019 Thamrin Nine Thamrin 97,500 For Lease Under Construction
2019 Millenium Centennial Center Sudirman 93,588 For Lease Under Construction
2020 Tower Two at The City Center Sudirman 101,260 For Lease & Sale Under Construction
2020 Chitaland Satrio 90,000 For Lease Under Construction
2020 Indonesia Satu North Tower Thamrin 43,000 For Lease Under Construction
2020 Indonesia Satu South Tower Thamrin 88,500 For Lease Under Construction
2020 Redevelopment Graha Binakarsa Rasuna Said 20,000 For Lease In Planning
2020 SSI Tower Rasuna Said 80,000 For Lease In Planning
OutSIDe CBD exCluDe tB SIMAtupAng
Q1 2017 Puri Indah Financial Tower Puri Indah 38,500 For Sale Operate
2017 Gallery West Kebun Jeruk 29,000 For Sale Under Construction
2017 Tamansari Parama Wahid Hasyim 10,800 For Sale Under Construction
2017 One Belpark Office Pondok Labu 17,800 For Lease Under Construction
2017 St Moritz Office Tower Puri Indah 30,000 For Sale Under Construction
2017 BKP Office Tower Sunter 16,000 For Lease Under Construction
2017 Hermina Office Building Kemayoran 20,000 For Sale Under Construction
2017 Puri Matahari Meruya 28,925 For Lease Under Construction
2018 One Tower Kemayoran 21,400 For Sale Under Construction
2018 Soho Pancoran Pancoran 30,000 For Sale Under Construction
2018 Ciputra International Puri 1 Phase 1 Puri 15,000 For Lease Under Construction
2018 Ciputra International Puri 2 Phase 1 Puri 20,000 For Lease Under Construction
2019 MNC Tower II Kebon Sirih 60,000 For Lease Under Construction
2019 Jakarta Box Tower Kebon Sirih 36,000 For Lease Under Construction
2019 Ciputra Business District Kemayoran Tower 1 Kemayoran 40,000 For Sale Under Construction
2019 Ciputra Business District Kemayoran Tower 2 Kemayoran 40,000 For Lease Under Constructioncontinued
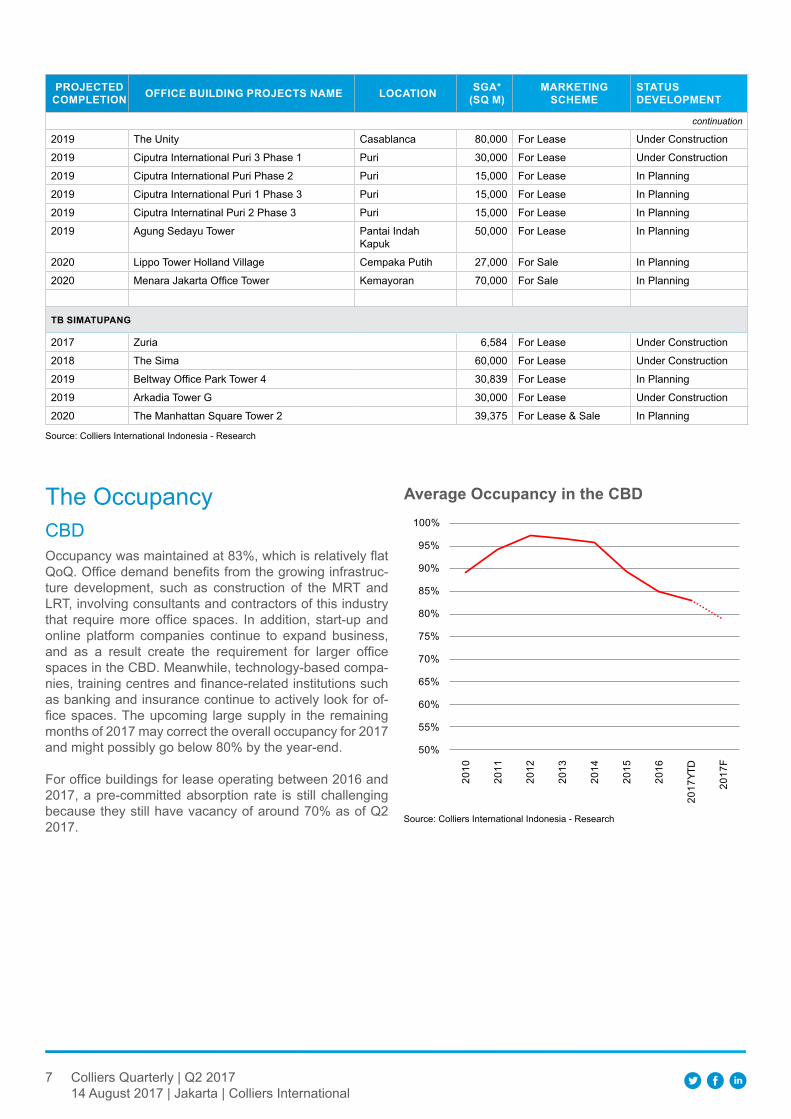
7 Colliers Quarterly | Q2 201714 August 2017 | Jakarta | Colliers International
projected COMpletIOn OffICe BuIlDIng prOjeCtS nAMe lOCAtIOn SgA*
(SQ M)MArketIng
SCheMeStAtuS DevelOpMent
continuation
2019 The Unity Casablanca 80,000 For Lease Under Construction
2019 Ciputra International Puri 3 Phase 1 Puri 30,000 For Lease Under Construction
2019 Ciputra International Puri Phase 2 Puri 15,000 For Lease In Planning
2019 Ciputra International Puri 1 Phase 3 Puri 15,000 For Lease In Planning
2019 Ciputra Internatinal Puri 2 Phase 3 Puri 15,000 For Lease In Planning
2019 Agung Sedayu Tower Pantai Indah Kapuk
50,000 For Lease In Planning
2020 Lippo Tower Holland Village Cempaka Putih 27,000 For Sale In Planning
2020 Menara Jakarta Office Tower Kemayoran 70,000 For Sale In Planning
tB SIMAtupAng
2017 Zuria 6,584 For Lease Under Construction
2018 The Sima 60,000 For Lease Under Construction
2019 Beltway Office Park Tower 4 30,839 For Lease In Planning
2019 Arkadia Tower G 30,000 For Lease Under Construction
2020 The Manhattan Square Tower 2 39,375 For Lease & Sale In Planning
Source: Colliers International Indonesia - Research
The OccupancyCBD
Occupancy was maintained at 83%, which is relatively flat QoQ. Office demand benefits from the growing infrastruc-ture development, such as construction of the MRT and LRT, involving consultants and contractors of this industry that require more office spaces. In addition, start-up and online platform companies continue to expand business, and as a result create the requirement for larger office spaces in the CBD. Meanwhile, technology-based compa-nies, training centres and finance-related institutions such as banking and insurance continue to actively look for of-fice spaces. The upcoming large supply in the remaining months of 2017 may correct the overall occupancy for 2017 and might possibly go below 80% by the year-end.
For office buildings for lease operating between 2016 and 2017, a pre-committed absorption rate is still challenging because they still have vacancy of around 70% as of Q2 2017.
Source: Colliers International Indonesia - Research
Average Occupancy in the CBD
50%
55%
60%
65%
70%
75%
80%
85%
90%
95%
100%
2010
2011
2012
2013
2014
2015
2016
2017
YTD
2017
F
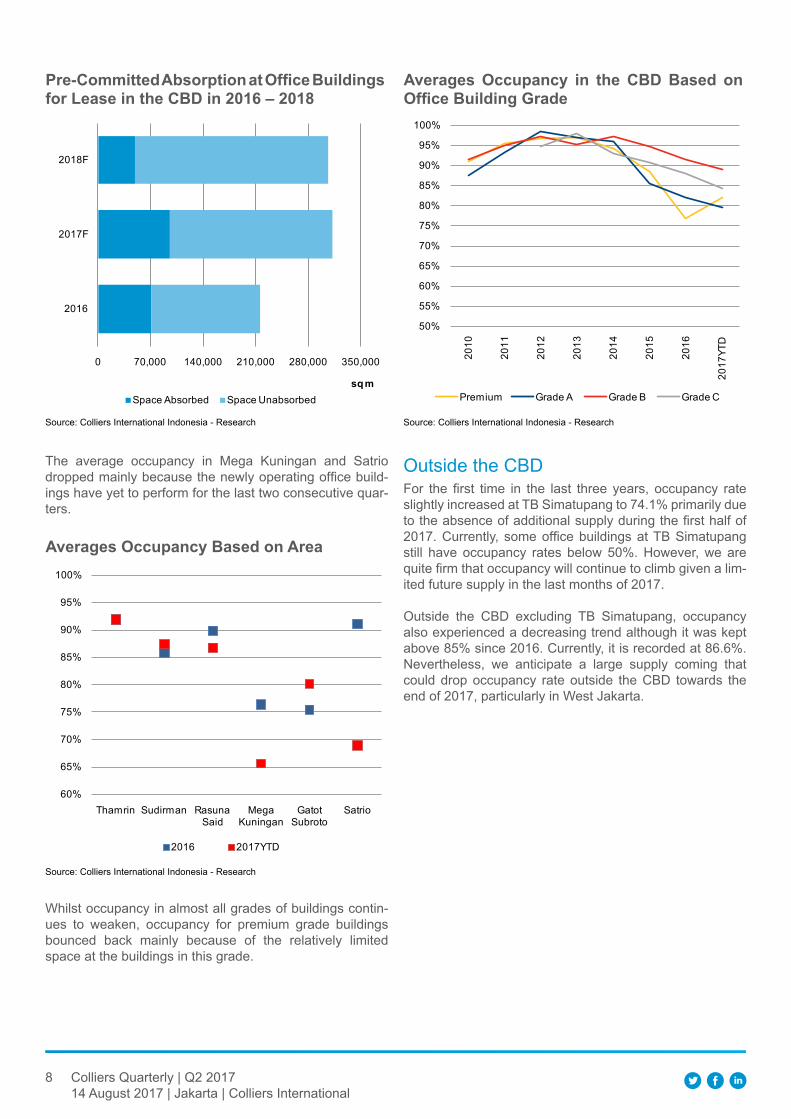
8 Colliers Quarterly | Q2 201714 August 2017 | Jakarta | Colliers International
Source: Colliers International Indonesia - Research
pre-Committed Absorption at Office Buildings for lease in the CBD in 2016 – 2018
Source: Colliers International Indonesia - Research
Averages Occupancy Based on Area
Source: Colliers International Indonesia - Research
Averages Occupancy in the CBD Based on Office Building grade
0 70,000 140,000 210,000 280,000 350,000
2016
2017F
2018F
sq mSpace Absorbed Space Unabsorbed
The average occupancy in Mega Kuningan and Satrio dropped mainly because the newly operating office build-ings have yet to perform for the last two consecutive quar-ters.
60%
65%
70%
75%
80%
85%
90%
95%
100%
Thamrin Sudirman Rasuna Said
Mega Kuningan
Gatot Subroto
Satrio
2016 2017YTD
Whilst occupancy in almost all grades of buildings contin-ues to weaken, occupancy for premium grade buildings bounced back mainly because of the relatively limited space at the buildings in this grade.
50%
55%
60%
65%
70%
75%
80%
85%
90%
95%
100%
2010
2011
2012
2013
2014
2015
2016
2017
YTD
Premium Grade A Grade B Grade C
Outside the CBD For the first time in the last three years, occupancy rate slightly increased at TB Simatupang to 74.1% primarily due to the absence of additional supply during the first half of 2017. Currently, some office buildings at TB Simatupang still have occupancy rates below 50%. However, we are quite firm that occupancy will continue to climb given a lim-ited future supply in the last months of 2017.
Outside the CBD excluding TB Simatupang, occupancy also experienced a decreasing trend although it was kept above 85% since 2016. Currently, it is recorded at 86.6%. Nevertheless, we anticipate a large supply coming that could drop occupancy rate outside the CBD towards the end of 2017, particularly in West Jakarta.
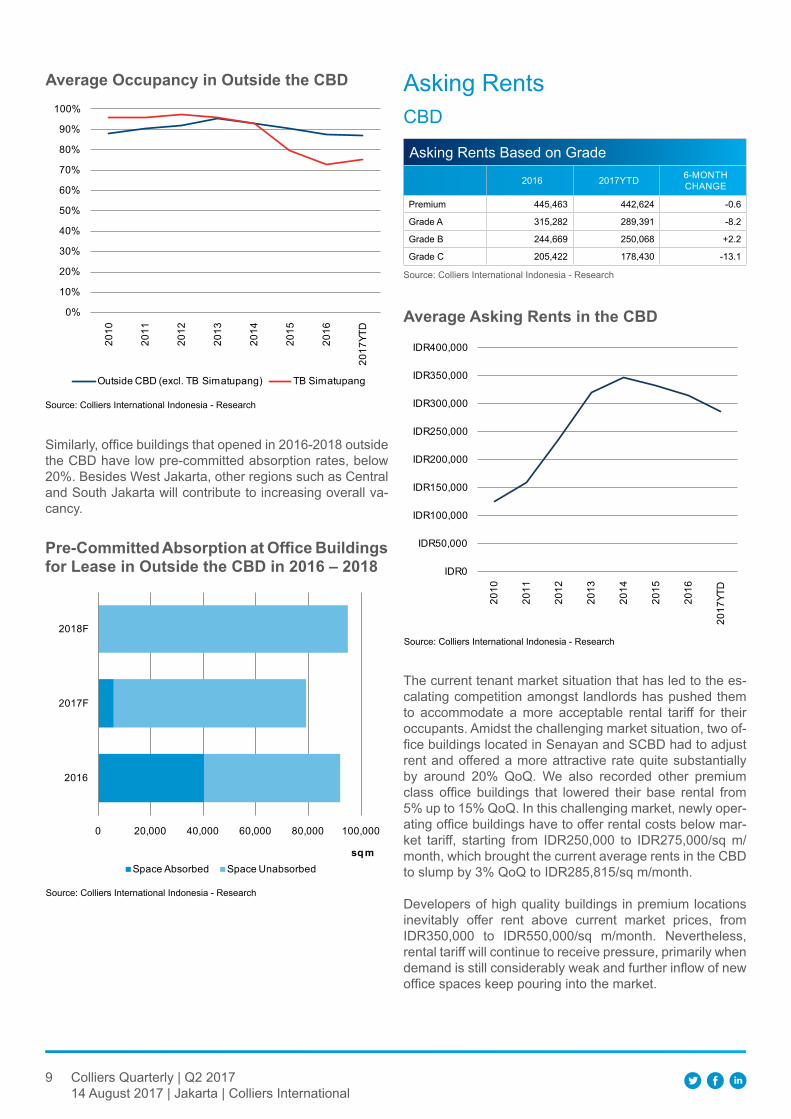
9 Colliers Quarterly | Q2 201714 August 2017 | Jakarta | Colliers International
Source: Colliers International Indonesia - Research
pre-Committed Absorption at Office Buildings for lease in Outside the CBD in 2016 – 2018
Source: Colliers International Indonesia - Research
Average Occupancy in Outside the CBD
50%
55%
60%
65%
70%
75%
80%
85%
90%
95%
100%20
10
2011
2012
2013
2014
2015
2016
2017
YTD
2017
F
Similarly, office buildings that opened in 2016-2018 outside the CBD have low pre-committed absorption rates, below 20%. Besides West Jakarta, other regions such as Central and South Jakarta will contribute to increasing overall va-cancy.
0%
10%
20%
30%
40%
50%
60%
70%
80%
90%
100%20
10
2011
2012
2013
2014
2015
2016
2017
YTD
Outside CBD (excl. TB Simatupang) TB Simatupang
0 20,000 40,000 60,000 80,000 100,000
2016
2017F
2018F
sq mSpace Absorbed Space Unabsorbed
Asking RentsCBD
Source: Colliers International Indonesia - Research
Asking Rents Based on Grade
2016 2017YTD 6-MONTH CHANGE
Premium 445,463 442,624 -0.6
Grade A 315,282 289,391 -8.2
Grade B 244,669 250,068 +2.2
Grade C 205,422 178,430 -13.1
The current tenant market situation that has led to the es-calating competition amongst landlords has pushed them to accommodate a more acceptable rental tariff for their occupants. Amidst the challenging market situation, two of-fice buildings located in Senayan and SCBD had to adjust rent and offered a more attractive rate quite substantially by around 20% QoQ. We also recorded other premium class office buildings that lowered their base rental from 5% up to 15% QoQ. In this challenging market, newly oper-ating office buildings have to offer rental costs below mar-ket tariff, starting from IDR250,000 to IDR275,000/sq m/month, which brought the current average rents in the CBD to slump by 3% QoQ to IDR285,815/sq m/month.
Developers of high quality buildings in premium locations inevitably offer rent above current market prices, from IDR350,000 to IDR550,000/sq m/month. Nevertheless, rental tariff will continue to receive pressure, primarily when demand is still considerably weak and further inflow of new office spaces keep pouring into the market.
Source: Colliers International Indonesia - Research
Average Asking rents in the CBD
IDR0
IDR50,000
IDR100,000
IDR150,000
IDR200,000
IDR250,000
IDR300,000
IDR350,000
IDR400,000
2010
2011
2012
2013
2014
2015
2016
2017
YTD
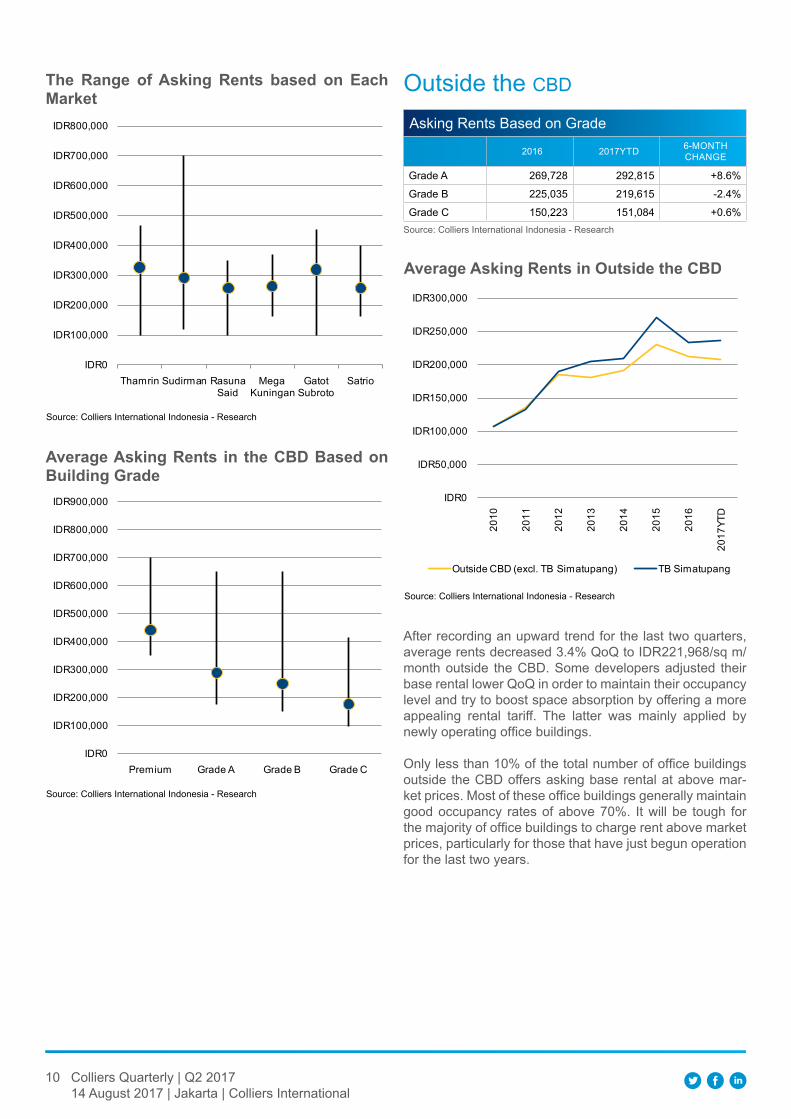
10 Colliers Quarterly | Q2 201714 August 2017 | Jakarta | Colliers International
Source: Colliers International Indonesia - Research
the range of Asking rents based on each Market
IDR0
IDR100,000
IDR200,000
IDR300,000
IDR400,000
IDR500,000
IDR600,000
IDR700,000
IDR800,000
Thamrin Sudirman Rasuna Said
Mega Kuningan
Gatot Subroto
Satrio
Source: Colliers International Indonesia - Research
Average Asking rents in the CBD Based on Building grade
IDR0
IDR100,000
IDR200,000
IDR300,000
IDR400,000
IDR500,000
IDR600,000
IDR700,000
IDR800,000
IDR900,000
Premium Grade A Grade B Grade C
Outside the CBD
Source: Colliers International Indonesia - Research
Asking Rents Based on Grade
2016 2017YTD 6-MONTH CHANGE
Grade A 269,728 292,815 +8.6%
Grade B 225,035 219,615 -2.4%
Grade C 150,223 151,084 +0.6%
After recording an upward trend for the last two quarters, average rents decreased 3.4% QoQ to IDR221,968/sq m/month outside the CBD. Some developers adjusted their base rental lower QoQ in order to maintain their occupancy level and try to boost space absorption by offering a more appealing rental tariff. The latter was mainly applied by newly operating office buildings. Only less than 10% of the total number of office buildings outside the CBD offers asking base rental at above mar-ket prices. Most of these office buildings generally maintain good occupancy rates of above 70%. It will be tough for the majority of office buildings to charge rent above market prices, particularly for those that have just begun operation for the last two years.
Source: Colliers International Indonesia - Research
Average Asking rents in Outside the CBD
IDR0
IDR50,000
IDR100,000
IDR150,000
IDR200,000
IDR250,000
IDR300,000
2010
2011
2012
2013
2014
2015
2016
2017
YTD
Outside CBD (excl. TB Simatupang) TB Simatupang
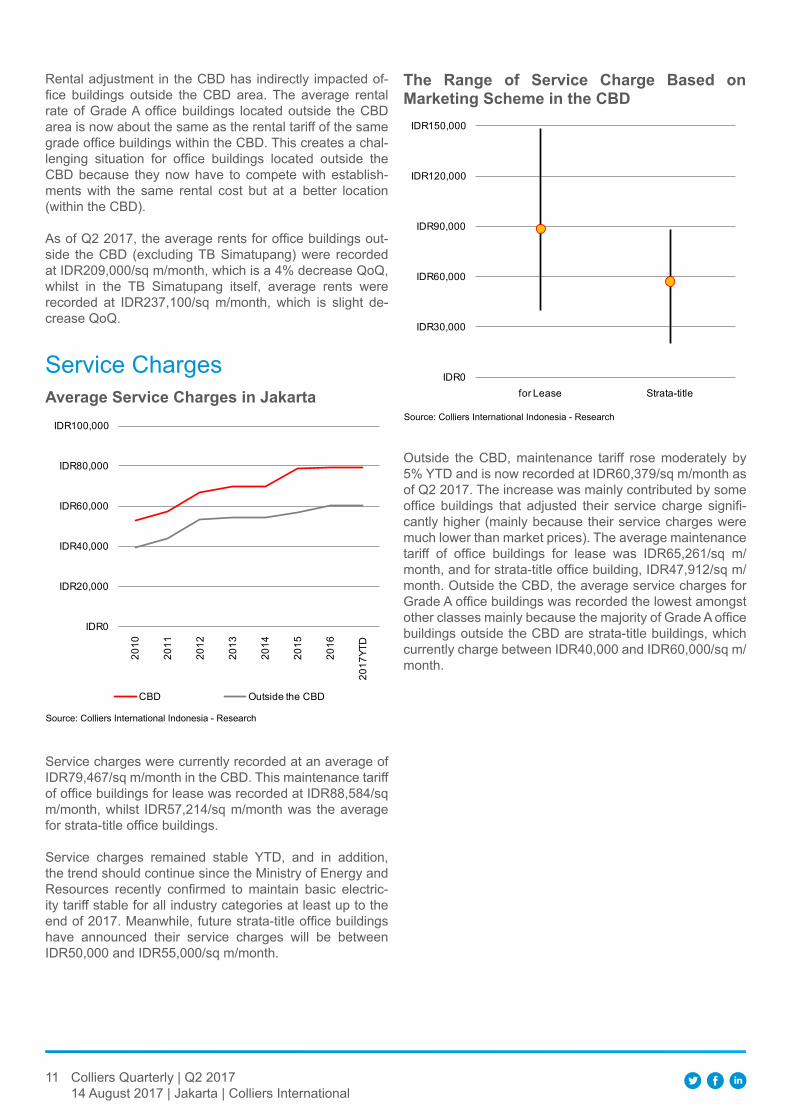
11 Colliers Quarterly | Q2 201714 August 2017 | Jakarta | Colliers International
Service Charges
Source: Colliers International Indonesia - Research
Average Service Charges in jakartaSource: Colliers International Indonesia - Research
the range of Service Charge Based on Marketing Scheme in the CBD
Service charges were currently recorded at an average of IDR79,467/sq m/month in the CBD. This maintenance tariff of office buildings for lease was recorded at IDR88,584/sq m/month, whilst IDR57,214/sq m/month was the average for strata-title office buildings.
Service charges remained stable YTD, and in addition, the trend should continue since the Ministry of Energy and Resources recently confirmed to maintain basic electric-ity tariff stable for all industry categories at least up to the end of 2017. Meanwhile, future strata-title office buildings have announced their service charges will be between IDR50,000 and IDR55,000/sq m/month.
Rental adjustment in the CBD has indirectly impacted of-fice buildings outside the CBD area. The average rental rate of Grade A office buildings located outside the CBD area is now about the same as the rental tariff of the same grade office buildings within the CBD. This creates a chal-lenging situation for office buildings located outside the CBD because they now have to compete with establish-ments with the same rental cost but at a better location (within the CBD).
As of Q2 2017, the average rents for office buildings out-side the CBD (excluding TB Simatupang) were recorded at IDR209,000/sq m/month, which is a 4% decrease QoQ, whilst in the TB Simatupang itself, average rents were recorded at IDR237,100/sq m/month, which is slight de-crease QoQ.
IDR0
IDR20,000
IDR40,000
IDR60,000
IDR80,000
IDR100,000
2010
2011
2012
2013
2014
2015
2016
2017
YTD
CBD Outside the CBD
IDR0
IDR30,000
IDR60,000
IDR90,000
IDR120,000
IDR150,000
for Lease Strata-title
Outside the CBD, maintenance tariff rose moderately by 5% YTD and is now recorded at IDR60,379/sq m/month as of Q2 2017. The increase was mainly contributed by some office buildings that adjusted their service charge signifi-cantly higher (mainly because their service charges were much lower than market prices). The average maintenance tariff of office buildings for lease was IDR65,261/sq m/month, and for strata-title office building, IDR47,912/sq m/month. Outside the CBD, the average service charges for Grade A office buildings was recorded the lowest amongst other classes mainly because the majority of Grade A office buildings outside the CBD are strata-title buildings, which currently charge between IDR40,000 and IDR60,000/sq m/month.
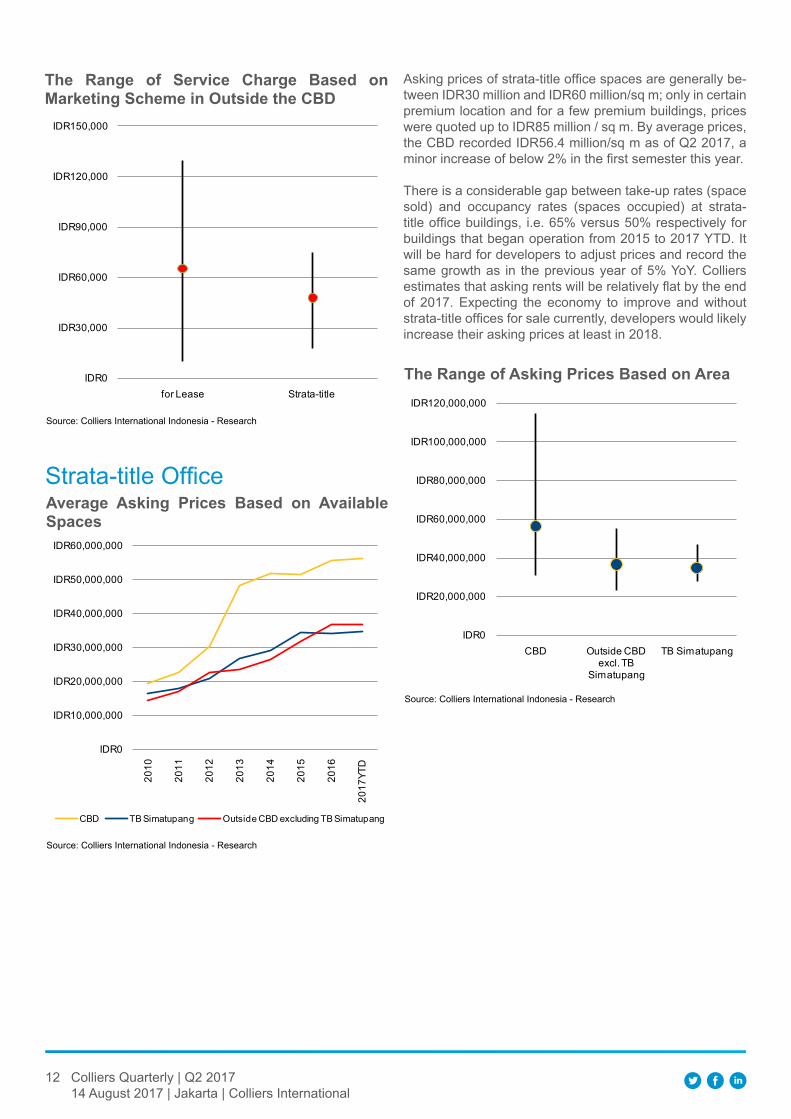
12 Colliers Quarterly | Q2 201714 August 2017 | Jakarta | Colliers International
Source: Colliers International Indonesia - Research
the range of Service Charge Based on Marketing Scheme in Outside the CBD
IDR0
IDR30,000
IDR60,000
IDR90,000
IDR120,000
IDR150,000
for Lease Strata-title
Strata-title Office
Source: Colliers International Indonesia - Research
Average Asking prices Based on Available Spaces
Asking prices of strata-title office spaces are generally be-tween IDR30 million and IDR60 million/sq m; only in certain premium location and for a few premium buildings, prices were quoted up to IDR85 million / sq m. By average prices, the CBD recorded IDR56.4 million/sq m as of Q2 2017, a minor increase of below 2% in the first semester this year.
There is a considerable gap between take-up rates (space sold) and occupancy rates (spaces occupied) at strata-title office buildings, i.e. 65% versus 50% respectively for buildings that began operation from 2015 to 2017 YTD. It will be hard for developers to adjust prices and record the same growth as in the previous year of 5% YoY. Colliers estimates that asking rents will be relatively flat by the end of 2017. Expecting the economy to improve and without strata-title offices for sale currently, developers would likely increase their asking prices at least in 2018.
IDR0
IDR10,000,000
IDR20,000,000
IDR30,000,000
IDR40,000,000
IDR50,000,000
IDR60,000,000
2010
2011
2012
2013
2014
2015
2016
2017
YTD
CBD TB Simatupang Outside CBD excluding TB Simatupang
Source: Colliers International Indonesia - Research
the range of Asking prices Based on Area
IDR0
IDR20,000,000
IDR40,000,000
IDR60,000,000
IDR80,000,000
IDR100,000,000
IDR120,000,000
CBD Outside CBD excl. TB
Simatupang
TB Simatupang
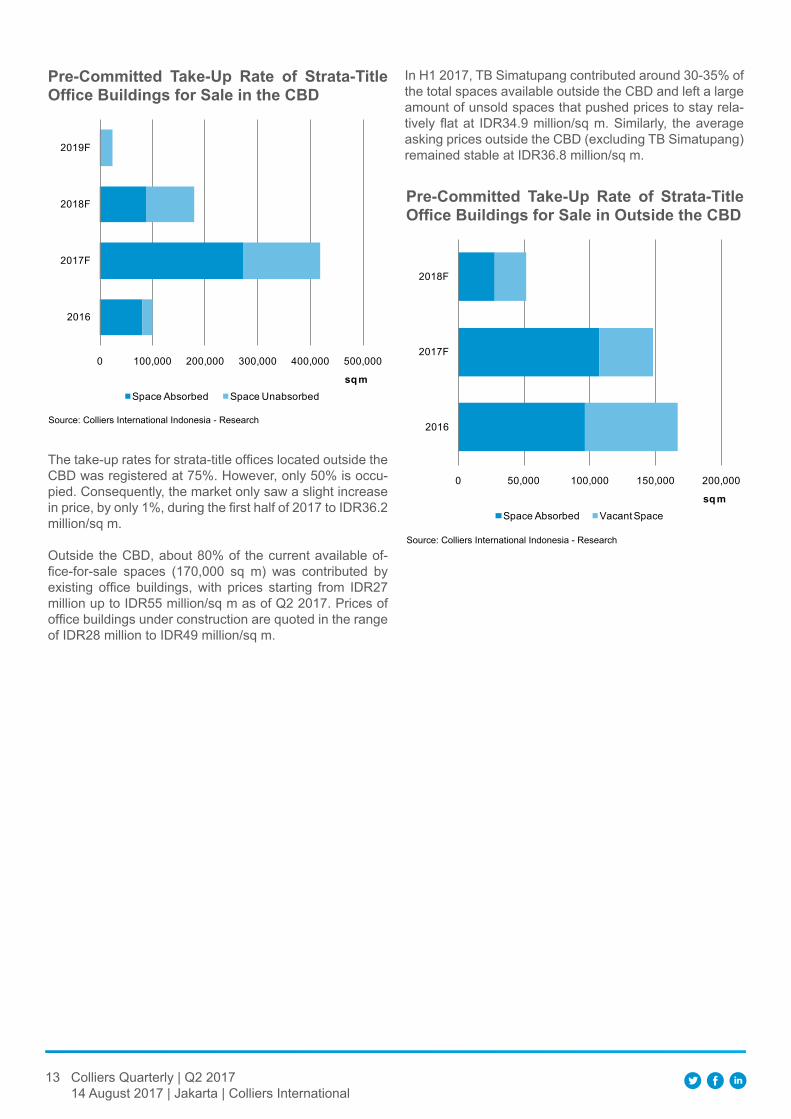
13 Colliers Quarterly | Q2 201714 August 2017 | Jakarta | Colliers International
Source: Colliers International Indonesia - Research
pre-Committed take-up rate of Strata-title Office Buildings for Sale in the CBD
The take-up rates for strata-title offices located outside the CBD was registered at 75%. However, only 50% is occu-pied. Consequently, the market only saw a slight increase in price, by only 1%, during the first half of 2017 to IDR36.2 million/sq m.
Outside the CBD, about 80% of the current available of-fice-for-sale spaces (170,000 sq m) was contributed by existing office buildings, with prices starting from IDR27 million up to IDR55 million/sq m as of Q2 2017. Prices of office buildings under construction are quoted in the range of IDR28 million to IDR49 million/sq m.
0 100,000 200,000 300,000 400,000 500,000
2016
2017F
2018F
2019F
sq mSpace Absorbed Space Unabsorbed
In H1 2017, TB Simatupang contributed around 30-35% of the total spaces available outside the CBD and left a large amount of unsold spaces that pushed prices to stay rela-tively flat at IDR34.9 million/sq m. Similarly, the average asking prices outside the CBD (excluding TB Simatupang) remained stable at IDR36.8 million/sq m.
Source: Colliers International Indonesia - Research
pre-Committed take-up rate of Strata-title Office Buildings for Sale in Outside the CBD
0 50,000 100,000 150,000 200,000
2016
2017F
2018F
sq mSpace Absorbed Vacant Space
Apartment SectorFerry Salanto Senior Associate Director | Research
the period saw very limited sales activities both in stra-ta-title apartment and apartment for lease markets. De-spite the successful jakarta election and tax amnesty programme, buyers have not returned to the market en masse. the sluggish market may be explained by the following reasons. first, this was related when people shifted their spending in line with the recent festivities and new school year. Second, potential buyers still wait and see until the elected governor takes his seat and what would happen regarding the regulation of their properties. Moreover, the repatriated money is still in the bank and has not been transformed into apartment investment due to the fact that financial instruments (e.g. government bond) currently offer more competi-tive return compared to the property sector. On the other hand, the weakening enquiry for apartments for lease during the traditionally slow month of ramadan (May-june) is due to the lacklustre hiring of expatriates and the evolving nature of the leasing landscape, from senior level Western expats to younger, single Asian expats. however, in light of the recent S&p rating up-grade, we are highly optimistic to see a boost to Indo-nesia’s foreign Direct Investment (fDI), which in turn will benefit the property market in a few years to come.
Forecast at a glanceSupplyFor the first semester, 3,130 new units have en-tered the market, almost 15% of the total 21,167 projected units in the full year of 2017. Further-more, we expect a huge supply of 55,087 new apartment units in the next three years.
DemandMany factors are now in place for Jakarta’s apart-ment market to improve. Aside from the coun-try’s recent rating upgrade by S&P to investment grade, if the government could maintain the cur-rent economic stability and remain proactive to stimulate the market, we may see improvements in the near to mid-term, as prospective buyers, particularly investors, need more assurance and a more comfortable environment in order to ex-ecute their investment plan.
RentThe on-going injection of newly completed ser-viced apartments will place further downward pressure on rents, as leasing demand from ex-patriates is still weak.
PriceThe average asking price of apartments in Jakarta rose by 1% QOQ and 4.5% YOY to IDR32.4 million/sq m during the quarter. Given the tight competition in the market, apartment price should experience moderation, particularly in the non-prime areas, or edged up slightly in the South Jakarta and CBD areas in the upcom-ing quarter.
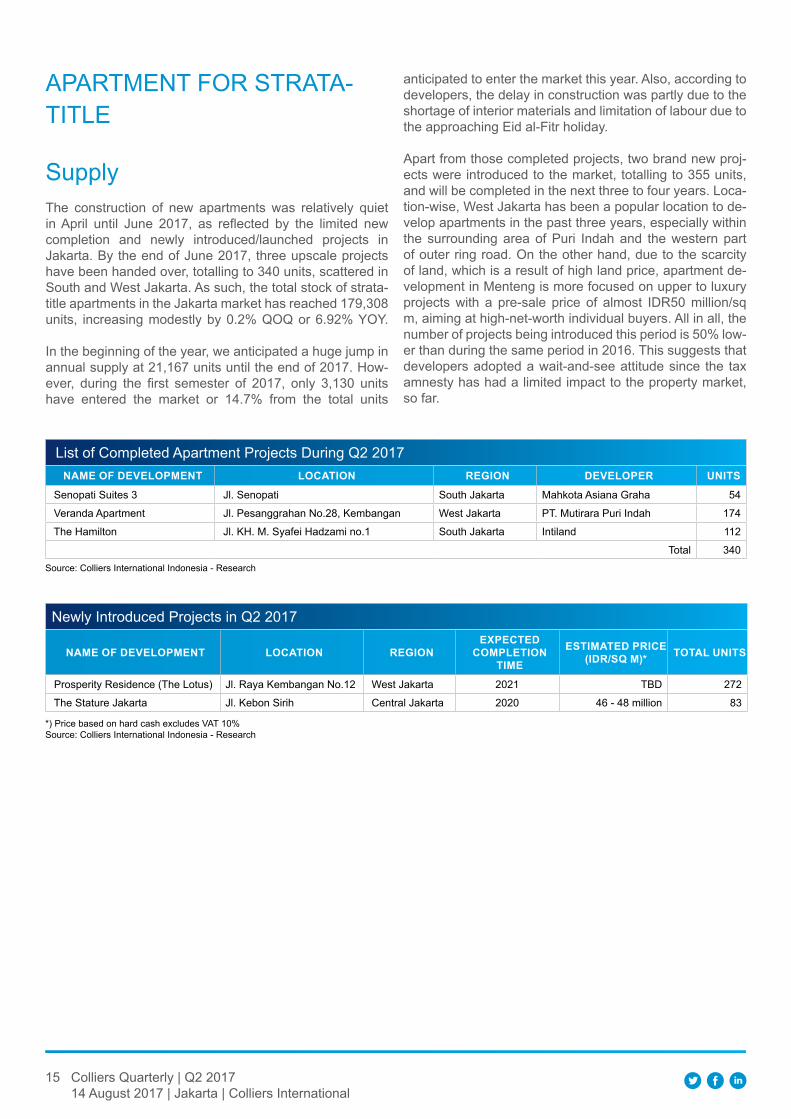
15 Colliers Quarterly | Q2 201714 August 2017 | Jakarta | Colliers International
APARTMENT FOR STRATA-TITLE
SupplyThe construction of new apartments was relatively quiet in April until June 2017, as reflected by the limited new completion and newly introduced/launched projects in Jakarta. By the end of June 2017, three upscale projects have been handed over, totalling to 340 units, scattered in South and West Jakarta. As such, the total stock of strata-title apartments in the Jakarta market has reached 179,308 units, increasing modestly by 0.2% QOQ or 6.92% YOY.
In the beginning of the year, we anticipated a huge jump in annual supply at 21,167 units until the end of 2017. How-ever, during the first semester of 2017, only 3,130 units have entered the market or 14.7% from the total units
anticipated to enter the market this year. Also, according to developers, the delay in construction was partly due to the shortage of interior materials and limitation of labour due to the approaching Eid al-Fitr holiday.
Apart from those completed projects, two brand new proj-ects were introduced to the market, totalling to 355 units, and will be completed in the next three to four years. Loca-tion-wise, West Jakarta has been a popular location to de-velop apartments in the past three years, especially within the surrounding area of Puri Indah and the western part of outer ring road. On the other hand, due to the scarcity of land, which is a result of high land price, apartment de-velopment in Menteng is more focused on upper to luxury projects with a pre-sale price of almost IDR50 million/sq m, aiming at high-net-worth individual buyers. All in all, the number of projects being introduced this period is 50% low-er than during the same period in 2016. This suggests that developers adopted a wait-and-see attitude since the tax amnesty has had a limited impact to the property market, so far.
List of Completed Apartment Projects During Q2 2017nAMe Of DevelOpMent lOCAtIOn regIOn DevelOper unItS
Senopati Suites 3 Jl. Senopati South Jakarta Mahkota Asiana Graha 54
Veranda Apartment Jl. Pesanggrahan No.28, Kembangan West Jakarta PT. Mutirara Puri Indah 174
The Hamilton Jl. KH. M. Syafei Hadzami no.1 South Jakarta Intiland 112
Total 340Source: Colliers International Indonesia - Research
Newly Introduced Projects in Q2 2017
nAMe Of DevelOpMent lOCAtIOn regIOnexpeCteD
COMpletIOn tIMe
eStIMAteD prICe (IDr/SQ M)* tOtAl unItS
Prosperity Residence (The Lotus) Jl. Raya Kembangan No.12 West Jakarta 2021 TBD 272
The Stature Jakarta Jl. Kebon Sirih Central Jakarta 2020 46 - 48 million 83
*) Price based on hard cash excludes VAT 10%Source: Colliers International Indonesia - Research
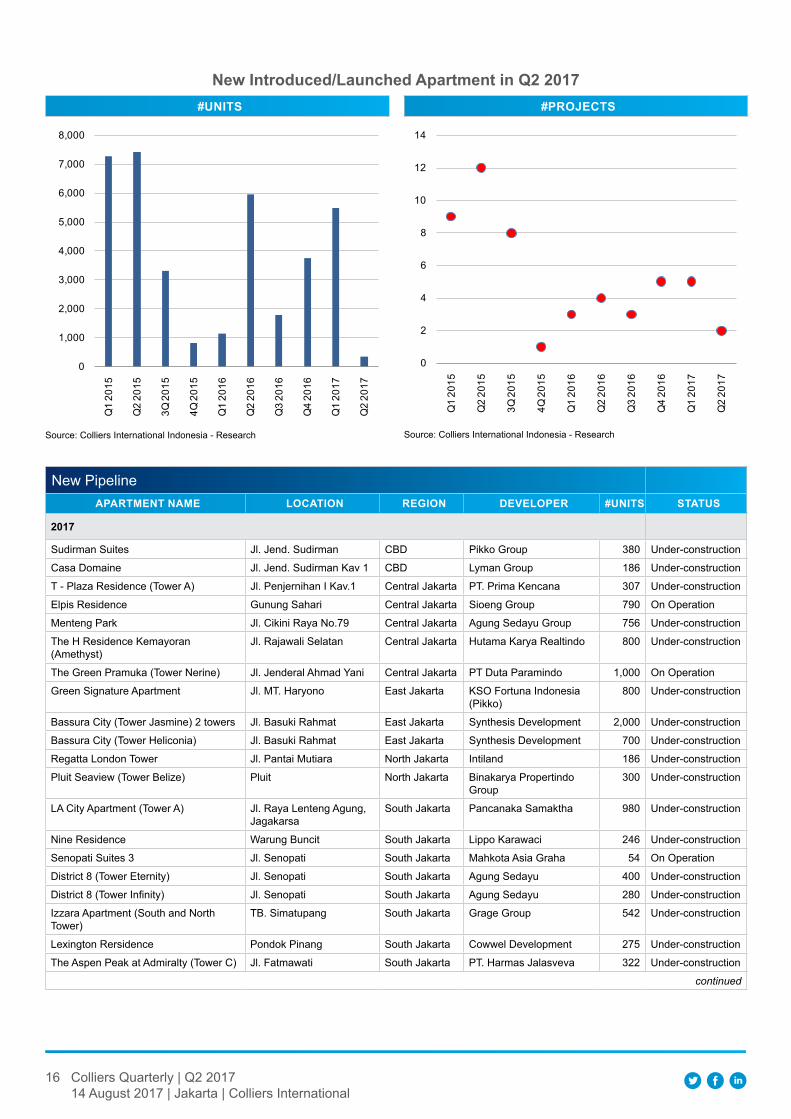
16 Colliers Quarterly | Q2 201714 August 2017 | Jakarta | Colliers International
Source: Colliers International Indonesia - Research
new Introduced/launched Apartment in Q2 2017#unItS #prOjeCtS
0
1,000
2,000
3,000
4,000
5,000
6,000
7,000
8,000
Q1
2015
Q2
2015
3Q 2
015
4Q 2
015
Q1
2016
Q2
2016
Q3
2016
Q4
2016
Q1
2017
Q2
2017
0
2
4
6
8
10
12
14
Q1
2015
Q2
2015
3Q 2
015
4Q 2
015
Q1
2016
Q2
2016
Q3
2016
Q4
2016
Q1
2017
Q2
2017
Source: Colliers International Indonesia - Research
New PipelineApArtMent nAMe lOCAtIOn regIOn DevelOper #unItS StAtuS
2017
Sudirman Suites Jl. Jend. Sudirman CBD Pikko Group 380 Under-construction
Casa Domaine Jl. Jend. Sudirman Kav 1 CBD Lyman Group 186 Under-construction
T - Plaza Residence (Tower A) Jl. Penjernihan I Kav.1 Central Jakarta PT. Prima Kencana 307 Under-construction
Elpis Residence Gunung Sahari Central Jakarta Sioeng Group 790 On Operation
Menteng Park Jl. Cikini Raya No.79 Central Jakarta Agung Sedayu Group 756 Under-construction
The H Residence Kemayoran (Amethyst)
Jl. Rajawali Selatan Central Jakarta Hutama Karya Realtindo 800 Under-construction
The Green Pramuka (Tower Nerine) Jl. Jenderal Ahmad Yani Central Jakarta PT Duta Paramindo 1,000 On Operation
Green Signature Apartment Jl. MT. Haryono East Jakarta KSO Fortuna Indonesia (Pikko)
800 Under-construction
Bassura City (Tower Jasmine) 2 towers Jl. Basuki Rahmat East Jakarta Synthesis Development 2,000 Under-construction
Bassura City (Tower Heliconia) Jl. Basuki Rahmat East Jakarta Synthesis Development 700 Under-construction
Regatta London Tower Jl. Pantai Mutiara North Jakarta Intiland 186 Under-construction
Pluit Seaview (Tower Belize) Pluit North Jakarta Binakarya Propertindo Group
300 Under-construction
LA City Apartment (Tower A) Jl. Raya Lenteng Agung, Jagakarsa
South Jakarta Pancanaka Samaktha 980 Under-construction
Nine Residence Warung Buncit South Jakarta Lippo Karawaci 246 Under-construction
Senopati Suites 3 Jl. Senopati South Jakarta Mahkota Asia Graha 54 On Operation
District 8 (Tower Eternity) Jl. Senopati South Jakarta Agung Sedayu 400 Under-construction
District 8 (Tower Infinity) Jl. Senopati South Jakarta Agung Sedayu 280 Under-construction
Izzara Apartment (South and North Tower)
TB. Simatupang South Jakarta Grage Group 542 Under-construction
Lexington Rersidence Pondok Pinang South Jakarta Cowwel Development 275 Under-construction
The Aspen Peak at Admiralty (Tower C) Jl. Fatmawati South Jakarta PT. Harmas Jalasveva 322 Under-construction
continued
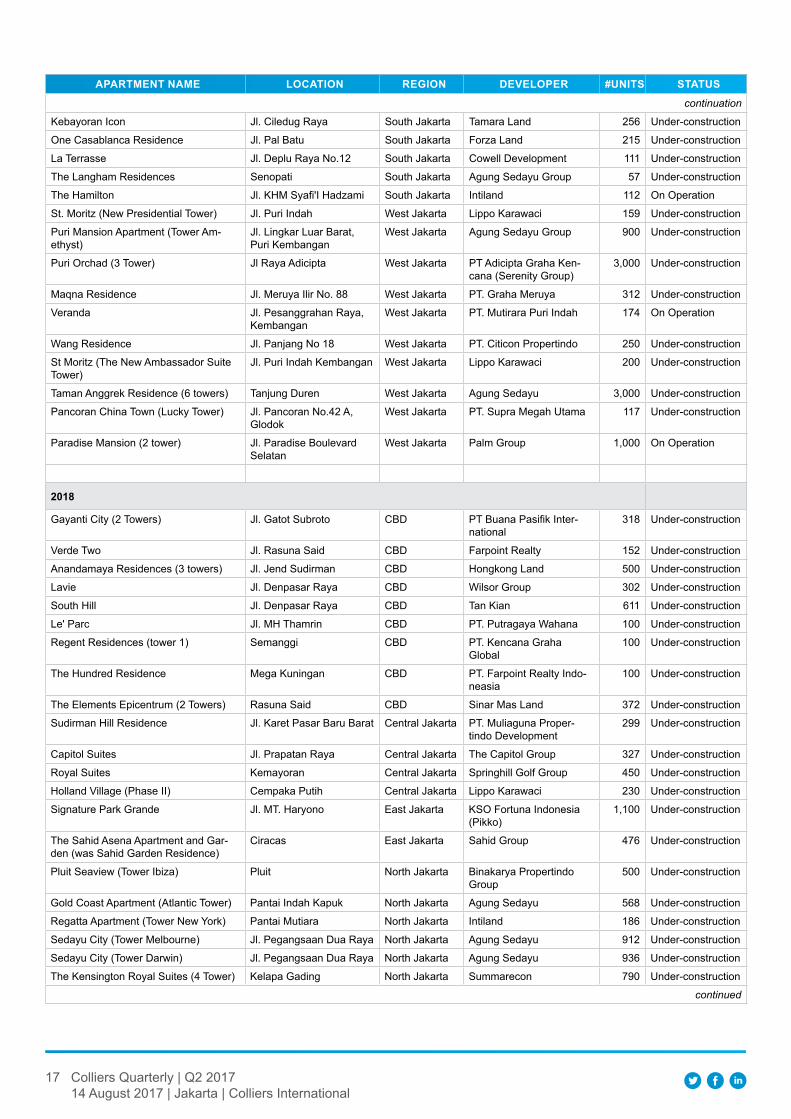
17 Colliers Quarterly | Q2 201714 August 2017 | Jakarta | Colliers International
ApArtMent nAMe lOCAtIOn regIOn DevelOper #unItS StAtuS
continuation
Kebayoran Icon Jl. Ciledug Raya South Jakarta Tamara Land 256 Under-construction
One Casablanca Residence Jl. Pal Batu South Jakarta Forza Land 215 Under-construction
La Terrasse Jl. Deplu Raya No.12 South Jakarta Cowell Development 111 Under-construction
The Langham Residences Senopati South Jakarta Agung Sedayu Group 57 Under-construction
The Hamilton Jl. KHM Syafi'I Hadzami South Jakarta Intiland 112 On Operation
St. Moritz (New Presidential Tower) Jl. Puri Indah West Jakarta Lippo Karawaci 159 Under-construction
Puri Mansion Apartment (Tower Am-ethyst)
Jl. Lingkar Luar Barat, Puri Kembangan
West Jakarta Agung Sedayu Group 900 Under-construction
Puri Orchad (3 Tower) Jl Raya Adicipta West Jakarta PT Adicipta Graha Ken-cana (Serenity Group)
3,000 Under-construction
Maqna Residence Jl. Meruya Ilir No. 88 West Jakarta PT. Graha Meruya 312 Under-construction
Veranda Jl. Pesanggrahan Raya, Kembangan
West Jakarta PT. Mutirara Puri Indah 174 On Operation
Wang Residence Jl. Panjang No 18 West Jakarta PT. Citicon Propertindo 250 Under-construction
St Moritz (The New Ambassador Suite Tower)
Jl. Puri Indah Kembangan West Jakarta Lippo Karawaci 200 Under-construction
Taman Anggrek Residence (6 towers) Tanjung Duren West Jakarta Agung Sedayu 3,000 Under-construction
Pancoran China Town (Lucky Tower) Jl. Pancoran No.42 A, Glodok
West Jakarta PT. Supra Megah Utama 117 Under-construction
Paradise Mansion (2 tower) Jl. Paradise Boulevard Selatan
West Jakarta Palm Group 1,000 On Operation
2018
Gayanti City (2 Towers) Jl. Gatot Subroto CBD PT Buana Pasifik Inter-national
318 Under-construction
Verde Two Jl. Rasuna Said CBD Farpoint Realty 152 Under-construction
Anandamaya Residences (3 towers) Jl. Jend Sudirman CBD Hongkong Land 500 Under-construction
Lavie Jl. Denpasar Raya CBD Wilsor Group 302 Under-construction
South Hill Jl. Denpasar Raya CBD Tan Kian 611 Under-construction
Le' Parc Jl. MH Thamrin CBD PT. Putragaya Wahana 100 Under-construction
Regent Residences (tower 1) Semanggi CBD PT. Kencana Graha Global
100 Under-construction
The Hundred Residence Mega Kuningan CBD PT. Farpoint Realty Indo-neasia
100 Under-construction
The Elements Epicentrum (2 Towers) Rasuna Said CBD Sinar Mas Land 372 Under-construction
Sudirman Hill Residence Jl. Karet Pasar Baru Barat Central Jakarta PT. Muliaguna Proper-tindo Development
299 Under-construction
Capitol Suites Jl. Prapatan Raya Central Jakarta The Capitol Group 327 Under-construction
Royal Suites Kemayoran Central Jakarta Springhill Golf Group 450 Under-construction
Holland Village (Phase II) Cempaka Putih Central Jakarta Lippo Karawaci 230 Under-construction
Signature Park Grande Jl. MT. Haryono East Jakarta KSO Fortuna Indonesia (Pikko)
1,100 Under-construction
The Sahid Asena Apartment and Gar-den (was Sahid Garden Residence)
Ciracas East Jakarta Sahid Group 476 Under-construction
Pluit Seaview (Tower Ibiza) Pluit North Jakarta Binakarya Propertindo Group
500 Under-construction
Gold Coast Apartment (Atlantic Tower) Pantai Indah Kapuk North Jakarta Agung Sedayu 568 Under-construction
Regatta Apartment (Tower New York) Pantai Mutiara North Jakarta Intiland 186 Under-construction
Sedayu City (Tower Melbourne) Jl. Pegangsaan Dua Raya North Jakarta Agung Sedayu 912 Under-construction
Sedayu City (Tower Darwin) Jl. Pegangsaan Dua Raya North Jakarta Agung Sedayu 936 Under-construction
The Kensington Royal Suites (4 Tower) Kelapa Gading North Jakarta Summarecon 790 Under-construction
continued
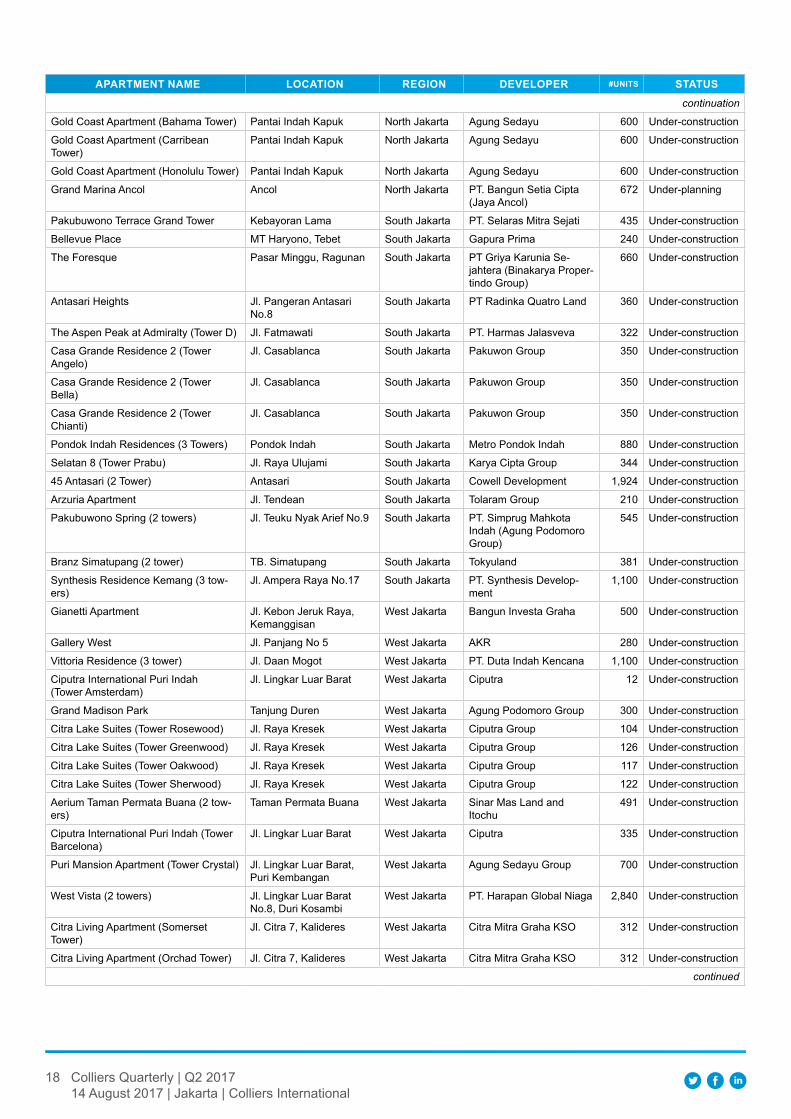
18 Colliers Quarterly | Q2 201714 August 2017 | Jakarta | Colliers International
ApArtMent nAMe lOCAtIOn regIOn DevelOper #unItS StAtuS
continuation
Gold Coast Apartment (Bahama Tower) Pantai Indah Kapuk North Jakarta Agung Sedayu 600 Under-construction
Gold Coast Apartment (Carribean Tower)
Pantai Indah Kapuk North Jakarta Agung Sedayu 600 Under-construction
Gold Coast Apartment (Honolulu Tower) Pantai Indah Kapuk North Jakarta Agung Sedayu 600 Under-construction
Grand Marina Ancol Ancol North Jakarta PT. Bangun Setia Cipta (Jaya Ancol)
672 Under-planning
Pakubuwono Terrace Grand Tower Kebayoran Lama South Jakarta PT. Selaras Mitra Sejati 435 Under-construction
Bellevue Place MT Haryono, Tebet South Jakarta Gapura Prima 240 Under-construction
The Foresque Pasar Minggu, Ragunan South Jakarta PT Griya Karunia Se-jahtera (Binakarya Proper-tindo Group)
660 Under-construction
Antasari Heights Jl. Pangeran Antasari No.8
South Jakarta PT Radinka Quatro Land 360 Under-construction
The Aspen Peak at Admiralty (Tower D) Jl. Fatmawati South Jakarta PT. Harmas Jalasveva 322 Under-construction
Casa Grande Residence 2 (Tower Angelo)
Jl. Casablanca South Jakarta Pakuwon Group 350 Under-construction
Casa Grande Residence 2 (Tower Bella)
Jl. Casablanca South Jakarta Pakuwon Group 350 Under-construction
Casa Grande Residence 2 (Tower Chianti)
Jl. Casablanca South Jakarta Pakuwon Group 350 Under-construction
Pondok Indah Residences (3 Towers) Pondok Indah South Jakarta Metro Pondok Indah 880 Under-construction
Selatan 8 (Tower Prabu) Jl. Raya Ulujami South Jakarta Karya Cipta Group 344 Under-construction
45 Antasari (2 Tower) Antasari South Jakarta Cowell Development 1,924 Under-construction
Arzuria Apartment Jl. Tendean South Jakarta Tolaram Group 210 Under-construction
Pakubuwono Spring (2 towers) Jl. Teuku Nyak Arief No.9 South Jakarta PT. Simprug Mahkota Indah (Agung Podomoro Group)
545 Under-construction
Branz Simatupang (2 tower) TB. Simatupang South Jakarta Tokyuland 381 Under-construction
Synthesis Residence Kemang (3 tow-ers)
Jl. Ampera Raya No.17 South Jakarta PT. Synthesis Develop-ment
1,100 Under-construction
Gianetti Apartment Jl. Kebon Jeruk Raya, Kemanggisan
West Jakarta Bangun Investa Graha 500 Under-construction
Gallery West Jl. Panjang No 5 West Jakarta AKR 280 Under-construction
Vittoria Residence (3 tower) Jl. Daan Mogot West Jakarta PT. Duta Indah Kencana 1,100 Under-construction
Ciputra International Puri Indah (Tower Amsterdam)
Jl. Lingkar Luar Barat West Jakarta Ciputra 12 Under-construction
Grand Madison Park Tanjung Duren West Jakarta Agung Podomoro Group 300 Under-construction
Citra Lake Suites (Tower Rosewood) Jl. Raya Kresek West Jakarta Ciputra Group 104 Under-construction
Citra Lake Suites (Tower Greenwood) Jl. Raya Kresek West Jakarta Ciputra Group 126 Under-construction
Citra Lake Suites (Tower Oakwood) Jl. Raya Kresek West Jakarta Ciputra Group 117 Under-construction
Citra Lake Suites (Tower Sherwood) Jl. Raya Kresek West Jakarta Ciputra Group 122 Under-construction
Aerium Taman Permata Buana (2 tow-ers)
Taman Permata Buana West Jakarta Sinar Mas Land and Itochu
491 Under-construction
Ciputra International Puri Indah (Tower Barcelona)
Jl. Lingkar Luar Barat West Jakarta Ciputra 335 Under-construction
Puri Mansion Apartment (Tower Crystal) Jl. Lingkar Luar Barat, Puri Kembangan
West Jakarta Agung Sedayu Group 700 Under-construction
West Vista (2 towers) Jl. Lingkar Luar Barat No.8, Duri Kosambi
West Jakarta PT. Harapan Global Niaga 2,840 Under-construction
Citra Living Apartment (Somerset Tower)
Jl. Citra 7, Kalideres West Jakarta Citra Mitra Graha KSO 312 Under-construction
Citra Living Apartment (Orchad Tower) Jl. Citra 7, Kalideres West Jakarta Citra Mitra Graha KSO 312 Under-construction
continued
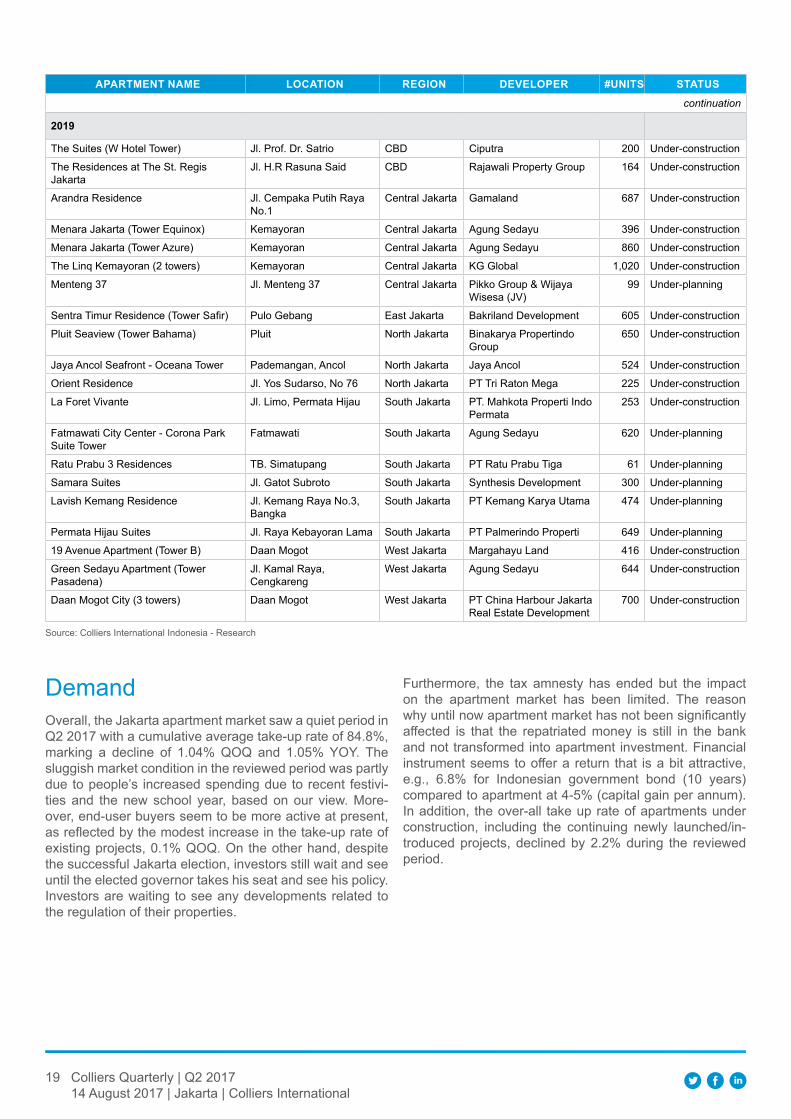
19 Colliers Quarterly | Q2 201714 August 2017 | Jakarta | Colliers International
ApArtMent nAMe lOCAtIOn regIOn DevelOper #unItS StAtuS
continuation
2019
The Suites (W Hotel Tower) Jl. Prof. Dr. Satrio CBD Ciputra 200 Under-construction
The Residences at The St. Regis Jakarta
Jl. H.R Rasuna Said CBD Rajawali Property Group 164 Under-construction
Arandra Residence Jl. Cempaka Putih Raya No.1
Central Jakarta Gamaland 687 Under-construction
Menara Jakarta (Tower Equinox) Kemayoran Central Jakarta Agung Sedayu 396 Under-construction
Menara Jakarta (Tower Azure) Kemayoran Central Jakarta Agung Sedayu 860 Under-construction
The Linq Kemayoran (2 towers) Kemayoran Central Jakarta KG Global 1,020 Under-construction
Menteng 37 Jl. Menteng 37 Central Jakarta Pikko Group & Wijaya Wisesa (JV)
99 Under-planning
Sentra Timur Residence (Tower Safir) Pulo Gebang East Jakarta Bakriland Development 605 Under-construction
Pluit Seaview (Tower Bahama) Pluit North Jakarta Binakarya Propertindo Group
650 Under-construction
Jaya Ancol Seafront - Oceana Tower Pademangan, Ancol North Jakarta Jaya Ancol 524 Under-construction
Orient Residence Jl. Yos Sudarso, No 76 North Jakarta PT Tri Raton Mega 225 Under-construction
La Foret Vivante Jl. Limo, Permata Hijau South Jakarta PT. Mahkota Properti Indo Permata
253 Under-construction
Fatmawati City Center - Corona Park Suite Tower
Fatmawati South Jakarta Agung Sedayu 620 Under-planning
Ratu Prabu 3 Residences TB. Simatupang South Jakarta PT Ratu Prabu Tiga 61 Under-planning
Samara Suites Jl. Gatot Subroto South Jakarta Synthesis Development 300 Under-planning
Lavish Kemang Residence Jl. Kemang Raya No.3, Bangka
South Jakarta PT Kemang Karya Utama 474 Under-planning
Permata Hijau Suites Jl. Raya Kebayoran Lama South Jakarta PT Palmerindo Properti 649 Under-planning
19 Avenue Apartment (Tower B) Daan Mogot West Jakarta Margahayu Land 416 Under-construction
Green Sedayu Apartment (Tower Pasadena)
Jl. Kamal Raya, Cengkareng
West Jakarta Agung Sedayu 644 Under-construction
Daan Mogot City (3 towers) Daan Mogot West Jakarta PT China Harbour Jakarta Real Estate Development
700 Under-construction
Source: Colliers International Indonesia - Research
DemandOverall, the Jakarta apartment market saw a quiet period in Q2 2017 with a cumulative average take-up rate of 84.8%, marking a decline of 1.04% QOQ and 1.05% YOY. The sluggish market condition in the reviewed period was partly due to people’s increased spending due to recent festivi-ties and the new school year, based on our view. More-over, end-user buyers seem to be more active at present, as reflected by the modest increase in the take-up rate of existing projects, 0.1% QOQ. On the other hand, despite the successful Jakarta election, investors still wait and see until the elected governor takes his seat and see his policy. Investors are waiting to see any developments related to the regulation of their properties.
Furthermore, the tax amnesty has ended but the impact on the apartment market has been limited. The reason why until now apartment market has not been significantly affected is that the repatriated money is still in the bank and not transformed into apartment investment. Financial instrument seems to offer a return that is a bit attractive, e.g., 6.8% for Indonesian government bond (10 years) compared to apartment at 4-5% (capital gain per annum). In addition, the over-all take up rate of apartments under construction, including the continuing newly launched/in-troduced projects, declined by 2.2% during the reviewed period.
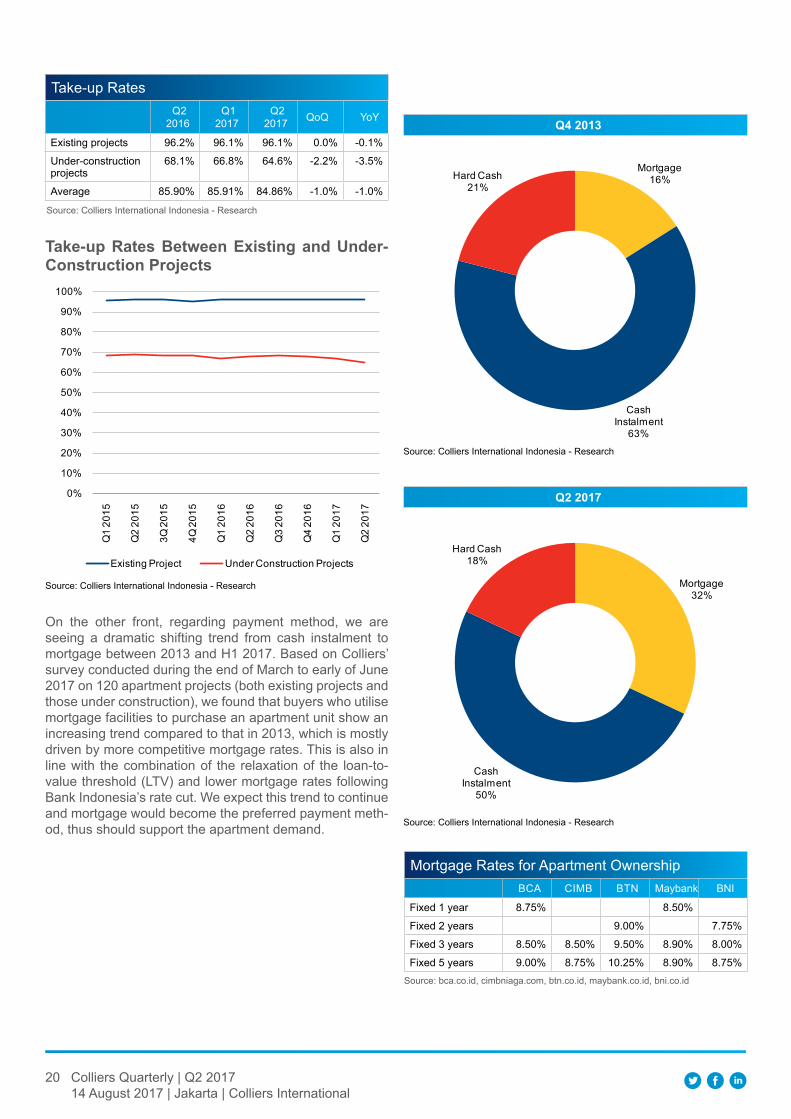
20 Colliers Quarterly | Q2 201714 August 2017 | Jakarta | Colliers International
Source: Colliers International Indonesia - Research
Source: Colliers International Indonesia - Research
take-up rates Between existing and under-Construction projects
On the other front, regarding payment method, we are seeing a dramatic shifting trend from cash instalment to mortgage between 2013 and H1 2017. Based on Colliers’ survey conducted during the end of March to early of June 2017 on 120 apartment projects (both existing projects and those under construction), we found that buyers who utilise mortgage facilities to purchase an apartment unit show an increasing trend compared to that in 2013, which is mostly driven by more competitive mortgage rates. This is also in line with the combination of the relaxation of the loan-to-value threshold (LTV) and lower mortgage rates following Bank Indonesia’s rate cut. We expect this trend to continue and mortgage would become the preferred payment meth-od, thus should support the apartment demand.
Source: Colliers International Indonesia - Research
Take-up Rates Q2
2016 Q1
2017 Q2
2017 QoQ YoY
Existing projects 96.2% 96.1% 96.1% 0.0% -0.1%
Under-construction projects
68.1% 66.8% 64.6% -2.2% -3.5%
Average 85.90% 85.91% 84.86% -1.0% -1.0%
0%
10%
20%
30%
40%
50%
60%
70%
80%
90%
100%
Q1
2015
Q2
2015
3Q 2
015
4Q 2
015
Q1
2016
Q2
2016
Q3
2016
Q4
2016
Q1
2017
Q2
2017
Existing Project Under Construction Projects
Q4 2013
Mortgage16%
Cash Instalment
63%
Hard Cash21%
Source: Colliers International Indonesia - Research
Q2 2017
Mortgage32%
Cash Instalment
50%
Hard Cash18%
Source: bca.co.id, cimbniaga.com, btn.co.id, maybank.co.id, bni.co.id
Mortgage Rates for Apartment OwnershipBCA CIMB BTN Maybank BNI
Fixed 1 year 8.75% 8.50%
Fixed 2 years 9.00% 7.75%
Fixed 3 years 8.50% 8.50% 9.50% 8.90% 8.00%
Fixed 5 years 9.00% 8.75% 10.25% 8.90% 8.75%
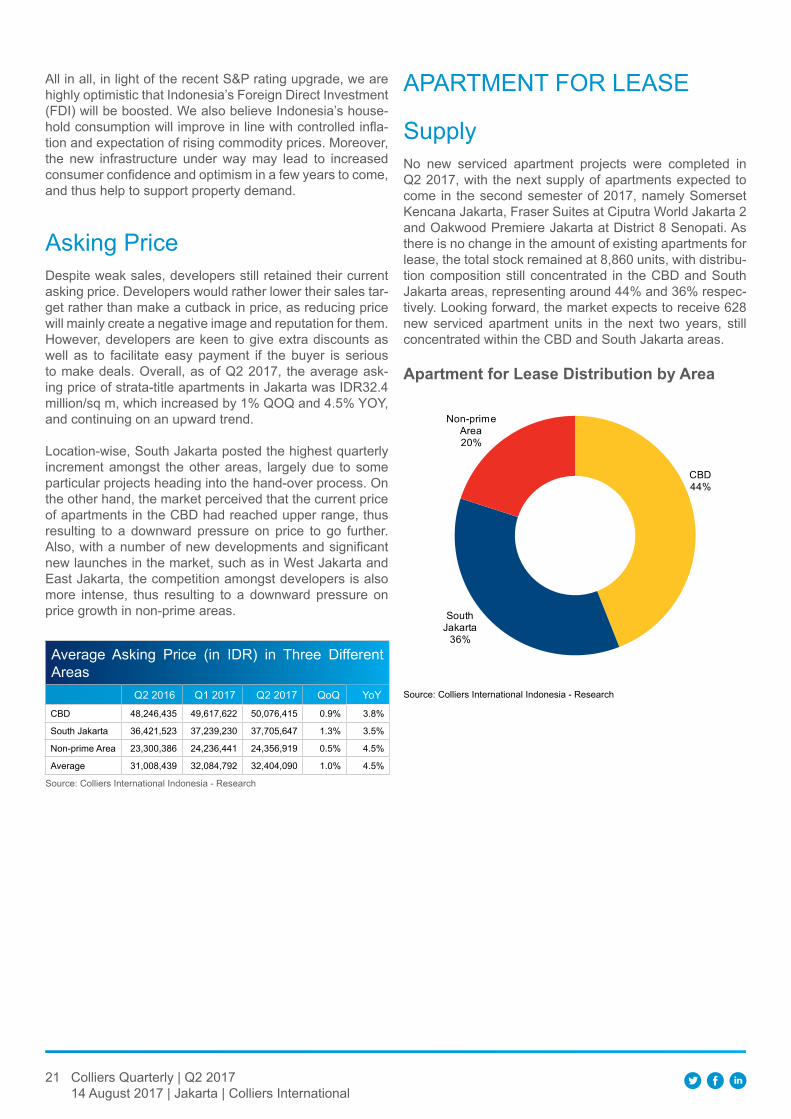
21 Colliers Quarterly | Q2 201714 August 2017 | Jakarta | Colliers International
All in all, in light of the recent S&P rating upgrade, we are highly optimistic that Indonesia’s Foreign Direct Investment (FDI) will be boosted. We also believe Indonesia’s house-hold consumption will improve in line with controlled infla-tion and expectation of rising commodity prices. Moreover, the new infrastructure under way may lead to increased consumer confidence and optimism in a few years to come, and thus help to support property demand.
Asking PriceDespite weak sales, developers still retained their current asking price. Developers would rather lower their sales tar-get rather than make a cutback in price, as reducing price will mainly create a negative image and reputation for them. However, developers are keen to give extra discounts as well as to facilitate easy payment if the buyer is serious to make deals. Overall, as of Q2 2017, the average ask-ing price of strata-title apartments in Jakarta was IDR32.4 million/sq m, which increased by 1% QOQ and 4.5% YOY, and continuing on an upward trend.
Location-wise, South Jakarta posted the highest quarterly increment amongst the other areas, largely due to some particular projects heading into the hand-over process. On the other hand, the market perceived that the current price of apartments in the CBD had reached upper range, thus resulting to a downward pressure on price to go further. Also, with a number of new developments and significant new launches in the market, such as in West Jakarta and East Jakarta, the competition amongst developers is also more intense, thus resulting to a downward pressure on price growth in non-prime areas.
Source: Colliers International Indonesia - Research
Average Asking Price (in IDR) in Three Different Areas
Q2 2016 Q1 2017 Q2 2017 QoQ YoY CBD 48,246,435 49,617,622 50,076,415 0.9% 3.8%
South Jakarta 36,421,523 37,239,230 37,705,647 1.3% 3.5%
Non-prime Area 23,300,386 24,236,441 24,356,919 0.5% 4.5%
Average 31,008,439 32,084,792 32,404,090 1.0% 4.5%
APARTMENT FOR LEASE
SupplyNo new serviced apartment projects were completed in Q2 2017, with the next supply of apartments expected to come in the second semester of 2017, namely Somerset Kencana Jakarta, Fraser Suites at Ciputra World Jakarta 2 and Oakwood Premiere Jakarta at District 8 Senopati. As there is no change in the amount of existing apartments for lease, the total stock remained at 8,860 units, with distribu-tion composition still concentrated in the CBD and South Jakarta areas, representing around 44% and 36% respec-tively. Looking forward, the market expects to receive 628 new serviced apartment units in the next two years, still concentrated within the CBD and South Jakarta areas.
Source: Colliers International Indonesia - Research
Apartment for lease Distribution by Area
CBD44%
South Jakarta
36%
Non-prime Area20%
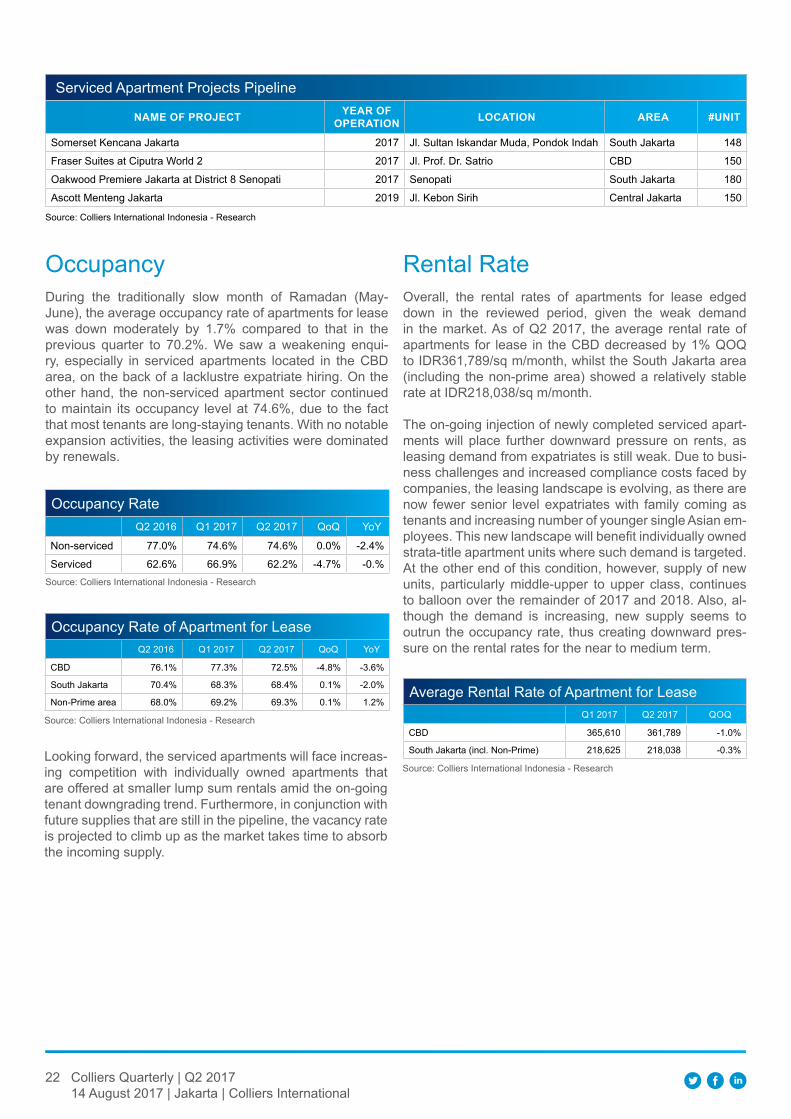
22 Colliers Quarterly | Q2 201714 August 2017 | Jakarta | Colliers International
Serviced Apartment Projects Pipeline
nAMe Of prOjeCt YeAr Of OperAtIOn lOCAtIOn AreA #unIt
Somerset Kencana Jakarta 2017 Jl. Sultan Iskandar Muda, Pondok Indah South Jakarta 148
Fraser Suites at Ciputra World 2 2017 Jl. Prof. Dr. Satrio CBD 150
Oakwood Premiere Jakarta at District 8 Senopati 2017 Senopati South Jakarta 180
Ascott Menteng Jakarta 2019 Jl. Kebon Sirih Central Jakarta 150
Source: Colliers International Indonesia - Research
OccupancyDuring the traditionally slow month of Ramadan (May-June), the average occupancy rate of apartments for lease was down moderately by 1.7% compared to that in the previous quarter to 70.2%. We saw a weakening enqui-ry, especially in serviced apartments located in the CBD area, on the back of a lacklustre expatriate hiring. On the other hand, the non-serviced apartment sector continued to maintain its occupancy level at 74.6%, due to the fact that most tenants are long-staying tenants. With no notable expansion activities, the leasing activities were dominated by renewals.
Source: Colliers International Indonesia - Research
Occupancy Rate Q2 2016 Q1 2017 Q2 2017 QoQ YoY
Non-serviced 77.0% 74.6% 74.6% 0.0% -2.4%
Serviced 62.6% 66.9% 62.2% -4.7% -0.%
Source: Colliers International Indonesia - Research
Occupancy Rate of Apartment for Lease Q2 2016 Q1 2017 Q2 2017 QoQ YoY
CBD 76.1% 77.3% 72.5% -4.8% -3.6%
South Jakarta 70.4% 68.3% 68.4% 0.1% -2.0%
Non-Prime area 68.0% 69.2% 69.3% 0.1% 1.2%
Looking forward, the serviced apartments will face increas-ing competition with individually owned apartments that are offered at smaller lump sum rentals amid the on-going tenant downgrading trend. Furthermore, in conjunction with future supplies that are still in the pipeline, the vacancy rate is projected to climb up as the market takes time to absorb the incoming supply.
Rental RateOverall, the rental rates of apartments for lease edged down in the reviewed period, given the weak demand in the market. As of Q2 2017, the average rental rate of apartments for lease in the CBD decreased by 1% QOQ to IDR361,789/sq m/month, whilst the South Jakarta area (including the non-prime area) showed a relatively stable rate at IDR218,038/sq m/month.
The on-going injection of newly completed serviced apart-ments will place further downward pressure on rents, as leasing demand from expatriates is still weak. Due to busi-ness challenges and increased compliance costs faced by companies, the leasing landscape is evolving, as there are now fewer senior level expatriates with family coming as tenants and increasing number of younger single Asian em-ployees. This new landscape will benefit individually owned strata-title apartment units where such demand is targeted. At the other end of this condition, however, supply of new units, particularly middle-upper to upper class, continues to balloon over the remainder of 2017 and 2018. Also, al-though the demand is increasing, new supply seems to outrun the occupancy rate, thus creating downward pres-sure on the rental rates for the near to medium term.
Source: Colliers International Indonesia - Research
Average Rental Rate of Apartment for Lease Q1 2017 Q2 2017 QOQ
CBD 365,610 361,789 -1.0%
South Jakarta (incl. Non-Prime) 218,625 218,038 -0.3%
23 Colliers Quarterly | Q2 201714 August 2017 | Jakarta | Colliers International
Concluding ThoughtDespite improving sentiment due to better economic fun-damentals and the government’s active steps to stimulate the market, buyers have not returned to the market en masse. We believe that it is only a matter of time until the economy stabilises and improves sufficiently so that sales could pick up on the ground. On the other hand, the recent slump has served to bring prices more or less stagnant, which, in our opinion, vastly improves the rationale for pur-chasing an apartment, especially for upgrades. This is an ideal time to make such a decision, especially those who live around the outskirts of Jakarta and those within the downtown area.
Expatriate Housing SectorFerry Salanto Senior Associate Director | Research
Market OverviewDuring summer, expatriates who plan to live in Indonesia normally search for homes to stay in. Anecdotal evidence suggests that there was an increasing number of expatri-ate arrivals during the first half of 2017 compared to that in the second half of 2016, but the quantity was still less than in the same period last year. Enquiries for living accom-modation continued to be suppressed due to concerns in the economy, business uncertainties and tightened corpo-rate housing budgets. South Jakarta undoubtedly remains as the most preferred location for expatriates, as demand generators shifted from the oil and gas sector to broader industries, such as banking and insurance, energy, infra-structure, automotive, fast moving consumer goods and consultancy services.
Prime properties, including selected housing compounds and some high-end stand-alone houses still continue to get
enquiries even now. As such, landlords of these prime properties have no obstacles in finding or retaining occu-pants. Landlords are generally more confident in setting a progressive rental tariff. The majority of demand for expat-standard housing was from high-level executives including country head or president director positions of multination-al companies.
In the meantime, despite experiencing a sluggish demand, high-rise residences (in this case, serviced apartment proj-ects) managed by global chain operators such as Shangri-La, Ascott, Frasers or Oakwood, maintain rental tariff in compliance with their global / headquarter offices, which is why they do not have the flexibility in setting their local price to be similar with other stand-alone housing or other local serviced and non-serviced apartments. However, these international operators may be more accommoda-tive in providing non-cash offerings like giving variety of features included in their services such as laundry, break-fast or use of facilities without extra charges.
Meanwhile, the current weakening market is not easy for most stand-alone and individually owned houses. Land-lords have limited options but have to cut rent tariff and offer more incentives for potential occupants. But again, it does not work that simple. An expat house is common-ly targeted for expatriates with family. However, with the tightening corporate budget, expatriates come without their families, and thus opt to run a more practical living.
Housing Rental Rates in Several Expatriate Areas
expAtrIAte hOuSIng BY AreA SIze (SQ M)OfferIng rentAl rAte per unIt
(uSD/unIt/MOnth)MInIMuM MAxIMuM
Menteng 4 - 5 Bedrooms House 500 - 1,200 4,000 12,000
Kuningan 4 - 5 Bedrooms House 500 - 900 3,000 4,500
Pondok Indah 4 - 5 Bedrooms House 450 - 1,000 3,000 7,000
continued
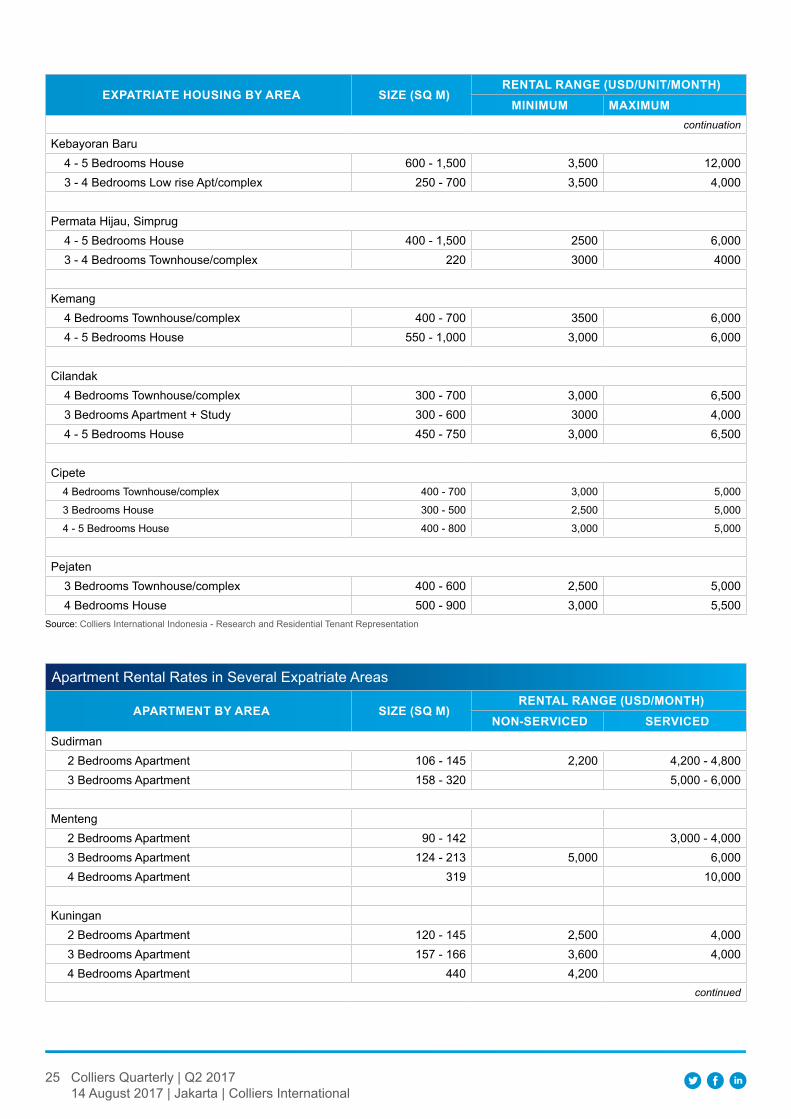
25 Colliers Quarterly | Q2 201714 August 2017 | Jakarta | Colliers International
expAtrIAte hOuSIng BY AreA SIze (SQ M)rentAl rAnge (uSD/unIt/MOnth)
MInIMuM MAxIMuMcontinuation
Kebayoran Baru 4 - 5 Bedrooms House 600 - 1,500 3,500 12,000 3 - 4 Bedrooms Low rise Apt/complex 250 - 700 3,500 4,000
Permata Hijau, Simprug 4 - 5 Bedrooms House 400 - 1,500 2500 6,000 3 - 4 Bedrooms Townhouse/complex 220 3000 4000
Kemang 4 Bedrooms Townhouse/complex 400 - 700 3500 6,000 4 - 5 Bedrooms House 550 - 1,000 3,000 6,000
Cilandak 4 Bedrooms Townhouse/complex 300 - 700 3,000 6,500 3 Bedrooms Apartment + Study 300 - 600 3000 4,000 4 - 5 Bedrooms House 450 - 750 3,000 6,500
Cipete 4 Bedrooms Townhouse/complex 400 - 700 3,000 5,000
3 Bedrooms House 300 - 500 2,500 5,000
4 - 5 Bedrooms House 400 - 800 3,000 5,000
Pejaten 3 Bedrooms Townhouse/complex 400 - 600 2,500 5,000 4 Bedrooms House 500 - 900 3,000 5,500
Source: Colliers International Indonesia - Research and Residential Tenant Representation
Apartment Rental Rates in Several Expatriate Areas
ApArtMent BY AreA SIze (SQ M)rentAl rAnge (uSD/MOnth)
nOn-ServICeD ServICeDSudirman 2 Bedrooms Apartment 106 - 145 2,200 4,200 - 4,800 3 Bedrooms Apartment 158 - 320 5,000 - 6,000
Menteng 2 Bedrooms Apartment 90 - 142 3,000 - 4,000 3 Bedrooms Apartment 124 - 213 5,000 6,000 4 Bedrooms Apartment 319 10,000
Kuningan 2 Bedrooms Apartment 120 - 145 2,500 4,000 3 Bedrooms Apartment 157 - 166 3,600 4,000 4 Bedrooms Apartment 440 4,200
continued
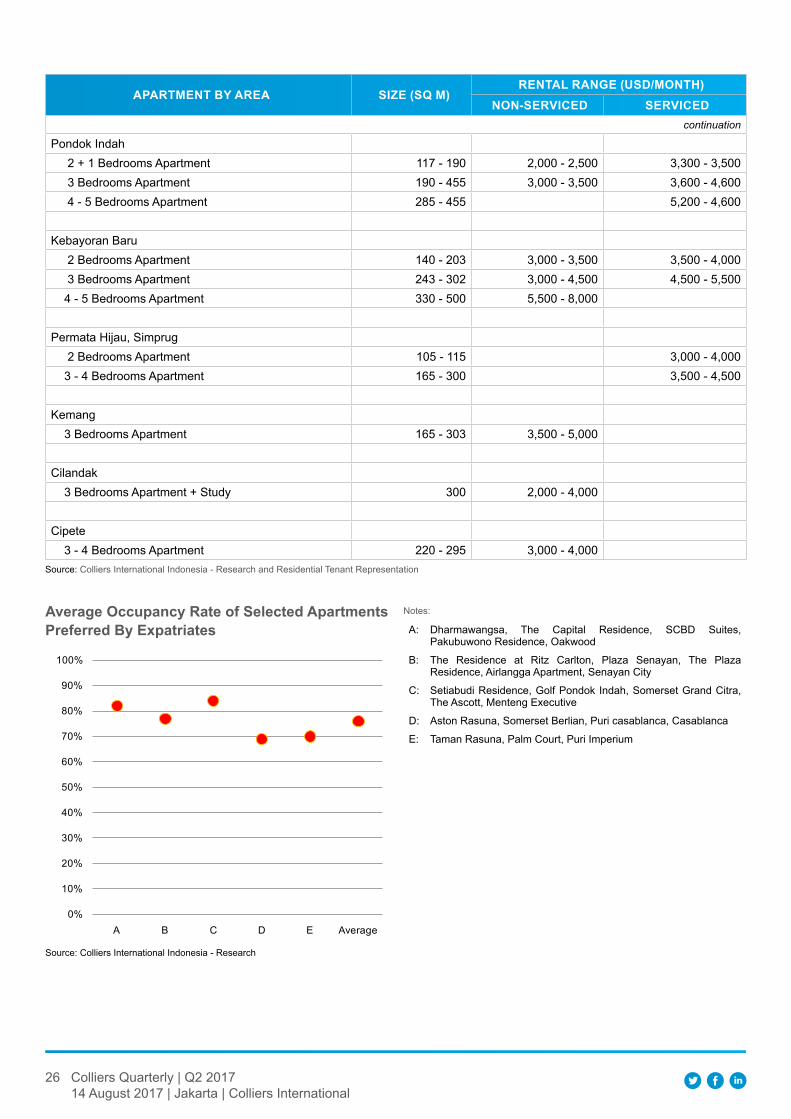
26 Colliers Quarterly | Q2 201714 August 2017 | Jakarta | Colliers International
ApArtMent BY AreA SIze (SQ M)rentAl rAnge (uSD/MOnth)
nOn-ServICeD ServICeDcontinuation
Pondok Indah 2 + 1 Bedrooms Apartment 117 - 190 2,000 - 2,500 3,300 - 3,500 3 Bedrooms Apartment 190 - 455 3,000 - 3,500 3,600 - 4,600 4 - 5 Bedrooms Apartment 285 - 455 5,200 - 4,600
Kebayoran Baru 2 Bedrooms Apartment 140 - 203 3,000 - 3,500 3,500 - 4,000 3 Bedrooms Apartment 243 - 302 3,000 - 4,500 4,500 - 5,500 4 - 5 Bedrooms Apartment 330 - 500 5,500 - 8,000
Permata Hijau, Simprug 2 Bedrooms Apartment 105 - 115 3,000 - 4,000 3 - 4 Bedrooms Apartment 165 - 300 3,500 - 4,500
Kemang 3 Bedrooms Apartment 165 - 303 3,500 - 5,000
Cilandak 3 Bedrooms Apartment + Study 300 2,000 - 4,000
Cipete 3 - 4 Bedrooms Apartment 220 - 295 3,000 - 4,000
Source: Colliers International Indonesia - Research and Residential Tenant Representation
Source: Colliers International Indonesia - Research
Average Occupancy rate of Selected Apartments preferred By expatriates
Notes:
A: Dharmawangsa, The Capital Residence, SCBD Suites, Pakubuwono Residence, Oakwood
B: The Residence at Ritz Carlton, Plaza Senayan, The Plaza Residence, Airlangga Apartment, Senayan City
C: Setiabudi Residence, Golf Pondok Indah, Somerset Grand Citra, The Ascott, Menteng Executive
D: Aston Rasuna, Somerset Berlian, Puri casablanca, Casablanca
E: Taman Rasuna, Palm Court, Puri Imperium
0%
10%
20%
30%
40%
50%
60%
70%
80%
90%
100%
A B C D E Average
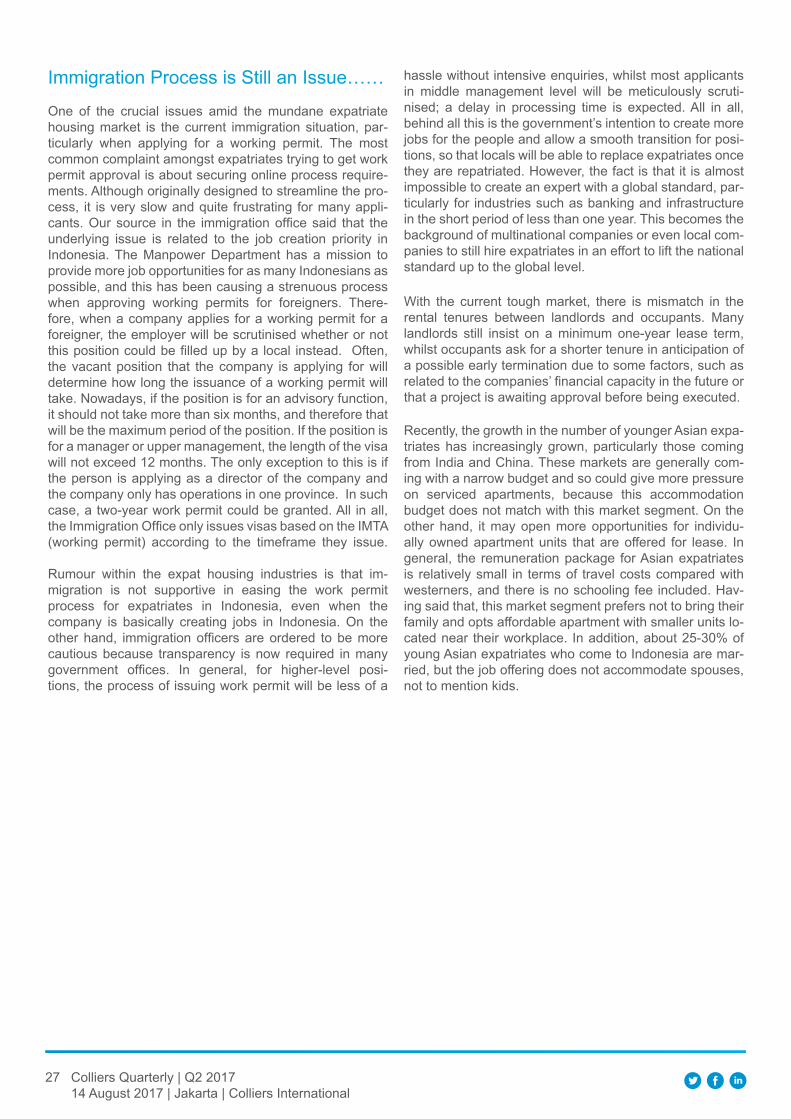
27 Colliers Quarterly | Q2 201714 August 2017 | Jakarta | Colliers International
Immigration Process is Still an Issue……
One of the crucial issues amid the mundane expatriate housing market is the current immigration situation, par-ticularly when applying for a working permit. The most common complaint amongst expatriates trying to get work permit approval is about securing online process require-ments. Although originally designed to streamline the pro-cess, it is very slow and quite frustrating for many appli-cants. Our source in the immigration office said that the underlying issue is related to the job creation priority in Indonesia. The Manpower Department has a mission to provide more job opportunities for as many Indonesians as possible, and this has been causing a strenuous process when approving working permits for foreigners. There-fore, when a company applies for a working permit for a foreigner, the employer will be scrutinised whether or not this position could be filled up by a local instead. Often, the vacant position that the company is applying for will determine how long the issuance of a working permit will take. Nowadays, if the position is for an advisory function, it should not take more than six months, and therefore that will be the maximum period of the position. If the position is for a manager or upper management, the length of the visa will not exceed 12 months. The only exception to this is if the person is applying as a director of the company and the company only has operations in one province. In such case, a two-year work permit could be granted. All in all, the Immigration Office only issues visas based on the IMTA (working permit) according to the timeframe they issue. Rumour within the expat housing industries is that im-migration is not supportive in easing the work permit process for expatriates in Indonesia, even when the company is basically creating jobs in Indonesia. On the other hand, immigration officers are ordered to be more cautious because transparency is now required in many government offices. In general, for higher-level posi-tions, the process of issuing work permit will be less of a
hassle without intensive enquiries, whilst most applicants in middle management level will be meticulously scruti-nised; a delay in processing time is expected. All in all, behind all this is the government’s intention to create more jobs for the people and allow a smooth transition for posi-tions, so that locals will be able to replace expatriates once they are repatriated. However, the fact is that it is almost impossible to create an expert with a global standard, par-ticularly for industries such as banking and infrastructure in the short period of less than one year. This becomes the background of multinational companies or even local com-panies to still hire expatriates in an effort to lift the national standard up to the global level.
With the current tough market, there is mismatch in the rental tenures between landlords and occupants. Many landlords still insist on a minimum one-year lease term, whilst occupants ask for a shorter tenure in anticipation of a possible early termination due to some factors, such as related to the companies’ financial capacity in the future or that a project is awaiting approval before being executed.
Recently, the growth in the number of younger Asian expa-triates has increasingly grown, particularly those coming from India and China. These markets are generally com-ing with a narrow budget and so could give more pressure on serviced apartments, because this accommodation budget does not match with this market segment. On the other hand, it may open more opportunities for individu-ally owned apartment units that are offered for lease. In general, the remuneration package for Asian expatriates is relatively small in terms of travel costs compared with westerners, and there is no schooling fee included. Hav-ing said that, this market segment prefers not to bring their family and opts affordable apartment with smaller units lo-cated near their workplace. In addition, about 25-30% of young Asian expatriates who come to Indonesia are mar-ried, but the job offering does not accommodate spouses, not to mention kids.
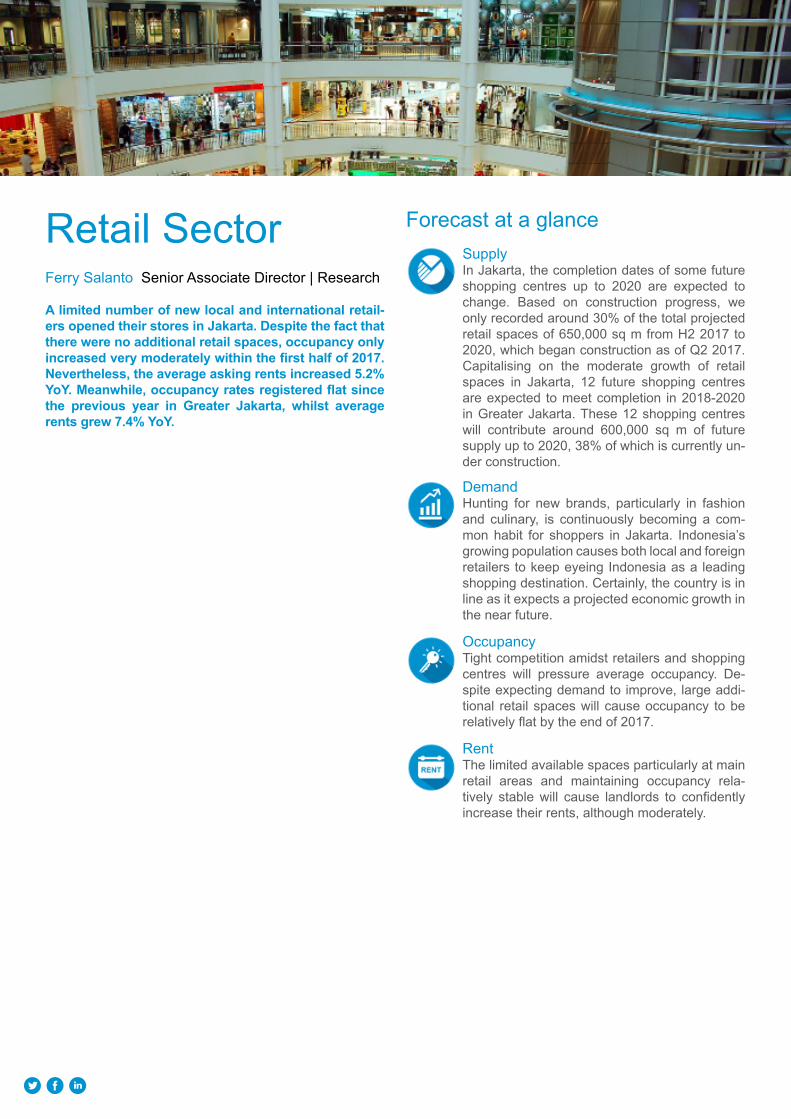
Retail SectorFerry Salanto Senior Associate Director | Research
A limited number of new local and international retail-ers opened their stores in jakarta. Despite the fact that there were no additional retail spaces, occupancy only increased very moderately within the first half of 2017. nevertheless, the average asking rents increased 5.2% YoY. Meanwhile, occupancy rates registered flat since the previous year in greater jakarta, whilst average rents grew 7.4% YoY.
SupplyIn Jakarta, the completion dates of some future shopping centres up to 2020 are expected to change. Based on construction progress, we only recorded around 30% of the total projected retail spaces of 650,000 sq m from H2 2017 to 2020, which began construction as of Q2 2017. Capitalising on the moderate growth of retail spaces in Jakarta, 12 future shopping centres are expected to meet completion in 2018-2020 in Greater Jakarta. These 12 shopping centres will contribute around 600,000 sq m of future supply up to 2020, 38% of which is currently un-der construction.
DemandHunting for new brands, particularly in fashion and culinary, is continuously becoming a com-mon habit for shoppers in Jakarta. Indonesia’s growing population causes both local and foreign retailers to keep eyeing Indonesia as a leading shopping destination. Certainly, the country is in line as it expects a projected economic growth in the near future.
OccupancyTight competition amidst retailers and shopping centres will pressure average occupancy. De-spite expecting demand to improve, large addi-tional retail spaces will cause occupancy to be relatively flat by the end of 2017.
RentThe limited available spaces particularly at main retail areas and maintaining occupancy rela-tively stable will cause landlords to confidently increase their rents, although moderately.
Forecast at a glance
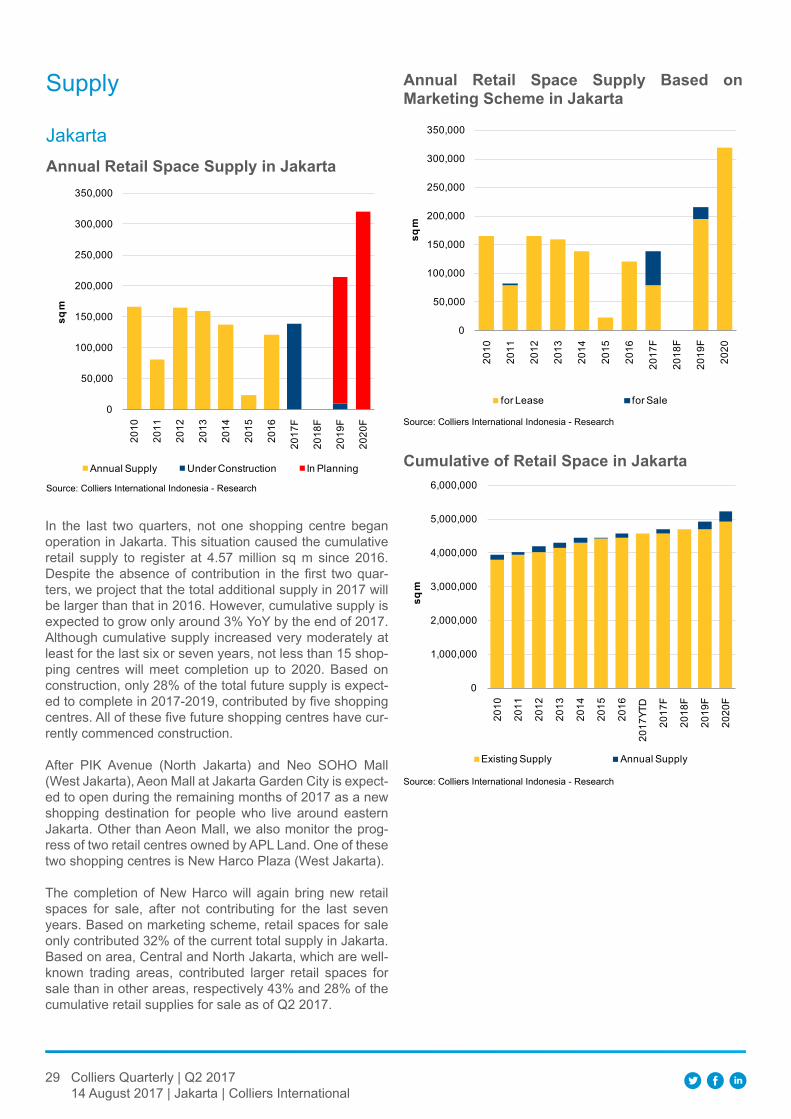
29 Colliers Quarterly | Q2 201714 August 2017 | Jakarta | Colliers International
Supply
Jakarta
Source: Colliers International Indonesia - Research
Annual retail Space Supply in jakarta
Source: Colliers International Indonesia - Research
Cumulative of retail Space in jakarta
In the last two quarters, not one shopping centre began operation in Jakarta. This situation caused the cumulative retail supply to register at 4.57 million sq m since 2016. Despite the absence of contribution in the first two quar-ters, we project that the total additional supply in 2017 will be larger than that in 2016. However, cumulative supply is expected to grow only around 3% YoY by the end of 2017. Although cumulative supply increased very moderately at least for the last six or seven years, not less than 15 shop-ping centres will meet completion up to 2020. Based on construction, only 28% of the total future supply is expect-ed to complete in 2017-2019, contributed by five shopping centres. All of these five future shopping centres have cur-rently commenced construction.
After PIK Avenue (North Jakarta) and Neo SOHO Mall (West Jakarta), Aeon Mall at Jakarta Garden City is expect-ed to open during the remaining months of 2017 as a new shopping destination for people who live around eastern Jakarta. Other than Aeon Mall, we also monitor the prog-ress of two retail centres owned by APL Land. One of these two shopping centres is New Harco Plaza (West Jakarta).
The completion of New Harco will again bring new retail spaces for sale, after not contributing for the last seven years. Based on marketing scheme, retail spaces for sale only contributed 32% of the current total supply in Jakarta. Based on area, Central and North Jakarta, which are well-known trading areas, contributed larger retail spaces for sale than in other areas, respectively 43% and 28% of the cumulative retail supplies for sale as of Q2 2017.
0
50,000
100,000
150,000
200,000
250,000
300,000
350,000
2010
2011
2012
2013
2014
2015
2016
2017
F
2018
F
2019
F
2020
F
sq m
Annual Supply Under Construction In Planning
Source: Colliers International Indonesia - Research
Annual retail Space Supply Based on Marketing Scheme in jakarta
0
50,000
100,000
150,000
200,000
250,000
300,000
350,000
2010
2011
2012
2013
2014
2015
2016
2017
F
2018
F
2019
F
2020
sq m
for Lease for Sale
0
1,000,000
2,000,000
3,000,000
4,000,000
5,000,000
6,000,00020
10
2011
2012
2013
2014
2015
2016
2017
YTD
2017
F
2018
F
2019
F
2020
F
sq m
Existing Supply Annual Supply
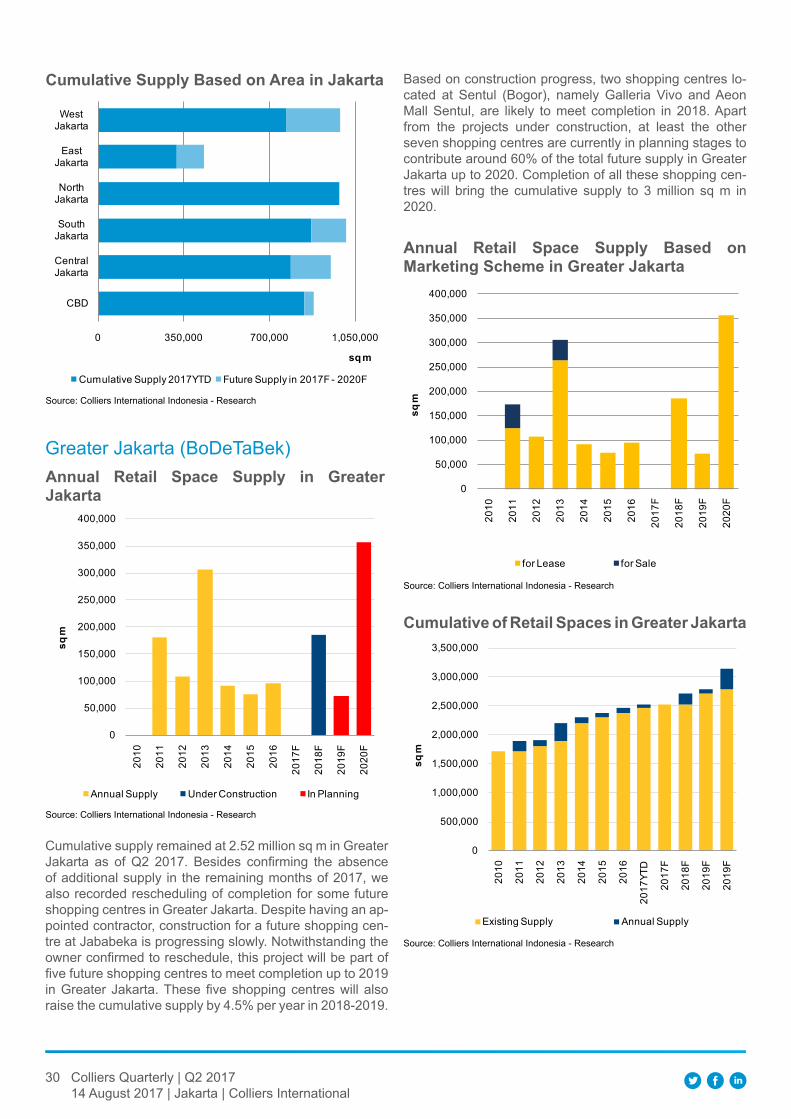
30 Colliers Quarterly | Q2 201714 August 2017 | Jakarta | Colliers International
Source: Colliers International Indonesia - Research
Cumulative Supply Based on Area in jakarta
Greater Jakarta (BoDeTaBek)
Based on construction progress, two shopping centres lo-cated at Sentul (Bogor), namely Galleria Vivo and Aeon Mall Sentul, are likely to meet completion in 2018. Apart from the projects under construction, at least the other seven shopping centres are currently in planning stages to contribute around 60% of the total future supply in Greater Jakarta up to 2020. Completion of all these shopping cen-tres will bring the cumulative supply to 3 million sq m in 2020.
Source: Colliers International Indonesia - Research
Annual retail Space Supply in greater jakarta
0 350,000 700,000 1,050,000
CBD
Central Jakarta
South Jakarta
North Jakarta
East Jakarta
West Jakarta
sq m
Cumulative Supply 2017YTD Future Supply in 2017F - 2020F
0
50,000
100,000
150,000
200,000
250,000
300,000
350,000
400,000
2010
2011
2012
2013
2014
2015
2016
2017
F
2018
F
2019
F
2020
F
sq m
Annual Supply Under Construction In Planning
Cumulative supply remained at 2.52 million sq m in Greater Jakarta as of Q2 2017. Besides confirming the absence of additional supply in the remaining months of 2017, we also recorded rescheduling of completion for some future shopping centres in Greater Jakarta. Despite having an ap-pointed contractor, construction for a future shopping cen-tre at Jababeka is progressing slowly. Notwithstanding the owner confirmed to reschedule, this project will be part of five future shopping centres to meet completion up to 2019 in Greater Jakarta. These five shopping centres will also raise the cumulative supply by 4.5% per year in 2018-2019.
Source: Colliers International Indonesia - Research
Annual retail Space Supply Based on Marketing Scheme in greater jakarta
0
50,000
100,000
150,000
200,000
250,000
300,000
350,000
400,000
2010
2011
2012
2013
2014
2015
2016
2017
F
2018
F
2019
F
2020
F
sq m
for Lease for Sale
Source: Colliers International Indonesia - Research
Cumulative of retail Spaces in greater jakarta
0
500,000
1,000,000
1,500,000
2,000,000
2,500,000
3,000,000
3,500,000
2010
2011
2012
2013
2014
2015
2016
2017
YTD
2017
F
2018
F
2019
F
2019
F
sq m
Existing Supply Annual Supply
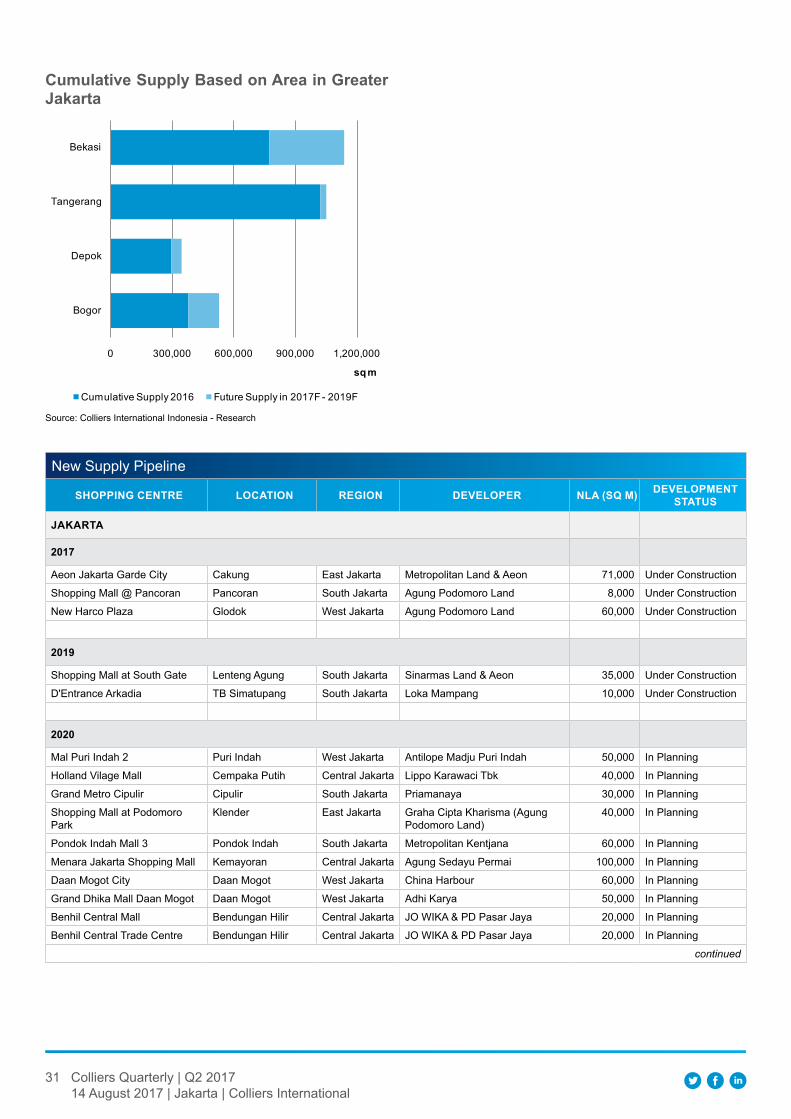
31 Colliers Quarterly | Q2 201714 August 2017 | Jakarta | Colliers International
Source: Colliers International Indonesia - Research
Cumulative Supply Based on Area in greater jakarta
New Supply Pipeline
ShOppIng Centre lOCAtIOn regIOn DevelOper nlA (SQ M) DevelOpMent StAtuS
jAkArtA
2017
Aeon Jakarta Garde City Cakung East Jakarta Metropolitan Land & Aeon 71,000 Under Construction
Shopping Mall @ Pancoran Pancoran South Jakarta Agung Podomoro Land 8,000 Under Construction
New Harco Plaza Glodok West Jakarta Agung Podomoro Land 60,000 Under Construction
2019
Shopping Mall at South Gate Lenteng Agung South Jakarta Sinarmas Land & Aeon 35,000 Under Construction
D'Entrance Arkadia TB Simatupang South Jakarta Loka Mampang 10,000 Under Construction
2020
Mal Puri Indah 2 Puri Indah West Jakarta Antilope Madju Puri Indah 50,000 In Planning
Holland Vilage Mall Cempaka Putih Central Jakarta Lippo Karawaci Tbk 40,000 In Planning
Grand Metro Cipulir Cipulir South Jakarta Priamanaya 30,000 In Planning
Shopping Mall at Podomoro Park
Klender East Jakarta Graha Cipta Kharisma (Agung Podomoro Land)
40,000 In Planning
Pondok Indah Mall 3 Pondok Indah South Jakarta Metropolitan Kentjana 60,000 In Planning
Menara Jakarta Shopping Mall Kemayoran Central Jakarta Agung Sedayu Permai 100,000 In Planning
Daan Mogot City Daan Mogot West Jakarta China Harbour 60,000 In Planning
Grand Dhika Mall Daan Mogot Daan Mogot West Jakarta Adhi Karya 50,000 In Planning
Benhil Central Mall Bendungan Hilir Central Jakarta JO WIKA & PD Pasar Jaya 20,000 In Planning
Benhil Central Trade Centre Bendungan Hilir Central Jakarta JO WIKA & PD Pasar Jaya 20,000 In Planning
continued
0 300,000 600,000 900,000 1,200,000
Bogor
Depok
Tangerang
Bekasi
sq m
Cumulative Supply 2016 Future Supply in 2017F - 2019F
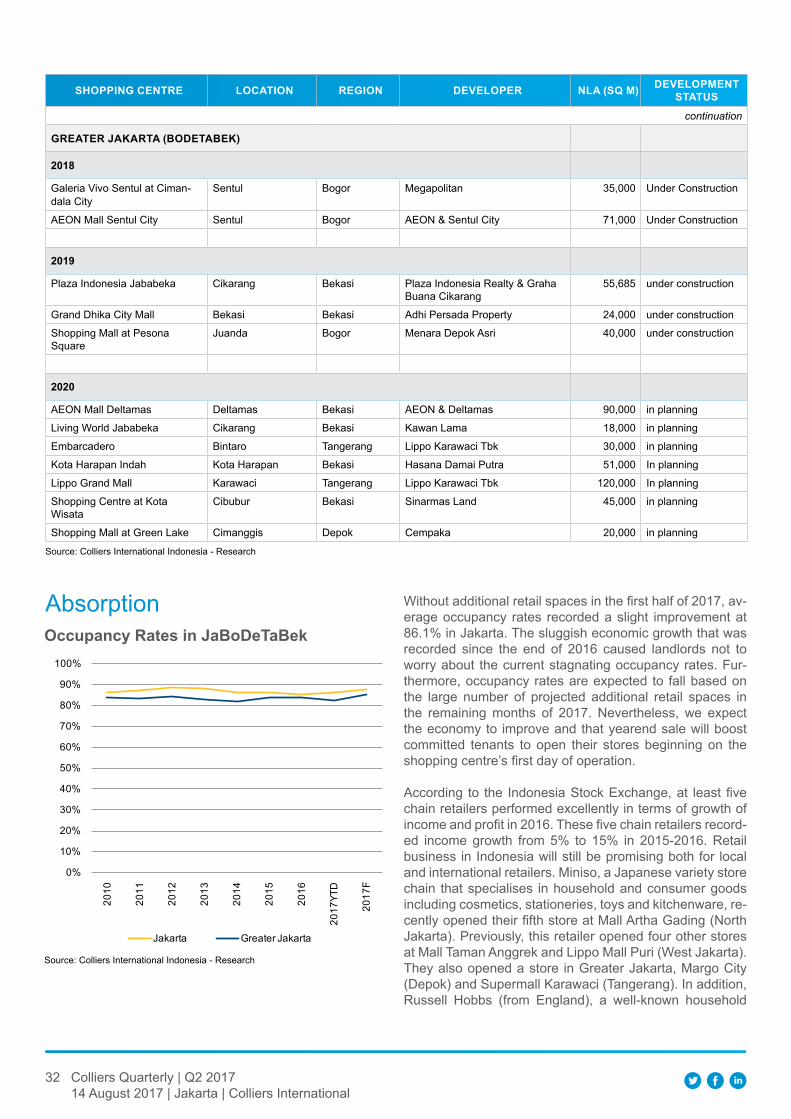
32 Colliers Quarterly | Q2 201714 August 2017 | Jakarta | Colliers International
Source: Colliers International Indonesia - Research
ShOppIng Centre lOCAtIOn regIOn DevelOper nlA (SQ M) DevelOpMent StAtuS
continuation
greAter jAkArtA (BODetABek)
2018
Galeria Vivo Sentul at Ciman-dala City
Sentul Bogor Megapolitan 35,000 Under Construction
AEON Mall Sentul City Sentul Bogor AEON & Sentul City 71,000 Under Construction
2019
Plaza Indonesia Jababeka Cikarang Bekasi Plaza Indonesia Realty & Graha Buana Cikarang
55,685 under construction
Grand Dhika City Mall Bekasi Bekasi Adhi Persada Property 24,000 under construction
Shopping Mall at Pesona Square
Juanda Bogor Menara Depok Asri 40,000 under construction
2020
AEON Mall Deltamas Deltamas Bekasi AEON & Deltamas 90,000 in planning
Living World Jababeka Cikarang Bekasi Kawan Lama 18,000 in planning
Embarcadero Bintaro Tangerang Lippo Karawaci Tbk 30,000 in planning
Kota Harapan Indah Kota Harapan Bekasi Hasana Damai Putra 51,000 In planning
Lippo Grand Mall Karawaci Tangerang Lippo Karawaci Tbk 120,000 In planning
Shopping Centre at Kota Wisata
Cibubur Bekasi Sinarmas Land 45,000 in planning
Shopping Mall at Green Lake Cimanggis Depok Cempaka 20,000 in planning
Absorption
Source: Colliers International Indonesia - Research
Occupancy rates in jaBoDetaBek
0%
10%
20%
30%
40%
50%
60%
70%
80%
90%
100%
2010
2011
2012
2013
2014
2015
2016
2017
YTD
2017
F
Jakarta Greater Jakarta
Without additional retail spaces in the first half of 2017, av-erage occupancy rates recorded a slight improvement at 86.1% in Jakarta. The sluggish economic growth that was recorded since the end of 2016 caused landlords not to worry about the current stagnating occupancy rates. Fur-thermore, occupancy rates are expected to fall based on the large number of projected additional retail spaces in the remaining months of 2017. Nevertheless, we expect the economy to improve and that yearend sale will boost committed tenants to open their stores beginning on the shopping centre’s first day of operation.
According to the Indonesia Stock Exchange, at least five chain retailers performed excellently in terms of growth of income and profit in 2016. These five chain retailers record-ed income growth from 5% to 15% in 2015-2016. Retail business in Indonesia will still be promising both for local and international retailers. Miniso, a Japanese variety store chain that specialises in household and consumer goods including cosmetics, stationeries, toys and kitchenware, re-cently opened their fifth store at Mall Artha Gading (North Jakarta). Previously, this retailer opened four other stores at Mall Taman Anggrek and Lippo Mall Puri (West Jakarta). They also opened a store in Greater Jakarta, Margo City (Depok) and Supermall Karawaci (Tangerang). In addition, Russell Hobbs (from England), a well-known household
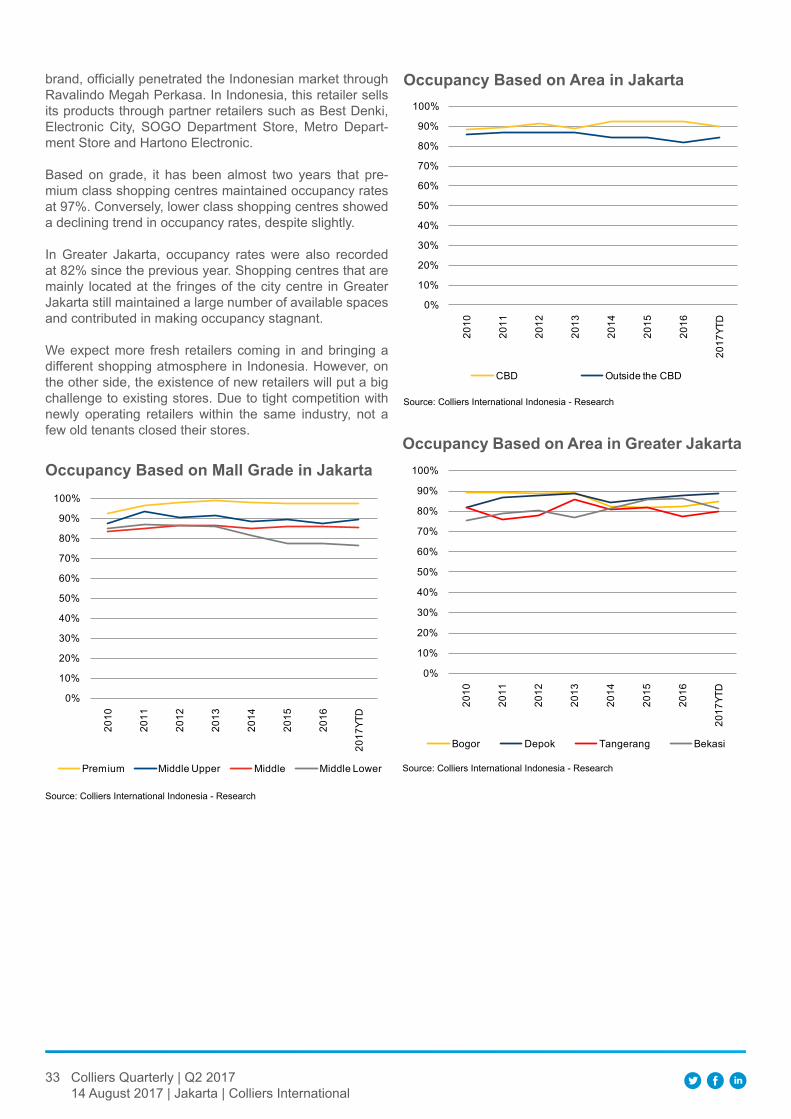
33 Colliers Quarterly | Q2 201714 August 2017 | Jakarta | Colliers International
brand, officially penetrated the Indonesian market through Ravalindo Megah Perkasa. In Indonesia, this retailer sells its products through partner retailers such as Best Denki, Electronic City, SOGO Department Store, Metro Depart-ment Store and Hartono Electronic.
Based on grade, it has been almost two years that pre-mium class shopping centres maintained occupancy rates at 97%. Conversely, lower class shopping centres showed a declining trend in occupancy rates, despite slightly.
In Greater Jakarta, occupancy rates were also recorded at 82% since the previous year. Shopping centres that are mainly located at the fringes of the city centre in Greater Jakarta still maintained a large number of available spaces and contributed in making occupancy stagnant.
We expect more fresh retailers coming in and bringing a different shopping atmosphere in Indonesia. However, on the other side, the existence of new retailers will put a big challenge to existing stores. Due to tight competition with newly operating retailers within the same industry, not a few old tenants closed their stores.
Source: Colliers International Indonesia - Research
Occupancy Based on Area in jakarta
Source: Colliers International Indonesia - Research
Occupancy Based on Area in greater jakarta
0%
10%
20%
30%
40%
50%
60%
70%
80%
90%
100%
2010
2011
2012
2013
2014
2015
2016
2017
YTD
CBD Outside the CBD
Source: Colliers International Indonesia - Research
Occupancy Based on Mall grade in jakarta
0%
10%
20%
30%
40%
50%
60%
70%
80%
90%
100%20
10
2011
2012
2013
2014
2015
2016
2017
YTD
Bogor Depok Tangerang Bekasi
0%
10%
20%
30%
40%
50%
60%
70%
80%
90%
100%
2010
2011
2012
2013
2014
2015
2016
2017
YTD
Premium Middle Upper Middle Middle Lower
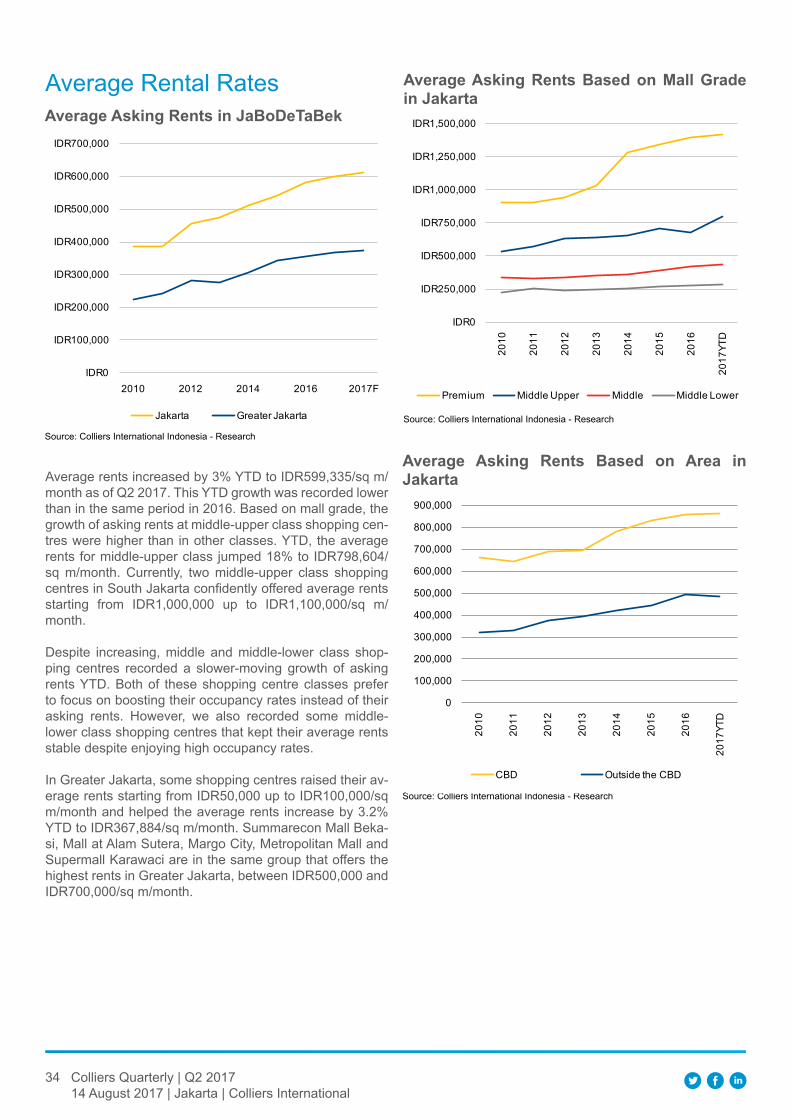
34 Colliers Quarterly | Q2 201714 August 2017 | Jakarta | Colliers International
Average Rental Rates
Source: Colliers International Indonesia - Research
Average Asking rents in jaBoDetaBek
Average rents increased by 3% YTD to IDR599,335/sq m/month as of Q2 2017. This YTD growth was recorded lower than in the same period in 2016. Based on mall grade, the growth of asking rents at middle-upper class shopping cen-tres were higher than in other classes. YTD, the average rents for middle-upper class jumped 18% to IDR798,604/sq m/month. Currently, two middle-upper class shopping centres in South Jakarta confidently offered average rents starting from IDR1,000,000 up to IDR1,100,000/sq m/month.
Despite increasing, middle and middle-lower class shop-ping centres recorded a slower-moving growth of asking rents YTD. Both of these shopping centre classes prefer to focus on boosting their occupancy rates instead of their asking rents. However, we also recorded some middle-lower class shopping centres that kept their average rents stable despite enjoying high occupancy rates. In Greater Jakarta, some shopping centres raised their av-erage rents starting from IDR50,000 up to IDR100,000/sq m/month and helped the average rents increase by 3.2% YTD to IDR367,884/sq m/month. Summarecon Mall Beka-si, Mall at Alam Sutera, Margo City, Metropolitan Mall and Supermall Karawaci are in the same group that offers the highest rents in Greater Jakarta, between IDR500,000 and IDR700,000/sq m/month.
IDR0
IDR100,000
IDR200,000
IDR300,000
IDR400,000
IDR500,000
IDR600,000
IDR700,000
2010 2012 2014 2016 2017F
Jakarta Greater Jakarta Source: Colliers International Indonesia - Research
Average Asking rents Based on Mall grade in jakarta
Source: Colliers International Indonesia - Research
Average Asking rents Based on Area in jakarta
IDR0
IDR250,000
IDR500,000
IDR750,000
IDR1,000,000
IDR1,250,000
IDR1,500,000
2010
2011
2012
2013
2014
2015
2016
2017
YTD
Premium Middle Upper Middle Middle Lower
0
100,000
200,000
300,000
400,000
500,000
600,000
700,000
800,000
900,000
2010
2011
2012
2013
2014
2015
2016
2017
YTD
CBD Outside the CBD
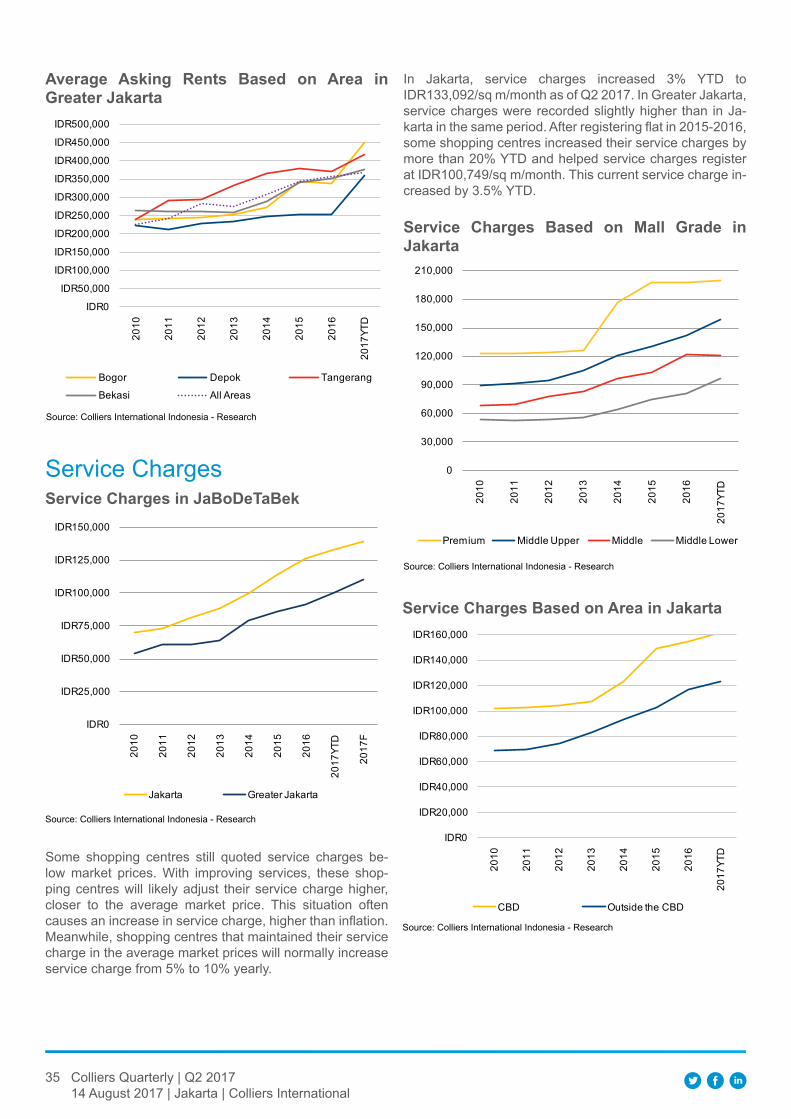
35 Colliers Quarterly | Q2 201714 August 2017 | Jakarta | Colliers International
Source: Colliers International Indonesia - Research
Average Asking rents Based on Area in greater jakarta
Source: Colliers International Indonesia - Research
Service Charges in jaBoDetaBekService Charges
IDR0
IDR25,000
IDR50,000
IDR75,000
IDR100,000
IDR125,000
IDR150,000
2010
2011
2012
2013
2014
2015
2016
2017
YTD
2017
F
Jakarta Greater Jakarta
Some shopping centres still quoted service charges be-low market prices. With improving services, these shop-ping centres will likely adjust their service charge higher, closer to the average market price. This situation often causes an increase in service charge, higher than inflation. Meanwhile, shopping centres that maintained their service charge in the average market prices will normally increase service charge from 5% to 10% yearly.
In Jakarta, service charges increased 3% YTD to IDR133,092/sq m/month as of Q2 2017. In Greater Jakarta, service charges were recorded slightly higher than in Ja-karta in the same period. After registering flat in 2015-2016, some shopping centres increased their service charges by more than 20% YTD and helped service charges register at IDR100,749/sq m/month. This current service charge in-creased by 3.5% YTD.
Source: Colliers International Indonesia - Research
Service Charges Based on Mall grade in jakarta
Source: Colliers International Indonesia - Research
Service Charges Based on Area in jakarta
0
30,000
60,000
90,000
120,000
150,000
180,000
210,000
2010
2011
2012
2013
2014
2015
2016
2017
YTD
Premium Middle Upper Middle Middle Lower
IDR0
IDR20,000
IDR40,000
IDR60,000
IDR80,000
IDR100,000
IDR120,000
IDR140,000
IDR160,000
2010
2011
2012
2013
2014
2015
2016
2017
YTD
CBD Outside the CBD
IDR0
IDR50,000
IDR100,000
IDR150,000
IDR200,000
IDR250,000
IDR300,000
IDR350,000
IDR400,000
IDR450,000
IDR500,00020
10
2011
2012
2013
2014
2015
2016
2017
YTD
Bogor Depok Tangerang
Bekasi All Areas
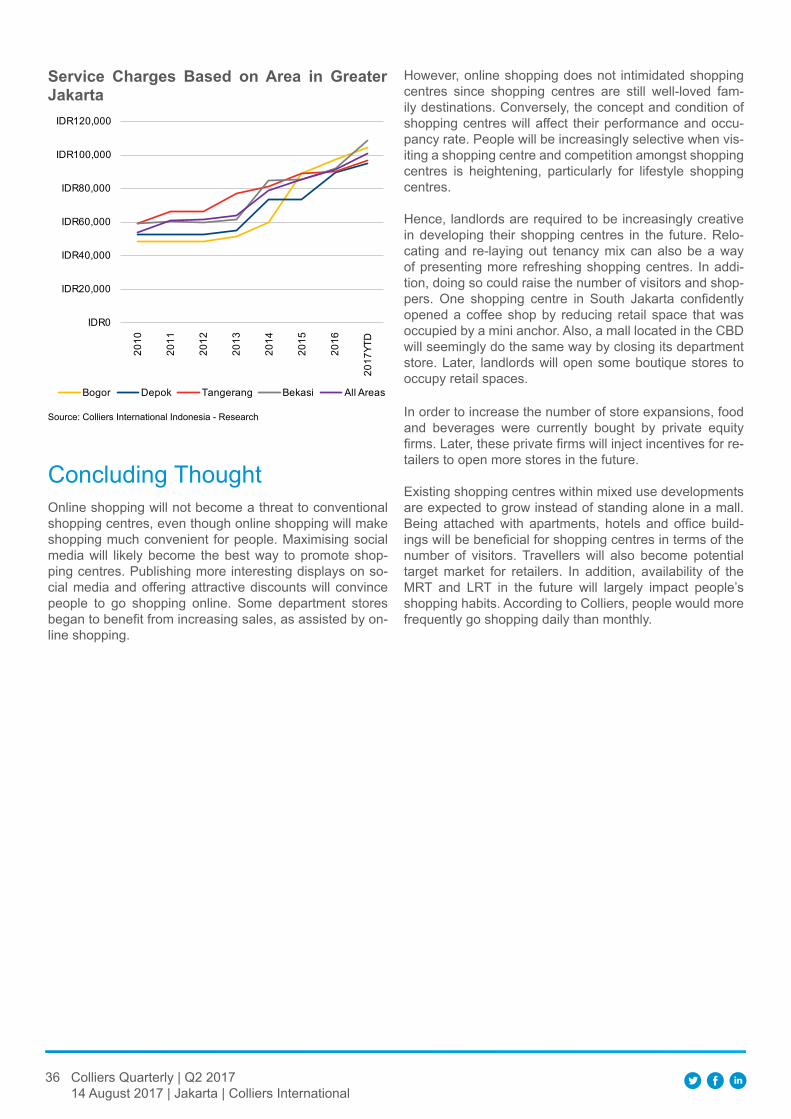
36 Colliers Quarterly | Q2 201714 August 2017 | Jakarta | Colliers International
Concluding ThoughtOnline shopping will not become a threat to conventional shopping centres, even though online shopping will make shopping much convenient for people. Maximising social media will likely become the best way to promote shop-ping centres. Publishing more interesting displays on so-cial media and offering attractive discounts will convince people to go shopping online. Some department stores began to benefit from increasing sales, as assisted by on-line shopping.
Source: Colliers International Indonesia - Research
Service Charges Based on Area in greater jakarta
IDR0
IDR20,000
IDR40,000
IDR60,000
IDR80,000
IDR100,000
IDR120,00020
10
2011
2012
2013
2014
2015
2016
2017
YTD
Bogor Depok Tangerang Bekasi All Areas
However, online shopping does not intimidated shopping centres since shopping centres are still well-loved fam-ily destinations. Conversely, the concept and condition of shopping centres will affect their performance and occu-pancy rate. People will be increasingly selective when vis-iting a shopping centre and competition amongst shopping centres is heightening, particularly for lifestyle shopping centres.
Hence, landlords are required to be increasingly creative in developing their shopping centres in the future. Relo-cating and re-laying out tenancy mix can also be a way of presenting more refreshing shopping centres. In addi-tion, doing so could raise the number of visitors and shop-pers. One shopping centre in South Jakarta confidently opened a coffee shop by reducing retail space that was occupied by a mini anchor. Also, a mall located in the CBD will seemingly do the same way by closing its department store. Later, landlords will open some boutique stores to occupy retail spaces.
In order to increase the number of store expansions, food and beverages were currently bought by private equity firms. Later, these private firms will inject incentives for re-tailers to open more stores in the future.
Existing shopping centres within mixed use developments are expected to grow instead of standing alone in a mall. Being attached with apartments, hotels and office build-ings will be beneficial for shopping centres in terms of the number of visitors. Travellers will also become potential target market for retailers. In addition, availability of the MRT and LRT in the future will largely impact people’s shopping habits. According to Colliers, people would more frequently go shopping daily than monthly.
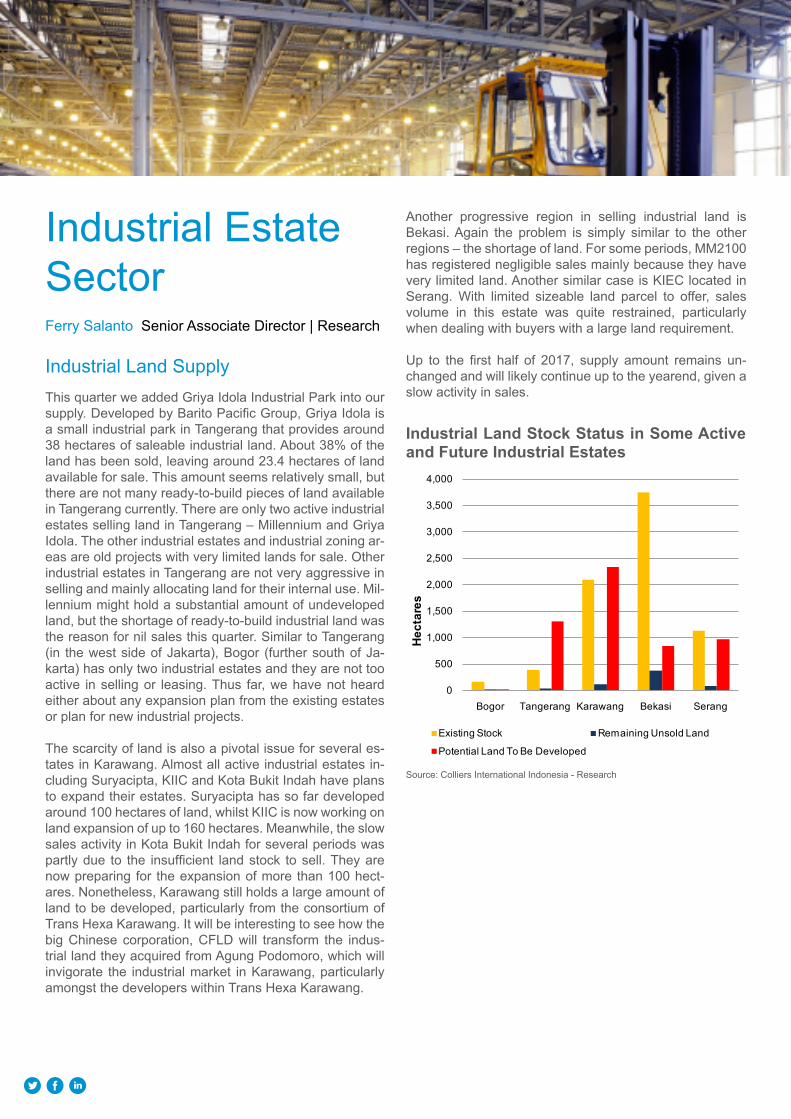
Industrial Land SupplyThis quarter we added Griya Idola Industrial Park into our supply. Developed by Barito Pacific Group, Griya Idola is a small industrial park in Tangerang that provides around 38 hectares of saleable industrial land. About 38% of the land has been sold, leaving around 23.4 hectares of land available for sale. This amount seems relatively small, but there are not many ready-to-build pieces of land available in Tangerang currently. There are only two active industrial estates selling land in Tangerang – Millennium and Griya Idola. The other industrial estates and industrial zoning ar-eas are old projects with very limited lands for sale. Other industrial estates in Tangerang are not very aggressive in selling and mainly allocating land for their internal use. Mil-lennium might hold a substantial amount of undeveloped land, but the shortage of ready-to-build industrial land was the reason for nil sales this quarter. Similar to Tangerang (in the west side of Jakarta), Bogor (further south of Ja-karta) has only two industrial estates and they are not too active in selling or leasing. Thus far, we have not heard either about any expansion plan from the existing estates or plan for new industrial projects.
The scarcity of land is also a pivotal issue for several es-tates in Karawang. Almost all active industrial estates in-cluding Suryacipta, KIIC and Kota Bukit Indah have plans to expand their estates. Suryacipta has so far developed around 100 hectares of land, whilst KIIC is now working on land expansion of up to 160 hectares. Meanwhile, the slow sales activity in Kota Bukit Indah for several periods was partly due to the insufficient land stock to sell. They are now preparing for the expansion of more than 100 hect-ares. Nonetheless, Karawang still holds a large amount of land to be developed, particularly from the consortium of Trans Hexa Karawang. It will be interesting to see how the big Chinese corporation, CFLD will transform the indus-trial land they acquired from Agung Podomoro, which will invigorate the industrial market in Karawang, particularly amongst the developers within Trans Hexa Karawang.
Industrial Estate SectorFerry Salanto Senior Associate Director | Research
Another progressive region in selling industrial land is Bekasi. Again the problem is simply similar to the other regions – the shortage of land. For some periods, MM2100 has registered negligible sales mainly because they have very limited land. Another similar case is KIEC located in Serang. With limited sizeable land parcel to offer, sales volume in this estate was quite restrained, particularly when dealing with buyers with a large land requirement.
Up to the first half of 2017, supply amount remains un-changed and will likely continue up to the yearend, given a slow activity in sales.
Source: Colliers International Indonesia - Research
Industrial land Stock Status in Some Active and future Industrial estates
0
500
1,000
1,500
2,000
2,500
3,000
3,500
4,000
Bogor Tangerang Karawang Bekasi Serang
hect
ares
Existing Stock Remaining Unsold Land
Potential Land To Be Developed
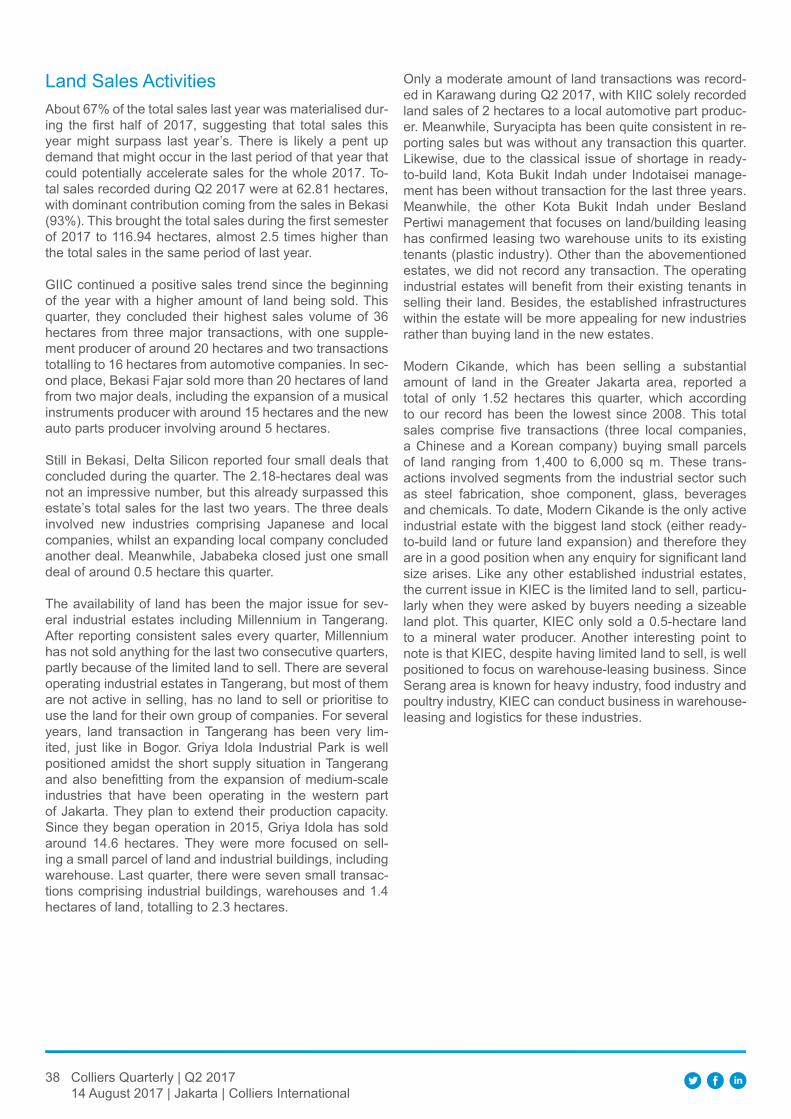
38 Colliers Quarterly | Q2 201714 August 2017 | Jakarta | Colliers International
About 67% of the total sales last year was materialised dur-ing the first half of 2017, suggesting that total sales this year might surpass last year’s. There is likely a pent up demand that might occur in the last period of that year that could potentially accelerate sales for the whole 2017. To-tal sales recorded during Q2 2017 were at 62.81 hectares, with dominant contribution coming from the sales in Bekasi (93%). This brought the total sales during the first semester of 2017 to 116.94 hectares, almost 2.5 times higher than the total sales in the same period of last year.
GIIC continued a positive sales trend since the beginning of the year with a higher amount of land being sold. This quarter, they concluded their highest sales volume of 36 hectares from three major transactions, with one supple-ment producer of around 20 hectares and two transactions totalling to 16 hectares from automotive companies. In sec-ond place, Bekasi Fajar sold more than 20 hectares of land from two major deals, including the expansion of a musical instruments producer with around 15 hectares and the new auto parts producer involving around 5 hectares.
Still in Bekasi, Delta Silicon reported four small deals that concluded during the quarter. The 2.18-hectares deal was not an impressive number, but this already surpassed this estate’s total sales for the last two years. The three deals involved new industries comprising Japanese and local companies, whilst an expanding local company concluded another deal. Meanwhile, Jababeka closed just one small deal of around 0.5 hectare this quarter.
The availability of land has been the major issue for sev-eral industrial estates including Millennium in Tangerang. After reporting consistent sales every quarter, Millennium has not sold anything for the last two consecutive quarters, partly because of the limited land to sell. There are several operating industrial estates in Tangerang, but most of them are not active in selling, has no land to sell or prioritise to use the land for their own group of companies. For several years, land transaction in Tangerang has been very lim-ited, just like in Bogor. Griya Idola Industrial Park is well positioned amidst the short supply situation in Tangerang and also benefitting from the expansion of medium-scale industries that have been operating in the western part of Jakarta. They plan to extend their production capacity. Since they began operation in 2015, Griya Idola has sold around 14.6 hectares. They were more focused on sell-ing a small parcel of land and industrial buildings, including warehouse. Last quarter, there were seven small transac-tions comprising industrial buildings, warehouses and 1.4 hectares of land, totalling to 2.3 hectares.
Land Sales Activities Only a moderate amount of land transactions was record-ed in Karawang during Q2 2017, with KIIC solely recorded land sales of 2 hectares to a local automotive part produc-er. Meanwhile, Suryacipta has been quite consistent in re-porting sales but was without any transaction this quarter. Likewise, due to the classical issue of shortage in ready-to-build land, Kota Bukit Indah under Indotaisei manage-ment has been without transaction for the last three years. Meanwhile, the other Kota Bukit Indah under Besland Pertiwi management that focuses on land/building leasing has confirmed leasing two warehouse units to its existing tenants (plastic industry). Other than the abovementioned estates, we did not record any transaction. The operating industrial estates will benefit from their existing tenants in selling their land. Besides, the established infrastructures within the estate will be more appealing for new industries rather than buying land in the new estates.
Modern Cikande, which has been selling a substantial amount of land in the Greater Jakarta area, reported a total of only 1.52 hectares this quarter, which according to our record has been the lowest since 2008. This total sales comprise five transactions (three local companies, a Chinese and a Korean company) buying small parcels of land ranging from 1,400 to 6,000 sq m. These trans-actions involved segments from the industrial sector such as steel fabrication, shoe component, glass, beverages and chemicals. To date, Modern Cikande is the only active industrial estate with the biggest land stock (either ready-to-build land or future land expansion) and therefore they are in a good position when any enquiry for significant land size arises. Like any other established industrial estates, the current issue in KIEC is the limited land to sell, particu-larly when they were asked by buyers needing a sizeable land plot. This quarter, KIEC only sold a 0.5-hectare land to a mineral water producer. Another interesting point to note is that KIEC, despite having limited land to sell, is well positioned to focus on warehouse-leasing business. Since Serang area is known for heavy industry, food industry and poultry industry, KIEC can conduct business in warehouse-leasing and logistics for these industries.
39 Colliers Quarterly | Q2 201714 August 2017 | Jakarta | Colliers International
Source: Colliers International Indonesia - Research
land Absorption in Q2 2017
Source: Colliers International Indonesia - Research
Annual Industrial land Absorption
0 5 10 15 20 25 30 35 40
Jababeka
Krakatau Industrial Estate Cilegon
Modern Cikande
KIIC
Delta Silicon
Bekasi Fajar
Greenland International Industrial Centre
hectares
0
200
400
600
800
1,000
1,200
1,400
2006
2007
2008
2009
2010
2011
2012
2013
2014
2015
2016
2017
YTD
hec
tare
s
Jakarta Bogor Tangerang Karawang Bekasi Serang
Source: Colliers International Indonesia - Research
types of Active Industries During Q2 2017
Automotive29.93%
Food & Beverage36.27%
Plastics0.14%
Pharmaceutical0.43%
Steel-related0.29%
Chemicals3.20%
Manufacturing1.03%
Logistics/Warehousing
4.43%
Packaging0.26% Metal
3.09%
Building Material1.91% Energy
5.13%
Others14.52%
The current general market condition and sales perfor-mance of each estate suggest that price should be kept at the current level. In our record, none of the operating indus-trial estates introduced a new price this quarter. Looking at the amount of transaction so far in the first semester this year, there is no strong reason or justification to increase price.
With the addition of Griya Idola to supply inventory, the average price in Tangerang somewhat changed because land price at Griya Idola is the highest (similar to those in the prime industrial estates in Bekasi).
In the remaining months of 2017, we do not detect any plan to increase industrial land price, and thus the average price should stabilise up to the end of 2017.
Land Price
Source: Colliers International Indonesia - Research*1USD = Rp 13,310
Industrial Land Prices and Maintenance Costs (in USD equivalent)
regIOnlAnD prICe (In uSD/SQ M) MAIntenAnCe COStS
(In uSD/SQ M/MOnth)
lOWeSt hIgheSt AverAge lOWeSt hIgheSt AverAge
Bogor 120.00 300.53 210.26 0.06 0.06 0.06
Bekasi 180.32 240.42 219.80 0.06 0.08 0.07
Tangerang 150.26 244.18 194.09 0.03 0.08 0.06
Karawang 170.00 185.00 178.75 0.05 0.10 0.06
Serang 150.26 165.29 157.78 0.03 0.05 0.04
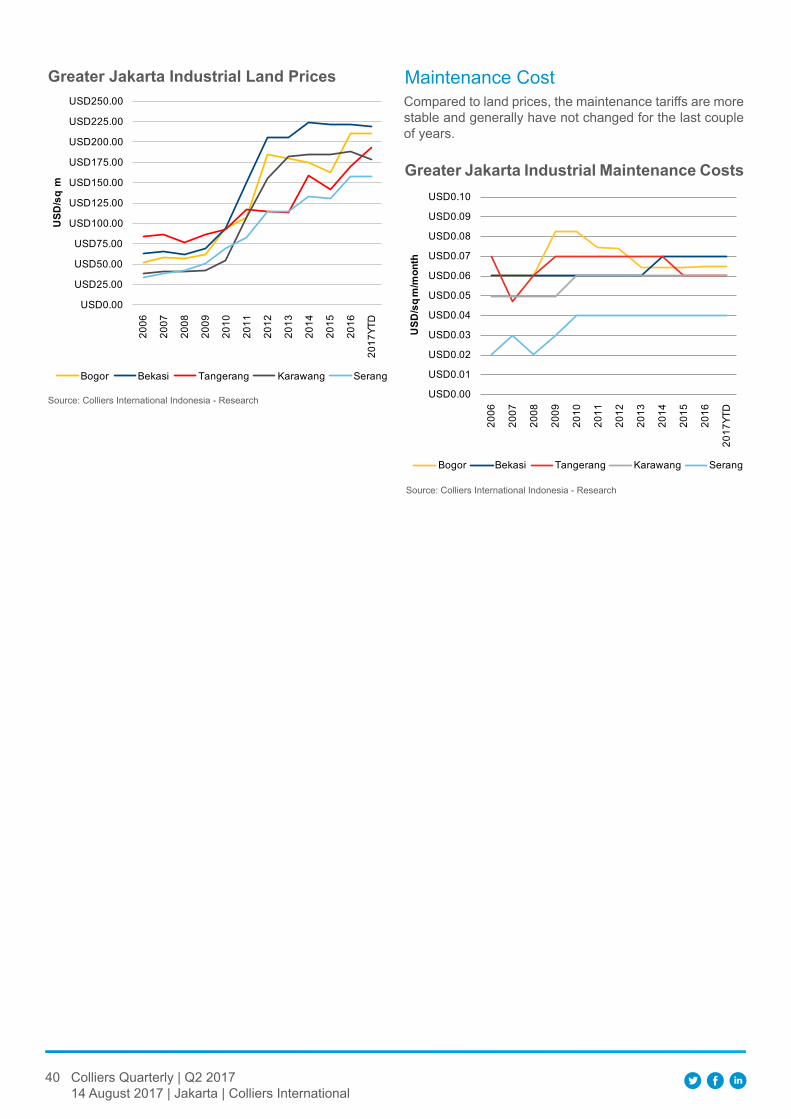
40 Colliers Quarterly | Q2 201714 August 2017 | Jakarta | Colliers International
Source: Colliers International Indonesia - Research
greater jakarta Industrial land prices Maintenance CostCompared to land prices, the maintenance tariffs are more stable and generally have not changed for the last couple of years.
USD0.00
USD25.00
USD50.00
USD75.00
USD100.00
USD125.00
USD150.00
USD175.00
USD200.00
USD225.00
USD250.00
2006
2007
2008
2009
2010
2011
2012
2013
2014
2015
2016
2017
YTD
uSD
/sq
m
Bogor Bekasi Tangerang Karawang Serang
Source: Colliers International Indonesia - Research
greater jakarta Industrial Maintenance Costs
USD0.00
USD0.01
USD0.02
USD0.03
USD0.04
USD0.05
USD0.06
USD0.07
USD0.08
USD0.09
USD0.10
2006
2007
2008
2009
2010
2011
2012
2013
2014
2015
2016
2017
YTD
uSD
/sq
m/m
onth
Bogor Bekasi Tangerang Karawang Serang
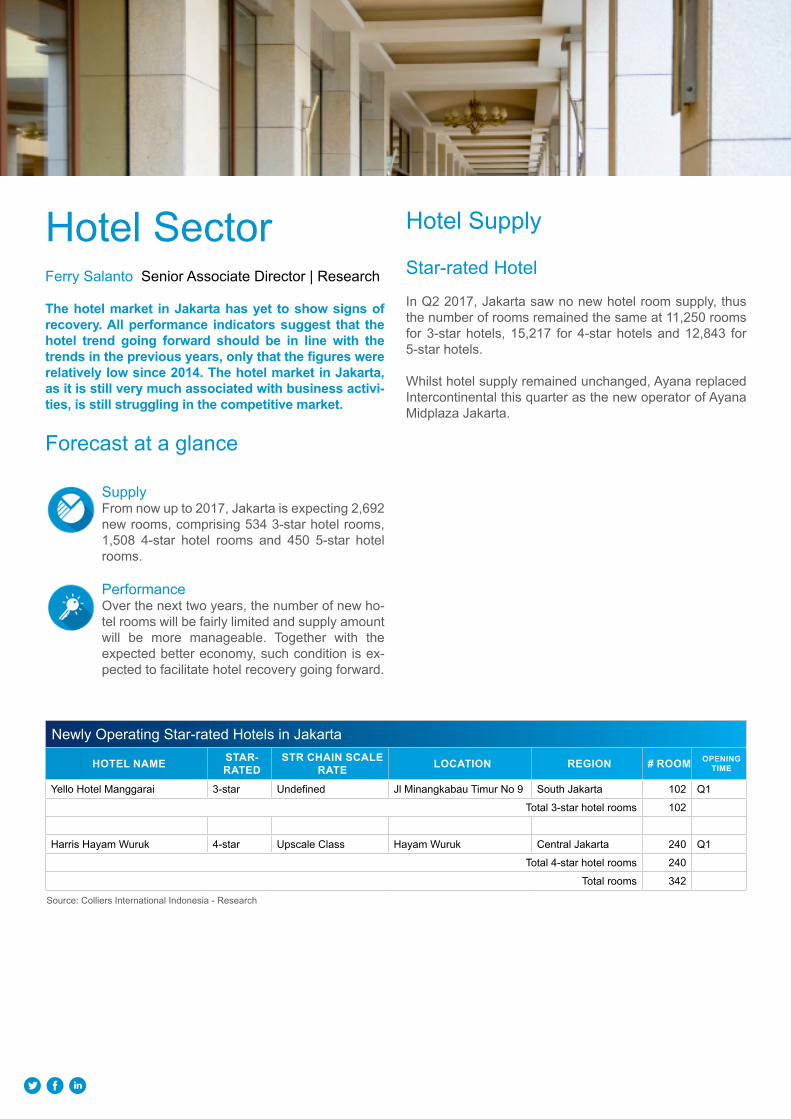
Hotel Supply
Star-rated Hotel In Q2 2017, Jakarta saw no new hotel room supply, thus the number of rooms remained the same at 11,250 rooms for 3-star hotels, 15,217 for 4-star hotels and 12,843 for 5-star hotels.
Whilst hotel supply remained unchanged, Ayana replaced Intercontinental this quarter as the new operator of Ayana Midplaza Jakarta.
Hotel SectorFerry Salanto Senior Associate Director | Research
the hotel market in jakarta has yet to show signs of recovery. All performance indicators suggest that the hotel trend going forward should be in line with the trends in the previous years, only that the figures were relatively low since 2014. the hotel market in jakarta, as it is still very much associated with business activi-ties, is still struggling in the competitive market.
Forecast at a glance
SupplyFrom now up to 2017, Jakarta is expecting 2,692 new rooms, comprising 534 3-star hotel rooms, 1,508 4-star hotel rooms and 450 5-star hotel rooms.
PerformanceOver the next two years, the number of new ho-tel rooms will be fairly limited and supply amount will be more manageable. Together with the expected better economy, such condition is ex-pected to facilitate hotel recovery going forward.
Newly Operating Star-rated Hotels in Jakarta
hOtel nAMe StAr-rAteD
Str ChAIn SCAle rAte lOCAtIOn regIOn # rOOM OpenIng
tIMe
Yello Hotel Manggarai 3-star Undefined Jl Minangkabau Timur No 9 South Jakarta 102 Q1
Total 3-star hotel rooms 102
Harris Hayam Wuruk 4-star Upscale Class Hayam Wuruk Central Jakarta 240 Q1
Total 4-star hotel rooms 240
Total rooms 342
Source: Colliers International Indonesia - Research

42 Colliers Quarterly | Q2 201714 August 2017 | Jakarta | Colliers International
Rebranded Hotels in Jakarta During 2017
hOtel nAMe prevIOuS nAMe StAr-rAteD
YeAr Of OperAtIOn lOCAtIOn regIOn nuMBer Of
rOOMS
Ayana Midplaza Jakarta Intercontinental Jakarta Midplaza
5-star 1998 Jl Jend. Sudirman Kav. 10-11
CBD 366
Source: Colliers International Indonesia - Research
Source: Colliers International Indonesia - Research
Cumulative Supply of Star-rated hotel projects in jakarta
Source: Colliers International Indonesia - Research
Cumulative Supply of Star-rated hotel rooms in jakarta
0
10
20
30
40
50
60
70
80
90
100
2010
2011
2012
2013
2014
2015
2016
Q1
2017
Q2
2017
2017
F
2018
F
2019
F
3-star 4-star 5-star
0
2,000
4,000
6,000
8,000
10,000
12,000
14,000
16,000
18,000
20,000
2010
2011
2012
2013
2014
2015
2016
Q1
2017
Q2
2017
2017
F
2018
F
2019
F
3-star 4-star 5-star
Source: Colliers International Indonesia - Research
top 5 hotel Operator Based on number of projects
Source: Colliers International Indonesia - Research
top 5 hotel Operator Based on number of rooms
0 5 10 15 20 25 30
Swiss-belhol International
Tauzia Management
Archipelago International
Marriott International
Accor
0 2,000 4,000 6,000 8,000
Swiss-belhol International
Tauzia Management
Archipelago International
Marriott International
Accor
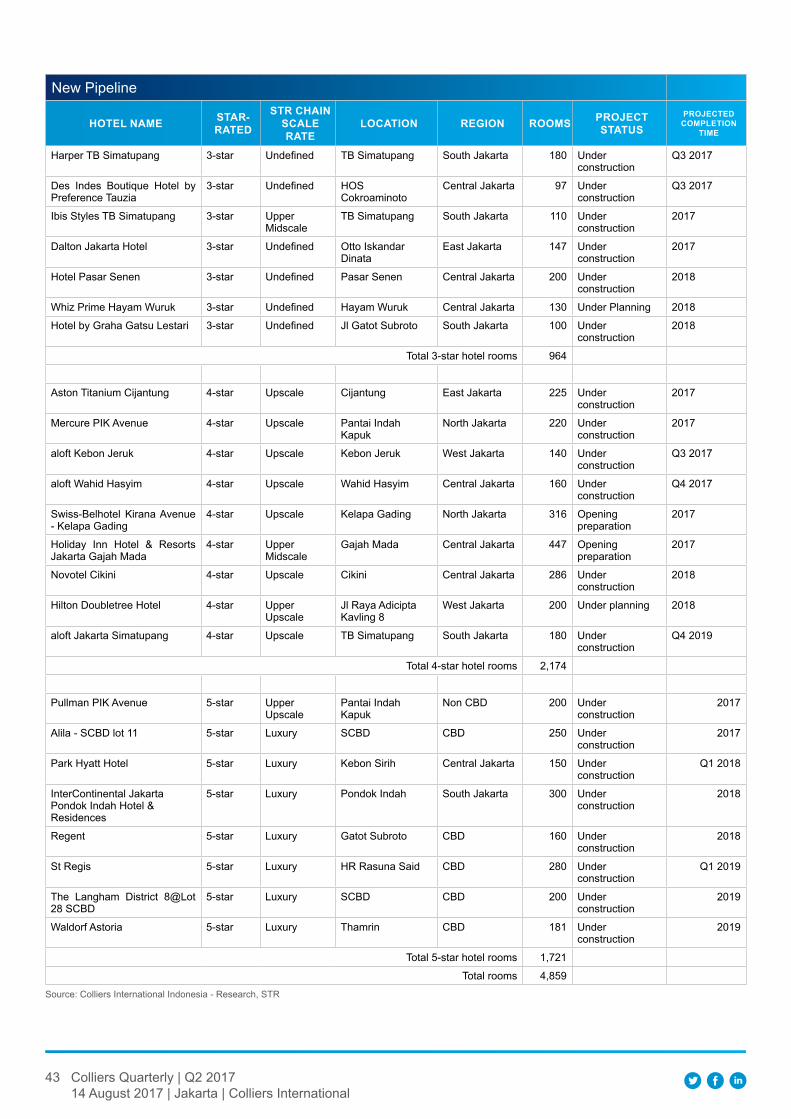
43 Colliers Quarterly | Q2 201714 August 2017 | Jakarta | Colliers International
New Pipeline
hOtel nAMe StAr- rAteD
Str ChAIn SCAle rAte
lOCAtIOn regIOn rOOMS project StAtuS
projected COMpletIOn
tIMe
Harper TB Simatupang 3-star Undefined TB Simatupang South Jakarta 180 Under construction
Q3 2017
Des Indes Boutique Hotel by Preference Tauzia
3-star Undefined HOS Cokroaminoto
Central Jakarta 97 Under construction
Q3 2017
Ibis Styles TB Simatupang 3-star Upper Midscale
TB Simatupang South Jakarta 110 Under construction
2017
Dalton Jakarta Hotel 3-star Undefined Otto Iskandar Dinata
East Jakarta 147 Under construction
2017
Hotel Pasar Senen 3-star Undefined Pasar Senen Central Jakarta 200 Under construction
2018
Whiz Prime Hayam Wuruk 3-star Undefined Hayam Wuruk Central Jakarta 130 Under Planning 2018
Hotel by Graha Gatsu Lestari 3-star Undefined Jl Gatot Subroto South Jakarta 100 Under construction
2018
Total 3-star hotel rooms 964
Aston Titanium Cijantung 4-star Upscale Cijantung East Jakarta 225 Under construction
2017
Mercure PIK Avenue 4-star Upscale Pantai Indah Kapuk
North Jakarta 220 Under construction
2017
aloft Kebon Jeruk 4-star Upscale Kebon Jeruk West Jakarta 140 Under construction
Q3 2017
aloft Wahid Hasyim 4-star Upscale Wahid Hasyim Central Jakarta 160 Under construction
Q4 2017
Swiss-Belhotel Kirana Avenue - Kelapa Gading
4-star Upscale Kelapa Gading North Jakarta 316 Opening preparation
2017
Holiday Inn Hotel & Resorts Jakarta Gajah Mada
4-star Upper Midscale
Gajah Mada Central Jakarta 447 Opening preparation
2017
Novotel Cikini 4-star Upscale Cikini Central Jakarta 286 Under construction
2018
Hilton Doubletree Hotel 4-star Upper Upscale
Jl Raya Adicipta Kavling 8
West Jakarta 200 Under planning 2018
aloft Jakarta Simatupang 4-star Upscale TB Simatupang South Jakarta 180 Under construction
Q4 2019
Total 4-star hotel rooms 2,174
Pullman PIK Avenue 5-star Upper Upscale
Pantai Indah Kapuk
Non CBD 200 Under construction
2017
Alila - SCBD lot 11 5-star Luxury SCBD CBD 250 Under construction
2017
Park Hyatt Hotel 5-star Luxury Kebon Sirih Central Jakarta 150 Under construction
Q1 2018
InterContinental Jakarta Pondok Indah Hotel & Residences
5-star Luxury Pondok Indah South Jakarta 300 Under construction
2018
Regent 5-star Luxury Gatot Subroto CBD 160 Under construction
2018
St Regis 5-star Luxury HR Rasuna Said CBD 280 Under construction
Q1 2019
The Langham District 8@Lot 28 SCBD
5-star Luxury SCBD CBD 200 Under construction
2019
Waldorf Astoria 5-star Luxury Thamrin CBD 181 Under construction
2019
Total 5-star hotel rooms 1,721
Total rooms 4,859Source: Colliers International Indonesia - Research, STR
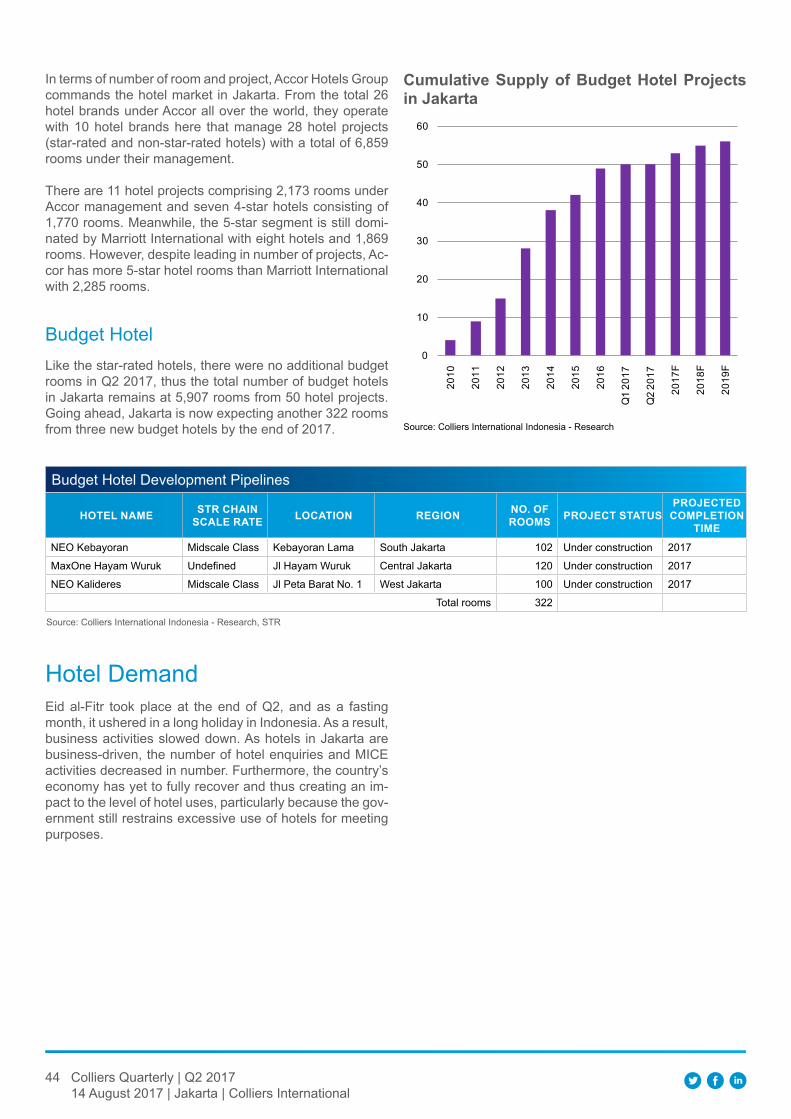
44 Colliers Quarterly | Q2 201714 August 2017 | Jakarta | Colliers International
In terms of number of room and project, Accor Hotels Group commands the hotel market in Jakarta. From the total 26 hotel brands under Accor all over the world, they operate with 10 hotel brands here that manage 28 hotel projects (star-rated and non-star-rated hotels) with a total of 6,859 rooms under their management.
There are 11 hotel projects comprising 2,173 rooms under Accor management and seven 4-star hotels consisting of 1,770 rooms. Meanwhile, the 5-star segment is still domi-nated by Marriott International with eight hotels and 1,869 rooms. However, despite leading in number of projects, Ac-cor has more 5-star hotel rooms than Marriott International with 2,285 rooms.
Budget HotelLike the star-rated hotels, there were no additional budget rooms in Q2 2017, thus the total number of budget hotels in Jakarta remains at 5,907 rooms from 50 hotel projects. Going ahead, Jakarta is now expecting another 322 rooms from three new budget hotels by the end of 2017. Source: Colliers International Indonesia - Research
Cumulative Supply of Budget hotel projects in jakarta
0
10
20
30
40
50
60
2010
2011
2012
2013
2014
2015
2016
Q1
2017
Q2
2017
2017
F
2018
F
2019
F
Budget Hotel Development Pipelines
hOtel nAMe Str ChAIn SCAle rAte lOCAtIOn regIOn nO. Of
rOOMS prOjeCt StAtuSprojected
COMpletIOn tIMe
NEO Kebayoran Midscale Class Kebayoran Lama South Jakarta 102 Under construction 2017
MaxOne Hayam Wuruk Undefined Jl Hayam Wuruk Central Jakarta 120 Under construction 2017
NEO Kalideres Midscale Class Jl Peta Barat No. 1 West Jakarta 100 Under construction 2017
Total rooms 322
Source: Colliers International Indonesia - Research, STR
Hotel DemandEid al-Fitr took place at the end of Q2, and as a fasting month, it ushered in a long holiday in Indonesia. As a result, business activities slowed down. As hotels in Jakarta are business-driven, the number of hotel enquiries and MICE activities decreased in number. Furthermore, the country’s economy has yet to fully recover and thus creating an im-pact to the level of hotel uses, particularly because the gov-ernment still restrains excessive use of hotels for meeting purposes.
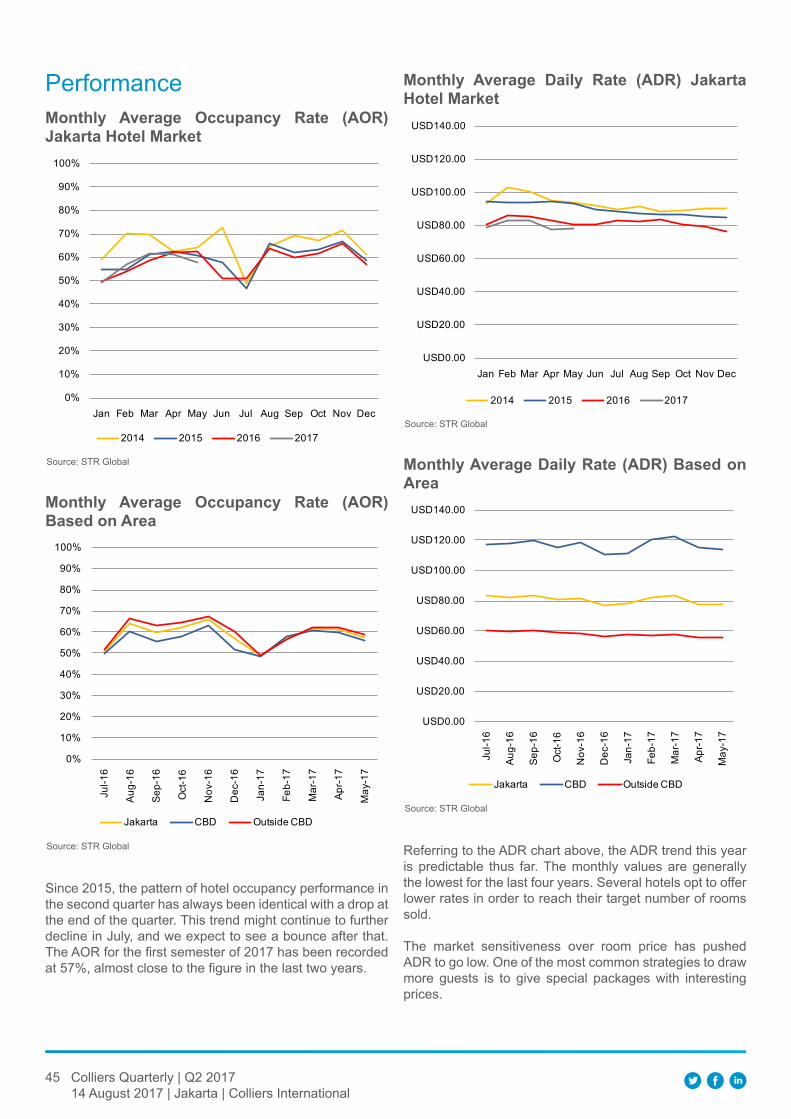
45 Colliers Quarterly | Q2 201714 August 2017 | Jakarta | Colliers International
PerformanceMonthly Average Occupancy rate (AOr) jakarta hotel Market
Source: STR Global
0%
10%
20%
30%
40%
50%
60%
70%
80%
90%
100%
Jan Feb Mar Apr May Jun Jul Aug Sep Oct Nov Dec
2014 2015 2016 2017
Monthly Average Occupancy rate (AOr) Based on Area
Source: STR Global
0%
10%
20%
30%
40%
50%
60%
70%
80%
90%
100%
Jul-1
6
Aug-
16
Sep-
16
Oct
-16
Nov
-16
Dec
-16
Jan-
17
Feb-
17
Mar
-17
Apr-1
7
May
-17
Jakarta CBD Outside CBD
Since 2015, the pattern of hotel occupancy performance in the second quarter has always been identical with a drop at the end of the quarter. This trend might continue to further decline in July, and we expect to see a bounce after that. The AOR for the first semester of 2017 has been recorded at 57%, almost close to the figure in the last two years.
Monthly Average Daily rate (ADr) jakarta hotel Market
Source: STR Global
Monthly Average Daily rate (ADr) Based on Area
Source: STR Global
Referring to the ADR chart above, the ADR trend this year is predictable thus far. The monthly values are generally the lowest for the last four years. Several hotels opt to offer lower rates in order to reach their target number of rooms sold.
The market sensitiveness over room price has pushed ADR to go low. One of the most common strategies to draw more guests is to give special packages with interesting prices.
USD0.00
USD20.00
USD40.00
USD60.00
USD80.00
USD100.00
USD120.00
USD140.00
Jan Feb Mar Apr May Jun Jul Aug Sep Oct Nov Dec
2014 2015 2016 2017
USD0.00
USD20.00
USD40.00
USD60.00
USD80.00
USD100.00
USD120.00
USD140.00
Jul-1
6
Aug-
16
Sep-
16
Oct
-16
Nov
-16
Dec
-16
Jan-
17
Feb-
17
Mar
-17
Apr-1
7
May
-17
Jakarta CBD Outside CBD

Copyright © 2017 Colliers International.
The information contained herein has been obtained from sources deemed reliable. While every reasonable effort has been made to ensure its accuracy, we cannot guarantee it. No responsibility is assumed for any inaccuracies. Readers are encouraged to consult their professional advisors prior to acting on any of the material contained in this report.
Accelerating success.
For more information:Ferry SalantoSenior Associate Director | Research+62 21 3043 [email protected]
Contributors:Eko ArfiantoSenior Manager | Research
Hern Rizal GobiManager | Research
Nurul SorayaSenior Research Executive | Research
Hotel guests in Jakarta are dominantly staying for busi-ness purposes. Most of them are short-stay guests, but a few will stay longer, for at least one month. Long-sty guest are mainly expatriates working somewhere near where they are staying. This typical long-stay hotel accommoda-tion will inevitably compete directly with serviced apart-ments and they mainly offer special rates whilst allowing their guests to access hotel facilities. Another benefit for long-stay guests is pick-up service for certain distances and made upon request.
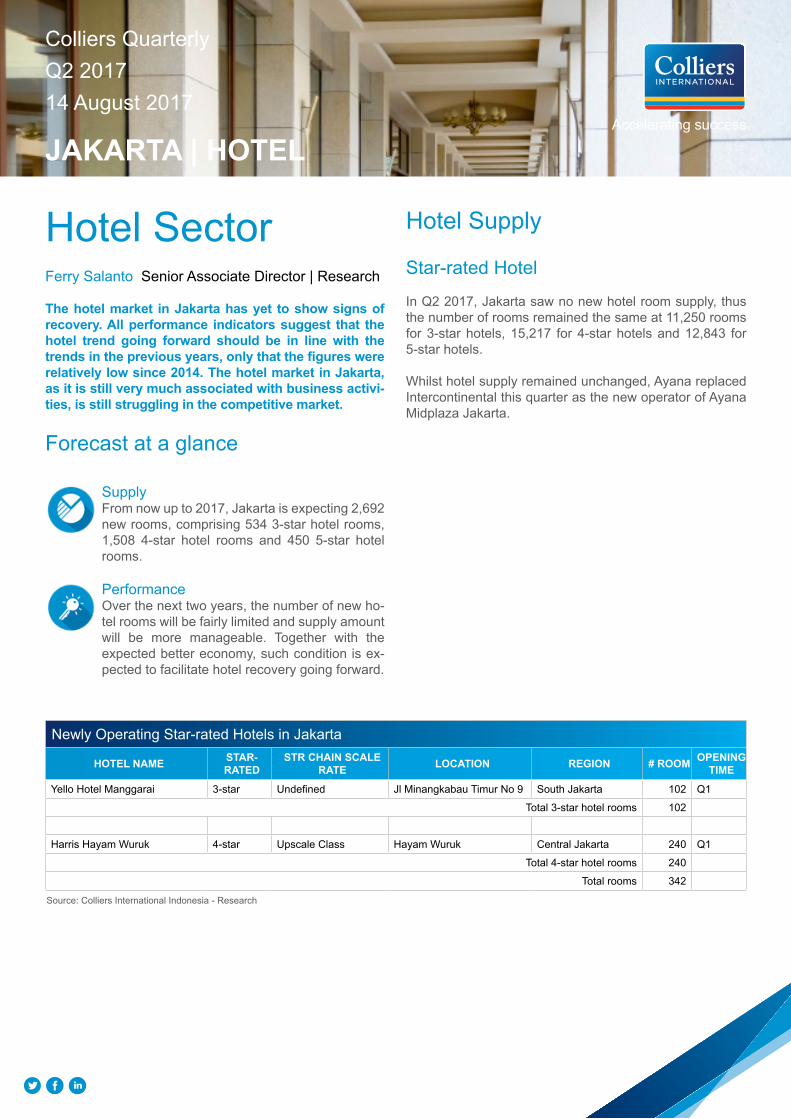
Accelerating success
Colliers QuarterlyQ2 201714 August 2017
JAKARTA | HOTEL
Hotel Supply
Star-rated Hotel In Q2 2017, Jakarta saw no new hotel room supply, thus the number of rooms remained the same at 11,250 rooms for 3-star hotels, 15,217 for 4-star hotels and 12,843 for 5-star hotels.
Whilst hotel supply remained unchanged, Ayana replaced Intercontinental this quarter as the new operator of Ayana Midplaza Jakarta.
Hotel SectorFerry Salanto Senior Associate Director | Research
The hotel market in Jakarta has yet to show signs of recovery. All performance indicators suggest that the hotel trend going forward should be in line with the trends in the previous years, only that the figures were relatively low since 2014. The hotel market in Jakarta, as it is still very much associated with business activi-ties, is still struggling in the competitive market.
Forecast at a glance
SupplyFrom now up to 2017, Jakarta is expecting 2,692 new rooms, comprising 534 3-star hotel rooms, 1,508 4-star hotel rooms and 450 5-star hotel rooms.
PerformanceOver the next two years, the number of new ho-tel rooms will be fairly limited and supply amount will be more manageable. Together with the expected better economy, such condition is ex-pected to facilitate hotel recovery going forward.
Newly Operating Star-rated Hotels in Jakarta
HOTEL NAME STAR-RATEd
STR CHAIN SCALE RATE LOCATION REGION # ROOM OPENING
TIME
Yello Hotel Manggarai 3-star Undefined Jl Minangkabau Timur No 9 South Jakarta 102 Q1
Total 3-star hotel rooms 102
Harris Hayam Wuruk 4-star Upscale Class Hayam Wuruk Central Jakarta 240 Q1
Total 4-star hotel rooms 240
Total rooms 342
Source: Colliers International Indonesia - Research
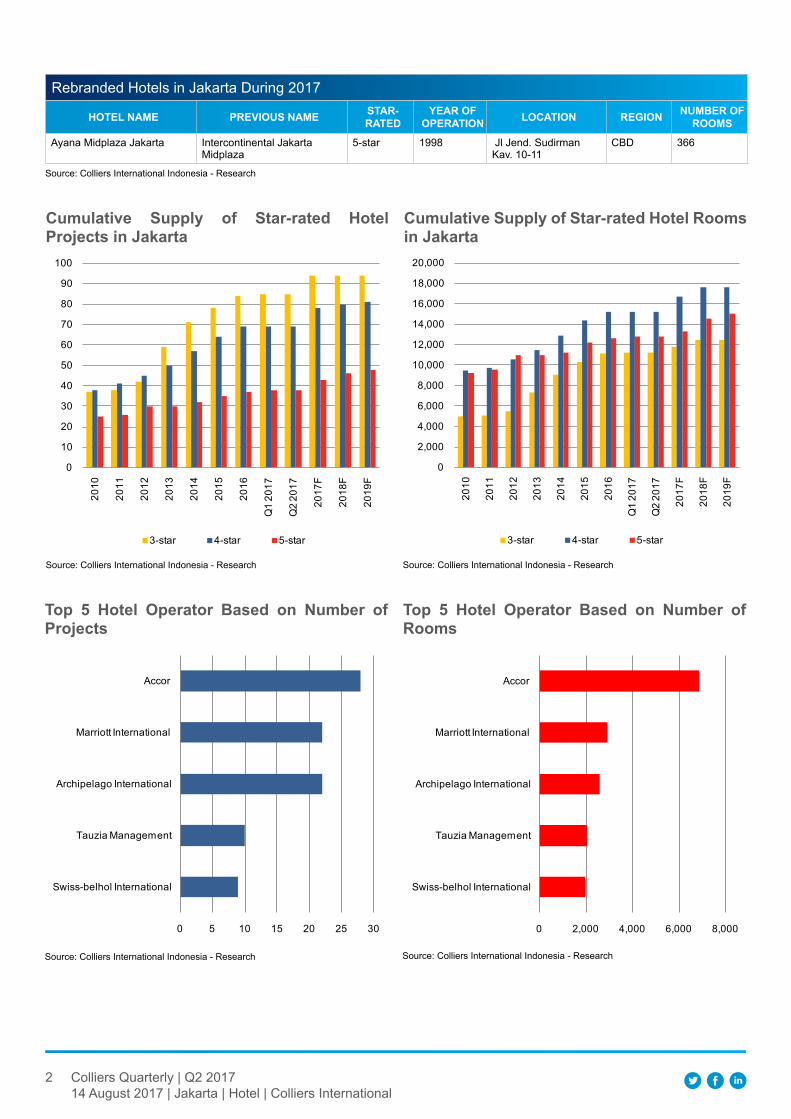
2 Colliers Quarterly | Q2 201714 August 2017 | Jakarta | Hotel | Colliers International
Rebranded Hotels in Jakarta During 2017
HOTEL NAME PREVIOUS NAME STAR-RATEd
YEAR OF OPERATION LOCATION REGION NUMBER OF
ROOMS
Ayana Midplaza Jakarta Intercontinental Jakarta Midplaza
5-star 1998 Jl Jend. Sudirman Kav. 10-11
CBD 366
Source: Colliers International Indonesia - Research
Source: Colliers International Indonesia - Research
Cumulative Supply of Star-rated Hotel Projects in Jakarta
Source: Colliers International Indonesia - Research
Cumulative Supply of Star-rated Hotel Rooms in Jakarta
0
10
20
30
40
50
60
70
80
90
100
2010
2011
2012
2013
2014
2015
2016
Q1
2017
Q2
2017
2017
F
2018
F
2019
F
3-star 4-star 5-star
0
2,000
4,000
6,000
8,000
10,000
12,000
14,000
16,000
18,000
20,000
2010
2011
2012
2013
2014
2015
2016
Q1
2017
Q2
2017
2017
F
2018
F
2019
F
3-star 4-star 5-star
Source: Colliers International Indonesia - Research
Top 5 Hotel Operator Based on Number of Projects
Source: Colliers International Indonesia - Research
Top 5 Hotel Operator Based on Number of Rooms
0 5 10 15 20 25 30
Swiss-belhol International
Tauzia Management
Archipelago International
Marriott International
Accor
0 2,000 4,000 6,000 8,000
Swiss-belhol International
Tauzia Management
Archipelago International
Marriott International
Accor

3 Colliers Quarterly | Q2 201714 August 2017 | Jakarta | Hotel | Colliers International
New Pipeline
HOTEL NAME STAR- RATEd
STR CHAIN SCALE RATE LOCATION REGION ROOMS PROJECT
STATUS
PROJECTEd COMPLETION
TIME
Harper TB Simatupang 3-star Undefined TB Simatupang South Jakarta 180 Under construction
Q3 2017
Des Indes Boutique Hotel by Preference Tauzia
3-star Undefined HOS Cokroaminoto
Central Jakarta 97 Under construction
Q3 2017
Ibis Styles TB Simatupang 3-star Upper Midscale
TB Simatupang South Jakarta 110 Under construction
2017
Dalton Jakarta Hotel 3-star Undefined Otto Iskandar Dinata
East Jakarta 147 Under construction
2017
Hotel Pasar Senen 3-star Undefined Pasar Senen Central Jakarta 200 Under construction
2018
Whiz Prime Hayam Wuruk 3-star Undefined Hayam Wuruk Central Jakarta 130 Under Planning 2018
Hotel by Graha Gatsu Lestari 3-star Undefined Jl Gatot Subroto South Jakarta 100 Under construction
2018
Total 3-star hotel rooms 964
Aston Titanium Cijantung 4-star Upscale Cijantung East Jakarta 225 Under construction
2017
Mercure PIK Avenue 4-star Upscale Pantai Indah Kapuk
North Jakarta 220 Under construction
2017
aloft Kebon Jeruk 4-star Upscale Kebon Jeruk West Jakarta 140 Under construction
Q3 2017
aloft Wahid Hasyim 4-star Upscale Wahid Hasyim Central Jakarta 160 Under construction
Q4 2017
Swiss-Belhotel Kirana Avenue - Kelapa Gading
4-star Upscale Kelapa Gading North Jakarta 316 Opening preparation
2017
Holiday Inn Hotel & Resorts Jakarta Gajah Mada
4-star Upper Midscale
Gajah Mada Central Jakarta 447 Opening preparation
2017
Novotel Cikini 4-star Upscale Cikini Central Jakarta 286 Under construction
2018
Hilton Doubletree Hotel 4-star Upper Upscale
Jl Raya Adicipta Kavling 8
West Jakarta 200 Under planning 2018
aloft Jakarta Simatupang 4-star Upscale TB Simatupang South Jakarta 180 Under construction
Q4 2019
Total 4-star hotel rooms 2,174
Pullman PIK Avenue 5-star Upper Upscale
Pantai Indah Kapuk
Non CBD 200 Under construction
2017
Alila - SCBD lot 11 5-star Luxury SCBD CBD 250 Under construction
2017
Park Hyatt Hotel 5-star Luxury Kebon Sirih Central Jakarta 150 Under construction
Q1 2018
InterContinental Jakarta Pondok Indah Hotel & Residences
5-star Luxury Pondok Indah South Jakarta 300 Under construction
2018
Regent 5-star Luxury Gatot Subroto CBD 160 Under construction
2018
St Regis 5-star Luxury HR Rasuna Said CBD 280 Under construction
Q1 2019
The Langham District 8@Lot 28 SCBD
5-star Luxury SCBD CBD 200 Under construction
2019
Waldorf Astoria 5-star Luxury Thamrin CBD 181 Under construction
2019
Total 5-star hotel rooms 1,721
Total rooms 4,859Source: Colliers International Indonesia - Research, STR

4 Colliers Quarterly | Q2 201714 August 2017 | Jakarta | Hotel | Colliers International
In terms of number of room and project, Accor Hotels Group commands the hotel market in Jakarta. From the total 26 hotel brands under Accor all over the world, they operate with 10 hotel brands here that manage 28 hotel projects (star-rated and non-star-rated hotels) with a total of 6,859 rooms under their management.
There are 11 hotel projects comprising 2,173 rooms under Accor management and seven 4-star hotels consisting of 1,770 rooms. Meanwhile, the 5-star segment is still domi-nated by Marriott International with eight hotels and 1,869 rooms. However, despite leading in number of projects, Ac-cor has more 5-star hotel rooms than Marriott International with 2,285 rooms.
Budget HotelLike the star-rated hotels, there were no additional budget rooms in Q2 2017, thus the total number of budget hotels in Jakarta remains at 5,907 rooms from 50 hotel projects. Going ahead, Jakarta is now expecting another 322 rooms from three new budget hotels by the end of 2017. Source: Colliers International Indonesia - Research
Cumulative Supply of Budget Hotel Projects in Jakarta
0
10
20
30
40
50
60
2010
2011
2012
2013
2014
2015
2016
Q1
2017
Q2
2017
2017
F
2018
F
2019
F
Budget Hotel Development Pipelines
HOTEL NAME STR CHAIN SCALE RATE LOCATION REGION NO. OF
ROOMS PROJECT STATUSPROJECTEd COMPLETION
TIME
NEO Kebayoran Midscale Class Kebayoran Lama South Jakarta 102 Under construction 2017
MaxOne Hayam Wuruk Undefined Jl Hayam Wuruk Central Jakarta 120 Under construction 2017
NEO Kalideres Midscale Class Jl Peta Barat No. 1 West Jakarta 100 Under construction 2017
Total rooms 322
Source: Colliers International Indonesia - Research, STR
Hotel DemandEid al-Fitr took place at the end of Q2, and as a fasting month, it ushered in a long holiday in Indonesia. As a result, business activities slowed down. As hotels in Jakarta are business-driven, the number of hotel enquiries and MICE activities decreased in number. Furthermore, the country’s economy has yet to fully recover and thus creating an im-pact to the level of hotel uses, particularly because the gov-ernment still restrains excessive use of hotels for meeting purposes.
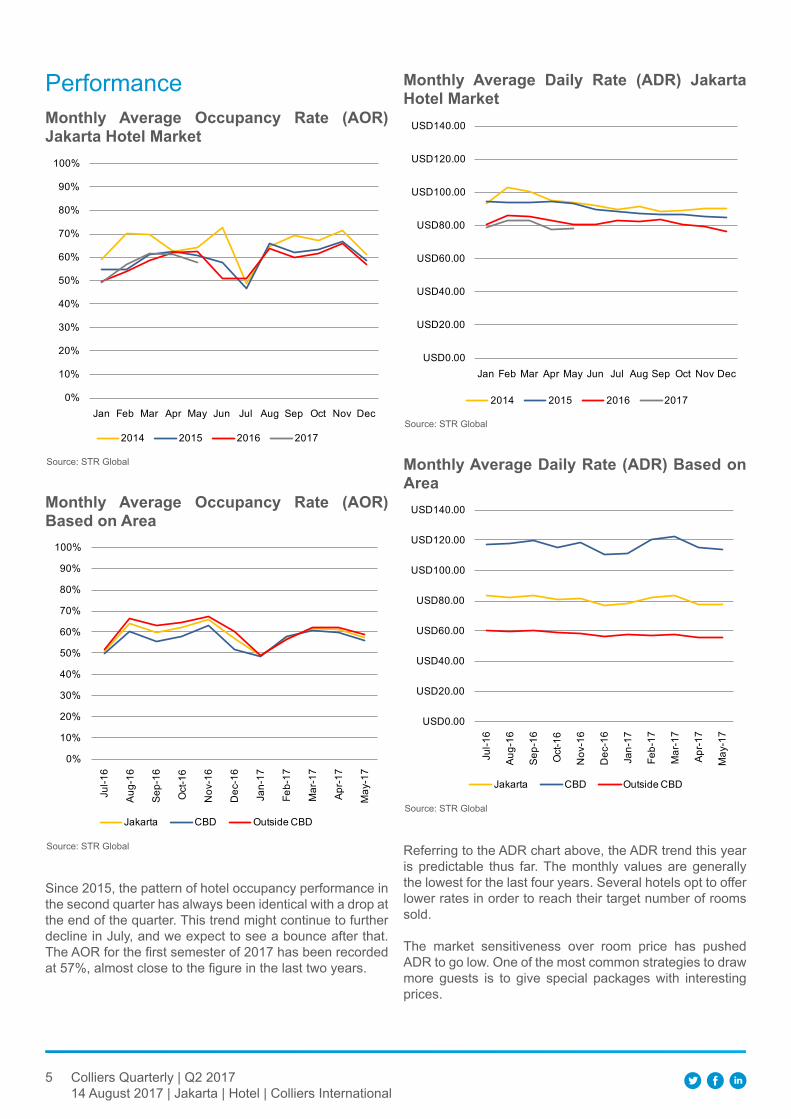
5 Colliers Quarterly | Q2 201714 August 2017 | Jakarta | Hotel | Colliers International
PerformanceMonthly Average Occupancy Rate (AOR) Jakarta Hotel Market
Source: STR Global
0%
10%
20%
30%
40%
50%
60%
70%
80%
90%
100%
Jan Feb Mar Apr May Jun Jul Aug Sep Oct Nov Dec
2014 2015 2016 2017
Monthly Average Occupancy Rate (AOR) Based on Area
Source: STR Global
0%
10%
20%
30%
40%
50%
60%
70%
80%
90%
100%
Jul-1
6
Aug-
16
Sep-
16
Oct
-16
Nov
-16
Dec
-16
Jan-
17
Feb-
17
Mar
-17
Apr-1
7
May
-17
Jakarta CBD Outside CBD
Since 2015, the pattern of hotel occupancy performance in the second quarter has always been identical with a drop at the end of the quarter. This trend might continue to further decline in July, and we expect to see a bounce after that. The AOR for the first semester of 2017 has been recorded at 57%, almost close to the figure in the last two years.
Monthly Average daily Rate (AdR) Jakarta Hotel Market
Source: STR Global
Monthly Average daily Rate (AdR) Based on Area
Source: STR Global
Referring to the ADR chart above, the ADR trend this year is predictable thus far. The monthly values are generally the lowest for the last four years. Several hotels opt to offer lower rates in order to reach their target number of rooms sold.
The market sensitiveness over room price has pushed ADR to go low. One of the most common strategies to draw more guests is to give special packages with interesting prices.
USD0.00
USD20.00
USD40.00
USD60.00
USD80.00
USD100.00
USD120.00
USD140.00
Jan Feb Mar Apr May Jun Jul Aug Sep Oct Nov Dec
2014 2015 2016 2017
USD0.00
USD20.00
USD40.00
USD60.00
USD80.00
USD100.00
USD120.00
USD140.00
Jul-1
6
Aug-
16
Sep-
16
Oct
-16
Nov
-16
Dec
-16
Jan-
17
Feb-
17
Mar
-17
Apr-1
7
May
-17
Jakarta CBD Outside CBD

Copyright © 2017 Colliers International.
The information contained herein has been obtained from sources deemed reliable. While every reasonable effort has been made to ensure its accuracy, we cannot guarantee it. No responsibility is assumed for any inaccuracies. Readers are encouraged to consult their professional advisors prior to acting on any of the material contained in this report.
Accelerating success
For more information:Ferry SalantoSenior Asociate Director | Research+62 21 3043 [email protected]
Contributors:Nurul SorayaSenior Research Executive | Research
Hotel guests in Jakarta are dominantly staying for busi-ness purposes. Most of them are short-stay guests, but a few will stay longer, for at least one month. Long-sty guest are mainly expatriates working somewhere near where they are staying. This typical long-stay hotel accommoda-tion will inevitably compete directly with serviced apart-ments and they mainly offer special rates whilst allowing their guests to access hotel facilities. Another benefit for long-stay guests is pick-up service for certain distances and made upon request.

Colliers QuarterlyQ3 20173 October 2017
JAKARTA PROPERTY MARKET REPORT
Accelerating success.

Colliers Quarterly | Q3 20173 October 2017 | Jakarta | Colliers International
Office SectorA mild rise in leasing activities.Intense enquiries for office spaces primarily coming from IT-based companies (including online businesses), shipping, con-sumer goods and banking highlighted this quarter’s office mar-ket. Nevertheless, the pressure on rental costs for landlords still continues in the tenant market. Tenants acquiring large footprints are taking advantage of low rents, whilst a vast number of new ventures, including start-up companies, are emerging.
Apartment SectorJakarta’s apartment market is anticipated to remain lacklustre for the rest of 2017 on the back of persistently weak market senti-ment and continued influx of new apartment projects. Several newly launched projects demonstrated a brisk pre-sales per-formance; this nonetheless generally occurred for a short-term period only, and thus it is too early to consider this as a sign of market recovery. Another prevailing trend that may affect current and future inventory growth is the rise of overseas developers and investors, particularly from major Asian countries. These business entities usually partner up with local players in develop-ing apartment projects. Some of these developers are quite ag-gressive and quick to execute new projects, usually targeting the middle-lower segment.
HighlightsRetail SectorThe current occupancy figure of Jakarta’s retail market was re-corded as the lowest, at least for the last 10 years. Besides the entry of large, newly operating shopping centres bringing more vacant spaces, the shutdown of two big department stores by the end of September 2017 has also rubbed salt to the wound. The retail market itself is entering a very challenging period, as consumers’ spending power declines and some prominent stores and mall outlets shut down. Thanks to the prevailing shopping centre moratorium in Jakarta, the supply side was controlled dur-ing the current slowdown.
Industrial Estate SectorThis quarter, transaction volume reduced in number, registering only 22.75 hectares from 67.31 in the previous quarter. Landlords opted to keep prices unchanged in this particularly slow market.
Hotel SectorHotel occupancy performance in the third quarter of the year was the best for the last three years for the same period. Thus far, the number of additional hotel rooms was quite limited at least until Q3 2017, but would probably inflate at the end of the year, albeit still lower than last year’s figure. The ADR has stabilised and is still in the same line with the previous trend, only that it has not exceeded the figures over the last three years.
DemandTenants are flooded with abundant office spaces as a result of the continuing influx of new office buildings. This provides opportunities for ten-ants to occupy a new building, since the rent is competitive when compared to older buildings. Furthermore, for efficiency reasons and due to budget constraints, more tenants are becoming very keen to moving into second-hand but fitted-out spaces left by previous tenants. Such situa-tion will likely to continue in 2018.
SupplyJakarta expects to see around 600,000 sq m of future supply at the remainder of 2017, 75% of which is located in the CBD area. The projected additional supply will bring total office spaces in the CBD to 6 million sq m by the end of 2017. Furthermore, we estimate around 1.5 million sq m of additional office spaces to enter the Jakarta market in 2018-2020, of which 60% is contrib-uted by office buildings in the CBD.
Vacancy RateDespite the expectation of strengthening de-mand, a large future supply will add more pres-sure to occupancy performance. We forecast vacancy to be higher than 20% in the CBD in 2017-2020. Conversely, average vacancy rate outside the CBD is predicted to be slightly lower, given a relatively small future supply in 2018-2020.
Office SectorFerry Salanto Senior Associate Director | Research
A mild rise in leasing activities.
Intense enquiries for office spaces primarily com-ing from IT-based companies (including online busi-nesses), shipping, consumer goods and banking high-lighted this quarter’s office market. Nevertheless, the pressure on rental costs for landlords still continues in the tenant market. Tenants acquiring large footprints are taking advantage of low rents, whilst a vast num-ber of new ventures, including start-up companies, are emerging.
Forecast at a glance
RentThe current large supply, particularly in 2017, will hit rental tariff. We estimate a drop of 10% YOY in the CBD by the end of 2017, and less than 5% outside the CBD.
PriceAround 40% of the total office spaces for sale in 2017-2018 remain unsold. Accordingly, price stood at an average of IDR56.6 million/sq m in the CBD and IDR36.4 million/sq m in other non-prime areas. Prices are projected to increase mildly by 2% next year, given a substantial num-ber of spaces available.
CBDOffice Spaces Offered For LeaseSupply
Source: Colliers International Indonesia - Research
Office Cumulative Supply
0
1,000,000
2,000,000
3,000,000
4,000,000
5,000,000
6,000,000
7,000,000
8,000,000
2010
2011
2012
2013
2014
2015
2016
2017
F
2018
F
2019
F
2020
F
sq m
Existing Supply Additional Supply YTD Supply Future Supply
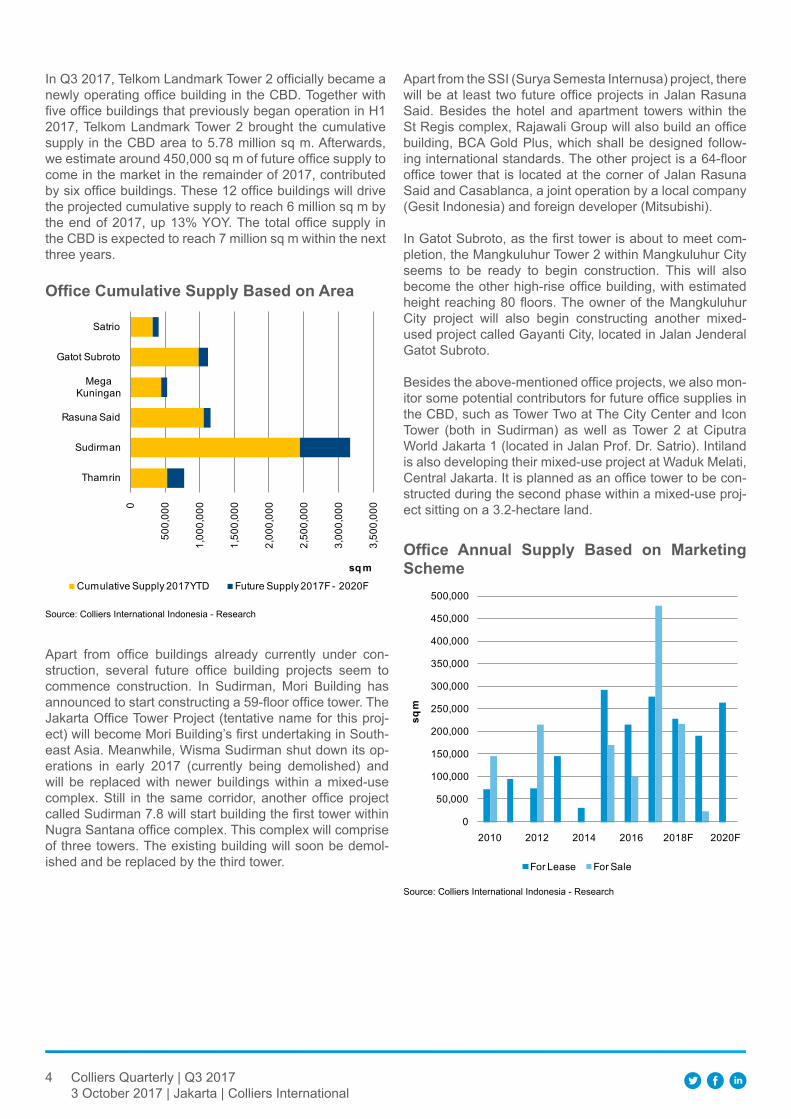
4 Colliers Quarterly | Q3 20173 October 2017 | Jakarta | Colliers International
Source: Colliers International Indonesia - Research
Office Cumulative Supply Based on Area
Apart from office buildings already currently under con-struction, several future office building projects seem to commence construction. In Sudirman, Mori Building has announced to start constructing a 59-floor office tower. The Jakarta Office Tower Project (tentative name for this proj-ect) will become Mori Building’s first undertaking in South-east Asia. Meanwhile, Wisma Sudirman shut down its op-erations in early 2017 (currently being demolished) and will be replaced with newer buildings within a mixed-use complex. Still in the same corridor, another office project called Sudirman 7.8 will start building the first tower within Nugra Santana office complex. This complex will comprise of three towers. The existing building will soon be demol-ished and be replaced by the third tower.
0
500,
000
1,00
0,00
0
1,50
0,00
0
2,00
0,00
0
2,50
0,00
0
3,00
0,00
0
3,50
0,00
0
Thamrin
Sudirman
Rasuna Said
Mega Kuningan
Gatot Subroto
Satrio
sq mCumulative Supply 2017YTD Future Supply 2017F - 2020F
In Q3 2017, Telkom Landmark Tower 2 officially became a newly operating office building in the CBD. Together with five office buildings that previously began operation in H1 2017, Telkom Landmark Tower 2 brought the cumulative supply in the CBD area to 5.78 million sq m. Afterwards, we estimate around 450,000 sq m of future office supply to come in the market in the remainder of 2017, contributed by six office buildings. These 12 office buildings will drive the projected cumulative supply to reach 6 million sq m by the end of 2017, up 13% YOY. The total office supply in the CBD is expected to reach 7 million sq m within the next three years.
Source: Colliers International Indonesia - Research
Office Annual Supply Based on Marketing Scheme
Apart from the SSI (Surya Semesta Internusa) project, there will be at least two future office projects in Jalan Rasuna Said. Besides the hotel and apartment towers within the St Regis complex, Rajawali Group will also build an office building, BCA Gold Plus, which shall be designed follow-ing international standards. The other project is a 64-floor office tower that is located at the corner of Jalan Rasuna Said and Casablanca, a joint operation by a local company (Gesit Indonesia) and foreign developer (Mitsubishi).
In Gatot Subroto, as the first tower is about to meet com-pletion, the Mangkuluhur Tower 2 within Mangkuluhur City seems to be ready to begin construction. This will also become the other high-rise office building, with estimated height reaching 80 floors. The owner of the Mangkuluhur City project will also begin constructing another mixed-used project called Gayanti City, located in Jalan Jenderal Gatot Subroto. Besides the above-mentioned office projects, we also mon-itor some potential contributors for future office supplies in the CBD, such as Tower Two at The City Center and Icon Tower (both in Sudirman) as well as Tower 2 at Ciputra World Jakarta 1 (located in Jalan Prof. Dr. Satrio). Intiland is also developing their mixed-use project at Waduk Melati, Central Jakarta. It is planned as an office tower to be con-structed during the second phase within a mixed-use proj-ect sitting on a 3.2-hectare land.
0
50,000
100,000
150,000
200,000
250,000
300,000
350,000
400,000
450,000
500,000
2010 2012 2014 2016 2018F 2020F
sq m
For Lease For Sale
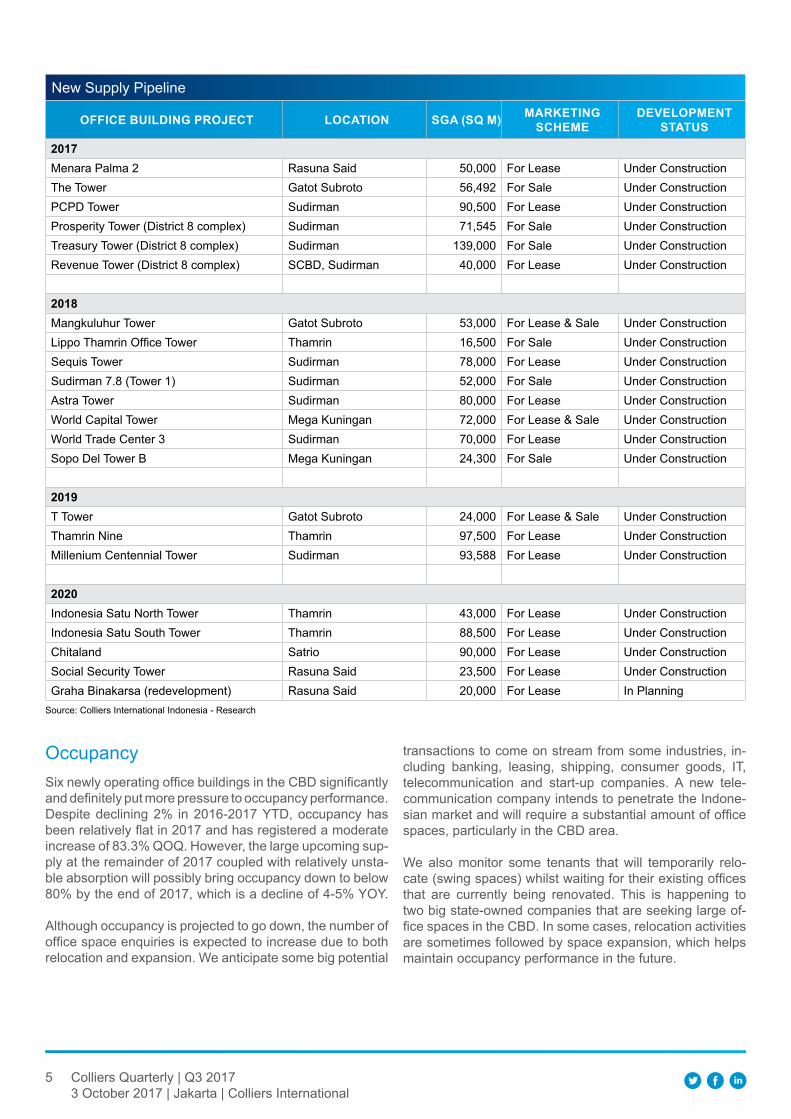
5 Colliers Quarterly | Q3 20173 October 2017 | Jakarta | Colliers International
New Supply Pipeline
OffICe BuIldINg PrOjeCT lOCATION SgA (Sq M) MArkeTINg SCheMe
develOPMeNT STATuS
2017Menara Palma 2 Rasuna Said 50,000 For Lease Under ConstructionThe Tower Gatot Subroto 56,492 For Sale Under ConstructionPCPD Tower Sudirman 90,500 For Lease Under ConstructionProsperity Tower (District 8 complex) Sudirman 71,545 For Sale Under ConstructionTreasury Tower (District 8 complex) Sudirman 139,000 For Sale Under ConstructionRevenue Tower (District 8 complex) SCBD, Sudirman 40,000 For Lease Under Construction
2018Mangkuluhur Tower Gatot Subroto 53,000 For Lease & Sale Under ConstructionLippo Thamrin Office Tower Thamrin 16,500 For Sale Under ConstructionSequis Tower Sudirman 78,000 For Lease Under ConstructionSudirman 7.8 (Tower 1) Sudirman 52,000 For Sale Under ConstructionAstra Tower Sudirman 80,000 For Lease Under ConstructionWorld Capital Tower Mega Kuningan 72,000 For Lease & Sale Under ConstructionWorld Trade Center 3 Sudirman 70,000 For Lease Under ConstructionSopo Del Tower B Mega Kuningan 24,300 For Sale Under Construction
2019T Tower Gatot Subroto 24,000 For Lease & Sale Under ConstructionThamrin Nine Thamrin 97,500 For Lease Under ConstructionMillenium Centennial Tower Sudirman 93,588 For Lease Under Construction
2020Indonesia Satu North Tower Thamrin 43,000 For Lease Under ConstructionIndonesia Satu South Tower Thamrin 88,500 For Lease Under ConstructionChitaland Satrio 90,000 For Lease Under ConstructionSocial Security Tower Rasuna Said 23,500 For Lease Under ConstructionGraha Binakarsa (redevelopment) Rasuna Said 20,000 For Lease In Planning
Source: Colliers International Indonesia - Research
OccupancySix newly operating office buildings in the CBD significantly and definitely put more pressure to occupancy performance. Despite declining 2% in 2016-2017 YTD, occupancy has been relatively flat in 2017 and has registered a moderate increase of 83.3% QOQ. However, the large upcoming sup-ply at the remainder of 2017 coupled with relatively unsta-ble absorption will possibly bring occupancy down to below 80% by the end of 2017, which is a decline of 4-5% YOY.
Although occupancy is projected to go down, the number of office space enquiries is expected to increase due to both relocation and expansion. We anticipate some big potential
transactions to come on stream from some industries, in-cluding banking, leasing, shipping, consumer goods, IT, telecommunication and start-up companies. A new tele-communication company intends to penetrate the Indone-sian market and will require a substantial amount of office spaces, particularly in the CBD area.
We also monitor some tenants that will temporarily relo-cate (swing spaces) whilst waiting for their existing offices that are currently being renovated. This is happening to two big state-owned companies that are seeking large of-fice spaces in the CBD. In some cases, relocation activities are sometimes followed by space expansion, which helps maintain occupancy performance in the future.
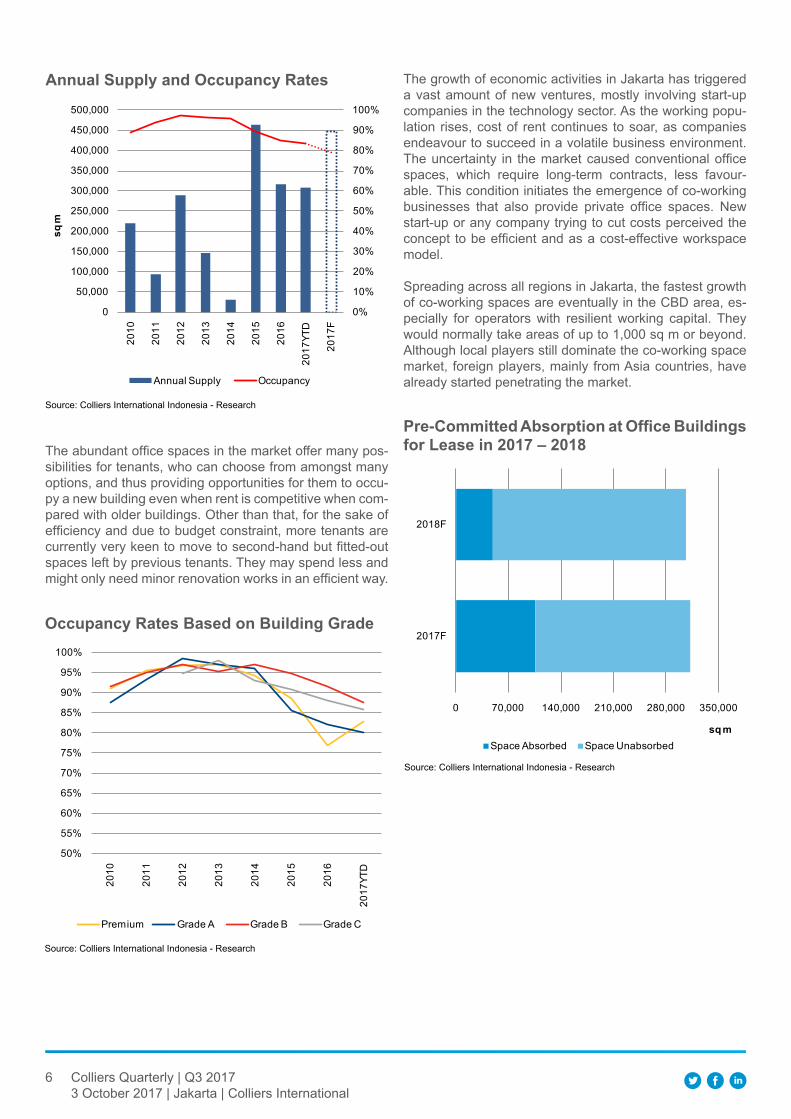
6 Colliers Quarterly | Q3 20173 October 2017 | Jakarta | Colliers International
Source: Colliers International Indonesia - Research
Annual Supply and Occupancy rates
0%
10%
20%
30%
40%
50%
60%
70%
80%
90%
100%
0
50,000
100,000
150,000
200,000
250,000
300,000
350,000
400,000
450,000
500,000
2010
2011
2012
2013
2014
2015
2016
2017
YTD
2017
F
sq m
Annual Supply Occupancy
The abundant office spaces in the market offer many pos-sibilities for tenants, who can choose from amongst many options, and thus providing opportunities for them to occu-py a new building even when rent is competitive when com-pared with older buildings. Other than that, for the sake of efficiency and due to budget constraint, more tenants are currently very keen to move to second-hand but fitted-out spaces left by previous tenants. They may spend less and might only need minor renovation works in an efficient way.
Source: Colliers International Indonesia - Research
Occupancy rates Based on Building grade
50%
55%
60%
65%
70%
75%
80%
85%
90%
95%
100%
2010
2011
2012
2013
2014
2015
2016
2017
YTD
Premium Grade A Grade B Grade C
The growth of economic activities in Jakarta has triggered a vast amount of new ventures, mostly involving start-up companies in the technology sector. As the working popu-lation rises, cost of rent continues to soar, as companies endeavour to succeed in a volatile business environment. The uncertainty in the market caused conventional office spaces, which require long-term contracts, less favour-able. This condition initiates the emergence of co-working businesses that also provide private office spaces. New start-up or any company trying to cut costs perceived the concept to be efficient and as a cost-effective workspace model.
Spreading across all regions in Jakarta, the fastest growth of co-working spaces are eventually in the CBD area, es-pecially for operators with resilient working capital. They would normally take areas of up to 1,000 sq m or beyond. Although local players still dominate the co-working space market, foreign players, mainly from Asia countries, have already started penetrating the market.
Source: Colliers International Indonesia - Research
Pre-Committed Absorption at Office Buildings for lease in 2017 – 2018
0 70,000 140,000 210,000 280,000 350,000
2017F
2018F
sq mSpace Absorbed Space Unabsorbed
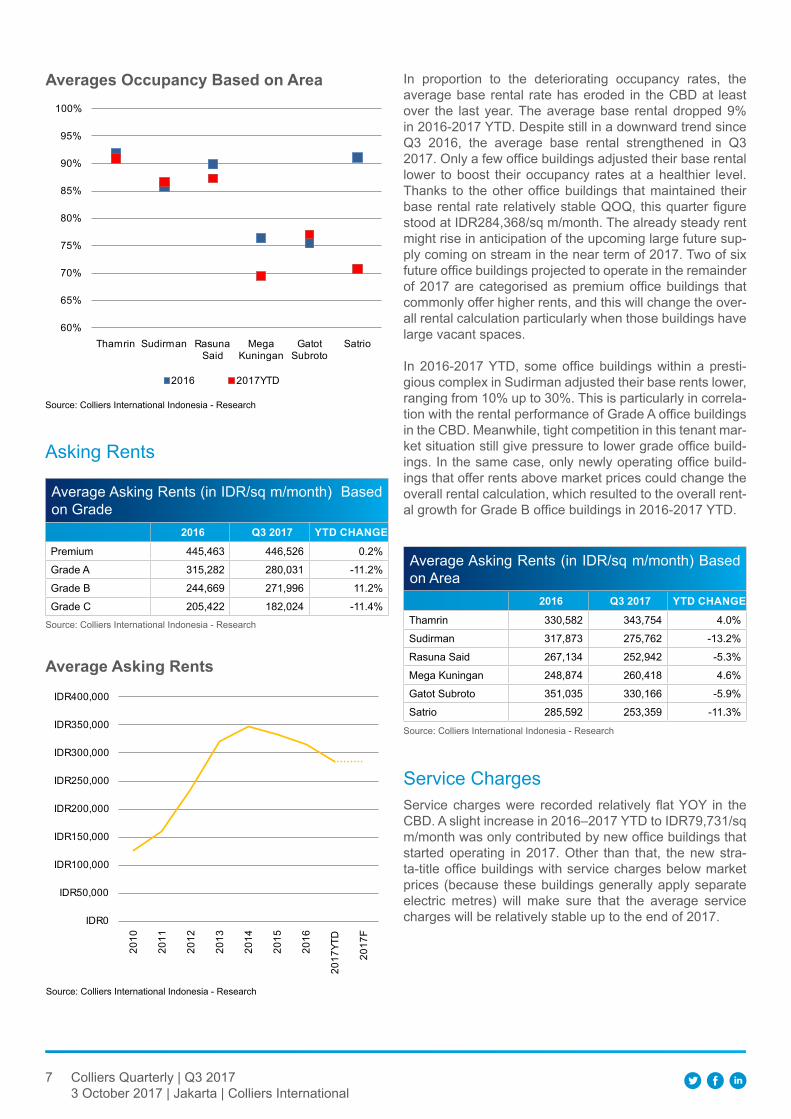
7 Colliers Quarterly | Q3 20173 October 2017 | Jakarta | Colliers International
Source: Colliers International Indonesia - Research
Averages Occupancy Based on Area
Asking Rents
60%
65%
70%
75%
80%
85%
90%
95%
100%
Thamrin Sudirman Rasuna Said
Mega Kuningan
Gatot Subroto
Satrio
2016 2017YTD
Source: Colliers International Indonesia - Research
Average Asking Rents (in IDR/sq m/month) Based on Grade
2016 q3 2017 YTd ChANge
Premium 445,463 446,526 0.2%
Grade A 315,282 280,031 -11.2%
Grade B 244,669 271,996 11.2%
Grade C 205,422 182,024 -11.4%
Source: Colliers International Indonesia - Research
Average Asking rents
IDR0
IDR50,000
IDR100,000
IDR150,000
IDR200,000
IDR250,000
IDR300,000
IDR350,000
IDR400,000
2010
2011
2012
2013
2014
2015
2016
2017
YTD
2017
F
In proportion to the deteriorating occupancy rates, the average base rental rate has eroded in the CBD at least over the last year. The average base rental dropped 9% in 2016-2017 YTD. Despite still in a downward trend since Q3 2016, the average base rental strengthened in Q3 2017. Only a few office buildings adjusted their base rental lower to boost their occupancy rates at a healthier level. Thanks to the other office buildings that maintained their base rental rate relatively stable QOQ, this quarter figure stood at IDR284,368/sq m/month. The already steady rent might rise in anticipation of the upcoming large future sup-ply coming on stream in the near term of 2017. Two of six future office buildings projected to operate in the remainder of 2017 are categorised as premium office buildings that commonly offer higher rents, and this will change the over-all rental calculation particularly when those buildings have large vacant spaces.
In 2016-2017 YTD, some office buildings within a presti-gious complex in Sudirman adjusted their base rents lower, ranging from 10% up to 30%. This is particularly in correla-tion with the rental performance of Grade A office buildings in the CBD. Meanwhile, tight competition in this tenant mar-ket situation still give pressure to lower grade office build-ings. In the same case, only newly operating office build-ings that offer rents above market prices could change the overall rental calculation, which resulted to the overall rent-al growth for Grade B office buildings in 2016-2017 YTD.
Average Asking Rents (in IDR/sq m/month) Based on Area
2016 q3 2017 YTd ChANge
Thamrin 330,582 343,754 4.0%
Sudirman 317,873 275,762 -13.2%
Rasuna Said 267,134 252,942 -5.3%
Mega Kuningan 248,874 260,418 4.6%
Gatot Subroto 351,035 330,166 -5.9%
Satrio 285,592 253,359 -11.3%
Source: Colliers International Indonesia - Research
Service ChargesService charges were recorded relatively flat YOY in the CBD. A slight increase in 2016–2017 YTD to IDR79,731/sq m/month was only contributed by new office buildings that started operating in 2017. Other than that, the new stra-ta-title office buildings with service charges below market prices (because these buildings generally apply separate electric metres) will make sure that the average service charges will be relatively stable up to the end of 2017.
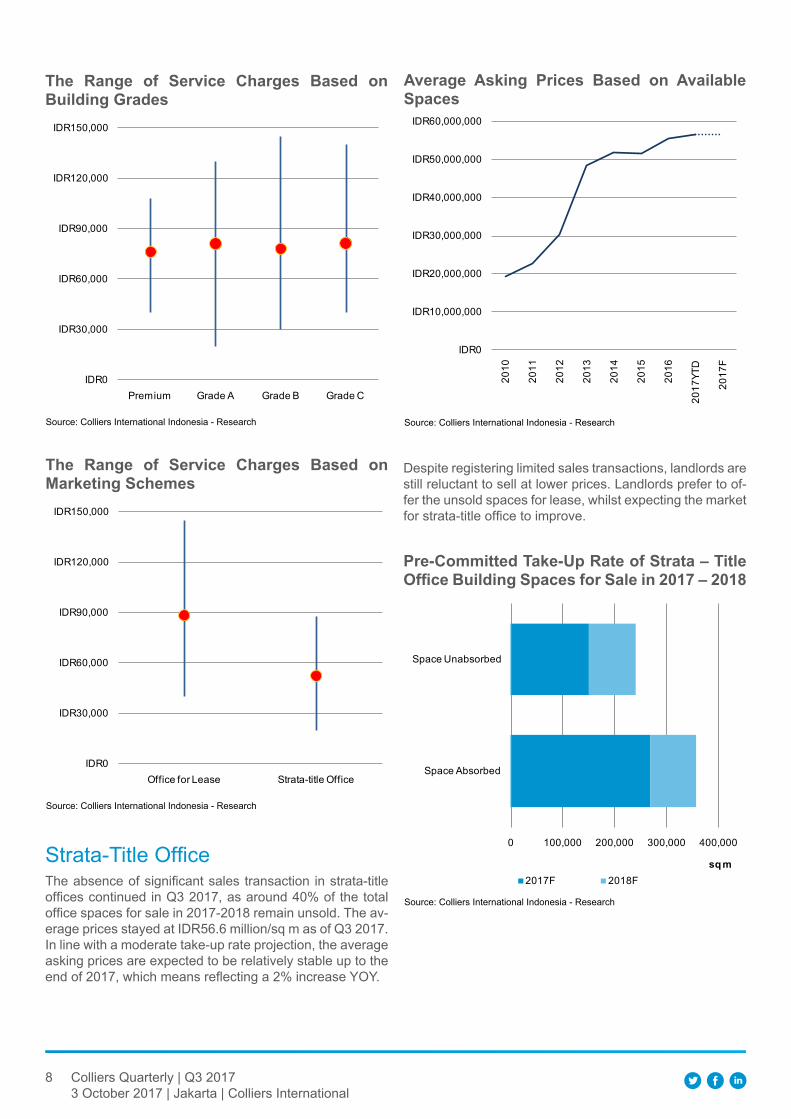
8 Colliers Quarterly | Q3 20173 October 2017 | Jakarta | Colliers International
Source: Colliers International Indonesia - Research
The range of Service Charges Based on Building grades
IDR0
IDR30,000
IDR60,000
IDR90,000
IDR120,000
IDR150,000
Premium Grade A Grade B Grade C
Source: Colliers International Indonesia - Research
The range of Service Charges Based on Marketing Schemes
IDR0
IDR30,000
IDR60,000
IDR90,000
IDR120,000
IDR150,000
Office for Lease Strata-title Office
Strata-Title Office
Source: Colliers International Indonesia - Research
Average Asking Prices Based on Available Spaces
IDR0
IDR10,000,000
IDR20,000,000
IDR30,000,000
IDR40,000,000
IDR50,000,000
IDR60,000,000
2010
2011
2012
2013
2014
2015
2016
2017
YTD
2017
F
Despite registering limited sales transactions, landlords are still reluctant to sell at lower prices. Landlords prefer to of-fer the unsold spaces for lease, whilst expecting the market for strata-title office to improve.
The absence of significant sales transaction in strata-title offices continued in Q3 2017, as around 40% of the total office spaces for sale in 2017-2018 remain unsold. The av-erage prices stayed at IDR56.6 million/sq m as of Q3 2017. In line with a moderate take-up rate projection, the average asking prices are expected to be relatively stable up to the end of 2017, which means reflecting a 2% increase YOY.
Source: Colliers International Indonesia - Research
Pre-Committed Take-up rate of Strata – Title Office Building Spaces for Sale in 2017 – 2018
0 100,000 200,000 300,000 400,000
Space Absorbed
Space Unabsorbed
sq m2017F 2018F
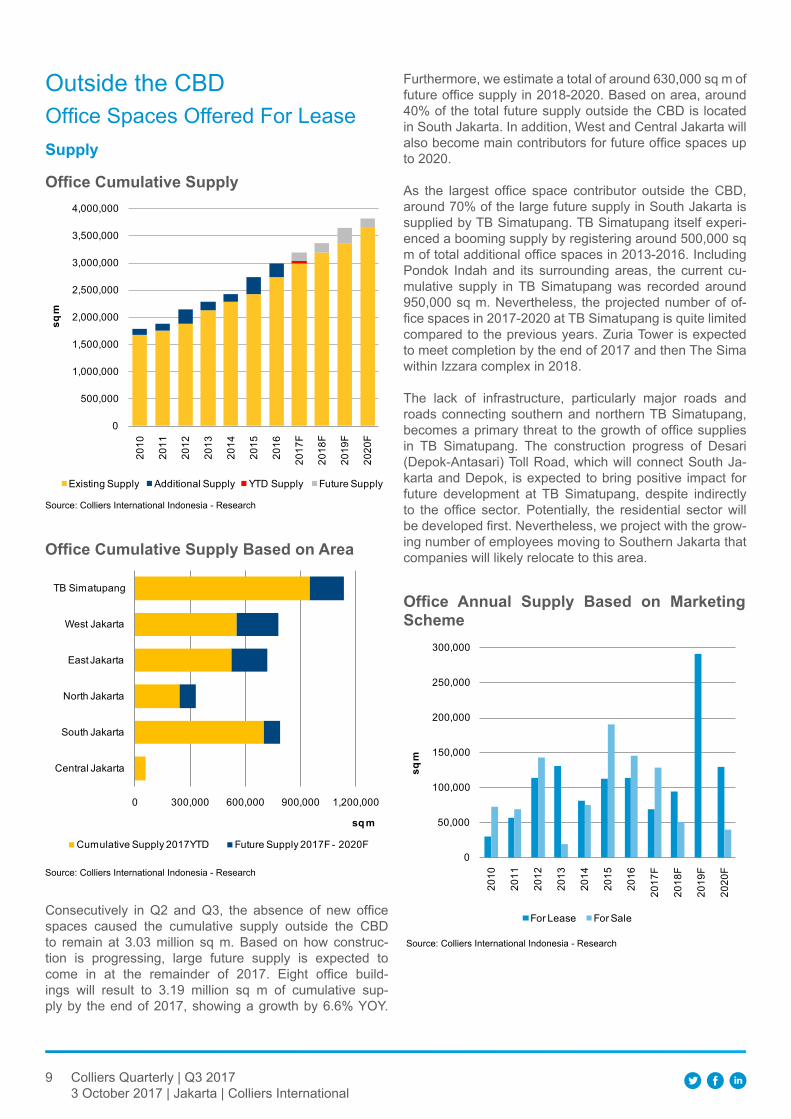
9 Colliers Quarterly | Q3 20173 October 2017 | Jakarta | Colliers International
Outside the CBDOffice Spaces Offered For LeaseSupply
Source: Colliers International Indonesia - Research
Office Cumulative Supply
Furthermore, we estimate a total of around 630,000 sq m of future office supply in 2018-2020. Based on area, around 40% of the total future supply outside the CBD is located in South Jakarta. In addition, West and Central Jakarta will also become main contributors for future office spaces up to 2020.
As the largest office space contributor outside the CBD, around 70% of the large future supply in South Jakarta is supplied by TB Simatupang. TB Simatupang itself experi-enced a booming supply by registering around 500,000 sq m of total additional office spaces in 2013-2016. Including Pondok Indah and its surrounding areas, the current cu-mulative supply in TB Simatupang was recorded around 950,000 sq m. Nevertheless, the projected number of of-fice spaces in 2017-2020 at TB Simatupang is quite limited compared to the previous years. Zuria Tower is expected to meet completion by the end of 2017 and then The Sima within Izzara complex in 2018.
The lack of infrastructure, particularly major roads and roads connecting southern and northern TB Simatupang, becomes a primary threat to the growth of office supplies in TB Simatupang. The construction progress of Desari (Depok-Antasari) Toll Road, which will connect South Ja-karta and Depok, is expected to bring positive impact for future development at TB Simatupang, despite indirectly to the office sector. Potentially, the residential sector will be developed first. Nevertheless, we project with the grow-ing number of employees moving to Southern Jakarta that companies will likely relocate to this area.
Source: Colliers International Indonesia - Research
Office Cumulative Supply Based on Area
Source: Colliers International Indonesia - Research
Office Annual Supply Based on Marketing Scheme
Consecutively in Q2 and Q3, the absence of new office spaces caused the cumulative supply outside the CBD to remain at 3.03 million sq m. Based on how construc-tion is progressing, large future supply is expected to come in at the remainder of 2017. Eight office build-ings will result to 3.19 million sq m of cumulative sup-ply by the end of 2017, showing a growth by 6.6% YOY.
0
50,000
100,000
150,000
200,000
250,000
300,000
2010
2011
2012
2013
2014
2015
2016
2017
F
2018
F
2019
F
2020
F
sq m
For Lease For Sale
0
500,000
1,000,000
1,500,000
2,000,000
2,500,000
3,000,000
3,500,000
4,000,000
2010
2011
2012
2013
2014
2015
2016
2017
F
2018
F
2019
F
2020
F
sq m
Existing Supply Additional Supply YTD Supply Future Supply
0 300,000 600,000 900,000 1,200,000
Central Jakarta
South Jakarta
North Jakarta
East Jakarta
West Jakarta
TB Simatupang
sq m
Cumulative Supply 2017YTD Future Supply 2017F - 2020F
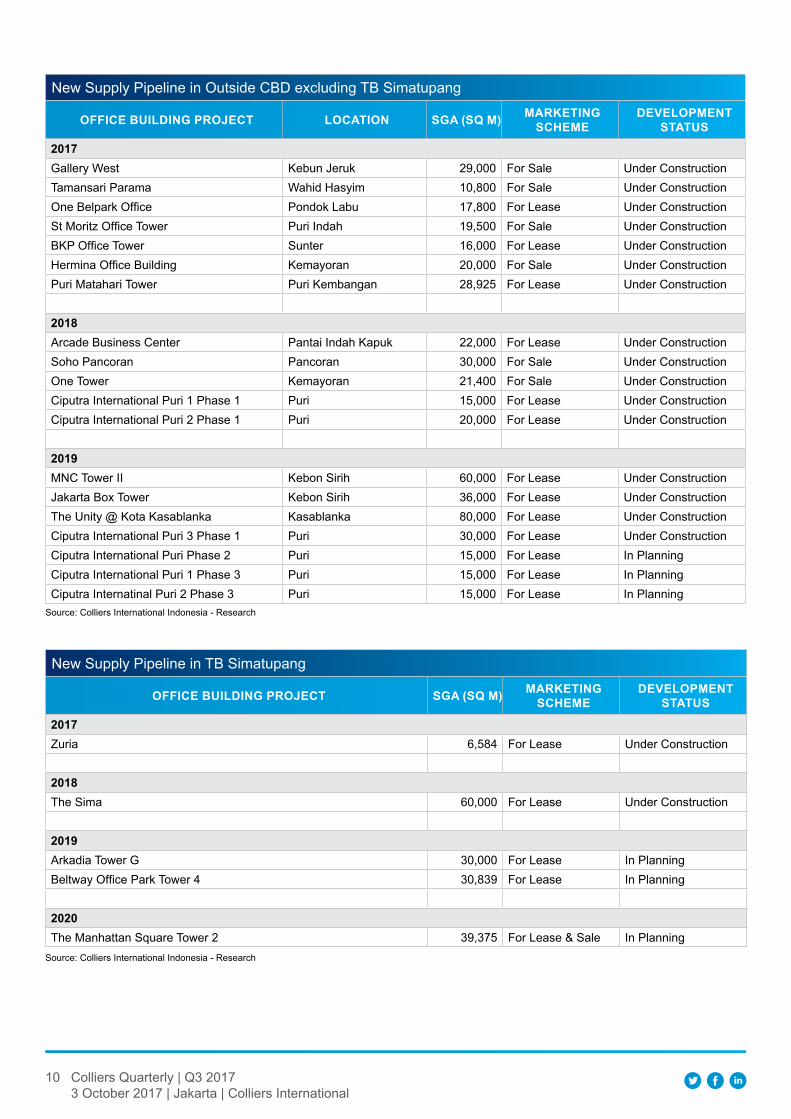
10 Colliers Quarterly | Q3 20173 October 2017 | Jakarta | Colliers International
New Supply Pipeline in Outside CBD excluding TB Simatupang
OffICe BuIldINg PrOjeCT lOCATION SgA (Sq M) MArkeTINg SCheMe
develOPMeNT STATuS
2017Gallery West Kebun Jeruk 29,000 For Sale Under ConstructionTamansari Parama Wahid Hasyim 10,800 For Sale Under ConstructionOne Belpark Office Pondok Labu 17,800 For Lease Under ConstructionSt Moritz Office Tower Puri Indah 19,500 For Sale Under ConstructionBKP Office Tower Sunter 16,000 For Lease Under ConstructionHermina Office Building Kemayoran 20,000 For Sale Under ConstructionPuri Matahari Tower Puri Kembangan 28,925 For Lease Under Construction
2018Arcade Business Center Pantai Indah Kapuk 22,000 For Lease Under ConstructionSoho Pancoran Pancoran 30,000 For Sale Under ConstructionOne Tower Kemayoran 21,400 For Sale Under ConstructionCiputra International Puri 1 Phase 1 Puri 15,000 For Lease Under ConstructionCiputra International Puri 2 Phase 1 Puri 20,000 For Lease Under Construction
2019MNC Tower II Kebon Sirih 60,000 For Lease Under ConstructionJakarta Box Tower Kebon Sirih 36,000 For Lease Under ConstructionThe Unity @ Kota Kasablanka Kasablanka 80,000 For Lease Under ConstructionCiputra International Puri 3 Phase 1 Puri 30,000 For Lease Under ConstructionCiputra International Puri Phase 2 Puri 15,000 For Lease In PlanningCiputra International Puri 1 Phase 3 Puri 15,000 For Lease In PlanningCiputra Internatinal Puri 2 Phase 3 Puri 15,000 For Lease In Planning
Source: Colliers International Indonesia - Research
New Supply Pipeline in TB Simatupang
OffICe BuIldINg PrOjeCT SgA (Sq M) MArkeTINg SCheMe
develOPMeNT STATuS
2017Zuria 6,584 For Lease Under Construction
2018The Sima 60,000 For Lease Under Construction
2019Arkadia Tower G 30,000 For Lease In PlanningBeltway Office Park Tower 4 30,839 For Lease In Planning
2020The Manhattan Square Tower 2 39,375 For Lease & Sale In Planning
Source: Colliers International Indonesia - Research
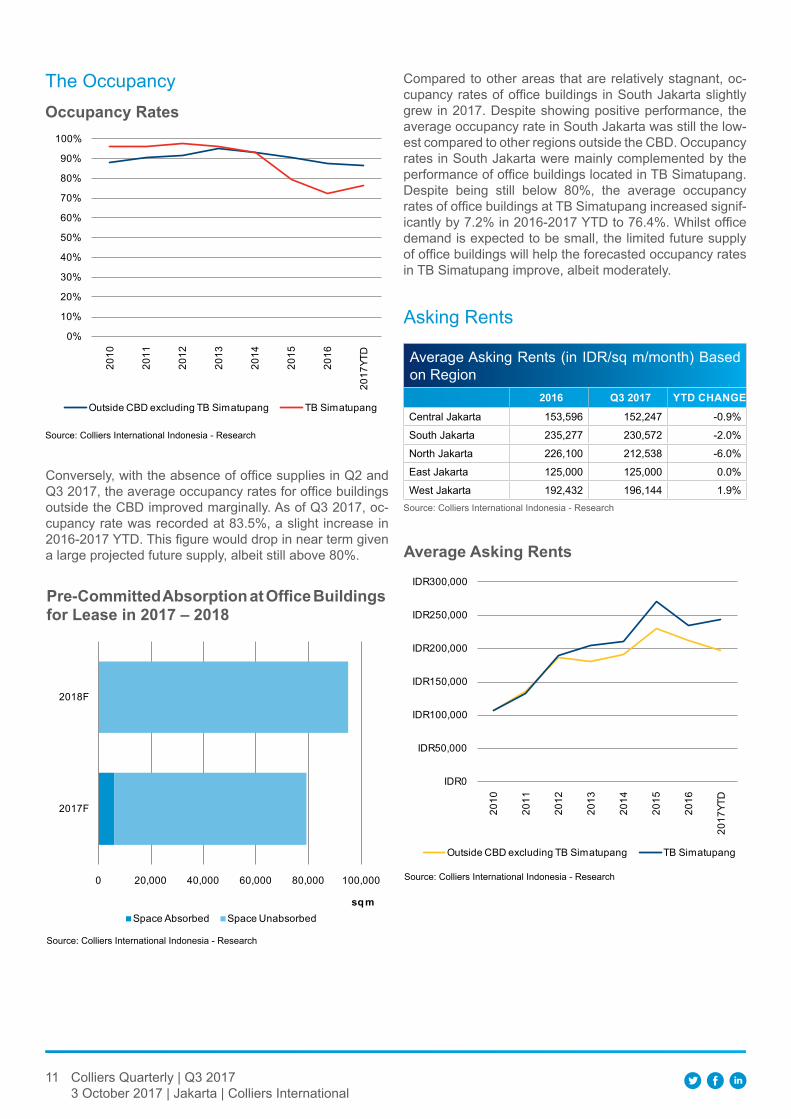
11 Colliers Quarterly | Q3 20173 October 2017 | Jakarta | Colliers International
The Occupancy
Source: Colliers International Indonesia - Research
Occupancy rates
0%
10%
20%
30%
40%
50%
60%
70%
80%
90%
100%
2010
2011
2012
2013
2014
2015
2016
2017
YTD
Outside CBD excluding TB Simatupang TB Simatupang
Conversely, with the absence of office supplies in Q2 and Q3 2017, the average occupancy rates for office buildings outside the CBD improved marginally. As of Q3 2017, oc-cupancy rate was recorded at 83.5%, a slight increase in 2016-2017 YTD. This figure would drop in near term given a large projected future supply, albeit still above 80%.
Source: Colliers International Indonesia - Research
Pre-Committed Absorption at Office Buildings for lease in 2017 – 2018
Compared to other areas that are relatively stagnant, oc-cupancy rates of office buildings in South Jakarta slightly grew in 2017. Despite showing positive performance, the average occupancy rate in South Jakarta was still the low-est compared to other regions outside the CBD. Occupancy rates in South Jakarta were mainly complemented by the performance of office buildings located in TB Simatupang. Despite being still below 80%, the average occupancy rates of office buildings at TB Simatupang increased signif-icantly by 7.2% in 2016-2017 YTD to 76.4%. Whilst office demand is expected to be small, the limited future supply of office buildings will help the forecasted occupancy rates in TB Simatupang improve, albeit moderately.
Asking Rents
Source: Colliers International Indonesia - Research
Average Asking Rents (in IDR/sq m/month) Based on Region
2016 q3 2017 YTd ChANge
Central Jakarta 153,596 152,247 -0.9%
South Jakarta 235,277 230,572 -2.0%
North Jakarta 226,100 212,538 -6.0%
East Jakarta 125,000 125,000 0.0%
West Jakarta 192,432 196,144 1.9%
Source: Colliers International Indonesia - Research
Average Asking rents
0 20,000 40,000 60,000 80,000 100,000
2017F
2018F
sq mSpace Absorbed Space Unabsorbed
IDR0
IDR50,000
IDR100,000
IDR150,000
IDR200,000
IDR250,000
IDR300,000
2010
2011
2012
2013
2014
2015
2016
2017
YTD
Outside CBD excluding TB Simatupang TB Simatupang
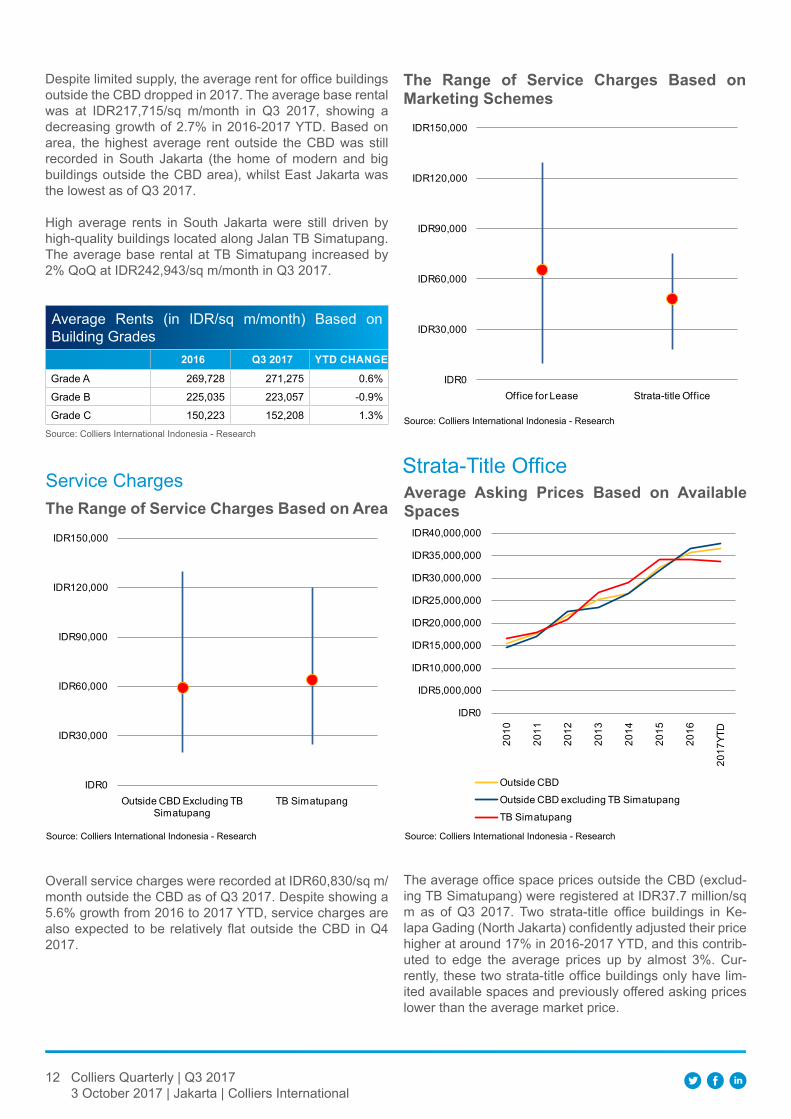
12 Colliers Quarterly | Q3 20173 October 2017 | Jakarta | Colliers International
Despite limited supply, the average rent for office buildings outside the CBD dropped in 2017. The average base rental was at IDR217,715/sq m/month in Q3 2017, showing a decreasing growth of 2.7% in 2016-2017 YTD. Based on area, the highest average rent outside the CBD was still recorded in South Jakarta (the home of modern and big buildings outside the CBD area), whilst East Jakarta was the lowest as of Q3 2017.
High average rents in South Jakarta were still driven by high-quality buildings located along Jalan TB Simatupang. The average base rental at TB Simatupang increased by 2% QoQ at IDR242,943/sq m/month in Q3 2017.
Source: Colliers International Indonesia - Research
Average Rents (in IDR/sq m/month) Based on Building Grades
2016 q3 2017 YTd ChANge
Grade A 269,728 271,275 0.6%
Grade B 225,035 223,057 -0.9%
Grade C 150,223 152,208 1.3%
Service Charges
Source: Colliers International Indonesia - Research
The range of Service Charges Based on Area
IDR0
IDR30,000
IDR60,000
IDR90,000
IDR120,000
IDR150,000
Outside CBD Excluding TB Simatupang
TB Simatupang
Overall service charges were recorded at IDR60,830/sq m/month outside the CBD as of Q3 2017. Despite showing a 5.6% growth from 2016 to 2017 YTD, service charges are also expected to be relatively flat outside the CBD in Q4 2017.
Source: Colliers International Indonesia - Research
The range of Service Charges Based on Marketing Schemes
IDR0
IDR30,000
IDR60,000
IDR90,000
IDR120,000
IDR150,000
Office for Lease Strata-title Office
Strata-Title Office
Source: Colliers International Indonesia - Research
Average Asking Prices Based on Available Spaces
IDR0
IDR5,000,000
IDR10,000,000
IDR15,000,000
IDR20,000,000
IDR25,000,000
IDR30,000,000
IDR35,000,000
IDR40,000,000
2010
2011
2012
2013
2014
2015
2016
2017
YTD
Outside CBDOutside CBD excluding TB SimatupangTB Simatupang
The average office space prices outside the CBD (exclud-ing TB Simatupang) were registered at IDR37.7 million/sq m as of Q3 2017. Two strata-title office buildings in Ke-lapa Gading (North Jakarta) confidently adjusted their price higher at around 17% in 2016-2017 YTD, and this contrib-uted to edge the average prices up by almost 3%. Cur-rently, these two strata-title office buildings only have lim-ited available spaces and previously offered asking prices lower than the average market price.
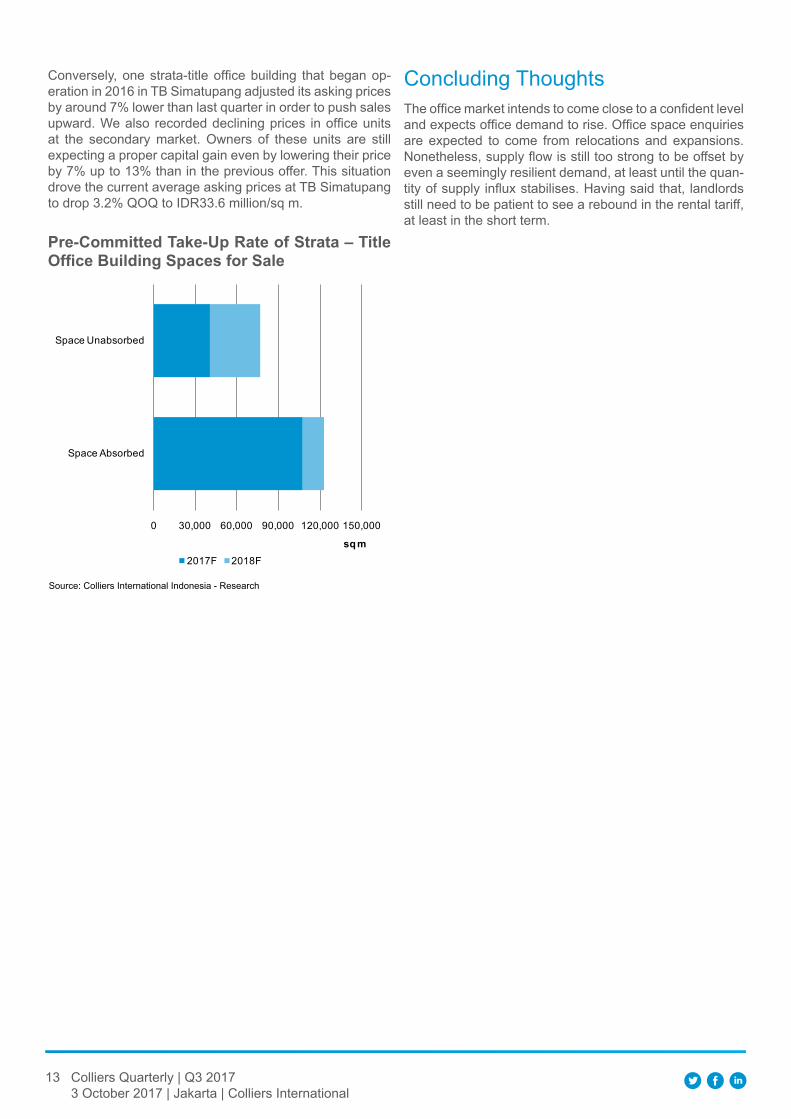
13 Colliers Quarterly | Q3 20173 October 2017 | Jakarta | Colliers International
Conversely, one strata-title office building that began op-eration in 2016 in TB Simatupang adjusted its asking prices by around 7% lower than last quarter in order to push sales upward. We also recorded declining prices in office units at the secondary market. Owners of these units are still expecting a proper capital gain even by lowering their price by 7% up to 13% than in the previous offer. This situation drove the current average asking prices at TB Simatupang to drop 3.2% QOQ to IDR33.6 million/sq m.
Source: Colliers International Indonesia - Research
Pre-Committed Take-up rate of Strata – Title Office Building Spaces for Sale
0 30,000 60,000 90,000 120,000 150,000
Space Absorbed
Space Unabsorbed
sq m2017F 2018F
Concluding ThoughtsThe office market intends to come close to a confident level and expects office demand to rise. Office space enquiries are expected to come from relocations and expansions. Nonetheless, supply flow is still too strong to be offset by even a seemingly resilient demand, at least until the quan-tity of supply influx stabilises. Having said that, landlords still need to be patient to see a rebound in the rental tariff, at least in the short term.
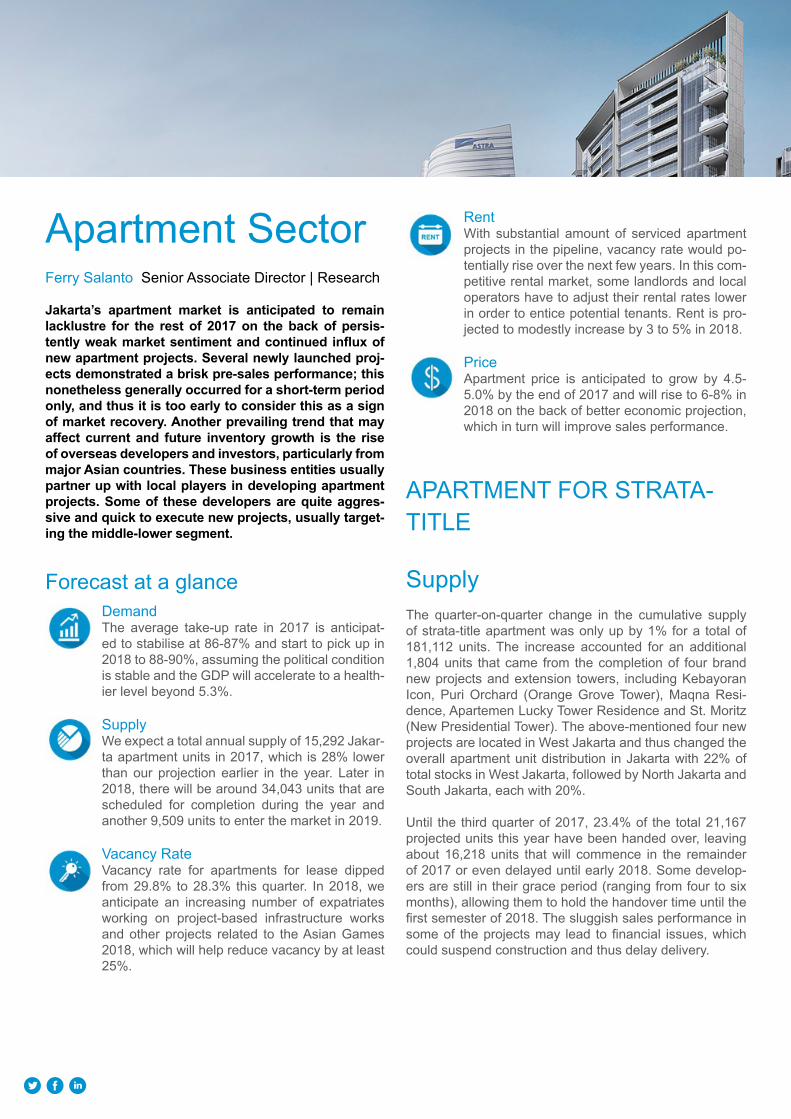
Apartment SectorFerry Salanto Senior Associate Director | Research
jakarta’s apartment market is anticipated to remain lacklustre for the rest of 2017 on the back of persis-tently weak market sentiment and continued influx of new apartment projects. Several newly launched proj-ects demonstrated a brisk pre-sales performance; this nonetheless generally occurred for a short-term period only, and thus it is too early to consider this as a sign of market recovery. Another prevailing trend that may affect current and future inventory growth is the rise of overseas developers and investors, particularly from major Asian countries. These business entities usually partner up with local players in developing apartment projects. Some of these developers are quite aggres-sive and quick to execute new projects, usually target-ing the middle-lower segment.
Forecast at a glanceDemandThe average take-up rate in 2017 is anticipat-ed to stabilise at 86-87% and start to pick up in 2018 to 88-90%, assuming the political condition is stable and the GDP will accelerate to a health-ier level beyond 5.3%.
SupplyWe expect a total annual supply of 15,292 Jakar-ta apartment units in 2017, which is 28% lower than our projection earlier in the year. Later in 2018, there will be around 34,043 units that are scheduled for completion during the year and another 9,509 units to enter the market in 2019.
Vacancy RateVacancy rate for apartments for lease dipped from 29.8% to 28.3% this quarter. In 2018, we anticipate an increasing number of expatriates working on project-based infrastructure works and other projects related to the Asian Games 2018, which will help reduce vacancy by at least 25%.
RentWith substantial amount of serviced apartment projects in the pipeline, vacancy rate would po-tentially rise over the next few years. In this com-petitive rental market, some landlords and local operators have to adjust their rental rates lower in order to entice potential tenants. Rent is pro-jected to modestly increase by 3 to 5% in 2018.
PriceApartment price is anticipated to grow by 4.5-5.0% by the end of 2017 and will rise to 6-8% in 2018 on the back of better economic projection, which in turn will improve sales performance.
APARTMENT FOR STRATA-TITLE
SupplyThe quarter-on-quarter change in the cumulative supply of strata-title apartment was only up by 1% for a total of 181,112 units. The increase accounted for an additional 1,804 units that came from the completion of four brand new projects and extension towers, including Kebayoran Icon, Puri Orchard (Orange Grove Tower), Maqna Resi-dence, Apartemen Lucky Tower Residence and St. Moritz (New Presidential Tower). The above-mentioned four new projects are located in West Jakarta and thus changed the overall apartment unit distribution in Jakarta with 22% of total stocks in West Jakarta, followed by North Jakarta and South Jakarta, each with 20%.
Until the third quarter of 2017, 23.4% of the total 21,167 projected units this year have been handed over, leaving about 16,218 units that will commence in the remainder of 2017 or even delayed until early 2018. Some develop-ers are still in their grace period (ranging from four to six months), allowing them to hold the handover time until the first semester of 2018. The sluggish sales performance in some of the projects may lead to financial issues, which could suspend construction and thus delay delivery.
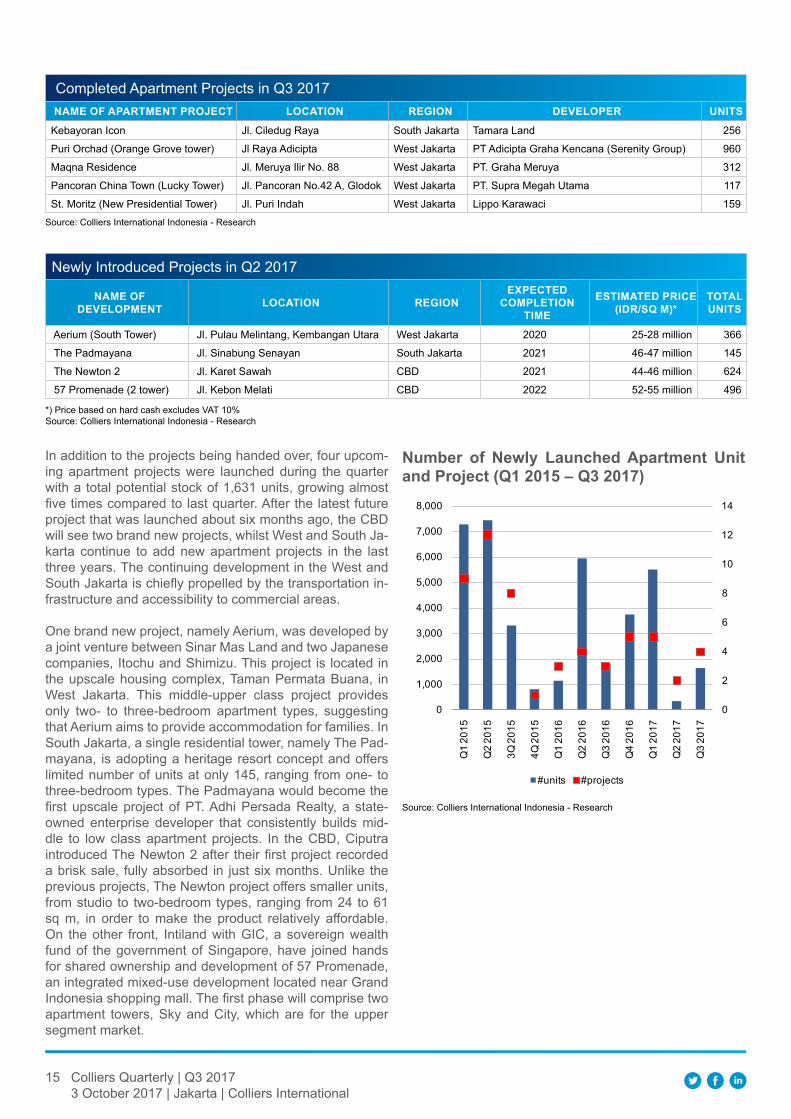
15 Colliers Quarterly | Q3 20173 October 2017 | Jakarta | Colliers International
Completed Apartment Projects in Q3 2017NAMe Of APArTMeNT PrOjeCT lOCATION regION develOPer uNITS
Kebayoran Icon Jl. Ciledug Raya South Jakarta Tamara Land 256
Puri Orchad (Orange Grove tower) Jl Raya Adicipta West Jakarta PT Adicipta Graha Kencana (Serenity Group) 960
Maqna Residence Jl. Meruya Ilir No. 88 West Jakarta PT. Graha Meruya 312
Pancoran China Town (Lucky Tower) Jl. Pancoran No.42 A, Glodok West Jakarta PT. Supra Megah Utama 117
St. Moritz (New Presidential Tower) Jl. Puri Indah West Jakarta Lippo Karawaci 159 Source: Colliers International Indonesia - Research
Newly Introduced Projects in Q2 2017
NAMe Of develOPMeNT lOCATION regION
exPeCTed COMPleTION
TIMe
eSTIMATed PrICe (Idr/Sq M)*
TOTAl uNITS
Aerium (South Tower) Jl. Pulau Melintang, Kembangan Utara West Jakarta 2020 25-28 million 366
The Padmayana Jl. Sinabung Senayan South Jakarta 2021 46-47 million 145
The Newton 2 Jl. Karet Sawah CBD 2021 44-46 million 624
57 Promenade (2 tower) Jl. Kebon Melati CBD 2022 52-55 million 496
*) Price based on hard cash excludes VAT 10%Source: Colliers International Indonesia - Research
In addition to the projects being handed over, four upcom-ing apartment projects were launched during the quarter with a total potential stock of 1,631 units, growing almost five times compared to last quarter. After the latest future project that was launched about six months ago, the CBD will see two brand new projects, whilst West and South Ja-karta continue to add new apartment projects in the last three years. The continuing development in the West and South Jakarta is chiefly propelled by the transportation in-frastructure and accessibility to commercial areas.
One brand new project, namely Aerium, was developed by a joint venture between Sinar Mas Land and two Japanese companies, Itochu and Shimizu. This project is located in the upscale housing complex, Taman Permata Buana, in West Jakarta. This middle-upper class project provides only two- to three-bedroom apartment types, suggesting that Aerium aims to provide accommodation for families. In South Jakarta, a single residential tower, namely The Pad-mayana, is adopting a heritage resort concept and offers limited number of units at only 145, ranging from one- to three-bedroom types. The Padmayana would become the first upscale project of PT. Adhi Persada Realty, a state-owned enterprise developer that consistently builds mid-dle to low class apartment projects. In the CBD, Ciputra introduced The Newton 2 after their first project recorded a brisk sale, fully absorbed in just six months. Unlike the previous projects, The Newton project offers smaller units, from studio to two-bedroom types, ranging from 24 to 61 sq m, in order to make the product relatively affordable. On the other front, Intiland with GIC, a sovereign wealth fund of the government of Singapore, have joined hands for shared ownership and development of 57 Promenade, an integrated mixed-use development located near Grand Indonesia shopping mall. The first phase will comprise two apartment towers, Sky and City, which are for the upper segment market.
Source: Colliers International Indonesia - Research
Number of Newly launched Apartment unit and Project (q1 2015 – q3 2017)
0
2
4
6
8
10
12
14
0
1,000
2,000
3,000
4,000
5,000
6,000
7,000
8,000
Q1
2015
Q2
2015
3Q 2
015
4Q 2
015
Q1
2016
Q2
2016
Q3
2016
Q4
2016
Q1
2017
Q2
2017
Q3
2017
#units #projects
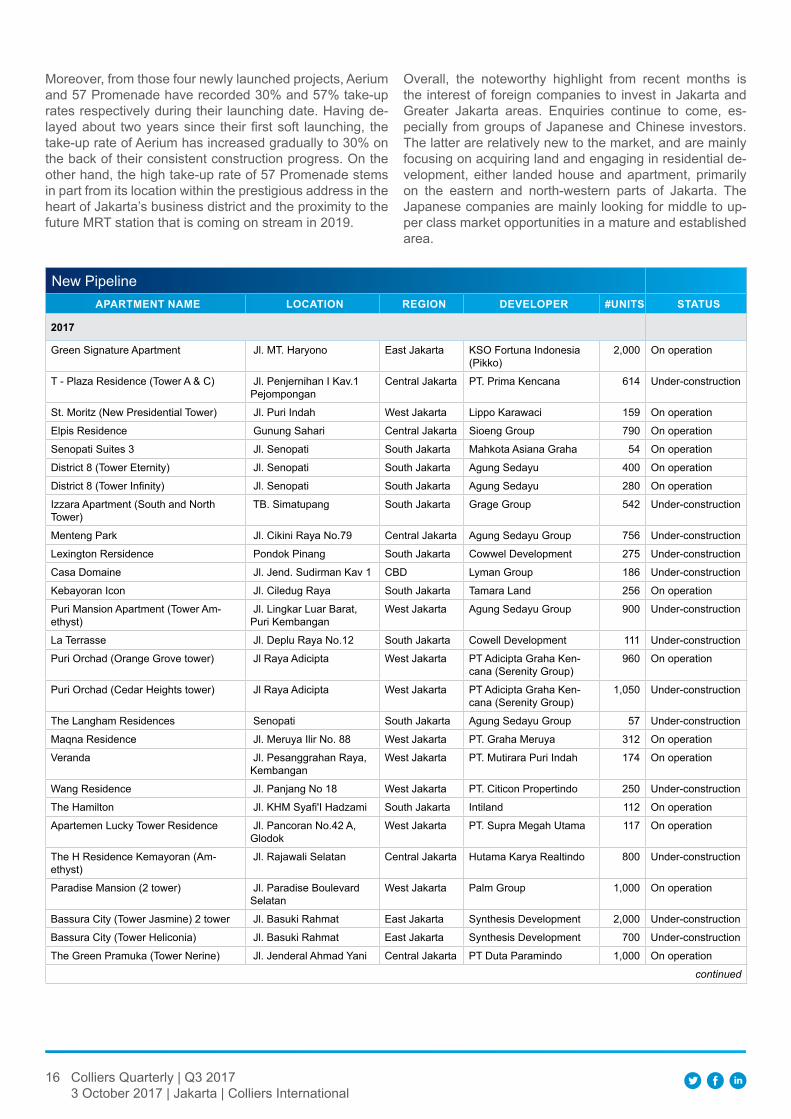
16 Colliers Quarterly | Q3 20173 October 2017 | Jakarta | Colliers International
New PipelineAPArTMeNT NAMe lOCATION regION develOPer #uNITS STATuS
2017
Green Signature Apartment Jl. MT. Haryono East Jakarta KSO Fortuna Indonesia (Pikko)
2,000 On operation
T - Plaza Residence (Tower A & C) Jl. Penjernihan I Kav.1 Pejompongan
Central Jakarta PT. Prima Kencana 614 Under-construction
St. Moritz (New Presidential Tower) Jl. Puri Indah West Jakarta Lippo Karawaci 159 On operation
Elpis Residence Gunung Sahari Central Jakarta Sioeng Group 790 On operation
Senopati Suites 3 Jl. Senopati South Jakarta Mahkota Asiana Graha 54 On operation
District 8 (Tower Eternity) Jl. Senopati South Jakarta Agung Sedayu 400 On operation
District 8 (Tower Infinity) Jl. Senopati South Jakarta Agung Sedayu 280 On operation
Izzara Apartment (South and North Tower)
TB. Simatupang South Jakarta Grage Group 542 Under-construction
Menteng Park Jl. Cikini Raya No.79 Central Jakarta Agung Sedayu Group 756 Under-construction
Lexington Rersidence Pondok Pinang South Jakarta Cowwel Development 275 Under-construction
Casa Domaine Jl. Jend. Sudirman Kav 1 CBD Lyman Group 186 Under-construction
Kebayoran Icon Jl. Ciledug Raya South Jakarta Tamara Land 256 On operation
Puri Mansion Apartment (Tower Am-ethyst)
Jl. Lingkar Luar Barat, Puri Kembangan
West Jakarta Agung Sedayu Group 900 Under-construction
La Terrasse Jl. Deplu Raya No.12 South Jakarta Cowell Development 111 Under-construction
Puri Orchad (Orange Grove tower) Jl Raya Adicipta West Jakarta PT Adicipta Graha Ken-cana (Serenity Group)
960 On operation
Puri Orchad (Cedar Heights tower) Jl Raya Adicipta West Jakarta PT Adicipta Graha Ken-cana (Serenity Group)
1,050 Under-construction
The Langham Residences Senopati South Jakarta Agung Sedayu Group 57 Under-construction
Maqna Residence Jl. Meruya Ilir No. 88 West Jakarta PT. Graha Meruya 312 On operation
Veranda Jl. Pesanggrahan Raya, Kembangan
West Jakarta PT. Mutirara Puri Indah 174 On operation
Wang Residence Jl. Panjang No 18 West Jakarta PT. Citicon Propertindo 250 Under-construction
The Hamilton Jl. KHM Syafi'I Hadzami South Jakarta Intiland 112 On operation
Apartemen Lucky Tower Residence Jl. Pancoran No.42 A, Glodok
West Jakarta PT. Supra Megah Utama 117 On operation
The H Residence Kemayoran (Am-ethyst)
Jl. Rajawali Selatan Central Jakarta Hutama Karya Realtindo 800 Under-construction
Paradise Mansion (2 tower) Jl. Paradise Boulevard Selatan
West Jakarta Palm Group 1,000 On operation
Bassura City (Tower Jasmine) 2 tower Jl. Basuki Rahmat East Jakarta Synthesis Development 2,000 Under-construction
Bassura City (Tower Heliconia) Jl. Basuki Rahmat East Jakarta Synthesis Development 700 Under-construction
The Green Pramuka (Tower Nerine) Jl. Jenderal Ahmad Yani Central Jakarta PT Duta Paramindo 1,000 On operation
continued
Moreover, from those four newly launched projects, Aerium and 57 Promenade have recorded 30% and 57% take-up rates respectively during their launching date. Having de-layed about two years since their first soft launching, the take-up rate of Aerium has increased gradually to 30% on the back of their consistent construction progress. On the other hand, the high take-up rate of 57 Promenade stems in part from its location within the prestigious address in the heart of Jakarta’s business district and the proximity to the future MRT station that is coming on stream in 2019.
Overall, the noteworthy highlight from recent months is the interest of foreign companies to invest in Jakarta and Greater Jakarta areas. Enquiries continue to come, es-pecially from groups of Japanese and Chinese investors. The latter are relatively new to the market, and are mainly focusing on acquiring land and engaging in residential de-velopment, either landed house and apartment, primarily on the eastern and north-western parts of Jakarta. The Japanese companies are mainly looking for middle to up-per class market opportunities in a mature and established area.
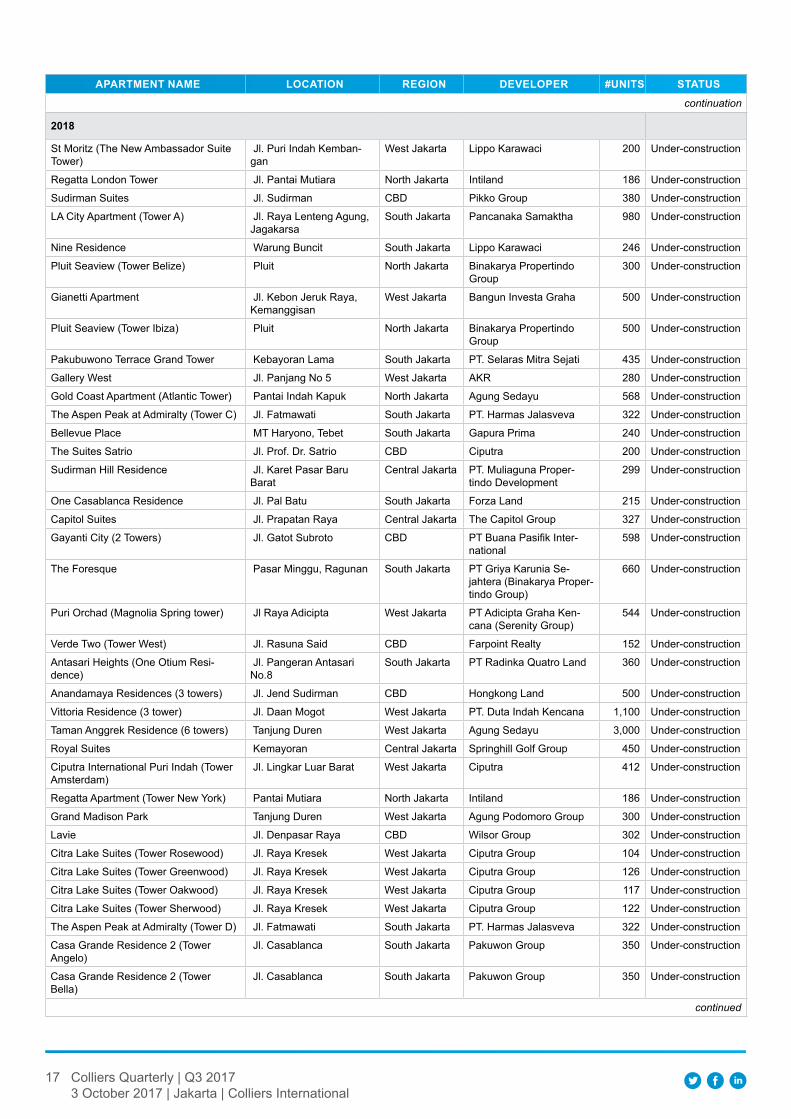
17 Colliers Quarterly | Q3 20173 October 2017 | Jakarta | Colliers International
APArTMeNT NAMe lOCATION regION develOPer #uNITS STATuS
continuation
2018
St Moritz (The New Ambassador Suite Tower)
Jl. Puri Indah Kemban-gan
West Jakarta Lippo Karawaci 200 Under-construction
Regatta London Tower Jl. Pantai Mutiara North Jakarta Intiland 186 Under-construction
Sudirman Suites Jl. Sudirman CBD Pikko Group 380 Under-construction
LA City Apartment (Tower A) Jl. Raya Lenteng Agung, Jagakarsa
South Jakarta Pancanaka Samaktha 980 Under-construction
Nine Residence Warung Buncit South Jakarta Lippo Karawaci 246 Under-construction
Pluit Seaview (Tower Belize) Pluit North Jakarta Binakarya Propertindo Group
300 Under-construction
Gianetti Apartment Jl. Kebon Jeruk Raya, Kemanggisan
West Jakarta Bangun Investa Graha 500 Under-construction
Pluit Seaview (Tower Ibiza) Pluit North Jakarta Binakarya Propertindo Group
500 Under-construction
Pakubuwono Terrace Grand Tower Kebayoran Lama South Jakarta PT. Selaras Mitra Sejati 435 Under-construction
Gallery West Jl. Panjang No 5 West Jakarta AKR 280 Under-construction
Gold Coast Apartment (Atlantic Tower) Pantai Indah Kapuk North Jakarta Agung Sedayu 568 Under-construction
The Aspen Peak at Admiralty (Tower C) Jl. Fatmawati South Jakarta PT. Harmas Jalasveva 322 Under-construction
Bellevue Place MT Haryono, Tebet South Jakarta Gapura Prima 240 Under-construction
The Suites Satrio Jl. Prof. Dr. Satrio CBD Ciputra 200 Under-construction
Sudirman Hill Residence Jl. Karet Pasar Baru Barat
Central Jakarta PT. Muliaguna Proper-tindo Development
299 Under-construction
One Casablanca Residence Jl. Pal Batu South Jakarta Forza Land 215 Under-construction
Capitol Suites Jl. Prapatan Raya Central Jakarta The Capitol Group 327 Under-construction
Gayanti City (2 Towers) Jl. Gatot Subroto CBD PT Buana Pasifik Inter-national
598 Under-construction
The Foresque Pasar Minggu, Ragunan South Jakarta PT Griya Karunia Se-jahtera (Binakarya Proper-tindo Group)
660 Under-construction
Puri Orchad (Magnolia Spring tower) Jl Raya Adicipta West Jakarta PT Adicipta Graha Ken-cana (Serenity Group)
544 Under-construction
Verde Two (Tower West) Jl. Rasuna Said CBD Farpoint Realty 152 Under-construction
Antasari Heights (One Otium Resi-dence)
Jl. Pangeran Antasari No.8
South Jakarta PT Radinka Quatro Land 360 Under-construction
Anandamaya Residences (3 towers) Jl. Jend Sudirman CBD Hongkong Land 500 Under-construction
Vittoria Residence (3 tower) Jl. Daan Mogot West Jakarta PT. Duta Indah Kencana 1,100 Under-construction
Taman Anggrek Residence (6 towers) Tanjung Duren West Jakarta Agung Sedayu 3,000 Under-construction
Royal Suites Kemayoran Central Jakarta Springhill Golf Group 450 Under-construction
Ciputra International Puri Indah (Tower Amsterdam)
Jl. Lingkar Luar Barat West Jakarta Ciputra 412 Under-construction
Regatta Apartment (Tower New York) Pantai Mutiara North Jakarta Intiland 186 Under-construction
Grand Madison Park Tanjung Duren West Jakarta Agung Podomoro Group 300 Under-construction
Lavie Jl. Denpasar Raya CBD Wilsor Group 302 Under-construction
Citra Lake Suites (Tower Rosewood) Jl. Raya Kresek West Jakarta Ciputra Group 104 Under-construction
Citra Lake Suites (Tower Greenwood) Jl. Raya Kresek West Jakarta Ciputra Group 126 Under-construction
Citra Lake Suites (Tower Oakwood) Jl. Raya Kresek West Jakarta Ciputra Group 117 Under-construction
Citra Lake Suites (Tower Sherwood) Jl. Raya Kresek West Jakarta Ciputra Group 122 Under-construction
The Aspen Peak at Admiralty (Tower D) Jl. Fatmawati South Jakarta PT. Harmas Jalasveva 322 Under-construction
Casa Grande Residence 2 (Tower Angelo)
Jl. Casablanca South Jakarta Pakuwon Group 350 Under-construction
Casa Grande Residence 2 (Tower Bella)
Jl. Casablanca South Jakarta Pakuwon Group 350 Under-construction
continued
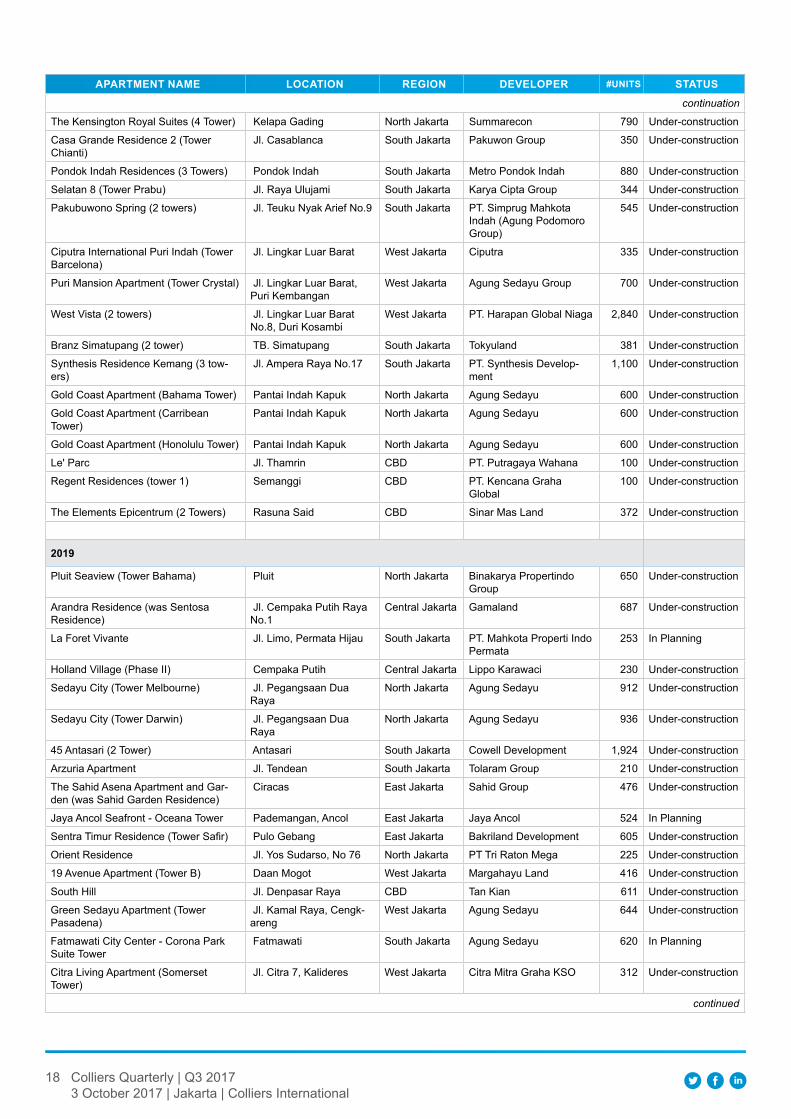
18 Colliers Quarterly | Q3 20173 October 2017 | Jakarta | Colliers International
APArTMeNT NAMe lOCATION regION develOPer #uNITS STATuS
continuation
The Kensington Royal Suites (4 Tower) Kelapa Gading North Jakarta Summarecon 790 Under-construction
Casa Grande Residence 2 (Tower Chianti)
Jl. Casablanca South Jakarta Pakuwon Group 350 Under-construction
Pondok Indah Residences (3 Towers) Pondok Indah South Jakarta Metro Pondok Indah 880 Under-construction
Selatan 8 (Tower Prabu) Jl. Raya Ulujami South Jakarta Karya Cipta Group 344 Under-construction
Pakubuwono Spring (2 towers) Jl. Teuku Nyak Arief No.9 South Jakarta PT. Simprug Mahkota Indah (Agung Podomoro Group)
545 Under-construction
Ciputra International Puri Indah (Tower Barcelona)
Jl. Lingkar Luar Barat West Jakarta Ciputra 335 Under-construction
Puri Mansion Apartment (Tower Crystal) Jl. Lingkar Luar Barat, Puri Kembangan
West Jakarta Agung Sedayu Group 700 Under-construction
West Vista (2 towers) Jl. Lingkar Luar Barat No.8, Duri Kosambi
West Jakarta PT. Harapan Global Niaga 2,840 Under-construction
Branz Simatupang (2 tower) TB. Simatupang South Jakarta Tokyuland 381 Under-construction
Synthesis Residence Kemang (3 tow-ers)
Jl. Ampera Raya No.17 South Jakarta PT. Synthesis Develop-ment
1,100 Under-construction
Gold Coast Apartment (Bahama Tower) Pantai Indah Kapuk North Jakarta Agung Sedayu 600 Under-construction
Gold Coast Apartment (Carribean Tower)
Pantai Indah Kapuk North Jakarta Agung Sedayu 600 Under-construction
Gold Coast Apartment (Honolulu Tower) Pantai Indah Kapuk North Jakarta Agung Sedayu 600 Under-construction
Le' Parc Jl. Thamrin CBD PT. Putragaya Wahana 100 Under-construction
Regent Residences (tower 1) Semanggi CBD PT. Kencana Graha Global
100 Under-construction
The Elements Epicentrum (2 Towers) Rasuna Said CBD Sinar Mas Land 372 Under-construction
2019
Pluit Seaview (Tower Bahama) Pluit North Jakarta Binakarya Propertindo Group
650 Under-construction
Arandra Residence (was Sentosa Residence)
Jl. Cempaka Putih Raya No.1
Central Jakarta Gamaland 687 Under-construction
La Foret Vivante Jl. Limo, Permata Hijau South Jakarta PT. Mahkota Properti Indo Permata
253 In Planning
Holland Village (Phase II) Cempaka Putih Central Jakarta Lippo Karawaci 230 Under-construction
Sedayu City (Tower Melbourne) Jl. Pegangsaan Dua Raya
North Jakarta Agung Sedayu 912 Under-construction
Sedayu City (Tower Darwin) Jl. Pegangsaan Dua Raya
North Jakarta Agung Sedayu 936 Under-construction
45 Antasari (2 Tower) Antasari South Jakarta Cowell Development 1,924 Under-construction
Arzuria Apartment Jl. Tendean South Jakarta Tolaram Group 210 Under-construction
The Sahid Asena Apartment and Gar-den (was Sahid Garden Residence)
Ciracas East Jakarta Sahid Group 476 Under-construction
Jaya Ancol Seafront - Oceana Tower Pademangan, Ancol East Jakarta Jaya Ancol 524 In Planning
Sentra Timur Residence (Tower Safir) Pulo Gebang East Jakarta Bakriland Development 605 Under-construction
Orient Residence Jl. Yos Sudarso, No 76 North Jakarta PT Tri Raton Mega 225 Under-construction
19 Avenue Apartment (Tower B) Daan Mogot West Jakarta Margahayu Land 416 Under-construction
South Hill Jl. Denpasar Raya CBD Tan Kian 611 Under-construction
Green Sedayu Apartment (Tower Pasadena)
Jl. Kamal Raya, Cengk-areng
West Jakarta Agung Sedayu 644 Under-construction
Fatmawati City Center - Corona Park Suite Tower
Fatmawati South Jakarta Agung Sedayu 620 In Planning
Citra Living Apartment (Somerset Tower)
Jl. Citra 7, Kalideres West Jakarta Citra Mitra Graha KSO 312 Under-construction
continued
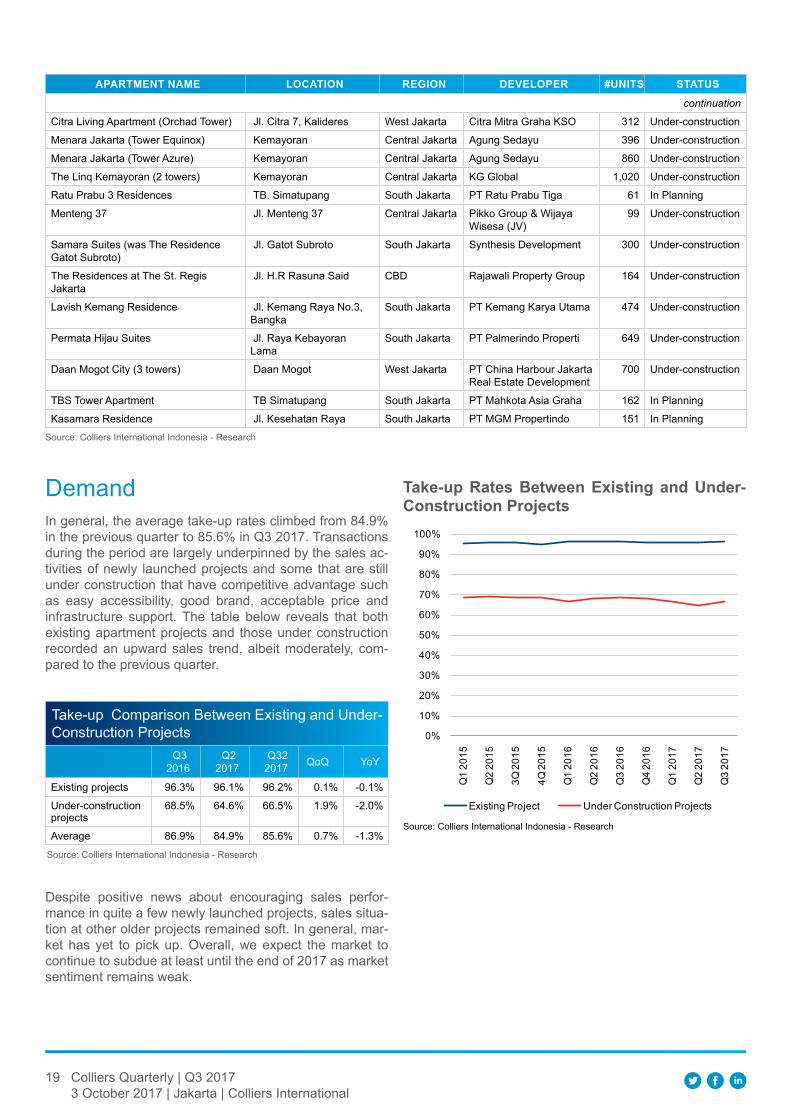
19 Colliers Quarterly | Q3 20173 October 2017 | Jakarta | Colliers International
APArTMeNT NAMe lOCATION regION develOPer #uNITS STATuS
continuation
Citra Living Apartment (Orchad Tower) Jl. Citra 7, Kalideres West Jakarta Citra Mitra Graha KSO 312 Under-construction
Menara Jakarta (Tower Equinox) Kemayoran Central Jakarta Agung Sedayu 396 Under-construction
Menara Jakarta (Tower Azure) Kemayoran Central Jakarta Agung Sedayu 860 Under-construction
The Linq Kemayoran (2 towers) Kemayoran Central Jakarta KG Global 1,020 Under-construction
Ratu Prabu 3 Residences TB. Simatupang South Jakarta PT Ratu Prabu Tiga 61 In Planning
Menteng 37 Jl. Menteng 37 Central Jakarta Pikko Group & Wijaya Wisesa (JV)
99 Under-construction
Samara Suites (was The Residence Gatot Subroto)
Jl. Gatot Subroto South Jakarta Synthesis Development 300 Under-construction
The Residences at The St. Regis Jakarta
Jl. H.R Rasuna Said CBD Rajawali Property Group 164 Under-construction
Lavish Kemang Residence Jl. Kemang Raya No.3, Bangka
South Jakarta PT Kemang Karya Utama 474 Under-construction
Permata Hijau Suites Jl. Raya Kebayoran Lama
South Jakarta PT Palmerindo Properti 649 Under-construction
Daan Mogot City (3 towers) Daan Mogot West Jakarta PT China Harbour Jakarta Real Estate Development
700 Under-construction
TBS Tower Apartment TB Simatupang South Jakarta PT Mahkota Asia Graha 162 In Planning
Kasamara Residence Jl. Kesehatan Raya South Jakarta PT MGM Propertindo 151 In PlanningSource: Colliers International Indonesia - Research
DemandIn general, the average take-up rates climbed from 84.9% in the previous quarter to 85.6% in Q3 2017. Transactions during the period are largely underpinned by the sales ac-tivities of newly launched projects and some that are still under construction that have competitive advantage such as easy accessibility, good brand, acceptable price and infrastructure support. The table below reveals that both existing apartment projects and those under construction recorded an upward sales trend, albeit moderately, com-pared to the previous quarter.
Source: Colliers International Indonesia - Research
Take-up Comparison Between Existing and Under-Construction Projects
Q3 2016
Q2 2017
Q32 2017 QoQ YoY
Existing projects 96.3% 96.1% 96.2% 0.1% -0.1%
Under-construction projects
68.5% 64.6% 66.5% 1.9% -2.0%
Average 86.9% 84.9% 85.6% 0.7% -1.3%
Despite positive news about encouraging sales perfor-mance in quite a few newly launched projects, sales situa-tion at other older projects remained soft. In general, mar-ket has yet to pick up. Overall, we expect the market to continue to subdue at least until the end of 2017 as market sentiment remains weak.
Source: Colliers International Indonesia - Research
Take-up rates Between existing and under-Construction Projects
0%
10%
20%
30%
40%
50%
60%
70%
80%
90%
100%
Q1
2015
Q2
2015
3Q 2
015
4Q 2
015
Q1
2016
Q2
2016
Q3
2016
Q4
2016
Q1
2017
Q2
2017
Q3
2017
Existing Project Under Construction Projects
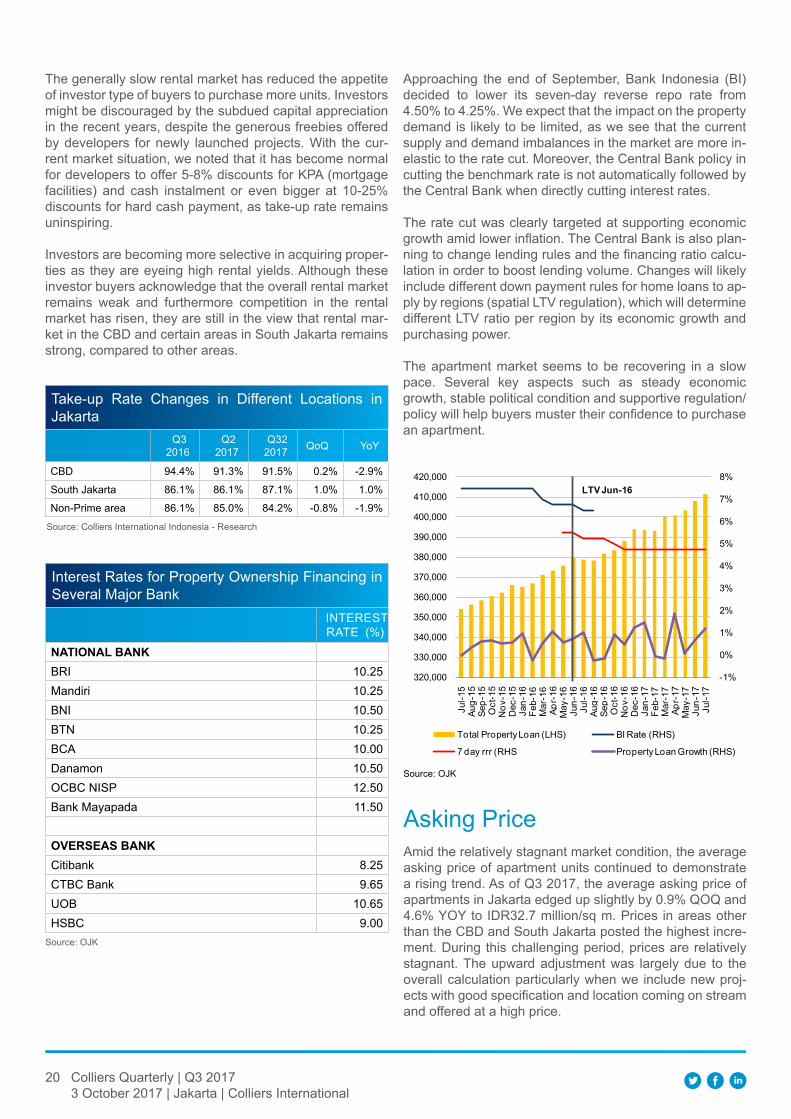
20 Colliers Quarterly | Q3 20173 October 2017 | Jakarta | Colliers International
The generally slow rental market has reduced the appetite of investor type of buyers to purchase more units. Investors might be discouraged by the subdued capital appreciation in the recent years, despite the generous freebies offered by developers for newly launched projects. With the cur-rent market situation, we noted that it has become normal for developers to offer 5-8% discounts for KPA (mortgage facilities) and cash instalment or even bigger at 10-25% discounts for hard cash payment, as take-up rate remains uninspiring.
Investors are becoming more selective in acquiring proper-ties as they are eyeing high rental yields. Although these investor buyers acknowledge that the overall rental market remains weak and furthermore competition in the rental market has risen, they are still in the view that rental mar-ket in the CBD and certain areas in South Jakarta remains strong, compared to other areas.
Source: Colliers International Indonesia - Research
Take-up Rate Changes in Different Locations in Jakarta
Q3 2016
Q2 2017
Q32 2017 QoQ YoY
CBD 94.4% 91.3% 91.5% 0.2% -2.9%
South Jakarta 86.1% 86.1% 87.1% 1.0% 1.0%
Non-Prime area 86.1% 85.0% 84.2% -0.8% -1.9%
Approaching the end of September, Bank Indonesia (BI) decided to lower its seven-day reverse repo rate from 4.50% to 4.25%. We expect that the impact on the property demand is likely to be limited, as we see that the current supply and demand imbalances in the market are more in-elastic to the rate cut. Moreover, the Central Bank policy in cutting the benchmark rate is not automatically followed by the Central Bank when directly cutting interest rates.
The rate cut was clearly targeted at supporting economic growth amid lower inflation. The Central Bank is also plan-ning to change lending rules and the financing ratio calcu-lation in order to boost lending volume. Changes will likely include different down payment rules for home loans to ap-ply by regions (spatial LTV regulation), which will determine different LTV ratio per region by its economic growth and purchasing power.
The apartment market seems to be recovering in a slow pace. Several key aspects such as steady economic growth, stable political condition and supportive regulation/policy will help buyers muster their confidence to purchase an apartment.
Source: OJK
Interest Rates for Property Ownership Financing in Several Major Bank
INTEREST RATE (%)
NATIONAl BANk BRI 10.25Mandiri 10.25BNI 10.50BTN 10.25BCA 10.00Danamon 10.50OCBC NISP 12.50Bank Mayapada 11.50
OverSeAS BANkCitibank 8.25CTBC Bank 9.65UOB 10.65HSBC 9.00
Source: OJK
-1%
0%
1%
2%
3%
4%
5%
6%
7%
8%
320,000
330,000
340,000
350,000
360,000
370,000
380,000
390,000
400,000
410,000
420,000
Jul-1
5Au
g-15
Sep-
15O
ct-1
5N
ov-1
5D
ec-1
5Ja
n-16
Feb-
16M
ar-1
6Ap
r-16
May
-16
Jun-
16Ju
l-16
Aug-
16Se
p-16
Oct
-16
Nov
-16
Dec
-16
Jan-
17Fe
b-17
Mar
-17
Apr-
17M
ay-1
7Ju
n-17
Jul-1
7
Total Property Loan (LHS) BI Rate (RHS)
7 day rrr (RHS Property Loan Growth (RHS)
lTv jun-16
Asking PriceAmid the relatively stagnant market condition, the average asking price of apartment units continued to demonstrate a rising trend. As of Q3 2017, the average asking price of apartments in Jakarta edged up slightly by 0.9% QOQ and 4.6% YOY to IDR32.7 million/sq m. Prices in areas other than the CBD and South Jakarta posted the highest incre-ment. During this challenging period, prices are relatively stagnant. The upward adjustment was largely due to the overall calculation particularly when we include new proj-ects with good specification and location coming on stream and offered at a high price.
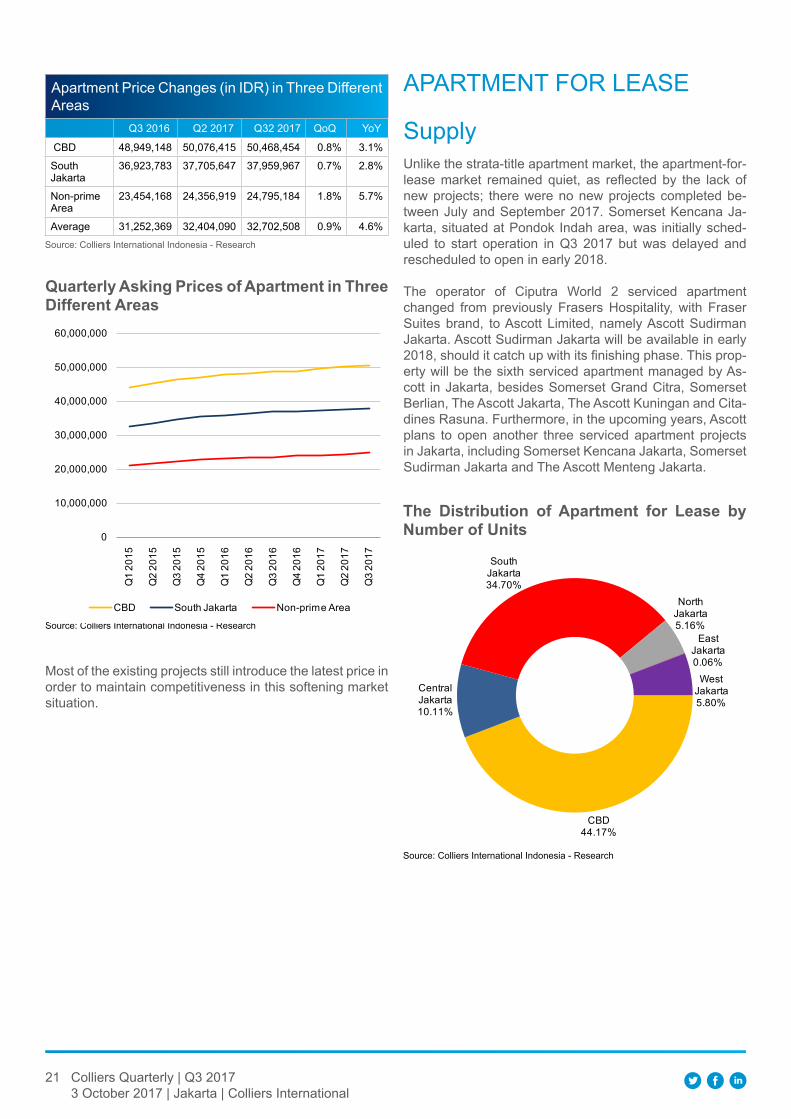
21 Colliers Quarterly | Q3 20173 October 2017 | Jakarta | Colliers International
Source: Colliers International Indonesia - Research
Apartment Price Changes (in IDR) in Three Different Areas
Q3 2016 Q2 2017 Q32 2017 QoQ YoY
CBD 48,949,148 50,076,415 50,468,454 0.8% 3.1%
South Jakarta
36,923,783 37,705,647 37,959,967 0.7% 2.8%
Non-prime Area
23,454,168 24,356,919 24,795,184 1.8% 5.7%
Average 31,252,369 32,404,090 32,702,508 0.9% 4.6%
Source: Colliers International Indonesia - Research
quarterly Asking Prices of Apartment in Three different Areas
0
10,000,000
20,000,000
30,000,000
40,000,000
50,000,000
60,000,000
Q1
2015
Q2
2015
Q3
2015
Q4
2015
Q1
2016
Q2
2016
Q3
2016
Q4
2016
Q1
2017
Q2
2017
Q3
2017
CBD South Jakarta Non-prime Area
Most of the existing projects still introduce the latest price in order to maintain competitiveness in this softening market situation.
APARTMENT FOR LEASE
SupplyUnlike the strata-title apartment market, the apartment-for-lease market remained quiet, as reflected by the lack of new projects; there were no new projects completed be-tween July and September 2017. Somerset Kencana Ja-karta, situated at Pondok Indah area, was initially sched-uled to start operation in Q3 2017 but was delayed and rescheduled to open in early 2018.
The operator of Ciputra World 2 serviced apartment changed from previously Frasers Hospitality, with Fraser Suites brand, to Ascott Limited, namely Ascott Sudirman Jakarta. Ascott Sudirman Jakarta will be available in early 2018, should it catch up with its finishing phase. This prop-erty will be the sixth serviced apartment managed by As-cott in Jakarta, besides Somerset Grand Citra, Somerset Berlian, The Ascott Jakarta, The Ascott Kuningan and Cita-dines Rasuna. Furthermore, in the upcoming years, Ascott plans to open another three serviced apartment projects in Jakarta, including Somerset Kencana Jakarta, Somerset Sudirman Jakarta and The Ascott Menteng Jakarta.
Source: Colliers International Indonesia - Research
The distribution of Apartment for lease by Number of units
CBD44.17%
Central Jakarta10.11%
South Jakarta34.70%
North Jakarta5.16%
East Jakarta0.06%
West Jakarta5.80%
22 Colliers Quarterly | Q3 20173 October 2017 | Jakarta | Colliers International
Serviced Apartment Projects Pipeline
NAMe Of PrOjeCT YeAr Of OPerATION lOCATION AreA #uNIT
Ascott Sudirman Jakarta 2018 Jl. Prof Dr Satrio CBD 192
Oakwood at District 8 Senopati 2018 SCBD CBD 180
Somerset Kencana Jakarta 2018 Pondok Indah South Jakarta 148
Ascott Menteng Jakarta 2021 Menteng CBD 151
Fraser Suites Kebon Melati 2022 Kebon Melati, Tanah Abang CBD TBA
Source: Colliers International Indonesia - Research
Overall, the total supply of apartments for lease (either ser-viced or non-serviced) stood at 8,860 units, of which 60% are categorised as serviced apartment. The majority of these apartment units are located in the CBD (44%), fol-lowed by South Jakarta (35%). More developers opt to as-sign international hotel operators to manage their serviced apartments in an attempt to attract broader market cover-age, particularly expatriates.
OccupancyThe average occupancy rate of apartments for lease in Ja-karta in Q3 2017 rose slightly from 70.2% to 71.3%, mainly generated from new short-term lease contracts in serviced apartments. The short-term deals were generally com-posed for business and leisure purposes, with rental tenure from daily to three-month rents. Such transactions helped increase the occupancy for serviced apartments from 62.2% to 65.6% this quarter. Active corporate clients that generate demand for apartments include those in the tele-communications sector, embassy staffs, non-government organisations (NGOs) and expatriates who are working on a project basis such as infrastructure works and other proj-ects that are related to the Asian Games 2018 that will be held in Jakarta and Palembang.
In contrast with serviced apartments, occupancy of non-serviced apartments fell slightly by 0.13% to 74.7% in the reviewed quarter. Besides the frequently reported reason such as lease contract expiration, some apartments also reported that most of their new tenants are currently ex-patriates without family members and who do not require big units, such as a three-bedroom unit. Sizeable units are typically offered by aged non-serviced apartments and as a result, tenants shifted to rent newer strata-title apartment units.
Source: Colliers International Indonesia - Research
Average Occupancy Rates of Apartment for Lease by type of Service
Q2 2016 Q2 2017 Q3 2017 QoQ YoY
Non-serviced 76.20% 74.60% 74.47% -0.13% -1.73%
Serviced 62.83% 62.24% 65.55% 3.31% 2.72%
Source: Colliers International Indonesia - Research
Average Occupancy Rates of Apartment for Lease in Three Different Areas
Q2 2016 Q2 2017 Q3 2017 QoQ YoY
CBD 76.1% 72.5% 75.2% 2.7% -0.9%
South Jakarta 70.4% 68.4% 69.0% 0.5% -1.4%
Non-Prime area
68.0% 69.3% 69.5% 0.2% 1.5%
Rental RateOverall, average rental rate for apartments for lease (both serviced and non-serviced) remained flat. Minor adjust-ments occurred during the quarter mainly due to the cor-rection of the exchange rate. In Q3 2017, the average ask-ing rental rate in the CBD was registered at IDR362,789/sq m/month, moderately down by less than 1% compared to the previous quarter. Meanwhile, South Jakarta, includ-ing other non-prime areas, was registered at IDR218,369/sq m/month.
With substantial amount of serviced apartment projects in the pipeline, vacancy rate would potentially rise over the next few years. In this competitive rental market where apartments for lease have to compete with individually owned strata-title apartment units that are offered for rent, some landlords have to adjust their rental rate lower, and this particularly affected mostly local operators.
Source: Colliers International Indonesia - Research
Average Rental Rate (in IDR/sq m/month) changes of Apartment for Lease Based on Region
Q2 2016 Q2 2017 Q3 2017 QoQ YoY
371,322 361,788 361,789 0.0% -2.6% -1.73%
223,747 218,037 218,369 0.2% -2.4% 2.72%
23 Colliers Quarterly | Q3 20173 October 2017 | Jakarta | Colliers International
Concluding ThoughtDespite the encouraging pre-sales result of some newly launched projects, we are in the view that overall apart-ment demand has not picked up yet. Opportunistic buy-ers generally characterise pre-sales activities of newly launched projects, making an impressive sales record only at the beginning. The initial stage of products, as typically offered, lures buyers who wish to make investments, no-tably because developers come up with compelling dis-counts and bonuses, as well as provide payment flexibility. Overtime, as more construction works progress, prices are inevitably raised and sales start to diminish. Furthermore, at the same time, the market continues to see new proj-ects coming on stream, thereby heightening competition amongst new projects. Given the limited number of trans-actions, we expect to see the apartment market continue to subdue, at least in the remainder of 2017.
On the other hand, the fact that loan growth remains lack-lustre, the Central Bank decided to further cut its repo rate by 25bps to 4.25%, and also deposit and lending facility rate 25bps to 3.5% and 5%, respectively. BI now expects loan growth to recover to 10-12% only by 2018 instead of this year. We think that BI may also consider the other monetary policies to be exercised, such as further ease LTV or down payment policies to help prevent properties from further deceleration.
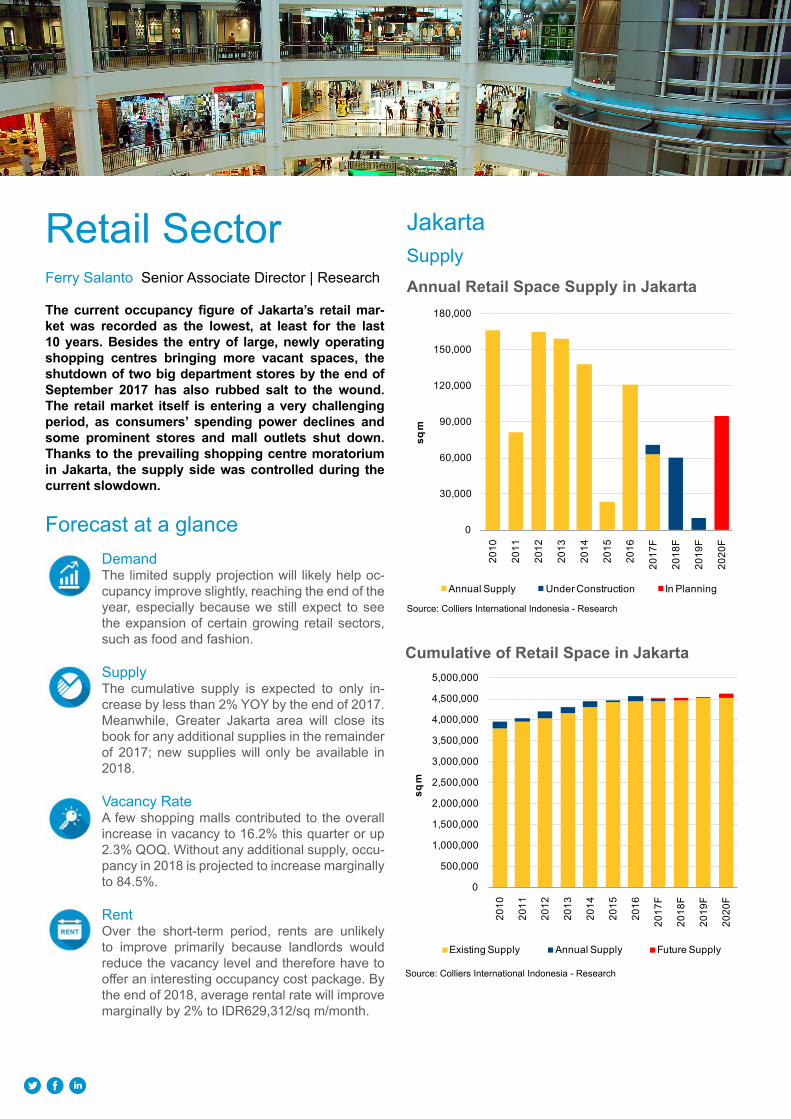
Retail SectorFerry Salanto Senior Associate Director | Research
The current occupancy figure of jakarta’s retail mar-ket was recorded as the lowest, at least for the last 10 years. Besides the entry of large, newly operating shopping centres bringing more vacant spaces, the shutdown of two big department stores by the end of September 2017 has also rubbed salt to the wound. The retail market itself is entering a very challenging period, as consumers’ spending power declines and some prominent stores and mall outlets shut down. Thanks to the prevailing shopping centre moratorium in jakarta, the supply side was controlled during the current slowdown.
Forecast at a glance
JakartaSupply
Source: Colliers International Indonesia - Research
Annual retail Space Supply in jakarta
0
30,000
60,000
90,000
120,000
150,000
180,000
2010
2011
2012
2013
2014
2015
2016
2017
F
2018
F
2019
F
2020
F
sq m
Annual Supply Under Construction In Planning
Source: Colliers International Indonesia - Research
Cumulative of retail Space in jakarta
0
500,000
1,000,000
1,500,000
2,000,000
2,500,000
3,000,000
3,500,000
4,000,000
4,500,000
5,000,000
2010
2011
2012
2013
2014
2015
2016
2017
F
2018
F
2019
F
2020
F
sq m
Existing Supply Annual Supply Future Supply
DemandThe limited supply projection will likely help oc-cupancy improve slightly, reaching the end of the year, especially because we still expect to see the expansion of certain growing retail sectors, such as food and fashion.
SupplyThe cumulative supply is expected to only in-crease by less than 2% YOY by the end of 2017. Meanwhile, Greater Jakarta area will close its book for any additional supplies in the remainder of 2017; new supplies will only be available in 2018.
Vacancy RateA few shopping malls contributed to the overall increase in vacancy to 16.2% this quarter or up 2.3% QOQ. Without any additional supply, occu-pancy in 2018 is projected to increase marginally to 84.5%.
RentOver the short-term period, rents are unlikely to improve primarily because landlords would reduce the vacancy level and therefore have to offer an interesting occupancy cost package. By the end of 2018, average rental rate will improve marginally by 2% to IDR629,312/sq m/month.
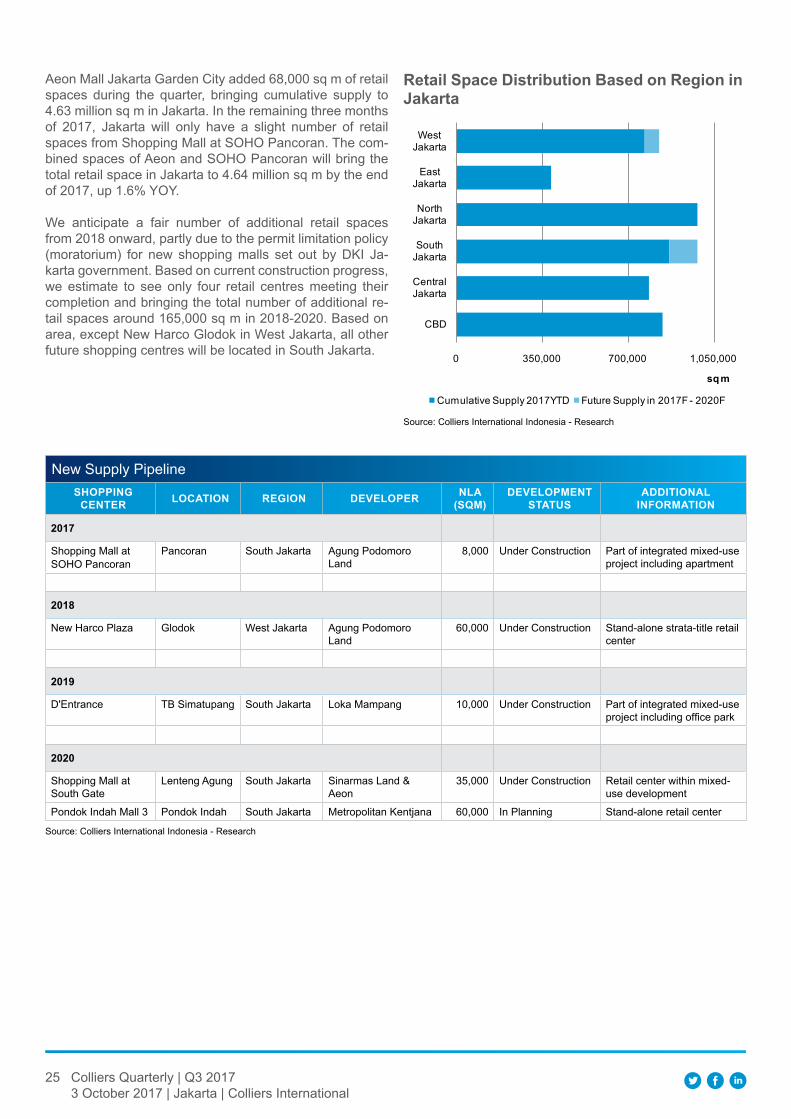
25 Colliers Quarterly | Q3 20173 October 2017 | Jakarta | Colliers International
Source: Colliers International Indonesia - Research
retail Space distribution Based on region in jakarta
Aeon Mall Jakarta Garden City added 68,000 sq m of retail spaces during the quarter, bringing cumulative supply to 4.63 million sq m in Jakarta. In the remaining three months of 2017, Jakarta will only have a slight number of retail spaces from Shopping Mall at SOHO Pancoran. The com-bined spaces of Aeon and SOHO Pancoran will bring the total retail space in Jakarta to 4.64 million sq m by the end of 2017, up 1.6% YOY.
We anticipate a fair number of additional retail spaces from 2018 onward, partly due to the permit limitation policy (moratorium) for new shopping malls set out by DKI Ja-karta government. Based on current construction progress, we estimate to see only four retail centres meeting their completion and bringing the total number of additional re-tail spaces around 165,000 sq m in 2018-2020. Based on area, except New Harco Glodok in West Jakarta, all other future shopping centres will be located in South Jakarta.
0 350,000 700,000 1,050,000
CBD
Central Jakarta
South Jakarta
North Jakarta
East Jakarta
West Jakarta
sq m
Cumulative Supply 2017YTD Future Supply in 2017F - 2020F
New Supply PipelineShOPPINg
CeNTer lOCATION regION develOPer NlA (SqM)
develOPMeNT STATuS
AddITIONAl INfOrMATION
2017
Shopping Mall at SOHO Pancoran
Pancoran South Jakarta Agung Podomoro Land
8,000 Under Construction Part of integrated mixed-use project including apartment
2018
New Harco Plaza Glodok West Jakarta Agung Podomoro Land
60,000 Under Construction Stand-alone strata-title retail center
2019
D'Entrance TB Simatupang South Jakarta Loka Mampang 10,000 Under Construction Part of integrated mixed-use project including office park
2020
Shopping Mall at South Gate
Lenteng Agung South Jakarta Sinarmas Land & Aeon
35,000 Under Construction Retail center within mixed-use development
Pondok Indah Mall 3 Pondok Indah South Jakarta Metropolitan Kentjana 60,000 In Planning Stand-alone retail center
Source: Colliers International Indonesia - Research
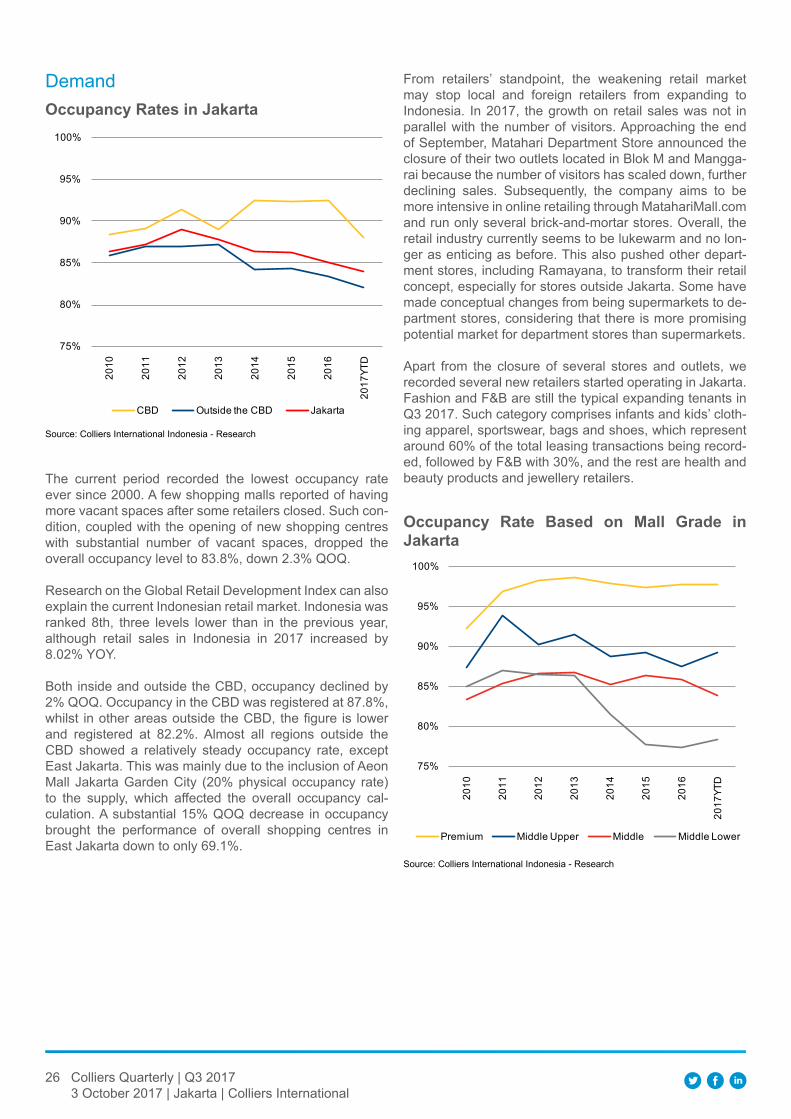
26 Colliers Quarterly | Q3 20173 October 2017 | Jakarta | Colliers International
Source: Colliers International Indonesia - Research
Occupancy rates in jakarta
From retailers’ standpoint, the weakening retail market may stop local and foreign retailers from expanding to Indonesia. In 2017, the growth on retail sales was not in parallel with the number of visitors. Approaching the end of September, Matahari Department Store announced the closure of their two outlets located in Blok M and Mangga-rai because the number of visitors has scaled down, further declining sales. Subsequently, the company aims to be more intensive in online retailing through MatahariMall.com and run only several brick-and-mortar stores. Overall, the retail industry currently seems to be lukewarm and no lon-ger as enticing as before. This also pushed other depart-ment stores, including Ramayana, to transform their retail concept, especially for stores outside Jakarta. Some have made conceptual changes from being supermarkets to de-partment stores, considering that there is more promising potential market for department stores than supermarkets.
Apart from the closure of several stores and outlets, we recorded several new retailers started operating in Jakarta. Fashion and F&B are still the typical expanding tenants in Q3 2017. Such category comprises infants and kids’ cloth-ing apparel, sportswear, bags and shoes, which represent around 60% of the total leasing transactions being record-ed, followed by F&B with 30%, and the rest are health and beauty products and jewellery retailers.
Demand
The current period recorded the lowest occupancy rate ever since 2000. A few shopping malls reported of having more vacant spaces after some retailers closed. Such con-dition, coupled with the opening of new shopping centres with substantial number of vacant spaces, dropped the overall occupancy level to 83.8%, down 2.3% QOQ.
Research on the Global Retail Development Index can also explain the current Indonesian retail market. Indonesia was ranked 8th, three levels lower than in the previous year, although retail sales in Indonesia in 2017 increased by 8.02% YOY.
Both inside and outside the CBD, occupancy declined by 2% QOQ. Occupancy in the CBD was registered at 87.8%, whilst in other areas outside the CBD, the figure is lower and registered at 82.2%. Almost all regions outside the CBD showed a relatively steady occupancy rate, except East Jakarta. This was mainly due to the inclusion of Aeon Mall Jakarta Garden City (20% physical occupancy rate) to the supply, which affected the overall occupancy cal-culation. A substantial 15% QOQ decrease in occupancy brought the performance of overall shopping centres in East Jakarta down to only 69.1%.
Source: Colliers International Indonesia - Research
Occupancy rate Based on Mall grade in jakarta
75%
80%
85%
90%
95%
100%
2010
2011
2012
2013
2014
2015
2016
2017
YTD
Premium Middle Upper Middle Middle Lower
75%
80%
85%
90%
95%
100%
2010
2011
2012
2013
2014
2015
2016
2017
YTD
CBD Outside the CBD Jakarta
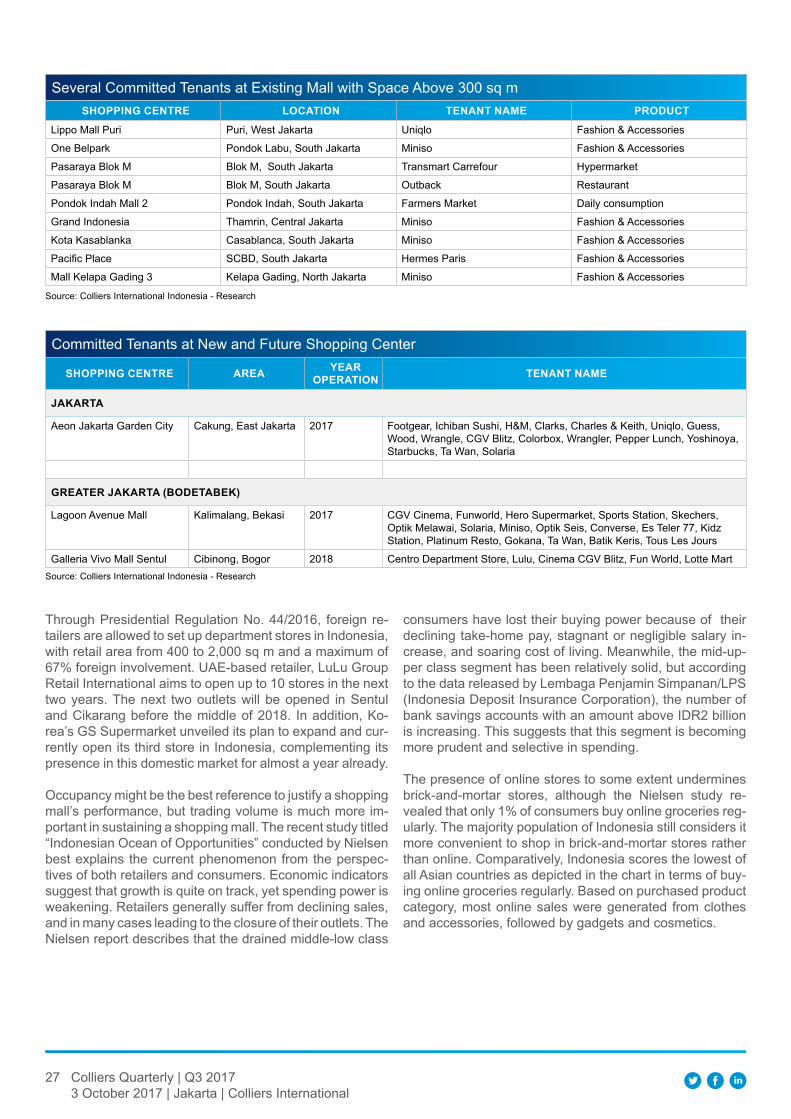
27 Colliers Quarterly | Q3 20173 October 2017 | Jakarta | Colliers International
Several Committed Tenants at Existing Mall with Space Above 300 sq mShOPPINg CeNTre lOCATION TeNANT NAMe PrOduCT
Lippo Mall Puri Puri, West Jakarta Uniqlo Fashion & Accessories
One Belpark Pondok Labu, South Jakarta Miniso Fashion & Accessories
Pasaraya Blok M Blok M, South Jakarta Transmart Carrefour Hypermarket
Pasaraya Blok M Blok M, South Jakarta Outback Restaurant
Pondok Indah Mall 2 Pondok Indah, South Jakarta Farmers Market Daily consumption
Grand Indonesia Thamrin, Central Jakarta Miniso Fashion & Accessories
Kota Kasablanka Casablanca, South Jakarta Miniso Fashion & Accessories
Pacific Place SCBD, South Jakarta Hermes Paris Fashion & Accessories
Mall Kelapa Gading 3 Kelapa Gading, North Jakarta Miniso Fashion & Accessories
Committed Tenants at New and Future Shopping Center
ShOPPINg CeNTre AreA YeAr OPerATION TeNANT NAMe
jAkArTA
Aeon Jakarta Garden City Cakung, East Jakarta 2017 Footgear, Ichiban Sushi, H&M, Clarks, Charles & Keith, Uniqlo, Guess, Wood, Wrangle, CGV Blitz, Colorbox, Wrangler, Pepper Lunch, Yoshinoya, Starbucks, Ta Wan, Solaria
greATer jAkArTA (BOdeTABek)
Lagoon Avenue Mall Kalimalang, Bekasi 2017 CGV Cinema, Funworld, Hero Supermarket, Sports Station, Skechers, Optik Melawai, Solaria, Miniso, Optik Seis, Converse, Es Teler 77, Kidz Station, Platinum Resto, Gokana, Ta Wan, Batik Keris, Tous Les Jours
Galleria Vivo Mall Sentul Cibinong, Bogor 2018 Centro Department Store, Lulu, Cinema CGV Blitz, Fun World, Lotte Mart
Source: Colliers International Indonesia - Research
Source: Colliers International Indonesia - Research
Through Presidential Regulation No. 44/2016, foreign re-tailers are allowed to set up department stores in Indonesia, with retail area from 400 to 2,000 sq m and a maximum of 67% foreign involvement. UAE-based retailer, LuLu Group Retail International aims to open up to 10 stores in the next two years. The next two outlets will be opened in Sentul and Cikarang before the middle of 2018. In addition, Ko-rea’s GS Supermarket unveiled its plan to expand and cur-rently open its third store in Indonesia, complementing its presence in this domestic market for almost a year already.
Occupancy might be the best reference to justify a shopping mall’s performance, but trading volume is much more im-portant in sustaining a shopping mall. The recent study titled “Indonesian Ocean of Opportunities” conducted by Nielsen best explains the current phenomenon from the perspec-tives of both retailers and consumers. Economic indicators suggest that growth is quite on track, yet spending power is weakening. Retailers generally suffer from declining sales, and in many cases leading to the closure of their outlets. The Nielsen report describes that the drained middle-low class
consumers have lost their buying power because of their declining take-home pay, stagnant or negligible salary in-crease, and soaring cost of living. Meanwhile, the mid-up-per class segment has been relatively solid, but according to the data released by Lembaga Penjamin Simpanan/LPS (Indonesia Deposit Insurance Corporation), the number of bank savings accounts with an amount above IDR2 billion is increasing. This suggests that this segment is becoming more prudent and selective in spending.
The presence of online stores to some extent undermines brick-and-mortar stores, although the Nielsen study re-vealed that only 1% of consumers buy online groceries reg-ularly. The majority population of Indonesia still considers it more convenient to shop in brick-and-mortar stores rather than online. Comparatively, Indonesia scores the lowest of all Asian countries as depicted in the chart in terms of buy-ing online groceries regularly. Based on purchased product category, most online sales were generated from clothes and accessories, followed by gadgets and cosmetics.
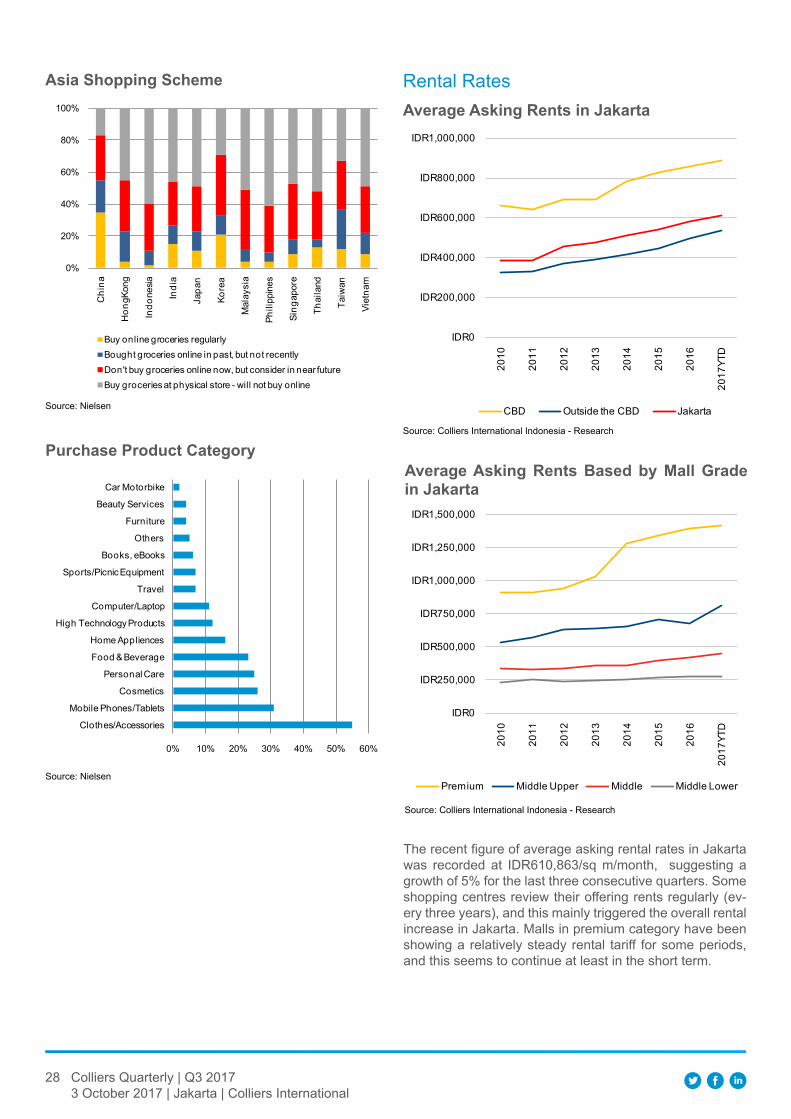
28 Colliers Quarterly | Q3 20173 October 2017 | Jakarta | Colliers International
Source: Nielsen
Asia Shopping Scheme
0%
20%
40%
60%
80%
100%C
hina
Hon
gKon
g
Indo
nesia
Indi
a
Japa
n
Kore
a
Mal
aysi
a
Phili
ppin
es
Sing
apor
e
Thai
land
Taiw
an
Viet
nam
Buy online groceries regularlyBought groceries online in past, but not recentlyDon't buy groceries online now, but consider in near futureBuy groceries at physical store - will not buy online
Source: Nielsen
Purchase Product Category
0% 10% 20% 30% 40% 50% 60%
Clothes/Accessories
Mobile Phones/Tablets
Cosmetics
Personal Care
Food & Beverage
Home Appliences
High Technology Products
Computer/Laptop
Travel
Sports/Picnic Equipment
Books, eBooks
Others
Furniture
Beauty Services
Car Motorbike
Rental Rates
Source: Colliers International Indonesia - Research
Average Asking rents in jakarta
IDR0
IDR200,000
IDR400,000
IDR600,000
IDR800,000
IDR1,000,000
2010
2011
2012
2013
2014
2015
2016
2017
YTD
CBD Outside the CBD Jakarta
Source: Colliers International Indonesia - Research
Average Asking rents Based by Mall grade in jakarta
IDR0
IDR250,000
IDR500,000
IDR750,000
IDR1,000,000
IDR1,250,000
IDR1,500,00020
10
2011
2012
2013
2014
2015
2016
2017
YTD
Premium Middle Upper Middle Middle Lower
The recent figure of average asking rental rates in Jakarta was recorded at IDR610,863/sq m/month, suggesting a growth of 5% for the last three consecutive quarters. Some shopping centres review their offering rents regularly (ev-ery three years), and this mainly triggered the overall rental increase in Jakarta. Malls in premium category have been showing a relatively steady rental tariff for some periods, and this seems to continue at least in the short term.
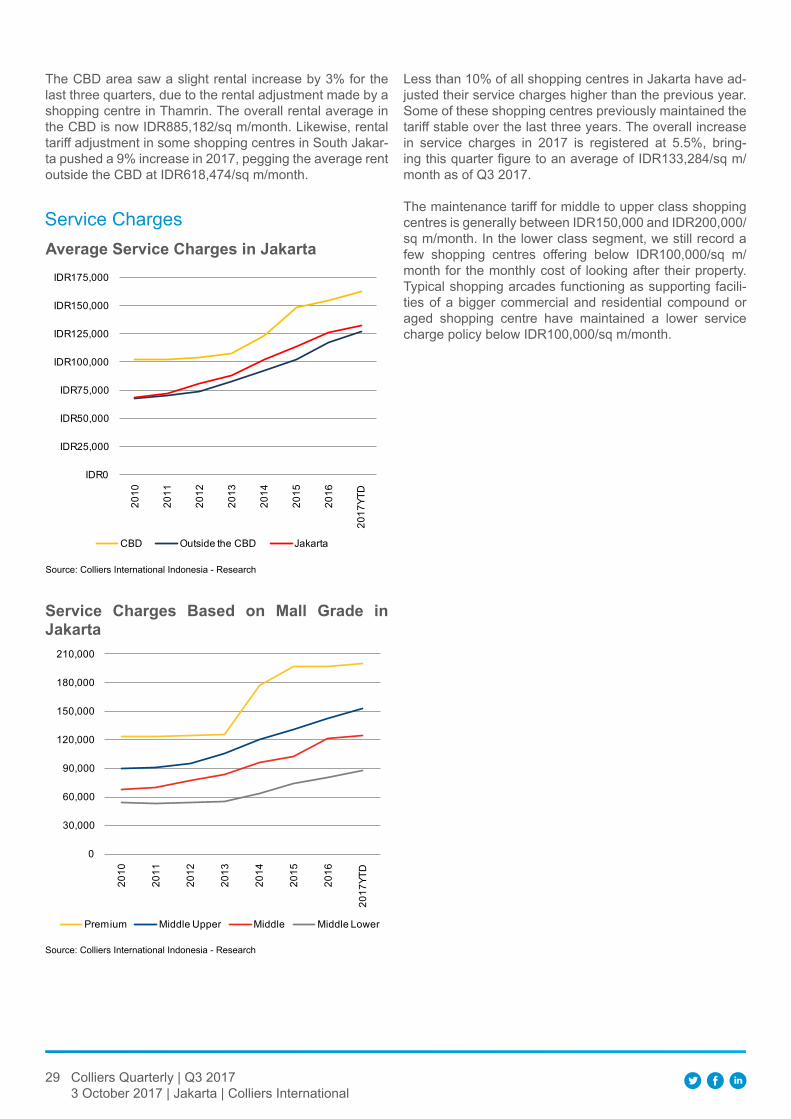
29 Colliers Quarterly | Q3 20173 October 2017 | Jakarta | Colliers International
The CBD area saw a slight rental increase by 3% for the last three quarters, due to the rental adjustment made by a shopping centre in Thamrin. The overall rental average in the CBD is now IDR885,182/sq m/month. Likewise, rental tariff adjustment in some shopping centres in South Jakar-ta pushed a 9% increase in 2017, pegging the average rent outside the CBD at IDR618,474/sq m/month.
Service Charges
Source: Colliers International Indonesia - Research
Average Service Charges in jakarta
IDR0
IDR25,000
IDR50,000
IDR75,000
IDR100,000
IDR125,000
IDR150,000
IDR175,000
2010
2011
2012
2013
2014
2015
2016
2017
YTD
CBD Outside the CBD Jakarta
Less than 10% of all shopping centres in Jakarta have ad-justed their service charges higher than the previous year. Some of these shopping centres previously maintained the tariff stable over the last three years. The overall increase in service charges in 2017 is registered at 5.5%, bring-ing this quarter figure to an average of IDR133,284/sq m/month as of Q3 2017.
The maintenance tariff for middle to upper class shopping centres is generally between IDR150,000 and IDR200,000/sq m/month. In the lower class segment, we still record a few shopping centres offering below IDR100,000/sq m/month for the monthly cost of looking after their property. Typical shopping arcades functioning as supporting facili-ties of a bigger commercial and residential compound or aged shopping centre have maintained a lower service charge policy below IDR100,000/sq m/month.
Source: Colliers International Indonesia - Research
Service Charges Based on Mall grade in jakarta
0
30,000
60,000
90,000
120,000
150,000
180,000
210,000
2010
2011
2012
2013
2014
2015
2016
2017
YTD
Premium Middle Upper Middle Middle Lower
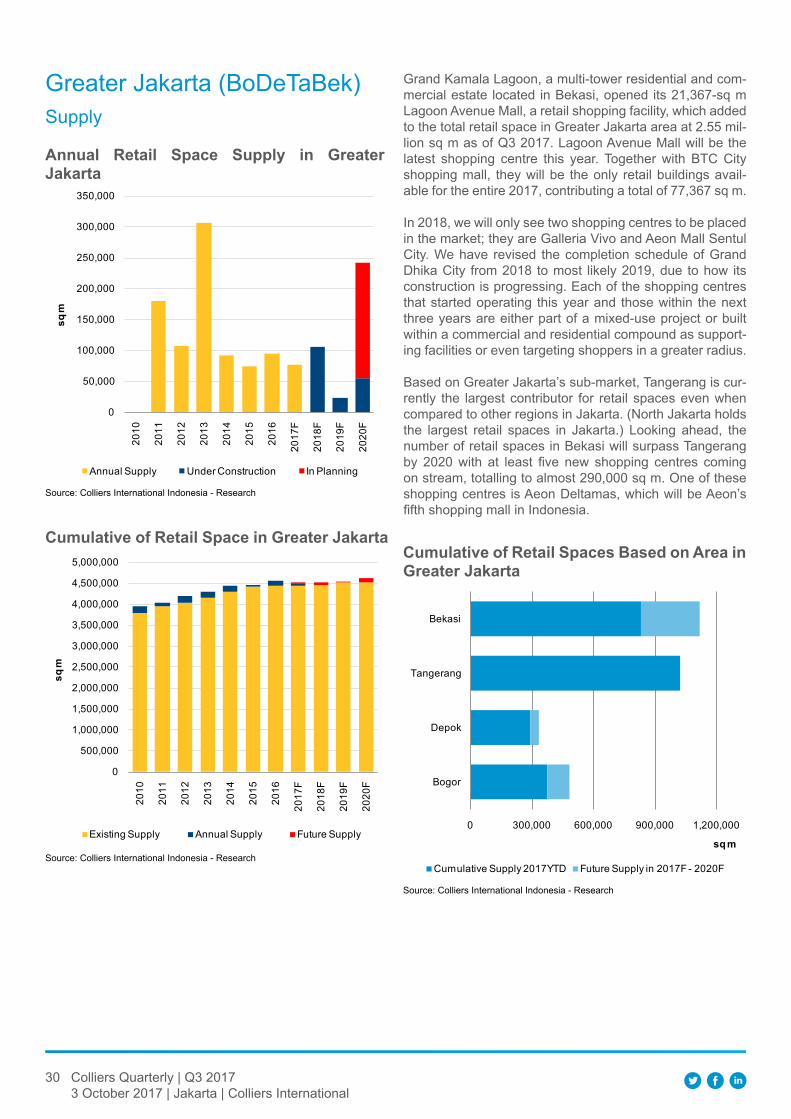
30 Colliers Quarterly | Q3 20173 October 2017 | Jakarta | Colliers International
Source: Colliers International Indonesia - Research
Annual retail Space Supply in greater jakarta
0
50,000
100,000
150,000
200,000
250,000
300,000
350,000
2010
2011
2012
2013
2014
2015
2016
2017
F
2018
F
2019
F
2020
F
sq m
Annual Supply Under Construction In Planning
Source: Colliers International Indonesia - Research
Cumulative of retail Space in greater jakarta
0
500,000
1,000,000
1,500,000
2,000,000
2,500,000
3,000,000
3,500,000
4,000,000
4,500,000
5,000,000
2010
2011
2012
2013
2014
2015
2016
2017
F
2018
F
2019
F
2020
F
sq m
Existing Supply Annual Supply Future Supply
Grand Kamala Lagoon, a multi-tower residential and com-mercial estate located in Bekasi, opened its 21,367-sq m Lagoon Avenue Mall, a retail shopping facility, which added to the total retail space in Greater Jakarta area at 2.55 mil-lion sq m as of Q3 2017. Lagoon Avenue Mall will be the latest shopping centre this year. Together with BTC City shopping mall, they will be the only retail buildings avail-able for the entire 2017, contributing a total of 77,367 sq m.
In 2018, we will only see two shopping centres to be placed in the market; they are Galleria Vivo and Aeon Mall Sentul City. We have revised the completion schedule of Grand Dhika City from 2018 to most likely 2019, due to how its construction is progressing. Each of the shopping centres that started operating this year and those within the next three years are either part of a mixed-use project or built within a commercial and residential compound as support-ing facilities or even targeting shoppers in a greater radius.
Based on Greater Jakarta’s sub-market, Tangerang is cur-rently the largest contributor for retail spaces even when compared to other regions in Jakarta. (North Jakarta holds the largest retail spaces in Jakarta.) Looking ahead, the number of retail spaces in Bekasi will surpass Tangerang by 2020 with at least five new shopping centres coming on stream, totalling to almost 290,000 sq m. One of these shopping centres is Aeon Deltamas, which will be Aeon’s fifth shopping mall in Indonesia.
Source: Colliers International Indonesia - Research
Cumulative of retail Spaces Based on Area in greater jakarta
0 300,000 600,000 900,000 1,200,000
Bogor
Depok
Tangerang
Bekasi
sq m
Cumulative Supply 2017YTD Future Supply in 2017F - 2020F
Greater Jakarta (BoDeTaBek)Supply
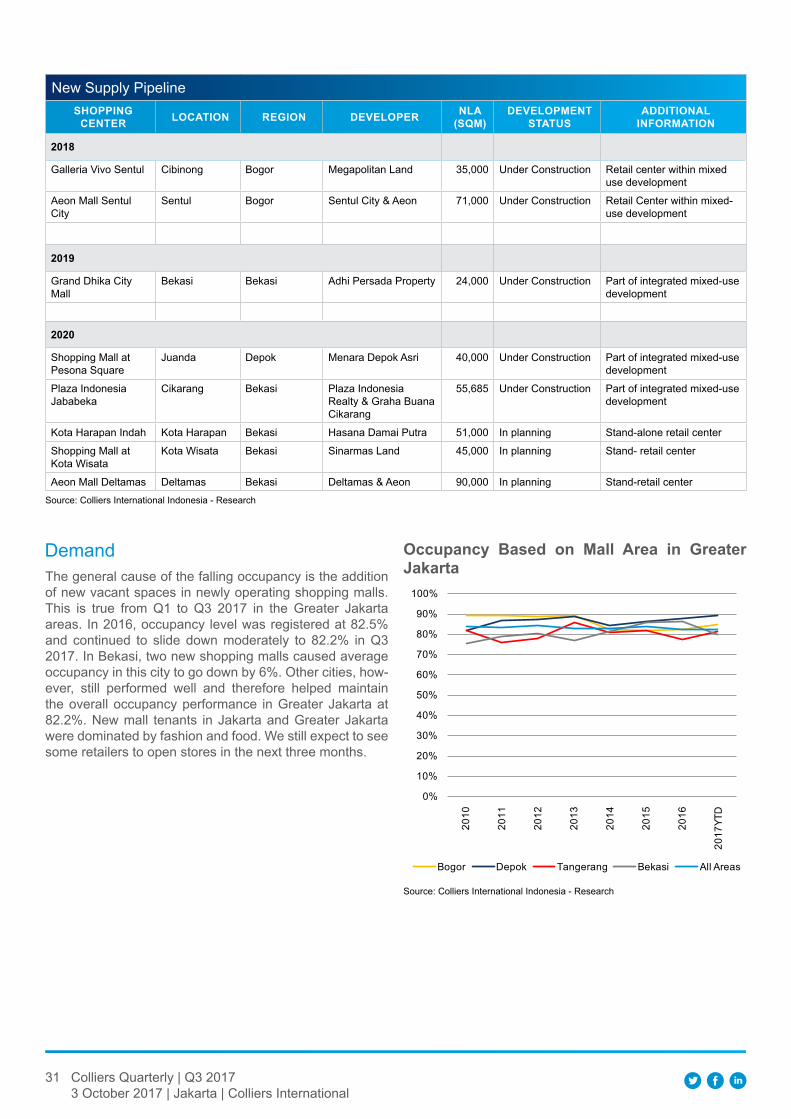
31 Colliers Quarterly | Q3 20173 October 2017 | Jakarta | Colliers International
New Supply PipelineShOPPINg
CeNTer lOCATION regION develOPer NlA (SqM)
develOPMeNT STATuS
AddITIONAl INfOrMATION
2018
Galleria Vivo Sentul Cibinong Bogor Megapolitan Land 35,000 Under Construction Retail center within mixed use development
Aeon Mall Sentul City
Sentul Bogor Sentul City & Aeon 71,000 Under Construction Retail Center within mixed- use development
2019
Grand Dhika City Mall
Bekasi Bekasi Adhi Persada Property 24,000 Under Construction Part of integrated mixed-use development
2020
Shopping Mall at Pesona Square
Juanda Depok Menara Depok Asri 40,000 Under Construction Part of integrated mixed-use development
Plaza Indonesia Jababeka
Cikarang Bekasi Plaza Indonesia Realty & Graha Buana Cikarang
55,685 Under Construction Part of integrated mixed-use development
Kota Harapan Indah Kota Harapan Bekasi Hasana Damai Putra 51,000 In planning Stand-alone retail center
Shopping Mall at Kota Wisata
Kota Wisata Bekasi Sinarmas Land 45,000 In planning Stand- retail center
Aeon Mall Deltamas Deltamas Bekasi Deltamas & Aeon 90,000 In planning Stand-retail centerSource: Colliers International Indonesia - Research
DemandThe general cause of the falling occupancy is the addition of new vacant spaces in newly operating shopping malls. This is true from Q1 to Q3 2017 in the Greater Jakarta areas. In 2016, occupancy level was registered at 82.5% and continued to slide down moderately to 82.2% in Q3 2017. In Bekasi, two new shopping malls caused average occupancy in this city to go down by 6%. Other cities, how-ever, still performed well and therefore helped maintain the overall occupancy performance in Greater Jakarta at 82.2%. New mall tenants in Jakarta and Greater Jakarta were dominated by fashion and food. We still expect to see some retailers to open stores in the next three months.
Source: Colliers International Indonesia - Research
Occupancy Based on Mall Area in greater jakarta
0%
10%
20%
30%
40%
50%
60%
70%
80%
90%
100%
2010
2011
2012
2013
2014
2015
2016
2017
YTD
Bogor Depok Tangerang Bekasi All Areas
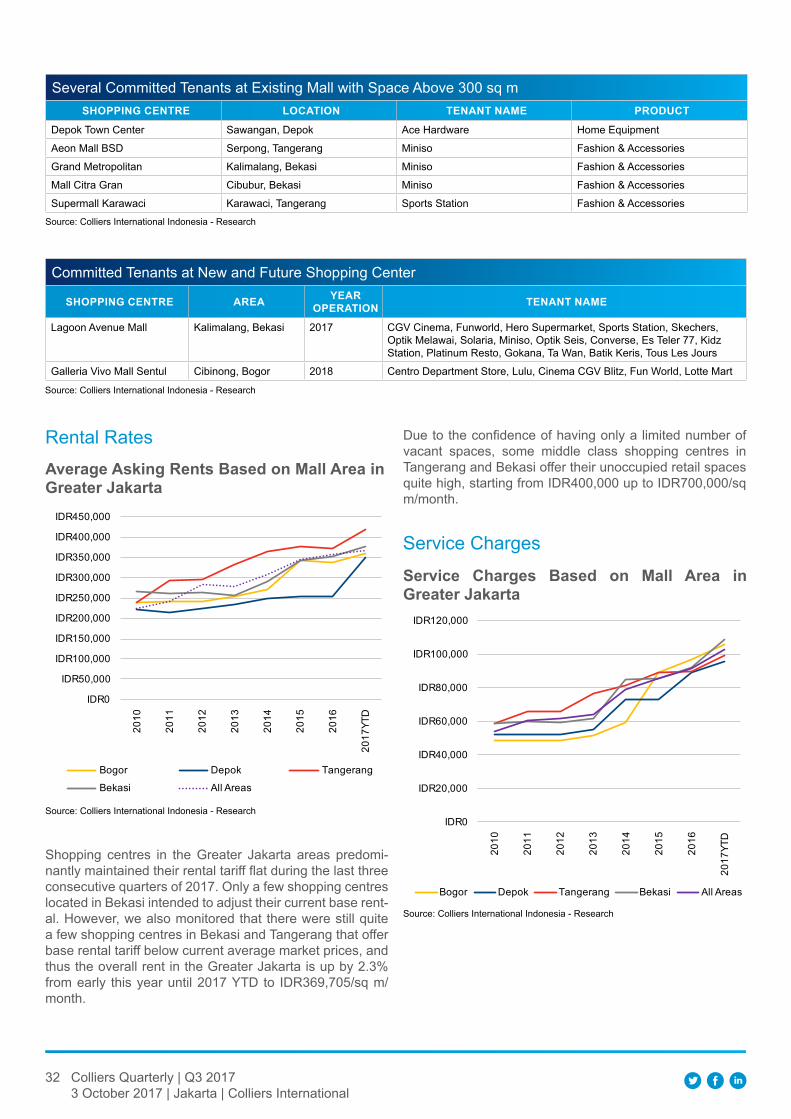
32 Colliers Quarterly | Q3 20173 October 2017 | Jakarta | Colliers International
Several Committed Tenants at Existing Mall with Space Above 300 sq mShOPPINg CeNTre lOCATION TeNANT NAMe PrOduCT
Depok Town Center Sawangan, Depok Ace Hardware Home Equipment
Aeon Mall BSD Serpong, Tangerang Miniso Fashion & Accessories
Grand Metropolitan Kalimalang, Bekasi Miniso Fashion & Accessories
Mall Citra Gran Cibubur, Bekasi Miniso Fashion & Accessories
Supermall Karawaci Karawaci, Tangerang Sports Station Fashion & AccessoriesSource: Colliers International Indonesia - Research
Committed Tenants at New and Future Shopping Center
ShOPPINg CeNTre AreA YeAr OPerATION TeNANT NAMe
Lagoon Avenue Mall Kalimalang, Bekasi 2017 CGV Cinema, Funworld, Hero Supermarket, Sports Station, Skechers, Optik Melawai, Solaria, Miniso, Optik Seis, Converse, Es Teler 77, Kidz Station, Platinum Resto, Gokana, Ta Wan, Batik Keris, Tous Les Jours
Galleria Vivo Mall Sentul Cibinong, Bogor 2018 Centro Department Store, Lulu, Cinema CGV Blitz, Fun World, Lotte Mart
Source: Colliers International Indonesia - Research
Source: Colliers International Indonesia - Research
Average Asking rents Based on Mall Area in greater jakarta
Rental Rates
IDR0
IDR50,000
IDR100,000
IDR150,000
IDR200,000
IDR250,000
IDR300,000
IDR350,000
IDR400,000
IDR450,000
2010
2011
2012
2013
2014
2015
2016
2017
YTD
Bogor Depok Tangerang
Bekasi All Areas
Shopping centres in the Greater Jakarta areas predomi-nantly maintained their rental tariff flat during the last three consecutive quarters of 2017. Only a few shopping centres located in Bekasi intended to adjust their current base rent-al. However, we also monitored that there were still quite a few shopping centres in Bekasi and Tangerang that offer base rental tariff below current average market prices, and thus the overall rent in the Greater Jakarta is up by 2.3% from early this year until 2017 YTD to IDR369,705/sq m/month.
Due to the confidence of having only a limited number of vacant spaces, some middle class shopping centres in Tangerang and Bekasi offer their unoccupied retail spaces quite high, starting from IDR400,000 up to IDR700,000/sq m/month.
Source: Colliers International Indonesia - Research
Service Charges Based on Mall Area in greater jakarta
Service Charges
IDR0
IDR20,000
IDR40,000
IDR60,000
IDR80,000
IDR100,000
IDR120,000
2010
2011
2012
2013
2014
2015
2016
2017
YTD
Bogor Depok Tangerang Bekasi All Areas
33 Colliers Quarterly | Q3 20173 October 2017 | Jakarta | Colliers International
Generally, shopping centre landlords in Greater Jakarta still see that there is no immediate action needed to ad-just service charges. Over the quarter, a moderate QOQ growth of 2% in Greater Jakarta only sends the overall ser-vice charges to register at IDR102,477/sq m/month as of Q3 2017. In our record, around 60% of shopping centres categorised as middle and mid-low class in Jakarta and Greater Jakarta are still offering maintenance tariff below the average market price.
Each city in the Greater Jakarta area has relatively simi-lar operational costs (mainly the minimum wages) and for sure the same utilities cost. Therefore, we see a similar service charge trend over the last few years, and there is also no big gap amongst the cities.
OutlookThe journey of Jakarta’s retail market has entered its most challenging period yet, marked by the declining spending power that has led to the shutdown of retail outlets. In Ja-karta, the retail market has been underpinned by a retail moratorium that maintains the number of additional retail spaces. Due to the moratorium, the retail sector has been quite “safe” from an oversupply situation. However, more incentives are needed to enliven trading activities. The middle to low class consumers will need more incentives from the government to recover their purchasing capabil-ity. Such incentives could include maintaining utilities pric-es (water, electricity, gas, etc.), stabilising transportation costs and lowering interest rates. Meanwhile, the middle to upper class segment needs more confidence over the cur-rent economic and political situation, which may include a friendlier tax regulation and more ease in doing business.
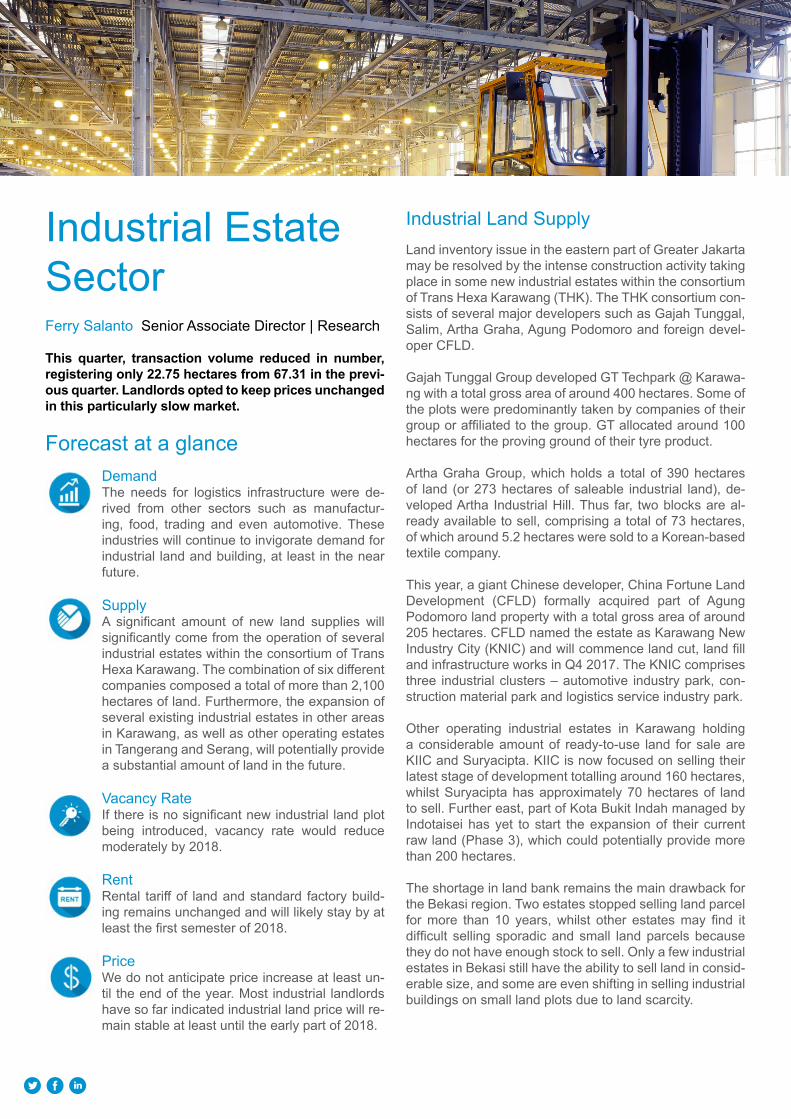
Industrial Land SupplyLand inventory issue in the eastern part of Greater Jakarta may be resolved by the intense construction activity taking place in some new industrial estates within the consortium of Trans Hexa Karawang (THK). The THK consortium con-sists of several major developers such as Gajah Tunggal, Salim, Artha Graha, Agung Podomoro and foreign devel-oper CFLD.
Gajah Tunggal Group developed GT Techpark @ Karawa-ng with a total gross area of around 400 hectares. Some of the plots were predominantly taken by companies of their group or affiliated to the group. GT allocated around 100 hectares for the proving ground of their tyre product.
Artha Graha Group, which holds a total of 390 hectares of land (or 273 hectares of saleable industrial land), de-veloped Artha Industrial Hill. Thus far, two blocks are al-ready available to sell, comprising a total of 73 hectares, of which around 5.2 hectares were sold to a Korean-based textile company.
This year, a giant Chinese developer, China Fortune Land Development (CFLD) formally acquired part of Agung Podomoro land property with a total gross area of around 205 hectares. CFLD named the estate as Karawang New Industry City (KNIC) and will commence land cut, land fill and infrastructure works in Q4 2017. The KNIC comprises three industrial clusters – automotive industry park, con-struction material park and logistics service industry park.
Other operating industrial estates in Karawang holding a considerable amount of ready-to-use land for sale are KIIC and Suryacipta. KIIC is now focused on selling their latest stage of development totalling around 160 hectares, whilst Suryacipta has approximately 70 hectares of land to sell. Further east, part of Kota Bukit Indah managed by Indotaisei has yet to start the expansion of their current raw land (Phase 3), which could potentially provide more than 200 hectares.
The shortage in land bank remains the main drawback for the Bekasi region. Two estates stopped selling land parcel for more than 10 years, whilst other estates may find it difficult selling sporadic and small land parcels because they do not have enough stock to sell. Only a few industrial estates in Bekasi still have the ability to sell land in consid-erable size, and some are even shifting in selling industrial buildings on small land plots due to land scarcity.
Industrial Estate SectorFerry Salanto Senior Associate Director | Research
This quarter, transaction volume reduced in number, registering only 22.75 hectares from 67.31 in the previ-ous quarter. landlords opted to keep prices unchanged in this particularly slow market.
Forecast at a glanceDemandThe needs for logistics infrastructure were de-rived from other sectors such as manufactur-ing, food, trading and even automotive. These industries will continue to invigorate demand for industrial land and building, at least in the near future.
SupplyA significant amount of new land supplies will significantly come from the operation of several industrial estates within the consortium of Trans Hexa Karawang. The combination of six different companies composed a total of more than 2,100 hectares of land. Furthermore, the expansion of several existing industrial estates in other areas in Karawang, as well as other operating estates in Tangerang and Serang, will potentially provide a substantial amount of land in the future.
Vacancy RateIf there is no significant new industrial land plot being introduced, vacancy rate would reduce moderately by 2018.
RentRental tariff of land and standard factory build-ing remains unchanged and will likely stay by at least the first semester of 2018.
PriceWe do not anticipate price increase at least un-til the end of the year. Most industrial landlords have so far indicated industrial land price will re-main stable at least until the early part of 2018.
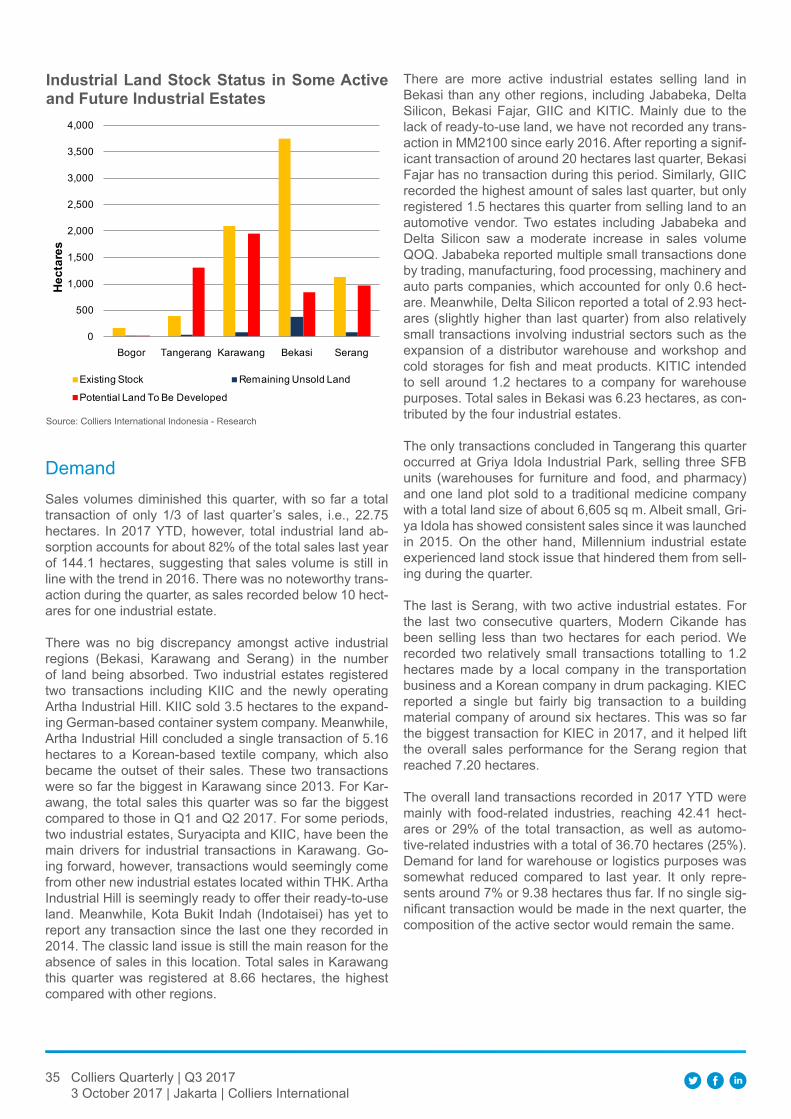
35 Colliers Quarterly | Q3 20173 October 2017 | Jakarta | Colliers International
Source: Colliers International Indonesia - Research
Industrial land Stock Status in Some Active and future Industrial estates
0
500
1,000
1,500
2,000
2,500
3,000
3,500
4,000
Bogor Tangerang Karawang Bekasi Serang
hect
ares
Existing Stock Remaining Unsold Land
Potential Land To Be Developed
DemandSales volumes diminished this quarter, with so far a total transaction of only 1/3 of last quarter’s sales, i.e., 22.75 hectares. In 2017 YTD, however, total industrial land ab-sorption accounts for about 82% of the total sales last year of 144.1 hectares, suggesting that sales volume is still in line with the trend in 2016. There was no noteworthy trans-action during the quarter, as sales recorded below 10 hect-ares for one industrial estate.
There was no big discrepancy amongst active industrial regions (Bekasi, Karawang and Serang) in the number of land being absorbed. Two industrial estates registered two transactions including KIIC and the newly operating Artha Industrial Hill. KIIC sold 3.5 hectares to the expand-ing German-based container system company. Meanwhile, Artha Industrial Hill concluded a single transaction of 5.16 hectares to a Korean-based textile company, which also became the outset of their sales. These two transactions were so far the biggest in Karawang since 2013. For Kar-awang, the total sales this quarter was so far the biggest compared to those in Q1 and Q2 2017. For some periods, two industrial estates, Suryacipta and KIIC, have been the main drivers for industrial transactions in Karawang. Go-ing forward, however, transactions would seemingly come from other new industrial estates located within THK. Artha Industrial Hill is seemingly ready to offer their ready-to-use land. Meanwhile, Kota Bukit Indah (Indotaisei) has yet to report any transaction since the last one they recorded in 2014. The classic land issue is still the main reason for the absence of sales in this location. Total sales in Karawang this quarter was registered at 8.66 hectares, the highest compared with other regions.
There are more active industrial estates selling land in Bekasi than any other regions, including Jababeka, Delta Silicon, Bekasi Fajar, GIIC and KITIC. Mainly due to the lack of ready-to-use land, we have not recorded any trans-action in MM2100 since early 2016. After reporting a signif-icant transaction of around 20 hectares last quarter, Bekasi Fajar has no transaction during this period. Similarly, GIIC recorded the highest amount of sales last quarter, but only registered 1.5 hectares this quarter from selling land to an automotive vendor. Two estates including Jababeka and Delta Silicon saw a moderate increase in sales volume QOQ. Jababeka reported multiple small transactions done by trading, manufacturing, food processing, machinery and auto parts companies, which accounted for only 0.6 hect-are. Meanwhile, Delta Silicon reported a total of 2.93 hect-ares (slightly higher than last quarter) from also relatively small transactions involving industrial sectors such as the expansion of a distributor warehouse and workshop and cold storages for fish and meat products. KITIC intended to sell around 1.2 hectares to a company for warehouse purposes. Total sales in Bekasi was 6.23 hectares, as con-tributed by the four industrial estates.
The only transactions concluded in Tangerang this quarter occurred at Griya Idola Industrial Park, selling three SFB units (warehouses for furniture and food, and pharmacy) and one land plot sold to a traditional medicine company with a total land size of about 6,605 sq m. Albeit small, Gri-ya Idola has showed consistent sales since it was launched in 2015. On the other hand, Millennium industrial estate experienced land stock issue that hindered them from sell-ing during the quarter.
The last is Serang, with two active industrial estates. For the last two consecutive quarters, Modern Cikande has been selling less than two hectares for each period. We recorded two relatively small transactions totalling to 1.2 hectares made by a local company in the transportation business and a Korean company in drum packaging. KIEC reported a single but fairly big transaction to a building material company of around six hectares. This was so far the biggest transaction for KIEC in 2017, and it helped lift the overall sales performance for the Serang region that reached 7.20 hectares.
The overall land transactions recorded in 2017 YTD were mainly with food-related industries, reaching 42.41 hect-ares or 29% of the total transaction, as well as automo-tive-related industries with a total of 36.70 hectares (25%). Demand for land for warehouse or logistics purposes was somewhat reduced compared to last year. It only repre-sents around 7% or 9.38 hectares thus far. If no single sig-nificant transaction would be made in the next quarter, the composition of the active sector would remain the same.
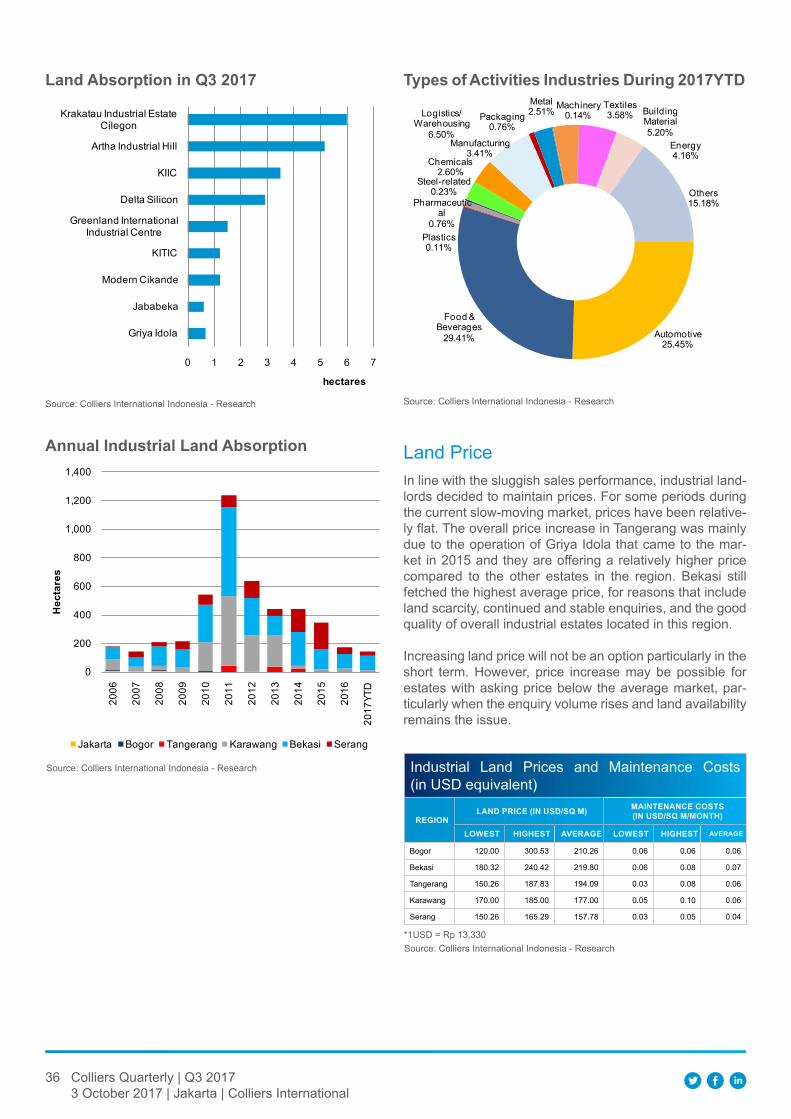
36 Colliers Quarterly | Q3 20173 October 2017 | Jakarta | Colliers International
Source: Colliers International Indonesia - Research
land Absorption in q3 2017
Source: Colliers International Indonesia - Research
Annual Industrial land Absorption
Source: Colliers International Indonesia - Research
Types of Activities Industries during 2017YTd
In line with the sluggish sales performance, industrial land-lords decided to maintain prices. For some periods during the current slow-moving market, prices have been relative-ly flat. The overall price increase in Tangerang was mainly due to the operation of Griya Idola that came to the mar-ket in 2015 and they are offering a relatively higher price compared to the other estates in the region. Bekasi still fetched the highest average price, for reasons that include land scarcity, continued and stable enquiries, and the good quality of overall industrial estates located in this region. Increasing land price will not be an option particularly in the short term. However, price increase may be possible for estates with asking price below the average market, par-ticularly when the enquiry volume rises and land availability remains the issue.
Land Price
Source: Colliers International Indonesia - Research*1USD = Rp 13,330
Industrial Land Prices and Maintenance Costs (in USD equivalent)
regIONlANd PrICe (IN uSd/Sq M) MAINTeNANCe COSTS
(IN uSd/Sq M/MONTh)
lOweST hIgheST AverAge lOweST hIgheST AverAge
Bogor 120.00 300.53 210.26 0.06 0.06 0.06
Bekasi 180.32 240.42 219.80 0.06 0.08 0.07
Tangerang 150.26 187.83 194.09 0.03 0.08 0.06
Karawang 170.00 185.00 177.00 0.05 0.10 0.06
Serang 150.26 165.29 157.78 0.03 0.05 0.04
0 1 2 3 4 5 6 7
Griya Idola
Jababeka
Modern Cikande
KITIC
Greenland International Industrial Centre
Delta Silicon
KIIC
Artha Industrial Hill
Krakatau Industrial Estate Cilegon
hectares
0
200
400
600
800
1,000
1,200
1,400
2006
2007
2008
2009
2010
2011
2012
2013
2014
2015
2016
2017
YTD
hec
tare
s
Jakarta Bogor Tangerang Karawang Bekasi Serang
Automotive25.45%
Food & Beverages
29.41%
Plastics0.11%
Pharmaceutical
0.76%
Steel-related0.23%
Chemicals2.60%
Manufacturing3.41%
Logistics/Warehousing
6.50%
Packaging0.76%
Metal2.51% Machinery
0.14%Textiles3.58% Building
Material5.20%
Energy4.16%
Others15.18%
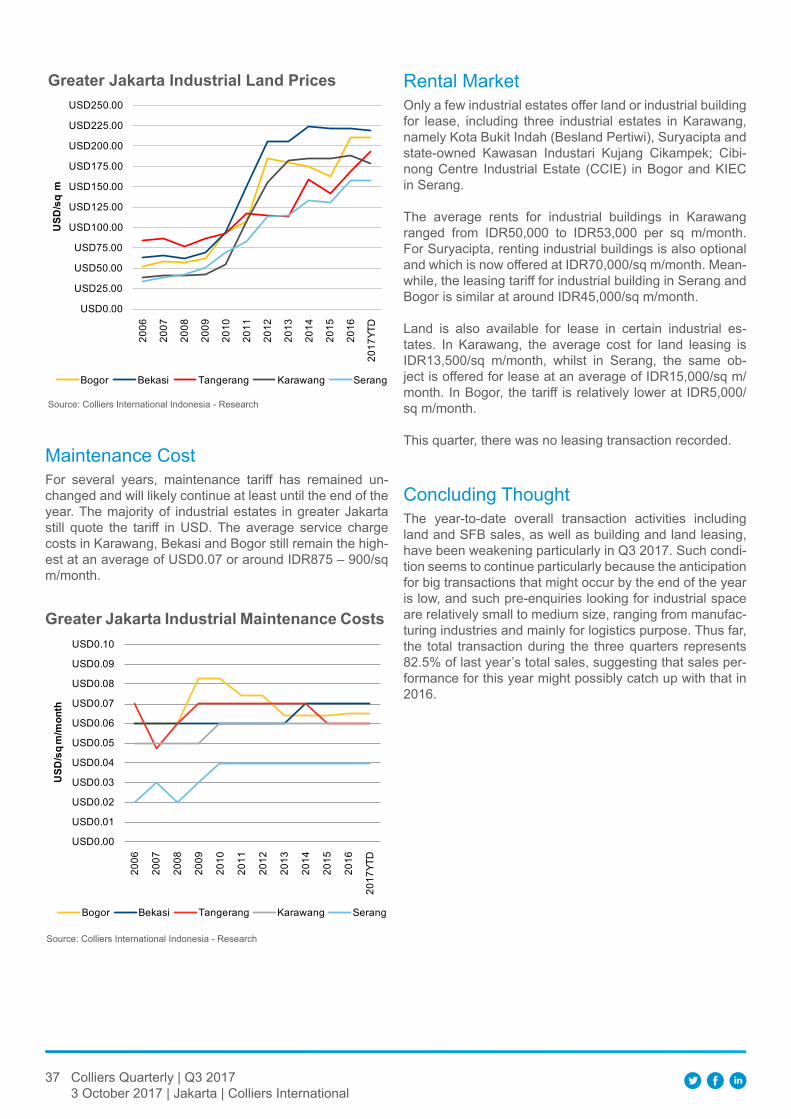
37 Colliers Quarterly | Q3 20173 October 2017 | Jakarta | Colliers International
Source: Colliers International Indonesia - Research
greater jakarta Industrial land Prices
USD0.00
USD25.00
USD50.00
USD75.00
USD100.00
USD125.00
USD150.00
USD175.00
USD200.00
USD225.00
USD250.00
2006
2007
2008
2009
2010
2011
2012
2013
2014
2015
2016
2017
YTD
uSd
/sq
m
Bogor Bekasi Tangerang Karawang Serang
Maintenance CostFor several years, maintenance tariff has remained un-changed and will likely continue at least until the end of the year. The majority of industrial estates in greater Jakarta still quote the tariff in USD. The average service charge costs in Karawang, Bekasi and Bogor still remain the high-est at an average of USD0.07 or around IDR875 – 900/sq m/month.
Source: Colliers International Indonesia - Research
greater jakarta Industrial Maintenance Costs
USD0.00
USD0.01
USD0.02
USD0.03
USD0.04
USD0.05
USD0.06
USD0.07
USD0.08
USD0.09
USD0.10
2006
2007
2008
2009
2010
2011
2012
2013
2014
2015
2016
2017
YTD
uSd
/sq
m/m
onth
Bogor Bekasi Tangerang Karawang Serang
Rental MarketOnly a few industrial estates offer land or industrial building for lease, including three industrial estates in Karawang, namely Kota Bukit Indah (Besland Pertiwi), Suryacipta and state-owned Kawasan Industari Kujang Cikampek; Cibi-nong Centre Industrial Estate (CCIE) in Bogor and KIEC in Serang.
The average rents for industrial buildings in Karawang ranged from IDR50,000 to IDR53,000 per sq m/month. For Suryacipta, renting industrial buildings is also optional and which is now offered at IDR70,000/sq m/month. Mean-while, the leasing tariff for industrial building in Serang and Bogor is similar at around IDR45,000/sq m/month.
Land is also available for lease in certain industrial es-tates. In Karawang, the average cost for land leasing is IDR13,500/sq m/month, whilst in Serang, the same ob-ject is offered for lease at an average of IDR15,000/sq m/month. In Bogor, the tariff is relatively lower at IDR5,000/sq m/month.
This quarter, there was no leasing transaction recorded.
Concluding ThoughtThe year-to-date overall transaction activities including land and SFB sales, as well as building and land leasing, have been weakening particularly in Q3 2017. Such condi-tion seems to continue particularly because the anticipation for big transactions that might occur by the end of the year is low, and such pre-enquiries looking for industrial space are relatively small to medium size, ranging from manufac-turing industries and mainly for logistics purpose. Thus far, the total transaction during the three quarters represents 82.5% of last year’s total sales, suggesting that sales per-formance for this year might possibly catch up with that in 2016.
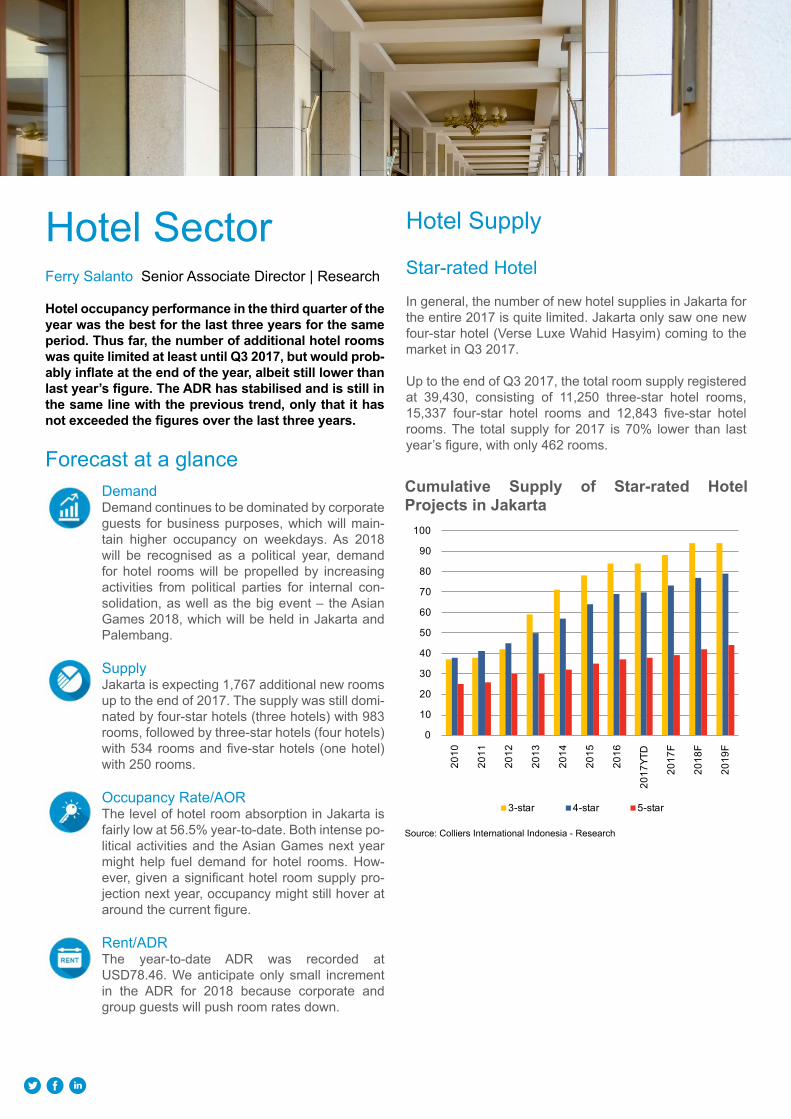
Hotel Supply
Star-rated Hotel In general, the number of new hotel supplies in Jakarta for the entire 2017 is quite limited. Jakarta only saw one new four-star hotel (Verse Luxe Wahid Hasyim) coming to the market in Q3 2017.
Up to the end of Q3 2017, the total room supply registered at 39,430, consisting of 11,250 three-star hotel rooms, 15,337 four-star hotel rooms and 12,843 five-star hotel rooms. The total supply for 2017 is 70% lower than last year’s figure, with only 462 rooms.
Hotel SectorFerry Salanto Senior Associate Director | Research
hotel occupancy performance in the third quarter of the year was the best for the last three years for the same period. Thus far, the number of additional hotel rooms was quite limited at least until q3 2017, but would prob-ably inflate at the end of the year, albeit still lower than last year’s figure. The Adr has stabilised and is still in the same line with the previous trend, only that it has not exceeded the figures over the last three years.
Forecast at a glanceDemandDemand continues to be dominated by corporate guests for business purposes, which will main-tain higher occupancy on weekdays. As 2018 will be recognised as a political year, demand for hotel rooms will be propelled by increasing activities from political parties for internal con-solidation, as well as the big event – the Asian Games 2018, which will be held in Jakarta and Palembang.
SupplyJakarta is expecting 1,767 additional new rooms up to the end of 2017. The supply was still domi-nated by four-star hotels (three hotels) with 983 rooms, followed by three-star hotels (four hotels) with 534 rooms and five-star hotels (one hotel) with 250 rooms.
Occupancy Rate/AORThe level of hotel room absorption in Jakarta is fairly low at 56.5% year-to-date. Both intense po-litical activities and the Asian Games next year might help fuel demand for hotel rooms. How-ever, given a significant hotel room supply pro-jection next year, occupancy might still hover at around the current figure.
Rent/ADRThe year-to-date ADR was recorded at USD78.46. We anticipate only small increment in the ADR for 2018 because corporate and group guests will push room rates down.
Source: Colliers International Indonesia - Research
Cumulative Supply of Star-rated hotel Projects in jakarta
0
10
20
30
40
50
60
70
80
90
100
2010
2011
2012
2013
2014
2015
2016
2017
YTD
2017
F
2018
F
2019
F
3-star 4-star 5-star
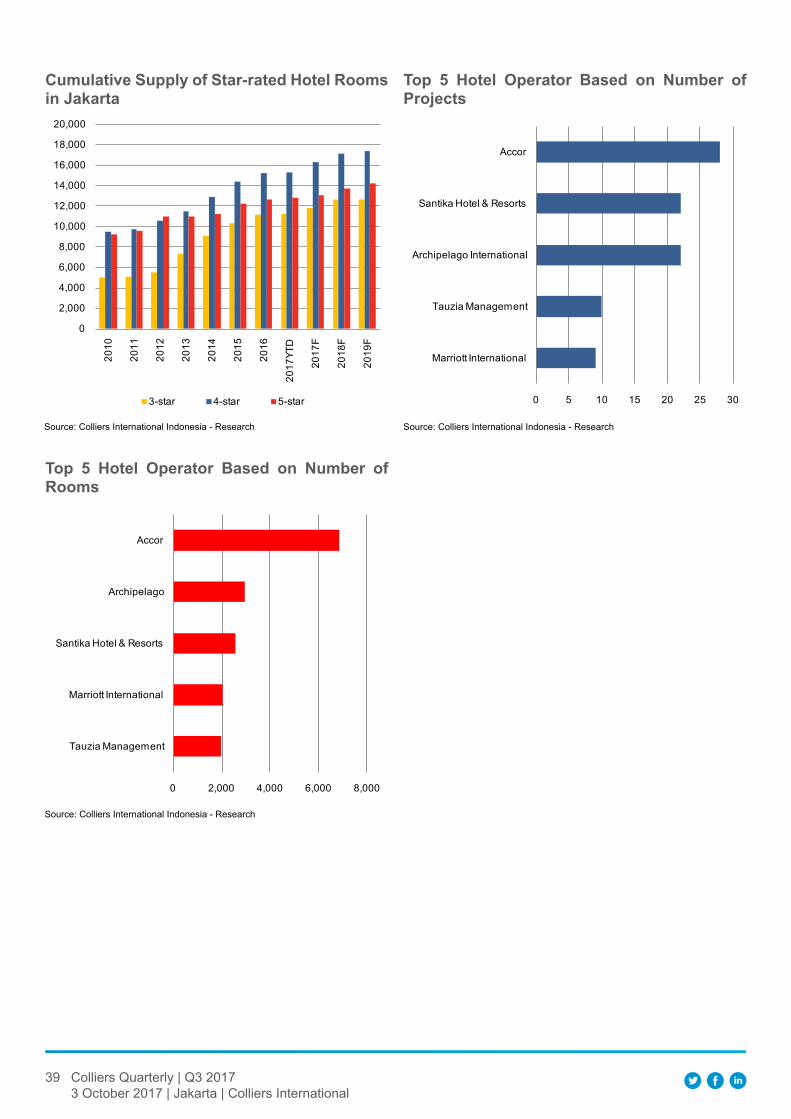
39 Colliers Quarterly | Q3 20173 October 2017 | Jakarta | Colliers International
Source: Colliers International Indonesia - Research
Cumulative Supply of Star-rated hotel rooms in jakarta
0
2,000
4,000
6,000
8,000
10,000
12,000
14,000
16,000
18,000
20,000
2010
2011
2012
2013
2014
2015
2016
2017
YTD
2017
F
2018
F
2019
F
3-star 4-star 5-star
Source: Colliers International Indonesia - Research
Top 5 hotel Operator Based on Number of Projects
0 5 10 15 20 25 30
Marriott International
Tauzia Management
Archipelago International
Santika Hotel & Resorts
Accor
Source: Colliers International Indonesia - Research
Top 5 hotel Operator Based on Number of rooms
0 2,000 4,000 6,000 8,000
Tauzia Management
Marriott International
Santika Hotel & Resorts
Archipelago
Accor
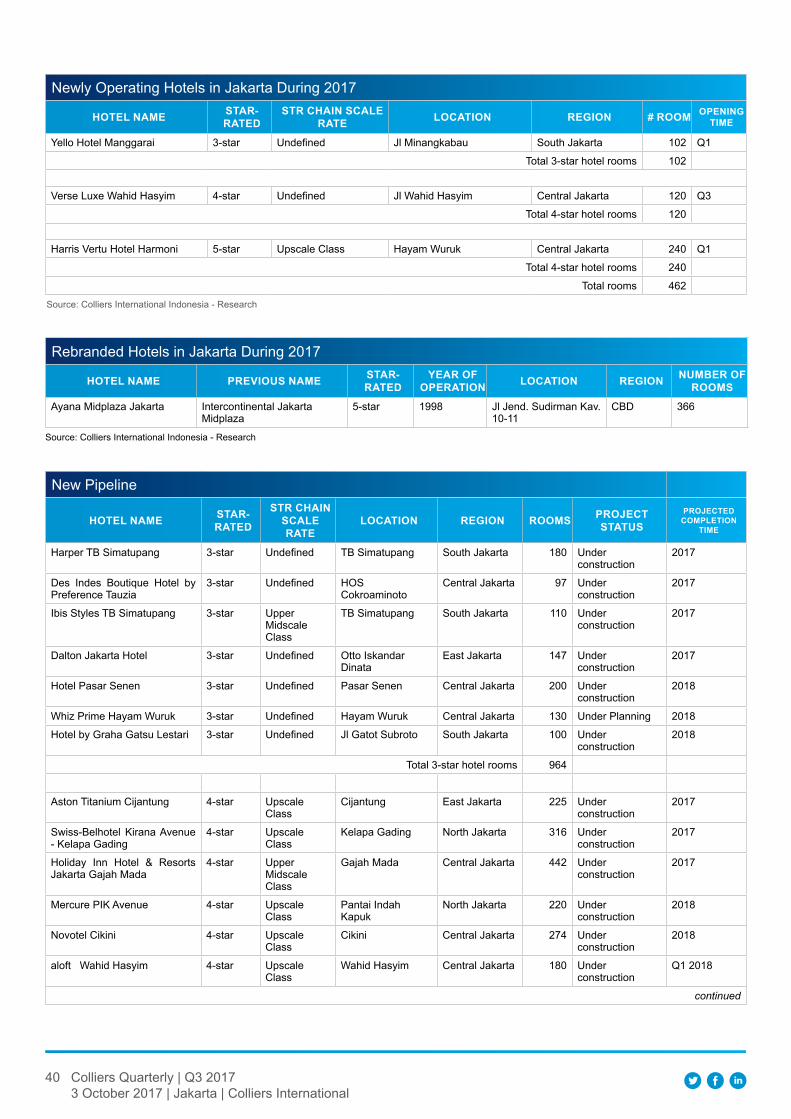
40 Colliers Quarterly | Q3 20173 October 2017 | Jakarta | Colliers International
Newly Operating Hotels in Jakarta During 2017
hOTel NAMe STAr-rATed
STr ChAIN SCAle rATe lOCATION regION # rOOM OPeNINg
TIMe
Yello Hotel Manggarai 3-star Undefined Jl Minangkabau South Jakarta 102 Q1
Total 3-star hotel rooms 102
Verse Luxe Wahid Hasyim 4-star Undefined Jl Wahid Hasyim Central Jakarta 120 Q3
Total 4-star hotel rooms 120
Harris Vertu Hotel Harmoni 5-star Upscale Class Hayam Wuruk Central Jakarta 240 Q1
Total 4-star hotel rooms 240
Total rooms 462
Source: Colliers International Indonesia - Research
Rebranded Hotels in Jakarta During 2017
hOTel NAMe PrevIOuS NAMe STAr-rATed
YeAr Of OPerATION lOCATION regION NuMBer Of
rOOMS
Ayana Midplaza Jakarta Intercontinental Jakarta Midplaza
5-star 1998 Jl Jend. Sudirman Kav. 10-11
CBD 366
Source: Colliers International Indonesia - Research
New Pipeline
hOTel NAMe STAr- rATed
STr ChAIN SCAle rATe
lOCATION regION rOOMS PrOjeCT STATuS
PrOjeCTed COMPleTION
TIMe
Harper TB Simatupang 3-star Undefined TB Simatupang South Jakarta 180 Under construction
2017
Des Indes Boutique Hotel by Preference Tauzia
3-star Undefined HOS Cokroaminoto
Central Jakarta 97 Under construction
2017
Ibis Styles TB Simatupang 3-star Upper Midscale Class
TB Simatupang South Jakarta 110 Under construction
2017
Dalton Jakarta Hotel 3-star Undefined Otto Iskandar Dinata
East Jakarta 147 Under construction
2017
Hotel Pasar Senen 3-star Undefined Pasar Senen Central Jakarta 200 Under construction
2018
Whiz Prime Hayam Wuruk 3-star Undefined Hayam Wuruk Central Jakarta 130 Under Planning 2018
Hotel by Graha Gatsu Lestari 3-star Undefined Jl Gatot Subroto South Jakarta 100 Under construction
2018
Total 3-star hotel rooms 964
Aston Titanium Cijantung 4-star Upscale Class
Cijantung East Jakarta 225 Under construction
2017
Swiss-Belhotel Kirana Avenue - Kelapa Gading
4-star Upscale Class
Kelapa Gading North Jakarta 316 Under construction
2017
Holiday Inn Hotel & Resorts Jakarta Gajah Mada
4-star Upper Midscale Class
Gajah Mada Central Jakarta 442 Under construction
2017
Mercure PIK Avenue 4-star Upscale Class
Pantai Indah Kapuk
North Jakarta 220 Under construction
2018
Novotel Cikini 4-star Upscale Class
Cikini Central Jakarta 274 Under construction
2018
aloft Wahid Hasyim 4-star Upscale Class
Wahid Hasyim Central Jakarta 180 Under construction
Q1 2018
continued
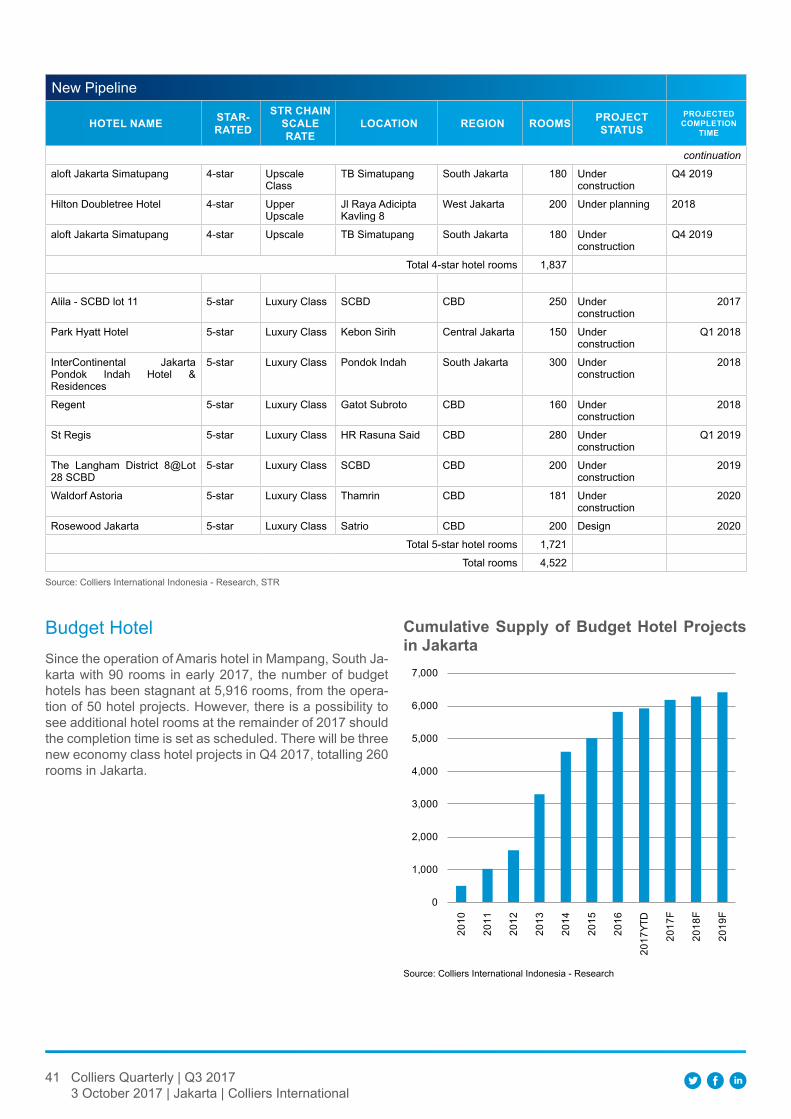
41 Colliers Quarterly | Q3 20173 October 2017 | Jakarta | Colliers International
New Pipeline
hOTel NAMe STAr- rATed
STr ChAIN SCAle rATe
lOCATION regION rOOMS PrOjeCT STATuS
PrOjeCTed COMPleTION
TIMe
continuation
aloft Jakarta Simatupang 4-star Upscale Class
TB Simatupang South Jakarta 180 Under construction
Q4 2019
Hilton Doubletree Hotel 4-star Upper Upscale
Jl Raya Adicipta Kavling 8
West Jakarta 200 Under planning 2018
aloft Jakarta Simatupang 4-star Upscale TB Simatupang South Jakarta 180 Under construction
Q4 2019
Total 4-star hotel rooms 1,837
Alila - SCBD lot 11 5-star Luxury Class SCBD CBD 250 Under construction
2017
Park Hyatt Hotel 5-star Luxury Class Kebon Sirih Central Jakarta 150 Under construction
Q1 2018
InterContinental Jakarta Pondok Indah Hotel & Residences
5-star Luxury Class Pondok Indah South Jakarta 300 Under construction
2018
Regent 5-star Luxury Class Gatot Subroto CBD 160 Under construction
2018
St Regis 5-star Luxury Class HR Rasuna Said CBD 280 Under construction
Q1 2019
The Langham District 8@Lot 28 SCBD
5-star Luxury Class SCBD CBD 200 Under construction
2019
Waldorf Astoria 5-star Luxury Class Thamrin CBD 181 Under construction
2020
Rosewood Jakarta 5-star Luxury Class Satrio CBD 200 Design 2020
Total 5-star hotel rooms 1,721
Total rooms 4,522
Source: Colliers International Indonesia - Research, STR
Budget HotelSince the operation of Amaris hotel in Mampang, South Ja-karta with 90 rooms in early 2017, the number of budget hotels has been stagnant at 5,916 rooms, from the opera-tion of 50 hotel projects. However, there is a possibility to see additional hotel rooms at the remainder of 2017 should the completion time is set as scheduled. There will be three new economy class hotel projects in Q4 2017, totalling 260 rooms in Jakarta.
Source: Colliers International Indonesia - Research
Cumulative Supply of Budget hotel Projects in jakarta
0
1,000
2,000
3,000
4,000
5,000
6,000
7,000
2010
2011
2012
2013
2014
2015
2016
2017
YTD
2017
F
2018
F
2019
F
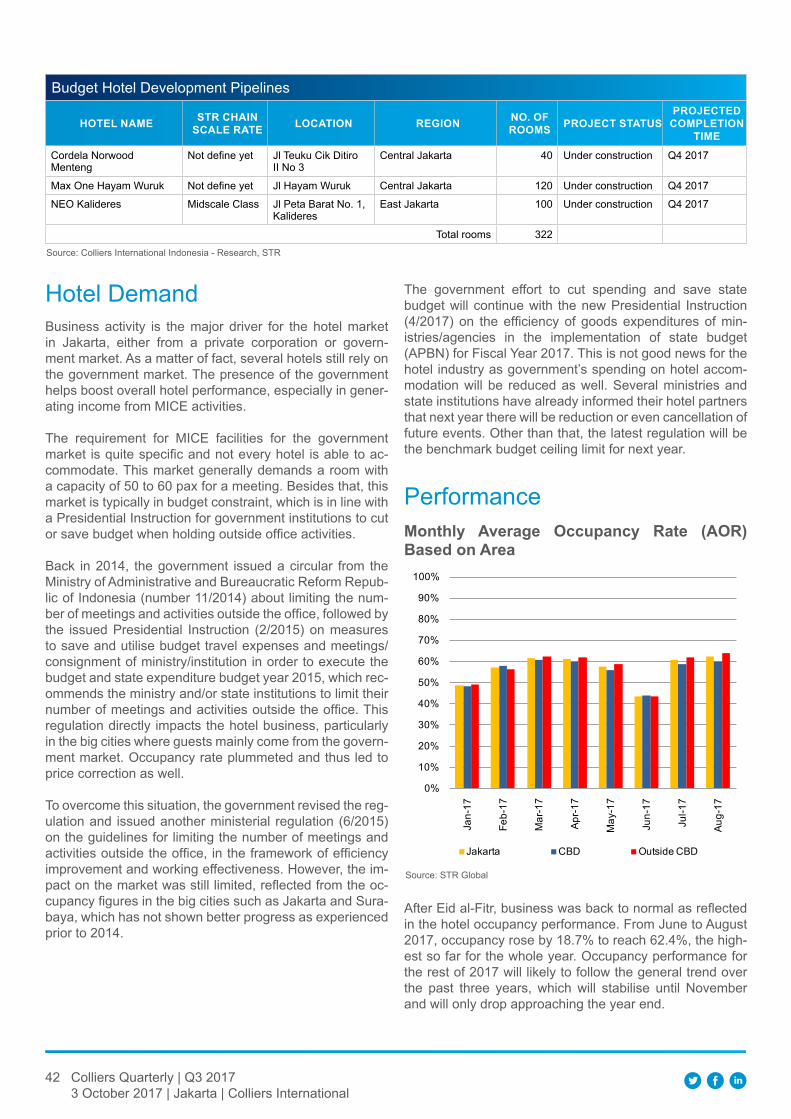
42 Colliers Quarterly | Q3 20173 October 2017 | Jakarta | Colliers International
Budget Hotel Development Pipelines
hOTel NAMe STr ChAIN SCAle rATe lOCATION regION NO. Of
rOOMS PrOjeCT STATuSPrOjeCTed
COMPleTION TIMe
Cordela Norwood Menteng
Not define yet Jl Teuku Cik Ditiro II No 3
Central Jakarta 40 Under construction Q4 2017
Max One Hayam Wuruk Not define yet Jl Hayam Wuruk Central Jakarta 120 Under construction Q4 2017
NEO Kalideres Midscale Class Jl Peta Barat No. 1, Kalideres
East Jakarta 100 Under construction Q4 2017
Total rooms 322Source: Colliers International Indonesia - Research, STR
Hotel DemandBusiness activity is the major driver for the hotel market in Jakarta, either from a private corporation or govern-ment market. As a matter of fact, several hotels still rely on the government market. The presence of the government helps boost overall hotel performance, especially in gener-ating income from MICE activities.
The requirement for MICE facilities for the government market is quite specific and not every hotel is able to ac-commodate. This market generally demands a room with a capacity of 50 to 60 pax for a meeting. Besides that, this market is typically in budget constraint, which is in line with a Presidential Instruction for government institutions to cut or save budget when holding outside office activities.
Back in 2014, the government issued a circular from the Ministry of Administrative and Bureaucratic Reform Repub-lic of Indonesia (number 11/2014) about limiting the num-ber of meetings and activities outside the office, followed by the issued Presidential Instruction (2/2015) on measures to save and utilise budget travel expenses and meetings/consignment of ministry/institution in order to execute the budget and state expenditure budget year 2015, which rec-ommends the ministry and/or state institutions to limit their number of meetings and activities outside the office. This regulation directly impacts the hotel business, particularly in the big cities where guests mainly come from the govern-ment market. Occupancy rate plummeted and thus led to price correction as well.
To overcome this situation, the government revised the reg-ulation and issued another ministerial regulation (6/2015) on the guidelines for limiting the number of meetings and activities outside the office, in the framework of efficiency improvement and working effectiveness. However, the im-pact on the market was still limited, reflected from the oc-cupancy figures in the big cities such as Jakarta and Sura-baya, which has not shown better progress as experienced prior to 2014.
The government effort to cut spending and save state budget will continue with the new Presidential Instruction (4/2017) on the efficiency of goods expenditures of min-istries/agencies in the implementation of state budget (APBN) for Fiscal Year 2017. This is not good news for the hotel industry as government’s spending on hotel accom-modation will be reduced as well. Several ministries and state institutions have already informed their hotel partners that next year there will be reduction or even cancellation of future events. Other than that, the latest regulation will be the benchmark budget ceiling limit for next year.
PerformanceMonthly Average Occupancy rate (AOr) Based on Area
Source: STR Global
0%
10%
20%
30%
40%
50%
60%
70%
80%
90%
100%
Jan-
17
Feb-
17
Mar
-17
Apr-1
7
May
-17
Jun-
17
Jul-1
7
Aug-
17
Jakarta CBD Outside CBD
After Eid al-Fitr, business was back to normal as reflected in the hotel occupancy performance. From June to August 2017, occupancy rose by 18.7% to reach 62.4%, the high-est so far for the whole year. Occupancy performance for the rest of 2017 will likely to follow the general trend over the past three years, which will stabilise until November and will only drop approaching the year end.
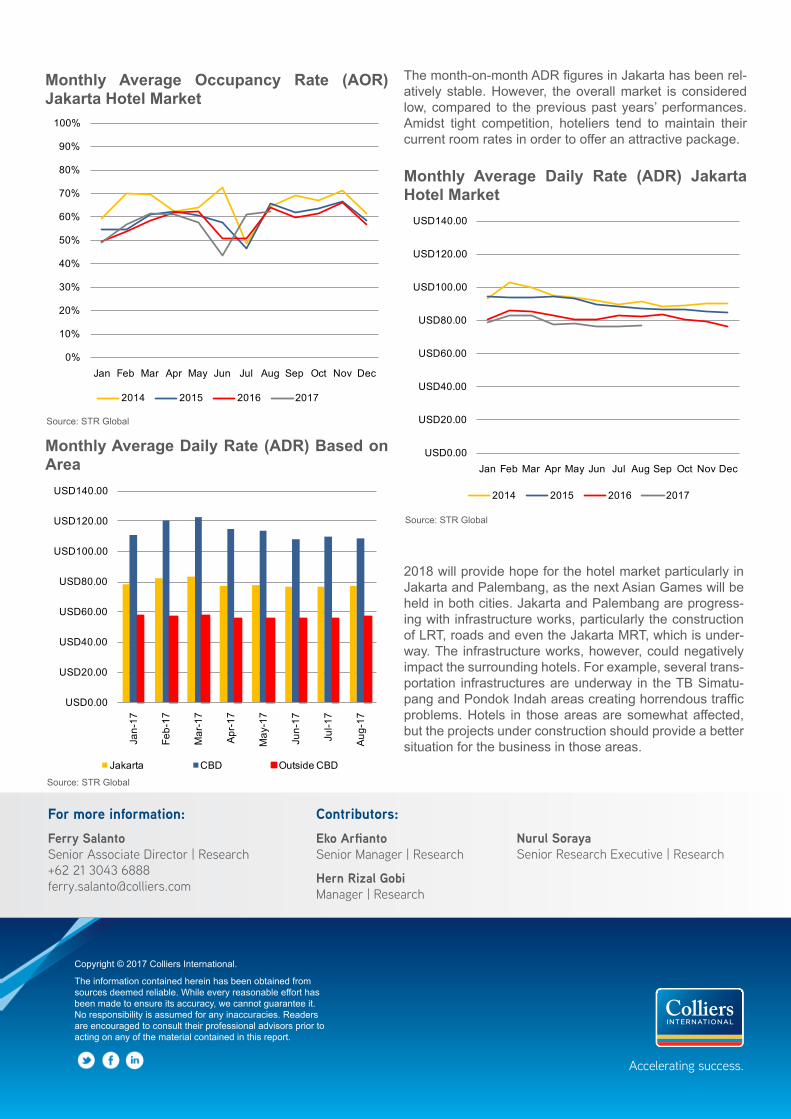
Copyright © 2017 Colliers International.
The information contained herein has been obtained from sources deemed reliable. While every reasonable effort has been made to ensure its accuracy, we cannot guarantee it. No responsibility is assumed for any inaccuracies. Readers are encouraged to consult their professional advisors prior to acting on any of the material contained in this report.
Accelerating success.
For more information:Ferry SalantoSenior Associate Director | Research+62 21 3043 [email protected]
Contributors:Eko ArfiantoSenior Manager | Research
Hern Rizal GobiManager | Research
Nurul SorayaSenior Research Executive | Research
Monthly Average Occupancy rate (AOr) jakarta hotel Market
Source: STR Global
0%
10%
20%
30%
40%
50%
60%
70%
80%
90%
100%
Jan Feb Mar Apr May Jun Jul Aug Sep Oct Nov Dec
2014 2015 2016 2017
Monthly Average daily rate (Adr) Based on Area
Source: STR Global
USD0.00
USD20.00
USD40.00
USD60.00
USD80.00
USD100.00
USD120.00
USD140.00
Jan-
17
Feb-
17
Mar
-17
Apr-1
7
May
-17
Jun-
17
Jul-1
7
Aug-
17
Jakarta CBD Outside CBD
The month-on-month ADR figures in Jakarta has been rel-atively stable. However, the overall market is considered low, compared to the previous past years’ performances. Amidst tight competition, hoteliers tend to maintain their current room rates in order to offer an attractive package.
2018 will provide hope for the hotel market particularly in Jakarta and Palembang, as the next Asian Games will be held in both cities. Jakarta and Palembang are progress-ing with infrastructure works, particularly the construction of LRT, roads and even the Jakarta MRT, which is under-way. The infrastructure works, however, could negatively impact the surrounding hotels. For example, several trans-portation infrastructures are underway in the TB Simatu-pang and Pondok Indah areas creating horrendous traffic problems. Hotels in those areas are somewhat affected, but the projects under construction should provide a better situation for the business in those areas.
Monthly Average daily rate (Adr) jakarta hotel Market
Source: STR Global
USD0.00
USD20.00
USD40.00
USD60.00
USD80.00
USD100.00
USD120.00
USD140.00
Jan Feb Mar Apr May Jun Jul Aug Sep Oct Nov Dec
2014 2015 2016 2017
Colliers QuarterlyQ4 201721 March 2018
JAKARTA PROPERTY MARKET REPORT
Accelerating success.
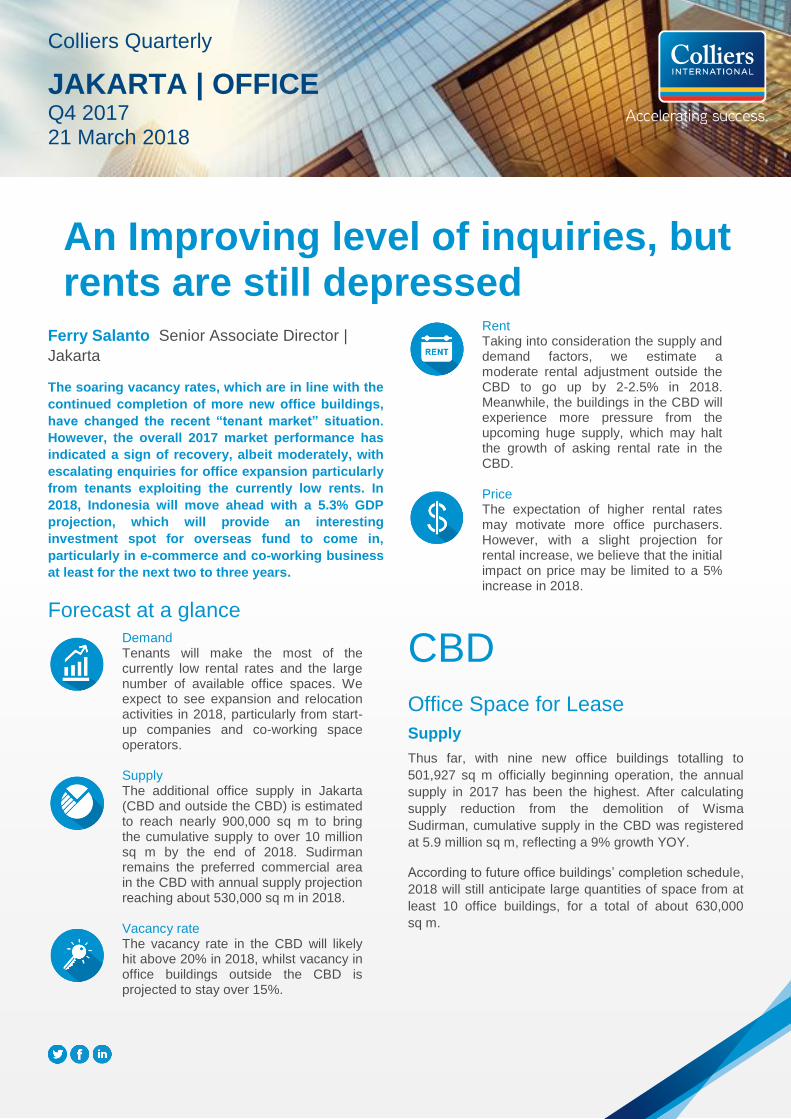
Copyright © 2015 Colliers International.
The information contained herein has been
obtained from sources deemed reliable.
While every reasonable effort has been
made to ensure its accuracy, we cannot
guarantee it. No responsibility is assumed
for any inaccuracies. Readers are
encouraged to consult their professional
advisors prior to acting on any of the
For more information:
Market Contact Name
Title | Market
+1 00 000 0000
Market Contact Name
Title | Market
+1 00 000 0000
Contributors:
Market Contact Name
Title | Market
Market Contact Name
Title | Market
Market Contact Name
Title | Market
Market Contact Name
Title | Market
Ferry Salanto Senior Associate Director |
Jakarta
The soaring vacancy rates, which are in line with the
continued completion of more new office buildings,
have changed the recent “tenant market” situation.
However, the overall 2017 market performance has
indicated a sign of recovery, albeit moderately, with
escalating enquiries for office expansion particularly
from tenants exploiting the currently low rents. In
2018, Indonesia will move ahead with a 5.3% GDP
projection, which will provide an interesting
investment spot for overseas fund to come in,
particularly in e-commerce and co-working business
at least for the next two to three years.
Forecast at a glance
Demand Tenants will make the most of the currently low rental rates and the large number of available office spaces. We expect to see expansion and relocation activities in 2018, particularly from start-up companies and co-working space operators.
Supply
The additional office supply in Jakarta (CBD and outside the CBD) is estimated to reach nearly 900,000 sq m to bring the cumulative supply to over 10 million sq m by the end of 2018. Sudirman remains the preferred commercial area in the CBD with annual supply projection reaching about 530,000 sq m in 2018.
Vacancy rate
The vacancy rate in the CBD will likely hit above 20% in 2018, whilst vacancy in office buildings outside the CBD is projected to stay over 15%.
Rent Taking into consideration the supply and demand factors, we estimate a moderate rental adjustment outside the CBD to go up by 2-2.5% in 2018. Meanwhile, the buildings in the CBD will experience more pressure from the upcoming huge supply, which may halt the growth of asking rental rate in the CBD.
Price
The expectation of higher rental rates may motivate more office purchasers. However, with a slight projection for rental increase, we believe that the initial impact on price may be limited to a 5% increase in 2018.
CBD
Office Space for Lease
Supply
Thus far, with nine new office buildings totalling to
501,927 sq m officially beginning operation, the annual
supply in 2017 has been the highest. After calculating
supply reduction from the demolition of Wisma
Sudirman, cumulative supply in the CBD was registered
at 5.9 million sq m, reflecting a 9% growth YOY.
According to future office buildings’ completion schedule,
2018 will still anticipate large quantities of space from at
least 10 office buildings, for a total of about 630,000
sq m.
Colliers Quarterly
JAKARTA | OFFICE Q4 2017 21 March 2018
An Improving level of inquiries, but rents are still depressed
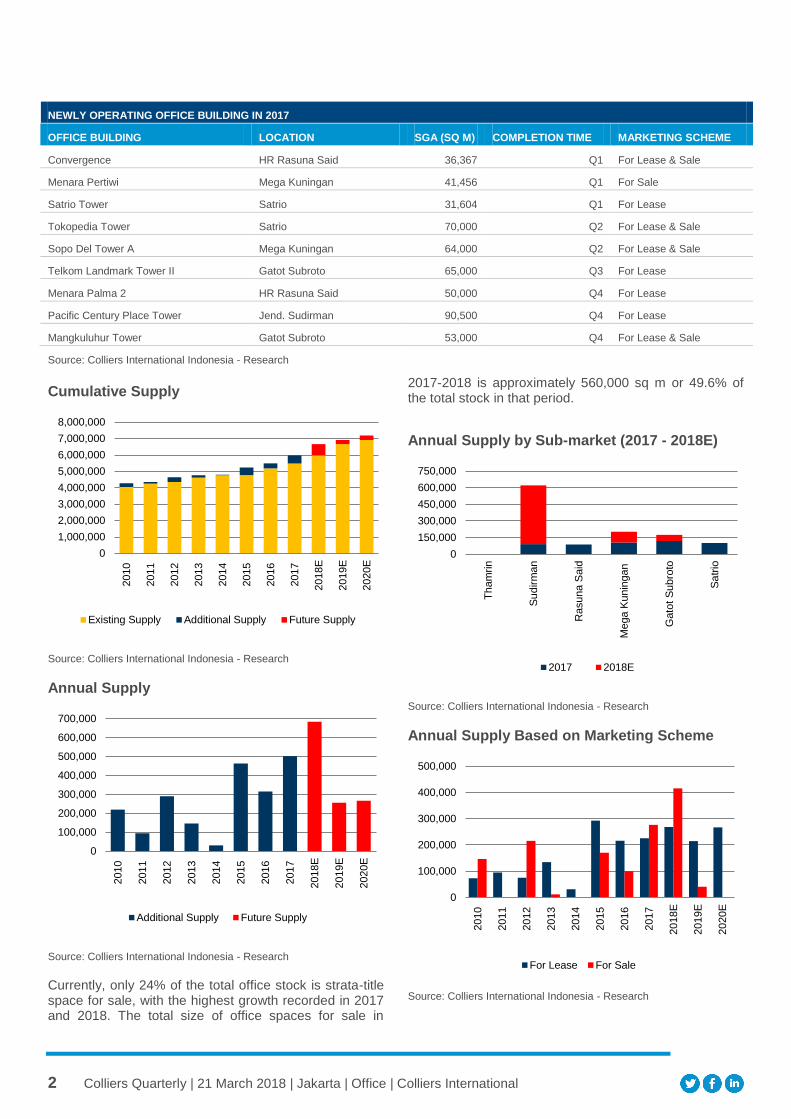
2 Colliers Quarterly | 21 March 2018 | Jakarta | Office | Colliers International
Cumulative Supply
Source: Colliers International Indonesia - Research
Annual Supply
Source: Colliers International Indonesia - Research
Currently, only 24% of the total office stock is strata-title space for sale, with the highest growth recorded in 2017 and 2018. The total size of office spaces for sale in
2017-2018 is approximately 560,000 sq m or 49.6% of the total stock in that period.
Annual Supply by Sub-market (2017 - 2018E)
Source: Colliers International Indonesia - Research
Annual Supply Based on Marketing Scheme
Source: Colliers International Indonesia - Research
0
1,000,000
2,000,000
3,000,000
4,000,000
5,000,000
6,000,000
7,000,000
8,000,000
2010
2011
2012
2013
2014
2015
2016
2017
2018E
2019E
2020E
Existing Supply Additional Supply Future Supply
0
100,000
200,000
300,000
400,000
500,000
600,000
700,000
2010
2011
2012
2013
2014
2015
2016
2017
2018E
2019E
2020E
Additional Supply Future Supply
0
150,000
300,000
450,000
600,000
750,000
Th
am
rin
Su
dirm
an
Rasuna S
aid
Me
ga K
unin
gan
Gato
t S
ubro
to
Sa
trio
2017 2018E
0
100,000
200,000
300,000
400,000
500,000
2010
2011
2012
2013
2014
2015
2016
2017
2018E
2019E
2020E
For Lease For Sale
NEWLY OPERATING OFFICE BUILDING IN 2017
OFFICE BUILDING LOCATION SGA (SQ M) COMPLETION TIME MARKETING SCHEME
Convergence HR Rasuna Said 36,367 Q1 For Lease & Sale
Menara Pertiwi Mega Kuningan 41,456 Q1 For Sale
Satrio Tower Satrio 31,604 Q1 For Lease
Tokopedia Tower Satrio 70,000 Q2 For Lease & Sale
Sopo Del Tower A Mega Kuningan 64,000 Q2 For Lease & Sale
Telkom Landmark Tower II Gatot Subroto 65,000 Q3 For Lease
Menara Palma 2 HR Rasuna Said 50,000 Q4 For Lease
Pacific Century Place Tower Jend. Sudirman 90,500 Q4 For Lease
Mangkuluhur Tower Gatot Subroto 53,000 Q4 For Lease & Sale
Source: Colliers International Indonesia - Research
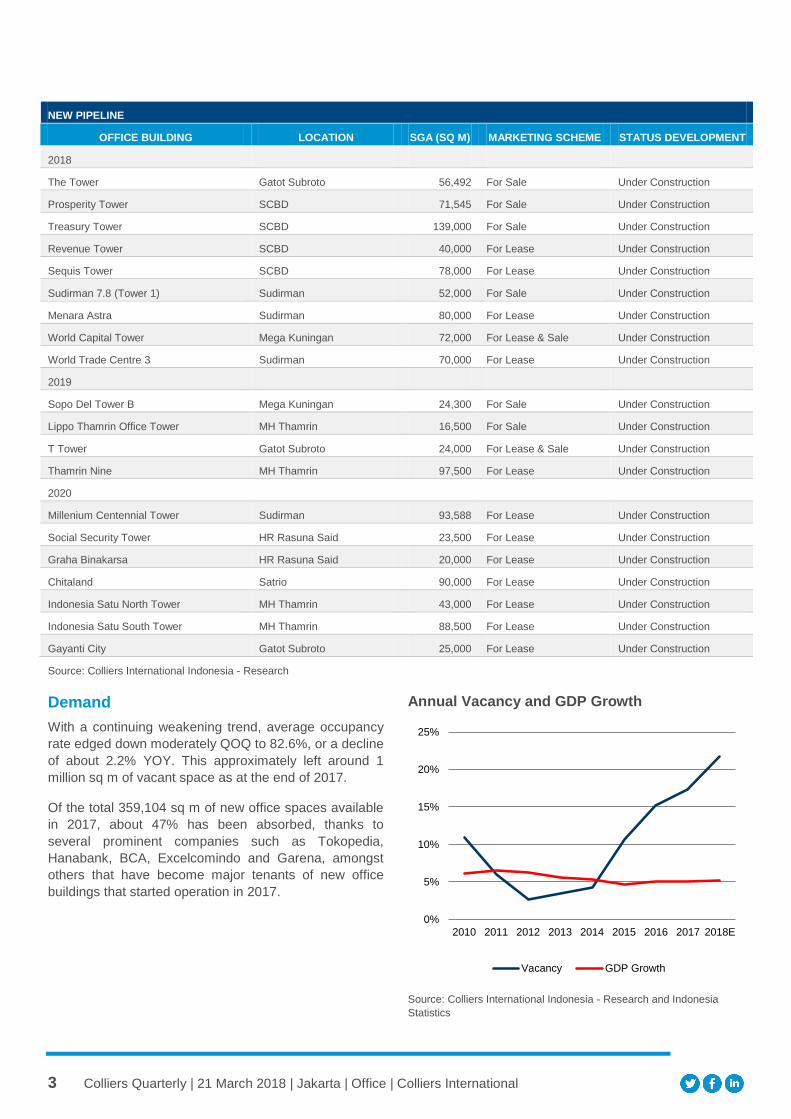
3 Colliers Quarterly | 21 March 2018 | Jakarta | Office | Colliers International
Demand
With a continuing weakening trend, average occupancy
rate edged down moderately QOQ to 82.6%, or a decline
of about 2.2% YOY. This approximately left around 1
million sq m of vacant space as at the end of 2017.
Of the total 359,104 sq m of new office spaces available
in 2017, about 47% has been absorbed, thanks to
several prominent companies such as Tokopedia,
Hanabank, BCA, Excelcomindo and Garena, amongst
others that have become major tenants of new office
buildings that started operation in 2017.
Annual Vacancy and GDP Growth
Source: Colliers International Indonesia - Research and Indonesia
Statistics
0%
5%
10%
15%
20%
25%
2010 2011 2012 2013 2014 2015 2016 2017 2018E
Vacancy GDP Growth
NEW PIPELINE
OFFICE BUILDING LOCATION SGA (SQ M) MARKETING SCHEME STATUS DEVELOPMENT
2018
The Tower Gatot Subroto 56,492 For Sale Under Construction
Prosperity Tower SCBD 71,545 For Sale Under Construction
Treasury Tower SCBD 139,000 For Sale Under Construction
Revenue Tower SCBD 40,000 For Lease Under Construction
Sequis Tower SCBD 78,000 For Lease Under Construction
Sudirman 7.8 (Tower 1) Sudirman 52,000 For Sale Under Construction
Menara Astra Sudirman 80,000 For Lease Under Construction
World Capital Tower Mega Kuningan 72,000 For Lease & Sale Under Construction
World Trade Centre 3 Sudirman 70,000 For Lease Under Construction
2019
Sopo Del Tower B Mega Kuningan 24,300 For Sale Under Construction
Lippo Thamrin Office Tower MH Thamrin 16,500 For Sale Under Construction
T Tower Gatot Subroto 24,000 For Lease & Sale Under Construction
Thamrin Nine MH Thamrin 97,500 For Lease Under Construction
2020
Millenium Centennial Tower Sudirman 93,588 For Lease Under Construction
Social Security Tower HR Rasuna Said 23,500 For Lease Under Construction
Graha Binakarsa HR Rasuna Said 20,000 For Lease Under Construction
Chitaland Satrio 90,000 For Lease Under Construction
Indonesia Satu North Tower MH Thamrin 43,000 For Lease Under Construction
Indonesia Satu South Tower MH Thamrin 88,500 For Lease Under Construction
Gayanti City Gatot Subroto 25,000 For Lease Under Construction
Source: Colliers International Indonesia - Research
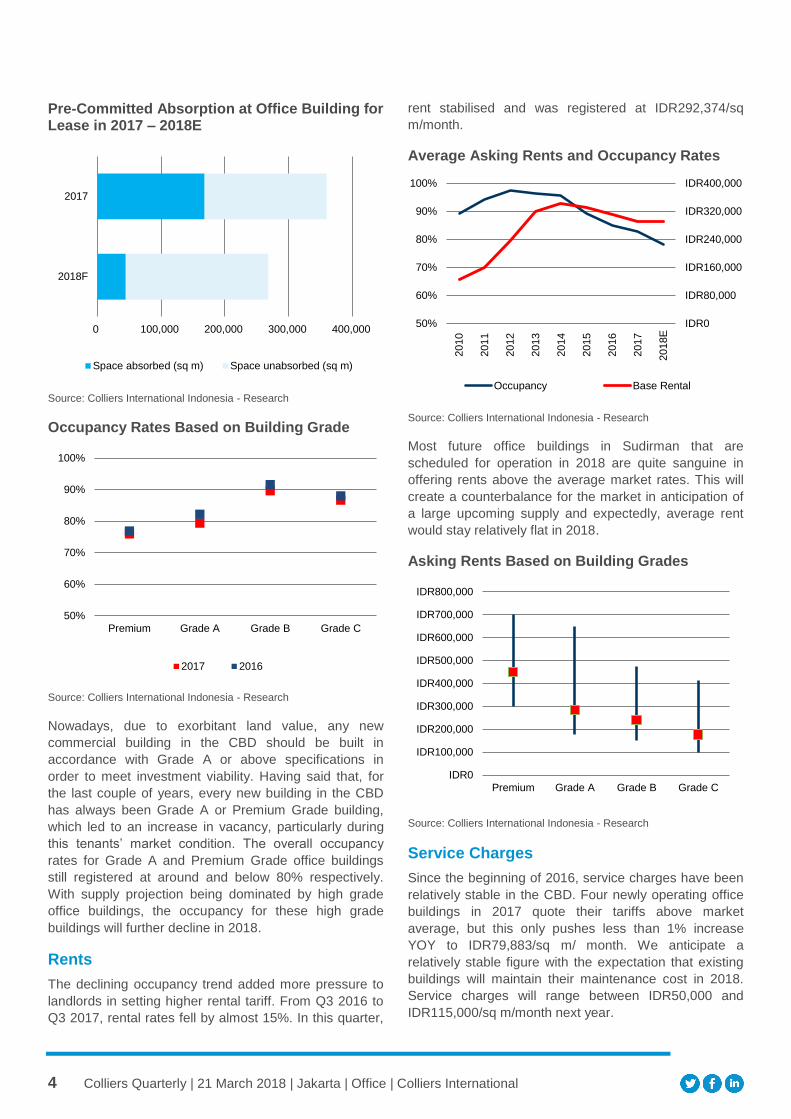
4 Colliers Quarterly | 21 March 2018 | Jakarta | Office | Colliers International
Pre-Committed Absorption at Office Building for Lease in 2017 – 2018E
Source: Colliers International Indonesia - Research
Occupancy Rates Based on Building Grade
Source: Colliers International Indonesia - Research
Nowadays, due to exorbitant land value, any new
commercial building in the CBD should be built in
accordance with Grade A or above specifications in
order to meet investment viability. Having said that, for
the last couple of years, every new building in the CBD
has always been Grade A or Premium Grade building,
which led to an increase in vacancy, particularly during
this tenants’ market condition. The overall occupancy
rates for Grade A and Premium Grade office buildings
still registered at around and below 80% respectively.
With supply projection being dominated by high grade
office buildings, the occupancy for these high grade
buildings will further decline in 2018.
Rents
The declining occupancy trend added more pressure to
landlords in setting higher rental tariff. From Q3 2016 to
Q3 2017, rental rates fell by almost 15%. In this quarter,
rent stabilised and was registered at IDR292,374/sq
m/month.
Average Asking Rents and Occupancy Rates
Source: Colliers International Indonesia - Research
Most future office buildings in Sudirman that are
scheduled for operation in 2018 are quite sanguine in
offering rents above the average market rates. This will
create a counterbalance for the market in anticipation of
a large upcoming supply and expectedly, average rent
would stay relatively flat in 2018.
Asking Rents Based on Building Grades
Source: Colliers International Indonesia - Research
Service Charges
Since the beginning of 2016, service charges have been
relatively stable in the CBD. Four newly operating office
buildings in 2017 quote their tariffs above market
average, but this only pushes less than 1% increase
YOY to IDR79,883/sq m/ month. We anticipate a
relatively stable figure with the expectation that existing
buildings will maintain their maintenance cost in 2018.
Service charges will range between IDR50,000 and
IDR115,000/sq m/month next year.
0 100,000 200,000 300,000 400,000
2018F
2017
Space absorbed (sq m) Space unabsorbed (sq m)
50%
60%
70%
80%
90%
100%
Premium Grade A Grade B Grade C
2017 2016
IDR0
IDR80,000
IDR160,000
IDR240,000
IDR320,000
IDR400,000
50%
60%
70%
80%
90%
100%
2010
2011
2012
2013
2014
2015
2016
2017
2018E
Occupancy Base Rental
IDR0
IDR100,000
IDR200,000
IDR300,000
IDR400,000
IDR500,000
IDR600,000
IDR700,000
IDR800,000
Premium Grade A Grade B Grade C
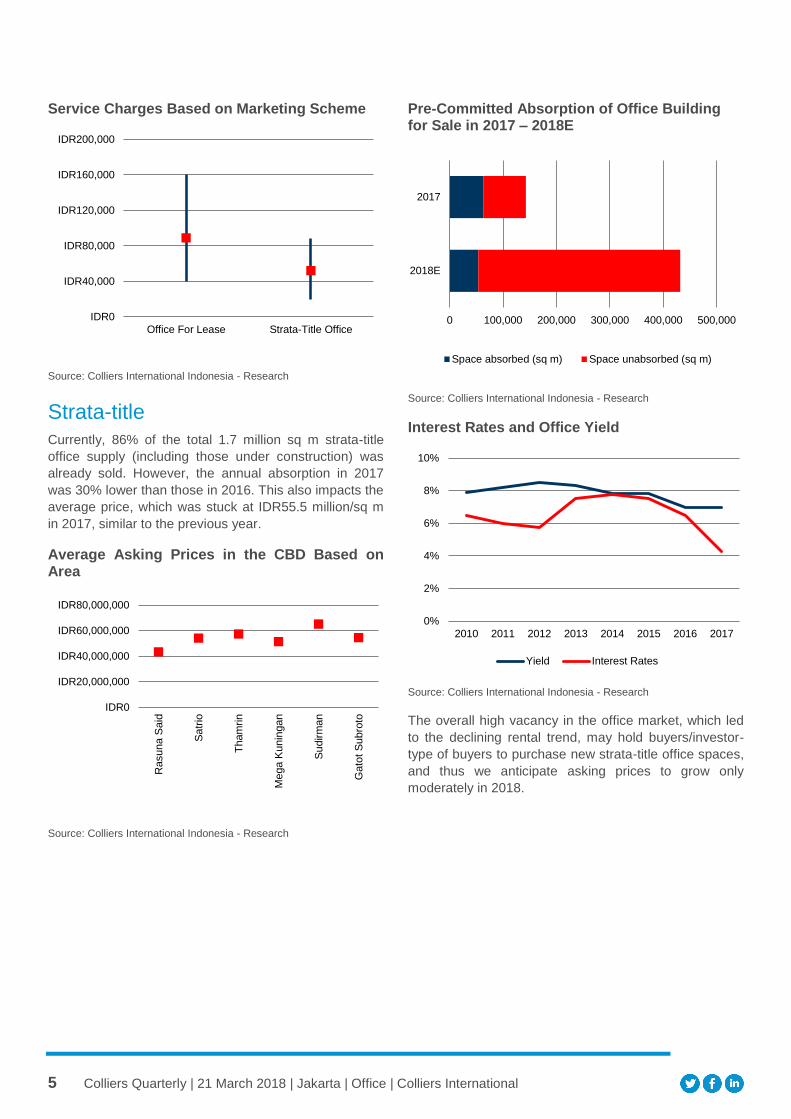
5 Colliers Quarterly | 21 March 2018 | Jakarta | Office | Colliers International
Service Charges Based on Marketing Scheme
Source: Colliers International Indonesia - Research
Strata-title
Currently, 86% of the total 1.7 million sq m strata-title
office supply (including those under construction) was
already sold. However, the annual absorption in 2017
was 30% lower than those in 2016. This also impacts the
average price, which was stuck at IDR55.5 million/sq m
in 2017, similar to the previous year.
Average Asking Prices in the CBD Based on Area
Source: Colliers International Indonesia - Research
Pre-Committed Absorption of Office Building for Sale in 2017 – 2018E
Source: Colliers International Indonesia - Research
Interest Rates and Office Yield
Source: Colliers International Indonesia - Research
The overall high vacancy in the office market, which led
to the declining rental trend, may hold buyers/investor-
type of buyers to purchase new strata-title office spaces,
and thus we anticipate asking prices to grow only
moderately in 2018.
IDR0
IDR40,000
IDR80,000
IDR120,000
IDR160,000
IDR200,000
Office For Lease Strata-Title Office
IDR0
IDR20,000,000
IDR40,000,000
IDR60,000,000
IDR80,000,000
Rasuna S
aid
Sa
trio
Th
am
rin
Me
ga K
unin
gan
Su
dirm
an
Gato
t S
ubro
to
0 100,000 200,000 300,000 400,000 500,000
2018E
2017
Space absorbed (sq m) Space unabsorbed (sq m)
0%
2%
4%
6%
8%
10%
2010 2011 2012 2013 2014 2015 2016 2017
Yield Interest Rates
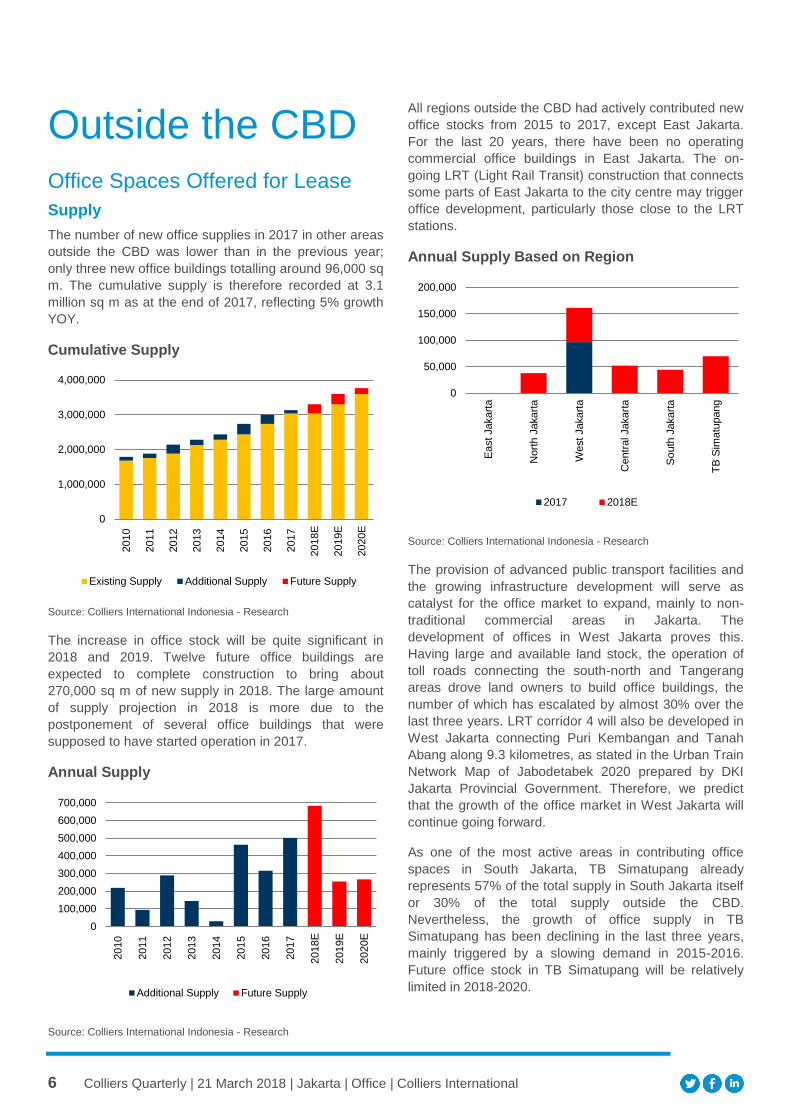
6 Colliers Quarterly | 21 March 2018 | Jakarta | Office | Colliers International
Outside the CBD
Office Spaces Offered for Lease
Supply
The number of new office supplies in 2017 in other areas
outside the CBD was lower than in the previous year;
only three new office buildings totalling around 96,000 sq
m. The cumulative supply is therefore recorded at 3.1
million sq m as at the end of 2017, reflecting 5% growth
YOY.
Cumulative Supply
Source: Colliers International Indonesia - Research
The increase in office stock will be quite significant in
2018 and 2019. Twelve future office buildings are
expected to complete construction to bring about
270,000 sq m of new supply in 2018. The large amount
of supply projection in 2018 is more due to the
postponement of several office buildings that were
supposed to have started operation in 2017.
Annual Supply
Source: Colliers International Indonesia - Research
All regions outside the CBD had actively contributed new
office stocks from 2015 to 2017, except East Jakarta.
For the last 20 years, there have been no operating
commercial office buildings in East Jakarta. The on-
going LRT (Light Rail Transit) construction that connects
some parts of East Jakarta to the city centre may trigger
office development, particularly those close to the LRT
stations.
Annual Supply Based on Region
Source: Colliers International Indonesia - Research
The provision of advanced public transport facilities and
the growing infrastructure development will serve as
catalyst for the office market to expand, mainly to non-
traditional commercial areas in Jakarta. The
development of offices in West Jakarta proves this.
Having large and available land stock, the operation of
toll roads connecting the south-north and Tangerang
areas drove land owners to build office buildings, the
number of which has escalated by almost 30% over the
last three years. LRT corridor 4 will also be developed in
West Jakarta connecting Puri Kembangan and Tanah
Abang along 9.3 kilometres, as stated in the Urban Train
Network Map of Jabodetabek 2020 prepared by DKI
Jakarta Provincial Government. Therefore, we predict
that the growth of the office market in West Jakarta will
continue going forward.
As one of the most active areas in contributing office
spaces in South Jakarta, TB Simatupang already
represents 57% of the total supply in South Jakarta itself
or 30% of the total supply outside the CBD.
Nevertheless, the growth of office supply in TB
Simatupang has been declining in the last three years,
mainly triggered by a slowing demand in 2015-2016.
Future office stock in TB Simatupang will be relatively
limited in 2018-2020.
0
1,000,000
2,000,000
3,000,000
4,000,000
2010
2011
2012
2013
2014
2015
2016
2017
2018E
2019E
2020E
Existing Supply Additional Supply Future Supply
0
100,000
200,000
300,000
400,000
500,000
600,000
700,000
2010
2011
2012
2013
2014
2015
2016
2017
2018E
2019E
2020E
Additional Supply Future Supply
0
50,000
100,000
150,000
200,000
Ea
st Jakart
a
Nort
h J
akart
a
West Jakart
a
Centr
al Jakart
a
So
uth
Jakart
a
TB
Sim
atu
pang
2017 2018E
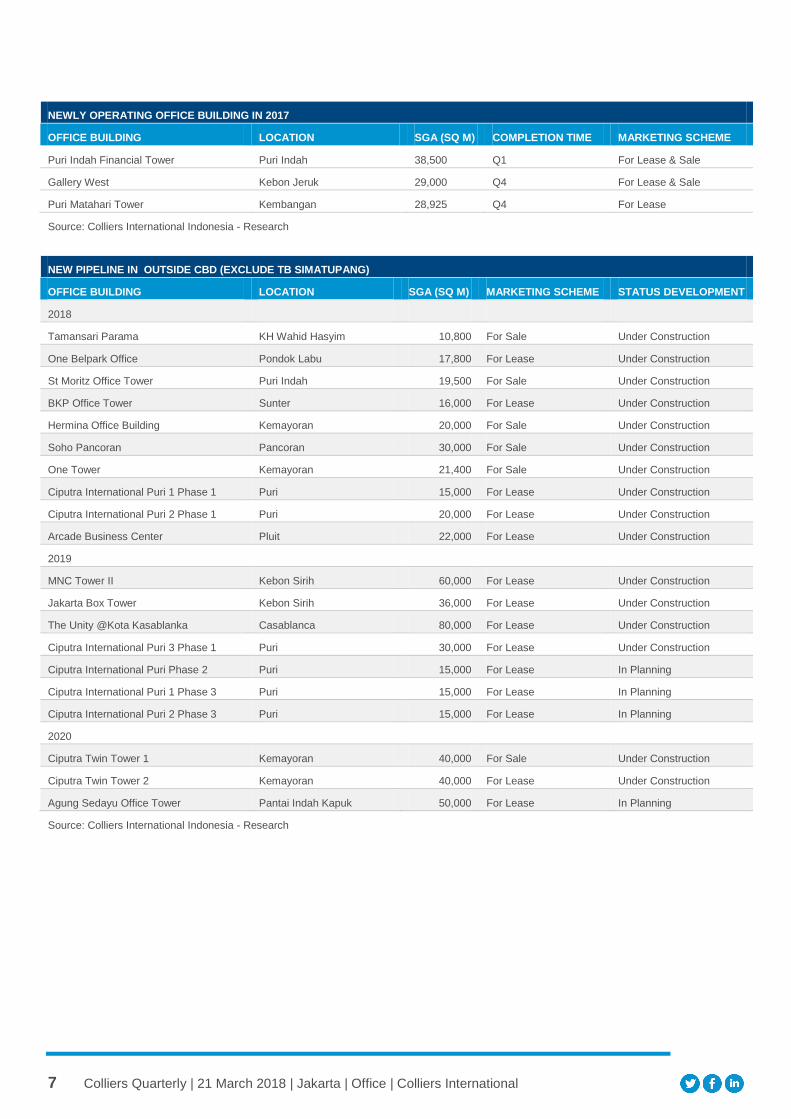
7 Colliers Quarterly | 21 March 2018 | Jakarta | Office | Colliers International
NEWLY OPERATING OFFICE BUILDING IN 2017
OFFICE BUILDING LOCATION SGA (SQ M) COMPLETION TIME MARKETING SCHEME
Puri Indah Financial Tower Puri Indah 38,500 Q1 For Lease & Sale
Gallery West Kebon Jeruk 29,000 Q4 For Lease & Sale
Puri Matahari Tower Kembangan 28,925 Q4 For Lease
Source: Colliers International Indonesia - Research
NEW PIPELINE IN OUTSIDE CBD (EXCLUDE TB SIMATUPANG)
OFFICE BUILDING LOCATION SGA (SQ M) MARKETING SCHEME STATUS DEVELOPMENT
2018
Tamansari Parama KH Wahid Hasyim 10,800 For Sale Under Construction
One Belpark Office Pondok Labu 17,800 For Lease Under Construction
St Moritz Office Tower Puri Indah 19,500 For Sale Under Construction
BKP Office Tower Sunter 16,000 For Lease Under Construction
Hermina Office Building Kemayoran 20,000 For Sale Under Construction
Soho Pancoran Pancoran 30,000 For Sale Under Construction
One Tower Kemayoran 21,400 For Sale Under Construction
Ciputra International Puri 1 Phase 1 Puri 15,000 For Lease Under Construction
Ciputra International Puri 2 Phase 1 Puri 20,000 For Lease Under Construction
Arcade Business Center Pluit 22,000 For Lease Under Construction
2019
MNC Tower II Kebon Sirih 60,000 For Lease Under Construction
Jakarta Box Tower Kebon Sirih 36,000 For Lease Under Construction
The Unity @Kota Kasablanka Casablanca 80,000 For Lease Under Construction
Ciputra International Puri 3 Phase 1 Puri 30,000 For Lease Under Construction
Ciputra International Puri Phase 2 Puri 15,000 For Lease In Planning
Ciputra International Puri 1 Phase 3 Puri 15,000 For Lease In Planning
Ciputra International Puri 2 Phase 3 Puri 15,000 For Lease In Planning
2020
Ciputra Twin Tower 1 Kemayoran 40,000 For Sale Under Construction
Ciputra Twin Tower 2 Kemayoran 40,000 For Lease Under Construction
Agung Sedayu Office Tower Pantai Indah Kapuk 50,000 For Lease In Planning
Source: Colliers International Indonesia - Research
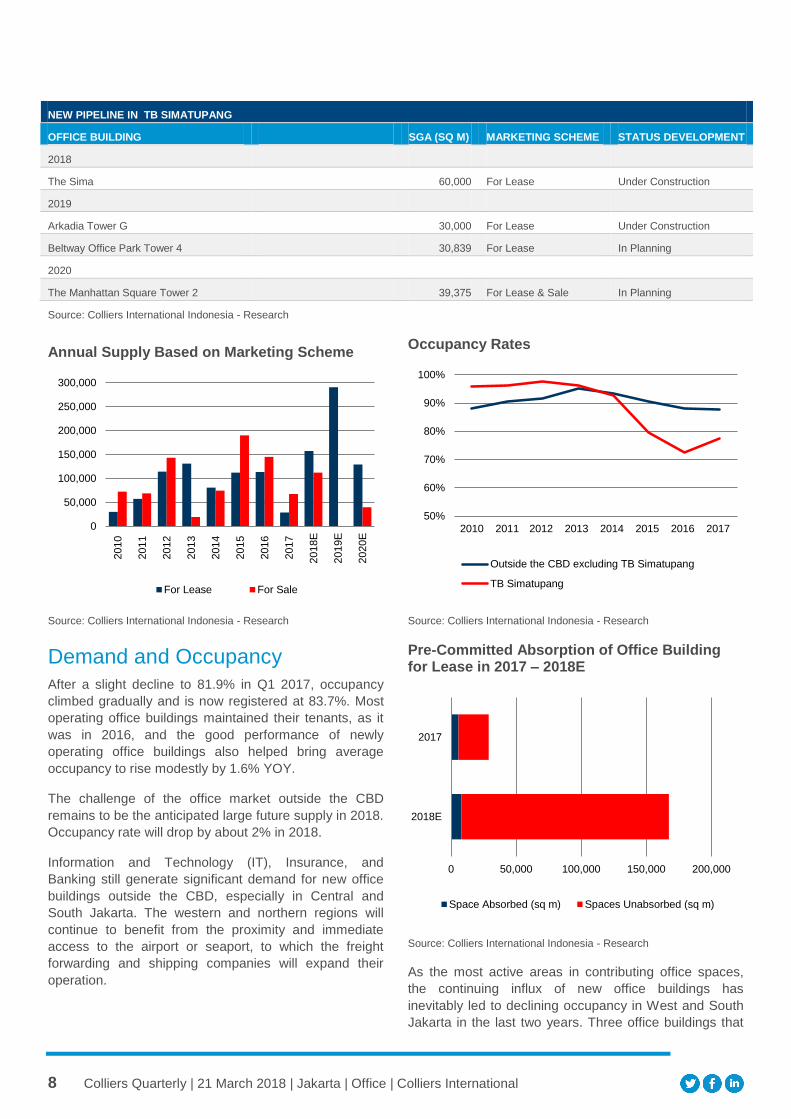
8 Colliers Quarterly | 21 March 2018 | Jakarta | Office | Colliers International
Annual Supply Based on Marketing Scheme
Source: Colliers International Indonesia - Research
Demand and Occupancy
After a slight decline to 81.9% in Q1 2017, occupancy
climbed gradually and is now registered at 83.7%. Most
operating office buildings maintained their tenants, as it
was in 2016, and the good performance of newly
operating office buildings also helped bring average
occupancy to rise modestly by 1.6% YOY.
The challenge of the office market outside the CBD
remains to be the anticipated large future supply in 2018.
Occupancy rate will drop by about 2% in 2018.
Information and Technology (IT), Insurance, and
Banking still generate significant demand for new office
buildings outside the CBD, especially in Central and
South Jakarta. The western and northern regions will
continue to benefit from the proximity and immediate
access to the airport or seaport, to which the freight
forwarding and shipping companies will expand their
operation.
Occupancy Rates
Source: Colliers International Indonesia - Research
Pre-Committed Absorption of Office Building for Lease in 2017 – 2018E
Source: Colliers International Indonesia - Research
As the most active areas in contributing office spaces,
the continuing influx of new office buildings has
inevitably led to declining occupancy in West and South
Jakarta in the last two years. Three office buildings that
0
50,000
100,000
150,000
200,000
250,000
300,000
2010
2011
2012
2013
2014
2015
2016
2017
2018E
2019E
2020E
For Lease For Sale
50%
60%
70%
80%
90%
100%
2010 2011 2012 2013 2014 2015 2016 2017
Outside the CBD excluding TB Simatupang
TB Simatupang
0 50,000 100,000 150,000 200,000
2018E
2017
Space Absorbed (sq m) Spaces Unabsorbed (sq m)
NEW PIPELINE IN TB SIMATUPANG
OFFICE BUILDING SGA (SQ M) MARKETING SCHEME STATUS DEVELOPMENT
2018
The Sima 60,000 For Lease Under Construction
2019
Arkadia Tower G 30,000 For Lease Under Construction
Beltway Office Park Tower 4 30,839 For Lease In Planning
2020
The Manhattan Square Tower 2 39,375 For Lease & Sale In Planning
Source: Colliers International Indonesia - Research
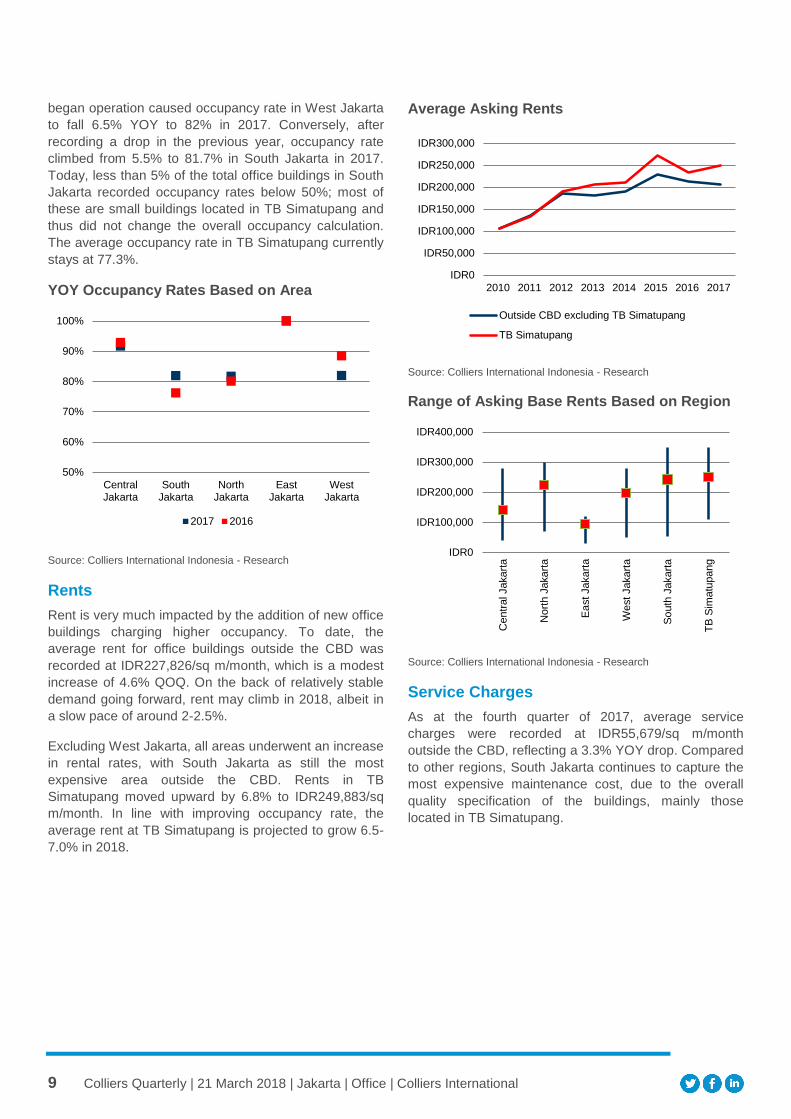
9 Colliers Quarterly | 21 March 2018 | Jakarta | Office | Colliers International
began operation caused occupancy rate in West Jakarta
to fall 6.5% YOY to 82% in 2017. Conversely, after
recording a drop in the previous year, occupancy rate
climbed from 5.5% to 81.7% in South Jakarta in 2017.
Today, less than 5% of the total office buildings in South
Jakarta recorded occupancy rates below 50%; most of
these are small buildings located in TB Simatupang and
thus did not change the overall occupancy calculation.
The average occupancy rate in TB Simatupang currently
stays at 77.3%.
YOY Occupancy Rates Based on Area
Source: Colliers International Indonesia - Research
Rents
Rent is very much impacted by the addition of new office
buildings charging higher occupancy. To date, the
average rent for office buildings outside the CBD was
recorded at IDR227,826/sq m/month, which is a modest
increase of 4.6% QOQ. On the back of relatively stable
demand going forward, rent may climb in 2018, albeit in
a slow pace of around 2-2.5%.
Excluding West Jakarta, all areas underwent an increase
in rental rates, with South Jakarta as still the most
expensive area outside the CBD. Rents in TB
Simatupang moved upward by 6.8% to IDR249,883/sq
m/month. In line with improving occupancy rate, the
average rent at TB Simatupang is projected to grow 6.5-
7.0% in 2018.
Average Asking Rents
Source: Colliers International Indonesia - Research
Range of Asking Base Rents Based on Region
Source: Colliers International Indonesia - Research
Service Charges
As at the fourth quarter of 2017, average service
charges were recorded at IDR55,679/sq m/month
outside the CBD, reflecting a 3.3% YOY drop. Compared
to other regions, South Jakarta continues to capture the
most expensive maintenance cost, due to the overall
quality specification of the buildings, mainly those
located in TB Simatupang.
50%
60%
70%
80%
90%
100%
CentralJakarta
SouthJakarta
NorthJakarta
EastJakarta
WestJakarta
2017 2016
IDR0
IDR50,000
IDR100,000
IDR150,000
IDR200,000
IDR250,000
IDR300,000
2010 2011 2012 2013 2014 2015 2016 2017
Outside CBD excluding TB Simatupang
TB Simatupang
IDR0
IDR100,000
IDR200,000
IDR300,000
IDR400,000
Centr
al Jakart
a
Nort
h J
akart
a
Ea
st Jakart
a
West Jakart
a
So
uth
Jakart
a
TB
Sim
atu
pang
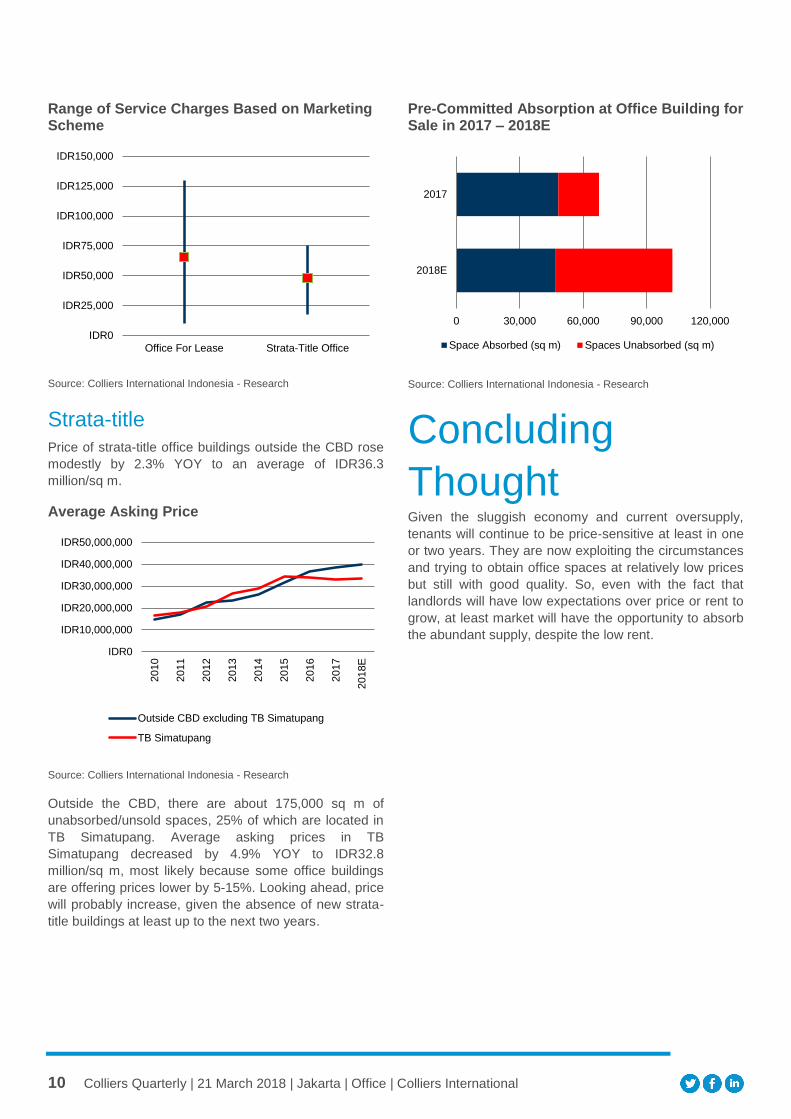
10 Colliers Quarterly | 21 March 2018 | Jakarta | Office | Colliers International
Range of Service Charges Based on Marketing Scheme
Source: Colliers International Indonesia - Research
Strata-title
Price of strata-title office buildings outside the CBD rose
modestly by 2.3% YOY to an average of IDR36.3
million/sq m.
Average Asking Price
Source: Colliers International Indonesia - Research
Outside the CBD, there are about 175,000 sq m of
unabsorbed/unsold spaces, 25% of which are located in
TB Simatupang. Average asking prices in TB
Simatupang decreased by 4.9% YOY to IDR32.8
million/sq m, most likely because some office buildings
are offering prices lower by 5-15%. Looking ahead, price
will probably increase, given the absence of new strata-
title buildings at least up to the next two years.
Pre-Committed Absorption at Office Building for Sale in 2017 – 2018E
Source: Colliers International Indonesia - Research
Concluding
Thought Given the sluggish economy and current oversupply,
tenants will continue to be price-sensitive at least in one
or two years. They are now exploiting the circumstances
and trying to obtain office spaces at relatively low prices
but still with good quality. So, even with the fact that
landlords will have low expectations over price or rent to
grow, at least market will have the opportunity to absorb
the abundant supply, despite the low rent.
IDR0
IDR25,000
IDR50,000
IDR75,000
IDR100,000
IDR125,000
IDR150,000
Office For Lease Strata-Title Office
IDR0
IDR10,000,000
IDR20,000,000
IDR30,000,000
IDR40,000,000
IDR50,000,000
2010
2011
2012
2013
2014
2015
2016
2017
2018E
Outside CBD excluding TB Simatupang
TB Simatupang
0 30,000 60,000 90,000 120,000
2018E
2017
Space Absorbed (sq m) Spaces Unabsorbed (sq m)

11 Colliers Quarterly | 21 March 2018 | Jakarta | Office | Colliers International
For more information: Contributors:
Ferry Salanto Senior Associate Director | Jakarta +62 21 3043 6730 [email protected]
Eko Arfianto Senior Manager | Research
Copyright © 2017 Colliers International.
The information contained herein has been obtained from
sources deemed reliable. While every reasonable effort has
been made to ensure its accuracy, we cannot guarantee it. No
responsibility is assumed for any inaccuracies. Readers are
encouraged to consult their professional advisors prior to
acting on any of the material contained in this report.
Copyright © 2015 Colliers International.
The information contained herein has been
obtained from sources deemed reliable.
While every reasonable effort has been
made to ensure its accuracy, we cannot
guarantee it. No responsibility is assumed
for any inaccuracies. Readers are
encouraged to consult their professional
advisors prior to acting on any of the
For more information:
Market Contact Name
Title | Market
+1 00 000 0000
Market Contact Name
Title | Market
+1 00 000 0000
Contributors:
Market Contact Name
Title | Market
Market Contact Name
Title | Market
Market Contact Name
Title | Market
Market Contact Name
Title | Market
Ferry Salanto Senior Associate Director |
Jakarta
Indonesia's on-going massive infrastructure
development had attracted overseas developers,
especially from Japan, China, Singapore and other
Asian countries. Local property developers, such as
Sinar Mas Land, Intiland Development, Alam Sutera
and Sentul, have already benefitted from the inflow
through the establishment of JVs and collaboration
with several foreign developers. We believe this
situation will improve further as many institutions
forecast Indonesia’s economy to grow and be better
in 2018.
In our view, the government policy is likely to be
more populist next year as we are approaching
election years 2018 and 2019. Anything to be
decided, such as raising electricity tariffs and gas
and subsidised fuel prices, which may increase
living costs, are likely to be the last option, we
believe.
Moreover, compared to alternative investments,
residential properties, particularly apartments,
generate relatively high yields with lower risks. Gold
and benchmark currencies such the US dollar are
conventionally considered the safest method of
hedging in Jakarta. However, both have generated
marginal or even negative returns in recent years.
Apartment yields are relatively similar to commercial
bank deposit rates. This helps maintain investment
appeal to local buyers who still perceive property as
safer than bank deposit.
Forecast at a glance
Demand We believe that next year, sales will be supported by real homebuyers rather than investors. Furthermore, we expect the average take-up rate to increase modestly by 2-3% from now, to be at 87-88% level by the end of 2018.
Supply
The market will receive an additional of 62,116 units from 104 projects: 32,429 units in 2018, 15,602 in 2019 and 14,085 in 2020.
Rent
With vacancy creeping up in the serviced apartment market, landlords are likely to remain conservative in rental negotiation. Coupled with downgrading trends in the market, we expect the average rent to increase modestly, in the range of 2-3% for the entire 2018.
Price
In 2018, we do not foresee much improvement in demand and the number of incoming apartments that are targeted to end-users. Therefore, we project the average apartment price would increase modestly, a little bit higher than 2017’s by 5% to 6%, to IDR34.5-35.5 million /sq m.
Strata-title
Apartment
Supply
With the completion of eight new apartment projects
consisting of 3,181 units, the cumulative supply of
apartments in Jakarta increased by 1.8% QOQ or 4.6%
YOY to 184,293 units. The annual supply in 2017
reached 8,115 units, the lowest in the last seven years,
which account for 21,167 units. Such situation happened
mainly due to soft absorption that may lead to the
financial issue and thus delay delivery of the projects.
Looking ahead in 2018-2020, the market will receive
62,116 units, which is a substantial number, bringing
apartment inventory in Jakarta to exceed 246,000 units
in 2020.
Colliers Quarterly
JAKARTA | APARTMENT Q4 2017 21 March 2018
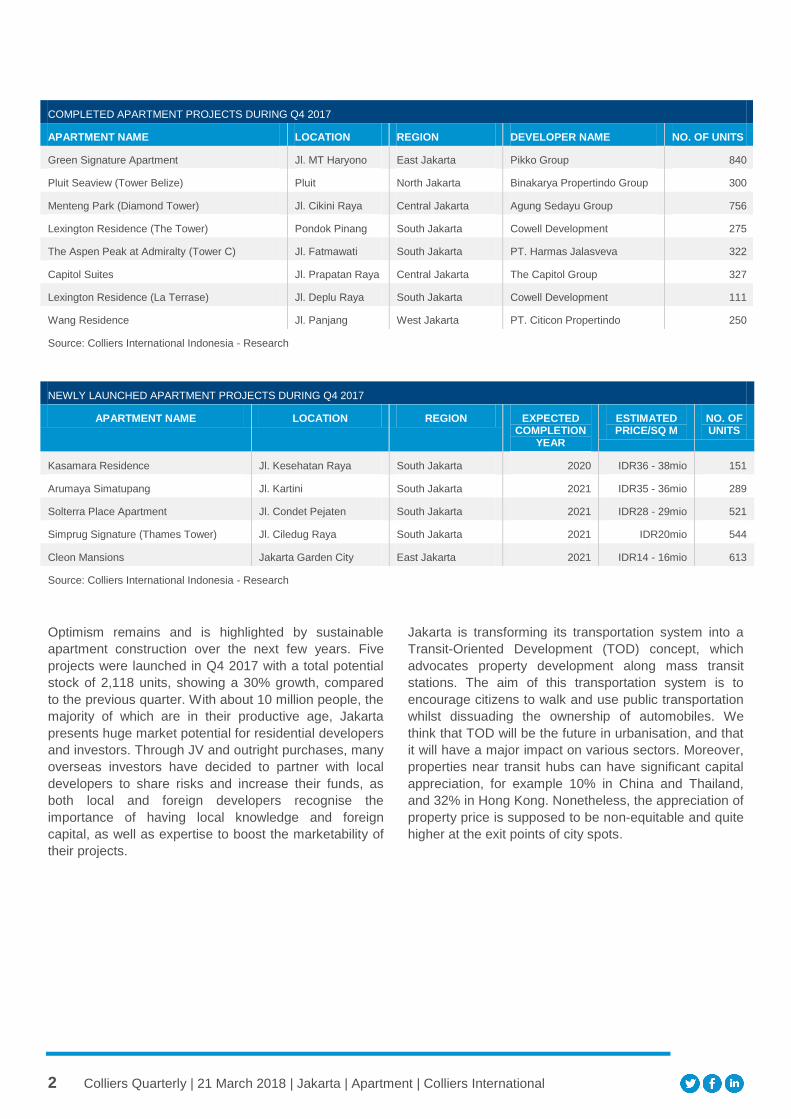
2 Colliers Quarterly | 21 March 2018 | Jakarta | Apartment | Colliers International
Optimism remains and is highlighted by sustainable
apartment construction over the next few years. Five
projects were launched in Q4 2017 with a total potential
stock of 2,118 units, showing a 30% growth, compared
to the previous quarter. With about 10 million people, the
majority of which are in their productive age, Jakarta
presents huge market potential for residential developers
and investors. Through JV and outright purchases, many
overseas investors have decided to partner with local
developers to share risks and increase their funds, as
both local and foreign developers recognise the
importance of having local knowledge and foreign
capital, as well as expertise to boost the marketability of
their projects.
Jakarta is transforming its transportation system into a
Transit-Oriented Development (TOD) concept, which
advocates property development along mass transit
stations. The aim of this transportation system is to
encourage citizens to walk and use public transportation
whilst dissuading the ownership of automobiles. We
think that TOD will be the future in urbanisation, and that
it will have a major impact on various sectors. Moreover,
properties near transit hubs can have significant capital
appreciation, for example 10% in China and Thailand,
and 32% in Hong Kong. Nonetheless, the appreciation of
property price is supposed to be non-equitable and quite
higher at the exit points of city spots.
COMPLETED APARTMENT PROJECTS DURING Q4 2017
APARTMENT NAME LOCATION REGION DEVELOPER NAME NO. OF UNITS
Green Signature Apartment Jl. MT Haryono East Jakarta Pikko Group 840
Pluit Seaview (Tower Belize) Pluit North Jakarta Binakarya Propertindo Group 300
Menteng Park (Diamond Tower) Jl. Cikini Raya Central Jakarta Agung Sedayu Group 756
Lexington Residence (The Tower) Pondok Pinang South Jakarta Cowell Development 275
The Aspen Peak at Admiralty (Tower C) Jl. Fatmawati South Jakarta PT. Harmas Jalasveva 322
Capitol Suites Jl. Prapatan Raya Central Jakarta The Capitol Group 327
Lexington Residence (La Terrase) Jl. Deplu Raya South Jakarta Cowell Development 111
Wang Residence Jl. Panjang West Jakarta PT. Citicon Propertindo 250
Source: Colliers International Indonesia - Research
NEWLY LAUNCHED APARTMENT PROJECTS DURING Q4 2017
APARTMENT NAME LOCATION REGION EXPECTED COMPLETION
YEAR
ESTIMATED PRICE/SQ M
NO. OF UNITS
Kasamara Residence Jl. Kesehatan Raya South Jakarta 2020 IDR36 - 38mio 151
Arumaya Simatupang Jl. Kartini South Jakarta 2021 IDR35 - 36mio 289
Solterra Place Apartment Jl. Condet Pejaten South Jakarta 2021 IDR28 - 29mio 521
Simprug Signature (Thames Tower) Jl. Ciledug Raya South Jakarta 2021 IDR20mio 544
Cleon Mansions Jakarta Garden City East Jakarta 2021 IDR14 - 16mio 613
Source: Colliers International Indonesia - Research
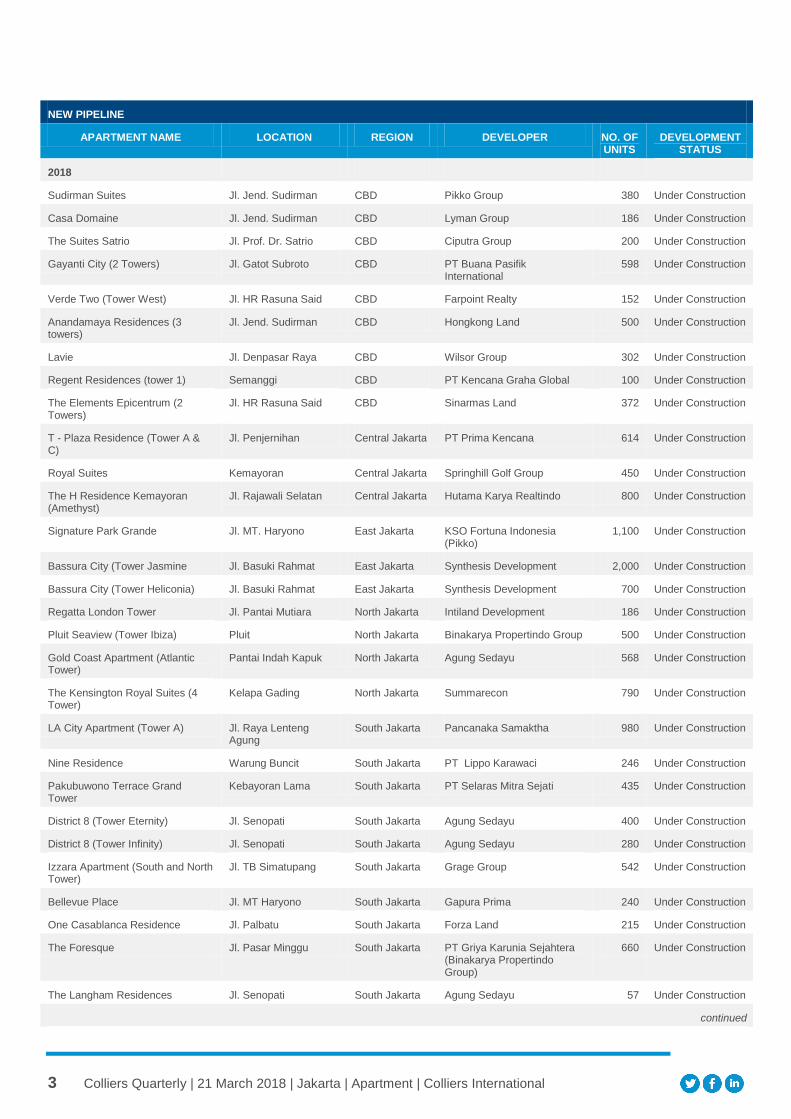
3 Colliers Quarterly | 21 March 2018 | Jakarta | Apartment | Colliers International
NEW PIPELINE
APARTMENT NAME LOCATION REGION DEVELOPER NO. OF UNITS
DEVELOPMENT STATUS
2018
Sudirman Suites Jl. Jend. Sudirman CBD Pikko Group 380 Under Construction
Casa Domaine Jl. Jend. Sudirman CBD Lyman Group 186 Under Construction
The Suites Satrio Jl. Prof. Dr. Satrio CBD Ciputra Group 200 Under Construction
Gayanti City (2 Towers) Jl. Gatot Subroto CBD PT Buana Pasifik International
598 Under Construction
Verde Two (Tower West) Jl. HR Rasuna Said CBD Farpoint Realty 152 Under Construction
Anandamaya Residences (3 towers)
Jl. Jend. Sudirman CBD Hongkong Land 500 Under Construction
Lavie Jl. Denpasar Raya CBD Wilsor Group 302 Under Construction
Regent Residences (tower 1) Semanggi CBD PT Kencana Graha Global 100 Under Construction
The Elements Epicentrum (2 Towers)
Jl. HR Rasuna Said CBD Sinarmas Land 372 Under Construction
T - Plaza Residence (Tower A & C)
Jl. Penjernihan Central Jakarta PT Prima Kencana 614 Under Construction
Royal Suites Kemayoran Central Jakarta Springhill Golf Group 450 Under Construction
The H Residence Kemayoran (Amethyst)
Jl. Rajawali Selatan Central Jakarta Hutama Karya Realtindo 800 Under Construction
Signature Park Grande Jl. MT. Haryono East Jakarta KSO Fortuna Indonesia (Pikko)
1,100 Under Construction
Bassura City (Tower Jasmine Jl. Basuki Rahmat East Jakarta Synthesis Development 2,000 Under Construction
Bassura City (Tower Heliconia) Jl. Basuki Rahmat East Jakarta Synthesis Development 700 Under Construction
Regatta London Tower Jl. Pantai Mutiara North Jakarta Intiland Development 186 Under Construction
Pluit Seaview (Tower Ibiza) Pluit North Jakarta Binakarya Propertindo Group 500 Under Construction
Gold Coast Apartment (Atlantic Tower)
Pantai Indah Kapuk North Jakarta Agung Sedayu 568 Under Construction
The Kensington Royal Suites (4 Tower)
Kelapa Gading North Jakarta Summarecon 790 Under Construction
LA City Apartment (Tower A) Jl. Raya Lenteng Agung
South Jakarta Pancanaka Samaktha 980 Under Construction
Nine Residence Warung Buncit South Jakarta PT Lippo Karawaci 246 Under Construction
Pakubuwono Terrace Grand Tower
Kebayoran Lama South Jakarta PT Selaras Mitra Sejati 435 Under Construction
District 8 (Tower Eternity) Jl. Senopati South Jakarta Agung Sedayu 400 Under Construction
District 8 (Tower Infinity) Jl. Senopati South Jakarta Agung Sedayu 280 Under Construction
Izzara Apartment (South and North Tower)
Jl. TB Simatupang South Jakarta Grage Group 542 Under Construction
Bellevue Place Jl. MT Haryono South Jakarta Gapura Prima 240 Under Construction
One Casablanca Residence Jl. Palbatu South Jakarta Forza Land 215 Under Construction
The Foresque Jl. Pasar Minggu South Jakarta PT Griya Karunia Sejahtera (Binakarya Propertindo Group)
660 Under Construction
The Langham Residences Jl. Senopati South Jakarta Agung Sedayu 57 Under Construction
continued
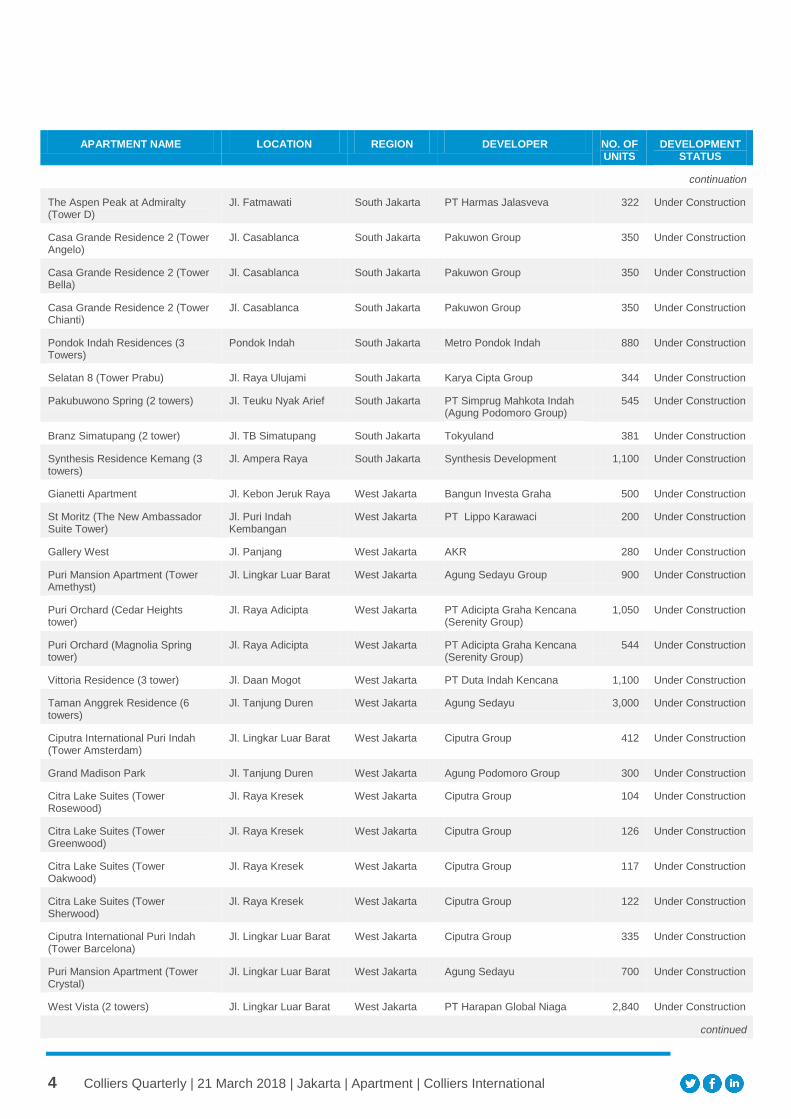
4 Colliers Quarterly | 21 March 2018 | Jakarta | Apartment | Colliers International
APARTMENT NAME LOCATION REGION DEVELOPER NO. OF UNITS
DEVELOPMENT STATUS
continuation
The Aspen Peak at Admiralty (Tower D)
Jl. Fatmawati South Jakarta PT Harmas Jalasveva 322 Under Construction
Casa Grande Residence 2 (Tower Angelo)
Jl. Casablanca South Jakarta Pakuwon Group 350 Under Construction
Casa Grande Residence 2 (Tower Bella)
Jl. Casablanca South Jakarta Pakuwon Group 350 Under Construction
Casa Grande Residence 2 (Tower Chianti)
Jl. Casablanca South Jakarta Pakuwon Group 350 Under Construction
Pondok Indah Residences (3 Towers)
Pondok Indah South Jakarta Metro Pondok Indah 880 Under Construction
Selatan 8 (Tower Prabu) Jl. Raya Ulujami South Jakarta Karya Cipta Group 344 Under Construction
Pakubuwono Spring (2 towers) Jl. Teuku Nyak Arief South Jakarta PT Simprug Mahkota Indah (Agung Podomoro Group)
545 Under Construction
Branz Simatupang (2 tower) Jl. TB Simatupang South Jakarta Tokyuland 381 Under Construction
Synthesis Residence Kemang (3 towers)
Jl. Ampera Raya South Jakarta Synthesis Development 1,100 Under Construction
Gianetti Apartment Jl. Kebon Jeruk Raya West Jakarta Bangun Investa Graha 500 Under Construction
St Moritz (The New Ambassador Suite Tower)
Jl. Puri Indah Kembangan
West Jakarta PT Lippo Karawaci 200 Under Construction
Gallery West Jl. Panjang West Jakarta AKR 280 Under Construction
Puri Mansion Apartment (Tower Amethyst)
Jl. Lingkar Luar Barat West Jakarta Agung Sedayu Group 900 Under Construction
Puri Orchard (Cedar Heights tower)
Jl. Raya Adicipta West Jakarta PT Adicipta Graha Kencana (Serenity Group)
1,050 Under Construction
Puri Orchard (Magnolia Spring tower)
Jl. Raya Adicipta West Jakarta PT Adicipta Graha Kencana (Serenity Group)
544 Under Construction
Vittoria Residence (3 tower) Jl. Daan Mogot West Jakarta PT Duta Indah Kencana 1,100 Under Construction
Taman Anggrek Residence (6 towers)
Jl. Tanjung Duren West Jakarta Agung Sedayu 3,000 Under Construction
Ciputra International Puri Indah (Tower Amsterdam)
Jl. Lingkar Luar Barat West Jakarta Ciputra Group 412 Under Construction
Grand Madison Park Jl. Tanjung Duren West Jakarta Agung Podomoro Group 300 Under Construction
Citra Lake Suites (Tower Rosewood)
Jl. Raya Kresek West Jakarta Ciputra Group 104 Under Construction
Citra Lake Suites (Tower Greenwood)
Jl. Raya Kresek West Jakarta Ciputra Group 126 Under Construction
Citra Lake Suites (Tower Oakwood)
Jl. Raya Kresek West Jakarta Ciputra Group 117 Under Construction
Citra Lake Suites (Tower Sherwood)
Jl. Raya Kresek West Jakarta Ciputra Group 122 Under Construction
Ciputra International Puri Indah (Tower Barcelona)
Jl. Lingkar Luar Barat West Jakarta Ciputra Group 335 Under Construction
Puri Mansion Apartment (Tower Crystal)
Jl. Lingkar Luar Barat West Jakarta Agung Sedayu 700 Under Construction
West Vista (2 towers) Jl. Lingkar Luar Barat West Jakarta PT Harapan Global Niaga 2,840 Under Construction
continued
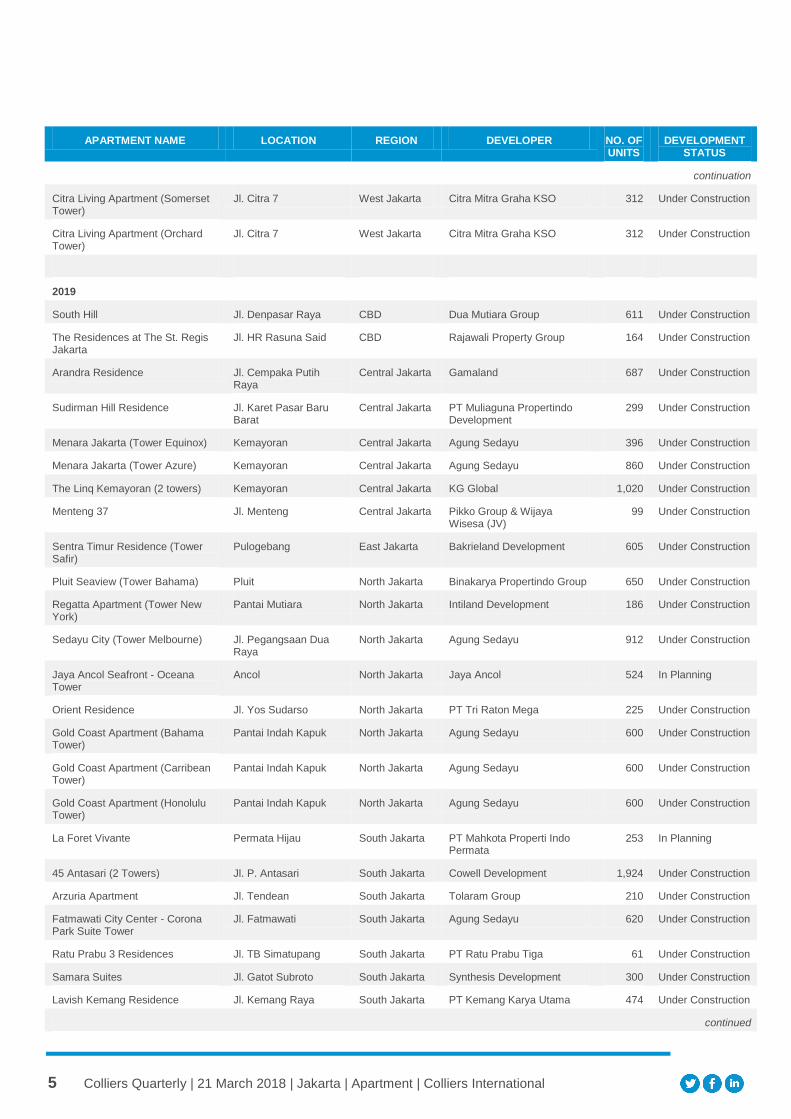
5 Colliers Quarterly | 21 March 2018 | Jakarta | Apartment | Colliers International
APARTMENT NAME LOCATION REGION DEVELOPER NO. OF UNITS
DEVELOPMENT STATUS
continuation
Citra Living Apartment (Somerset Tower)
Jl. Citra 7 West Jakarta Citra Mitra Graha KSO 312 Under Construction
Citra Living Apartment (Orchard Tower)
Jl. Citra 7 West Jakarta Citra Mitra Graha KSO 312 Under Construction
2019
South Hill Jl. Denpasar Raya CBD Dua Mutiara Group 611 Under Construction
The Residences at The St. Regis Jakarta
Jl. HR Rasuna Said CBD Rajawali Property Group 164 Under Construction
Arandra Residence Jl. Cempaka Putih Raya
Central Jakarta Gamaland 687 Under Construction
Sudirman Hill Residence Jl. Karet Pasar Baru Barat
Central Jakarta PT Muliaguna Propertindo Development
299 Under Construction
Menara Jakarta (Tower Equinox) Kemayoran Central Jakarta Agung Sedayu 396 Under Construction
Menara Jakarta (Tower Azure) Kemayoran Central Jakarta Agung Sedayu 860 Under Construction
The Linq Kemayoran (2 towers) Kemayoran Central Jakarta KG Global 1,020 Under Construction
Menteng 37 Jl. Menteng Central Jakarta Pikko Group & Wijaya Wisesa (JV)
99 Under Construction
Sentra Timur Residence (Tower Safir)
Pulogebang East Jakarta Bakrieland Development 605 Under Construction
Pluit Seaview (Tower Bahama) Pluit North Jakarta Binakarya Propertindo Group 650 Under Construction
Regatta Apartment (Tower New York)
Pantai Mutiara North Jakarta Intiland Development 186 Under Construction
Sedayu City (Tower Melbourne) Jl. Pegangsaan Dua Raya
North Jakarta Agung Sedayu 912 Under Construction
Jaya Ancol Seafront - Oceana Tower
Ancol North Jakarta Jaya Ancol 524 In Planning
Orient Residence Jl. Yos Sudarso North Jakarta PT Tri Raton Mega 225 Under Construction
Gold Coast Apartment (Bahama Tower)
Pantai Indah Kapuk North Jakarta Agung Sedayu 600 Under Construction
Gold Coast Apartment (Carribean Tower)
Pantai Indah Kapuk North Jakarta Agung Sedayu 600 Under Construction
Gold Coast Apartment (Honolulu Tower)
Pantai Indah Kapuk North Jakarta Agung Sedayu 600 Under Construction
La Foret Vivante Permata Hijau South Jakarta PT Mahkota Properti Indo Permata
253 In Planning
45 Antasari (2 Towers) Jl. P. Antasari South Jakarta Cowell Development 1,924 Under Construction
Arzuria Apartment Jl. Tendean South Jakarta Tolaram Group 210 Under Construction
Fatmawati City Center - Corona Park Suite Tower
Jl. Fatmawati South Jakarta Agung Sedayu 620 Under Construction
Ratu Prabu 3 Residences Jl. TB Simatupang South Jakarta PT Ratu Prabu Tiga 61 Under Construction
Samara Suites Jl. Gatot Subroto South Jakarta Synthesis Development 300 Under Construction
Lavish Kemang Residence Jl. Kemang Raya South Jakarta PT Kemang Karya Utama 474 Under Construction
continued
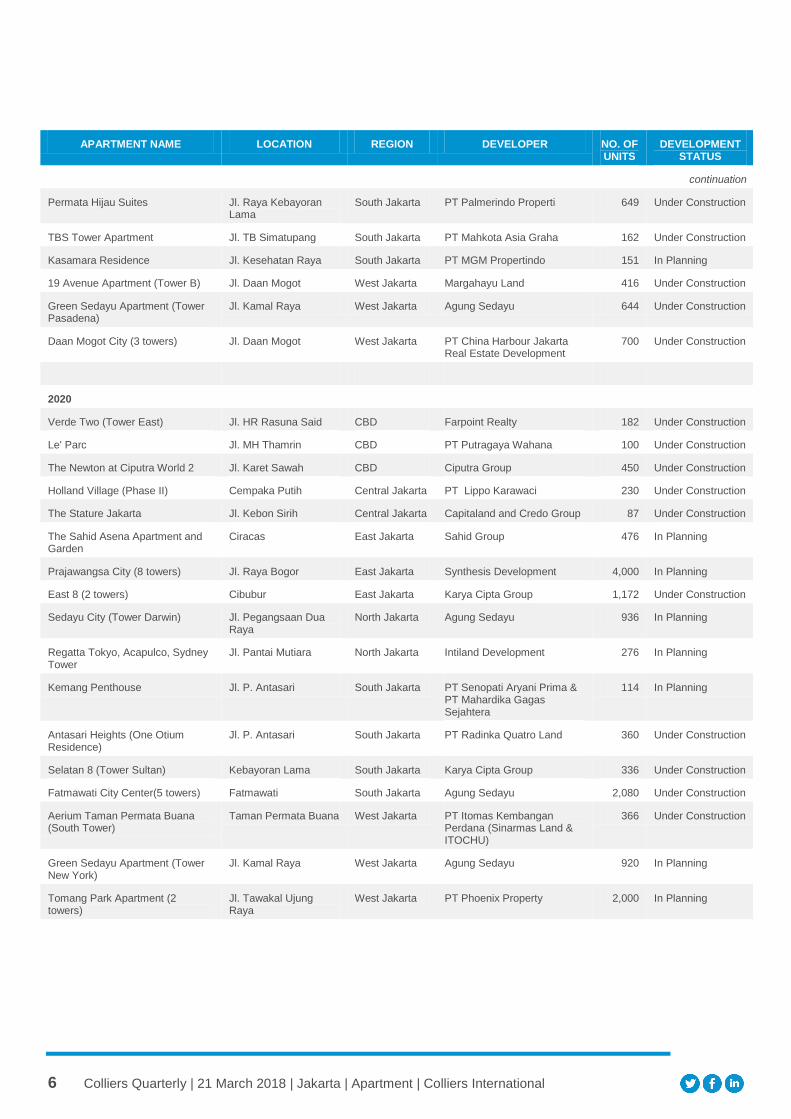
6 Colliers Quarterly | 21 March 2018 | Jakarta | Apartment | Colliers International
APARTMENT NAME LOCATION REGION DEVELOPER NO. OF UNITS
DEVELOPMENT STATUS
continuation
Permata Hijau Suites Jl. Raya Kebayoran Lama
South Jakarta PT Palmerindo Properti 649 Under Construction
TBS Tower Apartment Jl. TB Simatupang South Jakarta PT Mahkota Asia Graha 162 Under Construction
Kasamara Residence Jl. Kesehatan Raya South Jakarta PT MGM Propertindo 151 In Planning
19 Avenue Apartment (Tower B) Jl. Daan Mogot West Jakarta Margahayu Land 416 Under Construction
Green Sedayu Apartment (Tower Pasadena)
Jl. Kamal Raya West Jakarta Agung Sedayu 644 Under Construction
Daan Mogot City (3 towers) Jl. Daan Mogot West Jakarta PT China Harbour Jakarta Real Estate Development
700 Under Construction
2020
Verde Two (Tower East) Jl. HR Rasuna Said CBD Farpoint Realty 182 Under Construction
Le' Parc Jl. MH Thamrin CBD PT Putragaya Wahana 100 Under Construction
The Newton at Ciputra World 2 Jl. Karet Sawah CBD Ciputra Group 450 Under Construction
Holland Village (Phase II) Cempaka Putih Central Jakarta PT Lippo Karawaci 230 Under Construction
The Stature Jakarta Jl. Kebon Sirih Central Jakarta Capitaland and Credo Group 87 Under Construction
The Sahid Asena Apartment and Garden
Ciracas East Jakarta Sahid Group 476 In Planning
Prajawangsa City (8 towers) Jl. Raya Bogor East Jakarta Synthesis Development 4,000 In Planning
East 8 (2 towers) Cibubur East Jakarta Karya Cipta Group 1,172 Under Construction
Sedayu City (Tower Darwin) Jl. Pegangsaan Dua Raya
North Jakarta Agung Sedayu 936 In Planning
Regatta Tokyo, Acapulco, Sydney Tower
Jl. Pantai Mutiara North Jakarta Intiland Development 276 In Planning
Kemang Penthouse Jl. P. Antasari South Jakarta PT Senopati Aryani Prima & PT Mahardika Gagas Sejahtera
114 In Planning
Antasari Heights (One Otium Residence)
Jl. P. Antasari South Jakarta PT Radinka Quatro Land 360 Under Construction
Selatan 8 (Tower Sultan) Kebayoran Lama South Jakarta Karya Cipta Group 336 Under Construction
Fatmawati City Center(5 towers) Fatmawati South Jakarta Agung Sedayu 2,080 Under Construction
Aerium Taman Permata Buana (South Tower)
Taman Permata Buana West Jakarta PT Itomas Kembangan Perdana (Sinarmas Land & ITOCHU)
366 Under Construction
Green Sedayu Apartment (Tower New York)
Jl. Kamal Raya West Jakarta Agung Sedayu 920 In Planning
Tomang Park Apartment (2 towers)
Jl. Tawakal Ujung Raya
West Jakarta PT Phoenix Property 2,000 In Planning
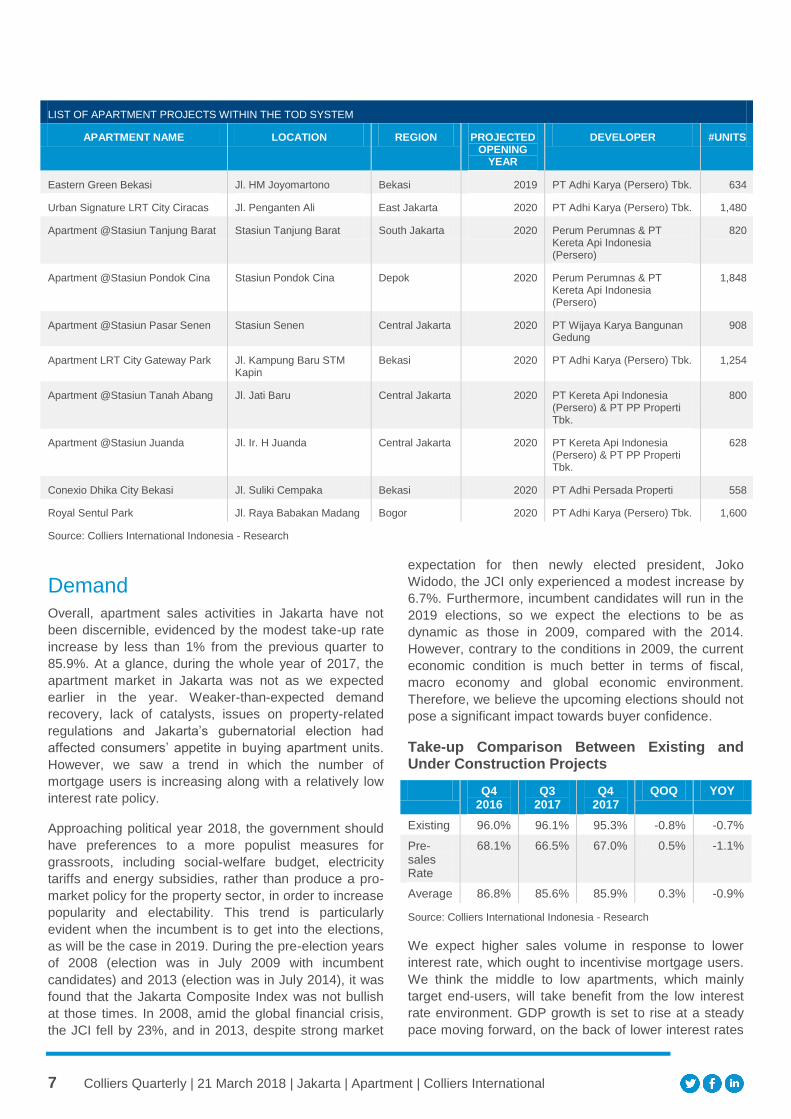
7 Colliers Quarterly | 21 March 2018 | Jakarta | Apartment | Colliers International
Demand
Overall, apartment sales activities in Jakarta have not
been discernible, evidenced by the modest take-up rate
increase by less than 1% from the previous quarter to
85.9%. At a glance, during the whole year of 2017, the
apartment market in Jakarta was not as we expected
earlier in the year. Weaker-than-expected demand
recovery, lack of catalysts, issues on property-related
regulations and Jakarta’s gubernatorial election had
affected consumers’ appetite in buying apartment units.
However, we saw a trend in which the number of
mortgage users is increasing along with a relatively low
interest rate policy.
Approaching political year 2018, the government should
have preferences to a more populist measures for
grassroots, including social-welfare budget, electricity
tariffs and energy subsidies, rather than produce a pro-
market policy for the property sector, in order to increase
popularity and electability. This trend is particularly
evident when the incumbent is to get into the elections,
as will be the case in 2019. During the pre-election years
of 2008 (election was in July 2009 with incumbent
candidates) and 2013 (election was in July 2014), it was
found that the Jakarta Composite Index was not bullish
at those times. In 2008, amid the global financial crisis,
the JCI fell by 23%, and in 2013, despite strong market
expectation for then newly elected president, Joko
Widodo, the JCI only experienced a modest increase by
6.7%. Furthermore, incumbent candidates will run in the
2019 elections, so we expect the elections to be as
dynamic as those in 2009, compared with the 2014.
However, contrary to the conditions in 2009, the current
economic condition is much better in terms of fiscal,
macro economy and global economic environment.
Therefore, we believe the upcoming elections should not
pose a significant impact towards buyer confidence.
Take-up Comparison Between Existing and Under Construction Projects
Q4 2016
Q3 2017
Q4 2017
QOQ YOY
Existing 96.0% 96.1% 95.3% -0.8% -0.7%
Pre-sales Rate
68.1% 66.5% 67.0% 0.5% -1.1%
Average 86.8% 85.6% 85.9% 0.3% -0.9%
Source: Colliers International Indonesia - Research
We expect higher sales volume in response to lower
interest rate, which ought to incentivise mortgage users.
We think the middle to low apartments, which mainly
target end-users, will take benefit from the low interest
rate environment. GDP growth is set to rise at a steady
pace moving forward, on the back of lower interest rates
LIST OF APARTMENT PROJECTS WITHIN THE TOD SYSTEM
APARTMENT NAME LOCATION REGION PROJECTED OPENING
YEAR
DEVELOPER #UNITS
Eastern Green Bekasi Jl. HM Joyomartono Bekasi 2019 PT Adhi Karya (Persero) Tbk. 634
Urban Signature LRT City Ciracas Jl. Penganten Ali East Jakarta 2020 PT Adhi Karya (Persero) Tbk. 1,480
Apartment @Stasiun Tanjung Barat Stasiun Tanjung Barat South Jakarta 2020 Perum Perumnas & PT Kereta Api Indonesia (Persero)
820
Apartment @Stasiun Pondok Cina Stasiun Pondok Cina Depok 2020 Perum Perumnas & PT Kereta Api Indonesia (Persero)
1,848
Apartment @Stasiun Pasar Senen Stasiun Senen Central Jakarta 2020 PT Wijaya Karya Bangunan Gedung
908
Apartment LRT City Gateway Park Jl. Kampung Baru STM Kapin
Bekasi 2020 PT Adhi Karya (Persero) Tbk. 1,254
Apartment @Stasiun Tanah Abang Jl. Jati Baru Central Jakarta 2020 PT Kereta Api Indonesia (Persero) & PT PP Properti Tbk.
800
Apartment @Stasiun Juanda Jl. Ir. H Juanda Central Jakarta 2020 PT Kereta Api Indonesia (Persero) & PT PP Properti Tbk.
628
Conexio Dhika City Bekasi Jl. Suliki Cempaka Bekasi 2020 PT Adhi Persada Properti 558
Royal Sentul Park Jl. Raya Babakan Madang Bogor 2020 PT Adhi Karya (Persero) Tbk. 1,600
Source: Colliers International Indonesia - Research
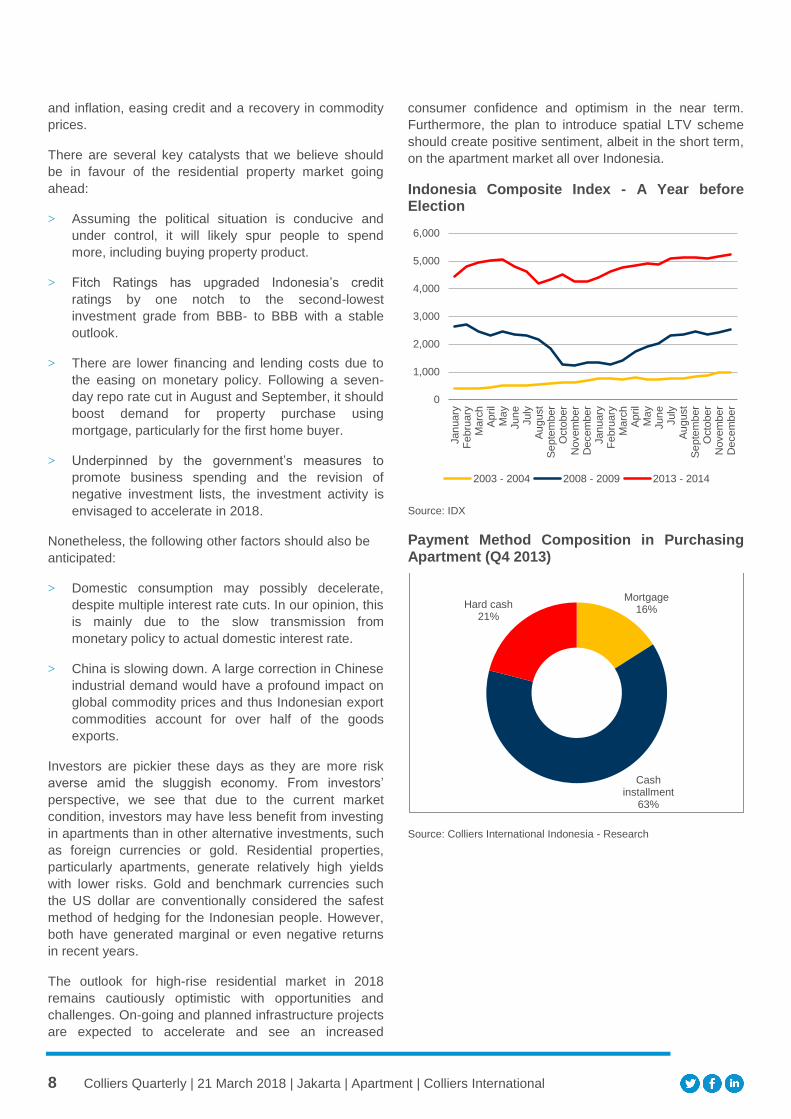
8 Colliers Quarterly | 21 March 2018 | Jakarta | Apartment | Colliers International
and inflation, easing credit and a recovery in commodity
prices.
There are several key catalysts that we believe should
be in favour of the residential property market going
ahead:
> Assuming the political situation is conducive and
under control, it will likely spur people to spend
more, including buying property product.
> Fitch Ratings has upgraded Indonesia’s credit
ratings by one notch to the second-lowest
investment grade from BBB- to BBB with a stable
outlook.
> There are lower financing and lending costs due to
the easing on monetary policy. Following a seven-
day repo rate cut in August and September, it should
boost demand for property purchase using
mortgage, particularly for the first home buyer.
> Underpinned by the government’s measures to
promote business spending and the revision of
negative investment lists, the investment activity is
envisaged to accelerate in 2018.
Nonetheless, the following other factors should also be
anticipated:
> Domestic consumption may possibly decelerate,
despite multiple interest rate cuts. In our opinion, this
is mainly due to the slow transmission from
monetary policy to actual domestic interest rate.
> China is slowing down. A large correction in Chinese
industrial demand would have a profound impact on
global commodity prices and thus Indonesian export
commodities account for over half of the goods
exports.
Investors are pickier these days as they are more risk
averse amid the sluggish economy. From investors’
perspective, we see that due to the current market
condition, investors may have less benefit from investing
in apartments than in other alternative investments, such
as foreign currencies or gold. Residential properties,
particularly apartments, generate relatively high yields
with lower risks. Gold and benchmark currencies such
the US dollar are conventionally considered the safest
method of hedging for the Indonesian people. However,
both have generated marginal or even negative returns
in recent years.
The outlook for high-rise residential market in 2018
remains cautiously optimistic with opportunities and
challenges. On-going and planned infrastructure projects
are expected to accelerate and see an increased
consumer confidence and optimism in the near term.
Furthermore, the plan to introduce spatial LTV scheme
should create positive sentiment, albeit in the short term,
on the apartment market all over Indonesia.
Indonesia Composite Index - A Year before Election
Source: IDX
Payment Method Composition in Purchasing Apartment (Q4 2013)
Source: Colliers International Indonesia - Research
0
1,000
2,000
3,000
4,000
5,000
6,000
Jan
uary
Fe
bru
ary
Ma
rch
Ap
ril
Ma
yJun
eJuly
Au
gust
Se
pte
mb
er
Octo
ber
Novem
ber
Decem
ber
Jan
uary
Fe
bru
ary
Ma
rch
Ap
ril
Ma
yJun
eJuly
Au
gust
Se
pte
mb
er
Octo
ber
Novem
ber
Decem
ber
2003 - 2004 2008 - 2009 2013 - 2014
Mortgage 16%
Cash installment
63%
Hard cash 21%
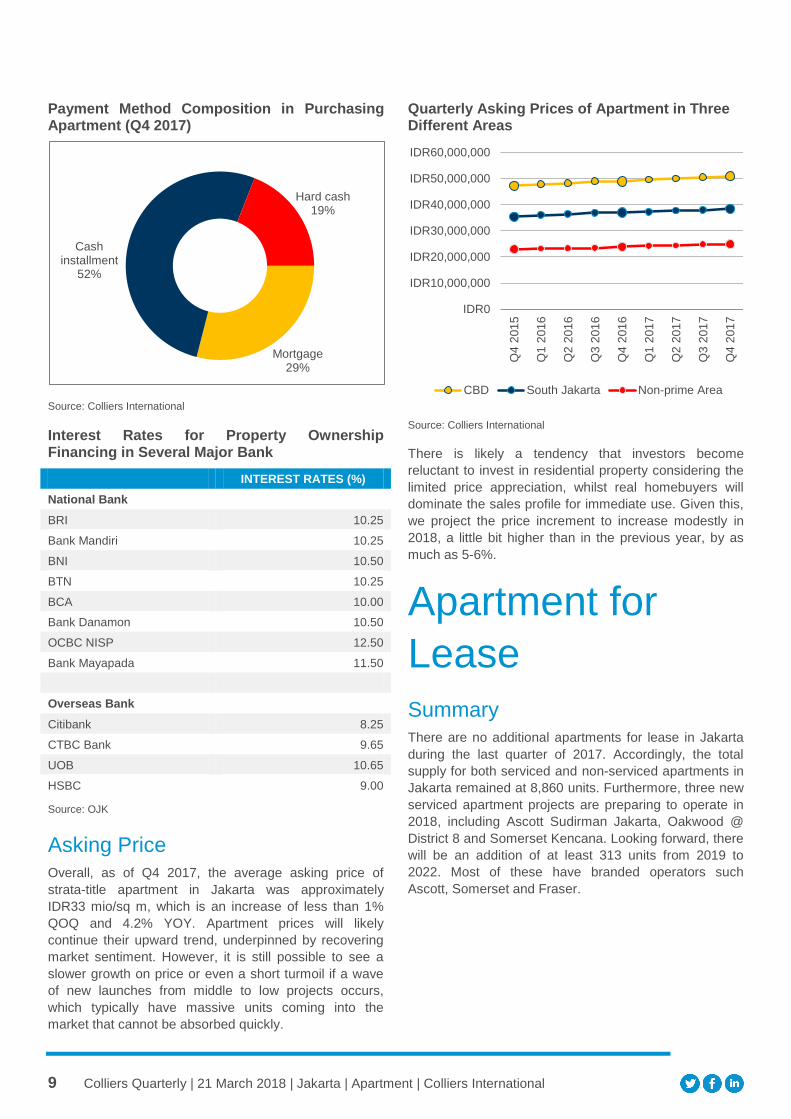
9 Colliers Quarterly | 21 March 2018 | Jakarta | Apartment | Colliers International
Payment Method Composition in Purchasing Apartment (Q4 2017)
Source: Colliers International
Interest Rates for Property Ownership Financing in Several Major Bank
INTEREST RATES (%)
National Bank
BRI 10.25
Bank Mandiri 10.25
BNI 10.50
BTN 10.25
BCA 10.00
Bank Danamon 10.50
OCBC NISP 12.50
Bank Mayapada 11.50
Overseas Bank
Citibank 8.25
CTBC Bank 9.65
UOB 10.65
HSBC 9.00
Source: OJK
Asking Price
Overall, as of Q4 2017, the average asking price of
strata-title apartment in Jakarta was approximately
IDR33 mio/sq m, which is an increase of less than 1%
QOQ and 4.2% YOY. Apartment prices will likely
continue their upward trend, underpinned by recovering
market sentiment. However, it is still possible to see a
slower growth on price or even a short turmoil if a wave
of new launches from middle to low projects occurs,
which typically have massive units coming into the
market that cannot be absorbed quickly.
Quarterly Asking Prices of Apartment in Three Different Areas
Source: Colliers International
There is likely a tendency that investors become
reluctant to invest in residential property considering the
limited price appreciation, whilst real homebuyers will
dominate the sales profile for immediate use. Given this,
we project the price increment to increase modestly in
2018, a little bit higher than in the previous year, by as
much as 5-6%.
Apartment for
Lease
Summary
There are no additional apartments for lease in Jakarta
during the last quarter of 2017. Accordingly, the total
supply for both serviced and non-serviced apartments in
Jakarta remained at 8,860 units. Furthermore, three new
serviced apartment projects are preparing to operate in
2018, including Ascott Sudirman Jakarta, Oakwood @
District 8 and Somerset Kencana. Looking forward, there
will be an addition of at least 313 units from 2019 to
2022. Most of these have branded operators such
Ascott, Somerset and Fraser.
Mortgage 29%
Cash installment
52%
Hard cash 19%
IDR0
IDR10,000,000
IDR20,000,000
IDR30,000,000
IDR40,000,000
IDR50,000,000
IDR60,000,000
Q4
201
5
Q1
201
6
Q2
201
6
Q3
201
6
Q4
201
6
Q1
201
7
Q2
201
7
Q3
201
7
Q4
201
7
CBD South Jakarta Non-prime Area
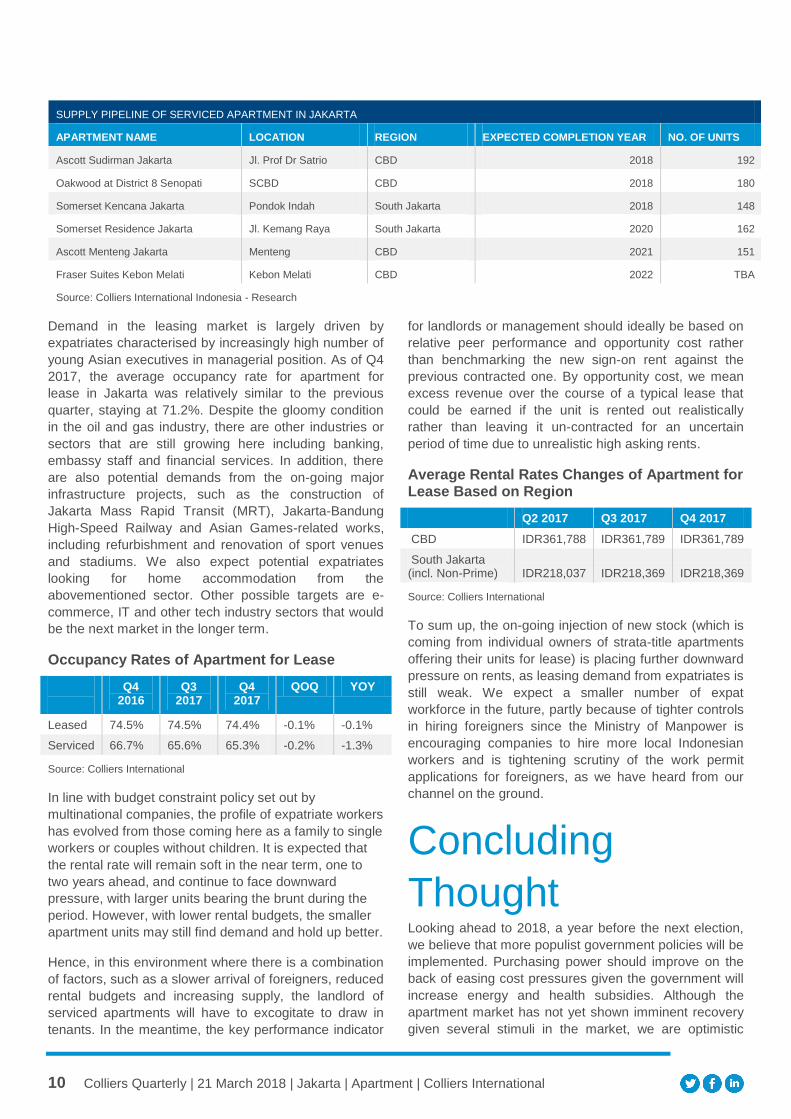
10 Colliers Quarterly | 21 March 2018 | Jakarta | Apartment | Colliers International
Demand in the leasing market is largely driven by
expatriates characterised by increasingly high number of
young Asian executives in managerial position. As of Q4
2017, the average occupancy rate for apartment for
lease in Jakarta was relatively similar to the previous
quarter, staying at 71.2%. Despite the gloomy condition
in the oil and gas industry, there are other industries or
sectors that are still growing here including banking,
embassy staff and financial services. In addition, there
are also potential demands from the on-going major
infrastructure projects, such as the construction of
Jakarta Mass Rapid Transit (MRT), Jakarta-Bandung
High-Speed Railway and Asian Games-related works,
including refurbishment and renovation of sport venues
and stadiums. We also expect potential expatriates
looking for home accommodation from the
abovementioned sector. Other possible targets are e-
commerce, IT and other tech industry sectors that would
be the next market in the longer term.
Occupancy Rates of Apartment for Lease
Q4 2016
Q3 2017
Q4 2017
QOQ YOY
Leased 74.5% 74.5% 74.4% -0.1% -0.1%
Serviced 66.7% 65.6% 65.3% -0.2% -1.3%
Source: Colliers International
In line with budget constraint policy set out by
multinational companies, the profile of expatriate workers
has evolved from those coming here as a family to single
workers or couples without children. It is expected that
the rental rate will remain soft in the near term, one to
two years ahead, and continue to face downward
pressure, with larger units bearing the brunt during the
period. However, with lower rental budgets, the smaller
apartment units may still find demand and hold up better.
Hence, in this environment where there is a combination
of factors, such as a slower arrival of foreigners, reduced
rental budgets and increasing supply, the landlord of
serviced apartments will have to excogitate to draw in
tenants. In the meantime, the key performance indicator
for landlords or management should ideally be based on
relative peer performance and opportunity cost rather
than benchmarking the new sign-on rent against the
previous contracted one. By opportunity cost, we mean
excess revenue over the course of a typical lease that
could be earned if the unit is rented out realistically
rather than leaving it un-contracted for an uncertain
period of time due to unrealistic high asking rents.
Average Rental Rates Changes of Apartment for Lease Based on Region
Q2 2017 Q3 2017 Q4 2017
CBD IDR361,788 IDR361,789 IDR361,789
South Jakarta (incl. Non-Prime) IDR218,037 IDR218,369 IDR218,369
Source: Colliers International
To sum up, the on-going injection of new stock (which is
coming from individual owners of strata-title apartments
offering their units for lease) is placing further downward
pressure on rents, as leasing demand from expatriates is
still weak. We expect a smaller number of expat
workforce in the future, partly because of tighter controls
in hiring foreigners since the Ministry of Manpower is
encouraging companies to hire more local Indonesian
workers and is tightening scrutiny of the work permit
applications for foreigners, as we have heard from our
channel on the ground.
Concluding
Thought Looking ahead to 2018, a year before the next election,
we believe that more populist government policies will be
implemented. Purchasing power should improve on the
back of easing cost pressures given the government will
increase energy and health subsidies. Although the
apartment market has not yet shown imminent recovery
given several stimuli in the market, we are optimistic
SUPPLY PIPELINE OF SERVICED APARTMENT IN JAKARTA
APARTMENT NAME LOCATION REGION EXPECTED COMPLETION YEAR NO. OF UNITS
Ascott Sudirman Jakarta Jl. Prof Dr Satrio CBD 2018 192
Oakwood at District 8 Senopati SCBD CBD 2018 180
Somerset Kencana Jakarta Pondok Indah South Jakarta 2018 148
Somerset Residence Jakarta Jl. Kemang Raya South Jakarta 2020 162
Ascott Menteng Jakarta Menteng CBD 2021 151
Fraser Suites Kebon Melati Kebon Melati CBD 2022 TBA
Source: Colliers International Indonesia - Research
11 Colliers Quarterly | 21 March 2018 | Jakarta | Apartment | Colliers International
about seeing better 2018 results, albeit in a slow pace.
Several key aspects such as steady economic growth,
stable political situation, supportive regulation
environment and on-going government infrastructure
projects should significantly impact the property market,
particularly the apartment market. Last but not least,
Indonesia’s huge population with the growing middle
class economy and rising urbanisation will naturally
create future demand for residential property. And for
that reason, we can see foreign and local developers
coming in and crowding the Indonesian property market.
For more information: Contributors:
Ferry Salanto Senior Associate Director Research +62 21 3043 6888 [email protected]
Hern Rizal Gobi Manager | Research
Copyright © 2017 Colliers International.
The information contained herein has been obtained from
sources deemed reliable. While every reasonable effort has
been made to ensure its accuracy, we cannot guarantee it. No
responsibility is assumed for any inaccuracies. Readers are
encouraged to consult their professional advisors prior to
acting on any of the material contained in this report.
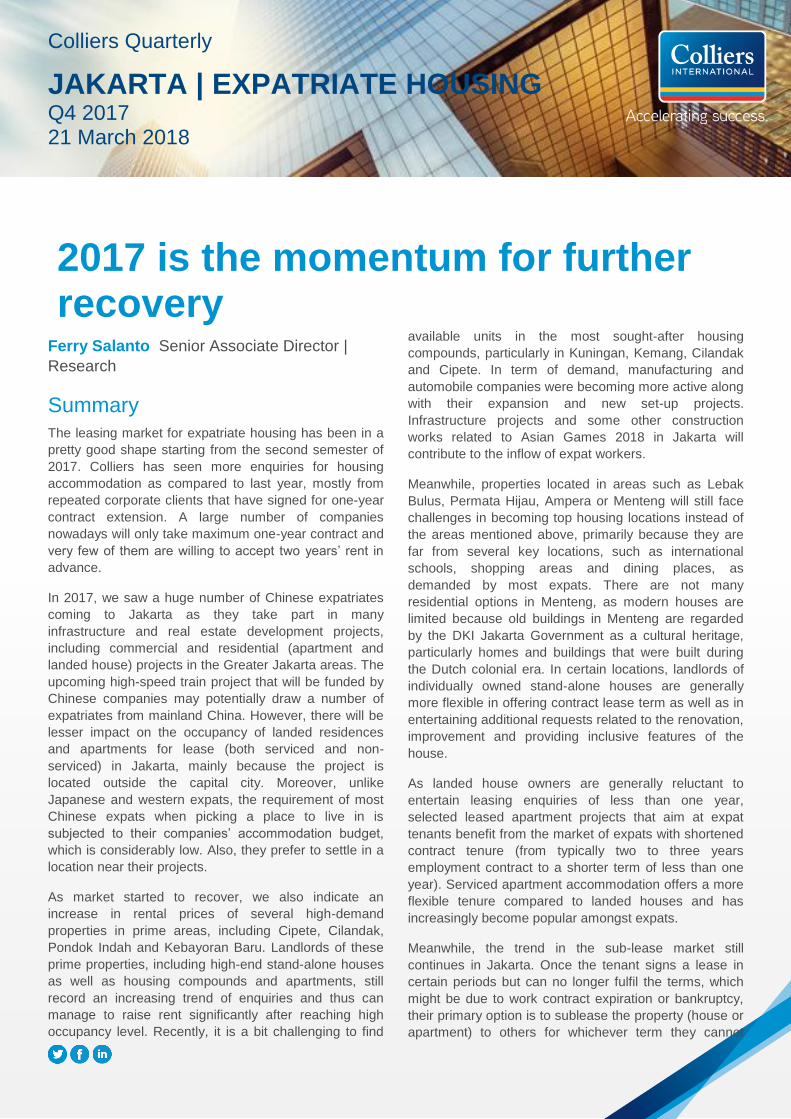
Copyright © 2015 Colliers International.
The information contained herein has been
obtained from sources deemed reliable.
While every reasonable effort has been
made to ensure its accuracy, we cannot
guarantee it. No responsibility is assumed
for any inaccuracies. Readers are
encouraged to consult their professional
advisors prior to acting on any of the
For more information:
Market Contact Name
Title | Market
+1 00 000 0000
Market Contact Name
Title | Market
+1 00 000 0000
Contributors:
Market Contact Name
Title | Market
Market Contact Name
Title | Market
Market Contact Name
Title | Market
Market Contact Name
Title | Market
Ferry Salanto Senior Associate Director |
Research
Summary
The leasing market for expatriate housing has been in a
pretty good shape starting from the second semester of
2017. Colliers has seen more enquiries for housing
accommodation as compared to last year, mostly from
repeated corporate clients that have signed for one-year
contract extension. A large number of companies
nowadays will only take maximum one-year contract and
very few of them are willing to accept two years’ rent in
advance.
In 2017, we saw a huge number of Chinese expatriates
coming to Jakarta as they take part in many
infrastructure and real estate development projects,
including commercial and residential (apartment and
landed house) projects in the Greater Jakarta areas. The
upcoming high-speed train project that will be funded by
Chinese companies may potentially draw a number of
expatriates from mainland China. However, there will be
lesser impact on the occupancy of landed residences
and apartments for lease (both serviced and non-
serviced) in Jakarta, mainly because the project is
located outside the capital city. Moreover, unlike
Japanese and western expats, the requirement of most
Chinese expats when picking a place to live in is
subjected to their companies’ accommodation budget,
which is considerably low. Also, they prefer to settle in a
location near their projects.
As market started to recover, we also indicate an
increase in rental prices of several high-demand
properties in prime areas, including Cipete, Cilandak,
Pondok Indah and Kebayoran Baru. Landlords of these
prime properties, including high-end stand-alone houses
as well as housing compounds and apartments, still
record an increasing trend of enquiries and thus can
manage to raise rent significantly after reaching high
occupancy level. Recently, it is a bit challenging to find
available units in the most sought-after housing
compounds, particularly in Kuningan, Kemang, Cilandak
and Cipete. In term of demand, manufacturing and
automobile companies were becoming more active along
with their expansion and new set-up projects.
Infrastructure projects and some other construction
works related to Asian Games 2018 in Jakarta will
contribute to the inflow of expat workers.
Meanwhile, properties located in areas such as Lebak
Bulus, Permata Hijau, Ampera or Menteng will still face
challenges in becoming top housing locations instead of
the areas mentioned above, primarily because they are
far from several key locations, such as international
schools, shopping areas and dining places, as
demanded by most expats. There are not many
residential options in Menteng, as modern houses are
limited because old buildings in Menteng are regarded
by the DKI Jakarta Government as a cultural heritage,
particularly homes and buildings that were built during
the Dutch colonial era. In certain locations, landlords of
individually owned stand-alone houses are generally
more flexible in offering contract lease term as well as in
entertaining additional requests related to the renovation,
improvement and providing inclusive features of the
house.
As landed house owners are generally reluctant to
entertain leasing enquiries of less than one year,
selected leased apartment projects that aim at expat
tenants benefit from the market of expats with shortened
contract tenure (from typically two to three years
employment contract to a shorter term of less than one
year). Serviced apartment accommodation offers a more
flexible tenure compared to landed houses and has
increasingly become popular amongst expats.
Meanwhile, the trend in the sub-lease market still
continues in Jakarta. Once the tenant signs a lease in
certain periods but can no longer fulfil the terms, which
might be due to work contract expiration or bankruptcy,
their primary option is to sublease the property (house or
apartment) to others for whichever term they cannot
Colliers Quarterly
JAKARTA | EXPATRIATE HOUSING Q4 2017 21 March 2018
2017 is the momentum for further recovery
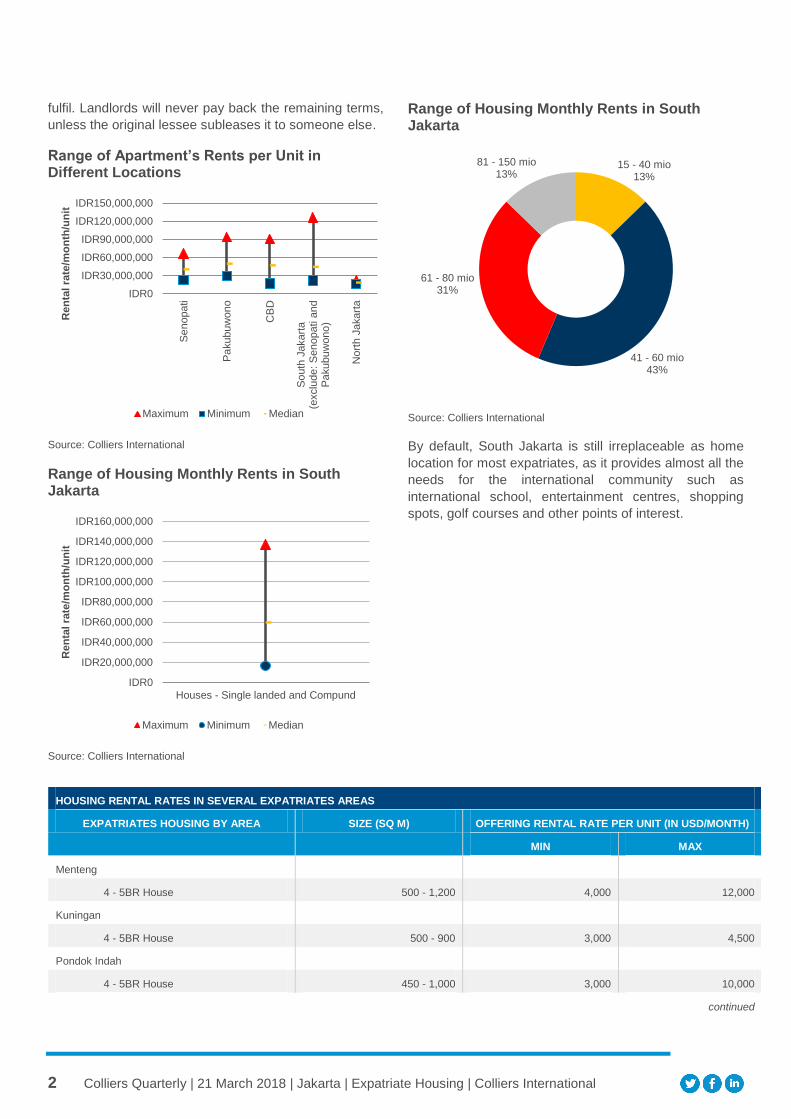
2 Colliers Quarterly | 21 March 2018 | Jakarta | Expatriate Housing | Colliers International
fulfil. Landlords will never pay back the remaining terms,
unless the original lessee subleases it to someone else.
Range of Apartment’s Rents per Unit in Different Locations
Source: Colliers International
Range of Housing Monthly Rents in South Jakarta
Source: Colliers International
Range of Housing Monthly Rents in South Jakarta
Source: Colliers International
By default, South Jakarta is still irreplaceable as home
location for most expatriates, as it provides almost all the
needs for the international community such as
international school, entertainment centres, shopping
spots, golf courses and other points of interest.
IDR0
IDR30,000,000
IDR60,000,000
IDR90,000,000
IDR120,000,000
IDR150,000,000
Se
nopati
Pa
kubuw
ono
CB
D
So
uth
Jakart
a(e
xclu
de: S
enopati a
nd
Pa
kubuw
ono
)
Nort
h J
akart
a
Ren
tal ra
te/m
on
th/u
nit
Maximum Minimum Median
IDR0
IDR20,000,000
IDR40,000,000
IDR60,000,000
IDR80,000,000
IDR100,000,000
IDR120,000,000
IDR140,000,000
IDR160,000,000
Houses - Single landed and Compund
Ren
tal ra
te/m
on
th/u
nit
Maximum Minimum Median
15 - 40 mio 13%
41 - 60 mio 43%
61 - 80 mio 31%
81 - 150 mio 13%
HOUSING RENTAL RATES IN SEVERAL EXPATRIATES AREAS
EXPATRIATES HOUSING BY AREA SIZE (SQ M) OFFERING RENTAL RATE PER UNIT (IN USD/MONTH)
MIN MAX
Menteng
4 - 5BR House 500 - 1,200 4,000 12,000
Kuningan
4 - 5BR House 500 - 900 3,000 4,500
Pondok Indah
4 - 5BR House 450 - 1,000 3,000 10,000
continued
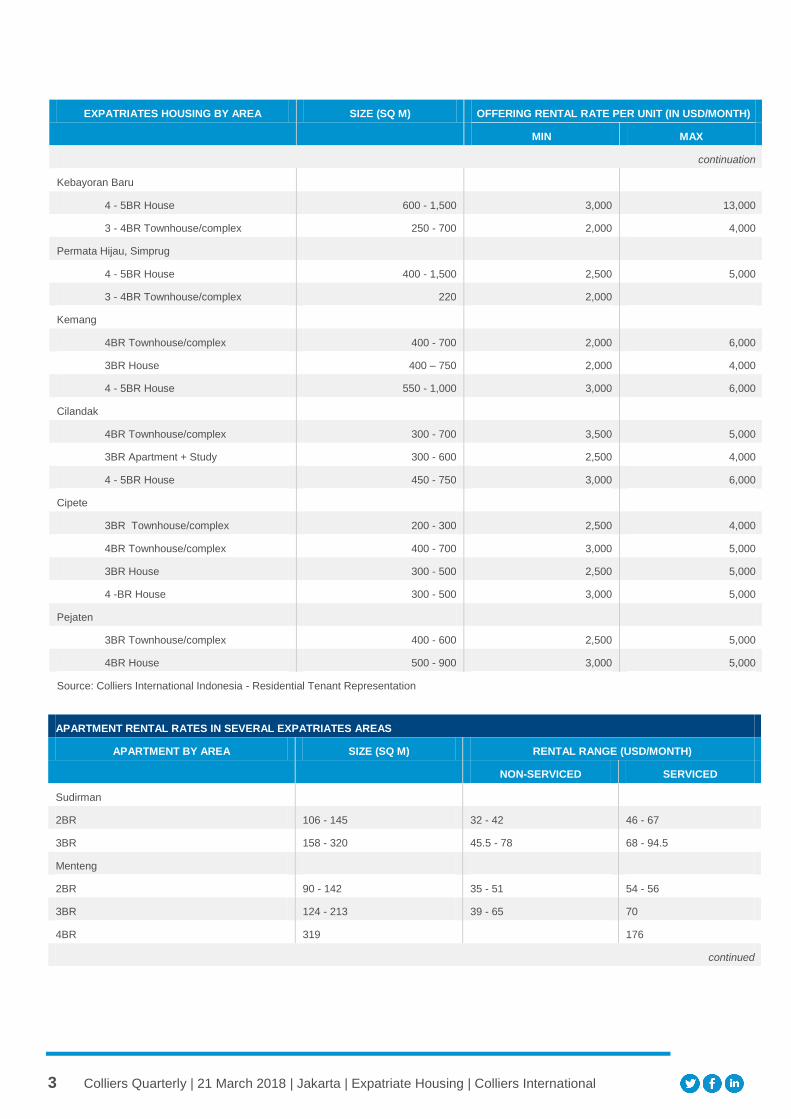
3 Colliers Quarterly | 21 March 2018 | Jakarta | Expatriate Housing | Colliers International
EXPATRIATES HOUSING BY AREA SIZE (SQ M) OFFERING RENTAL RATE PER UNIT (IN USD/MONTH)
MIN MAX
continuation
Kebayoran Baru
4 - 5BR House 600 - 1,500 3,000 13,000
3 - 4BR Townhouse/complex 250 - 700 2,000 4,000
Permata Hijau, Simprug
4 - 5BR House 400 - 1,500 2,500 5,000
3 - 4BR Townhouse/complex 220 2,000
Kemang
4BR Townhouse/complex 400 - 700 2,000 6,000
3BR House 400 – 750 2,000 4,000
4 - 5BR House 550 - 1,000 3,000 6,000
Cilandak
4BR Townhouse/complex 300 - 700 3,500 5,000
3BR Apartment + Study 300 - 600 2,500 4,000
4 - 5BR House 450 - 750 3,000 6,000
Cipete
3BR Townhouse/complex 200 - 300 2,500 4,000
4BR Townhouse/complex 400 - 700 3,000 5,000
3BR House 300 - 500 2,500 5,000
4 -BR House 300 - 500 3,000 5,000
Pejaten
3BR Townhouse/complex 400 - 600 2,500 5,000
4BR House 500 - 900 3,000 5,000
Source: Colliers International Indonesia - Residential Tenant Representation
APARTMENT RENTAL RATES IN SEVERAL EXPATRIATES AREAS
APARTMENT BY AREA SIZE (SQ M) RENTAL RANGE (USD/MONTH)
NON-SERVICED SERVICED
Sudirman
2BR 106 - 145 32 - 42 46 - 67
3BR 158 - 320 45.5 - 78 68 - 94.5
Menteng
2BR 90 - 142 35 - 51 54 - 56
3BR 124 - 213 39 - 65 70
4BR 319 176
continued
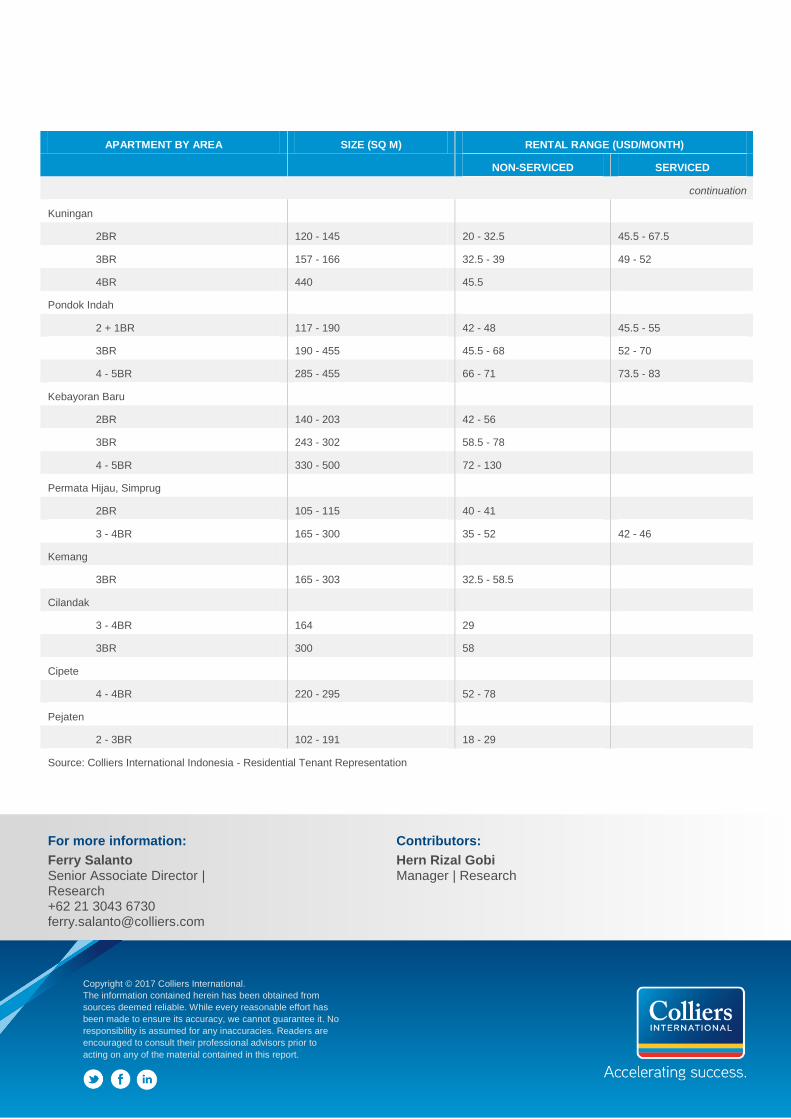
4 Colliers Quarterly | 21 March 2018 | Jakarta | Expatriate Housing | Colliers International
APARTMENT BY AREA SIZE (SQ M) RENTAL RANGE (USD/MONTH)
NON-SERVICED SERVICED
continuation
Kuningan
2BR 120 - 145 20 - 32.5 45.5 - 67.5
3BR 157 - 166 32.5 - 39 49 - 52
4BR 440 45.5
Pondok Indah
2 + 1BR 117 - 190 42 - 48 45.5 - 55
3BR 190 - 455 45.5 - 68 52 - 70
4 - 5BR 285 - 455 66 - 71 73.5 - 83
Kebayoran Baru
2BR 140 - 203 42 - 56
3BR 243 - 302 58.5 - 78
4 - 5BR 330 - 500 72 - 130
Permata Hijau, Simprug
2BR 105 - 115 40 - 41
3 - 4BR 165 - 300 35 - 52 42 - 46
Kemang
3BR 165 - 303 32.5 - 58.5
Cilandak
3 - 4BR 164 29
3BR 300 58
Cipete
4 - 4BR 220 - 295 52 - 78
Pejaten
2 - 3BR 102 - 191 18 - 29
Source: Colliers International Indonesia - Residential Tenant Representation
For more information: Contributors:
Ferry Salanto Senior Associate Director | Research +62 21 3043 6730 [email protected]
Hern Rizal Gobi Manager | Research
Copyright © 2017 Colliers International.
The information contained herein has been obtained from
sources deemed reliable. While every reasonable effort has
been made to ensure its accuracy, we cannot guarantee it. No
responsibility is assumed for any inaccuracies. Readers are
encouraged to consult their professional advisors prior to
acting on any of the material contained in this report.
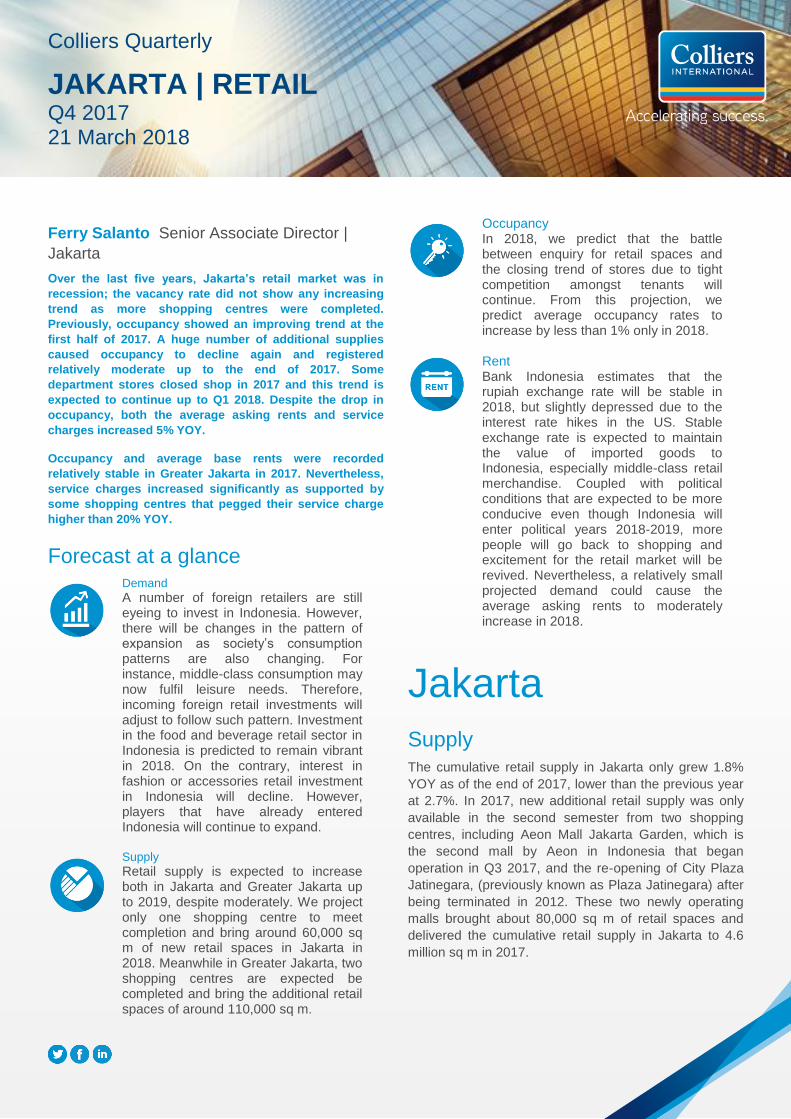
Copyright © 2015 Colliers International.
The information contained herein has been
obtained from sources deemed reliable.
While every reasonable effort has been
made to ensure its accuracy, we cannot
guarantee it. No responsibility is assumed
for any inaccuracies. Readers are
encouraged to consult their professional
advisors prior to acting on any of the
For more information:
Market Contact Name
Title | Market
+1 00 000 0000
Market Contact Name
Title | Market
+1 00 000 0000
Contributors:
Market Contact Name
Title | Market
Market Contact Name
Title | Market
Market Contact Name
Title | Market
Market Contact Name
Title | Market
Ferry Salanto Senior Associate Director |
Jakarta
Over the last five years, Jakarta’s retail market was in
recession; the vacancy rate did not show any increasing
trend as more shopping centres were completed.
Previously, occupancy showed an improving trend at the
first half of 2017. A huge number of additional supplies
caused occupancy to decline again and registered
relatively moderate up to the end of 2017. Some
department stores closed shop in 2017 and this trend is
expected to continue up to Q1 2018. Despite the drop in
occupancy, both the average asking rents and service
charges increased 5% YOY.
Occupancy and average base rents were recorded
relatively stable in Greater Jakarta in 2017. Nevertheless,
service charges increased significantly as supported by
some shopping centres that pegged their service charge
higher than 20% YOY.
Forecast at a glance
Demand
A number of foreign retailers are still eyeing to invest in Indonesia. However, there will be changes in the pattern of expansion as society’s consumption patterns are also changing. For instance, middle-class consumption may now fulfil leisure needs. Therefore, incoming foreign retail investments will adjust to follow such pattern. Investment in the food and beverage retail sector in Indonesia is predicted to remain vibrant in 2018. On the contrary, interest in fashion or accessories retail investment in Indonesia will decline. However, players that have already entered Indonesia will continue to expand.
Supply
Retail supply is expected to increase both in Jakarta and Greater Jakarta up to 2019, despite moderately. We project only one shopping centre to meet completion and bring around 60,000 sq m of new retail spaces in Jakarta in 2018. Meanwhile in Greater Jakarta, two shopping centres are expected be completed and bring the additional retail spaces of around 110,000 sq m.
Occupancy In 2018, we predict that the battle between enquiry for retail spaces and the closing trend of stores due to tight competition amongst tenants will continue. From this projection, we predict average occupancy rates to increase by less than 1% only in 2018.
Rent
Bank Indonesia estimates that the rupiah exchange rate will be stable in 2018, but slightly depressed due to the interest rate hikes in the US. Stable exchange rate is expected to maintain the value of imported goods to Indonesia, especially middle-class retail merchandise. Coupled with political conditions that are expected to be more conducive even though Indonesia will enter political years 2018-2019, more people will go back to shopping and excitement for the retail market will be revived. Nevertheless, a relatively small projected demand could cause the average asking rents to moderately increase in 2018.
Jakarta
Supply
The cumulative retail supply in Jakarta only grew 1.8%
YOY as of the end of 2017, lower than the previous year
at 2.7%. In 2017, new additional retail supply was only
available in the second semester from two shopping
centres, including Aeon Mall Jakarta Garden, which is
the second mall by Aeon in Indonesia that began
operation in Q3 2017, and the re-opening of City Plaza
Jatinegara, (previously known as Plaza Jatinegara) after
being terminated in 2012. These two newly operating
malls brought about 80,000 sq m of retail spaces and
delivered the cumulative retail supply in Jakarta to 4.6
million sq m in 2017.
Colliers Quarterly
JAKARTA | RETAIL Q4 2017 21 March 2018
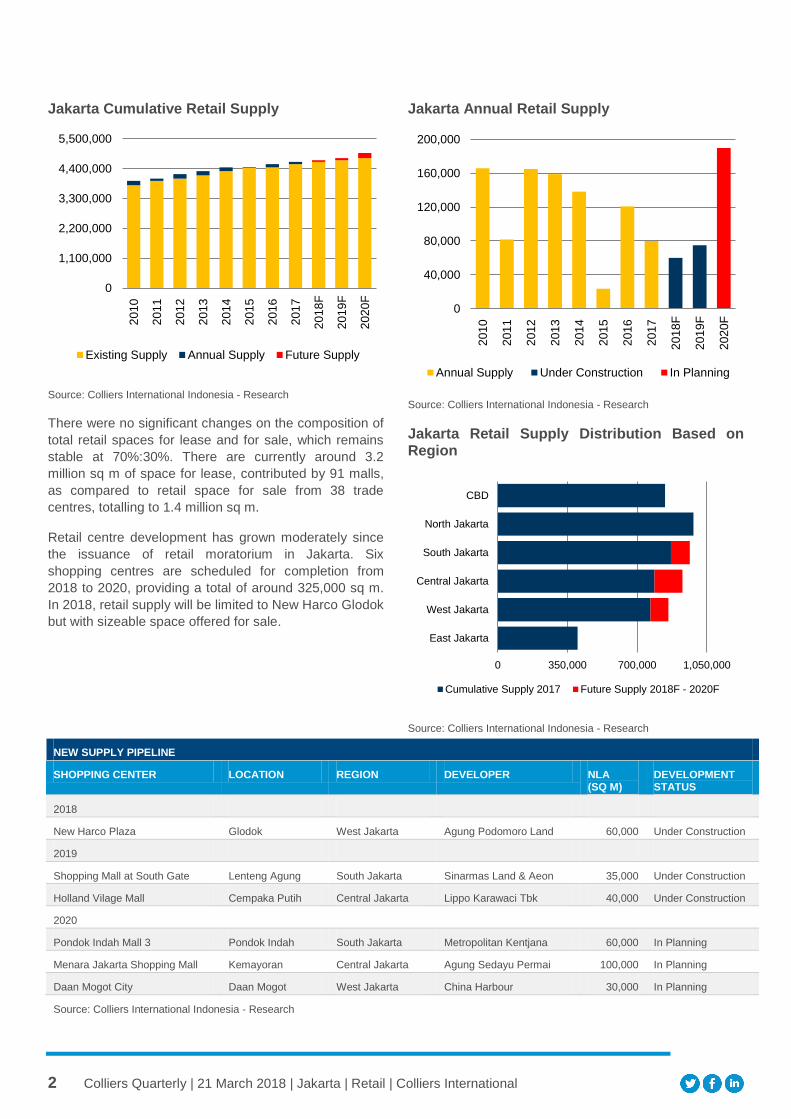
2 Colliers Quarterly | 21 March 2018 | Jakarta | Retail | Colliers International
Jakarta Cumulative Retail Supply
Source: Colliers International Indonesia - Research
There were no significant changes on the composition of
total retail spaces for lease and for sale, which remains
stable at 70%:30%. There are currently around 3.2
million sq m of space for lease, contributed by 91 malls,
as compared to retail space for sale from 38 trade
centres, totalling to 1.4 million sq m.
Retail centre development has grown moderately since
the issuance of retail moratorium in Jakarta. Six
shopping centres are scheduled for completion from
2018 to 2020, providing a total of around 325,000 sq m.
In 2018, retail supply will be limited to New Harco Glodok
but with sizeable space offered for sale.
Jakarta Annual Retail Supply
Source: Colliers International Indonesia - Research
Jakarta Retail Supply Distribution Based on Region
Source: Colliers International Indonesia - Research
0
1,100,000
2,200,000
3,300,000
4,400,000
5,500,0002
01
0
201
1
201
2
201
3
201
4
201
5
201
6
201
7
201
8F
201
9F
202
0F
Existing Supply Annual Supply Future Supply
0
40,000
80,000
120,000
160,000
200,000
201
0
201
1
201
2
201
3
201
4
201
5
201
6
201
7
201
8F
201
9F
202
0F
Annual Supply Under Construction In Planning
0 350,000 700,000 1,050,000
East Jakarta
West Jakarta
Central Jakarta
South Jakarta
North Jakarta
CBD
Cumulative Supply 2017 Future Supply 2018F - 2020F
NEW SUPPLY PIPELINE
SHOPPING CENTER LOCATION REGION DEVELOPER NLA (SQ M)
DEVELOPMENT STATUS
2018
New Harco Plaza Glodok West Jakarta Agung Podomoro Land 60,000 Under Construction
2019
Shopping Mall at South Gate Lenteng Agung South Jakarta Sinarmas Land & Aeon 35,000 Under Construction
Holland Vilage Mall Cempaka Putih Central Jakarta Lippo Karawaci Tbk 40,000 Under Construction
2020
Pondok Indah Mall 3 Pondok Indah South Jakarta Metropolitan Kentjana 60,000 In Planning
Menara Jakarta Shopping Mall Kemayoran Central Jakarta Agung Sedayu Permai 100,000 In Planning
Daan Mogot City Daan Mogot West Jakarta China Harbour 30,000 In Planning
Source: Colliers International Indonesia - Research
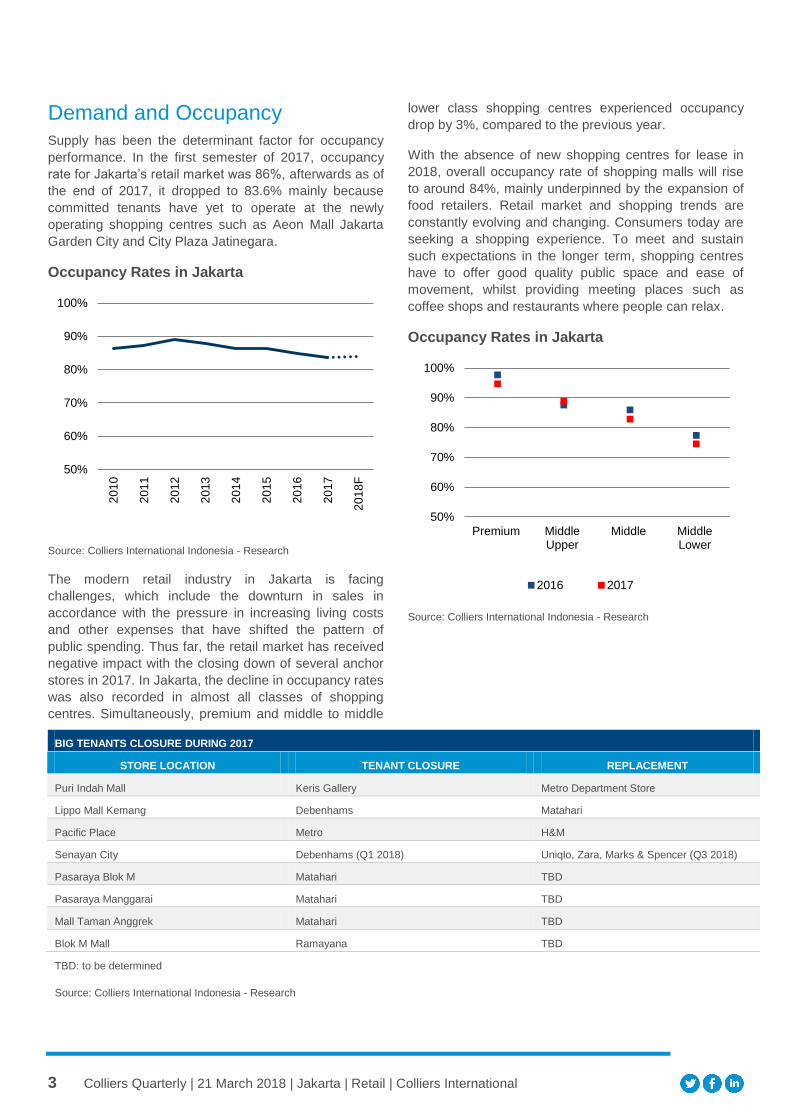
3 Colliers Quarterly | 21 March 2018 | Jakarta | Retail | Colliers International
Demand and Occupancy
Supply has been the determinant factor for occupancy
performance. In the first semester of 2017, occupancy
rate for Jakarta’s retail market was 86%, afterwards as of
the end of 2017, it dropped to 83.6% mainly because
committed tenants have yet to operate at the newly
operating shopping centres such as Aeon Mall Jakarta
Garden City and City Plaza Jatinegara.
Occupancy Rates in Jakarta
Source: Colliers International Indonesia - Research
The modern retail industry in Jakarta is facing
challenges, which include the downturn in sales in
accordance with the pressure in increasing living costs
and other expenses that have shifted the pattern of
public spending. Thus far, the retail market has received
negative impact with the closing down of several anchor
stores in 2017. In Jakarta, the decline in occupancy rates
was also recorded in almost all classes of shopping
centres. Simultaneously, premium and middle to middle
lower class shopping centres experienced occupancy
drop by 3%, compared to the previous year.
With the absence of new shopping centres for lease in
2018, overall occupancy rate of shopping malls will rise
to around 84%, mainly underpinned by the expansion of
food retailers. Retail market and shopping trends are
constantly evolving and changing. Consumers today are
seeking a shopping experience. To meet and sustain
such expectations in the longer term, shopping centres
have to offer good quality public space and ease of
movement, whilst providing meeting places such as
coffee shops and restaurants where people can relax.
Occupancy Rates in Jakarta
Source: Colliers International Indonesia - Research
50%
60%
70%
80%
90%
100%
201
0
201
1
201
2
201
3
201
4
201
5
201
6
201
7
201
8F
50%
60%
70%
80%
90%
100%
Premium MiddleUpper
Middle MiddleLower
2016 2017
BIG TENANTS CLOSURE DURING 2017
STORE LOCATION TENANT CLOSURE REPLACEMENT
Puri Indah Mall Keris Gallery Metro Department Store
Lippo Mall Kemang Debenhams Matahari
Pacific Place Metro H&M
Senayan City Debenhams (Q1 2018) Uniqlo, Zara, Marks & Spencer (Q3 2018)
Pasaraya Blok M Matahari TBD
Pasaraya Manggarai Matahari TBD
Mall Taman Anggrek Matahari TBD
Blok M Mall Ramayana TBD
TBD: to be determined
Source: Colliers International Indonesia - Research
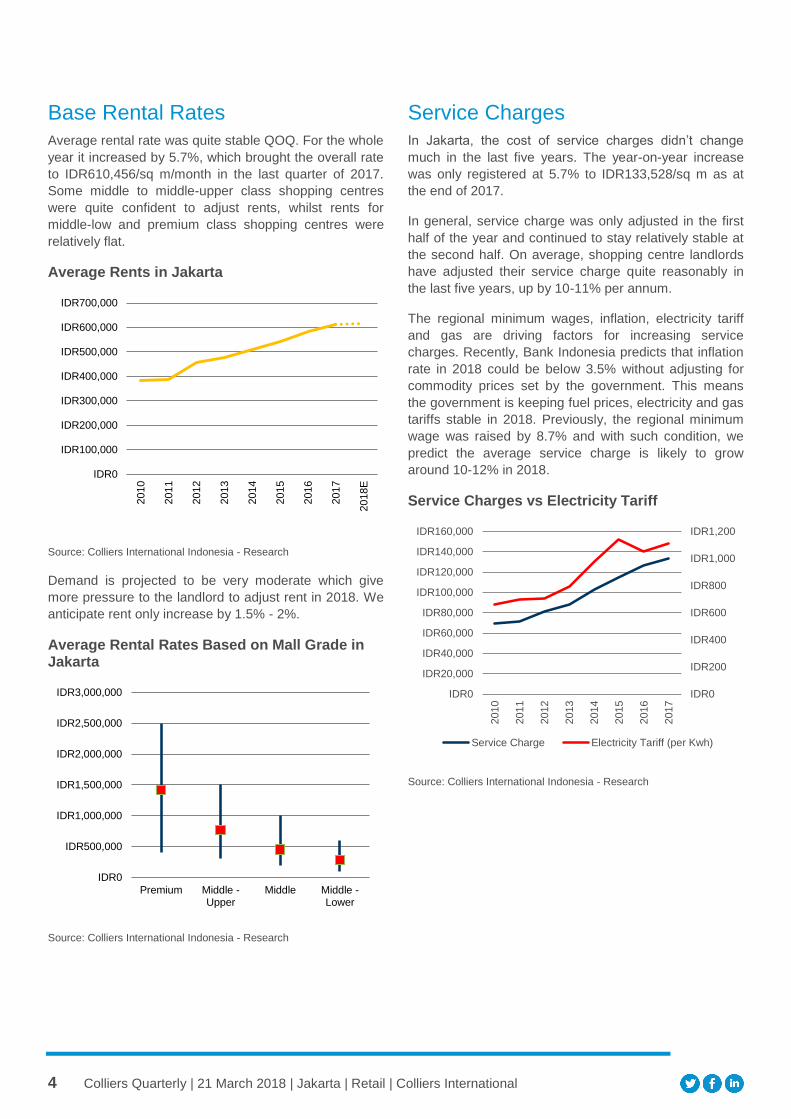
4 Colliers Quarterly | 21 March 2018 | Jakarta | Retail | Colliers International
Base Rental Rates
Average rental rate was quite stable QOQ. For the whole
year it increased by 5.7%, which brought the overall rate
to IDR610,456/sq m/month in the last quarter of 2017.
Some middle to middle-upper class shopping centres
were quite confident to adjust rents, whilst rents for
middle-low and premium class shopping centres were
relatively flat.
Average Rents in Jakarta
Source: Colliers International Indonesia - Research
Demand is projected to be very moderate which give
more pressure to the landlord to adjust rent in 2018. We
anticipate rent only increase by 1.5% - 2%.
Average Rental Rates Based on Mall Grade in Jakarta
Source: Colliers International Indonesia - Research
Service Charges
In Jakarta, the cost of service charges didn’t change
much in the last five years. The year-on-year increase
was only registered at 5.7% to IDR133,528/sq m as at
the end of 2017.
In general, service charge was only adjusted in the first
half of the year and continued to stay relatively stable at
the second half. On average, shopping centre landlords
have adjusted their service charge quite reasonably in
the last five years, up by 10-11% per annum.
The regional minimum wages, inflation, electricity tariff
and gas are driving factors for increasing service
charges. Recently, Bank Indonesia predicts that inflation
rate in 2018 could be below 3.5% without adjusting for
commodity prices set by the government. This means
the government is keeping fuel prices, electricity and gas
tariffs stable in 2018. Previously, the regional minimum
wage was raised by 8.7% and with such condition, we
predict the average service charge is likely to grow
around 10-12% in 2018.
Service Charges vs Electricity Tariff
Source: Colliers International Indonesia - Research
IDR0
IDR100,000
IDR200,000
IDR300,000
IDR400,000
IDR500,000
IDR600,000
IDR700,000
2010
2011
2012
2013
2014
2015
2016
2017
2018E
IDR0
IDR500,000
IDR1,000,000
IDR1,500,000
IDR2,000,000
IDR2,500,000
IDR3,000,000
Premium Middle -Upper
Middle Middle -Lower
IDR0
IDR200
IDR400
IDR600
IDR800
IDR1,000
IDR1,200
IDR0
IDR20,000
IDR40,000
IDR60,000
IDR80,000
IDR100,000
IDR120,000
IDR140,000
IDR160,000
2010
2011
2012
2013
2014
2015
2016
2017
Service Charge Electricity Tariff (per Kwh)
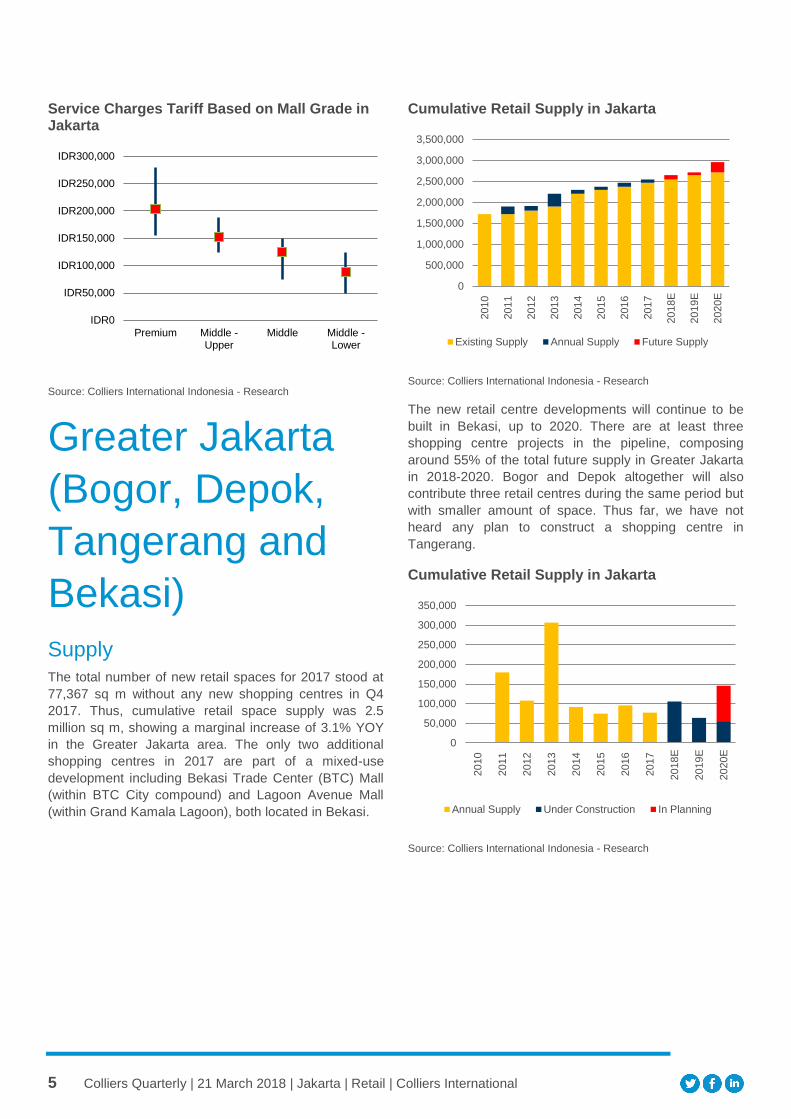
5 Colliers Quarterly | 21 March 2018 | Jakarta | Retail | Colliers International
Service Charges Tariff Based on Mall Grade in Jakarta
Source: Colliers International Indonesia - Research
Greater Jakarta
(Bogor, Depok,
Tangerang and
Bekasi)
Supply
The total number of new retail spaces for 2017 stood at
77,367 sq m without any new shopping centres in Q4
2017. Thus, cumulative retail space supply was 2.5
million sq m, showing a marginal increase of 3.1% YOY
in the Greater Jakarta area. The only two additional
shopping centres in 2017 are part of a mixed-use
development including Bekasi Trade Center (BTC) Mall
(within BTC City compound) and Lagoon Avenue Mall
(within Grand Kamala Lagoon), both located in Bekasi.
Cumulative Retail Supply in Jakarta
Source: Colliers International Indonesia - Research
The new retail centre developments will continue to be
built in Bekasi, up to 2020. There are at least three
shopping centre projects in the pipeline, composing
around 55% of the total future supply in Greater Jakarta
in 2018-2020. Bogor and Depok altogether will also
contribute three retail centres during the same period but
with smaller amount of space. Thus far, we have not
heard any plan to construct a shopping centre in
Tangerang.
Cumulative Retail Supply in Jakarta
Source: Colliers International Indonesia - Research
IDR0
IDR50,000
IDR100,000
IDR150,000
IDR200,000
IDR250,000
IDR300,000
Premium Middle -Upper
Middle Middle -Lower
0
500,000
1,000,000
1,500,000
2,000,000
2,500,000
3,000,000
3,500,000
2010
2011
2012
2013
2014
2015
2016
2017
2018E
2019E
2020E
Existing Supply Annual Supply Future Supply
0
50,000
100,000
150,000
200,000
250,000
300,000
350,000
2010
2011
2012
2013
2014
2015
2016
2017
2018E
2019E
2020E
Annual Supply Under Construction In Planning
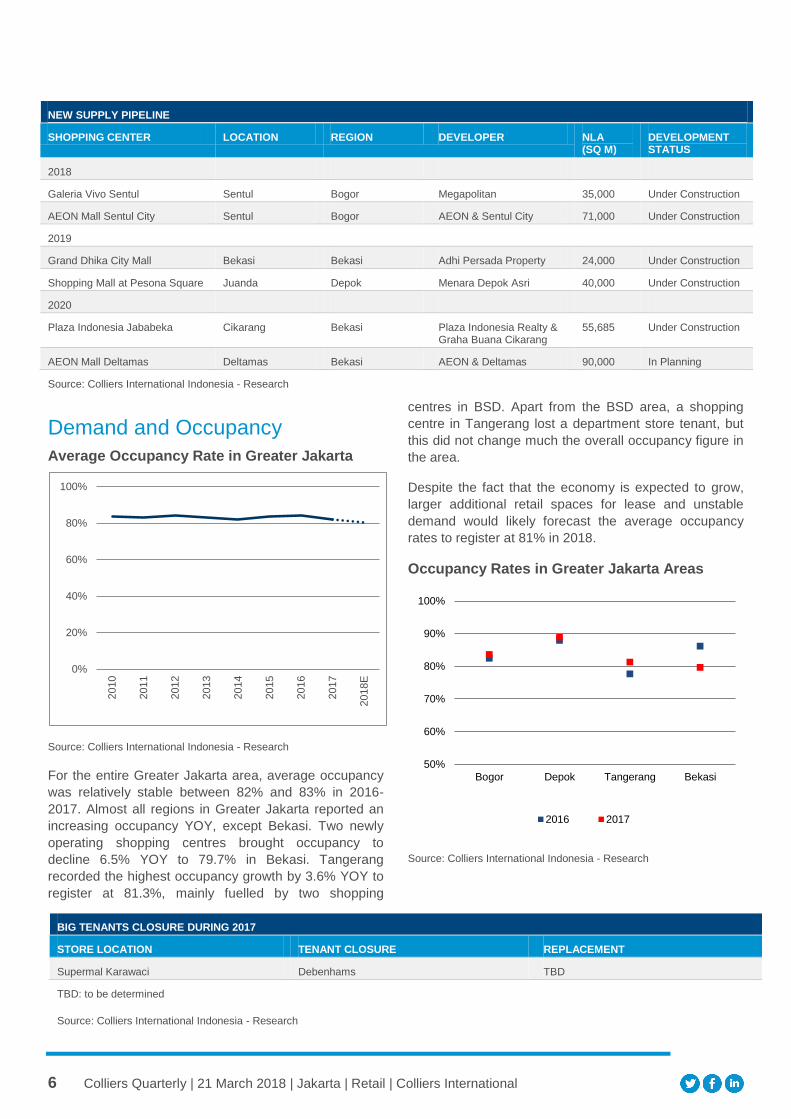
6 Colliers Quarterly | 21 March 2018 | Jakarta | Retail | Colliers International
Demand and Occupancy
Average Occupancy Rate in Greater Jakarta
Source: Colliers International Indonesia - Research
For the entire Greater Jakarta area, average occupancy
was relatively stable between 82% and 83% in 2016-
2017. Almost all regions in Greater Jakarta reported an
increasing occupancy YOY, except Bekasi. Two newly
operating shopping centres brought occupancy to
decline 6.5% YOY to 79.7% in Bekasi. Tangerang
recorded the highest occupancy growth by 3.6% YOY to
register at 81.3%, mainly fuelled by two shopping
centres in BSD. Apart from the BSD area, a shopping
centre in Tangerang lost a department store tenant, but
this did not change much the overall occupancy figure in
the area.
Despite the fact that the economy is expected to grow,
larger additional retail spaces for lease and unstable
demand would likely forecast the average occupancy
rates to register at 81% in 2018.
Occupancy Rates in Greater Jakarta Areas
Source: Colliers International Indonesia - Research
0%
20%
40%
60%
80%
100%
2010
2011
2012
2013
2014
2015
2016
2017
2018E
50%
60%
70%
80%
90%
100%
Bogor Depok Tangerang Bekasi
2016 2017
NEW SUPPLY PIPELINE
SHOPPING CENTER LOCATION REGION DEVELOPER NLA (SQ M)
DEVELOPMENT STATUS
2018
Galeria Vivo Sentul Sentul Bogor Megapolitan 35,000 Under Construction
AEON Mall Sentul City Sentul Bogor AEON & Sentul City 71,000 Under Construction
2019
Grand Dhika City Mall Bekasi Bekasi Adhi Persada Property 24,000 Under Construction
Shopping Mall at Pesona Square Juanda Depok Menara Depok Asri 40,000 Under Construction
2020
Plaza Indonesia Jababeka Cikarang Bekasi Plaza Indonesia Realty & Graha Buana Cikarang
55,685 Under Construction
AEON Mall Deltamas Deltamas Bekasi AEON & Deltamas 90,000 In Planning
Source: Colliers International Indonesia - Research
BIG TENANTS CLOSURE DURING 2017
STORE LOCATION TENANT CLOSURE REPLACEMENT
Supermal Karawaci Debenhams TBD
TBD: to be determined
Source: Colliers International Indonesia - Research
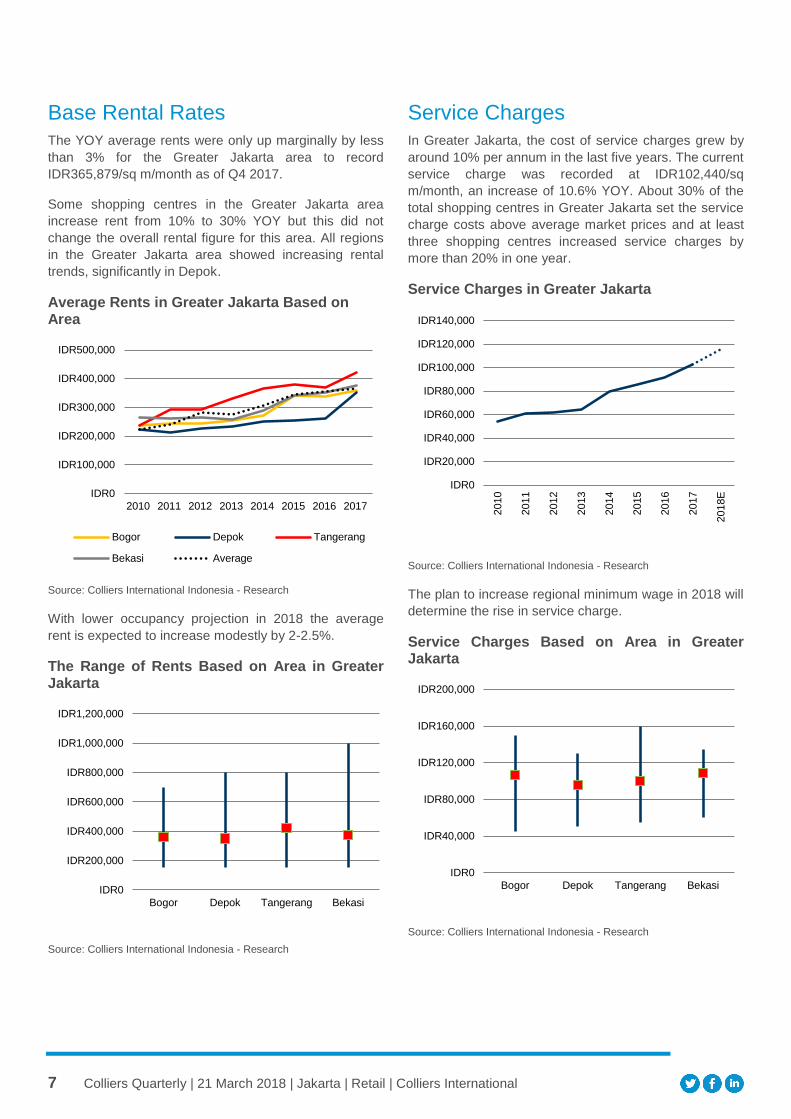
7 Colliers Quarterly | 21 March 2018 | Jakarta | Retail | Colliers International
Base Rental Rates
The YOY average rents were only up marginally by less
than 3% for the Greater Jakarta area to record
IDR365,879/sq m/month as of Q4 2017.
Some shopping centres in the Greater Jakarta area
increase rent from 10% to 30% YOY but this did not
change the overall rental figure for this area. All regions
in the Greater Jakarta area showed increasing rental
trends, significantly in Depok.
Average Rents in Greater Jakarta Based on Area
Source: Colliers International Indonesia - Research
With lower occupancy projection in 2018 the average
rent is expected to increase modestly by 2-2.5%.
The Range of Rents Based on Area in Greater Jakarta
Source: Colliers International Indonesia - Research
Service Charges
In Greater Jakarta, the cost of service charges grew by
around 10% per annum in the last five years. The current
service charge was recorded at IDR102,440/sq
m/month, an increase of 10.6% YOY. About 30% of the
total shopping centres in Greater Jakarta set the service
charge costs above average market prices and at least
three shopping centres increased service charges by
more than 20% in one year.
Service Charges in Greater Jakarta
Source: Colliers International Indonesia - Research
The plan to increase regional minimum wage in 2018 will
determine the rise in service charge.
Service Charges Based on Area in Greater Jakarta
Source: Colliers International Indonesia - Research
IDR0
IDR100,000
IDR200,000
IDR300,000
IDR400,000
IDR500,000
2010 2011 2012 2013 2014 2015 2016 2017
Bogor Depok Tangerang
Bekasi Average
IDR0
IDR200,000
IDR400,000
IDR600,000
IDR800,000
IDR1,000,000
IDR1,200,000
Bogor Depok Tangerang Bekasi
IDR0
IDR20,000
IDR40,000
IDR60,000
IDR80,000
IDR100,000
IDR120,000
IDR140,000
2010
2011
2012
2013
2014
2015
2016
2017
2018E
IDR0
IDR40,000
IDR80,000
IDR120,000
IDR160,000
IDR200,000
Bogor Depok Tangerang Bekasi
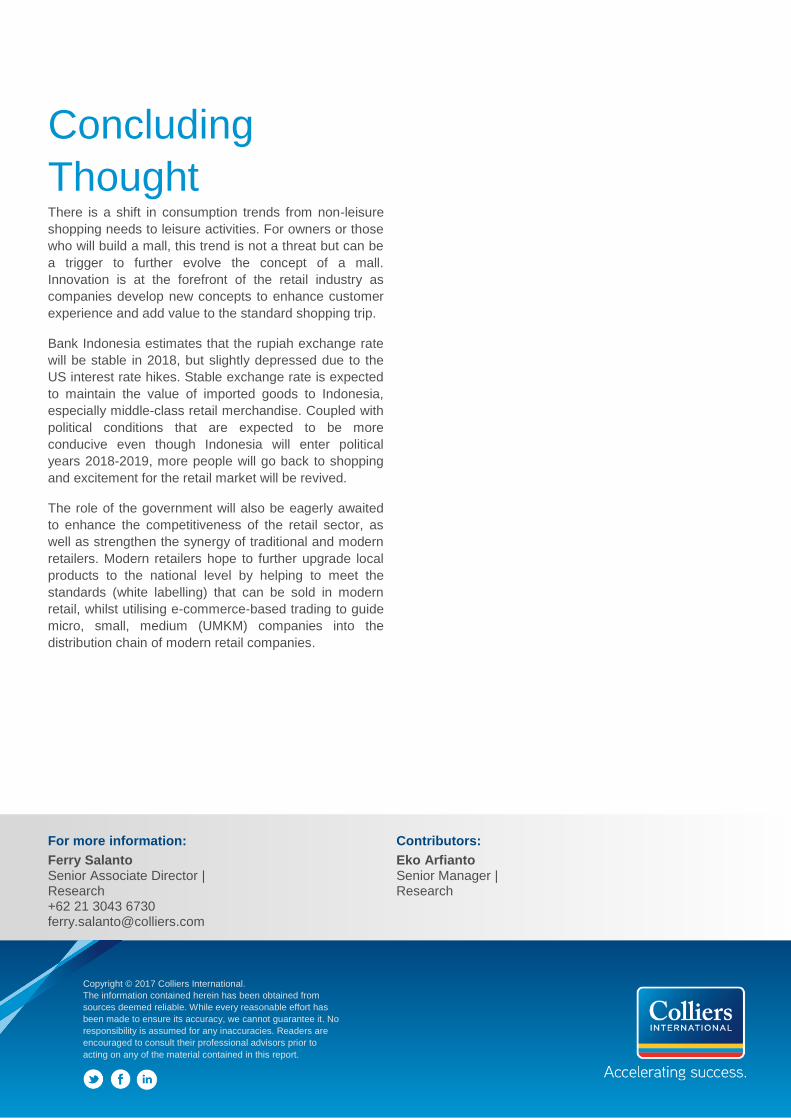
8 Colliers Quarterly | 21 March 2018 | Jakarta | Retail | Colliers International
Concluding
Thought There is a shift in consumption trends from non-leisure
shopping needs to leisure activities. For owners or those
who will build a mall, this trend is not a threat but can be
a trigger to further evolve the concept of a mall.
Innovation is at the forefront of the retail industry as
companies develop new concepts to enhance customer
experience and add value to the standard shopping trip.
Bank Indonesia estimates that the rupiah exchange rate
will be stable in 2018, but slightly depressed due to the
US interest rate hikes. Stable exchange rate is expected
to maintain the value of imported goods to Indonesia,
especially middle-class retail merchandise. Coupled with
political conditions that are expected to be more
conducive even though Indonesia will enter political
years 2018-2019, more people will go back to shopping
and excitement for the retail market will be revived.
The role of the government will also be eagerly awaited
to enhance the competitiveness of the retail sector, as
well as strengthen the synergy of traditional and modern
retailers. Modern retailers hope to further upgrade local
products to the national level by helping to meet the
standards (white labelling) that can be sold in modern
retail, whilst utilising e-commerce-based trading to guide
micro, small, medium (UMKM) companies into the
distribution chain of modern retail companies.
For more information: Contributors:
Ferry Salanto Senior Associate Director | Research +62 21 3043 6730 [email protected]
Eko Arfianto Senior Manager | Research
Copyright © 2017 Colliers International.
The information contained herein has been obtained from
sources deemed reliable. While every reasonable effort has
been made to ensure its accuracy, we cannot guarantee it. No
responsibility is assumed for any inaccuracies. Readers are
encouraged to consult their professional advisors prior to
acting on any of the material contained in this report.
Copyright © 2015 Colliers International.
The information contained herein has been
obtained from sources deemed reliable.
While every reasonable effort has been
made to ensure its accuracy, we cannot
guarantee it. No responsibility is assumed
for any inaccuracies. Readers are
encouraged to consult their professional
advisors prior to acting on any of the
For more information:
Market Contact Name
Title | Market
+1 00 000 0000
Market Contact Name
Title | Market
+1 00 000 0000
Contributors:
Market Contact Name
Title | Market
Market Contact Name
Title | Market
Market Contact Name
Title | Market
Market Contact Name
Title | Market
Ferry Salanto Senior Associate Director |
Jakarta
To improve infrastructure, government efforts, which
include ameliorating logistics and transportation
infrastructure, are expected to provide better
domestic and regional connectivity and integration.
This planned integration is expected to help
customers and service providers improve logistic
solutions. The logistics sector, along with
automotive and the food industry, has been quite
active in creating demand for industrial land.
Forecast at a glance
Demand We believe that enquiries from the logistics sector will remain strong in line with the government plan to improve transportation infrastructure.
Supply
The potential amount of industrial land supply will generally come from the industrial estates in Karawang, either from the new estates or from the expansion of existing ones. Apart from that, supply pipeline may come from further west of greater Jakarta.
Price
Unless there is a significant absorption of industrial land, developers may consider adjusting their land prices, particularly those having limited stock of land.
Land Supply
New industrial estates in Trans Hexa Karawang officially
announced their presence in the industrial market. After
acquiring around 205 hectares of gross land from Agung
Podomoro Group, China Fortune Land Development
(CFLD), a leading industry city developer in China,
introduced their new industrial estate, called Karawang
New Industry City. This estate is currently in the cut-and-
fill work stages and infrastructure construction.
Other land construction works seem to slowdown, but
some industrial estates are now in the stage of preparing
undeveloped land for future expansion.
The growing amount of companies operating in industrial
locations in the eastern part of greater Jakarta, as well
as the intense transportation infrastructure project, has
raised the middle class population. As a result, lands in
both Bekasi and Karawang are becoming commercially
valuable. We have witnessed that some land banks
previously allocated for industrial uses are transformed
into more expensive lands for commercial or residential
use. A few industrial estates have already started with
commercial development, benefitting from the increasing
number of operating companies.
Industrial Land Stock Status in Some Active and Future Industrial Estates
Source: Colliers International Indonesia - Research
Land Sales Activity
In the last minute, total sales of industrial land in Q4
2017 surprisingly surpassed sales in the previous period,
registering 64.03 hectares, compared to only 22.75
hectares in Q3 2017. Thus, total land sales for 2017 was
208.22 hectares, 19.1% higher than in 2016. A large
portion of the transactions (61.3%) in 2017 were
contributed by Bekasi, followed by Serang (22.1%) and
Karawang (13.6%). With only two active industrial
0
500
1,000
1,500
2,000
2,500
3,000
3,500
4,000
Bo
go
r
Ta
ng
era
ng
Ka
raw
an
g
Be
ka
si
Se
ran
g
He
cta
res
Existing Stock
Remaining Unsold Land
Potential Land To Be Developed
Colliers Quarterly
JAKARTA | INDUSTRIAL ESTATE Q4 2017 21 March 2018
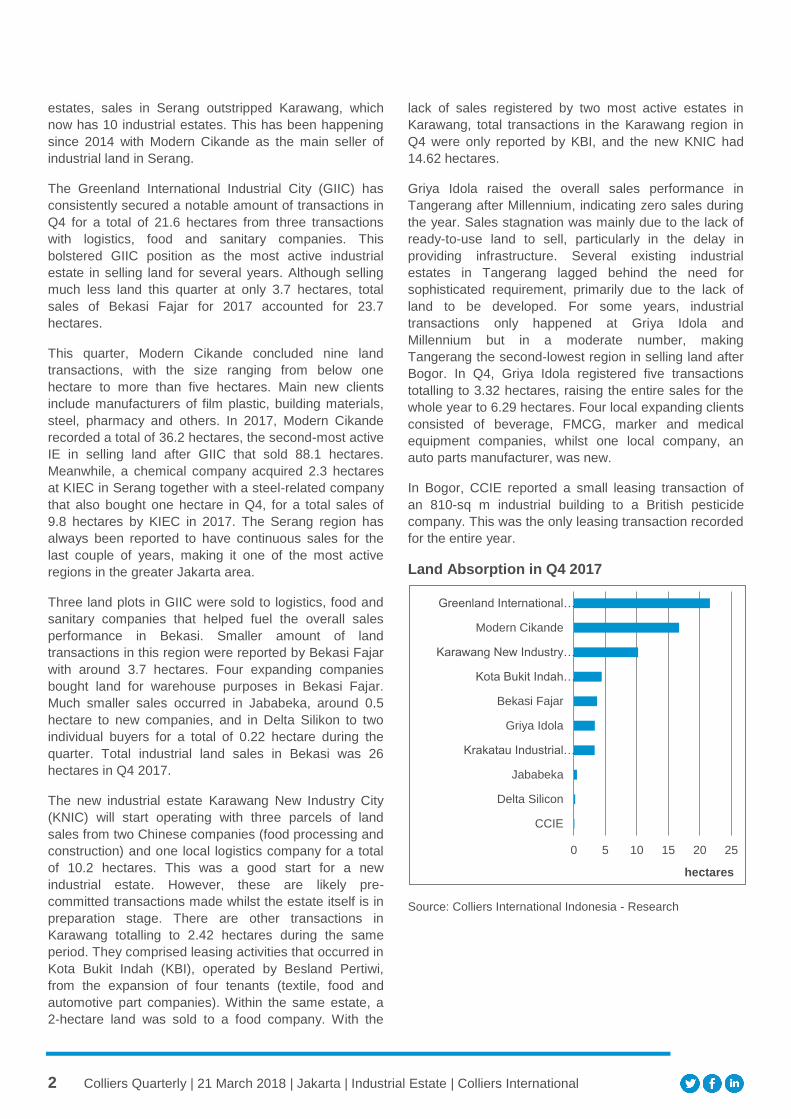
2 Colliers Quarterly | 21 March 2018 | Jakarta | Industrial Estate | Colliers International
estates, sales in Serang outstripped Karawang, which
now has 10 industrial estates. This has been happening
since 2014 with Modern Cikande as the main seller of
industrial land in Serang.
The Greenland International Industrial City (GIIC) has
consistently secured a notable amount of transactions in
Q4 for a total of 21.6 hectares from three transactions
with logistics, food and sanitary companies. This
bolstered GIIC position as the most active industrial
estate in selling land for several years. Although selling
much less land this quarter at only 3.7 hectares, total
sales of Bekasi Fajar for 2017 accounted for 23.7
hectares.
This quarter, Modern Cikande concluded nine land
transactions, with the size ranging from below one
hectare to more than five hectares. Main new clients
include manufacturers of film plastic, building materials,
steel, pharmacy and others. In 2017, Modern Cikande
recorded a total of 36.2 hectares, the second-most active
IE in selling land after GIIC that sold 88.1 hectares.
Meanwhile, a chemical company acquired 2.3 hectares
at KIEC in Serang together with a steel-related company
that also bought one hectare in Q4, for a total sales of
9.8 hectares by KIEC in 2017. The Serang region has
always been reported to have continuous sales for the
last couple of years, making it one of the most active
regions in the greater Jakarta area.
Three land plots in GIIC were sold to logistics, food and
sanitary companies that helped fuel the overall sales
performance in Bekasi. Smaller amount of land
transactions in this region were reported by Bekasi Fajar
with around 3.7 hectares. Four expanding companies
bought land for warehouse purposes in Bekasi Fajar.
Much smaller sales occurred in Jababeka, around 0.5
hectare to new companies, and in Delta Silikon to two
individual buyers for a total of 0.22 hectare during the
quarter. Total industrial land sales in Bekasi was 26
hectares in Q4 2017.
The new industrial estate Karawang New Industry City
(KNIC) will start operating with three parcels of land
sales from two Chinese companies (food processing and
construction) and one local logistics company for a total
of 10.2 hectares. This was a good start for a new
industrial estate. However, these are likely pre-
committed transactions made whilst the estate itself is in
preparation stage. There are other transactions in
Karawang totalling to 2.42 hectares during the same
period. They comprised leasing activities that occurred in
Kota Bukit Indah (KBI), operated by Besland Pertiwi,
from the expansion of four tenants (textile, food and
automotive part companies). Within the same estate, a
2-hectare land was sold to a food company. With the
lack of sales registered by two most active estates in
Karawang, total transactions in the Karawang region in
Q4 were only reported by KBI, and the new KNIC had
14.62 hectares.
Griya Idola raised the overall sales performance in
Tangerang after Millennium, indicating zero sales during
the year. Sales stagnation was mainly due to the lack of
ready-to-use land to sell, particularly in the delay in
providing infrastructure. Several existing industrial
estates in Tangerang lagged behind the need for
sophisticated requirement, primarily due to the lack of
land to be developed. For some years, industrial
transactions only happened at Griya Idola and
Millennium but in a moderate number, making
Tangerang the second-lowest region in selling land after
Bogor. In Q4, Griya Idola registered five transactions
totalling to 3.32 hectares, raising the entire sales for the
whole year to 6.29 hectares. Four local expanding clients
consisted of beverage, FMCG, marker and medical
equipment companies, whilst one local company, an
auto parts manufacturer, was new.
In Bogor, CCIE reported a small leasing transaction of
an 810-sq m industrial building to a British pesticide
company. This was the only leasing transaction recorded
for the entire year.
Land Absorption in Q4 2017
Source: Colliers International Indonesia - Research
0 5 10 15 20 25
CCIE
Delta Silicon
Jababeka
Krakatau Industrial…
Griya Idola
Bekasi Fajar
Kota Bukit Indah…
Karawang New Industry…
Modern Cikande
Greenland International…
hectares
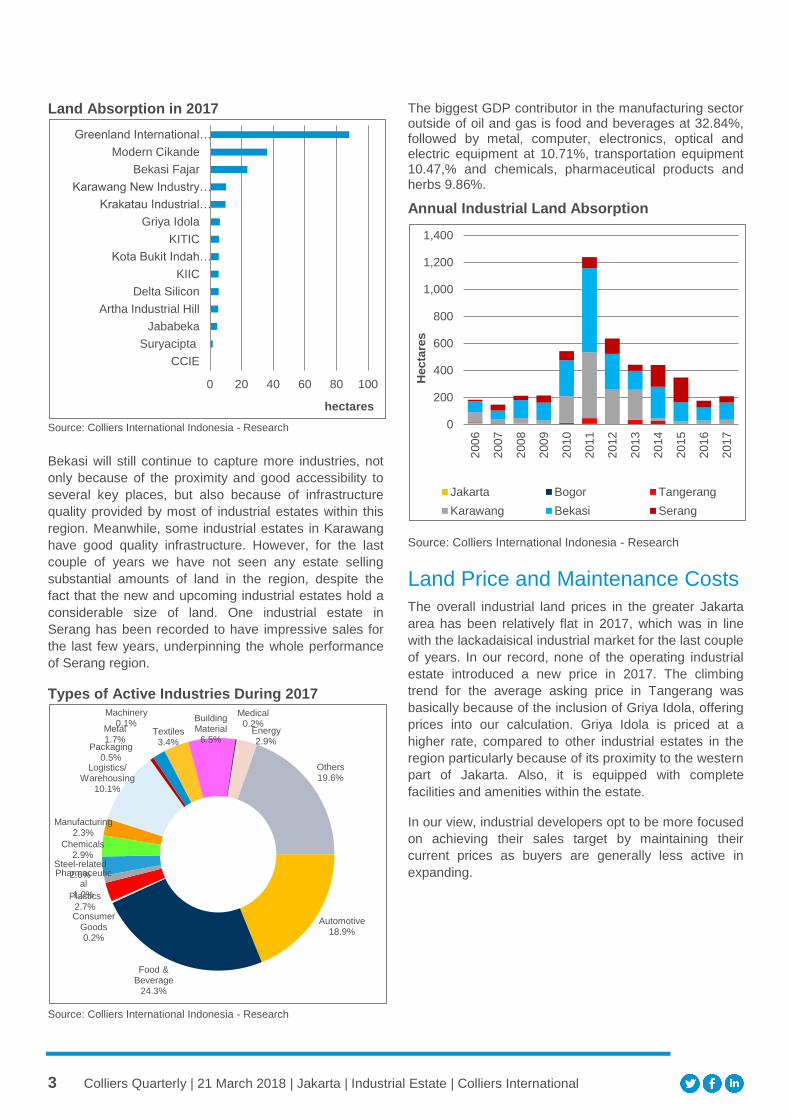
3 Colliers Quarterly | 21 March 2018 | Jakarta | Industrial Estate | Colliers International
Land Absorption in 2017
Source: Colliers International Indonesia - Research
Bekasi will still continue to capture more industries, not
only because of the proximity and good accessibility to
several key places, but also because of infrastructure
quality provided by most of industrial estates within this
region. Meanwhile, some industrial estates in Karawang
have good quality infrastructure. However, for the last
couple of years we have not seen any estate selling
substantial amounts of land in the region, despite the
fact that the new and upcoming industrial estates hold a
considerable size of land. One industrial estate in
Serang has been recorded to have impressive sales for
the last few years, underpinning the whole performance
of Serang region.
Types of Active Industries During 2017
Source: Colliers International Indonesia - Research
The biggest GDP contributor in the manufacturing sector outside of oil and gas is food and beverages at 32.84%, followed by metal, computer, electronics, optical and electric equipment at 10.71%, transportation equipment 10.47,% and chemicals, pharmaceutical products and herbs 9.86%.
Annual Industrial Land Absorption
Source: Colliers International Indonesia - Research
Land Price and Maintenance Costs
The overall industrial land prices in the greater Jakarta
area has been relatively flat in 2017, which was in line
with the lackadaisical industrial market for the last couple
of years. In our record, none of the operating industrial
estate introduced a new price in 2017. The climbing
trend for the average asking price in Tangerang was
basically because of the inclusion of Griya Idola, offering
prices into our calculation. Griya Idola is priced at a
higher rate, compared to other industrial estates in the
region particularly because of its proximity to the western
part of Jakarta. Also, it is equipped with complete
facilities and amenities within the estate.
In our view, industrial developers opt to be more focused
on achieving their sales target by maintaining their
current prices as buyers are generally less active in
expanding.
0 20 40 60 80 100
CCIE
Suryacipta
Jababeka
Artha Industrial Hill
Delta Silicon
KIIC
Kota Bukit Indah…
KITIC
Griya Idola
Krakatau Industrial…
Karawang New Industry…
Bekasi Fajar
Modern Cikande
Greenland International…
hectares
Automotive 18.9%
Food & Beverage
24.3%
Consumer Goods 0.2%
Plastics 2.7%
Pharmaceutical
1.0%
Steel-related 2.6%
Chemicals 2.9%
Manufacturing 2.3%
Logistics/ Warehousing
10.1%
Packaging 0.5%
Metal 1.7%
Machinery 0.1%
Textiles 3.4%
Building Material
6.5%
Medical 0.2%
Energy 2.9%
Others 19.6%
0
200
400
600
800
1,000
1,200
1,400
200
6
200
7
200
8
200
9
201
0
201
1
201
2
201
3
201
4
201
5
201
6
201
7
He
cta
res
Jakarta Bogor Tangerang
Karawang Bekasi Serang
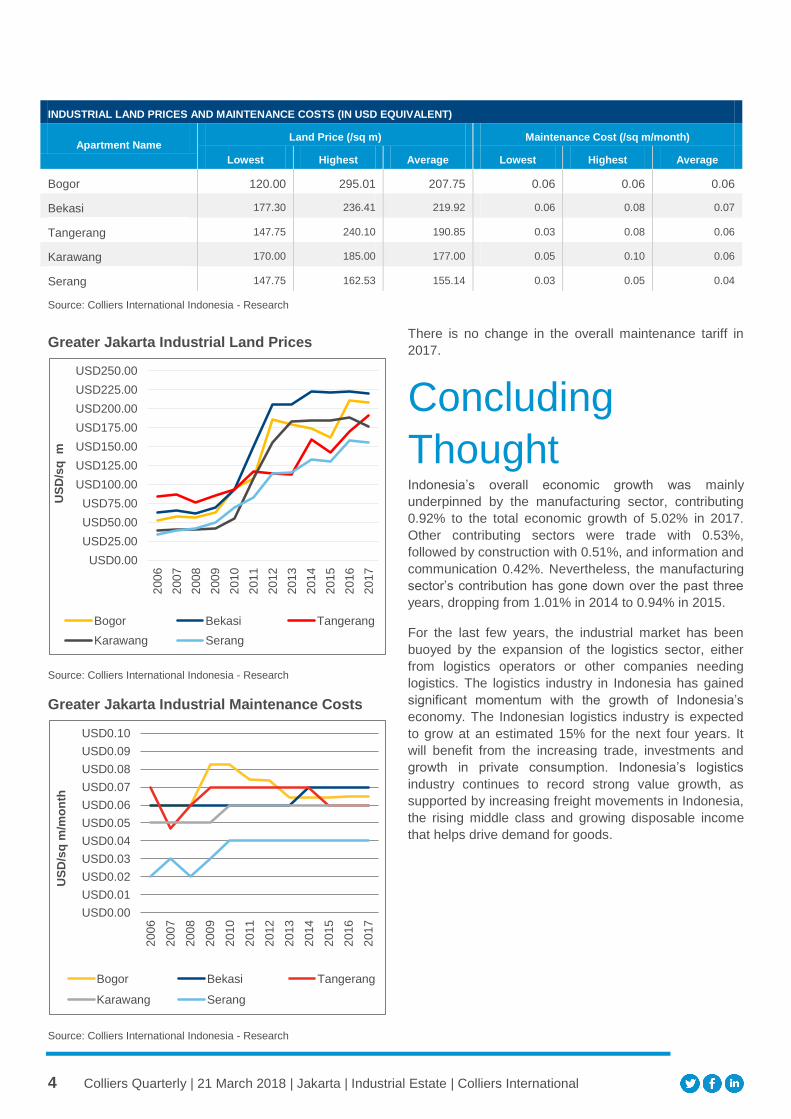
4 Colliers Quarterly | 21 March 2018 | Jakarta | Industrial Estate | Colliers International
Greater Jakarta Industrial Land Prices
Source: Colliers International Indonesia - Research
Greater Jakarta Industrial Maintenance Costs
Source: Colliers International Indonesia - Research
There is no change in the overall maintenance tariff in
2017.
Concluding
Thought Indonesia’s overall economic growth was mainly
underpinned by the manufacturing sector, contributing
0.92% to the total economic growth of 5.02% in 2017.
Other contributing sectors were trade with 0.53%,
followed by construction with 0.51%, and information and
communication 0.42%. Nevertheless, the manufacturing
sector’s contribution has gone down over the past three
years, dropping from 1.01% in 2014 to 0.94% in 2015.
For the last few years, the industrial market has been
buoyed by the expansion of the logistics sector, either
from logistics operators or other companies needing
logistics. The logistics industry in Indonesia has gained
significant momentum with the growth of Indonesia’s
economy. The Indonesian logistics industry is expected
to grow at an estimated 15% for the next four years. It
will benefit from the increasing trade, investments and
growth in private consumption. Indonesia’s logistics
industry continues to record strong value growth, as
supported by increasing freight movements in Indonesia,
the rising middle class and growing disposable income
that helps drive demand for goods.
USD0.00
USD25.00
USD50.00
USD75.00
USD100.00
USD125.00
USD150.00
USD175.00
USD200.00
USD225.00
USD250.00
200
6
200
7
200
8
200
9
201
0
201
1
201
2
201
3
201
4
201
5
201
6
201
7
US
D/s
q m
Bogor Bekasi Tangerang
Karawang Serang
USD0.00
USD0.01
USD0.02
USD0.03
USD0.04
USD0.05
USD0.06
USD0.07
USD0.08
USD0.09
USD0.10
200
6
200
7
200
8
200
9
201
0
201
1
201
2
201
3
201
4
201
5
201
6
201
7
US
D/s
q m
/mo
nth
Bogor Bekasi Tangerang
Karawang Serang
INDUSTRIAL LAND PRICES AND MAINTENANCE COSTS (IN USD EQUIVALENT)
Apartment Name Land Price (/sq m) Maintenance Cost (/sq m/month)
Lowest Highest Average Lowest Highest Average
Bogor 120.00 295.01 207.75 0.06 0.06 0.06
Bekasi 177.30 236.41 219.92 0.06 0.08 0.07
Tangerang 147.75 240.10 190.85 0.03 0.08 0.06
Karawang 170.00 185.00 177.00 0.05 0.10 0.06
Serang 147.75 162.53 155.14 0.03 0.05 0.04
Source: Colliers International Indonesia - Research

5 Colliers Quarterly | 21 March 2018 | Jakarta | Industrial Estate | Colliers International
For more information:
Ferry Salanto Senior Associate Director Research +62 21 3043 6888 [email protected]
Copyright © 2017 Colliers International.
The information contained herein has been obtained from
sources deemed reliable. While every reasonable effort has
been made to ensure its accuracy, we cannot guarantee it. No
responsibility is assumed for any inaccuracies. Readers are
encouraged to consult their professional advisors prior to
acting on any of the material contained in this report.
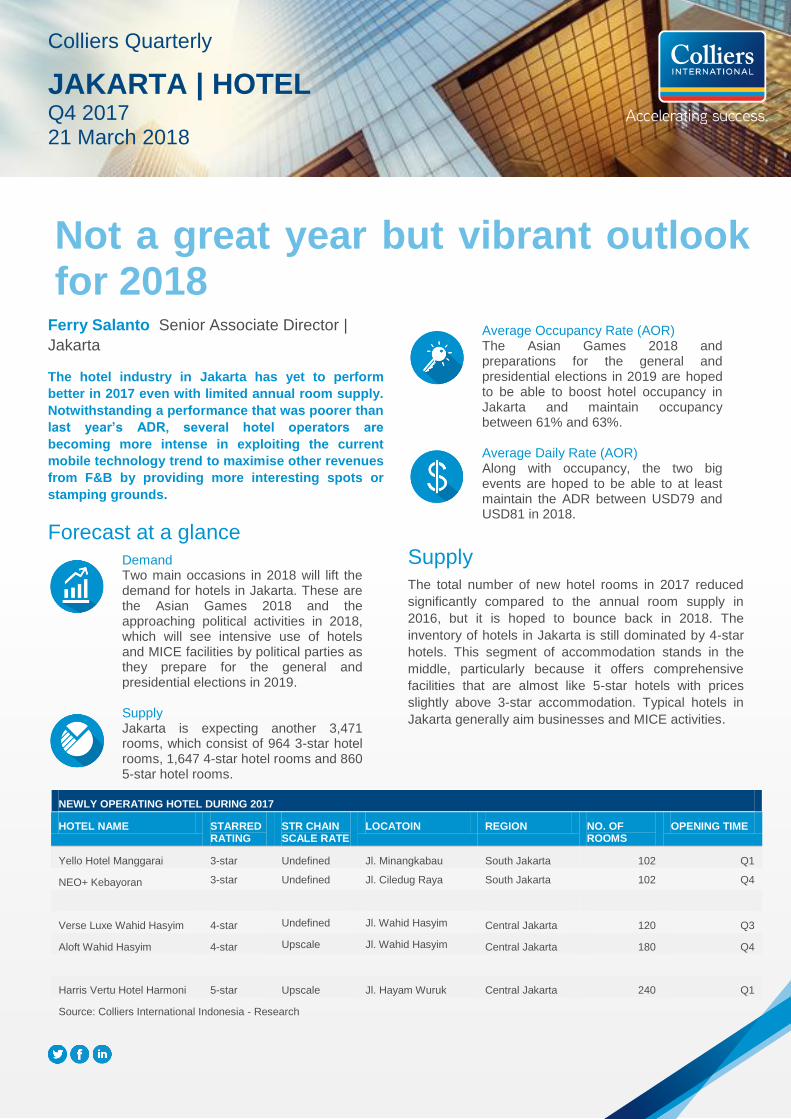
Copyright © 2015 Colliers International.
The information contained herein has been
obtained from sources deemed reliable.
While every reasonable effort has been
made to ensure its accuracy, we cannot
guarantee it. No responsibility is assumed
for any inaccuracies. Readers are
encouraged to consult their professional
advisors prior to acting on any of the
For more information:
Market Contact Name
Title | Market
+1 00 000 0000
Market Contact Name
Title | Market
+1 00 000 0000
Contributors:
Market Contact Name
Title | Market
Market Contact Name
Title | Market
Market Contact Name
Title | Market
Market Contact Name
Title | Market
Ferry Salanto Senior Associate Director |
Jakarta
The hotel industry in Jakarta has yet to perform
better in 2017 even with limited annual room supply.
Notwithstanding a performance that was poorer than
last year’s ADR, several hotel operators are
becoming more intense in exploiting the current
mobile technology trend to maximise other revenues
from F&B by providing more interesting spots or
stamping grounds.
Forecast at a glance
Demand Two main occasions in 2018 will lift the demand for hotels in Jakarta. These are the Asian Games 2018 and the approaching political activities in 2018, which will see intensive use of hotels and MICE facilities by political parties as they prepare for the general and presidential elections in 2019.
Supply
Jakarta is expecting another 3,471 rooms, which consist of 964 3-star hotel rooms, 1,647 4-star hotel rooms and 860 5-star hotel rooms.
Average Occupancy Rate (AOR)
The Asian Games 2018 and preparations for the general and presidential elections in 2019 are hoped to be able to boost hotel occupancy in Jakarta and maintain occupancy between 61% and 63%.
Average Daily Rate (AOR)
Along with occupancy, the two big events are hoped to be able to at least maintain the ADR between USD79 and USD81 in 2018.
Supply
The total number of new hotel rooms in 2017 reduced
significantly compared to the annual room supply in
2016, but it is hoped to bounce back in 2018. The
inventory of hotels in Jakarta is still dominated by 4-star
hotels. This segment of accommodation stands in the
middle, particularly because it offers comprehensive
facilities that are almost like 5-star hotels with prices
slightly above 3-star accommodation. Typical hotels in
Jakarta generally aim businesses and MICE activities.
Colliers Quarterly
JAKARTA | HOTEL Q4 2017 21 March 2018
Not a great year but vibrant outlook for 2018
NEWLY OPERATING HOTEL DURING 2017
HOTEL NAME STARRED RATING
STR CHAIN SCALE RATE
LOCATOIN REGION NO. OF ROOMS
OPENING TIME
Yello Hotel Manggarai 3-star Undefined Jl. Minangkabau South Jakarta 102 Q1
NEO+ Kebayoran 3-star Undefined Jl. Ciledug Raya South Jakarta 102 Q4
Verse Luxe Wahid Hasyim 4-star Undefined Jl. Wahid Hasyim Central Jakarta 120 Q3
Aloft Wahid Hasyim 4-star Upscale Jl. Wahid Hasyim Central Jakarta 180 Q4
Harris Vertu Hotel Harmoni 5-star Upscale Jl. Hayam Wuruk Central Jakarta 240 Q1
Source: Colliers International Indonesia - Research
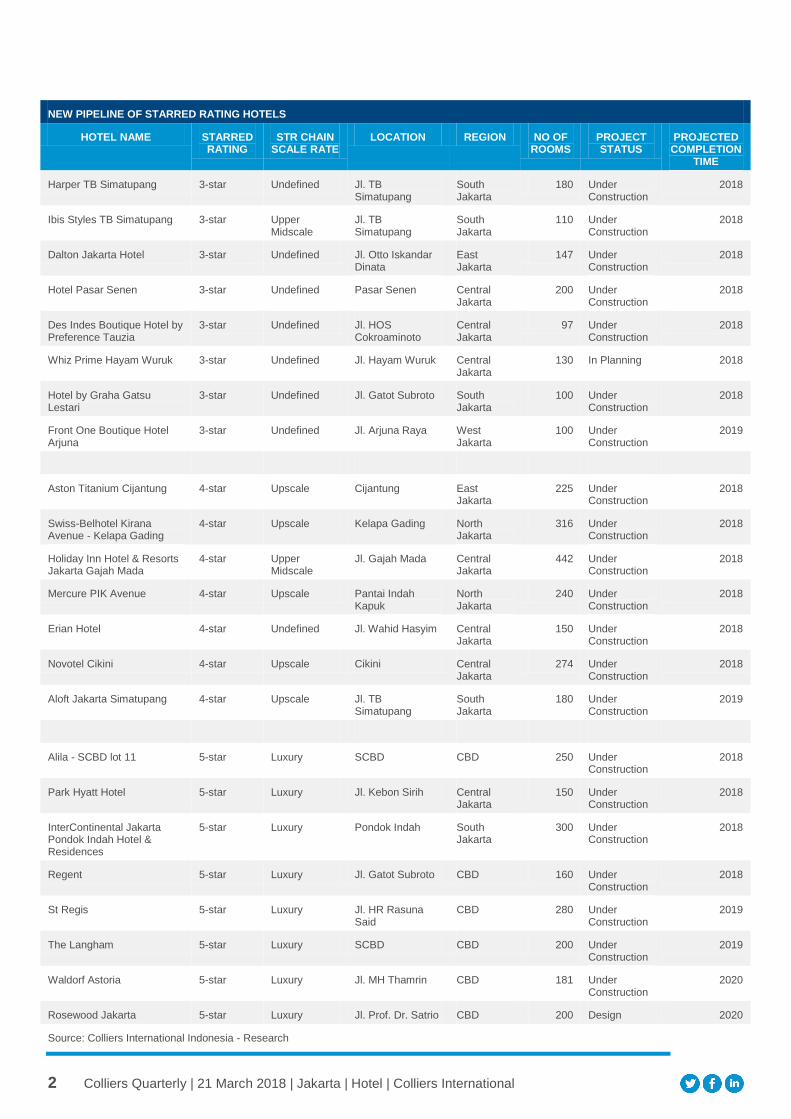
2 Colliers Quarterly | 21 March 2018 | Jakarta | Hotel | Colliers International
NEW PIPELINE OF STARRED RATING HOTELS
HOTEL NAME STARRED RATING
STR CHAIN SCALE RATE
LOCATION REGION NO OF ROOMS
PROJECT STATUS
PROJECTED COMPLETION
TIME
Harper TB Simatupang 3-star Undefined Jl. TB Simatupang
South Jakarta
180 Under Construction
2018
Ibis Styles TB Simatupang 3-star Upper Midscale
Jl. TB Simatupang
South Jakarta
110 Under Construction
2018
Dalton Jakarta Hotel 3-star Undefined Jl. Otto Iskandar Dinata
East Jakarta
147 Under Construction
2018
Hotel Pasar Senen 3-star Undefined Pasar Senen Central Jakarta
200 Under Construction
2018
Des Indes Boutique Hotel by Preference Tauzia
3-star Undefined Jl. HOS Cokroaminoto
Central Jakarta
97 Under Construction
2018
Whiz Prime Hayam Wuruk 3-star Undefined Jl. Hayam Wuruk Central Jakarta
130 In Planning 2018
Hotel by Graha Gatsu Lestari
3-star Undefined Jl. Gatot Subroto South Jakarta
100 Under Construction
2018
Front One Boutique Hotel Arjuna
3-star Undefined Jl. Arjuna Raya West Jakarta
100 Under Construction
2019
Aston Titanium Cijantung 4-star Upscale Cijantung East Jakarta
225 Under Construction
2018
Swiss-Belhotel Kirana Avenue - Kelapa Gading
4-star Upscale Kelapa Gading North Jakarta
316 Under Construction
2018
Holiday Inn Hotel & Resorts Jakarta Gajah Mada
4-star Upper Midscale
Jl. Gajah Mada Central Jakarta
442 Under Construction
2018
Mercure PIK Avenue 4-star Upscale Pantai Indah Kapuk
North Jakarta
240 Under Construction
2018
Erian Hotel 4-star Undefined Jl. Wahid Hasyim Central Jakarta
150 Under Construction
2018
Novotel Cikini 4-star Upscale Cikini Central Jakarta
274 Under Construction
2018
Aloft Jakarta Simatupang 4-star Upscale Jl. TB Simatupang
South Jakarta
180 Under Construction
2019
Alila - SCBD lot 11 5-star Luxury SCBD CBD 250 Under Construction
2018
Park Hyatt Hotel 5-star Luxury Jl. Kebon Sirih Central Jakarta
150 Under Construction
2018
InterContinental Jakarta Pondok Indah Hotel & Residences
5-star Luxury Pondok Indah South Jakarta
300 Under Construction
2018
Regent 5-star Luxury Jl. Gatot Subroto CBD 160 Under Construction
2018
St Regis 5-star Luxury Jl. HR Rasuna Said
CBD 280 Under Construction
2019
The Langham 5-star Luxury SCBD CBD 200 Under Construction
2019
Waldorf Astoria 5-star Luxury Jl. MH Thamrin CBD 181 Under Construction
2020
Rosewood Jakarta 5-star Luxury Jl. Prof. Dr. Satrio CBD 200 Design 2020
Source: Colliers International Indonesia - Research
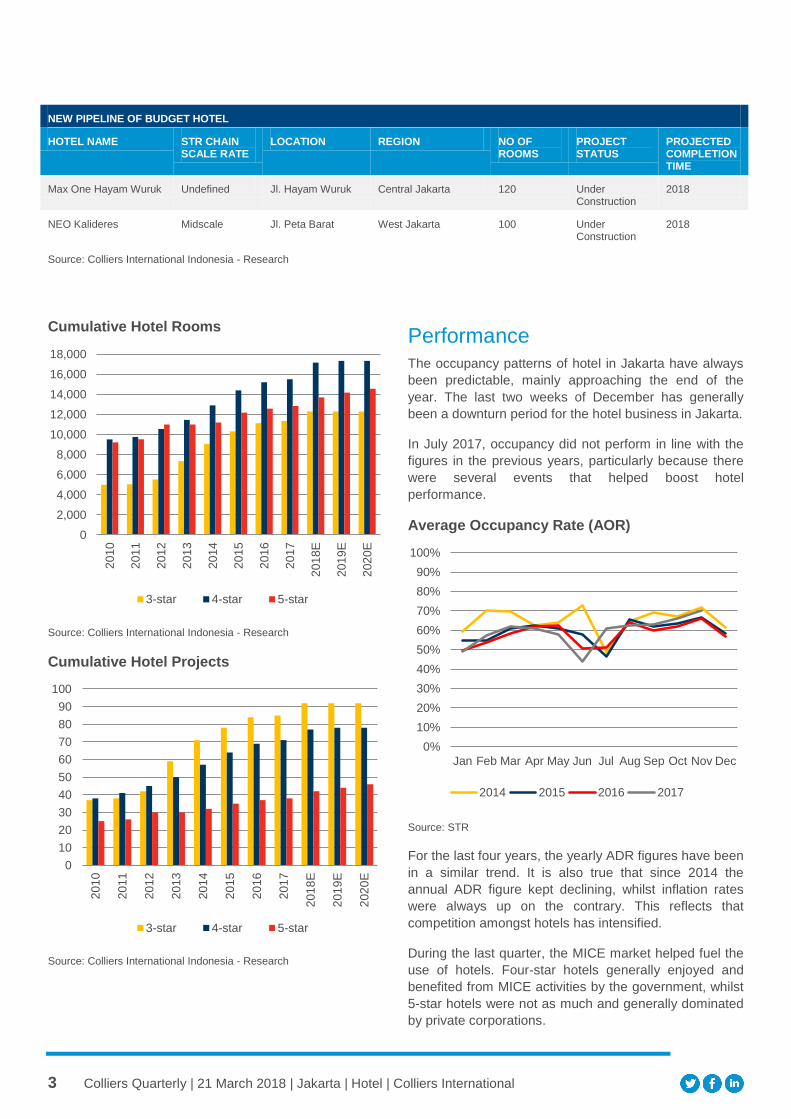
3 Colliers Quarterly | 21 March 2018 | Jakarta | Hotel | Colliers International
Cumulative Hotel Rooms
Source: Colliers International Indonesia - Research
Cumulative Hotel Projects
Source: Colliers International Indonesia - Research
Performance
The occupancy patterns of hotel in Jakarta have always
been predictable, mainly approaching the end of the
year. The last two weeks of December has generally
been a downturn period for the hotel business in Jakarta.
In July 2017, occupancy did not perform in line with the
figures in the previous years, particularly because there
were several events that helped boost hotel
performance. Average Occupancy Rate (AOR)
Source: STR
For the last four years, the yearly ADR figures have been
in a similar trend. It is also true that since 2014 the
annual ADR figure kept declining, whilst inflation rates
were always up on the contrary. This reflects that
competition amongst hotels has intensified.
During the last quarter, the MICE market helped fuel the
use of hotels. Four-star hotels generally enjoyed and
benefited from MICE activities by the government, whilst
5-star hotels were not as much and generally dominated
by private corporations.
0
2,000
4,000
6,000
8,000
10,000
12,000
14,000
16,000
18,000
201
0
201
1
201
2
201
3
201
4
201
5
201
6
201
7
201
8E
201
9E
202
0E
3-star 4-star 5-star
0
10
20
30
40
50
60
70
80
90
100
201
0
201
1
201
2
201
3
201
4
201
5
201
6
201
7
201
8E
201
9E
202
0E
3-star 4-star 5-star
0%
10%
20%
30%
40%
50%
60%
70%
80%
90%
100%
Jan Feb Mar Apr May Jun Jul Aug Sep Oct Nov Dec
2014 2015 2016 2017
NEW PIPELINE OF BUDGET HOTEL
HOTEL NAME STR CHAIN SCALE RATE
LOCATION REGION NO OF ROOMS
PROJECT STATUS
PROJECTED COMPLETION TIME
Max One Hayam Wuruk Undefined Jl. Hayam Wuruk Central Jakarta 120 Under Construction
2018
NEO Kalideres Midscale Jl. Peta Barat West Jakarta 100 Under Construction
2018
Source: Colliers International Indonesia - Research
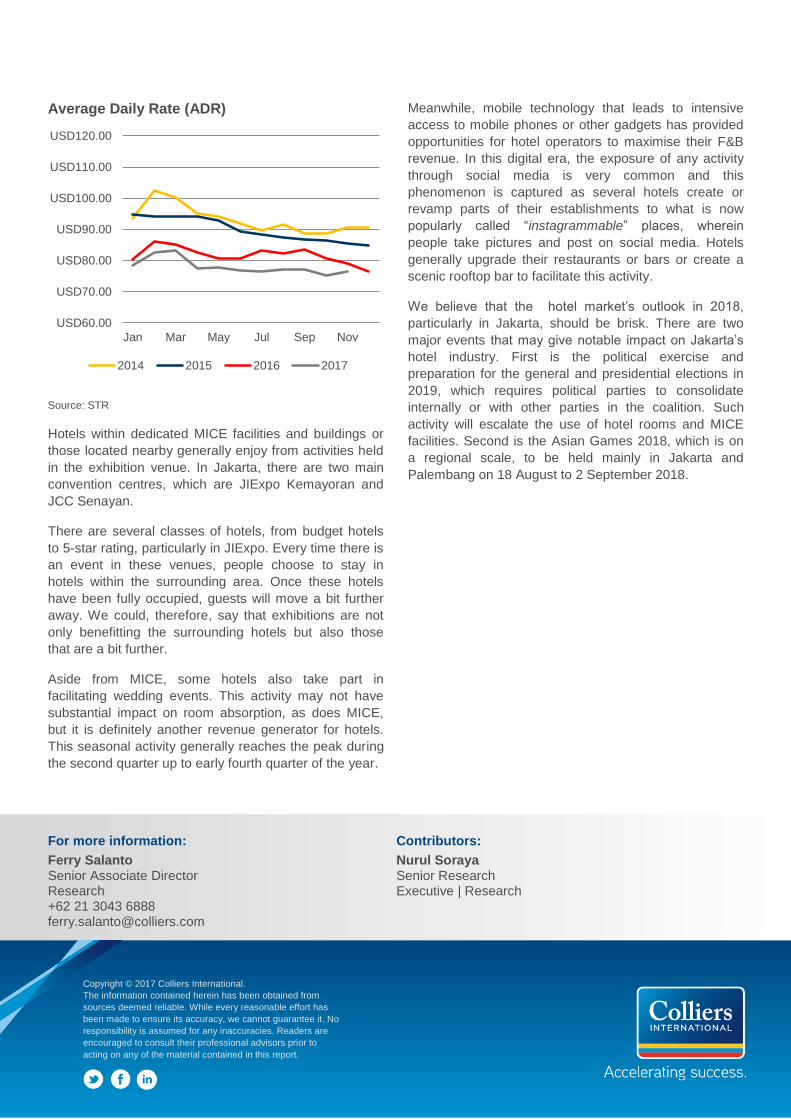
4 Colliers Quarterly | 21 March 2018 | Jakarta | Hotel | Colliers International
Average Daily Rate (ADR)
Source: STR
Hotels within dedicated MICE facilities and buildings or
those located nearby generally enjoy from activities held
in the exhibition venue. In Jakarta, there are two main
convention centres, which are JIExpo Kemayoran and
JCC Senayan.
There are several classes of hotels, from budget hotels
to 5-star rating, particularly in JIExpo. Every time there is
an event in these venues, people choose to stay in
hotels within the surrounding area. Once these hotels
have been fully occupied, guests will move a bit further
away. We could, therefore, say that exhibitions are not
only benefitting the surrounding hotels but also those
that are a bit further.
Aside from MICE, some hotels also take part in
facilitating wedding events. This activity may not have
substantial impact on room absorption, as does MICE,
but it is definitely another revenue generator for hotels.
This seasonal activity generally reaches the peak during
the second quarter up to early fourth quarter of the year.
Meanwhile, mobile technology that leads to intensive
access to mobile phones or other gadgets has provided
opportunities for hotel operators to maximise their F&B
revenue. In this digital era, the exposure of any activity
through social media is very common and this
phenomenon is captured as several hotels create or
revamp parts of their establishments to what is now
popularly called “instagrammable” places, wherein
people take pictures and post on social media. Hotels
generally upgrade their restaurants or bars or create a
scenic rooftop bar to facilitate this activity.
We believe that the hotel market’s outlook in 2018,
particularly in Jakarta, should be brisk. There are two
major events that may give notable impact on Jakarta’s
hotel industry. First is the political exercise and
preparation for the general and presidential elections in
2019, which requires political parties to consolidate
internally or with other parties in the coalition. Such
activity will escalate the use of hotel rooms and MICE
facilities. Second is the Asian Games 2018, which is on
a regional scale, to be held mainly in Jakarta and
Palembang on 18 August to 2 September 2018.
USD60.00
USD70.00
USD80.00
USD90.00
USD100.00
USD110.00
USD120.00
Jan Mar May Jul Sep Nov
2014 2015 2016 2017
For more information: Contributors:
Ferry Salanto Senior Associate Director Research +62 21 3043 6888 [email protected]
Nurul Soraya Senior Research Executive | Research
Copyright © 2017 Colliers International.
The information contained herein has been obtained from
sources deemed reliable. While every reasonable effort has
been made to ensure its accuracy, we cannot guarantee it. No
responsibility is assumed for any inaccuracies. Readers are
encouraged to consult their professional advisors prior to
acting on any of the material contained in this report.