Embed Size (px)
Citation preview
JOURNAL OF RESEARCH IN FORESTRY, WILDLIFE AND ENVIRONMENT, VOLUME 11, NO. 1 MARCH, 2019
DEVELOPMENT OF A NEGARIM MICRO-CATCHMENT SYSTEM FOR CITRUS PRODUCTION
Ayanshola A. M. 1
and Dauda K. A.
2
1 Department of Water Resources and Environmental Engineering, University of Ilorin, Nigeria.
2 Department of Agricultural and Bio-Environmental Engineering, Kwara State Polytechnic, Ilorin, Nigeria.
Corresponding Author: [email protected]/ 08035796934
ABSTRACT
A Negarim Micro-catchment System can be considered as a rudimentary form of irrigation and it is a
directly productive form of soil and water conservation which focused on harvesting and conserving
rainwater for improved crop productivity. The system was designed and constructed. The system consists of
the catchment area, cultivated area, runoff plot, runoff gutter and collection tank. Results of the analysis
revealed that on average, an annual rainfall of 1,233.6mm or higher can be expected at 50% probability of
occurrence and at average frequency of occurrence of 1,233.61mm or higher can be expected a 50%
probability of occurrence of 2½years interval. The results also showed that the mean runoff coefficient for
the catchment throughout the period of observations is 0.48, the average value of crop water requirement is
3.63mm/month, the chemical analysis results also showed that the salinity, infiltration rate, toxicity and
fertility level of the soil in the study area are satisfactory and suitable for citrus production and finally, the
average catchment-cultivated area ratio (C:CA) is 1.0478. However, if the available rain can be concentrated
on a small area, through water harvesting system, both yields and reliability of production can be
significantly improved.
Keywords: Micro-catchment, Runoff Gutter, Infiltration Pit, Catchment Area, Cultivated Area, Runoff Plot.
INTRODUCTION The term micro-catchments were introduced by Israeli
scientists who studied catchments of about one tenth of a
hectare during the 1970’s. The basic micro-catchment
consists of two parts, the catchment area and infiltration
basin. Rainfall runoff is collected from a small catchment
area that has been cleared or otherwise lacking
vegetation. The concentrated runoff is stored on or in the
soil profile of an adjacent infiltration basin for growing
crops (Hilary and Gary, 1995).
Micro-catchment systems are a common technique used
in agriculture to collect surface runoff, increase water
infiltration and prevent soil erosion. Their principle is
comparably simple. Small pools are surrounded by stone
walls and/or soil ridges on all sides to collect the
rainwater and surface runoff. This allows storing
rainwater and using it for small-scale tree and bush
planting, enabling increased growth of plants if there is a
moisture deficit. The basins may vary strongly in size
(ranging between 10 and 100m2) depending on the
planted crop. Sometimes, basins are also constructed
directly around the plant (Ali et al., 2009).
Different design types are possible, including half-
moon, v-shaped, diamond-shaped, trapezoidal, as
well as contour bund basins. V-shaped micro
catchments are also called “Negarims” (Malesu,
2007). Negarim is derived from the Hebrew word
“Negev” meaning runoff. It was popularized in
Israel Negev desert and appropriate in arid or semi-
arid conditions with as low as 100-150 mm rainfall
per annum. A Negarim micro-catchment system is
one of the water harvesting schemes for tree
production and is diamond – shaped basins
surrounded by small earth bunds with an infiltration
pit in the lowest corner of each. Runoff is collected
from within the basin and stored in the
Journal of Research in Forestry, Wildlife & Environment Vol. 11(1) March, 2019
http://www.ajol.info/index.php/jrfwe
jfewr ©2019 - jfewr Publications
E-mail:[email protected]
ISBN: 2141 – 1778
Ayanshola and Dauda 2019
This work is licensed under a Creative Commons Attribution 4.0 License
51
Ayanshola and Dauda 2019
JOURNAL OF RESEARCH IN FORESTRY, WILDLIFE AND ENVIRONMENT, VOLUME 11, NO. 1 MARCH, 2019
infiltration pit. Besides harvesting water for the
trees, it simultaneously conserves soil. Negarim
micro catchment is neat and precise, and relatively
easy to construct.
Water harvesting can be considered as a rudimentary
form of irrigation. The difference is that with water
harvesting the farmer (or more usually, the agro-
pastoralist) has no control over timing. Runoff can
only be harvested when it rains (FAO, 1991).Water
harvesting in its broadest sense can be defined as the
"collection of runoff for its productive use".
Productive use include; provision of domestic and
stock water, concentration of runoff for crops, fodder
and tree production and less frequently supply for
fish and duck ponds. Collecting, capture or diverting
rainwater for various productive usages is wide
spread. Especially for agricultural purposes and
soil/water conservation, the use of micro catchment
structures has been adopted in numerous projects and
is considered as “state of the art” approaches. In
addition, several international organisations and
institutions conduct substantial research on methods
to augment water availability for food production
(ADB, 2008).
The water harvesting process is distinguished from
irrigation by three key features: first, the’
catchments’ area is contiguous with the benefiting
target area and it is relatively small; second, the
application to the target area is essentially
uncontrolled- the objective is simply to capture as
much water as possible and store it within the reach
of the plant(s), in the soil profile of a cultivated area
or into some time of reservoir; third, water harvesting
can be used to concentrate rainfall for purposes other
than crop production (Theib et al., 1999).
Water harvesting technology is especially relevant to
the semi-arid and arid areas where the problems of
environmental degradation, drought and population
pressures are most evident. It is an important
component of the package of remedies for these
problem zones, and there is no doubt that
implementation of water harvesting techniques will
expand (FAO, 1991). Therefore, water harvesting
systems are directly productive form of soil and
water conservation in which both yields and
reliability of production can be significantly
improved.
It is in the light of the above that this study is
aim at design and construction of a Negarim
Micro catchment system for Citrus fruit
plantation and to evaluate the runoff coefficient
for the study area from the field measurement of
runoff and rainfall.
MATERIALS AND METHODS
Location of the Study Area
The study area is located within Agricultural and
Bio-Environmental Engineering Demonstration
Farm Site, Kwara State Polytechnic, Ilorin,
Kwara State, Nigeria. It lies around the latitude
of 08036' North and longitude 04
029' East. It is
situated on the altitude of approximately
344.13m above sea level and the total area of the
field used is (24.6m x 11.9m) 292.74m2.
Selection of Materials for Construction
The main materials generally use for the
construction of water harvesting systems are
soils and stones. The ability of a soil to form
resilient earth bunds is very important.
Generally, the soils which should particularly be
avoided are those which crack on drying, namely
those which contain a high proportion of
montmorillonite clay (especially vertisols or
black cotton soils), and those which form
erodible bunds, namely very sandy soils, or soils
with very poor structure. The availability of
stones for stone pitching within the local area
has to be considered in the selection of materials
for water harvesting system and labour
requirements are very sensitive to availability of
stone (FAO, 1991).
Physical Design Considerations
Precipitation
Water harvesting is of significant interest in arid
and semi-arid regions where crop growth is
restricted by infrequent or limited precipitation.
These areas have very unpredictable precipitation
patterns and quantities. The frequency of rain and
probability of certain intensities and amounts is
more important than the annual quantity. It is
usually desirable to look at monthly or growing
season precipitation quantities as opposed to
annual precipitation amounts. It is easier to
design the necessary size of the water harvesting
structures with information on rainfall during the
52
51

DEVELOPMENT OF A NEGARIM MICRO-CATCHMENT SYSTEM FOR CITRUS PRODUCTION
JOURNAL OF RESEARCH IN FORESTRY, WILDLIFE AND ENVIRONMENT, VOLUME 11, NO. 1 MARCH, 2019
growing season rather than annual quantities.
When possible, analysing a ten year minimum
climate record is recommended.
Soils The soils of micro catchment water harvesting site must
function as a water storage facility, medium for plant
growth, and a water collection surface. These soil
conditions must all be met in a single area. Because of
this, the soil depth and texture are important physical
elements necessary to understand and to design
successful micro catchment systems. Besides possessing
good water holding and infiltration properties, the soil
texture must also be able to generate runoff in the
catchment area. Another important quality of soil texture
to consider is the erosion potential. Highly erodible soils
which are self-mulching or well-structured do not make
durable crusts and should be avoided. Micro-catchments
on clay soils with medium to fine texture are the best at
generating sufficient runoff and are not susceptible to
erosion.
Slope In micro catchment systems, the slope is an important
design factor for the catchment area which affects the
quantity and quality of water generated. Slopes that are
too steep may erode and produce high amounts of
sediment in the runoff water. On very flat slopes, water is
lost by retention in small depressions. The retained water
either infiltrates into the soil or is evaporated into the
atmosphere and lost. The most efficient water harvesting
systems are usually on slopes of 3 to 5 percent.
Technical Design Considerations
Runoff/Run on Area Ratios
For micro catchments, the ratio of the runoff area to
the infiltration basin area is an important technical
design consideration. Major factors for consideration
in determining the proper catchment/cultivated area
ratio are: the climate (precipitation quantity and
timing); geomorphology (slope and soil texture); crop
type (water requirements); and the runoff efficiency
of the collecting area. Generally, the ratio can vary
between 1:1 to 20:1 depending upon the site
conditions, precipitation characteristics, and crop
water needs.
Runoff Efficiency
For designing micro catchment structures, an
important component is the catchment runoff
efficiency. The runoff efficiency is defined as the
percentage of total rainfall which is harvested as
runoff. The efficiency of the system, the amount of
runoff collected in relation to precipitation, depends
on storm duration and intensity, and antecedent soil
water. Typical runoff efficiencies range from 30 to
50 percent of average monthly precipitation.
Agronomic Features
The application of mulch and organic matter is a
notable feature of the technical design considerations
for micro catchment water harvesting systems. The
addition of mulch and organic matter in the
infiltration basin area can significantly improve soil
structure, and increase fertility and infiltration, while
decreasing soil water evaporation.
Plant Species
Selection of the proper plant species is one of the
most important technical design considerations for
micro catchments. Because water harvesting systems
increase the amount of water availability to crops,
certain types of plants can survive drought periods
and produce greater yields. With these systems, plant
species that are able to endure periods of
intermittently wet or dry soil will benefit. Plants
utilized in water harvesting systems should possess
deep roots and have water requirements which match
local rainfall patterns.
MATERIAL AND METHODS
Negarim Micro-catchment System Design
Evaluation of Crop Water Requirements
Thirty years of climatic data (evaporation rates)
were obtained (1986-2015), from Lower Niger River
Basin Development Authority (LNRBDA), Kwara
State, Nigeria. The daily evaporation values
obtained were summed and averaged to obtain the
mean daily and monthly evaporation rates. The
monthly evaporation rates (Erate) were multiplied by
pan coefficient (Kpan) to give reference
evapotranspiration. Thus:
(1)
Source: FAO (1986)
For Class A evaporation Pan, Kpan varies between
0.35 and 0.85, with an average value of 0.70. The
average Kpan was multiplied by mean monthly
evaporation rates to determine the mean monthly
reference evapotranspiration (ETo). This was
53
Ayanshola and Dauda 2019
JOURNAL OF RESEARCH IN FORESTRY, WILDLIFE AND ENVIRONMENT, VOLUME 11, NO. 1 MARCH, 2019
finally multiplied by the crop coefficient (Citrus
= 0.50 at 20% Canopy) to get the crop water
requirement (ETc).
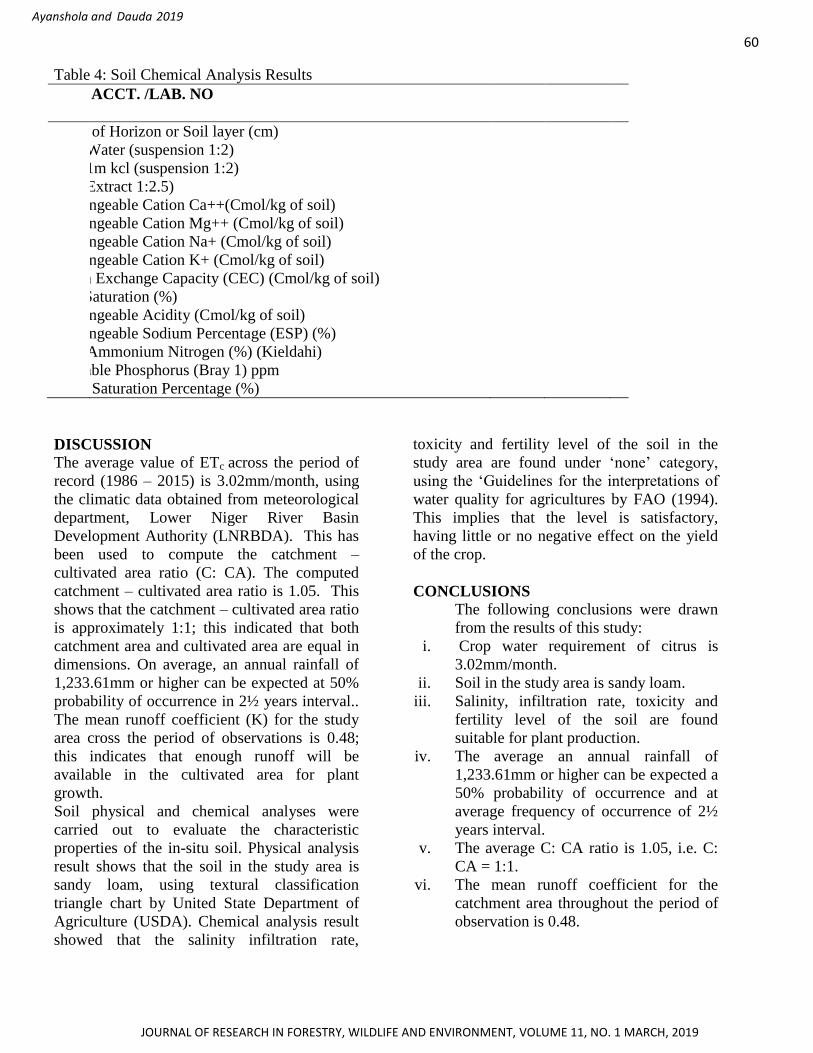
Soil Sampling and Analysis
Nine soil samples were randomly collected at the
depths of 0-20cm, 20-40cm and 40-60cm,
respectively, using soil auger and were taken to
soil laboratory for both physical and technical
analysis. Textural text was performed using
sieves of various pores diameters and sizes from
0.0 – 0.2, in order to evaluate the suitability of the
in-situ soil for this Negarim micro catchment
system. Among the parameters evaluated are;
Electrical conductivity (ECw), Cations and
Anions (Ca++
, Mg++
, Na+, CO3, HCO3, Cl
-, SO4
--),
Nutrients (Nitrate – Nitrogen NO3 – N,
Ammonium – Nitrogen NH4- - N, Phosphate –
Phosphorus PO4 – P, Potassium K+),
Acidity/Basicity (PH), Water saturation
percentage (%) and Exchangeable sodium
percentage (%).
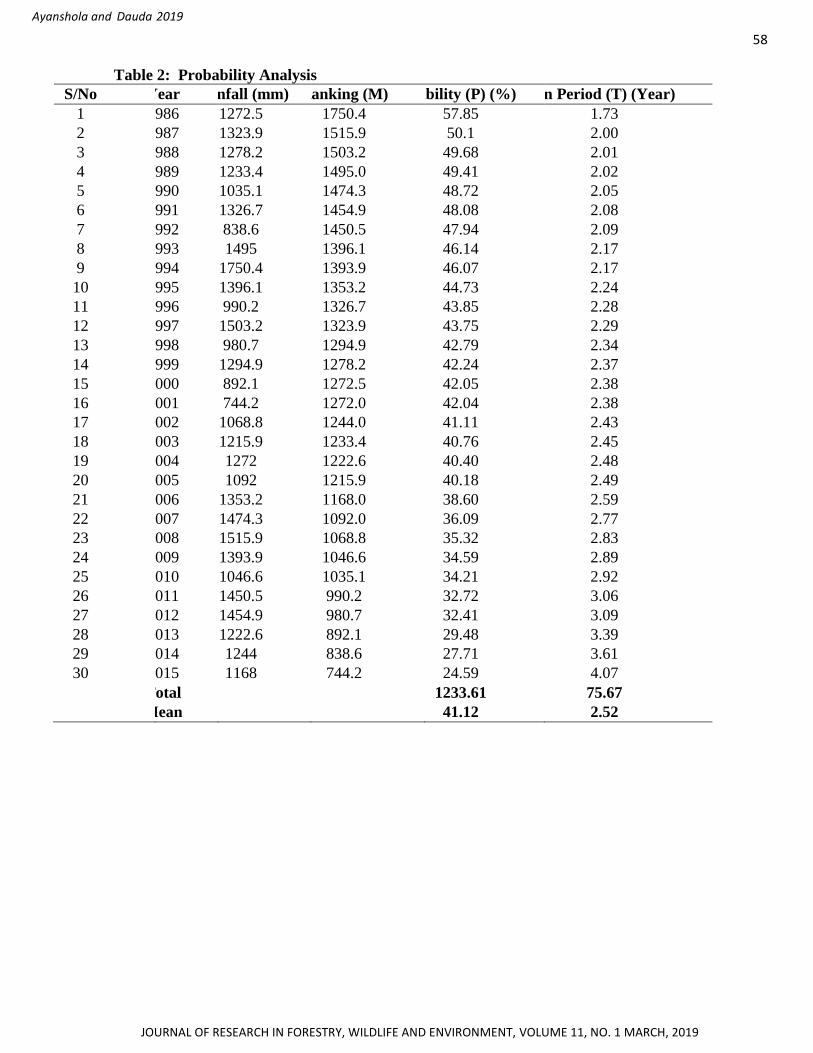
Design Rainfall and Probability Analysis
The design rainfall is usually assigned to a certain
probability of occurrence. The design rainfall was
determined by means of a statistical probability
analysis. Thirty years of annual rainfall totals
(from LNRBDA; 1986 – 2015) were used for this
analysis. The probability of occurrence P (%) for
each of the ranked observations was calculated as
thus:
......... (2)
Source: FAO (1991)
Where,
P = probability in (%) of the observation of rank
(m)
M = the rank of the observation and
N = total number of observations used.
0.375 and 0.25 are the constants of the equation
Then, ranked observations were plotted against the
corresponding probabilities, using normal
probability paper and the curve generated was
straight line in nature. Finally, the return period (T)
was then derived, since the exceedance probability P
(%) was known;
............... (3)
Design Model for Catchment: Cultivated Area
Ratio
For an appropriate design of water harvesting (WH)
system it is required to determine the ratio between
catchment (C) and cultivated area (CA). This can be
computed using the following Equation:
.. (4)
Source: FAO (1991)
The runoff coefficient value ranges between 0.1 and
0.5 with average value of 0.3 and efficiency factor
ranges between 0.5 and 0.75 with average value of
0.625 were used to determine C: CA by substituting
the known value of crop water requirement and
design rainfall in Equation 4.
Field Layout and Construction Procedure The first step is the establishment of the contour line
and the ground slope which was done using a line
level. By means of a measuring tape, the tips of the
bunds were marked along the ‘straightened contour’.
The first line was open – ended. The distance
between the tips (a – b) is 4.2cm which depends on
the selected catchment size of 3m x 3m.
A piece of string as long as the side length of the
catchment (4.2m for a 3m x 3m) was held at one tip
(a) and a second string of the same length at the other
tip (b). The two exactly met at the apex (c). The apex
was marked with a peg and the catchment sides (a –
c) and (b – c) marked on the ground alongside the
strings with a hoe. This procedure was repeated until
all bund alignments in the first row were determined.
The next row of micro catchments was then staked
out. The apexes of the bunds of the upper row were
the tips for the second row and the corresponding
were found. When the second row of micro
catchments has been marked, the procedure was
repeated for the third row, etc. The final result was a
block of diamond – shaped micro catchments, with a
first row which was open at the up slope end. The
size of the infiltration pits were staked out and the
pits were excavated, leaving a small step towards the
back on which the citrus seedlings were planted. The
bunds were constructed in two layers. The excavated
materials from the pits were used to form the bunds
and the bunds were compacted during construction,
using a barrel filled with sand. The diversion ditch
54

DEVELOPMENT OF A NEGARIM MICRO-CATCHMENT SYSTEM FOR CITRUS PRODUCTION
JOURNAL OF RESEARCH IN FORESTRY, WILDLIFE AND ENVIRONMENT, VOLUME 11, NO. 1 MARCH, 2019
was made above the block of micro catchments to
avoid the risk of damage by runoff from up slope of
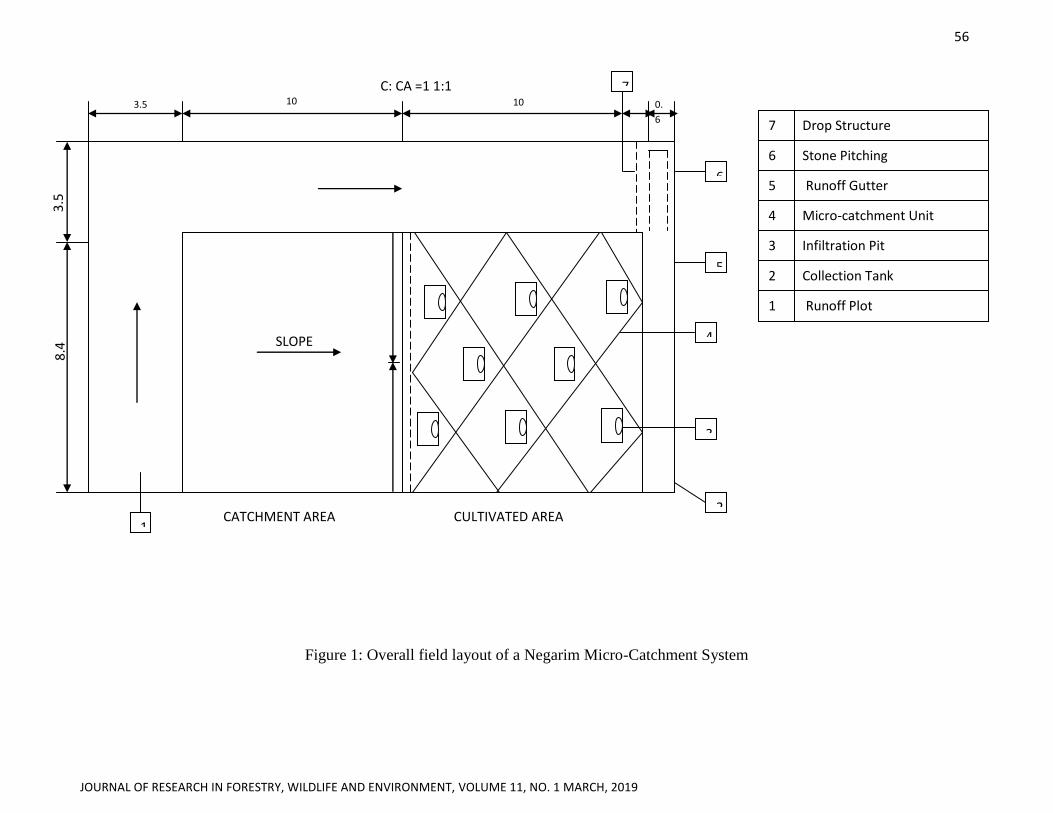
the block. The overall field layout of a Negarim
micro-catchment system is shown in Figure 1.
Estimation of Runoff Coefficient (K) for the Study
Area
An analysis of the rainfall–runoff relationship and
subsequently an assessment of relevant runoff
coefficient (k) are best done based on actual,
simultaneous measurements of both rainfall and
runoff in the study area. The runoff coefficient is
defined as runoff divided by the corresponding
rainfall both expressed as depth over catchment
area (mm). Rainfall and Runoff readings taken
after every rainfall event were averaged and used
to compute runoff coefficient, by dividing the
runoff against the corresponding rainfall.
(5)
55
JOURNAL OF RESEARCH IN FORESTRY, WILDLIFE AND ENVIRONMENT, VOLUME 11, NO. 1 MARCH, 2019
Figure 1: Overall field layout of a Negarim Micro-Catchment System
C: CA =1 1:1 0.
6
10 10 3.5
8.4
3
.5
SLOPE
CATCHMENT AREA CULTIVATED AREA
1
2
3
4
5
6
7
7 Drop Structure
6 Stone Pitching
5 Runoff Gutter
4 Micro-catchment Unit
U
MICROCATCHMENT UNIT
3 Infiltration Pit
2 Collection Tank
1 Runoff Plot
56
JOURNAL OF RESEARCH IN FORESTRY, WILDLIFE AND ENVIRONMENT, VOLUME 11, NO. 1 MARCH, 2019
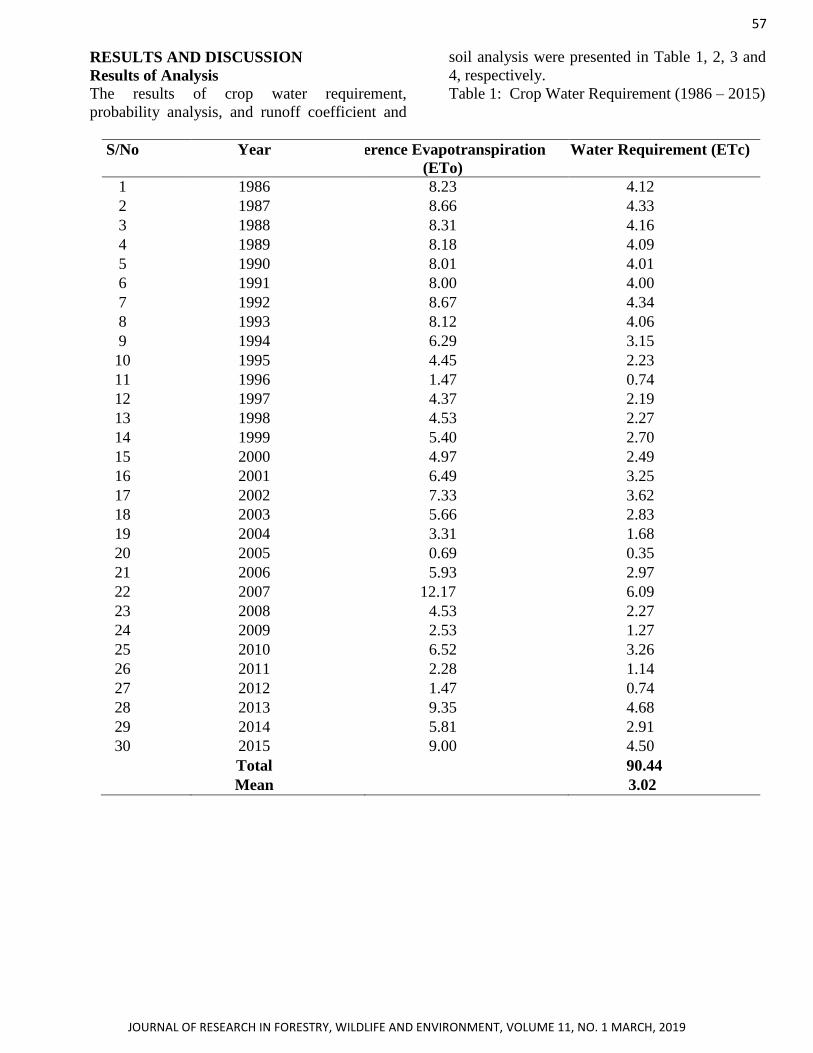
RESULTS AND DISCUSSION
Results of Analysis
The results of crop water requirement,
probability analysis, and runoff coefficient and
soil analysis were presented in Table 1, 2, 3 and
4, respectively.
Table 1: Crop Water Requirement (1986 – 2015)
S/No Year Reference Evapotranspiration
(ETo)
Crop Water Requirement (ETc)
1 1986 8.23 4.12
2 1987 8.66 4.33
3 1988 8.31 4.16
4 1989 8.18 4.09
5 1990 8.01 4.01
6 1991 8.00 4.00
7 1992 8.67 4.34
8 1993 8.12 4.06
9 1994 6.29 3.15
10 1995 4.45 2.23
11 1996 1.47 0.74
12 1997 4.37 2.19
13 1998 4.53 2.27
14 1999 5.40 2.70
15 2000 4.97 2.49
16 2001 6.49 3.25
17 2002 7.33 3.62
18 2003 5.66 2.83
19 2004 3.31 1.68
20 2005 0.69 0.35
21 2006 5.93 2.97
22 2007 12.17 6.09
23 2008 4.53 2.27
24 2009 2.53 1.27
25 2010 6.52 3.26
26 2011 2.28 1.14
27 2012 1.47 0.74
28 2013 9.35 4.68
29 2014 5.81 2.91
30 2015 9.00 4.50
Total 90.44
Mean 3.02
57
Ayanshola and Dauda 2019
JOURNAL OF RESEARCH IN FORESTRY, WILDLIFE AND ENVIRONMENT, VOLUME 11, NO. 1 MARCH, 2019
Table 2: Probability Analysis
S/No Year Rainfall (mm) Ranking (M) Probability (P) (%) Return Period (T) (Year)
1 1986 1272.5 1750.4 57.85 1.73
2 1987 1323.9 1515.9 50.1 2.00
3 1988 1278.2 1503.2 49.68 2.01
4 1989 1233.4 1495.0 49.41 2.02
5 1990 1035.1 1474.3 48.72 2.05
6 1991 1326.7 1454.9 48.08 2.08
7 1992 838.6 1450.5 47.94 2.09
8 1993 1495 1396.1 46.14 2.17
9 1994 1750.4 1393.9 46.07 2.17
10 1995 1396.1 1353.2 44.73 2.24
11 1996 990.2 1326.7 43.85 2.28
12 1997 1503.2 1323.9 43.75 2.29
13 1998 980.7 1294.9 42.79 2.34
14 1999 1294.9 1278.2 42.24 2.37
15 2000 892.1 1272.5 42.05 2.38
16 2001 744.2 1272.0 42.04 2.38
17 2002 1068.8 1244.0 41.11 2.43
18 2003 1215.9 1233.4 40.76 2.45
19 2004 1272 1222.6 40.40 2.48
20 2005 1092 1215.9 40.18 2.49
21 2006 1353.2 1168.0 38.60 2.59
22 2007 1474.3 1092.0 36.09 2.77
23 2008 1515.9 1068.8 35.32 2.83
24 2009 1393.9 1046.6 34.59 2.89
25 2010 1046.6 1035.1 34.21 2.92
26 2011 1450.5 990.2 32.72 3.06
27 2012 1454.9 980.7 32.41 3.09
28 2013 1222.6 892.1 29.48 3.39
29 2014 1244 838.6 27.71 3.61
30 2015 1168 744.2 24.59 4.07
Total 1233.61 75.67
Mean 41.12 2.52
58

DEVELOPMENT OF A NEGARIM MICRO-CATCHMENT SYSTEM FOR CITRUS PRODUCTION
JOURNAL OF RESEARCH IN FORESTRY, WILDLIFE AND ENVIRONMENT, VOLUME 11, NO. 1 MARCH, 2019
Table 3: Runoff Coefficient (K) from Field Measurements
S/N Date Runoff (mm) Rainfall (mm) Runoff Coefficient (K)
1
2
3
4
5
6
7
8
9
10
11
12
13
14
15
16
17
18
19
20
21
22
23
24
25
1/6/2016
4/6/2016
6/6/2016
7/6/2016
9/6/2016
11/6/2016
14/6/2016
16/6/2016
2/7/2016
6/7/2016
7/7/2016
9/7/2016
12/7/2016
17/7/2016
18/7/2016
25/7/2016
29/7/2016
2/8/2016
5/8/2016
9/8/2016
12/8/2016
14/8/2016
17/8/2016
20/8/2016
21/8/2016
Total
Mean
2.0
5.1
38.2
34.0
37.0
80.0
42.0
10.0
56.0
25.0
50.0
36.2
13.4
28.1
42.5
34.2
15.7
34.3
40.5
8.3
27.4
30.9
12.7
12.2
10.7
7.0
20.0
51.0
60.0
50.0
160.0
116.0
20.0
170.0
90.0
145.0
62.4
21.0
42.3
99.6
70.2
64.6
102.2
67.8
32.7
42.0
63.1
39.0
55.2
41.9
0.29
1.26
0.75
0.57
0.74
0.50
0.36
0.50
0.33
0.28
0.35
0.58
0.64
0.66
0.43
0.49
0.24
0.34
0.60
0.25
0.65
0.49
0.33
0.22
0.26
12.11
0.48
59
Ayanshola and Dauda 2019
JOURNAL OF RESEARCH IN FORESTRY, WILDLIFE AND ENVIRONMENT, VOLUME 11, NO. 1 MARCH, 2019
Table 4: Soil Chemical Analysis Results
S/N SOIL ACCT. /LAB. NO 1st
2nd
3rd
1
2
3
4
5
6
7
8
9
10
11
12
13
14
15
Depth of Horizon or Soil layer (cm)
PH in Water (suspension 1:2)
PH in 1m kcl (suspension 1:2)
ECw (Extract 1:2.5) Exchangeable Cation Ca++(Cmol/kg of soil)
Exchangeable Cation Mg++ (Cmol/kg of soil)
Exchangeable Cation Na+ (Cmol/kg of soil)
Exchangeable Cation K+ (Cmol/kg of soil)
Cation Exchange Capacity (CEC) (Cmol/kg of soil)
Base Saturation (%)
Exchangeable Acidity (Cmol/kg of soil)
Exchangeable Sodium Percentage (ESP) (%)
Total Ammonium Nitrogen (%) (Kieldahi)
Available Phosphorus (Bray 1) ppm
Water Saturation Percentage (%)
0-20
7.17
6.50
0.18
2.10
0.90
0.09
0.02
2.90
94.0
20.0
3.20
0.07
14.5
40.8
20-40
7.10
6.47
0.21
2.23
0.87
0.10
0.05
3.32
82.60
0.13
2.87
0.06
15.2
40.2
40-60
6.70
6.62
0.15
2.03
0.76
0.11
0.03
3.27
76.20
0.21
3.06
0.07
14.9
41.3
DISCUSSION
The average value of ETc across the period of
record (1986 – 2015) is 3.02mm/month, using
the climatic data obtained from meteorological
department, Lower Niger River Basin
Development Authority (LNRBDA). This has
been used to compute the catchment –
cultivated area ratio (C: CA). The computed
catchment – cultivated area ratio is 1.05. This
shows that the catchment – cultivated area ratio
is approximately 1:1; this indicated that both
catchment area and cultivated area are equal in
dimensions. On average, an annual rainfall of
1,233.61mm or higher can be expected at 50%
probability of occurrence in 2½ years interval..
The mean runoff coefficient (K) for the study
area cross the period of observations is 0.48;
this indicates that enough runoff will be
available in the cultivated area for plant
growth.
Soil physical and chemical analyses were
carried out to evaluate the characteristic
properties of the in-situ soil. Physical analysis
result shows that the soil in the study area is
sandy loam, using textural classification
triangle chart by United State Department of
Agriculture (USDA). Chemical analysis result
showed that the salinity infiltration rate,
toxicity and fertility level of the soil in the
study area are found under ‘none’ category,
using the ‘Guidelines for the interpretations of
water quality for agricultures by FAO (1994).
This implies that the level is satisfactory,
having little or no negative effect on the yield
of the crop.
CONCLUSIONS
The following conclusions were drawn
from the results of this study:
i. Crop water requirement of citrus is
3.02mm/month.
ii. Soil in the study area is sandy loam.
iii. Salinity, infiltration rate, toxicity and
fertility level of the soil are found
suitable for plant production.
iv. The average an annual rainfall of
1,233.61mm or higher can be expected a
50% probability of occurrence and at
average frequency of occurrence of 2½
years interval.
v. The average C: CA ratio is 1.05, i.e. C:
CA = 1:1.
vi. The mean runoff coefficient for the
catchment area throughout the period of
observation is 0.48.
60

DEVELOPMENT OF A NEGARIM MICRO-CATCHMENT SYSTEM FOR CITRUS PRODUCTION
JOURNAL OF RESEARCH IN FORESTRY, WILDLIFE AND ENVIRONMENT, VOLUME 11, NO. 1 MARCH, 2019
REFERENCES
ADB (2008): Assessment of Best Practices and
Experience in Water Harvesting, Rainwater
Harvesting Handbook. African Development
Bank.
Ali, A., Oweis, T., Salkini, A. B., and El-Naggar, S.
(2009): Rainwater Cisterns. Traditional
Technologies for Dry Areas. Aleppo:
International Center for Agricultural Research in
the Dry Areas (ICARDA).
FAO (1994): Water Quality for Agriculture. Irrigation
and Drainage Paper 29.Rev. 1, Food and
Agriculture Organisation of United Nations,
Rome, Italy.
FAO (1986): Irrigation Water Management; Irrigation
water Needs, Training Manual N0. 3, Rome,
Italy.
FAO (1991): Water Harvesting; A Manual for the
Design and Construction of Water Harvesting
Schemes for Plant Production, Rome, Italy.
Hilary, F. R. and Gary, F. (1995): Micro
catchment Water Harvesting for Agricultural
Production: Part I: Physical and Technical
Considerations. Department of civil
Engineering, Colorado State University,
Colorado 80526.
Malesu, M.M. (2007): Green Water Management
Handbook. Rainwater Harvesting for
Agricultural Production and Ecological
Sustainability. Nairobi: The World
Agroforestry Centre.
Theib, O., Ahmed, H., and Jacob, K. (1999): Water
Harvesting and Supplemental Irrigation for
Improved Water Use Efficiency in Dry Areas.
International Water Management Institute.
SWIM Paper 7. Colombo, Sri Lanka.
61


