Embed Size (px)
Citation preview
CSJ 4(2): December, 2013 ISSN: 2276 – 707X Abdulkadir and Jimoh
44
Comparative Analysis of Physico-Chemical Properties of Extracted and
Collected Palm Oil and Tallow
1Abdulkadir, A.G. and
2Jimoh, W.L.O.
1. Department of Chemical Science, Federal University Kashere, P.M.B. 0182, Gombe, Nigeria.
2. Department of Pure and Industrial Chemistry, Bayero University, P.M.B. 3011, Kano, Nigeria.
Email: [email protected]
ABSTRACT
Palm oil was extracted from palm fruits while animal fat (tallow) from Cow. Various samples of both palm oil
and tallow were also obtained from the market. Determination of the physico-chemical properties were made on
these reference and collected samples. The results obtained from the reference samples of both palm oil and
tallow are as follows: Relative density: palm oil; 0.875 and tallow; 0.909. Moisture content: palm oil;
0.24%m/m and tallow; 0.13%m/m. Free fatty acid: palm oil; 2.12% and tallow; 0.559%. Acid value: palm oil;
4.217 mg KOH / g of oil and tallow; 1.113 mg KOH / g of oil. Saponification value: palm oil; 191.324 mg KOH
/ g of oil and tallow; 190.763 mg KOH / g of oil. Peroxide value: palm oil; Nil and tallow; Nil. Unsaponifiable
matter: palm oil; 3.033g/kg and tallow; 1.133g/kg. Iodine value: palm oil; 53.870 and tallow; 44.154. Soap
content: palm oil; 0.003m/m and tallow; 0m/m. Insoluble impurities: palm oil; 0.001m/m and tallow; 0.001m/m.
Titre value: palm oil; 41.5 o
C and tallow; 42.5 o
C. Rancidity: palm oil; negative and tallow; negative. The
conclusion derived from these analyses is that, some of the samples do not comply with the standards given by
the regulatory bodies (Standard Organization of Nigeria, and National Food and Drug Administration and
Control).
Keywords: Free fatty acid, Lipids, Palm oil, Rancidity, Saponification, Tallow.
Introduction Lipids are a group of substances that in
general, are soluble in ether, chloroform, or other
organic solvents but are sparingly soluble in water.
However, some lipids, such as triacylglycerols, are
very hydrophobic. The term fat signifies extracted
lipids that are solid at room temperature and oil
refers to those that are liquid at room temperature.
However, the three terms lipid, fat and oil are often
used interchangeable (Nielsen, 2002). In plants,
lipids are of two types; the structural and the
storage. The former are present as constituent of
various membranes and protective surface layers
and make up about 7% of the leaves of higher plant
(Umar, 2005), while the latter occurs in fruits and
seeds and are predominantly oil (McDonald et al.,
1995). Fats and oils are characterized by a selection
of chemical and physical test methods. One of the
most important tests is the determination of the
fatty acid (FA) composition, which is done via Gas
chromatograph (GC) (Craske et al., 1988). The
chemical properties of fats and fatty acids may be
expressed in terms of the reactions of the carboxyl
groups and the hydrocarbon chain attached to it,
which may be saturated or unsaturated. Hydrolysis,
alcoholysis, autoxidation, and sulphurnation, are
some of the possible reactions that fats and fatty
acids can undergo.
Palm oil is composed of fatty acids,
esterifies with glycerol just like any ordinary fat.
Fatty acids are saturated and unsaturated aliphatic
carboxylic acids with carbon chain length in the
range of C6 up to C24 e.g. CH3-(CH2)14-COOH. It is
high in fatty acid, about 50%. The oil palm gives
its name to the 16 carbon saturated fatty acid
palmitic acid found in palm oil. Monounsaturated
oleic acid is also a constituent of palm oil. Palm oil
is the largest source of tocotrienol; part of the
vitamin E family and it is also high in vitamin K
and dietary magnesium. The split-off fatty acids are
a mixture of fatty acids ranging from C6 to C18
depending on the type of oil or fat (Faessler, 2004).
As palm oil is rich in carotene, it can be used in
place of cod liver oil for correcting vitamin A
deficiency. Each 100g of the fruit contains 540
calories, 26.2g H2O, 1.9g protein, 58.4g fat, 12.5g
total carbohydrates, 3.2g fiber, 1g ash, 82mg Ca,
47mg P, 4.5mg Fe, 42.42mg -carotene equivalent,
0.2mg thiamine, 0.1ng riboflavin, 1.4mg niacin,
and 12mg ascorbic acid (Barker and Worgan,
1981). The oil contains, per 100g, 878 calories,
0.5% H2O, 0% protein, 99.1% fat, 0.4g total
carbohydrates, 7ng Ca, 8mg P, 5.5mg Fe, 27.28mg
-carotene equivalent, 0.03mg riboflavin, and a
trace of thiamine. The glycerides composition of
the oil are; 45% oleodipalmitins, 30%
ChemSearch Journal 4(2): 44 – 54, Dec., 2013 Publication of Chemical Society of Nigeria, Kano Chapter
Received: 16/11/2013 Accepted: 13/12/2013 C.S.N
CH
EM
IC
AL SOCIETY OF N
IGE
RIA
CSJ 4(2): December, 2013 ISSN: 2276 – 707X Abdulkadir and Jimoh
45
palmitodioleins, 10% oleopalmatostearins, 6-8%
linoleodioleins, and 6-8% fully saturated
glycerides, tripalmatin and diapalmitostearin
(Barker and Worgan, 1981).
Tallow (animal fat) is rendered from beef
or mutton fat, processed from suet (the fatty tissue
about the loins and kidneys of sheep, oxen etc.)
(Appleby and Halloran, 1990). By definition,
tallow is animal fat with “titre” of greater than
40oC. This means that upon cooling a melted fat
sample, the temperature at which it re-solidifies is
40oC or greater. Thus, tallow is solid or semi-solid
at room temperature. There is a preponderance of
data that supports a greater consumption of poly-
unsaturated fats like the essential fatty acids
linoleic acid (LA) and the omega-3 fatty acids like
linolenic (ALA), eicosapentaenoic (EPA) and
docosahexaenoic (DHA) acid by dogs and cats for
the management of inflammatory diseases and
neurological development (Aldrich, 2007).
The fatty acids in beef tallow are about
50% saturated, with a small amount of LA (3.0%)
and ALA (0.6%) and none of the longer chain
omega-3s (EPA or DHA). Mutton tallow has a
similar level slightly higher level of LA (5.5%) and
ALA (2.3%). In general, tallow is good “platform”
to provide energy and flavor, but a balanced diet
may require an enrich meat with LA and (or)
omega-3 fatty acids (Aldrich, 2007).
It has been observed that most of the oils
and fats in the market are adulterated in one way or
the other, through the use of unripe fruits or the use
of tallow already affected with bacteria or the use
of substandard processing methods or the
combination of different oil plant fruits or animal
fats as the case may be. This tends to cause a great
detriment to the health of the consumers of the
lipids products. The significance of the research is
that, the findings could be used in deciding quality
of lipid samples from different parts of the country;
their level of adulteration and proffer solutions to
ways of checkmating the contamination. Therefore
it is within the aim of this research to determine
the physico-chemical properties such as; relative
density, moisture contents, free fatty acids, acid
values, saponification values, unsaponifiable
matter, soap contents, insoluble impurities, iodine
values, peroxide values, rancidity and titre values
of both extracted (reference samples) and the
collected samples of the palm oil and tallow, and
compare the results of the reference and mean of
the collected samples with that of the known.
Materials and Method
The methods used for the analysis of the
physico-chemical parameters in this research work,
are the traditional basic method which are the
official methods approved by Standard Analytical
Chemistry bodies (Nielsen, 2002; A.O.A.C, 1990;
A.O.C.S, 1990; I.U.P.A.C, 1987; Milwidsky and
Gabriel, 1982 and S.O.N, 2000).
Sampling and Sampling Pre-treatment
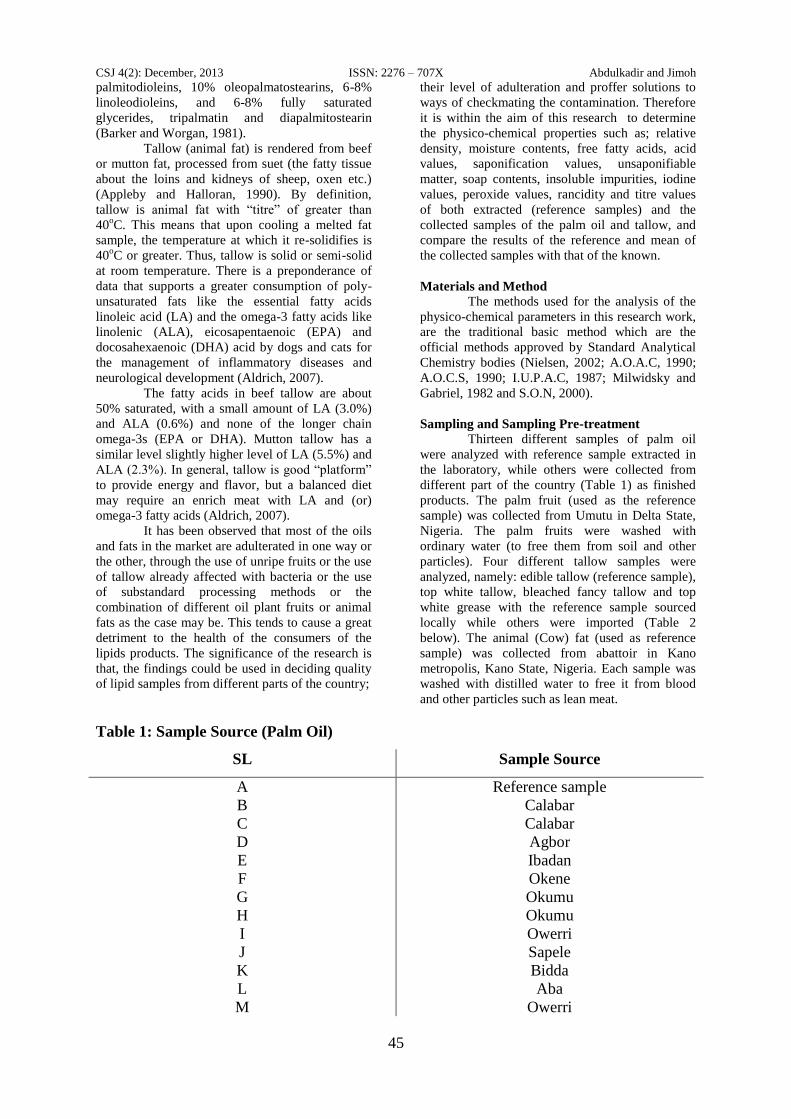
Thirteen different samples of palm oil
were analyzed with reference sample extracted in
the laboratory, while others were collected from
different part of the country (Table 1) as finished
products. The palm fruit (used as the reference
sample) was collected from Umutu in Delta State,
Nigeria. The palm fruits were washed with
ordinary water (to free them from soil and other
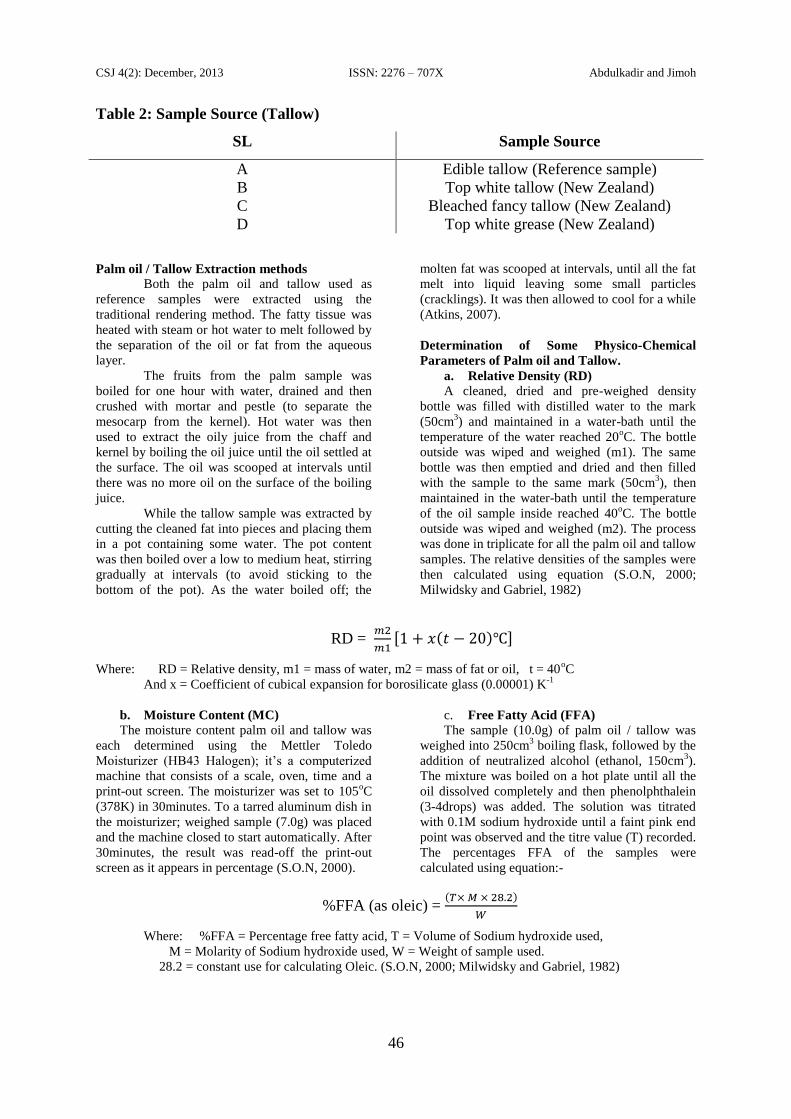
particles). Four different tallow samples were
analyzed, namely: edible tallow (reference sample),
top white tallow, bleached fancy tallow and top
white grease with the reference sample sourced
locally while others were imported (Table 2
below). The animal (Cow) fat (used as reference
sample) was collected from abattoir in Kano
metropolis, Kano State, Nigeria. Each sample was
washed with distilled water to free it from blood
and other particles such as lean meat.
Table 1: Sample Source (Palm Oil)
SL Sample Source
A Reference sample
B Calabar
C Calabar
D Agbor
E Ibadan
F Okene
G Okumu
H Okumu
I Owerri
J Sapele
K Bidda
L Aba
M Owerri
CSJ 4(2): December, 2013 ISSN: 2276 – 707X Abdulkadir and Jimoh
46
Table 2: Sample Source (Tallow)
SL Sample Source
A Edible tallow (Reference sample)
B Top white tallow (New Zealand)
C Bleached fancy tallow (New Zealand)
D Top white grease (New Zealand)
Palm oil / Tallow Extraction methods
Both the palm oil and tallow used as
reference samples were extracted using the
traditional rendering method. The fatty tissue was
heated with steam or hot water to melt followed by
the separation of the oil or fat from the aqueous
layer.
The fruits from the palm sample was
boiled for one hour with water, drained and then
crushed with mortar and pestle (to separate the
mesocarp from the kernel). Hot water was then
used to extract the oily juice from the chaff and
kernel by boiling the oil juice until the oil settled at
the surface. The oil was scooped at intervals until
there was no more oil on the surface of the boiling
juice.
While the tallow sample was extracted by
cutting the cleaned fat into pieces and placing them
in a pot containing some water. The pot content
was then boiled over a low to medium heat, stirring
gradually at intervals (to avoid sticking to the
bottom of the pot). As the water boiled off; the
molten fat was scooped at intervals, until all the fat
melt into liquid leaving some small particles
(cracklings). It was then allowed to cool for a while
(Atkins, 2007).
Determination of Some Physico-Chemical
Parameters of Palm oil and Tallow.
a. Relative Density (RD)
A cleaned, dried and pre-weighed density
bottle was filled with distilled water to the mark
(50cm3) and maintained in a water-bath until the
temperature of the water reached 20oC. The bottle
outside was wiped and weighed (m1). The same
bottle was then emptied and dried and then filled
with the sample to the same mark (50cm3), then
maintained in the water-bath until the temperature
of the oil sample inside reached 40oC. The bottle
outside was wiped and weighed (m2). The process
was done in triplicate for all the palm oil and tallow
samples. The relative densities of the samples were
then calculated using equation (S.O.N, 2000;
Milwidsky and Gabriel, 1982)
RD =
Where: RD = Relative density, m1 = mass of water, m2 = mass of fat or oil, t = 40oC
And x = Coefficient of cubical expansion for borosilicate glass (0.00001) K-1
b. Moisture Content (MC)
The moisture content palm oil and tallow was
each determined using the Mettler Toledo
Moisturizer (HB43 Halogen); it’s a computerized
machine that consists of a scale, oven, time and a
print-out screen. The moisturizer was set to 105oC
(378K) in 30minutes. To a tarred aluminum dish in
the moisturizer; weighed sample (7.0g) was placed
and the machine closed to start automatically. After
30minutes, the result was read-off the print-out
screen as it appears in percentage (S.O.N, 2000).
c. Free Fatty Acid (FFA) The sample (10.0g) of palm oil / tallow was
weighed into 250cm3 boiling flask, followed by the
addition of neutralized alcohol (ethanol, 150cm3).
The mixture was boiled on a hot plate until all the
oil dissolved completely and then phenolphthalein
(3-4drops) was added. The solution was titrated
with 0.1M sodium hydroxide until a faint pink end
point was observed and the titre value (T) recorded.
The percentages FFA of the samples were
calculated using equation:-
%FFA (as oleic) =
Where: %FFA = Percentage free fatty acid, T = Volume of Sodium hydroxide used,
M = Molarity of Sodium hydroxide used, W = Weight of sample used.
28.2 = constant use for calculating Oleic. (S.O.N, 2000; Milwidsky and Gabriel, 1982)
CSJ 4(2): December, 2013 ISSN: 2276 – 707X Abdulkadir and Jimoh
47
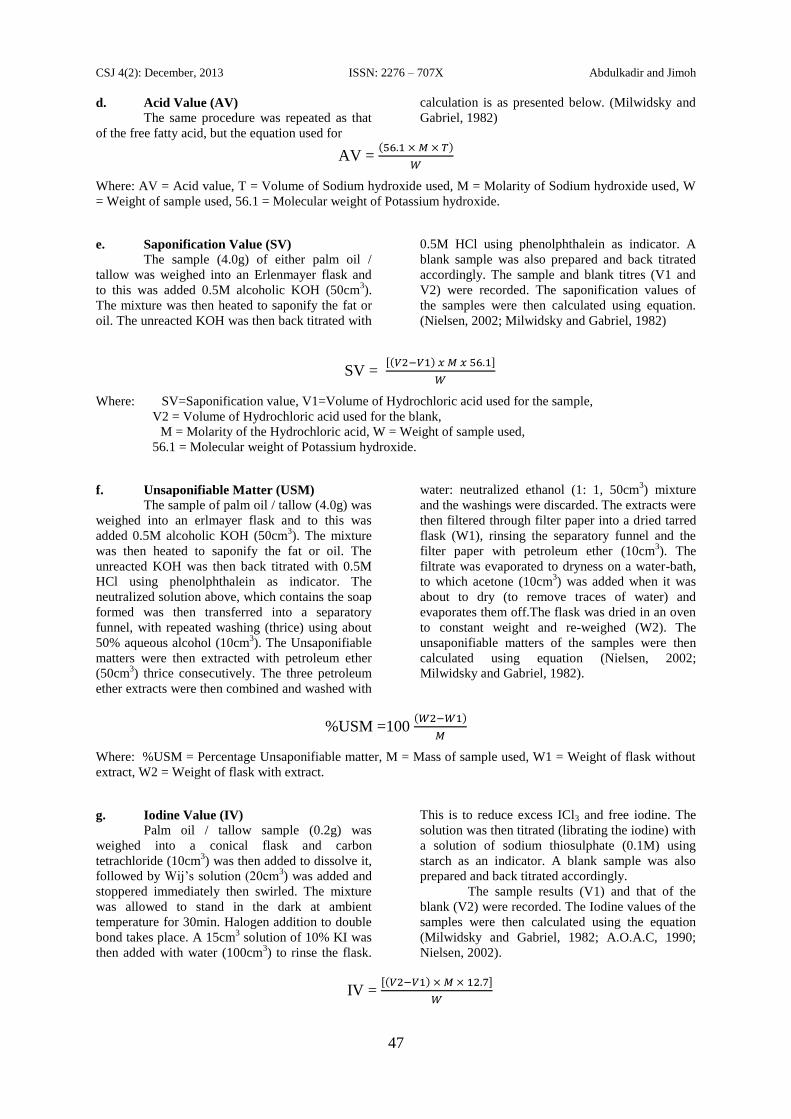
d. Acid Value (AV)
The same procedure was repeated as that
of the free fatty acid, but the equation used for
calculation is as presented below. (Milwidsky and
Gabriel, 1982)
AV =
Where: AV = Acid value, T = Volume of Sodium hydroxide used, M = Molarity of Sodium hydroxide used, W
= Weight of sample used, 56.1 = Molecular weight of Potassium hydroxide.
e. Saponification Value (SV)
The sample (4.0g) of either palm oil /
tallow was weighed into an Erlenmayer flask and
to this was added 0.5M alcoholic KOH (50cm3).
The mixture was then heated to saponify the fat or
oil. The unreacted KOH was then back titrated with
0.5M HCl using phenolphthalein as indicator. A
blank sample was also prepared and back titrated
accordingly. The sample and blank titres (V1 and
V2) were recorded. The saponification values of
the samples were then calculated using equation.
(Nielsen, 2002; Milwidsky and Gabriel, 1982)
SV =
Where: SV=Saponification value, V1=Volume of Hydrochloric acid used for the sample,
V2 = Volume of Hydrochloric acid used for the blank,
M = Molarity of the Hydrochloric acid, W = Weight of sample used,
56.1 = Molecular weight of Potassium hydroxide.
f. Unsaponifiable Matter (USM)
The sample of palm oil / tallow (4.0g) was
weighed into an erlmayer flask and to this was
added 0.5M alcoholic KOH (50cm3). The mixture
was then heated to saponify the fat or oil. The
unreacted KOH was then back titrated with 0.5M
HCl using phenolphthalein as indicator. The
neutralized solution above, which contains the soap
formed was then transferred into a separatory
funnel, with repeated washing (thrice) using about
50% aqueous alcohol (10cm3). The Unsaponifiable
matters were then extracted with petroleum ether
(50cm3) thrice consecutively. The three petroleum
ether extracts were then combined and washed with
water: neutralized ethanol (1: 1, 50cm3) mixture
and the washings were discarded. The extracts were
then filtered through filter paper into a dried tarred
flask (W1), rinsing the separatory funnel and the
filter paper with petroleum ether (10cm3). The
filtrate was evaporated to dryness on a water-bath,
to which acetone (10cm3) was added when it was
about to dry (to remove traces of water) and
evaporates them off.The flask was dried in an oven
to constant weight and re-weighed (W2). The
unsaponifiable matters of the samples were then
calculated using equation (Nielsen, 2002;
Milwidsky and Gabriel, 1982).
%USM =100
Where: %USM = Percentage Unsaponifiable matter, M = Mass of sample used, W1 = Weight of flask without
extract, W2 = Weight of flask with extract.
g. Iodine Value (IV)
Palm oil / tallow sample (0.2g) was
weighed into a conical flask and carbon
tetrachloride (10cm3) was then added to dissolve it,
followed by Wij’s solution (20cm3) was added and
stoppered immediately then swirled. The mixture
was allowed to stand in the dark at ambient
temperature for 30min. Halogen addition to double
bond takes place. A 15cm3 solution of 10% KI was
then added with water (100cm3) to rinse the flask.
This is to reduce excess ICl3 and free iodine. The
solution was then titrated (librating the iodine) with
a solution of sodium thiosulphate (0.1M) using
starch as an indicator. A blank sample was also
prepared and back titrated accordingly.
The sample results (V1) and that of the
blank (V2) were recorded. The Iodine values of the
samples were then calculated using the equation
(Milwidsky and Gabriel, 1982; A.O.A.C, 1990;
Nielsen, 2002).
IV =
CSJ 4(2): December, 2013 ISSN: 2276 – 707X Abdulkadir and Jimoh
48
Where: IV = Iodine value, V1 = Volume of Sodium thiosulphate used for the sample.
V2 = Volume of Sodium thiosulphate used for the blank,
M = Molarity of Sodium thiosulphate used, W = Weight of sample used.
12.7 = ~ constant used to convert from milliequivalent thiosulphate to gram (Molecular weight of
Iodine = 126.9)
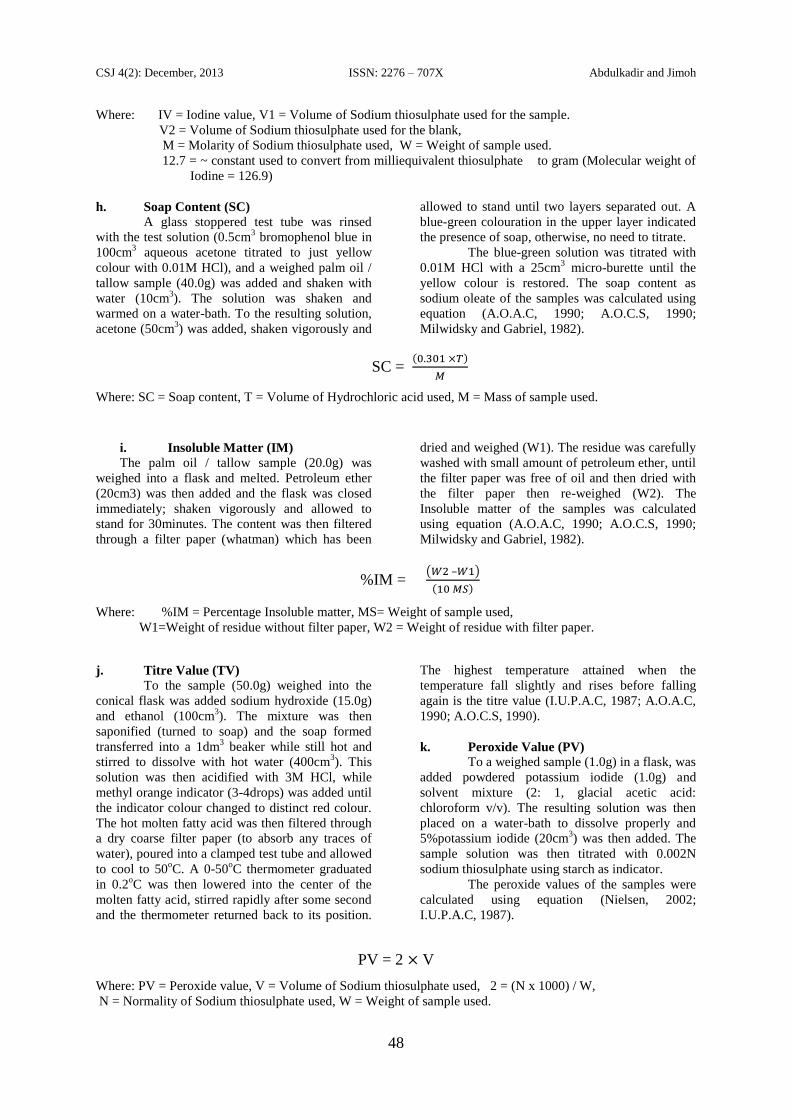
h. Soap Content (SC)
A glass stoppered test tube was rinsed
with the test solution (0.5cm3 bromophenol blue in
100cm3 aqueous acetone titrated to just yellow
colour with 0.01M HCl), and a weighed palm oil /
tallow sample (40.0g) was added and shaken with
water (10cm3). The solution was shaken and
warmed on a water-bath. To the resulting solution,
acetone (50cm3) was added, shaken vigorously and
allowed to stand until two layers separated out. A
blue-green colouration in the upper layer indicated
the presence of soap, otherwise, no need to titrate.
The blue-green solution was titrated with
0.01M HCl with a 25cm3 micro-burette until the
yellow colour is restored. The soap content as
sodium oleate of the samples was calculated using
equation (A.O.A.C, 1990; A.O.C.S, 1990;
Milwidsky and Gabriel, 1982).
SC =
Where: SC = Soap content, T = Volume of Hydrochloric acid used, M = Mass of sample used.
i. Insoluble Matter (IM)
The palm oil / tallow sample (20.0g) was
weighed into a flask and melted. Petroleum ether
(20cm3) was then added and the flask was closed
immediately; shaken vigorously and allowed to
stand for 30minutes. The content was then filtered
through a filter paper (whatman) which has been
dried and weighed (W1). The residue was carefully
washed with small amount of petroleum ether, until
the filter paper was free of oil and then dried with
the filter paper then re-weighed (W2). The
Insoluble matter of the samples was calculated
using equation (A.O.A.C, 1990; A.O.C.S, 1990;
Milwidsky and Gabriel, 1982).
%IM = –
Where: %IM = Percentage Insoluble matter, MS= Weight of sample used,
W1=Weight of residue without filter paper, W2 = Weight of residue with filter paper.
j. Titre Value (TV) To the sample (50.0g) weighed into the
conical flask was added sodium hydroxide (15.0g)
and ethanol (100cm3). The mixture was then
saponified (turned to soap) and the soap formed
transferred into a 1dm3 beaker while still hot and
stirred to dissolve with hot water (400cm3). This
solution was then acidified with 3M HCl, while
methyl orange indicator (3-4drops) was added until
the indicator colour changed to distinct red colour.
The hot molten fatty acid was then filtered through
a dry coarse filter paper (to absorb any traces of
water), poured into a clamped test tube and allowed
to cool to 50oC. A 0-50
oC thermometer graduated
in 0.2oC was then lowered into the center of the
molten fatty acid, stirred rapidly after some second
and the thermometer returned back to its position.
The highest temperature attained when the
temperature fall slightly and rises before falling
again is the titre value (I.U.P.A.C, 1987; A.O.A.C,
1990; A.O.C.S, 1990).
k. Peroxide Value (PV)
To a weighed sample (1.0g) in a flask, was
added powdered potassium iodide (1.0g) and
solvent mixture (2: 1, glacial acetic acid:
chloroform v/v). The resulting solution was then
placed on a water-bath to dissolve properly and
5%potassium iodide (20cm3) was then added. The
sample solution was then titrated with 0.002N
sodium thiosulphate using starch as indicator.
The peroxide values of the samples were
calculated using equation (Nielsen, 2002;
I.U.P.A.C, 1987).
PV = 2 V
Where: PV = Peroxide value, V = Volume of Sodium thiosulphate used, 2 = (N x 1000) / W,
N = Normality of Sodium thiosulphate used, W = Weight of sample used.
CSJ 4(2): December, 2013 ISSN: 2276 – 707X Abdulkadir and Jimoh
49
l. Rancidity (R) The Kreis test for rancidity was used. The
sample (10cm3) was melted in a stopperred test
tube. 0.1% phloroglucinol solution (10cm3) was
then added, followed by concentrated HCl (10cm3).
The mixture was shaken vigorously; a pink colour
indicates incipient rancidity. The sample results
were then recorded as; + (rancid) and – (not
rancid), (A.O.A.C, 1990; A.O.C.S, 1990).
Results and Discussion
The results of the analysis of the reference
samples, the mean of the collected samples and the
standard deviations of the collected samples of both
palm oil and tallow are compared in Table 4 and
Table 5 respectively, while Table 6 and Table 7
compare results of the reference samples, the mean
of collected samples, the standard deviations of the
collected samples and their standards.
Though, the results of some collected
samples of palm oil are found to be high compared
to the reference samples example; MC (% m/m) of
sample B =4.69,C=5.14,and D=1.27 and FFA (%)
of samples B=7.673, F=8.153, J=7.027,K=7.585
and M=10.77 where samples B,E,F and M are
found to be rancid while all the collected samples
have lower SV (mg KOH / g of oil) values than the
reference sample, except that of sample H
=191.114 that is very close. Likewise, same also
occur in the case of collected tallow samples where
sample D has a high MC (% m/m) value of 1.05
while both samples B and D are also found to be
rancid when compared with the tallow reference
sample.
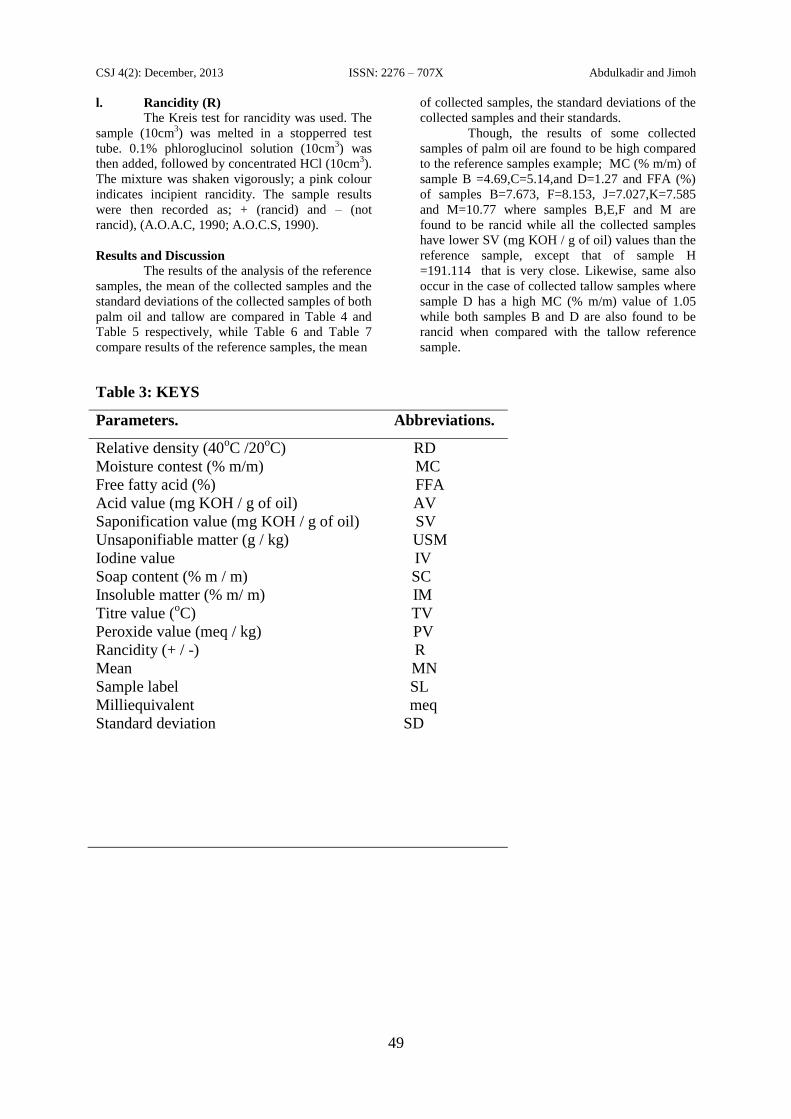
Table 3: KEYS
Parameters. Abbreviations.
Relative density (40oC /20
oC) RD
Moisture contest (% m/m) MC
Free fatty acid (%) FFA
Acid value (mg KOH / g of oil) AV
Saponification value (mg KOH / g of oil) SV
Unsaponifiable matter (g / kg) USM
Iodine value IV
Soap content (% m / m) SC
Insoluble matter (% m/ m) IM
Titre value (oC) TV
Peroxide value (meq / kg) PV
Rancidity (+ / -) R
Mean MN
Sample label SL
Milliequivalent meq
Standard deviation SD
CSJ 4(2): December, 2013 ISSN: 2276 – 707X Abdulkadir and Jimoh
50
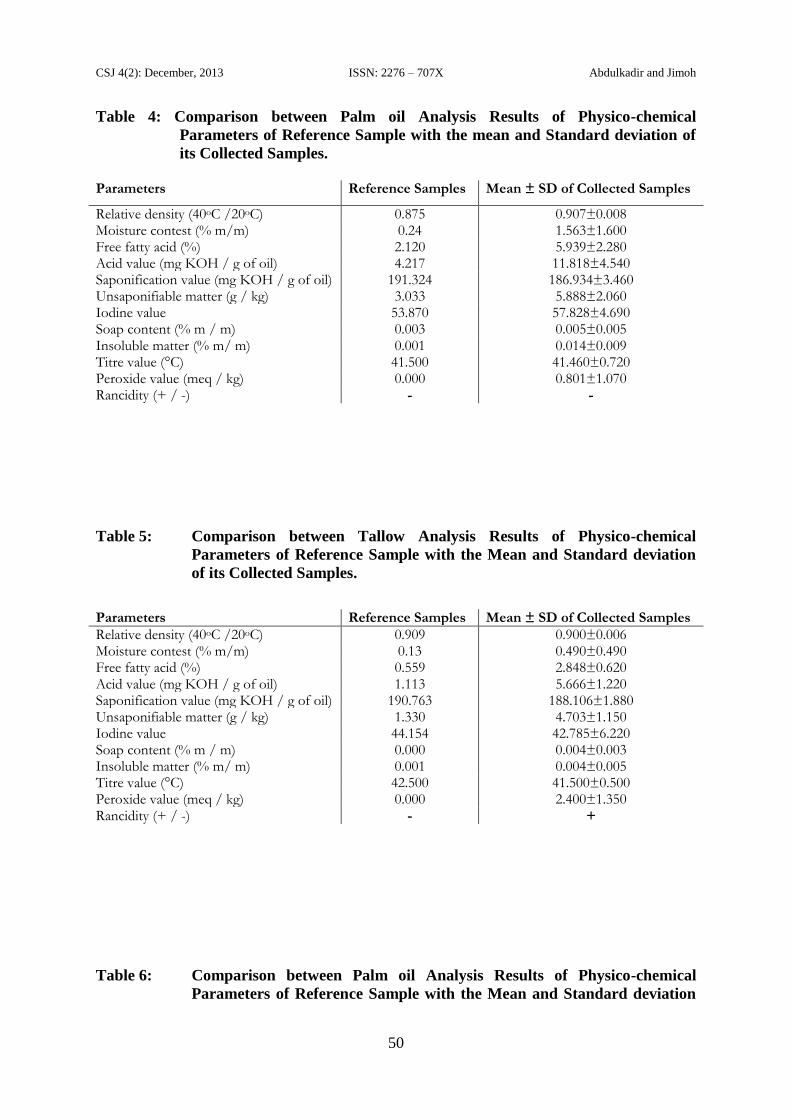
Table 4: Comparison between Palm oil Analysis Results of Physico-chemical
Parameters of Reference Sample with the mean and Standard deviation of
its Collected Samples.
Parameters Reference Samples Mean ± SD of Collected Samples
Relative density (40oC /20oC) 0.875 0.907±0.008 Moisture contest (% m/m) 0.24 1.563±1.600 Free fatty acid (%) 2.120 5.939±2.280 Acid value (mg KOH / g of oil) 4.217 11.818±4.540 Saponification value (mg KOH / g of oil) 191.324 186.934±3.460 Unsaponifiable matter (g / kg) 3.033 5.888±2.060 Iodine value 53.870 57.828±4.690 Soap content (% m / m) 0.003 0.005±0.005 Insoluble matter (% m/ m) 0.001 0.014±0.009 Titre value (°C) 41.500 41.460±0.720 Peroxide value (meq / kg) 0.000 0.801±1.070 Rancidity (+ / -) - -
Table 5: Comparison between Tallow Analysis Results of Physico-chemical
Parameters of Reference Sample with the Mean and Standard deviation
of its Collected Samples.
Parameters Reference Samples Mean ± SD of Collected Samples
Relative density (40oC /20oC) 0.909 0.900±0.006 Moisture contest (% m/m) 0.13 0.490±0.490 Free fatty acid (%) 0.559 2.848±0.620 Acid value (mg KOH / g of oil) 1.113 5.666±1.220 Saponification value (mg KOH / g of oil) 190.763 188.106±1.880 Unsaponifiable matter (g / kg) 1.330 4.703±1.150 Iodine value 44.154 42.785±6.220 Soap content (% m / m) 0.000 0.004±0.003 Insoluble matter (% m/ m) 0.001 0.004±0.005 Titre value (°C) 42.500 41.500±0.500 Peroxide value (meq / kg) 0.000 2.400±1.350 Rancidity (+ / -) - +
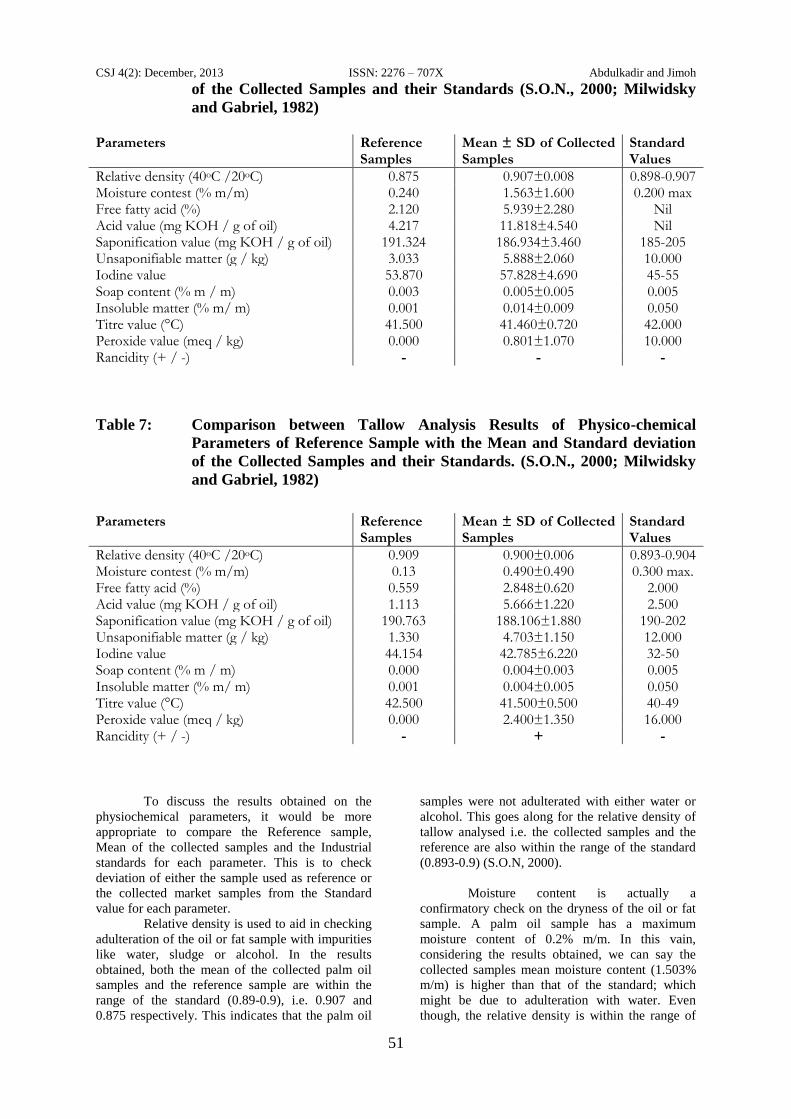
Table 6: Comparison between Palm oil Analysis Results of Physico-chemical
Parameters of Reference Sample with the Mean and Standard deviation
CSJ 4(2): December, 2013 ISSN: 2276 – 707X Abdulkadir and Jimoh
51
of the Collected Samples and their Standards (S.O.N., 2000; Milwidsky
and Gabriel, 1982)
Parameters Reference
Samples Mean ± SD of Collected Samples
Standard Values
Relative density (40oC /20oC) 0.875 0.907±0.008 0.898-0.907 Moisture contest (% m/m) 0.240 1.563±1.600 0.200 max Free fatty acid (%) 2.120 5.939±2.280 Nil Acid value (mg KOH / g of oil) 4.217 11.818±4.540 Nil Saponification value (mg KOH / g of oil) 191.324 186.934±3.460 185-205 Unsaponifiable matter (g / kg) 3.033 5.888±2.060 10.000 Iodine value 53.870 57.828±4.690 45-55 Soap content (% m / m) 0.003 0.005±0.005 0.005 Insoluble matter (% m/ m) 0.001 0.014±0.009 0.050 Titre value (°C) 41.500 41.460±0.720 42.000 Peroxide value (meq / kg) 0.000 0.801±1.070 10.000 Rancidity (+ / -) - - -
Table 7: Comparison between Tallow Analysis Results of Physico-chemical
Parameters of Reference Sample with the Mean and Standard deviation
of the Collected Samples and their Standards. (S.O.N., 2000; Milwidsky
and Gabriel, 1982)
Parameters Reference Samples
Mean ± SD of Collected Samples
Standard Values
Relative density (40oC /20oC) 0.909 0.900±0.006 0.893-0.904 Moisture contest (% m/m) 0.13 0.490±0.490 0.300 max. Free fatty acid (%) 0.559 2.848±0.620 2.000 Acid value (mg KOH / g of oil) 1.113 5.666±1.220 2.500 Saponification value (mg KOH / g of oil) 190.763 188.106±1.880 190-202 Unsaponifiable matter (g / kg) 1.330 4.703±1.150 12.000 Iodine value 44.154 42.785±6.220 32-50 Soap content (% m / m) 0.000 0.004±0.003 0.005 Insoluble matter (% m/ m) 0.001 0.004±0.005 0.050 Titre value (°C) 42.500 41.500±0.500 40-49 Peroxide value (meq / kg) 0.000 2.400±1.350 16.000 Rancidity (+ / -) - + -
To discuss the results obtained on the
physiochemical parameters, it would be more
appropriate to compare the Reference sample,
Mean of the collected samples and the Industrial
standards for each parameter. This is to check
deviation of either the sample used as reference or
the collected market samples from the Standard
value for each parameter.
Relative density is used to aid in checking
adulteration of the oil or fat sample with impurities
like water, sludge or alcohol. In the results
obtained, both the mean of the collected palm oil
samples and the reference sample are within the
range of the standard (0.89-0.9), i.e. 0.907 and
0.875 respectively. This indicates that the palm oil
samples were not adulterated with either water or
alcohol. This goes along for the relative density of
tallow analysed i.e. the collected samples and the
reference are also within the range of the standard
(0.893-0.9) (S.O.N, 2000).
Moisture content is actually a
confirmatory check on the dryness of the oil or fat
sample. A palm oil sample has a maximum
moisture content of 0.2% m/m. In this vain,
considering the results obtained, we can say the
collected samples mean moisture content (1.503%
m/m) is higher than that of the standard; which
might be due to adulteration with water. Even
though, the relative density is within the range of
CSJ 4(2): December, 2013 ISSN: 2276 – 707X Abdulkadir and Jimoh
52
the standard as seen above. This can be confirmed
from the result of the moisture content of the
reference sample (0.24% m/m), which is in
conformity with the standard of 0.2% m/m
maximum.
On the other hand, the moisture content of
mean of collected tallow samples (0.49%, ±0.490
m/m) tends to deviate a little from the standard of
0.3% m/m maximum. The reference sample and
one of the collected sample (sample C) tends to be
within the standard range i.e. 0.13% m/m and
0.19% m/m respectively. While another collected
sample (sample D), is highly wet with moisture
content of 1.05% m/m. This might be due to
handling or deliberate adulteration by the provider.
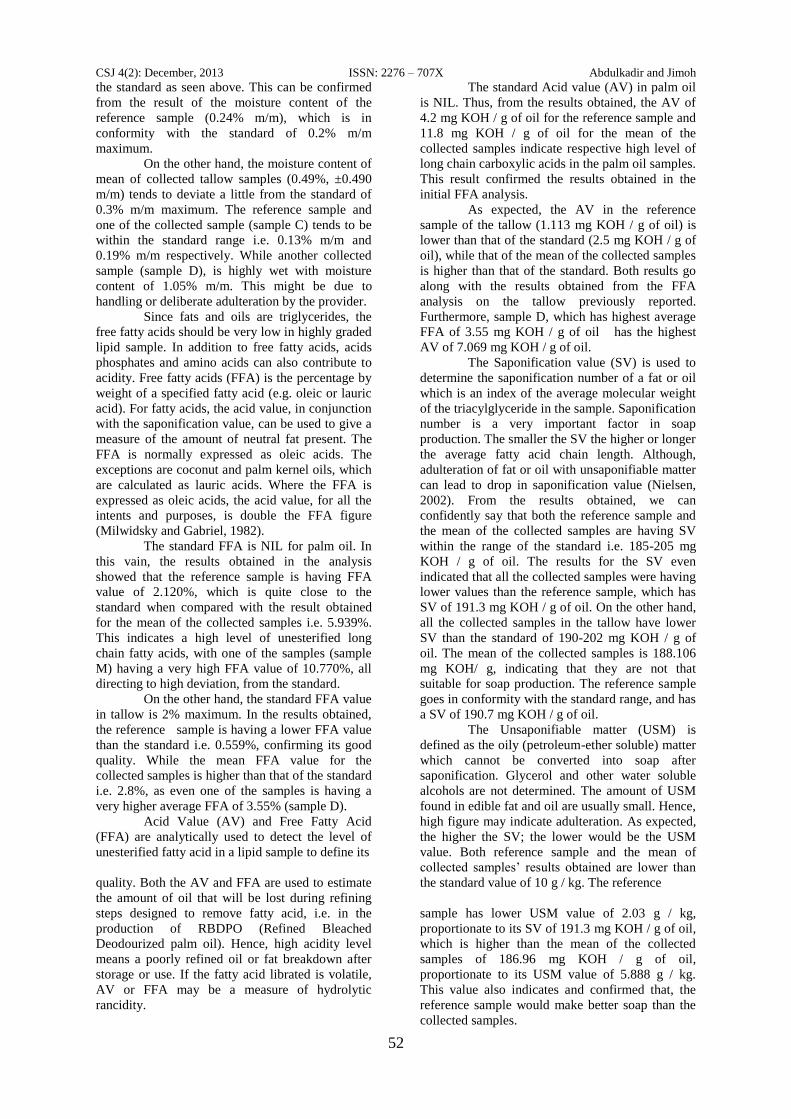
Since fats and oils are triglycerides, the
free fatty acids should be very low in highly graded
lipid sample. In addition to free fatty acids, acids
phosphates and amino acids can also contribute to
acidity. Free fatty acids (FFA) is the percentage by
weight of a specified fatty acid (e.g. oleic or lauric
acid). For fatty acids, the acid value, in conjunction
with the saponification value, can be used to give a
measure of the amount of neutral fat present. The
FFA is normally expressed as oleic acids. The
exceptions are coconut and palm kernel oils, which
are calculated as lauric acids. Where the FFA is
expressed as oleic acids, the acid value, for all the
intents and purposes, is double the FFA figure
(Milwidsky and Gabriel, 1982).
The standard FFA is NIL for palm oil. In
this vain, the results obtained in the analysis
showed that the reference sample is having FFA
value of 2.120%, which is quite close to the
standard when compared with the result obtained
for the mean of the collected samples i.e. 5.939%.
This indicates a high level of unesterified long
chain fatty acids, with one of the samples (sample
M) having a very high FFA value of 10.770%, all
directing to high deviation, from the standard.
On the other hand, the standard FFA value
in tallow is 2% maximum. In the results obtained,
the reference sample is having a lower FFA value
than the standard i.e. 0.559%, confirming its good
quality. While the mean FFA value for the
collected samples is higher than that of the standard
i.e. 2.8%, as even one of the samples is having a
very higher average FFA of 3.55% (sample D).
Acid Value (AV) and Free Fatty Acid
(FFA) are analytically used to detect the level of
unesterified fatty acid in a lipid sample to define its
quality. Both the AV and FFA are used to estimate
the amount of oil that will be lost during refining
steps designed to remove fatty acid, i.e. in the
production of RBDPO (Refined Bleached
Deodourized palm oil). Hence, high acidity level
means a poorly refined oil or fat breakdown after
storage or use. If the fatty acid librated is volatile,
AV or FFA may be a measure of hydrolytic
rancidity.
The standard Acid value (AV) in palm oil
is NIL. Thus, from the results obtained, the AV of
4.2 mg KOH / g of oil for the reference sample and
11.8 mg KOH / g of oil for the mean of the
collected samples indicate respective high level of
long chain carboxylic acids in the palm oil samples.
This result confirmed the results obtained in the
initial FFA analysis.
As expected, the AV in the reference
sample of the tallow (1.113 mg KOH / g of oil) is
lower than that of the standard (2.5 mg KOH / g of
oil), while that of the mean of the collected samples
is higher than that of the standard. Both results go
along with the results obtained from the FFA
analysis on the tallow previously reported.
Furthermore, sample D, which has highest average
FFA of 3.55 mg KOH / g of oil has the highest
AV of 7.069 mg KOH / g of oil.
The Saponification value (SV) is used to
determine the saponification number of a fat or oil
which is an index of the average molecular weight
of the triacylglyceride in the sample. Saponification
number is a very important factor in soap
production. The smaller the SV the higher or longer
the average fatty acid chain length. Although,
adulteration of fat or oil with unsaponifiable matter
can lead to drop in saponification value (Nielsen,
2002). From the results obtained, we can
confidently say that both the reference sample and
the mean of the collected samples are having SV
within the range of the standard i.e. 185-205 mg
KOH / g of oil. The results for the SV even
indicated that all the collected samples were having
lower values than the reference sample, which has
SV of 191.3 mg KOH / g of oil. On the other hand,
all the collected samples in the tallow have lower
SV than the standard of 190-202 mg KOH / g of
oil. The mean of the collected samples is 188.106
mg KOH/ g, indicating that they are not that
suitable for soap production. The reference sample
goes in conformity with the standard range, and has
a SV of 190.7 mg KOH / g of oil.
The Unsaponifiable matter (USM) is
defined as the oily (petroleum-ether soluble) matter
which cannot be converted into soap after
saponification. Glycerol and other water soluble
alcohols are not determined. The amount of USM
found in edible fat and oil are usually small. Hence,
high figure may indicate adulteration. As expected,
the higher the SV; the lower would be the USM
value. Both reference sample and the mean of
collected samples’ results obtained are lower than
the standard value of 10 g / kg. The reference
sample has lower USM value of 2.03 g / kg,
proportionate to its SV of 191.3 mg KOH / g of oil,
which is higher than the mean of the collected
samples of 186.96 mg KOH / g of oil,
proportionate to its USM value of 5.888 g / kg.
This value also indicates and confirmed that, the
reference sample would make better soap than the
collected samples.
CSJ 4(2): December, 2013 ISSN: 2276 – 707X Abdulkadir and Jimoh
53
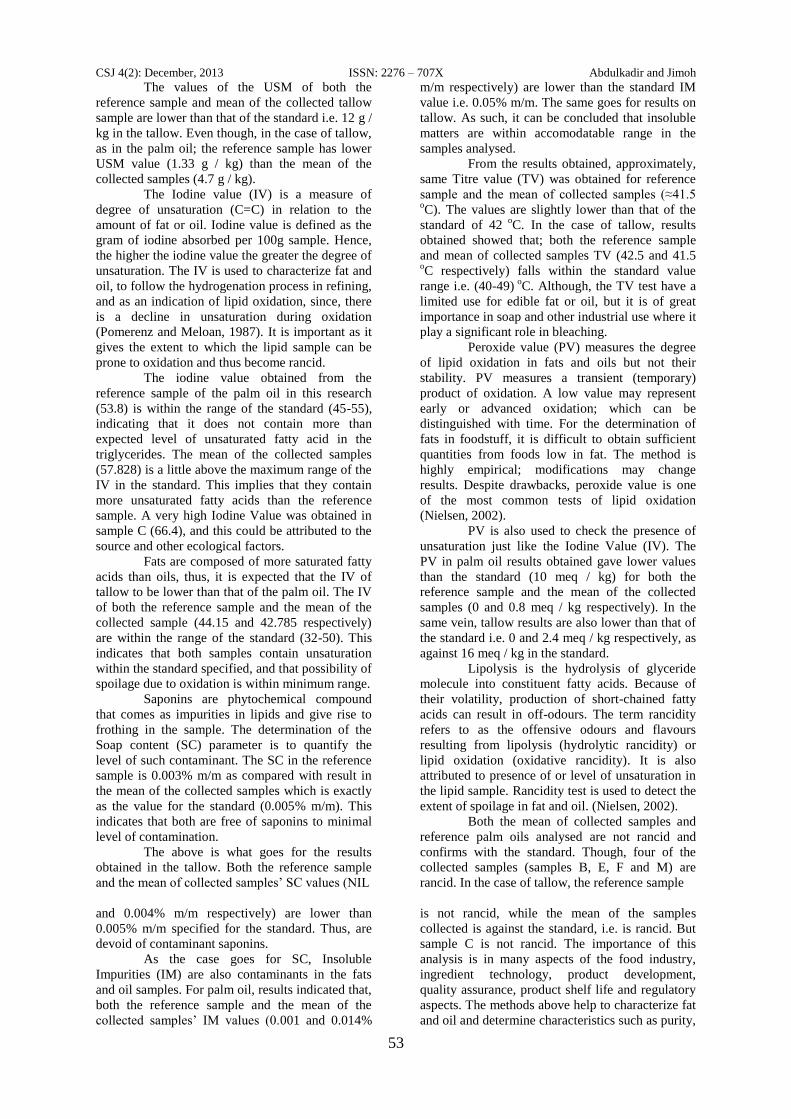
The values of the USM of both the
reference sample and mean of the collected tallow
sample are lower than that of the standard i.e. 12 g /
kg in the tallow. Even though, in the case of tallow,
as in the palm oil; the reference sample has lower
USM value (1.33 g / kg) than the mean of the
collected samples (4.7 g / kg).
The Iodine value (IV) is a measure of
degree of unsaturation (C=C) in relation to the
amount of fat or oil. Iodine value is defined as the
gram of iodine absorbed per 100g sample. Hence,
the higher the iodine value the greater the degree of
unsaturation. The IV is used to characterize fat and
oil, to follow the hydrogenation process in refining,
and as an indication of lipid oxidation, since, there
is a decline in unsaturation during oxidation
(Pomerenz and Meloan, 1987). It is important as it
gives the extent to which the lipid sample can be
prone to oxidation and thus become rancid.
The iodine value obtained from the
reference sample of the palm oil in this research
(53.8) is within the range of the standard (45-55),
indicating that it does not contain more than
expected level of unsaturated fatty acid in the
triglycerides. The mean of the collected samples
(57.828) is a little above the maximum range of the
IV in the standard. This implies that they contain
more unsaturated fatty acids than the reference
sample. A very high Iodine Value was obtained in
sample C (66.4), and this could be attributed to the
source and other ecological factors.
Fats are composed of more saturated fatty
acids than oils, thus, it is expected that the IV of
tallow to be lower than that of the palm oil. The IV
of both the reference sample and the mean of the
collected sample (44.15 and 42.785 respectively)
are within the range of the standard (32-50). This
indicates that both samples contain unsaturation
within the standard specified, and that possibility of
spoilage due to oxidation is within minimum range.
Saponins are phytochemical compound
that comes as impurities in lipids and give rise to
frothing in the sample. The determination of the
Soap content (SC) parameter is to quantify the
level of such contaminant. The SC in the reference
sample is 0.003% m/m as compared with result in
the mean of the collected samples which is exactly
as the value for the standard (0.005% m/m). This
indicates that both are free of saponins to minimal
level of contamination.
The above is what goes for the results
obtained in the tallow. Both the reference sample
and the mean of collected samples’ SC values (NIL
and 0.004% m/m respectively) are lower than
0.005% m/m specified for the standard. Thus, are
devoid of contaminant saponins.
As the case goes for SC, Insoluble
Impurities (IM) are also contaminants in the fats
and oil samples. For palm oil, results indicated that,
both the reference sample and the mean of the
collected samples’ IM values (0.001 and 0.014%
m/m respectively) are lower than the standard IM
value i.e. 0.05% m/m. The same goes for results on
tallow. As such, it can be concluded that insoluble
matters are within accomodatable range in the
samples analysed.
From the results obtained, approximately,
same Titre value (TV) was obtained for reference
sample and the mean of collected samples (≈41.5
oC). The values are slightly lower than that of the
standard of 42 o
C. In the case of tallow, results
obtained showed that; both the reference sample
and mean of collected samples TV (42.5 and 41.5
oC respectively) falls within the standard value
range i.e. (40-49) o
C. Although, the TV test have a
limited use for edible fat or oil, but it is of great
importance in soap and other industrial use where it
play a significant role in bleaching.
Peroxide value (PV) measures the degree
of lipid oxidation in fats and oils but not their
stability. PV measures a transient (temporary)
product of oxidation. A low value may represent
early or advanced oxidation; which can be
distinguished with time. For the determination of
fats in foodstuff, it is difficult to obtain sufficient
quantities from foods low in fat. The method is
highly empirical; modifications may change
results. Despite drawbacks, peroxide value is one
of the most common tests of lipid oxidation
(Nielsen, 2002).
PV is also used to check the presence of
unsaturation just like the Iodine Value (IV). The
PV in palm oil results obtained gave lower values
than the standard (10 meq / kg) for both the
reference sample and the mean of the collected
samples (0 and 0.8 meq / kg respectively). In the
same vein, tallow results are also lower than that of
the standard i.e. 0 and 2.4 meq / kg respectively, as
against 16 meq / kg in the standard.
Lipolysis is the hydrolysis of glyceride
molecule into constituent fatty acids. Because of
their volatility, production of short-chained fatty
acids can result in off-odours. The term rancidity
refers to as the offensive odours and flavours
resulting from lipolysis (hydrolytic rancidity) or
lipid oxidation (oxidative rancidity). It is also
attributed to presence of or level of unsaturation in
the lipid sample. Rancidity test is used to detect the
extent of spoilage in fat and oil. (Nielsen, 2002).
Both the mean of collected samples and
reference palm oils analysed are not rancid and
confirms with the standard. Though, four of the
collected samples (samples B, E, F and M) are
rancid. In the case of tallow, the reference sample
is not rancid, while the mean of the samples
collected is against the standard, i.e. is rancid. But
sample C is not rancid. The importance of this
analysis is in many aspects of the food industry,
ingredient technology, product development,
quality assurance, product shelf life and regulatory
aspects. The methods above help to characterize fat
and oil and determine characteristics such as purity,
CSJ 4(2): December, 2013 ISSN: 2276 – 707X Abdulkadir and Jimoh
54
degree of unsaturation, average fatty acid chain
length, adulteration level and status of the lipid
with regards to oxidation.
Conclusion
The conclusion derived from the results of
the analysis is that, some of the samples results do
not comply with the standards; this may be due to
adulteration or decomposition and the use of unripe
fruits (in the case of palm oil) or combination of
different animal fats.
Recommendation It is recommended that regulatory bodies
like National Food and Drug Administration and
Control (NAFDAC), Standard Organization of
Nigeria (SON) and other food quality regulatory
bodies in the country should give routine check on
fats and oils products within the country to
ascertain their quality before they are sent to the
market.
References:
Aldrich, G. (2007). Pet Foods.
(http://www.petfoodindustry.com/printpage.aspx?i
d=12862) 03/08/2008
A.O.A.C. (1990). Official Methods of Analysis,
15th
ed. Association of Official Chemists’
Washington DC.
AOCS. (1990). Official Methods and
Recommended Practices of the American Oil
Chemists Society, 4th
ed. 2nd
printing (additions and
revisions through 1993.) American Oil
Chemists’ Society, Champaign, IL.
Appleby B.D. and Halloran, A. (1990). Bleaching,
washing, perfuming, deodorizing and
hydrogenation of Tallow. The Procter and Gamble
Company, Cincinnati. Pp 94-106
Atkins R.W. (2007). How to melt animal fat and
how to clarify used cooking Grease. Prentice Hall
publishers New York.
www.grandpappy.info/wclarify.htm 25/7/2007
Barker, T.W. and Worgan, J.T. (1981): The
utilization of palm oil processing Effluents as
substrates from microbial protein production by the
fungus Aspergillus oryzae, Eur. J. Appl. Microbial
and Biotech. 11(4): 234-240.
Craske, J.D., Bannon, C.D. and Norman,
L.M.(1988): Analysis of Palmoil. J. Am. Oil Chem.
Soc. 65:262
Faessler, K. (2004): Advanced Fractionation for
the Oleo Chemical industry. Oil and fat
Conference. www.wikipedia.com 25/07/2008
IUPAC (1987) Standard Methods for Analysis of
Oils, Fats and Derivatives, 7th
edition.
International Union of Pure and Applied
Chemistry, Commission on Oils Fats and
Derivatives, C. Paquot and A. Hautfenne (Eds.).
Blackwell Scientific Publications, Oxford,
England.
McDonald, P., Edward, R.A., Greenhalti, F.D. and
Morgan, C.A. (1995): Animal Nutrition. Prentice
Hall, London, pp 101-122.
Milwidsky, B.M. and Gabriel, D.M. (1982).
Detergent analysis. (A Handbook for cost-effective
quality control). Pp 187-234
Nielsen, S.S. (2002): Introduction to the Chemical
Analysis of Foods. Pp 183-204
S.O.N. (2000) Standard Organization of Nigeria:
Standard for Edible palm oil and tallow. Eds.
Umar, K.J. (2005): Proximate Analysis of Seeds
and Pulp of African Locust Bean (Parkia biolobosa
L.) M.Sc., Dissertation (unpublished) Usman
Danfodiyo University, Sokoto.


