Embed Size (px)
Citation preview
Universidade de Aveiro
2020
João Emanuel Vieira Barbosa
Toxic and biochemical impacts of Primextra® Gold TZ and S-metolachlor on human skin and liver cells Impactos tóxicos e bioquímicos de Primextra® Gold TZ e S-metolachlor em células humanas da pele e do fígado
Universidade de Aveiro
2020
João Emanuel Vieira Barbosa
Toxic and biochemical impacts of Primextra® Gold TZ and S-metolachlor on human skin and liver cells Impactos tóxicos e bioquímicos de Primextra® Gold TZ e S-metolachlor em células humanas da pele e do fígado
Dissertação apresentada à Universidade de Aveiro para cumprimento dos requisitos necessários à obtenção do grau de Mestre em Eco-toxicologia e Análise de Risco, realizada sob a orientação científica da Doutora Helena Cristina Correia de Oliveira, Investigadora de Pós-doutoramento do Departamento de Biologia e do Centro de Estudos do Ambiente e do Mar (CESAM), da Universidade de Aveiro, e da Doutora Ana Marta dos Santos Mendes Gonçalves, Investigadora do Centro de Ciências do Mar e do Ambiente (MARE), Departamento das Ciências da Vida, Universidade de Coimbra e do Departamento de Biologia & CESAM, da Universidade de Aveiro.

Dedico este trabalho à minha sobrinha Aurora. Que nunca pare de sonhar e
que tenha força e sabedoria para realizar os seus sonhos.
o júri
Presidente Arguente Orientadora
Prof. Doutor Carlos Miguel Miguez Barroso Professor auxiliar, Universidade Aveiro
Doutora Sofia Isabel Antunes Gomes Guilherme Investigadora Doutorada (nível 1), Universidade de Aveiro
Doutora Helena Cristina Correia de Oliveira Equiparada a Investigadora Auxiliar, Universidade de Aveiro
agradecimentos
Em Primeiro lugar, gostaria de agradecer às minhas orientadoras, Doutora Helena Oliveira e Doutora Ana Marta Gonçalves pela dedicação, pela disponibilidade e pela paciência dispensada bem como pelo conhecimento transmitido.
Gostaria também de agradecer aos meus colegas de laboratório (Fábio, Rúben, Verónica, Párástu, Filipa, etc…) pelo espírito de equipa, pelos ensinamentos e pela ajuda prestada durante a realização do trabalho experimental.
Os meus agradecimentos vão também para os meus comparsas de Aveiro, o meu companheiro de casa, Silva e as minhas amigas Catarina e Claúdia por tornarem os meus dias em Aveiro bem mais divertidos.
Aos meus amigos de sempre (Tiago, Tomás, Jorge, Catarina, Mizé, Rúben, …) um muito obrigado por proporcionarem momentos bons e por sempre me apoiarem nos momentos difíceis.
Como não podia deixar de ser, gostaria de agradecer à minha família, aos meus pais, Manuel e Maria, ao meu irmão Ivo, ao meu tio Fausto e à minha tia Emília e ao meu primo Pedro, por acreditarem em mim e me incentivarem a querer ser sempre melhor, quer do ponto de vista profissional, quer do ponto de vista humano. Muito do que eu sou hoje se deve a eles e por isso estarei eternamente agradecido.
E por último, mas não menos importante, quero agradecer à minha namorada, companheira de aventuras e melhor amiga, Cláudia, pelas noites em claro que passou comigo durante a elaboração deste trabalho, pela sua capacidade de me ouvir, de me acalmar e me fazer recuperar o foco e de um modo geral por todo o seu amor e dedicação. Sem ela nada disto seria possível.
A todos os que mencionei e aos que me possa ter esquecido, um muito obrigado do fundo do coração.
palavras-chave
Toxicidade, Herbicida, Primextra® Gold TZ, S-metolacloro, linhas celulares humanas, HaCaT, HepG2.
resumo
Com o aumento da população humana surgiu a necessidade de otimizar e intensificar a produção agrícola aumentando a utilização de pesticidas e fertilizantes. O uso de pesticidas tem sido muito importante no combate a pragas que, se não fossem interrompidas, impossibilitariam o cumprimento da demanda alimentar. No entanto, o uso destes compostos tem consequências nefastas. Está comprovado que os pesticidas podem ter efeitos prejudiciais na saúde pública e ocupacional, pela contaminação do abastecimento de água potável, pelo depósito de resíduos nos alimentos, através da contaminação ao longo da cadeia alimentar ou simplesmente através do manuseamento dos referidos produtos químicos. Neste estudo, avaliamos os efeitos do herbicida Primextra® Gold TZ e do seu principal ingrediente ativo, o S-metolacloro, em modelos de células da pele e do fígado humano. Primextra® Gold TZ é um dos herbicidas mais vendidos em Portugal, sendo referenciado pelas cooperativas do Vale do Mondego como o herbicida mais utilizado na cultura do milho. Os modelos celulares usados para avaliar o perigo potencial dos produtos químicos na pele e no fígado foram a linha celular de queratinócitos humanos, HaCaT, e a linha celular de hepatoma humano, HepG2, respetivamente. Primeiro, os efeitos citotóxicos da formulação comercial e do ingrediente ativo foram testados usando um ensaio colorimétrico do brometo de 3- (4,5-dimetil-2-tiazolil) -2,5-difenil tetrazólio (MTT). Depois de calcular os valores de IC30 e IC50 do ensaio de viabilidade celular MTT, procedeu-se à análise do ciclo celular para determinar se algum dos produtos químicos induziu alterações na dinâmica do ciclo celular. Finalmente, com base em dados da literatura apontando que Primextra® Gold TZ e S-metolacloro podem induzir alterações no perfil lipídico e polissacarídeo de organismos não alvo, avaliaram-se os efeitos bioquímicos nos modelos de células humanas indicados anteriormente. Os resultados de MTT mostraram uma maior sensibilidade da linha celular HaCaT para o Primextra® Gold TZ e S-metolacloro do que a linha de células HepG2. Em HepG2, obtivemos um IC50 de 22,48 µg/ml para o Primextra® Gold TZ e um IC50 de 83,90 µg/ml para o S-metolacloro no ensaio de MTT de 48h, evidenciando uma toxicidade muito maior a formulação comercial nesta linha celular. Na linha celular HaCaT, tanto a formulação comercial quanto o ingrediente ativo apresentaram resultados semelhantes, com IC50 de 12,37 µg/ml e 12,28 µg/ml para Primextra® Gold TZ e S-metolacloro, respetivamente. Na análise do ciclo celular, Primextra® Gold TZ e S-metolacloro mostraram induzir paragem do ciclo celular na fase G2 na linha celular HepG2. Enquanto que, a linha celular HaCaT não mostrou nenhuma indicação de paragem do ciclo celular quando exposta aos produtos químicos. Quanto à análise do perfil de ácidos gordos, os resultados não mostraram alteração significativa na composição de ácidos gordos na exposição de células HepG2 aos químicos. A linha celular HaCat, no entanto, mostrou uma redução > 15% na percentagem de ácidos gordos saturados e um aumento proporcional nos ácidos gordos monoinsaturados. Os resultados da análise de polissacarídeos foram inconclusivos.
palavras-chave
Toxicidade, Herbicida, Primextra® Gold TZ, S-metolacloro, linhas celulares humanas, HaCaT, HepG2.
resumo (cont.)
Este estudo demonstrou que as linhas de queratinócitos humanos, HaCaT, são mais sensíveis a citotóxidade por exposição ao Primextra® Gold TZ e ao S-metolacloro, do que as linhas celulares do fígado, HepG2, apesar destas últimas serem mais suscetíveis a dano no DNA. A disparidade de resultados entre as linhas celulares pode ser devida às suas diferenças metabólicas intrínsecas, bem como às diferenças nos seus mecanismos de defesa inerentes. Assim sendo, para uma melhor compreensão das propriedades que conferem maior resistência da linha celular HepG2 à citotoxicidade por parte do Primextra® Gold TZ e do S-metolacloro, bem como se poder entender melhor os mecanismos de ação destes últimos, é importante a realização de mais estudos.
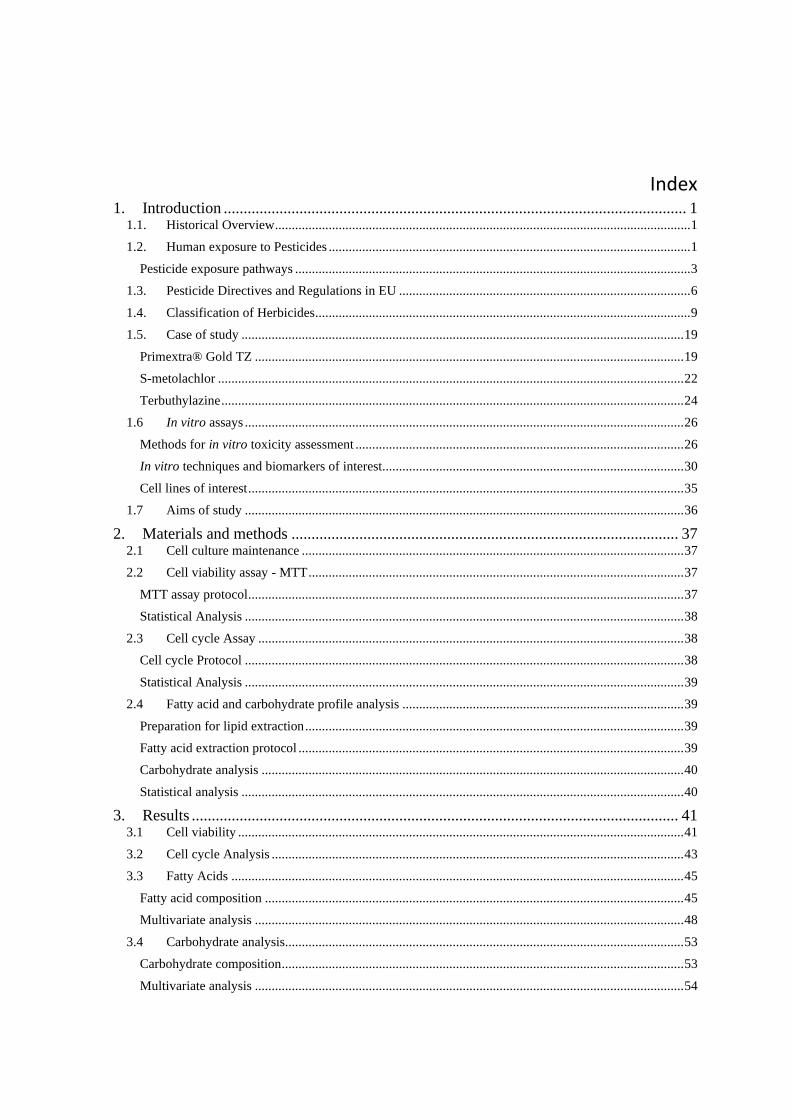
Keywords
Toxicity, Herbicide, Primextra® Gold TZ, S-metolachlor, human cell lines, HaCaT, HepG2.
Abstract
With the increase in the human population, came the need to optimize and intensify agricultural production by increasing the use of pesticides and fertilizers. The use of pesticides has been very important in combating pests that, if not stopped, would make it impossible to meet food demand. However, the use of these compounds has harmful consequences. It has been proven that pesticides can have deleterious effects on public and occupational health, by contaminating the drinking water supply, by depositing residues in food, through contamination along the food chain or simply by handling these chemicals. In this study, we evaluated the effects of the herbicide Primextra® Gold TZ and its main active ingredient, S-metolachlor, in models of human skin and liver cells. Primextra® Gold TZ is one of the bestselling herbicides in Portugal, being referenced by the Mondego Valley cooperatives as the most-used herbicide in corn fields. The cell models used to evaluate the potential hazard of the chemicals on skin and liver were human keratinocyte cell line, HaCaT, and human hepatoma cell line, HepG2, respectively. First, the cytotoxic effects of both commercial formulation and active ingredient were tested using a colorimetric 3-(4,5- dimethyl-2-thiazolyl)-2,5-diphenyl tetrazolium bromide (MTT) assay. After calculating IC30 and IC50 values from MTT assay we proceeded to cell cycle analysis to determine if any of the chemicals induced cell cycle arrest. based on data from the literature indicating that Primextra® Gold TZ and S-metolachlor can induce changes in the lipid and carbohydrate profile of non-target organisms, the biochemical effects on the human cell models indicated above were evaluated. MTT results showed a higher sensitivity from HaCaT cell line to both Primextra® Gold TZ and S-metolachlor then HepG2 cell line. In HepG2 we obtained an IC50 of 22.48 µg/ml for Primextra® Gold TZ and an IC50 of 83.90 µg/ml for S-metolachlor in the 48h MTT assay. Thus, showing a much bigger toxicity of the commercial formulation in this cell line. In HaCaT both the commercial formulation and active ingredient showed similar results, with an IC50 of 12.37 µg/ml and 12.28 µg/ml for Primextra® Gold TZ and S-metolachlor, respectively. Regarding the effects on the cell cycle dynamics, Primextra® Gold TZ and S-metolachlor were shown to induce cell cycle arrest at G2 phase in the HepG2 cell line. Whereas the HaCaT cell line showed no indication of cell cycle arrest when exposed to the chemicals. Regarding the analysis of the fatty acid profile, the results showed no significant alteration in the composition of fatty acids in the exposure of HepG2 cells to chemicals. The HaCaT cell line, however, showed a >15% reduction in the percentage of saturated fatty acids and a proportional increase in monounsaturated fatty acids. Carbohydrate analysis results were inconclusive.

Keywords
Toxicity, Herbicide, Primextra® Gold TZ, S-metolachlor, human cell lines, HaCaT, HepG2.
Abstract (cont.)
This study demonstrated that human keratinocyte lines, HaCaT, are more sensitive to cytotoxicity by exposure to Primextra® Gold TZ and S-metolachlor, than liver cell lines, HepG2, although the latter are more susceptible to DNA damage. The disparity in results between cell lines may be due to their intrinsic metabolic differences, as well as differences in their inherent defence mechanisms. Therefore, for a better understanding of the properties that give the HepG2 cell line greater resistance to cytotoxicity by Primextra® Gold TZ and S-metolachlor, as well as to be able to better understand the mechanisms of action of the latter, it is important to carry out more studies.
Index
1. Introduction .................................................................................................................... 1 1.1. Historical Overview ............................................................................................................................ 1
1.2. Human exposure to Pesticides ............................................................................................................ 1
Pesticide exposure pathways ...................................................................................................................... 3
1.3. Pesticide Directives and Regulations in EU ....................................................................................... 6
1.4. Classification of Herbicides ................................................................................................................ 9
1.5. Case of study .................................................................................................................................... 19
Primextra® Gold TZ ................................................................................................................................ 19
S-metolachlor ........................................................................................................................................... 22
Terbuthylazine .......................................................................................................................................... 24
1.6 In vitro assays ................................................................................................................................... 26
Methods for in vitro toxicity assessment .................................................................................................. 26
In vitro techniques and biomarkers of interest.......................................................................................... 30
Cell lines of interest .................................................................................................................................. 35
1.7 Aims of study ................................................................................................................................... 36
2. Materials and methods ................................................................................................. 37 2.1 Cell culture maintenance .................................................................................................................. 37
2.2 Cell viability assay - MTT ................................................................................................................ 37
MTT assay protocol .................................................................................................................................. 37
Statistical Analysis ................................................................................................................................... 38
2.3 Cell cycle Assay ............................................................................................................................... 38
Cell cycle Protocol ................................................................................................................................... 38
Statistical Analysis ................................................................................................................................... 39
2.4 Fatty acid and carbohydrate profile analysis .................................................................................... 39
Preparation for lipid extraction ................................................................................................................. 39
Fatty acid extraction protocol ................................................................................................................... 39
Carbohydrate analysis .............................................................................................................................. 40
Statistical analysis .................................................................................................................................... 40
3. Results .......................................................................................................................... 41 3.1 Cell viability ..................................................................................................................................... 41
3.2 Cell cycle Analysis ........................................................................................................................... 43
3.3 Fatty Acids ....................................................................................................................................... 45
Fatty acid composition ............................................................................................................................. 45
Multivariate analysis ................................................................................................................................ 48
3.4 Carbohydrate analysis....................................................................................................................... 53
Carbohydrate composition ........................................................................................................................ 53
Multivariate analysis ................................................................................................................................ 54

4. Discussion .................................................................................................................... 56 5. Conclusion .................................................................................................................... 59 6. References .................................................................................................................... 60
1
1. Introduction
1.1. Historical Overview
Having started about 11,500 years ago, agriculture has triggered such a change in society
and the way in which people lived that its development has been dubbed the “Neolithic
Revolution”. The Neolithic Revolution was a process of transition from a nomadic lifestyle
of hunter-gatherer to one of agriculture and pastoralism (Sadowski, 2017; Mazoyer & Rou,
2006), that allowed people to settle in communities and potentiated population growth.
Since then, human beings have been in a never-ending battle with plant pests and diseases.
Even with today’s methods there is an average loss of 35 to 40 % of all potential food and
fiber crops due to pests and diseases.
The need to improve agricultural results led to the development of plague control
chemicals. The first documented records of measures used for control pests date back to
2500 BC, with the Sumerians using sulphur to protect them from insects. The oldest medical
document of the ancient Egypt “Ebers papyrus” which dates to 1550 BC contains about 800
recipes, which include various substances acting as poisons for various plagues. Homer also
recorded in 1000 BC the burning of sulphur as a fumigating procedure against insects. At
that time, the use of arsenic, mercury, lime and insecticides of plant origin was already
recorded in China (Banaszkiewicz, 2010; Fishel, 2013). Therefore, the use of chemicals is
not new. However, it was only after the “green revolution” that the Humankind gave the
biggest step in the fight against plagues. With the development of sophisticated machinery
and irrigation methods, the extensive use of fertilizers and, the most important of all, the
development of chemical pesticides, humankind could finally fight food shortages due to
population growth (Ameen et al. 2018).
1.2. Human exposure to Pesticides
A pesticide is any substance used to eliminate organisms that are harmful and undesirable.
Pesticides are usually divided according to their target organism, e.g., insecticides,
herbicides, fungicides, rodenticides and play an important role in agricultural production,
by preventing unwanted plagues to invade crops (Kaur et al. 2019). However, when applied
to crops they can enter the soil, as well as surface and groundwaters via leaching and run-
off thus affecting habitats, contributing to biodiversity loss, leading to the deterioration of
ecosystem services and affecting the provision of clean drinking water(Ewald et al., 2015).
By affecting the provision of drinking water, leaving residues in food or by affecting
organisms throughout the food-chain, these chemicals pose a major threat to the Human
health (Bjørling-Poulsen et al., 2008). Exposure through food-chain and by drinking
contaminated waters is the most common route of exposure to the general population.
2
However, there are reports that living or working next to pesticide treated zones can
substantially contribute to exposure to these chemicals. Accidental poisoning with
pesticides from use around the house and garden has also been reported (Jaga et al., 2003
; Davis et al.,1992).
Exposure of farmers, when mixing and applying the pesticide or working in treated fields,
also poses a threat as the routine use of these chemicals can cause short and long-term
health problems. In developing countries, there is even a bigger risk of exposure due to the
use of banned or restricted pesticides, incorrect application techniques, inadequate
storage practices, poor maintenance, use of inappropriate equipment, and often the reuse
of old pesticide containers for food and water storage (Van Der Werf, 1996; Damalas et al.,
2011 ; Ye et al., 2013).
Some of the most worrying toxic effects are due to the neurotoxic and endocrine-
disruptive properties of certain chemicals (Bjørling-Poulsen et al., 2008). One of the best
examples of a neurotoxic and endocrine-disruptive pesticide is DDT.
The case of DDT
DDT or 1,1,1,-trichlor-2,2,-bis (p-chlorophenyl) ethane, is an insecticide that was discovered
in 1939 and was initially used during the World War II to fight diseases carried by insects,
like typhus and malaria. Its production at a large scale began around 1945 and it was one
of the most utilized pesticides worldwide for about 25 to 30 years. In fact it was such a
major pesticides that in 1950 it was estimated that each North American citizen had
ingested 0.28 mg per day (D’Amato et al., 2002). In 1962, Rachel Carson suggested in her
book “Silent Spring” that the wide use of DDT was the main cause of the population
reduction of various several bird species such as the peregrine falcon and the bald eagle
(Carson, 1962). It was shown that DDT causes a deficiency in eggshell calcification of said
species, which prevented the development of new offspring due to the action of DDT
metabolites, such as dichlorodiphenyldichloroethane (DDE). This metabolite has the
greatest impact on ecosystems, given its propensity to bioaccumulate, leading to endocrine
disruptions that can affect embryo development (Colborn et al., 1993). The
biomagnification of DDE in the trophic webs led to contamination of predators. In humans,
contamination may occur by direct exposure (inhalation) or by contaminated food
consumption. Within the organism DDT and DDT metabolites act over the
sodium/potassium equilibrium in the axons membranes leading to neurotoxic effects such
as behavioural alterations, sensorial disturbances, muscular contractions, convulsions,
paralysis, respiratory insufficiency and death (D’Amato et al., 2002). In terms of endocrine
disruption DDT can lower semen quality, induce spontaneous abortions and increase
developing children’s risk for autism (Beard 2006).
3
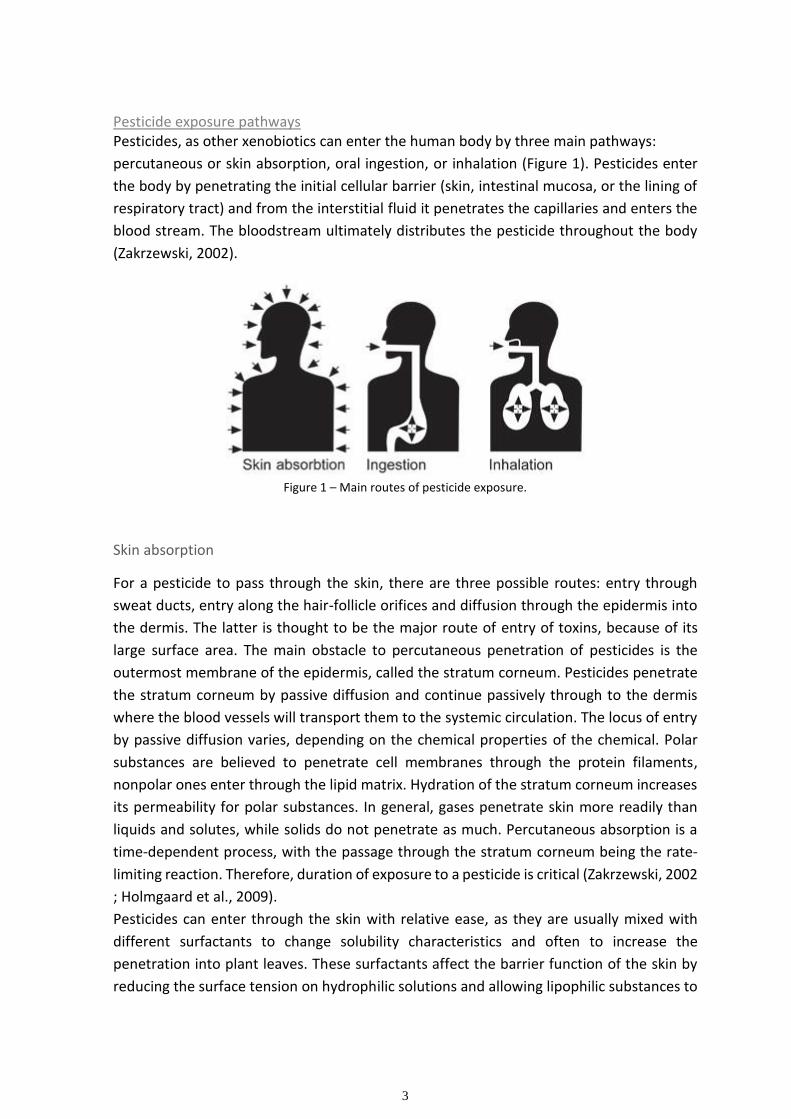
Pesticide exposure pathways Pesticides, as other xenobiotics can enter the human body by three main pathways:
percutaneous or skin absorption, oral ingestion, or inhalation (Figure 1). Pesticides enter
the body by penetrating the initial cellular barrier (skin, intestinal mucosa, or the lining of
respiratory tract) and from the interstitial fluid it penetrates the capillaries and enters the
blood stream. The bloodstream ultimately distributes the pesticide throughout the body
(Zakrzewski, 2002).
Figure 1 – Main routes of pesticide exposure.
Skin absorption
For a pesticide to pass through the skin, there are three possible routes: entry through
sweat ducts, entry along the hair-follicle orifices and diffusion through the epidermis into
the dermis. The latter is thought to be the major route of entry of toxins, because of its
large surface area. The main obstacle to percutaneous penetration of pesticides is the
outermost membrane of the epidermis, called the stratum corneum. Pesticides penetrate
the stratum corneum by passive diffusion and continue passively through to the dermis
where the blood vessels will transport them to the systemic circulation. The locus of entry
by passive diffusion varies, depending on the chemical properties of the chemical. Polar
substances are believed to penetrate cell membranes through the protein filaments,
nonpolar ones enter through the lipid matrix. Hydration of the stratum corneum increases
its permeability for polar substances. In general, gases penetrate skin more readily than
liquids and solutes, while solids do not penetrate as much. Percutaneous absorption is a
time-dependent process, with the passage through the stratum corneum being the rate-
limiting reaction. Therefore, duration of exposure to a pesticide is critical (Zakrzewski, 2002
; Holmgaard et al., 2009).
Pesticides can enter through the skin with relative ease, as they are usually mixed with
different surfactants to change solubility characteristics and often to increase the
penetration into plant leaves. These surfactants affect the barrier function of the skin by
reducing the surface tension on hydrophilic solutions and allowing lipophilic substances to
4
mix with hydrophilic solutions and letting hydrophilic substances to penetrate lipophilic
membranes (Holmgaard et al., 2009). Herbicides atrazine, alachlor, and trifluralin, for
example, have been shown to have a penetration index inferior than that of their
commercial formulations Aatrex, Lasso, and Treflan, at the same concentration, due to the
effect of their surfactants (Brand & Mueller, 2002).
Dermal exposure to some pesticides, like glyphosate based herbicides, have been shown
to induce various symptoms, from light symptoms like irritation or dermatitis to severe
ones like skin burns, porphyria cutanea tarda and even skin cancer and neurological
impairments, among others (Bradberry et al., 2004; Mariager et al., 2013; Bakre & Kaliwal,
2017).
Inhalation
The respiratory system consists of three regions: nasopharyngeal, tracheobronchial, and
pulmonary. The nasopharyngeal canal has the role to remove large, inhaled particles and
to increase the humidity and temperature of inhaled air. The tracheobronchial region
consists of the trachea, bronchi, and bronchioles and its role is to propel foreign particles
from the deep parts of the lungs to the oral cavity, where they can be either expelled with
the sputum or swallowed. The pulmonary region consists of respiratory bronchioles,
alveolar ducts, and clusters of alveoli in which the exchange of gases between the
environment and the blood takes place. Blood capillaries are in contact with the alveolar
lining cells, present in the alveolar region, so that gases as well as solutes can easily diffuse
between them. Inhaled pesticides can exert their harmful action either by damaging
respiratory tissue or by entering the circulation and causing systemic toxicity (Zakrzewski,
2002).
Within the problems associated with exposure of the respiratory tract to herbicides are
inflammation, chronic obstructive pulmonary disease (COPD), bronchitis, pulmonary
fibrosis among other breathing problems (Rocco et al., 2004 ; Choi et al., 2013 ; Alif et al.,
2017).
Ingestion
Absorption of ingested compounds begins in the mouth and oesophagus. When
compounds arrive the stomach, they are mixed with food, acid, gastric enzymes, and
bacteria, which can alter the toxicity of the chemical, either by influencing absorption or by
modifying the compound. Most food is absorbed in the small intestine. The gastrointestinal
tract possesses specialized carrier systems for certain nutrients such as carbohydrates and
amino acids. Some pesticides use these routes of passage through the cells; others enter
through passive diffusion. Lipid-soluble organic acids and bases, in nonionized form, are
absorbed by passive diffusion. Particles with several nanometres in diameter can be
absorbed from the gastrointestinal tract by pinocytosis and enter the circulation via the
5
lymphatic system (Zakrzewski, 2002). A percentage of pesticides absorbed in the
gastrointestinal cells may be biotransformed by the gut microbiota before entering the
circulatory system (Koppel et al., 2017). The absorbed compounds may enter the
circulation either via the lymphatic system, which will eventually drain into the
bloodstream, or via the portal circulation, which transports them to the liver (Zakrzewski,
2002).
Ingestion of pesticides, leads to an extremely high mortality rate, and can cause local
irritation of the mouth, oropharynx and oesophagus and multiple organ failure (heart,
brain, kidney, liver,…) (Chao & Fang, 2016).
Liver Role
After entering the bloodstream, a pesticide can affect any organ in the human body (brain,
kidney, liver). However, the entry of a pesticide into the bloodstream does not necessarily
ensure that it will arrive unchanged at its specific receptor. Pesticides absorbed from the
gastrointestinal tract are carried by the portal vein to the liver, which has a very active
xenobiotic-metabolizing system in which compounds can be altered before their release
through the hepatic veins into the general circulation. Alternatively, they can be excreted
into the bile and returned to the gastrointestinal tract. From there they may be completely
or in partially excreted or reabsorbed and carried back to the liver. This process is referred
to as enterohepatic circulation (Zakrzewski, 2002).
Due to the liver being the initial site of contact for many types of orally ingested chemicals,
it is particularly susceptible to chemical-induced injury. Among the chemical induced liver
diseases are acute and chronic hepatitis, granulomatous hepatitis, cholestasis with bile
duct injury, cholestasis with or without hepatitis, steatohepatitis, vascular disorders and
tumours. The severity of chemical-induced liver injury varies from minor nonspecific
changes in hepatic structure and function to acute liver failure, cirrhosis and liver cancer
(Gu et al., 2012).
6
1.3. Pesticide Directives and Regulations in EU
Due to the toxicological and ecotoxicological hazards that pesticides in general present,
European Union has adopted directives that aimed at regulating the use of these
substances and thus minimizing their impact on ecosystems.
One of the most important ones is the Regulation on plant protection products ((EC) No
1107/2009, 2009), in which the European Commission is required to identify active
ingredients with certain properties as candidates for substitution. Member States
posteriorly evaluate whether these active ingredients might be replaced by others that are
less harmful. The objective of this regulation is to promote the use of less harmful
pesticides.
Other important directives include: Water framework Directive, which manages the
pesticide contamination of surface waters (Directive 2000/60/EC, 2000) with the aim to
reduce emissions, discharges and losses of substances under the Priority Substances
Directive (The European Parlament and the Council of the European Union, 2013); The
Groundwater Directive which sets a maximum concentration of pesticides in groundwater;
the Drinking Water Directive (UNION, 1998) which stipulates a maximum concentration of
0.1 μg/l for any single pesticide and its relevant metabolites in potable water; the
Regulation (EU) No 396/2005 which sets the maximum residue levels of pesticides allowed
in or on food and feed of plant and animal origin and the Directive on the Sustainable Use
of Pesticides.
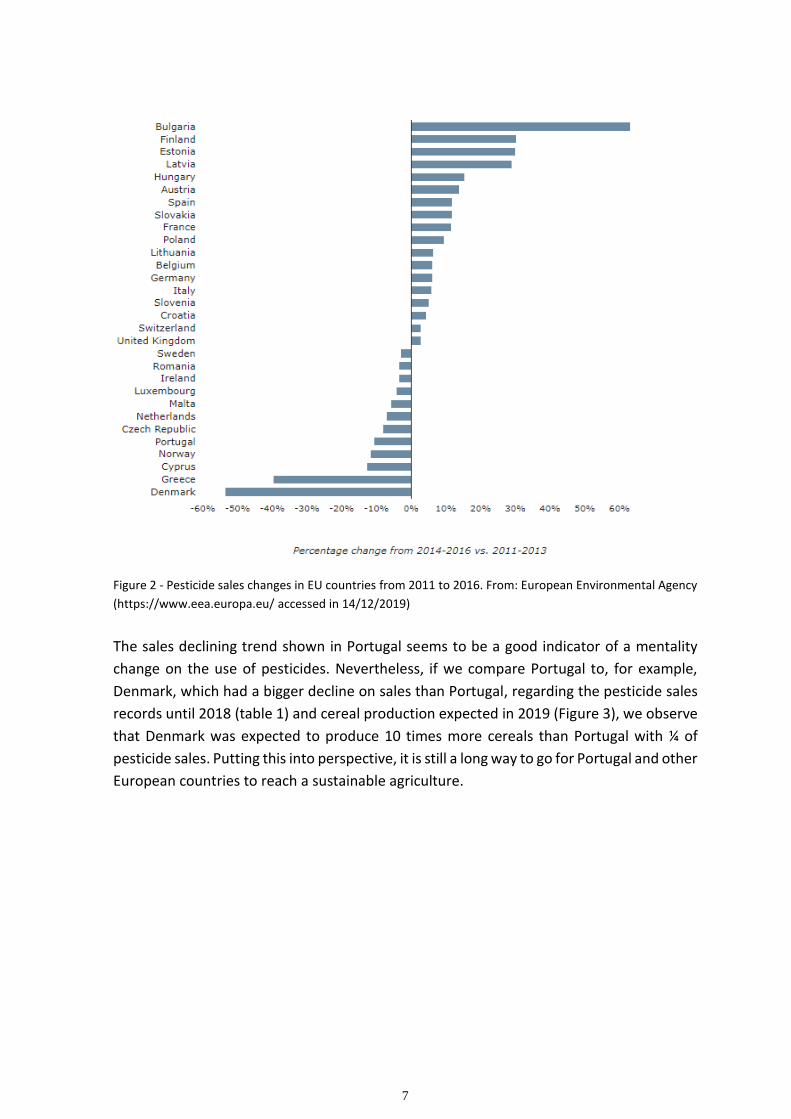
These directives and regulations seem however, to have little effect on the overall use of
pesticides. As we can see in figure 2 the reduction in sales in some countries is balanced by
the increase of sales in the others.
7
Figure 2 - Pesticide sales changes in EU countries from 2011 to 2016. From: European Environmental Agency
(https://www.eea.europa.eu/ accessed in 14/12/2019)
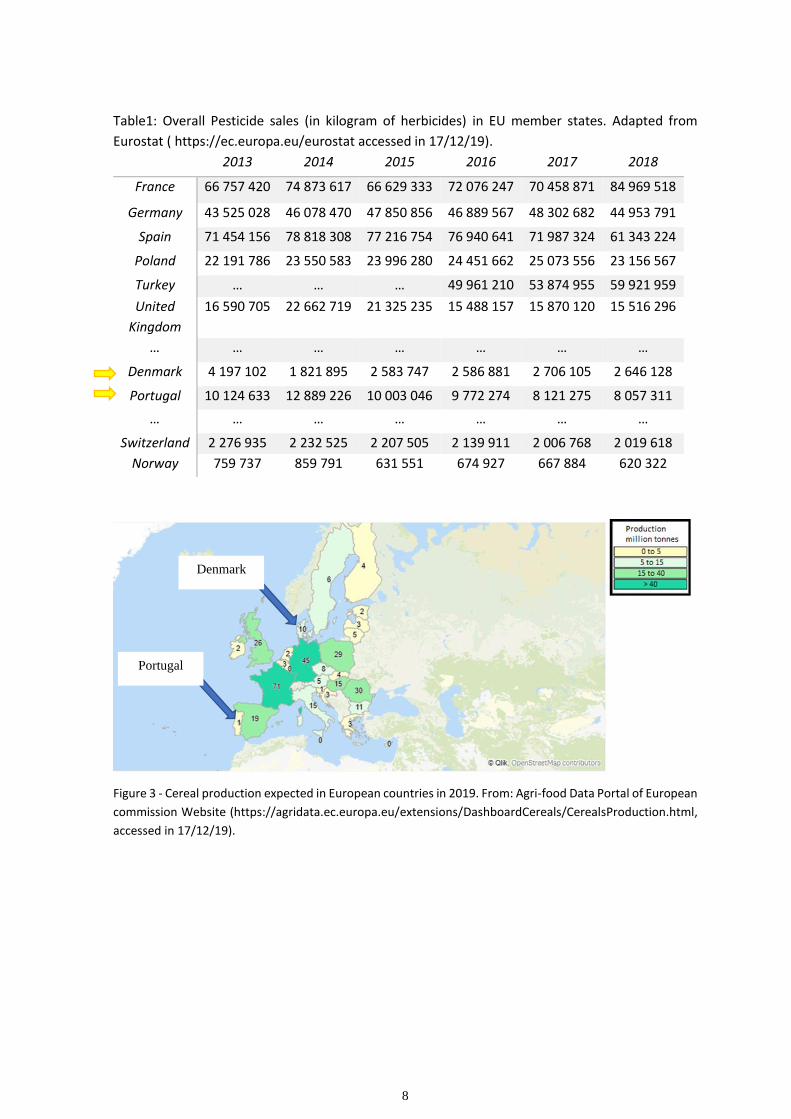
The sales declining trend shown in Portugal seems to be a good indicator of a mentality
change on the use of pesticides. Nevertheless, if we compare Portugal to, for example,
Denmark, which had a bigger decline on sales than Portugal, regarding the pesticide sales
records until 2018 (table 1) and cereal production expected in 2019 (Figure 3), we observe
that Denmark was expected to produce 10 times more cereals than Portugal with ¼ of
pesticide sales. Putting this into perspective, it is still a long way to go for Portugal and other
European countries to reach a sustainable agriculture.
8
Table1: Overall Pesticide sales (in kilogram of herbicides) in EU member states. Adapted from
Eurostat ( https://ec.europa.eu/eurostat accessed in 17/12/19).
2013 2014 2015 2016 2017 2018
France 66 757 420 74 873 617 66 629 333 72 076 247 70 458 871 84 969 518
Germany 43 525 028 46 078 470 47 850 856 46 889 567 48 302 682 44 953 791
Spain 71 454 156 78 818 308 77 216 754 76 940 641 71 987 324 61 343 224
Poland 22 191 786 23 550 583 23 996 280 24 451 662 25 073 556 23 156 567
Turkey … … … 49 961 210 53 874 955 59 921 959
United
Kingdom
16 590 705 22 662 719 21 325 235 15 488 157 15 870 120 15 516 296
… … … … … … …
Denmark 4 197 102 1 821 895 2 583 747 2 586 881 2 706 105 2 646 128
Portugal 10 124 633 12 889 226 10 003 046 9 772 274 8 121 275 8 057 311
… … … … … … …
Switzerland 2 276 935 2 232 525 2 207 505 2 139 911 2 006 768 2 019 618
Norway 759 737 859 791 631 551 674 927 667 884 620 322
Figure 3 - Cereal production expected in European countries in 2019. From: Agri-food Data Portal of European
commission Website (https://agridata.ec.europa.eu/extensions/DashboardCereals/CerealsProduction.html,
accessed in 17/12/19).
Denmark
Portugal
9
1.4. Herbicides
Herbicides are pesticides that kill weeds or other undesirable plants. Weeds reduce the
quality and quantity of agricultural production and can be a health threat as they produce
allergens, that may induce contact dermatitis. Therefore, weeds are treated as a major
plague in agriculture. Herbicides represent the most effective and economical mean of
control of these pests. Without the use of herbicides, it would have been impossible to
mechanize the full production of crops like cotton, sugar beets, grains, potatoes, or corn.
Today herbicide sales represent about 30% of all pesticides sales. This fact reveals the
importance of these chemical to food production.
Herbicides can be classified into multiple categories, according to the following criteria:
• Application timing;
• Method of Application;
• Selectivity;
• Mobility;
• Mode of action.
Application timing
Herbicides can be classified according to the application timing. There are three major
categories of application timing: preplant, preemergence, and post emergence.
Preplant herbicides, as the name indicates, are herbicides applied to soil before planting.
In some cases, the herbicide is applied in the fall to suppress early weed growth in the next
spring before the planting. Preplant herbicides will get incorporated into the soil and kill
weeds as they grow through the herbicide treated zone. Metam-sodium, Treflan and
Dazomet are examples of preplant herbicides. And crops grown in soil treated with these
herbicides include corn, soybeans and tomatoes.
Preemergence herbicides are applied after planting but before the crop and weeds emerge
through the soil surface. These herbicides affect the cell division of emerging weeds thus
killing them as they grow through the treated zone. Preemergence herbicides do not affect
weeds that have emerged before the application. Examples of pre-emergence herbicides
are Lasso, Dual, Lorox.
10
Postemergence herbicides are applied after weeds emerge from the soil. Generally,
multiple applications of the formulation are needed. An example of post-emergence
herbicide is 2,4-D (Vats, 2015).
Method of application
Regarding the application method, herbicides can be soil or foliar applied. Soil applied
herbicides are usually taken up by the root or shoot of emerging seedlings and used as
preplant and preemergence treatment. Effectiveness of this type of herbicides is usually
dependent on the positioning of the herbicide in the correct layer of soil, on the adsorption
to soil elements, and on the processes to which they may be subjected. Photolysis and
volatility are two of the processes that reduce the availability of herbicides. Examples of
soil applied herbicides are EPTC and Trifluralin.
Foliar applied herbicides are applied above the ground and are absorbed by the exposed
tissues. After being absorbed they can either act on site or be translocated throughout the
plant. These types of herbicides are postemergence. Glyphosate and 2,4D are examples of
foliar applied herbicides (Vats, 2015).
Selectivity
A selective herbicide is the one that kills or slows the growth of weeds while other plants
are tolerant and manage to grow under the same treatment. Selectivity of the herbicide is
based on absorption, morphological and physiological differences between plants.
Examples of selective herbicides are 2,4-D and Dicamba (Vats, 2015 ; Blanco et al. 2015).
Nonselective herbicides kill all plant material they come in contact with. This type of
herbicides is usually used to clear industrial sites, waste grounds and railways. Examples of
non-selective herbicides include Paraquat and Glyphosate (Vats, 2015).
Mobility
Herbicides can be classified according to their mobility within the plant.
Contact/non systemic herbicides kill the plant parts where the chemical is applied. They
are fast acting herbicides and are the most effective against annuals, weeds that germinate
from seeds and grow to maturity each year, and less effective on perennial plants, that can
regrow from rhizomes, roots, or tubers. Uniform spray coverage and particle size are
essential for adequate application of these type of herbicides and repeated application is
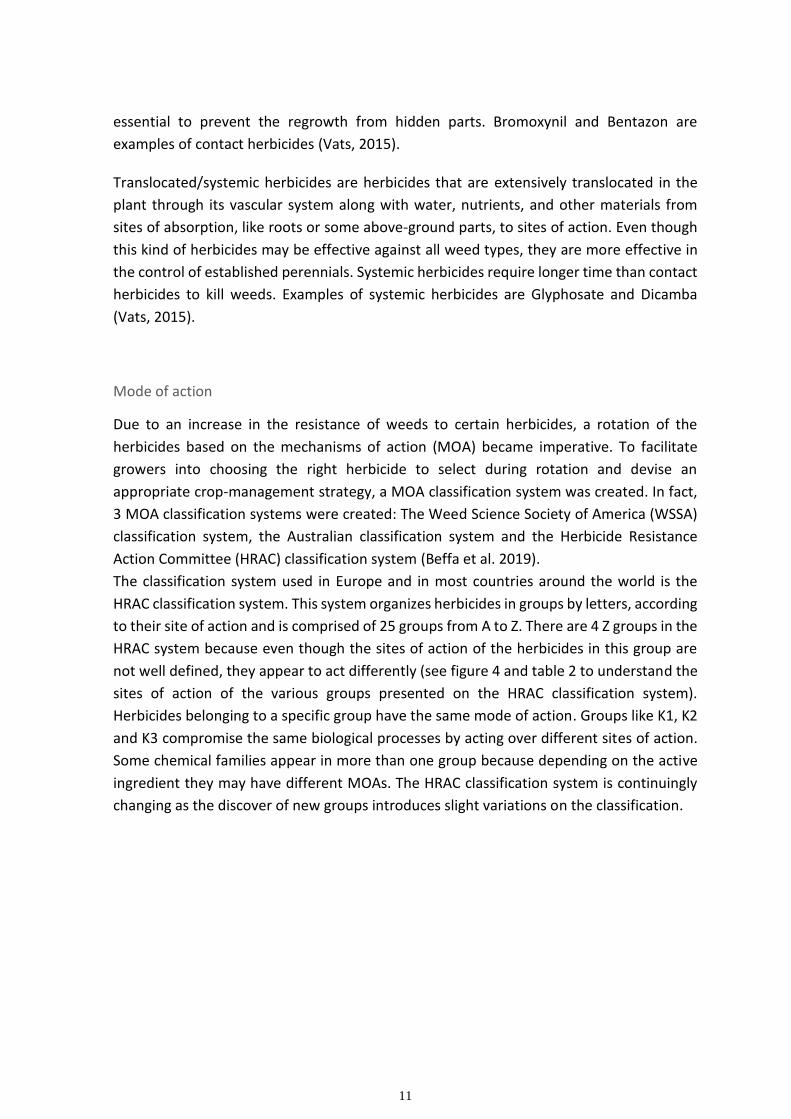
11
essential to prevent the regrowth from hidden parts. Bromoxynil and Bentazon are
examples of contact herbicides (Vats, 2015).
Translocated/systemic herbicides are herbicides that are extensively translocated in the
plant through its vascular system along with water, nutrients, and other materials from
sites of absorption, like roots or some above-ground parts, to sites of action. Even though
this kind of herbicides may be effective against all weed types, they are more effective in
the control of established perennials. Systemic herbicides require longer time than contact
herbicides to kill weeds. Examples of systemic herbicides are Glyphosate and Dicamba
(Vats, 2015).
Mode of action
Due to an increase in the resistance of weeds to certain herbicides, a rotation of the
herbicides based on the mechanisms of action (MOA) became imperative. To facilitate
growers into choosing the right herbicide to select during rotation and devise an
appropriate crop-management strategy, a MOA classification system was created. In fact,
3 MOA classification systems were created: The Weed Science Society of America (WSSA)
classification system, the Australian classification system and the Herbicide Resistance
Action Committee (HRAC) classification system (Beffa et al. 2019).
The classification system used in Europe and in most countries around the world is the
HRAC classification system. This system organizes herbicides in groups by letters, according
to their site of action and is comprised of 25 groups from A to Z. There are 4 Z groups in the
HRAC system because even though the sites of action of the herbicides in this group are
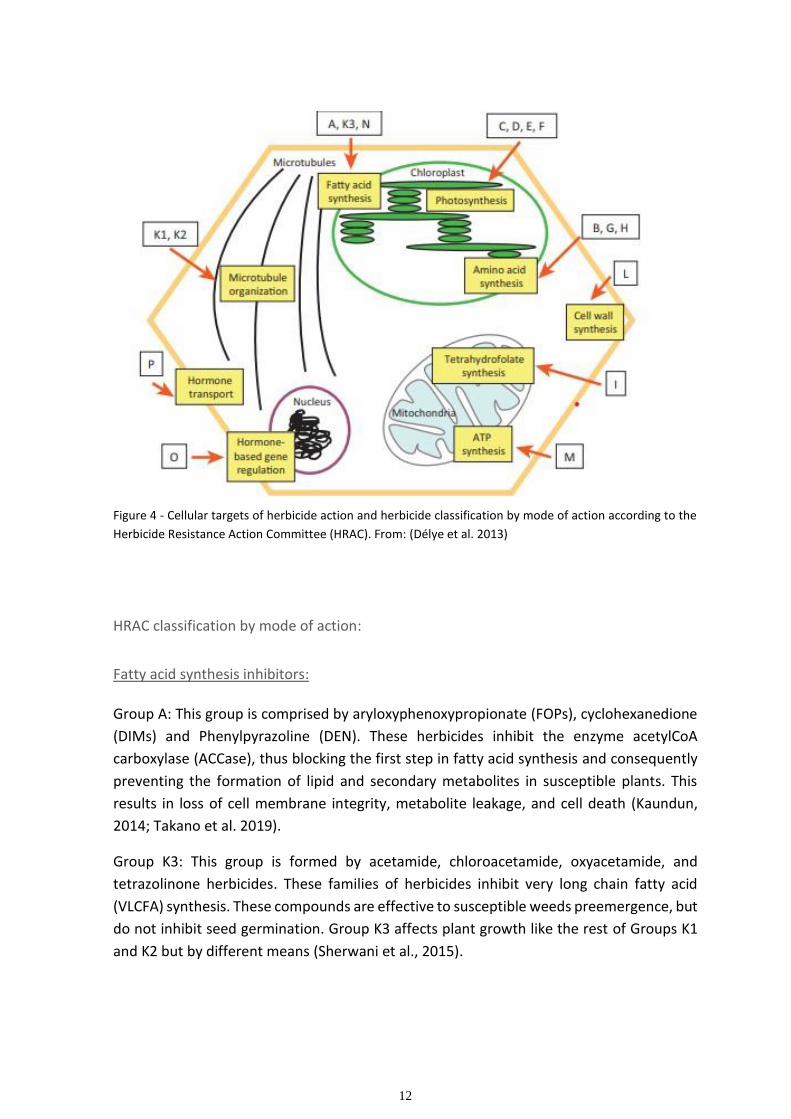
not well defined, they appear to act differently (see figure 4 and table 2 to understand the
sites of action of the various groups presented on the HRAC classification system).
Herbicides belonging to a specific group have the same mode of action. Groups like K1, K2
and K3 compromise the same biological processes by acting over different sites of action.
Some chemical families appear in more than one group because depending on the active
ingredient they may have different MOAs. The HRAC classification system is continuingly
changing as the discover of new groups introduces slight variations on the classification.
12
Figure 4 - Cellular targets of herbicide action and herbicide classification by mode of action according to the
Herbicide Resistance Action Committee (HRAC). From: (Délye et al. 2013)
HRAC classification by mode of action:
Fatty acid synthesis inhibitors:
Group A: This group is comprised by aryloxyphenoxypropionate (FOPs), cyclohexanedione
(DIMs) and Phenylpyrazoline (DEN). These herbicides inhibit the enzyme acetylCoA
carboxylase (ACCase), thus blocking the first step in fatty acid synthesis and consequently
preventing the formation of lipid and secondary metabolites in susceptible plants. This
results in loss of cell membrane integrity, metabolite leakage, and cell death (Kaundun,
2014; Takano et al. 2019).
Group K3: This group is formed by acetamide, chloroacetamide, oxyacetamide, and
tetrazolinone herbicides. These families of herbicides inhibit very long chain fatty acid
(VLCFA) synthesis. These compounds are effective to susceptible weeds preemergence, but
do not inhibit seed germination. Group K3 affects plant growth like the rest of Groups K1
and K2 but by different means (Sherwani et al., 2015).
13
Group N: The chemical families of herbicides within the group N are Benzofuranes,
chlorocarbonic acids, phosphorodithioates, and thiocarbamates. These herbicides are
known to block very long chain fatty acid elongases (VCLFAE) thus compromising the
synthesis of waxes and cutins, as well as sphingolipids. Such disruption leaves plants open
to external stresses resulting various lethal effects on plants in their initial developmental
stages (Böger, 2003; Busi, 2014).
Photosynthesis inhibitors
Group C: There are 3 C ggroups. Phenylcarbamates, pyridazinones, triazines, triazinones
and uracils form Group C1, amides and ureas form Group C2 and benzothiadiazinones,
nitriles, and phenylpyridazines form group C3. These herbicide´s families inhibit the QB-
binding site of the D1 protein in the photosystem II complex in chloroplast thylakoid
membranes. This inhibition results in a disruption of the chloroplastic electron transport
chain, resulting in the build-up of reactive oxygen species (Murphy et al. 2019). The
formation of Groups is due to the binding to the D1 protein being different.
Group D: This group is formed by 2 herbicides of the Bipyridylium family, Paraquat and
Diquat. These herbicides accept electrons from photosystem I (PSI) and reduce them to
form an herbicide radical. This radical then reduces other molecules to form reactive
oxidative species that overwhelm the plant antioxidant defences resulting in DNA damage,
and cell and tissue death (Lascano et al., 2012).
Group E: This group is represented by Diphenylethers, N-phenylphthalimides, oxadiazoles,
oxazolidinediones, phenylpyrazoles, pyrimidindiones, thiadiazoles, and triazolinones.
These families of herbicides inhibit the protoporphyrinogen oxidase (PPO or Protox).
Inhibition of the plant enzyme causes accumulation of the protoporphyrinogen-IX
substrate, which is exported to the cytoplasm, where it is oxidized by O2 in the
mitochondrion and chloroplast. This produces a photosensitive protoporphyrin IX. With
exposure to light, this protoporphyrin IX generates singlet oxygen molecules that causes
lipid peroxidation and cell death (Hao et al. 2011; Dayan & Duke, 2010).
Group F: There are 3 F groups. The group F1 is formed by Pyridazinone,
Pyridinecarboxamide, group F2 by Triketone, Isoxazole, Pyrazole and group F3 by Triazole,
Isoxazolidinone, Urea, Diphenylether. These groups of herbicides interfere with carotenoid
biosynthesis by different means. The compounds belonging to F1 inhibit phytoene
desaturase, which is an enzyme that plays a major role in carotenoid biosynthesis. F2
herbicides inhibit phydroxyphenyl pyruvate dioxygenase (HPPD), which plays an important
role in plastoquinone biosynthesis. As a cofactor of phytoene desaturase, inhibition of
plastoquinone will interfere with carotenoid biosynthesis. F3 herbicides don’t have a well
determined site of action but plants exposed to these herbicides have been shown to
14
accumulate phytoene, phytofluene, carotenes, and lycopene, all precursors of carotenoid
synthesis, suggesting that phytoene desaturase, lycopene cyclase, imidazole glycerol
phosphate dehydratase, nitrate reductase, or catalase may be inhibited (Rao, 2014).
Amino acid synthesis inhibitors:
Group B: This group is composed by Imidazolinones, pyrimidinylthiobenzoates,
sulfonylaminocarbonyltriazolinones, sulfonylureas and triazolopyrimidines. These kinds of
herbicides inhibit acetolactate synthase (ALS or AHAS) which is a key enzyme in the
biosynthesis of the branched-chain amino acids isoleucine, leucine, and valine. Plant death
results from events occurring in response to ALS inhibition and low branched-chain amino
acid production (Shaner, 1999; Monqueiro et al. 2001).
Group G: This group is comprised of glycines. Glycines are herbicides that inhibit 5-
enolpyruvylshikimate-3-phosphate (EPSP) synthase. This enzyme is found in the aromatic
biosynthesis pathway, also known as the shikimate pathway and catalyzes the transfer of
a carboxyvinyl group from phosphoenolpyruvate (PEP) to shikimate-3-phosphate. EPSP
synthase inhibition leads to depletion of the aromatic amino acids tryptophan, tyrosine,
and phenylalanine, all needed for protein synthesis or for biosynthetic pathways leading to
growth. The events occurring in response to EPSP synthase inhibition results in plant death
(Siehl, 1997; Dong et al., 2019).
Group H: The herbicides that comprise this group are Glufosinate and Bialophos. These
herbicides belong to a family known as Phosphinic acids. They inhibit glutamine synthase
(GS) which is responsible for converting glutamate and ammonia to glutamine (Gln). A
decrease in glutamate and glutamine leads to the accumulation of metabolites glyoxylate,
phosphoglycolate, and glycolate in photorespiration. The accumulation of high levels of
glyoxylate leads to the inhibition of ribulose-1,5-bisphosphate carboxylase/oxygenase
activase which is a key enzyme in the Calvin–Benson cycle. All this results in the
accumulation of reactive oxygen species, lipid peroxidation and cell death (Berlicki, 2008;
Brunharo et al. 2019).
Cell wall synthesis inhibitors:
Group L: The families of herbicides that form this group are nitrile, benzamide,
triazolocarboxamide, quinoline carboxylic acids. These are herbicides that affect cellulose
synthase in susceptible plants. As the name indicates, cellulose synthase is the enzyme
responsible for the synthesis of cellulose. Because cellulose plays an important structural
role in cell wall reinforcement, the inhibition of cellulose biosynthesis in the cell wall causes
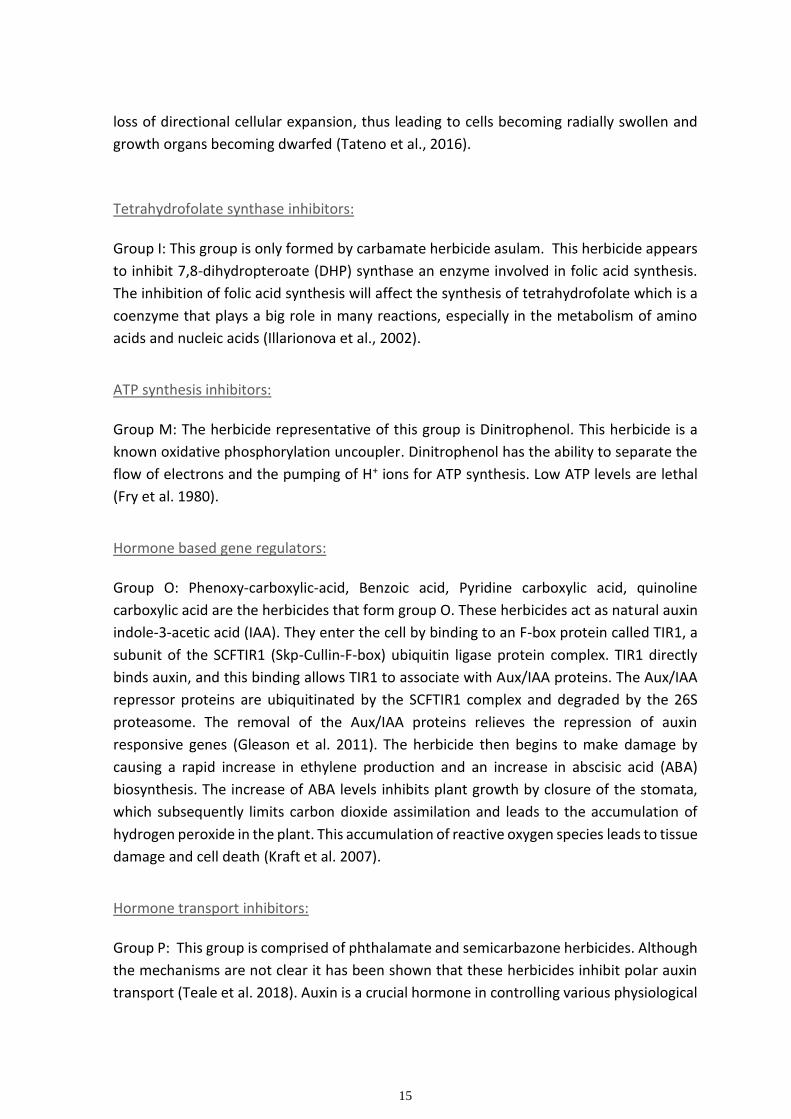
15
loss of directional cellular expansion, thus leading to cells becoming radially swollen and
growth organs becoming dwarfed (Tateno et al., 2016).
Tetrahydrofolate synthase inhibitors:
Group I: This group is only formed by carbamate herbicide asulam. This herbicide appears
to inhibit 7,8-dihydropteroate (DHP) synthase an enzyme involved in folic acid synthesis.
The inhibition of folic acid synthesis will affect the synthesis of tetrahydrofolate which is a
coenzyme that plays a big role in many reactions, especially in the metabolism of amino
acids and nucleic acids (Illarionova et al., 2002).
ATP synthesis inhibitors:
Group M: The herbicide representative of this group is Dinitrophenol. This herbicide is a
known oxidative phosphorylation uncoupler. Dinitrophenol has the ability to separate the
flow of electrons and the pumping of H+ ions for ATP synthesis. Low ATP levels are lethal
(Fry et al. 1980).
Hormone based gene regulators:
Group O: Phenoxy-carboxylic-acid, Benzoic acid, Pyridine carboxylic acid, quinoline
carboxylic acid are the herbicides that form group O. These herbicides act as natural auxin
indole-3-acetic acid (IAA). They enter the cell by binding to an F-box protein called TIR1, a
subunit of the SCFTIR1 (Skp-Cullin-F-box) ubiquitin ligase protein complex. TIR1 directly
binds auxin, and this binding allows TIR1 to associate with Aux/IAA proteins. The Aux/IAA
repressor proteins are ubiquitinated by the SCFTIR1 complex and degraded by the 26S
proteasome. The removal of the Aux/IAA proteins relieves the repression of auxin
responsive genes (Gleason et al. 2011). The herbicide then begins to make damage by
causing a rapid increase in ethylene production and an increase in abscisic acid (ABA)
biosynthesis. The increase of ABA levels inhibits plant growth by closure of the stomata,
which subsequently limits carbon dioxide assimilation and leads to the accumulation of
hydrogen peroxide in the plant. This accumulation of reactive oxygen species leads to tissue
damage and cell death (Kraft et al. 2007).
Hormone transport inhibitors:
Group P: This group is comprised of phthalamate and semicarbazone herbicides. Although
the mechanisms are not clear it has been shown that these herbicides inhibit polar auxin
transport (Teale et al. 2018). Auxin is a crucial hormone in controlling various physiological
16
phenomena like cell elongation, apical dominance, and tropism. So inhibition of this
hormone will ultimately affect plant growth and development (Saniewski et al., 2017).
Microtubule organization inhibitors:
Groups K1 and K2: These K groups affect microtubule polymerization. The K1 group is
comprised by the dinitroaniline, Phosphoroamidate, Pyridine, Benzamide and Benzoic acid
chemical families and the K2 group is comprised by the Carbamate herbicides,
carbetamide, propham and chlorpropham. These groups of herbicides are known to bind
to plant tubulin. This herbicide-tubulin complex inhibits polymerization of microtubules
thus affecting all processes in which microtubules are essential, like alignment and
separation of chromosomes during mitosis and cell wall formation (Quinlan et al. 1980;
Alebrahim et al., 2017; Délye et al., 2004).
Unknown MOA:
Group Z: Even though the mechanisms of action of Group Z herbicides are not well known, they can be divided into at least four groups that act on different sites of action: the Organoarsenicals, known to be nucleic acid inhibitors; the Arylaminopropionic acids, known antimicrotubule mitotic disrupters; the Pyrazoliums, known cell elongation inhibitors; and the Uknown, herbicides who have not yet been classified.
17
Her
bic
ide
Ch
emic
al F
amily
Ary
lox
yp
hen
ox
y-p
rop
ion
ate
“F
OP
S”
,
Cy
clo
hex
aned
ion
e “
DIM
s”,
Ph
eny
lpy
razo
lin
e
“D
EN
”
Su
lfo
ny
lure
a,
Imid
azo
lin
on
e,
Tri
azo
lop
yri
mid
ine,
Py
rim
idin
yl(
thio
)ben
zoat
e
Tri
azin
e,
Tri
azin
on
e,
Tri
azo
lin
on
e,
Ura
cil,
Py
rid
azin
on
e,
Ph
eny
l-ca
rbam
ate
/ U
rea,
A
mid
e /
Nit
rile
, B
enzo
thia
dia
zin
on
e, P
hen
yl-
py
rid
azin
e
Bip
yri
dy
liu
m
Dip
hen
yle
ther
, P
hen
ylp
yra
zole
, N
-
ph
eny
lph
thal
imid
e,
Th
iad
iazo
le,
Ox
adia
zole
,
Tri
azo
lin
on
e, O
xaz
oli
din
edio
ne,
Py
rim
idin
dio
ne
Py
rid
azin
on
e,
Pyri
din
ecar
box
amid
e /
Tri
ket
on
e,
Iso
xaz
ole
, P
yra
zole
/ T
riaz
ole
, Is
ox
azo
lid
inon
e, U
rea,
Dip
hen
yle
ther
Gly
cin
e
Ph
osp
hin
ic a
cid
Bio
logi
cal
Pro
cess
Co
mp
rom
ised
Fatt
y ac
id b
iosy
nth
esis
Am
ino
ac
id
bio
syn
thes
is
(Leu
, Il
e, V
al)
Ph
oto
syn
thes
is
(ele
ctro
n
tran
sfer
)
Ph
oto
syn
thes
is
(ele
ctro
n
tran
sfer
)
Ph
oto
syn
thes
is
(hem
e
bio
syn
thes
is
for
chlo
roph
yll
)
Ph
oto
syn
thes
is
(car
ote
no
id
bio
syn
thes
is)
Am
ino
ac
id
bio
syn
thes
is
(Ph
e, T
rp, T
yr)
Am
ino
ac
id
bio
syn
thes
is
(Gln
)
Mo
de
of
Act
ion
(M
A)
Inh
ibit
ion
o
f ac
ety
l-C
oA
ca
rbo
xy
lase
(AC
Case
)
Inh
ibit
ion o
f ac
eto
hy
dro
xy
acid
sy
nth
ase
(AH
AS
, A
LS
)
Inh
ibit
ion
of
pho
tosy
stem
II
pro
tein
D1
(psb
A)
Div
ersi
on
of
the
elec
tro
ns
tran
sfer
red
by
the
ph
oto
syst
em I
fer
red
ox
in (
Fd
)
Inh
ibit
ion
of
pro
top
orp
hy
rin
og
en
ox
idas
e (P
PO
)
Inh
ibit
ion o
f ph
yto
ene
des
atu
rase
(P
DS
)
or
4-h
yd
rox
yp
hen
ylp
yru
vat
e
dio
xy
gen
ase
(4-H
PP
D)
or
of
an
un
kno
wn
pro
tein
Inh
ibit
ion o
f 5
-eno
lpy
ruv
yls
hik
imat
e-3
-
ph
osp
hat
e sy
nth
ase
(EP
SP
S)
Inh
ibit
ion
of
glu
tam
ine
syn
thas
e
HR
AC
Gro
up
A
B
C1
/C2
/C3
D
E
F1
/F2
/F3
G
H
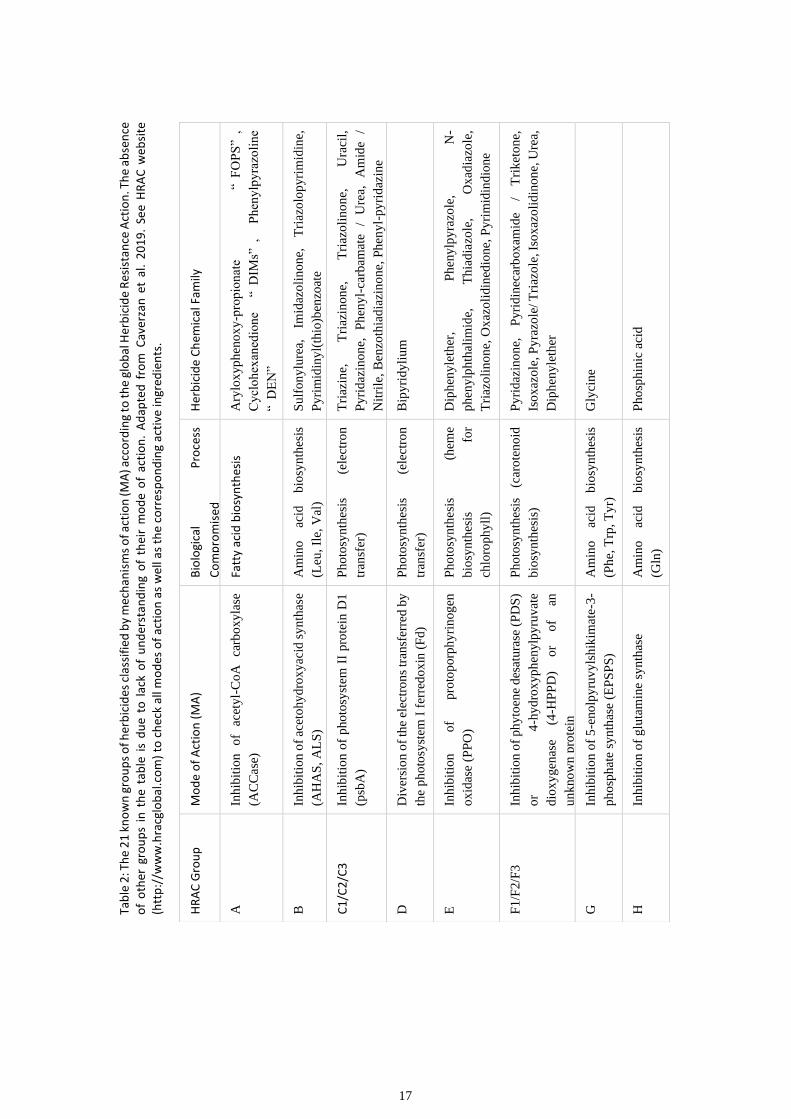
Tab
le 2
: Th
e 2
1 k
no
wn
gro
up
s o
f her
bic
ides
cla
ssif
ied
by
mec
han
ism
s o
f act
ion
(MA
) acc
ord
ing
to t
he
glo
bal
Her
bic
ide
Res
ista
nce
Act
ion
. Th
e ab
sen
ce
of
oth
er g
rou
ps
in t
he
tab
le i
s d
ue
to l
ack
of
un
der
stan
din
g o
f th
eir
mo
de
of
acti
on
. A
dap
ted
fro
m C
aver
zan
et
al.
20
19
. Se
e H
RA
C w
ebsi
te
(htt
p:/
/ww
w.h
racg
lob
al.c
om
) to
ch
eck
all m
od
es o
f ac
tio
n a
s w
ell a
s th
e co
rres
po
nd
ing
acti
ve in
gred
ien
ts.
18
Her
bic
ide
Ch
emic
al F
amil
y
Car
bam
ate
Din
itro
anil
ine,
P
ho
sph
oro
amid
ate,
Py
rid
ine,
B
enza
mid
e,
Ben
zoic
ac
id
/
Car
bam
ate
Ch
loro
acet
amid
e,
Ace
tam
ide,
Ox
yac
etam
ide,
Tet
razo
lin
on
e
Nit
rile
, B
enza
mid
e, T
riaz
olo
carb
ox
amid
e,
Qu
ino
lin
e ca
rbo
xy
lic
acid
Din
itro
ph
eno
l
Th
ioca
rbam
ate,
P
ho
spho
rod
ith
ioat
e,
Ben
zofu
ran
, C
hlo
ro-C
arbo
nic
-aci
d
Ph
eno
xy-c
arb
ox
yli
c-ac
id,
Ben
zoic
ac
id,
Py
rid
ine
carb
oxy
lic
acid
, Q
uin
oli
ne
carb
oxy
lic
acid
Ph
thal
amat
e, S
emic
arb
azo
ne
Bio
log
ical
Pro
cess
Co
mp
rom
ised
Tet
rah
yd
rofo
late
bio
syn
thes
is
Mic
rotu
be
po
lym
eriz
atio
n
Fat
ty a
cid
bio
syn
thes
is
Cel
l w
all
bio
syn
thes
is
AT
P b
iosy
nth
esis
Fat
ty a
cid
bio
syn
thes
is
Reg
ula
tio
n o
f au
xin
-res
po
nsi
ve
gen
es
Lo
ng
-ran
ge
ho
rmo
ne
sig
nal
ing
Mo
de
of
Act
ion
(M
A)
Inh
ibit
ion
of
dih
ydro
pte
roat
e sy
nth
ase
En
han
cem
ent
of
tub
uli
n d
epo
lym
eriz
atio
n
Inh
ibit
ion
of
fatt
y a
cid
sy
nth
ase
(FA
S)
Inh
ibit
ion
of
cell
ulo
se-s
yn
thas
e
Un
cou
pli
ng o
f o
xid
ativ
e p
ho
sph
ory
lati
on
Inh
ibit
ion
of
fatt
y a
cid
elo
ng
ase
Sti
mu
lati
on
of
tran
spo
rt I
nh
ibit
or
resp
on
se p
rote
in
1 (
TIR
1)
Inh
ibit
ion
of
aux
in t
ran
spo
rt
HR
AC
Gro
up
I K1
/K2
K3
L
M
N
O
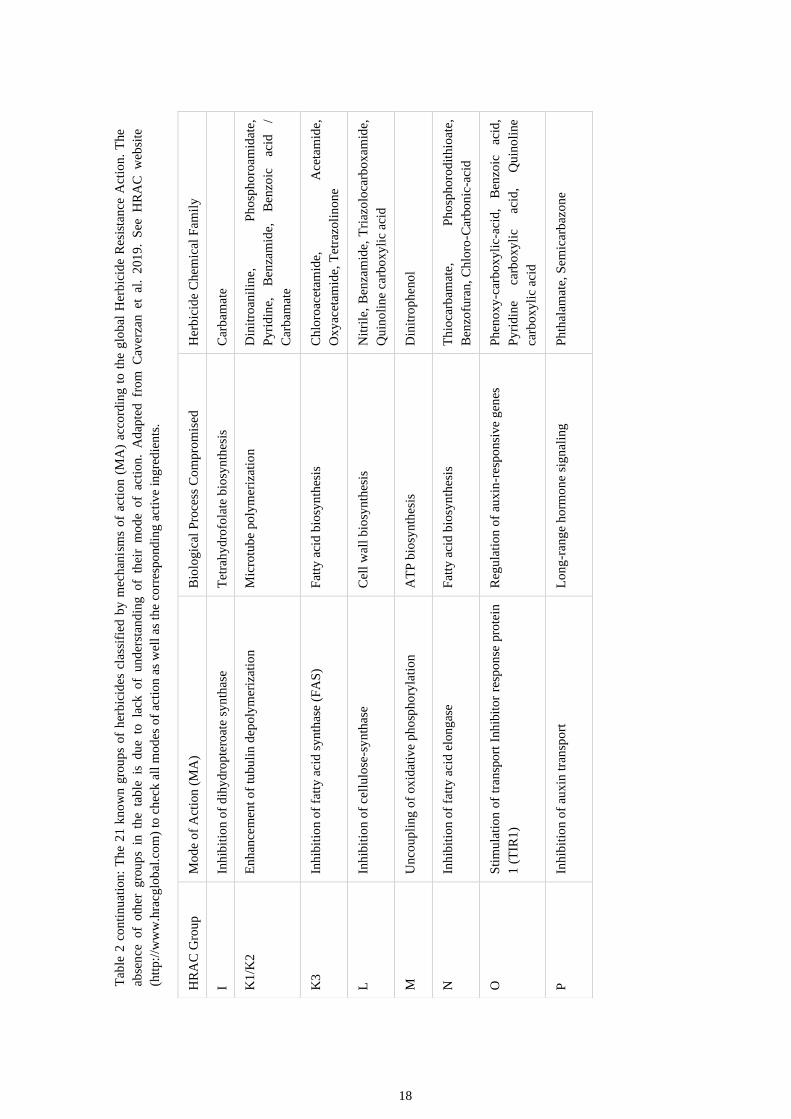
P Tab
le 2
co
nti
nu
atio
n:
Th
e 2
1 k
no
wn g
rou
ps
of
her
bic
ides
cla
ssif
ied
by
mec
han
ism
s o
f ac
tio
n (
MA
) ac
cord
ing
to t
he
glo
bal
Her
bic
ide
Res
ista
nce
Act
ion
. T
he
abse
nce
o
f o
ther
g
rou
ps
in th
e ta
ble
is
d
ue
to la
ck o
f un
der
stan
din
g of
thei
r m
od
e o
f ac
tion
. A
dap
ted fr
om
C
aver
zan et
al
. 2
01
9.
See
H
RA
C w
ebsi
te
(htt
p:/
/ww
w.h
racg
lob
al.c
om
) to
ch
eck
all
mo
des
of
acti
on
as
wel
l as
th
e co
rres
po
nd
ing
act
ive
ing
red
ien
ts.
19
1.5. Case of study
Primextra® Gold TZ
Primextra® Gold TZ is a selective and systemic herbicide of root and leaf absorption
indicated for pre (4 to 4.5 L/ha) and post-emergence application (3.5 to 4 L/ha) on corn and
sunflower crops for the control of grass weeds and water grass (Syngenta, 2017). This
commercial formulation is manufactured by Syngenta AG and is one of the bestselling
herbicides in Portugal, being referenced by the Mondego Valley cooperatives as the most-
used herbicide in corn fields (Gonçalves et al., 2016).
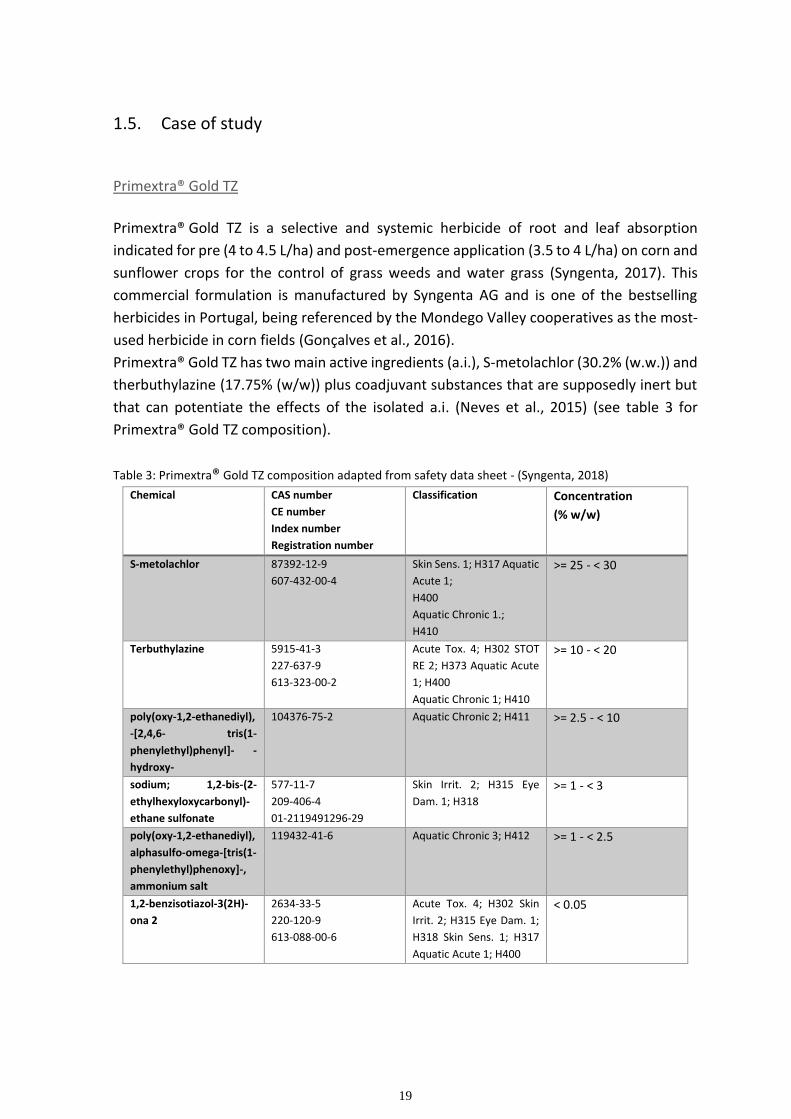
Primextra® Gold TZ has two main active ingredients (a.i.), S-metolachlor (30.2% (w.w.)) and
therbuthylazine (17.75% (w/w)) plus coadjuvant substances that are supposedly inert but
that can potentiate the effects of the isolated a.i. (Neves et al., 2015) (see table 3 for
Primextra® Gold TZ composition).
Table 3: Primextra® Gold TZ composition adapted from safety data sheet - (Syngenta, 2018)
Chemical CAS number
CE number
Index number
Registration number
Classification Concentration
(% w/w)
S-metolachlor 87392-12-9
607-432-00-4
Skin Sens. 1; H317 Aquatic
Acute 1;
H400
Aquatic Chronic 1.;
H410
>= 25 - < 30
Terbuthylazine 5915-41-3
227-637-9
613-323-00-2
Acute Tox. 4; H302 STOT
RE 2; H373 Aquatic Acute
1; H400
Aquatic Chronic 1; H410
>= 10 - < 20
poly(oxy-1,2-ethanediyl),
-[2,4,6- tris(1-
phenylethyl)phenyl]- -
hydroxy-
104376-75-2 Aquatic Chronic 2; H411 >= 2.5 - < 10
sodium; 1,2-bis-(2-
ethylhexyloxycarbonyl)-
ethane sulfonate
577-11-7
209-406-4
01-2119491296-29
Skin Irrit. 2; H315 Eye
Dam. 1; H318
>= 1 - < 3
poly(oxy-1,2-ethanediyl),
alphasulfo-omega-[tris(1-
phenylethyl)phenoxy]-,
ammonium salt
119432-41-6 Aquatic Chronic 3; H412 >= 1 - < 2.5
1,2-benzisotiazol-3(2H)-
ona 2
2634-33-5
220-120-9
613-088-00-6
Acute Tox. 4; H302 Skin
Irrit. 2; H315 Eye Dam. 1;
H318 Skin Sens. 1; H317
Aquatic Acute 1; H400
< 0.05
20
Primextra® Gold TZ is considered hazardous to human health and according to Syngenta
safety sheet the herbicide can cause severe ocular irritation; cutaneous allergic reaction;
organ damage after prolonged or repeated exposure; extreme toxicity to aquatic organisms
with long lasting effects. Main pathways of exposure are ingestion, inhalation, skin contact
and eye contact. Safety data sheet of the herbicide Primextra® Gold TZ also mentions the
toxicity values in various toxicity tests: In rats an acute toxicity test via oral exposure
obtained a LD50 of > 3.000 mg/kg. In fish a LC50 of 8.32 mg/l was obtained after exposure of
Oncorhynchus mykiss (rainbow trout) to the compound for 96 h. For invertebrates an EC50
of 35.2 mg/l was obtained by exposing Daphnia magna to Primextra® Gold TZ for 48 h. In
algae an EC50 and NOEC (No observed effect concentration) of 0.131 mg/l and 0.013 mg/l
was obtained after exposing Raphidocelis subcapitata (formerly Pseudokirchneriella
subcapitata) (green algae) for 72 h to the compound (Syngenta, 2018). In Daphnia
longispina exposed to the commercial product and to the a.i. S-metolachlor was obtained
a chronic EC50 of 6.58 mg/l and 8.24 mg/l, respectively (Neves et al., 2015).
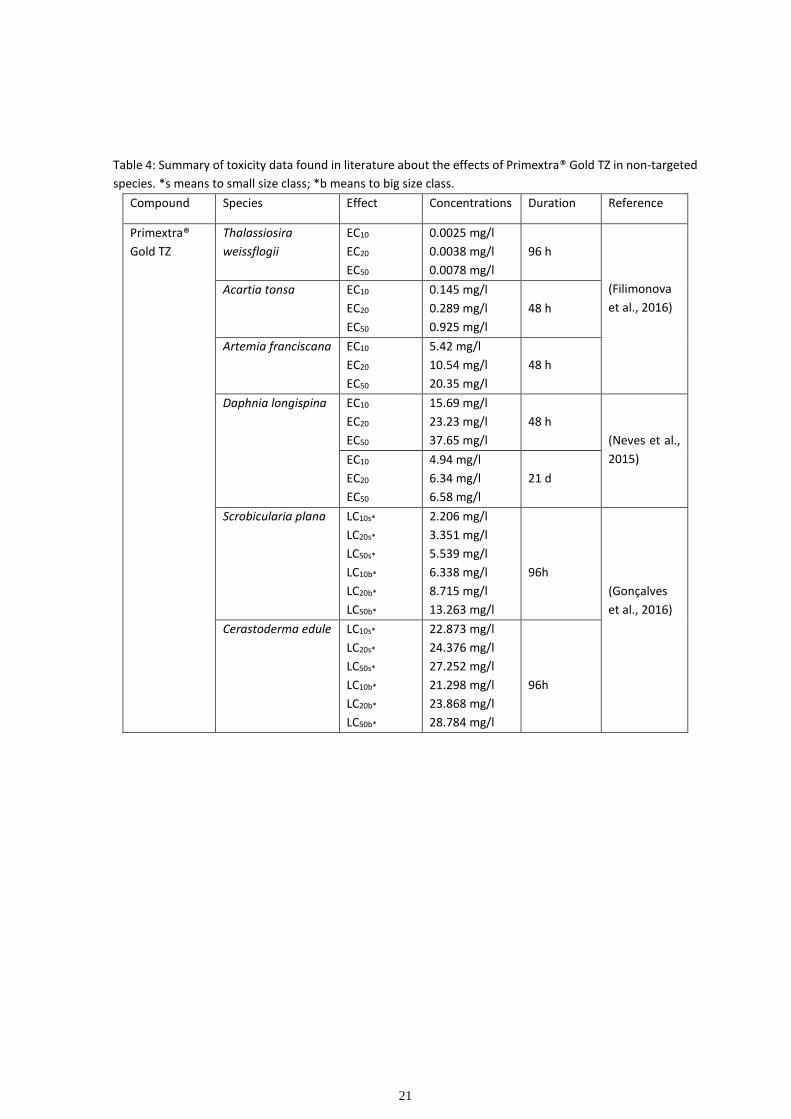
Because herbicides can contaminate the water bodies near agricultural areas through run-
off drainage, spry drift and accidental spills, most of the literature is focused on
determining if the compound represents danger to non-target aquatic species. Toxic effects
observed in literature include cell growth inhibition and fatty acid changes in marine
planktonic species (Filimonova et al., 2016), immobilization, reduction in fecundity,
developmental delay and reduction of number of broods on the life of the freshwater
species Daphnia longispina (Neves et al., 2015) and lethality and fatty acid changes in
marine bivalves ( Gonçalves et al., 2016) (See table 4 for additional toxicity data, found in
literature, on Primextra® Gold TZ).
21
Table 4: Summary of toxicity data found in literature about the effects of Primextra® Gold TZ in non-targeted
species. *s means to small size class; *b means to big size class. Compound Species Effect Concentrations Duration Reference
Primextra®
Gold TZ
Thalassiosira
weissflogii
EC10
EC20
EC50
0.0025 mg/l
0.0038 mg/l
0.0078 mg/l
96 h
(Filimonova
et al., 2016)
Acartia tonsa EC10
EC20
EC50
0.145 mg/l
0.289 mg/l
0.925 mg/l
48 h
Artemia franciscana EC10
EC20
EC50
5.42 mg/l
10.54 mg/l
20.35 mg/l
48 h
Daphnia longispina EC10
EC20
EC50
15.69 mg/l
23.23 mg/l
37.65 mg/l
48 h
(Neves et al.,
2015) EC10
EC20
EC50
4.94 mg/l
6.34 mg/l
6.58 mg/l
21 d
Scrobicularia plana LC10s*
LC20s*
LC50s*
LC10b*
LC20b*
LC50b*
2.206 mg/l
3.351 mg/l
5.539 mg/l
6.338 mg/l
8.715 mg/l
13.263 mg/l
96h
(Gonçalves
et al., 2016)
Cerastoderma edule LC10s*
LC20s*
LC50s*
LC10b*
LC20b*
LC50b*
22.873 mg/l
24.376 mg/l
27.252 mg/l
21.298 mg/l
23.868 mg/l
28.784 mg/l
96h
22
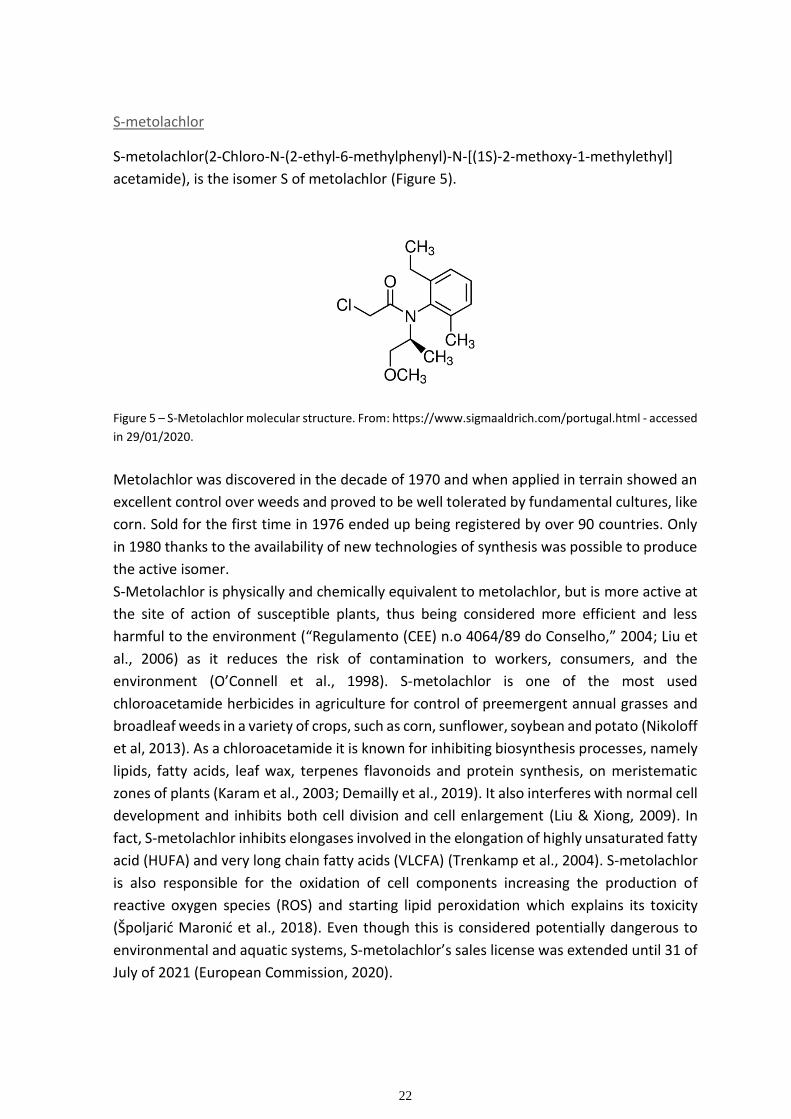
S-metolachlor
S-metolachlor(2-Chloro-N-(2-ethyl-6-methylphenyl)-N-[(1S)-2-methoxy-1-methylethyl]
acetamide), is the isomer S of metolachlor (Figure 5).
Figure 5 – S-Metolachlor molecular structure. From: https://www.sigmaaldrich.com/portugal.html - accessed
in 29/01/2020.
Metolachlor was discovered in the decade of 1970 and when applied in terrain showed an
excellent control over weeds and proved to be well tolerated by fundamental cultures, like
corn. Sold for the first time in 1976 ended up being registered by over 90 countries. Only
in 1980 thanks to the availability of new technologies of synthesis was possible to produce
the active isomer.
S-Metolachlor is physically and chemically equivalent to metolachlor, but is more active at
the site of action of susceptible plants, thus being considered more efficient and less
harmful to the environment (“Regulamento (CEE) n.o 4064/89 do Conselho,” 2004; Liu et
al., 2006) as it reduces the risk of contamination to workers, consumers, and the
environment (O’Connell et al., 1998). S-metolachlor is one of the most used
chloroacetamide herbicides in agriculture for control of preemergent annual grasses and
broadleaf weeds in a variety of crops, such as corn, sunflower, soybean and potato (Nikoloff
et al, 2013). As a chloroacetamide it is known for inhibiting biosynthesis processes, namely
lipids, fatty acids, leaf wax, terpenes flavonoids and protein synthesis, on meristematic
zones of plants (Karam et al., 2003; Demailly et al., 2019). It also interferes with normal cell
development and inhibits both cell division and cell enlargement (Liu & Xiong, 2009). In
fact, S-metolachlor inhibits elongases involved in the elongation of highly unsaturated fatty
acid (HUFA) and very long chain fatty acids (VLCFA) (Trenkamp et al., 2004). S-metolachlor
is also responsible for the oxidation of cell components increasing the production of
reactive oxygen species (ROS) and starting lipid peroxidation which explains its toxicity
(Špoljarić Maronić et al., 2018). Even though this is considered potentially dangerous to
environmental and aquatic systems, S-metolachlor’s sales license was extended until 31 of
July of 2021 (European Commission, 2020).
23
Toxicological information for S-metolachlor was documented in the 2004 “Review report
for the active substance S-Metolachlor” by the Standing Committee on the Food Chain and
Animal Health (European Commission, 2004). In this report the toxicology and metabolism
of the compound is assessed through various tests: for the acute toxicity assay LD50 for
toxicity through oral ingestion on rats was of 3267 mg/kg bw and 2577 mg/kg bw for males
and females, respectively. For the acute toxicity through dermal contact a LD50 > 2000
mg/kg bw was obtained and finally, for the acute toxicity through inhalation a LC50 >2.91
mg/l air was calculated.
In terms of carcinogenicity, S-metolachlor was shown to trigger the emergence of
eosinophilic foci and neoplastic nodules in rat liver. However, with a NOAEL of 14 mg/kg
bw/d the compound could not be labelled as carcinogenic.
As for the genotoxicity assessment, in vivo assays showed increased DNA-synthesis at 500
mg/kg bw and CYP2B induction at 24.5 mg/kg bw in rats. Despite that, S-metolachlor is not
considered to be genotoxic as the transient increase of DNA-synthesis in vivo was declared
as a result of hepatotoxicity and possible stimulation of cell proliferation. Higher
concentrations induced hepatotoxic but not genotoxic effects (European Commission,
2004).
Since 2004, further assays have been conducted as the herbicide’s ability to induce damage
to water organisms has been shown consistently over the years. S-metolachlor has been
shown to induce: immobilization, reduction in fecundity, developmental delay and
reduction of number of broods on the life of D. longispina (Neves et al., 2015), growth
inhibition of green algae (Liu & Xiong, 2009; Liu et al., 2012), bioluminescence inhibition on
Aliivibrio fischeri (formerly Vibrio fischeri) (Joly et al., 2013), mortality, malformations and
inhibition of embryo hatching of zebrafish (Danio rerio) (Quintaneiro et al., 2017), mortality
and fecundity reduction on D. magna (Liu et al., 2006). In 2009 it was also demonstrated
that the herbicide affected the bioenergetics of rat liver and the respiratory activity of
Bacillus stearothermophilus ( Pereira et al., 2009) (See table 5 below for additional toxicity
data on S-metolachlor).
In 2018, after a reassessment on the carcinogenicity of the compound, US. EPA declared S-
metolachlor as “not likely to likely to be Carcinogenic to Humans” at doses that do not
induce cellular proliferation in the liver (USEPA, 2018).
24
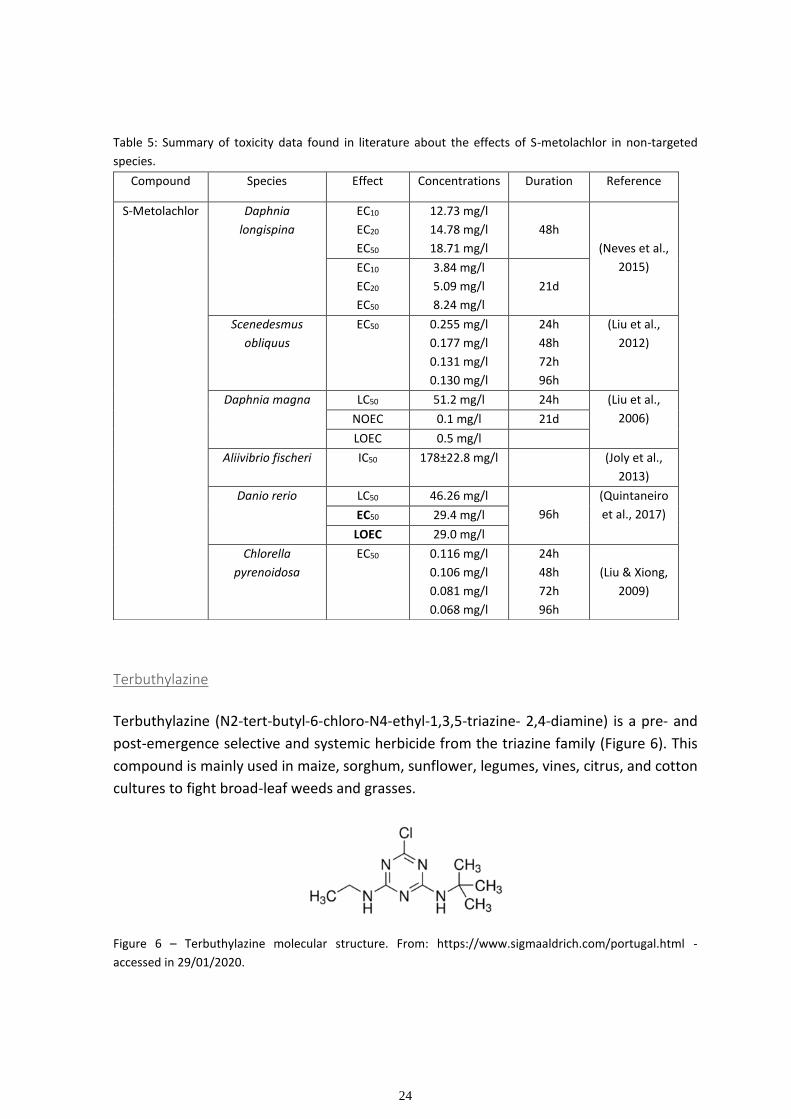
Table 5: Summary of toxicity data found in literature about the effects of S-metolachlor in non-targeted
species.
Terbuthylazine
Terbuthylazine (N2-tert-butyl-6-chloro-N4-ethyl-1,3,5-triazine- 2,4-diamine) is a pre- and
post-emergence selective and systemic herbicide from the triazine family (Figure 6). This
compound is mainly used in maize, sorghum, sunflower, legumes, vines, citrus, and cotton
cultures to fight broad-leaf weeds and grasses.
Figure 6 – Terbuthylazine molecular structure. From: https://www.sigmaaldrich.com/portugal.html -
accessed in 29/01/2020.
Compound Species Effect Concentrations Duration Reference
S-Metolachlor Daphnia
longispina
EC10
EC20
EC50
12.73 mg/l
14.78 mg/l
18.71 mg/l
48h
(Neves et al.,
2015) EC10
EC20
EC50
3.84 mg/l
5.09 mg/l
8.24 mg/l
21d
Scenedesmus
obliquus
EC50 0.255 mg/l
0.177 mg/l
0.131 mg/l
0.130 mg/l
24h
48h
72h
96h
(Liu et al.,
2012)
Daphnia magna LC50 51.2 mg/l 24h (Liu et al.,
2006) NOEC 0.1 mg/l 21d
LOEC 0.5 mg/l
Aliivibrio fischeri IC50 178±22.8 mg/l (Joly et al.,
2013)
Danio rerio LC50 46.26 mg/l
96h
(Quintaneiro
et al., 2017) EC50 29.4 mg/l
LOEC 29.0 mg/l
Chlorella
pyrenoidosa
EC50 0.116 mg/l
0.106 mg/l
0.081 mg/l
0.068 mg/l
24h
48h
72h
96h
(Liu & Xiong,
2009)
25
Terbuthylazine has been used as a substitute of atrazine in countries in which the latter has
been prohibited (Plhalova et al., 2012). This is due to the herbicide presenting a major
adsorption coefficient than atrazine thus being considered less risky regarding
contamination, even though its metabolites present high mobility and consequently
contaminate subterranean waters (Barra Caracciolo et al., 2005).
Terbuthylazine is known to inhibit photosynthesis in photosystem II (PS II). This is due to
the compound’s capability of binding to the plastoquinone-binding protein in photosystem
II, inhibiting electron transport (Cañero et al., 2011; Jerzykiewicz & Kłobus,. 2007).
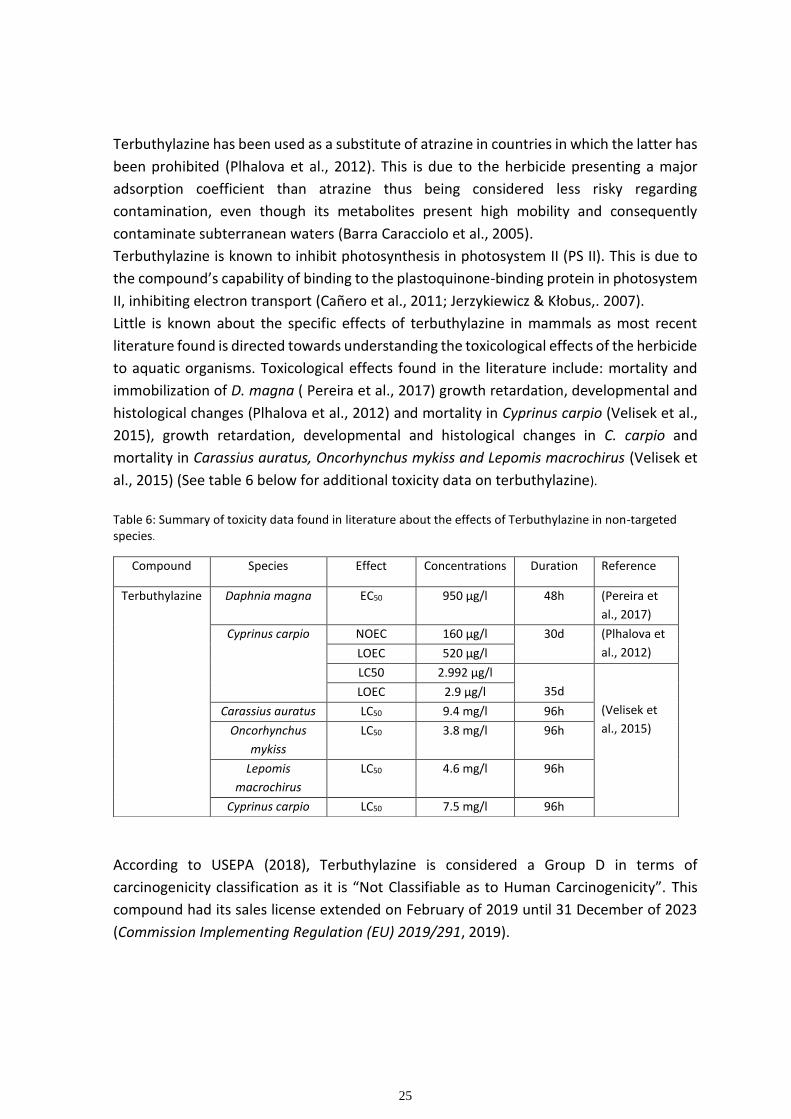
Little is known about the specific effects of terbuthylazine in mammals as most recent
literature found is directed towards understanding the toxicological effects of the herbicide
to aquatic organisms. Toxicological effects found in the literature include: mortality and
immobilization of D. magna ( Pereira et al., 2017) growth retardation, developmental and
histological changes (Plhalova et al., 2012) and mortality in Cyprinus carpio (Velisek et al.,
2015), growth retardation, developmental and histological changes in C. carpio and
mortality in Carassius auratus, Oncorhynchus mykiss and Lepomis macrochirus (Velisek et
al., 2015) (See table 6 below for additional toxicity data on terbuthylazine).
Table 6: Summary of toxicity data found in literature about the effects of Terbuthylazine in non-targeted species.
According to USEPA (2018), Terbuthylazine is considered a Group D in terms of
carcinogenicity classification as it is “Not Classifiable as to Human Carcinogenicity”. This
compound had its sales license extended on February of 2019 until 31 December of 2023
(Commission Implementing Regulation (EU) 2019/291, 2019).
Compound Species Effect Concentrations Duration Reference
Terbuthylazine Daphnia magna EC50 950 µg/l 48h (Pereira et
al., 2017)
Cyprinus carpio NOEC 160 µg/l 30d (Plhalova et
al., 2012) LOEC 520 µg/l
LC50 2.992 µg/l
35d
(Velisek et
al., 2015)
LOEC 2.9 µg/l
Carassius auratus LC50 9.4 mg/l 96h
Oncorhynchus
mykiss
LC50 3.8 mg/l 96h
Lepomis
macrochirus
LC50 4.6 mg/l 96h
Cyprinus carpio LC50 7.5 mg/l 96h
26
1.6 In vitro assays
As the name indicates, a test performed “in vitro” is a test done outside of a living organism.
These tests usually involve isolated tissues, organs, or cells. In vitro testing has risen for the
past decades as there has been an increasing global commitment to the reduction of animal
usage whenever possible, in accordance to the 3Rs principle (Refinement, Reduction,
Replacement) (Bednarczuk et al., 2010). These kinds of tests also have the particularity of
allowing human cells to be studied without extrapolation from an experimental animal's
cellular response.
Methods for in vitro toxicity assessment
Numerous approaches can be made when assessing in vitro toxicity. The most common
approach is tracking cell vitality, while others include genotoxicity, mutagenicity,
immunogenicity, and oxidative stress assessment.
Cytotoxicity Assessment
Cytotoxicity is the capability of a chemical to be toxic to the cells. The selection of an assay
for cytotoxicity analysis must take into consideration various factors: in vitro cell culture
model, the chemical properties of the toxicant, culture platforms, the endpoint and the
mechanism of cytotoxicity. The most frequently used endpoints in cellular toxicity testing
are based on the breakdown of the cellular permeability barrier, changes in cell
morphology and proliferation and mitochondrial function reduction (Eisenbrand et al.,
2002). Based on these endpoints there are a battery of tests that can be performed to
assess cytotoxicity of a compound.
Characterization and quantification of morphological indicators of toxicity in the cell, like
the formation of vacuoles, apoptotic particles, and nuclear fragmentation can be obtained
by the use of white light, fluorescence and electron microscopy methods (Poteser, 2017).
Cell proliferation can be measured by Sulforhodamine B assay. The SRB assay is based on
binding of the dye to basic amino acids of cellular proteins, and colorimetric evaluation
provides an estimate of total protein mass, which is related to cell number (Orellana &
Kasinski, 2016).
Membrane integrity is usually measured by the capability of a dye to pass through the
cellular membrane and bind to a specific target within the cell, e.g. intracellular proteins
(Trypan Blue exclusion assay), lysosomes (Neutral Red uptake assay), DNA (Propidium
Iodide uptake assay). Another way of measuring membrane integrity is by measuring the
release of intracellular enzymes such as lactate dehydrogenase (LDH assay) (Boucher et al.,
2014).
Mitochondrial activity can be measured by tetrazolium based colorimetric assays such as
3-(4,5- dimethyl-2-thiazolyl)-2,5-diphenyl tetrazolium bromide (MTT) assay, 3-(4,5-
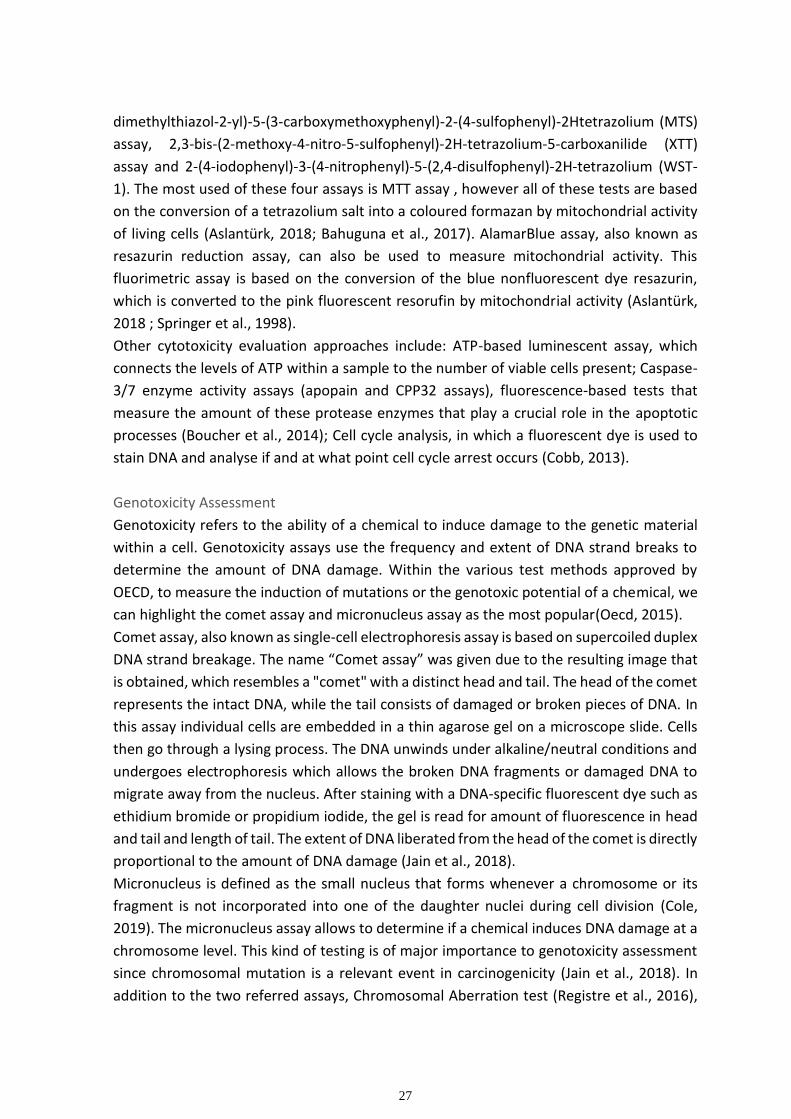
27
dimethylthiazol-2-yl)-5-(3-carboxymethoxyphenyl)-2-(4-sulfophenyl)-2Htetrazolium (MTS)
assay, 2,3-bis-(2-methoxy-4-nitro-5-sulfophenyl)-2H-tetrazolium-5-carboxanilide (XTT)
assay and 2-(4-iodophenyl)-3-(4-nitrophenyl)-5-(2,4-disulfophenyl)-2H-tetrazolium (WST-
1). The most used of these four assays is MTT assay , however all of these tests are based
on the conversion of a tetrazolium salt into a coloured formazan by mitochondrial activity
of living cells (Aslantürk, 2018; Bahuguna et al., 2017). AlamarBlue assay, also known as
resazurin reduction assay, can also be used to measure mitochondrial activity. This
fluorimetric assay is based on the conversion of the blue nonfluorescent dye resazurin,
which is converted to the pink fluorescent resorufin by mitochondrial activity (Aslantürk,
2018 ; Springer et al., 1998).
Other cytotoxicity evaluation approaches include: ATP-based luminescent assay, which
connects the levels of ATP within a sample to the number of viable cells present; Caspase-
3/7 enzyme activity assays (apopain and CPP32 assays), fluorescence-based tests that
measure the amount of these protease enzymes that play a crucial role in the apoptotic
processes (Boucher et al., 2014); Cell cycle analysis, in which a fluorescent dye is used to
stain DNA and analyse if and at what point cell cycle arrest occurs (Cobb, 2013).
Genotoxicity Assessment
Genotoxicity refers to the ability of a chemical to induce damage to the genetic material
within a cell. Genotoxicity assays use the frequency and extent of DNA strand breaks to
determine the amount of DNA damage. Within the various test methods approved by
OECD, to measure the induction of mutations or the genotoxic potential of a chemical, we
can highlight the comet assay and micronucleus assay as the most popular(Oecd, 2015).
Comet assay, also known as single-cell electrophoresis assay is based on supercoiled duplex
DNA strand breakage. The name “Comet assay” was given due to the resulting image that
is obtained, which resembles a "comet" with a distinct head and tail. The head of the comet
represents the intact DNA, while the tail consists of damaged or broken pieces of DNA. In
this assay individual cells are embedded in a thin agarose gel on a microscope slide. Cells
then go through a lysing process. The DNA unwinds under alkaline/neutral conditions and
undergoes electrophoresis which allows the broken DNA fragments or damaged DNA to
migrate away from the nucleus. After staining with a DNA-specific fluorescent dye such as
ethidium bromide or propidium iodide, the gel is read for amount of fluorescence in head
and tail and length of tail. The extent of DNA liberated from the head of the comet is directly
proportional to the amount of DNA damage (Jain et al., 2018).
Micronucleus is defined as the small nucleus that forms whenever a chromosome or its
fragment is not incorporated into one of the daughter nuclei during cell division (Cole,
2019). The micronucleus assay allows to determine if a chemical induces DNA damage at a
chromosome level. This kind of testing is of major importance to genotoxicity assessment
since chromosomal mutation is a relevant event in carcinogenicity (Jain et al., 2018). In
addition to the two referred assays, Chromosomal Aberration test (Registre et al., 2016),
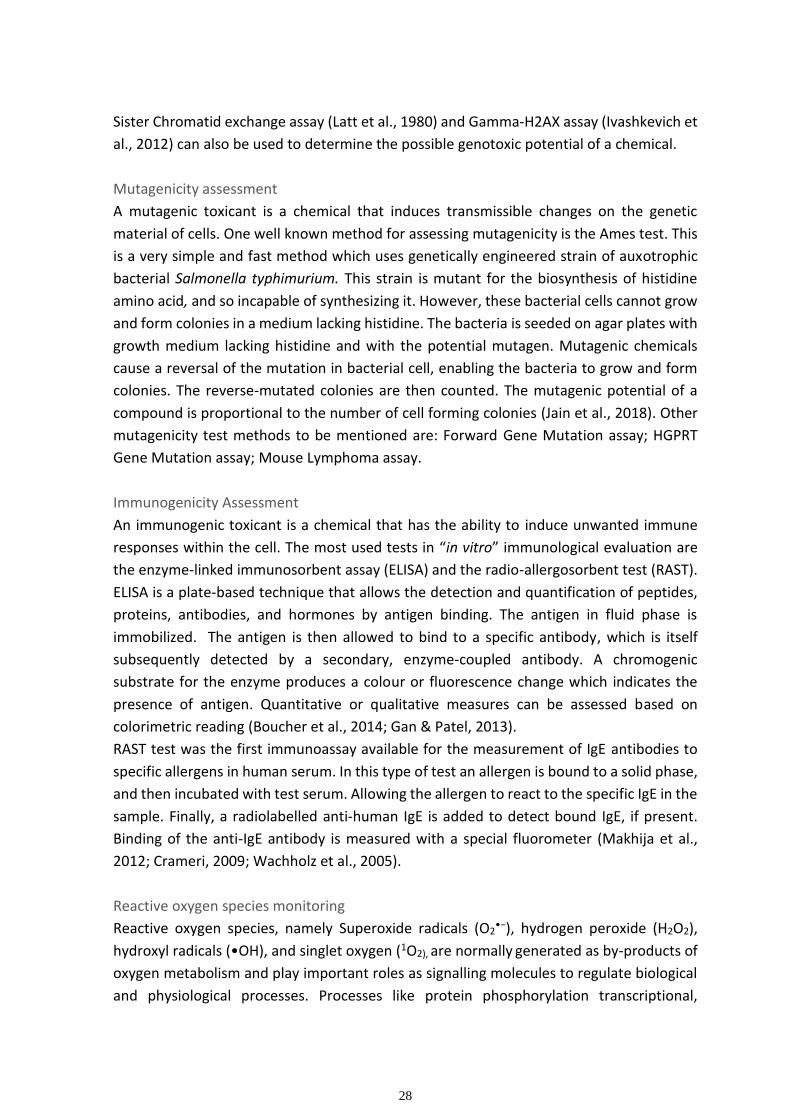
28
Sister Chromatid exchange assay (Latt et al., 1980) and Gamma-H2AX assay (Ivashkevich et
al., 2012) can also be used to determine the possible genotoxic potential of a chemical.
Mutagenicity assessment
A mutagenic toxicant is a chemical that induces transmissible changes on the genetic
material of cells. One well known method for assessing mutagenicity is the Ames test. This
is a very simple and fast method which uses genetically engineered strain of auxotrophic
bacterial Salmonella typhimurium. This strain is mutant for the biosynthesis of histidine
amino acid, and so incapable of synthesizing it. However, these bacterial cells cannot grow
and form colonies in a medium lacking histidine. The bacteria is seeded on agar plates with
growth medium lacking histidine and with the potential mutagen. Mutagenic chemicals
cause a reversal of the mutation in bacterial cell, enabling the bacteria to grow and form
colonies. The reverse-mutated colonies are then counted. The mutagenic potential of a
compound is proportional to the number of cell forming colonies (Jain et al., 2018). Other
mutagenicity test methods to be mentioned are: Forward Gene Mutation assay; HGPRT
Gene Mutation assay; Mouse Lymphoma assay.
Immunogenicity Assessment
An immunogenic toxicant is a chemical that has the ability to induce unwanted immune
responses within the cell. The most used tests in “in vitro” immunological evaluation are
the enzyme-linked immunosorbent assay (ELISA) and the radio-allergosorbent test (RAST).
ELISA is a plate-based technique that allows the detection and quantification of peptides,
proteins, antibodies, and hormones by antigen binding. The antigen in fluid phase is
immobilized. The antigen is then allowed to bind to a specific antibody, which is itself
subsequently detected by a secondary, enzyme-coupled antibody. A chromogenic
substrate for the enzyme produces a colour or fluorescence change which indicates the
presence of antigen. Quantitative or qualitative measures can be assessed based on
colorimetric reading (Boucher et al., 2014; Gan & Patel, 2013).
RAST test was the first immunoassay available for the measurement of IgE antibodies to
specific allergens in human serum. In this type of test an allergen is bound to a solid phase,
and then incubated with test serum. Allowing the allergen to react to the specific IgE in the
sample. Finally, a radiolabelled anti-human IgE is added to detect bound IgE, if present.
Binding of the anti-IgE antibody is measured with a special fluorometer (Makhija et al.,
2012; Crameri, 2009; Wachholz et al., 2005).
Reactive oxygen species monitoring
Reactive oxygen species, namely Superoxide radicals (O2•−), hydrogen peroxide (H2O2),
hydroxyl radicals (•OH), and singlet oxygen (1O2), are normally generated as by-products of
oxygen metabolism and play important roles as signalling molecules to regulate biological
and physiological processes. Processes like protein phosphorylation transcriptional,
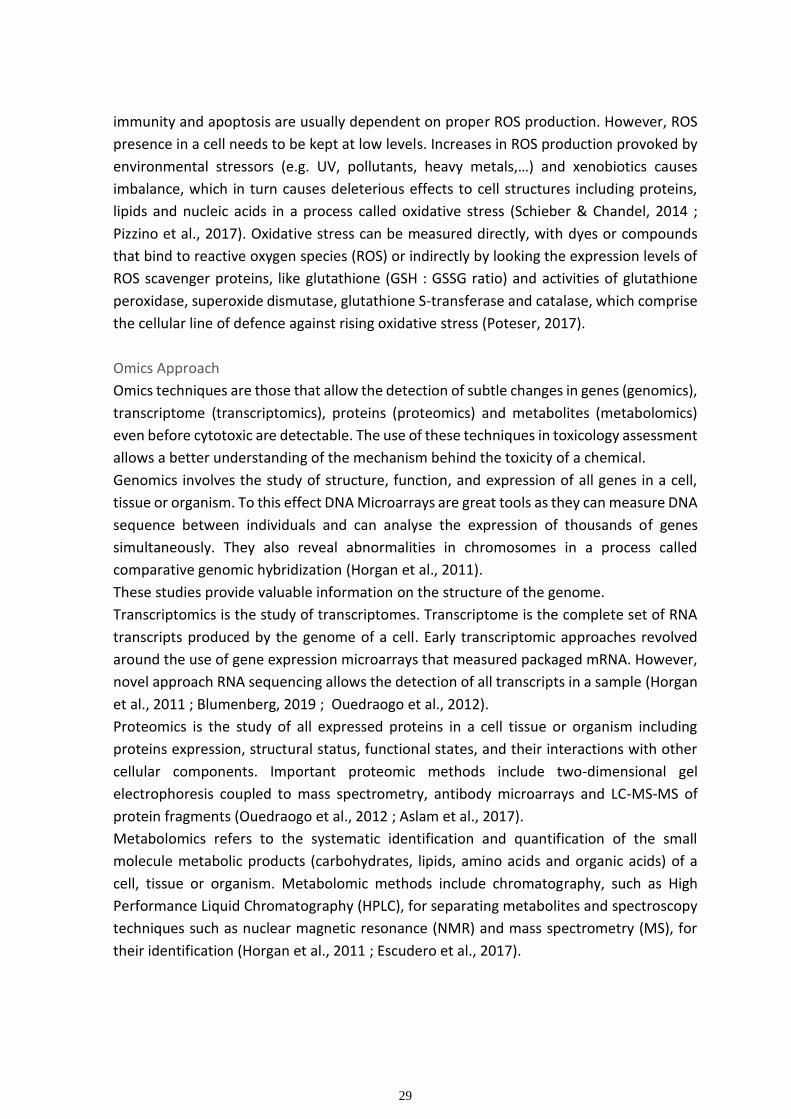
29
immunity and apoptosis are usually dependent on proper ROS production. However, ROS
presence in a cell needs to be kept at low levels. Increases in ROS production provoked by
environmental stressors (e.g. UV, pollutants, heavy metals,…) and xenobiotics causes
imbalance, which in turn causes deleterious effects to cell structures including proteins,
lipids and nucleic acids in a process called oxidative stress (Schieber & Chandel, 2014 ;
Pizzino et al., 2017). Oxidative stress can be measured directly, with dyes or compounds
that bind to reactive oxygen species (ROS) or indirectly by looking the expression levels of
ROS scavenger proteins, like glutathione (GSH : GSSG ratio) and activities of glutathione
peroxidase, superoxide dismutase, glutathione S-transferase and catalase, which comprise
the cellular line of defence against rising oxidative stress (Poteser, 2017).
Omics Approach
Omics techniques are those that allow the detection of subtle changes in genes (genomics),
transcriptome (transcriptomics), proteins (proteomics) and metabolites (metabolomics)
even before cytotoxic are detectable. The use of these techniques in toxicology assessment
allows a better understanding of the mechanism behind the toxicity of a chemical.
Genomics involves the study of structure, function, and expression of all genes in a cell,
tissue or organism. To this effect DNA Microarrays are great tools as they can measure DNA
sequence between individuals and can analyse the expression of thousands of genes
simultaneously. They also reveal abnormalities in chromosomes in a process called
comparative genomic hybridization (Horgan et al., 2011).
These studies provide valuable information on the structure of the genome.
Transcriptomics is the study of transcriptomes. Transcriptome is the complete set of RNA
transcripts produced by the genome of a cell. Early transcriptomic approaches revolved
around the use of gene expression microarrays that measured packaged mRNA. However,
novel approach RNA sequencing allows the detection of all transcripts in a sample (Horgan
et al., 2011 ; Blumenberg, 2019 ; Ouedraogo et al., 2012).
Proteomics is the study of all expressed proteins in a cell tissue or organism including
proteins expression, structural status, functional states, and their interactions with other
cellular components. Important proteomic methods include two-dimensional gel
electrophoresis coupled to mass spectrometry, antibody microarrays and LC-MS-MS of
protein fragments (Ouedraogo et al., 2012 ; Aslam et al., 2017).
Metabolomics refers to the systematic identification and quantification of the small
molecule metabolic products (carbohydrates, lipids, amino acids and organic acids) of a
cell, tissue or organism. Metabolomic methods include chromatography, such as High
Performance Liquid Chromatography (HPLC), for separating metabolites and spectroscopy
techniques such as nuclear magnetic resonance (NMR) and mass spectrometry (MS), for
their identification (Horgan et al., 2011 ; Escudero et al., 2017).
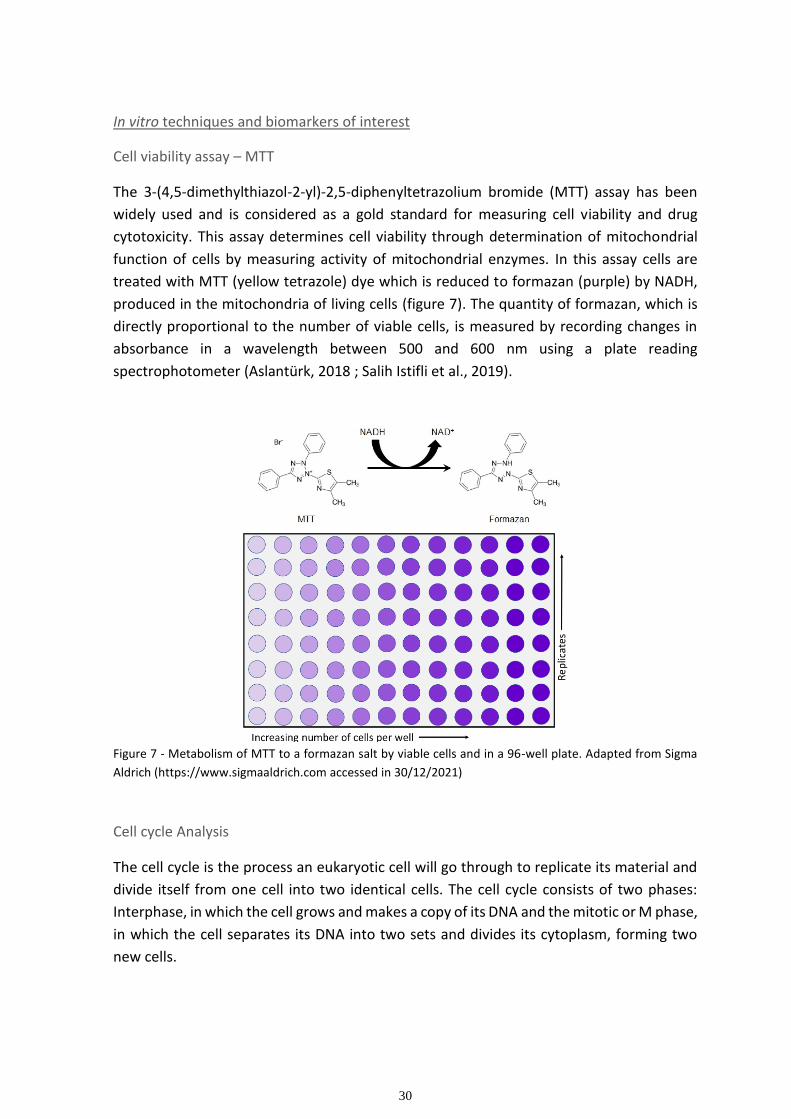
30
In vitro techniques and biomarkers of interest
Cell viability assay – MTT
The 3-(4,5-dimethylthiazol-2-yl)-2,5-diphenyltetrazolium bromide (MTT) assay has been
widely used and is considered as a gold standard for measuring cell viability and drug
cytotoxicity. This assay determines cell viability through determination of mitochondrial
function of cells by measuring activity of mitochondrial enzymes. In this assay cells are
treated with MTT (yellow tetrazole) dye which is reduced to formazan (purple) by NADH,
produced in the mitochondria of living cells (figure 7). The quantity of formazan, which is
directly proportional to the number of viable cells, is measured by recording changes in
absorbance in a wavelength between 500 and 600 nm using a plate reading
spectrophotometer (Aslantürk, 2018 ; Salih Istifli et al., 2019).
Figure 7 - Metabolism of MTT to a formazan salt by viable cells and in a 96-well plate. Adapted from Sigma
Aldrich (https://www.sigmaaldrich.com accessed in 30/12/2021)
Cell cycle Analysis
The cell cycle is the process an eukaryotic cell will go through to replicate its material and
divide itself from one cell into two identical cells. The cell cycle consists of two phases:
Interphase, in which the cell grows and makes a copy of its DNA and the mitotic or M phase,
in which the cell separates its DNA into two sets and divides its cytoplasm, forming two
new cells.
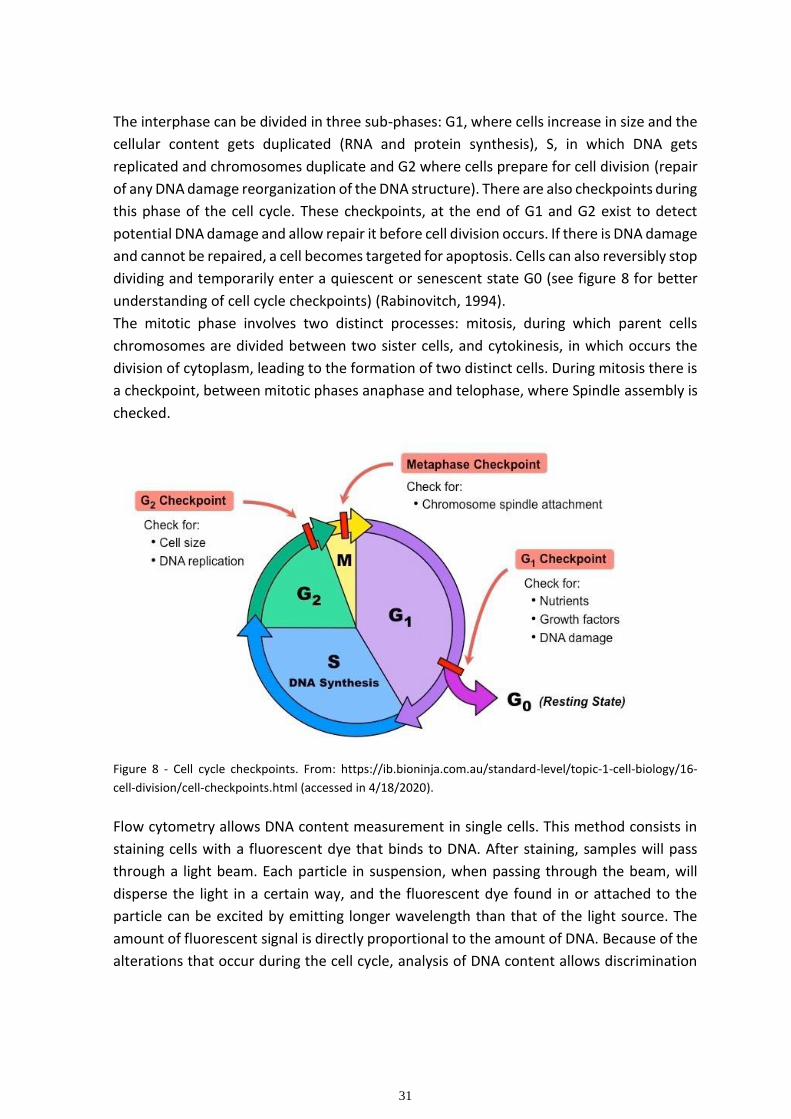
31
The interphase can be divided in three sub-phases: G1, where cells increase in size and the
cellular content gets duplicated (RNA and protein synthesis), S, in which DNA gets
replicated and chromosomes duplicate and G2 where cells prepare for cell division (repair
of any DNA damage reorganization of the DNA structure). There are also checkpoints during
this phase of the cell cycle. These checkpoints, at the end of G1 and G2 exist to detect
potential DNA damage and allow repair it before cell division occurs. If there is DNA damage
and cannot be repaired, a cell becomes targeted for apoptosis. Cells can also reversibly stop
dividing and temporarily enter a quiescent or senescent state G0 (see figure 8 for better
understanding of cell cycle checkpoints) (Rabinovitch, 1994).
The mitotic phase involves two distinct processes: mitosis, during which parent cells
chromosomes are divided between two sister cells, and cytokinesis, in which occurs the
division of cytoplasm, leading to the formation of two distinct cells. During mitosis there is
a checkpoint, between mitotic phases anaphase and telophase, where Spindle assembly is
checked.
Figure 8 - Cell cycle checkpoints. From: https://ib.bioninja.com.au/standard-level/topic-1-cell-biology/16-
cell-division/cell-checkpoints.html (accessed in 4/18/2020).
Flow cytometry allows DNA content measurement in single cells. This method consists in
staining cells with a fluorescent dye that binds to DNA. After staining, samples will pass
through a light beam. Each particle in suspension, when passing through the beam, will
disperse the light in a certain way, and the fluorescent dye found in or attached to the
particle can be excited by emitting longer wavelength than that of the light source. The
amount of fluorescent signal is directly proportional to the amount of DNA. Because of the
alterations that occur during the cell cycle, analysis of DNA content allows discrimination
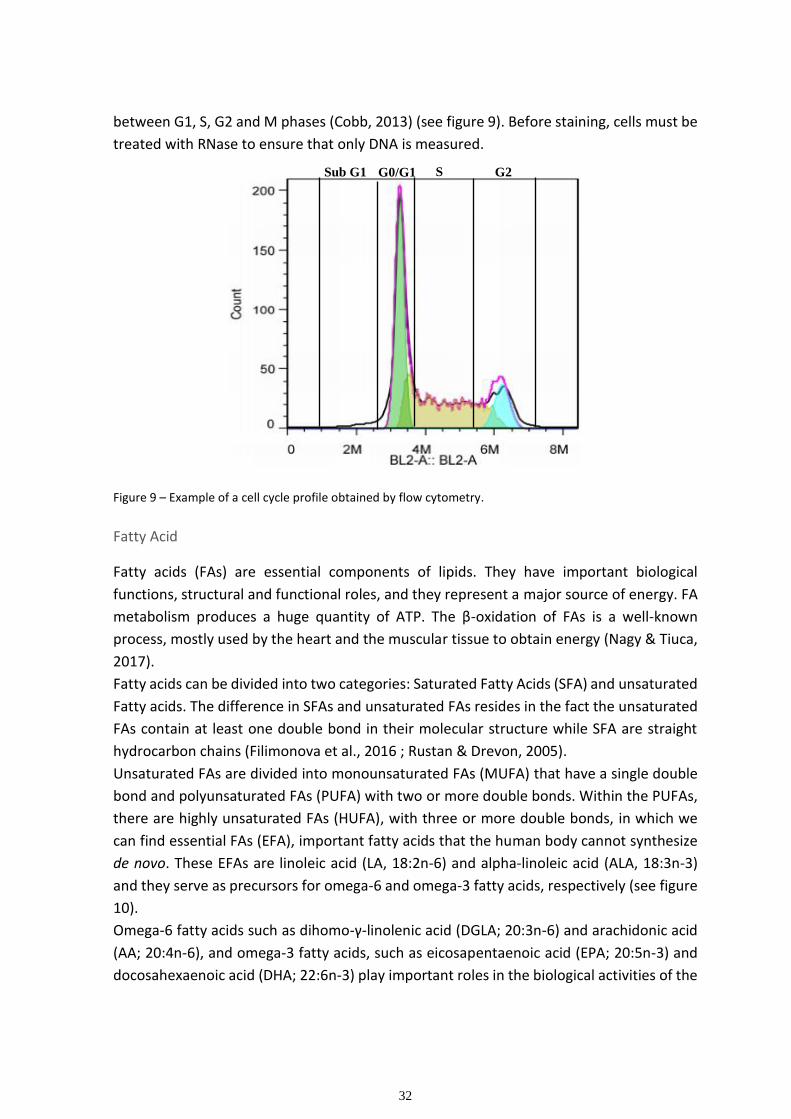
32
between G1, S, G2 and M phases (Cobb, 2013) (see figure 9). Before staining, cells must be
treated with RNase to ensure that only DNA is measured.
Figure 9 – Example of a cell cycle profile obtained by flow cytometry.
Fatty Acid
Fatty acids (FAs) are essential components of lipids. They have important biological
functions, structural and functional roles, and they represent a major source of energy. FA
metabolism produces a huge quantity of ATP. The β-oxidation of FAs is a well-known
process, mostly used by the heart and the muscular tissue to obtain energy (Nagy & Tiuca,
2017).
Fatty acids can be divided into two categories: Saturated Fatty Acids (SFA) and unsaturated
Fatty acids. The difference in SFAs and unsaturated FAs resides in the fact the unsaturated
FAs contain at least one double bond in their molecular structure while SFA are straight
hydrocarbon chains (Filimonova et al., 2016 ; Rustan & Drevon, 2005).
Unsaturated FAs are divided into monounsaturated FAs (MUFA) that have a single double
bond and polyunsaturated FAs (PUFA) with two or more double bonds. Within the PUFAs,
there are highly unsaturated FAs (HUFA), with three or more double bonds, in which we
can find essential FAs (EFA), important fatty acids that the human body cannot synthesize
de novo. These EFAs are linoleic acid (LA, 18:2n-6) and alpha-linoleic acid (ALA, 18:3n-3)
and they serve as precursors for omega-6 and omega-3 fatty acids, respectively (see figure
10).
Omega-6 fatty acids such as dihomo-γ-linolenic acid (DGLA; 20:3n-6) and arachidonic acid
(AA; 20:4n-6), and omega-3 fatty acids, such as eicosapentaenoic acid (EPA; 20:5n-3) and
docosahexaenoic acid (DHA; 22:6n-3) play important roles in the biological activities of the
Sub G1
G0/G1
S
G2
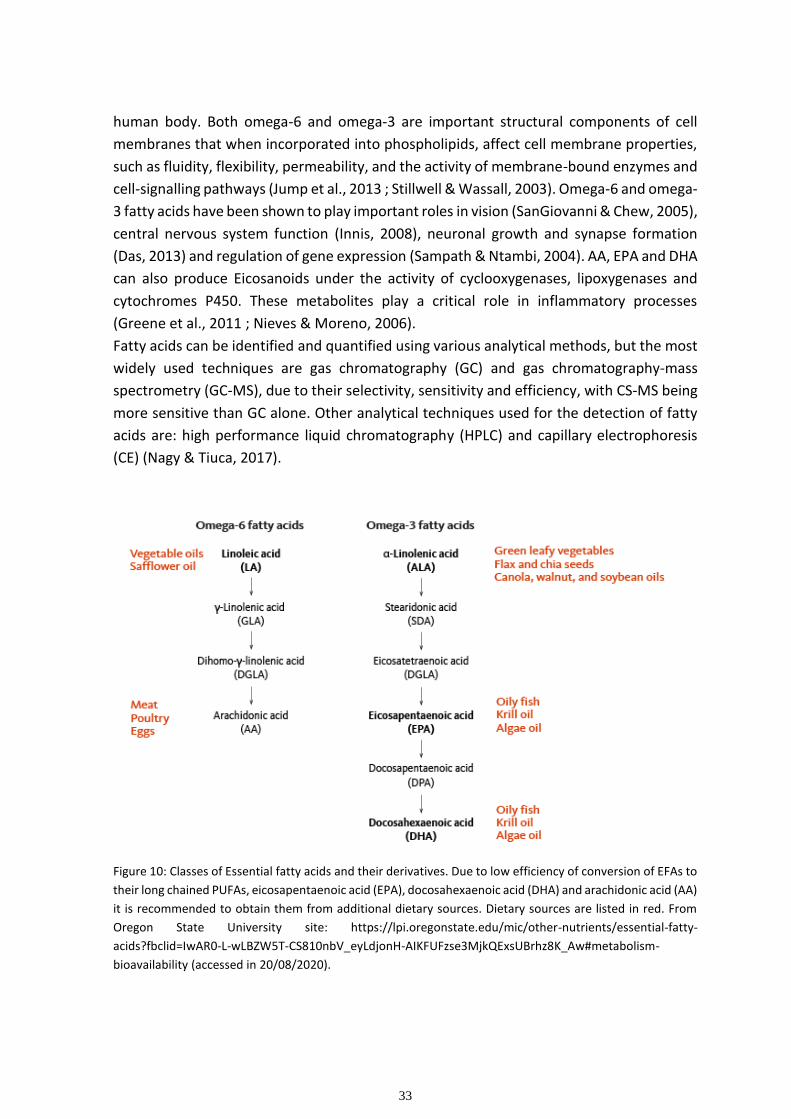
33
human body. Both omega-6 and omega-3 are important structural components of cell
membranes that when incorporated into phospholipids, affect cell membrane properties,
such as fluidity, flexibility, permeability, and the activity of membrane-bound enzymes and
cell-signalling pathways (Jump et al., 2013 ; Stillwell & Wassall, 2003). Omega-6 and omega-
3 fatty acids have been shown to play important roles in vision (SanGiovanni & Chew, 2005),
central nervous system function (Innis, 2008), neuronal growth and synapse formation
(Das, 2013) and regulation of gene expression (Sampath & Ntambi, 2004). AA, EPA and DHA
can also produce Eicosanoids under the activity of cyclooxygenases, lipoxygenases and
cytochromes P450. These metabolites play a critical role in inflammatory processes
(Greene et al., 2011 ; Nieves & Moreno, 2006).
Fatty acids can be identified and quantified using various analytical methods, but the most
widely used techniques are gas chromatography (GC) and gas chromatography-mass
spectrometry (GC-MS), due to their selectivity, sensitivity and efficiency, with CS-MS being
more sensitive than GC alone. Other analytical techniques used for the detection of fatty
acids are: high performance liquid chromatography (HPLC) and capillary electrophoresis
(CE) (Nagy & Tiuca, 2017).
Figure 10: Classes of Essential fatty acids and their derivatives. Due to low efficiency of conversion of EFAs to
their long chained PUFAs, eicosapentaenoic acid (EPA), docosahexaenoic acid (DHA) and arachidonic acid (AA)
it is recommended to obtain them from additional dietary sources. Dietary sources are listed in red. From
Oregon State University site: https://lpi.oregonstate.edu/mic/other-nutrients/essential-fatty-
acids?fbclid=IwAR0-L-wLBZW5T-CS810nbV_eyLdjonH-AIKFUFzse3MjkQExsUBrhz8K_Aw#metabolism-
bioavailability (accessed in 20/08/2020).
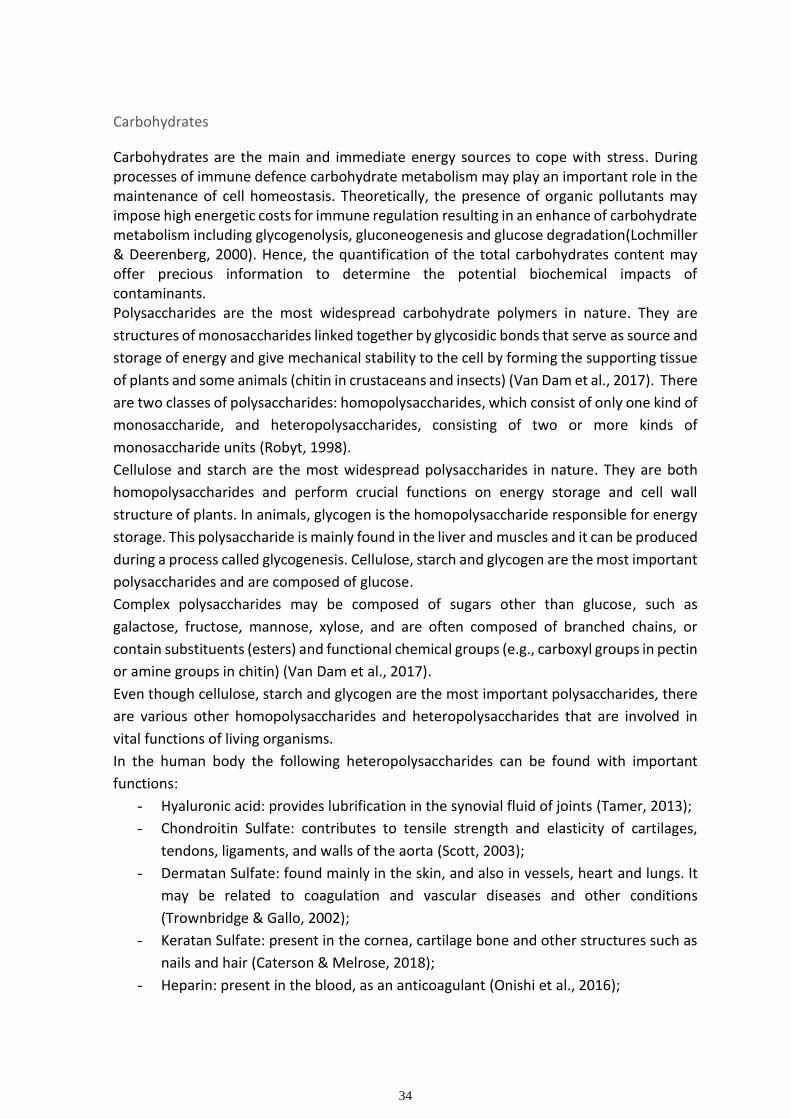
34
Carbohydrates
Carbohydrates are the main and immediate energy sources to cope with stress. During processes of immune defence carbohydrate metabolism may play an important role in the maintenance of cell homeostasis. Theoretically, the presence of organic pollutants may impose high energetic costs for immune regulation resulting in an enhance of carbohydrate metabolism including glycogenolysis, gluconeogenesis and glucose degradation(Lochmiller & Deerenberg, 2000). Hence, the quantification of the total carbohydrates content may offer precious information to determine the potential biochemical impacts of contaminants. Polysaccharides are the most widespread carbohydrate polymers in nature. They are
structures of monosaccharides linked together by glycosidic bonds that serve as source and
storage of energy and give mechanical stability to the cell by forming the supporting tissue
of plants and some animals (chitin in crustaceans and insects) (Van Dam et al., 2017). There
are two classes of polysaccharides: homopolysaccharides, which consist of only one kind of
monosaccharide, and heteropolysaccharides, consisting of two or more kinds of
monosaccharide units (Robyt, 1998).
Cellulose and starch are the most widespread polysaccharides in nature. They are both
homopolysaccharides and perform crucial functions on energy storage and cell wall
structure of plants. In animals, glycogen is the homopolysaccharide responsible for energy
storage. This polysaccharide is mainly found in the liver and muscles and it can be produced
during a process called glycogenesis. Cellulose, starch and glycogen are the most important
polysaccharides and are composed of glucose.
Complex polysaccharides may be composed of sugars other than glucose, such as
galactose, fructose, mannose, xylose, and are often composed of branched chains, or
contain substituents (esters) and functional chemical groups (e.g., carboxyl groups in pectin
or amine groups in chitin) (Van Dam et al., 2017).
Even though cellulose, starch and glycogen are the most important polysaccharides, there
are various other homopolysaccharides and heteropolysaccharides that are involved in
vital functions of living organisms.
In the human body the following heteropolysaccharides can be found with important
functions:
- Hyaluronic acid: provides lubrification in the synovial fluid of joints (Tamer, 2013);
- Chondroitin Sulfate: contributes to tensile strength and elasticity of cartilages,
tendons, ligaments, and walls of the aorta (Scott, 2003);
- Dermatan Sulfate: found mainly in the skin, and also in vessels, heart and lungs. It
may be related to coagulation and vascular diseases and other conditions
(Trownbridge & Gallo, 2002);
- Keratan Sulfate: present in the cornea, cartilage bone and other structures such as
nails and hair (Caterson & Melrose, 2018);
- Heparin: present in the blood, as an anticoagulant (Onishi et al., 2016);
35
The fact that polysaccharides are hydrophilic and sensitive to aqueous acid allows the
determination of their sugar concentrations by measuring the monosaccharides liberated
after acid hydrolysis (Van Dam et al., 2017 ; Borch & Kirchman, 1997).
Like fatty acids, carbohydrates can also be identified and quantified by GC, GC-MS, HPLC
and capillary electrophoresis (Bradbury, 1990 ; Goubet et al., 2011).
Cell lines of interest
HaCaT
One of the most common ways of pesticide poisoning is through skin contact. Therefore,
skin cell lines constitute appropriate in vitro models to study toxic effects of these
chemicals. The innermost layer of the epidermis mainly consists of keratinocyte cells.
Keratinocytes secrete keratin proteins which contribute to the skin's functional and
mechanical properties (Karthik et al., 2019). Damage to Keratinocytes may compromise the
integrity of the skin. HaCaT cell line is a nontumorigenic immortalized human keratinocyte
cell line that can be keep in continuous proliferation for over 140 passages without
affecting its capacity for normal differentiation, thus offering a suitable model to study
regulatory mechanisms in the process of differentiation of human epidermal cells.
(Boukamp, 1988).
HaCaT cells have been used in immunological and inflammatory response studies (Colombo
et al., 2017), in studies involving vitamin D3 metabolism (Lehmann, 1997), gene expression
studies (Seo et al., 2012), cytotoxicity studies (Hoh & Maier, 1993), skin sensitization tests
(Chung et al., 2018), among others.
HepG2
The liver is the major responsible organ for the biotransformation of endogenous and
exogenous xenobiotics, thus becoming a major target of these compounds. Therefore,
there is a need of using cell lines that mimic the function of normal human liver cells in the
assessment of xenobiotic toxicity.
HepG2 is a Human hepatoma cell line established from liver tumour biopsies obtained
during extended lobectomy of a 15-year-old Caucasian male in Argentina in 1975. This cell
line was isolated along with Hep3B by Aden et al., (1979). Because these cells express the
majority of biotransformation/drug-metabolizing enzymes and secrete major plasma
proteins found in the liver, like albumin, α2-macroglobulin, α1-antitrypsin, transferrin, and
plasminogen, they are extensively used as cellular reference models in pharmaceutical and
toxicological studies that aim to gain insight into drug metabolism (Bakre & Kaliwal, 2017 ;
Knasmüller et al., 1998 ; Qiu et al., 2014).
36
In toxicology this cell line has been used to assess cytotoxicity and genotoxicity of
xenobiotics (Juan-García et al., 2019), study liver disease mechanics (García-Ruiz et al.,
2015), allow drug toxicity mechanisms understanding (Duthie et al., 1995 ; Usui et al., 2003)
and give insights of transcriptional l regulation (Convertini et al., 2019) and gene expression
(Costantini et al., 2013).
A study made by Nikoloff et al., (2013) used this cell line to compare cytotoxic and
genotoxic effects induced by our target active ingredient S-metolachlor and the effects of
one of its commercial formulations Twin Pack Gold. In this study S-metolachlor did not
show reduction of mitochondrial or lysosomal activity nor it produced genotoxic effects.
1.7 Aims of study
The main aim of this thesis is to assess the hazardous effects of Primextra® Gold TZ and its
main active ingredient S-metolachlor in liver and skin, by using cell lines that mimic these
organs (HepG2 and HaCaT, respectively).
Therefore, this thesis can be divided in the following specific objectives:
- To evaluate the effects of the exposure to the herbicides on cell viability by
assessing metabolic activity;
- To determine the effects of the herbicides on the cell cycle arrest induction by the
herbicides;
- To characterize the fatty acid and carbohydrate profiles of both cell lines after
exposure to the commercial compound and the a.i.;
- To assess potential biochemical changes in fatty acid and carbohydrate composition
induced by the herbicides.
37
2. Materials and methods
Dulbecco's modified Eagle's medium (DMEM), fetal bovine serum (FBS), Pen/strep,
fungizone, L-glutamine, sodium pyruvate, phosphate buffer saline (PBS, pH 7.4) and
trypsin-ethylenedieminetetraacetic acid (trypsin-EDTA) were purchased from Life
Technologies (Carlsbad, CA, USA). 3-(4,5-dimethylthiazol-2-yl)-2,5 diphenyltetrazolium
bromide (MTT) and dimethyl sulfoxide (DMSO), RNase and propidium iodide (PI) were
obtained from Sigma-Aldrich (St. Louis, MO, USA).
HaCaT cell line was obtained from Cell Lines Services (Eppelheim, Germany) and HepG2 cell
line was obtained from European Collection of Authenticated Cell Cultures and were also
supplied by Sigma-Aldrich.
2.1 Cell culture maintenance
Both cell lines were grown in high glucose DMEM medium supplemented with FBS (10%),
Fungizone (1 %), Pen/strep (1 %), Glutamine (1%) and Sodium Pyruvate 1 % in 75 cm2-
flasks, at 37 ºC in 5% CO2 humidified atmosphere.
Subculture was performed when cells reached 80% confluence. For HepG2 cell line after
removal of the culture medium, cells were washed with PBS (pH 7.4) and incubated with
trypsin/EDTA at 37 ºC in 5% CO2 humidified atmosphere, for 5 min. Trypsin was then
neutralized by adding complete DMEM in a volume two times higher the volume of
trypsin/EDTA. Cells were counted and re-seeded in a ratio of 1:8. Cells were subcultured
every 3 to 4 days. For HaCaT cells, similar procedure was followed, except that before
adding the trypsin, cells were incubated with PBS/EDTA, at 37 ºC in 5% CO2 humidified
atmosphere, for 10 min.
2.2 Cell viability assay - MTT
MTT assay protocol Cell viability was determined by the colorimetric 3-(4,5- dimethyl-2-thiazolyl)-2,5-diphenyl
tetrazolium bromide (MTT) assay. Briefly, HepG2 Cells were seeded at a density of 1.8x10⁵
cells/ml, in 96-well plates, for 24 hours assays and at a density of 1 x 10⁵ cells/ml for the 48
hours assays. HaCaT cells were seeded at a density of 6x10⁴ cells/ml, in 96-well plates, for
24 hours assay and at a density of 5 x 10⁴ cells/ml for 48 hours assay.
After 24 hours cells had completely adhered to the plate and the medium was replaced
with control and treatments of Primextra® Gold TZ or S-metolachlor at a concentration
range of 0.5 to 80 µL/ml (0.5, 0.1, 2.5, 5, 10, 20, 40 and 80). In control cells medium was
replaced by fresh medium. After 24 or 48 h exposure, 50 µl of MTT were added and the
plate was incubated at 37 ºC in 5% CO2 humidified atmosphere for an additional 4 h period.
38
Then, 150 µl of DMSO were added and the plate was shaken for 2 hours. After that, the
absorbance at 570 nm was measured with a microplate reader (Synergy HT Multi-Mode,
BioTeK, Winooski, VT). Results of MTT assay are expressed as the mean percentage of cell
viability from three independent experiments performed in parallel with 5 replicates each.
Metabolic activity was calculated using the following formula:
Metabolic activity % =A570 of treatment x 100
A570 of control
Statistical Analysis A bar chart was made using the results reported as mean ± standard deviation of the 5
replicates in each of the 3 independent experiments and the statistical significance
between control and treatments was performed by one-way ANOVA, followed by
Dunnett’s test using Sigma Plot 12.5 software (Systat Software Inc.). Differences were
considered significant when the p value was lower than 0.05. IC50 and IC30 concentrations
were calculated based on the cell viability results for further experiments.
2.3 Cell cycle Assay
Cell cycle Protocol Cell cycle arrest was assessed by flow cytometry. Briefly, Cells were plated at a density of
5x10⁵ cells/well in HepG2 and 2x10⁵ cells/well in HaCaT in 6-well plates with 3 replicates
per concentration plus control and incubated 24 hours at 37ºC, 5 % CO2. Cells were
exposed to Primextra® Gold TZ or S-metolachlor at IC30 and IC50 concentrations and then
incubated at 37ºC, with 5 % CO2 for 48h. Trypsinization was performed as described above.
After that, cells were collected to eppendorfs and centrifuged at 700 g for 5 minutes. The
supernatant was then discarded, and cells were fixed with 1 ml of cold ethanol at 85% and
stored at -20ºC until analysis. At the time of analysis fixed cells were centrifuged at 3000
rpm for 6 min at 4ºC. The supernatant was then discarded, and the cells resuspended in
800 µl of PBS. After that 50 µl of RNase (1 mg/ml) and 50ul of Pl (1 mg/mL) were added.
Samples were incubated for 15 min in the dark at room temperature and then run through
and Relative fluorescence intensity was measured in an Attune® Acoustic Focusing
Cytometer (TermoFisher Scientific) equipped with an argon laser – 15 mW, 488 nm to
measure its relative fluorescence intensity. For each sample, the number of events reached
approximately 5000. Debris and doublets were excluded by the definition of the specific
region (Area vs. FL peak height). For each sample approximately 5000 nuclei were analyzed.
Cell cycle analysis was then conducted based on the histogram outputs.
39
Statistical Analysis A bar chart was made using the results reported as mean ± standard deviation of the 3
replicates in each of the 3 independent experiments. The statistical significance between
control and treatments was performed by one-way ANOVA, followed by Dunnett’s test
using Sigma Plot 12.5 software (Systat Software Inc.). Differences were considered
significant when the p value was lower than 0.05.
2.4 Fatty acid and carbohydrate profile analysis
Preparation for lipid extraction For this assay, cells were grown in 150 cm2 Petri dishes for 2 to 3 days. When cells reached
80 % confluence, they were sub cultured at a ratio of 1:8 and incubated at 37ºC, with 5 %
CO2. After 24 hours the medium was removed and cells were exposed to IC30
concentrations of each compound, as well as fresh medium for control and further
incubated again for 48 hours. Then, the medium was removed, and the plate was washed
with PBS. Trypsinization was performed as mentioned above. After adding the medium,
cells were collected to 50 ml eppendorfs and centrifuged at 300 g for 5 minutes at 4ºC. The
supernatant was then discarded, and Neutral saline solution (NS) was added for another
centrifugation at the exact same conditions previously mentioned. These last steps were
repeated 3-4 times and after removing the supernatant for the last time, NS solution was
added, and samples were stored at -80ºC.
Fatty acid extraction protocol The total lipids of the samples were extracted and methylation to FA methyl esters
(FAMEs) was conducted following the methodology described by Gonçalves et al., (2012).
Methyl nonadecanoate (C19:0, Fluka 74208) was added to the samples as an internal
standard for later fatty acid methyl esters (FAMEs) quantification.
Separation and quantification of FAMEs were performed through gas chromatography
coupled with mass spectrometry (GC-MS), using an Agilent Technologies 6890 N Network
(Santa Clara, CA) with a DB-FFAP column (30 m x 0.25 mm x 0.1 µm). The injector port was
lined with a splitless glass liner of 4.0 mm i.d. . An Agilent 5973 Network Mass Selective
Detector at 70 eV electron impact mode and scanning the m/z range of 40–500 in 1 s cycle
in full scan mode acquisition was used. The initial oven temperature was 80 °C, following a
linear temperature increase of 25 °C min−1 to 160 °C, followed by another temperature
ramp of 2 °C min−1 to 190 °C and finally an increase of 40 °C min−1 until a final temperature
of 230 °C which was maintained for 5 min. Helium was the carrier gas, at a flow rate of 4.4
mL min−1 and 2.66 psi of column head pressure. The detector starts operating 4 min after
injection, corresponding to solvent delay. The injector and transfer line were maintained
at 220 °C and 280 °C, respectively. The equipment's software output a chromatogram and
allowed the integration of the peaks. Identification of each peak as a FAME was done by
40
retention time and mass spectrum of each FAME, in comparison with the Supelco® 37
component FAME mix (Sigma-Aldrich, Steinheim, Germany) and mass spectra from the
library (Willey). The calculation of the FAMEs content was performed as described in
Gonçalves et al. (2012).
Carbohydrate analysis Carbohydrate analysis comprised the quantification of polysaccharides (analysed in the
form of monosaccharides). For sugar extraction the lower layer after centrifugation in the
above-mentioned protocol for fatty acid extraction was used. Samples were subjected to
hydrolysis followed by reduction and acetylation, as described in Nunes et al., (2012).
Samples were run through a Perkin-Elmer – Clarus 400 gas chromatography equipment
equipped with a flame ionization detector (GC-FID). A DB-225 (30 m x 0.25 mm x 0.15 μm)
GC column was used, and oven was programmed to an initial temperature of 200 °C,
following a linear temperature increase at 40 °C min−1 to 220 °C, this temperature was
maintained for 7 min, after which followed another linear increase of 20 °C min−1 until the
final temperature of 230 °C, maintaining this temperature for 1 min. The carrier gas was
hydrogen at a flow rate of 1.7 mL/min. The monosaccharides quantification was performed
by comparison of the peaks from chromatogram to the peaks obtained for the internal
standard used, 2-deoxyglucose.
Statistical analysis Both Fatty acid and carbohydrate data were converted to proportional relative
abundances. Bar charts were made using the results reported as mean ± standard deviation
for both FA and sugar analysis. The statistical significance between control and treatments
was performed by one-way ANOVA, followed by Dunnett’s test using Sigma Plot 12.5
software (Systat Software Inc.). Differences were considered significant when the p value
was lower than 0.05.
Multivariate statistical analyses were carried out using PRIMER 7 software to study the
variation of FA profiles via non-metric multidimensional scaling (n-MDS) plots, using the
data converted into similarity triangular matrices through Bray Curtis resemblance
measures. A one-way analysis of similarity (ANOSIM) was performed for each chemical to
assess the grade of differences of FA contents between samples. To analyse the
contribution of individual FAs to similarities and dissimilarities within and between sample
groups, a similarity percentage (SIMPER) analysis routine was performed for each
compound. Ultimately, principal component analysis (PCA), was used to reduce the profiles
to interpretable bidimensional plots that explain the highest proportion of variation in the
data.
41
3. Results
3.1 Cell viability
MTT assay was used to evaluate cell viability upon exposure to Primextra® Gold TZ and S-
metolachlor. MTT assay results are expressed in percentage of metabolic activity which is
used as a measure of cell viability and proliferation.
Cell viability (figure 11) of the two cell lines when exposed to Primextra® Gold TZ was
significantly decreased (p≤0.001) for both 24- and 48-hour assays for all concentrations
tested.
As for cell viability upon exposure to S-metolachlor, HepG2 presented significant reduction
for all concentrations tested for 24h exposure and for concentrations from 20 µg/ml to 80
µg/ml for 48-hour exposure. Regarding the cell viability of HaCaT cells, exposure to S-
metolachlor induced a significant reduction for all concentrations tested.
Calculated values of Primextra® Gold TZ on HepG2 cells were of 136.26 µg/ml and 22.38
µg/ml for 24- and 48-hours assays, respectively. While for HaCaT cell line these values were
of 44.26 µg/ml and 12.37µg/ml. In S-metolachlor this tendency appeared once more, as
the LC50 values for this compound in HepG2 were of 739.30 µg/ml and 83.90 µg/ml and in
HaCaT were of 23.74 µg/ml and 12.28 µg/ml for 24 and 48 hours, respectively (see table 7
for LC values summary).
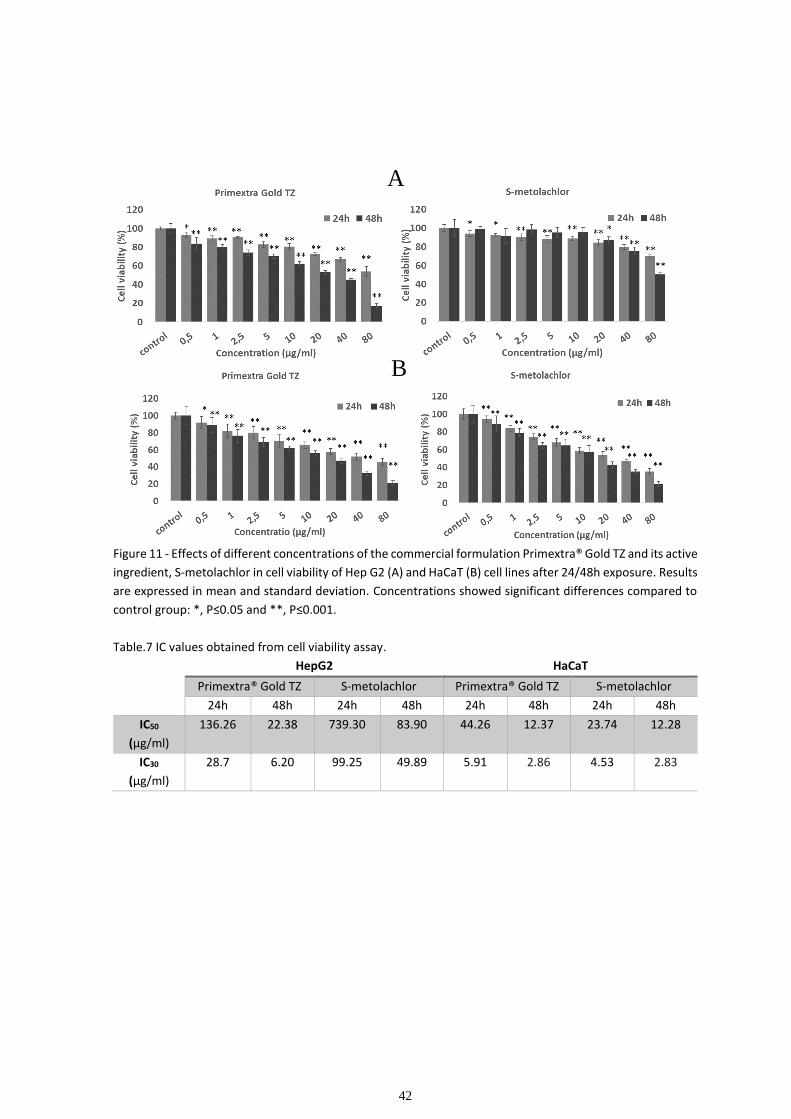
42
Figure 11 - Effects of different concentrations of the commercial formulation Primextra® Gold TZ and its active
ingredient, S-metolachlor in cell viability of Hep G2 (A) and HaCaT (B) cell lines after 24/48h exposure. Results
are expressed in mean and standard deviation. Concentrations showed significant differences compared to
control group: *, P≤0.05 and **, P≤0.001.
Table.7 IC values obtained from cell viability assay.
HepG2 HaCaT
Primextra® Gold TZ S-metolachlor Primextra® Gold TZ S-metolachlor
24h 48h 24h 48h 24h 48h 24h 48h
IC50
(µg/ml)
136.26 22.38 739.30 83.90 44.26 12.37
23.74 12.28
IC30
(µg/ml)
28.7 6.20
99.25 49.89
5.91 2.86 4.53 2.83
A
B
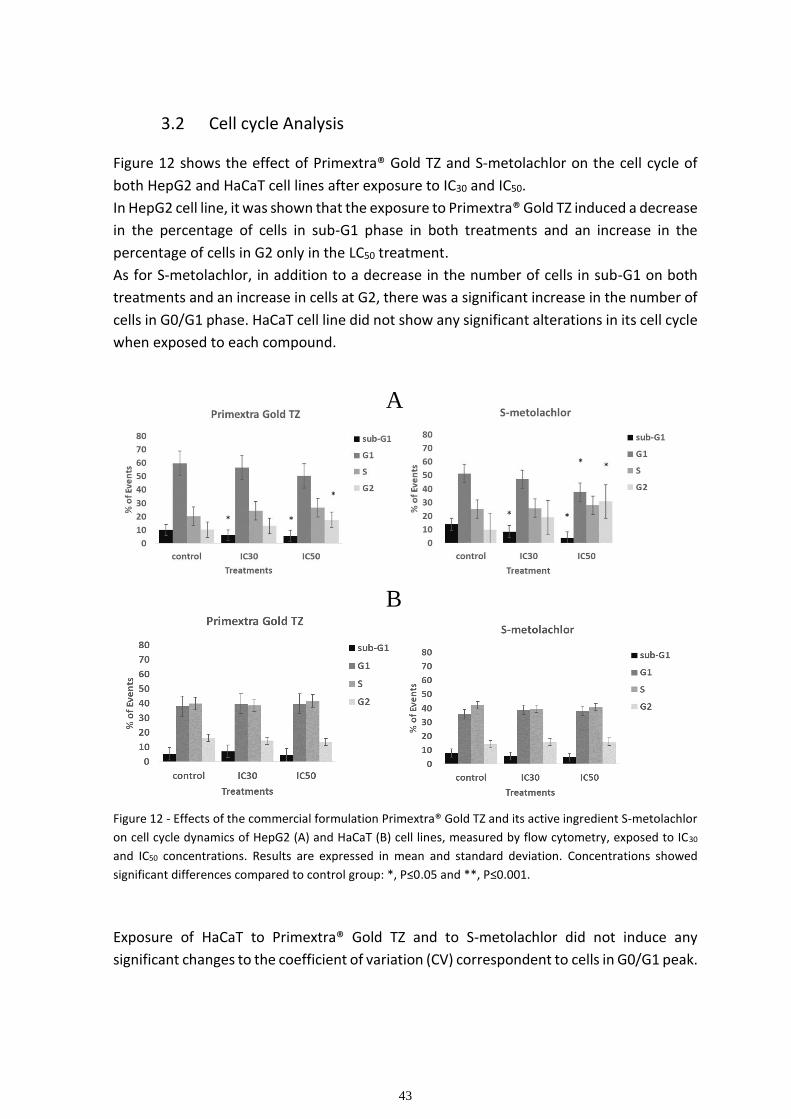
43
3.2 Cell cycle Analysis
Figure 12 shows the effect of Primextra® Gold TZ and S-metolachlor on the cell cycle of
both HepG2 and HaCaT cell lines after exposure to IC30 and IC50.
In HepG2 cell line, it was shown that the exposure to Primextra® Gold TZ induced a decrease
in the percentage of cells in sub-G1 phase in both treatments and an increase in the
percentage of cells in G2 only in the LC50 treatment.
As for S-metolachlor, in addition to a decrease in the number of cells in sub-G1 on both
treatments and an increase in cells at G2, there was a significant increase in the number of
cells in G0/G1 phase. HaCaT cell line did not show any significant alterations in its cell cycle
when exposed to each compound.
Figure 12 - Effects of the commercial formulation Primextra® Gold TZ and its active ingredient S-metolachlor
on cell cycle dynamics of HepG2 (A) and HaCaT (B) cell lines, measured by flow cytometry, exposed to IC30
and IC50 concentrations. Results are expressed in mean and standard deviation. Concentrations showed
significant differences compared to control group: *, P≤0.05 and **, P≤0.001.
Exposure of HaCaT to Primextra® Gold TZ and to S-metolachlor did not induce any
significant changes to the coefficient of variation (CV) correspondent to cells in G0/G1 peak.
A
B
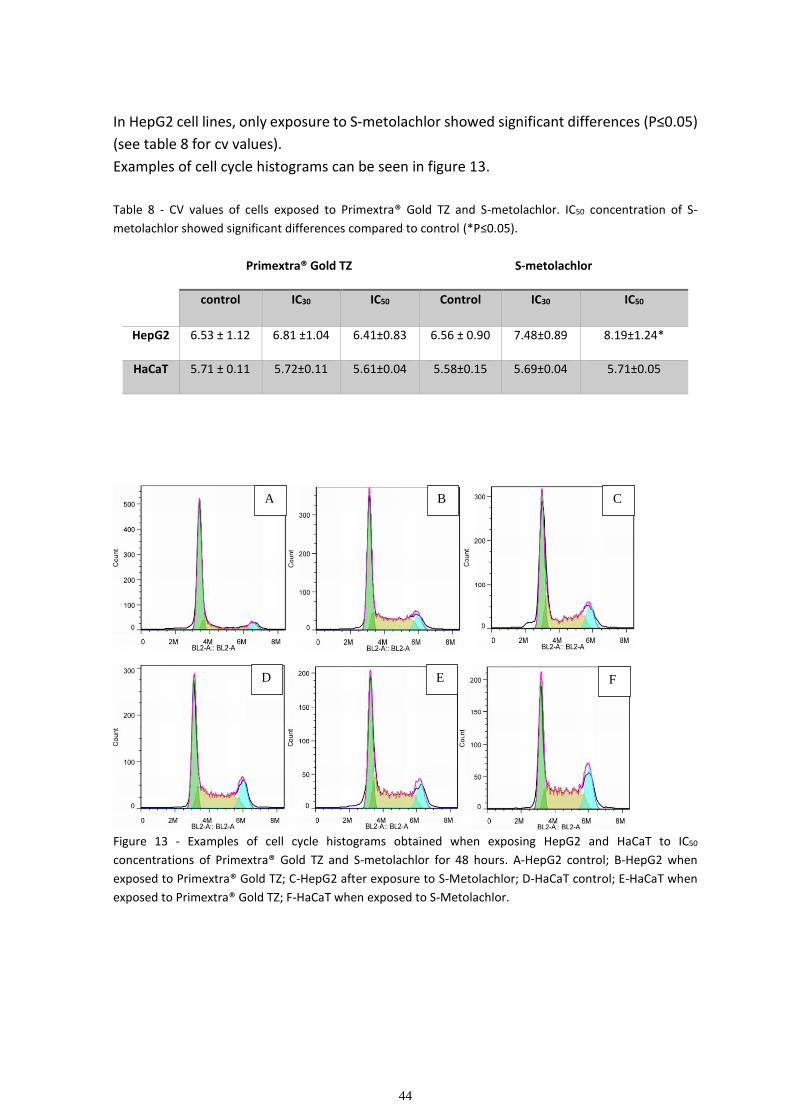
44
In HepG2 cell lines, only exposure to S-metolachlor showed significant differences (P≤0.05)
(see table 8 for cv values).
Examples of cell cycle histograms can be seen in figure 13.
Table 8 - CV values of cells exposed to Primextra® Gold TZ and S-metolachlor. IC50 concentration of S-
metolachlor showed significant differences compared to control (*P≤0.05).
Primextra® Gold TZ S-metolachlor
control IC30 IC50 Control IC30 IC50
HepG2 6.53 ± 1.12 6.81 ±1.04 6.41±0.83 6.56 ± 0.90 7.48±0.89 8.19±1.24*
HaCaT 5.71 ± 0.11 5.72±0.11 5.61±0.04 5.58±0.15 5.69±0.04 5.71±0.05
Figure 13 - Examples of cell cycle histograms obtained when exposing HepG2 and HaCaT to IC50
concentrations of Primextra® Gold TZ and S-metolachlor for 48 hours. A-HepG2 control; B-HepG2 when
exposed to Primextra® Gold TZ; C-HepG2 after exposure to S-Metolachlor; D-HaCaT control; E-HaCaT when
exposed to Primextra® Gold TZ; F-HaCaT when exposed to S-Metolachlor.
A B C
D E F
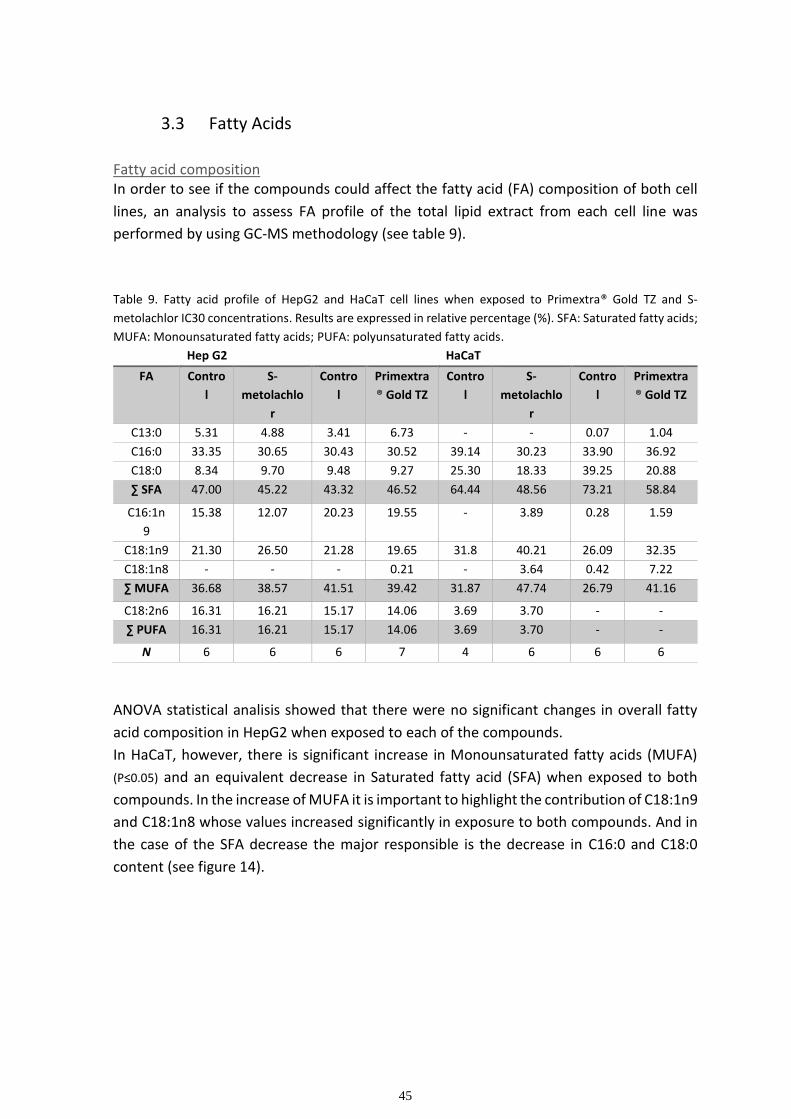
45
3.3 Fatty Acids
Fatty acid composition In order to see if the compounds could affect the fatty acid (FA) composition of both cell
lines, an analysis to assess FA profile of the total lipid extract from each cell line was
performed by using GC-MS methodology (see table 9).
Table 9. Fatty acid profile of HepG2 and HaCaT cell lines when exposed to Primextra® Gold TZ and S-
metolachlor IC30 concentrations. Results are expressed in relative percentage (%). SFA: Saturated fatty acids;
MUFA: Monounsaturated fatty acids; PUFA: polyunsaturated fatty acids.
Hep G2 HaCaT
FA Contro
l
S-
metolachlo
r
Contro
l
Primextra
® Gold TZ
Contro
l
S-
metolachlo
r
Contro
l
Primextra
® Gold TZ
C13:0 5.31 4.88 3.41 6.73 - - 0.07 1.04
C16:0 33.35 30.65 30.43 30.52 39.14 30.23 33.90 36.92
C18:0 8.34 9.70 9.48 9.27 25.30 18.33 39.25 20.88
∑ SFA 47.00 45.22 43.32 46.52 64.44 48.56 73.21 58.84
C16:1n
9
15.38 12.07 20.23 19.55 - 3.89 0.28 1.59
C18:1n9 21.30 26.50 21.28 19.65 31.8 40.21 26.09 32.35
C18:1n8 - - - 0.21 - 3.64 0.42 7.22
∑ MUFA 36.68 38.57 41.51 39.42 31.87 47.74 26.79 41.16
C18:2n6 16.31 16.21 15.17 14.06 3.69 3.70 - -
∑ PUFA 16.31 16.21 15.17 14.06 3.69 3.70 - -
N 6 6 6 7 4 6 6 6
ANOVA statistical analisis showed that there were no significant changes in overall fatty
acid composition in HepG2 when exposed to each of the compounds.
In HaCaT, however, there is significant increase in Monounsaturated fatty acids (MUFA)
(P≤0.05) and an equivalent decrease in Saturated fatty acid (SFA) when exposed to both
compounds. In the increase of MUFA it is important to highlight the contribution of C18:1n9
and C18:1n8 whose values increased significantly in exposure to both compounds. And in
the case of the SFA decrease the major responsible is the decrease in C16:0 and C18:0
content (see figure 14).
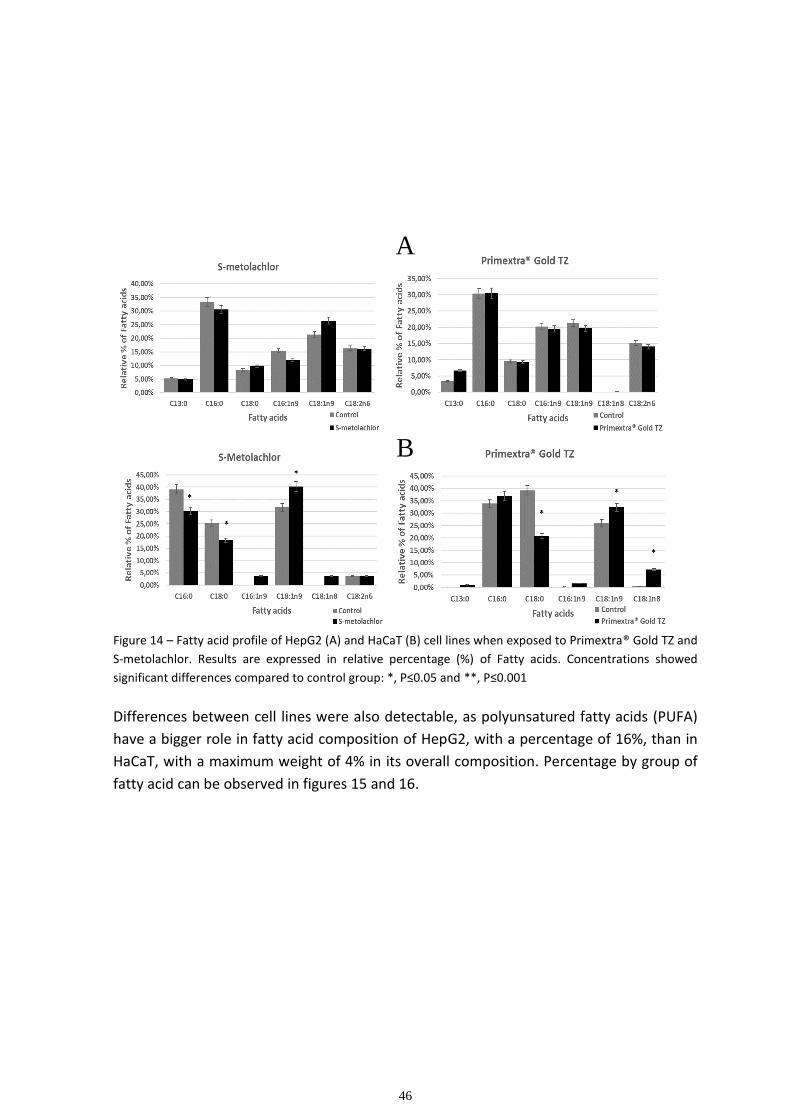
46
Figure 14 – Fatty acid profile of HepG2 (A) and HaCaT (B) cell lines when exposed to Primextra® Gold TZ and
S-metolachlor. Results are expressed in relative percentage (%) of Fatty acids. Concentrations showed
significant differences compared to control group: *, P≤0.05 and **, P≤0.001
Differences between cell lines were also detectable, as polyunsatured fatty acids (PUFA)
have a bigger role in fatty acid composition of HepG2, with a percentage of 16%, than in
HaCaT, with a maximum weight of 4% in its overall composition. Percentage by group of
fatty acid can be observed in figures 15 and 16.
A
B
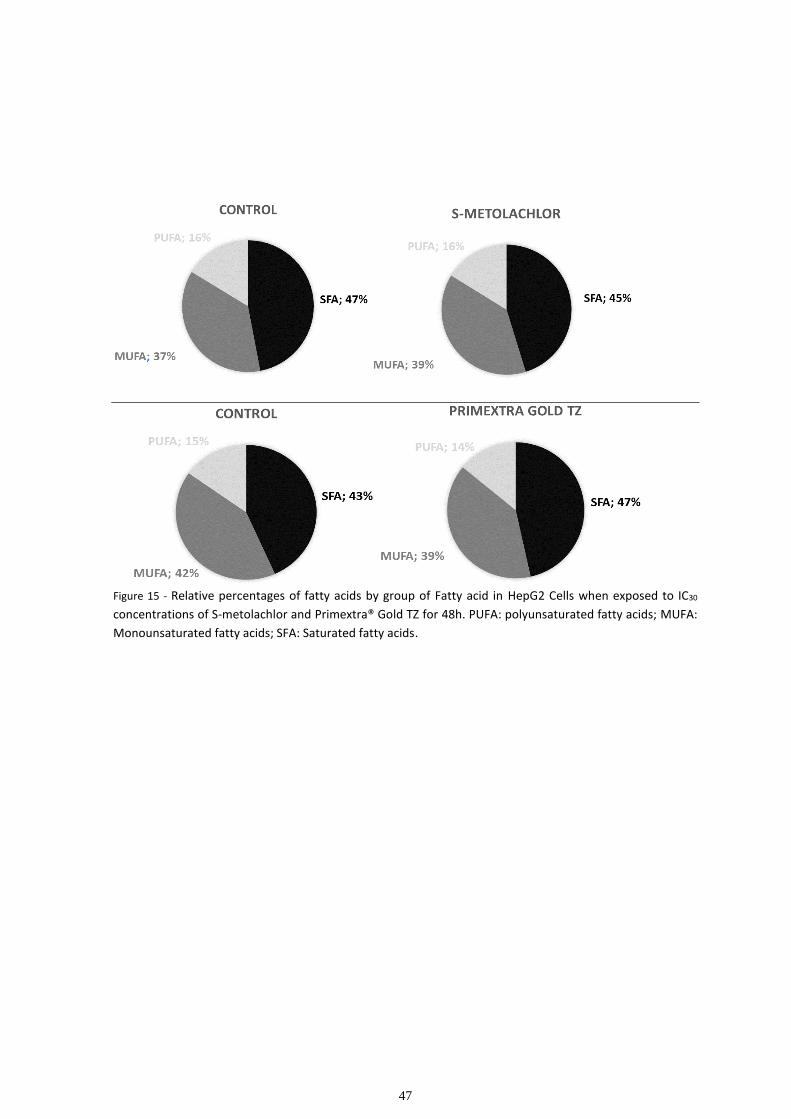
47
Figure 15 - Relative percentages of fatty acids by group of Fatty acid in HepG2 Cells when exposed to IC30
concentrations of S-metolachlor and Primextra® Gold TZ for 48h. PUFA: polyunsaturated fatty acids; MUFA:
Monounsaturated fatty acids; SFA: Saturated fatty acids.
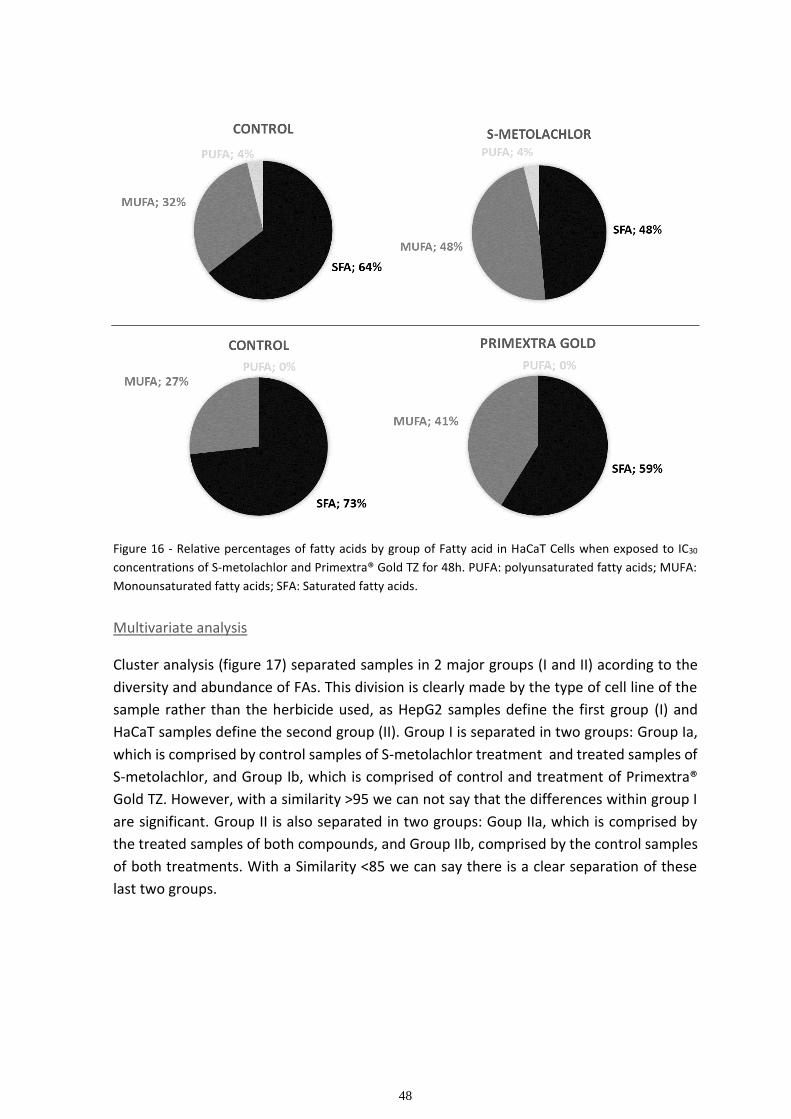
48
Figure 16 - Relative percentages of fatty acids by group of Fatty acid in HaCaT Cells when exposed to IC30
concentrations of S-metolachlor and Primextra® Gold TZ for 48h. PUFA: polyunsaturated fatty acids; MUFA:
Monounsaturated fatty acids; SFA: Saturated fatty acids.
Multivariate analysis
Cluster analysis (figure 17) separated samples in 2 major groups (I and II) acording to the
diversity and abundance of FAs. This division is clearly made by the type of cell line of the
sample rather than the herbicide used, as HepG2 samples define the first group (I) and
HaCaT samples define the second group (II). Group I is separated in two groups: Group Ia,
which is comprised by control samples of S-metolachlor treatment and treated samples of
S-metolachlor, and Group Ib, which is comprised of control and treatment of Primextra®
Gold TZ. However, with a similarity >95 we can not say that the differences within group I
are significant. Group II is also separated in two groups: Goup IIa, which is comprised by
the treated samples of both compounds, and Group IIb, comprised by the control samples
of both treatments. With a Similarity <85 we can say there is a clear separation of these
last two groups.
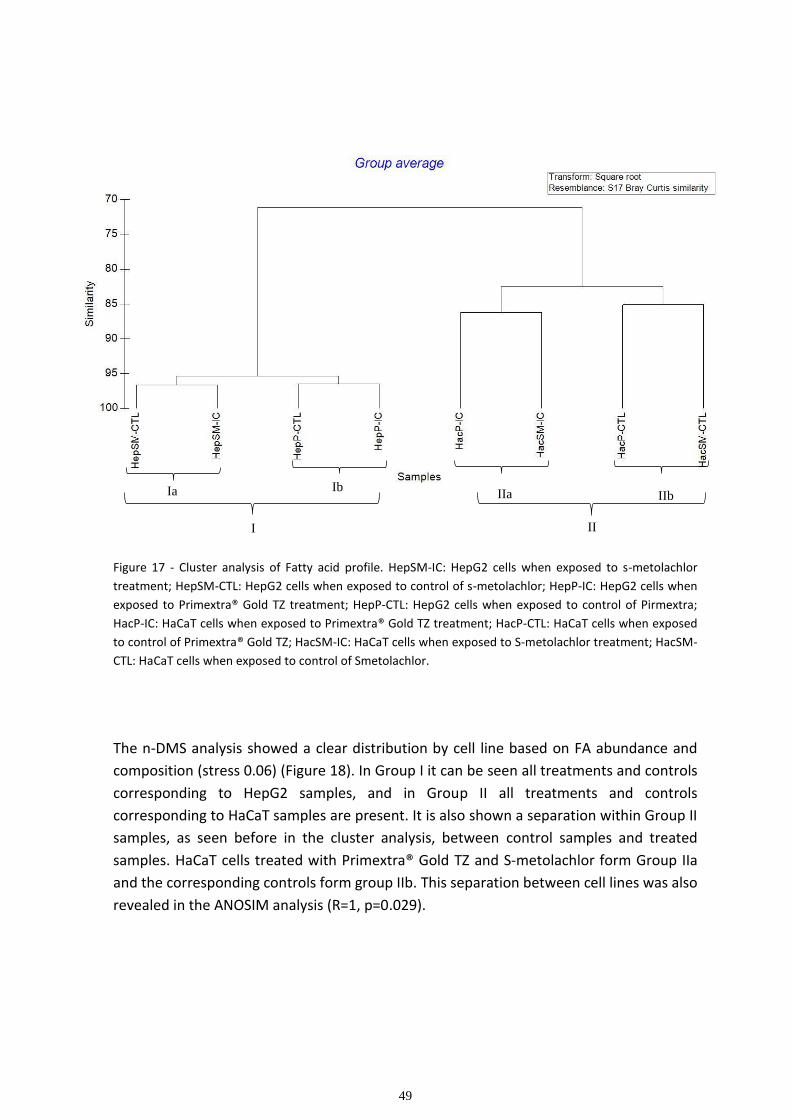
49
Figure 17 - Cluster analysis of Fatty acid profile. HepSM-IC: HepG2 cells when exposed to s-metolachlor
treatment; HepSM-CTL: HepG2 cells when exposed to control of s-metolachlor; HepP-IC: HepG2 cells when
exposed to Primextra® Gold TZ treatment; HepP-CTL: HepG2 cells when exposed to control of Pirmextra;
HacP-IC: HaCaT cells when exposed to Primextra® Gold TZ treatment; HacP-CTL: HaCaT cells when exposed
to control of Primextra® Gold TZ; HacSM-IC: HaCaT cells when exposed to S-metolachlor treatment; HacSM-
CTL: HaCaT cells when exposed to control of Smetolachlor.
The n-DMS analysis showed a clear distribution by cell line based on FA abundance and
composition (stress 0.06) (Figure 18). In Group I it can be seen all treatments and controls
corresponding to HepG2 samples, and in Group II all treatments and controls
corresponding to HaCaT samples are present. It is also shown a separation within Group II
samples, as seen before in the cluster analysis, between control samples and treated
samples. HaCaT cells treated with Primextra® Gold TZ and S-metolachlor form Group IIa
and the corresponding controls form group IIb. This separation between cell lines was also
revealed in the ANOSIM analysis (R=1, p=0.029).
IIa IIb
I II
Ib Ia
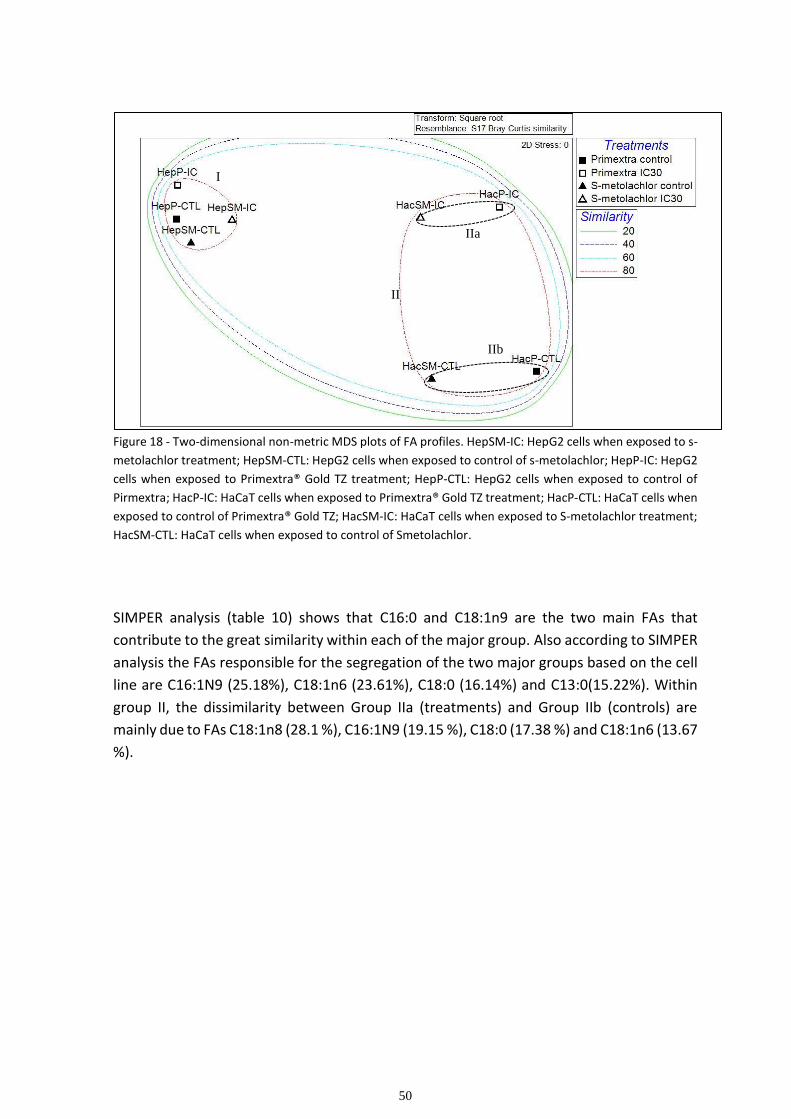
50
Figure 18 - Two-dimensional non-metric MDS plots of FA profiles. HepSM-IC: HepG2 cells when exposed to s-
metolachlor treatment; HepSM-CTL: HepG2 cells when exposed to control of s-metolachlor; HepP-IC: HepG2
cells when exposed to Primextra® Gold TZ treatment; HepP-CTL: HepG2 cells when exposed to control of
Pirmextra; HacP-IC: HaCaT cells when exposed to Primextra® Gold TZ treatment; HacP-CTL: HaCaT cells when
exposed to control of Primextra® Gold TZ; HacSM-IC: HaCaT cells when exposed to S-metolachlor treatment;
HacSM-CTL: HaCaT cells when exposed to control of Smetolachlor.
SIMPER analysis (table 10) shows that C16:0 and C18:1n9 are the two main FAs that
contribute to the great similarity within each of the major group. Also according to SIMPER
analysis the FAs responsible for the segregation of the two major groups based on the cell
line are C16:1N9 (25.18%), C18:1n6 (23.61%), C18:0 (16.14%) and C13:0(15.22%). Within
group II, the dissimilarity between Group IIa (treatments) and Group IIb (controls) are
mainly due to FAs C18:1n8 (28.1 %), C16:1N9 (19.15 %), C18:0 (17.38 %) and C18:1n6 (13.67
%).
I
II
IIb
IIa
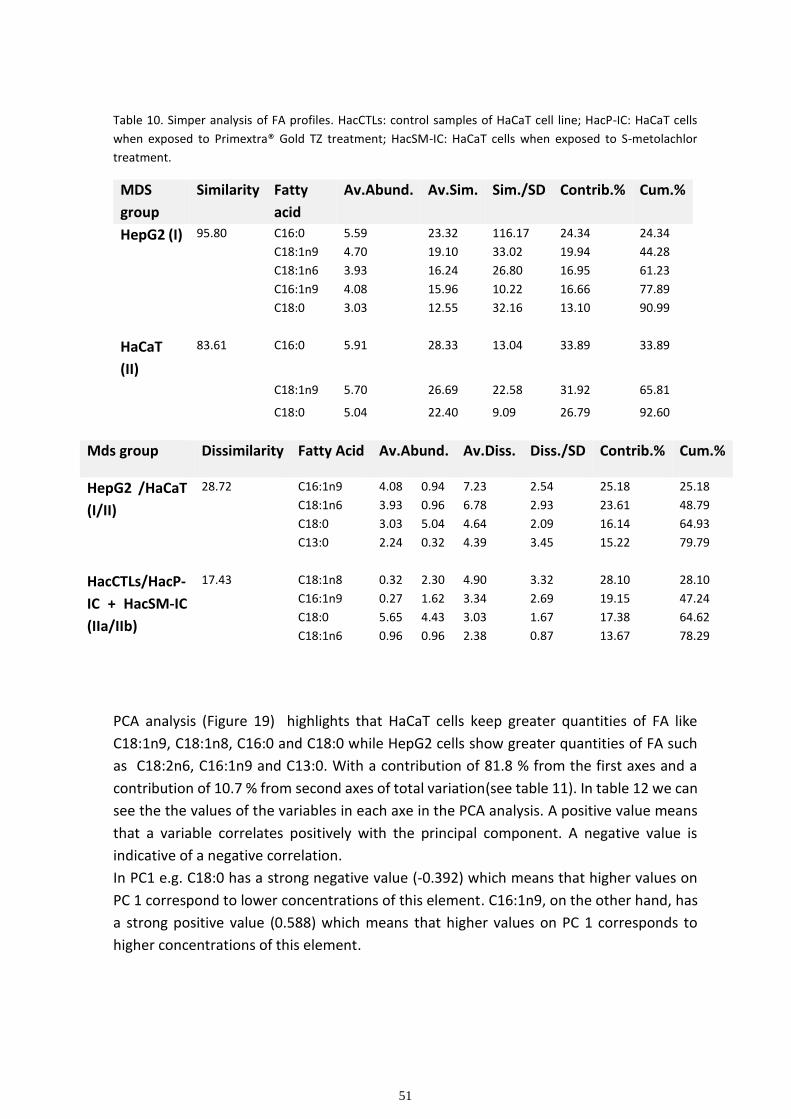
51
Table 10. Simper analysis of FA profiles. HacCTLs: control samples of HaCaT cell line; HacP-IC: HaCaT cells
when exposed to Primextra® Gold TZ treatment; HacSM-IC: HaCaT cells when exposed to S-metolachlor
treatment.
PCA analysis (Figure 19) highlights that HaCaT cells keep greater quantities of FA like
C18:1n9, C18:1n8, C16:0 and C18:0 while HepG2 cells show greater quantities of FA such
as C18:2n6, C16:1n9 and C13:0. With a contribution of 81.8 % from the first axes and a
contribution of 10.7 % from second axes of total variation(see table 11). In table 12 we can
see the the values of the variables in each axe in the PCA analysis. A positive value means
that a variable correlates positively with the principal component. A negative value is
indicative of a negative correlation.
In PC1 e.g. C18:0 has a strong negative value (-0.392) which means that higher values on
PC 1 correspond to lower concentrations of this element. C16:1n9, on the other hand, has
a strong positive value (0.588) which means that higher values on PC 1 corresponds to
higher concentrations of this element.
MDS
group
Similarity Fatty
acid
Av.Abund. Av.Sim. Sim./SD Contrib.% Cum.%
HepG2 (I) 95.80 C16:0
C18:1n9
C18:1n6
C16:1n9
C18:0
5.59
4.70
3.93
4.08
3.03
23.32
19.10
16.24
15.96
12.55
116.17
33.02
26.80
10.22
32.16
24.34
19.94
16.95
16.66
13.10
24.34
44.28
61.23
77.89
90.99
HaCaT
(II)
83.61 C16:0 5.91 28.33 13.04 33.89 33.89
C18:1n9 5.70 26.69 22.58 31.92 65.81
C18:0 5.04 22.40 9.09 26.79 92.60
Mds group Dissimilarity Fatty Acid Av.Abund. Av.Diss. Diss./SD Contrib.% Cum.%
HepG2 /HaCaT
(I/II)
28.72 C16:1n9
C18:1n6
C18:0
C13:0
4.08
3.93
3.03
2.24
0.94
0.96
5.04
0.32
7.23
6.78
4.64
4.39
2.54
2.93
2.09
3.45
25.18
23.61
16.14
15.22
25.18
48.79
64.93
79.79
HacCTLs/HacP-
IC + HacSM-IC
(IIa/IIb)
17.43
C18:1n8
C16:1n9
C18:0
C18:1n6
0.32
0.27
5.65
0.96
2.30
1.62
4.43
0.96
4.90
3.34
3.03
2.38
3.32
2.69
1.67
0.87
28.10
19.15
17.38
13.67
28.10
47.24
64.62
78.29
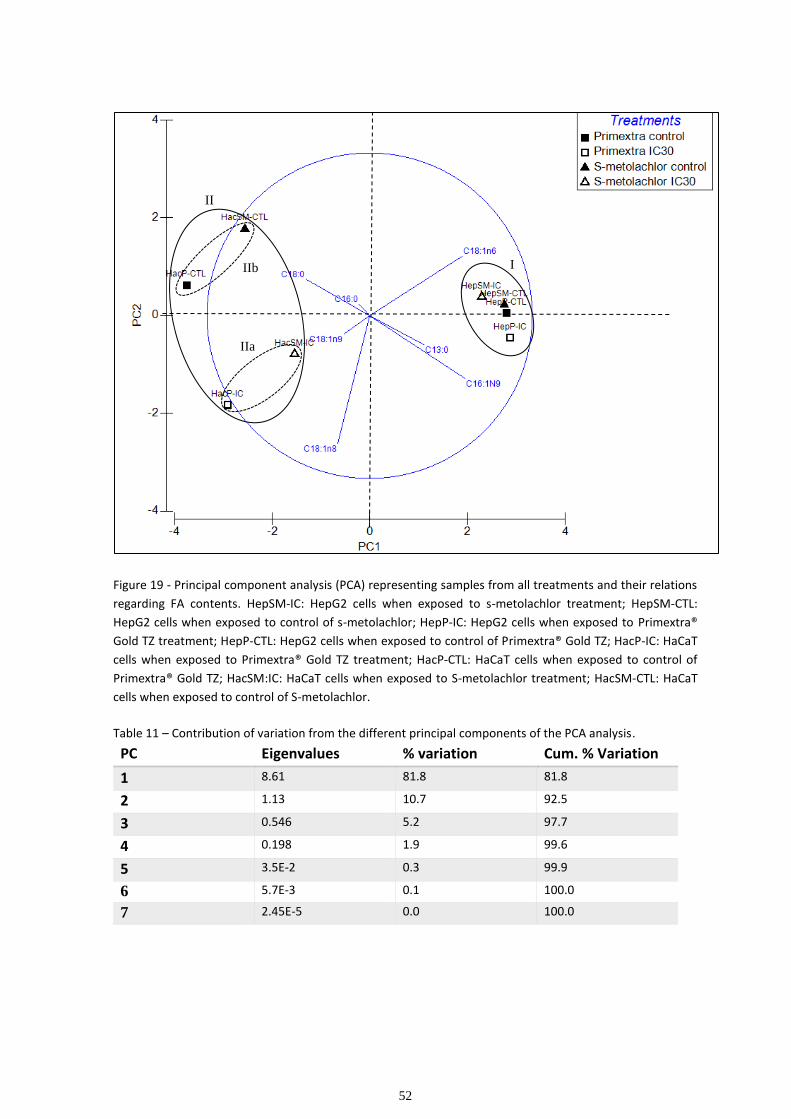
52
Figure 19 - Principal component analysis (PCA) representing samples from all treatments and their relations
regarding FA contents. HepSM-IC: HepG2 cells when exposed to s-metolachlor treatment; HepSM-CTL:
HepG2 cells when exposed to control of s-metolachlor; HepP-IC: HepG2 cells when exposed to Primextra®
Gold TZ treatment; HepP-CTL: HepG2 cells when exposed to control of Primextra® Gold TZ; HacP-IC: HaCaT
cells when exposed to Primextra® Gold TZ treatment; HacP-CTL: HaCaT cells when exposed to control of
Primextra® Gold TZ; HacSM:IC: HaCaT cells when exposed to S-metolachlor treatment; HacSM-CTL: HaCaT
cells when exposed to control of S-metolachlor.
Table 11 – Contribution of variation from the different principal components of the PCA analysis.
PC Eigenvalues % variation Cum. % Variation
1 8.61 81.8 81.8
2 1.13 10.7 92.5
3 0.546 5.2 97.7
4 0.198 1.9 99.6
5 3.5E-2 0.3 99.9
6 5.7E-3 0.1 100.0
7 2.45E-5 0.0 100.0
II
I
IIa
IIb
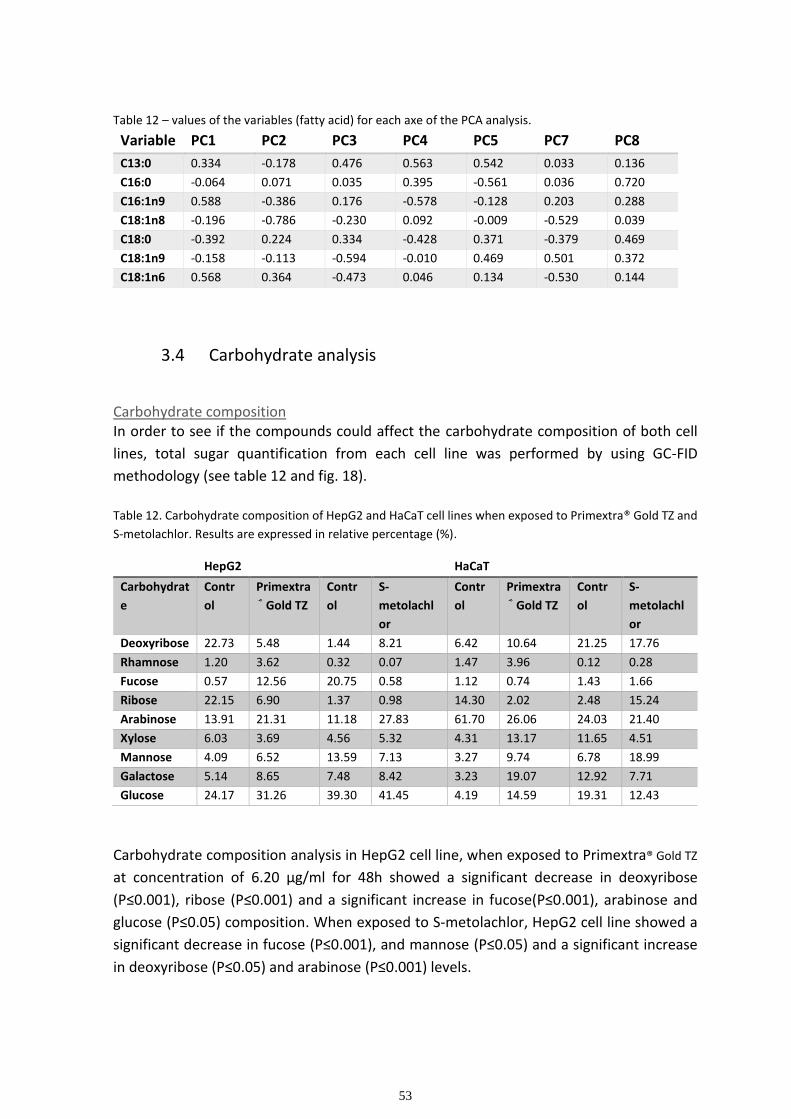
53
Table 12 – values of the variables (fatty acid) for each axe of the PCA analysis.
Variable PC1 PC2 PC3 PC4 PC5 PC7 PC8
C13:0 0.334 -0.178 0.476 0.563 0.542 0.033 0.136 C16:0 -0.064 0.071 0.035 0.395 -0.561 0.036 0.720 C16:1n9 0.588 -0.386 0.176 -0.578 -0.128 0.203 0.288 C18:1n8 -0.196 -0.786 -0.230 0.092 -0.009 -0.529 0.039 C18:0 -0.392 0.224 0.334 -0.428 0.371 -0.379 0.469 C18:1n9 -0.158 -0.113 -0.594 -0.010 0.469 0.501 0.372 C18:1n6 0.568 0.364 -0.473 0.046 0.134 -0.530 0.144
3.4 Carbohydrate analysis
Carbohydrate composition In order to see if the compounds could affect the carbohydrate composition of both cell
lines, total sugar quantification from each cell line was performed by using GC-FID
methodology (see table 12 and fig. 18).
Table 12. Carbohydrate composition of HepG2 and HaCaT cell lines when exposed to Primextra® Gold TZ and
S-metolachlor. Results are expressed in relative percentage (%).
HepG2 HaCaT
Carbohydrat
e
Contr
ol
Primextra
® Gold TZ
Contr
ol
S-
metolachl
or
Contr
ol
Primextra
® Gold TZ
Contr
ol
S-
metolachl
or
Deoxyribose 22.73 5.48 1.44 8.21 6.42 10.64 21.25 17.76
Rhamnose 1.20 3.62 0.32 0.07 1.47 3.96 0.12 0.28
Fucose 0.57 12.56 20.75 0.58 1.12 0.74 1.43 1.66
Ribose 22.15 6.90 1.37 0.98 14.30 2.02 2.48 15.24
Arabinose 13.91 21.31 11.18 27.83 61.70 26.06 24.03 21.40
Xylose 6.03 3.69 4.56 5.32 4.31 13.17 11.65 4.51
Mannose 4.09 6.52 13.59 7.13 3.27 9.74 6.78 18.99
Galactose 5.14 8.65 7.48 8.42 3.23 19.07 12.92 7.71
Glucose 24.17 31.26 39.30 41.45 4.19 14.59 19.31 12.43
Carbohydrate composition analysis in HepG2 cell line, when exposed to Primextra® Gold TZ
at concentration of 6.20 µg/ml for 48h showed a significant decrease in deoxyribose
(P≤0.001), ribose (P≤0.001) and a significant increase in fucose(P≤0.001), arabinose and
glucose (P≤0.05) composition. When exposed to S-metolachlor, HepG2 cell line showed a
significant decrease in fucose (P≤0.001), and mannose (P≤0.05) and a significant increase
in deoxyribose (P≤0.05) and arabinose (P≤0.001) levels.
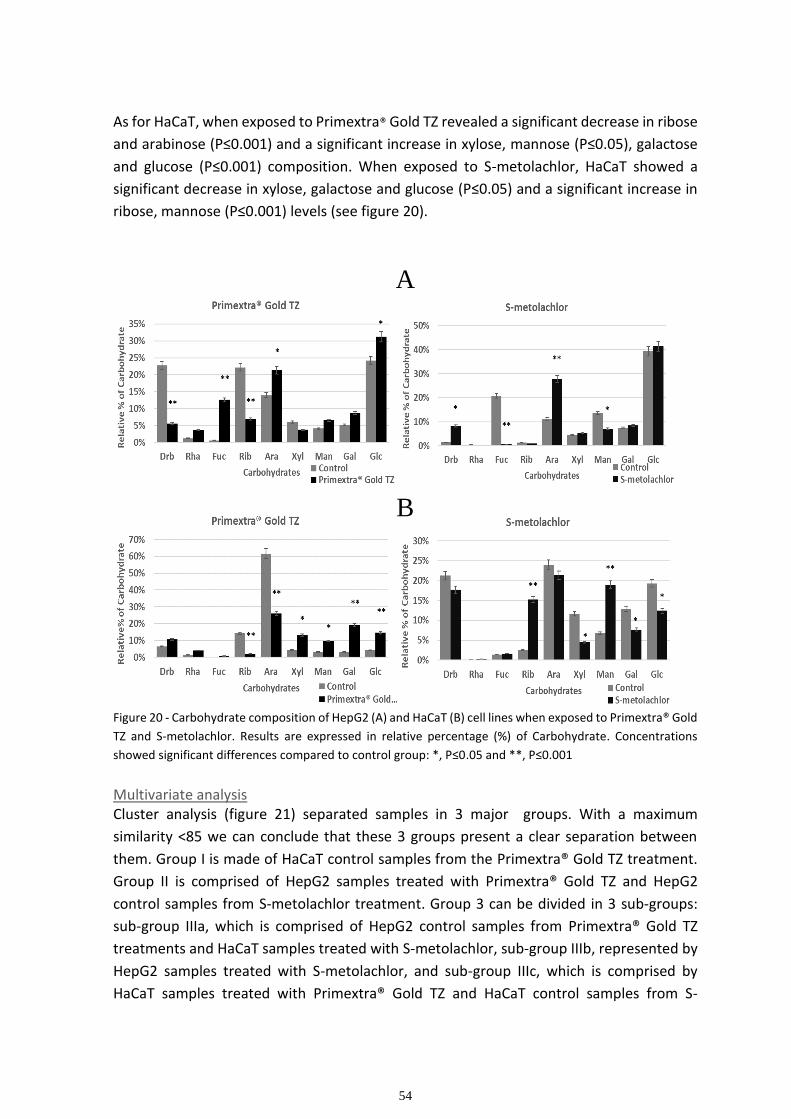
54
As for HaCaT, when exposed to Primextra® Gold TZ revealed a significant decrease in ribose
and arabinose (P≤0.001) and a significant increase in xylose, mannose (P≤0.05), galactose
and glucose (P≤0.001) composition. When exposed to S-metolachlor, HaCaT showed a
significant decrease in xylose, galactose and glucose (P≤0.05) and a significant increase in
ribose, mannose (P≤0.001) levels (see figure 20).
Figure 20 - Carbohydrate composition of HepG2 (A) and HaCaT (B) cell lines when exposed to Primextra® Gold
TZ and S-metolachlor. Results are expressed in relative percentage (%) of Carbohydrate. Concentrations
showed significant differences compared to control group: *, P≤0.05 and **, P≤0.001
Multivariate analysis Cluster analysis (figure 21) separated samples in 3 major groups. With a maximum
similarity <85 we can conclude that these 3 groups present a clear separation between
them. Group I is made of HaCaT control samples from the Primextra® Gold TZ treatment.
Group II is comprised of HepG2 samples treated with Primextra® Gold TZ and HepG2
control samples from S-metolachlor treatment. Group 3 can be divided in 3 sub-groups:
sub-group IIIa, which is comprised of HepG2 control samples from Primextra® Gold TZ
treatments and HaCaT samples treated with S-metolachlor, sub-group IIIb, represented by
HepG2 samples treated with S-metolachlor, and sub-group IIIc, which is comprised by
HaCaT samples treated with Primextra® Gold TZ and HaCaT control samples from S-
A
B
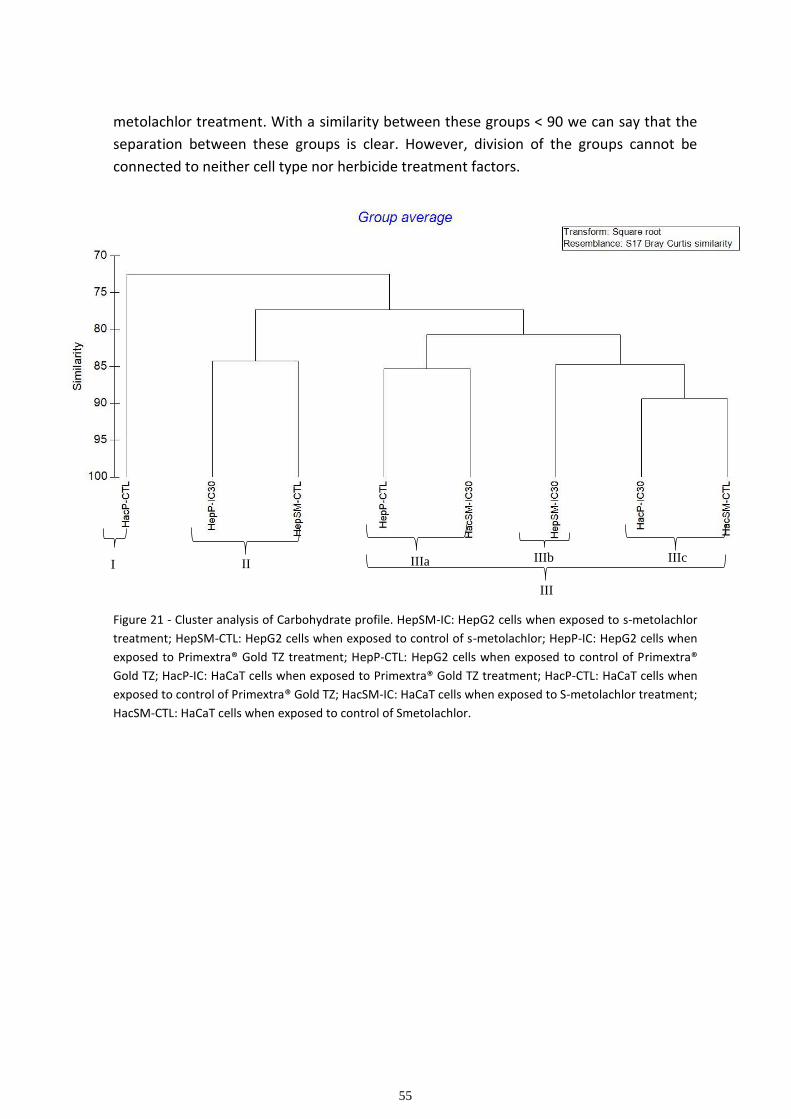
55
metolachlor treatment. With a similarity between these groups < 90 we can say that the
separation between these groups is clear. However, division of the groups cannot be
connected to neither cell type nor herbicide treatment factors.
Figure 21 - Cluster analysis of Carbohydrate profile. HepSM-IC: HepG2 cells when exposed to s-metolachlor
treatment; HepSM-CTL: HepG2 cells when exposed to control of s-metolachlor; HepP-IC: HepG2 cells when
exposed to Primextra® Gold TZ treatment; HepP-CTL: HepG2 cells when exposed to control of Primextra®
Gold TZ; HacP-IC: HaCaT cells when exposed to Primextra® Gold TZ treatment; HacP-CTL: HaCaT cells when
exposed to control of Primextra® Gold TZ; HacSM-IC: HaCaT cells when exposed to S-metolachlor treatment;
HacSM-CTL: HaCaT cells when exposed to control of Smetolachlor.
I II
III
IIIa IIIb IIIc
56
4. Discussion
The purpose of this study was to determine the cytotoxic potential of Primextra® Gold TZ
and S-Metolachlor on human skin and liver tissue, motivated by the large use of such
herbicide on Portuguese corn crops. For this purpose, we used MTT cell viability assay and
cell cycle analysis by flow cytometry. Additionally, due to reports in literature of Primextra®
Gold TZ having effect on the biochemical profile of other organisms, namely fatty acids and
carbohydrate composition (Gutiérrez et al., 2019; Filimonova et al., 2016; Neves et al.,
2015), it seemed pertinent to evaluate the effect over these biochemical biomarkers.
In the MTT cell viability assay, liver mimicking hepatoma cell line, HepG2, proved to be less
sensitive to toxicity from both compounds, the herbicide Primextra® Gold TZ and the a.i. S-
metolachlor than the nontumorigenic immortalized human keratinocyte cell line, HaCaT.
HepG2 48 h MTT results pointed to an IC50 of 22.38 µg/ml and 83.90 µg/ml for Primextra®
Gold TZ and S-metolachlor, respectively. HaCaT 48h MTT results pointed to an IC50 of 12.37
µg/ml and 12.28 µg/ml for Primextra® Gold TZ and S-metolachlor, respectively.
HepG2 results on cytotoxicity assay showed a higher toxicity of the commercial formulation
over the active ingredient. This proves Primextra® Gold TZ to be much more toxic than S-
metolachlor alone, which was also shown in literature (Neves et al., 2015; Pérez et al.,
2011). This effect may be due to the synergic potential of both the active ingredients
presented in the herbicide Primextra® Gold TZ, as the combinations of two or more active
ingredients can be more lethal to non-target organisms than the active ingredient in
isolation, despite the specificity of their mode of action. Also, it must be kept in mind that
the adjuvants can contribute to the toxicity of an herbicide. These organic solvents,
emulsifying and wetting agents which affect the pesticide penetration and performance,
may synergize or antagonize the toxicity of the active ingredient, leading to the necessity
to evaluate the toxic effect of a formulated pesticide not only by testing the a.i.’s in isolation
or combined, but by testing the formulated pesticide (Nikoloff et al., 2013).
The concentrations used on the acute test were based on the article from Nikoloff et al.,
(2013). Nikoloff’s study aimed to evaluate cytotoxicity and genotoxicity of S-metolachlor
and its commercial formulation, Twin Pack Gold, on HepG2 cells. To assess the cytotoxicity,
Nikoloff and colleagues performed a 24 hours MTT cell viability assay with a range of
concentrations between 0 and 15 µg/mL of S-metolachlor and commercial formulation.
The results for S-metolachlor were, however, different from the ones we obtained in our
study. Our results pointed to a significant metabolic activity inhibition when HepG2 cells
were exposed to any of the concentrations of S-metolachlor tested (from 0.5 to 80 µg/mL)
on the 24 hours assay, while on Nikoloff’s study none of the concentrations tested (0.5 to
15 µg/mL) showed to have significant effect on cell viability.
In the cell cycle assay using HepG2 cell line, Primextra® Gold TZ induced a decrease in the
percentage of events of sub-G1 phase in both IC30 and IC50 treatments and an increase in
57
the percentage of events in G2 phase in the IC50 treatment. S-metolachlor exposure
induced a decrease in percentage of events in sub-G1 at both treatments, a decrease of
percentage of events at G0/G1 and an increase of percentage of events in G2. Sub-G1 is
associated to apoptosis, or cell death. The fact that Primextra® Gold TZ and the a.i. decrease
cell death could be contradictory to what MTT results suggested as in MTT when the dose
increases, cell viability decreases. However, this could be explained by the mechanism the
a.i. and the commercial formulation affect this cell line. In fact, what we see in MTT test
could be a decrease of mitochondrial activity rather than cell death per se. The cell cycle
arrest we see at G2 could be due to the DNA damage repair stop that occurs in this phase.
The increase in G2 when exposed to S-metolachlor is contradictory to the information in
literature that suggest S-metolachlor as non-genotoxic (European Commission, 2004). In
fact, little is known about S-metolachlor mode of action on non-target organisms, especially
in mammals, however studies using metolachlor showed that this compound could
decrease the abundance of cyclin A transcript thus affecting the cell cycle progress of the S
phase to the G2 phase (Hartnett et al., 2013). Taking into account that a complex, cyclin
A2–cdk1, is also required for the progression from G2 to mitosis (Badie et al., 2000), this
could somehow explain the mechanism behind S-metolachlor toxicity in this type of cell.
Results in HaCaT cell cycle were very different from those obtain in HepG2 cell line, as none
of the compounds was shown to induce significant cell cycle alterations. That means that
the mechanism behind the toxicity in this cell line may differ from the ones that affect
HepG2.
As for the fatty acid profile analysis, results showed no significant alteration on fatty acid
composition on exposure of HepG2 cells. HaCaT cell line, however, showed a >15%
reduction on saturated fatty acid percentage and a proportional increase in
monounsaturated fatty acids. The fatty acids affected were all long-chain fatty acids. This
is due to the ability of S-metolachlor to inhibit Acyl-CoA elongation thus leading to the
inhibition of long-chain and very-long-chain fatty acids synthesis (Jump, 2009 ; Schmalfu et
al., 2000). Saturated fatty acids are of great importance for maintaining membrane
integrity, as they provide rigidity and control the activities of membrane proteins through
covalent bonding. They are also key factors in the formation of raft domains in membranes
and in the barrier properties of ceramides located in the epidermis of the skin (Ehehalt et
al., 2006). The replacement of saturated fatty acids for monounsaturated fatty acids in the
membrane leads to a decreased rigidity of the membrane (Weijers, 2016). This can be an
important factor in understanding the mechanism behind S-metolachlor and Primextra®
Gold TZ toxicity in this cell line.
Carbohydrate analysis results were inconclusive as the controls of the experiment differ
greatly in terms of carbohydrate composition. This may be due to handling and /or
preparation throughout the carbohydrate process, as fatty acid results was not observed
differences between the controls. We could expect, however, that both Primextra® Gold
TZ and S-metolachlor would have an effect over carbohydrate biomarkers, as it was shown
58
in literature that both Primextra® Gold TZ active ingredients, S-metolachlor and
Terbuthylazine, produced a decrease in glycogen (Gutiérrez et al., 2019). Because glycogen
is mainly produced by the liver and muscles and is mainly comprised of glucose it would be
expected a decrease in glucose. Since glycogen is produced in liver it would be expected to
see a greater percentage of this polysaccharide in HepG2 cell line than in HaCaT.
Overall, results from HepG2 assays were very different from the results using HaCaT.
Having in mind that test conditions were the same for both types of cells, the differences
in toxicity could only be related to the intrinsic metabolic differences between them, as
well as the differences in their inherent mechanisms, that counteract damage. The fact that
HepG2 was less sensitive to cell viability assay but showed higher DNA damage than other
cells could be comparable to what has been shown in a study by Želježić (2018) using
terbuthylazine. In that study, using isolated lymphocytes and HepG2, Želježić showed that
the highest tested concentration (8.00 ng/mL) reduced lymphocyte viability by 15 %, mostly
due to apoptosis, while cytotoxic effects in HepG2 cells at the same concentration were
negligible (Želježić 2018). However, comet assay proved that DNA instability was more
pronounced in HepG2 cells.
59
5. Conclusion
The present study demonstrates that the largely used herbicide Primextra® Gold TZ and its
main active ingredient, S-metolachlor, decreased cellular viability and provoked cell cycle
arrest at G2 phase of HepG2. Thus, proving the cytotoxic potential of the compound to the
human liver. In the case of HaCaT cell line both the herbicide Primextra® Gold TZ and the
a.i. reduced cell viability and provoked alterations in overall fatty acid profile, leading to a
reduction in saturated fatty acids and an increase in monounsaturated fatty acids, with no
alterations in cell cycle.
We can also conclude that HaCaT proved to be more sensitive to cytotoxicity than HepG2,
even though the latter was shown to be more susceptible to DNA damage. The differences
between the results of both cell lines are proof of the intrinsic metabolic differences
between them as well as the differences in their inherent mechanisms that counteract
damage.
Overall, this study emphasizes the validity of performing pre-clinical tests using HepG2 and
HaCaT cell lines, as models for liver and skin toxicity evaluation, respectively. The current
study also underlines fatty acids to be a more sensitive biochemical biomarker than
carbohydrates to be used as endpoint in ecotoxicological studies with HepG2 and HaCaT
cell lines.
To conclude, in future works it would be important to study the effect of Primextra® Gold
TZ on other cell lines or tissues. A study using pulmonary cell lines would be of great
relevance, since Primextra® Gold TZ is applied by spraying method. Different toxicity
assessments could also be made as a potential genotoxic effect of the commercial
formulation and active ingredients is still a possibility. Also, the ability of S-metolachlor to
increase the production of reactive oxidative stress, as described in literature, should be
addressed. It would also be of great relevance to analyze the combined effect of S-
metolachlor and terbuthylazine in the same proportions of the ones used in Primextra®
Gold TZ, to assess the impact of the excipients on the overall toxicity of the commercial
formulation.
60
6. References
(EC) No 1107/2009. (2009). REGULATION (EC) No 1107/2009 OF THE EUROPEAN
PARLIAMENT AND OF THE COUNCIL of 21 October 2009 concerning the
placing of plant protection products on the market and repealing Council Directives
79/117/EEC and 91/414/EEC. Official Journal of the European Union, 309(1), 1–50.
http://eur-
lex.europa.eu/LexUriServ/LexUriServ.do?uri=OJ:L:2009:309:0001:0050:en:PDF
Aden, D. P., Fogel, A., Plotkin, S., Damjanov, I., & Knowles, B. B. (1979). Controlled
synthesis of HBsAg in a differentiated human liver carcinoma-derived cell line. In
Nature (Vol. 282, Issue 5739, pp. 615–616). https://doi.org/10.1038/282615a0
Alebrahim, M. T., Zangoueinejad, R., & Tseng, T. M. (2017). Biochemical and Molecular
Knowledge about Developing Herbicide-Resistant Weeds. In Herbicide Resistance in
Weeds and Crops (Issue October). InTech. https://doi.org/10.5772/intechopen.69211
Alif, S. M., Dharmage, S. C., Benke, G., Dennekamp, M., Burgess, J. A., Perret, J. L.,
Lodge, C. J., Morrison, S., Johns, D. P., Giles, G. G., Gurrin, L. C., Thomas, P. S.,
Hopper, J. L., Wood-Baker, R., Thompson, B. R., Feather, I. H., Vermeulen, R.,
Kromhout, H., Walters, E. H., … Matheson, M. C. (2017). Occupational exposure to
pesticides are associated with fixed airflow obstruction in middle-age. Thorax, 72(11),
990–997. https://doi.org/10.1136/thoraxjnl-2016-209665
Ameen, A., & Raza, S. (2018). Green Revolution: A Review. International Journal of
Advances in Scientific Research, 3(12), 129. https://doi.org/10.7439/ijasr.v3i12.4410
Aslam, B., Basit, M., Nisar, M. A., Khurshid, M., & Rasool, M. H. (2017). Proteomics:
Technologies and their applications. In Journal of Chromatographic Science (Vol. 55,
Issue 2, pp. 182–196). https://doi.org/10.1093/chromsci/bmw167
Aslantürk, Ö. S. (2018a). In Vitro Cytotoxicity and Cell Viability Assays: Principles,
Advantages, and Disadvantages. In Genotoxicity - A Predictable Risk to Our Actual
World. https://doi.org/10.5772/intechopen.71923
Aslantürk, Ö. S. (2018b). In Vitro Cytotoxicity and Cell Viability Assays: Principles,
Advantages, and Disadvantages. In Genotoxicity - A Predictable Risk to Our Actual
World (Issue tourism, p. 13). InTech. https://doi.org/10.5772/intechopen.71923
Badie, C., Bourhis, J., Sobczak-Thépot, J., Haddada, H., Chiron, M., Janicot, M., Janot, F.,
Tursz, T., & Vassal, G. (2000). p53-dependent G2 arrest associated with a decrease in
cyclins A2 and B1 levels in a human carcinoma cell line. British Journal of Cancer,
82(3), 642–650. https://doi.org/10.1054/bjoc.1999.0976
Bahuguna, A., Khan, I., Bajpai, V. K., & Kang, S. C. (2017). MTT assay to evaluate the
cytotoxic potential of a drug. Bangladesh Journal of Pharmacology, 12(2), 115–118.
https://doi.org/10.3329/bjp.v12i2.30892
61
Bakre, D. S., & Kaliwal, B. B. (2017). In-vitro Assessment of Carbendazim and Copper
oxychloride cytotoxicity on HaCaT and HepG2 human cell lines. Journal of Applied
Biology & Biotechnology, 5(03), 23–29. https://doi.org/10.7324/JABB.2017.50305
Banaszkiewicz, T. (2010). Evolution of pesticide use. Contemporary Problems of
Management and Environmental Protection, 5, 7–18.
http://www.uwm.edu.pl/environ/vol05/vol_05_chapter01.pdf
Barra Caracciolo, A., Giuliano, G., Grenni, P., Cremisini, C., Ciccoli, R., & Ubaldi, C.
(2005). Effect of urea on degradation of terbuthylazine in soil. Environmental
Toxicology and Chemistry, 24(5), 1035–1040. https://doi.org/10.1897/04-253R.1
Bednarczuk, V. O., Verdam, M. C. S., Miguel, M. D., & Miguel, O. G. (2010). Testes in
Vitro E in Vivo Utilizados Na Triagem Toxicológica De Produtos Naturais. Visão
Acadêmica, 11(2). https://doi.org/10.5380/acd.v11i2.21366
Beffa, R., Menne, H., & Köcher, H. (2019). Herbicide Resistance Action Committee
(HRAC): Herbicide Classification, Resistance Evolution, Survey, and Resistance
Mitigation Activities. In Modern Crop Protection Compounds (pp. 5–32). Wiley-
VCH Verlag GmbH & Co. KGaA. https://doi.org/10.1002/9783527699261.ch1
Berlicki, L. (2008). Inhibitors of Glutamine Synthetase and their Potential Application in
Medicine. Mini-Reviews in Medicinal Chemistry, 8(9), 869–878.
https://doi.org/10.2174/138955708785132800
Bjørling-Poulsen, M., Andersen, H. R., & Grandjean, P. (2008). Potential developmental
neurotoxicity of pesticides used in Europe. Environmental Health: A Global Access
Science Source, 7. https://doi.org/10.1186/1476-069X-7-50
Blanco, F. M. G., Ramos, Y. G., Scarso, M. F., & Jorge, L. A. de C. (2015). Determining
the Selectivity of Herbicides and Assessing Their Effect on Plant Roots - A Case
Study with Indaziflam and Glyphosate Herbicides. In Herbicides, Physiology of
Action, and Safety (Vol. 395, pp. 116–124). InTech. https://doi.org/10.5772/61721
Blumenberg, M. (2019). Introductory Chapter: Transcriptome Analysis. In Transcriptome
Analysis (Issue tourism, p. 13). IntechOpen. https://doi.org/10.5772/intechopen.85980
Böger, P. (2003). Mode of action for chloroacetamides and functionally related
compounds. In Journal of Pesticide Sciences (Vol. 28, Issue 3, pp. 324–329).
https://doi.org/10.1584/jpestics.28.324
Borch, N. H., & Kirchman, D. L. (1997). Concentration and composition of dissolved
combined neutral sugars (polysaccharides) in seawater determined by HPLC-PAD.
Marine Chemistry, 57(1-2), 85–95. https://doi.org/10.1016/S0304-4203(97)00002-9
Boucher, D., Duclos, C., & Denault, J.-B. (2014). General In Vitro Caspase Assay
Procedures. In P. V. Bozhkov & G. Salvesen (Eds.), Aspergillosis: From Diagnosis to
Prevention (Vol. 1133, Issue January 2014, pp. 3–39). Springer Netherlands.
https://doi.org/10.1007/978-1-4939-0357-3_1
62
Boukamp, P. (1988). Normal Keratinization in a Spontaneously Immortalized. Journal of
Cell Biology, 106(March), 761–771.
Bradberry, S. M., Proudfoot, A. T., & Vale, J. A. (2004). Glyphosate poisoning. In
Toxicological Reviews (Vol. 23, Issue 3, pp. 159–167).
https://doi.org/10.2165/00139709-200423030-00003
Bradbury, A. G. W. (1990). Gas chromatography of carbohydrates in food. In Principles
and Applications of Gas Chromatography in Food Analysis (pp. 111–144).
https://doi.org/10.1007/978-1-4613-0681-8_4
Brand, R. M., & Mueller, C. (2002). Transdermal penetration by atrazine, alachlor, and
trifluralin: Effect of formulation. Toxicological Sciences, 68(1), 18–23.
https://doi.org/10.1093/toxsci/68.1.18
Brunharo, C. A. C. G., Takano, H. K., Mallory-Smith, C. a., Dayan, F. E., & Hanson, B. D.
(2019). Role of Glutamine Synthetase Isogenes and Herbicide Metabolism in the
Mechanism of Resistance to Glufosinate in Lolium perenne L. spp. multiflorum
Biotypes from Oregon. Journal of Agricultural and Food Chemistry, 67(31), 8431–
8440. https://doi.org/10.1021/acs.jafc.9b01392
Busi, R. (2014). Resistance to herbicides inhibiting the biosynthesis of very-long-chain
fatty acids. Pest Management Science, 70(9), 1378–1384.
https://doi.org/10.1002/ps.3746
Cañero, A. I., Cox, L., Redondo-Gómez, S., Mateos-Naranjo, E., Hermosín, M. C., &
Cornejo, J. (2011). Effect of the herbicides terbuthylazine and glyphosate on
photosystem II photochemistry of young olive (Olea europaea) plants. Journal of
Agricultural and Food Chemistry, 59(10), 5528–5534.
https://doi.org/10.1021/jf200875u
Carson, R. (1962). Silent Spring-III. The New Yorker, 34.
Caterson, B., & Melrose, J. (2018). Keratan sulfate, a complex glycosaminoglycan with
unique functional capability. Glycobiology, 28(4), 182–206.
https://doi.org/10.1093/glycob/cwy003
Chao, L. K., & Fang, T. C. (2016). Dialysis catheter-related pulmonary embolism in a
patient with paraquat intoxication. Tzu Chi Medical Journal, 28(4), 166–169.
https://doi.org/10.1016/j.tcmj.2015.05.005
Choi, J. S., Jou, S. S., Oh, M. H., Kim, Y. H., Park, M. J., Gil, H. W., Song, H. Y., &
Hong, S. Y. (2013). The dose of cyclophosphamide for treating paraquat-induced rat
lung injury. Korean Journal of Internal Medicine, 28(4), 420–427.
https://doi.org/10.3904/kjim.2013.28.4.420
Chung, H., Quan, H., Jung, D., Ravi, G., Cho, A., Kang, M. J., Kim, E., Che, J. H., Lee, E.
S., Jeong, T. C., Heo, Y., & Seok, S. H. (2018). Intra- and inter-laboratory
reproducibility and predictivity of the HaCaSens assay: A skin sensitization test using
human keratinocytes, HaCaT. Toxicology in Vitro, 46, 304–312.
https://doi.org/10.1016/j.tiv.2017.10.018
63
Cobb, L. (2013). The Cell Cycle Analysis. Materials and Methods, 3, 1–10.
https://doi.org/10.13070/mm.en.3.172
Colborn, T., Vom Saal, F. S., & Soto, A. M. (1993). Developmental effects of endocrine-
disrupting chemicals in wildlife and humans. In Environmental Health Perspectives
(Vol. 101, Issue 5, pp. 378–384). https://doi.org/10.1289/ehp.93101378
Cole, R. C. (2019). Micronucleus assay an overview. In Micronucleus Assay: An
Overview.
Colombo, I., Sangiovanni, E., Maggio, R., Mattozzi, C., Zava, S., Corbett, Y., Fumagalli,
M., Carlino, C., Corsetto, P. A., Scaccabarozzi, D., Calvieri, S., Gismondi, A.,
Taramelli, D., & Dell’Agli, M. (2017). HaCaT Cells as a Reliable in Vitro
Differentiation Model to Dissect the Inflammatory/Repair Response of Human
Keratinocytes. Mediators of Inflammation, 2017.
https://doi.org/10.1155/2017/7435621
Commission Implementing Regulation (EU) 2019/291. (2019).
Convertini, P., Todisco, S., De Santis, F., Pappalardo, I., Iacobazzi, D., Morelli, M. A. C.,
Fondufe-Mittendorf, Y. N., Martelli, G., Palmieri, F., & Infantino, V. (2019).
Transcriptional regulation factors of the human mitochondrial aspartate/glutamate
carrier gene, isoform 2 (SLC25A13): USF1 as basal factor and FOXA2 as activator in
liver cells. International Journal of Molecular Sciences, 20(8), 1–16.
https://doi.org/10.3390/ijms20081888
Costantini, S., Di Bernardo, G., Cammarota, M., Castello, G., & Colonna, G. (2013). Gene
expression signature of human HepG2 cell line. Gene, 518(2), 335–345.
https://doi.org/10.1016/j.gene.2012.12.106
Crameri, R. (2009). Specific IgE Testing (RAST). In Aspergillosis: From Diagnosis to
Prevention (Issue October, pp. 171–176). Springer Netherlands.
https://doi.org/10.1007/978-90-481-2408-4_11
D’Amato, C., Torres, J. P. M., & Malm, O. (2002). DDT (dicloro difenil tricloroetano):
toxicidade e contaminação ambiental <FONT FACE=Symbol>-</FONT> uma
revisão. Química Nova, 25(6a), 995–1002. https://doi.org/10.1590/S0100-
40422002000600017
Damalas, C. a., & Eleftherohorinos, I. G. (2011). Pesticide exposure, safety issues, and risk
assessment indicators. International Journal of Environmental Research and Public
Health, 8(5), 1402–1419. https://doi.org/10.3390/ijerph8051402
Das, U. N. (2013). Autism as a disorder of deficiency of brain-derived neurotrophic factor
and altered metabolism of polyunsaturated fatty acids. In Nutrition.
https://doi.org/10.1016/j.nut.2013.01.012
Davis, J. R., Brownson, R. C., & Garcia, R. (1992). Family pesticide use in the home,
garden, orchard, and yard. Archives of Environmental Contamination and Toxicology,
22(3), 260–266. https://doi.org/10.1007/BF00212083
64
Dayan, F. E., & Duke, S. O. (2010). Protoporphyrinogen Oxidase-Inhibiting Herbicides. In
Hayes’ Handbook of Pesticide Toxicology (Issue December 2019, pp. 1733–1751).
Elsevier. https://doi.org/10.1016/B978-0-12-374367-1.00081-1
Délye, C., Jasieniuk, M., & Le Corre, V. (2013). Deciphering the evolution of herbicide
resistance in weeds. Trends in Genetics, 29(11), 649–658.
https://doi.org/10.1016/j.tig.2013.06.001
Délye, C., Menchari, Y., Michel, S., & Darmency, H. (2004). Molecular Bases for
Sensitivity to Tubulin-Binding Herbicides in Green Foxtail. Plant Physiology, 136(4),
3920–3932. https://doi.org/10.1104/pp.103.037432
Demailly, F., Elfeky, I., Malbezin, L., Le Guédard, M., Eon, M., Bessoule, J. J., Feurtet-
Mazel, A., Delmas, F., Mazzella, N., Gonzalez, P., & Morin, S. (2019). Impact of
diuron and S-metolachlor on the freshwater diatom Gomphonema gracile:
Complementarity between fatty acid profiles and different kinds of ecotoxicological
impact-endpoints. Science of the Total Environment, 688, 960–969.
https://doi.org/10.1016/j.scitotenv.2019.06.347
Directive 2000/60/EC. (2000). Directive 2000/60/EC of the European Parliament and of
the council of 23 October 2000 establishin a framework for community actio in the
field of water policy. Official Journal of the European Union.
Dong, Y., Ng, E., Lu, J., Fenwick, T., Tao, Y., Bertain, S., Sandoval, M., Bermudez, E.,
Hou, Z., Patten, P., Lassner, M., & Siehl, D. (2019). Desensitizing plant EPSP
synthase to glyphosate: Optimized global sequence context accommodates a glycine-
to-alanine change in the active site. Journal of Biological Chemistry, 294(2), 716–
725. https://doi.org/10.1074/jbc.RA118.006134
Duthie, S. J., Melvin, W. T., & Burke, M. D. (1995). Drug toxicity mechanisms in human
hepatoma hepg2 cells: Cyclosporin a and tamoxifen. Xenobiotica, 25(10), 1151–1164.
https://doi.org/10.3109/00498259509061915
Ehehalt, R., Füllekrug, J., Pohl, J., Ring, A., Herrmann, T., & Stremmel, W. (2006).
Translocation of long chain fatty acids across the plasma membrane - Lipid rafts and
fatty acid transport proteins. Molecular and Cellular Biochemistry, 284(1-2), 135–
140. https://doi.org/10.1007/s11010-005-9034-1
Eisenbrand, G., Pool-Zobel, B., Baker, V., Balls, M., Blaauboer, B. J., Boobis, a., Carere,
a., Kevekordes, S., Lhuguenot, J. C., Pieters, R., & Kleiner, J. (2002). Methods of in
vitro toxicology. Food and Chemical Toxicology, 40(2-3), 193–236.
https://doi.org/10.1016/S0278-6915(01)00118-1
Escudero, N., Marhuenda-Egea, F., & Lopez-Llorca, L. V. (2017). Metabolomics. In R. H.
Manzanilla-López & L. V. Lopez-Llorca (Eds.), Perspectives in Sustainable
Nematode Management Through Pochonia chlamydosporia Applications for Root and
Rhizosphere Health (Issue September, pp. 169–181). Springer International
Publishing. https://doi.org/10.1007/978-3-319-59224-4_8
European Commission. (2020). Commission Implementig Regulation (EU) 2020/869.
Official Journal of the European Union, june.
65
European Commission Health & Consumer Protection Directorate General. (2004). 6(S-
metolachlor), 1–25.
Ewald, J. a., Wheatley, C. J., Aebischer, N. J., Moreby, S. J., Duffield, S. J., Crick, H. Q.
P., & Morecroft, M. B. (2015). Influences of extreme weather, climate and pesticide
use on invertebrates in cereal fields over 42 years. Global Change Biology, 21(11),
3931–3950. https://doi.org/10.1111/gcb.13026
Filimonova, V., Gonçalves, F., Marques, J. C., De Troch, M., & Gonçalves, A. M. M.
(2016). Biochemical and toxicological effects of organic (herbicide Primextra® Gold
TZ) and inorganic (copper) compounds on zooplankton and phytoplankton species.
Aquatic Toxicology, 177, 33–43. https://doi.org/10.1016/j.aquatox.2016.05.008
Fishel, F. M. (2013). Pest Management and Pesticides : A Historical perspective.
University of Florida IFAS Extension, PI219(February), 2–6. https://edis.ifas.ufl.edu
Fry, D. W., White, J. C., & Goldman, I. D. (1980). Effects of 2,4-Dinitrophenol and Other
Metabolic Inhibitors on the Bidirectional Carrier Fluxes, Net Transport, and
Intracellular Binding of Methotrexate in Ehrlich Ascites Tumor Cells. Cancer
Research, 40(10), 3669–3673.
Gan, S. D., & Patel, K. R. (2013). Enzyme immunoassay and enzyme-linked
immunosorbent assay. Journal of Investigative Dermatology, 133(9), 1–3.
https://doi.org/10.1038/jid.2013.287
García-Ruiz, I., Solís-Muñoz, P., Fernández-Moreira, D., Muñoz-Yagüe, T., & Solís-
Herruzo, J. a. (2015). In vitro treatment of HepG2 cells with saturated fatty acids
reproduces mitochondrial dysfunction found in nonalcoholic steatohepatitis. DMM
Disease Models and Mechanisms, 8(2), 183–191.
https://doi.org/10.1242/dmm.018234
Gleason, C., Foley, R. C., & Singh, K. B. (2011). Mutant Analysis in Arabidopsis Provides
Insight into the Molecular Mode of Action of the Auxinic Herbicide Dicamba. PLoS
ONE, 6(3), e17245. https://doi.org/10.1371/journal.pone.0017245
Gonçalves, a. M. M., Azeiteiro, U. M., Pardal, M. a., & De Troch, M. (2012). Fatty acid
profiling reveals seasonal and spatial shifts in zooplankton diet in a temperate estuary.
Estuarine, Coastal and Shelf Science, 109, 70–80.
https://doi.org/10.1016/j.ecss.2012.05.020
Gonçalves, A. M. M., Mesquita, A. F., Verdelhos, T., Coutinho, J. A. P., Marques, J. C., &
Gonçalves, F. (2016). Fatty acids’ profiles as indicators of stress induced by of a
common herbicide on two marine bivalves species: Cerastoderma edule (Linnaeus,
1758) and Scrobicularia plana (da Costa, 1778). Ecological Indicators, 63, 209–218.
https://doi.org/10.1016/j.ecolind.2015.12.006
Goubet, F., Dupree, P., & Johansen, K. S. (2011). Carbohydrate Gel Electrophoresis. In
Methods (Vol. 715, Issue January, pp. 81–92). https://doi.org/10.1007/978-1-61779-
008-9_5
66
Greene, E. R., Huang, S., Serhan, C. N., & Panigrahy, D. (2011). Regulation of
inflammation in cancer by eicosanoids. In Prostaglandins and Other Lipid Mediators.
https://doi.org/10.1016/j.prostaglandins.2011.08.004
Gu, X., & Manautou, J. E. (2012). Molecular mechanisms underlying chemical liver
injury. In Expert Reviews in Molecular Medicine (Vol. 14).
https://doi.org/10.1017/S1462399411002110
Gutiérrez, I. B., Mesquita, A. F. C., Nunes, C., Coimbra, M. a., Gonçalves, F. J. M.,
Marques, J. C., & Gonçalves, A. M. M. (2019). Impacts of S-metolachlor and
terbuthylazine in fatty acid and carbohydrate composition of the benthic clam
Scrobicularia plana. Ecotoxicology and Environmental Safety, 173(November 2018),
293–304. https://doi.org/10.1016/j.ecoenv.2019.02.034
Hao, G. F., Zuo, Y., Yang, S. G., & Yang, G. F. (2011). Protoporphyrinogen oxidase
inhibitor: An ideal target for herbicide discovery. Chimia, 65(12), 961–969.
https://doi.org/10.2533/chimia.2011.961
Hartnett, S., Musah, S., & Dhanwada, K. R. (2013). Cellular effects of metolachlor
exposure on human liver (HepG2) cells. Chemosphere, 90(3), 1258–1266.
https://doi.org/10.1016/j.chemosphere.2012.09.077
Hoh, A., & Maier, K. (1993). Comparative Cytotoxicity Test with Human Keratinocytes,
HaCaT Cells, and Skin Fibroblasts to Investigate Skin-Irritating Substances. In Cell
and Tissue Culture Models in Dermatological Research (pp. 341–347).
https://doi.org/10.1007/978-3-642-77817-9_38
Holmgaard, R., & Nielsen, J. B. (2009). Dermal absorption of pesticides – evaluation of
variability and prevention. Danish Environmental Protection Agency, 124, 116.
https://www2.mst.dk/udgiv/publications/2009/978-87-7052-980-8/pdf/978-87-7052-
981-5.pdf
Horgan, R. P., & Kenny, L. C. (2011). “Omic” technologies: genomics, transcriptomics,
proteomics and metabolomics. The Obstetrician & Gynaecologist, 13(3), 189–195.
https://doi.org/10.1576/toag.13.3.189.27672
Illarionova, V., Eisenreich, W., Fischer, M., Haußmann, C., Römisch, W., Richter, G., &
Bacher, A. (2002). Biosynthesis of Tetrahydrofolate. Journal of Biological Chemistry,
277(32), 28841–28847. https://doi.org/10.1074/jbc.M204046200
Innis, S. M. (2008). Dietary omega 3 fatty acids and the developing brain. In Brain
Research. https://doi.org/10.1016/j.brainres.2008.08.078
Ivashkevich, A., Redon, C. E., Nakamura, A. J., Martin, R. F., & Martin, O. a. (2012). Use
of the γ-H2AX assay to monitor DNA damage and repair in translational cancer
research. Cancer Letters, 327(1-2), 123–133.
https://doi.org/10.1016/j.canlet.2011.12.025
J., B. (2006). DDT and human health. Science of the Total Environment, 355(1-3), 78–89.
http://www.embase.com/search/results?subaction=viewrecord&from=export&id=L43
148945
67
Jaga, K., & Dharmani, C. (2003). Sources of exposure to and public health implications of
organophosphate pesticides. In Revista Panamericana de Salud Publica/Pan
American Journal of Public Health (Vol. 14, Issue 3, pp. 171–185).
https://doi.org/10.1590/S1020-49892003000800004
Jain, A. K., Singh, D., Dubey, K., Maurya, R., Mittal, S., & Pandey, A. K. (2018). Models
and Methods for In Vitro Toxicity. In In Vitro Toxicology (pp. 45–65).
https://doi.org/10.1016/B978-0-12-804667-8.00003-1
Jerzykiewicz, J., & Kłobus, G. (2007). The effect of triazine- and urea-type herbicides on
photosynthetic apparatus in cucumber leaves. Acta Societatis Botanicorum Poloniae,
76(1), 43–47. https://doi.org/10.5586/asbp.2007.005
Joly, P., Bonnemoy, F., Charvy, J. C., Bohatier, J., & Mallet, C. (2013). Toxicity
assessment of the maize herbicides S-metolachlor, benoxacor, mesotrione and
nicosulfuron, and their corresponding commercial formulations, alone and in
mixtures, using the Microtox® test. Chemosphere, 93(10), 2444–2450.
https://doi.org/10.1016/j.chemosphere.2013.08.074
Juan-García, A., Tolosa, J., Juan, C., & Ruiz, M. J. (2019). Cytotoxicity, genotoxicity and
disturbance of cell cycle in hepg2 cells exposed to OTA and BEA: Single and
combined actions. Toxins, 11(6). https://doi.org/10.3390/toxins11060341
Jump, D. B. (2009). Mammalian fatty acid elongases. Methods in Molecular Biology, 579,
375–389. https://doi.org/10.1007/978-1-60761-322-0_19
Jump, D. B., Tripathy, S., & Depner, C. M. (2013). Fatty acid-regulated transcription
factors in the liver. Annual Review of Nutrition. https://doi.org/10.1146/annurev-nutr-
071812-161139
Karam, D., Fara, F. R., Cruz, M. B., Filho, I. a. P., Pereira, F. T. F., Lara, F. R., &
Biologia, B. S. (2003). Características do Herbicida S-Metolachlor nas Culturas de
Milho e Sorgo. Ministério Da Agricultura, Pecuária E Abastecimento, 1983, 15–17.
Kaundun, S. S. (2014). Resistance to acetyl-CoA carboxylase-inhibiting herbicides. Pest
Management Science, 70(9), 1405–1417. https://doi.org/10.1002/ps.3790
Kaur, R., Mavi, G. K., Raghav, S., & Khan, I. (2019). Pesticides Classification and its
Impact on Environment. International Journal of Current Microbiology and Applied
Sciences, 8(03), 1889–1897. https://doi.org/10.20546/ijcmas.2019.803.224
Knasmüller, S., Parzefall, W., Sanyal, R., Ecker, S., Schwab, C., Uhl, M., Mersch-
Sundermann, V., Williamson, G., Hietsch, G., Langer, T., Darroudi, F., & Natarajan,
A. T. (1998). Use of metabolically competent human hepatoma cells for the detection
of mutagens and antimutagens. Mutation Research - Fundamental and Molecular
Mechanisms of Mutagenesis, 402(1-2), 185–202. https://doi.org/10.1016/S0027-
5107(97)00297-2
Kraft, M., Kuglitsch, R., Kwiatkowski, J., Frank, M., & Grossmann, K. (2007). Indole-3-
acetic acid and auxin herbicides up-regulate 9-cis-epoxycarotenoid dioxygenase gene
expression and abscisic acid accumulation in cleavers (Galium aparine): Interaction
68
with ethylene. Journal of Experimental Botany, 58(6), 1497–1503.
https://doi.org/10.1093/jxb/erm011
L Karthik, A. Vishnu Kirthi, Shivendu R. (2019). Biological Synthesis of Nanoparticles
and Their Applications. In Biological Synthesis of Nanoparticles and Their
Applications. https://doi.org/10.1201/9780429265235
Lascano, R., Munoz, N., Robert, G., Rodriguez, M., Melchiorre, M., Trippi, V., & Quero,
G. (2012). Paraquat: An Oxidative Stress Inducer. Herbicides - Properties, Synthesis
and Control of Weeds, January. https://doi.org/10.5772/32590
Latt, S. a., & Schreck, R. R. (1980). Sister chromatid exchange analysis. American Journal
of Human Genetics, 32(3), 297–313.
Lehmann, B. (1997). HaCaT cell line as a model system for vitamin D3 metabolism in
human skin. Journal of Investigative Dermatology, 108(1), 78–82.
https://doi.org/10.1111/1523-1747.ep12285640
Liu H, Cai W, Huang R, Xia H, W. Y. (2012). Enantioselective toxicity of metolachlor to
Scenedesmus obliquus in the presence of cyclodextrins. Chirality, 24, 181–187.
https://doi.org/10.1002/chir.21981
Liu, H., & Xiong, M. (2009). Comparative toxicity of racemic metolachlor and S-
metolachlor to Chlorella pyrenoidosa. Aquatic Toxicology, 93(2-3), 100–106.
https://doi.org/10.1016/j.aquatox.2009.04.006
Liu, H., Ye, W., Zhan, X., & Liu, W. (2006). A comparative study of rac- and S-
metolachlor toxicity to Daphnia magna. Ecotoxicology and Environmental Safety,
63(3), 451–455. https://doi.org/10.1016/j.ecoenv.2005.02.002
Lochmiller, R. L., & Deerenberg, C. (2000). Trade-offs in evolutionary immunology: Just
what is the cost of immunity? Oikos, 88(1), 87–98. https://doi.org/10.1034/j.1600-
0706.2000.880110.x
Makhija, M., & O’Gorman, M. R. G. (2012). Common in vitro tests for allergy and
immunology. In Allergy and Asthma Proceedings (Vol. 33, Issue SUPPL. 1).
https://doi.org/10.2500/aap.2012.33.3564
Mariager, T. P., Madsen, P. V., Ebbehoj, N. E., Schmidt, B., & Juhl, A. (2013). Severe
adverse effects related to dermal exposure to a glyphosate- surfactant herbicide.
Clinical Toxicology, 51(2), 111–113. https://doi.org/10.3109/15563650.2013.763951
Mazoyer, M., & Rou. (2006). A History o World Agriculture: From the Neolithic Age to
Current crisis. PhD Proposal, 1, 525. https://doi.org/10.1016/j.jhg.2008.01.011
Monqueiro, P. A., & Christoffoleti, P. J. (2001). Rapid bioassay to determine the
sensitivity of acetolactate synthase (ALS) to inhibitor herbicides. Scientia Agricola,
58(1), 193–196. https://doi.org/10.1590/S0103-90162001000100029
Murphy, B. P., & Tranel, P. J. (2019). Target-Site Mutations Conferring Herbicide
Resistance. Plants, 8(10), 382. https://doi.org/10.3390/plants8100382
69
Nagy, K., & Tiuca, I.-D. (2017a). Importance of Fatty Acids in Physiopathology of Human
Body. Fatty Acids. https://doi.org/10.5772/67407
Nagy, K., & Tiuca, I.-D. (2017b). Importance of Fatty Acids in Physiopathology of Human
Body. In Fatty Acids: Vol. i (Issue tourism, p. 38). InTech.
https://doi.org/10.5772/67407
Neves, M., Castro, B. B., Vidal, T., Vieira, R., Marques, J. C., Coutinho, J. a. P.,
Gonçalves, F., & Gonçalves, a. M. M. (2015a). Biochemical and populational
responses of an aquatic bioindicator species, Daphnia longispina, to a commercial
formulation of a herbicide (Primextra® Gold TZ) and its active ingredient (S-
metolachlor). Ecological Indicators, 53, 220–230.
https://doi.org/10.1016/j.ecolind.2015.01.031
Neves, M., Castro, B. B., Vidal, T., Vieira, R., Marques, J. C., Coutinho, J. A. P.,
Gonçalves, F., & Gonçalves, A. M. M. (2015b). Biochemical and populational
responses of an aquatic bioindicator species, Daphnia longispina, to a commercial
formulation of a herbicide (Primextra® Gold TZ) and its active ingredient (S-
metolachlor). Ecological Indicators, 53, 220–230.
https://doi.org/10.1016/j.ecolind.2015.01.031
Nieves, D., & Moreno, J. J. (2006). Effect of arachidonic and eicosapentaenoic acid
metabolism on RAW 264.7 macrophage proliferation. Journal of Cellular Physiology.
https://doi.org/10.1002/jcp.20678
Nikoloff, N., Escobar, L., Soloneski, S., & Larramendy, M. L. (2013). Comparative study
of cytotoxic and genotoxic effects induced by herbicide S-metolachlor and its
commercial formulation Twin Pack Gold® in human hepatoma (HepG2) cells. Food
and Chemical Toxicology, 62, 777–781. https://doi.org/10.1016/j.fct.2013.10.015
Nunes, C., Silva, L., Fernandes, A. P., Guiné, R. P. F., Domingues, M. R. M., & Coimbra,
M. A. (2012). Occurrence of cellobiose residues directly linked to galacturonic acid in
pectic polysaccharides. Carbohydrate Polymers, 87(1), 620–626.
https://doi.org/10.1016/j.carbpol.2011.08.027
O’Connell, P. J., Harms, C. T., & Allen, J. R. F. (1998). Metolachlor, S-metolachlor and
their role within sustainable weed-management. Crop Protection, 17(3), 207–212.
https://doi.org/10.1016/S0261-2194(98)80011-2
Oecd. (2015). Guidance Document on Revisions to OECD Genetic Toxicology - Test
Guidelines. Genetic Toxicology Guidance Document, Tg 488, 1–58.
https://www.oecd.org/env/ehs/testing/Draft Guidance Document on OECD Genetic
Toxicology Test Guidelines.pdf
Onishi, A., St Ange, K., Dordick, J. S., & Linhardt, R. J. (2016). Heparin and
anticoagulation. Frontiers in Bioscience - Landmark, 21(7), 1372–1392.
https://doi.org/10.2741/4462
Orellana, E., & Kasinski, A. (2016). Sulforhodamine B (SRB) Assay in Cell Culture to
Investigate Cell Proliferation. Bio-Protocol, 6(21).
https://doi.org/10.21769/bioprotoc.1984
70
Ouedraogo, M., Baudoux, T., Stévigny, C., Nortier, J., Colet, J. M., Efferth, T., Qu, F.,
Zhou, J., Chan, K., Shaw, D., Pelkonen, O., & Duez, P. (2012). Review of current and
“omics” methods for assessing the toxicity (genotoxicity, teratogenicity and
nephrotoxicity) of herbal medicines and mushrooms. Journal of Ethnopharmacology,
140(3), 492–512. https://doi.org/10.1016/j.jep.2012.01.059
Pereira, A. S., Cerejeira, M. J., & Daam, M. A. (2017). Toxicity of environmentally
realistic concentrations of chlorpyrifos and terbuthylazine in indoor microcosms.
Chemosphere, 182, 348–355. https://doi.org/10.1016/j.chemosphere.2017.05.032
Pereira, S. P., Fernandes, M. a. S., Martins, J. D., Santos, M. S., Moreno, A. J. M., Vicente,
J. a. F., Videira, R. a., & Jurado, A. S. (2009). Toxicity assessment of the herbicide
metolachlor comparative effects on bacterial and mitochondrial model systems.
Toxicology in Vitro, 23(8), 1585–1590. https://doi.org/10.1016/j.tiv.2009.06.032
Pérez, J., Domingues, I., Soares, A. M. V. M., & Loureiro, S. (2011). Growth rate of
Pseudokirchneriella subcapitata exposed to herbicides found in surface waters in the
Alqueva reservoir (Portugal): A bottom-up approach using binary mixtures.
Ecotoxicology, 20(6), 1167–1175. https://doi.org/10.1007/s10646-011-0661-x
Pizzino, G., Irrera, N., Cucinotta, M., Pallio, G., Mannino, F., Arcoraci, V., Squadrito, F.,
Altavilla, D., & Bitto, A. (2017). Oxidative Stress: Harms and Benefits for Human
Health. In Oxidative Medicine and Cellular Longevity (Vol. 2017).
https://doi.org/10.1155/2017/8416763
Plhalova, L., Stefanova, S., Blahová, J., Praskova, E., Hostovsky, M., Skoric, M.,
Zelnickova, L., Svobodova, Z., & Bedanova, I. (2012). The effects of subchronic
exposure to terbuthylazine on zebrafish. Neuroendocrinology Letters, 33(SUPPL. 3),
113–119. https://doi.org/10.1100/2012/615920
Poteser, M. (2017). Cell-based in vitro models in environmental toxicology: a review.
Biomonitoring, 4(1), 11–26. https://doi.org/10.1515/bimo-2017-0002
Qiu, G. H., Xie, X., Xu, F., Shi, X., Wang, Y., & Deng, L. (2014). Distinctive
pharmacological differences between liver cancer cell lines HepG2 and Hep3B. In
Cytotechnology (Vol. 67, Issue 1). https://doi.org/10.1007/s10616-014-9761-9
Quinlan, R. a., Pogson, C. I., & Gull, K. (1980). The influence of the microtubule inhibitor,
methyl benzimidazol-2-yl-carbamate (MBC) on nuclear division and the cell cycle in
Saccharomyces cerevisiae. Journal of Cell Science, VOL.46, 341–352.
Quintaneiro, C., Patrício, D., Novais, S. C., Soares, A. M. V. M., & Monteiro, M. S.
(2017). Endocrine and physiological effects of linuron and S-metolachlor in zebrafish
developing embryos. Science of the Total Environment, 586, 390–400.
https://doi.org/10.1016/j.scitotenv.2016.11.153
Rabinovitch, P. (1994). Introduction to cell cycle analysis. Phoenix Flow Systems, Inc, 1–
34.
http://w.denovosoftware.com/Download/Introduction_to_Cell_Cycle_Analysis.pdf
71
Rao, V. S. (2014). Transgenic Herbicide Resistance in Plants. In Transgenic Herbicide
Resistance in Plants. https://doi.org/10.1201/b17857
Registre, M., & Proudlock, R. (2016). The In Vitro Chromosome Aberration Test. In
Genetic Toxicology Testing (pp. 207–267). https://doi.org/10.1016/b978-0-12-
800764-8.00007-0
Regulamento (CEE) n.o 4064/89 do Conselho. (2004). Jornal Oficial Da União Europeia.
Robyt, J. F. (1998). Polysaccharides I. https://doi.org/10.1007/978-1-4612-1622-3_6
Rocco, P. R. M., Facchinetti, L. D., Ferreira, H. C., Negri, E. M., Capelozzi, V. L., Faffe,
D. S., & Zin, W. a. (2004). Time course of respiratory mechanics and pulmonary
structural remodelling in acute lung injury. Respiratory Physiology and Neurobiology,
143(1), 49–61. https://doi.org/10.1016/j.resp.2004.06.017
Rustan, A. C., & Drevon, C. a. (2005). Fatty Acids: Structures and Properties.
Encyclopedia of Life Sciences, April 2014. https://doi.org/10.1038/npg.els.0003894
Sadowski, R. F. (2017). Neolithic Revolution. In Encyclopedia of Food and Agricultural
Ethics (Issue Zeder 2015, pp. 1–8). Springer Netherlands. https://doi.org/10.1007/978-
94-007-6167-4_540-1
Salih Istifli, E., Tahir Hüsunet, M., & Basri Ila, H. (2019). Cell Division, Cytotoxicity, and
the Assays Used in the Detection of Cytotoxicity. In Cytotoxicity - Definition,
Identification, and Cytotoxic Compounds. https://doi.org/10.5772/intechopen.88368
Sampath, H., & Ntambi, J. M. (2004). Polyunsaturated fatty acid regulation of gene
expression. In Nutrition Reviews. https://doi.org/10.1301/nr.2004.sept.333-339
SanGiovanni, J. P., & Chew, E. Y. (2005). The role of omega-3 long-chain
polyunsaturated fatty acids in health and disease of the retina. In Progress in Retinal
and Eye Research. https://doi.org/10.1016/j.preteyeres.2004.06.002
Saniewski, M., Góraj-Koniarska, J., Gabryszewska, E., Miyamoto, K., & Ueda, J. (2017).
Differential effects of N-1-naphthylphthalamic acid (NPA) and 2,3,5-triiodobenzoic
acid (TIBA) on auxin control of swelling of the shoots of Bryophyllum calycinum
Salisb. Acta Agrobotanica, 70(3). https://doi.org/10.5586/aa.1723
Schieber, M., & Chandel, N. S. (2014). ROS function in redox signaling and oxidative
stress. Current Biology, 24(10), R453–R462.
https://doi.org/10.1016/j.cub.2014.03.034
Schmalfu, J., Matthes, B., Knuth, K., & Böger, P. (2000). Inhibition of acyl-CoA
elongation by chloroacetamide herbicides in microsomes from leek seedlings.
Pesticide Biochemistry and Physiology, 67(1), 25–35.
https://doi.org/10.1006/pest.2000.2473
Scott, J. E. (2003). Elasticity in extracellular matrix “shape modules” of tendon, cartilage,
etc. A sliding proteoglycan-filament model. In Journal of Physiology.
https://doi.org/10.1113/jphysiol.2003.050179
72
Seo, M. D., Kang, T. J., Lee, C. H., Lee, A. Y., & Noh, M. (2012). HaCa T keratinocytes
and primary epidermal keratinocytes have different transcriptional profiles of
cornified envelope-associated genes to T helper cell cytokines. Biomolecules and
Therapeutics, 20(2), 171–176. https://doi.org/10.4062/biomolther.2012.20.2.171
Shaner, D. L. (1999). Resistance to Acetolactate Synthase (ALS) Inhibitors in the United
States: History, Occurrence, Detection, and Management. Journal of Weed Science
and Technology, 44(4), 405–411. https://doi.org/10.3719/weed.44.405
Sherwani, S. I., Arif, I. A., & Khan, H. A. (2015). Modes of Action of Different Classes of
Herbicides. In Herbicides, Physiology of Action, and Safety: Vol. i (Issue tourism, p.
13). InTech. https://doi.org/10.5772/61779
Siehl, D. L. (1997). Inhibitors of EPSP synthase, glutamine synthetase and histidine
synthesis. Reviews in Toxicology, 1(3-4), 37–67.
Špoljarić Maronić, D., Štolfa Čamagajevac, I., Horvatić, J., Žuna Pfeiffer, T., Stević, F.,
Žarković, N., Waeg, G., & Jaganjac, M. (2018). S-metolachlor promotes oxidative
stress in green microalga Parachlorella kessleri - A potential environmental and health
risk for higher organisms. Science of the Total Environment, 637-638, 41–49.
https://doi.org/10.1016/j.scitotenv.2018.04.433
Springer, J. E., Azbill, R. D., & Carlson, S. L. (1998). A rapid and sensitive assay for
measuring mitochondrial metabolic activity in isolated neural tissue. Brain Research
Protocols, 2(4), 259–263. https://doi.org/10.1016/S1385-299X(97)00045-7
Stillwell, W., & Wassall, S. R. (2003). Docosahexaenoic acid: Membrane properties of a
unique fatty acid. In Chemistry and Physics of Lipids. https://doi.org/10.1016/S0009-
3084(03)00101-4
Syngenta. (2017). Primextra technichal sheet.
Syngenta. (2018). Safety Data sheet version 7.1 acording to Rule (CE) No. 1907/2006.
https://www.syngenta.pt/sites/g/files/zhg511/f/ficha-seguranca-primextra-gold-
tz.pdf?token=1529418332
Takano, H. K., Ovejero, R. F. L., Belchior, G. G., Maymone, G. P. L., & Dayan, F. E.
(2019). ACCase-inhibiting herbicides: mechanism of action, resistance evolution and
stewardship. Scientia Agricola, 78(1), 1–11. https://doi.org/10.1590/1678-992x-2019-
0102
Tamer, T. M. (2013). Hyaluronan and synovial joint: Function, distribution and healing. In
Interdisciplinary Toxicology. https://doi.org/10.2478/intox-2013-0019
Tateno, M., Brabham, C., & Debolt, S. (2016). Cellulose biosynthesis inhibitors - A
multifunctional toolbox. Journal of Experimental Botany, 67(2), 533–542.
https://doi.org/10.1093/jxb/erv489
Teale, W., & Palme, K. (2018). Naphthylphthalamic acid and the mechanism of polar
auxin transport. Journal of Experimental Botany, 69(2), 303–312.
https://doi.org/10.1093/jxb/erx323
73
The European Parlament and the Council of the European Union. (2013). Directive
2013/39/EU of the European Parliament and of the council of 12 August 2013
amending Directives 2000/60/EC and 2008/105/EC as regards priority substances in
the field of water policy. Official Journal of the European Union, July, 1–17.
https://doi.org/http://eur-lex.europa.eu/legal-content/EN/TXT/?uri=celex:32013L0039
Trenkamp, S., Martin, W., & Tietjen, K. (2004). Specific and differential inhibition of
very-long-chain fatty acid elongases from Arabidopsis thaliana by different
herbicides. Proceedings of the National Academy of Sciences of the United States of
America, 101(32), 11903–11908. https://doi.org/10.1073/pnas.0404600101
Trownbridge, J. M., & Gallo, R. L. (2002). Dermatan sulfate: New functions from an old
glycosaminoglycan. Glycobiology, 12(9). https://doi.org/10.1093/glycob/cwf066
UNION, C. O. T. E. (1998). Council Directive 98/83/EC of 3 November 1998 on the
quality of water intended for human consumption. Official Journal of the European
Union, 865–878. https://doi.org/10.1017/cbo9780511610851.055
Us Epa. (2018). US Environmental Protection Agency Office of Pesticide Programs
Chemicals Evaluated for Carcinogenic Potential Annual Cancer Report 2017.
https://www.epa.gov/risk/guidelines-carcinogen-risk-assessment
Usui, T., Saitoh, Y., & Komada, F. (2003). Induction of CYP3As in HepG2 cells by
several drugs. - Association between induction of CYP3A4 and expression of
glucocorticoid receptor. Biological and Pharmaceutical Bulletin, 26(4), 510–517.
https://doi.org/10.1248/bpb.26.510
Van Dam, J. E. G., Van Den Broek, L. A. M., & Boeriu, C. G. (2017). Polysaccharides in
human health care. Natural Product Communications, 12(6), 821–830.
https://doi.org/10.1177/1934578x1701200604
Van Der Werf, H. M. G. (1996). Assessing the impact of pesticides on the environment.
Agriculture, Ecosystems and Environment, 60(2-3), 81–96.
https://doi.org/10.1016/S0167-8809(96)01096-1
Vats, S. (2015). Sustainable Agriculture Reviews. In E. Lichtfouse (Ed.), Sustainable
Agriculture Reviews (Vol. 15, Issue January). Springer International Publishing.
https://doi.org/10.1007/978-3-319-09132-7
Velisek, J., Stara, A., Koutnik, D., & Zuskova, E. (2015). Effects of terbuthylazine on early
life stages of common carp. Neuroendocrinology Letters, 36(2015), 120–125.
Wachholz, P. A., Dearman, R. J., & Kimber, I. (2005). Detection of allergen-specific IgE
antibody responses. In Journal of Immunotoxicology (Vol. 1, Issues 3-4, pp. 189–
199). https://doi.org/10.1080/15476910490919140
Weijers, R. N. M. (2016). Membrane flexibility, free fatty acids, and the onset of vascular
and neurological lesions in type 2 diabetes. In Journal of Diabetes and Metabolic
Disorders (Vol. 15, Issue 1). https://doi.org/10.1186/s40200-016-0235-9
74
Ye, M., Beach, J., Martin, J. W., & Senthilselvan, A. (2013). Occupational pesticide
exposures and respiratory health. International Journal of Environmental Research
and Public Health, 10(12), 6442–6471. https://doi.org/10.3390/ijerph10126442
Zakrzewski, S. F. (2002). Environmental Toxicology (Third Edit). Oxford University Press.
Želježić, D., Žunec, S., Bjeliš, M., Benković, V., Mladinić, M., Lovaković Tariba, B.,
Pavičić, I., Marjanović Čermak, A. M., Kašuba, V., Milić, M., Pizent, A., Lucić
Vrdoljak, A., & Kopjar, N. (2018). Effects of the chloro-s-triazine herbicide
terbuthylazine on DNA integrity in human and mouse cells. Environmental Science
and Pollution Research, 25(19), 19065–19081. https://doi.org/10.1007/s11356-018-
2046-7