Embed Size (px)
Citation preview
1
POZIOM ZADOWOLENIA PRACOWNIKÓW HOTELI W ROZWIAJĄCYM SIĘ
REGIONIE, GOŚCINNEJ ANATOLII
JOB SATISFACTION LEVEL OF HOTEL EMPLOYEES IN DEVELOPING
HOSPITALITY REGIONS (ISTANBUL ANATOLIAN SIDE 5* HOTELS)
Asst. Prof. M. Onur Gülbahar*
STRESZCZENIE/KOMPENDIUMTo badanie ma na celu prześledzić/zbadać poziom zadowoleniapracowników hoteli w powiązaniu w ich cechami demograficznymi.Na samym początku został zrobiony ogólny przegląd poziomuzadowolenia z pracy. Jako metodę badawczą użytokwestionariusza, który został wysłany do pracowników 5-gwiazdkowych hoteli, do anatolijskiej części Istambułu. JSS(Ankieta satysfakcji z pracy) opracowana przez Spector zostałaużyta, aby określić poziom zadowolenia z pracy wśródpracowników. Pytania dotyczące pracy i cech osobowościowychzostały dołączone do wysłanych kwestionariuszy. Analiza wynikówzostała zsumowana i pozwoliła na określenie częstotliwościkażdej z cech demograficznych/osobowościowych, generalny poziomzadowolenia, poziom zadowolenia dla każdego ankietowanego iznaczenie relacji/powiązań między cechami demograficznymi/osobowościowymi, a poziomem zadowolenia z pracy. Stworzonoopisowe grafy, aby sprawdzić ogólny poziom zadowolenia z pracyjako wzorzec, tabele częstotliwości dla cech demograficznych itych związanych z pracą, tak aby móc dostrzec szczegółyzadowolenia z pracy każdego ankietowanego JSS, niezależnywzorzec T Test, jeden Way ANOVA i Welch Tests podczas ich PostHoc Tests i Crosstabs, aby zobaczyć powiązania pomiędzykwalifikacjami ankietowanych, a ich zadowoleniem z pracy. Wynikbył następujący 4,63 z 7, co oznacza, że testy i uzyskanerezultaty są bliskie nieznacznemu, minimalnemu zadowoleniu zwykonywanej pracy. Dodatkowo, pojedynczy mężczyzna, zarabiający
* MA, PhD. Okan University, School of Applied Sciences, Department of Tourism and Hotel Management, Istanbul, Turkey. E-mail: [email protected]
2
więcej niż przeciętna, miesięczna płaca, uzyskuje wyższystopień zadowolenia z wykonywanej pracy niż jego koledzy.Słowa Klucze: Turystyka, Przemysł hotelowy, Zadowolenie zpracy, Ankieta zadowolenia z pracy, strona anatolijskaIstanbułu.
ABSTRACTIn this study, it is aimed to investigate the level of jobsatisfaction of hotel employees in relation with theirdemographic characteristics. For the beginning, literaturereview was made about job satisfaction in general. As theresearch methodology, a questionnaire form was prepared andapplied to the employees of 5-star Hotels in the Anatolian sideof Istanbul. The JSS (Job Satisfaction Survey) developed bySpector was used for the determination of job satisfactionamong employees. Demographic and job related general questionswere added to the applied questionnaire. The analysis of theoutcomes were summarized and evaluated following thedetermination of frequencies of each demographiccharacteristics, general satisfaction level, satisfaction levelfor each JSS statement and significance of the relationsbetween demographic characteristics and job satisfactionlevels. Descriptive Statistics was made to see the overall jobsatisfaction level of the sample, Frequency Tables for generaldemographic / work related qualifications and each JSS items tosee the detailed satisfaction levels, Independent-Samples TTest, One Way ANOVA and Welch Tests along with their Post HocTests and Crosstabs to see the relationships between therespondents’ qualifications and their satisfaction level. Asper the outcomes, general satisfaction level calculated 4.63out of 7, which means the sample is close to being slightlysatisfied with their job. Additionally, single men, earningmore than the monthly poverty limit have the higher jobsatisfaction level among their colleagues.Key Words: Tourism, Hotel industry, Job satisfaction, the JobSatisfaction Survey, Istanbul-Anatolian Side
WSTĘPW każdej książce z ekonomii, zarządzania biznesem, marketingu ipokrewnych dziedzin, napisane jest, że głównym celem każdego

3
prywatnego przedsiębiorstwa jest „zysk”. Aby uzyskać najwyższyzysk z produkcji dóbr i usług powinno się podążać następującymizasadami. Najłatwiejszą i najbardziej ogólną z nich jestminimalizacja kosztów i maksymalizacja zysków. Leczminimalizując koszty produkcji i nie biorąc pod uwagę jakościdanego dobra, klienci nie będą zadowoleni, a przedsiębiorstwostraci. Ta strata będzie tym szybsza i większa, jeślikonsumentowi dostarczymy zła jakość w momencie wyprodukowania,a on przekaże ta informacje dalej. Aby zrównoważyć jakośćusług, personel powinien być utrzymywany na dobrym poziomie, awykwalifikowany personel powinien być szczęśliwy w pracy. Tojest cala prawda o hotelarstwie jak i gastronomii. Zadowolenipracownicy hotelu prowadza do zmniejszenia obrotów, wysokawydajność i wysoka jakość usług prowadzi do szczęśliwych ilojalnych klientów, którzy będą wspierać oraz podnosić dochody.Gdy podnoszą się dochody rozpoczyna się trend zwiększaniarentowności, możliwe jest podniesienie jakości, poprzezorganizowanie programów edukacyjnych dla obecnie zatrudnionychpracowników jak i zatrudnienie wykwalifikowanej kadry.
Początkowo szef może pomyśleć, ze uzyska większy zysk,zatrudniając tańszych pracowników z ograniczonymdoświadczeniem. Jednak nie robiąc nic dla swoich pracowników popewnym czasie staja się niezadowoleni z tej strategiizarządzania. Następnie przychodzi niepokój, niezadowolenie,brak motywacji, a ponadto uczucie, ze ich praca jest poniżającai upokarzająca. Wszystkie te powody są przyczyna niskiejjakości usług, niechęci do gościa, negatywnego stosunku dopracy. Nawet zadowoleni pracownicy mogą opuścić prace, jeżelioferta pracy nie przyciągnie ich uwagi, a przedsiębiorstwoprzeoczy to. Konsekwencje obrotu można podsumować następująco:zwiększenie rekrutacji, zatrudnianie, przyswajanie, szkolenienowych pracowników, ułatwienie formalności i koszty związane znimi, spadek wydajności, komunikacji i zadowolenia wśródobecnych pracowników. Niektórzy twierdza, ze miliony dolarówzostają utracony poprzez rotacje pracowników. Ponadto, większyproblem może wystąpić jeśli nie opuszcza miejsca pracy i nadalbędą oferować zlej jakości usługi wobec klienta. Ponieważlepiej wyłączyć pracowników niezaangażowanych,nieproduktywnych, często nieobecnych, spóźniających się dopracy lub działających na niekorzyść interesom firmy.
4
W dzisiejszych czasach ważne jest by utrzymać zrównoważonezatrudnienie w branży hotelarskiej. Od kiedy siła robocza stałasię najbardziej wartościowym wkładem w hotelu, jest bardzoważnym by budować odpowiednie środowisko pracy, które spełniawymagania pracowników, a nawet je przewyższa. Obecnośćwysokiego poziomu zadowolenia i satysfakcji nie tylko podnosiwydajności i jakość pracy pracowników, ale również redukujestres i zwiększa zaangażowanie organizacyjne. Przyszły sukcesbranży hotelarskiej może zależeć od poziomu zadowoleniapracowników i od zdolności poprawy wizerunku działy od sprawzatrudnienia.
INTRODUCTION
In every basic sourcebook about economics or businessadministration, management and related fields, prior aim of theprivate establishments is said to be “profit”. In order tomaintain the highest profit while production of goods orservices, there are several rules to follow. The simplest andmost general of them are to minimize costs and maximize prices.But while minimizing the input costs, if quality is not takeninto consideration, customers will not be satisfied and theestablishments will lose them. This loss will be quicker andbigger in the service industry, as the consumer sees the poorquality at the time of the service produced and supplied, andrespond right away. To have a sustainable service quality,besides other necessities, staff quality should be maintainedand that qualified staff should be happy at work. This is truefor hospitality industry as well. Satisfied hotel employeeslead to less turnover, high productivity and high qualityservice, service quality leads to happy and loyal customers,which will support the competition power and raise the income.When the raised income starts a trend of increasingprofitability, it will be possible to increase the inputquality, by organising education programs for the existingstaff and recruiting additional qualified staff as well.
At first, boss may think that he obtains more profit byrecruiting cheaper workforce with limited qualifications, andnot doing anything for his employees’ happiness, but in time,the existing employees become unsatisfied with this management
5
strategy. Then comes uneasiness, unhappiness, lack ofmotivation, furthermore with the feeling their work isinsulting, demeaning, and humiliating. All these could causepoor service quality, dislike for the guest, negative jobattitudes, and high turnover rates. Even the successfulemployees may disengage and leave their work, when they are notattracted by offers as much as they are left out of anestablishment. The consequences of turnover can be summarisedas; increase in recruiting, hiring, assimilating, training newstaff, closing paperwork and high costs of these operations,also decrease in productivity, communication and satisfactionamong existing employees. Some say that millions of dollarsbesides productivity are lost due to employee turnover.Moreover, a greater problem can come out if they do not leavethe industry but stay and continue providing poor service.Because, disengaged employees are uncommitted, marginallyproductive, frequently absent, going to work late, or workingagainst the interests of the company.
Today, it is a necessity to have a sustainable workforce in thehospitality industry. As the workforce has become the mostvaluable input of hotels, it is very important to build a workenvironment that meets or even exceeds their expectations. Therest is up to the employees’ individual characteristics andqualifications. The presence of high level job satisfaction notonly increases efficiency and the quality, but also provides alot of contributions, reduces stress and increaseorganizational commitment. The future success of the hotelindustry may depend on the level of employee satisfaction andthe ability to improve the image of service employment.
JOB SATISFACTION
There are several reasons why the concept “job satisfaction” issaid to be the most studied variable in the field oforganizational behaviour, and why we should be concerned with.From the humanitarian point of view, people deserve to betreated fairly and with respect. From the utilitarianperspective, as employee behaviour affects organizationalfunctioning, job satisfaction is an important determinant of
6
staff behaviour. It also can be a reflection of organizationalfunctioning (Spector, 1997).
The notion of job satisfaction is important because of itseffect on employees’ performance and behaviour, as well asoverall individual well-being (Judge and Watanabe, 1993). Jobsatisfaction is connected to employees’ general affectiveevaluation of their job, and customer satisfaction is linked toservices performed by workers who are satisfied with their jobsand their workplace environments (Arnett, Laverie and McLane,2002; Schneider and Mowen 1985). Satisfied employees providebetter services than those who are not satisfied, and arelikely to stay on the job (Schlesinger, 1982; Mobley, Griffeth,Hand and Meglino, 1979; Salazar and Hubbard, 2000). As serviceproducts are provided by people, employers have to meetemployees’ expectations (Rafaeli, 1989): this is especiallyvalid in an industry, which is mostly based on humaninteractions (Spinelli and Canavos, 2000).
Motivation is often associated with job satisfaction (Thierry,1998). Today’s managers generally believe that satisfiedemployees are likely to be motivated employees and that jobsatisfaction is a part of life satisfaction (Miles and Sledge,2006).
Job satisfaction was seen as a component of and having asignificant relationship with organizational commitment andturnover (Barrow, 1990; Schlesinger and Zornitsky, 1991). Someresearchers have found that job satisfaction affects turnover(Mobley et al., 1979), and some others estimated the costs ofhotel employee leaving between $1,500 and more than $12,000 perincident (Wasmuth and Davis, 1983; Hinkin and Tracey, 2000).Turnover leads to several negative consequences like increasein recruiting, hiring, assimilation, training, and closingpaperwork; and decrease of communication, productivity, andsatisfaction among employees who go on (Mobley, 1982).
Some other studies have also shown that job satisfaction isrelated to job performance, workplace turnover and lifesatisfaction (Morrison, 1997; Judge, Parker, Colbert, Hellerand Ilies, 2001). The hospitality industry is well known forits high turnover rate (Deery and Shaw, 1998). Some research
7
explains the reasons for high turnover rate as lowcompensation, inadequate benefits, poor working conditions,poor worker morale and job attitudes, and inadequaterecruitment (Hinkin and Tracey, 2000; Milman, 2002; Goymour,2002). The success or failure in a hotel can be contributed byjob satisfaction. Satisfied employees lead to satisfied guestsand reduced turnover. LaLopa’s (1997) research involving non-supervisory hospitality employees indicates that satisfactionis the most important variable of turnover intentions becauseit is generally regarded as triggering the turnover process,leading to intentions to quit, and final quit or staydecisions. An organization can reduce turnover by focusing onwhat contributes to job satisfaction (Salazar, Hubbard andSalazar, 2002). According to Lam, Zhang, & Baum (2001) thehotel’s goal rests on the employees’ belief that their effortscan lead to the satisfaction of employees’ needs. An increasein employee satisfaction motivates workers to be more engagedand, as a result, they are more likely to rake actions thatresult in increased guest satisfaction and profitability(Arnett et al., 2002).
Hotel managers need to keep employees longer, not only due tothe cost of hiring and training new employees, but also tenuredemployees tend to provide a more positive performance, which islinked to customer satisfaction (Bedeian, Ferris and Kacmar,1992). Job satisfaction is fundamental in the hotel industry asit helps to ensure that employees will treat customers with theutmost respect. So, employees’ satisfaction is a major concernfor organizations that are interested in increasing customerloyalty. Maintaining quality employees would be the idealmethod to sustain a solid reputation and attract repeatcustomers (Keane, 1996). Employees’ job satisfaction has beenlinked to an increase in customer orientation by the employee,an increase in customer satisfaction, and an increase inperceived service quality (Arnett et al., 2002).
The term job satisfaction was first defined by Hoppock (1935)as a combination of psychological, physical and environmentalcircumstances that causes a person to say, “I am satisfied withmy job”. One of the most accepted definitions of jobsatisfaction by Locke (1969) is that, it is a positiveemotional feeling, a result of one’s evaluation towards his job
8
or his job experience by comparing between what he expects fromhis job and what he actually gets from it. He later madeanother definition as; it is the result of the interaction ofthe employees’ values and his perception towards his job andenvironment (Locke, 1976). Similar definitions have been madeafterwards, by Arvey, 1995; Susskind, Borchgrevink, Kacmar, andBrymer, 2000; and Robbins, 2001.
Job satisfaction has been described in many different ways: asthe degree to which an individual feels positively ornegatively about various aspects of the job (Schermerhorn,1996); as an employee’s general attitude towards his or her job(Robbins and Coulter, 1996); as attitudes towards outcomes onthe job (Schneider, 1985); as an attitude toward work-relatedconditions, facets, or aspects of the job (Wiener, 1982); asthe extent to which employees like their work (Agho, Price, andMueller, 1992); and as the feelings employees have about theirjobs in general or job experiences in relation to previousexperiences, current expectations, or available alternatives(Smith, Kendall, and Hulin, 1969). Spector (1997) believes thatjob satisfaction “can be considered as a global feeling aboutthe job or as a related constellation of attitudes aboutvarious aspects or facets of the job.” It is the extent towhich people like (satisfaction) or dislike (dissatisfaction)their jobs in general.
According to Schneider and Snyder (1975), job satisfaction isthe personal evaluation of the job conditions (the job itself,the attitude of the administration etc.) or the consequences(wages, occupational security etc.) acquired from the job.Employees typically think about fairness in terms of workconditions, pay and supervision when they are asked about jobsatisfaction. They make a comparison between their expectationsand what they actually receive (Organ, 1990).
When we aim to determine the overall or bottom line attitude ofemployees, like the effects of liking or disliking the job, theglobal approach is used. The facet approach helps us find whichparts of the job leads to satisfaction or dissatisfaction(Spector, 1997).
9
Efraty and Sirgy (1990) describe job satisfaction as “one’seffective appraisal of various job dimensions”; this includesthe work itself, supervision, pay, promotion policies, and co-workers, all of which reflected by Wood, Wallace, Zeffane,Schermerhorn, Hunt, and Osborn (1998) as well. Hoffman & Ingram(1992) note job satisfaction factors are related to workingconditions, fringe benefits and organization’s policies andprocedures additionally, where Gürbüz (2007) agrees that,communication, security, efficiency and employment pattern areamong the variables that affect employee’s thought about thework. The other common job satisfaction facets for Spector(1997) are; appreciation, organization itself, personal growthand recognition. Tanke (1990) adds training and being involvedin decision making as factors influencing job satisfaction.Robbins (2001) includes meeting performance standards as one ofthe job satisfaction as well.
Loscocco and Roschelle (1991) believe that specific individualand situational characteristics influence job satisfaction.Individual characteristics include personality, education,gender, and family roles, while situational includes jobcharacteristics, organizational characteristics, and promotionopportunity (Hackman and Oldham, 1980). Glisson and Durick(1988) considered the worker and the nature of the work itselfas two important factors affecting job satisfaction. Just likePorter and Lawler (1968), theorists like Rose (2001) haveacknowledged job satisfaction as a bi-dimensional conceptconsisting of intrinsic and extrinsic satisfaction dimensions.Intrinsic sources of satisfaction depend on the feelingsobtained from work, or individual characteristics of theperson, such as the ability to use initiative, relations withsupervisors, or the work that the person actually performs.Extrinsic sources of satisfaction are situational and depend onthe environment, such as pay, promotion, relationships withcolleagues, good working environment, good welfare andutilities, or job security; these are financial and othermaterial rewards or advantages of a job. Both extrinsic andintrinsic job facets should be represented, as equally aspossible, in a composite measure of overall job satisfaction(Eurofound, 2007). Variables selected to measure jobsatisfaction need to represent all aspects of the workenvironment: human relations, the job itself, personal
10
feelings, and membership within the organization (Syptak,Marsland, and Ulmer, 1999). Identifying factors of jobsatisfaction provides hoteliers with information that assiststhem in making meaningful decisions regarding employee jobsatisfaction (Cranny, Smith, and Stone, 1992).
According to Sousa-Poza and Sousa-Poza (2000), some of the jobsatisfaction workplace determinants are whether the employeefinds the job interesting; has good relationships withmanagement; has a high income (more important for males thanfemales); can work independently; has good advancementopportunities and good relations with colleagues. Therefore, wecan say that job satisfaction depends on the balance betweenwork-role inputs - such as education, working time, effort -and work-role outputs - wages, fringe benefits, status, workingconditions, intrinsic aspects of the job. If work-role outputs(‘pleasures’) increase relative to work-role inputs (‘pains’),then job satisfaction will increase (Eurofound, 2007).
The empirical researches support that satisfaction ispositively related with wages, negatively with hours of work.Several studies have reported that females are happier at workthan males (Clark, 1997; Groot and van der Brick, 1998).According to Clark (1997) this can be due to women’s lowerexpectations from their jobs. The empirical evidence betweenjob satisfaction and age suggests the existence of a U-shapedrelationship (Clark, 1996; Sloane and Ward, 2001; Vieira,2005). Higher levels of education are apparently associatedwith lower levels of job satisfaction (Clark, 1997; Clark andOswald, 1996).
Susskind et al. (2000) explain that employees’ realisedorganisational support influences their job satisfaction andthat employees’ job satisfaction influences work-relatedattitudes. They define organisational support as, “the extentto which an employee believes that their employer is concernedabout their well-being”.
RESEARCH AND DATA COLLECTING
Although job satisfaction is one of the most popular researchsubjects, it is difficult for researchers to measure levels of
11
employee job satisfaction. This may be because there arenumerous specified variable variations among the studies andlots of variations on the level of importance or each specifiedvariable (Lester, 1987).
It is accepted to be much easier and less risky to use one ofthe existing scales in order to assess job satisfaction, asthey have been developed carefully and their reliability andvalidity have been proven in many different researches. Someadvantages of using an existing scale are; they already coverthe major job satisfaction facets, popular scales have beenused a sufficient number of times to provide norms, and itsaves cost and time necessary to develop a new scale. In orderto be applicable to most organization types, the facets of mostjob satisfaction scales are general and do not include morespecific areas to be applied for certain types of organizationsor a particular organization. This seems to be the majordisadvantage of using an existing scale (Spector, 1997).
There are six popular job satisfaction scales, four of whichare facet scales, and two global scales. The MinnesotaSatisfaction Questionnaire (MSQ; Weiss, Dawis, England andLofquist, 1967), the Job Descriptive Index (JDI; Smith, Kendalland Hulin, 1969), the Job Diagnostic Survey (JDS; Hackman andOldham, 1975), and the JSS (Spector, 1985) are facet measuresof job satisfaction. The two general job satisfaction scalesare the Michigan Organizational Assessment Questionnairesatisfaction subscale (Cammann, Fichman, Jenkins and Klesh,1979), and the Job in General Scale (JIG; Ironson, Smith,Brannick, Gibson and Paul, 1989).
The MSQ identified various aspects of job satisfaction: workingconditions, chances for advancement, freedom to use one’s ownjudgement, praise for going a good job and feelings ofaccomplishment (Weiss, Dawis, England, Lofquist, 1967).
The JDI is one of the most popular facet scales amongorganizational researchers. The scale assesses five facets;work, pay, promotion, supervision and co-workers. It contains72 items with 9 or 18 items per subscale. Each item is anevaluative adjective or short phrase descriptive of the job.Responses are “Yes”, “Uncertain” or “No”. The Job Diagnostic
12
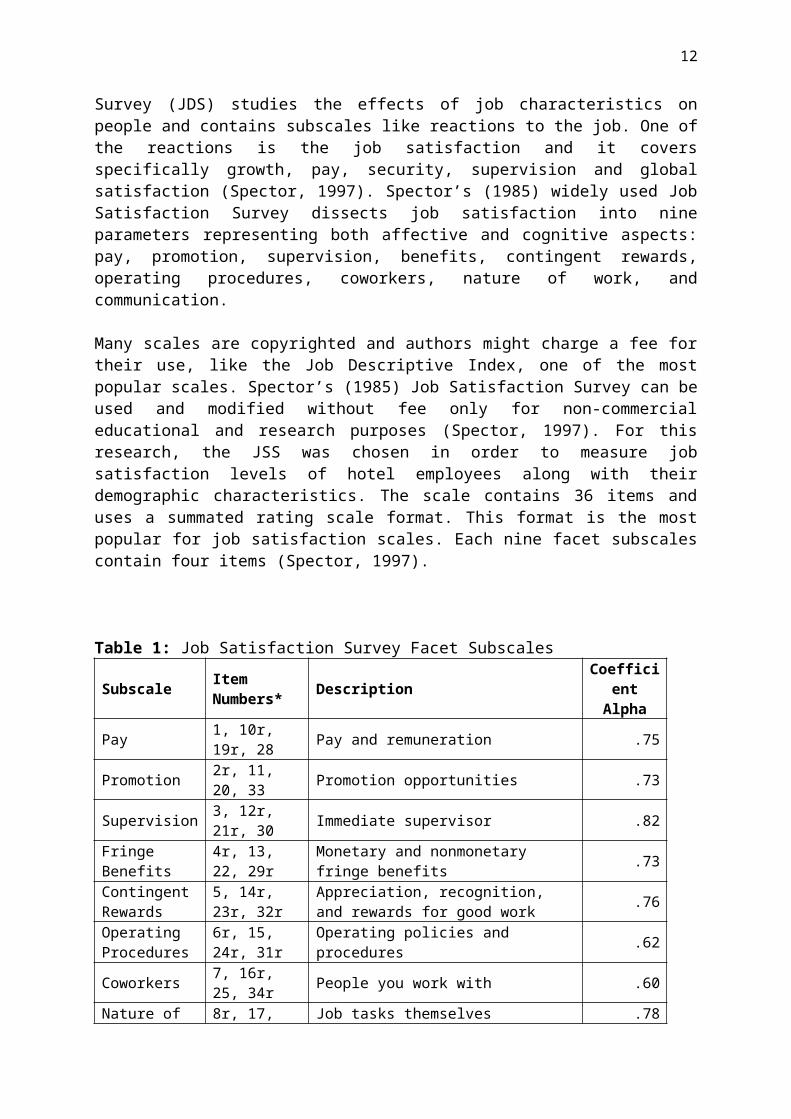
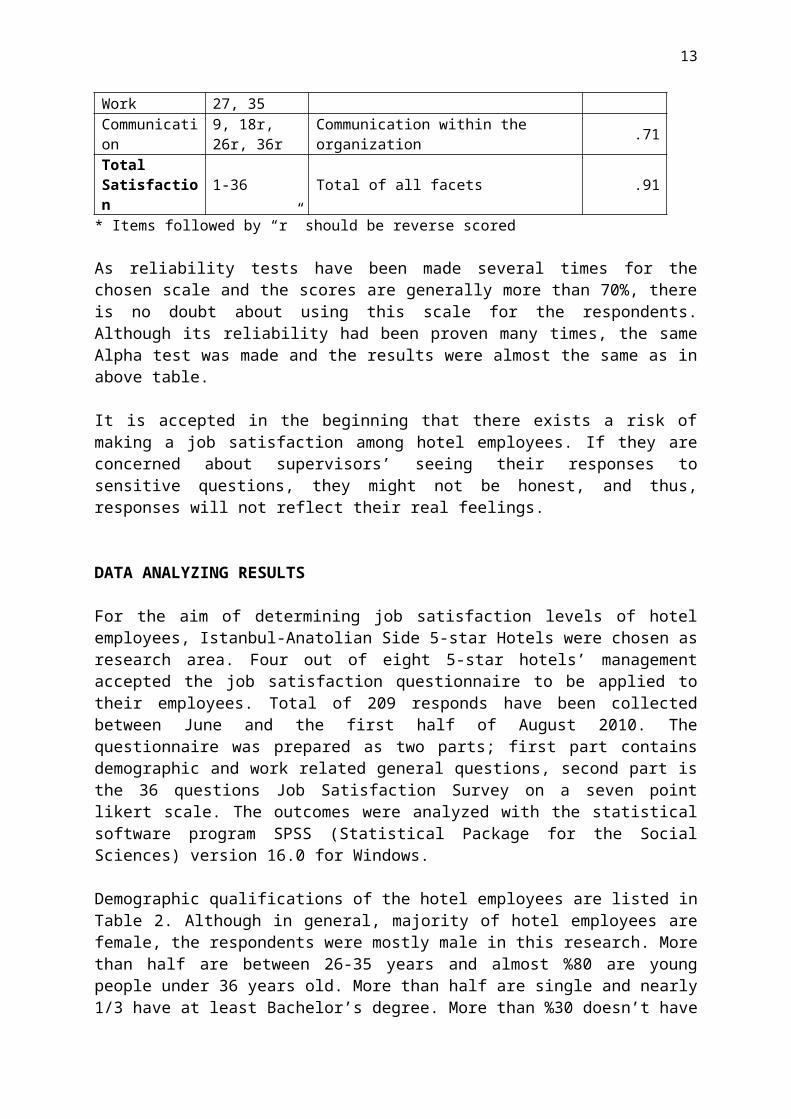
Survey (JDS) studies the effects of job characteristics onpeople and contains subscales like reactions to the job. One ofthe reactions is the job satisfaction and it coversspecifically growth, pay, security, supervision and globalsatisfaction (Spector, 1997). Spector’s (1985) widely used JobSatisfaction Survey dissects job satisfaction into nineparameters representing both affective and cognitive aspects:pay, promotion, supervision, benefits, contingent rewards,operating procedures, coworkers, nature of work, andcommunication.
Many scales are copyrighted and authors might charge a fee fortheir use, like the Job Descriptive Index, one of the mostpopular scales. Spector’s (1985) Job Satisfaction Survey can beused and modified without fee only for non-commercialeducational and research purposes (Spector, 1997). For thisresearch, the JSS was chosen in order to measure jobsatisfaction levels of hotel employees along with theirdemographic characteristics. The scale contains 36 items anduses a summated rating scale format. This format is the mostpopular for job satisfaction scales. Each nine facet subscalescontain four items (Spector, 1997).
Table 1: Job Satisfaction Survey Facet Subscales
Subscale Item Numbers* Description
Coefficient
Alpha
Pay 1, 10r, 19r, 28 Pay and remuneration .75
Promotion 2r, 11, 20, 33 Promotion opportunities .73
Supervision 3, 12r, 21r, 30 Immediate supervisor .82
Fringe Benefits
4r, 13, 22, 29r
Monetary and nonmonetary fringe benefits .73
Contingent Rewards
5, 14r, 23r, 32r
Appreciation, recognition, and rewards for good work .76
Operating Procedures
6r, 15, 24r, 31r
Operating policies and procedures .62
Coworkers 7, 16r, 25, 34r People you work with .60
Nature of 8r, 17, Job tasks themselves .78
13
Work 27, 35Communication
9, 18r, 26r, 36r
Communication within the organization .71
Total Satisfaction
1-36 Total of all facets .91
* Items followed by “r” should be reverse scored
As reliability tests have been made several times for thechosen scale and the scores are generally more than 70%, thereis no doubt about using this scale for the respondents.Although its reliability had been proven many times, the sameAlpha test was made and the results were almost the same as inabove table.
It is accepted in the beginning that there exists a risk ofmaking a job satisfaction among hotel employees. If they areconcerned about supervisors’ seeing their responses tosensitive questions, they might not be honest, and thus,responses will not reflect their real feelings.
DATA ANALYZING RESULTS
For the aim of determining job satisfaction levels of hotelemployees, Istanbul-Anatolian Side 5-star Hotels were chosen asresearch area. Four out of eight 5-star hotels’ managementaccepted the job satisfaction questionnaire to be applied totheir employees. Total of 209 responds have been collectedbetween June and the first half of August 2010. Thequestionnaire was prepared as two parts; first part containsdemographic and work related general questions, second part isthe 36 questions Job Satisfaction Survey on a seven pointlikert scale. The outcomes were analyzed with the statisticalsoftware program SPSS (Statistical Package for the SocialSciences) version 16.0 for Windows.
Demographic qualifications of the hotel employees are listed inTable 2. Although in general, majority of hotel employees arefemale, the respondents were mostly male in this research. Morethan half are between 26-35 years and almost %80 are youngpeople under 36 years old. More than half are single and nearly1/3 have at least Bachelor’s degree. More than %30 doesn’t have
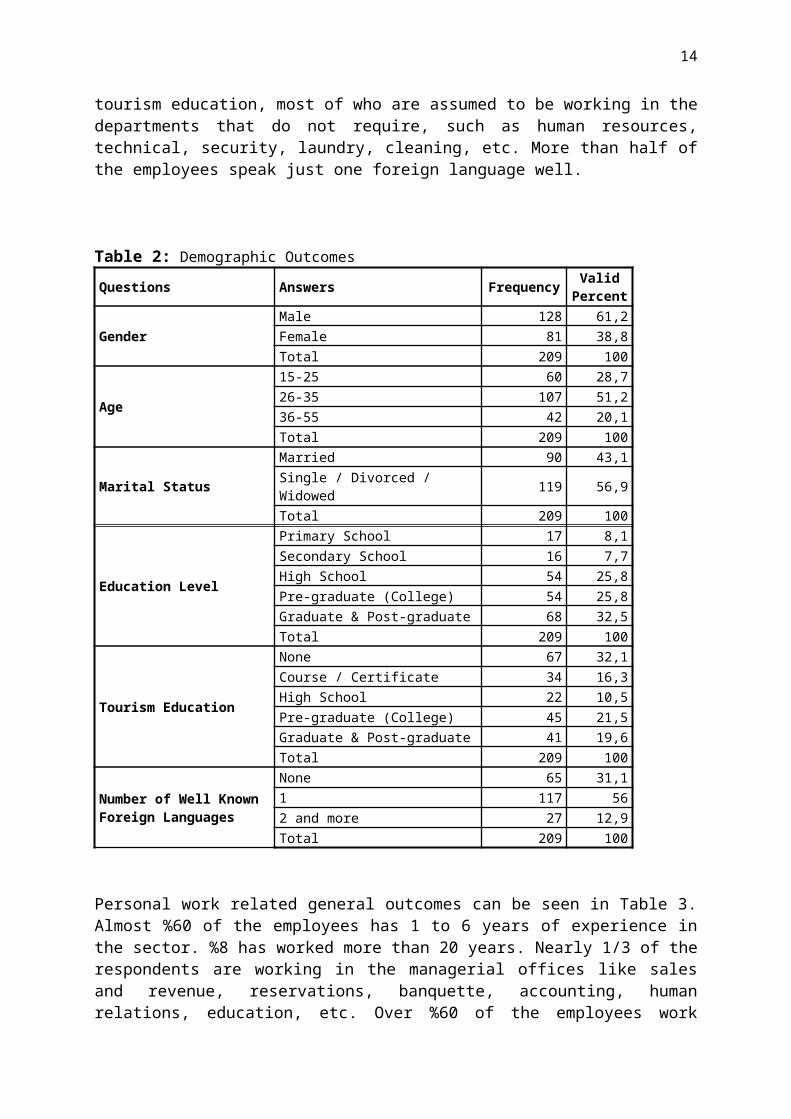
14
tourism education, most of who are assumed to be working in thedepartments that do not require, such as human resources,technical, security, laundry, cleaning, etc. More than half ofthe employees speak just one foreign language well.
Table 2: Demographic OutcomesQuestions Answers Frequency Valid
Percent
GenderMale 128 61,2Female 81 38,8Total 209 100
Age
15-25 60 28,726-35 107 51,236-55 42 20,1Total 209 100
Marital Status
Married 90 43,1Single / Divorced / Widowed 119 56,9
Total 209 100
Education Level
Primary School 17 8,1Secondary School 16 7,7High School 54 25,8Pre-graduate (College) 54 25,8Graduate & Post-graduate 68 32,5Total 209 100
Tourism Education
None 67 32,1Course / Certificate 34 16,3High School 22 10,5Pre-graduate (College) 45 21,5Graduate & Post-graduate 41 19,6Total 209 100
Number of Well Known Foreign Languages
None 65 31,11 117 562 and more 27 12,9Total 209 100
Personal work related general outcomes can be seen in Table 3.Almost %60 of the employees has 1 to 6 years of experience inthe sector. %8 has worked more than 20 years. Nearly 1/3 of therespondents are working in the managerial offices like salesand revenue, reservations, banquette, accounting, humanrelations, education, etc. Over %60 of the employees work
15
between 41 and 50 hours a week, meaning they work more than 8hours in week days or they have just one day off. This isbecause of the sector’s service based characteristic. Employeesof tourism establishments in general, especially the ones inoperational departments have more working hours than standards.When minimum wages in Turkey per month is 599.12 TL (~ $395)net, hunger limit for a four member family is calculated 846.63TL (~$560) and poverty limit is calculated as 2,757.75 TL(~$1,820) (Türk-İş, 2010), monthly total income of almost 1/5of the hotel employees is less than $660, more than half ofthem earn in the range of 1,000-2,000 TL ($660-1,320) permonth, only 12% of the respondents have a monthly income ofmore than $1,980.
Table 3: General Work Related OutcomesQuestions Answers Frequency Valid
Percent
Experience in Tourism Sector
1-3 years 65 31,14-6 years 59 28,27-10 years 39 18,711-15 years 22 10,516-20 years 7 3,320+ years 17 8,1Total 209 100
Department
Managerial / Offices 63 30,1Technical 16 7,7Front office / Guest relations 30 14,4
Housekeeping 26 12,4F&B / Service 50 23,9Other 24 11,5Total 209 100
Position in Department
High Level Manager 16 7,7Medium Level Manager 49 23,4Low Level Manager 36 17,2
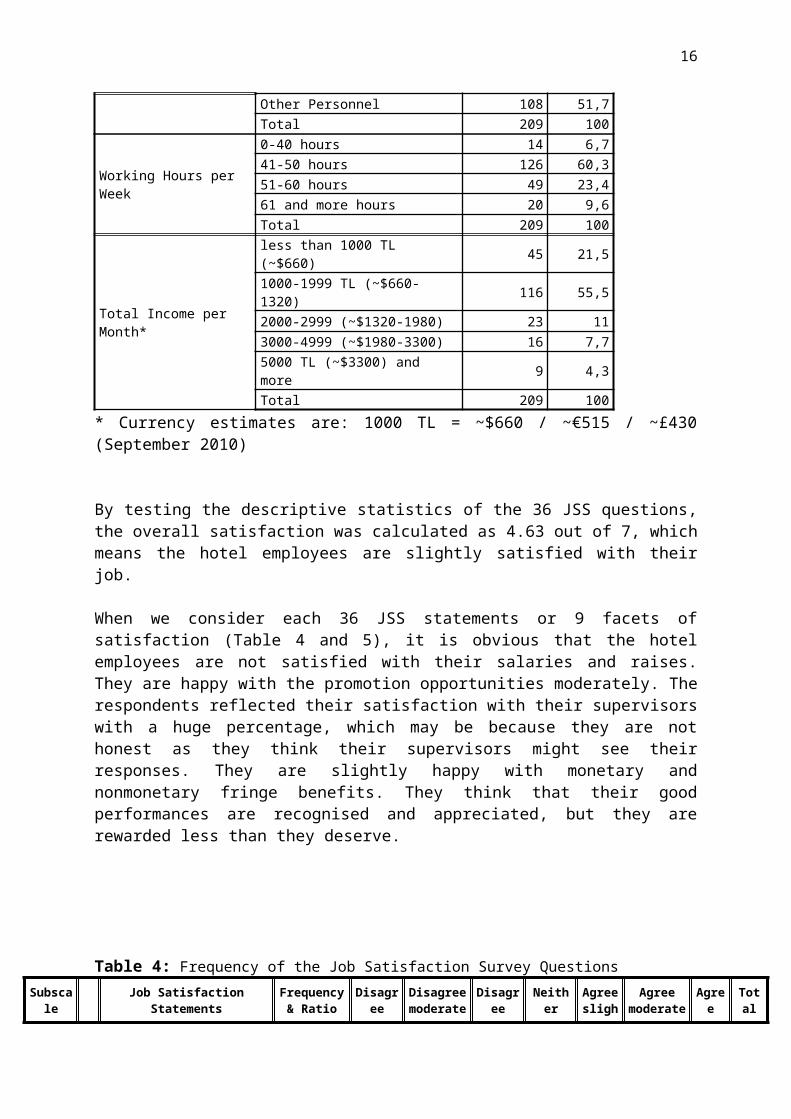
16
Other Personnel 108 51,7Total 209 100
Working Hours per Week
0-40 hours 14 6,741-50 hours 126 60,351-60 hours 49 23,461 and more hours 20 9,6Total 209 100
Total Income per Month*
less than 1000 TL (~$660) 45 21,5
1000-1999 TL (~$660-1320) 116 55,5
2000-2999 (~$1320-1980) 23 113000-4999 (~$1980-3300) 16 7,75000 TL (~$3300) and more 9 4,3
Total 209 100* Currency estimates are: 1000 TL = ~$660 / ~€515 / ~£430(September 2010)
By testing the descriptive statistics of the 36 JSS questions,the overall satisfaction was calculated as 4.63 out of 7, whichmeans the hotel employees are slightly satisfied with theirjob.
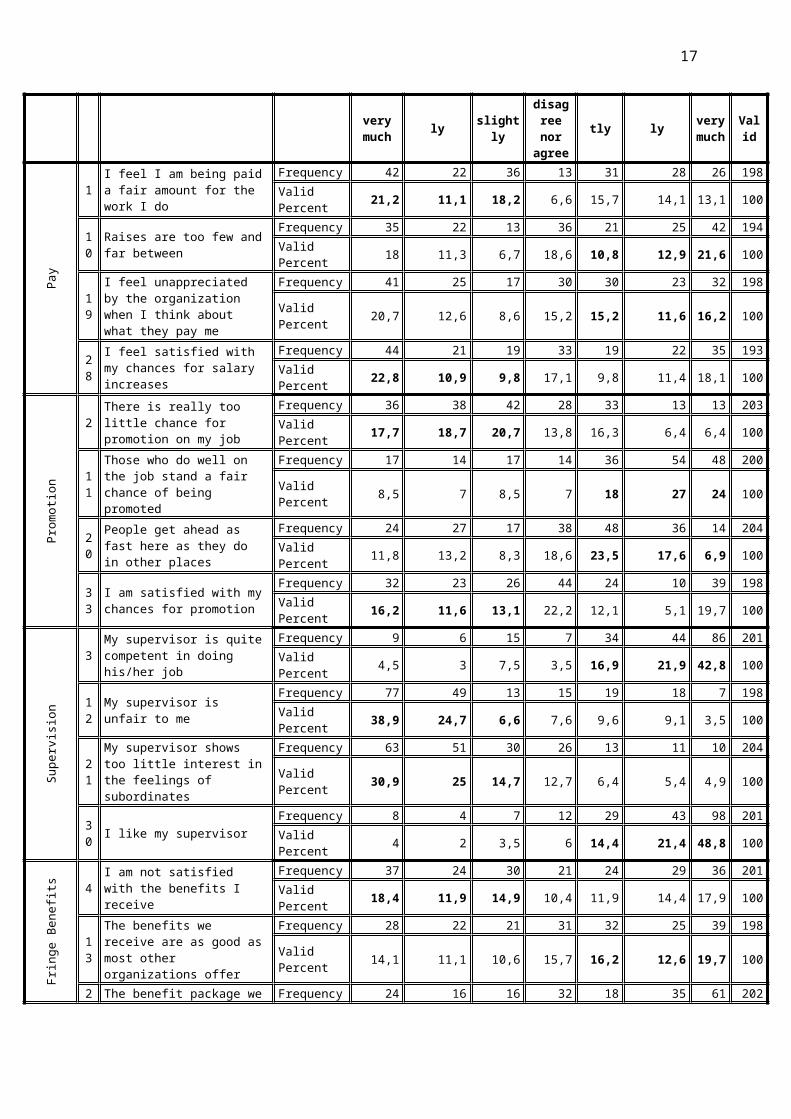
When we consider each 36 JSS statements or 9 facets ofsatisfaction (Table 4 and 5), it is obvious that the hotelemployees are not satisfied with their salaries and raises.They are happy with the promotion opportunities moderately. Therespondents reflected their satisfaction with their supervisorswith a huge percentage, which may be because they are nothonest as they think their supervisors might see theirresponses. They are slightly happy with monetary andnonmonetary fringe benefits. They think that their goodperformances are recognised and appreciated, but they arerewarded less than they deserve.
Table 4: Frequency of the Job Satisfaction Survey QuestionsSubscale
Job SatisfactionStatements
Frequency& Ratio
Disagree
Disagreemoderate
Disagree
Neither
Agreesligh
Agreemoderate
Agree
Total
17
verymuch ly slight
ly
disagreenor
agree
tly ly verymuch
Valid
Pay
1I feel I am being paida fair amount for the work I do
Frequency 42 22 36 13 31 28 26 198Valid Percent 21,2 11,1 18,2 6,6 15,7 14,1 13,1 100
10
Raises are too few andfar between
Frequency 35 22 13 36 21 25 42 194Valid Percent 18 11,3 6,7 18,6 10,8 12,9 21,6 100
19
I feel unappreciated by the organization when I think about what they pay me
Frequency 41 25 17 30 30 23 32 198
Valid Percent 20,7 12,6 8,6 15,2 15,2 11,6 16,2 100
28
I feel satisfied with my chances for salary increases
Frequency 44 21 19 33 19 22 35 193Valid Percent 22,8 10,9 9,8 17,1 9,8 11,4 18,1 100
Promot
ion
2There is really too little chance for promotion on my job
Frequency 36 38 42 28 33 13 13 203Valid Percent 17,7 18,7 20,7 13,8 16,3 6,4 6,4 100
11
Those who do well on the job stand a fair chance of being promoted
Frequency 17 14 17 14 36 54 48 200
Valid Percent 8,5 7 8,5 7 18 27 24 100
20
People get ahead as fast here as they do in other places
Frequency 24 27 17 38 48 36 14 204Valid Percent 11,8 13,2 8,3 18,6 23,5 17,6 6,9 100
33
I am satisfied with mychances for promotion
Frequency 32 23 26 44 24 10 39 198Valid Percent 16,2 11,6 13,1 22,2 12,1 5,1 19,7 100
Superv
ision
3My supervisor is quitecompetent in doing his/her job
Frequency 9 6 15 7 34 44 86 201Valid Percent 4,5 3 7,5 3,5 16,9 21,9 42,8 100
12
My supervisor is unfair to me
Frequency 77 49 13 15 19 18 7 198Valid Percent 38,9 24,7 6,6 7,6 9,6 9,1 3,5 100
21
My supervisor shows too little interest inthe feelings of subordinates
Frequency 63 51 30 26 13 11 10 204
Valid Percent 30,9 25 14,7 12,7 6,4 5,4 4,9 100
30 I like my supervisor
Frequency 8 4 7 12 29 43 98 201Valid Percent 4 2 3,5 6 14,4 21,4 48,8 100
Frin
ge B
enef
its 4
I am not satisfied with the benefits I receive
Frequency 37 24 30 21 24 29 36 201Valid Percent 18,4 11,9 14,9 10,4 11,9 14,4 17,9 100
13
The benefits we receive are as good asmost other organizations offer
Frequency 28 22 21 31 32 25 39 198
Valid Percent 14,1 11,1 10,6 15,7 16,2 12,6 19,7 100
2 The benefit package we Frequency 24 16 16 32 18 35 61 202
18
2 have is equitable Valid Percent 11,9 7,9 7,9 15,8 8,9 17,3 30,2 100
29
There are benefits we do not have which we should have
Frequency 29 28 11 29 24 31 51 203Valid Percent 14,3 13,8 5,4 14,3 11,8 15,3 25,1 100
Contingent R
ewards
5
When I do a good job, I receive the recognition for it that I should receive
Frequency 14 20 27 16 48 39 38 202
Valid Percent 6,9 9,9 13,4 7,9 23,8 19,3 18,8 100
14
I do not feel that thework I do is appreciated
Frequency 46 27 22 27 36 19 24 201Valid Percent 22,9 13,4 10,9 13,4 17,9 9,5 11,9 100
23
There are few rewards for those who work here
Frequency 36 19 18 32 43 30 27 205Valid Percent 17,6 9,3 8,8 15,6 21 14,6 13,2 100
32
I don't feel my efforts are rewarded the way they should be
Frequency 29 20 17 31 34 42 26 199Valid Percent 14,6 10,1 8,5 15,6 17,1 21,1 13,1 100
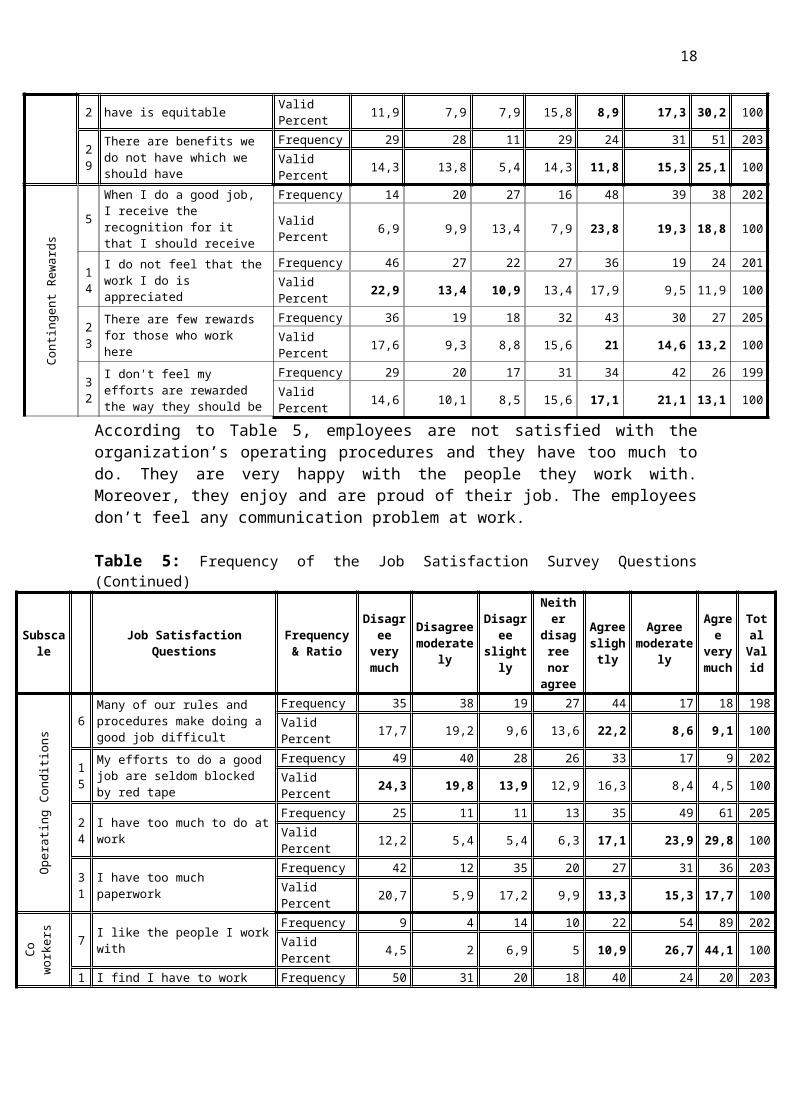
According to Table 5, employees are not satisfied with theorganization’s operating procedures and they have too much todo. They are very happy with the people they work with.Moreover, they enjoy and are proud of their job. The employeesdon’t feel any communication problem at work.
Table 5: Frequency of the Job Satisfaction Survey Questions(Continued)
Subscale
Job SatisfactionQuestions
Frequency& Ratio
Disagreeverymuch
Disagreemoderate
ly
Disagree
slightly
Neither
disagreenor
agree
Agreeslightly
Agreemoderate
ly
Agree
verymuch
TotalValid
Operat
ing
Condit
ions
6Many of our rules and procedures make doing a good job difficult
Frequency 35 38 19 27 44 17 18 198Valid Percent 17,7 19,2 9,6 13,6 22,2 8,6 9,1 100
15
My efforts to do a good job are seldom blocked by red tape
Frequency 49 40 28 26 33 17 9 202Valid Percent 24,3 19,8 13,9 12,9 16,3 8,4 4,5 100
24
I have too much to do atwork
Frequency 25 11 11 13 35 49 61 205Valid Percent 12,2 5,4 5,4 6,3 17,1 23,9 29,8 100
31
I have too much paperwork
Frequency 42 12 35 20 27 31 36 203Valid Percent 20,7 5,9 17,2 9,9 13,3 15,3 17,7 100
Cowork
ers
7 I like the people I workwith
Frequency 9 4 14 10 22 54 89 202Valid Percent 4,5 2 6,9 5 10,9 26,7 44,1 100
1 I find I have to work Frequency 50 31 20 18 40 24 20 203
19
6harder at my job becauseof the incompetence of people I work with
Valid Percent 24,6 15,3 9,9 8,9 19,7 11,8 9,9 100
25 I enjoy my co workers
Frequency 3 13 8 18 39 55 66 202Valid Percent 1,5 6,4 4 8,9 19,3 27,2 32,7 100
34
There is too much bickering and fighting at work
Frequency 69 40 23 18 19 22 10 201Valid Percent 34,3 19,9 11,4 9 9,5 10,9 5 100
Nature of
Work
8 I sometimes feel my job is meaningless
Frequency 99 29 10 14 25 14 6 197Valid Percent 50,3 14,7 5,1 7,1 12,7 7,1 3 100
17
I like doing the things I do at work
Frequency 4 6 5 8 31 50 98 202Valid Percent 2 3 2,5 4 15,3 24,8 48,5 100
27
I feel a sense of pride in doing my job
Frequency 7 5 8 22 21 39 103 205Valid Percent 3,4 2,4 3,9 10,7 10,2 19 50,2 100
35 My job is enjoyable
Frequency 8 6 9 11 29 42 98 203Valid Percent 3,9 3 4,4 5,4 14,3 20,7 48,3 100
Comm
unicat
ion
9 Communications seem goodwithin this organization
Frequency 15 7 19 19 37 47 59 203Valid Percent 7,4 3,4 9,4 9,4 18,2 23,2 29,1 100
18
The goals of this organization are not clear to me
Frequency 66 28 22 29 29 12 17 203Valid Percent 32,5 13,8 10,8 14,3 14,3 5,9 8,4 100
26
I often feel that I do not know what is going on with the organization
Frequency 46 37 26 38 19 16 18 200Valid Percent 23 18,5 13 19 9,5 8 9 100
36
Work assignments are notfully explained
Frequency 71 41 24 20 23 12 13 204Valid Percent 34,8 20,1 11,8 9,8 11,3 5,9 6,4 100
In order to analyze compare means between demographic / jobrelated qualifications and job satisfaction levels ofemployees, different types of tests were applied as per thenumber of choices for demographic questions. Demographicquestions having two answer choices were tested by Independent-Samples T Test, and others were tested by F Tests (One-WayANOVA and Welch).
The Independent-Samples T Test was applied to determine therelations between gender and the answers given to each jobsatisfaction item, and between marital status and differentanswers to every 36 job satisfaction statements. Fordetermination of the significances, Sig. (2-tailed) values,which are less than %5, were monitored. As per the outcomes;
20
gender differences affect the answers to the 1st, 7th, 11th, 17th,19th, 23rd, 29th, 33rd job satisfaction questions. This means,testing these questions between male and female employees issignificant. Moreover, marital status affects the outcomes ofthe job satisfaction items 3, 8, 12, 16, and 36. Especially,when married employees’ responses to the statement “Mysupervisor is unfair to me” are close to “agree slightly”,responses of singles are close to “agree moderately” (2-tailedsig. is 0).
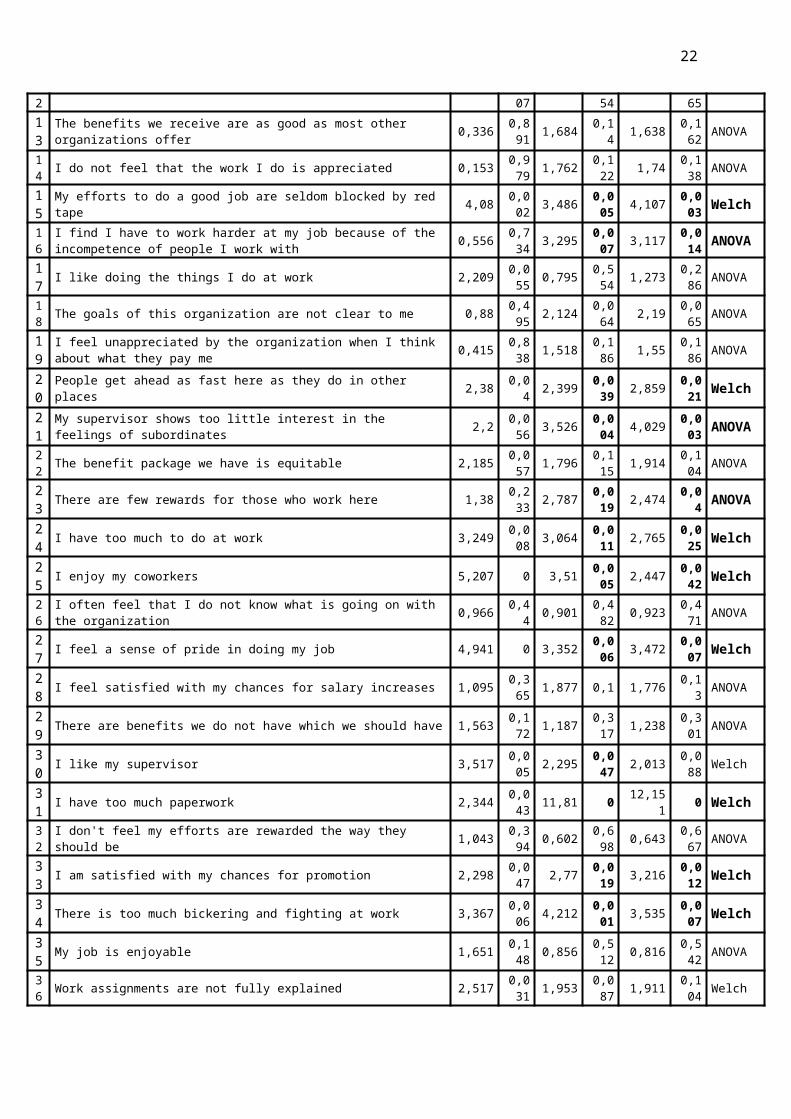
In order to see if there is significant relation between eachdemographic qualification and answers given to each JSSstatement, F Tests were applied to questions in the first part,except gender and marital status. In order to determine whichtest to evaluate for each Job Satisfaction statement, Test ofHomogeneity of Variances was monitored and for the Sig. valuesmore than %5, ANOVA Test results were considered, for the Sig.values less than %5, Welch Test results were evaluated. Afterchecking the significance by means of F Tests, forunderstanding which categories of employees think opposite way,Post Hoc Tests were scanned. The outcomes are as follows:It was observed that age, education, tourism education, numberof foreign languages and experience doesn’t have strong effectson the employees’ job satisfaction levels. For instance, agematters only in 3 negative variables; “My supervisor is unfairto me” (facet of Supervision), “I find I have to work harder atmy job because of the incompetence of people I work with” and“There is too much bickering and fighting at work” (facet ofCoworkers). These five demographic factors mostly affect theideas about the statements: “Communications seem good withinthis organization”, “My supervisor is unfair to me” and “I havetoo much paperwork”. Therefore, Pos Hoc tests were notevaluated for these variables. The outcomes for the Tests ofHomogeneity of Variances and F Tests can be seen in Tables 6,7, 8 and 9.
As per Table 6, we have to check Post Hoc Tests to find thesource of significances, where ANOVA Test results aresignificant for the variables 16, 21 and 23; Welch Test resultsare significant for the variables 1, 5, 8, 15, 20, 24, 25, 27,31, 33 and 34. For example, for the level of satisfaction aboutthe first statement, there is a significant difference between
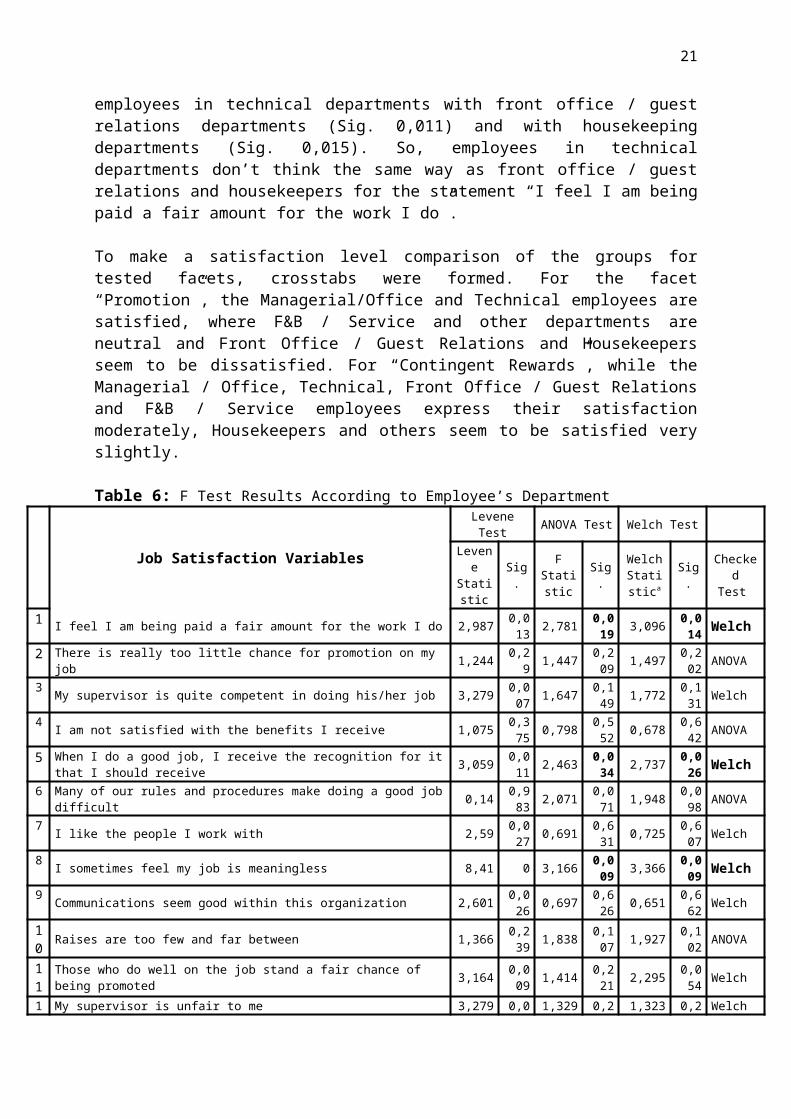
21
employees in technical departments with front office / guestrelations departments (Sig. 0,011) and with housekeepingdepartments (Sig. 0,015). So, employees in technicaldepartments don’t think the same way as front office / guestrelations and housekeepers for the statement “I feel I am beingpaid a fair amount for the work I do”.
To make a satisfaction level comparison of the groups fortested facets, crosstabs were formed. For the facet“Promotion”, the Managerial/Office and Technical employees aresatisfied, where F&B / Service and other departments areneutral and Front Office / Guest Relations and Housekeepersseem to be dissatisfied. For “Contingent Rewards”, while theManagerial / Office, Technical, Front Office / Guest Relationsand F&B / Service employees express their satisfactionmoderately, Housekeepers and others seem to be satisfied veryslightly.
Table 6: F Test Results According to Employee’s Department
Job Satisfaction Variables
LeveneTest ANOVA Test Welch Test
Levene
Statistic
Sig.
FStatistic
Sig.
WelchStatistica
Sig.
Checked
Test
1 I feel I am being paid a fair amount for the work I do 2,987 0,013 2,781 0,0
19 3,096 0,014 Welch
2 There is really too little chance for promotion on my job 1,244 0,2
9 1,447 0,209 1,497 0,2
02 ANOVA
3 My supervisor is quite competent in doing his/her job 3,279 0,007 1,647 0,1
49 1,772 0,131 Welch
4 I am not satisfied with the benefits I receive 1,075 0,375 0,798 0,5
52 0,678 0,642 ANOVA
5 When I do a good job, I receive the recognition for itthat I should receive 3,059 0,0
11 2,463 0,034 2,737 0,0
26 Welch6 Many of our rules and procedures make doing a good job
difficult 0,14 0,983 2,071 0,0
71 1,948 0,098 ANOVA
7 I like the people I work with 2,59 0,027 0,691 0,6
31 0,725 0,607 Welch
8 I sometimes feel my job is meaningless 8,41 0 3,166 0,009 3,366 0,0
09 Welch9 Communications seem good within this organization 2,601 0,0
26 0,697 0,626 0,651 0,6
62 Welch
10 Raises are too few and far between 1,366 0,2
39 1,838 0,107 1,927 0,1
02 ANOVA
11
Those who do well on the job stand a fair chance of being promoted 3,164 0,0
09 1,414 0,221 2,295 0,0
54 Welch
1 My supervisor is unfair to me 3,279 0,0 1,329 0,2 1,323 0,2 Welch
22
2 07 54 6513
The benefits we receive are as good as most other organizations offer 0,336 0,8
91 1,684 0,14 1,638 0,1
62 ANOVA
14 I do not feel that the work I do is appreciated 0,153 0,9
79 1,762 0,122 1,74 0,1
38 ANOVA
15
My efforts to do a good job are seldom blocked by red tape 4,08 0,0
02 3,486 0,005 4,107 0,0
03 Welch
16
I find I have to work harder at my job because of the incompetence of people I work with 0,556 0,7
34 3,295 0,007 3,117 0,0
14 ANOVA
17 I like doing the things I do at work 2,209 0,0
55 0,795 0,554 1,273 0,2
86 ANOVA
18 The goals of this organization are not clear to me 0,88 0,4
95 2,124 0,064 2,19 0,0
65 ANOVA
19
I feel unappreciated by the organization when I think about what they pay me 0,415 0,8
38 1,518 0,186 1,55 0,1
86 ANOVA
20
People get ahead as fast here as they do in other places 2,38 0,0
4 2,399 0,039 2,859 0,0
21 Welch
21
My supervisor shows too little interest in the feelings of subordinates 2,2 0,0
56 3,526 0,004 4,029 0,0
03 ANOVA
22 The benefit package we have is equitable 2,185 0,0
57 1,796 0,115 1,914 0,1
04 ANOVA
23 There are few rewards for those who work here 1,38 0,2
33 2,787 0,019 2,474 0,0
4 ANOVA
24 I have too much to do at work 3,249 0,0
08 3,064 0,011 2,765 0,0
25 Welch
25 I enjoy my coworkers 5,207 0 3,51 0,0
05 2,447 0,042 Welch
26
I often feel that I do not know what is going on with the organization 0,966 0,4
4 0,901 0,482 0,923 0,4
71 ANOVA
27 I feel a sense of pride in doing my job 4,941 0 3,352 0,0
06 3,472 0,007 Welch
28 I feel satisfied with my chances for salary increases 1,095 0,3
65 1,877 0,1 1,776 0,13 ANOVA
29 There are benefits we do not have which we should have 1,563 0,1
72 1,187 0,317 1,238 0,3
01 ANOVA
30 I like my supervisor 3,517 0,0
05 2,295 0,047 2,013 0,0
88 Welch
31 I have too much paperwork 2,344 0,0
43 11,81 0 12,151 0 Welch
32
I don't feel my efforts are rewarded the way they should be 1,043 0,3
94 0,602 0,698 0,643 0,6
67 ANOVA
33 I am satisfied with my chances for promotion 2,298 0,0
47 2,77 0,019 3,216 0,0
12 Welch
34 There is too much bickering and fighting at work 3,367 0,0
06 4,212 0,001 3,535 0,0
07 Welch
35 My job is enjoyable 1,651 0,1
48 0,856 0,512 0,816 0,5
42 ANOVA
36 Work assignments are not fully explained 2,517 0,0
31 1,953 0,087 1,911 0,1
04 Welch
23
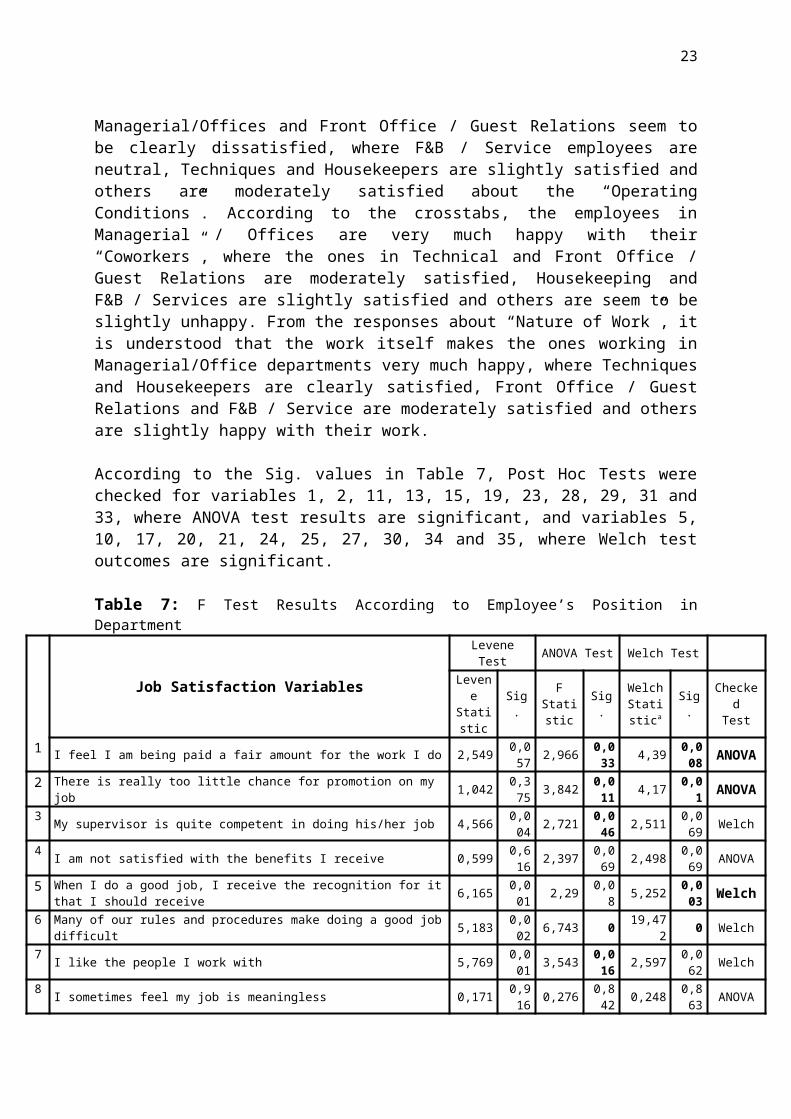
Managerial/Offices and Front Office / Guest Relations seem tobe clearly dissatisfied, where F&B / Service employees areneutral, Techniques and Housekeepers are slightly satisfied andothers are moderately satisfied about the “OperatingConditions”. According to the crosstabs, the employees inManagerial / Offices are very much happy with their“Coworkers”, where the ones in Technical and Front Office /Guest Relations are moderately satisfied, Housekeeping andF&B / Services are slightly satisfied and others are seem to beslightly unhappy. From the responses about “Nature of Work”, itis understood that the work itself makes the ones working inManagerial/Office departments very much happy, where Techniquesand Housekeepers are clearly satisfied, Front Office / GuestRelations and F&B / Service are moderately satisfied and othersare slightly happy with their work.
According to the Sig. values in Table 7, Post Hoc Tests werechecked for variables 1, 2, 11, 13, 15, 19, 23, 28, 29, 31 and33, where ANOVA test results are significant, and variables 5,10, 17, 20, 21, 24, 25, 27, 30, 34 and 35, where Welch testoutcomes are significant.
Table 7: F Test Results According to Employee’s Position inDepartment
Job Satisfaction Variables
LeveneTest ANOVA Test Welch Test
Levene
Statistic
Sig.
FStatistic
Sig.
WelchStatistica
Sig.
Checked
Test
1 I feel I am being paid a fair amount for the work I do 2,549 0,057 2,966 0,0
33 4,39 0,008 ANOVA
2 There is really too little chance for promotion on my job 1,042 0,3
75 3,842 0,011 4,17 0,0
1 ANOVA3 My supervisor is quite competent in doing his/her job 4,566 0,0
04 2,721 0,046 2,511 0,0
69 Welch
4 I am not satisfied with the benefits I receive 0,599 0,616 2,397 0,0
69 2,498 0,069 ANOVA
5 When I do a good job, I receive the recognition for itthat I should receive 6,165 0,0
01 2,29 0,08 5,252 0,0
03 Welch6 Many of our rules and procedures make doing a good job
difficult 5,183 0,002 6,743 0 19,47
2 0 Welch
7 I like the people I work with 5,769 0,001 3,543 0,0
16 2,597 0,062 Welch
8 I sometimes feel my job is meaningless 0,171 0,916 0,276 0,8
42 0,248 0,863 ANOVA
24
9 Communications seem good within this organization 1,729 0,162 1,932 0,1
26 1,843 0,15 ANOVA
10 Raises are too few and far between 2,706 0,0
47 8,212 0 13,57 0 Welch
11
Those who do well on the job stand a fair chance of being promoted 1,703 0,1
68 3,114 0,027 4,141 0,0
1 ANOVA
12 My supervisor is unfair to me 4,357 0,0
05 2,154 0,095 1,93 0,1
36 Welch
13
The benefits we receive are as good as most other organizations offer 0,463 0,7
09 3,911 0,01 3,723 0,0
17 ANOVA
14 I do not feel that the work I do is appreciated 1,01 0,3
89 2,61 0,053 2,591 0,0
62 ANOVA
15
My efforts to do a good job are seldom blocked by red tape 0,526 0,6
65 3,094 0,028 3,41 0,0
24 ANOVA
16
I find I have to work harder at my job because of the incompetence of people I work with 0,388 0,7
62 0,751 0,523 0,772 0,5
14 ANOVA
17 I like doing the things I do at work 5,28 0,0
02 4,723 0,003 8,82 0 Welch
18 The goals of this organization are not clear to me 1,225 0,3
02 2,319 0,077 2,256 0,0
92 ANOVA
19
I feel unappreciated by the organization when I think about what they pay me 0,177 0,9
12 2,882 0,037 2,844 0,0
46 ANOVA
20
People get ahead as fast here as they do in other places 3,558 0,0
15 4,789 0,003
11,522 0 Welch
21
My supervisor shows too little interest in the feelings of subordinates 5,804 0,0
01 4,307 0,006 3,527 0,0
21 Welch
22 The benefit package we have is equitable 0,352 0,7
88 2,291 0,079 2,035 0,1
2 ANOVA
23 There are few rewards for those who work here 1,22 0,3
03 3,555 0,015 3,955 0,0
13 ANOVA
24 I have too much to do at work 7,035 0 6,037 0,0
01 7,844 0 Welch
25 I enjoy my coworkers 5,283 0,0
02 1,349 0,26 6,292 0,0
01 Welch
26
I often feel that I do not know what is going on with the organization 1,26 0,2
89 1,326 0,267 1,366 0,2
63 ANOVA
27 I feel a sense of pride in doing my job 8,158 0 3,472 0,0
1727,80
3 0 Welch
28 I feel satisfied with my chances for salary increases 0,798 0,4
97 4,555 0,004 4,934 0,0
04 ANOVA
29 There are benefits we do not have which we should have 0,968 0,4
09 3,66 0,013 3,155 0,0
32 ANOVA
30 I like my supervisor 10,02
9 0 3,644 0,014 4,946 0,0
04 Welch
31 I have too much paperwork 1,79 0,1
5 6,758 0 7,176 0 ANOVA
32
I don't feel my efforts are rewarded the way they should be 0,747 0,5
25 0,296 0,828 0,308 0,8
2 ANOVA
33 I am satisfied with my chances for promotion 2,294 0,0
79 9,084 0 12,377 0 ANOVA
25
34 There is too much bickering and fighting at work 5,365 0,0
01 2,544 0,057 4,468 0,0
07 Welch
35 My job is enjoyable 7,319 0 2,266 0,0
8210,08
1 0 Welch
36 Work assignments are not fully explained 1,393 0,2
46 0,827 0,481 0,986 0,4
06 ANOVA
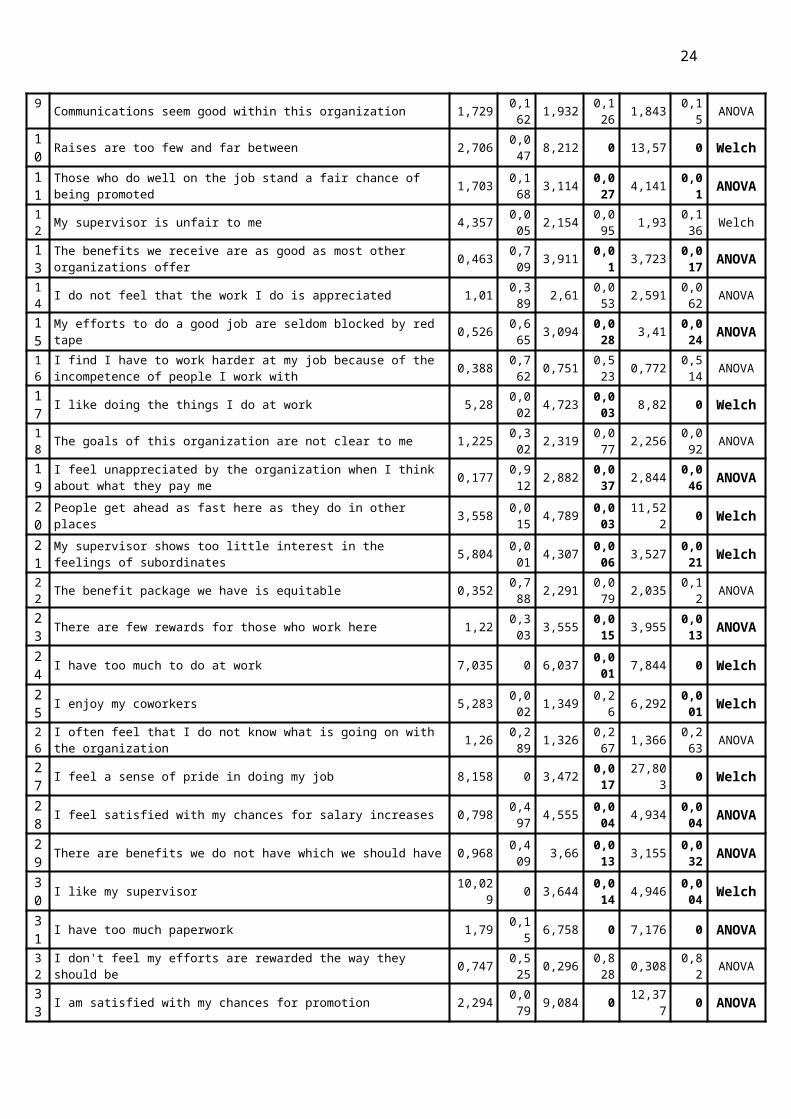
For example, high level managers don’t have the samesatisfaction level as the rest of the employees for thestatement “I feel I am being paid a fair amount for the work Ido”. The same is valid for most of the other statements, i.e.High Level Managers distinguish from other employees in termsof their general job satisfaction level.
When we make cross-tabulation to see the satisfactiontendencies of each group by means of specific facets, unlikeothers, High Level Managers seem to be clearly satisfied withthe facet “Pay”, slightly satisfied with the facet “Promotion”.They seem to be more satisfied about the facets “Supervision”and “Nature of Work”, but slightly more dissatisfied about“Operating Conditions” than the others.
As per Table 8, according to the Sig. values, Post Hoc Testswere checked for variables 4, 13, 16, 18, 26, 29, 32 and 36,where ANOVA test results are significant, and variables 7, 8,10, 14, 17 and 28, where Welch test outcomes are significant.
Table 8: F Test Results According to Employee’s Weekly Working Hours
Job Satisfaction Variables
LeveneTest ANOVA Test Welch Test
Levene
Statistic
Sig.
FStatistic
Sig.
WelchStatistica
Sig.
CheckedTest
I feel I am being paid a fair amount for the work I do 2,104 0,101 1,11 0,3
46 1,071 0,373 ANOVA
There is really too little chance for promotion on my job 1,61 0,188 0,635 0,5
93 0,789 0,507 ANOVA
My supervisor is quite competent in doing his/her job 3,252 0,023 1,143 0,3
33 1,052 0,38 Welch
I am not satisfied with the benefits I receive 0,723 0,539 3,783 0,0
11 3,425 0,027 ANOVA
When I do a good job, I receive the recognition for it that I should receive 2,047 0,1
09 1,27 0,286 1,216 0,3
16 ANOVA
Many of our rules and procedures make doing a good job difficult 2,834 0,0
39 1,806 0,147 1,89 0,1
46 ANOVA
I like the people I work with 8,799 0 4,227 0,0 3,546 0,0 Welch
26
06 24
I sometimes feel my job is meaningless 2,719 0,046 3,886 0,0
1 3,581 0,022 Welch
Communications seem good within this organization 3,44 0,018 2,387 0,0
7 2,159 0,108 Welch
Raises are too few and far between 3,059 0,029 5,529 0,0
01 6,888 0,001 Welch
Those who do well on the job stand a fair chance of being promoted 1,812 0,1
46 0,899 0,443 1,206 0,3
19 ANOVA
My supervisor is unfair to me 0,721 0,541 1,569 0,1
98 1,221 0,315 ANOVA
The benefits we receive are as good as most other organizations offer 1,454 0,2
28 3,074 0,029 3,397 0,0
27 ANOVA
I do not feel that the work I do is appreciated 5,599 0,001 3,831 0,0
11 5,795 0,002 Welch
My efforts to do a good job are seldom blocked by red tape 3,802 0,011 1,505 0,2
14 2,169 0,106 Welch
I find I have to work harder at my job because of the incompetence of people I work with 1,655 0,1
78 2,836 0,039 2,924 0,0
45 ANOVA
I like doing the things I do at work 7,804 0 6,891 0 4,946 0,005 Welch
The goals of this organization are not clear to me 0,254 0,859 3,818 0,0
11 3,624 0,021 ANOVA
I feel unappreciated by the organization when I think about what they pay me 1,239 0,2
97 1,793 0,15 1,814 0,1
61 ANOVA
People get ahead as fast here as they do in other places 0,388 0,762 2,242 0,0
85 2,266 0,095 ANOVA
My supervisor shows too little interest in the feelings of subordinates 8,192 0 1,421 0,2
38 1,201 0,322 Welch
The benefit package we have is equitable 2,758 0,043 2,862 0,0
38 2,789 0,053 Welch
There are few rewards for those who work here 4,329 0,006 1,15 0,3
3 2,436 0,076 Welch
I have too much to do at work 1,75 0,158 0,82 0,4
84 0,735 0,537 ANOVA
I enjoy my coworkers 2,529 0,059 2,412 0,0
68 2,155 0,109 ANOVA
I often feel that I do not know what is going on with the organization 2,431 0,0
66 7,932 0 8,339 0 ANOVA
I feel a sense of pride in doing my job 3,761 0,012 2,268 0,0
82 1,7 0,183 Welch
I feel satisfied with my chances for salary increases 3,016 0,031 3,522 0,0
16 4,599 0,007 Welch
There are benefits we do not have which we should have 1,652 0,179 3,737 0,0
12 4,566 0,007 ANOVA
I like my supervisor 1,231 0,3 0,89 0,447 0,626 0,6
02 ANOVA
I have too much paperwork 1,293 0,278 0,427 0,7
34 0,498 0,686 ANOVA
I don't feel my efforts are rewarded the way they should be 1,462 0,226 4,427 0,0
05 6,184 0,001 ANOVA
I am satisfied with my chances for promotion 0,283 0,837 2,273 0,0
81 2,496 0,073 ANOVA
27
There is too much bickering and fighting at work 0,619 0,604 1,266 0,2
87 1,267 0,299 ANOVA
My job is enjoyable 3,107 0,028 3,381 0,0
19 2,509 0,074 Welch
Work assignments are not fully explained 1,664 0,176 6,442 0 6,001 0,0
02 ANOVA
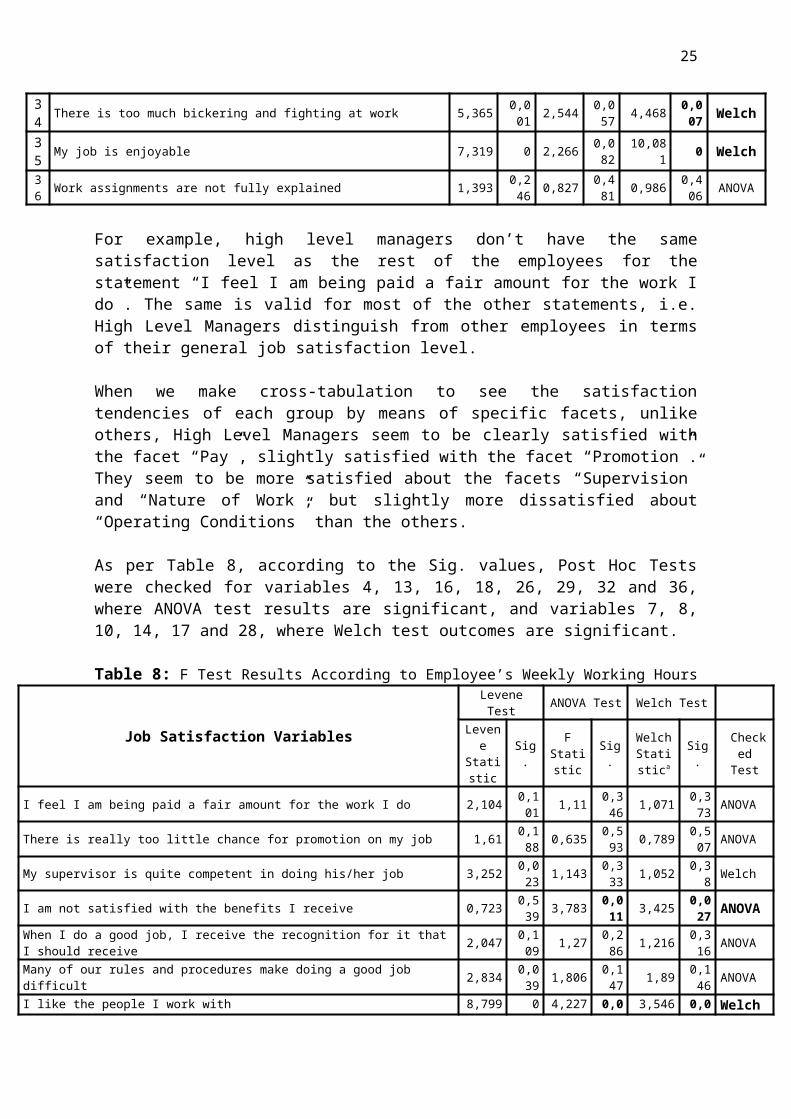
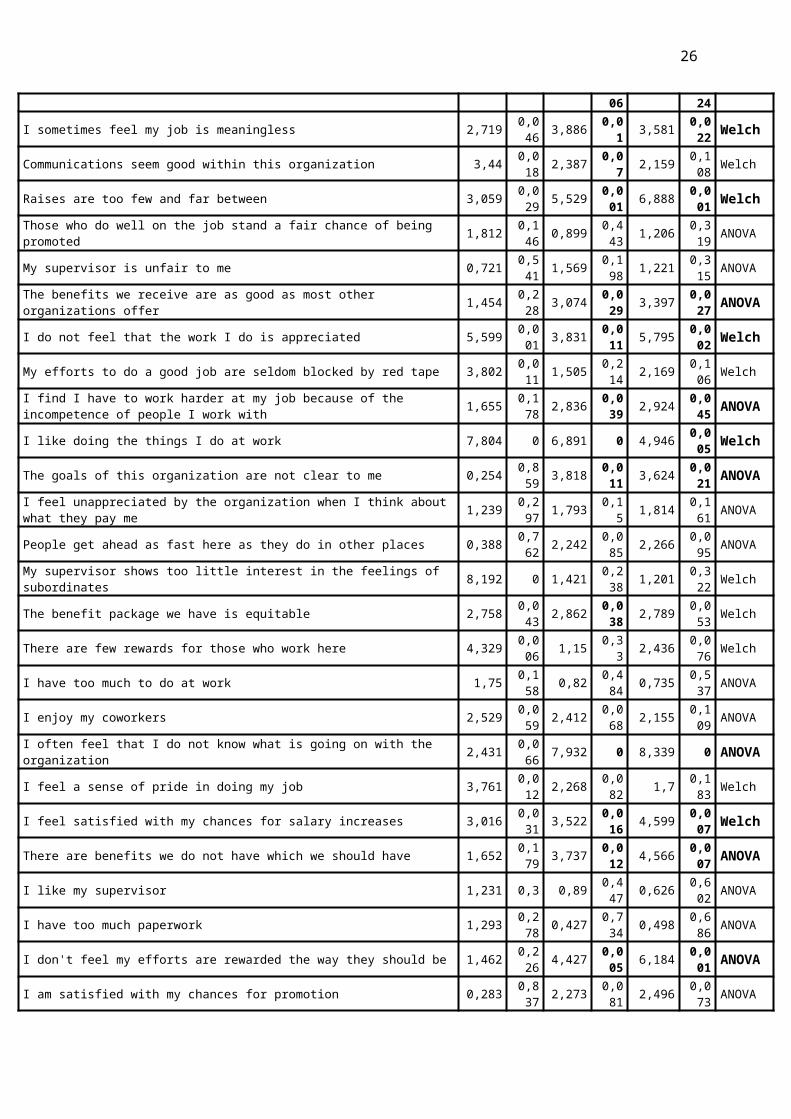
As per the Post Hoc Tests, it is clear that the hotel employeesworking between 41 and 50 hours per week have differentsatisfaction level than the others. Those who work 51 to 60hours weekly think different than some others about a fewstatements. To understand the way of these differences,crosstabs were made for the facets “Pay”, “Fringe Benefits” and“Communication”. It is understood that the employees workingbetween 41-50 hours a week are way ahead of others by means ofsatisfaction level, as they are very much satisfied with theabove work related facets. Then comes the ones working lessthan 41 hours far behind, who are slightly satisfied. Theemployees working between 51 and 60 hours are slightlydissatisfied and the unhappiest ones are the ones working morethan 60 hours a week.
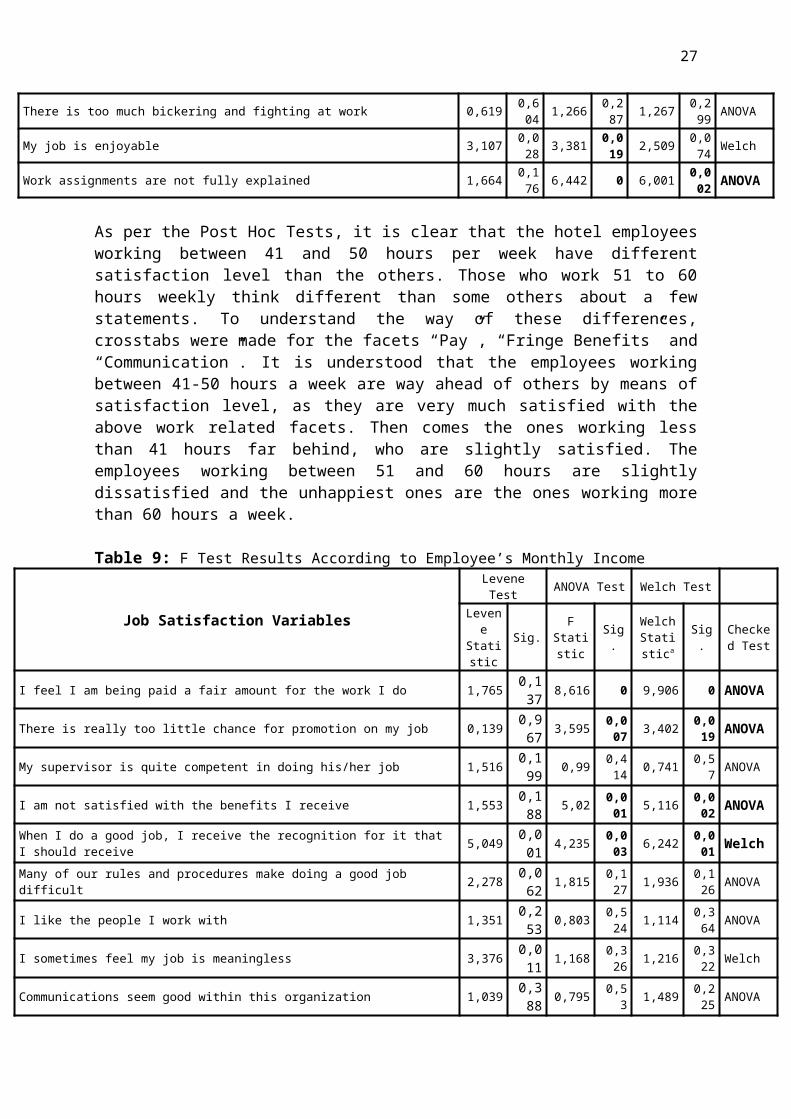
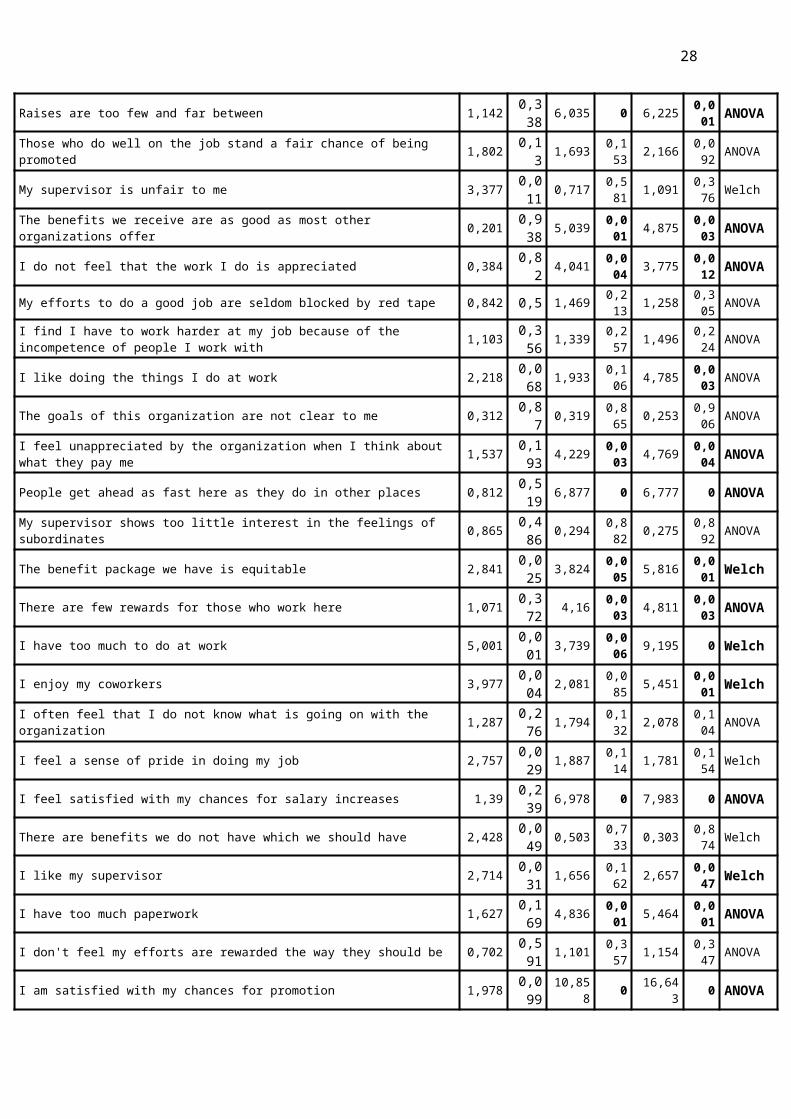
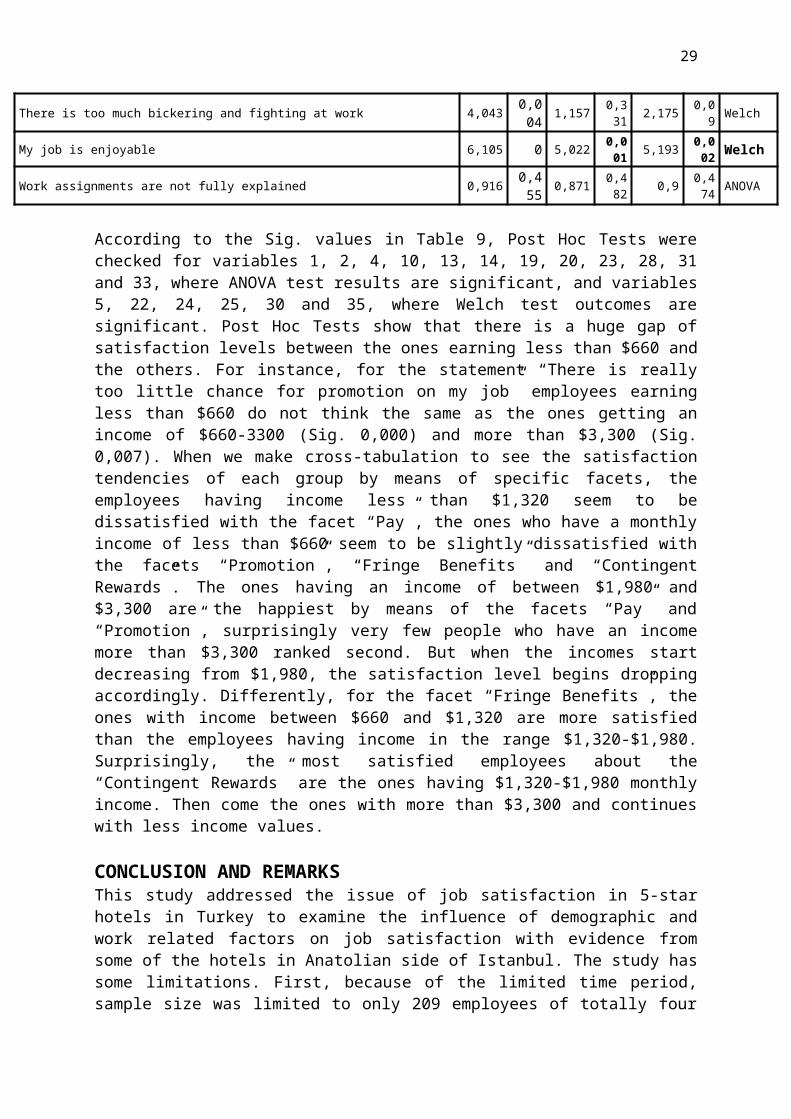
Table 9: F Test Results According to Employee’s Monthly Income
Job Satisfaction Variables
LeveneTest ANOVA Test Welch Test
Levene
Statistic
Sig.F
Statistic
Sig.
WelchStatistica
Sig.
Checked Test
I feel I am being paid a fair amount for the work I do 1,765 0,137 8,616 0 9,906 0 ANOVA
There is really too little chance for promotion on my job 0,139 0,967 3,595 0,0
07 3,402 0,019 ANOVA
My supervisor is quite competent in doing his/her job 1,516 0,199 0,99 0,4
14 0,741 0,57 ANOVA
I am not satisfied with the benefits I receive 1,553 0,188 5,02 0,0
01 5,116 0,002 ANOVA
When I do a good job, I receive the recognition for it that I should receive 5,049 0,0
01 4,235 0,003 6,242 0,0
01 Welch
Many of our rules and procedures make doing a good job difficult 2,278 0,0
62 1,815 0,127 1,936 0,1
26 ANOVA
I like the people I work with 1,351 0,253 0,803 0,5
24 1,114 0,364 ANOVA
I sometimes feel my job is meaningless 3,376 0,011 1,168 0,3
26 1,216 0,322 Welch
Communications seem good within this organization 1,039 0,388 0,795 0,5
3 1,489 0,225 ANOVA
28
Raises are too few and far between 1,142 0,338 6,035 0 6,225 0,0
01 ANOVA
Those who do well on the job stand a fair chance of being promoted 1,802 0,1
3 1,693 0,153 2,166 0,0
92 ANOVA
My supervisor is unfair to me 3,377 0,011 0,717 0,5
81 1,091 0,376 Welch
The benefits we receive are as good as most other organizations offer 0,201 0,9
38 5,039 0,001 4,875 0,0
03 ANOVA
I do not feel that the work I do is appreciated 0,384 0,82 4,041 0,0
04 3,775 0,012 ANOVA
My efforts to do a good job are seldom blocked by red tape 0,842 0,5 1,469 0,213 1,258 0,3
05 ANOVA
I find I have to work harder at my job because of the incompetence of people I work with 1,103 0,3
56 1,339 0,257 1,496 0,2
24 ANOVA
I like doing the things I do at work 2,218 0,068 1,933 0,1
06 4,785 0,003 ANOVA
The goals of this organization are not clear to me 0,312 0,87 0,319 0,8
65 0,253 0,906 ANOVA
I feel unappreciated by the organization when I think about what they pay me 1,537 0,1
93 4,229 0,003 4,769 0,0
04 ANOVA
People get ahead as fast here as they do in other places 0,812 0,519 6,877 0 6,777 0 ANOVA
My supervisor shows too little interest in the feelings of subordinates 0,865 0,4
86 0,294 0,882 0,275 0,8
92 ANOVA
The benefit package we have is equitable 2,841 0,025 3,824 0,0
05 5,816 0,001 Welch
There are few rewards for those who work here 1,071 0,372 4,16 0,0
03 4,811 0,003 ANOVA
I have too much to do at work 5,001 0,001 3,739 0,0
06 9,195 0 Welch
I enjoy my coworkers 3,977 0,004 2,081 0,0
85 5,451 0,001 Welch
I often feel that I do not know what is going on with the organization 1,287 0,2
76 1,794 0,132 2,078 0,1
04 ANOVA
I feel a sense of pride in doing my job 2,757 0,029 1,887 0,1
14 1,781 0,154 Welch
I feel satisfied with my chances for salary increases 1,39 0,239 6,978 0 7,983 0 ANOVA
There are benefits we do not have which we should have 2,428 0,049 0,503 0,7
33 0,303 0,874 Welch
I like my supervisor 2,714 0,031 1,656 0,1
62 2,657 0,047 Welch
I have too much paperwork 1,627 0,169 4,836 0,0
01 5,464 0,001 ANOVA
I don't feel my efforts are rewarded the way they should be 0,702 0,591 1,101 0,3
57 1,154 0,347 ANOVA
I am satisfied with my chances for promotion 1,978 0,099
10,858 0 16,64
3 0 ANOVA
29
There is too much bickering and fighting at work 4,043 0,004 1,157 0,3
31 2,175 0,09 Welch
My job is enjoyable 6,105 0 5,022 0,001 5,193 0,0
02 Welch
Work assignments are not fully explained 0,916 0,455 0,871 0,4
82 0,9 0,474 ANOVA
According to the Sig. values in Table 9, Post Hoc Tests werechecked for variables 1, 2, 4, 10, 13, 14, 19, 20, 23, 28, 31and 33, where ANOVA test results are significant, and variables5, 22, 24, 25, 30 and 35, where Welch test outcomes aresignificant. Post Hoc Tests show that there is a huge gap ofsatisfaction levels between the ones earning less than $660 andthe others. For instance, for the statement “There is reallytoo little chance for promotion on my job” employees earningless than $660 do not think the same as the ones getting anincome of $660-3300 (Sig. 0,000) and more than $3,300 (Sig.0,007). When we make cross-tabulation to see the satisfactiontendencies of each group by means of specific facets, theemployees having income less than $1,320 seem to bedissatisfied with the facet “Pay”, the ones who have a monthlyincome of less than $660 seem to be slightly dissatisfied withthe facets “Promotion”, “Fringe Benefits” and “ContingentRewards”. The ones having an income of between $1,980 and$3,300 are the happiest by means of the facets “Pay” and“Promotion”, surprisingly very few people who have an incomemore than $3,300 ranked second. But when the incomes startdecreasing from $1,980, the satisfaction level begins droppingaccordingly. Differently, for the facet “Fringe Benefits”, theones with income between $660 and $1,320 are more satisfiedthan the employees having income in the range $1,320-$1,980.Surprisingly, the most satisfied employees about the“Contingent Rewards” are the ones having $1,320-$1,980 monthlyincome. Then come the ones with more than $3,300 and continueswith less income values.
CONCLUSION AND REMARKSThis study addressed the issue of job satisfaction in 5-starhotels in Turkey to examine the influence of demographic andwork related factors on job satisfaction with evidence fromsome of the hotels in Anatolian side of Istanbul. The study hassome limitations. First, because of the limited time period,sample size was limited to only 209 employees of totally four
30
hotels. For the nature of the study, a larger sample size wouldhave strengthened results. Second, having limited the study to5* hotels a situation of constrained variance may be present.Finally, the timing of the data collection (June-August) mayhave had an impact on participants’ responses. Although thearticle is limited, it suggests that particular demographiccharacteristics can affect a person’s level of satisfactionwithin an accommodation service operation. We suggest that alarger sample of hotel operations should be used that moderatethis relationship.
Among the 209 hotel employees, job satisfaction level by meansof 9 different factors reflect that employees are not satisfiedwith their wages, raises, rewards and working conditions. Thisoutcome means that they have a problem with the nature oftourism sector itself, as wages and rewards do not make peoplehappy in general, although the operation conditions are forcingand difficult. That’s why rate of turnover in the industry isvery high. These conditions should be enhanced by hotelmanagements in order to prevent unhappy employees and highturnover.
The employees in general say they are satisfied with theirsupervisors, maybe because of the possibility of supervisors tosee their answers and risk their position. Another reason maycome from Turkish traditions, saying one should respect eldersand superiors. They are also very happy with each-other, theirjob itself and communication within the organization. Maybethese are the reasons of the decision not to leave the job, aswell as fear of not being able to find another job. They showtheir satisfaction with the promotion opportunities and fringebenefits by a small range.
When we look at the relations between gender and jobsatisfaction level, it is clear that women are less satisfiedor more dissatisfied by means of pay and promotion. Men arealso slightly happier with the nature of their job. Women areslightly more satisfied than men by means of fringe benefitsand contingent rewards. This result may be interpreted with twodimensions, these differences may be because women are braverexpressing their problems, or there is still a negativediscrimination for women at hotels. In order to prevent women
31
turnovers, working conditions of women should be levelled tothose of men.
Singles seem more satisfied with the supervision, nature ofwork itself, co-workers and communication than marriedemployees. Married employees are slightly happier than singlesby means of pay. Marital status does not have an effect onother facets.
Satisfaction levels of the employees working in differentdepartments may vary especially for the facets promotion,contingent rewards, operating conditions, co-workers and natureof work itself. The employees working in Managerial Departmentsand Offices are more satisfied by means of the nature of workitself, their co-workers, promotion opportunities andcontingent rewards; on the contrary they are dissatisfied withoperating conditions. The ones working in TechnicalDepartments are satisfied with the nature of work itself,promotion opportunities and their co-workers. Food & Beverageand Service employees are moderately satisfied with rewards andthe nature of work itself, they feel neutral to other facets.Front Office / Guest Relations employees seem to be moderatelysatisfied with their co-workers, the operating conditions andthe nature of work itself, unhappy with promotionopportunities. Housekeepers are happy with the nature of workitself, dissatisfied with promotion. The employees working inthe offices seem to be the happiest, followed by technical,F&B, Front Office and Housekeeping employees. As they have moreresponsibility and paper work in the offices, they don’t havelimited working hours, so they are unhappy with the operationconditions. Technical employees are happy with their workingconditions in general, as they do not have so much to do withinthe day, and not many forcing supervisors. The otheroperational and physically busy departments seem to be doingwell.
Likewise, by means of overall job satisfaction, there is ameaningful advantage of high level managers among others. Butthey are dissatisfied with the operating conditions because oftheir responsibility and unlimited working hours.
32
Working hours also matter about the satisfaction level. Theoutcome can be interpreted as; the best weekly working timeperiod is between 41 and 50 hours. Less working hours does notbring the highest satisfaction, as well as more than 50 hoursof work. More than 60 hours per week makes people extremelyunhappy.
By means of income, the most satisfied hotel employees earnbetween $1,980 and $3,300 per month. Surprisingly, those whohave an income more than $3,300 are on the second spot. Thismay be because the high level managers having more salarieshave high amount of expenses according to their situation inthe society and at the end of the day, their incomes aremelting.
So, gender, marital status and departments of employees matterby means of overall job satisfaction. Also, level of theirposition and income has a positive relationship with jobsatisfaction. To make a summary of the outcomes, for the 5*hotel employees in Turkey, or in Istanbul Anatolian sidespecifically, we can say that job satisfaction level is thehighest with single, male, high level managers, who are workingin managerial or technical offices between 41 to 50 hours aweek, and have an income of $1,980 to $3,300 per month. As thepoverty limit in Turkey is $1,820, the above outcome aboutincome tells us that in order to make employees satisfied withwages, it should be not less than the poverty limit of thatcountry. Also, because of the nature of the industry, singlemen can spend more time on their shift and have a feeling ofcommitment to their job.
It is very important for the hotels to build a work environmentthat meets the employees’ expectations and recruit people whocan be happy in this environment that is strongly affected bythe nature of the industry. Recruiters should consider thequalifications of the applicant and give him the convenientconditions, caring fairness and balance between his colleagues.After recruitment, if the employees aren’t paid according totheir marginal contribution, this will minimise theirefficiency through the process. Furthermore, employees need areasonable amount of social interaction on the job and somedegree of personal space, which diffuses tension and improves
33
working conditions. Increasing interactions with employees instaff meetings and guided discussions of topics related tooperational policies and working conditions may also increaseorganizational commitment and decrease subsequent turnover.
REFERENCES
Agho, A.O., Price, J.L., Mueller, C.W. (1992). Discriminatevalidity of measures of job satisfaction, positiveaffectivity and negative affectivity. Journal of Occupational andOrganizational Psychology 65, 185–196.
Arnett, D.B., Laverie, D.A., McLane, C. (2002). Using jobsatisfaction and pride as internal-marketing tools. CornellHotel and Restaurant Administration Quarterly 43 (2), 87–96.
Arvey, R. D. (1995). Job satisfaction, Encyclopedia dictionary oforganizational behaviour, N. Nicholson (Ed.), BlackwellPublishers, Cambridge, MA, 272-274.
Barrow, C.W. (1990). Employee turnover: implications forhotel managers, FIU Hospitality Review 8 (1), 24–31.
Bedeian, A., Ferris, G., Kacmar, K. (1992). Age, tenure, andjob satisfaction: a tale of two perspectives, Journal ofVocational Behavior 40, 33–48.
Cammann, C., Fichman, M., Jenkins, D., Klesh, J. (1979). TheMichigan Organizational Assessment Questionnaire.Unpublished manuscript. University of Michigan, Ann Arbor.
Clark, A. (1996). Job satisfaction in Britain, British Journal ofIndustrial Relations, Vol.34, No.2, 189-217.
Clark, A. (1997). Job satisfaction and gender: why are womenso happy at work?, Labour Economics, Vol.4, No.4, 341-372.
Clark, A., and Oswald, A. (1996). Satisfaction andcomparison income, Journal of Public Economics, Vol.61, No.3, 359-381.
Cranny, C. J., Smith, P. C., & Stone, M. (Eds.) (1992). Jobsatisfaction: How People Feel About Their Jobs and How It Affects TheirPerformance, Lexington Books, New York.
Deery, M. & Shaw, R. N. (1998). An exploratory analysis ofturnover culture in the hotel industry in Australia,International Journal of Hospitality Management, Vol.16, No.4, 375-392.
Efraty, D., Sirgy, M.J. (1990). The effect of quality ofworking life (QWL) on employee behavioral responses, SocialIndicators Research 22, 31–47.
Eurofound (European Foundation for the Improvement of Livingand Working Conditions) (2007). Measuring Job Satisfaction In Surveys
34
- Comparative Analytical Report,http://www.eurofound.europa.eu/ewco/reports/TN0608TR01/TN0608TR01.pdf, 07.05.2010.
Glisson, C.V., Durick, M. (1988). Predictors of jobsatisfaction and organizational commitment in human serviceorganizations, Administrative Quarterly 33 (1), 61–68.
Goymour, D. (2002). How to keep people, Hospitality, January,16-25.
Groot, W., and van der Brick, H. (1999). Job satisfactionand preference drift, Economics Letters, Vol:63, No.3, 363-367.
Gürbüz, Ahmet (2007). An Assessment on the Effect of EducationLevel on the Job Satisfaction From the Tourism Sector Point ofView, Journal of Doğuş University, 8 (1), 36-46,http://journal.dogus.edu.tr/13026739/2007/Cilt8/Sayi1/M00170.pdf,09.05.2010.
Hackman, R. J. and Oldham, G.R. (1975). Development of theJob Diagnostic Survey, Journal of Applied Psychology, 60: 159-170.
Hackman, J., and Oldham, G. (1980). Work redesign.Massachusetts: Addison-Wesley Publishing,
Hinkin, T. R. & Tracey, J. B. (2000). The cost of turnover:putting a price on the learning curve. Cornell Hotel andRestaurant Administration Quarterly, 41(3), 14-21.
Hoffman, K. D., & Ingram, T. N. (1992). Service provider jobsatisfaction and customer-oriented performance, The Journal ofServices Marketing, 6(2), 68-78.
Hoppock, R. (1935). Job Satisfaction, Harper and Brothers, NewYork.
Ironson, G.H., Smith, P.C., Brannick, M.T., Gibson, W.M.,Paul, K.B. (1989). Constitution of a job in general scale: acomparison of global, composite, and specific measures,Journal of Applied Psychology, 74, 193–200.
Judge, T. and Watanabe, S. (1993). Another Look at The JobSatisfaction – Life Satisfaction Relationship, Journal ofApplied Psychology, Vol.78, No.6, 939-948.
Judge, T.A., Parker, S., Colbert, A.B., Heller, D. & Ilies,R. (2001). Job satisfaction: a cross cultural review,Handbook of Industrial, Work and Organizational Psychology, N. Andersen,D. S. Ones, H. K., Sinangil, & C. Viewesvaran (eds.), Sage,London, Vol.2, 25-52.
Keane, M.J. (1996). Sustaining quality in tourismdestinations: an economic model with an application. AppliedEconomics 28 (12), 1545–1553.
35
LaLopa, J. M. (1997). Commitment and turnover in resortjobs, Journal of Hospitality and Tourism Research, Vol. 21, 1-26.
Lam, T., Zhang, H., & Baum, T. (2001). An investigation ofemployees’ job satisfaction: the case of hotels in HongKong, Tourism Management, 22(2), 157-165.
Lester, P.E. (1987). Development and factor analysis of theteacher job satisfaction questionnaire. Educational andPsychological Measurement 47, 223–233.
Locke, Edwin A. (1969). What is job satisfaction,Organizational Behavior and Human Performance, 4, 309-336.
Locke, Edwin A. (1976). The nature and causes of jobsatisfaction, Handbook of Industrial and Organizational Psychology,M.D. Dunnette (Ed.), Rand McNally College PublishingCompany, Chicago, 1297-1349.
Loscocco, K. A., and Roschelle, A. R. (1991). Influences onthe quality of work and nonwork life: Two decades in review.Journal of Vocational Behavior, Vol. 39, pp. 182-225.
Miles, A. and Sledge, S. (2006). Satisfaction, Service andCulture - Relations From The Hotel Industry In Brazil,Mexico and Spain, Proceedings – 2006 Academy of International BusinessSoutheast USA Chapter Annual Meeting, Clearwater Beach, Florida,http://www.aibse.org/Proceedings/Proceedings%202006/10%20Miles,%20Sledge.pdf, 101-114.
Milman, A. (2002). Hourly employee retention in theattraction industry: research from small and medium-sizedfacilities in Orlando, Florida, Journal of Leisure Property, Vol.2,40-51.
Mobley, William H. (1982). Employee turnover: Causes, consequences,and control. Reading, MA: Addison-Wesley.
Mobley, William H., Griffeth, Rodger W., Hand, Herbert H., &Meglino, Bruce M. (1979). Review and conceptual analysis ofthe employee turnover process, Psychological Bulletin, 86, 493-522.
Morrison, K.A. (1997). How franchise job satisfaction andpersonality affects performance, organizational commitment,franchisor relations, and intention to remain, Journal of SmallBusiness Management, Vol.35, 39-67.
Organ, D. (1990). The subtle significance of jobsatisfaction, Clinical laboratory management review, 1, 94-98.
Porter, L.W., Lawler, E.E. (1968). Managerial Attitudes andPerformance, Irwin, Homewood, IL.
36
Rafaeli, A. (1989). When cashier meet customers: an analysisof the role of supermarket cashiers, Academy of Journal ofManagement 30, 245–273.
Robbins, S. P. (2001). Organizational Behavior, 8th ed.,International Edition, Prentice-Hall, Upper Saddle River,NJ.
Robbins, S. P., & Coulter, M. (1996). Management. Prentice-Hall, Upper Saddle River, NJ.
Rose, M. (2001). “Disparate measures in theworkplace...Quantifying overall job satisfaction”, Paperpresented at the 2001 BHPS Research Conference, Colchester,http://www.iser.essex.ac.uk/bhps/2001/docs/pdf/papers/rose.pdf
Salazar, J. and Hubbard, S. (2000). The relationship betweenempowerment and overall job satisfaction: A study of asoutheastern resort. Praxis: The Journal of Applied HospitalityManagement, Vol. 3, 112-129.
Salazar, J., Hubbard, S. and Salazar, L. (2002). Locus ofControl and Its Influence on Hotel Managers' JobSatisfaction, Journal of Human Resources in Hospitality & Tourism,l(2), http://www.lriti.com/locusjobsat.pdf, 07.05.2010.
Schermerhorn, J. R. (1996). Essentials of management andorganizational behavior. John Wiley and Sons, New York, NY.
Schlesinger, L.A. (1982). Quality of Work Life and the Supervisor,Praeger, New York, NY.
Schlesinger, L.A., Zornitsky, J. (1991). Job satisfaction,service capability, and customer satisfaction: anexamination of linkages and management implications, HumanResource Planning 14, 141–150.
Schneider, B. (1985). Organizational behavior, Annual Review ofPsychology, Vol.36, 573-611.
Schneider, B., Mowen, D. (1985). Employee and customerperceptions of service in banks: replication and extension.Journal of Applied Psychology 70, 423–433.
Schneider, B. and Snyder, R. (1975). Some Relationshipsbetween Job Satisfaction and Organizational Climate, Journalof Applied Psychology, 60 (3), 318-328.
Sloane, P., and Ward, M. (2001). Cohort effects and jobsatisfaction of academics, Applied Economics Letters, Vol.8,No.12, 787-791.
37
Smith, P. C., Kendall, L. M., and Hulin, C. L. (1969). Themeasurement of satisfaction in work and retirement. Rand-Mcnally,Chicago, IL.
Sousa-Poza, A. and Sousa-Poza, A.A. (2000). Well-being atwork: a cross-national analysis of the levels anddeterminants of job satisfaction, Journal of Socio-Economics,Vol.29, No.6, 517-538.
Spector, Paul E. (1985). Measurement of Human Service StaffSatisfaction: Development of the Job Satisfaction Survey.American Journal of Community Psychology, 13(6), 693-713.
Spector, Paul E. (1997). Job Satisfaction: Application, Assessment,Causes, and Consequences, Sage Publications, Inc., ThousandOaks, California.
Spinelli, M.A., Canavos, G.C. (2000). Investigating therelationship between employee satisfaction and guestsatisfaction, Cornell Hotel and Restaurant Administration Quarterly, 41(6), 29–33.
Syptak, J.M., Marsland, D.W., Ulmer, D. (1999). Jobsatisfaction: putting theory into practice, Family PracticeManagement 6 (9).
Susskind, A. M., Borchgrevink, C. P., Kacmar, K. M. &Brymer, R. A. (2000). Customer service employees'behavioural intentions and attitudes: An examination ofconstruct validity and a path model, International Journal ofHospitality Management, Vol.19, 53-77.
Tanke, M.L. (1990), Human Resources Management for the HospitalityIndustry, Delmar Publishers, Albany, NY.
Thierry, H. (1998). Motivation and Satisfaction, Handbook ofwork and organizational psychology: volume 4 organizational psychology, P.Drenth, H. Thierry, C. De Wolff (Eds.), 253-289.
Türk-İş (Confederation of Turkish Trade Unions) (2010).Eylül 2010 Açlık ve Yoksulluk Sınırı (September 2010 Limitof Hunger and Poverty), http://www.turkis.org.tr,27.09.2010.
Vieira, J. (2005). Skill mismatches and job satisfaction,Economics Letters, Vol:89, No.1, 39-47.
Wasmuth, W. J., and Davis, S. W. (1983). Managing employeeturnover, Cornell Hotel and Restaurant Administration Quarterly, 23(4), 15-22.
Weiss, D. J., Dawis, R. V., England, G. W. & Lofquist, L. H.(1967). Manual for the Minnesota Satisfaction Questionnaire, Universityof Minnesota Industrial Relations Center, Minneapolis, MN.

38
Wiener, Y. (1982). Commitment in organizations: A normativeview. Academy of Management Review, 7(3), 418-428.
Wood, J., Wallace, J., Zeffane, R., Schermerhorn, J., Hunt,J. & Osborn, R. (1998). Organisational Behaviour: An Asia-PacificPerspective, Jacaranda Wiley, Milton, Qld.


