Embed Size (px)
Citation preview
Joint Breast Cancer Registry SINGAPORE
Report No.2
April 2019
Prepared by
Dr Wong Fuh Yong
Lian Wei Xiang
Dr Wong Ru Xin
On behalf of
Joint Breast Cancer Registry
© Joint Breast Cancer Registry
Information included herein may be used freely for the purpose of education, research or
advocacy provided that the Joint Breast Cancer Registry (JBCR) is acknowledged in full.
JBCR requests to be informed in writing of all such uses for its record. For copying in any
other circumstances, or for re-use in other publications, permission must be secured in
writing.
For further information and feedback, please email: [email protected]

Foreword
It gives me great pleasure to pen this forward for the 2nd Report of the Joint Breast Cancer
Registry (JBCR). This is an excellent collaborative effort by specialists from multiple disciplines
across all institutions in SingHealth to build a registry of breast cancer patients. There is
tremendous potential to use this data to help inform healthcare providers, the public and policy
makers. It will serve as a platform to lobby for resources, as well as to serve as a treasure
trove for retrospective review and future planning. I would like to congratulate Dr Wong Fuh
Yong, Lian Wei Xiang and Dr Wong Ru Xin as well as all contributors of the JBCR for having
put together this important work. This is an excellent example of how we can achieve more
when we work together and I am very proud of them.
Prof William Hwang Medical Director
National Cancer Centre, Singapore
Acknowledgement
We will like to thank the following people who have contributed towards the Joint Breast
Cancer Registry and in the preparation of this report.
Chan Junjie Jack NCC Ngeow Yuen Yie Joanne NCC
Chay Wen Yee NCC Poh Shuxian Sharon NCC
Chew Sui Tjien Lita NCC Preetha Madhukumar NCC
Chua Eu Tiong NCC Saw Myat Thitsar NCC
Chua Gail Wan Ying NCC Sethi Vijay Kumar NCC
Dent Rebecca NCC Shih Vivianne NCC
Ho Shihan Bryan NCC Sim Yirong NCC
Jain Amit NCC Tan Jing Ying Tira NCC
Koo Si-Lin NCC Tan Kiak Mien Veronique NCC
Kusumawidjaja Grace NCC Tan Kiat Tee Benita SKH
Lee Guek Eng NCC Tan Puay Hoon SGH
Lee Jie Xin Joycelyn NCC Tan Qing Ting KKH
Lee Jung Ah KKH Tan Su Ming CGH
Li Youquan NCC Tan Yia Swam KKH
Lian Weixiang NCC Tan Ying Cong Ryan Shea NCC
Lim Faye Lynette NCC Wong Chow Yin SGH
Lim Geok Hoon KKH Wong Fuh Yong NCC
Lim Hsuen Elaine NCC Wong Mabel NCC
Lim Sue Zann SGH Wong Ru Xin NCC
Lim Swee Ho KKH Wong Su Lin Jill NCC
Loh Kiley Wei-Jen NCC Yap Yoon Sim NCC
Mo Michelle JiaQi CGH Yeo Ming Chert Richard NCC
Ng Raymond NCC Yong Wei Sean NCC
Ng Wee Loon NCC
We also thank the staff of Department of Cancer Informatics, NCCS for their help in
creating and supporting the Breast Tumour Board software through which a significant
amount of data was made available for JBCR as well as the Division of Radiation
Oncology who has kindly provided manpower support for the curation of this database.
Table of Contents
Foreword ................................................................................................................................ I
Acknowledgement ................................................................................................................. II
List of Figures ....................................................................................................................... V
List of Tables ...................................................................................................................... VII
1. Status of the Joint Breast Cancer Registry (JBCR) ........................................................ 1
1.1. Number of cases .......................................................................................... 1
1.2. Completeness of the database ..................................................................... 2
2. Follow up........................................................................................................................ 3
2.1. Status .......................................................................................................... 3
3. Demographics ................................................................................................................ 5
3.1. Age at diagnosis .......................................................................................... 5
3.2. Race ............................................................................................................ 7
3.3. Menopausal Status .................................................................................... 10
3.4. Presentation ............................................................................................... 11
4. Tumour Characteristics ................................................................................................ 13
4.1. Histology .................................................................................................... 13
4.2. Staging ...................................................................................................... 15
4.3. Histology Subtype ...................................................................................... 19
4.4. Differentiation Grade .................................................................................. 23
4.5. Tumour Size .............................................................................................. 25
4.6. Nodal Status .............................................................................................. 26
5. Treatment..................................................................................................................... 28
5.1. Breast Surgery ........................................................................................... 28
5.2. Chemotherapy ........................................................................................... 34
5.3. Radiation Therapy ...................................................................................... 38
5.4. Targeted Treatment ................................................................................... 43
5.5. Neo-Adjuvant Chemotherapy Treatment .................................................... 46
6. Survival and Outcomes ................................................................................................ 47
6.1. Overall Survival .......................................................................................... 49
6.2. Disease Free Survival (DFS) ...................................................................... 55
6.3. Ipsilateral Breast Tumour Recurrence (IBTR) ............................................ 58
6.4. Distant Disease Free Survival (DDFS) ....................................................... 60
7. Non-invasive cancers ................................................................................................... 63
8. Research...................................................................................................................... 66
8.1. Published Manuscripts ............................................................................... 66
8.2. Ongoing Studies ........................................................................................ 67
9. Reference .................................................................................................................... 68
APPENDIX: List of variables ................................................................................................. A
List of Figures
Figure 1-1. Number of cases by diagnosis year. ................................................................... 1
Figure 1-2. Completeness of the JBCR database. ................................................................ 2
Figure 2-1. Histogram of years of follow up. .......................................................................... 3
Figure 3-1. Histogram of age at diagnosis. ............................................................................ 5
Figure 3-2. Boxplot of age by diagnosis year category. ......................................................... 6
Figure 3-3. Proportion of cases by race in different cohorts................................................... 7
Figure 3-4. Distribution of age at diagnosis by race in different cohorts. ................................ 8
Figure 3-5. Distribution of patients’ race by age group in different cohorts. ........................... 9
Figure 3-6. Distribution of patients’ menopausal status by race. .......................................... 10
Figure 3-7. Distribution of presentation type by age group. ................................................. 11
Figure 3-8. Distribution of presentation type by race. .......................................................... 12
Figure 4-1. Percentage of cases by anatomic and prognostic staging as per AJCC8. ......... 16
Figure 4-2. Distribution of anatomic stage by race. ............................................................. 16
Figure 4-3. Distribution of anatomic stage by age group. .................................................... 17
Figure 4-4. Percentage of cases by anatomic stage by presentation type. .......................... 17
Figure 4-5. Distribution of anatomic stage by histology subtype. ......................................... 18
Figure 4-6. Percentage of cases by histology subtype. ....................................................... 20
Figure 4-7. Distribution of histology subtype by race. .......................................................... 21
Figure 4-8. Distribution of histology subtype by age group. ................................................. 21
Figure 4-9. Distribution of histology subtype by grade differentiation. .................................. 22
Figure 4-10. Percentage of cases by histology subtype by presentation status. .................. 22
Figure 4-11. Percentage of cases by grade differentiation. ................................................. 23
Figure 4-12. Percentage of cases by grade differentiation by presentation type. ................. 24
Figure 4-13. Distribution of grade differentiation by race. .................................................... 24
Figure 4-14. Histogram of tumour size. ............................................................................... 25
Figure 4-15. Percentage of cases by nodal stage group. .................................................... 26
Figure 4-16. Percentage of cases by nodal stage by presentation type. .............................. 27
Figure 4-17. Percentage of patients receiving chemotherapy by nodal stage. ..................... 27
Figure 5-1. Percentage of cases by overall surgery type. .................................................... 29
Figure 5-2. Percentage of cases with reconstruction. .......................................................... 30
Figure 5-3. Distribution of surgery type by race. .................................................................. 31
Figure 5-4. Distribution of surgery type by age group. ......................................................... 32
Figure 5-5. Distribution of surgery type by anatomic staging. .............................................. 32
Figure 5-6. Distribution of surgery type by tumour size. ....................................................... 33
Figure 5-7. Proportion of surgery type by diagnosis year. ................................................... 33
Figure 5-8. Proportion of patients who received chemotherapy. .......................................... 34
Figure 5-9. Distribution of drugs for patients who received chemotherapy. .......................... 35
Figure 5-10. Percentage of patients receiving chemo by race. ............................................ 36
Figure 5-11. Percentage of patients who received chemotherapy by anatomic staging. ...... 36
Figure 5-12. Percentage of patients who received chemotherapy by histology subtype. ..... 37
Figure 5-13. Proportion of radiation therapy techniques received by patients. ..................... 38
Figure 5-14. Proportion of techniques used by patients by diagnosis year. ......................... 39
Figure 5-15. Proportion of hypo fractionation regimes received by patients by diagnosis year.
........................................................................................................................................... 40
Figure 5-16. Proportion of patients receiving radiation therapy by surgery type and age group.
........................................................................................................................................... 41
Figure 5-17. Proportion of patients receiving radiation therapy by surgery type and anatomic
stage group. ........................................................................................................................ 42
Figure 5-18. Distribution of radiation therapy field that patients received by surgery type and
anatomic stage group. ......................................................................................................... 42
Figure 5-19. Proportion of patients who received targeted treatment by treatment year. ..... 43
Figure 5-20. Use of targeted therapy in patients who are HER2 positive and had chemotherapy
by treatment year. ............................................................................................................... 44
Figure 5-21. Uptake of targeted therapy in patients who are node positive or had
chemotherapy by treatment year. ........................................................................................ 44
Figure 5-22. Distribution of patients who received targeted therapy by anatomic staging. ... 45
Figure 5-23. Proportion of patients who received neo-adjuvant treatment by treatment year.
........................................................................................................................................... 46
Figure 6-1. Snapshots of the online survival calculator. (a) Selection Criteria for outcomes
estimation. (b) Survival curve of matched population. (c) Icon array for easy visual
interpretation of outcomes. .................................................................................................. 48
Figure 6-2. Overall survival by race. .................................................................................... 49
Figure 6-3. Overall survival by anatomic stage group. ......................................................... 50
Figure 6-4. Overall survival by histology subtype. ............................................................... 51
Figure 6-5. Overall survival by tumour size group. .............................................................. 52
Figure 6-6. Overall survival by nodal stage. ........................................................................ 53
Figure 6-7. Overall survival by grade differentiation............................................................. 54
Figure 6-8. Disease free survival by age group. .................................................................. 55
Figure 6-9. Disease free survival by race. ........................................................................... 56
Figure 6-10. Disease free survival by histology subtype. ..................................................... 57
Figure 6-11. Ipsilateral breast tumour recurrence by tumour stage. ..................................... 58
Figure 6-12. Ipsilateral breast tumour recurrence by histology subtype. .............................. 59
Figure 6-13. Distant disease free survival by nodal stage. .................................................. 60
Figure 6-14. Distant disease free survival by histology subtype. ......................................... 61
List of Tables
Table 2-1. Summary statistics of all patients who have follow ups. ........................................ 3
Table 2-2. Percentage of cases by follow up years. .............................................................. 3
Table 3-1. Summary statistics of age at diagnosis. ............................................................... 5
Table 3-2. Proportion of cases by menopausal status. ........................................................ 10
Table 3-3. Proportion of cases by presentation status. ........................................................ 11
Table 4-1. Distribution of cases by anatomic and prognostic staging as per AJCC8. .......... 15
Table 4-2. Distribution in hormone receptor status. ............................................................. 19
Table 4-3. Proportion of cases by histology subtype. .......................................................... 19
Table 4-4. Proportion of cases by grade differentiation. ...................................................... 23
Table 4-5. Summary statistics for tumour size. .................................................................... 25
Table 4-6. Percentage of cases by nodal status. ................................................................. 26
Table 5-1. Percentage of cases by overall surgery type. ..................................................... 28
Table 5-2. Percentage of cases by reconstruction type. ...................................................... 30
Table 6-1. Definition of the survival end points. ................................................................... 47
1 | P a g e
New in the Second Report
Inclusion of Changi General Hospital and Sengkang General Hospital
Analyses on Singapore residents only (i.e. Singapore Citizens and Permanent
Residents)
Trend of incidence of breast cancer cases reported over the years
Prognostic staging of breast cancer patients based on the new AJCC 8th Breast
Cancer Staging Manual
Chemotherapy drug classification received by patients
Radiotherapy modality
Survival analyses in non-invasive cancers
Optimized scaling in axes for the Kaplan Meir survival plots for readability
1. Status of the Joint Breast Cancer Registry (JBCR)
1.1. Number of cases
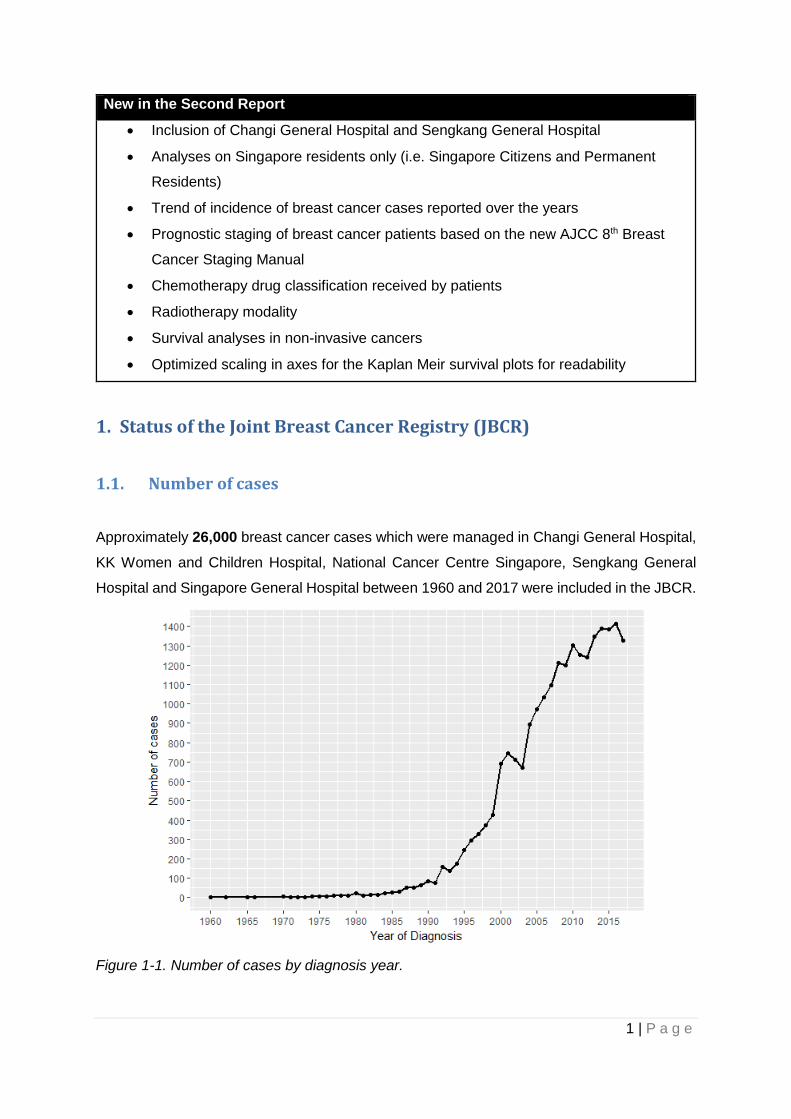
Approximately 26,000 breast cancer cases which were managed in Changi General Hospital,
KK Women and Children Hospital, National Cancer Centre Singapore, Sengkang General
Hospital and Singapore General Hospital between 1960 and 2017 were included in the JBCR.
Figure 1-1. Number of cases by diagnosis year.
2 | P a g e
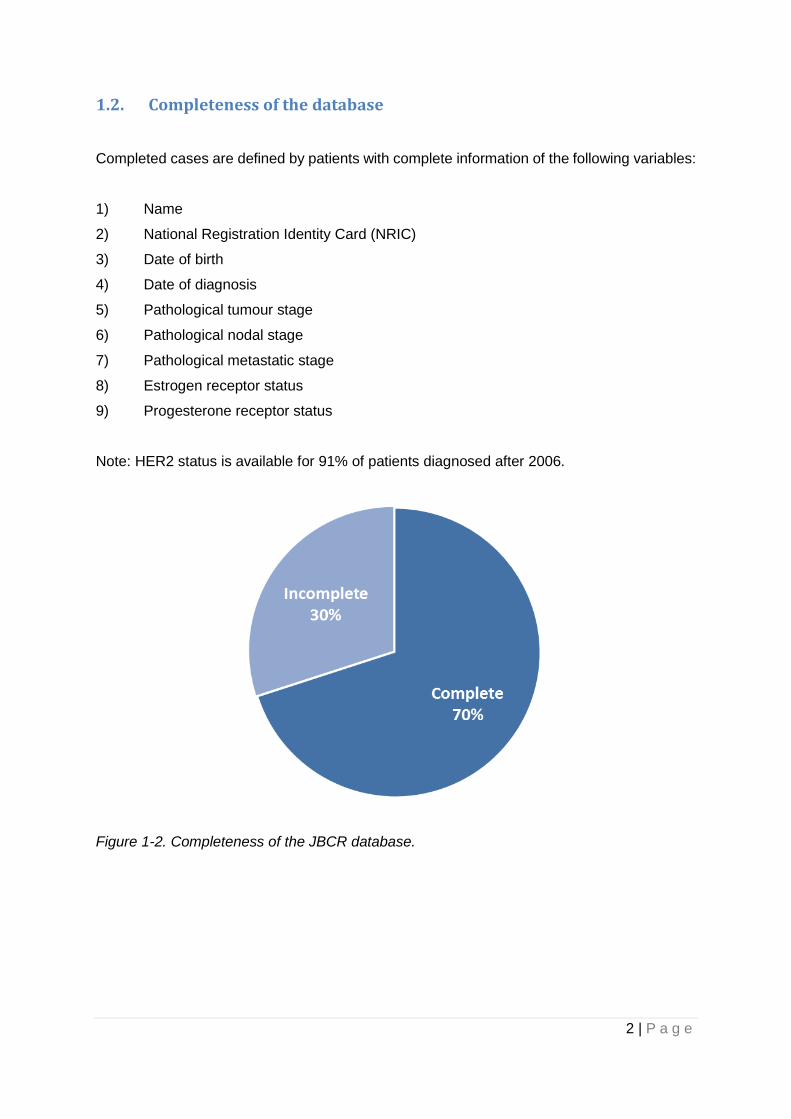
1.2. Completeness of the database
Completed cases are defined by patients with complete information of the following variables:
1) Name
2) National Registration Identity Card (NRIC)
3) Date of birth
4) Date of diagnosis
5) Pathological tumour stage
6) Pathological nodal stage
7) Pathological metastatic stage
8) Estrogen receptor status
9) Progesterone receptor status
Note: HER2 status is available for 91% of patients diagnosed after 2006.
Figure 1-2. Completeness of the JBCR database.
3 | P a g e
2. Follow up
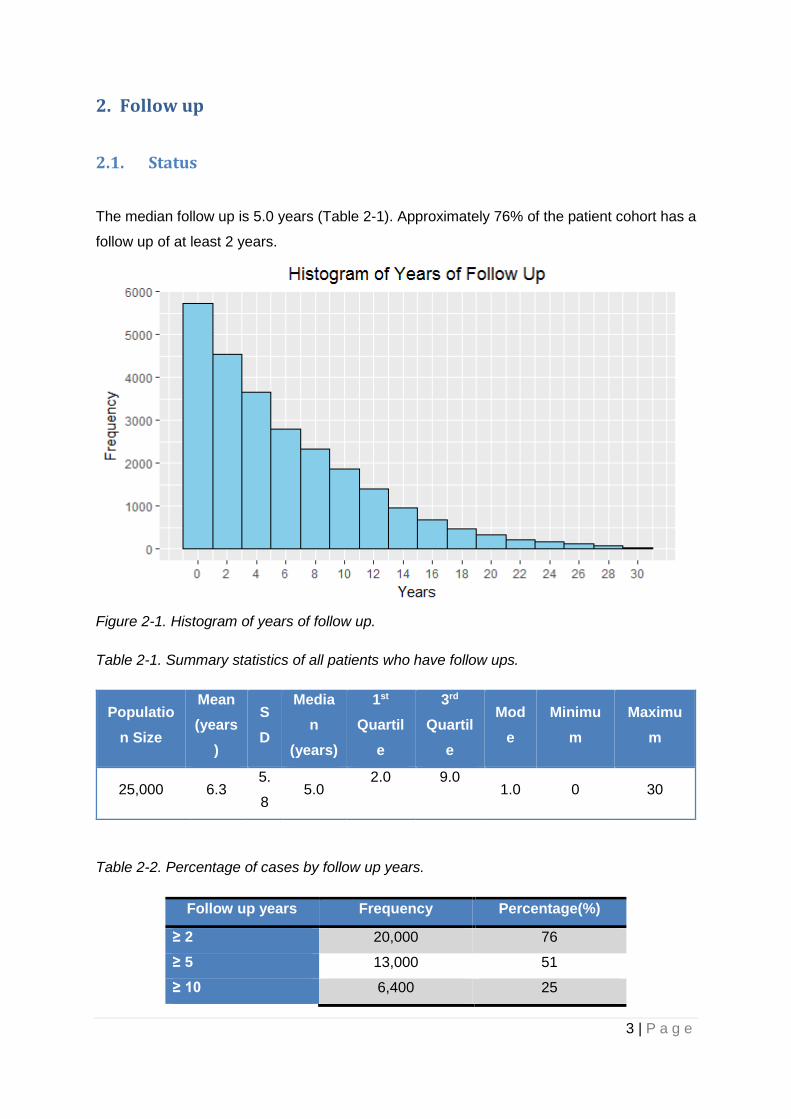
2.1. Status
The median follow up is 5.0 years (Table 2-1). Approximately 76% of the patient cohort has a
follow up of at least 2 years.
Figure 2-1. Histogram of years of follow up.
Table 2-1. Summary statistics of all patients who have follow ups.
Populatio
n Size
Mean
(years
)
S
D
Media
n
(years)
1st
Quartil
e
3rd
Quartil
e
Mod
e
Minimu
m
Maximu
m
25,000 6.3 5.
8 5.0
2.0 9.0 1.0 0 30
Table 2-2. Percentage of cases by follow up years.
Follow up years Frequency Percentage(%)
≥ 2 20,000 76
≥ 5 13,000 51
≥ 10 6,400 25

4 | P a g e
≥ 15 2,700 10
5 | P a g e
- [INVASIVE BREAST CANCER] -
For clarity, patients with invasive breast cancers are presented separately from those with
non-invasive disease (Section 3 to 6). All values are rounded to 2 significant figures.
5 | P a g e
JBCR – Invasive Breast Cancer: Demographics
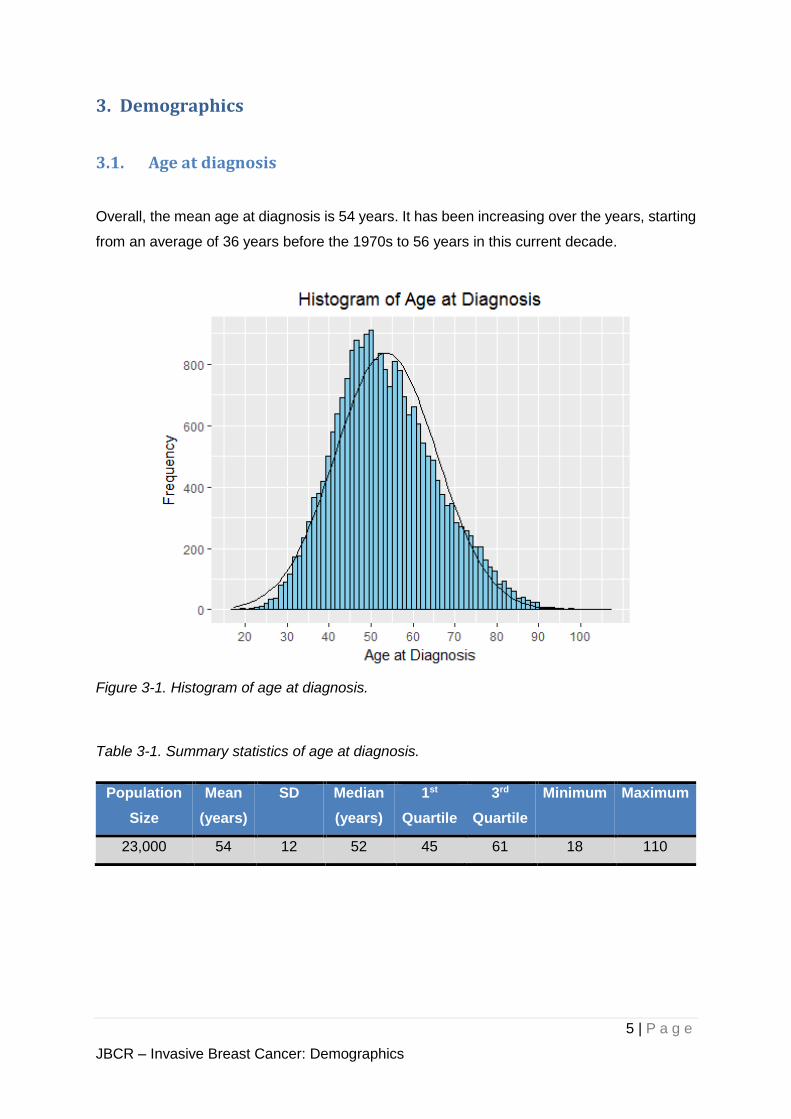
3. Demographics
3.1. Age at diagnosis
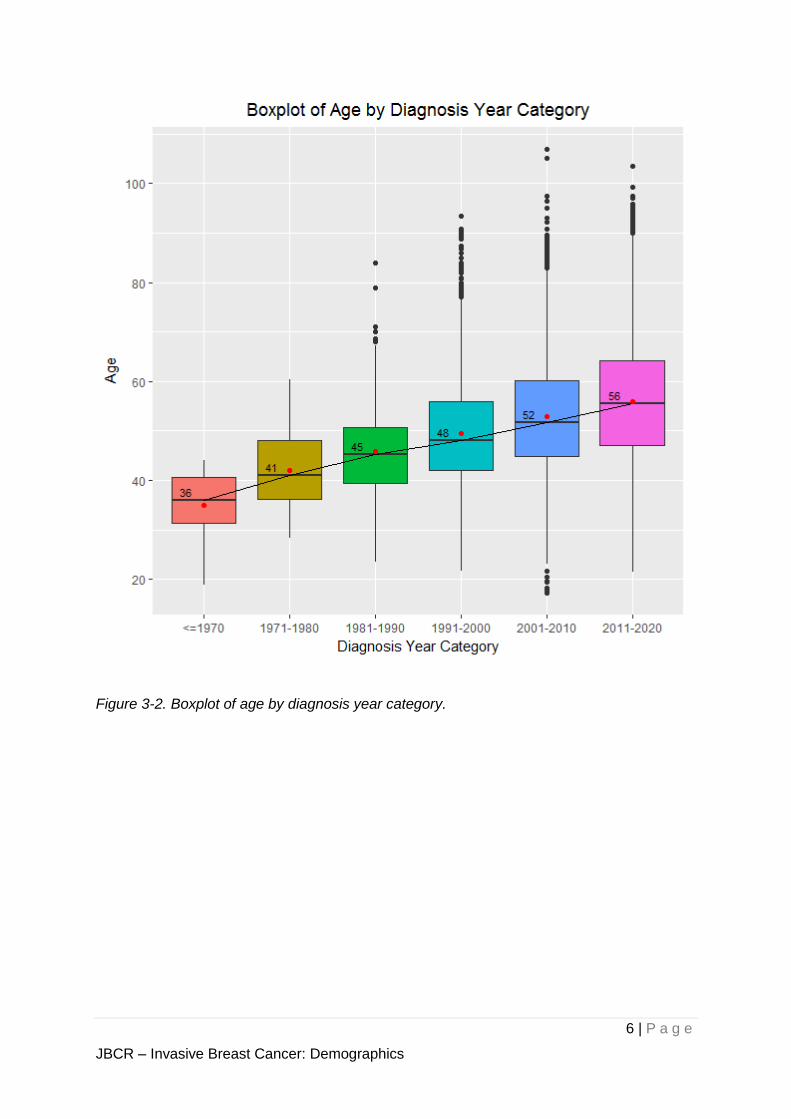
Overall, the mean age at diagnosis is 54 years. It has been increasing over the years, starting
from an average of 36 years before the 1970s to 56 years in this current decade.
Figure 3-1. Histogram of age at diagnosis.
Table 3-1. Summary statistics of age at diagnosis.
Population
Size
Mean
(years)
SD Median
(years)
1st
Quartile
3rd
Quartile
Minimum Maximum
23,000 54 12 52 45 61 18 110
6 | P a g e
JBCR – Invasive Breast Cancer: Demographics
Figure 3-2. Boxplot of age by diagnosis year category.
7 | P a g e
JBCR – Invasive Breast Cancer: Demographics
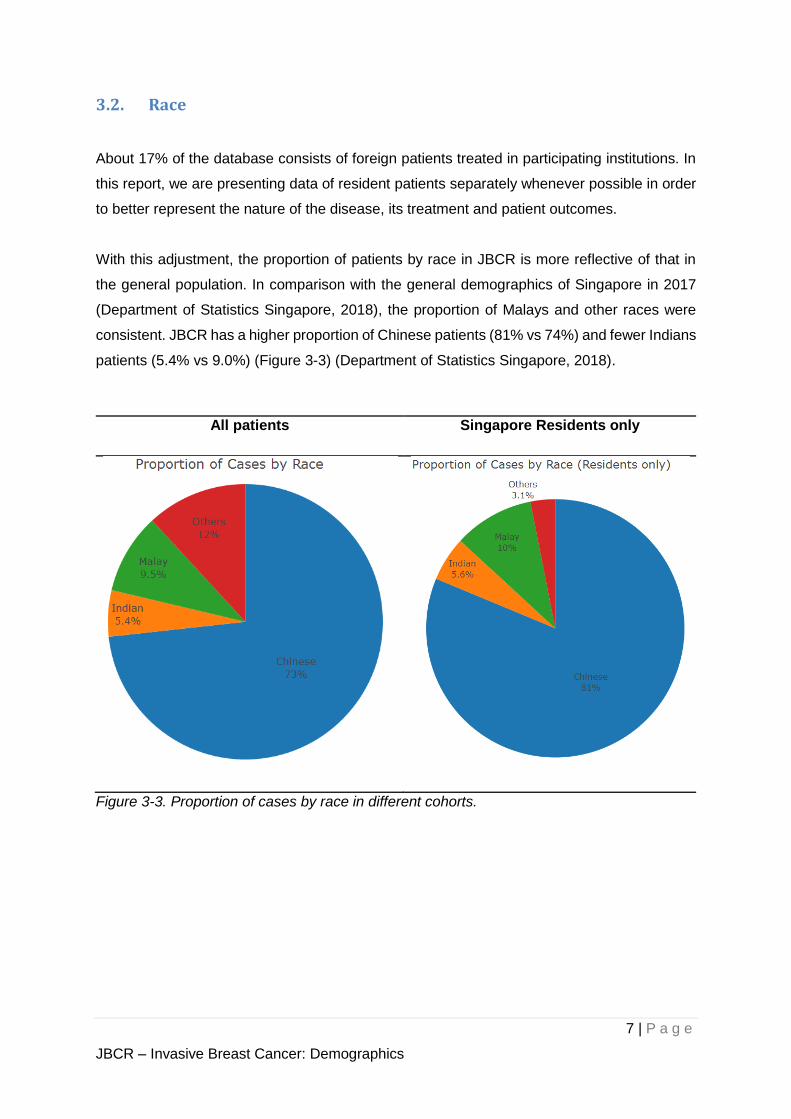
3.2. Race
About 17% of the database consists of foreign patients treated in participating institutions. In
this report, we are presenting data of resident patients separately whenever possible in order
to better represent the nature of the disease, its treatment and patient outcomes.
With this adjustment, the proportion of patients by race in JBCR is more reflective of that in
the general population. In comparison with the general demographics of Singapore in 2017
(Department of Statistics Singapore, 2018), the proportion of Malays and other races were
consistent. JBCR has a higher proportion of Chinese patients (81% vs 74%) and fewer Indians
patients (5.4% vs 9.0%) (Figure 3-3) (Department of Statistics Singapore, 2018).
All patients Singapore Residents only
Figure 3-3. Proportion of cases by race in different cohorts.
8 | P a g e
JBCR – Invasive Breast Cancer: Demographics
Cohort Histogram Race Median Age
(years)
All
patients
Chinese 53
Malay 51
Indian 54
Others 48
Singapore
Residents
only
Chinese 54
Malay 54
Indian 51
Others 50
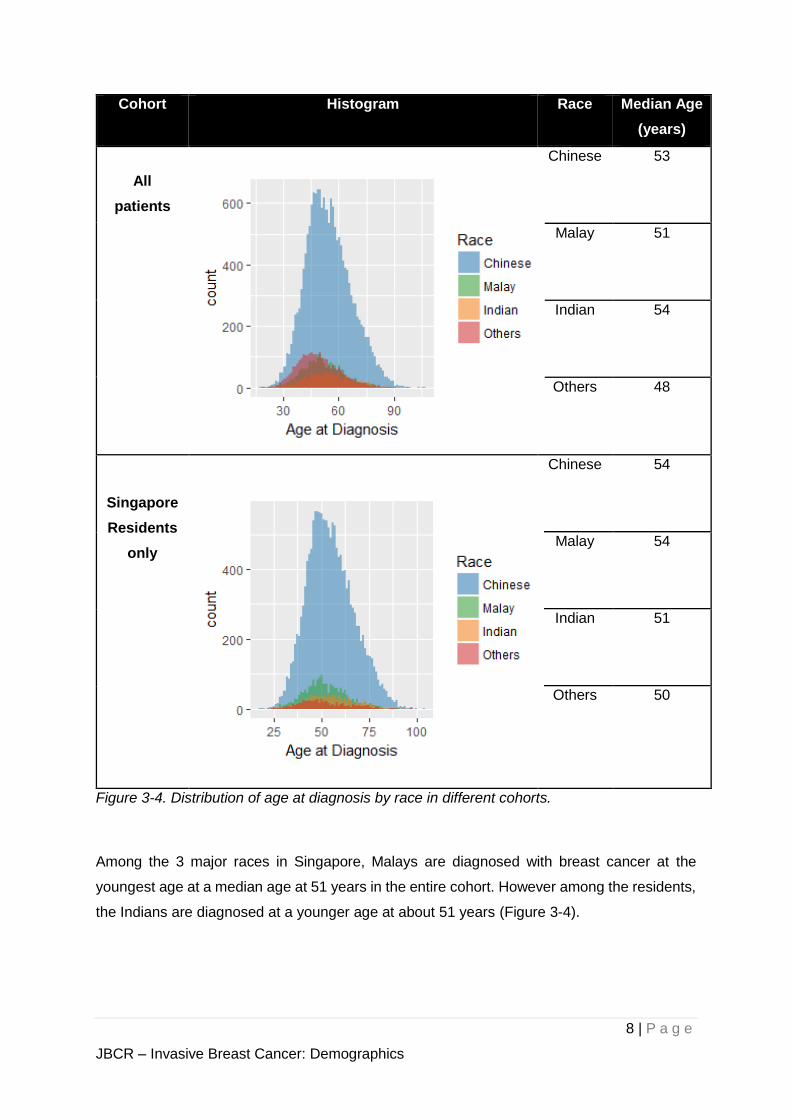
Figure 3-4. Distribution of age at diagnosis by race in different cohorts.
Among the 3 major races in Singapore, Malays are diagnosed with breast cancer at the
youngest age at a median age at 51 years in the entire cohort. However among the residents,
the Indians are diagnosed at a younger age at about 51 years (Figure 3-4).
9 | P a g e
JBCR – Invasive Breast Cancer: Demographics
Cohort Graph
All
patients
Singapore
Residents
only
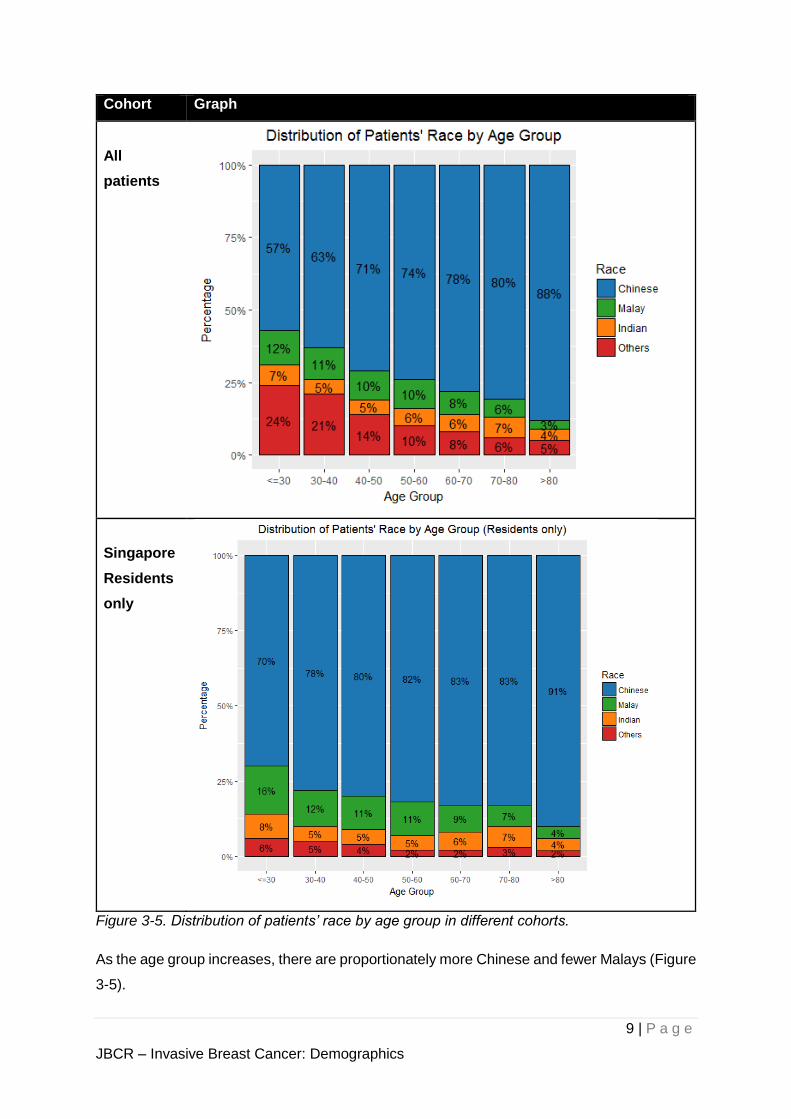
Figure 3-5. Distribution of patients’ race by age group in different cohorts.
As the age group increases, there are proportionately more Chinese and fewer Malays (Figure
3-5).
10 | P a g e
JBCR – Invasive Breast Cancer: Demographics
- [In the following analyses, only Singapore residents are analysed] -
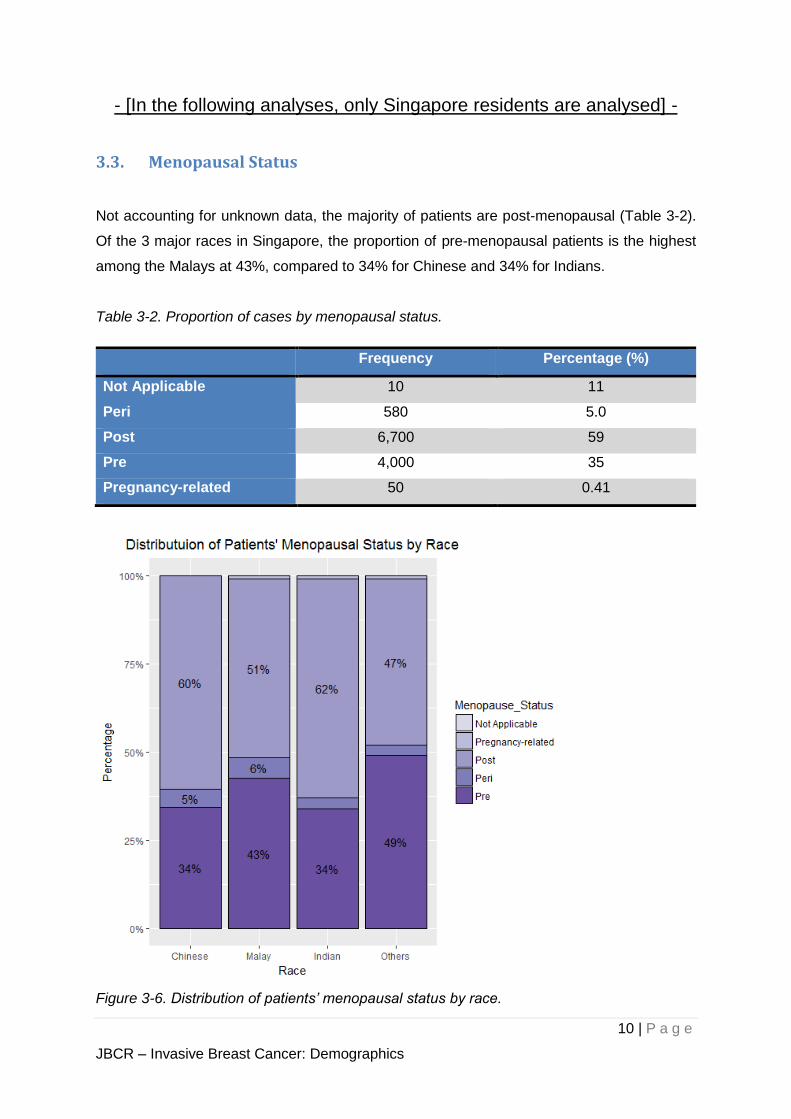
3.3. Menopausal Status
Not accounting for unknown data, the majority of patients are post-menopausal (Table 3-2).
Of the 3 major races in Singapore, the proportion of pre-menopausal patients is the highest
among the Malays at 43%, compared to 34% for Chinese and 34% for Indians.
Table 3-2. Proportion of cases by menopausal status.
Frequency Percentage (%)
Not Applicable 10 11
Peri 580 5.0
Post 6,700 59
Pre 4,000 35
Pregnancy-related 50 0.41
Figure 3-6. Distribution of patients’ menopausal status by race.
11 | P a g e
JBCR – Invasive Breast Cancer: Demographics
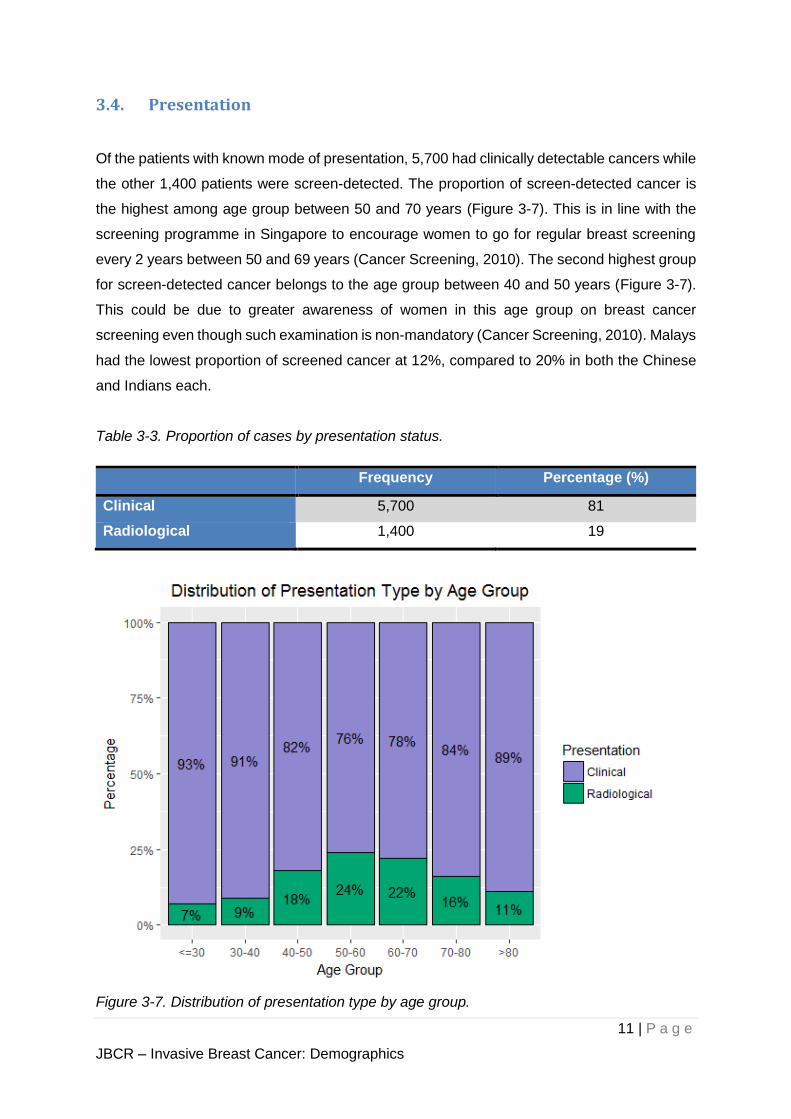
3.4. Presentation
Of the patients with known mode of presentation, 5,700 had clinically detectable cancers while
the other 1,400 patients were screen-detected. The proportion of screen-detected cancer is
the highest among age group between 50 and 70 years (Figure 3-7). This is in line with the
screening programme in Singapore to encourage women to go for regular breast screening
every 2 years between 50 and 69 years (Cancer Screening, 2010). The second highest group
for screen-detected cancer belongs to the age group between 40 and 50 years (Figure 3-7).
This could be due to greater awareness of women in this age group on breast cancer
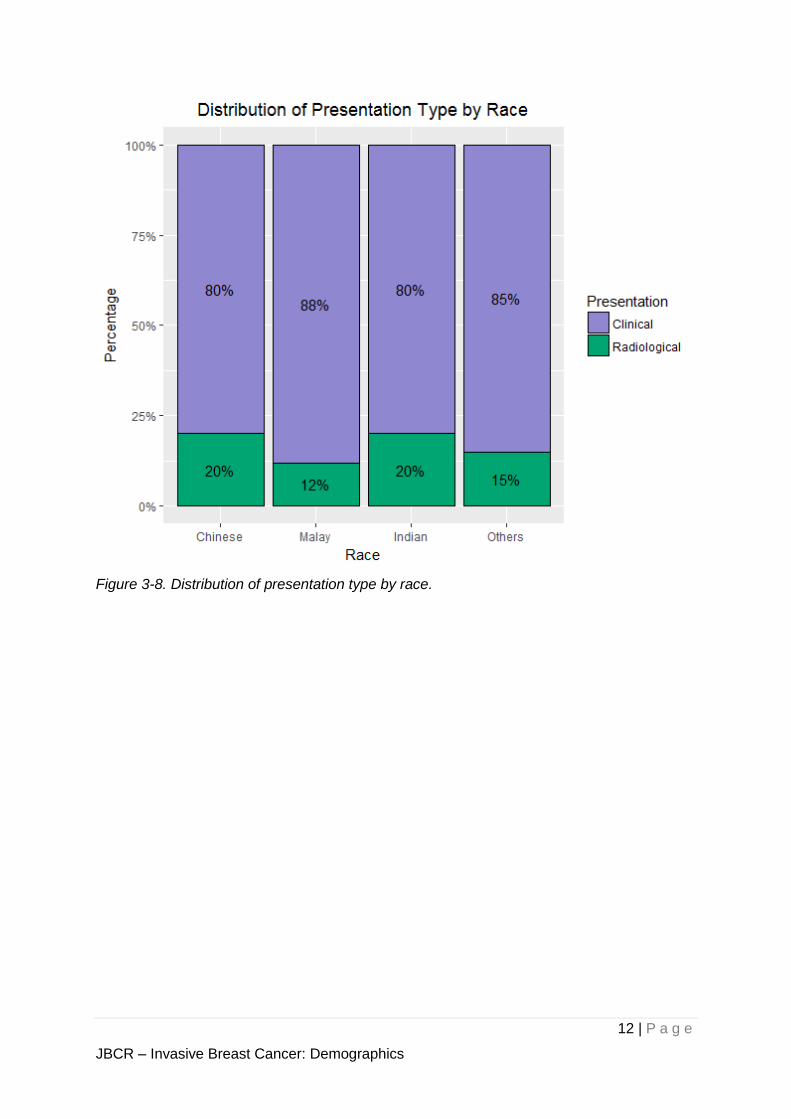
screening even though such examination is non-mandatory (Cancer Screening, 2010). Malays
had the lowest proportion of screened cancer at 12%, compared to 20% in both the Chinese
and Indians each.
Table 3-3. Proportion of cases by presentation status.
Frequency Percentage (%)
Clinical 5,700 81
Radiological 1,400 19
Figure 3-7. Distribution of presentation type by age group.
12 | P a g e
JBCR – Invasive Breast Cancer: Demographics
Figure 3-8. Distribution of presentation type by race.
13 | P a g e
JBCR – Invasive Breast Cancer: Tumour Characteristics
4. Tumour Characteristics
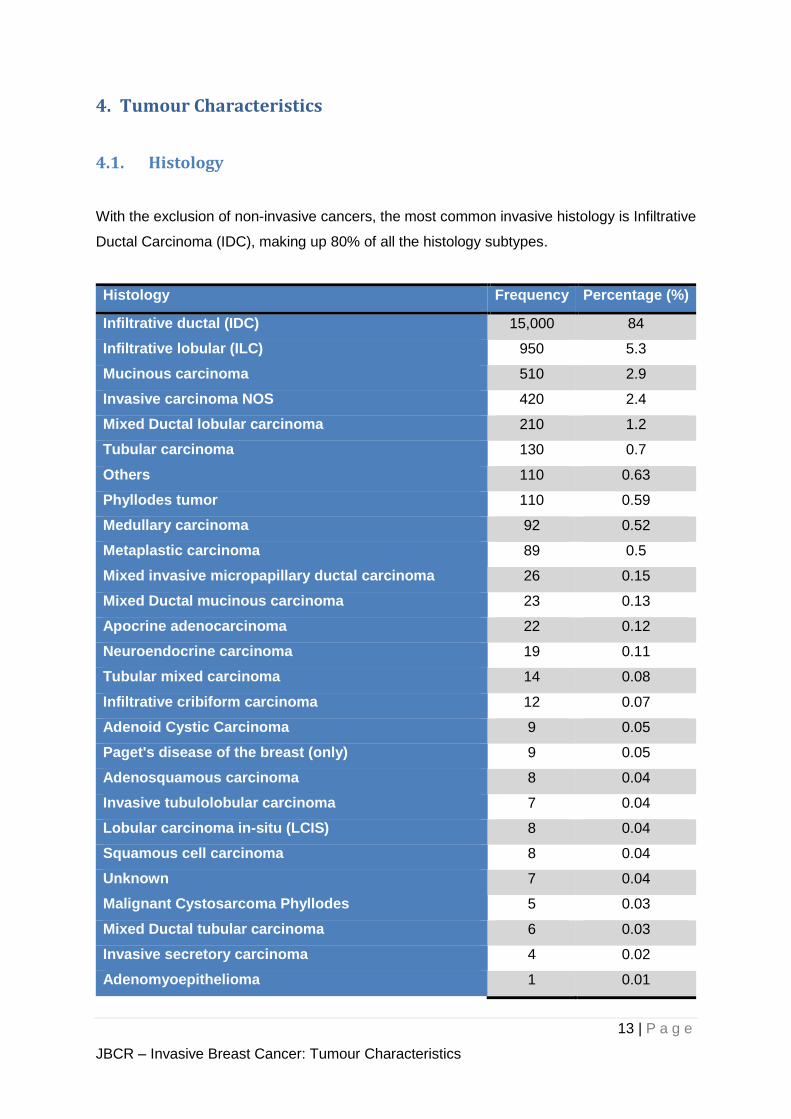
4.1. Histology
With the exclusion of non-invasive cancers, the most common invasive histology is Infiltrative
Ductal Carcinoma (IDC), making up 80% of all the histology subtypes.
Histology Frequency Percentage (%)
Infiltrative ductal (IDC) 15,000 84
Infiltrative lobular (ILC) 950 5.3
Mucinous carcinoma 510 2.9
Invasive carcinoma NOS 420 2.4
Mixed Ductal lobular carcinoma 210 1.2
Tubular carcinoma 130 0.7
Others 110 0.63
Phyllodes tumor 110 0.59
Medullary carcinoma 92 0.52
Metaplastic carcinoma 89 0.5
Mixed invasive micropapillary ductal carcinoma 26 0.15
Mixed Ductal mucinous carcinoma 23 0.13
Apocrine adenocarcinoma 22 0.12
Neuroendocrine carcinoma 19 0.11
Tubular mixed carcinoma 14 0.08
Infiltrative cribiform carcinoma 12 0.07
Adenoid Cystic Carcinoma 9 0.05
Paget's disease of the breast (only) 9 0.05
Adenosquamous carcinoma 8 0.04
Invasive tubulolobular carcinoma 7 0.04
Lobular carcinoma in-situ (LCIS) 8 0.04
Squamous cell carcinoma 8 0.04
Unknown 7 0.04
Malignant Cystosarcoma Phyllodes 5 0.03
Mixed Ductal tubular carcinoma 6 0.03
Invasive secretory carcinoma 4 0.02
Adenomyoepithelioma 1 0.01
14 | P a g e
JBCR – Invasive Breast Cancer: Tumour Characteristics
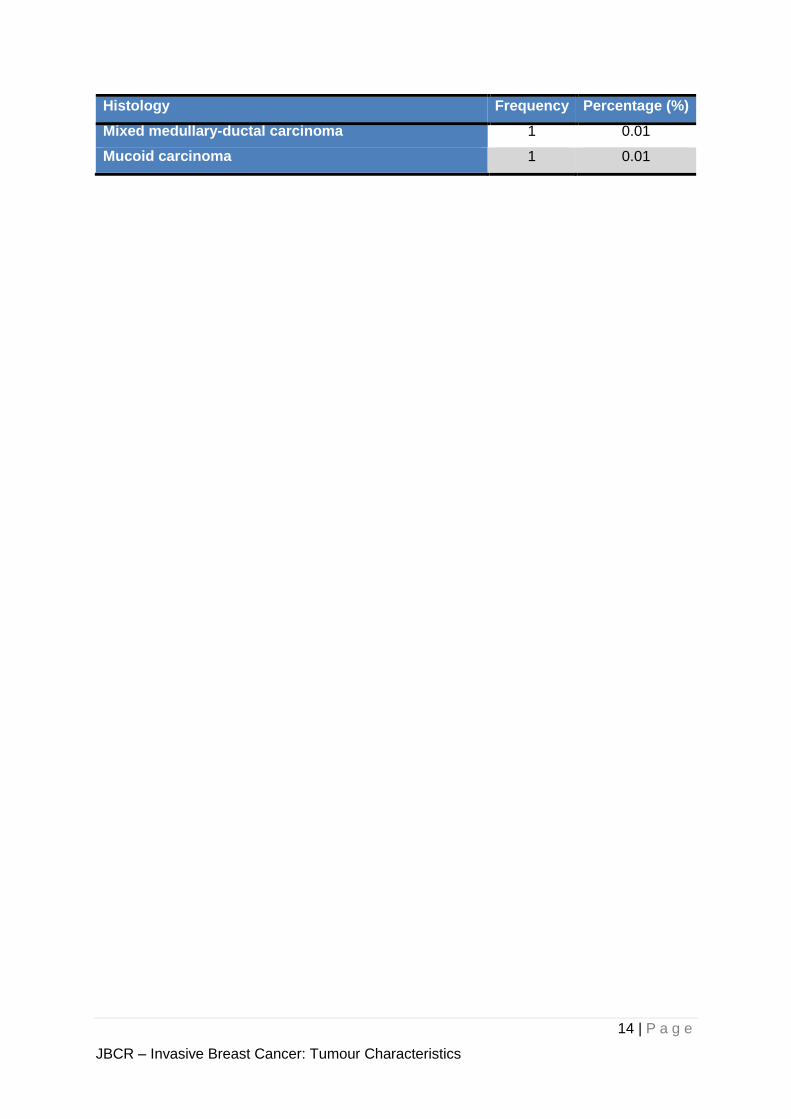
Histology Frequency Percentage (%)
Mixed medullary-ductal carcinoma 1 0.01
Mucoid carcinoma 1 0.01
15 | P a g e
JBCR – Invasive Breast Cancer: Tumour Characteristics
4.2. Staging
The AJCC 8th edition staging system was introduced into official use in January 2018. This
updated staging system retains an “Anatomic staging” that is similar to the preceding AJCC
7th edition. It further includes a new “Prognostic staging” system which incorporates biological
risk factors including tumour differentiation and receptor status on top of the existing anatomic
staging (Hortobagyi, et al., 2018).
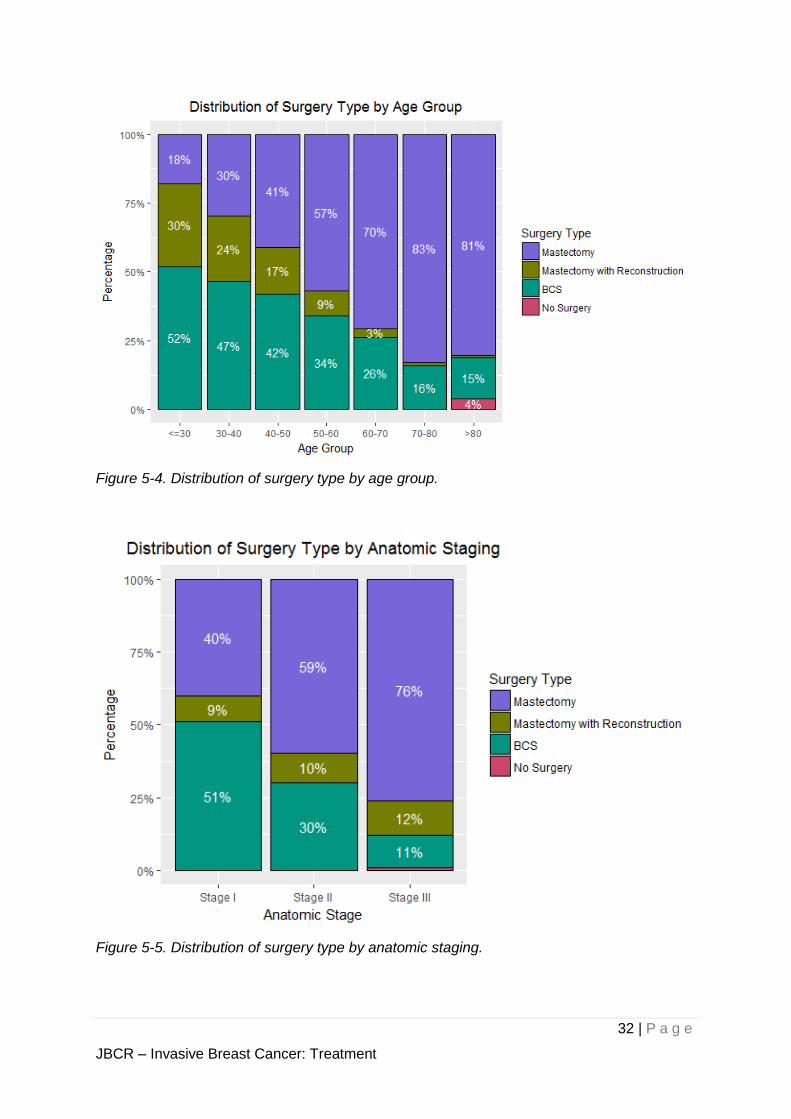
Under both anatomic and prognostic classification, the majority of patients were early staged
(stages I and II) at presentation which accounts to about 70% and 78% respectively (Table
4-1). However, there is a major change in the distribution of cancer stages under the
prognostic system, especially for the early stages. The percentage of Stage I patients under
the prognostic staging increases to more than half of the resident cohort while that for Stage
II patients decreases to about 20% in the same cohort (Figure 4-1). It is likely that the majority
of the Stage II patients under the anatomic classification were down-staged to Stage I under
the prognostic classification. We have compared the performance of the 7th vs the 8th AJCC
staging system and found slightly better discrimination (Wong et al., 2018).
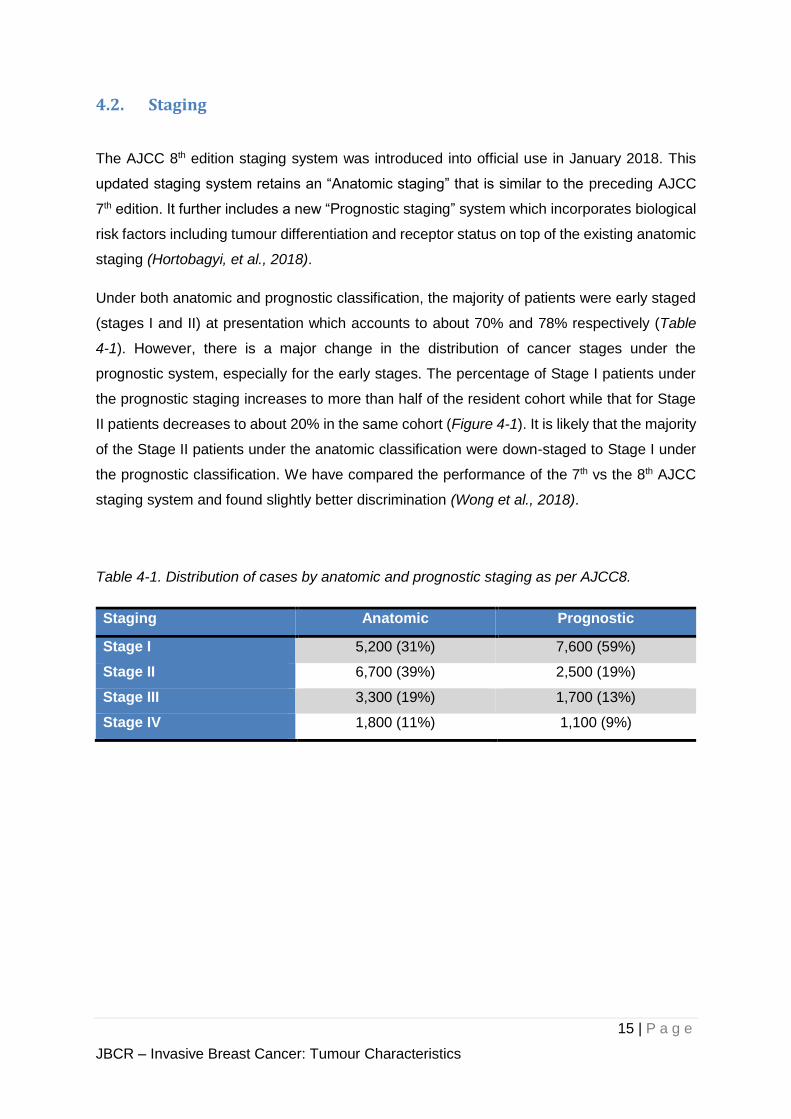
Table 4-1. Distribution of cases by anatomic and prognostic staging as per AJCC8.
Staging Anatomic Prognostic
Stage I 5,200 (31%) 7,600 (59%)
Stage II 6,700 (39%) 2,500 (19%)
Stage III 3,300 (19%) 1,700 (13%)
Stage IV 1,800 (11%) 1,100 (9%)
16 | P a g e
JBCR – Invasive Breast Cancer: Tumour Characteristics
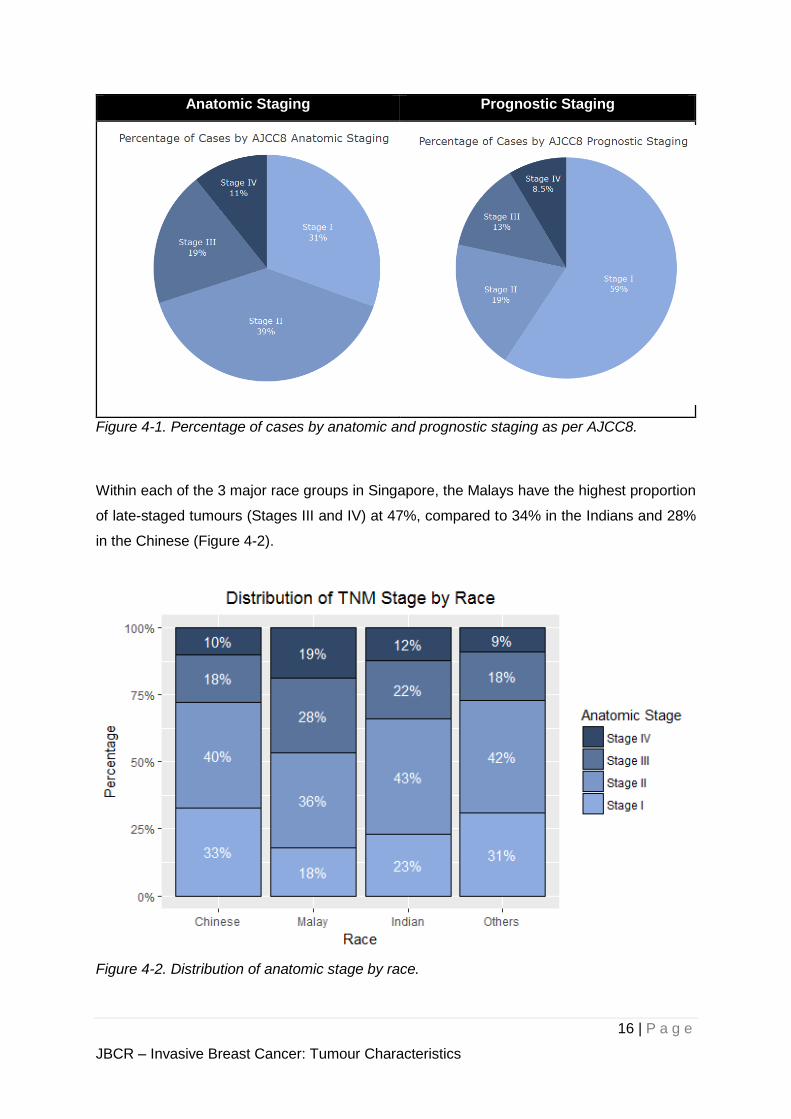
Anatomic Staging Prognostic Staging
Figure 4-1. Percentage of cases by anatomic and prognostic staging as per AJCC8.
Within each of the 3 major race groups in Singapore, the Malays have the highest proportion
of late-staged tumours (Stages III and IV) at 47%, compared to 34% in the Indians and 28%
in the Chinese (Figure 4-2).
Figure 4-2. Distribution of anatomic stage by race.
17 | P a g e
JBCR – Invasive Breast Cancer: Tumour Characteristics
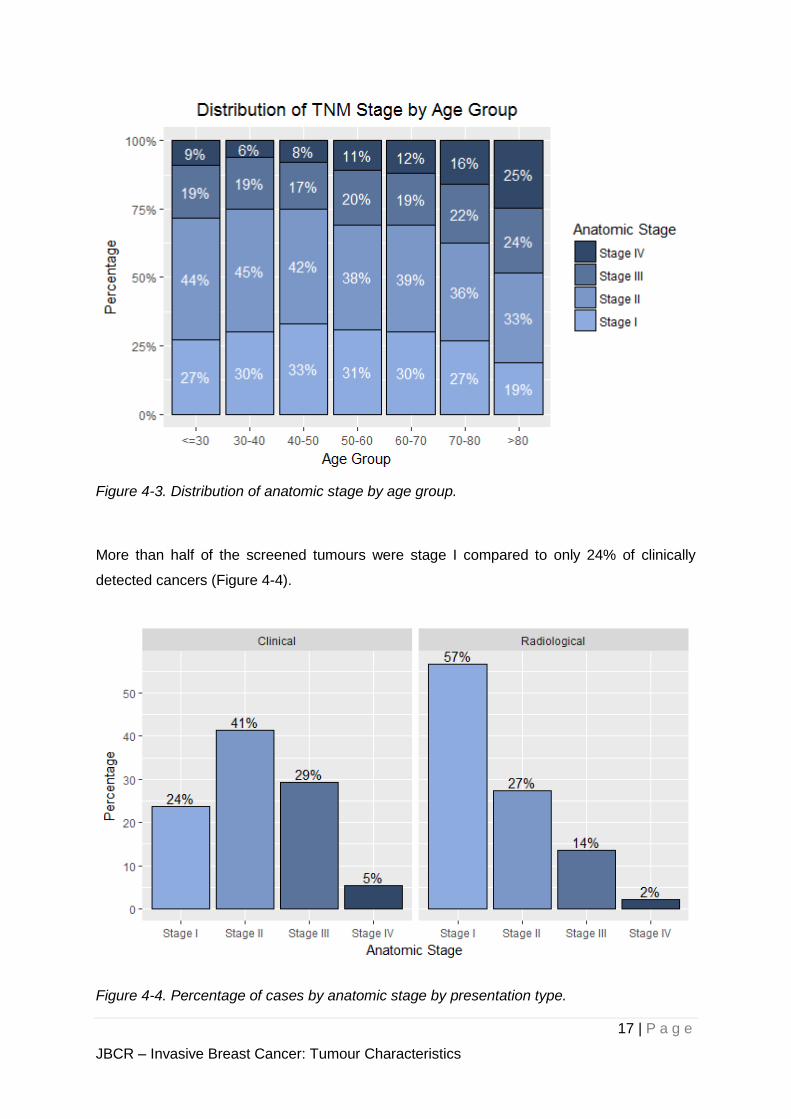
Figure 4-3. Distribution of anatomic stage by age group.
More than half of the screened tumours were stage I compared to only 24% of clinically
detected cancers (Figure 4-4).
Figure 4-4. Percentage of cases by anatomic stage by presentation type.
18 | P a g e
JBCR – Invasive Breast Cancer: Tumour Characteristics
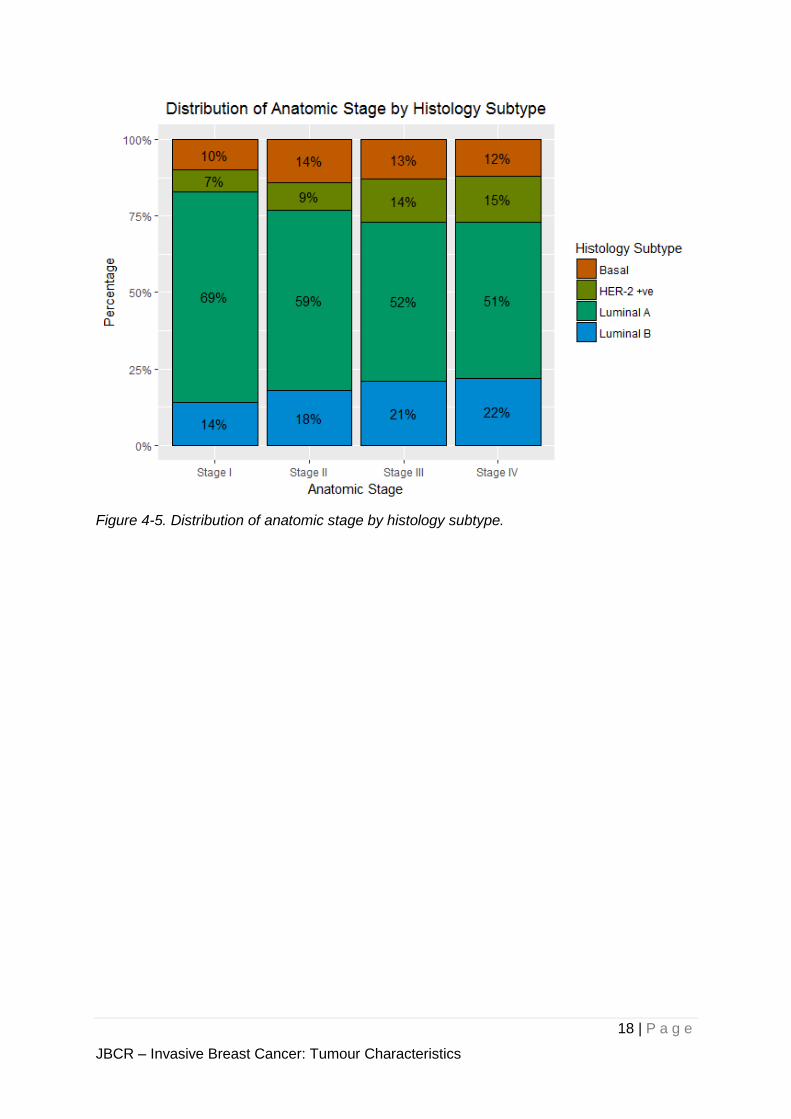
Figure 4-5. Distribution of anatomic stage by histology subtype.
19 | P a g e
JBCR – Invasive Breast Cancer: Tumour Characteristics
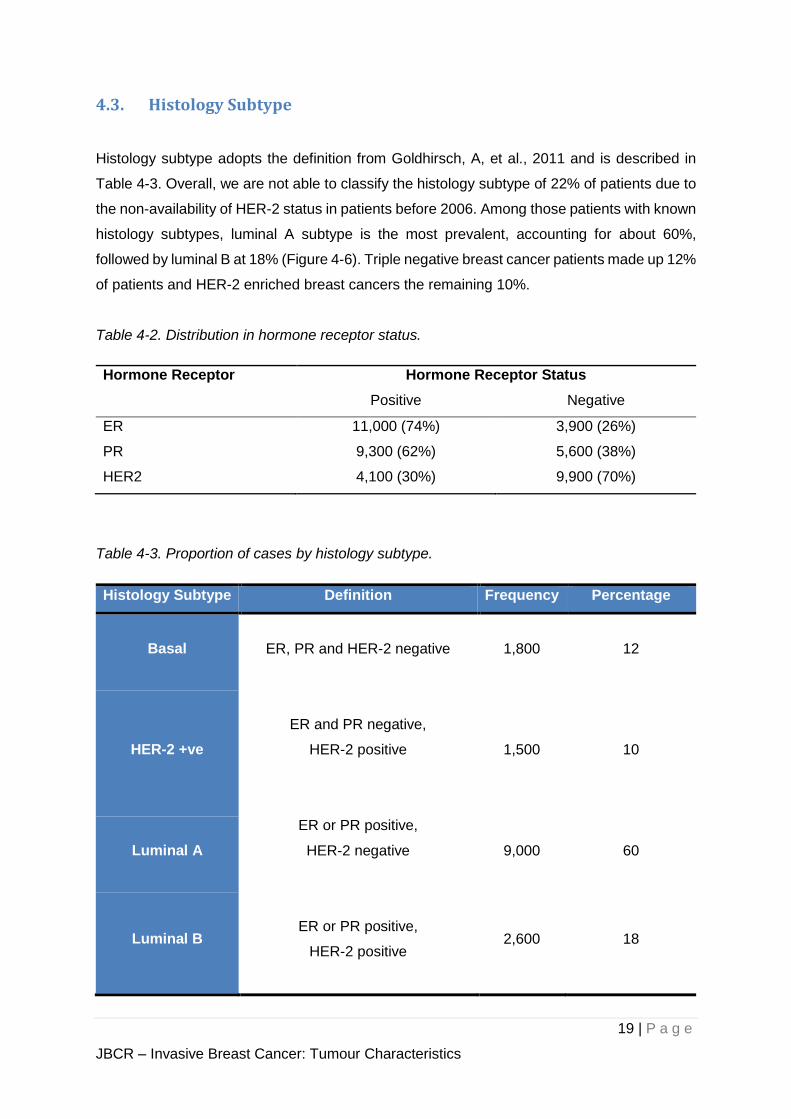
4.3. Histology Subtype
Histology subtype adopts the definition from Goldhirsch, A, et al., 2011 and is described in
Table 4-3. Overall, we are not able to classify the histology subtype of 22% of patients due to
the non-availability of HER-2 status in patients before 2006. Among those patients with known
histology subtypes, luminal A subtype is the most prevalent, accounting for about 60%,
followed by luminal B at 18% (Figure 4-6). Triple negative breast cancer patients made up 12%
of patients and HER-2 enriched breast cancers the remaining 10%.
Table 4-2. Distribution in hormone receptor status.
Hormone Receptor Hormone Receptor Status
Positive Negative
ER 11,000 (74%) 3,900 (26%)
PR 9,300 (62%) 5,600 (38%)
HER2 4,100 (30%) 9,900 (70%)
Table 4-3. Proportion of cases by histology subtype.
Histology Subtype Definition Frequency Percentage
Basal
ER, PR and HER-2 negative
1,800 12
HER-2 +ve
ER and PR negative,
HER-2 positive
1,500 10
Luminal A
ER or PR positive,
HER-2 negative
9,000 60
Luminal B
ER or PR positive,
HER-2 positive
2,600 18
20 | P a g e
JBCR – Invasive Breast Cancer: Tumour Characteristics
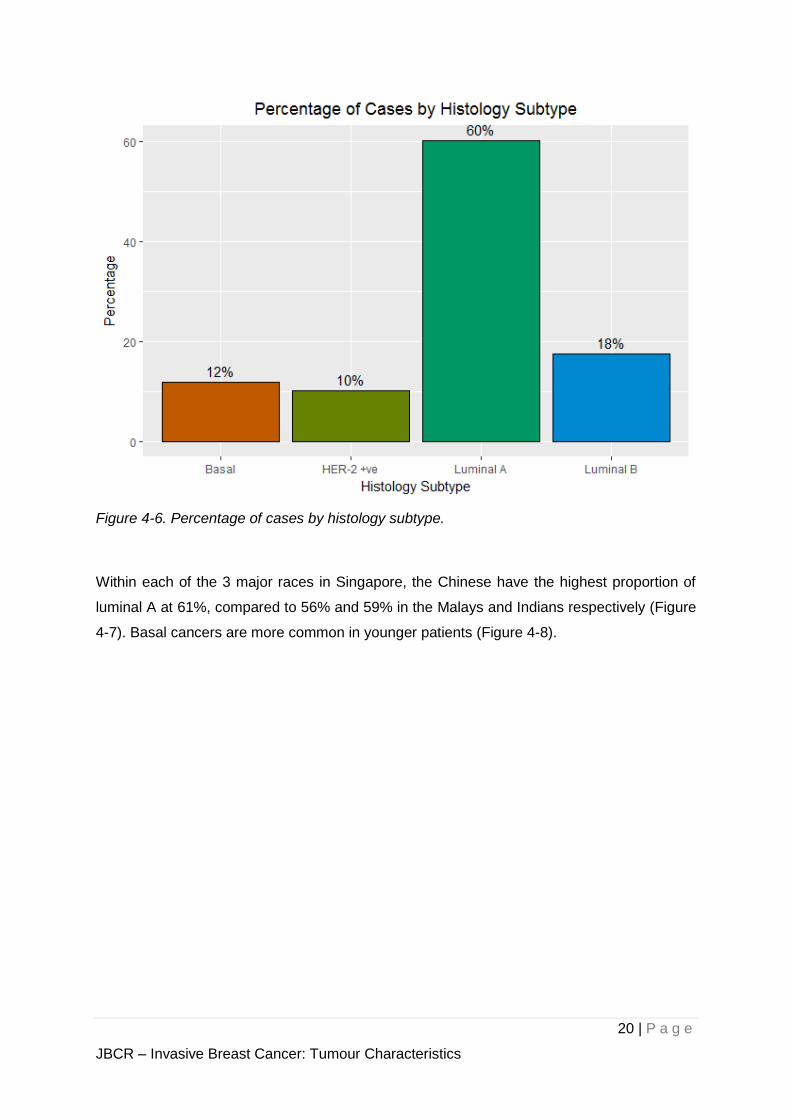
Figure 4-6. Percentage of cases by histology subtype.
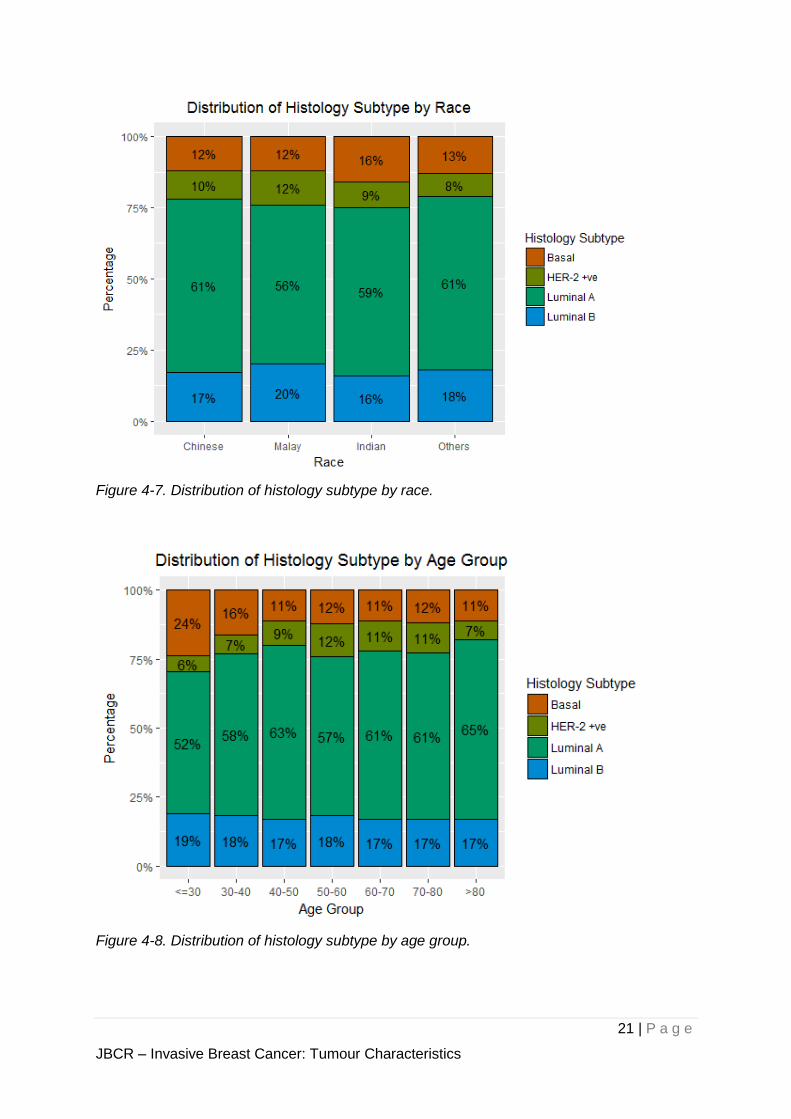
Within each of the 3 major races in Singapore, the Chinese have the highest proportion of
luminal A at 61%, compared to 56% and 59% in the Malays and Indians respectively (Figure
4-7). Basal cancers are more common in younger patients (Figure 4-8).
21 | P a g e
JBCR – Invasive Breast Cancer: Tumour Characteristics
Figure 4-7. Distribution of histology subtype by race.
Figure 4-8. Distribution of histology subtype by age group.
22 | P a g e
JBCR – Invasive Breast Cancer: Tumour Characteristics
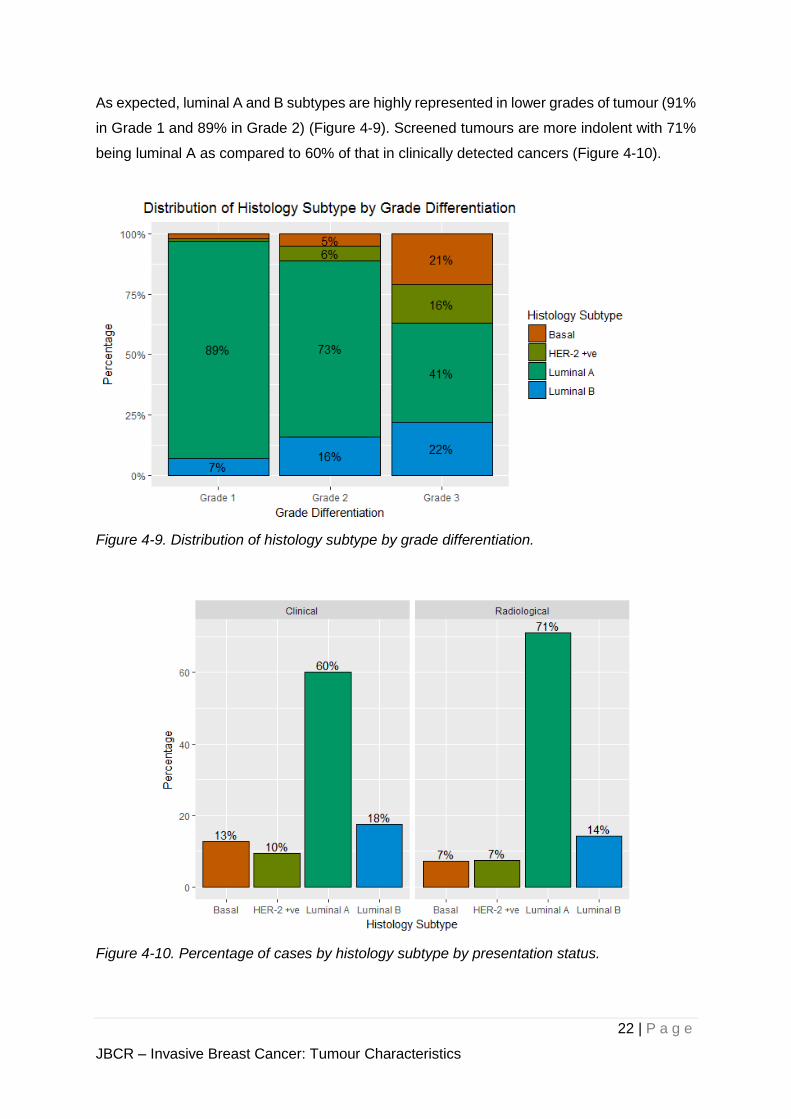
As expected, luminal A and B subtypes are highly represented in lower grades of tumour (91%
in Grade 1 and 89% in Grade 2) (Figure 4-9). Screened tumours are more indolent with 71%
being luminal A as compared to 60% of that in clinically detected cancers (Figure 4-10).
Figure 4-9. Distribution of histology subtype by grade differentiation.
Figure 4-10. Percentage of cases by histology subtype by presentation status.
23 | P a g e
JBCR – Invasive Breast Cancer: Tumour Characteristics
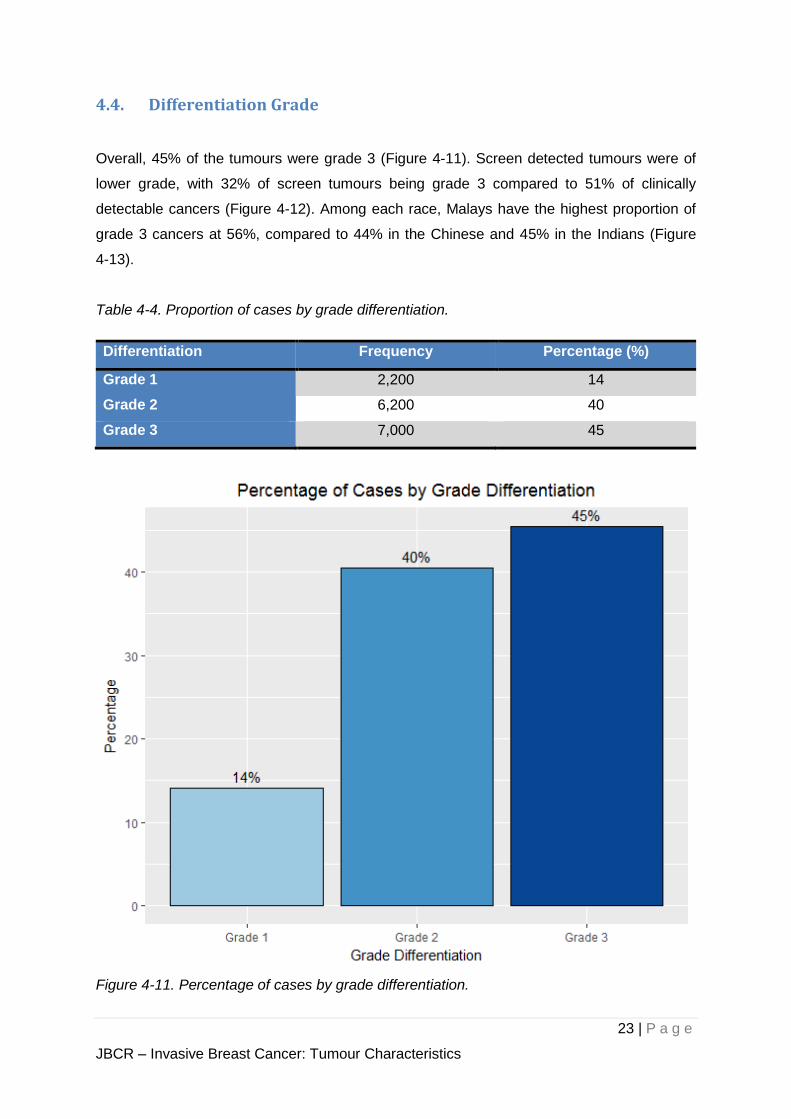
4.4. Differentiation Grade
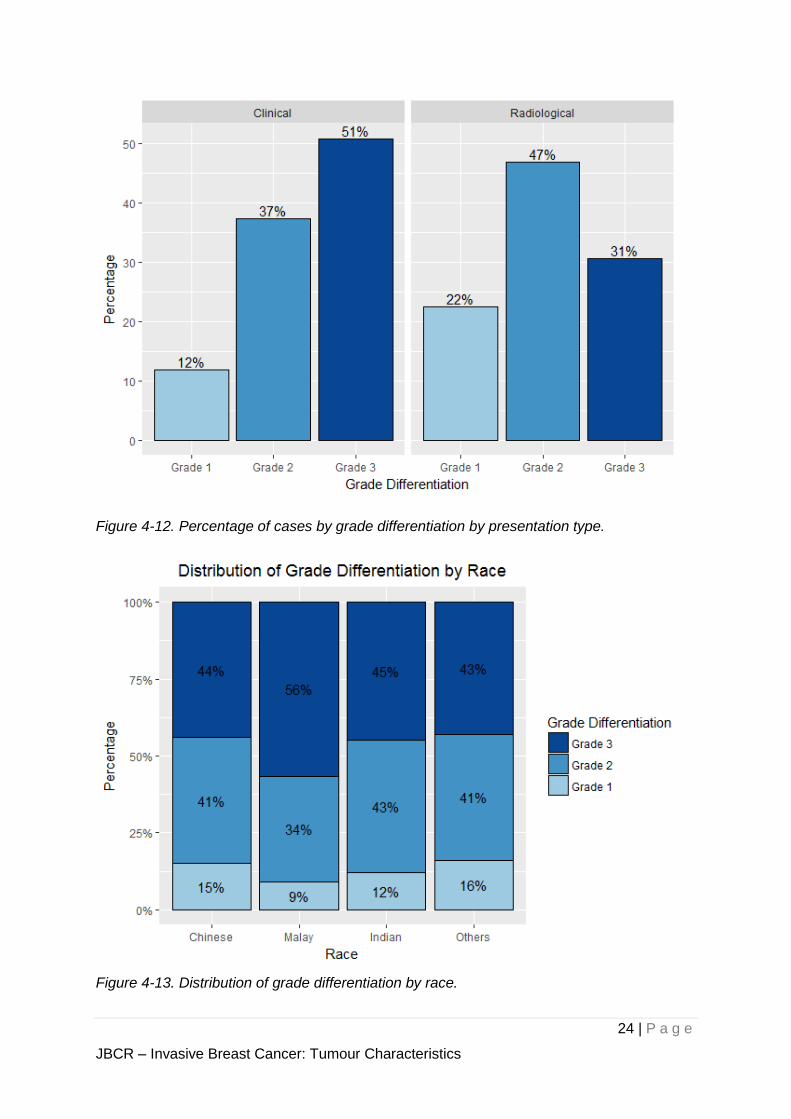
Overall, 45% of the tumours were grade 3 (Figure 4-11). Screen detected tumours were of
lower grade, with 32% of screen tumours being grade 3 compared to 51% of clinically
detectable cancers (Figure 4-12). Among each race, Malays have the highest proportion of
grade 3 cancers at 56%, compared to 44% in the Chinese and 45% in the Indians (Figure
4-13).
Table 4-4. Proportion of cases by grade differentiation.
Differentiation Frequency Percentage (%)
Grade 1 2,200 14
Grade 2 6,200 40
Grade 3 7,000 45
Figure 4-11. Percentage of cases by grade differentiation.
24 | P a g e
JBCR – Invasive Breast Cancer: Tumour Characteristics
Figure 4-12. Percentage of cases by grade differentiation by presentation type.
Figure 4-13. Distribution of grade differentiation by race.
25 | P a g e
JBCR – Invasive Breast Cancer: Tumour Characteristics
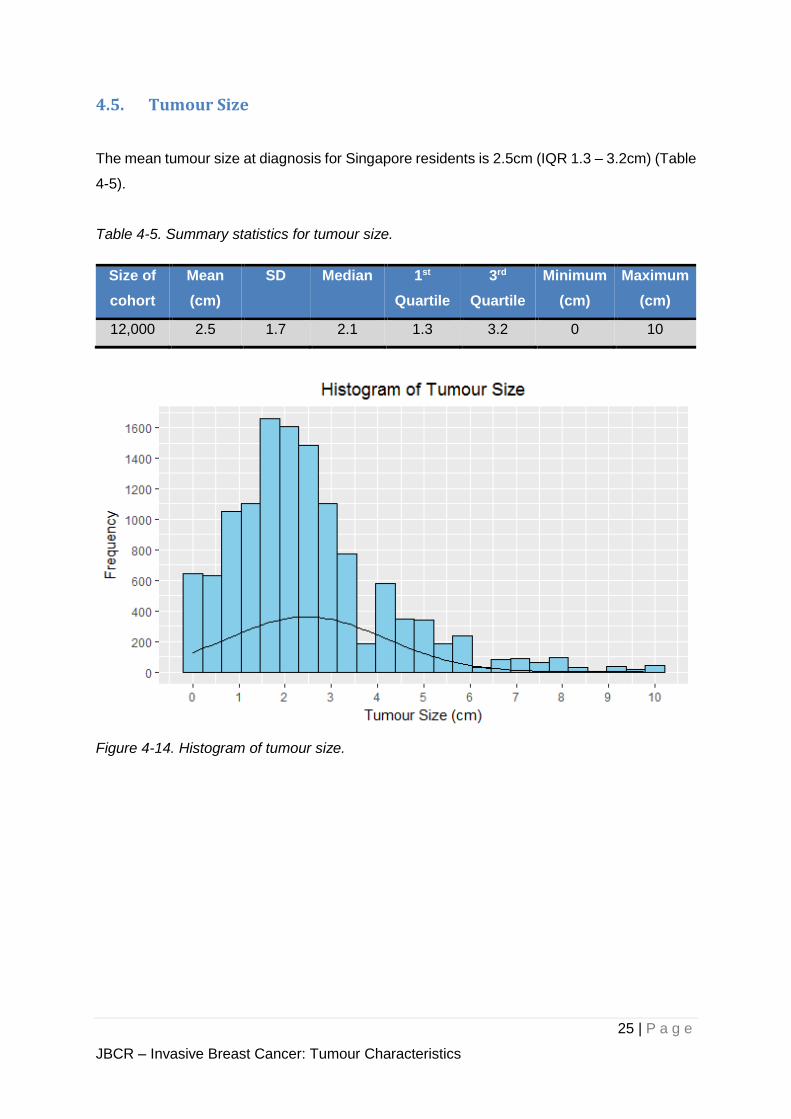
4.5. Tumour Size
The mean tumour size at diagnosis for Singapore residents is 2.5cm (IQR 1.3 – 3.2cm) (Table
4-5).
Table 4-5. Summary statistics for tumour size.
Size of
cohort
Mean
(cm)
SD Median 1st
Quartile
3rd
Quartile
Minimum
(cm)
Maximum
(cm)
12,000 2.5 1.7 2.1 1.3 3.2 0 10
Figure 4-14. Histogram of tumour size.
26 | P a g e
JBCR – Invasive Breast Cancer: Tumour Characteristics
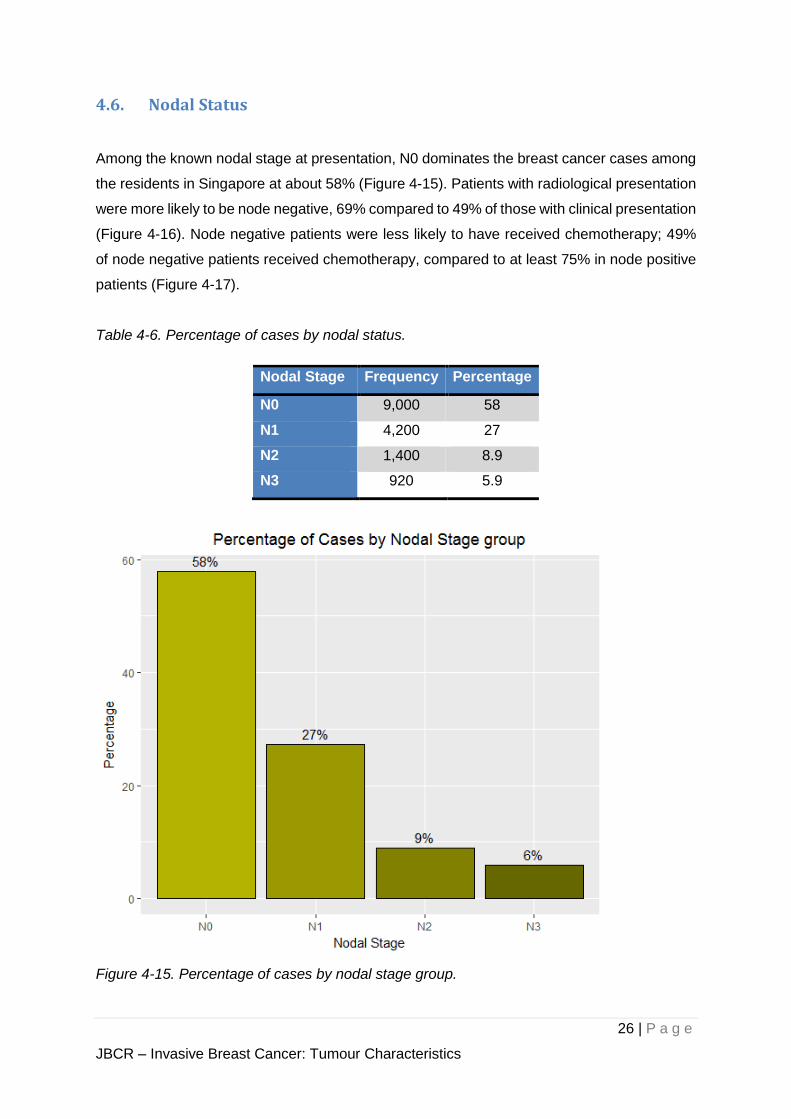
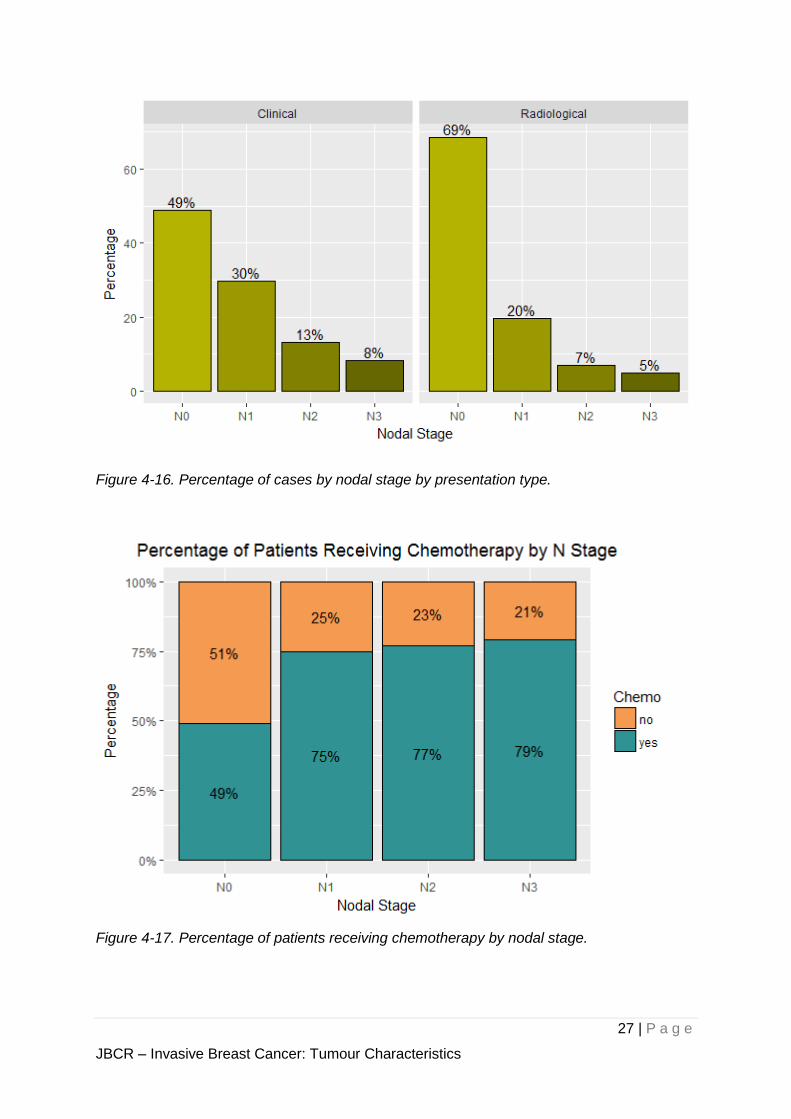
4.6. Nodal Status
Among the known nodal stage at presentation, N0 dominates the breast cancer cases among
the residents in Singapore at about 58% (Figure 4-15). Patients with radiological presentation
were more likely to be node negative, 69% compared to 49% of those with clinical presentation
(Figure 4-16). Node negative patients were less likely to have received chemotherapy; 49%
of node negative patients received chemotherapy, compared to at least 75% in node positive
patients (Figure 4-17).
Table 4-6. Percentage of cases by nodal status.
Nodal Stage Frequency Percentage
N0 9,000 58
N1 4,200 27
N2 1,400 8.9
N3 920 5.9
Figure 4-15. Percentage of cases by nodal stage group.
27 | P a g e
JBCR – Invasive Breast Cancer: Tumour Characteristics
Figure 4-16. Percentage of cases by nodal stage by presentation type.
Figure 4-17. Percentage of patients receiving chemotherapy by nodal stage.
28 | P a g e
JBCR – Invasive Breast Cancer: Treatment
5. Treatment
- Among the cohort of breast cancer patients who are
Singapore residents, those that are treated with curative intent
(i.e. Stages I to III) are analysed -
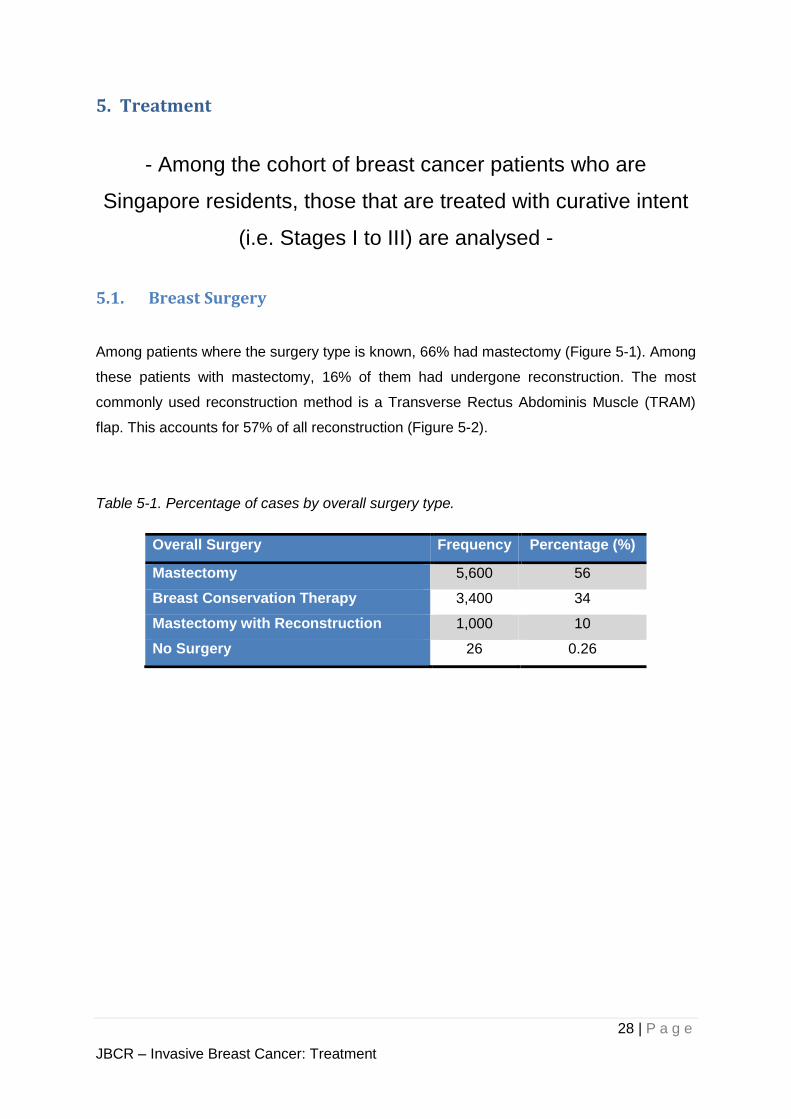
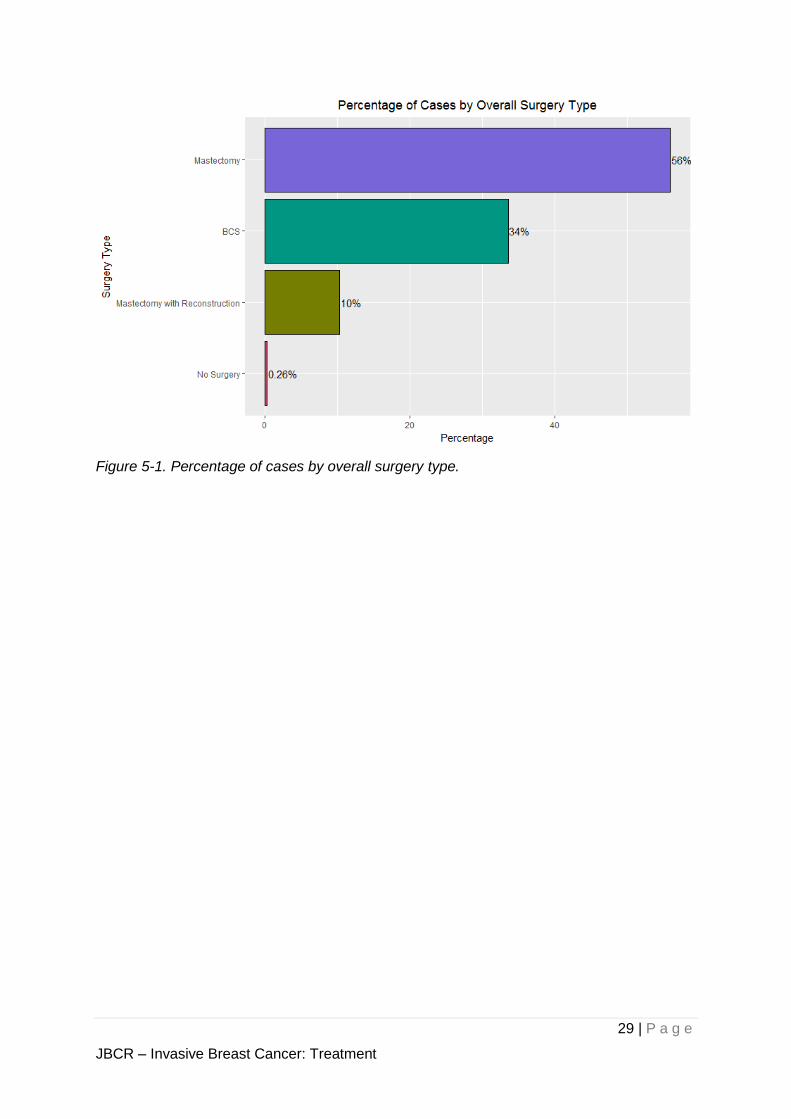
5.1. Breast Surgery
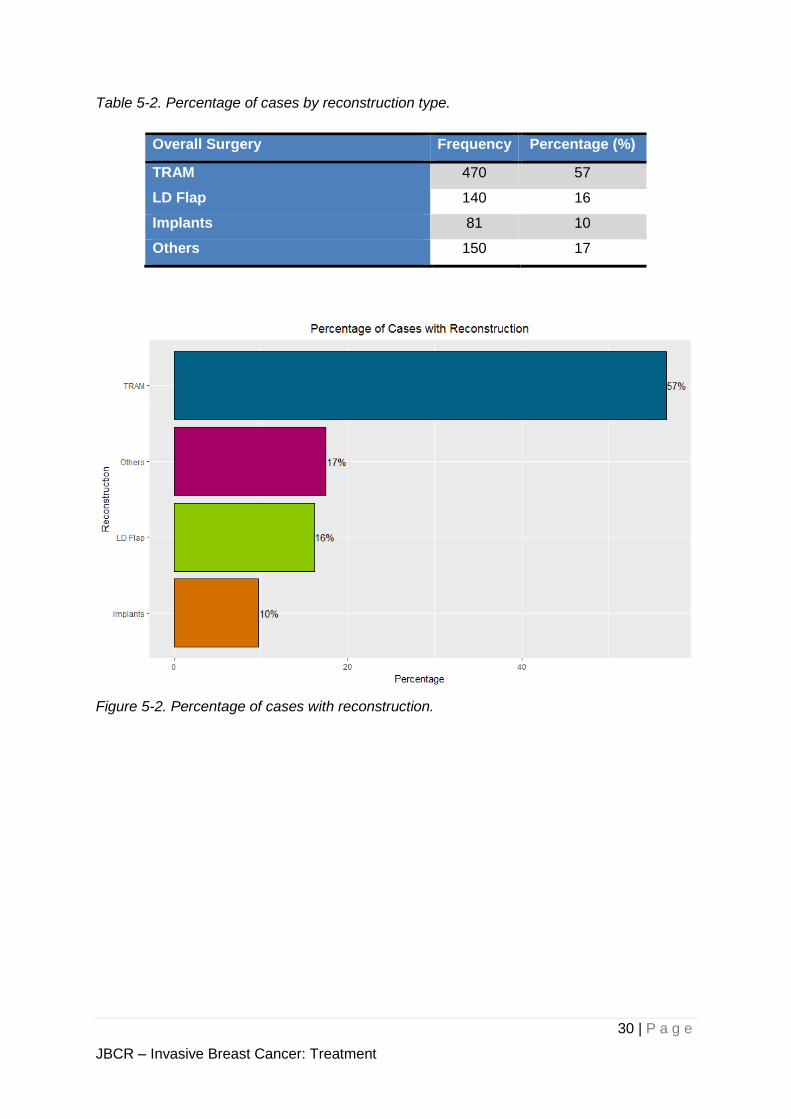
Among patients where the surgery type is known, 66% had mastectomy (Figure 5-1). Among
these patients with mastectomy, 16% of them had undergone reconstruction. The most
commonly used reconstruction method is a Transverse Rectus Abdominis Muscle (TRAM)
flap. This accounts for 57% of all reconstruction (Figure 5-2).
Table 5-1. Percentage of cases by overall surgery type.
Overall Surgery Frequency Percentage (%)
Mastectomy 5,600 56
Breast Conservation Therapy 3,400 34
Mastectomy with Reconstruction 1,000 10
No Surgery 26 0.26
29 | P a g e
JBCR – Invasive Breast Cancer: Treatment
Figure 5-1. Percentage of cases by overall surgery type.
30 | P a g e
JBCR – Invasive Breast Cancer: Treatment
Table 5-2. Percentage of cases by reconstruction type.
Overall Surgery Frequency Percentage (%)
TRAM 470 57
LD Flap 140 16
Implants 81 10
Others 150 17
Figure 5-2. Percentage of cases with reconstruction.
31 | P a g e
JBCR – Invasive Breast Cancer: Treatment
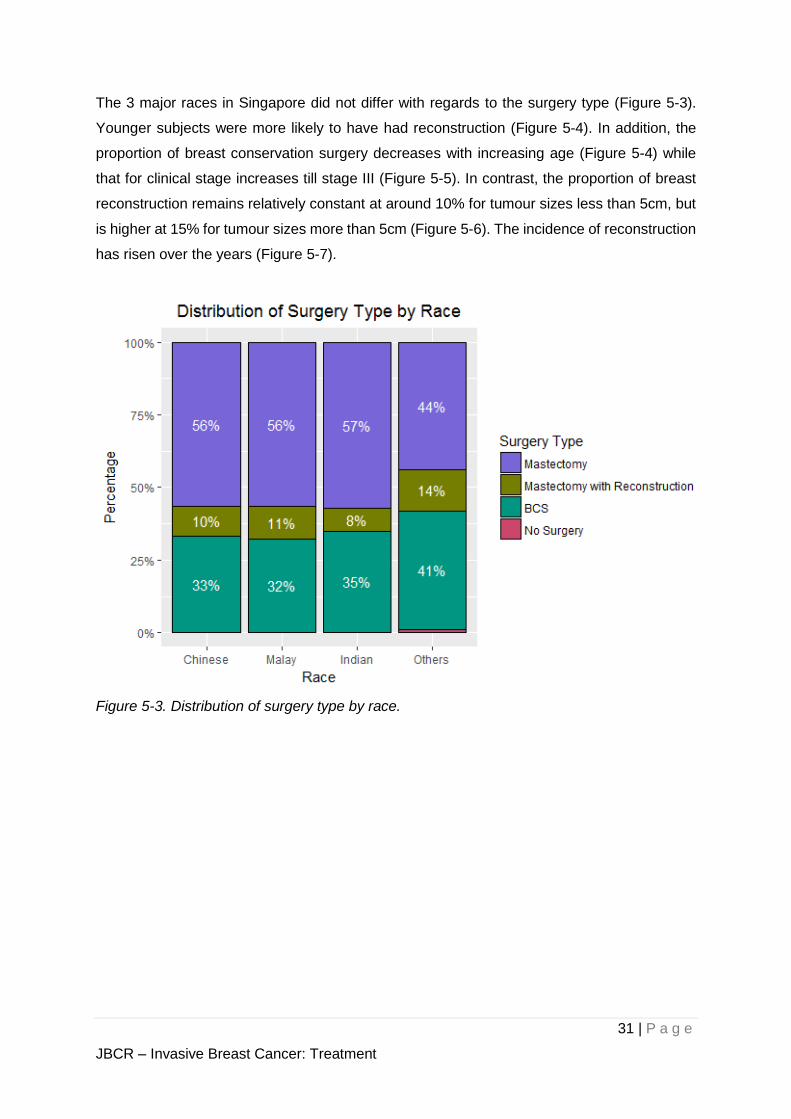
The 3 major races in Singapore did not differ with regards to the surgery type (Figure 5-3).
Younger subjects were more likely to have had reconstruction (Figure 5-4). In addition, the
proportion of breast conservation surgery decreases with increasing age (Figure 5-4) while
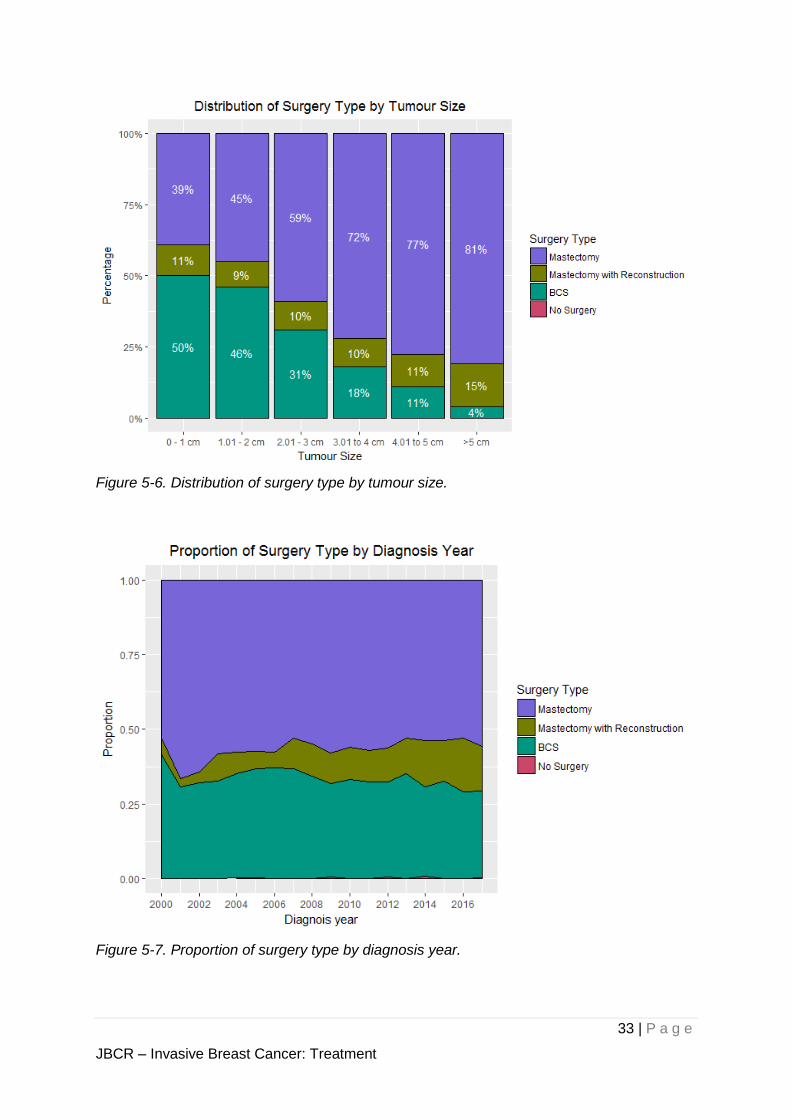
that for clinical stage increases till stage III (Figure 5-5). In contrast, the proportion of breast
reconstruction remains relatively constant at around 10% for tumour sizes less than 5cm, but
is higher at 15% for tumour sizes more than 5cm (Figure 5-6). The incidence of reconstruction
has risen over the years (Figure 5-7).
Figure 5-3. Distribution of surgery type by race.
32 | P a g e
JBCR – Invasive Breast Cancer: Treatment
Figure 5-4. Distribution of surgery type by age group.
Figure 5-5. Distribution of surgery type by anatomic staging.
33 | P a g e
JBCR – Invasive Breast Cancer: Treatment
Figure 5-6. Distribution of surgery type by tumour size.
Figure 5-7. Proportion of surgery type by diagnosis year.
34 | P a g e
JBCR – Invasive Breast Cancer: Treatment
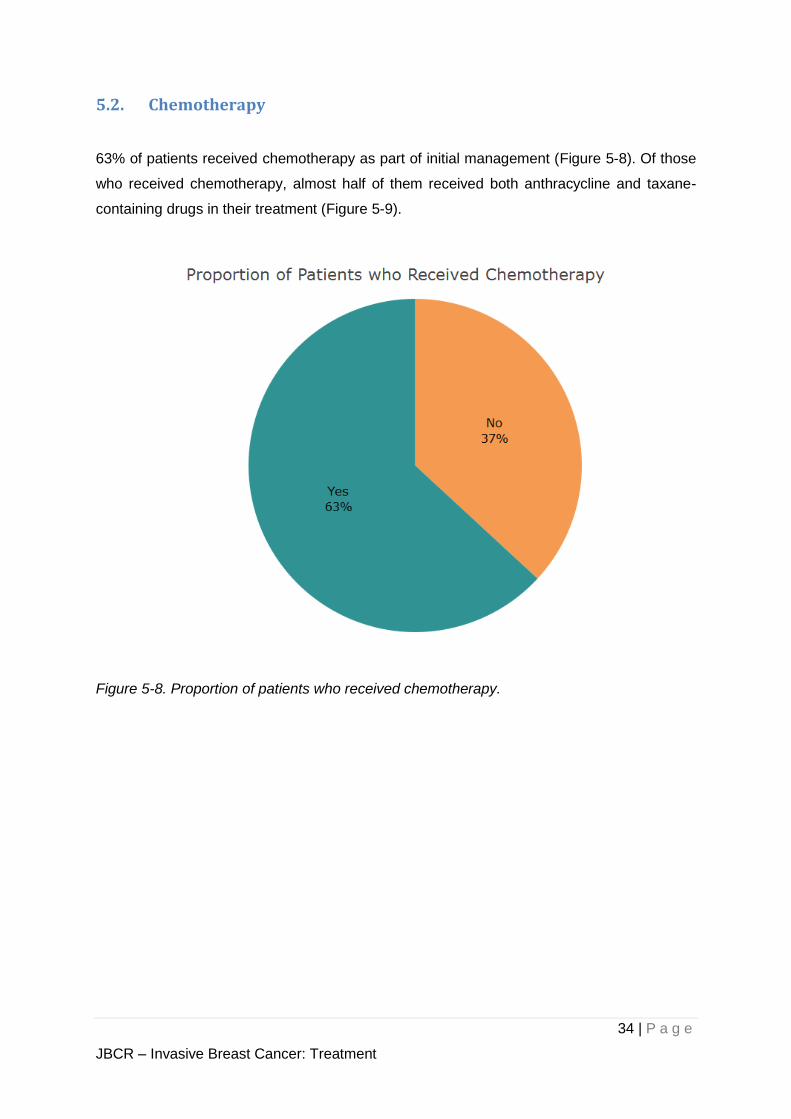
5.2. Chemotherapy
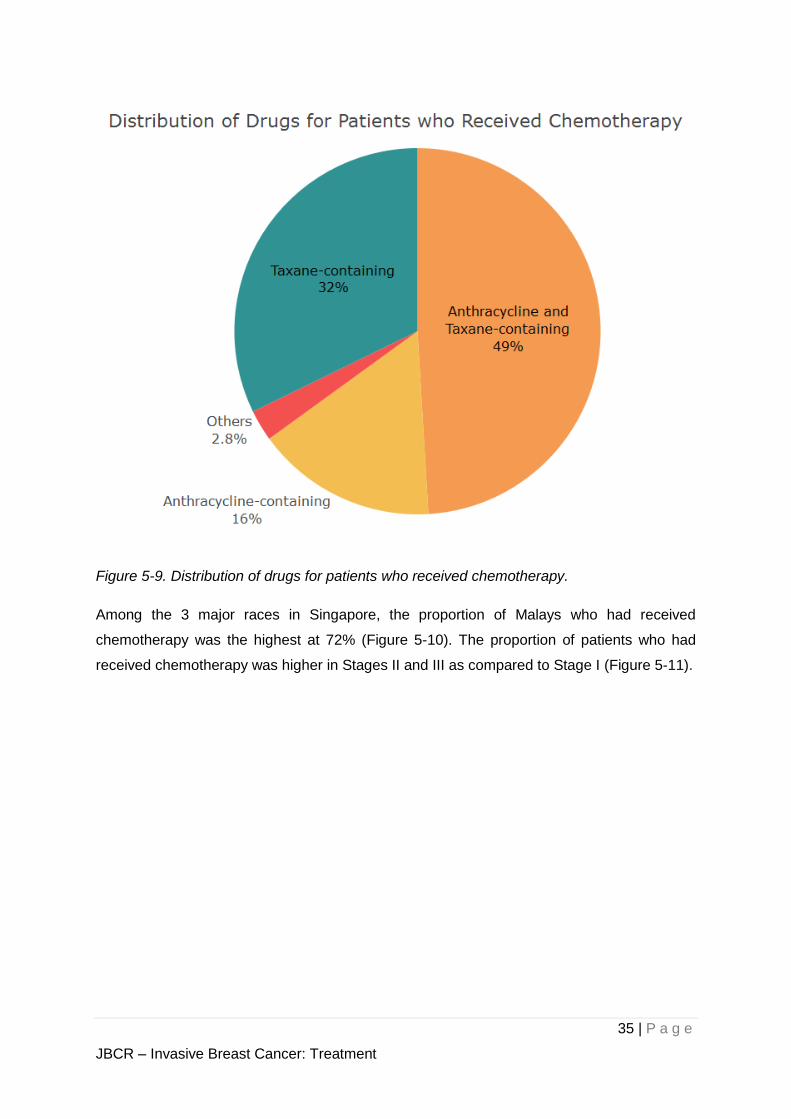
63% of patients received chemotherapy as part of initial management (Figure 5-8). Of those
who received chemotherapy, almost half of them received both anthracycline and taxane-
containing drugs in their treatment (Figure 5-9).
Figure 5-8. Proportion of patients who received chemotherapy.
35 | P a g e
JBCR – Invasive Breast Cancer: Treatment
Figure 5-9. Distribution of drugs for patients who received chemotherapy.
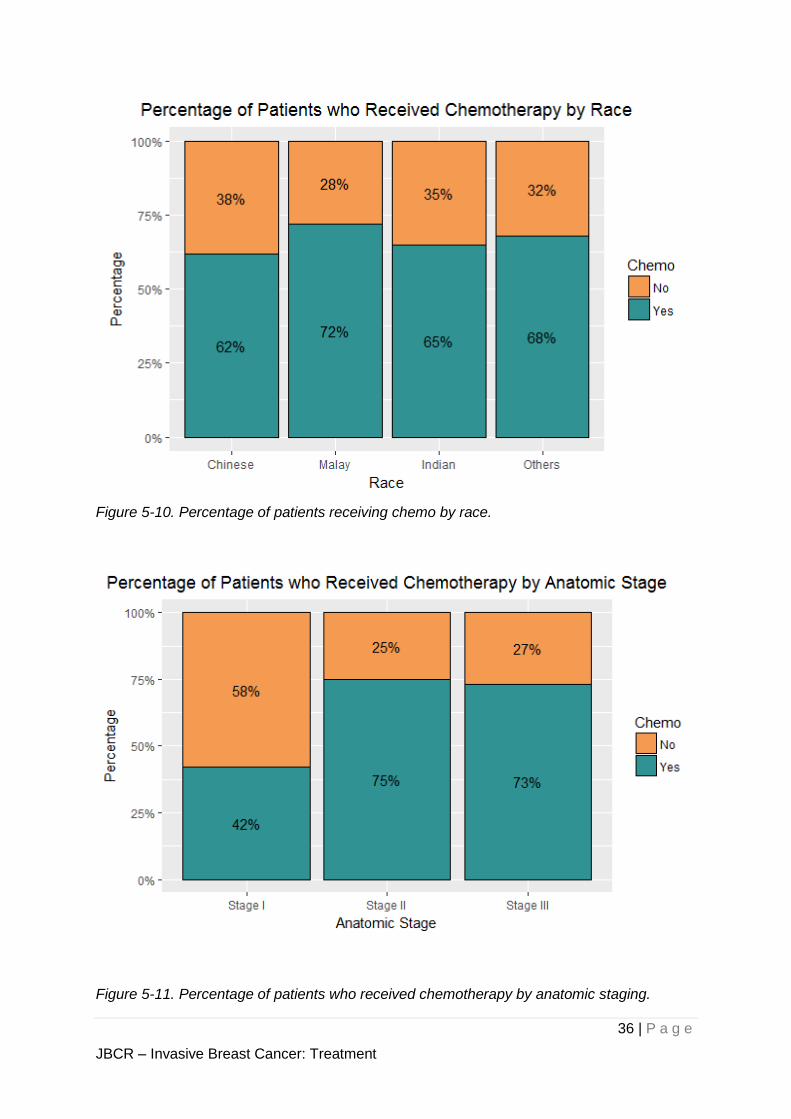
Among the 3 major races in Singapore, the proportion of Malays who had received
chemotherapy was the highest at 72% (Figure 5-10). The proportion of patients who had
received chemotherapy was higher in Stages II and III as compared to Stage I (Figure 5-11).
36 | P a g e
JBCR – Invasive Breast Cancer: Treatment
Figure 5-10. Percentage of patients receiving chemo by race.
Figure 5-11. Percentage of patients who received chemotherapy by anatomic staging.
37 | P a g e
JBCR – Invasive Breast Cancer: Treatment
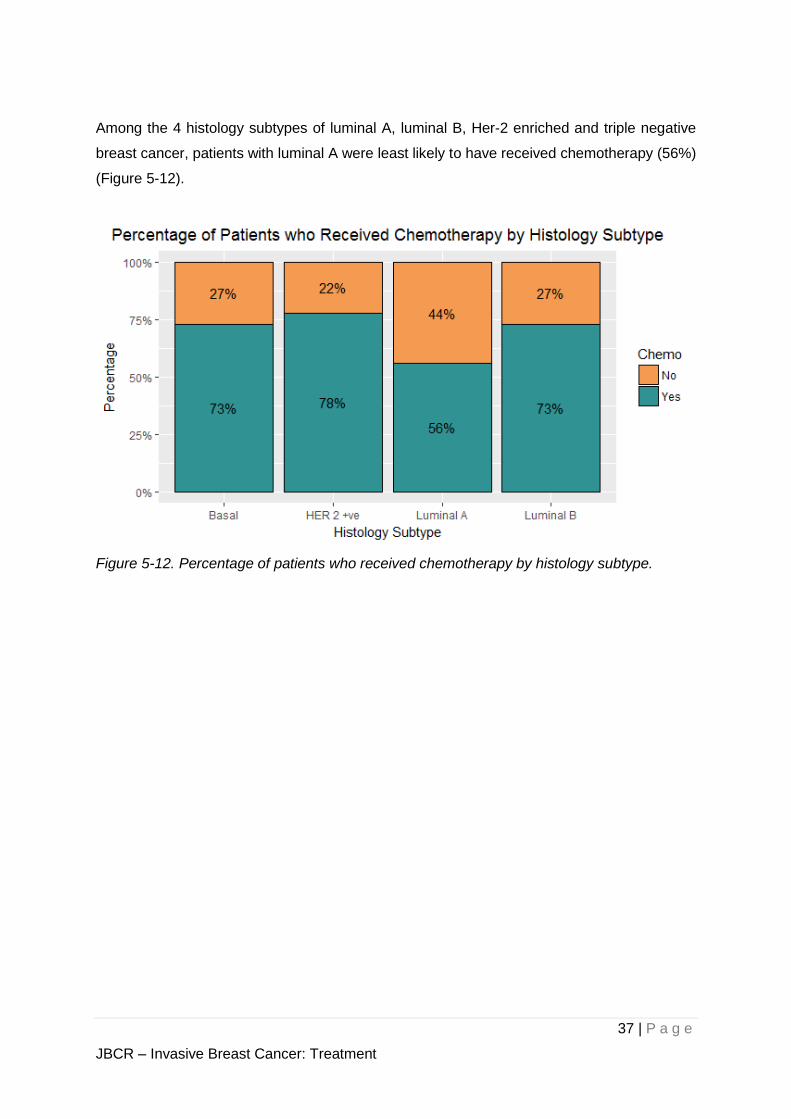
Among the 4 histology subtypes of luminal A, luminal B, Her-2 enriched and triple negative
breast cancer, patients with luminal A were least likely to have received chemotherapy (56%)
(Figure 5-12).
Figure 5-12. Percentage of patients who received chemotherapy by histology subtype.
38 | P a g e
JBCR – Invasive Breast Cancer: Treatment
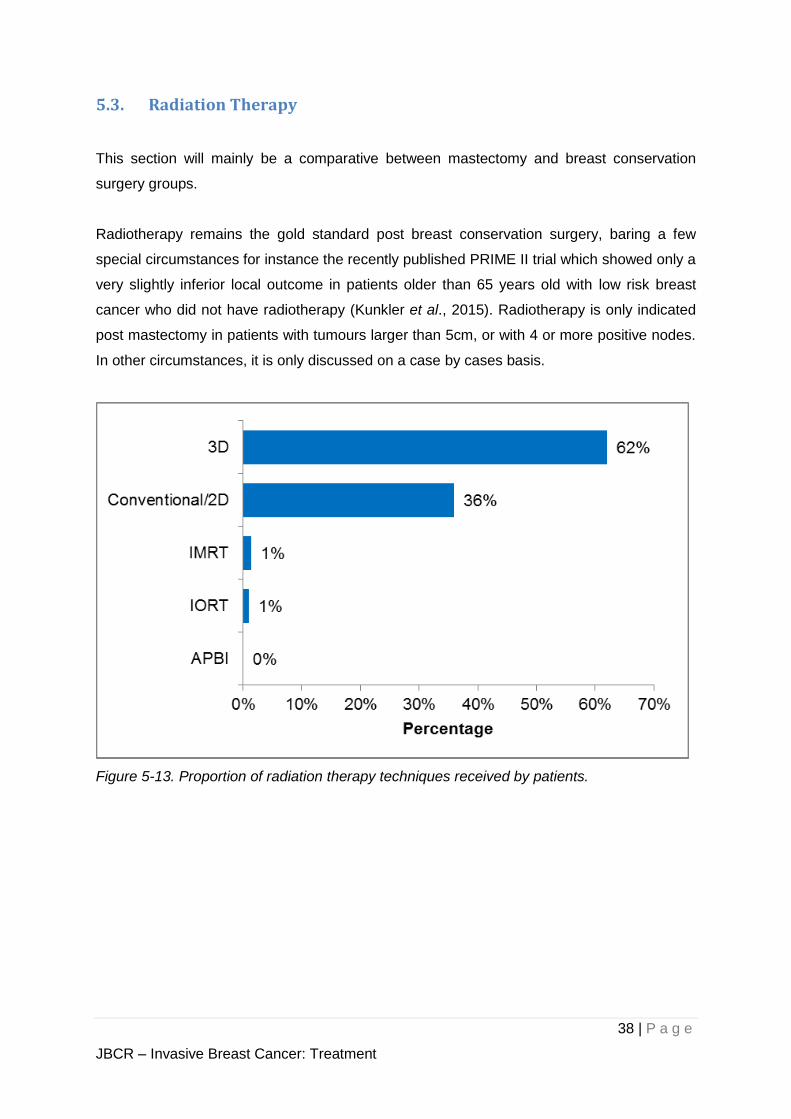
5.3. Radiation Therapy
This section will mainly be a comparative between mastectomy and breast conservation
surgery groups.
Radiotherapy remains the gold standard post breast conservation surgery, baring a few
special circumstances for instance the recently published PRIME II trial which showed only a
very slightly inferior local outcome in patients older than 65 years old with low risk breast
cancer who did not have radiotherapy (Kunkler et al., 2015). Radiotherapy is only indicated
post mastectomy in patients with tumours larger than 5cm, or with 4 or more positive nodes.
In other circumstances, it is only discussed on a case by cases basis.
Figure 5-13. Proportion of radiation therapy techniques received by patients.
39 | P a g e
JBCR – Invasive Breast Cancer: Treatment
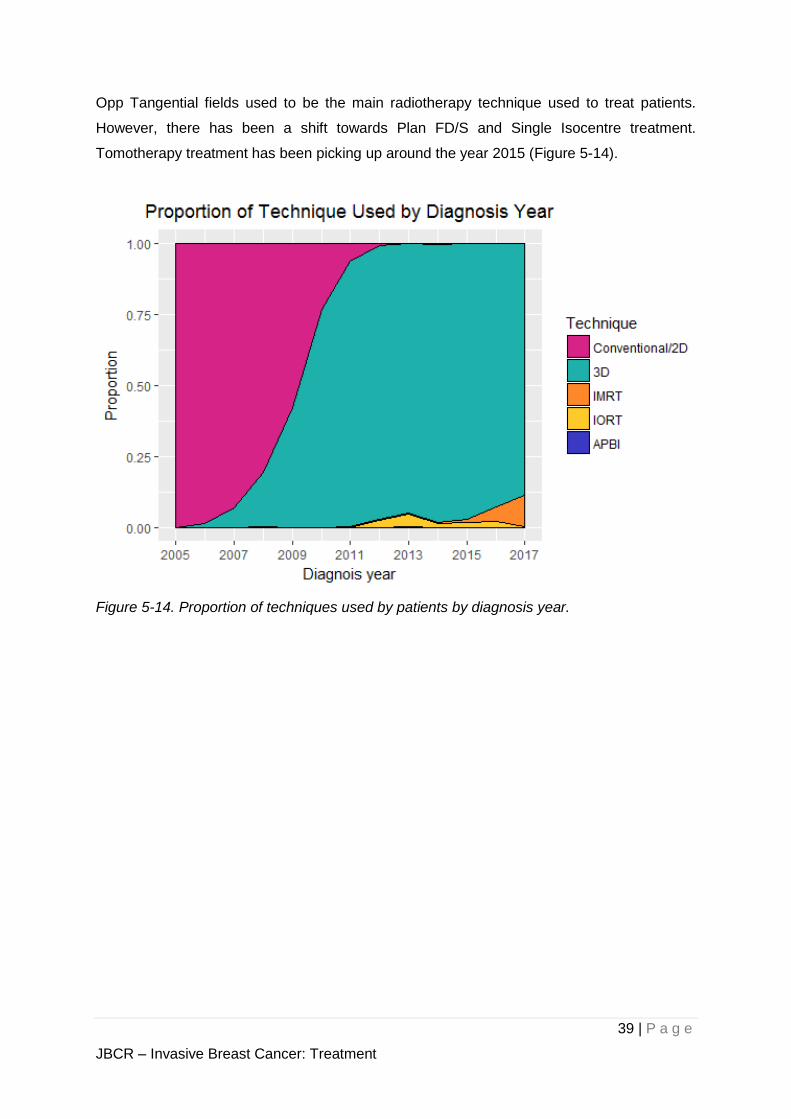
Opp Tangential fields used to be the main radiotherapy technique used to treat patients.
However, there has been a shift towards Plan FD/S and Single Isocentre treatment.
Tomotherapy treatment has been picking up around the year 2015 (Figure 5-14).
Figure 5-14. Proportion of techniques used by patients by diagnosis year.
40 | P a g e
JBCR – Invasive Breast Cancer: Treatment
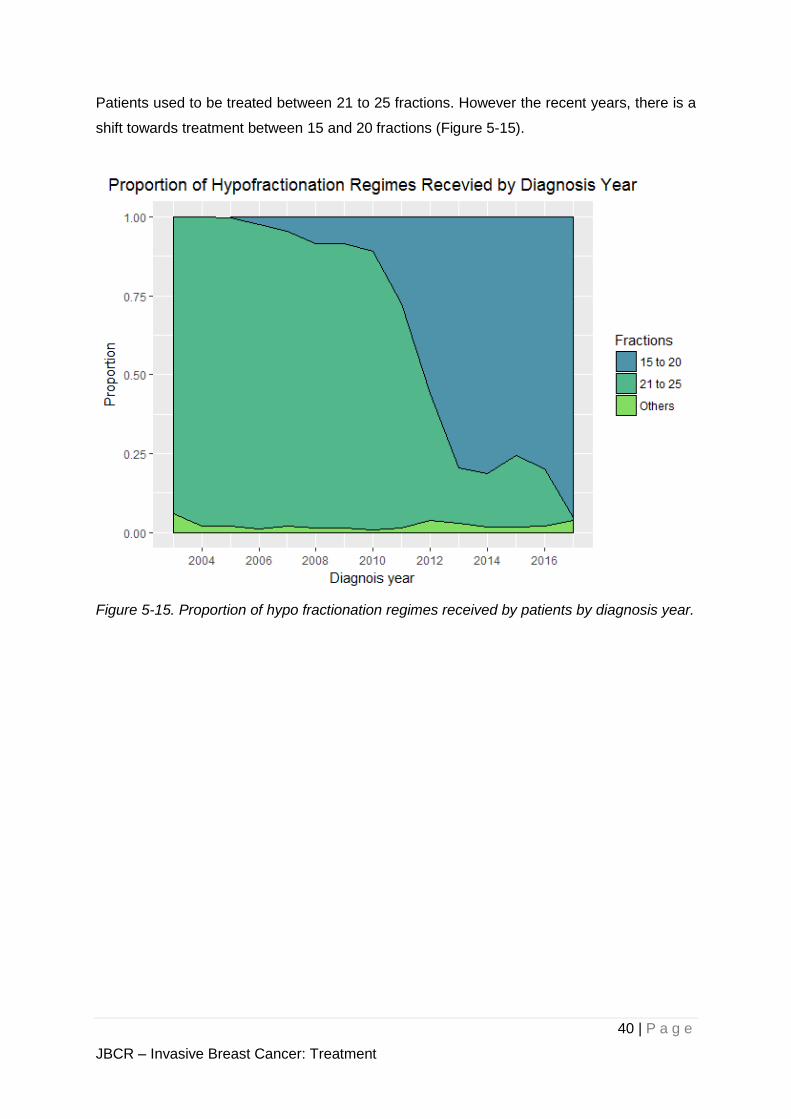
Patients used to be treated between 21 to 25 fractions. However the recent years, there is a
shift towards treatment between 15 and 20 fractions (Figure 5-15).
Figure 5-15. Proportion of hypo fractionation regimes received by patients by diagnosis year.
41 | P a g e
JBCR – Invasive Breast Cancer: Treatment
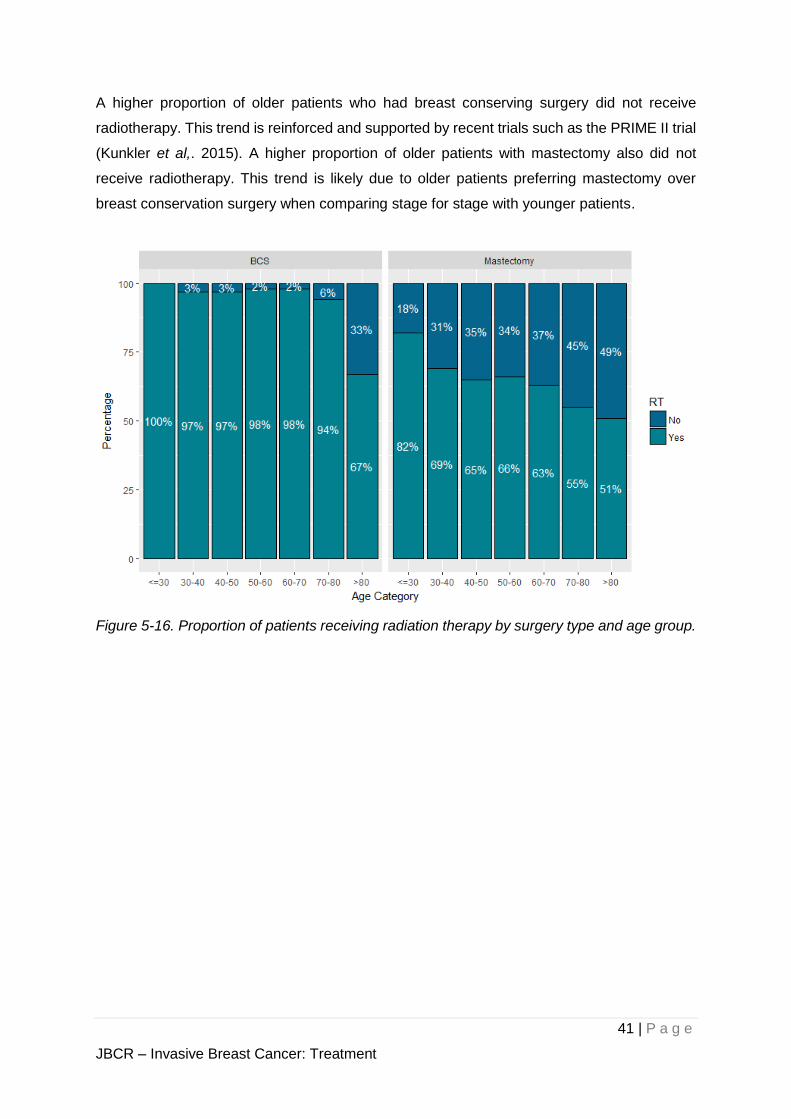
A higher proportion of older patients who had breast conserving surgery did not receive
radiotherapy. This trend is reinforced and supported by recent trials such as the PRIME II trial
(Kunkler et al,. 2015). A higher proportion of older patients with mastectomy also did not
receive radiotherapy. This trend is likely due to older patients preferring mastectomy over
breast conservation surgery when comparing stage for stage with younger patients.
Figure 5-16. Proportion of patients receiving radiation therapy by surgery type and age group.
42 | P a g e
JBCR – Invasive Breast Cancer: Treatment
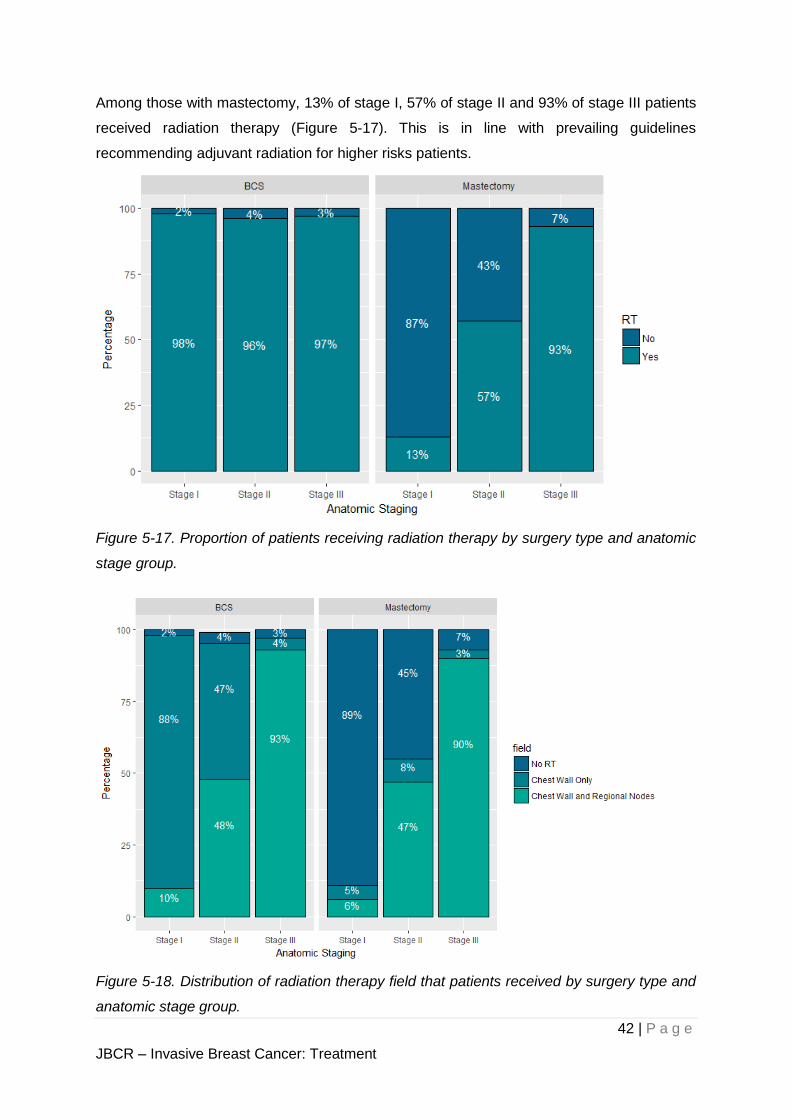
Among those with mastectomy, 13% of stage I, 57% of stage II and 93% of stage III patients
received radiation therapy (Figure 5-17). This is in line with prevailing guidelines
recommending adjuvant radiation for higher risks patients.
Figure 5-17. Proportion of patients receiving radiation therapy by surgery type and anatomic
stage group.
Figure 5-18. Distribution of radiation therapy field that patients received by surgery type and
anatomic stage group.
43 | P a g e
JBCR – Invasive Breast Cancer: Treatment
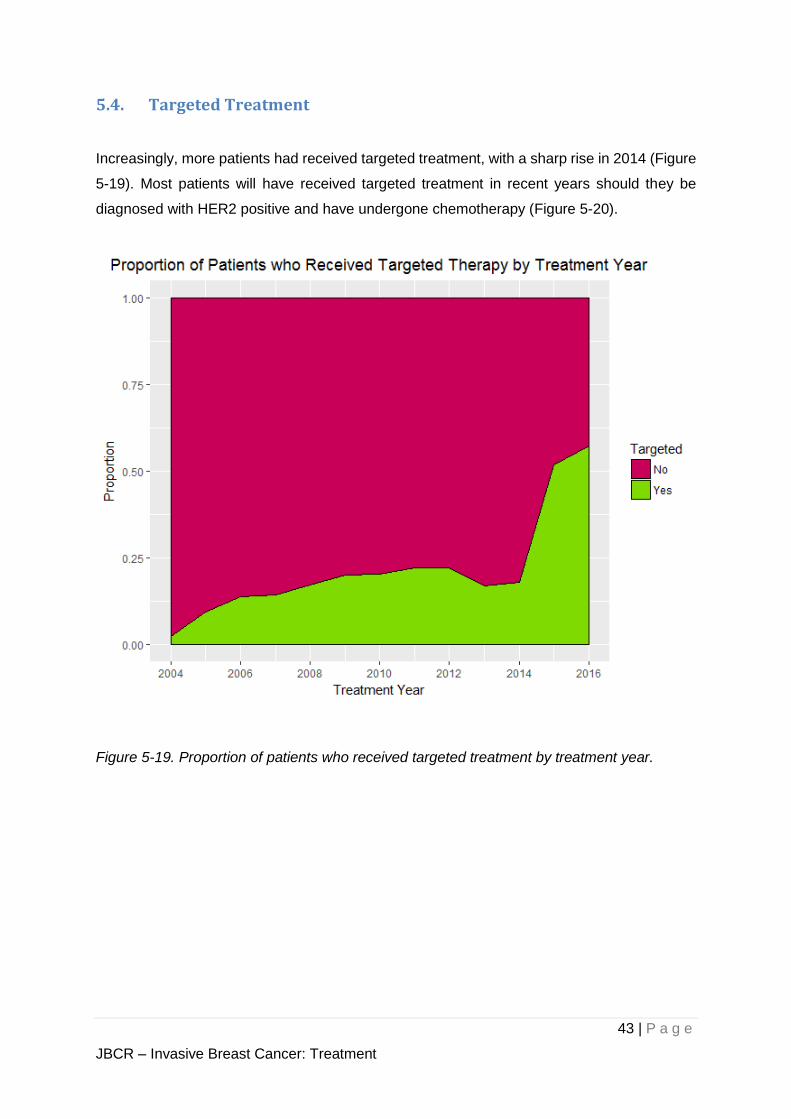
5.4. Targeted Treatment
Increasingly, more patients had received targeted treatment, with a sharp rise in 2014 (Figure
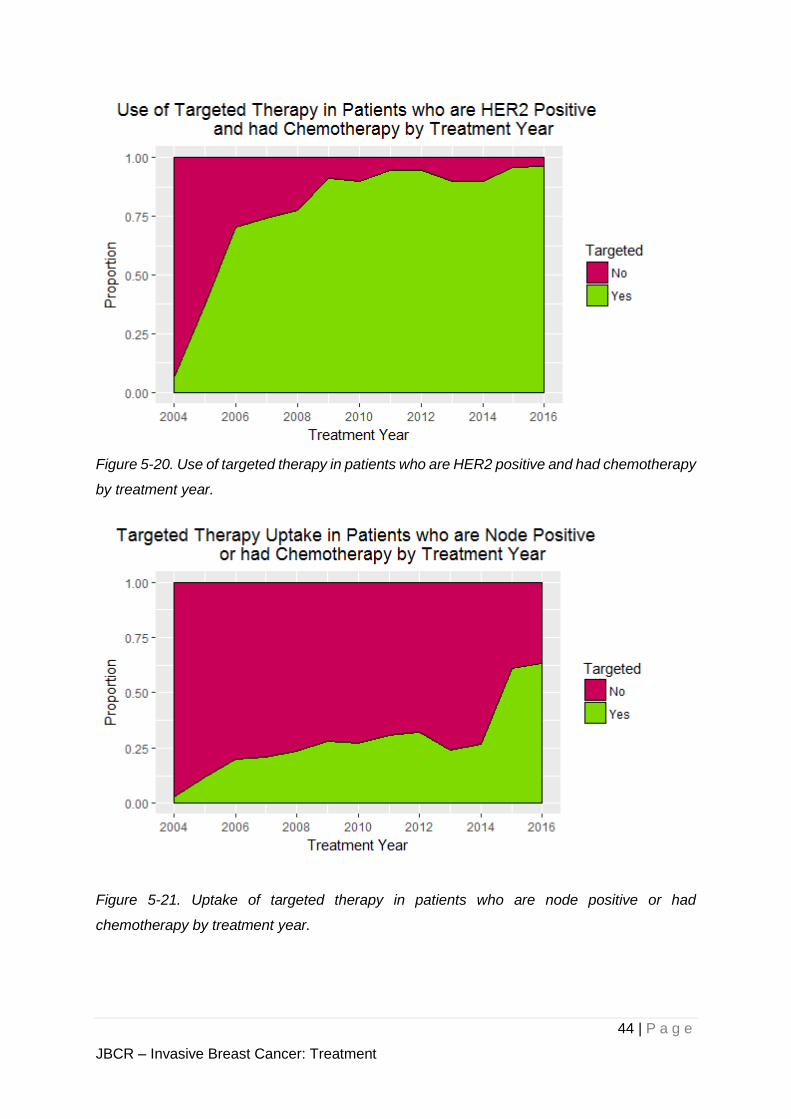
5-19). Most patients will have received targeted treatment in recent years should they be
diagnosed with HER2 positive and have undergone chemotherapy (Figure 5-20).
Figure 5-19. Proportion of patients who received targeted treatment by treatment year.
44 | P a g e
JBCR – Invasive Breast Cancer: Treatment
Figure 5-20. Use of targeted therapy in patients who are HER2 positive and had chemotherapy
by treatment year.
Figure 5-21. Uptake of targeted therapy in patients who are node positive or had
chemotherapy by treatment year.
45 | P a g e
JBCR – Invasive Breast Cancer: Treatment
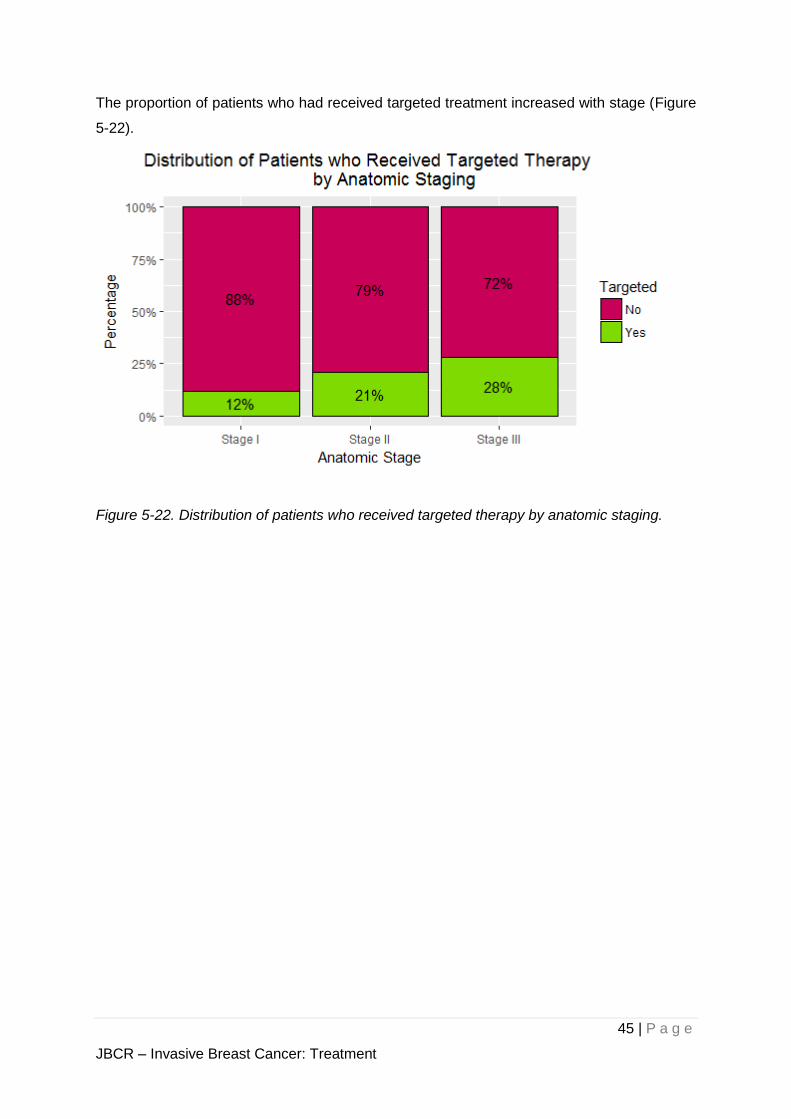
The proportion of patients who had received targeted treatment increased with stage (Figure
5-22).
Figure 5-22. Distribution of patients who received targeted therapy by anatomic staging.
46 | P a g e
JBCR – Invasive Breast Cancer: Treatment
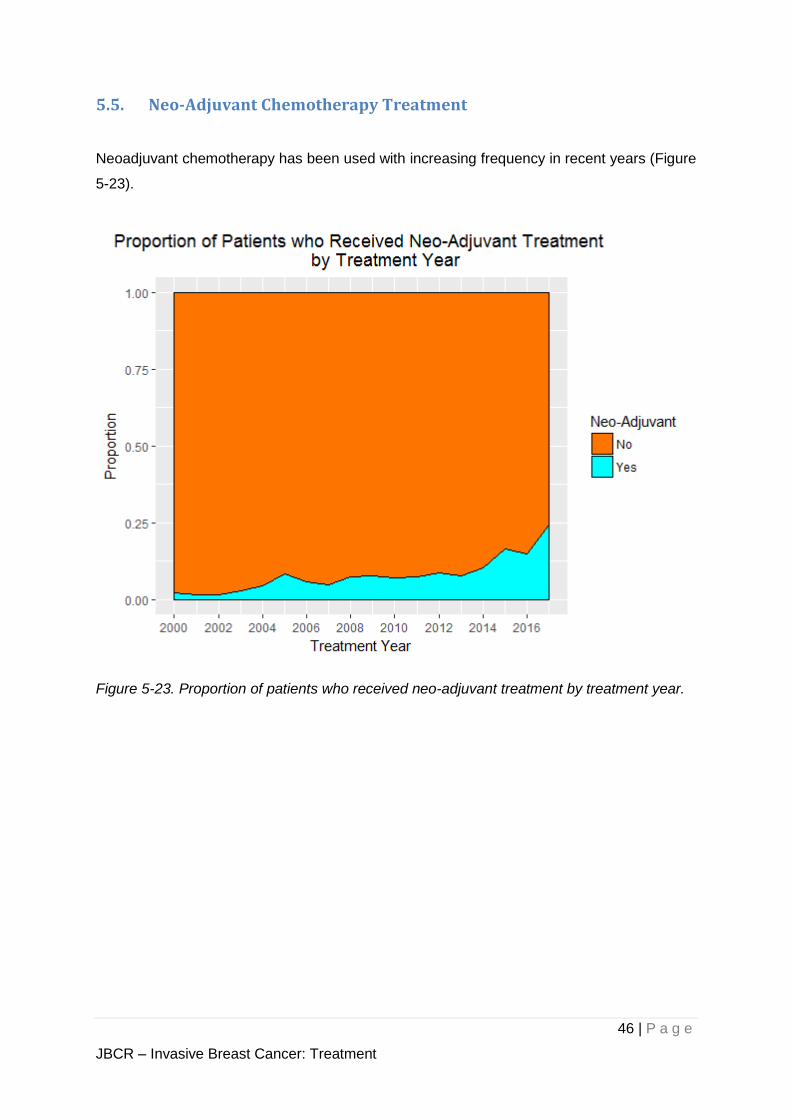
5.5. Neo-Adjuvant Chemotherapy Treatment
Neoadjuvant chemotherapy has been used with increasing frequency in recent years (Figure
5-23).
Figure 5-23. Proportion of patients who received neo-adjuvant treatment by treatment year.
47 | P a g e
JBCR – Invasive Breast Cancer: Survival and Outcomes
6. Survival and Outcomes
In the following sections, we report the outcomes of patients in the cohort of Singapore
residents with respect to Overall Survival (OS), Disease Free Survival (DFS), Ipsilateral Breast
Tumour Recurrence (IBTR) and Distant Disease Free Survival (DDFS).
The survival time for the respective outcomes are defined by the time difference between the
date of diagnosis of primary breast cancer and the corresponding survival end point described
in Table 6-1. If the patient did not experience the outcome, the last seen date of the patient
will be the survival end point.
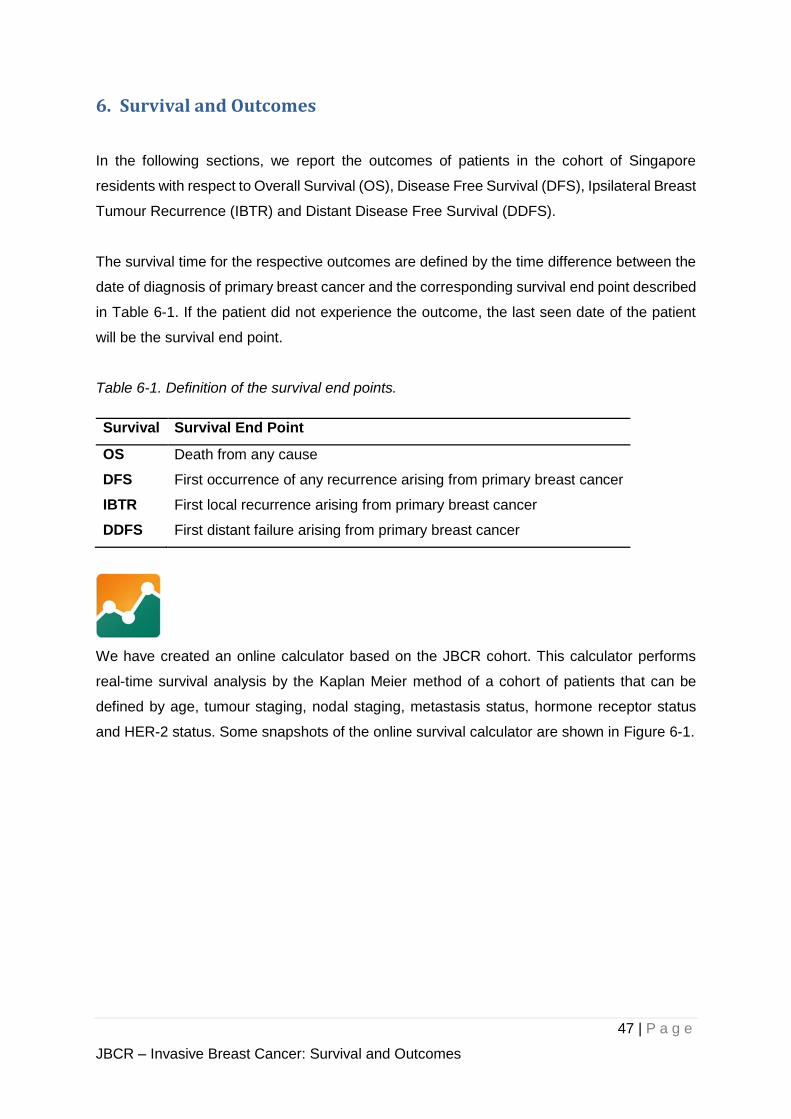
Table 6-1. Definition of the survival end points.
Survival Survival End Point
OS Death from any cause
DFS First occurrence of any recurrence arising from primary breast cancer
IBTR First local recurrence arising from primary breast cancer
DDFS First distant failure arising from primary breast cancer
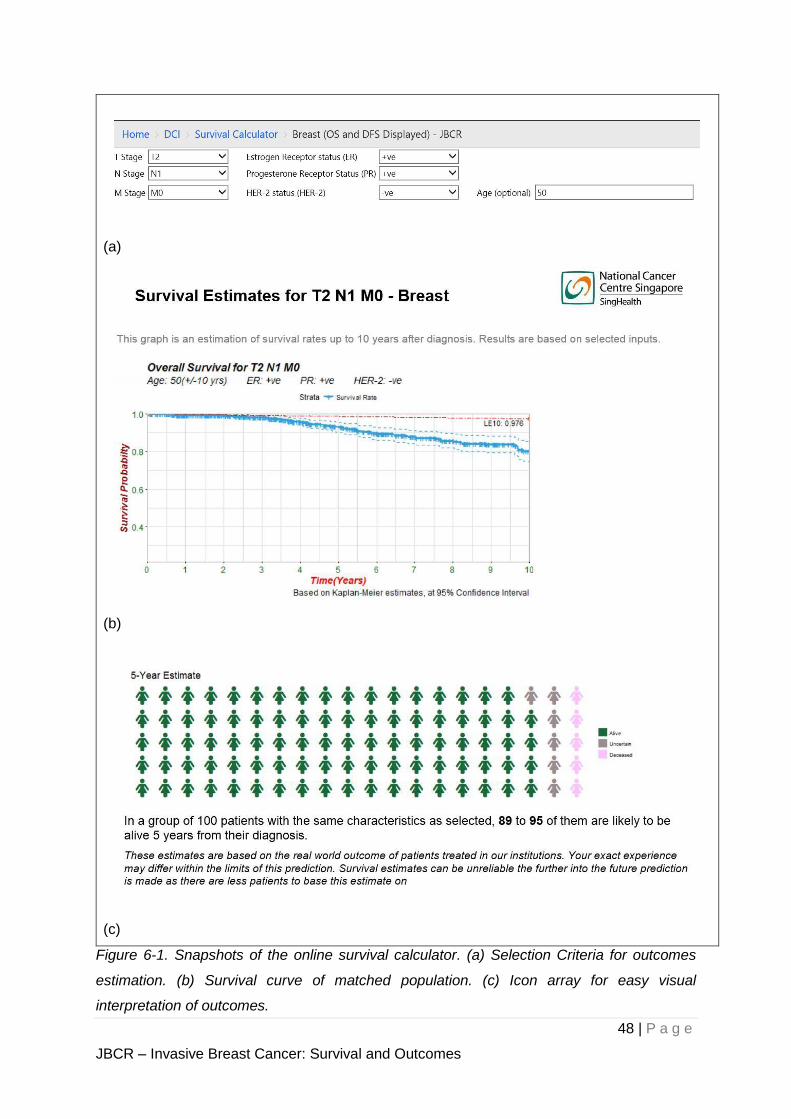
We have created an online calculator based on the JBCR cohort. This calculator performs
real-time survival analysis by the Kaplan Meier method of a cohort of patients that can be
defined by age, tumour staging, nodal staging, metastasis status, hormone receptor status
and HER-2 status. Some snapshots of the online survival calculator are shown in Figure 6-1.
48 | P a g e
JBCR – Invasive Breast Cancer: Survival and Outcomes
(a)
(b)
(c)
Figure 6-1. Snapshots of the online survival calculator. (a) Selection Criteria for outcomes
estimation. (b) Survival curve of matched population. (c) Icon array for easy visual
interpretation of outcomes.
49 | P a g e
JBCR – Invasive Breast Cancer: Survival and Outcomes
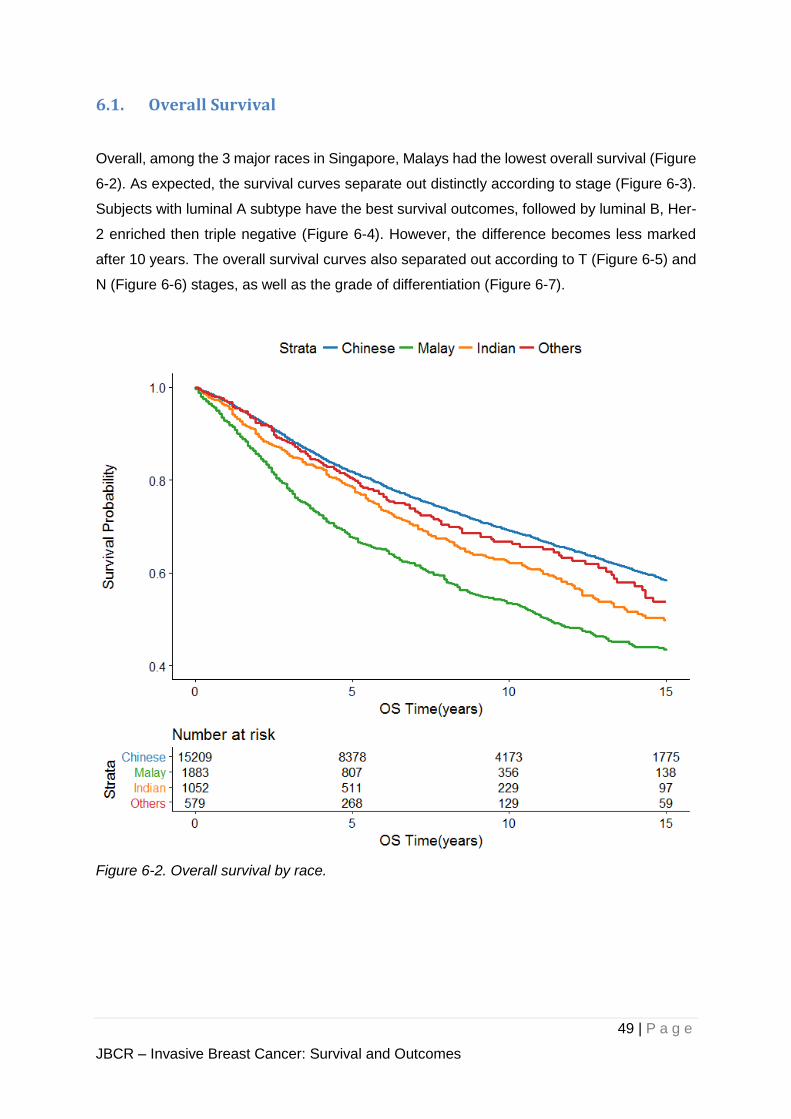
6.1. Overall Survival
Overall, among the 3 major races in Singapore, Malays had the lowest overall survival (Figure
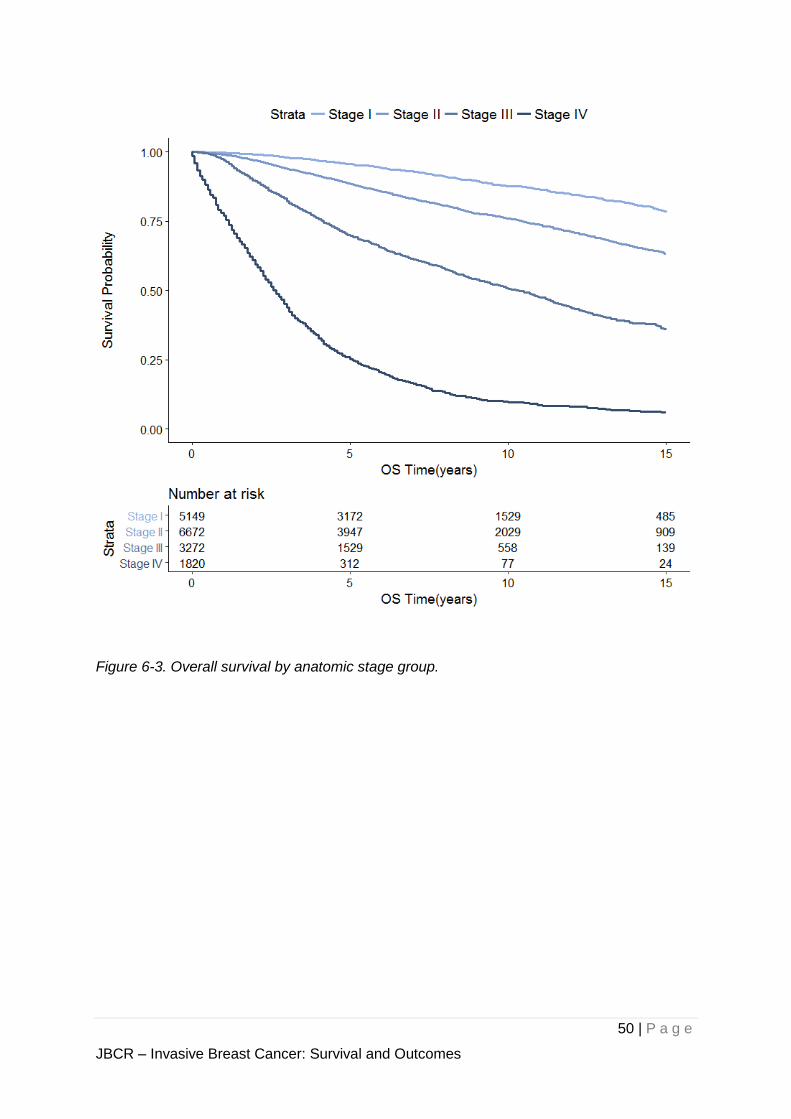
6-2). As expected, the survival curves separate out distinctly according to stage (Figure 6-3).
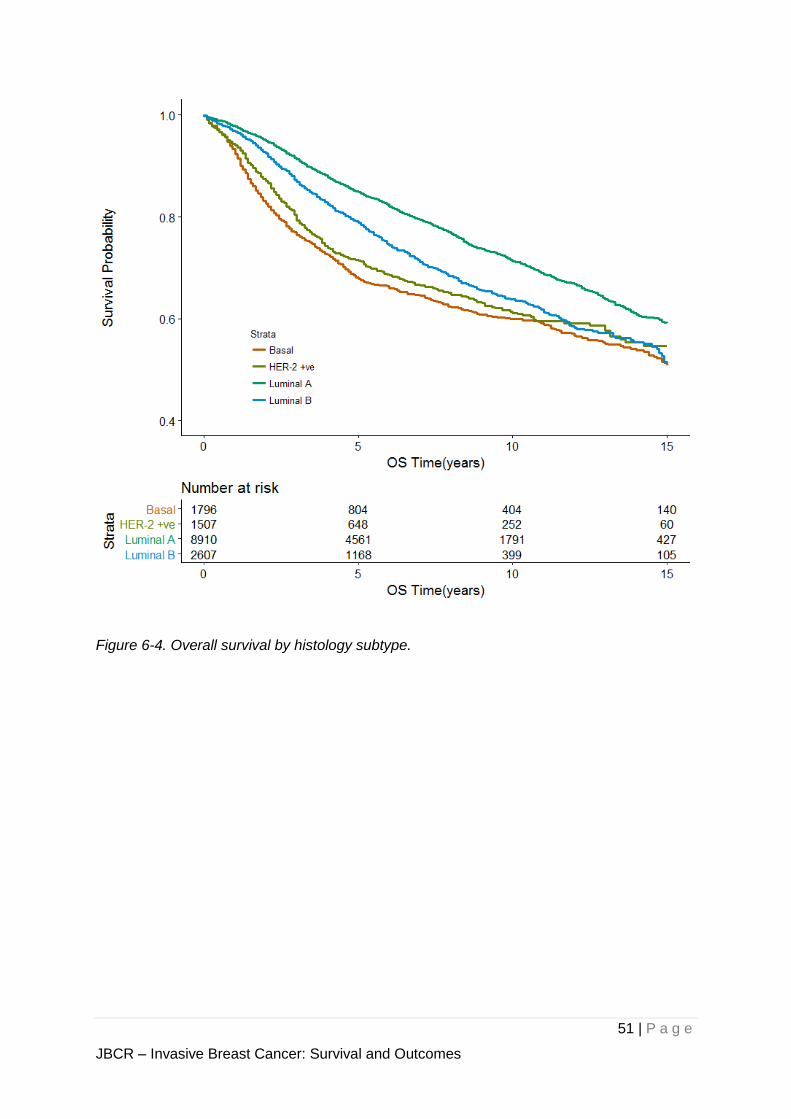
Subjects with luminal A subtype have the best survival outcomes, followed by luminal B, Her-
2 enriched then triple negative (Figure 6-4). However, the difference becomes less marked
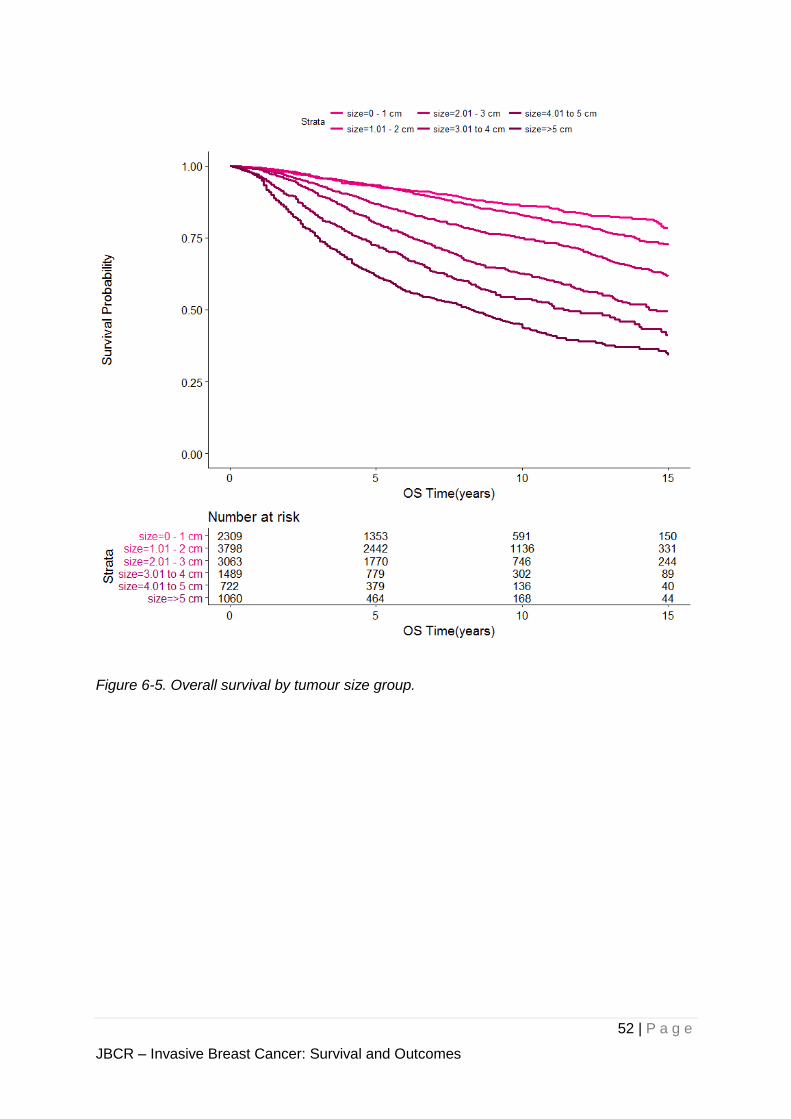
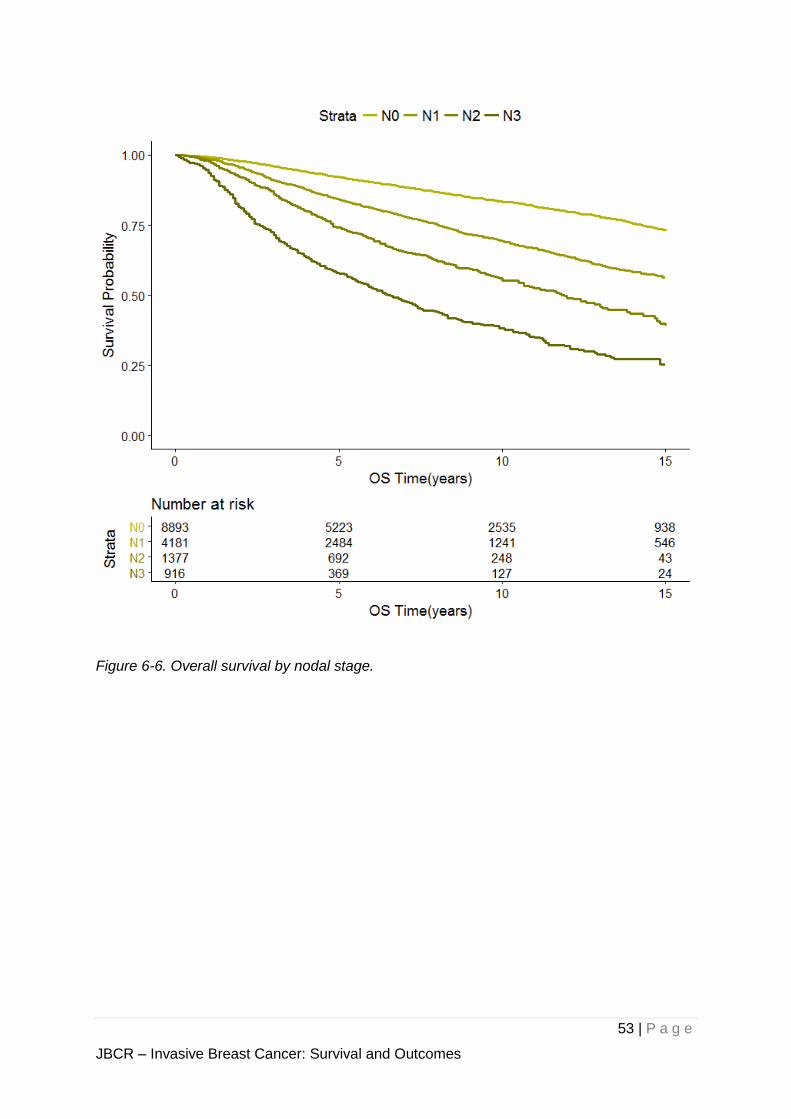
after 10 years. The overall survival curves also separated out according to T (Figure 6-5) and
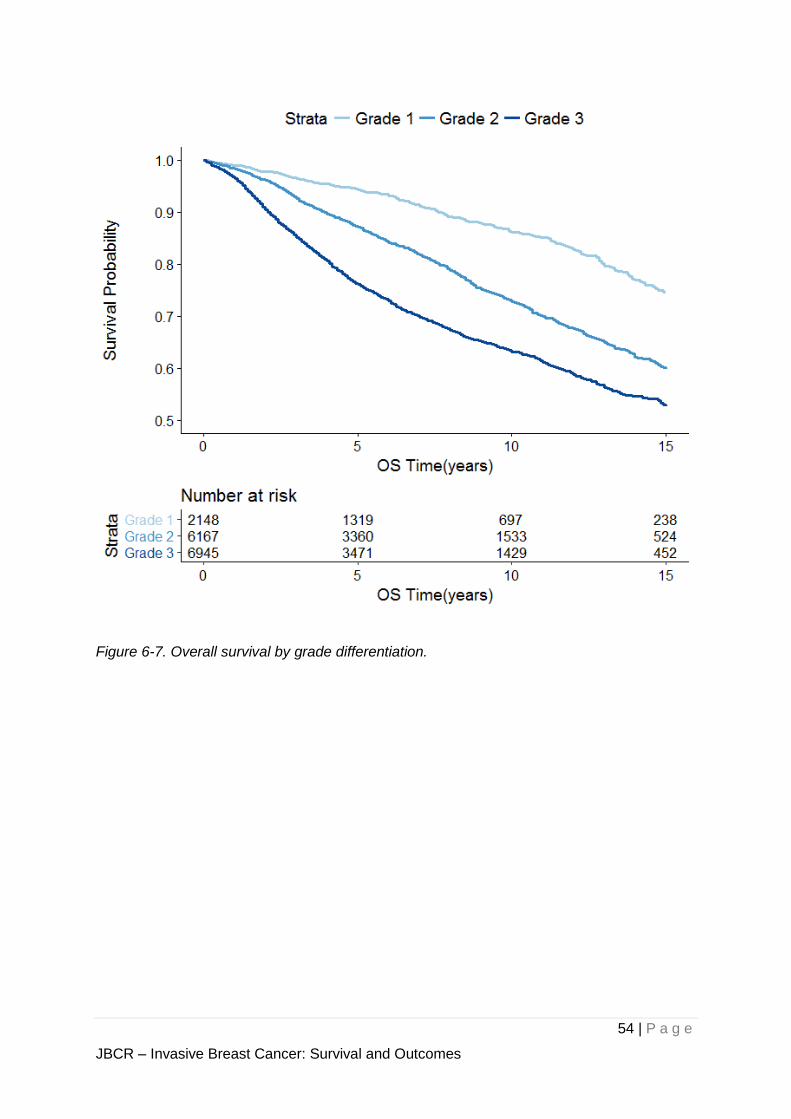
N (Figure 6-6) stages, as well as the grade of differentiation (Figure 6-7).
Figure 6-2. Overall survival by race.
50 | P a g e
JBCR – Invasive Breast Cancer: Survival and Outcomes
Figure 6-3. Overall survival by anatomic stage group.
51 | P a g e
JBCR – Invasive Breast Cancer: Survival and Outcomes
Figure 6-4. Overall survival by histology subtype.
52 | P a g e
JBCR – Invasive Breast Cancer: Survival and Outcomes
Figure 6-5. Overall survival by tumour size group.
53 | P a g e
JBCR – Invasive Breast Cancer: Survival and Outcomes
Figure 6-6. Overall survival by nodal stage.
54 | P a g e
JBCR – Invasive Breast Cancer: Survival and Outcomes
Figure 6-7. Overall survival by grade differentiation.
55 | P a g e
JBCR – Invasive Breast Cancer: Survival and Outcomes
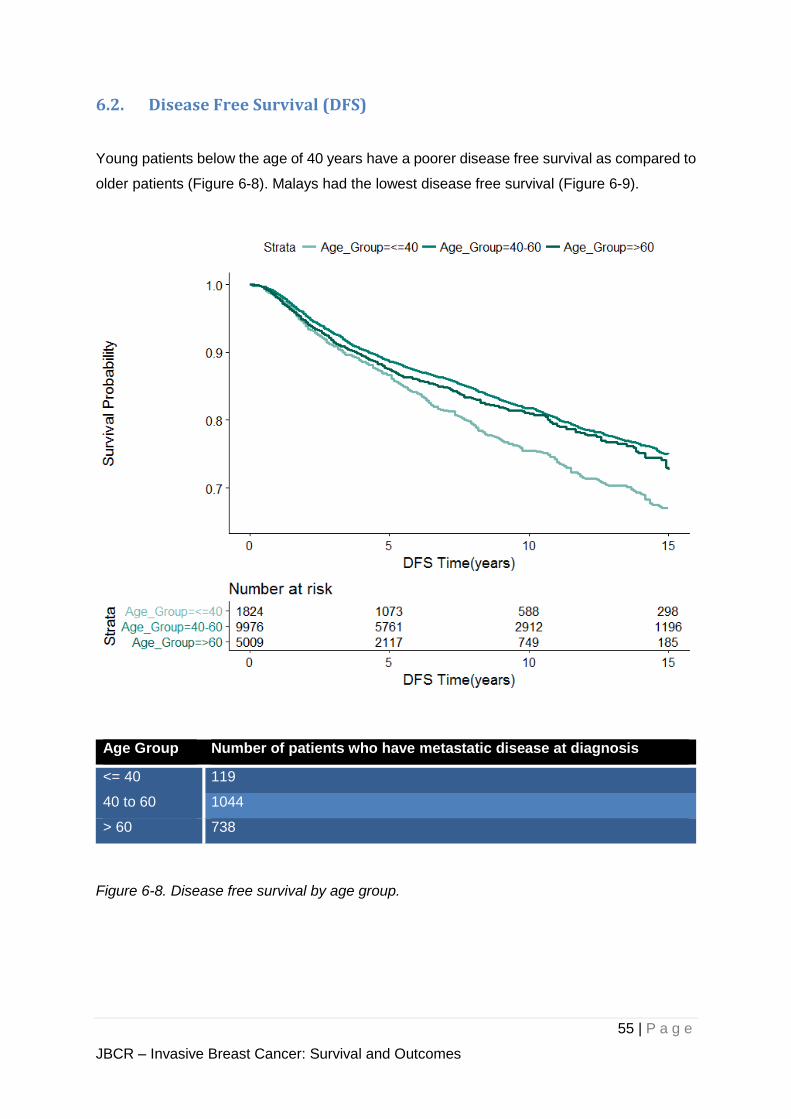
6.2. Disease Free Survival (DFS)
Young patients below the age of 40 years have a poorer disease free survival as compared to
older patients (Figure 6-8). Malays had the lowest disease free survival (Figure 6-9).
Age Group Number of patients who have metastatic disease at diagnosis
<= 40 119
40 to 60 1044
> 60 738
Figure 6-8. Disease free survival by age group.
56 | P a g e
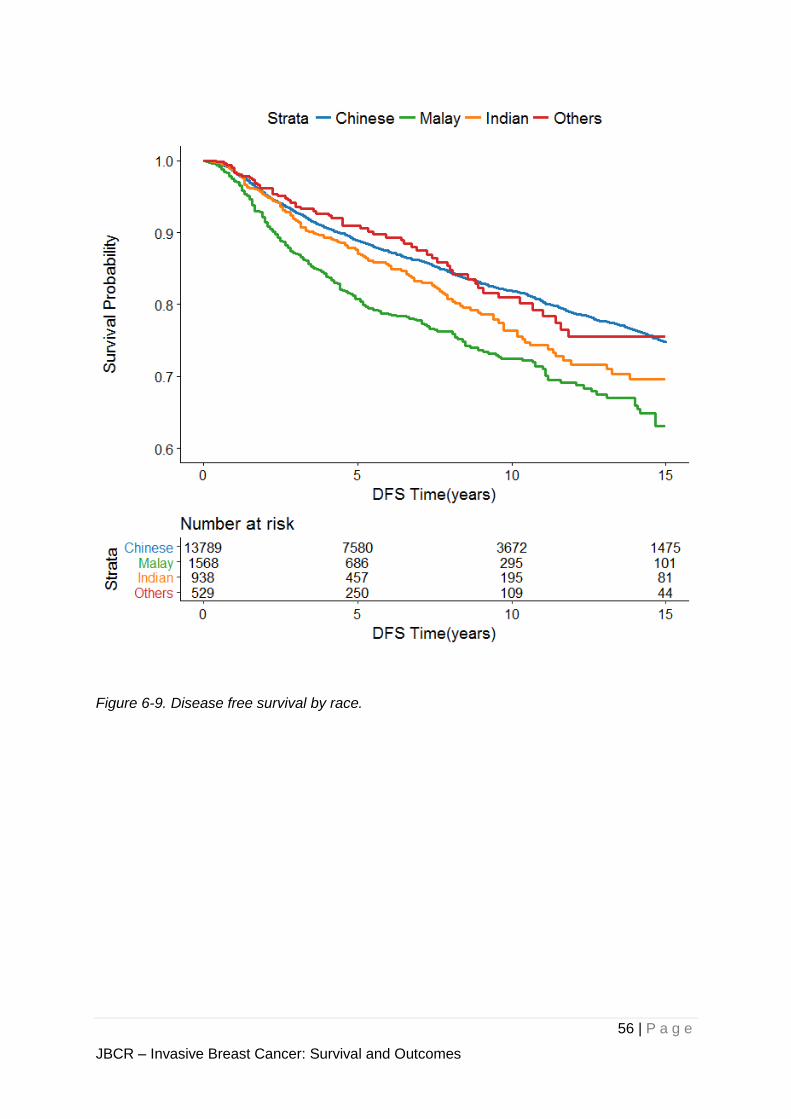
JBCR – Invasive Breast Cancer: Survival and Outcomes
Figure 6-9. Disease free survival by race.
57 | P a g e
JBCR – Invasive Breast Cancer: Survival and Outcomes
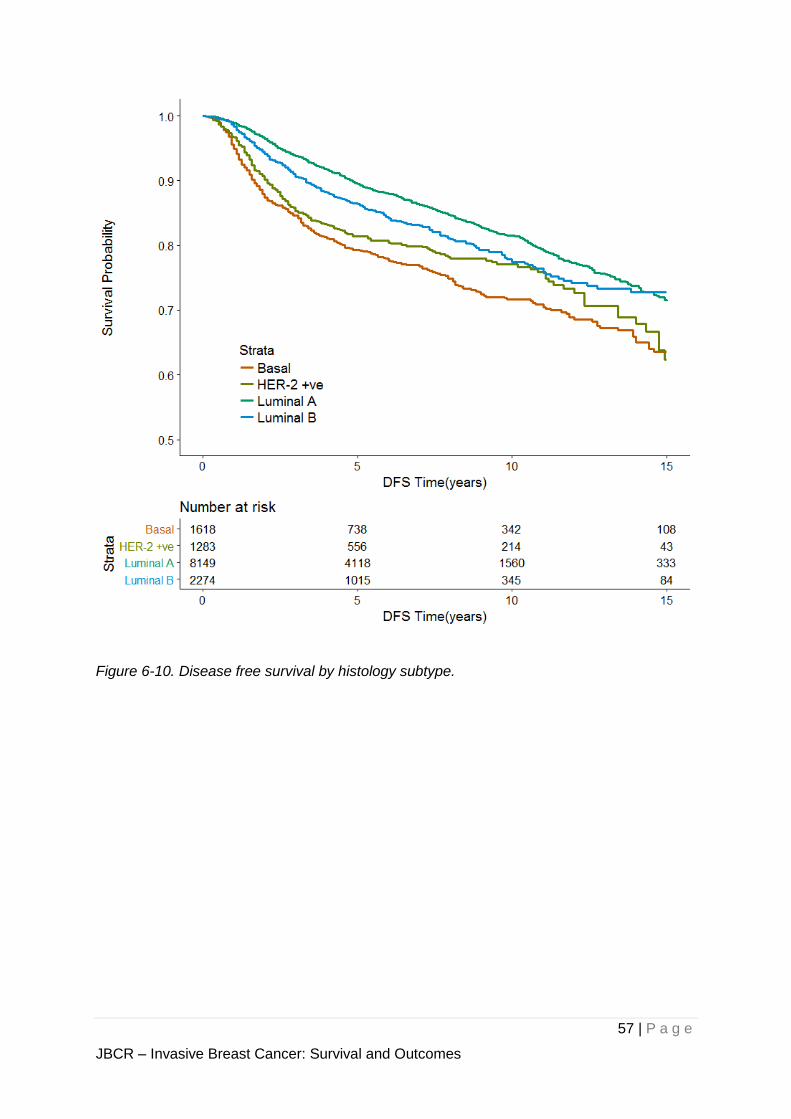
Figure 6-10. Disease free survival by histology subtype.
58 | P a g e
JBCR – Invasive Breast Cancer: Survival and Outcomes
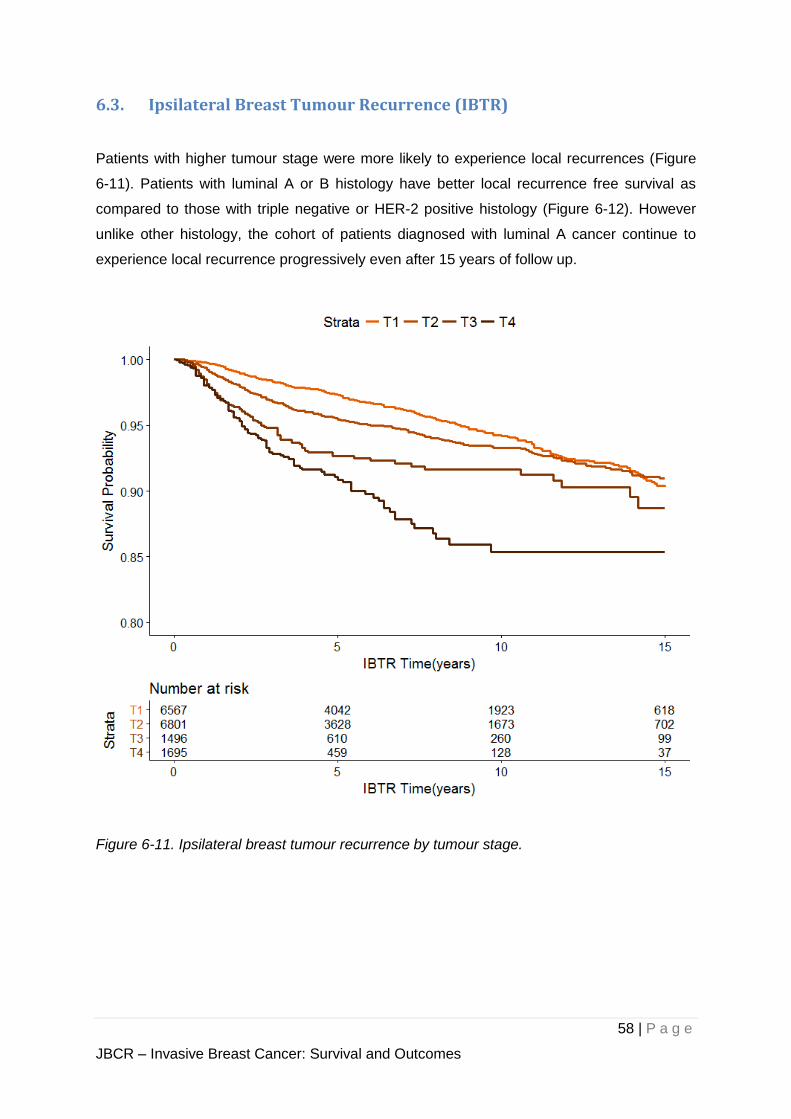
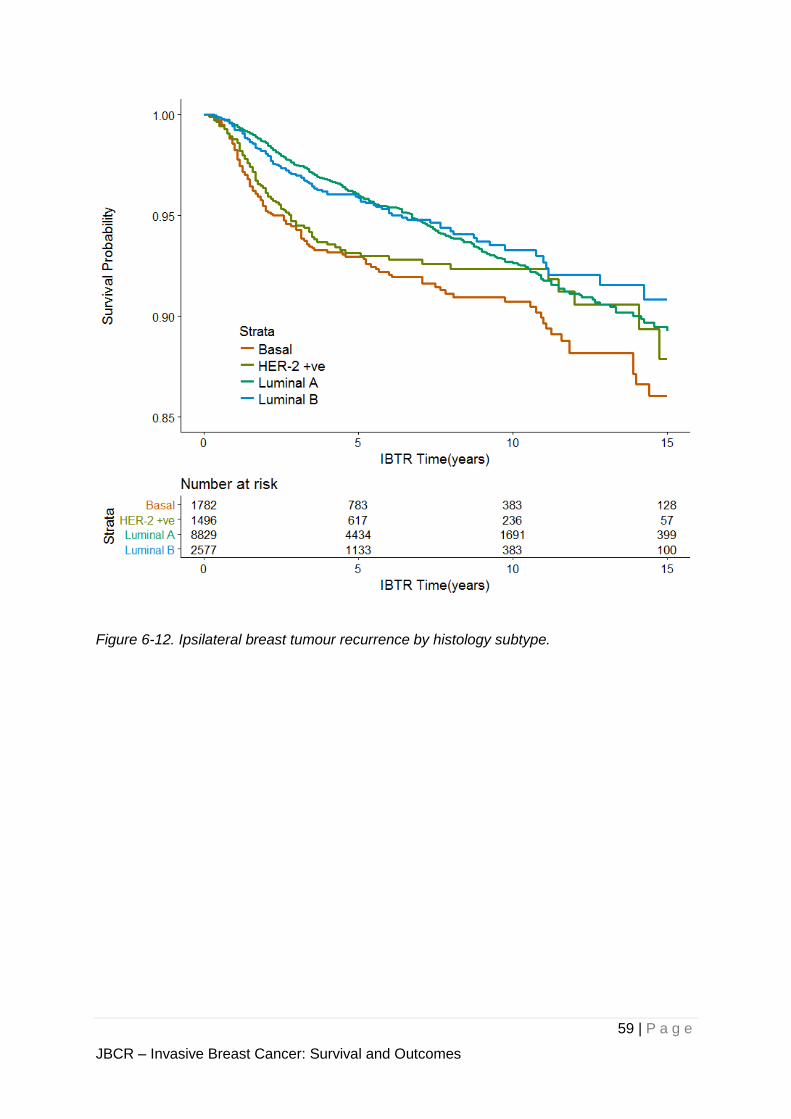
6.3. Ipsilateral Breast Tumour Recurrence (IBTR)
Patients with higher tumour stage were more likely to experience local recurrences (Figure
6-11). Patients with luminal A or B histology have better local recurrence free survival as
compared to those with triple negative or HER-2 positive histology (Figure 6-12). However
unlike other histology, the cohort of patients diagnosed with luminal A cancer continue to
experience local recurrence progressively even after 15 years of follow up.
Figure 6-11. Ipsilateral breast tumour recurrence by tumour stage.
59 | P a g e
JBCR – Invasive Breast Cancer: Survival and Outcomes
Figure 6-12. Ipsilateral breast tumour recurrence by histology subtype.
60 | P a g e
JBCR – Invasive Breast Cancer: Survival and Outcomes
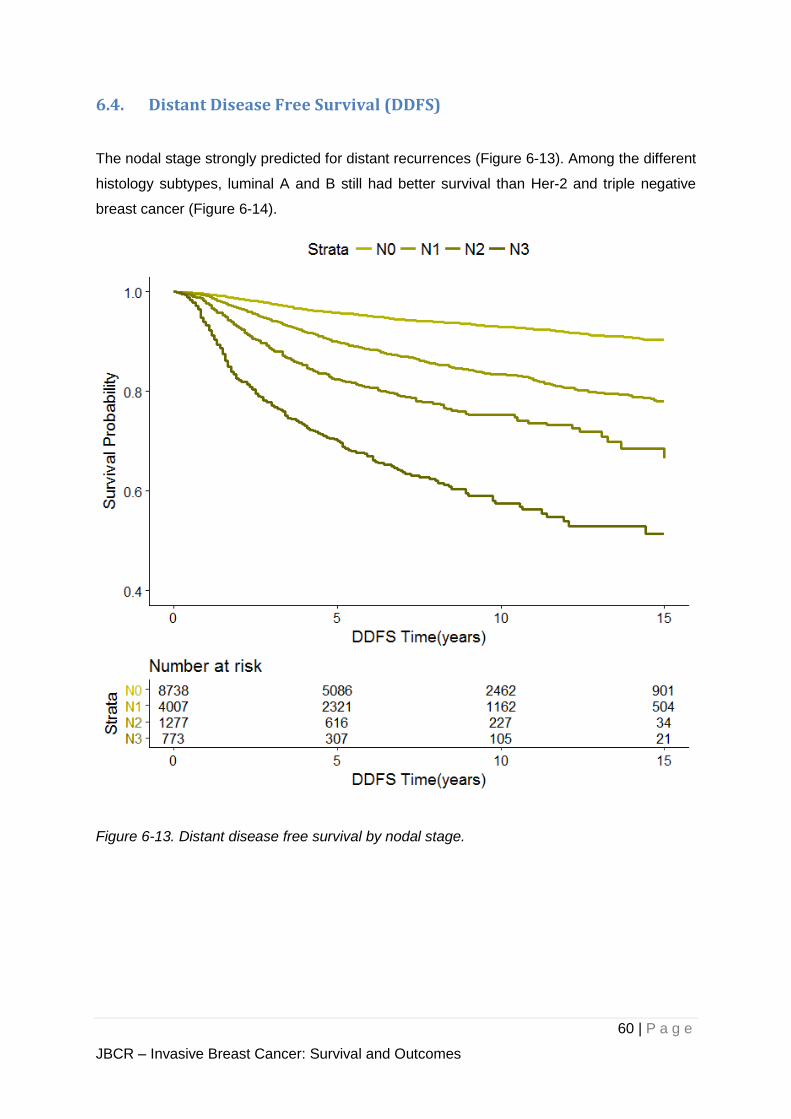
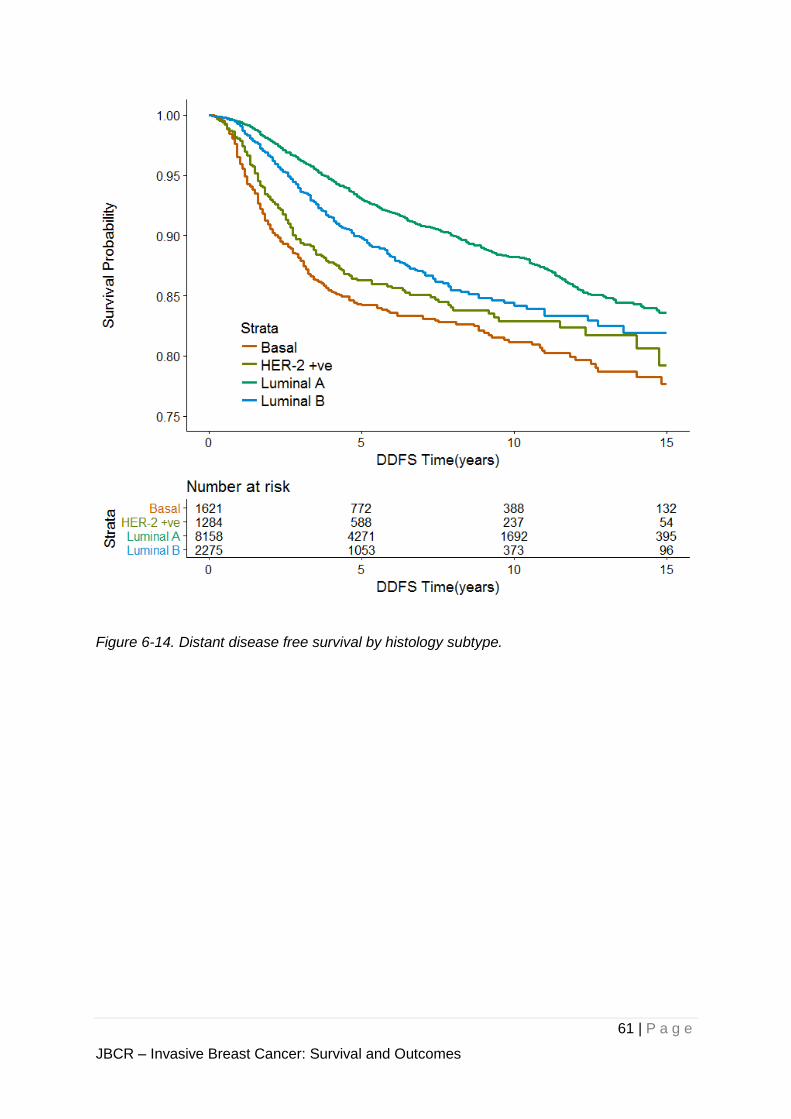
6.4. Distant Disease Free Survival (DDFS)
The nodal stage strongly predicted for distant recurrences (Figure 6-13). Among the different
histology subtypes, luminal A and B still had better survival than Her-2 and triple negative
breast cancer (Figure 6-14).
Figure 6-13. Distant disease free survival by nodal stage.
61 | P a g e
JBCR – Invasive Breast Cancer: Survival and Outcomes
Figure 6-14. Distant disease free survival by histology subtype.
62 | P a g e
- [NON-INVASIVE CANCER ONLY] -
In the following analyses, patients diagnosed with non-invasive cancers (including ductal
carcinoma in-situ) are presented. Any values are rounded to 2 significant figures for clarity
purpose.
63 | P a g e
JBCR – Non-Invasive Disease
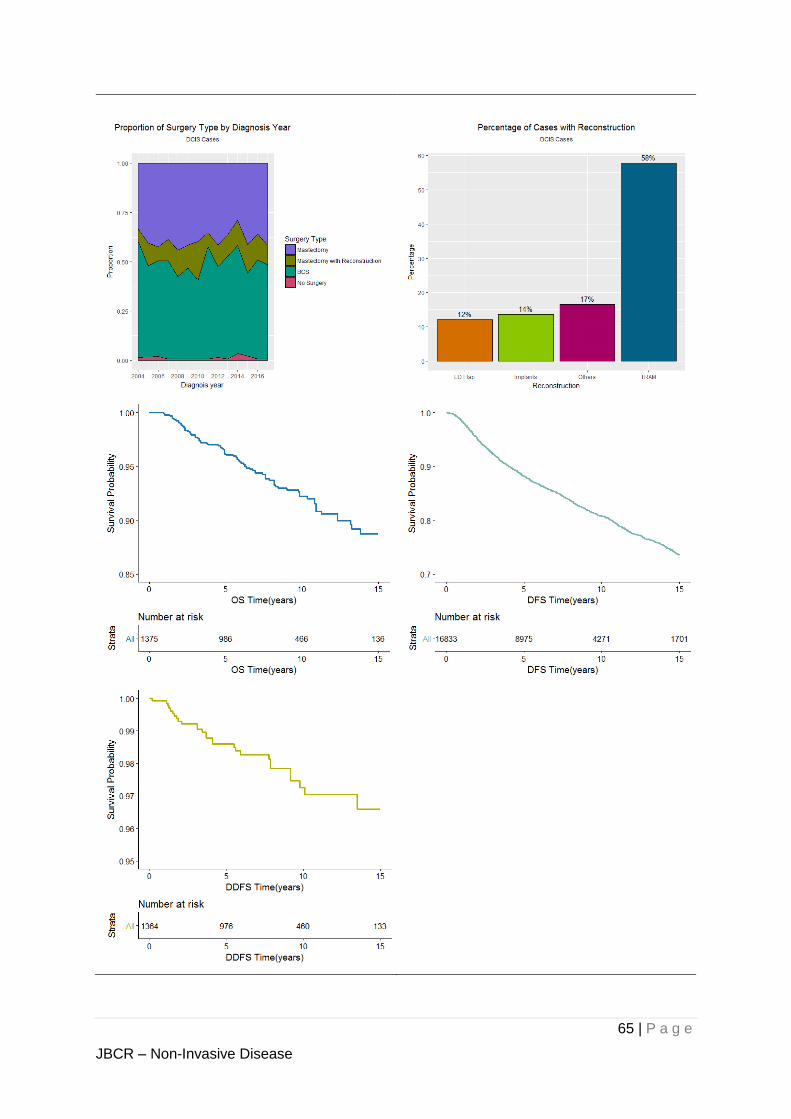
7. Non-invasive cancers
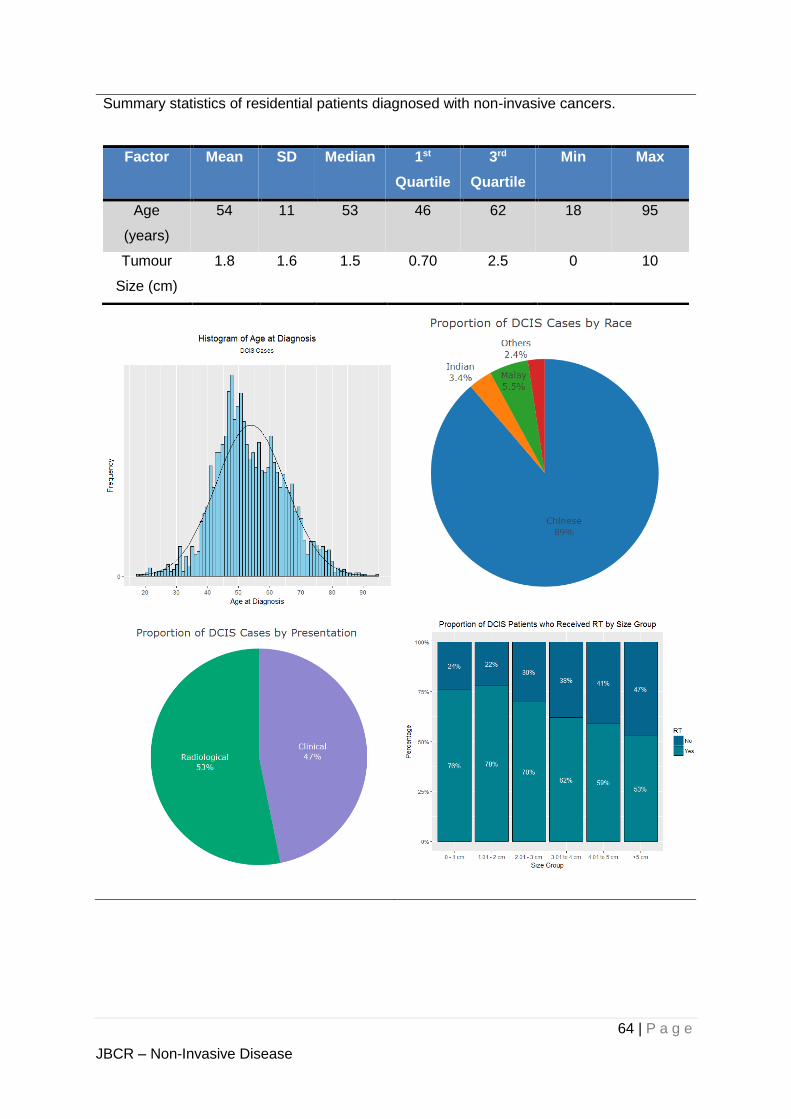
Ductal Carcinoma In-Situ (DCIS) cases are presented separately due to the more indolent
nature of the disease. There were about 2,700 DCIS cases, with a median age at diagnosis
of 53 years. The median tumour size was 1.5 cm. Most patients diagnosed with DCIS are in
their late 40s. 89% of DCIS subjects were Chinese, compared to 81% for IDC. 53% of DCIS
were screen-detected. 69% of the reconstructed cases were TRAM flaps.
64 | P a g e
JBCR – Non-Invasive Disease
Summary statistics of residential patients diagnosed with non-invasive cancers.
Factor Mean SD Median 1st
Quartile
3rd
Quartile
Min Max
Age
(years)
54 11 53 46 62 18 95
Tumour
Size (cm)
1.8 1.6 1.5 0.70 2.5 0 10
65 | P a g e
JBCR – Non-Invasive Disease
66 | P a g e
8. Research
8.1. Published Manuscripts
1. Prognostic role of adjuvant radiotherapy in triple-negative breast cancer: A historical
cohort study.
Int J Cancer. 2015 Nov 15;137(10):2504-12
2. Clinicopathological characteristics and treatment outcomes in patients with stage I-III
invasive Lobular carcinoma of the breast (ILC) treated at the National Cancer Centre
Singapore.
2016 ASCO Annual Meeting. J Clin Oncol 2016 suppl; abstr.
Joycelyn Jie Xin Lee, Fuh-Yong Wong, Benita Tan, Swee Ho Lim, Sze Huey Tan,
Joanne YY Ngeow, Rebecca Alexandra Dent
3. Outcome after neoadjuvant chemotherapy in Asian breast cancer patients.
Cancer Med. 2017 Jan; 6(1): 173–185. Li Yan Lim, Hui Miao, Joline S.J.Lim, Soo Chin
Lee, Nirmala Bhoo-Pathy, Cheng Har Yip, Nur Aishah B.M.Taib, Patrick Chan, Ern Yu
Tan, Swe Ho Lim, Geok Hoon Lim, Evan Woo, Yia Swam Tan, Jung Ah Lee, Mabel
Wong, Puay Hoon Tan, Kong Wee Ong, Fuh Yong Wong, Yoon Sim Yap, Mikael
Hartman
4. Screening uptake differences are not implicated in poorer breast cancer outcomes
among Singaporean malay women.
J Breast Cancer. 2017 Jun;20(2):183-191. Xin WR, Kwok LL, Yong WF.
5. Surgery for early breast cancer in the extremely elderly leads to improved outcomes -
An Asian population study.
Breast. 2017 Dec; 36:44-48. Lee CM, Zheng H, Tan VK, Tan TJ, Kanesvaran R, Wong
FY, Sim YR, Yong WS, Madhukumar P, Ong KW, Tan BK.
6. Validation of the AJCC 8th prognostic system for breast cancer in an Asian healthcare
setting.
Breast. 2018 Apr 17;40:38-44. Wong RX, Wong FY, Lim J, Lian WX, Yap YS
7. Breast cancer anatomic staging with biological risk Score is effective and simple to use.
Melbourne International Breast Conference Oct 2018. WX Lian, YH Seow, YS Yap,
JHC Lim, FY Wong
67 | P a g e
8.2. Ongoing Studies
1. Gestational breast cancer outcomes
2. Effect of ethnicity in breast cancer treatment and outcomes
3. Synchronous contralateral axillary metastases from breast cancer
4. Validation of the modified GPA (graded prognostic assessment) in brain metastases
for breast cancer
5. Role of radiotherapy in borderline and malignant phyllodes
6. Incidence of radiation induced sarcomas after breast radiotherapy
7. Healthcare expenditure in HER-2 enriched breast cancer
8. Validation of the NHS Predict nomogram
68 | P a g e
9. Reference
(2018, 12). Retrieved 12 2018, from Department of Statistics Singapore:
https://www.tablebuilder.singstat.gov.sg/publicfacing/createDataTable.action?refId=1
4911
Cancer Screening. (2010). Retrieved 12 2018, from Ministry of Health Singapore:
https://www.moh.gov.sg/docs/librariesprovider4/guidelines/cpg_cancer-screening.pdf
Goldhirsch, A, Wood, W. C., Coates, A. S., Gelber, R. D., Thürlimann, B., Senn, H. J., & Panel
members (2011). (2011). Strategies for subtypes--dealing with the diversity of breast
cancer: highlights of the St. Gallen International Expert Consensus on the Primary
Therapy of Early Breast Cancer 2011. Annals of oncology : official journal of the
European Society for Medical Oncology, 22(8), 1736-47.
Hortobagyi, G. N., Connolly, J. L., D'Orsi, C. J., B.Edge, S., Mittendorf, E. A., Rugo, H. S., . . .
Giuliano, A. (2018). Breast. In AJCC Cancer Staging Manual, Eight Edition (pp. 589-
636). Chicago, Illinois.
Kunkler, I. H., Williams, L. J., Jack, W. J., Cameron, D. A., & Dixon, J. M. (2015). Breast-
conserving surgery with or without irradiation in women aged 65 years or older with
early breast cancer (PRIME II): a randomised controlled trial. The lancet oncology,
16(3), 266-273.
Wong, R., Wong, F., Lim, J., Lian, W., & Yap, Y. (2018). Validation of the AJCC8th Prognostic
System for Breast Cancer in an Asian Healthcare Setting. Breast, 38-44.
A | P a g e
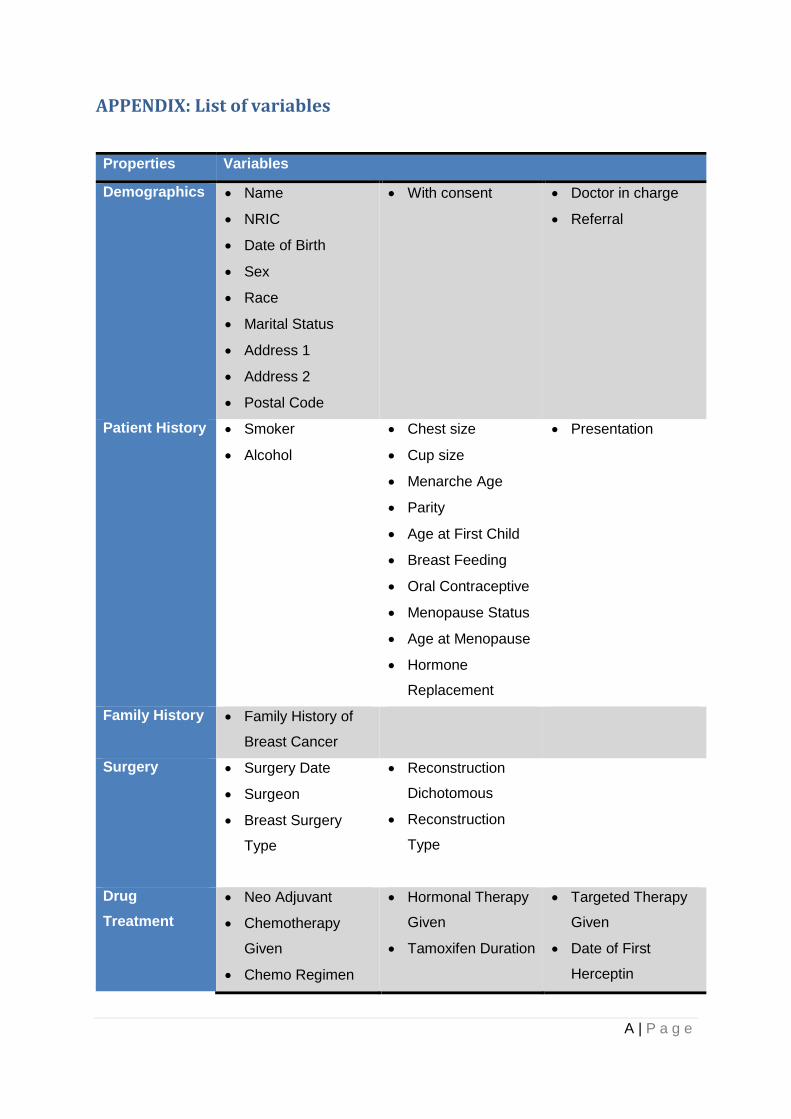
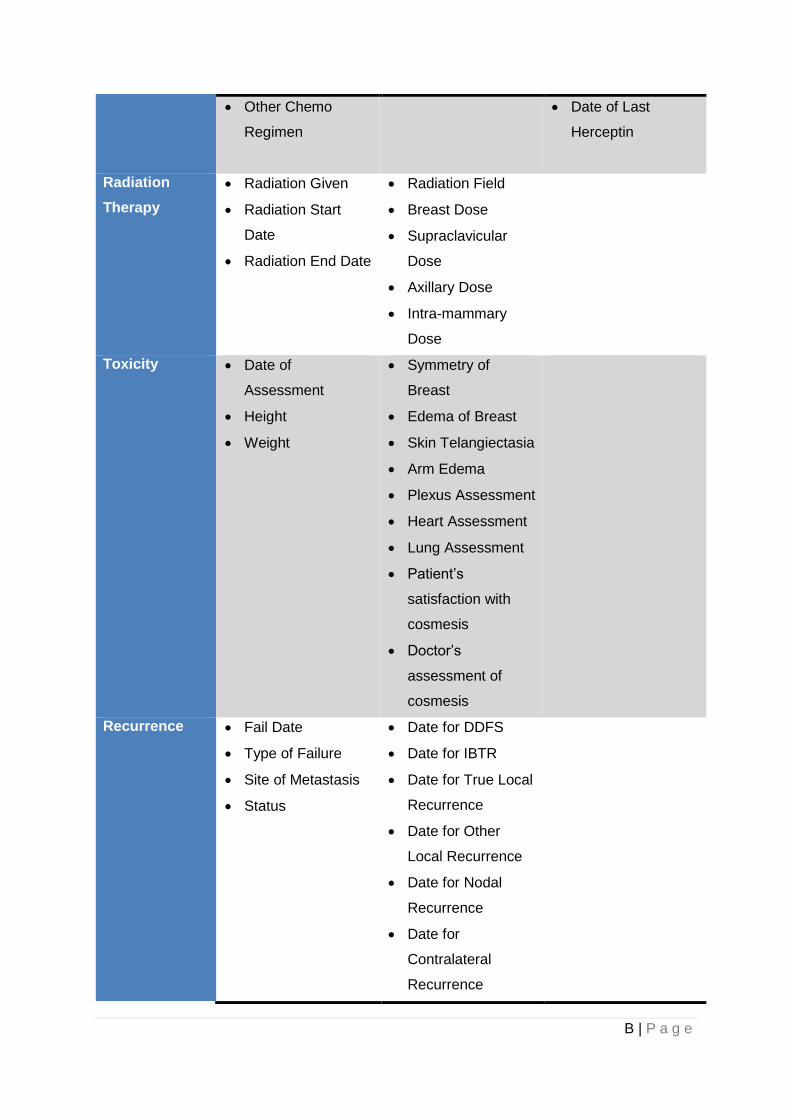
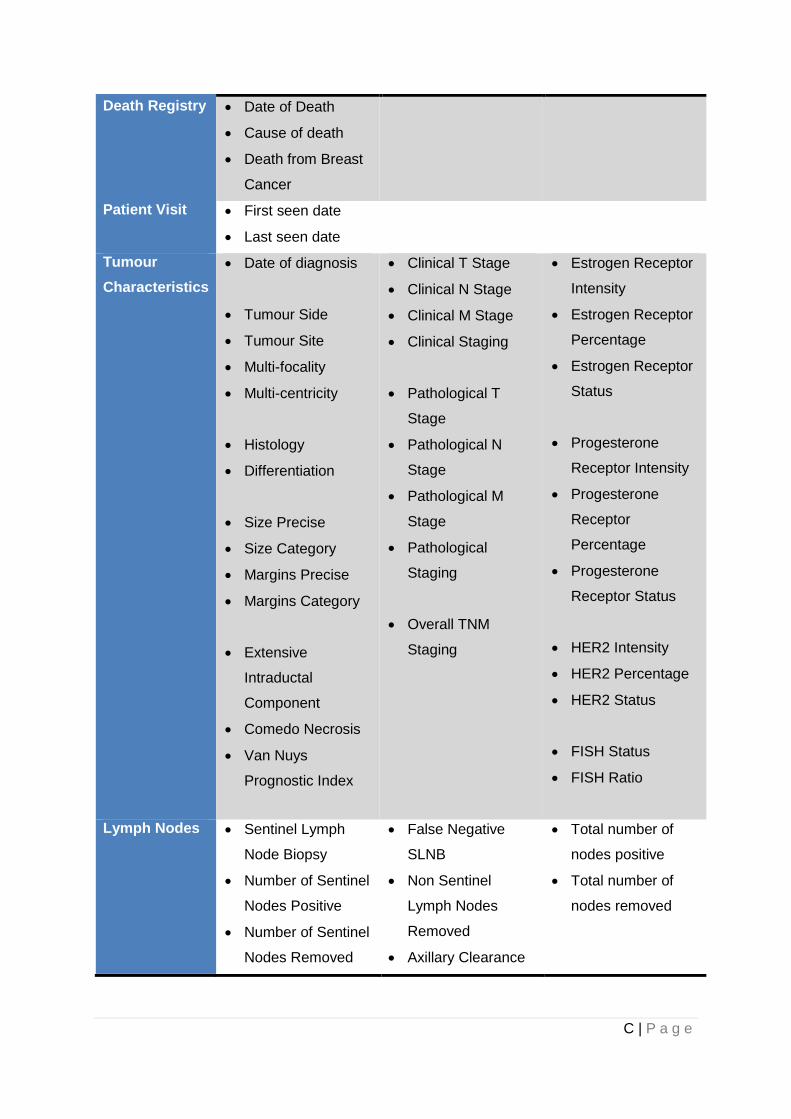
APPENDIX: List of variables
Properties Variables
Demographics Name
NRIC
Date of Birth
Sex
Race
Marital Status
Address 1
Address 2
Postal Code
With consent
Doctor in charge
Referral
Patient History Smoker
Alcohol
Chest size
Cup size
Menarche Age
Parity
Age at First Child
Breast Feeding
Oral Contraceptive
Menopause Status
Age at Menopause
Hormone
Replacement
Presentation
Family History Family History of
Breast Cancer
Surgery Surgery Date
Surgeon
Breast Surgery
Type
Reconstruction
Dichotomous
Reconstruction
Type
Drug
Treatment
Neo Adjuvant
Chemotherapy
Given
Chemo Regimen
Hormonal Therapy
Given
Tamoxifen Duration
Targeted Therapy
Given
Date of First
Herceptin
B | P a g e
Other Chemo
Regimen
Date of Last
Herceptin
Radiation
Therapy
Radiation Given
Radiation Start
Date
Radiation End Date
Radiation Field
Breast Dose
Supraclavicular
Dose
Axillary Dose
Intra-mammary
Dose
Toxicity Date of
Assessment
Height
Weight
Symmetry of
Breast
Edema of Breast
Skin Telangiectasia
Arm Edema
Plexus Assessment
Heart Assessment
Lung Assessment
Patient’s
satisfaction with
cosmesis
Doctor’s
assessment of
cosmesis
Recurrence Fail Date
Type of Failure
Site of Metastasis
Status
Date for DDFS
Date for IBTR
Date for True Local
Recurrence
Date for Other
Local Recurrence
Date for Nodal
Recurrence
Date for
Contralateral
Recurrence
C | P a g e
Death Registry Date of Death
Cause of death
Death from Breast
Cancer
Patient Visit First seen date
Last seen date
Tumour
Characteristics
Date of diagnosis
Tumour Side
Tumour Site
Multi-focality
Multi-centricity
Histology
Differentiation
Size Precise
Size Category
Margins Precise
Margins Category
Extensive
Intraductal
Component
Comedo Necrosis
Van Nuys
Prognostic Index
Clinical T Stage
Clinical N Stage
Clinical M Stage
Clinical Staging
Pathological T
Stage
Pathological N
Stage
Pathological M
Stage
Pathological
Staging
Overall TNM
Staging
Estrogen Receptor
Intensity
Estrogen Receptor
Percentage
Estrogen Receptor
Status
Progesterone
Receptor Intensity
Progesterone
Receptor
Percentage
Progesterone
Receptor Status
HER2 Intensity
HER2 Percentage
HER2 Status
FISH Status
FISH Ratio
Lymph Nodes Sentinel Lymph
Node Biopsy
Number of Sentinel
Nodes Positive
Number of Sentinel
Nodes Removed
False Negative
SLNB
Non Sentinel
Lymph Nodes
Removed
Axillary Clearance
Total number of
nodes positive
Total number of
nodes removed