Embed Size (px)
Citation preview
REPORT 2018
MALAYSIANTHALASSAEMIAREGISTRY
MOH/P/PAK/429.19(AR)
MTR Report_Part-1_PRINT_20191114_FA9.indd 1 27/11/2019 5:08 PM
The Malaysian Thalassaemia Registry Report 2018was prepared by
the Malaysian Thalassaemia Registry Committee, Ministry of Health, Malaysiain collaboration with
the Obstetrics & Gynaecological and Paediatric Services Unit, Medical Services Development Section, Medical Development Division, Ministry of Health, Malaysia
Published in 2019
A catalogue record of this document is available from the Library and Resource Unit of the National Institute of Health, Ministry of Health, Malaysia
MOH/P/PAK/429.19(AR)
And also available from the National Library of Malaysia
ISSN 2710-6322
All rights reserved.
No part of this publication may be reproduced or distributed in any form or any means, or stored in a database or retrieval system, without prior written permission from the Malaysian Thalassaemia Registry
Committee, Ministry of Health, Malaysia.
Suggested citation: Mohd Ibrahim, H. ed., (2019). Malaysian Thalassaemia Registry Report 2018. 1st ed.
Medical Development Division, Ministry of Health, Malaysia.
MTR Report_Part-1_PRINT_20191114_FA9.indd 2 27/11/2019 5:08 PM
The Malaysian Thalassaemia Registry (MTR) launched on the 12th of May 2007 is part of the National Thalassaemia Prevention and Control programme endorsed by the Malaysian Cabinet in August of 2004. This report is a compilation of work over the past decade showcasing the dynamics of the Malaysian thalassaemia patient landscape after the initiation of a comprehensive national programme. The registry’s web-based design allows for real-time data capture and analyses for healthcare personnel in over 100 hospitals nationwide managing thalassaemia patients. Aggregate data made available for policymakers had also enabled better monitoring and planning for the programme at the ministry, state, as well as at the individual hospital level.
Among the most significant finding was the reversal on the survival demography of our transfusion-dependent patients; the majority previously not living beyond the second decade and now with survivorship beyond the fourth decade of life. The enormous healthcare challenge now is on continuing to provide the best of clinical care for an increasingly older cohort of patients while at the same time reducing the number of new births with severe thalassaemia.
The registry has also provided the foundation for research initiatives on many fronts including patient outcomes, laboratory diagnostics, molecular characterisation of local thalassaemia syndromes, quality of life assessments as well as pharmacoeconomic analyses on thalassaemia management in Malaysia. We hope to further improve the wealth of data available in this registry with the largest cohort of thalassaemia patients in the world to serve as a valuable resource of thalassaemia bio-informatics for the country as well as for the wider global thalassaemia fraternity.
The key stakeholders for the MTR are the Medical Development Division and the Ministry’s Paediatric Services, both of which provides the much-needed administrative and logistic support. Data collection was accomplished by research assistants supervised by clinicians, with the coordinating centre based in the Paediatric Department, Hospital Kuala Lumpur. The Malaysian Society of Paediatric Haematology & Oncology had also supported the initiative by supplementing grants whenever the need arose.
The initial goal of providing universal iron chelation therapy has been achieved, and in the coming years, provision of optimal and comprehensive care to our increasing number of surviving patients would need to be enhanced further. The preventive aspects of the national programme would need to be revisited and given more emphasis as the number of new births with severe thalassaemia is still significant. It would need a collective effort with adequate resources to address this growing healthcare burden in a sustainable manner.
FOREWORD
Dr Hishamshah Mohd IbrahimEditor
Head, Paediatric Department,Women & Children’s Hospital, Kuala Lumpur
MTR Report_Part-1_PRINT_20191114_FA9.indd 1 27/11/2019 5:08 PM
We would like to thank and acknowledge the contribution of the following:
1. Medical Development Division, Ministry of Health, Malaysiai. Dr Hishamshah Mohd Ibrahim – Chairman, Malaysian Thalassaemia Registryii. Dr Noor Aziah Zainal Abidin – Senior Principal Assistant Director, Medical Development Divisioniii. Dr Jafanita Jamaluddin – Senior Principal Assistant Director, Medical Development Divisioniv. Dr Muhammad Aadiyat – Principal Assistant Director, Medical Development Division bin Abdul Hamid
2. MTR Coordinating Centre – Institute of Paediatrics, Hospital Kuala Lumpuri. Mohd Hafizudin Mohd Salimii. Faizah Mohd Hanapiahiii. Mohamad Khudri Khairudin
3. Paediatric Haematologist & Oncologist i. Dr Yeoh Seoh Leng – Hospital Pulau Pinang, Pulau Pinangii. Dr Aisyah Muhammad Rivai – Hospital Raja Permaisuri Bainun, Ipoh, Perakiii. Dr Zulaiha Muda – Institute of Paediatrics, Hospital Kuala Lumpur, Kuala Lumpuriv. Dr Mohamed Najib Mohamed Unni – Institute of Paediatrics,Hospital Kuala Lumpur, Kuala Lumpurv. Dr Ida Shahnaz Othman – Institute of Paediatrics, Hospital Kuala Lumpur, Kuala Lumpurvi. Dr Che Hadibiah Che Mohd Razali – Hospital Sultan Ismail, Johor Bahru, Johorvii. Dr Nazzlin Dizana Din – Hospital Sultanah Nur Zahirah, Kuala Terengganu, Terengganuviii. Dr Ong Gek Bee – Hospital Umum Sarawak, Kuching, Sarawakix. Dr Asohan Thevarajah and – Hospital Wanita & Kanak-Kanak, Likas, Kota Kinabalu, Sabah Dr Kogilavani Gunasagaran x. Prof Dr Hamidah Alias – Hospital Canselor Tuanku Muhriz UKM, Cheras, Kuala Lumpurxi. Dr Norsarwany Mohamad – Hospital Universiti Sains Malaysia, Kubang Kerian, Kelantan
4. Paediatriciani. Dr Thiyagar Nagarajaw – Head of Paediatric Department, Hospital Sultanah Bahiyah, Alor Setar, Kedahii. Dr Chin Choy Nyok – Head of Paediatric Department, Hospital Tengku Ampuan Afzan, Kuantan, Pahangiii. All state paediatricians and paediatricians in charge of thalassaemia patients.
5. Haematologisti. Dr Jameela Sathar – Head of Haematology Services, Ministry of Health, Malaysiaii. Dato Dr Goh Ai Sim – Head of Department, Hospital Pulau Pinang, Pulau Pinangiii. Dr Tan Swee Looi – Hospital Tengku Ampuan Rahimah, Klang, Selangoriv. Dr Lim Soo Min – Hospital Sultanah Aminah, Johor Bahru, Johorv. Dr Kamini Kirubamoorthy – Hospital Raja Permaisuri Bainun, Ipoh, Perakvi. Dr Ahlam Naila Korie – Hospital Tengku Ampuan Afzan, Kuantan, Pahang vii. Dr Sinari binti Salleh – Hospital Raja Perempuan Zainab II, Kota Bharu, Kelantan viii. Dr Chew Lee Ping – Hospital Umum Sarawak, Kuching, Sarawakix. Dr Lily Wong – Hospital Queen Elizabeth, Kota Kinabalu, Sabah
ACKNOWLEDGEMENTS
MTR Report_Part-1_PRINT_20191114_FA9.indd 2 27/11/2019 5:08 PM
6. Research Assistantsi. Nurasyilla Aslinda Mohd Nasir (Pulau Pinang)ii. Muhammad Farid Abdul Ghaffar (Perak)iii. Siti Nur Syahida Abdul Jalil (Ampang)iv. Nurul Shafika Mohd Hairi (Johor)v. Mohd Saharudin Mat Zin (Terengganu)vi. Nurliyana Kamarolzaman (Pahang)vii. Analisa Coldelia (Sarawak)viii. Elvyshirah Hadirin (Likas, Sabah)ix. Raphaela Romanus (Kota Kinabalu, Sabah)
7. SkimLatihan1Malaysiaofficers(fromFebruary2018)i. Cik Norafifa Mazlan (Kedah)ii. Mohd Afiq Azis (Negeri Sembilan)iii. Hamizah Karber (Johor)iv. Nor Aimy Ramli (Pahang)v. Nur Zuliana Hashim (Kelantan)vi. Nur Athirah Abdul Razak (Sarawak)vii. Mohd Afiq Mohd Sulaiman (Likas, Sabah)viii. Nurain Syahirah Abu Bakar (Tawau, Sabah)
8. MalaysianSocietyofPaediatricHaematology&Oncology
MTR Report_Part-1_PRINT_20191114_FA9.indd 3 27/11/2019 5:08 PM
Contents1 Introduction 18
1.1 Thalassaemia 181.2 Malaysian Thalassaemia Registry 181.3 Demographics of Malaysia 18 1.3.1 Population of Malaysia 191.4 Data Collection 191.5 Participating Centres 19 1.5.1 Johor 19 1.5.2 Kedah 19 1.5.3 Kelantan 20 1.5.4 Melaka 20 1.5.5 Negeri Sembilan 20 1.5.6 Pahang 20 1.5.7 Perak 20 1.5.8 Perlis 20 1.5.9 Pulau Pinang 20 1.5.10 Sabah 20 1.5.11 Sarawak 21 1.5.12 Selangor 21 1.5.13 Terengganu 21 1.5.14 Wilayah Persekutuan Kuala Lumpur 21 1.5.15 Wilayah Persekutuan Labuan 21 1.5.16 Wilayah Persekutuan Putrajaya 21
2 Registry Report 222.1 Ten Centres with the Highest Number of Patients 262.2 Patients’ Status 262.3 Birth Summary 262.4 Death Summary 282.5 Patient Demographics 32 2.5.1 Age 32 2.5.2 Gender 35 2.5.3 Ethnic group 362.6 Diagnosis 402.7 Iron Chelation Therapy 442.8 Splenectomy 522.9 Regular Transfusion 542.10 Serum Ferritin Level 562.11 Treatment Analysis 59
3 Conclusions and Observations 60
4 Johor 614.1 Introduction 614.2 Patient Demographics 61 4.2.1 Age 63 4.2.2 Gender 66 4.2.3 Ethnic Group 67
MTR Report_Part-1_PRINT_20191114_FA9.indd 4 27/11/2019 5:08 PM
4.3 Diagnosis 694.4 Treatment 72 4.4.1 Iron Chelation Therapy 72 4.4.2 Serum Ferritin Level 784.5 Observation and Comments 79 4.5.1 Recommendations 79
5 Kedah 805.1 Introduction 805.2 Patient Demographics 80 5.2.1 Age 82 5.2.2 Gender 85 5.2.3 Ethnic Group 865.3 Diagnosis 875.4 Treatment 89 5.4.1 Iron Chelation Therapy 89 5.4.2 Serum Ferritin Level 955.5 Observation and Comments 96 5.5.1 Recommendations 96 5.5.2 Conclusion 96
6 Kelantan 976.1 Introduction 976.2 Patient Demographics 97 6.2.1 Age 99 6.2.2 Gender 102 6.2.3 Ethnic Group 1036.3 Diagnosis 1046.4 Treatment 106 6.4.1 Iron Chelation Therapy 106 6.4.2 Serum Ferritin Level 1126.5 Observation and Comments 113 6.5.1 Recommendations 113 6.5.2 Conclusions 113
7 Melaka 1147.1 Introduction 1147.2 Patient Demographics 114 7.2.1 Age 115 7.2.2 Gender 118 7.2.3 Ethnic Group 1187.3 Diagnosis 1197.4 Treatment 121 7.4.1 Iron Chelation Therapy 121 7.4.2 Serum Ferritin Level 1257.5 Observation and Comments 125
8 Negeri Sembilan 1268.1 Introduction 1268.2 Patient Demographics 126 8.2.1 Age 128 8.2.2 Gender 131 8.2.3 Ethnic Group 1318.3 Diagnosis 133
MTR Report_Part-1_PRINT_20191114_FA9.indd 5 27/11/2019 5:08 PM
8.4 Treatment 135 8.4.1 Iron Chelation Therapy 135 8.4.2 Serum Ferritin Level 1398.5 Observation and Comments 139 8.5.1 Conclusion 140
9 Pahang 1419.1 Introduction 1419.2 Patient Demographics 141 9.2.1 Age 144 9.2.2 Gender 147 9.2.3 Ethnic Group 1489.3 Diagnosis 1499.4 Treatment 151 9.4.1 Iron Chelation Therapy 151 9.4.2 Serum Ferritin Level 1579.5 Observation and Comments 157 9.5.1 Recommendations 158
10 Perak 15910.1 Introduction 15910.2 Patient Demographics 159 10.2.1 Age 161 10.2.2 Gender 164 10.2.3 Ethnic Group 16510.3 Diagnosis 16610.4 Treatment 169 10.4.1 Iron Chelation Therapy 169 10.4.2 Serum Ferritin Level 17410.5 Observation and Comments 176 10.5.1 Recommendations 176 10.5.2 Conclusions 176
11 Perlis 17711.1 Introduction 17711.2 Patient Demographics 177 11.2.1 Age 178 11.2.2 Gender 181 11.2.3 Ethnic Group 18111.3 Diagnosis 18211.4 Treatment 184 11.4.1 Iron Chelation Therapy 184 11.4.2 Serum Ferritin Level 18711.5 Observation and Comments 188 11.5.1 Recommendations 188 11.5.2 Conclusion 188
12 Pulau Pinang 18912.1 Introduction 189
MTR Report_Part-1_PRINT_20191114_FA9.indd 6 27/11/2019 5:08 PM
12.2 Patient Demographics 189 12.2.1 Age 190 12.2.2 Gender 193 12.2.3 Ethnic Group 19412.3 Diagnosis 19512.4 Treatment 197 12.4.1 Iron Chelation Therapy 197 12.4.2 Serum Ferritin Level 20212.5 Observation and Comments 202 12.5.1 Recommendations 203
13 Sabah 20313.1 Introduction 20313.2 Patient Demographics 204 13.2.1 Age 206 13.2.2 Gender 209 13.2.3 Ethnic Group 21313.3 Diagnosis 21413.4 Treatment 217 13.4.1 Iron Chelation Therapy 217 13.4.2 Serum Ferritin Level 22513.5 Observation and Comments 226 13.5.1 Recommendations 226
14 Sarawak 22714.1 Introduction 22714.2 Patient Demographics 228 14.2.1 Age 230 14.2.2 Gender 23414.3 Diagnosis 23514.4 Treatment 237 14.4.1 Iron Chelation Therapy 237 14.4.2 Serum Ferritin Level 24214.5 Complications and Deaths 24414.6 Observation and Comments 246 14.6.1 Recommendations 246
15 Selangor 24715.1 Introduction 24715.2 Patient Demographics 247 15.2.1 Age 249 15.2.2 Gender 252 15.2.3 Ethnic Group 25315.3 Diagnosis 25415.4 Treatment 257 15.4.1 Iron Chelation Therapy 257 15.4.2 Serum Ferritin Level 26315.5 Observation and Comments 264 15.5.1 Recommendations 264
MTR Report_Part-1_PRINT_20191114_FA9.indd 7 27/11/2019 5:08 PM
16 Terengganu 26516.1 Introduction 26516.2 Patient Demographics 265 16.2.1 Age 267 16.2.2 Gender 270 16.2.3 Ethnic Group 27016.3 Diagnosis 27116.4 Treatment 274 16.4.1 Iron Chelation Therapy 274 16.4.2 Serum Ferritin Level 27816.5 Observation and Comments 279 16.5.1 Recommendations 279 16.5.2 Conclusions 279
17 WilayahPersekutuanKualaLumpur 28017.1 Introduction 28017.2 Patient Demographics 280 17.2.1 Age 282 17.2.2 Gender 285 17.2.3 Ethnic Group 28617.3 Diagnosis 28717.4 Treatment 289 17.4.1 Iron Chelation Therapy 289 17.4.2 Serum Ferritin Level 294 17.4.3 Haemopoietic Transplant in Thalassaemia 29417.5 Observation and Comments 295
18 Labuan 29618.1 Introduction 29618.2 Patient Demographics 296 18.2.1 Age 297 18.2.2 Gender 300 18.2.3 Ethnic Group 30018.3 Diagnosis 30118.4 Treatment 303 18.4.1 Iron Chelation Therapy 303 18.4.2 Serum Ferritin Level 30718.5 Observations and Comments 307 18.5.1 Recommendation 307
19 Putrajaya 30819.1 Introduction 30819.2 Patient Demographics 308 19.2.1 Age 309 19.2.2 Gender 311 19.2.3 Ethnic Group 31119.3 Diagnosis 31219.4 Treatment 313 19.4.1 Iron Chelation Therapy 313 19.4.2 Serum Ferritin Level 31519.5 Observation and Comments 316
MTR Report_Part-1_PRINT_20191114_FA9.indd 8 27/11/2019 5:08 PM
List of Tables
Table 2.1 : Distribution of Patients in Malaysia by Vital Status 22Table 2.2 : Number of Thalassaemia Patients by State (2014-2018) 22Table 2.3 : Top 10 Centres in Malaysia by Number of Thalassaemia Patients 26Table 2.4 : Number of New Births by State (2011-2018) 27Table 2.5 : Cumulative Reported Number of Deaths by State until December 2018 29Table 2.6 : Cumulative Causes of Death Since 2007 29Table 2.7 : Number of Thalassaemia Patient Deaths by State (2008-2018) 30Table 2.8 : Distribution of Thalassaemia Patients According to Age Group by State 32Table 2.9 : Distribution of Patients According to Gender by State 35Table 2.10 : Distribution of Patients by Ethnic Group 37Table 2.11 : Distribution of Patients According to Major Ethnic Groups by State 38Table 2.12 : Distribution of Patients According to Major Ethnic Group Based on Geographical Region 39Table 2.13 : Distribution of Patients by Diagnosis in 2018 40Table 2.14 : Distribution of Patients According to Diagnosis by Year 40Table 2.15 : Distribution of Patients According to Diagnosis by State 41Table 2.16 : Distribution of Patients According to Diagnosis by Age Group 42Table 2.17 : Distribution of Patients According to Ethnic Group by Diagnosis 43Table 2.18 : Distribution of Patients According to Type of Iron Chelator Received 44Table 2.19 : Distribution of Patients According to Type of Iron Chelator Received by State 46Table 2.20 : Distribution of Patients According to Type of Iron Chelator Received by Age Group 50Table 2.21 : Distribution of Splenectomised Patients by State 53Table 2.22 : Distribution of Patients Receiving Regular Transfusions by State 54Table 2.23 : Total Number of Patients Receiving Regular Transfusions by Year 56Table 2.24 : Distribution of Patients According to Most Recent Serum Ferritin Levels by State in 2018 57Table 2.25 : Distribution of Patients According to Serum Ferritin Levels by Year 57Table 4.1 : Distribution of Patients by Centre in Johor 61Table 4.2 : Distribution of Patients by Vital Status in Johor 62Table 4.3 : Cumulative Causes of Death Since 2007 in Johor 62Table 4.4 : Distribution of Patients in Johor by Age Group 63Table 4.5 : Distribution of Patients in Johor According to Diagnosis by Age Group 64Table 4.6 : Distribution of Patients in Johor by Gender 66Table 4.7 : Distribution of Patients in Johor by Ethnicity 67Table 4.8 : Distribution of Patients in Johor According to Ethnic Group by Centre 68Table 4.9 : Distribution of Patients in Johor by Diagnosis 69Table 4.10 : Distribution of Patients in Johor According to Diagnosis by Centre 70Table 4.11 : Distribution of Patients in Johor According to Ethnic Group by Diagnosis 71Table 4.12 : Distribution of Patients in Johor by Type of Iron Chelator Received 72Table 4.13 : Distribution of Patients in Johor According to Type of Iron Chelator Received by Centre 73Table 4.14 : Distribution of Patients in Johor According to Type of Iron Chelator Received by Age Group 75Table 4.15 : Distribution of Patients in Johor by Most Recent Serum Ferritin Level 78Table 5.1 : Distribution of Patients in Kedah by Centre 80Table 5.2 : Distribution of Patients in Kedah by Vital Status 81Table 5.3 : Cumulative Causes of Death Since 2007 in Kedah 81Table 5.4 : Distribution of Patients in Kedah by Age Group 82Table 5.5 : Distribution of Patients in Kedah According to Diagnosis by Age Group 83Table 5.6 : Distribution of Patients in Kedah by Gender 85Table 5.7 : Distribution of Patients in Kedah by Ethnic Group 86Table 5.8 : Distribution of Patients in Kedah According to Ethnic Group by Centre 87Table 5.9 : Distribution of Patients in Kedah by Diagnosis 87Table 5.10 : Distribution of Patients in Kedah According to Diagnosis by Centre 88Table 5.11 : Distribution of Patients in Kedah According to Ethnic Group by Diagnosis 89
MTR Report_Part-1_PRINT_20191114_FA9.indd 9 27/11/2019 5:08 PM
Table 5.12 : Distribution of Patients in Kedah by Type of Iron Chelator Received 89Table 5.13 : Distribution of Patients in Kedah According to Type of Iron Chelator Received by Centre 90Table 5.14 : Distribution of Patients in Kedah According to Type of Iron Chelator Received by Age Group 92Table 5.15 : Distribution of Patients in Kedah by Most Recent Serum Ferritin Level 95Table 6.1 : Distribution of Patients in Kelantan by Centre 97Table 6.2 : Distribution of Patients in Kelantan by Vital Status 98Table 6.3 : Cumulative Causes of Death Since 2007 in Kelantan 99Table 6.4 : Distribution of Patients in Kelantan by Age Group 99Table 6.5 : Distribution of Patients in Kelantan According to Diagnosis by Age Group 100Table 6.6 : Distribution of Patients in Kelantan by Gender 102Table 6.7 : Distribution of Patients in Kelantan by Ethnic Group 103Table 6.8 : Distribution of Patients in Kelantan According to Ethnic Group by Centre 104Table 6.9 : Distribution of Patients in Kelantan by Diagnosis 105Table 6.10 : Distribution of Patients in Kelantan According to Diagnosis by Centre 105Table 6.11 : Distribution of Patients in Kelantan According to Ethnic Group by Diagnosis 106Table 6.12 : Distribution of Patients in Kelantan by Type of Iron Chelator Received 107Table 6.13 : Distribution of Patients in Kelantan According to Type of Iron Chelator Received by Centre 107Table 6.14 : Distribution of Patients in Kelantan According to Type of Iron Chelator Received by Age Group 110Table 6.15 : Distribution of Patients in Kelantan by Most Recent Serum Ferritin Level 113Table 7.1 : Distribution of Patients in Melaka by Centre 114Table 7.2 : Distribution of Patients in Melaka by Vital Status 115Table 7.3 : Cumulative Causes of Death Since 2007 in Melaka 115Table 7.4 : Distribution of Patients in Melaka by Age Group 115Table 7.5 : Distribution of Patients in Melaka According to Diagnosis by Age Group 116Table 7.6 : Distribution of Patients in Melaka by Gender 117Table 7.7 : Distribution of Patients in Melaka by Ethnic Group 118Table 7.8 : Distribution of Patients in Melaka According to Ethnic Group by Centre 119Table 7.9 : Distribution of Patients in Melaka by Diagnosis 119Table 7.10 : Distribution of Patients in Melaka According to Diagnosis by Centre 120Table 7.11 : Distribution of Patients in Melaka According to Ethnic Group by Diagnosis 120Table 7.12 : Distribution of Patients in Melaka by Type of Iron Chelator Received 121Table 7.13 : Distribution of Patients in Melaka According to Type of Iron Chelator Received by Centre 122Table 7.14 : Distribution of Patients in Melaka According to Type of Iron Chelator Received by Age Group 123Table 7.15 : Distribution of Patients in Melaka by Most Recent Serum Ferritin Level 125Table 8.1 : Distribution of Patients in Negeri Sembilan by Centre 126Table 8.2 : Distribution of Patients in Negeri Sembilan by Vital Status 127Table 8.3 : Cumulative Causes of Death Since 2007 in Negeri Sembilan 127Table 8.4 : Distribution of Patients in Negeri Sembilan by Age Group 128Table 8.5 : Distribution of Patients in Negeri Sembilan According to Diagnosis by Age Group 129Table 8.6 : Distribution of Patients in Negeri Sembilan According to Gender by Centre 131Table 8.7 : Distribution of Patients in Negeri Sembilan by Ethnic Group 132Table 8.8 : Distribution of Patients in Negeri Sembilan According to Ethnic Group by Centre 132Table 8.9 : Distribution of Patients in Negeri Sembilan by Diagnosis 133Table 8.10 : Distribution of Patients in Negeri Sembilan According to Diagnosis by Centre 133Table 8.11 : Distribution of Patients in Negeri Sembilan According to Ethnic Group by Diagnosis 134Table 8.12 : Distribution of Patients in Negeri Sembilan by Type of Iron Chelator Received 135Table 8.13 : Distribution of Patients in Negeri Sembilan According to Type of Iron Chelator Received by Centre 135Table 8.14 : Distribution of Patients in Negeri Sembilan According to Type of Iron Chelator Received by Age Group 137
List of Tables
MTR Report_Part-1_PRINT_20191114_FA9.indd 10 27/11/2019 5:08 PM
Table 8.15 : Distribution of Patients in Negeri Sembilan by Most Recent Serum Ferritin Level 139Table 9.1 : Distribution of Patients in Pahang by Centre 141Table 9.2 : Distribution of Patients in Pahang by Vital Status 142Table 9.3 : Cumulative Causes of Death Since 2007 in Pahang 143Table 9.4 : Number of New Thalassaemia Cases and Births in Pahang by Year 143Table 9.5 : Distribution of Patients in Pahang by Age Group 144Table 9.6 : Distribution of Patients in Pahang According to Diagnosis by Age Group 145Table 9.7 : Distribution of Patients in Pahang by Gender 147Table 9.8 : Distribution of Patients in Pahang by Ethnic Group 148Table 9.9 : Distribution of Patients in Pahang According to Ethnic Group by Centre 148Table 9.10 : Distribution of Patients in Pahang by Diagnosis 149Table 9.11 : Distribution of Patients in Pahang According to Diagnosis by Centre 150Table 9.12 : Distribution of Patients in Pahang According to Ethnic Group by Diagnosis 150Table 9.13 : Distribution of Patients in Pahang by Type of Iron Chelator Received 152Table 9.14 : Distribution of Patients in Pahang According to Type of Iron Chelator Received by Centre 152Table 9.15 : Distribution of Patients in Pahang According to Type of Iron Chelator Received by Age Group 154Table 9.16 : Distribution of Patients in Pahang According to Most Recent Serum Ferritin Level by Centre 157Table 10.1 : Distribution of Patients in Perak by Centre 159Table 10.2 : Distribution of Patients in Perak by Vital Status 160Table 10.3 : Cumulative Causes of Death Since 2007 in Perak 160Table 10.4 : Distribution of Patients in Perak by Age Group 161Table 10.5 : Distribution of Patients in Perak According to Diagnosis by Age Group 162Table 10.6 : Distribution of Patients in Perak by Gender 164Table 10.7 : Distribution of Patients in Perak by Ethnic Group 165Table 10.8 : Distribution of Patients in Perak According to Ethnic Group by Centre 166Table 10.9 : Distribution of Patients in Perak by Diagnosis 166Table 10.10 : Distribution of Patients in Perak According to Diagnosis by Centre 167Table 10.11 : Distribution of of Patients in Perak According to Ethnic Group by Diagnosis 168Table 10.12 : Distribution of Patients in Perak by Type of Iron Chelator Received 169Table 10.13 : Distribution of Patients in Perak According to Type of Iron Chelator Received by Centre 169Table 10.14 : Distribution of Patients in Perak According to Type of Iron Chelator Received by Age Group 171Table 10.15 : Distribution of Patients in Perak According to Most Recent Serum Ferritin Level by Centre 174Table 10.16 : Distribution of TDT Patients in Perak According to Most Recent Serum Ferritin Level by Centre 175Table 11.1 : Distribution of Patients in Perlis by Centre 177Table 11.2 : Distribution of Patients in Perlis by Vital Status 177Table 11.3 : Cumulative Causes of Death Since 2007 in Perlis 177Table 11.4 : Distribution of Patients in Perlis by Age Group 178Table 11.5 : Distribution of Patients in Perlis According to Diagnosis by Age Group 179Table 11.6 : Distribution of Patients in Perlis by Gender 181Table 11.7 : Distribution of Patients in Perlis by Ethnic Group 181Table 11.8 : Distribution of Patients in Perlis by Diagnosis 182Table 11.9 : Distribution of Patients in Perlis According to Ethnic Group by Diagnosis 183Table 11.10 : Distribution of Patients in Perlis by Type of Iron Chelator Received 184Table 11.11 : Distribution of Patients in Perlis According to Type of Iron Chelator Received by Age Group 185Table 11.12 : Distribution of Patients in Perlis According to Most Recent Serum Ferritin Level by Centre 187Table 12.1 : Distribution of Patients in Pulau Pinang by Centre 189Table 12.2 : Distribution of Patients in Pulau Pinang by Vital Status 189Table 12.3 : Cumulative Cause of Death Since 2007 in Pulau Pinang 190Table 12.4 : Distribution of Patients in Pulau Pinang by Age Group 190Table 12.5 : Distribution of Patients in Pulau Pinang According to Diagnosis by Age Group 191
MTR Report_Part-1_PRINT_20191114_FA9.indd 11 27/11/2019 5:08 PM
List of Tables
Table 12.6 : Distribution of Patients in Pulau Pinang by Gender 193Table 12.7 : Distribution of Patients in Pulau Pinang by Ethnic Group 194Table 12.8 : Distribution of Patients in Pulau Pinang According to Ethnic Group by Centre 195Table 12.9 : Distribution of Patients in Pulau Pinang by Diagnosis 195Table 12.10 : Distribution of Patients in Pulau Pinang According to Diagnosis by Centre 196Table 12.11 : Distribution of Patients in Pulau Pinang According to Diagnosis by Ethnic Group 196Table 12.12 : Distribution of Patients in Pulau Pinang According to Most Recent Serum Ferritin Level by Centre 197Table 12.13 : Distribution of Patients in Pulau Pinang According to Type of Iron Chelator Received by Centre 198Table 12.14 : Distribution of Patients in Pulau Pinang According to Type of Iron Chelator Received by Age Group 199Table 12.15 : Distribution of Patients in Pulau Pinang According to Most Recent Serum Ferritin Level by Centre 202Table 13.1 : Population of Sabah by Ethnicity 203Table 13.2 : The Five Administrative Divisions of Sabah and Prevalence of Thalassaemia Patients in These Divisions 203Table 13.3 : Distribution of Thalassaemia Patients in Each Treatment Centre in Sabah and Estimated Prevalence Rate in the Respective City/Town 204Table 13.4 : Distribution of Patients in Sabah by Vital Status 205Table 13.5 : Cumulative Causes of Death Since 2007 in Sabah 205Table 13.6 : Distribution of Patients in Sabah by Age Group 206Table 13.7 : Distribution of Patients in Sabah According to Diagnosis by Age Group 207Table 13.8 : Distribution of Patients in Sabah by Gender 210Table 13.9 : Distribution of Patients in Sabah by Ethnic Group 211Table 13.10 : Distribution of Patients in Sabah According to Ethnic Group by Centre 213Table 13.11 : Distribution of Patients in Sabah by Diagnosis 214Table 13.12 : Distribution of Patients in Sabah According to Diagnosis by Centre 215Table 13.13 : Distribution of Patients in Sabah According to Diagnosis by Ethnic Group 215Table 13.14 : Distribution of Patients in Sabah by Type of Iron Chelator Received 217Table 13.15 : Distribution of Patients in Sabah According to Type of Iron Chelator Received by Centre 217Table 13.16 : Distribution of Patients in Sabah According to Type of Iron Chelator Received by Age Group 222Table 13.17 : Distribution of Patients in Sabah According to Most Recent Serum Ferritin Level by Centre 225Table 14.1 : Population of Thalassaemia Patients in Sarawak by District 227Table 14.2 : Distribution of Patients in Sarawak by Centre 228Table 14.3 : Distribution of Patients in Sarawak by Vital Status 229Table 14.4 : Distribution of Patients in Sarawak by Age Group 230Table 14.5 : Distribution of TDT and NTDT (Alpha and Beta Thalassaemia) Patients in Sarawak by Age Group 231Table 14.6 : Distribution of Patients in Sarawak According to Diagnosis by Age Group 232Table 14.7 : Distribution of Patients in Sarawak According to Gender by Centre 234Table 14.8 : Distribution of Patients in Sarawak by Diagnosis 235Table 14.9 : Distribution of Patients in Sarawak According to Diagnosis by Centre 236Table 14.10 : Distribution of Patients in Sarawak According to Diagnosis by Ethnic Group 236Table 14.11 : Distribution of Patients in Sarawak by Type of Iron Chelator Received 237Table 14.12 : Distribution of Patients in Sarawak According to Type of Iron Chelator Received by Centre 238Table 14.13 : Distribution of Patients in Sarawak According to Type of Iron Chelator Received by Age Group 240Table 14.14 : Distribution of Patients in Sarawak According to Most Recent Serum Ferritin Level by Centre 242Table 14.15 : Distribution of TDT Patients in Sarawak According to Most Recent Serum Ferritin Level by Age Group 243
MTR Report_Part-1_PRINT_20191114_FA9.indd 12 27/11/2019 5:08 PM
Table 14.16 : Distribution of NTDT Patients in Sarawak According to Most Recent Serum Ferritin Level by Age Group 244Table 14.17 : Distribution of Patients in Sarawak According to Transfusion Status by Centre 244Table 14.18 : Infectious Complications in Thalassaemia Patients Above 15 Years Old in Sarawak 244Table 14.19 : Endocrine Complications in Patients Above 15 Years Old in Sarawak Receiving Iron Chelation Therapy 245Table 14.20 : Cardiac Complication in Patients in Sarawak 245Table 14.21 : Causes of Death of Patients in Sarawak 245Table 15.1 : Distribution of Patients in Selangor by Centre 247Table 15.2 : Distribution of Patients in Selangor by Vital Status 248Table 15.3 : Cumulative Causes of Death since 1997 in Selangor 248Table 15.4 : Distribution of Patients in Selangor by Age Group 249Table 15.5 : Distribution of Patients in Selangor According to Diagnosis by Age Group 250Table 15.6 : Distribution of Patients in Selangor According to Gender by Centre 252Table 15.7 : Distribution of Patients in Selangor by Ethnic Group 253Table 15.8 : Distribution of Patients in Selangor According to Ethnic Group by Centre 254Table 15.9 : Distribution of Patients in Selangor by Diagnosis 254Table 15.10 : Distribution of Patients in Selangor According to Diagnosis by Centre 255Table 15.11 : Distribution of Patients in Selangor According to Ethnic Group by Diagnosis 256Table 15.12 : Distribution of Patients in Selangor by Type of Iron Chelator Received 257Table 15.13 : Distribution of Patients in Selangor According to Type of Iron Chelator Received by Centre 257Table 15.14 : Distribution of Patients in Selangor According to Type of Iron Chelator Received by Age Group 260Table 15.15 : Distribution of Patients in Selangor According to Most Recent Serum Ferritin Level by Centre in 2018 263Table 16.1 : Distribution of Patients in Terengganu by Centre 265Table 16.2 : Distribution of Patients in Terengganu by Vital Status 266Table 16.3 : Cumulative Causes of Death in Terengganu 266Table 16.4 : Distribution of Patients in Terengganu by Age Group 267Table 16.5 : Distribution of of Patients in Terengganu According to Diagnosis by Age Group 268Table 16.6 : Distribution of Patients in Terengganu According to Gender by Centre 270Table 16.7 : Distribution of Patients in Terengganu by Ethnic Group 270Table 16.8 : Distribution of Patients in Terengganu According to Ethnic Group by Centre 271Table 16.9 : Distribution of Patients in Terengganu by Diagnosis 271Table 16.10 : Distribution of Patients in Terengganu According to Diagnosis by Centre 272Table 16.11 : Distribution of Patients in Terengganu According to Ethnic Group by Diagnosis 273Table 16.12 : Distribution of Patients in Terengganu by Type of Iron Chelator Received 274Table 16.13 : Distribution of Patients in Terengganu According to Type of Iron Chelator Received by Centre 274Table 16.14 : Distribution of Patients in Terengganu According to Type of Iron Chelator Received by Age Group 276Table 16.15 : Distribution of Patients in Terengganu According to Most Recent Serum Ferritin Level by Centre 279Table 17.1 : Distribution of Patients in Kuala Lumpur by Centre 280Table 17.2 : Distribution of Patients in Kuala Lumpur by Vital Status 281Table 17.3 : Cumulative Causes of Death Since 1997 in Kuala Lumpur 281Table 17.4 : Distribution of Patients in Kuala Lumpur by Age Group 282Table 17.5 : Distribution of Patients in Kuala Lumpur According to Diagnosis by Age Group 283Table 17.6 : Distribution of Patients in Kuala Lumpur by Gender 285Table 17.7 : Distribution of Patients in Kuala Lumpur by Ethnic Group 286Table 17.8 : Distribution of Patients in Kuala Lumpur According to Ethnic Group by Centre 287Table 17.9 : Distribution of Patients in Kuala Lumpur by Diagnosis 287Table 17.10 : Distribution of Patients in Kuala Lumpur According to Diagnosis by Centre 288
MTR Report_Part-1_PRINT_20191114_FA9.indd 13 27/11/2019 5:08 PM
List of Tables
Table 17.11 : Distribution of Patients in Kuala Lumpur According to Ethnic Group by Diagnosis 288Table 17.12 : Distribution of Patients in Kuala Lumpur by Type of Iron Chelator Received 289Table 17.13 : Distribution of Patients in Kuala Lumpur According to Type of Iron Chelator Received by Centre 290Table 17.14 : Distribution of Patients in Kuala Lumpur According to Type of Iron Chelator Received by Age Group 291Table 17.15 : Distribution of Patients in Kuala Lumpur According to Serum Ferritin Level in 2017 by Centre 294Table 17.16 : Distribution of Patients in Kuala Lumpur According to Serum Ferritin Level in 2018 by Centre 294Table 18.1 : Distribution of Patients in Labuan by Vital Status 296Table 18.2 : Cumulative Causes of Death Since 2007 in Labuan 296Table 18.3 : Distribution of Patients in Labuan by Age Group 297Table 18.4 : Distribution of Patients in Labuan According to Age Group by Diagnosis 298Table 18.5 : Distribution of Patients in Labuan by Gender 300Table 18.6 : Distribution of Patients in Labuan by Ethnic Group 300Table 18.7 : Distribution of Patients in Labuan by Diagnosis 301Table 18.8 : Distribution of Patients in Labuan According to Ethnic Group by Diagnosis 302Table 18.9 : Distribution of Patients in Labuan by Type of Iron Chelator Received 303Table 18.10 : Distribution of Patients in Labuan According to Type of Iron Chelator Received by Age Group 304Table 18.11 : Distribution of Patients in Labuan According to Most Recent Serum Ferritin Level 307Table 19.1 : Distribution of Patients in Putrajaya by Centre 308Table 19.2 : Distribution of Patients in Putrajaya by Vital Status 308Table 19.3 : Cumulative Cause of Death Since 1997 in Putrajaya 308Table 19.4 : Distribution of Patients in Putrajaya by Age Group 309Table 19.5 : Distribution of Patients in Putrajaya According to Diagnosis by Age Group 310Table 19.6 : Distribution of Patients in Putrajaya by Gender 311Table 19.7 : Distribution of Patients in Putrajaya by Ethnic Group 311Table 19.8 : Distribution of Patients in Putrajaya by Ethnic Group by Centre 312Table 19.9 : Distribution of Patients in Putrajaya by Diagnosis 312Table 19.10 : Distribution of Patients in Putrajaya According to Ethnic Group by Diagnosis 313Table 19.11 : Distribution of Patients in Putrajaya by Type of Iron Chelator Received 313Table 19.12 : Distribution of Patients in Putrajaya According to Type of Iron Chelator Received by Age Group 314Table 19.13 : Distribution of Patients in Putrajaya According to Most Recent Serum Ferritin Level in 2018 315
MTR Report_Part-1_PRINT_20191114_FA9.indd 14 27/11/2019 5:08 PM
List of Figures
Figure 2.1 : Total Number of Thalassaemia Patients by State in 2018 23Figure 2.2 : Total Number of Patients by Year (2007-2018) 24Figure 2.3 : Total Number of Patients by State (2007-2018) 25Figure 2.4 : Total Number of New Births (2011-2018) 27Figure 2.5 : Number of New Births by State (2013-2018) 28Figure 2.6 : Total Number of Deaths by Year (2008-2018) 30Figure 2.7 : Total Number of Deaths by State (2008-2018) 31Figure 2.8 : Total Number of Patients by Age Group 33Figure 2.9 : Distribution of Patients According to Age Group by State 34Figure 2.10 : Distribution of Patients by Gender 35Figure 2.11 : Distribution of Patients According to Gender by State 36Figure 2.12 : Distribution of Patients by Ethnic Group 37Figure 2.13 : Distribution of Patients According to Major Ethnic Groups by Geographical Region 39Figure 2.14 : Distribution of Patients by Diagnosis 41Figure 2.15 : Distribution of Patients According to Diagnosis by State 42Figure 2.16 : Percentage Breakdown of Diagnoses by Ethnic Group 43Figure 2.17 : Distribution of Patients According to Type of Iron Chelator Received 45Figure 2.18 : Distribution of Patients According to Type of Iron Chelator Received by State in 2017 45Figure 2.19 : Distribution of Patients According to Type of Iron Chelator Received by State 49Figure 2.20 : Distribution of Splenectomised Patients by State 53Figure 2.21 : Distribution of Patients Receiving Regular Transfusions by State 55Figure 2.22 : Total Number of Transfusions by State 55Figure 2.23 : Distribution of Patients According to Serum Ferritin Levels by Year 58Figure 2.24 : Treatment Analysis 59Figure 4.1 : Distribution of Patients by Centre in Johor 62Figure 4.2 : Distribution of New Thalassaemia Births in Johor, According to Type of Thalassaemia by Year 63Figure 4.3 : Distribution of Patients in Johor by Age Group 64Figure 4.4 : Distribution of Patients in Johor by Gender 67Figure 4.5 : Distribution of Patients in Johor by Ethnic Group 67Figure 4.6 : Distribution of Patients in Johor According to Ethnic Group by Centre 68Figure 4.7 : Distribution of Patients in Johor by Diagnosis 69Figure 4.8 : Distribution of Patients in Johor According to Type of Thalassaemia by Age Group 70Figure 4.9 : Distribution of Patients in Johor by Type of Iron Chelator Received 72Figure 4.10 : Distribution of Patients in Johor According to Type of Iron Chelator Received by Age Group 78Figure 5.1 : Distribution of Patients in Kedah by Centre 80Figure 5.2 : Distribution of Patients in Kedah by Age Group 82Figure 5.3 : Distribution of Patients in Kedah by Gender 85Figure 5.4 : Distribution of Patients in Kedah by Ethnic Group 86Figure 5.5 : Distribution of Patients in Kedah by Diagnosis 88Figure 5.6 : Distribution of Patients in Kedah by Type of Iron Chelator Received 92Figure 6.1 : Distribution of Patients in Kelantan by Centre 98Figure 6.2 : Distribution of Patients in Kelantan by Age Group 100Figure 6.3 : Distribution of Patients in Kelantan by Gender 103Figure 6.4 : Distribution of Patients in Kelantan by Ethnic Group 104Figure 6.5 : Distribution of Patients in Kelantan by Diagnosis 105Figure 6.6 : Distribution of Patients in Kelantan by Type of Iron Chelator Received 109Figure 7.1 : Distribution of Patients in Melaka by Centre 114Figure 7.2 : Distribution of Patients in Melaka by Age Group 116Figure 7.3 : Distribution of Patients in Melaka by Gender 118Figure 7.4 : Distribution of Patients in Melaka by Ethnic Group 119
MTR Report_Part-1_PRINT_20191114_FA9.indd 15 27/11/2019 5:08 PM
List of Figures
Figure 7.5 : Distribution of Patients in Melaka by Diagnosis 120Figure 7.6 : Distribution of Patients in Melaka by Type of Iron Chelator Received 122Figure 8.1 : Distribution of Patients in Negeri Sembilan by Centre 127Figure 8.2 : Distribution of Patients in Negeri Sembilan by Age Group 128Figure 8.3 : Distribution of Patients in Negeri Sembilan by Gender 131Figure 8.4 : Distribution of Patients in Negeri Sembilan by Ethnic Group 132Figure 8.5 : Distribution of Patients in Negeri Sembilan by Diagnosis 133Figure 8.6 : Distribution of Patients in Negeri Sembilan by Type of Iron Chelator Received 136Figure 9.1 : Distribution of Patients in Pahang by Centre 142Figure 9.2 : Distribution of Patients in Pahang by Age Group 144Figure 9.3 : Distribution of Patients in Pahang by Gender 147Figure 9.4 : Distribution of Patients in Pahang by Ethnic Group 148Figure 9.5 : Distribution of Patients in Pahang by Diagnosis 149Figure 9.6 : Distribution of Alpha Thalassaemia Patients in Pahang by Ethnicity 151Figure 9.7 : Distribution ofBeta Thalassaemia Patients in Pahang by Ethnicity 151Figure 9.8 : Distribution of Patients by Type of Iron Chelator Received 154Figure 10.1 : Distribution of Patients in Perak by Centre 160Figure 10.2 : Distribution of Patients in Perak by Age Group 161Figure 10.3 : Distribution of Patients in Perak by Gender 164Figure 10.4 : Distribution of Patients in Perak by Ethnic Group 165Figure 10.5 : Distribution of Patients in Perak by Diagnosis 167Figure 10.6 : Distribution of Patients in Perak by Type of Iron Chelator Received 171Figure 10.7 : Distribution of Patients in Perak by Most Recent Serum Ferritin Level 175Figure 11.1 : Distribution of Patients in Perlis by Age Group 178Figure 11.2 : Distribution of Patients in Perlis by Gender 181Figure 11.3 : Distribution of Patients in Perlis by Ethnic Group 182Figure 11.4 : Distribution of Patients in Perlis by Diagnosis 183Figure 11.5 : Distribution of Patients in Perlis by Type of Iron Chelator Received 184Figure 12.1 : Distribution of Patients in Pulau Pinang by Centre 189Figure 12.2 : Distribution of Age Patients in Pulau Pinang by Age Group 191Figure 12.3 : Distribution of Patients in Pulau Pinang by Gender 193Figure 12.4 : Distribution of Patients in Pulau Pinang by Ethnic Group 194Figure 12.5 : Distribution of Population of Pulau Pinang by Ethnic Group 195Figure 12.6 : Distribution of Patients in Pulau Pinang by Diagnosis 196Figure 12.7 : Distribution of Patients in Pulau Pinang by Type of Iron Chelator Received 198Figure 13.1 : Distribution of Patients in Sabah by Centre 205Figure 13.2 : Distribution of Patients in Sabah by Age Group 207Figure 13.3 : Distribution of Patients in Sabah by Gender 209Figure 13.4 : Distribution of Patients in Sabah by Ethnic Group 212Figure 13.5 : Distribution of Patients in Sabah by Ethnic Sub-Group 212Figure 13.6 : Distribution of Patients in Sabah by Diagnosis 214Figure 13.7 : Distribution of Patients in Sabah by Type of Iron Chelator Received 222Figure 14.1 : Distribution of Patients in Sarawak by Centre 229Figure 14.2 : New Thalassaemia Births in Sarawak by Year 229Figure 14.3 : Distribution of Patients in Sarawak by Age Group 230Figure 14.4 : Distribution of TDT and NTDT (Alpha and Beta Thalassaemia) Patients in Sarawak by Age Group 231Figure 14.5 : Distribution of Patients in Sarawak by Gender 234Figure 14.6 : Distribution of Patients in Sarawak by Diagnosis 235Figure 14.7 : Distribution of Patients in Sarawak by Type of Iron Chelator Received 239Figure 14.8 : Distribution of Patients in Sarawak According to Most Recent Serum Ferritin Level 243
MTR Report_Part-1_PRINT_20191114_FA9.indd 16 27/11/2019 5:08 PM
Figure 15.1 : Distribution of Patients in Selangor by Centre 248Figure 15.2 : Distribution of Patients in Selangor by Age Group 249Figure 15.3 : Distribution of Patients in Selangor by Gender 252Figure 15.4 : Distribution of Patients in Selangor by Ethnic Group 253Figure 15.5 : Distribution of Patients in Selangor by Diagnosis 255Figure 15.6 : Distribution of Patients in Selangor by Type of Iron Chelator Received 260Figure 16.1 : Distribution of Patients in Terengganu by Centre 266Figure 16.2 : Distribution of Patients in Terengganu by Age Group 267Figure 16.3 : Distribution of Patients in Terengganu by Gender 270Figure 16.4 : Distribution of Patients in Terengganu by Ethnic Group 271Figure 16.5 : Distribution of Patients in Terengganu by Diagnosis 272Figure 16.6 : Distribution of Patients in Terengganu by Type of Iron Chelator Received 275Figure 17.1 : Distribution of Patients in Kuala Lumpur by Centre 281Figure 17.2 : Distribution of Patients in Kuala Lumpur by Age Group 282Figure 17.3 : Distribution of Patients in Kuala Lumpur by Gender 285Figure 17.4 : Distribution of Patients in Kuala Lumpur by Ethnic Group 286Figure 17.5 : Distribution of Patients in Kuala Lumpur by Diagnosis 288Figure 17.6 : Distribution of Patients in Kuala Lumpur by Type of Iron Chelator Received 290Figure 17.7 : Number of Thalassaemia Patients Who Underwent Stem Cell Transplant at IPHKL by Year 294Figure 18.1 : Distribution of Patients in Labuan by Age Group 297Figure 18.2 : Distribution of Patients in Labuan by Gender 300Figure 18.3 : Distribution of Patients in Labuan by Ethnic Group 301Figure 18.4 : Distribution of Patients in Labuan by Diagnosis 302Figure 18.5 : Distribution of Patients in Labuan by Type of Iron Chelator Received 304Figure 19.1 : Distribution of Patients in Putrajaya by Age Group 309Figure 19.2 : Distribution of Patients in Putrajaya by Gender 311Figure 19.3 : Distribution of Patients in Putrajaya by Ethnic Group 312Figure 19.4 : Distribution of Patients in Putrajaya by Diagnosis 313Figure 19.5 : Distribution of Patients in Putrajaya by Type of Iron Chelator Received 314
MTR Report_Part-1_PRINT_20191114_FA9.indd 17 27/11/2019 5:08 PM
18
MA
LAYS
IAN
TH
ALA
SSA
EMIA
REG
ISTR
YRE
PORT
201
8
Introduction1
1.1 Thalassaemia
Thalassaemia is the most common autosomal recessive disorder involving abnormal haemoglobin formation, with high prevalence in tropical countries including Malaysia. The reduced production or abnormality in one or more of the four globin subunits of haemoglobin would result in thalassaemia. It is estimated that about five percent of Malaysians are carriers, with the majority having alpha or beta thalassaemia with compound heterozygosity with other haemoglobinopathies.
Beta thalassaemia major produces severe anaemia that requires life-long blood transfusion for survival. The molecular defects producing beta thalassaemia are heterogeneous with each ethnic group having unique mutations. Alpha-thalassaemia major is also not uncommon. The fatal form of the condition Hb Bart’s hydrops fetalis, is present mainly among the Malaysian Chinese. Thalassaemia is more prominent among the Malay and Kadazan-Dusun ethnicities and it has rarely been observed in the Malaysian Indians. There is very little information regarding thalassaemia in the indigenous population of Peninsular Malaysia.
Regular blood transfusions are the mainstay of treatment for the thalassaemia major patients. The treatment results in transfusional iron overload which requires expensive iron chelation therapy. Unbridled chronic tissue iron deposition would result in hepatic dysfunction and failure, endocrinopathies, cardiac dysfunction and premature death. Clinical datasets documenting the trajectory of thalassaemia patients in the country would assist in its management as well as provide valuable insight on patient outcome and the national healthcare burden for this life-long chronic disorder.
1.2 Malaysian Thalassaemia Registry
The Malaysian Thalassaemia Registry (MTR) is a national registry for all thalassaemia patients who received treatment at hospitals under the Ministry of Health Malaysia and three main university hospitals. This registry provides comprehensive updated information on thalassaemia patients, including their socio-demographic, clinical records, type of treatment received, death records and other complications collated over the years, to give an overview of thalassaemia prevalence and incidence across the country as well as its clinical outcome.
The registry is a web-based system accessed by different users who have been enrolled through the website vortal: www.mytalasemia.net.my
MyTalasemia is a portal that takes a holistic approach in its implementation recognising that managing thalassaemia requires concerted action by all stakeholders including patients, medical professionals, the public and the government.
1.3 Demographics of Malaysia
Malaysia consists of thirteen states and three federal territories. Eleven states and two federal territories are located on the Malay Peninsula, collectively called Peninsular Malaysia or West Malaysia. The other two states are on the island of Borneo, and the remaining one federal territory consists of islands offshore of Borneo; these are collectively referred to as East Malaysia or Malaysian Borneo.
The states and federal territories of Malaysia are as follows:
1. Johor 9. Pulau Pinang 2. Kedah 10. Sabah3. Kelantan 11. Sarawak4. Melaka 12. Selangor5. Negeri Sembilan 13. Terengganu6. Pahang 14. Wilayah Persekutuan Kuala Lumpur7. Perak 15. Wilayah Persekutuan Labuan8. Perlis 16. Wilayah Persekutuan Putrajaya
MTR Report_Part-1_PRINT_20191114_FA9.indd 18 27/11/2019 5:08 PM
19
MA
LAYSIAN
THA
LASSA
EMIA
REGISTRY
REPORT 2018
1.3.1 Population of Malaysia
Malaysia is a fast-developing country in Southeast Asia with a population of 32.5 million in the third quarter (Q3) of 2018. According to the 2010 census, the population consists of a majority of Malays (50.8%) in addition to other ethnic groups, mainly Chinese (21%), Indian (6%) and other minority groups forming the remaining 11% of the population.
The Malays were the original inhabitants of peninsular Malaysia and together with the indigenous peoples in Sabah and Sarawak (known as “Bumiputera”) form the largest community in Malaysia at 62%. Malaysian Chinese are descendants of migrants from South China, while Malaysian Indians were descended from migrants from Southern India. Aboriginal people known as Orang Asli are present in the east and peninsular Malaysia.
1.4 Data Collection
Data were manually entered into the electronic database on MyTalasemia. The types of data collected are guided by the registry design with data elements grouped into several categories including socio-demographic, clinical characteristics, laboratory test results, types of treatment received, death records and other complications.
The management of registry data requires attention to detail, constant feedback to the participating centre Research Assistants (RA) to complete datasets, and effort to update patients’ new information in a timely manner.
1.5 Participating Centres
1.5.1 Johor1. Hospital Sultanah Nora Ismail, Batu Pahat2. Hospital Sultan Ismail, Johor Bahru3. Hospital Enche’ Besar Hajjah Khalsom, Kluang4. Hospital Kota Tinggi5. Hospital Mersing6. Hospital Pakar Sultanah Fatimah, Muar7. Hospital Pontian8. Hospital Segamat9. Hospital Sultanah Aminah, Johor Bahru10. Hospital Temenggung Seri Maharaja Tun Ibrahim, Kulai11. Hospital Tangkak
1.5.2 Kedah1. Hospital Sultanah Bahiyah, Alor Setar2. Hospital Kulim3. Hospital Sultan Abdul Halim, Sungai Petani4. Hospital Baling5. Hospital Jitra6. Hospital Kuala Nerang7. Hospital Langkawi8. Hospital Sik9. Hospital Yan
MTR Report_Part-1_PRINT_20191114_FA9.indd 19 27/11/2019 5:08 PM
20
MA
LAYS
IAN
TH
ALA
SSA
EMIA
REG
ISTR
YRE
PORT
201
8
1 Introduction
1.5.3 Kelantan1. Hospital Gua Musang2. Hospital Raja Perempuan Zainab II, Kota Bharu3. Hospital Kuala Krai4. Hospital Machang5. Hospital Pasir Mas6. Hospital Tanah Merah7. Hospital Tengku Anis, Pasir Puteh8. Hospital Tumpat9. Hospital Universiti Sains Malaysia, Kubang Kerian10. Hospital Jeli
1.5.4 Melaka1. Hospital Melaka2. Hospital Alor Gajah3. Hospital Jasin
1.5.5 Negeri Sembilan1. Hospital Tuanku Ja’afar, Seremban2. Hospital Tuanku Ampuan Najihah, Kuala Pilah3. Hospital Jelebu4. Hospital Port Dickson5. Hospital Tampin
1.5.6 Pahang1. Hospital Bentong2. Hospital Jengka3. Hospital Jerantut4. Hospital Kuala Lipis5. Hospital Muadzam Shah6. Hospital Raub7. Hospital Sultan Haji Ahmad Shah, Temerloh8. Hospital Tengku Ampuan Afzan, Kuantan9. Hospital Pekan10. Hospital Sultanah Hajjah Kalsom, Cameron Highlands
1.5.7 Perak1. Hospital Raja Permaisuri Bainun, Ipoh2. Hospital Kuala Kangsar3. Hospital Seri Manjung4. Hospital Slim River5. Hospital Taiping6. Hospital Teluk Intan7. Hospital Gerik
1.5.8 Perlis1. Hospital Tuanku Fauziah, Kangar
1.5.9 Pulau Pinang1. Hospital Pulau Pinang2. Hospital Seberang Jaya
1.5.10 Sabah1. Hospital Beaufort2. Hospital Beluran3. Hospital Duchess of Kent, Sandakan4. Hospital Keningau5. Hospital Kinabatangan6. Hospital Kota Belud7. Hospital Kota Marudu
MTR Report_Part-1_PRINT_20191114_FA9.indd 20 27/11/2019 5:08 PM
21
MA
LAYSIAN
THA
LASSA
EMIA
REGISTRY
REPORT 2018
1Introduction
8. Hospital Kuala Penyu9. Hospital Kudat10. Hospital Kunak11. Hospital Lahad Datu12. Hospital Wanita & Kanak-Kanak Sabah, Likas13. Hospital Papar14. Hospital Pitas15. Hospital Queen Elizabeth, Kota Kinabalu16. Hospital Ranau17. Hospital Semporna18. Hospital Sipitang19. Hospital Tambunan20. Hospital Tawau21. Hospital Tenom
1.5.11 Sarawak1. Hospital Bintulu2. Hospital Umum Sarawak, Kuching3. Hospital Lawas4. Hospital Limbang5. Hospital Miri6. Hospital Sibu7. Hospital Sarikei8. Hospital Sri Aman9. Hospital Betong
1.5.12 Selangor1. Hospital Ampang2. Hospital Banting3. Hospital Kajang4. Hospital Kuala Kubu Bharu5. Hospital Selayang6. Hospital Serdang7. Hospital Sungai Buloh8. Hospital Tanjung Karang9. Hospital Tengku Ampuan Jemaah, Sabak Bernam10. Hospital Tengku Ampuan Rahimah, Klang11. Hospital Shah Alam
1.5.13 Terengganu1. Hospital Besut2. Hospital Dungun3. Hospital Hulu Terengganu4. Hospital Kemaman5. Hospital Sultanah Nur Zahirah, Kuala Terengganu6. Hospital Setiu
1.5.14 Wilayah Persekutuan Kuala Lumpur1. Institute of Paediatrics, Hospital Kuala Lumpur2. Pusat Perubatan Universiti Kebangsaan Malaysia, Cheras3. Pusat Perubatan Universiti Malaya, Petaling Jaya
1.5.15 Wilayah Persekutuan Labuan1. Hospital Labuan
1.5.16 Wilayah Persekutuan Putrajaya1. Hospital Putrajaya
MTR Report_Part-1_PRINT_20191114_FA9.indd 21 27/11/2019 5:08 PM
22
MA
LAYS
IAN
TH
ALA
SSA
EMIA
REG
ISTR
YRE
PORT
201
8
Registry Report2
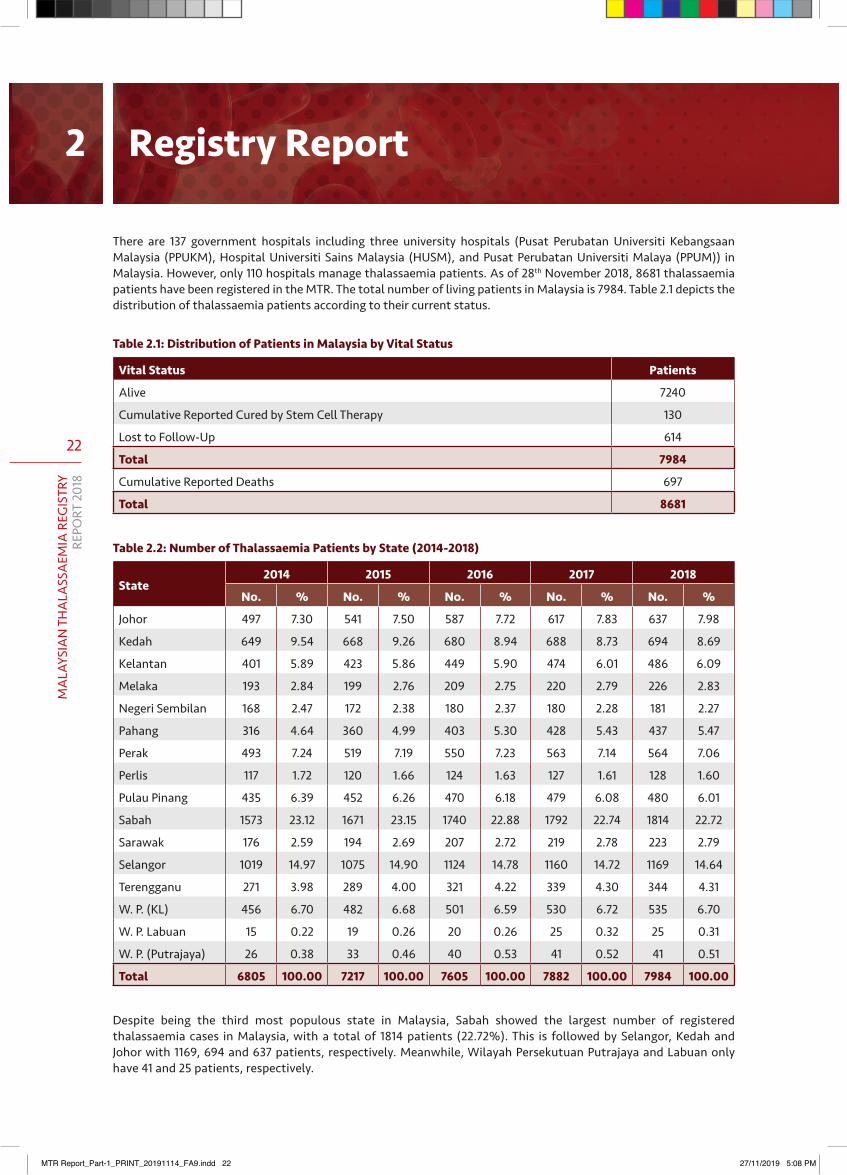
There are 137 government hospitals including three university hospitals (Pusat Perubatan Universiti Kebangsaan Malaysia (PPUKM), Hospital Universiti Sains Malaysia (HUSM), and Pusat Perubatan Universiti Malaya (PPUM)) in Malaysia. However, only 110 hospitals manage thalassaemia patients. As of 28th November 2018, 8681 thalassaemia patients have been registered in the MTR. The total number of living patients in Malaysia is 7984. Table 2.1 depicts the distribution of thalassaemia patients according to their current status.
Table 2.1: Distribution of Patients in Malaysia by Vital Status
Vital Status Patients
Alive 7240
Cumulative Reported Cured by Stem Cell Therapy 130
Lost to Follow-Up 614
Total 7984
Cumulative Reported Deaths 697
Total 8681
Table2.2:NumberofThalassaemiaPatientsbyState(2014-2018)
State2014 2015 2016 2017 2018
No. % No. % No. % No. % No. %
Johor 497 7.30 541 7.50 587 7.72 617 7.83 637 7.98
Kedah 649 9.54 668 9.26 680 8.94 688 8.73 694 8.69
Kelantan 401 5.89 423 5.86 449 5.90 474 6.01 486 6.09
Melaka 193 2.84 199 2.76 209 2.75 220 2.79 226 2.83
Negeri Sembilan 168 2.47 172 2.38 180 2.37 180 2.28 181 2.27
Pahang 316 4.64 360 4.99 403 5.30 428 5.43 437 5.47
Perak 493 7.24 519 7.19 550 7.23 563 7.14 564 7.06
Perlis 117 1.72 120 1.66 124 1.63 127 1.61 128 1.60
Pulau Pinang 435 6.39 452 6.26 470 6.18 479 6.08 480 6.01
Sabah 1573 23.12 1671 23.15 1740 22.88 1792 22.74 1814 22.72
Sarawak 176 2.59 194 2.69 207 2.72 219 2.78 223 2.79
Selangor 1019 14.97 1075 14.90 1124 14.78 1160 14.72 1169 14.64
Terengganu 271 3.98 289 4.00 321 4.22 339 4.30 344 4.31
W. P. (KL) 456 6.70 482 6.68 501 6.59 530 6.72 535 6.70
W. P. Labuan 15 0.22 19 0.26 20 0.26 25 0.32 25 0.31
W. P. (Putrajaya) 26 0.38 33 0.46 40 0.53 41 0.52 41 0.51
Total 6805 100.00 7217 100.00 7605 100.00 7882 100.00 7984 100.00
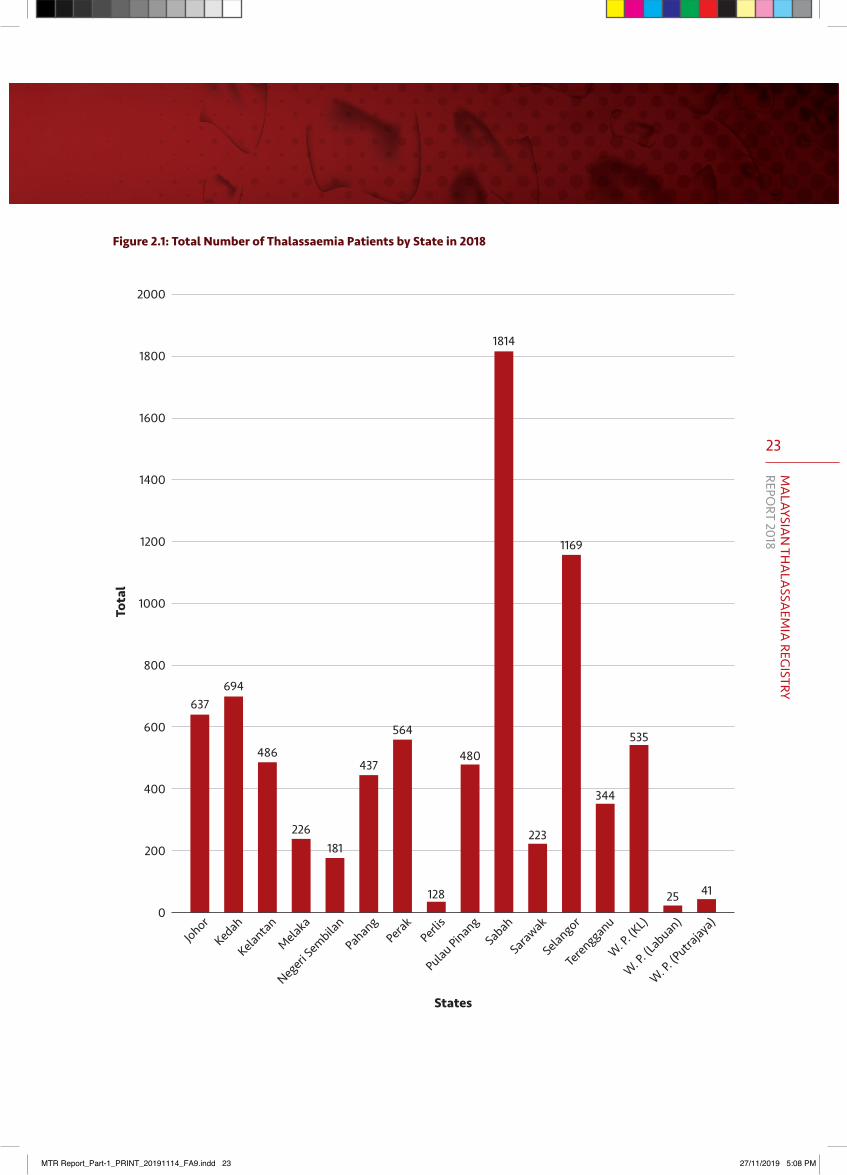
Despite being the third most populous state in Malaysia, Sabah showed the largest number of registered thalassaemia cases in Malaysia, with a total of 1814 patients (22.72%). This is followed by Selangor, Kedah and Johor with 1169, 694 and 637 patients, respectively. Meanwhile, Wilayah Persekutuan Putrajaya and Labuan only have 41 and 25 patients, respectively.
MTR Report_Part-1_PRINT_20191114_FA9.indd 22 27/11/2019 5:08 PM
23
MA
LAYSIAN
THA
LASSA
EMIA
REGISTRY
REPORT 2018
Figure2.1:TotalNumberofThalassaemiaPatientsbyStatein2018
Tota
l
2000
1800
1600
1400
1200
1000
800
600
400
200
0
637694
486
226181
437
564
128
480
1814
223
1169
344
535
25 41
JohorKedah
Kelantan
Melaka
Negeri Sembila
n
PahangPerak
Perlis
Pulau PinangSabah
Sarawak
Selangor
Terengganu
W. P. (K
L)
W. P. (L
abuan)
W. P. (P
utrajaya
)
States
MTR Report_Part-1_PRINT_20191114_FA9.indd 23 27/11/2019 5:08 PM
24
MA
LAYS
IAN
TH
ALA
SSA
EMIA
REG
ISTR
YRE
PORT
201
8
Registry Report2Total
Year
2000
1800
1600
1400
1200
1000 80
0
600
400
200 0
2007
2011
2015
2009
2013
2017
2008
2012
2016
2010
2014
2018
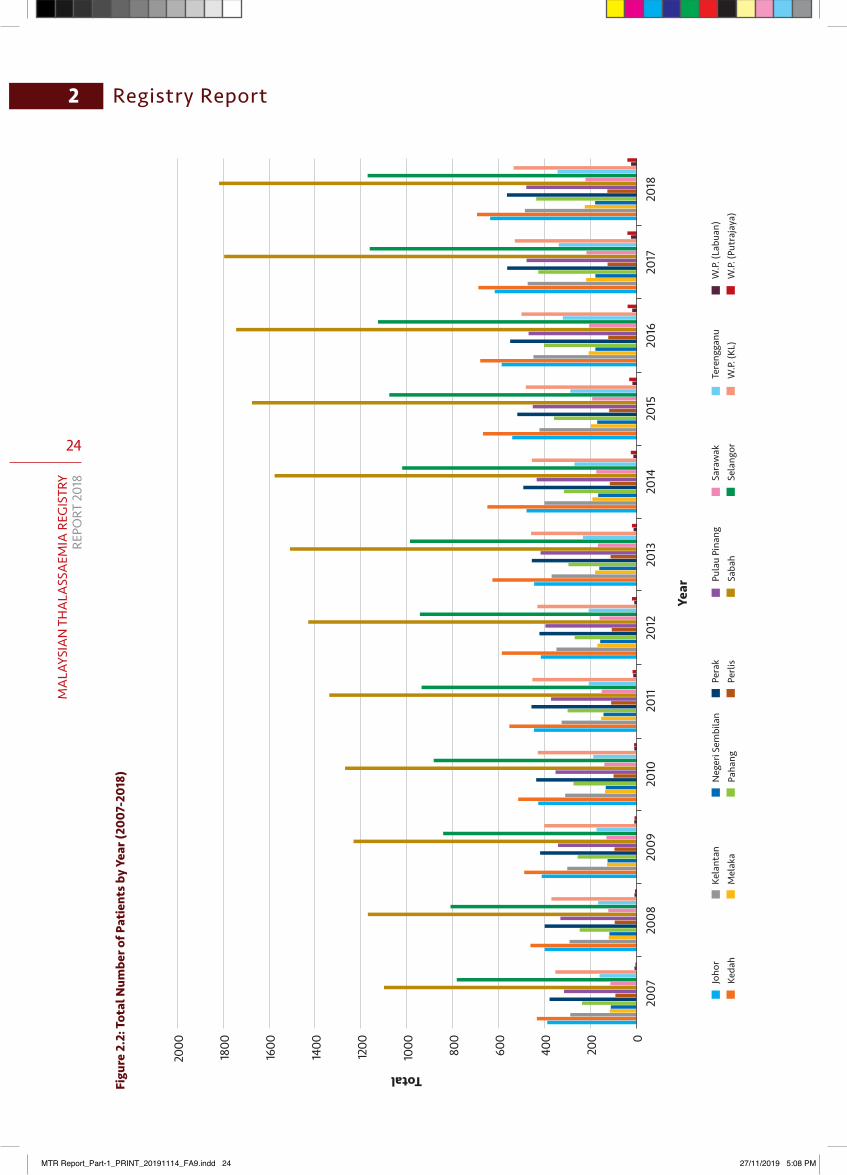
Figu
re2.2:T
otalNum
bero
fPatient
sbyYe
ar(2
007-20
18)
Joho
rKe
dah
Kela
ntan
Mel
aka
Neg
eri S
embi
lan
Paha
ngPe
rak
Perli
sPu
lau
Pina
ngSa
bah
Sara
wak
Sela
ngor
Tere
ngga
nuW
.P. (K
L)W
.P. (L
abua
n)W
.P. (P
utra
jaya
)
MTR Report_Part-1_PRINT_20191114_FA9.indd 24 27/11/2019 5:08 PM
25
MA
LAYSIAN
THA
LASSA
EMIA
REGISTRY
REPORT 2018
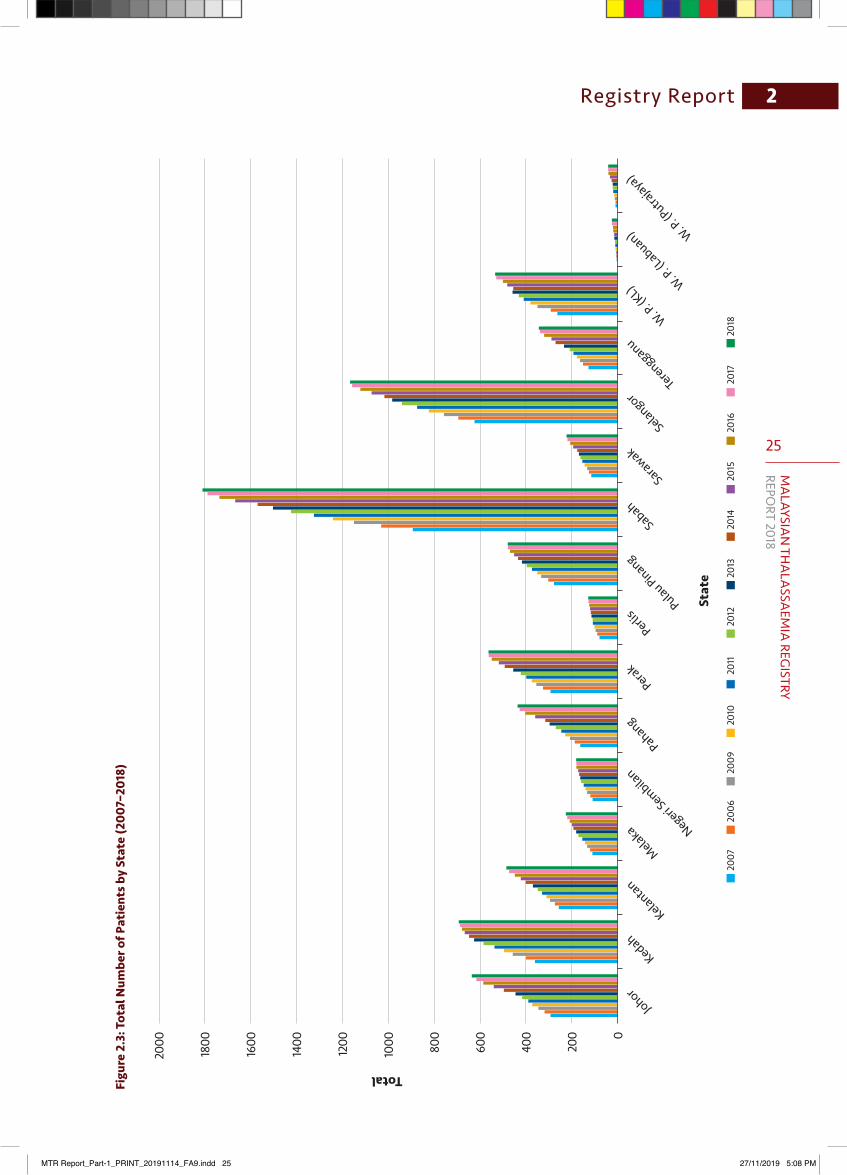
Registry Report 2Figu
re2.3:T
otalNum
bero
fPatient
sbyState(200
7–20
18)
2007
2006
2009
2010
2011
2012
2013
2014
2015
2016
2017
2018
Stat
e
Total
2000
1800
1600
1400
1200
1000 80
0
600
400
200 0
Johor
Kedah
Kelantan
Melaka Negeri Sembila
n
Pahang
Perak
PerlisPulau Pinang
Sabah
Sarawak
SelangorTerengganu
W. P. (K
L) W. P. (L
abuan) W. P. (P
utrajaya
)
MTR Report_Part-1_PRINT_20191114_FA9.indd 25 27/11/2019 5:08 PM
26
MA
LAYS
IAN
TH
ALA
SSA
EMIA
REG
ISTR
YRE
PORT
201
8
Registry Report2
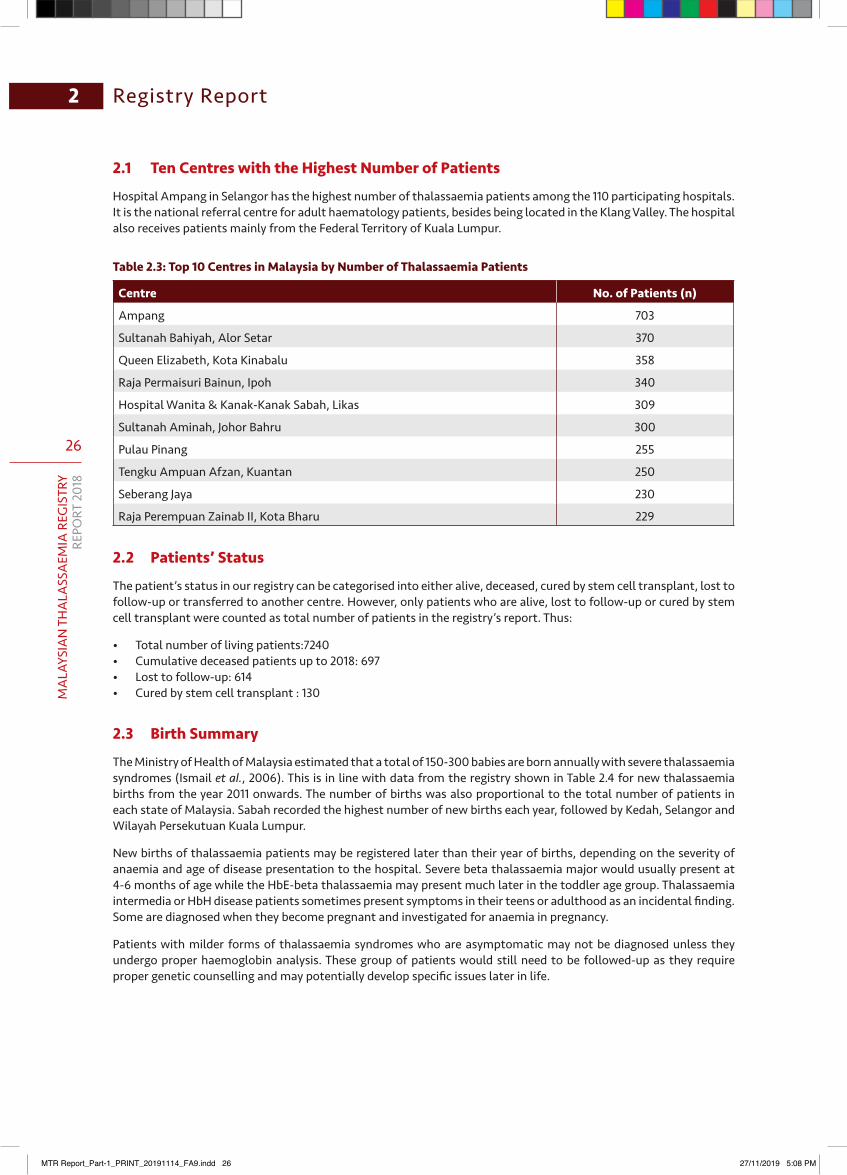
2.1 Ten Centres with the Highest Number of Patients
Hospital Ampang in Selangor has the highest number of thalassaemia patients among the 110 participating hospitals. It is the national referral centre for adult haematology patients, besides being located in the Klang Valley. The hospital also receives patients mainly from the Federal Territory of Kuala Lumpur.
Table 2.3: Top 10 Centres in Malaysia by Number of Thalassaemia Patients
Centre No. of Patients (n)
Ampang 703
Sultanah Bahiyah, Alor Setar 370
Queen Elizabeth, Kota Kinabalu 358
Raja Permaisuri Bainun, Ipoh 340
Hospital Wanita & Kanak-Kanak Sabah, Likas 309
Sultanah Aminah, Johor Bahru 300
Pulau Pinang 255
Tengku Ampuan Afzan, Kuantan 250
Seberang Jaya 230
Raja Perempuan Zainab II, Kota Bharu 229
2.2 Patients’ Status
The patient’s status in our registry can be categorised into either alive, deceased, cured by stem cell transplant, lost to follow-up or transferred to another centre. However, only patients who are alive, lost to follow-up or cured by stem cell transplant were counted as total number of patients in the registry’s report. Thus:
• Total number of living patients:7240• Cumulative deceased patients up to 2018: 697• Lost to follow-up: 614• Cured by stem cell transplant : 130
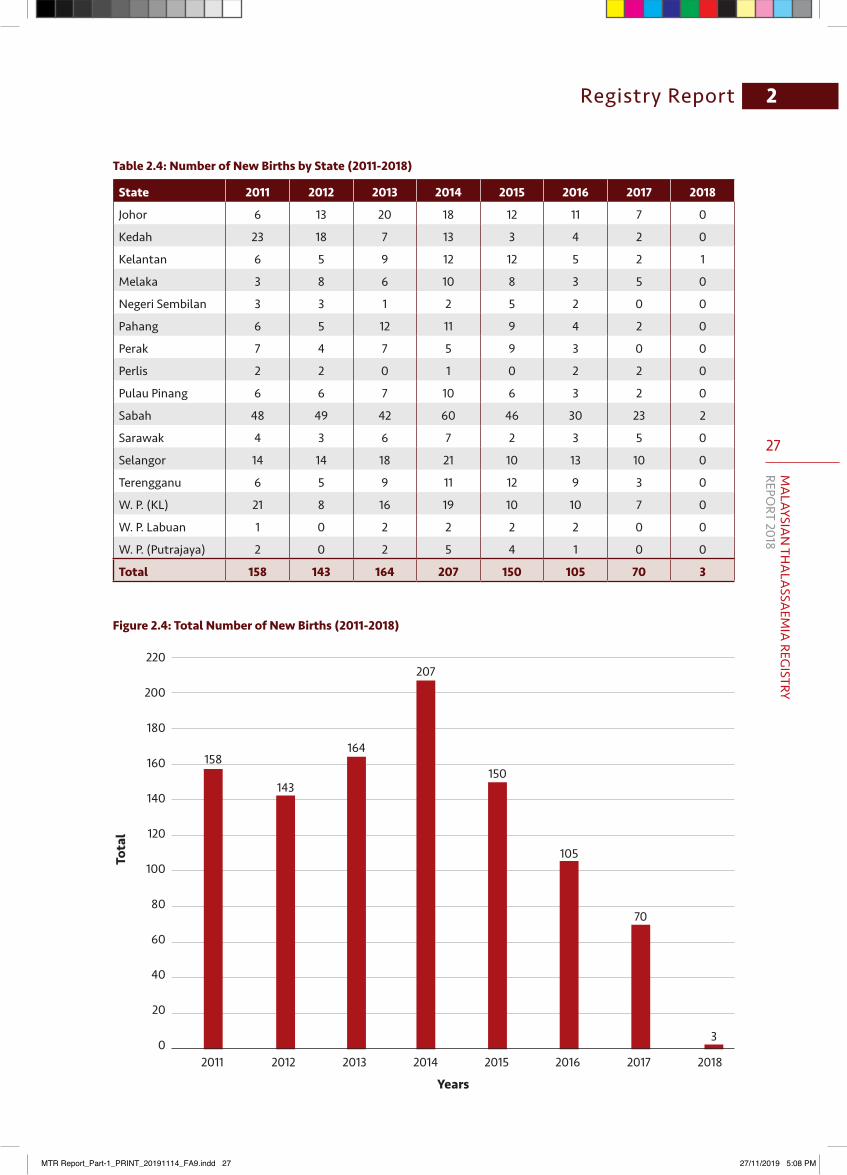
2.3 Birth Summary
The Ministry of Health of Malaysia estimated that a total of 150-300 babies are born annually with severe thalassaemia syndromes (Ismail et al., 2006). This is in line with data from the registry shown in Table 2.4 for new thalassaemia births from the year 2011 onwards. The number of births was also proportional to the total number of patients in each state of Malaysia. Sabah recorded the highest number of new births each year, followed by Kedah, Selangor and Wilayah Persekutuan Kuala Lumpur.
New births of thalassaemia patients may be registered later than their year of births, depending on the severity of anaemia and age of disease presentation to the hospital. Severe beta thalassaemia major would usually present at 4-6 months of age while the HbE-beta thalassaemia may present much later in the toddler age group. Thalassaemia intermedia or HbH disease patients sometimes present symptoms in their teens or adulthood as an incidental finding. Some are diagnosed when they become pregnant and investigated for anaemia in pregnancy.
Patients with milder forms of thalassaemia syndromes who are asymptomatic may not be diagnosed unless they undergo proper haemoglobin analysis. These group of patients would still need to be followed-up as they require proper genetic counselling and may potentially develop specific issues later in life.
MTR Report_Part-1_PRINT_20191114_FA9.indd 26 27/11/2019 5:08 PM
27
MA
LAYSIAN
THA
LASSA
EMIA
REGISTRY
REPORT 2018
Registry Report 2
Table2.4:NumberofNewBirthsbyState(2011-2018)
State 2011 2012 2013 2014 2015 2016 2017 2018
Johor 6 13 20 18 12 11 7 0
Kedah 23 18 7 13 3 4 2 0
Kelantan 6 5 9 12 12 5 2 1
Melaka 3 8 6 10 8 3 5 0
Negeri Sembilan 3 3 1 2 5 2 0 0
Pahang 6 5 12 11 9 4 2 0
Perak 7 4 7 5 9 3 0 0
Perlis 2 2 0 1 0 2 2 0
Pulau Pinang 6 6 7 10 6 3 2 0
Sabah 48 49 42 60 46 30 23 2
Sarawak 4 3 6 7 2 3 5 0
Selangor 14 14 18 21 10 13 10 0
Terengganu 6 5 9 11 12 9 3 0
W. P. (KL) 21 8 16 19 10 10 7 0
W. P. Labuan 1 0 2 2 2 2 0 0
W. P. (Putrajaya) 2 0 2 5 4 1 0 0
Total 158 143 164 207 150 105 70 3
Years
Tota
l
220
200
180
160
140
120
100
80
60
40
20
0
158
143
164
207
150
105
70
3
2011 20152013 20172012 20162014 2018
Figure2.4:TotalNumberofNewBirths(2011-2018)
MTR Report_Part-1_PRINT_20191114_FA9.indd 27 27/11/2019 5:08 PM
28
MA
LAYS
IAN
TH
ALA
SSA
EMIA
REG
ISTR
YRE
PORT
201
8
Registry Report2
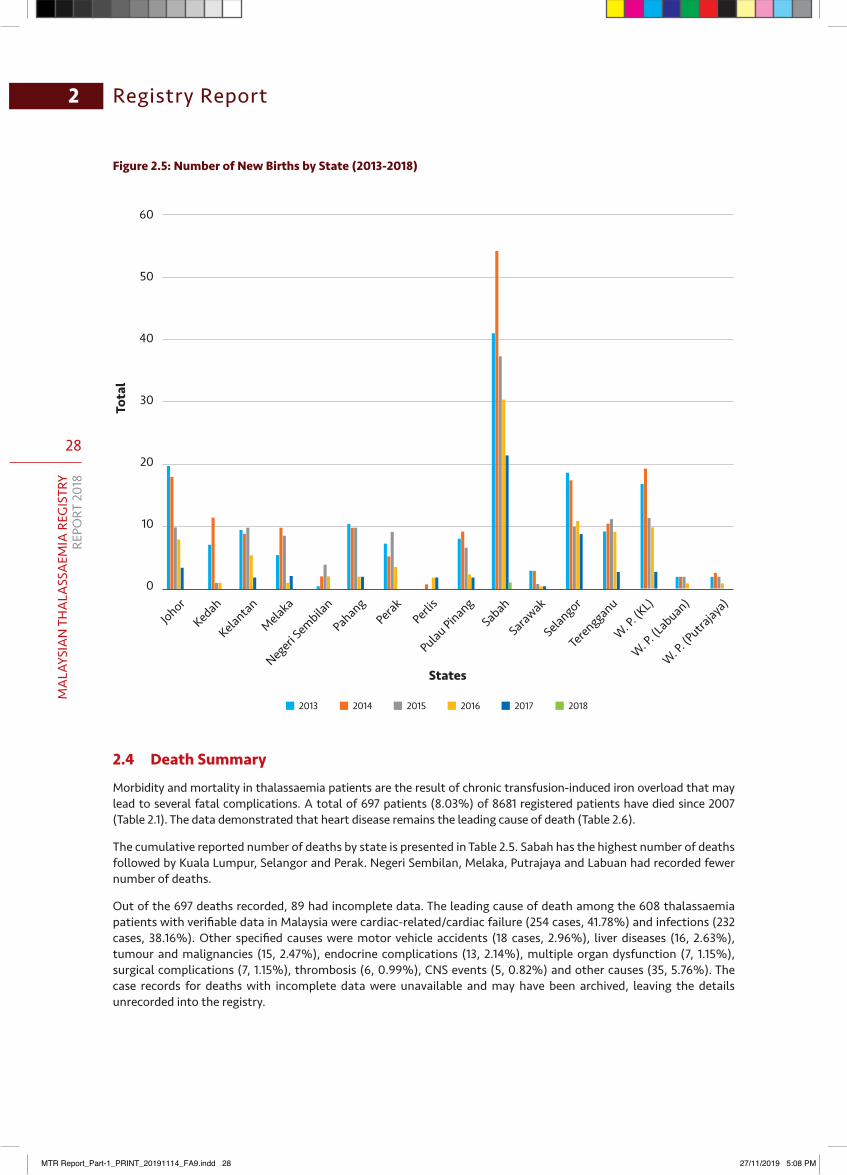
Figure2.5:NumberofNewBirthsbyState(2013-2018)
2.4 Death Summary
Morbidity and mortality in thalassaemia patients are the result of chronic transfusion-induced iron overload that may lead to several fatal complications. A total of 697 patients (8.03%) of 8681 registered patients have died since 2007 (Table 2.1). The data demonstrated that heart disease remains the leading cause of death (Table 2.6).
The cumulative reported number of deaths by state is presented in Table 2.5. Sabah has the highest number of deaths followed by Kuala Lumpur, Selangor and Perak. Negeri Sembilan, Melaka, Putrajaya and Labuan had recorded fewer number of deaths.
Out of the 697 deaths recorded, 89 had incomplete data. The leading cause of death among the 608 thalassaemia patients with verifiable data in Malaysia were cardiac-related/cardiac failure (254 cases, 41.78%) and infections (232 cases, 38.16%). Other specified causes were motor vehicle accidents (18 cases, 2.96%), liver diseases (16, 2.63%), tumour and malignancies (15, 2.47%), endocrine complications (13, 2.14%), multiple organ dysfunction (7, 1.15%), surgical complications (7, 1.15%), thrombosis (6, 0.99%), CNS events (5, 0.82%) and other causes (35, 5.76%). The case records for deaths with incomplete data were unavailable and may have been archived, leaving the details unrecorded into the registry.
Tota
l
States
60
50
40
30
20
10
0
JohorKedah
Kelantan
Melaka
Negeri Sembila
n
PahangPerak
Perlis
Pulau PinangSabah
Sarawak
Selangor
Terengganu
W. P. (K
L)
W. P. (L
abuan)
W. P. (P
utrajaya
)
2013 2014 2015 2016 2017 2018
MTR Report_Part-1_PRINT_20191114_FA9.indd 28 27/11/2019 5:08 PM
29
MA
LAYSIAN
THA
LASSA
EMIA
REGISTRY
REPORT 2018
Registry Report 2
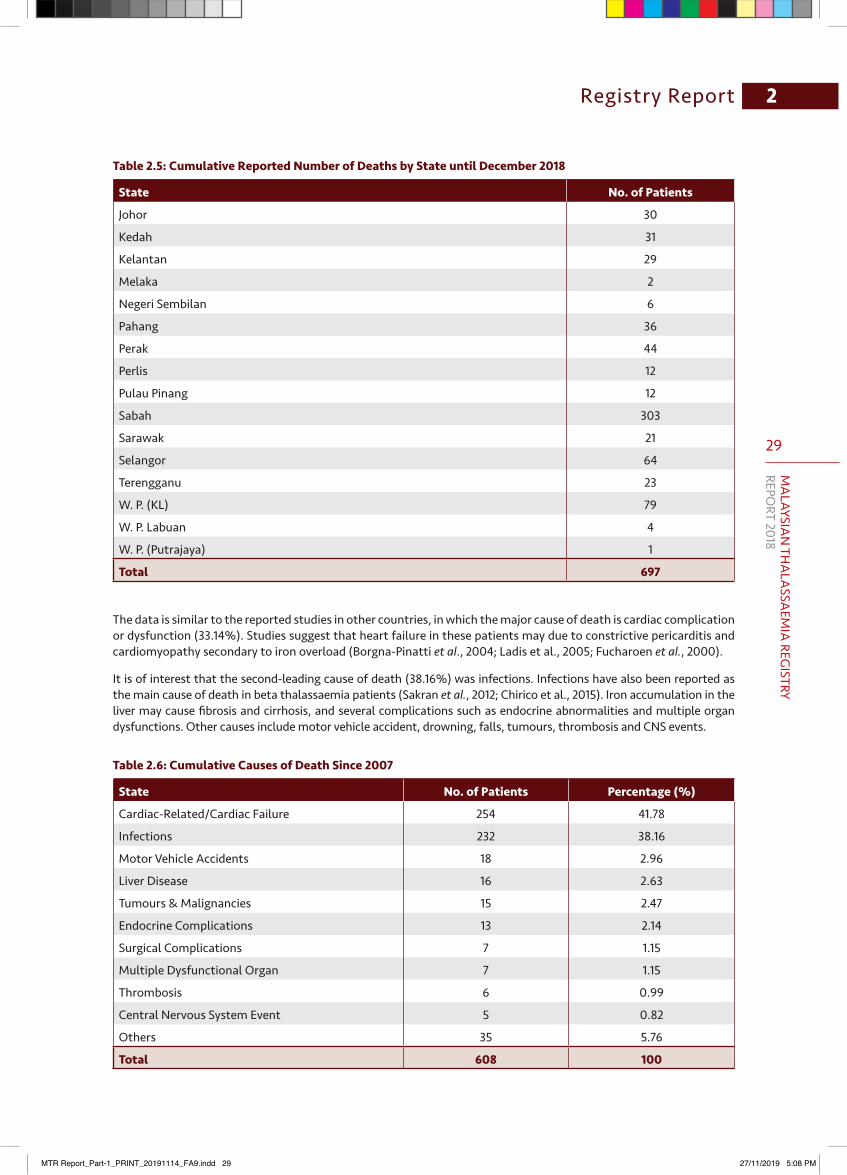
Table2.5:CumulativeReportedNumberofDeathsbyStateuntilDecember2018
State No. of Patients
Johor 30
Kedah 31
Kelantan 29
Melaka 2
Negeri Sembilan 6
Pahang 36
Perak 44
Perlis 12
Pulau Pinang 12
Sabah 303
Sarawak 21
Selangor 64
Terengganu 23
W. P. (KL) 79
W. P. Labuan 4
W. P. (Putrajaya) 1
Total 697
The data is similar to the reported studies in other countries, in which the major cause of death is cardiac complication or dysfunction (33.14%). Studies suggest that heart failure in these patients may due to constrictive pericarditis and cardiomyopathy secondary to iron overload (Borgna-Pinatti et al., 2004; Ladis et al., 2005; Fucharoen et al., 2000).
It is of interest that the second-leading cause of death (38.16%) was infections. Infections have also been reported as the main cause of death in beta thalassaemia patients (Sakran et al., 2012; Chirico et al., 2015). Iron accumulation in the liver may cause fibrosis and cirrhosis, and several complications such as endocrine abnormalities and multiple organ dysfunctions. Other causes include motor vehicle accident, drowning, falls, tumours, thrombosis and CNS events.
Table 2.6: Cumulative Causes of Death Since 2007
State No. of Patients Percentage (%)
Cardiac-Related/Cardiac Failure 254 41.78
Infections 232 38.16
Motor Vehicle Accidents 18 2.96
Liver Disease 16 2.63
Tumours & Malignancies 15 2.47
Endocrine Complications 13 2.14
Surgical Complications 7 1.15
Multiple Dysfunctional Organ 7 1.15
Thrombosis 6 0.99
Central Nervous System Event 5 0.82
Others 35 5.76
Total 608 100
MTR Report_Part-1_PRINT_20191114_FA9.indd 29 27/11/2019 5:08 PM
30
MA
LAYS
IAN
TH
ALA
SSA
EMIA
REG
ISTR
YRE
PORT
201
8
Registry Report2
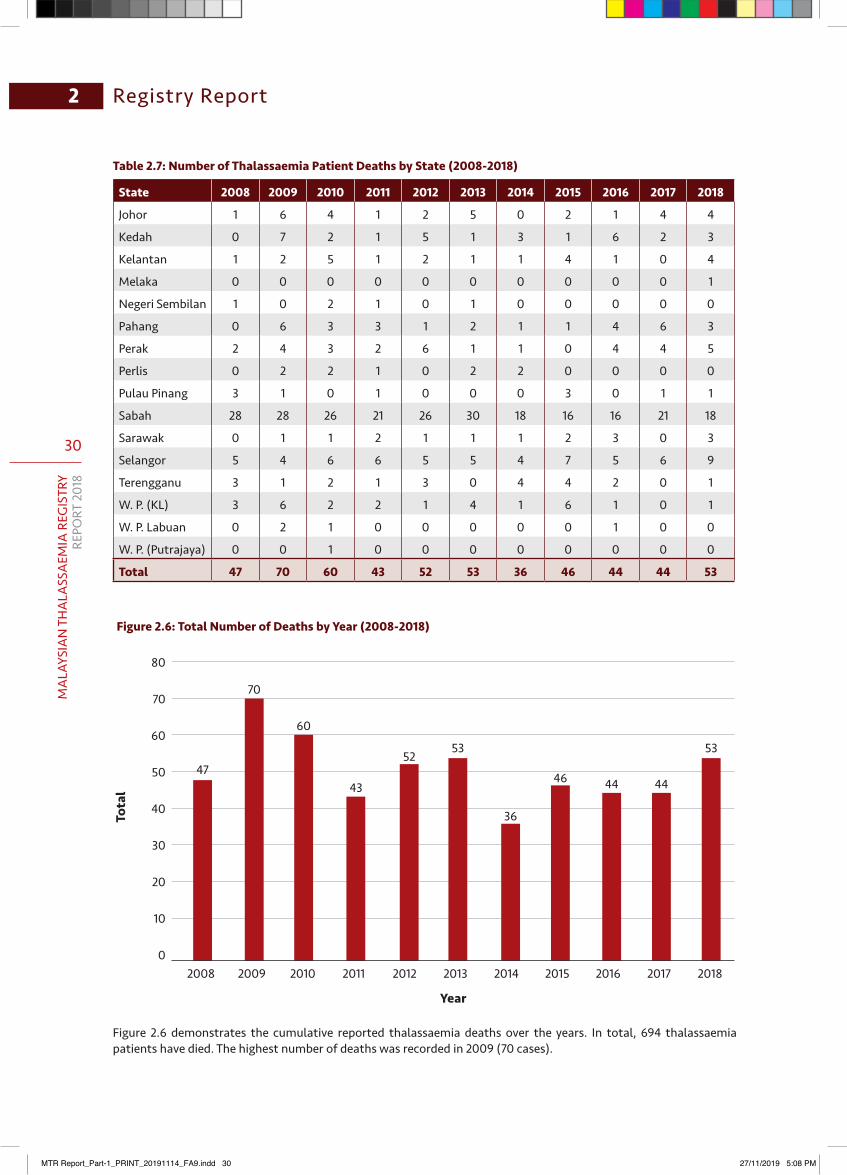
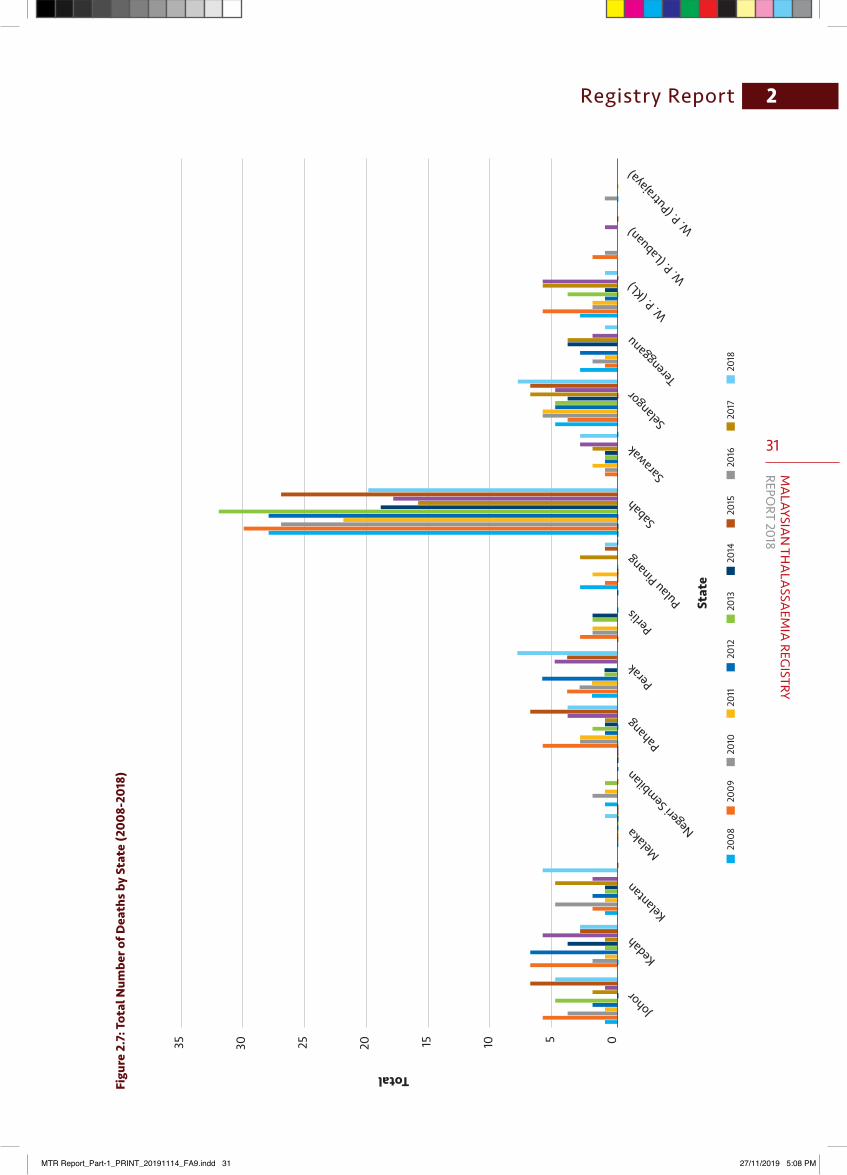
Table2.7:NumberofThalassaemiaPatientDeathsbyState(2008-2018)
State 2008 2009 2010 2011 2012 2013 2014 2015 2016 2017 2018
Johor 1 6 4 1 2 5 0 2 1 4 4
Kedah 0 7 2 1 5 1 3 1 6 2 3
Kelantan 1 2 5 1 2 1 1 4 1 0 4
Melaka 0 0 0 0 0 0 0 0 0 0 1
Negeri Sembilan 1 0 2 1 0 1 0 0 0 0 0
Pahang 0 6 3 3 1 2 1 1 4 6 3
Perak 2 4 3 2 6 1 1 0 4 4 5
Perlis 0 2 2 1 0 2 2 0 0 0 0
Pulau Pinang 3 1 0 1 0 0 0 3 0 1 1
Sabah 28 28 26 21 26 30 18 16 16 21 18
Sarawak 0 1 1 2 1 1 1 2 3 0 3
Selangor 5 4 6 6 5 5 4 7 5 6 9
Terengganu 3 1 2 1 3 0 4 4 2 0 1
W. P. (KL) 3 6 2 2 1 4 1 6 1 0 1
W. P. Labuan 0 2 1 0 0 0 0 0 1 0 0
W. P. (Putrajaya) 0 0 1 0 0 0 0 0 0 0 0
Total 47 70 60 43 52 53 36 46 44 44 53
Year
Tota
l
80
70
60
50
40
30
20
10
0
47
70
60
52
43
53
36
46 44 44
53
2011201020092008 20152013 20172012 20162014 2018
Figure2.6:TotalNumberofDeathsbyYear(2008-2018)
Figure 2.6 demonstrates the cumulative reported thalassaemia deaths over the years. In total, 694 thalassaemia patients have died. The highest number of deaths was recorded in 2009 (70 cases).
MTR Report_Part-1_PRINT_20191114_FA9.indd 30 27/11/2019 5:08 PM
31
MA
LAYSIAN
THA
LASSA
EMIA
REGISTRY
REPORT 2018
Registry Report 2Figu
re2.7:T
otalNum
bero
fDea
thsb
yState(200
8-20
18)
2008
20
09
2010
20
11
2012
20
13
2014
20
15
2016
20
17
2018
Total
35 30 25 20 15 10 5 0
Johor
Kedah
Kelantan
Melaka Negeri Sembila
n
Pahang
Perak
PerlisPulau Pinang
Sabah
Sarawak
SelangorTerengganu
W. P. (K
L) W. P. (L
abuan) W. P. (P
utrajaya
)
Stat
e
MTR Report_Part-1_PRINT_20191114_FA9.indd 31 27/11/2019 5:08 PM
32
MA
LAYS
IAN
TH
ALA
SSA
EMIA
REG
ISTR
YRE
PORT
201
8
Registry Report2
2.5 Patient Demographics
Healthcare registers have been defined as organised systems with uniform data aimed at comprehensive coverage of a target population with a particular disease, condition or exposure. Thus, it is essential to establish a national thalassaemia registry collecting specific patient information into the registry database. The thalassaemia registry collects a set of patients’ socio-demographic details, such as centre of treatment, name, date of birth, home address, contact phone number, gender, ethnicity, and sibling rank.
Though the core element in the information system is the diagnosis and other clinical characteristics, the demographic characteristics also play a major role for public health surveillance, healthcare monitoring and administrative purposes for specific regions or overall national data.
Specific MTR forms have been developed over the years to manage the data collection before data entry in the web system. Reported errors or modifications are managed centrally to prevent any double entries in the registry.
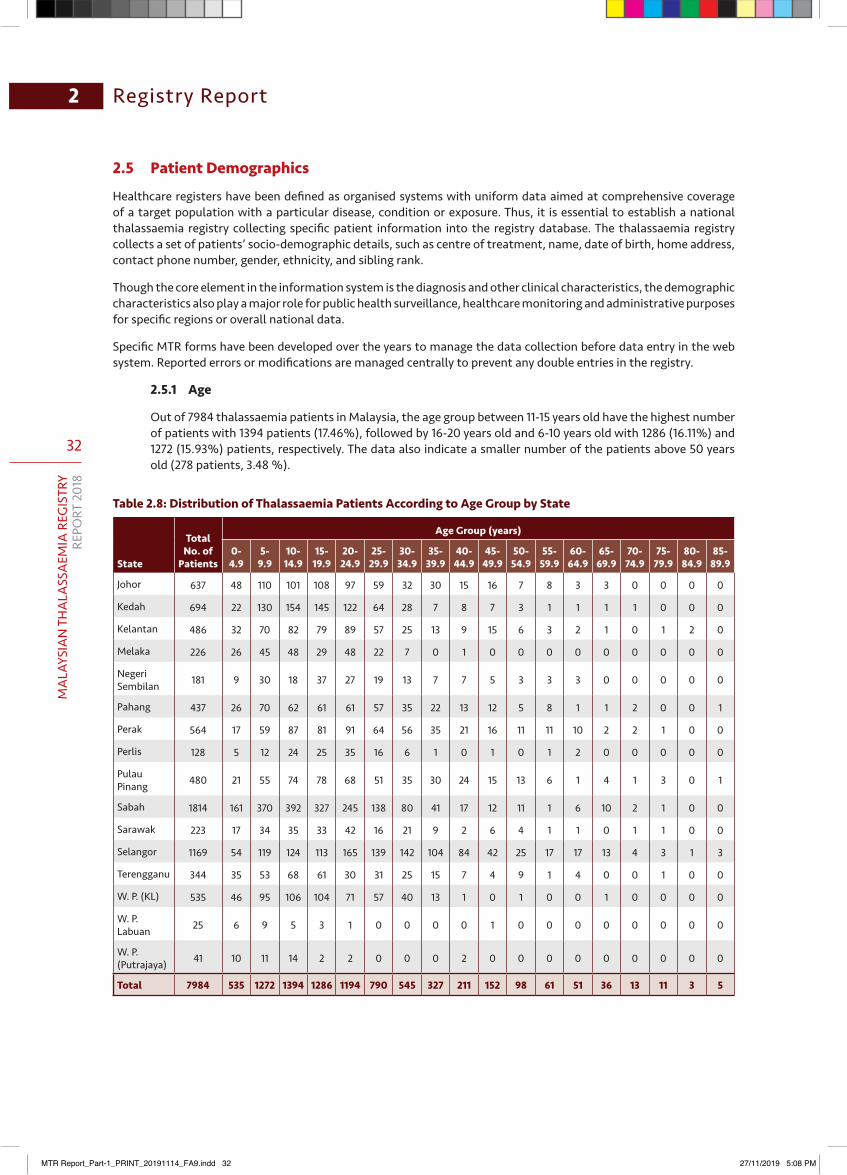
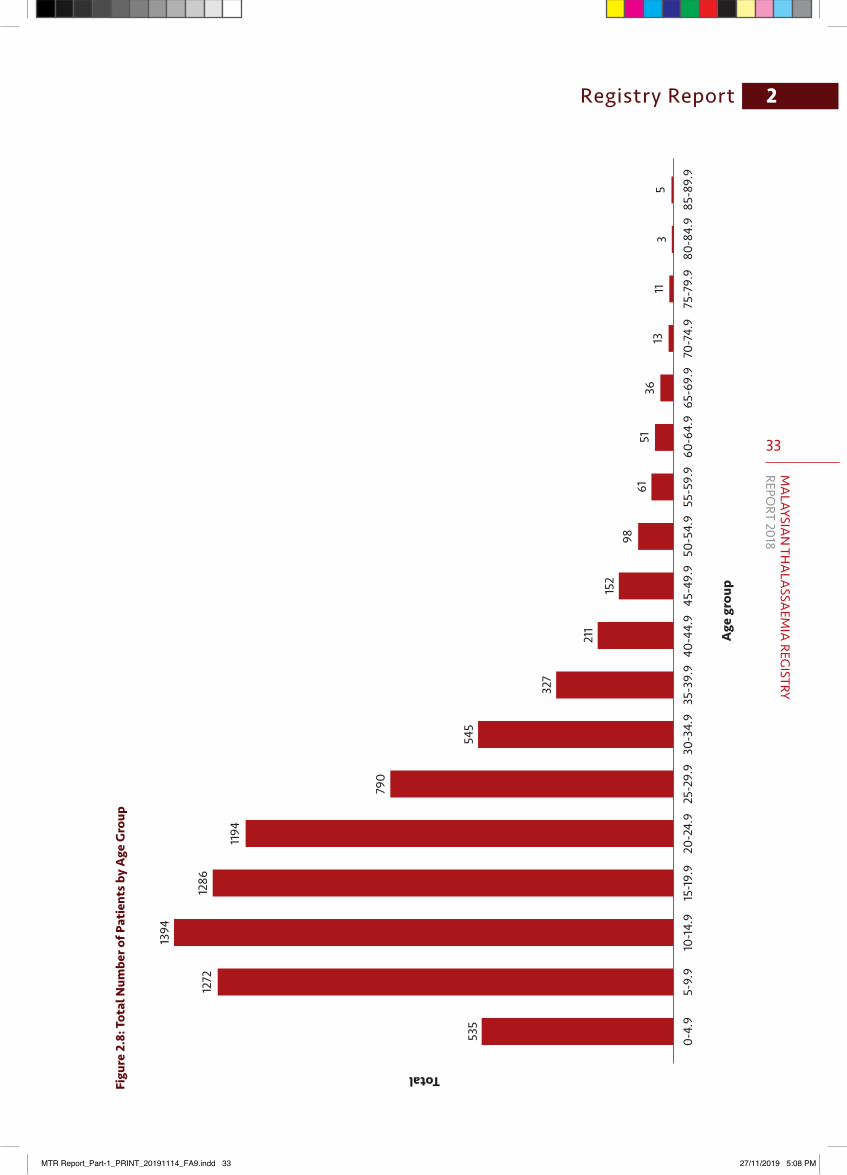
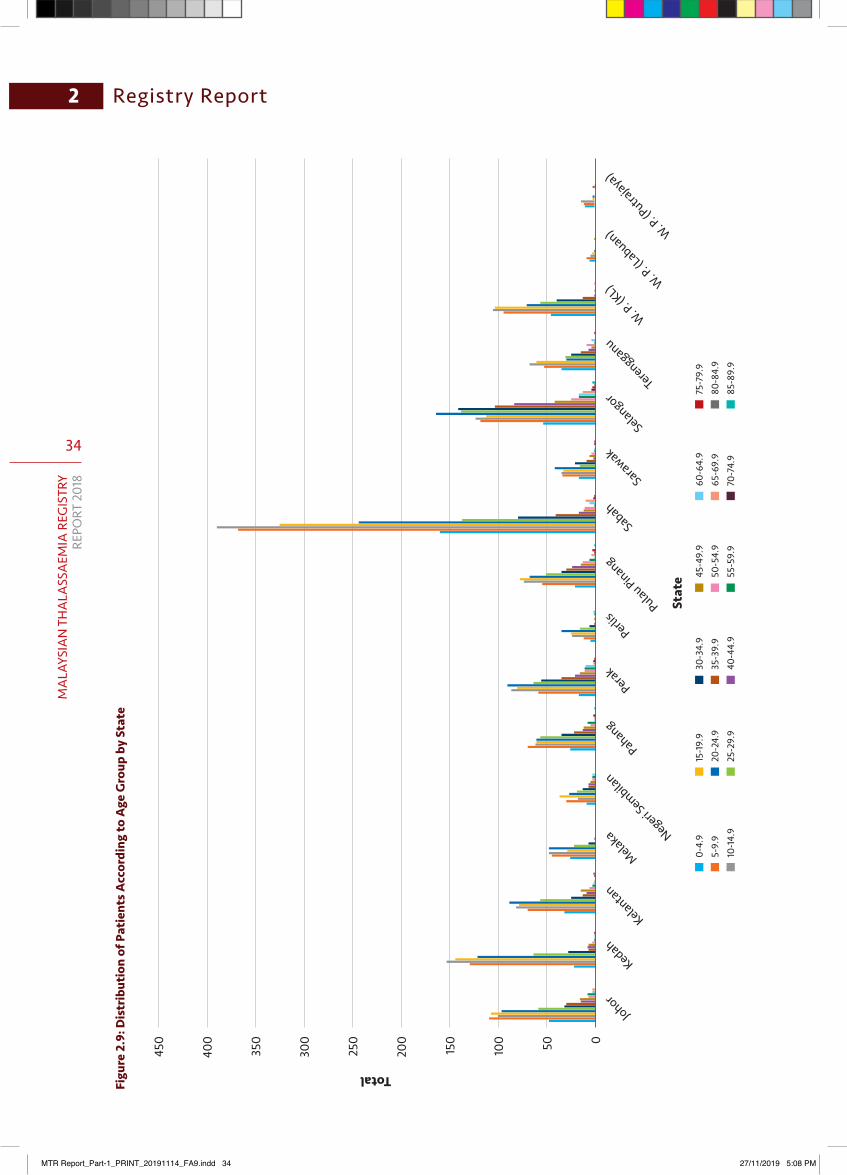
2.5.1 Age
Out of 7984 thalassaemia patients in Malaysia, the age group between 11-15 years old have the highest number of patients with 1394 patients (17.46%), followed by 16-20 years old and 6-10 years old with 1286 (16.11%) and 1272 (15.93%) patients, respectively. The data also indicate a smaller number of the patients above 50 years old (278 patients, 3.48 %).
Table2.8:DistributionofThalassaemiaPatientsAccordingtoAgeGroupbyState
State
Total No. of
Patients
Age Group (years)
0-4.9
5-9.9
10-14.9
15-19.9
20-24.9
25-29.9
30-34.9
35-39.9
40-44.9
45-49.9
50-54.9
55-59.9
60-64.9
65-69.9
70-74.9
75-79.9
80-84.9
85-89.9
Johor 637 48 110 101 108 97 59 32 30 15 16 7 8 3 3 0 0 0 0
Kedah 694 22 130 154 145 122 64 28 7 8 7 3 1 1 1 1 0 0 0
Kelantan 486 32 70 82 79 89 57 25 13 9 15 6 3 2 1 0 1 2 0
Melaka 226 26 45 48 29 48 22 7 0 1 0 0 0 0 0 0 0 0 0
Negeri Sembilan 181 9 30 18 37 27 19 13 7 7 5 3 3 3 0 0 0 0 0
Pahang 437 26 70 62 61 61 57 35 22 13 12 5 8 1 1 2 0 0 1
Perak 564 17 59 87 81 91 64 56 35 21 16 11 11 10 2 2 1 0 0
Perlis 128 5 12 24 25 35 16 6 1 0 1 0 1 2 0 0 0 0 0
Pulau Pinang 480 21 55 74 78 68 51 35 30 24 15 13 6 1 4 1 3 0 1
Sabah 1814 161 370 392 327 245 138 80 41 17 12 11 1 6 10 2 1 0 0
Sarawak 223 17 34 35 33 42 16 21 9 2 6 4 1 1 0 1 1 0 0
Selangor 1169 54 119 124 113 165 139 142 104 84 42 25 17 17 13 4 3 1 3
Terengganu 344 35 53 68 61 30 31 25 15 7 4 9 1 4 0 0 1 0 0
W. P. (KL) 535 46 95 106 104 71 57 40 13 1 0 1 0 0 1 0 0 0 0
W. P. Labuan 25 6 9 5 3 1 0 0 0 0 1 0 0 0 0 0 0 0 0
W. P. (Putrajaya) 41 10 11 14 2 2 0 0 0 2 0 0 0 0 0 0 0 0 0
Total 7984 535 1272 1394 1286 1194 790 545 327 211 152 98 61 51 36 13 11 3 5
MTR Report_Part-1_PRINT_20191114_FA9.indd 32 27/11/2019 5:08 PM
33
MA
LAYSIAN
THA
LASSA
EMIA
REGISTRY
REPORT 2018
Registry Report 2Figu
re2.8:T
otalNum
bero
fPatient
sbyAge
Group
Total
Age
gro
up
0-4.
9
535
5-9.
9
1272
10-14
.9
1394
15-19
.9
1286
20-2
4.9
1194
25-2
9.9
790
30-3
4.9
545
35-3
9.9
327
40-4
4.9
211
45-4
9.9
152
50-5
4.9
98
55-5
9.9
61
60-6
4.9
51
65-6
9.9
36
70-7
4.9
13
75-7
9.9
11
80-8
4.9
3
85-8
9.9
5
MTR Report_Part-1_PRINT_20191114_FA9.indd 33 27/11/2019 5:08 PM
34
MA
LAYS
IAN
TH
ALA
SSA
EMIA
REG
ISTR
YRE
PORT
201
8
Registry Report2Fi
gure
2.9
: Dis
trib
utio
n of
Pat
ient
s Acc
ordi
ng to
Age
Gro
up b
y St
ate
Total
Stat
e
450
400
350
300
250
200
150
100 50 0
Johor
Kedah
Kelantan
Melaka Negeri Sembila
n
Pahang
Perak
PerlisPulau Pinang
Sabah
Sarawak
SelangorTerengganu
W. P. (K
L) W. P. (L
abuan) W. P. (P
utrajaya
)
0-4.
95-
9.9
10-1
4.9
15-1
9.9
20-2
4.9
25-2
9.9
30-3
4.9
35-3
9.9
40-4
4.9
45-4
9.9
50-5
4.9
55-5
9.9
60-6
4.9
65-6
9.9
70-7
4.9
75-7
9.9
80-8
4.9
85-8
9.9
MTR Report_Part-1_PRINT_20191114_FA9.indd 34 27/11/2019 5:08 PM
35
MA
LAYSIAN
THA
LASSA
EMIA
REGISTRY
REPORT 2018
Registry Report 2
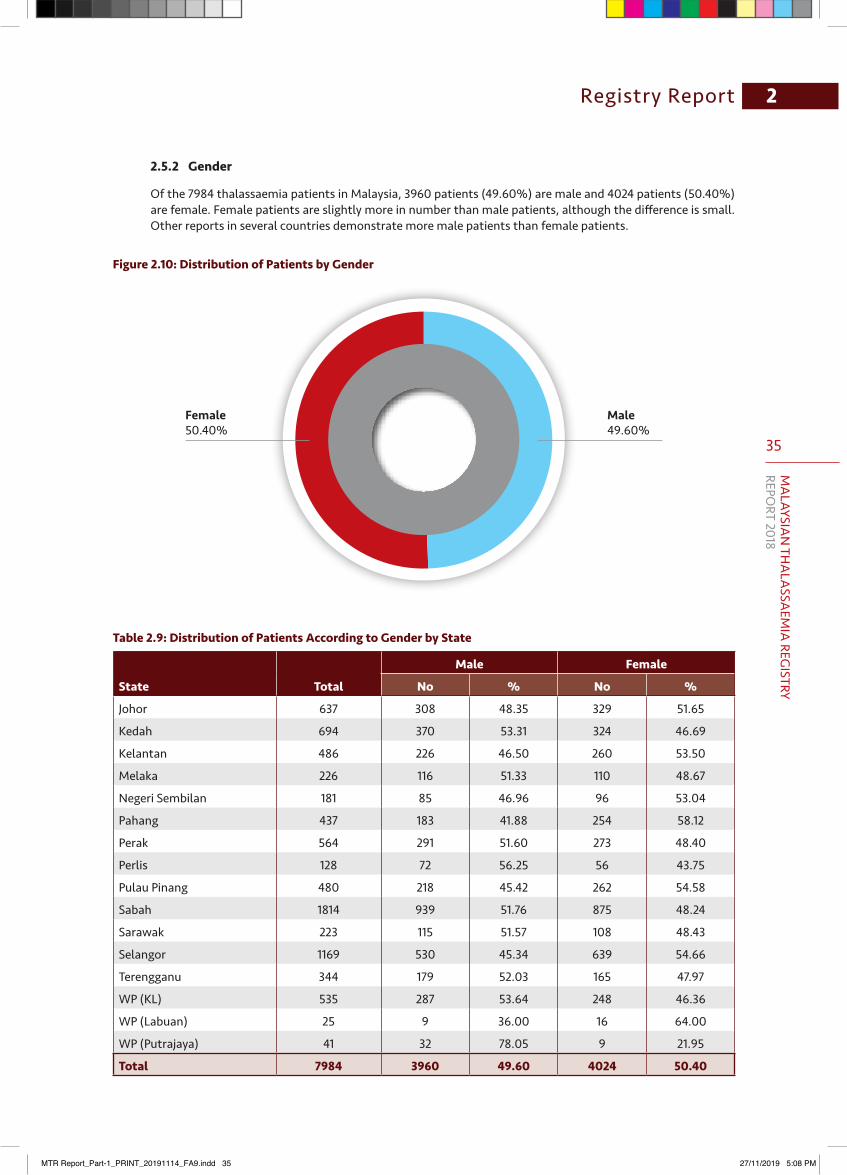
2.5.2 Gender
Of the 7984 thalassaemia patients in Malaysia, 3960 patients (49.60%) are male and 4024 patients (50.40%) are female. Female patients are slightly more in number than male patients, although the difference is small. Other reports in several countries demonstrate more male patients than female patients.
Figure 2.10: Distribution of Patients by Gender
Female50.40%
Male49.60%
Table 2.9: Distribution of Patients According to Gender by State
State Total
Male Female
No % No %
Johor 637 308 48.35 329 51.65
Kedah 694 370 53.31 324 46.69
Kelantan 486 226 46.50 260 53.50
Melaka 226 116 51.33 110 48.67
Negeri Sembilan 181 85 46.96 96 53.04
Pahang 437 183 41.88 254 58.12
Perak 564 291 51.60 273 48.40
Perlis 128 72 56.25 56 43.75
Pulau Pinang 480 218 45.42 262 54.58
Sabah 1814 939 51.76 875 48.24
Sarawak 223 115 51.57 108 48.43
Selangor 1169 530 45.34 639 54.66
Terengganu 344 179 52.03 165 47.97
WP (KL) 535 287 53.64 248 46.36
WP (Labuan) 25 9 36.00 16 64.00
WP (Putrajaya) 41 32 78.05 9 21.95
Total 7984 3960 49.60 4024 50.40
MTR Report_Part-1_PRINT_20191114_FA9.indd 35 27/11/2019 5:08 PM
36
MA
LAYS
IAN
TH
ALA
SSA
EMIA
REG
ISTR
YRE
PORT
201
8
Registry Report2
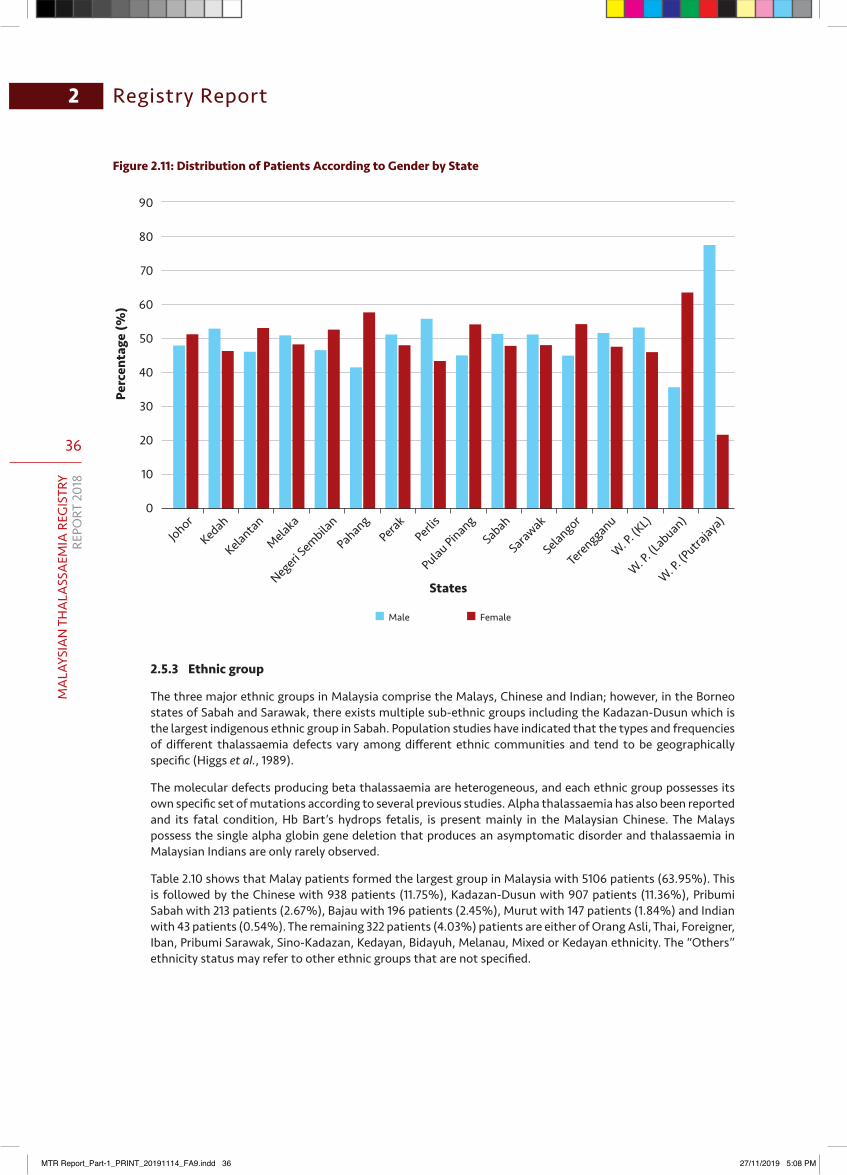
Figure 2.11: Distribution of Patients According to Gender by State
90
80
70
60
50
40
30
20
10
0
States
Perc
enta
ge (%
)
JohorKedah
Kelantan
Melaka
Negeri Sembila
n
PahangPerak
Perlis
Pulau PinangSabah
Sarawak
Selangor
Terengganu
W. P. (K
L)
W. P. (L
abuan)
W. P. (P
utrajaya
)
Male Female
2.5.3 Ethnic group
The three major ethnic groups in Malaysia comprise the Malays, Chinese and Indian; however, in the Borneo states of Sabah and Sarawak, there exists multiple sub-ethnic groups including the Kadazan-Dusun which is the largest indigenous ethnic group in Sabah. Population studies have indicated that the types and frequencies of different thalassaemia defects vary among different ethnic communities and tend to be geographically specific (Higgs et al., 1989).
The molecular defects producing beta thalassaemia are heterogeneous, and each ethnic group possesses its own specific set of mutations according to several previous studies. Alpha thalassaemia has also been reported and its fatal condition, Hb Bart’s hydrops fetalis, is present mainly in the Malaysian Chinese. The Malays possess the single alpha globin gene deletion that produces an asymptomatic disorder and thalassaemia in Malaysian Indians are only rarely observed.
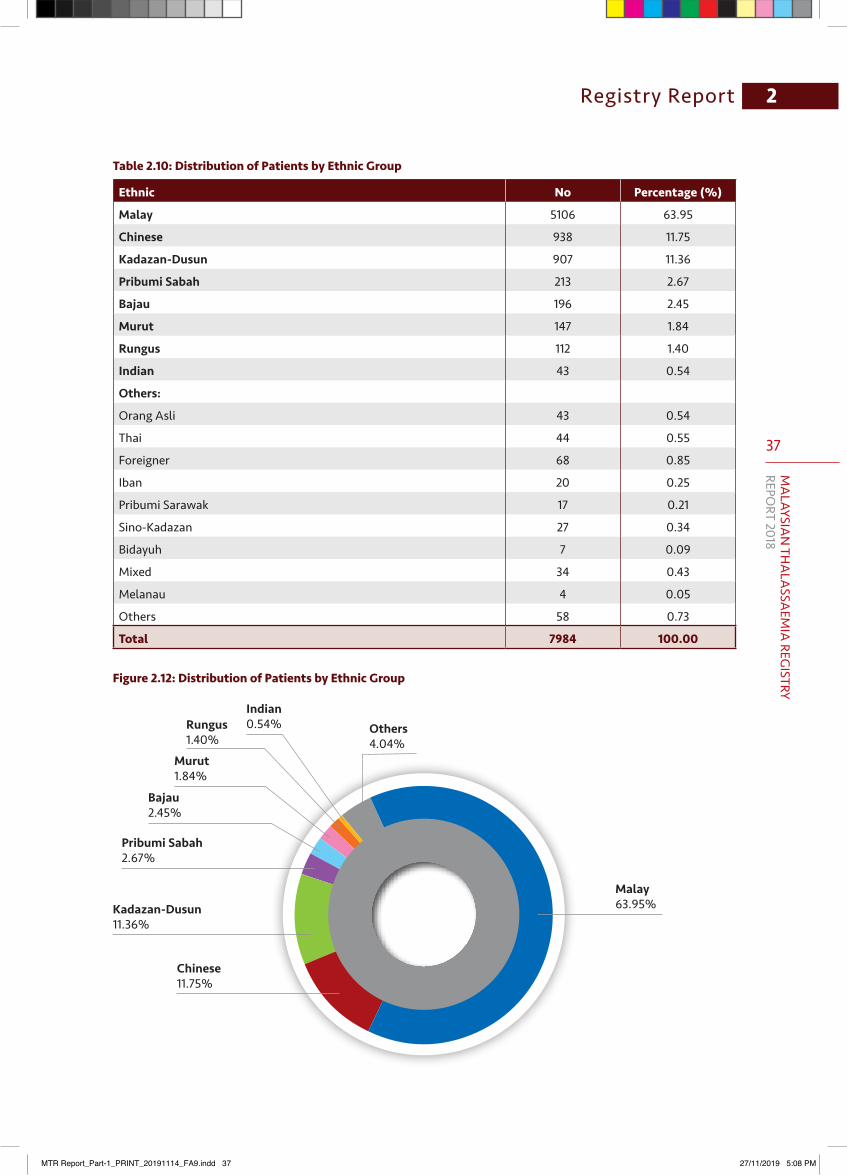
Table 2.10 shows that Malay patients formed the largest group in Malaysia with 5106 patients (63.95%). This is followed by the Chinese with 938 patients (11.75%), Kadazan-Dusun with 907 patients (11.36%), Pribumi Sabah with 213 patients (2.67%), Bajau with 196 patients (2.45%), Murut with 147 patients (1.84%) and Indian with 43 patients (0.54%). The remaining 322 patients (4.03%) patients are either of Orang Asli, Thai, Foreigner, Iban, Pribumi Sarawak, Sino-Kadazan, Kedayan, Bidayuh, Melanau, Mixed or Kedayan ethnicity. The “Others” ethnicity status may refer to other ethnic groups that are not specified.
MTR Report_Part-1_PRINT_20191114_FA9.indd 36 27/11/2019 5:08 PM
37
MA
LAYSIAN
THA
LASSA
EMIA
REGISTRY
REPORT 2018
Registry Report 2
Table 2.10: Distribution of Patients by Ethnic Group
Ethnic No Percentage (%)
Malay 5106 63.95
Chinese 938 11.75
Kadazan-Dusun 907 11.36
Pribumi Sabah 213 2.67
Bajau 196 2.45
Murut 147 1.84
Rungus 112 1.40
Indian 43 0.54
Others:
Orang Asli 43 0.54
Thai 44 0.55
Foreigner 68 0.85
Iban 20 0.25
Pribumi Sarawak 17 0.21
Sino-Kadazan 27 0.34
Bidayuh 7 0.09
Mixed 34 0.43
Melanau 4 0.05
Others 58 0.73
Total 7984 100.00
Figure 2.12: Distribution of Patients by Ethnic Group
Malay63.95%Kadazan-Dusun
11.36%
Murut1.84%
Indian0.54% Others
4.04%
Bajau2.45%
Rungus1.40%
Pribumi Sabah2.67%
Chinese11.75%
MTR Report_Part-1_PRINT_20191114_FA9.indd 37 27/11/2019 5:08 PM
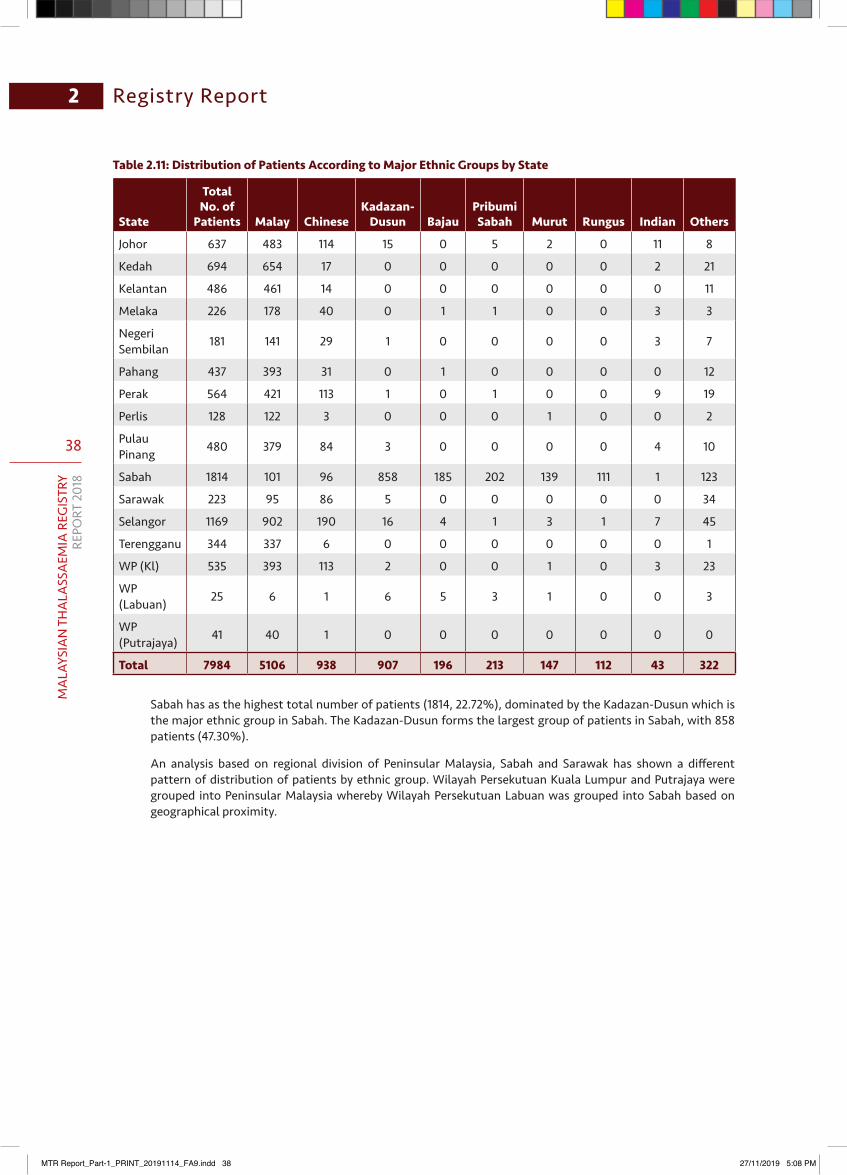
38
MA
LAYS
IAN
TH
ALA
SSA
EMIA
REG
ISTR
YRE
PORT
201
8
Registry Report2
Table 2.11: Distribution of Patients According to Major Ethnic Groups by State
State
Total No. of
Patients Malay ChineseKadazan-
Dusun BajauPribumi Sabah Murut Rungus Indian Others
Johor 637 483 114 15 0 5 2 0 11 8
Kedah 694 654 17 0 0 0 0 0 2 21
Kelantan 486 461 14 0 0 0 0 0 0 11
Melaka 226 178 40 0 1 1 0 0 3 3
Negeri Sembilan 181 141 29 1 0 0 0 0 3 7
Pahang 437 393 31 0 1 0 0 0 0 12
Perak 564 421 113 1 0 1 0 0 9 19
Perlis 128 122 3 0 0 0 1 0 0 2
Pulau Pinang 480 379 84 3 0 0 0 0 4 10
Sabah 1814 101 96 858 185 202 139 111 1 123
Sarawak 223 95 86 5 0 0 0 0 0 34
Selangor 1169 902 190 16 4 1 3 1 7 45
Terengganu 344 337 6 0 0 0 0 0 0 1
WP (Kl) 535 393 113 2 0 0 1 0 3 23
WP (Labuan) 25 6 1 6 5 3 1 0 0 3
WP (Putrajaya) 41 40 1 0 0 0 0 0 0 0
Total 7984 5106 938 907 196 213 147 112 43 322
Sabah has as the highest total number of patients (1814, 22.72%), dominated by the Kadazan-Dusun which is the major ethnic group in Sabah. The Kadazan-Dusun forms the largest group of patients in Sabah, with 858 patients (47.30%).
An analysis based on regional division of Peninsular Malaysia, Sabah and Sarawak has shown a different pattern of distribution of patients by ethnic group. Wilayah Persekutuan Kuala Lumpur and Putrajaya were grouped into Peninsular Malaysia whereby Wilayah Persekutuan Labuan was grouped into Sabah based on geographical proximity.
MTR Report_Part-1_PRINT_20191114_FA9.indd 38 27/11/2019 5:08 PM
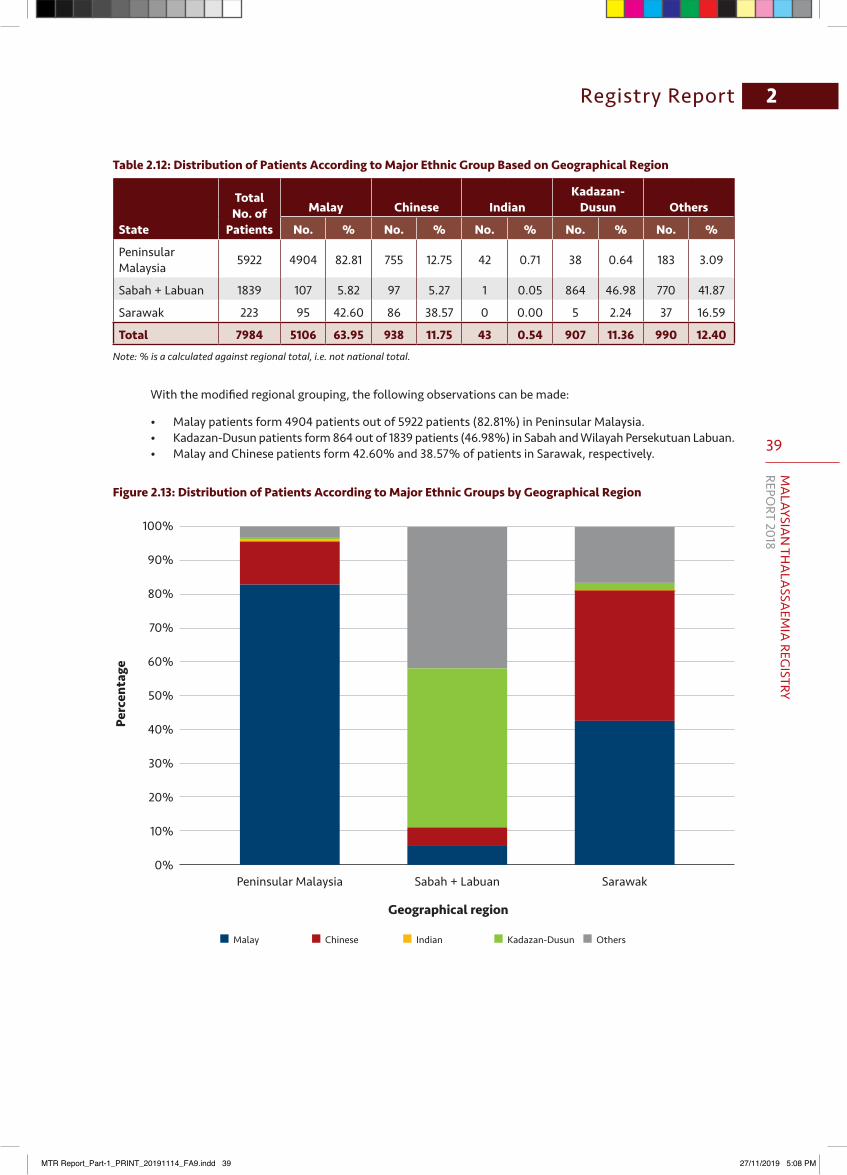
39
MA
LAYSIAN
THA
LASSA
EMIA
REGISTRY
REPORT 2018
Registry Report 2
Table 2.12: Distribution of Patients According to Major Ethnic Group Based on Geographical Region
State
Total No. of
Patients
Malay Chinese IndianKadazan-
Dusun Others
No. % No. % No. % No. % No. %
Peninsular Malaysia 5922 4904 82.81 755 12.75 42 0.71 38 0.64 183 3.09
Sabah + Labuan 1839 107 5.82 97 5.27 1 0.05 864 46.98 770 41.87
Sarawak 223 95 42.60 86 38.57 0 0.00 5 2.24 37 16.59
Total 7984 5106 63.95 938 11.75 43 0.54 907 11.36 990 12.40Note: % is a calculated against regional total, i.e. not national total.
With the modified regional grouping, the following observations can be made:
• Malay patients form 4904 patients out of 5922 patients (82.81%) in Peninsular Malaysia.• Kadazan-Dusun patients form 864 out of 1839 patients (46.98%) in Sabah and Wilayah Persekutuan Labuan.• Malay and Chinese patients form 42.60% and 38.57% of patients in Sarawak, respectively.
Figure 2.13: Distribution of Patients According to Major Ethnic Groups by Geographical Region
100%
90%
80%
70%
60%
50%
40%
30%
20%
10%
0%
Geographical region
Perc
enta
ge
Peninsular Malaysia Sabah + Labuan Sarawak
Malay Chinese Indian Kadazan-Dusun Others
MTR Report_Part-1_PRINT_20191114_FA9.indd 39 27/11/2019 5:08 PM
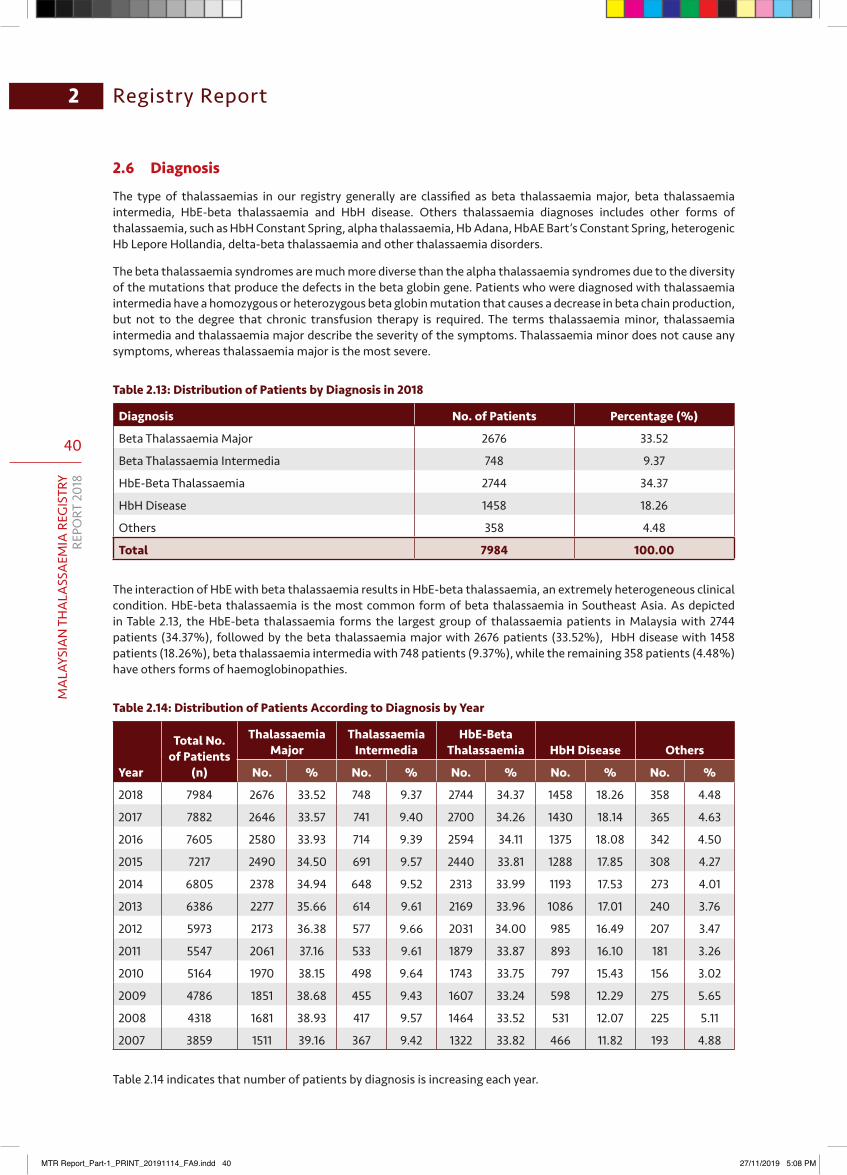
40
MA
LAYS
IAN
TH
ALA
SSA
EMIA
REG
ISTR
YRE
PORT
201
8
Registry Report2
2.6 Diagnosis
The type of thalassaemias in our registry generally are classified as beta thalassaemia major, beta thalassaemia intermedia, HbE-beta thalassaemia and HbH disease. Others thalassaemia diagnoses includes other forms of thalassaemia, such as HbH Constant Spring, alpha thalassaemia, Hb Adana, HbAE Bart’s Constant Spring, heterogenic Hb Lepore Hollandia, delta-beta thalassaemia and other thalassaemia disorders.
The beta thalassaemia syndromes are much more diverse than the alpha thalassaemia syndromes due to the diversity of the mutations that produce the defects in the beta globin gene. Patients who were diagnosed with thalassaemia intermedia have a homozygous or heterozygous beta globin mutation that causes a decrease in beta chain production, but not to the degree that chronic transfusion therapy is required. The terms thalassaemia minor, thalassaemia intermedia and thalassaemia major describe the severity of the symptoms. Thalassaemia minor does not cause any symptoms, whereas thalassaemia major is the most severe.
Table2.13:DistributionofPatientsbyDiagnosisin2018
Diagnosis No. of Patients Percentage (%)
Beta Thalassaemia Major 2676 33.52
Beta Thalassaemia Intermedia 748 9.37
HbE-Beta Thalassaemia 2744 34.37
HbH Disease 1458 18.26
Others 358 4.48
Total 7984 100.00
The interaction of HbE with beta thalassaemia results in HbE-beta thalassaemia, an extremely heterogeneous clinical condition. HbE-beta thalassaemia is the most common form of beta thalassaemia in Southeast Asia. As depicted in Table 2.13, the HbE-beta thalassaemia forms the largest group of thalassaemia patients in Malaysia with 2744 patients (34.37%), followed by the beta thalassaemia major with 2676 patients (33.52%), HbH disease with 1458 patients (18.26%), beta thalassaemia intermedia with 748 patients (9.37%), while the remaining 358 patients (4.48%) have others forms of haemoglobinopathies.
Table 2.14: Distribution of Patients According to Diagnosis by Year
Year
Total No. of Patients
(n)
Thalassaemia Major
Thalassaemia Intermedia
HbE-Beta Thalassaemia HbH Disease Others
No. % No. % No. % No. % No. %
2018 7984 2676 33.52 748 9.37 2744 34.37 1458 18.26 358 4.48
2017 7882 2646 33.57 741 9.40 2700 34.26 1430 18.14 365 4.63
2016 7605 2580 33.93 714 9.39 2594 34.11 1375 18.08 342 4.50
2015 7217 2490 34.50 691 9.57 2440 33.81 1288 17.85 308 4.27
2014 6805 2378 34.94 648 9.52 2313 33.99 1193 17.53 273 4.01
2013 6386 2277 35.66 614 9.61 2169 33.96 1086 17.01 240 3.76
2012 5973 2173 36.38 577 9.66 2031 34.00 985 16.49 207 3.47
2011 5547 2061 37.16 533 9.61 1879 33.87 893 16.10 181 3.26
2010 5164 1970 38.15 498 9.64 1743 33.75 797 15.43 156 3.02
2009 4786 1851 38.68 455 9.43 1607 33.24 598 12.29 275 5.65
2008 4318 1681 38.93 417 9.57 1464 33.52 531 12.07 225 5.11
2007 3859 1511 39.16 367 9.42 1322 33.82 466 11.82 193 4.88
Table 2.14 indicates that number of patients by diagnosis is increasing each year.
MTR Report_Part-1_PRINT_20191114_FA9.indd 40 27/11/2019 5:08 PM
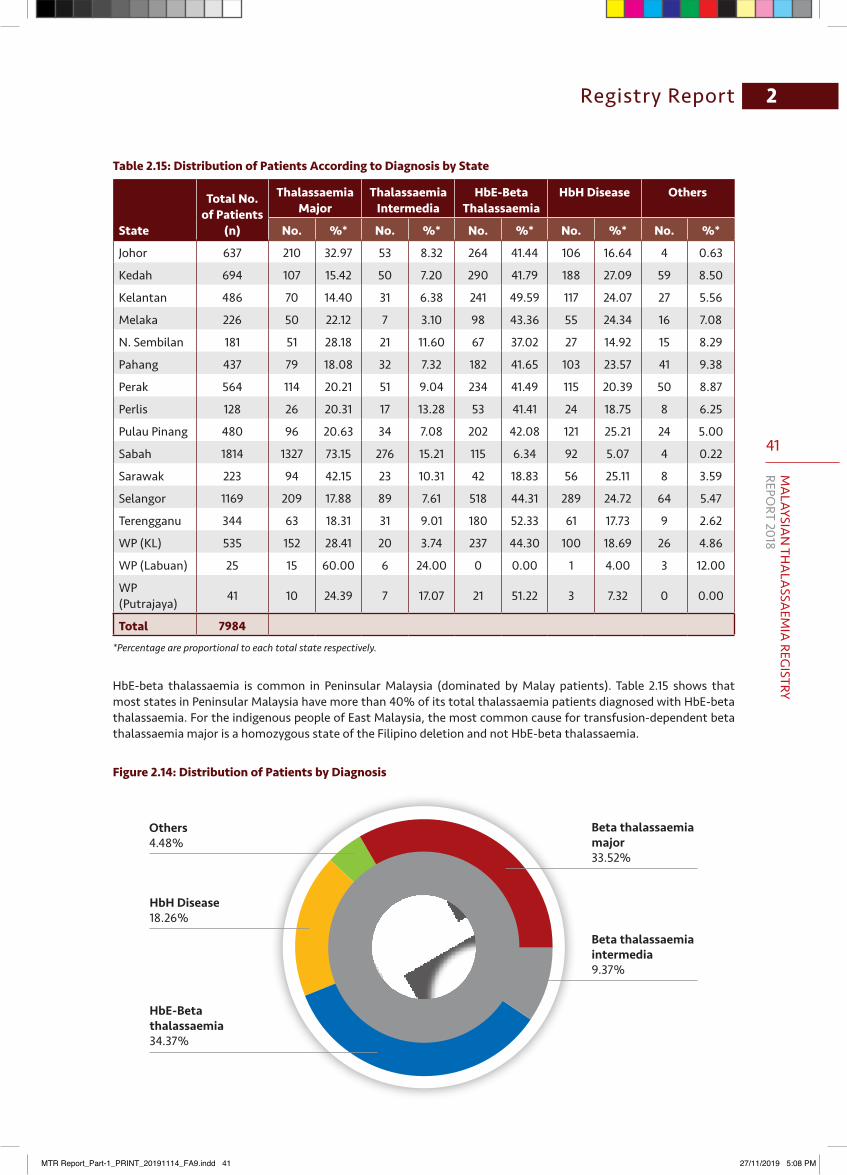
41
MA
LAYSIAN
THA
LASSA
EMIA
REGISTRY
REPORT 2018
Registry Report 2
Table 2.15: Distribution of Patients According to Diagnosis by State
State
Total No. of Patients
(n)
Thalassaemia Major
Thalassaemia Intermedia
HbE-Beta Thalassaemia
HbH Disease Others
No. %* No. %* No. %* No. %* No. %*
Johor 637 210 32.97 53 8.32 264 41.44 106 16.64 4 0.63
Kedah 694 107 15.42 50 7.20 290 41.79 188 27.09 59 8.50
Kelantan 486 70 14.40 31 6.38 241 49.59 117 24.07 27 5.56
Melaka 226 50 22.12 7 3.10 98 43.36 55 24.34 16 7.08
N. Sembilan 181 51 28.18 21 11.60 67 37.02 27 14.92 15 8.29
Pahang 437 79 18.08 32 7.32 182 41.65 103 23.57 41 9.38
Perak 564 114 20.21 51 9.04 234 41.49 115 20.39 50 8.87
Perlis 128 26 20.31 17 13.28 53 41.41 24 18.75 8 6.25
Pulau Pinang 480 96 20.63 34 7.08 202 42.08 121 25.21 24 5.00
Sabah 1814 1327 73.15 276 15.21 115 6.34 92 5.07 4 0.22
Sarawak 223 94 42.15 23 10.31 42 18.83 56 25.11 8 3.59
Selangor 1169 209 17.88 89 7.61 518 44.31 289 24.72 64 5.47
Terengganu 344 63 18.31 31 9.01 180 52.33 61 17.73 9 2.62
WP (KL) 535 152 28.41 20 3.74 237 44.30 100 18.69 26 4.86
WP (Labuan) 25 15 60.00 6 24.00 0 0.00 1 4.00 3 12.00
WP (Putrajaya) 41 10 24.39 7 17.07 21 51.22 3 7.32 0 0.00
Total 7984*Percentage are proportional to each total state respectively.
HbE-beta thalassaemia is common in Peninsular Malaysia (dominated by Malay patients). Table 2.15 shows that most states in Peninsular Malaysia have more than 40% of its total thalassaemia patients diagnosed with HbE-beta thalassaemia. For the indigenous people of East Malaysia, the most common cause for transfusion-dependent beta thalassaemia major is a homozygous state of the Filipino deletion and not HbE-beta thalassaemia.
Figure 2.14: Distribution of Patients by Diagnosis
Beta thalassaemia major33.52%
Beta thalassaemia intermedia9.37%
HbE-Beta thalassaemia34.37%
HbH Disease18.26%
Others4.48%
MTR Report_Part-1_PRINT_20191114_FA9.indd 41 27/11/2019 5:08 PM
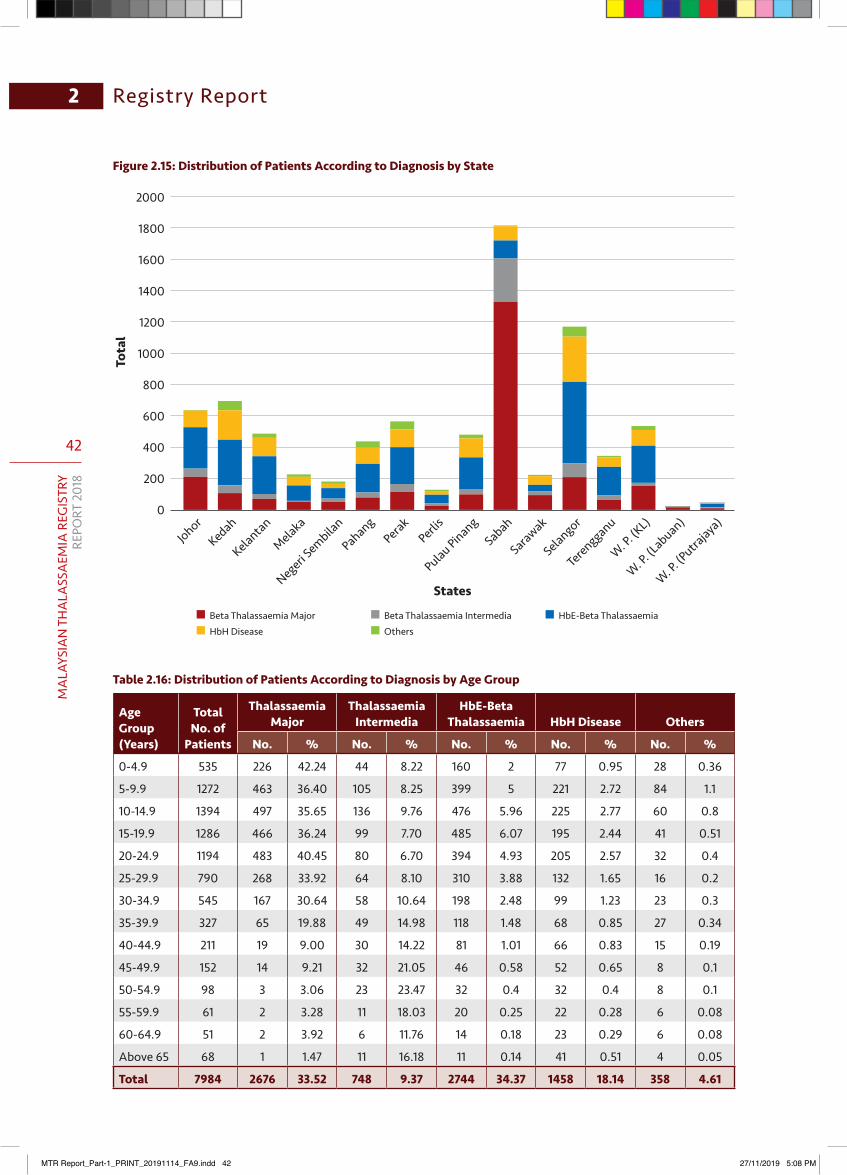
42
MA
LAYS
IAN
TH
ALA
SSA
EMIA
REG
ISTR
YRE
PORT
201
8
Registry Report2
Figure 2.15: Distribution of Patients According to Diagnosis by State
Table 2.16: Distribution of Patients According to Diagnosis by Age Group
Age Group (Years)
Total No. of
Patients
Thalassaemia Major
Thalassaemia Intermedia
HbE-Beta Thalassaemia HbH Disease Others
No. % No. % No. % No. % No. %
0-4.9 535 226 42.24 44 8.22 160 2 77 0.95 28 0.36
5-9.9 1272 463 36.40 105 8.25 399 5 221 2.72 84 1.1
10-14.9 1394 497 35.65 136 9.76 476 5.96 225 2.77 60 0.8
15-19.9 1286 466 36.24 99 7.70 485 6.07 195 2.44 41 0.51
20-24.9 1194 483 40.45 80 6.70 394 4.93 205 2.57 32 0.4
25-29.9 790 268 33.92 64 8.10 310 3.88 132 1.65 16 0.2
30-34.9 545 167 30.64 58 10.64 198 2.48 99 1.23 23 0.3
35-39.9 327 65 19.88 49 14.98 118 1.48 68 0.85 27 0.34
40-44.9 211 19 9.00 30 14.22 81 1.01 66 0.83 15 0.19
45-49.9 152 14 9.21 32 21.05 46 0.58 52 0.65 8 0.1
50-54.9 98 3 3.06 23 23.47 32 0.4 32 0.4 8 0.1
55-59.9 61 2 3.28 11 18.03 20 0.25 22 0.28 6 0.08
60-64.9 51 2 3.92 6 11.76 14 0.18 23 0.29 6 0.08
Above 65 68 1 1.47 11 16.18 11 0.14 41 0.51 4 0.05
Total 7984 2676 33.52 748 9.37 2744 34.37 1458 18.14 358 4.61
2000
1800
1600
1400
1200
1000
800
600
400
200
0
States
Tota
l
JohorKedah
Kelantan
Melaka
Negeri Sembila
n
PahangPerak
Perlis
Pulau PinangSabah
Sarawak
Selangor
Terengganu
W. P. (K
L)
W. P. (L
abuan)
W. P. (P
utrajaya
)
Beta Thalassaemia MajorHbH Disease
Beta Thalassaemia IntermediaOthers
HbE-Beta Thalassaemia
MTR Report_Part-1_PRINT_20191114_FA9.indd 42 27/11/2019 5:08 PM
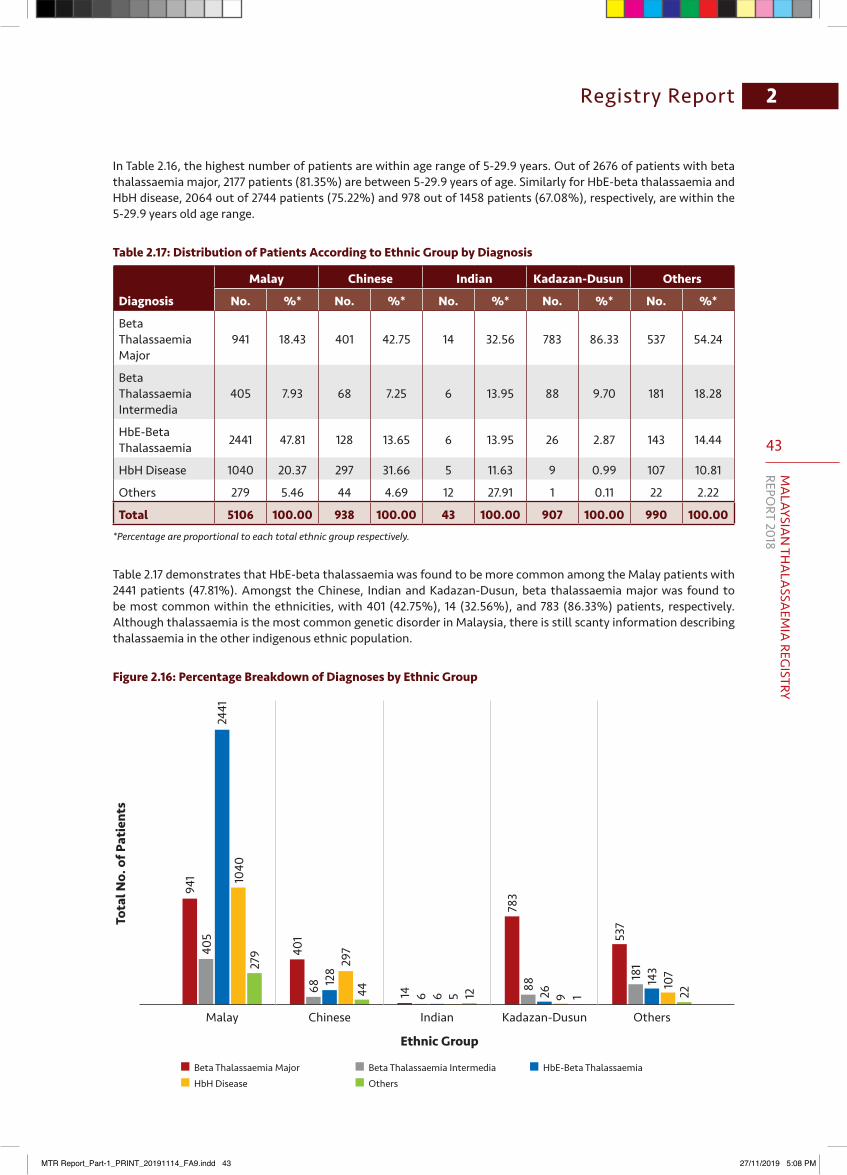
43
MA
LAYSIAN
THA
LASSA
EMIA
REGISTRY
REPORT 2018
Registry Report 2
In Table 2.16, the highest number of patients are within age range of 5-29.9 years. Out of 2676 of patients with beta thalassaemia major, 2177 patients (81.35%) are between 5-29.9 years of age. Similarly for HbE-beta thalassaemia and HbH disease, 2064 out of 2744 patients (75.22%) and 978 out of 1458 patients (67.08%), respectively, are within the 5-29.9 years old age range.
Table 2.17: Distribution of Patients According to Ethnic Group by Diagnosis
Diagnosis
Malay Chinese Indian Kadazan-Dusun Others
No. %* No. %* No. %* No. %* No. %*
Beta Thalassaemia Major
941 18.43 401 42.75 14 32.56 783 86.33 537 54.24
Beta Thalassaemia Intermedia
405 7.93 68 7.25 6 13.95 88 9.70 181 18.28
HbE-Beta Thalassaemia 2441 47.81 128 13.65 6 13.95 26 2.87 143 14.44
HbH Disease 1040 20.37 297 31.66 5 11.63 9 0.99 107 10.81
Others 279 5.46 44 4.69 12 27.91 1 0.11 22 2.22
Total 5106 100.00 938 100.00 43 100.00 907 100.00 990 100.00*Percentage are proportional to each total ethnic group respectively.
Table 2.17 demonstrates that HbE-beta thalassaemia was found to be more common among the Malay patients with 2441 patients (47.81%). Amongst the Chinese, Indian and Kadazan-Dusun, beta thalassaemia major was found to be most common within the ethnicities, with 401 (42.75%), 14 (32.56%), and 783 (86.33%) patients, respectively. Although thalassaemia is the most common genetic disorder in Malaysia, there is still scanty information describing thalassaemia in the other indigenous ethnic population.
Figure 2.16: Percentage Breakdown of Diagnoses by Ethnic Group
Ethnic Group
Tota
l No.
of P
atie
nts
Malay Chinese Indian Kadazan-Dusun Others
Beta Thalassaemia MajorHbH Disease
Beta Thalassaemia IntermediaOthers
HbE-Beta Thalassaemia
2441
405
941 10
4027
9 401
14
537
783
6
181
88
6
143
265
107
912 22168 128
297
44
MTR Report_Part-1_PRINT_20191114_FA9.indd 43 27/11/2019 5:08 PM
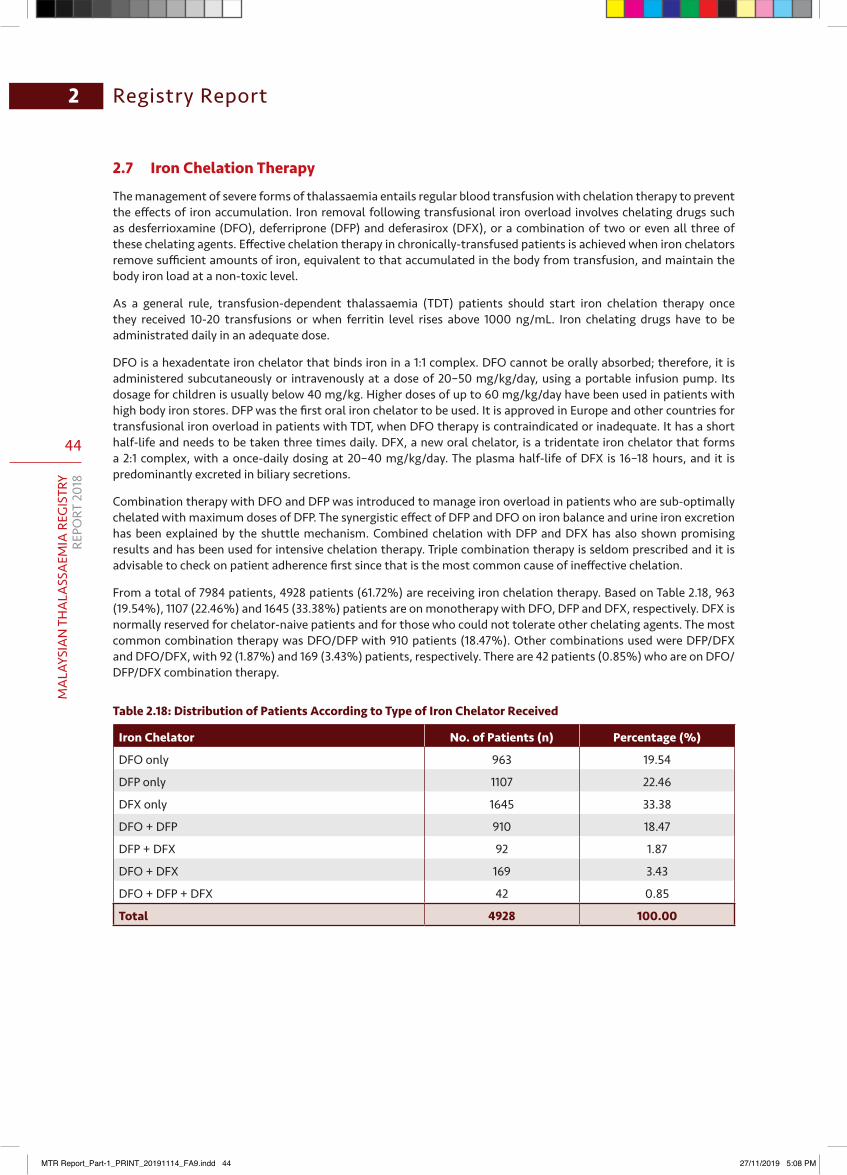
44
MA
LAYS
IAN
TH
ALA
SSA
EMIA
REG
ISTR
YRE
PORT
201
8
Registry Report2
2.7 Iron Chelation Therapy
The management of severe forms of thalassaemia entails regular blood transfusion with chelation therapy to prevent the effects of iron accumulation. Iron removal following transfusional iron overload involves chelating drugs such as desferrioxamine (DFO), deferriprone (DFP) and deferasirox (DFX), or a combination of two or even all three of these chelating agents. Effective chelation therapy in chronically-transfused patients is achieved when iron chelators remove sufficient amounts of iron, equivalent to that accumulated in the body from transfusion, and maintain the body iron load at a non-toxic level.
As a general rule, transfusion-dependent thalassaemia (TDT) patients should start iron chelation therapy once they received 10-20 transfusions or when ferritin level rises above 1000 ng/mL. Iron chelating drugs have to be administrated daily in an adequate dose.
DFO is a hexadentate iron chelator that binds iron in a 1:1 complex. DFO cannot be orally absorbed; therefore, it is administered subcutaneously or intravenously at a dose of 20–50 mg/kg/day, using a portable infusion pump. Its dosage for children is usually below 40 mg/kg. Higher doses of up to 60 mg/kg/day have been used in patients with high body iron stores. DFP was the first oral iron chelator to be used. It is approved in Europe and other countries for transfusional iron overload in patients with TDT, when DFO therapy is contraindicated or inadequate. It has a short half-life and needs to be taken three times daily. DFX, a new oral chelator, is a tridentate iron chelator that forms a 2:1 complex, with a once-daily dosing at 20–40 mg/kg/day. The plasma half-life of DFX is 16–18 hours, and it is predominantly excreted in biliary secretions.
Combination therapy with DFO and DFP was introduced to manage iron overload in patients who are sub-optimally chelated with maximum doses of DFP. The synergistic effect of DFP and DFO on iron balance and urine iron excretion has been explained by the shuttle mechanism. Combined chelation with DFP and DFX has also shown promising results and has been used for intensive chelation therapy. Triple combination therapy is seldom prescribed and it is advisable to check on patient adherence first since that is the most common cause of ineffective chelation.
From a total of 7984 patients, 4928 patients (61.72%) are receiving iron chelation therapy. Based on Table 2.18, 963 (19.54%), 1107 (22.46%) and 1645 (33.38%) patients are on monotherapy with DFO, DFP and DFX, respectively. DFX is normally reserved for chelator-naive patients and for those who could not tolerate other chelating agents. The most common combination therapy was DFO/DFP with 910 patients (18.47%). Other combinations used were DFP/DFX and DFO/DFX, with 92 (1.87%) and 169 (3.43%) patients, respectively. There are 42 patients (0.85%) who are on DFO/DFP/DFX combination therapy.
Table2.18:DistributionofPatientsAccordingtoTypeofIronChelatorReceived
Iron Chelator No. of Patients (n) Percentage (%)
DFO only 963 19.54
DFP only 1107 22.46
DFX only 1645 33.38
DFO + DFP 910 18.47
DFP + DFX 92 1.87
DFO + DFX 169 3.43
DFO + DFP + DFX 42 0.85
Total 4928 100.00
MTR Report_Part-1_PRINT_20191114_FA9.indd 44 27/11/2019 5:08 PM
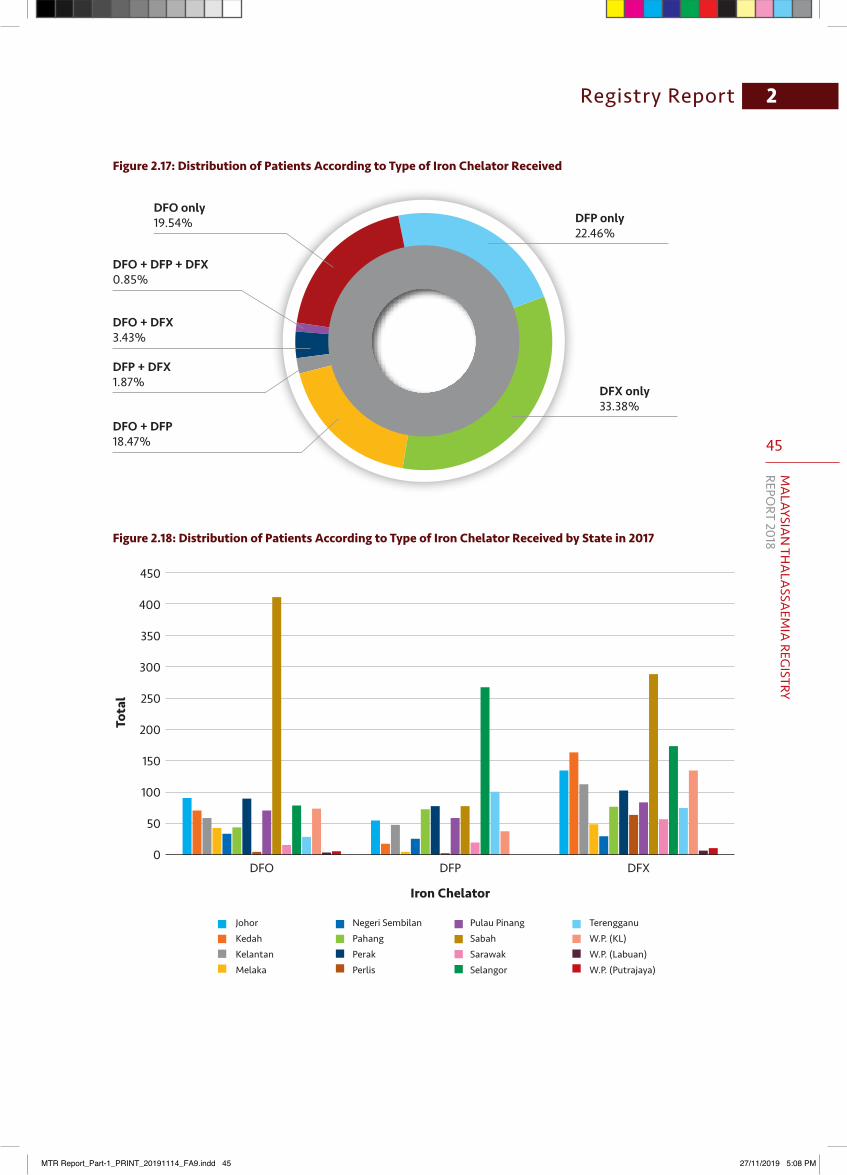
45
MA
LAYSIAN
THA
LASSA
EMIA
REGISTRY
REPORT 2018
Registry Report 2
Figure 2.17: Distribution of Patients According to Type of Iron Chelator Received
Figure2.18:DistributionofPatientsAccordingtoTypeofIronChelatorReceivedbyStatein2017
DFX only33.38%
DFO + DFP18.47%
DFP + DFX1.87%
DFO + DFX3.43%
DFO + DFP + DFX0.85%
DFO only19.54% DFP only
22.46%
JohorKedahKelantanMelaka
Negeri SembilanPahangPerakPerlis
Pulau PinangSabahSarawakSelangor
TerengganuW.P. (KL)W.P. (Labuan)W.P. (Putrajaya)
450
400
350
300
250
200
150
100
50
0
Iron Chelator
Tota
l
DFO DFP DFX
MTR Report_Part-1_PRINT_20191114_FA9.indd 45 27/11/2019 5:08 PM

46
MA
LAYS
IAN
TH
ALA
SSA
EMIA
REG
ISTR
YRE
PORT
201
8
Registry Report2
Table 2.19: Distribution of Patients According to Type of Iron Chelator Received by State
CentreTotal No. of
Patients Iron ChelatorNo. of
Patients (n)Percentage
(%)
Johor 422
DFO only 63 14.93
DFP only 119 28.20
DFX only 112 26.54
DFO + DFP 101 23.93
DFP + DFX 8 1.90
DFO + DFX 17 4.03
DFO + DFP + DFX 2 0.47
Kedah 371
DFO only 36 9.70
DFP only 70 18.87
DFX only 200 53.91
DFO + DFP 42 11.32
DFP + DFX 11 2.96
DFO + DFX 11 2.96
DFO + DFP + DFX 1 0.27
Kelantan 276
DFO only 49 17.75
DFP only 54 19.57
DFX only 134 48.55
DFO + DFP 18 6.52
DFP + DFX 6 2.17
DFO + DFX 14 5.07
DFO + DFP + DFX 1 0.36
Melaka 115
DFO only 44 38.26
DFP only 5 4.35
DFX only 50 43.48
DFO + DFP 12 10.43
DFP + DFX 0 0.00
DFO + DFX 4 3.48
DFO + DFP + DFX 0 0.00
Negeri Sembilan 115
DFO only 33 28.70
DFP only 27 23.48
DFX only 31 26.96
DFO + DFP 20 17.39
DFP + DFX 0 0.00
DFO + DFX 4 3.48
DFO + DFP + DFX 0 0.00
MTR Report_Part-1_PRINT_20191114_FA9.indd 46 27/11/2019 5:08 PM
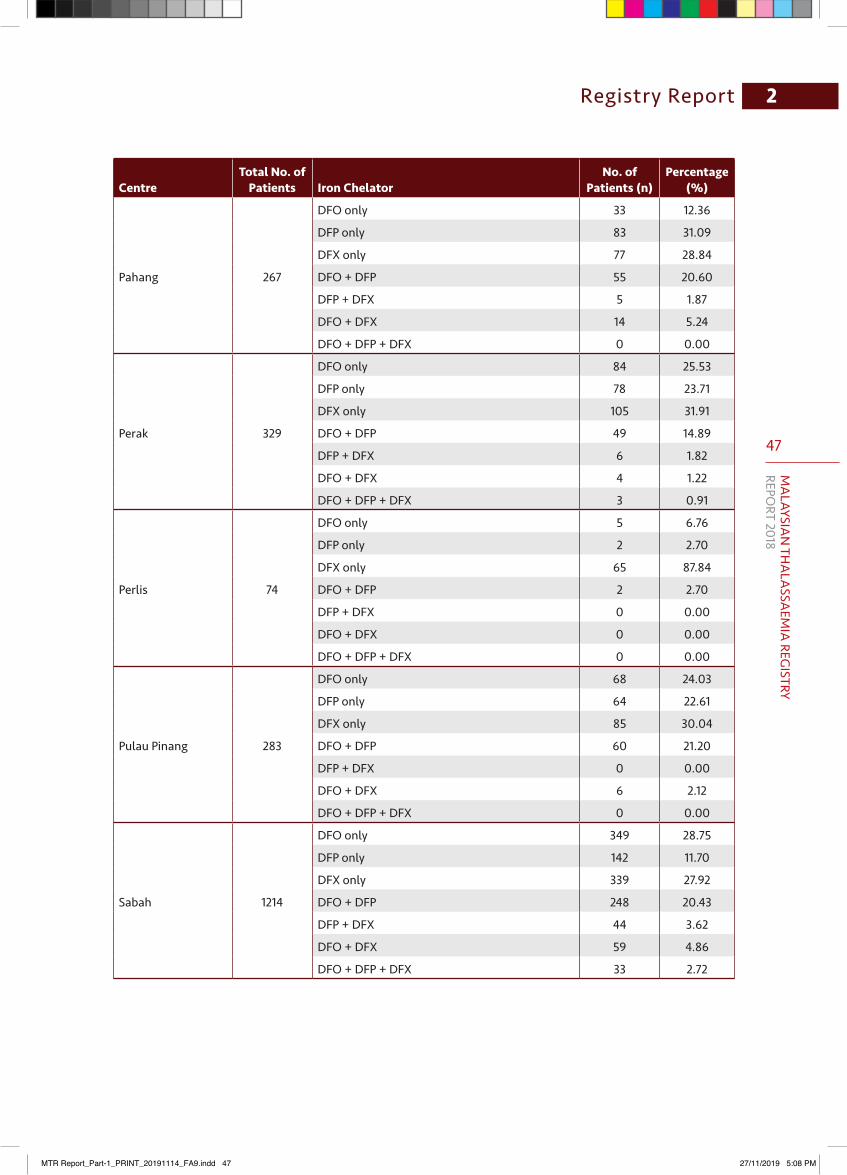
47
MA
LAYSIAN
THA
LASSA
EMIA
REGISTRY
REPORT 2018
Registry Report 2
CentreTotal No. of
Patients Iron ChelatorNo. of
Patients (n)Percentage
(%)
Pahang 267
DFO only 33 12.36
DFP only 83 31.09
DFX only 77 28.84
DFO + DFP 55 20.60
DFP + DFX 5 1.87
DFO + DFX 14 5.24
DFO + DFP + DFX 0 0.00
Perak 329
DFO only 84 25.53
DFP only 78 23.71
DFX only 105 31.91
DFO + DFP 49 14.89
DFP + DFX 6 1.82
DFO + DFX 4 1.22
DFO + DFP + DFX 3 0.91
Perlis 74
DFO only 5 6.76
DFP only 2 2.70
DFX only 65 87.84
DFO + DFP 2 2.70
DFP + DFX 0 0.00
DFO + DFX 0 0.00
DFO + DFP + DFX 0 0.00
Pulau Pinang 283
DFO only 68 24.03
DFP only 64 22.61
DFX only 85 30.04
DFO + DFP 60 21.20
DFP + DFX 0 0.00
DFO + DFX 6 2.12
DFO + DFP + DFX 0 0.00
Sabah 1214
DFO only 349 28.75
DFP only 142 11.70
DFX only 339 27.92
DFO + DFP 248 20.43
DFP + DFX 44 3.62
DFO + DFX 59 4.86
DFO + DFP + DFX 33 2.72
MTR Report_Part-1_PRINT_20191114_FA9.indd 47 27/11/2019 5:08 PM

48
MA
LAYS
IAN
TH
ALA
SSA
EMIA
REG
ISTR
YRE
PORT
201
8
Registry Report2
CentreTotal No. of
Patients Iron ChelatorNo. of
Patients (n)Percentage
(%)
Sarawak 124
DFO only 18 14.52
DFP only 19 15.32
DFX only 56 45.16
DFO + DFP 27 21.77
DFP + DFX 0 0.00
DFO + DFX 4 3.23
DFO + DFP + DFX 0 0.00
Selangor 753
DFO only 75 9.58
DFP only 292 37.29
DFX only 161 20.56
DFO + DFP 198 25.29
DFP + DFX 8 1.02
DFO + DFX 18 2.30
DFO + DFP + DFX 1 0.13
Terengganu 240
DFO only 29 12.08
DFP only 111 46.25
DFX only 78 32.50
DFO + DFP 22 9.17
DFP + DFX 0 0.00
DFO + DFX 0 0.00
DFO + DFP + DFX 0 0.00
WP Kuala Lumpur 306
DFO only 70 21.88
DFP only 39 12.19
DFX only 128 40.00
DFO + DFP 53 16.56
DFP + DFX 2 0.63
DFO + DFX 14 4.38
DFO + DFP + DFX 0 0.00
WP Labuan 18
DFO only 3 15.79
DFP only 0 0.00
DFX only 9 47.37
DFO + DFP 3 15.79
DFP + DFX 2 10.53
DFO + DFX 0 0.00
DFO + DFP + DFX 1 5.26
MTR Report_Part-1_PRINT_20191114_FA9.indd 48 27/11/2019 5:08 PM
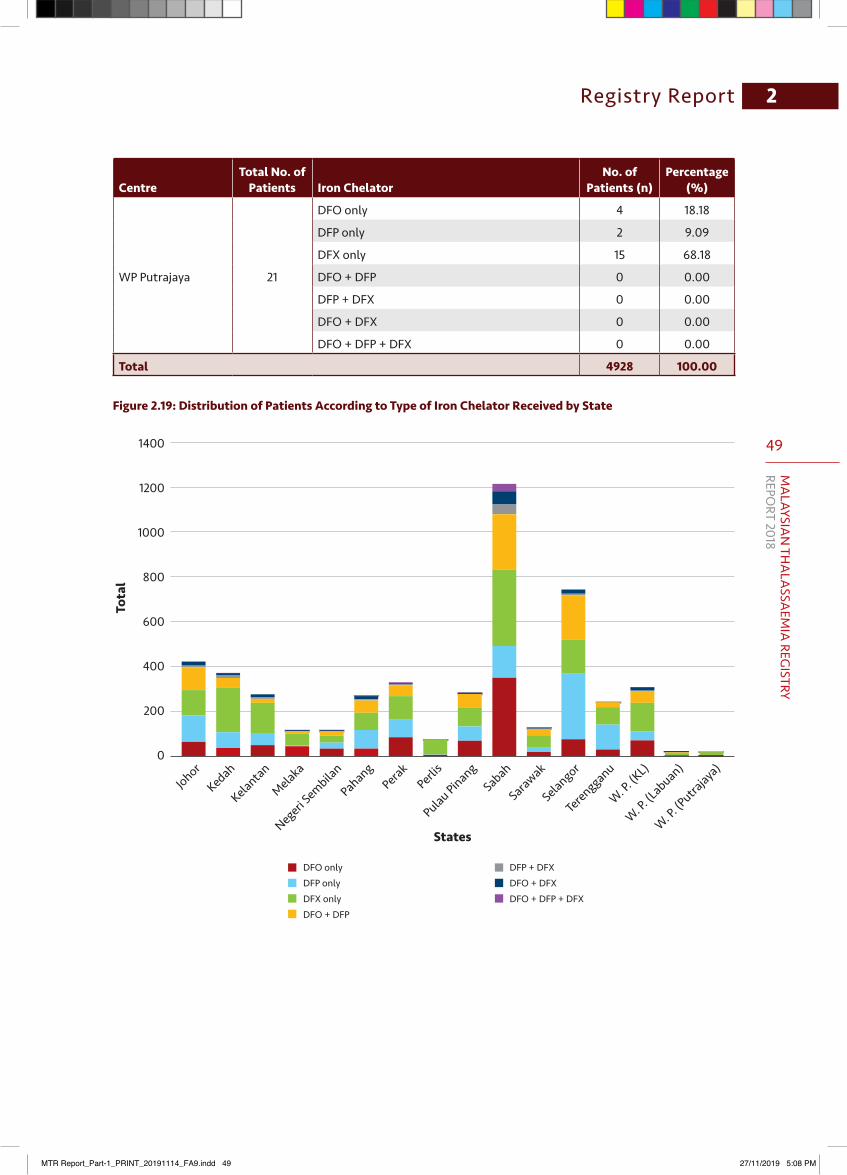
49
MA
LAYSIAN
THA
LASSA
EMIA
REGISTRY
REPORT 2018
Registry Report 2
CentreTotal No. of
Patients Iron ChelatorNo. of
Patients (n)Percentage
(%)
WP Putrajaya 21
DFO only 4 18.18
DFP only 2 9.09
DFX only 15 68.18
DFO + DFP 0 0.00
DFP + DFX 0 0.00
DFO + DFX 0 0.00
DFO + DFP + DFX 0 0.00
Total 4928 100.00
Figure 2.19: Distribution of Patients According to Type of Iron Chelator Received by State
DFO onlyDFP onlyDFX onlyDFO + DFP
DFP + DFXDFO + DFXDFO + DFP + DFX
1400
1200
1000
800
600
400
200
0
States
Tota
l
JohorKedah
Kelantan
Melaka
Negeri Sembila
n
PahangPerak
Perlis
Pulau PinangSabah
Sarawak
Selangor
Terengganu
W. P. (K
L)
W. P. (L
abuan)
W. P. (P
utrajaya
)
MTR Report_Part-1_PRINT_20191114_FA9.indd 49 27/11/2019 5:08 PM
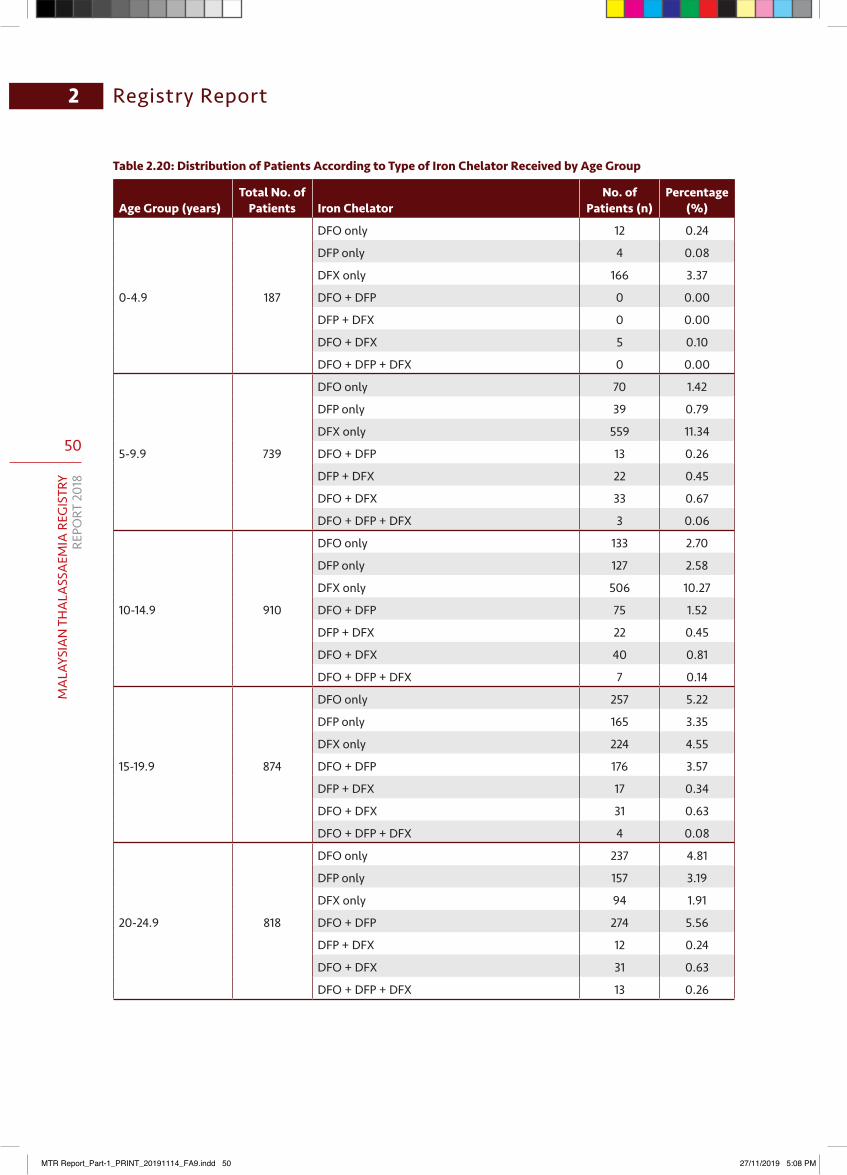
50
MA
LAYS
IAN
TH
ALA
SSA
EMIA
REG
ISTR
YRE
PORT
201
8
Registry Report2
Table 2.20: Distribution of Patients According to Type of Iron Chelator Received by Age Group
Age Group (years)Total No. of
Patients Iron ChelatorNo. of
Patients (n)Percentage
(%)
0-4.9 187
DFO only 12 0.24
DFP only 4 0.08
DFX only 166 3.37
DFO + DFP 0 0.00
DFP + DFX 0 0.00
DFO + DFX 5 0.10
DFO + DFP + DFX 0 0.00
5-9.9 739
DFO only 70 1.42
DFP only 39 0.79
DFX only 559 11.34
DFO + DFP 13 0.26
DFP + DFX 22 0.45
DFO + DFX 33 0.67
DFO + DFP + DFX 3 0.06
10-14.9 910
DFO only 133 2.70
DFP only 127 2.58
DFX only 506 10.27
DFO + DFP 75 1.52
DFP + DFX 22 0.45
DFO + DFX 40 0.81
DFO + DFP + DFX 7 0.14
15-19.9 874
DFO only 257 5.22
DFP only 165 3.35
DFX only 224 4.55
DFO + DFP 176 3.57
DFP + DFX 17 0.34
DFO + DFX 31 0.63
DFO + DFP + DFX 4 0.08
20-24.9 818
DFO only 237 4.81
DFP only 157 3.19
DFX only 94 1.91
DFO + DFP 274 5.56
DFP + DFX 12 0.24
DFO + DFX 31 0.63
DFO + DFP + DFX 13 0.26
MTR Report_Part-1_PRINT_20191114_FA9.indd 50 27/11/2019 5:08 PM
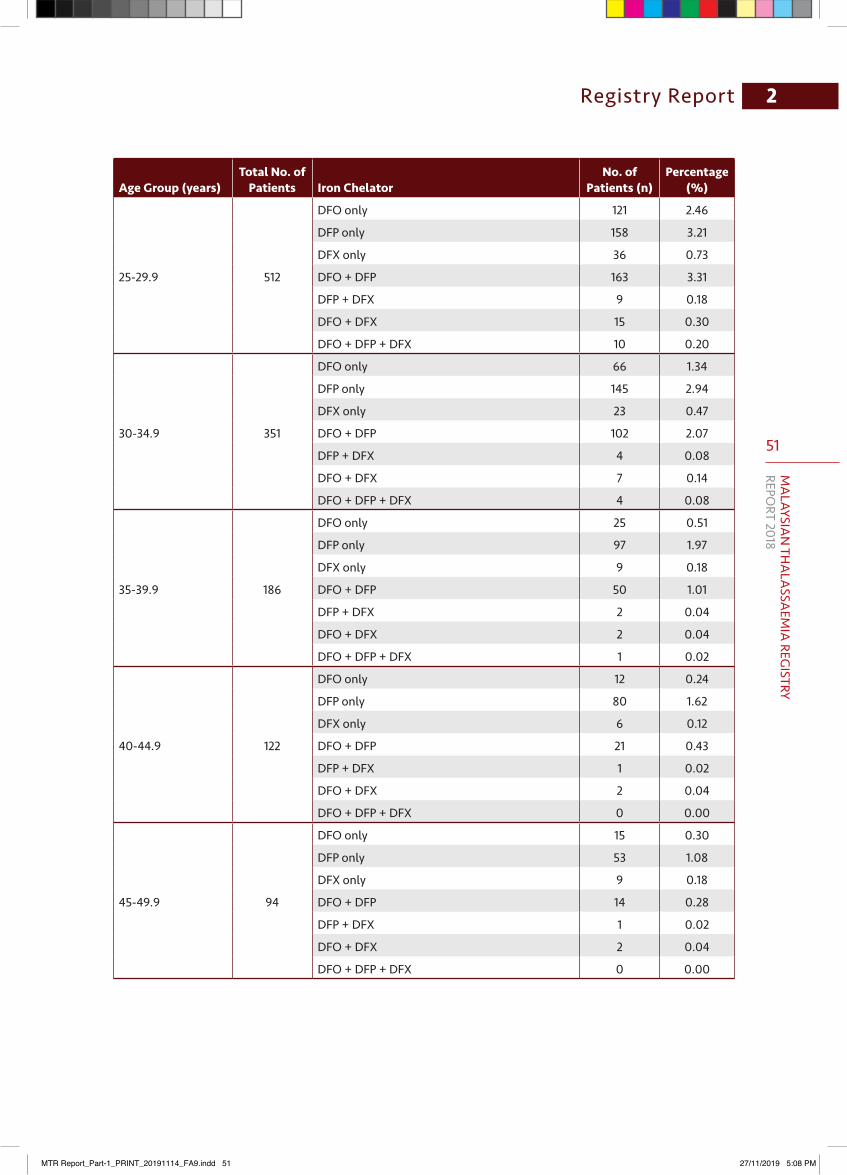
51
MA
LAYSIAN
THA
LASSA
EMIA
REGISTRY
REPORT 2018
Registry Report 2
Age Group (years)Total No. of
Patients Iron ChelatorNo. of
Patients (n)Percentage
(%)
25-29.9 512
DFO only 121 2.46
DFP only 158 3.21
DFX only 36 0.73
DFO + DFP 163 3.31
DFP + DFX 9 0.18
DFO + DFX 15 0.30
DFO + DFP + DFX 10 0.20
30-34.9 351
DFO only 66 1.34
DFP only 145 2.94
DFX only 23 0.47
DFO + DFP 102 2.07
DFP + DFX 4 0.08
DFO + DFX 7 0.14
DFO + DFP + DFX 4 0.08
35-39.9 186
DFO only 25 0.51
DFP only 97 1.97
DFX only 9 0.18
DFO + DFP 50 1.01
DFP + DFX 2 0.04
DFO + DFX 2 0.04
DFO + DFP + DFX 1 0.02
40-44.9 122
DFO only 12 0.24
DFP only 80 1.62
DFX only 6 0.12
DFO + DFP 21 0.43
DFP + DFX 1 0.02
DFO + DFX 2 0.04
DFO + DFP + DFX 0 0.00
45-49.9 94
DFO only 15 0.30
DFP only 53 1.08
DFX only 9 0.18
DFO + DFP 14 0.28
DFP + DFX 1 0.02
DFO + DFX 2 0.04
DFO + DFP + DFX 0 0.00
MTR Report_Part-1_PRINT_20191114_FA9.indd 51 27/11/2019 5:08 PM
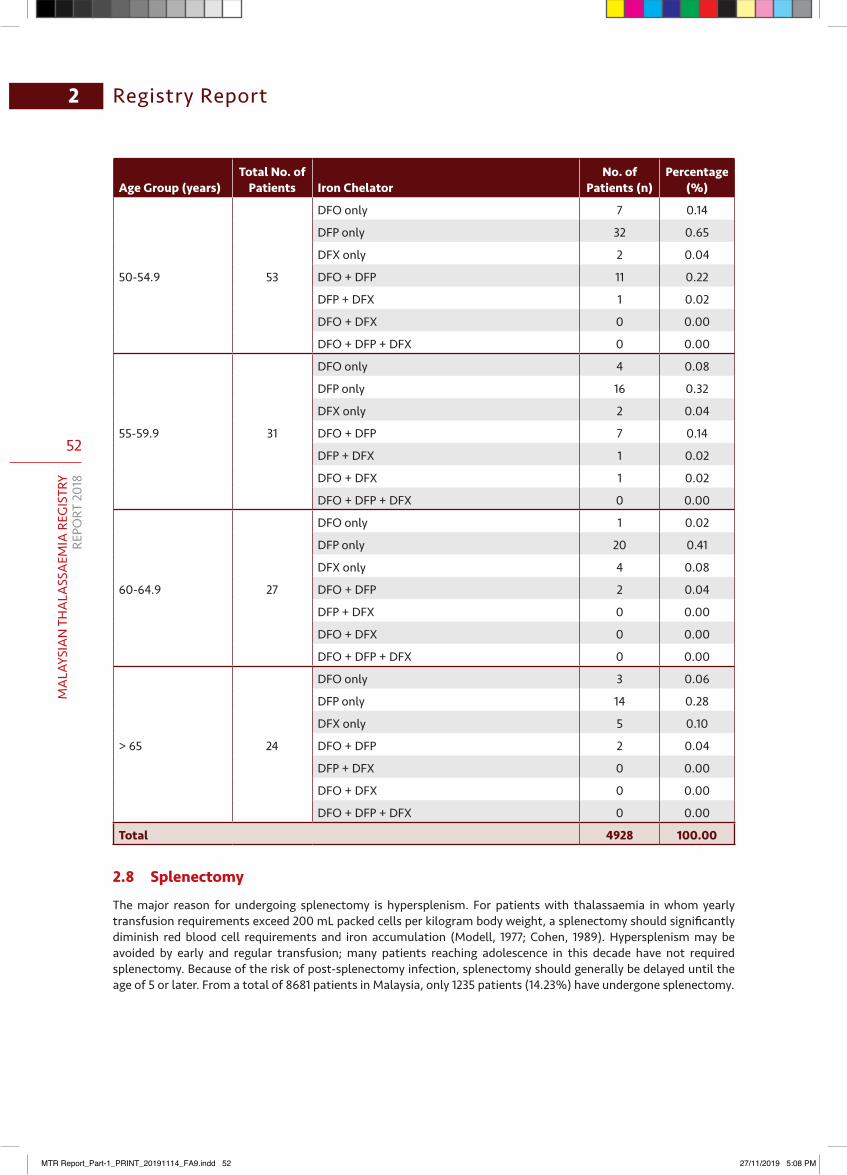
52
MA
LAYS
IAN
TH
ALA
SSA
EMIA
REG
ISTR
YRE
PORT
201
8
Registry Report2
Age Group (years)Total No. of
Patients Iron ChelatorNo. of
Patients (n)Percentage
(%)
50-54.9 53
DFO only 7 0.14
DFP only 32 0.65
DFX only 2 0.04
DFO + DFP 11 0.22
DFP + DFX 1 0.02
DFO + DFX 0 0.00
DFO + DFP + DFX 0 0.00
55-59.9 31
DFO only 4 0.08
DFP only 16 0.32
DFX only 2 0.04
DFO + DFP 7 0.14
DFP + DFX 1 0.02
DFO + DFX 1 0.02
DFO + DFP + DFX 0 0.00
60-64.9 27
DFO only 1 0.02
DFP only 20 0.41
DFX only 4 0.08
DFO + DFP 2 0.04
DFP + DFX 0 0.00
DFO + DFX 0 0.00
DFO + DFP + DFX 0 0.00
> 65 24
DFO only 3 0.06
DFP only 14 0.28
DFX only 5 0.10
DFO + DFP 2 0.04
DFP + DFX 0 0.00
DFO + DFX 0 0.00
DFO + DFP + DFX 0 0.00
Total 4928 100.00
2.8 Splenectomy
The major reason for undergoing splenectomy is hypersplenism. For patients with thalassaemia in whom yearly transfusion requirements exceed 200 mL packed cells per kilogram body weight, a splenectomy should significantly diminish red blood cell requirements and iron accumulation (Modell, 1977; Cohen, 1989). Hypersplenism may be avoided by early and regular transfusion; many patients reaching adolescence in this decade have not required splenectomy. Because of the risk of post-splenectomy infection, splenectomy should generally be delayed until the age of 5 or later. From a total of 8681 patients in Malaysia, only 1235 patients (14.23%) have undergone splenectomy.
MTR Report_Part-1_PRINT_20191114_FA9.indd 52 27/11/2019 5:08 PM
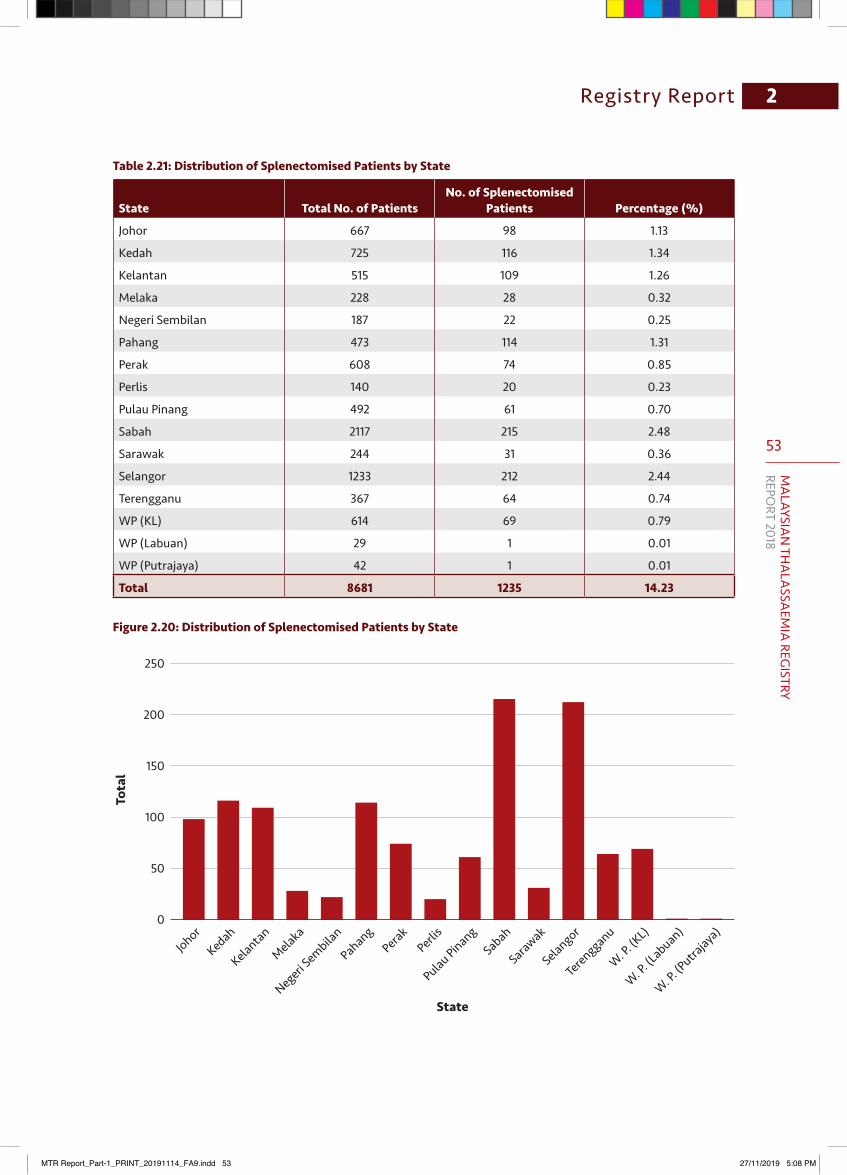
53
MA
LAYSIAN
THA
LASSA
EMIA
REGISTRY
REPORT 2018
Registry Report 2
Table 2.21: Distribution of Splenectomised Patients by State
State Total No. of PatientsNo. of Splenectomised
Patients Percentage (%)
Johor 667 98 1.13
Kedah 725 116 1.34
Kelantan 515 109 1.26
Melaka 228 28 0.32
Negeri Sembilan 187 22 0.25
Pahang 473 114 1.31
Perak 608 74 0.85
Perlis 140 20 0.23
Pulau Pinang 492 61 0.70
Sabah 2117 215 2.48
Sarawak 244 31 0.36
Selangor 1233 212 2.44
Terengganu 367 64 0.74
WP (KL) 614 69 0.79
WP (Labuan) 29 1 0.01
WP (Putrajaya) 42 1 0.01
Total 8681 1235 14.23
Figure 2.20: Distribution of Splenectomised Patients by State
250
200
150
100
50
0
State
Tota
l
JohorKedah
Kelantan
Melaka
Negeri Sembila
n
PahangPerak
Perlis
Pulau PinangSabah
Sarawak
Selangor
Terengganu
W. P. (K
L)
W. P. (L
abuan)
W. P. (P
utrajaya
)
MTR Report_Part-1_PRINT_20191114_FA9.indd 53 27/11/2019 5:08 PM
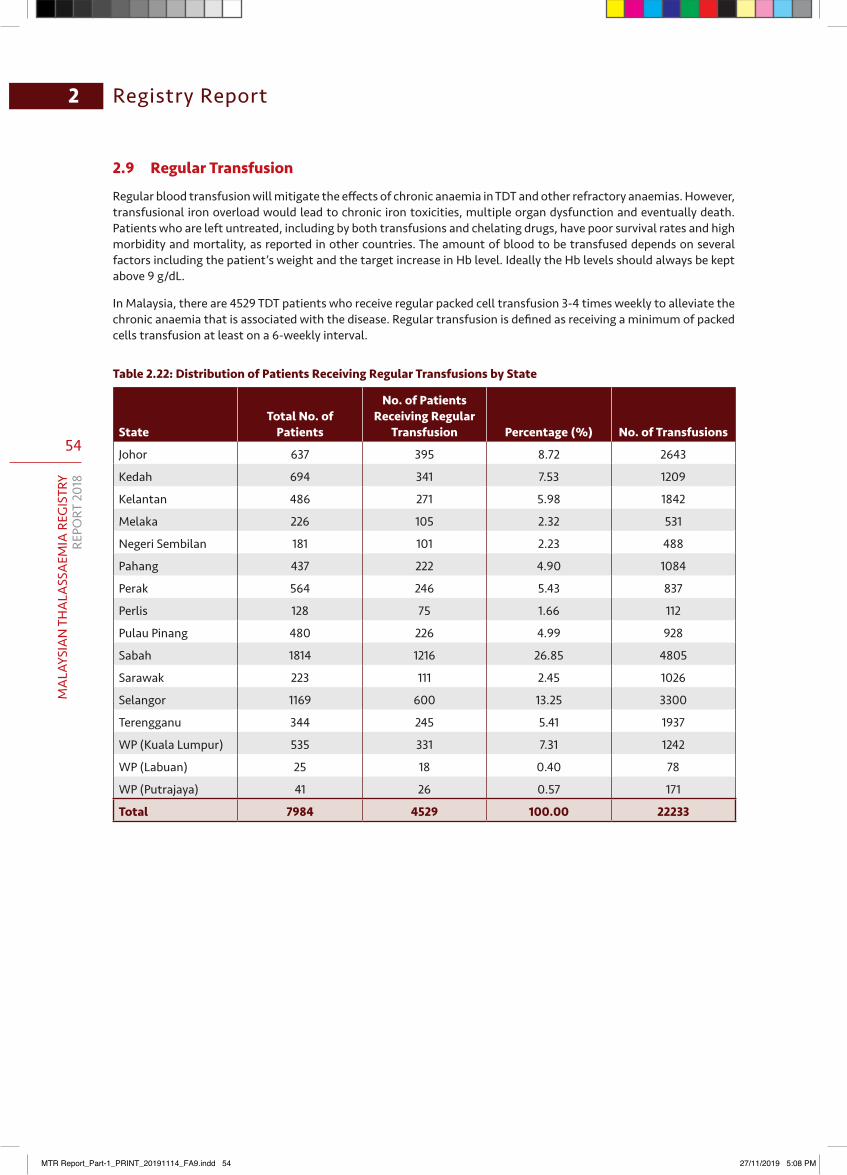
54
MA
LAYS
IAN
TH
ALA
SSA
EMIA
REG
ISTR
YRE
PORT
201
8
Registry Report2
2.9 Regular Transfusion
Regular blood transfusion will mitigate the effects of chronic anaemia in TDT and other refractory anaemias. However, transfusional iron overload would lead to chronic iron toxicities, multiple organ dysfunction and eventually death. Patients who are left untreated, including by both transfusions and chelating drugs, have poor survival rates and high morbidity and mortality, as reported in other countries. The amount of blood to be transfused depends on several factors including the patient’s weight and the target increase in Hb level. Ideally the Hb levels should always be kept above 9 g/dL.
In Malaysia, there are 4529 TDT patients who receive regular packed cell transfusion 3-4 times weekly to alleviate the chronic anaemia that is associated with the disease. Regular transfusion is defined as receiving a minimum of packed cells transfusion at least on a 6-weekly interval.
Table 2.22: Distribution of Patients Receiving Regular Transfusions by State
StateTotal No. of
Patients
No. of Patients Receiving Regular
Transfusion Percentage (%) No. of Transfusions
Johor 637 395 8.72 2643
Kedah 694 341 7.53 1209
Kelantan 486 271 5.98 1842
Melaka 226 105 2.32 531
Negeri Sembilan 181 101 2.23 488
Pahang 437 222 4.90 1084
Perak 564 246 5.43 837
Perlis 128 75 1.66 112
Pulau Pinang 480 226 4.99 928
Sabah 1814 1216 26.85 4805
Sarawak 223 111 2.45 1026
Selangor 1169 600 13.25 3300
Terengganu 344 245 5.41 1937
WP (Kuala Lumpur) 535 331 7.31 1242
WP (Labuan) 25 18 0.40 78
WP (Putrajaya) 41 26 0.57 171
Total 7984 4529 100.00 22233
MTR Report_Part-1_PRINT_20191114_FA9.indd 54 27/11/2019 5:08 PM
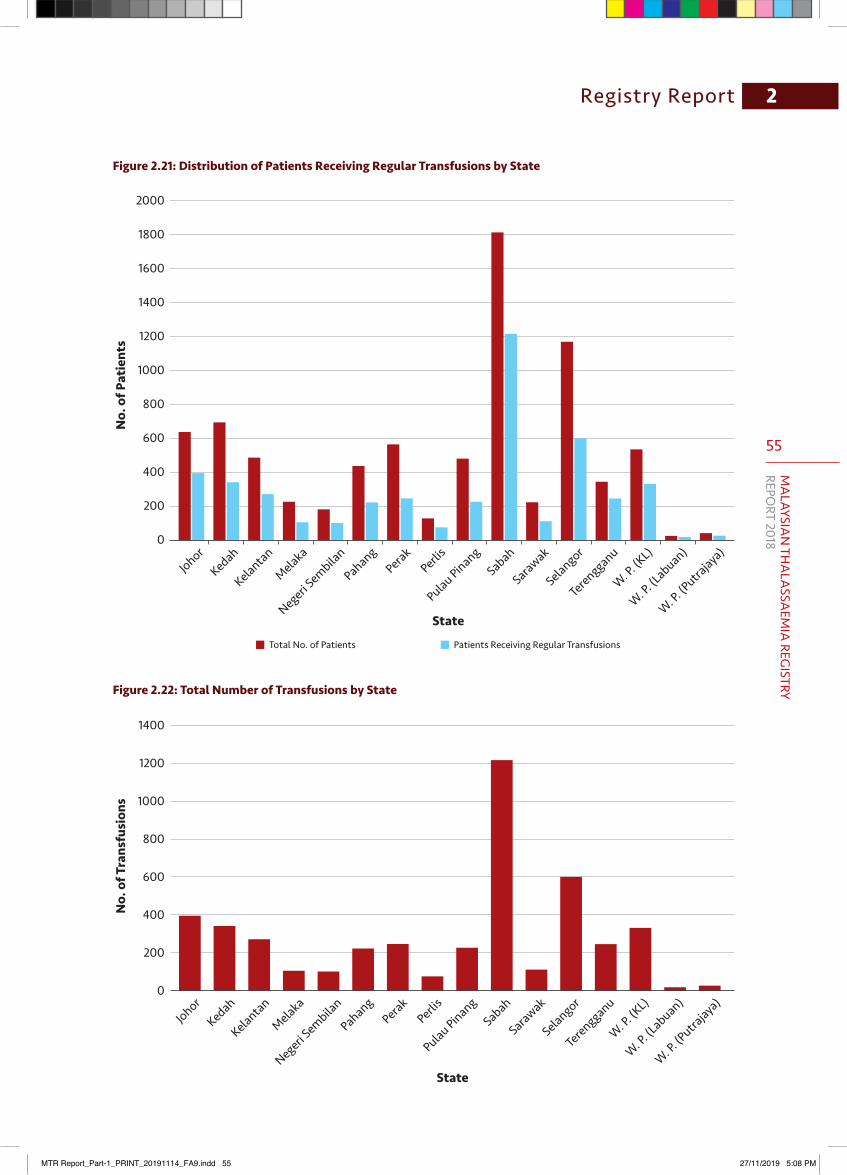
55
MA
LAYSIAN
THA
LASSA
EMIA
REGISTRY
REPORT 2018
Registry Report 2
Figure 2.21: Distribution of Patients Receiving Regular Transfusions by State
Figure 2.22: Total Number of Transfusions by State
2000
1800
1600
1400
1200
1000
800
600
400
200
0
State
No.
of P
atie
nts
JohorKedah
Kelantan
Melaka
Negeri Sembila
n
PahangPerak
Perlis
Pulau PinangSabah
Sarawak
Selangor
Terengganu
W. P. (K
L)
W. P. (L
abuan)
W. P. (P
utrajaya
)
Total No. of Patients Patients Receiving Regular Transfusions
1400
1200
1000
800
600
400
200
0
State
No.
of T
rans
fusi
ons
JohorKedah
Kelantan
Melaka
Negeri Sembila
n
PahangPerak
Perlis
Pulau PinangSabah
Sarawak
Selangor
Terengganu
W. P. (K
L)
W. P. (L
abuan)
W. P. (P
utrajaya
)
MTR Report_Part-1_PRINT_20191114_FA9.indd 55 27/11/2019 5:08 PM
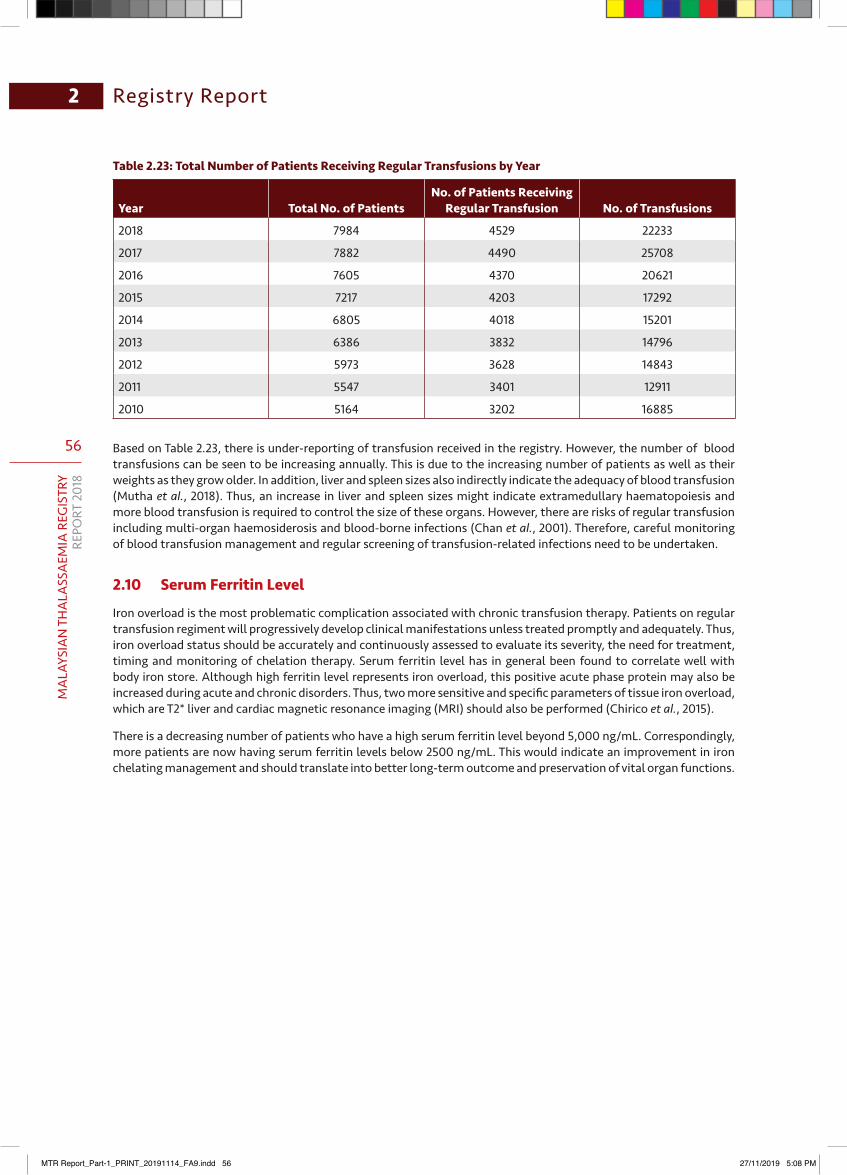
56
MA
LAYS
IAN
TH
ALA
SSA
EMIA
REG
ISTR
YRE
PORT
201
8
Registry Report2
Table 2.23: Total Number of Patients Receiving Regular Transfusions by Year
Year Total No. of PatientsNo. of Patients Receiving
Regular Transfusion No. of Transfusions
2018 7984 4529 22233
2017 7882 4490 25708
2016 7605 4370 20621
2015 7217 4203 17292
2014 6805 4018 15201
2013 6386 3832 14796
2012 5973 3628 14843
2011 5547 3401 12911
2010 5164 3202 16885
Based on Table 2.23, there is under-reporting of transfusion received in the registry. However, the number of blood transfusions can be seen to be increasing annually. This is due to the increasing number of patients as well as their weights as they grow older. In addition, liver and spleen sizes also indirectly indicate the adequacy of blood transfusion (Mutha et al., 2018). Thus, an increase in liver and spleen sizes might indicate extramedullary haematopoiesis and more blood transfusion is required to control the size of these organs. However, there are risks of regular transfusion including multi-organ haemosiderosis and blood-borne infections (Chan et al., 2001). Therefore, careful monitoring of blood transfusion management and regular screening of transfusion-related infections need to be undertaken.
2.10 Serum Ferritin Level
Iron overload is the most problematic complication associated with chronic transfusion therapy. Patients on regular transfusion regiment will progressively develop clinical manifestations unless treated promptly and adequately. Thus, iron overload status should be accurately and continuously assessed to evaluate its severity, the need for treatment, timing and monitoring of chelation therapy. Serum ferritin level has in general been found to correlate well with body iron store. Although high ferritin level represents iron overload, this positive acute phase protein may also be increased during acute and chronic disorders. Thus, two more sensitive and specific parameters of tissue iron overload, which are T2* liver and cardiac magnetic resonance imaging (MRI) should also be performed (Chirico et al., 2015).
There is a decreasing number of patients who have a high serum ferritin level beyond 5,000 ng/mL. Correspondingly, more patients are now having serum ferritin levels below 2500 ng/mL. This would indicate an improvement in iron chelating management and should translate into better long-term outcome and preservation of vital organ functions.
MTR Report_Part-1_PRINT_20191114_FA9.indd 56 27/11/2019 5:08 PM
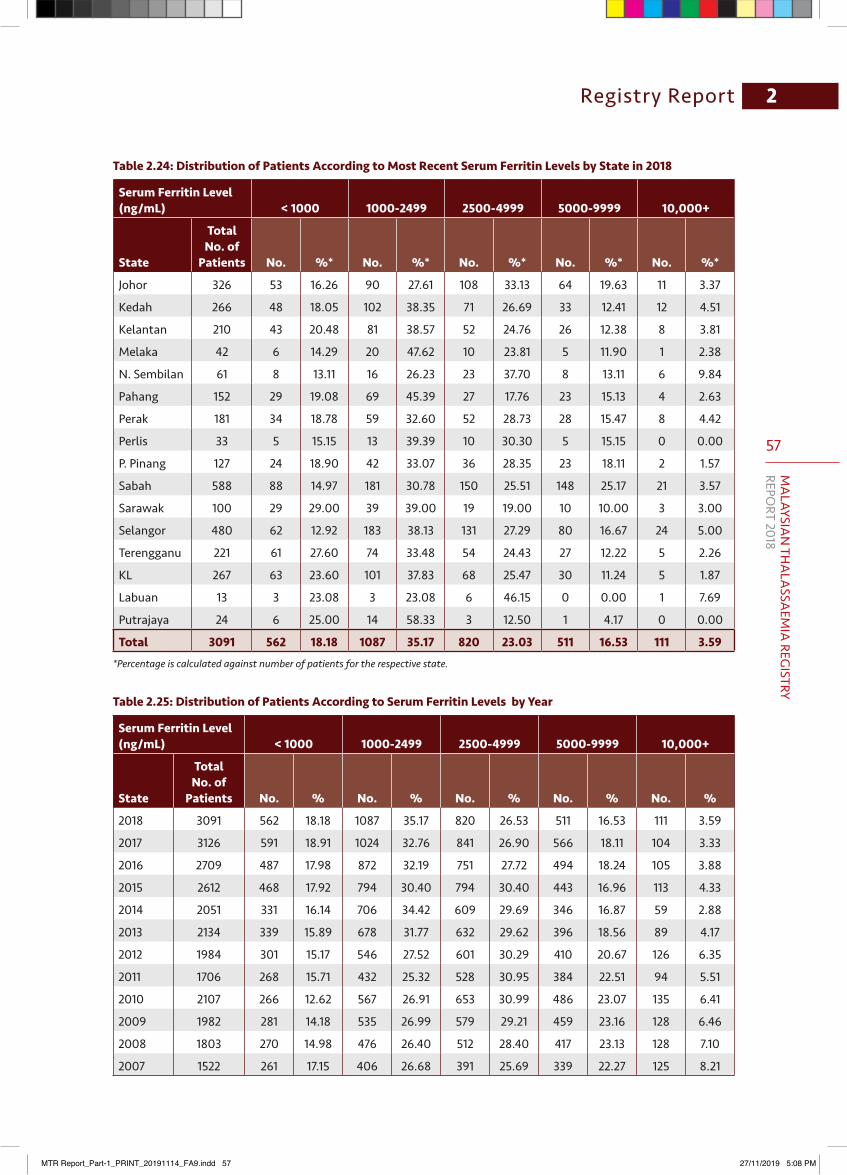
57
MA
LAYSIAN
THA
LASSA
EMIA
REGISTRY
REPORT 2018
Registry Report 2
Table2.24:DistributionofPatientsAccordingtoMostRecentSerumFerritinLevelsbyStatein2018
Serum Ferritin Level (ng/mL) < 1000 1000-2499 2500-4999 5000-9999 10,000+
State
Total No. of
Patients No. %* No. %* No. %* No. %* No. %*
Johor 326 53 16.26 90 27.61 108 33.13 64 19.63 11 3.37
Kedah 266 48 18.05 102 38.35 71 26.69 33 12.41 12 4.51
Kelantan 210 43 20.48 81 38.57 52 24.76 26 12.38 8 3.81
Melaka 42 6 14.29 20 47.62 10 23.81 5 11.90 1 2.38
N. Sembilan 61 8 13.11 16 26.23 23 37.70 8 13.11 6 9.84
Pahang 152 29 19.08 69 45.39 27 17.76 23 15.13 4 2.63
Perak 181 34 18.78 59 32.60 52 28.73 28 15.47 8 4.42
Perlis 33 5 15.15 13 39.39 10 30.30 5 15.15 0 0.00
P. Pinang 127 24 18.90 42 33.07 36 28.35 23 18.11 2 1.57
Sabah 588 88 14.97 181 30.78 150 25.51 148 25.17 21 3.57
Sarawak 100 29 29.00 39 39.00 19 19.00 10 10.00 3 3.00
Selangor 480 62 12.92 183 38.13 131 27.29 80 16.67 24 5.00
Terengganu 221 61 27.60 74 33.48 54 24.43 27 12.22 5 2.26
KL 267 63 23.60 101 37.83 68 25.47 30 11.24 5 1.87
Labuan 13 3 23.08 3 23.08 6 46.15 0 0.00 1 7.69
Putrajaya 24 6 25.00 14 58.33 3 12.50 1 4.17 0 0.00
Total 3091 562 18.18 1087 35.17 820 23.03 511 16.53 111 3.59 *Percentage is calculated against number of patients for the respective state.
Table 2.25: Distribution of Patients According to Serum Ferritin Levels by Year
Serum Ferritin Level (ng/mL) < 1000 1000-2499 2500-4999 5000-9999 10,000+
State
Total No. of
Patients No. % No. % No. % No. % No. %
2018 3091 562 18.18 1087 35.17 820 26.53 511 16.53 111 3.59
2017 3126 591 18.91 1024 32.76 841 26.90 566 18.11 104 3.33
2016 2709 487 17.98 872 32.19 751 27.72 494 18.24 105 3.88
2015 2612 468 17.92 794 30.40 794 30.40 443 16.96 113 4.33
2014 2051 331 16.14 706 34.42 609 29.69 346 16.87 59 2.88
2013 2134 339 15.89 678 31.77 632 29.62 396 18.56 89 4.17
2012 1984 301 15.17 546 27.52 601 30.29 410 20.67 126 6.35
2011 1706 268 15.71 432 25.32 528 30.95 384 22.51 94 5.51
2010 2107 266 12.62 567 26.91 653 30.99 486 23.07 135 6.41
2009 1982 281 14.18 535 26.99 579 29.21 459 23.16 128 6.46
2008 1803 270 14.98 476 26.40 512 28.40 417 23.13 128 7.10
2007 1522 261 17.15 406 26.68 391 25.69 339 22.27 125 8.21
MTR Report_Part-1_PRINT_20191114_FA9.indd 57 27/11/2019 5:08 PM
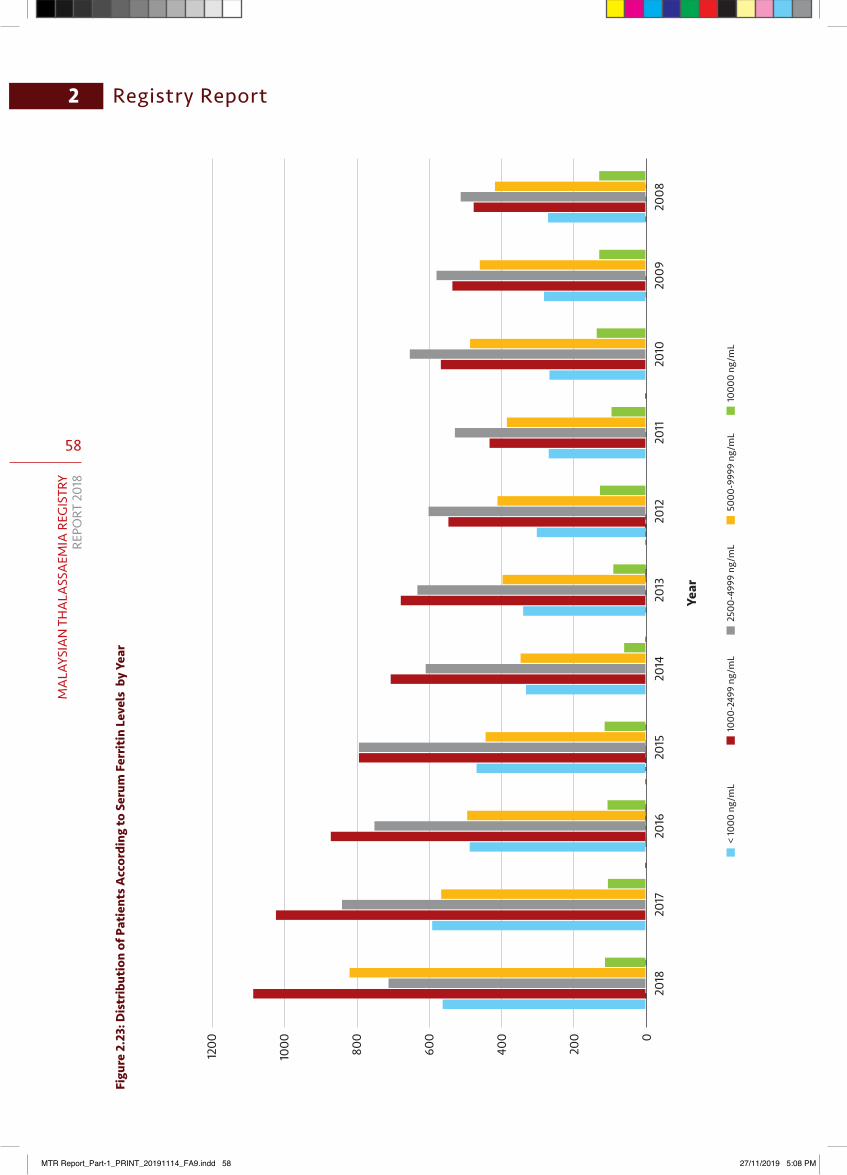
58
MA
LAYS
IAN
TH
ALA
SSA
EMIA
REG
ISTR
YRE
PORT
201
8
Registry Report2Fi
gure
2.2
3: D
istr
ibut
ion
of P
atie
nts A
ccor
ding
to S
erum
Fer
ritin
Lev
els
by Y
ear
< 10
00 n
g/m
L10
00-2
499
ng/m
L25
00-4
999
ng/m
L50
00-9
999
ng/m
L10
000
ng/m
L
Year
1200
1000 80
0
600
400
200 0
2018
2017
2016
2015
2014
2013
2012
2011
2010
2009
2008
MTR Report_Part-1_PRINT_20191114_FA9.indd 58 27/11/2019 5:08 PM
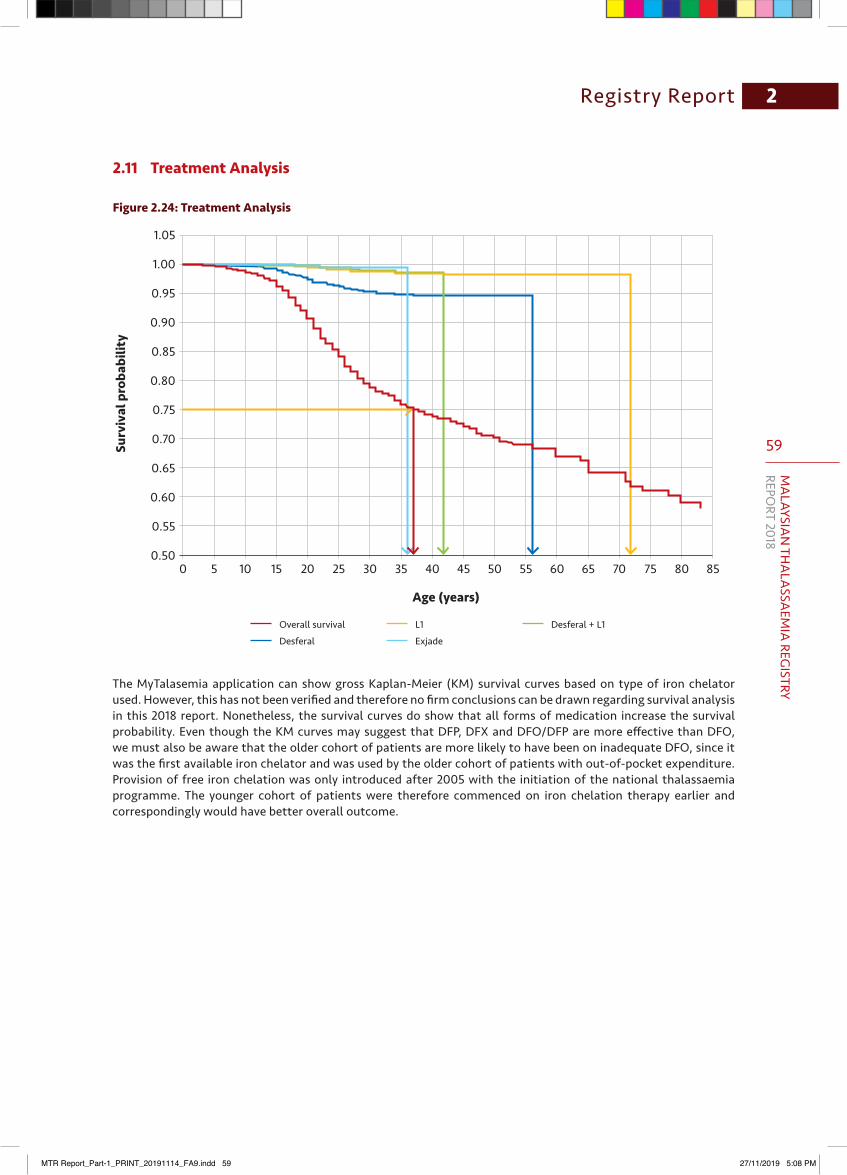
59
MA
LAYSIAN
THA
LASSA
EMIA
REGISTRY
REPORT 2018
Registry Report 2
2.11 Treatment Analysis
Figure 2.24: Treatment Analysis
Surv
ival
pro
babi
lity
Age (years)
1.05
1.00
0.95
0.90
0.85
0.80
0.75
0.70
0.65
0.60
0.55
0.500 5 10 15 20 25 30 35 40 45 50 55 60 65 70 75 80 85
Overall survivalDesferal
L1Exjade
Desferal + L1
The MyTalasemia application can show gross Kaplan-Meier (KM) survival curves based on type of iron chelator used. However, this has not been verified and therefore no firm conclusions can be drawn regarding survival analysis in this 2018 report. Nonetheless, the survival curves do show that all forms of medication increase the survival probability. Even though the KM curves may suggest that DFP, DFX and DFO/DFP are more effective than DFO, we must also be aware that the older cohort of patients are more likely to have been on inadequate DFO, since it was the first available iron chelator and was used by the older cohort of patients with out-of-pocket expenditure. Provision of free iron chelation was only introduced after 2005 with the initiation of the national thalassaemia programme. The younger cohort of patients were therefore commenced on iron chelation therapy earlier and correspondingly would have better overall outcome.
MTR Report_Part-1_PRINT_20191114_FA9.indd 59 27/11/2019 5:08 PM
60
MA
LAYS
IAN
TH
ALA
SSA
EMIA
REG
ISTR
YRE
PORT
201
8
Conclusions and Observations3
Prior to the development of the MTR, the prevalence of the thalassaemia syndromes in Malaysia were based on MOH annual reports, news archives, small studies, single-centred population or reports focused mainly on molecular characterisation or evaluation of quality of life according to state, centre, or ethnicity. Although the significance of thalassaemia in the region was emphasised, these sources lacked the exact figure of reported cases in the respective regions where the study was conducted.
As demonstrated in this report, the total number of thalassaemia patients in the registry has significantly rose over the years, totalling 7984 patients in 2018. The increasing numbers were due to improved survival, new births of thalassaemia patients as well as more newly diagnosed patients with less severe forms of thalassaemia being registered in the MTR. The initial estimated number of patients were 2500 nationwide in 2004, according to a survey sent out to major government hospitals treating TDT patients. With the launch of a web-based registry, more centres can now submit data online and currently a total of 110 centres are participating.
Although there appears to be a decreasing trend in the number of new thalassaemia births registered, the total numbers are still significant and more needs to be done to reduce it even further. Special emphasis should be given to Sabah as it has the highest numbers of registered patients and new thalassaemia births. Preventive measures, such as the targeted screening of all 16-year-olds since November 2016 should be followed up with screening and counselling of young and pre-marital couples. Provision of prenatal diagnostic services and selective termination of affected foetuses would also need to be developed further.
The most common diagnosis was HbE-beta thalassaemia with 2744 patients, followed bybeta thalassaemia major (2676 patients) and HbH disease (1458 patients). Malays predominantly have a higher prevalence of HbE-beta thalassaemia, with the highest proportion found in Selangor, Kuala Lumpur, Kelantan, and Kedah. Beta thalassaemia major is especially predominant among the Kadazan-Dusuns of Sabah due to the high prevalence of Filipino beta thalassaemia deletion in the ethnicity. Incidentally, HbH disease, which is commonly caused by the deletion of three alpha-globin genes (--/-α), are more common among the Malaysian Chinese.
Clinicians are encouraged to prescribe monotherapy whenever possible unless the chelation is inadequate, or patients are not compliant. An example is poorer compliance or tolerance towards DFO, which is administered subcutaneously for 8-12 hours, leading to the change to oral chelators such as DFX or DFP. DFX is the more popular option as it can be prescribed to younger patients (minimum 2 years old, in the form of dispersible tablets, once daily) compared to DFP (6 years and older, in the form of tablets or capsule, thrice daily). Combination therapy, in contrast, will only be initiated when intensive therapy is needed to overcome severe iron overload.
Iron chelation in the current population has shown a positive impact in decreasing the serum ferritin level. Although high-risk patients with levels above 10000 ng/mL are still present, the decline in their numbers indicate improvement in patient management. There is also appreciable decline in those with levels beyond 5000 ng/mL as well as an increase in those with levels below 2500 ng/mL. Nevertheless, cardiac complications due to iron overload is still the leading cause of death among thalassaemia patients. Thus, participating centres will need to improve on iron overload monitoring and chelation therapy, especially in high-risk patients. In addition, assessment using ferritin level alone is not specific and would not identify those with tissue iron deposition especially in the heart and liver. Therefore, there is an urgent need to expand further the routine use of magnetic resonance imaging (MRI) T2* to assess iron deposition in tissues. Currently, the MRI T2* data collection for the MTR has yet to begin and we hope to address this in future.
Although the MTR was able to gather most information on thalassaemia patients nationwide, certain records are still incomplete. Among the notable limitations are serum ferritin levels, death records, and birth summary. Certain information might not be accessible, or the evaluation was not completed on the whole population, leading to missing information. Data on thalassaemia births in 2017 and 2018, for instance, may not be up-to-date since disease presentation appears later during infancy or even later than that for patients with thalassaemia intermedia, and will be registered only after disease manifestation. Laboratory data on serum ferritin, on the other hand, might not be recorded in the patient’s notes and thus unavailable for analysis.
This MTR report describes the current and evolving scenario of thalassaemia in Malaysia over the past decade. The landscape has changed dramatically as patients are now living past the second decade of life with improvement of patient management. Data gathered into the MTR can be used to understand the progression of the disorder and to improve treatment outcomes, develop strategies on iron overload management, formulate policies and preventive strategies to reduce the healthcare burden of thalassaemia.
MTR Report_Part-1_PRINT_20191114_FA9.indd 60 27/11/2019 5:08 PM
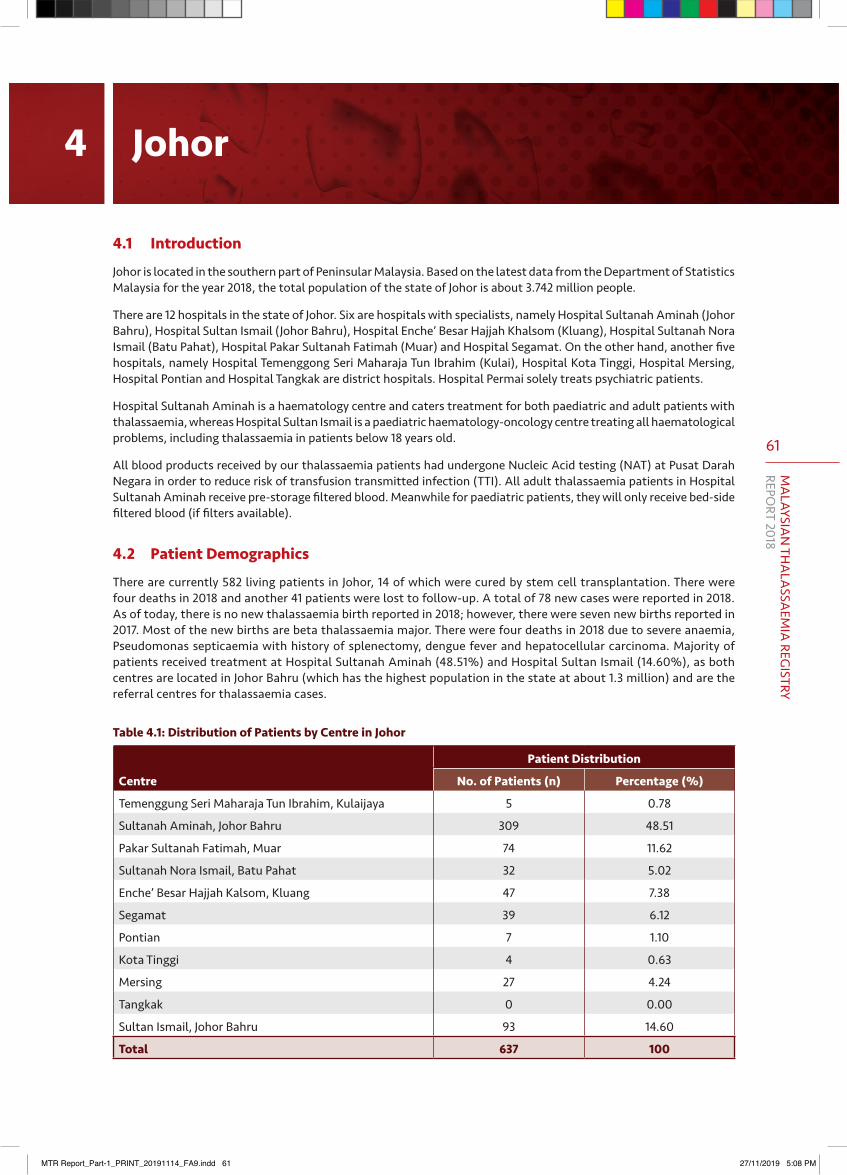
61
MA
LAYSIAN
THA
LASSA
EMIA
REGISTRY
REPORT 2018
4 Johor
4.1 Introduction
Johor is located in the southern part of Peninsular Malaysia. Based on the latest data from the Department of Statistics Malaysia for the year 2018, the total population of the state of Johor is about 3.742 million people.
There are 12 hospitals in the state of Johor. Six are hospitals with specialists, namely Hospital Sultanah Aminah (Johor Bahru), Hospital Sultan Ismail (Johor Bahru), Hospital Enche’ Besar Hajjah Khalsom (Kluang), Hospital Sultanah Nora Ismail (Batu Pahat), Hospital Pakar Sultanah Fatimah (Muar) and Hospital Segamat. On the other hand, another five hospitals, namely Hospital Temenggong Seri Maharaja Tun Ibrahim (Kulai), Hospital Kota Tinggi, Hospital Mersing, Hospital Pontian and Hospital Tangkak are district hospitals. Hospital Permai solely treats psychiatric patients.
Hospital Sultanah Aminah is a haematology centre and caters treatment for both paediatric and adult patients with thalassaemia, whereas Hospital Sultan Ismail is a paediatric haematology-oncology centre treating all haematological problems, including thalassaemia in patients below 18 years old.
All blood products received by our thalassaemia patients had undergone Nucleic Acid testing (NAT) at Pusat Darah Negara in order to reduce risk of transfusion transmitted infection (TTI). All adult thalassaemia patients in Hospital Sultanah Aminah receive pre-storage filtered blood. Meanwhile for paediatric patients, they will only receive bed-side filtered blood (if filters available).
4.2 Patient Demographics
There are currently 582 living patients in Johor, 14 of which were cured by stem cell transplantation. There were four deaths in 2018 and another 41 patients were lost to follow-up. A total of 78 new cases were reported in 2018. As of today, there is no new thalassaemia birth reported in 2018; however, there were seven new births reported in 2017. Most of the new births are beta thalassaemia major. There were four deaths in 2018 due to severe anaemia, Pseudomonas septicaemia with history of splenectomy, dengue fever and hepatocellular carcinoma. Majority of patients received treatment at Hospital Sultanah Aminah (48.51%) and Hospital Sultan Ismail (14.60%), as both centres are located in Johor Bahru (which has the highest population in the state at about 1.3 million) and are the referral centres for thalassaemia cases.
Table 4.1: Distribution of Patients by Centre in Johor
Centre
Patient Distribution
No. of Patients (n) Percentage (%)
Temenggung Seri Maharaja Tun Ibrahim, Kulaijaya 5 0.78
Sultanah Aminah, Johor Bahru 309 48.51
Pakar Sultanah Fatimah, Muar 74 11.62
Sultanah Nora Ismail, Batu Pahat 32 5.02
Enche’ Besar Hajjah Kalsom, Kluang 47 7.38
Segamat 39 6.12
Pontian 7 1.10
Kota Tinggi 4 0.63
Mersing 27 4.24
Tangkak 0 0.00
Sultan Ismail, Johor Bahru 93 14.60
Total 637 100
MTR Report_Part-1_PRINT_20191114_FA9.indd 61 27/11/2019 5:08 PM
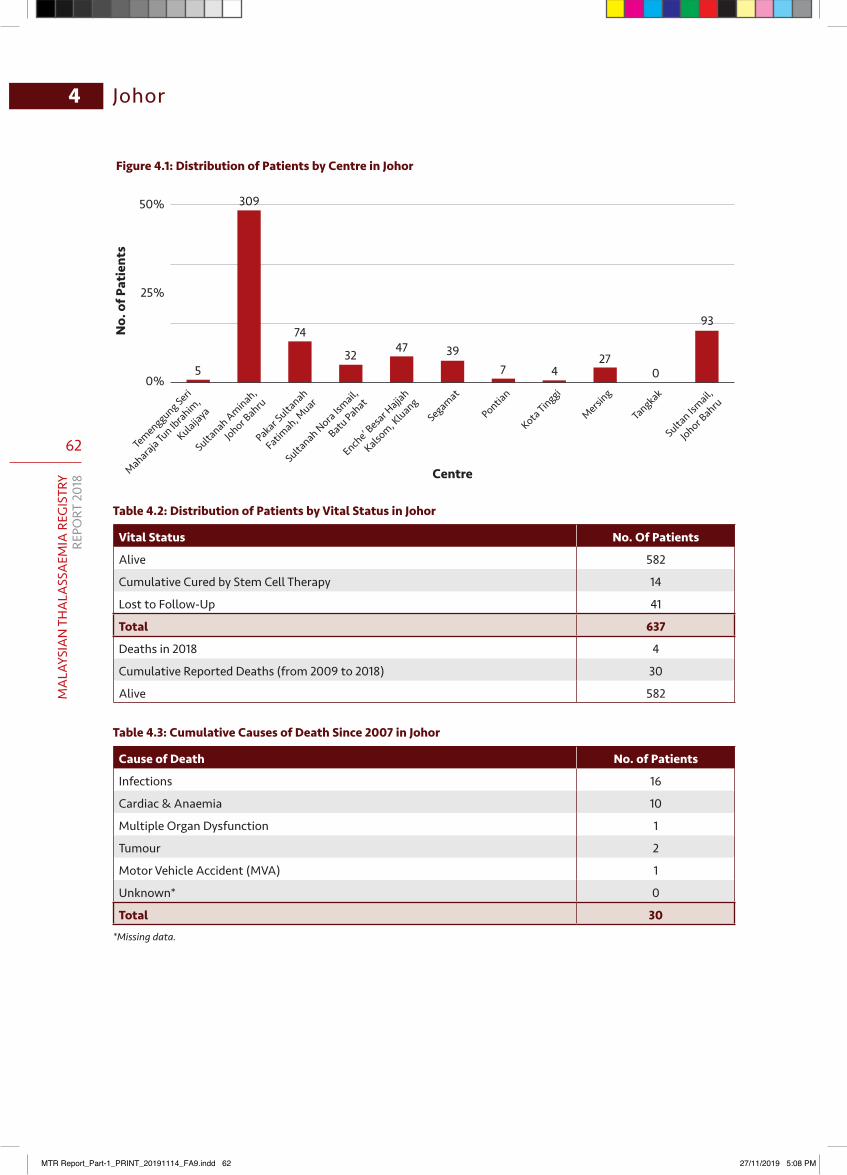
62
MA
LAYS
IAN
TH
ALA
SSA
EMIA
REG
ISTR
YRE
PORT
201
8
Johor4
Figure 4.1: Distribution of Patients by Centre in Johor
50%
25%
0%
Centre
No.
of P
atie
nts
Temenggung Seri
Maharaja Tun Ib
rahim,
Kulaijaya
Sultanah Aminah,
Johor Bahru
Pakar Sulta
nah
Fatimah, M
uar
Sultanah Nora Ism
ail,
Batu Pahat
Enche’ B
esar Hajja
h
Kalsom, K
luangSegamat
Pontian
Kota Tinggi
Mersing
Tangkak
Sultan Ism
ail,
Johor Bahru
5
309
74
32 47 397 4
270
93
Table 4.2: Distribution of Patients by Vital Status in Johor
Vital Status No. Of Patients
Alive 582
Cumulative Cured by Stem Cell Therapy 14
Lost to Follow-Up 41
Total 637
Deaths in 2018 4
Cumulative Reported Deaths (from 2009 to 2018) 30
Alive 582
Table 4.3: Cumulative Causes of Death Since 2007 in Johor
Cause of Death No. of Patients
Infections 16
Cardiac & Anaemia 10
Multiple Organ Dysfunction 1
Tumour 2
Motor Vehicle Accident (MVA) 1
Unknown* 0
Total 30*Missing data.
MTR Report_Part-1_PRINT_20191114_FA9.indd 62 27/11/2019 5:08 PM
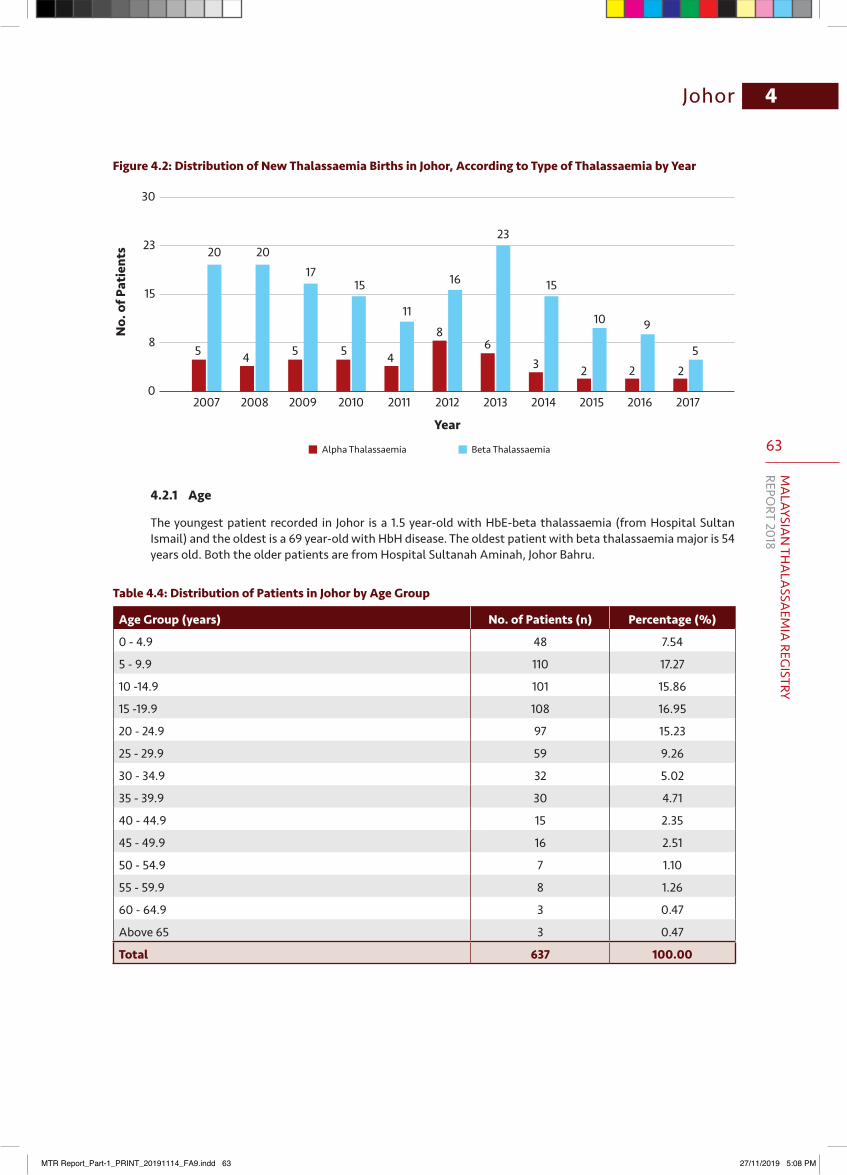
63
MA
LAYSIAN
THA
LASSA
EMIA
REGISTRY
REPORT 2018
Johor 4
Figure 4.2: Distribution of New Thalassaemia Births in Johor, According to Type of Thalassaemia by Year
Alpha Thalassaemia Beta Thalassaemia
30
23
15
8
0
Year
No.
of P
atie
nts
2007 2008 2009 2010 2011 2012 2013 2014 2015 2016 2017
5 4 5 5 4
86
3 2 2 2
20 2017
15
11
16
23
15
10 9
5
4.2.1 Age
The youngest patient recorded in Johor is a 1.5 year-old with HbE-beta thalassaemia (from Hospital Sultan Ismail) and the oldest is a 69 year-old with HbH disease. The oldest patient with beta thalassaemia major is 54 years old. Both the older patients are from Hospital Sultanah Aminah, Johor Bahru.
Table 4.4: Distribution of Patients in Johor by Age Group
Age Group (years) No. of Patients (n) Percentage (%)
0 - 4.9 48 7.54
5 - 9.9 110 17.27
10 -14.9 101 15.86
15 -19.9 108 16.95
20 - 24.9 97 15.23
25 - 29.9 59 9.26
30 - 34.9 32 5.02
35 - 39.9 30 4.71
40 - 44.9 15 2.35
45 - 49.9 16 2.51
50 - 54.9 7 1.10
55 - 59.9 8 1.26
60 - 64.9 3 0.47
Above 65 3 0.47
Total 637 100.00
MTR Report_Part-1_PRINT_20191114_FA9.indd 63 27/11/2019 5:08 PM
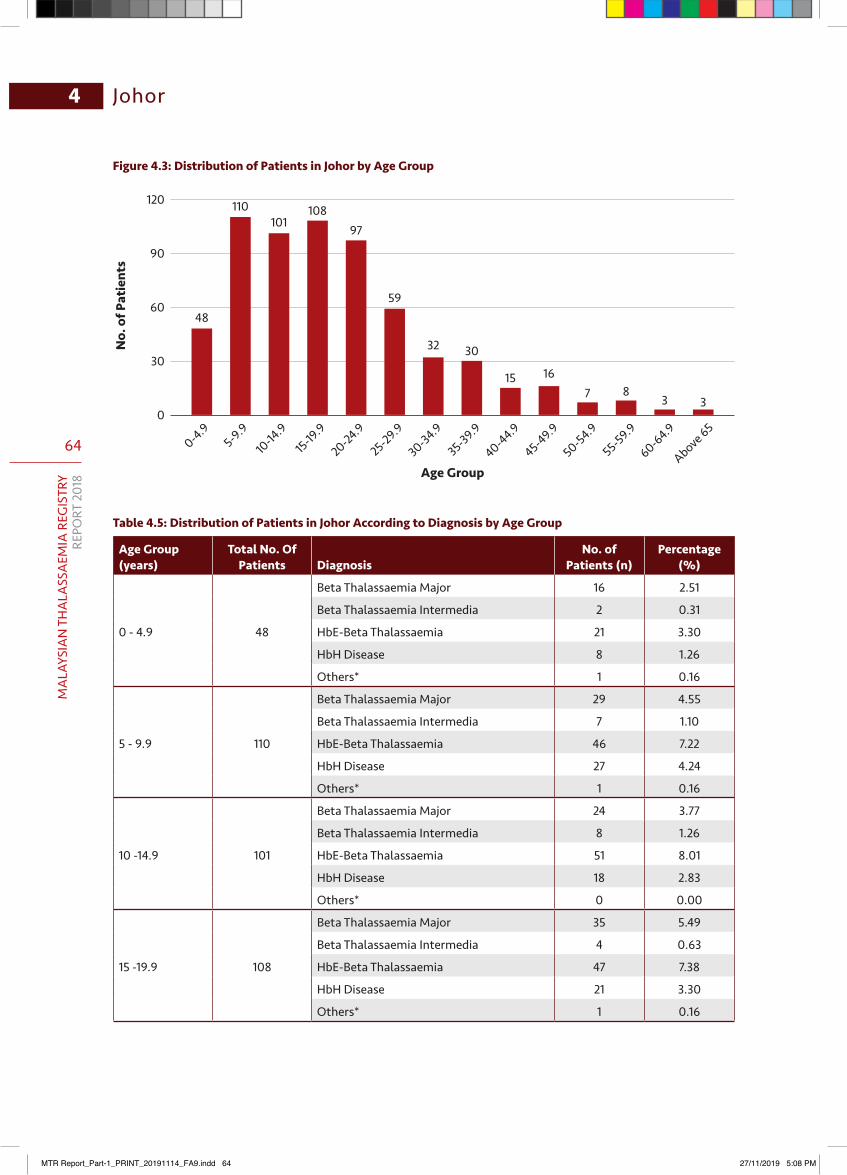
64
MA
LAYS
IAN
TH
ALA
SSA
EMIA
REG
ISTR
YRE
PORT
201
8
4 Johor
Figure 4.3: Distribution of Patients in Johor by Age Group
Table 4.5: Distribution of Patients in Johor According to Diagnosis by Age Group
Age Group (years)
Total No. Of Patients Diagnosis
No. of Patients (n)
Percentage (%)
0 - 4.9 48
Beta Thalassaemia Major 16 2.51
Beta Thalassaemia Intermedia 2 0.31
HbE-Beta Thalassaemia 21 3.30
HbH Disease 8 1.26
Others* 1 0.16
5 - 9.9 110
Beta Thalassaemia Major 29 4.55
Beta Thalassaemia Intermedia 7 1.10
HbE-Beta Thalassaemia 46 7.22
HbH Disease 27 4.24
Others* 1 0.16
10 -14.9 101
Beta Thalassaemia Major 24 3.77
Beta Thalassaemia Intermedia 8 1.26
HbE-Beta Thalassaemia 51 8.01
HbH Disease 18 2.83
Others* 0 0.00
15 -19.9 108
Beta Thalassaemia Major 35 5.49
Beta Thalassaemia Intermedia 4 0.63
HbE-Beta Thalassaemia 47 7.38
HbH Disease 21 3.30
Others* 1 0.16
120
90
60
30
0
Age Group
No.
of P
atie
nts
48
110101
10897
59
32 30
15 167 8
3 3
0-4.95-9.9
10-14
.915-19
.9
20-24.9
25-29.9
30-34.9
35-39.9
40-44.9
45-49.9
50-54.9
55-59.9
60-64.9
Above 65
MTR Report_Part-1_PRINT_20191114_FA9.indd 64 27/11/2019 5:08 PM
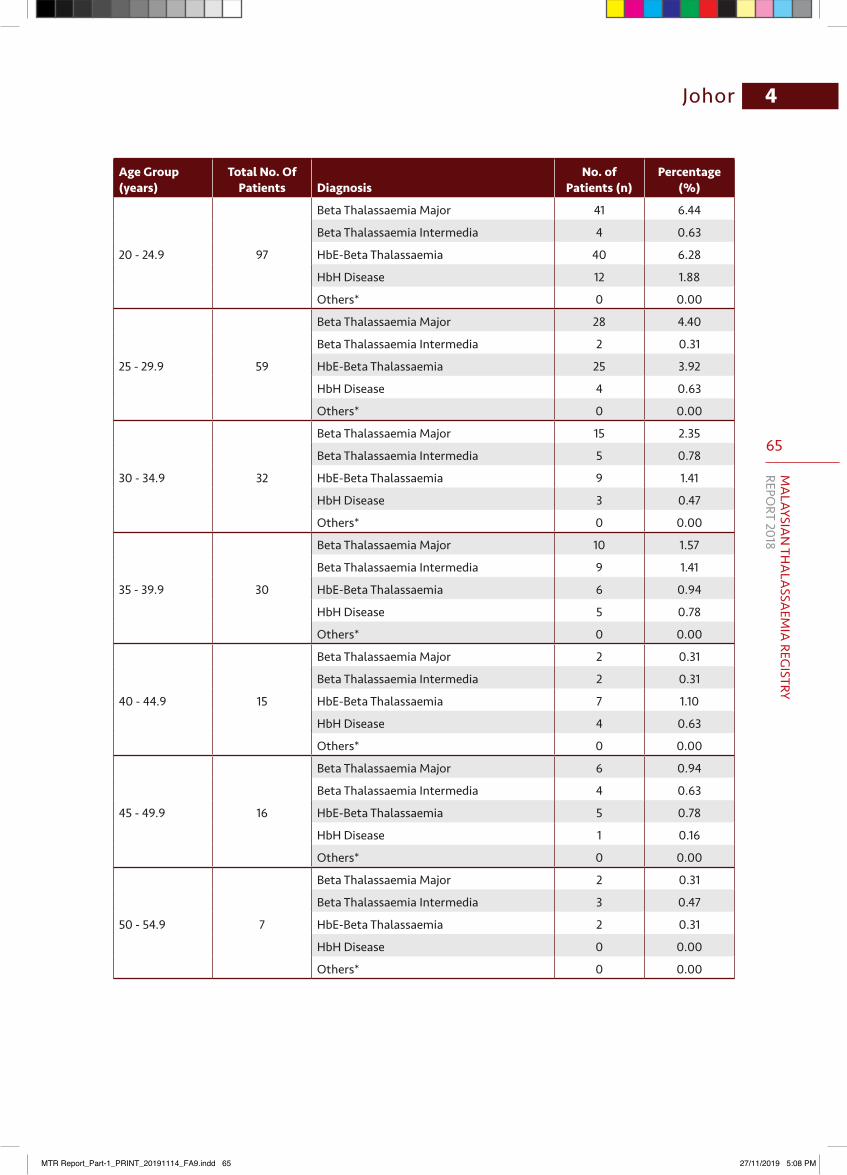
65
MA
LAYSIAN
THA
LASSA
EMIA
REGISTRY
REPORT 2018
4Johor
Age Group (years)
Total No. Of Patients Diagnosis
No. of Patients (n)
Percentage (%)
20 - 24.9 97
Beta Thalassaemia Major 41 6.44
Beta Thalassaemia Intermedia 4 0.63
HbE-Beta Thalassaemia 40 6.28
HbH Disease 12 1.88
Others* 0 0.00
25 - 29.9 59
Beta Thalassaemia Major 28 4.40
Beta Thalassaemia Intermedia 2 0.31
HbE-Beta Thalassaemia 25 3.92
HbH Disease 4 0.63
Others* 0 0.00
30 - 34.9 32
Beta Thalassaemia Major 15 2.35
Beta Thalassaemia Intermedia 5 0.78
HbE-Beta Thalassaemia 9 1.41
HbH Disease 3 0.47
Others* 0 0.00
35 - 39.9 30
Beta Thalassaemia Major 10 1.57
Beta Thalassaemia Intermedia 9 1.41
HbE-Beta Thalassaemia 6 0.94
HbH Disease 5 0.78
Others* 0 0.00
40 - 44.9 15
Beta Thalassaemia Major 2 0.31
Beta Thalassaemia Intermedia 2 0.31
HbE-Beta Thalassaemia 7 1.10
HbH Disease 4 0.63
Others* 0 0.00
45 - 49.9 16
Beta Thalassaemia Major 6 0.94
Beta Thalassaemia Intermedia 4 0.63
HbE-Beta Thalassaemia 5 0.78
HbH Disease 1 0.16
Others* 0 0.00
50 - 54.9 7
Beta Thalassaemia Major 2 0.31
Beta Thalassaemia Intermedia 3 0.47
HbE-Beta Thalassaemia 2 0.31
HbH Disease 0 0.00
Others* 0 0.00
MTR Report_Part-1_PRINT_20191114_FA9.indd 65 27/11/2019 5:08 PM
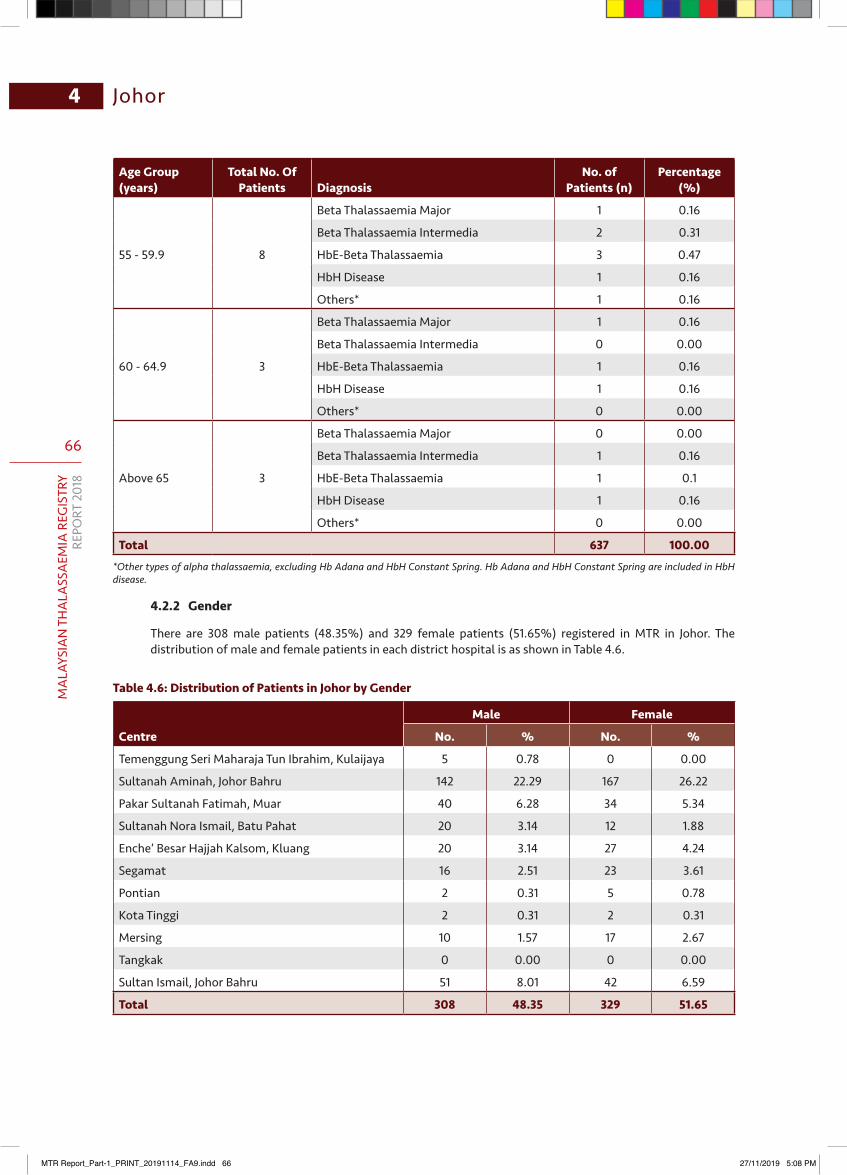
66
MA
LAYS
IAN
TH
ALA
SSA
EMIA
REG
ISTR
YRE
PORT
201
8
4 Johor
Age Group (years)
Total No. Of Patients Diagnosis
No. of Patients (n)
Percentage (%)
55 - 59.9 8
Beta Thalassaemia Major 1 0.16
Beta Thalassaemia Intermedia 2 0.31
HbE-Beta Thalassaemia 3 0.47
HbH Disease 1 0.16
Others* 1 0.16
60 - 64.9 3
Beta Thalassaemia Major 1 0.16
Beta Thalassaemia Intermedia 0 0.00
HbE-Beta Thalassaemia 1 0.16
HbH Disease 1 0.16
Others* 0 0.00
Above 65 3
Beta Thalassaemia Major 0 0.00
Beta Thalassaemia Intermedia 1 0.16
HbE-Beta Thalassaemia 1 0.1
HbH Disease 1 0.16
Others* 0 0.00
Total 637 100.00*Other types of alpha thalassaemia, excluding Hb Adana and HbH Constant Spring. Hb Adana and HbH Constant Spring are included in HbH disease.
4.2.2 Gender
There are 308 male patients (48.35%) and 329 female patients (51.65%) registered in MTR in Johor. The distribution of male and female patients in each district hospital is as shown in Table 4.6.
Table 4.6: Distribution of Patients in Johor by Gender
Centre
Male Female
No. % No. %
Temenggung Seri Maharaja Tun Ibrahim, Kulaijaya 5 0.78 0 0.00
Sultanah Aminah, Johor Bahru 142 22.29 167 26.22
Pakar Sultanah Fatimah, Muar 40 6.28 34 5.34
Sultanah Nora Ismail, Batu Pahat 20 3.14 12 1.88
Enche’ Besar Hajjah Kalsom, Kluang 20 3.14 27 4.24
Segamat 16 2.51 23 3.61
Pontian 2 0.31 5 0.78
Kota Tinggi 2 0.31 2 0.31
Mersing 10 1.57 17 2.67
Tangkak 0 0.00 0 0.00
Sultan Ismail, Johor Bahru 51 8.01 42 6.59
Total 308 48.35 329 51.65
MTR Report_Part-1_PRINT_20191114_FA9.indd 66 27/11/2019 5:08 PM
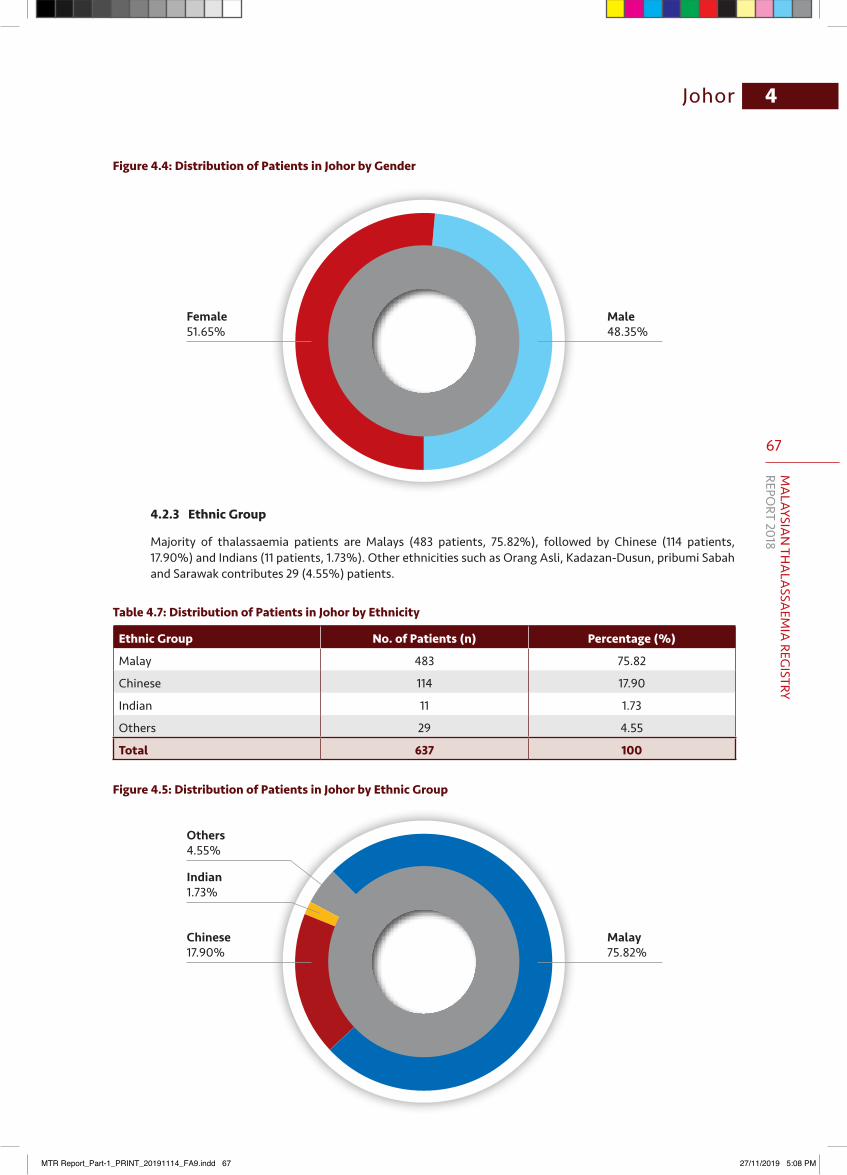
67
MA
LAYSIAN
THA
LASSA
EMIA
REGISTRY
REPORT 2018
4Johor
Figure 4.4: Distribution of Patients in Johor by Gender
Female51.65%
Male48.35%
Chinese17.90%
Indian1.73%
Others4.55%
Malay75.82%
4.2.3 Ethnic Group
Majority of thalassaemia patients are Malays (483 patients, 75.82%), followed by Chinese (114 patients, 17.90%) and Indians (11 patients, 1.73%). Other ethnicities such as Orang Asli, Kadazan-Dusun, pribumi Sabah and Sarawak contributes 29 (4.55%) patients.
Table 4.7: Distribution of Patients in Johor by Ethnicity
Ethnic Group No. of Patients (n) Percentage (%)
Malay 483 75.82
Chinese 114 17.90
Indian 11 1.73
Others 29 4.55
Total 637 100
Figure 4.5: Distribution of Patients in Johor by Ethnic Group
MTR Report_Part-1_PRINT_20191114_FA9.indd 67 27/11/2019 5:08 PM
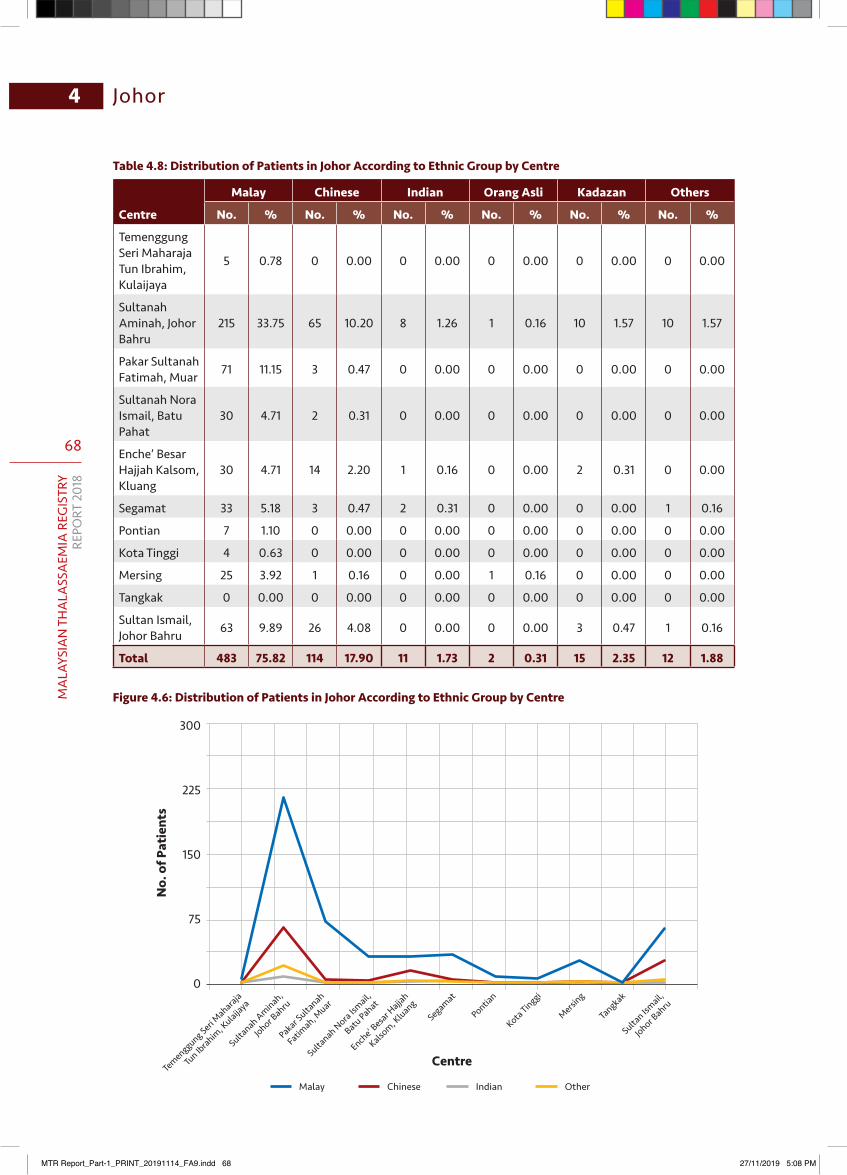
68
MA
LAYS
IAN
TH
ALA
SSA
EMIA
REG
ISTR
YRE
PORT
201
8
Johor4
Table4.8:DistributionofPatientsinJohorAccordingtoEthnicGroupbyCentre
Centre
Malay Chinese Indian Orang Asli Kadazan Others
No. % No. % No. % No. % No. % No. %
Temenggung Seri Maharaja Tun Ibrahim, Kulaijaya
5 0.78 0 0.00 0 0.00 0 0.00 0 0.00 0 0.00
Sultanah Aminah, Johor Bahru
215 33.75 65 10.20 8 1.26 1 0.16 10 1.57 10 1.57
Pakar Sultanah Fatimah, Muar 71 11.15 3 0.47 0 0.00 0 0.00 0 0.00 0 0.00
Sultanah Nora Ismail, Batu Pahat
30 4.71 2 0.31 0 0.00 0 0.00 0 0.00 0 0.00
Enche’ Besar Hajjah Kalsom, Kluang
30 4.71 14 2.20 1 0.16 0 0.00 2 0.31 0 0.00
Segamat 33 5.18 3 0.47 2 0.31 0 0.00 0 0.00 1 0.16
Pontian 7 1.10 0 0.00 0 0.00 0 0.00 0 0.00 0 0.00
Kota Tinggi 4 0.63 0 0.00 0 0.00 0 0.00 0 0.00 0 0.00
Mersing 25 3.92 1 0.16 0 0.00 1 0.16 0 0.00 0 0.00
Tangkak 0 0.00 0 0.00 0 0.00 0 0.00 0 0.00 0 0.00
Sultan Ismail, Johor Bahru 63 9.89 26 4.08 0 0.00 0 0.00 3 0.47 1 0.16
Total 483 75.82 114 17.90 11 1.73 2 0.31 15 2.35 12 1.88
Figure 4.6: Distribution of Patients in Johor According to Ethnic Group by Centre
Temenggung Seri Maharaja
Tun Ib
rahim, K
ulaijaya
Sultanah Nora Ism
ail,
Batu PahatPontia
n
Segamat
Enche’ B
esar Hajja
h
Kalsom, K
luang
Pakar Sulta
nah
Fatimah, M
uar
Sultanah Aminah,
Johor B
ahruTa
ngkak
Mersing
Kota Tinggi
Sultan Ism
ail,
Johor Bahru
300
225
150
75
0
Centre
Malay OtherChinese Indian
No.
of P
atie
nts
MTR Report_Part-1_PRINT_20191114_FA9.indd 68 27/11/2019 5:08 PM
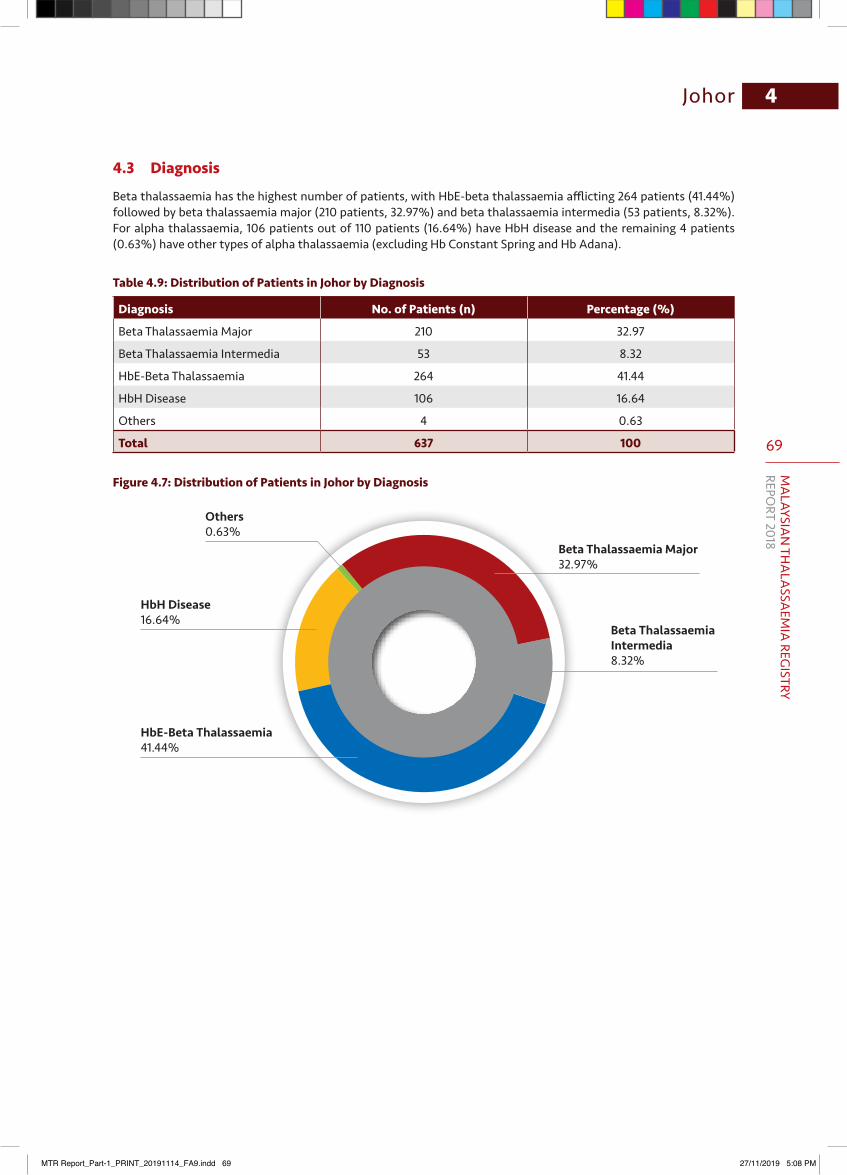
69
MA
LAYSIAN
THA
LASSA
EMIA
REGISTRY
REPORT 2018
Johor 4
4.3 Diagnosis
Beta thalassaemia has the highest number of patients, with HbE-beta thalassaemia afflicting 264 patients (41.44%) followed by beta thalassaemia major (210 patients, 32.97%) and beta thalassaemia intermedia (53 patients, 8.32%). For alpha thalassaemia, 106 patients out of 110 patients (16.64%) have HbH disease and the remaining 4 patients (0.63%) have other types of alpha thalassaemia (excluding Hb Constant Spring and Hb Adana).
Table 4.9: Distribution of Patients in Johor by Diagnosis
Diagnosis No. of Patients (n) Percentage (%)
Beta Thalassaemia Major 210 32.97
Beta Thalassaemia Intermedia 53 8.32
HbE-Beta Thalassaemia 264 41.44
HbH Disease 106 16.64
Others 4 0.63
Total 637 100
Figure 4.7: Distribution of Patients in Johor by Diagnosis
HbE-Beta Thalassaemia 41.44%
HbH Disease16.64%
Others0.63%
Beta Thalassaemia Major32.97%
Beta Thalassaemia Intermedia 8.32%
MTR Report_Part-1_PRINT_20191114_FA9.indd 69 27/11/2019 5:08 PM
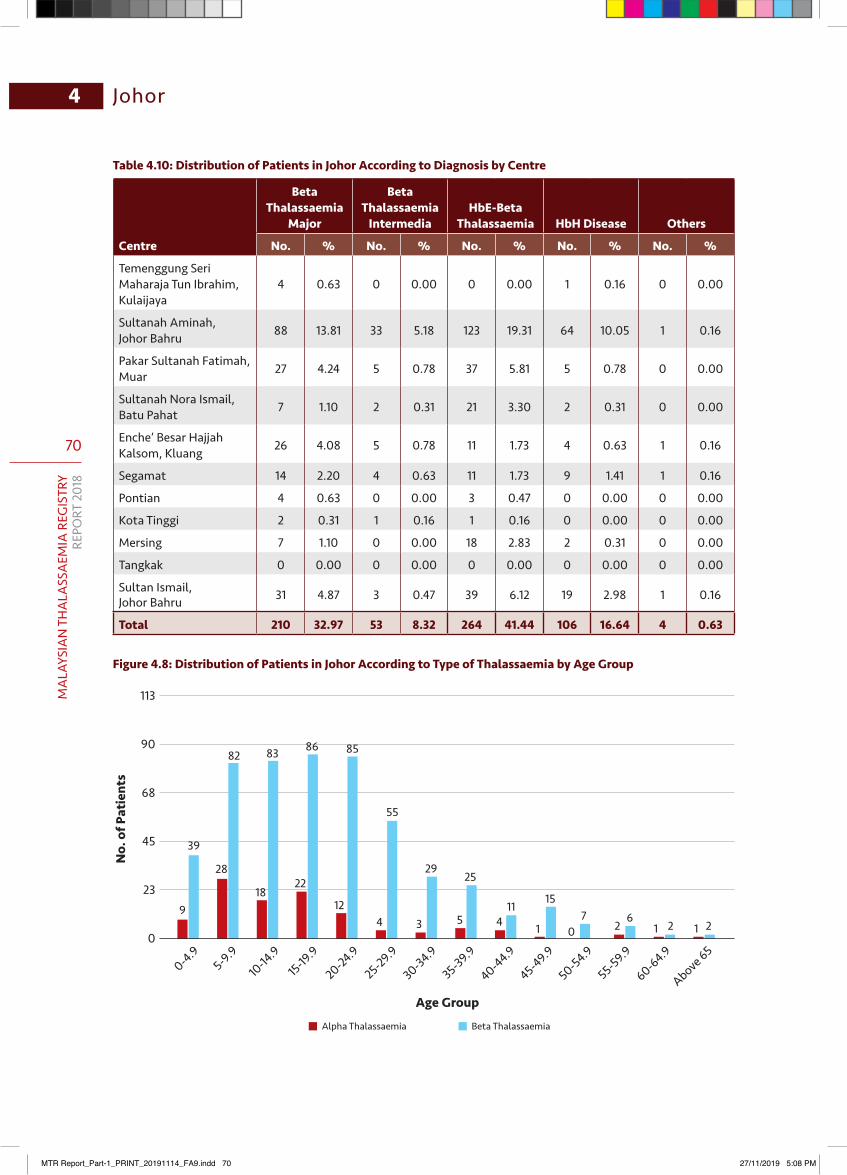
70
MA
LAYS
IAN
TH
ALA
SSA
EMIA
REG
ISTR
YRE
PORT
201
8
4 Johor
Table 4.10: Distribution of Patients in Johor According to Diagnosis by Centre
Centre
Beta Thalassaemia
Major
Beta Thalassaemia
IntermediaHbE-Beta
Thalassaemia HbH Disease Others
No. % No. % No. % No. % No. %
Temenggung Seri Maharaja Tun Ibrahim, Kulaijaya
4 0.63 0 0.00 0 0.00 1 0.16 0 0.00
Sultanah Aminah, Johor Bahru 88 13.81 33 5.18 123 19.31 64 10.05 1 0.16
Pakar Sultanah Fatimah, Muar 27 4.24 5 0.78 37 5.81 5 0.78 0 0.00
Sultanah Nora Ismail, Batu Pahat 7 1.10 2 0.31 21 3.30 2 0.31 0 0.00
Enche’ Besar Hajjah Kalsom, Kluang 26 4.08 5 0.78 11 1.73 4 0.63 1 0.16
Segamat 14 2.20 4 0.63 11 1.73 9 1.41 1 0.16
Pontian 4 0.63 0 0.00 3 0.47 0 0.00 0 0.00
Kota Tinggi 2 0.31 1 0.16 1 0.16 0 0.00 0 0.00
Mersing 7 1.10 0 0.00 18 2.83 2 0.31 0 0.00
Tangkak 0 0.00 0 0.00 0 0.00 0 0.00 0 0.00
Sultan Ismail, Johor Bahru 31 4.87 3 0.47 39 6.12 19 2.98 1 0.16
Total 210 32.97 53 8.32 264 41.44 106 16.64 4 0.63
Figure4.8:DistributionofPatientsinJohorAccordingtoTypeofThalassaemiabyAgeGroup
113
90
68
45
23
0
No.
of P
atie
nts
Age Group
Alpha Thalassaemia Beta Thalassaemia
9
28
82 83 86 85
55
2925
11 157
21 04534
12
2218
61 2 1 2
39
0-4.95-9.9
10-14
.915-19
.9
20-24.9
25-29.9
30-34.9
35-39.9
40-44.9
45-49.9
50-54.9
55-59.9
60-64.9
Above 65
MTR Report_Part-1_PRINT_20191114_FA9.indd 70 27/11/2019 5:08 PM
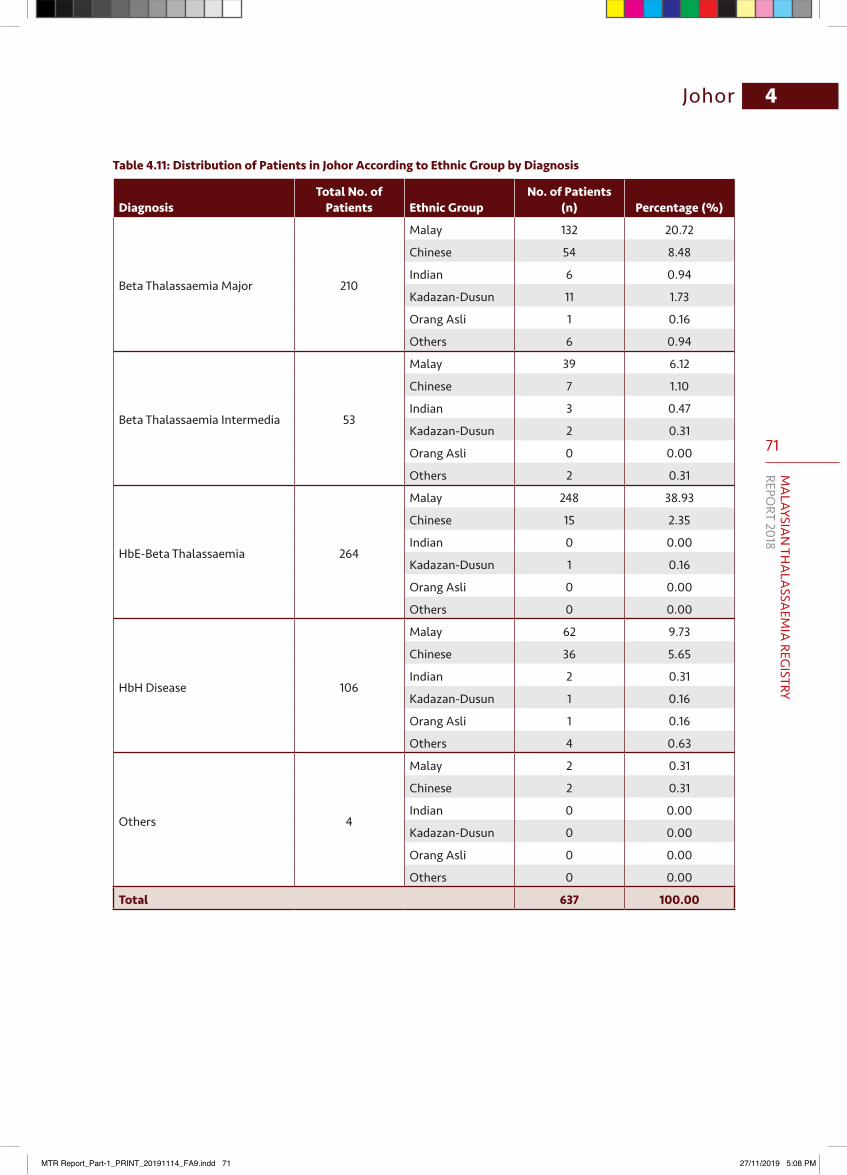
71
MA
LAYSIAN
THA
LASSA
EMIA
REGISTRY
REPORT 2018
4Johor
Table 4.11: Distribution of Patients in Johor According to Ethnic Group by Diagnosis
DiagnosisTotal No. of
Patients Ethnic GroupNo. of Patients
(n) Percentage (%)
Beta Thalassaemia Major 210
Malay 132 20.72
Chinese 54 8.48
Indian 6 0.94
Kadazan-Dusun 11 1.73
Orang Asli 1 0.16
Others 6 0.94
Beta Thalassaemia Intermedia 53
Malay 39 6.12
Chinese 7 1.10
Indian 3 0.47
Kadazan-Dusun 2 0.31
Orang Asli 0 0.00
Others 2 0.31
HbE-Beta Thalassaemia 264
Malay 248 38.93
Chinese 15 2.35
Indian 0 0.00
Kadazan-Dusun 1 0.16
Orang Asli 0 0.00
Others 0 0.00
HbH Disease 106
Malay 62 9.73
Chinese 36 5.65
Indian 2 0.31
Kadazan-Dusun 1 0.16
Orang Asli 1 0.16
Others 4 0.63
Others 4
Malay 2 0.31
Chinese 2 0.31
Indian 0 0.00
Kadazan-Dusun 0 0.00
Orang Asli 0 0.00
Others 0 0.00
Total 637 100.00
MTR Report_Part-1_PRINT_20191114_FA9.indd 71 27/11/2019 5:08 PM
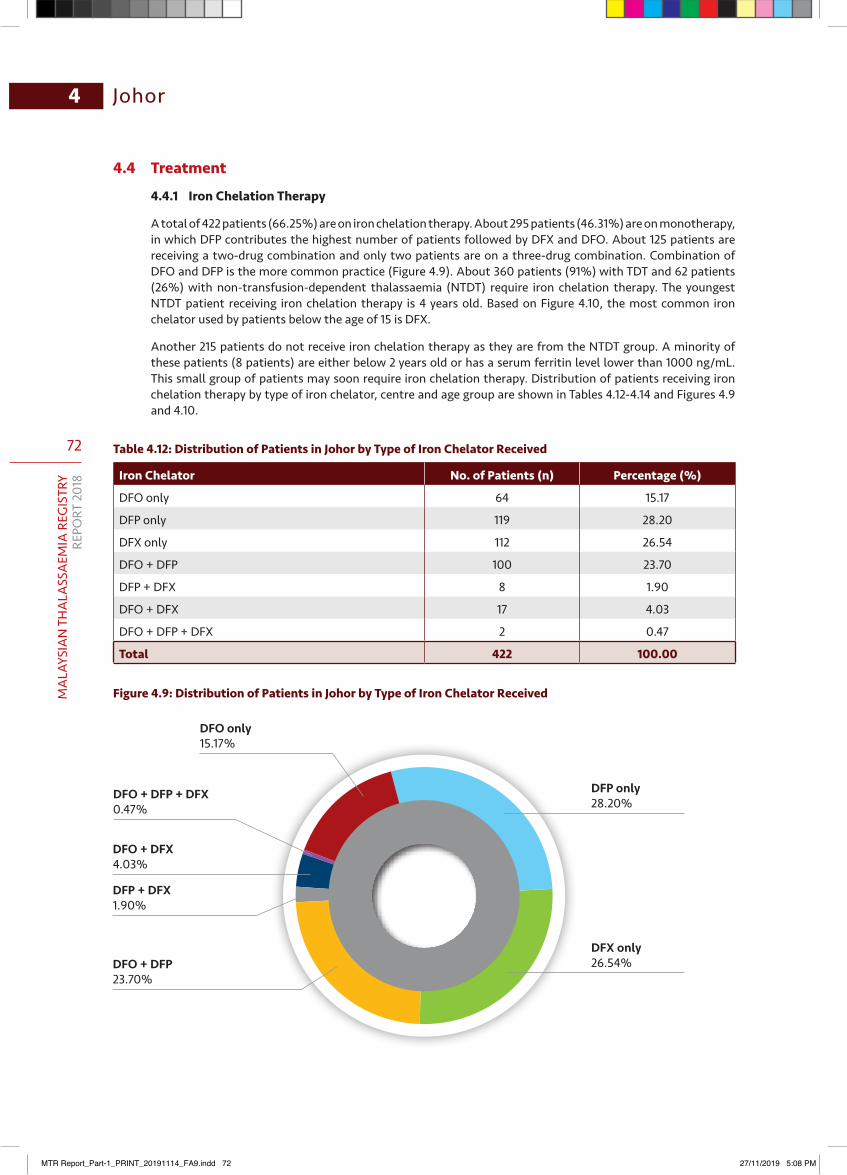
72
MA
LAYS
IAN
TH
ALA
SSA
EMIA
REG
ISTR
YRE
PORT
201
8
4
4.4 Treatment
4.4.1 Iron Chelation Therapy
A total of 422 patients (66.25%) are on iron chelation therapy. About 295 patients (46.31%) are on monotherapy, in which DFP contributes the highest number of patients followed by DFX and DFO. About 125 patients are receiving a two-drug combination and only two patients are on a three-drug combination. Combination of DFO and DFP is the more common practice (Figure 4.9). About 360 patients (91%) with TDT and 62 patients (26%) with non-transfusion-dependent thalassaemia (NTDT) require iron chelation therapy. The youngest NTDT patient receiving iron chelation therapy is 4 years old. Based on Figure 4.10, the most common iron chelator used by patients below the age of 15 is DFX.
Another 215 patients do not receive iron chelation therapy as they are from the NTDT group. A minority of these patients (8 patients) are either below 2 years old or has a serum ferritin level lower than 1000 ng/mL. This small group of patients may soon require iron chelation therapy. Distribution of patients receiving iron chelation therapy by type of iron chelator, centre and age group are shown in Tables 4.12-4.14 and Figures 4.9 and 4.10.
Table 4.12: Distribution of Patients in Johor by Type of Iron Chelator Received
Iron Chelator No. of Patients (n) Percentage (%)
DFO only 64 15.17
DFP only 119 28.20
DFX only 112 26.54
DFO + DFP 100 23.70
DFP + DFX 8 1.90
DFO + DFX 17 4.03
DFO + DFP + DFX 2 0.47
Total 422 100.00
Figure 4.9: Distribution of Patients in Johor by Type of Iron Chelator Received
DFX only26.54%DFO + DFP
23.70%
DFP + DFX1.90%
DFO + DFX4.03%
DFO + DFP + DFX0.47%
DFO only15.17%
DFP only28.20%
Johor
MTR Report_Part-1_PRINT_20191114_FA9.indd 72 27/11/2019 5:08 PM
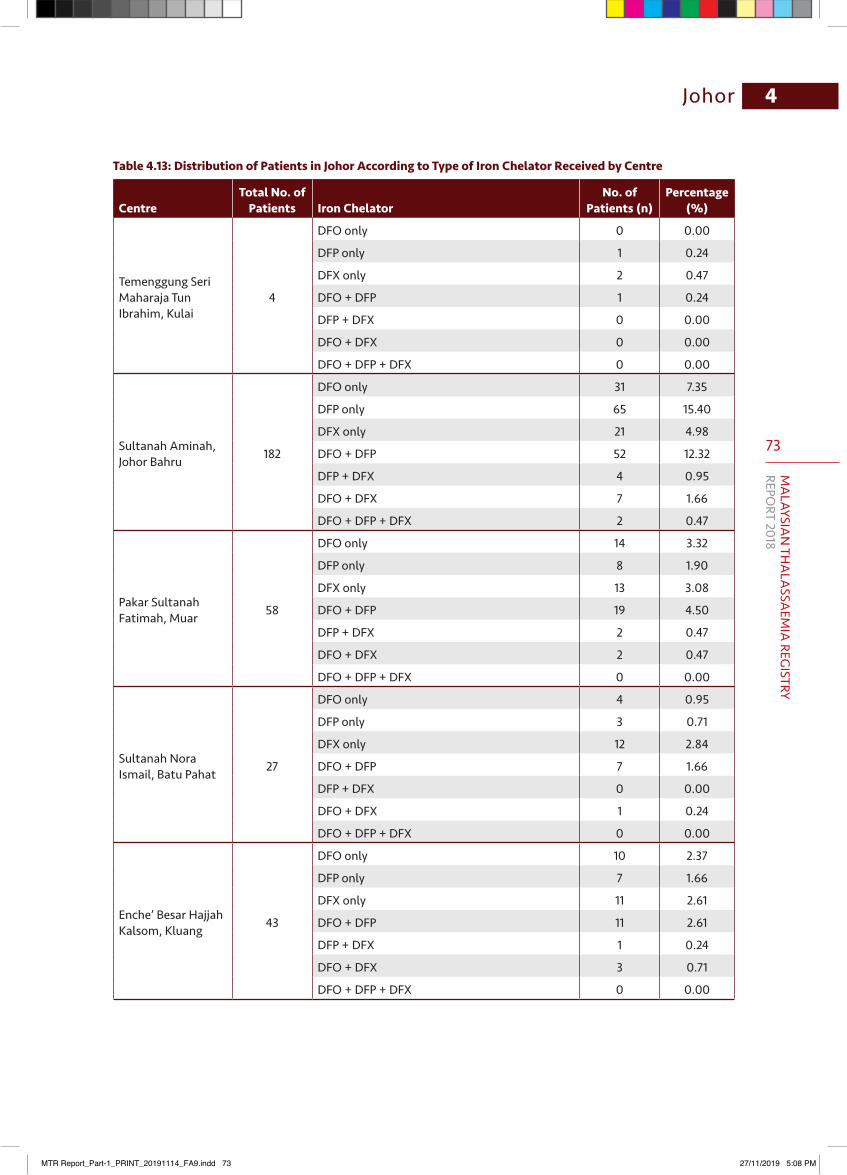
73
MA
LAYSIAN
THA
LASSA
EMIA
REGISTRY
REPORT 2018
4
Table 4.13: Distribution of Patients in Johor According to Type of Iron Chelator Received by Centre
CentreTotal No. of
Patients Iron ChelatorNo. of
Patients (n)Percentage
(%)
Temenggung Seri Maharaja Tun Ibrahim, Kulai
4
DFO only 0 0.00
DFP only 1 0.24
DFX only 2 0.47
DFO + DFP 1 0.24
DFP + DFX 0 0.00
DFO + DFX 0 0.00
DFO + DFP + DFX 0 0.00
Sultanah Aminah, Johor Bahru 182
DFO only 31 7.35
DFP only 65 15.40
DFX only 21 4.98
DFO + DFP 52 12.32
DFP + DFX 4 0.95
DFO + DFX 7 1.66
DFO + DFP + DFX 2 0.47
Pakar Sultanah Fatimah, Muar 58
DFO only 14 3.32
DFP only 8 1.90
DFX only 13 3.08
DFO + DFP 19 4.50
DFP + DFX 2 0.47
DFO + DFX 2 0.47
DFO + DFP + DFX 0 0.00
Sultanah Nora Ismail, Batu Pahat 27
DFO only 4 0.95
DFP only 3 0.71
DFX only 12 2.84
DFO + DFP 7 1.66
DFP + DFX 0 0.00
DFO + DFX 1 0.24
DFO + DFP + DFX 0 0.00
Enche’ Besar Hajjah Kalsom, Kluang 43
DFO only 10 2.37
DFP only 7 1.66
DFX only 11 2.61
DFO + DFP 11 2.61
DFP + DFX 1 0.24
DFO + DFX 3 0.71
DFO + DFP + DFX 0 0.00
Johor
MTR Report_Part-1_PRINT_20191114_FA9.indd 73 27/11/2019 5:08 PM
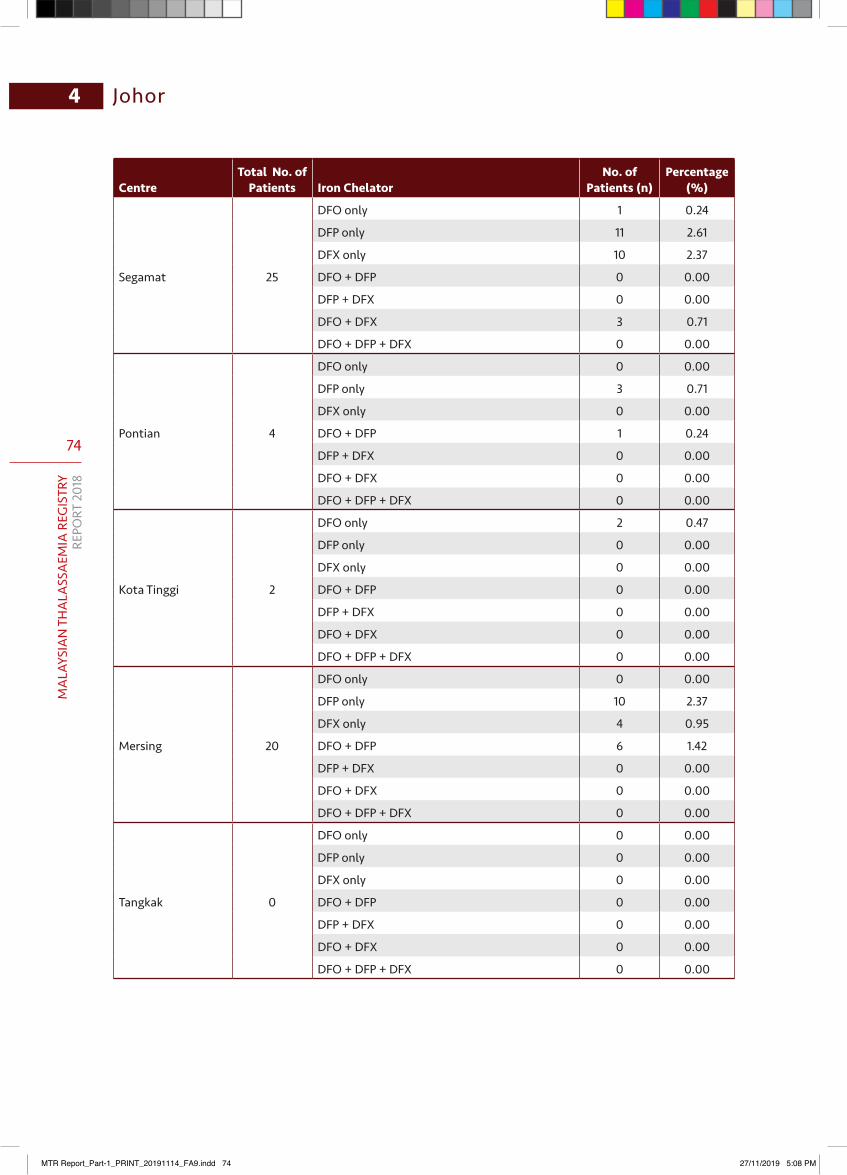
74
MA
LAYS
IAN
TH
ALA
SSA
EMIA
REG
ISTR
YRE
PORT
201
8
4
CentreTotal No. of
Patients Iron ChelatorNo. of
Patients (n)Percentage
(%)
Segamat 25
DFO only 1 0.24
DFP only 11 2.61
DFX only 10 2.37
DFO + DFP 0 0.00
DFP + DFX 0 0.00
DFO + DFX 3 0.71
DFO + DFP + DFX 0 0.00
Pontian 4
DFO only 0 0.00
DFP only 3 0.71
DFX only 0 0.00
DFO + DFP 1 0.24
DFP + DFX 0 0.00
DFO + DFX 0 0.00
DFO + DFP + DFX 0 0.00
Kota Tinggi 2
DFO only 2 0.47
DFP only 0 0.00
DFX only 0 0.00
DFO + DFP 0 0.00
DFP + DFX 0 0.00
DFO + DFX 0 0.00
DFO + DFP + DFX 0 0.00
Mersing 20
DFO only 0 0.00
DFP only 10 2.37
DFX only 4 0.95
DFO + DFP 6 1.42
DFP + DFX 0 0.00
DFO + DFX 0 0.00
DFO + DFP + DFX 0 0.00
Tangkak 0
DFO only 0 0.00
DFP only 0 0.00
DFX only 0 0.00
DFO + DFP 0 0.00
DFP + DFX 0 0.00
DFO + DFX 0 0.00
DFO + DFP + DFX 0 0.00
Johor
MTR Report_Part-1_PRINT_20191114_FA9.indd 74 27/11/2019 5:08 PM
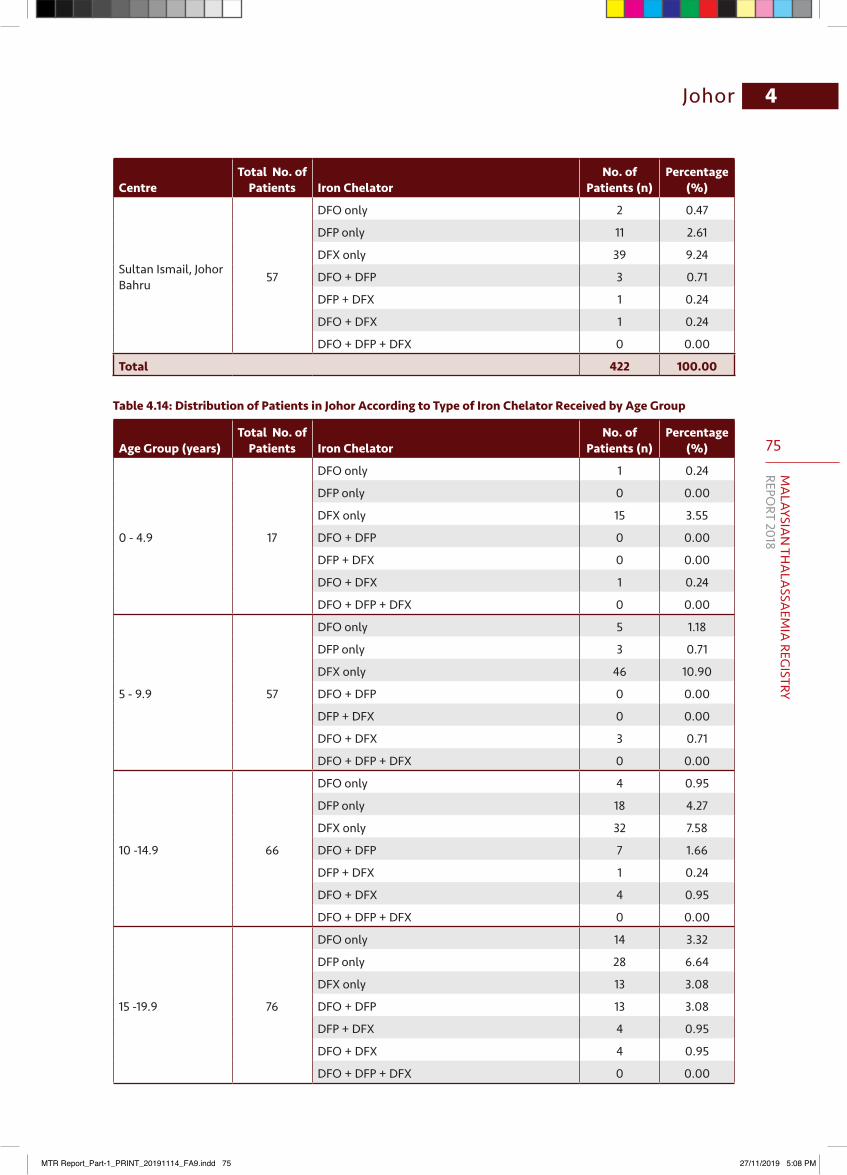
75
MA
LAYSIAN
THA
LASSA
EMIA
REGISTRY
REPORT 2018
4
CentreTotal No. of
Patients Iron ChelatorNo. of
Patients (n)Percentage
(%)
Sultan Ismail, Johor Bahru 57
DFO only 2 0.47
DFP only 11 2.61
DFX only 39 9.24
DFO + DFP 3 0.71
DFP + DFX 1 0.24
DFO + DFX 1 0.24
DFO + DFP + DFX 0 0.00
Total 422 100.00
Table 4.14: Distribution of Patients in Johor According to Type of Iron Chelator Received by Age Group
Age Group (years)Total No. of
Patients Iron ChelatorNo. of
Patients (n)Percentage
(%)
0 - 4.9 17
DFO only 1 0.24
DFP only 0 0.00
DFX only 15 3.55
DFO + DFP 0 0.00
DFP + DFX 0 0.00
DFO + DFX 1 0.24
DFO + DFP + DFX 0 0.00
5 - 9.9 57
DFO only 5 1.18
DFP only 3 0.71
DFX only 46 10.90
DFO + DFP 0 0.00
DFP + DFX 0 0.00
DFO + DFX 3 0.71
DFO + DFP + DFX 0 0.00
10 -14.9 66
DFO only 4 0.95
DFP only 18 4.27
DFX only 32 7.58
DFO + DFP 7 1.66
DFP + DFX 1 0.24
DFO + DFX 4 0.95
DFO + DFP + DFX 0 0.00
15 -19.9 76
DFO only 14 3.32
DFP only 28 6.64
DFX only 13 3.08
DFO + DFP 13 3.08
DFP + DFX 4 0.95
DFO + DFX 4 0.95
DFO + DFP + DFX 0 0.00
Johor
MTR Report_Part-1_PRINT_20191114_FA9.indd 75 27/11/2019 5:08 PM

76
MA
LAYS
IAN
TH
ALA
SSA
EMIA
REG
ISTR
YRE
PORT
201
8
4
Age Group (years)Total No. of
Patients Iron ChelatorNo. of
Patients (n)Percentage
(%)
20 - 24.9 76
DFO only 18 4.27
DFP only 15 3.55
DFX only 4 0.95
DFO + DFP 34 8.06
DFP + DFX 1 0.24
DFO + DFX 3 0.71
DFO + DFP + DFX 1 0.24
25 - 29.9 44
DFO only 9 2.13
DFP only 15 3.55
DFX only 1 0.24
DFO + DFP 17 4.03
DFP + DFX 1 0.24
DFO + DFX 1 0.24
DFO + DFP + DFX 0 0.00
30 - 34.9 24
DFO only 6 1.42
DFP only 7 1.66
DFX only 0 0.00
DFO + DFP 11 2.61
DFP + DFX 0 0.00
DFO + DFX 0 0.00
DFO + DFP + DFX 0 0.00
35 - 39.9 22
DFO only 1 0.24
DFP only 13 3.08
DFX only 0 0.00
DFO + DFP 5 1.18
DFP + DFX 1 0.24
DFO + DFX 1 0.24
DFO + DFP + DFX 1 0.24
40 - 44.9 12
DFO only 1 0.24
DFP only 8 1.90
DFX only 0 0.00
DFO + DFP 3 0.71
DFP + DFX 0 0.00
DFO + DFX 0 0.00
DFO + DFP + DFX 0 0.00
Johor
MTR Report_Part-1_PRINT_20191114_FA9.indd 76 27/11/2019 5:08 PM
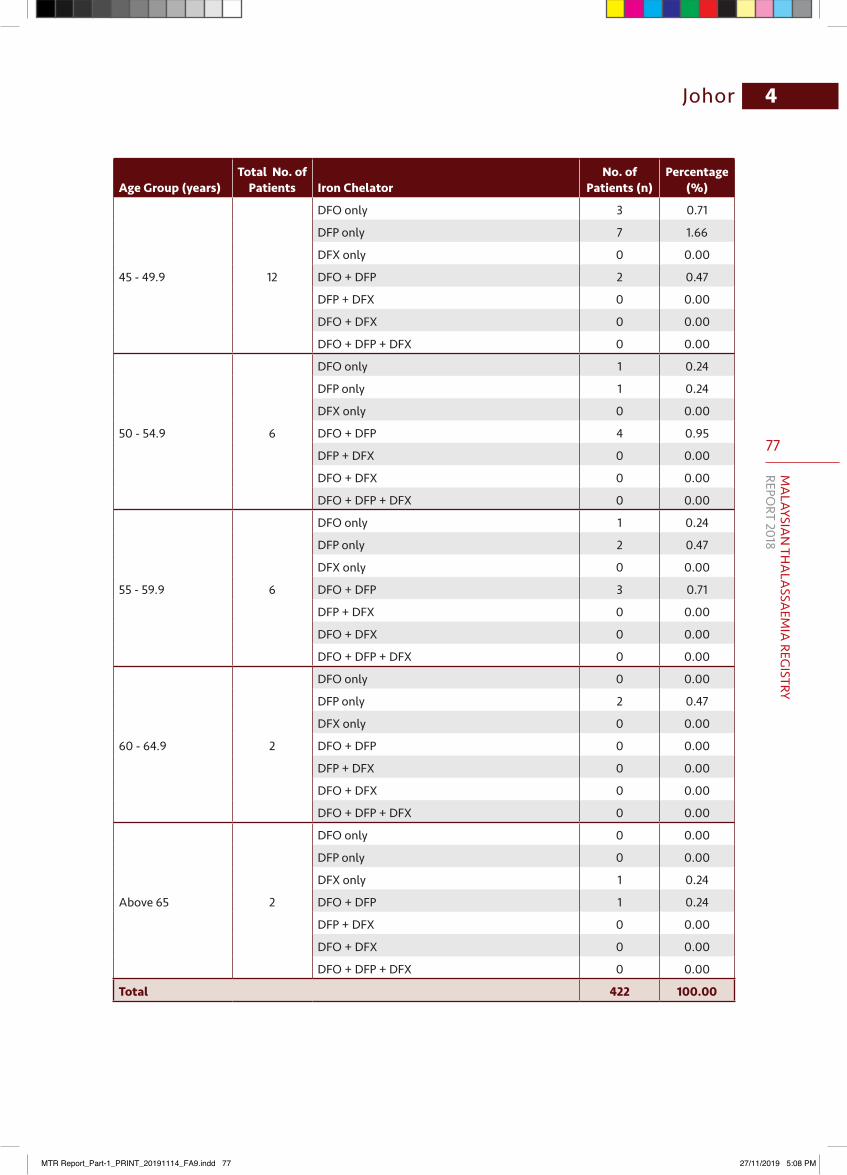
77
MA
LAYSIAN
THA
LASSA
EMIA
REGISTRY
REPORT 2018
4
Age Group (years)Total No. of
Patients Iron ChelatorNo. of
Patients (n)Percentage
(%)
45 - 49.9 12
DFO only 3 0.71
DFP only 7 1.66
DFX only 0 0.00
DFO + DFP 2 0.47
DFP + DFX 0 0.00
DFO + DFX 0 0.00
DFO + DFP + DFX 0 0.00
50 - 54.9 6
DFO only 1 0.24
DFP only 1 0.24
DFX only 0 0.00
DFO + DFP 4 0.95
DFP + DFX 0 0.00
DFO + DFX 0 0.00
DFO + DFP + DFX 0 0.00
55 - 59.9 6
DFO only 1 0.24
DFP only 2 0.47
DFX only 0 0.00
DFO + DFP 3 0.71
DFP + DFX 0 0.00
DFO + DFX 0 0.00
DFO + DFP + DFX 0 0.00
60 - 64.9 2
DFO only 0 0.00
DFP only 2 0.47
DFX only 0 0.00
DFO + DFP 0 0.00
DFP + DFX 0 0.00
DFO + DFX 0 0.00
DFO + DFP + DFX 0 0.00
Above 65 2
DFO only 0 0.00
DFP only 0 0.00
DFX only 1 0.24
DFO + DFP 1 0.24
DFP + DFX 0 0.00
DFO + DFX 0 0.00
DFO + DFP + DFX 0 0.00
Total 422 100.00
Johor
MTR Report_Part-1_PRINT_20191114_FA9.indd 77 27/11/2019 5:08 PM
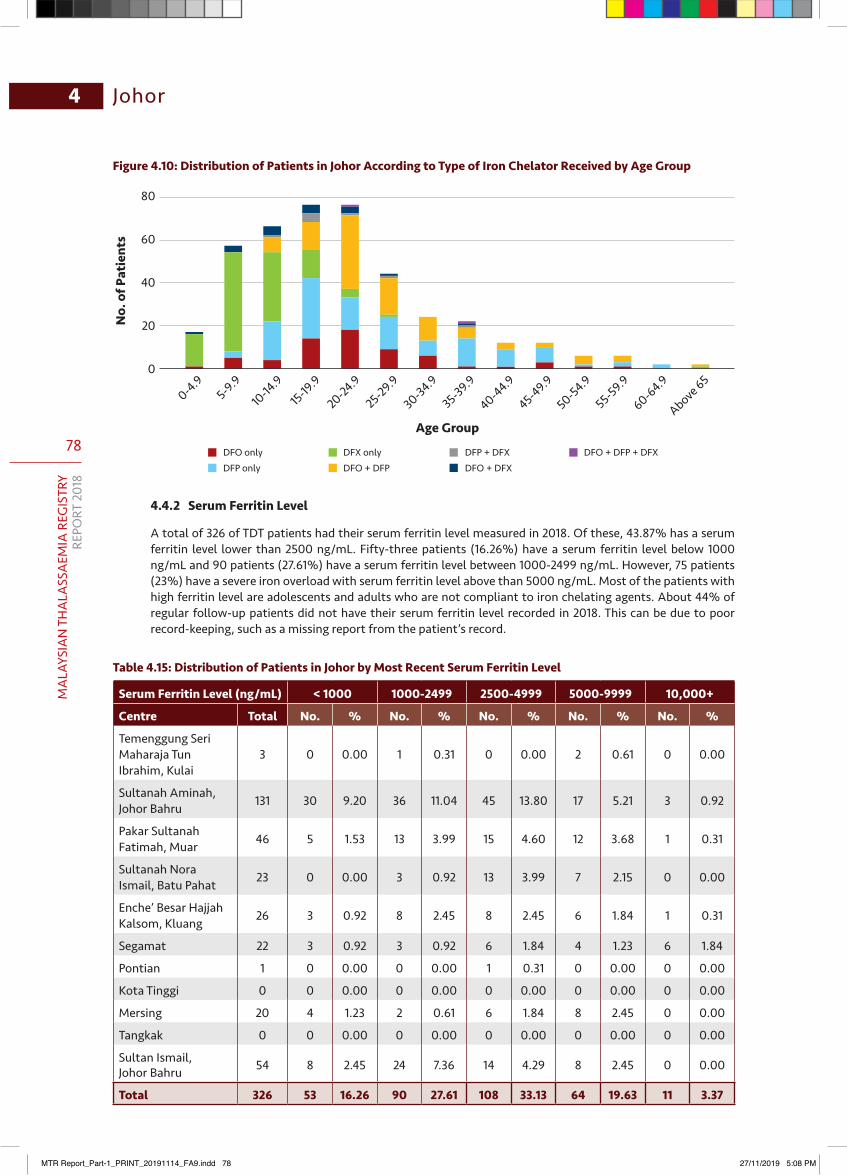
78
MA
LAYS
IAN
TH
ALA
SSA
EMIA
REG
ISTR
YRE
PORT
201
8
4 Johor
Figure 4.10: Distribution of Patients in Johor According to Type of Iron Chelator Received by Age Group
4.4.2 Serum Ferritin Level
A total of 326 of TDT patients had their serum ferritin level measured in 2018. Of these, 43.87% has a serum ferritin level lower than 2500 ng/mL. Fifty-three patients (16.26%) have a serum ferritin level below 1000 ng/mL and 90 patients (27.61%) have a serum ferritin level between 1000-2499 ng/mL. However, 75 patients (23%) have a severe iron overload with serum ferritin level above than 5000 ng/mL. Most of the patients with high ferritin level are adolescents and adults who are not compliant to iron chelating agents. About 44% of regular follow-up patients did not have their serum ferritin level recorded in 2018. This can be due to poor record-keeping, such as a missing report from the patient’s record.
Table 4.15: Distribution of Patients in Johor by Most Recent Serum Ferritin Level
Serum Ferritin Level (ng/mL) < 1000 1000-2499 2500-4999 5000-9999 10,000+
Centre Total No. % No. % No. % No. % No. %
Temenggung Seri Maharaja Tun Ibrahim, Kulai
3 0 0.00 1 0.31 0 0.00 2 0.61 0 0.00
Sultanah Aminah, Johor Bahru 131 30 9.20 36 11.04 45 13.80 17 5.21 3 0.92
Pakar Sultanah Fatimah, Muar 46 5 1.53 13 3.99 15 4.60 12 3.68 1 0.31
Sultanah Nora Ismail, Batu Pahat 23 0 0.00 3 0.92 13 3.99 7 2.15 0 0.00
Enche’ Besar Hajjah Kalsom, Kluang 26 3 0.92 8 2.45 8 2.45 6 1.84 1 0.31
Segamat 22 3 0.92 3 0.92 6 1.84 4 1.23 6 1.84
Pontian 1 0 0.00 0 0.00 1 0.31 0 0.00 0 0.00
Kota Tinggi 0 0 0.00 0 0.00 0 0.00 0 0.00 0 0.00
Mersing 20 4 1.23 2 0.61 6 1.84 8 2.45 0 0.00
Tangkak 0 0 0.00 0 0.00 0 0.00 0 0.00 0 0.00
Sultan Ismail, Johor Bahru 54 8 2.45 24 7.36 14 4.29 8 2.45 0 0.00
Total 326 53 16.26 90 27.61 108 33.13 64 19.63 11 3.37
80
60
40
20
0
No.
of P
atie
nts
Age Group
0-4.95-9.9
10-14
.915-19
.9
20-24.9
25-29.9
30-34.9
35-39.9
40-44.9
45-49.9
50-54.9
55-59.9
60-64.9
Above 65
DFO onlyDFP only
DFX onlyDFO + DFP
DFP + DFXDFO + DFX
DFO + DFP + DFX
MTR Report_Part-1_PRINT_20191114_FA9.indd 78 27/11/2019 5:08 PM
79
MA
LAYSIAN
THA
LASSA
EMIA
REGISTRY
REPORT 2018
4
4.5 Observation and Comments
1. The data needs to be updated and verified with the treating doctor, especially data for the adult patients.2. Most patients with high serum ferritin level have poor adherence to iron chelation therapy, a non-functioning
DFO pump, experience severe side effects or is unable to tolerate alternative iron chelators.3. The percentage of patients with serum ferritin level recorded is low due to poor documentation and irregular
monitoring. This may be due to budget constraints.4. Most patients from Johor are in the Johor Bahru district due to the high population in the area and presence of
two main haematology centres (Hospital Sultanah Aminah and Hospital Sultan Ismail).5. Most patients aged 15 years and below are on DFX whereas a majority of adult patients are on DFP or drug
combination therapy to reduce their serum ferritin level. 6. New thalassaemia birth cases is decreasing in trend. Most of new births were diagnosed as beta thalassaemia.
4.5.1 Recommendations
1. Closer working relationship between RAs and clinicians/paramedics.2. RAs must trace the necessary information required in the registry.3. TDT and NTDT in the registry should also be included in the transfusion summary.4. Each hospital must assign one paramedic to capture the latest data on thalassaemia patients, especially
for adult patients.5. Each patient in the registry should have their MRI T2* data recorded.6. To add on free entry write in annual comment section for clinicians. 7. To increase financial budget for iron chelation therapy, monitoring test for patients, blood filters as well as
payment for RA.
Johor
MTR Report_Part-1_PRINT_20191114_FA9.indd 79 27/11/2019 5:08 PM
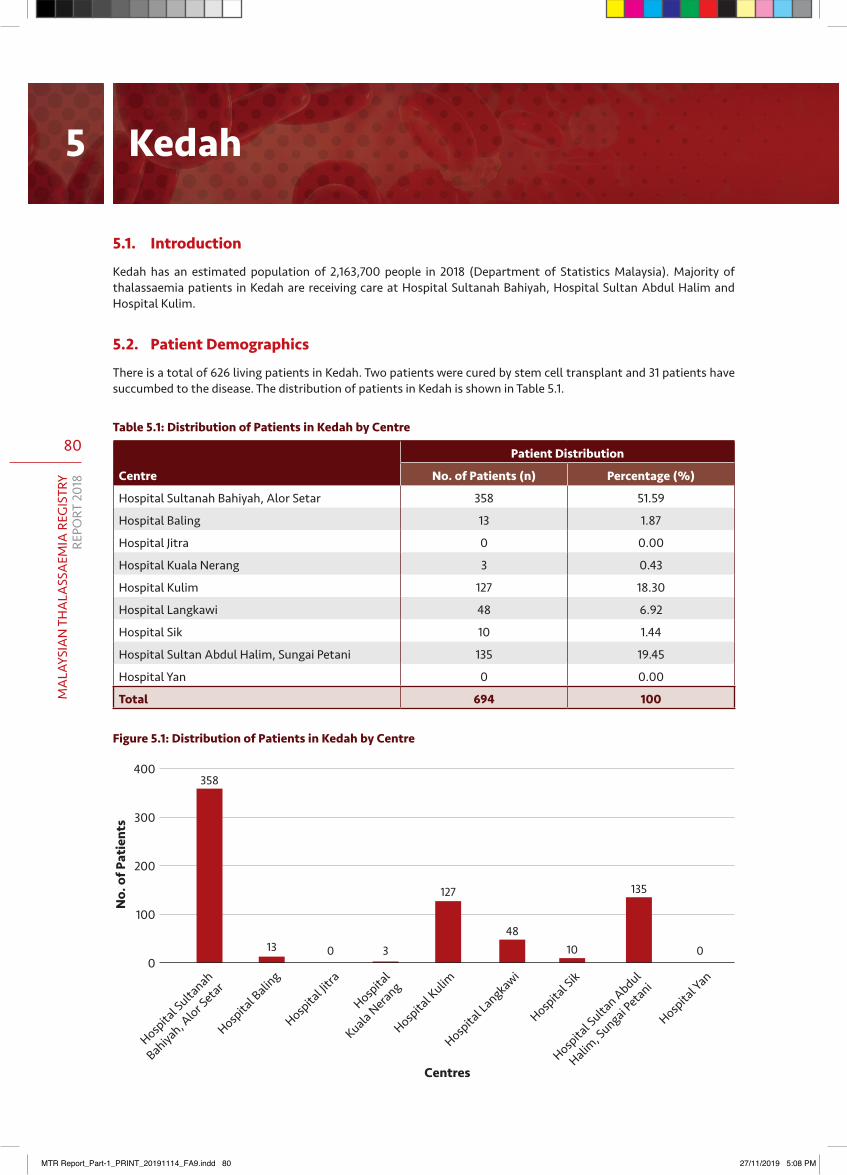
80
MA
LAYS
IAN
TH
ALA
SSA
EMIA
REG
ISTR
YRE
PORT
201
8
5.1. Introduction
Kedah has an estimated population of 2,163,700 people in 2018 (Department of Statistics Malaysia). Majority of thalassaemia patients in Kedah are receiving care at Hospital Sultanah Bahiyah, Hospital Sultan Abdul Halim and Hospital Kulim.
5.2. Patient Demographics
There is a total of 626 living patients in Kedah. Two patients were cured by stem cell transplant and 31 patients have succumbed to the disease. The distribution of patients in Kedah is shown in Table 5.1.
Table 5.1: Distribution of Patients in Kedah by Centre
Centre
Patient Distribution
No. of Patients (n) Percentage (%)
Hospital Sultanah Bahiyah, Alor Setar 358 51.59
Hospital Baling 13 1.87
Hospital Jitra 0 0.00
Hospital Kuala Nerang 3 0.43
Hospital Kulim 127 18.30
Hospital Langkawi 48 6.92
Hospital Sik 10 1.44
Hospital Sultan Abdul Halim, Sungai Petani 135 19.45
Hospital Yan 0 0.00
Total 694 100
Figure 5.1: Distribution of Patients in Kedah by Centre
400
300
200
100
0
No.
of P
atie
nts
Centres
Hospita
l Sulta
nah
Bahiyah, A
lor Setar
Hospita
l Kulim
Hospita
l Balin
g
Hospita
l Langkawi
Hospita
l Jitra
Hospita
l Sik
Hospita
l
Kuala Nerang
Hospita
l Sulta
n Abdul
Halim, S
ungai Petani
Hospita
l Yan
0 0
358
13 3
127
4810
135
Kedah5
MTR Report_Part-1_PRINT_20191114_FA9.indd 80 27/11/2019 5:08 PM
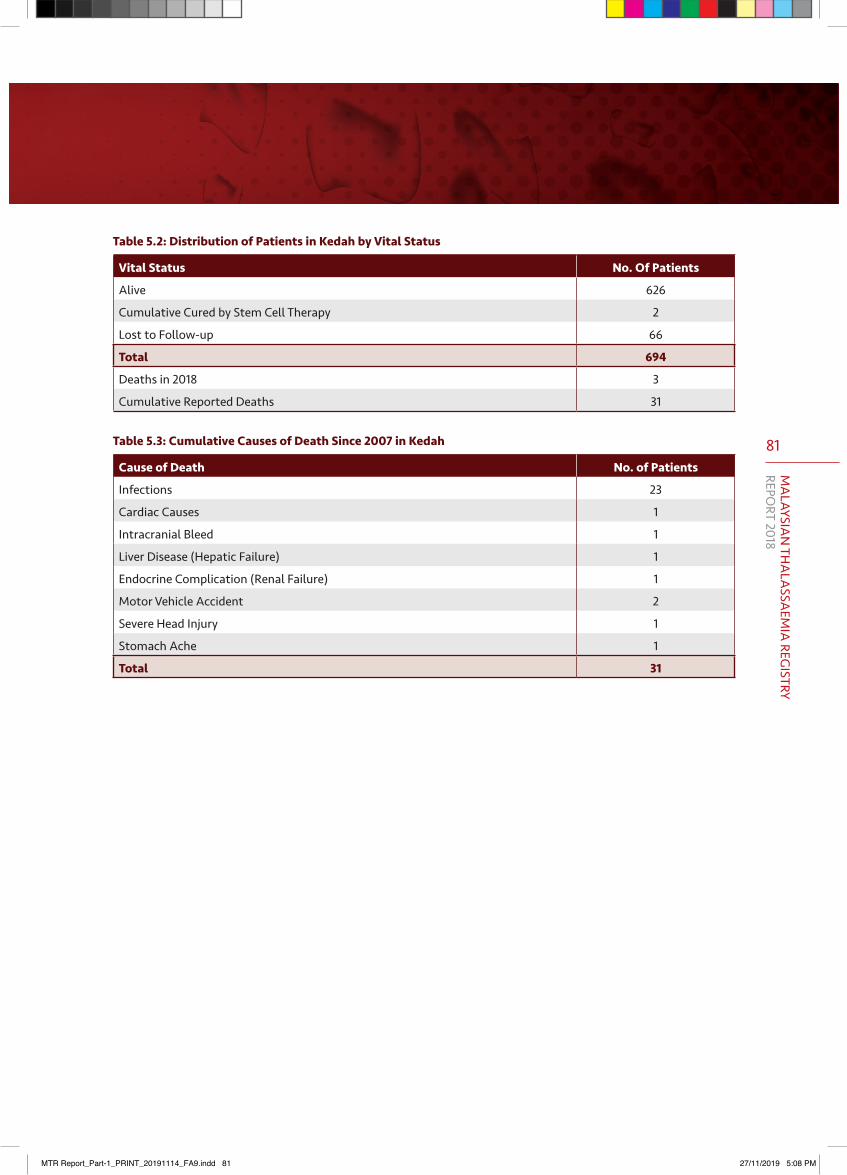
81
MA
LAYSIAN
THA
LASSA
EMIA
REGISTRY
REPORT 2018
Table 5.2: Distribution of Patients in Kedah by Vital Status
Vital Status No. Of Patients
Alive 626
Cumulative Cured by Stem Cell Therapy 2
Lost to Follow-up 66
Total 694
Deaths in 2018 3
Cumulative Reported Deaths 31
Table 5.3: Cumulative Causes of Death Since 2007 in Kedah
Cause of Death No. of Patients
Infections 23
Cardiac Causes 1
Intracranial Bleed 1
Liver Disease (Hepatic Failure) 1
Endocrine Complication (Renal Failure) 1
Motor Vehicle Accident 2
Severe Head Injury 1
Stomach Ache 1
Total 31
MTR Report_Part-1_PRINT_20191114_FA9.indd 81 27/11/2019 5:08 PM
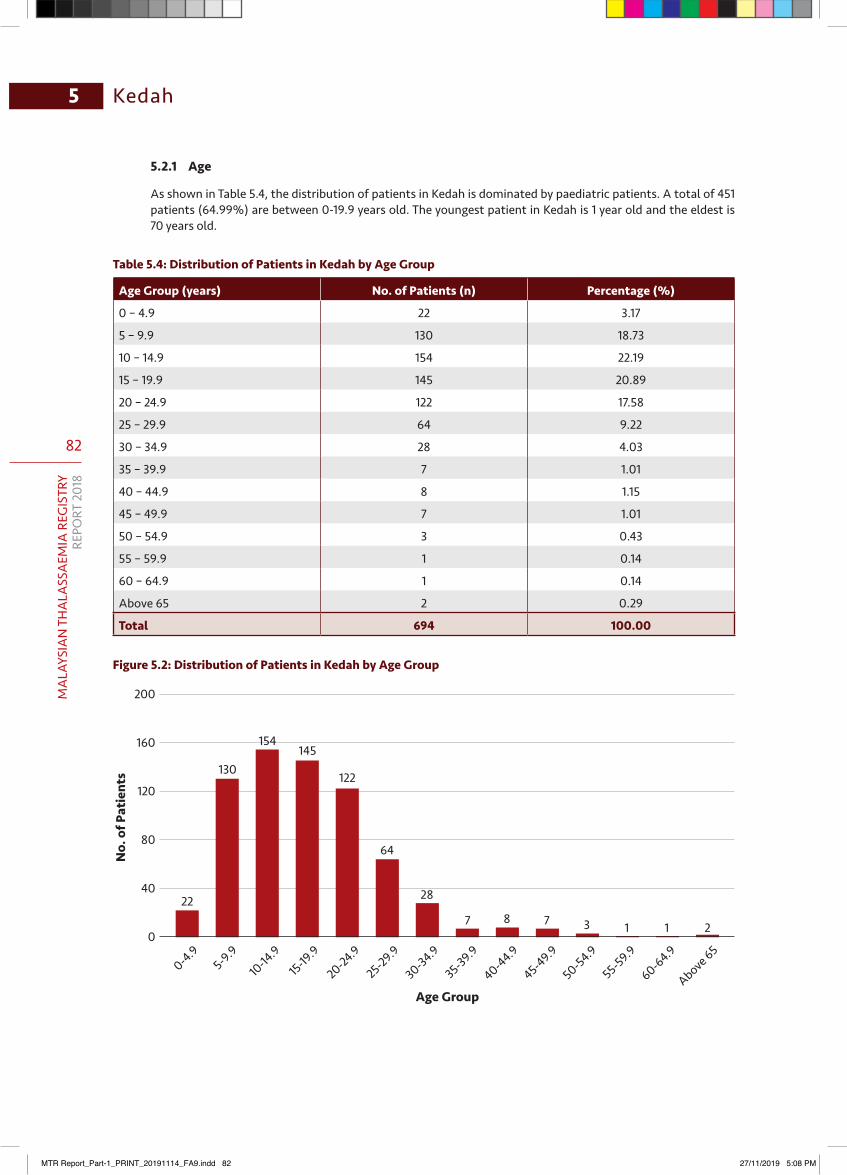
82
MA
LAYS
IAN
TH
ALA
SSA
EMIA
REG
ISTR
YRE
PORT
201
8
Kedah5
200
160
120
80
40
0
No.
of P
atie
nts
22
130
154145
122
64
28
7 8 7 3 1 1 2
Age Group
0-4.95-9.9
10-14
.915-19
.9
20-24.9
25-29.9
30-34.9
35-39.9
40-44.9
45-49.9
50-54.9
55-59.9
60-64.9
Above 65
5.2.1 Age
As shown in Table 5.4, the distribution of patients in Kedah is dominated by paediatric patients. A total of 451 patients (64.99%) are between 0-19.9 years old. The youngest patient in Kedah is 1 year old and the eldest is 70 years old.
Table 5.4: Distribution of Patients in Kedah by Age Group
Age Group (years) No. of Patients (n) Percentage (%)
0 – 4.9 22 3.17
5 – 9.9 130 18.73
10 – 14.9 154 22.19
15 – 19.9 145 20.89
20 – 24.9 122 17.58
25 – 29.9 64 9.22
30 – 34.9 28 4.03
35 – 39.9 7 1.01
40 – 44.9 8 1.15
45 – 49.9 7 1.01
50 – 54.9 3 0.43
55 – 59.9 1 0.14
60 – 64.9 1 0.14
Above 65 2 0.29
Total 694 100.00
Figure 5.2: Distribution of Patients in Kedah by Age Group
MTR Report_Part-1_PRINT_20191114_FA9.indd 82 27/11/2019 5:08 PM
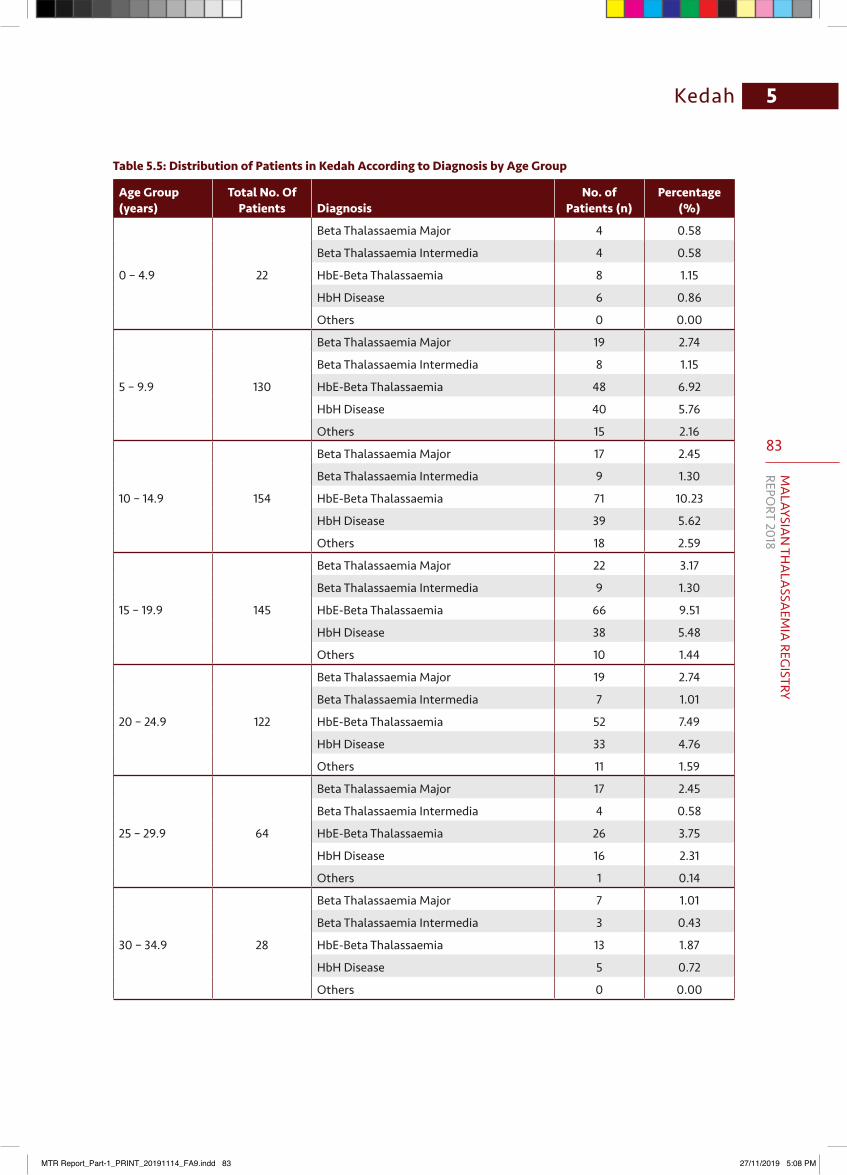
83
MA
LAYSIAN
THA
LASSA
EMIA
REGISTRY
REPORT 2018
5Kedah
Table 5.5: Distribution of Patients in Kedah According to Diagnosis by Age Group
Age Group (years)
Total No. Of Patients Diagnosis
No. of Patients (n)
Percentage (%)
0 – 4.9 22
Beta Thalassaemia Major 4 0.58
Beta Thalassaemia Intermedia 4 0.58
HbE-Beta Thalassaemia 8 1.15
HbH Disease 6 0.86
Others 0 0.00
5 – 9.9 130
Beta Thalassaemia Major 19 2.74
Beta Thalassaemia Intermedia 8 1.15
HbE-Beta Thalassaemia 48 6.92
HbH Disease 40 5.76
Others 15 2.16
10 – 14.9 154
Beta Thalassaemia Major 17 2.45
Beta Thalassaemia Intermedia 9 1.30
HbE-Beta Thalassaemia 71 10.23
HbH Disease 39 5.62
Others 18 2.59
15 – 19.9 145
Beta Thalassaemia Major 22 3.17
Beta Thalassaemia Intermedia 9 1.30
HbE-Beta Thalassaemia 66 9.51
HbH Disease 38 5.48
Others 10 1.44
20 – 24.9 122
Beta Thalassaemia Major 19 2.74
Beta Thalassaemia Intermedia 7 1.01
HbE-Beta Thalassaemia 52 7.49
HbH Disease 33 4.76
Others 11 1.59
25 – 29.9 64
Beta Thalassaemia Major 17 2.45
Beta Thalassaemia Intermedia 4 0.58
HbE-Beta Thalassaemia 26 3.75
HbH Disease 16 2.31
Others 1 0.14
30 – 34.9 28
Beta Thalassaemia Major 7 1.01
Beta Thalassaemia Intermedia 3 0.43
HbE-Beta Thalassaemia 13 1.87
HbH Disease 5 0.72
Others 0 0.00
MTR Report_Part-1_PRINT_20191114_FA9.indd 83 27/11/2019 5:08 PM
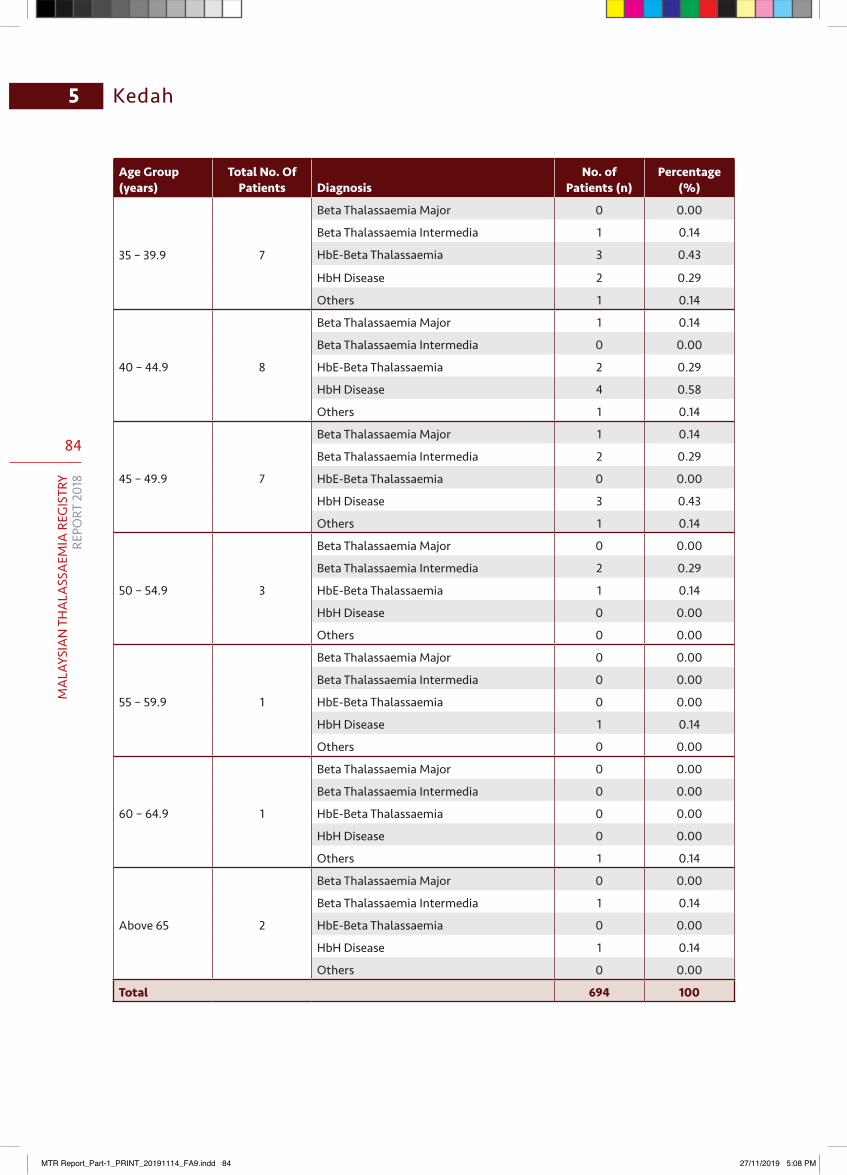
84
MA
LAYS
IAN
TH
ALA
SSA
EMIA
REG
ISTR
YRE
PORT
201
8
Kedah5
Age Group (years)
Total No. Of Patients Diagnosis
No. of Patients (n)
Percentage (%)
35 – 39.9 7
Beta Thalassaemia Major 0 0.00
Beta Thalassaemia Intermedia 1 0.14
HbE-Beta Thalassaemia 3 0.43
HbH Disease 2 0.29
Others 1 0.14
40 – 44.9 8
Beta Thalassaemia Major 1 0.14
Beta Thalassaemia Intermedia 0 0.00
HbE-Beta Thalassaemia 2 0.29
HbH Disease 4 0.58
Others 1 0.14
45 – 49.9 7
Beta Thalassaemia Major 1 0.14
Beta Thalassaemia Intermedia 2 0.29
HbE-Beta Thalassaemia 0 0.00
HbH Disease 3 0.43
Others 1 0.14
50 – 54.9 3
Beta Thalassaemia Major 0 0.00
Beta Thalassaemia Intermedia 2 0.29
HbE-Beta Thalassaemia 1 0.14
HbH Disease 0 0.00
Others 0 0.00
55 – 59.9 1
Beta Thalassaemia Major 0 0.00
Beta Thalassaemia Intermedia 0 0.00
HbE-Beta Thalassaemia 0 0.00
HbH Disease 1 0.14
Others 0 0.00
60 – 64.9 1
Beta Thalassaemia Major 0 0.00
Beta Thalassaemia Intermedia 0 0.00
HbE-Beta Thalassaemia 0 0.00
HbH Disease 0 0.00
Others 1 0.14
Above 65 2
Beta Thalassaemia Major 0 0.00
Beta Thalassaemia Intermedia 1 0.14
HbE-Beta Thalassaemia 0 0.00
HbH Disease 1 0.14
Others 0 0.00
Total 694 100
MTR Report_Part-1_PRINT_20191114_FA9.indd 84 27/11/2019 5:08 PM
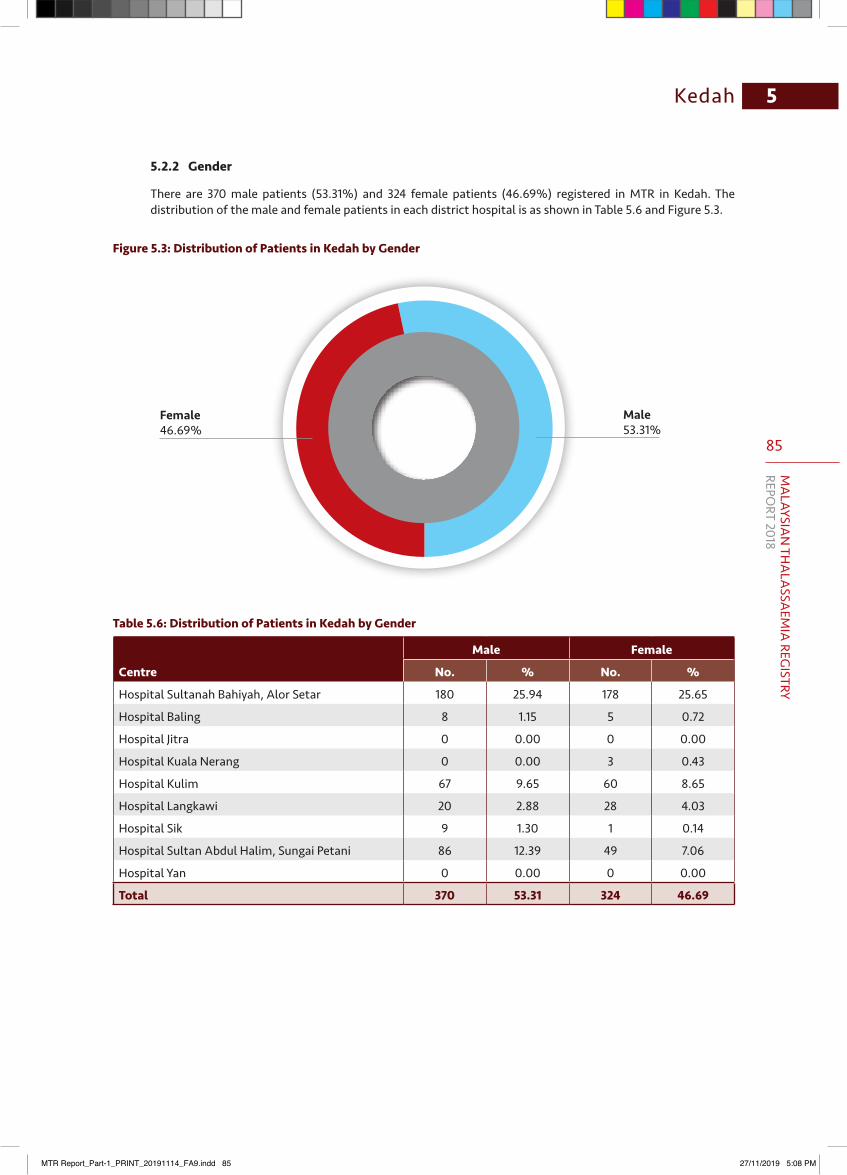
85
MA
LAYSIAN
THA
LASSA
EMIA
REGISTRY
REPORT 2018
5Kedah
5.2.2 Gender
There are 370 male patients (53.31%) and 324 female patients (46.69%) registered in MTR in Kedah. The distribution of the male and female patients in each district hospital is as shown in Table 5.6 and Figure 5.3.
Figure 5.3: Distribution of Patients in Kedah by Gender
Female46.69%
Male 53.31%
Table 5.6: Distribution of Patients in Kedah by Gender
Centre
Male Female
No. % No. %
Hospital Sultanah Bahiyah, Alor Setar 180 25.94 178 25.65
Hospital Baling 8 1.15 5 0.72
Hospital Jitra 0 0.00 0 0.00
Hospital Kuala Nerang 0 0.00 3 0.43
Hospital Kulim 67 9.65 60 8.65
Hospital Langkawi 20 2.88 28 4.03
Hospital Sik 9 1.30 1 0.14
Hospital Sultan Abdul Halim, Sungai Petani 86 12.39 49 7.06
Hospital Yan 0 0.00 0 0.00
Total 370 53.31 324 46.69
MTR Report_Part-1_PRINT_20191114_FA9.indd 85 27/11/2019 5:08 PM
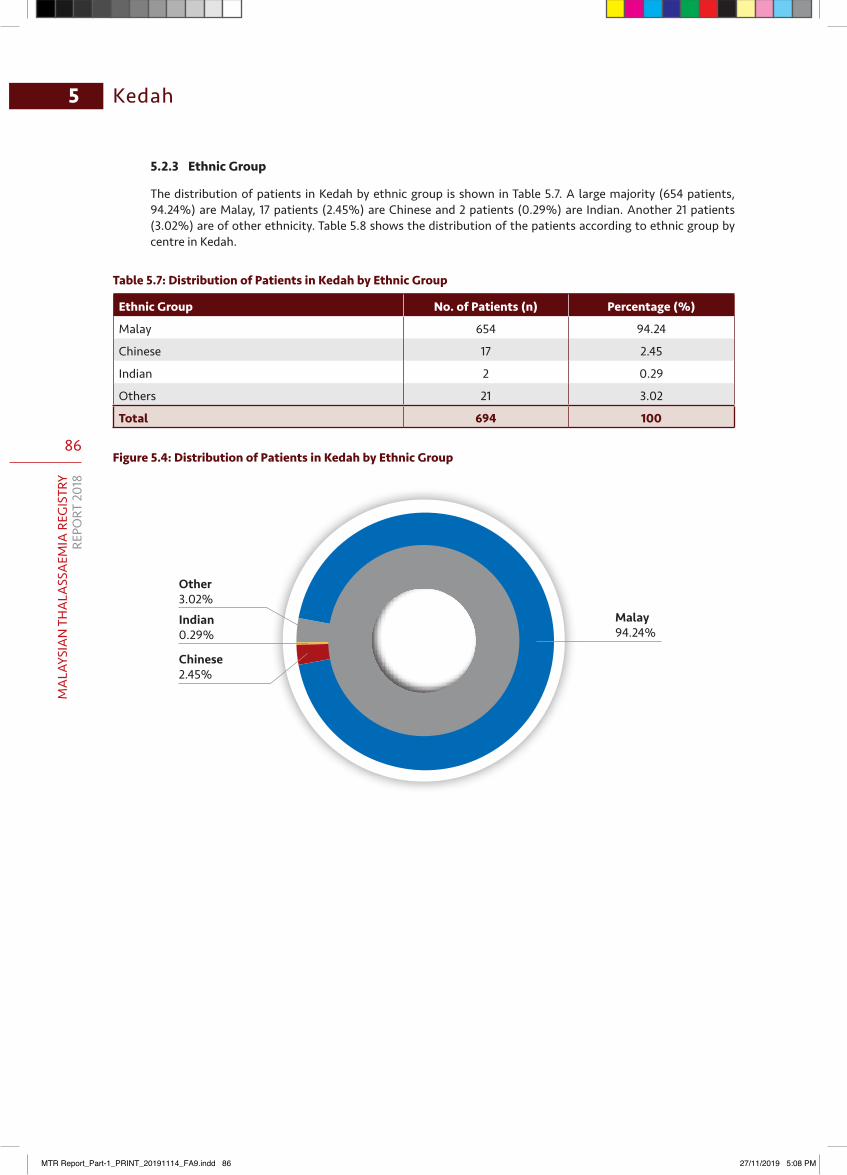
86
MA
LAYS
IAN
TH
ALA
SSA
EMIA
REG
ISTR
YRE
PORT
201
8
Kedah5
Other3.02%Indian0.29%
Chinese2.45%
Malay 94.24%
5.2.3 Ethnic Group
The distribution of patients in Kedah by ethnic group is shown in Table 5.7. A large majority (654 patients, 94.24%) are Malay, 17 patients (2.45%) are Chinese and 2 patients (0.29%) are Indian. Another 21 patients (3.02%) are of other ethnicity. Table 5.8 shows the distribution of the patients according to ethnic group by centre in Kedah.
Table 5.7: Distribution of Patients in Kedah by Ethnic Group
Ethnic Group No. of Patients (n) Percentage (%)
Malay 654 94.24
Chinese 17 2.45
Indian 2 0.29
Others 21 3.02
Total 694 100
Figure 5.4: Distribution of Patients in Kedah by Ethnic Group
MTR Report_Part-1_PRINT_20191114_FA9.indd 86 27/11/2019 5:08 PM
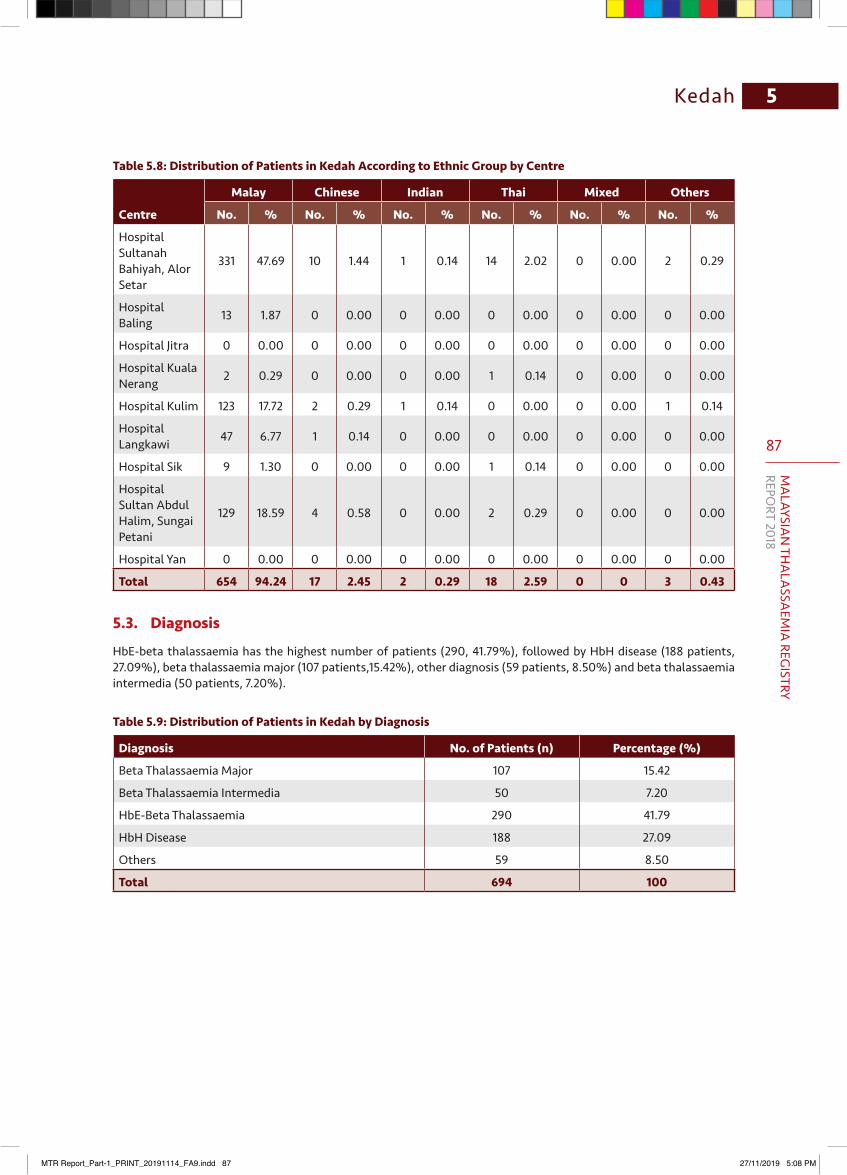
87
MA
LAYSIAN
THA
LASSA
EMIA
REGISTRY
REPORT 2018
5Kedah
Table5.8:DistributionofPatientsinKedahAccordingtoEthnicGroupbyCentre
Centre
Malay Chinese Indian Thai Mixed Others
No. % No. % No. % No. % No. % No. %
Hospital Sultanah Bahiyah, Alor Setar
331 47.69 10 1.44 1 0.14 14 2.02 0 0.00 2 0.29
Hospital Baling 13 1.87 0 0.00 0 0.00 0 0.00 0 0.00 0 0.00
Hospital Jitra 0 0.00 0 0.00 0 0.00 0 0.00 0 0.00 0 0.00
Hospital Kuala Nerang 2 0.29 0 0.00 0 0.00 1 0.14 0 0.00 0 0.00
Hospital Kulim 123 17.72 2 0.29 1 0.14 0 0.00 0 0.00 1 0.14
Hospital Langkawi 47 6.77 1 0.14 0 0.00 0 0.00 0 0.00 0 0.00
Hospital Sik 9 1.30 0 0.00 0 0.00 1 0.14 0 0.00 0 0.00
Hospital Sultan Abdul Halim, Sungai Petani
129 18.59 4 0.58 0 0.00 2 0.29 0 0.00 0 0.00
Hospital Yan 0 0.00 0 0.00 0 0.00 0 0.00 0 0.00 0 0.00
Total 654 94.24 17 2.45 2 0.29 18 2.59 0 0 3 0.43
5.3. Diagnosis
HbE-beta thalassaemia has the highest number of patients (290, 41.79%), followed by HbH disease (188 patients, 27.09%), beta thalassaemia major (107 patients,15.42%), other diagnosis (59 patients, 8.50%) and beta thalassaemia intermedia (50 patients, 7.20%).
Table 5.9: Distribution of Patients in Kedah by Diagnosis
Diagnosis No. of Patients (n) Percentage (%)
Beta Thalassaemia Major 107 15.42
Beta Thalassaemia Intermedia 50 7.20
HbE-Beta Thalassaemia 290 41.79
HbH Disease 188 27.09
Others 59 8.50
Total 694 100
MTR Report_Part-1_PRINT_20191114_FA9.indd 87 27/11/2019 5:08 PM
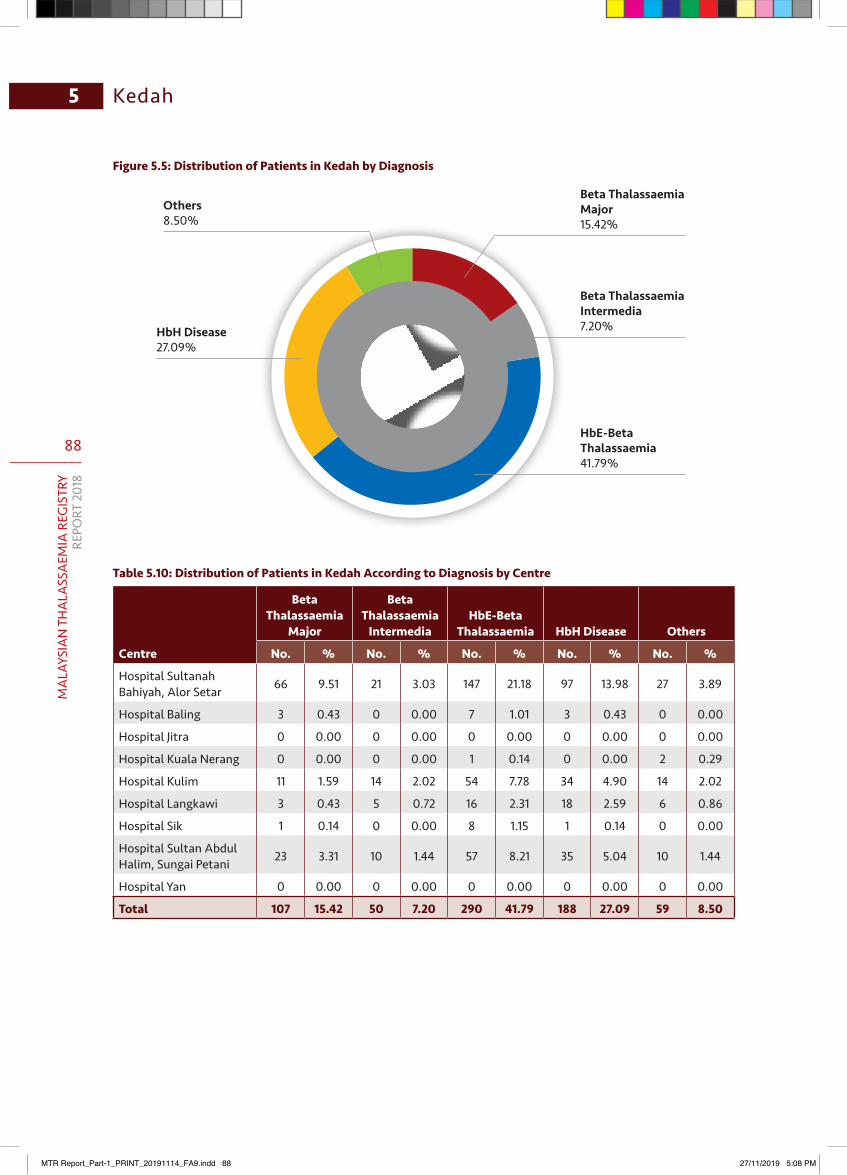
88
MA
LAYS
IAN
TH
ALA
SSA
EMIA
REG
ISTR
YRE
PORT
201
8
Kedah5
Figure 5.5: Distribution of Patients in Kedah by Diagnosis
Beta Thalassaemia Major15.42%
Beta Thalassaemia Intermedia7.20%
HbE-Beta Thalassaemia41.79%
HbH Disease27.09%
Others8.50%
Table 5.10: Distribution of Patients in Kedah According to Diagnosis by Centre
Centre
Beta Thalassaemia
Major
Beta Thalassaemia
IntermediaHbE-Beta
Thalassaemia HbH Disease Others
No. % No. % No. % No. % No. %
Hospital Sultanah Bahiyah, Alor Setar 66 9.51 21 3.03 147 21.18 97 13.98 27 3.89
Hospital Baling 3 0.43 0 0.00 7 1.01 3 0.43 0 0.00
Hospital Jitra 0 0.00 0 0.00 0 0.00 0 0.00 0 0.00
Hospital Kuala Nerang 0 0.00 0 0.00 1 0.14 0 0.00 2 0.29
Hospital Kulim 11 1.59 14 2.02 54 7.78 34 4.90 14 2.02
Hospital Langkawi 3 0.43 5 0.72 16 2.31 18 2.59 6 0.86
Hospital Sik 1 0.14 0 0.00 8 1.15 1 0.14 0 0.00
Hospital Sultan Abdul Halim, Sungai Petani 23 3.31 10 1.44 57 8.21 35 5.04 10 1.44
Hospital Yan 0 0.00 0 0.00 0 0.00 0 0.00 0 0.00
Total 107 15.42 50 7.20 290 41.79 188 27.09 59 8.50
MTR Report_Part-1_PRINT_20191114_FA9.indd 88 27/11/2019 5:08 PM
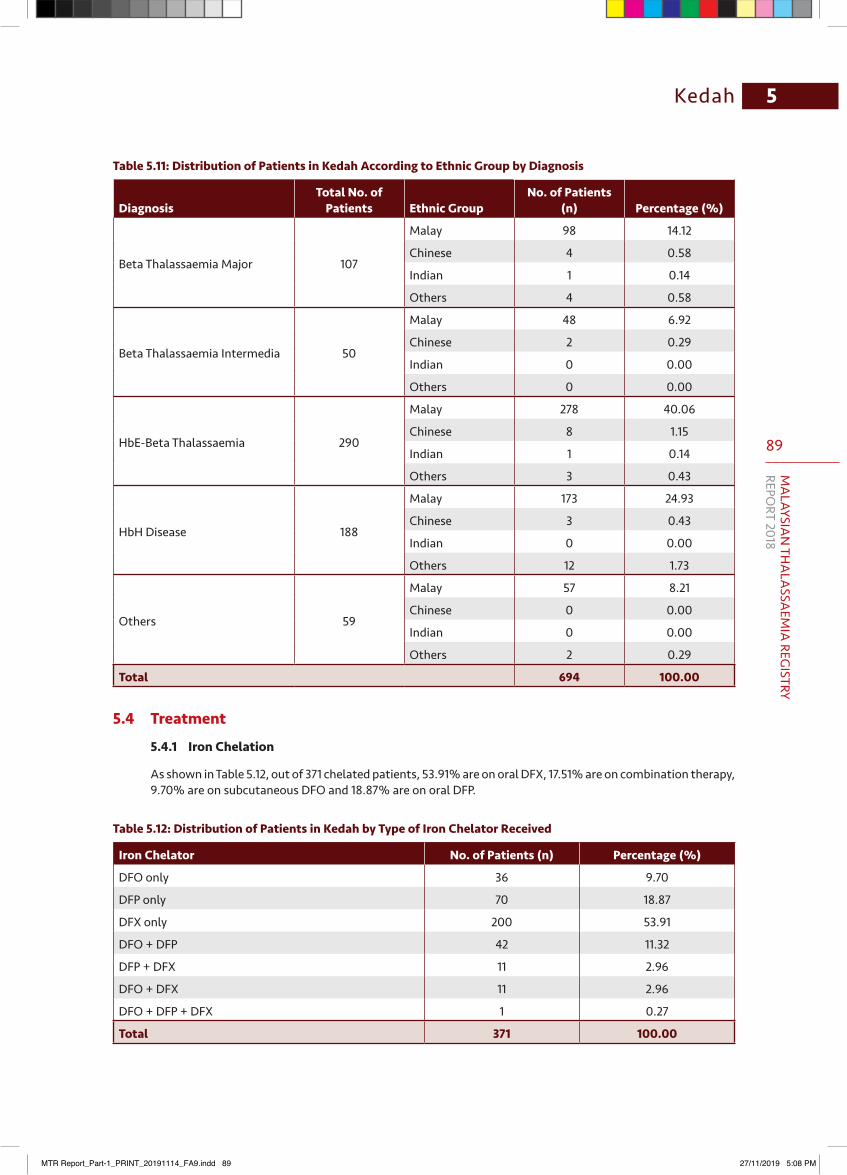
89
MA
LAYSIAN
THA
LASSA
EMIA
REGISTRY
REPORT 2018
5Kedah
Table 5.11: Distribution of Patients in Kedah According to Ethnic Group by Diagnosis
DiagnosisTotal No. of
Patients Ethnic GroupNo. of Patients
(n) Percentage (%)
Beta Thalassaemia Major 107
Malay 98 14.12
Chinese 4 0.58
Indian 1 0.14
Others 4 0.58
Beta Thalassaemia Intermedia 50
Malay 48 6.92
Chinese 2 0.29
Indian 0 0.00
Others 0 0.00
HbE-Beta Thalassaemia 290
Malay 278 40.06
Chinese 8 1.15
Indian 1 0.14
Others 3 0.43
HbH Disease 188
Malay 173 24.93
Chinese 3 0.43
Indian 0 0.00
Others 12 1.73
Others 59
Malay 57 8.21
Chinese 0 0.00
Indian 0 0.00
Others 2 0.29
Total 694 100.00
5.4 Treatment
5.4.1 Iron Chelation
As shown in Table 5.12, out of 371 chelated patients, 53.91% are on oral DFX, 17.51% are on combination therapy, 9.70% are on subcutaneous DFO and 18.87% are on oral DFP.
Table 5.12: Distribution of Patients in Kedah by Type of Iron Chelator Received
Iron Chelator No. of Patients (n) Percentage (%)
DFO only 36 9.70
DFP only 70 18.87
DFX only 200 53.91
DFO + DFP 42 11.32
DFP + DFX 11 2.96
DFO + DFX 11 2.96
DFO + DFP + DFX 1 0.27
Total 371 100.00
MTR Report_Part-1_PRINT_20191114_FA9.indd 89 27/11/2019 5:08 PM
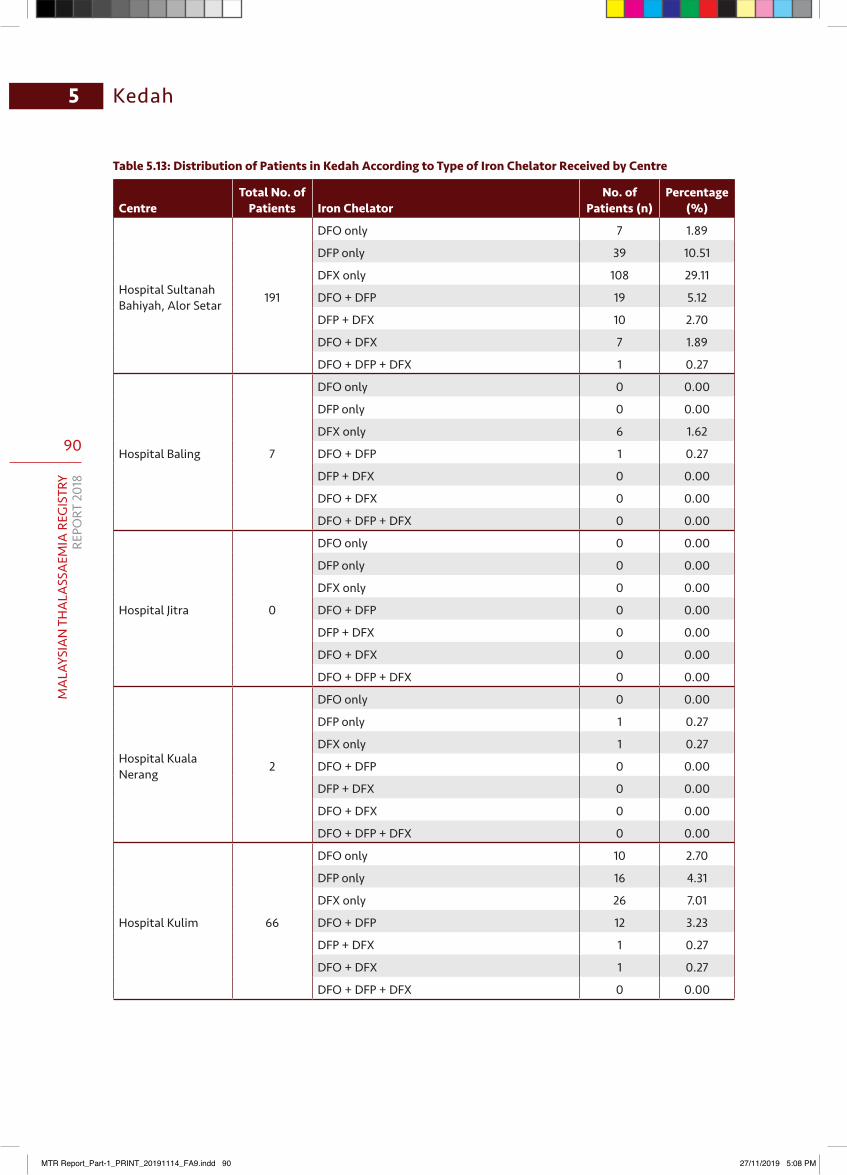
90
MA
LAYS
IAN
TH
ALA
SSA
EMIA
REG
ISTR
YRE
PORT
201
8
Kedah5
Table 5.13: Distribution of Patients in Kedah According to Type of Iron Chelator Received by Centre
CentreTotal No. of
Patients Iron ChelatorNo. of
Patients (n)Percentage
(%)
Hospital Sultanah Bahiyah, Alor Setar 191
DFO only 7 1.89
DFP only 39 10.51
DFX only 108 29.11
DFO + DFP 19 5.12
DFP + DFX 10 2.70
DFO + DFX 7 1.89
DFO + DFP + DFX 1 0.27
Hospital Baling 7
DFO only 0 0.00
DFP only 0 0.00
DFX only 6 1.62
DFO + DFP 1 0.27
DFP + DFX 0 0.00
DFO + DFX 0 0.00
DFO + DFP + DFX 0 0.00
Hospital Jitra 0
DFO only 0 0.00
DFP only 0 0.00
DFX only 0 0.00
DFO + DFP 0 0.00
DFP + DFX 0 0.00
DFO + DFX 0 0.00
DFO + DFP + DFX 0 0.00
Hospital Kuala Nerang 2
DFO only 0 0.00
DFP only 1 0.27
DFX only 1 0.27
DFO + DFP 0 0.00
DFP + DFX 0 0.00
DFO + DFX 0 0.00
DFO + DFP + DFX 0 0.00
Hospital Kulim 66
DFO only 10 2.70
DFP only 16 4.31
DFX only 26 7.01
DFO + DFP 12 3.23
DFP + DFX 1 0.27
DFO + DFX 1 0.27
DFO + DFP + DFX 0 0.00
MTR Report_Part-1_PRINT_20191114_FA9.indd 90 27/11/2019 5:08 PM
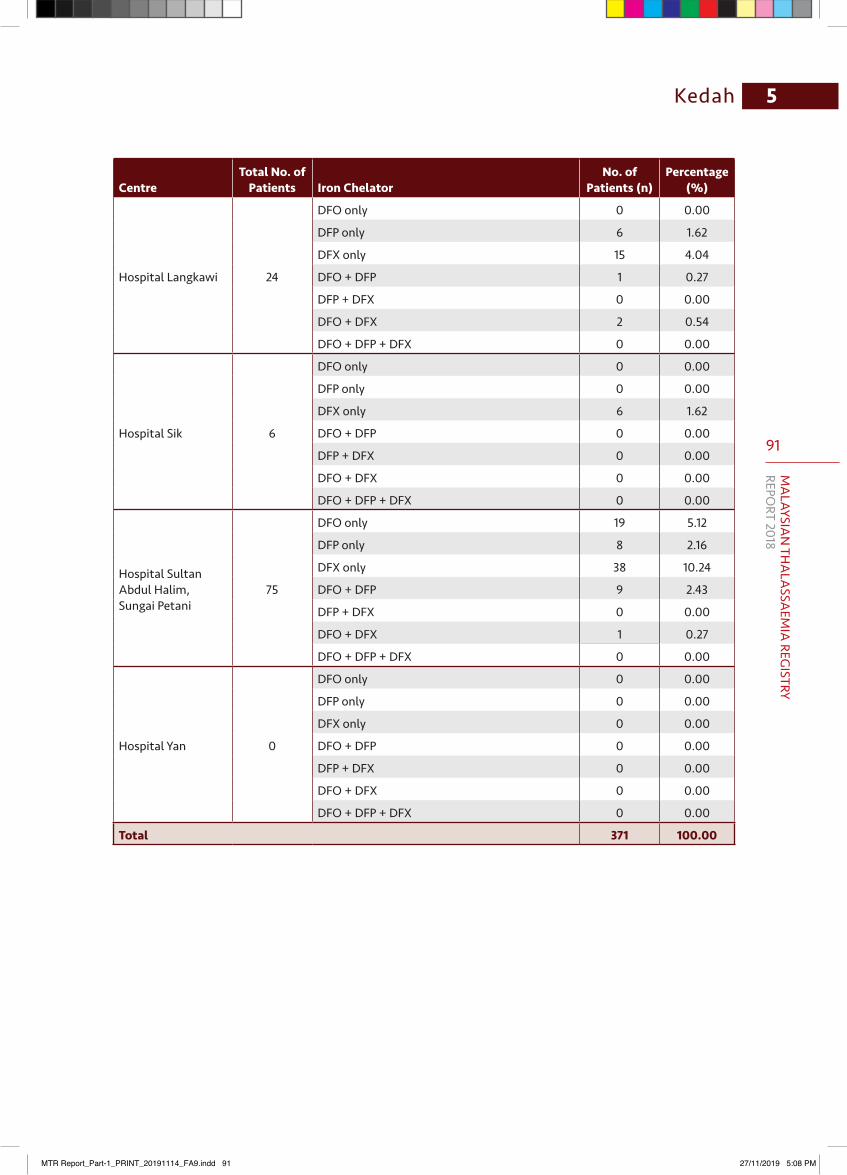
91
MA
LAYSIAN
THA
LASSA
EMIA
REGISTRY
REPORT 2018
5Kedah
CentreTotal No. of
Patients Iron ChelatorNo. of
Patients (n)Percentage
(%)
Hospital Langkawi 24
DFO only 0 0.00
DFP only 6 1.62
DFX only 15 4.04
DFO + DFP 1 0.27
DFP + DFX 0 0.00
DFO + DFX 2 0.54
DFO + DFP + DFX 0 0.00
Hospital Sik 6
DFO only 0 0.00
DFP only 0 0.00
DFX only 6 1.62
DFO + DFP 0 0.00
DFP + DFX 0 0.00
DFO + DFX 0 0.00
DFO + DFP + DFX 0 0.00
Hospital Sultan Abdul Halim, Sungai Petani
75
DFO only 19 5.12
DFP only 8 2.16
DFX only 38 10.24
DFO + DFP 9 2.43
DFP + DFX 0 0.00
DFO + DFX 1 0.27
DFO + DFP + DFX 0 0.00
Hospital Yan 0
DFO only 0 0.00
DFP only 0 0.00
DFX only 0 0.00
DFO + DFP 0 0.00
DFP + DFX 0 0.00
DFO + DFX 0 0.00
DFO + DFP + DFX 0 0.00
Total 371 100.00
MTR Report_Part-1_PRINT_20191114_FA9.indd 91 27/11/2019 5:08 PM
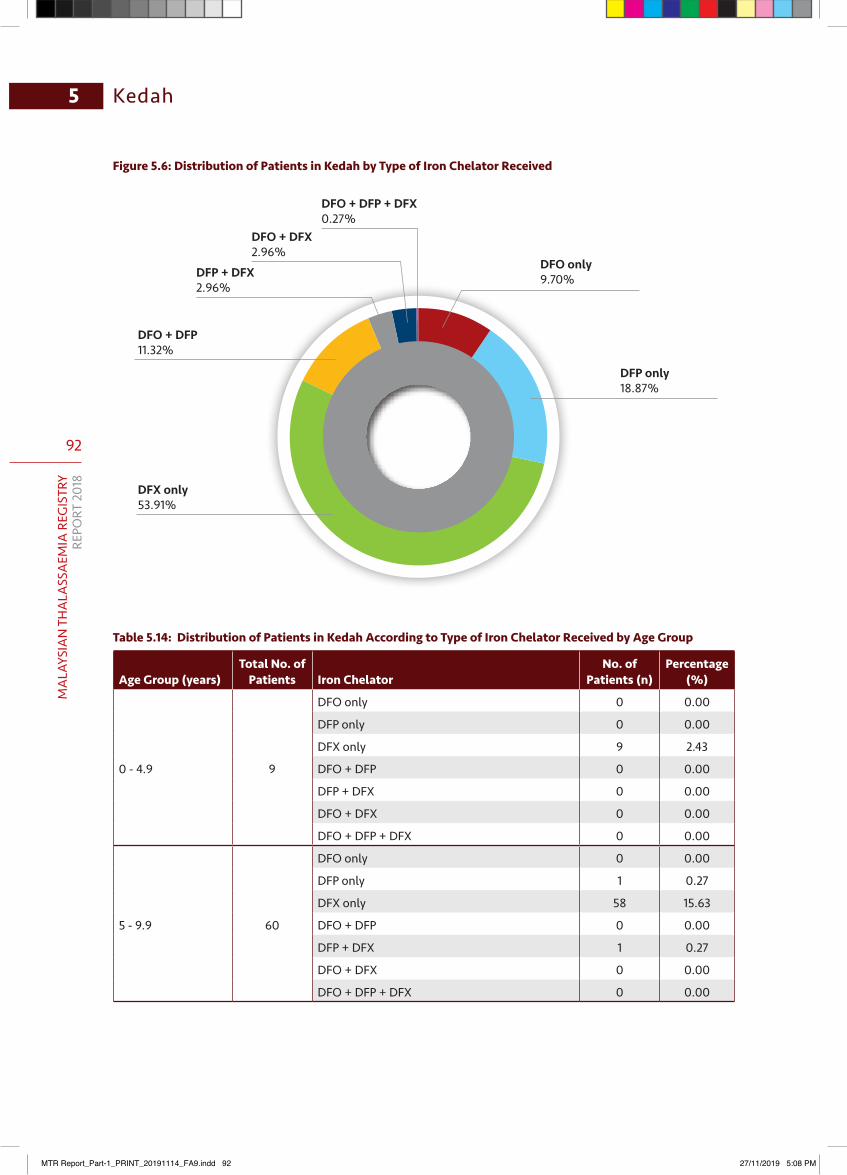
92
MA
LAYS
IAN
TH
ALA
SSA
EMIA
REG
ISTR
YRE
PORT
201
8
Kedah5
Figure 5.6: Distribution of Patients in Kedah by Type of Iron Chelator Received
DFX only53.91%
DFP + DFX2.96%
DFO + DFX2.96%
DFO + DFP11.32%
DFO only9.70%
DFO + DFP + DFX 0.27%
DFP only18.87%
Table 5.14: Distribution of Patients in Kedah According to Type of Iron Chelator Received by Age Group
Age Group (years)Total No. of
Patients Iron ChelatorNo. of
Patients (n)Percentage
(%)
0 - 4.9 9
DFO only 0 0.00
DFP only 0 0.00
DFX only 9 2.43
DFO + DFP 0 0.00
DFP + DFX 0 0.00
DFO + DFX 0 0.00
DFO + DFP + DFX 0 0.00
5 - 9.9 60
DFO only 0 0.00
DFP only 1 0.27
DFX only 58 15.63
DFO + DFP 0 0.00
DFP + DFX 1 0.27
DFO + DFX 0 0.00
DFO + DFP + DFX 0 0.00
MTR Report_Part-1_PRINT_20191114_FA9.indd 92 27/11/2019 5:08 PM

93
MA
LAYSIAN
THA
LASSA
EMIA
REGISTRY
REPORT 2018
5Kedah
Age Group (years)Total No. of
Patients Iron ChelatorNo. of
Patients (n)Percentage
(%)
10 -14.9 81
DFO only 4 1.08
DFP only 6 1.62
DFX only 64 17.25
DFO + DFP 6 1.62
DFP + DFX 0 0.00
DFO + DFX 1 0.27
DFO + DFP + DFX 0 0.00
15 -19.9 86
DFO only 9 2.43
DFP only 16 4.31
DFX only 45 12.13
DFO + DFP 11 2.96
DFP + DFX 3 0.81
DFO + DFX 2 0.54
DFO + DFP + DFX 0 0.00
20 - 24.9 60
DFO only 15 4.04
DFP only 11 2.96
DFX only 15 4.04
DFO + DFP 10 2.70
DFP + DFX 3 0.81
DFO + DFX 6 1.62
DFO + DFP + DFX 0 0.00
25 - 29.9 42
DFO only 6 1.62
DFP only 19 5.12
DFX only 4 1.08
DFO + DFP 8 2.16
DFP + DFX 3 0.81
DFO + DFX 2 0.54
DFO + DFP + DFX 0 0.00
30-34.9 21
DFO only 1 0.27
DFP only 11 2.96
DFX only 1 0.27
DFO + DFP 7 1.89
DFP + DFX 0 0.00
DFO + DFX 0 0.00
DFO + DFP + DFX 1 0.27
MTR Report_Part-1_PRINT_20191114_FA9.indd 93 27/11/2019 5:08 PM

94
MA
LAYS
IAN
TH
ALA
SSA
EMIA
REG
ISTR
YRE
PORT
201
8
Kedah5
Age Group (years)Total No. of
Patients Iron ChelatorNo. of
Patients (n)Percentage
(%)
35-39.9 3
DFO only 0 0.00
DFP only 3 0.81
DFX only 0 0.00
DFO + DFP 0 0.00
DFP + DFX 0 0.00
DFO + DFX 0 0.00
DFO + DFP + DFX 0 0.00
40 - 44.9 2
DFO only 0 0.00
DFP only 1 0.27
DFX only 1 0.27
DFO + DFP 0 0.00
DFP + DFX 0 0.00
DFO + DFX 0 0.00
DFO + DFP + DFX 0 0.00
45−49.9 3
DFO only 0 0.00
DFP only 1 0.27
DFX only 1 0.27
DFO + DFP 0 0.00
DFP + DFX 1 0.27
DFO + DFX 0 0.00
DFO + DFP + DFX 0 0.00
50−54.9 2
DFO only 1 0.27
DFP only 1 0.27
DFX only 0 0.00
DFO + DFP 0 0.00
DFP + DFX 0 0.00
DFO + DFX 0 0.00
DFO + DFP + DFX 0 0.00
55−59.9 1
DFO only 0 0.00
DFP only 0 0.00
DFX only 1 0.27
DFO + DFP 0 0.00
DFP + DFX 0 0.00
DFO + DFX 0 0.00
DFO + DFP + DFX 0 0.00
MTR Report_Part-1_PRINT_20191114_FA9.indd 94 27/11/2019 5:08 PM
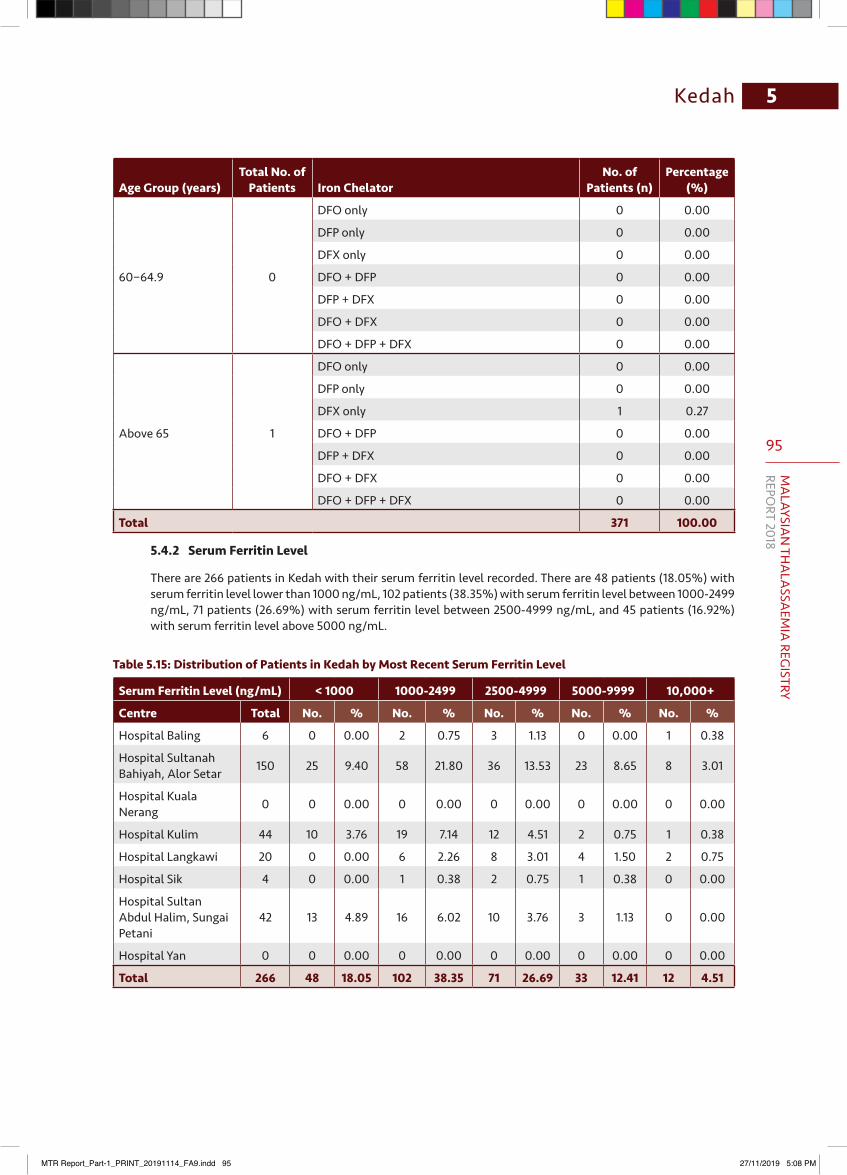
95
MA
LAYSIAN
THA
LASSA
EMIA
REGISTRY
REPORT 2018
5Kedah
Age Group (years)Total No. of
Patients Iron ChelatorNo. of
Patients (n)Percentage
(%)
60−64.9 0
DFO only 0 0.00
DFP only 0 0.00
DFX only 0 0.00
DFO + DFP 0 0.00
DFP + DFX 0 0.00
DFO + DFX 0 0.00
DFO + DFP + DFX 0 0.00
Above 65 1
DFO only 0 0.00
DFP only 0 0.00
DFX only 1 0.27
DFO + DFP 0 0.00
DFP + DFX 0 0.00
DFO + DFX 0 0.00
DFO + DFP + DFX 0 0.00
Total 371 100.00
5.4.2 Serum Ferritin Level
There are 266 patients in Kedah with their serum ferritin level recorded. There are 48 patients (18.05%) with serum ferritin level lower than 1000 ng/mL, 102 patients (38.35%) with serum ferritin level between 1000-2499 ng/mL, 71 patients (26.69%) with serum ferritin level between 2500-4999 ng/mL, and 45 patients (16.92%) with serum ferritin level above 5000 ng/mL.
Table 5.15: Distribution of Patients in Kedah by Most Recent Serum Ferritin Level
Serum Ferritin Level (ng/mL) < 1000 1000-2499 2500-4999 5000-9999 10,000+
Centre Total No. % No. % No. % No. % No. %
Hospital Baling 6 0 0.00 2 0.75 3 1.13 0 0.00 1 0.38
Hospital Sultanah Bahiyah, Alor Setar 150 25 9.40 58 21.80 36 13.53 23 8.65 8 3.01
Hospital Kuala Nerang 0 0 0.00 0 0.00 0 0.00 0 0.00 0 0.00
Hospital Kulim 44 10 3.76 19 7.14 12 4.51 2 0.75 1 0.38
Hospital Langkawi 20 0 0.00 6 2.26 8 3.01 4 1.50 2 0.75
Hospital Sik 4 0 0.00 1 0.38 2 0.75 1 0.38 0 0.00
Hospital Sultan Abdul Halim, Sungai Petani
42 13 4.89 16 6.02 10 3.76 3 1.13 0 0.00
Hospital Yan 0 0 0.00 0 0.00 0 0.00 0 0.00 0 0.00
Total 266 48 18.05 102 38.35 71 26.69 33 12.41 12 4.51
MTR Report_Part-1_PRINT_20191114_FA9.indd 95 27/11/2019 5:08 PM
96
MA
LAYS
IAN
TH
ALA
SSA
EMIA
REG
ISTR
YRE
PORT
201
8
Kedah5
5.5 Observation and Comments
Nearly 65% of the cases in Kedah involves patients below 20 years old. HbE-beta thalassaemia is the most common type, afflicting 41.79% patients in Kedah. Most chelated patients (53.91%) are on oral DFX. Based on the serum ferritin level, 56.39% of thalassaemia patients have satisfactory iron chelation, with serum ferritin level < 2500 ng/mL.
The poor compliance among younger patients is due to poor supervision from parents. Iron chelation therapy should be optimised in these patients by ensuring continuous education to ensure better patient compliance. For those with high ferritin level, a combination therapy should be considered to reduce long term complications of iron overload. Some patients on subcutaneous DFO infusion also face difficulties in obtaining an infusion pump due to financial constraints.
Only Hospital Sultan Abdul Halim has dedicated day care facilities for thalassaemia patients in Kedah. As such, patients in Kedah face added financial burden to travel twice monthly for treatment.
Nearly 75% of deaths were caused by infections. However, we were not able to retrieve the details of causative organisms. In addition, 66 patients were lost to follow-up for unknown reasons.
5.5.1 Recommendations
• The Ministry of Health Malaysia should consider providing infusion pumps to patients who are on subcutaneous DFO.
• Medication Therapy Adherence Clinic (MTAC) pharmacists should be available in all thalassaemia clinics.• All centres must work towards having a dedicated day care service for thalassaemia patients.• Each centre must have a system to recall patients who default. • It will be beneficial to document details on infectious causative organisms and comorbidities in patients
who passed away.
5.5.2 Conclusion
Kedah has the fourth highest number of thalassaemia patients in Malaysia. The most common type of thalassaemia in Kedah is HbE-beta thalassaemia, followed by HbH disease. The median age group is 15-19.9 years old. Two hundred patients are on chelation therapy, with oral DFX being the most common chelator. Around 56.39% of patients achieved serum ferritin level below 2500 ng/mL. Poor adherence to treatment is mainly due to social and financial issues. A significant proportion of deaths are caused by infections.
MTR Report_Part-1_PRINT_20191114_FA9.indd 96 27/11/2019 5:08 PM
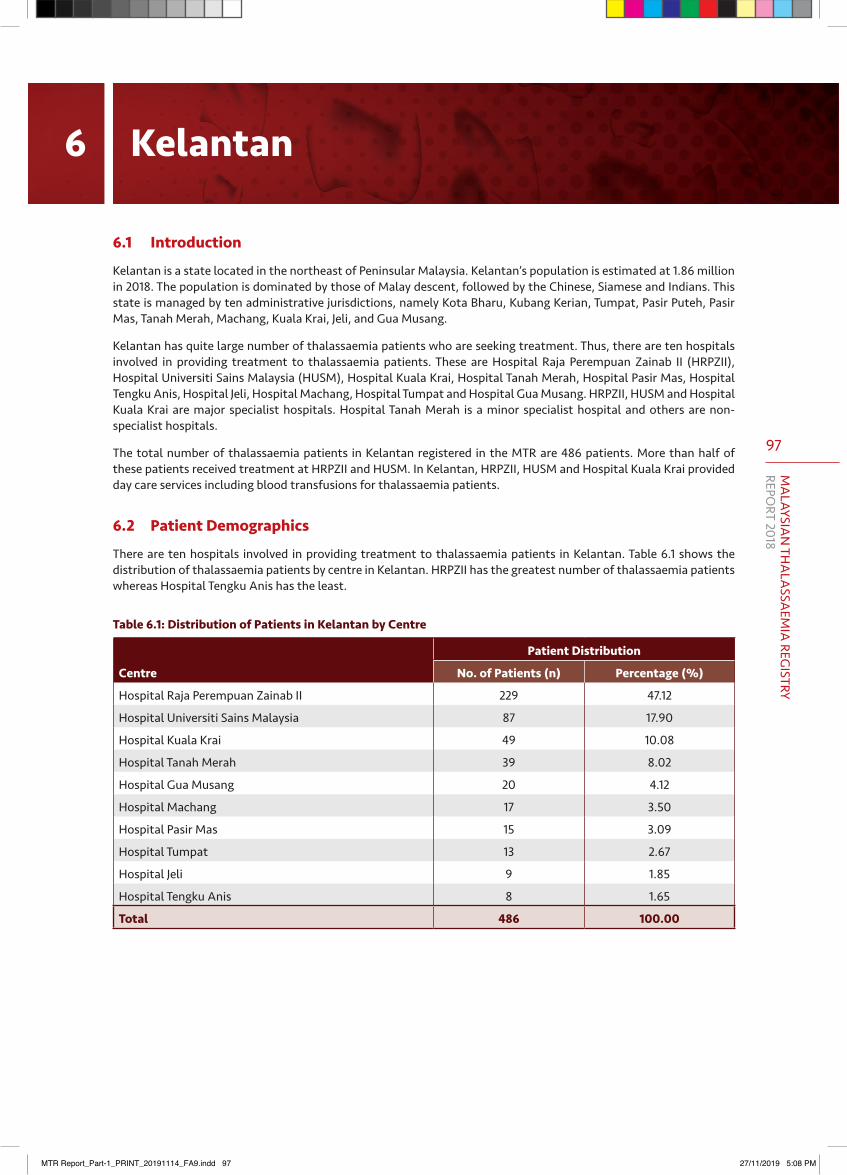
97
MA
LAYSIAN
THA
LASSA
EMIA
REGISTRY
REPORT 2018
6 Kelantan
6.1 Introduction
Kelantan is a state located in the northeast of Peninsular Malaysia. Kelantan’s population is estimated at 1.86 million in 2018. The population is dominated by those of Malay descent, followed by the Chinese, Siamese and Indians. This state is managed by ten administrative jurisdictions, namely Kota Bharu, Kubang Kerian, Tumpat, Pasir Puteh, Pasir Mas, Tanah Merah, Machang, Kuala Krai, Jeli, and Gua Musang.
Kelantan has quite large number of thalassaemia patients who are seeking treatment. Thus, there are ten hospitals involved in providing treatment to thalassaemia patients. These are Hospital Raja Perempuan Zainab II (HRPZII), Hospital Universiti Sains Malaysia (HUSM), Hospital Kuala Krai, Hospital Tanah Merah, Hospital Pasir Mas, Hospital Tengku Anis, Hospital Jeli, Hospital Machang, Hospital Tumpat and Hospital Gua Musang. HRPZII, HUSM and Hospital Kuala Krai are major specialist hospitals. Hospital Tanah Merah is a minor specialist hospital and others are non-specialist hospitals.
The total number of thalassaemia patients in Kelantan registered in the MTR are 486 patients. More than half of these patients received treatment at HRPZII and HUSM. In Kelantan, HRPZII, HUSM and Hospital Kuala Krai provided day care services including blood transfusions for thalassaemia patients.
6.2 Patient Demographics
There are ten hospitals involved in providing treatment to thalassaemia patients in Kelantan. Table 6.1 shows the distribution of thalassaemia patients by centre in Kelantan. HRPZII has the greatest number of thalassaemia patients whereas Hospital Tengku Anis has the least.
Table 6.1: Distribution of Patients in Kelantan by Centre
Centre
Patient Distribution
No. of Patients (n) Percentage (%)
Hospital Raja Perempuan Zainab II 229 47.12
Hospital Universiti Sains Malaysia 87 17.90
Hospital Kuala Krai 49 10.08
Hospital Tanah Merah 39 8.02
Hospital Gua Musang 20 4.12
Hospital Machang 17 3.50
Hospital Pasir Mas 15 3.09
Hospital Tumpat 13 2.67
Hospital Jeli 9 1.85
Hospital Tengku Anis 8 1.65
Total 486 100.00
MTR Report_Part-1_PRINT_20191114_FA9.indd 97 27/11/2019 5:08 PM
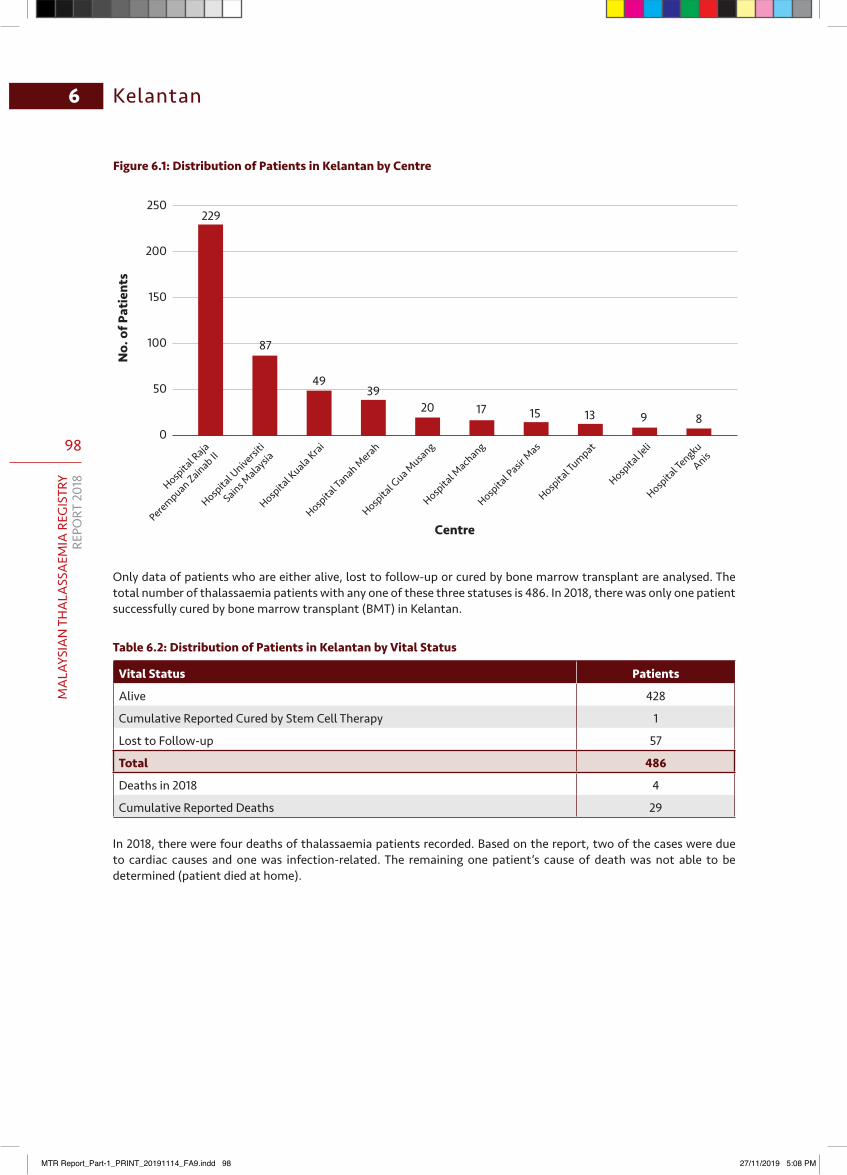
98
MA
LAYS
IAN
TH
ALA
SSA
EMIA
REG
ISTR
YRE
PORT
201
8
6 Kelantan
250
200
150
100
50
0
Centre
No.
of P
atie
nts
Hospita
l Raja
Perempuan Zainab II
Hospita
l Universi
ti
Sains Malaysia
Hospita
l Kuala Krai
Hospita
l Tanah M
erah
Hospita
l Gua M
usang
Hospita
l Mach
ang
Hospita
l Pasir
Mas
Hospita
l Tumpat
Hospita
l Jeli
Hospita
l Tengku
Anis
229
87
4939
20 17 15 13 9 8
Only data of patients who are either alive, lost to follow-up or cured by bone marrow transplant are analysed. The total number of thalassaemia patients with any one of these three statuses is 486. In 2018, there was only one patient successfully cured by bone marrow transplant (BMT) in Kelantan.
Table 6.2: Distribution of Patients in Kelantan by Vital Status
Vital Status Patients
Alive 428
Cumulative Reported Cured by Stem Cell Therapy 1
Lost to Follow-up 57
Total 486
Deaths in 2018 4
Cumulative Reported Deaths 29
In 2018, there were four deaths of thalassaemia patients recorded. Based on the report, two of the cases were due to cardiac causes and one was infection-related. The remaining one patient’s cause of death was not able to be determined (patient died at home).
Figure 6.1: Distribution of Patients in Kelantan by Centre
MTR Report_Part-1_PRINT_20191114_FA9.indd 98 27/11/2019 5:08 PM
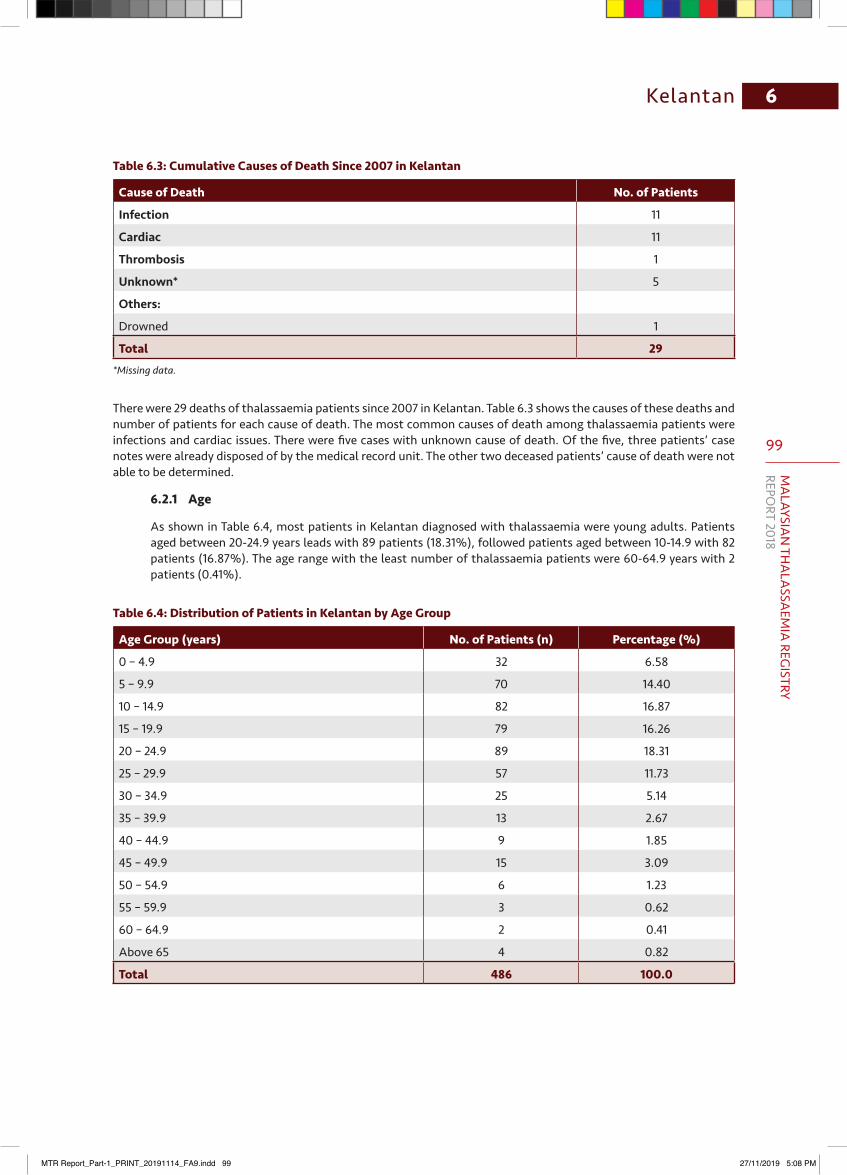
99
MA
LAYSIAN
THA
LASSA
EMIA
REGISTRY
REPORT 2018
6Kelantan
Table 6.3: Cumulative Causes of Death Since 2007 in Kelantan
Cause of Death No. of Patients
Infection 11
Cardiac 11
Thrombosis 1
Unknown* 5
Others:
Drowned 1
Total 29*Missing data.
There were 29 deaths of thalassaemia patients since 2007 in Kelantan. Table 6.3 shows the causes of these deaths and number of patients for each cause of death. The most common causes of death among thalassaemia patients were infections and cardiac issues. There were five cases with unknown cause of death. Of the five, three patients’ case notes were already disposed of by the medical record unit. The other two deceased patients’ cause of death were not able to be determined.
6.2.1 Age
As shown in Table 6.4, most patients in Kelantan diagnosed with thalassaemia were young adults. Patients aged between 20-24.9 years leads with 89 patients (18.31%), followed patients aged between 10-14.9 with 82 patients (16.87%). The age range with the least number of thalassaemia patients were 60-64.9 years with 2 patients (0.41%).
Table 6.4: Distribution of Patients in Kelantan by Age Group
Age Group (years) No. of Patients (n) Percentage (%)
0 – 4.9 32 6.58
5 – 9.9 70 14.40
10 – 14.9 82 16.87
15 – 19.9 79 16.26
20 – 24.9 89 18.31
25 – 29.9 57 11.73
30 – 34.9 25 5.14
35 – 39.9 13 2.67
40 – 44.9 9 1.85
45 – 49.9 15 3.09
50 – 54.9 6 1.23
55 – 59.9 3 0.62
60 – 64.9 2 0.41
Above 65 4 0.82
Total 486 100.0
MTR Report_Part-1_PRINT_20191114_FA9.indd 99 27/11/2019 5:08 PM
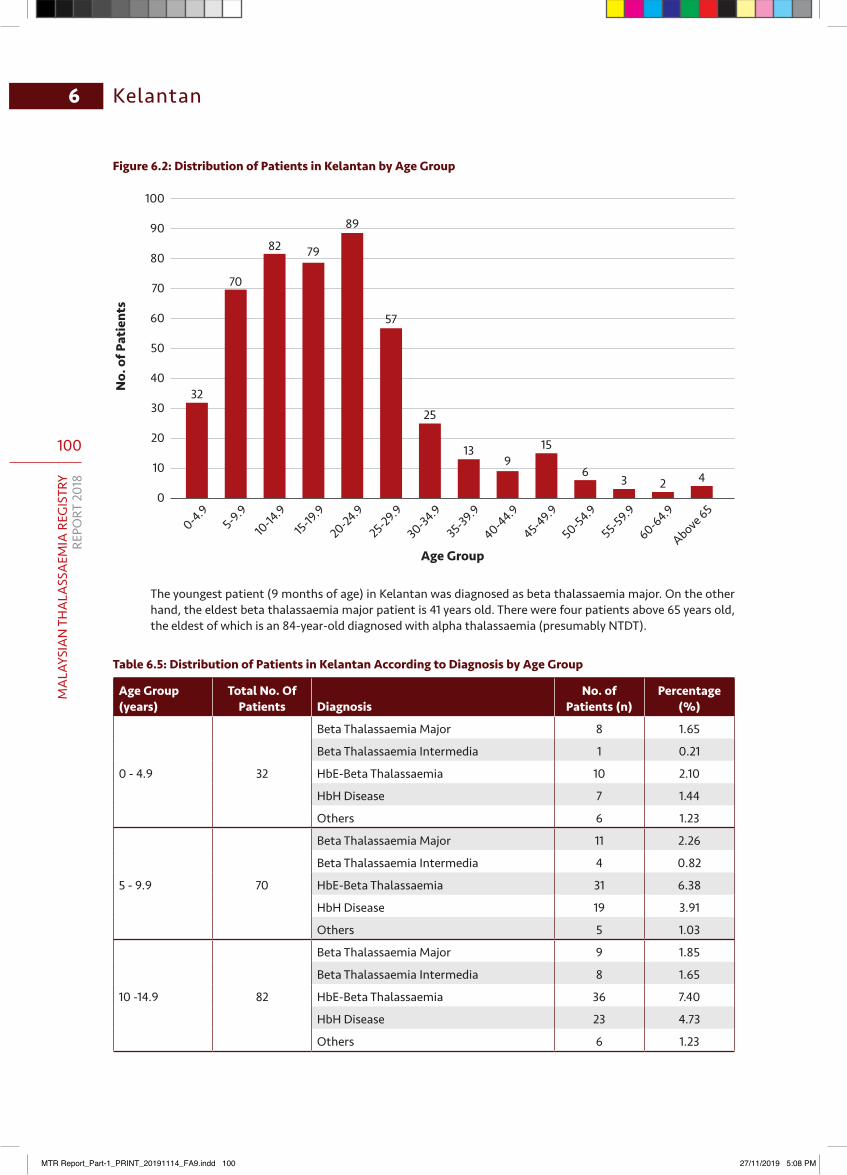
100
MA
LAYS
IAN
TH
ALA
SSA
EMIA
REG
ISTR
YRE
PORT
201
8
6 Kelantan
Figure 6.2: Distribution of Patients in Kelantan by Age Group
100
90
80
70
60
50
40
30
20
10
0
Age Group
No.
of P
atie
nts
0-4.95-9.9
10-14
.915-19
.9
20-24.9
25-29.9
30-34.9
35-39.9
40-44.9
45-49.9
50-54.9
55-59.9
60-64.9
Above 65
32
70
82 79
89
57
25
139
15
63 2 4
The youngest patient (9 months of age) in Kelantan was diagnosed as beta thalassaemia major. On the other hand, the eldest beta thalassaemia major patient is 41 years old. There were four patients above 65 years old, the eldest of which is an 84-year-old diagnosed with alpha thalassaemia (presumably NTDT).
Table 6.5: Distribution of Patients in Kelantan According to Diagnosis by Age Group
Age Group (years)
Total No. Of Patients Diagnosis
No. of Patients (n)
Percentage (%)
0 - 4.9 32
Beta Thalassaemia Major 8 1.65
Beta Thalassaemia Intermedia 1 0.21
HbE-Beta Thalassaemia 10 2.10
HbH Disease 7 1.44
Others 6 1.23
5 - 9.9 70
Beta Thalassaemia Major 11 2.26
Beta Thalassaemia Intermedia 4 0.82
HbE-Beta Thalassaemia 31 6.38
HbH Disease 19 3.91
Others 5 1.03
10 -14.9 82
Beta Thalassaemia Major 9 1.85
Beta Thalassaemia Intermedia 8 1.65
HbE-Beta Thalassaemia 36 7.40
HbH Disease 23 4.73
Others 6 1.23
MTR Report_Part-1_PRINT_20191114_FA9.indd 100 27/11/2019 5:08 PM
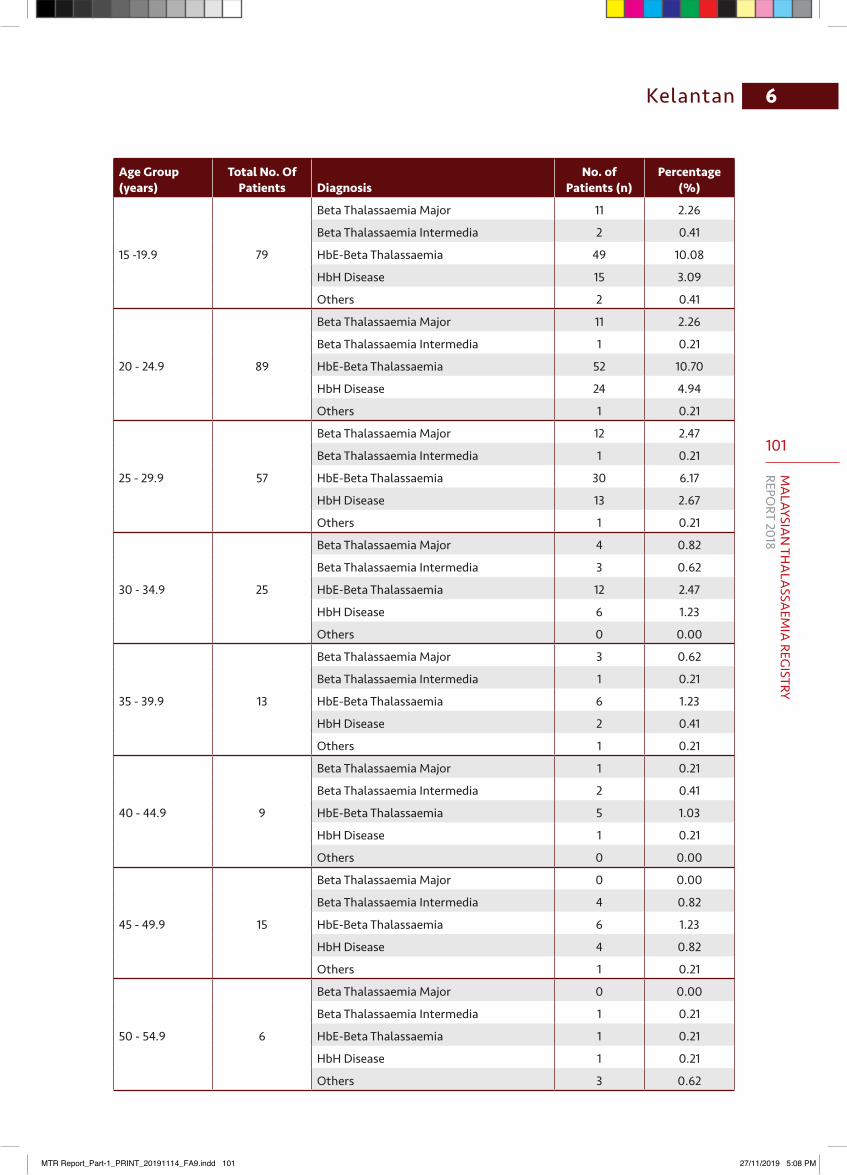
101
MA
LAYSIAN
THA
LASSA
EMIA
REGISTRY
REPORT 2018
6Kelantan
Age Group (years)
Total No. Of Patients Diagnosis
No. of Patients (n)
Percentage (%)
15 -19.9 79
Beta Thalassaemia Major 11 2.26
Beta Thalassaemia Intermedia 2 0.41
HbE-Beta Thalassaemia 49 10.08
HbH Disease 15 3.09
Others 2 0.41
20 - 24.9 89
Beta Thalassaemia Major 11 2.26
Beta Thalassaemia Intermedia 1 0.21
HbE-Beta Thalassaemia 52 10.70
HbH Disease 24 4.94
Others 1 0.21
25 - 29.9 57
Beta Thalassaemia Major 12 2.47
Beta Thalassaemia Intermedia 1 0.21
HbE-Beta Thalassaemia 30 6.17
HbH Disease 13 2.67
Others 1 0.21
30 - 34.9 25
Beta Thalassaemia Major 4 0.82
Beta Thalassaemia Intermedia 3 0.62
HbE-Beta Thalassaemia 12 2.47
HbH Disease 6 1.23
Others 0 0.00
35 - 39.9 13
Beta Thalassaemia Major 3 0.62
Beta Thalassaemia Intermedia 1 0.21
HbE-Beta Thalassaemia 6 1.23
HbH Disease 2 0.41
Others 1 0.21
40 - 44.9 9
Beta Thalassaemia Major 1 0.21
Beta Thalassaemia Intermedia 2 0.41
HbE-Beta Thalassaemia 5 1.03
HbH Disease 1 0.21
Others 0 0.00
45 - 49.9 15
Beta Thalassaemia Major 0 0.00
Beta Thalassaemia Intermedia 4 0.82
HbE-Beta Thalassaemia 6 1.23
HbH Disease 4 0.82
Others 1 0.21
50 - 54.9 6
Beta Thalassaemia Major 0 0.00
Beta Thalassaemia Intermedia 1 0.21
HbE-Beta Thalassaemia 1 0.21
HbH Disease 1 0.21
Others 3 0.62
MTR Report_Part-1_PRINT_20191114_FA9.indd 101 27/11/2019 5:08 PM
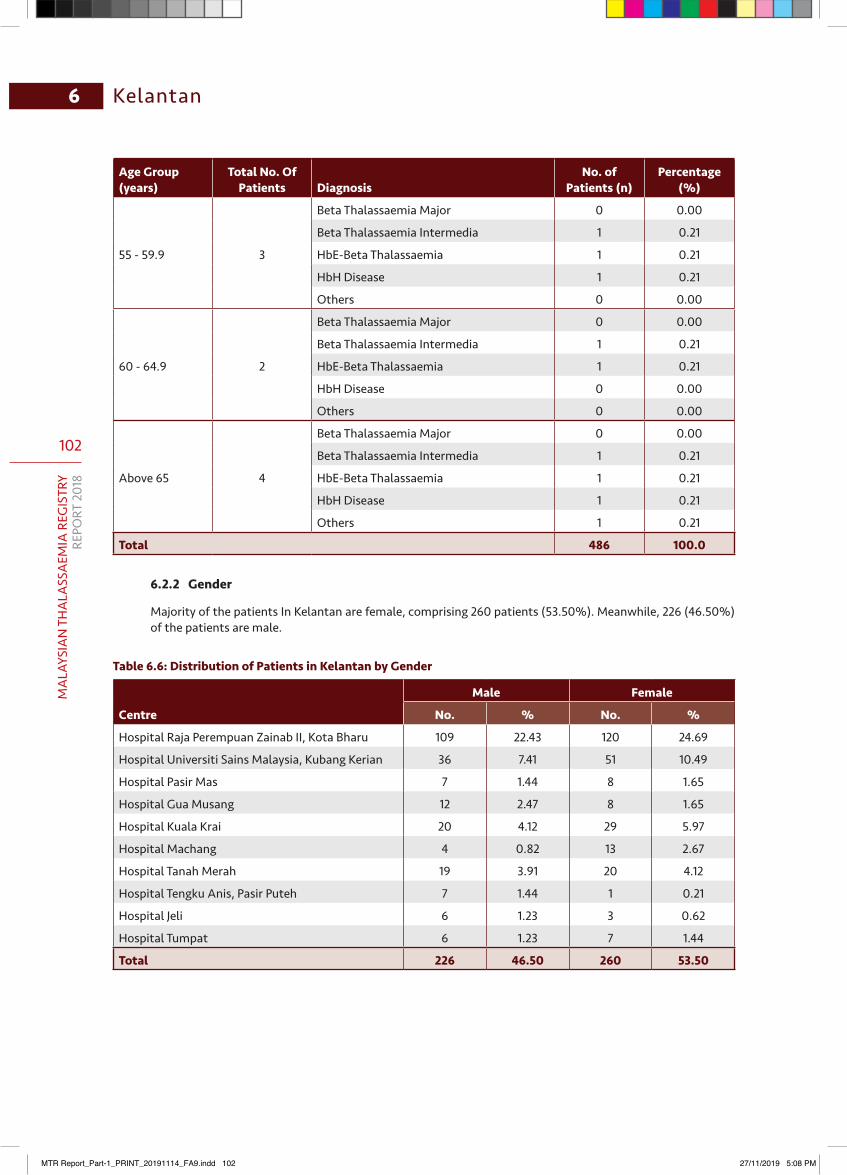
102
MA
LAYS
IAN
TH
ALA
SSA
EMIA
REG
ISTR
YRE
PORT
201
8
6 Kelantan
Age Group (years)
Total No. Of Patients Diagnosis
No. of Patients (n)
Percentage (%)
55 - 59.9 3
Beta Thalassaemia Major 0 0.00
Beta Thalassaemia Intermedia 1 0.21
HbE-Beta Thalassaemia 1 0.21
HbH Disease 1 0.21
Others 0 0.00
60 - 64.9 2
Beta Thalassaemia Major 0 0.00
Beta Thalassaemia Intermedia 1 0.21
HbE-Beta Thalassaemia 1 0.21
HbH Disease 0 0.00
Others 0 0.00
Above 65 4
Beta Thalassaemia Major 0 0.00
Beta Thalassaemia Intermedia 1 0.21
HbE-Beta Thalassaemia 1 0.21
HbH Disease 1 0.21
Others 1 0.21
Total 486 100.0
6.2.2 Gender
Majority of the patients In Kelantan are female, comprising 260 patients (53.50%). Meanwhile, 226 (46.50%) of the patients are male.
Table 6.6: Distribution of Patients in Kelantan by Gender
Centre
Male Female
No. % No. %
Hospital Raja Perempuan Zainab II, Kota Bharu 109 22.43 120 24.69
Hospital Universiti Sains Malaysia, Kubang Kerian 36 7.41 51 10.49
Hospital Pasir Mas 7 1.44 8 1.65
Hospital Gua Musang 12 2.47 8 1.65
Hospital Kuala Krai 20 4.12 29 5.97
Hospital Machang 4 0.82 13 2.67
Hospital Tanah Merah 19 3.91 20 4.12
Hospital Tengku Anis, Pasir Puteh 7 1.44 1 0.21
Hospital Jeli 6 1.23 3 0.62
Hospital Tumpat 6 1.23 7 1.44
Total 226 46.50 260 53.50
MTR Report_Part-1_PRINT_20191114_FA9.indd 102 27/11/2019 5:08 PM
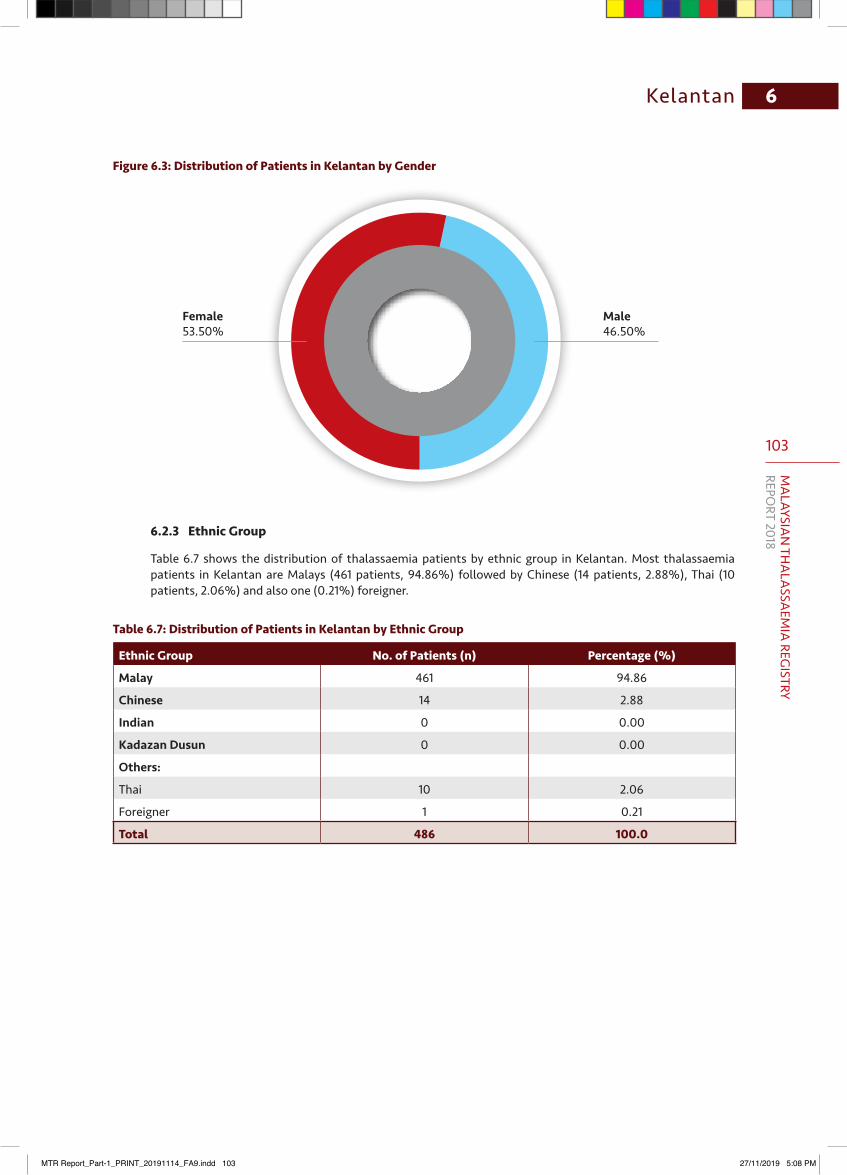
103
MA
LAYSIAN
THA
LASSA
EMIA
REGISTRY
REPORT 2018
6Kelantan
Female53.50%
Male46.50%
Figure 6.3: Distribution of Patients in Kelantan by Gender
6.2.3 Ethnic Group
Table 6.7 shows the distribution of thalassaemia patients by ethnic group in Kelantan. Most thalassaemia patients in Kelantan are Malays (461 patients, 94.86%) followed by Chinese (14 patients, 2.88%), Thai (10 patients, 2.06%) and also one (0.21%) foreigner.
Table 6.7: Distribution of Patients in Kelantan by Ethnic Group
Ethnic Group No. of Patients (n) Percentage (%)
Malay 461 94.86
Chinese 14 2.88
Indian 0 0.00
Kadazan Dusun 0 0.00
Others:
Thai 10 2.06
Foreigner 1 0.21
Total 486 100.0
MTR Report_Part-1_PRINT_20191114_FA9.indd 103 27/11/2019 5:08 PM
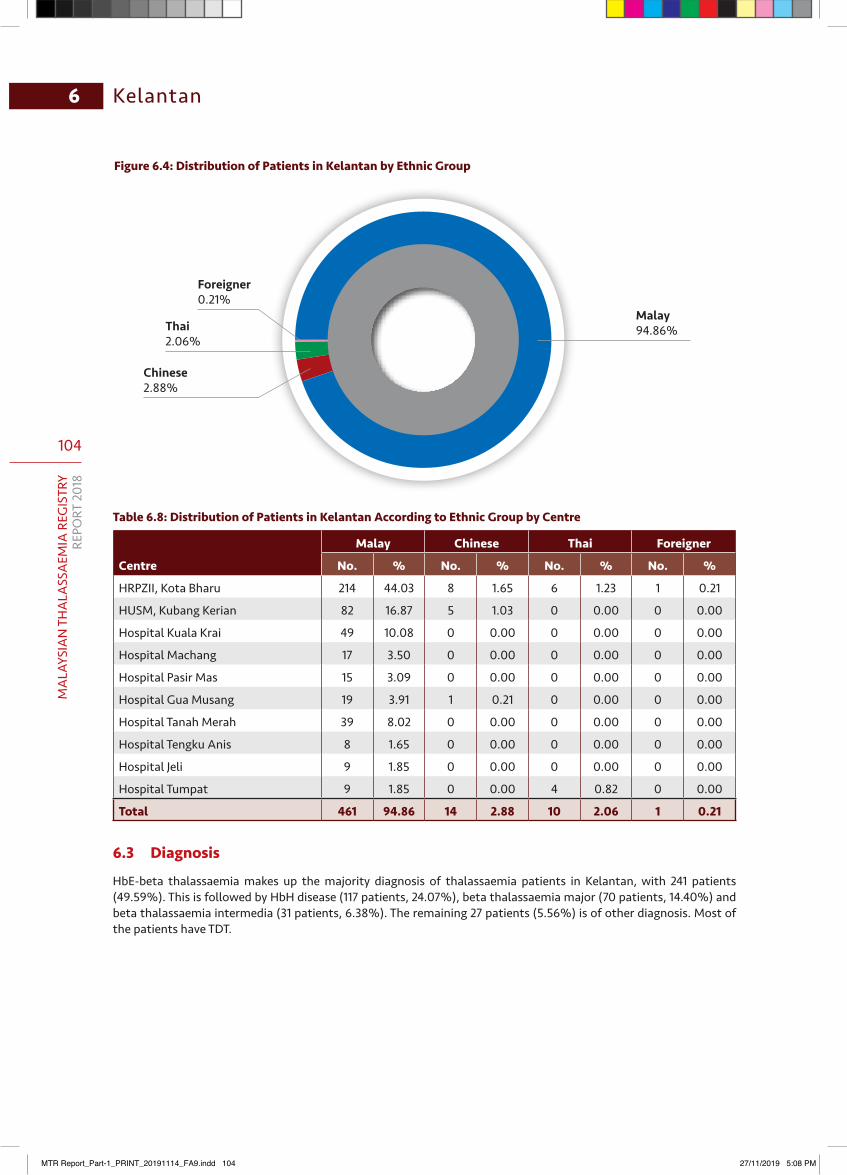
104
MA
LAYS
IAN
TH
ALA
SSA
EMIA
REG
ISTR
YRE
PORT
201
8
6 Kelantan
Chinese2.88%
Thai2.06%
Foreigner0.21%
Malay94.86%
Figure 6.4: Distribution of Patients in Kelantan by Ethnic Group
Table6.8:DistributionofPatientsinKelantanAccordingtoEthnicGroupbyCentre
Centre
Malay Chinese Thai Foreigner
No. % No. % No. % No. %
HRPZII, Kota Bharu 214 44.03 8 1.65 6 1.23 1 0.21
HUSM, Kubang Kerian 82 16.87 5 1.03 0 0.00 0 0.00
Hospital Kuala Krai 49 10.08 0 0.00 0 0.00 0 0.00
Hospital Machang 17 3.50 0 0.00 0 0.00 0 0.00
Hospital Pasir Mas 15 3.09 0 0.00 0 0.00 0 0.00
Hospital Gua Musang 19 3.91 1 0.21 0 0.00 0 0.00
Hospital Tanah Merah 39 8.02 0 0.00 0 0.00 0 0.00
Hospital Tengku Anis 8 1.65 0 0.00 0 0.00 0 0.00
Hospital Jeli 9 1.85 0 0.00 0 0.00 0 0.00
Hospital Tumpat 9 1.85 0 0.00 4 0.82 0 0.00
Total 461 94.86 14 2.88 10 2.06 1 0.21
6.3 Diagnosis
HbE-beta thalassaemia makes up the majority diagnosis of thalassaemia patients in Kelantan, with 241 patients (49.59%). This is followed by HbH disease (117 patients, 24.07%), beta thalassaemia major (70 patients, 14.40%) and beta thalassaemia intermedia (31 patients, 6.38%). The remaining 27 patients (5.56%) is of other diagnosis. Most of the patients have TDT.
MTR Report_Part-1_PRINT_20191114_FA9.indd 104 27/11/2019 5:08 PM
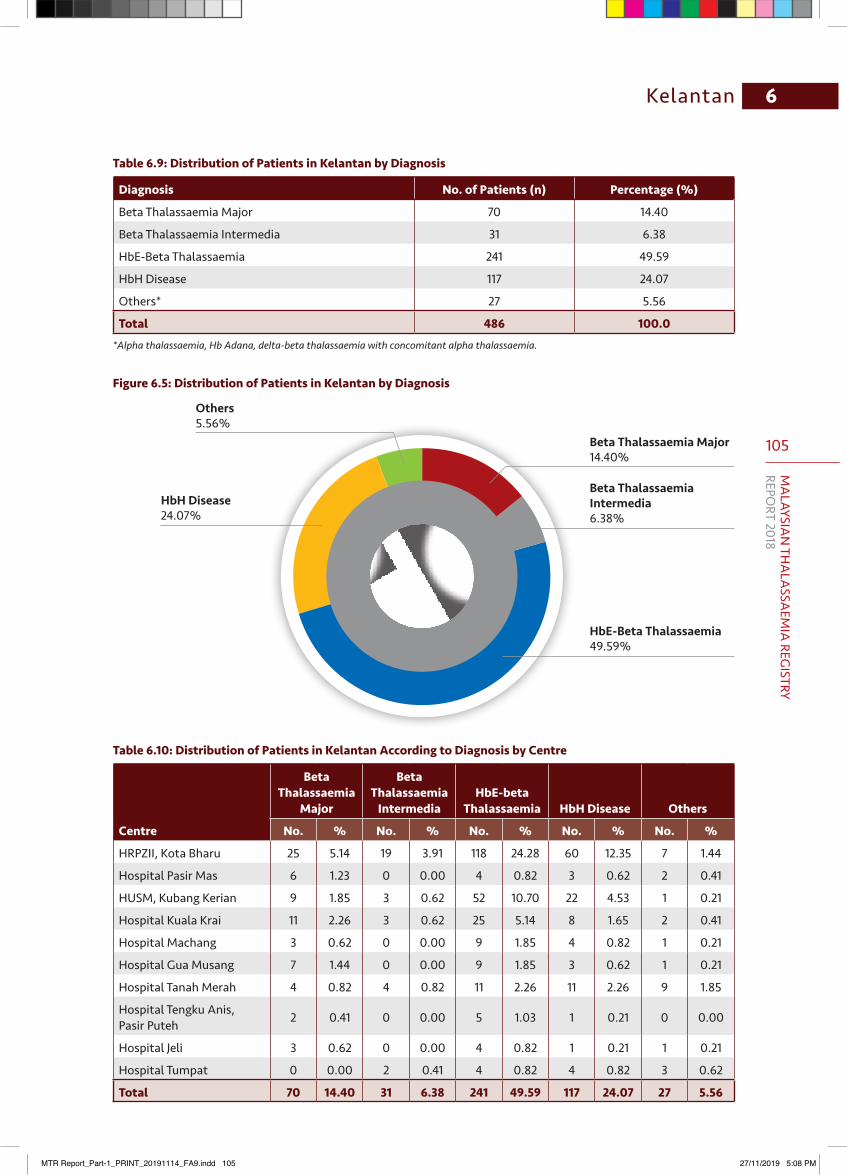
105
MA
LAYSIAN
THA
LASSA
EMIA
REGISTRY
REPORT 2018
6Kelantan
Beta Thalassaemia Major14.40%
Beta Thalassaemia Intermedia6.38%
HbE-Beta Thalassaemia49.59%
HbH Disease24.07%
Others5.56%
Table 6.9: Distribution of Patients in Kelantan by Diagnosis
Diagnosis No. of Patients (n) Percentage (%)
Beta Thalassaemia Major 70 14.40
Beta Thalassaemia Intermedia 31 6.38
HbE-Beta Thalassaemia 241 49.59
HbH Disease 117 24.07
Others* 27 5.56
Total 486 100.0*Alpha thalassaemia, Hb Adana, delta-beta thalassaemia with concomitant alpha thalassaemia.
Figure 6.5: Distribution of Patients in Kelantan by Diagnosis
Table 6.10: Distribution of Patients in Kelantan According to Diagnosis by Centre
Centre
Beta Thalassaemia
Major
Beta Thalassaemia
IntermediaHbE-beta
Thalassaemia HbH Disease Others
No. % No. % No. % No. % No. %
HRPZII, Kota Bharu 25 5.14 19 3.91 118 24.28 60 12.35 7 1.44
Hospital Pasir Mas 6 1.23 0 0.00 4 0.82 3 0.62 2 0.41
HUSM, Kubang Kerian 9 1.85 3 0.62 52 10.70 22 4.53 1 0.21
Hospital Kuala Krai 11 2.26 3 0.62 25 5.14 8 1.65 2 0.41
Hospital Machang 3 0.62 0 0.00 9 1.85 4 0.82 1 0.21
Hospital Gua Musang 7 1.44 0 0.00 9 1.85 3 0.62 1 0.21
Hospital Tanah Merah 4 0.82 4 0.82 11 2.26 11 2.26 9 1.85
Hospital Tengku Anis, Pasir Puteh 2 0.41 0 0.00 5 1.03 1 0.21 0 0.00
Hospital Jeli 3 0.62 0 0.00 4 0.82 1 0.21 1 0.21
Hospital Tumpat 0 0.00 2 0.41 4 0.82 4 0.82 3 0.62
Total 70 14.40 31 6.38 241 49.59 117 24.07 27 5.56
MTR Report_Part-1_PRINT_20191114_FA9.indd 105 27/11/2019 5:08 PM
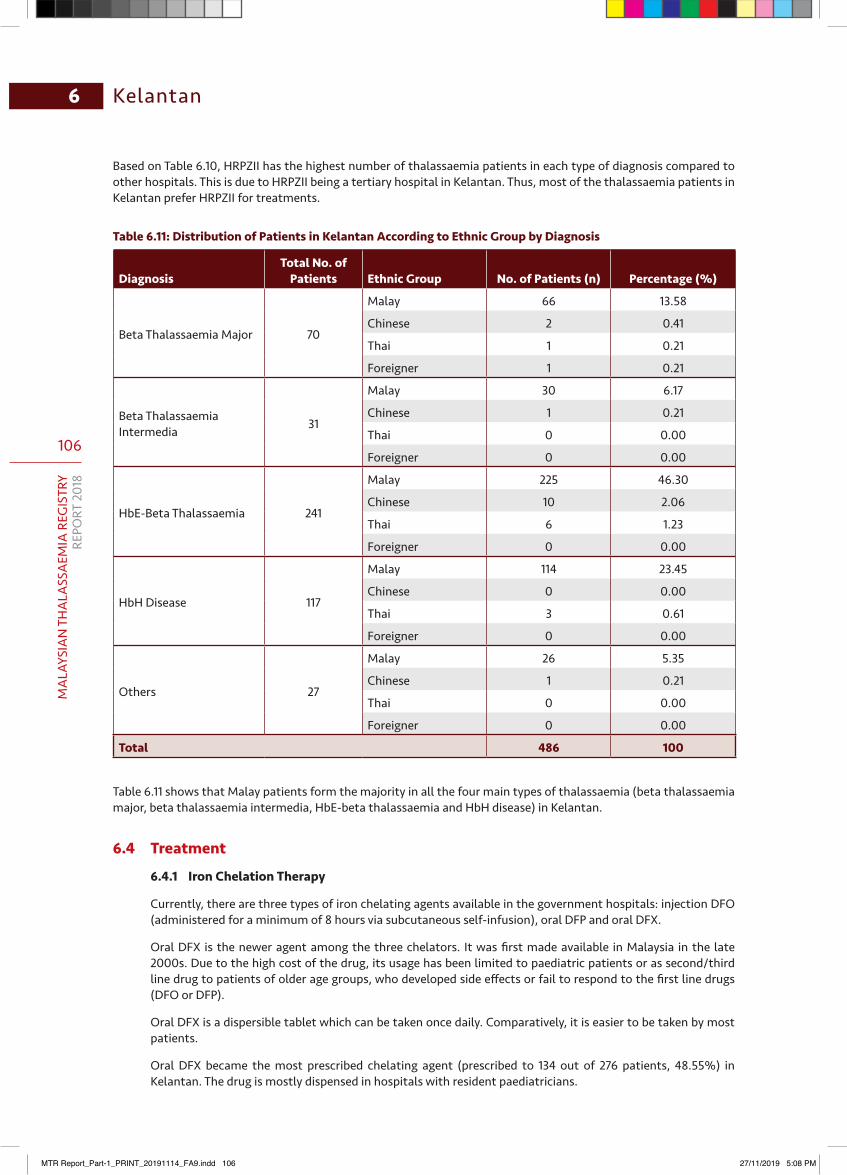
106
MA
LAYS
IAN
TH
ALA
SSA
EMIA
REG
ISTR
YRE
PORT
201
8
6 Kelantan
Based on Table 6.10, HRPZII has the highest number of thalassaemia patients in each type of diagnosis compared to other hospitals. This is due to HRPZII being a tertiary hospital in Kelantan. Thus, most of the thalassaemia patients in Kelantan prefer HRPZII for treatments.
Table 6.11: Distribution of Patients in Kelantan According to Ethnic Group by Diagnosis
DiagnosisTotal No. of
Patients Ethnic Group No. of Patients (n) Percentage (%)
Beta Thalassaemia Major 70
Malay 66 13.58
Chinese 2 0.41
Thai 1 0.21
Foreigner 1 0.21
Beta Thalassaemia Intermedia 31
Malay 30 6.17
Chinese 1 0.21
Thai 0 0.00
Foreigner 0 0.00
HbE-Beta Thalassaemia 241
Malay 225 46.30
Chinese 10 2.06
Thai 6 1.23
Foreigner 0 0.00
HbH Disease 117
Malay 114 23.45
Chinese 0 0.00
Thai 3 0.61
Foreigner 0 0.00
Others 27
Malay 26 5.35
Chinese 1 0.21
Thai 0 0.00
Foreigner 0 0.00
Total 486 100
Table 6.11 shows that Malay patients form the majority in all the four main types of thalassaemia (beta thalassaemia major, beta thalassaemia intermedia, HbE-beta thalassaemia and HbH disease) in Kelantan.
6.4 Treatment
6.4.1 Iron Chelation Therapy
Currently, there are three types of iron chelating agents available in the government hospitals: injection DFO (administered for a minimum of 8 hours via subcutaneous self-infusion), oral DFP and oral DFX.
Oral DFX is the newer agent among the three chelators. It was first made available in Malaysia in the late 2000s. Due to the high cost of the drug, its usage has been limited to paediatric patients or as second/third line drug to patients of older age groups, who developed side effects or fail to respond to the first line drugs (DFO or DFP).
Oral DFX is a dispersible tablet which can be taken once daily. Comparatively, it is easier to be taken by most patients.
Oral DFX became the most prescribed chelating agent (prescribed to 134 out of 276 patients, 48.55%) in Kelantan. The drug is mostly dispensed in hospitals with resident paediatricians.
MTR Report_Part-1_PRINT_20191114_FA9.indd 106 27/11/2019 5:08 PM
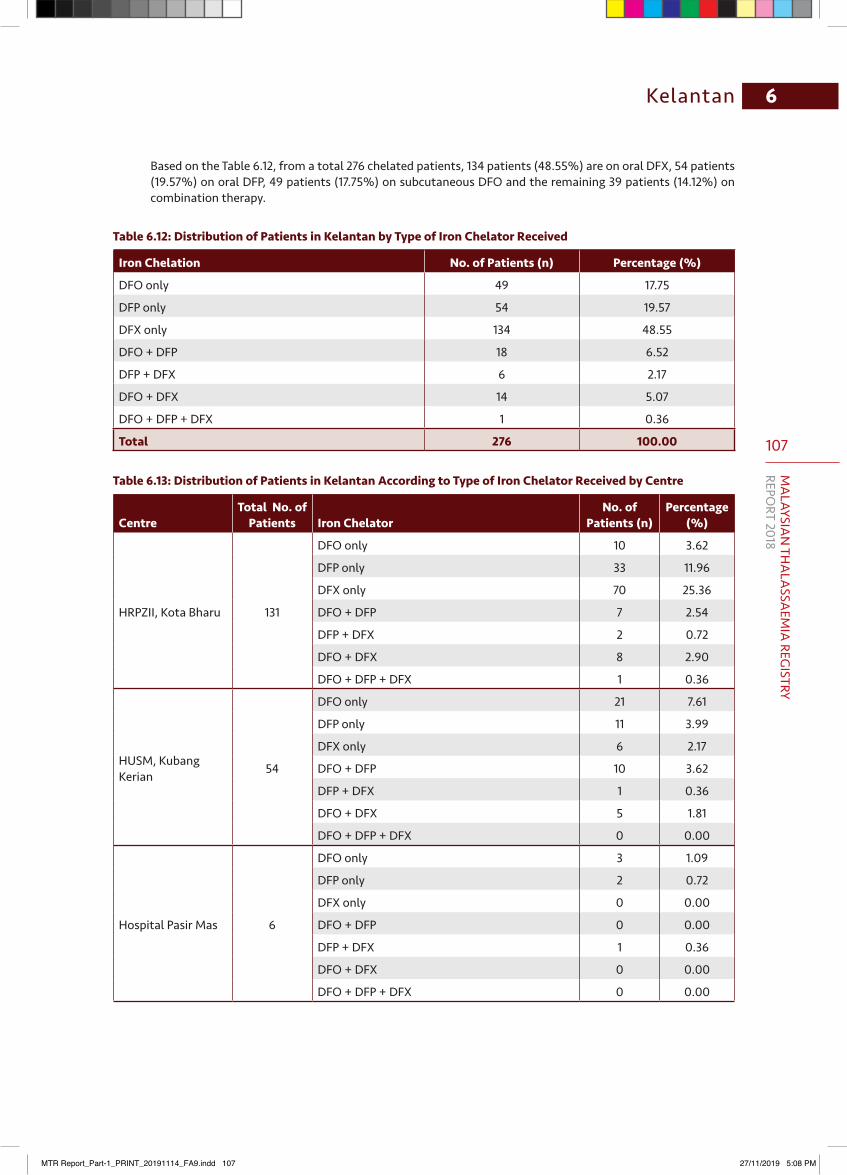
107
MA
LAYSIAN
THA
LASSA
EMIA
REGISTRY
REPORT 2018
6Kelantan
Based on the Table 6.12, from a total 276 chelated patients, 134 patients (48.55%) are on oral DFX, 54 patients (19.57%) on oral DFP, 49 patients (17.75%) on subcutaneous DFO and the remaining 39 patients (14.12%) on combination therapy.
Table 6.12: Distribution of Patients in Kelantan by Type of Iron Chelator Received
Iron Chelation No. of Patients (n) Percentage (%)
DFO only 49 17.75
DFP only 54 19.57
DFX only 134 48.55
DFO + DFP 18 6.52
DFP + DFX 6 2.17
DFO + DFX 14 5.07
DFO + DFP + DFX 1 0.36
Total 276 100.00
Table 6.13: Distribution of Patients in Kelantan According to Type of Iron Chelator Received by Centre
CentreTotal No. of
Patients Iron ChelatorNo. of
Patients (n)Percentage
(%)
HRPZII, Kota Bharu 131
DFO only 10 3.62
DFP only 33 11.96
DFX only 70 25.36
DFO + DFP 7 2.54
DFP + DFX 2 0.72
DFO + DFX 8 2.90
DFO + DFP + DFX 1 0.36
HUSM, Kubang Kerian 54
DFO only 21 7.61
DFP only 11 3.99
DFX only 6 2.17
DFO + DFP 10 3.62
DFP + DFX 1 0.36
DFO + DFX 5 1.81
DFO + DFP + DFX 0 0.00
Hospital Pasir Mas 6
DFO only 3 1.09
DFP only 2 0.72
DFX only 0 0.00
DFO + DFP 0 0.00
DFP + DFX 1 0.36
DFO + DFX 0 0.00
DFO + DFP + DFX 0 0.00
MTR Report_Part-1_PRINT_20191114_FA9.indd 107 27/11/2019 5:08 PM

108
MA
LAYS
IAN
TH
ALA
SSA
EMIA
REG
ISTR
YRE
PORT
201
8
6 Kelantan
CentreTotal No. of
Patients Iron ChelatorNo. of
Patients (n)Percentage
(%)
Hospital Machang 13
DFO only 4 1.45
DFP only 0 0.00
DFX only 8 2.90
DFO + DFP 0 0.00
DFP + DFX 1 0.36
DFO + DFX 0 0.00
DFO + DFP + DFX 0 0.00
Hospital Kuala Krai 26
DFO only 6 2.17
DFP only 2 0.72
DFX only 16 5.80
DFO + DFP 1 0.36
DFP + DFX 1 0.36
DFO + DFX 0 0.00
DFO + DFP + DFX 0 0.00
Hospital Gua Musang 16
DFO only 2 0.72
DFP only 0 0.00
DFX only 14 5.07
DFO + DFP 0 0.00
DFP + DFX 0 0.00
DFO + DFX 0 0.00
DFO + DFP + DFX 0 0.00
Hospital Tanah Merah 20
DFO only 0 0.00
DFP only 5 1.81
DFX only 15 5.43
DFO + DFP 0 0.00
DFP + DFX 0 0.00
DFO + DFX 0 0.00
DFO + DFP + DFX 0 0.00
Hospital Tengku Anis, Pasir Puteh 5
DFO only 3 1.09
DFP only 0 0.00
DFX only 2 0.72
DFO + DFP 0 0.00
DFP + DFX 0 0.00
DFO + DFX 0 0.00
DFO + DFP + DFX 0 0.00
MTR Report_Part-1_PRINT_20191114_FA9.indd 108 27/11/2019 5:08 PM
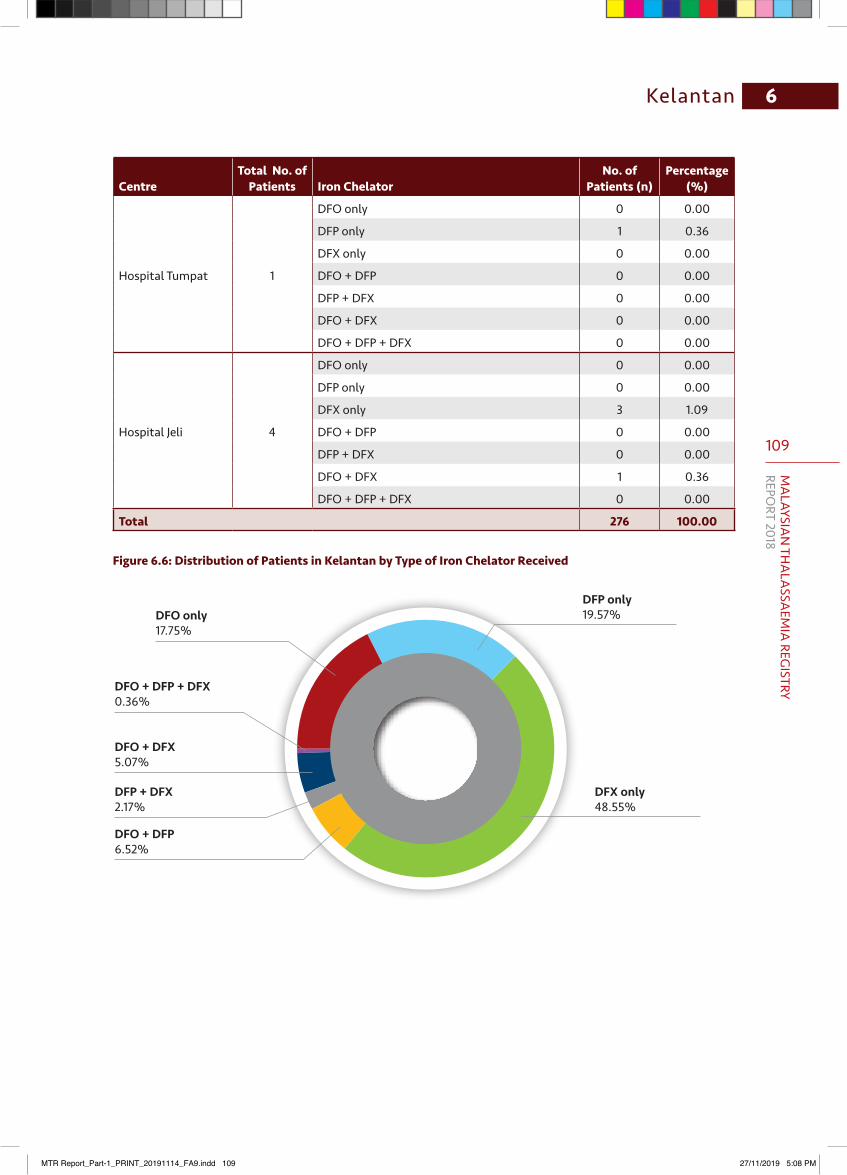
109
MA
LAYSIAN
THA
LASSA
EMIA
REGISTRY
REPORT 2018
6Kelantan
CentreTotal No. of
Patients Iron ChelatorNo. of
Patients (n)Percentage
(%)
Hospital Tumpat 1
DFO only 0 0.00
DFP only 1 0.36
DFX only 0 0.00
DFO + DFP 0 0.00
DFP + DFX 0 0.00
DFO + DFX 0 0.00
DFO + DFP + DFX 0 0.00
Hospital Jeli 4
DFO only 0 0.00
DFP only 0 0.00
DFX only 3 1.09
DFO + DFP 0 0.00
DFP + DFX 0 0.00
DFO + DFX 1 0.36
DFO + DFP + DFX 0 0.00
Total 276 100.00
Figure 6.6: Distribution of Patients in Kelantan by Type of Iron Chelator Received
DFX only48.55%
DFO + DFP6.52%
DFP + DFX2.17%
DFO + DFX5.07%
DFO + DFP + DFX0.36%
DFO only17.75%
DFP only19.57%
MTR Report_Part-1_PRINT_20191114_FA9.indd 109 27/11/2019 5:08 PM

110
MA
LAYS
IAN
TH
ALA
SSA
EMIA
REG
ISTR
YRE
PORT
201
8
6 Kelantan
Table 6.14: Distribution of Patients in Kelantan According to Type of Iron Chelator Received by Age Group
Age Group (years)Total No. of
Patients Iron ChelatorNo. of
Patients (n)Percentage
(%)
0−4.9 6
DFO only 0 0.00
DFP only 1 0.36
DFX only 4 1.45
DFO + DFP 0 0.00
DFP + DFX 0 0.00
DFO + DFX 1 0.36
DFO + DFP + DFX 0 0.00
5−9.9 41
DFO only 1 0.36
DFP only 0 0.00
DFX only 35 12.68
DFO + DFP 0 0.00
DFP + DFX 1 0.36
DFO + DFX 4 1.45
DFO + DFP + DFX 0 0.00
10−14.9 44
DFO only 7 2.54
DFP only 3 1.09
DFX only 31 11.23
DFO + DFP 1 0.36
DFP + DFX 0 0.00
DFO + DFX 2 0.72
DFO + DFP + DFX 0 0.00
15−19.9 60
DFO only 14 5.07
DFP only 14 5.07
DFX only 27 9.78
DFO + DFP 0 0.00
DFP + DFX 0 0.00
DFO + DFX 4 1.45
DFO + DFP + DFX 1 0.36
20−24.9 48
DFO only 15 5.43
DFP only 7 2.54
DFX only 17 6.16
DFO + DFP 5 1.81
DFP + DFX 2 0.72
DFO + DFX 2 0.72
DFO + DFP + DFX 0 0.00
MTR Report_Part-1_PRINT_20191114_FA9.indd 110 27/11/2019 5:08 PM

111
MA
LAYSIAN
THA
LASSA
EMIA
REGISTRY
REPORT 2018
6Kelantan
Age Group (years)Total No. of
Patients Iron ChelatorNo. of
Patients (n)Percentage
(%)
25−29.9 35
DFO only 7 2.54
DFP only 9 3.26
DFX only 12 4.35
DFO + DFP 6 2.17
DFP + DFX 1 0.36
DFO + DFX 0 0.00
DFO + DFP + DFX 0 0.00
30−34.9 14
DFO only 1 0.36
DFP only 8 2.90
DFX only 3 1.09
DFO + DFP 1 0.36
DFP + DFX 0 0.00
DFO + DFX 1 0.36
DFO + DFP + DFX 0 0.00
35−39.9 7
DFO only 1 0.36
DFP only 2 0.72
DFX only 1 0.36
DFO + DFP 2 0.72
DFP + DFX 1 0.36
DFO + DFX 0 0.00
DFO + DFP + DFX 0 0.00
40−44.9 5
DFO only 1 0.36
DFP only 3 1.09
DFX only 1 0.36
DFO + DFP 0 0.00
DFP + DFX 0 0.00
DFO + DFX 0 0.00
DFO + DFP + DFX 0 0.00
45−49.9 10
DFO only 1 0.36
DFP only 4 1.45
DFX only 3 1.09
DFO + DFP 2 0.72
DFP + DFX 0 0.00
DFO + DFX 0 0.00
DFO + DFP + DFX 0 0.00
MTR Report_Part-1_PRINT_20191114_FA9.indd 111 27/11/2019 5:08 PM
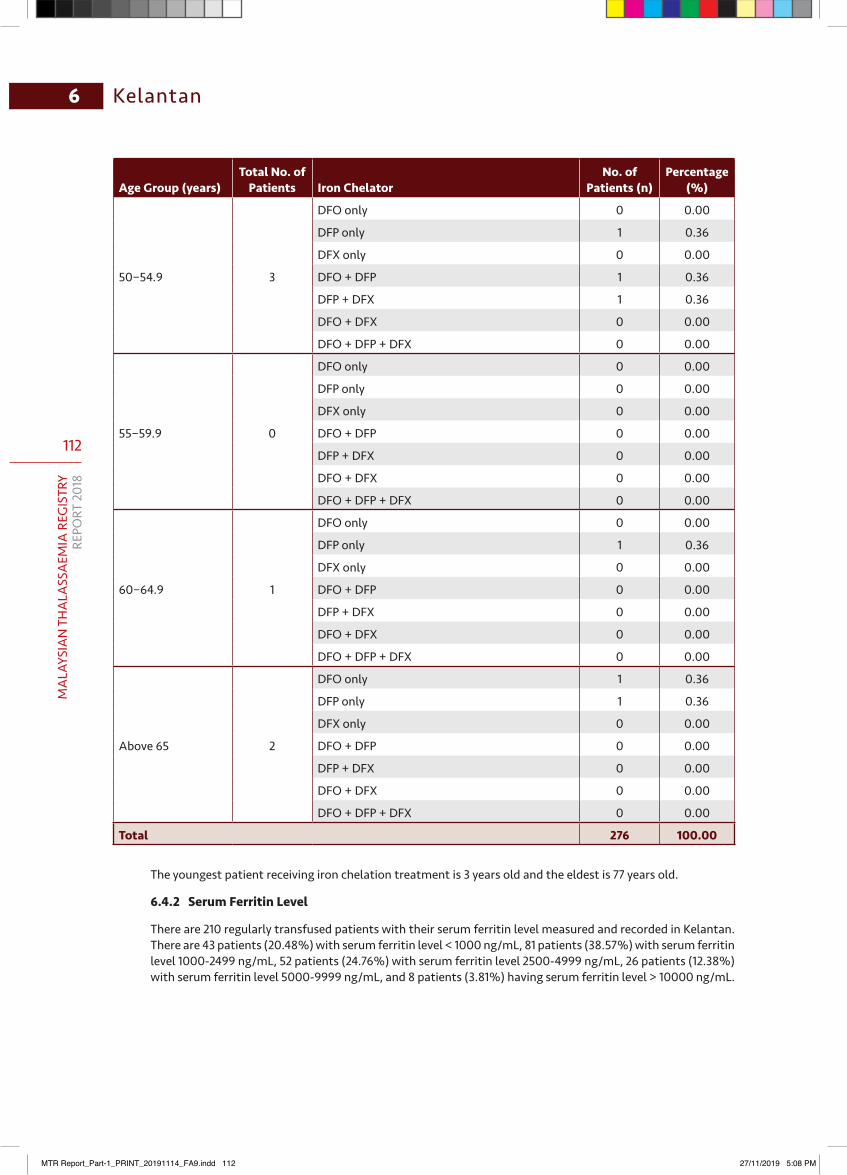
112
MA
LAYS
IAN
TH
ALA
SSA
EMIA
REG
ISTR
YRE
PORT
201
8
6 Kelantan
Age Group (years)Total No. of
Patients Iron ChelatorNo. of
Patients (n)Percentage
(%)
50−54.9 3
DFO only 0 0.00
DFP only 1 0.36
DFX only 0 0.00
DFO + DFP 1 0.36
DFP + DFX 1 0.36
DFO + DFX 0 0.00
DFO + DFP + DFX 0 0.00
55−59.9 0
DFO only 0 0.00
DFP only 0 0.00
DFX only 0 0.00
DFO + DFP 0 0.00
DFP + DFX 0 0.00
DFO + DFX 0 0.00
DFO + DFP + DFX 0 0.00
60−64.9 1
DFO only 0 0.00
DFP only 1 0.36
DFX only 0 0.00
DFO + DFP 0 0.00
DFP + DFX 0 0.00
DFO + DFX 0 0.00
DFO + DFP + DFX 0 0.00
Above 65 2
DFO only 1 0.36
DFP only 1 0.36
DFX only 0 0.00
DFO + DFP 0 0.00
DFP + DFX 0 0.00
DFO + DFX 0 0.00
DFO + DFP + DFX 0 0.00
Total 276 100.00
The youngest patient receiving iron chelation treatment is 3 years old and the eldest is 77 years old.
6.4.2 Serum Ferritin Level
There are 210 regularly transfused patients with their serum ferritin level measured and recorded in Kelantan. There are 43 patients (20.48%) with serum ferritin level < 1000 ng/mL, 81 patients (38.57%) with serum ferritin level 1000-2499 ng/mL, 52 patients (24.76%) with serum ferritin level 2500-4999 ng/mL, 26 patients (12.38%) with serum ferritin level 5000-9999 ng/mL, and 8 patients (3.81%) having serum ferritin level > 10000 ng/mL.
MTR Report_Part-1_PRINT_20191114_FA9.indd 112 27/11/2019 5:08 PM
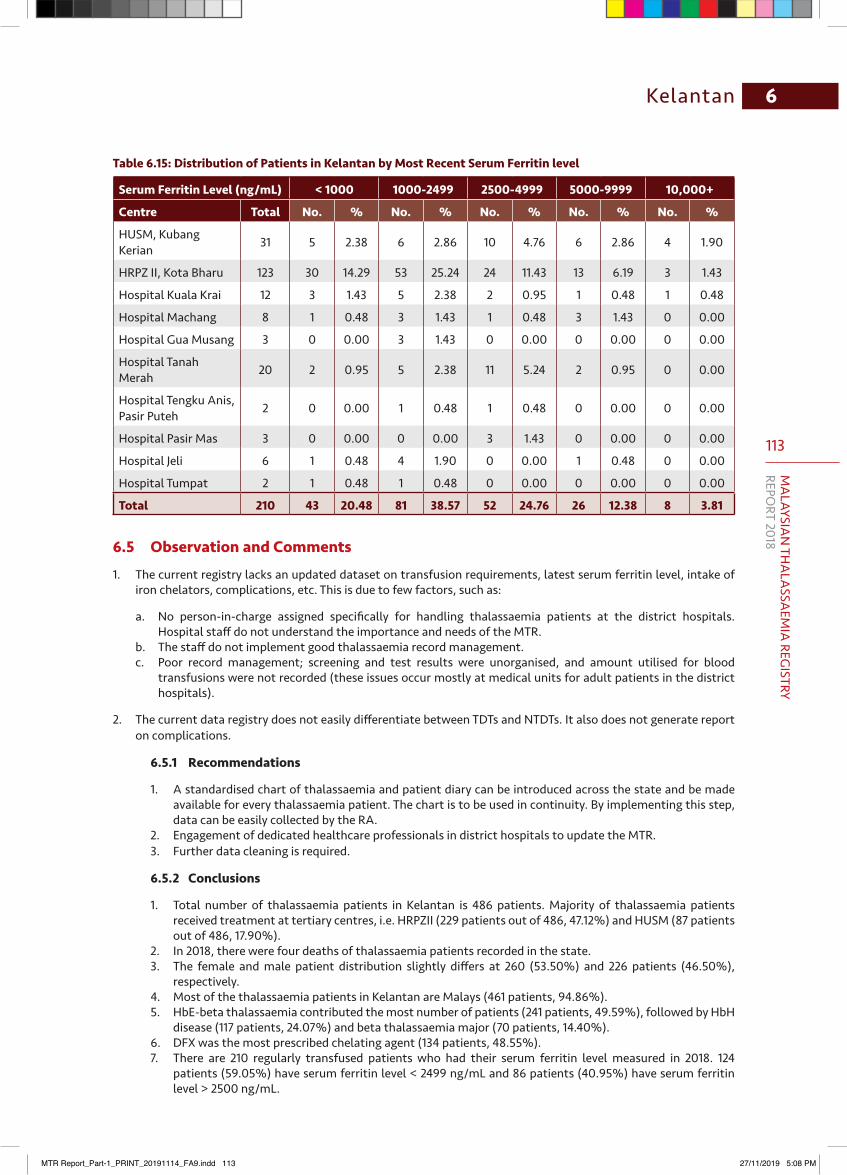
113
MA
LAYSIAN
THA
LASSA
EMIA
REGISTRY
REPORT 2018
6Kelantan
Table 6.15: Distribution of Patients in Kelantan by Most Recent Serum Ferritin level
Serum Ferritin Level (ng/mL) < 1000 1000-2499 2500-4999 5000-9999 10,000+
Centre Total No. % No. % No. % No. % No. %
HUSM, Kubang Kerian 31 5 2.38 6 2.86 10 4.76 6 2.86 4 1.90
HRPZ II, Kota Bharu 123 30 14.29 53 25.24 24 11.43 13 6.19 3 1.43
Hospital Kuala Krai 12 3 1.43 5 2.38 2 0.95 1 0.48 1 0.48
Hospital Machang 8 1 0.48 3 1.43 1 0.48 3 1.43 0 0.00
Hospital Gua Musang 3 0 0.00 3 1.43 0 0.00 0 0.00 0 0.00
Hospital Tanah Merah 20 2 0.95 5 2.38 11 5.24 2 0.95 0 0.00
Hospital Tengku Anis, Pasir Puteh 2 0 0.00 1 0.48 1 0.48 0 0.00 0 0.00
Hospital Pasir Mas 3 0 0.00 0 0.00 3 1.43 0 0.00 0 0.00
Hospital Jeli 6 1 0.48 4 1.90 0 0.00 1 0.48 0 0.00
Hospital Tumpat 2 1 0.48 1 0.48 0 0.00 0 0.00 0 0.00
Total 210 43 20.48 81 38.57 52 24.76 26 12.38 8 3.81
6.5 Observation and Comments
1. The current registry lacks an updated dataset on transfusion requirements, latest serum ferritin level, intake of iron chelators, complications, etc. This is due to few factors, such as:
a. No person-in-charge assigned specifically for handling thalassaemia patients at the district hospitals. Hospital staff do not understand the importance and needs of the MTR.
b. The staff do not implement good thalassaemia record management.c. Poor record management; screening and test results were unorganised, and amount utilised for blood
transfusions were not recorded (these issues occur mostly at medical units for adult patients in the district hospitals).
2. The current data registry does not easily differentiate between TDTs and NTDTs. It also does not generate report on complications.
6.5.1 Recommendations
1. A standardised chart of thalassaemia and patient diary can be introduced across the state and be made available for every thalassaemia patient. The chart is to be used in continuity. By implementing this step, data can be easily collected by the RA.
2. Engagement of dedicated healthcare professionals in district hospitals to update the MTR.3. Further data cleaning is required.
6.5.2 Conclusions
1. Total number of thalassaemia patients in Kelantan is 486 patients. Majority of thalassaemia patients received treatment at tertiary centres, i.e. HRPZII (229 patients out of 486, 47.12%) and HUSM (87 patients out of 486, 17.90%).
2. In 2018, there were four deaths of thalassaemia patients recorded in the state. 3. The female and male patient distribution slightly differs at 260 (53.50%) and 226 patients (46.50%),
respectively.4. Most of the thalassaemia patients in Kelantan are Malays (461 patients, 94.86%).5. HbE-beta thalassaemia contributed the most number of patients (241 patients, 49.59%), followed by HbH
disease (117 patients, 24.07%) and beta thalassaemia major (70 patients, 14.40%).6. DFX was the most prescribed chelating agent (134 patients, 48.55%).7. There are 210 regularly transfused patients who had their serum ferritin level measured in 2018. 124
patients (59.05%) have serum ferritin level < 2499 ng/mL and 86 patients (40.95%) have serum ferritin level > 2500 ng/mL.
MTR Report_Part-1_PRINT_20191114_FA9.indd 113 27/11/2019 5:08 PM
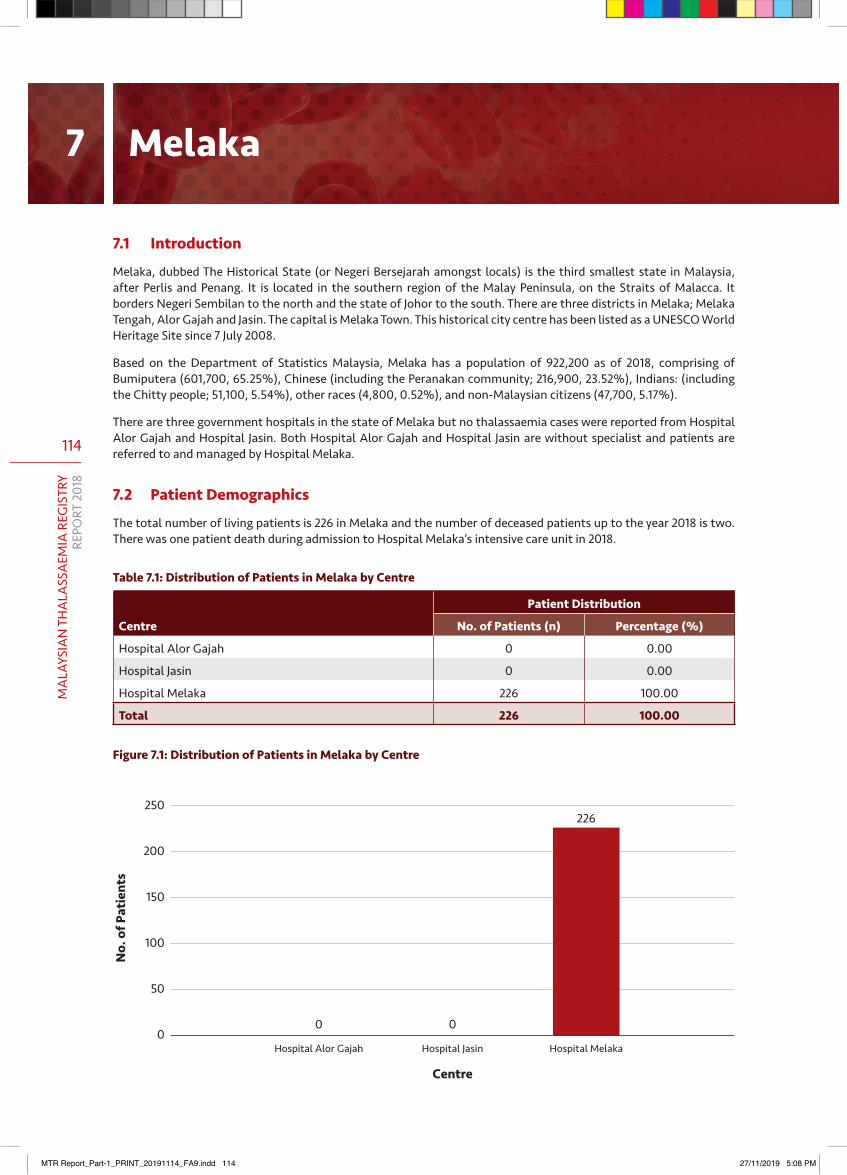
114
MA
LAYS
IAN
TH
ALA
SSA
EMIA
REG
ISTR
YRE
PORT
201
8
7.1 Introduction
Melaka, dubbed The Historical State (or Negeri Bersejarah amongst locals) is the third smallest state in Malaysia, after Perlis and Penang. It is located in the southern region of the Malay Peninsula, on the Straits of Malacca. It borders Negeri Sembilan to the north and the state of Johor to the south. There are three districts in Melaka; Melaka Tengah, Alor Gajah and Jasin. The capital is Melaka Town. This historical city centre has been listed as a UNESCO World Heritage Site since 7 July 2008.
Based on the Department of Statistics Malaysia, Melaka has a population of 922,200 as of 2018, comprising of Bumiputera (601,700, 65.25%), Chinese (including the Peranakan community; 216,900, 23.52%), Indians: (including the Chitty people; 51,100, 5.54%), other races (4,800, 0.52%), and non-Malaysian citizens (47,700, 5.17%).
There are three government hospitals in the state of Melaka but no thalassaemia cases were reported from Hospital Alor Gajah and Hospital Jasin. Both Hospital Alor Gajah and Hospital Jasin are without specialist and patients are referred to and managed by Hospital Melaka.
7.2 Patient Demographics
The total number of living patients is 226 in Melaka and the number of deceased patients up to the year 2018 is two. There was one patient death during admission to Hospital Melaka’s intensive care unit in 2018.
Table 7.1: Distribution of Patients in Melaka by Centre
Centre
Patient Distribution
No. of Patients (n) Percentage (%)
Hospital Alor Gajah 0 0.00
Hospital Jasin 0 0.00
Hospital Melaka 226 100.00
Total 226 100.00
Figure 7.1: Distribution of Patients in Melaka by Centre
250
200
150
100
50
0
Centre
No.
of P
atie
nts
Hospital Alor Gajah Hospital Jasin Hospital Melaka
226
00
Melaka7
MTR Report_Part-1_PRINT_20191114_FA9.indd 114 27/11/2019 5:08 PM
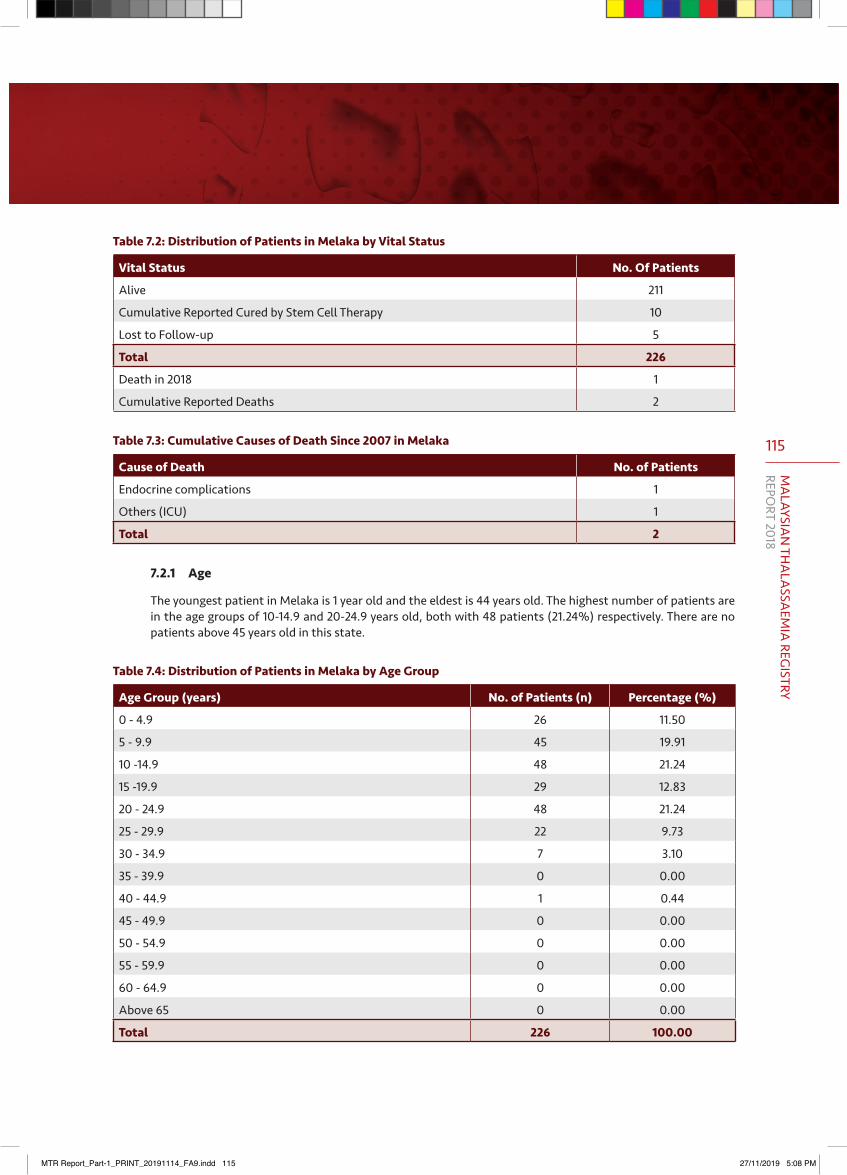
115
MA
LAYSIAN
THA
LASSA
EMIA
REGISTRY
REPORT 2018
Table 7.2: Distribution of Patients in Melaka by Vital Status
Vital Status No. Of Patients
Alive 211
Cumulative Reported Cured by Stem Cell Therapy 10
Lost to Follow-up 5
Total 226
Death in 2018 1
Cumulative Reported Deaths 2
Table 7.3: Cumulative Causes of Death Since 2007 in Melaka
Cause of Death No. of Patients
Endocrine complications 1
Others (ICU) 1
Total 2
7.2.1 Age
The youngest patient in Melaka is 1 year old and the eldest is 44 years old. The highest number of patients are in the age groups of 10-14.9 and 20-24.9 years old, both with 48 patients (21.24%) respectively. There are no patients above 45 years old in this state.
Table 7.4: Distribution of Patients in Melaka by Age Group
Age Group (years) No. of Patients (n) Percentage (%)
0 - 4.9 26 11.50
5 - 9.9 45 19.91
10 -14.9 48 21.24
15 -19.9 29 12.83
20 - 24.9 48 21.24
25 - 29.9 22 9.73
30 - 34.9 7 3.10
35 - 39.9 0 0.00
40 - 44.9 1 0.44
45 - 49.9 0 0.00
50 - 54.9 0 0.00
55 - 59.9 0 0.00
60 - 64.9 0 0.00
Above 65 0 0.00
Total 226 100.00
MTR Report_Part-1_PRINT_20191114_FA9.indd 115 27/11/2019 5:08 PM
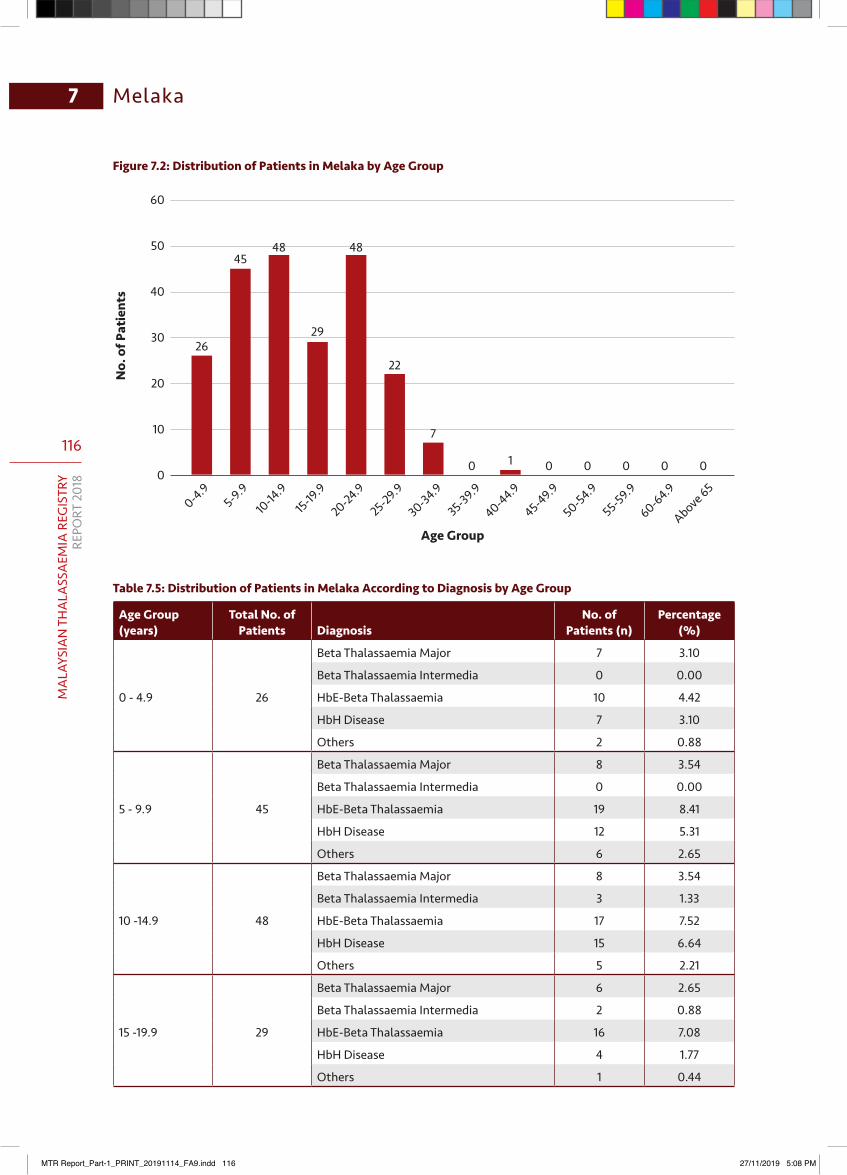
116
MA
LAYS
IAN
TH
ALA
SSA
EMIA
REG
ISTR
YRE
PORT
201
8
7 Melaka
Figure 7.2: Distribution of Patients in Melaka by Age Group
0-4.95-9.9
10-14
.915-19
.9
20-24.9
25-29.9
30-34.9
35-39.9
40-44.9
45-49.9
50-54.9
55-59.9
60-64.9
Above 65
60
50
40
30
20
10
0
Age Group
No.
of P
atie
nts
26
4548
29
48
22
7
0 1 0 0 0 0 0
Table 7.5: Distribution of Patients in Melaka According to Diagnosis by Age Group
Age Group (years)
Total No. of Patients Diagnosis
No. of Patients (n)
Percentage (%)
0 - 4.9 26
Beta Thalassaemia Major 7 3.10
Beta Thalassaemia Intermedia 0 0.00
HbE-Beta Thalassaemia 10 4.42
HbH Disease 7 3.10
Others 2 0.88
5 - 9.9 45
Beta Thalassaemia Major 8 3.54
Beta Thalassaemia Intermedia 0 0.00
HbE-Beta Thalassaemia 19 8.41
HbH Disease 12 5.31
Others 6 2.65
10 -14.9 48
Beta Thalassaemia Major 8 3.54
Beta Thalassaemia Intermedia 3 1.33
HbE-Beta Thalassaemia 17 7.52
HbH Disease 15 6.64
Others 5 2.21
15 -19.9 29
Beta Thalassaemia Major 6 2.65
Beta Thalassaemia Intermedia 2 0.88
HbE-Beta Thalassaemia 16 7.08
HbH Disease 4 1.77
Others 1 0.44
MTR Report_Part-1_PRINT_20191114_FA9.indd 116 27/11/2019 5:08 PM
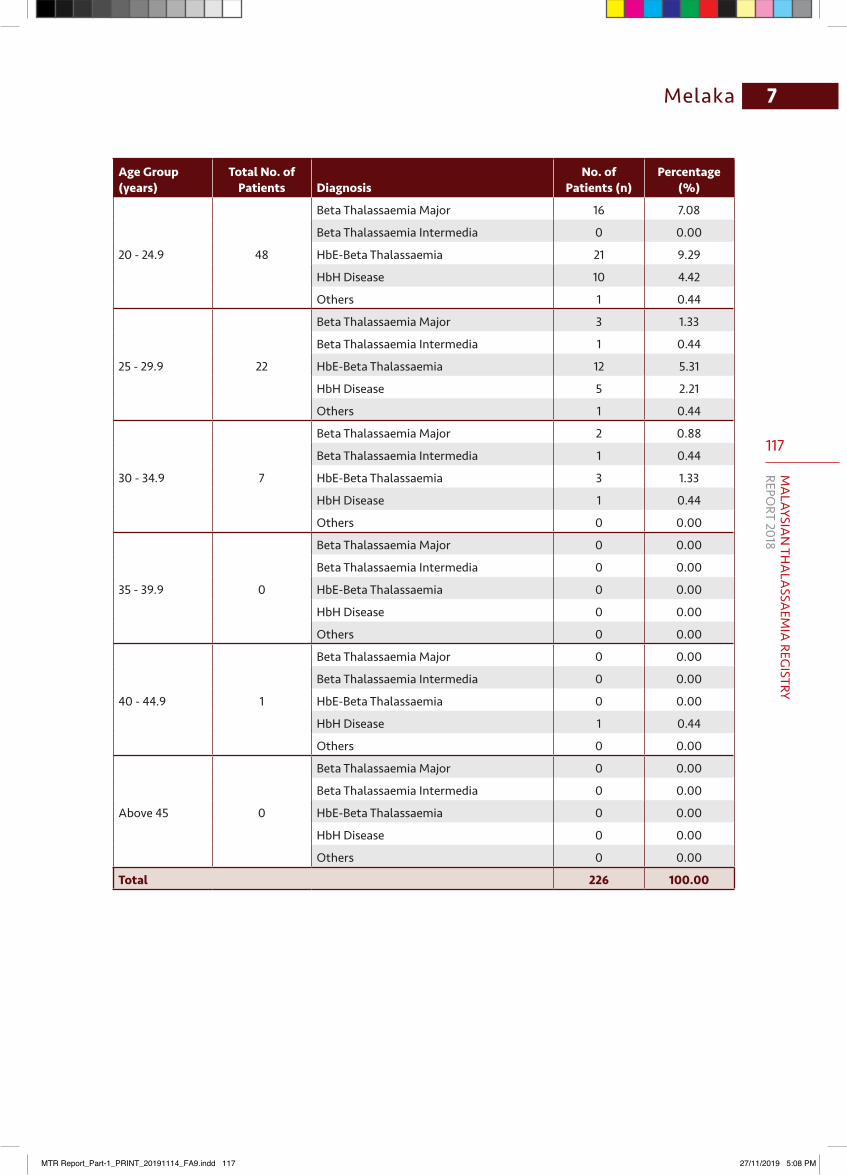
117
MA
LAYSIAN
THA
LASSA
EMIA
REGISTRY
REPORT 2018
7 Melaka
Age Group (years)
Total No. of Patients Diagnosis
No. of Patients (n)
Percentage (%)
20 - 24.9 48
Beta Thalassaemia Major 16 7.08
Beta Thalassaemia Intermedia 0 0.00
HbE-Beta Thalassaemia 21 9.29
HbH Disease 10 4.42
Others 1 0.44
25 - 29.9 22
Beta Thalassaemia Major 3 1.33
Beta Thalassaemia Intermedia 1 0.44
HbE-Beta Thalassaemia 12 5.31
HbH Disease 5 2.21
Others 1 0.44
30 - 34.9 7
Beta Thalassaemia Major 2 0.88
Beta Thalassaemia Intermedia 1 0.44
HbE-Beta Thalassaemia 3 1.33
HbH Disease 1 0.44
Others 0 0.00
35 - 39.9 0
Beta Thalassaemia Major 0 0.00
Beta Thalassaemia Intermedia 0 0.00
HbE-Beta Thalassaemia 0 0.00
HbH Disease 0 0.00
Others 0 0.00
40 - 44.9 1
Beta Thalassaemia Major 0 0.00
Beta Thalassaemia Intermedia 0 0.00
HbE-Beta Thalassaemia 0 0.00
HbH Disease 1 0.44
Others 0 0.00
Above 45 0
Beta Thalassaemia Major 0 0.00
Beta Thalassaemia Intermedia 0 0.00
HbE-Beta Thalassaemia 0 0.00
HbH Disease 0 0.00
Others 0 0.00
Total 226 100.00
MTR Report_Part-1_PRINT_20191114_FA9.indd 117 27/11/2019 5:08 PM
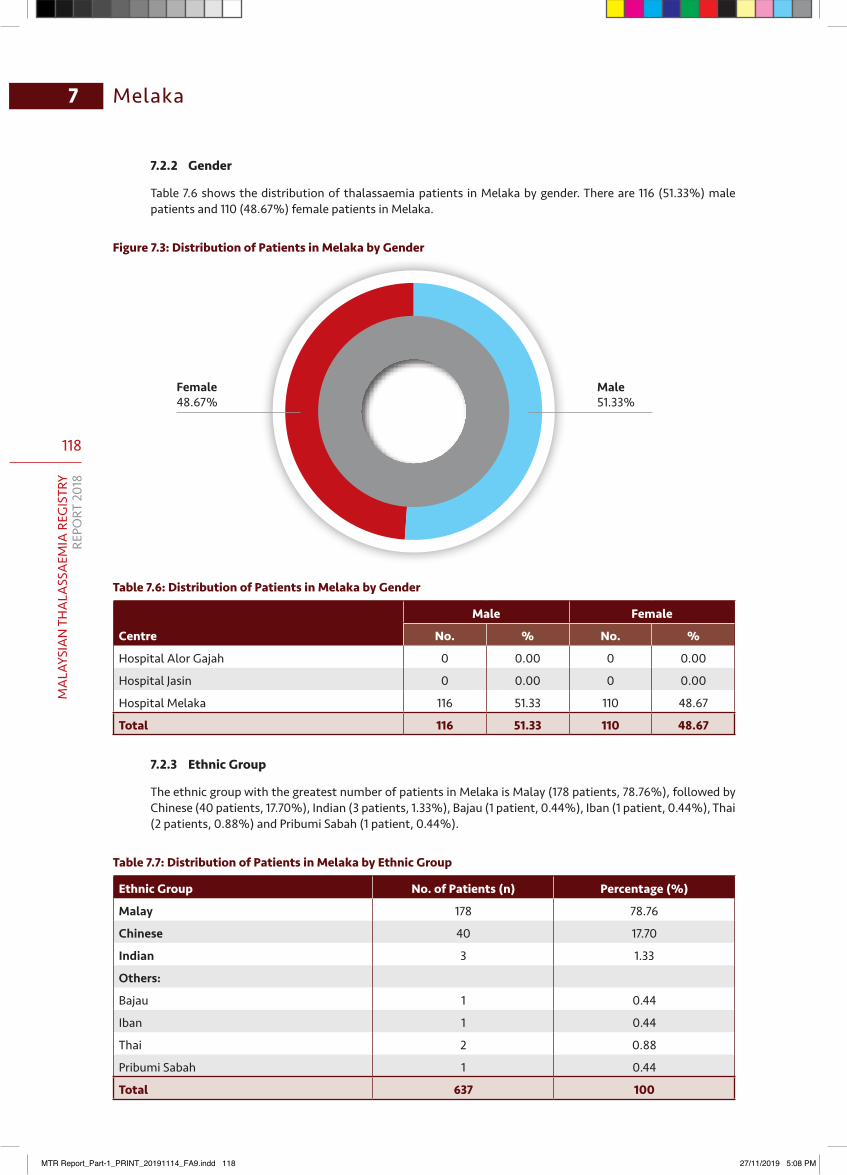
118
MA
LAYS
IAN
TH
ALA
SSA
EMIA
REG
ISTR
YRE
PORT
201
8
7 Melaka
7.2.2 Gender
Table 7.6 shows the distribution of thalassaemia patients in Melaka by gender. There are 116 (51.33%) male patients and 110 (48.67%) female patients in Melaka.
Figure 7.3: Distribution of Patients in Melaka by Gender
Table 7.6: Distribution of Patients in Melaka by Gender
Centre
Male Female
No. % No. %
Hospital Alor Gajah 0 0.00 0 0.00
Hospital Jasin 0 0.00 0 0.00
Hospital Melaka 116 51.33 110 48.67
Total 116 51.33 110 48.67
7.2.3 Ethnic Group
The ethnic group with the greatest number of patients in Melaka is Malay (178 patients, 78.76%), followed by Chinese (40 patients, 17.70%), Indian (3 patients, 1.33%), Bajau (1 patient, 0.44%), Iban (1 patient, 0.44%), Thai (2 patients, 0.88%) and Pribumi Sabah (1 patient, 0.44%).
Table 7.7: Distribution of Patients in Melaka by Ethnic Group
Ethnic Group No. of Patients (n) Percentage (%)
Malay 178 78.76
Chinese 40 17.70
Indian 3 1.33
Others:
Bajau 1 0.44
Iban 1 0.44
Thai 2 0.88
Pribumi Sabah 1 0.44
Total 637 100
Female48.67%
Male51.33%
MTR Report_Part-1_PRINT_20191114_FA9.indd 118 27/11/2019 5:08 PM
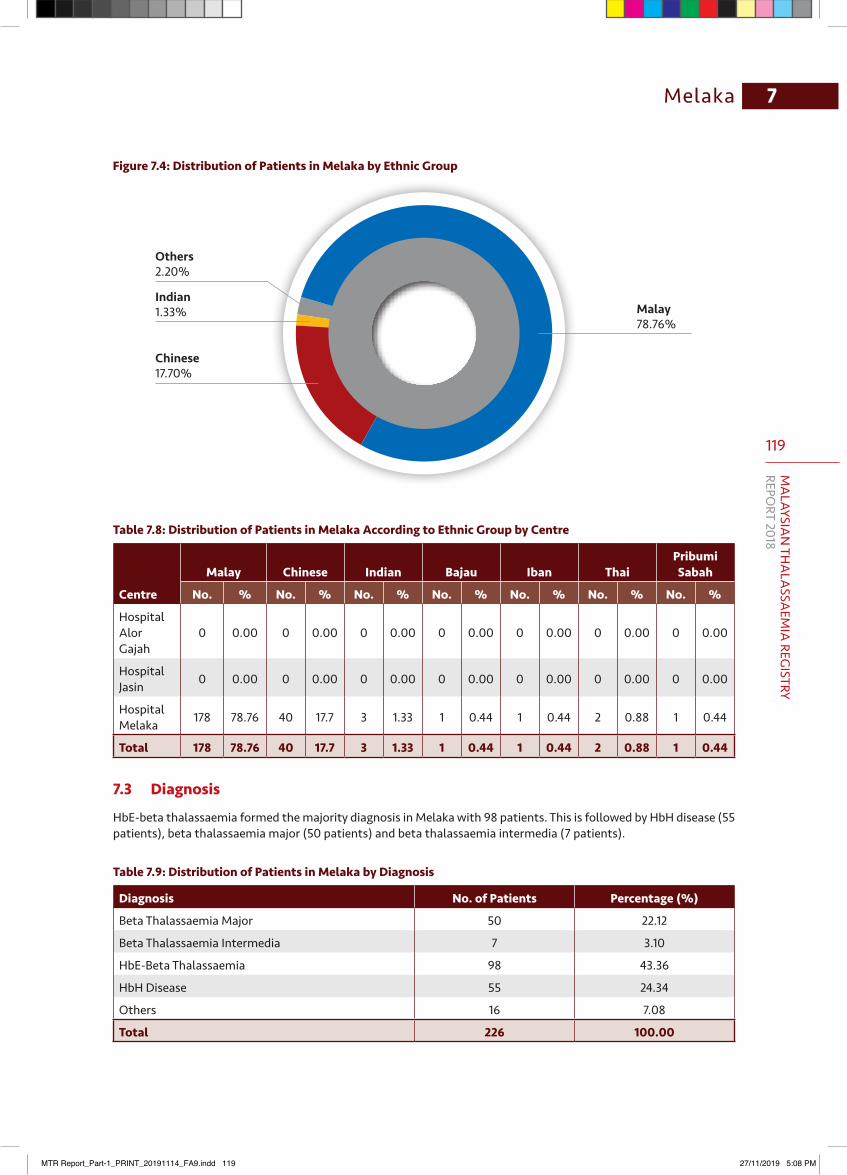
119
MA
LAYSIAN
THA
LASSA
EMIA
REGISTRY
REPORT 2018
7 Melaka
Figure 7.4: Distribution of Patients in Melaka by Ethnic Group
Chinese17.70%
Indian1.33%
Others2.20%
Malay78.76%
Table7.8:DistributionofPatientsinMelakaAccordingtoEthnicGroupbyCentre
Centre
Malay Chinese Indian Bajau Iban ThaiPribumi Sabah
No. % No. % No. % No. % No. % No. % No. %
Hospital Alor Gajah
0 0.00 0 0.00 0 0.00 0 0.00 0 0.00 0 0.00 0 0.00
Hospital Jasin 0 0.00 0 0.00 0 0.00 0 0.00 0 0.00 0 0.00 0 0.00
Hospital Melaka 178 78.76 40 17.7 3 1.33 1 0.44 1 0.44 2 0.88 1 0.44
Total 178 78.76 40 17.7 3 1.33 1 0.44 1 0.44 2 0.88 1 0.44
7.3 Diagnosis
HbE-beta thalassaemia formed the majority diagnosis in Melaka with 98 patients. This is followed by HbH disease (55 patients), beta thalassaemia major (50 patients) and beta thalassaemia intermedia (7 patients).
Table 7.9: Distribution of Patients in Melaka by Diagnosis
Diagnosis No. of Patients Percentage (%)
Beta Thalassaemia Major 50 22.12
Beta Thalassaemia Intermedia 7 3.10
HbE-Beta Thalassaemia 98 43.36
HbH Disease 55 24.34
Others 16 7.08
Total 226 100.00
MTR Report_Part-1_PRINT_20191114_FA9.indd 119 27/11/2019 5:08 PM
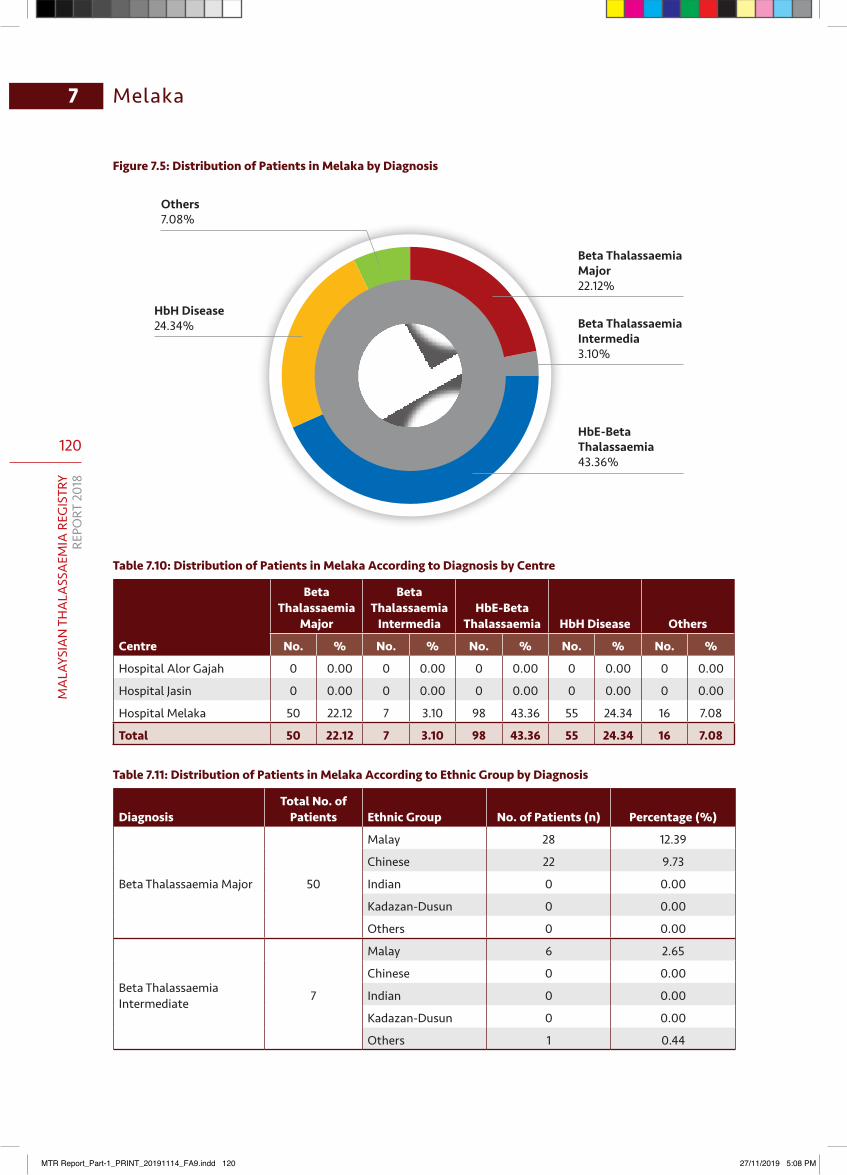
120
MA
LAYS
IAN
TH
ALA
SSA
EMIA
REG
ISTR
YRE
PORT
201
8
7 Melaka
Figure 7.5: Distribution of Patients in Melaka by Diagnosis
Beta Thalassaemia Major22.12%
Beta Thalassaemia Intermedia3.10%
HbE-Beta Thalassaemia43.36%
HbH Disease24.34%
Others7.08%
Table 7.10: Distribution of Patients in Melaka According to Diagnosis by Centre
Centre
Beta Thalassaemia
Major
Beta Thalassaemia
IntermediaHbE-Beta
Thalassaemia HbH Disease Others
No. % No. % No. % No. % No. %
Hospital Alor Gajah 0 0.00 0 0.00 0 0.00 0 0.00 0 0.00
Hospital Jasin 0 0.00 0 0.00 0 0.00 0 0.00 0 0.00
Hospital Melaka 50 22.12 7 3.10 98 43.36 55 24.34 16 7.08
Total 50 22.12 7 3.10 98 43.36 55 24.34 16 7.08
Table 7.11: Distribution of Patients in Melaka According to Ethnic Group by Diagnosis
DiagnosisTotal No. of
Patients Ethnic Group No. of Patients (n) Percentage (%)
Beta Thalassaemia Major 50
Malay 28 12.39
Chinese 22 9.73
Indian 0 0.00
Kadazan-Dusun 0 0.00
Others 0 0.00
Beta Thalassaemia Intermediate 7
Malay 6 2.65
Chinese 0 0.00
Indian 0 0.00
Kadazan-Dusun 0 0.00
Others 1 0.44
MTR Report_Part-1_PRINT_20191114_FA9.indd 120 27/11/2019 5:08 PM
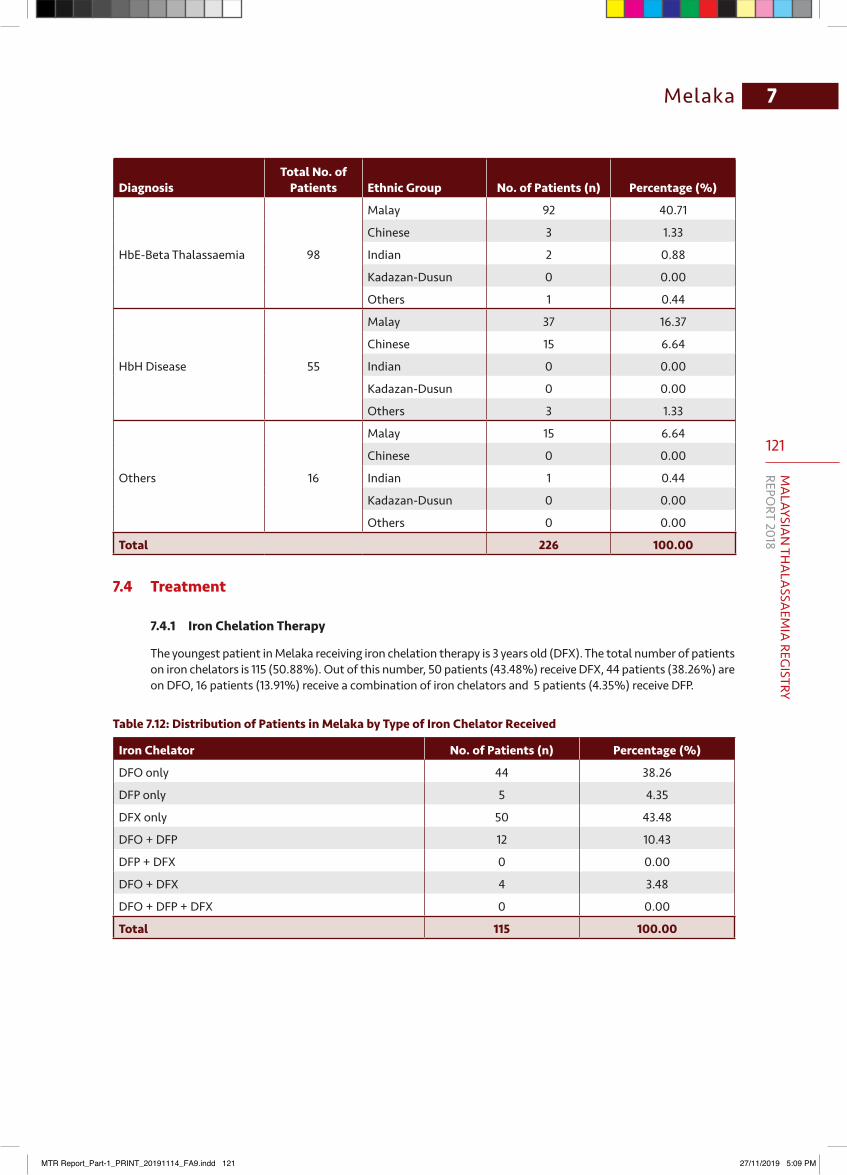
121
MA
LAYSIAN
THA
LASSA
EMIA
REGISTRY
REPORT 2018
7 Melaka
DiagnosisTotal No. of
Patients Ethnic Group No. of Patients (n) Percentage (%)
HbE-Beta Thalassaemia 98
Malay 92 40.71
Chinese 3 1.33
Indian 2 0.88
Kadazan-Dusun 0 0.00
Others 1 0.44
HbH Disease 55
Malay 37 16.37
Chinese 15 6.64
Indian 0 0.00
Kadazan-Dusun 0 0.00
Others 3 1.33
Others 16
Malay 15 6.64
Chinese 0 0.00
Indian 1 0.44
Kadazan-Dusun 0 0.00
Others 0 0.00
Total 226 100.00
7.4 Treatment
7.4.1 Iron Chelation Therapy
The youngest patient in Melaka receiving iron chelation therapy is 3 years old (DFX). The total number of patients on iron chelators is 115 (50.88%). Out of this number, 50 patients (43.48%) receive DFX, 44 patients (38.26%) are on DFO, 16 patients (13.91%) receive a combination of iron chelators and 5 patients (4.35%) receive DFP.
Table 7.12: Distribution of Patients in Melaka by Type of Iron Chelator Received
Iron Chelator No. of Patients (n) Percentage (%)
DFO only 44 38.26
DFP only 5 4.35
DFX only 50 43.48
DFO + DFP 12 10.43
DFP + DFX 0 0.00
DFO + DFX 4 3.48
DFO + DFP + DFX 0 0.00
Total 115 100.00
MTR Report_Part-1_PRINT_20191114_FA9.indd 121 27/11/2019 5:09 PM
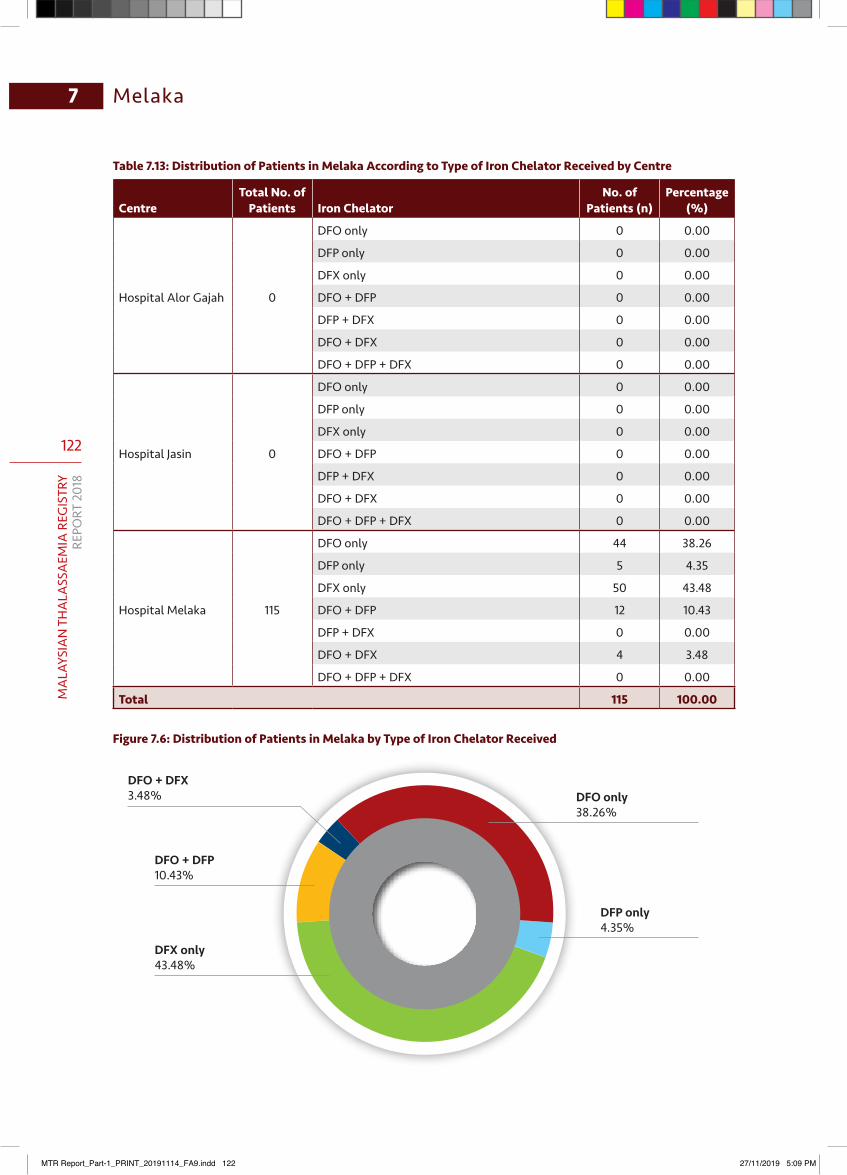
122
MA
LAYS
IAN
TH
ALA
SSA
EMIA
REG
ISTR
YRE
PORT
201
8
7 Melaka
Table 7.13: Distribution of Patients in Melaka According to Type of Iron Chelator Received by Centre
CentreTotal No. of
Patients Iron ChelatorNo. of
Patients (n)Percentage
(%)
Hospital Alor Gajah 0
DFO only 0 0.00
DFP only 0 0.00
DFX only 0 0.00
DFO + DFP 0 0.00
DFP + DFX 0 0.00
DFO + DFX 0 0.00
DFO + DFP + DFX 0 0.00
Hospital Jasin 0
DFO only 0 0.00
DFP only 0 0.00
DFX only 0 0.00
DFO + DFP 0 0.00
DFP + DFX 0 0.00
DFO + DFX 0 0.00
DFO + DFP + DFX 0 0.00
Hospital Melaka 115
DFO only 44 38.26
DFP only 5 4.35
DFX only 50 43.48
DFO + DFP 12 10.43
DFP + DFX 0 0.00
DFO + DFX 4 3.48
DFO + DFP + DFX 0 0.00
Total 115 100.00
Figure 7.6: Distribution of Patients in Melaka by Type of Iron Chelator Received
DFP only4.35%
DFX only43.48%
DFO + DFP10.43%
DFO + DFX3.48% DFO only
38.26%
MTR Report_Part-1_PRINT_20191114_FA9.indd 122 27/11/2019 5:09 PM

123
MA
LAYSIAN
THA
LASSA
EMIA
REGISTRY
REPORT 2018
7 Melaka
Table 7.14: Distribution of Patients in Melaka According to Type of Iron Chelator Received by Age Group
Age Group (years)Total No. of
Patients Iron ChelatorNo. of
Patients (n)Percentage
(%)
0 - 4.9 4
DFO only 0 0.00
DFP only 0 0.00
DFX only 4 3.48
DFO + DFP 0 0.00
DFP + DFX 0 0.00
DFO + DFX 0 0.00
DFO + DFP + DFX 0 0.00
5 - 9.9 20
DFO only 4 3.48
DFP only 0 0.00
DFX only 13 11.30
DFO + DFP 0 0.00
DFP + DFX 0 0.00
DFO + DFX 3 2.61
DFO + DFP + DFX 0 0.00
10 -14.9 22
DFO only 4 3.48
DFP only 0 0.00
DFX only 18 15.65
DFO + DFP 0 0.00
DFP + DFX 0 0.00
DFO + DFX 0 0.00
DFO + DFP + DFX 0 0.00
15 -19.9 19
DFO only 7 6.09
DFP only 1 0.87
DFX only 9 7.83
DFO + DFP 1 0.87
DFP + DFX 0 0.00
DFO + DFX 1 0.87
DFO + DFP + DFX 0 0.00
20 - 24.9 33
DFO only 18 15.65
DFP only 3 2.61
DFX only 5 4.35
DFO + DFP 7 6.09
DFP + DFX 0 0.00
DFO + DFX 0 0.00
DFO + DFP + DFX 0 0.00
MTR Report_Part-1_PRINT_20191114_FA9.indd 123 27/11/2019 5:09 PM

124
MA
LAYS
IAN
TH
ALA
SSA
EMIA
REG
ISTR
YRE
PORT
201
8
7 Melaka
Age Group (years)Total No. of
Patients Iron ChelatorNo. of
Patients (n)Percentage
(%)
25 - 29.9 11
DFO only 6 5.22
DFP only 1 0.87
DFX only 0 0.00
DFO + DFP 4 3.48
DFP + DFX 0 0.00
DFO + DFX 0 0.00
DFO + DFP + DFX 0 0.00
30-34.9 6
DFO only 5 4.35
DFP only 0 0.00
DFX only 1 0.87
DFO + DFP 0 0.00
DFP + DFX 0 0.00
DFO + DFX 0 0.00
DFO + DFP + DFX 0 0.00
35-39.9 0
DFO only 0 0.00
DFP only 0 0.00
DFX only 0 0.00
DFO + DFP 0 0.00
DFP + DFX 0 0.00
DFO + DFX 0 0.00
DFO + DFP + DFX 0 0.00
40 - 44.9 0
DFO only 0 0.00
DFP only 0 0.00
DFX only 0 0.00
DFO + DFP 0 0.00
DFP + DFX 0 0.00
DFO + DFX 0 0.00
DFO + DFP + DFX 0 0.00
Above 45 0
DFO only 0 0.00
DFP only 0 0.00
DFX only 0 0.00
DFO + DFP 0 0.00
DFP + DFX 0 0.00
DFO + DFX 0 0.00
DFO + DFP + DFX 0 0.00
Total 115 100.00
MTR Report_Part-1_PRINT_20191114_FA9.indd 124 27/11/2019 5:09 PM
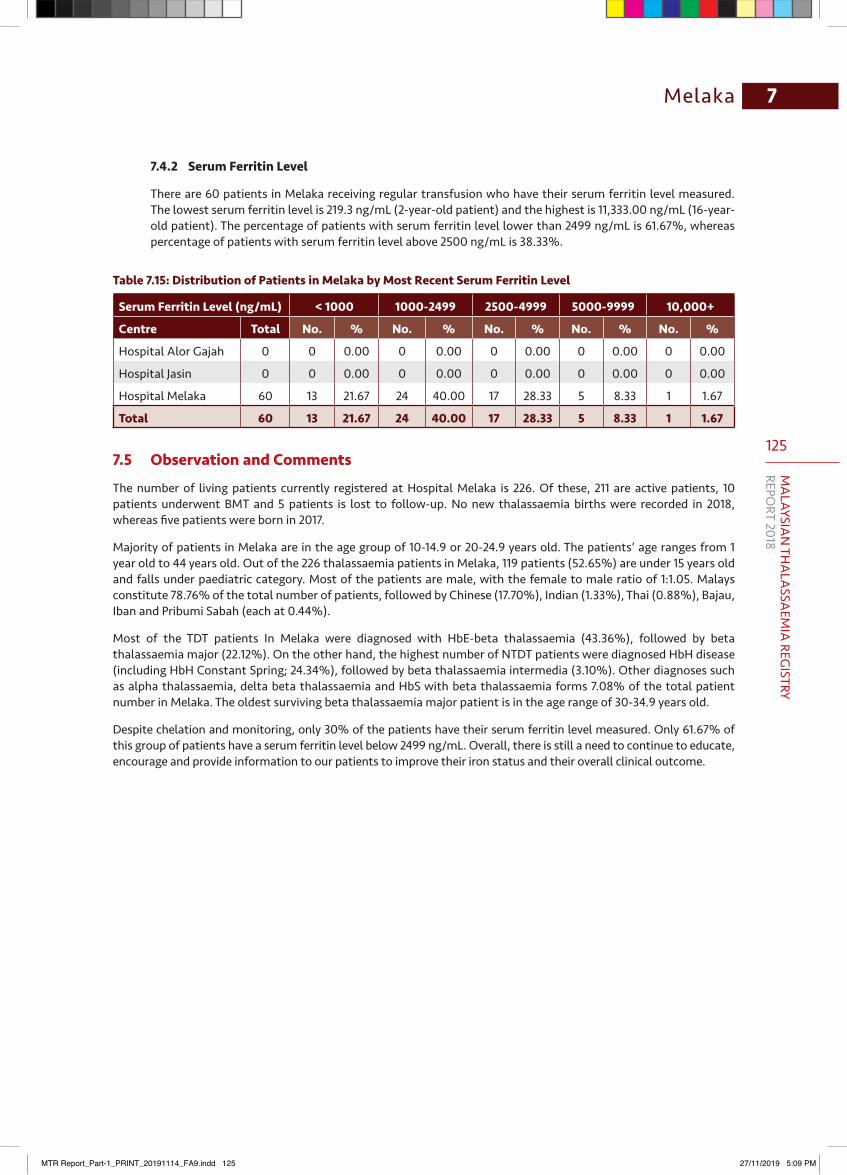
125
MA
LAYSIAN
THA
LASSA
EMIA
REGISTRY
REPORT 2018
7 Melaka
7.4.2 Serum Ferritin Level
There are 60 patients in Melaka receiving regular transfusion who have their serum ferritin level measured. The lowest serum ferritin level is 219.3 ng/mL (2-year-old patient) and the highest is 11,333.00 ng/mL (16-year-old patient). The percentage of patients with serum ferritin level lower than 2499 ng/mL is 61.67%, whereas percentage of patients with serum ferritin level above 2500 ng/mL is 38.33%.
Table 7.15: Distribution of Patients in Melaka by Most Recent Serum Ferritin Level
Serum Ferritin Level (ng/mL) < 1000 1000-2499 2500-4999 5000-9999 10,000+
Centre Total No. % No. % No. % No. % No. %
Hospital Alor Gajah 0 0 0.00 0 0.00 0 0.00 0 0.00 0 0.00
Hospital Jasin 0 0 0.00 0 0.00 0 0.00 0 0.00 0 0.00
Hospital Melaka 60 13 21.67 24 40.00 17 28.33 5 8.33 1 1.67
Total 60 13 21.67 24 40.00 17 28.33 5 8.33 1 1.67
7.5 Observation and Comments
The number of living patients currently registered at Hospital Melaka is 226. Of these, 211 are active patients, 10 patients underwent BMT and 5 patients is lost to follow-up. No new thalassaemia births were recorded in 2018, whereas five patients were born in 2017.
Majority of patients in Melaka are in the age group of 10-14.9 or 20-24.9 years old. The patients’ age ranges from 1 year old to 44 years old. Out of the 226 thalassaemia patients in Melaka, 119 patients (52.65%) are under 15 years old and falls under paediatric category. Most of the patients are male, with the female to male ratio of 1:1.05. Malays constitute 78.76% of the total number of patients, followed by Chinese (17.70%), Indian (1.33%), Thai (0.88%), Bajau, Iban and Pribumi Sabah (each at 0.44%).
Most of the TDT patients In Melaka were diagnosed with HbE-beta thalassaemia (43.36%), followed by beta thalassaemia major (22.12%). On the other hand, the highest number of NTDT patients were diagnosed HbH disease (including HbH Constant Spring; 24.34%), followed by beta thalassaemia intermedia (3.10%). Other diagnoses such as alpha thalassaemia, delta beta thalassaemia and HbS with beta thalassaemia forms 7.08% of the total patient number in Melaka. The oldest surviving beta thalassaemia major patient is in the age range of 30-34.9 years old.
Despite chelation and monitoring, only 30% of the patients have their serum ferritin level measured. Only 61.67% of this group of patients have a serum ferritin level below 2499 ng/mL. Overall, there is still a need to continue to educate, encourage and provide information to our patients to improve their iron status and their overall clinical outcome.
MTR Report_Part-1_PRINT_20191114_FA9.indd 125 27/11/2019 5:09 PM
126
MA
LAYS
IAN
TH
ALA
SSA
EMIA
REG
ISTR
YRE
PORT
201
8
8.1 Introduction
Negeri Sembilan, is one of the 14 states which constitutes Malaysia. It is located on the western coast of Peninsular Malaysia, just south of Kuala Lumpur and is bordered in the north by Selangor, in the east by Pahang and in the south by Melaka and Johor.
Negeri Sembilan has collective population of 1.13 million in 2018 and consists of seven districts, namely Seremban, Port Dickson, Kuala Pilah, Jempol, Jelebu, Rembau and Tampin.
There are six government hospitals in the state of Negeri Sembilan, namely Hospital Tuanku Ja’afar (HTJ, Seremban), Hospital Tuanku Ampuan Najihah (HTAN, Kuala Pilah), Hospital Jelebu, Hospital Port Dickson, Hospital Jempol and Hospital Tampin.
The total number of thalassaemia patients registered in the MTR in Negeri Sembilan are 181 patients. Most patients (135 patients) received treatment at HTJ, followed by HTAN (37 patients). HTJ is the only hospital in Negeri Sembilan which provides day care service including blood transfusion for thalassaemia patients.
8.2 PatientDemographics
Patient were categorised as alive, lost to follow-up and cured by transplant. The total number of living patients is 181 and the number of deceased patient up to 2018 is 6 patients.
Table8.1:DistributionofPatientsinNegeriSembilanbyCentre
Centre No. of Patients (n) Percentage (%)
Hospital Jelebu 6 3.31
Hospital Tuanku Ampuan Najihah, Kuala Pilah 37 20.44
Hospital Port Dickson 3 1.66
Hospital Tuanku Ja’afar, Seremban 135 74.59
Hospital Tampin 0 0.00
Hospital Jempol 0 0.00
Total 181 100.00
Negeri Sembilan8
MTR Report_Part-1_PRINT_20191114_FA9.indd 126 27/11/2019 5:09 PM
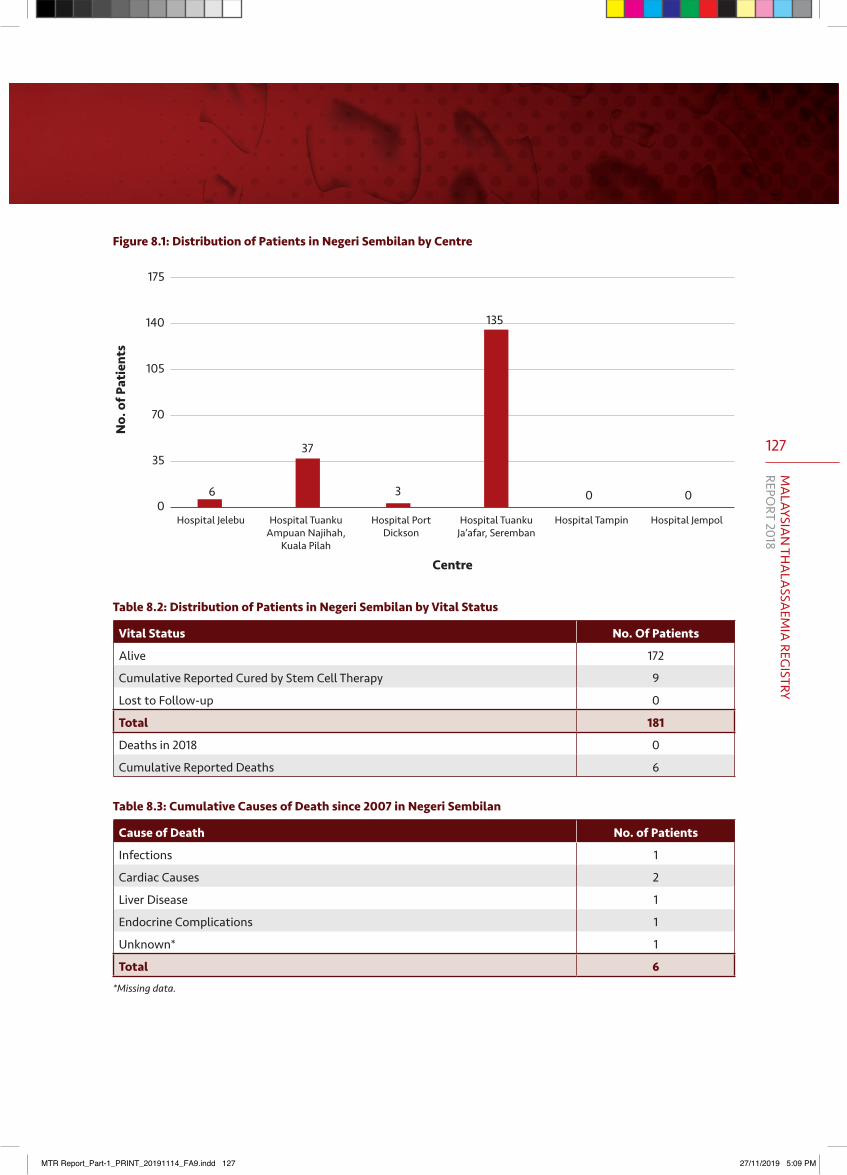
127
MA
LAYSIAN
THA
LASSA
EMIA
REGISTRY
REPORT 2018
175
140
105
70
35
0
Centre
No.
of P
atie
nts
Hospital Jelebu Hospital Tuanku Ampuan Najihah,
Kuala Pilah
Hospital Port Dickson
Hospital Tuanku Ja’afar, Seremban
Hospital Tampin Hospital Jempol
135
3
37
6 00
Figure8.1:DistributionofPatientsinNegeriSembilanbyCentre
Table8.2:DistributionofPatientsinNegeriSembilanbyVitalStatus
Vital Status No. Of Patients
Alive 172
Cumulative Reported Cured by Stem Cell Therapy 9
Lost to Follow-up 0
Total 181
Deaths in 2018 0
Cumulative Reported Deaths 6
Table8.3:CumulativeCausesofDeathsince2007inNegeriSembilan
Cause of Death No. of Patients
Infections 1
Cardiac Causes 2
Liver Disease 1
Endocrine Complications 1
Unknown* 1
Total 6*Missing data.
MTR Report_Part-1_PRINT_20191114_FA9.indd 127 27/11/2019 5:09 PM
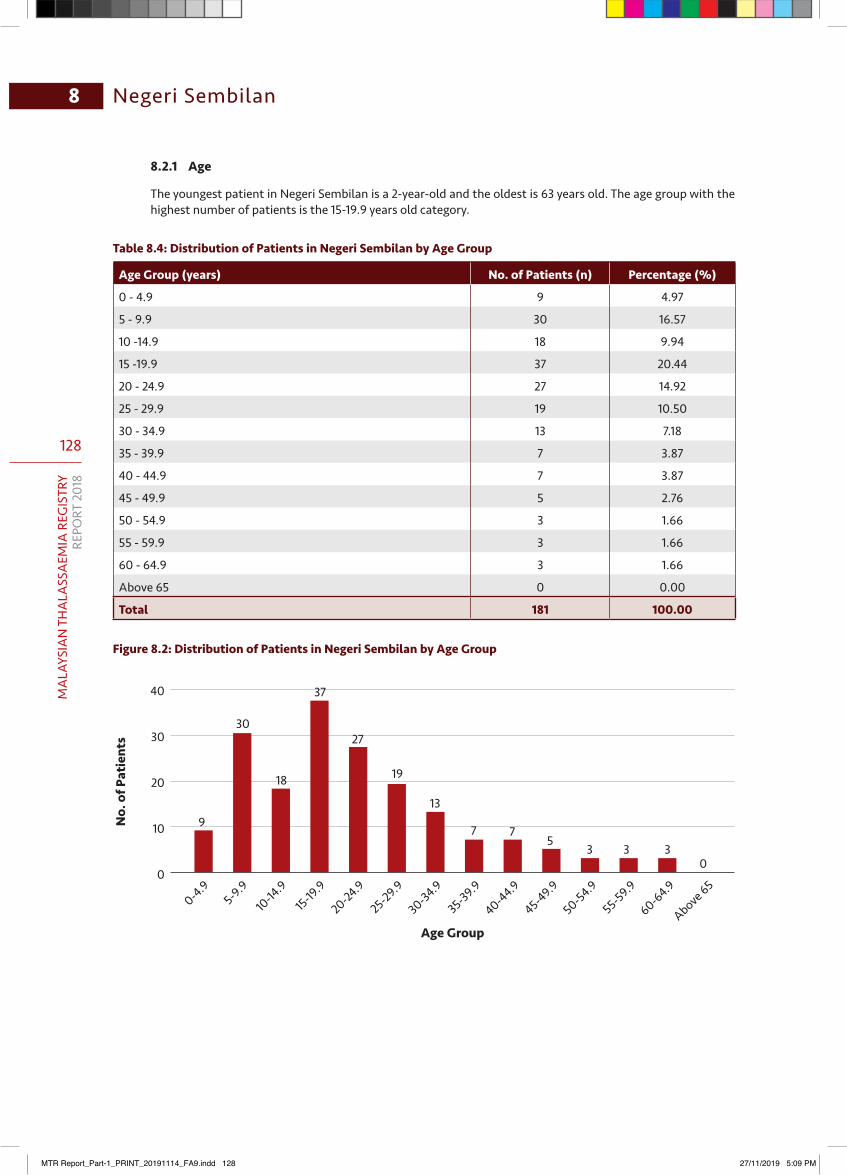
128
MA
LAYS
IAN
TH
ALA
SSA
EMIA
REG
ISTR
YRE
PORT
201
8
8 Negeri Sembilan
8.2.1 Age
The youngest patient in Negeri Sembilan is a 2-year-old and the oldest is 63 years old. The age group with the highest number of patients is the 15-19.9 years old category.
Table8.4:DistributionofPatientsinNegeriSembilanbyAgeGroup
Age Group (years) No. of Patients (n) Percentage (%)
0 - 4.9 9 4.97
5 - 9.9 30 16.57
10 -14.9 18 9.94
15 -19.9 37 20.44
20 - 24.9 27 14.92
25 - 29.9 19 10.50
30 - 34.9 13 7.18
35 - 39.9 7 3.87
40 - 44.9 7 3.87
45 - 49.9 5 2.76
50 - 54.9 3 1.66
55 - 59.9 3 1.66
60 - 64.9 3 1.66
Above 65 0 0.00
Total 181 100.00
Figure8.2:DistributionofPatientsinNegeriSembilanbyAgeGroup
0-4.95-9.9
10-14
.915-19
.9
20-24.9
25-29.9
30-34.9
35-39.9
40-44.9
45-49.9
50-54.9
55-59.9
60-64.9
Above 65
40
30
20
10
0
Age Group
No.
of P
atie
nts
9
30
18
37
27
19
13
7 75
3 3 30
MTR Report_Part-1_PRINT_20191114_FA9.indd 128 27/11/2019 5:09 PM
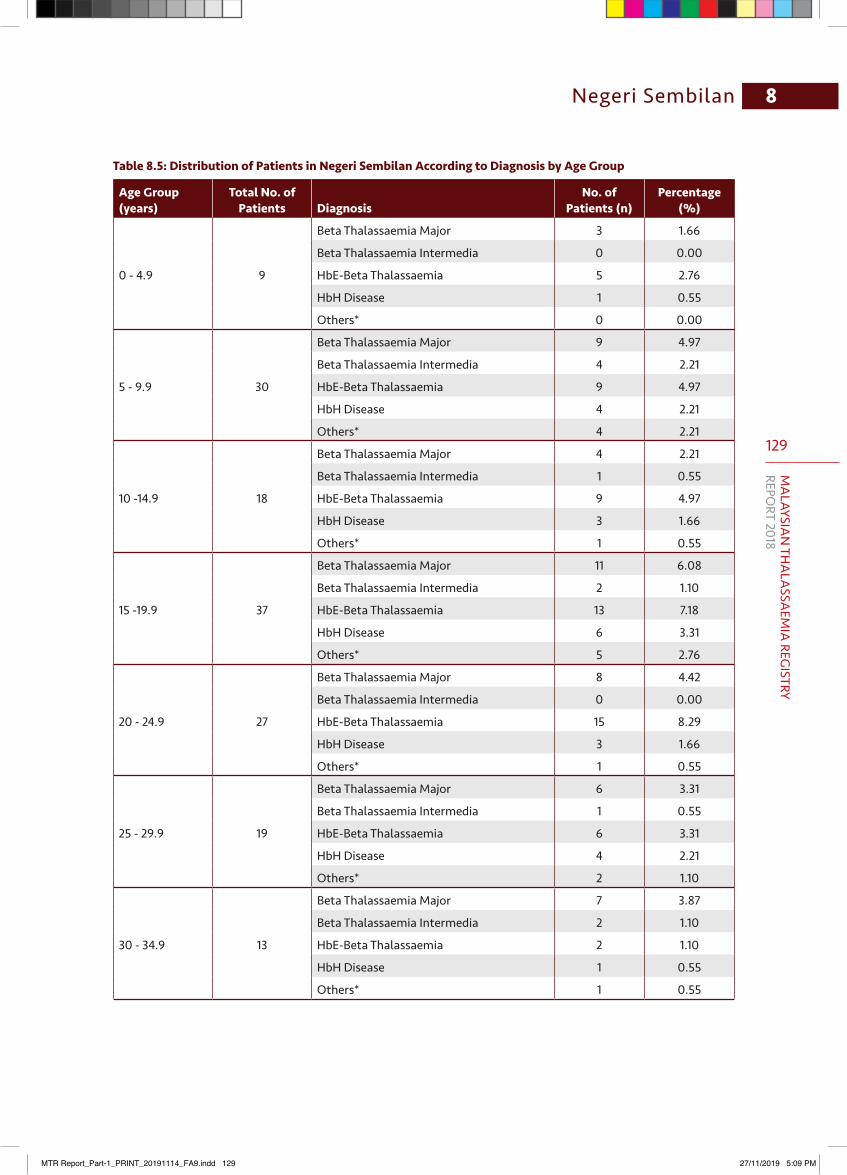
129
MA
LAYSIAN
THA
LASSA
EMIA
REGISTRY
REPORT 2018
8Negeri Sembilan
Table8.5:DistributionofPatientsinNegeriSembilanAccordingtoDiagnosisbyAgeGroup
Age Group (years)
Total No. of Patients Diagnosis
No. of Patients (n)
Percentage (%)
0 - 4.9 9
Beta Thalassaemia Major 3 1.66
Beta Thalassaemia Intermedia 0 0.00
HbE-Beta Thalassaemia 5 2.76
HbH Disease 1 0.55
Others* 0 0.00
5 - 9.9 30
Beta Thalassaemia Major 9 4.97
Beta Thalassaemia Intermedia 4 2.21
HbE-Beta Thalassaemia 9 4.97
HbH Disease 4 2.21
Others* 4 2.21
10 -14.9 18
Beta Thalassaemia Major 4 2.21
Beta Thalassaemia Intermedia 1 0.55
HbE-Beta Thalassaemia 9 4.97
HbH Disease 3 1.66
Others* 1 0.55
15 -19.9 37
Beta Thalassaemia Major 11 6.08
Beta Thalassaemia Intermedia 2 1.10
HbE-Beta Thalassaemia 13 7.18
HbH Disease 6 3.31
Others* 5 2.76
20 - 24.9 27
Beta Thalassaemia Major 8 4.42
Beta Thalassaemia Intermedia 0 0.00
HbE-Beta Thalassaemia 15 8.29
HbH Disease 3 1.66
Others* 1 0.55
25 - 29.9 19
Beta Thalassaemia Major 6 3.31
Beta Thalassaemia Intermedia 1 0.55
HbE-Beta Thalassaemia 6 3.31
HbH Disease 4 2.21
Others* 2 1.10
30 - 34.9 13
Beta Thalassaemia Major 7 3.87
Beta Thalassaemia Intermedia 2 1.10
HbE-Beta Thalassaemia 2 1.10
HbH Disease 1 0.55
Others* 1 0.55
MTR Report_Part-1_PRINT_20191114_FA9.indd 129 27/11/2019 5:09 PM
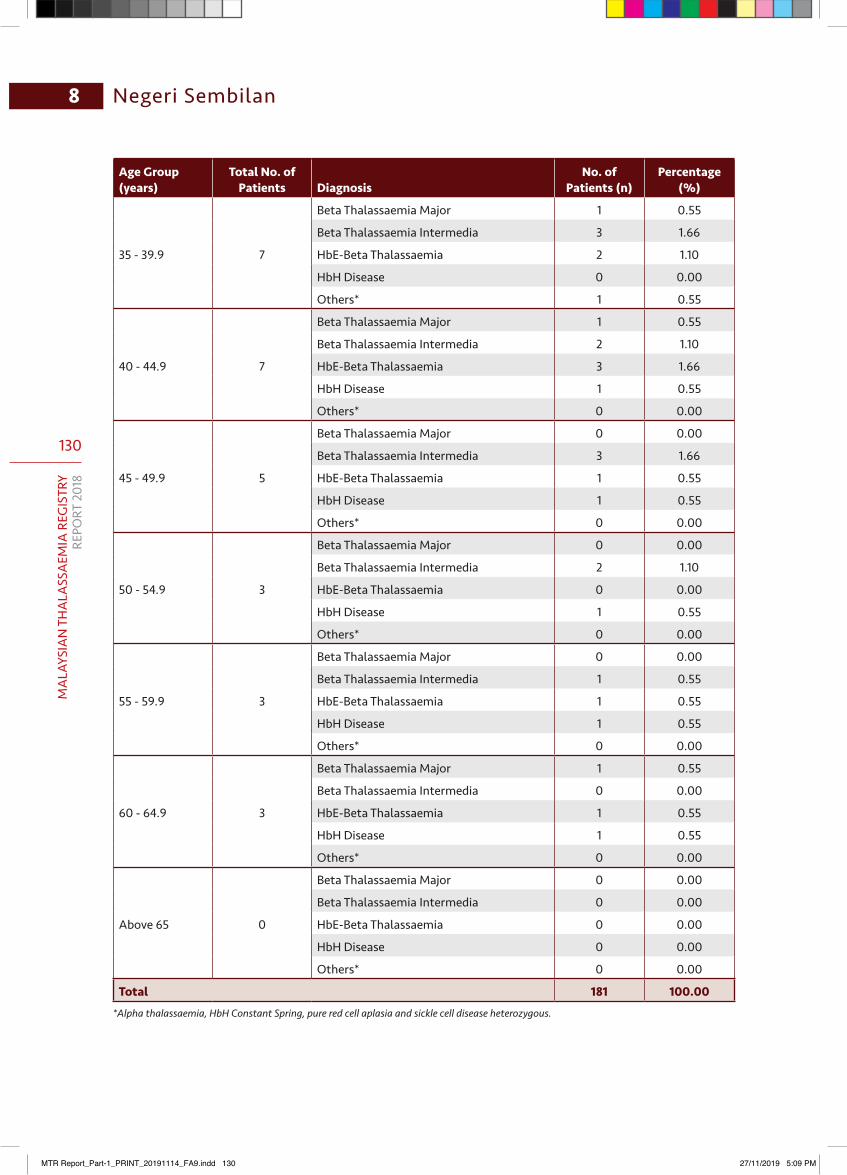
130
MA
LAYS
IAN
TH
ALA
SSA
EMIA
REG
ISTR
YRE
PORT
201
8
8 Negeri Sembilan
Age Group (years)
Total No. of Patients Diagnosis
No. of Patients (n)
Percentage (%)
35 - 39.9 7
Beta Thalassaemia Major 1 0.55
Beta Thalassaemia Intermedia 3 1.66
HbE-Beta Thalassaemia 2 1.10
HbH Disease 0 0.00
Others* 1 0.55
40 - 44.9 7
Beta Thalassaemia Major 1 0.55
Beta Thalassaemia Intermedia 2 1.10
HbE-Beta Thalassaemia 3 1.66
HbH Disease 1 0.55
Others* 0 0.00
45 - 49.9 5
Beta Thalassaemia Major 0 0.00
Beta Thalassaemia Intermedia 3 1.66
HbE-Beta Thalassaemia 1 0.55
HbH Disease 1 0.55
Others* 0 0.00
50 - 54.9 3
Beta Thalassaemia Major 0 0.00
Beta Thalassaemia Intermedia 2 1.10
HbE-Beta Thalassaemia 0 0.00
HbH Disease 1 0.55
Others* 0 0.00
55 - 59.9 3
Beta Thalassaemia Major 0 0.00
Beta Thalassaemia Intermedia 1 0.55
HbE-Beta Thalassaemia 1 0.55
HbH Disease 1 0.55
Others* 0 0.00
60 - 64.9 3
Beta Thalassaemia Major 1 0.55
Beta Thalassaemia Intermedia 0 0.00
HbE-Beta Thalassaemia 1 0.55
HbH Disease 1 0.55
Others* 0 0.00
Above 65 0
Beta Thalassaemia Major 0 0.00
Beta Thalassaemia Intermedia 0 0.00
HbE-Beta Thalassaemia 0 0.00
HbH Disease 0 0.00
Others* 0 0.00
Total 181 100.00*Alpha thalassaemia, HbH Constant Spring, pure red cell aplasia and sickle cell disease heterozygous.
MTR Report_Part-1_PRINT_20191114_FA9.indd 130 27/11/2019 5:09 PM
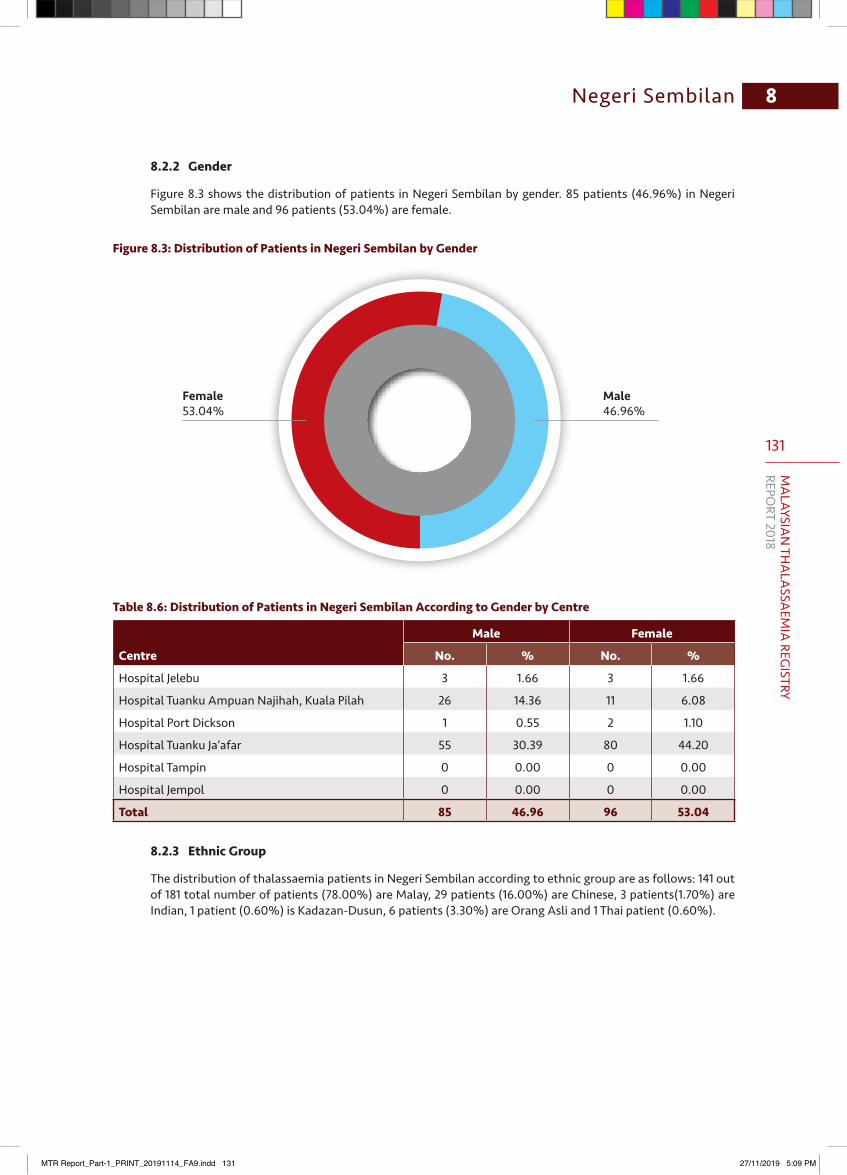
131
MA
LAYSIAN
THA
LASSA
EMIA
REGISTRY
REPORT 2018
8Negeri Sembilan
8.2.2 Gender
Figure 8.3 shows the distribution of patients in Negeri Sembilan by gender. 85 patients (46.96%) in Negeri Sembilan are male and 96 patients (53.04%) are female.
Figure8.3:DistributionofPatientsinNegeriSembilanbyGender
Female53.04%
Male46.96%
Table8.6:DistributionofPatientsinNegeriSembilanAccordingtoGenderbyCentre
Centre
Male Female
No. % No. %
Hospital Jelebu 3 1.66 3 1.66
Hospital Tuanku Ampuan Najihah, Kuala Pilah 26 14.36 11 6.08
Hospital Port Dickson 1 0.55 2 1.10
Hospital Tuanku Ja’afar 55 30.39 80 44.20
Hospital Tampin 0 0.00 0 0.00
Hospital Jempol 0 0.00 0 0.00
Total 85 46.96 96 53.04
8.2.3 EthnicGroup
The distribution of thalassaemia patients in Negeri Sembilan according to ethnic group are as follows: 141 out of 181 total number of patients (78.00%) are Malay, 29 patients (16.00%) are Chinese, 3 patients(1.70%) are Indian, 1 patient (0.60%) is Kadazan-Dusun, 6 patients (3.30%) are Orang Asli and 1 Thai patient (0.60%).
MTR Report_Part-1_PRINT_20191114_FA9.indd 131 27/11/2019 5:09 PM
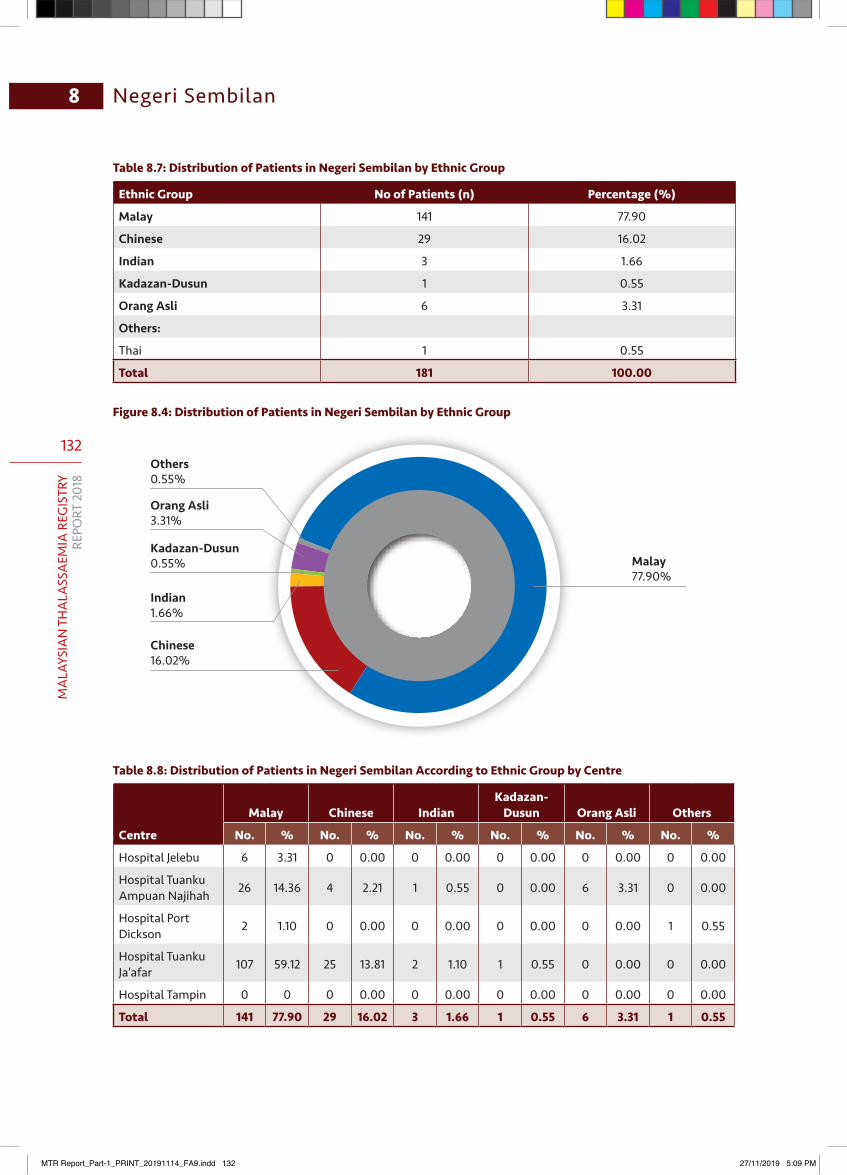
132
MA
LAYS
IAN
TH
ALA
SSA
EMIA
REG
ISTR
YRE
PORT
201
8
8 Negeri Sembilan
Table8.7:DistributionofPatientsinNegeriSembilanbyEthnicGroup
Ethnic Group No of Patients (n) Percentage (%)
Malay 141 77.90
Chinese 29 16.02
Indian 3 1.66
Kadazan-Dusun 1 0.55
Orang Asli 6 3.31
Others:
Thai 1 0.55
Total 181 100.00
Figure8.4:DistributionofPatientsinNegeriSembilanbyEthnicGroup
Chinese16.02%
Indian1.66%
Kadazan-Dusun0.55%
Others0.55%
Orang Asli3.31%
Malay77.90%
Table8.8:DistributionofPatientsinNegeriSembilanAccordingtoEthnicGroupbyCentre
Centre
Malay Chinese IndianKadazan-
Dusun Orang Asli Others
No. % No. % No. % No. % No. % No. %
Hospital Jelebu 6 3.31 0 0.00 0 0.00 0 0.00 0 0.00 0 0.00
Hospital Tuanku Ampuan Najihah 26 14.36 4 2.21 1 0.55 0 0.00 6 3.31 0 0.00
Hospital Port Dickson 2 1.10 0 0.00 0 0.00 0 0.00 0 0.00 1 0.55
Hospital Tuanku Ja’afar 107 59.12 25 13.81 2 1.10 1 0.55 0 0.00 0 0.00
Hospital Tampin 0 0 0 0.00 0 0.00 0 0.00 0 0.00 0 0.00
Total 141 77.90 29 16.02 3 1.66 1 0.55 6 3.31 1 0.55
MTR Report_Part-1_PRINT_20191114_FA9.indd 132 27/11/2019 5:09 PM
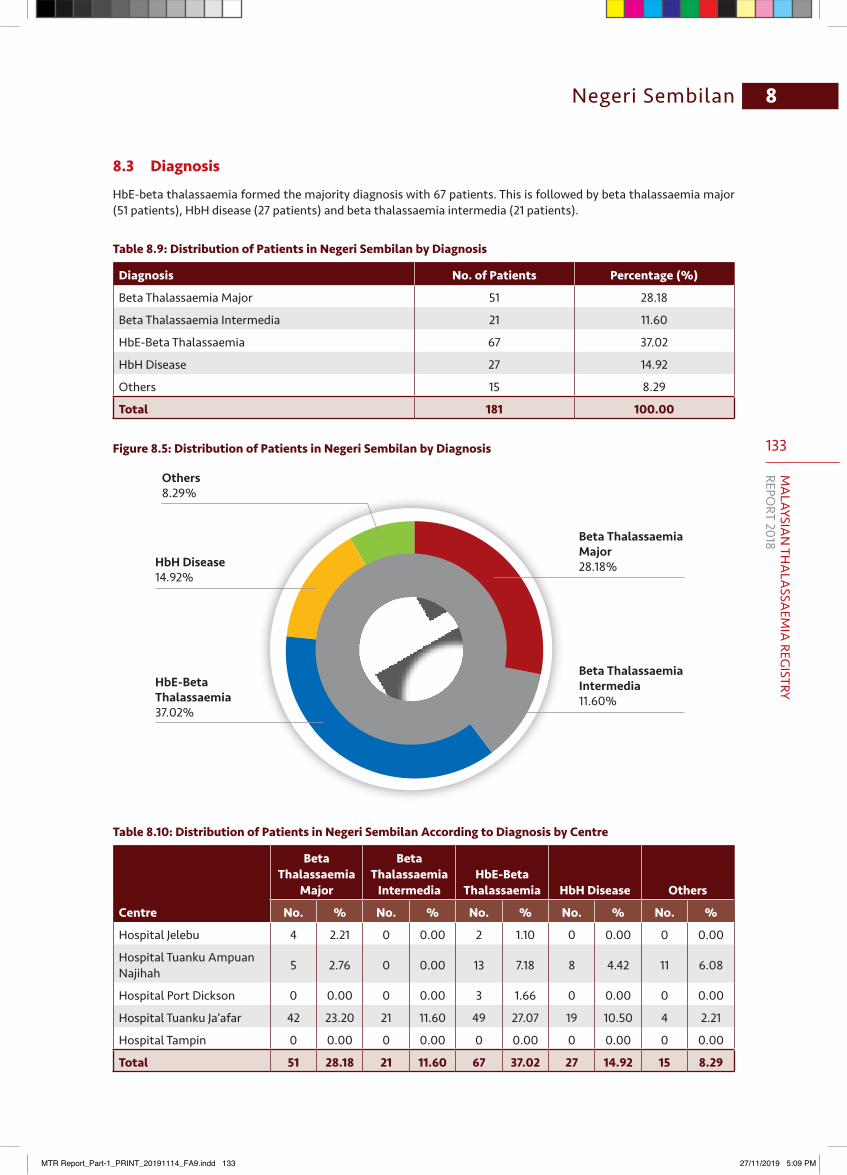
133
MA
LAYSIAN
THA
LASSA
EMIA
REGISTRY
REPORT 2018
8Negeri Sembilan
8.3 Diagnosis
HbE-beta thalassaemia formed the majority diagnosis with 67 patients. This is followed by beta thalassaemia major (51 patients), HbH disease (27 patients) and beta thalassaemia intermedia (21 patients).
Table8.9:DistributionofPatientsinNegeriSembilanbyDiagnosis
Diagnosis No. of Patients Percentage (%)
Beta Thalassaemia Major 51 28.18
Beta Thalassaemia Intermedia 21 11.60
HbE-Beta Thalassaemia 67 37.02
HbH Disease 27 14.92
Others 15 8.29
Total 181 100.00
Figure8.5:DistributionofPatientsinNegeriSembilanbyDiagnosis
Beta Thalassaemia Major28.18%
Beta Thalassaemia Intermedia11.60%
HbH Disease14.92%
HbE-Beta Thalassaemia37.02%
Others8.29%
Table8.10:DistributionofPatientsinNegeriSembilanAccordingtoDiagnosisbyCentre
Centre
Beta Thalassaemia
Major
Beta Thalassaemia
IntermediaHbE-Beta
Thalassaemia HbH Disease Others
No. % No. % No. % No. % No. %
Hospital Jelebu 4 2.21 0 0.00 2 1.10 0 0.00 0 0.00
Hospital Tuanku Ampuan Najihah 5 2.76 0 0.00 13 7.18 8 4.42 11 6.08
Hospital Port Dickson 0 0.00 0 0.00 3 1.66 0 0.00 0 0.00
Hospital Tuanku Ja’afar 42 23.20 21 11.60 49 27.07 19 10.50 4 2.21
Hospital Tampin 0 0.00 0 0.00 0 0.00 0 0.00 0 0.00
Total 51 28.18 21 11.60 67 37.02 27 14.92 15 8.29
MTR Report_Part-1_PRINT_20191114_FA9.indd 133 27/11/2019 5:09 PM
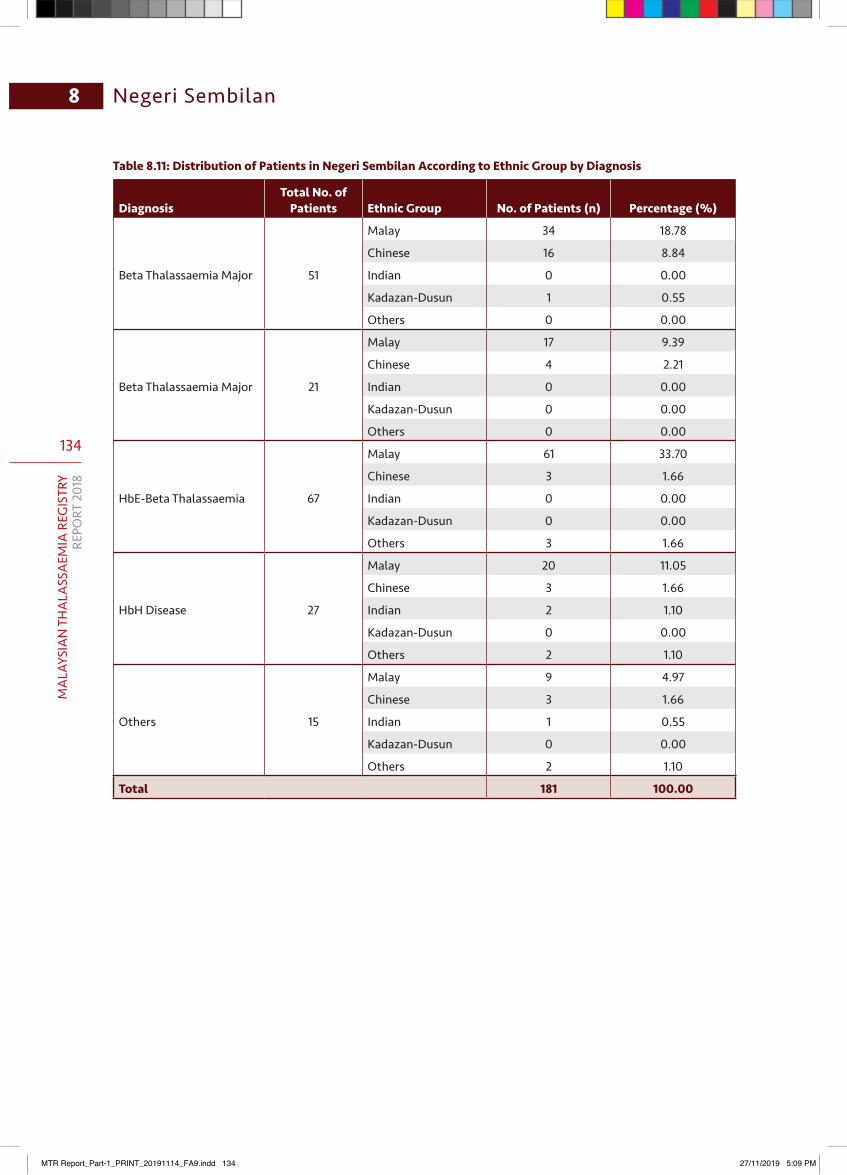
134
MA
LAYS
IAN
TH
ALA
SSA
EMIA
REG
ISTR
YRE
PORT
201
8
8 Negeri Sembilan
Table8.11:DistributionofPatientsinNegeriSembilanAccordingtoEthnicGroupbyDiagnosis
DiagnosisTotal No. of
Patients Ethnic Group No. of Patients (n) Percentage (%)
Beta Thalassaemia Major 51
Malay 34 18.78
Chinese 16 8.84
Indian 0 0.00
Kadazan-Dusun 1 0.55
Others 0 0.00
Beta Thalassaemia Major 21
Malay 17 9.39
Chinese 4 2.21
Indian 0 0.00
Kadazan-Dusun 0 0.00
Others 0 0.00
HbE-Beta Thalassaemia 67
Malay 61 33.70
Chinese 3 1.66
Indian 0 0.00
Kadazan-Dusun 0 0.00
Others 3 1.66
HbH Disease 27
Malay 20 11.05
Chinese 3 1.66
Indian 2 1.10
Kadazan-Dusun 0 0.00
Others 2 1.10
Others 15
Malay 9 4.97
Chinese 3 1.66
Indian 1 0.55
Kadazan-Dusun 0 0.00
Others 2 1.10
Total 181 100.00
MTR Report_Part-1_PRINT_20191114_FA9.indd 134 27/11/2019 5:09 PM
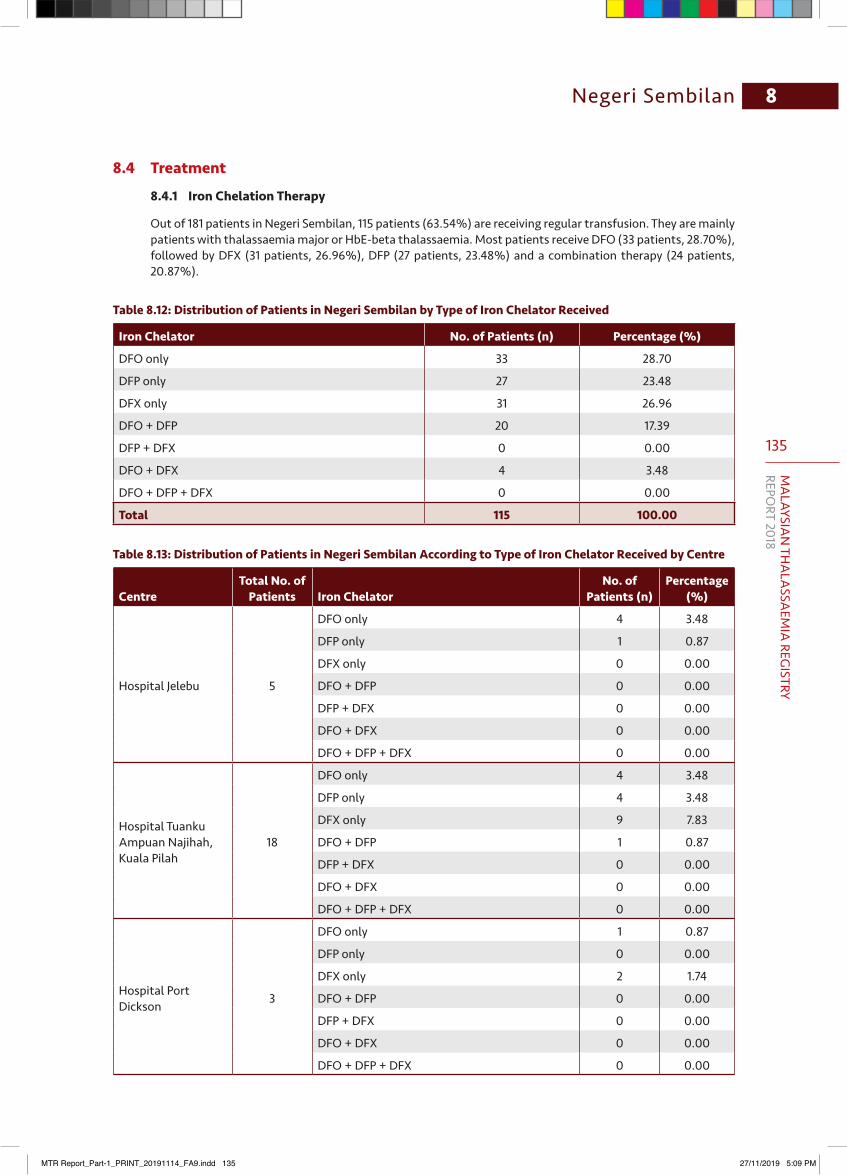
135
MA
LAYSIAN
THA
LASSA
EMIA
REGISTRY
REPORT 2018
8Negeri Sembilan
8.4 Treatment
8.4.1 IronChelationTherapy
Out of 181 patients in Negeri Sembilan, 115 patients (63.54%) are receiving regular transfusion. They are mainly patients with thalassaemia major or HbE-beta thalassaemia. Most patients receive DFO (33 patients, 28.70%), followed by DFX (31 patients, 26.96%), DFP (27 patients, 23.48%) and a combination therapy (24 patients, 20.87%).
Table8.12:DistributionofPatientsinNegeriSembilanbyTypeofIronChelatorReceived
Iron Chelator No. of Patients (n) Percentage (%)
DFO only 33 28.70
DFP only 27 23.48
DFX only 31 26.96
DFO + DFP 20 17.39
DFP + DFX 0 0.00
DFO + DFX 4 3.48
DFO + DFP + DFX 0 0.00
Total 115 100.00
Table8.13:DistributionofPatientsinNegeriSembilanAccordingtoTypeofIronChelatorReceivedbyCentre
CentreTotal No. of
Patients Iron ChelatorNo. of
Patients (n)Percentage
(%)
Hospital Jelebu 5
DFO only 4 3.48
DFP only 1 0.87
DFX only 0 0.00
DFO + DFP 0 0.00
DFP + DFX 0 0.00
DFO + DFX 0 0.00
DFO + DFP + DFX 0 0.00
Hospital Tuanku Ampuan Najihah, Kuala Pilah
18
DFO only 4 3.48
DFP only 4 3.48
DFX only 9 7.83
DFO + DFP 1 0.87
DFP + DFX 0 0.00
DFO + DFX 0 0.00
DFO + DFP + DFX 0 0.00
Hospital Port Dickson 3
DFO only 1 0.87
DFP only 0 0.00
DFX only 2 1.74
DFO + DFP 0 0.00
DFP + DFX 0 0.00
DFO + DFX 0 0.00
DFO + DFP + DFX 0 0.00
MTR Report_Part-1_PRINT_20191114_FA9.indd 135 27/11/2019 5:09 PM
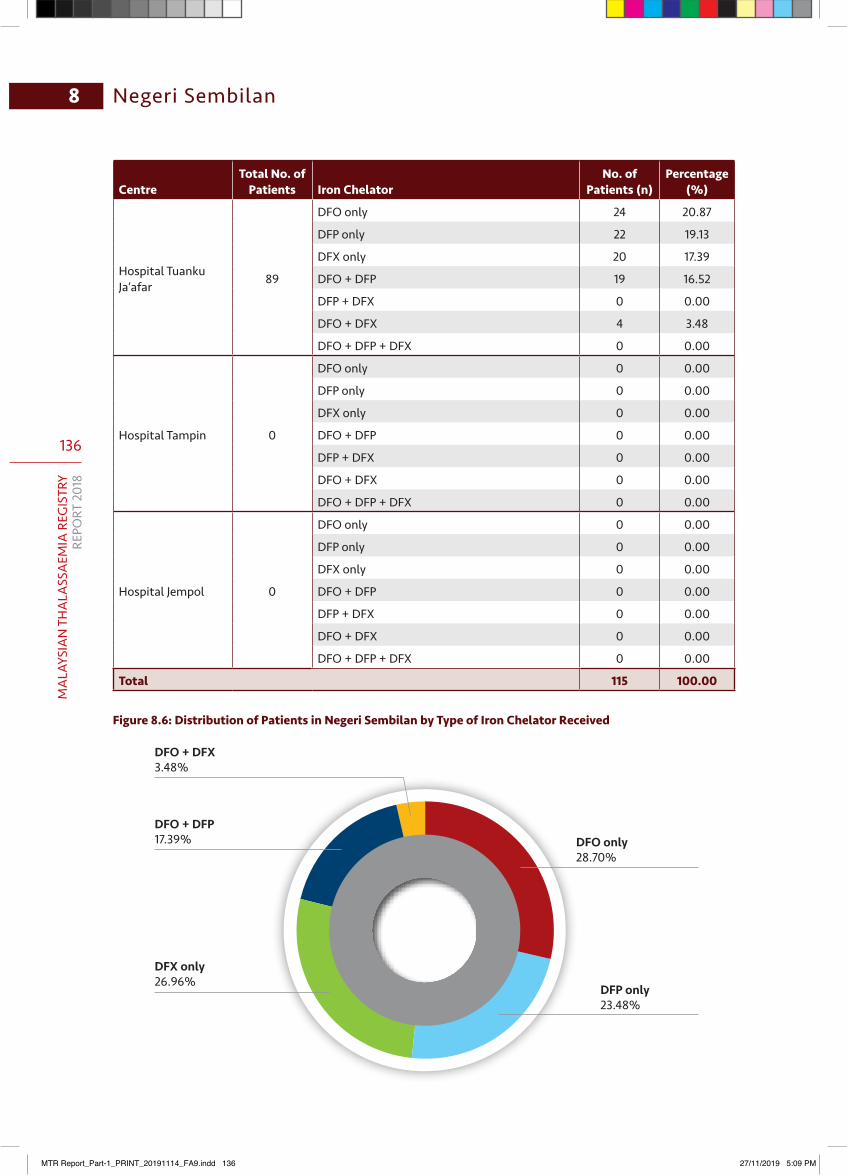
136
MA
LAYS
IAN
TH
ALA
SSA
EMIA
REG
ISTR
YRE
PORT
201
8
8 Negeri Sembilan
CentreTotal No. of
Patients Iron ChelatorNo. of
Patients (n)Percentage
(%)
Hospital Tuanku Ja’afar 89
DFO only 24 20.87
DFP only 22 19.13
DFX only 20 17.39
DFO + DFP 19 16.52
DFP + DFX 0 0.00
DFO + DFX 4 3.48
DFO + DFP + DFX 0 0.00
Hospital Tampin 0
DFO only 0 0.00
DFP only 0 0.00
DFX only 0 0.00
DFO + DFP 0 0.00
DFP + DFX 0 0.00
DFO + DFX 0 0.00
DFO + DFP + DFX 0 0.00
Hospital Jempol 0
DFO only 0 0.00
DFP only 0 0.00
DFX only 0 0.00
DFO + DFP 0 0.00
DFP + DFX 0 0.00
DFO + DFX 0 0.00
DFO + DFP + DFX 0 0.00
Total 115 100.00
Figure8.6:DistributionofPatientsinNegeriSembilanbyTypeofIronChelatorReceived
DFP only23.48%
DFX only26.96%
DFO + DFP17.39%
DFO + DFX3.48%
DFO only28.70%
MTR Report_Part-1_PRINT_20191114_FA9.indd 136 27/11/2019 5:09 PM
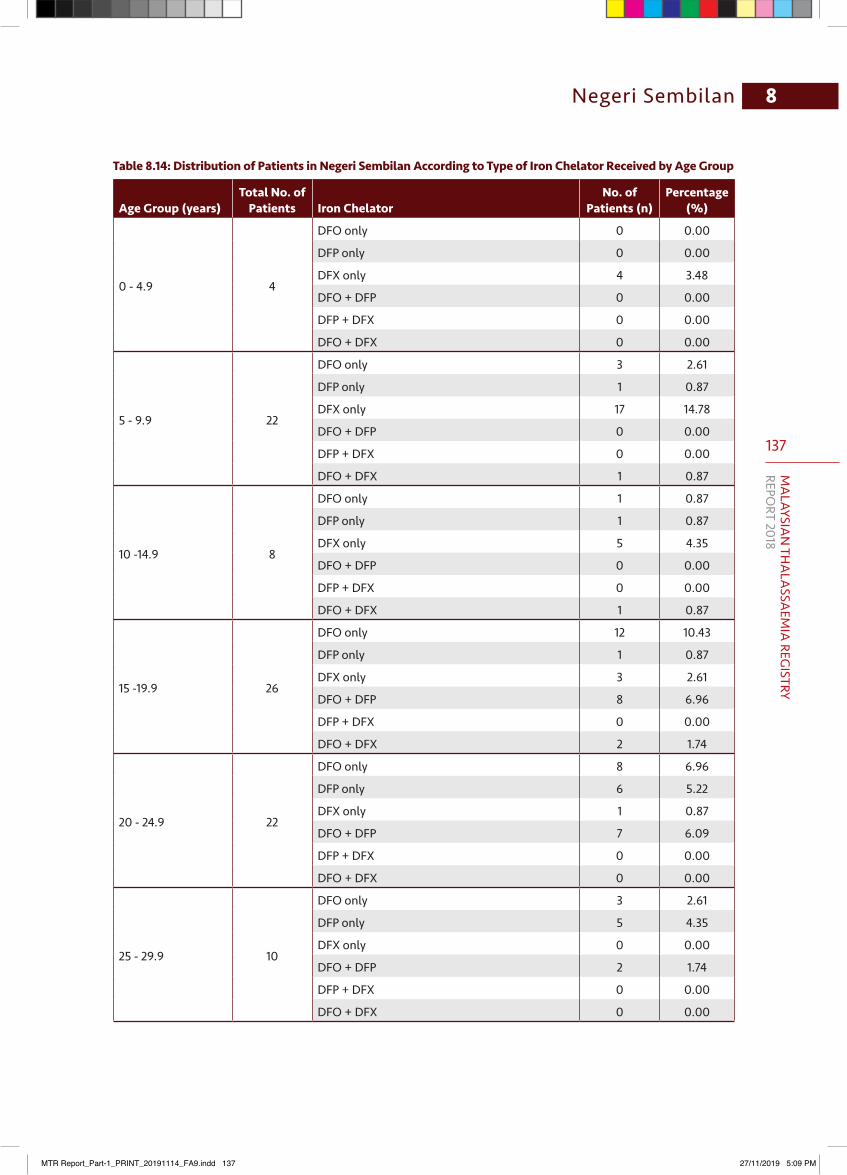
137
MA
LAYSIAN
THA
LASSA
EMIA
REGISTRY
REPORT 2018
8Negeri Sembilan
Table8.14:DistributionofPatientsinNegeriSembilanAccordingtoTypeofIronChelatorReceivedbyAgeGroup
Age Group (years)Total No. of
Patients Iron ChelatorNo. of
Patients (n)Percentage
(%)
0 - 4.9 4
DFO only 0 0.00
DFP only 0 0.00
DFX only 4 3.48
DFO + DFP 0 0.00
DFP + DFX 0 0.00
DFO + DFX 0 0.00
5 - 9.9 22
DFO only 3 2.61
DFP only 1 0.87
DFX only 17 14.78
DFO + DFP 0 0.00
DFP + DFX 0 0.00
DFO + DFX 1 0.87
10 -14.9 8
DFO only 1 0.87
DFP only 1 0.87
DFX only 5 4.35
DFO + DFP 0 0.00
DFP + DFX 0 0.00
DFO + DFX 1 0.87
15 -19.9 26
DFO only 12 10.43
DFP only 1 0.87
DFX only 3 2.61
DFO + DFP 8 6.96
DFP + DFX 0 0.00
DFO + DFX 2 1.74
20 - 24.9 22
DFO only 8 6.96
DFP only 6 5.22
DFX only 1 0.87
DFO + DFP 7 6.09
DFP + DFX 0 0.00
DFO + DFX 0 0.00
25 - 29.9 10
DFO only 3 2.61
DFP only 5 4.35
DFX only 0 0.00
DFO + DFP 2 1.74
DFP + DFX 0 0.00
DFO + DFX 0 0.00
MTR Report_Part-1_PRINT_20191114_FA9.indd 137 27/11/2019 5:09 PM
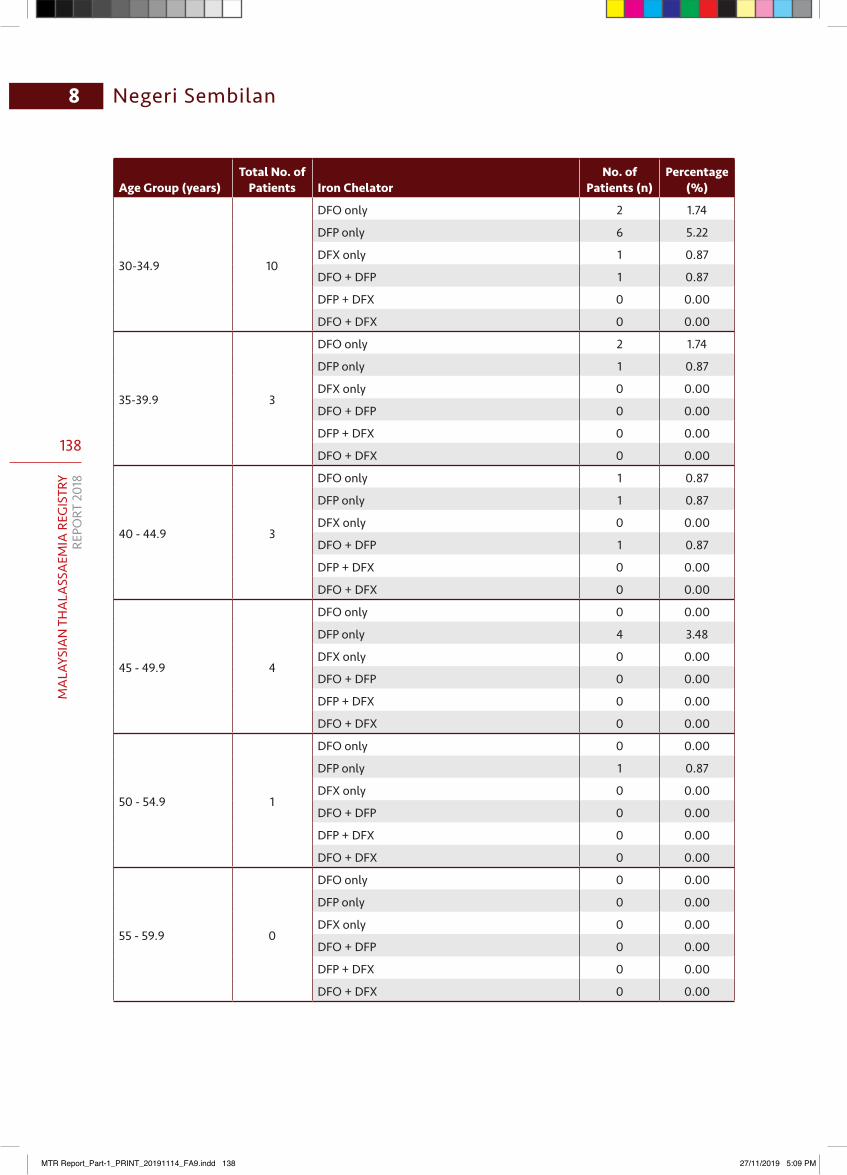
138
MA
LAYS
IAN
TH
ALA
SSA
EMIA
REG
ISTR
YRE
PORT
201
8
8 Negeri Sembilan
Age Group (years)Total No. of
Patients Iron ChelatorNo. of
Patients (n)Percentage
(%)
30-34.9 10
DFO only 2 1.74
DFP only 6 5.22
DFX only 1 0.87
DFO + DFP 1 0.87
DFP + DFX 0 0.00
DFO + DFX 0 0.00
35-39.9 3
DFO only 2 1.74
DFP only 1 0.87
DFX only 0 0.00
DFO + DFP 0 0.00
DFP + DFX 0 0.00
DFO + DFX 0 0.00
40 - 44.9 3
DFO only 1 0.87
DFP only 1 0.87
DFX only 0 0.00
DFO + DFP 1 0.87
DFP + DFX 0 0.00
DFO + DFX 0 0.00
45 - 49.9 4
DFO only 0 0.00
DFP only 4 3.48
DFX only 0 0.00
DFO + DFP 0 0.00
DFP + DFX 0 0.00
DFO + DFX 0 0.00
50 - 54.9 1
DFO only 0 0.00
DFP only 1 0.87
DFX only 0 0.00
DFO + DFP 0 0.00
DFP + DFX 0 0.00
DFO + DFX 0 0.00
55 - 59.9 0
DFO only 0 0.00
DFP only 0 0.00
DFX only 0 0.00
DFO + DFP 0 0.00
DFP + DFX 0 0.00
DFO + DFX 0 0.00
MTR Report_Part-1_PRINT_20191114_FA9.indd 138 27/11/2019 5:09 PM
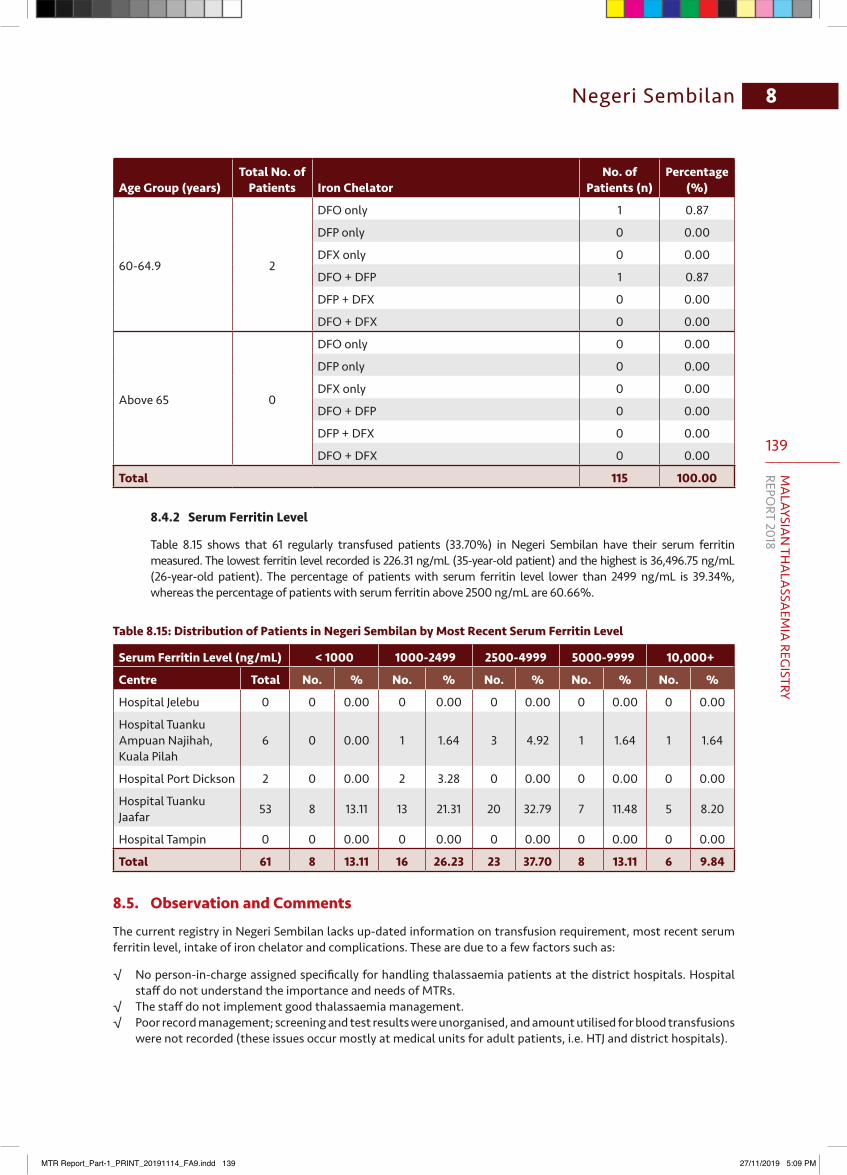
139
MA
LAYSIAN
THA
LASSA
EMIA
REGISTRY
REPORT 2018
8Negeri Sembilan
Age Group (years)Total No. of
Patients Iron ChelatorNo. of
Patients (n)Percentage
(%)
60-64.9 2
DFO only 1 0.87
DFP only 0 0.00
DFX only 0 0.00
DFO + DFP 1 0.87
DFP + DFX 0 0.00
DFO + DFX 0 0.00
Above 65 0
DFO only 0 0.00
DFP only 0 0.00
DFX only 0 0.00
DFO + DFP 0 0.00
DFP + DFX 0 0.00
DFO + DFX 0 0.00
Total 115 100.00
8.4.2 SerumFerritinLevel
Table 8.15 shows that 61 regularly transfused patients (33.70%) in Negeri Sembilan have their serum ferritin measured. The lowest ferritin level recorded is 226.31 ng/mL (35-year-old patient) and the highest is 36,496.75 ng/mL (26-year-old patient). The percentage of patients with serum ferritin level lower than 2499 ng/mL is 39.34%, whereas the percentage of patients with serum ferritin above 2500 ng/mL are 60.66%.
Table8.15:DistributionofPatientsinNegeriSembilanbyMostRecentSerumFerritinLevel
Serum Ferritin Level (ng/mL) < 1000 1000-2499 2500-4999 5000-9999 10,000+
Centre Total No. % No. % No. % No. % No. %
Hospital Jelebu 0 0 0.00 0 0.00 0 0.00 0 0.00 0 0.00
Hospital Tuanku Ampuan Najihah, Kuala Pilah
6 0 0.00 1 1.64 3 4.92 1 1.64 1 1.64
Hospital Port Dickson 2 0 0.00 2 3.28 0 0.00 0 0.00 0 0.00
Hospital Tuanku Jaafar 53 8 13.11 13 21.31 20 32.79 7 11.48 5 8.20
Hospital Tampin 0 0 0.00 0 0.00 0 0.00 0 0.00 0 0.00
Total 61 8 13.11 16 26.23 23 37.70 8 13.11 6 9.84
8.5. ObservationandComments
The current registry in Negeri Sembilan lacks up-dated information on transfusion requirement, most recent serum ferritin level, intake of iron chelator and complications. These are due to a few factors such as:
√ No person-in-charge assigned specifically for handling thalassaemia patients at the district hospitals. Hospital staff do not understand the importance and needs of MTRs.
√ The staff do not implement good thalassaemia management.√ Poor record management; screening and test results were unorganised, and amount utilised for blood transfusions
were not recorded (these issues occur mostly at medical units for adult patients, i.e. HTJ and district hospitals).
MTR Report_Part-1_PRINT_20191114_FA9.indd 139 27/11/2019 5:09 PM
140
MA
LAYS
IAN
TH
ALA
SSA
EMIA
REG
ISTR
YRE
PORT
201
8
8 Negeri Sembilan
In the process of generating the annual report, we detected a certain number of patients who were diagnosed as alpha thalassaemia were actually alpha trait (based on DNA analysis result). The current data registry does not differentiate between TDTs and NTDTs. It also does not generate report on complications.
8.5.1 Conclusion
HTJ, Seremban and HTAN, Kuala Pilah serve as the referral centres for thalassaemia patients in Negeri Sembilan. Patients receiving treatment from district hospitals are under the care of visiting specialists.
The age group with the highest number of thalassaemia patients in Negeri Sembilan is between 15-29.9 years old. The patients’ age ranges between 2 to 61 years old. 57 patients (31.49%) are below 15 years of age and is under paediatric care. Majority of the patients in Negeri Sembilan are females, with the male to female ratio of 1:1.13. Malays constitute 77.90% of the total number of patients, followed by Chinese (16.02%), Orang Asli (3.31%), Indian (1.66%), Kadazan-Dusun (0.55%) and other ethnicities (0.55%).
TDT patients in Negeri Sembilan are typically diagnosed with HbE-beta thalassaemia (37.02%) followed by beta thalassaemia major (28.18%). On the other hand, NTDT patients were diagnosed with HbH disease (14.92%), followed by beta thalassaemia intermedia (11.60%). Other diagnoses, such as alpha thalassaemia, HbH Constant Spring, pure red cell aplasia and sickle cell disease heterozygous forms 8.29% of the diagnoses. The oldest surviving beta thalassaemia major patient is in the range of 60-64.9 years old.
Only 63.54% out of the 181 patients in Negeri Sembilan are receiving iron chelation therapy, out of which 29.57% are under paediatric care. The remaining 36.46% are not receiving any form of chelator.
Finally, despite chelation and monitoring, only 33.70% of the patients have their serum ferritin level measured. Of that amount, only 13.11% of patients have serum ferritin level below 1000 ng/mL, and 26.23% of patients have a serum ferritin level between 1000-2499 ng/mL.
MTR Report_Part-1_PRINT_20191114_FA9.indd 140 27/11/2019 5:09 PM
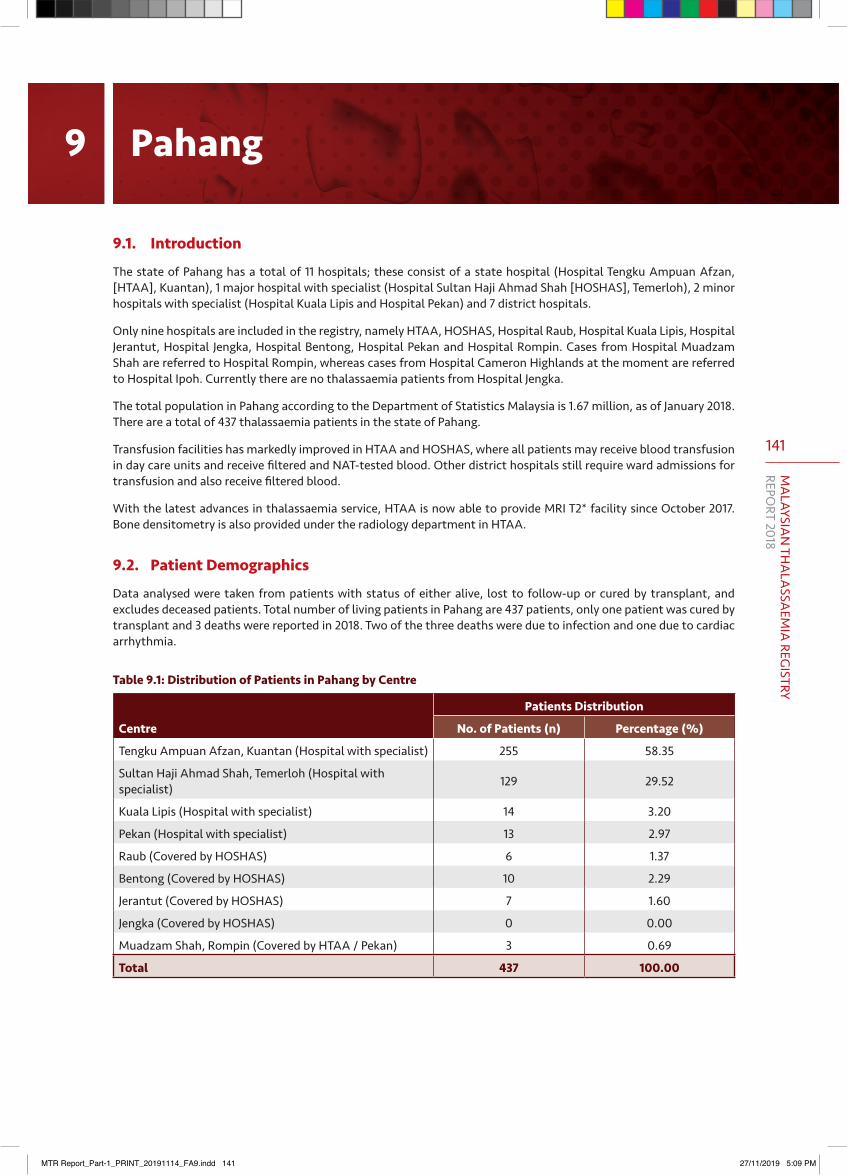
141
MA
LAYSIAN
THA
LASSA
EMIA
REGISTRY
REPORT 2018
9.1. Introduction
The state of Pahang has a total of 11 hospitals; these consist of a state hospital (Hospital Tengku Ampuan Afzan, [HTAA], Kuantan), 1 major hospital with specialist (Hospital Sultan Haji Ahmad Shah [HOSHAS], Temerloh), 2 minor hospitals with specialist (Hospital Kuala Lipis and Hospital Pekan) and 7 district hospitals.
Only nine hospitals are included in the registry, namely HTAA, HOSHAS, Hospital Raub, Hospital Kuala Lipis, Hospital Jerantut, Hospital Jengka, Hospital Bentong, Hospital Pekan and Hospital Rompin. Cases from Hospital Muadzam Shah are referred to Hospital Rompin, whereas cases from Hospital Cameron Highlands at the moment are referred to Hospital Ipoh. Currently there are no thalassaemia patients from Hospital Jengka.
The total population in Pahang according to the Department of Statistics Malaysia is 1.67 million, as of January 2018. There are a total of 437 thalassaemia patients in the state of Pahang.
Transfusion facilities has markedly improved in HTAA and HOSHAS, where all patients may receive blood transfusion in day care units and receive filtered and NAT-tested blood. Other district hospitals still require ward admissions for transfusion and also receive filtered blood.
With the latest advances in thalassaemia service, HTAA is now able to provide MRI T2* facility since October 2017. Bone densitometry is also provided under the radiology department in HTAA.
9.2. Patient Demographics
Data analysed were taken from patients with status of either alive, lost to follow-up or cured by transplant, and excludes deceased patients. Total number of living patients in Pahang are 437 patients, only one patient was cured by transplant and 3 deaths were reported in 2018. Two of the three deaths were due to infection and one due to cardiac arrhythmia.
Table 9.1: Distribution of Patients in Pahang by Centre
Centre
Patients Distribution
No. of Patients (n) Percentage (%)
Tengku Ampuan Afzan, Kuantan (Hospital with specialist) 255 58.35
Sultan Haji Ahmad Shah, Temerloh (Hospital with specialist) 129 29.52
Kuala Lipis (Hospital with specialist) 14 3.20
Pekan (Hospital with specialist) 13 2.97
Raub (Covered by HOSHAS) 6 1.37
Bentong (Covered by HOSHAS) 10 2.29
Jerantut (Covered by HOSHAS) 7 1.60
Jengka (Covered by HOSHAS) 0 0.00
Muadzam Shah, Rompin (Covered by HTAA / Pekan) 3 0.69
Total 437 100.00
9 Pahang
MTR Report_Part-1_PRINT_20191114_FA9.indd 141 27/11/2019 5:09 PM
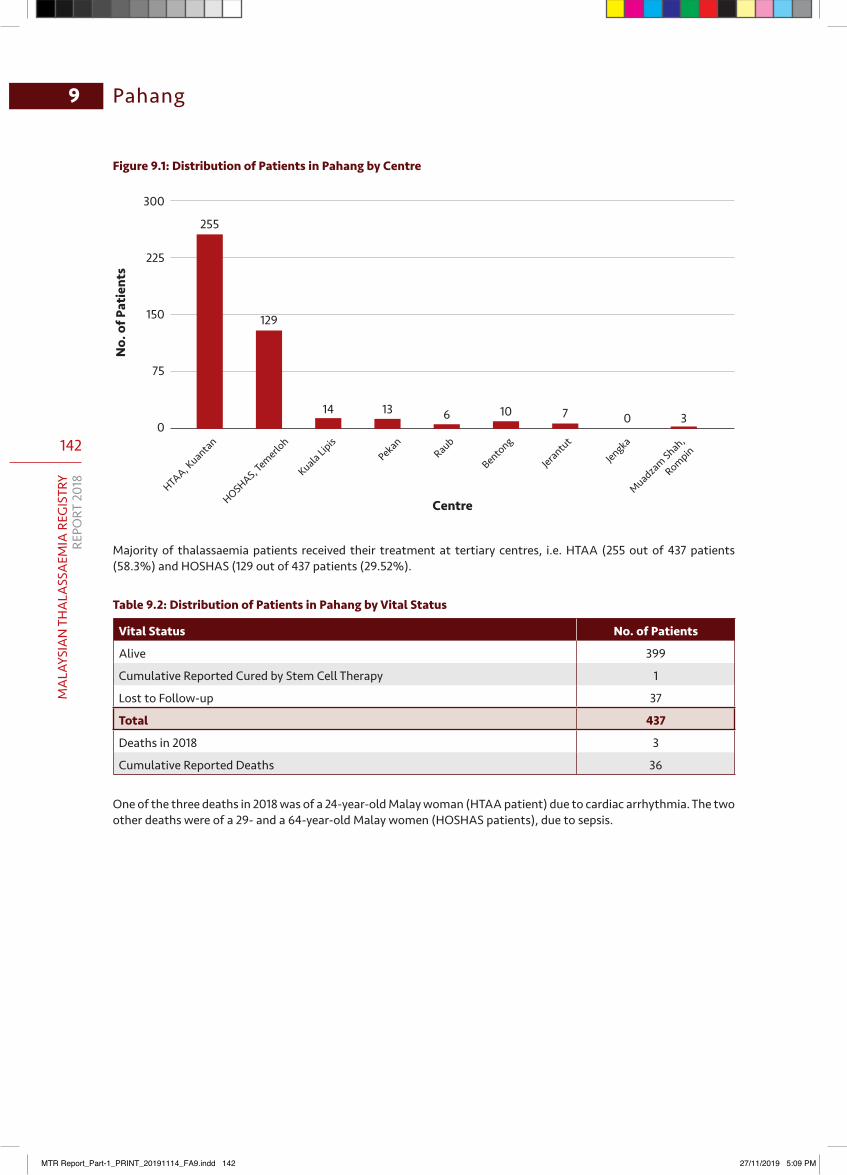
142
MA
LAYS
IAN
TH
ALA
SSA
EMIA
REG
ISTR
YRE
PORT
201
8
Pahang9
Figure 9.1: Distribution of Patients in Pahang by Centre
300
225
150
75
0
Centre
No.
of P
atie
nts
HTAA, Kuantan
HOSHAS, Temerlo
h
Kuala LipisPekan
Raub
Jerantut
Jengka
Muadzam Shah,
RompinBentong
255
129
14 13 6 10 7 0 3
Majority of thalassaemia patients received their treatment at tertiary centres, i.e. HTAA (255 out of 437 patients (58.3%) and HOSHAS (129 out of 437 patients (29.52%).
Table 9.2: Distribution of Patients in Pahang by Vital Status
Vital Status No. of Patients
Alive 399
Cumulative Reported Cured by Stem Cell Therapy 1
Lost to Follow-up 37
Total 437
Deaths in 2018 3
Cumulative Reported Deaths 36
One of the three deaths in 2018 was of a 24-year-old Malay woman (HTAA patient) due to cardiac arrhythmia. The two other deaths were of a 29- and a 64-year-old Malay women (HOSHAS patients), due to sepsis.
MTR Report_Part-1_PRINT_20191114_FA9.indd 142 27/11/2019 5:09 PM
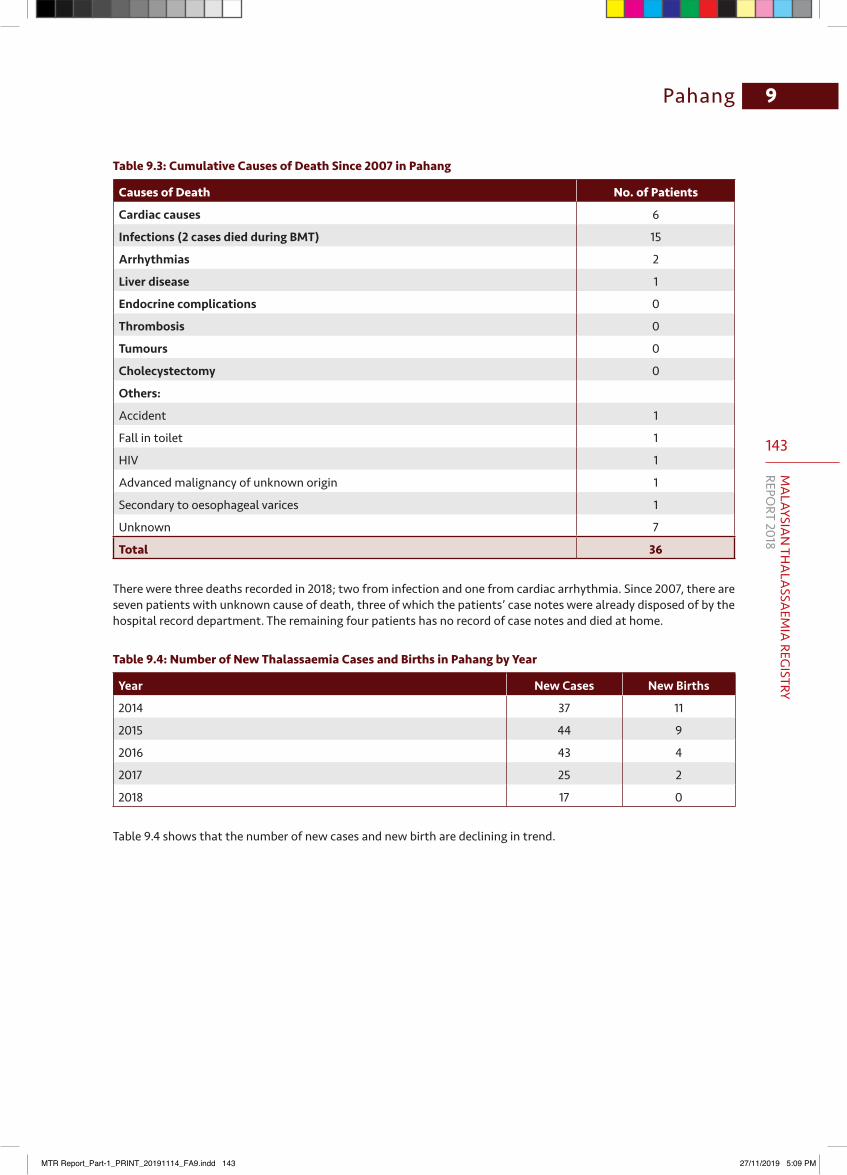
143
MA
LAYSIAN
THA
LASSA
EMIA
REGISTRY
REPORT 2018
9Pahang
Table 9.3: Cumulative Causes of Death Since 2007 in Pahang
Causes of Death No. of Patients
Cardiac causes 6
Infections (2 cases died during BMT) 15
Arrhythmias 2
Liver disease 1
Endocrine complications 0
Thrombosis 0
Tumours 0
Cholecystectomy 0
Others:
Accident 1
Fall in toilet 1
HIV 1
Advanced malignancy of unknown origin 1
Secondary to oesophageal varices 1
Unknown 7
Total 36
There were three deaths recorded in 2018; two from infection and one from cardiac arrhythmia. Since 2007, there are seven patients with unknown cause of death, three of which the patients’ case notes were already disposed of by the hospital record department. The remaining four patients has no record of case notes and died at home.
Table 9.4: Number of New Thalassaemia Cases and Births in Pahang by Year
Year New Cases New Births
2014 37 11
2015 44 9
2016 43 4
2017 25 2
2018 17 0
Table 9.4 shows that the number of new cases and new birth are declining in trend.
MTR Report_Part-1_PRINT_20191114_FA9.indd 143 27/11/2019 5:09 PM
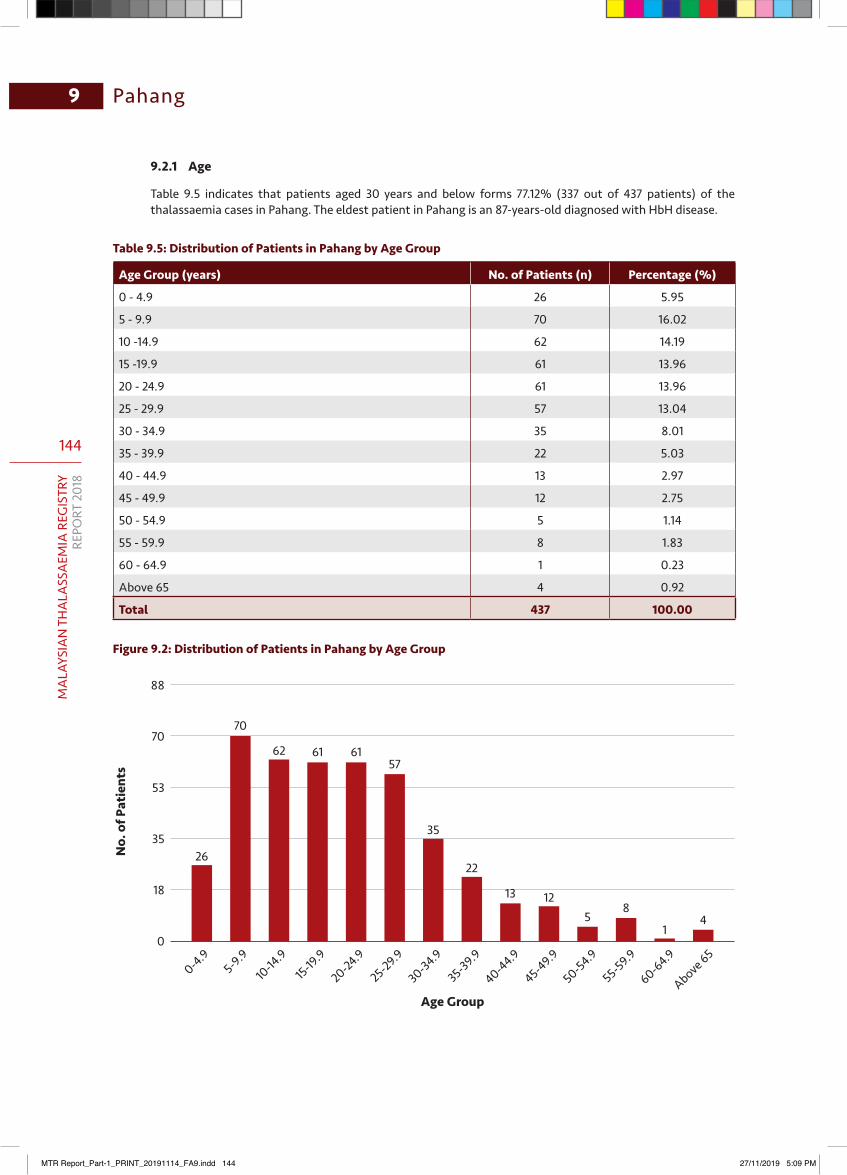
144
MA
LAYS
IAN
TH
ALA
SSA
EMIA
REG
ISTR
YRE
PORT
201
8
Pahang9
9.2.1 Age
Table 9.5 indicates that patients aged 30 years and below forms 77.12% (337 out of 437 patients) of the thalassaemia cases in Pahang. The eldest patient in Pahang is an 87-years-old diagnosed with HbH disease.
Table 9.5: Distribution of Patients in Pahang by Age Group
Age Group (years) No. of Patients (n) Percentage (%)
0 - 4.9 26 5.95
5 - 9.9 70 16.02
10 -14.9 62 14.19
15 -19.9 61 13.96
20 - 24.9 61 13.96
25 - 29.9 57 13.04
30 - 34.9 35 8.01
35 - 39.9 22 5.03
40 - 44.9 13 2.97
45 - 49.9 12 2.75
50 - 54.9 5 1.14
55 - 59.9 8 1.83
60 - 64.9 1 0.23
Above 65 4 0.92
Total 437 100.00
Figure 9.2: Distribution of Patients in Pahang by Age Group
0-4.95-9.9
10-14
.915-19
.9
20-24.9
25-29.9
30-34.9
35-39.9
40-44.9
45-49.9
50-54.9
55-59.9
60-64.9
Above 65
88
70
53
35
18
0
Age Group
No.
of P
atie
nts
26
70
62 61 6157
35
22
13 125
8
14
MTR Report_Part-1_PRINT_20191114_FA9.indd 144 27/11/2019 5:09 PM
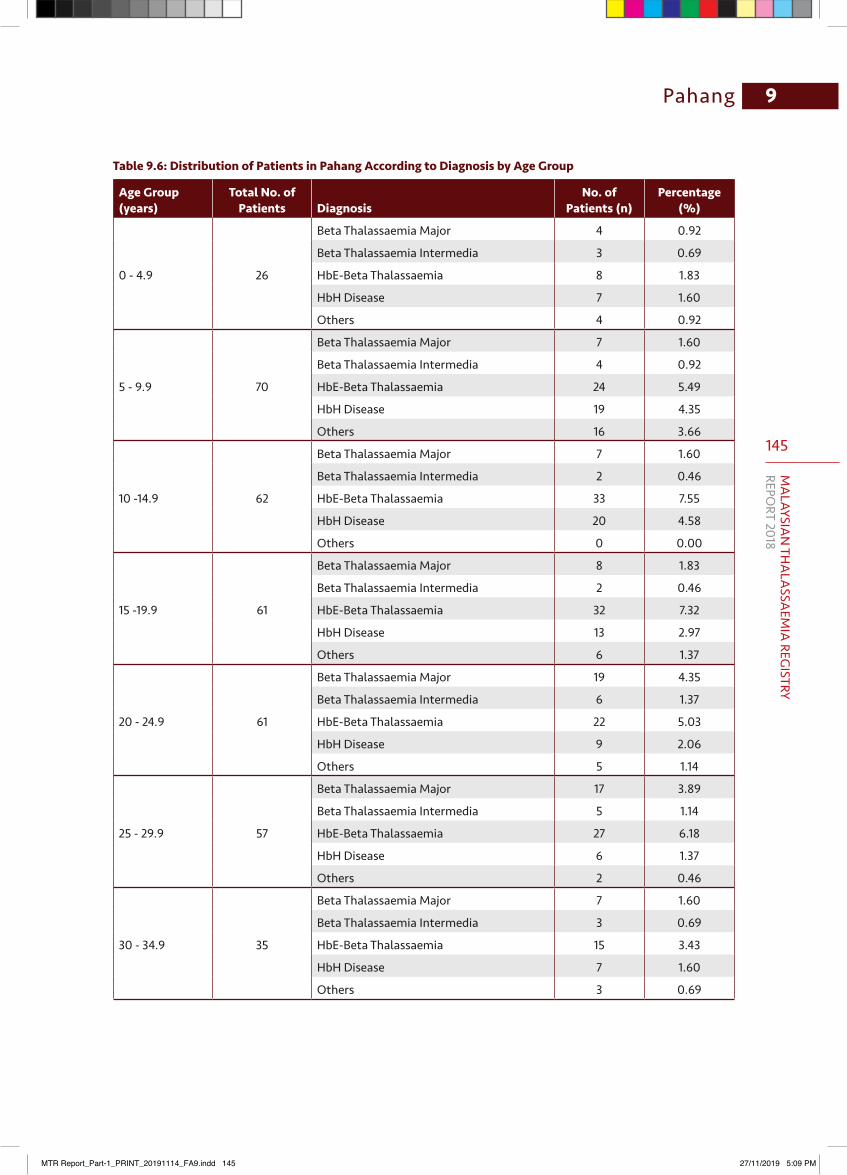
145
MA
LAYSIAN
THA
LASSA
EMIA
REGISTRY
REPORT 2018
9Pahang
Table 9.6: Distribution of Patients in Pahang According to Diagnosis by Age Group
Age Group (years)
Total No. of Patients Diagnosis
No. of Patients (n)
Percentage (%)
0 - 4.9 26
Beta Thalassaemia Major 4 0.92
Beta Thalassaemia Intermedia 3 0.69
HbE-Beta Thalassaemia 8 1.83
HbH Disease 7 1.60
Others 4 0.92
5 - 9.9 70
Beta Thalassaemia Major 7 1.60
Beta Thalassaemia Intermedia 4 0.92
HbE-Beta Thalassaemia 24 5.49
HbH Disease 19 4.35
Others 16 3.66
10 -14.9 62
Beta Thalassaemia Major 7 1.60
Beta Thalassaemia Intermedia 2 0.46
HbE-Beta Thalassaemia 33 7.55
HbH Disease 20 4.58
Others 0 0.00
15 -19.9 61
Beta Thalassaemia Major 8 1.83
Beta Thalassaemia Intermedia 2 0.46
HbE-Beta Thalassaemia 32 7.32
HbH Disease 13 2.97
Others 6 1.37
20 - 24.9 61
Beta Thalassaemia Major 19 4.35
Beta Thalassaemia Intermedia 6 1.37
HbE-Beta Thalassaemia 22 5.03
HbH Disease 9 2.06
Others 5 1.14
25 - 29.9 57
Beta Thalassaemia Major 17 3.89
Beta Thalassaemia Intermedia 5 1.14
HbE-Beta Thalassaemia 27 6.18
HbH Disease 6 1.37
Others 2 0.46
30 - 34.9 35
Beta Thalassaemia Major 7 1.60
Beta Thalassaemia Intermedia 3 0.69
HbE-Beta Thalassaemia 15 3.43
HbH Disease 7 1.60
Others 3 0.69
MTR Report_Part-1_PRINT_20191114_FA9.indd 145 27/11/2019 5:09 PM
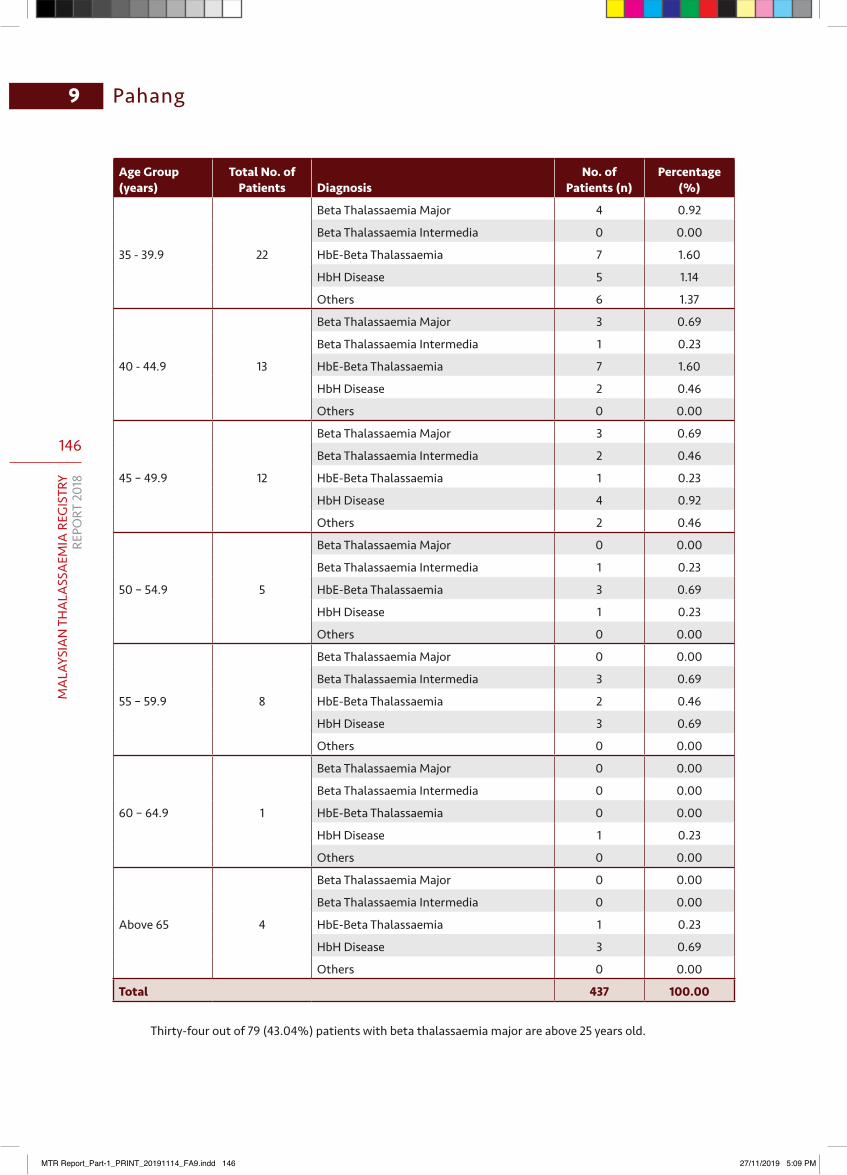
146
MA
LAYS
IAN
TH
ALA
SSA
EMIA
REG
ISTR
YRE
PORT
201
8
Pahang9
Age Group (years)
Total No. of Patients Diagnosis
No. of Patients (n)
Percentage (%)
35 - 39.9 22
Beta Thalassaemia Major 4 0.92
Beta Thalassaemia Intermedia 0 0.00
HbE-Beta Thalassaemia 7 1.60
HbH Disease 5 1.14
Others 6 1.37
40 - 44.9 13
Beta Thalassaemia Major 3 0.69
Beta Thalassaemia Intermedia 1 0.23
HbE-Beta Thalassaemia 7 1.60
HbH Disease 2 0.46
Others 0 0.00
45 – 49.9 12
Beta Thalassaemia Major 3 0.69
Beta Thalassaemia Intermedia 2 0.46
HbE-Beta Thalassaemia 1 0.23
HbH Disease 4 0.92
Others 2 0.46
50 – 54.9 5
Beta Thalassaemia Major 0 0.00
Beta Thalassaemia Intermedia 1 0.23
HbE-Beta Thalassaemia 3 0.69
HbH Disease 1 0.23
Others 0 0.00
55 – 59.9 8
Beta Thalassaemia Major 0 0.00
Beta Thalassaemia Intermedia 3 0.69
HbE-Beta Thalassaemia 2 0.46
HbH Disease 3 0.69
Others 0 0.00
60 – 64.9 1
Beta Thalassaemia Major 0 0.00
Beta Thalassaemia Intermedia 0 0.00
HbE-Beta Thalassaemia 0 0.00
HbH Disease 1 0.23
Others 0 0.00
Above 65 4
Beta Thalassaemia Major 0 0.00
Beta Thalassaemia Intermedia 0 0.00
HbE-Beta Thalassaemia 1 0.23
HbH Disease 3 0.69
Others 0 0.00
Total 437 100.00
Thirty-four out of 79 (43.04%) patients with beta thalassaemia major are above 25 years old.
MTR Report_Part-1_PRINT_20191114_FA9.indd 146 27/11/2019 5:09 PM
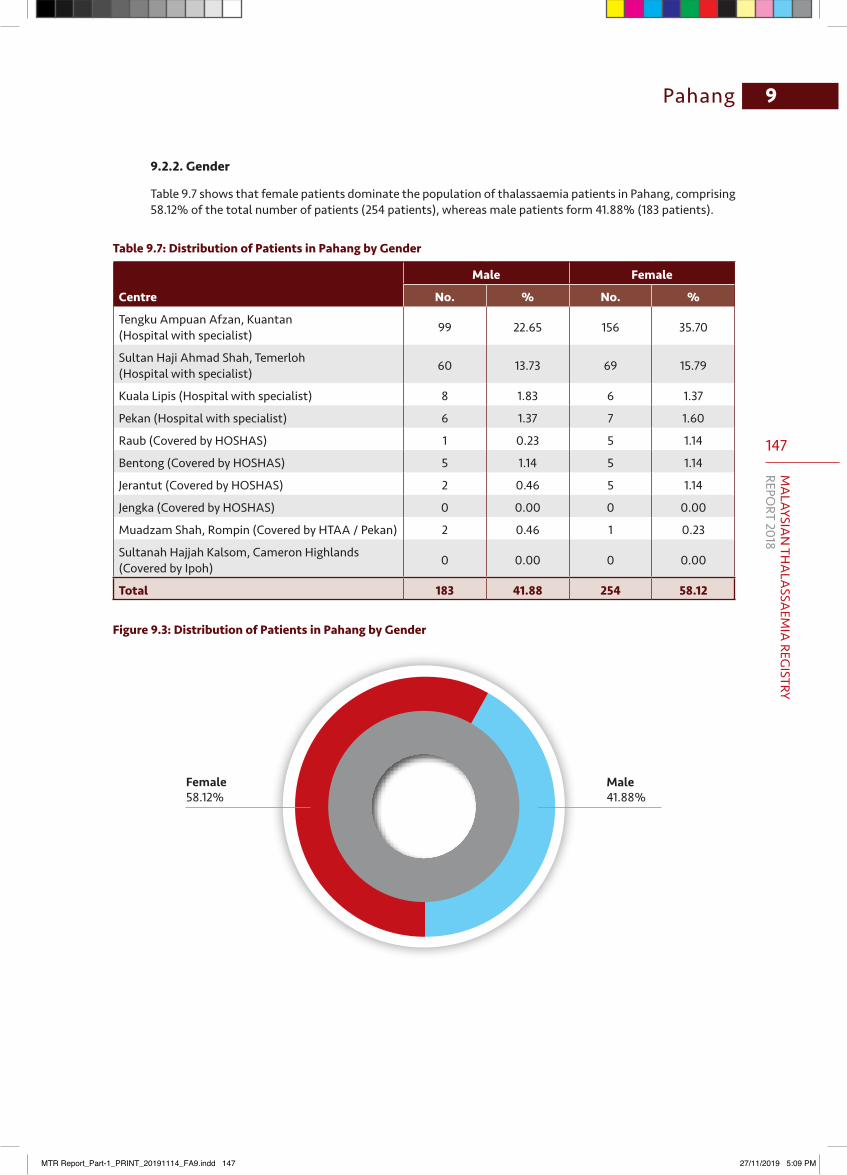
147
MA
LAYSIAN
THA
LASSA
EMIA
REGISTRY
REPORT 2018
9Pahang
9.2.2. Gender
Table 9.7 shows that female patients dominate the population of thalassaemia patients in Pahang, comprising 58.12% of the total number of patients (254 patients), whereas male patients form 41.88% (183 patients).
Table 9.7: Distribution of Patients in Pahang by Gender
Centre
Male Female
No. % No. %
Tengku Ampuan Afzan, Kuantan (Hospital with specialist) 99 22.65 156 35.70
Sultan Haji Ahmad Shah, Temerloh (Hospital with specialist) 60 13.73 69 15.79
Kuala Lipis (Hospital with specialist) 8 1.83 6 1.37
Pekan (Hospital with specialist) 6 1.37 7 1.60
Raub (Covered by HOSHAS) 1 0.23 5 1.14
Bentong (Covered by HOSHAS) 5 1.14 5 1.14
Jerantut (Covered by HOSHAS) 2 0.46 5 1.14
Jengka (Covered by HOSHAS) 0 0.00 0 0.00
Muadzam Shah, Rompin (Covered by HTAA / Pekan) 2 0.46 1 0.23
Sultanah Hajjah Kalsom, Cameron Highlands (Covered by Ipoh) 0 0.00 0 0.00
Total 183 41.88 254 58.12
Figure 9.3: Distribution of Patients in Pahang by Gender
Female58.12%
Male41.88%
MTR Report_Part-1_PRINT_20191114_FA9.indd 147 27/11/2019 5:09 PM
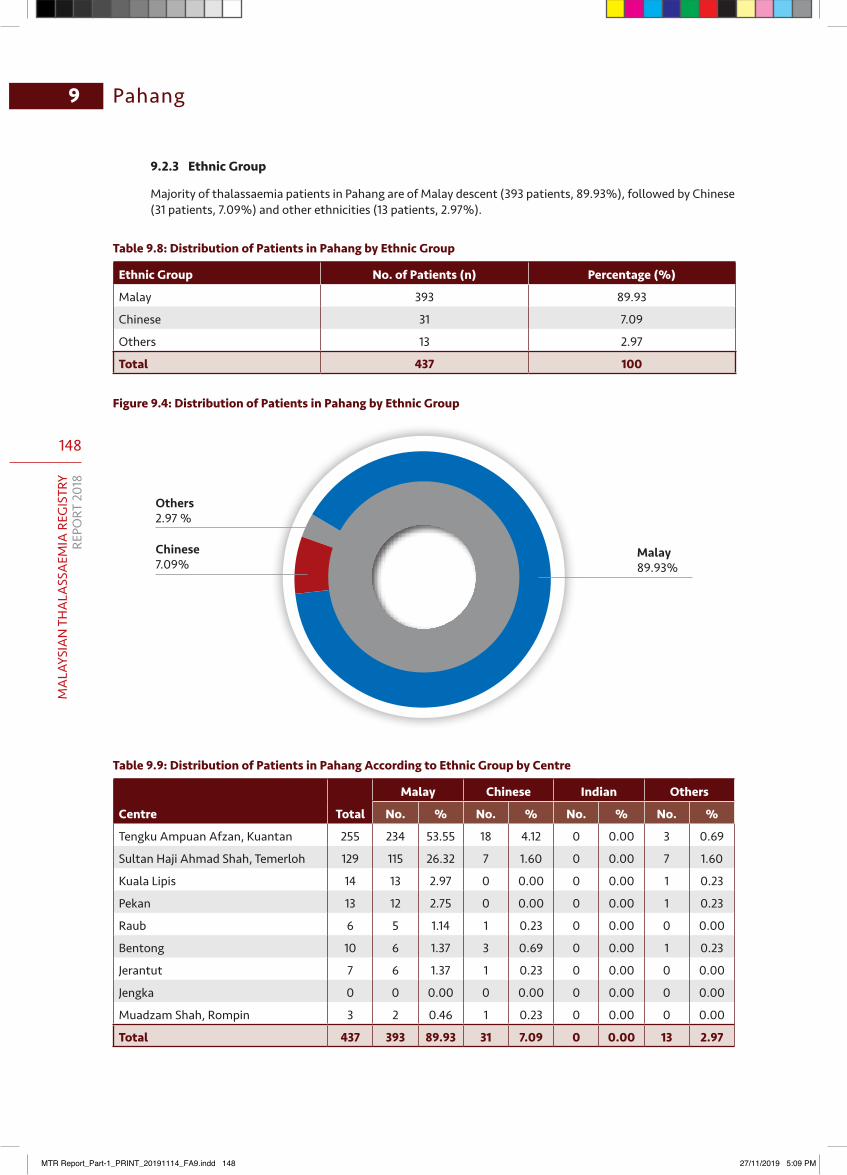
148
MA
LAYS
IAN
TH
ALA
SSA
EMIA
REG
ISTR
YRE
PORT
201
8
Pahang9
9.2.3 Ethnic Group
Majority of thalassaemia patients in Pahang are of Malay descent (393 patients, 89.93%), followed by Chinese (31 patients, 7.09%) and other ethnicities (13 patients, 2.97%).
Table9.8:DistributionofPatientsinPahangbyEthnicGroup
Ethnic Group No. of Patients (n) Percentage (%)
Malay 393 89.93
Chinese 31 7.09
Others 13 2.97
Total 437 100
Figure 9.4: Distribution of Patients in Pahang by Ethnic Group
Chinese7.09%
Others2.97 %
Malay89.93%
Table 9.9: Distribution of Patients in Pahang According to Ethnic Group by Centre
Centre Total
Malay Chinese Indian Others
No. % No. % No. % No. %
Tengku Ampuan Afzan, Kuantan 255 234 53.55 18 4.12 0 0.00 3 0.69
Sultan Haji Ahmad Shah, Temerloh 129 115 26.32 7 1.60 0 0.00 7 1.60
Kuala Lipis 14 13 2.97 0 0.00 0 0.00 1 0.23
Pekan 13 12 2.75 0 0.00 0 0.00 1 0.23
Raub 6 5 1.14 1 0.23 0 0.00 0 0.00
Bentong 10 6 1.37 3 0.69 0 0.00 1 0.23
Jerantut 7 6 1.37 1 0.23 0 0.00 0 0.00
Jengka 0 0 0.00 0 0.00 0 0.00 0 0.00
Muadzam Shah, Rompin 3 2 0.46 1 0.23 0 0.00 0 0.00
Total 437 393 89.93 31 7.09 0 0.00 13 2.97
MTR Report_Part-1_PRINT_20191114_FA9.indd 148 27/11/2019 5:09 PM
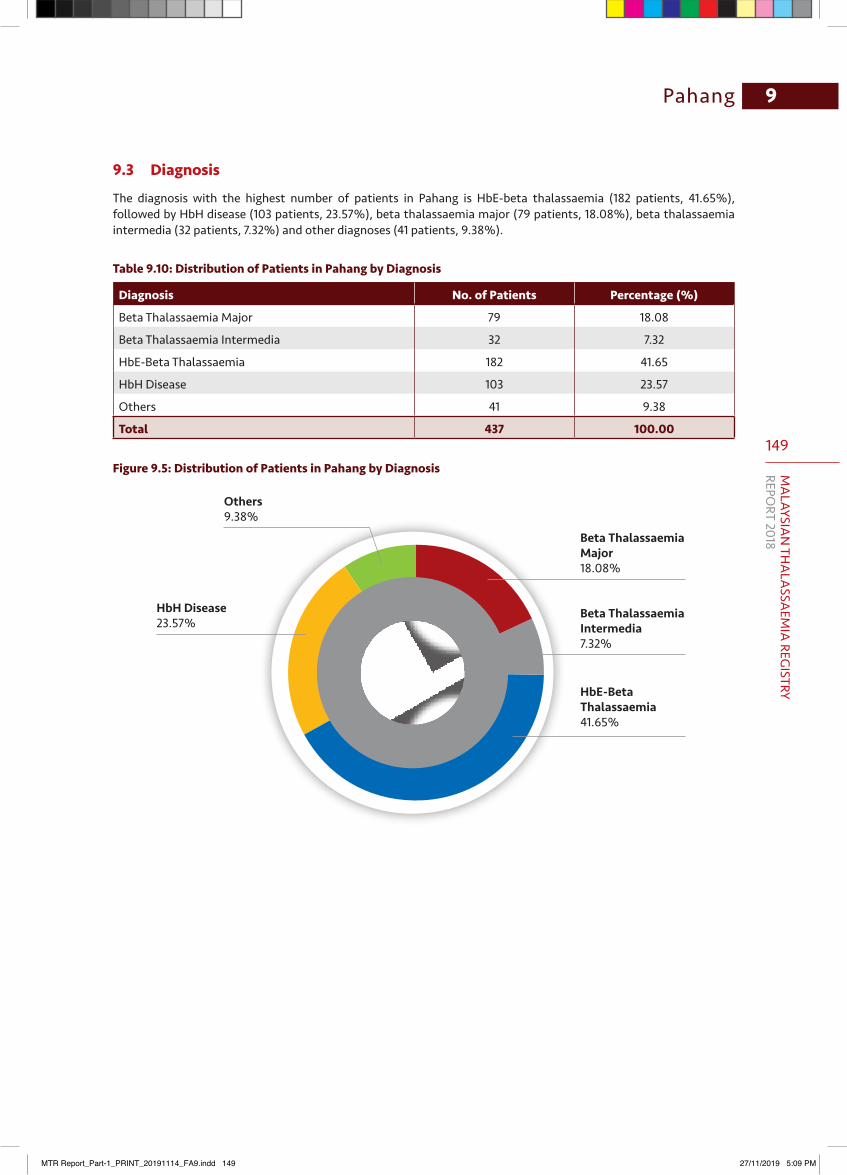
149
MA
LAYSIAN
THA
LASSA
EMIA
REGISTRY
REPORT 2018
9Pahang
9.3 Diagnosis
The diagnosis with the highest number of patients in Pahang is HbE-beta thalassaemia (182 patients, 41.65%), followed by HbH disease (103 patients, 23.57%), beta thalassaemia major (79 patients, 18.08%), beta thalassaemia intermedia (32 patients, 7.32%) and other diagnoses (41 patients, 9.38%).
Table 9.10: Distribution of Patients in Pahang by Diagnosis
Diagnosis No. of Patients Percentage (%)
Beta Thalassaemia Major 79 18.08
Beta Thalassaemia Intermedia 32 7.32
HbE-Beta Thalassaemia 182 41.65
HbH Disease 103 23.57
Others 41 9.38
Total 437 100.00
Figure 9.5: Distribution of Patients in Pahang by Diagnosis
Beta Thalassaemia Major18.08%
Beta Thalassaemia Intermedia7.32%
HbH Disease23.57%
HbE-Beta Thalassaemia41.65%
Others9.38%
MTR Report_Part-1_PRINT_20191114_FA9.indd 149 27/11/2019 5:09 PM
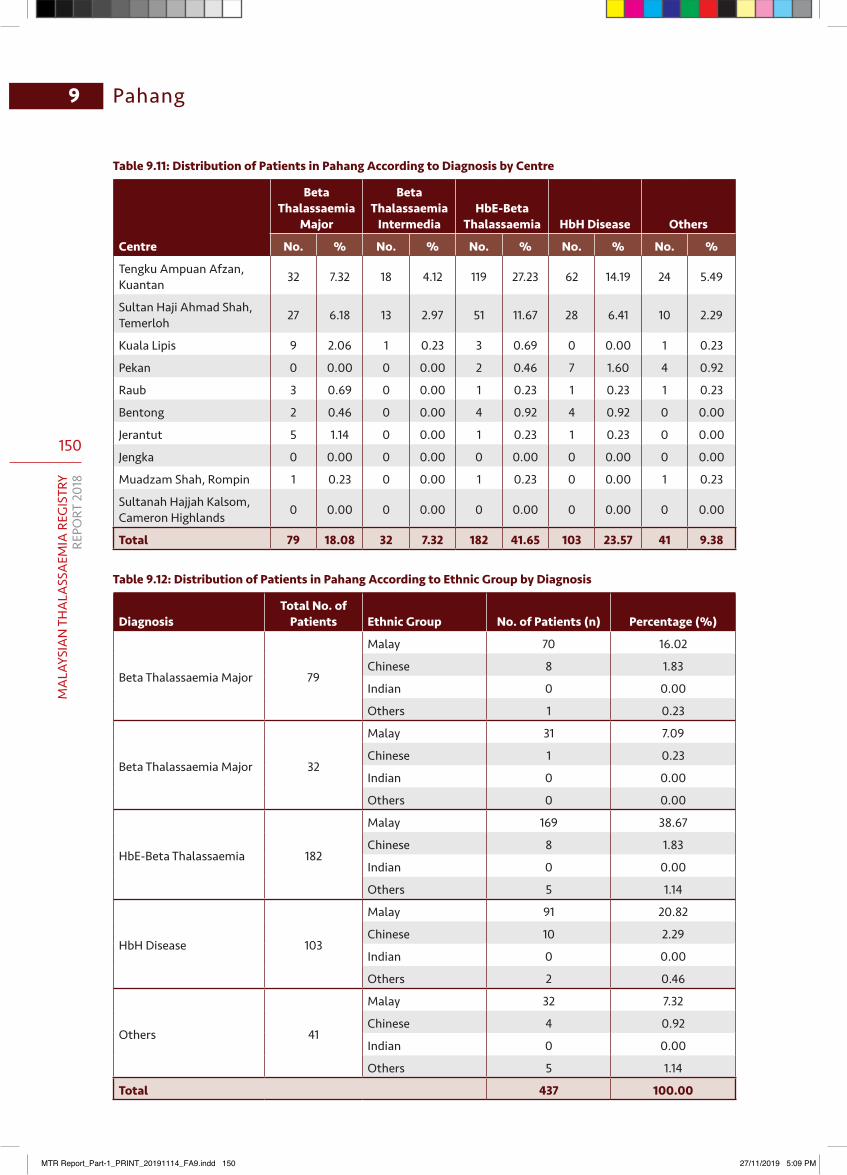
150
MA
LAYS
IAN
TH
ALA
SSA
EMIA
REG
ISTR
YRE
PORT
201
8
Pahang9
Table 9.11: Distribution of Patients in Pahang According to Diagnosis by Centre
Centre
Beta Thalassaemia
Major
Beta Thalassaemia
IntermediaHbE-Beta
Thalassaemia HbH Disease Others
No. % No. % No. % No. % No. %
Tengku Ampuan Afzan, Kuantan 32 7.32 18 4.12 119 27.23 62 14.19 24 5.49
Sultan Haji Ahmad Shah, Temerloh 27 6.18 13 2.97 51 11.67 28 6.41 10 2.29
Kuala Lipis 9 2.06 1 0.23 3 0.69 0 0.00 1 0.23
Pekan 0 0.00 0 0.00 2 0.46 7 1.60 4 0.92
Raub 3 0.69 0 0.00 1 0.23 1 0.23 1 0.23
Bentong 2 0.46 0 0.00 4 0.92 4 0.92 0 0.00
Jerantut 5 1.14 0 0.00 1 0.23 1 0.23 0 0.00
Jengka 0 0.00 0 0.00 0 0.00 0 0.00 0 0.00
Muadzam Shah, Rompin 1 0.23 0 0.00 1 0.23 0 0.00 1 0.23
Sultanah Hajjah Kalsom, Cameron Highlands 0 0.00 0 0.00 0 0.00 0 0.00 0 0.00
Total 79 18.08 32 7.32 182 41.65 103 23.57 41 9.38
Table 9.12: Distribution of Patients in Pahang According to Ethnic Group by Diagnosis
DiagnosisTotal No. of
Patients Ethnic Group No. of Patients (n) Percentage (%)
Beta Thalassaemia Major 79
Malay 70 16.02
Chinese 8 1.83
Indian 0 0.00
Others 1 0.23
Beta Thalassaemia Major 32
Malay 31 7.09
Chinese 1 0.23
Indian 0 0.00
Others 0 0.00
HbE-Beta Thalassaemia 182
Malay 169 38.67
Chinese 8 1.83
Indian 0 0.00
Others 5 1.14
HbH Disease 103
Malay 91 20.82
Chinese 10 2.29
Indian 0 0.00
Others 2 0.46
Others 41
Malay 32 7.32
Chinese 4 0.92
Indian 0 0.00
Others 5 1.14
Total 437 100.00
MTR Report_Part-1_PRINT_20191114_FA9.indd 150 27/11/2019 5:09 PM
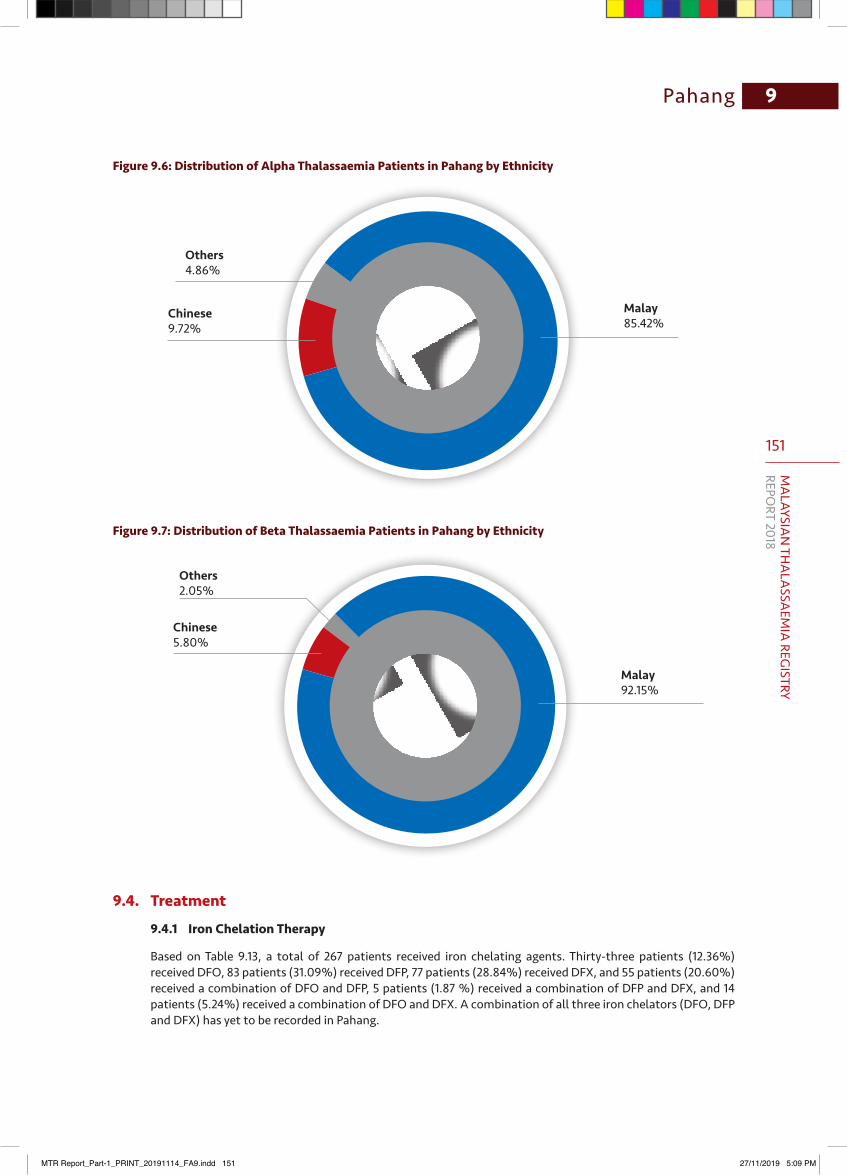
151
MA
LAYSIAN
THA
LASSA
EMIA
REGISTRY
REPORT 2018
9Pahang
Malay85.42%
Others4.86%
Chinese9.72%
Figure 9.6: Distribution of Alpha Thalassaemia Patients in Pahang by Ethnicity
Chinese5.80%
Others2.05%
Malay92.15%
Figure 9.7: Distribution of Beta Thalassaemia Patients in Pahang by Ethnicity
9.4. Treatment
9.4.1 Iron Chelation Therapy
Based on Table 9.13, a total of 267 patients received iron chelating agents. Thirty-three patients (12.36%) received DFO, 83 patients (31.09%) received DFP, 77 patients (28.84%) received DFX, and 55 patients (20.60%) received a combination of DFO and DFP, 5 patients (1.87 %) received a combination of DFP and DFX, and 14 patients (5.24%) received a combination of DFO and DFX. A combination of all three iron chelators (DFO, DFP and DFX) has yet to be recorded in Pahang.
MTR Report_Part-1_PRINT_20191114_FA9.indd 151 27/11/2019 5:09 PM
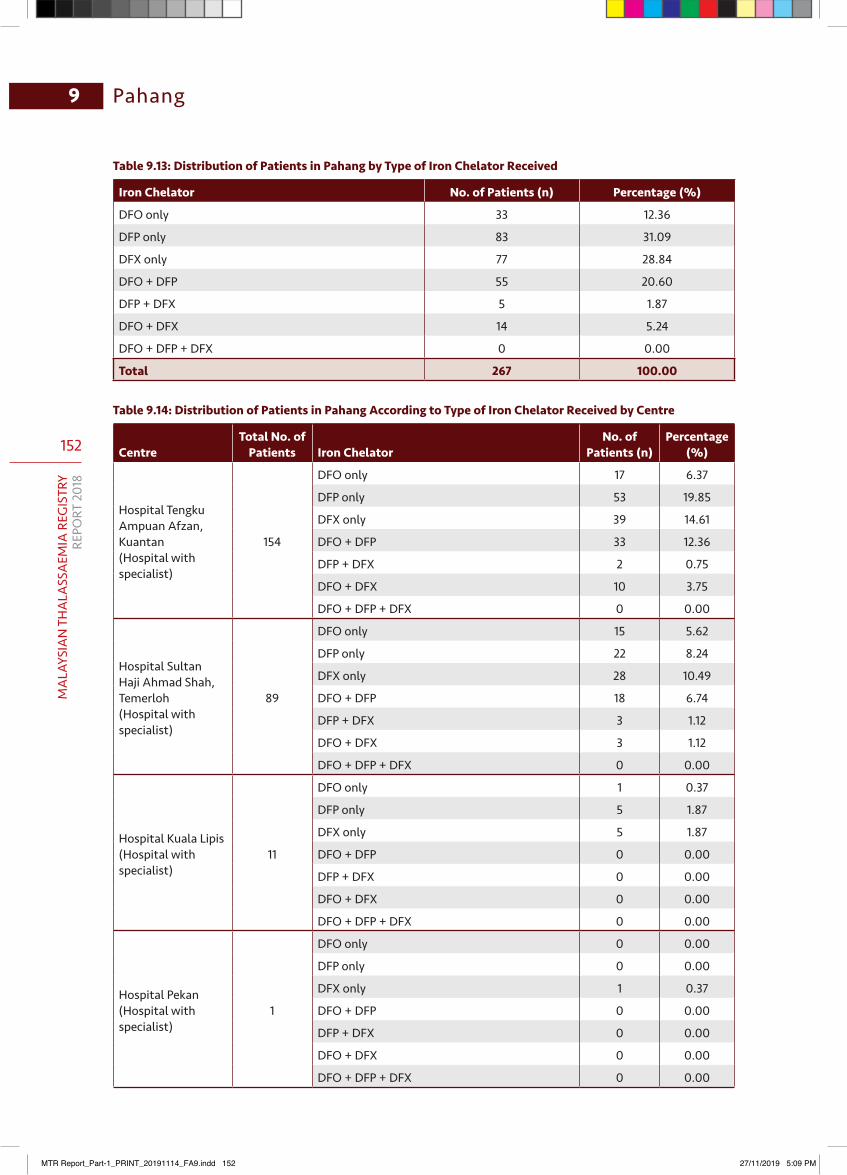
152
MA
LAYS
IAN
TH
ALA
SSA
EMIA
REG
ISTR
YRE
PORT
201
8
Pahang9
Table 9.13: Distribution of Patients in Pahang by Type of Iron Chelator Received
Iron Chelator No. of Patients (n) Percentage (%)
DFO only 33 12.36
DFP only 83 31.09
DFX only 77 28.84
DFO + DFP 55 20.60
DFP + DFX 5 1.87
DFO + DFX 14 5.24
DFO + DFP + DFX 0 0.00
Total 267 100.00
Table 9.14: Distribution of Patients in Pahang According to Type of Iron Chelator Received by Centre
CentreTotal No. of
Patients Iron ChelatorNo. of
Patients (n)Percentage
(%)
Hospital Tengku Ampuan Afzan, Kuantan (Hospital with specialist)
154
DFO only 17 6.37
DFP only 53 19.85
DFX only 39 14.61
DFO + DFP 33 12.36
DFP + DFX 2 0.75
DFO + DFX 10 3.75
DFO + DFP + DFX 0 0.00
Hospital Sultan Haji Ahmad Shah, Temerloh (Hospital with specialist)
89
DFO only 15 5.62
DFP only 22 8.24
DFX only 28 10.49
DFO + DFP 18 6.74
DFP + DFX 3 1.12
DFO + DFX 3 1.12
DFO + DFP + DFX 0 0.00
Hospital Kuala Lipis (Hospital with specialist)
11
DFO only 1 0.37
DFP only 5 1.87
DFX only 5 1.87
DFO + DFP 0 0.00
DFP + DFX 0 0.00
DFO + DFX 0 0.00
DFO + DFP + DFX 0 0.00
Hospital Pekan (Hospital with specialist)
1
DFO only 0 0.00
DFP only 0 0.00
DFX only 1 0.37
DFO + DFP 0 0.00
DFP + DFX 0 0.00
DFO + DFX 0 0.00
DFO + DFP + DFX 0 0.00
MTR Report_Part-1_PRINT_20191114_FA9.indd 152 27/11/2019 5:09 PM

153
MA
LAYSIAN
THA
LASSA
EMIA
REGISTRY
REPORT 2018
9Pahang
CentreTotal No. of
Patients Iron ChelatorNo. of
Patients (n)Percentage
(%)
Hospital Raub (Covered by HOSHAS)
2
DFO only 0 0.00
DFP only 1 0.37
DFX only 1 0.37
DFO + DFP 0 0.00
DFP + DFX 0 0.00
DFO + DFX 0 0.00
DFO + DFP + DFX 0 0.00
Hospital Bentong (Covered by HOSHAS)
5
DFO only 0 0.00
DFP only 1 0.37
DFX only 3 1.12
DFO + DFP 0 0.00
DFP + DFX 0 0.00
DFO + DFX 1 0.37
DFO + DFP + DFX 0 0.00
Hospital Jerantut (Covered by HOSHAS)
5
DFO only 0 0.00
DFP only 1 0.37
DFX only 0 0.00
DFO + DFP 4 1.50
DFP + DFX 0 0.00
DFO + DFX 0 0.00
DFO + DFP + DFX 0 0.00
Hospital Jengka (Covered by HOSHAS)
0
DFO only 0 0.00
DFP only 0 0.00
DFX only 0 0.00
DFO + DFP 0 0.00
DFP + DFX 0 0.00
DFO + DFX 0 0.00
DFO + DFP + DFX 0 0.00
Hospital Rompin (Covered by HTAA / Pekan)
0
DFO only 0 0.00
DFP only 0 0.00
DFX only 0 0.00
DFO + DFP 0 0.00
DFP + DFX 0 0.00
DFO + DFX 0 0.00
DFO + DFP + DFX 0 0.00
Total 267 100.00
MTR Report_Part-1_PRINT_20191114_FA9.indd 153 27/11/2019 5:09 PM
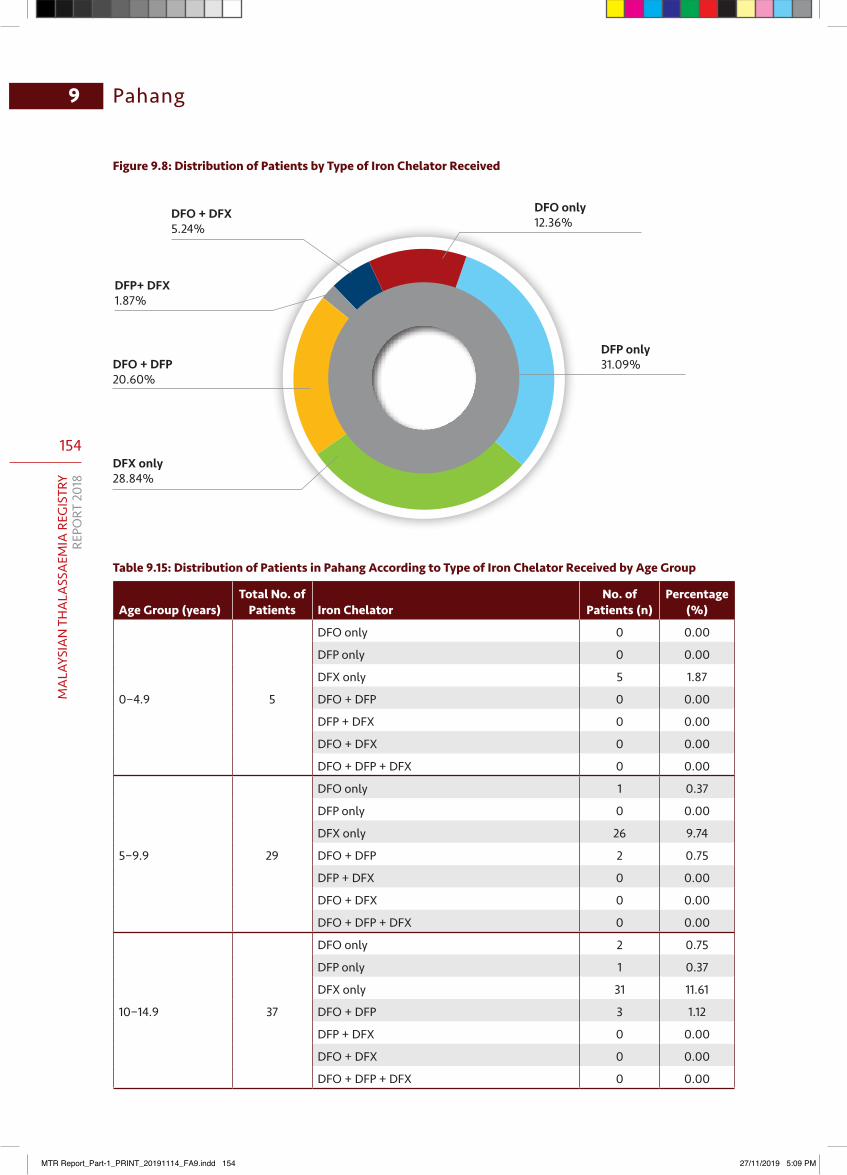
154
MA
LAYS
IAN
TH
ALA
SSA
EMIA
REG
ISTR
YRE
PORT
201
8
Pahang9
DFP only31.09%
DFX only28.84%
DFO + DFP20.60%
DFO + DFX5.24%
DFP+ DFX1.87%
DFO only12.36%
Figure9.8:DistributionofPatientsbyTypeofIronChelatorReceived
Table 9.15: Distribution of Patients in Pahang According to Type of Iron Chelator Received by Age Group
Age Group (years)Total No. of
Patients Iron ChelatorNo. of
Patients (n)Percentage
(%)
0−4.9 5
DFO only 0 0.00
DFP only 0 0.00
DFX only 5 1.87
DFO + DFP 0 0.00
DFP + DFX 0 0.00
DFO + DFX 0 0.00
DFO + DFP + DFX 0 0.00
5−9.9 29
DFO only 1 0.37
DFP only 0 0.00
DFX only 26 9.74
DFO + DFP 2 0.75
DFP + DFX 0 0.00
DFO + DFX 0 0.00
DFO + DFP + DFX 0 0.00
10−14.9 37
DFO only 2 0.75
DFP only 1 0.37
DFX only 31 11.61
DFO + DFP 3 1.12
DFP + DFX 0 0.00
DFO + DFX 0 0.00
DFO + DFP + DFX 0 0.00
MTR Report_Part-1_PRINT_20191114_FA9.indd 154 27/11/2019 5:09 PM

155
MA
LAYSIAN
THA
LASSA
EMIA
REGISTRY
REPORT 2018
9Pahang
Age Group (years)Total No. of
Patients Iron ChelatorNo. of
Patients (n)Percentage
(%)
15−19.9 40
DFO only 7 2.62
DFP only 8 3.00
DFX only 9 3.37
DFO + DFP 13 4.87
DFP + DFX 1 0.37
DFO + DFX 2 0.75
DFO + DFP + DFX 0 0.00
20−24.9 48
DFO only 10 3.75
DFP only 19 7.12
DFX only 0 0.00
DFO + DFP 15 5.62
DFP + DFX 1 0.37
DFO + DFX 3 1.12
DFO + DFP + DFX 0 0.00
25−29.9 41
DFO only 5 1.87
DFP only 18 6.74
DFX only 4 1.50
DFO + DFP 8 3.00
DFP + DFX 0 0.00
DFO + DFX 6 2.25
DFO + DFP + DFX 0 0.00
30−34.9 25
DFO only 4 1.50
DFP only 10 3.75
DFX only 2 0.75
DFO + DFP 6 2.25
DFP + DFX 1 0.37
DFO + DFX 2 0.75
DFO + DFP + DFX 0 0.00
35−39.9 11
DFO only 1 0.37
DFP only 6 2.25
DFX only 0 0.00
DFO + DFP 4 1.50
DFP + DFX 0 0.00
DFO + DFX 0 0.00
DFO + DFP + DFX 0 0.00
MTR Report_Part-1_PRINT_20191114_FA9.indd 155 27/11/2019 5:09 PM

156
MA
LAYS
IAN
TH
ALA
SSA
EMIA
REG
ISTR
YRE
PORT
201
8
Pahang9
Age Group (years)Total No. of
Patients Iron ChelatorNo. of
Patients (n)Percentage
(%)
40−44.9 12
DFO only 1 0.37
DFP only 7 2.62
DFX only 0 0.00
DFO + DFP 2 0.75
DFP + DFX 1 0.37
DFO + DFX 1 0.37
DFO + DFP + DFX 0 0.00
45−49.9 8
DFO only 1 0.37
DFP only 6 2.25
DFX only 0 0.00
DFO + DFP 1 0.37
DFP + DFX 0 0.00
DFO + DFX 0 0.00
DFO + DFP + DFX 0 0.00
50−54.9 4
DFO only 0 0.00
DFP only 3 1.12
DFX only 0 0.00
DFO + DFP 1 0.37
DFP + DFX 0 0.00
DFO + DFX 0 0.00
DFO + DFP + DFX 0 0.00
55−59.9 5
DFO only 1 0.37
DFP only 3 1.12
DFX only 0 0.00
DFO + DFP 0 0.00
DFP + DFX 1 0.37
DFO + DFX 0 0.00
DFO + DFP + DFX 0 0.00
60−64.9 0
DFO only 0 0.00
DFP only 0 0.00
DFX only 0 0.00
DFO + DFP 0 0.00
DFP + DFX 0 0.00
DFO + DFX 0 0.00
DFO + DFP + DFX 0 0.00
MTR Report_Part-1_PRINT_20191114_FA9.indd 156 27/11/2019 5:09 PM
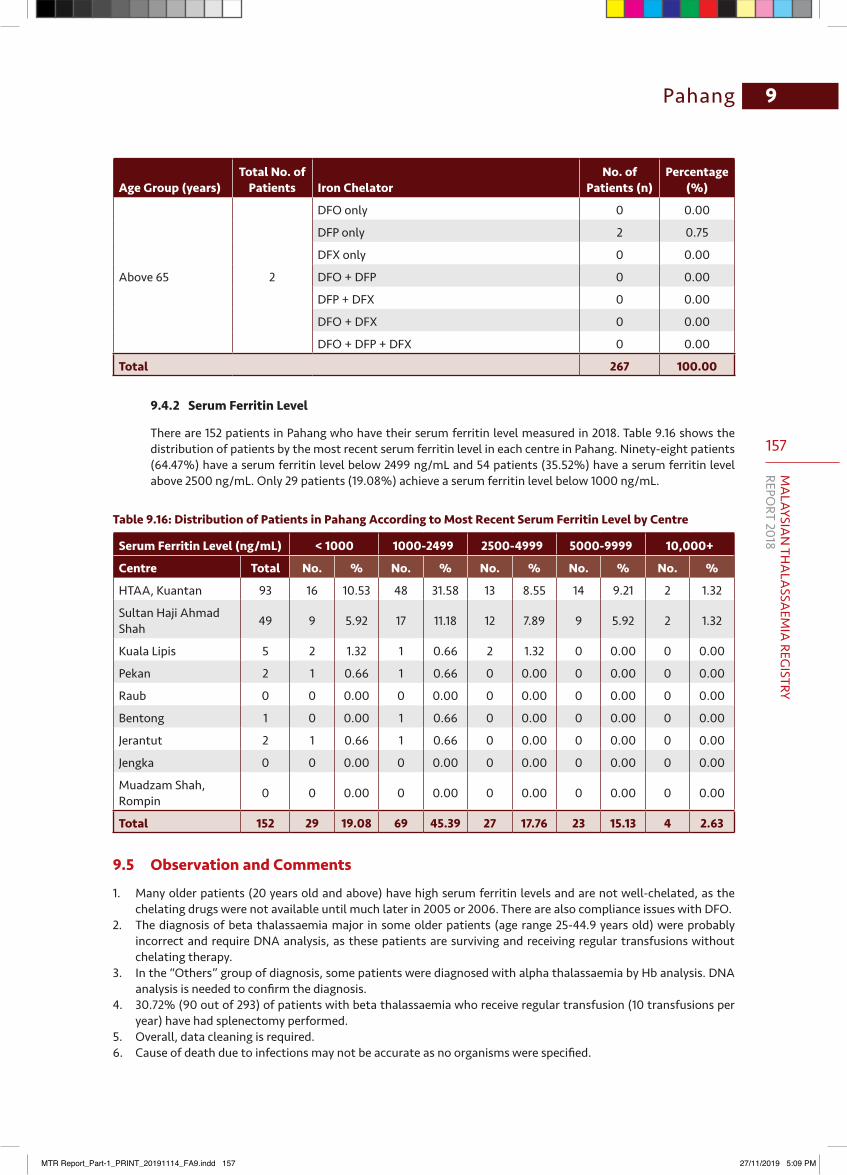
157
MA
LAYSIAN
THA
LASSA
EMIA
REGISTRY
REPORT 2018
9Pahang
Age Group (years)Total No. of
Patients Iron ChelatorNo. of
Patients (n)Percentage
(%)
Above 65 2
DFO only 0 0.00
DFP only 2 0.75
DFX only 0 0.00
DFO + DFP 0 0.00
DFP + DFX 0 0.00
DFO + DFX 0 0.00
DFO + DFP + DFX 0 0.00
Total 267 100.00
9.4.2 Serum Ferritin Level
There are 152 patients in Pahang who have their serum ferritin level measured in 2018. Table 9.16 shows the distribution of patients by the most recent serum ferritin level in each centre in Pahang. Ninety-eight patients (64.47%) have a serum ferritin level below 2499 ng/mL and 54 patients (35.52%) have a serum ferritin level above 2500 ng/mL. Only 29 patients (19.08%) achieve a serum ferritin level below 1000 ng/mL.
Table 9.16: Distribution of Patients in Pahang According to Most Recent Serum Ferritin Level by Centre
Serum Ferritin Level (ng/mL) < 1000 1000-2499 2500-4999 5000-9999 10,000+
Centre Total No. % No. % No. % No. % No. %
HTAA, Kuantan 93 16 10.53 48 31.58 13 8.55 14 9.21 2 1.32
Sultan Haji Ahmad Shah 49 9 5.92 17 11.18 12 7.89 9 5.92 2 1.32
Kuala Lipis 5 2 1.32 1 0.66 2 1.32 0 0.00 0 0.00
Pekan 2 1 0.66 1 0.66 0 0.00 0 0.00 0 0.00
Raub 0 0 0.00 0 0.00 0 0.00 0 0.00 0 0.00
Bentong 1 0 0.00 1 0.66 0 0.00 0 0.00 0 0.00
Jerantut 2 1 0.66 1 0.66 0 0.00 0 0.00 0 0.00
Jengka 0 0 0.00 0 0.00 0 0.00 0 0.00 0 0.00
Muadzam Shah, Rompin 0 0 0.00 0 0.00 0 0.00 0 0.00 0 0.00
Total 152 29 19.08 69 45.39 27 17.76 23 15.13 4 2.63
9.5 Observation and Comments
1. Many older patients (20 years old and above) have high serum ferritin levels and are not well-chelated, as the chelating drugs were not available until much later in 2005 or 2006. There are also compliance issues with DFO.
2. The diagnosis of beta thalassaemia major in some older patients (age range 25-44.9 years old) were probably incorrect and require DNA analysis, as these patients are surviving and receiving regular transfusions without chelating therapy.
3. In the “Others” group of diagnosis, some patients were diagnosed with alpha thalassaemia by Hb analysis. DNA analysis is needed to confirm the diagnosis.
4. 30.72% (90 out of 293) of patients with beta thalassaemia who receive regular transfusion (10 transfusions per year) have had splenectomy performed.
5. Overall, data cleaning is required. 6. Cause of death due to infections may not be accurate as no organisms were specified.
MTR Report_Part-1_PRINT_20191114_FA9.indd 157 27/11/2019 5:09 PM
158
MA
LAYS
IAN
TH
ALA
SSA
EMIA
REG
ISTR
YRE
PORT
201
8
Pahang9
9.5.1 Recommendations
1. A standardised chart of thalassaemia and patient diary can be introduced across the state and be made available for every thalassaemia patient. The chart is to be used in continuity. By implementing this step, data can be easily collected by the RA.
2. To conduct regular training on thalassaemia for medical staff in Pahang to improve diagnosis, management and outcome due to high turnover of doctors.
3. District hospitals with smaller numbers of thalassaemia patients may train dedicated staff nurses to assist in updating the MTR.
4. The cause of death of thalassaemia patients should be looked into thoroughly, especially involving infections to improve accuracy.
MTR Report_Part-1_PRINT_20191114_FA9.indd 158 27/11/2019 5:09 PM
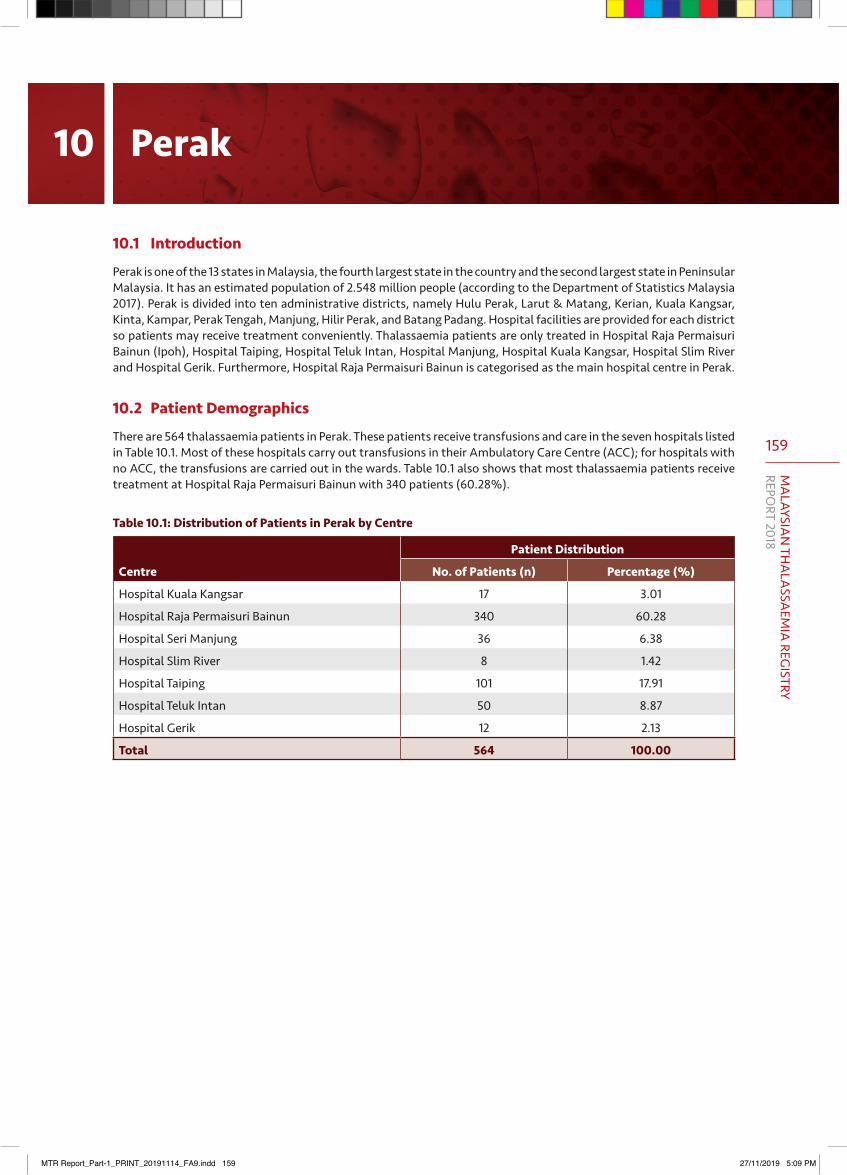
159
MA
LAYSIAN
THA
LASSA
EMIA
REGISTRY
REPORT 2018
10.1 Introduction
Perak is one of the 13 states in Malaysia, the fourth largest state in the country and the second largest state in Peninsular Malaysia. It has an estimated population of 2.548 million people (according to the Department of Statistics Malaysia 2017). Perak is divided into ten administrative districts, namely Hulu Perak, Larut & Matang, Kerian, Kuala Kangsar, Kinta, Kampar, Perak Tengah, Manjung, Hilir Perak, and Batang Padang. Hospital facilities are provided for each district so patients may receive treatment conveniently. Thalassaemia patients are only treated in Hospital Raja Permaisuri Bainun (Ipoh), Hospital Taiping, Hospital Teluk Intan, Hospital Manjung, Hospital Kuala Kangsar, Hospital Slim River and Hospital Gerik. Furthermore, Hospital Raja Permaisuri Bainun is categorised as the main hospital centre in Perak.
10.2 Patient Demographics
There are 564 thalassaemia patients in Perak. These patients receive transfusions and care in the seven hospitals listed in Table 10.1. Most of these hospitals carry out transfusions in their Ambulatory Care Centre (ACC); for hospitals with no ACC, the transfusions are carried out in the wards. Table 10.1 also shows that most thalassaemia patients receive treatment at Hospital Raja Permaisuri Bainun with 340 patients (60.28%).
Table 10.1: Distribution of Patients in Perak by Centre
Centre
Patient Distribution
No. of Patients (n) Percentage (%)
Hospital Kuala Kangsar 17 3.01
Hospital Raja Permaisuri Bainun 340 60.28
Hospital Seri Manjung 36 6.38
Hospital Slim River 8 1.42
Hospital Taiping 101 17.91
Hospital Teluk Intan 50 8.87
Hospital Gerik 12 2.13
Total 564 100.00
10 Perak
MTR Report_Part-1_PRINT_20191114_FA9.indd 159 27/11/2019 5:09 PM
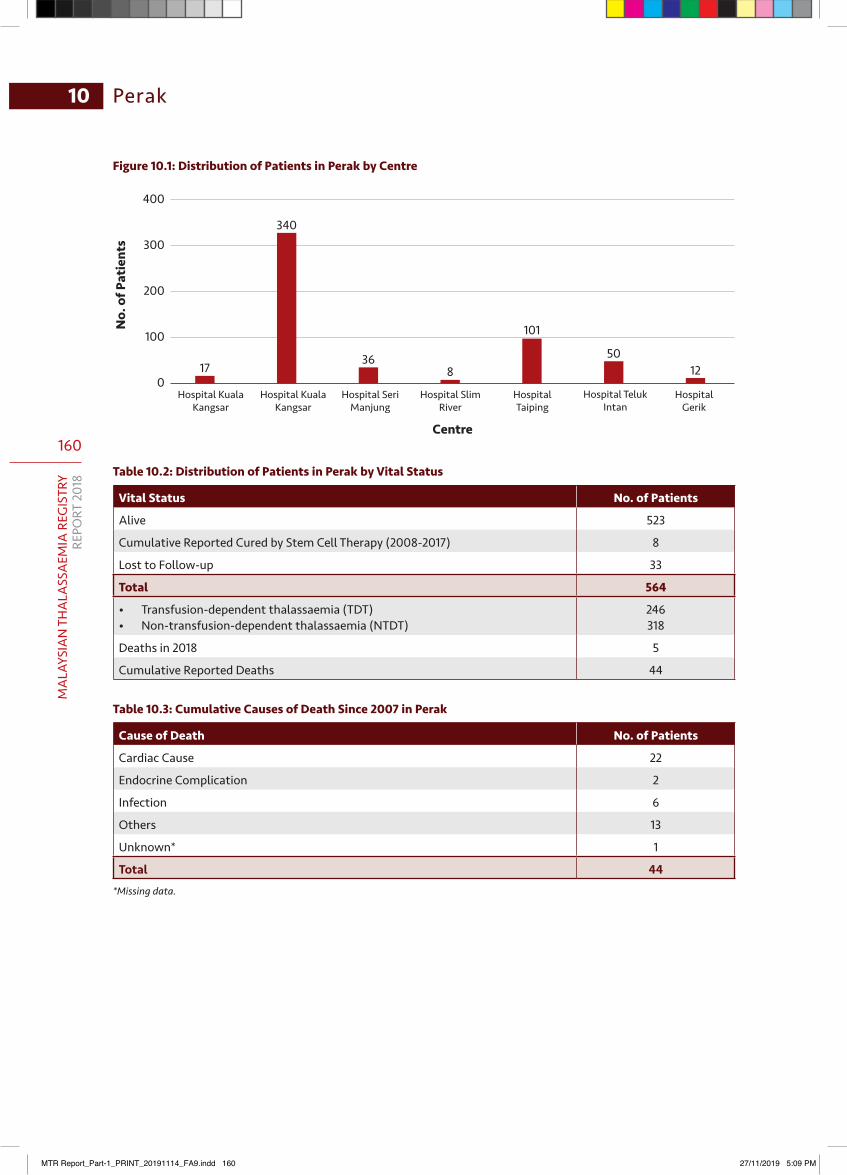
160
MA
LAYS
IAN
TH
ALA
SSA
EMIA
REG
ISTR
YRE
PORT
201
8
10 Perak
400
300
200
100
0
Centre
No.
of P
atie
nts
Hospital Kuala Kangsar
Hospital Kuala Kangsar
Hospital Seri Manjung
Hospital Slim River
Hospital Taiping
Hospital Teluk Intan
Hospital Gerik
101
836
340
1750
12
Table 10.2: Distribution of Patients in Perak by Vital Status
Vital Status No. of Patients
Alive 523
Cumulative Reported Cured by Stem Cell Therapy (2008-2017) 8
Lost to Follow-up 33
Total 564
• Transfusion-dependent thalassaemia (TDT)• Non-transfusion-dependent thalassaemia (NTDT)
246318
Deaths in 2018 5
Cumulative Reported Deaths 44
Table 10.3: Cumulative Causes of Death Since 2007 in Perak
Cause of Death No. of Patients
Cardiac Cause 22
Endocrine Complication 2
Infection 6
Others 13
Unknown* 1
Total 44
*Missing data.
Figure 10.1: Distribution of Patients in Perak by Centre
MTR Report_Part-1_PRINT_20191114_FA9.indd 160 27/11/2019 5:09 PM
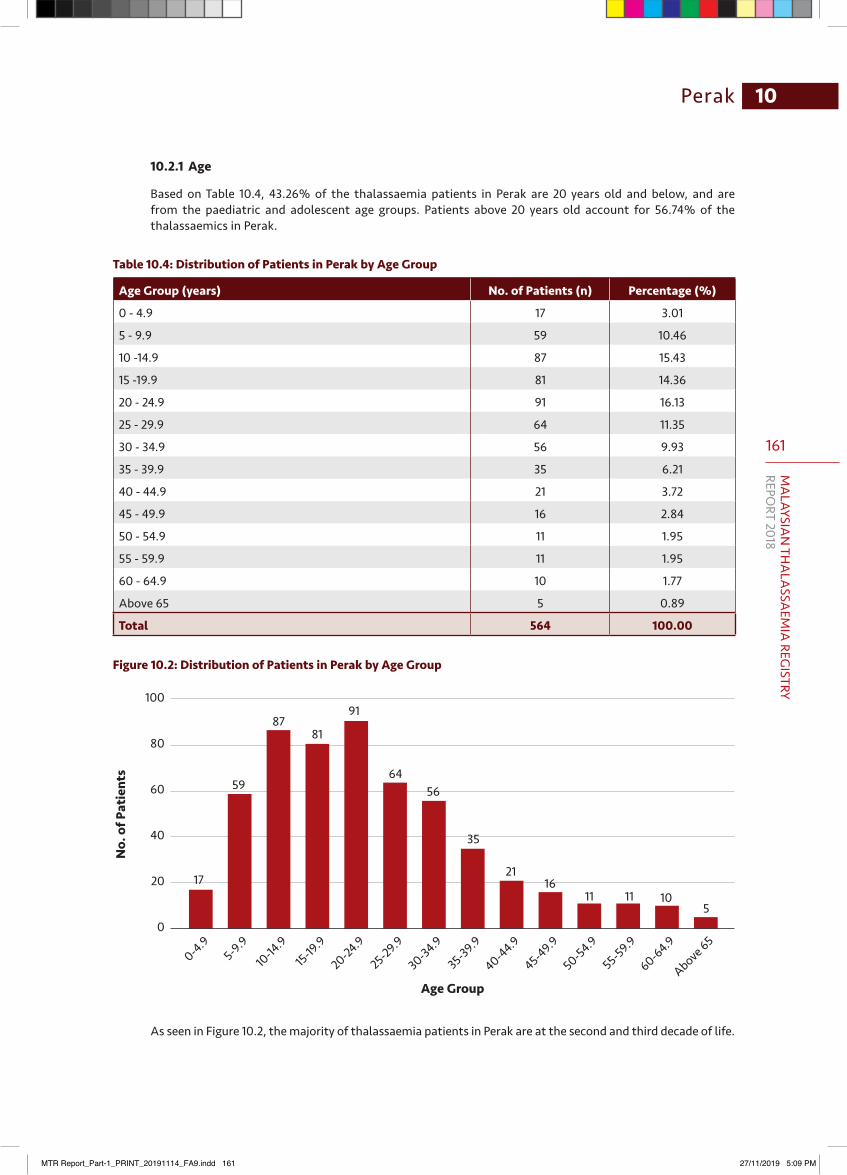
161
MA
LAYSIAN
THA
LASSA
EMIA
REGISTRY
REPORT 2018
10Perak
10.2.1 Age
Based on Table 10.4, 43.26% of the thalassaemia patients in Perak are 20 years old and below, and are from the paediatric and adolescent age groups. Patients above 20 years old account for 56.74% of the thalassaemics in Perak.
Table 10.4: Distribution of Patients in Perak by Age Group
Age Group (years) No. of Patients (n) Percentage (%)
0 - 4.9 17 3.01
5 - 9.9 59 10.46
10 -14.9 87 15.43
15 -19.9 81 14.36
20 - 24.9 91 16.13
25 - 29.9 64 11.35
30 - 34.9 56 9.93
35 - 39.9 35 6.21
40 - 44.9 21 3.72
45 - 49.9 16 2.84
50 - 54.9 11 1.95
55 - 59.9 11 1.95
60 - 64.9 10 1.77
Above 65 5 0.89
Total 564 100.00
Figure 10.2: Distribution of Patients in Perak by Age Group
0-4.95-9.9
10-14
.915-19
.9
20-24.9
25-29.9
30-34.9
35-39.9
40-44.9
45-49.9
50-54.9
55-59.9
60-64.9
Above 65
100
80
60
40
20
0
Age Group
No.
of P
atie
nts
17
59
8781
91
6456
35
2116
11 11 105
As seen in Figure 10.2, the majority of thalassaemia patients in Perak are at the second and third decade of life.
MTR Report_Part-1_PRINT_20191114_FA9.indd 161 27/11/2019 5:09 PM
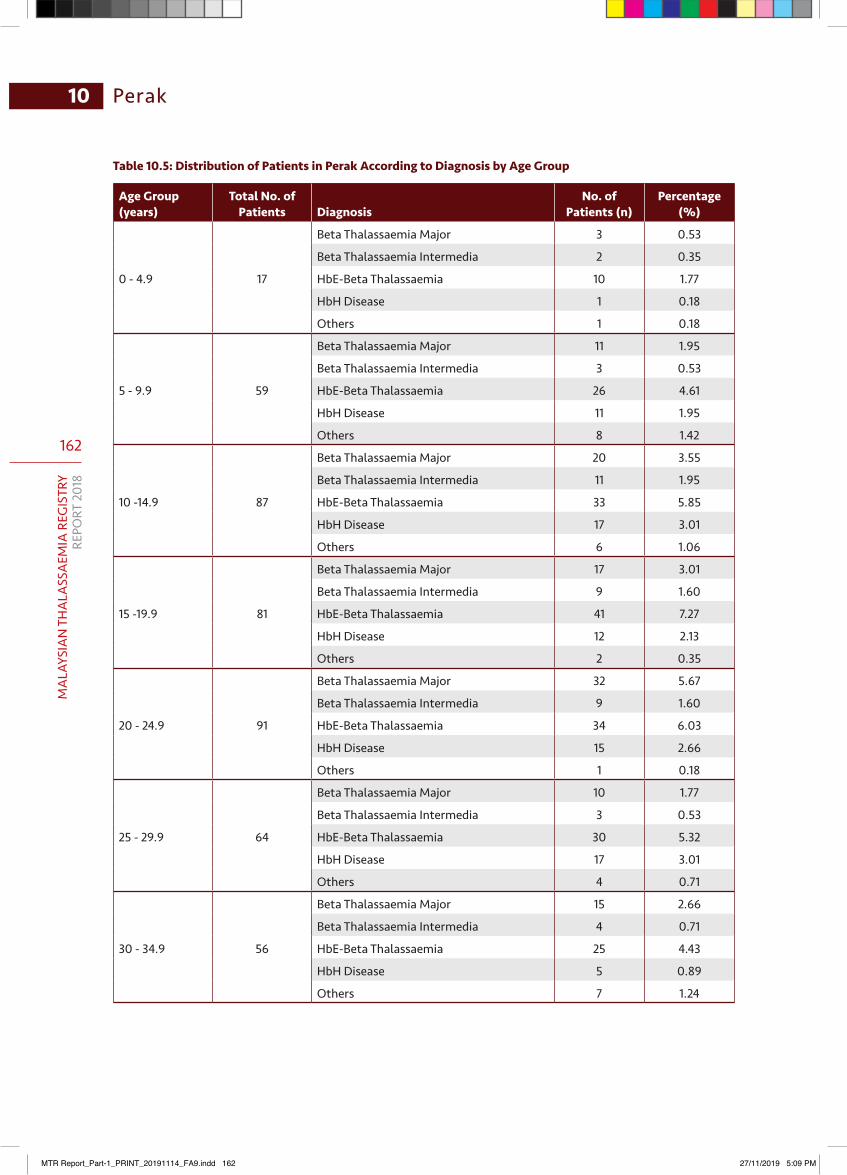
162
MA
LAYS
IAN
TH
ALA
SSA
EMIA
REG
ISTR
YRE
PORT
201
8
10 Perak
Table 10.5: Distribution of Patients in Perak According to Diagnosis by Age Group
Age Group (years)
Total No. of Patients Diagnosis
No. of Patients (n)
Percentage (%)
0 - 4.9 17
Beta Thalassaemia Major 3 0.53
Beta Thalassaemia Intermedia 2 0.35
HbE-Beta Thalassaemia 10 1.77
HbH Disease 1 0.18
Others 1 0.18
5 - 9.9 59
Beta Thalassaemia Major 11 1.95
Beta Thalassaemia Intermedia 3 0.53
HbE-Beta Thalassaemia 26 4.61
HbH Disease 11 1.95
Others 8 1.42
10 -14.9 87
Beta Thalassaemia Major 20 3.55
Beta Thalassaemia Intermedia 11 1.95
HbE-Beta Thalassaemia 33 5.85
HbH Disease 17 3.01
Others 6 1.06
15 -19.9 81
Beta Thalassaemia Major 17 3.01
Beta Thalassaemia Intermedia 9 1.60
HbE-Beta Thalassaemia 41 7.27
HbH Disease 12 2.13
Others 2 0.35
20 - 24.9 91
Beta Thalassaemia Major 32 5.67
Beta Thalassaemia Intermedia 9 1.60
HbE-Beta Thalassaemia 34 6.03
HbH Disease 15 2.66
Others 1 0.18
25 - 29.9 64
Beta Thalassaemia Major 10 1.77
Beta Thalassaemia Intermedia 3 0.53
HbE-Beta Thalassaemia 30 5.32
HbH Disease 17 3.01
Others 4 0.71
30 - 34.9 56
Beta Thalassaemia Major 15 2.66
Beta Thalassaemia Intermedia 4 0.71
HbE-Beta Thalassaemia 25 4.43
HbH Disease 5 0.89
Others 7 1.24
MTR Report_Part-1_PRINT_20191114_FA9.indd 162 27/11/2019 5:09 PM
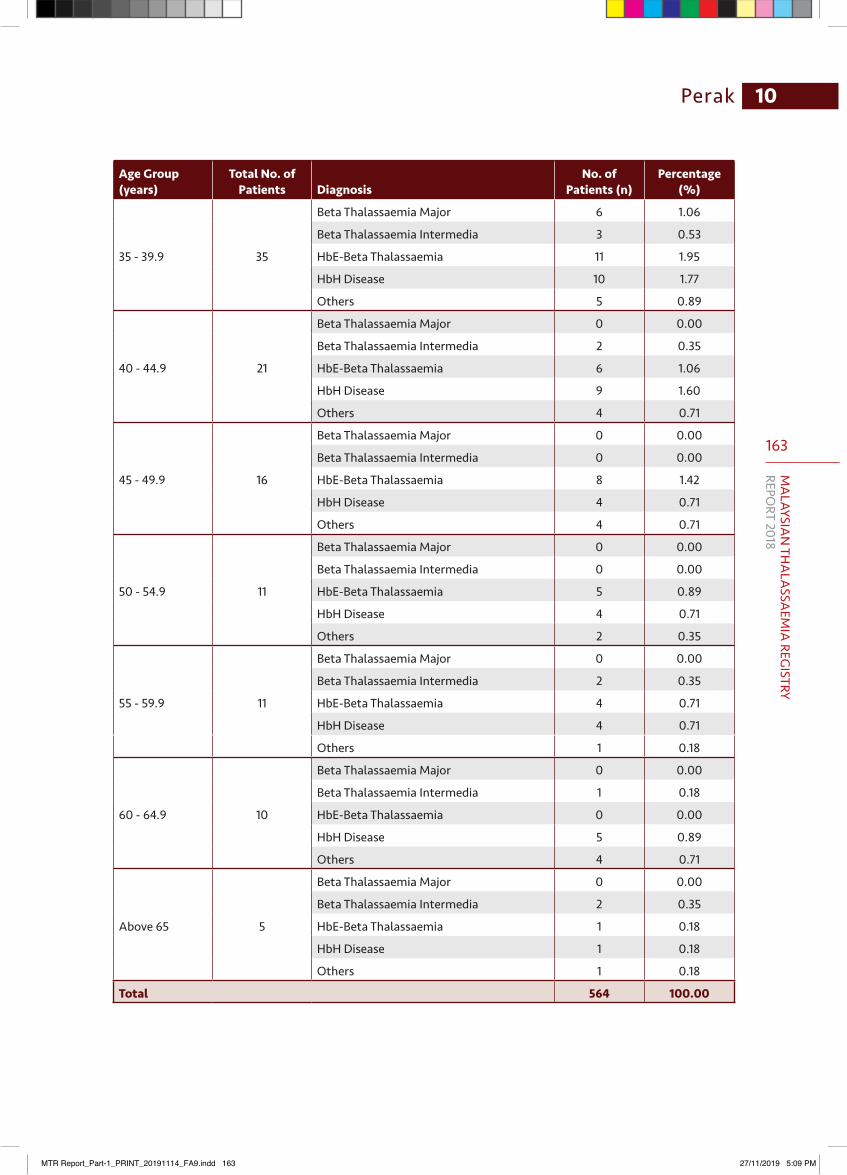
163
MA
LAYSIAN
THA
LASSA
EMIA
REGISTRY
REPORT 2018
10Perak
Age Group (years)
Total No. of Patients Diagnosis
No. of Patients (n)
Percentage (%)
35 - 39.9 35
Beta Thalassaemia Major 6 1.06
Beta Thalassaemia Intermedia 3 0.53
HbE-Beta Thalassaemia 11 1.95
HbH Disease 10 1.77
Others 5 0.89
40 - 44.9 21
Beta Thalassaemia Major 0 0.00
Beta Thalassaemia Intermedia 2 0.35
HbE-Beta Thalassaemia 6 1.06
HbH Disease 9 1.60
Others 4 0.71
45 - 49.9 16
Beta Thalassaemia Major 0 0.00
Beta Thalassaemia Intermedia 0 0.00
HbE-Beta Thalassaemia 8 1.42
HbH Disease 4 0.71
Others 4 0.71
50 - 54.9 11
Beta Thalassaemia Major 0 0.00
Beta Thalassaemia Intermedia 0 0.00
HbE-Beta Thalassaemia 5 0.89
HbH Disease 4 0.71
Others 2 0.35
55 - 59.9 11
Beta Thalassaemia Major 0 0.00
Beta Thalassaemia Intermedia 2 0.35
HbE-Beta Thalassaemia 4 0.71
HbH Disease 4 0.71
Others 1 0.18
60 - 64.9 10
Beta Thalassaemia Major 0 0.00
Beta Thalassaemia Intermedia 1 0.18
HbE-Beta Thalassaemia 0 0.00
HbH Disease 5 0.89
Others 4 0.71
Above 65 5
Beta Thalassaemia Major 0 0.00
Beta Thalassaemia Intermedia 2 0.35
HbE-Beta Thalassaemia 1 0.18
HbH Disease 1 0.18
Others 1 0.18
Total 564 100.00
MTR Report_Part-1_PRINT_20191114_FA9.indd 163 27/11/2019 5:09 PM
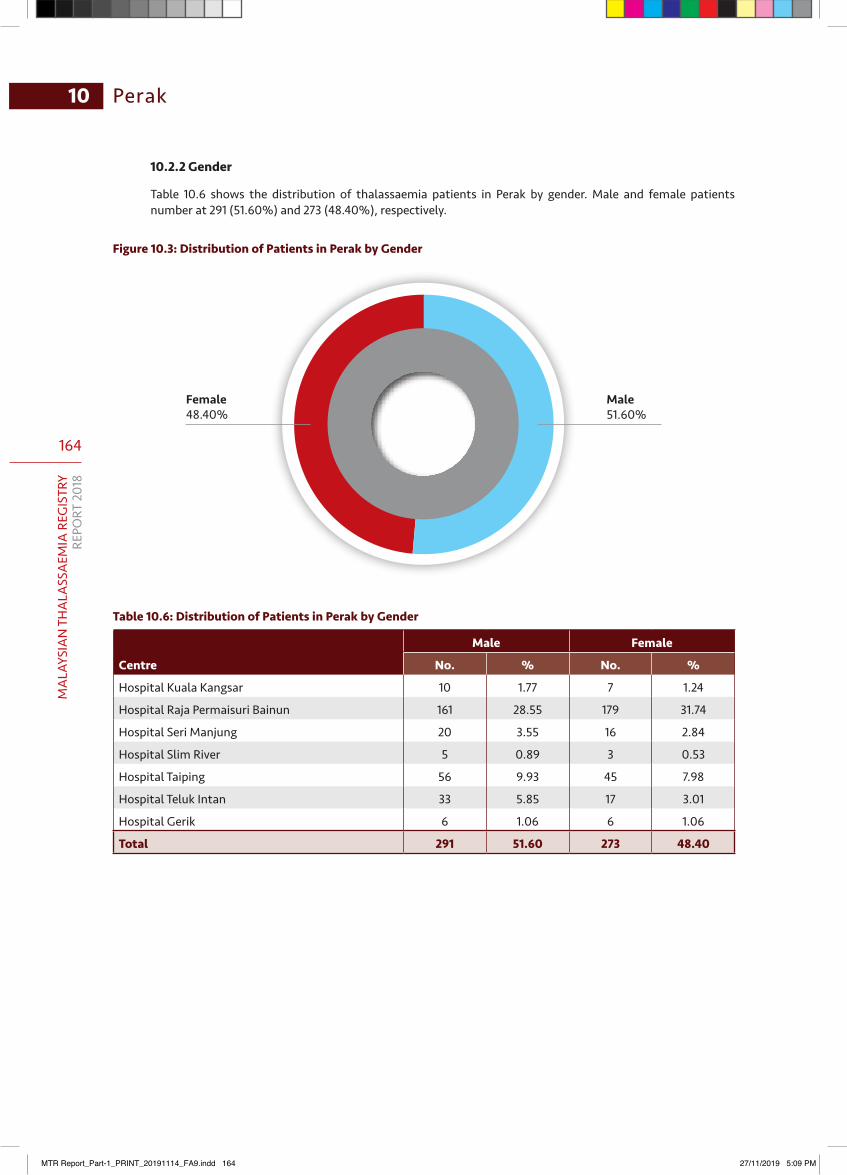
164
MA
LAYS
IAN
TH
ALA
SSA
EMIA
REG
ISTR
YRE
PORT
201
8
10 Perak
10.2.2 Gender
Table 10.6 shows the distribution of thalassaemia patients in Perak by gender. Male and female patients number at 291 (51.60%) and 273 (48.40%), respectively.
Figure 10.3: Distribution of Patients in Perak by Gender
Female48.40%
Male51.60%
Table 10.6: Distribution of Patients in Perak by Gender
Centre
Male Female
No. % No. %
Hospital Kuala Kangsar 10 1.77 7 1.24
Hospital Raja Permaisuri Bainun 161 28.55 179 31.74
Hospital Seri Manjung 20 3.55 16 2.84
Hospital Slim River 5 0.89 3 0.53
Hospital Taiping 56 9.93 45 7.98
Hospital Teluk Intan 33 5.85 17 3.01
Hospital Gerik 6 1.06 6 1.06
Total 291 51.60 273 48.40
MTR Report_Part-1_PRINT_20191114_FA9.indd 164 27/11/2019 5:09 PM
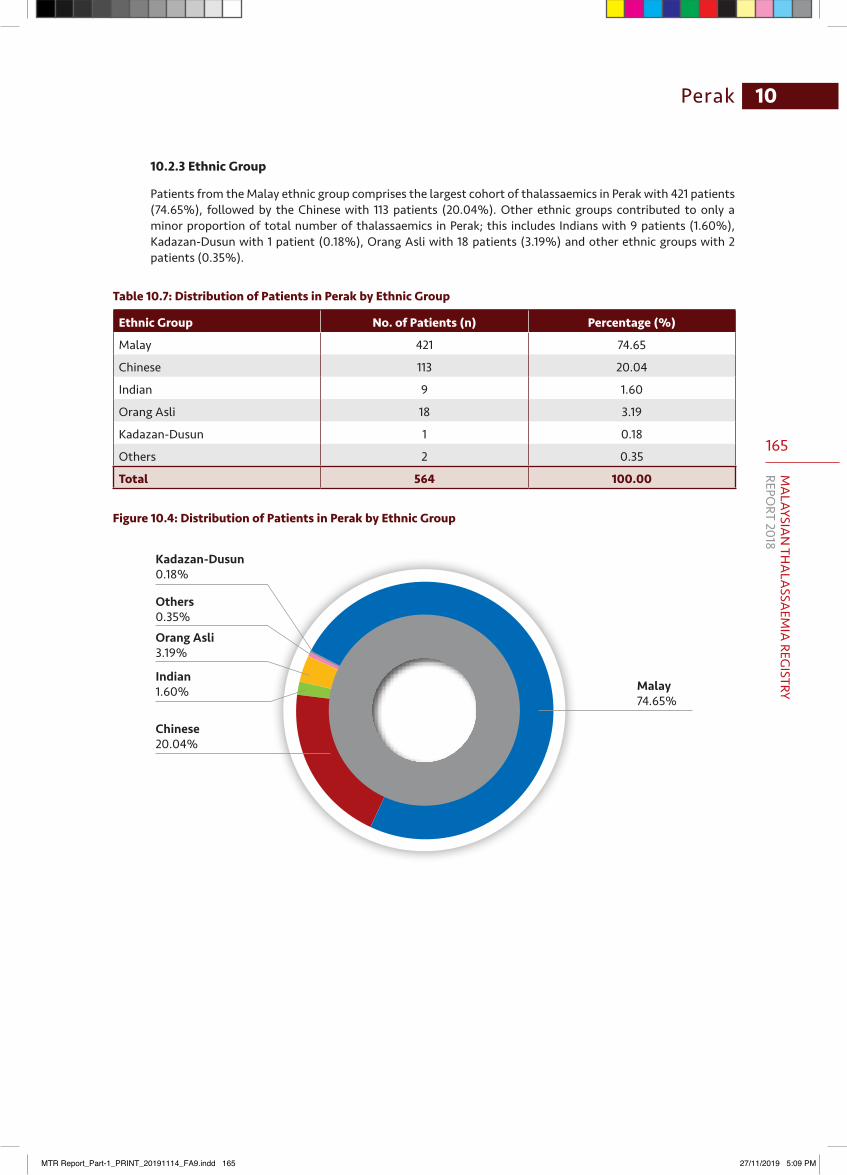
165
MA
LAYSIAN
THA
LASSA
EMIA
REGISTRY
REPORT 2018
10Perak
10.2.3 Ethnic Group
Patients from the Malay ethnic group comprises the largest cohort of thalassaemics in Perak with 421 patients (74.65%), followed by the Chinese with 113 patients (20.04%). Other ethnic groups contributed to only a minor proportion of total number of thalassaemics in Perak; this includes Indians with 9 patients (1.60%), Kadazan-Dusun with 1 patient (0.18%), Orang Asli with 18 patients (3.19%) and other ethnic groups with 2 patients (0.35%).
Table 10.7: Distribution of Patients in Perak by Ethnic Group
Ethnic Group No. of Patients (n) Percentage (%)
Malay 421 74.65
Chinese 113 20.04
Indian 9 1.60
Orang Asli 18 3.19
Kadazan-Dusun 1 0.18
Others 2 0.35
Total 564 100.00
Figure 10.4: Distribution of Patients in Perak by Ethnic Group
Chinese20.04%
Indian1.60%
Kadazan-Dusun0.18%
Others0.35%Orang Asli3.19%
Malay74.65%
MTR Report_Part-1_PRINT_20191114_FA9.indd 165 27/11/2019 5:09 PM
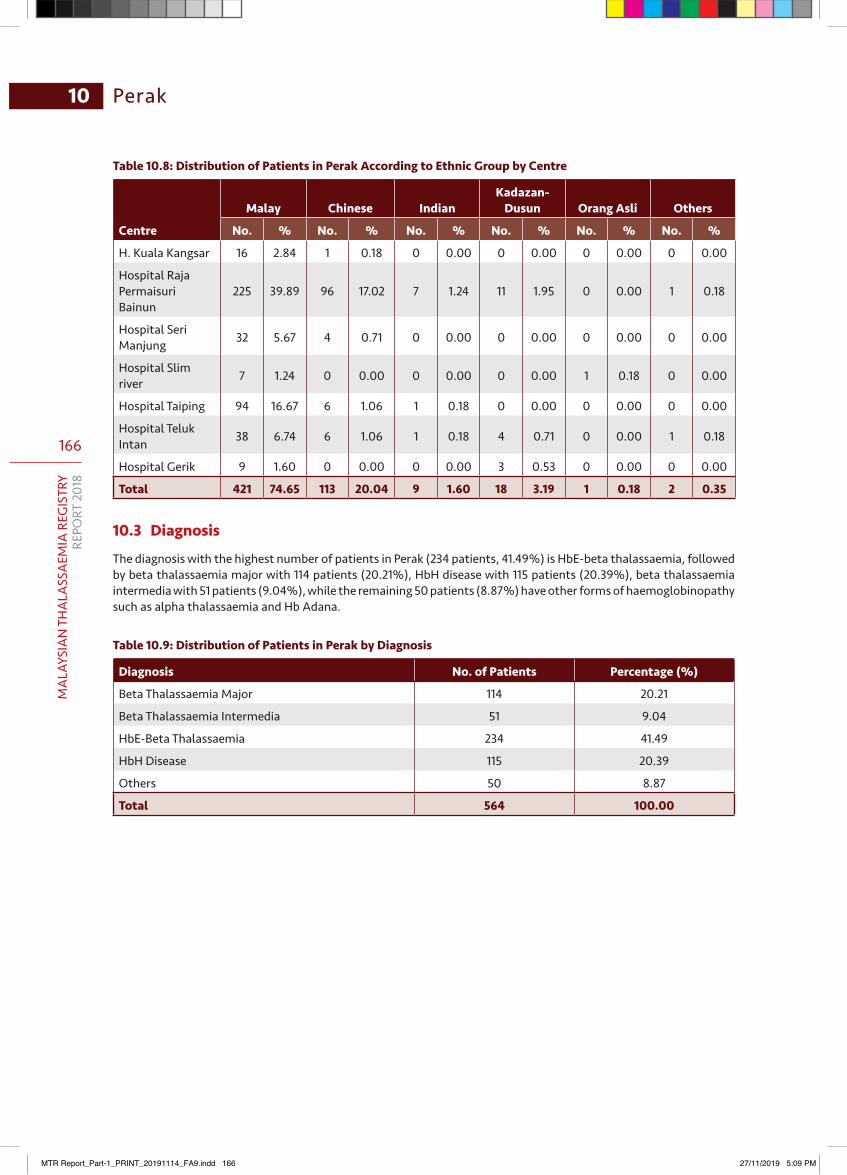
166
MA
LAYS
IAN
TH
ALA
SSA
EMIA
REG
ISTR
YRE
PORT
201
8
10 Perak
Table10.8:DistributionofPatientsinPerakAccordingtoEthnicGroupbyCentre
Centre
Malay Chinese IndianKadazan-
Dusun Orang Asli Others
No. % No. % No. % No. % No. % No. %
H. Kuala Kangsar 16 2.84 1 0.18 0 0.00 0 0.00 0 0.00 0 0.00
Hospital Raja Permaisuri Bainun
225 39.89 96 17.02 7 1.24 11 1.95 0 0.00 1 0.18
Hospital Seri Manjung 32 5.67 4 0.71 0 0.00 0 0.00 0 0.00 0 0.00
Hospital Slim river 7 1.24 0 0.00 0 0.00 0 0.00 1 0.18 0 0.00
Hospital Taiping 94 16.67 6 1.06 1 0.18 0 0.00 0 0.00 0 0.00
Hospital Teluk Intan 38 6.74 6 1.06 1 0.18 4 0.71 0 0.00 1 0.18
Hospital Gerik 9 1.60 0 0.00 0 0.00 3 0.53 0 0.00 0 0.00
Total 421 74.65 113 20.04 9 1.60 18 3.19 1 0.18 2 0.35
10.3 Diagnosis
The diagnosis with the highest number of patients in Perak (234 patients, 41.49%) is HbE-beta thalassaemia, followed by beta thalassaemia major with 114 patients (20.21%), HbH disease with 115 patients (20.39%), beta thalassaemia intermedia with 51 patients (9.04%), while the remaining 50 patients (8.87%) have other forms of haemoglobinopathy such as alpha thalassaemia and Hb Adana.
Table 10.9: Distribution of Patients in Perak by Diagnosis
Diagnosis No. of Patients Percentage (%)
Beta Thalassaemia Major 114 20.21
Beta Thalassaemia Intermedia 51 9.04
HbE-Beta Thalassaemia 234 41.49
HbH Disease 115 20.39
Others 50 8.87
Total 564 100.00
MTR Report_Part-1_PRINT_20191114_FA9.indd 166 27/11/2019 5:09 PM
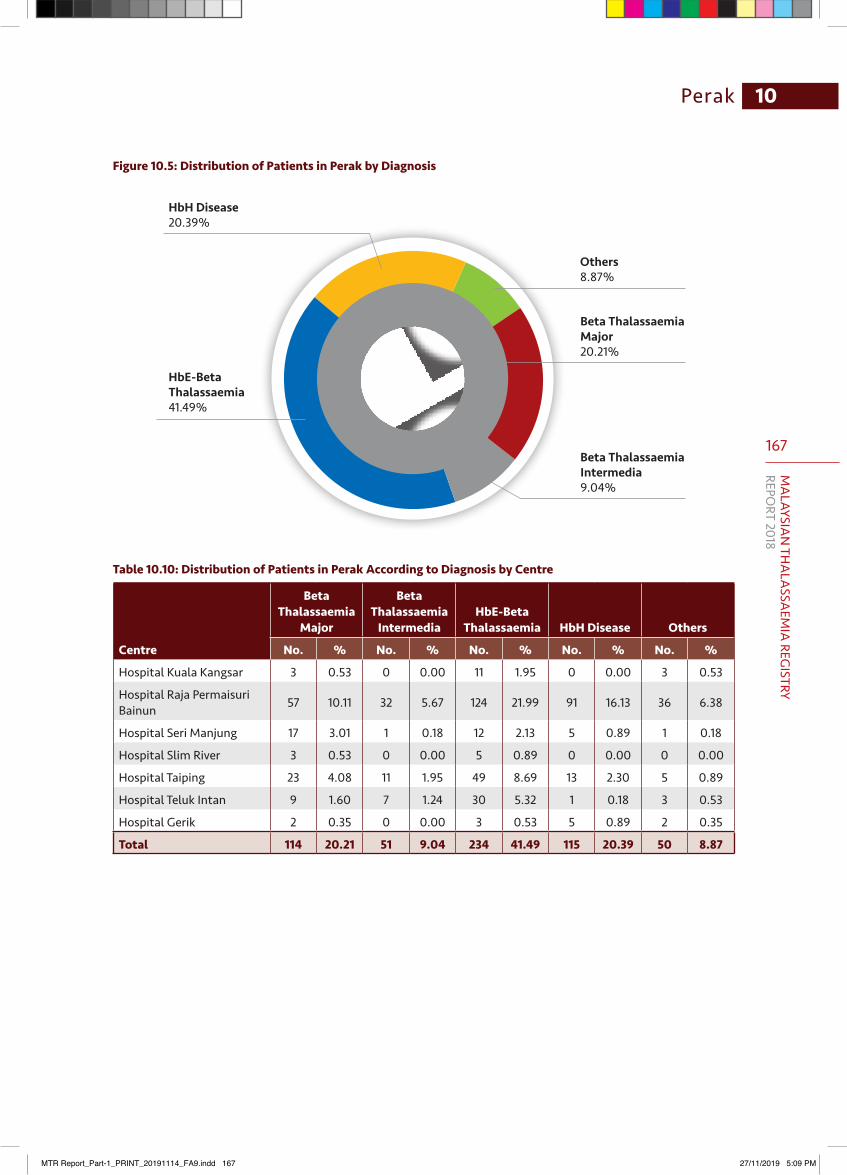
167
MA
LAYSIAN
THA
LASSA
EMIA
REGISTRY
REPORT 2018
10Perak
Beta Thalassaemia Major20.21%
Beta Thalassaemia Intermedia9.04%
HbH Disease20.39%
HbE-Beta Thalassaemia41.49%
Others8.87%
Figure 10.5: Distribution of Patients in Perak by Diagnosis
Table 10.10: Distribution of Patients in Perak According to Diagnosis by Centre
Centre
Beta Thalassaemia
Major
Beta Thalassaemia
IntermediaHbE-Beta
Thalassaemia HbH Disease Others
No. % No. % No. % No. % No. %
Hospital Kuala Kangsar 3 0.53 0 0.00 11 1.95 0 0.00 3 0.53
Hospital Raja Permaisuri Bainun 57 10.11 32 5.67 124 21.99 91 16.13 36 6.38
Hospital Seri Manjung 17 3.01 1 0.18 12 2.13 5 0.89 1 0.18
Hospital Slim River 3 0.53 0 0.00 5 0.89 0 0.00 0 0.00
Hospital Taiping 23 4.08 11 1.95 49 8.69 13 2.30 5 0.89
Hospital Teluk Intan 9 1.60 7 1.24 30 5.32 1 0.18 3 0.53
Hospital Gerik 2 0.35 0 0.00 3 0.53 5 0.89 2 0.35
Total 114 20.21 51 9.04 234 41.49 115 20.39 50 8.87
MTR Report_Part-1_PRINT_20191114_FA9.indd 167 27/11/2019 5:09 PM
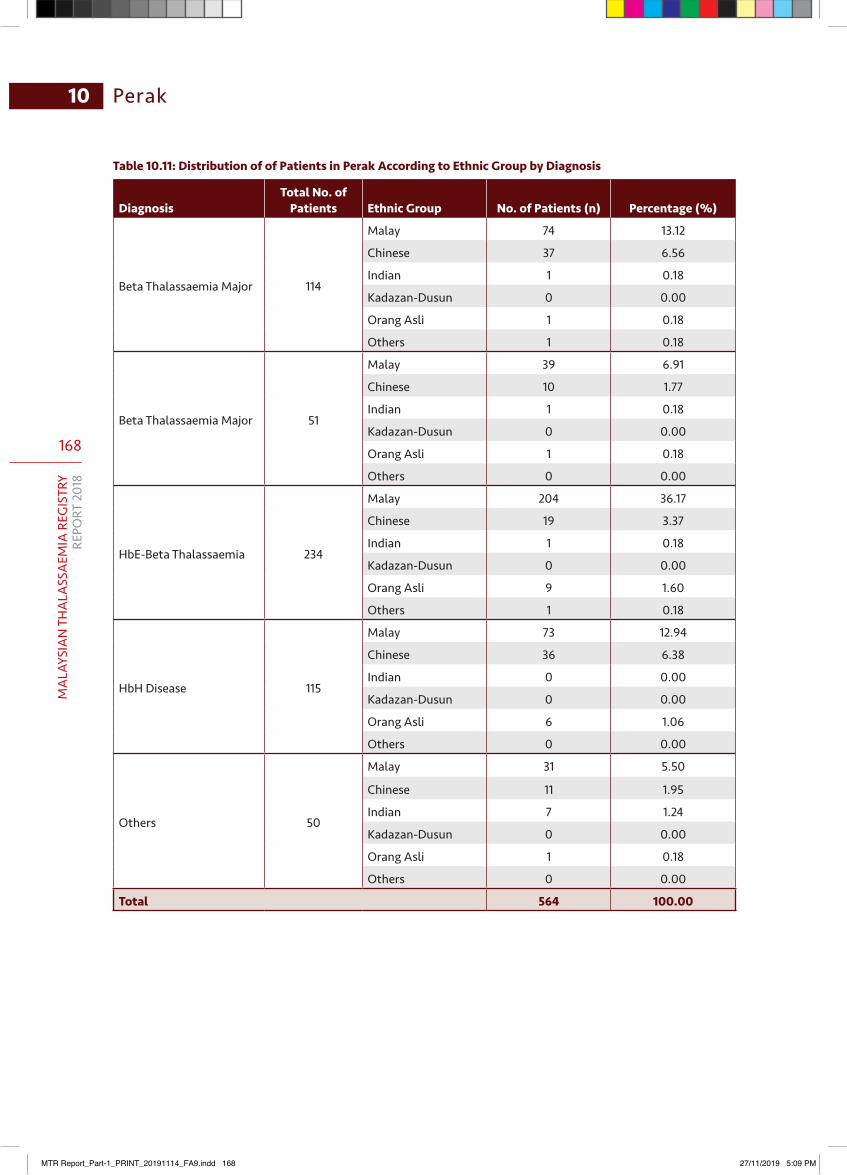
168
MA
LAYS
IAN
TH
ALA
SSA
EMIA
REG
ISTR
YRE
PORT
201
8
10 Perak
Table 10.11: Distribution of of Patients in Perak According to Ethnic Group by Diagnosis
DiagnosisTotal No. of
Patients Ethnic Group No. of Patients (n) Percentage (%)
Beta Thalassaemia Major 114
Malay 74 13.12
Chinese 37 6.56
Indian 1 0.18
Kadazan-Dusun 0 0.00
Orang Asli 1 0.18
Others 1 0.18
Beta Thalassaemia Major 51
Malay 39 6.91
Chinese 10 1.77
Indian 1 0.18
Kadazan-Dusun 0 0.00
Orang Asli 1 0.18
Others 0 0.00
HbE-Beta Thalassaemia 234
Malay 204 36.17
Chinese 19 3.37
Indian 1 0.18
Kadazan-Dusun 0 0.00
Orang Asli 9 1.60
Others 1 0.18
HbH Disease 115
Malay 73 12.94
Chinese 36 6.38
Indian 0 0.00
Kadazan-Dusun 0 0.00
Orang Asli 6 1.06
Others 0 0.00
Others 50
Malay 31 5.50
Chinese 11 1.95
Indian 7 1.24
Kadazan-Dusun 0 0.00
Orang Asli 1 0.18
Others 0 0.00
Total 564 100.00
MTR Report_Part-1_PRINT_20191114_FA9.indd 168 27/11/2019 5:09 PM
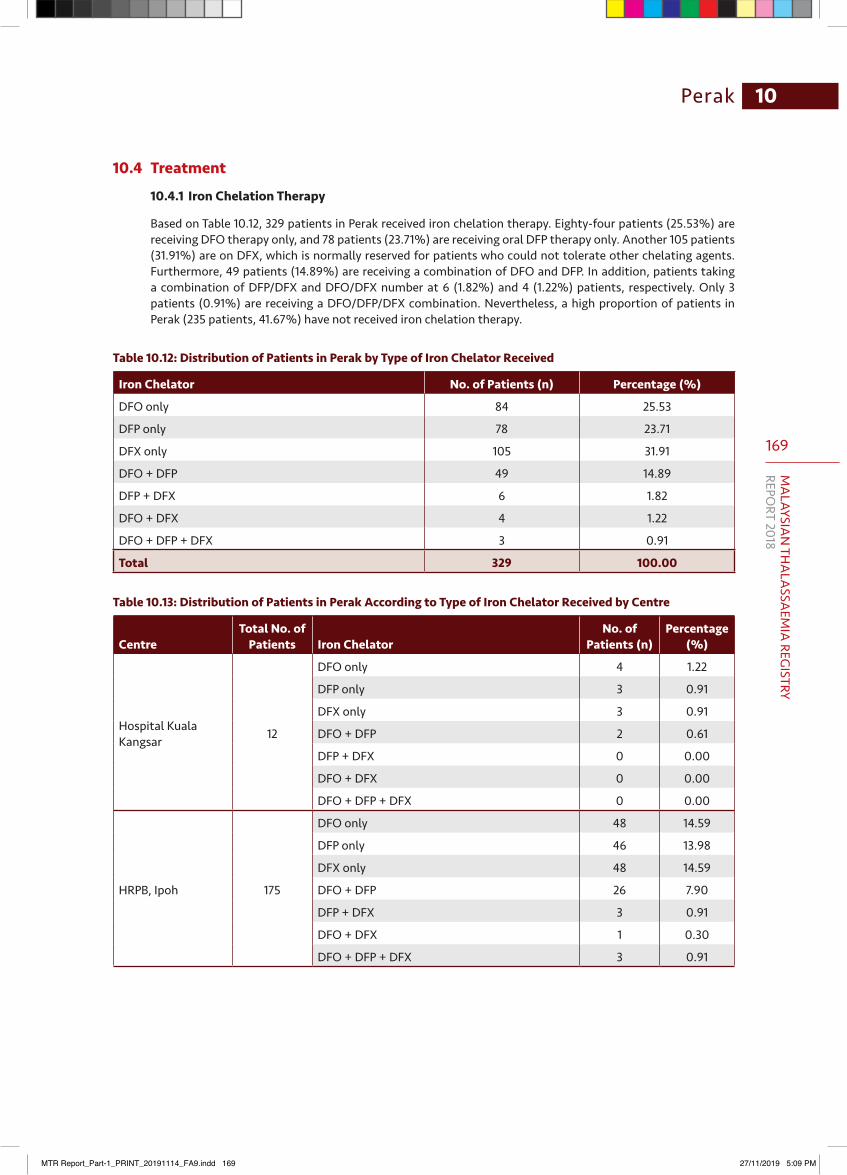
169
MA
LAYSIAN
THA
LASSA
EMIA
REGISTRY
REPORT 2018
10Perak
10.4 Treatment
10.4.1 Iron Chelation Therapy
Based on Table 10.12, 329 patients in Perak received iron chelation therapy. Eighty-four patients (25.53%) are receiving DFO therapy only, and 78 patients (23.71%) are receiving oral DFP therapy only. Another 105 patients (31.91%) are on DFX, which is normally reserved for patients who could not tolerate other chelating agents. Furthermore, 49 patients (14.89%) are receiving a combination of DFO and DFP. In addition, patients taking a combination of DFP/DFX and DFO/DFX number at 6 (1.82%) and 4 (1.22%) patients, respectively. Only 3 patients (0.91%) are receiving a DFO/DFP/DFX combination. Nevertheless, a high proportion of patients in Perak (235 patients, 41.67%) have not received iron chelation therapy.
Table 10.12: Distribution of Patients in Perak by Type of Iron Chelator Received
Iron Chelator No. of Patients (n) Percentage (%)
DFO only 84 25.53
DFP only 78 23.71
DFX only 105 31.91
DFO + DFP 49 14.89
DFP + DFX 6 1.82
DFO + DFX 4 1.22
DFO + DFP + DFX 3 0.91
Total 329 100.00
Table 10.13: Distribution of Patients in Perak According to Type of Iron Chelator Received by Centre
CentreTotal No. of
Patients Iron ChelatorNo. of
Patients (n)Percentage
(%)
Hospital Kuala Kangsar 12
DFO only 4 1.22
DFP only 3 0.91
DFX only 3 0.91
DFO + DFP 2 0.61
DFP + DFX 0 0.00
DFO + DFX 0 0.00
DFO + DFP + DFX 0 0.00
HRPB, Ipoh 175
DFO only 48 14.59
DFP only 46 13.98
DFX only 48 14.59
DFO + DFP 26 7.90
DFP + DFX 3 0.91
DFO + DFX 1 0.30
DFO + DFP + DFX 3 0.91
MTR Report_Part-1_PRINT_20191114_FA9.indd 169 27/11/2019 5:09 PM
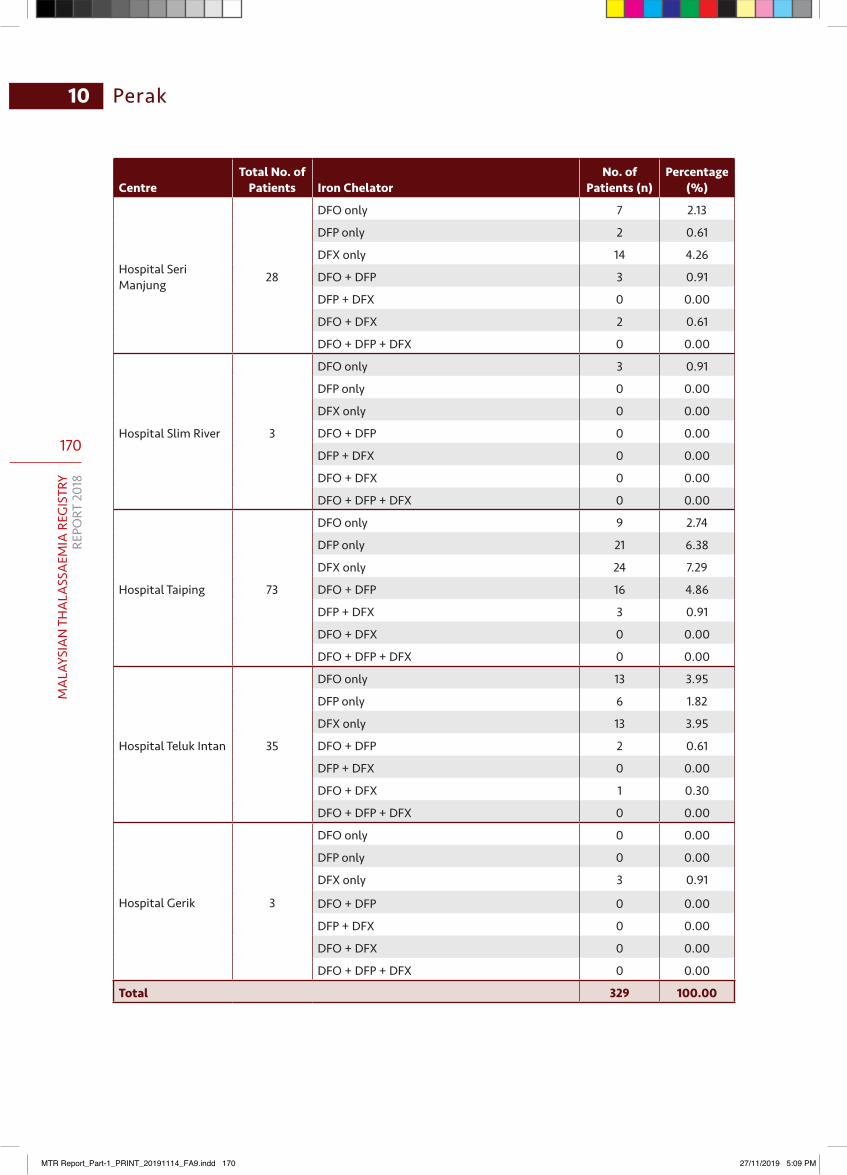
170
MA
LAYS
IAN
TH
ALA
SSA
EMIA
REG
ISTR
YRE
PORT
201
8
10 Perak
CentreTotal No. of
Patients Iron ChelatorNo. of
Patients (n)Percentage
(%)
Hospital Seri Manjung 28
DFO only 7 2.13
DFP only 2 0.61
DFX only 14 4.26
DFO + DFP 3 0.91
DFP + DFX 0 0.00
DFO + DFX 2 0.61
DFO + DFP + DFX 0 0.00
Hospital Slim River 3
DFO only 3 0.91
DFP only 0 0.00
DFX only 0 0.00
DFO + DFP 0 0.00
DFP + DFX 0 0.00
DFO + DFX 0 0.00
DFO + DFP + DFX 0 0.00
Hospital Taiping 73
DFO only 9 2.74
DFP only 21 6.38
DFX only 24 7.29
DFO + DFP 16 4.86
DFP + DFX 3 0.91
DFO + DFX 0 0.00
DFO + DFP + DFX 0 0.00
Hospital Teluk Intan 35
DFO only 13 3.95
DFP only 6 1.82
DFX only 13 3.95
DFO + DFP 2 0.61
DFP + DFX 0 0.00
DFO + DFX 1 0.30
DFO + DFP + DFX 0 0.00
Hospital Gerik 3
DFO only 0 0.00
DFP only 0 0.00
DFX only 3 0.91
DFO + DFP 0 0.00
DFP + DFX 0 0.00
DFO + DFX 0 0.00
DFO + DFP + DFX 0 0.00
Total 329 100.00
MTR Report_Part-1_PRINT_20191114_FA9.indd 170 27/11/2019 5:09 PM
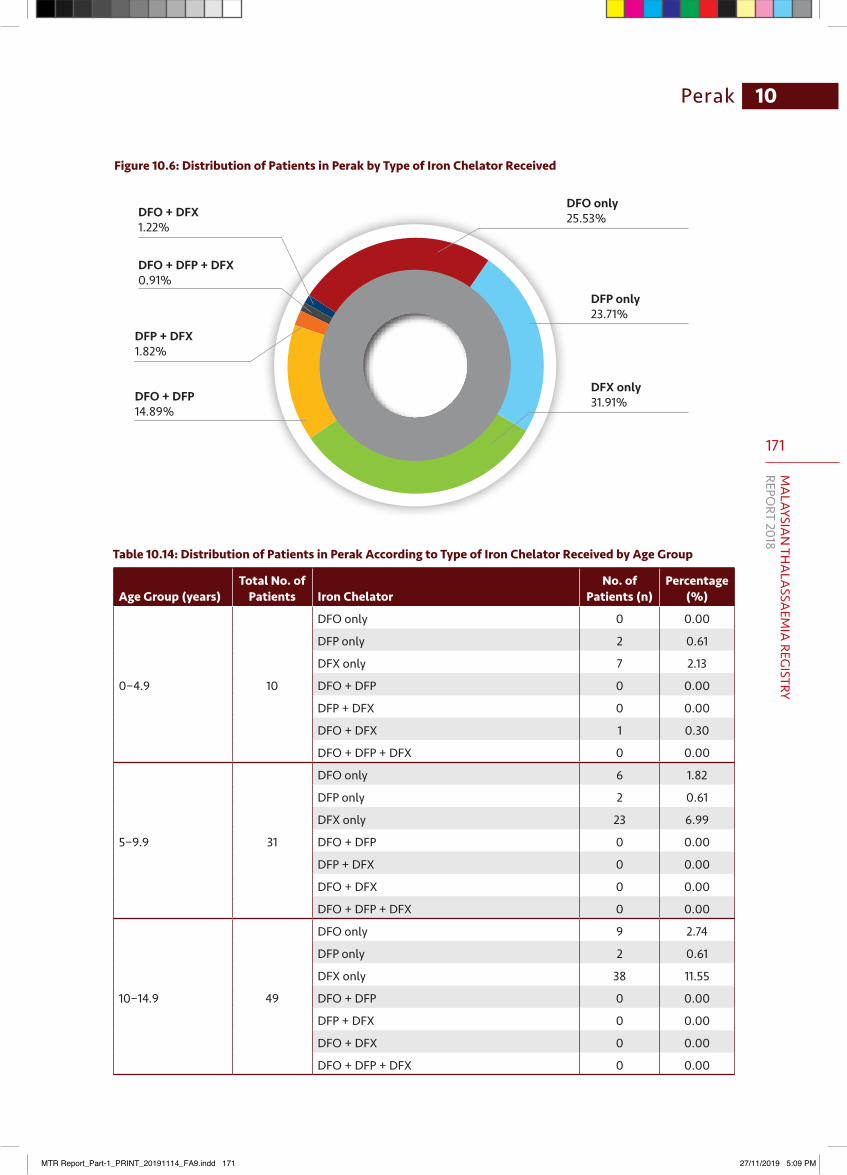
171
MA
LAYSIAN
THA
LASSA
EMIA
REGISTRY
REPORT 2018
10Perak
DFP only23.71%
DFX only31.91%DFO + DFP
14.89%
DFP + DFX1.82%
DFO + DFX1.22%
DFO + DFP + DFX0.91%
DFO only25.53%
Figure 10.6: Distribution of Patients in Perak by Type of Iron Chelator Received
Table 10.14: Distribution of Patients in Perak According to Type of Iron Chelator Received by Age Group
Age Group (years)Total No. of
Patients Iron ChelatorNo. of
Patients (n)Percentage
(%)
0−4.9 10
DFO only 0 0.00
DFP only 2 0.61
DFX only 7 2.13
DFO + DFP 0 0.00
DFP + DFX 0 0.00
DFO + DFX 1 0.30
DFO + DFP + DFX 0 0.00
5−9.9 31
DFO only 6 1.82
DFP only 2 0.61
DFX only 23 6.99
DFO + DFP 0 0.00
DFP + DFX 0 0.00
DFO + DFX 0 0.00
DFO + DFP + DFX 0 0.00
10−14.9 49
DFO only 9 2.74
DFP only 2 0.61
DFX only 38 11.55
DFO + DFP 0 0.00
DFP + DFX 0 0.00
DFO + DFX 0 0.00
DFO + DFP + DFX 0 0.00
MTR Report_Part-1_PRINT_20191114_FA9.indd 171 27/11/2019 5:09 PM

172
MA
LAYS
IAN
TH
ALA
SSA
EMIA
REG
ISTR
YRE
PORT
201
8
10 Perak
Age Group (years)Total No. of
Patients Iron ChelatorNo. of
Patients (n)Percentage
(%)
15−19.9 51
DFO only 14 4.26
DFP only 8 2.43
DFX only 20 6.08
DFO + DFP 8 2.43
DFP + DFX 1 0.30
DFO + DFX 0 0.00
DFO + DFP + DFX 0 0.00
20−24.9 62
DFO only 20 6.08
DFP only 11 3.34
DFX only 9 2.74
DFO + DFP 17 5.17
DFP + DFX 3 0.91
DFO + DFX 1 0.30
DFO + DFP + DFX 1 0.30
25−29.9 36
DFO only 12 3.65
DFP only 8 2.43
DFX only 1 0.30
DFO + DFP 11 3.34
DFP + DFX 1 0.30
DFO + DFX 1 0.30
DFO + DFP + DFX 2 0.61
30−34.9 42
DFO only 11 3.34
DFP only 19 5.78
DFX only 3 0.91
DFO + DFP 8 2.43
DFP + DFX 1 0.30
DFO + DFX 0 0.00
DFO + DFP + DFX 0 0.00
35−39.9 15
DFO only 5 1.52
DFP only 6 1.82
DFX only 1 0.30
DFO + DFP 3 0.91
DFP + DFX 0 0.00
DFO + DFX 0 0.00
DFO + DFP + DFX 0 0.00
MTR Report_Part-1_PRINT_20191114_FA9.indd 172 27/11/2019 5:09 PM

173
MA
LAYSIAN
THA
LASSA
EMIA
REGISTRY
REPORT 2018
10Perak
Age Group (years)Total No. of
Patients Iron ChelatorNo. of
Patients (n)Percentage
(%)
40−44.9 8
DFO only 2 0.61
DFP only 5 1.52
DFX only 1 0.30
DFO + DFP 0 0.00
DFP + DFX 0 0.00
DFO + DFX 0 0.00
DFO + DFP + DFX 0 0.00
45−49.9 5
DFO only 2 0.61
DFP only 2 0.61
DFX only 1 0.30
DFO + DFP 0 0.00
DFP + DFX 0 0.00
DFO + DFX 0 0.00
DFO + DFP + DFX 0 0.00
50−54.9 4
DFO only 1 0.30
DFP only 3 0.91
DFX only 0 0.00
DFO + DFP 0 0.00
DFP + DFX 0 0.00
DFO + DFX 0 0.00
DFO + DFP + DFX 0 0.00
55−59.9 7
DFO only 1 0.30
DFP only 3 0.91
DFX only 0 0.00
DFO + DFP 2 0.61
DFP + DFX 0 0.00
DFO + DFX 1 0.30
DFO + DFP + DFX 0 0.00
60−64.9 6
DFO only 0 0.00
DFP only 5 1.52
DFX only 1 0.30
DFO + DFP 0 0.00
DFP + DFX 0 0.00
DFO + DFX 0 0.00
DFO + DFP + DFX 0 0.00
MTR Report_Part-1_PRINT_20191114_FA9.indd 173 27/11/2019 5:09 PM
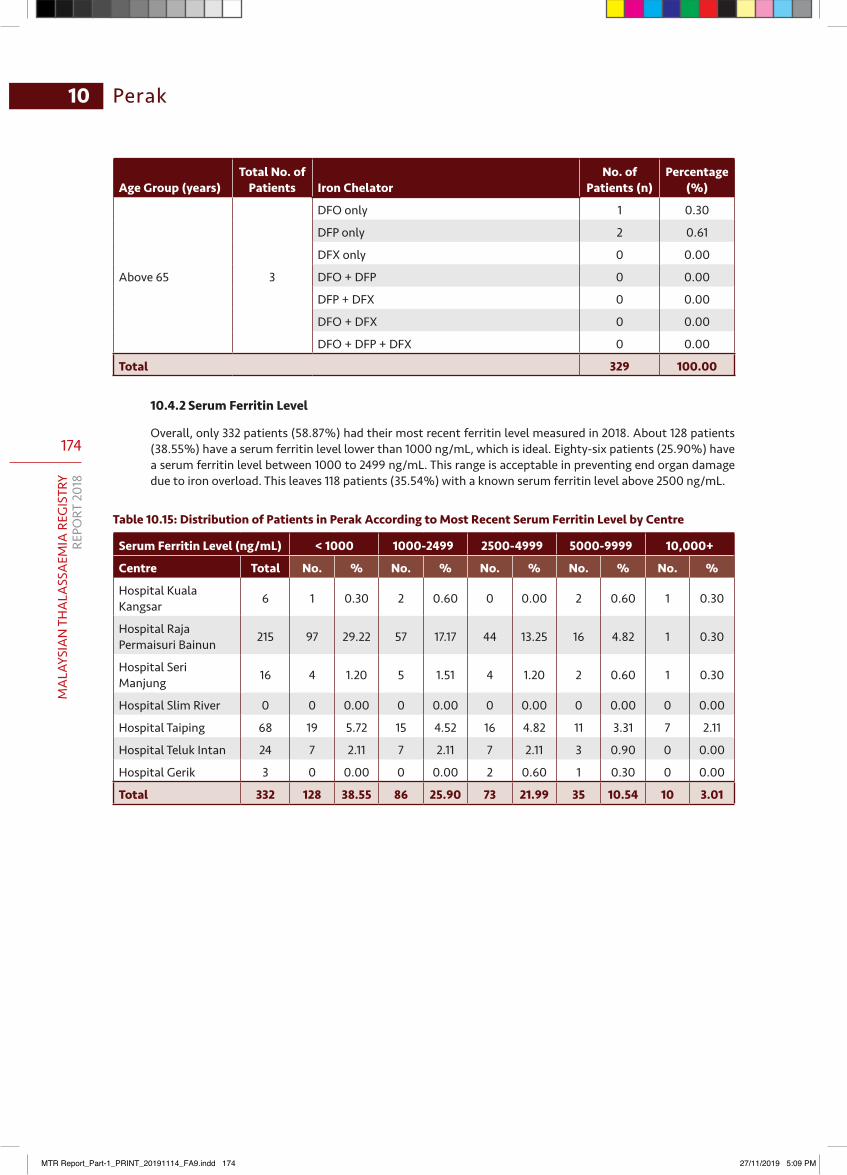
174
MA
LAYS
IAN
TH
ALA
SSA
EMIA
REG
ISTR
YRE
PORT
201
8
10 Perak
Age Group (years)Total No. of
Patients Iron ChelatorNo. of
Patients (n)Percentage
(%)
Above 65 3
DFO only 1 0.30
DFP only 2 0.61
DFX only 0 0.00
DFO + DFP 0 0.00
DFP + DFX 0 0.00
DFO + DFX 0 0.00
DFO + DFP + DFX 0 0.00
Total 329 100.00
10.4.2 Serum Ferritin Level
Overall, only 332 patients (58.87%) had their most recent ferritin level measured in 2018. About 128 patients (38.55%) have a serum ferritin level lower than 1000 ng/mL, which is ideal. Eighty-six patients (25.90%) have a serum ferritin level between 1000 to 2499 ng/mL. This range is acceptable in preventing end organ damage due to iron overload. This leaves 118 patients (35.54%) with a known serum ferritin level above 2500 ng/mL.
Table 10.15: Distribution of Patients in Perak According to Most Recent Serum Ferritin Level by Centre
Serum Ferritin Level (ng/mL) < 1000 1000-2499 2500-4999 5000-9999 10,000+
Centre Total No. % No. % No. % No. % No. %
Hospital Kuala Kangsar 6 1 0.30 2 0.60 0 0.00 2 0.60 1 0.30
Hospital Raja Permaisuri Bainun 215 97 29.22 57 17.17 44 13.25 16 4.82 1 0.30
Hospital Seri Manjung 16 4 1.20 5 1.51 4 1.20 2 0.60 1 0.30
Hospital Slim River 0 0 0.00 0 0.00 0 0.00 0 0.00 0 0.00
Hospital Taiping 68 19 5.72 15 4.52 16 4.82 11 3.31 7 2.11
Hospital Teluk Intan 24 7 2.11 7 2.11 7 2.11 3 0.90 0 0.00
Hospital Gerik 3 0 0.00 0 0.00 2 0.60 1 0.30 0 0.00
Total 332 128 38.55 86 25.90 73 21.99 35 10.54 10 3.01
MTR Report_Part-1_PRINT_20191114_FA9.indd 174 27/11/2019 5:09 PM
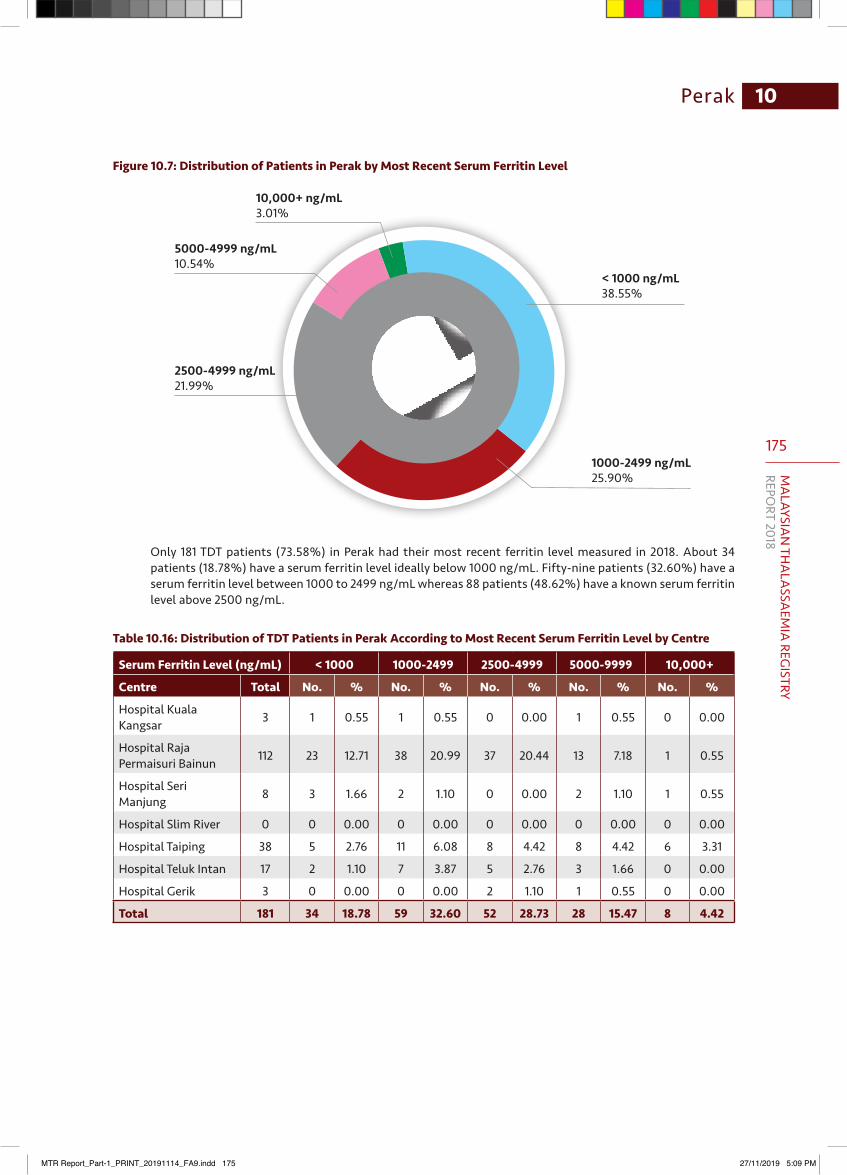
175
MA
LAYSIAN
THA
LASSA
EMIA
REGISTRY
REPORT 2018
10Perak
Figure 10.7: Distribution of Patients in Perak by Most Recent Serum Ferritin Level
1000-2499 ng/mL25.90%
10,000+ ng/mL3.01%
2500-4999 ng/mL21.99%
5000-4999 ng/mL10.54%
< 1000 ng/mL38.55%
Only 181 TDT patients (73.58%) in Perak had their most recent ferritin level measured in 2018. About 34 patients (18.78%) have a serum ferritin level ideally below 1000 ng/mL. Fifty-nine patients (32.60%) have a serum ferritin level between 1000 to 2499 ng/mL whereas 88 patients (48.62%) have a known serum ferritin level above 2500 ng/mL.
Table 10.16: Distribution of TDT Patients in Perak According to Most Recent Serum Ferritin Level by Centre
Serum Ferritin Level (ng/mL) < 1000 1000-2499 2500-4999 5000-9999 10,000+
Centre Total No. % No. % No. % No. % No. %
Hospital Kuala Kangsar 3 1 0.55 1 0.55 0 0.00 1 0.55 0 0.00
Hospital Raja Permaisuri Bainun 112 23 12.71 38 20.99 37 20.44 13 7.18 1 0.55
Hospital Seri Manjung 8 3 1.66 2 1.10 0 0.00 2 1.10 1 0.55
Hospital Slim River 0 0 0.00 0 0.00 0 0.00 0 0.00 0 0.00
Hospital Taiping 38 5 2.76 11 6.08 8 4.42 8 4.42 6 3.31
Hospital Teluk Intan 17 2 1.10 7 3.87 5 2.76 3 1.66 0 0.00
Hospital Gerik 3 0 0.00 0 0.00 2 1.10 1 0.55 0 0.00
Total 181 34 18.78 59 32.60 52 28.73 28 15.47 8 4.42
MTR Report_Part-1_PRINT_20191114_FA9.indd 175 27/11/2019 5:09 PM
176
MA
LAYS
IAN
TH
ALA
SSA
EMIA
REG
ISTR
YRE
PORT
201
8
10 Perak
10.5 Observation and Comments
This report gives a brief overview on the number of thalassaemia patients, the type of thalassaemia and the treatment provided to all thalassaemia patients in the state of Perak. Serum ferritin levels below 1000 ng/mL indicate good compliance to iron chelators; however, only 18.78% of patients fall in this category. About 64.46% of patients have an acceptable serum ferritin level lower than 2500 ng/mL. Thus, compliance still remains a major problem in Perak (as shown in Table 10.15). Based on Table 10.16, approximately half of the total number of patients (51.38%) are within the desirable ferritin level. Therefore, we have undertaken several measures to improve the statistic, among which are to consolidate treatment in major hospitals with specialists or at least with regular visiting specialists and to set up a dedicated team to manage thalassaemia patients.
Over the last five years, there have been 23 documented new births with thalassaemia in Perak. A total of five deaths were reported in 2018.The deaths were mainly due to cardiac complications, among which was a case of severe pulmonary hypertension, decompensated congestive cardiac failure with cardiac arrhythmia. There was only one mortality due to severe infection.
10.5.1 Recommendations
1. A standardised documentation and charting of the results for all thalassaemia patients and a personal patient diary can be made available for easy access by the treating clinicians all over the state. This practise can also improve the effectiveness of data entry by the RA.
2. To conduct regular training for all healthcare personnel on management of thalassaemia patients.3. To require staff nurses to record data on patients’ date and cause of death.
10.5.2 Conclusions
1. The number of thalassaemia patients in the state of Perak for the year 2018 was reported at 564 patients. Of this number, TDT comprises 246 patients (43.62%) and NTDT comprises patients 318 patients (56.38%).
2. The majority of thalassaemia patients in Perak are adults with 320 patients (56.74%), whereas paediatric patients number at 244 patients (43.26%).
3. The subtypes of thalassaemia found in the state were mainly HbE-beta thalassaemia (41.49%) followed by beta thalassaemia major (20.21%).
4. The ethnic distribution of thalassaemia in Perak reported in the national data registry consists of Malays (74.65%), Chinese (20.04), and other ethnicities (5.32%).
5. The mortalities reported in Perak in 2018 involved four adults and one paediatric patient. The causes of death were cardiac complications and infection. These were also the major causes of death in the national registry data.
6. Total number of patients on chelation therapy in the state of Perak is 329 patients (58.33%). A total of 230 TDT patients (93.5%) are currently receiving chelation therapy. The remaining 6.5% of TDT patients were not on chelation therapy, mainly due to non-compliance to treatment or was lost to follow-up. A total of 99 NTDT patients (31.13%) are also on chelation therapy.
7. The main chelation therapy used was DFX (31.91%), followed by DFO (25.53%). This is mainly due to its use in the paediatric age group, which favours oral iron chelators to subcutaneous preparation. The most common combination therapy was DFO/DFP.
8. A total of 181 (73.58%) out of 246 TDT patients had their serum ferritin level measured in 2018. Of the 181 patients, 51.38% have a serum ferritin level below 2499 ng/mL.
MTR Report_Part-1_PRINT_20191114_FA9.indd 176 27/11/2019 5:09 PM
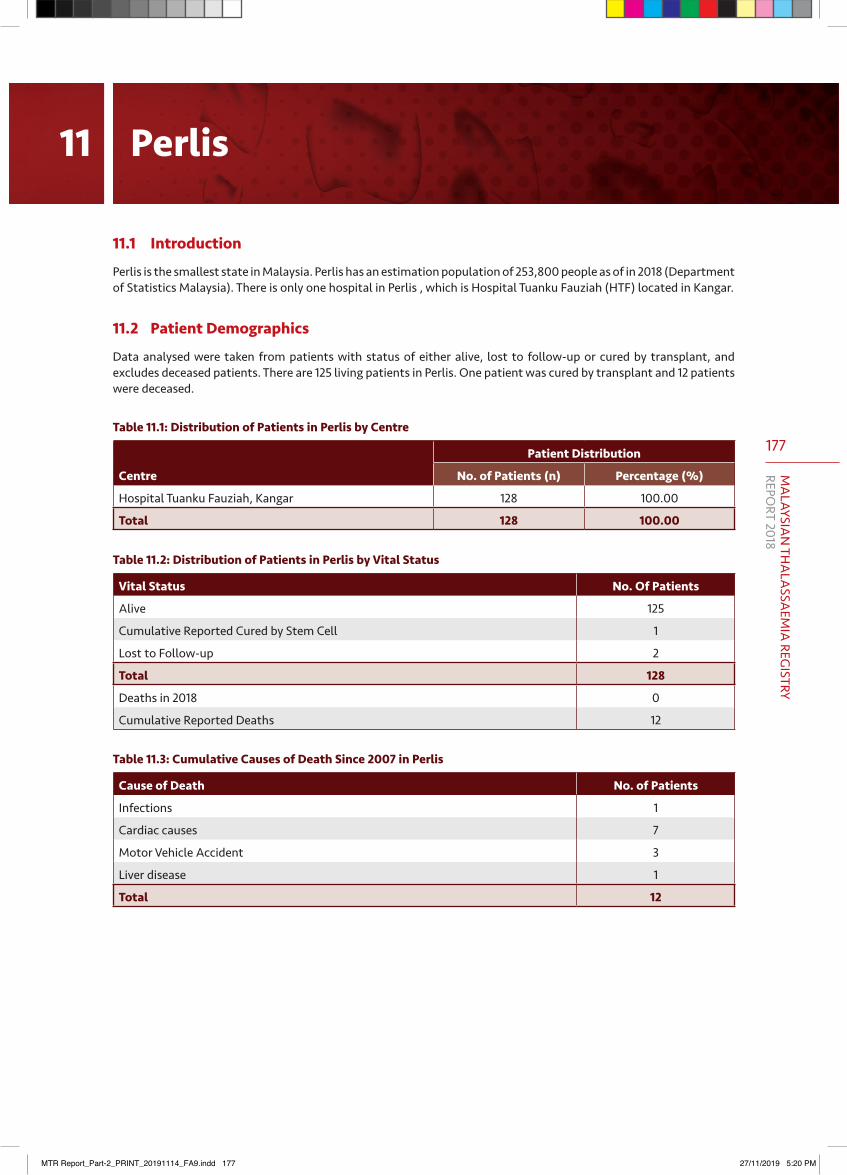
177
MA
LAYSIAN
THA
LASSA
EMIA
REGISTRY
REPORT 2018
11.1 Introduction
Perlis is the smallest state in Malaysia. Perlis has an estimation population of 253,800 people as of in 2018 (Department of Statistics Malaysia). There is only one hospital in Perlis , which is Hospital Tuanku Fauziah (HTF) located in Kangar.
11.2 Patient Demographics
Data analysed were taken from patients with status of either alive, lost to follow-up or cured by transplant, and excludes deceased patients. There are 125 living patients in Perlis. One patient was cured by transplant and 12 patients were deceased.
Table 11.1: Distribution of Patients in Perlis by Centre
Centre
Patient Distribution
No. of Patients (n) Percentage (%)
Hospital Tuanku Fauziah, Kangar 128 100.00
Total 128 100.00
Table 11.2: Distribution of Patients in Perlis by Vital Status
Vital Status No. Of Patients
Alive 125
Cumulative Reported Cured by Stem Cell 1
Lost to Follow-up 2
Total 128
Deaths in 2018 0
Cumulative Reported Deaths 12
Table 11.3: Cumulative Causes of Death Since 2007 in Perlis
Cause of Death No. of Patients
Infections 1
Cardiac causes 7
Motor Vehicle Accident 3
Liver disease 1
Total 12
11 Perlis
MTR Report_Part-2_PRINT_20191114_FA9.indd 177 27/11/2019 5:20 PM
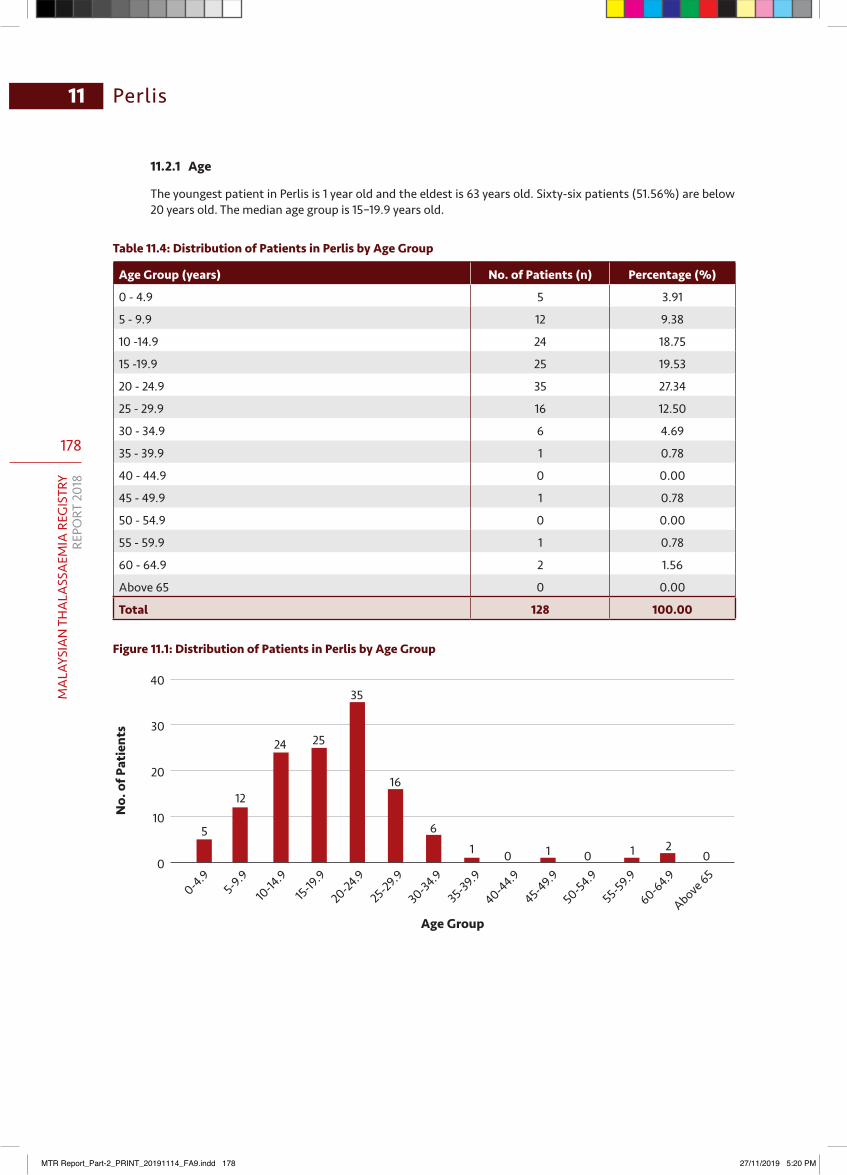
178
MA
LAYS
IAN
TH
ALA
SSA
EMIA
REG
ISTR
YRE
PORT
201
8
Perlis11
11.2.1 Age
The youngest patient in Perlis is 1 year old and the eldest is 63 years old. Sixty-six patients (51.56%) are below 20 years old. The median age group is 15–19.9 years old.
Table 11.4: Distribution of Patients in Perlis by Age Group
Age Group (years) No. of Patients (n) Percentage (%)
0 - 4.9 5 3.91
5 - 9.9 12 9.38
10 -14.9 24 18.75
15 -19.9 25 19.53
20 - 24.9 35 27.34
25 - 29.9 16 12.50
30 - 34.9 6 4.69
35 - 39.9 1 0.78
40 - 44.9 0 0.00
45 - 49.9 1 0.78
50 - 54.9 0 0.00
55 - 59.9 1 0.78
60 - 64.9 2 1.56
Above 65 0 0.00
Total 128 100.00
Figure 11.1: Distribution of Patients in Perlis by Age Group
0-4.95-9.9
10-14
.915-19
.9
20-24.9
25-29.9
30-34.9
35-39.9
40-44.9
45-49.9
50-54.9
55-59.9
60-64.9
Above 65
40
30
20
10
0
Age Group
No.
of P
atie
nts
5
12
24 25
35
16
61 0 0 0
211
MTR Report_Part-2_PRINT_20191114_FA9.indd 178 27/11/2019 5:20 PM

179
MA
LAYSIAN
THA
LASSA
EMIA
REGISTRY
REPORT 2018
Perlis 11
Table 11.5: Distribution of Patients in Perlis According to Diagnosis by Age Group
Age Group (years)
Total No. Of Patients Diagnosis
No. of Patients (n)
Percentage (%)
0 - 4.9 5
Beta Thalassaemia Major 0 0.00
Beta Thalassaemia Intermedia 2 1.56
HbE-Beta Thalassaemia 0 0.00
HbH Disease 2 1.56
Others 1 0.78
5 - 9.9 12
Beta Thalassaemia Major 0 0.00
Beta Thalassaemia Intermedia 5 3.91
HbE-Beta Thalassaemia 4 3.13
HbH Disease 3 2.34
Others 0 0.00
10 -14.9 24
Beta Thalassaemia Major 8 6.25
Beta Thalassaemia Intermedia 3 2.34
HbE-Beta Thalassaemia 6 4.69
HbH Disease 4 3.13
Others 3 2.34
15 -19.9 25
Beta Thalassaemia Major 2 1.56
Beta Thalassaemia Intermedia 5 3.91
HbE-Beta Thalassaemia 10 7.81
HbH Disease 5 3.91
Others 3 2.34
20 - 24.9 35
Beta Thalassaemia Major 9 7.03
Beta Thalassaemia Intermedia 0 0.00
HbE-Beta Thalassaemia 17 13.28
HbH Disease 9 7.03
Others 0 0.00
25 - 29.9 16
Beta Thalassaemia Major 3 2.34
Beta Thalassaemia Intermedia 1 0.78
HbE-Beta Thalassaemia 11 8.59
HbH Disease 1 0.78
Others 0 0.00
30 - 34.9 6
Beta Thalassaemia Major 3 2.34
Beta Thalassaemia Intermedia 0 0.00
HbE-Beta Thalassaemia 3 2.34
HbH Disease 0 0.00
Others 0 0.00
MTR Report_Part-2_PRINT_20191114_FA9.indd 179 27/11/2019 5:20 PM
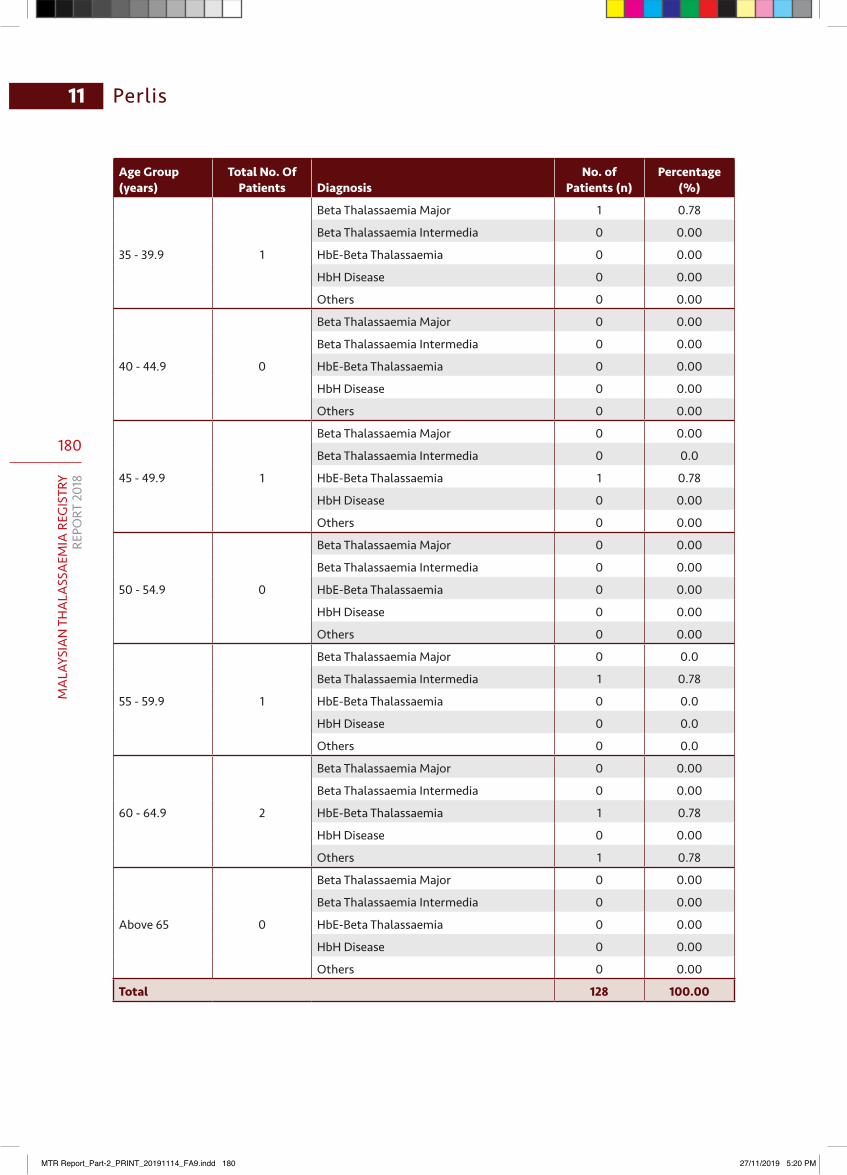
180
MA
LAYS
IAN
TH
ALA
SSA
EMIA
REG
ISTR
YRE
PORT
201
8
Perlis11
Age Group (years)
Total No. Of Patients Diagnosis
No. of Patients (n)
Percentage (%)
35 - 39.9 1
Beta Thalassaemia Major 1 0.78
Beta Thalassaemia Intermedia 0 0.00
HbE-Beta Thalassaemia 0 0.00
HbH Disease 0 0.00
Others 0 0.00
40 - 44.9 0
Beta Thalassaemia Major 0 0.00
Beta Thalassaemia Intermedia 0 0.00
HbE-Beta Thalassaemia 0 0.00
HbH Disease 0 0.00
Others 0 0.00
45 - 49.9 1
Beta Thalassaemia Major 0 0.00
Beta Thalassaemia Intermedia 0 0.0
HbE-Beta Thalassaemia 1 0.78
HbH Disease 0 0.00
Others 0 0.00
50 - 54.9 0
Beta Thalassaemia Major 0 0.00
Beta Thalassaemia Intermedia 0 0.00
HbE-Beta Thalassaemia 0 0.00
HbH Disease 0 0.00
Others 0 0.00
55 - 59.9 1
Beta Thalassaemia Major 0 0.0
Beta Thalassaemia Intermedia 1 0.78
HbE-Beta Thalassaemia 0 0.0
HbH Disease 0 0.0
Others 0 0.0
60 - 64.9 2
Beta Thalassaemia Major 0 0.00
Beta Thalassaemia Intermedia 0 0.00
HbE-Beta Thalassaemia 1 0.78
HbH Disease 0 0.00
Others 1 0.78
Above 65 0
Beta Thalassaemia Major 0 0.00
Beta Thalassaemia Intermedia 0 0.00
HbE-Beta Thalassaemia 0 0.00
HbH Disease 0 0.00
Others 0 0.00
Total 128 100.00
MTR Report_Part-2_PRINT_20191114_FA9.indd 180 27/11/2019 5:20 PM
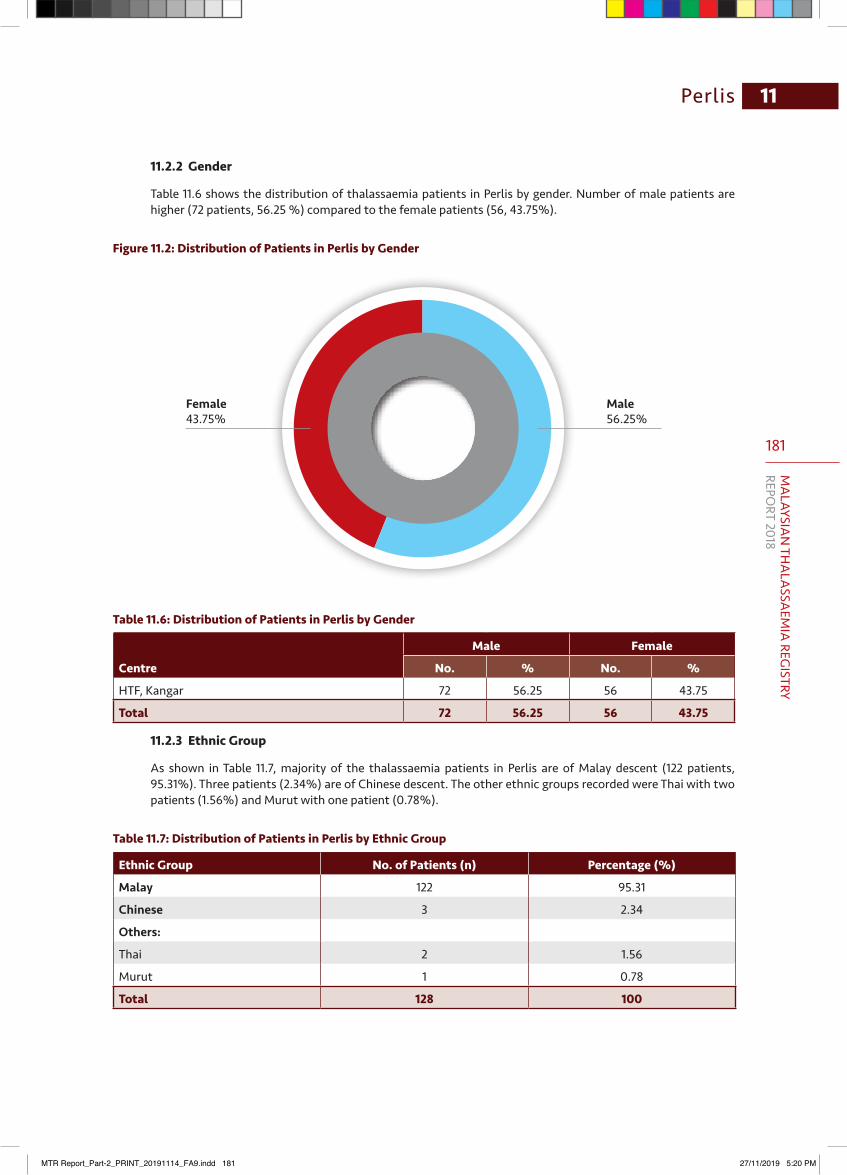
181
MA
LAYSIAN
THA
LASSA
EMIA
REGISTRY
REPORT 2018
Perlis 11
11.2.2 Gender
Table 11.6 shows the distribution of thalassaemia patients in Perlis by gender. Number of male patients are higher (72 patients, 56.25 %) compared to the female patients (56, 43.75%).
Figure 11.2: Distribution of Patients in Perlis by Gender
Female43.75%
Male56.25%
Table 11.6: Distribution of Patients in Perlis by Gender
Centre
Male Female
No. % No. %
HTF, Kangar 72 56.25 56 43.75
Total 72 56.25 56 43.75
11.2.3 Ethnic Group
As shown in Table 11.7, majority of the thalassaemia patients in Perlis are of Malay descent (122 patients, 95.31%). Three patients (2.34%) are of Chinese descent. The other ethnic groups recorded were Thai with two patients (1.56%) and Murut with one patient (0.78%).
Table 11.7: Distribution of Patients in Perlis by Ethnic Group
Ethnic Group No. of Patients (n) Percentage (%)
Malay 122 95.31
Chinese 3 2.34
Others:
Thai 2 1.56
Murut 1 0.78
Total 128 100
MTR Report_Part-2_PRINT_20191114_FA9.indd 181 27/11/2019 5:20 PM
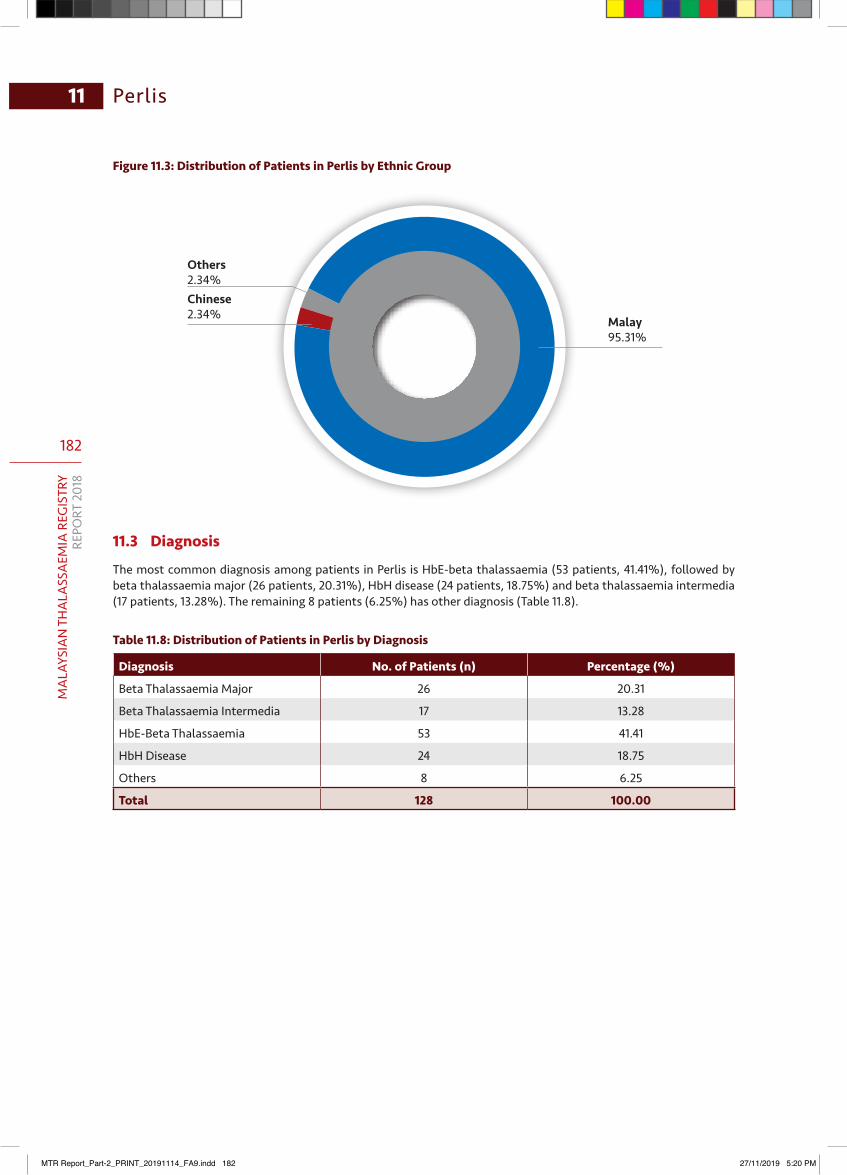
182
MA
LAYS
IAN
TH
ALA
SSA
EMIA
REG
ISTR
YRE
PORT
201
8
Perlis11
Figure 11.3: Distribution of Patients in Perlis by Ethnic Group
Chinese2.34%
Others2.34%
Malay95.31%
11.3 Diagnosis
The most common diagnosis among patients in Perlis is HbE-beta thalassaemia (53 patients, 41.41%), followed by beta thalassaemia major (26 patients, 20.31%), HbH disease (24 patients, 18.75%) and beta thalassaemia intermedia (17 patients, 13.28%). The remaining 8 patients (6.25%) has other diagnosis (Table 11.8).
Table 11.8: Distribution of Patients in Perlis by Diagnosis
Diagnosis No. of Patients (n) Percentage (%)
Beta Thalassaemia Major 26 20.31
Beta Thalassaemia Intermedia 17 13.28
HbE-Beta Thalassaemia 53 41.41
HbH Disease 24 18.75
Others 8 6.25
Total 128 100.00
MTR Report_Part-2_PRINT_20191114_FA9.indd 182 27/11/2019 5:20 PM
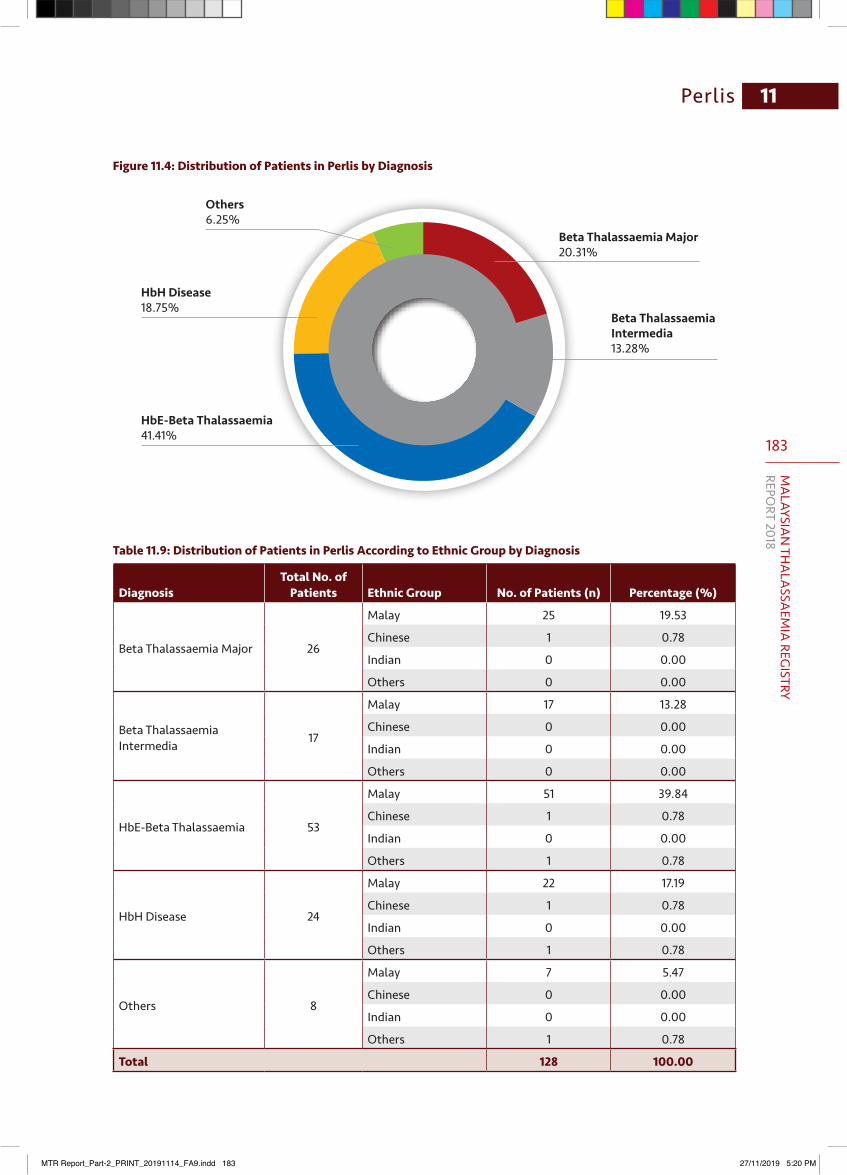
183
MA
LAYSIAN
THA
LASSA
EMIA
REGISTRY
REPORT 2018
Perlis 11
HbE-Beta Thalassaemia 41.41%
HbH Disease18.75%
Others6.25%
Beta Thalassaemia Major20.31%
Beta Thalassaemia Intermedia 13.28%
Figure 11.4: Distribution of Patients in Perlis by Diagnosis
Table 11.9: Distribution of Patients in Perlis According to Ethnic Group by Diagnosis
DiagnosisTotal No. of
Patients Ethnic Group No. of Patients (n) Percentage (%)
Beta Thalassaemia Major 26
Malay 25 19.53
Chinese 1 0.78
Indian 0 0.00
Others 0 0.00
Beta Thalassaemia Intermedia 17
Malay 17 13.28
Chinese 0 0.00
Indian 0 0.00
Others 0 0.00
HbE-Beta Thalassaemia 53
Malay 51 39.84
Chinese 1 0.78
Indian 0 0.00
Others 1 0.78
HbH Disease 24
Malay 22 17.19
Chinese 1 0.78
Indian 0 0.00
Others 1 0.78
Others 8
Malay 7 5.47
Chinese 0 0.00
Indian 0 0.00
Others 1 0.78
Total 128 100.00
MTR Report_Part-2_PRINT_20191114_FA9.indd 183 27/11/2019 5:20 PM
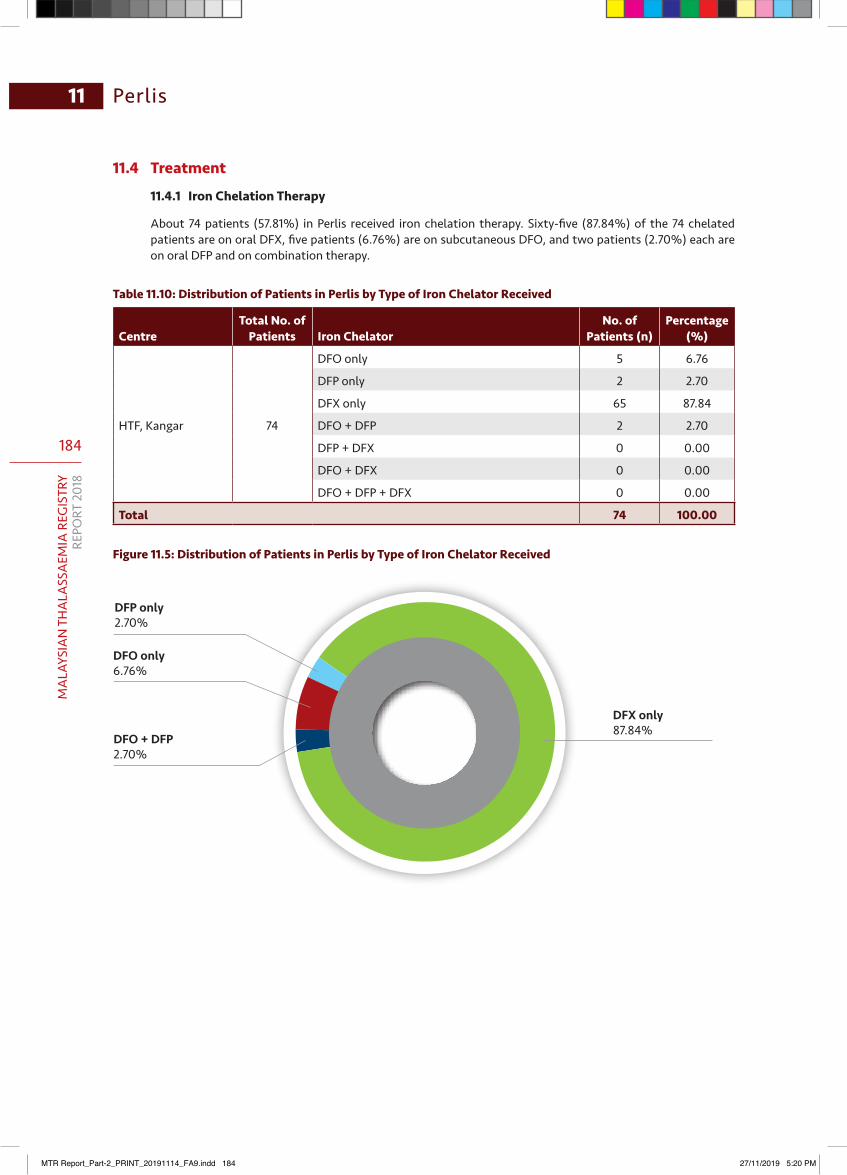
184
MA
LAYS
IAN
TH
ALA
SSA
EMIA
REG
ISTR
YRE
PORT
201
8
Perlis11
11.4 Treatment
11.4.1 Iron Chelation Therapy
About 74 patients (57.81%) in Perlis received iron chelation therapy. Sixty-five (87.84%) of the 74 chelated patients are on oral DFX, five patients (6.76%) are on subcutaneous DFO, and two patients (2.70%) each are on oral DFP and on combination therapy.
Table 11.10: Distribution of Patients in Perlis by Type of Iron Chelator Received
CentreTotal No. of
Patients Iron ChelatorNo. of
Patients (n)Percentage
(%)
HTF, Kangar 74
DFO only 5 6.76
DFP only 2 2.70
DFX only 65 87.84
DFO + DFP 2 2.70
DFP + DFX 0 0.00
DFO + DFX 0 0.00
DFO + DFP + DFX 0 0.00
Total 74 100.00
Figure 11.5: Distribution of Patients in Perlis by Type of Iron Chelator Received
DFO + DFP2.70%
DFO only6.76%
DFP only2.70%
DFX only87.84%
MTR Report_Part-2_PRINT_20191114_FA9.indd 184 27/11/2019 5:20 PM
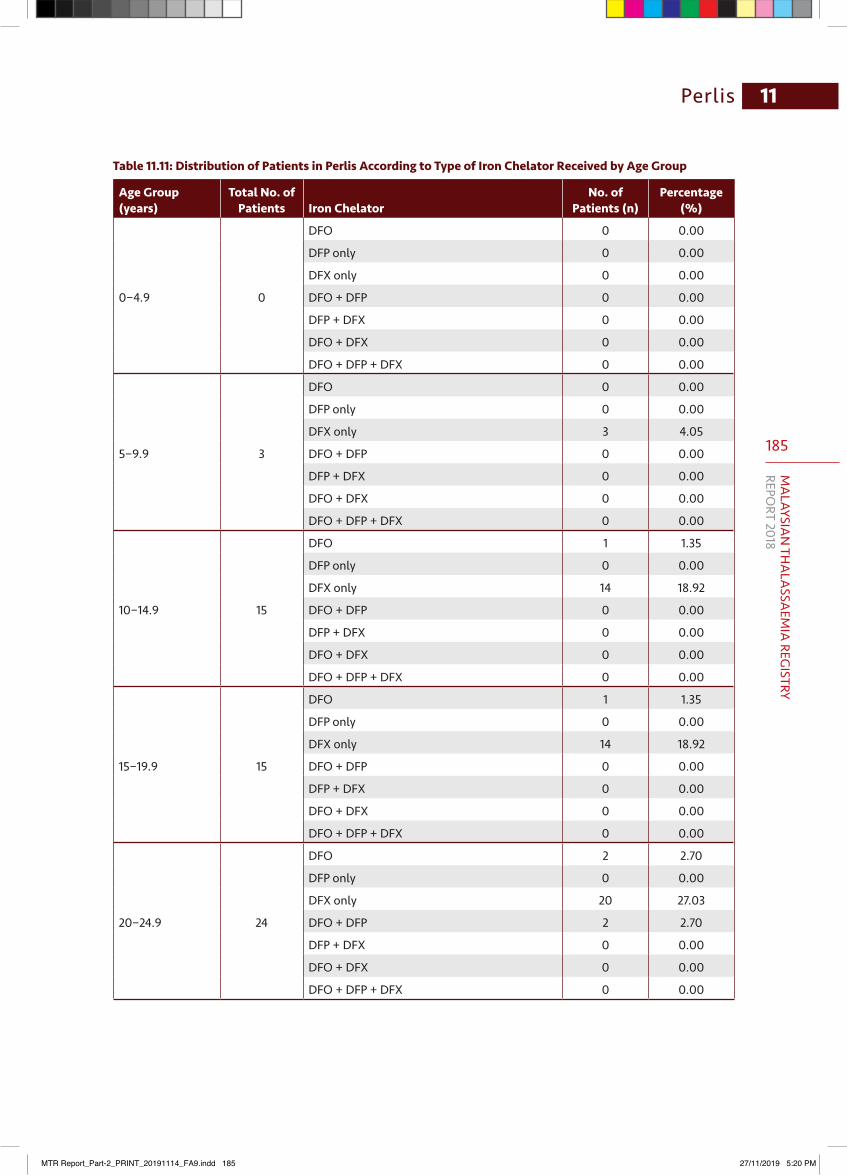
185
MA
LAYSIAN
THA
LASSA
EMIA
REGISTRY
REPORT 2018
Perlis 11
Table 11.11: Distribution of Patients in Perlis According to Type of Iron Chelator Received by Age Group
Age Group (years)
Total No. of Patients Iron Chelator
No. of Patients (n)
Percentage (%)
0−4.9 0
DFO 0 0.00
DFP only 0 0.00
DFX only 0 0.00
DFO + DFP 0 0.00
DFP + DFX 0 0.00
DFO + DFX 0 0.00
DFO + DFP + DFX 0 0.00
5−9.9 3
DFO 0 0.00
DFP only 0 0.00
DFX only 3 4.05
DFO + DFP 0 0.00
DFP + DFX 0 0.00
DFO + DFX 0 0.00
DFO + DFP + DFX 0 0.00
10−14.9 15
DFO 1 1.35
DFP only 0 0.00
DFX only 14 18.92
DFO + DFP 0 0.00
DFP + DFX 0 0.00
DFO + DFX 0 0.00
DFO + DFP + DFX 0 0.00
15−19.9 15
DFO 1 1.35
DFP only 0 0.00
DFX only 14 18.92
DFO + DFP 0 0.00
DFP + DFX 0 0.00
DFO + DFX 0 0.00
DFO + DFP + DFX 0 0.00
20−24.9 24
DFO 2 2.70
DFP only 0 0.00
DFX only 20 27.03
DFO + DFP 2 2.70
DFP + DFX 0 0.00
DFO + DFX 0 0.00
DFO + DFP + DFX 0 0.00
MTR Report_Part-2_PRINT_20191114_FA9.indd 185 27/11/2019 5:20 PM

186
MA
LAYS
IAN
TH
ALA
SSA
EMIA
REG
ISTR
YRE
PORT
201
8
Perlis11
Age Group (years)
Total No. of Patients Iron Chelator
No. of Patients (n)
Percentage (%)
25−29.9 9
DFO 1 1.35
DFP only 0 0.00
DFX only 8 10.81
DFO + DFP 0 0.00
DFP + DFX 0 0.00
DFO + DFX 0 0.00
DFO + DFP + DFX 0 0.00
30−34.9 5
DFO 0 0.00
DFP only 1 1.35
DFX only 4 5.41
DFO + DFP 0 0.00
DFP + DFX 0 0.00
DFO + DFX 0 0.00
DFO + DFP + DFX 0 0.00
35−39.9 1
DFO 0 0.00
DFP only 0 0.00
DFX only 1 1.35
DFO + DFP 0 0.00
DFP + DFX 0 0.00
DFO + DFX 0 0.00
DFO + DFP + DFX 0 0.00
40−44.9 0
DFO 0 0.00
DFP only 0 0.00
DFX only 0 0.00
DFO + DFP 0 0.00
DFP + DFX 0 0.00
DFO + DFX 0 0.00
DFO + DFP + DFX 0 0.00
45−49.9 1
DFO 0 0.00
DFP only 0 0.00
DFX only 1 1.35
DFO + DFP 0 0.00
DFP + DFX 0 0.00
DFO + DFX 0 0.00
DFO + DFP + DFX 0 0.00
MTR Report_Part-2_PRINT_20191114_FA9.indd 186 27/11/2019 5:20 PM
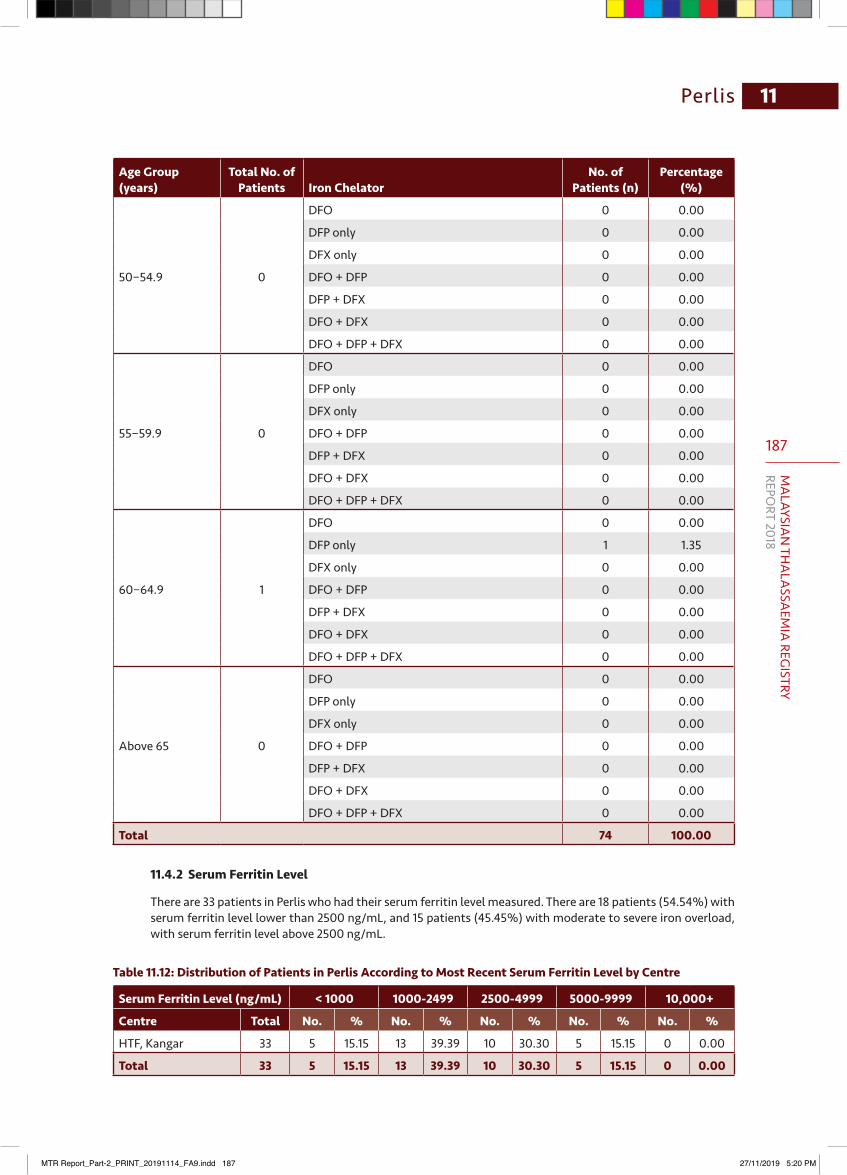
187
MA
LAYSIAN
THA
LASSA
EMIA
REGISTRY
REPORT 2018
Perlis 11
Age Group (years)
Total No. of Patients Iron Chelator
No. of Patients (n)
Percentage (%)
50−54.9 0
DFO 0 0.00
DFP only 0 0.00
DFX only 0 0.00
DFO + DFP 0 0.00
DFP + DFX 0 0.00
DFO + DFX 0 0.00
DFO + DFP + DFX 0 0.00
55−59.9 0
DFO 0 0.00
DFP only 0 0.00
DFX only 0 0.00
DFO + DFP 0 0.00
DFP + DFX 0 0.00
DFO + DFX 0 0.00
DFO + DFP + DFX 0 0.00
60−64.9 1
DFO 0 0.00
DFP only 1 1.35
DFX only 0 0.00
DFO + DFP 0 0.00
DFP + DFX 0 0.00
DFO + DFX 0 0.00
DFO + DFP + DFX 0 0.00
Above 65 0
DFO 0 0.00
DFP only 0 0.00
DFX only 0 0.00
DFO + DFP 0 0.00
DFP + DFX 0 0.00
DFO + DFX 0 0.00
DFO + DFP + DFX 0 0.00
Total 74 100.00
11.4.2 Serum Ferritin Level
There are 33 patients in Perlis who had their serum ferritin level measured. There are 18 patients (54.54%) with serum ferritin level lower than 2500 ng/mL, and 15 patients (45.45%) with moderate to severe iron overload, with serum ferritin level above 2500 ng/mL.
Table 11.12: Distribution of Patients in Perlis According to Most Recent Serum Ferritin Level by Centre
Serum Ferritin Level (ng/mL) < 1000 1000-2499 2500-4999 5000-9999 10,000+
Centre Total No. % No. % No. % No. % No. %
HTF, Kangar 33 5 15.15 13 39.39 10 30.30 5 15.15 0 0.00
Total 33 5 15.15 13 39.39 10 30.30 5 15.15 0 0.00
MTR Report_Part-2_PRINT_20191114_FA9.indd 187 27/11/2019 5:20 PM
188
MA
LAYS
IAN
TH
ALA
SSA
EMIA
REG
ISTR
YRE
PORT
201
8
Perlis11
11.5 Observation and Comments
Approximately 52% of thalassaemia patients in Perlis are below 20 years old. HbE-beta thalassaemia is the main type diagnosed in Perlis (41.41% of all cases). Sixty-five chelated patients (87.84%) are on oral DFX.
T2* MRI services are available in HTF and is a great help in the assessment of iron overload. However, there is a need for details in the report for validation of data from time to time, to ensure quality care is being provided at all times.
11.5.1 Recommendations
Patients compliance need to be checked regularly and combination therapy is needed in severely iron overloaded patients for better outcomes. There is a need for a dedicated RA for the state of Perlis to clean up and verify the registry data.
11.5.2 Conclusion
The most common type of thalassaemia in Perlis is HbE-beta thalassaemia, followed by beta thalassaemia major and HbH disease. The median age group is 15-19.9 years old. DFX (87.84%) is the most common iron chelation therapy prescribed. Approximately 55% of patients on iron chelators achieve a serum ferritin level below 2500 ng/mL. A significant proportion of deaths were due to cardiac complication.
MTR Report_Part-2_PRINT_20191114_FA9.indd 188 27/11/2019 5:21 PM
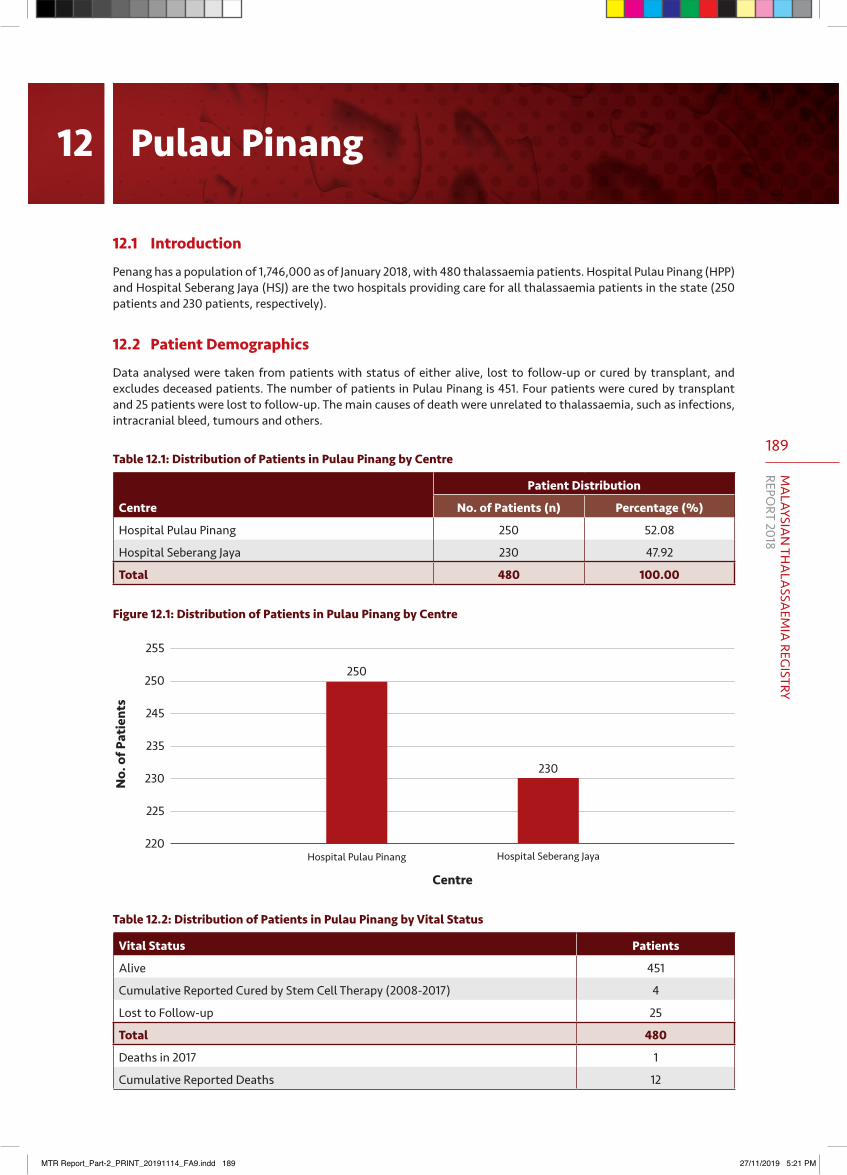
189
MA
LAYSIAN
THA
LASSA
EMIA
REGISTRY
REPORT 2018
12.1 Introduction
Penang has a population of 1,746,000 as of January 2018, with 480 thalassaemia patients. Hospital Pulau Pinang (HPP) and Hospital Seberang Jaya (HSJ) are the two hospitals providing care for all thalassaemia patients in the state (250 patients and 230 patients, respectively).
12.2 Patient Demographics
Data analysed were taken from patients with status of either alive, lost to follow-up or cured by transplant, and excludes deceased patients. The number of patients in Pulau Pinang is 451. Four patients were cured by transplant and 25 patients were lost to follow-up. The main causes of death were unrelated to thalassaemia, such as infections, intracranial bleed, tumours and others.
Table 12.1: Distribution of Patients in Pulau Pinang by Centre
Centre
Patient Distribution
No. of Patients (n) Percentage (%)
Hospital Pulau Pinang 250 52.08
Hospital Seberang Jaya 230 47.92
Total 480 100.00
Figure 12.1: Distribution of Patients in Pulau Pinang by Centre
Centre
255
250
245
235
230
225
220
No.
of P
atie
nts
Hospital Pulau Pinang Hospital Seberang Jaya
250
230
Table 12.2: Distribution of Patients in Pulau Pinang by Vital Status
Vital Status Patients
Alive 451
Cumulative Reported Cured by Stem Cell Therapy (2008-2017) 4
Lost to Follow-up 25
Total 480
Deaths in 2017 1
Cumulative Reported Deaths 12
12 Pulau Pinang
MTR Report_Part-2_PRINT_20191114_FA9.indd 189 27/11/2019 5:21 PM
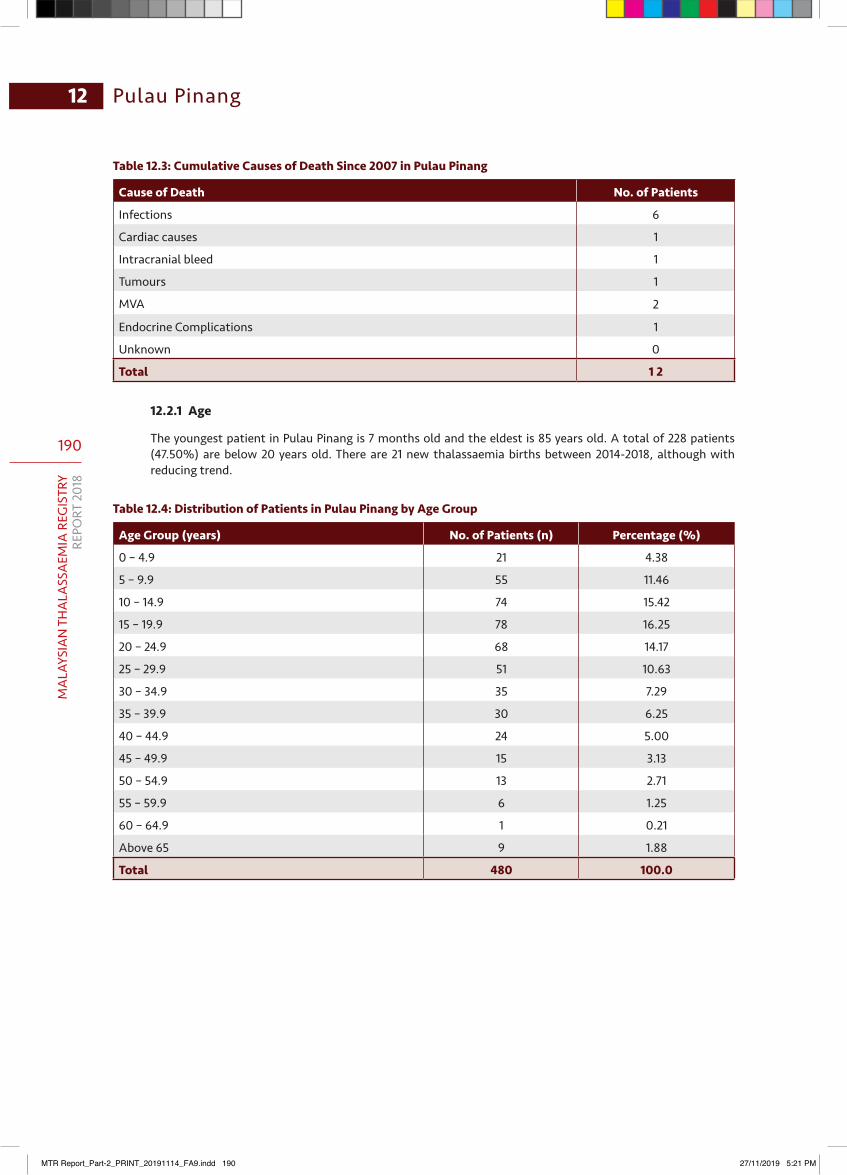
190
MA
LAYS
IAN
TH
ALA
SSA
EMIA
REG
ISTR
YRE
PORT
201
8
Pulau Pinang12
Table 12.3: Cumulative Causes of Death Since 2007 in Pulau Pinang
Cause of Death No. of Patients
Infections 6
Cardiac causes 1
Intracranial bleed 1
Tumours 1
MVA 2
Endocrine Complications 1
Unknown 0
Total 1 2
12.2.1 Age
The youngest patient in Pulau Pinang is 7 months old and the eldest is 85 years old. A total of 228 patients (47.50%) are below 20 years old. There are 21 new thalassaemia births between 2014-2018, although with reducing trend.
Table 12.4: Distribution of Patients in Pulau Pinang by Age Group
Age Group (years) No. of Patients (n) Percentage (%)
0 – 4.9 21 4.38
5 – 9.9 55 11.46
10 – 14.9 74 15.42
15 – 19.9 78 16.25
20 – 24.9 68 14.17
25 – 29.9 51 10.63
30 – 34.9 35 7.29
35 – 39.9 30 6.25
40 – 44.9 24 5.00
45 – 49.9 15 3.13
50 – 54.9 13 2.71
55 – 59.9 6 1.25
60 – 64.9 1 0.21
Above 65 9 1.88
Total 480 100.0
MTR Report_Part-2_PRINT_20191114_FA9.indd 190 27/11/2019 5:21 PM
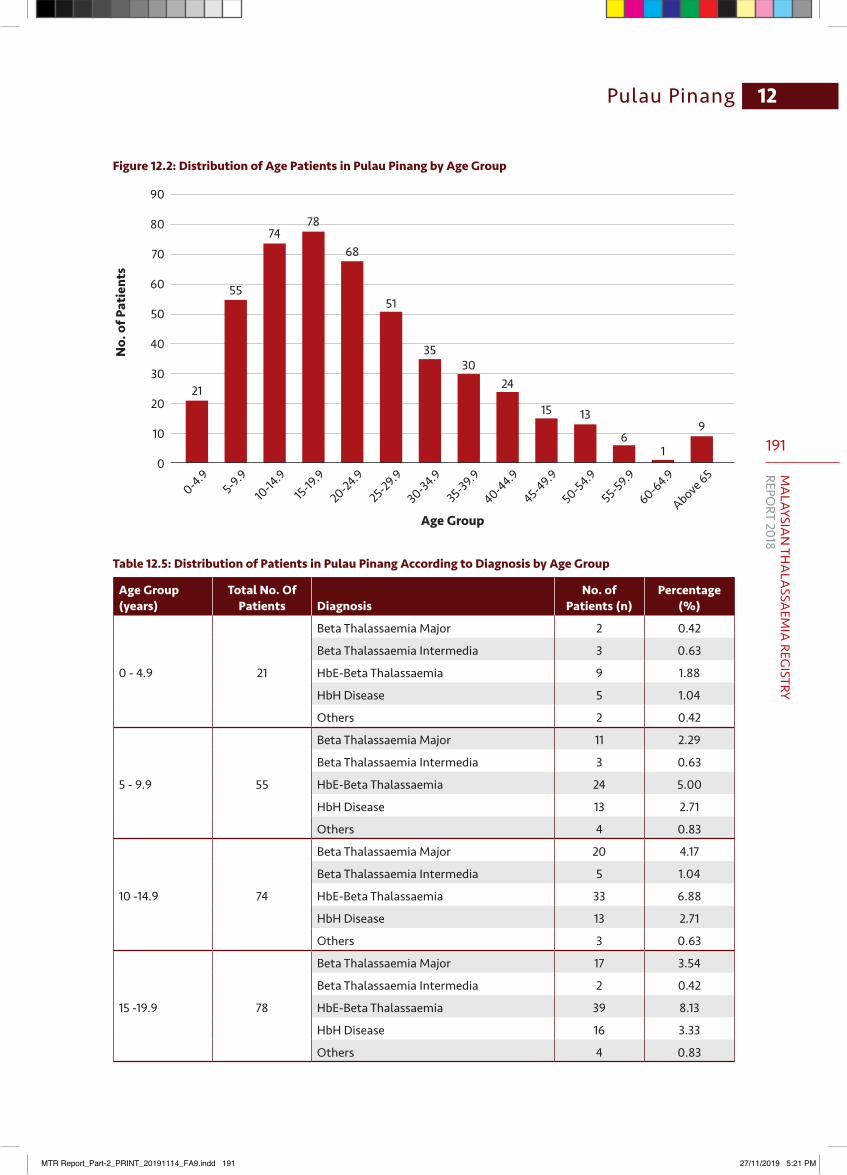
191
MA
LAYSIAN
THA
LASSA
EMIA
REGISTRY
REPORT 2018
12Pulau Pinang
Figure 12.2: Distribution of Age Patients in Pulau Pinang by Age Group
90
80
70
60
50
40
30
20
10
0
Age Group
No.
of P
atie
nts
0-4.95-9.9
10-14
.915-19
.9
20-24.9
25-29.9
30-34.9
35-39.9
40-44.9
45-49.9
50-54.9
55-59.9
60-64.9
Above 65
21
55
7478
68
51
3530
24
15 13
61
9
Table 12.5: Distribution of Patients in Pulau Pinang According to Diagnosis by Age Group
Age Group (years)
Total No. Of Patients Diagnosis
No. of Patients (n)
Percentage (%)
0 - 4.9 21
Beta Thalassaemia Major 2 0.42
Beta Thalassaemia Intermedia 3 0.63
HbE-Beta Thalassaemia 9 1.88
HbH Disease 5 1.04
Others 2 0.42
5 - 9.9 55
Beta Thalassaemia Major 11 2.29
Beta Thalassaemia Intermedia 3 0.63
HbE-Beta Thalassaemia 24 5.00
HbH Disease 13 2.71
Others 4 0.83
10 -14.9 74
Beta Thalassaemia Major 20 4.17
Beta Thalassaemia Intermedia 5 1.04
HbE-Beta Thalassaemia 33 6.88
HbH Disease 13 2.71
Others 3 0.63
15 -19.9 78
Beta Thalassaemia Major 17 3.54
Beta Thalassaemia Intermedia 2 0.42
HbE-Beta Thalassaemia 39 8.13
HbH Disease 16 3.33
Others 4 0.83
MTR Report_Part-2_PRINT_20191114_FA9.indd 191 27/11/2019 5:21 PM
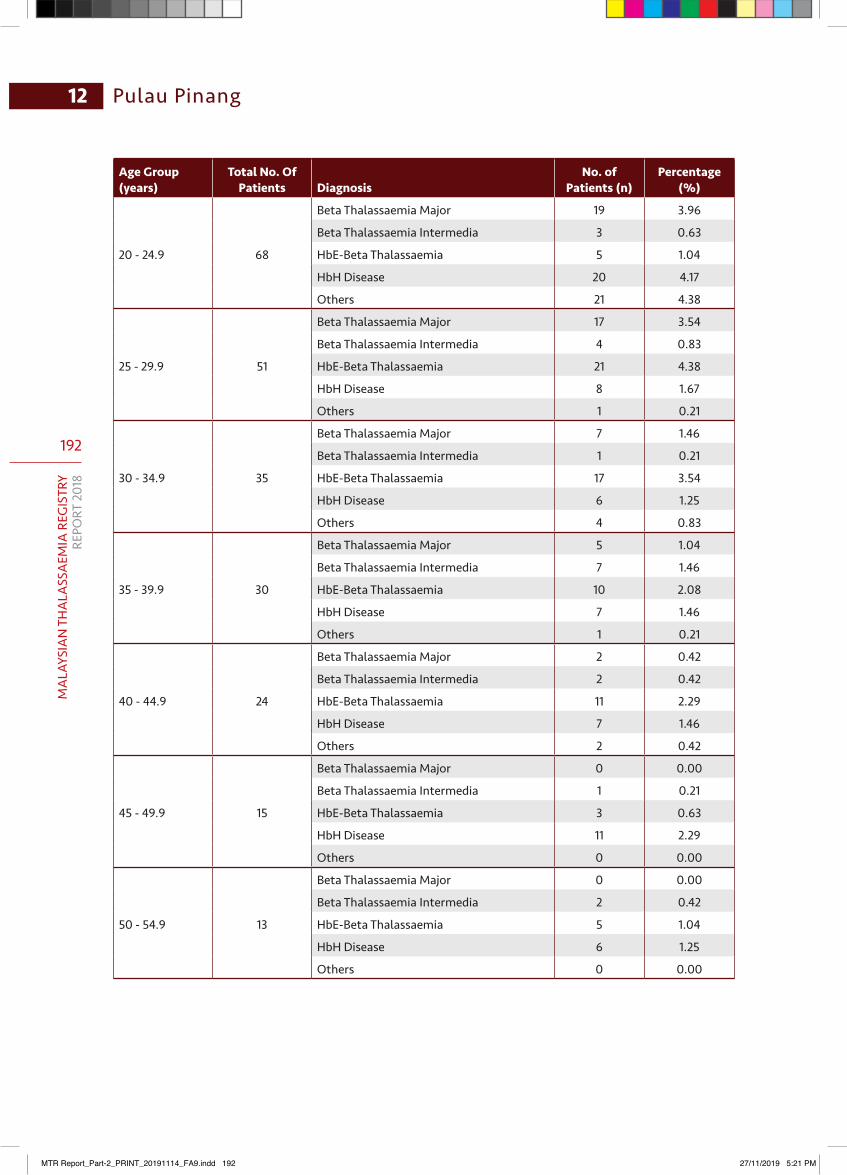
192
MA
LAYS
IAN
TH
ALA
SSA
EMIA
REG
ISTR
YRE
PORT
201
8
Pulau Pinang12
Age Group (years)
Total No. Of Patients Diagnosis
No. of Patients (n)
Percentage (%)
20 - 24.9 68
Beta Thalassaemia Major 19 3.96
Beta Thalassaemia Intermedia 3 0.63
HbE-Beta Thalassaemia 5 1.04
HbH Disease 20 4.17
Others 21 4.38
25 - 29.9 51
Beta Thalassaemia Major 17 3.54
Beta Thalassaemia Intermedia 4 0.83
HbE-Beta Thalassaemia 21 4.38
HbH Disease 8 1.67
Others 1 0.21
30 - 34.9 35
Beta Thalassaemia Major 7 1.46
Beta Thalassaemia Intermedia 1 0.21
HbE-Beta Thalassaemia 17 3.54
HbH Disease 6 1.25
Others 4 0.83
35 - 39.9 30
Beta Thalassaemia Major 5 1.04
Beta Thalassaemia Intermedia 7 1.46
HbE-Beta Thalassaemia 10 2.08
HbH Disease 7 1.46
Others 1 0.21
40 - 44.9 24
Beta Thalassaemia Major 2 0.42
Beta Thalassaemia Intermedia 2 0.42
HbE-Beta Thalassaemia 11 2.29
HbH Disease 7 1.46
Others 2 0.42
45 - 49.9 15
Beta Thalassaemia Major 0 0.00
Beta Thalassaemia Intermedia 1 0.21
HbE-Beta Thalassaemia 3 0.63
HbH Disease 11 2.29
Others 0 0.00
50 - 54.9 13
Beta Thalassaemia Major 0 0.00
Beta Thalassaemia Intermedia 2 0.42
HbE-Beta Thalassaemia 5 1.04
HbH Disease 6 1.25
Others 0 0.00
MTR Report_Part-2_PRINT_20191114_FA9.indd 192 27/11/2019 5:21 PM
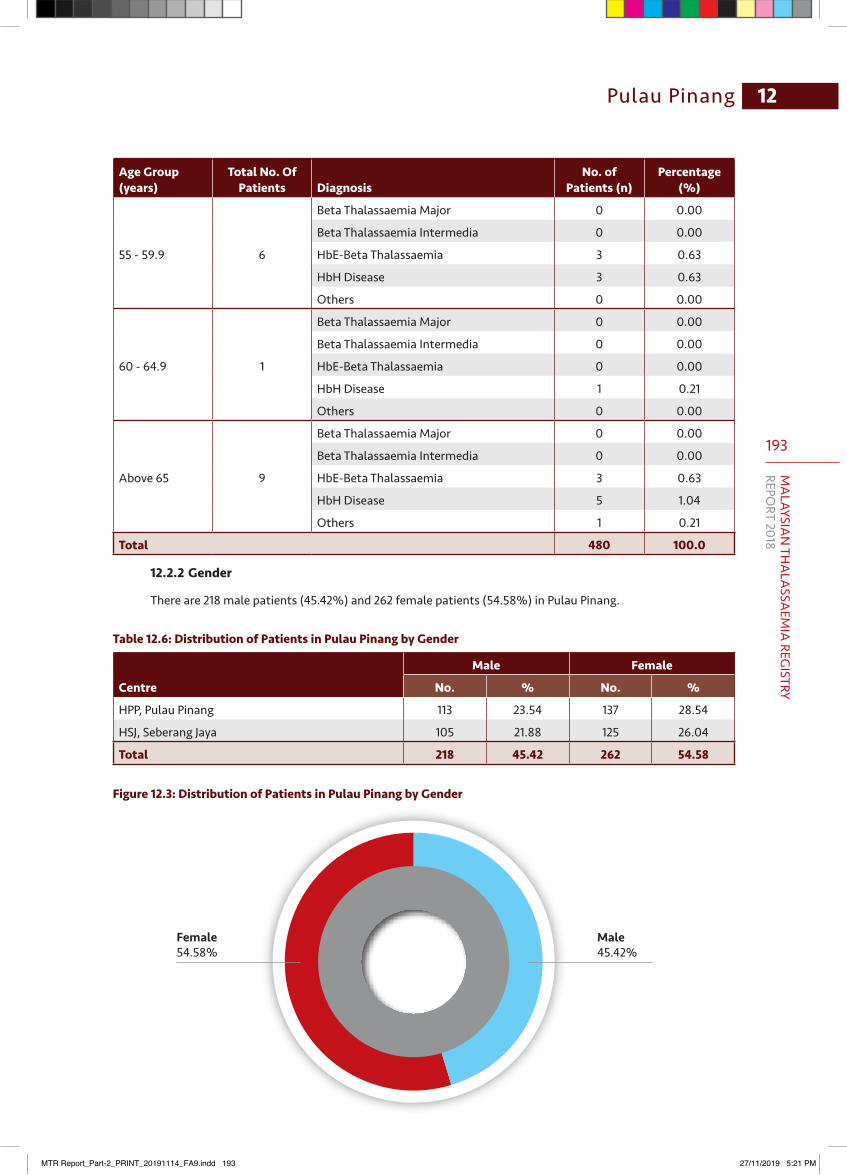
193
MA
LAYSIAN
THA
LASSA
EMIA
REGISTRY
REPORT 2018
12Pulau Pinang
Age Group (years)
Total No. Of Patients Diagnosis
No. of Patients (n)
Percentage (%)
55 - 59.9 6
Beta Thalassaemia Major 0 0.00
Beta Thalassaemia Intermedia 0 0.00
HbE-Beta Thalassaemia 3 0.63
HbH Disease 3 0.63
Others 0 0.00
60 - 64.9 1
Beta Thalassaemia Major 0 0.00
Beta Thalassaemia Intermedia 0 0.00
HbE-Beta Thalassaemia 0 0.00
HbH Disease 1 0.21
Others 0 0.00
Above 65 9
Beta Thalassaemia Major 0 0.00
Beta Thalassaemia Intermedia 0 0.00
HbE-Beta Thalassaemia 3 0.63
HbH Disease 5 1.04
Others 1 0.21
Total 480 100.0
12.2.2 Gender
There are 218 male patients (45.42%) and 262 female patients (54.58%) in Pulau Pinang.
Table 12.6: Distribution of Patients in Pulau Pinang by Gender
Centre
Male Female
No. % No. %
HPP, Pulau Pinang 113 23.54 137 28.54
HSJ, Seberang Jaya 105 21.88 125 26.04
Total 218 45.42 262 54.58
Figure 12.3: Distribution of Patients in Pulau Pinang by Gender
Female54.58%
Male45.42%
MTR Report_Part-2_PRINT_20191114_FA9.indd 193 27/11/2019 5:21 PM
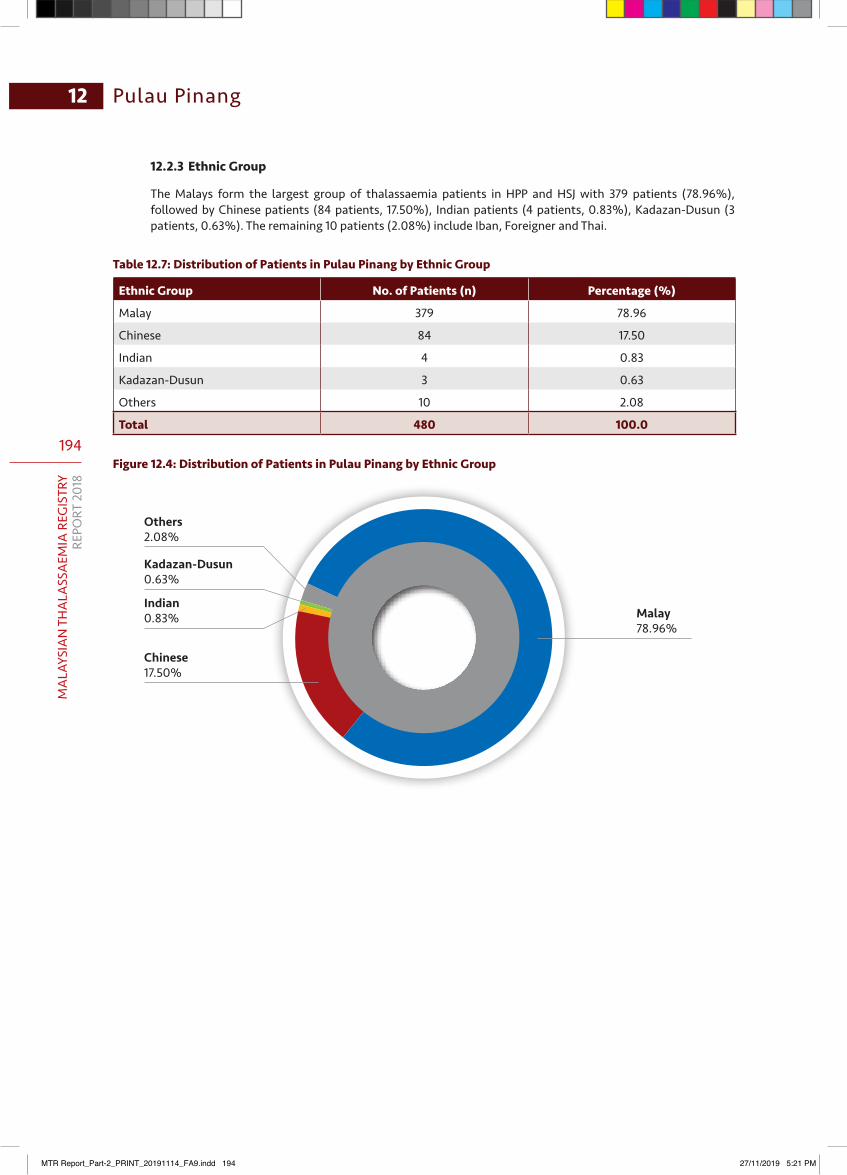
194
MA
LAYS
IAN
TH
ALA
SSA
EMIA
REG
ISTR
YRE
PORT
201
8
Pulau Pinang12
12.2.3 Ethnic Group
The Malays form the largest group of thalassaemia patients in HPP and HSJ with 379 patients (78.96%), followed by Chinese patients (84 patients, 17.50%), Indian patients (4 patients, 0.83%), Kadazan-Dusun (3 patients, 0.63%). The remaining 10 patients (2.08%) include Iban, Foreigner and Thai.
Table 12.7: Distribution of Patients in Pulau Pinang by Ethnic Group
Ethnic Group No. of Patients (n) Percentage (%)
Malay 379 78.96
Chinese 84 17.50
Indian 4 0.83
Kadazan-Dusun 3 0.63
Others 10 2.08
Total 480 100.0
Figure 12.4: Distribution of Patients in Pulau Pinang by Ethnic Group
Chinese17.50%
Malay78.96%
Indian0.83%
Kadazan-Dusun0.63%
Others2.08%
MTR Report_Part-2_PRINT_20191114_FA9.indd 194 27/11/2019 5:21 PM
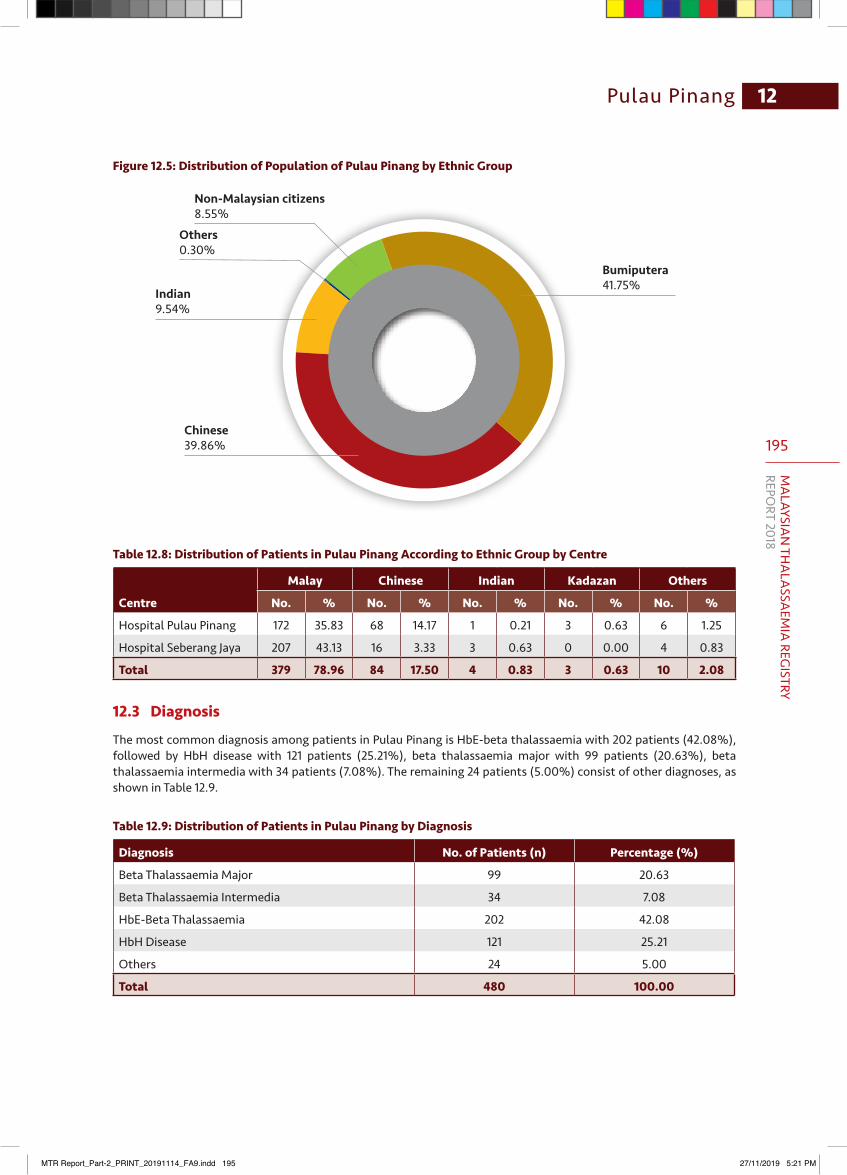
195
MA
LAYSIAN
THA
LASSA
EMIA
REGISTRY
REPORT 2018
12Pulau Pinang
Figure 12.5: Distribution of Population of Pulau Pinang by Ethnic Group
Chinese39.86%
Indian9.54%
Others0.30%
Non-Malaysian citizens8.55%
Bumiputera41.75%
Table 12.8: Distribution of Patients in Pulau Pinang According to Ethnic Group by Centre
Centre
Malay Chinese Indian Kadazan Others
No. % No. % No. % No. % No. %
Hospital Pulau Pinang 172 35.83 68 14.17 1 0.21 3 0.63 6 1.25
Hospital Seberang Jaya 207 43.13 16 3.33 3 0.63 0 0.00 4 0.83
Total 379 78.96 84 17.50 4 0.83 3 0.63 10 2.08
12.3 Diagnosis
The most common diagnosis among patients in Pulau Pinang is HbE-beta thalassaemia with 202 patients (42.08%), followed by HbH disease with 121 patients (25.21%), beta thalassaemia major with 99 patients (20.63%), beta thalassaemia intermedia with 34 patients (7.08%). The remaining 24 patients (5.00%) consist of other diagnoses, as shown in Table 12.9.
Table 12.9: Distribution of Patients in Pulau Pinang by Diagnosis
Diagnosis No. of Patients (n) Percentage (%)
Beta Thalassaemia Major 99 20.63
Beta Thalassaemia Intermedia 34 7.08
HbE-Beta Thalassaemia 202 42.08
HbH Disease 121 25.21
Others 24 5.00
Total 480 100.00
MTR Report_Part-2_PRINT_20191114_FA9.indd 195 27/11/2019 5:21 PM
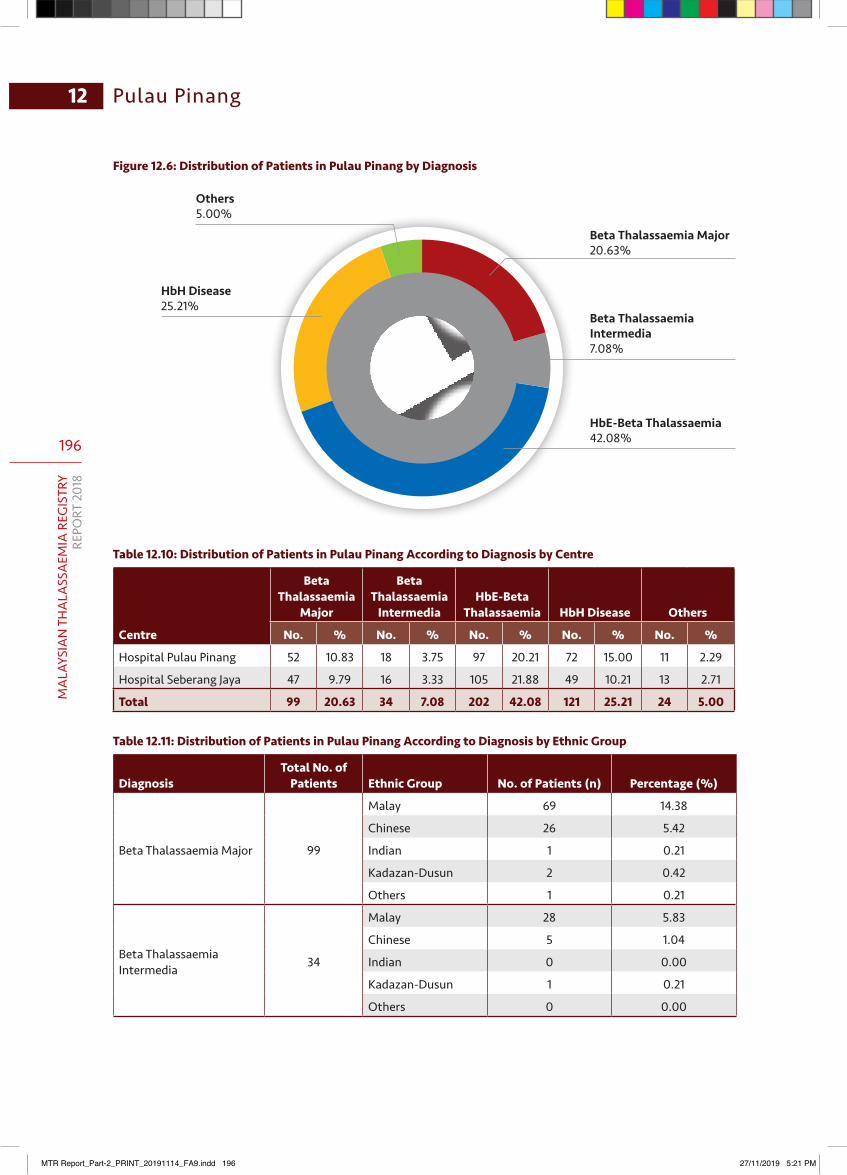
196
MA
LAYS
IAN
TH
ALA
SSA
EMIA
REG
ISTR
YRE
PORT
201
8
Pulau Pinang12
Beta Thalassaemia Major20.63%
Beta Thalassaemia Intermedia7.08%
HbE-Beta Thalassaemia42.08%
HbH Disease25.21%
Others5.00%
Figure 12.6: Distribution of Patients in Pulau Pinang by Diagnosis
Table 12.10: Distribution of Patients in Pulau Pinang According to Diagnosis by Centre
Centre
Beta Thalassaemia
Major
Beta Thalassaemia
IntermediaHbE-Beta
Thalassaemia HbH Disease Others
No. % No. % No. % No. % No. %
Hospital Pulau Pinang 52 10.83 18 3.75 97 20.21 72 15.00 11 2.29
Hospital Seberang Jaya 47 9.79 16 3.33 105 21.88 49 10.21 13 2.71
Total 99 20.63 34 7.08 202 42.08 121 25.21 24 5.00
Table 12.11: Distribution of Patients in Pulau Pinang According to Diagnosis by Ethnic Group
DiagnosisTotal No. of
Patients Ethnic Group No. of Patients (n) Percentage (%)
Beta Thalassaemia Major 99
Malay 69 14.38
Chinese 26 5.42
Indian 1 0.21
Kadazan-Dusun 2 0.42
Others 1 0.21
Beta Thalassaemia Intermedia 34
Malay 28 5.83
Chinese 5 1.04
Indian 0 0.00
Kadazan-Dusun 1 0.21
Others 0 0.00
MTR Report_Part-2_PRINT_20191114_FA9.indd 196 27/11/2019 5:21 PM
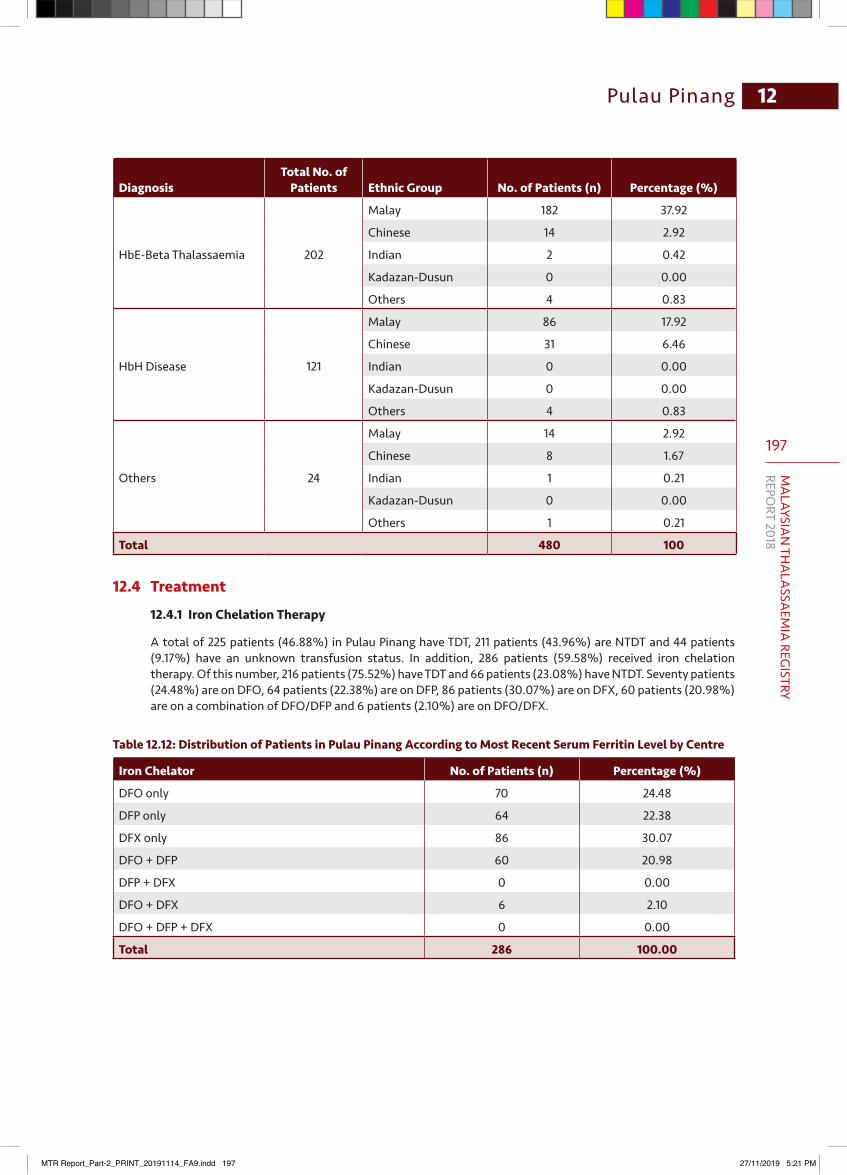
197
MA
LAYSIAN
THA
LASSA
EMIA
REGISTRY
REPORT 2018
12Pulau Pinang
DiagnosisTotal No. of
Patients Ethnic Group No. of Patients (n) Percentage (%)
HbE-Beta Thalassaemia 202
Malay 182 37.92
Chinese 14 2.92
Indian 2 0.42
Kadazan-Dusun 0 0.00
Others 4 0.83
HbH Disease 121
Malay 86 17.92
Chinese 31 6.46
Indian 0 0.00
Kadazan-Dusun 0 0.00
Others 4 0.83
Others 24
Malay 14 2.92
Chinese 8 1.67
Indian 1 0.21
Kadazan-Dusun 0 0.00
Others 1 0.21
Total 480 100
12.4 Treatment
12.4.1 Iron Chelation Therapy
A total of 225 patients (46.88%) in Pulau Pinang have TDT, 211 patients (43.96%) are NTDT and 44 patients (9.17%) have an unknown transfusion status. In addition, 286 patients (59.58%) received iron chelation therapy. Of this number, 216 patients (75.52%) have TDT and 66 patients (23.08%) have NTDT. Seventy patients (24.48%) are on DFO, 64 patients (22.38%) are on DFP, 86 patients (30.07%) are on DFX, 60 patients (20.98%) are on a combination of DFO/DFP and 6 patients (2.10%) are on DFO/DFX.
Table 12.12: Distribution of Patients in Pulau Pinang According to Most Recent Serum Ferritin Level by Centre
Iron Chelator No. of Patients (n) Percentage (%)
DFO only 70 24.48
DFP only 64 22.38
DFX only 86 30.07
DFO + DFP 60 20.98
DFP + DFX 0 0.00
DFO + DFX 6 2.10
DFO + DFP + DFX 0 0.00
Total 286 100.00
MTR Report_Part-2_PRINT_20191114_FA9.indd 197 27/11/2019 5:21 PM
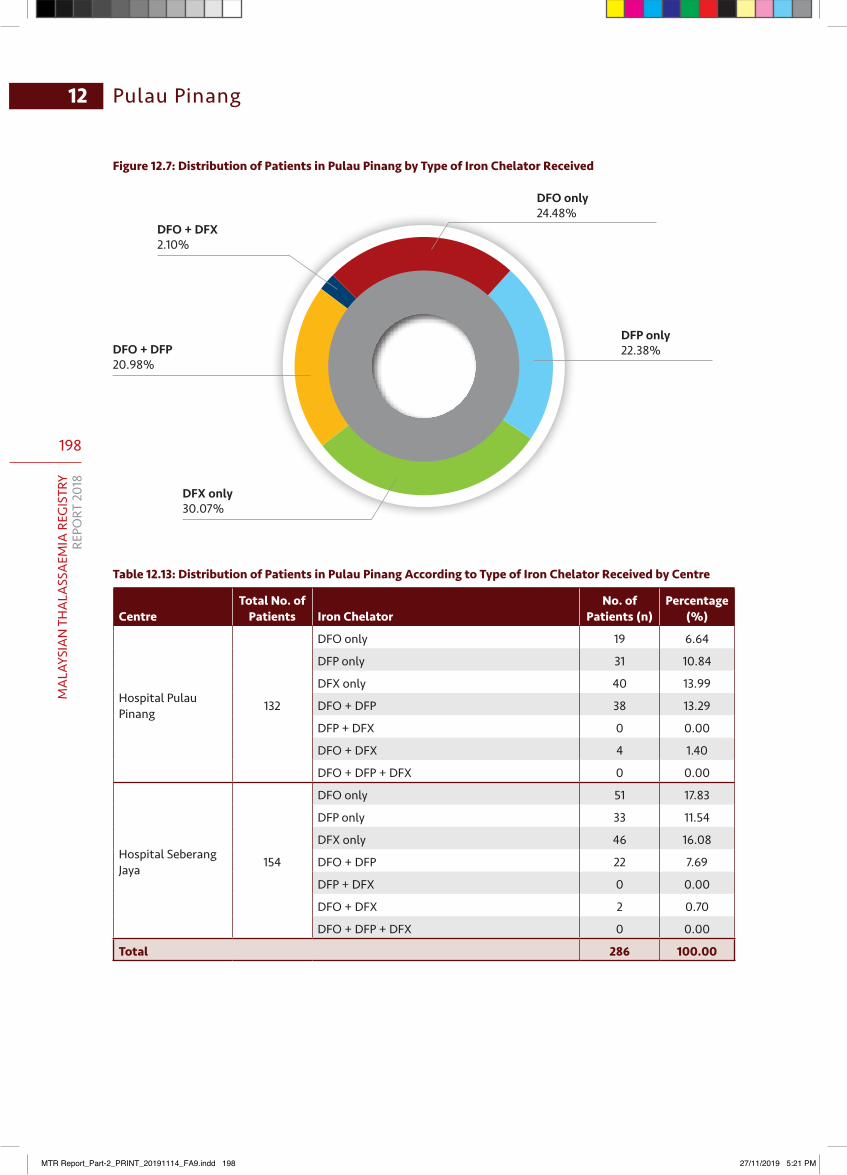
198
MA
LAYS
IAN
TH
ALA
SSA
EMIA
REG
ISTR
YRE
PORT
201
8
Pulau Pinang12
Figure 12.7: Distribution of Patients in Pulau Pinang by Type of Iron Chelator Received
DFP only22.38%
DFX only30.07%
DFO + DFP20.98%
DFO + DFX2.10%
DFO only24.48%
Table 12.13: Distribution of Patients in Pulau Pinang According to Type of Iron Chelator Received by Centre
CentreTotal No. of
Patients Iron ChelatorNo. of
Patients (n)Percentage
(%)
Hospital Pulau Pinang 132
DFO only 19 6.64
DFP only 31 10.84
DFX only 40 13.99
DFO + DFP 38 13.29
DFP + DFX 0 0.00
DFO + DFX 4 1.40
DFO + DFP + DFX 0 0.00
Hospital Seberang Jaya 154
DFO only 51 17.83
DFP only 33 11.54
DFX only 46 16.08
DFO + DFP 22 7.69
DFP + DFX 0 0.00
DFO + DFX 2 0.70
DFO + DFP + DFX 0 0.00
Total 286 100.00
MTR Report_Part-2_PRINT_20191114_FA9.indd 198 27/11/2019 5:21 PM
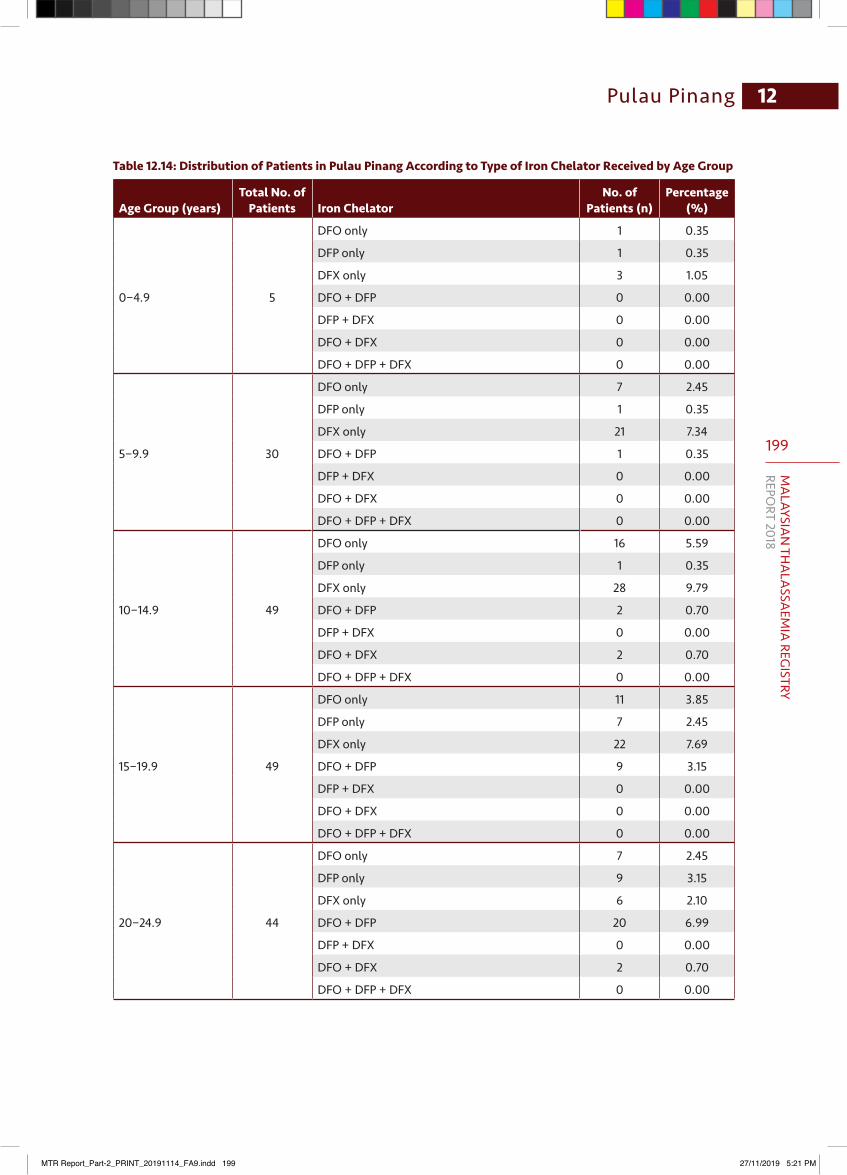
199
MA
LAYSIAN
THA
LASSA
EMIA
REGISTRY
REPORT 2018
12Pulau Pinang
Table 12.14: Distribution of Patients in Pulau Pinang According to Type of Iron Chelator Received by Age Group
Age Group (years)Total No. of
Patients Iron ChelatorNo. of
Patients (n)Percentage
(%)
0−4.9 5
DFO only 1 0.35
DFP only 1 0.35
DFX only 3 1.05
DFO + DFP 0 0.00
DFP + DFX 0 0.00
DFO + DFX 0 0.00
DFO + DFP + DFX 0 0.00
5−9.9 30
DFO only 7 2.45
DFP only 1 0.35
DFX only 21 7.34
DFO + DFP 1 0.35
DFP + DFX 0 0.00
DFO + DFX 0 0.00
DFO + DFP + DFX 0 0.00
10−14.9 49
DFO only 16 5.59
DFP only 1 0.35
DFX only 28 9.79
DFO + DFP 2 0.70
DFP + DFX 0 0.00
DFO + DFX 2 0.70
DFO + DFP + DFX 0 0.00
15−19.9 49
DFO only 11 3.85
DFP only 7 2.45
DFX only 22 7.69
DFO + DFP 9 3.15
DFP + DFX 0 0.00
DFO + DFX 0 0.00
DFO + DFP + DFX 0 0.00
20−24.9 44
DFO only 7 2.45
DFP only 9 3.15
DFX only 6 2.10
DFO + DFP 20 6.99
DFP + DFX 0 0.00
DFO + DFX 2 0.70
DFO + DFP + DFX 0 0.00
MTR Report_Part-2_PRINT_20191114_FA9.indd 199 27/11/2019 5:21 PM

200
MA
LAYS
IAN
TH
ALA
SSA
EMIA
REG
ISTR
YRE
PORT
201
8
Pulau Pinang12
Age Group (years)Total No. of
Patients Iron ChelatorNo. of
Patients (n)Percentage
(%)
25−29.9 29
DFO only 8 2.80
DFP only 9 3.15
DFX only 1 0.35
DFO + DFP 10 3.50
DFP + DFX 0 0.00
DFO + DFX 1 0.35
DFO + DFP + DFX 0 0.00
30−34.9 20
DFO only 4 1.40
DFP only 8 2.80
DFX only 2 0.70
DFO + DFP 6 2.10
DFP + DFX 0 0.00
DFO + DFX 0 0.00
DFO + DFP + DFX 0 0.00
35−39.9 18
DFO only 4 1.40
DFP only 8 2.80
DFX only 0 0.00
DFO + DFP 6 2.10
DFP + DFX 0 0.00
DFO + DFX 0 0.00
DFO + DFP + DFX 0 0.00
40−44.9 17
DFO only 3 1.05
DFP only 11 3.85
DFX only 1 0.35
DFO + DFP 2 0.70
DFP + DFX 0 0.00
DFO + DFX 0 0.00
DFO + DFP + DFX 0 0.00
45−49.9 10
DFO only 4 1.40
DFP only 3 1.05
DFX only 0 0.00
DFO + DFP 2 0.70
DFP + DFX 0 0.00
DFO + DFX 1 0.35
DFO + DFP + DFX 0 0.00
MTR Report_Part-2_PRINT_20191114_FA9.indd 200 27/11/2019 5:21 PM
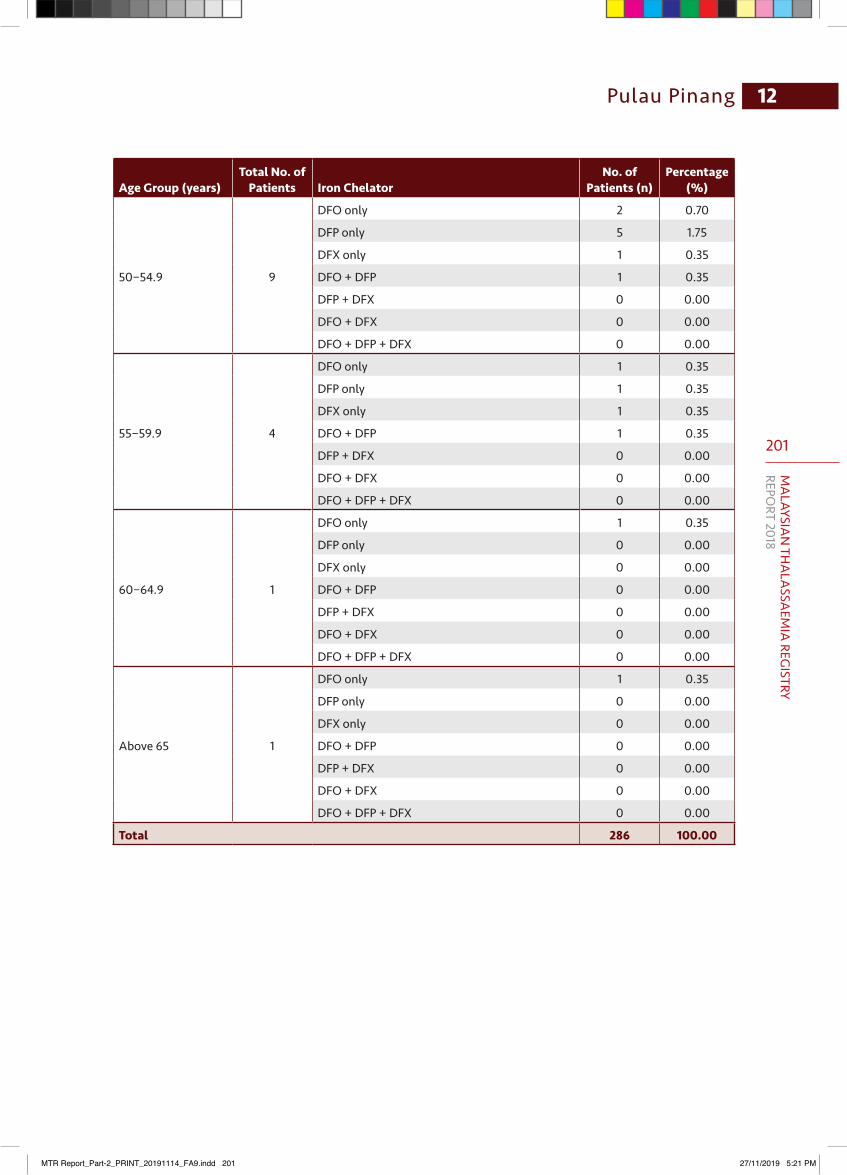
201
MA
LAYSIAN
THA
LASSA
EMIA
REGISTRY
REPORT 2018
12Pulau Pinang
Age Group (years)Total No. of
Patients Iron ChelatorNo. of
Patients (n)Percentage
(%)
50−54.9 9
DFO only 2 0.70
DFP only 5 1.75
DFX only 1 0.35
DFO + DFP 1 0.35
DFP + DFX 0 0.00
DFO + DFX 0 0.00
DFO + DFP + DFX 0 0.00
55−59.9 4
DFO only 1 0.35
DFP only 1 0.35
DFX only 1 0.35
DFO + DFP 1 0.35
DFP + DFX 0 0.00
DFO + DFX 0 0.00
DFO + DFP + DFX 0 0.00
60−64.9 1
DFO only 1 0.35
DFP only 0 0.00
DFX only 0 0.00
DFO + DFP 0 0.00
DFP + DFX 0 0.00
DFO + DFX 0 0.00
DFO + DFP + DFX 0 0.00
Above 65 1
DFO only 1 0.35
DFP only 0 0.00
DFX only 0 0.00
DFO + DFP 0 0.00
DFP + DFX 0 0.00
DFO + DFX 0 0.00
DFO + DFP + DFX 0 0.00
Total 286 100.00
MTR Report_Part-2_PRINT_20191114_FA9.indd 201 27/11/2019 5:21 PM
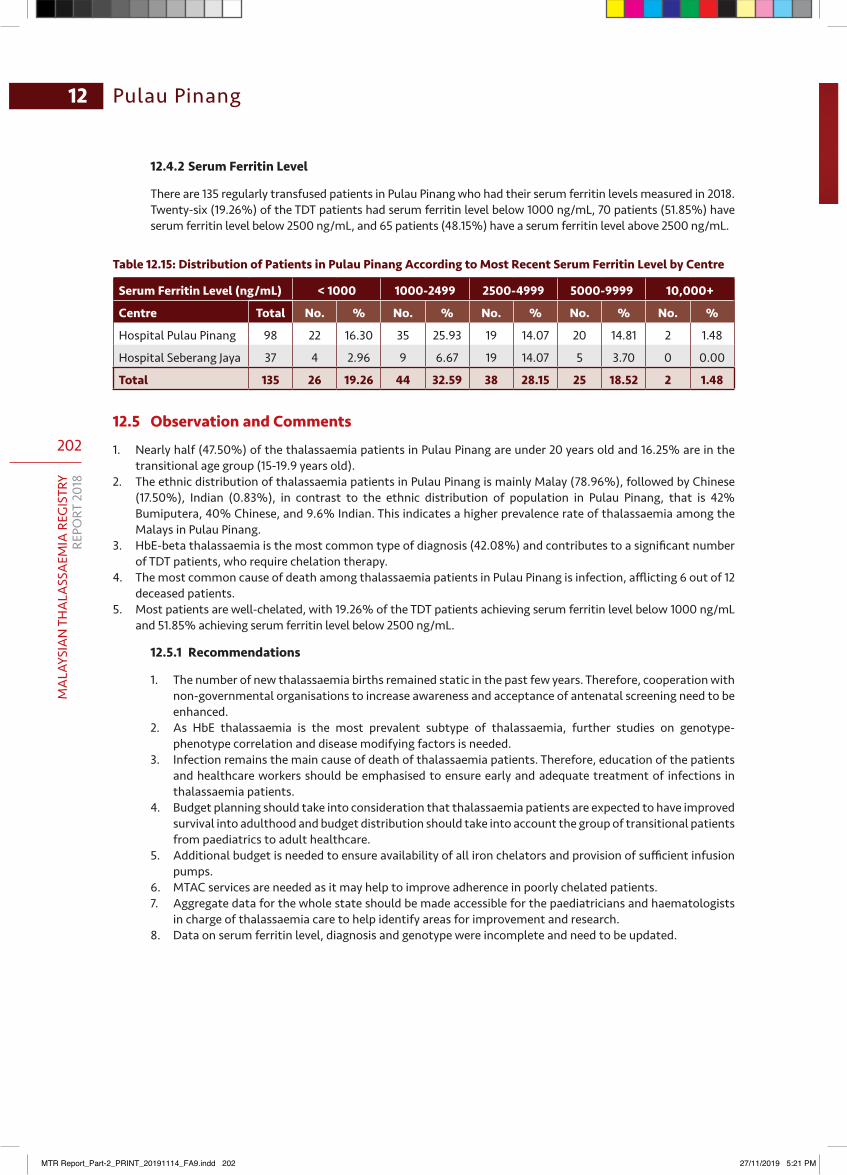
202
MA
LAYS
IAN
TH
ALA
SSA
EMIA
REG
ISTR
YRE
PORT
201
8
Pulau Pinang12
12.4.2 Serum Ferritin Level
There are 135 regularly transfused patients in Pulau Pinang who had their serum ferritin levels measured in 2018. Twenty-six (19.26%) of the TDT patients had serum ferritin level below 1000 ng/mL, 70 patients (51.85%) have serum ferritin level below 2500 ng/mL, and 65 patients (48.15%) have a serum ferritin level above 2500 ng/mL.
Table 12.15: Distribution of Patients in Pulau Pinang According to Most Recent Serum Ferritin Level by Centre
Serum Ferritin Level (ng/mL) < 1000 1000-2499 2500-4999 5000-9999 10,000+
Centre Total No. % No. % No. % No. % No. %
Hospital Pulau Pinang 98 22 16.30 35 25.93 19 14.07 20 14.81 2 1.48
Hospital Seberang Jaya 37 4 2.96 9 6.67 19 14.07 5 3.70 0 0.00
Total 135 26 19.26 44 32.59 38 28.15 25 18.52 2 1.48
12.5 Observation and Comments
1. Nearly half (47.50%) of the thalassaemia patients in Pulau Pinang are under 20 years old and 16.25% are in the transitional age group (15-19.9 years old).
2. The ethnic distribution of thalassaemia patients in Pulau Pinang is mainly Malay (78.96%), followed by Chinese (17.50%), Indian (0.83%), in contrast to the ethnic distribution of population in Pulau Pinang, that is 42% Bumiputera, 40% Chinese, and 9.6% Indian. This indicates a higher prevalence rate of thalassaemia among the Malays in Pulau Pinang.
3. HbE-beta thalassaemia is the most common type of diagnosis (42.08%) and contributes to a significant number of TDT patients, who require chelation therapy.
4. The most common cause of death among thalassaemia patients in Pulau Pinang is infection, afflicting 6 out of 12 deceased patients.
5. Most patients are well-chelated, with 19.26% of the TDT patients achieving serum ferritin level below 1000 ng/mL and 51.85% achieving serum ferritin level below 2500 ng/mL.
12.5.1 Recommendations
1. The number of new thalassaemia births remained static in the past few years. Therefore, cooperation with non-governmental organisations to increase awareness and acceptance of antenatal screening need to be enhanced.
2. As HbE thalassaemia is the most prevalent subtype of thalassaemia, further studies on genotype-phenotype correlation and disease modifying factors is needed.
3. Infection remains the main cause of death of thalassaemia patients. Therefore, education of the patients and healthcare workers should be emphasised to ensure early and adequate treatment of infections in thalassaemia patients.
4. Budget planning should take into consideration that thalassaemia patients are expected to have improved survival into adulthood and budget distribution should take into account the group of transitional patients from paediatrics to adult healthcare.
5. Additional budget is needed to ensure availability of all iron chelators and provision of sufficient infusion pumps.
6. MTAC services are needed as it may help to improve adherence in poorly chelated patients. 7. Aggregate data for the whole state should be made accessible for the paediatricians and haematologists
in charge of thalassaemia care to help identify areas for improvement and research. 8. Data on serum ferritin level, diagnosis and genotype were incomplete and need to be updated.
MTR Report_Part-2_PRINT_20191114_FA9.indd 202 27/11/2019 5:21 PM
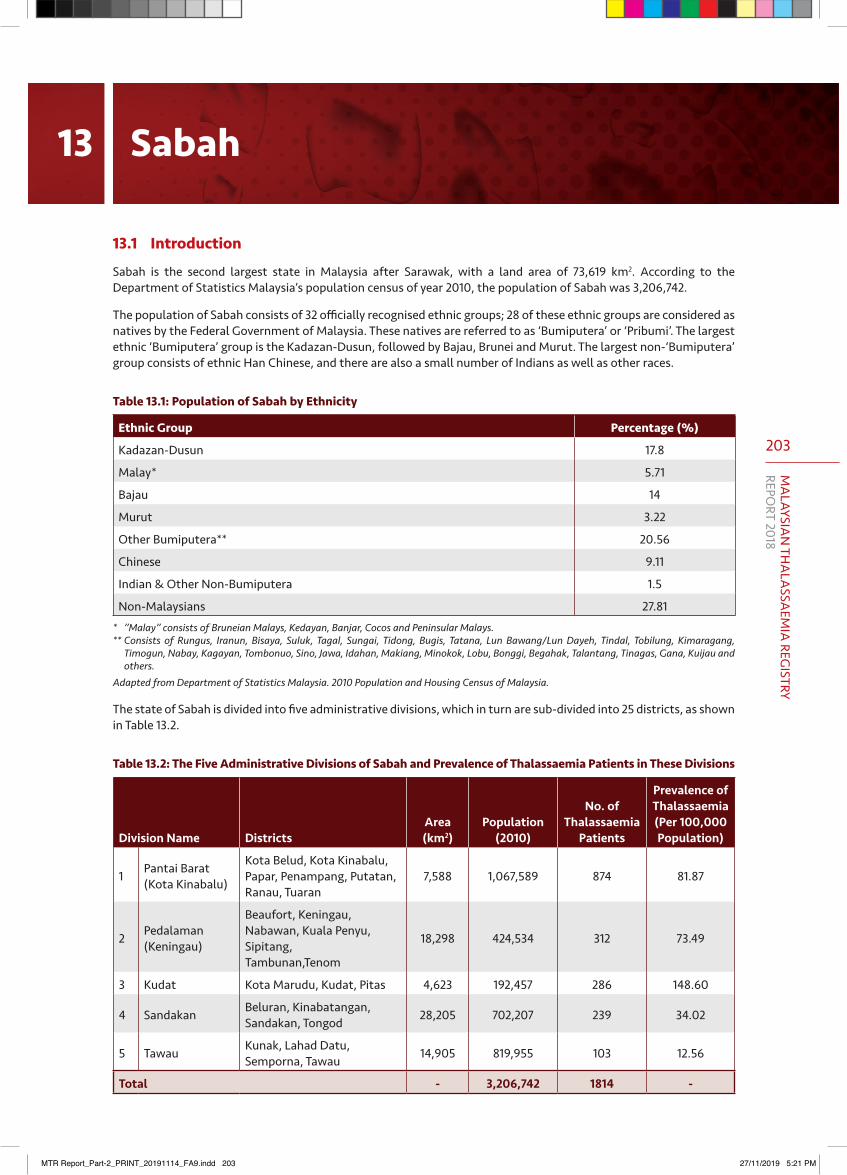
203
MA
LAYSIAN
THA
LASSA
EMIA
REGISTRY
REPORT 2018
13.1 Introduction
Sabah is the second largest state in Malaysia after Sarawak, with a land area of 73,619 km2. According to the Department of Statistics Malaysia’s population census of year 2010, the population of Sabah was 3,206,742.
The population of Sabah consists of 32 officially recognised ethnic groups; 28 of these ethnic groups are considered as natives by the Federal Government of Malaysia. These natives are referred to as ‘Bumiputera’ or ‘Pribumi’. The largest ethnic ‘Bumiputera’ group is the Kadazan-Dusun, followed by Bajau, Brunei and Murut. The largest non-‘Bumiputera’ group consists of ethnic Han Chinese, and there are also a small number of Indians as well as other races.
Table 13.1: Population of Sabah by Ethnicity
Ethnic Group Percentage (%)
Kadazan-Dusun 17.8
Malay* 5.71
Bajau 14
Murut 3.22
Other Bumiputera** 20.56
Chinese 9.11
Indian & Other Non-Bumiputera 1.5
Non-Malaysians 27.81* ”Malay” consists of Bruneian Malays, Kedayan, Banjar, Cocos and Peninsular Malays.** Consists of Rungus, Iranun, Bisaya, Suluk, Tagal, Sungai, Tidong, Bugis, Tatana, Lun Bawang/Lun Dayeh, Tindal, Tobilung, Kimaragang,
Timogun, Nabay, Kagayan, Tombonuo, Sino, Jawa, Idahan, Makiang, Minokok, Lobu, Bonggi, Begahak, Talantang, Tinagas, Gana, Kuijau and others.
Adapted from Department of Statistics Malaysia. 2010 Population and Housing Census of Malaysia.
The state of Sabah is divided into five administrative divisions, which in turn are sub-divided into 25 districts, as shown in Table 13.2.
Table 13.2: The Five Administrative Divisions of Sabah and Prevalence of Thalassaemia Patients in These Divisions
Division Name DistrictsArea (km2)
Population(2010)
No. of Thalassaemia
Patients
Prevalence of Thalassaemia (Per 100,000 Population)
1 Pantai Barat (Kota Kinabalu)
Kota Belud, Kota Kinabalu,Papar, Penampang, Putatan, Ranau, Tuaran
7,588 1,067,589 874 81.87
2 Pedalaman (Keningau)
Beaufort, Keningau, Nabawan, Kuala Penyu, Sipitang,Tambunan,Tenom
18,298 424,534 312 73.49
3 Kudat Kota Marudu, Kudat, Pitas 4,623 192,457 286 148.60
4 Sandakan Beluran, Kinabatangan,Sandakan, Tongod 28,205 702,207 239 34.02
5 Tawau Kunak, Lahad Datu,Semporna, Tawau 14,905 819,955 103 12.56
Total - 3,206,742 1814 -
13 Sabah
MTR Report_Part-2_PRINT_20191114_FA9.indd 203 27/11/2019 5:21 PM
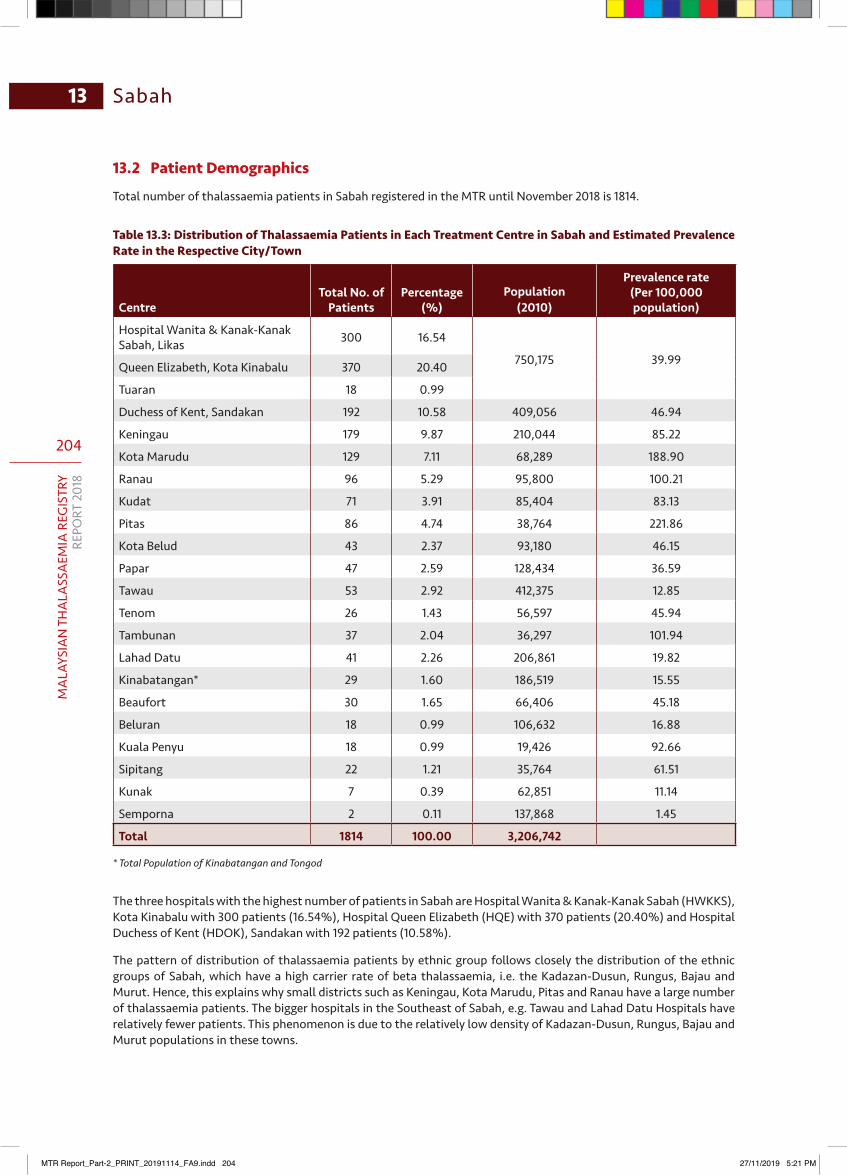
204
MA
LAYS
IAN
TH
ALA
SSA
EMIA
REG
ISTR
YRE
PORT
201
8
Sabah13
13.2 Patient Demographics
Total number of thalassaemia patients in Sabah registered in the MTR until November 2018 is 1814.
Table 13.3: Distribution of Thalassaemia Patients in Each Treatment Centre in Sabah and Estimated Prevalence Rate in the Respective City/Town
CentreTotal No. of
PatientsPercentage
(%)Population
(2010)
Prevalence rate(Per 100,000 population)
Hospital Wanita & Kanak-Kanak Sabah, Likas 300 16.54
750,175 39.99Queen Elizabeth, Kota Kinabalu 370 20.40
Tuaran 18 0.99
Duchess of Kent, Sandakan 192 10.58 409,056 46.94
Keningau 179 9.87 210,044 85.22
Kota Marudu 129 7.11 68,289 188.90
Ranau 96 5.29 95,800 100.21
Kudat 71 3.91 85,404 83.13
Pitas 86 4.74 38,764 221.86
Kota Belud 43 2.37 93,180 46.15
Papar 47 2.59 128,434 36.59
Tawau 53 2.92 412,375 12.85
Tenom 26 1.43 56,597 45.94
Tambunan 37 2.04 36,297 101.94
Lahad Datu 41 2.26 206,861 19.82
Kinabatangan* 29 1.60 186,519 15.55
Beaufort 30 1.65 66,406 45.18
Beluran 18 0.99 106,632 16.88
Kuala Penyu 18 0.99 19,426 92.66
Sipitang 22 1.21 35,764 61.51
Kunak 7 0.39 62,851 11.14
Semporna 2 0.11 137,868 1.45
Total 1814 100.00 3,206,742
* Total Population of Kinabatangan and Tongod
The three hospitals with the highest number of patients in Sabah are Hospital Wanita & Kanak-Kanak Sabah (HWKKS), Kota Kinabalu with 300 patients (16.54%), Hospital Queen Elizabeth (HQE) with 370 patients (20.40%) and Hospital Duchess of Kent (HDOK), Sandakan with 192 patients (10.58%).
The pattern of distribution of thalassaemia patients by ethnic group follows closely the distribution of the ethnic groups of Sabah, which have a high carrier rate of beta thalassaemia, i.e. the Kadazan-Dusun, Rungus, Bajau and Murut. Hence, this explains why small districts such as Keningau, Kota Marudu, Pitas and Ranau have a large number of thalassaemia patients. The bigger hospitals in the Southeast of Sabah, e.g. Tawau and Lahad Datu Hospitals have relatively fewer patients. This phenomenon is due to the relatively low density of Kadazan-Dusun, Rungus, Bajau and Murut populations in these towns.
MTR Report_Part-2_PRINT_20191114_FA9.indd 204 27/11/2019 5:21 PM
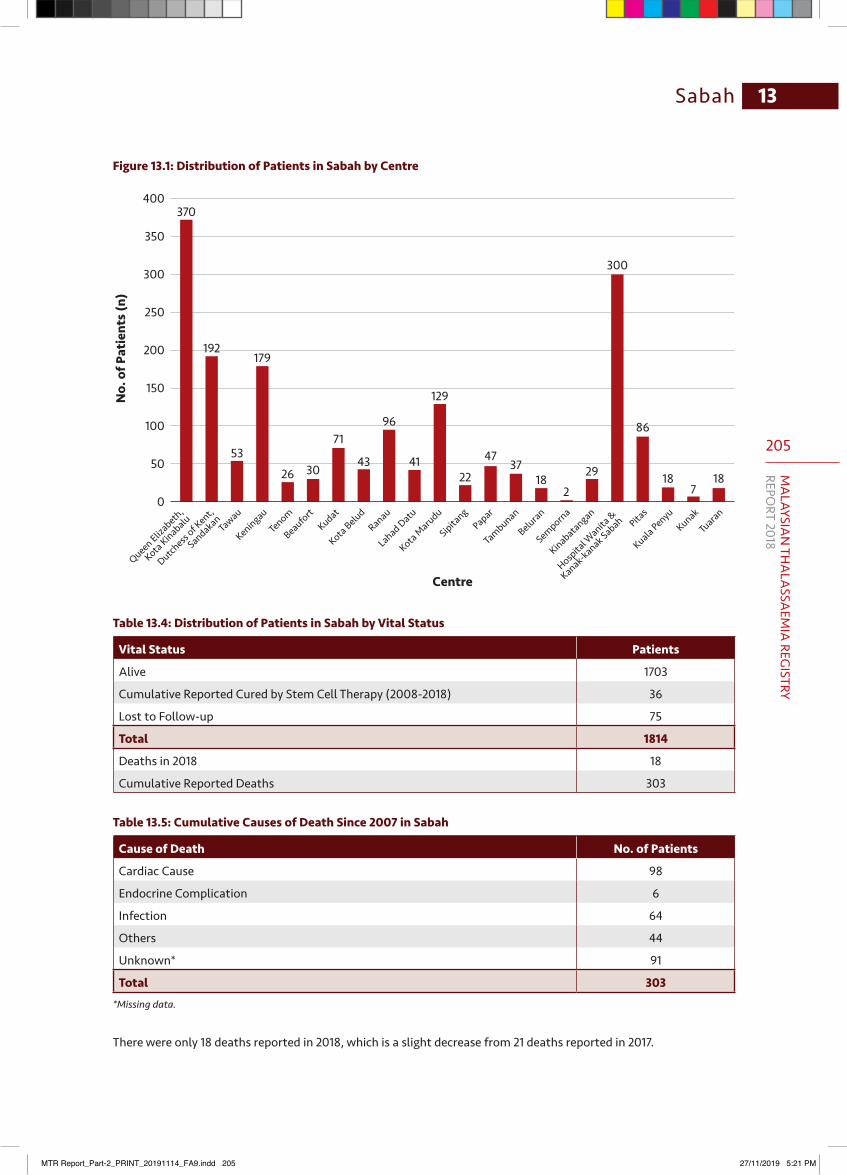
205
MA
LAYSIAN
THA
LASSA
EMIA
REGISTRY
REPORT 2018
13Sabah
Figure 13.1: Distribution of Patients in Sabah by Centre
18
400
350
300
250
200
150
100
50
0
Centre
No.
of P
atie
nts (
n)
Queen Elizabeth
,
Kota Kinabalu
Dutchess
of Kent,
SandakanTa
wau
KeningauTenom
BeaufortKudat
Kota BeludRanau
Lahad Datu
Kota Marudu
Sipitang
Papar
Tambunan
Beluran
Semporna
Kinabatangan
Hospita
l Wanita
&
Kanak-kanak Sabah Pitas
Kuala PenyuKunak
Tuaran
370
192179
5326 30
71
43
96
41
129
22
4737
182
29
300
86
187
Table 13.4: Distribution of Patients in Sabah by Vital Status
Vital Status Patients
Alive 1703
Cumulative Reported Cured by Stem Cell Therapy (2008-2018) 36
Lost to Follow-up 75
Total 1814
Deaths in 2018 18
Cumulative Reported Deaths 303
Table 13.5: Cumulative Causes of Death Since 2007 in Sabah
Cause of Death No. of Patients
Cardiac Cause 98
Endocrine Complication 6
Infection 64
Others 44
Unknown* 91
Total 303*Missing data.
There were only 18 deaths reported in 2018, which is a slight decrease from 21 deaths reported in 2017.
MTR Report_Part-2_PRINT_20191114_FA9.indd 205 27/11/2019 5:21 PM
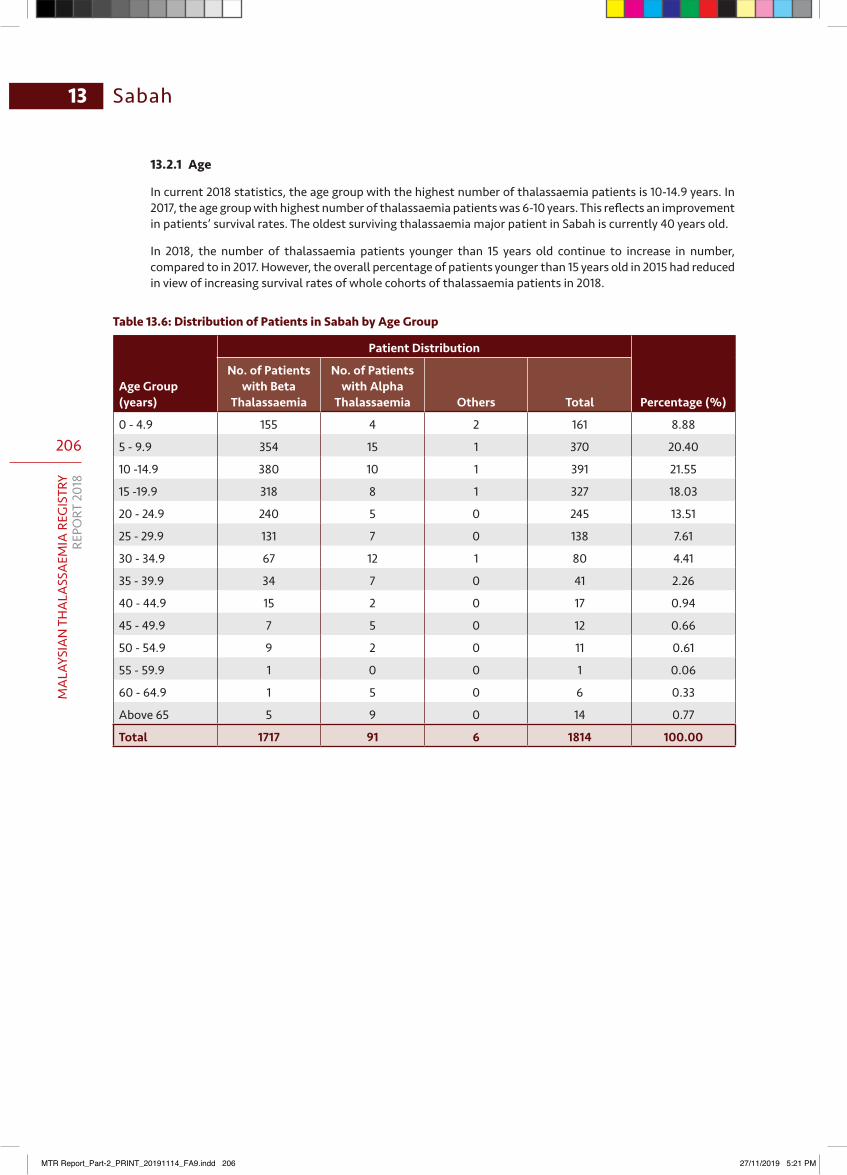
206
MA
LAYS
IAN
TH
ALA
SSA
EMIA
REG
ISTR
YRE
PORT
201
8
Sabah13
13.2.1 Age
In current 2018 statistics, the age group with the highest number of thalassaemia patients is 10-14.9 years. In 2017, the age group with highest number of thalassaemia patients was 6-10 years. This reflects an improvement in patients’ survival rates. The oldest surviving thalassaemia major patient in Sabah is currently 40 years old.
In 2018, the number of thalassaemia patients younger than 15 years old continue to increase in number, compared to in 2017. However, the overall percentage of patients younger than 15 years old in 2015 had reduced in view of increasing survival rates of whole cohorts of thalassaemia patients in 2018.
Table 13.6: Distribution of Patients in Sabah by Age Group
Age Group (years)
Patient Distribution
Percentage (%)
No. of Patients with Beta
Thalassaemia
No. of Patients with Alpha
Thalassaemia Others Total
0 - 4.9 155 4 2 161 8.88
5 - 9.9 354 15 1 370 20.40
10 -14.9 380 10 1 391 21.55
15 -19.9 318 8 1 327 18.03
20 - 24.9 240 5 0 245 13.51
25 - 29.9 131 7 0 138 7.61
30 - 34.9 67 12 1 80 4.41
35 - 39.9 34 7 0 41 2.26
40 - 44.9 15 2 0 17 0.94
45 - 49.9 7 5 0 12 0.66
50 - 54.9 9 2 0 11 0.61
55 - 59.9 1 0 0 1 0.06
60 - 64.9 1 5 0 6 0.33
Above 65 5 9 0 14 0.77
Total 1717 91 6 1814 100.00
MTR Report_Part-2_PRINT_20191114_FA9.indd 206 27/11/2019 5:21 PM
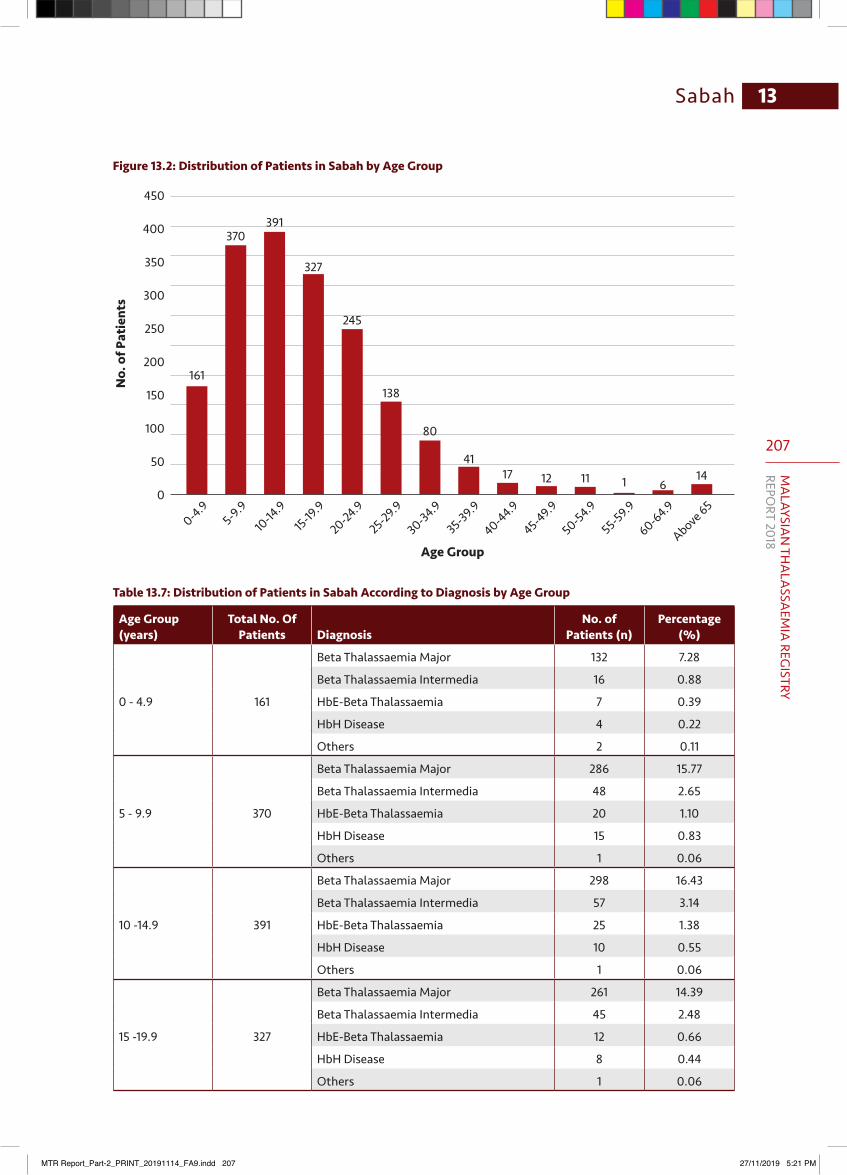
207
MA
LAYSIAN
THA
LASSA
EMIA
REGISTRY
REPORT 2018
13Sabah
Figure 13.2: Distribution of Patients in Sabah by Age Group
450
400
350
300
250
200
150
100
50
0
Age Group
No.
of P
atie
nts
0-4.95-9.9
10-14
.915-19
.9
20-24.9
25-29.9
30-34.9
35-39.9
40-44.9
45-49.9
50-54.9
55-59.9
60-64.9
Above 65
161
370391
327
245
138
80
4117 12 11 1 6
14
Table 13.7: Distribution of Patients in Sabah According to Diagnosis by Age Group
Age Group (years)
Total No. Of Patients Diagnosis
No. of Patients (n)
Percentage (%)
0 - 4.9 161
Beta Thalassaemia Major 132 7.28
Beta Thalassaemia Intermedia 16 0.88
HbE-Beta Thalassaemia 7 0.39
HbH Disease 4 0.22
Others 2 0.11
5 - 9.9 370
Beta Thalassaemia Major 286 15.77
Beta Thalassaemia Intermedia 48 2.65
HbE-Beta Thalassaemia 20 1.10
HbH Disease 15 0.83
Others 1 0.06
10 -14.9 391
Beta Thalassaemia Major 298 16.43
Beta Thalassaemia Intermedia 57 3.14
HbE-Beta Thalassaemia 25 1.38
HbH Disease 10 0.55
Others 1 0.06
15 -19.9 327
Beta Thalassaemia Major 261 14.39
Beta Thalassaemia Intermedia 45 2.48
HbE-Beta Thalassaemia 12 0.66
HbH Disease 8 0.44
Others 1 0.06
MTR Report_Part-2_PRINT_20191114_FA9.indd 207 27/11/2019 5:21 PM
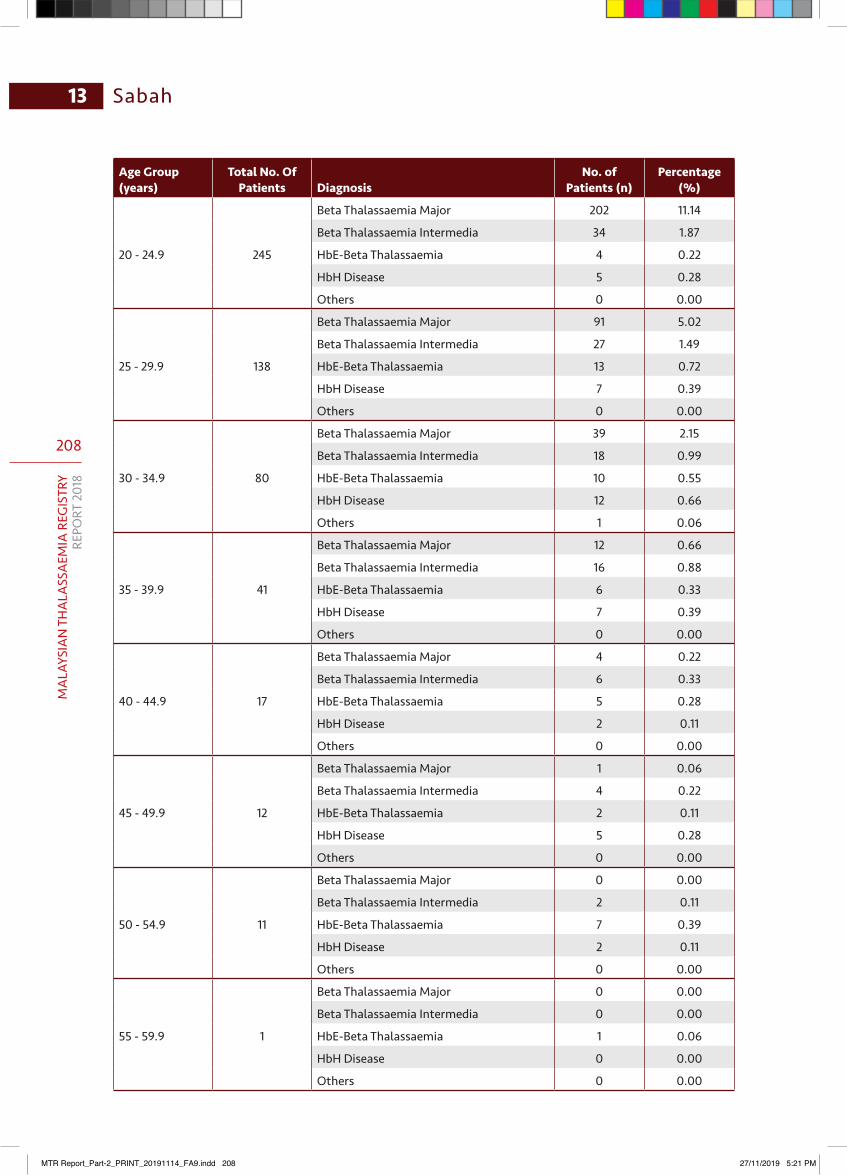
208
MA
LAYS
IAN
TH
ALA
SSA
EMIA
REG
ISTR
YRE
PORT
201
8
Sabah13
Age Group (years)
Total No. Of Patients Diagnosis
No. of Patients (n)
Percentage (%)
20 - 24.9 245
Beta Thalassaemia Major 202 11.14
Beta Thalassaemia Intermedia 34 1.87
HbE-Beta Thalassaemia 4 0.22
HbH Disease 5 0.28
Others 0 0.00
25 - 29.9 138
Beta Thalassaemia Major 91 5.02
Beta Thalassaemia Intermedia 27 1.49
HbE-Beta Thalassaemia 13 0.72
HbH Disease 7 0.39
Others 0 0.00
30 - 34.9 80
Beta Thalassaemia Major 39 2.15
Beta Thalassaemia Intermedia 18 0.99
HbE-Beta Thalassaemia 10 0.55
HbH Disease 12 0.66
Others 1 0.06
35 - 39.9 41
Beta Thalassaemia Major 12 0.66
Beta Thalassaemia Intermedia 16 0.88
HbE-Beta Thalassaemia 6 0.33
HbH Disease 7 0.39
Others 0 0.00
40 - 44.9 17
Beta Thalassaemia Major 4 0.22
Beta Thalassaemia Intermedia 6 0.33
HbE-Beta Thalassaemia 5 0.28
HbH Disease 2 0.11
Others 0 0.00
45 - 49.9 12
Beta Thalassaemia Major 1 0.06
Beta Thalassaemia Intermedia 4 0.22
HbE-Beta Thalassaemia 2 0.11
HbH Disease 5 0.28
Others 0 0.00
50 - 54.9 11
Beta Thalassaemia Major 0 0.00
Beta Thalassaemia Intermedia 2 0.11
HbE-Beta Thalassaemia 7 0.39
HbH Disease 2 0.11
Others 0 0.00
55 - 59.9 1
Beta Thalassaemia Major 0 0.00
Beta Thalassaemia Intermedia 0 0.00
HbE-Beta Thalassaemia 1 0.06
HbH Disease 0 0.00
Others 0 0.00
MTR Report_Part-2_PRINT_20191114_FA9.indd 208 27/11/2019 5:21 PM
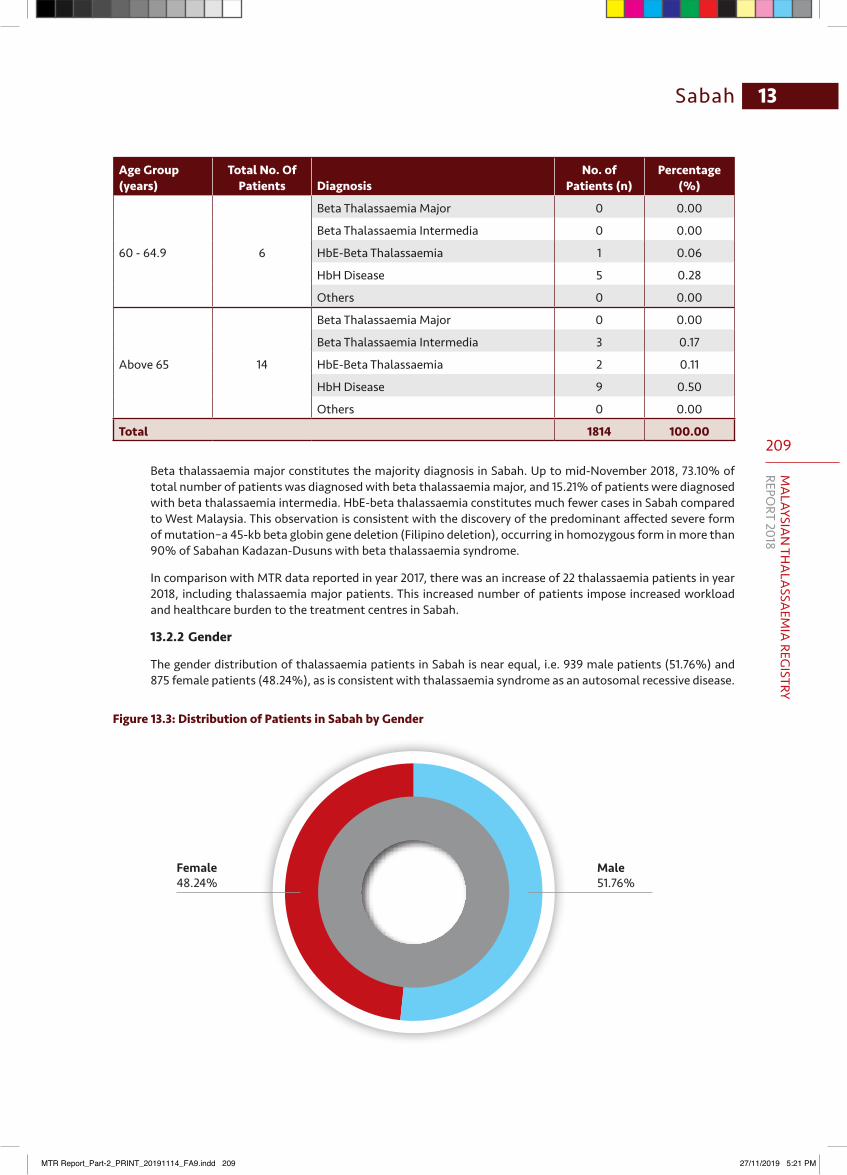
209
MA
LAYSIAN
THA
LASSA
EMIA
REGISTRY
REPORT 2018
13Sabah
Age Group (years)
Total No. Of Patients Diagnosis
No. of Patients (n)
Percentage (%)
60 - 64.9 6
Beta Thalassaemia Major 0 0.00
Beta Thalassaemia Intermedia 0 0.00
HbE-Beta Thalassaemia 1 0.06
HbH Disease 5 0.28
Others 0 0.00
Above 65 14
Beta Thalassaemia Major 0 0.00
Beta Thalassaemia Intermedia 3 0.17
HbE-Beta Thalassaemia 2 0.11
HbH Disease 9 0.50
Others 0 0.00
Total 1814 100.00
Beta thalassaemia major constitutes the majority diagnosis in Sabah. Up to mid-November 2018, 73.10% of total number of patients was diagnosed with beta thalassaemia major, and 15.21% of patients were diagnosed with beta thalassaemia intermedia. HbE-beta thalassaemia constitutes much fewer cases in Sabah compared to West Malaysia. This observation is consistent with the discovery of the predominant affected severe form of mutation–a 45-kb beta globin gene deletion (Filipino deletion), occurring in homozygous form in more than 90% of Sabahan Kadazan-Dusuns with beta thalassaemia syndrome.
In comparison with MTR data reported in year 2017, there was an increase of 22 thalassaemia patients in year 2018, including thalassaemia major patients. This increased number of patients impose increased workload and healthcare burden to the treatment centres in Sabah.
13.2.2 Gender
The gender distribution of thalassaemia patients in Sabah is near equal, i.e. 939 male patients (51.76%) and 875 female patients (48.24%), as is consistent with thalassaemia syndrome as an autosomal recessive disease.
Figure 13.3: Distribution of Patients in Sabah by Gender
Female48.24%
Male51.76%
MTR Report_Part-2_PRINT_20191114_FA9.indd 209 27/11/2019 5:21 PM
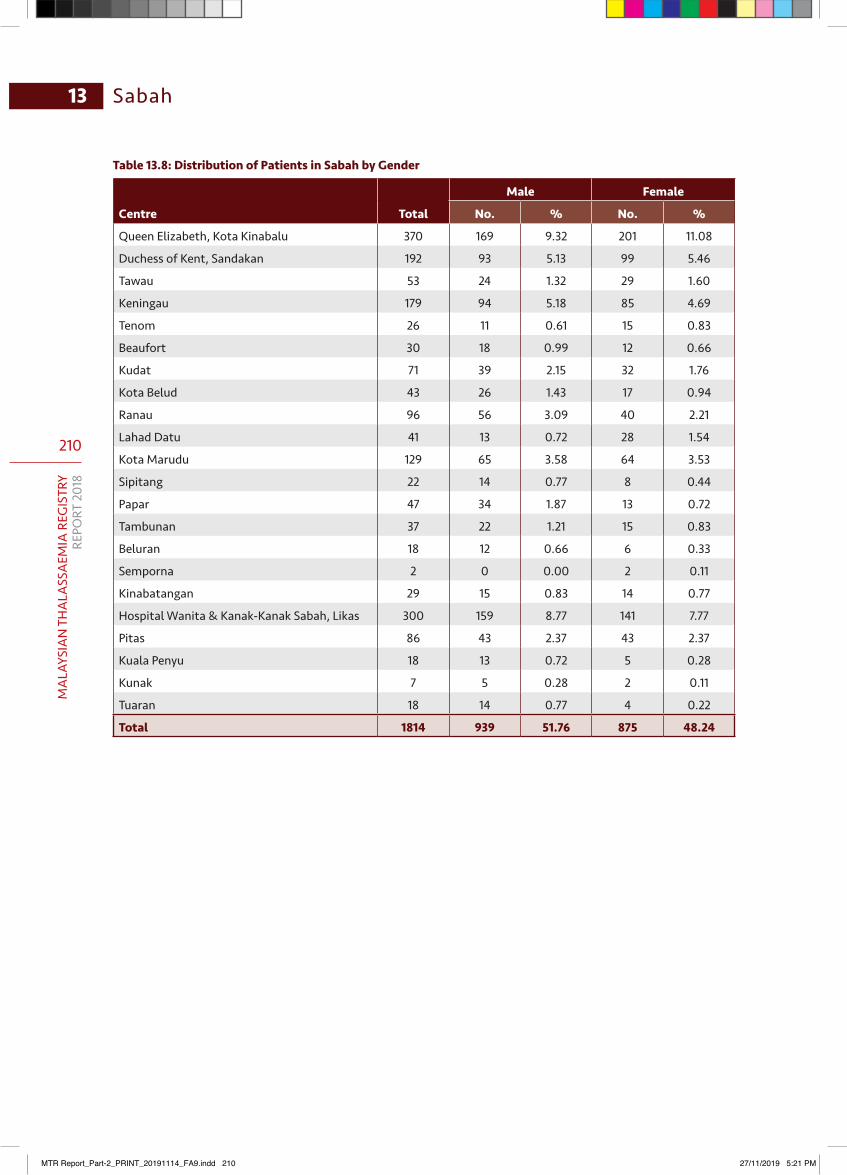
210
MA
LAYS
IAN
TH
ALA
SSA
EMIA
REG
ISTR
YRE
PORT
201
8
Sabah13
Table 13.8: Distribution of Patients in Sabah by Gender
Centre Total
Male Female
No. % No. %
Queen Elizabeth, Kota Kinabalu 370 169 9.32 201 11.08
Duchess of Kent, Sandakan 192 93 5.13 99 5.46
Tawau 53 24 1.32 29 1.60
Keningau 179 94 5.18 85 4.69
Tenom 26 11 0.61 15 0.83
Beaufort 30 18 0.99 12 0.66
Kudat 71 39 2.15 32 1.76
Kota Belud 43 26 1.43 17 0.94
Ranau 96 56 3.09 40 2.21
Lahad Datu 41 13 0.72 28 1.54
Kota Marudu 129 65 3.58 64 3.53
Sipitang 22 14 0.77 8 0.44
Papar 47 34 1.87 13 0.72
Tambunan 37 22 1.21 15 0.83
Beluran 18 12 0.66 6 0.33
Semporna 2 0 0.00 2 0.11
Kinabatangan 29 15 0.83 14 0.77
Hospital Wanita & Kanak-Kanak Sabah, Likas 300 159 8.77 141 7.77
Pitas 86 43 2.37 43 2.37
Kuala Penyu 18 13 0.72 5 0.28
Kunak 7 5 0.28 2 0.11
Tuaran 18 14 0.77 4 0.22
Total 1814 939 51.76 875 48.24
MTR Report_Part-2_PRINT_20191114_FA9.indd 210 27/11/2019 5:21 PM
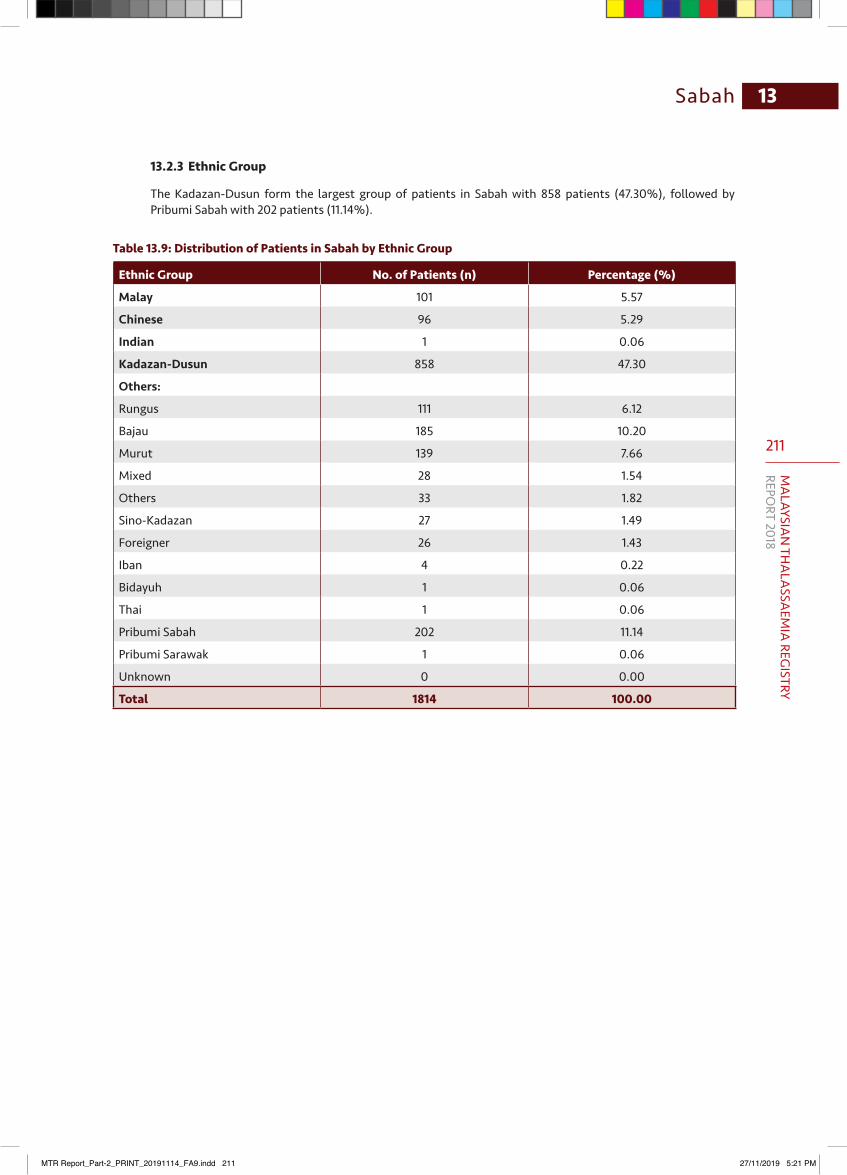
211
MA
LAYSIAN
THA
LASSA
EMIA
REGISTRY
REPORT 2018
13Sabah
13.2.3 Ethnic Group
The Kadazan-Dusun form the largest group of patients in Sabah with 858 patients (47.30%), followed by Pribumi Sabah with 202 patients (11.14%).
Table 13.9: Distribution of Patients in Sabah by Ethnic Group
Ethnic Group No. of Patients (n) Percentage (%)
Malay 101 5.57
Chinese 96 5.29
Indian 1 0.06
Kadazan-Dusun 858 47.30
Others:
Rungus 111 6.12
Bajau 185 10.20
Murut 139 7.66
Mixed 28 1.54
Others 33 1.82
Sino-Kadazan 27 1.49
Foreigner 26 1.43
Iban 4 0.22
Bidayuh 1 0.06
Thai 1 0.06
Pribumi Sabah 202 11.14
Pribumi Sarawak 1 0.06
Unknown 0 0.00
Total 1814 100.00
MTR Report_Part-2_PRINT_20191114_FA9.indd 211 27/11/2019 5:21 PM
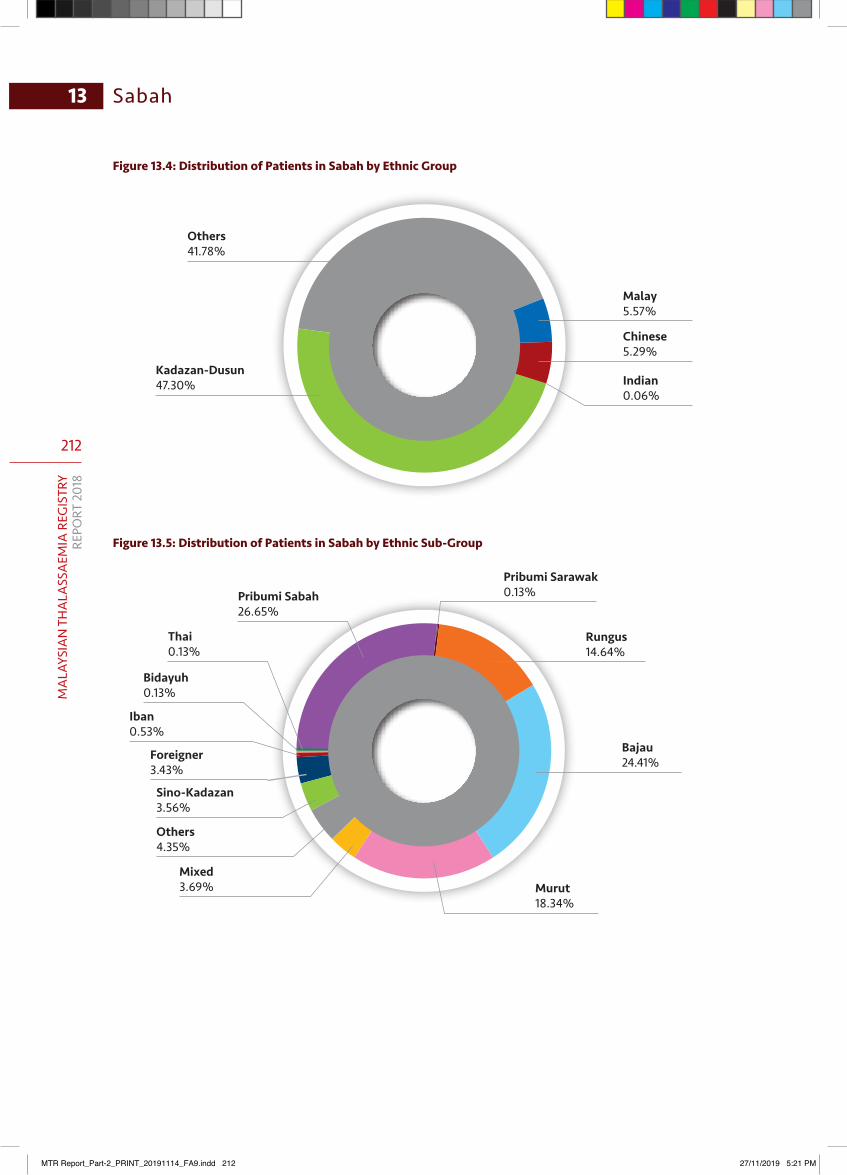
212
MA
LAYS
IAN
TH
ALA
SSA
EMIA
REG
ISTR
YRE
PORT
201
8
Sabah13
Figure 13.5: Distribution of Patients in Sabah by Ethnic Sub-Group
Figure 13.4: Distribution of Patients in Sabah by Ethnic Group
Others41.78%
Malay5.57%
Chinese5.29%
Indian0.06%
Kadazan-Dusun47.30%
Sino-Kadazan3.56%
Foreigner3.43%
Iban0.53%
Bidayuh0.13%
Thai0.13%
Pribumi Sabah26.65%
Others4.35%
Mixed3.69%
Rungus14.64%
Pribumi Sarawak0.13%
Bajau24.41%
Murut18.34%
MTR Report_Part-2_PRINT_20191114_FA9.indd 212 27/11/2019 5:21 PM
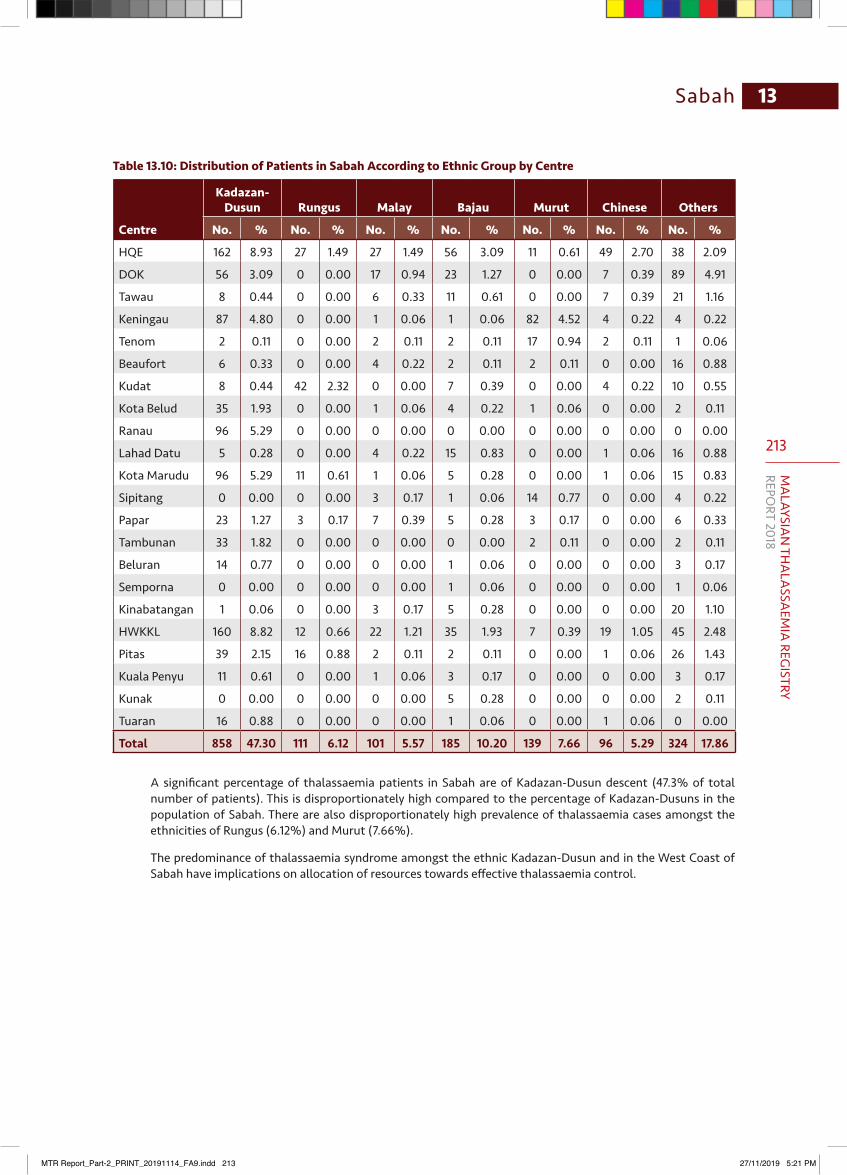
213
MA
LAYSIAN
THA
LASSA
EMIA
REGISTRY
REPORT 2018
13Sabah
Table 13.10: Distribution of Patients in Sabah According to Ethnic Group by Centre
Centre
Kadazan-Dusun Rungus Malay Bajau Murut Chinese Others
No. % No. % No. % No. % No. % No. % No. %
HQE 162 8.93 27 1.49 27 1.49 56 3.09 11 0.61 49 2.70 38 2.09
DOK 56 3.09 0 0.00 17 0.94 23 1.27 0 0.00 7 0.39 89 4.91
Tawau 8 0.44 0 0.00 6 0.33 11 0.61 0 0.00 7 0.39 21 1.16
Keningau 87 4.80 0 0.00 1 0.06 1 0.06 82 4.52 4 0.22 4 0.22
Tenom 2 0.11 0 0.00 2 0.11 2 0.11 17 0.94 2 0.11 1 0.06
Beaufort 6 0.33 0 0.00 4 0.22 2 0.11 2 0.11 0 0.00 16 0.88
Kudat 8 0.44 42 2.32 0 0.00 7 0.39 0 0.00 4 0.22 10 0.55
Kota Belud 35 1.93 0 0.00 1 0.06 4 0.22 1 0.06 0 0.00 2 0.11
Ranau 96 5.29 0 0.00 0 0.00 0 0.00 0 0.00 0 0.00 0 0.00
Lahad Datu 5 0.28 0 0.00 4 0.22 15 0.83 0 0.00 1 0.06 16 0.88
Kota Marudu 96 5.29 11 0.61 1 0.06 5 0.28 0 0.00 1 0.06 15 0.83
Sipitang 0 0.00 0 0.00 3 0.17 1 0.06 14 0.77 0 0.00 4 0.22
Papar 23 1.27 3 0.17 7 0.39 5 0.28 3 0.17 0 0.00 6 0.33
Tambunan 33 1.82 0 0.00 0 0.00 0 0.00 2 0.11 0 0.00 2 0.11
Beluran 14 0.77 0 0.00 0 0.00 1 0.06 0 0.00 0 0.00 3 0.17
Semporna 0 0.00 0 0.00 0 0.00 1 0.06 0 0.00 0 0.00 1 0.06
Kinabatangan 1 0.06 0 0.00 3 0.17 5 0.28 0 0.00 0 0.00 20 1.10
HWKKL 160 8.82 12 0.66 22 1.21 35 1.93 7 0.39 19 1.05 45 2.48
Pitas 39 2.15 16 0.88 2 0.11 2 0.11 0 0.00 1 0.06 26 1.43
Kuala Penyu 11 0.61 0 0.00 1 0.06 3 0.17 0 0.00 0 0.00 3 0.17
Kunak 0 0.00 0 0.00 0 0.00 5 0.28 0 0.00 0 0.00 2 0.11
Tuaran 16 0.88 0 0.00 0 0.00 1 0.06 0 0.00 1 0.06 0 0.00
Total 858 47.30 111 6.12 101 5.57 185 10.20 139 7.66 96 5.29 324 17.86
A significant percentage of thalassaemia patients in Sabah are of Kadazan-Dusun descent (47.3% of total number of patients). This is disproportionately high compared to the percentage of Kadazan-Dusuns in the population of Sabah. There are also disproportionately high prevalence of thalassaemia cases amongst the ethnicities of Rungus (6.12%) and Murut (7.66%).
The predominance of thalassaemia syndrome amongst the ethnic Kadazan-Dusun and in the West Coast of Sabah have implications on allocation of resources towards effective thalassaemia control.
MTR Report_Part-2_PRINT_20191114_FA9.indd 213 27/11/2019 5:21 PM
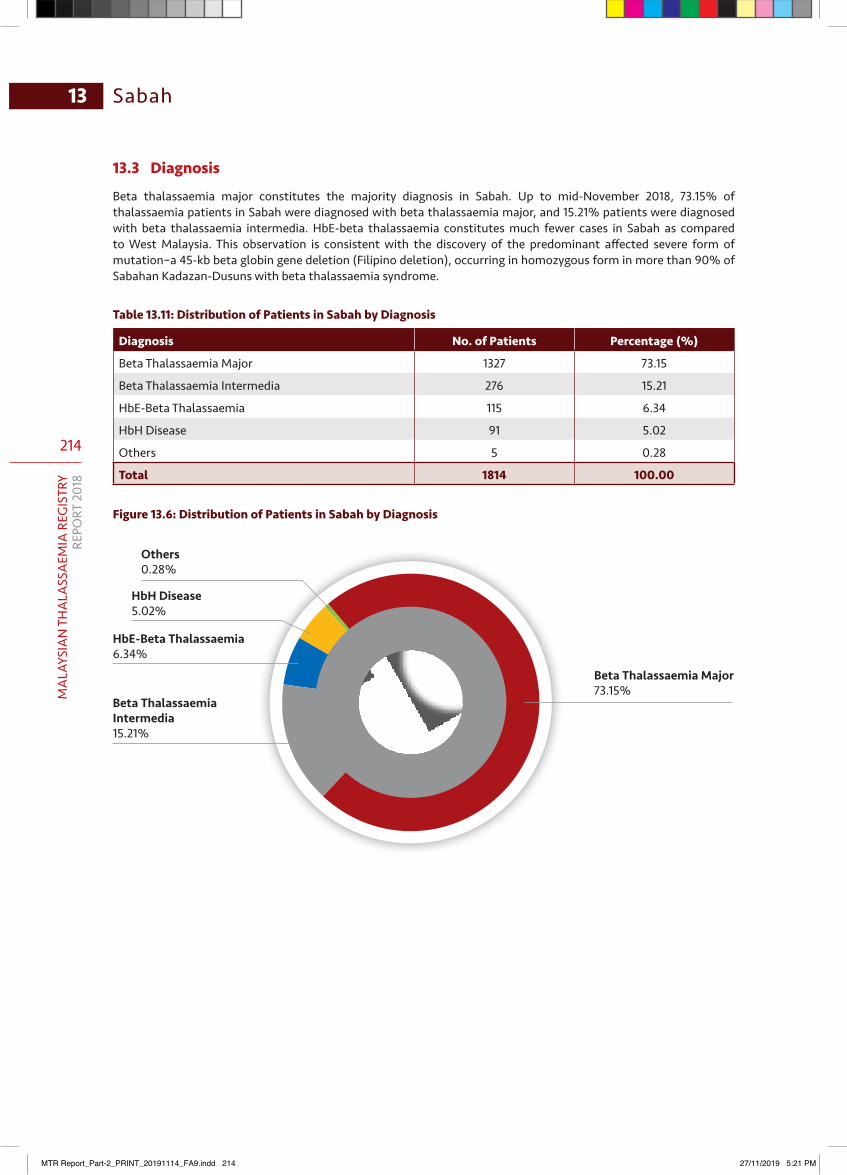
214
MA
LAYS
IAN
TH
ALA
SSA
EMIA
REG
ISTR
YRE
PORT
201
8
Sabah13
13.3 Diagnosis
Beta thalassaemia major constitutes the majority diagnosis in Sabah. Up to mid-November 2018, 73.15% of thalassaemia patients in Sabah were diagnosed with beta thalassaemia major, and 15.21% patients were diagnosed with beta thalassaemia intermedia. HbE-beta thalassaemia constitutes much fewer cases in Sabah as compared to West Malaysia. This observation is consistent with the discovery of the predominant affected severe form of mutation–a 45-kb beta globin gene deletion (Filipino deletion), occurring in homozygous form in more than 90% of Sabahan Kadazan-Dusuns with beta thalassaemia syndrome.
Table 13.11: Distribution of Patients in Sabah by Diagnosis
Diagnosis No. of Patients Percentage (%)
Beta Thalassaemia Major 1327 73.15
Beta Thalassaemia Intermedia 276 15.21
HbE-Beta Thalassaemia 115 6.34
HbH Disease 91 5.02
Others 5 0.28
Total 1814 100.00
Figure 13.6: Distribution of Patients in Sabah by Diagnosis
Beta Thalassaemia Major73.15%
Others0.28%
HbE-Beta Thalassaemia6.34%
HbH Disease5.02%
Beta Thalassaemia Intermedia15.21%
MTR Report_Part-2_PRINT_20191114_FA9.indd 214 27/11/2019 5:21 PM
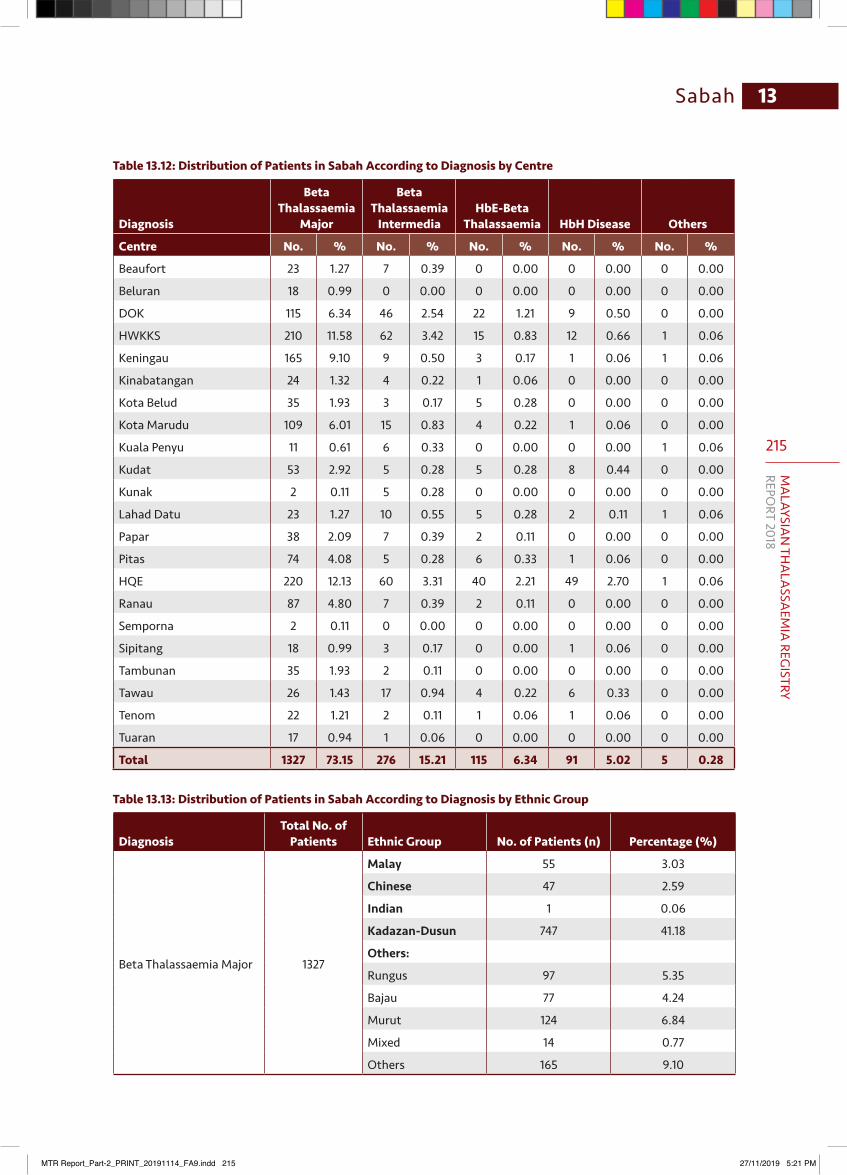
215
MA
LAYSIAN
THA
LASSA
EMIA
REGISTRY
REPORT 2018
13Sabah
Table 13.12: Distribution of Patients in Sabah According to Diagnosis by Centre
Diagnosis
Beta Thalassaemia
Major
Beta Thalassaemia
IntermediaHbE-Beta
Thalassaemia HbH Disease Others
Centre No. % No. % No. % No. % No. %
Beaufort 23 1.27 7 0.39 0 0.00 0 0.00 0 0.00
Beluran 18 0.99 0 0.00 0 0.00 0 0.00 0 0.00
DOK 115 6.34 46 2.54 22 1.21 9 0.50 0 0.00
HWKKS 210 11.58 62 3.42 15 0.83 12 0.66 1 0.06
Keningau 165 9.10 9 0.50 3 0.17 1 0.06 1 0.06
Kinabatangan 24 1.32 4 0.22 1 0.06 0 0.00 0 0.00
Kota Belud 35 1.93 3 0.17 5 0.28 0 0.00 0 0.00
Kota Marudu 109 6.01 15 0.83 4 0.22 1 0.06 0 0.00
Kuala Penyu 11 0.61 6 0.33 0 0.00 0 0.00 1 0.06
Kudat 53 2.92 5 0.28 5 0.28 8 0.44 0 0.00
Kunak 2 0.11 5 0.28 0 0.00 0 0.00 0 0.00
Lahad Datu 23 1.27 10 0.55 5 0.28 2 0.11 1 0.06
Papar 38 2.09 7 0.39 2 0.11 0 0.00 0 0.00
Pitas 74 4.08 5 0.28 6 0.33 1 0.06 0 0.00
HQE 220 12.13 60 3.31 40 2.21 49 2.70 1 0.06
Ranau 87 4.80 7 0.39 2 0.11 0 0.00 0 0.00
Semporna 2 0.11 0 0.00 0 0.00 0 0.00 0 0.00
Sipitang 18 0.99 3 0.17 0 0.00 1 0.06 0 0.00
Tambunan 35 1.93 2 0.11 0 0.00 0 0.00 0 0.00
Tawau 26 1.43 17 0.94 4 0.22 6 0.33 0 0.00
Tenom 22 1.21 2 0.11 1 0.06 1 0.06 0 0.00
Tuaran 17 0.94 1 0.06 0 0.00 0 0.00 0 0.00
Total 1327 73.15 276 15.21 115 6.34 91 5.02 5 0.28
Table 13.13: Distribution of Patients in Sabah According to Diagnosis by Ethnic Group
DiagnosisTotal No. of
Patients Ethnic Group No. of Patients (n) Percentage (%)
Beta Thalassaemia Major 1327
Malay 55 3.03
Chinese 47 2.59
Indian 1 0.06
Kadazan-Dusun 747 41.18
Others:
Rungus 97 5.35
Bajau 77 4.24
Murut 124 6.84
Mixed 14 0.77
Others 165 9.10
MTR Report_Part-2_PRINT_20191114_FA9.indd 215 27/11/2019 5:21 PM
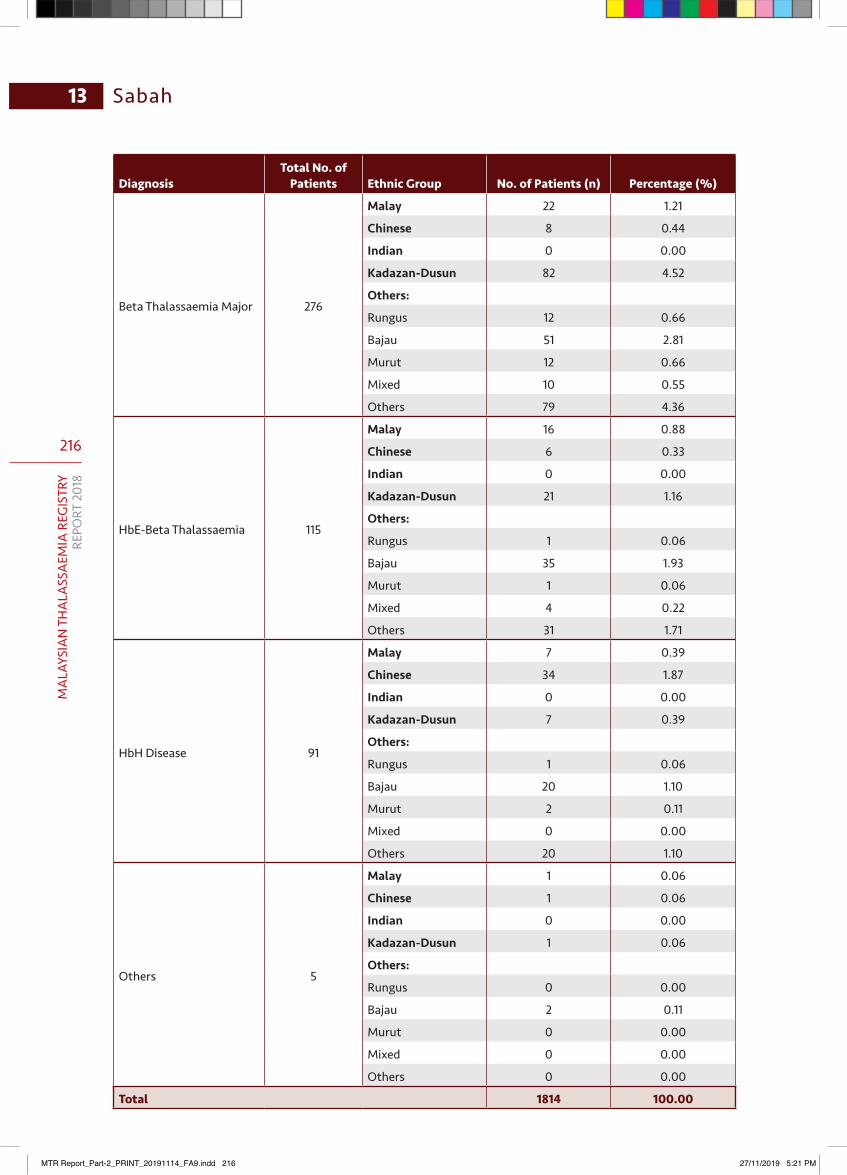
216
MA
LAYS
IAN
TH
ALA
SSA
EMIA
REG
ISTR
YRE
PORT
201
8
Sabah13
DiagnosisTotal No. of
Patients Ethnic Group No. of Patients (n) Percentage (%)
Beta Thalassaemia Major 276
Malay 22 1.21
Chinese 8 0.44
Indian 0 0.00
Kadazan-Dusun 82 4.52
Others:
Rungus 12 0.66
Bajau 51 2.81
Murut 12 0.66
Mixed 10 0.55
Others 79 4.36
HbE-Beta Thalassaemia 115
Malay 16 0.88
Chinese 6 0.33
Indian 0 0.00
Kadazan-Dusun 21 1.16
Others:
Rungus 1 0.06
Bajau 35 1.93
Murut 1 0.06
Mixed 4 0.22
Others 31 1.71
HbH Disease 91
Malay 7 0.39
Chinese 34 1.87
Indian 0 0.00
Kadazan-Dusun 7 0.39
Others:
Rungus 1 0.06
Bajau 20 1.10
Murut 2 0.11
Mixed 0 0.00
Others 20 1.10
Others 5
Malay 1 0.06
Chinese 1 0.06
Indian 0 0.00
Kadazan-Dusun 1 0.06
Others:
Rungus 0 0.00
Bajau 2 0.11
Murut 0 0.00
Mixed 0 0.00
Others 0 0.00
Total 1814 100.00
MTR Report_Part-2_PRINT_20191114_FA9.indd 216 27/11/2019 5:21 PM
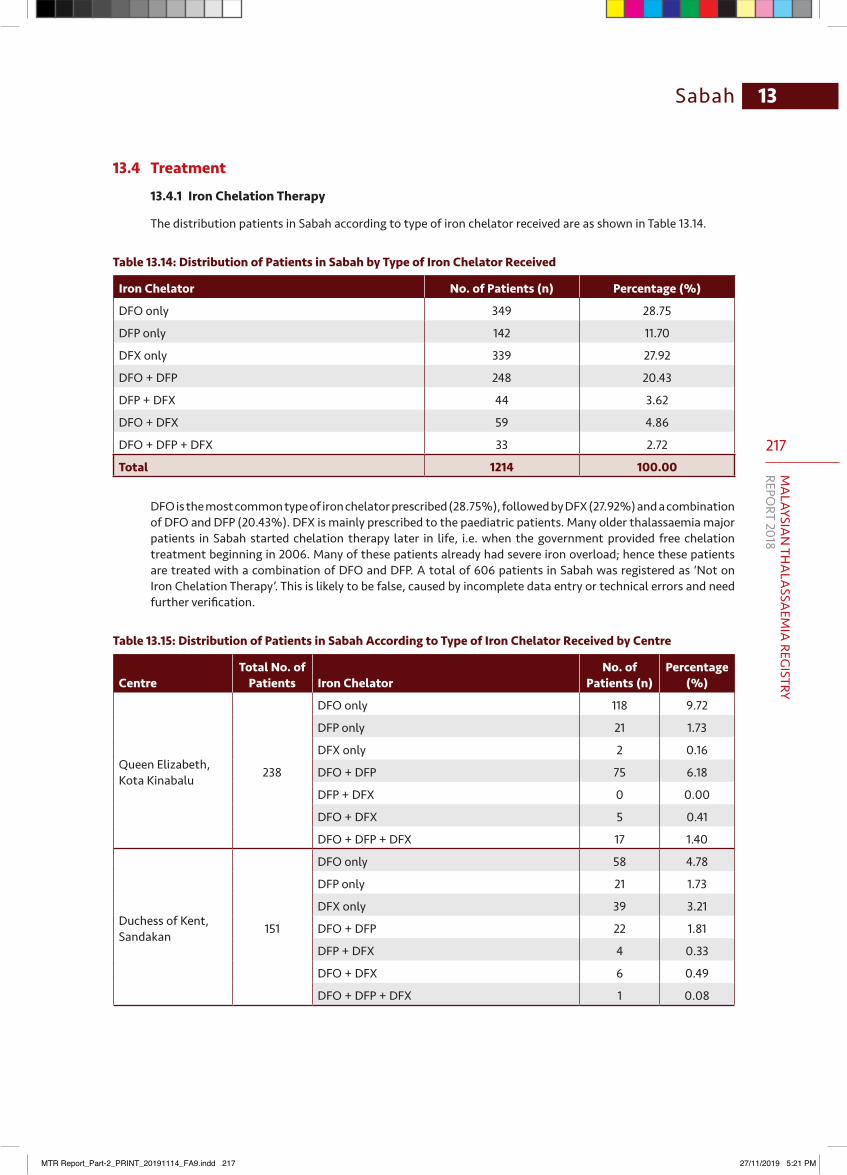
217
MA
LAYSIAN
THA
LASSA
EMIA
REGISTRY
REPORT 2018
13Sabah
13.4 Treatment
13.4.1 Iron Chelation Therapy
The distribution patients in Sabah according to type of iron chelator received are as shown in Table 13.14.
Table 13.14: Distribution of Patients in Sabah by Type of Iron Chelator Received
Iron Chelator No. of Patients (n) Percentage (%)
DFO only 349 28.75
DFP only 142 11.70
DFX only 339 27.92
DFO + DFP 248 20.43
DFP + DFX 44 3.62
DFO + DFX 59 4.86
DFO + DFP + DFX 33 2.72
Total 1214 100.00
DFO is the most common type of iron chelator prescribed (28.75%), followed by DFX (27.92%) and a combination of DFO and DFP (20.43%). DFX is mainly prescribed to the paediatric patients. Many older thalassaemia major patients in Sabah started chelation therapy later in life, i.e. when the government provided free chelation treatment beginning in 2006. Many of these patients already had severe iron overload; hence these patients are treated with a combination of DFO and DFP. A total of 606 patients in Sabah was registered as ‘Not on Iron Chelation Therapy’. This is likely to be false, caused by incomplete data entry or technical errors and need further verification.
Table 13.15: Distribution of Patients in Sabah According to Type of Iron Chelator Received by Centre
CentreTotal No. of
Patients Iron ChelatorNo. of
Patients (n)Percentage
(%)
Queen Elizabeth, Kota Kinabalu 238
DFO only 118 9.72
DFP only 21 1.73
DFX only 2 0.16
DFO + DFP 75 6.18
DFP + DFX 0 0.00
DFO + DFX 5 0.41
DFO + DFP + DFX 17 1.40
Duchess of Kent, Sandakan 151
DFO only 58 4.78
DFP only 21 1.73
DFX only 39 3.21
DFO + DFP 22 1.81
DFP + DFX 4 0.33
DFO + DFX 6 0.49
DFO + DFP + DFX 1 0.08
MTR Report_Part-2_PRINT_20191114_FA9.indd 217 27/11/2019 5:21 PM

218
MA
LAYS
IAN
TH
ALA
SSA
EMIA
REG
ISTR
YRE
PORT
201
8
Sabah13
CentreTotal No. of
Patients Iron ChelatorNo. of
Patients (n)Percentage
(%)
Tawau 34
DFO only 2 0.16
DFP only 2 0.16
DFX only 12 0.99
DFO + DFP 8 0.66
DFP + DFX 3 0.25
DFO + DFX 4 0.33
DFO + DFP + DFX 3 0.25
Keningau 129
DFO only 17 1.40
DFP only 23 1.89
DFX only 30 2.47
DFO + DFP 29 2.39
DFP + DFX 20 1.65
DFO + DFX 6 0.49
DFO + DFP + DFX 4 0.33
Tenom 20
DFO only 6 0.49
DFP only 2 0.16
DFX only 3 0.25
DFO + DFP 7 0.58
DFP + DFX 1 0.08
DFO + DFX 1 0.08
DFO + DFP + DFX 0 0.00
Beaufort 23
DFO only 7 0.58
DFP only 3 0.25
DFX only 10 0.82
DFO + DFP 2 0.16
DFP + DFX 0 0.00
DFO + DFX 1 0.08
DFO + DFP + DFX 0 0.00
Kudat 55
DFO only 9 0.74
DFP only 2 0.16
DFX only 21 1.73
DFO + DFP 19 1.57
DFP + DFX 0 0.00
DFO + DFX 3 0.25
DFO + DFP + DFX 1 0.08
MTR Report_Part-2_PRINT_20191114_FA9.indd 218 27/11/2019 5:21 PM
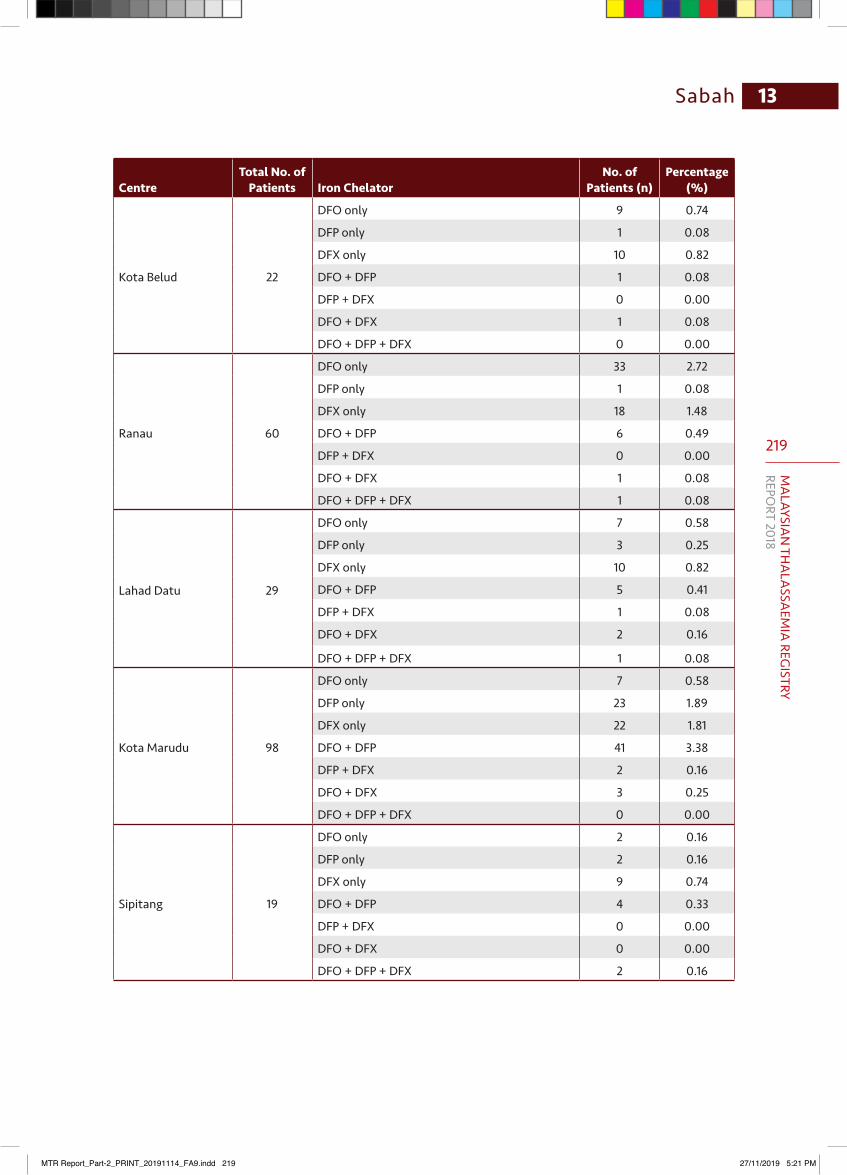
219
MA
LAYSIAN
THA
LASSA
EMIA
REGISTRY
REPORT 2018
13Sabah
CentreTotal No. of
Patients Iron ChelatorNo. of
Patients (n)Percentage
(%)
Kota Belud 22
DFO only 9 0.74
DFP only 1 0.08
DFX only 10 0.82
DFO + DFP 1 0.08
DFP + DFX 0 0.00
DFO + DFX 1 0.08
DFO + DFP + DFX 0 0.00
Ranau 60
DFO only 33 2.72
DFP only 1 0.08
DFX only 18 1.48
DFO + DFP 6 0.49
DFP + DFX 0 0.00
DFO + DFX 1 0.08
DFO + DFP + DFX 1 0.08
Lahad Datu 29
DFO only 7 0.58
DFP only 3 0.25
DFX only 10 0.82
DFO + DFP 5 0.41
DFP + DFX 1 0.08
DFO + DFX 2 0.16
DFO + DFP + DFX 1 0.08
Kota Marudu 98
DFO only 7 0.58
DFP only 23 1.89
DFX only 22 1.81
DFO + DFP 41 3.38
DFP + DFX 2 0.16
DFO + DFX 3 0.25
DFO + DFP + DFX 0 0.00
Sipitang 19
DFO only 2 0.16
DFP only 2 0.16
DFX only 9 0.74
DFO + DFP 4 0.33
DFP + DFX 0 0.00
DFO + DFX 0 0.00
DFO + DFP + DFX 2 0.16
MTR Report_Part-2_PRINT_20191114_FA9.indd 219 27/11/2019 5:21 PM
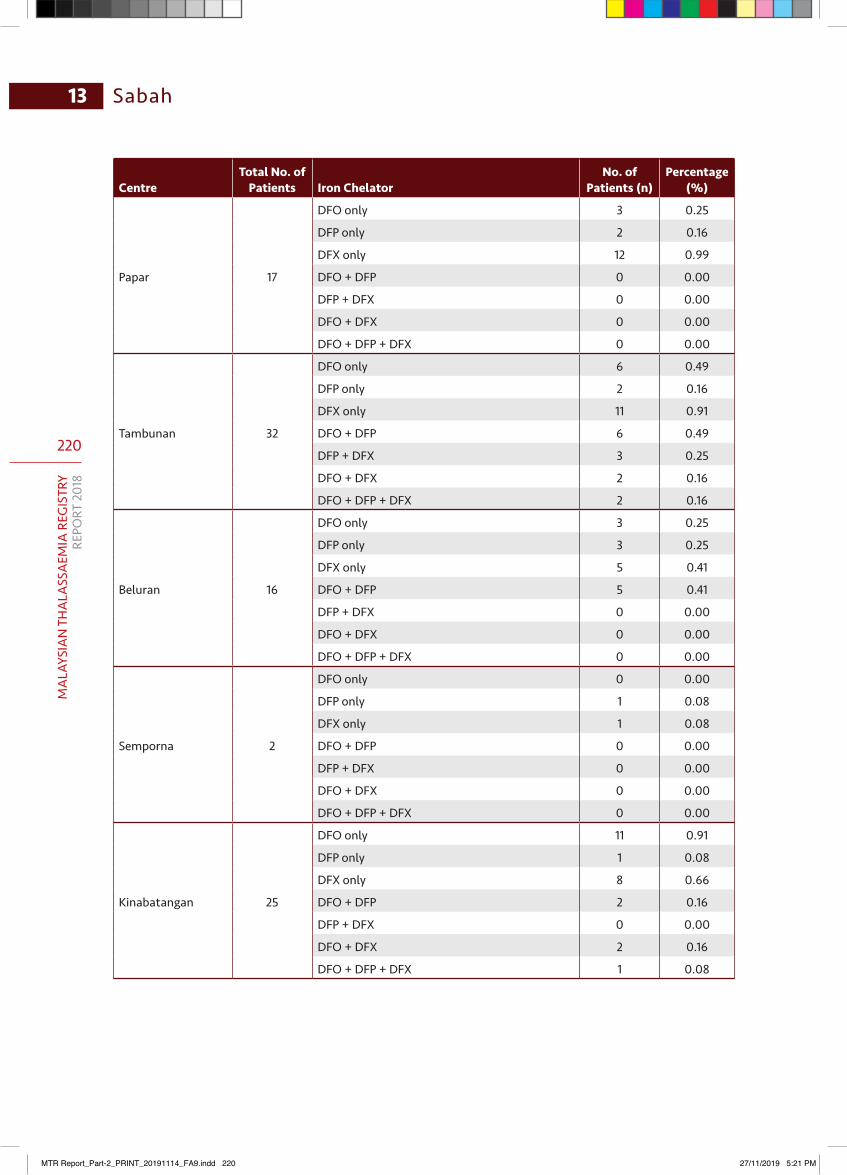
220
MA
LAYS
IAN
TH
ALA
SSA
EMIA
REG
ISTR
YRE
PORT
201
8
Sabah13
CentreTotal No. of
Patients Iron ChelatorNo. of
Patients (n)Percentage
(%)
Papar 17
DFO only 3 0.25
DFP only 2 0.16
DFX only 12 0.99
DFO + DFP 0 0.00
DFP + DFX 0 0.00
DFO + DFX 0 0.00
DFO + DFP + DFX 0 0.00
Tambunan 32
DFO only 6 0.49
DFP only 2 0.16
DFX only 11 0.91
DFO + DFP 6 0.49
DFP + DFX 3 0.25
DFO + DFX 2 0.16
DFO + DFP + DFX 2 0.16
Beluran 16
DFO only 3 0.25
DFP only 3 0.25
DFX only 5 0.41
DFO + DFP 5 0.41
DFP + DFX 0 0.00
DFO + DFX 0 0.00
DFO + DFP + DFX 0 0.00
Semporna 2
DFO only 0 0.00
DFP only 1 0.08
DFX only 1 0.08
DFO + DFP 0 0.00
DFP + DFX 0 0.00
DFO + DFX 0 0.00
DFO + DFP + DFX 0 0.00
Kinabatangan 25
DFO only 11 0.91
DFP only 1 0.08
DFX only 8 0.66
DFO + DFP 2 0.16
DFP + DFX 0 0.00
DFO + DFX 2 0.16
DFO + DFP + DFX 1 0.08
MTR Report_Part-2_PRINT_20191114_FA9.indd 220 27/11/2019 5:21 PM
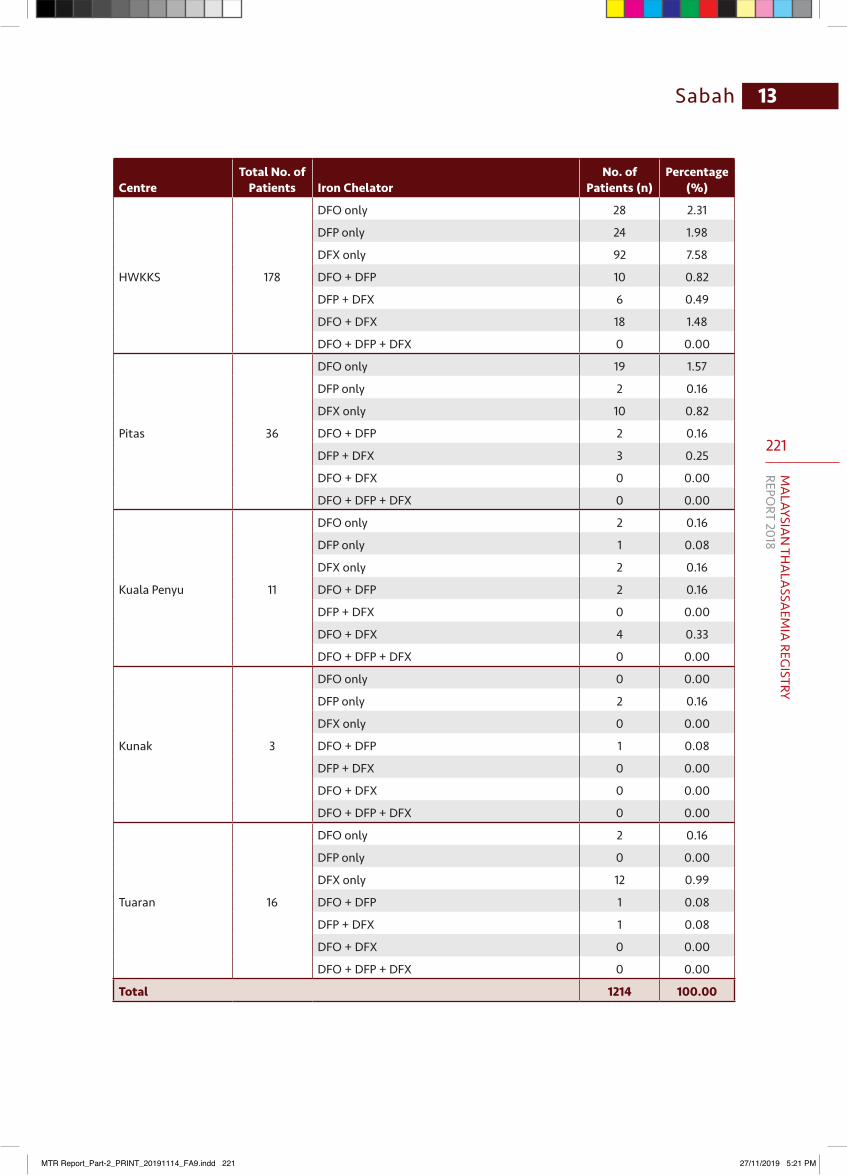
221
MA
LAYSIAN
THA
LASSA
EMIA
REGISTRY
REPORT 2018
13Sabah
CentreTotal No. of
Patients Iron ChelatorNo. of
Patients (n)Percentage
(%)
HWKKS 178
DFO only 28 2.31
DFP only 24 1.98
DFX only 92 7.58
DFO + DFP 10 0.82
DFP + DFX 6 0.49
DFO + DFX 18 1.48
DFO + DFP + DFX 0 0.00
Pitas 36
DFO only 19 1.57
DFP only 2 0.16
DFX only 10 0.82
DFO + DFP 2 0.16
DFP + DFX 3 0.25
DFO + DFX 0 0.00
DFO + DFP + DFX 0 0.00
Kuala Penyu 11
DFO only 2 0.16
DFP only 1 0.08
DFX only 2 0.16
DFO + DFP 2 0.16
DFP + DFX 0 0.00
DFO + DFX 4 0.33
DFO + DFP + DFX 0 0.00
Kunak 3
DFO only 0 0.00
DFP only 2 0.16
DFX only 0 0.00
DFO + DFP 1 0.08
DFP + DFX 0 0.00
DFO + DFX 0 0.00
DFO + DFP + DFX 0 0.00
Tuaran 16
DFO only 2 0.16
DFP only 0 0.00
DFX only 12 0.99
DFO + DFP 1 0.08
DFP + DFX 1 0.08
DFO + DFX 0 0.00
DFO + DFP + DFX 0 0.00
Total 1214 100.00
MTR Report_Part-2_PRINT_20191114_FA9.indd 221 27/11/2019 5:21 PM
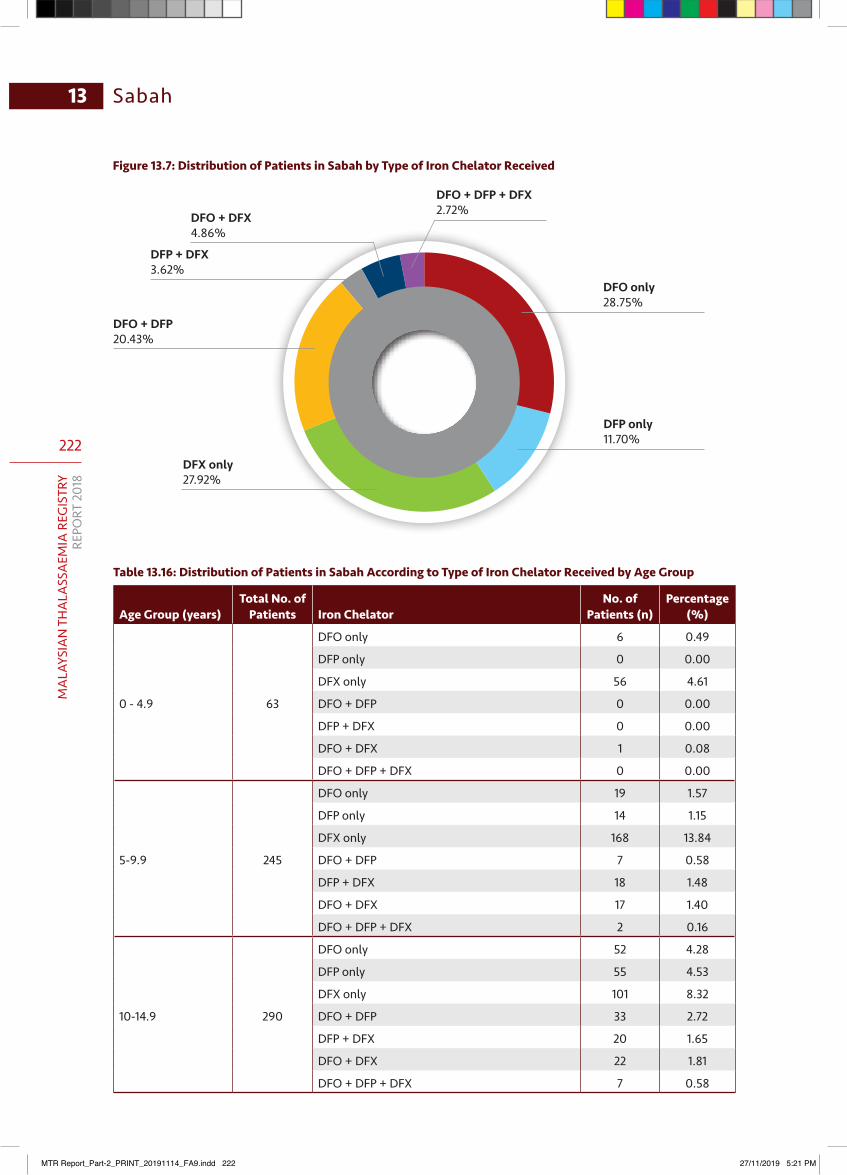
222
MA
LAYS
IAN
TH
ALA
SSA
EMIA
REG
ISTR
YRE
PORT
201
8
Sabah13
Figure 13.7: Distribution of Patients in Sabah by Type of Iron Chelator Received
DFX only27.92%
DFO + DFX4.86%
DFP + DFX3.62%
DFO + DFP20.43%
DFO only28.75%
DFO + DFP + DFX 2.72%
DFP only11.70%
Table 13.16: Distribution of Patients in Sabah According to Type of Iron Chelator Received by Age Group
Age Group (years)Total No. of
Patients Iron ChelatorNo. of
Patients (n)Percentage
(%)
0 - 4.9 63
DFO only 6 0.49
DFP only 0 0.00
DFX only 56 4.61
DFO + DFP 0 0.00
DFP + DFX 0 0.00
DFO + DFX 1 0.08
DFO + DFP + DFX 0 0.00
5-9.9 245
DFO only 19 1.57
DFP only 14 1.15
DFX only 168 13.84
DFO + DFP 7 0.58
DFP + DFX 18 1.48
DFO + DFX 17 1.40
DFO + DFP + DFX 2 0.16
10-14.9 290
DFO only 52 4.28
DFP only 55 4.53
DFX only 101 8.32
DFO + DFP 33 2.72
DFP + DFX 20 1.65
DFO + DFX 22 1.81
DFO + DFP + DFX 7 0.58
MTR Report_Part-2_PRINT_20191114_FA9.indd 222 27/11/2019 5:21 PM

223
MA
LAYSIAN
THA
LASSA
EMIA
REGISTRY
REPORT 2018
13Sabah
Age Group (years)Total No. of
Patients Iron ChelatorNo. of
Patients (n)Percentage
(%)
15-19.9 238
DFO only 125 10.30
DFP only 26 2.14
DFX only 10 0.82
DFO + DFP 62 5.11
DFP + DFX 4 0.33
DFO + DFX 9 0.74
DFO + DFP + DFX 2 0.16
20-24.9 200
DFO only 91 7.50
DFP only 10 0.82
DFX only 4 0.33
DFO + DFP 78 6.43
DFP + DFX 0 0.00
DFO + DFX 6 0.49
DFO + DFP + DFX 11 0.91
25-29.9 96
DFO only 31 2.55
DFP only 8 0.66
DFX only 0 0.00
DFO + DFP 45 3.71
DFP + DFX 2 0.16
DFO + DFX 2 0.16
DFO + DFP + DFX 8 0.66
30-34.9 46
DFO only 15 1.24
DFP only 13 1.07
DFX only 0 0.00
DFO + DFP 13 1.07
DFP + DFX 0 0.00
DFO + DFX 2 0.16
DFO + DFP + DFX 3 0.25
35-39.9 21
DFO only 6 0.49
DFP only 7 0.58
DFX only 0 0.00
DFO + DFP 8 0.66
DFP + DFX 0 0.00
DFO + DFX 0 0.00
DFO + DFP + DFX 0 0.00
MTR Report_Part-2_PRINT_20191114_FA9.indd 223 27/11/2019 5:21 PM

224
MA
LAYS
IAN
TH
ALA
SSA
EMIA
REG
ISTR
YRE
PORT
201
8
Sabah13
Age Group (years)Total No. of
Patients Iron ChelatorNo. of
Patients (n)Percentage
(%)
40=44.9 8
DFO only 2 0.16
DFP only 4 0.33
DFX only 0 0.00
DFO + DFP 2 0.16
DFP + DFX 0 0.00
DFO + DFX 0 0.00
DFO + DFP + DFX 0 0.00
45-49.9 4
DFO only 1 0.08
DFP only 3 0.25
DFX only 0 0.00
DFO + DFP 0 0.00
DFP + DFX 0 0.00
DFO + DFX 0 0.00
DFO + DFP + DFX 0 0.00
50-54.9 2
DFO only 1 0.08
DFP only 1 0.08
DFX only 0 0.00
DFO + DFP 0 0.00
DFP + DFX 0 0.00
DFO + DFX 0 0.00
DFO + DFP + DFX 0 0.00
55-59.9 1
DFO only 0 0.00
DFP only 1 0.08
DFX only 0 0.00
DFO + DFP 0 0.00
DFP + DFX 0 0.00
DFO + DFX 0 0.00
DFO + DFP + DFX 0 0.00
60-64.9 0
DFO only 0 0.00
DFP only 0 0.00
DFX only 0 0.00
DFO + DFP 0 0.00
DFP + DFX 0 0.00
DFO + DFX 0 0.00
DFO + DFP + DFX 0 0.00
MTR Report_Part-2_PRINT_20191114_FA9.indd 224 27/11/2019 5:21 PM
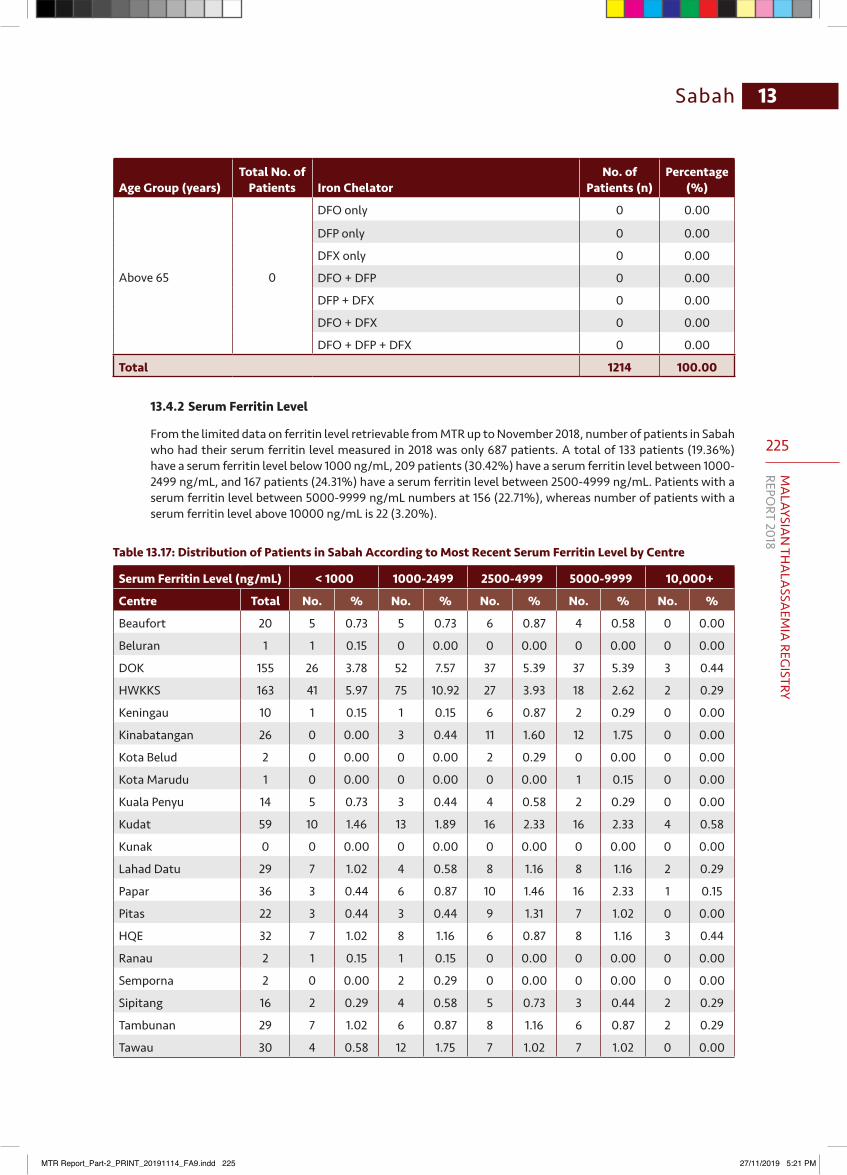
225
MA
LAYSIAN
THA
LASSA
EMIA
REGISTRY
REPORT 2018
13Sabah
Age Group (years)Total No. of
Patients Iron ChelatorNo. of
Patients (n)Percentage
(%)
Above 65 0
DFO only 0 0.00
DFP only 0 0.00
DFX only 0 0.00
DFO + DFP 0 0.00
DFP + DFX 0 0.00
DFO + DFX 0 0.00
DFO + DFP + DFX 0 0.00
Total 1214 100.00
13.4.2 Serum Ferritin Level
From the limited data on ferritin level retrievable from MTR up to November 2018, number of patients in Sabah who had their serum ferritin level measured in 2018 was only 687 patients. A total of 133 patients (19.36%) have a serum ferritin level below 1000 ng/mL, 209 patients (30.42%) have a serum ferritin level between 1000-2499 ng/mL, and 167 patients (24.31%) have a serum ferritin level between 2500-4999 ng/mL. Patients with a serum ferritin level between 5000-9999 ng/mL numbers at 156 (22.71%), whereas number of patients with a serum ferritin level above 10000 ng/mL is 22 (3.20%).
Table 13.17: Distribution of Patients in Sabah According to Most Recent Serum Ferritin Level by Centre
Serum Ferritin Level (ng/mL) < 1000 1000-2499 2500-4999 5000-9999 10,000+
Centre Total No. % No. % No. % No. % No. %
Beaufort 20 5 0.73 5 0.73 6 0.87 4 0.58 0 0.00
Beluran 1 1 0.15 0 0.00 0 0.00 0 0.00 0 0.00
DOK 155 26 3.78 52 7.57 37 5.39 37 5.39 3 0.44
HWKKS 163 41 5.97 75 10.92 27 3.93 18 2.62 2 0.29
Keningau 10 1 0.15 1 0.15 6 0.87 2 0.29 0 0.00
Kinabatangan 26 0 0.00 3 0.44 11 1.60 12 1.75 0 0.00
Kota Belud 2 0 0.00 0 0.00 2 0.29 0 0.00 0 0.00
Kota Marudu 1 0 0.00 0 0.00 0 0.00 1 0.15 0 0.00
Kuala Penyu 14 5 0.73 3 0.44 4 0.58 2 0.29 0 0.00
Kudat 59 10 1.46 13 1.89 16 2.33 16 2.33 4 0.58
Kunak 0 0 0.00 0 0.00 0 0.00 0 0.00 0 0.00
Lahad Datu 29 7 1.02 4 0.58 8 1.16 8 1.16 2 0.29
Papar 36 3 0.44 6 0.87 10 1.46 16 2.33 1 0.15
Pitas 22 3 0.44 3 0.44 9 1.31 7 1.02 0 0.00
HQE 32 7 1.02 8 1.16 6 0.87 8 1.16 3 0.44
Ranau 2 1 0.15 1 0.15 0 0.00 0 0.00 0 0.00
Semporna 2 0 0.00 2 0.29 0 0.00 0 0.00 0 0.00
Sipitang 16 2 0.29 4 0.58 5 0.73 3 0.44 2 0.29
Tambunan 29 7 1.02 6 0.87 8 1.16 6 0.87 2 0.29
Tawau 30 4 0.58 12 1.75 7 1.02 7 1.02 0 0.00
MTR Report_Part-2_PRINT_20191114_FA9.indd 225 27/11/2019 5:21 PM
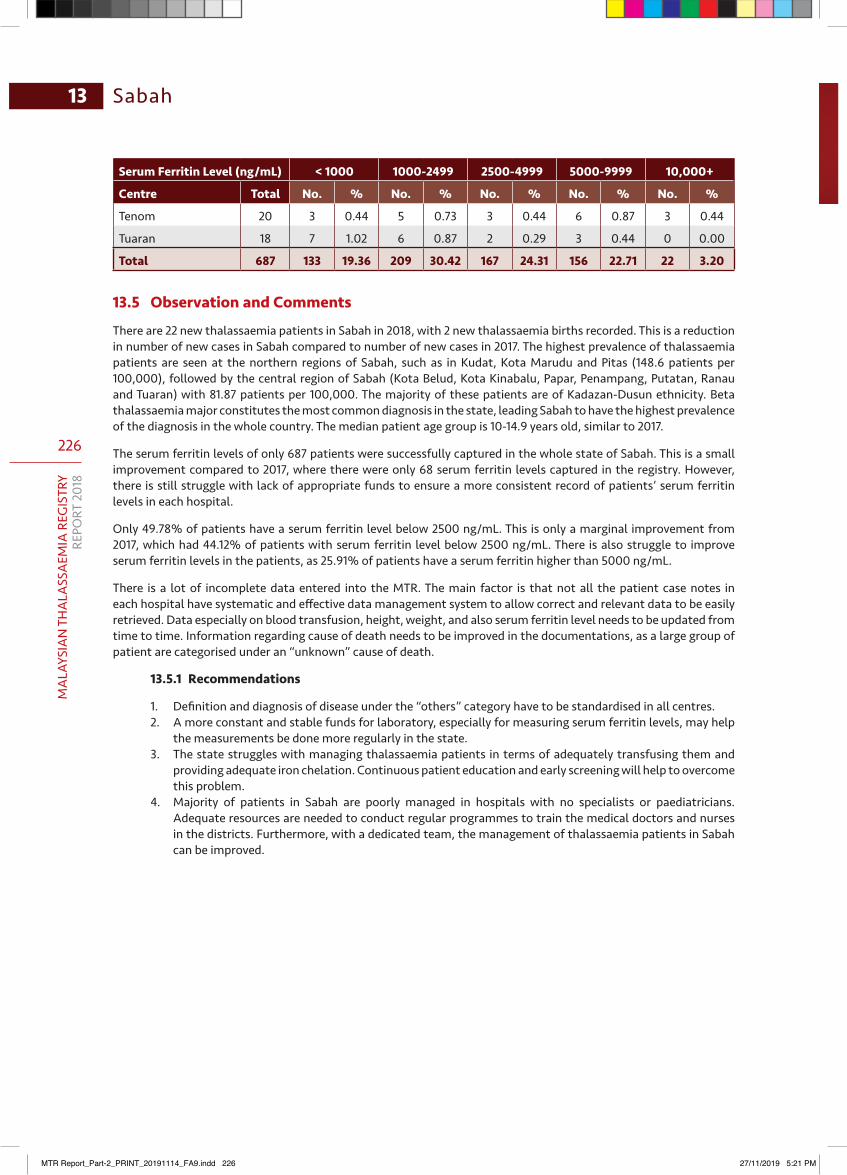
226
MA
LAYS
IAN
TH
ALA
SSA
EMIA
REG
ISTR
YRE
PORT
201
8
Sabah13
Serum Ferritin Level (ng/mL) < 1000 1000-2499 2500-4999 5000-9999 10,000+
Centre Total No. % No. % No. % No. % No. %
Tenom 20 3 0.44 5 0.73 3 0.44 6 0.87 3 0.44
Tuaran 18 7 1.02 6 0.87 2 0.29 3 0.44 0 0.00
Total 687 133 19.36 209 30.42 167 24.31 156 22.71 22 3.20
13.5 Observation and Comments
There are 22 new thalassaemia patients in Sabah in 2018, with 2 new thalassaemia births recorded. This is a reduction in number of new cases in Sabah compared to number of new cases in 2017. The highest prevalence of thalassaemia patients are seen at the northern regions of Sabah, such as in Kudat, Kota Marudu and Pitas (148.6 patients per 100,000), followed by the central region of Sabah (Kota Belud, Kota Kinabalu, Papar, Penampang, Putatan, Ranau and Tuaran) with 81.87 patients per 100,000. The majority of these patients are of Kadazan-Dusun ethnicity. Beta thalassaemia major constitutes the most common diagnosis in the state, leading Sabah to have the highest prevalence of the diagnosis in the whole country. The median patient age group is 10-14.9 years old, similar to 2017.
The serum ferritin levels of only 687 patients were successfully captured in the whole state of Sabah. This is a small improvement compared to 2017, where there were only 68 serum ferritin levels captured in the registry. However, there is still struggle with lack of appropriate funds to ensure a more consistent record of patients’ serum ferritin levels in each hospital.
Only 49.78% of patients have a serum ferritin level below 2500 ng/mL. This is only a marginal improvement from 2017, which had 44.12% of patients with serum ferritin level below 2500 ng/mL. There is also struggle to improve serum ferritin levels in the patients, as 25.91% of patients have a serum ferritin higher than 5000 ng/mL.
There is a lot of incomplete data entered into the MTR. The main factor is that not all the patient case notes in each hospital have systematic and effective data management system to allow correct and relevant data to be easily retrieved. Data especially on blood transfusion, height, weight, and also serum ferritin level needs to be updated from time to time. Information regarding cause of death needs to be improved in the documentations, as a large group of patient are categorised under an “unknown” cause of death.
13.5.1 Recommendations
1. Definition and diagnosis of disease under the “others” category have to be standardised in all centres.2. A more constant and stable funds for laboratory, especially for measuring serum ferritin levels, may help
the measurements be done more regularly in the state.3. The state struggles with managing thalassaemia patients in terms of adequately transfusing them and
providing adequate iron chelation. Continuous patient education and early screening will help to overcome this problem.
4. Majority of patients in Sabah are poorly managed in hospitals with no specialists or paediatricians. Adequate resources are needed to conduct regular programmes to train the medical doctors and nurses in the districts. Furthermore, with a dedicated team, the management of thalassaemia patients in Sabah can be improved.
MTR Report_Part-2_PRINT_20191114_FA9.indd 226 27/11/2019 5:21 PM
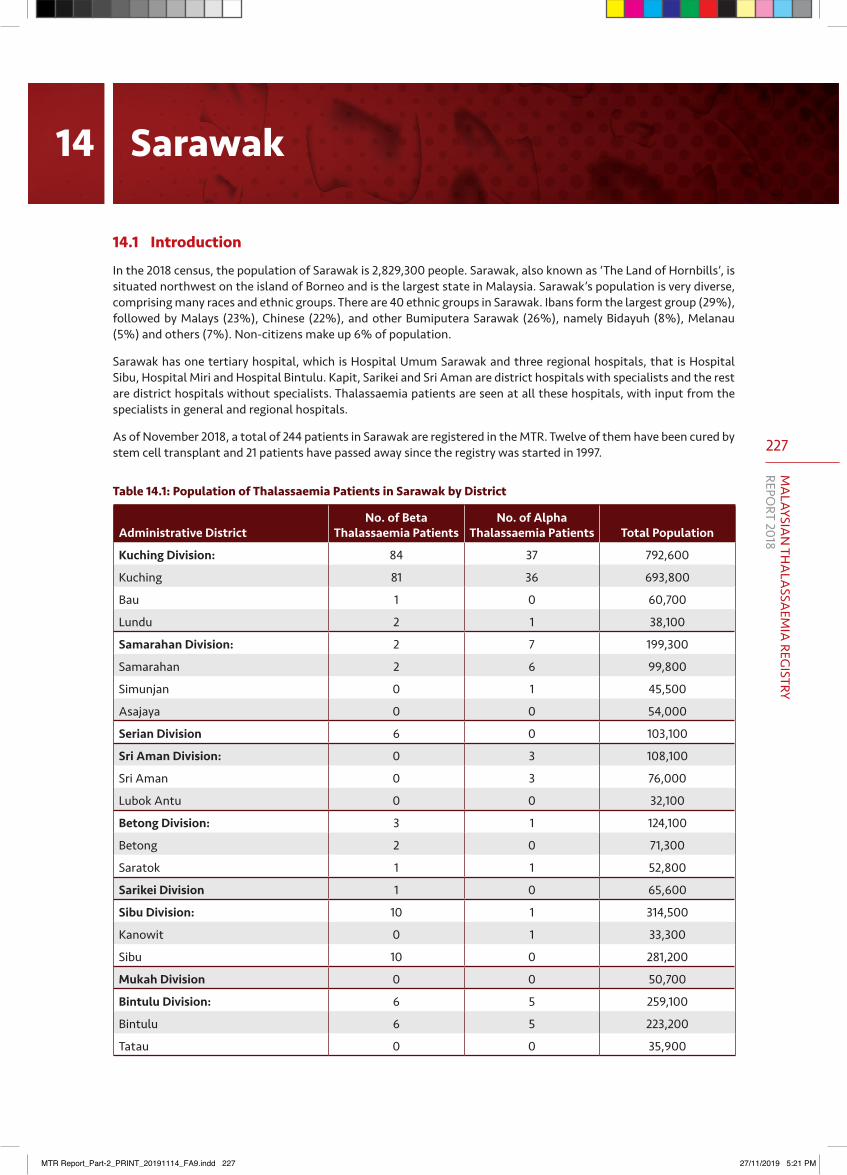
227
MA
LAYSIAN
THA
LASSA
EMIA
REGISTRY
REPORT 2018
14.1 Introduction
In the 2018 census, the population of Sarawak is 2,829,300 people. Sarawak, also known as ‘The Land of Hornbills’, is situated northwest on the island of Borneo and is the largest state in Malaysia. Sarawak’s population is very diverse, comprising many races and ethnic groups. There are 40 ethnic groups in Sarawak. Ibans form the largest group (29%), followed by Malays (23%), Chinese (22%), and other Bumiputera Sarawak (26%), namely Bidayuh (8%), Melanau (5%) and others (7%). Non-citizens make up 6% of population.
Sarawak has one tertiary hospital, which is Hospital Umum Sarawak and three regional hospitals, that is Hospital Sibu, Hospital Miri and Hospital Bintulu. Kapit, Sarikei and Sri Aman are district hospitals with specialists and the rest are district hospitals without specialists. Thalassaemia patients are seen at all these hospitals, with input from the specialists in general and regional hospitals.
As of November 2018, a total of 244 patients in Sarawak are registered in the MTR. Twelve of them have been cured by stem cell transplant and 21 patients have passed away since the registry was started in 1997.
Table 14.1: Population of Thalassaemia Patients in Sarawak by District
Administrative DistrictNo. of Beta
Thalassaemia Patients No. of Alpha
Thalassaemia Patients Total Population
Kuching Division: 84 37 792,600
Kuching 81 36 693,800
Bau 1 0 60,700
Lundu 2 1 38,100
Samarahan Division: 2 7 199,300
Samarahan 2 6 99,800
Simunjan 0 1 45,500
Asajaya 0 0 54,000
Serian Division 6 0 103,100
Sri Aman Division: 0 3 108,100
Sri Aman 0 3 76,000
Lubok Antu 0 0 32,100
Betong Division: 3 1 124,100
Betong 2 0 71,300
Saratok 1 1 52,800
Sarikei Division 1 0 65,600
Sibu Division: 10 1 314,500
Kanowit 0 1 33,300
Sibu 10 0 281,200
Mukah Division 0 0 50,700
Bintulu Division: 6 5 259,100
Bintulu 6 5 223,200
Tatau 0 0 35,900
14 Sarawak
MTR Report_Part-2_PRINT_20191114_FA9.indd 227 27/11/2019 5:21 PM
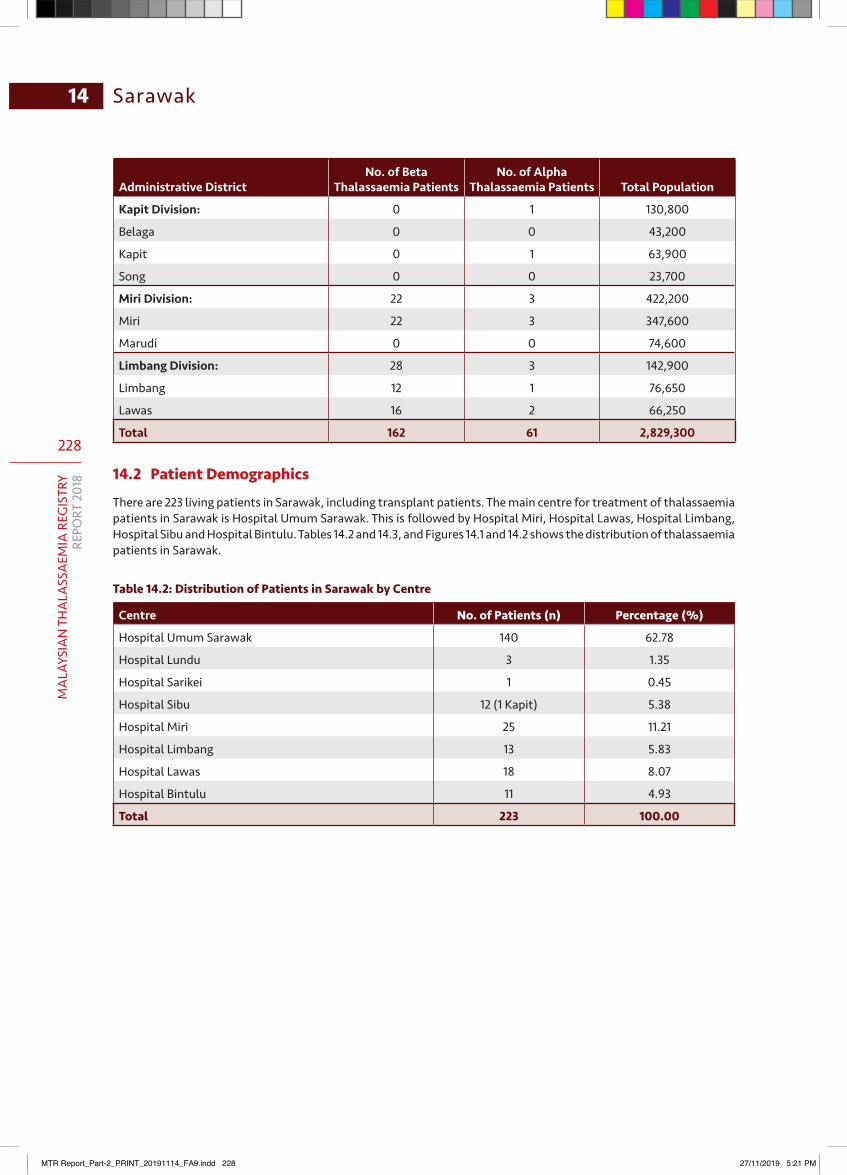
228
MA
LAYS
IAN
TH
ALA
SSA
EMIA
REG
ISTR
YRE
PORT
201
8
14 Sarawak
Administrative DistrictNo. of Beta
Thalassaemia Patients No. of Alpha
Thalassaemia Patients Total Population
Kapit Division: 0 1 130,800
Belaga 0 0 43,200
Kapit 0 1 63,900
Song 0 0 23,700
Miri Division: 22 3 422,200
Miri 22 3 347,600
Marudi 0 0 74,600
Limbang Division: 28 3 142,900
Limbang 12 1 76,650
Lawas 16 2 66,250
Total 162 61 2,829,300
14.2 Patient Demographics
There are 223 living patients in Sarawak, including transplant patients. The main centre for treatment of thalassaemia patients in Sarawak is Hospital Umum Sarawak. This is followed by Hospital Miri, Hospital Lawas, Hospital Limbang, Hospital Sibu and Hospital Bintulu. Tables 14.2 and 14.3, and Figures 14.1 and 14.2 shows the distribution of thalassaemia patients in Sarawak.
Table 14.2: Distribution of Patients in Sarawak by Centre
Centre No. of Patients (n) Percentage (%)
Hospital Umum Sarawak 140 62.78
Hospital Lundu 3 1.35
Hospital Sarikei 1 0.45
Hospital Sibu 12 (1 Kapit) 5.38
Hospital Miri 25 11.21
Hospital Limbang 13 5.83
Hospital Lawas 18 8.07
Hospital Bintulu 11 4.93
Total 223 100.00
MTR Report_Part-2_PRINT_20191114_FA9.indd 228 27/11/2019 5:21 PM
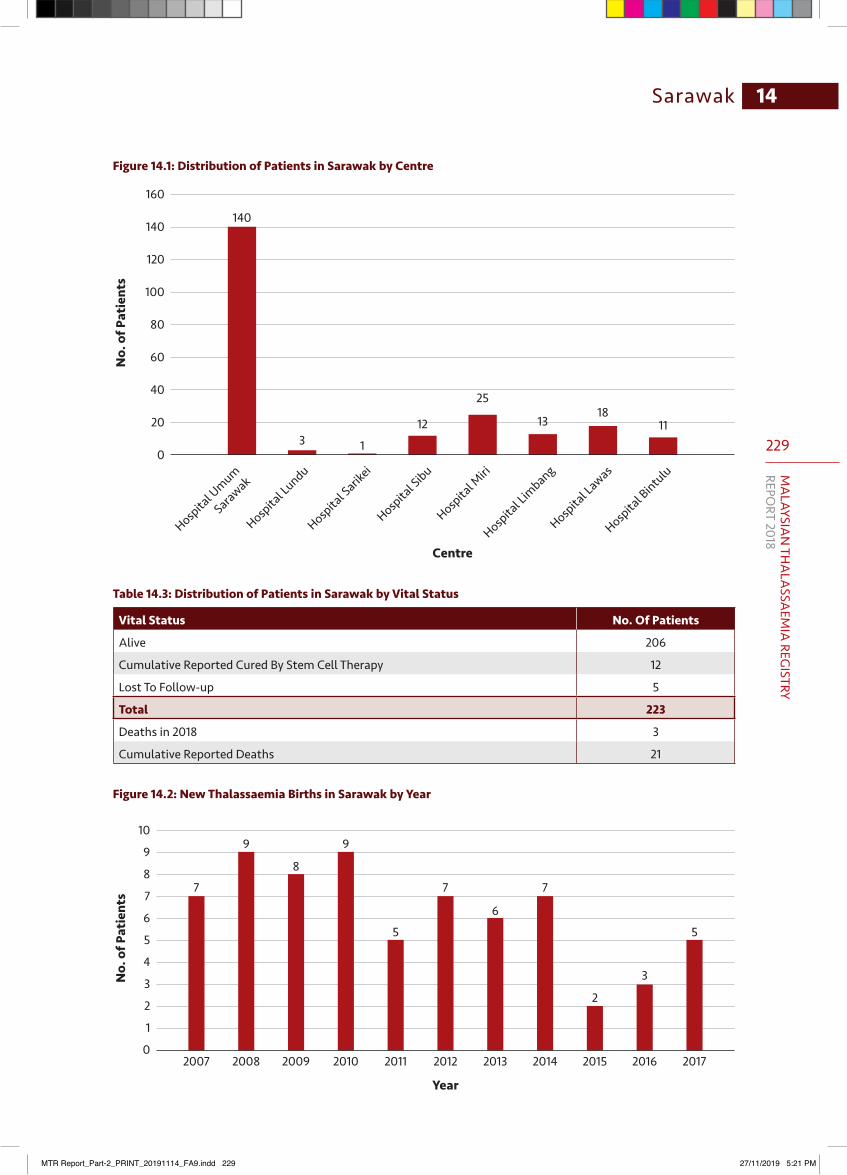
229
MA
LAYSIAN
THA
LASSA
EMIA
REGISTRY
REPORT 2018
14Sarawak
160
140
120
100
80
60
40
20
0
No.
of P
atie
nts
Hospita
l Umum
Sarawak
Hospita
l Lundu
Hospita
l Sarik
ei
Hospita
l Sibu
Hospita
l Miri
Hospita
l Lim
bang
Hospita
l Lawas
Hospita
l Bintulu
140
312 13 11
1825
1
Centre
Figure 14.1: Distribution of Patients in Sarawak by Centre
Table 14.3: Distribution of Patients in Sarawak by Vital Status
Vital Status No. Of Patients
Alive 206
Cumulative Reported Cured By Stem Cell Therapy 12
Lost To Follow-up 5
Total 223
Deaths in 2018 3
Cumulative Reported Deaths 21
10
9
8
7
6
5
4
3
2
1
0
Year
No.
of P
atie
nts 7 7 7
5 5
3
2
6
9 9
8
Figure 14.2: New Thalassaemia Births in Sarawak by Year
2007 2008 2009 2010 2011 2012 2013 2014 2015 2016 2017
MTR Report_Part-2_PRINT_20191114_FA9.indd 229 27/11/2019 5:21 PM
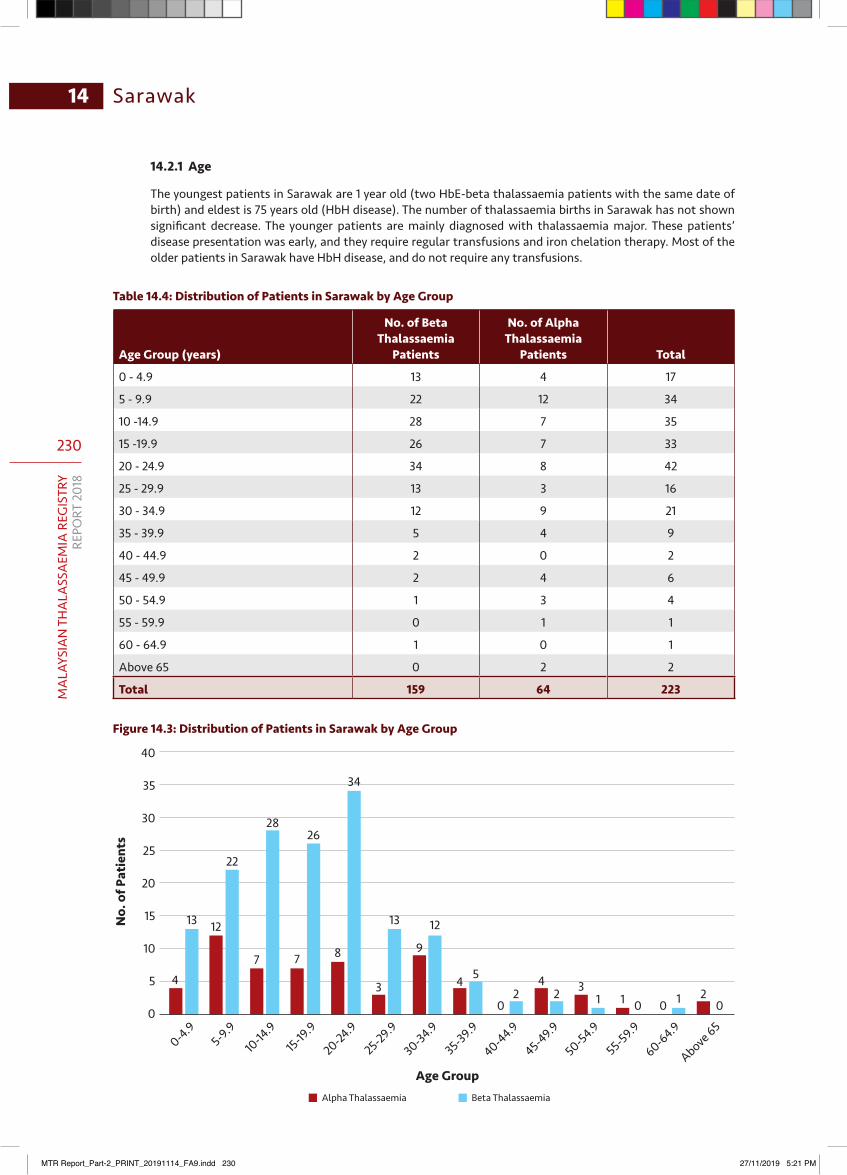
230
MA
LAYS
IAN
TH
ALA
SSA
EMIA
REG
ISTR
YRE
PORT
201
8
14 Sarawak
14.2.1 Age
The youngest patients in Sarawak are 1 year old (two HbE-beta thalassaemia patients with the same date of birth) and eldest is 75 years old (HbH disease). The number of thalassaemia births in Sarawak has not shown significant decrease. The younger patients are mainly diagnosed with thalassaemia major. These patients’ disease presentation was early, and they require regular transfusions and iron chelation therapy. Most of the older patients in Sarawak have HbH disease, and do not require any transfusions.
Table 14.4: Distribution of Patients in Sarawak by Age Group
Age Group (years)
No. of Beta Thalassaemia
Patients
No. of Alpha Thalassaemia
Patients Total
0 - 4.9 13 4 17
5 - 9.9 22 12 34
10 -14.9 28 7 35
15 -19.9 26 7 33
20 - 24.9 34 8 42
25 - 29.9 13 3 16
30 - 34.9 12 9 21
35 - 39.9 5 4 9
40 - 44.9 2 0 2
45 - 49.9 2 4 6
50 - 54.9 1 3 4
55 - 59.9 0 1 1
60 - 64.9 1 0 1
Above 65 0 2 2
Total 159 64 223
Figure 14.3: Distribution of Patients in Sarawak by Age Group
40
35
30
25
20
15
10
5
0
Age Group
No.
of P
atie
nts
Alpha Thalassaemia Beta Thalassaemia
0-4.95-9.9
10-14
.915-19
.9
20-24.9
25-29.9
30-34.9
35-39.9
40-44.9
45-49.9
50-54.9
55-59.9
60-64.9
Above 65
4
13 12
22
7
28
7
26
8
34
3
13
9
12
4 52
02
41 01
310
20
MTR Report_Part-2_PRINT_20191114_FA9.indd 230 27/11/2019 5:21 PM
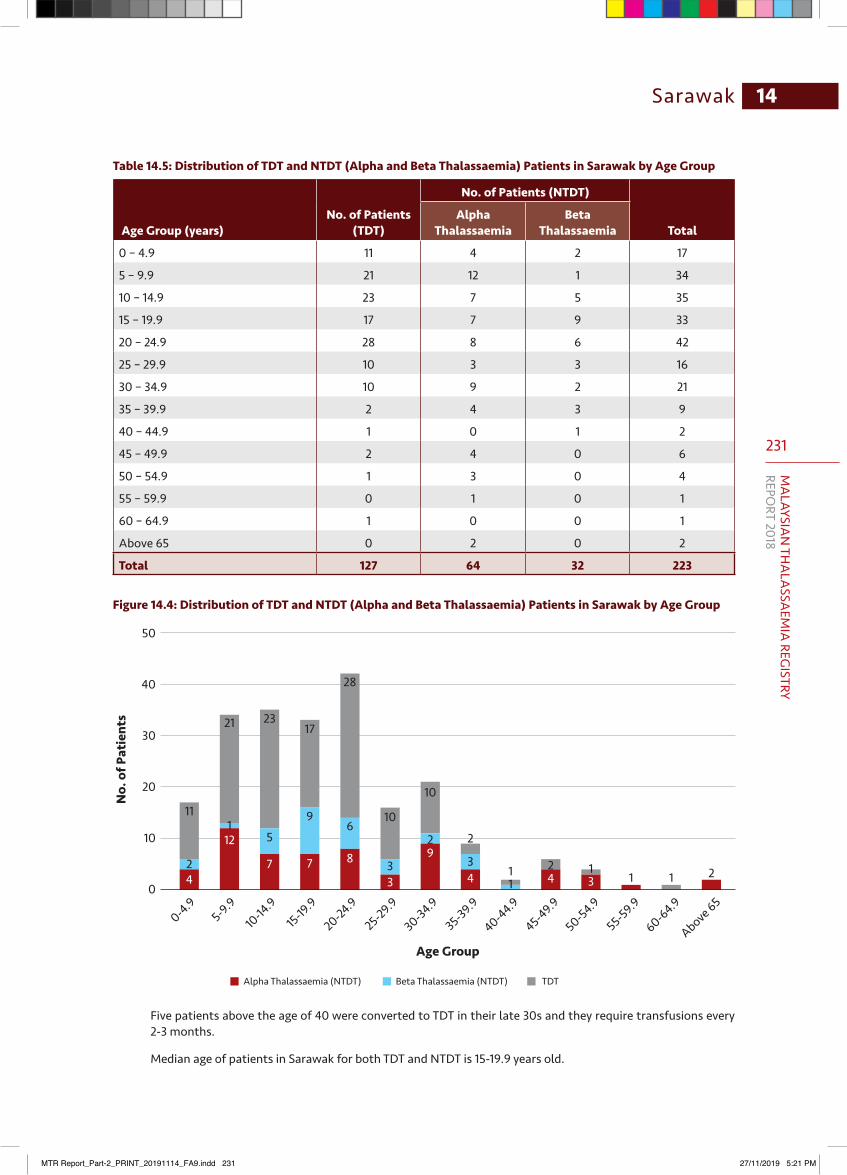
231
MA
LAYSIAN
THA
LASSA
EMIA
REGISTRY
REPORT 2018
14Sarawak
Table 14.5: Distribution of TDT and NTDT (Alpha and Beta Thalassaemia) Patients in Sarawak by Age Group
Age Group (years)No. of Patients
(TDT)
No. of Patients (NTDT)
TotalAlpha
ThalassaemiaBeta
Thalassaemia
0 – 4.9 11 4 2 17
5 – 9.9 21 12 1 34
10 – 14.9 23 7 5 35
15 – 19.9 17 7 9 33
20 – 24.9 28 8 6 42
25 – 29.9 10 3 3 16
30 – 34.9 10 9 2 21
35 – 39.9 2 4 3 9
40 – 44.9 1 0 1 2
45 – 49.9 2 4 0 6
50 – 54.9 1 3 0 4
55 – 59.9 0 1 0 1
60 – 64.9 1 0 0 1
Above 65 0 2 0 2
Total 127 64 32 223
Figure 14.4: Distribution of TDT and NTDT (Alpha and Beta Thalassaemia) Patients in Sarawak by Age Group
50
40
30
20
10
0
Age Group
No.
of P
atie
nts
0-4.95-9.9
10-14
.915-19
.9
20-24.9
25-29.9
30-34.9
35-39.9
40-44.9
45-49.9
50-54.9
55-59.9
60-64.9
Above 65
Alpha Thalassaemia (NTDT) Beta Thalassaemia (NTDT) TDT
2
15
96
3
2
3
12 1
1 1 2
11
21 2317
28
10
10
2
14
12
7 7 8
3
9
4 4 3
Five patients above the age of 40 were converted to TDT in their late 30s and they require transfusions every 2-3 months.
Median age of patients in Sarawak for both TDT and NTDT is 15-19.9 years old.
MTR Report_Part-2_PRINT_20191114_FA9.indd 231 27/11/2019 5:21 PM
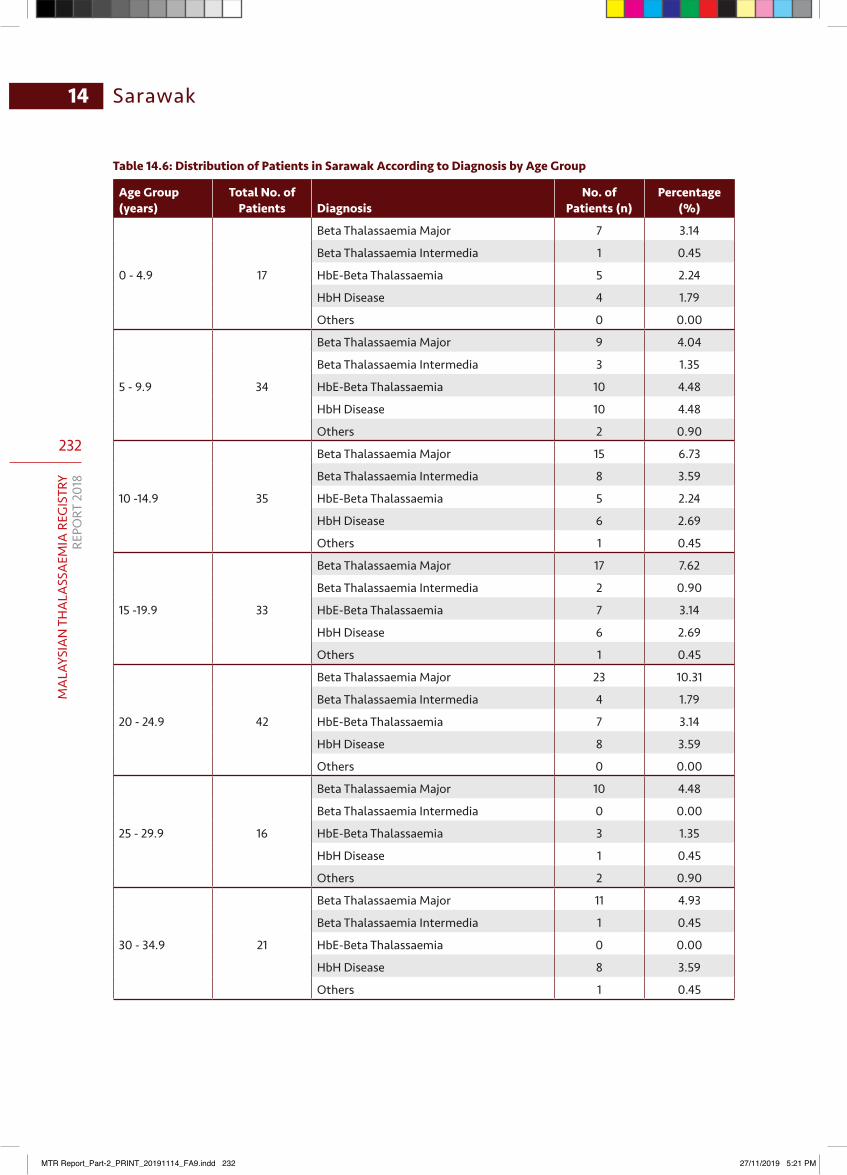
232
MA
LAYS
IAN
TH
ALA
SSA
EMIA
REG
ISTR
YRE
PORT
201
8
14 Sarawak
Table 14.6: Distribution of Patients in Sarawak According to Diagnosis by Age Group
Age Group (years)
Total No. of Patients Diagnosis
No. of Patients (n)
Percentage (%)
0 - 4.9 17
Beta Thalassaemia Major 7 3.14
Beta Thalassaemia Intermedia 1 0.45
HbE-Beta Thalassaemia 5 2.24
HbH Disease 4 1.79
Others 0 0.00
5 - 9.9 34
Beta Thalassaemia Major 9 4.04
Beta Thalassaemia Intermedia 3 1.35
HbE-Beta Thalassaemia 10 4.48
HbH Disease 10 4.48
Others 2 0.90
10 -14.9 35
Beta Thalassaemia Major 15 6.73
Beta Thalassaemia Intermedia 8 3.59
HbE-Beta Thalassaemia 5 2.24
HbH Disease 6 2.69
Others 1 0.45
15 -19.9 33
Beta Thalassaemia Major 17 7.62
Beta Thalassaemia Intermedia 2 0.90
HbE-Beta Thalassaemia 7 3.14
HbH Disease 6 2.69
Others 1 0.45
20 - 24.9 42
Beta Thalassaemia Major 23 10.31
Beta Thalassaemia Intermedia 4 1.79
HbE-Beta Thalassaemia 7 3.14
HbH Disease 8 3.59
Others 0 0.00
25 - 29.9 16
Beta Thalassaemia Major 10 4.48
Beta Thalassaemia Intermedia 0 0.00
HbE-Beta Thalassaemia 3 1.35
HbH Disease 1 0.45
Others 2 0.90
30 - 34.9 21
Beta Thalassaemia Major 11 4.93
Beta Thalassaemia Intermedia 1 0.45
HbE-Beta Thalassaemia 0 0.00
HbH Disease 8 3.59
Others 1 0.45
MTR Report_Part-2_PRINT_20191114_FA9.indd 232 27/11/2019 5:21 PM

233
MA
LAYSIAN
THA
LASSA
EMIA
REGISTRY
REPORT 2018
14Sarawak
Age Group (years)
Total No. of Patients Diagnosis
No. of Patients (n)
Percentage (%)
35 - 39.9 9
Beta Thalassaemia Major 2 0.90
Beta Thalassaemia Intermedia 1 0.45
HbE-Beta Thalassaemia 2 0.90
HbH Disease 3 1.35
Others 1 0.45
40 - 44.9 2
Beta Thalassaemia Major 0 0.00
Beta Thalassaemia Intermedia 0 0.00
HbE-Beta Thalassaemia 2 0.90
HbH Disease 0 0.00
Others 0 0.00
45 – 49.9 6
Beta Thalassaemia Major 0 0.00
Beta Thalassaemia Intermedia 1 0.45
HbE-Beta Thalassaemia 1 0.45
HbH Disease 4 1.79
Others 0 0.00
50 – 54.9 4
Beta Thalassaemia Major 0 0.00
Beta Thalassaemia Intermedia 1 0.45
HbE-Beta Thalassaemia 0 0.00
HbH Disease 3 1.35
Others 0 0.00
55 – 59.9 1
Beta Thalassaemia Major 0 0.00
Beta Thalassaemia Intermedia 0 0.00
HbE-Beta Thalassaemia 0 0.00
HbH Disease 1 0.45
Others 0 0.00
60 – 64.9 1
Beta Thalassaemia Major 0 0.00
Beta Thalassaemia Intermedia 1 0.45
HbE-Beta Thalassaemia 0 0.00
HbH Disease 0 0.00
Others 0 0.00
Above 65 2
Beta Thalassaemia Major 0 0.00
Beta Thalassaemia Intermedia 0 0.00
HbE-Beta Thalassaemia 0 0.00
HbH Disease 2 0.90
Others 0 0.00
Total 223 100.00
MTR Report_Part-2_PRINT_20191114_FA9.indd 233 27/11/2019 5:21 PM
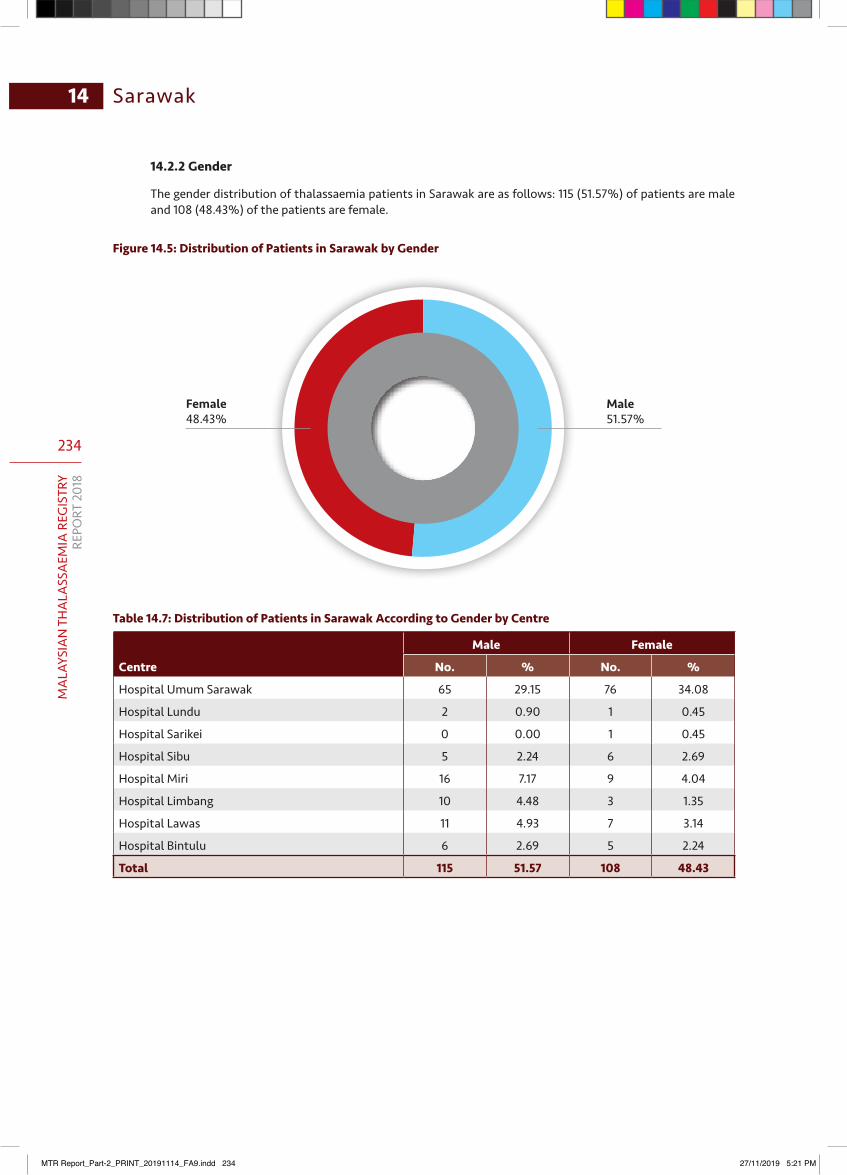
234
MA
LAYS
IAN
TH
ALA
SSA
EMIA
REG
ISTR
YRE
PORT
201
8
14 Sarawak
14.2.2 Gender
The gender distribution of thalassaemia patients in Sarawak are as follows: 115 (51.57%) of patients are male and 108 (48.43%) of the patients are female.
Figure 14.5: Distribution of Patients in Sarawak by Gender
Female48.43%
Male51.57%
Table 14.7: Distribution of Patients in Sarawak According to Gender by Centre
Centre
Male Female
No. % No. %
Hospital Umum Sarawak 65 29.15 76 34.08
Hospital Lundu 2 0.90 1 0.45
Hospital Sarikei 0 0.00 1 0.45
Hospital Sibu 5 2.24 6 2.69
Hospital Miri 16 7.17 9 4.04
Hospital Limbang 10 4.48 3 1.35
Hospital Lawas 11 4.93 7 3.14
Hospital Bintulu 6 2.69 5 2.24
Total 115 51.57 108 48.43
MTR Report_Part-2_PRINT_20191114_FA9.indd 234 27/11/2019 5:21 PM
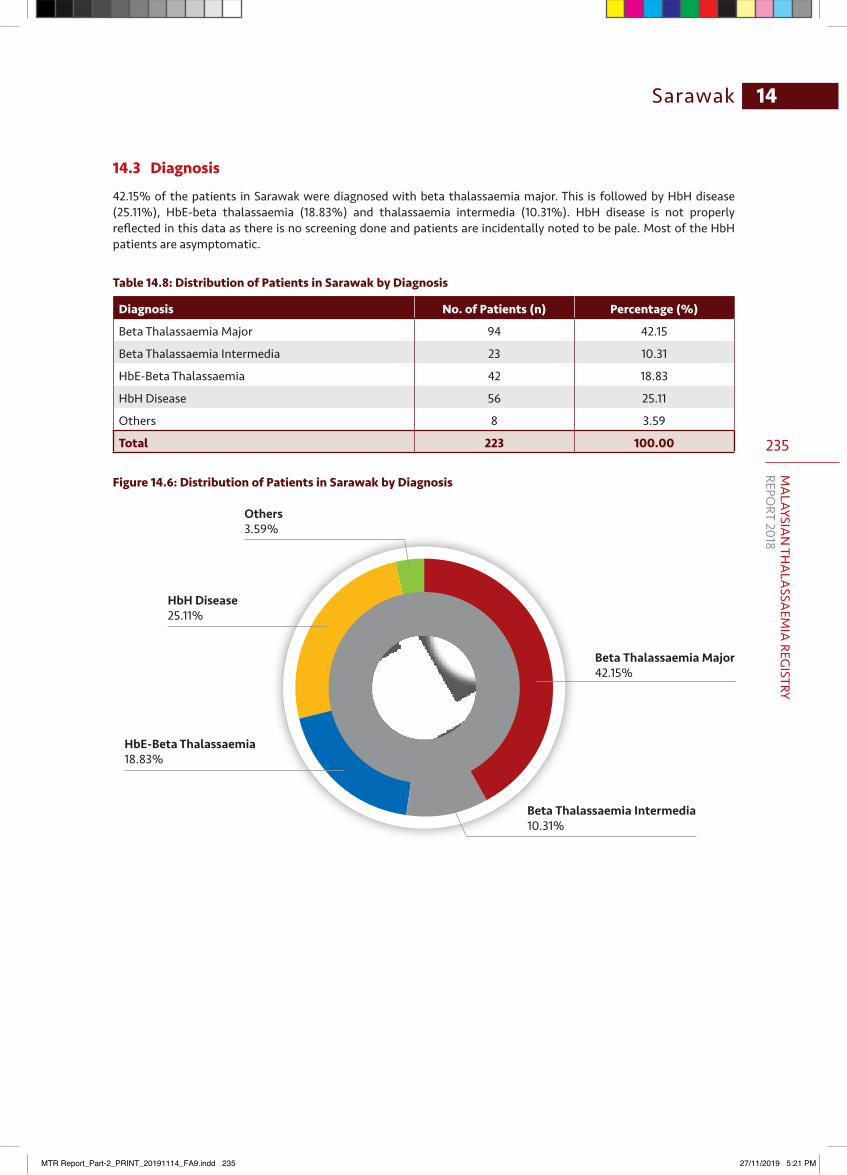
235
MA
LAYSIAN
THA
LASSA
EMIA
REGISTRY
REPORT 2018
14Sarawak
14.3 Diagnosis
42.15% of the patients in Sarawak were diagnosed with beta thalassaemia major. This is followed by HbH disease (25.11%), HbE-beta thalassaemia (18.83%) and thalassaemia intermedia (10.31%). HbH disease is not properly reflected in this data as there is no screening done and patients are incidentally noted to be pale. Most of the HbH patients are asymptomatic.
Table 14.8: Distribution of Patients in Sarawak by Diagnosis
Diagnosis No. of Patients (n) Percentage (%)
Beta Thalassaemia Major 94 42.15
Beta Thalassaemia Intermedia 23 10.31
HbE-Beta Thalassaemia 42 18.83
HbH Disease 56 25.11
Others 8 3.59
Total 223 100.00
Figure 14.6: Distribution of Patients in Sarawak by Diagnosis
Beta Thalassaemia Major42.15%
Beta Thalassaemia Intermedia10.31%
HbH Disease25.11%
HbE-Beta Thalassaemia18.83%
Others3.59%
MTR Report_Part-2_PRINT_20191114_FA9.indd 235 27/11/2019 5:21 PM
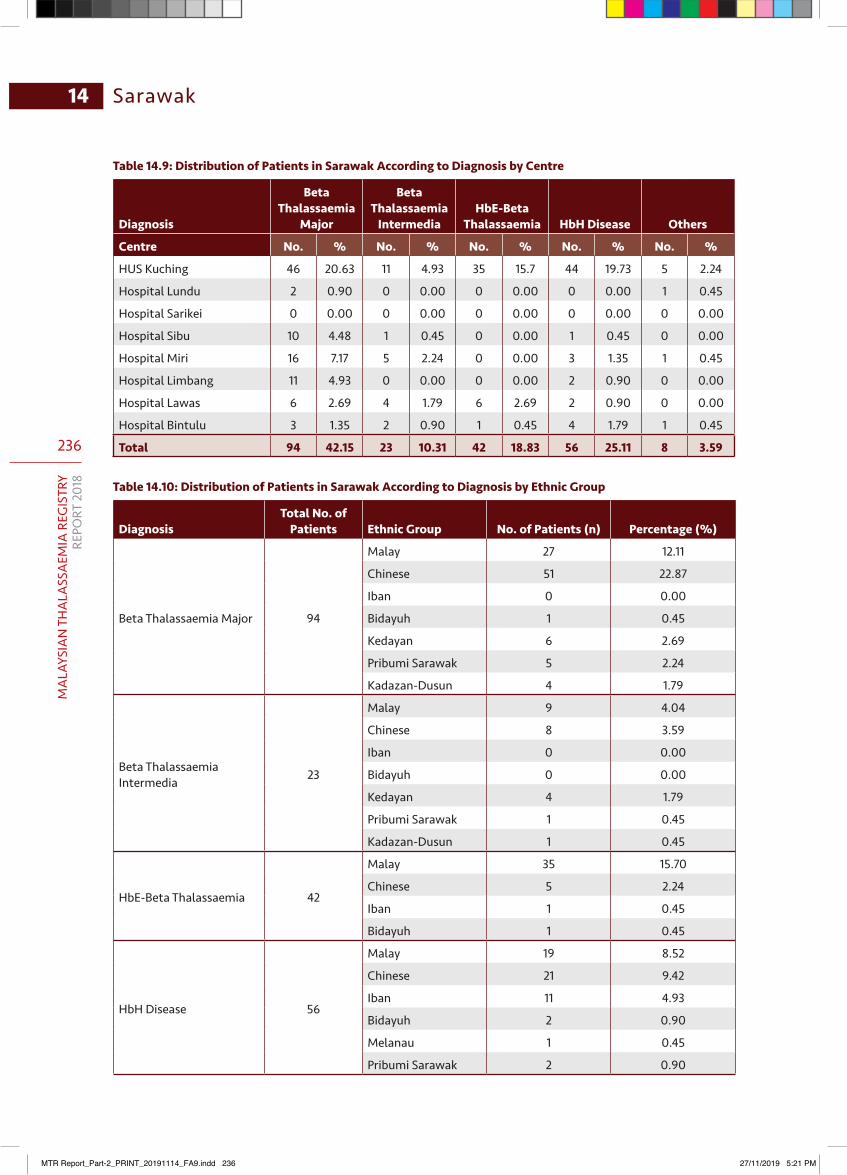
236
MA
LAYS
IAN
TH
ALA
SSA
EMIA
REG
ISTR
YRE
PORT
201
8
14 Sarawak
Table 14.9: Distribution of Patients in Sarawak According to Diagnosis by Centre
Diagnosis
Beta Thalassaemia
Major
Beta Thalassaemia
IntermediaHbE-Beta
Thalassaemia HbH Disease Others
Centre No. % No. % No. % No. % No. %
HUS Kuching 46 20.63 11 4.93 35 15.7 44 19.73 5 2.24
Hospital Lundu 2 0.90 0 0.00 0 0.00 0 0.00 1 0.45
Hospital Sarikei 0 0.00 0 0.00 0 0.00 0 0.00 0 0.00
Hospital Sibu 10 4.48 1 0.45 0 0.00 1 0.45 0 0.00
Hospital Miri 16 7.17 5 2.24 0 0.00 3 1.35 1 0.45
Hospital Limbang 11 4.93 0 0.00 0 0.00 2 0.90 0 0.00
Hospital Lawas 6 2.69 4 1.79 6 2.69 2 0.90 0 0.00
Hospital Bintulu 3 1.35 2 0.90 1 0.45 4 1.79 1 0.45
Total 94 42.15 23 10.31 42 18.83 56 25.11 8 3.59
Table 14.10: Distribution of Patients in Sarawak According to Diagnosis by Ethnic Group
DiagnosisTotal No. of
Patients Ethnic Group No. of Patients (n) Percentage (%)
Beta Thalassaemia Major 94
Malay 27 12.11
Chinese 51 22.87
Iban 0 0.00
Bidayuh 1 0.45
Kedayan 6 2.69
Pribumi Sarawak 5 2.24
Kadazan-Dusun 4 1.79
Beta Thalassaemia Intermedia 23
Malay 9 4.04
Chinese 8 3.59
Iban 0 0.00
Bidayuh 0 0.00
Kedayan 4 1.79
Pribumi Sarawak 1 0.45
Kadazan-Dusun 1 0.45
HbE-Beta Thalassaemia 42
Malay 35 15.70
Chinese 5 2.24
Iban 1 0.45
Bidayuh 1 0.45
HbH Disease 56
Malay 19 8.52
Chinese 21 9.42
Iban 11 4.93
Bidayuh 2 0.90
Melanau 1 0.45
Pribumi Sarawak 2 0.90
MTR Report_Part-2_PRINT_20191114_FA9.indd 236 27/11/2019 5:21 PM
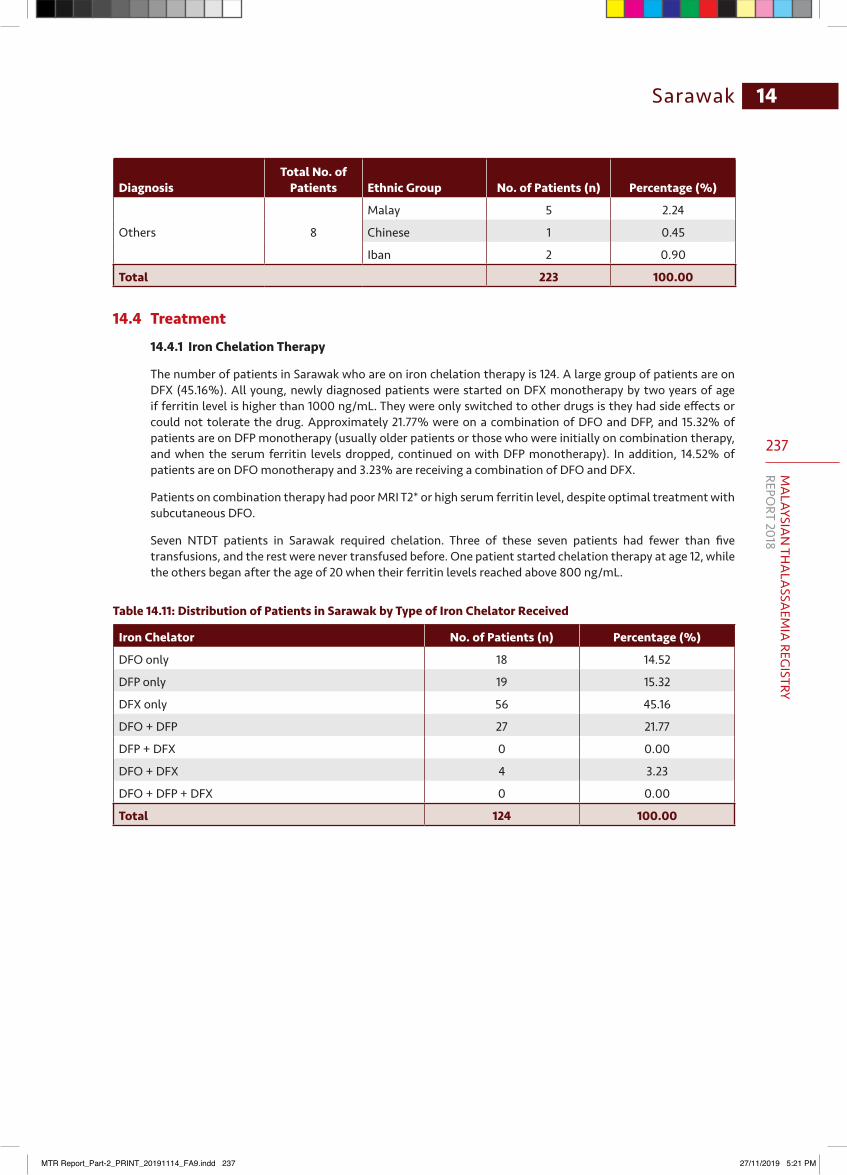
237
MA
LAYSIAN
THA
LASSA
EMIA
REGISTRY
REPORT 2018
14Sarawak
DiagnosisTotal No. of
Patients Ethnic Group No. of Patients (n) Percentage (%)
Others 8
Malay 5 2.24
Chinese 1 0.45
Iban 2 0.90
Total 223 100.00
14.4 Treatment
14.4.1 Iron Chelation Therapy
The number of patients in Sarawak who are on iron chelation therapy is 124. A large group of patients are on DFX (45.16%). All young, newly diagnosed patients were started on DFX monotherapy by two years of age if ferritin level is higher than 1000 ng/mL. They were only switched to other drugs is they had side effects or could not tolerate the drug. Approximately 21.77% were on a combination of DFO and DFP, and 15.32% of patients are on DFP monotherapy (usually older patients or those who were initially on combination therapy, and when the serum ferritin levels dropped, continued on with DFP monotherapy). In addition, 14.52% of patients are on DFO monotherapy and 3.23% are receiving a combination of DFO and DFX.
Patients on combination therapy had poor MRI T2* or high serum ferritin level, despite optimal treatment with subcutaneous DFO.
Seven NTDT patients in Sarawak required chelation. Three of these seven patients had fewer than five transfusions, and the rest were never transfused before. One patient started chelation therapy at age 12, while the others began after the age of 20 when their ferritin levels reached above 800 ng/mL.
Table 14.11: Distribution of Patients in Sarawak by Type of Iron Chelator Received
Iron Chelator No. of Patients (n) Percentage (%)
DFO only 18 14.52
DFP only 19 15.32
DFX only 56 45.16
DFO + DFP 27 21.77
DFP + DFX 0 0.00
DFO + DFX 4 3.23
DFO + DFP + DFX 0 0.00
Total 124 100.00
MTR Report_Part-2_PRINT_20191114_FA9.indd 237 27/11/2019 5:21 PM

238
MA
LAYS
IAN
TH
ALA
SSA
EMIA
REG
ISTR
YRE
PORT
201
8
14 Sarawak
Table 14.12: Distribution of Patients in Sarawak According to Type of Iron Chelator Received by Centre
CentreTotal No. of
Patients Iron ChelatorNo. of
Patients (n)Percentage
(%)
HUS, Kuching 68
DFO only 6 4.84
DFP only 14 11.29
DFX only 27 21.77
DFO + DFP 17 13.71
DFP + DFX 0 0.00
DFO + DFX 4 3.23
DFO + DFP + DFX 0 0.00
Hospital Lundu 2
DFO only 2 1.61
DFP only 0 0.00
DFX only 0 0.00
DFO + DFP 0 0.00
DFP + DFX 0 0.00
DFO + DFX 0 0.00
DFO + DFP + DFX 0 0.00
Hospital Sibu 10
DFO only 4 3.23
DFP only 0 0.00
DFX only 5 4.03
DFO + DFP 1 0.81
DFP + DFX 0 0.00
DFO + DFX 0 0.00
DFO + DFP + DFX 0 0.00
Hospital Miri 17
DFO only 3 2.42
DFP only 2 1.61
DFX only 10 8.06
DFO + DFP 2 1.61
DFP + DFX 0 0.00
DFO + DFX 0 0.00
DFO + DFP + DFX 0 0.00
Hospital Limbang 9
DFO only 1 0.81
DFP only 2 1.61
DFX only 6 4.84
DFO + DFP 0 0.00
DFP + DFX 0 0.00
DFO + DFX 0 0.00
DFO + DFP + DFX 0 0.00
MTR Report_Part-2_PRINT_20191114_FA9.indd 238 27/11/2019 5:21 PM
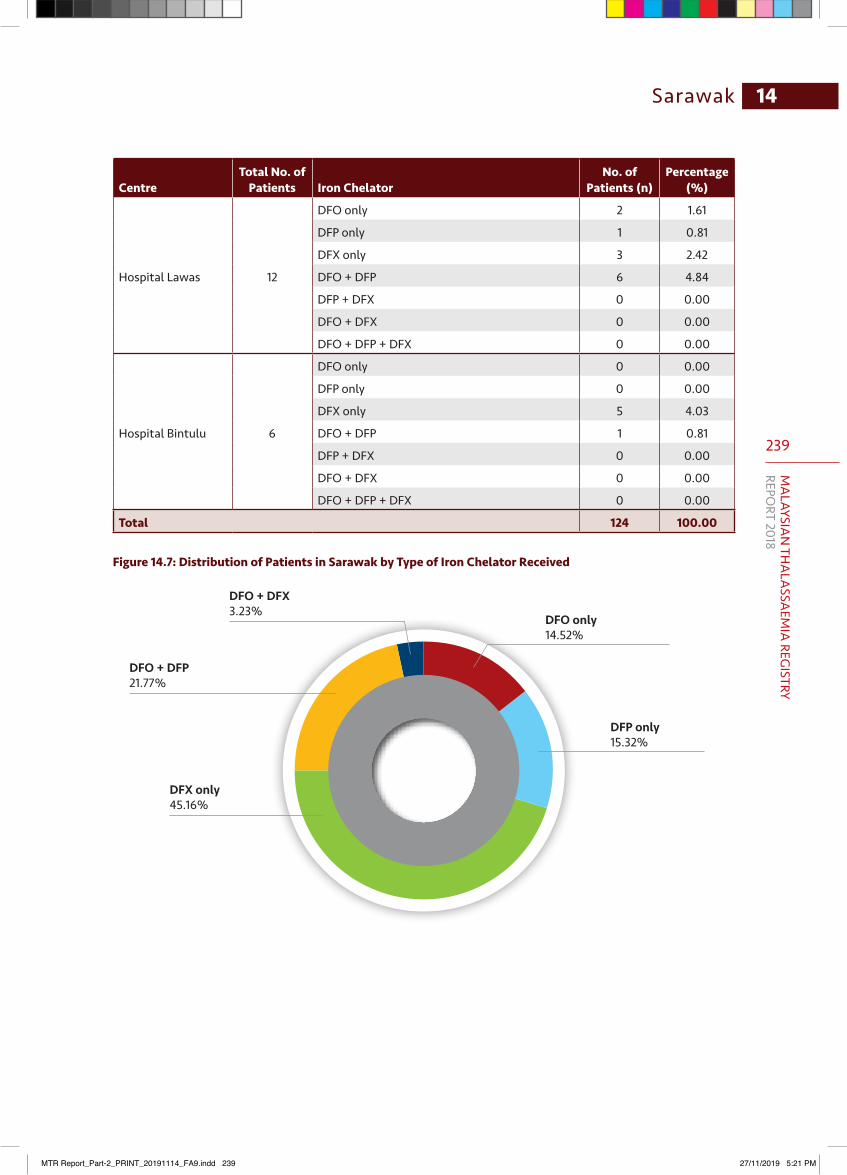
239
MA
LAYSIAN
THA
LASSA
EMIA
REGISTRY
REPORT 2018
14Sarawak
CentreTotal No. of
Patients Iron ChelatorNo. of
Patients (n)Percentage
(%)
Hospital Lawas 12
DFO only 2 1.61
DFP only 1 0.81
DFX only 3 2.42
DFO + DFP 6 4.84
DFP + DFX 0 0.00
DFO + DFX 0 0.00
DFO + DFP + DFX 0 0.00
Hospital Bintulu 6
DFO only 0 0.00
DFP only 0 0.00
DFX only 5 4.03
DFO + DFP 1 0.81
DFP + DFX 0 0.00
DFO + DFX 0 0.00
DFO + DFP + DFX 0 0.00
Total 124 100.00
Figure 14.7: Distribution of Patients in Sarawak by Type of Iron Chelator Received
DFP only15.32%
DFX only45.16%
DFO + DFX3.23%
DFO + DFP21.77%
DFO only14.52%
MTR Report_Part-2_PRINT_20191114_FA9.indd 239 27/11/2019 5:21 PM

240
MA
LAYS
IAN
TH
ALA
SSA
EMIA
REG
ISTR
YRE
PORT
201
8
14 Sarawak
Table 14.13: Distribution of Patients in Sarawak According to Type of Iron Chelator Received by Age Group
Age Group (years)Total No. of
Patients Iron ChelatorNo. of
Patients (n)Percentage
(%)
0−4.9 4
DFO only 1 0.81
DFP only 0 0.00
DFX only 3 2.42
DFO + DFP 0 0.00
DFO + DFX 0 0.00
DFP + DFX 0 0.00
5−9.9 16
DFO only 0 0.00
DFP only 0 0.00
DFX only 16 12.90
DFO + DFP 0 0.00
DFO + DFX 0 0.00
DFP + DFX 0 0.00
10−14.9 24
DFO only 1 0.81
DFP only 0 0.00
DFX only 22 17.74
DFO + DFP 1 0.81
DFO + DFX 0 0.00
DFP + DFX 0 0.00
15−19.9 22
DFO only 6 4.84
DFP only 5 4.03
DFX only 3 2.42
DFO + DFP 8 6.45
DFO + DFX 0 0.00
DFP + DFX 0 0.00
20−24.9 25
DFO only 5 4.03
DFP only 4 3.23
DFX only 2 1.61
DFO + DFP 12 9.68
DFO + DFX 0 0.00
DFP + DFX 2 1.61
25−29.9 12
DFO only 3 2.42
DFP only 0 0.00
DFX only 3 2.42
DFO + DFP 5 4.03
DFO + DFX 0 0.00
DFP + DFX 1 0.81
MTR Report_Part-2_PRINT_20191114_FA9.indd 240 27/11/2019 5:21 PM
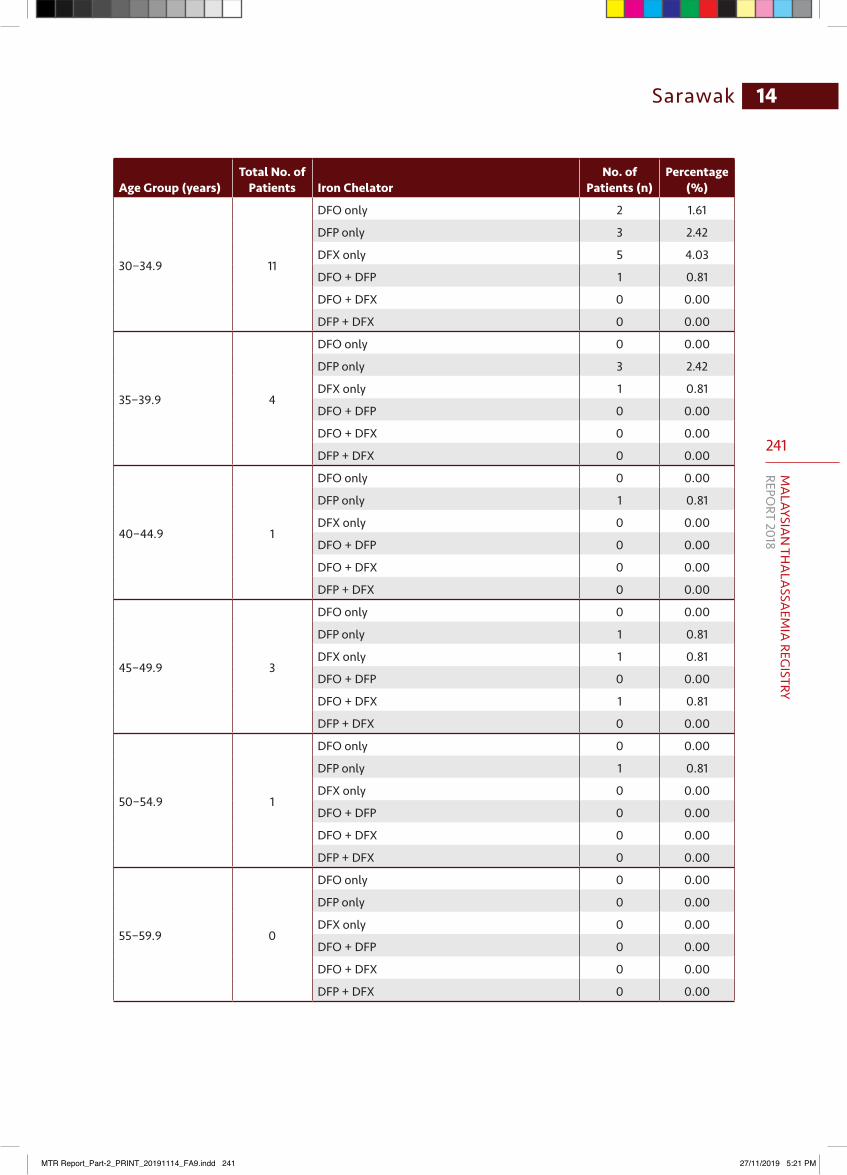
241
MA
LAYSIAN
THA
LASSA
EMIA
REGISTRY
REPORT 2018
14Sarawak
Age Group (years)Total No. of
Patients Iron ChelatorNo. of
Patients (n)Percentage
(%)
30−34.9 11
DFO only 2 1.61
DFP only 3 2.42
DFX only 5 4.03
DFO + DFP 1 0.81
DFO + DFX 0 0.00
DFP + DFX 0 0.00
35−39.9 4
DFO only 0 0.00
DFP only 3 2.42
DFX only 1 0.81
DFO + DFP 0 0.00
DFO + DFX 0 0.00
DFP + DFX 0 0.00
40−44.9 1
DFO only 0 0.00
DFP only 1 0.81
DFX only 0 0.00
DFO + DFP 0 0.00
DFO + DFX 0 0.00
DFP + DFX 0 0.00
45−49.9 3
DFO only 0 0.00
DFP only 1 0.81
DFX only 1 0.81
DFO + DFP 0 0.00
DFO + DFX 1 0.81
DFP + DFX 0 0.00
50−54.9 1
DFO only 0 0.00
DFP only 1 0.81
DFX only 0 0.00
DFO + DFP 0 0.00
DFO + DFX 0 0.00
DFP + DFX 0 0.00
55−59.9 0
DFO only 0 0.00
DFP only 0 0.00
DFX only 0 0.00
DFO + DFP 0 0.00
DFO + DFX 0 0.00
DFP + DFX 0 0.00
MTR Report_Part-2_PRINT_20191114_FA9.indd 241 27/11/2019 5:21 PM
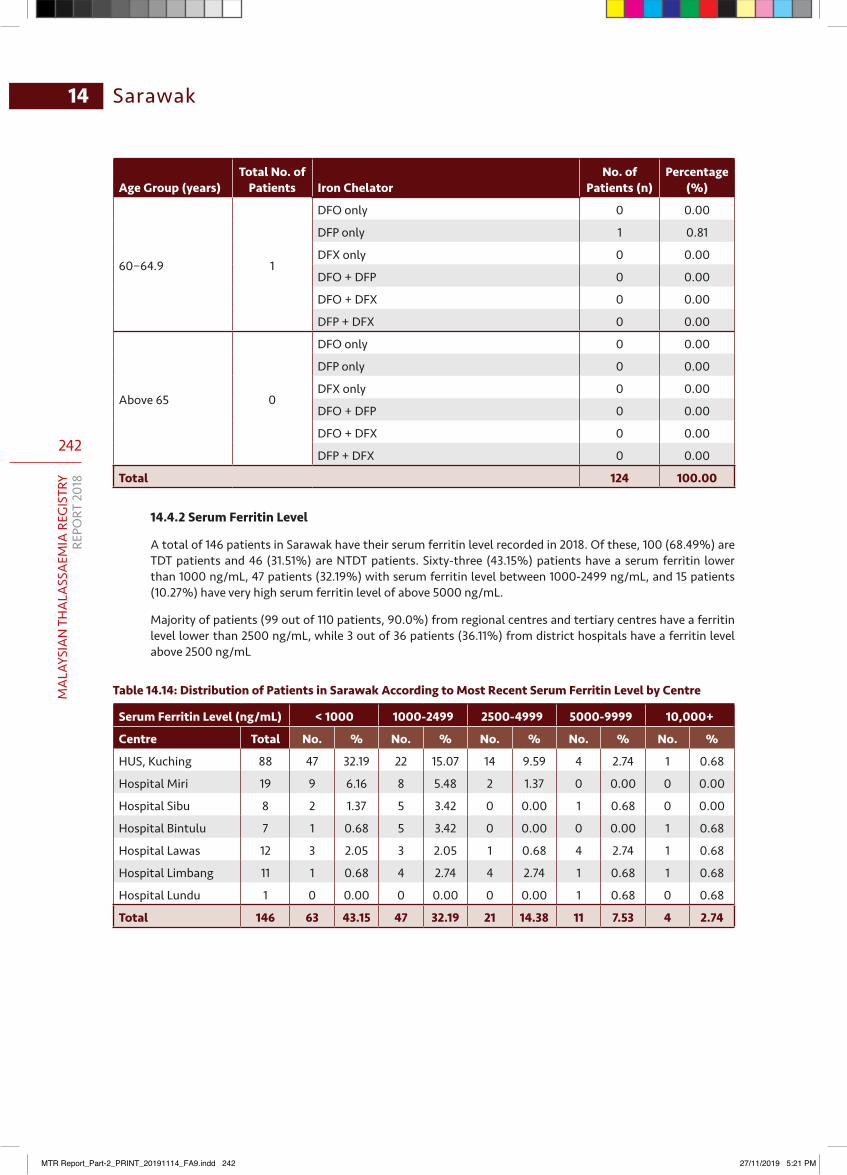
242
MA
LAYS
IAN
TH
ALA
SSA
EMIA
REG
ISTR
YRE
PORT
201
8
14 Sarawak
Age Group (years)Total No. of
Patients Iron ChelatorNo. of
Patients (n)Percentage
(%)
60−64.9 1
DFO only 0 0.00
DFP only 1 0.81
DFX only 0 0.00
DFO + DFP 0 0.00
DFO + DFX 0 0.00
DFP + DFX 0 0.00
Above 65 0
DFO only 0 0.00
DFP only 0 0.00
DFX only 0 0.00
DFO + DFP 0 0.00
DFO + DFX 0 0.00
DFP + DFX 0 0.00
Total 124 100.00
14.4.2 Serum Ferritin Level
A total of 146 patients in Sarawak have their serum ferritin level recorded in 2018. Of these, 100 (68.49%) are TDT patients and 46 (31.51%) are NTDT patients. Sixty-three (43.15%) patients have a serum ferritin lower than 1000 ng/mL, 47 patients (32.19%) with serum ferritin level between 1000-2499 ng/mL, and 15 patients (10.27%) have very high serum ferritin level of above 5000 ng/mL.
Majority of patients (99 out of 110 patients, 90.0%) from regional centres and tertiary centres have a ferritin level lower than 2500 ng/mL, while 3 out of 36 patients (36.11%) from district hospitals have a ferritin level above 2500 ng/mL
Table 14.14: Distribution of Patients in Sarawak According to Most Recent Serum Ferritin Level by Centre
Serum Ferritin Level (ng/mL) < 1000 1000-2499 2500-4999 5000-9999 10,000+
Centre Total No. % No. % No. % No. % No. %
HUS, Kuching 88 47 32.19 22 15.07 14 9.59 4 2.74 1 0.68
Hospital Miri 19 9 6.16 8 5.48 2 1.37 0 0.00 0 0.00
Hospital Sibu 8 2 1.37 5 3.42 0 0.00 1 0.68 0 0.00
Hospital Bintulu 7 1 0.68 5 3.42 0 0.00 0 0.00 1 0.68
Hospital Lawas 12 3 2.05 3 2.05 1 0.68 4 2.74 1 0.68
Hospital Limbang 11 1 0.68 4 2.74 4 2.74 1 0.68 1 0.68
Hospital Lundu 1 0 0.00 0 0.00 0 0.00 1 0.68 0 0.68
Total 146 63 43.15 47 32.19 21 14.38 11 7.53 4 2.74
MTR Report_Part-2_PRINT_20191114_FA9.indd 242 27/11/2019 5:21 PM
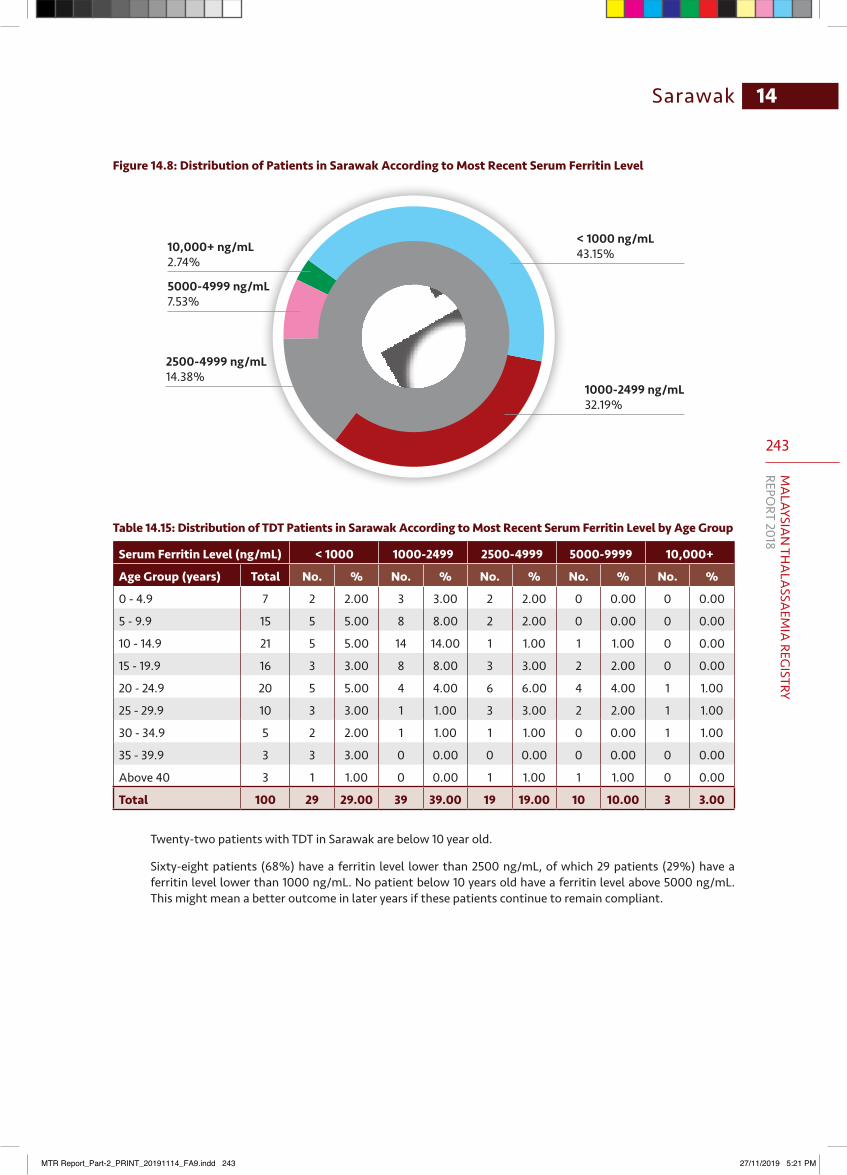
243
MA
LAYSIAN
THA
LASSA
EMIA
REGISTRY
REPORT 2018
14Sarawak
Figure 14.8: Distribution of Patients in Sarawak According to Most Recent Serum Ferritin Level
2500-4999 ng/mL14.38%
5000-4999 ng/mL7.53%
10,000+ ng/mL2.74%
< 1000 ng/mL43.15%
1000-2499 ng/mL32.19%
Table 14.15: Distribution of TDT Patients in Sarawak According to Most Recent Serum Ferritin Level by Age Group
Serum Ferritin Level (ng/mL) < 1000 1000-2499 2500-4999 5000-9999 10,000+
Age Group (years) Total No. % No. % No. % No. % No. %
0 - 4.9 7 2 2.00 3 3.00 2 2.00 0 0.00 0 0.00
5 - 9.9 15 5 5.00 8 8.00 2 2.00 0 0.00 0 0.00
10 - 14.9 21 5 5.00 14 14.00 1 1.00 1 1.00 0 0.00
15 - 19.9 16 3 3.00 8 8.00 3 3.00 2 2.00 0 0.00
20 - 24.9 20 5 5.00 4 4.00 6 6.00 4 4.00 1 1.00
25 - 29.9 10 3 3.00 1 1.00 3 3.00 2 2.00 1 1.00
30 - 34.9 5 2 2.00 1 1.00 1 1.00 0 0.00 1 1.00
35 - 39.9 3 3 3.00 0 0.00 0 0.00 0 0.00 0 0.00
Above 40 3 1 1.00 0 0.00 1 1.00 1 1.00 0 0.00
Total 100 29 29.00 39 39.00 19 19.00 10 10.00 3 3.00
Twenty-two patients with TDT in Sarawak are below 10 year old.
Sixty-eight patients (68%) have a ferritin level lower than 2500 ng/mL, of which 29 patients (29%) have a ferritin level lower than 1000 ng/mL. No patient below 10 years old have a ferritin level above 5000 ng/mL. This might mean a better outcome in later years if these patients continue to remain compliant.
MTR Report_Part-2_PRINT_20191114_FA9.indd 243 27/11/2019 5:21 PM
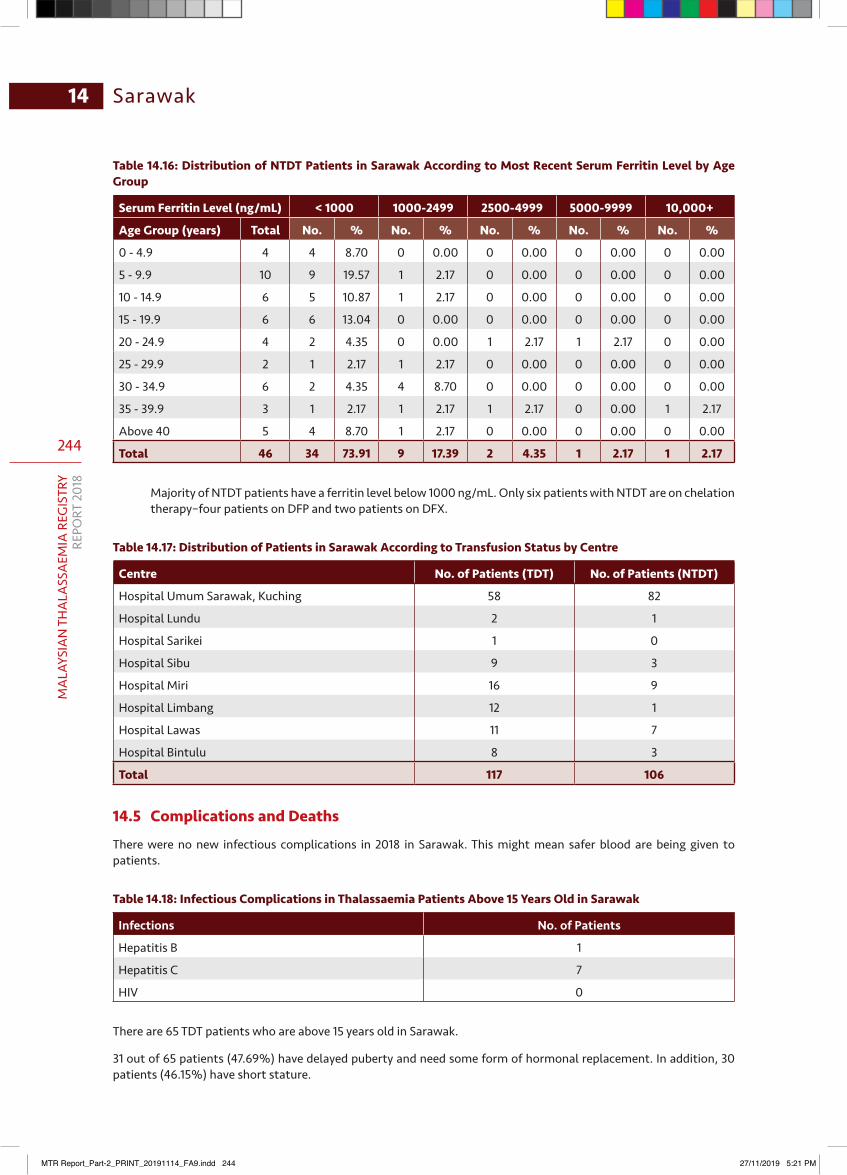
244
MA
LAYS
IAN
TH
ALA
SSA
EMIA
REG
ISTR
YRE
PORT
201
8
14 Sarawak
Table 14.16: Distribution of NTDT Patients in Sarawak According to Most Recent Serum Ferritin Level by Age Group
Serum Ferritin Level (ng/mL) < 1000 1000-2499 2500-4999 5000-9999 10,000+
Age Group (years) Total No. % No. % No. % No. % No. %
0 - 4.9 4 4 8.70 0 0.00 0 0.00 0 0.00 0 0.00
5 - 9.9 10 9 19.57 1 2.17 0 0.00 0 0.00 0 0.00
10 - 14.9 6 5 10.87 1 2.17 0 0.00 0 0.00 0 0.00
15 - 19.9 6 6 13.04 0 0.00 0 0.00 0 0.00 0 0.00
20 - 24.9 4 2 4.35 0 0.00 1 2.17 1 2.17 0 0.00
25 - 29.9 2 1 2.17 1 2.17 0 0.00 0 0.00 0 0.00
30 - 34.9 6 2 4.35 4 8.70 0 0.00 0 0.00 0 0.00
35 - 39.9 3 1 2.17 1 2.17 1 2.17 0 0.00 1 2.17
Above 40 5 4 8.70 1 2.17 0 0.00 0 0.00 0 0.00
Total 46 34 73.91 9 17.39 2 4.35 1 2.17 1 2.17
Majority of NTDT patients have a ferritin level below 1000 ng/mL. Only six patients with NTDT are on chelation therapy–four patients on DFP and two patients on DFX.
Table 14.17: Distribution of Patients in Sarawak According to Transfusion Status by Centre
Centre No. of Patients (TDT) No. of Patients (NTDT)
Hospital Umum Sarawak, Kuching 58 82
Hospital Lundu 2 1
Hospital Sarikei 1 0
Hospital Sibu 9 3
Hospital Miri 16 9
Hospital Limbang 12 1
Hospital Lawas 11 7
Hospital Bintulu 8 3
Total 117 106
14.5 Complications and Deaths
There were no new infectious complications in 2018 in Sarawak. This might mean safer blood are being given to patients.
Table 14.18: Infectious Complications in Thalassaemia Patients Above 15 Years Old in Sarawak
Infections No. of Patients
Hepatitis B 1
Hepatitis C 7
HIV 0
There are 65 TDT patients who are above 15 years old in Sarawak.
31 out of 65 patients (47.69%) have delayed puberty and need some form of hormonal replacement. In addition, 30 patients (46.15%) have short stature.
MTR Report_Part-2_PRINT_20191114_FA9.indd 244 27/11/2019 5:21 PM
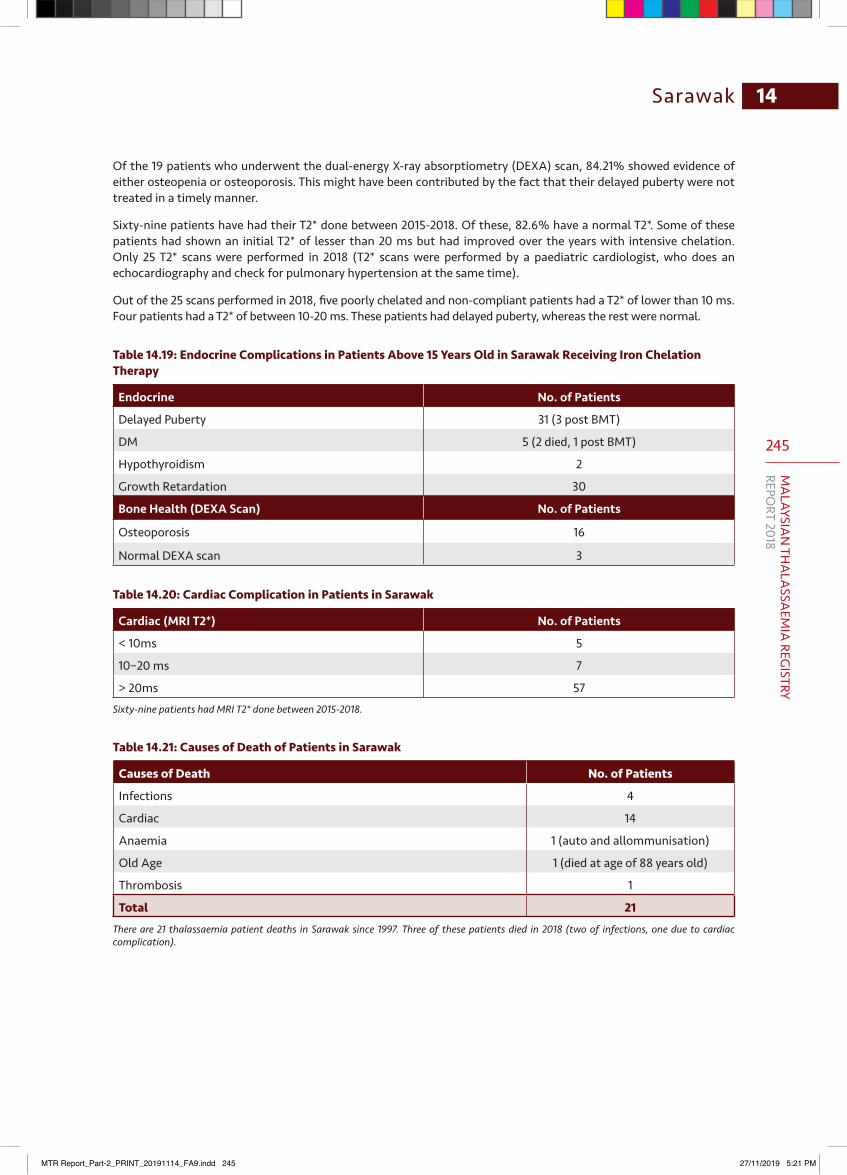
245
MA
LAYSIAN
THA
LASSA
EMIA
REGISTRY
REPORT 2018
14Sarawak
Of the 19 patients who underwent the dual-energy X-ray absorptiometry (DEXA) scan, 84.21% showed evidence of either osteopenia or osteoporosis. This might have been contributed by the fact that their delayed puberty were not treated in a timely manner.
Sixty-nine patients have had their T2* done between 2015-2018. Of these, 82.6% have a normal T2*. Some of these patients had shown an initial T2* of lesser than 20 ms but had improved over the years with intensive chelation. Only 25 T2* scans were performed in 2018 (T2* scans were performed by a paediatric cardiologist, who does an echocardiography and check for pulmonary hypertension at the same time).
Out of the 25 scans performed in 2018, five poorly chelated and non-compliant patients had a T2* of lower than 10 ms. Four patients had a T2* of between 10-20 ms. These patients had delayed puberty, whereas the rest were normal.
Table 14.19: Endocrine Complications in Patients Above 15 Years Old in Sarawak Receiving Iron Chelation Therapy
Endocrine No. of Patients
Delayed Puberty 31 (3 post BMT)
DM 5 (2 died, 1 post BMT)
Hypothyroidism 2
Growth Retardation 30
Bone Health (DEXA Scan) No. of Patients
Osteoporosis 16
Normal DEXA scan 3
Table 14.20: Cardiac Complication in Patients in Sarawak
Cardiac (MRI T2*) No. of Patients
< 10ms 5
10–20 ms 7
> 20ms 57Sixty-nine patients had MRI T2* done between 2015-2018.
Table 14.21: Causes of Death of Patients in Sarawak
Causes of Death No. of Patients
Infections 4
Cardiac 14
Anaemia 1 (auto and allommunisation)
Old Age 1 (died at age of 88 years old)
Thrombosis 1
Total 21There are 21 thalassaemia patient deaths in Sarawak since 1997. Three of these patients died in 2018 (two of infections, one due to cardiac complication).
MTR Report_Part-2_PRINT_20191114_FA9.indd 245 27/11/2019 5:21 PM
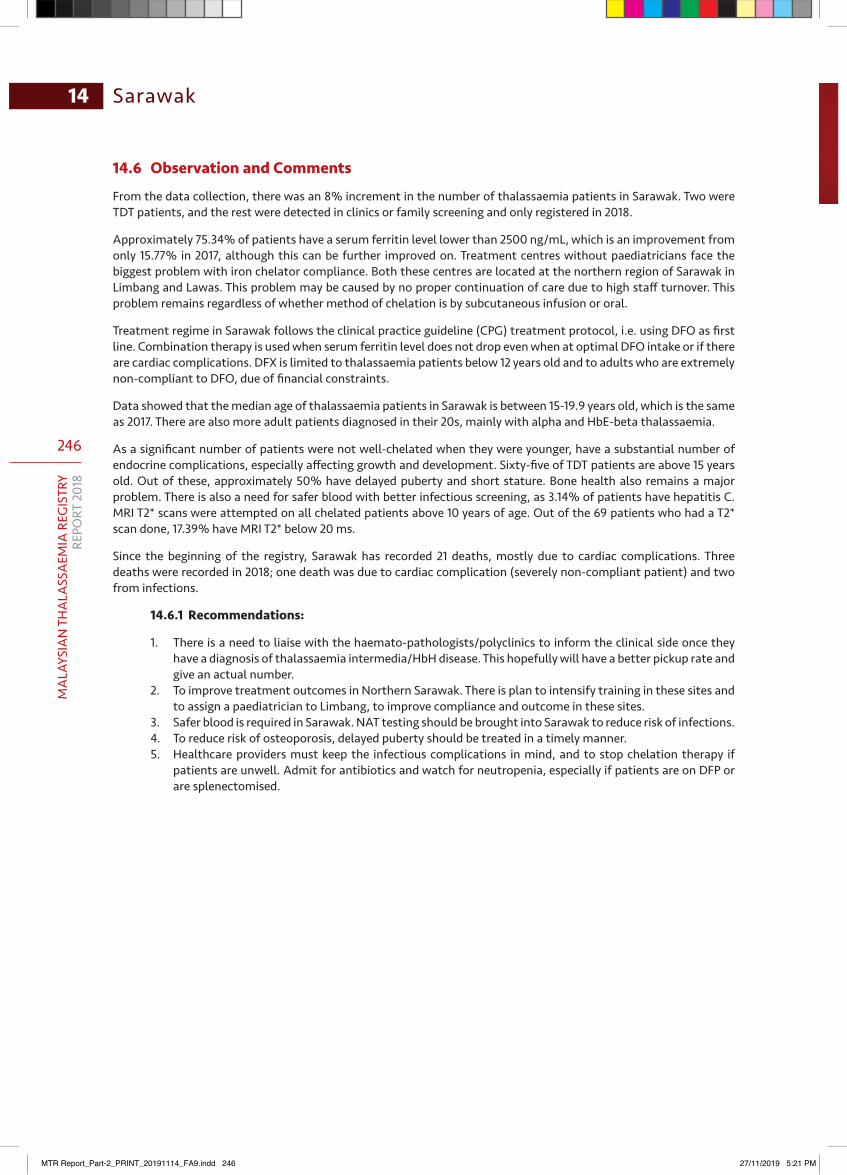
246
MA
LAYS
IAN
TH
ALA
SSA
EMIA
REG
ISTR
YRE
PORT
201
8
14 Sarawak
14.6 Observation and Comments
From the data collection, there was an 8% increment in the number of thalassaemia patients in Sarawak. Two were TDT patients, and the rest were detected in clinics or family screening and only registered in 2018.
Approximately 75.34% of patients have a serum ferritin level lower than 2500 ng/mL, which is an improvement from only 15.77% in 2017, although this can be further improved on. Treatment centres without paediatricians face the biggest problem with iron chelator compliance. Both these centres are located at the northern region of Sarawak in Limbang and Lawas. This problem may be caused by no proper continuation of care due to high staff turnover. This problem remains regardless of whether method of chelation is by subcutaneous infusion or oral.
Treatment regime in Sarawak follows the clinical practice guideline (CPG) treatment protocol, i.e. using DFO as first line. Combination therapy is used when serum ferritin level does not drop even when at optimal DFO intake or if there are cardiac complications. DFX is limited to thalassaemia patients below 12 years old and to adults who are extremely non-compliant to DFO, due of financial constraints.
Data showed that the median age of thalassaemia patients in Sarawak is between 15-19.9 years old, which is the same as 2017. There are also more adult patients diagnosed in their 20s, mainly with alpha and HbE-beta thalassaemia.
As a significant number of patients were not well-chelated when they were younger, have a substantial number of endocrine complications, especially affecting growth and development. Sixty-five of TDT patients are above 15 years old. Out of these, approximately 50% have delayed puberty and short stature. Bone health also remains a major problem. There is also a need for safer blood with better infectious screening, as 3.14% of patients have hepatitis C. MRI T2* scans were attempted on all chelated patients above 10 years of age. Out of the 69 patients who had a T2* scan done, 17.39% have MRI T2* below 20 ms.
Since the beginning of the registry, Sarawak has recorded 21 deaths, mostly due to cardiac complications. Three deaths were recorded in 2018; one death was due to cardiac complication (severely non-compliant patient) and two from infections.
14.6.1 Recommendations:
1. There is a need to liaise with the haemato-pathologists/polyclinics to inform the clinical side once they have a diagnosis of thalassaemia intermedia/HbH disease. This hopefully will have a better pickup rate and give an actual number.
2. To improve treatment outcomes in Northern Sarawak. There is plan to intensify training in these sites and to assign a paediatrician to Limbang, to improve compliance and outcome in these sites.
3. Safer blood is required in Sarawak. NAT testing should be brought into Sarawak to reduce risk of infections.4. To reduce risk of osteoporosis, delayed puberty should be treated in a timely manner. 5. Healthcare providers must keep the infectious complications in mind, and to stop chelation therapy if
patients are unwell. Admit for antibiotics and watch for neutropenia, especially if patients are on DFP or are splenectomised.
MTR Report_Part-2_PRINT_20191114_FA9.indd 246 27/11/2019 5:21 PM
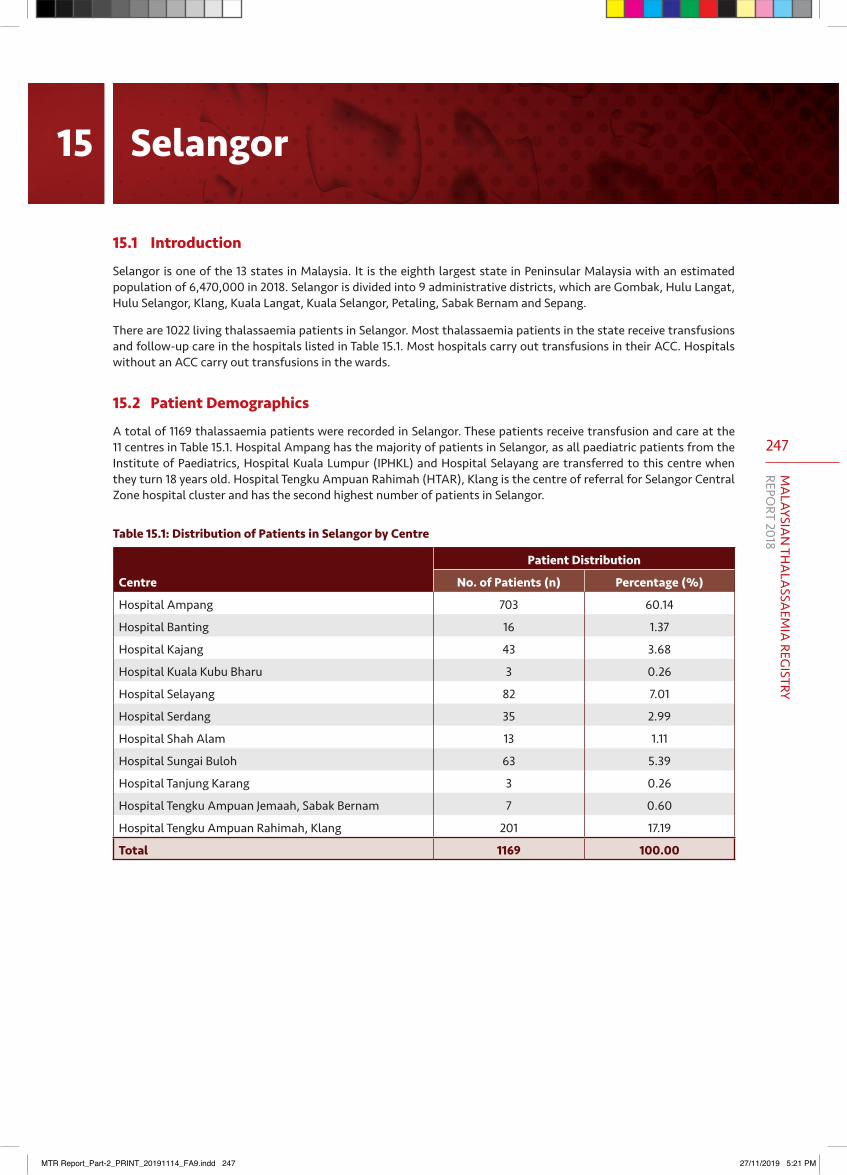
247
MA
LAYSIAN
THA
LASSA
EMIA
REGISTRY
REPORT 2018
15.1 Introduction
Selangor is one of the 13 states in Malaysia. It is the eighth largest state in Peninsular Malaysia with an estimated population of 6,470,000 in 2018. Selangor is divided into 9 administrative districts, which are Gombak, Hulu Langat, Hulu Selangor, Klang, Kuala Langat, Kuala Selangor, Petaling, Sabak Bernam and Sepang.
There are 1022 living thalassaemia patients in Selangor. Most thalassaemia patients in the state receive transfusions and follow-up care in the hospitals listed in Table 15.1. Most hospitals carry out transfusions in their ACC. Hospitals without an ACC carry out transfusions in the wards.
15.2 Patient Demographics
A total of 1169 thalassaemia patients were recorded in Selangor. These patients receive transfusion and care at the 11 centres in Table 15.1. Hospital Ampang has the majority of patients in Selangor, as all paediatric patients from the Institute of Paediatrics, Hospital Kuala Lumpur (IPHKL) and Hospital Selayang are transferred to this centre when they turn 18 years old. Hospital Tengku Ampuan Rahimah (HTAR), Klang is the centre of referral for Selangor Central Zone hospital cluster and has the second highest number of patients in Selangor.
Table 15.1: Distribution of Patients in Selangor by Centre
Centre
Patient Distribution
No. of Patients (n) Percentage (%)
Hospital Ampang 703 60.14
Hospital Banting 16 1.37
Hospital Kajang 43 3.68
Hospital Kuala Kubu Bharu 3 0.26
Hospital Selayang 82 7.01
Hospital Serdang 35 2.99
Hospital Shah Alam 13 1.11
Hospital Sungai Buloh 63 5.39
Hospital Tanjung Karang 3 0.26
Hospital Tengku Ampuan Jemaah, Sabak Bernam 7 0.60
Hospital Tengku Ampuan Rahimah, Klang 201 17.19
Total 1169 100.00
15 Selangor
MTR Report_Part-2_PRINT_20191114_FA9.indd 247 27/11/2019 5:21 PM
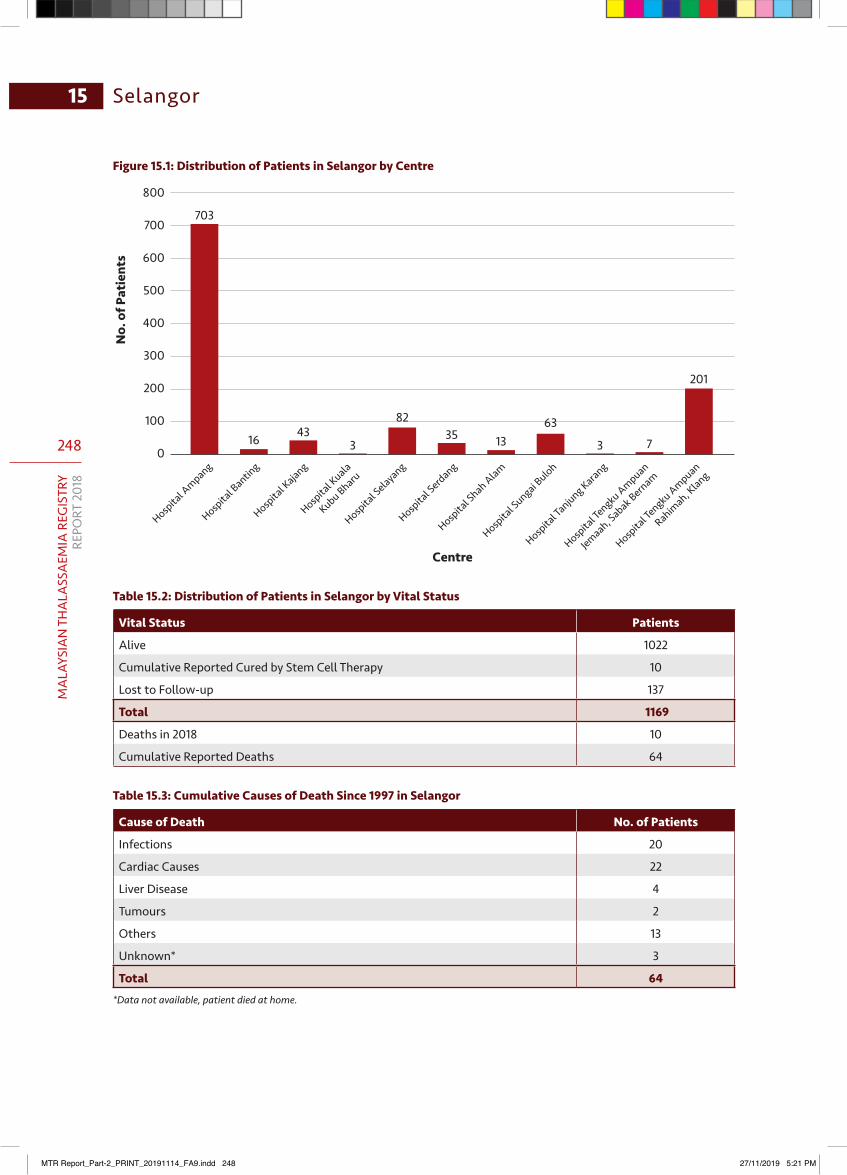
248
MA
LAYS
IAN
TH
ALA
SSA
EMIA
REG
ISTR
YRE
PORT
201
8
15 Selangor
800
700
600
500
400
300
200
100
0
Centre
No.
of P
atie
nts
Hospita
l Ampang
Hospita
l Bantin
g
Hospita
l Kajang
Hospita
l Kuala
Kubu Bharu
Hospita
l Selaya
ng
Hospita
l Serdang
Hospita
l Shah Alam
Hospita
l Sungai B
uloh
Hospita
l Tanjung Karang
Hospita
l Tengku Ampuan
Jemaah, Sabak Bernam
Hospita
l Tengku Ampuan
Rahimah, K
lang
703
201
73
631335
82
34316
Figure 15.1: Distribution of Patients in Selangor by Centre
Table 15.2: Distribution of Patients in Selangor by Vital Status
Vital Status Patients
Alive 1022
Cumulative Reported Cured by Stem Cell Therapy 10
Lost to Follow-up 137
Total 1169
Deaths in 2018 10
Cumulative Reported Deaths 64
Table 15.3: Cumulative Causes of Death Since 1997 in Selangor
Cause of Death No. of Patients
Infections 20
Cardiac Causes 22
Liver Disease 4
Tumours 2
Others 13
Unknown* 3
Total 64*Data not available, patient died at home.
MTR Report_Part-2_PRINT_20191114_FA9.indd 248 27/11/2019 5:21 PM
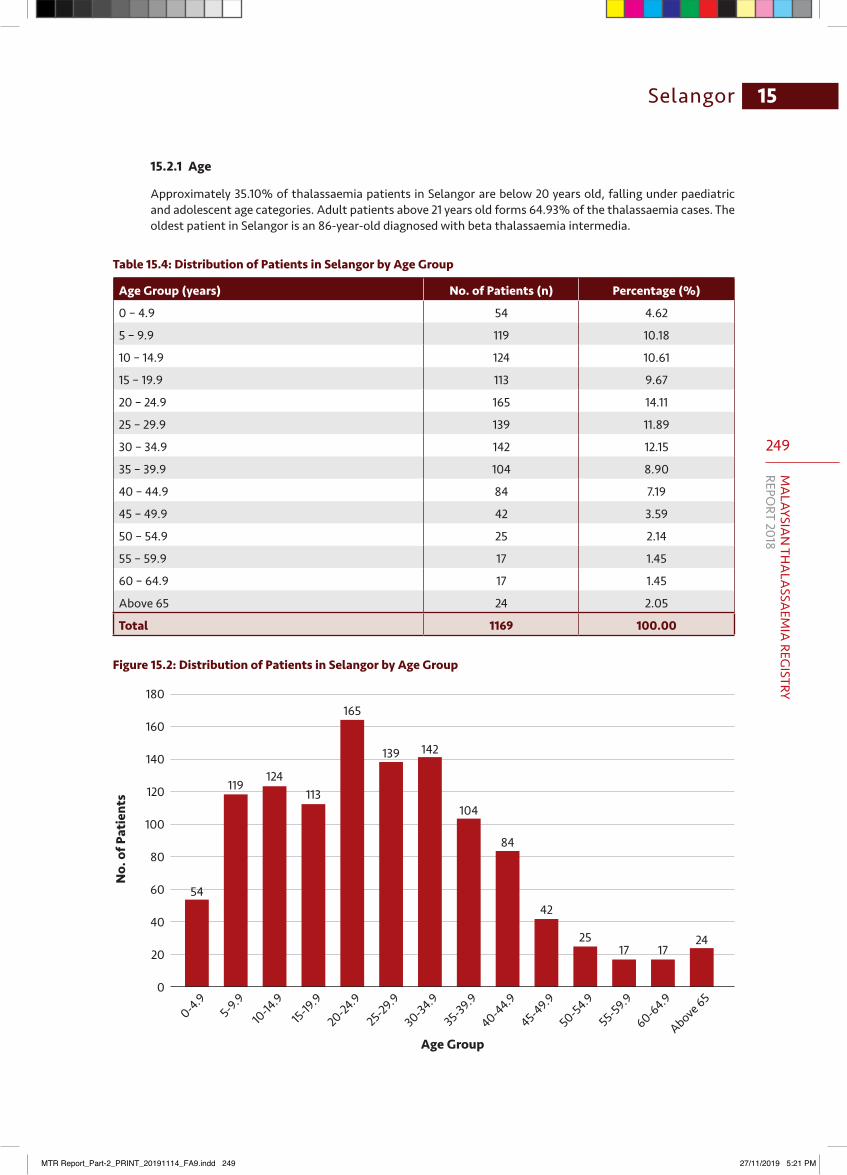
249
MA
LAYSIAN
THA
LASSA
EMIA
REGISTRY
REPORT 2018
15Selangor
15.2.1 Age
Approximately 35.10% of thalassaemia patients in Selangor are below 20 years old, falling under paediatric and adolescent age categories. Adult patients above 21 years old forms 64.93% of the thalassaemia cases. The oldest patient in Selangor is an 86-year-old diagnosed with beta thalassaemia intermedia.
Table 15.4: Distribution of Patients in Selangor by Age Group
Age Group (years) No. of Patients (n) Percentage (%)
0 – 4.9 54 4.62
5 – 9.9 119 10.18
10 – 14.9 124 10.61
15 – 19.9 113 9.67
20 – 24.9 165 14.11
25 – 29.9 139 11.89
30 – 34.9 142 12.15
35 – 39.9 104 8.90
40 – 44.9 84 7.19
45 – 49.9 42 3.59
50 – 54.9 25 2.14
55 – 59.9 17 1.45
60 – 64.9 17 1.45
Above 65 24 2.05
Total 1169 100.00
Figure 15.2: Distribution of Patients in Selangor by Age Group
180
160
140
120
100
80
60
40
20
0
No.
of P
atie
nts
0-4.95-9.9
10-14
.915-19
.9
20-24.9
25-29.9
30-34.9
35-39.9
40-44.9
45-49.9
50-54.9
55-59.9
60-64.9
Above 65
54
119124
113
165
139 142
104
84
42
2517 17
24
Age Group
MTR Report_Part-2_PRINT_20191114_FA9.indd 249 27/11/2019 5:21 PM
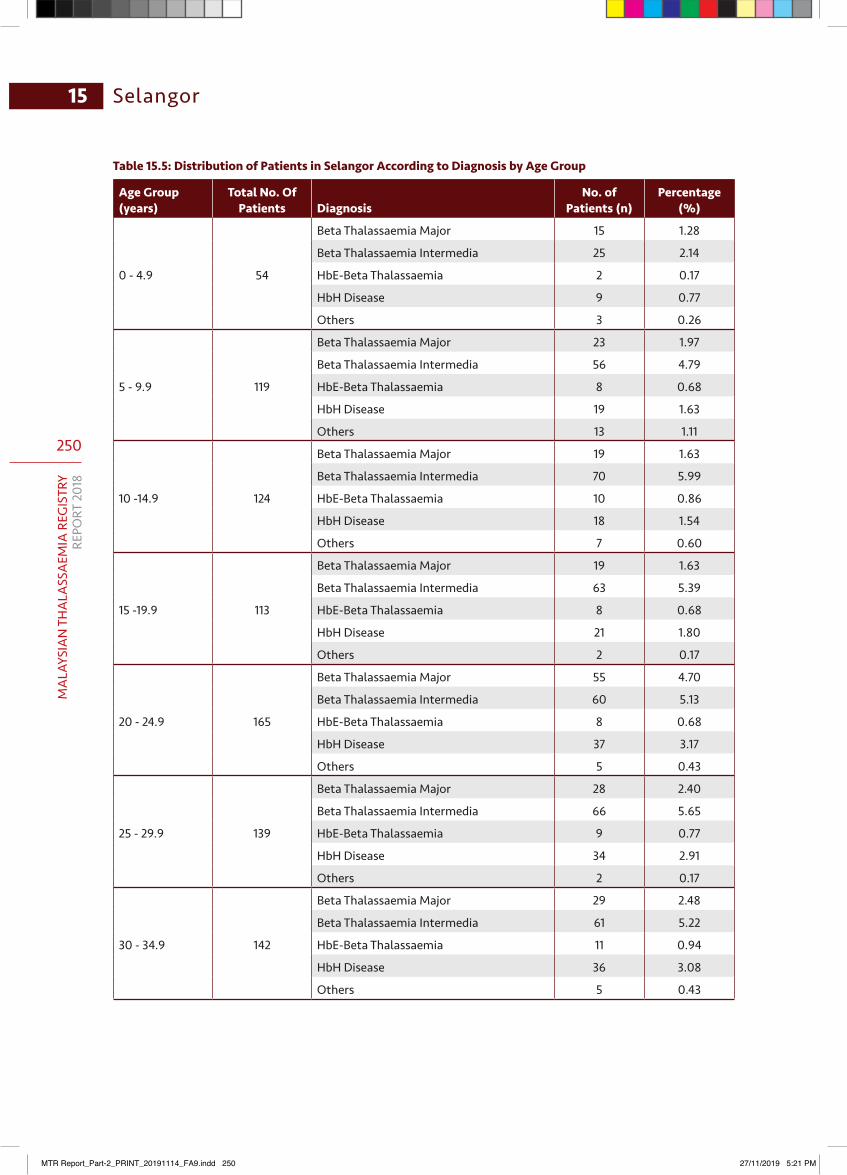
250
MA
LAYS
IAN
TH
ALA
SSA
EMIA
REG
ISTR
YRE
PORT
201
8
15 Selangor
Table 15.5: Distribution of Patients in Selangor According to Diagnosis by Age Group
Age Group (years)
Total No. Of Patients Diagnosis
No. of Patients (n)
Percentage (%)
0 - 4.9 54
Beta Thalassaemia Major 15 1.28
Beta Thalassaemia Intermedia 25 2.14
HbE-Beta Thalassaemia 2 0.17
HbH Disease 9 0.77
Others 3 0.26
5 - 9.9 119
Beta Thalassaemia Major 23 1.97
Beta Thalassaemia Intermedia 56 4.79
HbE-Beta Thalassaemia 8 0.68
HbH Disease 19 1.63
Others 13 1.11
10 -14.9 124
Beta Thalassaemia Major 19 1.63
Beta Thalassaemia Intermedia 70 5.99
HbE-Beta Thalassaemia 10 0.86
HbH Disease 18 1.54
Others 7 0.60
15 -19.9 113
Beta Thalassaemia Major 19 1.63
Beta Thalassaemia Intermedia 63 5.39
HbE-Beta Thalassaemia 8 0.68
HbH Disease 21 1.80
Others 2 0.17
20 - 24.9 165
Beta Thalassaemia Major 55 4.70
Beta Thalassaemia Intermedia 60 5.13
HbE-Beta Thalassaemia 8 0.68
HbH Disease 37 3.17
Others 5 0.43
25 - 29.9 139
Beta Thalassaemia Major 28 2.40
Beta Thalassaemia Intermedia 66 5.65
HbE-Beta Thalassaemia 9 0.77
HbH Disease 34 2.91
Others 2 0.17
30 - 34.9 142
Beta Thalassaemia Major 29 2.48
Beta Thalassaemia Intermedia 61 5.22
HbE-Beta Thalassaemia 11 0.94
HbH Disease 36 3.08
Others 5 0.43
MTR Report_Part-2_PRINT_20191114_FA9.indd 250 27/11/2019 5:21 PM

251
MA
LAYSIAN
THA
LASSA
EMIA
REGISTRY
REPORT 2018
15Selangor
Age Group (years)
Total No. Of Patients Diagnosis
No. of Patients (n)
Percentage (%)
35 - 39.9 104
Beta Thalassaemia Major 16 1.37
Beta Thalassaemia Intermedia 48 4.11
HbE-Beta Thalassaemia 4 0.34
HbH Disease 25 2.14
Others 11 0.94
40 - 44.9 84
Beta Thalassaemia Major 4 0.34
Beta Thalassaemia Intermedia 30 2.57
HbE-Beta Thalassaemia 9 0.77
HbH Disease 33 2.82
Others 8 0.68
45 - 49.9 42
Beta Thalassaemia Major 1 0.09
Beta Thalassaemia Intermedia 18 1.54
HbE-Beta Thalassaemia 9 0.77
HbH Disease 14 1.20
Others 0 0.00
50 - 54.9 25
Beta Thalassaemia Major 0 0.00
Beta Thalassaemia Intermedia 6 0.51
HbE-Beta Thalassaemia 4 0.34
HbH Disease 12 1.03
Others 3 0.26
55 - 59.9 17
Beta Thalassaemia Major 0 0.00
Beta Thalassaemia Intermedia 5 0.43
HbE-Beta Thalassaemia 1 0.09
HbH Disease 7 0.60
Others 4 0.34
60 - 64.9 17
Beta Thalassaemia Major 0 0.00
Beta Thalassaemia Intermedia 8 0.68
HbE-Beta Thalassaemia 2 0.17
HbH Disease 7 0.60
Others 0 0.00
Above 65 24
Beta Thalassaemia Major 0 0.00
Beta Thalassaemia Intermedia 2 0.17
HbE-Beta Thalassaemia 4 0.34
HbH Disease 17 1.45
Others 1 0.09
Total 1169 100.00
MTR Report_Part-2_PRINT_20191114_FA9.indd 251 27/11/2019 5:21 PM
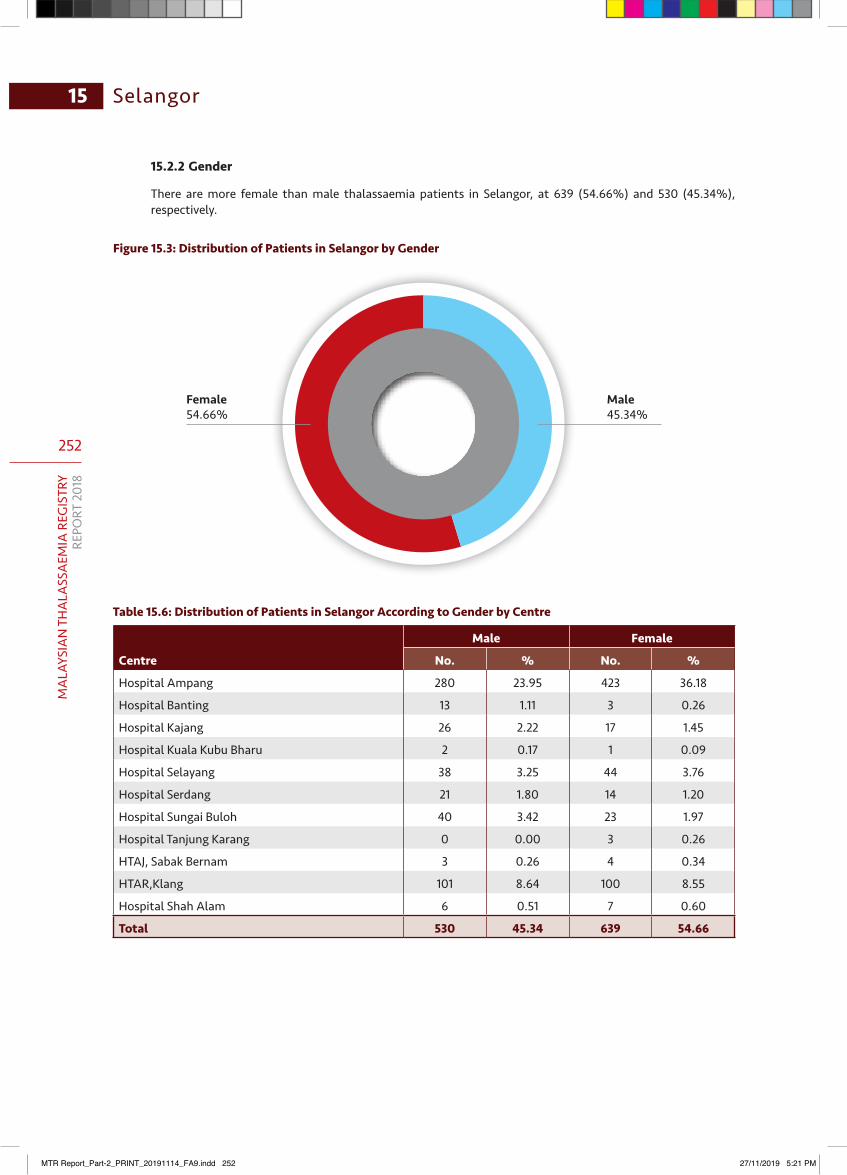
252
MA
LAYS
IAN
TH
ALA
SSA
EMIA
REG
ISTR
YRE
PORT
201
8
15 Selangor
15.2.2 Gender
There are more female than male thalassaemia patients in Selangor, at 639 (54.66%) and 530 (45.34%), respectively.
Figure 15.3: Distribution of Patients in Selangor by Gender
Female54.66%
Male45.34%
Table 15.6: Distribution of Patients in Selangor According to Gender by Centre
Centre
Male Female
No. % No. %
Hospital Ampang 280 23.95 423 36.18
Hospital Banting 13 1.11 3 0.26
Hospital Kajang 26 2.22 17 1.45
Hospital Kuala Kubu Bharu 2 0.17 1 0.09
Hospital Selayang 38 3.25 44 3.76
Hospital Serdang 21 1.80 14 1.20
Hospital Sungai Buloh 40 3.42 23 1.97
Hospital Tanjung Karang 0 0.00 3 0.26
HTAJ, Sabak Bernam 3 0.26 4 0.34
HTAR,Klang 101 8.64 100 8.55
Hospital Shah Alam 6 0.51 7 0.60
Total 530 45.34 639 54.66
MTR Report_Part-2_PRINT_20191114_FA9.indd 252 27/11/2019 5:21 PM
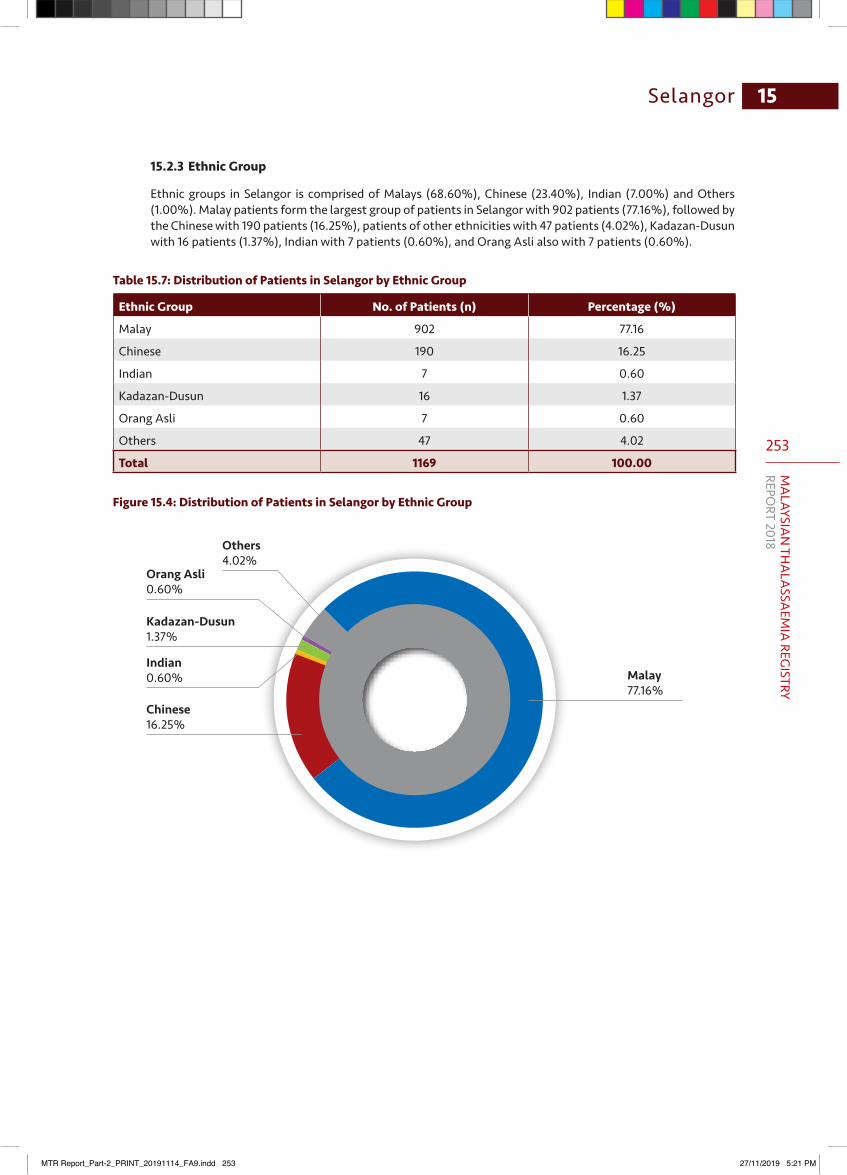
253
MA
LAYSIAN
THA
LASSA
EMIA
REGISTRY
REPORT 2018
15Selangor
15.2.3 Ethnic Group
Ethnic groups in Selangor is comprised of Malays (68.60%), Chinese (23.40%), Indian (7.00%) and Others (1.00%). Malay patients form the largest group of patients in Selangor with 902 patients (77.16%), followed by the Chinese with 190 patients (16.25%), patients of other ethnicities with 47 patients (4.02%), Kadazan-Dusun with 16 patients (1.37%), Indian with 7 patients (0.60%), and Orang Asli also with 7 patients (0.60%).
Table 15.7: Distribution of Patients in Selangor by Ethnic Group
Ethnic Group No. of Patients (n) Percentage (%)
Malay 902 77.16
Chinese 190 16.25
Indian 7 0.60
Kadazan-Dusun 16 1.37
Orang Asli 7 0.60
Others 47 4.02
Total 1169 100.00
Figure 15.4: Distribution of Patients in Selangor by Ethnic Group
Chinese16.25%
Indian0.60%
Kadazan-Dusun1.37%
Orang Asli0.60%
Others4.02%
Malay77.16%
MTR Report_Part-2_PRINT_20191114_FA9.indd 253 27/11/2019 5:21 PM
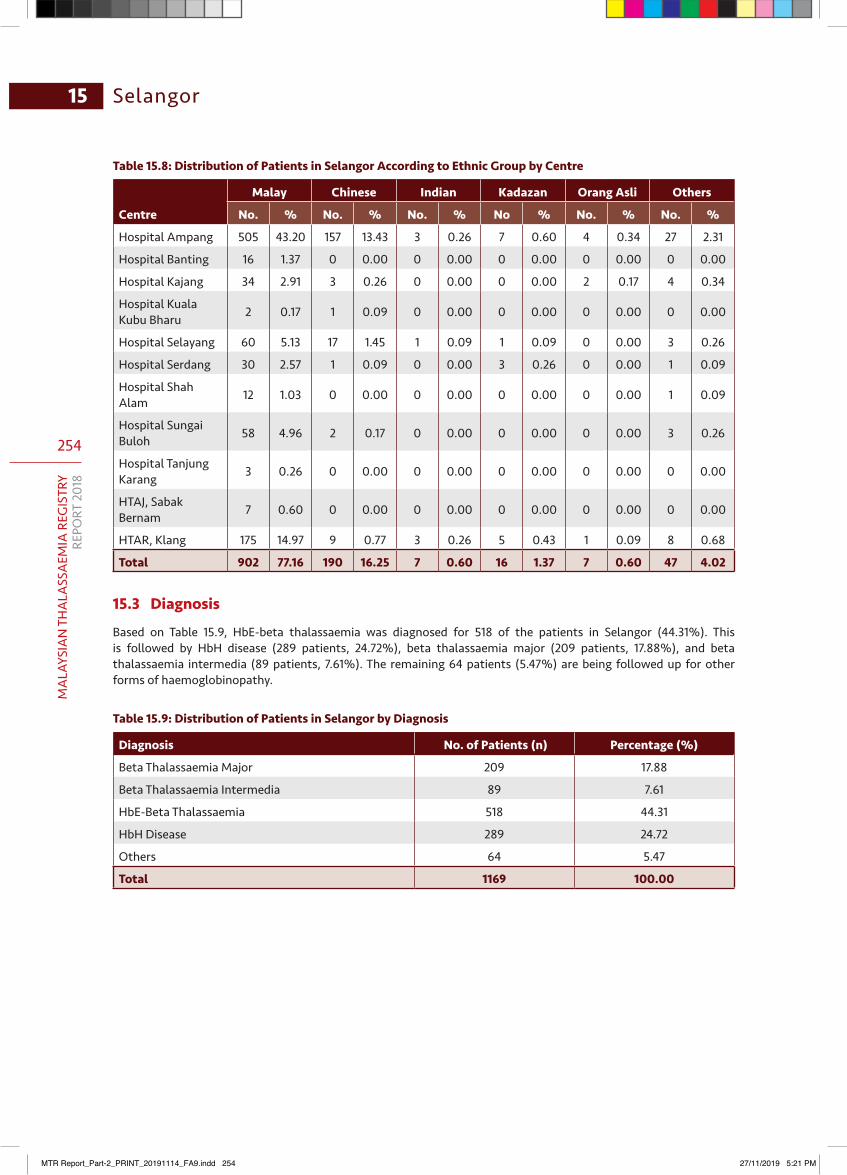
254
MA
LAYS
IAN
TH
ALA
SSA
EMIA
REG
ISTR
YRE
PORT
201
8
15 Selangor
Table 15.8: Distribution of Patients in Selangor According to Ethnic Group by Centre
Centre
Malay Chinese Indian Kadazan Orang Asli Others
No. % No. % No. % No % No. % No. %
Hospital Ampang 505 43.20 157 13.43 3 0.26 7 0.60 4 0.34 27 2.31
Hospital Banting 16 1.37 0 0.00 0 0.00 0 0.00 0 0.00 0 0.00
Hospital Kajang 34 2.91 3 0.26 0 0.00 0 0.00 2 0.17 4 0.34
Hospital Kuala Kubu Bharu 2 0.17 1 0.09 0 0.00 0 0.00 0 0.00 0 0.00
Hospital Selayang 60 5.13 17 1.45 1 0.09 1 0.09 0 0.00 3 0.26
Hospital Serdang 30 2.57 1 0.09 0 0.00 3 0.26 0 0.00 1 0.09
Hospital Shah Alam 12 1.03 0 0.00 0 0.00 0 0.00 0 0.00 1 0.09
Hospital Sungai Buloh 58 4.96 2 0.17 0 0.00 0 0.00 0 0.00 3 0.26
Hospital Tanjung Karang 3 0.26 0 0.00 0 0.00 0 0.00 0 0.00 0 0.00
HTAJ, Sabak Bernam 7 0.60 0 0.00 0 0.00 0 0.00 0 0.00 0 0.00
HTAR, Klang 175 14.97 9 0.77 3 0.26 5 0.43 1 0.09 8 0.68
Total 902 77.16 190 16.25 7 0.60 16 1.37 7 0.60 47 4.02
15.3 Diagnosis
Based on Table 15.9, HbE-beta thalassaemia was diagnosed for 518 of the patients in Selangor (44.31%). This is followed by HbH disease (289 patients, 24.72%), beta thalassaemia major (209 patients, 17.88%), and beta thalassaemia intermedia (89 patients, 7.61%). The remaining 64 patients (5.47%) are being followed up for other forms of haemoglobinopathy.
Table 15.9: Distribution of Patients in Selangor by Diagnosis
Diagnosis No. of Patients (n) Percentage (%)
Beta Thalassaemia Major 209 17.88
Beta Thalassaemia Intermedia 89 7.61
HbE-Beta Thalassaemia 518 44.31
HbH Disease 289 24.72
Others 64 5.47
Total 1169 100.00
MTR Report_Part-2_PRINT_20191114_FA9.indd 254 27/11/2019 5:21 PM
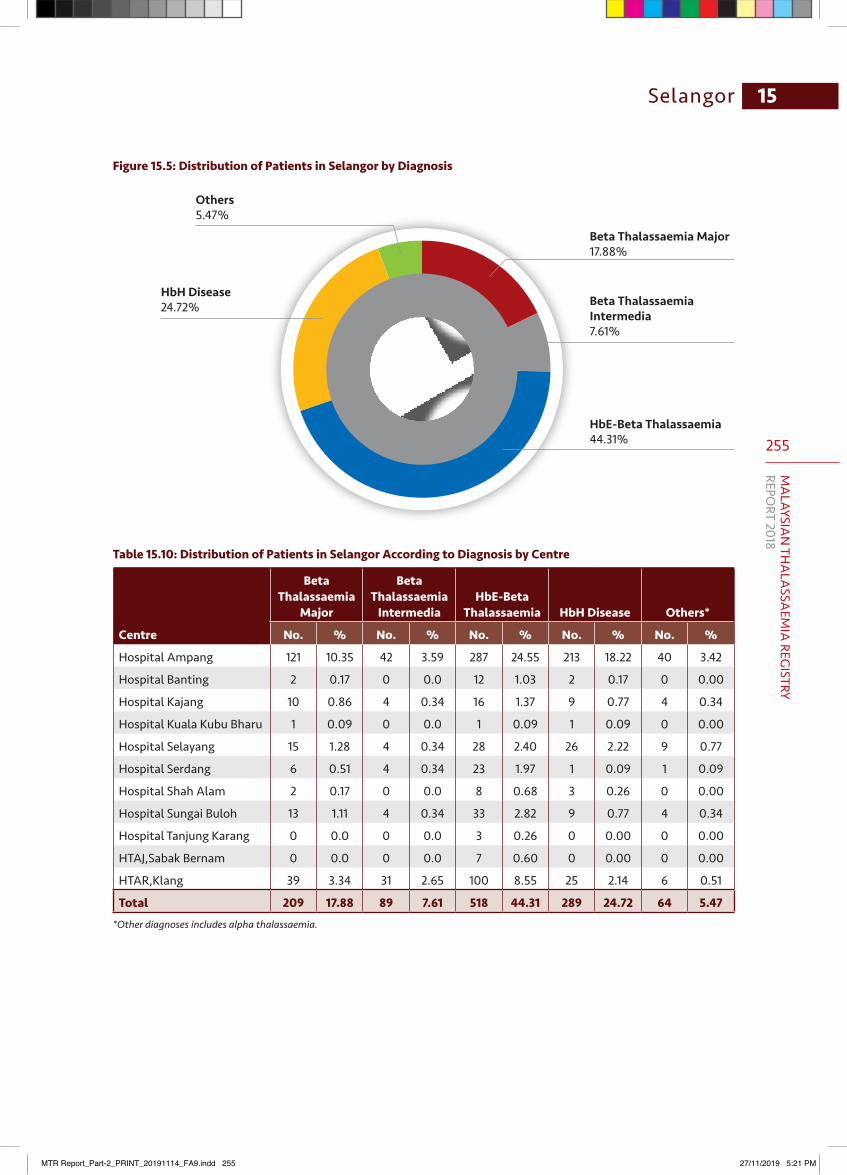
255
MA
LAYSIAN
THA
LASSA
EMIA
REGISTRY
REPORT 2018
15Selangor
Figure 15.5: Distribution of Patients in Selangor by Diagnosis
Beta Thalassaemia Major17.88%
Beta Thalassaemia Intermedia7.61%
HbE-Beta Thalassaemia44.31%
HbH Disease24.72%
Others5.47%
Table 15.10: Distribution of Patients in Selangor According to Diagnosis by Centre
Centre
Beta Thalassaemia
Major
Beta Thalassaemia
IntermediaHbE-Beta
Thalassaemia HbH Disease Others*
No. % No. % No. % No. % No. %
Hospital Ampang 121 10.35 42 3.59 287 24.55 213 18.22 40 3.42
Hospital Banting 2 0.17 0 0.0 12 1.03 2 0.17 0 0.00
Hospital Kajang 10 0.86 4 0.34 16 1.37 9 0.77 4 0.34
Hospital Kuala Kubu Bharu 1 0.09 0 0.0 1 0.09 1 0.09 0 0.00
Hospital Selayang 15 1.28 4 0.34 28 2.40 26 2.22 9 0.77
Hospital Serdang 6 0.51 4 0.34 23 1.97 1 0.09 1 0.09
Hospital Shah Alam 2 0.17 0 0.0 8 0.68 3 0.26 0 0.00
Hospital Sungai Buloh 13 1.11 4 0.34 33 2.82 9 0.77 4 0.34
Hospital Tanjung Karang 0 0.0 0 0.0 3 0.26 0 0.00 0 0.00
HTAJ,Sabak Bernam 0 0.0 0 0.0 7 0.60 0 0.00 0 0.00
HTAR,Klang 39 3.34 31 2.65 100 8.55 25 2.14 6 0.51
Total 209 17.88 89 7.61 518 44.31 289 24.72 64 5.47*Other diagnoses includes alpha thalassaemia.
MTR Report_Part-2_PRINT_20191114_FA9.indd 255 27/11/2019 5:21 PM
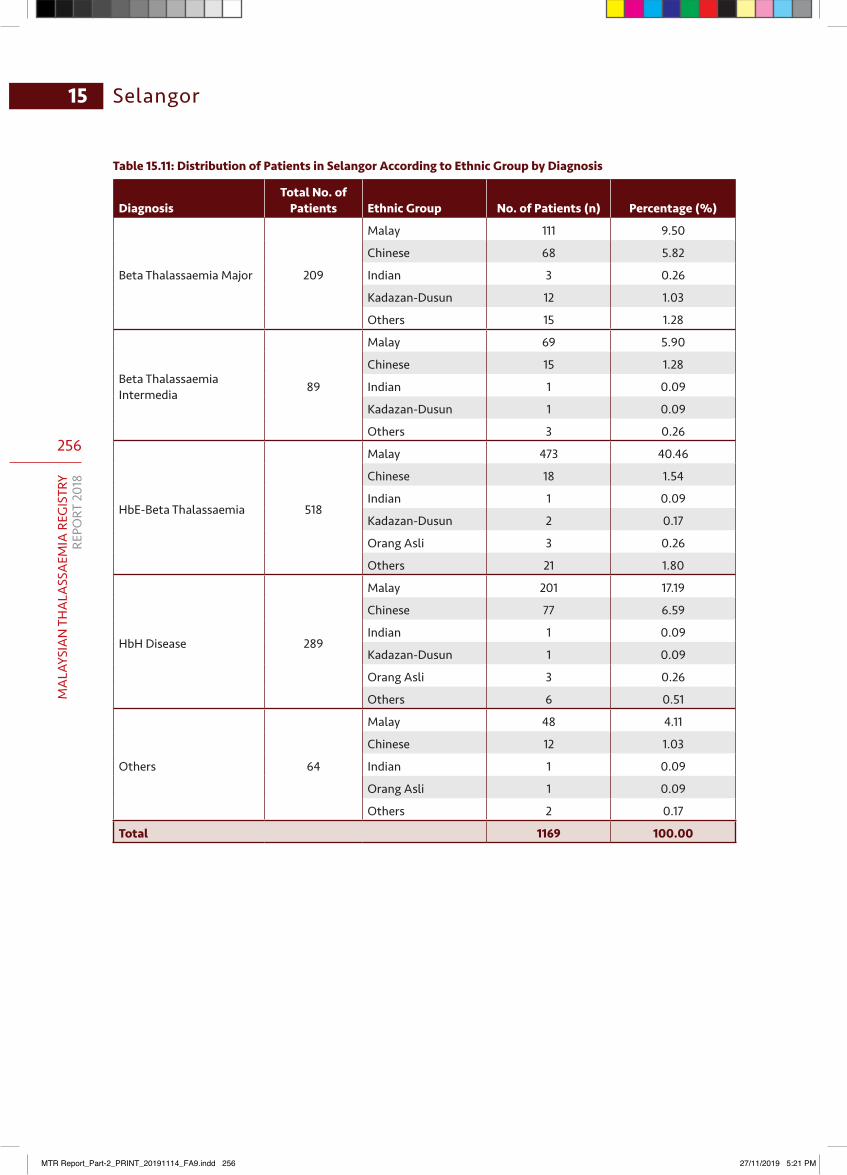
256
MA
LAYS
IAN
TH
ALA
SSA
EMIA
REG
ISTR
YRE
PORT
201
8
15 Selangor
Table 15.11: Distribution of Patients in Selangor According to Ethnic Group by Diagnosis
DiagnosisTotal No. of
Patients Ethnic Group No. of Patients (n) Percentage (%)
Beta Thalassaemia Major 209
Malay 111 9.50
Chinese 68 5.82
Indian 3 0.26
Kadazan-Dusun 12 1.03
Others 15 1.28
Beta Thalassaemia Intermedia 89
Malay 69 5.90
Chinese 15 1.28
Indian 1 0.09
Kadazan-Dusun 1 0.09
Others 3 0.26
HbE-Beta Thalassaemia 518
Malay 473 40.46
Chinese 18 1.54
Indian 1 0.09
Kadazan-Dusun 2 0.17
Orang Asli 3 0.26
Others 21 1.80
HbH Disease 289
Malay 201 17.19
Chinese 77 6.59
Indian 1 0.09
Kadazan-Dusun 1 0.09
Orang Asli 3 0.26
Others 6 0.51
Others 64
Malay 48 4.11
Chinese 12 1.03
Indian 1 0.09
Orang Asli 1 0.09
Others 2 0.17
Total 1169 100.00
MTR Report_Part-2_PRINT_20191114_FA9.indd 256 27/11/2019 5:21 PM
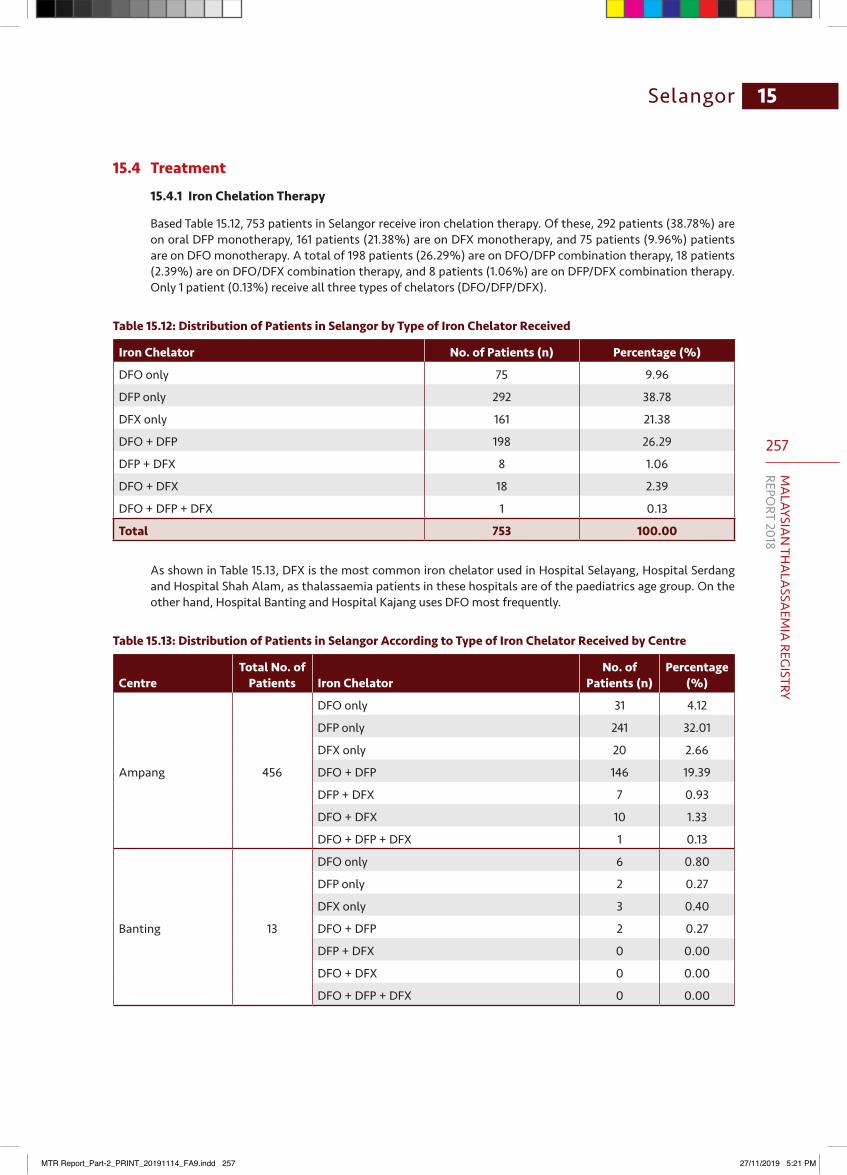
257
MA
LAYSIAN
THA
LASSA
EMIA
REGISTRY
REPORT 2018
15Selangor
15.4 Treatment
15.4.1 Iron Chelation Therapy
Based Table 15.12, 753 patients in Selangor receive iron chelation therapy. Of these, 292 patients (38.78%) are on oral DFP monotherapy, 161 patients (21.38%) are on DFX monotherapy, and 75 patients (9.96%) patients are on DFO monotherapy. A total of 198 patients (26.29%) are on DFO/DFP combination therapy, 18 patients (2.39%) are on DFO/DFX combination therapy, and 8 patients (1.06%) are on DFP/DFX combination therapy. Only 1 patient (0.13%) receive all three types of chelators (DFO/DFP/DFX).
Table 15.12: Distribution of Patients in Selangor by Type of Iron Chelator Received
Iron Chelator No. of Patients (n) Percentage (%)
DFO only 75 9.96
DFP only 292 38.78
DFX only 161 21.38
DFO + DFP 198 26.29
DFP + DFX 8 1.06
DFO + DFX 18 2.39
DFO + DFP + DFX 1 0.13
Total 753 100.00
As shown in Table 15.13, DFX is the most common iron chelator used in Hospital Selayang, Hospital Serdang and Hospital Shah Alam, as thalassaemia patients in these hospitals are of the paediatrics age group. On the other hand, Hospital Banting and Hospital Kajang uses DFO most frequently.
Table 15.13: Distribution of Patients in Selangor According to Type of Iron Chelator Received by Centre
CentreTotal No. of
Patients Iron ChelatorNo. of
Patients (n)Percentage
(%)
Ampang 456
DFO only 31 4.12
DFP only 241 32.01
DFX only 20 2.66
DFO + DFP 146 19.39
DFP + DFX 7 0.93
DFO + DFX 10 1.33
DFO + DFP + DFX 1 0.13
Banting 13
DFO only 6 0.80
DFP only 2 0.27
DFX only 3 0.40
DFO + DFP 2 0.27
DFP + DFX 0 0.00
DFO + DFX 0 0.00
DFO + DFP + DFX 0 0.00
MTR Report_Part-2_PRINT_20191114_FA9.indd 257 27/11/2019 5:21 PM

258
MA
LAYS
IAN
TH
ALA
SSA
EMIA
REG
ISTR
YRE
PORT
201
8
15 Selangor
CentreTotal No. of
Patients Iron ChelatorNo. of
Patients (n)Percentage
(%)
Kajang 22
DFO only 7 0.93
DFP only 0 0.00
DFX only 5 0.66
DFO + DFP 10 1.33
DFP + DFX 0 0.00
DFO + DFX 0 0.00
DFO + DFP + DFX 0 0.00
Kuala Kubu Bharu 3
DFO only 1 0.13
DFP only 1 0.13
DFX only 0 0.00
DFO + DFP 1 0.13
DFP + DFX 0 0.00
DFO + DFX 0 0.00
DFO + DFP + DFX 0 0.00
Selayang 37
DFO only 5 0.66
DFP only 0 0.00
DFX only 28 3.72
DFO + DFP 0 0.00
DFP + DFX 1 0.13
DFO + DFX 3 0.40
DFO + DFP + DFX 0 0.00
Serdang 25
DFO only 6 0.80
DFP only 0 0.00
DFX only 18 2.39
DFO + DFP 0 0.00
DFP + DFX 0 0.00
DFO + DFX 1 0.13
DFO + DFP + DFX 0 0.00
Shah Alam 4
DFO only 1 0.13
DFP only 0 0.00
DFX only 3 0.40
DFO + DFP 0 0.00
DFP + DFX 0 0.00
DFO + DFX 0 0.00
DFO + DFP + DFX 0 0.00
MTR Report_Part-2_PRINT_20191114_FA9.indd 258 27/11/2019 5:21 PM
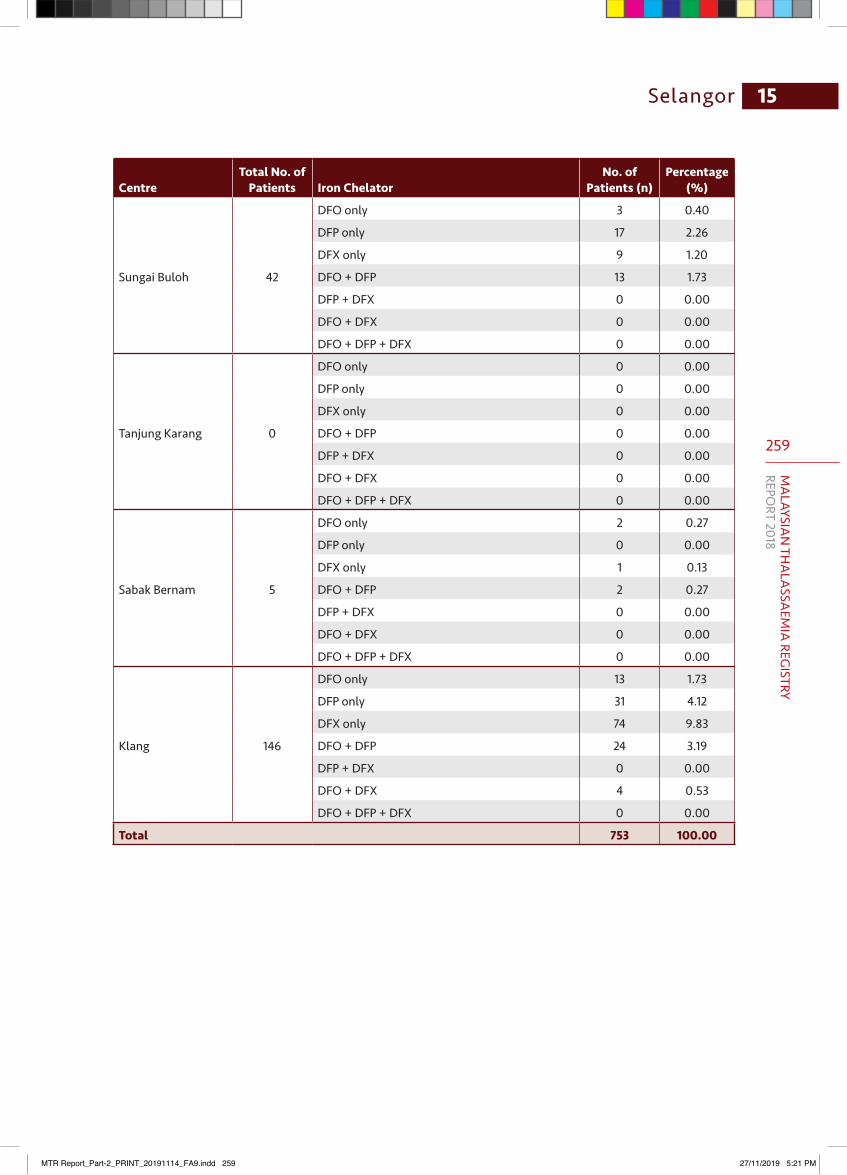
259
MA
LAYSIAN
THA
LASSA
EMIA
REGISTRY
REPORT 2018
15Selangor
CentreTotal No. of
Patients Iron ChelatorNo. of
Patients (n)Percentage
(%)
Sungai Buloh 42
DFO only 3 0.40
DFP only 17 2.26
DFX only 9 1.20
DFO + DFP 13 1.73
DFP + DFX 0 0.00
DFO + DFX 0 0.00
DFO + DFP + DFX 0 0.00
Tanjung Karang 0
DFO only 0 0.00
DFP only 0 0.00
DFX only 0 0.00
DFO + DFP 0 0.00
DFP + DFX 0 0.00
DFO + DFX 0 0.00
DFO + DFP + DFX 0 0.00
Sabak Bernam 5
DFO only 2 0.27
DFP only 0 0.00
DFX only 1 0.13
DFO + DFP 2 0.27
DFP + DFX 0 0.00
DFO + DFX 0 0.00
DFO + DFP + DFX 0 0.00
Klang 146
DFO only 13 1.73
DFP only 31 4.12
DFX only 74 9.83
DFO + DFP 24 3.19
DFP + DFX 0 0.00
DFO + DFX 4 0.53
DFO + DFP + DFX 0 0.00
Total 753 100.00
MTR Report_Part-2_PRINT_20191114_FA9.indd 259 27/11/2019 5:21 PM
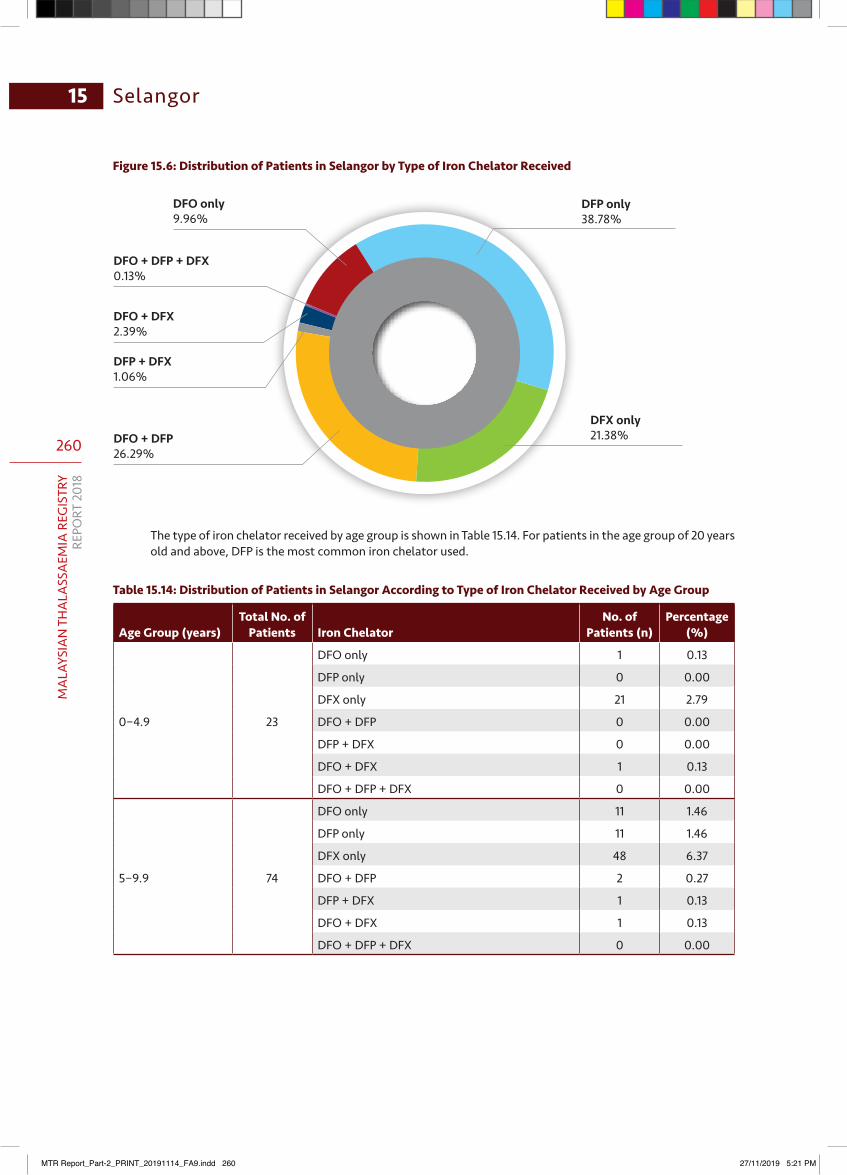
260
MA
LAYS
IAN
TH
ALA
SSA
EMIA
REG
ISTR
YRE
PORT
201
8
15 Selangor
Figure 15.6: Distribution of Patients in Selangor by Type of Iron Chelator Received
DFX only21.38%DFO + DFP
26.29%
DFP + DFX1.06%
DFO + DFX2.39%
DFO + DFP + DFX0.13%
DFO only9.96%
DFP only38.78%
The type of iron chelator received by age group is shown in Table 15.14. For patients in the age group of 20 years old and above, DFP is the most common iron chelator used.
Table 15.14: Distribution of Patients in Selangor According to Type of Iron Chelator Received by Age Group
Age Group (years)Total No. of
Patients Iron ChelatorNo. of
Patients (n)Percentage
(%)
0−4.9 23
DFO only 1 0.13
DFP only 0 0.00
DFX only 21 2.79
DFO + DFP 0 0.00
DFP + DFX 0 0.00
DFO + DFX 1 0.13
DFO + DFP + DFX 0 0.00
5−9.9 74
DFO only 11 1.46
DFP only 11 1.46
DFX only 48 6.37
DFO + DFP 2 0.27
DFP + DFX 1 0.13
DFO + DFX 1 0.13
DFO + DFP + DFX 0 0.00
MTR Report_Part-2_PRINT_20191114_FA9.indd 260 27/11/2019 5:21 PM
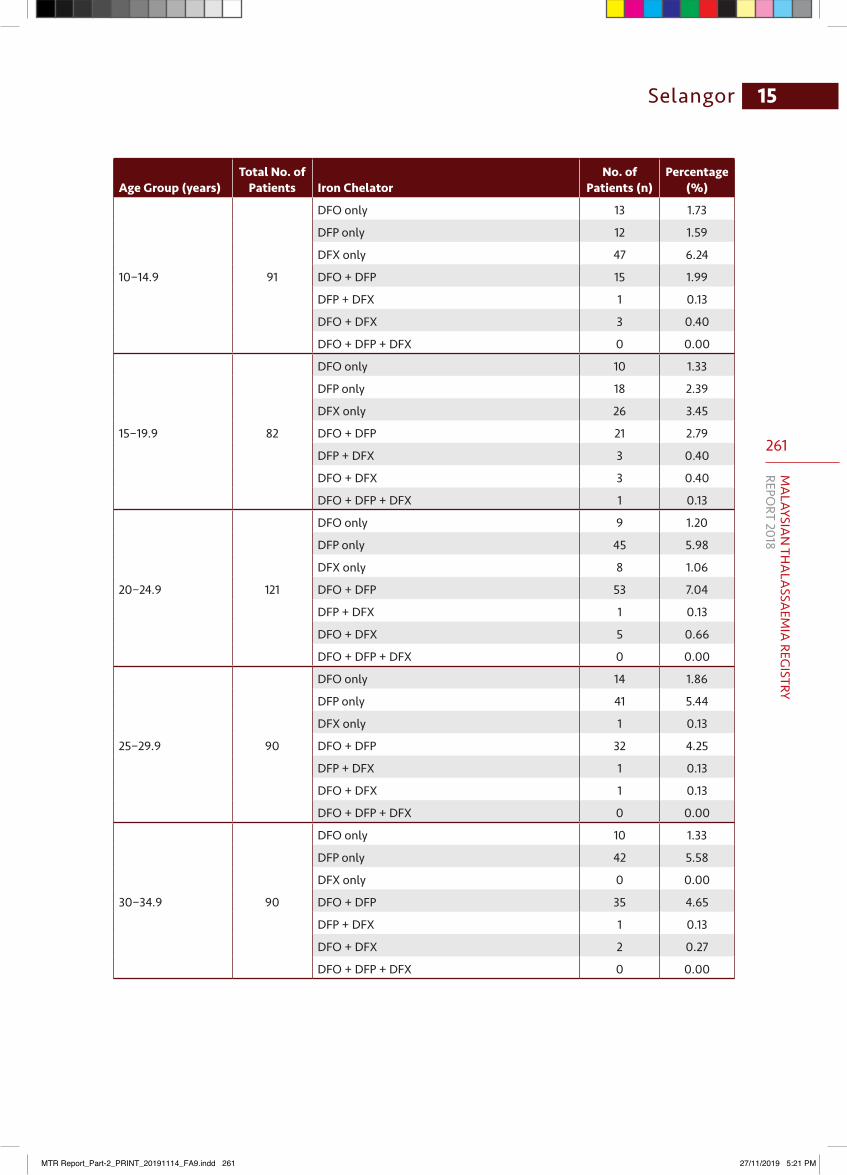
261
MA
LAYSIAN
THA
LASSA
EMIA
REGISTRY
REPORT 2018
15Selangor
Age Group (years)Total No. of
Patients Iron ChelatorNo. of
Patients (n)Percentage
(%)
10−14.9 91
DFO only 13 1.73
DFP only 12 1.59
DFX only 47 6.24
DFO + DFP 15 1.99
DFP + DFX 1 0.13
DFO + DFX 3 0.40
DFO + DFP + DFX 0 0.00
15−19.9 82
DFO only 10 1.33
DFP only 18 2.39
DFX only 26 3.45
DFO + DFP 21 2.79
DFP + DFX 3 0.40
DFO + DFX 3 0.40
DFO + DFP + DFX 1 0.13
20−24.9 121
DFO only 9 1.20
DFP only 45 5.98
DFX only 8 1.06
DFO + DFP 53 7.04
DFP + DFX 1 0.13
DFO + DFX 5 0.66
DFO + DFP + DFX 0 0.00
25−29.9 90
DFO only 14 1.86
DFP only 41 5.44
DFX only 1 0.13
DFO + DFP 32 4.25
DFP + DFX 1 0.13
DFO + DFX 1 0.13
DFO + DFP + DFX 0 0.00
30−34.9 90
DFO only 10 1.33
DFP only 42 5.58
DFX only 0 0.00
DFO + DFP 35 4.65
DFP + DFX 1 0.13
DFO + DFX 2 0.27
DFO + DFP + DFX 0 0.00
MTR Report_Part-2_PRINT_20191114_FA9.indd 261 27/11/2019 5:21 PM

262
MA
LAYS
IAN
TH
ALA
SSA
EMIA
REG
ISTR
YRE
PORT
201
8
15 Selangor
Age Group (years)Total No. of
Patients Iron ChelatorNo. of
Patients (n)Percentage
(%)
35−39.9 60
DFO only 2 0.27
DFP only 38 5.05
DFX only 1 0.13
DFO + DFP 18 2.39
DFP + DFX 0 0.00
DFO + DFX 1 0.13
DFO + DFP + DFX 0 0.00
40−44.9 49
DFO only 1 0.13
DFP only 36 4.78
DFX only 1 0.13
DFO + DFP 10 1.33
DFP + DFX 0 0.00
DFO + DFX 1 0.13
DFO + DFP + DFX 0 0.00
45−49.9 31
DFO only 3 0.40
DFP only 20 2.66
DFX only 2 0.27
DFO + DFP 6 0.80
DFP + DFX 0 0.00
DFO + DFX 0 0.00
DFO + DFP + DFX 0 0.00
50−54.9 13
DFO only 1 0.13
DFP only 6 0.80
DFX only 2 0.27
DFO + DFP 4 0.53
DFP + DFX 0 0.00
DFO + DFX 0 0.00
DFO + DFP + DFX 0 0.00
55−59.9 7
DFO only 0 0.00
DFP only 6 0.80
DFX only 0 0.00
DFO + DFP 1 0.13
DFP + DFX 0 0.00
DFO + DFX 0 0.00
DFO + DFP + DFX 0 0.00
MTR Report_Part-2_PRINT_20191114_FA9.indd 262 27/11/2019 5:21 PM
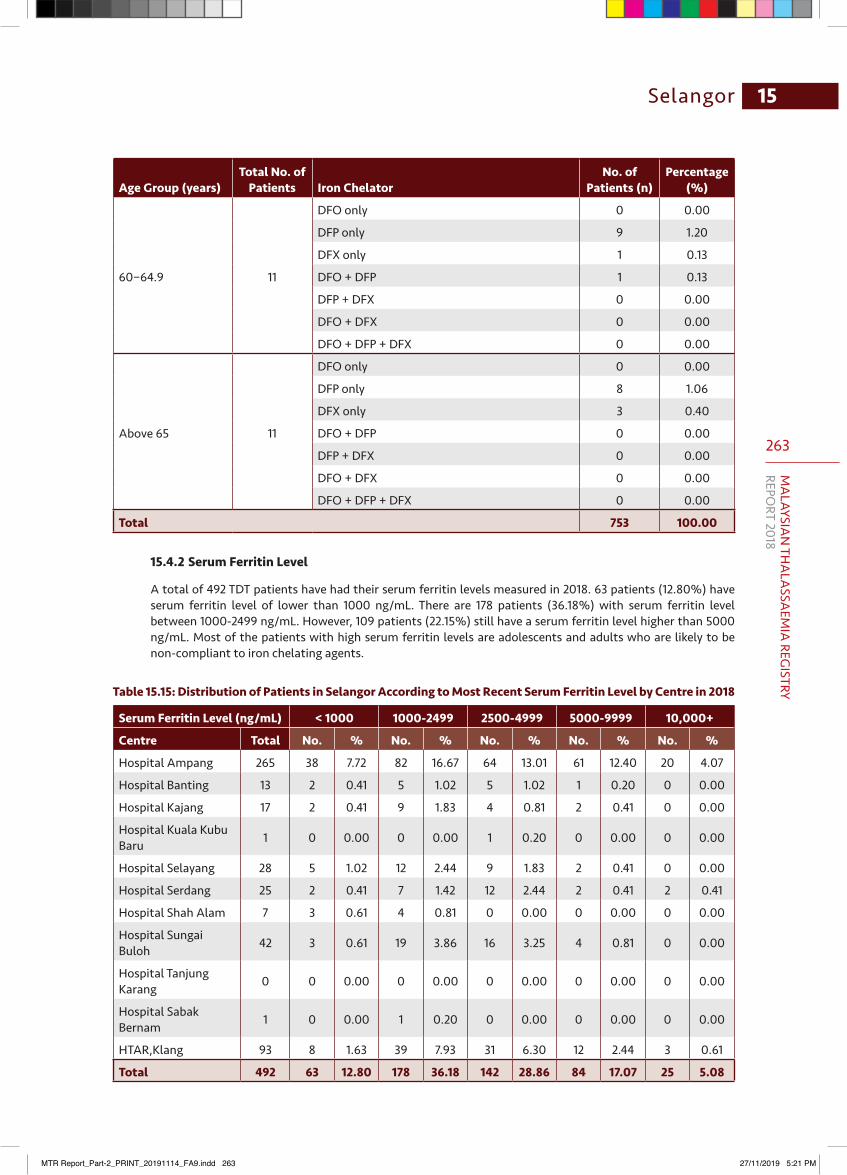
263
MA
LAYSIAN
THA
LASSA
EMIA
REGISTRY
REPORT 2018
15Selangor
Age Group (years)Total No. of
Patients Iron ChelatorNo. of
Patients (n)Percentage
(%)
60−64.9 11
DFO only 0 0.00
DFP only 9 1.20
DFX only 1 0.13
DFO + DFP 1 0.13
DFP + DFX 0 0.00
DFO + DFX 0 0.00
DFO + DFP + DFX 0 0.00
Above 65 11
DFO only 0 0.00
DFP only 8 1.06
DFX only 3 0.40
DFO + DFP 0 0.00
DFP + DFX 0 0.00
DFO + DFX 0 0.00
DFO + DFP + DFX 0 0.00
Total 753 100.00
15.4.2 Serum Ferritin Level
A total of 492 TDT patients have had their serum ferritin levels measured in 2018. 63 patients (12.80%) have serum ferritin level of lower than 1000 ng/mL. There are 178 patients (36.18%) with serum ferritin level between 1000-2499 ng/mL. However, 109 patients (22.15%) still have a serum ferritin level higher than 5000 ng/mL. Most of the patients with high serum ferritin levels are adolescents and adults who are likely to be non-compliant to iron chelating agents.
Table 15.15: Distribution of Patients in Selangor According to Most Recent Serum Ferritin Level by Centre in 2018
Serum Ferritin Level (ng/mL) < 1000 1000-2499 2500-4999 5000-9999 10,000+
Centre Total No. % No. % No. % No. % No. %
Hospital Ampang 265 38 7.72 82 16.67 64 13.01 61 12.40 20 4.07
Hospital Banting 13 2 0.41 5 1.02 5 1.02 1 0.20 0 0.00
Hospital Kajang 17 2 0.41 9 1.83 4 0.81 2 0.41 0 0.00
Hospital Kuala Kubu Baru 1 0 0.00 0 0.00 1 0.20 0 0.00 0 0.00
Hospital Selayang 28 5 1.02 12 2.44 9 1.83 2 0.41 0 0.00
Hospital Serdang 25 2 0.41 7 1.42 12 2.44 2 0.41 2 0.41
Hospital Shah Alam 7 3 0.61 4 0.81 0 0.00 0 0.00 0 0.00
Hospital Sungai Buloh 42 3 0.61 19 3.86 16 3.25 4 0.81 0 0.00
Hospital Tanjung Karang 0 0 0.00 0 0.00 0 0.00 0 0.00 0 0.00
Hospital Sabak Bernam 1 0 0.00 1 0.20 0 0.00 0 0.00 0 0.00
HTAR,Klang 93 8 1.63 39 7.93 31 6.30 12 2.44 3 0.61
Total 492 63 12.80 178 36.18 142 28.86 84 17.07 25 5.08
MTR Report_Part-2_PRINT_20191114_FA9.indd 263 27/11/2019 5:21 PM
264
MA
LAYS
IAN
TH
ALA
SSA
EMIA
REG
ISTR
YRE
PORT
201
8
15 Selangor
15.5 Observation and Comment
Male to female patients ratio in Selangor was near 1:1. By ethnicity, Malay patients form the largest number of patients in Selangor. Patients age group of 20 to 24.9 years has the highest number of patients. Most adult patients are treated in Hospital Ampang, as it is the country’s referral haematology centre. One third of patients in Selangor are in the paediatric age group, indicating poor awareness on thalassaemia inheritance.
Most patients were diagnosed with HbE-beta thalassaemia. Other haemoglobinopathies include beta thalassaemia major, HbH disease, beta thalassaemia intermedia and more. All these diagnoses were based on Hb and DNA analysis for identification of specific mutations.
A significant group of patients receiving iron chelation therapy in Selangor are on DFP monotherapy, and the most common combination therapy is DFO/DFP. Reinforcement of compliance to iron chelators is important to prevent iron overload complications, such as cardiac complications.
Many TDT patients in Selangor have serum ferritin level between 1000-2500 ng/mL. Most NTDT patients’ serum ferritin levels are not regularly monitored and their appointments are at longer intervals compared to TDT patients. Furthermore, there was a period of 3-4 months whereby the test was not offered in the hospital due to budget constraints. Although high ferritin level represents iron overload, this positive acute phase proteins may be increased during acute and chronic disorders. Therefore, the health status of thalassaemia patients may also influence the serum ferritin level.
As a conclusion, in order to prevent thalassaemia from becoming a disease burden to the country, more thalassaemia screening and public education regarding thalassaemia should be emphasised through various mediums, such as campaigns and social media. Thus, awareness on this genetic disease will bridge the knowledge to the society.
15.5.1 Recommendations
1. To have clear definition for diagnosis should be implemented and standardised among all centres throughout the country.
2. To have clear and standardised definition of “lost to follow-up” status, i.e. either one year, two years, etc.3. To clearly define TDT and NTDT and subsequently include it in the data that needs to be filled up in the registry.4. More frequent visits to peripheral hospitals to better update data.
MTR Report_Part-2_PRINT_20191114_FA9.indd 264 27/11/2019 5:21 PM
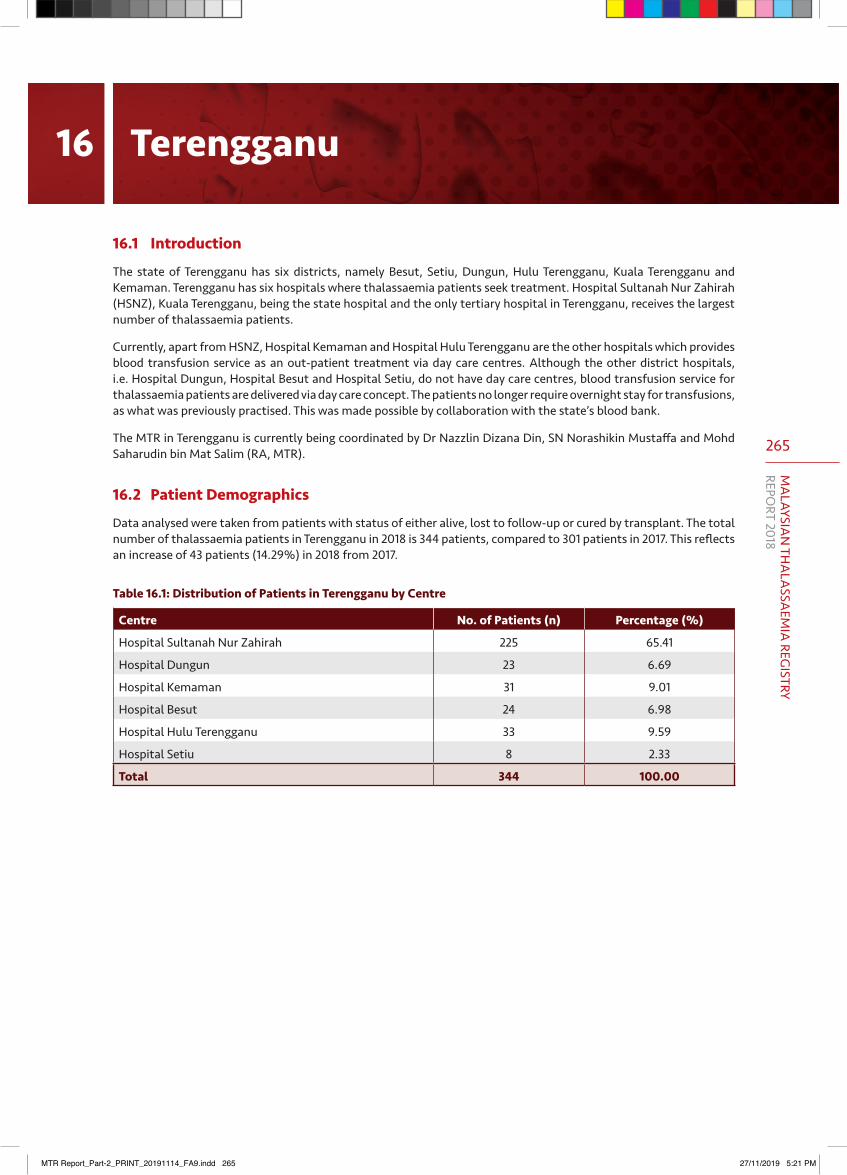
265
MA
LAYSIAN
THA
LASSA
EMIA
REGISTRY
REPORT 2018
16.1 Introduction
The state of Terengganu has six districts, namely Besut, Setiu, Dungun, Hulu Terengganu, Kuala Terengganu and Kemaman. Terengganu has six hospitals where thalassaemia patients seek treatment. Hospital Sultanah Nur Zahirah (HSNZ), Kuala Terengganu, being the state hospital and the only tertiary hospital in Terengganu, receives the largest number of thalassaemia patients.
Currently, apart from HSNZ, Hospital Kemaman and Hospital Hulu Terengganu are the other hospitals which provides blood transfusion service as an out-patient treatment via day care centres. Although the other district hospitals, i.e. Hospital Dungun, Hospital Besut and Hospital Setiu, do not have day care centres, blood transfusion service for thalassaemia patients are delivered via day care concept. The patients no longer require overnight stay for transfusions, as what was previously practised. This was made possible by collaboration with the state’s blood bank.
The MTR in Terengganu is currently being coordinated by Dr Nazzlin Dizana Din, SN Norashikin Mustaffa and Mohd Saharudin bin Mat Salim (RA, MTR).
16.2 Patient Demographics
Data analysed were taken from patients with status of either alive, lost to follow-up or cured by transplant. The total number of thalassaemia patients in Terengganu in 2018 is 344 patients, compared to 301 patients in 2017. This reflects an increase of 43 patients (14.29%) in 2018 from 2017.
Table 16.1: Distribution of Patients in Terengganu by Centre
Centre No. of Patients (n) Percentage (%)
Hospital Sultanah Nur Zahirah 225 65.41
Hospital Dungun 23 6.69
Hospital Kemaman 31 9.01
Hospital Besut 24 6.98
Hospital Hulu Terengganu 33 9.59
Hospital Setiu 8 2.33
Total 344 100.00
16 Terengganu
MTR Report_Part-2_PRINT_20191114_FA9.indd 265 27/11/2019 5:21 PM
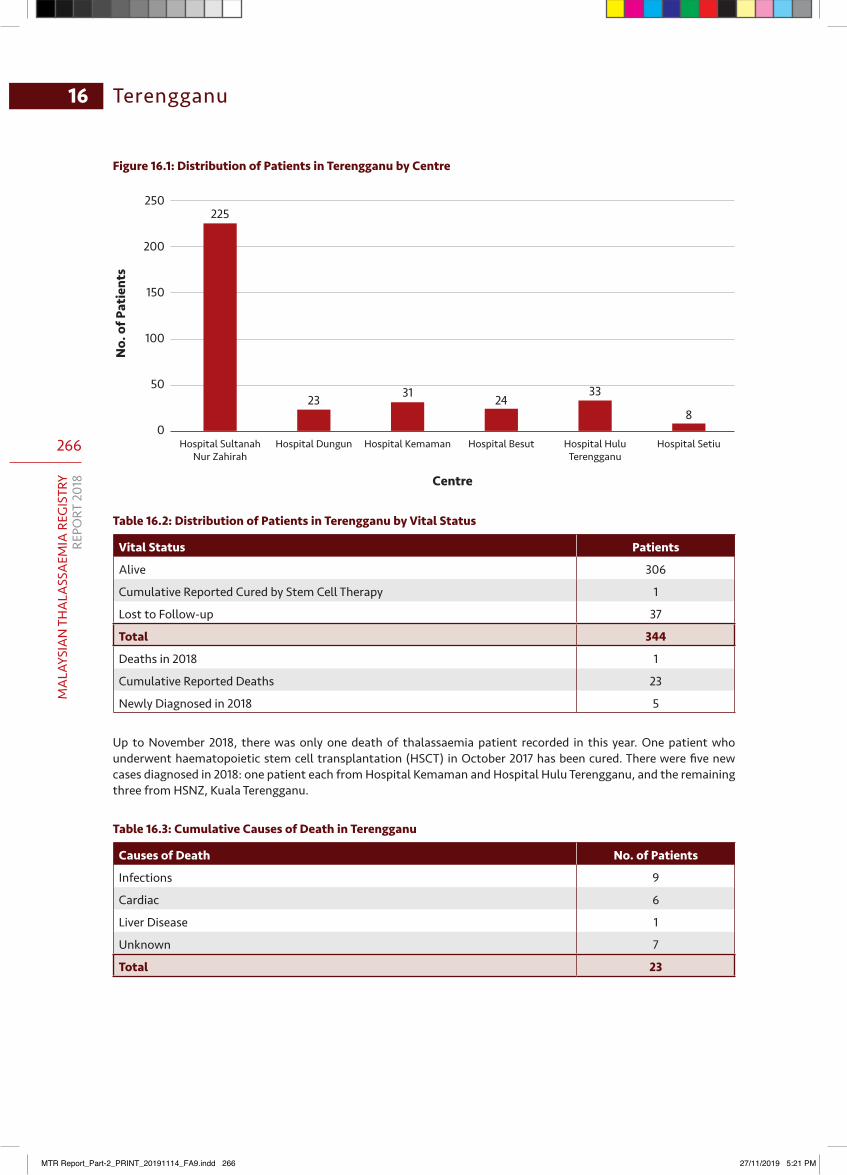
266
MA
LAYS
IAN
TH
ALA
SSA
EMIA
REG
ISTR
YRE
PORT
201
8
16 Terengganu
250
200
150
100
50
0
Centre
No.
of P
atie
nts
Hospital Sultanah Nur Zahirah
Hospital Dungun Hospital Kemaman Hospital Besut Hospital Hulu Terengganu
Hospital Setiu
225
238
332431
Figure 16.1: Distribution of Patients in Terengganu by Centre
Table 16.2: Distribution of Patients in Terengganu by Vital Status
Vital Status Patients
Alive 306
Cumulative Reported Cured by Stem Cell Therapy 1
Lost to Follow-up 37
Total 344
Deaths in 2018 1
Cumulative Reported Deaths 23
Newly Diagnosed in 2018 5
Up to November 2018, there was only one death of thalassaemia patient recorded in this year. One patient who underwent haematopoietic stem cell transplantation (HSCT) in October 2017 has been cured. There were five new cases diagnosed in 2018: one patient each from Hospital Kemaman and Hospital Hulu Terengganu, and the remaining three from HSNZ, Kuala Terengganu.
Table 16.3: Cumulative Causes of Death in Terengganu
Causes of Death No. of Patients
Infections 9
Cardiac 6
Liver Disease 1
Unknown 7
Total 23
MTR Report_Part-2_PRINT_20191114_FA9.indd 266 27/11/2019 5:21 PM
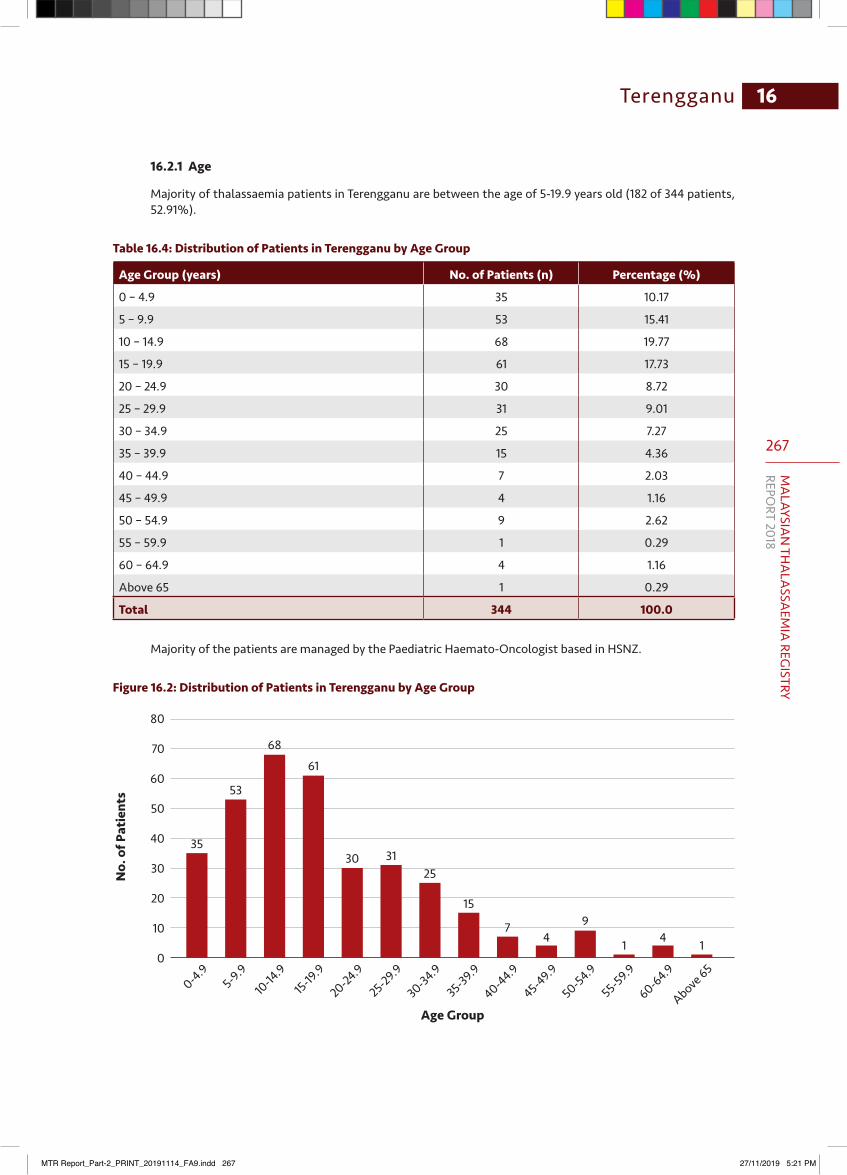
267
MA
LAYSIAN
THA
LASSA
EMIA
REGISTRY
REPORT 2018
16Terengganu
16.2.1 Age
Majority of thalassaemia patients in Terengganu are between the age of 5-19.9 years old (182 of 344 patients, 52.91%).
Table 16.4: Distribution of Patients in Terengganu by Age Group
Age Group (years) No. of Patients (n) Percentage (%)
0 – 4.9 35 10.17
5 – 9.9 53 15.41
10 – 14.9 68 19.77
15 – 19.9 61 17.73
20 – 24.9 30 8.72
25 – 29.9 31 9.01
30 – 34.9 25 7.27
35 – 39.9 15 4.36
40 – 44.9 7 2.03
45 – 49.9 4 1.16
50 – 54.9 9 2.62
55 – 59.9 1 0.29
60 – 64.9 4 1.16
Above 65 1 0.29
Total 344 100.0
Majority of the patients are managed by the Paediatric Haemato-Oncologist based in HSNZ.
Figure 16.2: Distribution of Patients in Terengganu by Age Group
80
70
60
50
40
30
20
10
0
Age Group
No.
of P
atie
nts
0-4.95-9.9
10-14
.915-19
.9
20-24.9
25-29.9
30-34.9
35-39.9
40-44.9
45-49.9
50-54.9
55-59.9
60-64.9
Above 65
35
53
6861
30 3125
15
74
9
1 4 1
MTR Report_Part-2_PRINT_20191114_FA9.indd 267 27/11/2019 5:21 PM
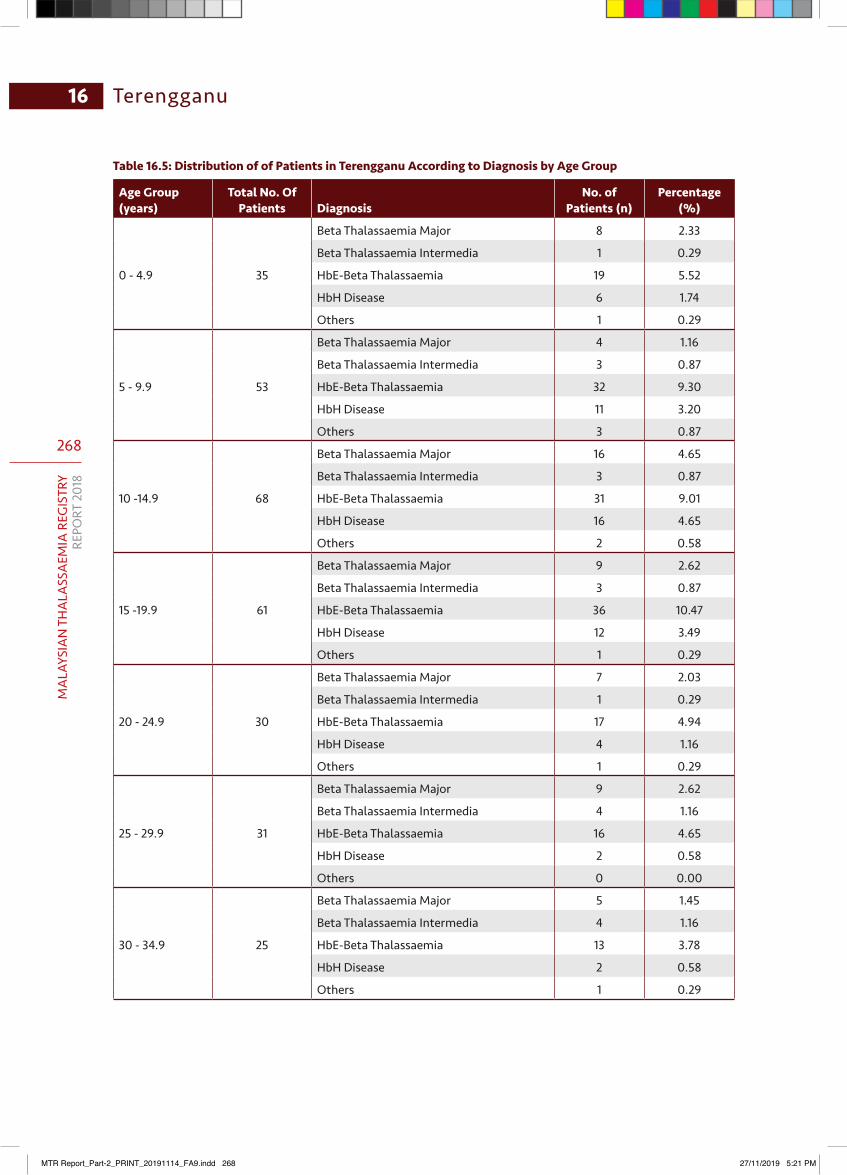
268
MA
LAYS
IAN
TH
ALA
SSA
EMIA
REG
ISTR
YRE
PORT
201
8
16 Terengganu
Table 16.5: Distribution of of Patients in Terengganu According to Diagnosis by Age Group
Age Group (years)
Total No. Of Patients Diagnosis
No. of Patients (n)
Percentage (%)
0 - 4.9 35
Beta Thalassaemia Major 8 2.33
Beta Thalassaemia Intermedia 1 0.29
HbE-Beta Thalassaemia 19 5.52
HbH Disease 6 1.74
Others 1 0.29
5 - 9.9 53
Beta Thalassaemia Major 4 1.16
Beta Thalassaemia Intermedia 3 0.87
HbE-Beta Thalassaemia 32 9.30
HbH Disease 11 3.20
Others 3 0.87
10 -14.9 68
Beta Thalassaemia Major 16 4.65
Beta Thalassaemia Intermedia 3 0.87
HbE-Beta Thalassaemia 31 9.01
HbH Disease 16 4.65
Others 2 0.58
15 -19.9 61
Beta Thalassaemia Major 9 2.62
Beta Thalassaemia Intermedia 3 0.87
HbE-Beta Thalassaemia 36 10.47
HbH Disease 12 3.49
Others 1 0.29
20 - 24.9 30
Beta Thalassaemia Major 7 2.03
Beta Thalassaemia Intermedia 1 0.29
HbE-Beta Thalassaemia 17 4.94
HbH Disease 4 1.16
Others 1 0.29
25 - 29.9 31
Beta Thalassaemia Major 9 2.62
Beta Thalassaemia Intermedia 4 1.16
HbE-Beta Thalassaemia 16 4.65
HbH Disease 2 0.58
Others 0 0.00
30 - 34.9 25
Beta Thalassaemia Major 5 1.45
Beta Thalassaemia Intermedia 4 1.16
HbE-Beta Thalassaemia 13 3.78
HbH Disease 2 0.58
Others 1 0.29
MTR Report_Part-2_PRINT_20191114_FA9.indd 268 27/11/2019 5:21 PM

269
MA
LAYSIAN
THA
LASSA
EMIA
REGISTRY
REPORT 2018
16Terengganu
Age Group (years)
Total No. Of Patients Diagnosis
No. of Patients (n)
Percentage (%)
35 - 39.9 15
Beta Thalassaemia Major 1 0.29
Beta Thalassaemia Intermedia 3 0.87
HbE-Beta Thalassaemia 11 3.20
HbH Disease 0 0.00
Others 0 0.00
40 - 44.9 7
Beta Thalassaemia Major 1 0.29
Beta Thalassaemia Intermedia 2 0.58
HbE-Beta Thalassaemia 2 0.58
HbH Disease 2 0.58
Others 0 0.00
45 - 49.9 4
Beta Thalassaemia Major 1 0.29
Beta Thalassaemia Intermedia 2 0.58
HbE-Beta Thalassaemia 0 0.00
HbH Disease 1 0.29
Others 0 0.00
50 - 54.9 9
Beta Thalassaemia Major 1 0.29
Beta Thalassaemia Intermedia 4 1.16
HbE-Beta Thalassaemia 2 0.58
HbH Disease 2 0.58
Others 0 0.00
55 - 59.9 1
Beta Thalassaemia Major 1 0.29
Beta Thalassaemia Intermedia 0 0.00
HbE-Beta Thalassaemia 0 0.00
HbH Disease 0 0.00
Others 0 0.00
60 - 64.9 4
Beta Thalassaemia Major 0 0.00
Beta Thalassaemia Intermedia 1 0.29
HbE-Beta Thalassaemia 1 0.29
HbH Disease 2 0.58
Others 0 0.00
Above 65 1
Beta Thalassaemia Major 0 0.00
Beta Thalassaemia Intermedia 0 0.00
HbE-Beta Thalassaemia 0 0.00
HbH Disease 1 0.29
Others 0 0.00
Total 344 100.0
MTR Report_Part-2_PRINT_20191114_FA9.indd 269 27/11/2019 5:21 PM
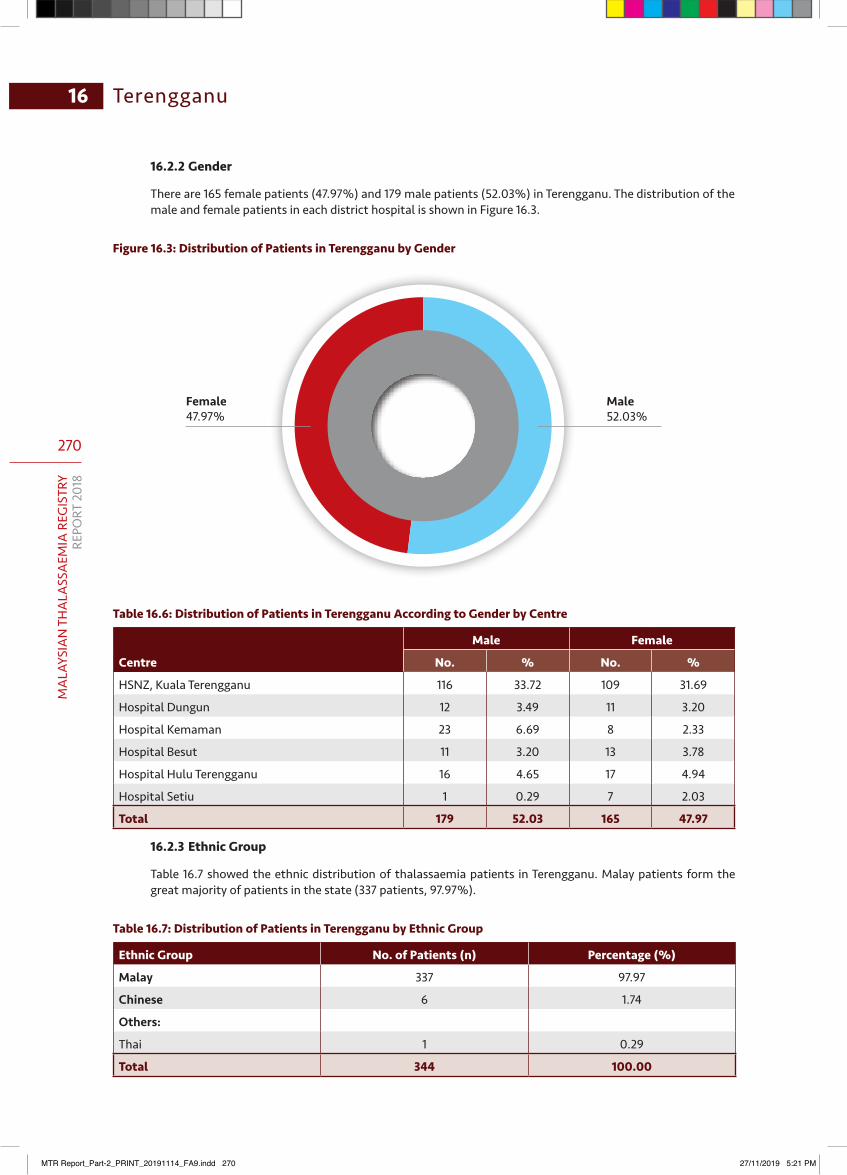
270
MA
LAYS
IAN
TH
ALA
SSA
EMIA
REG
ISTR
YRE
PORT
201
8
16 Terengganu
16.2.2 Gender
There are 165 female patients (47.97%) and 179 male patients (52.03%) in Terengganu. The distribution of the male and female patients in each district hospital is shown in Figure 16.3.
Figure 16.3: Distribution of Patients in Terengganu by Gender
Female47.97%
Male52.03%
Table 16.6: Distribution of Patients in Terengganu According to Gender by Centre
Centre
Male Female
No. % No. %
HSNZ, Kuala Terengganu 116 33.72 109 31.69
Hospital Dungun 12 3.49 11 3.20
Hospital Kemaman 23 6.69 8 2.33
Hospital Besut 11 3.20 13 3.78
Hospital Hulu Terengganu 16 4.65 17 4.94
Hospital Setiu 1 0.29 7 2.03
Total 179 52.03 165 47.97
16.2.3 Ethnic Group
Table 16.7 showed the ethnic distribution of thalassaemia patients in Terengganu. Malay patients form the great majority of patients in the state (337 patients, 97.97%).
Table 16.7: Distribution of Patients in Terengganu by Ethnic Group
Ethnic Group No. of Patients (n) Percentage (%)
Malay 337 97.97
Chinese 6 1.74
Others:
Thai 1 0.29
Total 344 100.00
MTR Report_Part-2_PRINT_20191114_FA9.indd 270 27/11/2019 5:21 PM
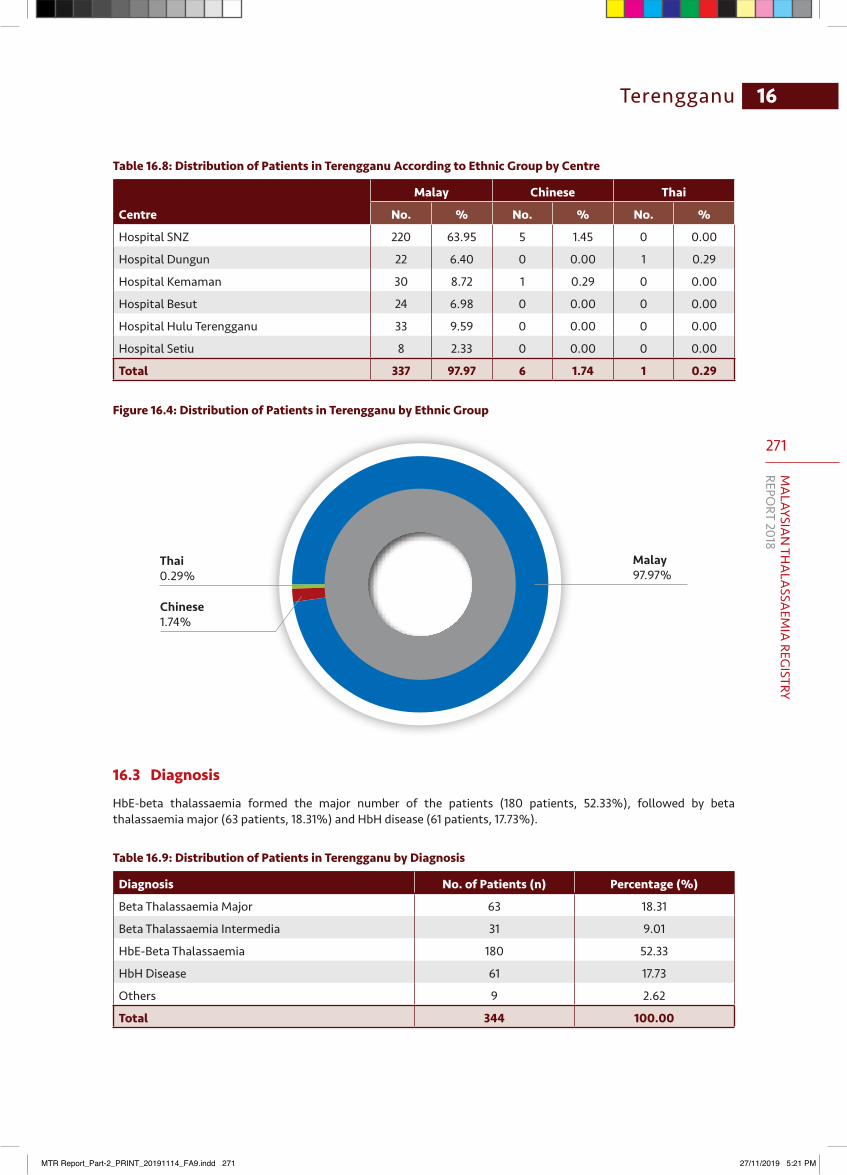
271
MA
LAYSIAN
THA
LASSA
EMIA
REGISTRY
REPORT 2018
16Terengganu
Table 16.8: Distribution of Patients in Terengganu According to Ethnic Group by Centre
Centre
Malay Chinese Thai
No. % No. % No. %
Hospital SNZ 220 63.95 5 1.45 0 0.00
Hospital Dungun 22 6.40 0 0.00 1 0.29
Hospital Kemaman 30 8.72 1 0.29 0 0.00
Hospital Besut 24 6.98 0 0.00 0 0.00
Hospital Hulu Terengganu 33 9.59 0 0.00 0 0.00
Hospital Setiu 8 2.33 0 0.00 0 0.00
Total 337 97.97 6 1.74 1 0.29
Figure 16.4: Distribution of Patients in Terengganu by Ethnic Group
Chinese1.74%
Thai0.29%
Malay97.97%
16.3 Diagnosis
HbE-beta thalassaemia formed the major number of the patients (180 patients, 52.33%), followed by beta thalassaemia major (63 patients, 18.31%) and HbH disease (61 patients, 17.73%).
Table 16.9: Distribution of Patients in Terengganu by Diagnosis
Diagnosis No. of Patients (n) Percentage (%)
Beta Thalassaemia Major 63 18.31
Beta Thalassaemia Intermedia 31 9.01
HbE-Beta Thalassaemia 180 52.33
HbH Disease 61 17.73
Others 9 2.62
Total 344 100.00
MTR Report_Part-2_PRINT_20191114_FA9.indd 271 27/11/2019 5:21 PM
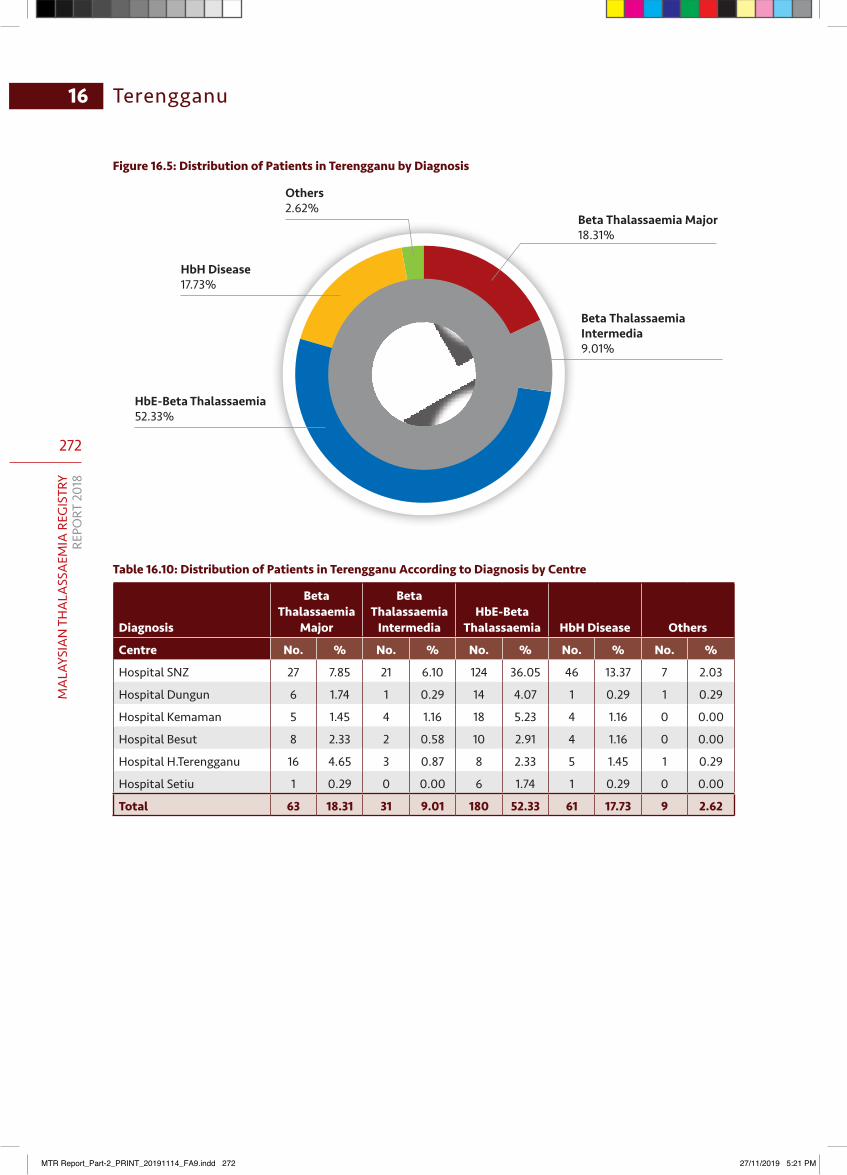
272
MA
LAYS
IAN
TH
ALA
SSA
EMIA
REG
ISTR
YRE
PORT
201
8
16 Terengganu
Figure 16.5: Distribution of Patients in Terengganu by Diagnosis
Beta Thalassaemia Major18.31%
Beta Thalassaemia Intermedia9.01%
HbH Disease17.73%
HbE-Beta Thalassaemia52.33%
Others2.62%
Table 16.10: Distribution of Patients in Terengganu According to Diagnosis by Centre
Diagnosis
Beta Thalassaemia
Major
Beta Thalassaemia
IntermediaHbE-Beta
Thalassaemia HbH Disease Others
Centre No. % No. % No. % No. % No. %
Hospital SNZ 27 7.85 21 6.10 124 36.05 46 13.37 7 2.03
Hospital Dungun 6 1.74 1 0.29 14 4.07 1 0.29 1 0.29
Hospital Kemaman 5 1.45 4 1.16 18 5.23 4 1.16 0 0.00
Hospital Besut 8 2.33 2 0.58 10 2.91 4 1.16 0 0.00
Hospital H.Terengganu 16 4.65 3 0.87 8 2.33 5 1.45 1 0.29
Hospital Setiu 1 0.29 0 0.00 6 1.74 1 0.29 0 0.00
Total 63 18.31 31 9.01 180 52.33 61 17.73 9 2.62
MTR Report_Part-2_PRINT_20191114_FA9.indd 272 27/11/2019 5:21 PM
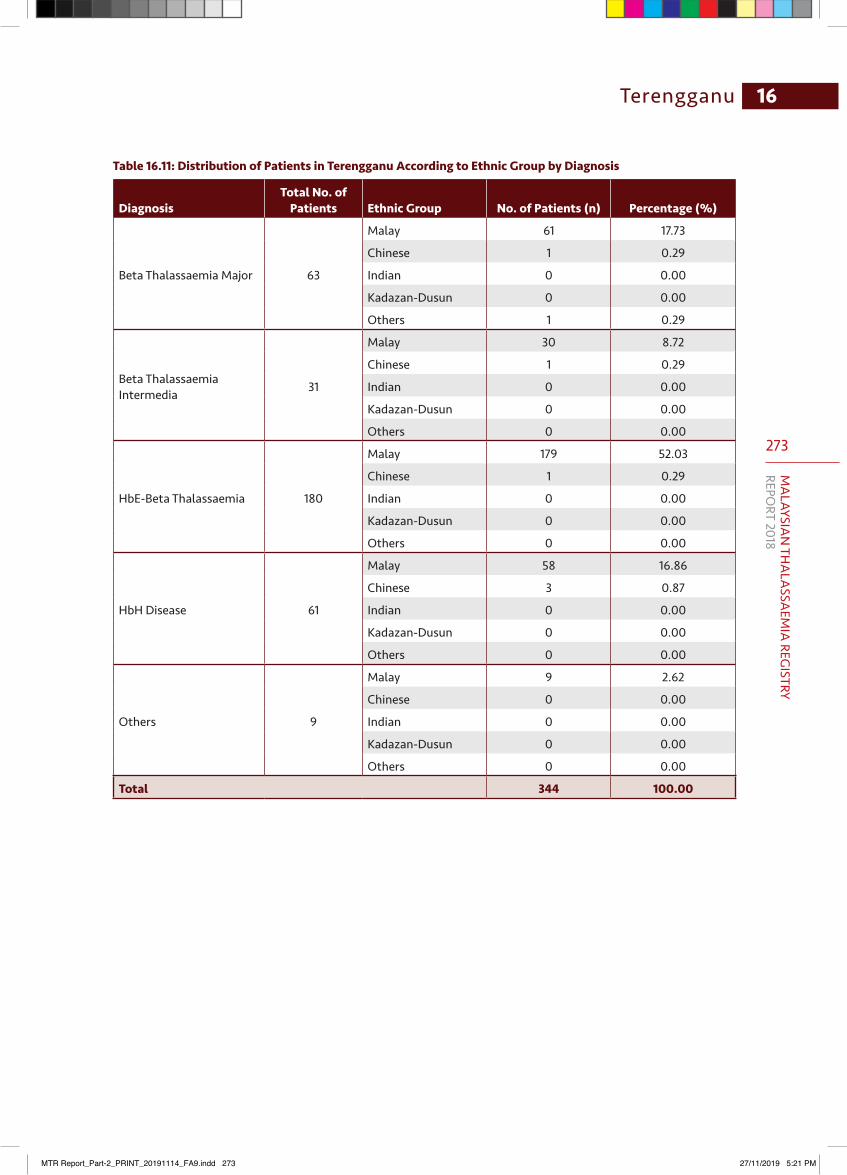
273
MA
LAYSIAN
THA
LASSA
EMIA
REGISTRY
REPORT 2018
16Terengganu
Table 16.11: Distribution of Patients in Terengganu According to Ethnic Group by Diagnosis
DiagnosisTotal No. of
Patients Ethnic Group No. of Patients (n) Percentage (%)
Beta Thalassaemia Major 63
Malay 61 17.73
Chinese 1 0.29
Indian 0 0.00
Kadazan-Dusun 0 0.00
Others 1 0.29
Beta Thalassaemia Intermedia 31
Malay 30 8.72
Chinese 1 0.29
Indian 0 0.00
Kadazan-Dusun 0 0.00
Others 0 0.00
HbE-Beta Thalassaemia 180
Malay 179 52.03
Chinese 1 0.29
Indian 0 0.00
Kadazan-Dusun 0 0.00
Others 0 0.00
HbH Disease 61
Malay 58 16.86
Chinese 3 0.87
Indian 0 0.00
Kadazan-Dusun 0 0.00
Others 0 0.00
Others 9
Malay 9 2.62
Chinese 0 0.00
Indian 0 0.00
Kadazan-Dusun 0 0.00
Others 0 0.00
Total 344 100.00
MTR Report_Part-2_PRINT_20191114_FA9.indd 273 27/11/2019 5:21 PM
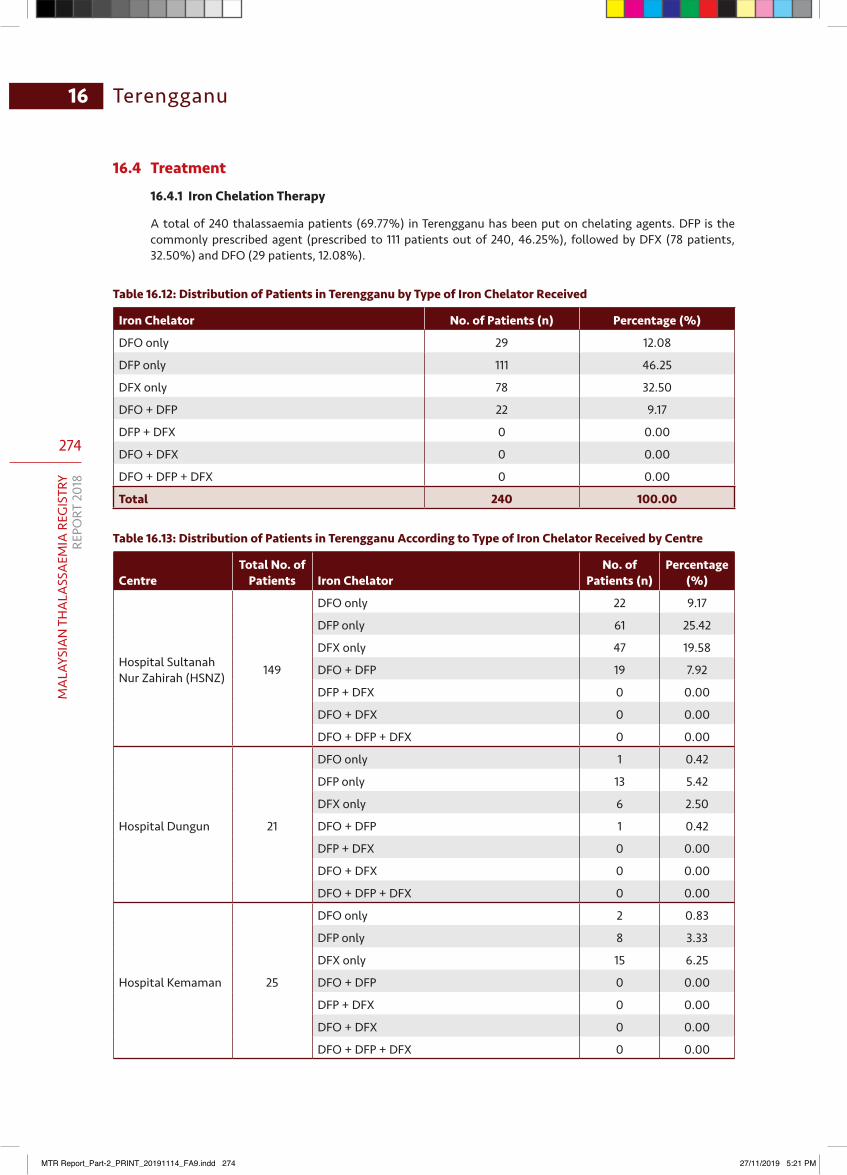
274
MA
LAYS
IAN
TH
ALA
SSA
EMIA
REG
ISTR
YRE
PORT
201
8
16 Terengganu
16.4 Treatment
16.4.1 Iron Chelation Therapy
A total of 240 thalassaemia patients (69.77%) in Terengganu has been put on chelating agents. DFP is the commonly prescribed agent (prescribed to 111 patients out of 240, 46.25%), followed by DFX (78 patients, 32.50%) and DFO (29 patients, 12.08%).
Table 16.12: Distribution of Patients in Terengganu by Type of Iron Chelator Received
Iron Chelator No. of Patients (n) Percentage (%)
DFO only 29 12.08
DFP only 111 46.25
DFX only 78 32.50
DFO + DFP 22 9.17
DFP + DFX 0 0.00
DFO + DFX 0 0.00
DFO + DFP + DFX 0 0.00
Total 240 100.00
Table 16.13: Distribution of Patients in Terengganu According to Type of Iron Chelator Received by Centre
CentreTotal No. of
Patients Iron ChelatorNo. of
Patients (n)Percentage
(%)
Hospital Sultanah Nur Zahirah (HSNZ) 149
DFO only 22 9.17
DFP only 61 25.42
DFX only 47 19.58
DFO + DFP 19 7.92
DFP + DFX 0 0.00
DFO + DFX 0 0.00
DFO + DFP + DFX 0 0.00
Hospital Dungun 21
DFO only 1 0.42
DFP only 13 5.42
DFX only 6 2.50
DFO + DFP 1 0.42
DFP + DFX 0 0.00
DFO + DFX 0 0.00
DFO + DFP + DFX 0 0.00
Hospital Kemaman 25
DFO only 2 0.83
DFP only 8 3.33
DFX only 15 6.25
DFO + DFP 0 0.00
DFP + DFX 0 0.00
DFO + DFX 0 0.00
DFO + DFP + DFX 0 0.00
MTR Report_Part-2_PRINT_20191114_FA9.indd 274 27/11/2019 5:21 PM
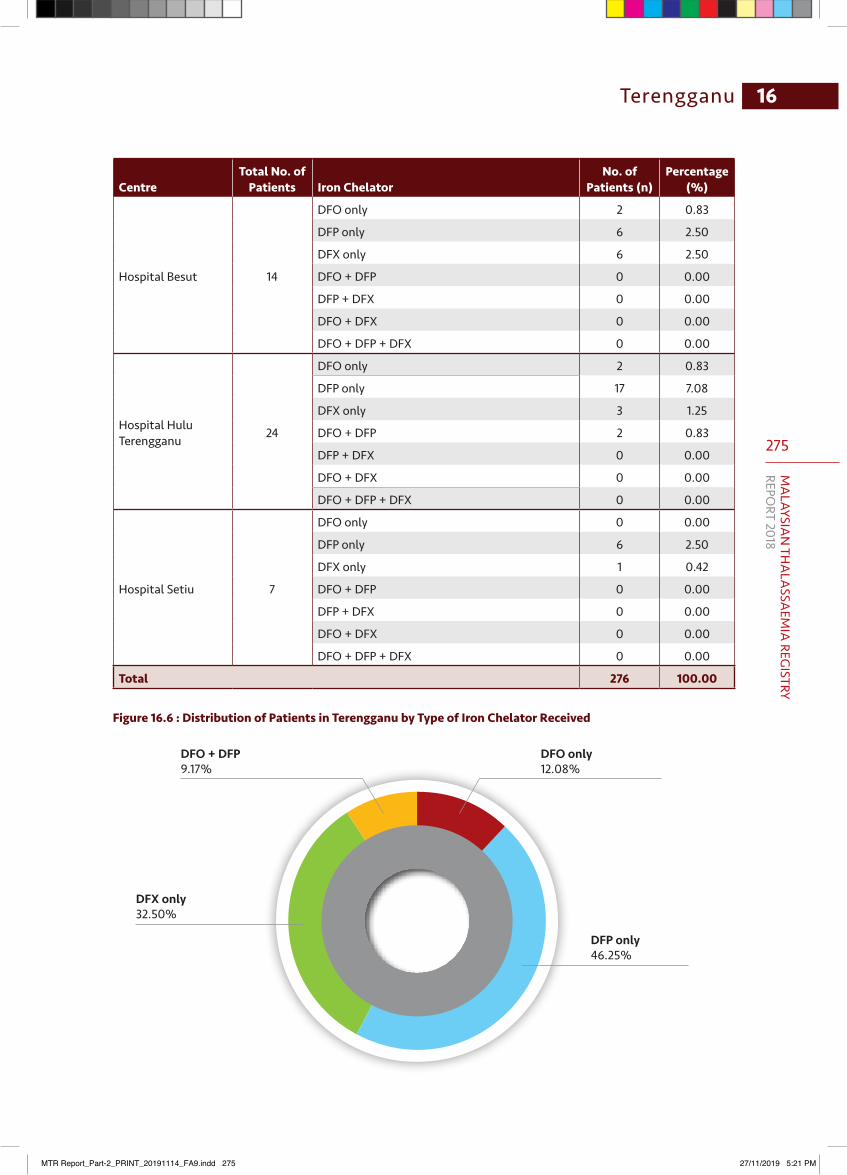
275
MA
LAYSIAN
THA
LASSA
EMIA
REGISTRY
REPORT 2018
16Terengganu
CentreTotal No. of
Patients Iron ChelatorNo. of
Patients (n)Percentage
(%)
Hospital Besut 14
DFO only 2 0.83
DFP only 6 2.50
DFX only 6 2.50
DFO + DFP 0 0.00
DFP + DFX 0 0.00
DFO + DFX 0 0.00
DFO + DFP + DFX 0 0.00
Hospital Hulu Terengganu 24
DFO only 2 0.83
DFP only 17 7.08
DFX only 3 1.25
DFO + DFP 2 0.83
DFP + DFX 0 0.00
DFO + DFX 0 0.00
DFO + DFP + DFX 0 0.00
Hospital Setiu 7
DFO only 0 0.00
DFP only 6 2.50
DFX only 1 0.42
DFO + DFP 0 0.00
DFP + DFX 0 0.00
DFO + DFX 0 0.00
DFO + DFP + DFX 0 0.00
Total 276 100.00
Figure 16.6 : Distribution of Patients in Terengganu by Type of Iron Chelator Received
DFP only46.25%
DFX only32.50%
DFO + DFP9.17%
DFO only12.08%
MTR Report_Part-2_PRINT_20191114_FA9.indd 275 27/11/2019 5:21 PM
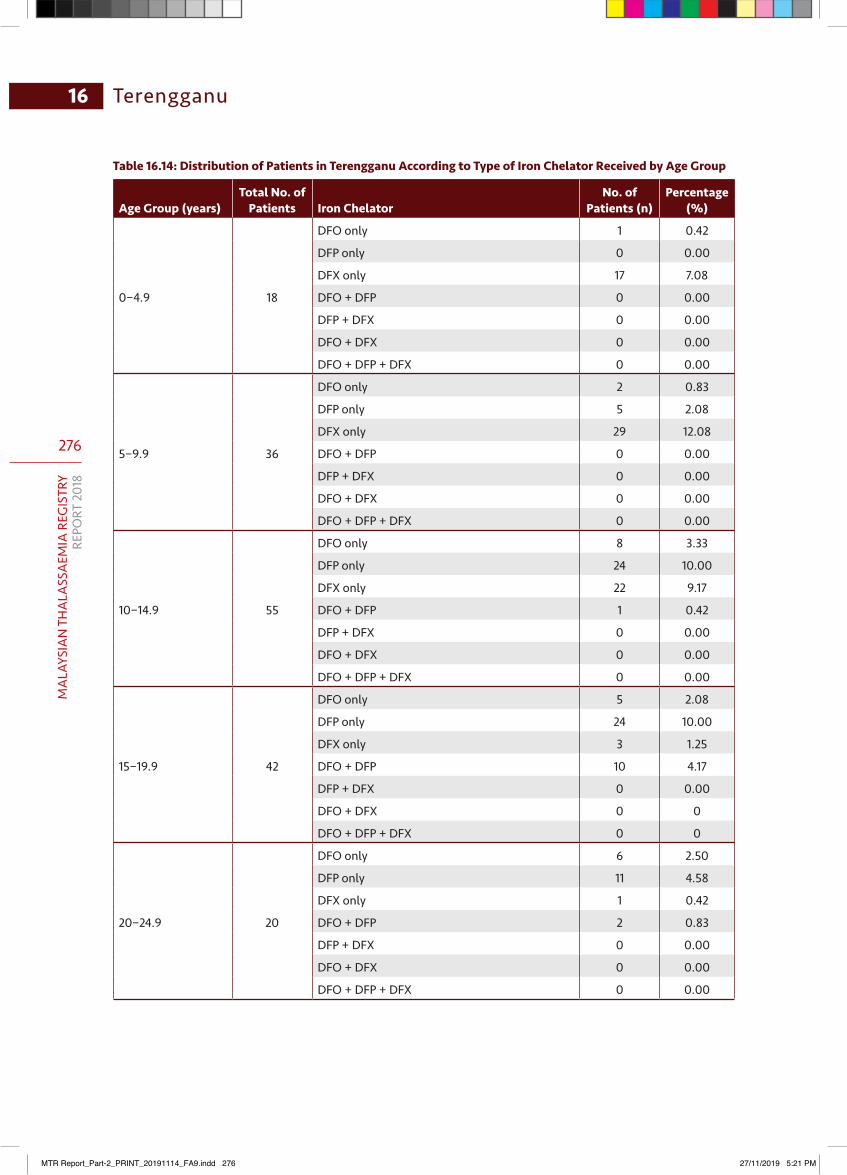
276
MA
LAYS
IAN
TH
ALA
SSA
EMIA
REG
ISTR
YRE
PORT
201
8
16 Terengganu
Table 16.14: Distribution of Patients in Terengganu According to Type of Iron Chelator Received by Age Group
Age Group (years)Total No. of
Patients Iron ChelatorNo. of
Patients (n)Percentage
(%)
0−4.9 18
DFO only 1 0.42
DFP only 0 0.00
DFX only 17 7.08
DFO + DFP 0 0.00
DFP + DFX 0 0.00
DFO + DFX 0 0.00
DFO + DFP + DFX 0 0.00
5−9.9 36
DFO only 2 0.83
DFP only 5 2.08
DFX only 29 12.08
DFO + DFP 0 0.00
DFP + DFX 0 0.00
DFO + DFX 0 0.00
DFO + DFP + DFX 0 0.00
10−14.9 55
DFO only 8 3.33
DFP only 24 10.00
DFX only 22 9.17
DFO + DFP 1 0.42
DFP + DFX 0 0.00
DFO + DFX 0 0.00
DFO + DFP + DFX 0 0.00
15−19.9 42
DFO only 5 2.08
DFP only 24 10.00
DFX only 3 1.25
DFO + DFP 10 4.17
DFP + DFX 0 0.00
DFO + DFX 0 0
DFO + DFP + DFX 0 0
20−24.9 20
DFO only 6 2.50
DFP only 11 4.58
DFX only 1 0.42
DFO + DFP 2 0.83
DFP + DFX 0 0.00
DFO + DFX 0 0.00
DFO + DFP + DFX 0 0.00
MTR Report_Part-2_PRINT_20191114_FA9.indd 276 27/11/2019 5:21 PM
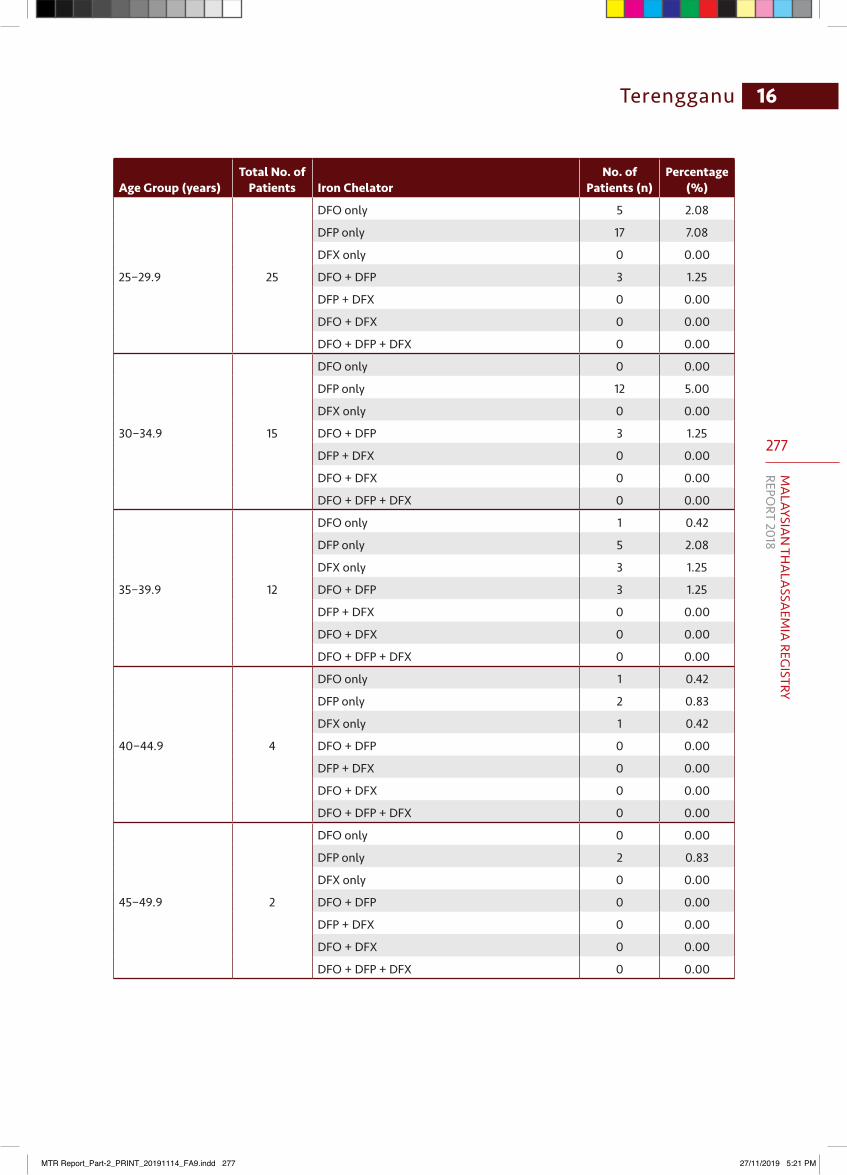
277
MA
LAYSIAN
THA
LASSA
EMIA
REGISTRY
REPORT 2018
16Terengganu
Age Group (years)Total No. of
Patients Iron ChelatorNo. of
Patients (n)Percentage
(%)
25−29.9 25
DFO only 5 2.08
DFP only 17 7.08
DFX only 0 0.00
DFO + DFP 3 1.25
DFP + DFX 0 0.00
DFO + DFX 0 0.00
DFO + DFP + DFX 0 0.00
30−34.9 15
DFO only 0 0.00
DFP only 12 5.00
DFX only 0 0.00
DFO + DFP 3 1.25
DFP + DFX 0 0.00
DFO + DFX 0 0.00
DFO + DFP + DFX 0 0.00
35−39.9 12
DFO only 1 0.42
DFP only 5 2.08
DFX only 3 1.25
DFO + DFP 3 1.25
DFP + DFX 0 0.00
DFO + DFX 0 0.00
DFO + DFP + DFX 0 0.00
40−44.9 4
DFO only 1 0.42
DFP only 2 0.83
DFX only 1 0.42
DFO + DFP 0 0.00
DFP + DFX 0 0.00
DFO + DFX 0 0.00
DFO + DFP + DFX 0 0.00
45−49.9 2
DFO only 0 0.00
DFP only 2 0.83
DFX only 0 0.00
DFO + DFP 0 0.00
DFP + DFX 0 0.00
DFO + DFX 0 0.00
DFO + DFP + DFX 0 0.00
MTR Report_Part-2_PRINT_20191114_FA9.indd 277 27/11/2019 5:21 PM
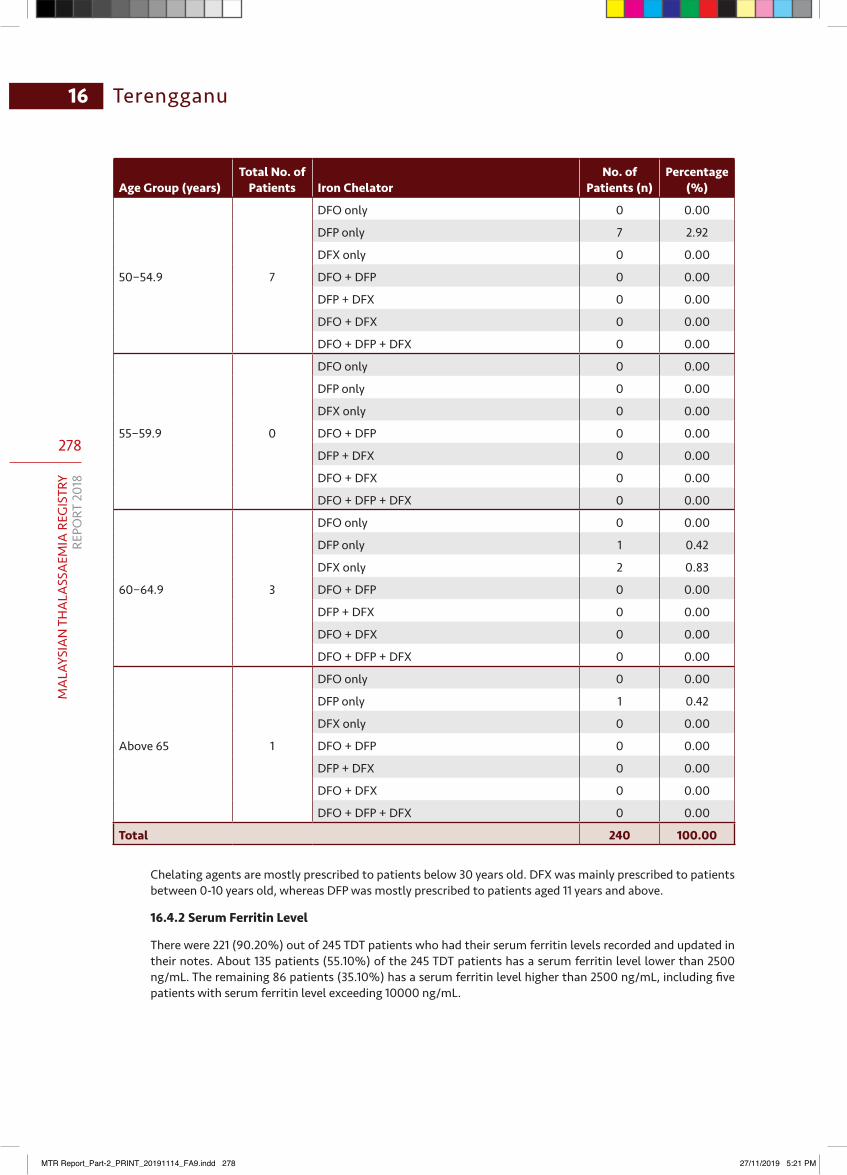
278
MA
LAYS
IAN
TH
ALA
SSA
EMIA
REG
ISTR
YRE
PORT
201
8
16 Terengganu
Age Group (years)Total No. of
Patients Iron ChelatorNo. of
Patients (n)Percentage
(%)
50−54.9 7
DFO only 0 0.00
DFP only 7 2.92
DFX only 0 0.00
DFO + DFP 0 0.00
DFP + DFX 0 0.00
DFO + DFX 0 0.00
DFO + DFP + DFX 0 0.00
55−59.9 0
DFO only 0 0.00
DFP only 0 0.00
DFX only 0 0.00
DFO + DFP 0 0.00
DFP + DFX 0 0.00
DFO + DFX 0 0.00
DFO + DFP + DFX 0 0.00
60−64.9 3
DFO only 0 0.00
DFP only 1 0.42
DFX only 2 0.83
DFO + DFP 0 0.00
DFP + DFX 0 0.00
DFO + DFX 0 0.00
DFO + DFP + DFX 0 0.00
Above 65 1
DFO only 0 0.00
DFP only 1 0.42
DFX only 0 0.00
DFO + DFP 0 0.00
DFP + DFX 0 0.00
DFO + DFX 0 0.00
DFO + DFP + DFX 0 0.00
Total 240 100.00
Chelating agents are mostly prescribed to patients below 30 years old. DFX was mainly prescribed to patients between 0-10 years old, whereas DFP was mostly prescribed to patients aged 11 years and above.
16.4.2 Serum Ferritin Level
There were 221 (90.20%) out of 245 TDT patients who had their serum ferritin levels recorded and updated in their notes. About 135 patients (55.10%) of the 245 TDT patients has a serum ferritin level lower than 2500 ng/mL. The remaining 86 patients (35.10%) has a serum ferritin level higher than 2500 ng/mL, including five patients with serum ferritin level exceeding 10000 ng/mL.
MTR Report_Part-2_PRINT_20191114_FA9.indd 278 27/11/2019 5:21 PM
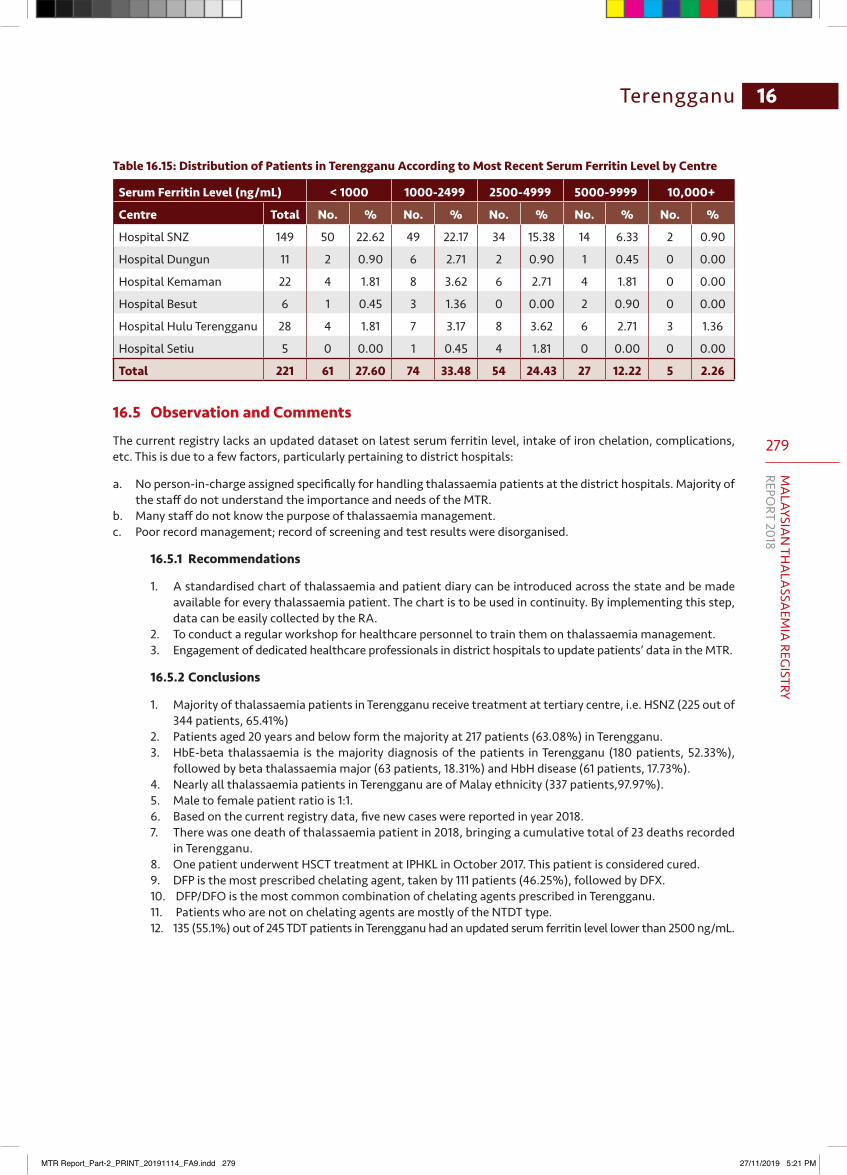
279
MA
LAYSIAN
THA
LASSA
EMIA
REGISTRY
REPORT 2018
16Terengganu
Table 16.15: Distribution of Patients in Terengganu According to Most Recent Serum Ferritin Level by Centre
Serum Ferritin Level (ng/mL) < 1000 1000-2499 2500-4999 5000-9999 10,000+
Centre Total No. % No. % No. % No. % No. %
Hospital SNZ 149 50 22.62 49 22.17 34 15.38 14 6.33 2 0.90
Hospital Dungun 11 2 0.90 6 2.71 2 0.90 1 0.45 0 0.00
Hospital Kemaman 22 4 1.81 8 3.62 6 2.71 4 1.81 0 0.00
Hospital Besut 6 1 0.45 3 1.36 0 0.00 2 0.90 0 0.00
Hospital Hulu Terengganu 28 4 1.81 7 3.17 8 3.62 6 2.71 3 1.36
Hospital Setiu 5 0 0.00 1 0.45 4 1.81 0 0.00 0 0.00
Total 221 61 27.60 74 33.48 54 24.43 27 12.22 5 2.26
16.5 Observation and Comments
The current registry lacks an updated dataset on latest serum ferritin level, intake of iron chelation, complications, etc. This is due to a few factors, particularly pertaining to district hospitals:
a. No person-in-charge assigned specifically for handling thalassaemia patients at the district hospitals. Majority of the staff do not understand the importance and needs of the MTR.
b. Many staff do not know the purpose of thalassaemia management.c. Poor record management; record of screening and test results were disorganised.
16.5.1 Recommendations
1. A standardised chart of thalassaemia and patient diary can be introduced across the state and be made available for every thalassaemia patient. The chart is to be used in continuity. By implementing this step, data can be easily collected by the RA.
2. To conduct a regular workshop for healthcare personnel to train them on thalassaemia management.3. Engagement of dedicated healthcare professionals in district hospitals to update patients’ data in the MTR.
16.5.2 Conclusions
1. Majority of thalassaemia patients in Terengganu receive treatment at tertiary centre, i.e. HSNZ (225 out of 344 patients, 65.41%)
2. Patients aged 20 years and below form the majority at 217 patients (63.08%) in Terengganu.3. HbE-beta thalassaemia is the majority diagnosis of the patients in Terengganu (180 patients, 52.33%),
followed by beta thalassaemia major (63 patients, 18.31%) and HbH disease (61 patients, 17.73%).4. Nearly all thalassaemia patients in Terengganu are of Malay ethnicity (337 patients,97.97%).5. Male to female patient ratio is 1:1.6. Based on the current registry data, five new cases were reported in year 2018.7. There was one death of thalassaemia patient in 2018, bringing a cumulative total of 23 deaths recorded
in Terengganu.8. One patient underwent HSCT treatment at IPHKL in October 2017. This patient is considered cured. 9. DFP is the most prescribed chelating agent, taken by 111 patients (46.25%), followed by DFX.10. DFP/DFO is the most common combination of chelating agents prescribed in Terengganu.11. Patients who are not on chelating agents are mostly of the NTDT type.12. 135 (55.1%) out of 245 TDT patients in Terengganu had an updated serum ferritin level lower than 2500 ng/mL.
MTR Report_Part-2_PRINT_20191114_FA9.indd 279 27/11/2019 5:21 PM
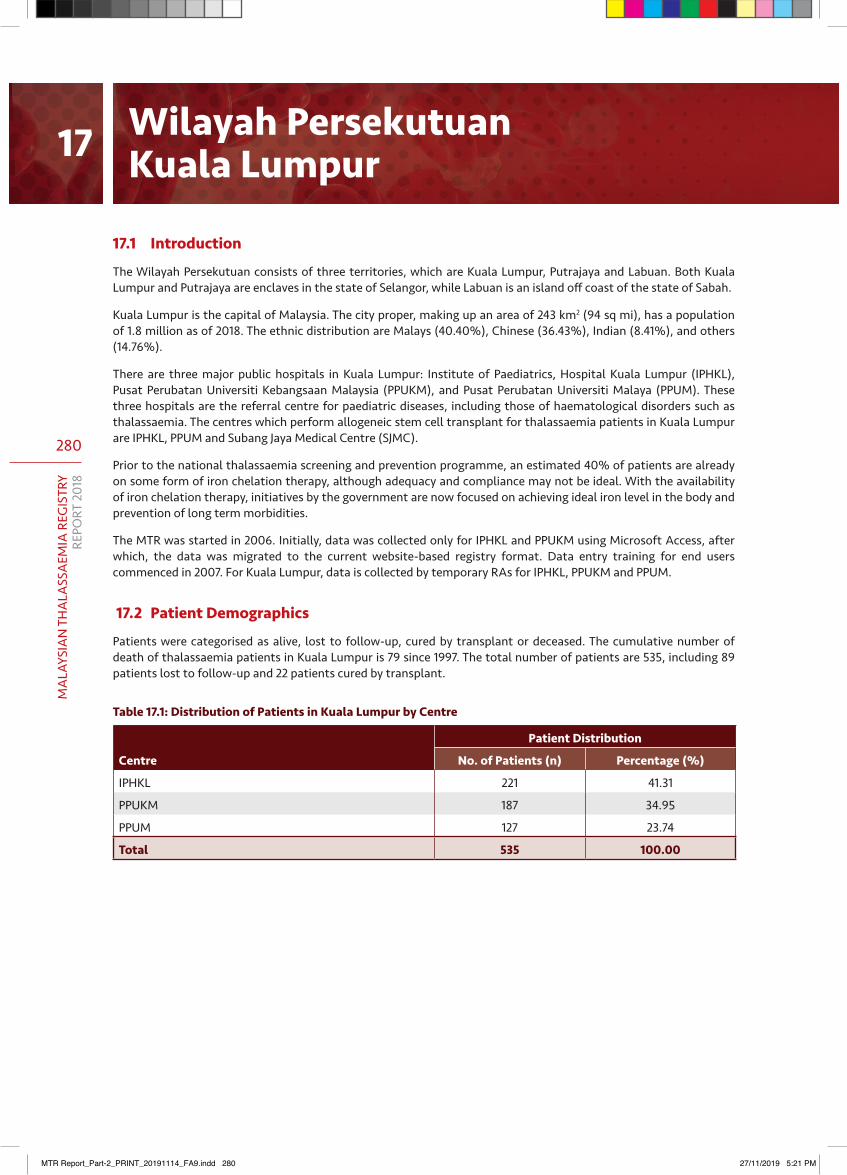
280
MA
LAYS
IAN
TH
ALA
SSA
EMIA
REG
ISTR
YRE
PORT
201
8
17.1 Introduction
The Wilayah Persekutuan consists of three territories, which are Kuala Lumpur, Putrajaya and Labuan. Both Kuala Lumpur and Putrajaya are enclaves in the state of Selangor, while Labuan is an island off coast of the state of Sabah.
Kuala Lumpur is the capital of Malaysia. The city proper, making up an area of 243 km2 (94 sq mi), has a population of 1.8 million as of 2018. The ethnic distribution are Malays (40.40%), Chinese (36.43%), Indian (8.41%), and others (14.76%).
There are three major public hospitals in Kuala Lumpur: Institute of Paediatrics, Hospital Kuala Lumpur (IPHKL), Pusat Perubatan Universiti Kebangsaan Malaysia (PPUKM), and Pusat Perubatan Universiti Malaya (PPUM). These three hospitals are the referral centre for paediatric diseases, including those of haematological disorders such as thalassaemia. The centres which perform allogeneic stem cell transplant for thalassaemia patients in Kuala Lumpur are IPHKL, PPUM and Subang Jaya Medical Centre (SJMC).
Prior to the national thalassaemia screening and prevention programme, an estimated 40% of patients are already on some form of iron chelation therapy, although adequacy and compliance may not be ideal. With the availability of iron chelation therapy, initiatives by the government are now focused on achieving ideal iron level in the body and prevention of long term morbidities.
The MTR was started in 2006. Initially, data was collected only for IPHKL and PPUKM using Microsoft Access, after which, the data was migrated to the current website-based registry format. Data entry training for end users commenced in 2007. For Kuala Lumpur, data is collected by temporary RAs for IPHKL, PPUKM and PPUM.
17.2 Patient Demographics
Patients were categorised as alive, lost to follow-up, cured by transplant or deceased. The cumulative number of death of thalassaemia patients in Kuala Lumpur is 79 since 1997. The total number of patients are 535, including 89 patients lost to follow-up and 22 patients cured by transplant.
Table 17.1: Distribution of Patients in Kuala Lumpur by Centre
Centre
Patient Distribution
No. of Patients (n) Percentage (%)
IPHKL 221 41.31
PPUKM 187 34.95
PPUM 127 23.74
Total 535 100.00
Wilayah Persekutuan Kuala Lumpur17
MTR Report_Part-2_PRINT_20191114_FA9.indd 280 27/11/2019 5:21 PM
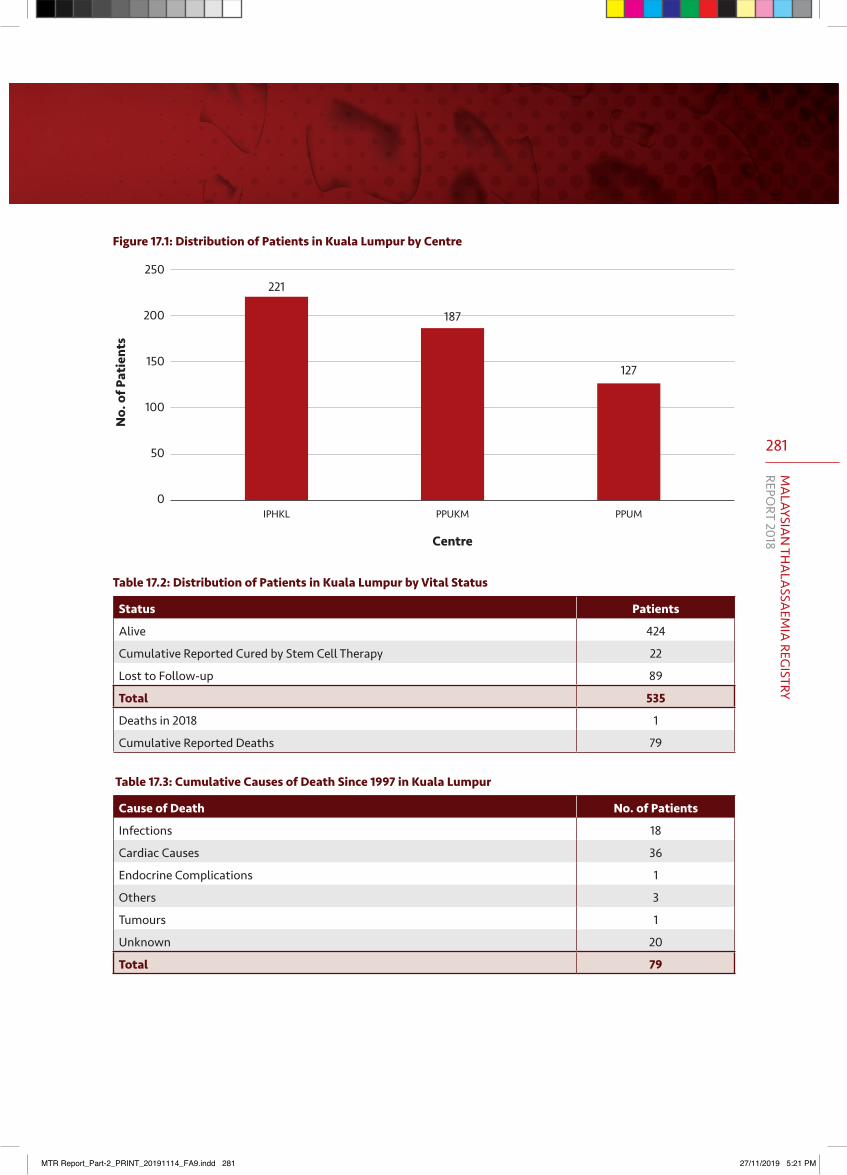
281
MA
LAYSIAN
THA
LASSA
EMIA
REGISTRY
REPORT 2018
250
200
150
100
50
0
Centre
No.
of P
atie
nts
IPHKL PPUKM PPUM
221
187
127
Table 17.2: Distribution of Patients in Kuala Lumpur by Vital Status
Status Patients
Alive 424
Cumulative Reported Cured by Stem Cell Therapy 22
Lost to Follow-up 89
Total 535
Deaths in 2018 1
Cumulative Reported Deaths 79
Table 17.3: Cumulative Causes of Death Since 1997 in Kuala Lumpur
Cause of Death No. of Patients
Infections 18
Cardiac Causes 36
Endocrine Complications 1
Others 3
Tumours 1
Unknown 20
Total 79
Figure 17.1: Distribution of Patients in Kuala Lumpur by Centre
MTR Report_Part-2_PRINT_20191114_FA9.indd 281 27/11/2019 5:21 PM
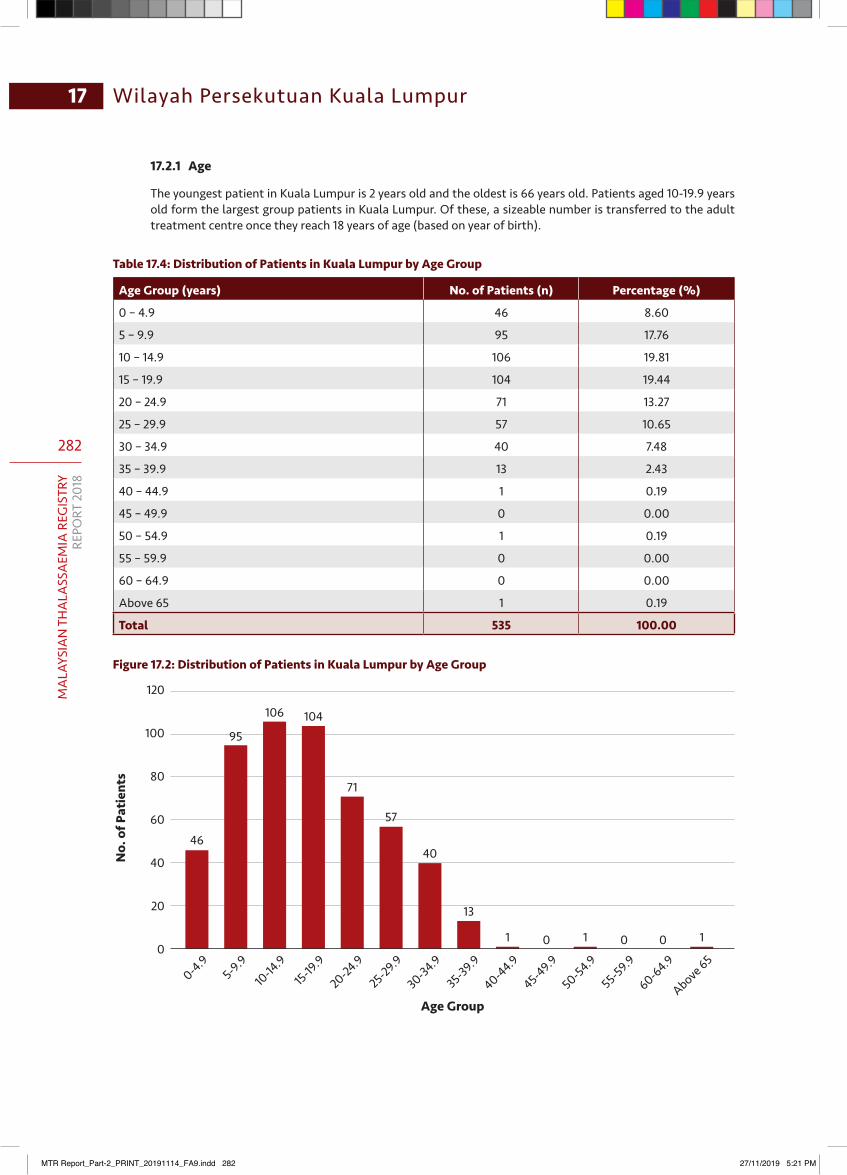
282
MA
LAYS
IAN
TH
ALA
SSA
EMIA
REG
ISTR
YRE
PORT
201
8
Wilayah Persekutuan Kuala Lumpur17
17.2.1 Age
The youngest patient in Kuala Lumpur is 2 years old and the oldest is 66 years old. Patients aged 10-19.9 years old form the largest group patients in Kuala Lumpur. Of these, a sizeable number is transferred to the adult treatment centre once they reach 18 years of age (based on year of birth).
Table 17.4: Distribution of Patients in Kuala Lumpur by Age Group
Age Group (years) No. of Patients (n) Percentage (%)
0 – 4.9 46 8.60
5 – 9.9 95 17.76
10 – 14.9 106 19.81
15 – 19.9 104 19.44
20 – 24.9 71 13.27
25 – 29.9 57 10.65
30 – 34.9 40 7.48
35 – 39.9 13 2.43
40 – 44.9 1 0.19
45 – 49.9 0 0.00
50 – 54.9 1 0.19
55 – 59.9 0 0.00
60 – 64.9 0 0.00
Above 65 1 0.19
Total 535 100.00
Figure 17.2: Distribution of Patients in Kuala Lumpur by Age Group
120
100
80
60
40
20
0
Age Group
No.
of P
atie
nts
0-4.95-9.9
10-14
.915-19
.9
20-24.9
25-29.9
30-34.9
35-39.9
40-44.9
45-49.9
50-54.9
55-59.9
60-64.9
Above 65
46
95
106 104
71
57
40
13
1 0 1 0 0 1
MTR Report_Part-2_PRINT_20191114_FA9.indd 282 27/11/2019 5:21 PM
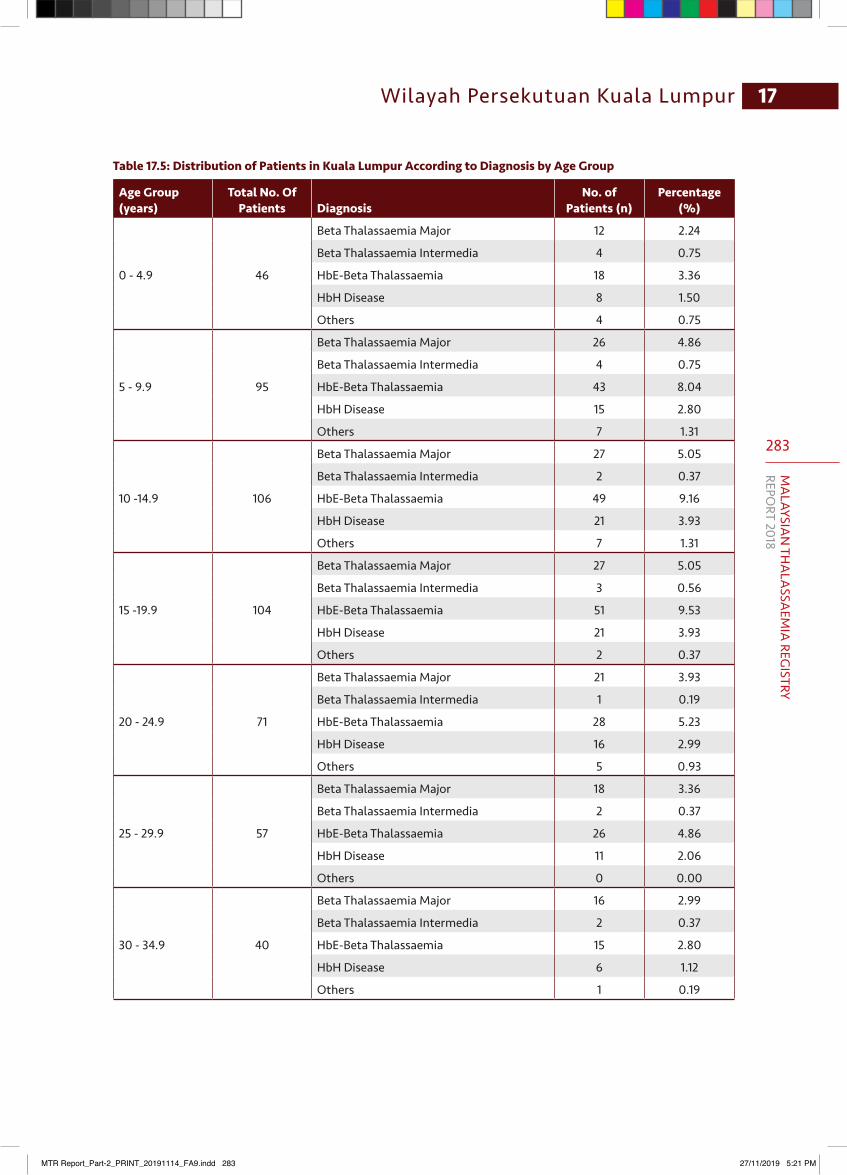
283
MA
LAYSIAN
THA
LASSA
EMIA
REGISTRY
REPORT 2018
17Wilayah Persekutuan Kuala Lumpur
Table 17.5: Distribution of Patients in Kuala Lumpur According to Diagnosis by Age Group
Age Group (years)
Total No. Of Patients Diagnosis
No. of Patients (n)
Percentage (%)
0 - 4.9 46
Beta Thalassaemia Major 12 2.24
Beta Thalassaemia Intermedia 4 0.75
HbE-Beta Thalassaemia 18 3.36
HbH Disease 8 1.50
Others 4 0.75
5 - 9.9 95
Beta Thalassaemia Major 26 4.86
Beta Thalassaemia Intermedia 4 0.75
HbE-Beta Thalassaemia 43 8.04
HbH Disease 15 2.80
Others 7 1.31
10 -14.9 106
Beta Thalassaemia Major 27 5.05
Beta Thalassaemia Intermedia 2 0.37
HbE-Beta Thalassaemia 49 9.16
HbH Disease 21 3.93
Others 7 1.31
15 -19.9 104
Beta Thalassaemia Major 27 5.05
Beta Thalassaemia Intermedia 3 0.56
HbE-Beta Thalassaemia 51 9.53
HbH Disease 21 3.93
Others 2 0.37
20 - 24.9 71
Beta Thalassaemia Major 21 3.93
Beta Thalassaemia Intermedia 1 0.19
HbE-Beta Thalassaemia 28 5.23
HbH Disease 16 2.99
Others 5 0.93
25 - 29.9 57
Beta Thalassaemia Major 18 3.36
Beta Thalassaemia Intermedia 2 0.37
HbE-Beta Thalassaemia 26 4.86
HbH Disease 11 2.06
Others 0 0.00
30 - 34.9 40
Beta Thalassaemia Major 16 2.99
Beta Thalassaemia Intermedia 2 0.37
HbE-Beta Thalassaemia 15 2.80
HbH Disease 6 1.12
Others 1 0.19
MTR Report_Part-2_PRINT_20191114_FA9.indd 283 27/11/2019 5:21 PM
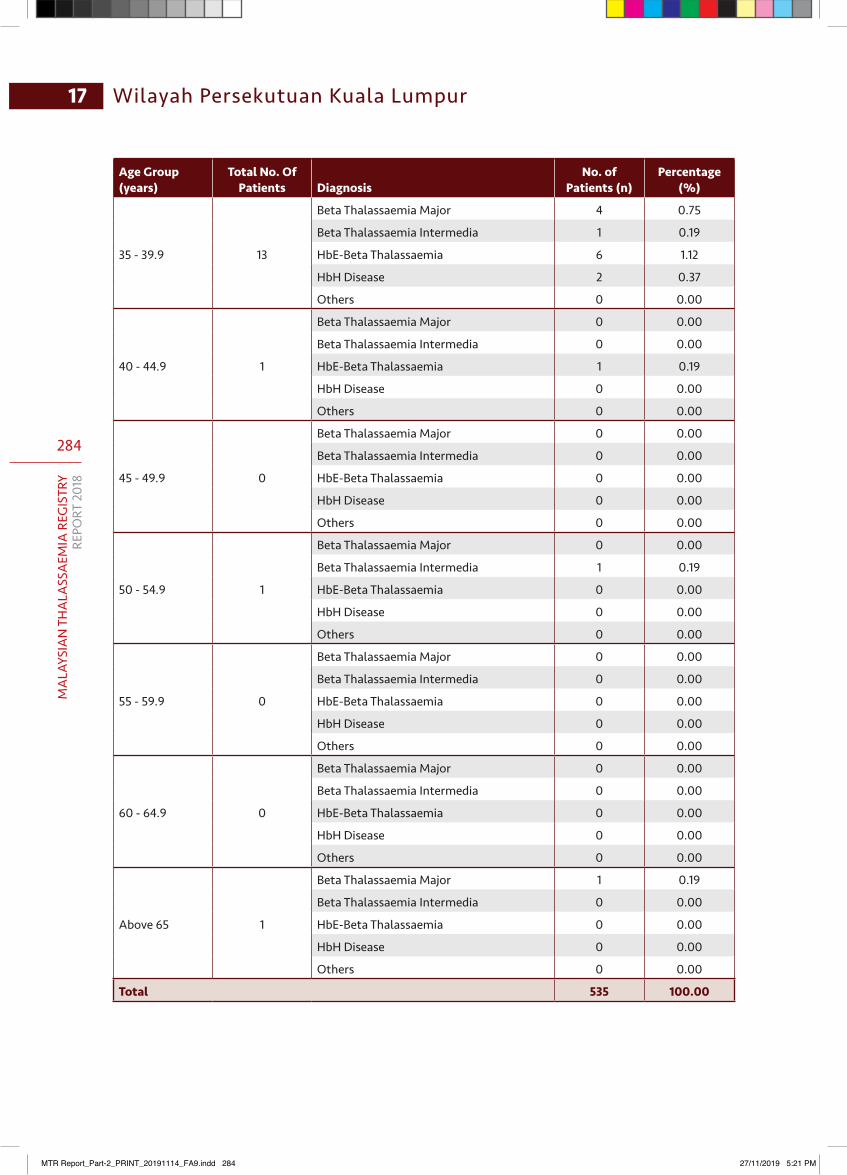
284
MA
LAYS
IAN
TH
ALA
SSA
EMIA
REG
ISTR
YRE
PORT
201
8
Wilayah Persekutuan Kuala Lumpur17
Age Group (years)
Total No. Of Patients Diagnosis
No. of Patients (n)
Percentage (%)
35 - 39.9 13
Beta Thalassaemia Major 4 0.75
Beta Thalassaemia Intermedia 1 0.19
HbE-Beta Thalassaemia 6 1.12
HbH Disease 2 0.37
Others 0 0.00
40 - 44.9 1
Beta Thalassaemia Major 0 0.00
Beta Thalassaemia Intermedia 0 0.00
HbE-Beta Thalassaemia 1 0.19
HbH Disease 0 0.00
Others 0 0.00
45 - 49.9 0
Beta Thalassaemia Major 0 0.00
Beta Thalassaemia Intermedia 0 0.00
HbE-Beta Thalassaemia 0 0.00
HbH Disease 0 0.00
Others 0 0.00
50 - 54.9 1
Beta Thalassaemia Major 0 0.00
Beta Thalassaemia Intermedia 1 0.19
HbE-Beta Thalassaemia 0 0.00
HbH Disease 0 0.00
Others 0 0.00
55 - 59.9 0
Beta Thalassaemia Major 0 0.00
Beta Thalassaemia Intermedia 0 0.00
HbE-Beta Thalassaemia 0 0.00
HbH Disease 0 0.00
Others 0 0.00
60 - 64.9 0
Beta Thalassaemia Major 0 0.00
Beta Thalassaemia Intermedia 0 0.00
HbE-Beta Thalassaemia 0 0.00
HbH Disease 0 0.00
Others 0 0.00
Above 65 1
Beta Thalassaemia Major 1 0.19
Beta Thalassaemia Intermedia 0 0.00
HbE-Beta Thalassaemia 0 0.00
HbH Disease 0 0.00
Others 0 0.00
Total 535 100.00
MTR Report_Part-2_PRINT_20191114_FA9.indd 284 27/11/2019 5:21 PM
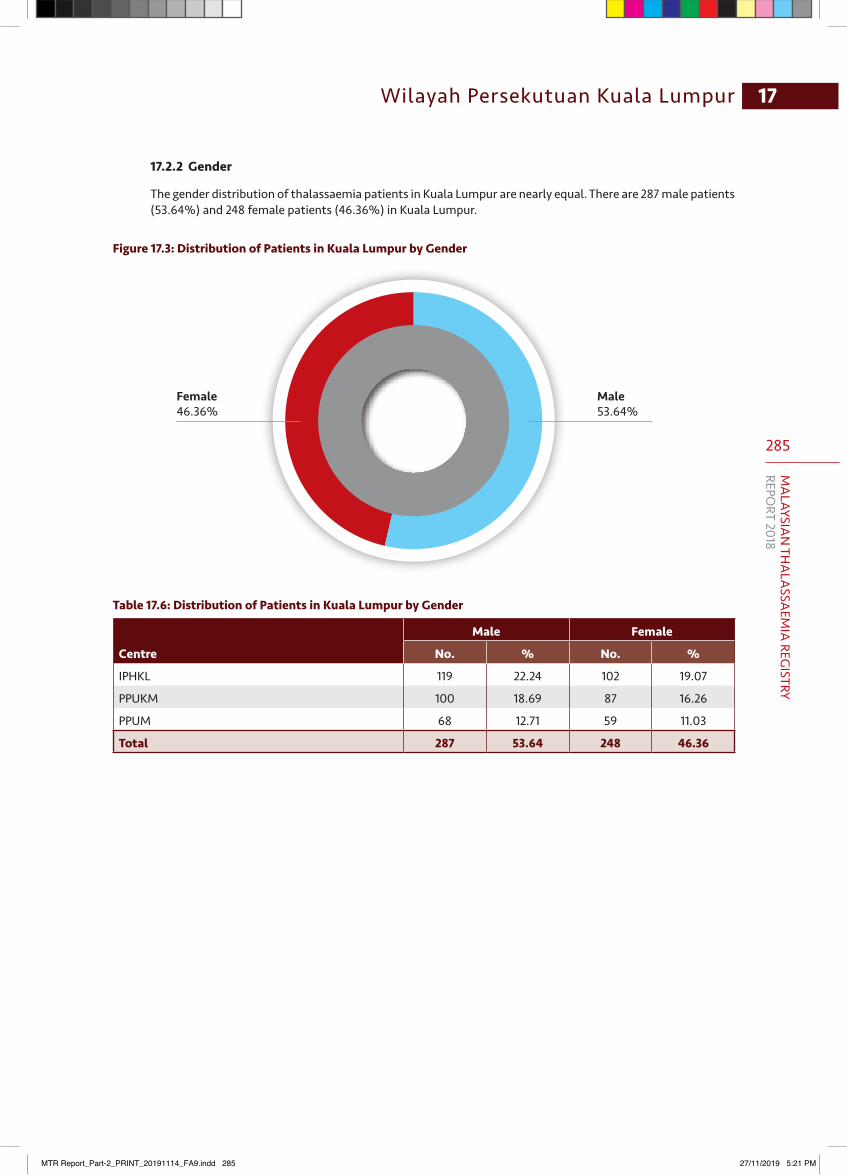
285
MA
LAYSIAN
THA
LASSA
EMIA
REGISTRY
REPORT 2018
17Wilayah Persekutuan Kuala Lumpur
17.2.2 Gender
The gender distribution of thalassaemia patients in Kuala Lumpur are nearly equal. There are 287 male patients (53.64%) and 248 female patients (46.36%) in Kuala Lumpur.
Figure 17.3: Distribution of Patients in Kuala Lumpur by Gender
Female46.36%
Male53.64%
Table 17.6: Distribution of Patients in Kuala Lumpur by Gender
Centre
Male Female
No. % No. %
IPHKL 119 22.24 102 19.07
PPUKM 100 18.69 87 16.26
PPUM 68 12.71 59 11.03
Total 287 53.64 248 46.36
MTR Report_Part-2_PRINT_20191114_FA9.indd 285 27/11/2019 5:21 PM
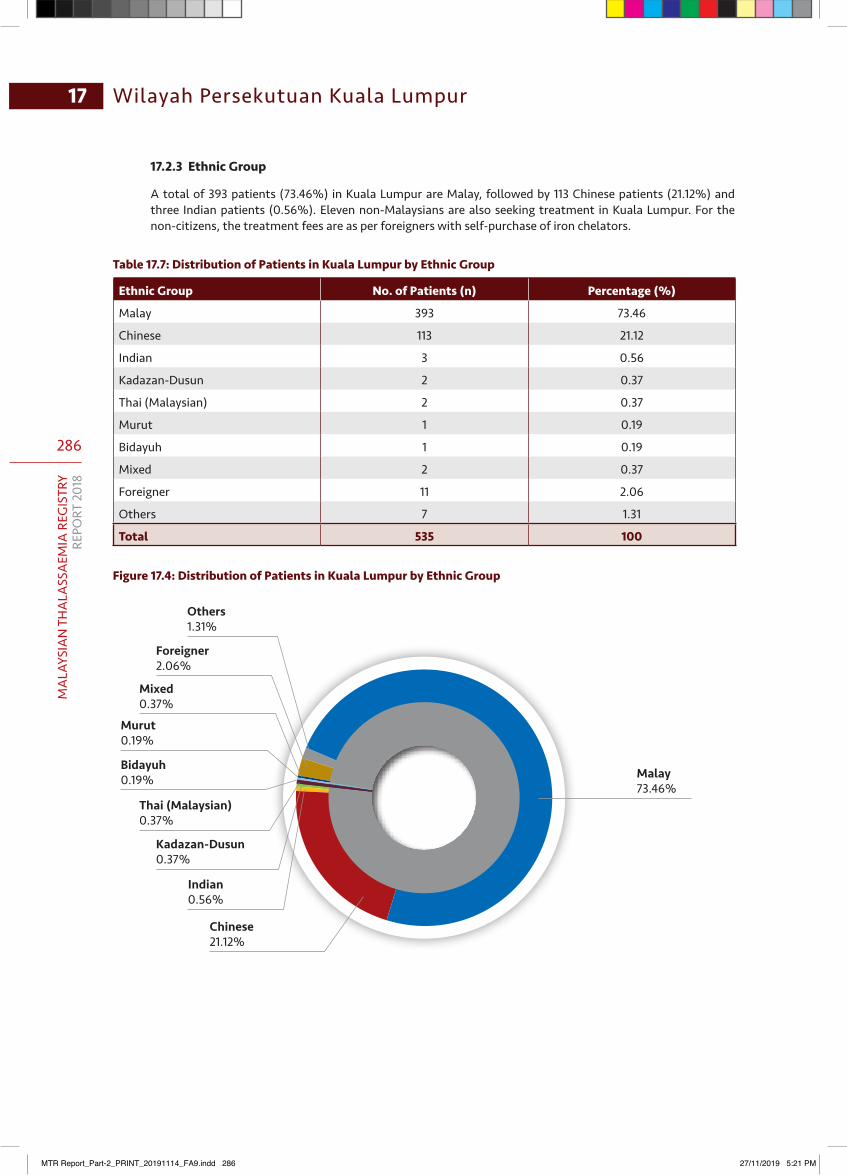
286
MA
LAYS
IAN
TH
ALA
SSA
EMIA
REG
ISTR
YRE
PORT
201
8
Wilayah Persekutuan Kuala Lumpur17
17.2.3 Ethnic Group
A total of 393 patients (73.46%) in Kuala Lumpur are Malay, followed by 113 Chinese patients (21.12%) and three Indian patients (0.56%). Eleven non-Malaysians are also seeking treatment in Kuala Lumpur. For the non-citizens, the treatment fees are as per foreigners with self-purchase of iron chelators.
Table 17.7: Distribution of Patients in Kuala Lumpur by Ethnic Group
Ethnic Group No. of Patients (n) Percentage (%)
Malay 393 73.46
Chinese 113 21.12
Indian 3 0.56
Kadazan-Dusun 2 0.37
Thai (Malaysian) 2 0.37
Murut 1 0.19
Bidayuh 1 0.19
Mixed 2 0.37
Foreigner 11 2.06
Others 7 1.31
Total 535 100
Figure 17.4: Distribution of Patients in Kuala Lumpur by Ethnic Group
Chinese21.12%
Kadazan-Dusun0.37%
Indian0.56%
Thai (Malaysian)0.37%
Bidayuh0.19%
Murut0.19%
Malay73.46%
Mixed0.37%
Foreigner2.06%
Others1.31%
MTR Report_Part-2_PRINT_20191114_FA9.indd 286 27/11/2019 5:21 PM
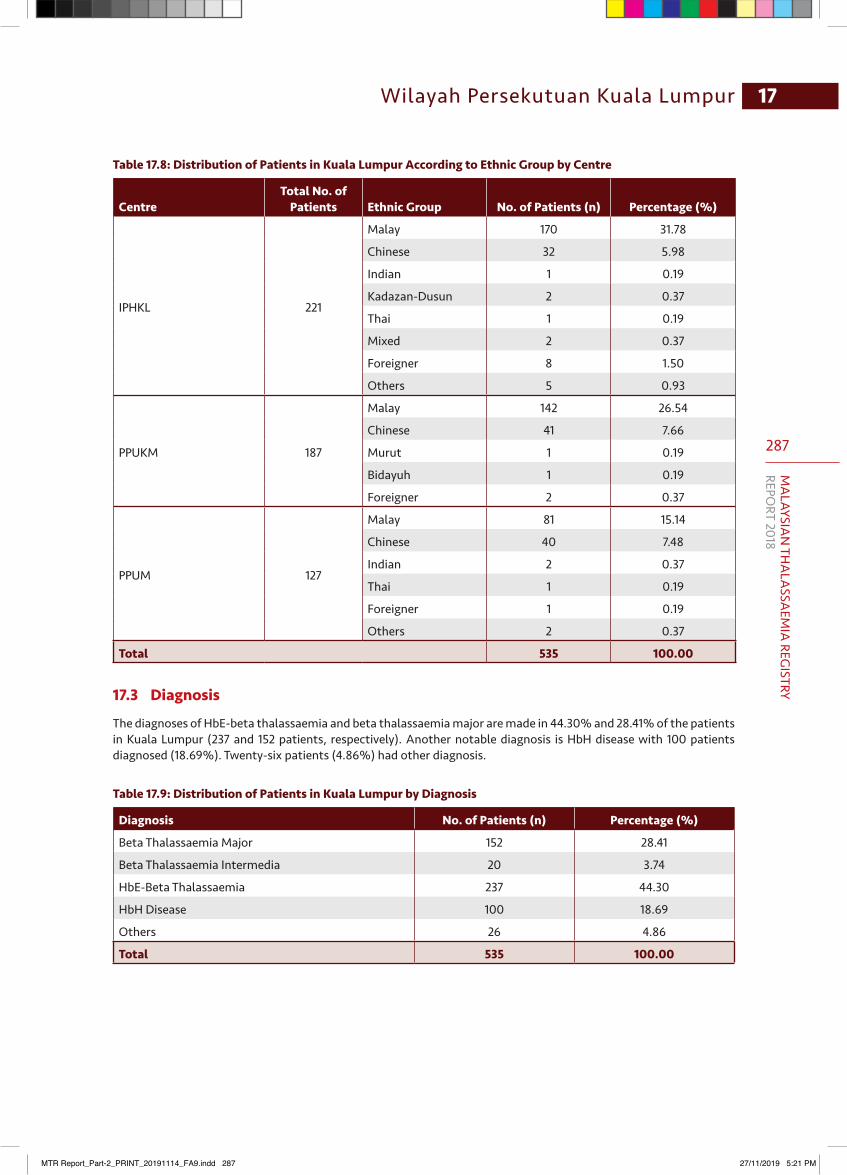
287
MA
LAYSIAN
THA
LASSA
EMIA
REGISTRY
REPORT 2018
17Wilayah Persekutuan Kuala Lumpur
Table 17.8: Distribution of Patients in Kuala Lumpur According to Ethnic Group by Centre
CentreTotal No. of
Patients Ethnic Group No. of Patients (n) Percentage (%)
IPHKL 221
Malay 170 31.78
Chinese 32 5.98
Indian 1 0.19
Kadazan-Dusun 2 0.37
Thai 1 0.19
Mixed 2 0.37
Foreigner 8 1.50
Others 5 0.93
PPUKM 187
Malay 142 26.54
Chinese 41 7.66
Murut 1 0.19
Bidayuh 1 0.19
Foreigner 2 0.37
PPUM 127
Malay 81 15.14
Chinese 40 7.48
Indian 2 0.37
Thai 1 0.19
Foreigner 1 0.19
Others 2 0.37
Total 535 100.00
17.3 Diagnosis
The diagnoses of HbE-beta thalassaemia and beta thalassaemia major are made in 44.30% and 28.41% of the patients in Kuala Lumpur (237 and 152 patients, respectively). Another notable diagnosis is HbH disease with 100 patients diagnosed (18.69%). Twenty-six patients (4.86%) had other diagnosis.
Table 17.9: Distribution of Patients in Kuala Lumpur by Diagnosis
Diagnosis No. of Patients (n) Percentage (%)
Beta Thalassaemia Major 152 28.41
Beta Thalassaemia Intermedia 20 3.74
HbE-Beta Thalassaemia 237 44.30
HbH Disease 100 18.69
Others 26 4.86
Total 535 100.00
MTR Report_Part-2_PRINT_20191114_FA9.indd 287 27/11/2019 5:21 PM
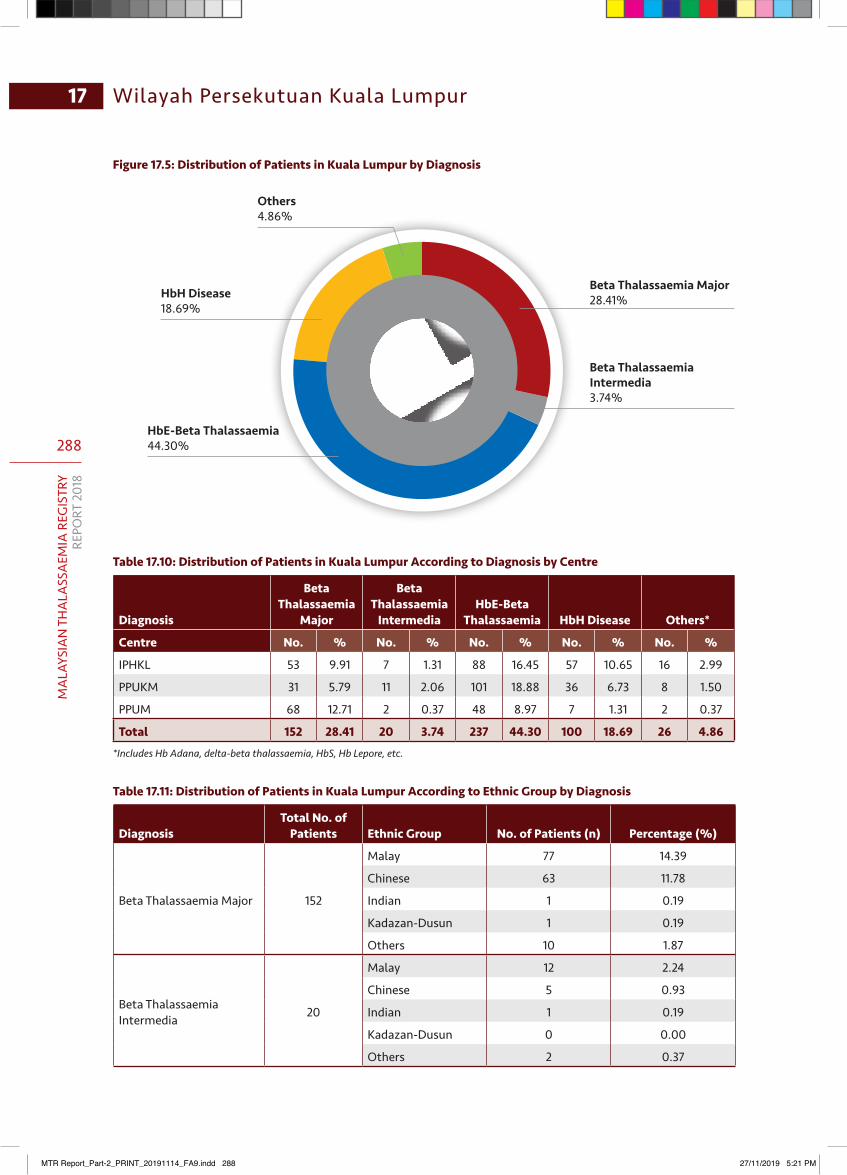
288
MA
LAYS
IAN
TH
ALA
SSA
EMIA
REG
ISTR
YRE
PORT
201
8
Wilayah Persekutuan Kuala Lumpur17
Figure 17.5: Distribution of Patients in Kuala Lumpur by Diagnosis
Beta Thalassaemia Major28.41%
Beta Thalassaemia Intermedia3.74%
HbH Disease18.69%
HbE-Beta Thalassaemia44.30%
Others4.86%
Table 17.10: Distribution of Patients in Kuala Lumpur According to Diagnosis by Centre
Diagnosis
Beta Thalassaemia
Major
Beta Thalassaemia
IntermediaHbE-Beta
Thalassaemia HbH Disease Others*
Centre No. % No. % No. % No. % No. %
IPHKL 53 9.91 7 1.31 88 16.45 57 10.65 16 2.99
PPUKM 31 5.79 11 2.06 101 18.88 36 6.73 8 1.50
PPUM 68 12.71 2 0.37 48 8.97 7 1.31 2 0.37
Total 152 28.41 20 3.74 237 44.30 100 18.69 26 4.86*Includes Hb Adana, delta-beta thalassaemia, HbS, Hb Lepore, etc.
Table 17.11: Distribution of Patients in Kuala Lumpur According to Ethnic Group by Diagnosis
DiagnosisTotal No. of
Patients Ethnic Group No. of Patients (n) Percentage (%)
Beta Thalassaemia Major 152
Malay 77 14.39
Chinese 63 11.78
Indian 1 0.19
Kadazan-Dusun 1 0.19
Others 10 1.87
Beta Thalassaemia Intermedia 20
Malay 12 2.24
Chinese 5 0.93
Indian 1 0.19
Kadazan-Dusun 0 0.00
Others 2 0.37
MTR Report_Part-2_PRINT_20191114_FA9.indd 288 27/11/2019 5:21 PM
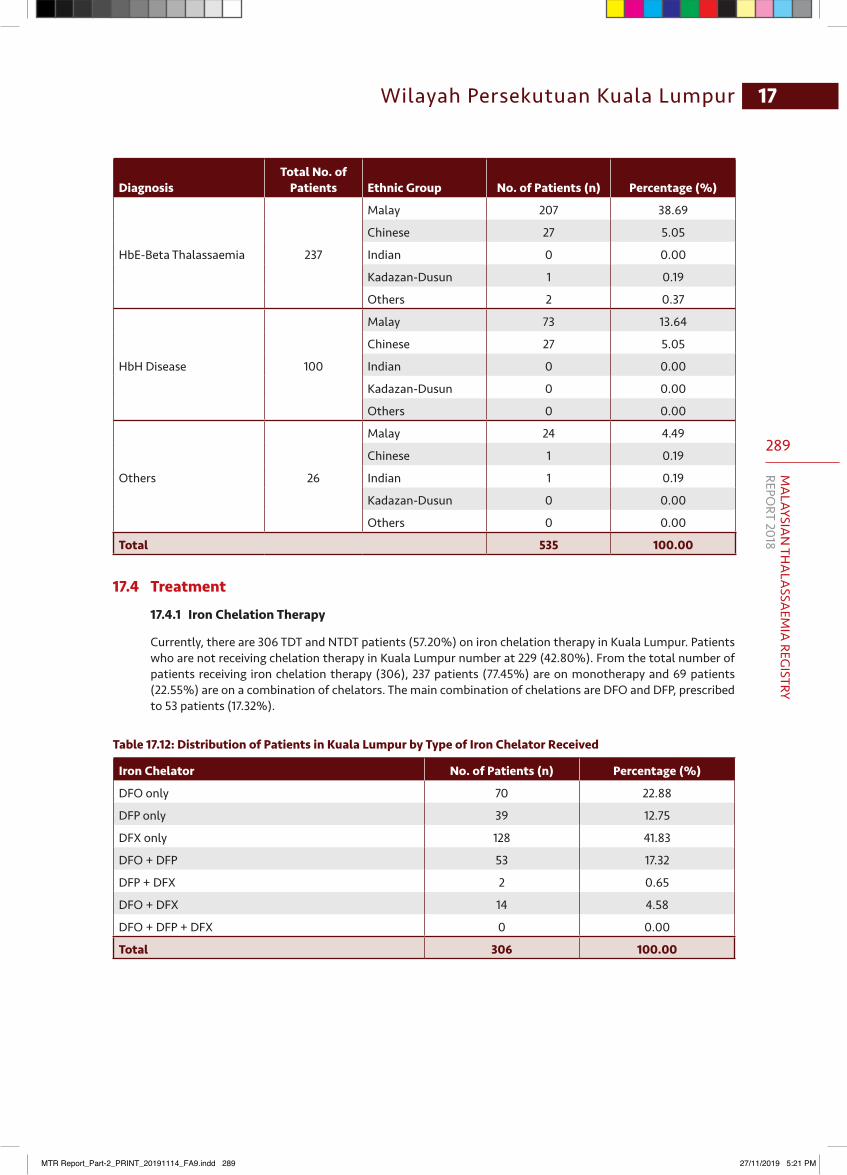
289
MA
LAYSIAN
THA
LASSA
EMIA
REGISTRY
REPORT 2018
17Wilayah Persekutuan Kuala Lumpur
DiagnosisTotal No. of
Patients Ethnic Group No. of Patients (n) Percentage (%)
HbE-Beta Thalassaemia 237
Malay 207 38.69
Chinese 27 5.05
Indian 0 0.00
Kadazan-Dusun 1 0.19
Others 2 0.37
HbH Disease 100
Malay 73 13.64
Chinese 27 5.05
Indian 0 0.00
Kadazan-Dusun 0 0.00
Others 0 0.00
Others 26
Malay 24 4.49
Chinese 1 0.19
Indian 1 0.19
Kadazan-Dusun 0 0.00
Others 0 0.00
Total 535 100.00
17.4 Treatment
17.4.1 Iron Chelation Therapy
Currently, there are 306 TDT and NTDT patients (57.20%) on iron chelation therapy in Kuala Lumpur. Patients who are not receiving chelation therapy in Kuala Lumpur number at 229 (42.80%). From the total number of patients receiving iron chelation therapy (306), 237 patients (77.45%) are on monotherapy and 69 patients (22.55%) are on a combination of chelators. The main combination of chelations are DFO and DFP, prescribed to 53 patients (17.32%).
Table 17.12: Distribution of Patients in Kuala Lumpur by Type of Iron Chelator Received
Iron Chelator No. of Patients (n) Percentage (%)
DFO only 70 22.88
DFP only 39 12.75
DFX only 128 41.83
DFO + DFP 53 17.32
DFP + DFX 2 0.65
DFO + DFX 14 4.58
DFO + DFP + DFX 0 0.00
Total 306 100.00
MTR Report_Part-2_PRINT_20191114_FA9.indd 289 27/11/2019 5:21 PM
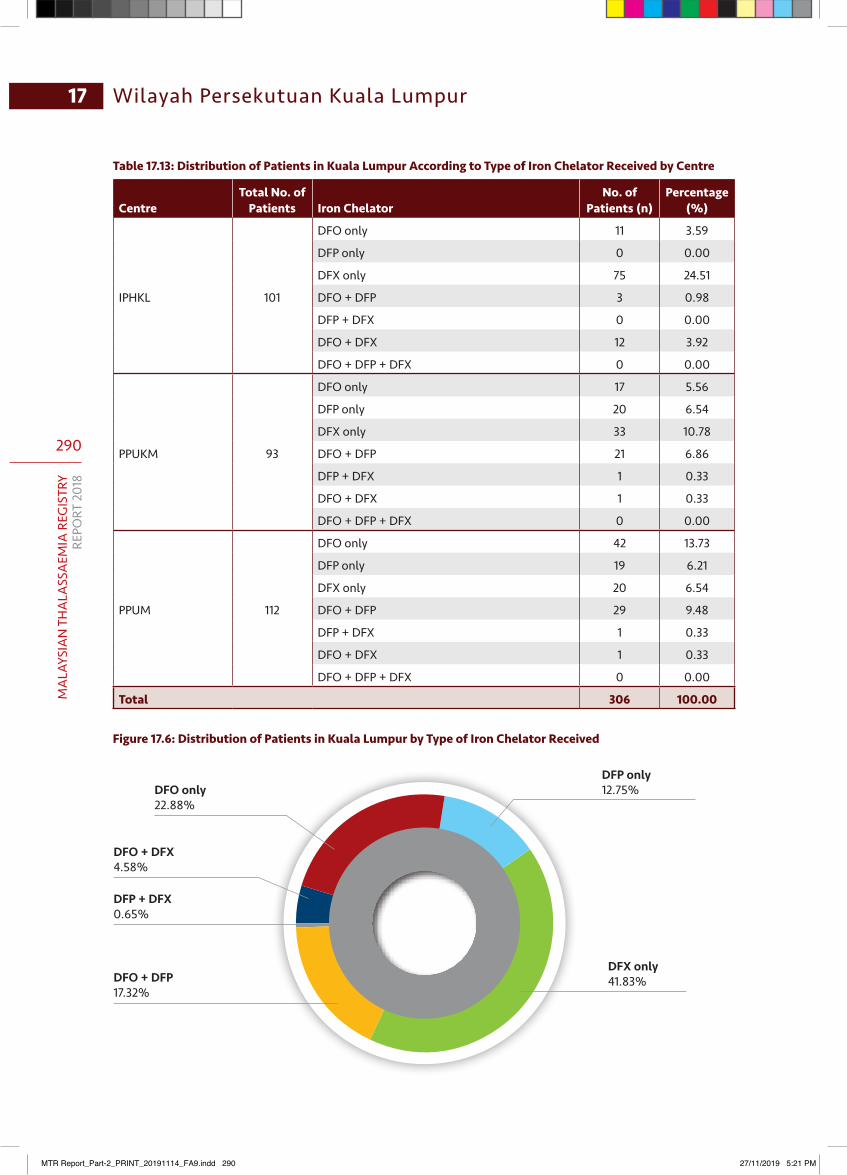
290
MA
LAYS
IAN
TH
ALA
SSA
EMIA
REG
ISTR
YRE
PORT
201
8
Wilayah Persekutuan Kuala Lumpur17
Table 17.13: Distribution of Patients in Kuala Lumpur According to Type of Iron Chelator Received by Centre
CentreTotal No. of
Patients Iron ChelatorNo. of
Patients (n)Percentage
(%)
IPHKL 101
DFO only 11 3.59
DFP only 0 0.00
DFX only 75 24.51
DFO + DFP 3 0.98
DFP + DFX 0 0.00
DFO + DFX 12 3.92
DFO + DFP + DFX 0 0.00
PPUKM 93
DFO only 17 5.56
DFP only 20 6.54
DFX only 33 10.78
DFO + DFP 21 6.86
DFP + DFX 1 0.33
DFO + DFX 1 0.33
DFO + DFP + DFX 0 0.00
PPUM 112
DFO only 42 13.73
DFP only 19 6.21
DFX only 20 6.54
DFO + DFP 29 9.48
DFP + DFX 1 0.33
DFO + DFX 1 0.33
DFO + DFP + DFX 0 0.00
Total 306 100.00
Figure 17.6: Distribution of Patients in Kuala Lumpur by Type of Iron Chelator Received
DFX only41.83%DFO + DFP
17.32%
DFP + DFX0.65%
DFO + DFX4.58%
DFO only22.88%
DFP only12.75%
MTR Report_Part-2_PRINT_20191114_FA9.indd 290 27/11/2019 5:21 PM
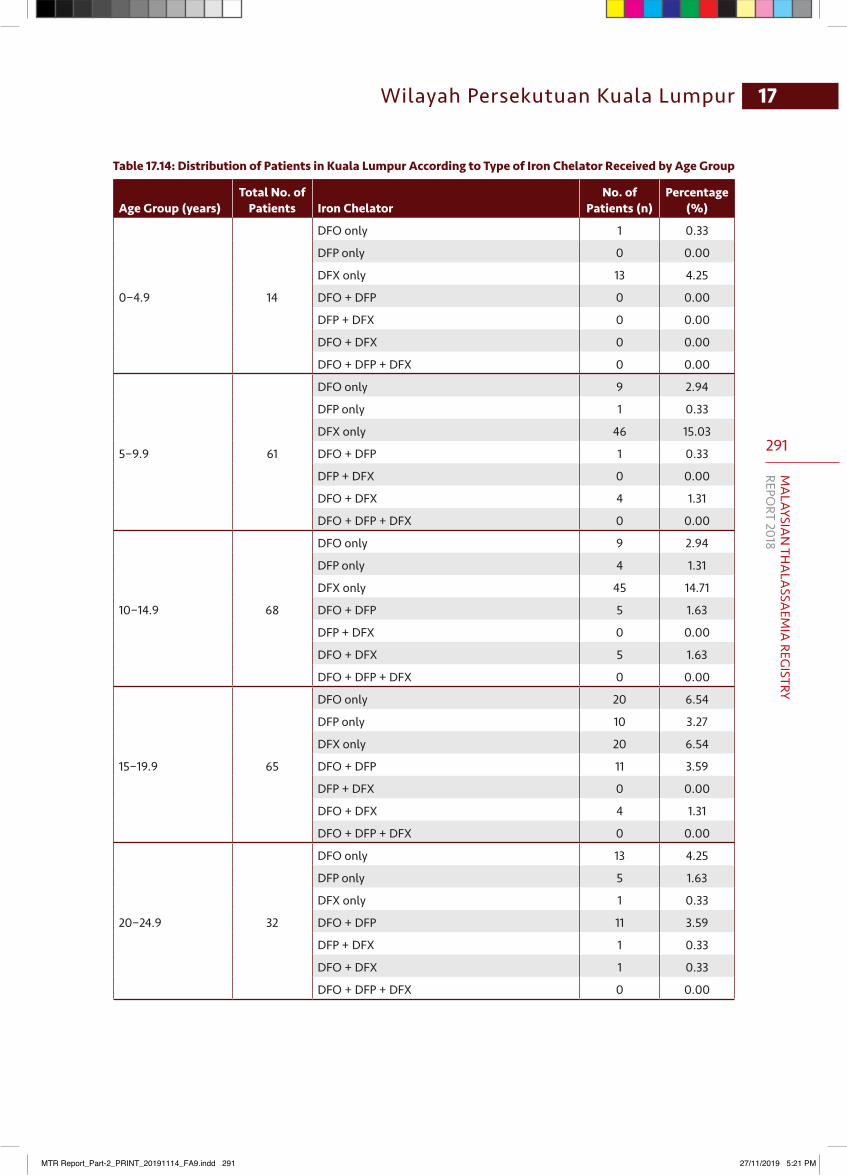
291
MA
LAYSIAN
THA
LASSA
EMIA
REGISTRY
REPORT 2018
17Wilayah Persekutuan Kuala Lumpur
Table 17.14: Distribution of Patients in Kuala Lumpur According to Type of Iron Chelator Received by Age Group
Age Group (years)Total No. of
Patients Iron ChelatorNo. of
Patients (n)Percentage
(%)
0−4.9 14
DFO only 1 0.33
DFP only 0 0.00
DFX only 13 4.25
DFO + DFP 0 0.00
DFP + DFX 0 0.00
DFO + DFX 0 0.00
DFO + DFP + DFX 0 0.00
5−9.9 61
DFO only 9 2.94
DFP only 1 0.33
DFX only 46 15.03
DFO + DFP 1 0.33
DFP + DFX 0 0.00
DFO + DFX 4 1.31
DFO + DFP + DFX 0 0.00
10−14.9 68
DFO only 9 2.94
DFP only 4 1.31
DFX only 45 14.71
DFO + DFP 5 1.63
DFP + DFX 0 0.00
DFO + DFX 5 1.63
DFO + DFP + DFX 0 0.00
15−19.9 65
DFO only 20 6.54
DFP only 10 3.27
DFX only 20 6.54
DFO + DFP 11 3.59
DFP + DFX 0 0.00
DFO + DFX 4 1.31
DFO + DFP + DFX 0 0.00
20−24.9 32
DFO only 13 4.25
DFP only 5 1.63
DFX only 1 0.33
DFO + DFP 11 3.59
DFP + DFX 1 0.33
DFO + DFX 1 0.33
DFO + DFP + DFX 0 0.00
MTR Report_Part-2_PRINT_20191114_FA9.indd 291 27/11/2019 5:21 PM

292
MA
LAYS
IAN
TH
ALA
SSA
EMIA
REG
ISTR
YRE
PORT
201
8
Wilayah Persekutuan Kuala Lumpur17
Age Group (years)Total No. of
Patients Iron ChelatorNo. of
Patients (n)Percentage
(%)
25−29.9 32
DFO only 11 3.59
DFP only 8 2.61
DFX only 1 0.33
DFO + DFP 12 3.92
DFP + DFX 0 0.00
DFO + DFX 0 0.00
DFO + DFP + DFX 0 0.00
30−34.9 22
DFO only 5 1.63
DFP only 5 1.63
DFX only 1 0.33
DFO + DFP 10 3.27
DFP + DFX 1 0.33
DFO + DFX 0 0.00
DFO + DFP + DFX 0 0.00
35−39.9 9
DFO only 2 0.65
DFP only 5 1.63
DFX only 1 0.33
DFO + DFP 1 0.33
DFP + DFX 0 0.00
DFO + DFX 0 0.00
DFO + DFP + DFX 0 0.00
40−44.9 1
DFO only 0 0.00
DFP only 0 0.00
DFX only 0 0.00
DFO + DFP 1 0.33
DFP + DFX 0 0.00
DFO + DFX 0 0.00
DFO + DFP + DFX 0 0.00
45−49.9 0
DFO only 0 0.00
DFP only 0 0.00
DFX only 0 0.00
DFO + DFP 0 0.00
DFP + DFX 0 0.00
DFO + DFX 0 0.00
DFO + DFP + DFX 0 0.00
MTR Report_Part-2_PRINT_20191114_FA9.indd 292 27/11/2019 5:21 PM
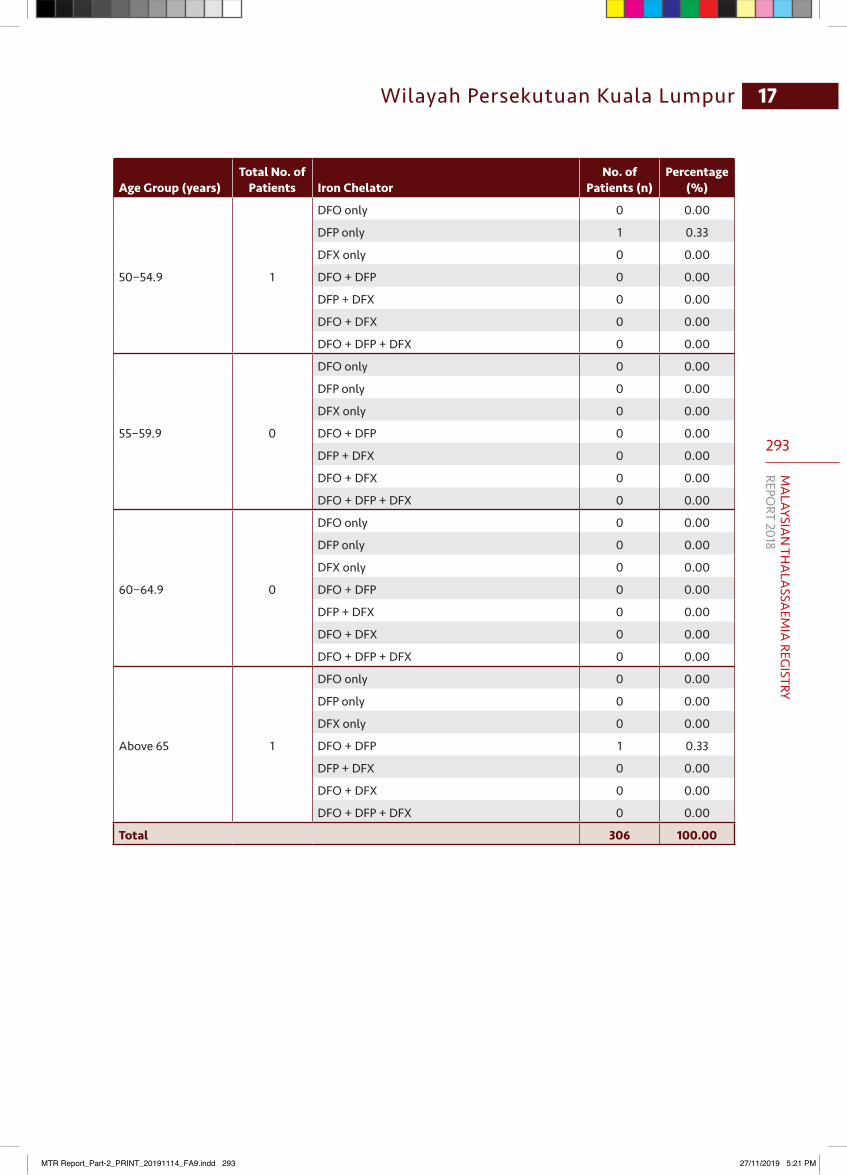
293
MA
LAYSIAN
THA
LASSA
EMIA
REGISTRY
REPORT 2018
17Wilayah Persekutuan Kuala Lumpur
Age Group (years)Total No. of
Patients Iron ChelatorNo. of
Patients (n)Percentage
(%)
50−54.9 1
DFO only 0 0.00
DFP only 1 0.33
DFX only 0 0.00
DFO + DFP 0 0.00
DFP + DFX 0 0.00
DFO + DFX 0 0.00
DFO + DFP + DFX 0 0.00
55−59.9 0
DFO only 0 0.00
DFP only 0 0.00
DFX only 0 0.00
DFO + DFP 0 0.00
DFP + DFX 0 0.00
DFO + DFX 0 0.00
DFO + DFP + DFX 0 0.00
60−64.9 0
DFO only 0 0.00
DFP only 0 0.00
DFX only 0 0.00
DFO + DFP 0 0.00
DFP + DFX 0 0.00
DFO + DFX 0 0.00
DFO + DFP + DFX 0 0.00
Above 65 1
DFO only 0 0.00
DFP only 0 0.00
DFX only 0 0.00
DFO + DFP 1 0.33
DFP + DFX 0 0.00
DFO + DFX 0 0.00
DFO + DFP + DFX 0 0.00
Total 306 100.00
MTR Report_Part-2_PRINT_20191114_FA9.indd 293 27/11/2019 5:21 PM
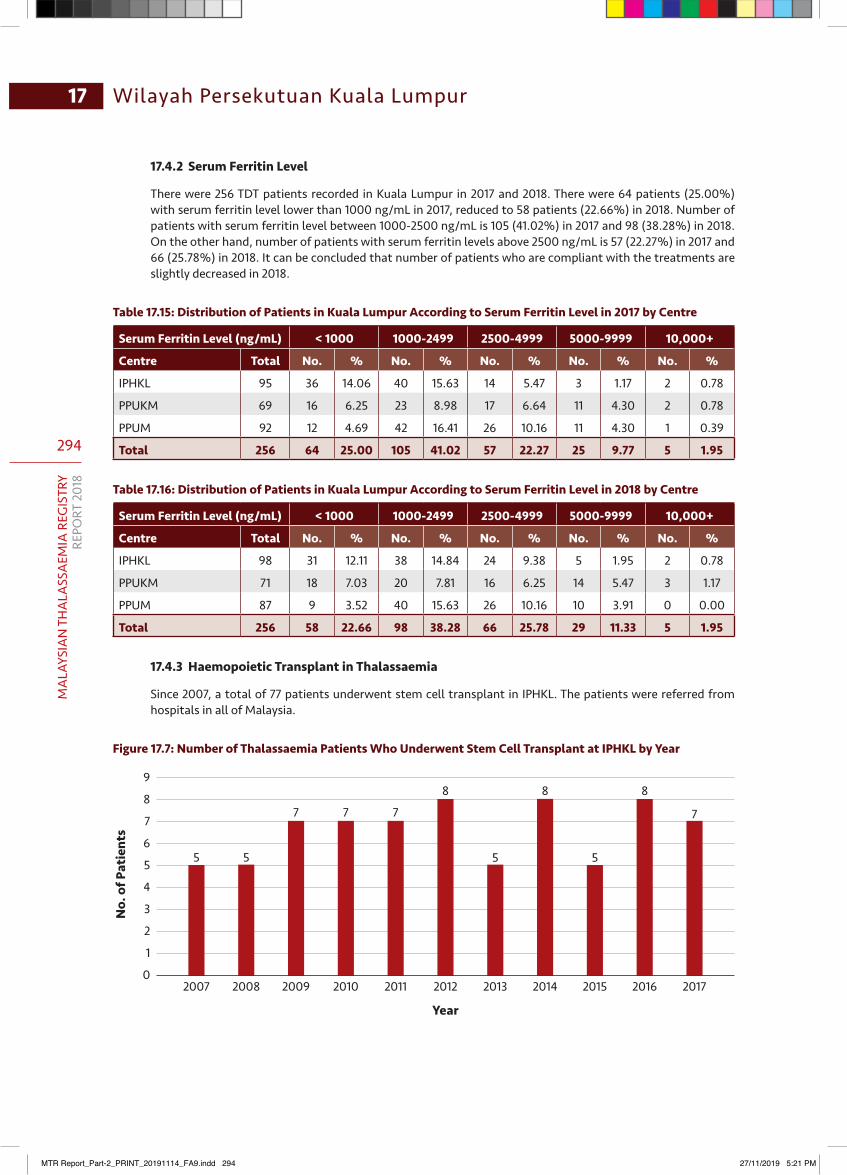
294
MA
LAYS
IAN
TH
ALA
SSA
EMIA
REG
ISTR
YRE
PORT
201
8
Wilayah Persekutuan Kuala Lumpur17
17.4.2 Serum Ferritin Level
There were 256 TDT patients recorded in Kuala Lumpur in 2017 and 2018. There were 64 patients (25.00%) with serum ferritin level lower than 1000 ng/mL in 2017, reduced to 58 patients (22.66%) in 2018. Number of patients with serum ferritin level between 1000-2500 ng/mL is 105 (41.02%) in 2017 and 98 (38.28%) in 2018. On the other hand, number of patients with serum ferritin levels above 2500 ng/mL is 57 (22.27%) in 2017 and 66 (25.78%) in 2018. It can be concluded that number of patients who are compliant with the treatments are slightly decreased in 2018.
Table 17.15: Distribution of Patients in Kuala Lumpur According to Serum Ferritin Level in 2017 by Centre
Serum Ferritin Level (ng/mL) < 1000 1000-2499 2500-4999 5000-9999 10,000+
Centre Total No. % No. % No. % No. % No. %
IPHKL 95 36 14.06 40 15.63 14 5.47 3 1.17 2 0.78
PPUKM 69 16 6.25 23 8.98 17 6.64 11 4.30 2 0.78
PPUM 92 12 4.69 42 16.41 26 10.16 11 4.30 1 0.39
Total 256 64 25.00 105 41.02 57 22.27 25 9.77 5 1.95
Table 17.16: Distribution of Patients in Kuala Lumpur According to Serum Ferritin Level in 2018 by Centre
Serum Ferritin Level (ng/mL) < 1000 1000-2499 2500-4999 5000-9999 10,000+
Centre Total No. % No. % No. % No. % No. %
IPHKL 98 31 12.11 38 14.84 24 9.38 5 1.95 2 0.78
PPUKM 71 18 7.03 20 7.81 16 6.25 14 5.47 3 1.17
PPUM 87 9 3.52 40 15.63 26 10.16 10 3.91 0 0.00
Total 256 58 22.66 98 38.28 66 25.78 29 11.33 5 1.95
17.4.3 Haemopoietic Transplant in Thalassaemia
Since 2007, a total of 77 patients underwent stem cell transplant in IPHKL. The patients were referred from hospitals in all of Malaysia.
Figure 17.7: Number of Thalassaemia Patients Who Underwent Stem Cell Transplant at IPHKL by Year
9
8
7
6
5
4
3
2
1
0
Year
No.
of P
atie
nts
5
8 8
7 7
8
555
77
2007 2008 2009 2010 2011 2012 2013 2014 2015 2016 2017
MTR Report_Part-2_PRINT_20191114_FA9.indd 294 27/11/2019 5:21 PM
295
MA
LAYSIAN
THA
LASSA
EMIA
REGISTRY
REPORT 2018
17Wilayah Persekutuan Kuala Lumpur
17.5 Observation and Comment
The report focuses on the result of patient management and outcomes ever since MTR has been operational, from 2007 to 2018. It describes outcomes based on demographic statistics, the types of thalassaemia and effectiveness of treatment.
There are 287 (53.64%) male patients and 248 (46.36%) female patients in Kuala Lumpur. The youngest patient is 2 years old and the oldest is 66 years old. Patients between 10-19.9 years old form the largest number of patients in Kuala Lumpur. Generally, as paediatric patients turn 18 years old, they are transferred to the adult treatment centres (usually Hospital Ampang). Malay patients are the largest group with 393 patients (73.46%), followed by Chinese with 113 patients (21.12%) and Indians with only three patients (0.56%). A total of 11 foreigners are also seeking treatment for thalassaemia in Kuala Lumpur facilities. The treatment fees and iron chelators are self-paid for foreigners, and these cost more than for citizens.
Most children with moderate to severe thalassaemia show signs and symptoms within the first two years of life. If the doctors suspect the child has thalassaemia, he or she may confirm the diagnosis using blood tests. The Hb analysis uses high-performance liquid chromatography (HPLC) test and capillary electrophoresis (CE). HbE-beta thalassaemia and beta thalassaemia major afflicts 237 (44.30%) and 152 (28.41%) of patients in Kuala Lumpur. Another notable diagnosis is HbH disease with 100 patients diagnosed (18.69%), whereas 26 (4.86%) patients have other diagnoses.
Iron chelation therapy is essential for patients with thalassaemia to remove iron overload. In total, 237 patients (77.45%) in Kuala Lumpur are on monotherapy and 69 patients (22.55%) are on combination therapy. The most common combination of chelators are DFO and DFP, prescribed to 53 patients (17.32%). A significant number of patients are on monotherapy with DFX (128 patients, 41.83%).
A total of 169 out of 535 patients (31.59%) have a serum ferritin level lower than 2500 ng/mL in 2017, compared to 156 out of 535 patients (29.16%) in 2018.
MTR Report_Part-2_PRINT_20191114_FA9.indd 295 27/11/2019 5:21 PM
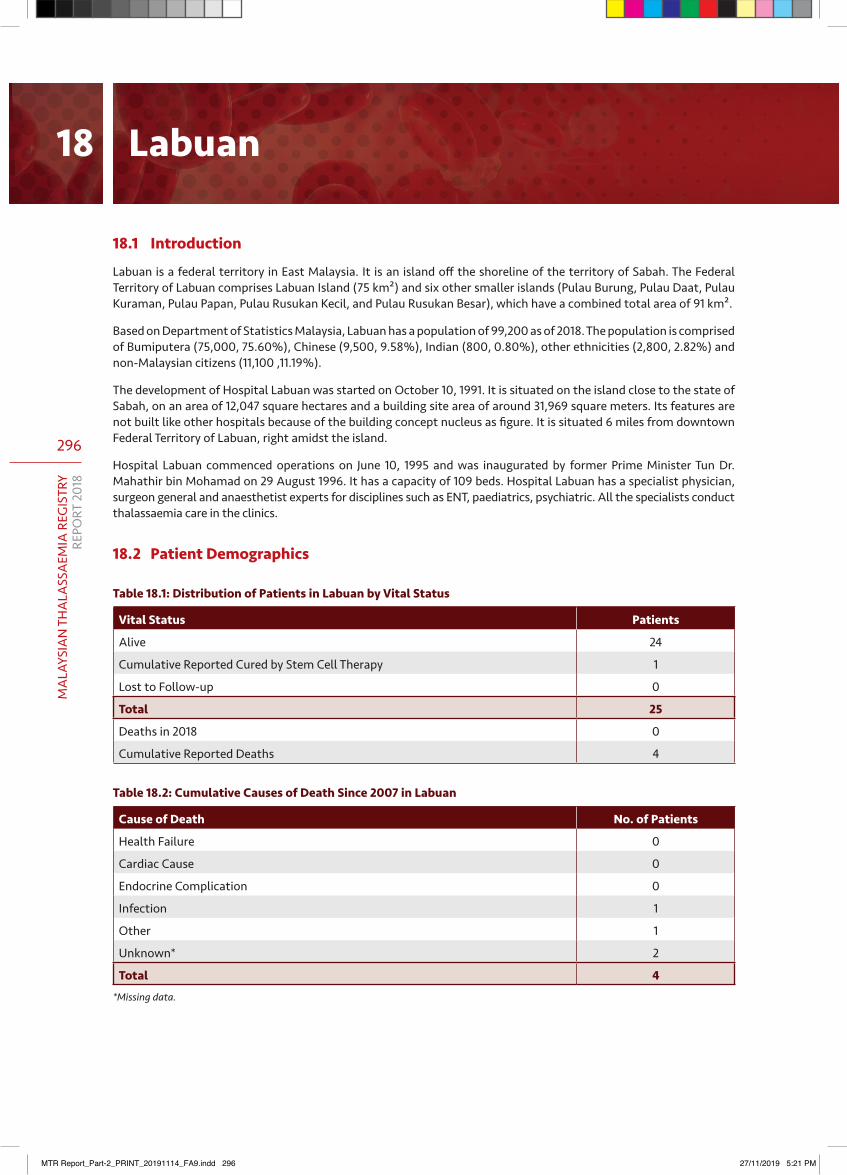
296
MA
LAYS
IAN
TH
ALA
SSA
EMIA
REG
ISTR
YRE
PORT
201
8
18.1 Introduction
Labuan is a federal territory in East Malaysia. It is an island off the shoreline of the territory of Sabah. The Federal Territory of Labuan comprises Labuan Island (75 km²) and six other smaller islands (Pulau Burung, Pulau Daat, Pulau Kuraman, Pulau Papan, Pulau Rusukan Kecil, and Pulau Rusukan Besar), which have a combined total area of 91 km².
Based on Department of Statistics Malaysia, Labuan has a population of 99,200 as of 2018. The population is comprised of Bumiputera (75,000, 75.60%), Chinese (9,500, 9.58%), Indian (800, 0.80%), other ethnicities (2,800, 2.82%) and non-Malaysian citizens (11,100 ,11.19%).
The development of Hospital Labuan was started on October 10, 1991. It is situated on the island close to the state of Sabah, on an area of 12,047 square hectares and a building site area of around 31,969 square meters. Its features are not built like other hospitals because of the building concept nucleus as figure. It is situated 6 miles from downtown Federal Territory of Labuan, right amidst the island.
Hospital Labuan commenced operations on June 10, 1995 and was inaugurated by former Prime Minister Tun Dr. Mahathir bin Mohamad on 29 August 1996. It has a capacity of 109 beds. Hospital Labuan has a specialist physician, surgeon general and anaesthetist experts for disciplines such as ENT, paediatrics, psychiatric. All the specialists conduct thalassaemia care in the clinics.
18.2 Patient Demographics
Table 18.1: Distribution of Patients in Labuan by Vital Status
Vital Status Patients
Alive 24
Cumulative Reported Cured by Stem Cell Therapy 1
Lost to Follow-up 0
Total 25
Deaths in 2018 0
Cumulative Reported Deaths 4
Table 18.2: Cumulative Causes of Death Since 2007 in Labuan
Cause of Death No. of Patients
Health Failure 0
Cardiac Cause 0
Endocrine Complication 0
Infection 1
Other 1
Unknown* 2
Total 4*Missing data.
Labuan18
MTR Report_Part-2_PRINT_20191114_FA9.indd 296 27/11/2019 5:21 PM
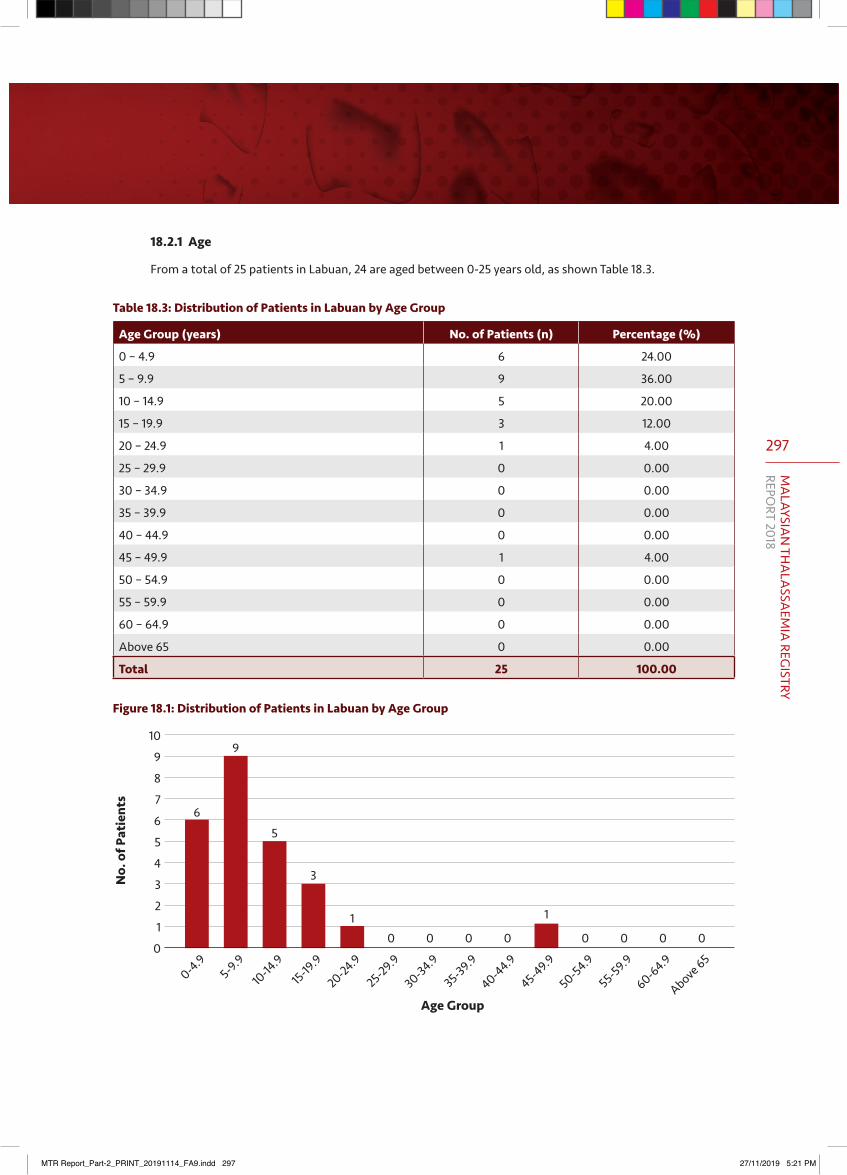
297
MA
LAYSIAN
THA
LASSA
EMIA
REGISTRY
REPORT 2018
18.2.1 Age
From a total of 25 patients in Labuan, 24 are aged between 0-25 years old, as shown Table 18.3.
Table 18.3: Distribution of Patients in Labuan by Age Group
Age Group (years) No. of Patients (n) Percentage (%)
0 – 4.9 6 24.00
5 – 9.9 9 36.00
10 – 14.9 5 20.00
15 – 19.9 3 12.00
20 – 24.9 1 4.00
25 – 29.9 0 0.00
30 – 34.9 0 0.00
35 – 39.9 0 0.00
40 – 44.9 0 0.00
45 – 49.9 1 4.00
50 – 54.9 0 0.00
55 – 59.9 0 0.00
60 – 64.9 0 0.00
Above 65 0 0.00
Total 25 100.00
Figure 18.1: Distribution of Patients in Labuan by Age Group
10
9
8
7
6
5
4
3
2
1
0
Age Group
No.
of P
atie
nts
0-4.95-9.9
10-14
.915-19
.9
20-24.9
25-29.9
30-34.9
35-39.9
40-44.9
45-49.9
50-54.9
55-59.9
60-64.9
Above 65
6
9
5
3
10 0 0 0
1
0 0 0 0
MTR Report_Part-2_PRINT_20191114_FA9.indd 297 27/11/2019 5:21 PM
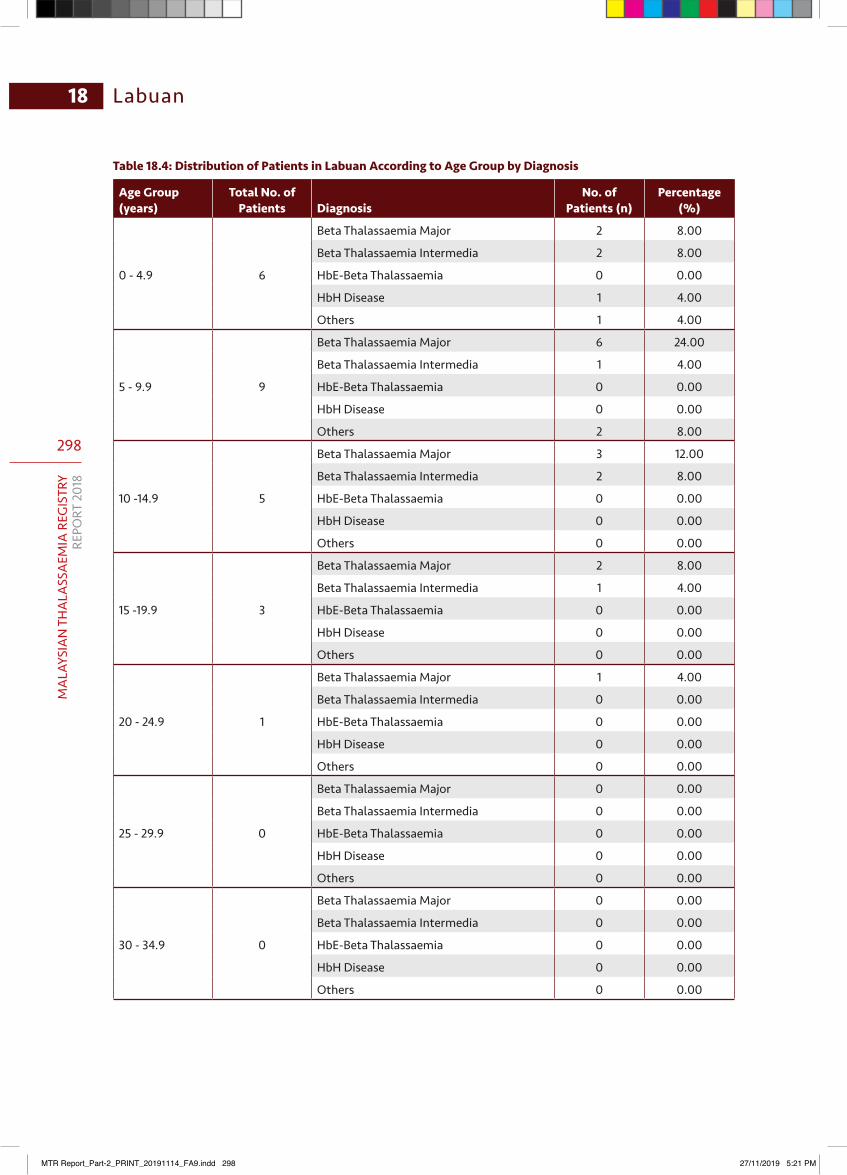
298
MA
LAYS
IAN
TH
ALA
SSA
EMIA
REG
ISTR
YRE
PORT
201
8
18 Labuan
Table 18.4: Distribution of Patients in Labuan According to Age Group by Diagnosis
Age Group (years)
Total No. of Patients Diagnosis
No. of Patients (n)
Percentage (%)
0 - 4.9 6
Beta Thalassaemia Major 2 8.00
Beta Thalassaemia Intermedia 2 8.00
HbE-Beta Thalassaemia 0 0.00
HbH Disease 1 4.00
Others 1 4.00
5 - 9.9 9
Beta Thalassaemia Major 6 24.00
Beta Thalassaemia Intermedia 1 4.00
HbE-Beta Thalassaemia 0 0.00
HbH Disease 0 0.00
Others 2 8.00
10 -14.9 5
Beta Thalassaemia Major 3 12.00
Beta Thalassaemia Intermedia 2 8.00
HbE-Beta Thalassaemia 0 0.00
HbH Disease 0 0.00
Others 0 0.00
15 -19.9 3
Beta Thalassaemia Major 2 8.00
Beta Thalassaemia Intermedia 1 4.00
HbE-Beta Thalassaemia 0 0.00
HbH Disease 0 0.00
Others 0 0.00
20 - 24.9 1
Beta Thalassaemia Major 1 4.00
Beta Thalassaemia Intermedia 0 0.00
HbE-Beta Thalassaemia 0 0.00
HbH Disease 0 0.00
Others 0 0.00
25 - 29.9 0
Beta Thalassaemia Major 0 0.00
Beta Thalassaemia Intermedia 0 0.00
HbE-Beta Thalassaemia 0 0.00
HbH Disease 0 0.00
Others 0 0.00
30 - 34.9 0
Beta Thalassaemia Major 0 0.00
Beta Thalassaemia Intermedia 0 0.00
HbE-Beta Thalassaemia 0 0.00
HbH Disease 0 0.00
Others 0 0.00
MTR Report_Part-2_PRINT_20191114_FA9.indd 298 27/11/2019 5:21 PM

299
MA
LAYSIAN
THA
LASSA
EMIA
REGISTRY
REPORT 2018
18Labuan
Age Group (years)
Total No. of Patients Diagnosis
No. of Patients (n)
Percentage (%)
35 - 39.9 0
Beta Thalassaemia Major 0 0.00
Beta Thalassaemia Intermedia 0 0.00
HbE-Beta Thalassaemia 0 0.00
HbH Disease 0 0.00
Others 0 0.00
40 - 44.9 0
Beta Thalassaemia Major 0 0.00
Beta Thalassaemia Intermedia 0 0.00
HbE-Beta Thalassaemia 0 0.00
HbH Disease 0 0.00
Others 0 0.00
45 – 49.9 1
Beta Thalassaemia Major 1 4.00
Beta Thalassaemia Intermedia 0 0.00
HbE-Beta Thalassaemia 0 0.00
HbH Disease 0 0.00
Others 0 0.00
50 – 54.9 0
Beta Thalassaemia Major 0 0.00
Beta Thalassaemia Intermedia 0 0.00
HbE-Beta Thalassaemia 0 0.00
HbH Disease 0 0.00
Others 0 0.00
55 – 59.9 0
Beta Thalassaemia Major 0 0.00
Beta Thalassaemia Intermedia 0 0.00
HbE-Beta Thalassaemia 0 0.00
HbH Disease 0 0.00
Others 0 0.00
60 – 64.9 0
Beta Thalassaemia Major 0 0.00
Beta Thalassaemia Intermedia 0 0.00
HbE-Beta Thalassaemia 0 0.00
HbH Disease 0 0.00
Others 0 0.00
Above 65 0
Beta Thalassaemia Major 0 0.00
Beta Thalassaemia Intermedia 0 0.00
HbE-Beta Thalassaemia 0 0.00
HbH Disease 0 0.00
Others 0 0.00
Total 25 100.00
MTR Report_Part-2_PRINT_20191114_FA9.indd 299 27/11/2019 5:21 PM
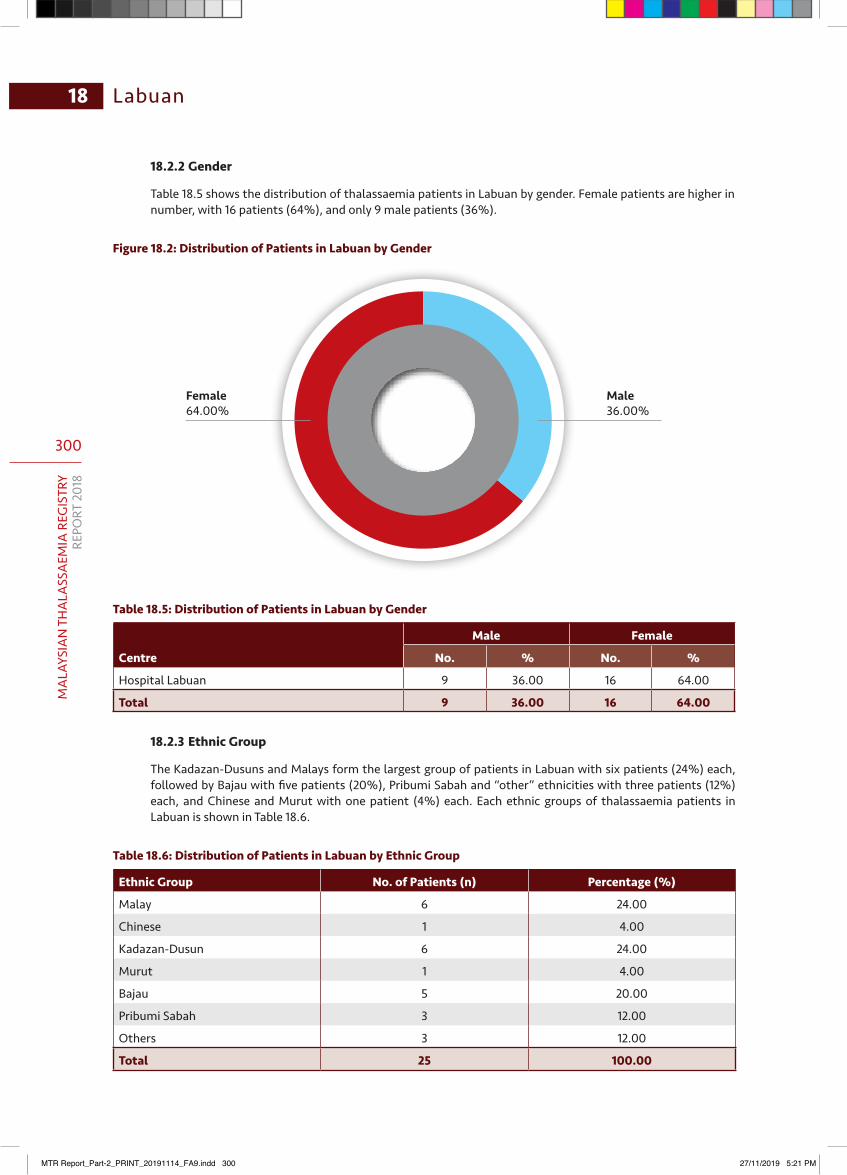
300
MA
LAYS
IAN
TH
ALA
SSA
EMIA
REG
ISTR
YRE
PORT
201
8
18 Labuan
18.2.2 Gender
Table 18.5 shows the distribution of thalassaemia patients in Labuan by gender. Female patients are higher in number, with 16 patients (64%), and only 9 male patients (36%).
Figure 18.2: Distribution of Patients in Labuan by Gender
Female64.00%
Male36.00%
Table 18.5: Distribution of Patients in Labuan by Gender
Centre
Male Female
No. % No. %
Hospital Labuan 9 36.00 16 64.00
Total 9 36.00 16 64.00
18.2.3 Ethnic Group
The Kadazan-Dusuns and Malays form the largest group of patients in Labuan with six patients (24%) each, followed by Bajau with five patients (20%), Pribumi Sabah and “other” ethnicities with three patients (12%) each, and Chinese and Murut with one patient (4%) each. Each ethnic groups of thalassaemia patients in Labuan is shown in Table 18.6.
Table 18.6: Distribution of Patients in Labuan by Ethnic Group
Ethnic Group No. of Patients (n) Percentage (%)
Malay 6 24.00
Chinese 1 4.00
Kadazan-Dusun 6 24.00
Murut 1 4.00
Bajau 5 20.00
Pribumi Sabah 3 12.00
Others 3 12.00
Total 25 100.00
MTR Report_Part-2_PRINT_20191114_FA9.indd 300 27/11/2019 5:21 PM
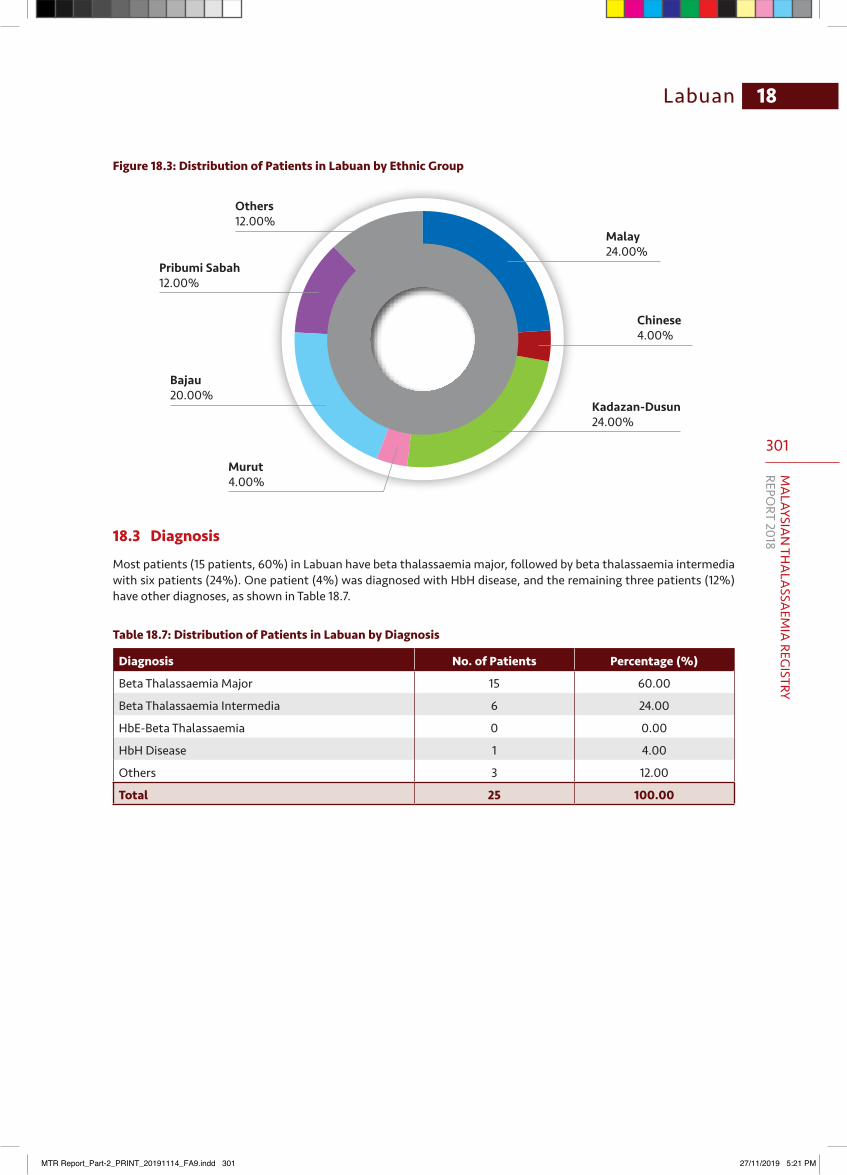
301
MA
LAYSIAN
THA
LASSA
EMIA
REGISTRY
REPORT 2018
18Labuan
Figure 18.3: Distribution of Patients in Labuan by Ethnic Group
Murut4.00%
Bajau20.00%
Pribumi Sabah12.00%
Others12.00%
Malay24.00%
Chinese4.00%
Kadazan-Dusun24.00%
18.3 Diagnosis
Most patients (15 patients, 60%) in Labuan have beta thalassaemia major, followed by beta thalassaemia intermedia with six patients (24%). One patient (4%) was diagnosed with HbH disease, and the remaining three patients (12%) have other diagnoses, as shown in Table 18.7.
Table 18.7: Distribution of Patients in Labuan by Diagnosis
Diagnosis No. of Patients Percentage (%)
Beta Thalassaemia Major 15 60.00
Beta Thalassaemia Intermedia 6 24.00
HbE-Beta Thalassaemia 0 0.00
HbH Disease 1 4.00
Others 3 12.00
Total 25 100.00
MTR Report_Part-2_PRINT_20191114_FA9.indd 301 27/11/2019 5:21 PM
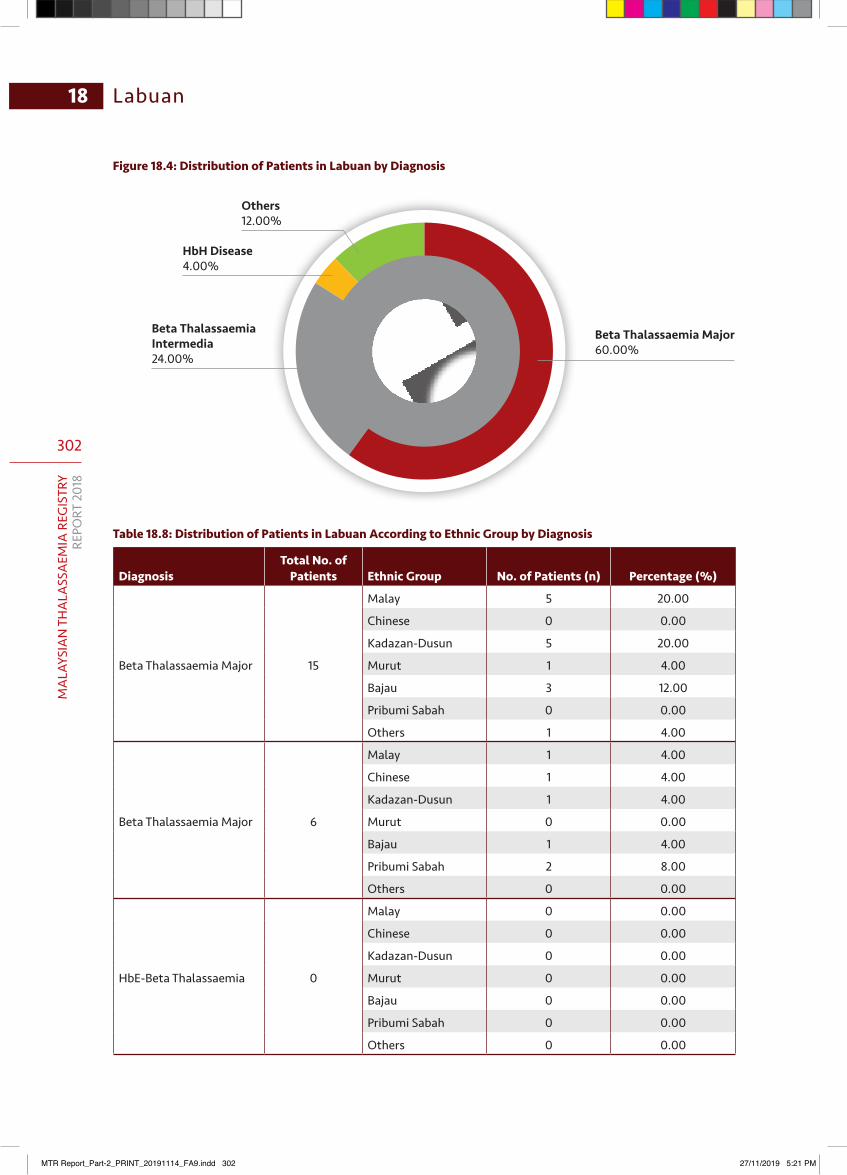
302
MA
LAYS
IAN
TH
ALA
SSA
EMIA
REG
ISTR
YRE
PORT
201
8
18 Labuan
Beta Thalassaemia Major60.00%
Others12.00%
HbH Disease4.00%
Beta Thalassaemia Intermedia24.00%
Figure 18.4: Distribution of Patients in Labuan by Diagnosis
Table 18.8: Distribution of Patients in Labuan According to Ethnic Group by Diagnosis
DiagnosisTotal No. of
Patients Ethnic Group No. of Patients (n) Percentage (%)
Beta Thalassaemia Major 15
Malay 5 20.00
Chinese 0 0.00
Kadazan-Dusun 5 20.00
Murut 1 4.00
Bajau 3 12.00
Pribumi Sabah 0 0.00
Others 1 4.00
Beta Thalassaemia Major 6
Malay 1 4.00
Chinese 1 4.00
Kadazan-Dusun 1 4.00
Murut 0 0.00
Bajau 1 4.00
Pribumi Sabah 2 8.00
Others 0 0.00
HbE-Beta Thalassaemia 0
Malay 0 0.00
Chinese 0 0.00
Kadazan-Dusun 0 0.00
Murut 0 0.00
Bajau 0 0.00
Pribumi Sabah 0 0.00
Others 0 0.00
MTR Report_Part-2_PRINT_20191114_FA9.indd 302 27/11/2019 5:21 PM
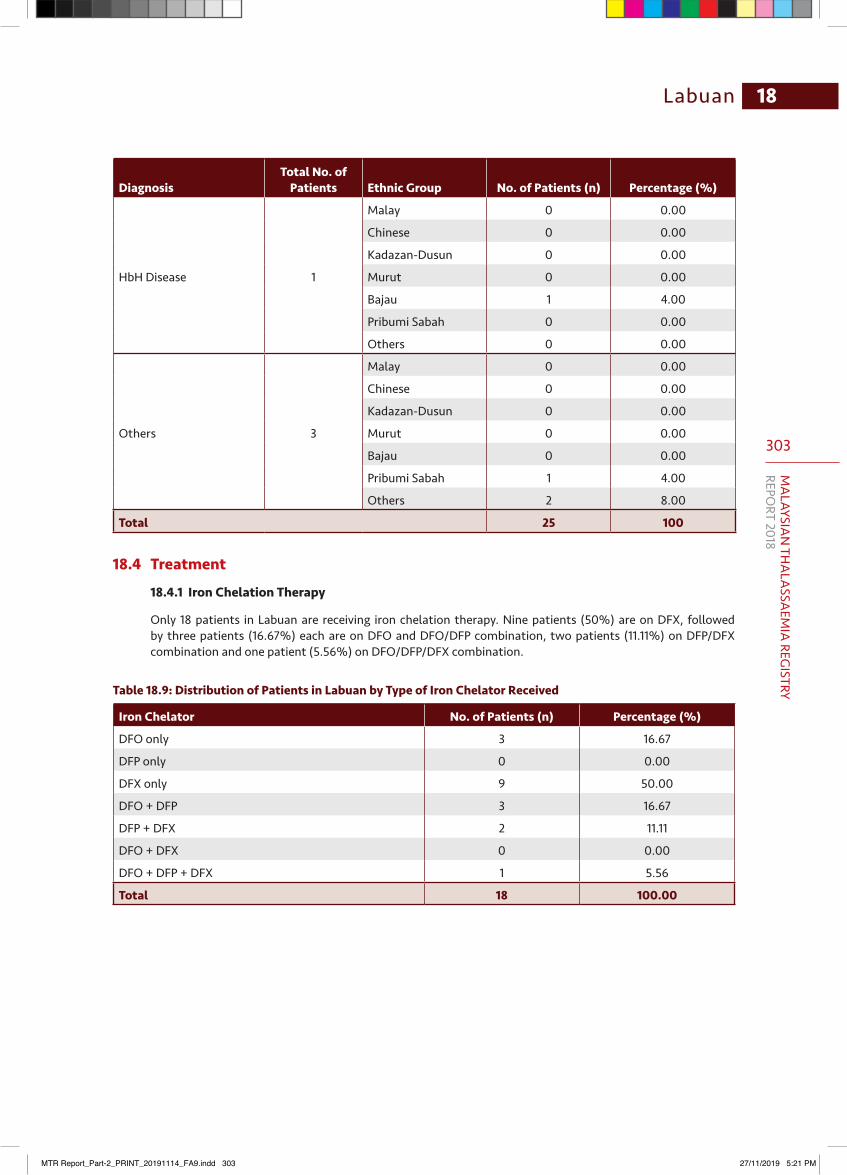
303
MA
LAYSIAN
THA
LASSA
EMIA
REGISTRY
REPORT 2018
18Labuan
DiagnosisTotal No. of
Patients Ethnic Group No. of Patients (n) Percentage (%)
HbH Disease 1
Malay 0 0.00
Chinese 0 0.00
Kadazan-Dusun 0 0.00
Murut 0 0.00
Bajau 1 4.00
Pribumi Sabah 0 0.00
Others 0 0.00
Others 3
Malay 0 0.00
Chinese 0 0.00
Kadazan-Dusun 0 0.00
Murut 0 0.00
Bajau 0 0.00
Pribumi Sabah 1 4.00
Others 2 8.00
Total 25 100
18.4 Treatment
18.4.1 Iron Chelation Therapy
Only 18 patients in Labuan are receiving iron chelation therapy. Nine patients (50%) are on DFX, followed by three patients (16.67%) each are on DFO and DFO/DFP combination, two patients (11.11%) on DFP/DFX combination and one patient (5.56%) on DFO/DFP/DFX combination.
Table 18.9: Distribution of Patients in Labuan by Type of Iron Chelator Received
Iron Chelator No. of Patients (n) Percentage (%)
DFO only 3 16.67
DFP only 0 0.00
DFX only 9 50.00
DFO + DFP 3 16.67
DFP + DFX 2 11.11
DFO + DFX 0 0.00
DFO + DFP + DFX 1 5.56
Total 18 100.00
MTR Report_Part-2_PRINT_20191114_FA9.indd 303 27/11/2019 5:21 PM
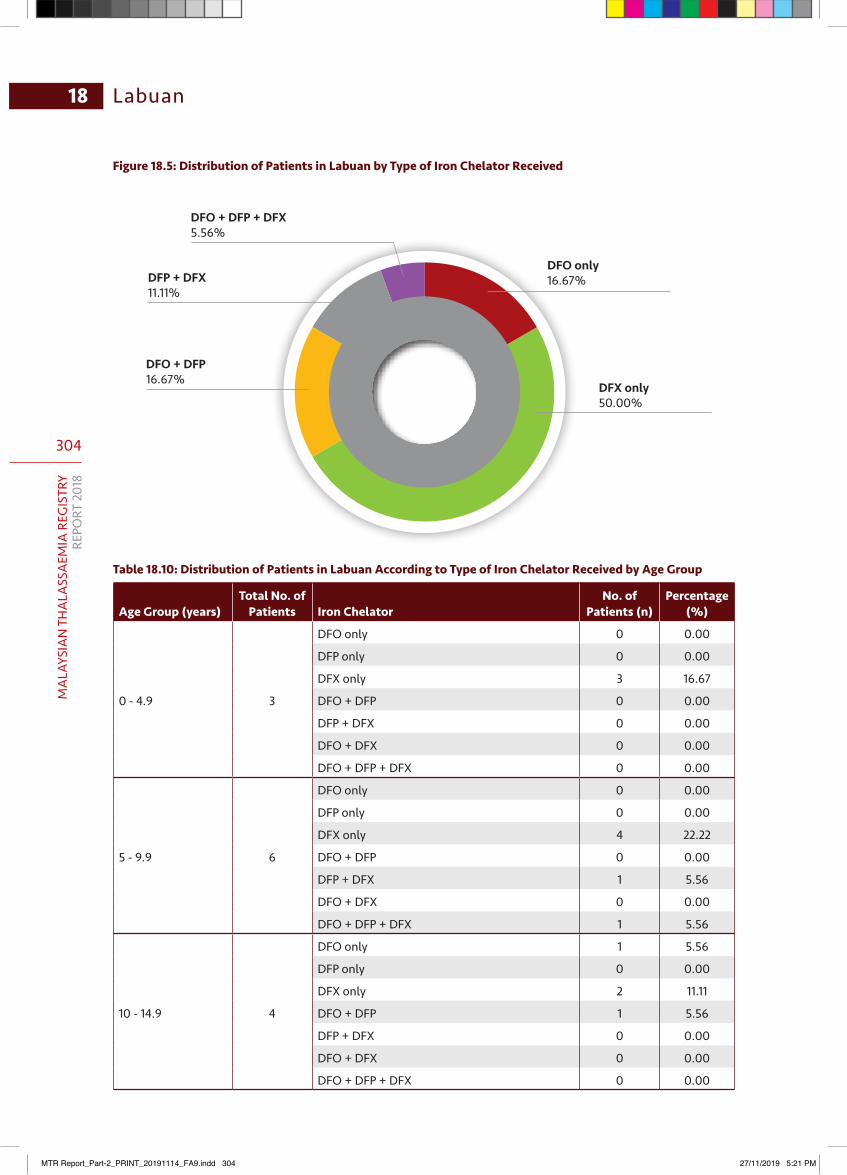
304
MA
LAYS
IAN
TH
ALA
SSA
EMIA
REG
ISTR
YRE
PORT
201
8
18 Labuan
Figure 18.5: Distribution of Patients in Labuan by Type of Iron Chelator Received
DFO + DFP + DFX 5.56%
DFP + DFX11.11%
DFO + DFP16.67%
DFO only16.67%
DFX only50.00%
Table 18.10: Distribution of Patients in Labuan According to Type of Iron Chelator Received by Age Group
Age Group (years)Total No. of
Patients Iron ChelatorNo. of
Patients (n)Percentage
(%)
0 - 4.9 3
DFO only 0 0.00
DFP only 0 0.00
DFX only 3 16.67
DFO + DFP 0 0.00
DFP + DFX 0 0.00
DFO + DFX 0 0.00
DFO + DFP + DFX 0 0.00
5 - 9.9 6
DFO only 0 0.00
DFP only 0 0.00
DFX only 4 22.22
DFO + DFP 0 0.00
DFP + DFX 1 5.56
DFO + DFX 0 0.00
DFO + DFP + DFX 1 5.56
10 - 14.9 4
DFO only 1 5.56
DFP only 0 0.00
DFX only 2 11.11
DFO + DFP 1 5.56
DFP + DFX 0 0.00
DFO + DFX 0 0.00
DFO + DFP + DFX 0 0.00
MTR Report_Part-2_PRINT_20191114_FA9.indd 304 27/11/2019 5:21 PM

305
MA
LAYSIAN
THA
LASSA
EMIA
REGISTRY
REPORT 2018
18Labuan
Age Group (years)Total No. of
Patients Iron ChelatorNo. of
Patients (n)Percentage
(%)
15 - 19.9 3
DFO only 2 11.11
DFP only 0 0.00
DFX only 0 0.00
DFO + DFP 0 0.00
DFP + DFX 1 5.56
DFO + DFX 0 0.00
DFO + DFP + DFX 0 0.00
20 - 24.9 1
DFO only 0 0.00
DFP only 0 0.00
DFX only 0 0.00
DFO + DFP 1 5.56
DFP + DFX 0 0.00
DFO + DFX 0 0.00
DFO + DFP + DFX 0 0.00
25 - 29.9 0
DFO only 0 0.00
DFP only 0 0.00
DFX only 0 0.00
DFO + DFP 0 0.00
DFP + DFX 0 0.00
DFO + DFX 0 0.00
DFO + DFP + DFX 0 0.00
30 - 34.9 0
DFO only 0 0.00
DFP only 0 0.00
DFX only 0 0.00
DFO + DFP 0 0.00
DFP + DFX 0 0.00
DFO + DFX 0 0.00
DFO + DFP + DFX 0 0.00
35 - 39.9 0
DFO only 0 0.00
DFP only 0 0.00
DFX only 0 0.00
DFO + DFP 0 0.00
DFP + DFX 0 0.00
DFO + DFX 0 0.00
DFO + DFP + DFX 0 0.00
MTR Report_Part-2_PRINT_20191114_FA9.indd 305 27/11/2019 5:21 PM

306
MA
LAYS
IAN
TH
ALA
SSA
EMIA
REG
ISTR
YRE
PORT
201
8
18 Labuan
Age Group (years)Total No. of
Patients Iron ChelatorNo. of
Patients (n)Percentage
(%)
40 - 44.9 0
DFO only 0 0.00
DFP only 0 0.00
DFX only 0 0.00
DFO + DFP 0 0.00
DFP + DFX 0 0.00
DFO + DFX 0 0.00
DFO + DFP + DFX 0 0.00
45 - 49.9 1
DFO only 0 0.00
DFP only 0 0.00
DFX only 0 0.00
DFO + DFP 1 5.56
DFP + DFX 0 0.00
DFO + DFX 0 0.00
DFO + DFP + DFX 0 0.00
50 - 54.9 0
DFO only 0 0.00
DFP only 0 0.00
DFX only 0 0.00
DFO + DFP 0 0.00
DFP + DFX 0 0.00
DFO + DFX 0 0.00
DFO + DFP + DFX 0 0.00
55 - 59.9 0
DFO only 0 0.00
DFP only 0 0.00
DFX only 0 0.00
DFO + DFP 0 0.00
DFP + DFX 0 0.00
DFO + DFX 0 0.00
DFO + DFP + DFX 0 0.00
60 - 64.9 0
DFO only 0 0.00
DFP only 0 0.00
DFX only 0 0.00
DFO + DFP 0 0.00
DFP + DFX 0 0.00
DFO + DFX 0 0.00
DFO + DFP + DFX 0 0.00
MTR Report_Part-2_PRINT_20191114_FA9.indd 306 27/11/2019 5:21 PM
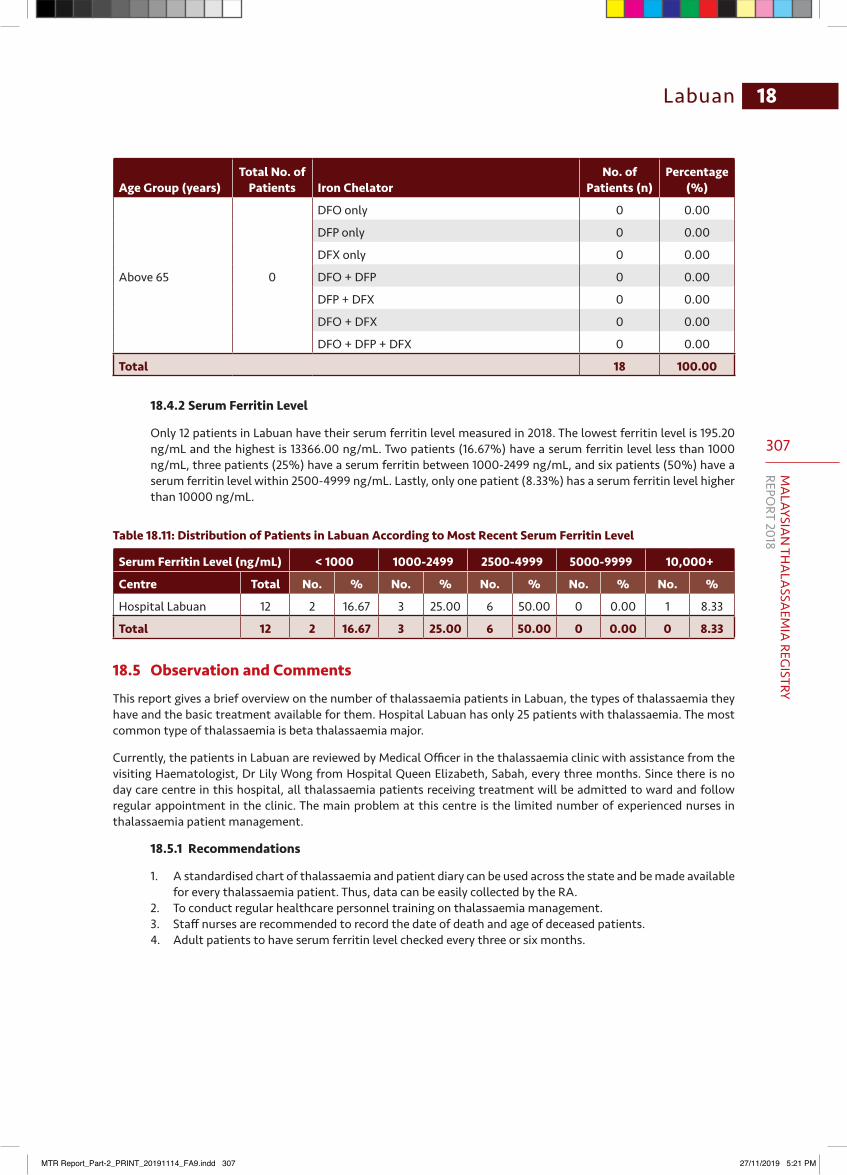
307
MA
LAYSIAN
THA
LASSA
EMIA
REGISTRY
REPORT 2018
18Labuan
Age Group (years)Total No. of
Patients Iron ChelatorNo. of
Patients (n)Percentage
(%)
Above 65 0
DFO only 0 0.00
DFP only 0 0.00
DFX only 0 0.00
DFO + DFP 0 0.00
DFP + DFX 0 0.00
DFO + DFX 0 0.00
DFO + DFP + DFX 0 0.00
Total 18 100.00
18.4.2 Serum Ferritin Level
Only 12 patients in Labuan have their serum ferritin level measured in 2018. The lowest ferritin level is 195.20 ng/mL and the highest is 13366.00 ng/mL. Two patients (16.67%) have a serum ferritin level less than 1000 ng/mL, three patients (25%) have a serum ferritin between 1000-2499 ng/mL, and six patients (50%) have a serum ferritin level within 2500-4999 ng/mL. Lastly, only one patient (8.33%) has a serum ferritin level higher than 10000 ng/mL.
Table 18.11: Distribution of Patients in Labuan According to Most Recent Serum Ferritin Level
Serum Ferritin Level (ng/mL) < 1000 1000-2499 2500-4999 5000-9999 10,000+
Centre Total No. % No. % No. % No. % No. %
Hospital Labuan 12 2 16.67 3 25.00 6 50.00 0 0.00 1 8.33
Total 12 2 16.67 3 25.00 6 50.00 0 0.00 0 8.33
18.5 Observation and Comments
This report gives a brief overview on the number of thalassaemia patients in Labuan, the types of thalassaemia they have and the basic treatment available for them. Hospital Labuan has only 25 patients with thalassaemia. The most common type of thalassaemia is beta thalassaemia major.
Currently, the patients in Labuan are reviewed by Medical Officer in the thalassaemia clinic with assistance from the visiting Haematologist, Dr Lily Wong from Hospital Queen Elizabeth, Sabah, every three months. Since there is no day care centre in this hospital, all thalassaemia patients receiving treatment will be admitted to ward and follow regular appointment in the clinic. The main problem at this centre is the limited number of experienced nurses in thalassaemia patient management.
18.5.1 Recommendations
1. A standardised chart of thalassaemia and patient diary can be used across the state and be made available for every thalassaemia patient. Thus, data can be easily collected by the RA.
2. To conduct regular healthcare personnel training on thalassaemia management.3. Staff nurses are recommended to record the date of death and age of deceased patients.4. Adult patients to have serum ferritin level checked every three or six months.
MTR Report_Part-2_PRINT_20191114_FA9.indd 307 27/11/2019 5:21 PM
308
MA
LAYS
IAN
TH
ALA
SSA
EMIA
REG
ISTR
YRE
PORT
201
8
19.1 Introduction
Putrajaya is a planned city, located south of Kuala Lumpur. The city serves as the federal administrative centre of Malaysia. The seat of government was shifted from Kuala Lumpur to Putrajaya in 1999 due to overcrowding and congestion in Kuala Lumpur. Nevertheless, Kuala Lumpur remains as Malaysia’s national capital and also as the commercial and financial centre. Putrajaya was the brainchild of Prime Minister Tun Dr Mahathir Mohamad. In 2001, Putrajaya was made into a Federal Territory, increasing the number of federal territories of Malaysia to three (after Kuala Lumpur and Labuan).
Putrajaya was named after the first Malaysian Prime Minister, Tunku Abdul Rahman Putra. The city is situated within the Multimedia Super Corridor, beside the also newly-developed Cyberjaya. The development began in 1995 and today, major landmarks are completed and the population is expected to grow in the relatively new city. “Jaya” in the city’s name means “victory” in Sanskrit.
As of 2017, the population of Putrajaya is around 90,000.
19.2 Patient Demographics
Data analysed were taken from patients with status of either alive, lost to follow-up or cured by transplant, and excludes deceased patients. In total, there are 41 living patients in Putrajaya, as well as one deceased patient.
Table 19.1: Distribution of Patients in Putrajaya by Centre
Centre No. of Patients (n) Percentage (%)
Hospital Putrajaya 41 100.00
Total 41 100.00
Table 19.2: Distribution of Patients in Putrajaya by Vital Status
Vital Status No. Of Patients
Alive 37
Cumulative Reported Cured by Stem Cell Therapy 3
Lost to Follow-up 1
Total 41
Deaths in 2018 0
Cumulative Reported Deaths 1
Table 19.3: Cumulative Cause of Death Since 1997 in Putrajaya
Cause of Death No. of Patients
Infections 1
Total 1
Putrajaya19
MTR Report_Part-2_PRINT_20191114_FA9.indd 308 27/11/2019 5:21 PM
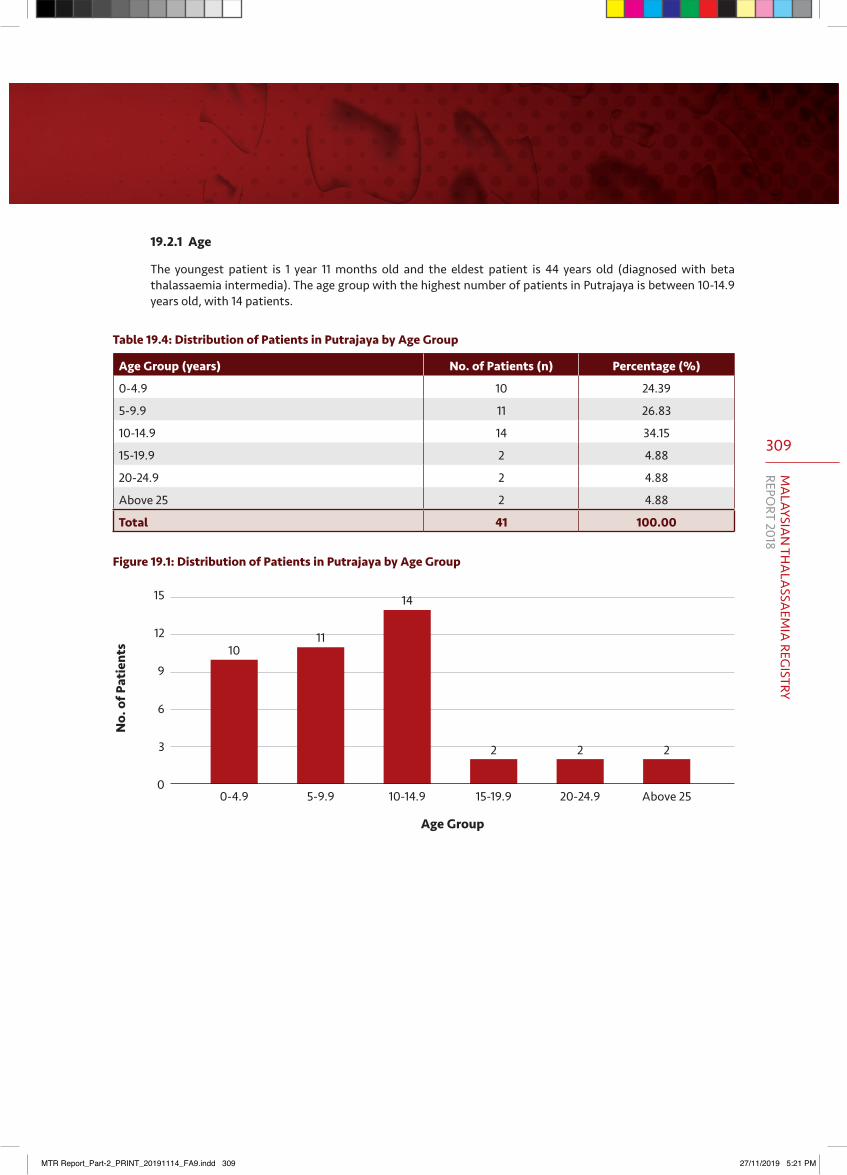
309
MA
LAYSIAN
THA
LASSA
EMIA
REGISTRY
REPORT 2018
19.2.1 Age
The youngest patient is 1 year 11 months old and the eldest patient is 44 years old (diagnosed with beta thalassaemia intermedia). The age group with the highest number of patients in Putrajaya is between 10-14.9 years old, with 14 patients.
Table 19.4: Distribution of Patients in Putrajaya by Age Group
Age Group (years) No. of Patients (n) Percentage (%)
0-4.9 10 24.39
5-9.9 11 26.83
10-14.9 14 34.15
15-19.9 2 4.88
20-24.9 2 4.88
Above 25 2 4.88
Total 41 100.00
Figure 19.1: Distribution of Patients in Putrajaya by Age Group
15
12
9
6
3
0
Age Group
No.
of P
atie
nts
0-4.9 5-9.9 10-14.9 15-19.9 20-24.9 Above 25
1011
14
2 2 2
MTR Report_Part-2_PRINT_20191114_FA9.indd 309 27/11/2019 5:21 PM
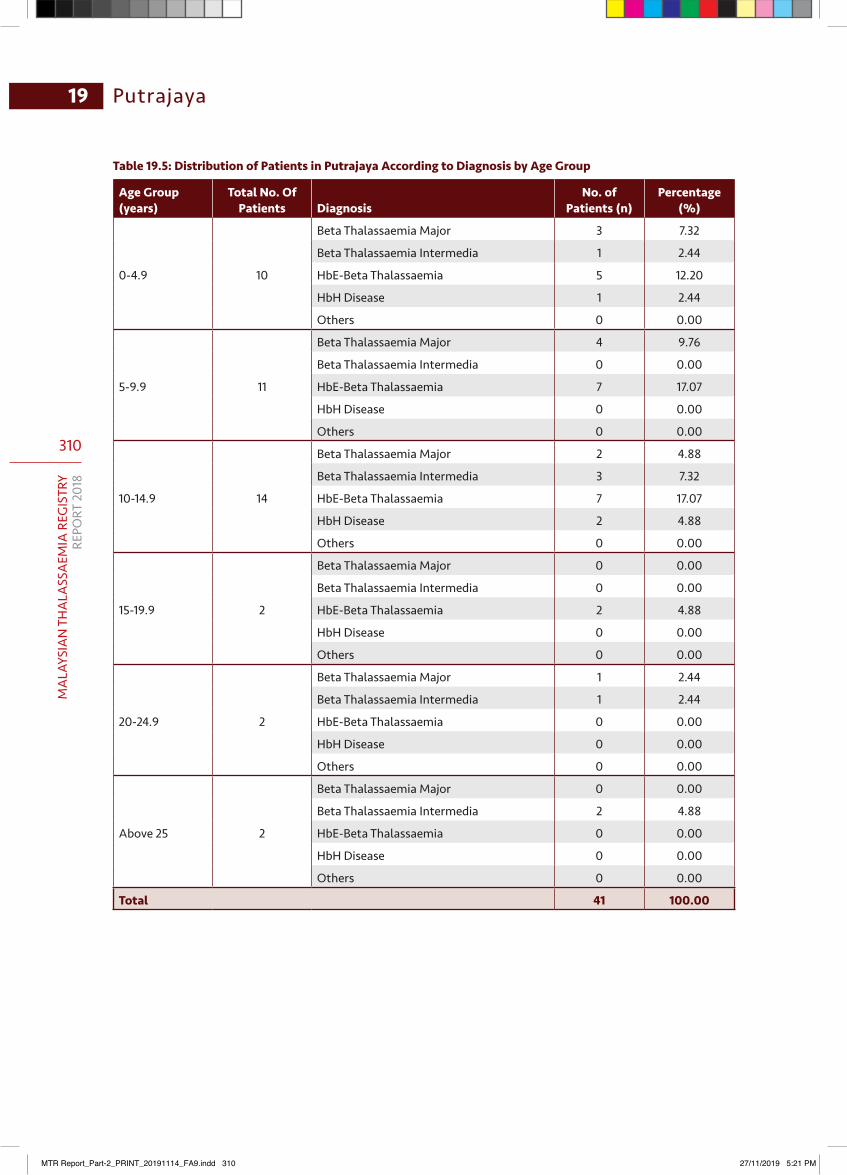
310
MA
LAYS
IAN
TH
ALA
SSA
EMIA
REG
ISTR
YRE
PORT
201
8
19 Putrajaya
Table 19.5: Distribution of Patients in Putrajaya According to Diagnosis by Age Group
Age Group (years)
Total No. Of Patients Diagnosis
No. of Patients (n)
Percentage (%)
0-4.9 10
Beta Thalassaemia Major 3 7.32
Beta Thalassaemia Intermedia 1 2.44
HbE-Beta Thalassaemia 5 12.20
HbH Disease 1 2.44
Others 0 0.00
5-9.9 11
Beta Thalassaemia Major 4 9.76
Beta Thalassaemia Intermedia 0 0.00
HbE-Beta Thalassaemia 7 17.07
HbH Disease 0 0.00
Others 0 0.00
10-14.9 14
Beta Thalassaemia Major 2 4.88
Beta Thalassaemia Intermedia 3 7.32
HbE-Beta Thalassaemia 7 17.07
HbH Disease 2 4.88
Others 0 0.00
15-19.9 2
Beta Thalassaemia Major 0 0.00
Beta Thalassaemia Intermedia 0 0.00
HbE-Beta Thalassaemia 2 4.88
HbH Disease 0 0.00
Others 0 0.00
20-24.9 2
Beta Thalassaemia Major 1 2.44
Beta Thalassaemia Intermedia 1 2.44
HbE-Beta Thalassaemia 0 0.00
HbH Disease 0 0.00
Others 0 0.00
Above 25 2
Beta Thalassaemia Major 0 0.00
Beta Thalassaemia Intermedia 2 4.88
HbE-Beta Thalassaemia 0 0.00
HbH Disease 0 0.00
Others 0 0.00
Total 41 100.00
MTR Report_Part-2_PRINT_20191114_FA9.indd 310 27/11/2019 5:21 PM
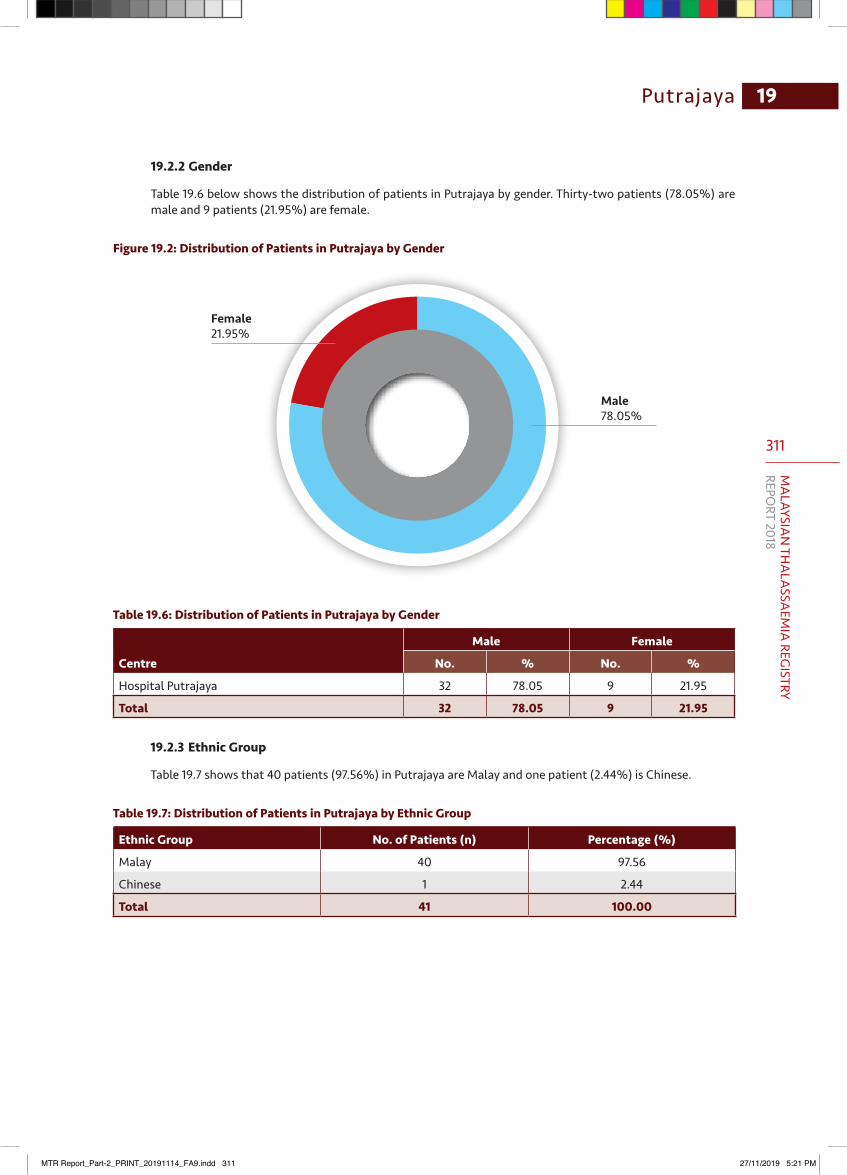
311
MA
LAYSIAN
THA
LASSA
EMIA
REGISTRY
REPORT 2018
Putrajaya 19
Female21.95%
Male78.05%
19.2.2 Gender
Table 19.6 below shows the distribution of patients in Putrajaya by gender. Thirty-two patients (78.05%) are male and 9 patients (21.95%) are female.
Figure 19.2: Distribution of Patients in Putrajaya by Gender
Table 19.6: Distribution of Patients in Putrajaya by Gender
Centre
Male Female
No. % No. %
Hospital Putrajaya 32 78.05 9 21.95
Total 32 78.05 9 21.95
19.2.3 Ethnic Group
Table 19.7 shows that 40 patients (97.56%) in Putrajaya are Malay and one patient (2.44%) is Chinese.
Table 19.7: Distribution of Patients in Putrajaya by Ethnic Group
Ethnic Group No. of Patients (n) Percentage (%)
Malay 40 97.56
Chinese 1 2.44
Total 41 100.00
MTR Report_Part-2_PRINT_20191114_FA9.indd 311 27/11/2019 5:21 PM
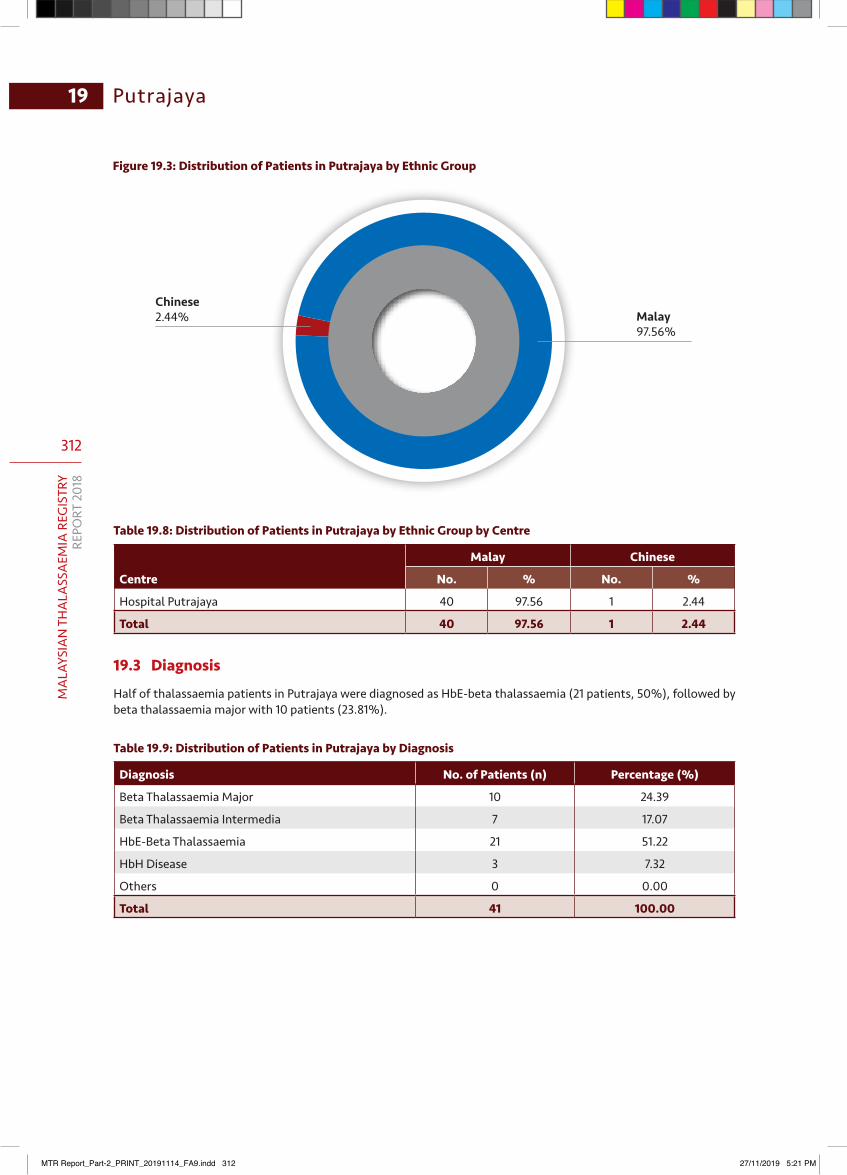
312
MA
LAYS
IAN
TH
ALA
SSA
EMIA
REG
ISTR
YRE
PORT
201
8
19 Putrajaya
Chinese2.44% Malay
97.56%
Table 19.8: Distribution of Patients in Putrajaya by Ethnic Group by Centre
Centre
Malay Chinese
No. % No. %
Hospital Putrajaya 40 97.56 1 2.44
Total 40 97.56 1 2.44
19.3 Diagnosis
Half of thalassaemia patients in Putrajaya were diagnosed as HbE-beta thalassaemia (21 patients, 50%), followed by beta thalassaemia major with 10 patients (23.81%).
Table 19.9: Distribution of Patients in Putrajaya by Diagnosis
Diagnosis No. of Patients (n) Percentage (%)
Beta Thalassaemia Major 10 24.39
Beta Thalassaemia Intermedia 7 17.07
HbE-Beta Thalassaemia 21 51.22
HbH Disease 3 7.32
Others 0 0.00
Total 41 100.00
Figure 19.3: Distribution of Patients in Putrajaya by Ethnic Group
MTR Report_Part-2_PRINT_20191114_FA9.indd 312 27/11/2019 5:21 PM
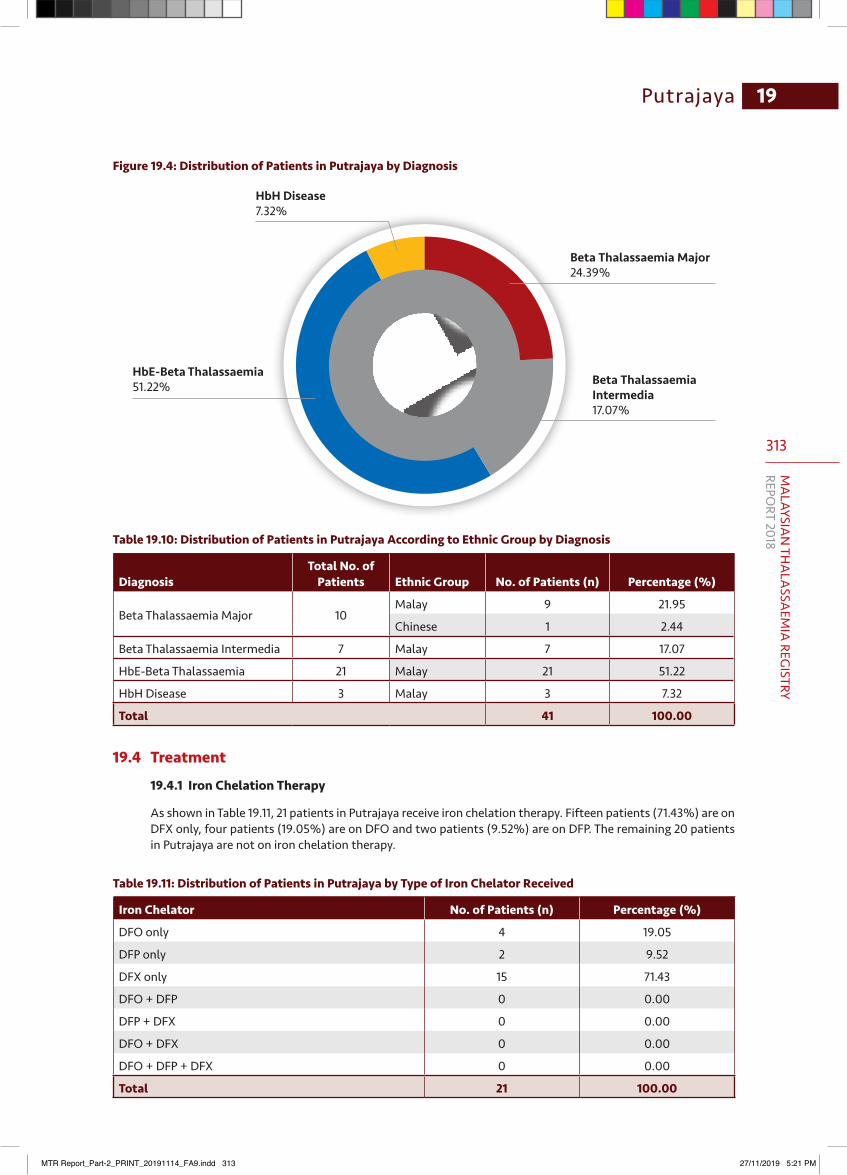
313
MA
LAYSIAN
THA
LASSA
EMIA
REGISTRY
REPORT 2018
Putrajaya 19
Figure 19.4: Distribution of Patients in Putrajaya by Diagnosis
Beta Thalassaemia Major24.39%
Beta Thalassaemia Intermedia17.07%
HbE-Beta Thalassaemia51.22%
HbH Disease7.32%
Table 19.10: Distribution of Patients in Putrajaya According to Ethnic Group by Diagnosis
DiagnosisTotal No. of
Patients Ethnic Group No. of Patients (n) Percentage (%)
Beta Thalassaemia Major 10Malay 9 21.95
Chinese 1 2.44
Beta Thalassaemia Intermedia 7 Malay 7 17.07
HbE-Beta Thalassaemia 21 Malay 21 51.22
HbH Disease 3 Malay 3 7.32
Total 41 100.00
19.4 Treatment
19.4.1 Iron Chelation Therapy
As shown in Table 19.11, 21 patients in Putrajaya receive iron chelation therapy. Fifteen patients (71.43%) are on DFX only, four patients (19.05%) are on DFO and two patients (9.52%) are on DFP. The remaining 20 patients in Putrajaya are not on iron chelation therapy.
Table 19.11: Distribution of Patients in Putrajaya by Type of Iron Chelator Received
Iron Chelator No. of Patients (n) Percentage (%)
DFO only 4 19.05
DFP only 2 9.52
DFX only 15 71.43
DFO + DFP 0 0.00
DFP + DFX 0 0.00
DFO + DFX 0 0.00
DFO + DFP + DFX 0 0.00
Total 21 100.00
MTR Report_Part-2_PRINT_20191114_FA9.indd 313 27/11/2019 5:21 PM
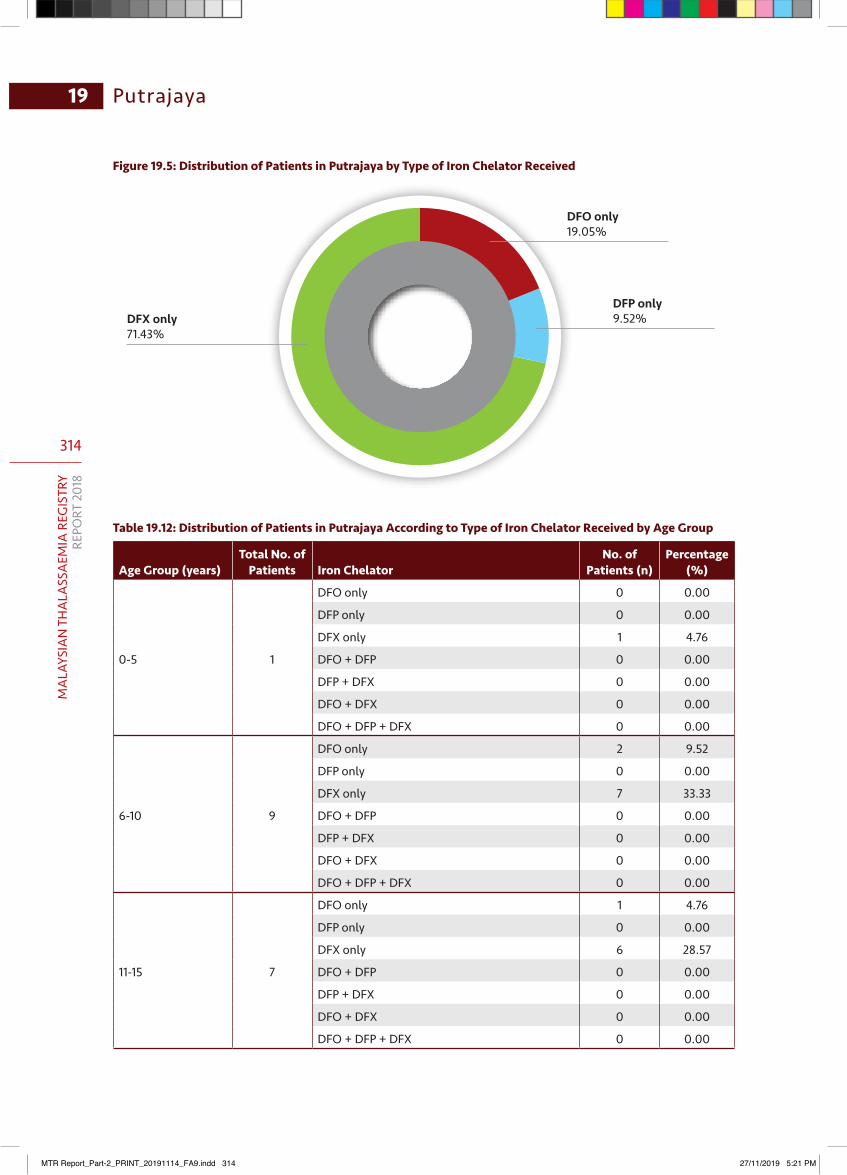
314
MA
LAYS
IAN
TH
ALA
SSA
EMIA
REG
ISTR
YRE
PORT
201
8
19 Putrajaya
Figure 19.5: Distribution of Patients in Putrajaya by Type of Iron Chelator Received
DFP only9.52%
DFO only19.05%
DFX only71.43%
Table 19.12: Distribution of Patients in Putrajaya According to Type of Iron Chelator Received by Age Group
Age Group (years)Total No. of
Patients Iron ChelatorNo. of
Patients (n)Percentage
(%)
0-5 1
DFO only 0 0.00
DFP only 0 0.00
DFX only 1 4.76
DFO + DFP 0 0.00
DFP + DFX 0 0.00
DFO + DFX 0 0.00
DFO + DFP + DFX 0 0.00
6-10 9
DFO only 2 9.52
DFP only 0 0.00
DFX only 7 33.33
DFO + DFP 0 0.00
DFP + DFX 0 0.00
DFO + DFX 0 0.00
DFO + DFP + DFX 0 0.00
11-15 7
DFO only 1 4.76
DFP only 0 0.00
DFX only 6 28.57
DFO + DFP 0 0.00
DFP + DFX 0 0.00
DFO + DFX 0 0.00
DFO + DFP + DFX 0 0.00
MTR Report_Part-2_PRINT_20191114_FA9.indd 314 27/11/2019 5:21 PM
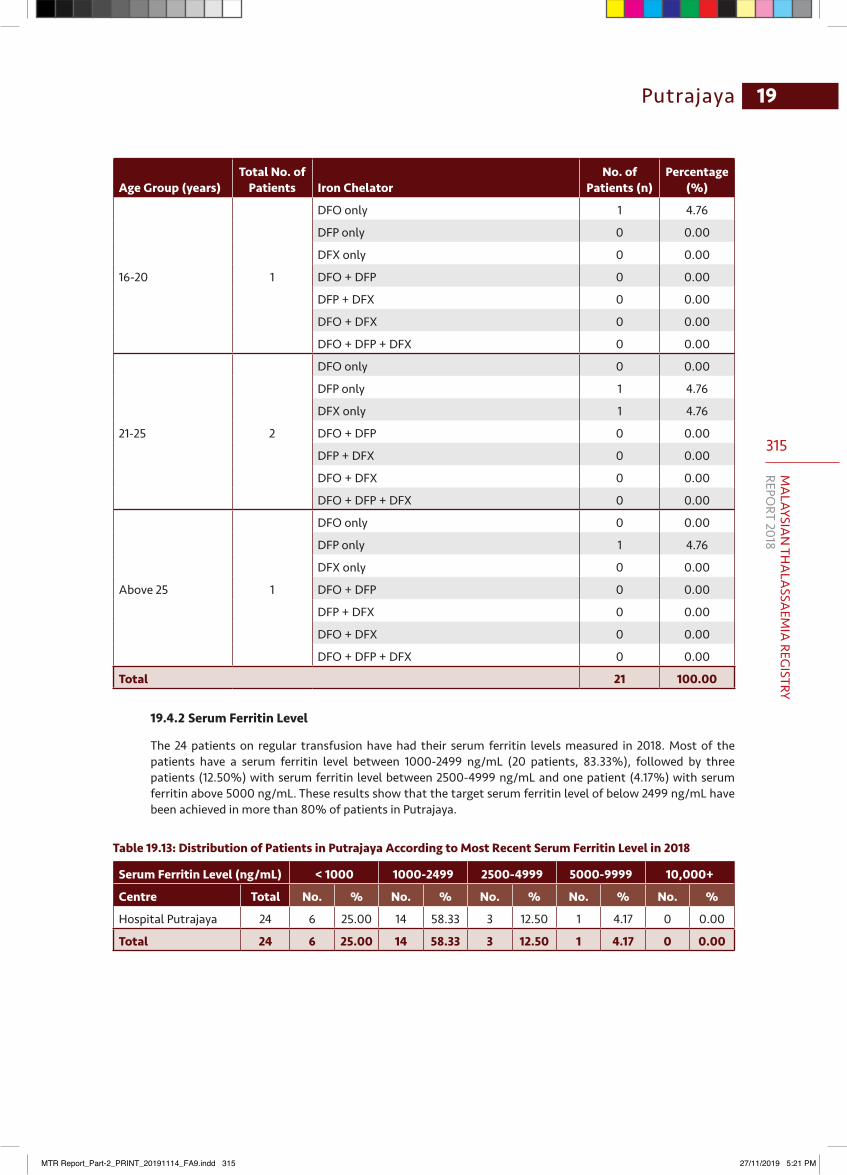
315
MA
LAYSIAN
THA
LASSA
EMIA
REGISTRY
REPORT 2018
Putrajaya 19
Age Group (years)Total No. of
Patients Iron ChelatorNo. of
Patients (n)Percentage
(%)
16-20 1
DFO only 1 4.76
DFP only 0 0.00
DFX only 0 0.00
DFO + DFP 0 0.00
DFP + DFX 0 0.00
DFO + DFX 0 0.00
DFO + DFP + DFX 0 0.00
21-25 2
DFO only 0 0.00
DFP only 1 4.76
DFX only 1 4.76
DFO + DFP 0 0.00
DFP + DFX 0 0.00
DFO + DFX 0 0.00
DFO + DFP + DFX 0 0.00
Above 25 1
DFO only 0 0.00
DFP only 1 4.76
DFX only 0 0.00
DFO + DFP 0 0.00
DFP + DFX 0 0.00
DFO + DFX 0 0.00
DFO + DFP + DFX 0 0.00
Total 21 100.00
19.4.2 Serum Ferritin Level
The 24 patients on regular transfusion have had their serum ferritin levels measured in 2018. Most of the patients have a serum ferritin level between 1000-2499 ng/mL (20 patients, 83.33%), followed by three patients (12.50%) with serum ferritin level between 2500-4999 ng/mL and one patient (4.17%) with serum ferritin above 5000 ng/mL. These results show that the target serum ferritin level of below 2499 ng/mL have been achieved in more than 80% of patients in Putrajaya.
Table 19.13: Distribution of Patients in Putrajaya According to Most Recent Serum Ferritin Level in 2018
Serum Ferritin Level (ng/mL) < 1000 1000-2499 2500-4999 5000-9999 10,000+
Centre Total No. % No. % No. % No. % No. %
Hospital Putrajaya 24 6 25.00 14 58.33 3 12.50 1 4.17 0 0.00
Total 24 6 25.00 14 58.33 3 12.50 1 4.17 0 0.00
MTR Report_Part-2_PRINT_20191114_FA9.indd 315 27/11/2019 5:21 PM
316
MA
LAYS
IAN
TH
ALA
SSA
EMIA
REG
ISTR
YRE
PORT
201
8
19 Putrajaya
19.5 Observation and Comments
Out of 41 patients in Putrajaya, 27 of them require regular transfusions. Thirty-two patients (78.05%) are male and 9 patients (21.95%) are female. Most patients in Putrajaya are of Malay descent (40 patients, 97.56%) and only one patient (2.44%) is of Chinese descent. Twenty-one of the patients are children below 10 years of age.
The majority of patients in Putrajaya were diagnosed with HbE-beta thalassaemia (21 patients, 51.22%), followed by beta thalassaemia major (10 patients, 24.39%) and beta thalassaemia intermedia (7 patients, 17.07%). Twenty-one patients (51.22%) receive iron chelation therapy; 15 patients (71.43%) are on DFX monotherapy, followed by four patients (19.05%) on DFO monotherapy and two patients (9.52%) on DFP monotherapy.
Based on serum ferritin level record in 2018, majority of patients (20 out of 24 TDT patients, 83.33%) in Putrajaya have a serum ferritin level below 2500 ng/mL. The remaining four patients had serum ferritin levels above 2500 ng/mL. Data on serum ferritin levels in Putrajaya were entered only for TDT patients in the registry.
MTR Report_Part-2_PRINT_20191114_FA9.indd 316 27/11/2019 5:21 PM
Borgna-Pignatti CA, Rugolotto SI, De Stefano P, et al. Survival and complications in patients with thalassemia major treated with transfusion and deferoxamine. Haematologica 2004;89(10):1187-93.
Chan LL, Lin HP, Ariffn WA, Ariffin H. Providing a cure for beta thalassaemia major. Med J Malaysia. 2001;56(4):435-40.
Chirico V, Rigoli L, Lacquaniti A, et al. Endocrinopathies, metabolic disorders, and iron overload in major and intermedia thalassemia: serum ferritin as diagnostic and predictive marker associated with liver and cardiac T2* MRI assessment. Eur J Haematol. 2015;94(5):404-12.
Cohen A, Gayer R, Mizanin J. Long-term effect of splenectomy on transfusion requirements in thalassemia major. Am J Hematol. 1989;30(4):254-6.
Fucharoen S, Ketvichit P, Pootrakul P, Siritanaratkul N, Piankijagum A, Wasi P. Clinical manifestation of β-thalassemia/hemoglobin E disease. J Pediatr Hematol Oncol. 2000;22(6):552-7.
Higgs DR, Vickers MA, Wilkie AO, Pretorius IM, Jarman AP, Weatherall DJ. A review of the molecular genetics of the human alpha-globin gene cluster. Blood 1989;73(5):1081-104.
Ismail A, Campbell MJ, Ibrahim HM, Jones GL. Health related quality of life in Malaysian children with thalassaemia. Health Qual Life Outcomes. 2006;4(1):39.
Ladis V, Chouliaras G, Berdousi H, Kanavakis E, Kattamis C. Longitudinal study of survival and causes of death in patients with thalassemia major in Greece. Ann N Y Acad Sci. 2005;1054(1):445-50.
Modell B. Total management of thalassaemia major. Arch Dis Child. 1977;52(6):489-500.
Mutha AS, Shah KU, Kinikar AA, Ghongane BB. Efficacy and safety of wheat grass in thalassemic children on regular blood transfusion. Cureus 2018;10(3):e2306.
Sakran W, Levin C, Kenes Y, Colodner R, Koren A. Clinical spectrum of serious bacterial infections among splenectomized patients with hemoglobinopathies in Israel: A 37-year follow-up study. Infection. 2012;40(1):35-9.
Department of Statistics Malaysia 2018. Current population estimates, Malaysia, 2017-2018. Available at https://www.dosm.gov.my/v1/index.php?r=column/cthemeByCat&cat=155&bul_id=c1pqTnFjb29HSnNYNUpiTmNWZHArdz09&menu_id=L0pheU43NWJwRWVSZklWdzQ4TlhUUT09#.
Department of Statistics Malaysia. Population quick info. Available at http://pqi.stats.gov.my/searchBI.php?kodData=2.
MyTalasemia Registry. Available at https://www.mytalasemia.net.my.
References
MTR Report_Part-2_PRINT_20191114_FA9.indd 317 27/11/2019 5:21 PM
MTR Report_Part-2_PRINT_20191114_FA9.indd 318 27/11/2019 5:21 PM