Embed Size (px)
Citation preview
Copyright @ 2014 by the American College of Sports Medicine. Unauthorized reproduction of this article is prohibited.
Joint Kinetics in Rearfoot versus ForefootRunning: Implications of Switching Technique
SARAH M. STEARNE, JACQUELINE A. ALDERSON, BENJAMIN GREEN, CYRIL J. DONNELLY,and JONAS RUBENSON
School of Sport Science, Exercise and Health, The University of Western Australia, Crawley, WA, AUSTRALIA
ABSTRACT
STEARNE, S. M., J. A. ALDERSON, B. GREEN, C. J. DONNELLY, and J. RUBENSON. Joint Kinetics in Rearfoot versus Forefoot
Running: Implications of Switching Technique.Med. Sci. Sports Exerc., Vol. 46, No. 8, pp. 00–00, 2014. Purpose: To better understand
the mechanical factors differentiating forefoot and rearfoot strike (RFS) running, as well as the mechanical consequences of switching
techniques, we assessed lower limb joint kinetics in habitual and imposed techniques in both groups. Methods: All participants
performed both RFS and forefoot strike (FFS) techniques on an instrumented treadmill at 4.5 msj1 while force and kinematic data were
collected. Results: Total (sum of ankle, knee, and hip) lower limb work and average power did not differ between habitual RFS and FFS
runners. However, moments and negative work and power during stance were greater at the knee in RFS and at the ankle in FFS
techniques. When habitual RFS runners switched to an imposed FFS, they were able to replicate the sagittal plane mechanics of a
habitual FFS; however, the ankle external rotation moment was increased by 33%, whereas the knee abduction moments were not
reduced, remaining 48.5% higher than a habitual FFS. In addition, total positive and negative lower limb average power was increased by
17% and 9%, respectively. When habitual FFS runners switched to an imposed RFS, they were able to match the mechanics of habitual
RFS runners with the exception of knee abduction moments, which remained 38% lower than a habitual RFS and, surprisingly, a
reduction of total lower limb positive average power of 10.5%. Conclusions: There appears to be no clear overall mechanical advantage
of a habitual FFS or RFS. Switching techniques may have different injury implications given the altered distribution in loading between
joints but should be weighed against the overall effects on limb mechanics; adopting an imposed RFS may prove the most beneficial
given the absence of any clear mechanical performance decrements. Key Words: FOOT STRIKE, JOINT MECHANICS, JOINT
WORK, GAIT, COACHING
Runners can be classified as either rearfoot, midfoot, orforefoot strikers depending on the part of the footthat makes initial contact with the ground. A rearfoot
strike (RFS) can be defined as when the heel of the foot/shoemakes initial contact with the ground. A midfoot strike(MFS) can be defined as when the heel and ball of the footland simultaneously, and a forefoot strike (FFS) can be de-fined when the ball of the foot makes initial contact with theground followed by the heel (6,22).
Although an RFS is more predominant among long-distance runners versus an MFS and an FFS, the percentageof an MFS and an FFS has been found to be greater amongelite distance runners (15,17) (although this may be related,in part, to increased running speed). The higher prevalence
of an FFS in elite runners has contributed to a recent sub-culture among recreational and competitive runners to adoptan FFS pattern, despite the majority naturally preferring anRFS (1,12). Of the hypothesized performance advantagesfor adopting an FFS running technique purported by certainmembers of the running community, among the most com-mon is a reduction in the prevalence of lower limb inju-ries (24). Although a study by Walther (34) concluded thatthe overall injury prevalence is similar between foot striketechniques, with differences only observed in the natureand/or location of the injuries, a recent retrospective studyby Daoud et al. (7) has shown that injury rates may in-deed be lower among FFS when compared with RFS run-ners. Given the high incidence of running-related injuries(19.4%–79.3% of runners incur a lower limb injury annu-ally (10,32)), it is becoming common for coaches to rec-ommend an athlete change their foot strike technique (1) inattempts to mitigate injury risk.
However, despite the alleged advantage of FFS runningfor lowering injuries, how mechanical alterations are linkedto differences/similarities in running mechanics and injuryrisk between foot strike techniques remains poorly under-stood. As a result, there is little empirical evidence sup-porting the rationale for switching between a habitual RFSto an imposed FFS technique (or vice versa). In context of
Address for correspondence: Jonas Rubenson, Ph.D., School of SportScience, Exercise and Health (M408), The University of Western Australia,35 Stirling highway, Crawley, Perth, Western Australia 6009; E-mail:[email protected] for publication June 2013.Accepted for publication December 2013.
0195-9131/14/4608-0000/0MEDICINE & SCIENCE IN SPORTS & EXERCISE�Copyright � 2014 by the American College of Sports Medicine
DOI: 10.1249/MSS.0000000000000254
1
Copyeditor: Rhodney Teng
Copyright @ 2014 by the American College of Sports Medicine. Unauthorized reproduction of this article is prohibited.
sports injury prevention, misinterpretation of the factors thatcan contribute to injury and/or improve performance canhave unintentional negative effects such as the implemen-tation of an unsuccessful training intervention, or worse,unintentionally increasing an athletes’ risk of injury (2,9).
Recent studies indicate that joint kinetics may play a keyfunctional role in differentiating RFS and FFS running (36)and may help to reveal how different foot strike techniquescould offer potential functional advantages/disadvantages.For example, greater peak plantarflexion moments, negativeinstantaneous joint power (power absorption), and negativework have been reported at the ankle in habitual FFS run-ning, whereas greater peak knee flexion torque, negativepower, and negative work are observed at the knee in ha-bitual RFS running (14,18,20,26,28,36). Most of these al-terations can be replicated by switching from an RFS to anFFS, notwithstanding the high ankle moments and peaknegative ankle power in stance in habitual FFS runners (36).The different distribution of joint moments, negative power,and work observed between FFS and RFS runners maysubsequently alter muscle and tendon function, leading tochanges in the prevalence, location, and risk of musculo-skeletal injury.
Although these previous studies investigating joint ki-netics have provided crucial knowledge concerning footstrike biomechanics (14,18,20,26,28,36), none have pro-vided a comprehensive analysis of the lower limb joint ki-netics between RFS and FFS running that includes ananalysis of both habitual and imposed techniques in bothgroups. To start with, the large majority of studies into footstrike technique have focused on the ankle and knee. Nostudy to the authors’ knowledge has reported the effect ofhabitual and imposed foot strike techniques on joint mo-ments, powers, and work at all of the major lower limb jointsor their combined effect on the overall lower limb mechan-ics. This consideration is important given that any differencein ankle or knee joint mechanics may lead to functionaladaptations at the hip joint that could also affect injurysusceptibility and/or overall lower limb mechanics and thusrunning performance. Secondly, few articles report positivepower, and to the authors’ knowledge, none report positivework in the context of foot strike technique. This is sur-prising because positive power and work affect muscularfatigue and energy use (27,31), and their inclusion can proveessential for understanding the complex interaction betweenfoot strike technique, gait mechanics and energetics, andinjury risk. Thirdly, and importantly, no study has examinedrates of joint loading (average moment rate) or work production/absorption (average joint power) despite the known asso-ciation between loading rates and injury (23,33) and thehigher stride frequency in FFS running (13,29). Finally,with the exception of Hamill et al. (14) studies addressingthe mechanics of altering foot strike technique have fo-cused nearly exclusively on habitual RFS runners, and theeffect on the above parameters when habitual FFS runnersalter their technique to an RFS remains largely unknown.
Consequently, our understanding of the potential merits ofswitching between either technique remains incomplete.
The purpose of this study was therefore to expand uponthe recent work of Hamill et al. (14) to further deter-mine what mechanical differences exist between RFS andFFS techniques in competitive runners at each of the majorlower limb joints, and their effect on the overall lower limbmechanics. More specifically, we addressed two relatedquestions: 1) How do the peak joint moments and peak in-stantaneous joint powers (both positive and negative) at theankle, knee, and hip differ between foot strike techniques?2) How does the average moment rate and the averagepower generation/absorption (and work) differ between footstrike techniques, both at the individual joints and in thecombined lower limb? In each of these questions, we com-pared both habitual RFS and FFS runners and, importantly,also addressed the effect of switching between habitual andimposed foot strike techniques in both groups.
METHODS
Participants. Sixteen trained competitive male distancerunners were recruited for the study, with eight habitual RFSand eight habitual FFS runners. Those who landed with theheel and ball of their foot simultaneously (MFS runners)were not included because of their variable kinematic andkinetic profiles (7). Foot strike technique was confirmedusing high-speed video recording at 100 Hz positioned inthe sagittal plane (Basler A602fc-2, Ahrensburg, Germany).Participants ran 89 T 35 kmIwkj1 (mean T SD) with a his-tory of 7.5 T 4.7 yr of running experience (mean T SD). Allrunners were experienced in using their imposed runningtechnique and had practiced using this technique in trainingruns. There were no significant differences in the age,height, or weight between RFS and FFS groups (age: RFS21.9 T 3.3 yr, FFS 23.6 T 4.1 yr; height: RFS 187.1 T 5.6 cm,FFS 184.6 T 6.7 cm; weight: RFS 76.4 T 3.4 kg, FFS 73.1 T8.9 kg; mean T SD). The participants had not experiencedany lower limb injuries in the 6 months before testing andpresented without any preexisting gait abnormalities. Par-ticipants provided written, informed consent before partak-ing in the study. All procedures were approved by theHuman Research Ethics Committee before the commence-ment of testing.
Joint kinematics and kinetics. Participants completeda 5-min warm-up on a force-plate instrumented treadmill(Bertec Corporation, Columbus, OH) at 3.33 msj1 in theirhabitual foot strike technique. Participants were thenallowed as long as they needed to familiarize themselveswith the imposed foot strike technique. After the warm-up,participants were allowed to rest and their HR (Polar F1Heart Rate Monitor, Kempele, Finland) return to within 10%of their resting value before commencing the measurementtrials. Two running trials at 4.5 msj1 (a speed commonlyused in the participants’ training) were completed: 1) ha-bitual foot strike technique and 2) imposed technique, the
http://www.acsm-msse.org2 Official Journal of the American College of Sports Medicine
Copyright @ 2014 by the American College of Sports Medicine. Unauthorized reproduction of this article is prohibited.
order of which was randomized. Each measurement triallasted for 2 min. All participants were provided with the samelightweight running footwear (Nike Lunaraceri).
Joint kinematic and kinetic data for the ankle, knee, andhip were computed using three-dimensional (3D) inverse-dynamic gait analysis. 3D segment motion was recordedusing an eight-camera near-infrared 200 Hz Vicon MX 3Dmotion capture system (Oxford Metrics, Oxford, UK). Seg-ment kinematics were computed from 34 retroreflectivemarkers attached to the pelvis, lower limbs, and shoes usingto the lower body marker set outlined in the study of BesierAQ1et al. (8). Ground reaction forces from the instrumentedtreadmill were recorded at 2000 Hz and synchronized withthe kinematic data using a Vicon MX-Net control box(Oxford Metrics). Lower limb biomechanical modeling wasperformed in accordance with the UWAAQ2 lower body model(4). Ankle joint centers were defined as the midpoint be-tween the medial and lateral malleoli anatomical landmarks.A functional knee helical axis was used to define knee jointcenters and knee joint coordinate system. A functional methodwas also used to define the hip joint centers. A custom footalignment rig was used to measure calcaneus inversion/eversion and foot abduction/adduction to define the ana-tomical coordinate system of the foot segment. All markertrajectories were filtered using a zero-lag fourth-order low-pass Butterworth filter with cutoff frequencies typically at11 Hz, which was determined by a custom residual analysisalgorithm for each participant (MATLAB; The MathWorksInc., USA). Ground reaction forces were filtered at the samecutoff frequency as the kinematic data to mitigate any arti-facts in joint moments arising because of un-accounted seg-ment acceleration (5,19).
Net hip, knee, and ankle joint moments and instantaneouspower from the right leg across the gait cycle were calcu-lated using BodyBuilder software (Oxford Metrics). Peakpositive and negative instantaneous powers and peak mo-ments in the sagittal, frontal, and transverse planes werecalculated during the stance phase and normalized to bodymass. Net positive work (JIkgj1) and net negative work(JIkgj1) per stride for each joint were computed by integrat-ing the positive and negative instantaneous joint power datawith respect to time, respectively:
W posj ¼ X
tftiPj dt for Pj 9 0 ½1�
W negj ¼ X
tftiPj dt for Pj G 0 ½2�
where j represents the joint (ankle, knee or hip), P the jointpower, and ti and tf represent the start and end time the inte-gration respectively.
Positive and negative work at each joint (ankle, knee, andhip) was computed separately for the stance (as definedby a ground reaction force threshold of 10 N) and swingphases. The total combined limb work of the entire stride wassubsequently computed as the sum of each joint’s (ankle,knee, and hip) work production. The rate of work production/
absorption (referred to here as average power) during run-ning was computed by multiplying the right leg’s joint work(either positive or negative, equations 1 and 2) at each jointacross the stride by two (assuming bilateral symmetry) torepresent both legs and dividing by the participant’s stridetime. As an index of cumulative joint loading, the averagerate of joint moment production (referred to here as averagemoment rate) was computed as the average joint momentduring stance divided by the stride time (Nm
;Isj1). We
computed the average moment rate for both sagittal andnonsagittal moments. The percentage each joint contributedto the total positive and negative work and average powerwas computed by dividing the individual joint work duringstance by the total stance work.
Statistical analyses. Five strides for each participantfrom each trial were selected for analysis and used to com-pute participant mean data. These data were used to assem-ble group mean data for each running condition (habitualRFS, habitual FFS, imposed RFS, and imposed FFS). Two-waymixed-model multivariate analyses of variance (MANOVA)were performed to determine whether any significant differ-ences in peak joint moments and instantaneous powers, workand average power, and average moment rates existed be-tween foot strike groups (between-subjects factors) and ha-bitual versus imposed conditions (within-subjects factors).To address our questions, several multivariate analyses wereperformed. Joint level analyses included (a) peak joint mo-ments and average moment rate (dependent variables: sagit-tal and nonsagittal plane moments and average moment ratesin stance), (b) peak instantaneous power (dependent vari-ables: positive and negative peak power in stance), and (c)work and average power (dependent variables: positive andnegative work and average power in stance). A MANOVAwas also performed on total lower limb work and total av-erage power (dependent variables: total positive and negativework and average power) and the percentage contribution ofeach joint to the total positive and negative work/averagepower in stance (dependent variables: positive and negativecontribution from the hip, knee, and ankle during stance).When significant multivariate effects were found (P G 0.05),we considered the univariate effects to determine what ex-tent individual dependent variables contributed. As uni-variate effects only informed us of the significance at thedependent variable level, post hoc analyses were run todetermine which foot strike/condition groups were signif-icantly different from one another. Habitual RFS versushabitual FFS groups were compared using independentsamples t-tests, and habitual RFS versus imposed FFS andhabitual FFS versus imposed RFS were compared usingpaired samples t-tests. To guard against inflation of type Ierror rates due to multiple comparisons, a Bonferroni ad-justment was applied to the univariate MANOVA resultsand subsequently also to the t-tests. The P value was set at0.025 for peak moment, peak power, and average momentrate, to 0.0125 for work and average power, and to 0.0167for the individual joint percentage contributions to total
REARFOOT VERSUS FOREFOOT JOINT KINETICS Medicine & Science in Sports & Exercised 3
Copyright @ 2014 by the American College of Sports Medicine. Unauthorized reproduction of this article is prohibited.
lower limb work and average power. The P value was setat 0.0167 for all t-tests.
RESULTS
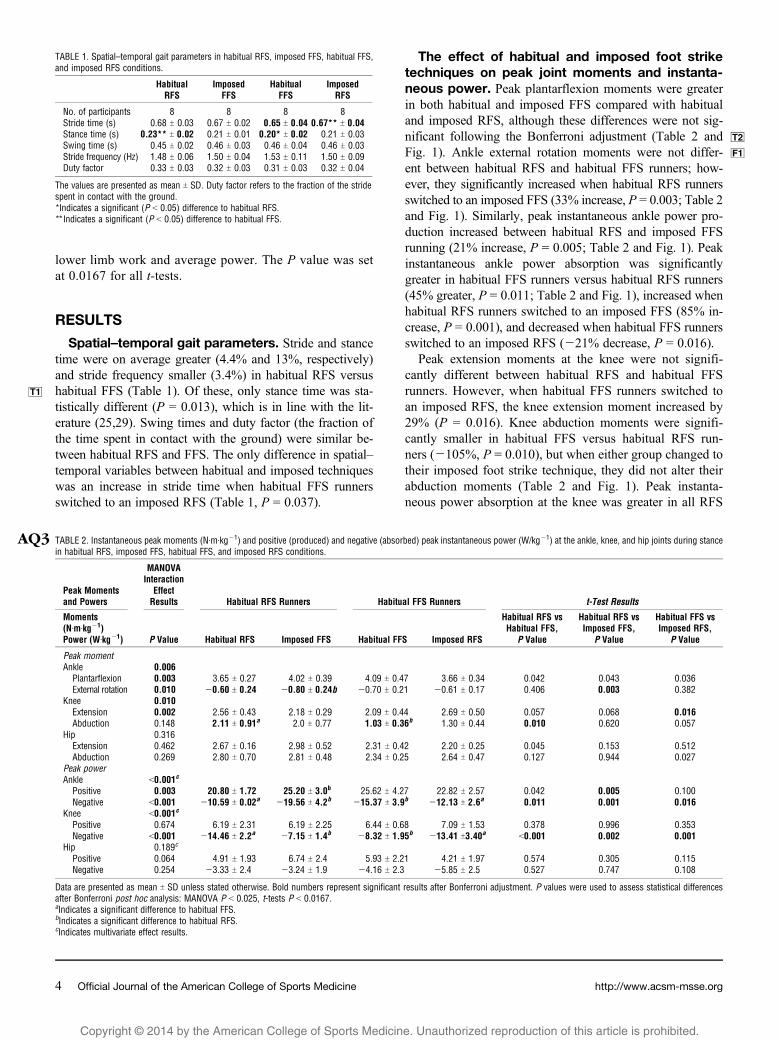
Spatial–temporal gait parameters. Stride and stancetime were on average greater (4.4% and 13%, respectively)and stride frequency smaller (3.4%) in habitual RFS versushabitual FFS (T1 Table 1). Of these, only stance time was sta-tistically different (P = 0.013), which is in line with the lit-erature (25,29). Swing times and duty factor (the fraction ofthe time spent in contact with the ground) were similar be-tween habitual RFS and FFS. The only difference in spatial–temporal variables between habitual and imposed techniqueswas an increase in stride time when habitual FFS runnersswitched to an imposed RFS (Table 1, P = 0.037).
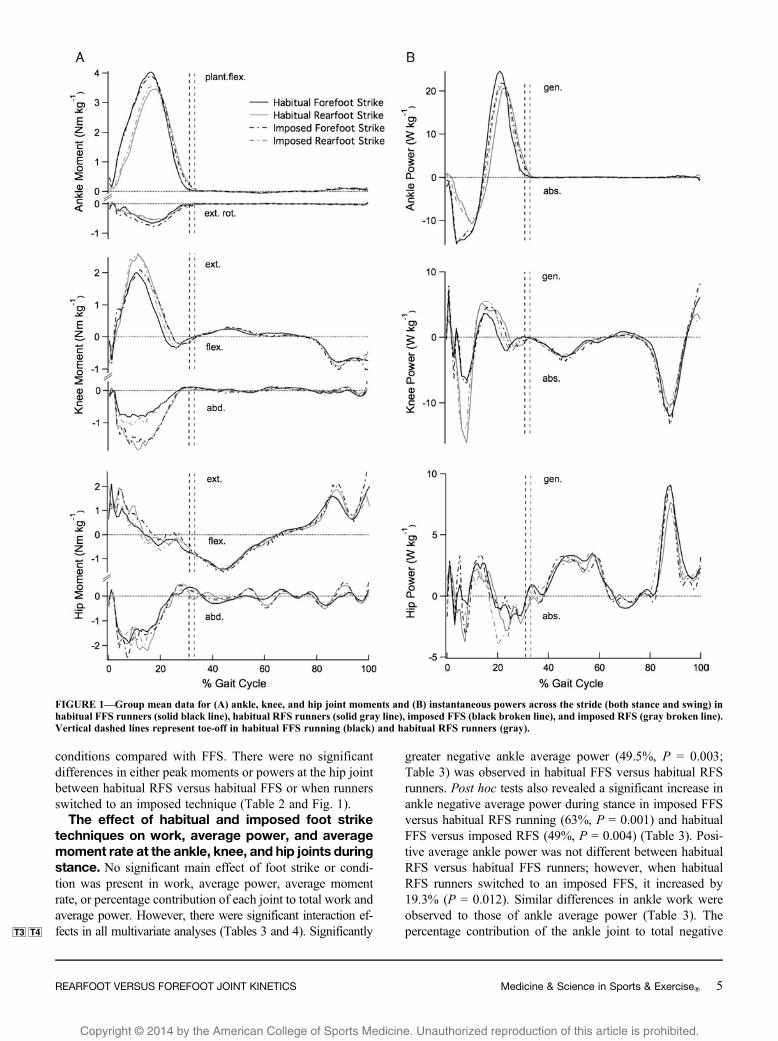
The effect of habitual and imposed foot striketechniques on peak joint moments and instanta-neous power. Peak plantarflexion moments were greaterin both habitual and imposed FFS compared with habitualand imposed RFS, although these differences were not sig-nificant following the Bonferroni adjustment ( T2Table 2 and
F1Fig. 1). Ankle external rotation moments were not differ-ent between habitual RFS and habitual FFS runners; how-ever, they significantly increased when habitual RFS runnersswitched to an imposed FFS (33% increase, P = 0.003; Table 2and Fig. 1). Similarly, peak instantaneous ankle power pro-duction increased between habitual RFS and imposed FFSrunning (21% increase, P = 0.005; Table 2 and Fig. 1). Peakinstantaneous ankle power absorption was significantlygreater in habitual FFS runners versus habitual RFS runners(45% greater, P = 0.011; Table 2 and Fig. 1), increased whenhabitual RFS runners switched to an imposed FFS (85% in-crease, P = 0.001), and decreased when habitual FFS runnersswitched to an imposed RFS (j21% decrease, P = 0.016).
Peak extension moments at the knee were not signifi-cantly different between habitual RFS and habitual FFSrunners. However, when habitual FFS runners switched toan imposed RFS, the knee extension moment increased by29% (P = 0.016). Knee abduction moments were signifi-cantly smaller in habitual FFS versus habitual RFS run-ners (j105%, P = 0.010), but when either group changed totheir imposed foot strike technique, they did not alter theirabduction moments (Table 2 and Fig. 1). Peak instanta-neous power absorption at the knee was greater in all RFS
TABLE 1. Spatial–temporal gait parameters in habitual RFS, imposed FFS, habitual FFS,and imposed RFS conditions.
HabitualRFS
ImposedFFS
HabitualFFS
ImposedRFS
No. of participants 8 8 8 8Stride time (s) 0.68 T 0.03 0.67 T 0.02 0.65 T 0.04 0.67** T 0.04Stance time (s) 0.23** T 0.02 0.21 T 0.01 0.20* T 0.02 0.21 T 0.03Swing time (s) 0.45 T 0.02 0.46 T 0.03 0.46 T 0.04 0.46 T 0.03Stride frequency (Hz) 1.48 T 0.06 1.50 T 0.04 1.53 T 0.11 1.50 T 0.09Duty factor 0.33 T 0.03 0.32 T 0.03 0.31 T 0.03 0.32 T 0.04
The values are presented as mean T SD. Duty factor refers to the fraction of the stridespent in contact with the ground.*Indicates a significant (P G 0.05) difference to habitual RFS.**Indicates a significant (P G 0.05) difference to habitual FFS.
TABLE 2. Instantaneous peak moments (NAQ3 ImIkgj1) and positive (produced) and negative (absorbed) peak instantaneous power (W/kgj1) at the ankle, knee, and hip joints during stancein habitual RFS, imposed FFS, habitual FFS, and imposed RFS conditions.
Peak Momentsand Powers
MANOVAInteraction
EffectResults Habitual RFS Runners Habitual FFS Runners t-Test Results
Moments(NImIkgj1)Power (WIkgj1) P Value Habitual RFS Imposed FFS Habitual FFS Imposed RFS
Habitual RFS vsHabitual FFS,
P Value
Habitual RFS vsImposed FFS,
P Value
Habitual FFS vsImposed RFS,
P Value
Peak momentAnkle 0.006
Plantarflexion 0.003 3.65 T 0.27 4.02 T 0.39 4.09 T 0.47 3.66 T 0.34 0.042 0.043 0.036External rotation 0.010 j0.60 T 0.24 j0.80 T 0.24b j0.70 T 0.21 j0.61 T 0.17 0.406 0.003 0.382
Knee 0.010Extension 0.002 2.56 T 0.43 2.18 T 0.29 2.09 T 0.44 2.69 T 0.50 0.057 0.068 0.016Abduction 0.148 2.11 T 0.91a 2.0 T 0.77 1.03 T 0.36b 1.30 T 0.44 0.010 0.620 0.057
Hip 0.316Extension 0.462 2.67 T 0.16 2.98 T 0.52 2.31 T 0.42 2.20 T 0.25 0.045 0.153 0.512Abduction 0.269 2.80 T 0.70 2.81 T 0.48 2.34 T 0.25 2.64 T 0.47 0.127 0.944 0.027
Peak powerAnkle G0.001c
Positive 0.003 20.80 T 1.72 25.20 T 3.0b 25.62 T 4.27 22.82 T 2.57 0.042 0.005 0.100Negative G0.001 j10.59 T 0.02a j19.56 T 4.2b j15.37 T 3.9b j12.13 T 2.6a 0.011 0.001 0.016
Knee G0.001c
Positive 0.674 6.19 T 2.31 6.19 T 2.25 6.44 T 0.68 7.09 T 1.53 0.378 0.996 0.353Negative G0.001 j14.46 T 2.2a j7.15 T 1.4b j8.32 T 1.95b j13.41 T3.40a G0.001 0.002 0.001
Hip 0.189c
Positive 0.064 4.91 T 1.93 6.74 T 2.4 5.93 T 2.21 4.21 T 1.97 0.574 0.305 0.115Negative 0.254 j3.33 T 2.4 j3.24 T 1.9 j4.16 T 2.3 j5.85 T 2.5 0.527 0.747 0.108
Data are presented as mean T SD unless stated otherwise. Bold numbers represent significant results after Bonferroni adjustment. P values were used to assess statistical differencesafter Bonferroni post hoc analysis: MANOVA P G 0.025, t-tests P G 0.0167.aIndicates a significant difference to habitual FFS.bIndicates a significant difference to habitual RFS.cIndicates multivariate effect results.
http://www.acsm-msse.org4 Official Journal of the American College of Sports Medicine
Copyright @ 2014 by the American College of Sports Medicine. Unauthorized reproduction of this article is prohibited.
conditions compared with FFS. There were no significantdifferences in either peak moments or powers at the hip jointbetween habitual RFS versus habitual FFS or when runnersswitched to an imposed technique (Table 2 and Fig. 1).
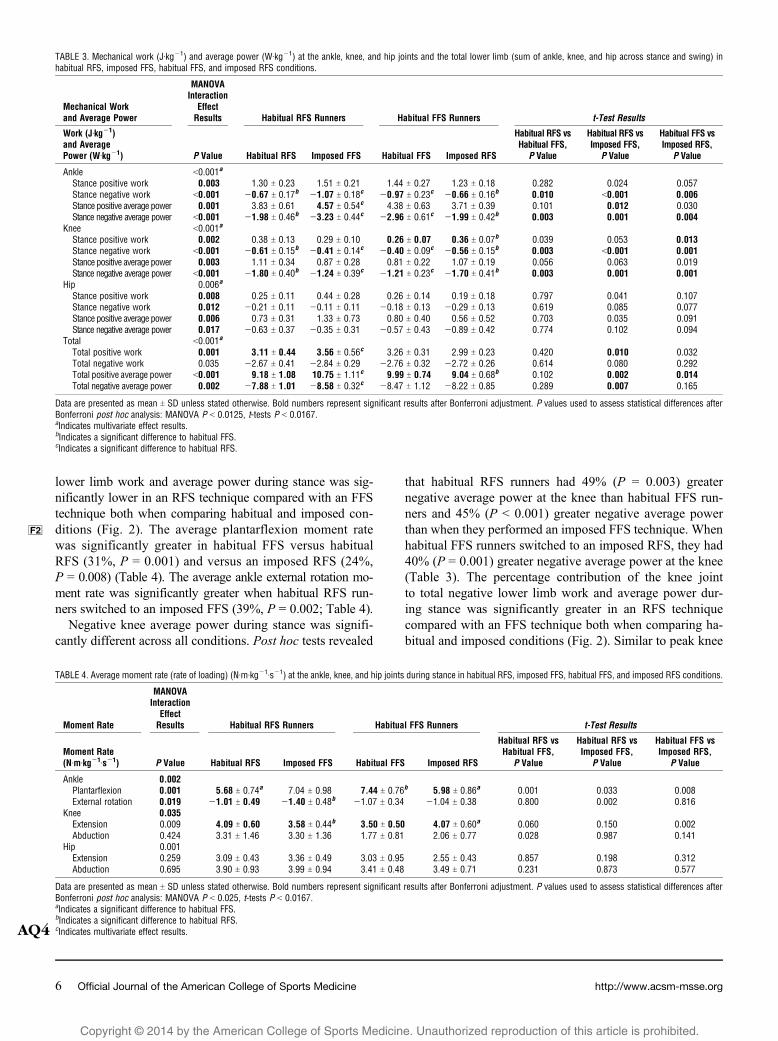
The effect of habitual and imposed foot striketechniques on work, average power, and averagemoment rate at the ankle, knee, and hip joints duringstance. No significant main effect of foot strike or condi-tion was present in work, average power, average momentrate, or percentage contribution of each joint to total work andaverage power. However, there were significant interaction ef-fects in all multivariate analyses (T3 Tables 3 andT4 4). Significantly
greater negative ankle average power (49.5%, P = 0.003;Table 3) was observed in habitual FFS versus habitual RFSrunners. Post hoc tests also revealed a significant increase inankle negative average power during stance in imposed FFSversus habitual RFS running (63%, P = 0.001) and habitualFFS versus imposed RFS (49%, P = 0.004) (Table 3). Posi-tive average ankle power was not different between habitualRFS versus habitual FFS runners; however, when habitualRFS runners switched to an imposed FFS, it increased by19.3% (P = 0.012). Similar differences in ankle work wereobserved to those of ankle average power (Table 3). Thepercentage contribution of the ankle joint to total negative
FIGURE 1—Group mean data for (A) ankle, knee, and hip joint moments and (B) instantaneous powers across the stride (both stance and swing) inhabitual FFS runners (solid black line), habitual RFS runners (solid gray line), imposed FFS (black broken line), and imposed RFS (gray broken line).Vertical dashed lines represent toe-off in habitual FFS running (black) and habitual RFS runners (gray).
REARFOOT VERSUS FOREFOOT JOINT KINETICS Medicine & Science in Sports & Exercised 5
Copyright @ 2014 by the American College of Sports Medicine. Unauthorized reproduction of this article is prohibited.
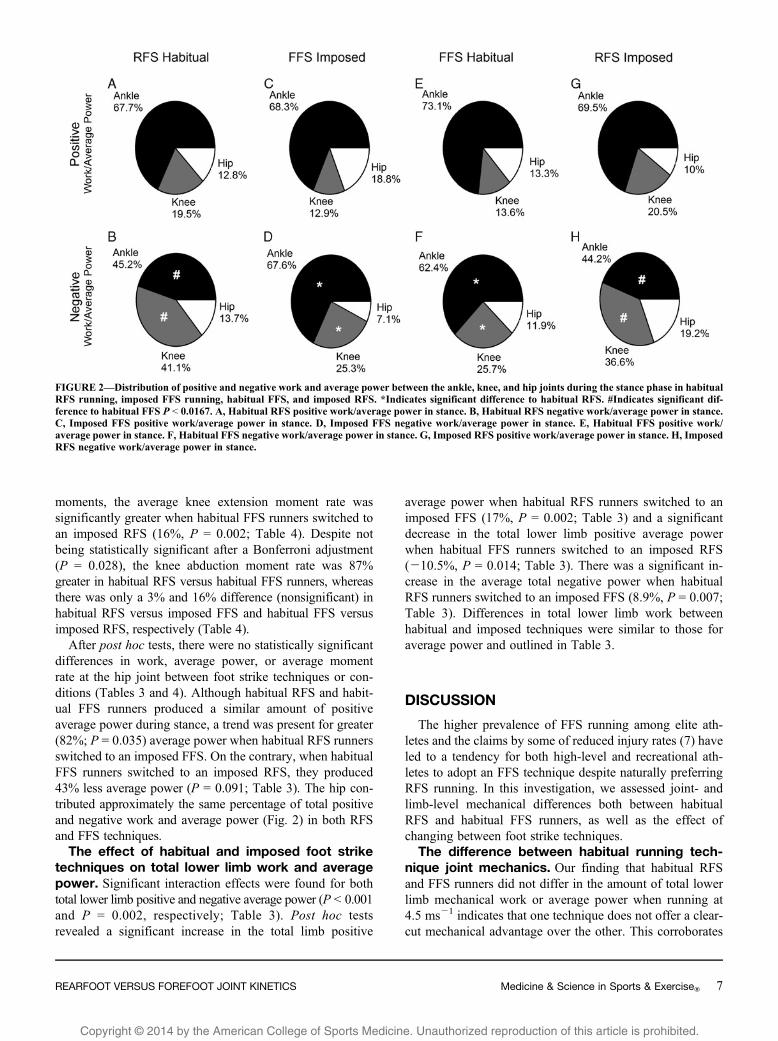
lower limb work and average power during stance was sig-nificantly lower in an RFS technique compared with an FFStechnique both when comparing habitual and imposed con-ditions (F2 Fig. 2). The average plantarflexion moment ratewas significantly greater in habitual FFS versus habitualRFS (31%, P = 0.001) and versus an imposed RFS (24%,P = 0.008) (Table 4). The average ankle external rotation mo-ment rate was significantly greater when habitual RFS run-ners switched to an imposed FFS (39%, P = 0.002; Table 4).
Negative knee average power during stance was signifi-cantly different across all conditions. Post hoc tests revealed
that habitual RFS runners had 49% (P = 0.003) greaternegative average power at the knee than habitual FFS run-ners and 45% (P G 0.001) greater negative average powerthan when they performed an imposed FFS technique. Whenhabitual FFS runners switched to an imposed RFS, they had40% (P = 0.001) greater negative average power at the knee(Table 3). The percentage contribution of the knee jointto total negative lower limb work and average power dur-ing stance was significantly greater in an RFS techniquecompared with an FFS technique both when comparing ha-bitual and imposed conditions (Fig. 2). Similar to peak knee
TABLE 3. Mechanical work (JIkgj1) and average power (WIkgj1) at the ankle, knee, and hip joints and the total lower limb (sum of ankle, knee, and hip across stance and swing) inhabitual RFS, imposed FFS, habitual FFS, and imposed RFS conditions.
Mechanical Workand Average Power
MANOVAInteraction
EffectResults Habitual RFS Runners Habitual FFS Runners t-Test Results
Work (JIkgj1)and AveragePower (WIkgj1) P Value Habitual RFS Imposed FFS Habitual FFS Imposed RFS
Habitual RFS vsHabitual FFS,
P Value
Habitual RFS vsImposed FFS,
P Value
Habitual FFS vsImposed RFS,
P Value
Ankle G0.001a
Stance positive work 0.003 1.30 T 0.23 1.51 T 0.21 1.44 T 0.27 1.23 T 0.18 0.282 0.024 0.057Stance negative work G0.001 j0.67 T 0.17b j1.07 T 0.18c j0.97 T 0.23c j0.66 T 0.16b 0.010 G0.001 0.006Stance positive average power 0.001 3.83 T 0.61 4.57 T 0.54c 4.38 T 0.63 3.71 T 0.39 0.101 0.012 0.030Stance negative average power G0.001 j1.98 T 0.46b j3.23 T 0.44c j2.96 T 0.61c j1.99 T 0.42b 0.003 0.001 0.004
Knee G0.001a
Stance positive work 0.002 0.38 T 0.13 0.29 T 0.10 0.26 T 0.07 0.36 T 0.07b 0.039 0.053 0.013Stance negative work G0.001 j0.61 T 0.15b j0.41 T 0.14c j0.40 T 0.09c j0.56 T 0.15b 0.003 G0.001 0.001Stance positive average power 0.003 1.11 T 0.34 0.87 T 0.28 0.81 T 0.22 1.07 T 0.19 0.056 0.063 0.019Stance negative average power G0.001 j1.80 T 0.40b j1.24 T 0.39c j1.21 T 0.23c j1.70 T 0.41b 0.003 0.001 0.001
Hip 0.006a
Stance positive work 0.008 0.25 T 0.11 0.44 T 0.28 0.26 T 0.14 0.19 T 0.18 0.797 0.041 0.107Stance negative work 0.012 j0.21 T 0.11 j0.11 T 0.11 j0.18 T 0.13 j0.29 T 0.13 0.619 0.085 0.077Stance positive average power 0.006 0.73 T 0.31 1.33 T 0.73 0.80 T 0.40 0.56 T 0.52 0.703 0.035 0.091Stance negative average power 0.017 j0.63 T 0.37 j0.35 T 0.31 j0.57 T 0.43 j0.89 T 0.42 0.774 0.102 0.094
Total G0.001a
Total positive work 0.001 3.11 T 0.44 3.56 T 0.56c 3.26 T 0.31 2.99 T 0.23 0.420 0.010 0.032Total negative work 0.035 j2.67 T 0.41 j2.84 T 0.29 j2.76 T 0.32 j2.72 T 0.26 0.614 0.080 0.292Total positive average power G0.001 9.18 T 1.08 10.75 T 1.11c 9.99 T 0.74 9.04 T 0.68b 0.102 0.002 0.014Total negative average power 0.002 j7.88 T 1.01 j8.58 T 0.32c j8.47 T 1.12 j8.22 T 0.85 0.289 0.007 0.165
Data are presented as mean T SD unless stated otherwise. Bold numbers represent significant results after Bonferroni adjustment. P values used to assess statistical differences afterBonferroni post hoc analysis: MANOVA P G 0.0125, t-tests P G 0.0167.aIndicates multivariate effect results.bIndicates a significant difference to habitual FFS.cIndicates a significant difference to habitual RFS.
TABLE 4. Average moment rate (rate of loading) (NImIkgj1Isj1) at the ankle, knee, and hip joints during stance in habitual RFS, imposed FFS, habitual FFS, and imposed RFS conditions.
Moment Rate
MANOVAInteraction
EffectResults Habitual RFS Runners Habitual FFS Runners t-Test Results
Moment Rate(NImIkgj1Isj1) P Value Habitual RFS Imposed FFS Habitual FFS Imposed RFS
Habitual RFS vsHabitual FFS,
P Value
Habitual RFS vsImposed FFS,
P Value
Habitual FFS vsImposed RFS,
P Value
Ankle 0.002Plantarflexion 0.001 5.68 T 0.74a 7.04 T 0.98 7.44 T 0.76b 5.98 T 0.86a 0.001 0.033 0.008External rotation 0.019 j1.01 T 0.49 j1.40 T 0.48b j1.07 T 0.34 j1.04 T 0.38 0.800 0.002 0.816
Knee 0.035Extension 0.009 4.09 T 0.60 3.58 T 0.44b 3.50 T 0.50 4.07 T 0.60a 0.060 0.150 0.002Abduction 0.424 3.31 T 1.46 3.30 T 1.36 1.77 T 0.81 2.06 T 0.77 0.028 0.987 0.141
Hip 0.001Extension 0.259 3.09 T 0.43 3.36 T 0.49 3.03 T 0.95 2.55 T 0.43 0.857 0.198 0.312Abduction 0.695 3.90 T 0.93 3.99 T 0.94 3.41 T 0.48 3.49 T 0.71 0.231 0.873 0.577
Data are presented as mean T SD unless stated otherwise. Bold numbers represent significant results after Bonferroni adjustment. P values used to assess statistical differences afterBonferroni post hoc analysis: MANOVA P G 0.025, t-tests P G 0.0167.aIndicates a significant difference to habitual FFS.bIndicates a significant difference to habitual RFS.cIndicates multivariate effect results.AQ4
http://www.acsm-msse.org6 Official Journal of the American College of Sports Medicine
Copyright @ 2014 by the American College of Sports Medicine. Unauthorized reproduction of this article is prohibited.
moments, the average knee extension moment rate wassignificantly greater when habitual FFS runners switched toan imposed RFS (16%, P = 0.002; Table 4). Despite notbeing statistically significant after a Bonferroni adjustment(P = 0.028), the knee abduction moment rate was 87%greater in habitual RFS versus habitual FFS runners, whereasthere was only a 3% and 16% difference (nonsignificant) inhabitual RFS versus imposed FFS and habitual FFS versusimposed RFS, respectively (Table 4).
After post hoc tests, there were no statistically significantdifferences in work, average power, or average momentrate at the hip joint between foot strike techniques or con-ditions (Tables 3 and 4). Although habitual RFS and habit-ual FFS runners produced a similar amount of positiveaverage power during stance, a trend was present for greater(82%; P = 0.035) average power when habitual RFS runnersswitched to an imposed FFS. On the contrary, when habitualFFS runners switched to an imposed RFS, they produced43% less average power (P = 0.091; Table 3). The hip con-tributed approximately the same percentage of total positiveand negative work and average power (Fig. 2) in both RFSand FFS techniques.
The effect of habitual and imposed foot striketechniques on total lower limb work and averagepower. Significant interaction effects were found for bothtotal lower limb positive and negative average power (P G 0.001and P = 0.002, respectively; Table 3). Post hoc testsrevealed a significant increase in the total limb positive
average power when habitual RFS runners switched to animposed FFS (17%, P = 0.002; Table 3) and a significantdecrease in the total lower limb positive average powerwhen habitual FFS runners switched to an imposed RFS(j10.5%, P = 0.014; Table 3). There was a significant in-crease in the average total negative power when habitualRFS runners switched to an imposed FFS (8.9%, P = 0.007;Table 3). Differences in total lower limb work betweenhabitual and imposed techniques were similar to those foraverage power and outlined in Table 3.
DISCUSSION
The higher prevalence of FFS running among elite ath-letes and the claims by some of reduced injury rates (7) haveled to a tendency for both high-level and recreational ath-letes to adopt an FFS technique despite naturally preferringRFS running. In this investigation, we assessed joint- andlimb-level mechanical differences both between habitualRFS and habitual FFS runners, as well as the effect ofchanging between foot strike techniques.
The difference between habitual running tech-nique joint mechanics. Our finding that habitual RFSand FFS runners did not differ in the amount of total lowerlimb mechanical work or average power when running at4.5 msj1 indicates that one technique does not offer a clear-cut mechanical advantage over the other. This corroborates
FIGURE 2—Distribution of positive and negative work and average power between the ankle, knee, and hip joints during the stance phase in habitualRFS running, imposed FFS running, habitual FFS, and imposed RFS. *Indicates significant difference to habitual RFS. #Indicates significant dif-ference to habitual FFS P G 0.0167. A, Habitual RFS positive work/average power in stance. B, Habitual RFS negative work/average power in stance.C, Imposed FFS positive work/average power in stance. D, Imposed FFS negative work/average power in stance. E, Habitual FFS positive work/average power in stance. F, Habitual FFS negative work/average power in stance. G, Imposed RFS positive work/average power in stance. H, ImposedRFS negative work/average power in stance.
REARFOOT VERSUS FOREFOOT JOINT KINETICS Medicine & Science in Sports & Exercised 7
Copyright @ 2014 by the American College of Sports Medicine. Unauthorized reproduction of this article is prohibited.
the recent finding by Gruber et al. (13) that no differencein metabolic cost exists between habitual RFS and FFSrunners. It may instead be the altered loading profile anddistribution of work and average power between lower limbjoints, resulting in varying mechanical demands on the mus-culoskeletal system, that explains the functional effect of footstrike technique and injury risk.
The current study reinforces the notion that habitual RFSrunners place more demand on the knee joint in both thesagittal and frontal planes, whereas habitual FFS runnersplaced more demand on the ankle joint in the sagittal plane(14,26,36). In a systematic review by van Gent (32), it isreported that 19.4%–79.3% of runners experience lowerlimb injuries each year with the knee being the predominantsite of injury (7.2%–50%). Given that 75% of runners adoptan RFS technique (15), the high occurrence of knee injuriescompared with other joints may be associated with the largemechanical demand that occurs at the knee during stance inRFS running. Although the lower mechanical demand at theknee might place habitual FFS runners at a lower risk ofknee injury, the higher mechanical demand at the anklemight, on the other hand, place FFS runners at a greaterrisk of ankle-related injuries such as Achilles tendinopathyand/or rupture or eccentric loading injuries in the tricepssurae group.
Although the mechanics of the stance phase itself dictatesmost of the differences between techniques, our study alsoshows, for the first time, that the rate of mechanical load-ing and thus the cumulative work and moment productionalso plays an important role. Indeed, we found a more pro-nounced difference in the average ankle moment rate andaverage negative ankle power in FFS versus RFS runnerscompared with differences in peak ankle moments and neg-ative ankle work. In contrast, differences in the average kneemoment rates and average negative knee power between footstrike techniques were smaller than those observed for peakknee moments and negative work. These findings suggeststhat the ankle in FFS running might be especially susceptibleto cumulative overload injury, although the relative impor-tance of peak and cumulative joint loading to musculoskele-tal injury remains unclear.
By extending our measurements to include positive av-erage power, we found that the ankle contributed equalamounts of positive work in habitual RFS and FFS running(Fig. 2A and E) even though there is greater negative workat the joint in FFS running. It is well known that the Achillestendon is capable of storing energy absorbed at the ankle(negative work) as elastic strain energy and returning thisenergy to provide positive ankle joint work in the secondhalf of stance (3,11,16,21). It is possible, therefore, thatelastic recoil provides a greater contribution to positive workat the ankle in FFS runners. However, if this is the case, itdoes not translate to a benefit in the total metabolic cost ofrunning (13).
The effect of switching technique: RFS to FFS. Forswitching techniques to be effective as an injury prevention/
management strategy, the aim is for the imposed technique toreplicate the habitual mechanics. When habitual RFS run-ners were instructed to switch to an FFS technique, theywere able to replicate the sagittal plane mechanics observedduring habitual FFS running. However, despite there beingno difference in ankle external rotation moments or averagemoment rate between habitual RFS and habitual FFS run-ners, an imposed FFS increased these variables by 33% and38%, respectively, (P = 0.003 and P = 0.002). In addition,the lower abduction moments about the knee joint in ha-bitual FFS versus RFS runners reported here and in thestudy of Kulmala et al. (20) were not replicated in imposedFFS running. Considering that knee abduction momentspossibly have a stronger link to knee injuries (30,35), aswell as the increase in ankle transverse plane loading inimposed FFS running, calls to question the advice somecoaches are giving to their athletes to change from an RFSto an FFS to reduce their injury risk.
Furthermore, when habitual RFS runners switched to animposed FFS technique, the total positive average powerand the total negative average power increased by 17% and9%, respectively, (Table 3). This increase in mechanical costis possibly related to an increase in muscle work and powerand thus may be detrimental to running performance. Thisprovides a possible explanation for the recent results ofGruber et al. (13) who found oxygen consumption increasedwhen habitual RFS runners changed to an imposed FFS. Thesource of the increase in positive average power in imposedFFS running is primarily at the ankle and hip joints (despitea nonsignificant difference at the hip joint after Bonferronicorrection), whereas the increase in negative average poweris primarily at the ankle joint. It is possible that the elasticmechanisms at the ankle are not as well developed in ha-bitual RFS runners, and therefore, increased work at the hipjoint is required to maintain the required work output. Theprospect that the calf musculature in habitual RFS runnersmay limit their ability to effectively adopt an FFS techniquewas highlighted in a study by Williams et al. (36) whereRFS runners who performed a training session using anFFS experienced significant calf fatigue and delayed onsetmuscle soreness.
The effect of switching technique: FFS to RFS. Incontrast to habitual RFS runners switching technique, whenhabitual FFS runners adopt RFS running, they are able toreplicate all of the joint mechanical characteristics of ha-bitual RFS runners with the exception that they do notincrease their frontal plane knee loads (peak abduction mo-ment and average moment rate were 62% and 61% lowerthan habitual RFS running, respectively). In addition, per-forming an imposed RFS required 10.5% less positive me-chanical average power in the limb to maintain the samerunning speed. These findings were surprising, suggestingthat switching to an imposed RFS could prove a usefulstrategy for injury rehabilitation while not affecting me-chanical performance negatively. More specifically, usingan imposed RFS in training may be useful to lower the ankle
http://www.acsm-msse.org8 Official Journal of the American College of Sports Medicine
Copyright @ 2014 by the American College of Sports Medicine. Unauthorized reproduction of this article is prohibited.
and Achilles tendon loading in athletes with ankle instabilityor tendon pathology/injury while at the same time reducingthe overall average power, which may help mitigate fatigue.
CONCLUSIONS
Contrary to popular claims by some in the running com-munity, this study found no clear mechanical advantageof habitual FFS running over a habitual RFS running.Switching between RFS and FFS running techniques mayhave implications for injury reduction/recovery given thealtered distribution in loading between joints but should beweighed against possible overall performance decrements/improvements. Switching from a habitual RFS to an im-posed FFS may be detrimental to overall performance be-cause of an increase in both positive and negative averagelower limb power, which can help explain the recent findingthat imposed FFS running also requires more metabolic en-ergy (13). Furthermore, considering that the high knee ab-duction moments were not reduced by adopting an FFStechnique questions the extent that switching technique willlower knee injury susceptibility. Habitual FFS runners can
replicate the joint dynamics of a habitual RFS techniquewithout incurring high knee abduction moments while, sur-prisingly, also lowering their positive average limb power.In this last regard, FFS runners adopting an imposed RFStechnique, rather than the opposite, may prove the mostuseful training/rehabilitation strategy given the absence ofclear mechanical performance decrements. It should bestated, however, that further research is needed to determinewhether these findings hold following a training interven-tion. Nevertheless, this study stands in contrast to the strat-egy of switching from an RFS to an FFS which is avidlypromoted by certain members of the running community(12,24).
The authors would like to thank the participants for taking part inthis study, Dr. Ben Jackson from the University of Western Australiafor his assistance with the statistics analysis, and two anonymousreferees for their valuable comments and constructive suggestions.
S. M. S. was supported through an Australian PostgraduateAward scholarship.
No external funding was received for this work. None of the au-thors involved in the present study have any conflict of interest, fi-nancial, personal, or otherwise, that would influence this research,and the results do not constitute endorsement by the AmericanCollege of Sports Medicine.
REFERENCES
1. Abshire D, Metzler B. Natural Running: The Simple Path toStronger, Healthier Running. Boulder (Colorado): Velo Press;2010. p. 224.
2. Alderson J, Donnelly CJ. Sports injury prevention: are we tilting atwindmills? In: Proceedings of the Annual Conference of the Inter-national Society of Biomechanics in Sport. Melbourne (Australia):AQ52012. pp. 30–4.
3. Alexander RM. Elastic Mechanisms in Animal Movement. Cambridge:Cambridge University Press; 1988. p. 141.
4. Besier TF, Sturnieks DL, Alderson JA, Lloyd DG. Repeatabilityof gait data using a functional hip joint centre and a mean helicalknee axis. J Biomech. 2003;36:1159–68.
5. Bisseling RW, Hof AL. Handling of impact forces in inverse dy-namics. J Biomech. 2006;39(13):2438–44.
6. Cavanagh PR, Lafortune MA. Ground reaction forces in distancerunning. J Biomech. 1980;13:397–406.
7. Daoud A, Geissler G, Wang F, Saretsky J, Daoud Y, Lieberman D.Foot strike and injury rates in endurance runners: a retrospectivestudy. Med Sci Sports Exerc. 2012;44(7):1325–34.
8. Donnelly CJ, Elliott B, Lloyd DG, Reinbolt JA. Optimizing wholebody kinematics to minimize valgus knee loading during side-stepping: implications for ACL injury risk. J Biomech. 2012;45(8):1491–7.
9. Donnelly CJ, Elliott BC, Ackland TR, et al. An anterior cruciateligament injury prevention framework: incorporating the recentevidence. Res Sports Med. 2012;20(3–4):239–62.
10. Fields KB, Sykes JC, Walker KM, Jackson JC. Prevention ofrunning injuries. Curr Sports Med Rep. 2010;9(3):176–82.
11. Fukunaga T, Kubo K, Kawakami Y, Fukashiro S, Kanehisa H,Maganaris C. In vivo behaviour of human muscle tendon duringwalking. Proc R Soc Lond B. 2001;268:229–33.
12. Good Form Running website [Internet]. Okemos (MI): Play-makers; 2013 [cited 2013 Jan 20]. Good Form Running. Availablefrom: http://www.goodformrunning.com/.
13. Gruber A, Umberger BR, Braun B, Hamill J. Economy and rate ofcarbohydrate oxidation during running with rearfoot and forefootstrike patterns. J Appl Physiol. 2013;115(2):194–201.
14. Hamill J, Gruber A, Derrick T. Lower extremity joint stiffnesscharacteristics during running with different footfall patterns. Eur JSport Sci. 2012:1–7. AQ6
15. Hasegawa H, Yamauchi T, Kraemer W. Foot strike patterns ofrunners at the 15-km point during an elite-level half marathon.J Strength Cond Res. 2007;21(3):888–93.
16. Ishikawa M, Komi PV, Grey MJ, Lepola V, Bruggemann G-P.Muscle-tendon interaction and elastic energy usage in humanwalking. J Appl Physiol. 2005;99:603–8.
17. Kerr BA, Beauchamp L, Fisher V, Neil R. Footstrike patterns indistance running. In: International Symposium on BiomechanicalAspects of Sport Shoes and Playing Surfaces. University of Cal-gary: University Press; 1983. pp. 135–42.
18. Kleindienst FI, Campe S, Graf ES, Michel KJ, Witte K. Differ-ences between fore- and rearfoot strike running patterns based onkinetics and kinematics. In: Proceedings of the XXV International AQ5Society of Biomechanics in Sport Symposium. Ouro Preto (Brazil):2007. pp. 252–5.
19. Kristianslund E, Krosshaug T, van den Bogert A. Effect of lowpass filtering on joint moments from inverse dynamics: implica-tions for injury prevention. J Biomech. 2012;45(4):666–71.
20. Kulmala J-P, Avela J, Pasanen K, Parkkari J. Forefoot strikersexhibit lower running-induced knee loading than rearfoot strikers.Med Sci Sports Exerc. 2013; AQ7Published Ahead of Print. Epub 17May 2013.
21. Lichtwark GA, Bougoulias K, Wilson AM. Muscle fascicle and serieselastic element length changes along the length of the human gastroc-nemius during walking and running. J Biomech. 2007;40(1):157–64.
22. Lieberman D, Venkadesan M, Werbel WA, et al. Foot strike pat-terns and collision forces in habitually barefoot versus shod run-ners. Nature. 2010;463:531–5.
REARFOOT VERSUS FOREFOOT JOINT KINETICS Medicine & Science in Sports & Exercised 9
Copyright @ 2014 by the American College of Sports Medicine. Unauthorized reproduction of this article is prohibited.
23. Macera CA, Pate RR, Powell KE, Jackson KL, Kendrick JS,Craven TE. Predicting lower-extremity injuries among habitualrunners. Arch Intern Med. 1989;149(11):2565–8.
24. Newton Running website [Internet]. Boulder (CO): Newton RunningCompany; [cited 2013 Jan 20]. Optimal Running Form. Available from:http://www.newton-running.com.au/run-better/optimal-running-form.
25. Ogueta-Alday A, Rodrıguez-Marroyo JA, Garcıa-Lopez J. Rear-foot striking runners are more economical than midfoot strikers.
AQ7 Med Sci Sports Exerc. 2013; Publish ahead of Print.26. Paquette MR, Zhang S, Baumgartner LD. Acute effects of bare-
foot, minimal shoes and running shoes on lower limb mechanics inrear and forefoot strike runners. Footwear Science. 2013;5(1):9–18.
27. Pasquet B, Carpentier A, Duchateau J, Hainaut K. Muscle fatigueduring concentric and eccentric contractions. Muscle Nerve. 2000;23:1727–35.
28. Rooney BD. Joint contact loading in forefoot and rearfoot strikepatterns during running [graduate theses and dissertations]. Dig-ital Repository @ Iowa State University: Iowa State University;2011. p. 39.
29. Shih Y, Lin K, Shiang T. Is the foot striking pattern more impor-tant than barefoot or shod conditions in running? Gait Posture.2013;38:490–4.
30. Stefanyshyn DJ, Stergiou P, Lun VMY,MeeuwisseWH,Worobets JT.Knee angular impulse as a predictor of patellofemoral pain in run-ners. Am J Sports Med. 2006;34(11):1844–51.
31. Umberger BR, Rubenson J. Understanding muscle energetics inlocomotion: new modeling and experimental approaches. ExercSport Sci Rev. 2011;39(2):59–67.
32. van Gent RN, Siem D, van Middelkoop M, van Os AG, Bierma-Zeinstra SMA, Koes BW. Incidence and determinants of lowerextremity running injuries in long distance runners: a systematicreview. Br J Sports Med. 2007;41:469–80.
33. Walter SD, Hart LE, McIntosh JM, Sutton JR. The Ontariocohort study of running-related injuries. Arch Intern Med. 1989;149(11):2561–4.
34. Walther M. [Barefoot running does not protect against overloadproblems]. Orthopadieschuhtechnik. 2005;6:34. German.
35. Weidow J, Tranberg R, Saari T, Karrholm AQ8J. Hip and knee jointrotations differ between patients with medial and lateral knee os-teoarthritis: gait analysis of 30 patients and 15 controls. J OrthopRes. 2006;24:1890–9.
36. Williams DS, McClay IS, Manal KT. Lower extremity mechanicsin runners with a converted forefoot strike pattern J Appl Biomech.2000;16:210–8.
http://www.acsm-msse.org10 Official Journal of the American College of Sports Medicine

Copyright @ 2014 by the American College of Sports Medicine. Unauthorized reproduction of this article is prohibited.
AUTHOR QUERIES
AUTHOR PLEASE ANSWER ALL QUERIES
AQ1 = The author mentioned here do not match that given in reference 8. Please check ifthis is correct.
AQ2 = Please spell out UWA.
AQ3 = ‘‘NmIkgj1’’ has been changed to ‘‘NImIkgj1’’. Please check if this is correct.
AQ4 = Footnote c is not cited in Table 4. Please check if this is still needed.
AQ5 = Please provide the publisher information in references 2 and 18.
AQ6 = Please provide the volume number in reference 14.
AQ7 = Please provide the volume and page range in reference 20 and 25 if already available.
AQ8 = Please check if the author name here is correct.
END OF AUTHOR QUERIES