Embed Size (px)
Citation preview
JPMorgan Investment Funds
Société d’Investissement à Capital Variable
Register of Commerce Luxembourg No. B 49 663
AUDITED ANNUAL REPORT
31 December 2013
JPMorgan Investment Funds
Audited Annual Report
As at 31 December 2013
Contents
Board of Directors 1
Management and Administration 2
Board of Directors’ Report 3
Investment Managers’ Report 8
Audit Report 9
Financial Statements and Statistical InformationCombined Statement of Net Assets 11Combined Statement of Operations and Changes in Net Assets 17Statement of Changes in the Number of Shares 23Statistical Information 30
Notes to the Financial Statements 37
Schedules of InvestmentsJPMorgan Investment Funds - Blue and Green Fund 52JPMorgan Investment Funds - Emerging Markets Corporate Bond Portfolio Fund I 56JPMorgan Investment Funds - Euro Liquid Market Fund 59JPMorgan Investment Funds - Europe Select Equity Fund 61JPMorgan Investment Funds - Europe Strategic Dividend Fund 64JPMorgan Investment Funds - Global Balanced Fund 68JPMorgan Investment Funds - Global Capital Appreciation Fund 73JPMorgan Investment Funds - Global Capital Preservation Fund (USD) 78JPMorgan Investment Funds - Global Conservative Balanced Fund 83JPMorgan Investment Funds - Global Convertibles Fund (USD) 89JPMorgan Investment Funds - Global Dividend Fund 93JPMorgan Investment Funds - Global Financials Fund 97JPMorgan Investment Funds - Global High Yield Bond Fund 100JPMorgan Investment Funds - Global Income Fund 105JPMorgan Investment Funds - Global Select Equity Fund 124JPMorgan Investment Funds - Global Select Equity Plus Fund 127JPMorgan Investment Funds - Highbridge Statistical Market Neutral Fund 131JPMorgan Investment Funds - Income Opportunity Fund 135JPMorgan Investment Funds - Japan 50 Equity Fund 151JPMorgan Investment Funds - Japan Select Equity Fund 153JPMorgan Investment Funds - Japan Strategic Value Fund 155JPMorgan Investment Funds - US Bond Fund 158JPMorgan Investment Funds - US Equity Fund 163JPMorgan Investment Funds - US Select Equity Fund 166
Appendix: Unaudited Additional DisclosuresFund Total Expense Ratios 169Summary of Investment Objectives of the Sub-Funds 177Performance and Volatility 179Interest Rate Received/(Charged) on Bank Accounts 187Sub-Fund Share Classes Subject to Taxe d’Abonnement Rate of 0.01% 187Portfolio Turnover Ratio 188Calculation Method of the Risk Exposure 189Historical Statements of Changes in the Number of Shares 190
For additional information please consult www.jpmorganassetmanagement.com
No subscriptions can be received solely on the basis of this report. Subscriptions are only valid if made on the basis of the current Prospectus, the current KeyInvestor Information Documents, supplemented by the latest audited annual report and, if published thereafter, the latest unaudited semi-annual report.
The current Prospectus, the current Key Investor Information Documents, the unaudited semi-annual reports as well as the audited annual report can beobtained free of charge from the registered office of the SICAV and from local paying agents.
Following a review of the disclosure of Investment Manager(s) within the Prospectus and current Key Investor Information Documents, the details of theInvestment Manager(s) for the individual Sub-Funds will now be available from the Management Company at its registered office, or fromwww.jpmorganassetmanagement.com.
JPMorgan Investment Funds
Board of Directors
Chairman
Iain O.S. SaundersDuine, ArdfernArgyll PA31 8QNUnited Kingdom
Directors
Jacques ElvingerElvinger, Hoss & Prussen2, place Winston ChurchillB.P. 425L-2014 LuxembourgGrand Duchy of Luxembourg
Jean FrijnsAntigonelaan 2NL-5631 LR EindhovenThe Netherlands
Berndt MayJPMorgan Asset Management (Europe) S.à r.l.Austrian BranchFührichgasse 8A-1010 ViennaAustria
Registered Office
6, route de TrèvesL-2633 SenningerbergGrand Duchy of Luxembourg
John Li How CheongThe Directors’ Office19 rue de BitbourgL-1273 LuxembourgGrand Duchy of Luxembourg
Peter Thomas SchwichtJPMorgan Asset Management (UK) LimitedFinsbury Dials20 Finsbury StreetLondon EC2Y 9AQUnited Kingdom
1
JPMorgan Investment Funds
Management and Administration
Management Company, Registrar and Transfer Agent,Global Distributor and Domiciliary Agent
JPMorgan Asset Management (Europe) S.à r.l.European Bank & Business Centre6, route de TrèvesL-2633 SenningerbergGrand Duchy of Luxembourg
Investment Managers
J.P. Morgan Investment Management Inc.245 Park AvenueNew York, NY 10167United States of America
JPMorgan Asset Management (Japan) LimitedTokyo Building 7-3Marunouchi 2-ChomeChiyoda-KuTokyo 100-6432, Japan
JPMorgan Asset Management (UK) LimitedFinsbury Dials20 Finsbury StreetLondon EC2Y 9AQUnited Kingdom
JF Asset Management Limited21st Floor, Chater House8 Connaught Road CentralHong Kong
Highbridge Capital Management, LLC9 West 57th StreetNew York, NY 10019United States of America
JPMorgan Asset Management (Singapore) Limited168 Robinson Road17th Floor, Capital TowerSingapore 068912
Custodian, Corporate and Administrative Agent
J.P. Morgan Bank Luxembourg S.A.European Bank & Business Centre6, route de TrèvesL-2633 SenningerbergGrand Duchy of Luxembourg
Auditor
PricewaterhouseCoopers, Société coopérative400, Route d’EschB.P. 1443L-1014 LuxembourgGrand Duchy of Luxembourg
Legal Adviser
Elvinger, Hoss & Prussen2, place Winston ChurchillB.P. 425L-2014 LuxembourgGrand Duchy of Luxembourg
22
JPMorgan Investment Funds
Board of Directors’ Report
Chairman
Iain O.S. SaundersIndependent Director and Chairman. A member of the Board since September 2001.
Mr Saunders graduated in Economics from Bristol University and joined Robert Fleming in 1970. He held several senior positions with the group in HongKong, Japan and the US, before returning to the UK in 1988. He was appointed Deputy Chairman of Fleming Asset Management and retired in 2001 followingthe merger of the Robert Fleming group with JP Morgan. Mr Saunders is currently Chairman of several JPMorgan managed Luxembourg-domiciledinvestment funds and MB Asia Select Fund.
Directors
Jacques ElvingerIndependent Director. A member of the Board since January 2009.
Mr Elvinger became a member of the Luxembourg Bar in 1984 and has been a partner of the Luxembourg law firm Elvinger, Hoss & Prussen since 1987. MrElvinger practices general corporate and banking law and specialises in the field of investment and pension funds. He is a member of the Board of Directorsof the Luxembourg Fund Association (ALFI) and is currently Chairman of the Regulation Advisory Board and Co-Chair of the Legal Committee of ALFI. He isalso a member of the Advisory Committees to the Luxembourg Commission for the Supervision of the Financial Sector in the area of investment funds,pension funds and investment companies in risk capital. Mr Elvinger currently holds a number of professional and board mandates with Europeanorganisations including several JPMorgan managed Luxembourg-domiciled investment funds.
Jean FrijnsIndependent Director. A member of the Board since July 2005.
Mr Frijns studied Econometrics, attained a doctorate in Economics from the University of Tilburg and was a lecturer at the Northern Illinois University. Hejoined the Dutch Central Planning Bureau (CPB), the economic think-tank of the Dutch government in 1980 and, in 1983, was appointed as deputy director ofthe CPB. Mr Frijns has held various posts including Chief Investment Strategist of ABP, a Dutch pension fund, a professorship in Investments from VrijeUniversiteit (Amsterdam) and, since 2005 has served as Chairman of the Monitoring Committee on Corporate Governance. Mr Frijns currently holds anumber of professional and board mandates with European organisations including several JPMorgan managed Luxembourg-domiciled investment funds.
John Li How CheongIndependent Director. A member of the Board since June 2012.
During the last 26 years Mr Li worked essentially in the financial sector auditing and advising clients such as banks, investment funds, insurance companies,etc. Clients also were from Europe, US, Japan and Asia offering Mr Li an extensive experience in dealing with international companies. Mr Li was a Partner atKPMG Luxembourg for more than 20 years during which he was Managing Partner for 8 years before taking on the role of Chairman of the Supervisory Boardfor 3 years. Mr Li was also a member of the Investment Management Practice. Mr Li is a board member of the Institut Luxembourgeois des Administrateurs.Mr Li currently holds a number of board mandates with financial institutions including several JPMorgan managed Luxembourg-domiciled investmentfunds.
Berndt MayConnected Director. A member of the Board since October 2006.
Mr May studied Business Administration at the University of Vienna and was head of Investment Services for Invesco Bank in Austria, before joiningJPMorgan in 2001. Prior to this, he was deputy head of private banking and a fund manager at P.S.K. Bank. Mr. May is Member of the Board of VAIÖ, theAssociation of International Funds in Austria and has been speaker of the Board since 2003. He is currently country head of JPMorgan Asset Management,Austria; responsible for the distribution of JPMorgan Funds in Austria and Central Eastern Europe to institutional clients and to wholesale and retaildistribution networks. He is currently a director of several JPMorgan managed Luxembourg-domiciled investment funds.
Peter Thomas SchwichtConnected Director. A member of the Board since June 2012.
Mr Schwicht is Chief Executive of Investment Management, EMEA and is also a director of the firm’s principal legal entities and funds boards in Europe. AJ.P.Morgan employee since 1987, Mr Schwicht was Head of the Continental Europe Institutional business until June 2013 and before that was InvestmentManagement Country Head for Institutional and Retail business in Germany where he first developed the business and then went on to expand thisthroughout Continental Europe. Prior to this appointment, Mr Schwicht held a number of positions on the securities side in Fixed Income trading, proprietarypositioning and sales in Frankfurt and New York. In 1995, he was appointed Managing Director of J.P. Morgan GmbH, responsible for global markets andTreasury. He relocated to Buenos Aires in 1998 to join J.P. Morgan Argentina to develop its business into local markets, returning to Frankfurt to head theGerman Asset Management operations in 1999 when he additionally became responsible for Switzerland, Austria, Nordics and Eastern Europe. He alsoserved as a member of the executive board and supervisory board of J.P. Morgan AG, Frankfurt and as Executive Director for J.P. Morgan Asset Management(Europe) in Luxembourg. Mr Schwicht obtained his Business Economics degree from the University of Mannheim in Germany after having studied Business,Tax and Accounting in Hamburg, Norway and the USA. Mr Schwicht is currently a Director of several JPMorgan managed Luxembourg-domiciled investmentfunds.
The Board of Directors (the “Board”) is pleased to present the Audited Annual Report for the year ended 31 December 2013.
33
JPMorgan Investment Funds
Board of Directors’ Report (continued)
Structure of the Fund
The Fund is a variable capital investment company, organised as a “Société Anonyme”, under the laws of the Grand Duchy of Luxembourg. The Board hasappointed JPMorgan Asset Management (Europe) S.à r.l. (JPMAME) as Management Company of the Fund. The Fund is organised as an “umbrella” with anumber of Sub-Funds each of which has its own investment objective, policies and restrictions.
The objective of the Fund is to place the money available to it in transferable securities and other permitted assets of any kind, in accordance with the Fund’sProspectus, with the purpose of spreading investment risks and affording shareholders the results of the management of their portfolios.
The Fund qualifies as an Undertaking for Collective Investment in Transferable Securities (UCITS) under the EC Directive 2009/65/EC of 13 July 2009 and issubject to the Luxembourg law of 17 December 2010 on undertakings for collective investment. The Fund may therefore be offered for sale in EuropeanUnion Member States, subject to notification in countries other than the Grand Duchy of Luxembourg. In addition, applications to register the Fund and itsSub-Funds may be made in other countries.
As at the year end the Fund had 24 Sub-Funds. All of the Sub-Funds and Share Classes are registered for offer and distribution in the Grand Duchy ofLuxembourg and a number of the Sub-Funds and Share Classes are registered for distribution in the following jurisdictions:
Austria, Bahrain, Belgium, Chile, Cyprus, Denmark, Estonia, Finland, France, Germany, Greece, Hong Kong, Hungary, Ireland, Italy, Jersey, Macau,The Netherlands, Netherlands Antilles, Norway, Poland, Portugal, Singapore, Spain, Sweden, Switzerland, Taiwan and the United Kingdom.
Role and Responsibility of the Board
The responsibility of the Board is governed exclusively by Luxembourg law. With respect to the annual accounts of the Fund, the duties of the Directors aregoverned by the law of 10 December 2010 on, inter alia, the accounting and annual accounts of undertakings for collective investment and by the law of17 December 2010 relating to undertakings for collective investment.
A management agreement between the Fund and JPMorgan Asset Management (Europe) S.à r.l sets out the matters over which the Management Companyhas authority under Chapter 15 of the Law of 17 December 2010. This includes management of the Fund’s assets and the provision of administration,registration, domiciliation agent and marketing services. All other matters are reserved for approval by the Board and a schedule setting out such mattersfor clarity is in place between the Board and the Management Company. The matters reserved for the Board include determination of each Sub-Fund’sinvestment objective and policies, investment restrictions and powers, amendments to the Prospectus, reviewing and approving key investment andfinancial data, including the annual accounts, as well as the appointment of, and review of the services provided by, the Management Company, Auditor andcustodian.
Prior to each Board meeting the Directors receive detailed and timely information allowing them to be prepared for the items under discussion during themeeting. For each quarterly meeting the Board requests, and receives, reports from, amongst others, the Management Company, the investment managers,risk management as well as proposals for changes to existing Sub-Funds or proposals to launch new ones as appropriate. Senior representatives of each ofthese functions attend Board meetings by invitation to enable the Directors to question the reports presented to it.
The Directors take decisions in the interests of the Fund and its shareholders as a whole and refrain from taking part in any deliberation or decision whichcreates a conflict of interest between their personal interests and those of the Fund and its shareholders. The subject of conflicts of interest is documented inthe Prospectus and the Management Company’s policy on conflicts of interest is available for inspection on the website:http://www.jpmorganassetmanagement.lu/ENG/Document_Library
The Board can take independent professional advice if necessary and at the Fund’s expense.
Board Composition
The Board is chaired by Mr. Saunders and consists of four Independent Directors and two Connected Directors. The Board defines a Connected Director assomeone who is employed by JPMorgan Chase & Co or any of its affiliates. All Board meetings require a majority of Independent Directors to be in attendanceand as such the Board acts independently from the Management Company. The Board as a whole has a breadth of investment knowledge, financial skills, aswell as legal and other experience relevant to the Fund’s business. Directors are elected annually by shareholders at the Annual General Meeting. The Boarddoes not limit the number of years of Directors’ service and it does take into account the nature and requirements of the fund industry and of the Fund’sbusiness when making recommendation to shareholders that Directors be elected. The terms of each Director’s appointment are set out in a contract forservices and these are available at the Fund’s registered office for inspection.
Board Remuneration
The Board believes that the remuneration of the Board members should reflect the responsibilities of the Board, the experience of the Board as a whole andbe fair and appropriate given the size, complexity and investment objectives of the Fund and Sub-Funds.
The remuneration is reviewed on an annual basis. The Chairman is currently paid EUR 38,750 per annum and the other Directors EUR 35,750 per annumapart from the Connected Directors who have agreed to waive their remuneration.
Board Meetings and Committees
The Board meets quarterly but if necessary additional meetings will be arranged.
Given the scope and nature of the business of the Fund, the Board does not currently consider it necessary to have a formal Audit or RemunerationCommittee or indeed any other standing committees. However, this is kept under review.
All Board related matters are therefore currently approved by the Board or, where there are specific matters that need further consideration, aSub-Committee of the Board could be formed for this specific purpose. Such circumstances could be where the Board requests some amendments to theProspectus and where it is not appropriate to wait till the next quarterly Board meeting for this to be approved. These Sub-Committee meetings are usuallyformed of a minimum of two Directors.
There were four Board meetings held during the year. These were the quarterly Board meetings where, amongst other matters, the agenda included thoseitems highlighted under the section above called ‘Role and Responsibility of the Board’ and the approval of the annual report and accounts. There were threeSub-Committee meetings of the Board held during the year.
In addition to the Board meeting where the Auditors present the report on the audit of the Fund accounts, the Independent Directors also meet with themannually without the Connected Directors being in attendance.
4
JPMorgan Investment Funds
Board of Directors’ Report (continued)
Internal Control
Investment management and all administrative services are provided by the Management Company and custody of assets is provided by J.P. Morgan BankLuxembourg S.A. The Board’s system of internal control therefore mainly comprises monitoring the services provided by the Management Company and theCustodian, including the operational and compliance controls established by them to meet the Fund’s obligations to shareholders as set out in theProspectus, Articles of Incorporation as well as all relevant regulations. The Management Company formally reports to the Board on a quarterly basis on thevarious activities it is responsible for and in addition shall inform the Board without delay of any material administrative or accounting matters.
Corporate Governance and ALFI Code of Conduct
The Board is responsible for ensuring that a high level of corporate governance is met and considers that the Fund has complied with the best practices in theLuxembourg funds industry.
In particular the Board has adopted the ALFI Code of Conduct (the “Code”) which sets out principles of good governance. These principles were amended inAugust 2013 and are set out below:
1. The Board should ensure that high standards of corporate governance are applied at all times;
2. The Board should have good professional standing and appropriate experience and use best efforts to ensure that it is collectively competent to fulfil itsresponsibilities;
3. The Board should act fairly and independently in the best interests of the investors;
4. The Board should act with due care and diligence in the performance of their duties;
5. The Board should ensure compliance with all applicable laws and regulations and with the Fund’s constitutional documents;
6. The Board should ensure that investors are properly informed, are fairly and equitably treated, and receive the benefits and services to which they areentitled;
7. The Board should ensure that an effective risk management process and appropriate internal controls are in place;
8. The Board should identify and manage fairly and effectively, to the best of its ability, any actual, potential or apparent conflict of interest and ensureappropriate disclosure;
9. The Board should ensure that shareholder rights are exercised in a considered way and in the best interests of the Fund;
10. The Board should ensure that the remuneration of the Board members is reasonable and fair and adequately disclosed.
The Board considers that the Fund has been in compliance with the principles of the Code in all material aspects throughout the financial year ended 31December 2013. The Board undertakes an annual review of ongoing compliance with the principles of the Code.
Proxy Voting Policy
The Board delegates responsibility for proxy voting to the Management Company.
The Management Company manages the voting rights of the shares entrusted in a prudent and diligent manner, based exclusively on the reasonablejudgement of what will best serve the financial interests of clients. So far as is practicable, the Management Company will vote at all of the meetings called bycompanies in which they are invested.
A copy of the proxy voting policy is available from the Fund’s registered office upon request or on the website:http://am.jpmorgan.co.uk/institutional/aboutus/aboutus/corporategovernance.aspx
Directors and Officers Indemnity Insurance
The Fund’s Articles of Incorporation indemnify the Directors against expenses reasonably incurred in connection with any claim against them arising in thecourse of their duties or responsibilities as long as they have not acted fraudulently or dishonestly. To protect shareholders against any such claim, the Boardhas taken out Directors and Officers Indemnity Insurance which indemnifies the Directors against certain liabilities arising in the course of their duties andresponsibilities but does not cover against any fraudulent or dishonest actions on their part.
Independent Auditor
PricewaterhouseCoopers, Société coopérative, has been the Fund’s Auditor since December 1994. The provision of audit services was last put to competitivetender in 2009. The Board reviewed the services of PwC this year and decided that, subject to any other influencing factor, they should continue to beproposed to the Shareholders to be appointed as Auditor for the next three years. At the conclusion of this period the Board will consider again whether toput the provision of audit services out to competitive tender.
Annual General Meeting
The next Annual General Meeting of the Company will be held on 25 April 2014 at the Registered Office of the Company to consider matters relating to the yearending on 31 December 2013. At this meeting shareholders will, amongst other matters, be requested to consider the usual matters at such meetings including:
1. the adoption of the financial statements and approval of the allocation of the results;
2. the approval of Directors fees;
3. the election of the Directors, all of whom wish to stand for election;
4. the election of the Auditor.
No special business is being proposed by the Board.
5
JPMorgan Investment Funds
Board of Directors’ Report (continued)
Events during the Year
During the year, the total net assets of the Fund increased from USD 18.7 billion to USD 34.1 billion at year end.
The Board agreed the following corporate actions relating to Sub-Funds during the year:
a) Liquidations
Shareholders in the following Sub-Fund were informed of the decision of the Board to liquidate the Sub-Fund as set out below:
- JPMorgan Investment Funds - Japan Behavioural Finance Equity Fund on 30 August 2013.
b) Mergers
Shareholders in the following Sub-Funds were informed of the decision of the Board to merge them as set out below:
i) with effect from 23 August 2013:
- JPMorgan Investment Funds - Europe Recovery Fund was merged into JPMorgan Funds - Europe Dynamic Fund;
ii) with effect from 13 September 2013:
- JPMorgan Investment Funds - Asia ex-Japan Fund was merged into JPMorgan Funds - Asia Alpha Plus Fund;
iii) with effect from 25 October 2013:
- JPMorgan Investment Funds - Europe Bond Fund was merged into JPMorgan Funds - Euro Aggregate Bond Fund;
- JPMorgan Investment Funds - Global Total Return Fund was merged into JPMorgan Investment Funds - Global Capital Appreciation Fund;
- JPMorgan Investment Funds - Japan Focus Fund was merged into JPMorgan Investment Funds - Japan 50 Equity Fund;
iv) with effect from 29 November 2013:
- JPMorgan Investment Funds - Global Bond Fund (EUR) was merged into JPMorgan Funds - Aggregate Bond Fund;
- JPMorgan Investment Funds - Global Bond Fund (USD) was merged into JPMorgan Funds - Aggregate Bond Fund;
- JPMorgan Investment Funds - Global Enhanced Bond Fund was merged into JPMorgan Funds - Aggregate Bond Fund;
- JPMorgan Investment Funds - Global Balanced Fund (USD) was merged into JPMorgan Investment Funds - Global Balanced Fund (EUR);
The following other significant amendments to Sub-Funds were also approved by the Board during the year:
a) Changes to investment strategies, investment objectives and policies, and names
Shareholders in a number of Sub-Funds were informed of the decision of the Board to make the following amendments:
i) with effect from 21 August 2013:
- JPMorgan Investment Funds - Global Conservative Balanced Fund (previously JPMorgan Investment Funds - Global Capital Preservation Fund (EUR)). Theinvestment objective and policy was re-ordered to give prominence to debt securities as this is a larger part of the portfolio “debt securities and equitysecurities”.
b) Name Changes
i) with effect from 1 January 2013:
To remove the confusion caused by the term “130/30" the Board decided to rename the following Sub-Fund:
- JPMorgan Investment Funds - Global Select 130/30 Fund changed its name to JPMorgan Investment Funds - Global Select Equity Plus Fund
ii) With effect from 4 February 2013, those Sub-Funds branded “JF” were renamed as set out below and in addition all share classes branded “JF” were alsoreplaced with “JPMorgan” Classes of Shares:
- JPMorgan Investment Funds - JF Asia ex-Japan Fund changed its name to JPMorgan Investment Funds - Asia ex-Japan Fund
iii) with effect from 21 August 2013:
- JPMorgan Investment Funds - Global Capital Preservation Fund (EUR) changed its name to JPMorgan Investment Funds - Global Conservative BalancedFund
iv) with effect from 29 November 2013:
- JPMorgan Investment Funds - Global Balanced Fund (EUR) changed its name to JPMorgan Investment Funds - Global Balanced Fund
6
JPMorgan Investment Funds
Board of Directors’ Report (continued)
Events After Year-End
a) New Share Classes
i) with effect from December 2013:
- The creation of RMB hedged share classes to offer a solution to the growing number of clients holding CNH deposits.
b) Mergers
The following mergers are scheduled to take place:
i) with effect from 17 January 2014:
- JPMorgan Investment Funds - Euro Liquid Market Fund into JPMorgan Funds - Euro Money Market Fund
c) Changes to investment strategies, investment objectives and policies, and names
i) with effect from 5 February 2014:
- JPMorgan Investment Funds - Emerging Markets Corporate Bond Portfolio Fund I. The investment objective and policy was amended to allow them to investthe majority of their assets in a portfolio of emerging market below investment grade corporate debt securities.
ii) with effect from 5 February 2014:
- JPMorgan Investment Funds - Global Income Fund. The Prospectus was amended to remove the following sentence from the Investment Policy section:“The majority of the assets (excluding cash and cash equivalents) will be invested in debt securities.”
Board of Directors
Luxembourg, 21 March 2014
7
JPMorgan Investment Funds
Investment Managers’ Report
Market review of 2013Global equities outperformed fixed income in the 12-month period to the end of December, with the MSCI World Index up 21.2%, compared to the BarclaysGlobal Aggregate Index’s 6.8% decline, both in euro terms (source: Factset, as of 31 December 2013).
Investor sentiment in the 12-month period to the end of December was shaped primarily by growing speculation that the US Federal Reserve (the Fed) wouldbegin tapering its asset purchases. Uncertainty about the potential timing of the withdrawal of monetary stimulus was sparked by Fed chairman BenBernanke’s comments in May that bond buying could be scaled back “in the next few meetings” of the Federal Open Market Committee.
As improving economic indicators-particularly the falling US unemployment rate-pointed to a more entrenched US recovery, the vast majority of marketparticipants became convinced that the Fed would taper in September. As a result, Bernanke’s decision in September to leave unchanged the Fed’s assetpurchase programme took markets by surprise.
The taper decision ultimately came in December, as the uncertainty brought about by budgetary wrangling receded, and conditions in the US labour marketshowed sustained improvement. The Fed announced that starting January 2014, it would reduce its monthly bond purchases by USD 10 billion, with furtherreductions to come during the year.
The speculation about the scaling back of the Fed’s monetary support had a particularly negative effect on emerging markets (both equity and debt) andfixed income more broadly. Yields on US, UK and German government bonds rose significantly, while emerging market investors suffered sizeable losses.The sell-off in emerging markets continued for most of the period. While corporate bonds were also adversely affected, losses were less severe.
However, as fixed income investors adjusted their expectations about the scaling back of asset purchases, government bond yields in developed economiesstabilised over the second half of the year, and there was no repeat of the May scenario in December.
US, European and Japanese equity markets made strong gains in the 12 months to the end of December. Although unemployment remained at a record highin the eurozone, investor sentiment on the region became more positive, particularly as a pick up in purchasing managers’ indices towards the end of theperiod suggested that manufacturing activity was improving. In the second quarter, the eurozone economy emerged from recession after 18 months ofcontraction, while the UK appeared to be recovering at a faster than expected rate.
US equities were among the top performers as the US economy continued to lead the developed world recovery. Although congressional wrangling over theraising of the debt ceiling led to a government shutdown that brought with it increased uncertainty, the effect on equities was muted. Japanese equities wereboosted by the positive effects of prime minister Shinzo Abe’s reform programme aimed at raising the rate of consumer price inflation to 2% in two years andreturning the Japanese economy to a path of sustainable growth.
Outlook for 2014Investors are looking ahead with a mixture of excitement and trepidation. Excitement, because of the better economic growth environment in the US and inEurope, as well as the improving outlook for corporate earnings growth that should support developed equity markets. But trepidation, because althoughthe initial market response to Fed tapering has been positive, it remains to be seen what the medium-term effects of reduced monetary stimulus will be.
It is likely that Fed tapering will lead to further rises in bond yields during 2014. The US economic recovery should continue to boost US equities, while anyupturn in eurozone growth could be positive for the region. Despite the weakness of emerging markets in 2013, the case for investing in emerging marketsremains intact, underpinned by a long-term structural growth story.
Investors are expected to keep a close eye on developments in US-Iran relations, as well as the progress made by Chinese authorities in implementing thereform programme that they have set out. While the planned reforms can be regarded as a good first step towards achieving economic stability, the failure toimplement them could have negative effects on both the Chinese and the global economy.
The Investment Managers
21 March 2014
The information stated in this report is historical and not necessarily indicative of future performance.
8

pwc
Audit Report
To the c.4
JPMorgan investment Funds
We have audited the accompanying financial statements of 1PMorgan and of each of its ."ib-Funds, which comprise the Combined Statement of Net Assets and the Schedule of Investments as at 31 December 2013 . Combined Stater f.mt of c, :•,rations and Changes in 1,1 the year then ended, and a summary of significant accounting policies and other / notes to 1;;;,_ statements.
Responsibility of the Board of Directors of the SICAV for the financial statements The Beard of Directors of the SICAV is responsible for the preparation and fair presentation of these financial statements in accordance with Luxembourg legal and regulatory requirements relating to the preparation of the financial statements and for such internal control as the Board of Directors of the SICAV determines is necessary to enable the preparation of financial statements that are free from material misstatement, whether due to fraud or error.
Responsibility of the "Reyiseur d'entreprises agree" Our responsibility is to express an opinion on these financial statements based on our audit. We conducted our audit in accordance with International Standards on Auditing as adopted for Luxembourg by the "Commission de Surveillance du Secteur Financier", Those standards require that we comply with ethical requirements and plan and perform the audit to obtain reasonable assurance about whether the financial statements are free from material misstatement,
An audit involves performing procedures to obtain audit evidence about the amounts and disclosures in the financial statements. The procedures selected depend on the judgment of the "Reviseur d'entreprises agree", including the assessment of the risks of material misstatement of the financial statements, whether due to fraud or error. In making those risk assessments, the "Reviseur d'entreprises agree" considers internal control relevant to the entity's preparation and fair presentation of the financial statements in order to design audit procedures that are appropriate in the circumstances, but not for the purpose of expressing an opinion on the effectiveness of the entity's internal control. An audit also includes evaluating the appropriateness of accounting policies used and the reasonableness of accounting estimates made by the Board of Directors of the SICAV, as well as evaluating the overall presentation of the financial statements.
We believe that the audit evidence we have obtained is sufficient and appropriate to provide a basis for our audit opinion.
Opinion In our opinion, the financial statements give a true and fair view of the financial position of 1PMorgan Investment Funds and of each of its Sub-Funds as of 31 December 2013, and of the results of their operations and changes in their net assets for the year then ended in accordance with Luxembourg legal and regulatory requirements relating to the preparation of the financial statements,
Other matters Supplementary information included in the annual report has been reviewed in the context of our mandate but has not been subject to specific audit procedures carried out in accordance with the standards described above. Consequently, we express no opinion on such information. However, we have no observation to make concerning such information in the context of the financial statements taken as a whole.
PricewaterhouseCoopers, Societe cooperative Luxembourg, 21 March 2014
Represented by
Emmanuel Cl
PricewaterhouseCoopers, Societe cooperative, 400 Route d'Esch, B.P. 1443, L-1014 Luxembourg 352 4948481, F:4352 4 94848 2900, www.pwc.lu
Cabinet be revision agree. Expert-comptable (auforisation gouvernementale n° 10028256) R.C.S. Luxembourg B 65 4 77 - TVA LU25482518
9

This page has been left blank intentionally
10
JPMorgan Investment Funds
Combined Statement of Net Assets
As at 31 December 2013
JPMorganInvestment Funds
CombinedUSD
Blue andGreen Fund
EUR
Assets
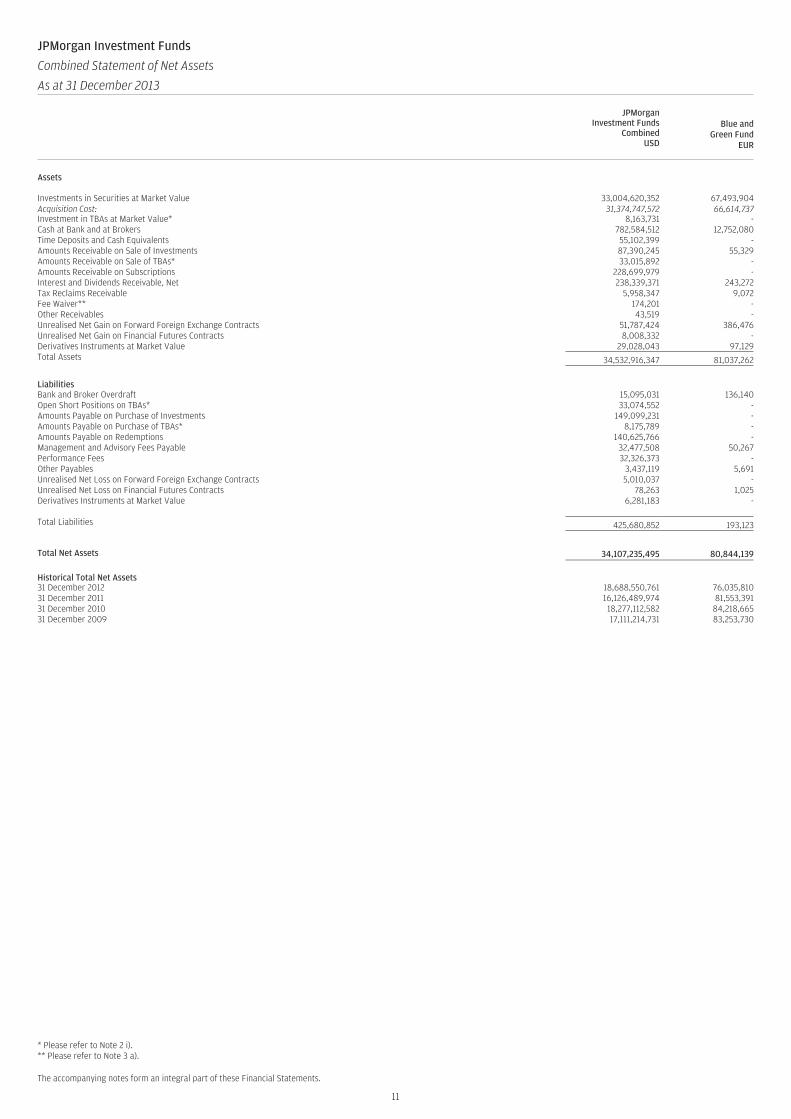
Investments in Securities at Market Value 33,004,620,352 67,493,904Acquisition Cost: 31,374,747,572 66,614,737Investment in TBAs at Market Value* 8,163,731 -Cash at Bank and at Brokers 782,584,512 12,752,080Time Deposits and Cash Equivalents 55,102,399 -Amounts Receivable on Sale of Investments 87,390,245 55,329Amounts Receivable on Sale of TBAs* 33,015,892 -Amounts Receivable on Subscriptions 228,699,979 -Interest and Dividends Receivable, Net 238,339,371 243,272Tax Reclaims Receivable 5,958,347 9,072Fee Waiver** 174,201 -Other Receivables 43,519 -Unrealised Net Gain on Forward Foreign Exchange Contracts 51,787,424 386,476Unrealised Net Gain on Financial Futures Contracts 8,008,332 -Derivatives Instruments at Market Value 29,028,043 97,129Total Assets 34,532,916,347 81,037,262
LiabilitiesBank and Broker Overdraft 15,095,031 136,140Open Short Positions on TBAs* 33,074,552 -Amounts Payable on Purchase of Investments 149,099,231 -Amounts Payable on Purchase of TBAs* 8,175,789 -Amounts Payable on Redemptions 140,625,766 -Management and Advisory Fees Payable 32,477,508 50,267Performance Fees 32,326,373 -Other Payables 3,437,119 5,691Unrealised Net Loss on Forward Foreign Exchange Contracts 5,010,037 -Unrealised Net Loss on Financial Futures Contracts 78,263 1,025Derivatives Instruments at Market Value 6,281,183 -
Total Liabilities 425,680,852 193,123
Total Net Assets 34,107,235,495 80,844,139
Historical Total Net Assets31 December 2012 18,688,550,761 76,035,81031 December 2011 16,126,489,974 81,553,39131 December 2010 18,277,112,582 84,218,66531 December 2009 17,111,214,731 83,253,730
* Please refer to Note 2 i).** Please refer to Note 3 a).
The accompanying notes form an integral part of these Financial Statements.
11
JPMorgan Investment Funds
Combined Statement of Net Assets (continued)
As at 31 December 2013
Emerging MarketsCorporate BondPortfolio Fund I
USD
EuroLiquid Market
FundEUR
EuropeSelect
Equity FundEUR
Europe StrategicDividend
FundEUR
Global BalancedFund (1)
EUR
Global CapitalAppreciation
FundEUR
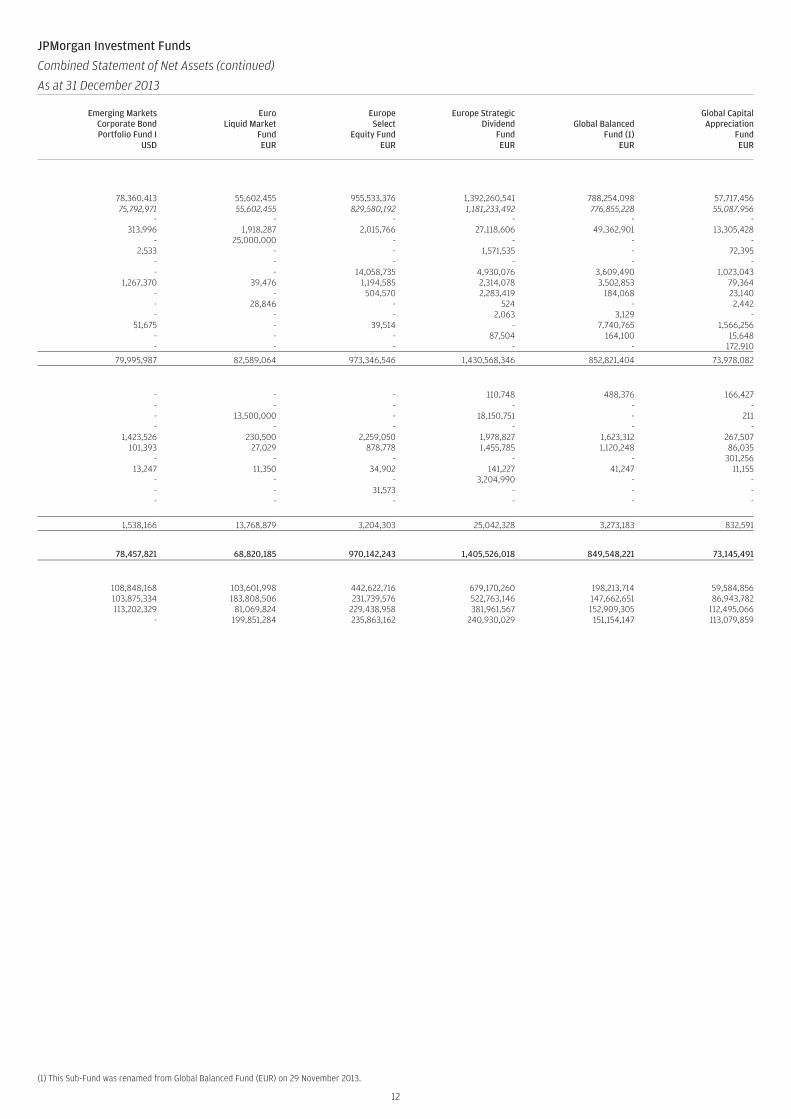
78,360,413 55,602,455 955,533,376 1,392,260,541 788,254,098 57,717,45675,792,971 55,602,455 829,580,192 1,181,233,492 776,855,228 55,087,956
- - - - - -313,996 1,918,287 2,015,766 27,118,606 49,362,901 13,305,428
- 25,000,000 - - - -2,533 - - 1,571,535 - 72,395
- - - - - -- - 14,058,735 4,930,076 3,609,490 1,023,043
1,267,370 39,476 1,194,585 2,314,078 3,502,853 79,364- - 504,570 2,283,419 184,068 23,140- 28,846 - 524 - 2,442- - - 2,063 3,129 -
51,675 - 39,514 - 7,740,765 1,566,256- - - 87,504 164,100 15,648- - - - - 172,910
79,995,987 82,589,064 973,346,546 1,430,568,346 852,821,404 73,978,082
- - - 110,748 488,376 166,427- - - - - -- 13,500,000 - 18,150,751 - 211- - - - - -
1,423,526 230,500 2,259,050 1,978,827 1,623,312 267,507101,393 27,029 878,778 1,455,785 1,120,248 86,035
- - - - - 301,25613,247 11,350 34,902 141,227 41,247 11,155
- - - 3,204,990 - -- - 31,573 - - -- - - - - -
1,538,166 13,768,879 3,204,303 25,042,328 3,273,183 832,591
78,457,821 68,820,185 970,142,243 1,405,526,018 849,548,221 73,145,491
108,848,168 103,601,998 442,622,716 679,170,260 198,213,714 59,584,856103,875,334 183,808,506 231,739,576 522,763,146 147,662,651 86,943,782113,202,329 81,069,824 229,438,958 381,961,567 152,909,305 112,495,066
- 199,851,284 235,863,162 240,930,029 151,154,147 113,079,859
(1) This Sub-Fund was renamed from Global Balanced Fund (EUR) on 29 November 2013.
12
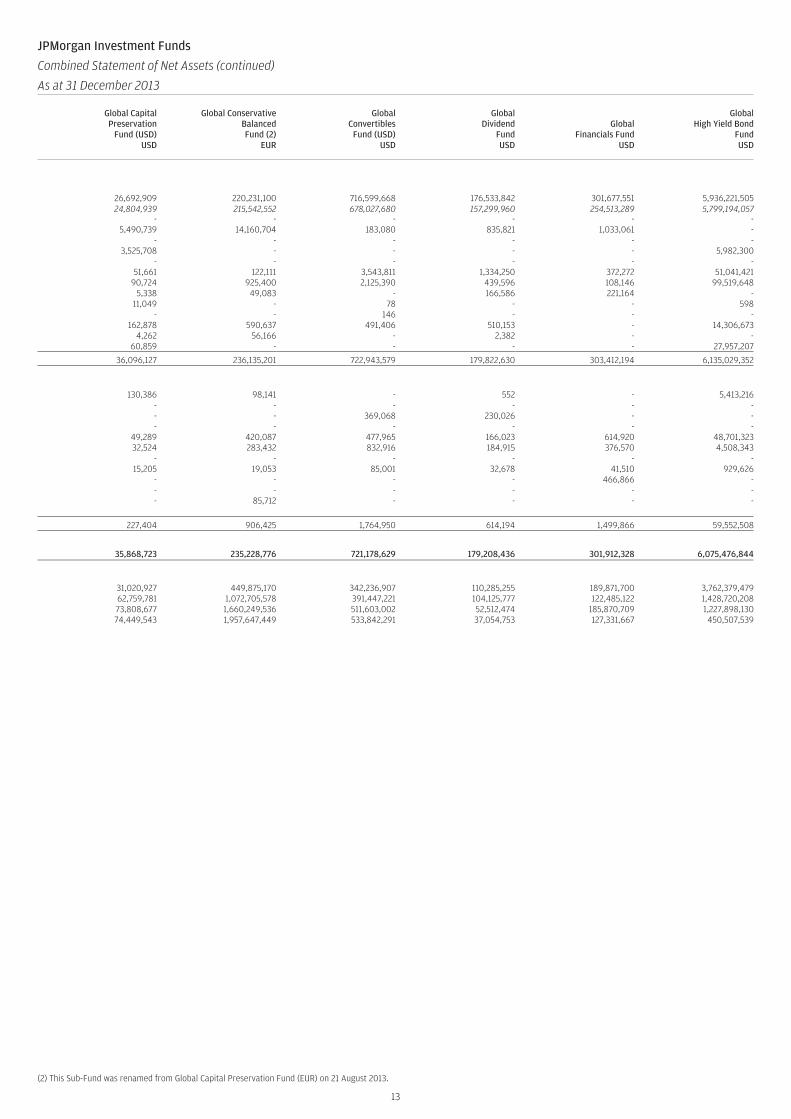
JPMorgan Investment Funds
Combined Statement of Net Assets (continued)
As at 31 December 2013
Global CapitalPreservation
Fund (USD)USD
Global ConservativeBalancedFund (2)
EUR
GlobalConvertibles
Fund (USD)USD
GlobalDividend
FundUSD
GlobalFinancials Fund
USD
GlobalHigh Yield Bond
FundUSD
26,692,909 220,231,100 716,599,668 176,533,842 301,677,551 5,936,221,50524,804,939 215,542,552 678,027,680 157,299,960 254,513,289 5,799,194,057
- - - - - -5,490,739 14,160,704 183,080 835,821 1,033,061 -
- - - - - -3,525,708 - - - - 5,982,300
- - - - - -51,661 122,111 3,543,811 1,334,250 372,272 51,041,421
90,724 925,400 2,125,390 439,596 108,146 99,519,6485,338 49,083 - 166,586 221,164 -
11,049 - 78 - - 598- - 146 - - -
162,878 590,637 491,406 510,153 - 14,306,6734,262 56,166 - 2,382 - -
60,859 - - - - 27,957,207
36,096,127 236,135,201 722,943,579 179,822,630 303,412,194 6,135,029,352
130,386 98,141 - 552 - 5,413,216- - - - - -- - 369,068 230,026 - -- - - - - -
49,289 420,087 477,965 166,023 614,920 48,701,32332,524 283,432 832,916 184,915 376,570 4,508,343
- - - - - -15,205 19,053 85,001 32,678 41,510 929,626
- - - - 466,866 -- - - - - -- 85,712 - - - -
227,404 906,425 1,764,950 614,194 1,499,866 59,552,508
35,868,723 235,228,776 721,178,629 179,208,436 301,912,328 6,075,476,844
31,020,927 449,875,170 342,236,907 110,285,255 189,871,700 3,762,379,47962,759,781 1,072,705,578 391,447,221 104,125,777 122,485,122 1,428,720,20873,808,677 1,660,249,536 511,603,002 52,512,474 185,870,709 1,227,898,13074,449,543 1,957,647,449 533,842,291 37,054,753 127,331,667 450,507,539
(2) This Sub-Fund was renamed from Global Capital Preservation Fund (EUR) on 21 August 2013.
13
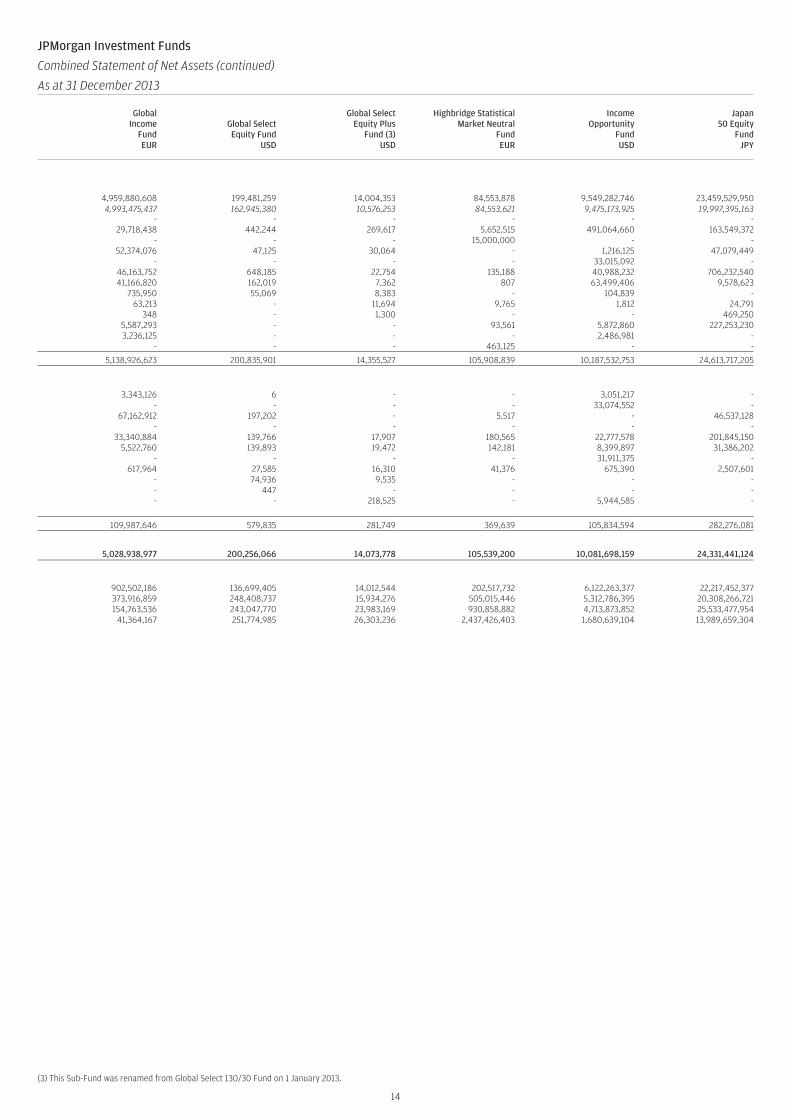
JPMorgan Investment Funds
Combined Statement of Net Assets (continued)
As at 31 December 2013
GlobalIncome
FundEUR
Global SelectEquity Fund
USD
Global SelectEquity Plus
Fund (3)USD
Highbridge StatisticalMarket Neutral
FundEUR
IncomeOpportunity
FundUSD
Japan50 Equity
FundJPY
4,959,880,608 199,481,259 14,004,353 84,553,878 9,549,282,746 23,459,529,9504,993,475,437 162,945,380 10,576,253 84,553,621 9,475,173,925 19,997,395,163
- - - - - -29,718,438 442,244 269,617 5,652,515 491,064,660 163,549,372
- - - 15,000,000 - -52,374,076 47,125 30,064 - 1,216,125 47,079,449
- - - - 33,015,092 -46,163,752 648,185 22,754 135,188 40,988,232 706,232,54041,166,820 162,019 7,362 807 63,499,406 9,578,623
735,950 55,069 8,383 - 104,839 -63,213 - 11,694 9,765 1,812 24,791
348 - 1,300 - - 469,2505,587,293 - - 93,561 5,872,860 227,253,2303,236,125 - - - 2,486,981 -
- - - 463,125 - -
5,138,926,623 200,835,901 14,355,527 105,908,839 10,187,532,753 24,613,717,205
3,343,126 6 - - 3,051,217 -- - - - 33,074,552 -
67,162,912 197,202 - 5,517 - 46,537,128- - - - - -
33,340,884 139,766 17,907 180,565 22,777,578 201,845,1505,522,760 139,893 19,472 142,181 8,399,897 31,386,202
- - - - 31,911,375 -617,964 27,585 16,310 41,376 675,390 2,507,601
- 74,936 9,535 - - -- 447 - - - -- - 218,525 - 5,944,585 -
109,987,646 579,835 281,749 369,639 105,834,594 282,276,081
5,028,938,977 200,256,066 14,073,778 105,539,200 10,081,698,159 24,331,441,124
902,502,186 136,699,405 14,012,544 202,517,732 6,122,263,377 22,217,452,377373,916,859 248,408,737 15,934,276 505,015,446 5,312,786,395 20,308,266,721154,763,536 243,047,770 23,983,169 930,858,882 4,713,873,852 25,533,477,954
41,364,167 251,774,985 26,303,236 2,437,426,403 1,680,639,104 13,989,659,304
(3) This Sub-Fund was renamed from Global Select 130/30 Fund on 1 January 2013.
14
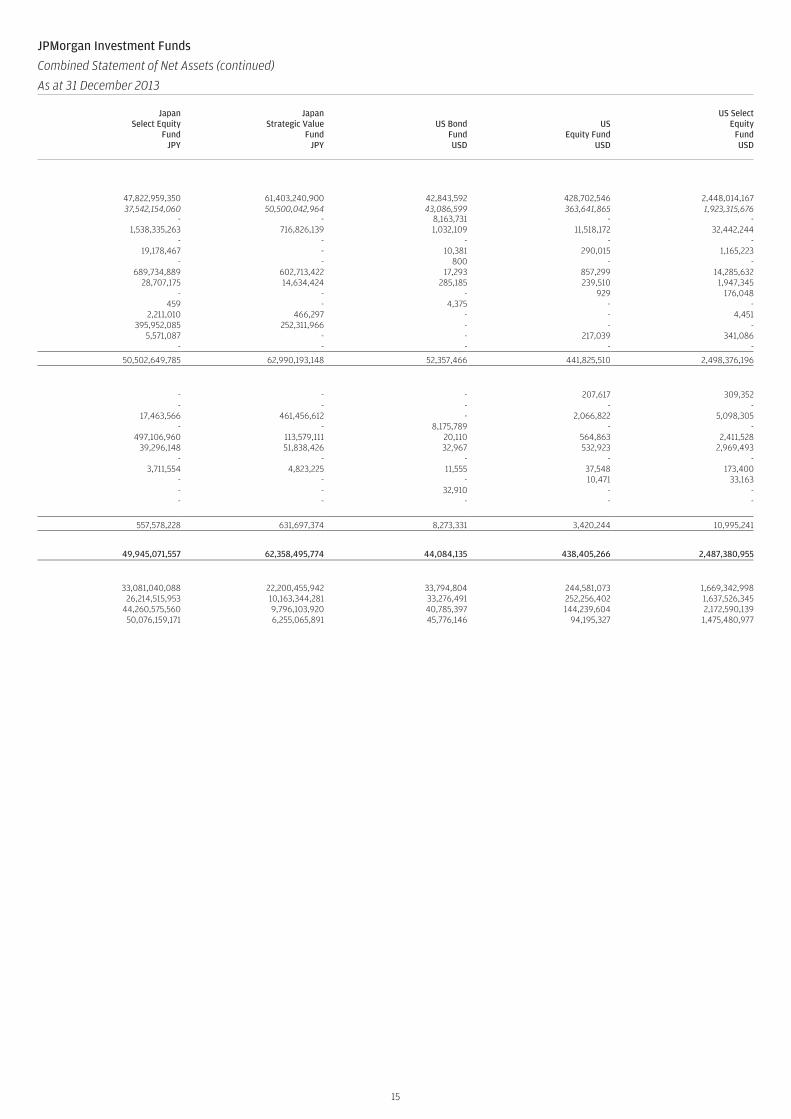
JPMorgan Investment Funds
Combined Statement of Net Assets (continued)
As at 31 December 2013
JapanSelect Equity
FundJPY
JapanStrategic Value
FundJPY
US BondFundUSD
USEquity Fund
USD
US SelectEquity
FundUSD
47,822,959,350 61,403,240,900 42,843,592 428,702,546 2,448,014,16737,542,154,060 50,500,042,964 43,086,599 363,641,865 1,923,315,676
- - 8,163,731 - -1,538,335,263 716,826,139 1,032,109 11,518,172 32,442,244
- - - - -19,178,467 - 10,381 290,015 1,165,223
- - 800 - -689,734,889 602,713,422 17,293 857,299 14,285,632
28,707,175 14,634,424 285,185 239,510 1,947,345- - - 929 176,048
459 - 4,375 - -2,211,010 466,297 - - 4,451
395,952,085 252,311,966 - - -5,571,087 - - 217,039 341,086
- - - - -
50,502,649,785 62,990,193,148 52,357,466 441,825,510 2,498,376,196
- - - 207,617 309,352- - - - -
17,463,566 461,456,612 - 2,066,822 5,098,305- - 8,175,789 - -
497,106,960 113,579,111 20,110 564,863 2,411,52839,296,148 51,838,426 32,967 532,923 2,969,493
- - - - -3,711,554 4,823,225 11,555 37,548 173,400
- - - 10,471 33,163- - 32,910 - -- - - - -
557,578,228 631,697,374 8,273,331 3,420,244 10,995,241
49,945,071,557 62,358,495,774 44,084,135 438,405,266 2,487,380,955
33,081,040,088 22,200,455,942 33,794,804 244,581,073 1,669,342,99826,214,515,953 10,163,344,281 33,276,491 252,256,402 1,637,526,345
44,260,575,560 9,796,103,920 40,785,397 144,239,604 2,172,590,13950,076,159,171 6,255,065,891 45,776,146 94,195,327 1,475,480,977
15

This page has been left blank intentionally
16
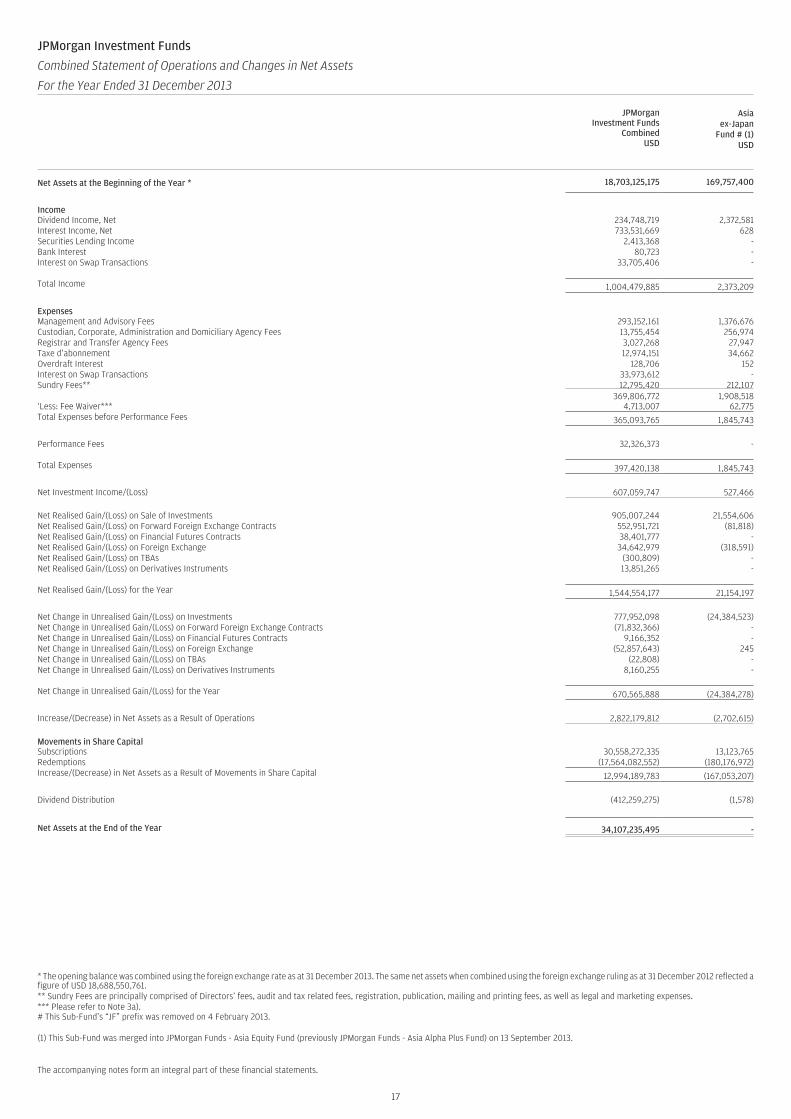
JPMorgan Investment Funds
Combined Statement of Operations and Changes in Net Assets
For the Year Ended 31 December 2013
JPMorganInvestment Funds
CombinedUSD
Asiaex-Japan
Fund # (1)USD
Net Assets at the Beginning of the Year * 18,703,125,175 169,757,400
IncomeDividend Income, Net 234,748,719 2,372,581Interest Income, Net 733,531,669 628Securities Lending Income 2,413,368 -Bank Interest 80,723 -Interest on Swap Transactions 33,705,406 -
Total Income 1,004,479,885 2,373,209
ExpensesManagement and Advisory Fees 293,152,161 1,376,676Custodian, Corporate, Administration and Domiciliary Agency Fees 13,755,454 256,974Registrar and Transfer Agency Fees 3,027,268 27,947Taxe d’abonnement 12,974,151 34,662Overdraft Interest 128,706 152Interest on Swap Transactions 33,973,612 -Sundry Fees** 12,795,420 212,107
369,806,772 1,908,518‘Less: Fee Waiver*** 4,713,007 62,775Total Expenses before Performance Fees 365,093,765 1,845,743
Performance Fees 32,326,373 -
Total Expenses 397,420,138 1,845,743
Net Investment Income/(Loss) 607,059,747 527,466
Net Realised Gain/(Loss) on Sale of Investments 905,007,244 21,554,606Net Realised Gain/(Loss) on Forward Foreign Exchange Contracts 552,951,721 (81,818)Net Realised Gain/(Loss) on Financial Futures Contracts 38,401,777 -Net Realised Gain/(Loss) on Foreign Exchange 34,642,979 (318,591)Net Realised Gain/(Loss) on TBAs (300,809) -Net Realised Gain/(Loss) on Derivatives Instruments 13,851,265 -
Net Realised Gain/(Loss) for the Year 1,544,554,177 21,154,197
Net Change in Unrealised Gain/(Loss) on Investments 777,952,098 (24,384,523)Net Change in Unrealised Gain/(Loss) on Forward Foreign Exchange Contracts (71,832,366) -Net Change in Unrealised Gain/(Loss) on Financial Futures Contracts 9,166,352 -Net Change in Unrealised Gain/(Loss) on Foreign Exchange (52,857,643) 245Net Change in Unrealised Gain/(Loss) on TBAs (22,808) -Net Change in Unrealised Gain/(Loss) on Derivatives Instruments 8,160,255 -
Net Change in Unrealised Gain/(Loss) for the Year 670,565,888 (24,384,278)
Increase/(Decrease) in Net Assets as a Result of Operations 2,822,179,812 (2,702,615)
Movements in Share CapitalSubscriptions 30,558,272,335 13,123,765Redemptions (17,564,082,552) (180,176,972)Increase/(Decrease) in Net Assets as a Result of Movements in Share Capital 12,994,189,783 (167,053,207)
Dividend Distribution (412,259,275) (1,578)
Net Assets at the End of the Year 34,107,235,495 -
* The opening balance was combined using the foreign exchange rate as at 31 December 2013. The same net assets when combined using the foreign exchange ruling as at 31 December 2012 reflected afigure of USD 18,688,550,761.** Sundry Fees are principally comprised of Directors’ fees, audit and tax related fees, registration, publication, mailing and printing fees, as well as legal and marketing expenses.*** Please refer to Note 3a).# This Sub-Fund’s “JF” prefix was removed on 4 February 2013.
(1) This Sub-Fund was merged into JPMorgan Funds - Asia Equity Fund (previously JPMorgan Funds - Asia Alpha Plus Fund) on 13 September 2013.
The accompanying notes form an integral part of these financial statements.
17
JPMorgan Investment Funds
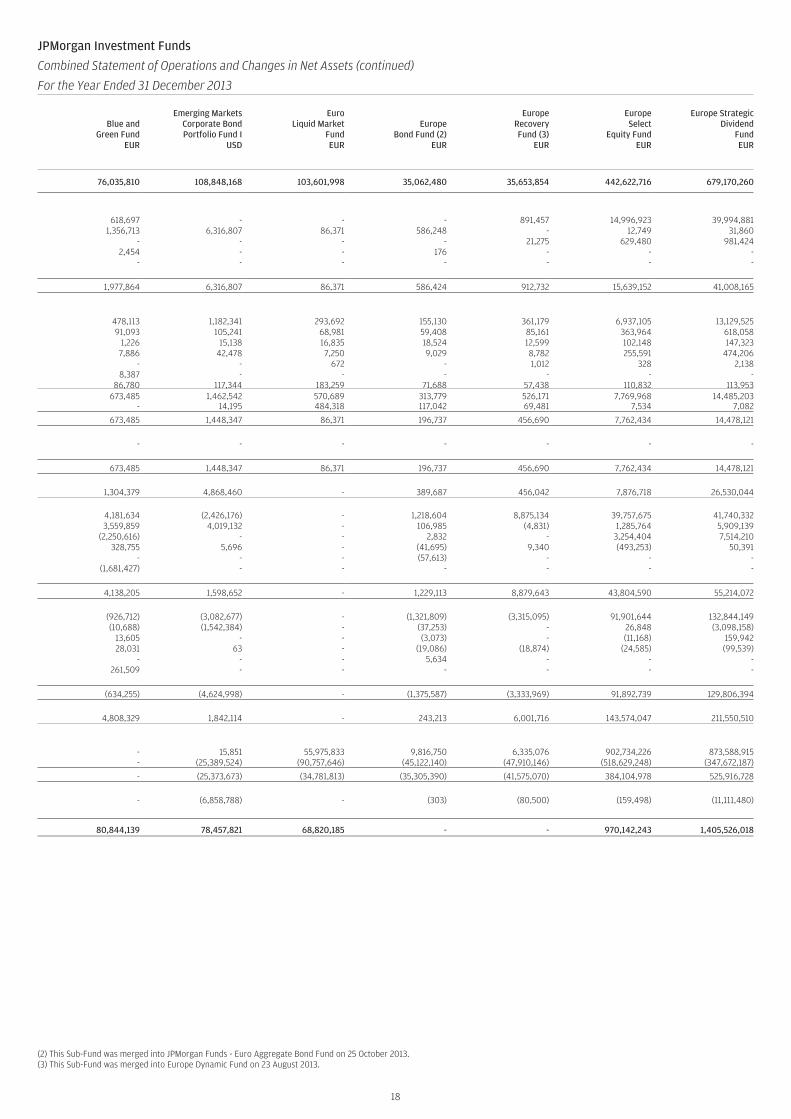
Combined Statement of Operations and Changes in Net Assets (continued)
For the Year Ended 31 December 2013
Blue andGreen Fund
EUR
Emerging MarketsCorporate BondPortfolio Fund I
USD
EuroLiquid Market
FundEUR
EuropeBond Fund (2)
EUR
EuropeRecoveryFund (3)
EUR
EuropeSelect
Equity FundEUR
Europe StrategicDividend
FundEUR
76,035,810 108,848,168 103,601,998 35,062,480 35,653,854 442,622,716 679,170,260
618,697 - - - 891,457 14,996,923 39,994,8811,356,713 6,316,807 86,371 586,248 - 12,749 31,860
- - - - 21,275 629,480 981,4242,454 - - 176 - - -
- - - - - - -
1,977,864 6,316,807 86,371 586,424 912,732 15,639,152 41,008,165
478,113 1,182,341 293,692 155,130 361,179 6,937,105 13,129,52591,093 105,241 68,981 59,408 85,161 363,964 618,058
1,226 15,138 16,835 18,524 12,599 102,148 147,3237,886 42,478 7,250 9,029 8,782 255,591 474,206
- - 672 - 1,012 328 2,1388,387 - - - - - -
86,780 117,344 183,259 71,688 57,438 110,832 113,953673,485 1,462,542 570,689 313,779 526,171 7,769,968 14,485,203
- 14,195 484,318 117,042 69,481 7,534 7,082
673,485 1,448,347 86,371 196,737 456,690 7,762,434 14,478,121
- - - - - - -
673,485 1,448,347 86,371 196,737 456,690 7,762,434 14,478,121
1,304,379 4,868,460 - 389,687 456,042 7,876,718 26,530,044
4,181,634 (2,426,176) - 1,218,604 8,875,134 39,757,675 41,740,3323,559,859 4,019,132 - 106,985 (4,831) 1,285,764 5,909,139
(2,250,616) - - 2,832 - 3,254,404 7,514,210328,755 5,696 - (41,695) 9,340 (493,253) 50,391
- - - (57,613) - - -(1,681,427) - - - - - -
4,138,205 1,598,652 - 1,229,113 8,879,643 43,804,590 55,214,072
(926,712) (3,082,677) - (1,321,809) (3,315,095) 91,901,644 132,844,149(10,688) (1,542,384) - (37,253) - 26,848 (3,098,158)
13,605 - - (3,073) - (11,168) 159,94228,031 63 - (19,086) (18,874) (24,585) (99,539)
- - - 5,634 - - -261,509 - - - - - -
(634,255) (4,624,998) - (1,375,587) (3,333,969) 91,892,739 129,806,394
4,808,329 1,842,114 - 243,213 6,001,716 143,574,047 211,550,510
- 15,851 55,975,833 9,816,750 6,335,076 902,734,226 873,588,915- (25,389,524) (90,757,646) (45,122,140) (47,910,146) (518,629,248) (347,672,187)
- (25,373,673) (34,781,813) (35,305,390) (41,575,070) 384,104,978 525,916,728
- (6,858,788) - (303) (80,500) (159,498) (11,111,480)
80,844,139 78,457,821 68,820,185 - - 970,142,243 1,405,526,018
(2) This Sub-Fund was merged into JPMorgan Funds - Euro Aggregate Bond Fund on 25 October 2013.(3) This Sub-Fund was merged into Europe Dynamic Fund on 23 August 2013.
18
JPMorgan Investment Funds
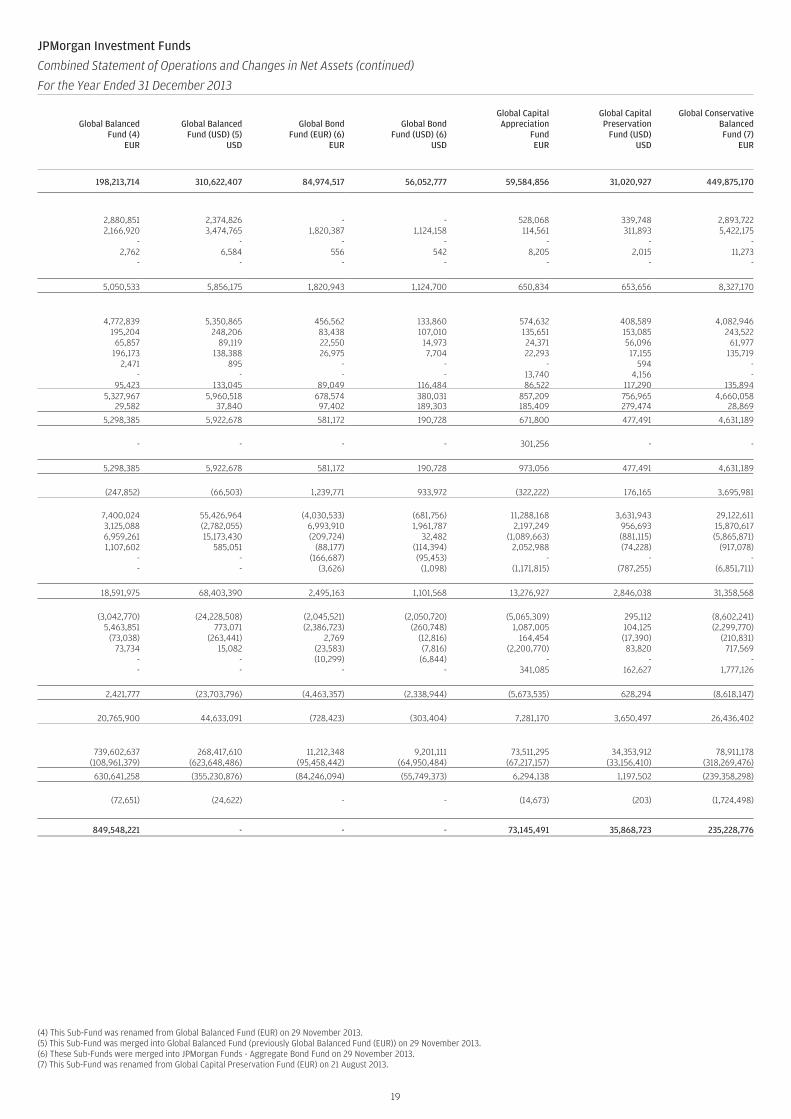
Combined Statement of Operations and Changes in Net Assets (continued)
For the Year Ended 31 December 2013
Global BalancedFund (4)
EUR
Global BalancedFund (USD) (5)
USD
Global BondFund (EUR) (6)
EUR
Global BondFund (USD) (6)
USD
Global CapitalAppreciation
FundEUR
Global CapitalPreservation
Fund (USD)USD
Global ConservativeBalancedFund (7)
EUR
198,213,714 310,622,407 84,974,517 56,052,777 59,584,856 31,020,927 449,875,170
2,880,851 2,374,826 - - 528,068 339,748 2,893,7222,166,920 3,474,765 1,820,387 1,124,158 114,561 311,893 5,422,175
- - - - - - -2,762 6,584 556 542 8,205 2,015 11,273
- - - - - - -
5,050,533 5,856,175 1,820,943 1,124,700 650,834 653,656 8,327,170
4,772,839 5,350,865 456,562 133,860 574,632 408,589 4,082,946195,204 248,206 83,438 107,010 135,651 153,085 243,522
65,857 89,119 22,550 14,973 24,371 56,096 61,977196,173 138,388 26,975 7,704 22,293 17,155 135,719
2,471 895 - - - 594 -- - - - 13,740 4,156 -
95,423 133,045 89,049 116,484 86,522 117,290 135,8945,327,967 5,960,518 678,574 380,031 857,209 756,965 4,660,058
29,582 37,840 97,402 189,303 185,409 279,474 28,869
5,298,385 5,922,678 581,172 190,728 671,800 477,491 4,631,189
- - - - 301,256 - -
5,298,385 5,922,678 581,172 190,728 973,056 477,491 4,631,189
(247,852) (66,503) 1,239,771 933,972 (322,222) 176,165 3,695,981
7,400,024 55,426,964 (4,030,533) (681,756) 11,288,168 3,631,943 29,122,6113,125,088 (2,782,055) 6,993,910 1,961,787 2,197,249 956,693 15,870,6176,959,261 15,173,430 (209,724) 32,482 (1,089,663) (881,115) (5,865,871)1,107,602 585,051 (88,177) (114,394) 2,052,988 (74,228) (917,078)
- - (166,687) (95,453) - - -- - (3,626) (1,098) (1,171,815) (787,255) (6,851,711)
18,591,975 68,403,390 2,495,163 1,101,568 13,276,927 2,846,038 31,358,568
(3,042,770) (24,228,508) (2,045,521) (2,050,720) (5,065,309) 295,112 (8,602,241)5,463,851 773,071 (2,386,723) (260,748) 1,087,005 104,125 (2,299,770)
(73,038) (263,441) 2,769 (12,816) 164,454 (17,390) (210,831)73,734 15,082 (23,583) (7,816) (2,200,770) 83,820 717,569
- - (10,299) (6,844) - - -- - - - 341,085 162,627 1,777,126
2,421,777 (23,703,796) (4,463,357) (2,338,944) (5,673,535) 628,294 (8,618,147)
20,765,900 44,633,091 (728,423) (303,404) 7,281,170 3,650,497 26,436,402
739,602,637 268,417,610 11,212,348 9,201,111 73,511,295 34,353,912 78,911,178(108,961,379) (623,648,486) (95,458,442) (64,950,484) (67,217,157) (33,156,410) (318,269,476)
630,641,258 (355,230,876) (84,246,094) (55,749,373) 6,294,138 1,197,502 (239,358,298)
(72,651) (24,622) - - (14,673) (203) (1,724,498)
849,548,221 - - - 73,145,491 35,868,723 235,228,776
(4) This Sub-Fund was renamed from Global Balanced Fund (EUR) on 29 November 2013.(5) This Sub-Fund was merged into Global Balanced Fund (previously Global Balanced Fund (EUR)) on 29 November 2013.(6) These Sub-Funds were merged into JPMorgan Funds - Aggregate Bond Fund on 29 November 2013.(7) This Sub-Fund was renamed from Global Capital Preservation Fund (EUR) on 21 August 2013.
19
JPMorgan Investment Funds
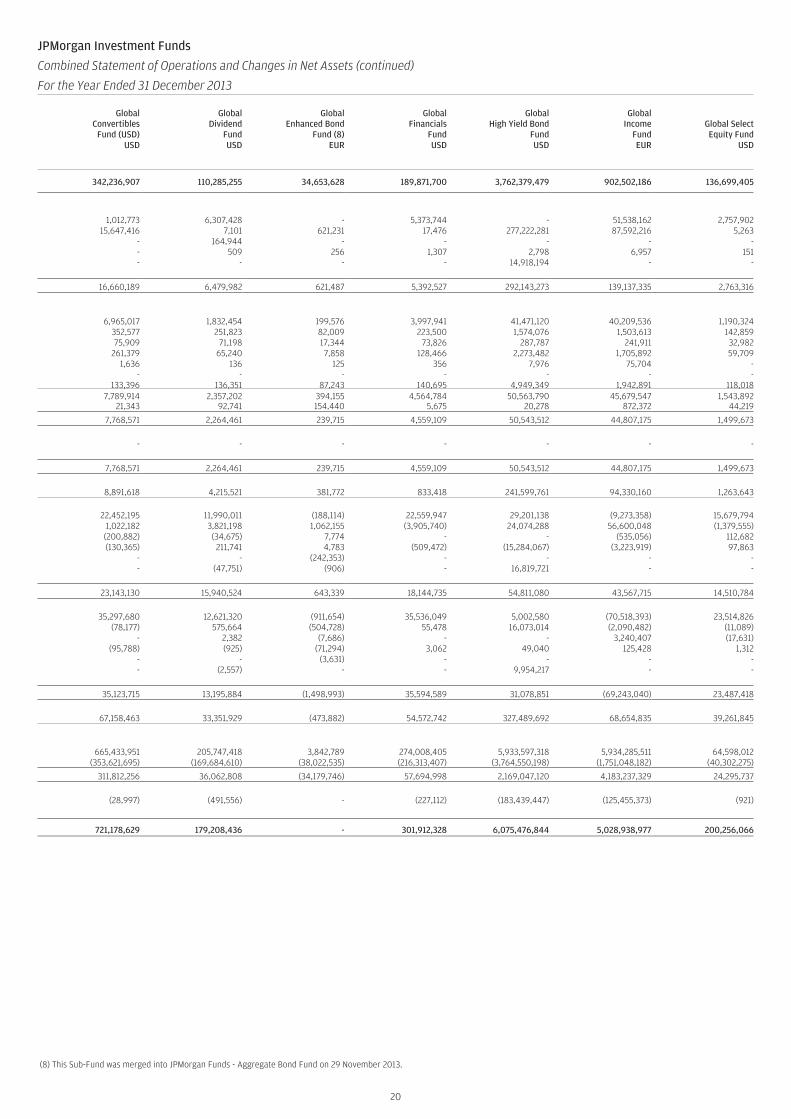
Combined Statement of Operations and Changes in Net Assets (continued)
For the Year Ended 31 December 2013
GlobalConvertibles
Fund (USD)USD
GlobalDividend
FundUSD
GlobalEnhanced Bond
Fund (8)EUR
GlobalFinancials
FundUSD
GlobalHigh Yield Bond
FundUSD
GlobalIncome
FundEUR
Global SelectEquity Fund
USD
342,236,907 110,285,255 34,653,628 189,871,700 3,762,379,479 902,502,186 136,699,405
1,012,773 6,307,428 - 5,373,744 - 51,538,162 2,757,90215,647,416 7,101 621,231 17,476 277,222,281 87,592,216 5,263
- 164,944 - - - - -- 509 256 1,307 2,798 6,957 151- - - - 14,918,194 - -
16,660,189 6,479,982 621,487 5,392,527 292,143,273 139,137,335 2,763,316
6,965,017 1,832,454 199,576 3,997,941 41,471,120 40,209,536 1,190,324352,577 251,823 82,009 223,500 1,574,076 1,503,613 142,85975,909 71,198 17,344 73,826 287,787 241,911 32,982
261,379 65,240 7,858 128,466 2,273,482 1,705,892 59,7091,636 136 125 356 7,976 75,704 -
- - - - - - -133,396 136,351 87,243 140,695 4,949,349 1,942,891 118,018
7,789,914 2,357,202 394,155 4,564,784 50,563,790 45,679,547 1,543,89221,343 92,741 154,440 5,675 20,278 872,372 44,219
7,768,571 2,264,461 239,715 4,559,109 50,543,512 44,807,175 1,499,673
- - - - - - -
7,768,571 2,264,461 239,715 4,559,109 50,543,512 44,807,175 1,499,673
8,891,618 4,215,521 381,772 833,418 241,599,761 94,330,160 1,263,643
22,452,195 11,990,011 (188,114) 22,559,947 29,201,138 (9,273,358) 15,679,7941,022,182 3,821,198 1,062,155 (3,905,740) 24,074,288 56,600,048 (1,379,555)(200,882) (34,675) 7,774 - - (535,056) 112,682(130,365) 211,741 4,783 (509,472) (15,284,067) (3,223,919) 97,863
- - (242,353) - - - -- (47,751) (906) - 16,819,721 - -
23,143,130 15,940,524 643,339 18,144,735 54,811,080 43,567,715 14,510,784
35,297,680 12,621,320 (911,654) 35,536,049 5,002,580 (70,518,393) 23,514,826(78,177) 575,664 (504,728) 55,478 16,073,014 (2,090,482) (11,089)
- 2,382 (7,686) - - 3,240,407 (17,631)(95,788) (925) (71,294) 3,062 49,040 125,428 1,312
- - (3,631) - - - -- (2,557) - - 9,954,217 - -
35,123,715 13,195,884 (1,498,993) 35,594,589 31,078,851 (69,243,040) 23,487,418
67,158,463 33,351,929 (473,882) 54,572,742 327,489,692 68,654,835 39,261,845
665,433,951 205,747,418 3,842,789 274,008,405 5,933,597,318 5,934,285,511 64,598,012(353,621,695) (169,684,610) (38,022,535) (216,313,407) (3,764,550,198) (1,751,048,182) (40,302,275)
311,812,256 36,062,808 (34,179,746) 57,694,998 2,169,047,120 4,183,237,329 24,295,737
(28,997) (491,556) - (227,112) (183,439,447) (125,455,373) (921)
721,178,629 179,208,436 - 301,912,328 6,075,476,844 5,028,938,977 200,256,066
(8) This Sub-Fund was merged into JPMorgan Funds - Aggregate Bond Fund on 29 November 2013.
20
JPMorgan Investment Funds
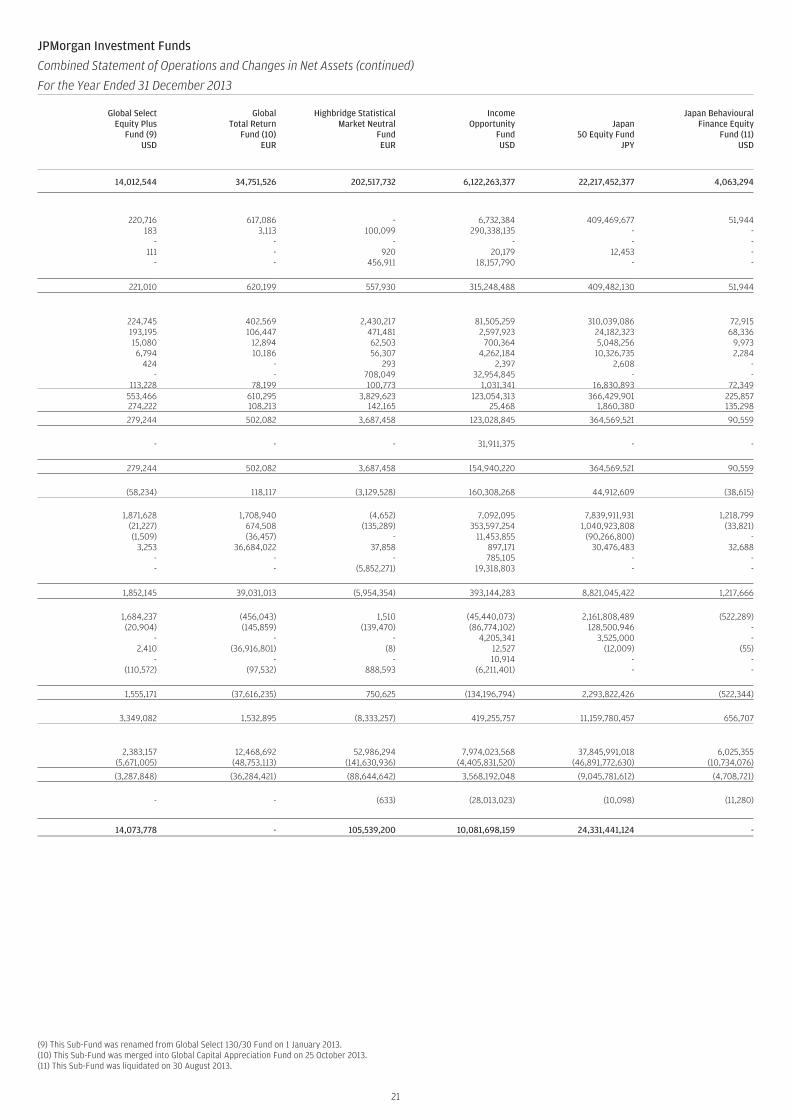
Combined Statement of Operations and Changes in Net Assets (continued)
For the Year Ended 31 December 2013
Global SelectEquity Plus
Fund (9)USD
GlobalTotal Return
Fund (10)EUR
Highbridge StatisticalMarket Neutral
FundEUR
IncomeOpportunity
FundUSD
Japan50 Equity Fund
JPY
Japan BehaviouralFinance Equity
Fund (11)USD
14,012,544 34,751,526 202,517,732 6,122,263,377 22,217,452,377 4,063,294
220,716 617,086 - 6,732,384 409,469,677 51,944183 3,113 100,099 290,338,135 - -
- - - - - -111 - 920 20,179 12,453 -
- - 456,911 18,157,790 - -
221,010 620,199 557,930 315,248,488 409,482,130 51,944
224,745 402,569 2,430,217 81,505,259 310,039,086 72,915193,195 106,447 471,481 2,597,923 24,182,323 68,33615,080 12,894 62,503 700,364 5,048,256 9,9736,794 10,186 56,307 4,262,184 10,326,735 2,284
424 - 293 2,397 2,608 -- - 708,049 32,954,845 - -
113,228 78,199 100,773 1,031,341 16,830,893 72,349553,466 610,295 3,829,623 123,054,313 366,429,901 225,857274,222 108,213 142,165 25,468 1,860,380 135,298
279,244 502,082 3,687,458 123,028,845 364,569,521 90,559
- - - 31,911,375 - -
279,244 502,082 3,687,458 154,940,220 364,569,521 90,559
(58,234) 118,117 (3,129,528) 160,308,268 44,912,609 (38,615)
1,871,628 1,708,940 (4,652) 7,092,095 7,839,911,931 1,218,799(21,227) 674,508 (135,289) 353,597,254 1,040,923,808 (33,821)(1,509) (36,457) - 11,453,855 (90,266,800) -
3,253 36,684,022 37,858 897,171 30,476,483 32,688- - - 785,105 - -- - (5,852,271) 19,318,803 - -
1,852,145 39,031,013 (5,954,354) 393,144,283 8,821,045,422 1,217,666
1,684,237 (456,043) 1,510 (45,440,073) 2,161,808,489 (522,289)(20,904) (145,859) (139,470) (86,774,102) 128,500,946 -
- - - 4,205,341 3,525,000 -2,410 (36,916,801) (8) 12,527 (12,009) (55)
- - - 10,914 - -(110,572) (97,532) 888,593 (6,211,401) - -
1,555,171 (37,616,235) 750,625 (134,196,794) 2,293,822,426 (522,344)
3,349,082 1,532,895 (8,333,257) 419,255,757 11,159,780,457 656,707
2,383,157 12,468,692 52,986,294 7,974,023,568 37,845,991,018 6,025,355(5,671,005) (48,753,113) (141,630,936) (4,405,831,520) (46,891,772,630) (10,734,076)
(3,287,848) (36,284,421) (88,644,642) 3,568,192,048 (9,045,781,612) (4,708,721)
- - (633) (28,013,023) (10,098) (11,280)
14,073,778 - 105,539,200 10,081,698,159 24,331,441,124 -
(9) This Sub-Fund was renamed from Global Select 130/30 Fund on 1 January 2013.(10) This Sub-Fund was merged into Global Capital Appreciation Fund on 25 October 2013.(11) This Sub-Fund was liquidated on 30 August 2013.
21
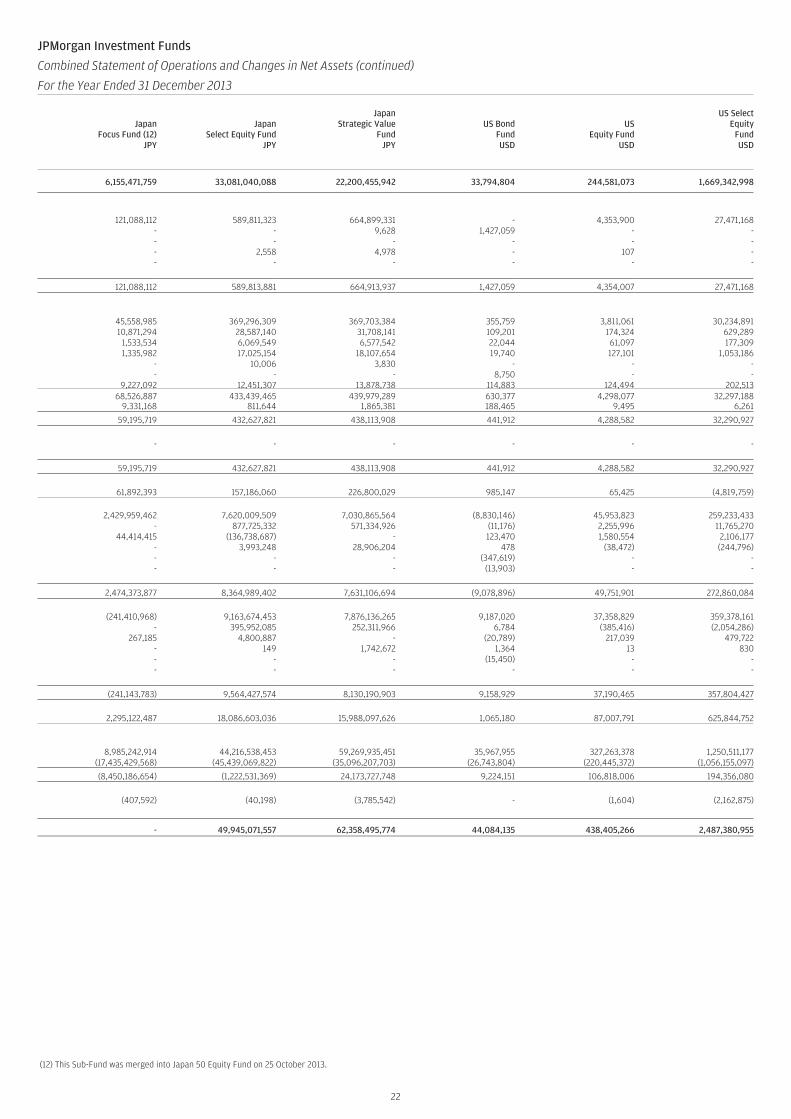
JPMorgan Investment Funds
Combined Statement of Operations and Changes in Net Assets (continued)
For the Year Ended 31 December 2013
JapanFocus Fund (12)
JPY
JapanSelect Equity Fund
JPY
JapanStrategic Value
FundJPY
US BondFundUSD
USEquity Fund
USD
US SelectEquity
FundUSD
6,155,471,759 33,081,040,088 22,200,455,942 33,794,804 244,581,073 1,669,342,998
121,088,112 589,811,323 664,899,331 - 4,353,900 27,471,168- - 9,628 1,427,059 - -- - - - - -- 2,558 4,978 - 107 -- - - - - -
121,088,112 589,813,881 664,913,937 1,427,059 4,354,007 27,471,168
45,558,985 369,296,309 369,703,384 355,759 3,811,061 30,234,89110,871,294 28,587,140 31,708,141 109,201 174,324 629,289
1,533,534 6,069,549 6,577,542 22,044 61,097 177,3091,335,982 17,025,154 18,107,654 19,740 127,101 1,053,186
- 10,006 3,830 - - -- - - 8,750 - -
9,227,092 12,451,307 13,878,738 114,883 124,494 202,51368,526,887 433,439,465 439,979,289 630,377 4,298,077 32,297,188
9,331,168 811,644 1,865,381 188,465 9,495 6,261
59,195,719 432,627,821 438,113,908 441,912 4,288,582 32,290,927
- - - - - -
59,195,719 432,627,821 438,113,908 441,912 4,288,582 32,290,927
61,892,393 157,186,060 226,800,029 985,147 65,425 (4,819,759)
2,429,959,462 7,620,009,509 7,030,865,564 (8,830,146) 45,953,823 259,233,433- 877,725,332 571,334,926 (11,176) 2,255,996 11,765,270
44,414,415 (136,738,687) - 123,470 1,580,554 2,106,177- 3,993,248 28,906,204 478 (38,472) (244,796)- - - (347,619) - -- - - (13,903) - -
2,474,373,877 8,364,989,402 7,631,106,694 (9,078,896) 49,751,901 272,860,084
(241,410,968) 9,163,674,453 7,876,136,265 9,187,020 37,358,829 359,378,161- 395,952,085 252,311,966 6,784 (385,416) (2,054,286)
267,185 4,800,887 - (20,789) 217,039 479,722- 149 1,742,672 1,364 13 830- - - (15,450) - -- - - - - -
(241,143,783) 9,564,427,574 8,130,190,903 9,158,929 37,190,465 357,804,427
2,295,122,487 18,086,603,036 15,988,097,626 1,065,180 87,007,791 625,844,752
8,985,242,914 44,216,538,453 59,269,935,451 35,967,955 327,263,378 1,250,511,177(17,435,429,568) (45,439,069,822) (35,096,207,703) (26,743,804) (220,445,372) (1,056,155,097)
(8,450,186,654) (1,222,531,369) 24,173,727,748 9,224,151 106,818,006 194,356,080
(407,592) (40,198) (3,785,542) - (1,604) (2,162,875)
- 49,945,071,557 62,358,495,774 44,084,135 438,405,266 2,487,380,955
(12) This Sub-Fund was merged into Japan 50 Equity Fund on 25 October 2013.
22
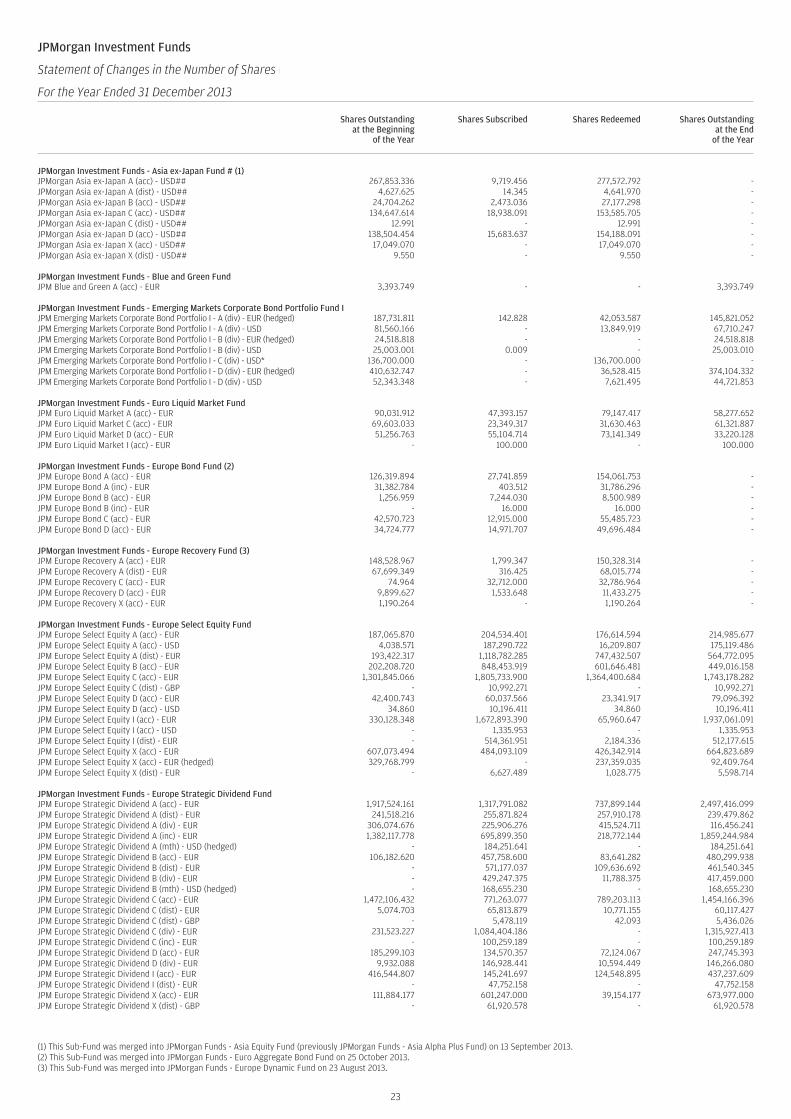
JPMorgan Investment Funds
Statement of Changes in the Number of Shares (continued)
For the Year Ended 31 December 2013
Shares Outstandingat the Beginning
of the Year
Shares Subscribed Shares Redeemed Shares Outstandingat the End
of the Year
JPMorgan Investment Funds - Asia ex-Japan Fund # (1)JPMorgan Asia ex-Japan A (acc) - USD## 267,853.336 9,719.456 277,572.792 -JPMorgan Asia ex-Japan A (dist) - USD## 4,627.625 14.345 4,641.970 -JPMorgan Asia ex-Japan B (acc) - USD## 24,704.262 2,473.036 27,177.298 -JPMorgan Asia ex-Japan C (acc) - USD## 134,647.614 18,938.091 153,585.705 -JPMorgan Asia ex-Japan C (dist) - USD## 12.991 - 12.991 -JPMorgan Asia ex-Japan D (acc) - USD## 138,504.454 15,683.637 154,188.091 -JPMorgan Asia ex-Japan X (acc) - USD## 17,049.070 - 17,049.070 -JPMorgan Asia ex-Japan X (dist) - USD## 9.550 - 9.550 -
JPMorgan Investment Funds - Blue and Green FundJPM Blue and Green A (acc) - EUR 3,393.749 - - 3,393.749
JPMorgan Investment Funds - Emerging Markets Corporate Bond Portfolio Fund IJPM Emerging Markets Corporate Bond Portfolio I - A (div) - EUR (hedged) 187,731.811 142.828 42,053.587 145,821.052JPM Emerging Markets Corporate Bond Portfolio I - A (div) - USD 81,560.166 - 13,849.919 67,710.247JPM Emerging Markets Corporate Bond Portfolio I - B (div) - EUR (hedged) 24,518.818 - - 24,518.818JPM Emerging Markets Corporate Bond Portfolio I - B (div) - USD 25,003.001 0.009 - 25,003.010JPM Emerging Markets Corporate Bond Portfolio I - C (div) - USD* 136,700.000 - 136,700.000 -JPM Emerging Markets Corporate Bond Portfolio I - D (div) - EUR (hedged) 410,632.747 - 36,528.415 374,104.332JPM Emerging Markets Corporate Bond Portfolio I - D (div) - USD 52,343.348 - 7,621.495 44,721.853
JPMorgan Investment Funds - Euro Liquid Market FundJPM Euro Liquid Market A (acc) - EUR 90,031.912 47,393.157 79,147.417 58,277.652JPM Euro Liquid Market C (acc) - EUR 69,603.033 23,349.317 31,630.463 61,321.887JPM Euro Liquid Market D (acc) - EUR 51,256.763 55,104.714 73,141.349 33,220.128JPM Euro Liquid Market I (acc) - EUR - 100.000 - 100.000
JPMorgan Investment Funds - Europe Bond Fund (2)JPM Europe Bond A (acc) - EUR 126,319.894 27,741.859 154,061.753 -JPM Europe Bond A (inc) - EUR 31,382.784 403.512 31,786.296 -JPM Europe Bond B (acc) - EUR 1,256.959 7,244.030 8,500.989 -JPM Europe Bond B (inc) - EUR - 16.000 16.000 -JPM Europe Bond C (acc) - EUR 42,570.723 12,915.000 55,485.723 -JPM Europe Bond D (acc) - EUR 34,724.777 14,971.707 49,696.484 -
JPMorgan Investment Funds - Europe Recovery Fund (3)JPM Europe Recovery A (acc) - EUR 148,528.967 1,799.347 150,328.314 -JPM Europe Recovery A (dist) - EUR 67,699.349 316.425 68,015.774 -JPM Europe Recovery C (acc) - EUR 74.964 32,712.000 32,786.964 -JPM Europe Recovery D (acc) - EUR 9,899.627 1,533.648 11,433.275 -JPM Europe Recovery X (acc) - EUR 1,190.264 - 1,190.264 -
JPMorgan Investment Funds - Europe Select Equity FundJPM Europe Select Equity A (acc) - EUR 187,065.870 204,534.401 176,614.594 214,985.677JPM Europe Select Equity A (acc) - USD 4,038.571 187,290.722 16,209.807 175,119.486JPM Europe Select Equity A (dist) - EUR 193,422.317 1,118,782.285 747,432.507 564,772.095JPM Europe Select Equity B (acc) - EUR 202,208.720 848,453.919 601,646.481 449,016.158JPM Europe Select Equity C (acc) - EUR 1,301,845.066 1,805,733.900 1,364,400.684 1,743,178.282JPM Europe Select Equity C (dist) - GBP - 10,992.271 - 10,992.271JPM Europe Select Equity D (acc) - EUR 42,400.743 60,037.566 23,341.917 79,096.392JPM Europe Select Equity D (acc) - USD 34.860 10,196.411 34.860 10,196.411JPM Europe Select Equity I (acc) - EUR 330,128.348 1,672,893.390 65,960.647 1,937,061.091JPM Europe Select Equity I (acc) - USD - 1,335.953 - 1,335.953JPM Europe Select Equity I (dist) - EUR - 514,361.951 2,184.336 512,177.615JPM Europe Select Equity X (acc) - EUR 607,073.494 484,093.109 426,342.914 664,823.689JPM Europe Select Equity X (acc) - EUR (hedged) 329,768.799 - 237,359.035 92,409.764JPM Europe Select Equity X (dist) - EUR - 6,627.489 1,028.775 5,598.714
JPMorgan Investment Funds - Europe Strategic Dividend FundJPM Europe Strategic Dividend A (acc) - EUR 1,917,524.161 1,317,791.082 737,899.144 2,497,416.099JPM Europe Strategic Dividend A (dist) - EUR 241,518.216 255,871.824 257,910.178 239,479.862JPM Europe Strategic Dividend A (div) - EUR 306,074.676 225,906.276 415,524.711 116,456.241JPM Europe Strategic Dividend A (inc) - EUR 1,382,117.778 695,899.350 218,772.144 1,859,244.984JPM Europe Strategic Dividend A (mth) - USD (hedged) - 184,251.641 - 184,251.641JPM Europe Strategic Dividend B (acc) - EUR 106,182.620 457,758.600 83,641.282 480,299.938JPM Europe Strategic Dividend B (dist) - EUR - 571,177.037 109,636.692 461,540.345JPM Europe Strategic Dividend B (div) - EUR - 429,247.375 11,788.375 417,459.000JPM Europe Strategic Dividend B (mth) - USD (hedged) - 168,655.230 - 168,655.230JPM Europe Strategic Dividend C (acc) - EUR 1,472,106.432 771,263.077 789,203.113 1,454,166.396JPM Europe Strategic Dividend C (dist) - EUR 5,074.703 65,813.879 10,771.155 60,117.427JPM Europe Strategic Dividend C (dist) - GBP - 5,478.119 42.093 5,436.026JPM Europe Strategic Dividend C (div) - EUR 231,523.227 1,084,404.186 - 1,315,927.413JPM Europe Strategic Dividend C (inc) - EUR - 100,259.189 - 100,259.189JPM Europe Strategic Dividend D (acc) - EUR 185,299.103 134,570.357 72,124.067 247,745.393JPM Europe Strategic Dividend D (div) - EUR 9,932.088 146,928.441 10,594.449 146,266.080JPM Europe Strategic Dividend I (acc) - EUR 416,544.807 145,241.697 124,548.895 437,237.609JPM Europe Strategic Dividend I (dist) - EUR - 47,752.158 - 47,752.158JPM Europe Strategic Dividend X (acc) - EUR 111,884.177 601,247.000 39,154.177 673,977.000JPM Europe Strategic Dividend X (dist) - GBP - 61,920.578 - 61,920.578
(1) This Sub-Fund was merged into JPMorgan Funds - Asia Equity Fund (previously JPMorgan Funds - Asia Alpha Plus Fund) on 13 September 2013.(2) This Sub-Fund was merged into JPMorgan Funds - Euro Aggregate Bond Fund on 25 October 2013.(3) This Sub-Fund was merged into JPMorgan Funds - Europe Dynamic Fund on 23 August 2013.
23
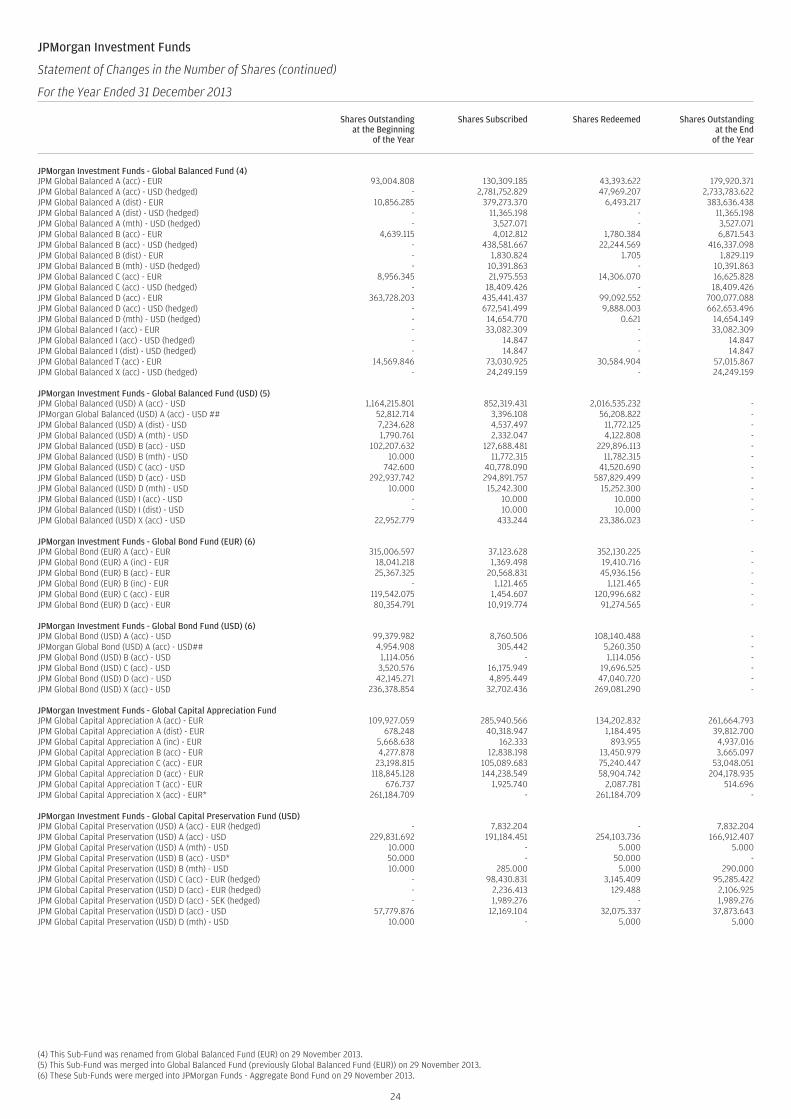
JPMorgan Investment Funds
Statement of Changes in the Number of Shares (continued)
For the Year Ended 31 December 2013
Shares Outstandingat the Beginning
of the Year
Shares Subscribed Shares Redeemed Shares Outstandingat the End
of the Year
JPMorgan Investment Funds - Global Balanced Fund (4)JPM Global Balanced A (acc) - EUR 93,004.808 130,309.185 43,393.622 179,920.371JPM Global Balanced A (acc) - USD (hedged) - 2,781,752.829 47,969.207 2,733,783.622JPM Global Balanced A (dist) - EUR 10,856.285 379,273.370 6,493.217 383,636.438JPM Global Balanced A (dist) - USD (hedged) - 11,365.198 - 11,365.198JPM Global Balanced A (mth) - USD (hedged) - 3,527.071 - 3,527.071JPM Global Balanced B (acc) - EUR 4,639.115 4,012.812 1,780.384 6,871.543JPM Global Balanced B (acc) - USD (hedged) - 438,581.667 22,244.569 416,337.098JPM Global Balanced B (dist) - EUR - 1,830.824 1.705 1,829.119JPM Global Balanced B (mth) - USD (hedged) - 10,391.863 - 10,391.863JPM Global Balanced C (acc) - EUR 8,956.345 21,975.553 14,306.070 16,625.828JPM Global Balanced C (acc) - USD (hedged) - 18,409.426 - 18,409.426JPM Global Balanced D (acc) - EUR 363,728.203 435,441.437 99,092.552 700,077.088JPM Global Balanced D (acc) - USD (hedged) - 672,541.499 9,888.003 662,653.496JPM Global Balanced D (mth) - USD (hedged) - 14,654.770 0.621 14,654.149JPM Global Balanced I (acc) - EUR - 33,082.309 - 33,082.309JPM Global Balanced I (acc) - USD (hedged) - 14.847 - 14.847JPM Global Balanced I (dist) - USD (hedged) - 14.847 - 14.847JPM Global Balanced T (acc) - EUR 14,569.846 73,030.925 30,584.904 57,015.867JPM Global Balanced X (acc) - USD (hedged) - 24,249.159 - 24,249.159
JPMorgan Investment Funds - Global Balanced Fund (USD) (5)JPM Global Balanced (USD) A (acc) - USD 1,164,215.801 852,319.431 2,016,535.232 -JPMorgan Global Balanced (USD) A (acc) - USD ## 52,812.714 3,396.108 56,208.822 -JPM Global Balanced (USD) A (dist) - USD 7,234.628 4,537.497 11,772.125 -JPM Global Balanced (USD) A (mth) - USD 1,790.761 2,332.047 4,122.808 -JPM Global Balanced (USD) B (acc) - USD 102,207.632 127,688.481 229,896.113 -JPM Global Balanced (USD) B (mth) - USD 10.000 11,772.315 11,782.315 -JPM Global Balanced (USD) C (acc) - USD 742.600 40,778.090 41,520.690 -JPM Global Balanced (USD) D (acc) - USD 292,937.742 294,891.757 587,829.499 -JPM Global Balanced (USD) D (mth) - USD 10.000 15,242.300 15,252.300 -JPM Global Balanced (USD) I (acc) - USD - 10.000 10.000 -JPM Global Balanced (USD) I (dist) - USD - 10.000 10.000 -JPM Global Balanced (USD) X (acc) - USD 22,952.779 433.244 23,386.023 -
JPMorgan Investment Funds - Global Bond Fund (EUR) (6)JPM Global Bond (EUR) A (acc) - EUR 315,006.597 37,123.628 352,130.225 -JPM Global Bond (EUR) A (inc) - EUR 18,041.218 1,369.498 19,410.716 -JPM Global Bond (EUR) B (acc) - EUR 25,367.325 20,568.831 45,936.156 -JPM Global Bond (EUR) B (inc) - EUR - 1,121.465 1,121.465 -JPM Global Bond (EUR) C (acc) - EUR 119,542.075 1,454.607 120,996.682 -JPM Global Bond (EUR) D (acc) - EUR 80,354.791 10,919.774 91,274.565 -
JPMorgan Investment Funds - Global Bond Fund (USD) (6)JPM Global Bond (USD) A (acc) - USD 99,379.982 8,760.506 108,140.488 -JPMorgan Global Bond (USD) A (acc) - USD## 4,954.908 305.442 5,260.350 -JPM Global Bond (USD) B (acc) - USD 1,114.056 - 1,114.056 -JPM Global Bond (USD) C (acc) - USD 3,520.576 16,175.949 19,696.525 -JPM Global Bond (USD) D (acc) - USD 42,145.271 4,895.449 47,040.720 -JPM Global Bond (USD) X (acc) - USD 236,378.854 32,702.436 269,081.290 -
JPMorgan Investment Funds - Global Capital Appreciation FundJPM Global Capital Appreciation A (acc) - EUR 109,927.059 285,940.566 134,202.832 261,664.793JPM Global Capital Appreciation A (dist) - EUR 678.248 40,318.947 1,184.495 39,812.700JPM Global Capital Appreciation A (inc) - EUR 5,668.638 162.333 893.955 4,937.016JPM Global Capital Appreciation B (acc) - EUR 4,277.878 12,838.198 13,450.979 3,665.097JPM Global Capital Appreciation C (acc) - EUR 23,198.815 105,089.683 75,240.447 53,048.051JPM Global Capital Appreciation D (acc) - EUR 118,845.128 144,238.549 58,904.742 204,178.935JPM Global Capital Appreciation T (acc) - EUR 676.737 1,925.740 2,087.781 514.696JPM Global Capital Appreciation X (acc) - EUR* 261,184.709 - 261,184.709 -
JPMorgan Investment Funds - Global Capital Preservation Fund (USD)JPM Global Capital Preservation (USD) A (acc) - EUR (hedged) - 7,832.204 - 7,832.204JPM Global Capital Preservation (USD) A (acc) - USD 229,831.692 191,184.451 254,103.736 166,912.407JPM Global Capital Preservation (USD) A (mth) - USD 10.000 - 5.000 5.000JPM Global Capital Preservation (USD) B (acc) - USD* 50.000 - 50.000 -JPM Global Capital Preservation (USD) B (mth) - USD 10.000 285.000 5.000 290.000JPM Global Capital Preservation (USD) C (acc) - EUR (hedged) - 98,430.831 3,145.409 95,285.422JPM Global Capital Preservation (USD) D (acc) - EUR (hedged) - 2,236.413 129.488 2,106.925JPM Global Capital Preservation (USD) D (acc) - SEK (hedged) - 1,989.276 - 1,989.276JPM Global Capital Preservation (USD) D (acc) - USD 57,779.876 12,169.104 32,075.337 37,873.643JPM Global Capital Preservation (USD) D (mth) - USD 10.000 - 5.000 5.000
(4) This Sub-Fund was renamed from Global Balanced Fund (EUR) on 29 November 2013.(5) This Sub-Fund was merged into Global Balanced Fund (previously Global Balanced Fund (EUR)) on 29 November 2013.(6) These Sub-Funds were merged into JPMorgan Funds - Aggregate Bond Fund on 29 November 2013.
24
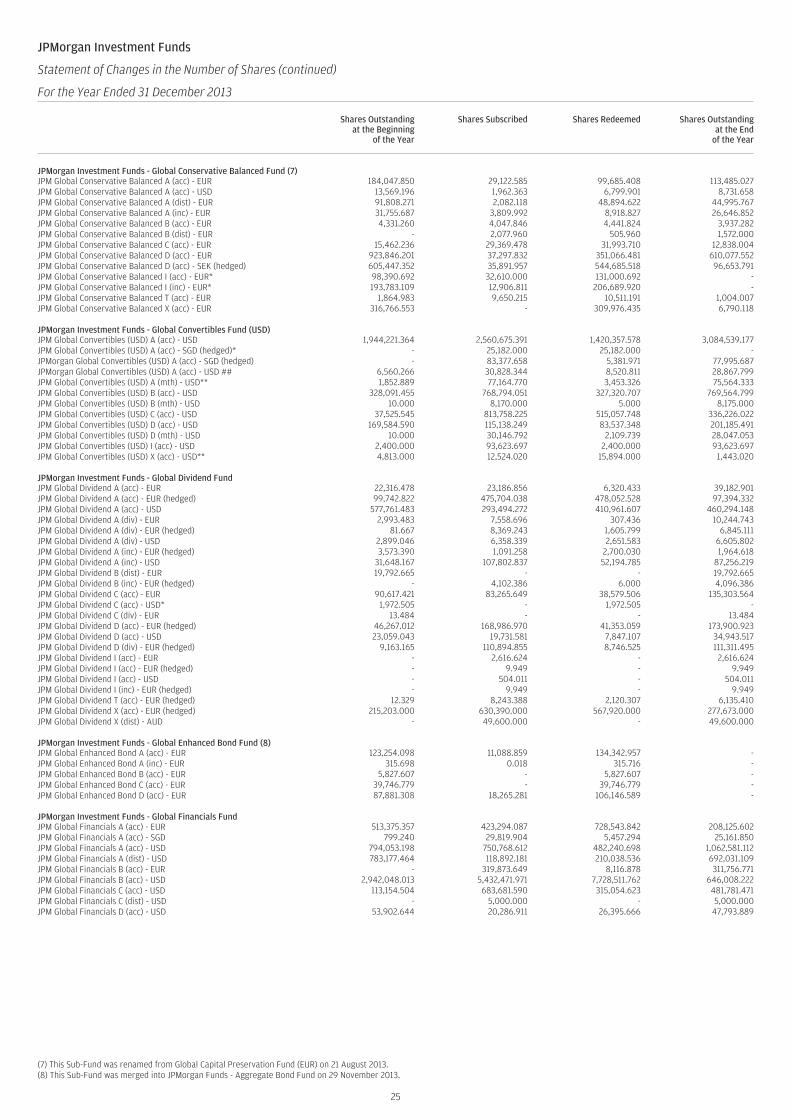
JPMorgan Investment Funds
Statement of Changes in the Number of Shares (continued)
For the Year Ended 31 December 2013
Shares Outstandingat the Beginning
of the Year
Shares Subscribed Shares Redeemed Shares Outstandingat the End
of the Year
JPMorgan Investment Funds - Global Conservative Balanced Fund (7)JPM Global Conservative Balanced A (acc) - EUR 184,047.850 29,122.585 99,685.408 113,485.027JPM Global Conservative Balanced A (acc) - USD 13,569.196 1,962.363 6,799.901 8,731.658JPM Global Conservative Balanced A (dist) - EUR 91,808.271 2,082.118 48,894.622 44,995.767JPM Global Conservative Balanced A (inc) - EUR 31,755.687 3,809.992 8,918.827 26,646.852JPM Global Conservative Balanced B (acc) - EUR 4,331.260 4,047.846 4,441.824 3,937.282JPM Global Conservative Balanced B (dist) - EUR - 2,077.960 505.960 1,572.000JPM Global Conservative Balanced C (acc) - EUR 15,462.236 29,369.478 31,993.710 12,838.004JPM Global Conservative Balanced D (acc) - EUR 923,846.201 37,297.832 351,066.481 610,077.552JPM Global Conservative Balanced D (acc) - SEK (hedged) 605,447.352 35,891.957 544,685.518 96,653.791JPM Global Conservative Balanced I (acc) - EUR* 98,390.692 32,610.000 131,000.692 -JPM Global Conservative Balanced I (inc) - EUR* 193,783.109 12,906.811 206,689.920 -JPM Global Conservative Balanced T (acc) - EUR 1,864.983 9,650.215 10,511.191 1,004.007JPM Global Conservative Balanced X (acc) - EUR 316,766.553 - 309,976.435 6,790.118
JPMorgan Investment Funds - Global Convertibles Fund (USD)JPM Global Convertibles (USD) A (acc) - USD 1,944,221.364 2,560,675.391 1,420,357.578 3,084,539.177JPM Global Convertibles (USD) A (acc) - SGD (hedged)* - 25,182.000 25,182.000 -JPMorgan Global Convertibles (USD) A (acc) - SGD (hedged) - 83,377.658 5,381.971 77,995.687JPMorgan Global Convertibles (USD) A (acc) - USD ## 6,560.266 30,828.344 8,520.811 28,867.799JPM Global Convertibles (USD) A (mth) - USD** 1,852.889 77,164.770 3,453.326 75,564.333JPM Global Convertibles (USD) B (acc) - USD 328,091.455 768,794.051 327,320.707 769,564.799JPM Global Convertibles (USD) B (mth) - USD 10.000 8,170.000 5.000 8,175.000JPM Global Convertibles (USD) C (acc) - USD 37,525.545 813,758.225 515,057.748 336,226.022JPM Global Convertibles (USD) D (acc) - USD 169,584.590 115,138.249 83,537.348 201,185.491JPM Global Convertibles (USD) D (mth) - USD 10.000 30,146.792 2,109.739 28,047.053JPM Global Convertibles (USD) I (acc) - USD 2,400.000 93,623.697 2,400.000 93,623.697JPM Global Convertibles (USD) X (acc) - USD** 4,813.000 12,524.020 15,894.000 1,443.020
JPMorgan Investment Funds - Global Dividend FundJPM Global Dividend A (acc) - EUR 22,316.478 23,186.856 6,320.433 39,182.901JPM Global Dividend A (acc) - EUR (hedged) 99,742.822 475,704.038 478,052.528 97,394.332JPM Global Dividend A (acc) - USD 577,761.483 293,494.272 410,961.607 460,294.148JPM Global Dividend A (div) - EUR 2,993.483 7,558.696 307.436 10,244.743JPM Global Dividend A (div) - EUR (hedged) 81.667 8,369.243 1,605.799 6,845.111JPM Global Dividend A (div) - USD 2,899.046 6,358.339 2,651.583 6,605.802JPM Global Dividend A (inc) - EUR (hedged) 3,573.390 1,091.258 2,700.030 1,964.618JPM Global Dividend A (inc) - USD 31,648.167 107,802.837 52,194.785 87,256.219JPM Global Dividend B (dist) - EUR 19,792.665 - - 19,792.665JPM Global Dividend B (inc) - EUR (hedged) - 4,102.386 6.000 4,096.386JPM Global Dividend C (acc) - EUR 90,617.421 83,265.649 38,579.506 135,303.564JPM Global Dividend C (acc) - USD* 1,972.505 - 1,972.505 -JPM Global Dividend C (div) - EUR 13.484 - - 13.484JPM Global Dividend D (acc) - EUR (hedged) 46,267.012 168,986.970 41,353.059 173,900.923JPM Global Dividend D (acc) - USD 23,059.043 19,731.581 7,847.107 34,943.517JPM Global Dividend D (div) - EUR (hedged) 9,163.165 110,894.855 8,746.525 111,311.495JPM Global Dividend I (acc) - EUR - 2,616.624 - 2,616.624JPM Global Dividend I (acc) - EUR (hedged) - 9.949 - 9.949JPM Global Dividend I (acc) - USD - 504.011 - 504.011JPM Global Dividend I (inc) - EUR (hedged) - 9.949 - 9.949JPM Global Dividend T (acc) - EUR (hedged) 12.329 8,243.388 2,120.307 6,135.410JPM Global Dividend X (acc) - EUR (hedged) 215,203.000 630,390.000 567,920.000 277,673.000JPM Global Dividend X (dist) - AUD - 49,600.000 - 49,600.000
JPMorgan Investment Funds - Global Enhanced Bond Fund (8)JPM Global Enhanced Bond A (acc) - EUR 123,254.098 11,088.859 134,342.957 -JPM Global Enhanced Bond A (inc) - EUR 315.698 0.018 315.716 -JPM Global Enhanced Bond B (acc) - EUR 5,827.607 - 5,827.607 -JPM Global Enhanced Bond C (acc) - EUR 39,746.779 - 39,746.779 -JPM Global Enhanced Bond D (acc) - EUR 87,881.308 18,265.281 106,146.589 -
JPMorgan Investment Funds - Global Financials FundJPM Global Financials A (acc) - EUR 513,375.357 423,294.087 728,543.842 208,125.602JPM Global Financials A (acc) - SGD 799.240 29,819.904 5,457.294 25,161.850JPM Global Financials A (acc) - USD 794,053.198 750,768.612 482,240.698 1,062,581.112JPM Global Financials A (dist) - USD 783,177.464 118,892.181 210,038.536 692,031.109JPM Global Financials B (acc) - EUR - 319,873.649 8,116.878 311,756.771JPM Global Financials B (acc) - USD 2,942,048.013 5,432,471.971 7,728,511.762 646,008.222JPM Global Financials C (acc) - USD 113,154.504 683,681.590 315,054.623 481,781.471JPM Global Financials C (dist) - USD - 5,000.000 - 5,000.000JPM Global Financials D (acc) - USD 53,902.644 20,286.911 26,395.666 47,793.889
(7) This Sub-Fund was renamed from Global Capital Preservation Fund (EUR) on 21 August 2013.(8) This Sub-Fund was merged into JPMorgan Funds - Aggregate Bond Fund on 29 November 2013.
25
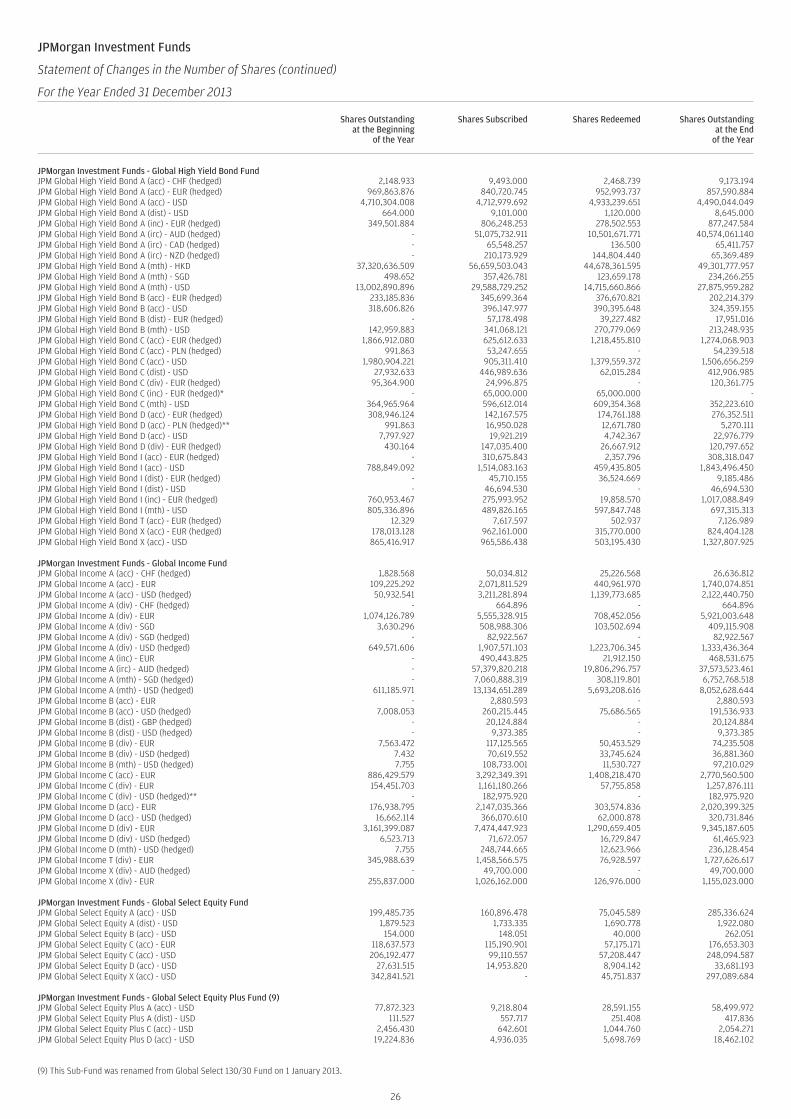
JPMorgan Investment Funds
Statement of Changes in the Number of Shares (continued)
For the Year Ended 31 December 2013
Shares Outstandingat the Beginning
of the Year
Shares Subscribed Shares Redeemed Shares Outstandingat the End
of the Year
JPMorgan Investment Funds - Global High Yield Bond FundJPM Global High Yield Bond A (acc) - CHF (hedged) 2,148.933 9,493.000 2,468.739 9,173.194JPM Global High Yield Bond A (acc) - EUR (hedged) 969,863.876 840,720.745 952,993.737 857,590.884JPM Global High Yield Bond A (acc) - USD 4,710,304.008 4,712,979.692 4,933,239.651 4,490,044.049JPM Global High Yield Bond A (dist) - USD 664.000 9,101.000 1,120.000 8,645.000JPM Global High Yield Bond A (inc) - EUR (hedged) 349,501.884 806,248.253 278,502.553 877,247.584JPM Global High Yield Bond A (irc) - AUD (hedged) - 51,075,732.911 10,501,671.771 40,574,061.140JPM Global High Yield Bond A (irc) - CAD (hedged) - 65,548.257 136.500 65,411.757JPM Global High Yield Bond A (irc) - NZD (hedged) - 210,173.929 144,804.440 65,369.489JPM Global High Yield Bond A (mth) - HKD 37,320,636.509 56,659,503.043 44,678,361.595 49,301,777.957JPM Global High Yield Bond A (mth) - SGD 498.652 357,426.781 123,659.178 234,266.255JPM Global High Yield Bond A (mth) - USD 13,002,890.896 29,588,729.252 14,715,660.866 27,875,959.282JPM Global High Yield Bond B (acc) - EUR (hedged) 233,185.836 345,699.364 376,670.821 202,214.379JPM Global High Yield Bond B (acc) - USD 318,606.826 396,147.977 390,395.648 324,359.155JPM Global High Yield Bond B (dist) - EUR (hedged) - 57,178.498 39,227.482 17,951.016JPM Global High Yield Bond B (mth) - USD 142,959.883 341,068.121 270,779.069 213,248.935JPM Global High Yield Bond C (acc) - EUR (hedged) 1,866,912.080 625,612.633 1,218,455.810 1,274,068.903JPM Global High Yield Bond C (acc) - PLN (hedged) 991.863 53,247.655 - 54,239.518JPM Global High Yield Bond C (acc) - USD 1,980,904.221 905,311.410 1,379,559.372 1,506,656.259JPM Global High Yield Bond C (dist) - USD 27,932.633 446,989.636 62,015.284 412,906.985JPM Global High Yield Bond C (div) - EUR (hedged) 95,364.900 24,996.875 - 120,361.775JPM Global High Yield Bond C (inc) - EUR (hedged)* - 65,000.000 65,000.000 -JPM Global High Yield Bond C (mth) - USD 364,965.964 596,612.014 609,354.368 352,223.610JPM Global High Yield Bond D (acc) - EUR (hedged) 308,946.124 142,167.575 174,761.188 276,352.511JPM Global High Yield Bond D (acc) - PLN (hedged)** 991.863 16,950.028 12,671.780 5,270.111JPM Global High Yield Bond D (acc) - USD 7,797.927 19,921.219 4,742.367 22,976.779JPM Global High Yield Bond D (div) - EUR (hedged) 430.164 147,035.400 26,667.912 120,797.652JPM Global High Yield Bond I (acc) - EUR (hedged) - 310,675.843 2,357.796 308,318.047JPM Global High Yield Bond I (acc) - USD 788,849.092 1,514,083.163 459,435.805 1,843,496.450JPM Global High Yield Bond I (dist) - EUR (hedged) - 45,710.155 36,524.669 9,185.486JPM Global High Yield Bond I (dist) - USD - 46,694.530 - 46,694.530JPM Global High Yield Bond I (inc) - EUR (hedged) 760,953.467 275,993.952 19,858.570 1,017,088.849JPM Global High Yield Bond I (mth) - USD 805,336.896 489,826.165 597,847.748 697,315.313JPM Global High Yield Bond T (acc) - EUR (hedged) 12.329 7,617.597 502.937 7,126.989JPM Global High Yield Bond X (acc) - EUR (hedged) 178,013.128 962,161.000 315,770.000 824,404.128JPM Global High Yield Bond X (acc) - USD 865,416.917 965,586.438 503,195.430 1,327,807.925
JPMorgan Investment Funds - Global Income FundJPM Global Income A (acc) - CHF (hedged) 1,828.568 50,034.812 25,226.568 26,636.812JPM Global Income A (acc) - EUR 109,225.292 2,071,811.529 440,961.970 1,740,074.851JPM Global Income A (acc) - USD (hedged) 50,932.541 3,211,281.894 1,139,773.685 2,122,440.750JPM Global Income A (div) - CHF (hedged) - 664.896 - 664.896JPM Global Income A (div) - EUR 1,074,126.789 5,555,328.915 708,452.056 5,921,003.648JPM Global Income A (div) - SGD 3,630.296 508,988.306 103,502.694 409,115.908JPM Global Income A (div) - SGD (hedged) - 82,922.567 - 82,922.567JPM Global Income A (div) - USD (hedged) 649,571.606 1,907,571.103 1,223,706.345 1,333,436.364JPM Global Income A (inc) - EUR - 490,443.825 21,912.150 468,531.675JPM Global Income A (irc) - AUD (hedged) - 57,379,820.218 19,806,296.757 37,573,523.461JPM Global Income A (mth) - SGD (hedged) - 7,060,888.319 308,119.801 6,752,768.518JPM Global Income A (mth) - USD (hedged) 611,185.971 13,134,651.289 5,693,208.616 8,052,628.644JPM Global Income B (acc) - EUR - 2,880.593 - 2,880.593JPM Global Income B (acc) - USD (hedged) 7,008.053 260,215.445 75,686.565 191,536.933JPM Global Income B (dist) - GBP (hedged) - 20,124.884 - 20,124.884JPM Global Income B (dist) - USD (hedged) - 9,373.385 - 9,373.385JPM Global Income B (div) - EUR 7,563.472 117,125.565 50,453.529 74,235.508JPM Global Income B (div) - USD (hedged) 7.432 70,619.552 33,745.624 36,881.360JPM Global Income B (mth) - USD (hedged) 7.755 108,733.001 11,530.727 97,210.029JPM Global Income C (acc) - EUR 886,429.579 3,292,349.391 1,408,218.470 2,770,560.500JPM Global Income C (div) - EUR 154,451.703 1,161,180.266 57,755.858 1,257,876.111JPM Global Income C (div) - USD (hedged)** - 182,975.920 - 182,975.920JPM Global Income D (acc) - EUR 176,938.795 2,147,035.366 303,574.836 2,020,399.325JPM Global Income D (acc) - USD (hedged) 16,662.114 366,070.610 62,000.878 320,731.846JPM Global Income D (div) - EUR 3,161,399.087 7,474,447.923 1,290,659.405 9,345,187.605JPM Global Income D (div) - USD (hedged) 6,523.713 71,672.057 16,729.847 61,465.923JPM Global Income D (mth) - USD (hedged) 7.755 248,744.665 12,623.966 236,128.454JPM Global Income T (div) - EUR 345,988.639 1,458,566.575 76,928.597 1,727,626.617JPM Global Income X (div) - AUD (hedged) - 49,700.000 - 49,700.000JPM Global Income X (div) - EUR 255,837.000 1,026,162.000 126,976.000 1,155,023.000
JPMorgan Investment Funds - Global Select Equity FundJPM Global Select Equity A (acc) - USD 199,485.735 160,896.478 75,045.589 285,336.624JPM Global Select Equity A (dist) - USD 1,879.523 1,733.335 1,690.778 1,922.080JPM Global Select Equity B (acc) - USD 154.000 148.051 40.000 262.051JPM Global Select Equity C (acc) - EUR 118,637.573 115,190.901 57,175.171 176,653.303JPM Global Select Equity C (acc) - USD 206,192.477 99,110.557 57,208.447 248,094.587JPM Global Select Equity D (acc) - USD 27,631.515 14,953.820 8,904.142 33,681.193JPM Global Select Equity X (acc) - USD 342,841.521 - 45,751.837 297,089.684
JPMorgan Investment Funds - Global Select Equity Plus Fund (9)JPM Global Select Equity Plus A (acc) - USD 77,872.323 9,218.804 28,591.155 58,499.972JPM Global Select Equity Plus A (dist) - USD 111.527 557.717 251.408 417.836JPM Global Select Equity Plus C (acc) - USD 2,456.430 642.601 1,044.760 2,054.271JPM Global Select Equity Plus D (acc) - USD 19,224.836 4,936.035 5,698.769 18,462.102
(9) This Sub-Fund was renamed from Global Select 130/30 Fund on 1 January 2013.
26
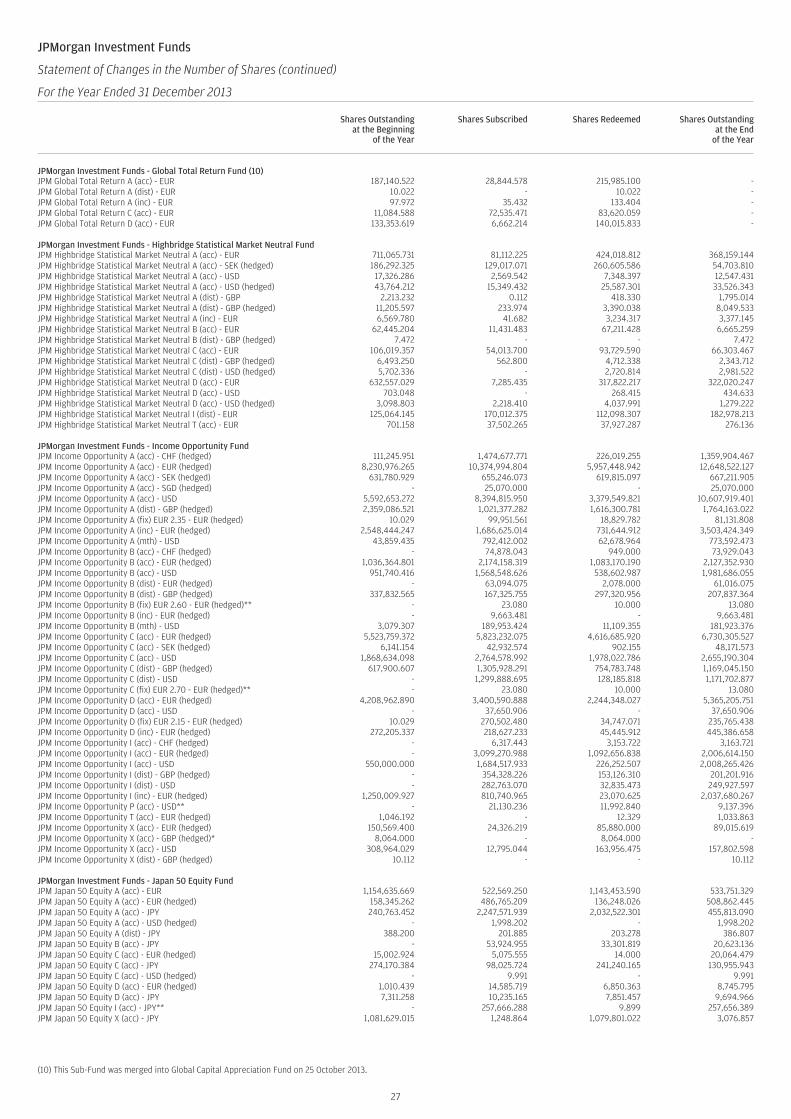
JPMorgan Investment Funds
Statement of Changes in the Number of Shares (continued)
For the Year Ended 31 December 2013
Shares Outstandingat the Beginning
of the Year
Shares Subscribed Shares Redeemed Shares Outstandingat the End
of the Year
JPMorgan Investment Funds - Global Total Return Fund (10)JPM Global Total Return A (acc) - EUR 187,140.522 28,844.578 215,985.100 -JPM Global Total Return A (dist) - EUR 10.022 - 10.022 -JPM Global Total Return A (inc) - EUR 97.972 35.432 133.404 -JPM Global Total Return C (acc) - EUR 11,084.588 72,535.471 83,620.059 -JPM Global Total Return D (acc) - EUR 133,353.619 6,662.214 140,015.833 -
JPMorgan Investment Funds - Highbridge Statistical Market Neutral FundJPM Highbridge Statistical Market Neutral A (acc) - EUR 711,065.731 81,112.225 424,018.812 368,159.144JPM Highbridge Statistical Market Neutral A (acc) - SEK (hedged) 186,292.325 129,017.071 260,605.586 54,703.810JPM Highbridge Statistical Market Neutral A (acc) - USD 17,326.286 2,569.542 7,348.397 12,547.431JPM Highbridge Statistical Market Neutral A (acc) - USD (hedged) 43,764.212 15,349.432 25,587.301 33,526.343JPM Highbridge Statistical Market Neutral A (dist) - GBP 2,213.232 0.112 418.330 1,795.014JPM Highbridge Statistical Market Neutral A (dist) - GBP (hedged) 11,205.597 233.974 3,390.038 8,049.533JPM Highbridge Statistical Market Neutral A (inc) - EUR 6,569.780 41.682 3,234.317 3,377.145JPM Highbridge Statistical Market Neutral B (acc) - EUR 62,445.204 11,431.483 67,211.428 6,665.259JPM Highbridge Statistical Market Neutral B (dist) - GBP (hedged) 7.472 - - 7.472JPM Highbridge Statistical Market Neutral C (acc) - EUR 106,019.357 54,013.700 93,729.590 66,303.467JPM Highbridge Statistical Market Neutral C (dist) - GBP (hedged) 6,493.250 562.800 4,712.338 2,343.712JPM Highbridge Statistical Market Neutral C (dist) - USD (hedged) 5,702.336 - 2,720.814 2,981.522JPM Highbridge Statistical Market Neutral D (acc) - EUR 632,557.029 7,285.435 317,822.217 322,020.247JPM Highbridge Statistical Market Neutral D (acc) - USD 703.048 - 268.415 434.633JPM Highbridge Statistical Market Neutral D (acc) - USD (hedged) 3,098.803 2,218.410 4,037.991 1,279.222JPM Highbridge Statistical Market Neutral I (dist) - EUR 125,064.145 170,012.375 112,098.307 182,978.213JPM Highbridge Statistical Market Neutral T (acc) - EUR 701.158 37,502.265 37,927.287 276.136
JPMorgan Investment Funds - Income Opportunity FundJPM Income Opportunity A (acc) - CHF (hedged) 111,245.951 1,474,677.771 226,019.255 1,359,904.467JPM Income Opportunity A (acc) - EUR (hedged) 8,230,976.265 10,374,994.804 5,957,448.942 12,648,522.127JPM Income Opportunity A (acc) - SEK (hedged) 631,780.929 655,246.073 619,815.097 667,211.905JPM Income Opportunity A (acc) - SGD (hedged) - 25,070.000 - 25,070.000JPM Income Opportunity A (acc) - USD 5,592,653.272 8,394,815.950 3,379,549.821 10,607,919.401JPM Income Opportunity A (dist) - GBP (hedged) 2,359,086.521 1,021,377.282 1,616,300.781 1,764,163.022JPM Income Opportunity A (fix) EUR 2.35 - EUR (hedged) 10.029 99,951.561 18,829.782 81,131.808JPM Income Opportunity A (inc) - EUR (hedged) 2,548,444.247 1,686,625.014 731,644.912 3,503,424.349JPM Income Opportunity A (mth) - USD 43,859.435 792,412.002 62,678.964 773,592.473JPM Income Opportunity B (acc) - CHF (hedged) - 74,878.043 949.000 73,929.043JPM Income Opportunity B (acc) - EUR (hedged) 1,036,364.801 2,174,158.319 1,083,170.190 2,127,352.930JPM Income Opportunity B (acc) - USD 951,740.416 1,568,548.626 538,602.987 1,981,686.055JPM Income Opportunity B (dist) - EUR (hedged) - 63,094.075 2,078.000 61,016.075JPM Income Opportunity B (dist) - GBP (hedged) 337,832.565 167,325.755 297,320.956 207,837.364JPM Income Opportunity B (fix) EUR 2.60 - EUR (hedged)** - 23.080 10.000 13.080JPM Income Opportunity B (inc) - EUR (hedged) - 9,663.481 - 9,663.481JPM Income Opportunity B (mth) - USD 3,079.307 189,953.424 11,109.355 181,923.376JPM Income Opportunity C (acc) - EUR (hedged) 5,523,759.372 5,823,232.075 4,616,685.920 6,730,305.527JPM Income Opportunity C (acc) - SEK (hedged) 6,141.154 42,932.574 902.155 48,171.573JPM Income Opportunity C (acc) - USD 1,868,634.098 2,764,578.992 1,978,022.786 2,655,190.304JPM Income Opportunity C (dist) - GBP (hedged) 617,900.607 1,305,928.291 754,783.748 1,169,045.150JPM Income Opportunity C (dist) - USD - 1,299,888.695 128,185.818 1,171,702.877JPM Income Opportunity C (fix) EUR 2.70 - EUR (hedged)** - 23.080 10.000 13.080JPM Income Opportunity D (acc) - EUR (hedged) 4,208,962.890 3,400,590.888 2,244,348.027 5,365,205.751JPM Income Opportunity D (acc) - USD - 37,650.906 - 37,650.906JPM Income Opportunity D (fix) EUR 2.15 - EUR (hedged) 10.029 270,502.480 34,747.071 235,765.438JPM Income Opportunity D (inc) - EUR (hedged) 272,205.337 218,627.233 45,445.912 445,386.658JPM Income Opportunity I (acc) - CHF (hedged) - 6,317.443 3,153.722 3,163.721JPM Income Opportunity I (acc) - EUR (hedged) - 3,099,270.988 1,092,656.838 2,006,614.150JPM Income Opportunity I (acc) - USD 550,000.000 1,684,517.933 226,252.507 2,008,265.426JPM Income Opportunity I (dist) - GBP (hedged) - 354,328.226 153,126.310 201,201.916JPM Income Opportunity I (dist) - USD - 282,763.070 32,835.473 249,927.597JPM Income Opportunity I (inc) - EUR (hedged) 1,250,009.927 810,740.965 23,070.625 2,037,680.267JPM Income Opportunity P (acc) - USD** - 21,130.236 11,992.840 9,137.396JPM Income Opportunity T (acc) - EUR (hedged) 1,046.192 - 12.329 1,033.863JPM Income Opportunity X (acc) - EUR (hedged) 150,569.400 24,326.219 85,880.000 89,015.619JPM Income Opportunity X (acc) - GBP (hedged)* 8,064.000 - 8,064.000 -JPM Income Opportunity X (acc) - USD 308,964.029 12,795.044 163,956.475 157,802.598JPM Income Opportunity X (dist) - GBP (hedged) 10.112 - - 10.112
JPMorgan Investment Funds - Japan 50 Equity FundJPM Japan 50 Equity A (acc) - EUR 1,154,635.669 522,569.250 1,143,453.590 533,751.329JPM Japan 50 Equity A (acc) - EUR (hedged) 158,345.262 486,765.209 136,248.026 508,862.445JPM Japan 50 Equity A (acc) - JPY 240,763.452 2,247,571.939 2,032,522.301 455,813.090JPM Japan 50 Equity A (acc) - USD (hedged) - 1,998.202 - 1,998.202JPM Japan 50 Equity A (dist) - JPY 388.200 201.885 203.278 386.807JPM Japan 50 Equity B (acc) - JPY - 53,924.955 33,301.819 20,623.136JPM Japan 50 Equity C (acc) - EUR (hedged) 15,002.924 5,075.555 14.000 20,064.479JPM Japan 50 Equity C (acc) - JPY 274,170.384 98,025.724 241,240.165 130,955.943JPM Japan 50 Equity C (acc) - USD (hedged) - 9.991 - 9.991JPM Japan 50 Equity D (acc) - EUR (hedged) 1,010.439 14,585.719 6,850.363 8,745.795JPM Japan 50 Equity D (acc) - JPY 7,311.258 10,235.165 7,851.457 9,694.966JPM Japan 50 Equity I (acc) - JPY** - 257,666.288 9.899 257,656.389JPM Japan 50 Equity X (acc) - JPY 1,081,629.015 1,248.864 1,079,801.022 3,076.857
(10) This Sub-Fund was merged into Global Capital Appreciation Fund on 25 October 2013.
27
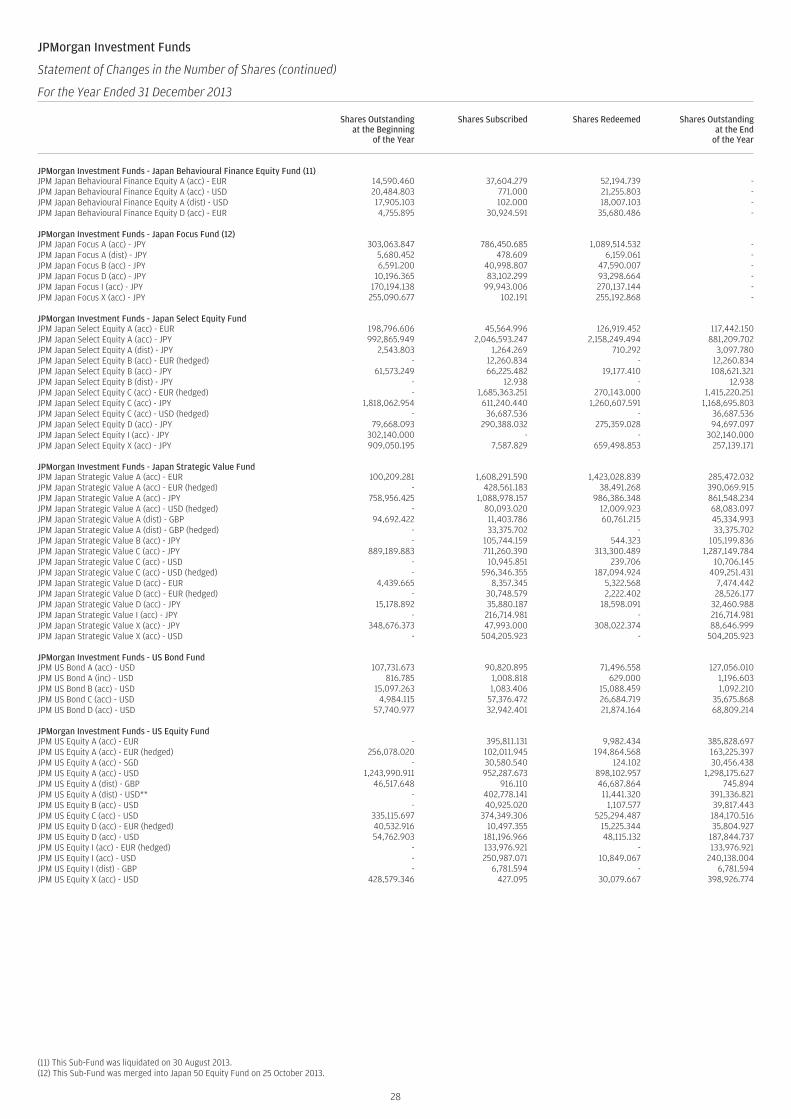
JPMorgan Investment Funds
Statement of Changes in the Number of Shares (continued)
For the Year Ended 31 December 2013
Shares Outstandingat the Beginning
of the Year
Shares Subscribed Shares Redeemed Shares Outstandingat the End
of the Year
JPMorgan Investment Funds - Japan Behavioural Finance Equity Fund (11)JPM Japan Behavioural Finance Equity A (acc) - EUR 14,590.460 37,604.279 52,194.739 -JPM Japan Behavioural Finance Equity A (acc) - USD 20,484.803 771.000 21,255.803 -JPM Japan Behavioural Finance Equity A (dist) - USD 17,905.103 102.000 18,007.103 -JPM Japan Behavioural Finance Equity D (acc) - EUR 4,755.895 30,924.591 35,680.486 -
JPMorgan Investment Funds - Japan Focus Fund (12)JPM Japan Focus A (acc) - JPY 303,063.847 786,450.685 1,089,514.532 -JPM Japan Focus A (dist) - JPY 5,680.452 478.609 6,159.061 -JPM Japan Focus B (acc) - JPY 6,591.200 40,998.807 47,590.007 -JPM Japan Focus D (acc) - JPY 10,196.365 83,102.299 93,298.664 -JPM Japan Focus I (acc) - JPY 170,194.138 99,943.006 270,137.144 -JPM Japan Focus X (acc) - JPY 255,090.677 102.191 255,192.868 -
JPMorgan Investment Funds - Japan Select Equity FundJPM Japan Select Equity A (acc) - EUR 198,796.606 45,564.996 126,919.452 117,442.150JPM Japan Select Equity A (acc) - JPY 992,865.949 2,046,593.247 2,158,249.494 881,209.702JPM Japan Select Equity A (dist) - JPY 2,543.803 1,264.269 710.292 3,097.780JPM Japan Select Equity B (acc) - EUR (hedged) - 12,260.834 - 12,260.834JPM Japan Select Equity B (acc) - JPY 61,573.249 66,225.482 19,177.410 108,621.321JPM Japan Select Equity B (dist) - JPY - 12.938 - 12.938JPM Japan Select Equity C (acc) - EUR (hedged) - 1,685,363.251 270,143.000 1,415,220.251JPM Japan Select Equity C (acc) - JPY 1,818,062.954 611,240.440 1,260,607.591 1,168,695.803JPM Japan Select Equity C (acc) - USD (hedged) - 36,687.536 - 36,687.536JPM Japan Select Equity D (acc) - JPY 79,668.093 290,388.032 275,359.028 94,697.097JPM Japan Select Equity I (acc) - JPY 302,140.000 - - 302,140.000JPM Japan Select Equity X (acc) - JPY 909,050.195 7,587.829 659,498.853 257,139.171
JPMorgan Investment Funds - Japan Strategic Value FundJPM Japan Strategic Value A (acc) - EUR 100,209.281 1,608,291.590 1,423,028.839 285,472.032JPM Japan Strategic Value A (acc) - EUR (hedged) - 428,561.183 38,491.268 390,069.915JPM Japan Strategic Value A (acc) - JPY 758,956.425 1,088,978.157 986,386.348 861,548.234JPM Japan Strategic Value A (acc) - USD (hedged) - 80,093.020 12,009.923 68,083.097JPM Japan Strategic Value A (dist) - GBP 94,692.422 11,403.786 60,761.215 45,334.993JPM Japan Strategic Value A (dist) - GBP (hedged) - 33,375.702 - 33,375.702JPM Japan Strategic Value B (acc) - JPY - 105,744.159 544.323 105,199.836JPM Japan Strategic Value C (acc) - JPY 889,189.883 711,260.390 313,300.489 1,287,149.784JPM Japan Strategic Value C (acc) - USD - 10,945.851 239.706 10,706.145JPM Japan Strategic Value C (acc) - USD (hedged) - 596,346.355 187,094.924 409,251.431JPM Japan Strategic Value D (acc) - EUR 4,439.665 8,357.345 5,322.568 7,474.442JPM Japan Strategic Value D (acc) - EUR (hedged) - 30,748.579 2,222.402 28,526.177JPM Japan Strategic Value D (acc) - JPY 15,178.892 35,880.187 18,598.091 32,460.988JPM Japan Strategic Value I (acc) - JPY - 216,714.981 - 216,714.981JPM Japan Strategic Value X (acc) - JPY 348,676.373 47,993.000 308,022.374 88,646.999JPM Japan Strategic Value X (acc) - USD - 504,205.923 - 504,205.923
JPMorgan Investment Funds - US Bond FundJPM US Bond A (acc) - USD 107,731.673 90,820.895 71,496.558 127,056.010JPM US Bond A (inc) - USD 816.785 1,008.818 629.000 1,196.603JPM US Bond B (acc) - USD 15,097.263 1,083.406 15,088.459 1,092.210JPM US Bond C (acc) - USD 4,984.115 57,376.472 26,684.719 35,675.868JPM US Bond D (acc) - USD 57,740.977 32,942.401 21,874.164 68,809.214
JPMorgan Investment Funds - US Equity FundJPM US Equity A (acc) - EUR - 395,811.131 9,982.434 385,828.697JPM US Equity A (acc) - EUR (hedged) 256,078.020 102,011.945 194,864.568 163,225.397JPM US Equity A (acc) - SGD - 30,580.540 124.102 30,456.438JPM US Equity A (acc) - USD 1,243,990.911 952,287.673 898,102.957 1,298,175.627JPM US Equity A (dist) - GBP 46,517.648 916.110 46,687.864 745.894JPM US Equity A (dist) - USD** - 402,778.141 11,441.320 391,336.821JPM US Equity B (acc) - USD - 40,925.020 1,107.577 39,817.443JPM US Equity C (acc) - USD 335,115.697 374,349.306 525,294.487 184,170.516JPM US Equity D (acc) - EUR (hedged) 40,532.916 10,497.355 15,225.344 35,804.927JPM US Equity D (acc) - USD 54,762.903 181,196.966 48,115.132 187,844.737JPM US Equity I (acc) - EUR (hedged) - 133,976.921 - 133,976.921JPM US Equity I (acc) - USD - 250,987.071 10,849.067 240,138.004JPM US Equity I (dist) - GBP - 6,781.594 - 6,781.594JPM US Equity X (acc) - USD 428,579.346 427.095 30,079.667 398,926.774
(11) This Sub-Fund was liquidated on 30 August 2013.(12) This Sub-Fund was merged into Japan 50 Equity Fund on 25 October 2013.
28
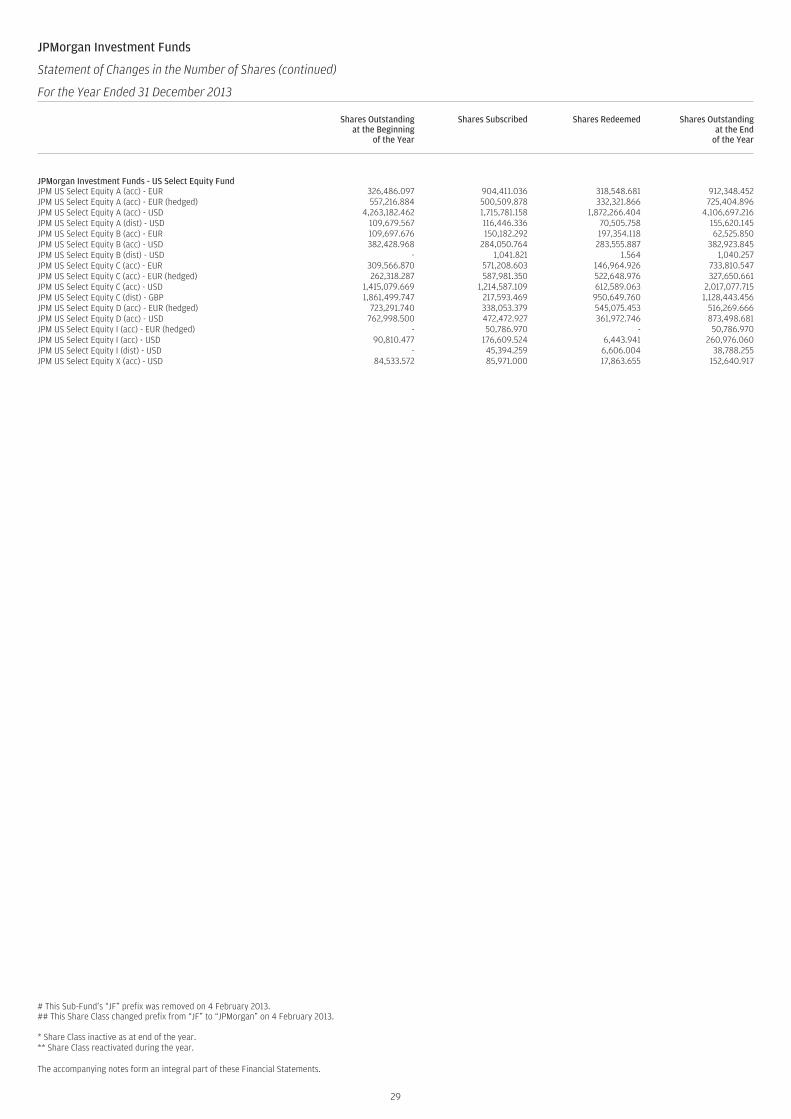
JPMorgan Investment Funds
Statement of Changes in the Number of Shares (continued)
For the Year Ended 31 December 2013
Shares Outstandingat the Beginning
of the Year
Shares Subscribed Shares Redeemed Shares Outstandingat the End
of the Year
JPMorgan Investment Funds - US Select Equity FundJPM US Select Equity A (acc) - EUR 326,486.097 904,411.036 318,548.681 912,348.452JPM US Select Equity A (acc) - EUR (hedged) 557,216.884 500,509.878 332,321.866 725,404.896JPM US Select Equity A (acc) - USD 4,263,182.462 1,715,781.158 1,872,266.404 4,106,697.216JPM US Select Equity A (dist) - USD 109,679.567 116,446.336 70,505.758 155,620.145JPM US Select Equity B (acc) - EUR 109,697.676 150,182.292 197,354.118 62,525.850JPM US Select Equity B (acc) - USD 382,428.968 284,050.764 283,555.887 382,923.845JPM US Select Equity B (dist) - USD - 1,041.821 1.564 1,040.257JPM US Select Equity C (acc) - EUR 309,566.870 571,208.603 146,964.926 733,810.547JPM US Select Equity C (acc) - EUR (hedged) 262,318.287 587,981.350 522,648.976 327,650.661JPM US Select Equity C (acc) - USD 1,415,079.669 1,214,587.109 612,589.063 2,017,077.715JPM US Select Equity C (dist) - GBP 1,861,499.747 217,593.469 950,649.760 1,128,443.456JPM US Select Equity D (acc) - EUR (hedged) 723,291.740 338,053.379 545,075.453 516,269.666JPM US Select Equity D (acc) - USD 762,998.500 472,472.927 361,972.746 873,498.681JPM US Select Equity I (acc) - EUR (hedged) - 50,786.970 - 50,786.970JPM US Select Equity I (acc) - USD 90,810.477 176,609.524 6,443.941 260,976.060JPM US Select Equity I (dist) - USD - 45,394.259 6,606.004 38,788.255JPM US Select Equity X (acc) - USD 84,533.572 85,971.000 17,863.655 152,640.917
# This Sub-Fund’s “JF” prefix was removed on 4 February 2013.## This Share Class changed prefix from “JF” to “JPMorgan” on 4 February 2013.
* Share Class inactive as at end of the year.** Share Class reactivated during the year.
The accompanying notes form an integral part of these Financial Statements.
29
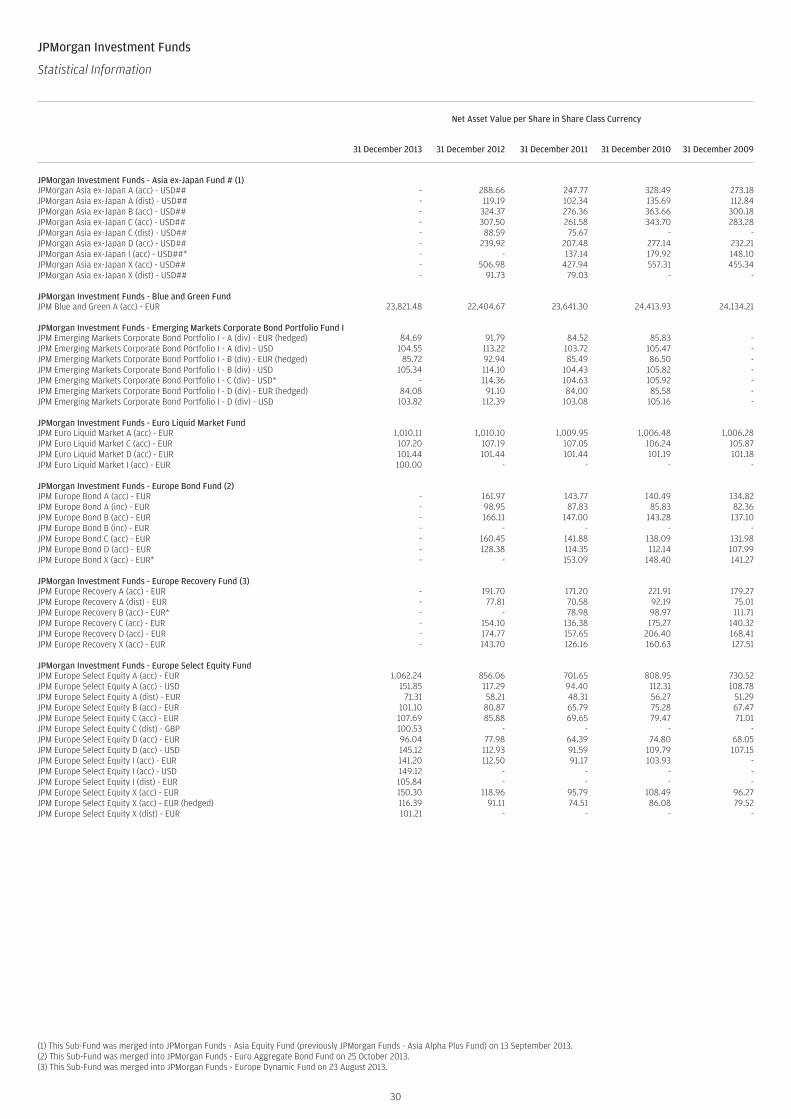
JPMorgan Investment Funds
Statistical Information (continued)
Net Asset Value per Share in Share Class Currency
31 December 2013 31 December 2012 31 December 2011 31 December 2010 31 December 2009
JPMorgan Investment Funds - Asia ex-Japan Fund # (1)JPMorgan Asia ex-Japan A (acc) - USD## - 288.66 247.77 328.49 273.18JPMorgan Asia ex-Japan A (dist) - USD## - 119.19 102.34 135.69 112.84JPMorgan Asia ex-Japan B (acc) - USD## - 324.37 276.36 363.66 300.18JPMorgan Asia ex-Japan C (acc) - USD## - 307.50 261.58 343.70 283.28JPMorgan Asia ex-Japan C (dist) - USD## - 88.59 75.67 - -JPMorgan Asia ex-Japan D (acc) - USD## - 239.92 207.48 277.14 232.21JPMorgan Asia ex-Japan I (acc) - USD##* - - 137.14 179.92 148.10JPMorgan Asia ex-Japan X (acc) - USD## - 506.98 427.94 557.31 455.34JPMorgan Asia ex-Japan X (dist) - USD## - 91.73 79.03 - -
JPMorgan Investment Funds - Blue and Green FundJPM Blue and Green A (acc) - EUR 23,821.48 22,404.67 23,641.30 24,413.93 24,134.21
JPMorgan Investment Funds - Emerging Markets Corporate Bond Portfolio Fund IJPM Emerging Markets Corporate Bond Portfolio I - A (div) - EUR (hedged) 84.69 91.79 84.52 85.83 -JPM Emerging Markets Corporate Bond Portfolio I - A (div) - USD 104.55 113.22 103.72 105.47 -JPM Emerging Markets Corporate Bond Portfolio I - B (div) - EUR (hedged) 85.72 92.94 85.49 86.50 -JPM Emerging Markets Corporate Bond Portfolio I - B (div) - USD 105.34 114.10 104.43 105.82 -JPM Emerging Markets Corporate Bond Portfolio I - C (div) - USD* - 114.36 104.63 105.92 -JPM Emerging Markets Corporate Bond Portfolio I - D (div) - EUR (hedged) 84.08 91.10 84.00 85.58 -JPM Emerging Markets Corporate Bond Portfolio I - D (div) - USD 103.82 112.39 103.08 105.16 -
JPMorgan Investment Funds - Euro Liquid Market FundJPM Euro Liquid Market A (acc) - EUR 1,010.11 1,010.10 1,009.95 1,006.48 1,006.28JPM Euro Liquid Market C (acc) - EUR 107.20 107.19 107.05 106.24 105.87JPM Euro Liquid Market D (acc) - EUR 101.44 101.44 101.44 101.19 101.18JPM Euro Liquid Market I (acc) - EUR 100.00 - - - -
JPMorgan Investment Funds - Europe Bond Fund (2)JPM Europe Bond A (acc) - EUR - 161.97 143.77 140.49 134.82JPM Europe Bond A (inc) - EUR - 98.95 87.83 85.83 82.36JPM Europe Bond B (acc) - EUR - 166.11 147.00 143.28 137.10JPM Europe Bond B (inc) - EUR - - - - -JPM Europe Bond C (acc) - EUR - 160.45 141.88 138.09 131.98JPM Europe Bond D (acc) - EUR - 128.38 114.35 112.14 107.99JPM Europe Bond X (acc) - EUR* - - 153.09 148.40 141.27
JPMorgan Investment Funds - Europe Recovery Fund (3)JPM Europe Recovery A (acc) - EUR - 191.70 171.20 221.91 179.27JPM Europe Recovery A (dist) - EUR - 77.81 70.58 92.19 75.01JPM Europe Recovery B (acc) - EUR* - - 78.98 98.97 111.71JPM Europe Recovery C (acc) - EUR - 154.10 136.38 175.27 140.32JPM Europe Recovery D (acc) - EUR - 174.77 157.65 206.40 168.41JPM Europe Recovery X (acc) - EUR - 143.70 126.16 160.63 127.51
JPMorgan Investment Funds - Europe Select Equity FundJPM Europe Select Equity A (acc) - EUR 1,062.24 856.06 701.65 808.95 730.52JPM Europe Select Equity A (acc) - USD 151.85 117.29 94.40 112.31 108.78JPM Europe Select Equity A (dist) - EUR 71.31 58.21 48.31 56.27 51.29JPM Europe Select Equity B (acc) - EUR 101.10 80.87 65.79 75.28 67.47JPM Europe Select Equity C (acc) - EUR 107.69 85.88 69.65 79.47 71.01JPM Europe Select Equity C (dist) - GBP 100.53 - - - -JPM Europe Select Equity D (acc) - EUR 96.04 77.98 64.39 74.80 68.05JPM Europe Select Equity D (acc) - USD 145.12 112.93 91.59 109.79 107.15JPM Europe Select Equity I (acc) - EUR 141.20 112.50 91.17 103.93 -JPM Europe Select Equity I (acc) - USD 149.12 - - - -JPM Europe Select Equity I (dist) - EUR 105.84 - - - -JPM Europe Select Equity X (acc) - EUR 150.30 118.96 95.79 108.49 96.27JPM Europe Select Equity X (acc) - EUR (hedged) 116.39 91.11 74.51 86.08 79.52JPM Europe Select Equity X (dist) - EUR 101.21 - - - -
(1) This Sub-Fund was merged into JPMorgan Funds - Asia Equity Fund (previously JPMorgan Funds - Asia Alpha Plus Fund) on 13 September 2013.(2) This Sub-Fund was merged into JPMorgan Funds - Euro Aggregate Bond Fund on 25 October 2013.(3) This Sub-Fund was merged into JPMorgan Funds - Europe Dynamic Fund on 23 August 2013.
30
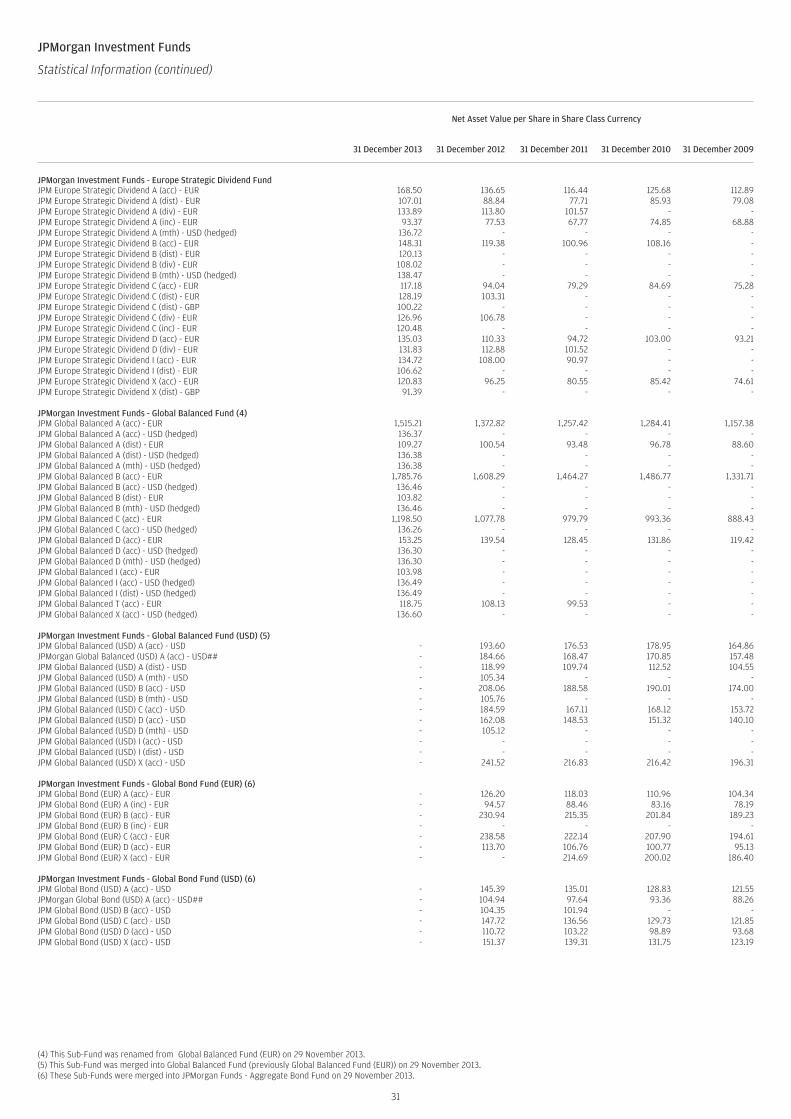
JPMorgan Investment Funds
Statistical Information (continued)
Net Asset Value per Share in Share Class Currency
31 December 2013 31 December 2012 31 December 2011 31 December 2010 31 December 2009
JPMorgan Investment Funds - Europe Strategic Dividend FundJPM Europe Strategic Dividend A (acc) - EUR 168.50 136.65 116.44 125.68 112.89JPM Europe Strategic Dividend A (dist) - EUR 107.01 88.84 77.71 85.93 79.08JPM Europe Strategic Dividend A (div) - EUR 133.89 113.80 101.57 - -JPM Europe Strategic Dividend A (inc) - EUR 93.37 77.53 67.77 74.85 68.88JPM Europe Strategic Dividend A (mth) - USD (hedged) 136.72 - - - -JPM Europe Strategic Dividend B (acc) - EUR 148.31 119.38 100.96 108.16 -JPM Europe Strategic Dividend B (dist) - EUR 120.13 - - - -JPM Europe Strategic Dividend B (div) - EUR 108.02 - - - -JPM Europe Strategic Dividend B (mth) - USD (hedged) 138.47 - - - -JPM Europe Strategic Dividend C (acc) - EUR 117.18 94.04 79.29 84.69 75.28JPM Europe Strategic Dividend C (dist) - EUR 128.19 103.31 - - -JPM Europe Strategic Dividend C (dist) - GBP 100.22 - - - -JPM Europe Strategic Dividend C (div) - EUR 126.96 106.78 - - -JPM Europe Strategic Dividend C (inc) - EUR 120.48 - - - -JPM Europe Strategic Dividend D (acc) - EUR 135.03 110.33 94.72 103.00 93.21JPM Europe Strategic Dividend D (div) - EUR 131.83 112.88 101.52 - -JPM Europe Strategic Dividend I (acc) - EUR 134.72 108.00 90.97 - -JPM Europe Strategic Dividend I (dist) - EUR 106.62 - - - -JPM Europe Strategic Dividend X (acc) - EUR 120.83 96.25 80.55 85.42 74.61JPM Europe Strategic Dividend X (dist) - GBP 91.39 - - - -
JPMorgan Investment Funds - Global Balanced Fund (4)JPM Global Balanced A (acc) - EUR 1,515.21 1,372.82 1,257.42 1,284.41 1,157.38JPM Global Balanced A (acc) - USD (hedged) 136.37 - - - -JPM Global Balanced A (dist) - EUR 109.27 100.54 93.48 96.78 88.60JPM Global Balanced A (dist) - USD (hedged) 136.38 - - - -JPM Global Balanced A (mth) - USD (hedged) 136.38 - - - -JPM Global Balanced B (acc) - EUR 1,785.76 1,608.29 1,464.27 1,486.77 1,331.71JPM Global Balanced B (acc) - USD (hedged) 136.46 - - - -JPM Global Balanced B (dist) - EUR 103.82 - - - -JPM Global Balanced B (mth) - USD (hedged) 136.46 - - - -JPM Global Balanced C (acc) - EUR 1,198.50 1,077.78 979.79 993.36 888.43JPM Global Balanced C (acc) - USD (hedged) 136.26 - - - -JPM Global Balanced D (acc) - EUR 153.25 139.54 128.45 131.86 119.42JPM Global Balanced D (acc) - USD (hedged) 136.30 - - - -JPM Global Balanced D (mth) - USD (hedged) 136.30 - - - -JPM Global Balanced I (acc) - EUR 103.98 - - - -JPM Global Balanced I (acc) - USD (hedged) 136.49 - - - -JPM Global Balanced I (dist) - USD (hedged) 136.49 - - - -JPM Global Balanced T (acc) - EUR 118.75 108.13 99.53 - -JPM Global Balanced X (acc) - USD (hedged) 136.60 - - - -
JPMorgan Investment Funds - Global Balanced Fund (USD) (5)JPM Global Balanced (USD) A (acc) - USD - 193.60 176.53 178.95 164.86JPMorgan Global Balanced (USD) A (acc) - USD## - 184.66 168.47 170.85 157.48JPM Global Balanced (USD) A (dist) - USD - 118.99 109.74 112.52 104.55JPM Global Balanced (USD) A (mth) - USD - 105.34 - - -JPM Global Balanced (USD) B (acc) - USD - 208.06 188.58 190.01 174.00JPM Global Balanced (USD) B (mth) - USD - 105.76 - - -JPM Global Balanced (USD) C (acc) - USD - 184.59 167.11 168.12 153.72JPM Global Balanced (USD) D (acc) - USD - 162.08 148.53 151.32 140.10JPM Global Balanced (USD) D (mth) - USD - 105.12 - - -JPM Global Balanced (USD) I (acc) - USD - - - - -JPM Global Balanced (USD) I (dist) - USD - - - - -JPM Global Balanced (USD) X (acc) - USD - 241.52 216.83 216.42 196.31
JPMorgan Investment Funds - Global Bond Fund (EUR) (6)JPM Global Bond (EUR) A (acc) - EUR - 126.20 118.03 110.96 104.34JPM Global Bond (EUR) A (inc) - EUR - 94.57 88.46 83.16 78.19JPM Global Bond (EUR) B (acc) - EUR - 230.94 215.35 201.84 189.23JPM Global Bond (EUR) B (inc) - EUR - - - - -JPM Global Bond (EUR) C (acc) - EUR - 238.58 222.14 207.90 194.61JPM Global Bond (EUR) D (acc) - EUR - 113.70 106.76 100.77 95.13JPM Global Bond (EUR) X (acc) - EUR - - 214.69 200.02 186.40
JPMorgan Investment Funds - Global Bond Fund (USD) (6)JPM Global Bond (USD) A (acc) - USD - 145.39 135.01 128.83 121.55JPMorgan Global Bond (USD) A (acc) - USD## - 104.94 97.64 93.36 88.26JPM Global Bond (USD) B (acc) - USD - 104.35 101.94 - -JPM Global Bond (USD) C (acc) - USD - 147.72 136.56 129.73 121.85JPM Global Bond (USD) D (acc) - USD - 110.72 103.22 98.89 93.68JPM Global Bond (USD) X (acc) - USD - 151.37 139.31 131.75 123.19
(4) This Sub-Fund was renamed from Global Balanced Fund (EUR) on 29 November 2013.(5) This Sub-Fund was merged into Global Balanced Fund (previously Global Balanced Fund (EUR)) on 29 November 2013.(6) These Sub-Funds were merged into JPMorgan Funds - Aggregate Bond Fund on 29 November 2013.
31
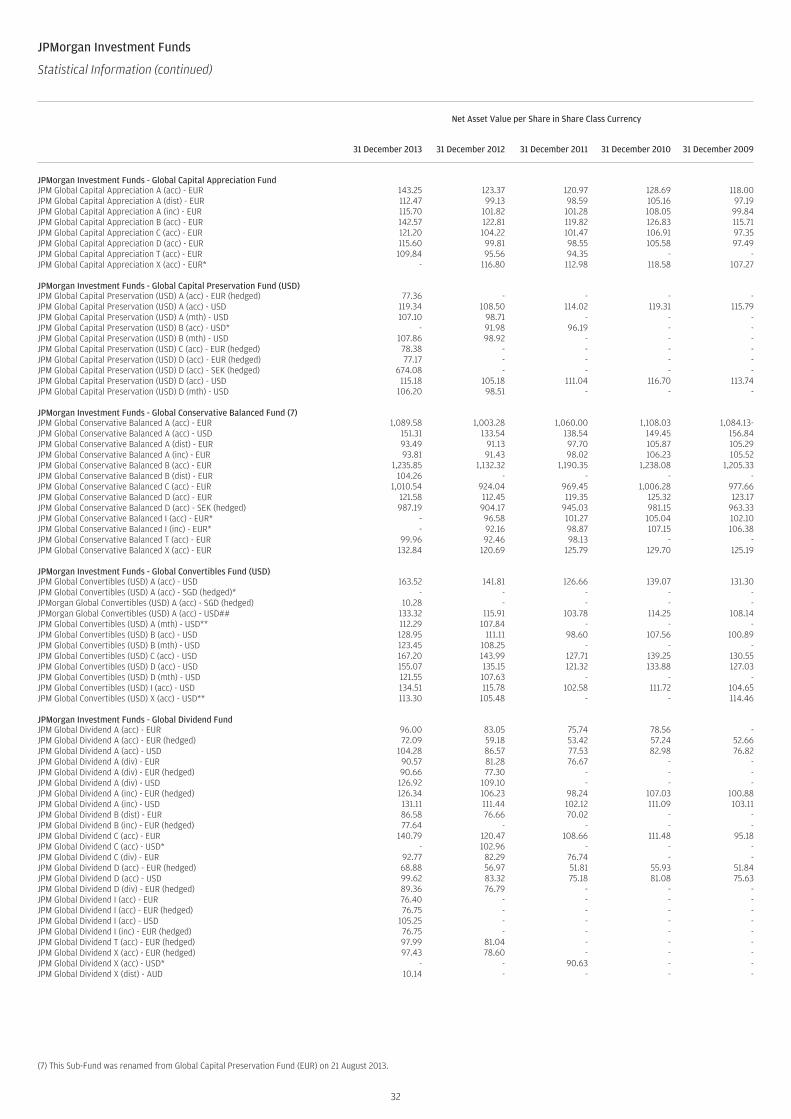
JPMorgan Investment Funds
Statistical Information (continued)
Net Asset Value per Share in Share Class Currency
31 December 2013 31 December 2012 31 December 2011 31 December 2010 31 December 2009
JPMorgan Investment Funds - Global Capital Appreciation FundJPM Global Capital Appreciation A (acc) - EUR 143.25 123.37 120.97 128.69 118.00JPM Global Capital Appreciation A (dist) - EUR 112.47 99.13 98.59 105.16 97.19JPM Global Capital Appreciation A (inc) - EUR 115.70 101.82 101.28 108.05 99.84JPM Global Capital Appreciation B (acc) - EUR 142.57 122.81 119.82 126.83 115.71JPM Global Capital Appreciation C (acc) - EUR 121.20 104.22 101.47 106.91 97.35JPM Global Capital Appreciation D (acc) - EUR 115.60 99.81 98.55 105.58 97.49JPM Global Capital Appreciation T (acc) - EUR 109.84 95.56 94.35 - -JPM Global Capital Appreciation X (acc) - EUR* - 116.80 112.98 118.58 107.27
JPMorgan Investment Funds - Global Capital Preservation Fund (USD)JPM Global Capital Preservation (USD) A (acc) - EUR (hedged) 77.36 - - - -JPM Global Capital Preservation (USD) A (acc) - USD 119.34 108.50 114.02 119.31 115.79JPM Global Capital Preservation (USD) A (mth) - USD 107.10 98.71 - - -JPM Global Capital Preservation (USD) B (acc) - USD* - 91.98 96.19 - -JPM Global Capital Preservation (USD) B (mth) - USD 107.86 98.92 - - -JPM Global Capital Preservation (USD) C (acc) - EUR (hedged) 78.38 - - - -JPM Global Capital Preservation (USD) D (acc) - EUR (hedged) 77.17 - - - -JPM Global Capital Preservation (USD) D (acc) - SEK (hedged) 674.08 - - - -JPM Global Capital Preservation (USD) D (acc) - USD 115.18 105.18 111.04 116.70 113.74JPM Global Capital Preservation (USD) D (mth) - USD 106.20 98.51 - - -
JPMorgan Investment Funds - Global Conservative Balanced Fund (7)JPM Global Conservative Balanced A (acc) - EUR 1,089.58 1,003.28 1,060.00 1,108.03 1,084.13-JPM Global Conservative Balanced A (acc) - USD 151.31 133.54 138.54 149.45 156.84JPM Global Conservative Balanced A (dist) - EUR 93.49 91.13 97.70 105.87 105.29JPM Global Conservative Balanced A (inc) - EUR 93.81 91.43 98.02 106.23 105.52JPM Global Conservative Balanced B (acc) - EUR 1,235.85 1,132.32 1,190.35 1,238.08 1,205.33JPM Global Conservative Balanced B (dist) - EUR 104.26 - - - -JPM Global Conservative Balanced C (acc) - EUR 1,010.54 924.04 969.45 1,006.28 977.66JPM Global Conservative Balanced D (acc) - EUR 121.58 112.45 119.35 125.32 123.17JPM Global Conservative Balanced D (acc) - SEK (hedged) 987.19 904.17 945.03 981.15 963.33JPM Global Conservative Balanced I (acc) - EUR* - 96.58 101.27 105.04 102.10JPM Global Conservative Balanced I (inc) - EUR* - 92.16 98.87 107.15 106.38JPM Global Conservative Balanced T (acc) - EUR 99.96 92.46 98.13 - -JPM Global Conservative Balanced X (acc) - EUR 132.84 120.69 125.79 129.70 125.19
JPMorgan Investment Funds - Global Convertibles Fund (USD)JPM Global Convertibles (USD) A (acc) - USD 163.52 141.81 126.66 139.07 131.30JPM Global Convertibles (USD) A (acc) - SGD (hedged)* - - - - -JPMorgan Global Convertibles (USD) A (acc) - SGD (hedged) 10.28 - - - -JPMorgan Global Convertibles (USD) A (acc) - USD## 133.32 115.91 103.78 114.25 108.14JPM Global Convertibles (USD) A (mth) - USD** 112.29 107.84 - - -JPM Global Convertibles (USD) B (acc) - USD 128.95 111.11 98.60 107.56 100.89JPM Global Convertibles (USD) B (mth) - USD 123.45 108.25 - - -JPM Global Convertibles (USD) C (acc) - USD 167.20 143.99 127.71 139.25 130.55JPM Global Convertibles (USD) D (acc) - USD 155.07 135.15 121.32 133.88 127.03JPM Global Convertibles (USD) D (mth) - USD 121.55 107.63 - - -JPM Global Convertibles (USD) I (acc) - USD 134.51 115.78 102.58 111.72 104.65JPM Global Convertibles (USD) X (acc) - USD** 113.30 105.48 - - 114.46
JPMorgan Investment Funds - Global Dividend FundJPM Global Dividend A (acc) - EUR 96.00 83.05 75.74 78.56 -JPM Global Dividend A (acc) - EUR (hedged) 72.09 59.18 53.42 57.24 52.66JPM Global Dividend A (acc) - USD 104.28 86.57 77.53 82.98 76.82JPM Global Dividend A (div) - EUR 90.57 81.28 76.67 - -JPM Global Dividend A (div) - EUR (hedged) 90.66 77.30 - - -JPM Global Dividend A (div) - USD 126.92 109.10 - - -JPM Global Dividend A (inc) - EUR (hedged) 126.34 106.23 98.24 107.03 100.88JPM Global Dividend A (inc) - USD 131.11 111.44 102.12 111.09 103.11JPM Global Dividend B (dist) - EUR 86.58 76.66 70.02 - -JPM Global Dividend B (inc) - EUR (hedged) 77.64 - - - -JPM Global Dividend C (acc) - EUR 140.79 120.47 108.66 111.48 95.18JPM Global Dividend C (acc) - USD* - 102.96 - - -JPM Global Dividend C (div) - EUR 92.77 82.29 76.74 - -JPM Global Dividend D (acc) - EUR (hedged) 68.88 56.97 51.81 55.93 51.84JPM Global Dividend D (acc) - USD 99.62 83.32 75.18 81.08 75.63JPM Global Dividend D (div) - EUR (hedged) 89.36 76.79 - - -JPM Global Dividend I (acc) - EUR 76.40 - - - -JPM Global Dividend I (acc) - EUR (hedged) 76.75 - - - -JPM Global Dividend I (acc) - USD 105.25 - - - -JPM Global Dividend I (inc) - EUR (hedged) 76.75 - - - -JPM Global Dividend T (acc) - EUR (hedged) 97.99 81.04 - - -JPM Global Dividend X (acc) - EUR (hedged) 97.43 78.60 - - -JPM Global Dividend X (acc) - USD* - - 90.63 - -JPM Global Dividend X (dist) - AUD 10.14 - - - -
(7) This Sub-Fund was renamed from Global Capital Preservation Fund (EUR) on 21 August 2013.
32
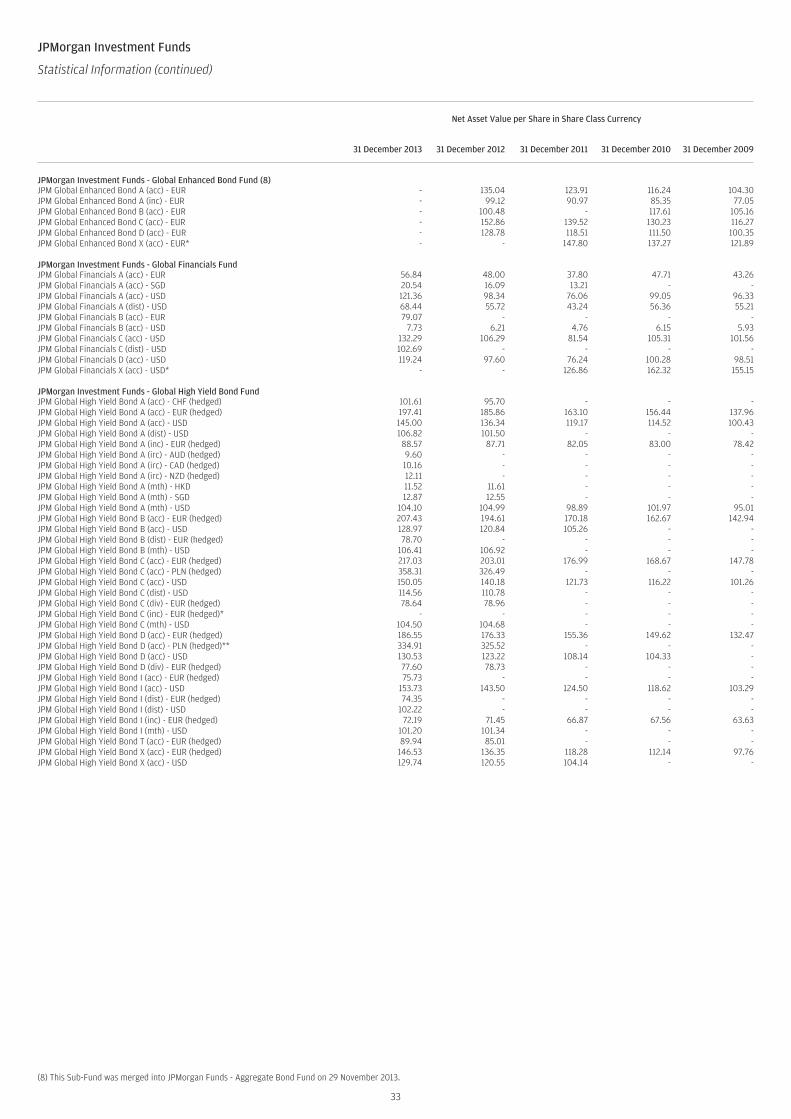
JPMorgan Investment Funds
Statistical Information (continued)
Net Asset Value per Share in Share Class Currency
31 December 2013 31 December 2012 31 December 2011 31 December 2010 31 December 2009
JPMorgan Investment Funds - Global Enhanced Bond Fund (8)JPM Global Enhanced Bond A (acc) - EUR - 135.04 123.91 116.24 104.30JPM Global Enhanced Bond A (inc) - EUR - 99.12 90.97 85.35 77.05JPM Global Enhanced Bond B (acc) - EUR - 100.48 - 117.61 105.16JPM Global Enhanced Bond C (acc) - EUR - 152.86 139.52 130.23 116.27JPM Global Enhanced Bond D (acc) - EUR - 128.78 118.51 111.50 100.35JPM Global Enhanced Bond X (acc) - EUR* - - 147.80 137.27 121.89
JPMorgan Investment Funds - Global Financials FundJPM Global Financials A (acc) - EUR 56.84 48.00 37.80 47.71 43.26JPM Global Financials A (acc) - SGD 20.54 16.09 13.21 - -JPM Global Financials A (acc) - USD 121.36 98.34 76.06 99.05 96.33JPM Global Financials A (dist) - USD 68.44 55.72 43.24 56.36 55.21JPM Global Financials B (acc) - EUR 79.07 - - - -JPM Global Financials B (acc) - USD 7.73 6.21 4.76 6.15 5.93JPM Global Financials C (acc) - USD 132.29 106.29 81.54 105.31 101.56JPM Global Financials C (dist) - USD 102.69 - - - -JPM Global Financials D (acc) - USD 119.24 97.60 76.24 100.28 98.51JPM Global Financials X (acc) - USD* - - 126.86 162.32 155.15
JPMorgan Investment Funds - Global High Yield Bond FundJPM Global High Yield Bond A (acc) - CHF (hedged) 101.61 95.70 - - -JPM Global High Yield Bond A (acc) - EUR (hedged) 197.41 185.86 163.10 156.44 137.96JPM Global High Yield Bond A (acc) - USD 145.00 136.34 119.17 114.52 100.43JPM Global High Yield Bond A (dist) - USD 106.82 101.50 - - -JPM Global High Yield Bond A (inc) - EUR (hedged) 88.57 87.71 82.05 83.00 78.42JPM Global High Yield Bond A (irc) - AUD (hedged) 9.60 - - - -JPM Global High Yield Bond A (irc) - CAD (hedged) 10.16 - - - -JPM Global High Yield Bond A (irc) - NZD (hedged) 12.11 - - - -JPM Global High Yield Bond A (mth) - HKD 11.52 11.61 - - -JPM Global High Yield Bond A (mth) - SGD 12.87 12.55 - - -JPM Global High Yield Bond A (mth) - USD 104.10 104.99 98.89 101.97 95.01JPM Global High Yield Bond B (acc) - EUR (hedged) 207.43 194.61 170.18 162.67 142.94JPM Global High Yield Bond B (acc) - USD 128.97 120.84 105.26 - -JPM Global High Yield Bond B (dist) - EUR (hedged) 78.70 - - - -JPM Global High Yield Bond B (mth) - USD 106.41 106.92 - - -JPM Global High Yield Bond C (acc) - EUR (hedged) 217.03 203.01 176.99 168.67 147.78JPM Global High Yield Bond C (acc) - PLN (hedged) 358.31 326.49 - - -JPM Global High Yield Bond C (acc) - USD 150.05 140.18 121.73 116.22 101.26JPM Global High Yield Bond C (dist) - USD 114.56 110.78 - - -JPM Global High Yield Bond C (div) - EUR (hedged) 78.64 78.96 - - -JPM Global High Yield Bond C (inc) - EUR (hedged)* - - - - -JPM Global High Yield Bond C (mth) - USD 104.50 104.68 - - -JPM Global High Yield Bond D (acc) - EUR (hedged) 186.55 176.33 155.36 149.62 132.47JPM Global High Yield Bond D (acc) - PLN (hedged)** 334.91 325.52 - - -JPM Global High Yield Bond D (acc) - USD 130.53 123.22 108.14 104.33 -JPM Global High Yield Bond D (div) - EUR (hedged) 77.60 78.73 - - -JPM Global High Yield Bond I (acc) - EUR (hedged) 75.73 - - - -JPM Global High Yield Bond I (acc) - USD 153.73 143.50 124.50 118.62 103.29JPM Global High Yield Bond I (dist) - EUR (hedged) 74.35 - - - -JPM Global High Yield Bond I (dist) - USD 102.22 - - - -JPM Global High Yield Bond I (inc) - EUR (hedged) 72.19 71.45 66.87 67.56 63.63JPM Global High Yield Bond I (mth) - USD 101.20 101.34 - - -JPM Global High Yield Bond T (acc) - EUR (hedged) 89.94 85.01 - - -JPM Global High Yield Bond X (acc) - EUR (hedged) 146.53 136.35 118.28 112.14 97.76JPM Global High Yield Bond X (acc) - USD 129.74 120.55 104.14 - -
(8) This Sub-Fund was merged into JPMorgan Funds - Aggregate Bond Fund on 29 November 2013.
33
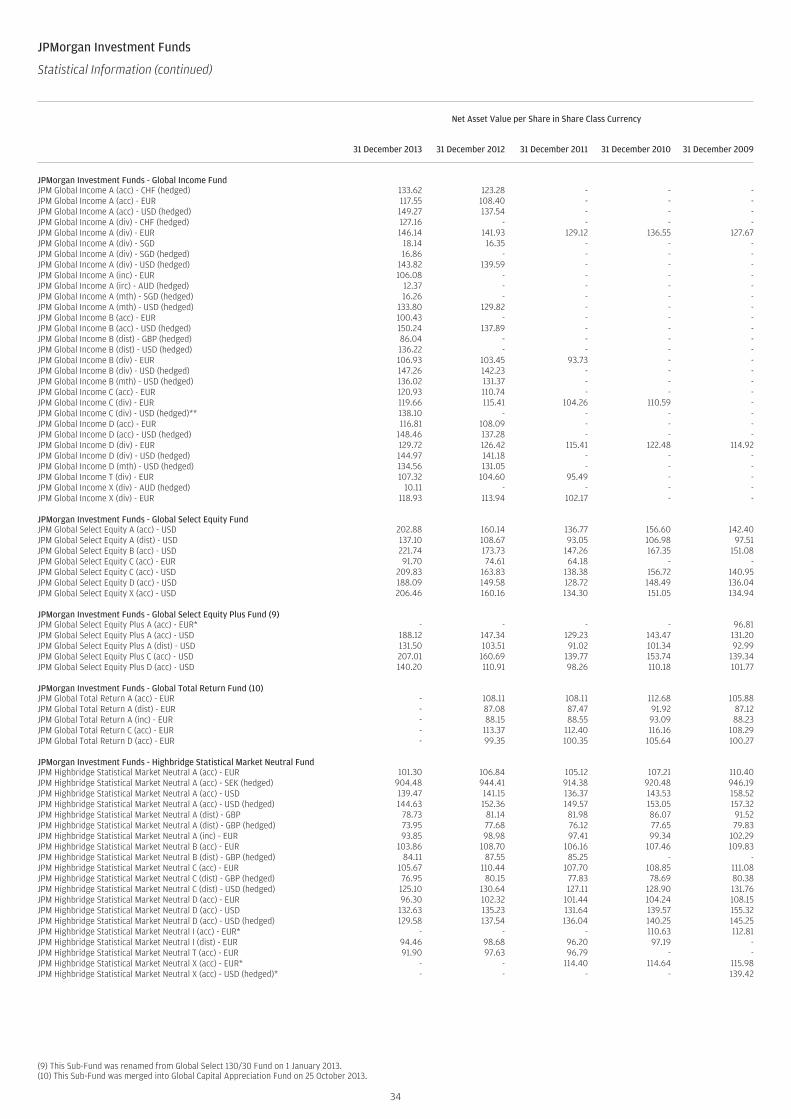
JPMorgan Investment Funds
Statistical Information (continued)
Net Asset Value per Share in Share Class Currency
31 December 2013 31 December 2012 31 December 2011 31 December 2010 31 December 2009
JPMorgan Investment Funds - Global Income FundJPM Global Income A (acc) - CHF (hedged) 133.62 123.28 - - -JPM Global Income A (acc) - EUR 117.55 108.40 - - -JPM Global Income A (acc) - USD (hedged) 149.27 137.54 - - -JPM Global Income A (div) - CHF (hedged) 127.16 - - - -JPM Global Income A (div) - EUR 146.14 141.93 129.12 136.55 127.67JPM Global Income A (div) - SGD 18.14 16.35 - - -JPM Global Income A (div) - SGD (hedged) 16.86 - - - -JPM Global Income A (div) - USD (hedged) 143.82 139.59 - - -JPM Global Income A (inc) - EUR 106.08 - - - -JPM Global Income A (irc) - AUD (hedged) 12.37 - - - -JPM Global Income A (mth) - SGD (hedged) 16.26 - - - -JPM Global Income A (mth) - USD (hedged) 133.80 129.82 - - -JPM Global Income B (acc) - EUR 100.43 - - - -JPM Global Income B (acc) - USD (hedged) 150.24 137.89 - - -JPM Global Income B (dist) - GBP (hedged) 86.04 - - - -JPM Global Income B (dist) - USD (hedged) 136.22 - - - -JPM Global Income B (div) - EUR 106.93 103.45 93.73 - -JPM Global Income B (div) - USD (hedged) 147.26 142.23 - - -JPM Global Income B (mth) - USD (hedged) 136.02 131.37 - - -JPM Global Income C (acc) - EUR 120.93 110.74 - - -JPM Global Income C (div) - EUR 119.66 115.41 104.26 110.59 -JPM Global Income C (div) - USD (hedged)** 138.10 - - - -JPM Global Income D (acc) - EUR 116.81 108.09 - - -JPM Global Income D (acc) - USD (hedged) 148.46 137.28 - - -JPM Global Income D (div) - EUR 129.72 126.42 115.41 122.48 114.92JPM Global Income D (div) - USD (hedged) 144.97 141.18 - - -JPM Global Income D (mth) - USD (hedged) 134.56 131.05 - - -JPM Global Income T (div) - EUR 107.32 104.60 95.49 - -JPM Global Income X (div) - AUD (hedged) 10.11 - - - -JPM Global Income X (div) - EUR 118.93 113.94 102.17 - -
JPMorgan Investment Funds - Global Select Equity FundJPM Global Select Equity A (acc) - USD 202.88 160.14 136.77 156.60 142.40JPM Global Select Equity A (dist) - USD 137.10 108.67 93.05 106.98 97.51JPM Global Select Equity B (acc) - USD 221.74 173.73 147.26 167.35 151.08JPM Global Select Equity C (acc) - EUR 91.70 74.61 64.18 - -JPM Global Select Equity C (acc) - USD 209.83 163.83 138.38 156.72 140.95JPM Global Select Equity D (acc) - USD 188.09 149.58 128.72 148.49 136.04JPM Global Select Equity X (acc) - USD 206.46 160.16 134.30 151.05 134.94
JPMorgan Investment Funds - Global Select Equity Plus Fund (9)JPM Global Select Equity Plus A (acc) - EUR* - - - - 96.81JPM Global Select Equity Plus A (acc) - USD 188.12 147.34 129.23 143.47 131.20JPM Global Select Equity Plus A (dist) - USD 131.50 103.51 91.02 101.34 92.99JPM Global Select Equity Plus C (acc) - USD 207.01 160.69 139.77 153.74 139.34JPM Global Select Equity Plus D (acc) - USD 140.20 110.91 98.26 110.18 101.77
JPMorgan Investment Funds - Global Total Return Fund (10)JPM Global Total Return A (acc) - EUR - 108.11 108.11 112.68 105.88JPM Global Total Return A (dist) - EUR - 87.08 87.47 91.92 87.12JPM Global Total Return A (inc) - EUR - 88.15 88.55 93.09 88.23JPM Global Total Return C (acc) - EUR - 113.37 112.40 116.16 108.29JPM Global Total Return D (acc) - EUR - 99.35 100.35 105.64 100.27
JPMorgan Investment Funds - Highbridge Statistical Market Neutral FundJPM Highbridge Statistical Market Neutral A (acc) - EUR 101.30 106.84 105.12 107.21 110.40JPM Highbridge Statistical Market Neutral A (acc) - SEK (hedged) 904.48 944.41 914.38 920.48 946.19JPM Highbridge Statistical Market Neutral A (acc) - USD 139.47 141.15 136.37 143.53 158.52JPM Highbridge Statistical Market Neutral A (acc) - USD (hedged) 144.63 152.36 149.57 153.05 157.32JPM Highbridge Statistical Market Neutral A (dist) - GBP 78.73 81.14 81.98 86.07 91.52JPM Highbridge Statistical Market Neutral A (dist) - GBP (hedged) 73.95 77.68 76.12 77.65 79.83JPM Highbridge Statistical Market Neutral A (inc) - EUR 93.85 98.98 97.41 99.34 102.29JPM Highbridge Statistical Market Neutral B (acc) - EUR 103.86 108.70 106.16 107.46 109.83JPM Highbridge Statistical Market Neutral B (dist) - GBP (hedged) 84.11 87.55 85.25 - -JPM Highbridge Statistical Market Neutral C (acc) - EUR 105.67 110.44 107.70 108.85 111.08JPM Highbridge Statistical Market Neutral C (dist) - GBP (hedged) 76.95 80.15 77.83 78.69 80.38JPM Highbridge Statistical Market Neutral C (dist) - USD (hedged) 125.10 130.64 127.11 128.90 131.76JPM Highbridge Statistical Market Neutral D (acc) - EUR 96.30 102.32 101.44 104.24 108.15JPM Highbridge Statistical Market Neutral D (acc) - USD 132.63 135.23 131.64 139.57 155.32JPM Highbridge Statistical Market Neutral D (acc) - USD (hedged) 129.58 137.54 136.04 140.25 145.25JPM Highbridge Statistical Market Neutral I (acc) - EUR* - - - 110.63 112.81JPM Highbridge Statistical Market Neutral I (dist) - EUR 94.46 98.68 96.20 97.19 -JPM Highbridge Statistical Market Neutral T (acc) - EUR 91.90 97.63 96.79 - -JPM Highbridge Statistical Market Neutral X (acc) - EUR* - - 114.40 114.64 115.98JPM Highbridge Statistical Market Neutral X (acc) - USD (hedged)* - - - - 139.42
(9) This Sub-Fund was renamed from Global Select 130/30 Fund on 1 January 2013.(10) This Sub-Fund was merged into Global Capital Appreciation Fund on 25 October 2013.
34
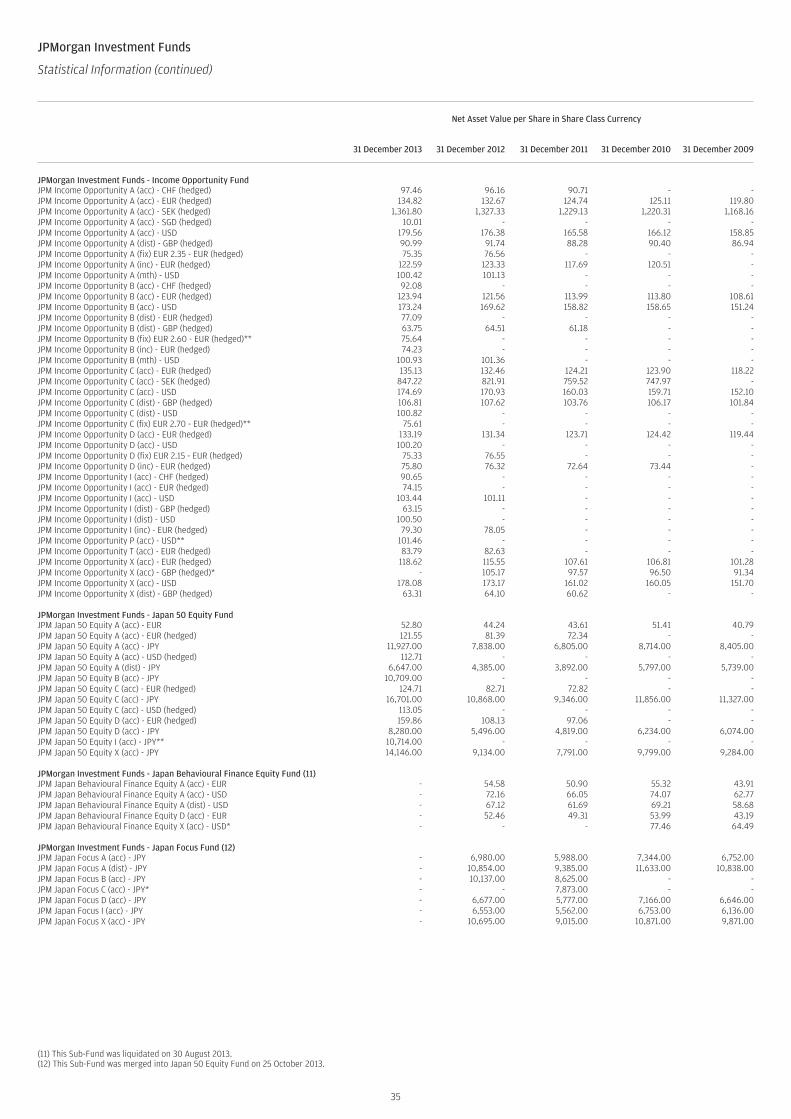
JPMorgan Investment Funds
Statistical Information (continued)
Net Asset Value per Share in Share Class Currency
31 December 2013 31 December 2012 31 December 2011 31 December 2010 31 December 2009
JPMorgan Investment Funds - Income Opportunity FundJPM Income Opportunity A (acc) - CHF (hedged) 97.46 96.16 90.71 - -JPM Income Opportunity A (acc) - EUR (hedged) 134.82 132.67 124.74 125.11 119.80JPM Income Opportunity A (acc) - SEK (hedged) 1,361.80 1,327.33 1,229.13 1,220.31 1,168.16JPM Income Opportunity A (acc) - SGD (hedged) 10.01 - - - -JPM Income Opportunity A (acc) - USD 179.56 176.38 165.58 166.12 158.85JPM Income Opportunity A (dist) - GBP (hedged) 90.99 91.74 88.28 90.40 86.94JPM Income Opportunity A (fix) EUR 2.35 - EUR (hedged) 75.35 76.56 - - -JPM Income Opportunity A (inc) - EUR (hedged) 122.59 123.33 117.69 120.51 -JPM Income Opportunity A (mth) - USD 100.42 101.13 - - -JPM Income Opportunity B (acc) - CHF (hedged) 92.08 - - - -JPM Income Opportunity B (acc) - EUR (hedged) 123.94 121.56 113.99 113.80 108.61JPM Income Opportunity B (acc) - USD 173.24 169.62 158.82 158.65 151.24JPM Income Opportunity B (dist) - EUR (hedged) 77.09 - - - -JPM Income Opportunity B (dist) - GBP (hedged) 63.75 64.51 61.18 - -JPM Income Opportunity B (fix) EUR 2.60 - EUR (hedged)** 75.64 - - - -JPM Income Opportunity B (inc) - EUR (hedged) 74.23 - - - -JPM Income Opportunity B (mth) - USD 100.93 101.36 - - -JPM Income Opportunity C (acc) - EUR (hedged) 135.13 132.46 124.21 123.90 118.22JPM Income Opportunity C (acc) - SEK (hedged) 847.22 821.91 759.52 747.97 -JPM Income Opportunity C (acc) - USD 174.69 170.93 160.03 159.71 152.10JPM Income Opportunity C (dist) - GBP (hedged) 106.81 107.62 103.76 106.17 101.84JPM Income Opportunity C (dist) - USD 100.82 - - - -JPM Income Opportunity C (fix) EUR 2.70 - EUR (hedged)** 75.61 - - - -JPM Income Opportunity D (acc) - EUR (hedged) 133.19 131.34 123.71 124.42 119.44JPM Income Opportunity D (acc) - USD 100.20 - - - -JPM Income Opportunity D (fix) EUR 2.15 - EUR (hedged) 75.33 76.55 - - -JPM Income Opportunity D (inc) - EUR (hedged) 75.80 76.32 72.64 73.44 -JPM Income Opportunity I (acc) - CHF (hedged) 90.65 - - - -JPM Income Opportunity I (acc) - EUR (hedged) 74.15 - - - -JPM Income Opportunity I (acc) - USD 103.44 101.11 - - -JPM Income Opportunity I (dist) - GBP (hedged) 63.15 - - - -JPM Income Opportunity I (dist) - USD 100.50 - - - -JPM Income Opportunity I (inc) - EUR (hedged) 79.30 78.05 - - -JPM Income Opportunity P (acc) - USD** 101.46 - - - -JPM Income Opportunity T (acc) - EUR (hedged) 83.79 82.63 - - -JPM Income Opportunity X (acc) - EUR (hedged) 118.62 115.55 107.61 106.81 101.28JPM Income Opportunity X (acc) - GBP (hedged)* - 105.17 97.57 96.50 91.34JPM Income Opportunity X (acc) - USD 178.08 173.17 161.02 160.05 151.70JPM Income Opportunity X (dist) - GBP (hedged) 63.31 64.10 60.62 - -
JPMorgan Investment Funds - Japan 50 Equity FundJPM Japan 50 Equity A (acc) - EUR 52.80 44.24 43.61 51.41 40.79JPM Japan 50 Equity A (acc) - EUR (hedged) 121.55 81.39 72.34 - -JPM Japan 50 Equity A (acc) - JPY 11,927.00 7,838.00 6,805.00 8,714.00 8,405.00JPM Japan 50 Equity A (acc) - USD (hedged) 112.71 - - - -JPM Japan 50 Equity A (dist) - JPY 6,647.00 4,385.00 3,892.00 5,797.00 5,739.00JPM Japan 50 Equity B (acc) - JPY 10,709.00 - - - -JPM Japan 50 Equity C (acc) - EUR (hedged) 124.71 82.71 72.82 - -JPM Japan 50 Equity C (acc) - JPY 16,701.00 10,868.00 9,346.00 11,856.00 11,327.00JPM Japan 50 Equity C (acc) - USD (hedged) 113.05 - - - -JPM Japan 50 Equity D (acc) - EUR (hedged) 159.86 108.13 97.06 - -JPM Japan 50 Equity D (acc) - JPY 8,280.00 5,496.00 4,819.00 6,234.00 6,074.00JPM Japan 50 Equity I (acc) - JPY** 10,714.00 - - - -JPM Japan 50 Equity X (acc) - JPY 14,146.00 9,134.00 7,791.00 9,799.00 9,284.00
JPMorgan Investment Funds - Japan Behavioural Finance Equity Fund (11)JPM Japan Behavioural Finance Equity A (acc) - EUR - 54.58 50.90 55.32 43.91JPM Japan Behavioural Finance Equity A (acc) - USD - 72.16 66.05 74.07 62.77JPM Japan Behavioural Finance Equity A (dist) - USD - 67.12 61.69 69.21 58.68JPM Japan Behavioural Finance Equity D (acc) - EUR - 52.46 49.31 53.99 43.19JPM Japan Behavioural Finance Equity X (acc) - USD* - - - 77.46 64.49
JPMorgan Investment Funds - Japan Focus Fund (12)JPM Japan Focus A (acc) - JPY - 6,980.00 5,988.00 7,344.00 6,752.00JPM Japan Focus A (dist) - JPY - 10,854.00 9,385.00 11,633.00 10,838.00JPM Japan Focus B (acc) - JPY - 10,137.00 8,625.00 - -JPM Japan Focus C (acc) - JPY* - - 7,873.00 - -JPM Japan Focus D (acc) - JPY - 6,677.00 5,777.00 7,166.00 6,646.00JPM Japan Focus I (acc) - JPY - 6,553.00 5,562.00 6,753.00 6,136.00JPM Japan Focus X (acc) - JPY - 10,695.00 9,015.00 10,871.00 9,871.00
(11) This Sub-Fund was liquidated on 30 August 2013.(12) This Sub-Fund was merged into Japan 50 Equity Fund on 25 October 2013.
35
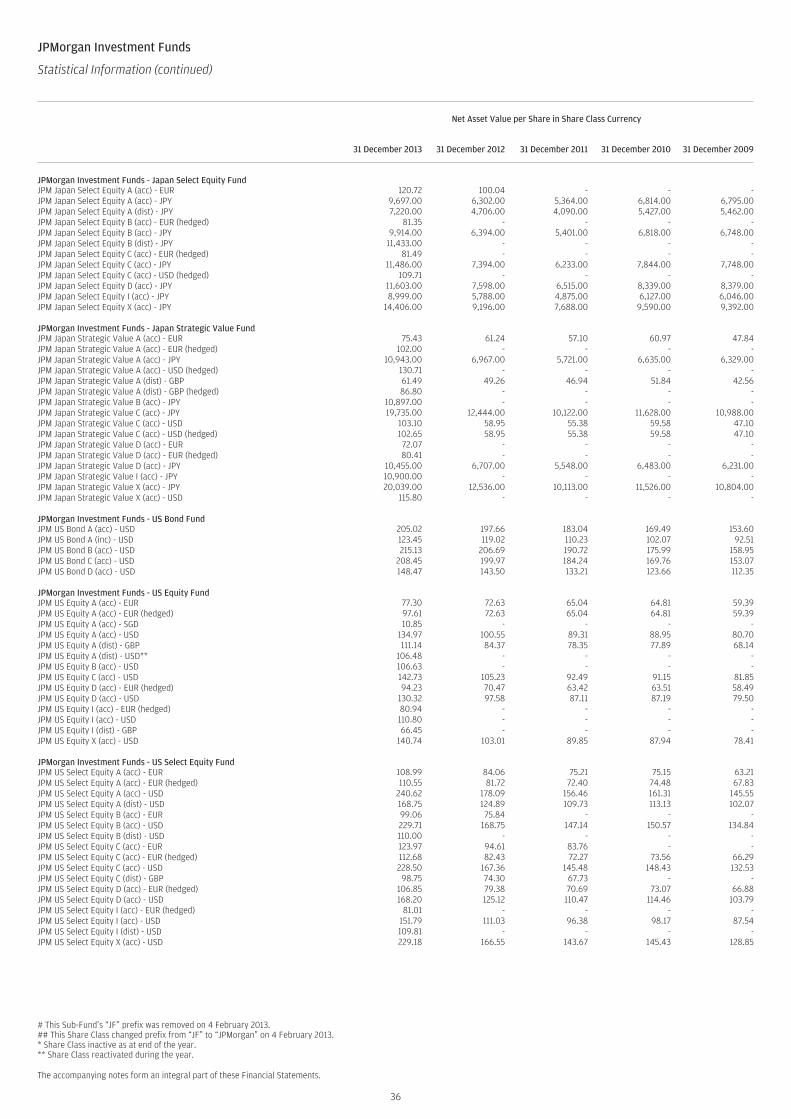
JPMorgan Investment Funds
Statistical Information (continued)
Net Asset Value per Share in Share Class Currency
31 December 2013 31 December 2012 31 December 2011 31 December 2010 31 December 2009
JPMorgan Investment Funds - Japan Select Equity FundJPM Japan Select Equity A (acc) - EUR 120.72 100.04 - - -JPM Japan Select Equity A (acc) - JPY 9,697.00 6,302.00 5,364.00 6,814.00 6,795.00JPM Japan Select Equity A (dist) - JPY 7,220.00 4,706.00 4,090.00 5,427.00 5,462.00JPM Japan Select Equity B (acc) - EUR (hedged) 81.35 - - - -JPM Japan Select Equity B (acc) - JPY 9,914.00 6,394.00 5,401.00 6,818.00 6,748.00JPM Japan Select Equity B (dist) - JPY 11,433.00 - - - -JPM Japan Select Equity C (acc) - EUR (hedged) 81.49 - - - -JPM Japan Select Equity C (acc) - JPY 11,486.00 7,394.00 6,233.00 7,844.00 7,748.00JPM Japan Select Equity C (acc) - USD (hedged) 109.71 - - - -JPM Japan Select Equity D (acc) - JPY 11,603.00 7,598.00 6,515.00 8,339.00 8,379.00JPM Japan Select Equity I (acc) - JPY 8,999.00 5,788.00 4,875.00 6,127.00 6,046.00JPM Japan Select Equity X (acc) - JPY 14,406.00 9,196.00 7,688.00 9,590.00 9,392.00
JPMorgan Investment Funds - Japan Strategic Value FundJPM Japan Strategic Value A (acc) - EUR 75.43 61.24 57.10 60.97 47.84JPM Japan Strategic Value A (acc) - EUR (hedged) 102.00 - - - -JPM Japan Strategic Value A (acc) - JPY 10,943.00 6,967.00 5,721.00 6,635.00 6,329.00JPM Japan Strategic Value A (acc) - USD (hedged) 130.71 - - - -JPM Japan Strategic Value A (dist) - GBP 61.49 49.26 46.94 51.84 42.56JPM Japan Strategic Value A (dist) - GBP (hedged) 86.80 - - - -JPM Japan Strategic Value B (acc) - JPY 10,897.00 - - - -JPM Japan Strategic Value C (acc) - JPY 19,735.00 12,444.00 10,122.00 11,628.00 10,988.00JPM Japan Strategic Value C (acc) - USD 103.10 58.95 55.38 59.58 47.10JPM Japan Strategic Value C (acc) - USD (hedged) 102.65 58.95 55.38 59.58 47.10JPM Japan Strategic Value D (acc) - EUR 72.07 - - - -JPM Japan Strategic Value D (acc) - EUR (hedged) 80.41 - - - -JPM Japan Strategic Value D (acc) - JPY 10,455.00 6,707.00 5,548.00 6,483.00 6,231.00JPM Japan Strategic Value I (acc) - JPY 10,900.00 - - - -JPM Japan Strategic Value X (acc) - JPY 20,039.00 12,536.00 10,113.00 11,526.00 10,804.00JPM Japan Strategic Value X (acc) - USD 115.80 - - - -
JPMorgan Investment Funds - US Bond FundJPM US Bond A (acc) - USD 205.02 197.66 183.04 169.49 153.60JPM US Bond A (inc) - USD 123.45 119.02 110.23 102.07 92.51JPM US Bond B (acc) - USD 215.13 206.69 190.72 175.99 158.95JPM US Bond C (acc) - USD 208.45 199.97 184.24 169.76 153.07JPM US Bond D (acc) - USD 148.47 143.50 133.21 123.66 112.35
JPMorgan Investment Funds - US Equity FundJPM US Equity A (acc) - EUR 77.30 72.63 65.04 64.81 59.39JPM US Equity A (acc) - EUR (hedged) 97.61 72.63 65.04 64.81 59.39JPM US Equity A (acc) - SGD 10.85 - - - -JPM US Equity A (acc) - USD 134.97 100.55 89.31 88.95 80.70JPM US Equity A (dist) - GBP 111.14 84.37 78.35 77.89 68.14JPM US Equity A (dist) - USD** 106.48 - - - -JPM US Equity B (acc) - USD 106.63 - - - -JPM US Equity C (acc) - USD 142.73 105.23 92.49 91.15 81.85JPM US Equity D (acc) - EUR (hedged) 94.23 70.47 63.42 63.51 58.49JPM US Equity D (acc) - USD 130.32 97.58 87.11 87.19 79.50JPM US Equity I (acc) - EUR (hedged) 80.94 - - - -JPM US Equity I (acc) - USD 110.80 - - - -JPM US Equity I (dist) - GBP 66.45 - - - -JPM US Equity X (acc) - USD 140.74 103.01 89.85 87.94 78.41
JPMorgan Investment Funds - US Select Equity FundJPM US Select Equity A (acc) - EUR 108.99 84.06 75.21 75.15 63.21JPM US Select Equity A (acc) - EUR (hedged) 110.55 81.72 72.40 74.48 67.83JPM US Select Equity A (acc) - USD 240.62 178.09 156.46 161.31 145.55JPM US Select Equity A (dist) - USD 168.75 124.89 109.73 113.13 102.07JPM US Select Equity B (acc) - EUR 99.06 75.84 - - -JPM US Select Equity B (acc) - USD 229.71 168.75 147.14 150.57 134.84JPM US Select Equity B (dist) - USD 110.00 - - - -JPM US Select Equity C (acc) - EUR 123.97 94.61 83.76 - -JPM US Select Equity C (acc) - EUR (hedged) 112.68 82.43 72.27 73.56 66.29JPM US Select Equity C (acc) - USD 228.50 167.36 145.48 148.43 132.53JPM US Select Equity C (dist) - GBP 98.75 74.30 67.73 - -JPM US Select Equity D (acc) - EUR (hedged) 106.85 79.38 70.69 73.07 66.88JPM US Select Equity D (acc) - USD 168.20 125.12 110.47 114.46 103.79JPM US Select Equity I (acc) - EUR (hedged) 81.01 - - - -JPM US Select Equity I (acc) - USD 151.79 111.03 96.38 98.17 87.54JPM US Select Equity I (dist) - USD 109.81 - - - -JPM US Select Equity X (acc) - USD 229.18 166.55 143.67 145.43 128.85
# This Sub-Fund’s “JF” prefix was removed on 4 February 2013.## This Share Class changed prefix from “JF” to “JPMorgan” on 4 February 2013.* Share Class inactive as at end of the year.** Share Class reactivated during the year.
The accompanying notes form an integral part of these Financial Statements.
36
1. Organisation
JPMorgan Investment Funds (the “SICAV”) is an investment company incorporated on 22 December 1994 under the name J.P. Morgan Investment Funds. Thename of the SICAV was changed to JPMorgan Fleming Investment Funds on 19 November 2001 and then to JPMorgan Investment Funds on 12 September2005.
It is organised under Part I of the Luxembourg Law of 17 December 2010 on Undertakings for Collective Investment, as a Société Anonyme qualifying as a“Société d’Investissement à Capital Variable” (SICAV). As at 31 December 2013, it comprises 24 Sub-Funds, each relating to a separate investment portfolioconsisting of securities, cash and other instruments.
On 12 September 2005, JPMorgan Asset Management (Europe) S.à r.l. was appointed by the SICAV to act as Management Company. The Articles ofIncorporation were also modified so the SICAV complies with UCITS III regulations. From 1 July 2011, JPMorgan Asset Management (Europe) S.à r.l. is actingas a Chapter 15 Management Company under the Luxembourg Law of 17 December 2010 and complies with UCITS IV regulations.
The SICAV is registered with the Registre de Commerce et des Sociétés of Luxembourg, under number B 49 663.
Each Sub-Fund may contain A, B, C, D, I, P, T and X Classes of Shares, which may differ in the minimum subscription amount, minimum holding amount,currency and/or eligibility requirements, the fees and expenses, and the dividend policy applicable to them. In addition, each Sub-Fund may contain Classesof Shares named either “JPM” or “JPMorgan”.
Within each Sub-Fund, individual Classes of Shares may have a currency of denomination that differs from the currency of denomination of the Sub-Fund.The currency of denomination for each Class of Share is indicated by a suffix on the name of the Share Class.
2. Significant Accounting Policies
The Financial Statements are prepared in accordance with Luxembourg regulations relating to Undertakings for Collective Investments.
a) Investment Valuation
Transferable securities which are admitted to an official exchange listing or dealt in on another regulated market are valued on the basis of the latestavailable price prevailing at the time of calculating the net asset value.
If securities are listed or dealt in on several exchanges or markets, the latest available price, or if appropriate, the average price on the principal exchange ormarket will be applied.
Transferable securities not admitted to an official exchange listing nor dealt in on another regulated market are valued at the latest available price. Thosesecurities for which no price is available or for which the latest available price is not representative are valued on the basis of their reasonably foreseeablesales price determined with prudence and in good faith by the Board of Directors.
Shares or Units in UCITS or other UCIS are valued at the latest available price or net asset value, as reported or provided by such undertakings or their agents.
Liquid assets and money market instruments may be valued at nominal values plus any accrued interest or on an amortised cost basis.
For the JPMorgan Investment Funds - Euro Liquid Market Fund:
• Except as noted below, all investments are valued at amortised cost, which approximates market value. Under this method, the cost of investments isadjusted to income for the amortisation of premiums and discounts over the life of the investments.
• Where the amortised cost basis does not reflect a fair approach to the valuation of the security, the latest available price prevailing on the valuation day isused.
The financial statements are presented on the basis of the net asset values of the Sub-Funds calculated on 31 December 2013, except for JPMorganInvestment Funds - Blue and Green Fund, JPMorgan Investment Funds - Europe Select Equity Fund, JPMorgan Investment Funds - Global Balanced Fund,JPMorgan Investment Funds - Global Capital Appreciation Fund, JPMorgan Investment Funds - Global Capital Preservation Fund (USD), JPMorgan InvestmentFunds - Global Conservative Balanced Fund, JPMorgan Investment Funds - Japan 50 Equity Fund, JPMorgan Investment Funds - Japan Select Equity Fund andJPMorgan Investment Funds - Japan Strategic Value Fund calculated on 30 December 2013 (due to the Management Company’s decision to close these fundson 31 December 2013 due to a substantial portion of the portfolios being traded on a closed stock exchange). In accordance with the Prospectus, the net assetvalues were calculated using the latest exchange rates known at the time of calculation.
b) Swing Pricing
A Sub-Fund may suffer dilution of the Net Asset Value per Share due to investors buying or selling Shares in a Sub-Fund at a price that does not reflect thedealing and other costs that arise when security trades are undertaken by the Investment Manager to accommodate cash inflows or outflows.
In order to counter this impact, a Swing Pricing mechanism may be adopted to protect the interests of Shareholders of the Fund. If on any Valuation Day, theaggregate net transactions in Shares of a Sub-Fund exceed a pre-determined threshold, as determined and reviewed for each Sub-Fund on a periodic basisby the Management Company, the Net Asset Value per Share may be adjusted upwards or downwards to reflect net inflows and net outflows respectively.The net inflows and net outflows will be determined by the Management Company based on the latest available information at the time of calculation of theNet Asset Value per Share. The Swing Pricing mechanism may be applied across all Sub-Funds with the exception of JPMorgan Investment Funds – Blue andGreen Fund, JPMorgan Investment Funds – Highbridge Statistical Market Neutral Fund and the money market Sub-Funds, as defined by the Prospectus. Theextent of the price adjustment will be set by the Management Company to reflect dealing and other costs. Such adjustment may vary from Sub-Fund toSub-Fund and will not exceed 2% of the original Net Asset Value per Share. The official Net Asset Value per Share as at year end, disclosed in the StatisticalInformation section of this report may therefore include a Swing Pricing adjustment, which would not be recognised in the Combined Statement of NetAssets and in the Combined Statement of Operations and Changes in Net Assets.
As at year end, a Swing Pricing adjustment had been applied to JPMorgan Investment Funds - Emerging Markets Corporate Bond Portfolio Fund I andJPMorgan Investment Funds - Japan 50 Equity Fund.
No other Sub-Funds were swung as at 31 December 2013.
From 30 July 2010 onwards, the net asset values of JPMorgan Investment Funds - Emerging Markets Corporate Bond Portfolio Fund I had been adjusteddownwards by a swing factor determined by the Management Company under its established procedures, irrespective of redemption flows. The decision toswing downwards is due to the specific nature of the product and the fact that after the initial subscription phase, no further subscriptions will be acceptedinto the Fund.
c) Realised and Unrealised Gains and Losses on Investments
Investment transactions are accounted for on the trade date (the date the order to buy or sell is executed). For trades into other collective investmentschemes, transactions are accounted for on receipt of the trade confirmation from the underlying transfer agents.
37
JPMorgan Investment Funds
Notes to the Financial Statements
As at 31 December 2013
Realised gains and losses on sales of investments are calculated on the average book cost. The associated foreign exchange movement between the date ofpurchase and date of sale of investments is included in realised gains and losses on investments. Unrealised gains and losses on holdings of investments arecalculated on the total book cost and include the associated unrealised gains and losses on foreign exchange.
d) Income Recognition
Interest income is accrued daily and includes the amortisation of premiums and accretion of discounts, where applicable. Bank interest income is recognisedon an accrual basis. Dividend income is accrued on the ex-dividend date. This income is shown net of any withholding taxes and adjusted accordingly whentax reclaims apply.
e) Conversion of Foreign Currencies
The books and records of each Sub-Fund are denominated in the base currency of the corresponding Sub-Fund. Amounts denominated in other currenciesare translated into the base currency on the following basis: (i) investment valuations and other assets and liabilities initially expressed in other currenciesare converted each business day into the base currency using currency exchange rates prevailing on each such business day; (ii) purchases and sales offoreign investments, income and expenses are converted into the base currency using currency exchange rates prevailing on the respective dates of suchtransactions.
Net realised and unrealised gains or losses on foreign exchange represent: (i) foreign exchange gains and losses from the sale and holding of foreigncurrencies and foreign cash equivalents; (ii) gains and losses between trade date and settlement date on securities transactions; and (iii) gains and lossesarising from the difference between amounts of dividends and interest recorded and the amounts actually received.
The resulting gains and losses on translation are included in “Net Realised Gain/(Loss) on Foreign Exchange” in the Combined Statement of Operations andChanges in Net Assets.
The reference currency of the SICAV as reflected in the combined statements is USD.
The principal exchange rates applied as at 31 December 2013 are as follows:
1 USD = 0.72592121 EUR;1 USD = 0.60437568 GBP;1 USD = 104.92000000 JPY.
f) Forward Foreign Exchange Contracts
Unrealised gains or losses on outstanding forward foreign exchange contracts are valued on the basis of currency exchange rates prevailing at the relevantvaluation date. The changes in such amounts are included in the Combined Statement of Operations and Changes in Net Assets under “Net Change inUnrealised Gain/(Loss) on Forward Foreign Exchange Contracts”. When a contract is closed, the Realised Gain/(Loss) is recorded under “Net RealisedGain/(Loss) on Forward Foreign Exchange Contracts” in the Combined Statement of Operations and Changes in Net Assets. Unrealised Gains or Losses arerecorded under “Unrealised Gain/(Loss) on Forward Foreign Exchanges Contracts” in the Combined Statement of Net Assets.
g) Financial Futures Contracts on Securities and Indices
Regulated financial futures contracts are valued at the exchange quoted settlement price. Initial margin deposits are made upon entering into the contractsand can be either in cash or securities. During the period the contracts are open, changes in the value of the contracts are recognised as unrealised gains andlosses by “marking-to-market” on a daily basis to reflect the market value of the contracts at the end of each business day’s trading. Variation marginpayments are made or received, depending upon whether losses or gains are incurred. When a contract is closed, the SICAV records a realised gain or lossequal to the difference between the proceeds from, or cost of, the closing transaction and the initial cost of the contract in “Net Realised Gain/(Loss) onFinancial Futures Contracts” in the Combined Statement of Operations and Changes in Net Assets.
Unrealised gains or losses are recorded under “Unrealised Net Gain/(Loss) on Financial Futures Contracts” in the Combined Statement of Net Assets.
Daily margin calls are recorded under “Net Realised Gain/(Loss) on Financial Futures Contracts” in the Combined Statement of Operations and Changes inNet Assets.
h) Option Contracts
Options purchased are recorded as investments; options written or sold are recorded as liabilities. When the exercise of an option results in a cashsettlement, the difference between the premium and the settlement proceeds is accounted for as a realised gain or loss. When securities are acquired ordelivered upon exercise of an option, the acquisition cost or sale proceeds are adjusted by the amount of the premium. When an option is closed, thedifference between the premium and the cost to close the position is accounted for as a realised gain or loss. When an option expires, the premium isaccounted for as a realised gain for options written or as a realised loss for options purchased.
The SICAV writes options on securities, futures, currencies and interest rate swaps (“swaptions”). These options are settled in cash and subject the SICAV tounlimited risk of loss. The SICAV, however, is not subject to credit risk on written options as the counterparty has already performed its obligation by payingthe premium at the inception of the contract. As of 31 December 2013, the SICAV had written options contracts outstanding as listed on its Schedule ofInvestments.
For options on futures, where the investment manager is based in the United Kingdom, variation margin payments are made or received daily, dependingupon whether losses or gains are incurred on the underlying futures contract.
The market values are recorded under “Derivative Instruments at Market Value” in the Combined Statement of Net Assets.
i) To Be Announced Securities (“TBAs”)
TBAs are related to mortgage backed securities issued by government sponsored agencies. These agencies usually pool mortgage loans and sell interests inthe pools created. TBAs relate to future pools of these agencies that are bought and sold for future settlement for which either the interest rate or thematurity date is not yet fixed. TBAs are separately disclosed in the Schedule of Investments.
Certain Sub-Funds may enter into Dollar Rolls, principally using To Be Announced (“TBA”) Securities, in which the Sub-Funds sell mortgage-backed securitiesfor delivery in the current month and simultaneously contract to repurchase similar, but not identical, securities at an agreed-upon price on a fixed date. TheSub-Funds account for such Dollar Rolls as purchases and sales and receive compensation as consideration for entering into the commitment to repurchase.The Sub-Funds must maintain liquid securities having a value not less than the repurchase price (including accrued interest) for such Dollar Rolls. The marketvalue of the securities that the Sub-Funds are required to purchase may decline below the agreed upon repurchase price of those securities.
Certain Sub-Funds had TBAs outstanding as of 31 December 2013, which are included in Investment in TBAs at Market Value and Open Short Positions onTBAs in the Combined Statement of Net Assets.
38
JPMorgan Investment Funds
Notes to the Financial Statements (continued)
As at 31 December 2013
j) Interest Rate Swaps
An interest rate swap is a bilateral agreement in which each of the parties agree to exchange a series of interest payments for another series of interestpayments (usually fixed/floating) based on a notional amount that serves as a computation basis and that is usually not exchanged.
The market values are recorded under “Derivative Instruments at Market Value” in the Combined Statement of Net Assets. The changes in such amounts arerecorded under “Net Change in Unrealised Gain/(Loss) on Derivative Instruments” and the Realised under “Net Realised Gain/(Loss) on DerivativeInstruments” in the Combined Statement of Operations and Changes in Net Assets.
k) Total Return Swaps
The SICAV may enter into swap contracts in which the SICAV and the counterparty agree to exchange payments where one or both parties pay the returnsgenerated by a security, instrument, basket or index thereof. The payments made by the SICAV to the counterparty and vice versa are calculated byreference to a specific security, index, or instruments and an agreed upon notional amount. Any such underlying security or instrument must be atransferable security and any such index must be an index of a regulated market.
A Total Return Swap on a basket of equities will exchange the total performance on the specific basket of equities, selected by the Investment Manageragainst a reference rate plus a spread. The total performance includes interest, dividends, gains and losses on the underlying securities during the contractperiod according to the type of underlying. The risk of this type of instrument will depend on the uncertain evolution, at the time of the contract conclusion, ofthe performance of the underlying. These underlying securities are listed on a primary exchange.
The value of the underlying securities shall be taken into account for the calculation of the investment restrictions applicable to individual issuers. Therelevant indices include, but are not limited to, currencies, interest rates, prices and total return on interest rates indices, fixed income indices and stockindices.
The market values are recorded under “Derivative Instruments at Market Value” in the Combined Statement of Net Assets. The changes in such amounts areincluded in the Combined Statement of Operations and Changes in Net Assets under “Net Change in Unrealised Gain/(Loss) on Derivative Instruments”.When a contract is closed, the Realised Gain/(Loss) is recorded under “Net Realised Gain/(Loss) on Derivative Instruments” in the Combined Statement ofOperations and Changes in Net Assets.
l) Credit Default Swaps
A Credit Default Swap is a credit derivative transaction in which two parties enter into an agreement, whereby one party pays the other a periodic paymentfor the specified life of the agreement. The other party makes no payments unless a credit event, relating to a predetermined reference asset, occurs. If suchan event occurs, the party will then make a payment to the first party, and the swap will terminate. The value of the underlying securities shall be taken intoaccount for the calculation of the investment restrictions applicable to individual issuers.
The market values are recorded under “Derivative Instruments at Market Value” in the Combined Statement of Net Assets. The changes in such amounts arerecorded under “Net Change in Unrealised Gain/(Loss) on Derivative Instruments” and the Realised under “Net Realised Gain/(Loss) on DerivativeInstruments” in the Combined Statement of Operations and Changes in Net Assets.
m) Forward Starting Variance Swap
A variance swap is an instrument which allows the SICAV to trade future realized (or historical) volatility of an underlying asset against its current impliedvolatility. The market values are recorded under “Derivatives Instruments at Market Value” in the Combined Statement of Net Assets. The changes in suchamounts are recorded under “Net Change in Unrealised Gain/(Loss) on Derivatives Instruments” and the Realised Gain/(Loss) when contracts are closed arerecorded under “Net Realised Gain/(Loss) on Derivatives Instruments” in the Combined Statement of Operations and Changes in Net Assets.
3. Fees and Expenses
a) All Sub-Funds - Share Classes A, B, C, D and T
The fees and expenses charged to these Classes of shares are set at a fixed percentage of the total net assets of each Class of shares. This fixed percentagecovers all fees and expenses connected with the management of these Classes of shares, including Investment Management Fees, shareholder servicingfees and Other Operating and Administrative Expenses, which include but are not limited to Custody, Registrar and Transfer Agent Fees; it does not covertaxes paid on investment, brokerage expenses, extraordinary costs or performance fees, if any. No other costs are charged to these Classes of shares, andthe Management Company absorbs any difference that may arise between the actual costs of the operations of these Classes of shares and the fixedpercentage. To the extent that the actual operating costs are less than the fixed percentage, the excess is paid to the Management Company and includedwithin “Management and Advisory Fees”. To the extent that actual operating costs exceed the fixed percentage, the amount borne by the ManagementCompany will be separately disclosed as a “Fee Waiver’’ in the Combined Statement of Net Assets and the Combined Statement of Operations and Changes inNet Assets.
This fixedannual rateof feesandexpenses iscategorisedasaTotalExpenseRatio.The fixedannual ratesof fees foreachClassofsharesareshownin theAppendix.
Please refer to Note 16d) regarding changes in the Structure of the Share Classes Operating and Administrative Expenses.
b) All Sub-Funds - Share Class I & P
The maximum total fees and expenses to be borne by Class I shareholders of any Sub-Fund will not exceed a capped percentage of the total net assetsattributable to that Class. These capped fees and expenses comprise Investment Management Fees plus other Operating and Administrative Expenses,limited to Custody, Fiduciary, Accounting, Transfer Agency Fees, Taxes and Sundry Expenses; it does not cover performance fees, if any.
This capped annual rate of fees and expenses is categorised as a Capped Expense Ratio. The capped annual rates of fees for each Class of shares are shown inthe Appendix.
c) All Sub-Funds - Share Class X
The Class X shares of each Sub-Fund are charged a pro-rata share of the Custody and Accounting Fees allocable to that Sub-Fund.
The Management Company pays all other Operating and Administrative Expenses allocable to such Class to the exclusion of performance fees, if any. Themaximum Operating and Administrative Expenses to be borne by the Class X shareholders of any Sub-Fund will not exceed a capped percentage of the totalnet assets attributable to that Class, as set out in the Appendix.
The Annual Management Fee that would normally be payable in respect of the X Share Class are administratively levied and collected by the GlobalDistributor directly from the shareholder or through the relevant J.P.Morgan Chase & Co entity.
39
JPMorgan Investment Funds
Notes to the Financial Statements (continued)
As at 31 December 2013
Sub-Funds may invest in UCITS and other UCIs managed by the Management Company, the Investment Manager or any other member of JPMorgan Chase &Co. The avoidance of a double-charge of the Annual Management and Advisory Fee on such assets is achieved by either a) excluding the assets from the netassets on which the Annual Management and Advisory Fee is calculated; or b) investing in UCITS or UCIs via classes that do not accrue an AnnualManagement and Advisory Fee or other equivalent fees payable to the relevant Investment Manager’s group; or c) the Annual Management and AdvisoryFee being netted off by a rebate to the SICAV or Sub-Fund of the Annual Management and Advisory Fee (or equivalent) charged to the underlying UCITS orUCIs; or d) charging only the difference between the Annual Management and Advisory Fee of the SICAV or Sub-Fund and the Annual Management andAdvisory Fee (or equivalent) charged to the underlying UCITS or UCIs.
The Management Company has from time to time waived all or part of the Annual Management and Advisory Fees payable to it on a number of Sub-Funds. Inaddition, the Management Company has from time to time paid part of the Operating and Administrative Expenses payable on a number of Sub-Funds.These actions have had the effect of reducing the Annual Total Expenses on a number of Sub-Funds.
d) Performance Fees
Pursuant to the Investment Management Agreement, as set out in the Appendix to the Prospectus, the Investment Manager is entitled to receive from thenet assets of certain Sub-Funds or Classes, an annual performance-based incentive fee (the “Performance Fee”) if the performance of the Sub-Fund exceedsthe return from the benchmark, subject to the operation of a Claw-Back Mechanism or of a High Water Mark as defined in Appendix V of the Prospectus and asspecified in Appendix III of the Prospectus for each Sub-Fund. On each Valuation Day, an accrual for the previous Valuation Day’s Performance Fee is made,when appropriate, and the final Performance Fee is payable annually. Pursuant to the provisions of the relevant Investment Management Agreement, theInvestment Manager may be entitled to receive the performance Fee from the Management Company.
On each Valuation Day, the net asset value of each Class of each Sub-Fund for which a Performance Fee applies, which includes an accrual for all fees andexpenses (including the Annual Management and Advisory Fee, and the Operating and Administrative Expenses to be borne by the relevant Class at the rateset out in the Appendix to the Prospectus), is adjusted for any dividend distributions and for subscriptions and redemptions dealt with on that Valuation Day,if any, and any Performance Fee accrued through that day in respect of such Class is added back (the “Adjusted net asset value”). For purposes of calculatingthe Performance Fee, the “Share Class Return” is computed on each Valuation Day, as the difference between the net asset value (adjusted by adding backany accrued Performance Fee) on such day and the Adjusted net asset value on the previous Valuation Day, expressed as a return based on the previousValuation Day’s Adjusted net asset value for that Class.
High Water Mark Method
If the Share Class Return exceeds the Benchmark Return and the cumulative Share Class Return exceeds the High Water Mark Return (as set out in theAppendix to the Prospectus), the Performance Fee accrual is increased by the Performance Fee Rate multiplied by the Excess Return multiplied by theprevious Valuation Day’s Adjusted net asset value for that Class. If the Share Class Return does not exceed the Benchmark Return, the Performance Feeaccrual is reduced (but not below zero) by the Performance Fee Rate multiplied by the negative Excess Return multiplied by the previous Valuation Day’sAdjusted net asset value for that Class. Following a period of negative Excess Return whereby the Performance Fee accrual has been reduced to zero, no newPerformance Fee is accrued until such time as the cumulative Share Class Return exceeds the greater of the High Water Mark Return and the cumulativeBenchmark Return since the beginning of the SICAV accounting year. The Performance Fee accrued on any Valuation Day is reflected in the Net Asset Valueper Share on the basis of which subscriptions and redemptions may be accepted.
Claw-Back mechanism
The purpose of the Claw-Back Mechanism is to ensure that the Management Company will only become entitled to a Performance Fee when it outperformsthe cumulative Benchmark Return (as defined in Appendix V of the Prospectus) accrued since the last Valuation Day of the last period in which a PerformanceFee was paid.
As at 31 December 2013, the Performance Fee rate and the benchmarks are as follows:
Sub-Fund or Share Class PerformanceFee Rate
Benchmark
Claw-Back Mechanism method
JPMorgan Investment Funds - Global Select Equity Plus Fund 10% MSCI World Index (Total Return Net)
JPMorgan Investment Funds – Japan Focus Fund (1) 10% TOPIX (Total Return Net)
High Water Mark Return methodJPMorgan Investment Funds - Global Total Return Fund (2) 10% BBA 1 Month EUR LIBOR
JPMorgan Investment Funds - Global Capital Appreciation Fund 10% BBA 1 Month EUR LIBOR
JPMorgan Investment Funds - Global Capital Preservation Fund (USD) (3) 10% BBA 1 Month USD LIBOR
JPMorgan Investment Funds - Global Conservative Balanced Fund (4) 10% BBA 1 Month EUR LIBOR
JPMorgan Investment Funds - Global Conservative Balanced Fund (SEK hedged) (4) 10% BBA 1 Month EUR LIBOR Hedged to SEK
JPMorgan Investment Funds - Highbridge Statistical Market Neutral Fund 20% EONIA
JPMorgan Investment Funds - Highbridge Statistical Market Neutral Fund (GBP hedged) 20% BBA Overnight GBP LIBOR
JPMorgan Investment Funds - Highbridge Statistical Market Neutral Fund (SEK hedged) 20% STIBOR Tomorrow Next Offered Rate
JPMorgan Investment Funds - Highbridge Statistical Market Neutral Fund (USD hedged) 20% BBA Overnight USD LIBOR
JPMorgan Investment Funds - Income Opportunity Fund 20% BBA Overnight USD LIBOR
JPMorgan Investment Funds - Income Opportunity Fund (CHF hedged) 20% BBA Spot Next CHF LIBOR
JPMorgan Investment Funds - Income Opportunity Fund (EUR hedged) 20% EONIA
JPMorgan Investment Funds - Income Opportunity Fund (GBP hedged) 20% BBA Overnight GBP LIBOR
JPMorgan Investment Funds - Income Opportunity Fund (SEK hedged) 20% STIBOR Tomorrow Next Offered Rate
JPMorgan Investment Funds - Income Opportunity Fund (SGD hedged) 20% Singapore Interbank Overnight Rate
(1) Accrual of the Performance Fees stopped on 17 May 2013. Please refer to Note 16d).(2) This Sub-Fund was merged into Global Capital Appreciation Fund on 25 October 2013.(3) Accrual of the Performance Fees stopped on 1 February 2013. Please refer to Note 16d).(4) Accrual of the Performance Fees stopped on 1 February 2013. Please refer to Note 16d). This Sub-Fund was renamed from Global Capital Preservation Fund (EUR) on 21 August 2013.
40
JPMorgan Investment Funds
Notes to the Financial Statements (continued)
As at 31 December 2013
4. Dividend Policy
Share Classes with the suffix “(acc)” are accumulation Share Classes and will not normally pay dividends.
Distribution Share Classes will normally pay dividends as described below.
Share Classes suffixed “(dist)” and suffixed “(inc)”
It is intended that all those Share Classes with the suffix “(dist)” will meet the conditions to qualify as “reporting Fund” for the purposes of the UnitedKingdom tax legislation relating to offshore funds and will, if appropriate, pay dividends which at least meet the greater of the reportable income under thatlegislation or the taxable earnings from investments in accordance with the German Investment Tax Act. It is intended that those Share Classes with the suffix“(inc)” will, if appropriate, pay dividends equal to or in excess of the taxable earnings from investments in accordance with the German Investment Tax Act.Payment of dividends on these Share Classes will normally be made in March of each year.
Share Classes suffixed “(div)”
Share Classes with the suffix “(div)” will normally pay quarterly dividends which are calculated by the Management Company based on the estimated annualyield of the relevant Sub-Fund’s portfolio which is attributable to that Share Class. The Management Company will review the dividend rate for each ShareClass at least semi-annually, but may adjust the dividend rate more frequently to reflect changes in the portfolio’s expected yield.
Investors should be aware that “(div)” Share Classes give priority to dividends, rather than to capital growth. The expected yield for each Share Class will becalculated gross of both the Annual Management and Advisory Fee and the Operating and Administrative Expenses, and such Share Classes will typicallydistribute more than the income received. Share Classes with the suffix “(div)” in issue at the dividend record date will be eligible for any dividends which willnormally be paid in the currency of the relevant Share Class.
Share Classes suffixed “(mth)”
Share Classes with the suffix “(mth)” will be available to Shareholders subscribing, and remaining subscribed, through specific Asian distribution networksand to other distributors at the sole discretion of the Management Company. Share Classes with the suffix “(mth)” will normally pay dividends on a monthlybasis. The monthly dividend rate per Share will be calculated by the Management Company based on the estimated annual yield of the relevant Sub-Fund’sportfolio which is attributable to that Share Class. The Management Company will review the dividend rate for each Share Class at least semi-annually, butmay adjust the dividend rate more frequently to reflect changes in the portfolio’s expected yield. Investors should be aware that “(mth)” share classes givepriority to dividends, rather than to capital growth. The expected yield for each Share Class will be calculated gross of both the Annual Management andAdvisory Fee and the Operating and Administrative Expenses, and such Share Classes will typically distribute more than the income received. Dividendpayments for these Share Classes will normally be made to Shareholders each month in the currency of the relevant Share Class. The Management Companyreserves the right to fix a minimum amount per Share Class, below which the actual payment of the dividend would not be economically efficient for theFund. These payments will be deferred to the following month or reinvested in further Shares of the same Share Class and not paid directly to theShareholders. The Net Asset Value of “(mth)” Share Classes may fluctuate more than other Share Classes due to more frequent distribution of income.
Share Classes suffixed “(fix)”
Share Classes with the suffix “(fix)” will normally pay a quarterly fixed dividend based on a total amount per Share per annum as defined in the Prospectus.
Share Classes suffixed “(irc)”
Share Classes with the suffix “(irc)” will normally pay dividends on a monthly basis. The monthly dividend rate per Share will be variable and will be calculatedby the Management Company based on: the estimated gross annual yield of the relevant Sub-Fund’s portfolio attributable to that Share Class, which isrevised at least semi-annually; and the addition or deduction of the estimated interest rate carry depending on whether such carry is positive or negativerespectively.
Other Information
Shareholders should note that, where the dividend rate is in excess of the investment income of the Share Class, dividends will be paid out of the capitalattributed to the Share Class, as well as from realised and unrealised capital gains. This may be tax inefficient for investors in certain countries. Investorsshould consult their local tax adviser about their own position. Share Classes with the suffix “(div)”, “(fix)”, “(inc)”, “(irc)” and “(mth)” do not distribute thereportable income in accordance with the United Kingdom tax legislation relating to offshore funds.
During the year ended 31 December 2013, the SICAV paid dividends as follows:
Class name Currency Dividend Amount per Share Payment Date
JPM Global Balanced (USD) A (mth) - USD USD 0.14 17 January 2013
JPM Global Balanced (USD) B (mth) - USD USD 0.14 17 January 2013
JPM Global Balanced (USD) D (mth) - USD USD 0.14 17 January 2013
JPM Global Capital Preservation (USD) A (mth) - USD USD 0.12 17 January 2013
JPM Global Capital Preservation (USD) B (mth) - USD USD 0.12 17 January 2013
JPM Global Capital Preservation (USD) D (mth) - USD USD 0.12 17 January 2013
JPM Global Convertibles (USD) B (mth) - USD USD 0.17 17 January 2013
JPM Global Convertibles (USD) D (mth) - USD USD 0.17 17 January 2013
JPM Global High Yield Bond A (mth) - HKD HKD 0.06 17 January 2013
JPM Global High Yield Bond A (mth) - SGD SGD 0.07 17 January 2013
JPM Global High Yield Bond A (mth) - USD USD 0.58 17 January 2013
JPM Global High Yield Bond B (mth) - USD USD 0.59 17 January 2013
JPM Global High Yield Bond C (mth) - USD USD 0.57 17 January 2013
JPM Global High Yield Bond I (mth) - USD USD 0.59 17 January 2013
JPM Global Income A (mth) - USD (hedged) USD 0.61 17 January 2013
JPM Global Income B (mth) - USD (hedged) USD 0.62 17 January 2013
JPM Global Income D (mth) - USD (hedged) USD 0.62 17 January 2013
JPM Income Opportunity A (mth) - USD USD 0.24 17 January 2013
JPM Income Opportunity B (mth) - USD USD 0.24 17 January 2013
JPM Global Balanced (USD) A (mth) - USD USD 0.14 19 February 2013
JPM Global Balanced (USD) B (mth) - USD USD 0.14 19 February 2013
JPM Global Balanced (USD) D (mth) - USD USD 0.14 19 February 2013
41
JPMorgan Investment Funds
Notes to the Financial Statements (continued)
As at 31 December 2013
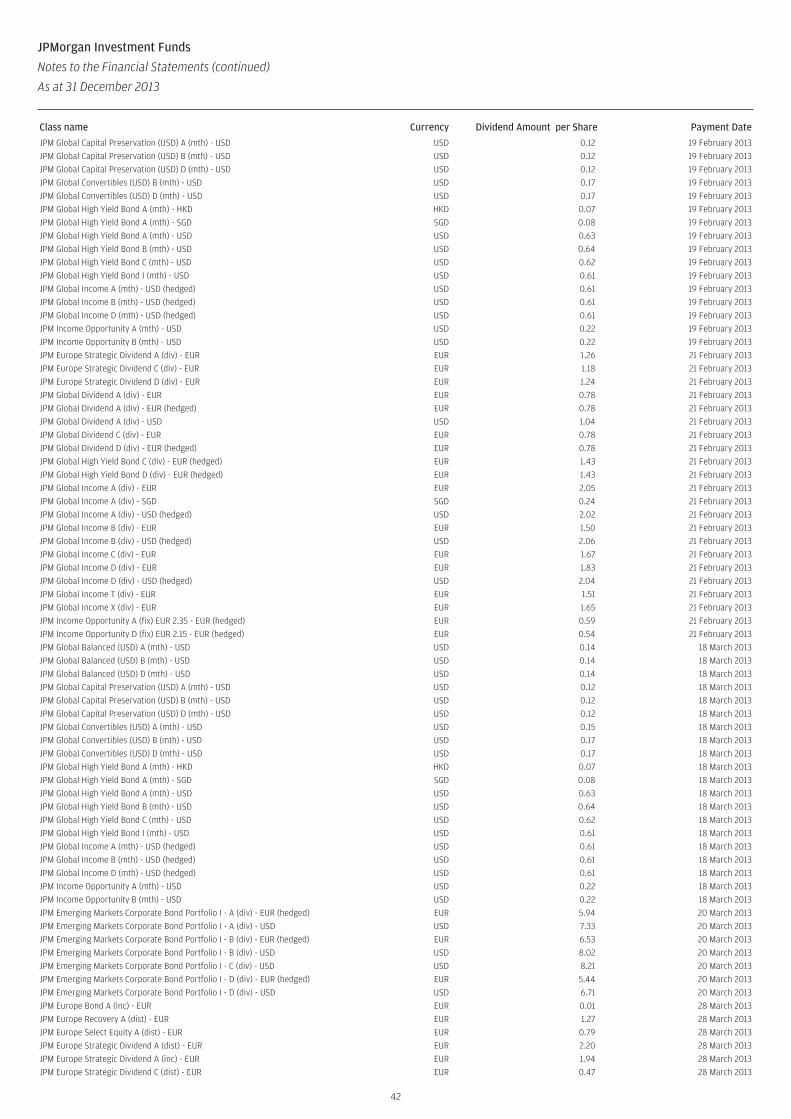
Class name Currency Dividend Amount per Share Payment Date
JPM Global Capital Preservation (USD) A (mth) - USD USD 0.12 19 February 2013
JPM Global Capital Preservation (USD) B (mth) - USD USD 0.12 19 February 2013
JPM Global Capital Preservation (USD) D (mth) - USD USD 0.12 19 February 2013
JPM Global Convertibles (USD) B (mth) - USD USD 0.17 19 February 2013
JPM Global Convertibles (USD) D (mth) - USD USD 0.17 19 February 2013
JPM Global High Yield Bond A (mth) - HKD HKD 0.07 19 February 2013
JPM Global High Yield Bond A (mth) - SGD SGD 0.08 19 February 2013
JPM Global High Yield Bond A (mth) - USD USD 0.63 19 February 2013
JPM Global High Yield Bond B (mth) - USD USD 0.64 19 February 2013
JPM Global High Yield Bond C (mth) - USD USD 0.62 19 February 2013
JPM Global High Yield Bond I (mth) - USD USD 0.61 19 February 2013
JPM Global Income A (mth) - USD (hedged) USD 0.61 19 February 2013
JPM Global Income B (mth) - USD (hedged) USD 0.61 19 February 2013
JPM Global Income D (mth) - USD (hedged) USD 0.61 19 February 2013
JPM Income Opportunity A (mth) - USD USD 0.22 19 February 2013
JPM Income Opportunity B (mth) - USD USD 0.22 19 February 2013
JPM Europe Strategic Dividend A (div) - EUR EUR 1.26 21 February 2013
JPM Europe Strategic Dividend C (div) - EUR EUR 1.18 21 February 2013
JPM Europe Strategic Dividend D (div) - EUR EUR 1.24 21 February 2013
JPM Global Dividend A (div) - EUR EUR 0.78 21 February 2013
JPM Global Dividend A (div) - EUR (hedged) EUR 0.78 21 February 2013
JPM Global Dividend A (div) - USD USD 1.04 21 February 2013
JPM Global Dividend C (div) - EUR EUR 0.78 21 February 2013
JPM Global Dividend D (div) - EUR (hedged) EUR 0.78 21 February 2013
JPM Global High Yield Bond C (div) - EUR (hedged) EUR 1.43 21 February 2013
JPM Global High Yield Bond D (div) - EUR (hedged) EUR 1.43 21 February 2013
JPM Global Income A (div) - EUR EUR 2.05 21 February 2013
JPM Global Income A (div) - SGD SGD 0.24 21 February 2013
JPM Global Income A (div) - USD (hedged) USD 2.02 21 February 2013
JPM Global Income B (div) - EUR EUR 1.50 21 February 2013
JPM Global Income B (div) - USD (hedged) USD 2.06 21 February 2013
JPM Global Income C (div) - EUR EUR 1.67 21 February 2013
JPM Global Income D (div) - EUR EUR 1.83 21 February 2013
JPM Global Income D (div) - USD (hedged) USD 2.04 21 February 2013
JPM Global Income T (div) - EUR EUR 1.51 21 February 2013
JPM Global Income X (div) - EUR EUR 1.65 21 February 2013
JPM Income Opportunity A (fix) EUR 2.35 - EUR (hedged) EUR 0.59 21 February 2013
JPM Income Opportunity D (fix) EUR 2.15 - EUR (hedged) EUR 0.54 21 February 2013
JPM Global Balanced (USD) A (mth) - USD USD 0.14 18 March 2013
JPM Global Balanced (USD) B (mth) - USD USD 0.14 18 March 2013
JPM Global Balanced (USD) D (mth) - USD USD 0.14 18 March 2013
JPM Global Capital Preservation (USD) A (mth) - USD USD 0.12 18 March 2013
JPM Global Capital Preservation (USD) B (mth) - USD USD 0.12 18 March 2013
JPM Global Capital Preservation (USD) D (mth) - USD USD 0.12 18 March 2013
JPM Global Convertibles (USD) A (mth) - USD USD 0.15 18 March 2013
JPM Global Convertibles (USD) B (mth) - USD USD 0.17 18 March 2013
JPM Global Convertibles (USD) D (mth) - USD USD 0.17 18 March 2013
JPM Global High Yield Bond A (mth) - HKD HKD 0.07 18 March 2013
JPM Global High Yield Bond A (mth) - SGD SGD 0.08 18 March 2013
JPM Global High Yield Bond A (mth) - USD USD 0.63 18 March 2013
JPM Global High Yield Bond B (mth) - USD USD 0.64 18 March 2013
JPM Global High Yield Bond C (mth) - USD USD 0.62 18 March 2013
JPM Global High Yield Bond I (mth) - USD USD 0.61 18 March 2013
JPM Global Income A (mth) - USD (hedged) USD 0.61 18 March 2013
JPM Global Income B (mth) - USD (hedged) USD 0.61 18 March 2013
JPM Global Income D (mth) - USD (hedged) USD 0.61 18 March 2013
JPM Income Opportunity A (mth) - USD USD 0.22 18 March 2013
JPM Income Opportunity B (mth) - USD USD 0.22 18 March 2013
JPM Emerging Markets Corporate Bond Portfolio I - A (div) - EUR (hedged) EUR 5.94 20 March 2013
JPM Emerging Markets Corporate Bond Portfolio I - A (div) - USD USD 7.33 20 March 2013
JPM Emerging Markets Corporate Bond Portfolio I - B (div) - EUR (hedged) EUR 6.53 20 March 2013
JPM Emerging Markets Corporate Bond Portfolio I - B (div) - USD USD 8.02 20 March 2013
JPM Emerging Markets Corporate Bond Portfolio I - C (div) - USD USD 8.21 20 March 2013
JPM Emerging Markets Corporate Bond Portfolio I - D (div) - EUR (hedged) EUR 5.44 20 March 2013
JPM Emerging Markets Corporate Bond Portfolio I - D (div) - USD USD 6.71 20 March 2013
JPM Europe Bond A (inc) - EUR EUR 0.01 28 March 2013
JPM Europe Recovery A (dist) - EUR EUR 1.27 28 March 2013
JPM Europe Select Equity A (dist) - EUR EUR 0.79 28 March 2013
JPM Europe Strategic Dividend A (dist) - EUR EUR 2.20 28 March 2013
JPM Europe Strategic Dividend A (inc) - EUR EUR 1.94 28 March 2013
JPM Europe Strategic Dividend C (dist) - EUR EUR 0.47 28 March 2013
42
JPMorgan Investment Funds
Notes to the Financial Statements (continued)
As at 31 December 2013
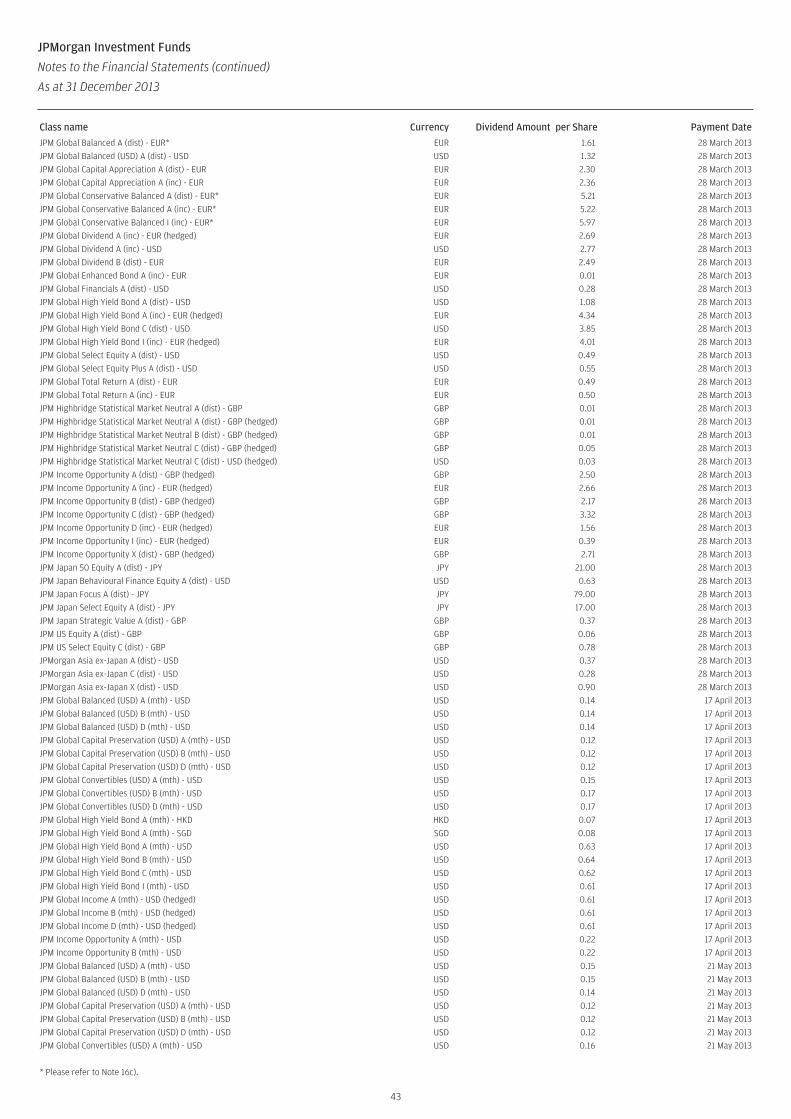
Class name Currency Dividend Amount per Share Payment Date
JPM Global Balanced A (dist) - EUR* EUR 1.61 28 March 2013
JPM Global Balanced (USD) A (dist) - USD USD 1.32 28 March 2013
JPM Global Capital Appreciation A (dist) - EUR EUR 2.30 28 March 2013
JPM Global Capital Appreciation A (inc) - EUR EUR 2.36 28 March 2013
JPM Global Conservative Balanced A (dist) - EUR* EUR 5.21 28 March 2013
JPM Global Conservative Balanced A (inc) - EUR* EUR 5.22 28 March 2013
JPM Global Conservative Balanced I (inc) - EUR* EUR 5.97 28 March 2013
JPM Global Dividend A (inc) - EUR (hedged) EUR 2.69 28 March 2013
JPM Global Dividend A (inc) - USD USD 2.77 28 March 2013
JPM Global Dividend B (dist) - EUR EUR 2.49 28 March 2013
JPM Global Enhanced Bond A (inc) - EUR EUR 0.01 28 March 2013
JPM Global Financials A (dist) - USD USD 0.28 28 March 2013
JPM Global High Yield Bond A (dist) - USD USD 1.08 28 March 2013
JPM Global High Yield Bond A (inc) - EUR (hedged) EUR 4.34 28 March 2013
JPM Global High Yield Bond C (dist) - USD USD 3.85 28 March 2013
JPM Global High Yield Bond I (inc) - EUR (hedged) EUR 4.01 28 March 2013
JPM Global Select Equity A (dist) - USD USD 0.49 28 March 2013
JPM Global Select Equity Plus A (dist) - USD USD 0.55 28 March 2013
JPM Global Total Return A (dist) - EUR EUR 0.49 28 March 2013
JPM Global Total Return A (inc) - EUR EUR 0.50 28 March 2013
JPM Highbridge Statistical Market Neutral A (dist) - GBP GBP 0.01 28 March 2013
JPM Highbridge Statistical Market Neutral A (dist) - GBP (hedged) GBP 0.01 28 March 2013
JPM Highbridge Statistical Market Neutral B (dist) - GBP (hedged) GBP 0.01 28 March 2013
JPM Highbridge Statistical Market Neutral C (dist) - GBP (hedged) GBP 0.05 28 March 2013
JPM Highbridge Statistical Market Neutral C (dist) - USD (hedged) USD 0.03 28 March 2013
JPM Income Opportunity A (dist) - GBP (hedged) GBP 2.50 28 March 2013
JPM Income Opportunity A (inc) - EUR (hedged) EUR 2.66 28 March 2013
JPM Income Opportunity B (dist) - GBP (hedged) GBP 2.17 28 March 2013
JPM Income Opportunity C (dist) - GBP (hedged) GBP 3.32 28 March 2013
JPM Income Opportunity D (inc) - EUR (hedged) EUR 1.56 28 March 2013
JPM Income Opportunity I (inc) - EUR (hedged) EUR 0.39 28 March 2013
JPM Income Opportunity X (dist) - GBP (hedged) GBP 2.71 28 March 2013
JPM Japan 50 Equity A (dist) - JPY JPY 21.00 28 March 2013
JPM Japan Behavioural Finance Equity A (dist) - USD USD 0.63 28 March 2013
JPM Japan Focus A (dist) - JPY JPY 79.00 28 March 2013
JPM Japan Select Equity A (dist) - JPY JPY 17.00 28 March 2013
JPM Japan Strategic Value A (dist) - GBP GBP 0.37 28 March 2013
JPM US Equity A (dist) - GBP GBP 0.06 28 March 2013
JPM US Select Equity C (dist) - GBP GBP 0.78 28 March 2013
JPMorgan Asia ex-Japan A (dist) - USD USD 0.37 28 March 2013
JPMorgan Asia ex-Japan C (dist) - USD USD 0.28 28 March 2013
JPMorgan Asia ex-Japan X (dist) - USD USD 0.90 28 March 2013
JPM Global Balanced (USD) A (mth) - USD USD 0.14 17 April 2013
JPM Global Balanced (USD) B (mth) - USD USD 0.14 17 April 2013
JPM Global Balanced (USD) D (mth) - USD USD 0.14 17 April 2013
JPM Global Capital Preservation (USD) A (mth) - USD USD 0.12 17 April 2013
JPM Global Capital Preservation (USD) B (mth) - USD USD 0.12 17 April 2013
JPM Global Capital Preservation (USD) D (mth) - USD USD 0.12 17 April 2013
JPM Global Convertibles (USD) A (mth) - USD USD 0.15 17 April 2013
JPM Global Convertibles (USD) B (mth) - USD USD 0.17 17 April 2013
JPM Global Convertibles (USD) D (mth) - USD USD 0.17 17 April 2013
JPM Global High Yield Bond A (mth) - HKD HKD 0.07 17 April 2013
JPM Global High Yield Bond A (mth) - SGD SGD 0.08 17 April 2013
JPM Global High Yield Bond A (mth) - USD USD 0.63 17 April 2013
JPM Global High Yield Bond B (mth) - USD USD 0.64 17 April 2013
JPM Global High Yield Bond C (mth) - USD USD 0.62 17 April 2013
JPM Global High Yield Bond I (mth) - USD USD 0.61 17 April 2013
JPM Global Income A (mth) - USD (hedged) USD 0.61 17 April 2013
JPM Global Income B (mth) - USD (hedged) USD 0.61 17 April 2013
JPM Global Income D (mth) - USD (hedged) USD 0.61 17 April 2013
JPM Income Opportunity A (mth) - USD USD 0.22 17 April 2013
JPM Income Opportunity B (mth) - USD USD 0.22 17 April 2013
JPM Global Balanced (USD) A (mth) - USD USD 0.15 21 May 2013
JPM Global Balanced (USD) B (mth) - USD USD 0.15 21 May 2013
JPM Global Balanced (USD) D (mth) - USD USD 0.14 21 May 2013
JPM Global Capital Preservation (USD) A (mth) - USD USD 0.12 21 May 2013
JPM Global Capital Preservation (USD) B (mth) - USD USD 0.12 21 May 2013
JPM Global Capital Preservation (USD) D (mth) - USD USD 0.12 21 May 2013
JPM Global Convertibles (USD) A (mth) - USD USD 0.16 21 May 2013
* Please refer to Note 16c).
43
JPMorgan Investment Funds
Notes to the Financial Statements (continued)
As at 31 December 2013
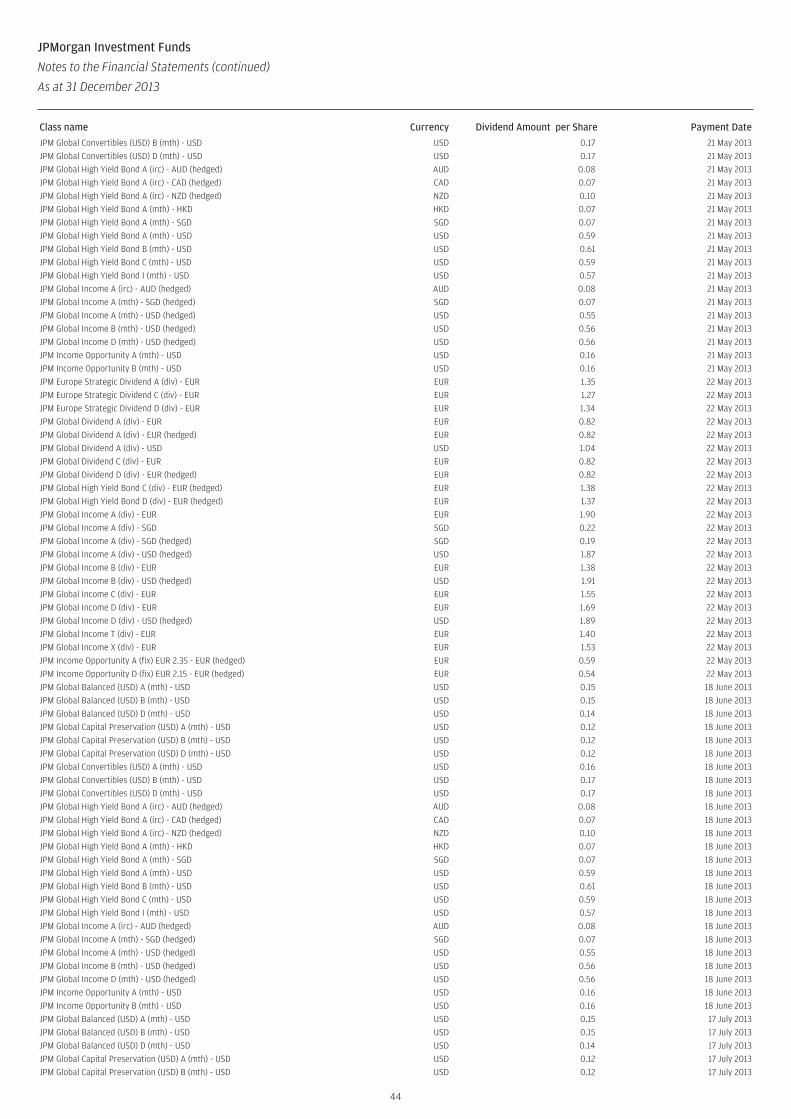
Class name Currency Dividend Amount per Share Payment Date
JPM Global Convertibles (USD) B (mth) - USD USD 0.17 21 May 2013
JPM Global Convertibles (USD) D (mth) - USD USD 0.17 21 May 2013
JPM Global High Yield Bond A (irc) - AUD (hedged) AUD 0.08 21 May 2013
JPM Global High Yield Bond A (irc) - CAD (hedged) CAD 0.07 21 May 2013
JPM Global High Yield Bond A (irc) - NZD (hedged) NZD 0.10 21 May 2013
JPM Global High Yield Bond A (mth) - HKD HKD 0.07 21 May 2013
JPM Global High Yield Bond A (mth) - SGD SGD 0.07 21 May 2013
JPM Global High Yield Bond A (mth) - USD USD 0.59 21 May 2013
JPM Global High Yield Bond B (mth) - USD USD 0.61 21 May 2013
JPM Global High Yield Bond C (mth) - USD USD 0.59 21 May 2013
JPM Global High Yield Bond I (mth) - USD USD 0.57 21 May 2013
JPM Global Income A (irc) - AUD (hedged) AUD 0.08 21 May 2013
JPM Global Income A (mth) - SGD (hedged) SGD 0.07 21 May 2013
JPM Global Income A (mth) - USD (hedged) USD 0.55 21 May 2013
JPM Global Income B (mth) - USD (hedged) USD 0.56 21 May 2013
JPM Global Income D (mth) - USD (hedged) USD 0.56 21 May 2013
JPM Income Opportunity A (mth) - USD USD 0.16 21 May 2013
JPM Income Opportunity B (mth) - USD USD 0.16 21 May 2013
JPM Europe Strategic Dividend A (div) - EUR EUR 1.35 22 May 2013
JPM Europe Strategic Dividend C (div) - EUR EUR 1.27 22 May 2013
JPM Europe Strategic Dividend D (div) - EUR EUR 1.34 22 May 2013
JPM Global Dividend A (div) - EUR EUR 0.82 22 May 2013
JPM Global Dividend A (div) - EUR (hedged) EUR 0.82 22 May 2013
JPM Global Dividend A (div) - USD USD 1.04 22 May 2013
JPM Global Dividend C (div) - EUR EUR 0.82 22 May 2013
JPM Global Dividend D (div) - EUR (hedged) EUR 0.82 22 May 2013
JPM Global High Yield Bond C (div) - EUR (hedged) EUR 1.38 22 May 2013
JPM Global High Yield Bond D (div) - EUR (hedged) EUR 1.37 22 May 2013
JPM Global Income A (div) - EUR EUR 1.90 22 May 2013
JPM Global Income A (div) - SGD SGD 0.22 22 May 2013
JPM Global Income A (div) - SGD (hedged) SGD 0.19 22 May 2013
JPM Global Income A (div) - USD (hedged) USD 1.87 22 May 2013
JPM Global Income B (div) - EUR EUR 1.38 22 May 2013
JPM Global Income B (div) - USD (hedged) USD 1.91 22 May 2013
JPM Global Income C (div) - EUR EUR 1.55 22 May 2013
JPM Global Income D (div) - EUR EUR 1.69 22 May 2013
JPM Global Income D (div) - USD (hedged) USD 1.89 22 May 2013
JPM Global Income T (div) - EUR EUR 1.40 22 May 2013
JPM Global Income X (div) - EUR EUR 1.53 22 May 2013
JPM Income Opportunity A (fix) EUR 2.35 - EUR (hedged) EUR 0.59 22 May 2013
JPM Income Opportunity D (fix) EUR 2.15 - EUR (hedged) EUR 0.54 22 May 2013
JPM Global Balanced (USD) A (mth) - USD USD 0.15 18 June 2013
JPM Global Balanced (USD) B (mth) - USD USD 0.15 18 June 2013
JPM Global Balanced (USD) D (mth) - USD USD 0.14 18 June 2013
JPM Global Capital Preservation (USD) A (mth) - USD USD 0.12 18 June 2013
JPM Global Capital Preservation (USD) B (mth) - USD USD 0.12 18 June 2013
JPM Global Capital Preservation (USD) D (mth) - USD USD 0.12 18 June 2013
JPM Global Convertibles (USD) A (mth) - USD USD 0.16 18 June 2013
JPM Global Convertibles (USD) B (mth) - USD USD 0.17 18 June 2013
JPM Global Convertibles (USD) D (mth) - USD USD 0.17 18 June 2013
JPM Global High Yield Bond A (irc) - AUD (hedged) AUD 0.08 18 June 2013
JPM Global High Yield Bond A (irc) - CAD (hedged) CAD 0.07 18 June 2013
JPM Global High Yield Bond A (irc) - NZD (hedged) NZD 0.10 18 June 2013
JPM Global High Yield Bond A (mth) - HKD HKD 0.07 18 June 2013
JPM Global High Yield Bond A (mth) - SGD SGD 0.07 18 June 2013
JPM Global High Yield Bond A (mth) - USD USD 0.59 18 June 2013
JPM Global High Yield Bond B (mth) - USD USD 0.61 18 June 2013
JPM Global High Yield Bond C (mth) - USD USD 0.59 18 June 2013
JPM Global High Yield Bond I (mth) - USD USD 0.57 18 June 2013
JPM Global Income A (irc) - AUD (hedged) AUD 0.08 18 June 2013
JPM Global Income A (mth) - SGD (hedged) SGD 0.07 18 June 2013
JPM Global Income A (mth) - USD (hedged) USD 0.55 18 June 2013
JPM Global Income B (mth) - USD (hedged) USD 0.56 18 June 2013
JPM Global Income D (mth) - USD (hedged) USD 0.56 18 June 2013
JPM Income Opportunity A (mth) - USD USD 0.16 18 June 2013
JPM Income Opportunity B (mth) - USD USD 0.16 18 June 2013
JPM Global Balanced (USD) A (mth) - USD USD 0.15 17 July 2013
JPM Global Balanced (USD) B (mth) - USD USD 0.15 17 July 2013
JPM Global Balanced (USD) D (mth) - USD USD 0.14 17 July 2013
JPM Global Capital Preservation (USD) A (mth) - USD USD 0.12 17 July 2013
JPM Global Capital Preservation (USD) B (mth) - USD USD 0.12 17 July 2013
44
JPMorgan Investment Funds
Notes to the Financial Statements (continued)
As at 31 December 2013
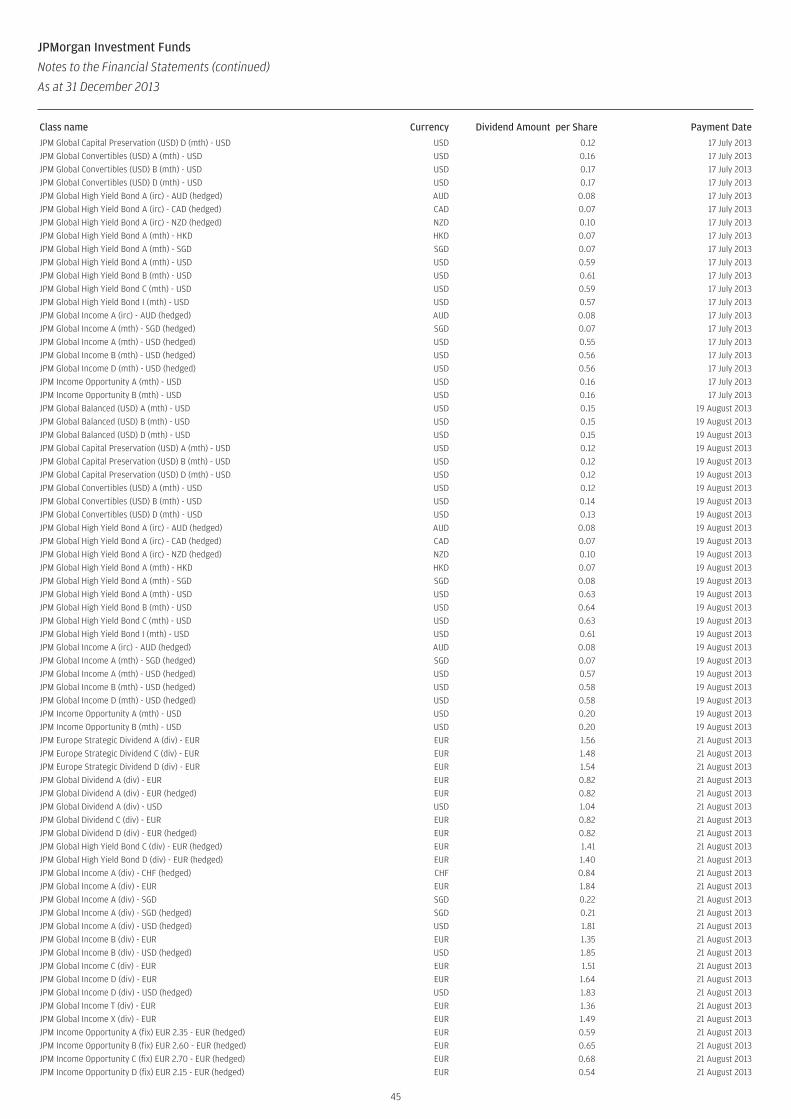
Class name Currency Dividend Amount per Share Payment Date
JPM Global Capital Preservation (USD) D (mth) - USD USD 0.12 17 July 2013
JPM Global Convertibles (USD) A (mth) - USD USD 0.16 17 July 2013
JPM Global Convertibles (USD) B (mth) - USD USD 0.17 17 July 2013
JPM Global Convertibles (USD) D (mth) - USD USD 0.17 17 July 2013
JPM Global High Yield Bond A (irc) - AUD (hedged) AUD 0.08 17 July 2013
JPM Global High Yield Bond A (irc) - CAD (hedged) CAD 0.07 17 July 2013
JPM Global High Yield Bond A (irc) - NZD (hedged) NZD 0.10 17 July 2013
JPM Global High Yield Bond A (mth) - HKD HKD 0.07 17 July 2013
JPM Global High Yield Bond A (mth) - SGD SGD 0.07 17 July 2013
JPM Global High Yield Bond A (mth) - USD USD 0.59 17 July 2013
JPM Global High Yield Bond B (mth) - USD USD 0.61 17 July 2013
JPM Global High Yield Bond C (mth) - USD USD 0.59 17 July 2013
JPM Global High Yield Bond I (mth) - USD USD 0.57 17 July 2013
JPM Global Income A (irc) - AUD (hedged) AUD 0.08 17 July 2013
JPM Global Income A (mth) - SGD (hedged) SGD 0.07 17 July 2013
JPM Global Income A (mth) - USD (hedged) USD 0.55 17 July 2013
JPM Global Income B (mth) - USD (hedged) USD 0.56 17 July 2013
JPM Global Income D (mth) - USD (hedged) USD 0.56 17 July 2013
JPM Income Opportunity A (mth) - USD USD 0.16 17 July 2013
JPM Income Opportunity B (mth) - USD USD 0.16 17 July 2013
JPM Global Balanced (USD) A (mth) - USD USD 0.15 19 August 2013
JPM Global Balanced (USD) B (mth) - USD USD 0.15 19 August 2013
JPM Global Balanced (USD) D (mth) - USD USD 0.15 19 August 2013
JPM Global Capital Preservation (USD) A (mth) - USD USD 0.12 19 August 2013
JPM Global Capital Preservation (USD) B (mth) - USD USD 0.12 19 August 2013
JPM Global Capital Preservation (USD) D (mth) - USD USD 0.12 19 August 2013
JPM Global Convertibles (USD) A (mth) - USD USD 0.12 19 August 2013
JPM Global Convertibles (USD) B (mth) - USD USD 0.14 19 August 2013
JPM Global Convertibles (USD) D (mth) - USD USD 0.13 19 August 2013
JPM Global High Yield Bond A (irc) - AUD (hedged) AUD 0.08 19 August 2013
JPM Global High Yield Bond A (irc) - CAD (hedged) CAD 0.07 19 August 2013
JPM Global High Yield Bond A (irc) - NZD (hedged) NZD 0.10 19 August 2013
JPM Global High Yield Bond A (mth) - HKD HKD 0.07 19 August 2013
JPM Global High Yield Bond A (mth) - SGD SGD 0.08 19 August 2013
JPM Global High Yield Bond A (mth) - USD USD 0.63 19 August 2013
JPM Global High Yield Bond B (mth) - USD USD 0.64 19 August 2013
JPM Global High Yield Bond C (mth) - USD USD 0.63 19 August 2013
JPM Global High Yield Bond I (mth) - USD USD 0.61 19 August 2013
JPM Global Income A (irc) - AUD (hedged) AUD 0.08 19 August 2013
JPM Global Income A (mth) - SGD (hedged) SGD 0.07 19 August 2013
JPM Global Income A (mth) - USD (hedged) USD 0.57 19 August 2013
JPM Global Income B (mth) - USD (hedged) USD 0.58 19 August 2013
JPM Global Income D (mth) - USD (hedged) USD 0.58 19 August 2013
JPM Income Opportunity A (mth) - USD USD 0.20 19 August 2013
JPM Income Opportunity B (mth) - USD USD 0.20 19 August 2013
JPM Europe Strategic Dividend A (div) - EUR EUR 1.56 21 August 2013
JPM Europe Strategic Dividend C (div) - EUR EUR 1.48 21 August 2013
JPM Europe Strategic Dividend D (div) - EUR EUR 1.54 21 August 2013
JPM Global Dividend A (div) - EUR EUR 0.82 21 August 2013
JPM Global Dividend A (div) - EUR (hedged) EUR 0.82 21 August 2013
JPM Global Dividend A (div) - USD USD 1.04 21 August 2013
JPM Global Dividend C (div) - EUR EUR 0.82 21 August 2013
JPM Global Dividend D (div) - EUR (hedged) EUR 0.82 21 August 2013
JPM Global High Yield Bond C (div) - EUR (hedged) EUR 1.41 21 August 2013
JPM Global High Yield Bond D (div) - EUR (hedged) EUR 1.40 21 August 2013
JPM Global Income A (div) - CHF (hedged) CHF 0.84 21 August 2013
JPM Global Income A (div) - EUR EUR 1.84 21 August 2013
JPM Global Income A (div) - SGD SGD 0.22 21 August 2013
JPM Global Income A (div) - SGD (hedged) SGD 0.21 21 August 2013
JPM Global Income A (div) - USD (hedged) USD 1.81 21 August 2013
JPM Global Income B (div) - EUR EUR 1.35 21 August 2013
JPM Global Income B (div) - USD (hedged) USD 1.85 21 August 2013
JPM Global Income C (div) - EUR EUR 1.51 21 August 2013
JPM Global Income D (div) - EUR EUR 1.64 21 August 2013
JPM Global Income D (div) - USD (hedged) USD 1.83 21 August 2013
JPM Global Income T (div) - EUR EUR 1.36 21 August 2013
JPM Global Income X (div) - EUR EUR 1.49 21 August 2013
JPM Income Opportunity A (fix) EUR 2.35 - EUR (hedged) EUR 0.59 21 August 2013
JPM Income Opportunity B (fix) EUR 2.60 - EUR (hedged) EUR 0.65 21 August 2013
JPM Income Opportunity C (fix) EUR 2.70 - EUR (hedged) EUR 0.68 21 August 2013
JPM Income Opportunity D (fix) EUR 2.15 - EUR (hedged) EUR 0.54 21 August 2013
45
JPMorgan Investment Funds
Notes to the Financial Statements (continued)
As at 31 December 2013
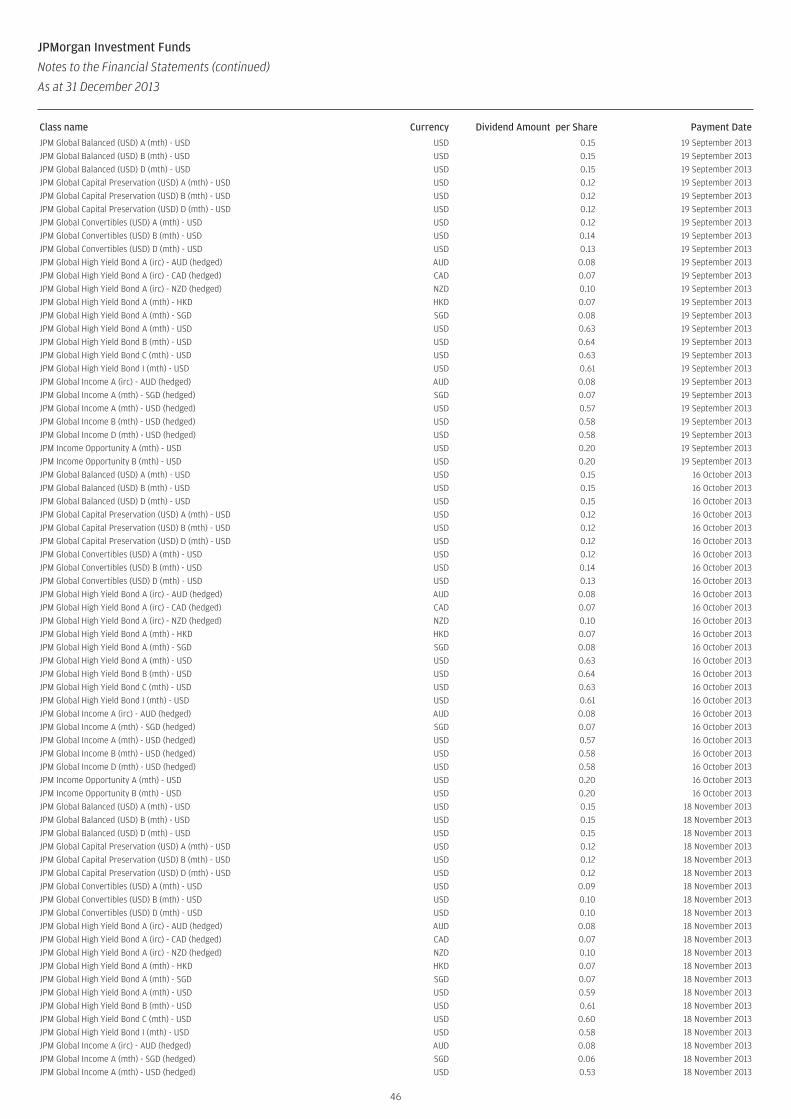
Class name Currency Dividend Amount per Share Payment Date
JPM Global Balanced (USD) A (mth) - USD USD 0.15 19 September 2013
JPM Global Balanced (USD) B (mth) - USD USD 0.15 19 September 2013
JPM Global Balanced (USD) D (mth) - USD USD 0.15 19 September 2013
JPM Global Capital Preservation (USD) A (mth) - USD USD 0.12 19 September 2013
JPM Global Capital Preservation (USD) B (mth) - USD USD 0.12 19 September 2013
JPM Global Capital Preservation (USD) D (mth) - USD USD 0.12 19 September 2013
JPM Global Convertibles (USD) A (mth) - USD USD 0.12 19 September 2013
JPM Global Convertibles (USD) B (mth) - USD USD 0.14 19 September 2013
JPM Global Convertibles (USD) D (mth) - USD USD 0.13 19 September 2013
JPM Global High Yield Bond A (irc) - AUD (hedged) AUD 0.08 19 September 2013
JPM Global High Yield Bond A (irc) - CAD (hedged) CAD 0.07 19 September 2013
JPM Global High Yield Bond A (irc) - NZD (hedged) NZD 0.10 19 September 2013
JPM Global High Yield Bond A (mth) - HKD HKD 0.07 19 September 2013
JPM Global High Yield Bond A (mth) - SGD SGD 0.08 19 September 2013
JPM Global High Yield Bond A (mth) - USD USD 0.63 19 September 2013
JPM Global High Yield Bond B (mth) - USD USD 0.64 19 September 2013
JPM Global High Yield Bond C (mth) - USD USD 0.63 19 September 2013
JPM Global High Yield Bond I (mth) - USD USD 0.61 19 September 2013
JPM Global Income A (irc) - AUD (hedged) AUD 0.08 19 September 2013
JPM Global Income A (mth) - SGD (hedged) SGD 0.07 19 September 2013
JPM Global Income A (mth) - USD (hedged) USD 0.57 19 September 2013
JPM Global Income B (mth) - USD (hedged) USD 0.58 19 September 2013
JPM Global Income D (mth) - USD (hedged) USD 0.58 19 September 2013
JPM Income Opportunity A (mth) - USD USD 0.20 19 September 2013
JPM Income Opportunity B (mth) - USD USD 0.20 19 September 2013
JPM Global Balanced (USD) A (mth) - USD USD 0.15 16 October 2013
JPM Global Balanced (USD) B (mth) - USD USD 0.15 16 October 2013
JPM Global Balanced (USD) D (mth) - USD USD 0.15 16 October 2013
JPM Global Capital Preservation (USD) A (mth) - USD USD 0.12 16 October 2013
JPM Global Capital Preservation (USD) B (mth) - USD USD 0.12 16 October 2013
JPM Global Capital Preservation (USD) D (mth) - USD USD 0.12 16 October 2013
JPM Global Convertibles (USD) A (mth) - USD USD 0.12 16 October 2013
JPM Global Convertibles (USD) B (mth) - USD USD 0.14 16 October 2013
JPM Global Convertibles (USD) D (mth) - USD USD 0.13 16 October 2013
JPM Global High Yield Bond A (irc) - AUD (hedged) AUD 0.08 16 October 2013
JPM Global High Yield Bond A (irc) - CAD (hedged) CAD 0.07 16 October 2013
JPM Global High Yield Bond A (irc) - NZD (hedged) NZD 0.10 16 October 2013
JPM Global High Yield Bond A (mth) - HKD HKD 0.07 16 October 2013
JPM Global High Yield Bond A (mth) - SGD SGD 0.08 16 October 2013
JPM Global High Yield Bond A (mth) - USD USD 0.63 16 October 2013
JPM Global High Yield Bond B (mth) - USD USD 0.64 16 October 2013
JPM Global High Yield Bond C (mth) - USD USD 0.63 16 October 2013
JPM Global High Yield Bond I (mth) - USD USD 0.61 16 October 2013
JPM Global Income A (irc) - AUD (hedged) AUD 0.08 16 October 2013
JPM Global Income A (mth) - SGD (hedged) SGD 0.07 16 October 2013
JPM Global Income A (mth) - USD (hedged) USD 0.57 16 October 2013
JPM Global Income B (mth) - USD (hedged) USD 0.58 16 October 2013
JPM Global Income D (mth) - USD (hedged) USD 0.58 16 October 2013
JPM Income Opportunity A (mth) - USD USD 0.20 16 October 2013
JPM Income Opportunity B (mth) - USD USD 0.20 16 October 2013
JPM Global Balanced (USD) A (mth) - USD USD 0.15 18 November 2013
JPM Global Balanced (USD) B (mth) - USD USD 0.15 18 November 2013
JPM Global Balanced (USD) D (mth) - USD USD 0.15 18 November 2013
JPM Global Capital Preservation (USD) A (mth) - USD USD 0.12 18 November 2013
JPM Global Capital Preservation (USD) B (mth) - USD USD 0.12 18 November 2013
JPM Global Capital Preservation (USD) D (mth) - USD USD 0.12 18 November 2013
JPM Global Convertibles (USD) A (mth) - USD USD 0.09 18 November 2013
JPM Global Convertibles (USD) B (mth) - USD USD 0.10 18 November 2013
JPM Global Convertibles (USD) D (mth) - USD USD 0.10 18 November 2013
JPM Global High Yield Bond A (irc) - AUD (hedged) AUD 0.08 18 November 2013
JPM Global High Yield Bond A (irc) - CAD (hedged) CAD 0.07 18 November 2013
JPM Global High Yield Bond A (irc) - NZD (hedged) NZD 0.10 18 November 2013
JPM Global High Yield Bond A (mth) - HKD HKD 0.07 18 November 2013
JPM Global High Yield Bond A (mth) - SGD SGD 0.07 18 November 2013
JPM Global High Yield Bond A (mth) - USD USD 0.59 18 November 2013
JPM Global High Yield Bond B (mth) - USD USD 0.61 18 November 2013
JPM Global High Yield Bond C (mth) - USD USD 0.60 18 November 2013
JPM Global High Yield Bond I (mth) - USD USD 0.58 18 November 2013
JPM Global Income A (irc) - AUD (hedged) AUD 0.08 18 November 2013
JPM Global Income A (mth) - SGD (hedged) SGD 0.06 18 November 2013
JPM Global Income A (mth) - USD (hedged) USD 0.53 18 November 2013
46
JPMorgan Investment Funds
Notes to the Financial Statements (continued)
As at 31 December 2013
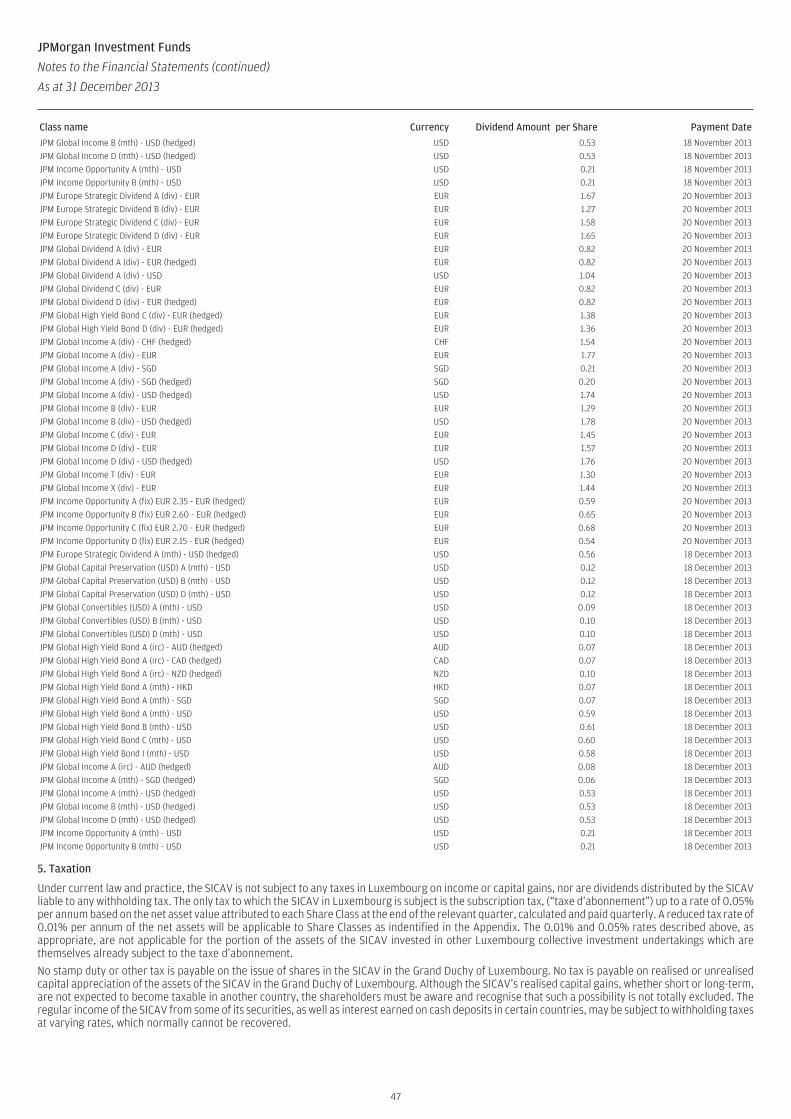
Class name Currency Dividend Amount per Share Payment Date
JPM Global Income B (mth) - USD (hedged) USD 0.53 18 November 2013
JPM Global Income D (mth) - USD (hedged) USD 0.53 18 November 2013
JPM Income Opportunity A (mth) - USD USD 0.21 18 November 2013
JPM Income Opportunity B (mth) - USD USD 0.21 18 November 2013
JPM Europe Strategic Dividend A (div) - EUR EUR 1.67 20 November 2013
JPM Europe Strategic Dividend B (div) - EUR EUR 1.27 20 November 2013
JPM Europe Strategic Dividend C (div) - EUR EUR 1.58 20 November 2013
JPM Europe Strategic Dividend D (div) - EUR EUR 1.65 20 November 2013
JPM Global Dividend A (div) - EUR EUR 0.82 20 November 2013
JPM Global Dividend A (div) - EUR (hedged) EUR 0.82 20 November 2013
JPM Global Dividend A (div) - USD USD 1.04 20 November 2013
JPM Global Dividend C (div) - EUR EUR 0.82 20 November 2013
JPM Global Dividend D (div) - EUR (hedged) EUR 0.82 20 November 2013
JPM Global High Yield Bond C (div) - EUR (hedged) EUR 1.38 20 November 2013
JPM Global High Yield Bond D (div) - EUR (hedged) EUR 1.36 20 November 2013
JPM Global Income A (div) - CHF (hedged) CHF 1.54 20 November 2013
JPM Global Income A (div) - EUR EUR 1.77 20 November 2013
JPM Global Income A (div) - SGD SGD 0.21 20 November 2013
JPM Global Income A (div) - SGD (hedged) SGD 0.20 20 November 2013
JPM Global Income A (div) - USD (hedged) USD 1.74 20 November 2013
JPM Global Income B (div) - EUR EUR 1.29 20 November 2013
JPM Global Income B (div) - USD (hedged) USD 1.78 20 November 2013
JPM Global Income C (div) - EUR EUR 1.45 20 November 2013
JPM Global Income D (div) - EUR EUR 1.57 20 November 2013
JPM Global Income D (div) - USD (hedged) USD 1.76 20 November 2013
JPM Global Income T (div) - EUR EUR 1.30 20 November 2013
JPM Global Income X (div) - EUR EUR 1.44 20 November 2013
JPM Income Opportunity A (fix) EUR 2.35 - EUR (hedged) EUR 0.59 20 November 2013
JPM Income Opportunity B (fix) EUR 2.60 - EUR (hedged) EUR 0.65 20 November 2013
JPM Income Opportunity C (fix) EUR 2.70 - EUR (hedged) EUR 0.68 20 November 2013
JPM Income Opportunity D (fix) EUR 2.15 - EUR (hedged) EUR 0.54 20 November 2013
JPM Europe Strategic Dividend A (mth) - USD (hedged) USD 0.56 18 December 2013
JPM Global Capital Preservation (USD) A (mth) - USD USD 0.12 18 December 2013
JPM Global Capital Preservation (USD) B (mth) - USD USD 0.12 18 December 2013
JPM Global Capital Preservation (USD) D (mth) - USD USD 0.12 18 December 2013
JPM Global Convertibles (USD) A (mth) - USD USD 0.09 18 December 2013
JPM Global Convertibles (USD) B (mth) - USD USD 0.10 18 December 2013
JPM Global Convertibles (USD) D (mth) - USD USD 0.10 18 December 2013
JPM Global High Yield Bond A (irc) - AUD (hedged) AUD 0.07 18 December 2013
JPM Global High Yield Bond A (irc) - CAD (hedged) CAD 0.07 18 December 2013
JPM Global High Yield Bond A (irc) - NZD (hedged) NZD 0.10 18 December 2013
JPM Global High Yield Bond A (mth) - HKD HKD 0.07 18 December 2013
JPM Global High Yield Bond A (mth) - SGD SGD 0.07 18 December 2013
JPM Global High Yield Bond A (mth) - USD USD 0.59 18 December 2013
JPM Global High Yield Bond B (mth) - USD USD 0.61 18 December 2013
JPM Global High Yield Bond C (mth) - USD USD 0.60 18 December 2013
JPM Global High Yield Bond I (mth) - USD USD 0.58 18 December 2013
JPM Global Income A (irc) - AUD (hedged) AUD 0.08 18 December 2013
JPM Global Income A (mth) - SGD (hedged) SGD 0.06 18 December 2013
JPM Global Income A (mth) - USD (hedged) USD 0.53 18 December 2013
JPM Global Income B (mth) - USD (hedged) USD 0.53 18 December 2013
JPM Global Income D (mth) - USD (hedged) USD 0.53 18 December 2013
JPM Income Opportunity A (mth) - USD USD 0.21 18 December 2013
JPM Income Opportunity B (mth) - USD USD 0.21 18 December 2013
5. Taxation
Under current law and practice, the SICAV is not subject to any taxes in Luxembourg on income or capital gains, nor are dividends distributed by the SICAVliable to any withholding tax. The only tax to which the SICAV in Luxembourg is subject is the subscription tax, (“taxe d’abonnement”) up to a rate of 0.05%per annum based on the net asset value attributed to each Share Class at the end of the relevant quarter, calculated and paid quarterly. A reduced tax rate of0.01% per annum of the net assets will be applicable to Share Classes as indentified in the Appendix. The 0.01% and 0.05% rates described above, asappropriate, are not applicable for the portion of the assets of the SICAV invested in other Luxembourg collective investment undertakings which arethemselves already subject to the taxe d’abonnement.
No stamp duty or other tax is payable on the issue of shares in the SICAV in the Grand Duchy of Luxembourg. No tax is payable on realised or unrealisedcapital appreciation of the assets of the SICAV in the Grand Duchy of Luxembourg. Although the SICAV’s realised capital gains, whether short or long-term,are not expected to become taxable in another country, the shareholders must be aware and recognise that such a possibility is not totally excluded. Theregular income of the SICAV from some of its securities, as well as interest earned on cash deposits in certain countries, may be subject to withholding taxesat varying rates, which normally cannot be recovered.
47
JPMorgan Investment Funds
Notes to the Financial Statements (continued)
As at 31 December 2013
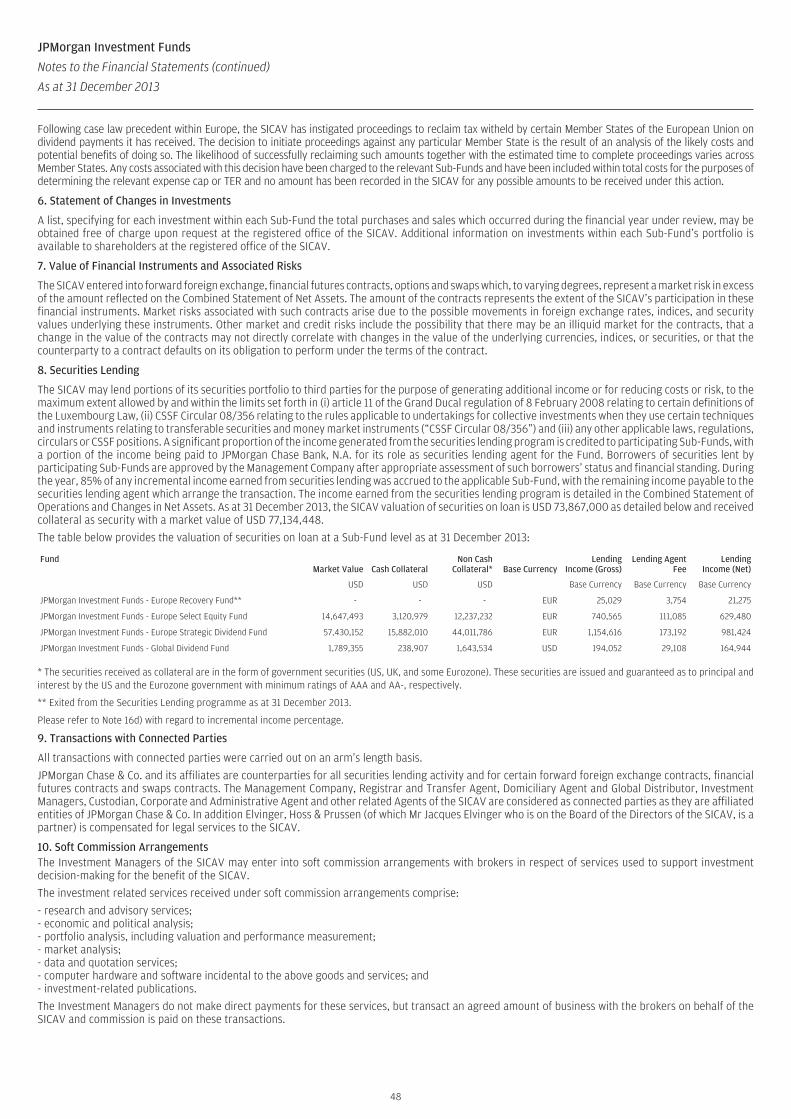
Following case law precedent within Europe, the SICAV has instigated proceedings to reclaim tax witheld by certain Member States of the European Union ondividend payments it has received. The decision to initiate proceedings against any particular Member State is the result of an analysis of the likely costs andpotential benefits of doing so. The likelihood of successfully reclaiming such amounts together with the estimated time to complete proceedings varies acrossMember States. Any costs associated with this decision have been charged to the relevant Sub-Funds and have been included within total costs for the purposes ofdetermining the relevant expense cap or TER and no amount has been recorded in the SICAV for any possible amounts to be received under this action.
6. Statement of Changes in Investments
A list, specifying for each investment within each Sub-Fund the total purchases and sales which occurred during the financial year under review, may beobtained free of charge upon request at the registered office of the SICAV. Additional information on investments within each Sub-Fund’s portfolio isavailable to shareholders at the registered office of the SICAV.
7. Value of Financial Instruments and Associated Risks
The SICAV entered into forward foreign exchange, financial futures contracts, options and swaps which, to varying degrees, represent a market risk in excessof the amount reflected on the Combined Statement of Net Assets. The amount of the contracts represents the extent of the SICAV’s participation in thesefinancial instruments. Market risks associated with such contracts arise due to the possible movements in foreign exchange rates, indices, and securityvalues underlying these instruments. Other market and credit risks include the possibility that there may be an illiquid market for the contracts, that achange in the value of the contracts may not directly correlate with changes in the value of the underlying currencies, indices, or securities, or that thecounterparty to a contract defaults on its obligation to perform under the terms of the contract.
8. Securities Lending
The SICAV may lend portions of its securities portfolio to third parties for the purpose of generating additional income or for reducing costs or risk, to themaximum extent allowed by and within the limits set forth in (i) article 11 of the Grand Ducal regulation of 8 February 2008 relating to certain definitions ofthe Luxembourg Law, (ii) CSSF Circular 08/356 relating to the rules applicable to undertakings for collective investments when they use certain techniquesand instruments relating to transferable securities and money market instruments (“CSSF Circular 08/356”) and (iii) any other applicable laws, regulations,circulars or CSSF positions. A significant proportion of the income generated from the securities lending program is credited to participating Sub-Funds, witha portion of the income being paid to JPMorgan Chase Bank, N.A. for its role as securities lending agent for the Fund. Borrowers of securities lent byparticipating Sub-Funds are approved by the Management Company after appropriate assessment of such borrowers’ status and financial standing. Duringthe year, 85% of any incremental income earned from securities lending was accrued to the applicable Sub-Fund, with the remaining income payable to thesecurities lending agent which arrange the transaction. The income earned from the securities lending program is detailed in the Combined Statement ofOperations and Changes in Net Assets. As at 31 December 2013, the SICAV valuation of securities on loan is USD 73,867,000 as detailed below and receivedcollateral as security with a market value of USD 77,134,448.
The table below provides the valuation of securities on loan at a Sub-Fund level as at 31 December 2013:
FundMarket Value Cash Collateral
Non CashCollateral* Base Currency
LendingIncome (Gross)
Lending AgentFee
LendingIncome (Net)
USD USD USD Base Currency Base Currency Base Currency
JPMorgan Investment Funds - Europe Recovery Fund** - - - EUR 25,029 3,754 21,275
JPMorgan Investment Funds - Europe Select Equity Fund 14,647,493 3,120,979 12,237,232 EUR 740,565 111,085 629,480
JPMorgan Investment Funds - Europe Strategic Dividend Fund 57,430,152 15,882,010 44,011,786 EUR 1,154,616 173,192 981,424
JPMorgan Investment Funds - Global Dividend Fund 1,789,355 238,907 1,643,534 USD 194,052 29,108 164,944
* The securities received as collateral are in the form of government securities (US, UK, and some Eurozone). These securities are issued and guaranteed as to principal andinterest by the US and the Eurozone government with minimum ratings of AAA and AA-, respectively.
** Exited from the Securities Lending programme as at 31 December 2013.
Please refer to Note 16d) with regard to incremental income percentage.
9. Transactions with Connected Parties
All transactions with connected parties were carried out on an arm’s length basis.
JPMorgan Chase & Co. and its affiliates are counterparties for all securities lending activity and for certain forward foreign exchange contracts, financialfutures contracts and swaps contracts. The Management Company, Registrar and Transfer Agent, Domiciliary Agent and Global Distributor, InvestmentManagers, Custodian, Corporate and Administrative Agent and other related Agents of the SICAV are considered as connected parties as they are affiliatedentities of JPMorgan Chase & Co. In addition Elvinger, Hoss & Prussen (of which Mr Jacques Elvinger who is on the Board of the Directors of the SICAV, is apartner) is compensated for legal services to the SICAV.
10. Soft Commission ArrangementsThe Investment Managers of the SICAV may enter into soft commission arrangements with brokers in respect of services used to support investmentdecision-making for the benefit of the SICAV.
The investment related services received under soft commission arrangements comprise:
- research and advisory services;- economic and political analysis;- portfolio analysis, including valuation and performance measurement;- market analysis;- data and quotation services;- computer hardware and software incidental to the above goods and services; and- investment-related publications.
The Investment Managers do not make direct payments for these services, but transact an agreed amount of business with the brokers on behalf of theSICAV and commission is paid on these transactions.
48
JPMorgan Investment Funds
Notes to the Financial Statements (continued)
As at 31 December 2013
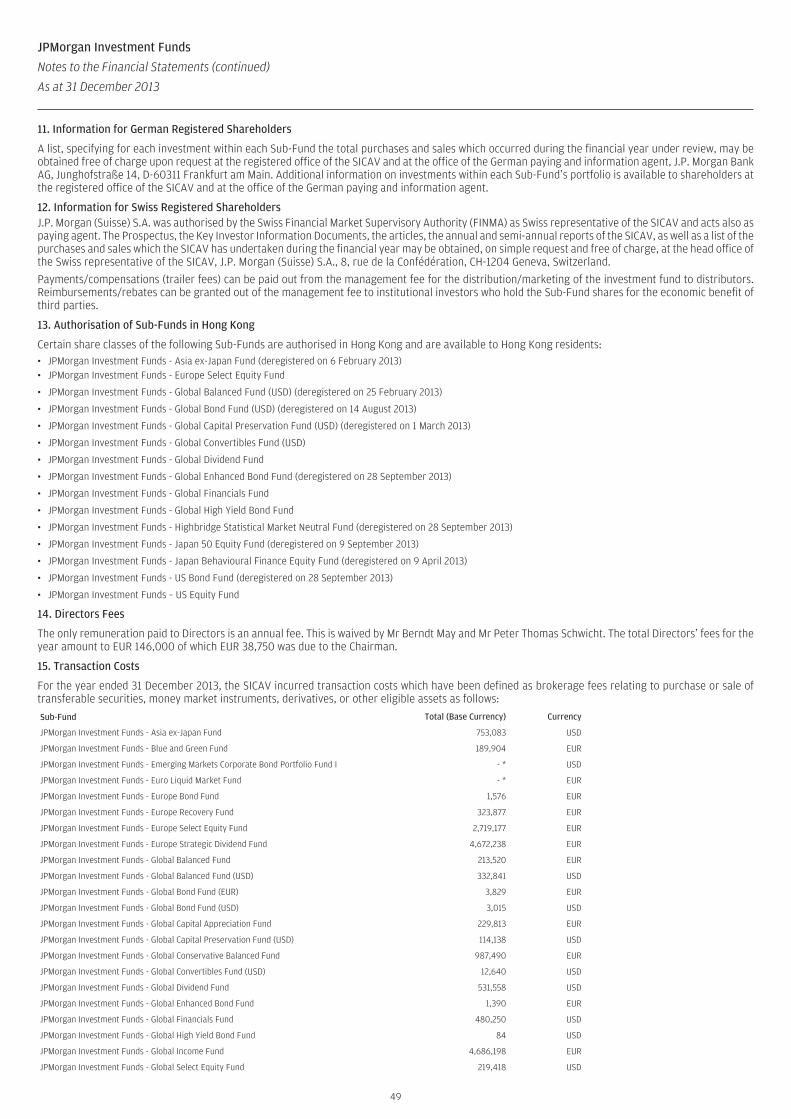
11. Information for German Registered Shareholders
A list, specifying for each investment within each Sub-Fund the total purchases and sales which occurred during the financial year under review, may beobtained free of charge upon request at the registered office of the SICAV and at the office of the German paying and information agent, J.P. Morgan BankAG, Junghofstraße 14, D-60311 Frankfurt am Main. Additional information on investments within each Sub-Fund’s portfolio is available to shareholders atthe registered office of the SICAV and at the office of the German paying and information agent.
12. Information for Swiss Registered ShareholdersJ.P. Morgan (Suisse) S.A. was authorised by the Swiss Financial Market Supervisory Authority (FINMA) as Swiss representative of the SICAV and acts also aspaying agent. The Prospectus, the Key Investor Information Documents, the articles, the annual and semi-annual reports of the SICAV, as well as a list of thepurchases and sales which the SICAV has undertaken during the financial year may be obtained, on simple request and free of charge, at the head office ofthe Swiss representative of the SICAV, J.P. Morgan (Suisse) S.A., 8, rue de la Confédération, CH-1204 Geneva, Switzerland.
Payments/compensations (trailer fees) can be paid out from the management fee for the distribution/marketing of the investment fund to distributors.Reimbursements/rebates can be granted out of the management fee to institutional investors who hold the Sub-Fund shares for the economic benefit ofthird parties.
13. Authorisation of Sub-Funds in Hong Kong
Certain share classes of the following Sub-Funds are authorised in Hong Kong and are available to Hong Kong residents:• JPMorgan Investment Funds - Asia ex-Japan Fund (deregistered on 6 February 2013)• JPMorgan Investment Funds - Europe Select Equity Fund
• JPMorgan Investment Funds - Global Balanced Fund (USD) (deregistered on 25 February 2013)
• JPMorgan Investment Funds - Global Bond Fund (USD) (deregistered on 14 August 2013)
• JPMorgan Investment Funds - Global Capital Preservation Fund (USD) (deregistered on 1 March 2013)
• JPMorgan Investment Funds - Global Convertibles Fund (USD)
• JPMorgan Investment Funds - Global Dividend Fund
• JPMorgan Investment Funds - Global Enhanced Bond Fund (deregistered on 28 September 2013)
• JPMorgan Investment Funds - Global Financials Fund
• JPMorgan Investment Funds - Global High Yield Bond Fund
• JPMorgan Investment Funds - Highbridge Statistical Market Neutral Fund (deregistered on 28 September 2013)
• JPMorgan Investment Funds - Japan 50 Equity Fund (deregistered on 9 September 2013)
• JPMorgan Investment Funds - Japan Behavioural Finance Equity Fund (deregistered on 9 April 2013)
• JPMorgan Investment Funds - US Bond Fund (deregistered on 28 September 2013)
• JPMorgan Investment Funds – US Equity Fund
14. Directors Fees
The only remuneration paid to Directors is an annual fee. This is waived by Mr Berndt May and Mr Peter Thomas Schwicht. The total Directors’ fees for theyear amount to EUR 146,000 of which EUR 38,750 was due to the Chairman.
15. Transaction Costs
For the year ended 31 December 2013, the SICAV incurred transaction costs which have been defined as brokerage fees relating to purchase or sale oftransferable securities, money market instruments, derivatives, or other eligible assets as follows:
Sub-Fund Total (Base Currency) Currency
JPMorgan Investment Funds - Asia ex-Japan Fund 753,083 USD
JPMorgan Investment Funds - Blue and Green Fund 189,904 EUR
JPMorgan Investment Funds - Emerging Markets Corporate Bond Portfolio Fund I - * USD
JPMorgan Investment Funds - Euro Liquid Market Fund - * EUR
JPMorgan Investment Funds - Europe Bond Fund 1,576 EUR
JPMorgan Investment Funds - Europe Recovery Fund 323,877 EUR
JPMorgan Investment Funds - Europe Select Equity Fund 2,719,177 EUR
JPMorgan Investment Funds - Europe Strategic Dividend Fund 4,672,238 EUR
JPMorgan Investment Funds - Global Balanced Fund 213,520 EUR
JPMorgan Investment Funds - Global Balanced Fund (USD) 332,841 USD
JPMorgan Investment Funds - Global Bond Fund (EUR) 3,829 EUR
JPMorgan Investment Funds - Global Bond Fund (USD) 3,015 USD
JPMorgan Investment Funds - Global Capital Appreciation Fund 229,813 EUR
JPMorgan Investment Funds - Global Capital Preservation Fund (USD) 114,138 USD
JPMorgan Investment Funds - Global Conservative Balanced Fund 987,490 EUR
JPMorgan Investment Funds - Global Convertibles Fund (USD) 12,640 USD
JPMorgan Investment Funds - Global Dividend Fund 531,558 USD
JPMorgan Investment Funds - Global Enhanced Bond Fund 1,390 EUR
JPMorgan Investment Funds - Global Financials Fund 480,250 USD
JPMorgan Investment Funds - Global High Yield Bond Fund 84 USD
JPMorgan Investment Funds - Global Income Fund 4,686,198 EUR
JPMorgan Investment Funds - Global Select Equity Fund 219,418 USD
49
JPMorgan Investment Funds
Notes to the Financial Statements (continued)
As at 31 December 2013
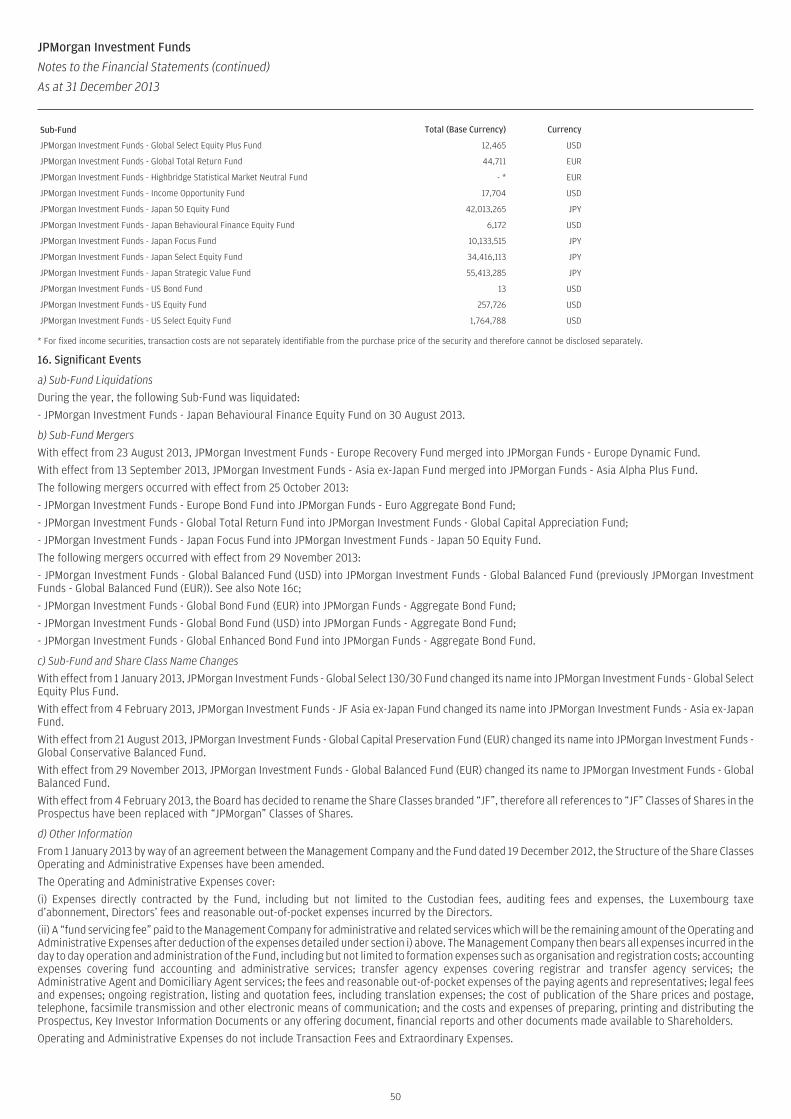
Sub-Fund Total (Base Currency) Currency
JPMorgan Investment Funds - Global Select Equity Plus Fund 12,465 USD
JPMorgan Investment Funds - Global Total Return Fund 44,711 EUR
JPMorgan Investment Funds - Highbridge Statistical Market Neutral Fund - * EUR
JPMorgan Investment Funds - Income Opportunity Fund 17,704 USD
JPMorgan Investment Funds - Japan 50 Equity Fund 42,013,265 JPY
JPMorgan Investment Funds - Japan Behavioural Finance Equity Fund 6,172 USD
JPMorgan Investment Funds - Japan Focus Fund 10,133,515 JPY
JPMorgan Investment Funds - Japan Select Equity Fund 34,416,113 JPY
JPMorgan Investment Funds - Japan Strategic Value Fund 55,413,285 JPY
JPMorgan Investment Funds - US Bond Fund 13 USD
JPMorgan Investment Funds - US Equity Fund 257,726 USD
JPMorgan Investment Funds - US Select Equity Fund 1,764,788 USD
* For fixed income securities, transaction costs are not separately identifiable from the purchase price of the security and therefore cannot be disclosed separately.
16. Significant Events
a) Sub-Fund Liquidations
During the year, the following Sub-Fund was liquidated:
- JPMorgan Investment Funds - Japan Behavioural Finance Equity Fund on 30 August 2013.
b) Sub-Fund Mergers
With effect from 23 August 2013, JPMorgan Investment Funds - Europe Recovery Fund merged into JPMorgan Funds - Europe Dynamic Fund.
With effect from 13 September 2013, JPMorgan Investment Funds - Asia ex-Japan Fund merged into JPMorgan Funds - Asia Alpha Plus Fund.
The following mergers occurred with effect from 25 October 2013:
- JPMorgan Investment Funds - Europe Bond Fund into JPMorgan Funds - Euro Aggregate Bond Fund;
- JPMorgan Investment Funds - Global Total Return Fund into JPMorgan Investment Funds - Global Capital Appreciation Fund;
- JPMorgan Investment Funds - Japan Focus Fund into JPMorgan Investment Funds - Japan 50 Equity Fund.
The following mergers occurred with effect from 29 November 2013:
- JPMorgan Investment Funds - Global Balanced Fund (USD) into JPMorgan Investment Funds - Global Balanced Fund (previously JPMorgan InvestmentFunds - Global Balanced Fund (EUR)). See also Note 16c;
- JPMorgan Investment Funds - Global Bond Fund (EUR) into JPMorgan Funds - Aggregate Bond Fund;
- JPMorgan Investment Funds - Global Bond Fund (USD) into JPMorgan Funds - Aggregate Bond Fund;
- JPMorgan Investment Funds - Global Enhanced Bond Fund into JPMorgan Funds - Aggregate Bond Fund.
c) Sub-Fund and Share Class Name Changes
With effect from 1 January 2013, JPMorgan Investment Funds - Global Select 130/30 Fund changed its name into JPMorgan Investment Funds - Global SelectEquity Plus Fund.
With effect from 4 February 2013, JPMorgan Investment Funds - JF Asia ex-Japan Fund changed its name into JPMorgan Investment Funds - Asia ex-JapanFund.
With effect from 21 August 2013, JPMorgan Investment Funds - Global Capital Preservation Fund (EUR) changed its name into JPMorgan Investment Funds -Global Conservative Balanced Fund.
With effect from 29 November 2013, JPMorgan Investment Funds - Global Balanced Fund (EUR) changed its name to JPMorgan Investment Funds - GlobalBalanced Fund.
With effect from 4 February 2013, the Board has decided to rename the Share Classes branded “JF”, therefore all references to “JF” Classes of Shares in theProspectus have been replaced with “JPMorgan” Classes of Shares.
d) Other Information
From 1 January 2013 by way of an agreement between the Management Company and the Fund dated 19 December 2012, the Structure of the Share ClassesOperating and Administrative Expenses have been amended.
The Operating and Administrative Expenses cover:
(i) Expenses directly contracted by the Fund, including but not limited to the Custodian fees, auditing fees and expenses, the Luxembourg taxed’abonnement, Directors’ fees and reasonable out-of-pocket expenses incurred by the Directors.
(ii) A “fund servicing fee” paid to the Management Company for administrative and related services which will be the remaining amount of the Operating andAdministrative Expenses after deduction of the expenses detailed under section i) above. The Management Company then bears all expenses incurred in theday to day operation and administration of the Fund, including but not limited to formation expenses such as organisation and registration costs; accountingexpenses covering fund accounting and administrative services; transfer agency expenses covering registrar and transfer agency services; theAdministrative Agent and Domiciliary Agent services; the fees and reasonable out-of-pocket expenses of the paying agents and representatives; legal feesand expenses; ongoing registration, listing and quotation fees, including translation expenses; the cost of publication of the Share prices and postage,telephone, facsimile transmission and other electronic means of communication; and the costs and expenses of preparing, printing and distributing theProspectus, Key Investor Information Documents or any offering document, financial reports and other documents made available to Shareholders.
Operating and Administrative Expenses do not include Transaction Fees and Extraordinary Expenses.
50
JPMorgan Investment Funds
Notes to the Financial Statements (continued)
As at 31 December 2013
The change in the structure of the Operating and Administrative Expenses does not affect the current fixed percentage level on all Sub-Funds for ShareClasses - A, B, C, D and T, or the capped Operating and Administrative Expenses level on all Sub-Funds for I, and X Shares as disclosed in Appendix III of theProspectus.
From 1 January 2013, the Management Company has waived the incremental income previously received from the portion of income generated by SecuritiesLending, for its oversight of the program. From this date, 85% of any incremental income earned from securities lending is accrued to the applicableSub-Fund, with the remaining income payable to the securities lending agent who arranges the transaction.
The Management Company has stopped the accrual of the following Sub-Funds’ Performance Fees:
- JPMorgan Investment Funds – Global Capital Preservation Fund (EUR) on 1 February 2013;
- JPMorgan Investment Funds – Global Capital Preservation Fund (USD) on 1 February 2013;
- JPMorgan Investment Funds – Japan Focus Fund on 17 May 2013.
The SICAV’s Prospectus was amended to indicate the removal of these performance fees.
17. Events After Year-End
JPMorgan Investment Funds - Euro Liquid Market Fund merged into JPMorgan Funds - Euro Money Market Fund on 17 January 2014.
51
JPMorgan Investment Funds
Notes to the Financial Statements (continued)
As at 31 December 2013
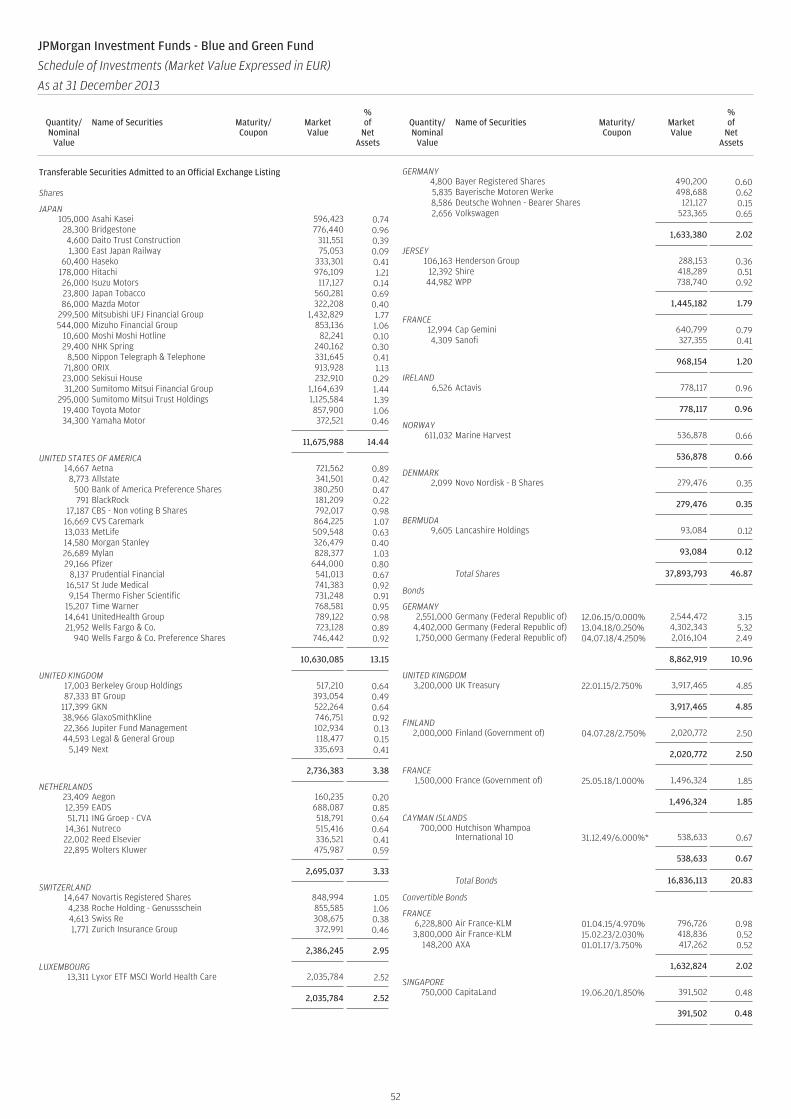
Transferable Securities Admitted to an Official Exchange Listing
Shares
JAPAN105,000 Asahi Kasei 596,423 0.74
28,300 Bridgestone 776,440 0.964,600 Daito Trust Construction 311,551 0.391,300 East Japan Railway 75,053 0.09
60,400 Haseko 333,301 0.41178,000 Hitachi 976,109 1.2126,000 Isuzu Motors 117,127 0.1423,800 Japan Tobacco 560,281 0.6986,000 Mazda Motor 322,208 0.40
299,500 Mitsubishi UFJ Financial Group 1,432,829 1.77544,000 Mizuho Financial Group 853,136 1.06
10,600 Moshi Moshi Hotline 82,241 0.1029,400 NHK Spring 240,162 0.30
8,500 Nippon Telegraph & Telephone 331,645 0.4171,800 ORIX 913,928 1.1323,000 Sekisui House 232,910 0.2931,200 Sumitomo Mitsui Financial Group 1,164,639 1.44
295,000 Sumitomo Mitsui Trust Holdings 1,125,584 1.3919,400 Toyota Motor 857,900 1.0634,300 Yamaha Motor 372,521 0.46
11,675,988 14.44
UNITED STATES OF AMERICA14,667 Aetna 721,562 0.89
8,773 Allstate 341,501 0.42500 Bank of America Preference Shares 380,250 0.47791 BlackRock 181,209 0.22
17,187 CBS - Non voting B Shares 792,017 0.9816,669 CVS Caremark 864,225 1.0713,033 MetLife 509,548 0.6314,580 Morgan Stanley 326,479 0.4026,689 Mylan 828,377 1.0329,166 Pfizer 644,000 0.80
8,137 Prudential Financial 541,013 0.6716,517 St Jude Medical 741,383 0.929,154 Thermo Fisher Scientific 731,248 0.91
15,207 Time Warner 768,581 0.9514,641 UnitedHealth Group 789,122 0.9821,952 Wells Fargo & Co. 723,128 0.89
940 Wells Fargo & Co. Preference Shares 746,442 0.92
10,630,085 13.15
UNITED KINGDOM17,003 Berkeley Group Holdings 517,210 0.6487,333 BT Group 393,054 0.49
117,399 GKN 522,264 0.6438,966 GlaxoSmithKline 746,751 0.9222,366 Jupiter Fund Management 102,934 0.1344,593 Legal & General Group 118,477 0.15
5,149 Next 335,693 0.41
2,736,383 3.38
NETHERLANDS23,409 Aegon 160,235 0.2012,359 EADS 688,087 0.8551,711 ING Groep - CVA 518,791 0.64
14,361 Nutreco 515,416 0.6422,002 Reed Elsevier 336,521 0.4122,895 Wolters Kluwer 475,987 0.59
2,695,037 3.33
SWITZERLAND14,647 Novartis Registered Shares 848,994 1.054,238 Roche Holding - Genussschein 855,585 1.064,613 Swiss Re 308,675 0.381,771 Zurich Insurance Group 372,991 0.46
2,386,245 2.95
LUXEMBOURG13,311 Lyxor ETF MSCI World Health Care 2,035,784 2.52
2,035,784 2.52
GERMANY4,800 Bayer Registered Shares 490,200 0.605,835 Bayerische Motoren Werke 498,688 0.628,586 Deutsche Wohnen - Bearer Shares 121,127 0.152,656 Volkswagen 523,365 0.65
1,633,380 2.02
JERSEY106,163 Henderson Group 288,153 0.36
12,392 Shire 418,289 0.5144,982 WPP 738,740 0.92
1,445,182 1.79
FRANCE12,994 Cap Gemini 640,799 0.794,309 Sanofi 327,355 0.41
968,154 1.20
IRELAND6,526 Actavis 778,117 0.96
778,117 0.96
NORWAY611,032 Marine Harvest 536,878 0.66
536,878 0.66
DENMARK2,099 Novo Nordisk - B Shares 279,476 0.35
279,476 0.35
BERMUDA9,605 Lancashire Holdings 93,084 0.12
93,084 0.12
Total Shares 37,893,793 46.87
Bonds
GERMANY2,551,000 Germany (Federal Republic of) 12.06.15/0.000% 2,544,472 3.15
4,402,000 Germany (Federal Republic of) 13.04.18/0.250% 4,302,343 5.321,750,000 Germany (Federal Republic of) 04.07.18/4.250% 2,016,104 2.49
8,862,919 10.96
UNITED KINGDOM3,200,000 UK Treasury 22.01.15/2.750% 3,917,465 4.85
3,917,465 4.85
FINLAND2,000,000 Finland (Government of) 04.07.28/2.750% 2,020,772 2.50
2,020,772 2.50
FRANCE1,500,000 France (Government of) 25.05.18/1.000% 1,496,324 1.85
1,496,324 1.85
CAYMAN ISLANDS700,000 Hutchison Whampoa
International 10 31.12.49/6.000%* 538,633 0.67
538,633 0.67
Total Bonds 16,836,113 20.83
Convertible Bonds
FRANCE6,228,800 Air France-KLM 01.04.15/4.970% 796,726 0.983,800,000 Air France-KLM 15.02.23/2.030% 418,836 0.52
148,200 AXA 01.01.17/3.750% 417,262 0.52
1,632,824 2.02
SINGAPORE750,000 CapitaLand 19.06.20/1.850% 391,502 0.48
391,502 0.48
52
JPMorgan Investment Funds - Blue and Green Fund
Schedule of Investments (Market Value Expressed in EUR)
As at 31 December 2013
Quantity/Nominal
Value
Name of Securities Maturity/Coupon
MarketValue
%of
NetAssets
Quantity/Nominal
Value
Name of Securities Maturity/Coupon
MarketValue
%of
NetAssets
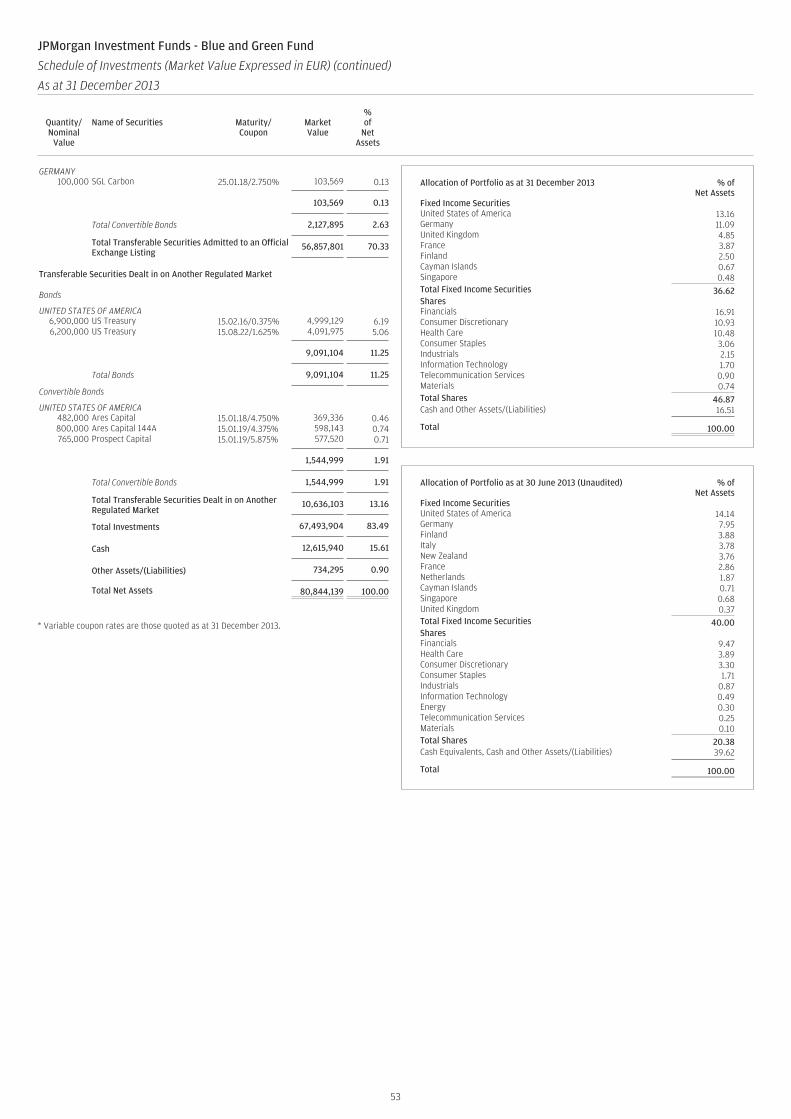
GERMANY100,000 SGL Carbon 25.01.18/2.750% 103,569 0.13
103,569 0.13
Total Convertible Bonds 2,127,895 2.63
Total Transferable Securities Admitted to an OfficialExchange Listing
56,857,801 70.33
Transferable Securities Dealt in on Another Regulated Market
Bonds
UNITED STATES OF AMERICA6,900,000 US Treasury 15.02.16/0.375% 4,999,129 6.196,200,000 US Treasury 15.08.22/1.625% 4,091,975 5.06
9,091,104 11.25
Total Bonds 9,091,104 11.25
Convertible Bonds
UNITED STATES OF AMERICA482,000 Ares Capital 15.01.18/4.750% 369,336 0.46800,000 Ares Capital 144A 15.01.19/4.375% 598,143 0.74765,000 Prospect Capital 15.01.19/5.875% 577,520 0.71
1,544,999 1.91
Total Convertible Bonds 1,544,999 1.91
Total Transferable Securities Dealt in on AnotherRegulated Market
10,636,103 13.16
Total Investments 67,493,904 83.49
Cash 12,615,940 15.61
Other Assets/(Liabilities) 734,295 0.90
Total Net Assets 80,844,139 100.00
* Variable coupon rates are those quoted as at 31 December 2013.
Allocation of Portfolio as at 31 December 2013 % ofNet Assets
Fixed Income SecuritiesUnited States of America 13.16Germany 11.09United Kingdom 4.85France 3.87Finland 2.50Cayman Islands 0.67Singapore 0.48Total Fixed Income Securities 36.62SharesFinancials 16.91Consumer Discretionary 10.93Health Care 10.48Consumer Staples 3.06Industrials 2.15Information Technology 1.70Telecommunication Services 0.90Materials 0.74Total Shares 46.87Cash and Other Assets/(Liabilities) 16.51
Total 100.00
Allocation of Portfolio as at 30 June 2013 (Unaudited) % ofNet Assets
Fixed Income SecuritiesUnited States of America 14.14Germany 7.95Finland 3.88Italy 3.78New Zealand 3.76France 2.86Netherlands 1.87Cayman Islands 0.71Singapore 0.68United Kingdom 0.37Total Fixed Income Securities 40.00SharesFinancials 9.47Health Care 3.89Consumer Discretionary 3.30Consumer Staples 1.71Industrials 0.87Information Technology 0.49Energy 0.30Telecommunication Services 0.25Materials 0.10Total Shares 20.38Cash Equivalents, Cash and Other Assets/(Liabilities) 39.62
Total 100.00
53
JPMorgan Investment Funds - Blue and Green Fund
Schedule of Investments (Market Value Expressed in EUR) (continued)
As at 31 December 2013
Quantity/Nominal
Value
Name of Securities Maturity/Coupon
MarketValue
%of
NetAssets
Quantity/Nominal
Value
Name of Securities Maturity/Coupon
MarketValue
%of
NetAssets
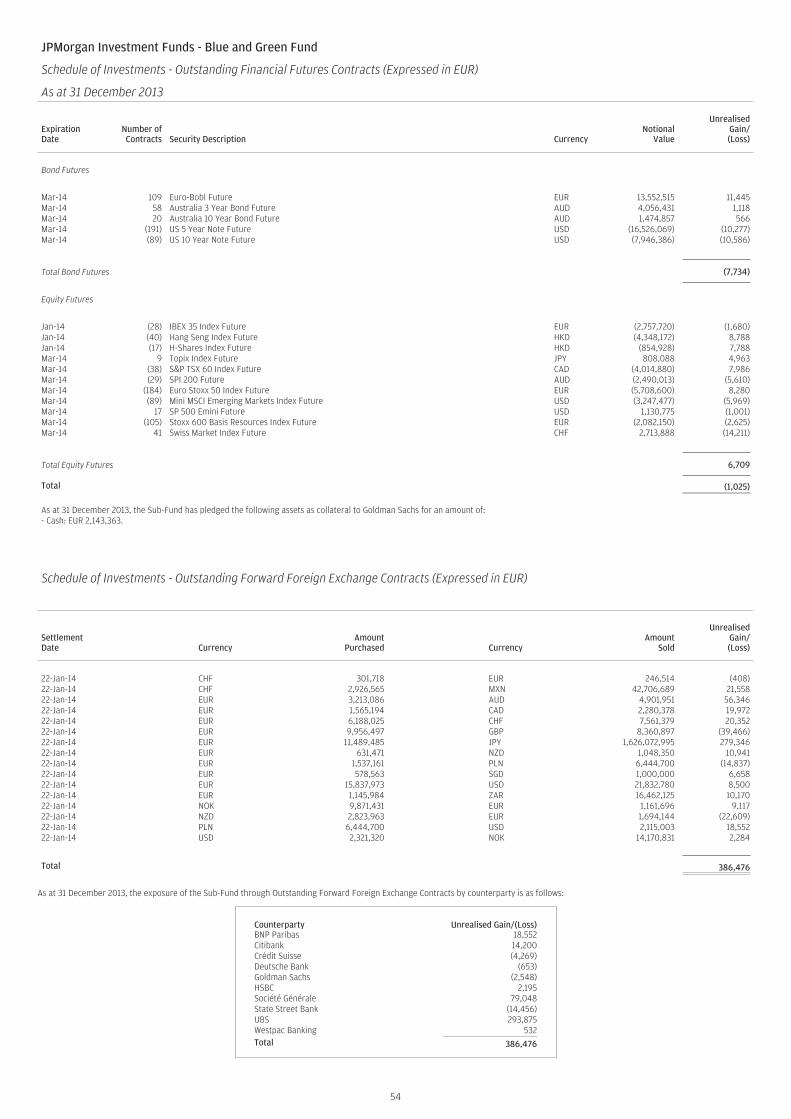
JPMorgan Investment Funds - Blue and Green Fund
Schedule of Investments - Outstanding Financial Futures Contracts (Expressed in EUR)
As at 31 December 2013
ExpirationDate
Number ofContracts Security Description Currency
NotionalValue
UnrealisedGain/(Loss)
Bond Futures
Mar-14 109 Euro-Bobl Future EUR 13,552,515 11,445Mar-14 58 Australia 3 Year Bond Future AUD 4,056,431 1,118Mar-14 20 Australia 10 Year Bond Future AUD 1,474,857 566Mar-14 (191) US 5 Year Note Future USD (16,526,069) (10,277)Mar-14 (89) US 10 Year Note Future USD (7,946,386) (10,586)
Total Bond Futures (7,734)
Equity Futures
Jan-14 (28) IBEX 35 Index Future EUR (2,757,720) (1,680)Jan-14 (40) Hang Seng Index Future HKD (4,348,172) 8,788Jan-14 (17) H-Shares Index Future HKD (854,928) 7,788Mar-14 9 Topix Index Future JPY 808,088 4,963Mar-14 (38) S&P TSX 60 Index Future CAD (4,014,880) 7,986Mar-14 (29) SPI 200 Future AUD (2,490,013) (5,610)Mar-14 (184) Euro Stoxx 50 Index Future EUR (5,708,600) 8,280Mar-14 (89) Mini MSCI Emerging Markets Index Future USD (3,247,477) (5,969)Mar-14 17 SP 500 Emini Future USD 1,130,775 (1,001)Mar-14 (105) Stoxx 600 Basis Resources Index Future EUR (2,082,150) (2,625)Mar-14 41 Swiss Market Index Future CHF 2,713,888 (14,211)
Total Equity Futures 6,709
Total (1,025)
As at 31 December 2013, the Sub-Fund has pledged the following assets as collateral to Goldman Sachs for an amount of:- Cash: EUR 2,143,363.
Schedule of Investments - Outstanding Forward Foreign Exchange Contracts (Expressed in EUR)
SettlementDate Currency
AmountPurchased Currency
AmountSold
UnrealisedGain/(Loss)
22-Jan-14 CHF 301,718 EUR 246,514 (408)22-Jan-14 CHF 2,926,565 MXN 42,706,689 21,55822-Jan-14 EUR 3,213,086 AUD 4,901,951 56,34622-Jan-14 EUR 1,565,194 CAD 2,280,378 19,97222-Jan-14 EUR 6,188,025 CHF 7,561,379 20,35222-Jan-14 EUR 9,956,497 GBP 8,360,897 (39,466)22-Jan-14 EUR 11,489,485 JPY 1,626,072,995 279,34622-Jan-14 EUR 631,471 NZD 1,048,350 10,94122-Jan-14 EUR 1,537,161 PLN 6,444,700 (14,837)22-Jan-14 EUR 578,563 SGD 1,000,000 6,65822-Jan-14 EUR 15,837,973 USD 21,832,780 8,50022-Jan-14 EUR 1,145,984 ZAR 16,462,125 10,17022-Jan-14 NOK 9,871,431 EUR 1,161,696 9,11722-Jan-14 NZD 2,823,963 EUR 1,694,144 (22,609)22-Jan-14 PLN 6,444,700 USD 2,115,003 18,55222-Jan-14 USD 2,321,320 NOK 14,170,831 2,284
Total 386,476
As at 31 December 2013, the exposure of the Sub-Fund through Outstanding Forward Foreign Exchange Contracts by counterparty is as follows:
Counterparty Unrealised Gain/(Loss)BNP Paribas 18,552Citibank 14,200Crédit Suisse (4,269)Deutsche Bank (653)Goldman Sachs (2,548)HSBC 2,195Société Générale 79,048State Street Bank (14,456)UBS 293,875Westpac Banking 532Total 386,476
54
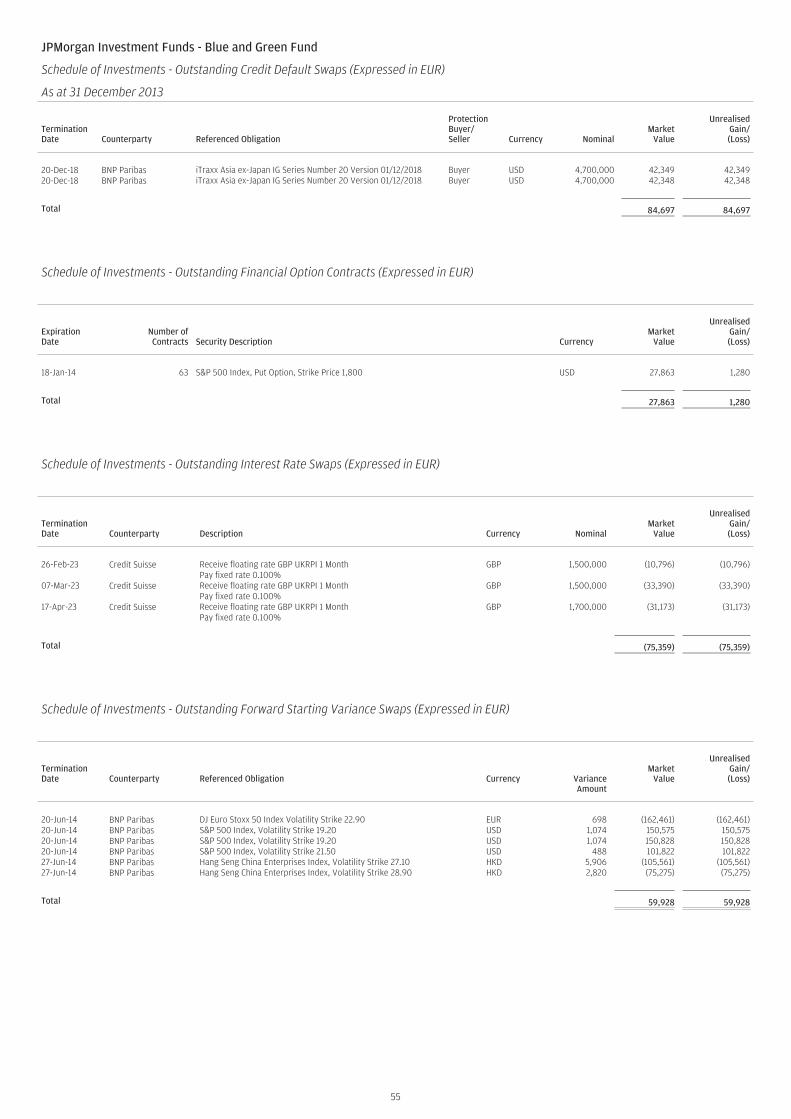
JPMorgan Investment Funds - Blue and Green Fund
Schedule of Investments - Outstanding Credit Default Swaps (Expressed in EUR)
As at 31 December 2013
TerminationDate Counterparty Referenced Obligation
ProtectionBuyer/Seller Currency Nominal
MarketValue
UnrealisedGain/(Loss)
20-Dec-18 BNP Paribas iTraxx Asia ex-Japan IG Series Number 20 Version 01/12/2018 Buyer USD 4,700,000 42,349 42,34920-Dec-18 BNP Paribas iTraxx Asia ex-Japan IG Series Number 20 Version 01/12/2018 Buyer USD 4,700,000 42,348 42,348
Total 84,697 84,697
Schedule of Investments - Outstanding Financial Option Contracts (Expressed in EUR)
ExpirationDate
Number ofContracts Security Description Currency
MarketValue
UnrealisedGain/(Loss)
18-Jan-14 63 S&P 500 Index, Put Option, Strike Price 1,800 USD 27,863 1,280
Total 27,863 1,280
Schedule of Investments - Outstanding Interest Rate Swaps (Expressed in EUR)
TerminationDate Counterparty Description Currency Nominal
MarketValue
UnrealisedGain/(Loss)
26-Feb-23 Credit Suisse Receive floating rate GBP UKRPI 1 Month GBP 1,500,000 (10,796) (10,796)Pay fixed rate 0.100%
07-Mar-23 Credit Suisse Receive floating rate GBP UKRPI 1 Month GBP 1,500,000 (33,390) (33,390)Pay fixed rate 0.100%
17-Apr-23 Credit Suisse Receive floating rate GBP UKRPI 1 Month GBP 1,700,000 (31,173) (31,173)Pay fixed rate 0.100%
Total (75,359) (75,359)
Schedule of Investments - Outstanding Forward Starting Variance Swaps (Expressed in EUR)
TerminationDate Counterparty Referenced Obligation Currency Variance
Amount
MarketValue
UnrealisedGain/(Loss)
20-Jun-14 BNP Paribas DJ Euro Stoxx 50 Index Volatility Strike 22.90 EUR 698 (162,461) (162,461)20-Jun-14 BNP Paribas S&P 500 Index, Volatility Strike 19.20 USD 1,074 150,575 150,57520-Jun-14 BNP Paribas S&P 500 Index, Volatility Strike 19.20 USD 1,074 150,828 150,82820-Jun-14 BNP Paribas S&P 500 Index, Volatility Strike 21.50 USD 488 101,822 101,82227-Jun-14 BNP Paribas Hang Seng China Enterprises Index, Volatility Strike 27.10 HKD 5,906 (105,561) (105,561)27-Jun-14 BNP Paribas Hang Seng China Enterprises Index, Volatility Strike 28.90 HKD 2,820 (75,275) (75,275)
Total 59,928 59,928
55
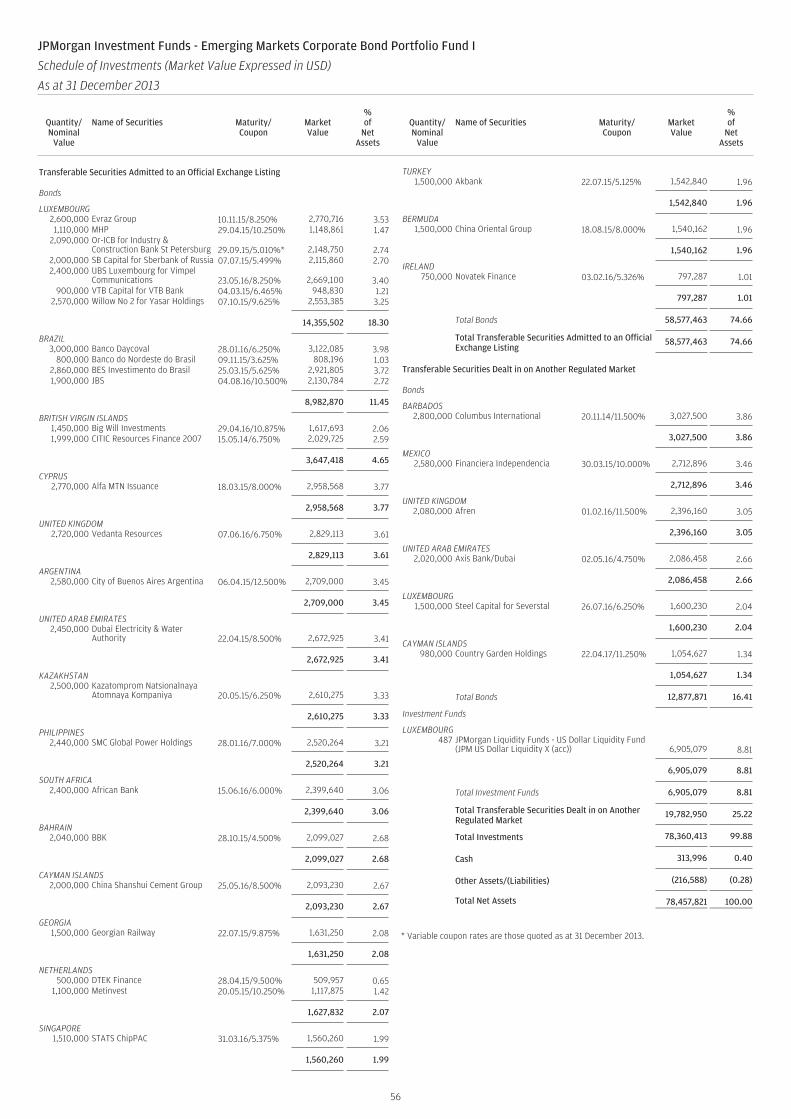
Transferable Securities Admitted to an Official Exchange Listing
Bonds
LUXEMBOURG2,600,000 Evraz Group 10.11.15/8.250% 2,770,716 3.531,110,000 MHP 29.04.15/10.250% 1,148,861 1.47
2,090,000 Or-ICB for Industry &Construction Bank St Petersburg 29.09.15/5.010%* 2,148,750 2.74
2,000,000 SB Capital for Sberbank of Russia 07.07.15/5.499% 2,115,860 2.702,400,000 UBS Luxembourg for Vimpel
Communications 23.05.16/8.250% 2,669,100 3.40900,000 VTB Capital for VTB Bank 04.03.15/6.465% 948,830 1.21
2,570,000 Willow No 2 for Yasar Holdings 07.10.15/9.625% 2,553,385 3.25
14,355,502 18.30
BRAZIL3,000,000 Banco Daycoval 28.01.16/6.250% 3,122,085 3.98
800,000 Banco do Nordeste do Brasil 09.11.15/3.625% 808,196 1.032,860,000 BES Investimento do Brasil 25.03.15/5.625% 2,921,805 3.721,900,000 JBS 04.08.16/10.500% 2,130,784 2.72
8,982,870 11.45
BRITISH VIRGIN ISLANDS1,450,000 Big Will Investments 29.04.16/10.875% 1,617,693 2.061,999,000 CITIC Resources Finance 2007 15.05.14/6.750% 2,029,725 2.59
3,647,418 4.65
CYPRUS2,770,000 Alfa MTN Issuance 18.03.15/8.000% 2,958,568 3.77
2,958,568 3.77
UNITED KINGDOM2,720,000 Vedanta Resources 07.06.16/6.750% 2,829,113 3.61
2,829,113 3.61
ARGENTINA2,580,000 City of Buenos Aires Argentina 06.04.15/12.500% 2,709,000 3.45
2,709,000 3.45
UNITED ARAB EMIRATES2,450,000 Dubai Electricity & Water
Authority 22.04.15/8.500% 2,672,925 3.41
2,672,925 3.41
KAZAKHSTAN2,500,000 Kazatomprom Natsionalnaya
Atomnaya Kompaniya 20.05.15/6.250% 2,610,275 3.33
2,610,275 3.33
PHILIPPINES2,440,000 SMC Global Power Holdings 28.01.16/7.000% 2,520,264 3.21
2,520,264 3.21
SOUTH AFRICA2,400,000 African Bank 15.06.16/6.000% 2,399,640 3.06
2,399,640 3.06
BAHRAIN2,040,000 BBK 28.10.15/4.500% 2,099,027 2.68
2,099,027 2.68
CAYMAN ISLANDS2,000,000 China Shanshui Cement Group 25.05.16/8.500% 2,093,230 2.67
2,093,230 2.67
GEORGIA1,500,000 Georgian Railway 22.07.15/9.875% 1,631,250 2.08
1,631,250 2.08
NETHERLANDS500,000 DTEK Finance 28.04.15/9.500% 509,957 0.65
1,100,000 Metinvest 20.05.15/10.250% 1,117,875 1.42
1,627,832 2.07
SINGAPORE1,510,000 STATS ChipPAC 31.03.16/5.375% 1,560,260 1.99
1,560,260 1.99
TURKEY1,500,000 Akbank 22.07.15/5.125% 1,542,840 1.96
1,542,840 1.96
BERMUDA1,500,000 China Oriental Group 18.08.15/8.000% 1,540,162 1.96
1,540,162 1.96
IRELAND750,000 Novatek Finance 03.02.16/5.326% 797,287 1.01
797,287 1.01
Total Bonds 58,577,463 74.66
Total Transferable Securities Admitted to an OfficialExchange Listing
58,577,463 74.66
Transferable Securities Dealt in on Another Regulated Market
Bonds
BARBADOS2,800,000 Columbus International 20.11.14/11.500% 3,027,500 3.86
3,027,500 3.86
MEXICO2,580,000 Financiera Independencia 30.03.15/10.000% 2,712,896 3.46
2,712,896 3.46
UNITED KINGDOM2,080,000 Afren 01.02.16/11.500% 2,396,160 3.05
2,396,160 3.05
UNITED ARAB EMIRATES2,020,000 Axis Bank/Dubai 02.05.16/4.750% 2,086,458 2.66
2,086,458 2.66
LUXEMBOURG1,500,000 Steel Capital for Severstal 26.07.16/6.250% 1,600,230 2.04
1,600,230 2.04
CAYMAN ISLANDS980,000 Country Garden Holdings 22.04.17/11.250% 1,054,627 1.34
1,054,627 1.34
Total Bonds 12,877,871 16.41
Investment Funds
LUXEMBOURG487 JPMorgan Liquidity Funds - US Dollar Liquidity Fund
(JPM US Dollar Liquidity X (acc)) 6,905,079 8.81
6,905,079 8.81
Total Investment Funds 6,905,079 8.81
Total Transferable Securities Dealt in on AnotherRegulated Market
19,782,950 25.22
Total Investments 78,360,413 99.88
Cash 313,996 0.40
Other Assets/(Liabilities) (216,588) (0.28)
Total Net Assets 78,457,821 100.00
* Variable coupon rates are those quoted as at 31 December 2013.
56
JPMorgan Investment Funds - Emerging Markets Corporate Bond Portfolio Fund I
Schedule of Investments (Market Value Expressed in USD)
As at 31 December 2013
Quantity/Nominal
Value
Name of Securities Maturity/Coupon
MarketValue
%of
NetAssets
Quantity/Nominal
Value
Name of Securities Maturity/Coupon
MarketValue
%of
NetAssets
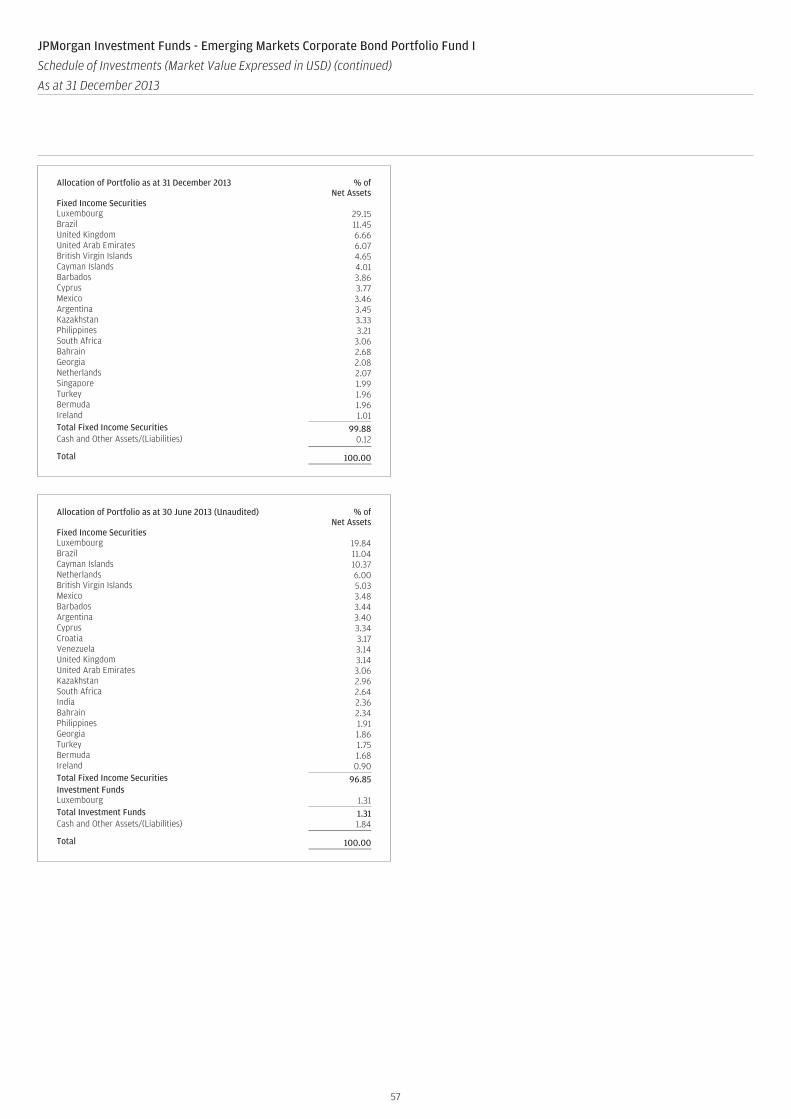
Allocation of Portfolio as at 31 December 2013 % ofNet Assets
Fixed Income SecuritiesLuxembourg 29.15Brazil 11.45United Kingdom 6.66United Arab Emirates 6.07British Virgin Islands 4.65Cayman Islands 4.01Barbados 3.86Cyprus 3.77Mexico 3.46Argentina 3.45Kazakhstan 3.33Philippines 3.21South Africa 3.06Bahrain 2.68Georgia 2.08Netherlands 2.07Singapore 1.99Turkey 1.96Bermuda 1.96Ireland 1.01Total Fixed Income Securities 99.88Cash and Other Assets/(Liabilities) 0.12
Total 100.00
Allocation of Portfolio as at 30 June 2013 (Unaudited) % ofNet Assets
Fixed Income SecuritiesLuxembourg 19.84Brazil 11.04Cayman Islands 10.37Netherlands 6.00British Virgin Islands 5.03Mexico 3.48Barbados 3.44Argentina 3.40Cyprus 3.34Croatia 3.17Venezuela 3.14United Kingdom 3.14United Arab Emirates 3.06Kazakhstan 2.96South Africa 2.64India 2.36Bahrain 2.34Philippines 1.91Georgia 1.86Turkey 1.75Bermuda 1.68Ireland 0.90Total Fixed Income Securities 96.85Investment FundsLuxembourg 1.31Total Investment Funds 1.31Cash and Other Assets/(Liabilities) 1.84
Total 100.00
57
JPMorgan Investment Funds - Emerging Markets Corporate Bond Portfolio Fund I
Schedule of Investments (Market Value Expressed in USD) (continued)
As at 31 December 2013
Quantity/Nominal
Value
Name of Securities Maturity/Coupon
MarketValue
%of
NetAssets
Quantity/Nominal
Value
Name of Securities Maturity/Coupon
MarketValue
%of
NetAssets
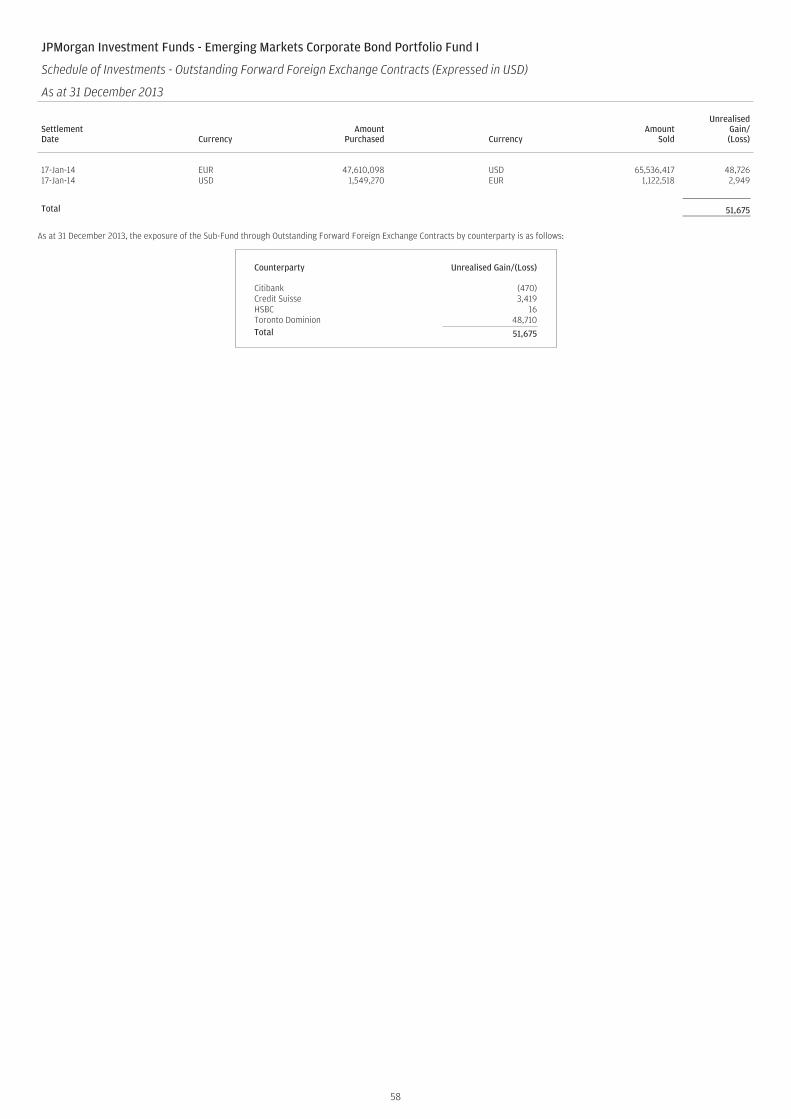
JPMorgan Investment Funds - Emerging Markets Corporate Bond Portfolio Fund I
Schedule of Investments - Outstanding Forward Foreign Exchange Contracts (Expressed in USD)
As at 31 December 2013
SettlementDate Currency
AmountPurchased Currency
AmountSold
UnrealisedGain/(Loss)
17-Jan-14 EUR 47,610,098 USD 65,536,417 48,72617-Jan-14 USD 1,549,270 EUR 1,122,518 2,949
Total 51,675
As at 31 December 2013, the exposure of the Sub-Fund through Outstanding Forward Foreign Exchange Contracts by counterparty is as follows:
Counterparty Unrealised Gain/(Loss)
Citibank (470)Credit Suisse 3,419HSBC 16Toronto Dominion 48,710Total 51,675
58
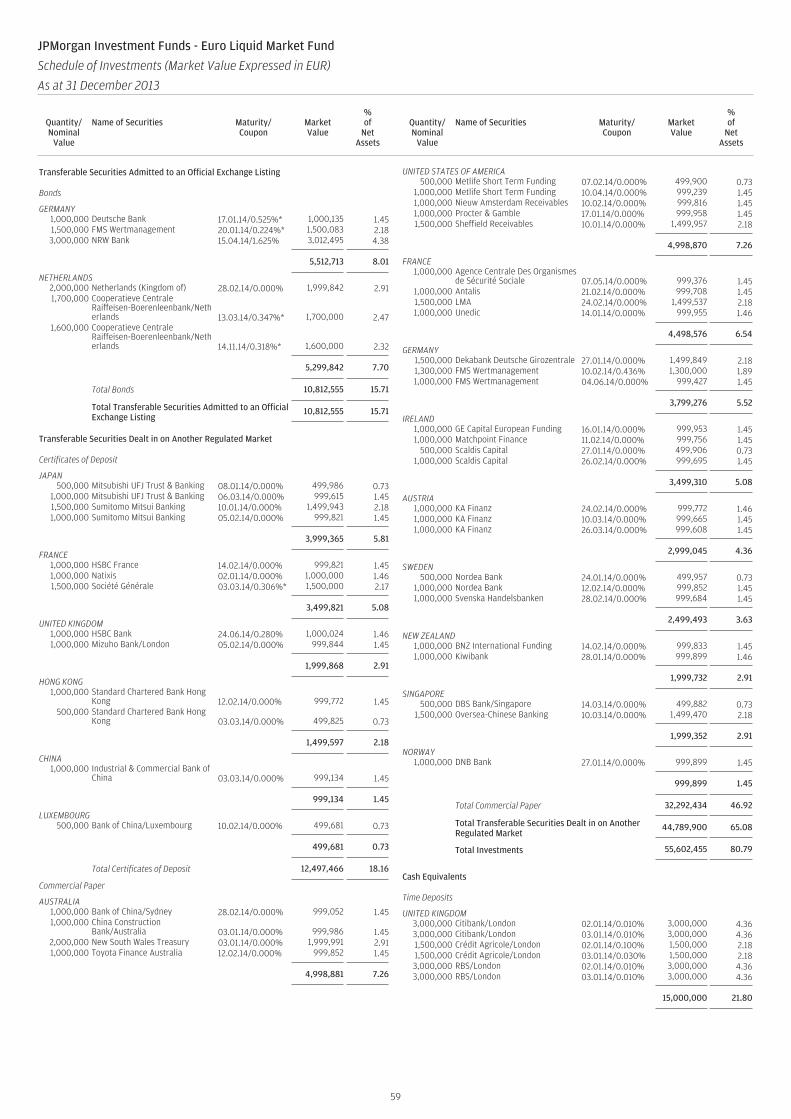
Transferable Securities Admitted to an Official Exchange Listing
Bonds
GERMANY1,000,000 Deutsche Bank 17.01.14/0.525%* 1,000,135 1.451,500,000 FMS Wertmanagement 20.01.14/0.224%* 1,500,083 2.183,000,000 NRW Bank 15.04.14/1.625% 3,012,495 4.38
5,512,713 8.01
NETHERLANDS2,000,000 Netherlands (Kingdom of) 28.02.14/0.000% 1,999,842 2.911,700,000 Cooperatieve Centrale
Raiffeisen-Boerenleenbank/Netherlands 13.03.14/0.347%* 1,700,000 2.47
1,600,000 Cooperatieve CentraleRaiffeisen-Boerenleenbank/Netherlands 14.11.14/0.318%* 1,600,000 2.32
5,299,842 7.70
Total Bonds 10,812,555 15.71
Total Transferable Securities Admitted to an OfficialExchange Listing
10,812,555 15.71
Transferable Securities Dealt in on Another Regulated Market
Certificates of Deposit
JAPAN500,000 Mitsubishi UFJ Trust & Banking 08.01.14/0.000% 499,986 0.73
1,000,000 Mitsubishi UFJ Trust & Banking 06.03.14/0.000% 999,615 1.451,500,000 Sumitomo Mitsui Banking 10.01.14/0.000% 1,499,943 2.181,000,000 Sumitomo Mitsui Banking 05.02.14/0.000% 999,821 1.45
3,999,365 5.81
FRANCE1,000,000 HSBC France 14.02.14/0.000% 999,821 1.451,000,000 Natixis 02.01.14/0.000% 1,000,000 1.461,500,000 Société Générale 03.03.14/0.306%* 1,500,000 2.17
3,499,821 5.08
UNITED KINGDOM1,000,000 HSBC Bank 24.06.14/0.280% 1,000,024 1.461,000,000 Mizuho Bank/London 05.02.14/0.000% 999,844 1.45
1,999,868 2.91
HONG KONG1,000,000 Standard Chartered Bank Hong
Kong 12.02.14/0.000% 999,772 1.45500,000 Standard Chartered Bank Hong
Kong 03.03.14/0.000% 499,825 0.73
1,499,597 2.18
CHINA1,000,000 Industrial & Commercial Bank of
China 03.03.14/0.000% 999,134 1.45
999,134 1.45
LUXEMBOURG500,000 Bank of China/Luxembourg 10.02.14/0.000% 499,681 0.73
499,681 0.73
Total Certificates of Deposit 12,497,466 18.16
Commercial Paper
AUSTRALIA1,000,000 Bank of China/Sydney 28.02.14/0.000% 999,052 1.451,000,000 China Construction
Bank/Australia 03.01.14/0.000% 999,986 1.452,000,000 New South Wales Treasury 03.01.14/0.000% 1,999,991 2.911,000,000 Toyota Finance Australia 12.02.14/0.000% 999,852 1.45
4,998,881 7.26
UNITED STATES OF AMERICA500,000 Metlife Short Term Funding 07.02.14/0.000% 499,900 0.73
1,000,000 Metlife Short Term Funding 10.04.14/0.000% 999,239 1.451,000,000 Nieuw Amsterdam Receivables 10.02.14/0.000% 999,816 1.451,000,000 Procter & Gamble 17.01.14/0.000% 999,958 1.451,500,000 Sheffield Receivables 10.01.14/0.000% 1,499,957 2.18
4,998,870 7.26
FRANCE1,000,000 Agence Centrale Des Organismes
de Sécurité Sociale 07.05.14/0.000% 999,376 1.451,000,000 Antalis 21.02.14/0.000% 999,708 1.451,500,000 LMA 24.02.14/0.000% 1,499,537 2.181,000,000 Unedic 14.01.14/0.000% 999,955 1.46
4,498,576 6.54
GERMANY1,500,000 Dekabank Deutsche Girozentrale 27.01.14/0.000% 1,499,849 2.181,300,000 FMS Wertmanagement 10.02.14/0.436% 1,300,000 1.891,000,000 FMS Wertmanagement 04.06.14/0.000% 999,427 1.45
3,799,276 5.52
IRELAND1,000,000 GE Capital European Funding 16.01.14/0.000% 999,953 1.451,000,000 Matchpoint Finance 11.02.14/0.000% 999,756 1.45
500,000 Scaldis Capital 27.01.14/0.000% 499,906 0.731,000,000 Scaldis Capital 26.02.14/0.000% 999,695 1.45
3,499,310 5.08
AUSTRIA1,000,000 KA Finanz 24.02.14/0.000% 999,772 1.461,000,000 KA Finanz 10.03.14/0.000% 999,665 1.451,000,000 KA Finanz 26.03.14/0.000% 999,608 1.45
2,999,045 4.36
SWEDEN500,000 Nordea Bank 24.01.14/0.000% 499,957 0.73
1,000,000 Nordea Bank 12.02.14/0.000% 999,852 1.451,000,000 Svenska Handelsbanken 28.02.14/0.000% 999,684 1.45
2,499,493 3.63
NEW ZEALAND1,000,000 BNZ International Funding 14.02.14/0.000% 999,833 1.451,000,000 Kiwibank 28.01.14/0.000% 999,899 1.46
1,999,732 2.91
SINGAPORE500,000 DBS Bank/Singapore 14.03.14/0.000% 499,882 0.73
1,500,000 Oversea-Chinese Banking 10.03.14/0.000% 1,499,470 2.18
1,999,352 2.91
NORWAY1,000,000 DNB Bank 27.01.14/0.000% 999,899 1.45
999,899 1.45
Total Commercial Paper 32,292,434 46.92
Total Transferable Securities Dealt in on AnotherRegulated Market
44,789,900 65.08
Total Investments 55,602,455 80.79
Cash Equivalents
Time Deposits
UNITED KINGDOM3,000,000 Citibank/London 02.01.14/0.010% 3,000,000 4.363,000,000 Citibank/London 03.01.14/0.010% 3,000,000 4.361,500,000 Crédit Agricole/London 02.01.14/0.100% 1,500,000 2.181,500,000 Crédit Agricole/London 03.01.14/0.030% 1,500,000 2.183,000,000 RBS/London 02.01.14/0.010% 3,000,000 4.363,000,000 RBS/London 03.01.14/0.010% 3,000,000 4.36
15,000,000 21.80
59
JPMorgan Investment Funds - Euro Liquid Market Fund
Schedule of Investments (Market Value Expressed in EUR)
As at 31 December 2013
Quantity/Nominal
Value
Name of Securities Maturity/Coupon
MarketValue
%of
NetAssets
Quantity/Nominal
Value
Name of Securities Maturity/Coupon
MarketValue
%of
NetAssets
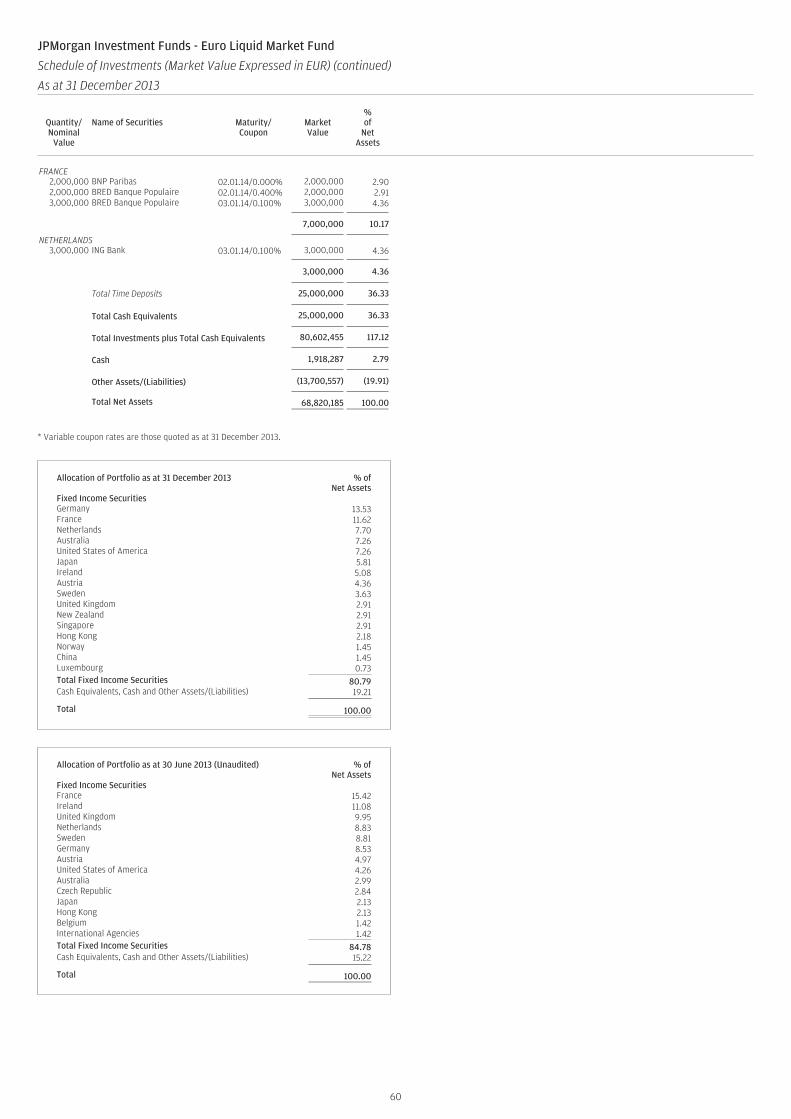
FRANCE2,000,000 BNP Paribas 02.01.14/0.000% 2,000,000 2.902,000,000 BRED Banque Populaire 02.01.14/0.400% 2,000,000 2.913,000,000 BRED Banque Populaire 03.01.14/0.100% 3,000,000 4.36
7,000,000 10.17
NETHERLANDS3,000,000 ING Bank 03.01.14/0.100% 3,000,000 4.36
3,000,000 4.36
Total Time Deposits 25,000,000 36.33
Total Cash Equivalents 25,000,000 36.33
Total Investments plus Total Cash Equivalents 80,602,455 117.12
Cash 1,918,287 2.79
Other Assets/(Liabilities) (13,700,557) (19.91)
Total Net Assets 68,820,185 100.00
* Variable coupon rates are those quoted as at 31 December 2013.
Allocation of Portfolio as at 31 December 2013 % ofNet Assets
Fixed Income SecuritiesGermany 13.53France 11.62Netherlands 7.70Australia 7.26United States of America 7.26Japan 5.81Ireland 5.08Austria 4.36Sweden 3.63United Kingdom 2.91New Zealand 2.91Singapore 2.91Hong Kong 2.18Norway 1.45China 1.45Luxembourg 0.73Total Fixed Income Securities 80.79Cash Equivalents, Cash and Other Assets/(Liabilities) 19.21
Total 100.00
Allocation of Portfolio as at 30 June 2013 (Unaudited) % ofNet Assets
Fixed Income SecuritiesFrance 15.42Ireland 11.08United Kingdom 9.95Netherlands 8.83Sweden 8.81Germany 8.53Austria 4.97United States of America 4.26Australia 2.99Czech Republic 2.84Japan 2.13Hong Kong 2.13Belgium 1.42International Agencies 1.42Total Fixed Income Securities 84.78Cash Equivalents, Cash and Other Assets/(Liabilities) 15.22
Total 100.00
60
JPMorgan Investment Funds - Euro Liquid Market Fund
Schedule of Investments (Market Value Expressed in EUR) (continued)
As at 31 December 2013
Quantity/Nominal
Value
Name of Securities Maturity/Coupon
MarketValue
%of
NetAssets
Quantity/Nominal
Value
Name of Securities Maturity/Coupon
MarketValue
%of
NetAssets

Transferable Securities Admitted to an Official Exchange Listing
Shares and Rights
UNITED KINGDOM2,136,463 3i Group 9,876,004 1.02
122,945 Anglo American 1,965,469 0.2029,062 ASOS 2,128,412 0.22
343,670 Associated British Foods 10,156,084 1.05313,405 AstraZeneca 13,473,774 1.39
51,721 Aveva Group 1,334,264 0.131,967,216 Barclays 6,369,197 0.66
126,576 BG Group 1,952,005 0.202,979,804 BP 17,363,227 1.791,038,712 Brammer 5,534,632 0.57601,087 British American Tobacco 23,092,561 2.38
2,132,769 BT Group 9,598,812 0.996,610,788 Debenhams 6,517,303 0.67
253,874 Diageo 6,013,492 0.62450,386 Domino’s Pizza Group 2,731,687 0.28190,507 Go-Ahead Group 4,042,137 0.42
1,162,806 HSBC Holdings 9,162,558 0.943,855,040 ITV 8,847,917 0.912,129,400 Lloyds Banking Group 1,992,859 0.20
790,310 Partnership Assurance Group 2,781,069 0.29343,978 Prudential 5,503,143 0.57217,879 Rightmove 6,958,463 0.72288,385 Rio Tinto 11,749,857 1.21373,148 Rolls-Royce Holdings 5,606,188 0.58177,644 SABMiller 6,502,927 0.67916,839 SIG 2,314,224 0.24315,723 Standard Chartered 5,124,720 0.53524,138 Tate & Lyle 5,066,986 0.52
3,802,303 Taylor Wimpey 5,019,262 0.529,429,803 Vodafone Group 26,637,808 2.75
122,097 Whitbread 5,445,501 0.561,683,711 William Hill 7,954,239 0.82
238,816,781 24.62
GERMANY137,514 Allianz Registered Shares 17,938,701 1.85218,696 BASF 16,994,866 1.75260,571 Bayer Registered Shares 26,610,813 2.75140,839 Bayerische Motoren Werke 12,036,805 1.24106,013 Continental 16,909,073 1.7487,006 Deutsche Bank Registered Shares 3,019,543 0.31
245,850 HeidelbergCement 13,615,173 1.41222,537 Henkel & Co. Non Voting Preference Shares 18,813,278 1.94195,001 Metro 6,885,973 0.71219,379 SAP 13,719,963 1.41799,619 Sky Deutschland 6,401,350 0.66
152,945,538 15.77
SWITZERLAND206,477 Holcim Registered Shares 11,256,731 1.16530,310 Logitech International Registered Shares 5,308,728 0.55722,713 Nestlé Registered Shares 38,472,636 3.97
343,869 Novartis Registered Shares 19,931,918 2.05132,758 Roche Holding - Genussschein 26,801,730 2.76
5,485 Swatch Group - Bearer Shares 2,624,635 0.27235,716 Swiss Re 15,772,729 1.63
1,096,131 UBS Registered Shares 15,129,700 1.56
135,298,807 13.95
FRANCE1,744,042 Alcatel-Lucent 5,736,154 0.59
857,315 AXA 17,232,031 1.78240,034 BNP Paribas 13,569,122 1.40
86,174 Bouygues 2,365,261 0.24196,815 Compagnie de Saint-Gobain 7,838,649 0.8130,016 Dassault Systèmes 2,728,905 0.28
517,996 Electricite de France 13,271,057 1.37705,798 GDF Suez 12,023,269 1.24150,477 Renault 8,787,857 0.91224,864 Société Générale 9,506,126 0.98272,747 Thalès 12,685,463 1.31117,080 Total 5,212,987 0.53
110,956,881 11.44
NETHERLANDS289,675 EADS 16,127,656 1.66709,991 Koninklijke Ahold 9,320,407 0.96
1,751,588 Koninklijke KPN 4,099,592 0.42426,497 Koninklijke Philips 11,318,164 1.17
1,436,566 PostNL 5,985,452 0.62667,357 Royal Dutch Shell - A Shares 17,206,058 1.77135,577 Ziggo 4,464,551 0.46
68,521,880 7.06
ITALY208,102 Banca Generali 4,692,700 0.48
3,044,307 Enel 9,699,162 1.002,788,902 Enel Green Power 5,114,846 0.53
810,198 Eni 14,214,924 1.47127,785 Moncler 2,004,308 0.20
7,953,759 Telecom Italia 5,724,718 0.592,146,732 UniCredit 11,565,519 1.19
53,016,177 5.46
SPAIN1,047,055 Banco Santander 6,817,899 0.704,465,532 Bankia 5,450,182 0.561,087,774 Distribuidora Internacional de Alimentacion 7,122,200 0.73
502,494 Repsol 9,218,252 0.95502,494 Repsol - Rights 09.01.14 248,986 0.03817,877 Telefonica 9,644,814 1.00
38,502,333 3.97
SWEDEN548,032 Electrolux - B Shares 10,329,339 1.07
1,671,868 Nordea Bank 16,127,286 1.66669,071 Tele2 - B Shares 5,484,709 0.56532,549 Telefonaktiebolaget LM Ericsson - B Shares 4,711,639 0.49
36,652,973 3.78
DENMARK80,781 Chr. Hansen Holding 2,330,373 0.24
732,364 Danske Bank 12,198,243 1.26136,052 Novo Nordisk - B Shares 18,114,961 1.86
32,643,577 3.36
JERSEY329,197 Petrofac 4,786,450 0.49478,156 Shire 16,140,037 1.67
20,926,487 2.16
BELGIUM134,460 Solvay 15,395,670 1.59
15,395,670 1.59
NORWAY64,132 Algeta 2,730,863 0.28
494,062 Telenor 8,476,816 0.88
11,207,679 1.16
FINLAND644,270 UPM-Kymmene 7,943,849 0.82
7,943,849 0.82
PORTUGAL1,821,135 EDP - Energias de Portugal 4,894,300 0.50
4,894,300 0.50
IRELAND596,752 Ryanair Holdings 3,735,966 0.38
3,735,966 0.38
AUSTRIA58,492 Andritz 2,658,023 0.27
2,658,023 0.27
LUXEMBOURG116,394 ArcelorMittal 1,497,991 0.15
1,497,991 0.15
Total Shares and Rights 935,614,912 96.44
Total Transferable Securities Admitted to anOfficial Exchange Listing
935,614,912 96.44
61
JPMorgan Investment Funds - Europe Select Equity Fund
Schedule of Investments (Market Value Expressed in EUR)
As at 31 December 2013
Quantity/Nominal
Value
Name of Securities Maturity/Coupon
MarketValue
%of
NetAssets
Quantity/Nominal
Value
Name of Securities Maturity/Coupon
MarketValue
%of
NetAssets
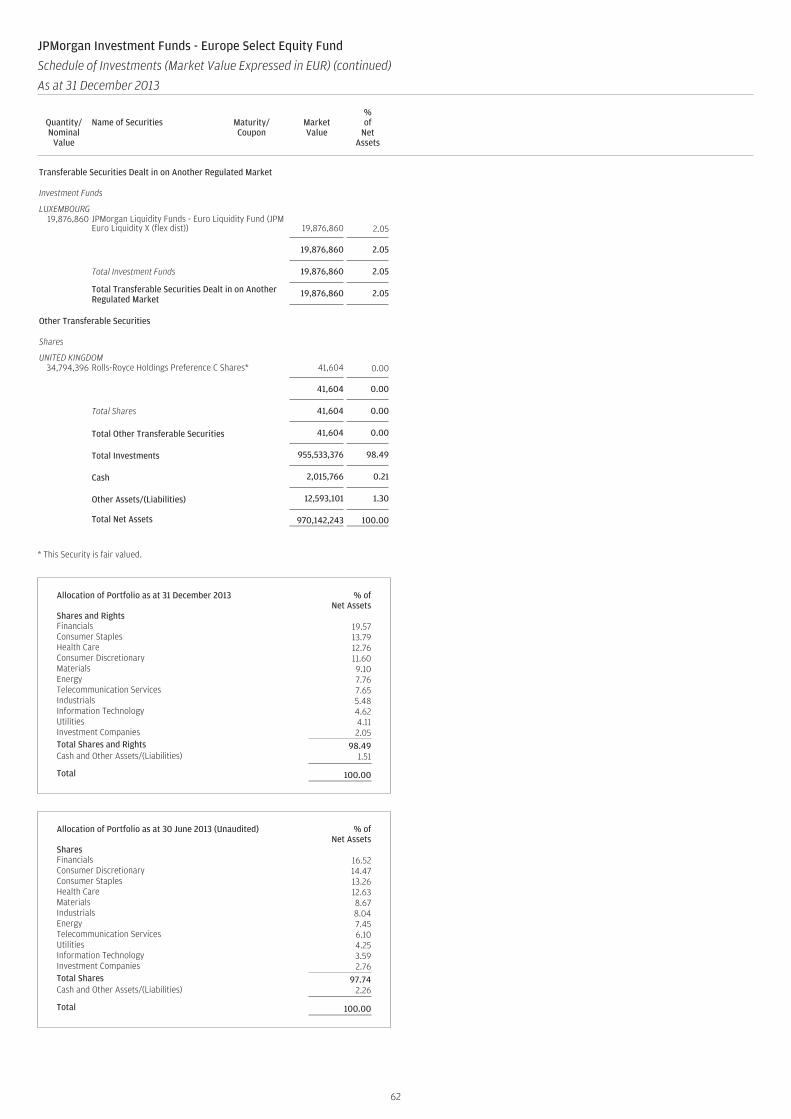
Transferable Securities Dealt in on Another Regulated Market
Investment Funds
LUXEMBOURG19,876,860 JPMorgan Liquidity Funds - Euro Liquidity Fund (JPM
Euro Liquidity X (flex dist)) 19,876,860 2.05
19,876,860 2.05
Total Investment Funds 19,876,860 2.05
Total Transferable Securities Dealt in on AnotherRegulated Market
19,876,860 2.05
Other Transferable Securities
Shares
UNITED KINGDOM34,794,396 Rolls-Royce Holdings Preference C Shares* 41,604 0.00
41,604 0.00
Total Shares 41,604 0.00
Total Other Transferable Securities 41,604 0.00
Total Investments 955,533,376 98.49
Cash 2,015,766 0.21
Other Assets/(Liabilities) 12,593,101 1.30
Total Net Assets 970,142,243 100.00
* This Security is fair valued.
Allocation of Portfolio as at 31 December 2013 % ofNet Assets
Shares and RightsFinancials 19.57Consumer Staples 13.79Health Care 12.76Consumer Discretionary 11.60Materials 9.10Energy 7.76Telecommunication Services 7.65Industrials 5.48Information Technology 4.62Utilities 4.11Investment Companies 2.05Total Shares and Rights 98.49Cash and Other Assets/(Liabilities) 1.51
Total 100.00
Allocation of Portfolio as at 30 June 2013 (Unaudited) % ofNet Assets
SharesFinancials 16.52Consumer Discretionary 14.47Consumer Staples 13.26Health Care 12.63Materials 8.67Industrials 8.04Energy 7.45Telecommunication Services 6.10Utilities 4.25Information Technology 3.59Investment Companies 2.76Total Shares 97.74Cash and Other Assets/(Liabilities) 2.26
Total 100.00
62
JPMorgan Investment Funds - Europe Select Equity Fund
Schedule of Investments (Market Value Expressed in EUR) (continued)
As at 31 December 2013
Quantity/Nominal
Value
Name of Securities Maturity/Coupon
MarketValue
%of
NetAssets
Quantity/Nominal
Value
Name of Securities Maturity/Coupon
MarketValue
%of
NetAssets
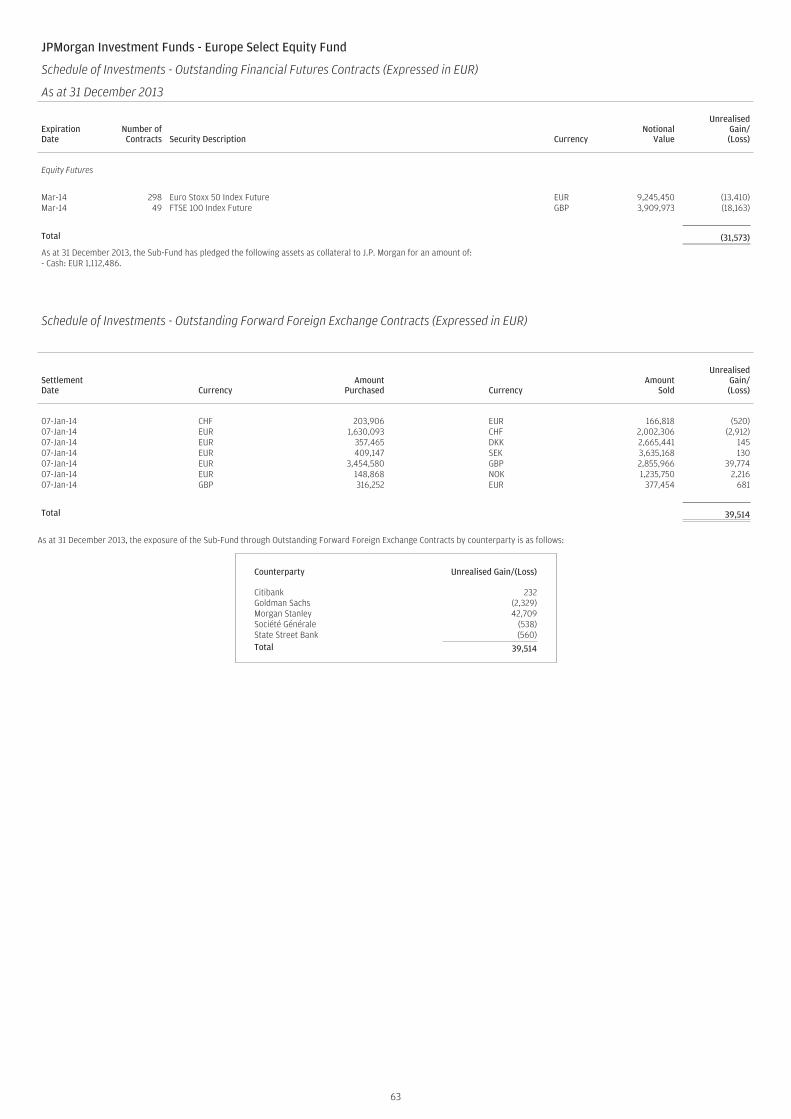
JPMorgan Investment Funds - Europe Select Equity Fund
Schedule of Investments - Outstanding Financial Futures Contracts (Expressed in EUR)
As at 31 December 2013
ExpirationDate
Number ofContracts Security Description Currency
NotionalValue
UnrealisedGain/(Loss)
Equity Futures
Mar-14 298 Euro Stoxx 50 Index Future EUR 9,245,450 (13,410)Mar-14 49 FTSE 100 Index Future GBP 3,909,973 (18,163)
Total (31,573)
As at 31 December 2013, the Sub-Fund has pledged the following assets as collateral to J.P. Morgan for an amount of:- Cash: EUR 1,112,486.
Schedule of Investments - Outstanding Forward Foreign Exchange Contracts (Expressed in EUR)
SettlementDate Currency
AmountPurchased Currency
AmountSold
UnrealisedGain/(Loss)
07-Jan-14 CHF 203,906 EUR 166,818 (520)07-Jan-14 EUR 1,630,093 CHF 2,002,306 (2,912)07-Jan-14 EUR 357,465 DKK 2,665,441 14507-Jan-14 EUR 409,147 SEK 3,635,168 13007-Jan-14 EUR 3,454,580 GBP 2,855,966 39,77407-Jan-14 EUR 148,868 NOK 1,235,750 2,21607-Jan-14 GBP 316,252 EUR 377,454 681
Total 39,514
As at 31 December 2013, the exposure of the Sub-Fund through Outstanding Forward Foreign Exchange Contracts by counterparty is as follows:
Counterparty Unrealised Gain/(Loss)
Citibank 232Goldman Sachs (2,329)Morgan Stanley 42,709Société Générale (538)State Street Bank (560)Total 39,514
63
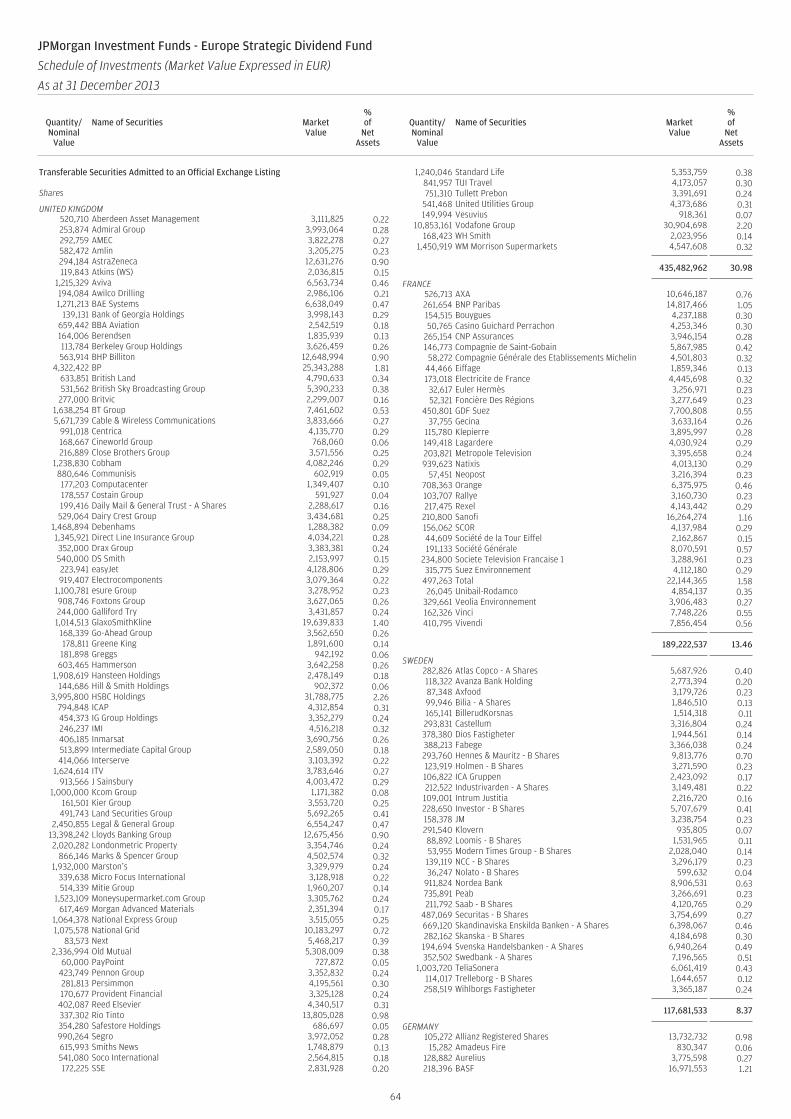
Transferable Securities Admitted to an Official Exchange Listing
Shares
UNITED KINGDOM520,710 Aberdeen Asset Management 3,111,825 0.22253,874 Admiral Group 3,993,064 0.28292,759 AMEC 3,822,278 0.27582,472 Amlin 3,205,275 0.23294,184 AstraZeneca 12,631,276 0.90119,843 Atkins (WS) 2,036,815 0.15
1,215,329 Aviva 6,563,734 0.46194,084 Awilco Drilling 2,986,106 0.211,271,213 BAE Systems 6,638,049 0.47
139,131 Bank of Georgia Holdings 3,998,143 0.29659,442 BBA Aviation 2,542,519 0.18164,006 Berendsen 1,835,939 0.13113,784 Berkeley Group Holdings 3,626,459 0.26563,914 BHP Billiton 12,648,994 0.90
4,322,422 BP 25,343,288 1.81633,851 British Land 4,790,633 0.34531,562 British Sky Broadcasting Group 5,390,233 0.38
277,000 Britvic 2,299,007 0.161,638,254 BT Group 7,461,602 0.535,671,739 Cable & Wireless Communications 3,833,666 0.27
991,018 Centrica 4,135,770 0.29168,667 Cineworld Group 768,060 0.06216,889 Close Brothers Group 3,571,556 0.25
1,238,830 Cobham 4,082,246 0.29880,646 Communisis 602,919 0.05177,203 Computacenter 1,349,407 0.10178,557 Costain Group 591,927 0.04199,416 Daily Mail & General Trust - A Shares 2,288,617 0.16529,064 Dairy Crest Group 3,434,681 0.25
1,468,894 Debenhams 1,288,382 0.091,345,921 Direct Line Insurance Group 4,034,221 0.28352,000 Drax Group 3,383,381 0.24540,000 DS Smith 2,153,997 0.15223,941 easyJet 4,128,806 0.29919,407 Electrocomponents 3,079,364 0.22
1,100,781 esure Group 3,278,952 0.23908,746 Foxtons Group 3,627,065 0.26244,000 Galliford Try 3,431,857 0.241,014,513 GlaxoSmithKline 19,639,833 1.40
168,339 Go-Ahead Group 3,562,650 0.26178,811 Greene King 1,891,600 0.14181,898 Greggs 942,192 0.06
603,465 Hammerson 3,642,258 0.261,908,619 Hansteen Holdings 2,478,149 0.18
144,686 Hill & Smith Holdings 902,372 0.063,995,800 HSBC Holdings 31,788,775 2.26
794,848 ICAP 4,312,854 0.31454,373 IG Group Holdings 3,352,279 0.24246,237 IMI 4,516,218 0.32406,185 Inmarsat 3,690,756 0.26513,899 Intermediate Capital Group 2,589,050 0.18414,066 Interserve 3,103,392 0.22
1,624,614 ITV 3,783,646 0.27913,566 J Sainsbury 4,003,472 0.29
1,000,000 Kcom Group 1,171,382 0.08161,501 Kier Group 3,553,720 0.25
491,743 Land Securities Group 5,692,265 0.412,450,855 Legal & General Group 6,554,247 0.47
13,398,242 Lloyds Banking Group 12,675,456 0.902,020,282 Londonmetric Property 3,354,746 0.24
866,146 Marks & Spencer Group 4,502,574 0.321,932,000 Marston’s 3,329,979 0.24
339,638 Micro Focus International 3,128,918 0.22514,339 Mitie Group 1,960,207 0.14
1,523,109 Moneysupermarket.com Group 3,305,762 0.24617,469 Morgan Advanced Materials 2,351,394 0.17
1,064,378 National Express Group 3,515,055 0.251,075,578 National Grid 10,183,297 0.72
83,573 Next 5,468,217 0.392,336,994 Old Mutual 5,308,009 0.38
60,000 PayPoint 727,872 0.05423,749 Pennon Group 3,352,832 0.24281,813 Persimmon 4,195,561 0.30170,677 Provident Financial 3,325,128 0.24
402,087 Reed Elsevier 4,340,517 0.31337,302 Rio Tinto 13,805,028 0.98354,280 Safestore Holdings 686,697 0.05990,264 Segro 3,972,052 0.28615,993 Smiths News 1,748,879 0.13541,080 Soco International 2,564,815 0.18172,225 SSE 2,831,928 0.20
1,240,046 Standard Life 5,353,759 0.38841,957 TUI Travel 4,173,057 0.30751,310 Tullett Prebon 3,391,691 0.24
541,468 United Utilities Group 4,373,686 0.31149,994 Vesuvius 918,361 0.07
10,853,161 Vodafone Group 30,904,698 2.20168,423 WH Smith 2,023,956 0.14
1,450,919 WM Morrison Supermarkets 4,547,608 0.32
435,482,962 30.98
FRANCE526,713 AXA 10,646,187 0.76261,654 BNP Paribas 14,817,466 1.05154,515 Bouygues 4,237,188 0.3050,765 Casino Guichard Perrachon 4,253,346 0.30
265,154 CNP Assurances 3,946,154 0.28146,773 Compagnie de Saint-Gobain 5,867,985 0.4258,272 Compagnie Générale des Etablissements Michelin 4,501,803 0.32
44,466 Eiffage 1,859,346 0.13173,018 Electricite de France 4,445,698 0.3232,617 Euler Hermès 3,256,971 0.2352,321 Foncière Des Régions 3,277,649 0.23
450,801 GDF Suez 7,700,808 0.5537,755 Gecina 3,633,164 0.26
115,780 Klepierre 3,895,997 0.28149,418 Lagardere 4,030,924 0.29203,821 Metropole Television 3,395,658 0.24939,623 Natixis 4,013,130 0.29
57,451 Neopost 3,216,394 0.23708,363 Orange 6,375,975 0.46103,707 Rallye 3,160,730 0.23217,475 Rexel 4,143,442 0.29
210,800 Sanofi 16,264,274 1.16156,062 SCOR 4,137,984 0.2944,609 Société de la Tour Eiffel 2,162,867 0.15191,133 Société Générale 8,070,591 0.57
234,800 Societe Television Francaise 1 3,288,961 0.23315,775 Suez Environnement 4,112,180 0.29
497,263 Total 22,144,365 1.5826,045 Unibail-Rodamco 4,854,137 0.35
329,661 Veolia Environnement 3,906,483 0.27162,326 Vinci 7,748,226 0.55410,795 Vivendi 7,856,454 0.56
189,222,537 13.46
SWEDEN282,826 Atlas Copco - A Shares 5,687,926 0.40118,322 Avanza Bank Holding 2,773,394 0.2087,348 Axfood 3,179,726 0.2399,946 Bilia - A Shares 1,846,510 0.13165,141 BillerudKorsnas 1,514,318 0.11293,831 Castellum 3,316,804 0.24378,380 Dios Fastigheter 1,944,561 0.14388,213 Fabege 3,366,038 0.24293,760 Hennes & Mauritz - B Shares 9,813,776 0.70123,919 Holmen - B Shares 3,271,590 0.23106,822 ICA Gruppen 2,423,092 0.17212,522 Industrivarden - A Shares 3,149,481 0.22109,001 Intrum Justitia 2,216,720 0.16228,650 Investor - B Shares 5,707,679 0.41158,378 JM 3,238,754 0.23291,540 Klovern 935,805 0.0788,892 Loomis - B Shares 1,531,965 0.1153,955 Modern Times Group - B Shares 2,028,040 0.14139,119 NCC - B Shares 3,296,179 0.2336,247 Nolato - B Shares 599,632 0.04
911,824 Nordea Bank 8,906,531 0.63735,891 Peab 3,266,691 0.23211,792 Saab - B Shares 4,120,765 0.29
487,069 Securitas - B Shares 3,754,699 0.27669,120 Skandinaviska Enskilda Banken - A Shares 6,398,067 0.46282,162 Skanska - B Shares 4,184,698 0.30194,694 Svenska Handelsbanken - A Shares 6,940,264 0.49352,502 Swedbank - A Shares 7,196,565 0.51
1,003,720 TeliaSonera 6,061,419 0.43114,017 Trelleborg - B Shares 1,644,657 0.12258,519 Wihlborgs Fastigheter 3,365,187 0.24
117,681,533 8.37
GERMANY105,272 Allianz Registered Shares 13,732,732 0.98
15,282 Amadeus Fire 830,347 0.06128,882 Aurelius 3,775,598 0.27218,396 BASF 16,971,553 1.21
64
JPMorgan Investment Funds - Europe Strategic Dividend Fund
Schedule of Investments (Market Value Expressed in EUR)
As at 31 December 2013
Quantity/Nominal
Value
Name of Securities MarketValue
%of
NetAssets
Quantity/Nominal
Value
Name of Securities MarketValue
%of
NetAssets
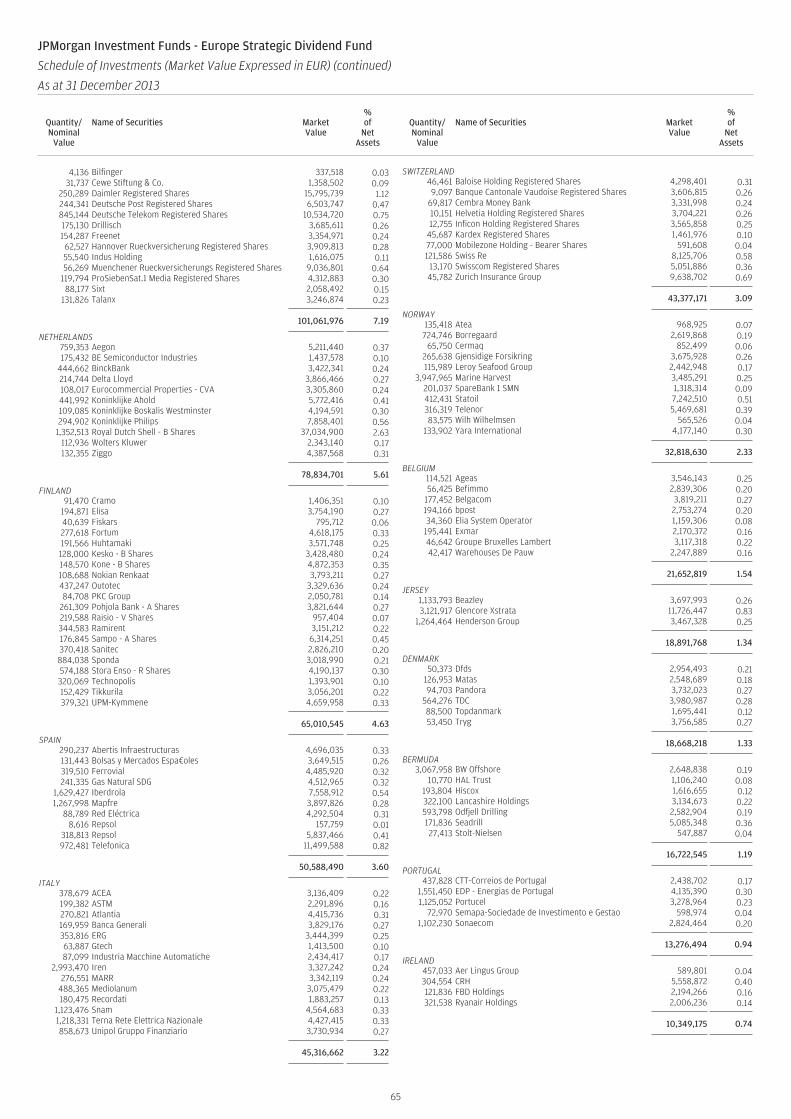
4,136 Bilfinger 337,518 0.0331,737 Cewe Stiftung & Co. 1,358,502 0.09
250,289 Daimler Registered Shares 15,795,739 1.12244,341 Deutsche Post Registered Shares 6,503,747 0.47845,144 Deutsche Telekom Registered Shares 10,534,720 0.75175,130 Drillisch 3,685,611 0.26154,287 Freenet 3,354,971 0.2462,527 Hannover Rueckversicherung Registered Shares 3,909,813 0.2855,540 Indus Holding 1,616,075 0.1156,269 Muenchener Rueckversicherungs Registered Shares 9,036,801 0.64
119,794 ProSiebenSat.1 Media Registered Shares 4,312,883 0.3088,177 Sixt 2,058,492 0.15
131,826 Talanx 3,246,874 0.23
101,061,976 7.19
NETHERLANDS759,353 Aegon 5,211,440 0.37175,432 BE Semiconductor Industries 1,437,578 0.10
444,662 BinckBank 3,422,341 0.24214,744 Delta Lloyd 3,866,466 0.27108,017 Eurocommercial Properties - CVA 3,305,860 0.24441,992 Koninklijke Ahold 5,772,416 0.41109,085 Koninklijke Boskalis Westminster 4,194,591 0.30294,902 Koninklijke Philips 7,858,401 0.56
1,352,513 Royal Dutch Shell - B Shares 37,034,900 2.63112,936 Wolters Kluwer 2,343,140 0.17132,355 Ziggo 4,387,568 0.31
78,834,701 5.61
FINLAND91,470 Cramo 1,406,351 0.10
194,871 Elisa 3,754,190 0.2740,639 Fiskars 795,712 0.06277,618 Fortum 4,618,175 0.33191,566 Huhtamaki 3,571,748 0.25128,000 Kesko - B Shares 3,428,480 0.24148,570 Kone - B Shares 4,872,353 0.35108,688 Nokian Renkaat 3,793,211 0.27437,247 Outotec 3,329,636 0.2484,708 PKC Group 2,050,781 0.14
261,309 Pohjola Bank - A Shares 3,821,644 0.27219,588 Raisio - V Shares 957,404 0.07344,583 Ramirent 3,151,212 0.22176,845 Sampo - A Shares 6,314,251 0.45370,418 Sanitec 2,826,210 0.20884,038 Sponda 3,018,990 0.21574,188 Stora Enso - R Shares 4,190,137 0.30320,069 Technopolis 1,393,901 0.10152,429 Tikkurila 3,056,201 0.22379,321 UPM-Kymmene 4,659,958 0.33
65,010,545 4.63
SPAIN290,237 Abertis Infraestructuras 4,696,035 0.33131,443 Bolsas y Mercados Espa¤oles 3,649,515 0.26319,510 Ferrovial 4,485,920 0.32241,335 Gas Natural SDG 4,512,965 0.32
1,629,427 Iberdrola 7,558,912 0.541,267,998 Mapfre 3,897,826 0.28
88,789 Red Eléctrica 4,292,504 0.318,616 Repsol 157,759 0.01
318,813 Repsol 5,837,466 0.41972,481 Telefonica 11,499,588 0.82
50,588,490 3.60
ITALY378,679 ACEA 3,136,409 0.22199,382 ASTM 2,291,896 0.16270,821 Atlantia 4,415,736 0.31169,959 Banca Generali 3,829,176 0.27353,816 ERG 3,444,399 0.2563,887 Gtech 1,413,500 0.1087,099 Industria Macchine Automatiche 2,434,417 0.17
2,993,470 Iren 3,327,242 0.24276,551 MARR 3,342,119 0.24
488,365 Mediolanum 3,075,479 0.22180,475 Recordati 1,883,257 0.13
1,123,476 Snam 4,564,683 0.331,218,331 Terna Rete Elettrica Nazionale 4,427,415 0.33858,673 Unipol Gruppo Finanziario 3,730,934 0.27
45,316,662 3.22
SWITZERLAND46,461 Baloise Holding Registered Shares 4,298,401 0.319,097 Banque Cantonale Vaudoise Registered Shares 3,606,815 0.26
69,817 Cembra Money Bank 3,331,998 0.2410,151 Helvetia Holding Registered Shares 3,704,221 0.2612,755 Inficon Holding Registered Shares 3,565,858 0.25
45,687 Kardex Registered Shares 1,461,976 0.1077,000 Mobilezone Holding - Bearer Shares 591,608 0.04121,586 Swiss Re 8,125,706 0.58
13,170 Swisscom Registered Shares 5,051,886 0.3645,782 Zurich Insurance Group 9,638,702 0.69
43,377,171 3.09
NORWAY135,418 Atea 968,925 0.07724,746 Borregaard 2,619,868 0.19
65,750 Cermaq 852,499 0.06265,638 Gjensidige Forsikring 3,675,928 0.26115,989 Leroy Seafood Group 2,442,948 0.17
3,947,965 Marine Harvest 3,485,291 0.25201,037 SpareBank 1 SMN 1,318,314 0.09412,431 Statoil 7,242,510 0.51316,319 Telenor 5,469,681 0.3983,575 Wilh Wilhelmsen 565,526 0.04
133,902 Yara International 4,177,140 0.30
32,818,630 2.33
BELGIUM114,521 Ageas 3,546,143 0.2556,425 Befimmo 2,839,306 0.20
177,452 Belgacom 3,819,211 0.27194,166 bpost 2,753,274 0.2034,360 Elia System Operator 1,159,306 0.08
195,441 Exmar 2,170,372 0.1646,642 Groupe Bruxelles Lambert 3,117,318 0.2242,417 Warehouses De Pauw 2,247,889 0.16
21,652,819 1.54
JERSEY1,133,793 Beazley 3,697,993 0.263,121,917 Glencore Xstrata 11,726,447 0.83
1,264,464 Henderson Group 3,467,328 0.25
18,891,768 1.34
DENMARK50,373 Dfds 2,954,493 0.21
126,953 Matas 2,548,689 0.1894,703 Pandora 3,732,023 0.27
564,276 TDC 3,980,987 0.2888,500 Topdanmark 1,695,441 0.1253,450 Tryg 3,756,585 0.27
18,668,218 1.33
BERMUDA3,067,958 BW Offshore 2,648,838 0.19
10,770 HAL Trust 1,106,240 0.08193,804 Hiscox 1,616,655 0.12322,100 Lancashire Holdings 3,134,673 0.22593,798 Odfjell Drilling 2,582,904 0.19171,836 Seadrill 5,085,348 0.3627,413 Stolt-Nielsen 547,887 0.04
16,722,545 1.19
PORTUGAL437,828 CTT-Correios de Portugal 2,438,702 0.17
1,551,450 EDP - Energias de Portugal 4,135,390 0.301,125,052 Portucel 3,278,964 0.23
72,970 Semapa-Sociedade de Investimento e Gestao 598,974 0.041,102,230 Sonaecom 2,824,464 0.20
13,276,494 0.94
IRELAND457,033 Aer Lingus Group 589,801 0.04304,554 CRH 5,558,872 0.40121,836 FBD Holdings 2,194,266 0.16321,538 Ryanair Holdings 2,006,236 0.14
10,349,175 0.74
65
JPMorgan Investment Funds - Europe Strategic Dividend Fund
Schedule of Investments (Market Value Expressed in EUR) (continued)
As at 31 December 2013
Quantity/Nominal
Value
Name of Securities MarketValue
%of
NetAssets
Quantity/Nominal
Value
Name of Securities MarketValue
%of
NetAssets
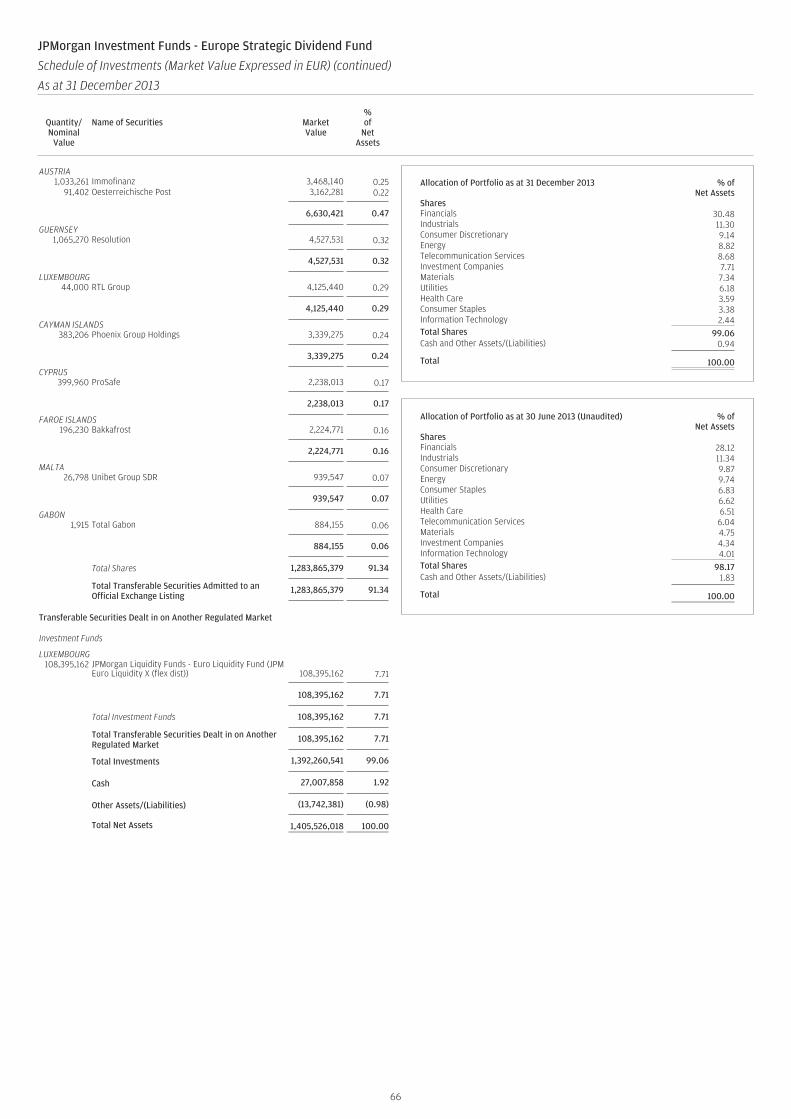
AUSTRIA1,033,261 Immofinanz 3,468,140 0.25
91,402 Oesterreichische Post 3,162,281 0.22
6,630,421 0.47
GUERNSEY1,065,270 Resolution 4,527,531 0.32
4,527,531 0.32
LUXEMBOURG44,000 RTL Group 4,125,440 0.29
4,125,440 0.29
CAYMAN ISLANDS383,206 Phoenix Group Holdings 3,339,275 0.24
3,339,275 0.24
CYPRUS399,960 ProSafe 2,238,013 0.17
2,238,013 0.17
FAROE ISLANDS196,230 Bakkafrost 2,224,771 0.16
2,224,771 0.16
MALTA26,798 Unibet Group SDR 939,547 0.07
939,547 0.07
GABON1,915 Total Gabon 884,155 0.06
884,155 0.06
Total Shares 1,283,865,379 91.34
Total Transferable Securities Admitted to anOfficial Exchange Listing
1,283,865,379 91.34
Transferable Securities Dealt in on Another Regulated Market
Investment Funds
LUXEMBOURG108,395,162 JPMorgan Liquidity Funds - Euro Liquidity Fund (JPM
Euro Liquidity X (flex dist)) 108,395,162 7.71
108,395,162 7.71
Total Investment Funds 108,395,162 7.71
Total Transferable Securities Dealt in on AnotherRegulated Market
108,395,162 7.71
Total Investments 1,392,260,541 99.06
Cash 27,007,858 1.92
Other Assets/(Liabilities) (13,742,381) (0.98)
Total Net Assets 1,405,526,018 100.00
Allocation of Portfolio as at 31 December 2013 % ofNet Assets
SharesFinancials 30.48Industrials 11.30Consumer Discretionary 9.14Energy 8.82Telecommunication Services 8.68Investment Companies 7.71Materials 7.34Utilities 6.18Health Care 3.59Consumer Staples 3.38Information Technology 2.44Total Shares 99.06Cash and Other Assets/(Liabilities) 0.94
Total 100.00
Allocation of Portfolio as at 30 June 2013 (Unaudited) % ofNet Assets
SharesFinancials 28.12Industrials 11.34Consumer Discretionary 9.87Energy 9.74Consumer Staples 6.83Utilities 6.62Health Care 6.51Telecommunication Services 6.04Materials 4.75Investment Companies 4.34Information Technology 4.01Total Shares 98.17Cash and Other Assets/(Liabilities) 1.83
Total 100.00
66
JPMorgan Investment Funds - Europe Strategic Dividend Fund
Schedule of Investments (Market Value Expressed in EUR) (continued)
As at 31 December 2013
Quantity/Nominal
Value
Name of Securities MarketValue
%of
NetAssets
Quantity/Nominal
Value
Name of Securities MarketValue
%of
NetAssets
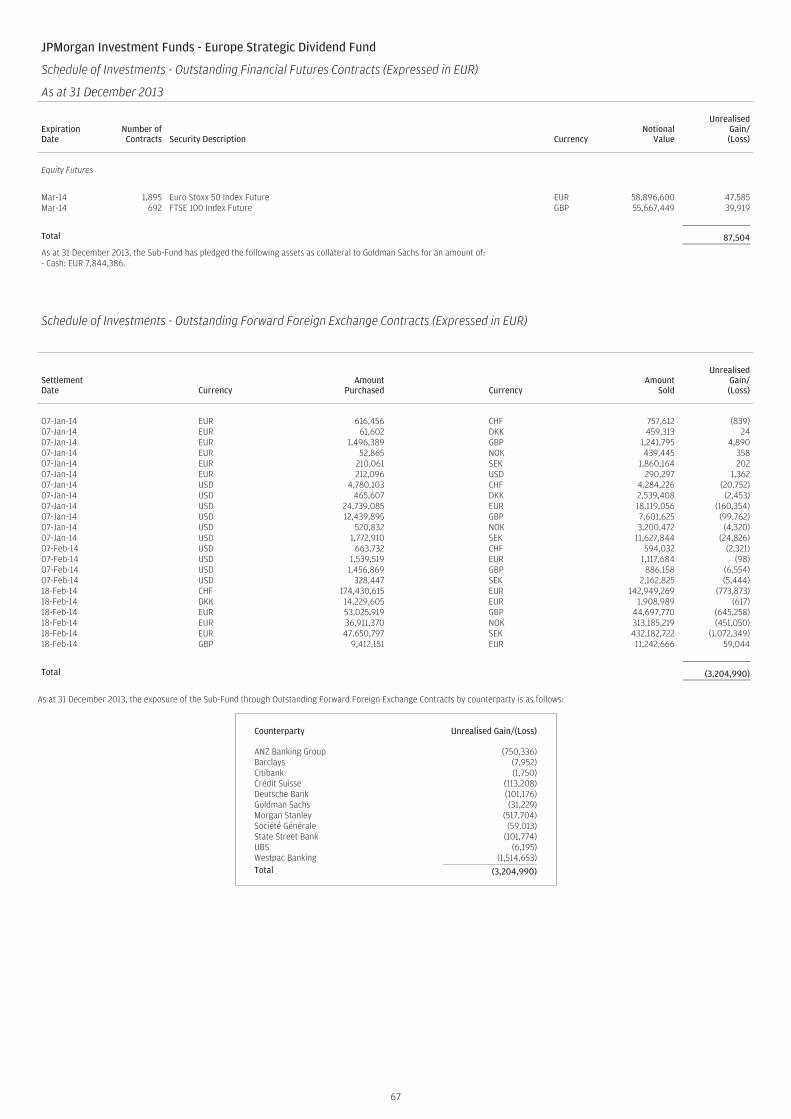
JPMorgan Investment Funds - Europe Strategic Dividend Fund
Schedule of Investments - Outstanding Financial Futures Contracts (Expressed in EUR)
As at 31 December 2013
ExpirationDate
Number ofContracts Security Description Currency
NotionalValue
UnrealisedGain/(Loss)
Equity Futures
Mar-14 1,895 Euro Stoxx 50 Index Future EUR 58,896,600 47,585Mar-14 692 FTSE 100 Index Future GBP 55,667,449 39,919
Total 87,504
As at 31 December 2013, the Sub-Fund has pledged the following assets as collateral to Goldman Sachs for an amount of:- Cash: EUR 7,844,386.
Schedule of Investments - Outstanding Forward Foreign Exchange Contracts (Expressed in EUR)
SettlementDate Currency
AmountPurchased Currency
AmountSold
UnrealisedGain/(Loss)
07-Jan-14 EUR 616,456 CHF 757,612 (839)07-Jan-14 EUR 61,602 DKK 459,313 2407-Jan-14 EUR 1,496,389 GBP 1,241,795 4,89007-Jan-14 EUR 52,865 NOK 439,445 35807-Jan-14 EUR 210,061 SEK 1,860,164 20207-Jan-14 EUR 212,096 USD 290,297 1,36207-Jan-14 USD 4,780,103 CHF 4,284,226 (20,752)07-Jan-14 USD 465,607 DKK 2,539,408 (2,453)07-Jan-14 USD 24,739,085 EUR 18,119,056 (160,354)07-Jan-14 USD 12,439,895 GBP 7,601,625 (99,762)07-Jan-14 USD 520,832 NOK 3,200,472 (4,320)07-Jan-14 USD 1,772,910 SEK 11,627,844 (24,826)07-Feb-14 USD 663,732 CHF 594,032 (2,321)07-Feb-14 USD 1,539,519 EUR 1,117,684 (98)07-Feb-14 USD 1,456,869 GBP 886,158 (6,554)07-Feb-14 USD 328,447 SEK 2,162,825 (5,444)18-Feb-14 CHF 174,430,615 EUR 142,949,269 (773,873)18-Feb-14 DKK 14,229,605 EUR 1,908,989 (617)18-Feb-14 EUR 53,025,919 GBP 44,697,770 (645,258)18-Feb-14 EUR 36,911,370 NOK 313,185,219 (451,050)18-Feb-14 EUR 47,650,797 SEK 432,182,722 (1,072,349)18-Feb-14 GBP 9,412,151 EUR 11,242,666 59,044
Total (3,204,990)
As at 31 December 2013, the exposure of the Sub-Fund through Outstanding Forward Foreign Exchange Contracts by counterparty is as follows:
Counterparty Unrealised Gain/(Loss)
ANZ Banking Group (750,336)Barclays (7,952)Citibank (1,750)Crédit Suisse (113,208)Deutsche Bank (101,176)Goldman Sachs (31,229)Morgan Stanley (517,704)Société Générale (59,013)State Street Bank (101,774)UBS (6,195)Westpac Banking (1,514,653)Total (3,204,990)
67
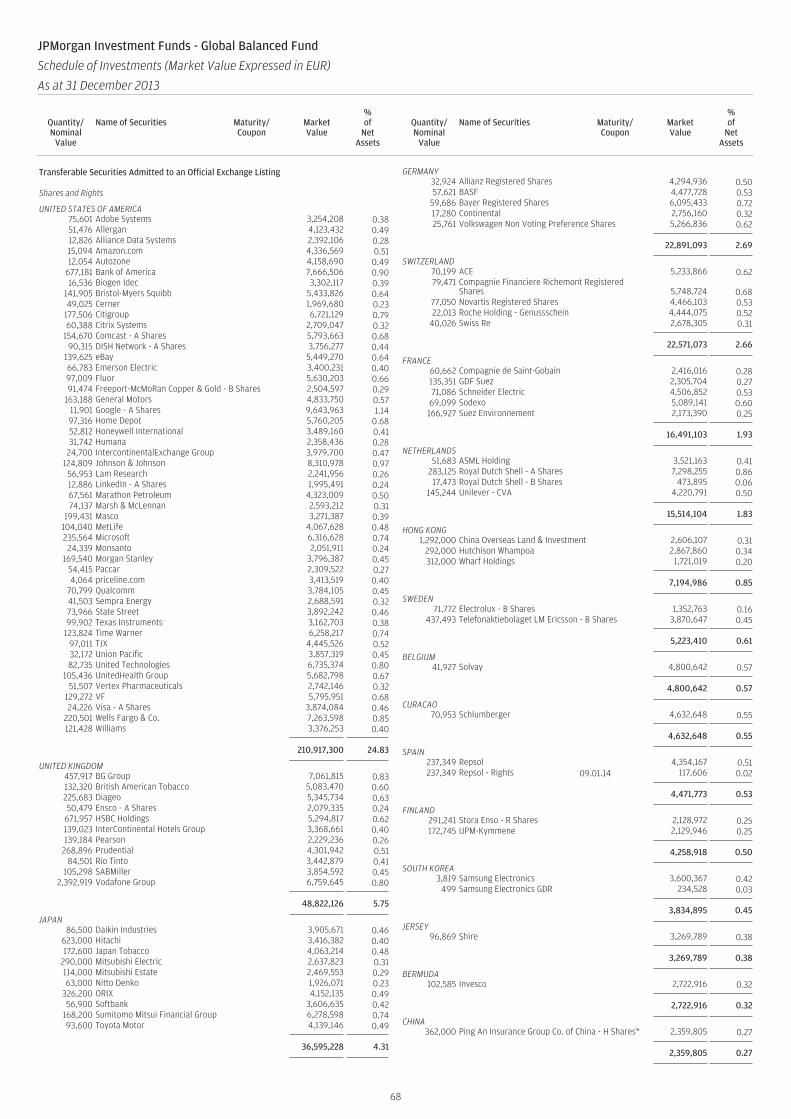
Transferable Securities Admitted to an Official Exchange Listing
Shares and Rights
UNITED STATES OF AMERICA75,601 Adobe Systems 3,254,208 0.3851,476 Allergan 4,123,432 0.4912,826 Alliance Data Systems 2,392,106 0.2815,094 Amazon.com 4,336,569 0.5112,054 Autozone 4,158,690 0.49
677,181 Bank of America 7,666,506 0.9016,536 Biogen Idec 3,302,117 0.39
141,905 Bristol-Myers Squibb 5,433,826 0.6449,025 Cerner 1,969,680 0.23
177,506 Citigroup 6,721,129 0.7960,388 Citrix Systems 2,709,047 0.32
154,670 Comcast - A Shares 5,793,663 0.6890,315 DISH Network - A Shares 3,756,277 0.44
139,625 eBay 5,449,270 0.6466,783 Emerson Electric 3,400,231 0.4097,009 Fluor 5,630,203 0.6691,474 Freeport-McMoRan Copper & Gold - B Shares 2,504,597 0.29
163,188 General Motors 4,833,750 0.5711,901 Google - A Shares 9,643,963 1.1497,316 Home Depot 5,760,205 0.6852,812 Honeywell International 3,489,160 0.4131,742 Humana 2,358,436 0.28
24,700 IntercontinentalExchange Group 3,979,700 0.47124,809 Johnson & Johnson 8,310,978 0.97
56,953 Lam Research 2,241,956 0.2612,886 LinkedIn - A Shares 1,995,491 0.2467,561 Marathon Petroleum 4,323,009 0.5074,137 Marsh & McLennan 2,593,212 0.31
199,431 Masco 3,271,387 0.39104,040 MetLife 4,067,628 0.48235,564 Microsoft 6,316,628 0.7424,339 Monsanto 2,051,911 0.24
169,540 Morgan Stanley 3,796,387 0.4554,415 Paccar 2,309,522 0.274,064 priceline.com 3,413,519 0.40
70,799 Qualcomm 3,784,105 0.4541,503 Sempra Energy 2,688,591 0.3273,966 State Street 3,892,242 0.4699,902 Texas Instruments 3,162,703 0.38
123,824 Time Warner 6,258,217 0.7497,011 TJX 4,445,526 0.5232,172 Union Pacific 3,857,319 0.4582,735 United Technologies 6,735,374 0.80
105,436 UnitedHealth Group 5,682,798 0.6751,507 Vertex Pharmaceuticals 2,742,146 0.32
129,272 VF 5,795,951 0.6824,226 Visa - A Shares 3,874,084 0.46
220,501 Wells Fargo & Co. 7,263,598 0.85121,428 Williams 3,376,253 0.40
210,917,300 24.83
UNITED KINGDOM457,917 BG Group 7,061,815 0.83132,320 British American Tobacco 5,083,470 0.60225,683 Diageo 5,345,734 0.6350,479 Ensco - A Shares 2,079,335 0.24
671,957 HSBC Holdings 5,294,817 0.62139,023 InterContinental Hotels Group 3,368,661 0.40139,184 Pearson 2,229,236 0.26
268,896 Prudential 4,301,942 0.5184,501 Rio Tinto 3,442,879 0.41
105,298 SABMiller 3,854,592 0.452,392,919 Vodafone Group 6,759,645 0.80
48,822,126 5.75
JAPAN86,500 Daikin Industries 3,905,671 0.46
623,000 Hitachi 3,416,382 0.40172,600 Japan Tobacco 4,063,214 0.48
290,000 Mitsubishi Electric 2,637,823 0.31114,000 Mitsubishi Estate 2,469,553 0.2963,000 Nitto Denko 1,926,071 0.23
326,200 ORIX 4,152,135 0.4956,900 Softbank 3,606,635 0.42
168,200 Sumitomo Mitsui Financial Group 6,278,598 0.7493,600 Toyota Motor 4,139,146 0.49
36,595,228 4.31
GERMANY32,924 Allianz Registered Shares 4,294,936 0.5057,621 BASF 4,477,728 0.53
59,686 Bayer Registered Shares 6,095,433 0.7217,280 Continental 2,756,160 0.3225,761 Volkswagen Non Voting Preference Shares 5,266,836 0.62
22,891,093 2.69
SWITZERLAND70,199 ACE 5,233,866 0.6279,471 Compagnie Financiere Richemont Registered
Shares 5,748,724 0.6877,050 Novartis Registered Shares 4,466,103 0.5322,013 Roche Holding - Genussschein 4,444,075 0.52
40,026 Swiss Re 2,678,305 0.31
22,571,073 2.66
FRANCE60,662 Compagnie de Saint-Gobain 2,416,016 0.28135,351 GDF Suez 2,305,704 0.2771,086 Schneider Electric 4,506,852 0.5369,099 Sodexo 5,089,141 0.60166,927 Suez Environnement 2,173,390 0.25
16,491,103 1.93
NETHERLANDS51,683 ASML Holding 3,521,163 0.41
283,125 Royal Dutch Shell - A Shares 7,298,255 0.8617,473 Royal Dutch Shell - B Shares 473,895 0.06
145,244 Unilever - CVA 4,220,791 0.50
15,514,104 1.83
HONG KONG1,292,000 China Overseas Land & Investment 2,606,107 0.31
292,000 Hutchison Whampoa 2,867,860 0.34312,000 Wharf Holdings 1,721,019 0.20
7,194,986 0.85
SWEDEN71,772 Electrolux - B Shares 1,352,763 0.16
437,493 Telefonaktiebolaget LM Ericsson - B Shares 3,870,647 0.45
5,223,410 0.61
BELGIUM41,927 Solvay 4,800,642 0.57
4,800,642 0.57
CURACAO70,953 Schlumberger 4,632,648 0.55
4,632,648 0.55
SPAIN237,349 Repsol 4,354,167 0.51237,349 Repsol - Rights 09.01.14 117,606 0.02
4,471,773 0.53
FINLAND291,241 Stora Enso - R Shares 2,128,972 0.25172,745 UPM-Kymmene 2,129,946 0.25
4,258,918 0.50
SOUTH KOREA3,819 Samsung Electronics 3,600,367 0.42
499 Samsung Electronics GDR 234,528 0.03
3,834,895 0.45
JERSEY96,869 Shire 3,269,789 0.38
3,269,789 0.38
BERMUDA102,585 Invesco 2,722,916 0.32
2,722,916 0.32
CHINA362,000 Ping An Insurance Group Co. of China - H Shares* 2,359,805 0.27
2,359,805 0.27
68
JPMorgan Investment Funds - Global Balanced Fund
Schedule of Investments (Market Value Expressed in EUR)
As at 31 December 2013
Quantity/Nominal
Value
Name of Securities Maturity/Coupon
MarketValue
%of
NetAssets
Quantity/Nominal
Value
Name of Securities Maturity/Coupon
MarketValue
%of
NetAssets
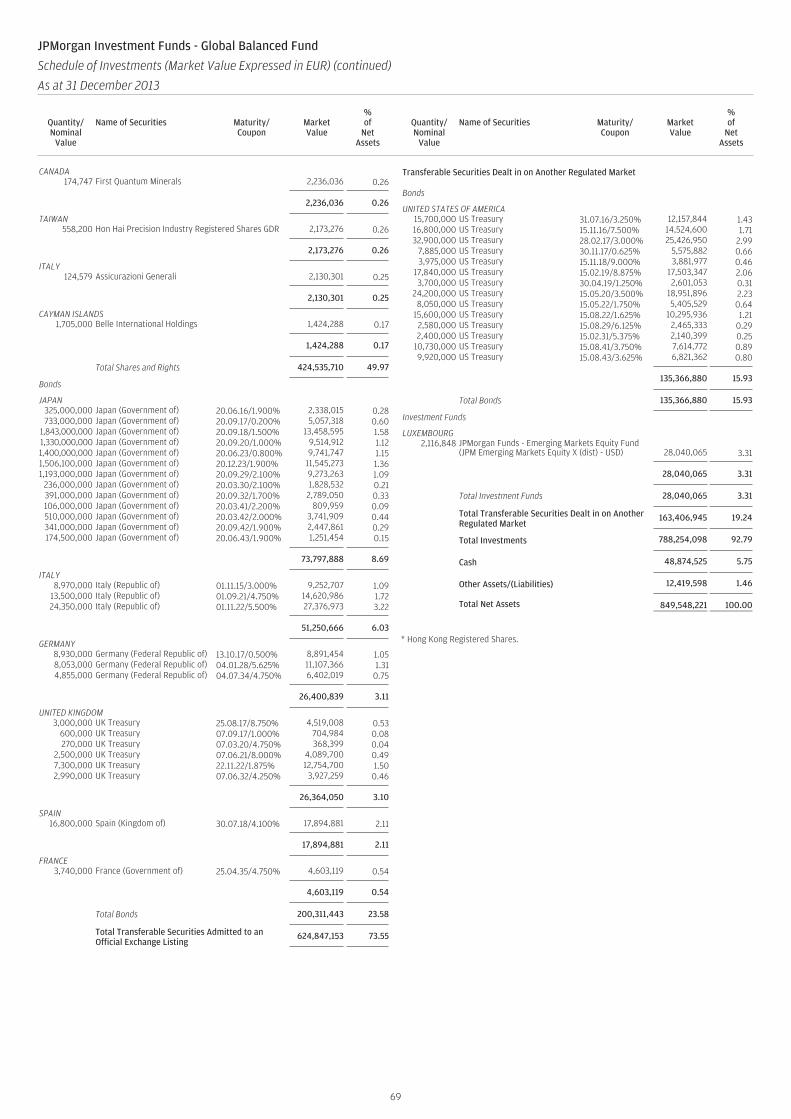
CANADA174,747 First Quantum Minerals 2,236,036 0.26
2,236,036 0.26
TAIWAN558,200 Hon Hai Precision Industry Registered Shares GDR 2,173,276 0.26
2,173,276 0.26
ITALY124,579 Assicurazioni Generali 2,130,301 0.25
2,130,301 0.25
CAYMAN ISLANDS1,705,000 Belle International Holdings 1,424,288 0.17
1,424,288 0.17
Total Shares and Rights 424,535,710 49.97
Bonds
JAPAN325,000,000 Japan (Government of) 20.06.16/1.900% 2,338,015 0.28733,000,000 Japan (Government of) 20.09.17/0.200% 5,057,318 0.60
1,843,000,000 Japan (Government of) 20.09.18/1.500% 13,458,595 1.581,330,000,000 Japan (Government of) 20.09.20/1.000% 9,514,912 1.121,400,000,000 Japan (Government of) 20.06.23/0.800% 9,741,747 1.151,506,100,000 Japan (Government of) 20.12.23/1.900% 11,545,273 1.361,193,000,000 Japan (Government of) 20.09.29/2.100% 9,273,263 1.09
236,000,000 Japan (Government of) 20.03.30/2.100% 1,828,532 0.21391,000,000 Japan (Government of) 20.09.32/1.700% 2,789,050 0.33106,000,000 Japan (Government of) 20.03.41/2.200% 809,959 0.09510,000,000 Japan (Government of) 20.03.42/2.000% 3,741,909 0.44341,000,000 Japan (Government of) 20.09.42/1.900% 2,447,861 0.29174,500,000 Japan (Government of) 20.06.43/1.900% 1,251,454 0.15
73,797,888 8.69
ITALY8,970,000 Italy (Republic of) 01.11.15/3.000% 9,252,707 1.09
13,500,000 Italy (Republic of) 01.09.21/4.750% 14,620,986 1.7224,350,000 Italy (Republic of) 01.11.22/5.500% 27,376,973 3.22
51,250,666 6.03
GERMANY8,930,000 Germany (Federal Republic of) 13.10.17/0.500% 8,891,454 1.058,053,000 Germany (Federal Republic of) 04.01.28/5.625% 11,107,366 1.314,855,000 Germany (Federal Republic of) 04.07.34/4.750% 6,402,019 0.75
26,400,839 3.11
UNITED KINGDOM3,000,000 UK Treasury 25.08.17/8.750% 4,519,008 0.53
600,000 UK Treasury 07.09.17/1.000% 704,984 0.08270,000 UK Treasury 07.03.20/4.750% 368,399 0.04
2,500,000 UK Treasury 07.06.21/8.000% 4,089,700 0.497,300,000 UK Treasury 22.11.22/1.875% 12,754,700 1.502,990,000 UK Treasury 07.06.32/4.250% 3,927,259 0.46
26,364,050 3.10
SPAIN16,800,000 Spain (Kingdom of) 30.07.18/4.100% 17,894,881 2.11
17,894,881 2.11
FRANCE3,740,000 France (Government of) 25.04.35/4.750% 4,603,119 0.54
4,603,119 0.54
Total Bonds 200,311,443 23.58
Total Transferable Securities Admitted to anOfficial Exchange Listing
624,847,153 73.55
Transferable Securities Dealt in on Another Regulated Market
Bonds
UNITED STATES OF AMERICA15,700,000 US Treasury 31.07.16/3.250% 12,157,844 1.4316,800,000 US Treasury 15.11.16/7.500% 14,524,600 1.7132,900,000 US Treasury 28.02.17/3.000% 25,426,950 2.99
7,885,000 US Treasury 30.11.17/0.625% 5,575,882 0.663,975,000 US Treasury 15.11.18/9.000% 3,881,977 0.46
17,840,000 US Treasury 15.02.19/8.875% 17,503,347 2.063,700,000 US Treasury 30.04.19/1.250% 2,601,053 0.31
24,200,000 US Treasury 15.05.20/3.500% 18,951,896 2.238,050,000 US Treasury 15.05.22/1.750% 5,405,529 0.64
15,600,000 US Treasury 15.08.22/1.625% 10,295,936 1.212,580,000 US Treasury 15.08.29/6.125% 2,465,333 0.292,400,000 US Treasury 15.02.31/5.375% 2,140,399 0.25
10,730,000 US Treasury 15.08.41/3.750% 7,614,772 0.899,920,000 US Treasury 15.08.43/3.625% 6,821,362 0.80
135,366,880 15.93
Total Bonds 135,366,880 15.93
Investment Funds
LUXEMBOURG2,116,848 JPMorgan Funds - Emerging Markets Equity Fund
(JPM Emerging Markets Equity X (dist) - USD) 28,040,065 3.31
28,040,065 3.31
Total Investment Funds 28,040,065 3.31
Total Transferable Securities Dealt in on AnotherRegulated Market
163,406,945 19.24
Total Investments 788,254,098 92.79
Cash 48,874,525 5.75
Other Assets/(Liabilities) 12,419,598 1.46
Total Net Assets 849,548,221 100.00
* Hong Kong Registered Shares.
69
JPMorgan Investment Funds - Global Balanced Fund
Schedule of Investments (Market Value Expressed in EUR) (continued)
As at 31 December 2013
Quantity/Nominal
Value
Name of Securities Maturity/Coupon
MarketValue
%of
NetAssets
Quantity/Nominal
Value
Name of Securities Maturity/Coupon
MarketValue
%of
NetAssets
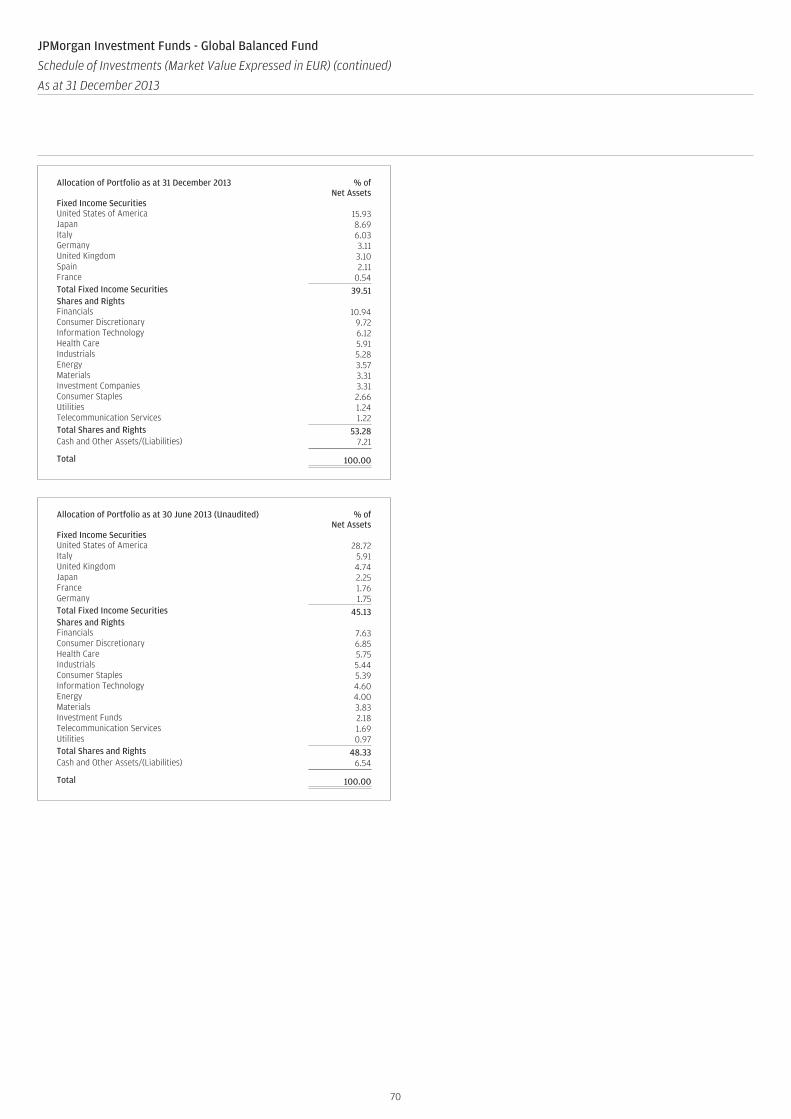
Allocation of Portfolio as at 31 December 2013 % ofNet Assets
Fixed Income SecuritiesUnited States of America 15.93Japan 8.69Italy 6.03Germany 3.11United Kingdom 3.10Spain 2.11France 0.54Total Fixed Income Securities 39.51Shares and RightsFinancials 10.94Consumer Discretionary 9.72Information Technology 6.12Health Care 5.91Industrials 5.28Energy 3.57Materials 3.31Investment Companies 3.31Consumer Staples 2.66Utilities 1.24Telecommunication Services 1.22Total Shares and Rights 53.28Cash and Other Assets/(Liabilities) 7.21
Total 100.00
Allocation of Portfolio as at 30 June 2013 (Unaudited) % ofNet Assets
Fixed Income SecuritiesUnited States of America 28.72Italy 5.91United Kingdom 4.74Japan 2.25France 1.76Germany 1.75Total Fixed Income Securities 45.13Shares and RightsFinancials 7.63Consumer Discretionary 6.85Health Care 5.75Industrials 5.44Consumer Staples 5.39Information Technology 4.60Energy 4.00Materials 3.83Investment Funds 2.18Telecommunication Services 1.69Utilities 0.97Total Shares and Rights 48.33Cash and Other Assets/(Liabilities) 6.54
Total 100.00
70
JPMorgan Investment Funds - Global Balanced Fund
Schedule of Investments (Market Value Expressed in EUR) (continued)
As at 31 December 2013
Quantity/Nominal
Value
Name of Securities Maturity/Coupon
MarketValue
%of
NetAssets
Quantity/Nominal
Value
Name of Securities Maturity/Coupon
MarketValue
%of
NetAssets
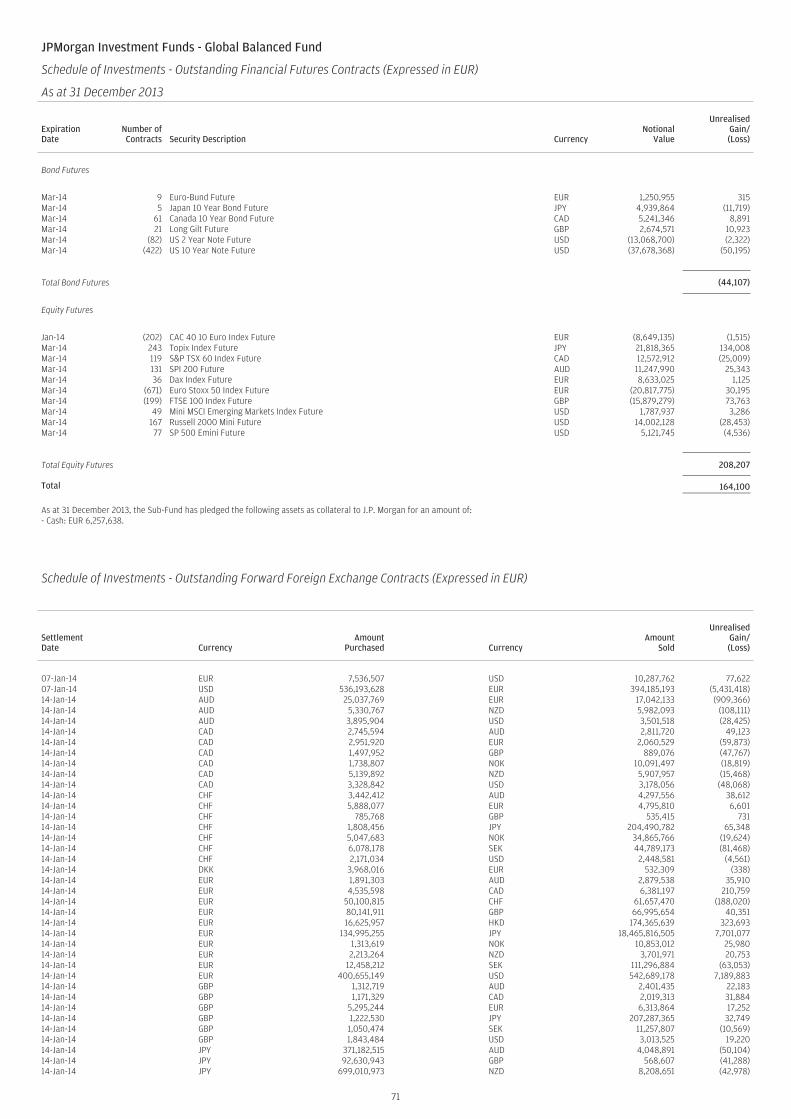
JPMorgan Investment Funds - Global Balanced Fund
Schedule of Investments - Outstanding Financial Futures Contracts (Expressed in EUR)
As at 31 December 2013
ExpirationDate
Number ofContracts Security Description Currency
NotionalValue
UnrealisedGain/(Loss)
Bond Futures
Mar-14 9 Euro-Bund Future EUR 1,250,955 315Mar-14 5 Japan 10 Year Bond Future JPY 4,939,864 (11,719)Mar-14 61 Canada 10 Year Bond Future CAD 5,241,346 8,891Mar-14 21 Long Gilt Future GBP 2,674,571 10,923Mar-14 (82) US 2 Year Note Future USD (13,068,700) (2,322)Mar-14 (422) US 10 Year Note Future USD (37,678,368) (50,195)
Total Bond Futures (44,107)
Equity Futures
Jan-14 (202) CAC 40 10 Euro Index Future EUR (8,649,135) (1,515)Mar-14 243 Topix Index Future JPY 21,818,365 134,008Mar-14 119 S&P TSX 60 Index Future CAD 12,572,912 (25,009)Mar-14 131 SPI 200 Future AUD 11,247,990 25,343Mar-14 36 Dax Index Future EUR 8,633,025 1,125Mar-14 (671) Euro Stoxx 50 Index Future EUR (20,817,775) 30,195Mar-14 (199) FTSE 100 Index Future GBP (15,879,279) 73,763Mar-14 49 Mini MSCI Emerging Markets Index Future USD 1,787,937 3,286Mar-14 167 Russell 2000 Mini Future USD 14,002,128 (28,453)Mar-14 77 SP 500 Emini Future USD 5,121,745 (4,536)
Total Equity Futures 208,207
Total 164,100
As at 31 December 2013, the Sub-Fund has pledged the following assets as collateral to J.P. Morgan for an amount of:- Cash: EUR 6,257,638.
JPMorgan Investment Funds - Global Balanced Fund
Schedule of Investments - Outstanding Forward Foreign Exchange Contracts (Expressed in EUR) (continued)
As at 31 December 2013
SettlementDate Currency
AmountPurchased Currency
AmountSold
UnrealisedGain/(Loss)
07-Jan-14 EUR 7,536,507 USD 10,287,762 77,62207-Jan-14 USD 536,193,628 EUR 394,185,193 (5,431,418)14-Jan-14 AUD 25,037,769 EUR 17,042,133 (909,366)14-Jan-14 AUD 5,330,767 NZD 5,982,093 (108,111)14-Jan-14 AUD 3,895,904 USD 3,501,518 (28,425)14-Jan-14 CAD 2,745,594 AUD 2,811,720 49,12314-Jan-14 CAD 2,951,920 EUR 2,060,529 (59,873)14-Jan-14 CAD 1,497,952 GBP 889,076 (47,767)14-Jan-14 CAD 1,738,807 NOK 10,091,497 (18,819)14-Jan-14 CAD 5,139,892 NZD 5,907,957 (15,468)14-Jan-14 CAD 3,328,842 USD 3,178,056 (48,068)14-Jan-14 CHF 3,442,412 AUD 4,297,556 38,61214-Jan-14 CHF 5,888,077 EUR 4,795,810 6,60114-Jan-14 CHF 785,768 GBP 535,415 73114-Jan-14 CHF 1,808,456 JPY 204,490,782 65,34814-Jan-14 CHF 5,047,683 NOK 34,865,766 (19,624)14-Jan-14 CHF 6,078,178 SEK 44,789,173 (81,468)14-Jan-14 CHF 2,171,034 USD 2,448,581 (4,561)14-Jan-14 DKK 3,968,016 EUR 532,309 (338)14-Jan-14 EUR 1,891,303 AUD 2,879,538 35,91014-Jan-14 EUR 4,535,598 CAD 6,381,197 210,75914-Jan-14 EUR 50,100,815 CHF 61,657,470 (188,020)14-Jan-14 EUR 80,141,911 GBP 66,995,654 40,35114-Jan-14 EUR 16,625,957 HKD 174,365,639 323,69314-Jan-14 EUR 134,995,255 JPY 18,465,816,505 7,701,07714-Jan-14 EUR 1,313,619 NOK 10,853,012 25,98014-Jan-14 EUR 2,213,264 NZD 3,701,971 20,75314-Jan-14 EUR 12,458,212 SEK 111,296,884 (63,053)14-Jan-14 EUR 400,655,149 USD 542,689,178 7,189,88314-Jan-14 GBP 1,312,719 AUD 2,401,435 22,18314-Jan-14 GBP 1,171,329 CAD 2,019,313 31,88414-Jan-14 GBP 5,295,244 EUR 6,313,864 17,25214-Jan-14 GBP 1,222,530 JPY 207,287,365 32,74914-Jan-14 GBP 1,050,474 SEK 11,257,807 (10,569)14-Jan-14 GBP 1,843,484 USD 3,013,525 19,22014-Jan-14 JPY 371,182,515 AUD 4,048,891 (50,104)14-Jan-14 JPY 92,630,943 GBP 568,607 (41,288)14-Jan-14 JPY 699,010,973 NZD 8,208,651 (42,978)
71
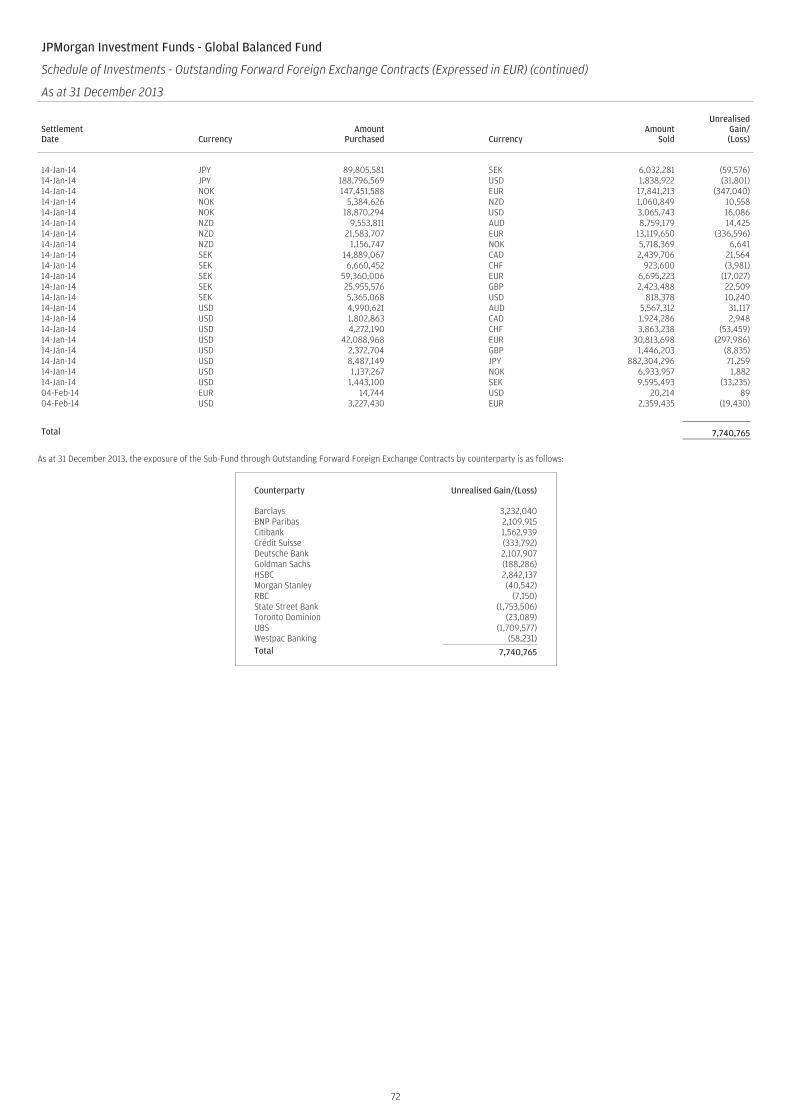
JPMorgan Investment Funds - Global Balanced Fund
Schedule of Investments - Outstanding Forward Foreign Exchange Contracts (Expressed in EUR) (continued)
As at 31 December 2013
SettlementDate Currency
AmountPurchased Currency
AmountSold
UnrealisedGain/(Loss)
14-Jan-14 JPY 89,805,581 SEK 6,032,281 (59,576)14-Jan-14 JPY 188,796,569 USD 1,838,922 (31,801)14-Jan-14 NOK 147,451,588 EUR 17,841,213 (347,040)14-Jan-14 NOK 5,384,626 NZD 1,060,849 10,55814-Jan-14 NOK 18,870,294 USD 3,065,743 16,08614-Jan-14 NZD 9,553,811 AUD 8,759,179 14,42514-Jan-14 NZD 21,583,707 EUR 13,119,650 (336,596)14-Jan-14 NZD 1,156,747 NOK 5,718,369 6,64114-Jan-14 SEK 14,889,067 CAD 2,439,706 21,56414-Jan-14 SEK 6,660,452 CHF 923,600 (3,981)14-Jan-14 SEK 59,360,006 EUR 6,695,223 (17,027)14-Jan-14 SEK 25,955,576 GBP 2,423,488 22,50914-Jan-14 SEK 5,365,068 USD 818,378 10,24014-Jan-14 USD 4,990,621 AUD 5,567,312 31,11714-Jan-14 USD 1,802,863 CAD 1,924,286 2,94814-Jan-14 USD 4,272,190 CHF 3,863,238 (53,459)14-Jan-14 USD 42,088,968 EUR 30,813,698 (297,986)14-Jan-14 USD 2,372,704 GBP 1,446,203 (8,835)14-Jan-14 USD 8,487,149 JPY 882,304,296 71,25914-Jan-14 USD 1,137,267 NOK 6,933,957 1,88214-Jan-14 USD 1,443,100 SEK 9,595,493 (33,235)04-Feb-14 EUR 14,744 USD 20,214 8904-Feb-14 USD 3,227,430 EUR 2,359,435 (19,430)
Total 7,740,765
As at 31 December 2013, the exposure of the Sub-Fund through Outstanding Forward Foreign Exchange Contracts by counterparty is as follows:
Counterparty Unrealised Gain/(Loss)
Barclays 3,232,040BNP Paribas 2,109,915Citibank 1,562,939Crédit Suisse (333,792)Deutsche Bank 2,107,907Goldman Sachs (188,286)HSBC 2,842,137Morgan Stanley (40,542)RBC (7,150)State Street Bank (1,753,506)Toronto Dominion (23,089)UBS (1,709,577)Westpac Banking (58,231)Total 7,740,765
72
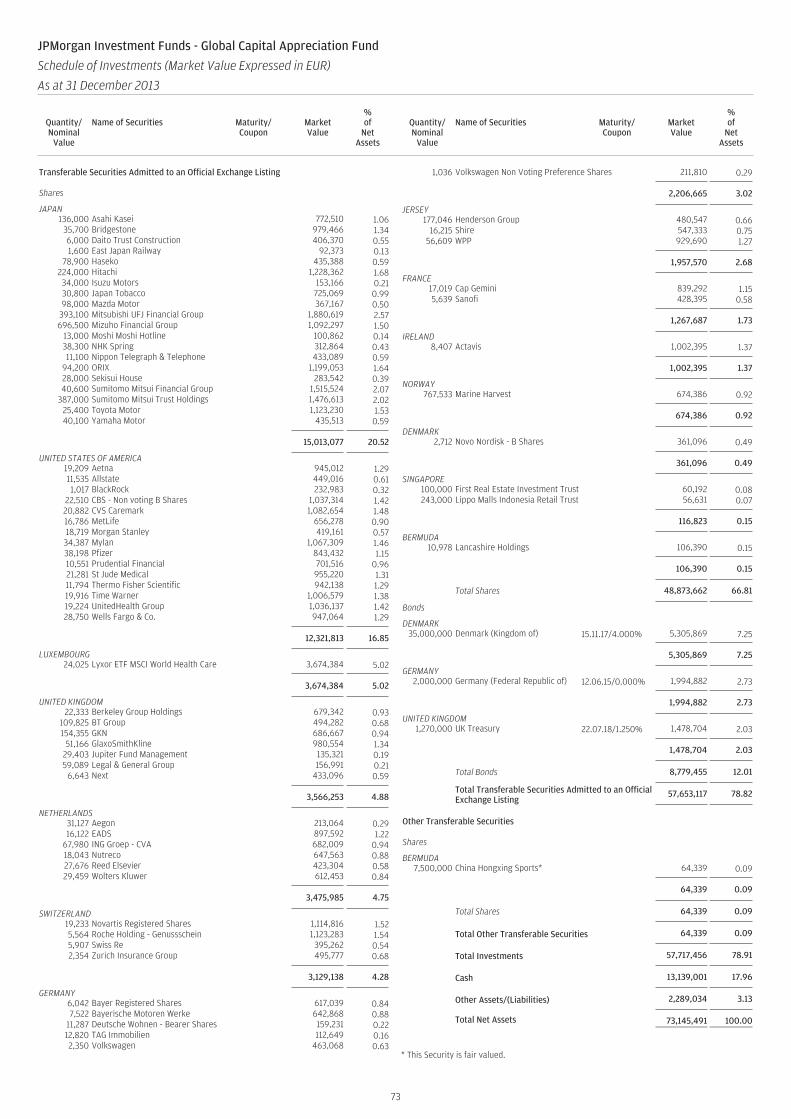
Transferable Securities Admitted to an Official Exchange Listing
Shares
JAPAN136,000 Asahi Kasei 772,510 1.06
35,700 Bridgestone 979,466 1.346,000 Daito Trust Construction 406,370 0.551,600 East Japan Railway 92,373 0.13
78,900 Haseko 435,388 0.59224,000 Hitachi 1,228,362 1.6834,000 Isuzu Motors 153,166 0.2130,800 Japan Tobacco 725,069 0.9998,000 Mazda Motor 367,167 0.50
393,100 Mitsubishi UFJ Financial Group 1,880,619 2.57696,500 Mizuho Financial Group 1,092,297 1.50
13,000 Moshi Moshi Hotline 100,862 0.1438,300 NHK Spring 312,864 0.4311,100 Nippon Telegraph & Telephone 433,089 0.59
94,200 ORIX 1,199,053 1.6428,000 Sekisui House 283,542 0.3940,600 Sumitomo Mitsui Financial Group 1,515,524 2.07
387,000 Sumitomo Mitsui Trust Holdings 1,476,613 2.0225,400 Toyota Motor 1,123,230 1.5340,100 Yamaha Motor 435,513 0.59
15,013,077 20.52
UNITED STATES OF AMERICA19,209 Aetna 945,012 1.2911,535 Allstate 449,016 0.611,017 BlackRock 232,983 0.32
22,510 CBS - Non voting B Shares 1,037,314 1.4220,882 CVS Caremark 1,082,654 1.4816,786 MetLife 656,278 0.9018,719 Morgan Stanley 419,161 0.5734,387 Mylan 1,067,309 1.4638,198 Pfizer 843,432 1.1510,551 Prudential Financial 701,516 0.9621,281 St Jude Medical 955,220 1.3111,794 Thermo Fisher Scientific 942,138 1.2919,916 Time Warner 1,006,579 1.3819,224 UnitedHealth Group 1,036,137 1.4228,750 Wells Fargo & Co. 947,064 1.29
12,321,813 16.85
LUXEMBOURG24,025 Lyxor ETF MSCI World Health Care 3,674,384 5.02
3,674,384 5.02
UNITED KINGDOM22,333 Berkeley Group Holdings 679,342 0.93
109,825 BT Group 494,282 0.68154,355 GKN 686,667 0.94
51,166 GlaxoSmithKline 980,554 1.3429,403 Jupiter Fund Management 135,321 0.1959,089 Legal & General Group 156,991 0.21
6,643 Next 433,096 0.59
3,566,253 4.88
NETHERLANDS31,127 Aegon 213,064 0.2916,122 EADS 897,592 1.22
67,980 ING Groep - CVA 682,009 0.9418,043 Nutreco 647,563 0.8827,676 Reed Elsevier 423,304 0.5829,459 Wolters Kluwer 612,453 0.84
3,475,985 4.75
SWITZERLAND19,233 Novartis Registered Shares 1,114,816 1.525,564 Roche Holding - Genussschein 1,123,283 1.545,907 Swiss Re 395,262 0.542,354 Zurich Insurance Group 495,777 0.68
3,129,138 4.28
GERMANY6,042 Bayer Registered Shares 617,039 0.847,522 Bayerische Motoren Werke 642,868 0.88
11,287 Deutsche Wohnen - Bearer Shares 159,231 0.2212,820 TAG Immobilien 112,649 0.162,350 Volkswagen 463,068 0.63
1,036 Volkswagen Non Voting Preference Shares 211,810 0.29
2,206,665 3.02
JERSEY177,046 Henderson Group 480,547 0.66
16,215 Shire 547,333 0.7556,609 WPP 929,690 1.27
1,957,570 2.68
FRANCE17,019 Cap Gemini 839,292 1.155,639 Sanofi 428,395 0.58
1,267,687 1.73
IRELAND8,407 Actavis 1,002,395 1.37
1,002,395 1.37
NORWAY767,533 Marine Harvest 674,386 0.92
674,386 0.92
DENMARK2,712 Novo Nordisk - B Shares 361,096 0.49
361,096 0.49
SINGAPORE100,000 First Real Estate Investment Trust 60,192 0.08243,000 Lippo Malls Indonesia Retail Trust 56,631 0.07
116,823 0.15
BERMUDA10,978 Lancashire Holdings 106,390 0.15
106,390 0.15
Total Shares 48,873,662 66.81
Bonds
DENMARK35,000,000 Denmark (Kingdom of) 15.11.17/4.000% 5,305,869 7.25
5,305,869 7.25
GERMANY2,000,000 Germany (Federal Republic of) 12.06.15/0.000% 1,994,882 2.73
1,994,882 2.73
UNITED KINGDOM1,270,000 UK Treasury 22.07.18/1.250% 1,478,704 2.03
1,478,704 2.03
Total Bonds 8,779,455 12.01
Total Transferable Securities Admitted to an OfficialExchange Listing
57,653,117 78.82
Other Transferable Securities
Shares
BERMUDA7,500,000 China Hongxing Sports* 64,339 0.09
64,339 0.09
Total Shares 64,339 0.09
Total Other Transferable Securities 64,339 0.09
Total Investments 57,717,456 78.91
Cash 13,139,001 17.96
Other Assets/(Liabilities) 2,289,034 3.13
Total Net Assets 73,145,491 100.00
* This Security is fair valued.
73
JPMorgan Investment Funds - Global Capital Appreciation Fund
Schedule of Investments (Market Value Expressed in EUR)
As at 31 December 2013
Quantity/Nominal
Value
Name of Securities Maturity/Coupon
MarketValue
%of
NetAssets
Quantity/Nominal
Value
Name of Securities Maturity/Coupon
MarketValue
%of
NetAssets
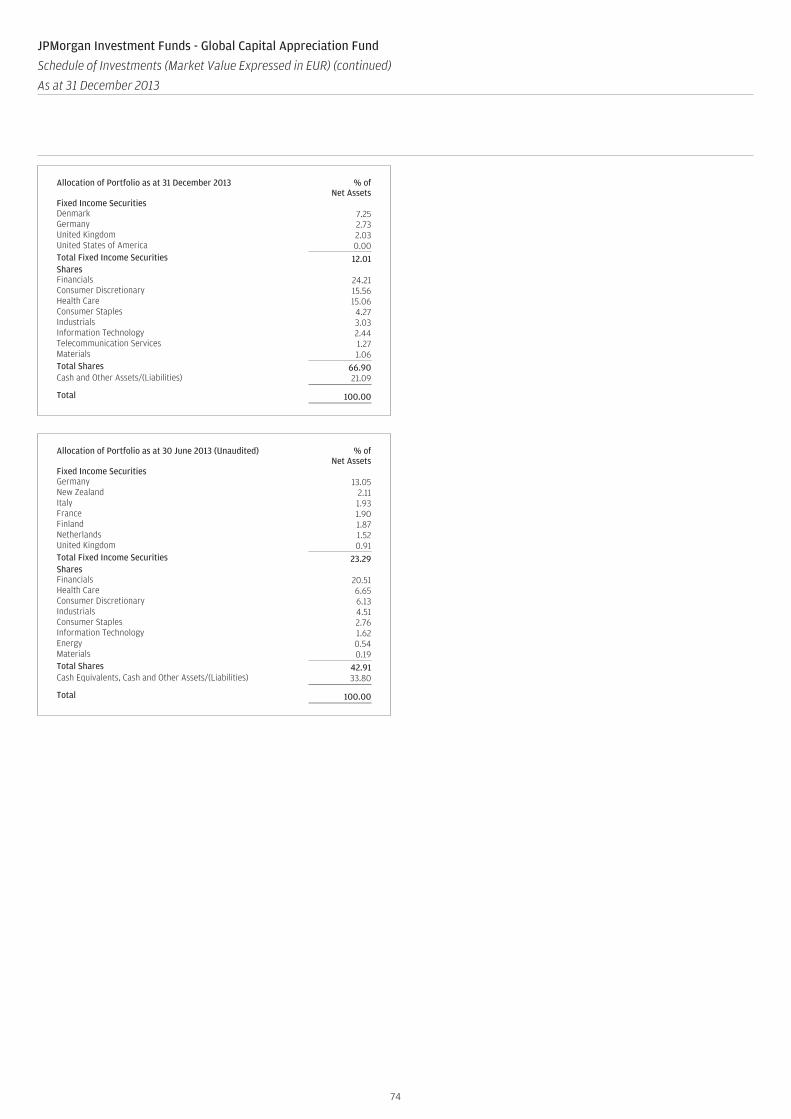
Allocation of Portfolio as at 31 December 2013 % ofNet Assets
Fixed Income SecuritiesDenmark 7.25Germany 2.73United Kingdom 2.03United States of America 0.00Total Fixed Income Securities 12.01SharesFinancials 24.21Consumer Discretionary 15.56Health Care 15.06Consumer Staples 4.27Industrials 3.03Information Technology 2.44Telecommunication Services 1.27Materials 1.06Total Shares 66.90Cash and Other Assets/(Liabilities) 21.09
Total 100.00
Allocation of Portfolio as at 30 June 2013 (Unaudited) % ofNet Assets
Fixed Income SecuritiesGermany 13.05New Zealand 2.11Italy 1.93France 1.90Finland 1.87Netherlands 1.52United Kingdom 0.91Total Fixed Income Securities 23.29SharesFinancials 20.51Health Care 6.65Consumer Discretionary 6.13Industrials 4.51Consumer Staples 2.76Information Technology 1.62Energy 0.54Materials 0.19Total Shares 42.91Cash Equivalents, Cash and Other Assets/(Liabilities) 33.80
Total 100.00
74
JPMorgan Investment Funds - Global Capital Appreciation Fund
Schedule of Investments (Market Value Expressed in EUR) (continued)
As at 31 December 2013
Quantity/Nominal
Value
Name of Securities Maturity/Coupon
MarketValue
%of
NetAssets
Quantity/Nominal
Value
Name of Securities Maturity/Coupon
MarketValue
%of
NetAssets
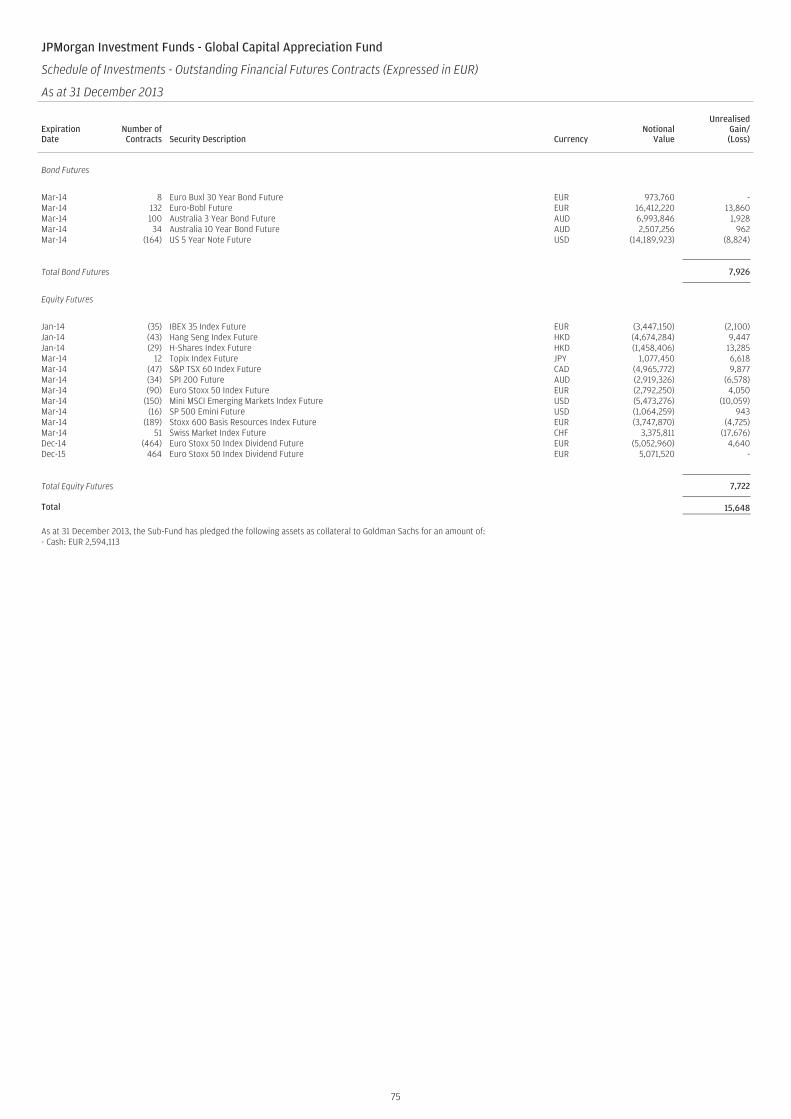
JPMorgan Investment Funds - Global Capital Appreciation Fund
Schedule of Investments - Outstanding Financial Futures Contracts (Expressed in EUR)
As at 31 December 2013
ExpirationDate
Number ofContracts Security Description Currency
NotionalValue
UnrealisedGain/(Loss)
Bond Futures
Mar-14 8 Euro Buxl 30 Year Bond Future EUR 973,760 -Mar-14 132 Euro-Bobl Future EUR 16,412,220 13,860Mar-14 100 Australia 3 Year Bond Future AUD 6,993,846 1,928Mar-14 34 Australia 10 Year Bond Future AUD 2,507,256 962Mar-14 (164) US 5 Year Note Future USD (14,189,923) (8,824)
Total Bond Futures 7,926
Equity Futures
Jan-14 (35) IBEX 35 Index Future EUR (3,447,150) (2,100)Jan-14 (43) Hang Seng Index Future HKD (4,674,284) 9,447Jan-14 (29) H-Shares Index Future HKD (1,458,406) 13,285Mar-14 12 Topix Index Future JPY 1,077,450 6,618Mar-14 (47) S&P TSX 60 Index Future CAD (4,965,772) 9,877Mar-14 (34) SPI 200 Future AUD (2,919,326) (6,578)Mar-14 (90) Euro Stoxx 50 Index Future EUR (2,792,250) 4,050Mar-14 (150) Mini MSCI Emerging Markets Index Future USD (5,473,276) (10,059)Mar-14 (16) SP 500 Emini Future USD (1,064,259) 943Mar-14 (189) Stoxx 600 Basis Resources Index Future EUR (3,747,870) (4,725)Mar-14 51 Swiss Market Index Future CHF 3,375,811 (17,676)Dec-14 (464) Euro Stoxx 50 Index Dividend Future EUR (5,052,960) 4,640Dec-15 464 Euro Stoxx 50 Index Dividend Future EUR 5,071,520 -
Total Equity Futures 7,722
Total 15,648
As at 31 December 2013, the Sub-Fund has pledged the following assets as collateral to Goldman Sachs for an amount of:- Cash: EUR 2,594,113
75
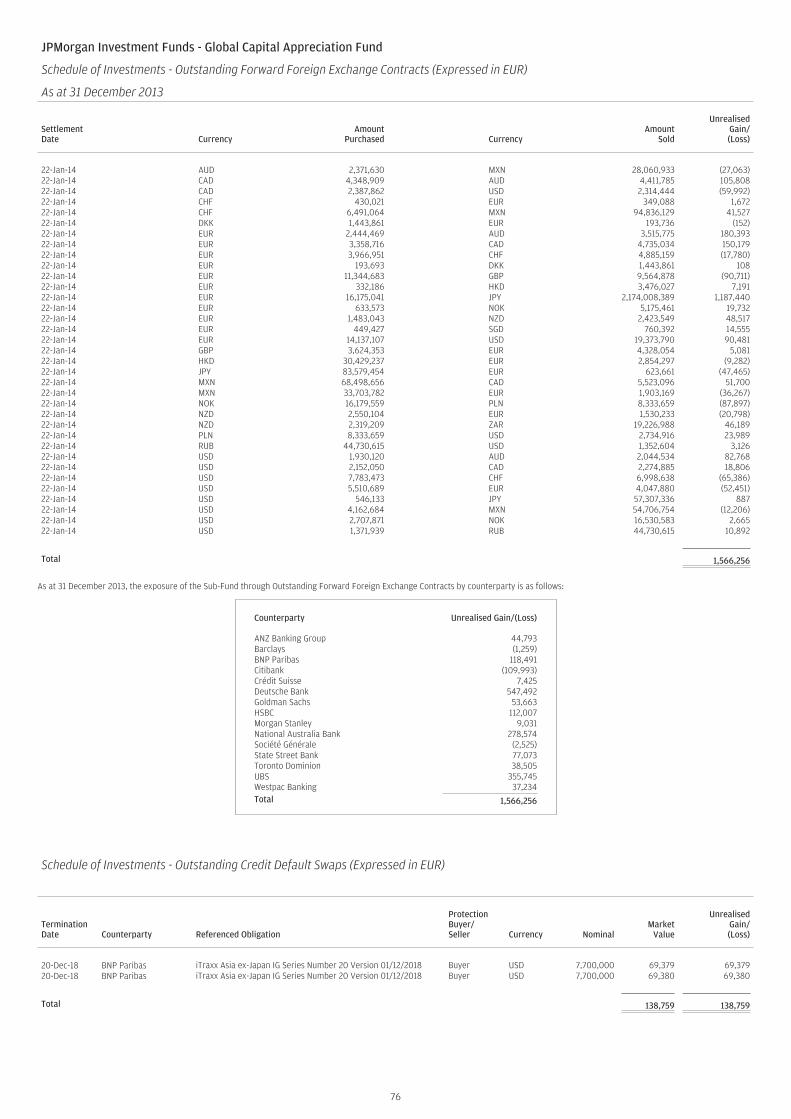
JPMorgan Investment Funds - Global Capital Appreciation Fund
Schedule of Investments - Outstanding Forward Foreign Exchange Contracts (Expressed in EUR)
As at 31 December 2013
SettlementDate Currency
AmountPurchased Currency
AmountSold
UnrealisedGain/(Loss)
22-Jan-14 AUD 2,371,630 MXN 28,060,933 (27,063)22-Jan-14 CAD 4,348,909 AUD 4,411,785 105,80822-Jan-14 CAD 2,387,862 USD 2,314,444 (59,992)22-Jan-14 CHF 430,021 EUR 349,088 1,67222-Jan-14 CHF 6,491,064 MXN 94,836,129 41,52722-Jan-14 DKK 1,443,861 EUR 193,736 (152)22-Jan-14 EUR 2,444,469 AUD 3,515,775 180,39322-Jan-14 EUR 3,358,716 CAD 4,735,034 150,17922-Jan-14 EUR 3,966,951 CHF 4,885,159 (17,780)22-Jan-14 EUR 193,693 DKK 1,443,861 10822-Jan-14 EUR 11,344,683 GBP 9,564,878 (90,711)22-Jan-14 EUR 332,186 HKD 3,476,027 7,19122-Jan-14 EUR 16,175,041 JPY 2,174,008,389 1,187,44022-Jan-14 EUR 633,573 NOK 5,175,461 19,73222-Jan-14 EUR 1,483,043 NZD 2,423,549 48,51722-Jan-14 EUR 449,427 SGD 760,392 14,55522-Jan-14 EUR 14,137,107 USD 19,373,790 90,48122-Jan-14 GBP 3,624,353 EUR 4,328,054 5,08122-Jan-14 HKD 30,429,237 EUR 2,854,297 (9,282)22-Jan-14 JPY 83,579,454 EUR 623,661 (47,465)22-Jan-14 MXN 68,498,656 CAD 5,523,096 51,70022-Jan-14 MXN 33,703,782 EUR 1,903,169 (36,267)22-Jan-14 NOK 16,179,559 PLN 8,333,659 (87,897)22-Jan-14 NZD 2,550,104 EUR 1,530,233 (20,798)22-Jan-14 NZD 2,319,209 ZAR 19,226,988 46,18922-Jan-14 PLN 8,333,659 USD 2,734,916 23,98922-Jan-14 RUB 44,730,615 USD 1,352,604 3,12622-Jan-14 USD 1,930,120 AUD 2,044,534 82,76822-Jan-14 USD 2,152,050 CAD 2,274,885 18,80622-Jan-14 USD 7,783,473 CHF 6,998,638 (65,386)22-Jan-14 USD 5,510,689 EUR 4,047,880 (52,451)22-Jan-14 USD 546,133 JPY 57,307,336 88722-Jan-14 USD 4,162,684 MXN 54,706,754 (12,206)22-Jan-14 USD 2,707,871 NOK 16,530,583 2,66522-Jan-14 USD 1,371,939 RUB 44,730,615 10,892
Total 1,566,256
As at 31 December 2013, the exposure of the Sub-Fund through Outstanding Forward Foreign Exchange Contracts by counterparty is as follows:
Counterparty Unrealised Gain/(Loss)
ANZ Banking Group 44,793Barclays (1,259)BNP Paribas 118,491Citibank (109,993)Crédit Suisse 7,425Deutsche Bank 547,492Goldman Sachs 53,663HSBC 112,007Morgan Stanley 9,031National Australia Bank 278,574Société Générale (2,525)State Street Bank 77,073Toronto Dominion 38,505UBS 355,745Westpac Banking 37,234Total 1,566,256
Schedule of Investments - Outstanding Credit Default Swaps (Expressed in EUR)
TerminationDate Counterparty Referenced Obligation
ProtectionBuyer/Seller Currency Nominal
MarketValue
UnrealisedGain/(Loss)
20-Dec-18 BNP Paribas iTraxx Asia ex-Japan IG Series Number 20 Version 01/12/2018 Buyer USD 7,700,000 69,379 69,37920-Dec-18 BNP Paribas iTraxx Asia ex-Japan IG Series Number 20 Version 01/12/2018 Buyer USD 7,700,000 69,380 69,380
Total 138,759 138,759
76
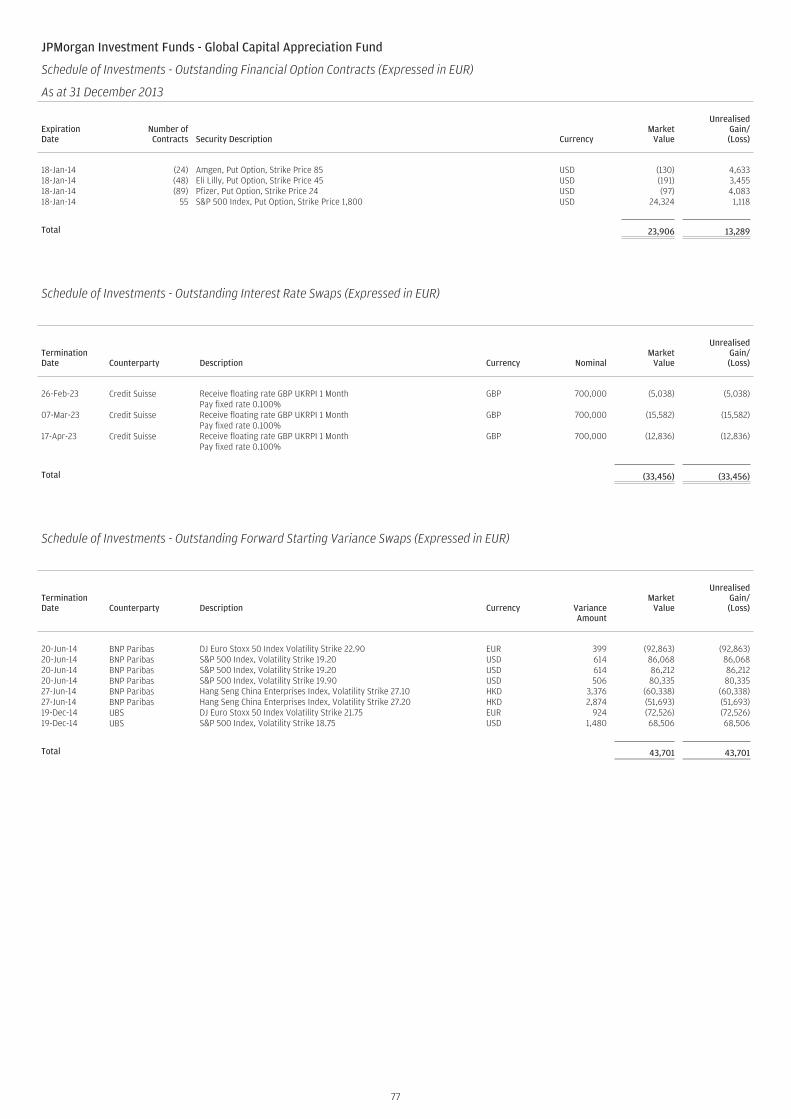
JPMorgan Investment Funds - Global Capital Appreciation Fund
Schedule of Investments - Outstanding Financial Option Contracts (Expressed in EUR)
As at 31 December 2013
ExpirationDate
Number ofContracts Security Description Currency
MarketValue
UnrealisedGain/(Loss)
18-Jan-14 (24) Amgen, Put Option, Strike Price 85 USD (130) 4,63318-Jan-14 (48) Eli Lilly, Put Option, Strike Price 45 USD (191) 3,45518-Jan-14 (89) Pfizer, Put Option, Strike Price 24 USD (97) 4,08318-Jan-14 55 S&P 500 Index, Put Option, Strike Price 1,800 USD 24,324 1,118
Total 23,906 13,289
Schedule of Investments - Outstanding Interest Rate Swaps (Expressed in EUR)
TerminationDate Counterparty Description Currency Nominal
MarketValue
UnrealisedGain/(Loss)
26-Feb-23 Credit Suisse Receive floating rate GBP UKRPI 1 Month GBP 700,000 (5,038) (5,038)Pay fixed rate 0.100%
07-Mar-23 Credit Suisse Receive floating rate GBP UKRPI 1 Month GBP 700,000 (15,582) (15,582)Pay fixed rate 0.100%
17-Apr-23 Credit Suisse Receive floating rate GBP UKRPI 1 Month GBP 700,000 (12,836) (12,836)Pay fixed rate 0.100%
Total (33,456) (33,456)
Schedule of Investments - Outstanding Forward Starting Variance Swaps (Expressed in EUR)
TerminationDate Counterparty Description Currency Variance
Amount
MarketValue
UnrealisedGain/(Loss)
20-Jun-14 BNP Paribas DJ Euro Stoxx 50 Index Volatility Strike 22.90 EUR 399 (92,863) (92,863)20-Jun-14 BNP Paribas S&P 500 Index, Volatility Strike 19.20 USD 614 86,068 86,06820-Jun-14 BNP Paribas S&P 500 Index, Volatility Strike 19.20 USD 614 86,212 86,21220-Jun-14 BNP Paribas S&P 500 Index, Volatility Strike 19.90 USD 506 80,335 80,33527-Jun-14 BNP Paribas Hang Seng China Enterprises Index, Volatility Strike 27.10 HKD 3,376 (60,338) (60,338)27-Jun-14 BNP Paribas Hang Seng China Enterprises Index, Volatility Strike 27.20 HKD 2,874 (51,693) (51,693)19-Dec-14 UBS DJ Euro Stoxx 50 Index Volatility Strike 21.75 EUR 924 (72,526) (72,526)19-Dec-14 UBS S&P 500 Index, Volatility Strike 18.75 USD 1,480 68,506 68,506
Total 43,701 43,701
77
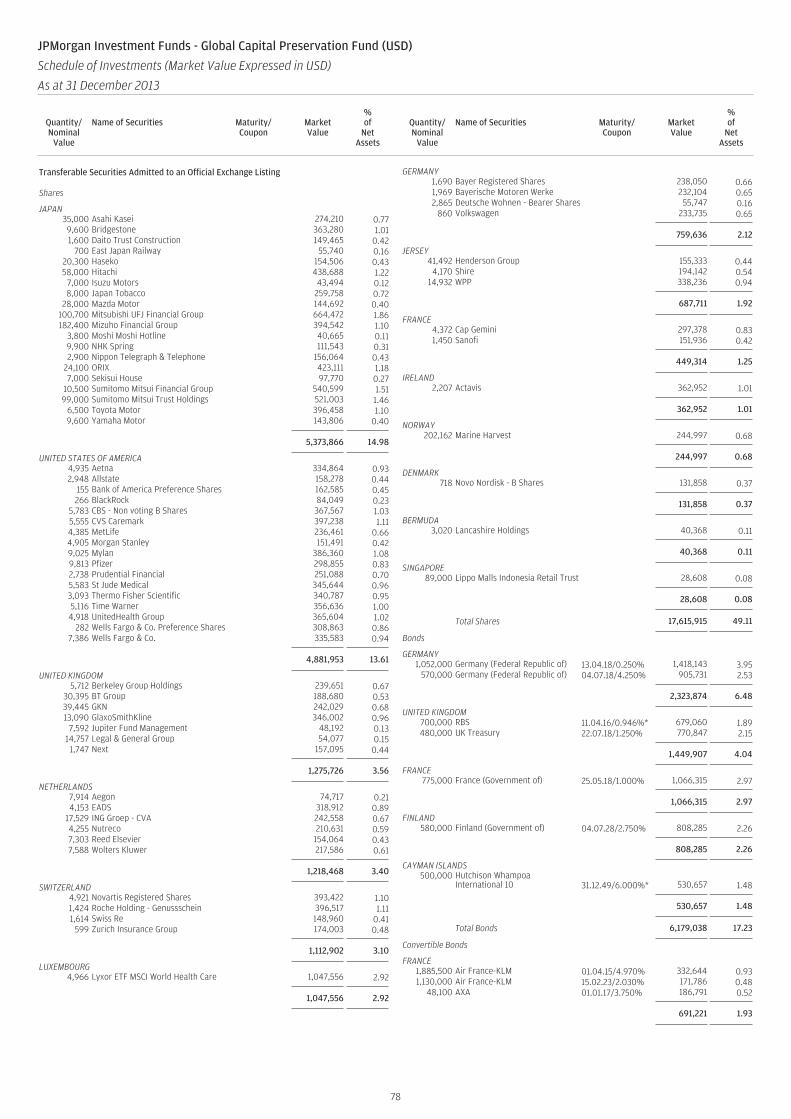
Transferable Securities Admitted to an Official Exchange Listing
Shares
JAPAN35,000 Asahi Kasei 274,210 0.779,600 Bridgestone 363,280 1.011,600 Daito Trust Construction 149,465 0.42
700 East Japan Railway 55,740 0.1620,300 Haseko 154,506 0.4358,000 Hitachi 438,688 1.22
7,000 Isuzu Motors 43,494 0.128,000 Japan Tobacco 259,758 0.72
28,000 Mazda Motor 144,692 0.40100,700 Mitsubishi UFJ Financial Group 664,472 1.86182,400 Mizuho Financial Group 394,542 1.10
3,800 Moshi Moshi Hotline 40,665 0.119,900 NHK Spring 111,543 0.312,900 Nippon Telegraph & Telephone 156,064 0.43
24,100 ORIX 423,111 1.187,000 Sekisui House 97,770 0.27
10,500 Sumitomo Mitsui Financial Group 540,599 1.5199,000 Sumitomo Mitsui Trust Holdings 521,003 1.46
6,500 Toyota Motor 396,458 1.109,600 Yamaha Motor 143,806 0.40
5,373,866 14.98
UNITED STATES OF AMERICA4,935 Aetna 334,864 0.932,948 Allstate 158,278 0.44
155 Bank of America Preference Shares 162,585 0.45266 BlackRock 84,049 0.23
5,783 CBS - Non voting B Shares 367,567 1.035,555 CVS Caremark 397,238 1.114,385 MetLife 236,461 0.664,905 Morgan Stanley 151,491 0.429,025 Mylan 386,360 1.089,813 Pfizer 298,855 0.832,738 Prudential Financial 251,088 0.705,583 St Jude Medical 345,644 0.963,093 Thermo Fisher Scientific 340,787 0.955,116 Time Warner 356,636 1.004,918 UnitedHealth Group 365,604 1.02
282 Wells Fargo & Co. Preference Shares 308,863 0.867,386 Wells Fargo & Co. 335,583 0.94
4,881,953 13.61
UNITED KINGDOM5,712 Berkeley Group Holdings 239,651 0.67
30,395 BT Group 188,680 0.5339,445 GKN 242,029 0.6813,090 GlaxoSmithKline 346,002 0.96
7,592 Jupiter Fund Management 48,192 0.1314,757 Legal & General Group 54,077 0.151,747 Next 157,095 0.44
1,275,726 3.56
NETHERLANDS7,914 Aegon 74,717 0.214,153 EADS 318,912 0.89
17,529 ING Groep - CVA 242,558 0.674,255 Nutreco 210,631 0.597,303 Reed Elsevier 154,064 0.437,588 Wolters Kluwer 217,586 0.61
1,218,468 3.40
SWITZERLAND4,921 Novartis Registered Shares 393,422 1.101,424 Roche Holding - Genussschein 396,517 1.111,614 Swiss Re 148,960 0.41
599 Zurich Insurance Group 174,003 0.48
1,112,902 3.10
LUXEMBOURG4,966 Lyxor ETF MSCI World Health Care 1,047,556 2.92
1,047,556 2.92
GERMANY1,690 Bayer Registered Shares 238,050 0.661,969 Bayerische Motoren Werke 232,104 0.652,865 Deutsche Wohnen - Bearer Shares 55,747 0.16
860 Volkswagen 233,735 0.65
759,636 2.12
JERSEY41,492 Henderson Group 155,333 0.44
4,170 Shire 194,142 0.5414,932 WPP 338,236 0.94
687,711 1.92
FRANCE4,372 Cap Gemini 297,378 0.831,450 Sanofi 151,936 0.42
449,314 1.25
IRELAND2,207 Actavis 362,952 1.01
362,952 1.01
NORWAY202,162 Marine Harvest 244,997 0.68
244,997 0.68
DENMARK718 Novo Nordisk - B Shares 131,858 0.37
131,858 0.37
BERMUDA3,020 Lancashire Holdings 40,368 0.11
40,368 0.11
SINGAPORE89,000 Lippo Malls Indonesia Retail Trust 28,608 0.08
28,608 0.08
Total Shares 17,615,915 49.11
Bonds
GERMANY1,052,000 Germany (Federal Republic of) 13.04.18/0.250% 1,418,143 3.95
570,000 Germany (Federal Republic of) 04.07.18/4.250% 905,731 2.53
2,323,874 6.48
UNITED KINGDOM700,000 RBS 11.04.16/0.946%* 679,060 1.89480,000 UK Treasury 22.07.18/1.250% 770,847 2.15
1,449,907 4.04
FRANCE775,000 France (Government of) 25.05.18/1.000% 1,066,315 2.97
1,066,315 2.97
FINLAND580,000 Finland (Government of) 04.07.28/2.750% 808,285 2.26
808,285 2.26
CAYMAN ISLANDS500,000 Hutchison Whampoa
International 10 31.12.49/6.000%* 530,657 1.48
530,657 1.48
Total Bonds 6,179,038 17.23
Convertible Bonds
FRANCE1,885,500 Air France-KLM 01.04.15/4.970% 332,644 0.931,130,000 Air France-KLM 15.02.23/2.030% 171,786 0.48
48,100 AXA 01.01.17/3.750% 186,791 0.52
691,221 1.93
78
JPMorgan Investment Funds - Global Capital Preservation Fund (USD)
Schedule of Investments (Market Value Expressed in USD)
As at 31 December 2013
Quantity/Nominal
Value
Name of Securities Maturity/Coupon
MarketValue
%of
NetAssets
Quantity/Nominal
Value
Name of Securities Maturity/Coupon
MarketValue
%of
NetAssets
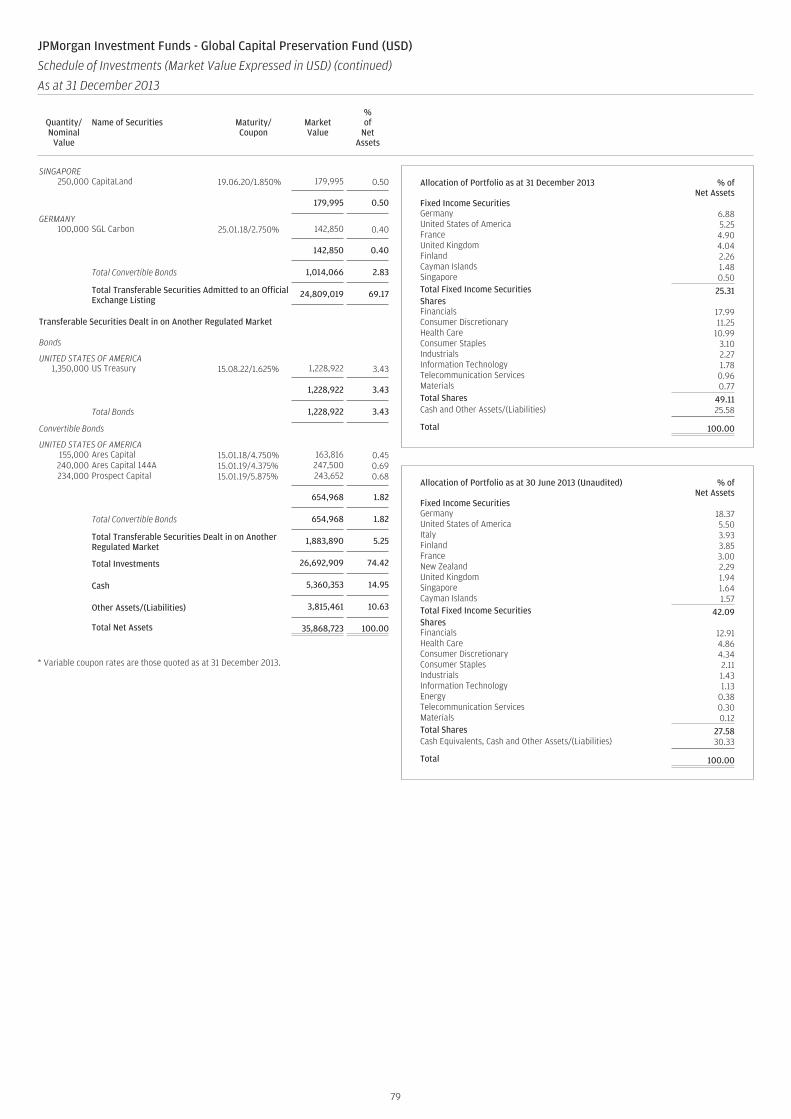
SINGAPORE250,000 CapitaLand 19.06.20/1.850% 179,995 0.50
179,995 0.50
GERMANY100,000 SGL Carbon 25.01.18/2.750% 142,850 0.40
142,850 0.40
Total Convertible Bonds 1,014,066 2.83
Total Transferable Securities Admitted to an OfficialExchange Listing
24,809,019 69.17
Transferable Securities Dealt in on Another Regulated Market
Bonds
UNITED STATES OF AMERICA1,350,000 US Treasury 15.08.22/1.625% 1,228,922 3.43
1,228,922 3.43
Total Bonds 1,228,922 3.43
Convertible Bonds
UNITED STATES OF AMERICA155,000 Ares Capital 15.01.18/4.750% 163,816 0.45
240,000 Ares Capital 144A 15.01.19/4.375% 247,500 0.69234,000 Prospect Capital 15.01.19/5.875% 243,652 0.68
654,968 1.82
Total Convertible Bonds 654,968 1.82
Total Transferable Securities Dealt in on AnotherRegulated Market
1,883,890 5.25
Total Investments 26,692,909 74.42
Cash 5,360,353 14.95
Other Assets/(Liabilities) 3,815,461 10.63
Total Net Assets 35,868,723 100.00
* Variable coupon rates are those quoted as at 31 December 2013.
Allocation of Portfolio as at 31 December 2013 % ofNet Assets
Fixed Income SecuritiesGermany 6.88United States of America 5.25France 4.90United Kingdom 4.04Finland 2.26Cayman Islands 1.48Singapore 0.50Total Fixed Income Securities 25.31SharesFinancials 17.99Consumer Discretionary 11.25Health Care 10.99Consumer Staples 3.10Industrials 2.27Information Technology 1.78Telecommunication Services 0.96Materials 0.77Total Shares 49.11Cash and Other Assets/(Liabilities) 25.58
Total 100.00
Allocation of Portfolio as at 30 June 2013 (Unaudited) % ofNet Assets
Fixed Income SecuritiesGermany 18.37United States of America 5.50Italy 3.93Finland 3.85France 3.00New Zealand 2.29United Kingdom 1.94Singapore 1.64Cayman Islands 1.57Total Fixed Income Securities 42.09SharesFinancials 12.91Health Care 4.86Consumer Discretionary 4.34Consumer Staples 2.11Industrials 1.43Information Technology 1.13Energy 0.38Telecommunication Services 0.30Materials 0.12Total Shares 27.58Cash Equivalents, Cash and Other Assets/(Liabilities) 30.33
Total 100.00
79
JPMorgan Investment Funds - Global Capital Preservation Fund (USD)
Schedule of Investments (Market Value Expressed in USD) (continued)
As at 31 December 2013
Quantity/Nominal
Value
Name of Securities Maturity/Coupon
MarketValue
%of
NetAssets
Quantity/Nominal
Value
Name of Securities Maturity/Coupon
MarketValue
%of
NetAssets
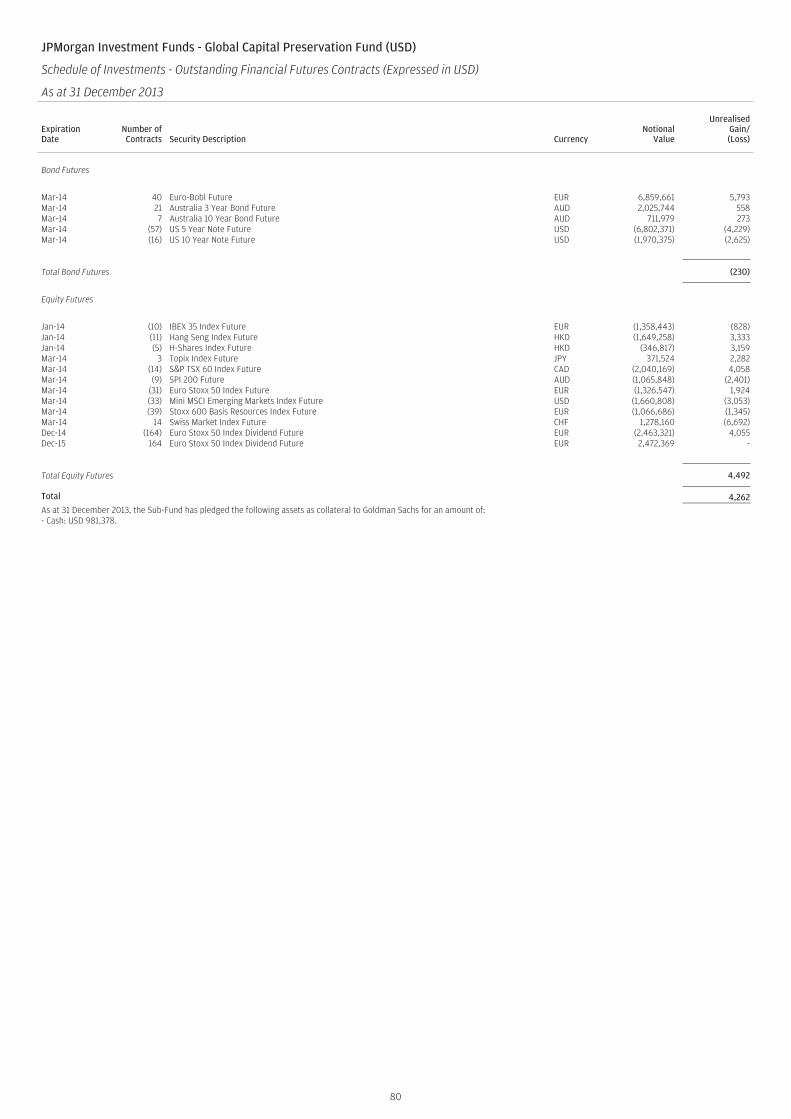
JPMorgan Investment Funds - Global Capital Preservation Fund (USD)
Schedule of Investments - Outstanding Financial Futures Contracts (Expressed in USD)
As at 31 December 2013
ExpirationDate
Number ofContracts Security Description Currency
NotionalValue
UnrealisedGain/(Loss)
Bond Futures
Mar-14 40 Euro-Bobl Future EUR 6,859,661 5,793Mar-14 21 Australia 3 Year Bond Future AUD 2,025,744 558Mar-14 7 Australia 10 Year Bond Future AUD 711,979 273Mar-14 (57) US 5 Year Note Future USD (6,802,371) (4,229)Mar-14 (16) US 10 Year Note Future USD (1,970,375) (2,625)
Total Bond Futures (230)
Equity Futures
Jan-14 (10) IBEX 35 Index Future EUR (1,358,443) (828)Jan-14 (11) Hang Seng Index Future HKD (1,649,258) 3,333Jan-14 (5) H-Shares Index Future HKD (346,817) 3,159Mar-14 3 Topix Index Future JPY 371,524 2,282Mar-14 (14) S&P TSX 60 Index Future CAD (2,040,169) 4,058Mar-14 (9) SPI 200 Future AUD (1,065,848) (2,401)Mar-14 (31) Euro Stoxx 50 Index Future EUR (1,326,547) 1,924Mar-14 (33) Mini MSCI Emerging Markets Index Future USD (1,660,808) (3,053)Mar-14 (39) Stoxx 600 Basis Resources Index Future EUR (1,066,686) (1,345)Mar-14 14 Swiss Market Index Future CHF 1,278,160 (6,692)Dec-14 (164) Euro Stoxx 50 Index Dividend Future EUR (2,463,321) 4,055Dec-15 164 Euro Stoxx 50 Index Dividend Future EUR 2,472,369 -
Total Equity Futures 4,492
Total 4,262As at 31 December 2013, the Sub-Fund has pledged the following assets as collateral to Goldman Sachs for an amount of:- Cash: USD 981,378.
80
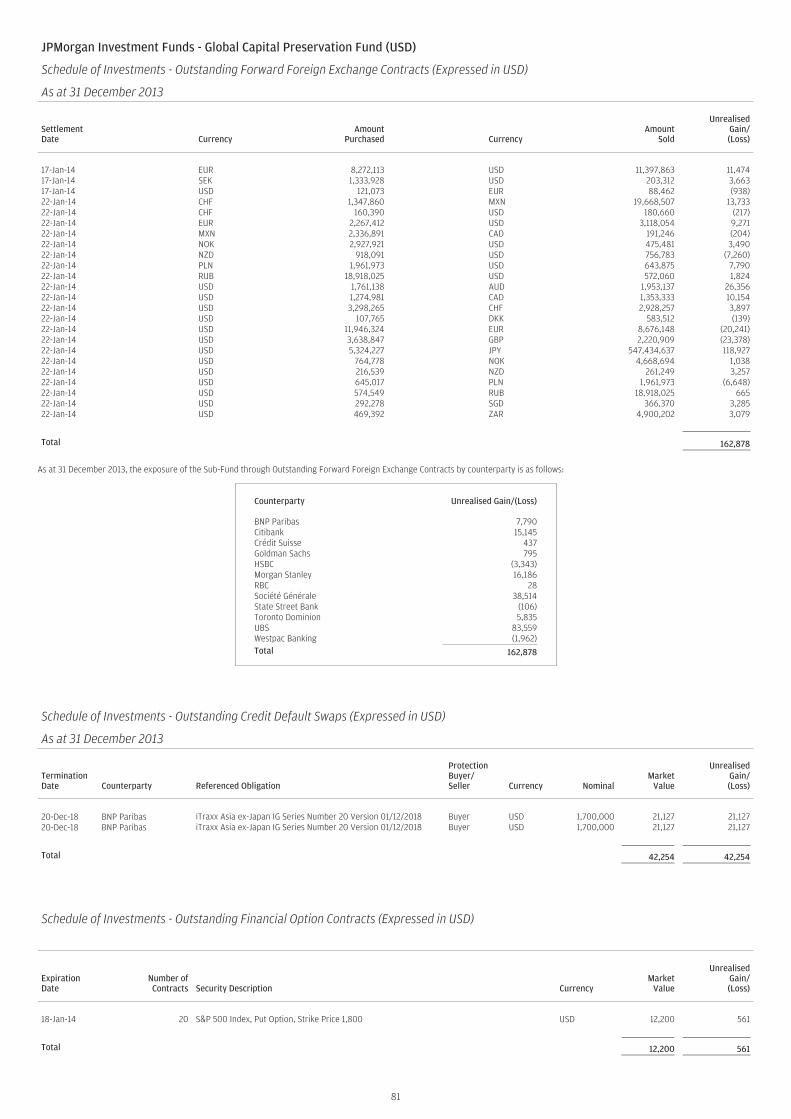
JPMorgan Investment Funds - Global Capital Preservation Fund (USD)
Schedule of Investments - Outstanding Forward Foreign Exchange Contracts (Expressed in USD)
As at 31 December 2013
SettlementDate Currency
AmountPurchased Currency
AmountSold
UnrealisedGain/(Loss)
17-Jan-14 EUR 8,272,113 USD 11,397,863 11,47417-Jan-14 SEK 1,333,928 USD 203,312 3,66317-Jan-14 USD 121,073 EUR 88,462 (938)22-Jan-14 CHF 1,347,860 MXN 19,668,507 13,73322-Jan-14 CHF 160,390 USD 180,660 (217)22-Jan-14 EUR 2,267,412 USD 3,118,054 9,27122-Jan-14 MXN 2,336,891 CAD 191,246 (204)22-Jan-14 NOK 2,927,921 USD 475,481 3,49022-Jan-14 NZD 918,091 USD 756,783 (7,260)22-Jan-14 PLN 1,961,973 USD 643,875 7,79022-Jan-14 RUB 18,918,025 USD 572,060 1,82422-Jan-14 USD 1,761,138 AUD 1,953,137 26,35622-Jan-14 USD 1,274,981 CAD 1,353,333 10,15422-Jan-14 USD 3,298,265 CHF 2,928,257 3,89722-Jan-14 USD 107,765 DKK 583,512 (139)22-Jan-14 USD 11,946,324 EUR 8,676,148 (20,241)22-Jan-14 USD 3,638,847 GBP 2,220,909 (23,378)22-Jan-14 USD 5,324,227 JPY 547,434,637 118,92722-Jan-14 USD 764,778 NOK 4,668,694 1,03822-Jan-14 USD 216,539 NZD 261,249 3,25722-Jan-14 USD 645,017 PLN 1,961,973 (6,648)22-Jan-14 USD 574,549 RUB 18,918,025 66522-Jan-14 USD 292,278 SGD 366,370 3,28522-Jan-14 USD 469,392 ZAR 4,900,202 3,079
Total 162,878
As at 31 December 2013, the exposure of the Sub-Fund through Outstanding Forward Foreign Exchange Contracts by counterparty is as follows:
Counterparty Unrealised Gain/(Loss)
BNP Paribas 7,790Citibank 15,145Crédit Suisse 437Goldman Sachs 795HSBC (3,343)Morgan Stanley 16,186RBC 28Société Générale 38,514State Street Bank (106)Toronto Dominion 5,835UBS 83,559Westpac Banking (1,962)Total 162,878
Schedule of Investments - Outstanding Credit Default Swaps (Expressed in USD)
As at 31 December 2013
TerminationDate Counterparty Referenced Obligation
ProtectionBuyer/Seller Currency Nominal
MarketValue
UnrealisedGain/(Loss)
20-Dec-18 BNP Paribas iTraxx Asia ex-Japan IG Series Number 20 Version 01/12/2018 Buyer USD 1,700,000 21,127 21,12720-Dec-18 BNP Paribas iTraxx Asia ex-Japan IG Series Number 20 Version 01/12/2018 Buyer USD 1,700,000 21,127 21,127
Total 42,254 42,254
Schedule of Investments - Outstanding Financial Option Contracts (Expressed in USD)
ExpirationDate
Number ofContracts Security Description Currency
MarketValue
UnrealisedGain/(Loss)
18-Jan-14 20 S&P 500 Index, Put Option, Strike Price 1,800 USD 12,200 561
Total 12,200 561
81
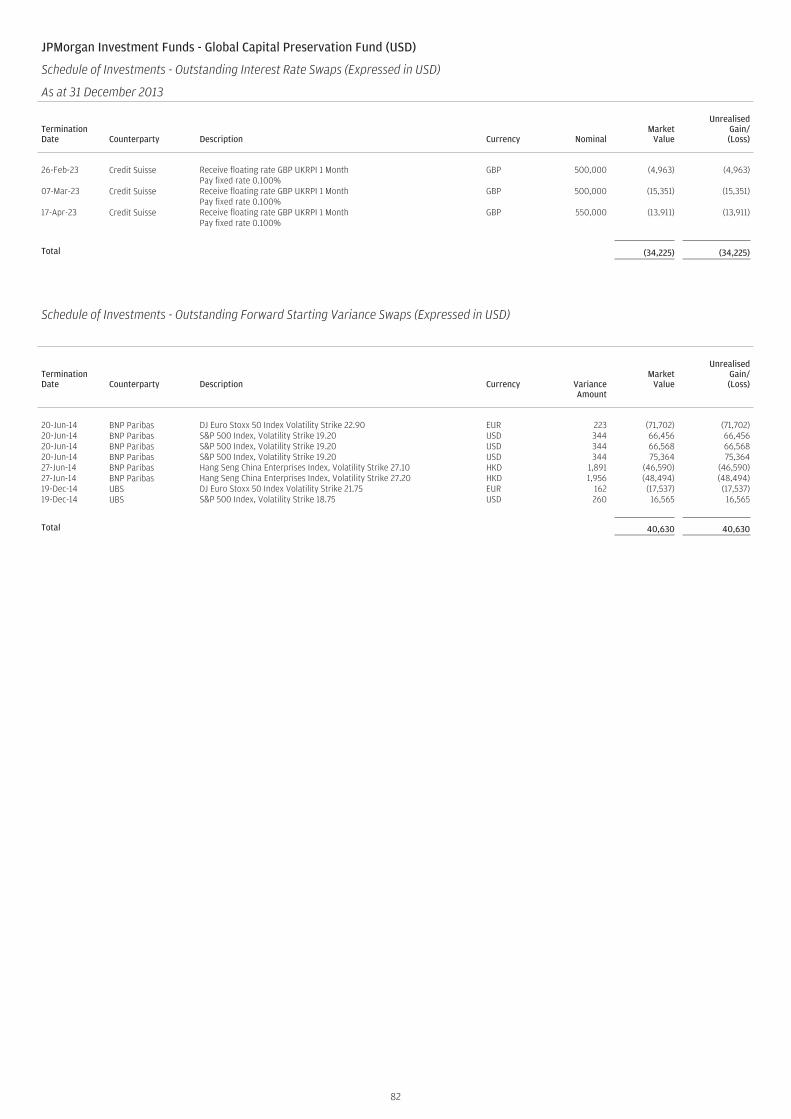
JPMorgan Investment Funds - Global Capital Preservation Fund (USD)
Schedule of Investments - Outstanding Interest Rate Swaps (Expressed in USD)
As at 31 December 2013
TerminationDate Counterparty Description Currency Nominal
MarketValue
UnrealisedGain/(Loss)
26-Feb-23 Credit Suisse Receive floating rate GBP UKRPI 1 Month GBP 500,000 (4,963) (4,963)Pay fixed rate 0.100%
07-Mar-23 Credit Suisse Receive floating rate GBP UKRPI 1 Month GBP 500,000 (15,351) (15,351)Pay fixed rate 0.100%
17-Apr-23 Credit Suisse Receive floating rate GBP UKRPI 1 Month GBP 550,000 (13,911) (13,911)Pay fixed rate 0.100%
Total (34,225) (34,225)
Schedule of Investments - Outstanding Forward Starting Variance Swaps (Expressed in USD)
TerminationDate Counterparty Description Currency Variance
Amount
MarketValue
UnrealisedGain/(Loss)
20-Jun-14 BNP Paribas DJ Euro Stoxx 50 Index Volatility Strike 22.90 EUR 223 (71,702) (71,702)20-Jun-14 BNP Paribas S&P 500 Index, Volatility Strike 19.20 USD 344 66,456 66,45620-Jun-14 BNP Paribas S&P 500 Index, Volatility Strike 19.20 USD 344 66,568 66,56820-Jun-14 BNP Paribas S&P 500 Index, Volatility Strike 19.20 USD 344 75,364 75,36427-Jun-14 BNP Paribas Hang Seng China Enterprises Index, Volatility Strike 27.10 HKD 1,891 (46,590) (46,590)27-Jun-14 BNP Paribas Hang Seng China Enterprises Index, Volatility Strike 27.20 HKD 1,956 (48,494) (48,494)19-Dec-14 UBS DJ Euro Stoxx 50 Index Volatility Strike 21.75 EUR 162 (17,537) (17,537)19-Dec-14 UBS S&P 500 Index, Volatility Strike 18.75 USD 260 16,565 16,565
Total 40,630 40,630
82
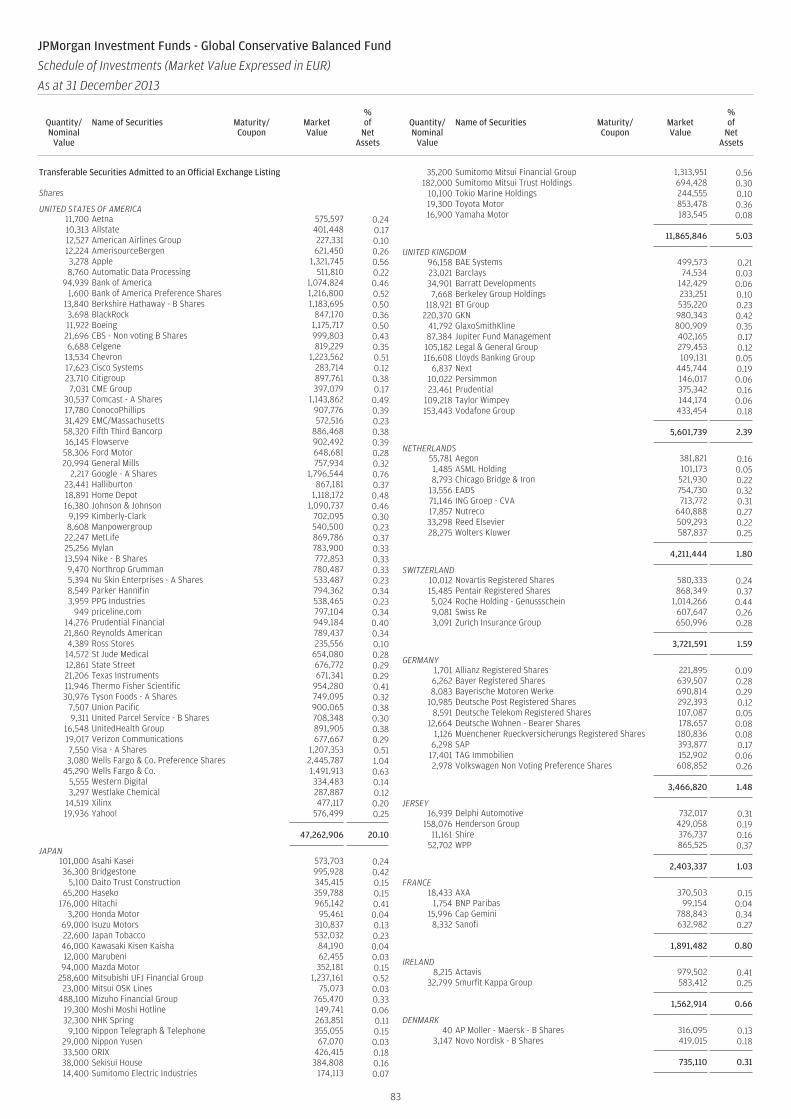
Transferable Securities Admitted to an Official Exchange Listing
Shares
UNITED STATES OF AMERICA11,700 Aetna 575,597 0.2410,313 Allstate 401,448 0.1712,527 American Airlines Group 227,331 0.1012,224 AmerisourceBergen 621,450 0.263,278 Apple 1,321,745 0.568,760 Automatic Data Processing 511,810 0.22
94,939 Bank of America 1,074,824 0.461,600 Bank of America Preference Shares 1,216,800 0.52
13,840 Berkshire Hathaway - B Shares 1,183,695 0.503,698 BlackRock 847,170 0.3611,922 Boeing 1,175,717 0.5021,696 CBS - Non voting B Shares 999,803 0.436,688 Celgene 819,229 0.35
13,534 Chevron 1,223,562 0.5117,623 Cisco Systems 283,714 0.1223,710 Citigroup 897,761 0.387,031 CME Group 397,079 0.17
30,537 Comcast - A Shares 1,143,862 0.4917,780 ConocoPhillips 907,776 0.3931,429 EMC/Massachusetts 572,516 0.2358,320 Fifth Third Bancorp 886,468 0.3816,145 Flowserve 902,492 0.39
58,306 Ford Motor 648,681 0.2820,994 General Mills 757,934 0.32
2,217 Google - A Shares 1,796,544 0.7623,441 Halliburton 867,181 0.3718,891 Home Depot 1,118,172 0.4816,380 Johnson & Johnson 1,090,737 0.46
9,199 Kimberly-Clark 702,095 0.308,608 Manpowergroup 540,500 0.23
22,247 MetLife 869,786 0.3725,256 Mylan 783,900 0.3313,594 Nike - B Shares 772,853 0.339,470 Northrop Grumman 780,487 0.335,394 Nu Skin Enterprises - A Shares 533,487 0.238,549 Parker Hannifin 794,362 0.343,959 PPG Industries 538,465 0.23
949 priceline.com 797,104 0.3414,276 Prudential Financial 949,184 0.4021,860 Reynolds American 789,437 0.344,389 Ross Stores 235,556 0.1014,572 St Jude Medical 654,080 0.2812,861 State Street 676,772 0.2921,206 Texas Instruments 671,341 0.2911,946 Thermo Fisher Scientific 954,280 0.4130,976 Tyson Foods - A Shares 749,095 0.32
7,507 Union Pacific 900,065 0.389,311 United Parcel Service - B Shares 708,348 0.30
16,548 UnitedHealth Group 891,905 0.3819,017 Verizon Communications 677,667 0.297,550 Visa - A Shares 1,207,353 0.513,080 Wells Fargo & Co. Preference Shares 2,445,787 1.04
45,290 Wells Fargo & Co. 1,491,913 0.635,555 Western Digital 334,483 0.143,297 Westlake Chemical 287,887 0.12
14,519 Xilinx 477,117 0.2019,936 Yahoo! 576,499 0.25
47,262,906 20.10
JAPAN101,000 Asahi Kasei 573,703 0.2436,300 Bridgestone 995,928 0.42
5,100 Daito Trust Construction 345,415 0.1565,200 Haseko 359,788 0.15
176,000 Hitachi 965,142 0.413,200 Honda Motor 95,461 0.04
69,000 Isuzu Motors 310,837 0.1322,600 Japan Tobacco 532,032 0.2346,000 Kawasaki Kisen Kaisha 84,190 0.0412,000 Marubeni 62,455 0.0394,000 Mazda Motor 352,181 0.15
258,600 Mitsubishi UFJ Financial Group 1,237,161 0.5223,000 Mitsui OSK Lines 75,073 0.03
488,100 Mizuho Financial Group 765,470 0.3319,300 Moshi Moshi Hotline 149,741 0.0632,300 NHK Spring 263,851 0.11
9,100 Nippon Telegraph & Telephone 355,055 0.1529,000 Nippon Yusen 67,070 0.0333,500 ORIX 426,415 0.1838,000 Sekisui House 384,808 0.1614,400 Sumitomo Electric Industries 174,113 0.07
35,200 Sumitomo Mitsui Financial Group 1,313,951 0.56182,000 Sumitomo Mitsui Trust Holdings 694,428 0.30
10,100 Tokio Marine Holdings 244,555 0.1019,300 Toyota Motor 853,478 0.3616,900 Yamaha Motor 183,545 0.08
11,865,846 5.03
UNITED KINGDOM96,158 BAE Systems 499,573 0.2123,021 Barclays 74,534 0.0334,901 Barratt Developments 142,429 0.067,668 Berkeley Group Holdings 233,251 0.10
118,921 BT Group 535,220 0.23220,370 GKN 980,343 0.42
41,792 GlaxoSmithKline 800,909 0.3587,384 Jupiter Fund Management 402,165 0.17105,182 Legal & General Group 279,453 0.12116,608 Lloyds Banking Group 109,131 0.05
6,837 Next 445,744 0.1910,022 Persimmon 146,017 0.0623,461 Prudential 375,342 0.16
109,218 Taylor Wimpey 144,174 0.06153,443 Vodafone Group 433,454 0.18
5,601,739 2.39
NETHERLANDS55,781 Aegon 381,821 0.161,485 ASML Holding 101,173 0.058,793 Chicago Bridge & Iron 521,930 0.22
13,556 EADS 754,730 0.3271,146 ING Groep - CVA 713,772 0.3117,857 Nutreco 640,888 0.2733,298 Reed Elsevier 509,293 0.2228,275 Wolters Kluwer 587,837 0.25
4,211,444 1.80
SWITZERLAND10,012 Novartis Registered Shares 580,333 0.2415,485 Pentair Registered Shares 868,349 0.375,024 Roche Holding - Genussschein 1,014,266 0.449,081 Swiss Re 607,647 0.263,091 Zurich Insurance Group 650,996 0.28
3,721,591 1.59
GERMANY1,701 Allianz Registered Shares 221,895 0.096,262 Bayer Registered Shares 639,507 0.288,083 Bayerische Motoren Werke 690,814 0.29
10,985 Deutsche Post Registered Shares 292,393 0.128,591 Deutsche Telekom Registered Shares 107,087 0.05
12,664 Deutsche Wohnen - Bearer Shares 178,657 0.081,126 Muenchener Rueckversicherungs Registered Shares 180,836 0.08
6,298 SAP 393,877 0.1717,401 TAG Immobilien 152,902 0.062,978 Volkswagen Non Voting Preference Shares 608,852 0.26
3,466,820 1.48
JERSEY16,939 Delphi Automotive 732,017 0.31
158,076 Henderson Group 429,058 0.1911,161 Shire 376,737 0.16
52,702 WPP 865,525 0.37
2,403,337 1.03
FRANCE18,433 AXA 370,503 0.15
1,754 BNP Paribas 99,154 0.0415,996 Cap Gemini 788,843 0.348,332 Sanofi 632,982 0.27
1,891,482 0.80
IRELAND8,215 Actavis 979,502 0.41
32,799 Smurfit Kappa Group 583,412 0.25
1,562,914 0.66
DENMARK40 AP Moller - Maersk - B Shares 316,095 0.13
3,147 Novo Nordisk - B Shares 419,015 0.18
735,110 0.31
83
JPMorgan Investment Funds - Global Conservative Balanced Fund
Schedule of Investments (Market Value Expressed in EUR)
As at 31 December 2013
Quantity/Nominal
Value
Name of Securities Maturity/Coupon
MarketValue
%of
NetAssets
Quantity/Nominal
Value
Name of Securities Maturity/Coupon
MarketValue
%of
NetAssets
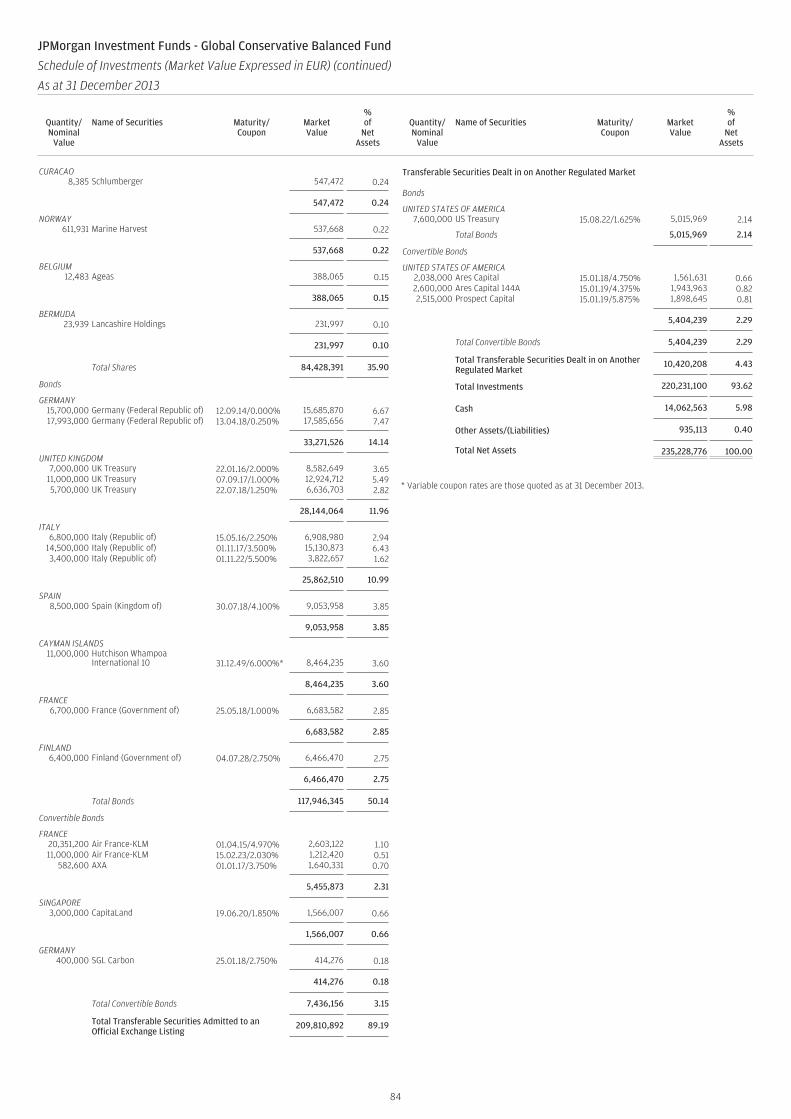
CURACAO8,385 Schlumberger 547,472 0.24
547,472 0.24
NORWAY611,931 Marine Harvest 537,668 0.22
537,668 0.22
BELGIUM12,483 Ageas 388,065 0.15
388,065 0.15
BERMUDA23,939 Lancashire Holdings 231,997 0.10
231,997 0.10
Total Shares 84,428,391 35.90
Bonds
GERMANY15,700,000 Germany (Federal Republic of) 12.09.14/0.000% 15,685,870 6.6717,993,000 Germany (Federal Republic of) 13.04.18/0.250% 17,585,656 7.47
33,271,526 14.14
UNITED KINGDOM7,000,000 UK Treasury 22.01.16/2.000% 8,582,649 3.65
11,000,000 UK Treasury 07.09.17/1.000% 12,924,712 5.495,700,000 UK Treasury 22.07.18/1.250% 6,636,703 2.82
28,144,064 11.96
ITALY6,800,000 Italy (Republic of) 15.05.16/2.250% 6,908,980 2.94
14,500,000 Italy (Republic of) 01.11.17/3.500% 15,130,873 6.433,400,000 Italy (Republic of) 01.11.22/5.500% 3,822,657 1.62
25,862,510 10.99
SPAIN8,500,000 Spain (Kingdom of) 30.07.18/4.100% 9,053,958 3.85
9,053,958 3.85
CAYMAN ISLANDS11,000,000 Hutchison Whampoa
International 10 31.12.49/6.000%* 8,464,235 3.60
8,464,235 3.60
FRANCE6,700,000 France (Government of) 25.05.18/1.000% 6,683,582 2.85
6,683,582 2.85
FINLAND6,400,000 Finland (Government of) 04.07.28/2.750% 6,466,470 2.75
6,466,470 2.75
Total Bonds 117,946,345 50.14
Convertible Bonds
FRANCE20,351,200 Air France-KLM 01.04.15/4.970% 2,603,122 1.1011,000,000 Air France-KLM 15.02.23/2.030% 1,212,420 0.51
582,600 AXA 01.01.17/3.750% 1,640,331 0.70
5,455,873 2.31
SINGAPORE3,000,000 CapitaLand 19.06.20/1.850% 1,566,007 0.66
1,566,007 0.66
GERMANY400,000 SGL Carbon 25.01.18/2.750% 414,276 0.18
414,276 0.18
Total Convertible Bonds 7,436,156 3.15
Total Transferable Securities Admitted to anOfficial Exchange Listing
209,810,892 89.19
Transferable Securities Dealt in on Another Regulated Market
Bonds
UNITED STATES OF AMERICA7,600,000 US Treasury 15.08.22/1.625% 5,015,969 2.14
Total Bonds 5,015,969 2.14
Convertible Bonds
UNITED STATES OF AMERICA2,038,000 Ares Capital 15.01.18/4.750% 1,561,631 0.662,600,000 Ares Capital 144A 15.01.19/4.375% 1,943,963 0.822,515,000 Prospect Capital 15.01.19/5.875% 1,898,645 0.81
5,404,239 2.29
Total Convertible Bonds 5,404,239 2.29
Total Transferable Securities Dealt in on AnotherRegulated Market
10,420,208 4.43
Total Investments 220,231,100 93.62
Cash 14,062,563 5.98
Other Assets/(Liabilities) 935,113 0.40
Total Net Assets 235,228,776 100.00
* Variable coupon rates are those quoted as at 31 December 2013.
84
JPMorgan Investment Funds - Global Conservative Balanced Fund
Schedule of Investments (Market Value Expressed in EUR) (continued)
As at 31 December 2013
Quantity/Nominal
Value
Name of Securities Maturity/Coupon
MarketValue
%of
NetAssets
Quantity/Nominal
Value
Name of Securities Maturity/Coupon
MarketValue
%of
NetAssets
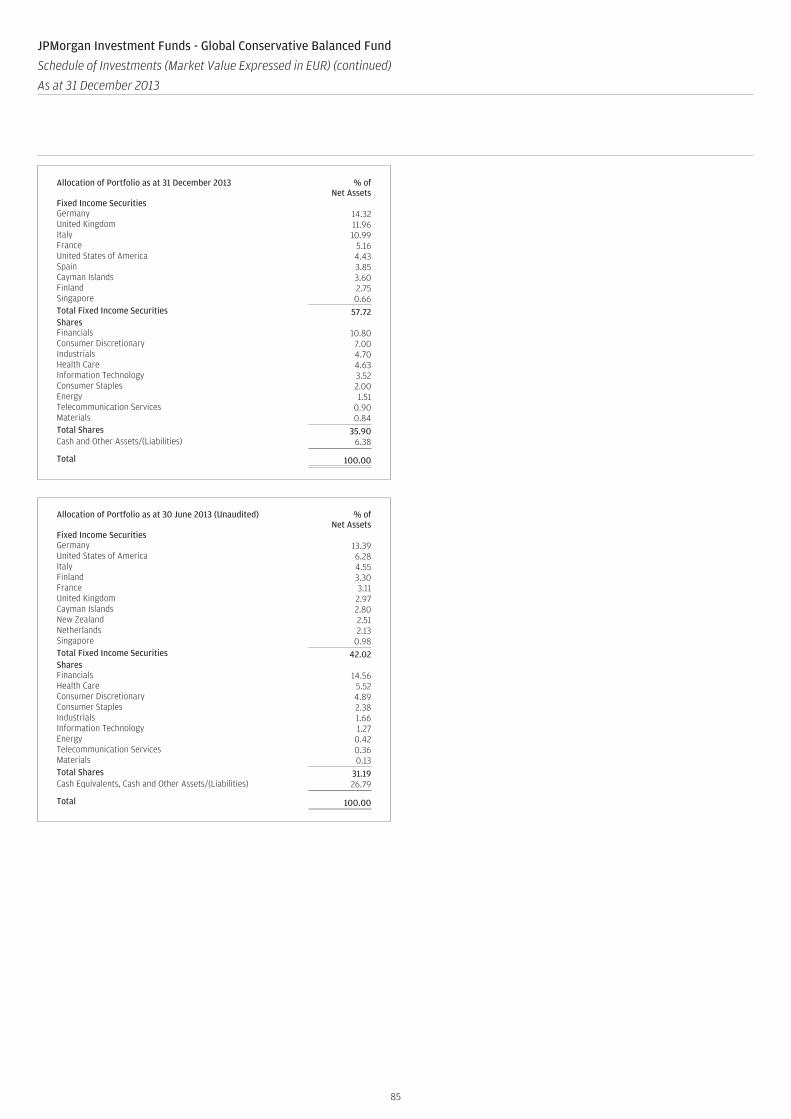
Allocation of Portfolio as at 31 December 2013 % ofNet Assets
Fixed Income SecuritiesGermany 14.32United Kingdom 11.96Italy 10.99France 5.16United States of America 4.43Spain 3.85Cayman Islands 3.60Finland 2.75Singapore 0.66Total Fixed Income Securities 57.72SharesFinancials 10.80Consumer Discretionary 7.00Industrials 4.70Health Care 4.63Information Technology 3.52Consumer Staples 2.00Energy 1.51Telecommunication Services 0.90Materials 0.84Total Shares 35.90Cash and Other Assets/(Liabilities) 6.38
Total 100.00
Allocation of Portfolio as at 30 June 2013 (Unaudited) % ofNet Assets
Fixed Income SecuritiesGermany 13.39United States of America 6.28Italy 4.55Finland 3.30France 3.11United Kingdom 2.97Cayman Islands 2.80New Zealand 2.51Netherlands 2.13Singapore 0.98Total Fixed Income Securities 42.02SharesFinancials 14.56Health Care 5.52Consumer Discretionary 4.89Consumer Staples 2.38Industrials 1.66Information Technology 1.27Energy 0.42Telecommunication Services 0.36Materials 0.13Total Shares 31.19Cash Equivalents, Cash and Other Assets/(Liabilities) 26.79
Total 100.00
85
JPMorgan Investment Funds - Global Conservative Balanced Fund
Schedule of Investments (Market Value Expressed in EUR) (continued)
As at 31 December 2013
Quantity/Nominal
Value
Name of Securities Maturity/Coupon
MarketValue
%of
NetAssets
Quantity/Nominal
Value
Name of Securities Maturity/Coupon
MarketValue
%of
NetAssets
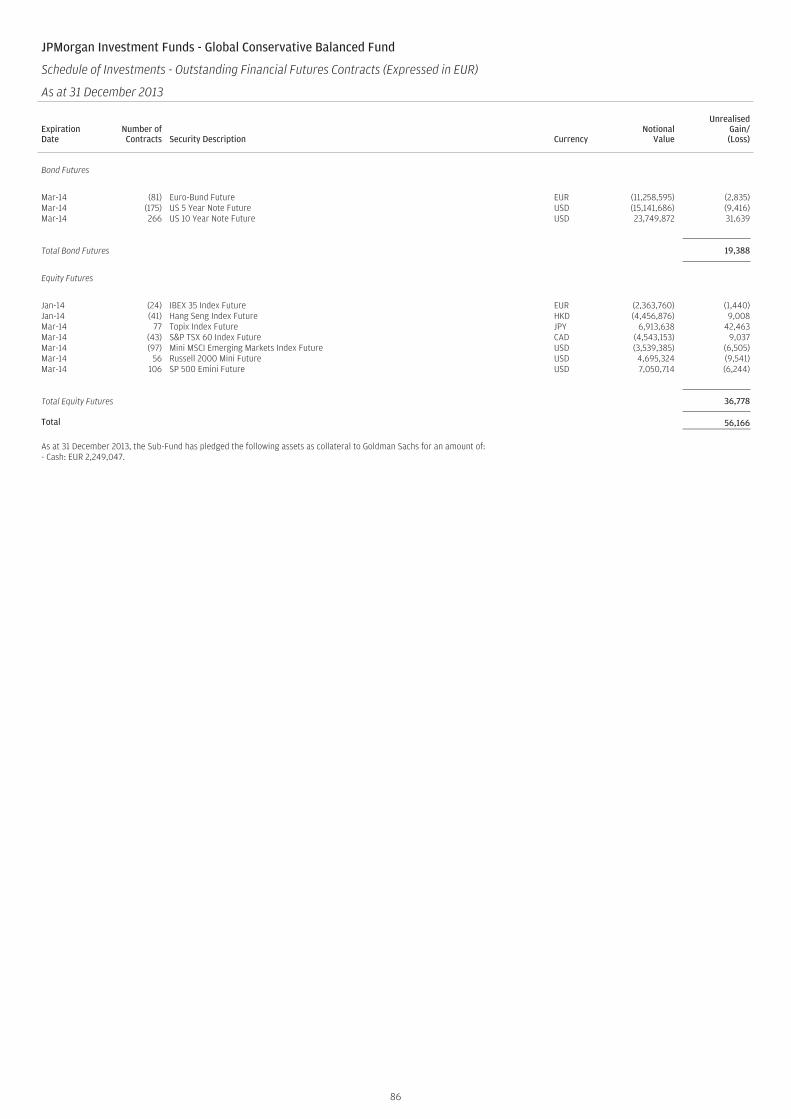
JPMorgan Investment Funds - Global Conservative Balanced Fund
Schedule of Investments - Outstanding Financial Futures Contracts (Expressed in EUR)
As at 31 December 2013
ExpirationDate
Number ofContracts Security Description Currency
NotionalValue
UnrealisedGain/(Loss)
Bond Futures
Mar-14 (81) Euro-Bund Future EUR (11,258,595) (2,835)Mar-14 (175) US 5 Year Note Future USD (15,141,686) (9,416)Mar-14 266 US 10 Year Note Future USD 23,749,872 31,639
Total Bond Futures 19,388
Equity Futures
Jan-14 (24) IBEX 35 Index Future EUR (2,363,760) (1,440)Jan-14 (41) Hang Seng Index Future HKD (4,456,876) 9,008Mar-14 77 Topix Index Future JPY 6,913,638 42,463Mar-14 (43) S&P TSX 60 Index Future CAD (4,543,153) 9,037Mar-14 (97) Mini MSCI Emerging Markets Index Future USD (3,539,385) (6,505)Mar-14 56 Russell 2000 Mini Future USD 4,695,324 (9,541)Mar-14 106 SP 500 Emini Future USD 7,050,714 (6,244)
Total Equity Futures 36,778
Total 56,166
As at 31 December 2013, the Sub-Fund has pledged the following assets as collateral to Goldman Sachs for an amount of:- Cash: EUR 2,249,047.
86
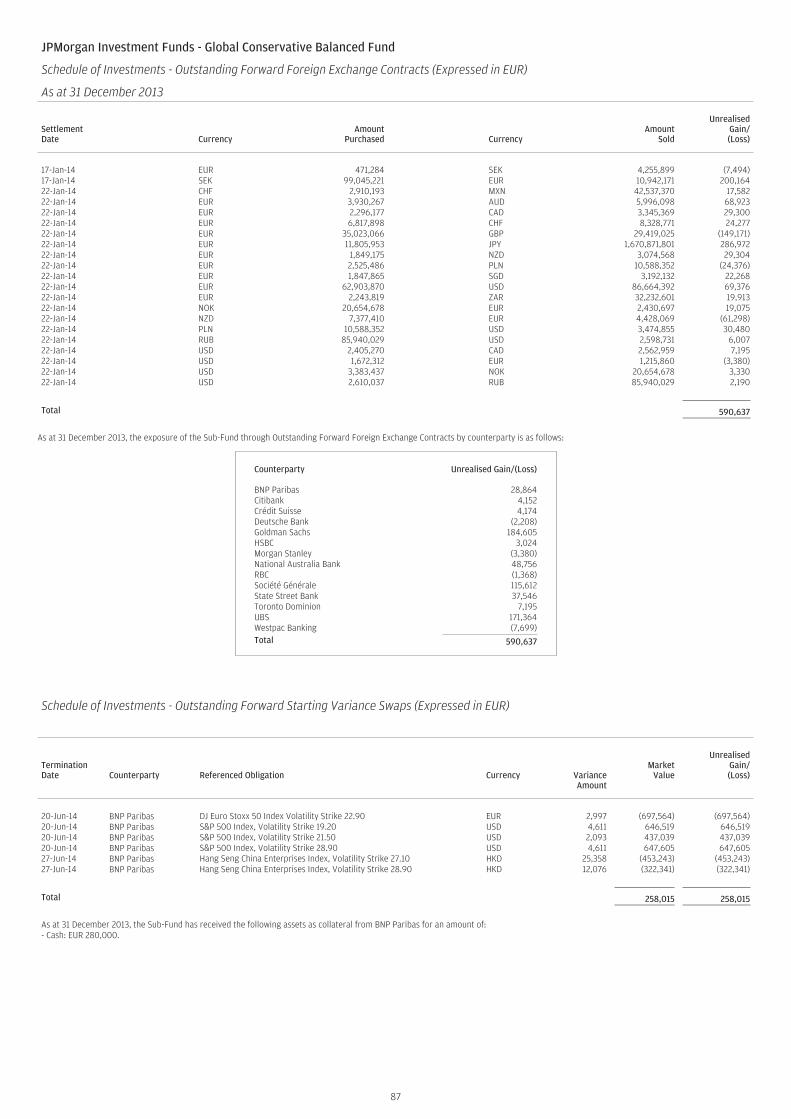
JPMorgan Investment Funds - Global Conservative Balanced Fund
Schedule of Investments - Outstanding Forward Foreign Exchange Contracts (Expressed in EUR)
As at 31 December 2013
SettlementDate Currency
AmountPurchased Currency
AmountSold
UnrealisedGain/(Loss)
17-Jan-14 EUR 471,284 SEK 4,255,899 (7,494)17-Jan-14 SEK 99,045,221 EUR 10,942,171 200,16422-Jan-14 CHF 2,910,193 MXN 42,537,370 17,58222-Jan-14 EUR 3,930,267 AUD 5,996,098 68,92322-Jan-14 EUR 2,296,177 CAD 3,345,369 29,30022-Jan-14 EUR 6,817,898 CHF 8,328,771 24,27722-Jan-14 EUR 35,023,066 GBP 29,419,025 (149,171)22-Jan-14 EUR 11,805,953 JPY 1,670,871,801 286,97222-Jan-14 EUR 1,849,175 NZD 3,074,568 29,30422-Jan-14 EUR 2,525,486 PLN 10,588,352 (24,376)22-Jan-14 EUR 1,847,865 SGD 3,192,132 22,26822-Jan-14 EUR 62,903,870 USD 86,664,392 69,37622-Jan-14 EUR 2,243,819 ZAR 32,232,601 19,91322-Jan-14 NOK 20,654,678 EUR 2,430,697 19,07522-Jan-14 NZD 7,377,410 EUR 4,428,069 (61,298)22-Jan-14 PLN 10,588,352 USD 3,474,855 30,48022-Jan-14 RUB 85,940,029 USD 2,598,731 6,00722-Jan-14 USD 2,405,270 CAD 2,562,959 7,19522-Jan-14 USD 1,672,312 EUR 1,215,860 (3,380)22-Jan-14 USD 3,383,437 NOK 20,654,678 3,33022-Jan-14 USD 2,610,037 RUB 85,940,029 2,190
Total 590,637
As at 31 December 2013, the exposure of the Sub-Fund through Outstanding Forward Foreign Exchange Contracts by counterparty is as follows:
Counterparty Unrealised Gain/(Loss)
BNP Paribas 28,864Citibank 4,152Crédit Suisse 4,174Deutsche Bank (2,208)Goldman Sachs 184,605HSBC 3,024Morgan Stanley (3,380)National Australia Bank 48,756RBC (1,368)Société Générale 115,612State Street Bank 37,546Toronto Dominion 7,195UBS 171,364Westpac Banking (7,699)Total 590,637
Schedule of Investments - Outstanding Forward Starting Variance Swaps (Expressed in EUR)
TerminationDate Counterparty Referenced Obligation Currency Variance
Amount
MarketValue
UnrealisedGain/(Loss)
20-Jun-14 BNP Paribas DJ Euro Stoxx 50 Index Volatility Strike 22.90 EUR 2,997 (697,564) (697,564)20-Jun-14 BNP Paribas S&P 500 Index, Volatility Strike 19.20 USD 4,611 646,519 646,51920-Jun-14 BNP Paribas S&P 500 Index, Volatility Strike 21.50 USD 2,093 437,039 437,03920-Jun-14 BNP Paribas S&P 500 Index, Volatility Strike 28.90 USD 4,611 647,605 647,60527-Jun-14 BNP Paribas Hang Seng China Enterprises Index, Volatility Strike 27.10 HKD 25,358 (453,243) (453,243)27-Jun-14 BNP Paribas Hang Seng China Enterprises Index, Volatility Strike 28.90 HKD 12,076 (322,341) (322,341)
Total 258,015 258,015
As at 31 December 2013, the Sub-Fund has received the following assets as collateral from BNP Paribas for an amount of:- Cash: EUR 280,000.
87
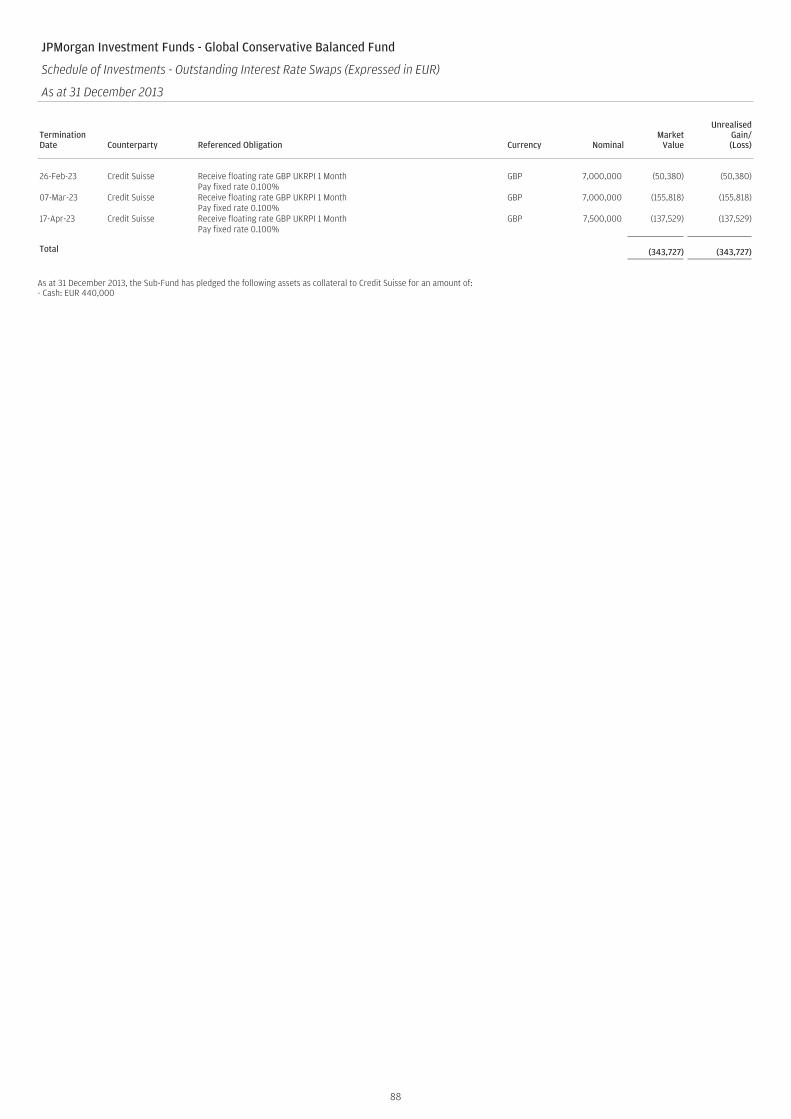
JPMorgan Investment Funds - Global Conservative Balanced Fund
Schedule of Investments - Outstanding Interest Rate Swaps (Expressed in EUR)
As at 31 December 2013
TerminationDate Counterparty Referenced Obligation Currency Nominal
MarketValue
UnrealisedGain/(Loss)
26-Feb-23 Credit Suisse Receive floating rate GBP UKRPI 1 Month GBP 7,000,000 (50,380) (50,380)Pay fixed rate 0.100%
07-Mar-23 Credit Suisse Receive floating rate GBP UKRPI 1 Month GBP 7,000,000 (155,818) (155,818)Pay fixed rate 0.100%
17-Apr-23 Credit Suisse Receive floating rate GBP UKRPI 1 Month GBP 7,500,000 (137,529) (137,529)Pay fixed rate 0.100%
Total (343,727) (343,727)
As at 31 December 2013, the Sub-Fund has pledged the following assets as collateral to Credit Suisse for an amount of:- Cash: EUR 440,000
88
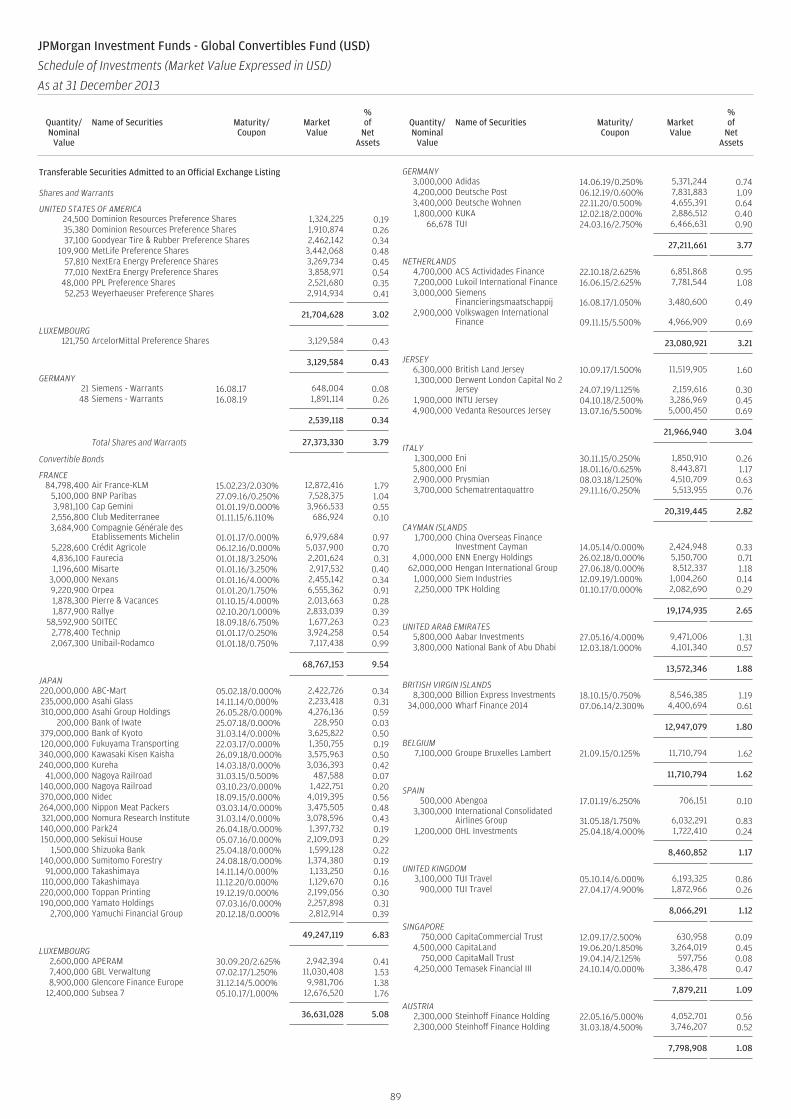
Transferable Securities Admitted to an Official Exchange Listing
Shares and Warrants
UNITED STATES OF AMERICA24,500 Dominion Resources Preference Shares 1,324,225 0.1935,380 Dominion Resources Preference Shares 1,910,874 0.2637,100 Goodyear Tire & Rubber Preference Shares 2,462,142 0.34
109,900 MetLife Preference Shares 3,442,068 0.4857,810 NextEra Energy Preference Shares 3,269,734 0.4577,010 NextEra Energy Preference Shares 3,858,971 0.54
48,000 PPL Preference Shares 2,521,680 0.3552,253 Weyerhaeuser Preference Shares 2,914,934 0.41
21,704,628 3.02
LUXEMBOURG121,750 ArcelorMittal Preference Shares 3,129,584 0.43
3,129,584 0.43
GERMANY21 Siemens - Warrants 16.08.17 648,004 0.0848 Siemens - Warrants 16.08.19 1,891,114 0.26
2,539,118 0.34
Total Shares and Warrants 27,373,330 3.79
Convertible Bonds
FRANCE84,798,400 Air France-KLM 15.02.23/2.030% 12,872,416 1.79
5,100,000 BNP Paribas 27.09.16/0.250% 7,528,375 1.043,981,100 Cap Gemini 01.01.19/0.000% 3,966,533 0.552,556,800 Club Mediterranee 01.11.15/6.110% 686,924 0.103,684,900 Compagnie Générale des
Etablissements Michelin 01.01.17/0.000% 6,979,684 0.975,228,600 Crédit Agricole 06.12.16/0.000% 5,037,900 0.704,836,100 Faurecia 01.01.18/3.250% 2,201,624 0.311,196,600 Misarte 01.01.16/3.250% 2,917,532 0.40
3,000,000 Nexans 01.01.16/4.000% 2,455,142 0.349,220,900 Orpea 01.01.20/1.750% 6,555,362 0.911,878,300 Pierre & Vacances 01.10.15/4.000% 2,013,663 0.281,877,900 Rallye 02.10.20/1.000% 2,833,039 0.39
58,592,900 SOITEC 18.09.18/6.750% 1,677,263 0.232,778,400 Technip 01.01.17/0.250% 3,924,258 0.542,067,300 Unibail-Rodamco 01.01.18/0.750% 7,117,438 0.99
68,767,153 9.54
JAPAN220,000,000 ABC-Mart 05.02.18/0.000% 2,422,726 0.34235,000,000 Asahi Glass 14.11.14/0.000% 2,233,418 0.31310,000,000 Asahi Group Holdings 26.05.28/0.000% 4,276,136 0.59
200,000 Bank of Iwate 25.07.18/0.000% 228,950 0.03379,000,000 Bank of Kyoto 31.03.14/0.000% 3,625,822 0.50120,000,000 Fukuyama Transporting 22.03.17/0.000% 1,350,755 0.19340,000,000 Kawasaki Kisen Kaisha 26.09.18/0.000% 3,575,963 0.50240,000,000 Kureha 14.03.18/0.000% 3,036,393 0.42
41,000,000 Nagoya Railroad 31.03.15/0.500% 487,588 0.07140,000,000 Nagoya Railroad 03.10.23/0.000% 1,422,751 0.20370,000,000 Nidec 18.09.15/0.000% 4,019,395 0.56264,000,000 Nippon Meat Packers 03.03.14/0.000% 3,475,505 0.48321,000,000 Nomura Research Institute 31.03.14/0.000% 3,078,596 0.43140,000,000 Park24 26.04.18/0.000% 1,397,732 0.19150,000,000 Sekisui House 05.07.16/0.000% 2,109,093 0.29
1,500,000 Shizuoka Bank 25.04.18/0.000% 1,599,128 0.22140,000,000 Sumitomo Forestry 24.08.18/0.000% 1,374,380 0.19
91,000,000 Takashimaya 14.11.14/0.000% 1,133,250 0.16110,000,000 Takashimaya 11.12.20/0.000% 1,129,670 0.16220,000,000 Toppan Printing 19.12.19/0.000% 2,199,056 0.30190,000,000 Yamato Holdings 07.03.16/0.000% 2,257,898 0.31
2,700,000 Yamuchi Financial Group 20.12.18/0.000% 2,812,914 0.39
49,247,119 6.83
LUXEMBOURG2,600,000 APERAM 30.09.20/2.625% 2,942,394 0.417,400,000 GBL Verwaltung 07.02.17/1.250% 11,030,408 1.538,900,000 Glencore Finance Europe 31.12.14/5.000% 9,981,706 1.38
12,400,000 Subsea 7 05.10.17/1.000% 12,676,520 1.76
36,631,028 5.08
GERMANY3,000,000 Adidas 14.06.19/0.250% 5,371,244 0.744,200,000 Deutsche Post 06.12.19/0.600% 7,831,883 1.093,400,000 Deutsche Wohnen 22.11.20/0.500% 4,655,391 0.641,800,000 KUKA 12.02.18/2.000% 2,886,512 0.40
66,678 TUI 24.03.16/2.750% 6,466,631 0.90
27,211,661 3.77
NETHERLANDS4,700,000 ACS Actividades Finance 22.10.18/2.625% 6,851,868 0.957,200,000 Lukoil International Finance 16.06.15/2.625% 7,781,544 1.083,000,000 Siemens
Financieringsmaatschappij 16.08.17/1.050% 3,480,600 0.492,900,000 Volkswagen International
Finance 09.11.15/5.500% 4,966,909 0.69
23,080,921 3.21
JERSEY6,300,000 British Land Jersey 10.09.17/1.500% 11,519,905 1.601,300,000 Derwent London Capital No 2
Jersey 24.07.19/1.125% 2,159,616 0.301,900,000 INTU Jersey 04.10.18/2.500% 3,286,969 0.454,900,000 Vedanta Resources Jersey 13.07.16/5.500% 5,000,450 0.69
21,966,940 3.04
ITALY1,300,000 Eni 30.11.15/0.250% 1,850,910 0.265,800,000 Eni 18.01.16/0.625% 8,443,871 1.172,900,000 Prysmian 08.03.18/1.250% 4,510,709 0.633,700,000 Schematrentaquattro 29.11.16/0.250% 5,513,955 0.76
20,319,445 2.82
CAYMAN ISLANDS1,700,000 China Overseas Finance
Investment Cayman 14.05.14/0.000% 2,424,948 0.334,000,000 ENN Energy Holdings 26.02.18/0.000% 5,150,700 0.71
62,000,000 Hengan International Group 27.06.18/0.000% 8,512,337 1.181,000,000 Siem Industries 12.09.19/1.000% 1,004,260 0.142,250,000 TPK Holding 01.10.17/0.000% 2,082,690 0.29
19,174,935 2.65
UNITED ARAB EMIRATES5,800,000 Aabar Investments 27.05.16/4.000% 9,471,006 1.313,800,000 National Bank of Abu Dhabi 12.03.18/1.000% 4,101,340 0.57
13,572,346 1.88
BRITISH VIRGIN ISLANDS8,300,000 Billion Express Investments 18.10.15/0.750% 8,546,385 1.19
34,000,000 Wharf Finance 2014 07.06.14/2.300% 4,400,694 0.61
12,947,079 1.80
BELGIUM7,100,000 Groupe Bruxelles Lambert 21.09.15/0.125% 11,710,794 1.62
11,710,794 1.62
SPAIN500,000 Abengoa 17.01.19/6.250% 706,151 0.10
3,300,000 International ConsolidatedAirlines Group 31.05.18/1.750% 6,032,291 0.83
1,200,000 OHL Investments 25.04.18/4.000% 1,722,410 0.24
8,460,852 1.17
UNITED KINGDOM3,100,000 TUI Travel 05.10.14/6.000% 6,193,325 0.86
900,000 TUI Travel 27.04.17/4.900% 1,872,966 0.26
8,066,291 1.12
SINGAPORE750,000 CapitaCommercial Trust 12.09.17/2.500% 630,958 0.09
4,500,000 CapitaLand 19.06.20/1.850% 3,264,019 0.45750,000 CapitaMall Trust 19.04.14/2.125% 597,756 0.08
4,250,000 Temasek Financial III 24.10.14/0.000% 3,386,478 0.47
7,879,211 1.09
AUSTRIA2,300,000 Steinhoff Finance Holding 22.05.16/5.000% 4,052,701 0.562,300,000 Steinhoff Finance Holding 31.03.18/4.500% 3,746,207 0.52
7,798,908 1.08
89
JPMorgan Investment Funds - Global Convertibles Fund (USD)
Schedule of Investments (Market Value Expressed in USD)
As at 31 December 2013
Quantity/Nominal
Value
Name of Securities Maturity/Coupon
MarketValue
%of
NetAssets
Quantity/Nominal
Value
Name of Securities Maturity/Coupon
MarketValue
%of
NetAssets
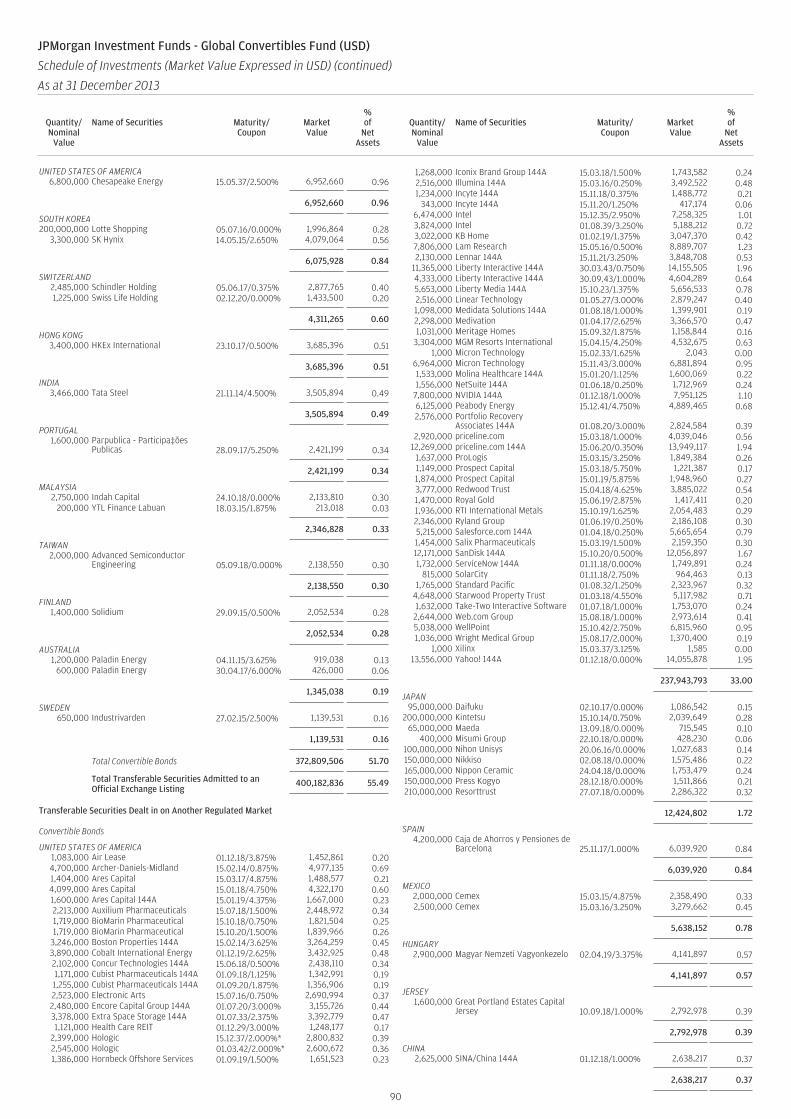
UNITED STATES OF AMERICA6,800,000 Chesapeake Energy 15.05.37/2.500% 6,952,660 0.96
6,952,660 0.96
SOUTH KOREA200,000,000 Lotte Shopping 05.07.16/0.000% 1,996,864 0.28
3,300,000 SK Hynix 14.05.15/2.650% 4,079,064 0.56
6,075,928 0.84
SWITZERLAND2,485,000 Schindler Holding 05.06.17/0.375% 2,877,765 0.401,225,000 Swiss Life Holding 02.12.20/0.000% 1,433,500 0.20
4,311,265 0.60
HONG KONG3,400,000 HKEx International 23.10.17/0.500% 3,685,396 0.51
3,685,396 0.51
INDIA3,466,000 Tata Steel 21.11.14/4.500% 3,505,894 0.49
3,505,894 0.49
PORTUGAL1,600,000 Parpublica - Participa‡ões
Publicas 28.09.17/5.250% 2,421,199 0.34
2,421,199 0.34
MALAYSIA2,750,000 Indah Capital 24.10.18/0.000% 2,133,810 0.30
200,000 YTL Finance Labuan 18.03.15/1.875% 213,018 0.03
2,346,828 0.33
TAIWAN2,000,000 Advanced Semiconductor
Engineering 05.09.18/0.000% 2,138,550 0.30
2,138,550 0.30
FINLAND1,400,000 Solidium 29.09.15/0.500% 2,052,534 0.28
2,052,534 0.28
AUSTRALIA1,200,000 Paladin Energy 04.11.15/3.625% 919,038 0.13
600,000 Paladin Energy 30.04.17/6.000% 426,000 0.06
1,345,038 0.19
SWEDEN650,000 Industrivarden 27.02.15/2.500% 1,139,531 0.16
1,139,531 0.16
Total Convertible Bonds 372,809,506 51.70
Total Transferable Securities Admitted to anOfficial Exchange Listing
400,182,836 55.49
Transferable Securities Dealt in on Another Regulated Market
Convertible Bonds
UNITED STATES OF AMERICA1,083,000 Air Lease 01.12.18/3.875% 1,452,861 0.204,700,000 Archer-Daniels-Midland 15.02.14/0.875% 4,977,135 0.691,404,000 Ares Capital 15.03.17/4.875% 1,488,577 0.214,099,000 Ares Capital 15.01.18/4.750% 4,322,170 0.601,600,000 Ares Capital 144A 15.01.19/4.375% 1,667,000 0.232,213,000 Auxilium Pharmaceuticals 15.07.18/1.500% 2,448,972 0.341,719,000 BioMarin Pharmaceutical 15.10.18/0.750% 1,821,504 0.251,719,000 BioMarin Pharmaceutical 15.10.20/1.500% 1,839,966 0.26
3,246,000 Boston Properties 144A 15.02.14/3.625% 3,264,259 0.453,890,000 Cobalt International Energy 01.12.19/2.625% 3,432,925 0.482,102,000 Concur Technologies 144A 15.06.18/0.500% 2,438,110 0.341,171,000 Cubist Pharmaceuticals 144A 01.09.18/1.125% 1,342,991 0.191,255,000 Cubist Pharmaceuticals 144A 01.09.20/1.875% 1,356,906 0.192,523,000 Electronic Arts 15.07.16/0.750% 2,690,994 0.372,480,000 Encore Capital Group 144A 01.07.20/3.000% 3,155,726 0.443,378,000 Extra Space Storage 144A 01.07.33/2.375% 3,392,779 0.471,121,000 Health Care REIT 01.12.29/3.000% 1,248,177 0.17
2,399,000 Hologic 15.12.37/2.000%* 2,800,832 0.392,545,000 Hologic 01.03.42/2.000%* 2,600,672 0.361,386,000 Hornbeck Offshore Services 01.09.19/1.500% 1,651,523 0.23
1,268,000 Iconix Brand Group 144A 15.03.18/1.500% 1,743,582 0.242,516,000 Illumina 144A 15.03.16/0.250% 3,492,522 0.481,234,000 Incyte 144A 15.11.18/0.375% 1,488,772 0.21
343,000 Incyte 144A 15.11.20/1.250% 417,174 0.066,474,000 Intel 15.12.35/2.950% 7,258,325 1.013,824,000 Intel 01.08.39/3.250% 5,188,212 0.723,022,000 KB Home 01.02.19/1.375% 3,047,370 0.427,806,000 Lam Research 15.05.16/0.500% 8,889,707 1.232,130,000 Lennar 144A 15.11.21/3.250% 3,848,708 0.53
11,365,000 Liberty Interactive 144A 30.03.43/0.750% 14,155,505 1.964,333,000 Liberty Interactive 144A 30.09.43/1.000% 4,604,289 0.645,653,000 Liberty Media 144A 15.10.23/1.375% 5,656,533 0.782,516,000 Linear Technology 01.05.27/3.000% 2,879,247 0.401,098,000 Medidata Solutions 144A 01.08.18/1.000% 1,399,901 0.192,298,000 Medivation 01.04.17/2.625% 3,366,570 0.471,031,000 Meritage Homes 15.09.32/1.875% 1,158,844 0.16
3,304,000 MGM Resorts International 15.04.15/4.250% 4,532,675 0.631,000 Micron Technology 15.02.33/1.625% 2,043 0.00
6,964,000 Micron Technology 15.11.43/3.000% 6,881,894 0.951,533,000 Molina Healthcare 144A 15.01.20/1.125% 1,600,069 0.221,556,000 NetSuite 144A 01.06.18/0.250% 1,712,969 0.24
7,800,000 NVIDIA 144A 01.12.18/1.000% 7,951,125 1.106,125,000 Peabody Energy 15.12.41/4.750% 4,889,465 0.682,576,000 Portfolio Recovery
Associates 144A 01.08.20/3.000% 2,824,584 0.392,920,000 priceline.com 15.03.18/1.000% 4,039,046 0.56
12,269,000 priceline.com 144A 15.06.20/0.350% 13,949,117 1.941,637,000 ProLogis 15.03.15/3.250% 1,849,384 0.261,149,000 Prospect Capital 15.03.18/5.750% 1,221,387 0.171,874,000 Prospect Capital 15.01.19/5.875% 1,948,960 0.273,777,000 Redwood Trust 15.04.18/4.625% 3,885,022 0.541,470,000 Royal Gold 15.06.19/2.875% 1,417,411 0.201,936,000 RTI International Metals 15.10.19/1.625% 2,054,483 0.292,346,000 Ryland Group 01.06.19/0.250% 2,186,108 0.305,215,000 Salesforce.com 144A 01.04.18/0.250% 5,665,654 0.791,454,000 Salix Pharmaceuticals 15.03.19/1.500% 2,159,350 0.3012,171,000 SanDisk 144A 15.10.20/0.500% 12,056,897 1.671,732,000 ServiceNow 144A 01.11.18/0.000% 1,749,891 0.24
815,000 SolarCity 01.11.18/2.750% 964,463 0.131,765,000 Standard Pacific 01.08.32/1.250% 2,323,967 0.32
4,648,000 Starwood Property Trust 01.03.18/4.550% 5,117,982 0.711,632,000 Take-Two Interactive Software 01.07.18/1.000% 1,753,070 0.242,644,000 Web.com Group 15.08.18/1.000% 2,973,614 0.415,038,000 WellPoint 15.10.42/2.750% 6,815,960 0.951,036,000 Wright Medical Group 15.08.17/2.000% 1,370,400 0.19
1,000 Xilinx 15.03.37/3.125% 1,585 0.0013,556,000 Yahoo! 144A 01.12.18/0.000% 14,055,878 1.95
237,943,793 33.00
JAPAN95,000,000 Daifuku 02.10.17/0.000% 1,086,542 0.15
200,000,000 Kintetsu 15.10.14/0.750% 2,039,649 0.2865,000,000 Maeda 13.09.18/0.000% 715,545 0.10
400,000 Misumi Group 22.10.18/0.000% 428,230 0.06100,000,000 Nihon Unisys 20.06.16/0.000% 1,027,683 0.14150,000,000 Nikkiso 02.08.18/0.000% 1,575,486 0.22165,000,000 Nippon Ceramic 24.04.18/0.000% 1,753,479 0.24150,000,000 Press Kogyo 28.12.18/0.000% 1,511,866 0.21210,000,000 Resorttrust 27.07.18/0.000% 2,286,322 0.32
12,424,802 1.72
SPAIN4,200,000 Caja de Ahorros y Pensiones de
Barcelona 25.11.17/1.000% 6,039,920 0.84
6,039,920 0.84
MEXICO2,000,000 Cemex 15.03.15/4.875% 2,358,490 0.332,500,000 Cemex 15.03.16/3.250% 3,279,662 0.45
5,638,152 0.78
HUNGARY2,900,000 Magyar Nemzeti Vagyonkezelo 02.04.19/3.375% 4,141,897 0.57
4,141,897 0.57
JERSEY1,600,000 Great Portland Estates Capital
Jersey 10.09.18/1.000% 2,792,978 0.39
2,792,978 0.39
CHINA2,625,000 SINA/China 144A 01.12.18/1.000% 2,638,217 0.37
2,638,217 0.37
90
JPMorgan Investment Funds - Global Convertibles Fund (USD)
Schedule of Investments (Market Value Expressed in USD) (continued)
As at 31 December 2013
Quantity/Nominal
Value
Name of Securities Maturity/Coupon
MarketValue
%of
NetAssets
Quantity/Nominal
Value
Name of Securities Maturity/Coupon
MarketValue
%of
NetAssets
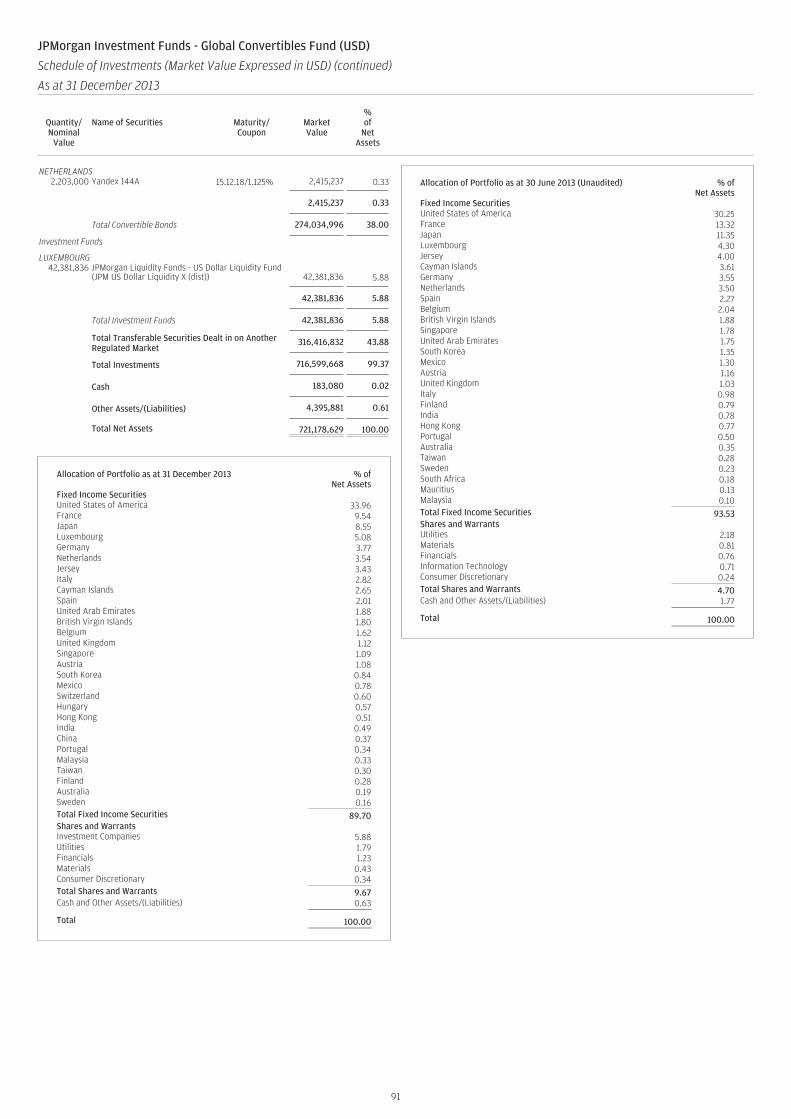
NETHERLANDS2,203,000 Yandex 144A 15.12.18/1.125% 2,415,237 0.33
2,415,237 0.33
Total Convertible Bonds 274,034,996 38.00
Investment Funds
LUXEMBOURG42,381,836 JPMorgan Liquidity Funds - US Dollar Liquidity Fund
(JPM US Dollar Liquidity X (dist)) 42,381,836 5.88
42,381,836 5.88
Total Investment Funds 42,381,836 5.88
Total Transferable Securities Dealt in on AnotherRegulated Market
316,416,832 43.88
Total Investments 716,599,668 99.37
Cash 183,080 0.02
Other Assets/(Liabilities) 4,395,881 0.61
Total Net Assets 721,178,629 100.00
Allocation of Portfolio as at 31 December 2013 % ofNet Assets
Fixed Income SecuritiesUnited States of America 33.96France 9.54Japan 8.55Luxembourg 5.08Germany 3.77Netherlands 3.54Jersey 3.43Italy 2.82Cayman Islands 2.65Spain 2.01United Arab Emirates 1.88British Virgin Islands 1.80Belgium 1.62United Kingdom 1.12Singapore 1.09Austria 1.08South Korea 0.84Mexico 0.78Switzerland 0.60Hungary 0.57Hong Kong 0.51India 0.49China 0.37Portugal 0.34Malaysia 0.33Taiwan 0.30Finland 0.28Australia 0.19Sweden 0.16Total Fixed Income Securities 89.70Shares and WarrantsInvestment Companies 5.88Utilities 1.79Financials 1.23Materials 0.43Consumer Discretionary 0.34Total Shares and Warrants 9.67Cash and Other Assets/(Liabilities) 0.63
Total 100.00
Allocation of Portfolio as at 30 June 2013 (Unaudited) % ofNet Assets
Fixed Income SecuritiesUnited States of America 30.25France 13.32Japan 11.35Luxembourg 4.30Jersey 4.00Cayman Islands 3.61Germany 3.55Netherlands 3.50Spain 2.27Belgium 2.04British Virgin Islands 1.88Singapore 1.78United Arab Emirates 1.75South Korea 1.35Mexico 1.30Austria 1.16United Kingdom 1.03Italy 0.98Finland 0.79India 0.78Hong Kong 0.77Portugal 0.50Australia 0.35Taiwan 0.28Sweden 0.23South Africa 0.18Mauritius 0.13Malaysia 0.10Total Fixed Income Securities 93.53Shares and WarrantsUtilities 2.18Materials 0.81Financials 0.76Information Technology 0.71Consumer Discretionary 0.24Total Shares and Warrants 4.70Cash and Other Assets/(Liabilities) 1.77
Total 100.00
91
JPMorgan Investment Funds - Global Convertibles Fund (USD)
Schedule of Investments (Market Value Expressed in USD) (continued)
As at 31 December 2013
Quantity/Nominal
Value
Name of Securities Maturity/Coupon
MarketValue
%of
NetAssets
Quantity/Nominal
Value
Name of Securities Maturity/Coupon
MarketValue
%of
NetAssets
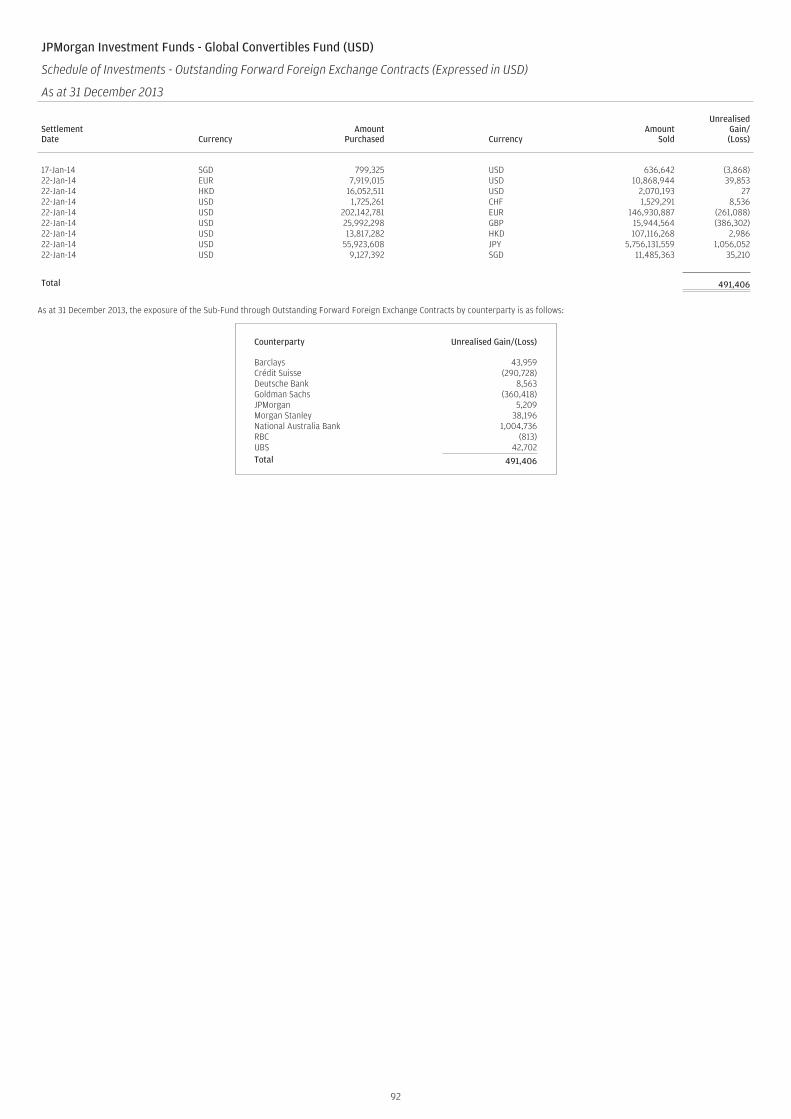
JPMorgan Investment Funds - Global Convertibles Fund (USD)
Schedule of Investments - Outstanding Forward Foreign Exchange Contracts (Expressed in USD)
As at 31 December 2013
SettlementDate Currency
AmountPurchased Currency
AmountSold
UnrealisedGain/(Loss)
17-Jan-14 SGD 799,325 USD 636,642 (3,868)22-Jan-14 EUR 7,919,015 USD 10,868,944 39,85322-Jan-14 HKD 16,052,511 USD 2,070,193 2722-Jan-14 USD 1,725,261 CHF 1,529,291 8,53622-Jan-14 USD 202,142,781 EUR 146,930,887 (261,088)22-Jan-14 USD 25,992,298 GBP 15,944,564 (386,302)22-Jan-14 USD 13,817,282 HKD 107,116,268 2,98622-Jan-14 USD 55,923,608 JPY 5,756,131,559 1,056,05222-Jan-14 USD 9,127,392 SGD 11,485,363 35,210
Total 491,406
As at 31 December 2013, the exposure of the Sub-Fund through Outstanding Forward Foreign Exchange Contracts by counterparty is as follows:
Counterparty Unrealised Gain/(Loss)
Barclays 43,959Crédit Suisse (290,728)Deutsche Bank 8,563Goldman Sachs (360,418)JPMorgan 5,209Morgan Stanley 38,196National Australia Bank 1,004,736RBC (813)UBS 42,702Total 491,406
92
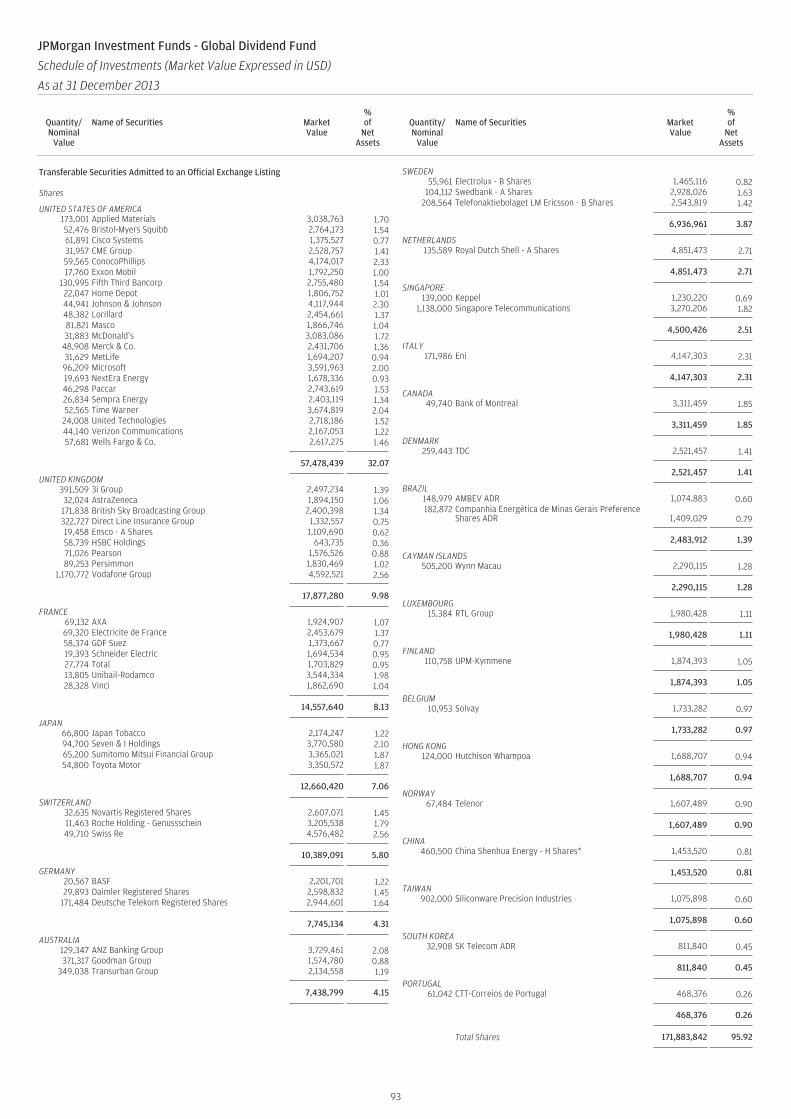
Transferable Securities Admitted to an Official Exchange Listing
Shares
UNITED STATES OF AMERICA173,001 Applied Materials 3,038,763 1.7052,476 Bristol-Myers Squibb 2,764,173 1.5461,891 Cisco Systems 1,375,527 0.7731,957 CME Group 2,528,757 1.4159,565 ConocoPhillips 4,174,017 2.3317,760 Exxon Mobil 1,792,250 1.00
130,995 Fifth Third Bancorp 2,755,480 1.5422,047 Home Depot 1,806,752 1.0144,941 Johnson & Johnson 4,117,944 2.3048,382 Lorillard 2,454,661 1.3781,821 Masco 1,866,746 1.0431,883 McDonald’s 3,083,086 1.72
48,908 Merck & Co. 2,431,706 1.3631,629 MetLife 1,694,207 0.9496,209 Microsoft 3,591,963 2.0019,693 NextEra Energy 1,678,336 0.9346,298 Paccar 2,743,619 1.5326,834 Sempra Energy 2,403,119 1.3452,565 Time Warner 3,674,819 2.0424,008 United Technologies 2,718,186 1.5244,140 Verizon Communications 2,167,053 1.2257,681 Wells Fargo & Co. 2,617,275 1.46
57,478,439 32.07
UNITED KINGDOM391,509 3i Group 2,497,234 1.3932,024 AstraZeneca 1,894,150 1.06171,838 British Sky Broadcasting Group 2,400,398 1.34322,727 Direct Line Insurance Group 1,332,557 0.7519,458 Ensco - A Shares 1,109,690 0.6258,739 HSBC Holdings 643,735 0.3671,026 Pearson 1,576,526 0.8889,253 Persimmon 1,830,469 1.02
1,170,772 Vodafone Group 4,592,521 2.56
17,877,280 9.98
FRANCE69,132 AXA 1,924,907 1.0769,320 Electricite de France 2,453,679 1.3758,374 GDF Suez 1,373,667 0.7719,393 Schneider Electric 1,694,534 0.9527,774 Total 1,703,829 0.9513,805 Unibail-Rodamco 3,544,334 1.9828,328 Vinci 1,862,690 1.04
14,557,640 8.13
JAPAN66,800 Japan Tobacco 2,174,247 1.2294,700 Seven & I Holdings 3,770,580 2.1065,200 Sumitomo Mitsui Financial Group 3,365,021 1.8754,800 Toyota Motor 3,350,572 1.87
12,660,420 7.06
SWITZERLAND32,635 Novartis Registered Shares 2,607,071 1.4511,463 Roche Holding - Genussschein 3,205,538 1.7949,710 Swiss Re 4,576,482 2.56
10,389,091 5.80
GERMANY20,567 BASF 2,201,701 1.2229,893 Daimler Registered Shares 2,598,832 1.45
171,484 Deutsche Telekom Registered Shares 2,944,601 1.64
7,745,134 4.31
AUSTRALIA129,347 ANZ Banking Group 3,729,461 2.08371,317 Goodman Group 1,574,780 0.88
349,038 Transurban Group 2,134,558 1.19
7,438,799 4.15
SWEDEN55,961 Electrolux - B Shares 1,465,116 0.82
104,112 Swedbank - A Shares 2,928,026 1.63208,564 Telefonaktiebolaget LM Ericsson - B Shares 2,543,819 1.42
6,936,961 3.87
NETHERLANDS135,589 Royal Dutch Shell - A Shares 4,851,473 2.71
4,851,473 2.71
SINGAPORE139,000 Keppel 1,230,220 0.69
1,138,000 Singapore Telecommunications 3,270,206 1.82
4,500,426 2.51
ITALY171,986 Eni 4,147,303 2.31
4,147,303 2.31
CANADA49,740 Bank of Montreal 3,311,459 1.85
3,311,459 1.85
DENMARK259,443 TDC 2,521,457 1.41
2,521,457 1.41
BRAZIL148,979 AMBEV ADR 1,074,883 0.60182,872 Companhia Energética de Minas Gerais Preference
Shares ADR 1,409,029 0.79
2,483,912 1.39
CAYMAN ISLANDS505,200 Wynn Macau 2,290,115 1.28
2,290,115 1.28
LUXEMBOURG15,384 RTL Group 1,980,428 1.11
1,980,428 1.11
FINLAND110,758 UPM-Kymmene 1,874,393 1.05
1,874,393 1.05
BELGIUM10,953 Solvay 1,733,282 0.97
1,733,282 0.97
HONG KONG124,000 Hutchison Whampoa 1,688,707 0.94
1,688,707 0.94
NORWAY67,484 Telenor 1,607,489 0.90
1,607,489 0.90
CHINA460,500 China Shenhua Energy - H Shares* 1,453,520 0.81
1,453,520 0.81
TAIWAN902,000 Siliconware Precision Industries 1,075,898 0.60
1,075,898 0.60
SOUTH KOREA32,908 SK Telecom ADR 811,840 0.45
811,840 0.45
PORTUGAL61,042 CTT-Correios de Portugal 468,376 0.26
468,376 0.26
Total Shares 171,883,842 95.92
93
JPMorgan Investment Funds - Global Dividend Fund
Schedule of Investments (Market Value Expressed in USD)
As at 31 December 2013
Quantity/Nominal
Value
Name of Securities MarketValue
%of
NetAssets
Quantity/Nominal
Value
Name of Securities MarketValue
%of
NetAssets
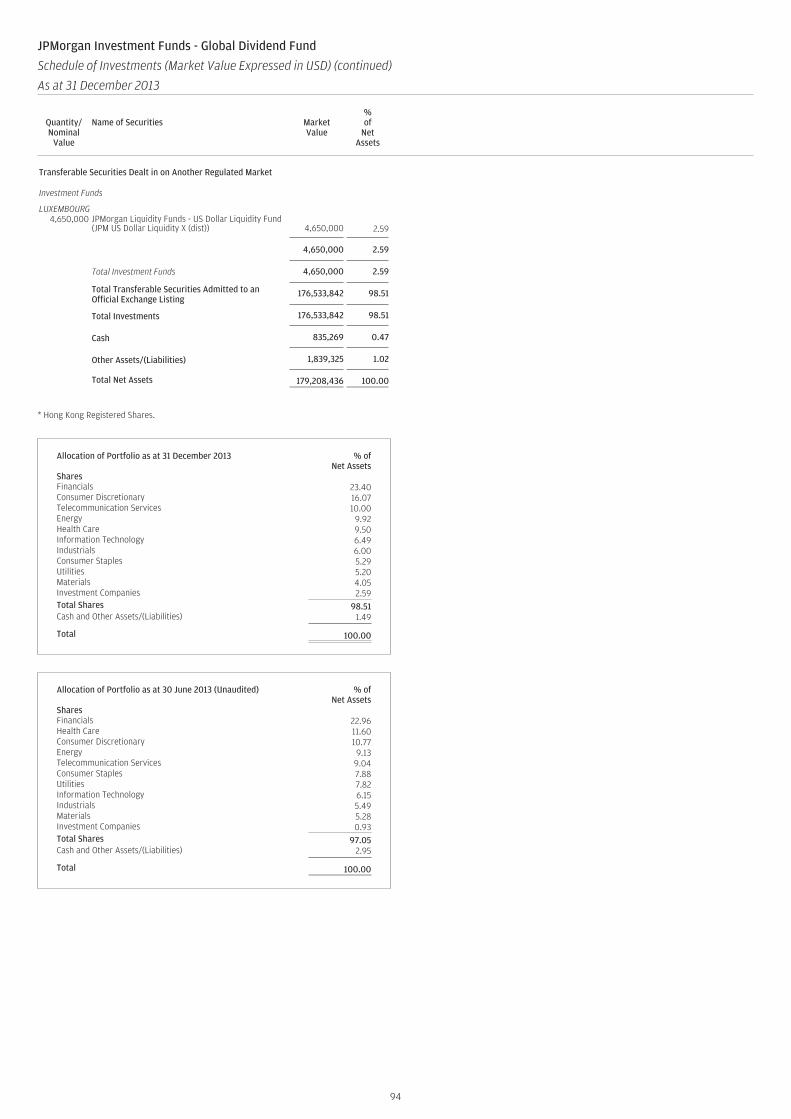
Transferable Securities Dealt in on Another Regulated Market
Investment Funds
LUXEMBOURG4,650,000 JPMorgan Liquidity Funds - US Dollar Liquidity Fund
(JPM US Dollar Liquidity X (dist)) 4,650,000 2.59
4,650,000 2.59
Total Investment Funds 4,650,000 2.59
Total Transferable Securities Admitted to anOfficial Exchange Listing
176,533,842 98.51
Total Investments 176,533,842 98.51
Cash 835,269 0.47
Other Assets/(Liabilities) 1,839,325 1.02
Total Net Assets 179,208,436 100.00
* Hong Kong Registered Shares.
Allocation of Portfolio as at 31 December 2013 % ofNet Assets
SharesFinancials 23.40Consumer Discretionary 16.07Telecommunication Services 10.00Energy 9.92Health Care 9.50Information Technology 6.49Industrials 6.00Consumer Staples 5.29Utilities 5.20Materials 4.05Investment Companies 2.59Total Shares 98.51Cash and Other Assets/(Liabilities) 1.49
Total 100.00
Allocation of Portfolio as at 30 June 2013 (Unaudited) % ofNet Assets
SharesFinancials 22.96Health Care 11.60Consumer Discretionary 10.77Energy 9.13Telecommunication Services 9.04Consumer Staples 7.88Utilities 7.82Information Technology 6.15Industrials 5.49Materials 5.28Investment Companies 0.93Total Shares 97.05Cash and Other Assets/(Liabilities) 2.95
Total 100.00
94
JPMorgan Investment Funds - Global Dividend Fund
Schedule of Investments (Market Value Expressed in USD) (continued)
As at 31 December 2013
Quantity/Nominal
Value
Name of Securities MarketValue
%of
NetAssets
Quantity/Nominal
Value
Name of Securities MarketValue
%of
NetAssets
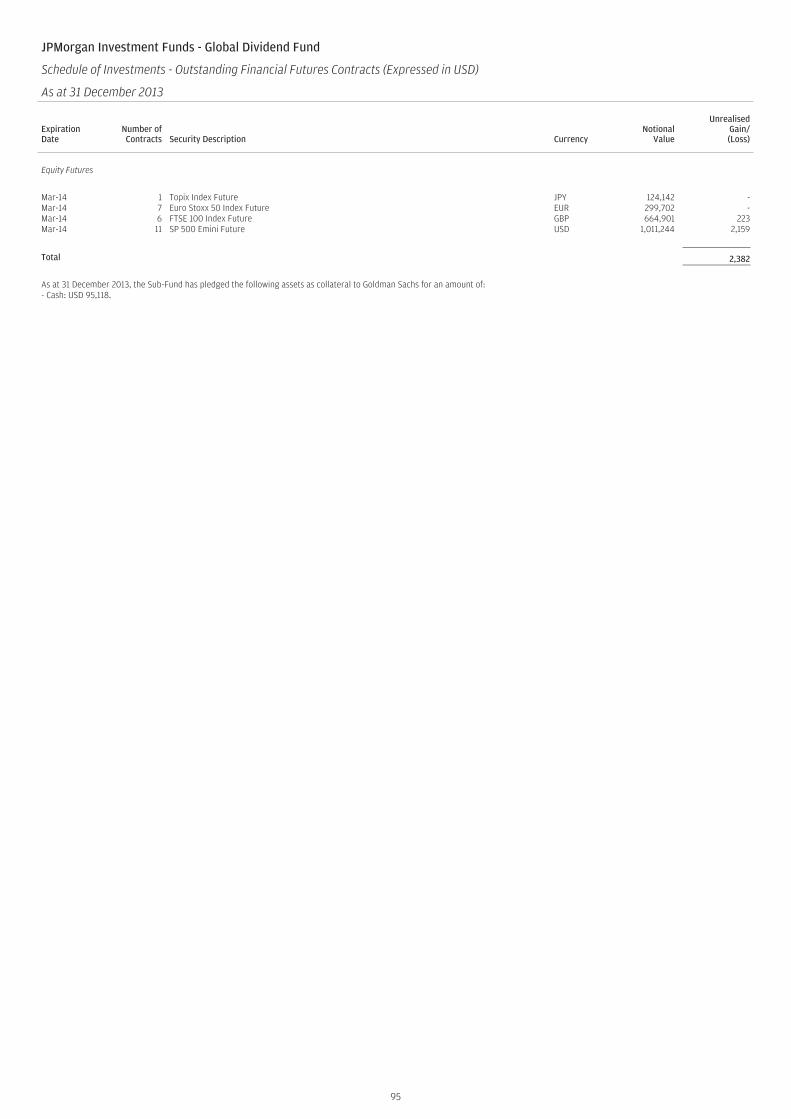
JPMorgan Investment Funds - Global Dividend Fund
Schedule of Investments - Outstanding Financial Futures Contracts (Expressed in USD)
As at 31 December 2013
ExpirationDate
Number ofContracts Security Description Currency
NotionalValue
UnrealisedGain/(Loss)
Equity Futures
Mar-14 1 Topix Index Future JPY 124,142 -Mar-14 7 Euro Stoxx 50 Index Future EUR 299,702 -Mar-14 6 FTSE 100 Index Future GBP 664,901 223Mar-14 11 SP 500 Emini Future USD 1,011,244 2,159
Total 2,382
As at 31 December 2013, the Sub-Fund has pledged the following assets as collateral to Goldman Sachs for an amount of:- Cash: USD 95,118.
95
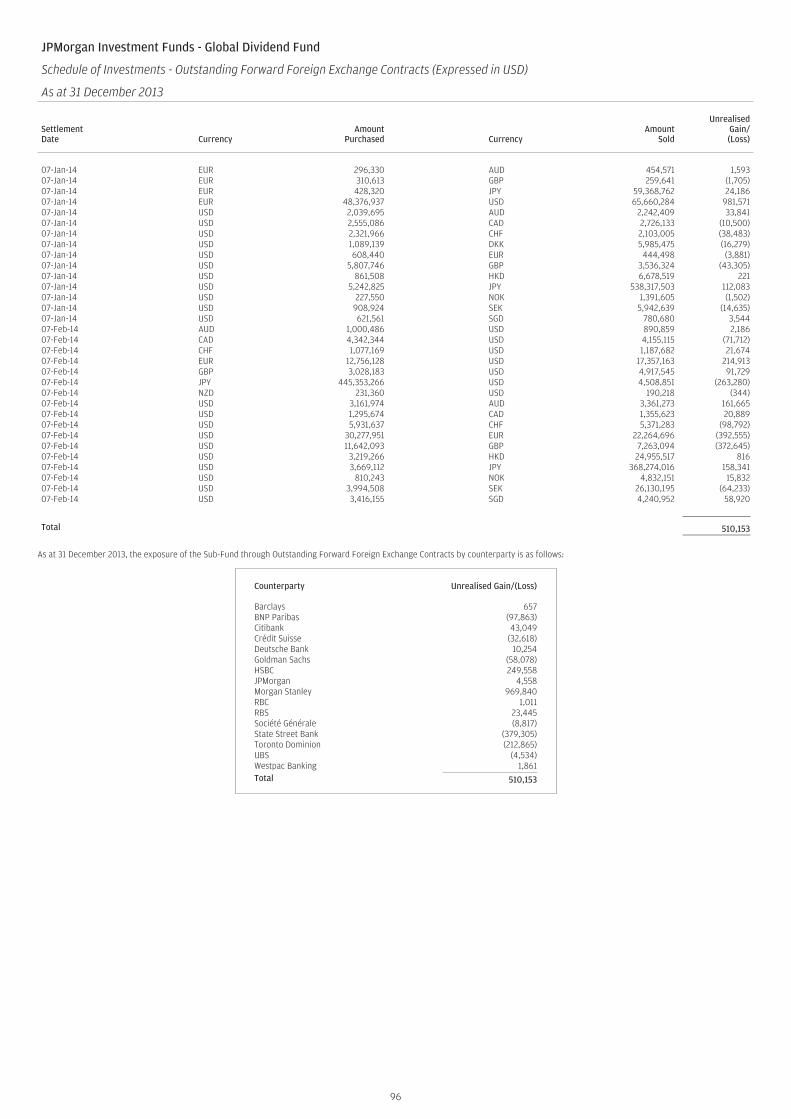
JPMorgan Investment Funds - Global Dividend Fund
Schedule of Investments - Outstanding Forward Foreign Exchange Contracts (Expressed in USD)
As at 31 December 2013
SettlementDate Currency
AmountPurchased Currency
AmountSold
UnrealisedGain/(Loss)
07-Jan-14 EUR 296,330 AUD 454,571 1,59307-Jan-14 EUR 310,613 GBP 259,641 (1,705)07-Jan-14 EUR 428,320 JPY 59,368,762 24,18607-Jan-14 EUR 48,376,937 USD 65,660,284 981,57107-Jan-14 USD 2,039,695 AUD 2,242,409 33,84107-Jan-14 USD 2,555,086 CAD 2,726,133 (10,500)07-Jan-14 USD 2,321,966 CHF 2,103,005 (38,483)07-Jan-14 USD 1,089,139 DKK 5,985,475 (16,279)07-Jan-14 USD 608,440 EUR 444,498 (3,881)07-Jan-14 USD 5,807,746 GBP 3,536,324 (43,305)07-Jan-14 USD 861,508 HKD 6,678,519 22107-Jan-14 USD 5,242,825 JPY 538,317,503 112,08307-Jan-14 USD 227,550 NOK 1,391,605 (1,502)07-Jan-14 USD 908,924 SEK 5,942,639 (14,635)07-Jan-14 USD 621,561 SGD 780,680 3,54407-Feb-14 AUD 1,000,486 USD 890,859 2,18607-Feb-14 CAD 4,342,344 USD 4,155,115 (71,712)07-Feb-14 CHF 1,077,169 USD 1,187,682 21,67407-Feb-14 EUR 12,756,128 USD 17,357,163 214,91307-Feb-14 GBP 3,028,183 USD 4,917,545 91,72907-Feb-14 JPY 445,353,266 USD 4,508,851 (263,280)07-Feb-14 NZD 231,360 USD 190,218 (344)07-Feb-14 USD 3,161,974 AUD 3,361,273 161,66507-Feb-14 USD 1,295,674 CAD 1,355,623 20,88907-Feb-14 USD 5,931,637 CHF 5,371,283 (98,792)07-Feb-14 USD 30,277,951 EUR 22,264,696 (392,555)07-Feb-14 USD 11,642,093 GBP 7,263,094 (372,645)07-Feb-14 USD 3,219,266 HKD 24,955,517 81607-Feb-14 USD 3,669,112 JPY 368,274,016 158,34107-Feb-14 USD 810,243 NOK 4,832,151 15,83207-Feb-14 USD 3,994,508 SEK 26,130,195 (64,233)07-Feb-14 USD 3,416,155 SGD 4,240,952 58,920
Total 510,153
As at 31 December 2013, the exposure of the Sub-Fund through Outstanding Forward Foreign Exchange Contracts by counterparty is as follows:
Counterparty Unrealised Gain/(Loss)
Barclays 657BNP Paribas (97,863)Citibank 43,049Crédit Suisse (32,618)Deutsche Bank 10,254Goldman Sachs (58,078)HSBC 249,558JPMorgan 4,558Morgan Stanley 969,840RBC 1,011RBS 23,445Société Générale (8,817)State Street Bank (379,305)Toronto Dominion (212,865)UBS (4,534)Westpac Banking 1,861Total 510,153
96
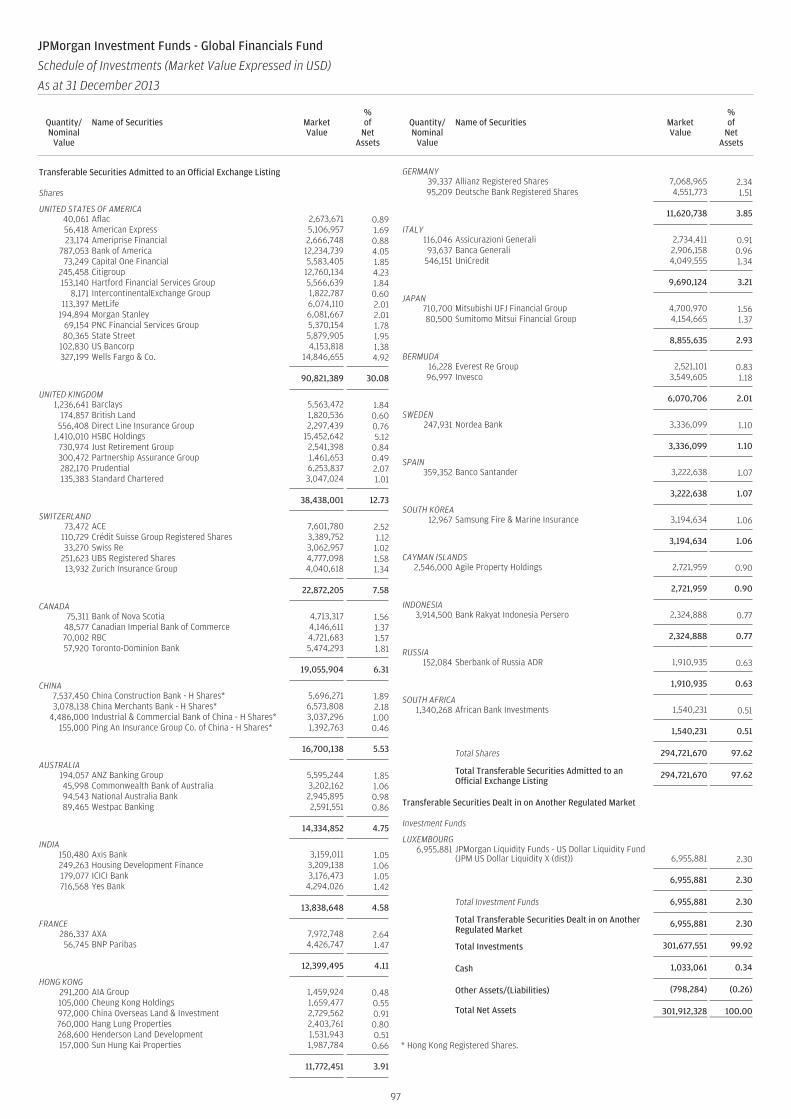
Transferable Securities Admitted to an Official Exchange Listing
Shares
UNITED STATES OF AMERICA40,061 Aflac 2,673,671 0.8956,418 American Express 5,106,957 1.6923,174 Ameriprise Financial 2,666,748 0.88
787,053 Bank of America 12,234,739 4.0573,249 Capital One Financial 5,583,405 1.85
245,458 Citigroup 12,760,134 4.23153,140 Hartford Financial Services Group 5,566,639 1.84
8,171 IntercontinentalExchange Group 1,822,787 0.60113,397 MetLife 6,074,110 2.01
194,894 Morgan Stanley 6,081,667 2.0169,154 PNC Financial Services Group 5,370,154 1.7880,365 State Street 5,879,905 1.95
102,830 US Bancorp 4,153,818 1.38327,199 Wells Fargo & Co. 14,846,655 4.92
90,821,389 30.08
UNITED KINGDOM1,236,641 Barclays 5,563,472 1.84
174,857 British Land 1,820,536 0.60556,408 Direct Line Insurance Group 2,297,439 0.76
1,410,010 HSBC Holdings 15,452,642 5.12730,974 Just Retirement Group 2,541,398 0.84300,472 Partnership Assurance Group 1,461,653 0.49282,170 Prudential 6,253,837 2.07135,383 Standard Chartered 3,047,024 1.01
38,438,001 12.73
SWITZERLAND73,472 ACE 7,601,780 2.52
110,729 Crédit Suisse Group Registered Shares 3,389,752 1.1233,270 Swiss Re 3,062,957 1.02
251,623 UBS Registered Shares 4,777,098 1.5813,932 Zurich Insurance Group 4,040,618 1.34
22,872,205 7.58
CANADA75,311 Bank of Nova Scotia 4,713,317 1.56
48,577 Canadian Imperial Bank of Commerce 4,146,611 1.3770,002 RBC 4,721,683 1.5757,920 Toronto-Dominion Bank 5,474,293 1.81
19,055,904 6.31
CHINA7,537,450 China Construction Bank - H Shares* 5,696,271 1.893,078,138 China Merchants Bank - H Shares* 6,573,808 2.18
4,486,000 Industrial & Commercial Bank of China - H Shares* 3,037,296 1.00155,000 Ping An Insurance Group Co. of China - H Shares* 1,392,763 0.46
16,700,138 5.53
AUSTRALIA194,057 ANZ Banking Group 5,595,244 1.8545,998 Commonwealth Bank of Australia 3,202,162 1.0694,543 National Australia Bank 2,945,895 0.9889,465 Westpac Banking 2,591,551 0.86
14,334,852 4.75
INDIA150,480 Axis Bank 3,159,011 1.05249,263 Housing Development Finance 3,209,138 1.06179,077 ICICI Bank 3,176,473 1.05716,568 Yes Bank 4,294,026 1.42
13,838,648 4.58
FRANCE286,337 AXA 7,972,748 2.6456,745 BNP Paribas 4,426,747 1.47
12,399,495 4.11
HONG KONG291,200 AIA Group 1,459,924 0.48105,000 Cheung Kong Holdings 1,659,477 0.55972,000 China Overseas Land & Investment 2,729,562 0.91760,000 Hang Lung Properties 2,403,761 0.80268,600 Henderson Land Development 1,531,943 0.51157,000 Sun Hung Kai Properties 1,987,784 0.66
11,772,451 3.91
GERMANY39,337 Allianz Registered Shares 7,068,965 2.3495,209 Deutsche Bank Registered Shares 4,551,773 1.51
11,620,738 3.85
ITALY116,046 Assicurazioni Generali 2,734,411 0.9193,637 Banca Generali 2,906,158 0.96
546,151 UniCredit 4,049,555 1.34
9,690,124 3.21
JAPAN710,700 Mitsubishi UFJ Financial Group 4,700,970 1.5680,500 Sumitomo Mitsui Financial Group 4,154,665 1.37
8,855,635 2.93
BERMUDA16,228 Everest Re Group 2,521,101 0.8396,997 Invesco 3,549,605 1.18
6,070,706 2.01
SWEDEN247,931 Nordea Bank 3,336,099 1.10
3,336,099 1.10
SPAIN359,352 Banco Santander 3,222,638 1.07
3,222,638 1.07
SOUTH KOREA12,967 Samsung Fire & Marine Insurance 3,194,634 1.06
3,194,634 1.06
CAYMAN ISLANDS2,546,000 Agile Property Holdings 2,721,959 0.90
2,721,959 0.90
INDONESIA3,914,500 Bank Rakyat Indonesia Persero 2,324,888 0.77
2,324,888 0.77
RUSSIA152,084 Sberbank of Russia ADR 1,910,935 0.63
1,910,935 0.63
SOUTH AFRICA1,340,268 African Bank Investments 1,540,231 0.51
1,540,231 0.51
Total Shares 294,721,670 97.62
Total Transferable Securities Admitted to anOfficial Exchange Listing
294,721,670 97.62
Transferable Securities Dealt in on Another Regulated Market
Investment Funds
LUXEMBOURG6,955,881 JPMorgan Liquidity Funds - US Dollar Liquidity Fund
(JPM US Dollar Liquidity X (dist)) 6,955,881 2.30
6,955,881 2.30
Total Investment Funds 6,955,881 2.30
Total Transferable Securities Dealt in on AnotherRegulated Market
6,955,881 2.30
Total Investments 301,677,551 99.92
Cash 1,033,061 0.34
Other Assets/(Liabilities) (798,284) (0.26)
Total Net Assets 301,912,328 100.00
* Hong Kong Registered Shares.
97
JPMorgan Investment Funds - Global Financials Fund
Schedule of Investments (Market Value Expressed in USD)
As at 31 December 2013
Quantity/Nominal
Value
Name of Securities MarketValue
%of
NetAssets
Quantity/Nominal
Value
Name of Securities MarketValue
%of
NetAssets
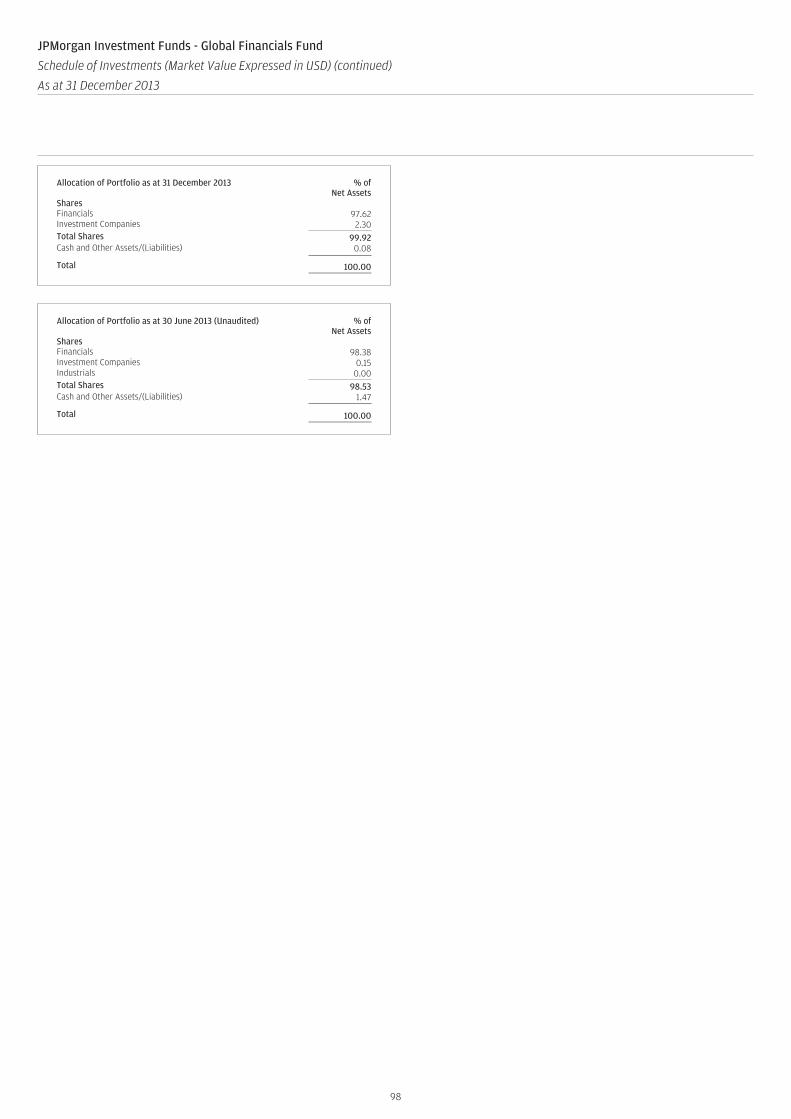
Allocation of Portfolio as at 31 December 2013 % ofNet Assets
SharesFinancials 97.62Investment Companies 2.30Total Shares 99.92Cash and Other Assets/(Liabilities) 0.08
Total 100.00
Allocation of Portfolio as at 30 June 2013 (Unaudited) % ofNet Assets
SharesFinancials 98.38Investment Companies 0.15Industrials 0.00Total Shares 98.53Cash and Other Assets/(Liabilities) 1.47
Total 100.00
98
JPMorgan Investment Funds - Global Financials Fund
Schedule of Investments (Market Value Expressed in USD) (continued)
As at 31 December 2013
Quantity/Nominal
Value
Name of Securities MarketValue
%of
NetAssets
Quantity/Nominal
Value
Name of Securities MarketValue
%of
NetAssets
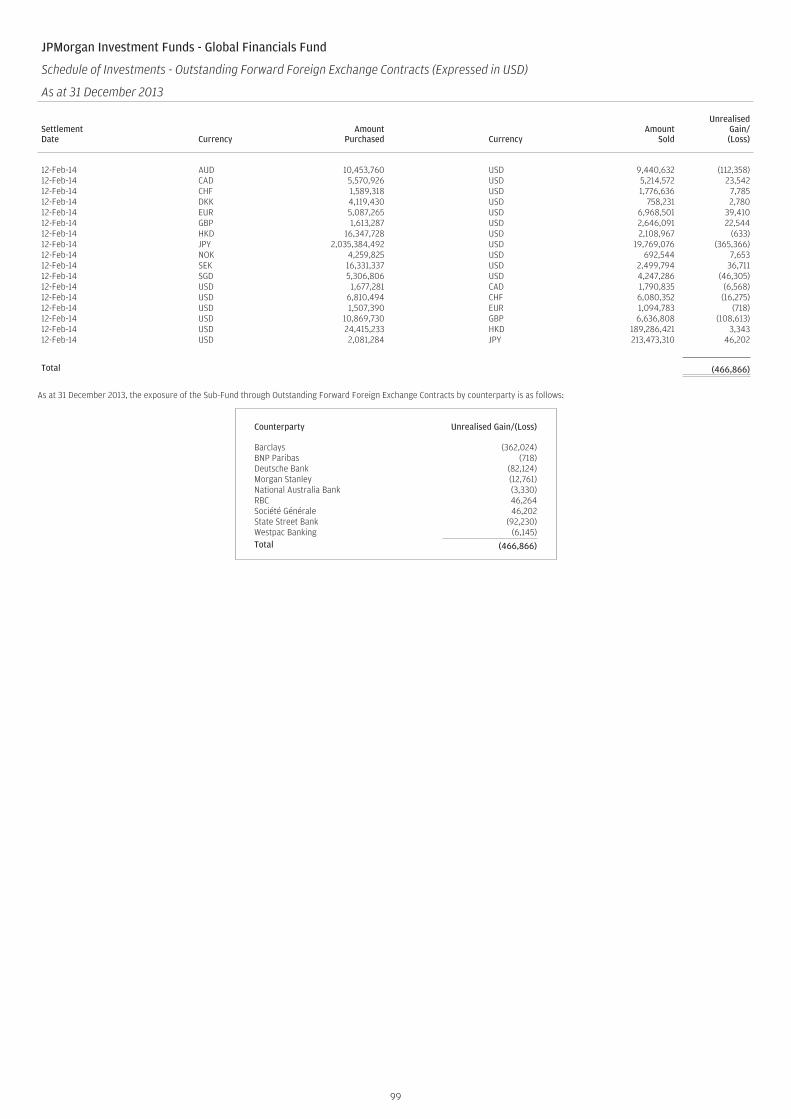
JPMorgan Investment Funds - Global Financials Fund
Schedule of Investments - Outstanding Forward Foreign Exchange Contracts (Expressed in USD)
As at 31 December 2013
SettlementDate Currency
AmountPurchased Currency
AmountSold
UnrealisedGain/(Loss)
12-Feb-14 AUD 10,453,760 USD 9,440,632 (112,358)12-Feb-14 CAD 5,570,926 USD 5,214,572 23,54212-Feb-14 CHF 1,589,318 USD 1,776,636 7,78512-Feb-14 DKK 4,119,430 USD 758,231 2,78012-Feb-14 EUR 5,087,265 USD 6,968,501 39,41012-Feb-14 GBP 1,613,287 USD 2,646,091 22,54412-Feb-14 HKD 16,347,728 USD 2,108,967 (633)12-Feb-14 JPY 2,035,384,492 USD 19,769,076 (365,366)12-Feb-14 NOK 4,259,825 USD 692,544 7,65312-Feb-14 SEK 16,331,337 USD 2,499,794 36,71112-Feb-14 SGD 5,306,806 USD 4,247,286 (46,305)12-Feb-14 USD 1,677,281 CAD 1,790,835 (6,568)12-Feb-14 USD 6,810,494 CHF 6,080,352 (16,275)12-Feb-14 USD 1,507,390 EUR 1,094,783 (718)12-Feb-14 USD 10,869,730 GBP 6,636,808 (108,613)12-Feb-14 USD 24,415,233 HKD 189,286,421 3,34312-Feb-14 USD 2,081,284 JPY 213,473,310 46,202
Total (466,866)
As at 31 December 2013, the exposure of the Sub-Fund through Outstanding Forward Foreign Exchange Contracts by counterparty is as follows:
Counterparty Unrealised Gain/(Loss)
Barclays (362,024)BNP Paribas (718)Deutsche Bank (82,124)Morgan Stanley (12,761)National Australia Bank (3,330)RBC 46,264Société Générale 46,202State Street Bank (92,230)Westpac Banking (6,145)Total (466,866)
99
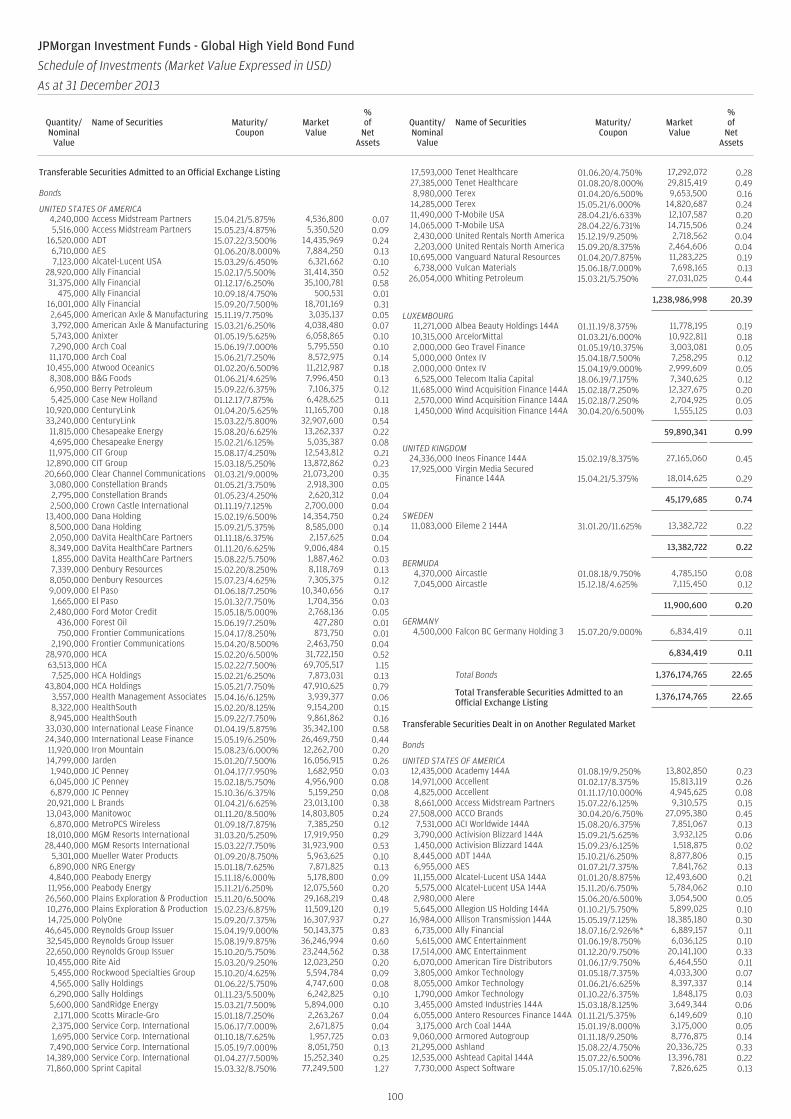
Transferable Securities Admitted to an Official Exchange Listing
Bonds
UNITED STATES OF AMERICA4,240,000 Access Midstream Partners 15.04.21/5.875% 4,536,800 0.075,516,000 Access Midstream Partners 15.05.23/4.875% 5,350,520 0.09
16,520,000 ADT 15.07.22/3.500% 14,435,969 0.246,710,000 AES 01.06.20/8.000% 7,884,250 0.137,123,000 Alcatel-Lucent USA 15.03.29/6.450% 6,321,662 0.10
28,920,000 Ally Financial 15.02.17/5.500% 31,414,350 0.5231,375,000 Ally Financial 01.12.17/6.250% 35,100,781 0.58
475,000 Ally Financial 10.09.18/4.750% 500,531 0.0116,001,000 Ally Financial 15.09.20/7.500% 18,701,169 0.312,645,000 American Axle & Manufacturing 15.11.19/7.750% 3,035,137 0.053,792,000 American Axle & Manufacturing 15.03.21/6.250% 4,038,480 0.075,743,000 Anixter 01.05.19/5.625% 6,058,865 0.107,290,000 Arch Coal 15.06.19/7.000% 5,795,550 0.1011,170,000 Arch Coal 15.06.21/7.250% 8,572,975 0.14
10,455,000 Atwood Oceanics 01.02.20/6.500% 11,212,987 0.188,308,000 B&G Foods 01.06.21/4.625% 7,996,450 0.136,950,000 Berry Petroleum 15.09.22/6.375% 7,106,375 0.125,425,000 Case New Holland 01.12.17/7.875% 6,428,625 0.11
10,920,000 CenturyLink 01.04.20/5.625% 11,165,700 0.1833,240,000 CenturyLink 15.03.22/5.800% 32,907,600 0.5411,815,000 Chesapeake Energy 15.08.20/6.625% 13,262,337 0.224,695,000 Chesapeake Energy 15.02.21/6.125% 5,035,387 0.0811,975,000 CIT Group 15.08.17/4.250% 12,543,812 0.2112,890,000 CIT Group 15.03.18/5.250% 13,872,862 0.2320,660,000 Clear Channel Communications 01.03.21/9.000% 21,073,200 0.35
3,080,000 Constellation Brands 01.05.21/3.750% 2,918,300 0.052,795,000 Constellation Brands 01.05.23/4.250% 2,620,312 0.042,500,000 Crown Castle International 01.11.19/7.125% 2,700,000 0.04
13,400,000 Dana Holding 15.02.19/6.500% 14,354,750 0.248,500,000 Dana Holding 15.09.21/5.375% 8,585,000 0.142,050,000 DaVita HealthCare Partners 01.11.18/6.375% 2,157,625 0.048,349,000 DaVita HealthCare Partners 01.11.20/6.625% 9,006,484 0.151,855,000 DaVita HealthCare Partners 15.08.22/5.750% 1,887,462 0.037,339,000 Denbury Resources 15.02.20/8.250% 8,118,769 0.138,050,000 Denbury Resources 15.07.23/4.625% 7,305,375 0.129,009,000 El Paso 01.06.18/7.250% 10,340,656 0.171,665,000 El Paso 15.01.32/7.750% 1,704,356 0.032,480,000 Ford Motor Credit 15.05.18/5.000% 2,768,136 0.05
436,000 Forest Oil 15.06.19/7.250% 427,280 0.01750,000 Frontier Communications 15.04.17/8.250% 873,750 0.01
2,190,000 Frontier Communications 15.04.20/8.500% 2,463,750 0.0428,970,000 HCA 15.02.20/6.500% 31,722,150 0.5263,513,000 HCA 15.02.22/7.500% 69,705,517 1.157,525,000 HCA Holdings 15.02.21/6.250% 7,873,031 0.13
43,804,000 HCA Holdings 15.05.21/7.750% 47,910,625 0.793,557,000 Health Management Associates 15.04.16/6.125% 3,939,377 0.068,322,000 HealthSouth 15.02.20/8.125% 9,154,200 0.158,945,000 HealthSouth 15.09.22/7.750% 9,861,862 0.16
33,030,000 International Lease Finance 01.04.19/5.875% 35,342,100 0.5824,340,000 International Lease Finance 15.05.19/6.250% 26,469,750 0.4411,920,000 Iron Mountain 15.08.23/6.000% 12,262,700 0.2014,799,000 Jarden 15.01.20/7.500% 16,056,915 0.261,940,000 JC Penney 01.04.17/7.950% 1,682,950 0.036,045,000 JC Penney 15.02.18/5.750% 4,956,900 0.086,879,000 JC Penney 15.10.36/6.375% 5,159,250 0.08
20,921,000 L Brands 01.04.21/6.625% 23,013,100 0.3813,043,000 Manitowoc 01.11.20/8.500% 14,803,805 0.246,870,000 MetroPCS Wireless 01.09.18/7.875% 7,385,250 0.12
18,010,000 MGM Resorts International 31.03.20/5.250% 17,919,950 0.2928,440,000 MGM Resorts International 15.03.22/7.750% 31,923,900 0.53
5,301,000 Mueller Water Products 01.09.20/8.750% 5,963,625 0.106,890,000 NRG Energy 15.01.18/7.625% 7,871,825 0.134,840,000 Peabody Energy 15.11.18/6.000% 5,178,800 0.0911,956,000 Peabody Energy 15.11.21/6.250% 12,075,560 0.20
26,560,000 Plains Exploration & Production 15.11.20/6.500% 29,168,219 0.4810,276,000 Plains Exploration & Production 15.02.23/6.875% 11,509,120 0.1914,725,000 PolyOne 15.09.20/7.375% 16,307,937 0.27
46,645,000 Reynolds Group Issuer 15.04.19/9.000% 50,143,375 0.8332,545,000 Reynolds Group Issuer 15.08.19/9.875% 36,246,994 0.6022,650,000 Reynolds Group Issuer 15.10.20/5.750% 23,244,562 0.3810,455,000 Rite Aid 15.03.20/9.250% 12,023,250 0.205,455,000 Rockwood Specialties Group 15.10.20/4.625% 5,594,784 0.094,565,000 Sally Holdings 01.06.22/5.750% 4,747,600 0.086,290,000 Sally Holdings 01.11.23/5.500% 6,242,825 0.105,600,000 SandRidge Energy 15.03.21/7.500% 5,894,000 0.102,171,000 Scotts Miracle-Gro 15.01.18/7.250% 2,263,267 0.042,375,000 Service Corp. International 15.06.17/7.000% 2,671,875 0.041,695,000 Service Corp. International 01.10.18/7.625% 1,957,725 0.037,490,000 Service Corp. International 15.05.19/7.000% 8,051,750 0.13
14,389,000 Service Corp. International 01.04.27/7.500% 15,252,340 0.2571,860,000 Sprint Capital 15.03.32/8.750% 77,249,500 1.27
17,593,000 Tenet Healthcare 01.06.20/4.750% 17,292,072 0.2827,385,000 Tenet Healthcare 01.08.20/8.000% 29,815,419 0.498,980,000 Terex 01.04.20/6.500% 9,653,500 0.16
14,285,000 Terex 15.05.21/6.000% 14,820,687 0.2411,490,000 T-Mobile USA 28.04.21/6.633% 12,107,587 0.2014,065,000 T-Mobile USA 28.04.22/6.731% 14,715,506 0.242,430,000 United Rentals North America 15.12.19/9.250% 2,718,562 0.042,203,000 United Rentals North America 15.09.20/8.375% 2,464,606 0.04
10,695,000 Vanguard Natural Resources 01.04.20/7.875% 11,283,225 0.196,738,000 Vulcan Materials 15.06.18/7.000% 7,698,165 0.13
26,054,000 Whiting Petroleum 15.03.21/5.750% 27,031,025 0.44
1,238,986,998 20.39
LUXEMBOURG11,271,000 Albea Beauty Holdings 144A 01.11.19/8.375% 11,778,195 0.1910,315,000 ArcelorMittal 01.03.21/6.000% 10,922,811 0.182,000,000 Geo Travel Finance 01.05.19/10.375% 3,003,081 0.055,000,000 Ontex IV 15.04.18/7.500% 7,258,295 0.122,000,000 Ontex IV 15.04.19/9.000% 2,999,609 0.056,525,000 Telecom Italia Capital 18.06.19/7.175% 7,340,625 0.12
11,685,000 Wind Acquisition Finance 144A 15.02.18/7.250% 12,327,675 0.202,570,000 Wind Acquisition Finance 144A 15.02.18/7.250% 2,704,925 0.051,450,000 Wind Acquisition Finance 144A 30.04.20/6.500% 1,555,125 0.03
59,890,341 0.99
UNITED KINGDOM24,336,000 Ineos Finance 144A 15.02.19/8.375% 27,165,060 0.4517,925,000 Virgin Media Secured
Finance 144A 15.04.21/5.375% 18,014,625 0.29
45,179,685 0.74
SWEDEN11,083,000 Eileme 2 144A 31.01.20/11.625% 13,382,722 0.22
13,382,722 0.22
BERMUDA4,370,000 Aircastle 01.08.18/9.750% 4,785,150 0.087,045,000 Aircastle 15.12.18/4.625% 7,115,450 0.12
11,900,600 0.20
GERMANY4,500,000 Falcon BC Germany Holding 3 15.07.20/9.000% 6,834,419 0.11
6,834,419 0.11
Total Bonds 1,376,174,765 22.65
Total Transferable Securities Admitted to anOfficial Exchange Listing
1,376,174,765 22.65
Transferable Securities Dealt in on Another Regulated Market
Bonds
UNITED STATES OF AMERICA12,435,000 Academy 144A 01.08.19/9.250% 13,802,850 0.2314,971,000 Accellent 01.02.17/8.375% 15,813,119 0.264,825,000 Accellent 01.11.17/10.000% 4,945,625 0.088,661,000 Access Midstream Partners 15.07.22/6.125% 9,310,575 0.15
27,508,000 ACCO Brands 30.04.20/6.750% 27,095,380 0.457,531,000 ACI Worldwide 144A 15.08.20/6.375% 7,851,067 0.133,790,000 Activision Blizzard 144A 15.09.21/5.625% 3,932,125 0.061,450,000 Activision Blizzard 144A 15.09.23/6.125% 1,518,875 0.028,445,000 ADT 144A 15.10.21/6.250% 8,877,806 0.156,955,000 AES 01.07.21/7.375% 7,841,762 0.1311,155,000 Alcatel-Lucent USA 144A 01.01.20/8.875% 12,493,600 0.215,575,000 Alcatel-Lucent USA 144A 15.11.20/6.750% 5,784,062 0.102,980,000 Alere 15.06.20/6.500% 3,054,500 0.055,645,000 Allegion US Holding 144A 01.10.21/5.750% 5,899,025 0.10
16,984,000 Allison Transmission 144A 15.05.19/7.125% 18,385,180 0.306,735,000 Ally Financial 18.07.16/2.926%* 6,889,157 0.115,615,000 AMC Entertainment 01.06.19/8.750% 6,036,125 0.10
17,514,000 AMC Entertainment 01.12.20/9.750% 20,141,100 0.336,070,000 American Tire Distributors 01.06.17/9.750% 6,464,550 0.113,805,000 Amkor Technology 01.05.18/7.375% 4,033,300 0.078,055,000 Amkor Technology 01.06.21/6.625% 8,397,337 0.141,790,000 Amkor Technology 01.10.22/6.375% 1,848,175 0.033,455,000 Amsted Industries 144A 15.03.18/8.125% 3,649,344 0.066,055,000 Antero Resources Finance 144A 01.11.21/5.375% 6,149,609 0.103,175,000 Arch Coal 144A 15.01.19/8.000% 3,175,000 0.05
9,060,000 Armored Autogroup 01.11.18/9.250% 8,776,875 0.1421,295,000 Ashland 15.08.22/4.750% 20,336,725 0.3312,535,000 Ashtead Capital 144A 15.07.22/6.500% 13,396,781 0.227,730,000 Aspect Software 15.05.17/10.625% 7,826,625 0.13
100
JPMorgan Investment Funds - Global High Yield Bond Fund
Schedule of Investments (Market Value Expressed in USD)
As at 31 December 2013
Quantity/Nominal
Value
Name of Securities Maturity/Coupon
MarketValue
%of
NetAssets
Quantity/Nominal
Value
Name of Securities Maturity/Coupon
MarketValue
%of
NetAssets
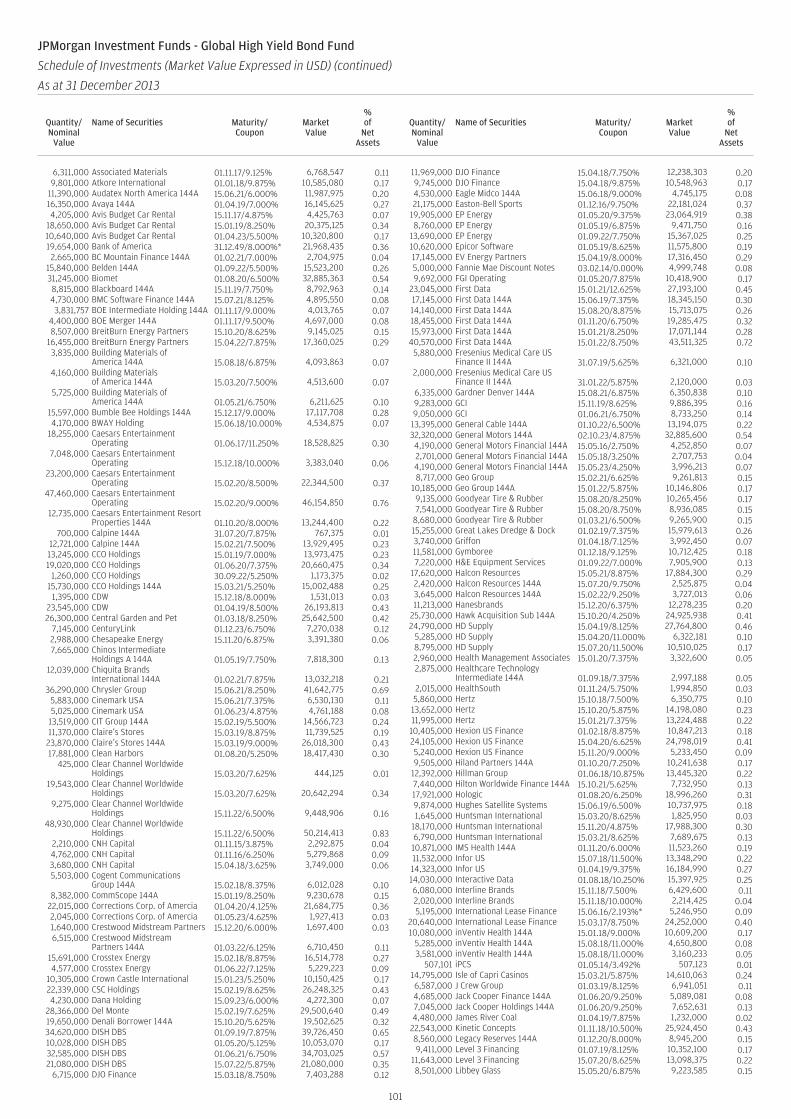
6,311,000 Associated Materials 01.11.17/9.125% 6,768,547 0.119,801,000 Atkore International 01.01.18/9.875% 10,585,080 0.17
11,390,000 Audatex North America 144A 15.06.21/6.000% 11,987,975 0.2016,350,000 Avaya 144A 01.04.19/7.000% 16,145,625 0.274,205,000 Avis Budget Car Rental 15.11.17/4.875% 4,425,763 0.07
18,650,000 Avis Budget Car Rental 15.01.19/8.250% 20,375,125 0.3410,640,000 Avis Budget Car Rental 01.04.23/5.500% 10,320,800 0.1719,654,000 Bank of America 31.12.49/8.000%* 21,968,435 0.362,665,000 BC Mountain Finance 144A 01.02.21/7.000% 2,704,975 0.04
15,840,000 Belden 144A 01.09.22/5.500% 15,523,200 0.2631,245,000 Biomet 01.08.20/6.500% 32,885,363 0.548,815,000 Blackboard 144A 15.11.19/7.750% 8,792,963 0.144,730,000 BMC Software Finance 144A 15.07.21/8.125% 4,895,550 0.083,831,757 BOE Intermediate Holding 144A 01.11.17/9.000% 4,013,765 0.07
4,400,000 BOE Merger 144A 01.11.17/9.500% 4,697,000 0.088,507,000 BreitBurn Energy Partners 15.10.20/8.625% 9,145,025 0.15
16,455,000 BreitBurn Energy Partners 15.04.22/7.875% 17,360,025 0.293,835,000 Building Materials of
America 144A 15.08.18/6.875% 4,093,863 0.074,160,000 Building Materials
of America 144A 15.03.20/7.500% 4,513,600 0.075,725,000 Building Materials of
America 144A 01.05.21/6.750% 6,211,625 0.1015,597,000 Bumble Bee Holdings 144A 15.12.17/9.000% 17,117,708 0.284,170,000 BWAY Holding 15.06.18/10.000% 4,534,875 0.07
18,255,000 Caesars EntertainmentOperating 01.06.17/11.250% 18,528,825 0.30
7,048,000 Caesars EntertainmentOperating 15.12.18/10.000% 3,383,040 0.06
23,200,000 Caesars EntertainmentOperating 15.02.20/8.500% 22,344,500 0.37
47,460,000 Caesars EntertainmentOperating 15.02.20/9.000% 46,154,850 0.76
12,735,000 Caesars Entertainment ResortProperties 144A 01.10.20/8.000% 13,244,400 0.22
700,000 Calpine 144A 31.07.20/7.875% 767,375 0.0112,721,000 Calpine 144A 15.02.21/7.500% 13,929,495 0.2313,245,000 CCO Holdings 15.01.19/7.000% 13,973,475 0.2319,020,000 CCO Holdings 01.06.20/7.375% 20,660,475 0.34
1,260,000 CCO Holdings 30.09.22/5.250% 1,173,375 0.0215,730,000 CCO Holdings 144A 15.03.21/5.250% 15,002,488 0.25
1,395,000 CDW 15.12.18/8.000% 1,531,013 0.0323,545,000 CDW 01.04.19/8.500% 26,193,813 0.4326,300,000 Central Garden and Pet 01.03.18/8.250% 25,642,500 0.42
7,145,000 CenturyLink 01.12.23/6.750% 7,270,038 0.122,988,000 Chesapeake Energy 15.11.20/6.875% 3,391,380 0.067,665,000 Chinos Intermediate
Holdings A 144A 01.05.19/7.750% 7,818,300 0.1312,039,000 Chiquita Brands
International 144A 01.02.21/7.875% 13,032,218 0.2136,290,000 Chrysler Group 15.06.21/8.250% 41,642,775 0.69
5,883,000 Cinemark USA 15.06.21/7.375% 6,530,130 0.115,025,000 Cinemark USA 01.06.23/4.875% 4,761,188 0.08
13,519,000 CIT Group 144A 15.02.19/5.500% 14,566,723 0.2411,370,000 Claire’s Stores 15.03.19/8.875% 11,739,525 0.19
23,870,000 Claire’s Stores 144A 15.03.19/9.000% 26,018,300 0.4317,881,000 Clean Harbors 01.08.20/5.250% 18,417,430 0.30
425,000 Clear Channel WorldwideHoldings 15.03.20/7.625% 444,125 0.01
19,543,000 Clear Channel WorldwideHoldings 15.03.20/7.625% 20,642,294 0.34
9,275,000 Clear Channel WorldwideHoldings 15.11.22/6.500% 9,448,906 0.16
48,930,000 Clear Channel WorldwideHoldings 15.11.22/6.500% 50,214,413 0.83
2,210,000 CNH Capital 01.11.15/3.875% 2,292,875 0.044,762,000 CNH Capital 01.11.16/6.250% 5,279,868 0.093,680,000 CNH Capital 15.04.18/3.625% 3,749,000 0.065,503,000 Cogent Communications
Group 144A 15.02.18/8.375% 6,012,028 0.108,382,000 CommScope 144A 15.01.19/8.250% 9,230,678 0.15
22,015,000 Corrections Corp. of Amercia 01.04.20/4.125% 21,684,775 0.362,045,000 Corrections Corp. of Amercia 01.05.23/4.625% 1,927,413 0.031,640,000 Crestwood Midstream Partners 15.12.20/6.000% 1,697,400 0.036,515,000 Crestwood Midstream
Partners 144A 01.03.22/6.125% 6,710,450 0.1115,691,000 Crosstex Energy 15.02.18/8.875% 16,514,778 0.274,577,000 Crosstex Energy 01.06.22/7.125% 5,229,223 0.09
10,305,000 Crown Castle International 15.01.23/5.250% 10,150,425 0.1722,339,000 CSC Holdings 15.02.19/8.625% 26,248,325 0.434,230,000 Dana Holding 15.09.23/6.000% 4,272,300 0.07
28,366,000 Del Monte 15.02.19/7.625% 29,500,640 0.4919,650,000 Denali Borrower 144A 15.10.20/5.625% 19,502,625 0.3234,620,000 DISH DBS 01.09.19/7.875% 39,726,450 0.6510,028,000 DISH DBS 01.05.20/5.125% 10,053,070 0.1732,585,000 DISH DBS 01.06.21/6.750% 34,703,025 0.5721,080,000 DISH DBS 15.07.22/5.875% 21,080,000 0.35
6,715,000 DJO Finance 15.03.18/8.750% 7,403,288 0.12
11,969,000 DJO Finance 15.04.18/7.750% 12,238,303 0.209,745,000 DJO Finance 15.04.18/9.875% 10,548,963 0.174,530,000 Eagle Midco 144A 15.06.18/9.000% 4,745,175 0.0821,175,000 Easton-Bell Sports 01.12.16/9.750% 22,181,024 0.37
19,905,000 EP Energy 01.05.20/9.375% 23,064,919 0.388,760,000 EP Energy 01.05.19/6.875% 9,471,750 0.16
13,690,000 EP Energy 01.09.22/7.750% 15,367,025 0.2510,620,000 Epicor Software 01.05.19/8.625% 11,575,800 0.1917,145,000 EV Energy Partners 15.04.19/8.000% 17,316,450 0.295,000,000 Fannie Mae Discount Notes 03.02.14/0.000% 4,999,748 0.089,692,000 FGI Operating 01.05.20/7.875% 10,418,900 0.17
23,045,000 First Data 15.01.21/12.625% 27,193,100 0.4517,145,000 First Data 144A 15.06.19/7.375% 18,345,150 0.3014,140,000 First Data 144A 15.08.20/8.875% 15,713,075 0.2618,455,000 First Data 144A 01.11.20/6.750% 19,285,475 0.3215,973,000 First Data 144A 15.01.21/8.250% 17,071,144 0.28
40,570,000 First Data 144A 15.01.22/8.750% 43,511,325 0.725,880,000 Fresenius Medical Care US
Finance II 144A 31.07.19/5.625% 6,321,000 0.102,000,000 Fresenius Medical Care US
Finance II 144A 31.01.22/5.875% 2,120,000 0.036,335,000 Gardner Denver 144A 15.08.21/6.875% 6,350,838 0.109,283,000 GCI 15.11.19/8.625% 9,886,395 0.169,050,000 GCI 01.06.21/6.750% 8,733,250 0.1413,395,000 General Cable 144A 01.10.22/6.500% 13,194,075 0.2232,320,000 General Motors 144A 02.10.23/4.875% 32,885,600 0.544,190,000 General Motors Financial 144A 15.05.16/2.750% 4,252,850 0.072,701,000 General Motors Financial 144A 15.05.18/3.250% 2,707,753 0.044,190,000 General Motors Financial 144A 15.05.23/4.250% 3,996,213 0.078,717,000 Geo Group 15.02.21/6.625% 9,261,813 0.15
10,185,000 Geo Group 144A 15.01.22/5.875% 10,146,806 0.179,135,000 Goodyear Tire & Rubber 15.08.20/8.250% 10,265,456 0.177,541,000 Goodyear Tire & Rubber 15.08.20/8.750% 8,936,085 0.15
8,680,000 Goodyear Tire & Rubber 01.03.21/6.500% 9,265,900 0.1515,255,000 Great Lakes Dredge & Dock 01.02.19/7.375% 15,979,613 0.263,740,000 Griffon 01.04.18/7.125% 3,992,450 0.0711,581,000 Gymboree 01.12.18/9.125% 10,712,425 0.187,220,000 H&E Equipment Services 01.09.22/7.000% 7,905,900 0.13
17,620,000 Halcon Resources 15.05.21/8.875% 17,884,300 0.292,420,000 Halcon Resources 144A 15.07.20/9.750% 2,525,875 0.043,645,000 Halcon Resources 144A 15.02.22/9.250% 3,727,013 0.0611,213,000 Hanesbrands 15.12.20/6.375% 12,278,235 0.20
25,730,000 Hawk Acquisition Sub 144A 15.10.20/4.250% 24,925,938 0.4124,790,000 HD Supply 15.04.19/8.125% 27,764,800 0.46
5,285,000 HD Supply 15.04.20/11.000% 6,322,181 0.108,795,000 HD Supply 15.07.20/11.500% 10,510,025 0.172,960,000 Health Management Associates 15.01.20/7.375% 3,322,600 0.052,875,000 Healthcare Technology
Intermediate 144A 01.09.18/7.375% 2,997,188 0.052,015,000 HealthSouth 01.11.24/5.750% 1,994,850 0.035,860,000 Hertz 15.10.18/7.500% 6,350,775 0.10
13,652,000 Hertz 15.10.20/5.875% 14,198,080 0.2311,995,000 Hertz 15.01.21/7.375% 13,224,488 0.2210,405,000 Hexion US Finance 01.02.18/8.875% 10,847,213 0.1824,105,000 Hexion US Finance 15.04.20/6.625% 24,798,019 0.415,240,000 Hexion US Finance 15.11.20/9.000% 5,233,450 0.099,505,000 Hiland Partners 144A 01.10.20/7.250% 10,241,638 0.17
12,392,000 Hillman Group 01.06.18/10.875% 13,445,320 0.227,440,000 Hilton Worldwide Finance 144A 15.10.21/5.625% 7,732,950 0.1317,921,000 Hologic 01.08.20/6.250% 18,996,260 0.319,874,000 Hughes Satellite Systems 15.06.19/6.500% 10,737,975 0.181,645,000 Huntsman International 15.03.20/8.625% 1,825,950 0.03
18,170,000 Huntsman International 15.11.20/4.875% 17,988,300 0.306,790,000 Huntsman International 15.03.21/8.625% 7,689,675 0.1310,871,000 IMS Health 144A 01.11.20/6.000% 11,523,260 0.1911,532,000 Infor US 15.07.18/11.500% 13,348,290 0.2214,323,000 Infor US 01.04.19/9.375% 16,184,990 0.2714,030,000 Interactive Data 01.08.18/10.250% 15,397,925 0.256,080,000 Interline Brands 15.11.18/7.500% 6,429,600 0.112,020,000 Interline Brands 15.11.18/10.000% 2,214,425 0.045,195,000 International Lease Finance 15.06.16/2.193%* 5,246,950 0.09
20,640,000 International Lease Finance 15.03.17/8.750% 24,252,000 0.4010,080,000 inVentiv Health 144A 15.01.18/9.000% 10,609,200 0.17
5,285,000 inVentiv Health 144A 15.08.18/11.000% 4,650,800 0.083,581,000 inVentiv Health 144A 15.08.18/11.000% 3,160,233 0.05
507,101 iPCS 01.05.14/3.492% 507,123 0.0114,795,000 Isle of Capri Casinos 15.03.21/5.875% 14,610,063 0.246,587,000 J Crew Group 01.03.19/8.125% 6,941,051 0.114,685,000 Jack Cooper Finance 144A 01.06.20/9.250% 5,089,081 0.087,045,000 Jack Cooper Holdings 144A 01.06.20/9.250% 7,652,631 0.134,480,000 James River Coal 01.04.19/7.875% 1,232,000 0.02
22,543,000 Kinetic Concepts 01.11.18/10.500% 25,924,450 0.438,560,000 Legacy Reserves 144A 01.12.20/8.000% 8,945,200 0.159,411,000 Level 3 Financing 01.07.19/8.125% 10,352,100 0.17
11,643,000 Level 3 Financing 15.07.20/8.625% 13,098,375 0.228,501,000 Libbey Glass 15.05.20/6.875% 9,223,585 0.15
101
JPMorgan Investment Funds - Global High Yield Bond Fund
Schedule of Investments (Market Value Expressed in USD) (continued)
As at 31 December 2013
Quantity/Nominal
Value
Name of Securities Maturity/Coupon
MarketValue
%of
NetAssets
Quantity/Nominal
Value
Name of Securities Maturity/Coupon
MarketValue
%of
NetAssets
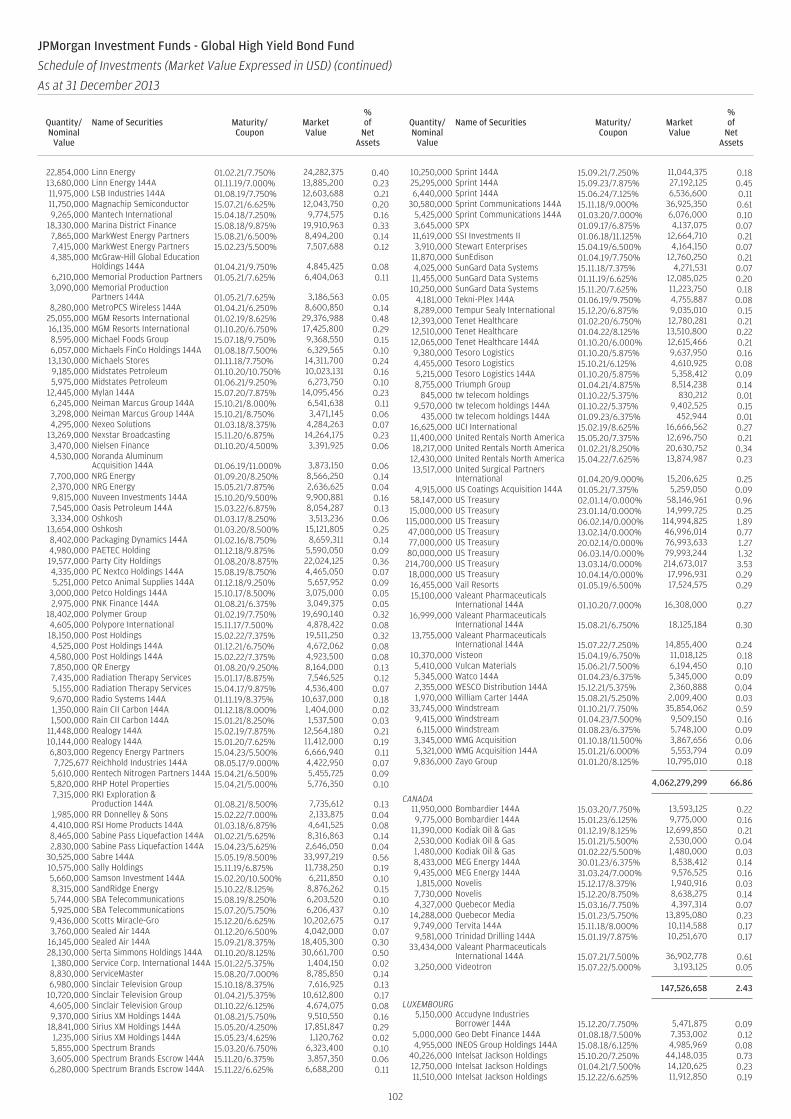
22,854,000 Linn Energy 01.02.21/7.750% 24,282,375 0.4013,680,000 Linn Energy 144A 01.11.19/7.000% 13,885,200 0.2311,975,000 LSB Industries 144A 01.08.19/7.750% 12,603,688 0.2111,750,000 Magnachip Semiconductor 15.07.21/6.625% 12,043,750 0.209,265,000 Mantech International 15.04.18/7.250% 9,774,575 0.16
18,330,000 Marina District Finance 15.08.18/9.875% 19,910,963 0.337,865,000 MarkWest Energy Partners 15.08.21/6.500% 8,494,200 0.147,415,000 MarkWest Energy Partners 15.02.23/5.500% 7,507,688 0.124,385,000 McGraw-Hill Global Education
Holdings 144A 01.04.21/9.750% 4,845,425 0.086,210,000 Memorial Production Partners 01.05.21/7.625% 6,404,063 0.113,090,000 Memorial Production
Partners 144A 01.05.21/7.625% 3,186,563 0.058,280,000 MetroPCS Wireless 144A 01.04.21/6.250% 8,600,850 0.14
25,055,000 MGM Resorts International 01.02.19/8.625% 29,376,988 0.4816,135,000 MGM Resorts International 01.10.20/6.750% 17,425,800 0.298,595,000 Michael Foods Group 15.07.18/9.750% 9,368,550 0.156,057,000 Michaels FinCo Holdings 144A 01.08.18/7.500% 6,329,565 0.10
13,130,000 Michaels Stores 01.11.18/7.750% 14,311,700 0.249,185,000 Midstates Petroleum 01.10.20/10.750% 10,023,131 0.165,975,000 Midstates Petroleum 01.06.21/9.250% 6,273,750 0.10
12,445,000 Mylan 144A 15.07.20/7.875% 14,095,456 0.236,245,000 Neiman Marcus Group 144A 15.10.21/8.000% 6,541,638 0.113,298,000 Neiman Marcus Group 144A 15.10.21/8.750% 3,471,145 0.064,295,000 Nexeo Solutions 01.03.18/8.375% 4,284,263 0.07
13,269,000 Nexstar Broadcasting 15.11.20/6.875% 14,264,175 0.233,470,000 Nielsen Finance 01.10.20/4.500% 3,391,925 0.064,530,000 Noranda Aluminum
Acquisition 144A 01.06.19/11.000% 3,873,150 0.067,700,000 NRG Energy 01.09.20/8.250% 8,566,250 0.142,370,000 NRG Energy 15.05.21/7.875% 2,636,625 0.049,815,000 Nuveen Investments 144A 15.10.20/9.500% 9,900,881 0.167,545,000 Oasis Petroleum 144A 15.03.22/6.875% 8,054,287 0.133,334,000 Oshkosh 01.03.17/8.250% 3,513,236 0.06
13,654,000 Oshkosh 01.03.20/8.500% 15,121,805 0.258,402,000 Packaging Dynamics 144A 01.02.16/8.750% 8,659,311 0.144,980,000 PAETEC Holding 01.12.18/9.875% 5,590,050 0.0919,577,000 Party City Holdings 01.08.20/8.875% 22,024,125 0.364,335,000 PC Nextco Holdings 144A 15.08.19/8.750% 4,465,050 0.075,251,000 Petco Animal Supplies 144A 01.12.18/9.250% 5,657,952 0.09
3,000,000 Petco Holdings 144A 15.10.17/8.500% 3,075,000 0.052,975,000 PNK Finance 144A 01.08.21/6.375% 3,049,375 0.05
18,402,000 Polymer Group 01.02.19/7.750% 19,690,140 0.324,605,000 Polypore International 15.11.17/7.500% 4,878,422 0.0818,150,000 Post Holdings 15.02.22/7.375% 19,511,250 0.324,525,000 Post Holdings 144A 01.12.21/6.750% 4,672,062 0.084,580,000 Post Holdings 144A 15.02.22/7.375% 4,923,500 0.087,850,000 QR Energy 01.08.20/9.250% 8,164,000 0.137,435,000 Radiation Therapy Services 15.01.17/8.875% 7,546,525 0.125,155,000 Radiation Therapy Services 15.04.17/9.875% 4,536,400 0.07
9,670,000 Radio Systems 144A 01.11.19/8.375% 10,637,000 0.181,350,000 Rain CII Carbon 144A 01.12.18/8.000% 1,404,000 0.021,500,000 Rain CII Carbon 144A 15.01.21/8.250% 1,537,500 0.03
11,448,000 Realogy 144A 15.02.19/7.875% 12,564,180 0.2110,144,000 Realogy 144A 15.01.20/7.625% 11,412,000 0.196,803,000 Regency Energy Partners 15.04.23/5.500% 6,666,940 0.117,725,677 Reichhold Industries 144A 08.05.17/9.000% 4,422,950 0.07
5,610,000 Rentech Nitrogen Partners 144A 15.04.21/6.500% 5,455,725 0.095,820,000 RHP Hotel Properties 15.04.21/5.000% 5,776,350 0.107,315,000 RKI Exploration &
Production 144A 01.08.21/8.500% 7,735,612 0.131,985,000 RR Donnelley & Sons 15.02.22/7.000% 2,133,875 0.044,410,000 RSI Home Products 144A 01.03.18/6.875% 4,641,525 0.088,465,000 Sabine Pass Liquefaction 144A 01.02.21/5.625% 8,316,863 0.142,830,000 Sabine Pass Liquefaction 144A 15.04.23/5.625% 2,646,050 0.04
30,525,000 Sabre 144A 15.05.19/8.500% 33,997,219 0.5610,575,000 Sally Holdings 15.11.19/6.875% 11,738,250 0.195,660,000 Samson Investment 144A 15.02.20/10.500% 6,211,850 0.108,315,000 SandRidge Energy 15.10.22/8.125% 8,876,262 0.155,744,000 SBA Telecommunications 15.08.19/8.250% 6,203,520 0.105,925,000 SBA Telecommunications 15.07.20/5.750% 6,206,437 0.109,436,000 Scotts Miracle-Gro 15.12.20/6.625% 10,202,675 0.173,760,000 Sealed Air 144A 01.12.20/6.500% 4,042,000 0.07
16,145,000 Sealed Air 144A 15.09.21/8.375% 18,405,300 0.3028,130,000 Serta Simmons Holdings 144A 01.10.20/8.125% 30,661,700 0.501,380,000 Service Corp. International 144A 15.01.22/5.375% 1,404,150 0.028,830,000 ServiceMaster 15.08.20/7.000% 8,785,850 0.146,980,000 Sinclair Television Group 15.10.18/8.375% 7,616,925 0.13
10,720,000 Sinclair Television Group 01.04.21/5.375% 10,612,800 0.174,605,000 Sinclair Television Group 01.10.22/6.125% 4,674,075 0.089,370,000 Sirius XM Holdings 144A 01.08.21/5.750% 9,510,550 0.16
18,841,000 Sirius XM Holdings 144A 15.05.20/4.250% 17,851,847 0.291,235,000 Sirius XM Holdings 144A 15.05.23/4.625% 1,120,762 0.025,855,000 Spectrum Brands 15.03.20/6.750% 6,323,400 0.103,605,000 Spectrum Brands Escrow 144A 15.11.20/6.375% 3,857,350 0.066,280,000 Spectrum Brands Escrow 144A 15.11.22/6.625% 6,688,200 0.11
10,250,000 Sprint 144A 15.09.21/7.250% 11,044,375 0.1825,295,000 Sprint 144A 15.09.23/7.875% 27,192,125 0.456,440,000 Sprint 144A 15.06.24/7.125% 6,536,600 0.11
30,580,000 Sprint Communications 144A 15.11.18/9.000% 36,925,350 0.615,425,000 Sprint Communications 144A 01.03.20/7.000% 6,076,000 0.103,645,000 SPX 01.09.17/6.875% 4,137,075 0.0711,619,000 SSI Investments II 01.06.18/11.125% 12,664,710 0.213,910,000 Stewart Enterprises 15.04.19/6.500% 4,164,150 0.07
11,870,000 SunEdison 01.04.19/7.750% 12,760,250 0.214,025,000 SunGard Data Systems 15.11.18/7.375% 4,271,531 0.0711,455,000 SunGard Data Systems 01.11.19/6.625% 12,085,025 0.2010,250,000 SunGard Data Systems 15.11.20/7.625% 11,223,750 0.18
4,181,000 Tekni-Plex 144A 01.06.19/9.750% 4,755,887 0.088,289,000 Tempur Sealy International 15.12.20/6.875% 9,035,010 0.15
12,393,000 Tenet Healthcare 01.02.20/6.750% 12,780,281 0.2112,510,000 Tenet Healthcare 01.04.22/8.125% 13,510,800 0.2212,065,000 Tenet Healthcare 144A 01.10.20/6.000% 12,615,466 0.219,380,000 Tesoro Logistics 01.10.20/5.875% 9,637,950 0.164,455,000 Tesoro Logistics 15.10.21/6.125% 4,610,925 0.085,215,000 Tesoro Logistics 144A 01.10.20/5.875% 5,358,412 0.098,755,000 Triumph Group 01.04.21/4.875% 8,514,238 0.14
845,000 tw telecom holdings 01.10.22/5.375% 830,212 0.019,570,000 tw telecom holdings 144A 01.10.22/5.375% 9,402,525 0.15
435,000 tw telecom holdings 144A 01.09.23/6.375% 452,944 0.0116,625,000 UCI International 15.02.19/8.625% 16,666,562 0.2711,400,000 United Rentals North America 15.05.20/7.375% 12,696,750 0.2118,217,000 United Rentals North America 01.02.21/8.250% 20,630,752 0.3412,430,000 United Rentals North America 15.04.22/7.625% 13,874,987 0.2313,517,000 United Surgical Partners
International 01.04.20/9.000% 15,206,625 0.254,915,000 US Coatings Acquisition 144A 01.05.21/7.375% 5,259,050 0.09
58,147,000 US Treasury 02.01.14/0.000% 58,146,961 0.9615,000,000 US Treasury 23.01.14/0.000% 14,999,725 0.25
115,000,000 US Treasury 06.02.14/0.000% 114,994,825 1.8947,000,000 US Treasury 13.02.14/0.000% 46,996,014 0.7777,000,000 US Treasury 20.02.14/0.000% 76,993,633 1.2780,000,000 US Treasury 06.03.14/0.000% 79,993,244 1.32214,700,000 US Treasury 13.03.14/0.000% 214,673,017 3.5318,000,000 US Treasury 10.04.14/0.000% 17,996,931 0.2916,455,000 Vail Resorts 01.05.19/6.500% 17,524,575 0.2915,100,000 Valeant Pharmaceuticals
International 144A 01.10.20/7.000% 16,308,000 0.2716,999,000 Valeant Pharmaceuticals
International 144A 15.08.21/6.750% 18,125,184 0.3013,755,000 Valeant Pharmaceuticals
International 144A 15.07.22/7.250% 14,855,400 0.2410,370,000 Visteon 15.04.19/6.750% 11,018,125 0.185,410,000 Vulcan Materials 15.06.21/7.500% 6,194,450 0.105,345,000 Watco 144A 01.04.23/6.375% 5,345,000 0.092,355,000 WESCO Distribution 144A 15.12.21/5.375% 2,360,888 0.041,970,000 William Carter 144A 15.08.21/5.250% 2,009,400 0.03
33,745,000 Windstream 01.10.21/7.750% 35,854,062 0.599,415,000 Windstream 01.04.23/7.500% 9,509,150 0.166,115,000 Windstream 01.08.23/6.375% 5,748,100 0.093,345,000 WMG Acquisition 01.10.18/11.500% 3,867,656 0.065,321,000 WMG Acquisition 144A 15.01.21/6.000% 5,553,794 0.09
9,836,000 Zayo Group 01.01.20/8.125% 10,795,010 0.18
4,062,279,299 66.86
CANADA11,950,000 Bombardier 144A 15.03.20/7.750% 13,593,125 0.229,775,000 Bombardier 144A 15.01.23/6.125% 9,775,000 0.16
11,390,000 Kodiak Oil & Gas 01.12.19/8.125% 12,699,850 0.212,530,000 Kodiak Oil & Gas 15.01.21/5.500% 2,530,000 0.041,480,000 Kodiak Oil & Gas 01.02.22/5.500% 1,480,000 0.038,433,000 MEG Energy 144A 30.01.23/6.375% 8,538,412 0.149,435,000 MEG Energy 144A 31.03.24/7.000% 9,576,525 0.161,815,000 Novelis 15.12.17/8.375% 1,940,916 0.037,730,000 Novelis 15.12.20/8.750% 8,638,275 0.144,327,000 Quebecor Media 15.03.16/7.750% 4,397,314 0.07
14,288,000 Quebecor Media 15.01.23/5.750% 13,895,080 0.239,749,000 Tervita 144A 15.11.18/8.000% 10,114,588 0.179,581,000 Trinidad Drilling 144A 15.01.19/7.875% 10,251,670 0.17
33,434,000 Valeant PharmaceuticalsInternational 144A 15.07.21/7.500% 36,902,778 0.61
3,250,000 Videotron 15.07.22/5.000% 3,193,125 0.05
147,526,658 2.43
LUXEMBOURG5,150,000 Accudyne Industries
Borrower 144A 15.12.20/7.750% 5,471,875 0.095,000,000 Geo Debt Finance 144A 01.08.18/7.500% 7,353,002 0.124,955,000 INEOS Group Holdings 144A 15.08.18/6.125% 4,985,969 0.08
40,226,000 Intelsat Jackson Holdings 15.10.20/7.250% 44,148,035 0.7312,750,000 Intelsat Jackson Holdings 01.04.21/7.500% 14,120,625 0.2311,510,000 Intelsat Jackson Holdings 15.12.22/6.625% 11,912,850 0.19
102
JPMorgan Investment Funds - Global High Yield Bond Fund
Schedule of Investments (Market Value Expressed in USD) (continued)
As at 31 December 2013
Quantity/Nominal
Value
Name of Securities Maturity/Coupon
MarketValue
%of
NetAssets
Quantity/Nominal
Value
Name of Securities Maturity/Coupon
MarketValue
%of
NetAssets
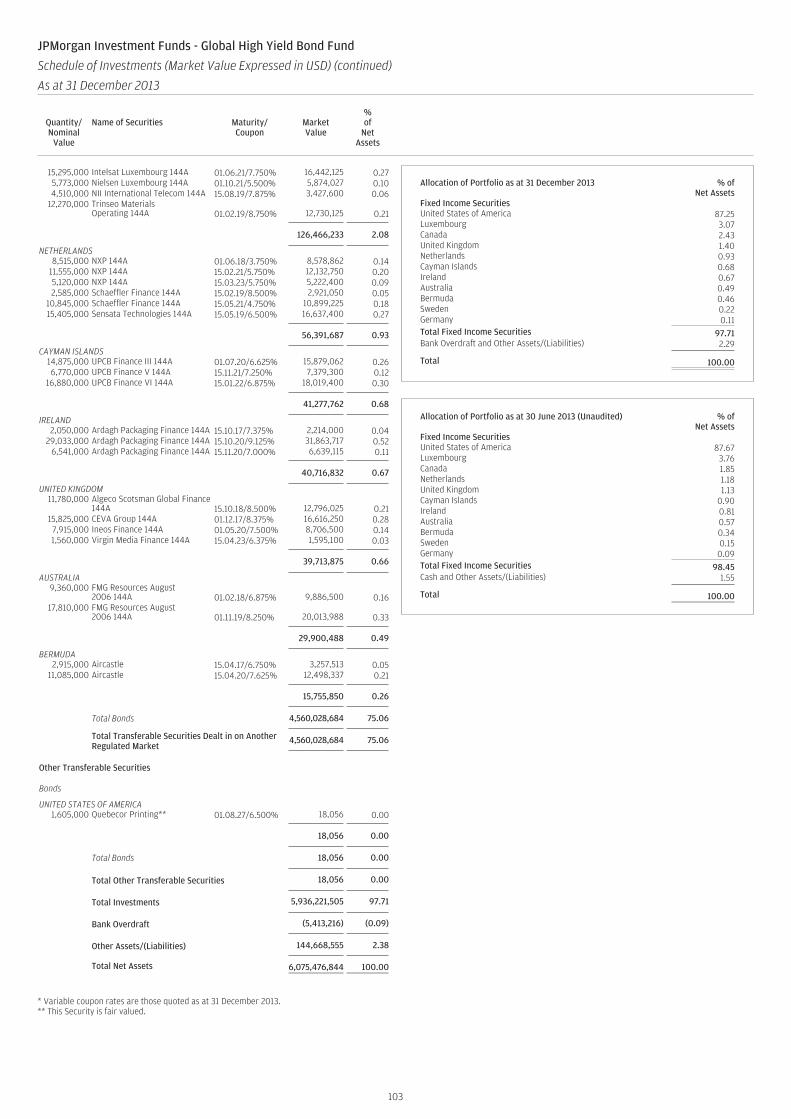
15,295,000 Intelsat Luxembourg 144A 01.06.21/7.750% 16,442,125 0.275,773,000 Nielsen Luxembourg 144A 01.10.21/5.500% 5,874,027 0.104,510,000 NII International Telecom 144A 15.08.19/7.875% 3,427,600 0.06
12,270,000 Trinseo MaterialsOperating 144A 01.02.19/8.750% 12,730,125 0.21
126,466,233 2.08
NETHERLANDS8,515,000 NXP 144A 01.06.18/3.750% 8,578,862 0.14
11,555,000 NXP 144A 15.02.21/5.750% 12,132,750 0.205,120,000 NXP 144A 15.03.23/5.750% 5,222,400 0.092,585,000 Schaeffler Finance 144A 15.02.19/8.500% 2,921,050 0.05
10,845,000 Schaeffler Finance 144A 15.05.21/4.750% 10,899,225 0.1815,405,000 Sensata Technologies 144A 15.05.19/6.500% 16,637,400 0.27
56,391,687 0.93
CAYMAN ISLANDS14,875,000 UPCB Finance III 144A 01.07.20/6.625% 15,879,062 0.266,770,000 UPCB Finance V 144A 15.11.21/7.250% 7,379,300 0.12
16,880,000 UPCB Finance VI 144A 15.01.22/6.875% 18,019,400 0.30
41,277,762 0.68
IRELAND2,050,000 Ardagh Packaging Finance 144A 15.10.17/7.375% 2,214,000 0.04
29,033,000 Ardagh Packaging Finance 144A 15.10.20/9.125% 31,863,717 0.526,541,000 Ardagh Packaging Finance 144A 15.11.20/7.000% 6,639,115 0.11
40,716,832 0.67
UNITED KINGDOM11,780,000 Algeco Scotsman Global Finance
144A 15.10.18/8.500% 12,796,025 0.2115,825,000 CEVA Group 144A 01.12.17/8.375% 16,616,250 0.287,915,000 Ineos Finance 144A 01.05.20/7.500% 8,706,500 0.141,560,000 Virgin Media Finance 144A 15.04.23/6.375% 1,595,100 0.03
39,713,875 0.66
AUSTRALIA9,360,000 FMG Resources August
2006 144A 01.02.18/6.875% 9,886,500 0.1617,810,000 FMG Resources August
2006 144A 01.11.19/8.250% 20,013,988 0.33
29,900,488 0.49
BERMUDA2,915,000 Aircastle 15.04.17/6.750% 3,257,513 0.05
11,085,000 Aircastle 15.04.20/7.625% 12,498,337 0.21
15,755,850 0.26
Total Bonds 4,560,028,684 75.06
Total Transferable Securities Dealt in on AnotherRegulated Market
4,560,028,684 75.06
Other Transferable Securities
Bonds
UNITED STATES OF AMERICA1,605,000 Quebecor Printing** 01.08.27/6.500% 18,056 0.00
18,056 0.00
Total Bonds 18,056 0.00
Total Other Transferable Securities 18,056 0.00
Total Investments 5,936,221,505 97.71
Bank Overdraft (5,413,216) (0.09)
Other Assets/(Liabilities) 144,668,555 2.38
Total Net Assets 6,075,476,844 100.00
* Variable coupon rates are those quoted as at 31 December 2013.** This Security is fair valued.
Allocation of Portfolio as at 31 December 2013 % ofNet Assets
Fixed Income SecuritiesUnited States of America 87.25Luxembourg 3.07Canada 2.43United Kingdom 1.40Netherlands 0.93Cayman Islands 0.68Ireland 0.67Australia 0.49Bermuda 0.46Sweden 0.22Germany 0.11Total Fixed Income Securities 97.71Bank Overdraft and Other Assets/(Liabilities) 2.29
Total 100.00
Allocation of Portfolio as at 30 June 2013 (Unaudited) % ofNet Assets
Fixed Income SecuritiesUnited States of America 87.67Luxembourg 3.76Canada 1.85Netherlands 1.18United Kingdom 1.13Cayman Islands 0.90Ireland 0.81Australia 0.57Bermuda 0.34Sweden 0.15Germany 0.09Total Fixed Income Securities 98.45Cash and Other Assets/(Liabilities) 1.55
Total 100.00
103
JPMorgan Investment Funds - Global High Yield Bond Fund
Schedule of Investments (Market Value Expressed in USD) (continued)
As at 31 December 2013
Quantity/Nominal
Value
Name of Securities Maturity/Coupon
MarketValue
%of
NetAssets
Quantity/Nominal
Value
Name of Securities Maturity/Coupon
MarketValue
%of
NetAssets
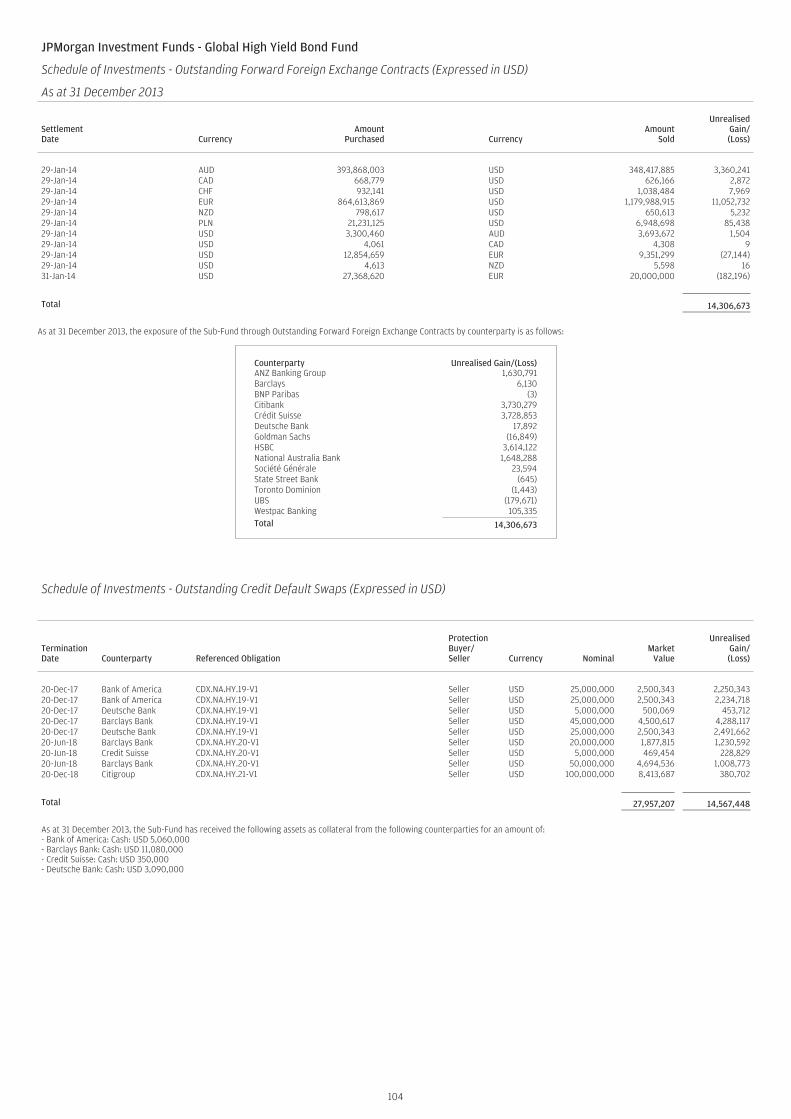
JPMorgan Investment Funds - Global High Yield Bond Fund
Schedule of Investments - Outstanding Forward Foreign Exchange Contracts (Expressed in USD)
As at 31 December 2013
SettlementDate Currency
AmountPurchased Currency
AmountSold
UnrealisedGain/(Loss)
29-Jan-14 AUD 393,868,003 USD 348,417,885 3,360,24129-Jan-14 CAD 668,779 USD 626,166 2,87229-Jan-14 CHF 932,141 USD 1,038,484 7,96929-Jan-14 EUR 864,613,869 USD 1,179,988,915 11,052,73229-Jan-14 NZD 798,617 USD 650,613 5,23229-Jan-14 PLN 21,231,125 USD 6,948,698 85,43829-Jan-14 USD 3,300,460 AUD 3,693,672 1,50429-Jan-14 USD 4,061 CAD 4,308 929-Jan-14 USD 12,854,659 EUR 9,351,299 (27,144)29-Jan-14 USD 4,613 NZD 5,598 1631-Jan-14 USD 27,368,620 EUR 20,000,000 (182,196)
Total 14,306,673
As at 31 December 2013, the exposure of the Sub-Fund through Outstanding Forward Foreign Exchange Contracts by counterparty is as follows:
Counterparty Unrealised Gain/(Loss)ANZ Banking Group 1,630,791Barclays 6,130BNP Paribas (3)Citibank 3,730,279Crédit Suisse 3,728,853Deutsche Bank 17,892Goldman Sachs (16,849)HSBC 3,614,122National Australia Bank 1,648,288Société Générale 23,594State Street Bank (645)Toronto Dominion (1,443)UBS (179,671)Westpac Banking 105,335Total 14,306,673
Schedule of Investments - Outstanding Credit Default Swaps (Expressed in USD)
TerminationDate Counterparty Referenced Obligation
ProtectionBuyer/Seller Currency Nominal
MarketValue
UnrealisedGain/(Loss)
20-Dec-17 Bank of America CDX.NA.HY.19-V1 Seller USD 25,000,000 2,500,343 2,250,34320-Dec-17 Bank of America CDX.NA.HY.19-V1 Seller USD 25,000,000 2,500,343 2,234,71820-Dec-17 Deutsche Bank CDX.NA.HY.19-V1 Seller USD 5,000,000 500,069 453,71220-Dec-17 Barclays Bank CDX.NA.HY.19-V1 Seller USD 45,000,000 4,500,617 4,288,11720-Dec-17 Deutsche Bank CDX.NA.HY.19-V1 Seller USD 25,000,000 2,500,343 2,491,66220-Jun-18 Barclays Bank CDX.NA.HY.20-V1 Seller USD 20,000,000 1,877,815 1,230,59220-Jun-18 Credit Suisse CDX.NA.HY.20-V1 Seller USD 5,000,000 469,454 228,82920-Jun-18 Barclays Bank CDX.NA.HY.20-V1 Seller USD 50,000,000 4,694,536 1,008,77320-Dec-18 Citigroup CDX.NA.HY.21-V1 Seller USD 100,000,000 8,413,687 380,702
Total 27,957,207 14,567,448
As at 31 December 2013, the Sub-Fund has received the following assets as collateral from the following counterparties for an amount of:- Bank of America: Cash: USD 5,060,000- Barclays Bank: Cash: USD 11,080,000- Credit Suisse: Cash: USD 350,000- Deutsche Bank: Cash: USD 3,090,000
104
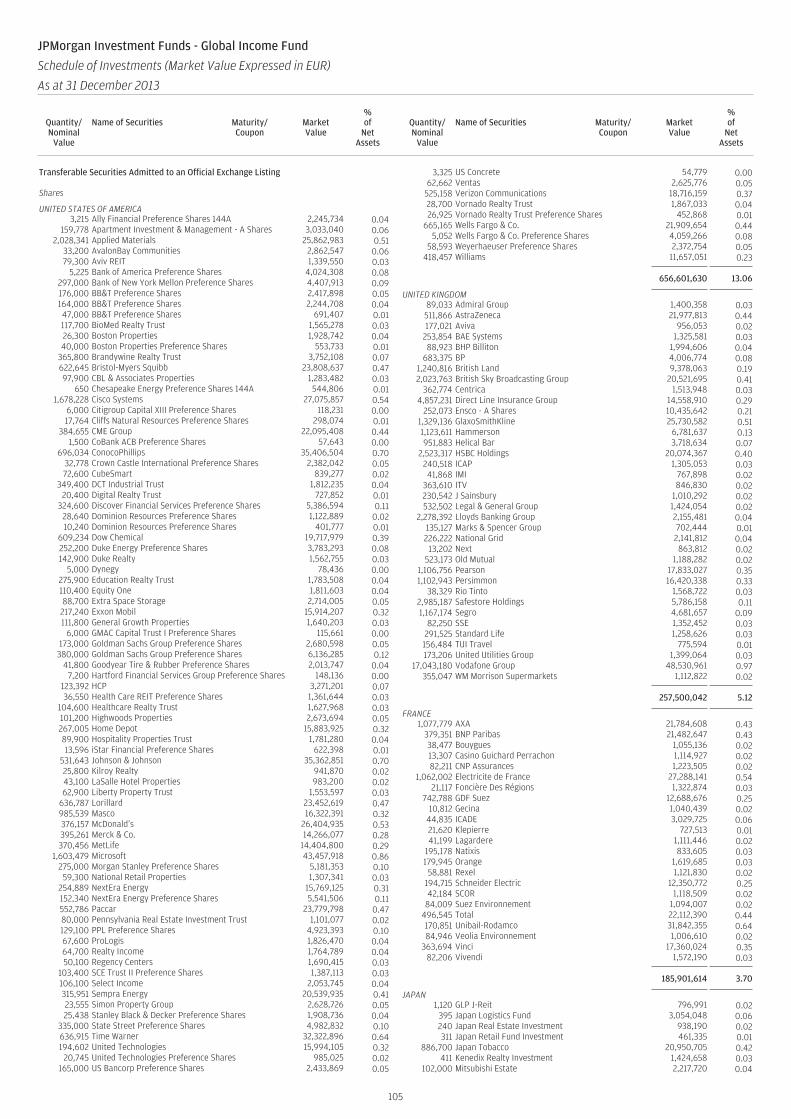
105
Transferable Securities Admitted to an Official Exchange Listing
Shares
UNITED STATES OF AMERICA3,215 Ally Financial Preference Shares 144A 2,245,734 0.04
159,778 Apartment Investment & Management - A Shares 3,033,040 0.062,028,341 Applied Materials 25,862,983 0.51
33,200 AvalonBay Communities 2,862,547 0.0679,300 Aviv REIT 1,339,550 0.03
5,225 Bank of America Preference Shares 4,024,308 0.08297,000 Bank of New York Mellon Preference Shares 4,407,913 0.09176,000 BB&T Preference Shares 2,417,898 0.05164,000 BB&T Preference Shares 2,244,708 0.0447,000 BB&T Preference Shares 691,407 0.01117,700 BioMed Realty Trust 1,565,278 0.0326,300 Boston Properties 1,928,742 0.0440,000 Boston Properties Preference Shares 553,733 0.01
365,800 Brandywine Realty Trust 3,752,108 0.07622,645 Bristol-Myers Squibb 23,808,637 0.4797,900 CBL & Associates Properties 1,283,482 0.03
650 Chesapeake Energy Preference Shares 144A 544,806 0.011,678,228 Cisco Systems 27,075,857 0.54
6,000 Citigroup Capital XIII Preference Shares 118,231 0.0017,764 Cliffs Natural Resources Preference Shares 298,074 0.01
384,655 CME Group 22,095,408 0.441,500 CoBank ACB Preference Shares 57,643 0.00
696,034 ConocoPhillips 35,406,504 0.7032,778 Crown Castle International Preference Shares 2,382,042 0.0572,600 CubeSmart 839,277 0.02
349,400 DCT Industrial Trust 1,812,235 0.0420,400 Digital Realty Trust 727,852 0.01
324,600 Discover Financial Services Preference Shares 5,386,594 0.1128,640 Dominion Resources Preference Shares 1,122,889 0.0210,240 Dominion Resources Preference Shares 401,777 0.01
609,234 Dow Chemical 19,717,979 0.39252,200 Duke Energy Preference Shares 3,783,293 0.08142,900 Duke Realty 1,562,755 0.03
5,000 Dynegy 78,436 0.00275,900 Education Realty Trust 1,783,508 0.04110,400 Equity One 1,811,603 0.0488,700 Extra Space Storage 2,714,005 0.05
217,240 Exxon Mobil 15,914,207 0.32111,800 General Growth Properties 1,640,203 0.03
6,000 GMAC Capital Trust I Preference Shares 115,661 0.00173,000 Goldman Sachs Group Preference Shares 2,680,598 0.05
380,000 Goldman Sachs Group Preference Shares 6,136,285 0.1241,800 Goodyear Tire & Rubber Preference Shares 2,013,747 0.04
7,200 Hartford Financial Services Group Preference Shares 148,136 0.00123,392 HCP 3,271,201 0.0736,550 Health Care REIT Preference Shares 1,361,644 0.03
104,600 Healthcare Realty Trust 1,627,968 0.03101,200 Highwoods Properties 2,673,694 0.05267,005 Home Depot 15,883,925 0.3289,900 Hospitality Properties Trust 1,781,280 0.0413,596 iStar Financial Preference Shares 622,398 0.01
531,643 Johnson & Johnson 35,362,851 0.7025,800 Kilroy Realty 941,870 0.0243,100 LaSalle Hotel Properties 983,200 0.0262,900 Liberty Property Trust 1,553,597 0.03
636,787 Lorillard 23,452,619 0.47985,539 Masco 16,322,391 0.32376,157 McDonald’s 26,404,935 0.53395,261 Merck & Co. 14,266,077 0.28370,456 MetLife 14,404,800 0.29
1,603,479 Microsoft 43,457,918 0.86275,000 Morgan Stanley Preference Shares 5,181,353 0.1059,300 National Retail Properties 1,307,341 0.03
254,889 NextEra Energy 15,769,125 0.31152,340 NextEra Energy Preference Shares 5,541,506 0.11552,786 Paccar 23,779,798 0.4780,000 Pennsylvania Real Estate Investment Trust 1,101,077 0.02129,100 PPL Preference Shares 4,923,393 0.1067,600 ProLogis 1,826,470 0.0464,700 Realty Income 1,764,789 0.0450,100 Regency Centers 1,690,415 0.03
103,400 SCE Trust II Preference Shares 1,387,113 0.03106,100 Select Income 2,053,745 0.04315,951 Sempra Energy 20,539,935 0.4123,555 Simon Property Group 2,628,726 0.0525,438 Stanley Black & Decker Preference Shares 1,908,736 0.04
335,000 State Street Preference Shares 4,982,832 0.10636,915 Time Warner 32,322,896 0.64194,602 United Technologies 15,994,105 0.32
20,745 United Technologies Preference Shares 985,025 0.02165,000 US Bancorp Preference Shares 2,433,869 0.05
3,325 US Concrete 54,779 0.0062,662 Ventas 2,625,776 0.05
525,158 Verizon Communications 18,716,159 0.3728,700 Vornado Realty Trust 1,867,033 0.0426,925 Vornado Realty Trust Preference Shares 452,868 0.01
665,165 Wells Fargo & Co. 21,909,654 0.445,052 Wells Fargo & Co. Preference Shares 4,059,266 0.08
58,593 Weyerhaeuser Preference Shares 2,372,754 0.05418,457 Williams 11,657,051 0.23
656,601,630 13.06
UNITED KINGDOM89,033 Admiral Group 1,400,358 0.03511,866 AstraZeneca 21,977,813 0.44177,021 Aviva 956,053 0.02
253,854 BAE Systems 1,325,581 0.0388,923 BHP Billiton 1,994,606 0.04
683,375 BP 4,006,774 0.081,240,816 British Land 9,378,063 0.192,023,763 British Sky Broadcasting Group 20,521,695 0.41
362,774 Centrica 1,513,948 0.034,857,231 Direct Line Insurance Group 14,558,910 0.29
252,073 Ensco - A Shares 10,435,642 0.211,329,136 GlaxoSmithKline 25,730,582 0.511,123,611 Hammerson 6,781,637 0.13951,883 Helical Bar 3,718,634 0.07
2,523,317 HSBC Holdings 20,074,367 0.40240,518 ICAP 1,305,053 0.0341,868 IMI 767,898 0.02
363,610 ITV 846,830 0.02230,542 J Sainsbury 1,010,292 0.02532,502 Legal & General Group 1,424,054 0.02
2,278,392 Lloyds Banking Group 2,155,481 0.04135,127 Marks & Spencer Group 702,444 0.01226,222 National Grid 2,141,812 0.04
13,202 Next 863,812 0.02523,173 Old Mutual 1,188,282 0.02
1,106,756 Pearson 17,833,027 0.351,102,943 Persimmon 16,420,338 0.33
38,329 Rio Tinto 1,568,722 0.032,985,187 Safestore Holdings 5,786,158 0.111,167,174 Segro 4,681,657 0.09
82,250 SSE 1,352,452 0.03291,525 Standard Life 1,258,626 0.03156,484 TUI Travel 775,594 0.01173,206 United Utilities Group 1,399,064 0.03
17,043,180 Vodafone Group 48,530,961 0.97355,047 WM Morrison Supermarkets 1,112,822 0.02
257,500,042 5.12
FRANCE1,077,779 AXA 21,784,608 0.43
379,351 BNP Paribas 21,482,647 0.4338,477 Bouygues 1,055,136 0.0213,307 Casino Guichard Perrachon 1,114,927 0.0282,211 CNP Assurances 1,223,505 0.02
1,062,002 Electricite de France 27,288,141 0.5421,117 Foncière Des Régions 1,322,874 0.03
742,788 GDF Suez 12,688,676 0.2510,812 Gecina 1,040,439 0.02
44,835 ICADE 3,029,725 0.0621,620 Klepierre 727,513 0.0141,199 Lagardere 1,111,446 0.02
195,178 Natixis 833,605 0.03179,945 Orange 1,619,685 0.03
58,881 Rexel 1,121,830 0.02194,715 Schneider Electric 12,350,772 0.2542,184 SCOR 1,118,509 0.02
84,009 Suez Environnement 1,094,007 0.02496,545 Total 22,112,390 0.44170,851 Unibail-Rodamco 31,842,355 0.6484,946 Veolia Environnement 1,006,610 0.02
363,694 Vinci 17,360,024 0.3582,206 Vivendi 1,572,190 0.03
185,901,614 3.70
JAPAN1,120 GLP J-Reit 796,991 0.02
395 Japan Logistics Fund 3,054,048 0.06240 Japan Real Estate Investment 938,190 0.02311 Japan Retail Fund Investment 461,335 0.01
886,700 Japan Tobacco 20,950,705 0.42411 Kenedix Realty Investment 1,424,658 0.03
102,000 Mitsubishi Estate 2,217,720 0.04
JPMorgan Investment Funds - Global Income Fund
Schedule of Investments (Market Value Expressed in EUR)
As at 31 December 2013
Quantity/Nominal
Value
Name of Securities Maturity/Coupon
MarketValue
%of
NetAssets
Quantity/Nominal
Value
Name of Securities Maturity/Coupon
MarketValue
%of
NetAssets
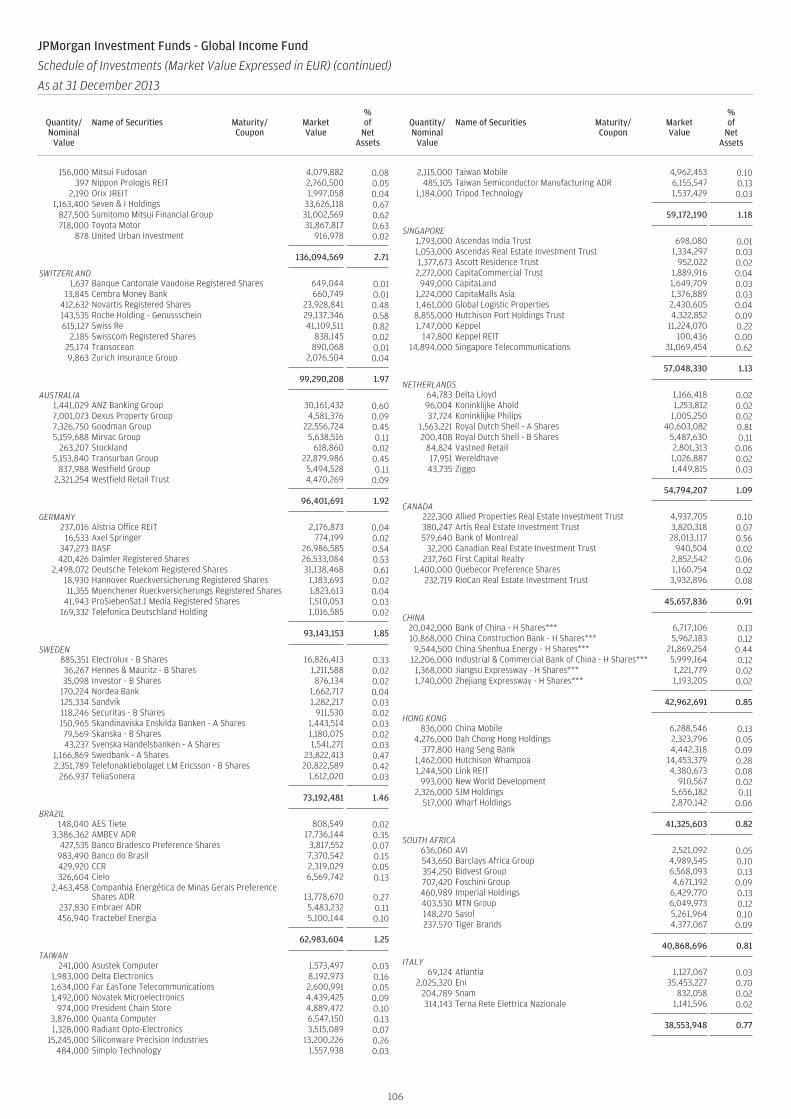
156,000 Mitsui Fudosan 4,079,882 0.08397 Nippon Prologis REIT 2,760,500 0.05
2,190 Orix JREIT 1,997,058 0.041,163,400 Seven & I Holdings 33,626,118 0.67
827,500 Sumitomo Mitsui Financial Group 31,002,569 0.62718,000 Toyota Motor 31,867,817 0.63
878 United Urban Investment 916,978 0.02
136,094,569 2.71
SWITZERLAND1,637 Banque Cantonale Vaudoise Registered Shares 649,044 0.01
13,845 Cembra Money Bank 660,749 0.01412,632 Novartis Registered Shares 23,928,841 0.48143,535 Roche Holding - Genussschein 29,137,346 0.58615,127 Swiss Re 41,109,511 0.82
2,185 Swisscom Registered Shares 838,145 0.0225,174 Transocean 890,068 0.019,863 Zurich Insurance Group 2,076,504 0.04
99,290,208 1.97
AUSTRALIA1,441,029 ANZ Banking Group 30,161,432 0.607,001,073 Dexus Property Group 4,581,376 0.097,326,750 Goodman Group 22,556,724 0.455,159,688 Mirvac Group 5,638,516 0.11
263,207 Stockland 618,860 0.025,153,840 Transurban Group 22,879,986 0.45
837,988 Westfield Group 5,494,528 0.112,321,254 Westfield Retail Trust 4,470,269 0.09
96,401,691 1.92
GERMANY237,016 Alstria Office REIT 2,176,873 0.04
16,533 Axel Springer 774,199 0.02347,273 BASF 26,986,585 0.54420,426 Daimler Registered Shares 26,533,084 0.53
2,498,072 Deutsche Telekom Registered Shares 31,138,468 0.6118,930 Hannover Rueckversicherung Registered Shares 1,183,693 0.0211,355 Muenchener Rueckversicherungs Registered Shares 1,823,613 0.04
41,943 ProSiebenSat.1 Media Registered Shares 1,510,053 0.03169,332 Telefonica Deutschland Holding 1,016,585 0.02
93,143,153 1.85
SWEDEN885,351 Electrolux - B Shares 16,826,413 0.3336,267 Hennes & Mauritz - B Shares 1,211,588 0.0235,098 Investor - B Shares 876,134 0.02
170,224 Nordea Bank 1,662,717 0.04125,334 Sandvik 1,282,217 0.03118,246 Securitas - B Shares 911,530 0.02150,965 Skandinaviska Enskilda Banken - A Shares 1,443,514 0.0379,569 Skanska - B Shares 1,180,075 0.0243,237 Svenska Handelsbanken - A Shares 1,541,271 0.03
1,166,869 Swedbank - A Shares 23,822,413 0.472,351,789 Telefonaktiebolaget LM Ericsson - B Shares 20,822,589 0.42
266,937 TeliaSonera 1,612,020 0.03
73,192,481 1.46
BRAZIL148,040 AES Tiete 808,549 0.02
3,386,362 AMBEV ADR 17,736,144 0.35427,535 Banco Bradesco Preference Shares 3,817,552 0.07
983,490 Banco do Brasil 7,370,542 0.15429,920 CCR 2,319,029 0.05326,604 Cielo 6,569,742 0.13
2,463,458 Companhia Energética de Minas Gerais PreferenceShares ADR 13,778,670 0.27
237,830 Embraer ADR 5,483,232 0.11456,940 Tractebel Energia 5,100,144 0.10
62,983,604 1.25
TAIWAN241,000 Asustek Computer 1,573,497 0.03
1,983,000 Delta Electronics 8,192,973 0.161,634,000 Far EasTone Telecommunications 2,600,991 0.051,492,000 Novatek Microelectronics 4,439,425 0.09
974,000 President Chain Store 4,889,472 0.103,876,000 Quanta Computer 6,547,150 0.131,328,000 Radiant Opto-Electronics 3,515,089 0.07
15,245,000 Siliconware Precision Industries 13,200,226 0.26484,000 Simplo Technology 1,557,938 0.03
2,115,000 Taiwan Mobile 4,962,453 0.10485,105 Taiwan Semiconductor Manufacturing ADR 6,155,547 0.13
1,184,000 Tripod Technology 1,537,429 0.03
59,172,190 1.18
SINGAPORE1,793,000 Ascendas India Trust 698,080 0.011,053,000 Ascendas Real Estate Investment Trust 1,334,297 0.031,377,673 Ascott Residence Trust 952,022 0.02
2,272,000 CapitaCommercial Trust 1,889,916 0.04949,000 CapitaLand 1,649,709 0.03
1,224,000 CapitaMalls Asia 1,376,889 0.031,461,000 Global Logistic Properties 2,430,605 0.048,855,000 Hutchison Port Holdings Trust 4,322,852 0.091,747,000 Keppel 11,224,070 0.22
147,800 Keppel REIT 100,436 0.0014,894,000 Singapore Telecommunications 31,069,454 0.62
57,048,330 1.13
NETHERLANDS64,783 Delta Lloyd 1,166,418 0.0296,004 Koninklijke Ahold 1,253,812 0.0237,724 Koninklijke Philips 1,005,250 0.02
1,563,221 Royal Dutch Shell - A Shares 40,603,082 0.81200,408 Royal Dutch Shell - B Shares 5,487,630 0.11
84,824 Vastned Retail 2,801,313 0.0617,951 Wereldhave 1,026,887 0.0243,735 Ziggo 1,449,815 0.03
54,794,207 1.09
CANADA222,300 Allied Properties Real Estate Investment Trust 4,937,705 0.10380,247 Artis Real Estate Investment Trust 3,820,318 0.07579,640 Bank of Montreal 28,013,117 0.56
32,200 Canadian Real Estate Investment Trust 940,504 0.02237,760 First Capital Realty 2,852,542 0.06
1,400,000 Quebecor Preference Shares 1,160,754 0.02232,719 RioCan Real Estate Investment Trust 3,932,896 0.08
45,657,836 0.91
CHINA20,042,000 Bank of China - H Shares*** 6,717,106 0.1310,868,000 China Construction Bank - H Shares*** 5,962,183 0.12
9,544,500 China Shenhua Energy - H Shares*** 21,869,254 0.4412,206,000 Industrial & Commercial Bank of China - H Shares*** 5,999,164 0.121,368,000 Jiangsu Expressway - H Shares*** 1,221,779 0.021,740,000 Zhejiang Expressway - H Shares*** 1,193,205 0.02
42,962,691 0.85
HONG KONG836,000 China Mobile 6,288,546 0.13
4,276,000 Dah Chong Hong Holdings 2,323,796 0.05377,800 Hang Seng Bank 4,442,318 0.09
1,462,000 Hutchison Whampoa 14,453,379 0.281,244,500 Link REIT 4,380,673 0.08
993,000 New World Development 910,567 0.022,326,000 SJM Holdings 5,656,182 0.11
517,000 Wharf Holdings 2,870,142 0.06
41,325,603 0.82
SOUTH AFRICA636,060 AVI 2,521,092 0.05543,650 Barclays Africa Group 4,989,545 0.10354,250 Bidvest Group 6,568,093 0.13707,420 Foschini Group 4,671,192 0.09460,989 Imperial Holdings 6,429,770 0.13403,530 MTN Group 6,049,973 0.12148,270 Sasol 5,261,964 0.10237,570 Tiger Brands 4,377,067 0.09
40,868,696 0.81
ITALY69,124 Atlantia 1,127,067 0.03
2,025,320 Eni 35,453,227 0.70204,789 Snam 832,058 0.02314,143 Terna Rete Elettrica Nazionale 1,141,596 0.02
38,553,948 0.77
106
JPMorgan Investment Funds - Global Income Fund
Schedule of Investments (Market Value Expressed in EUR) (continued)
As at 31 December 2013
Quantity/Nominal
Value
Name of Securities Maturity/Coupon
MarketValue
%of
NetAssets
Quantity/Nominal
Value
Name of Securities Maturity/Coupon
MarketValue
%of
NetAssets
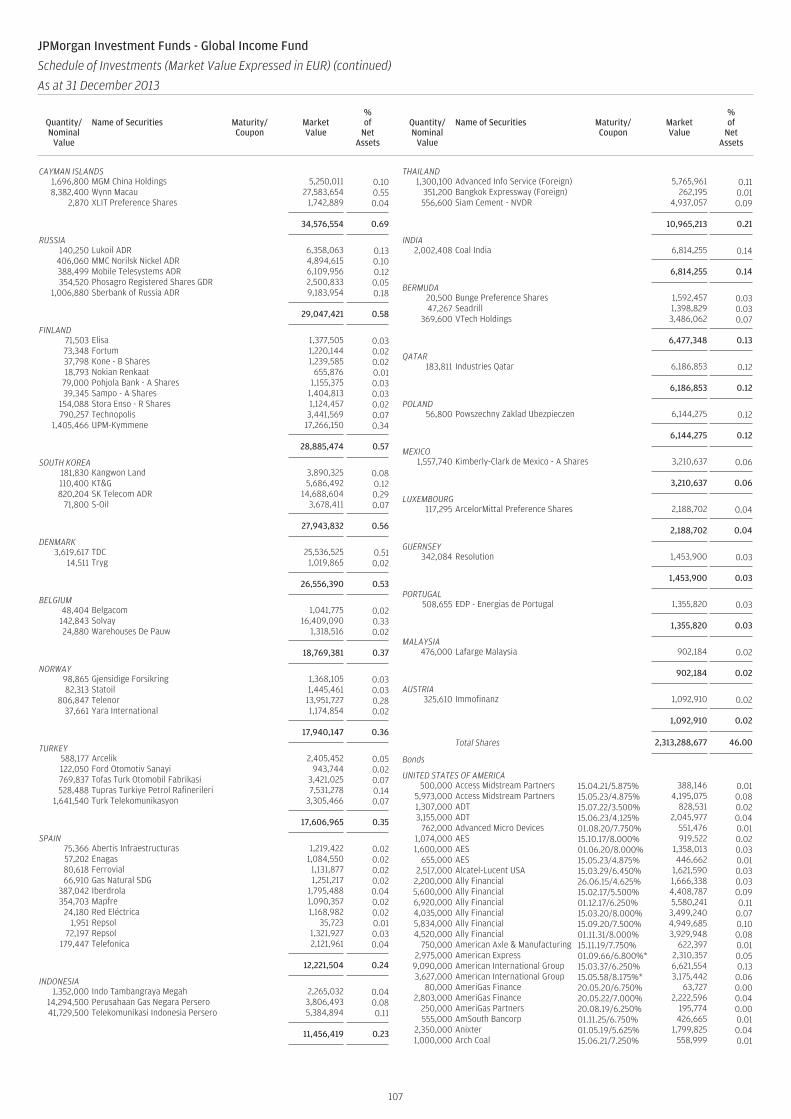
CAYMAN ISLANDS1,696,800 MGM China Holdings 5,250,011 0.108,382,400 Wynn Macau 27,583,654 0.55
2,870 XLIT Preference Shares 1,742,889 0.04
34,576,554 0.69
RUSSIA140,250 Lukoil ADR 6,358,063 0.13
406,060 MMC Norilsk Nickel ADR 4,894,615 0.10388,499 Mobile Telesystems ADR 6,109,956 0.12354,520 Phosagro Registered Shares GDR 2,500,833 0.05
1,006,880 Sberbank of Russia ADR 9,183,954 0.18
29,047,421 0.58
FINLAND71,503 Elisa 1,377,505 0.0373,348 Fortum 1,220,144 0.0237,798 Kone - B Shares 1,239,585 0.0218,793 Nokian Renkaat 655,876 0.01
79,000 Pohjola Bank - A Shares 1,155,375 0.0339,345 Sampo - A Shares 1,404,813 0.03
154,088 Stora Enso - R Shares 1,124,457 0.02790,257 Technopolis 3,441,569 0.07
1,405,466 UPM-Kymmene 17,266,150 0.34
28,885,474 0.57
SOUTH KOREA181,830 Kangwon Land 3,890,325 0.08110,400 KT&G 5,686,492 0.12820,204 SK Telecom ADR 14,688,604 0.29
71,800 S-Oil 3,678,411 0.07
27,943,832 0.56
DENMARK3,619,617 TDC 25,536,525 0.51
14,511 Tryg 1,019,865 0.02
26,556,390 0.53
BELGIUM48,404 Belgacom 1,041,775 0.02142,843 Solvay 16,409,090 0.3324,880 Warehouses De Pauw 1,318,516 0.02
18,769,381 0.37
NORWAY98,865 Gjensidige Forsikring 1,368,105 0.0382,313 Statoil 1,445,461 0.03
806,847 Telenor 13,951,727 0.2837,661 Yara International 1,174,854 0.02
17,940,147 0.36
TURKEY588,177 Arcelik 2,405,452 0.05122,050 Ford Otomotiv Sanayi 943,744 0.02769,837 Tofas Turk Otomobil Fabrikasi 3,421,025 0.07528,488 Tupras Turkiye Petrol Rafinerileri 7,531,278 0.14
1,641,540 Turk Telekomunikasyon 3,305,466 0.07
17,606,965 0.35
SPAIN75,366 Abertis Infraestructuras 1,219,422 0.0257,202 Enagas 1,084,550 0.0280,618 Ferrovial 1,131,877 0.0266,910 Gas Natural SDG 1,251,217 0.02
387,042 Iberdrola 1,795,488 0.04354,703 Mapfre 1,090,357 0.02
24,180 Red Eléctrica 1,168,982 0.021,951 Repsol 35,723 0.01
72,197 Repsol 1,321,927 0.03179,447 Telefonica 2,121,961 0.04
12,221,504 0.24
INDONESIA1,352,000 Indo Tambangraya Megah 2,265,032 0.04
14,294,500 Perusahaan Gas Negara Persero 3,806,493 0.0841,729,500 Telekomunikasi Indonesia Persero 5,384,894 0.11
11,456,419 0.23
THAILAND1,300,100 Advanced Info Service (Foreign) 5,765,961 0.11
351,200 Bangkok Expressway (Foreign) 262,195 0.01556,600 Siam Cement - NVDR 4,937,057 0.09
10,965,213 0.21
INDIA2,002,408 Coal India 6,814,255 0.14
6,814,255 0.14
BERMUDA20,500 Bunge Preference Shares 1,592,457 0.0347,267 Seadrill 1,398,829 0.03
369,600 VTech Holdings 3,486,062 0.07
6,477,348 0.13
QATAR183,811 Industries Qatar 6,186,853 0.12
6,186,853 0.12
POLAND56,800 Powszechny Zaklad Ubezpieczen 6,144,275 0.12
6,144,275 0.12
MEXICO1,557,740 Kimberly-Clark de Mexico - A Shares 3,210,637 0.06
3,210,637 0.06
LUXEMBOURG117,295 ArcelorMittal Preference Shares 2,188,702 0.04
2,188,702 0.04
GUERNSEY342,084 Resolution 1,453,900 0.03
1,453,900 0.03
PORTUGAL508,655 EDP - Energias de Portugal 1,355,820 0.03
1,355,820 0.03
MALAYSIA476,000 Lafarge Malaysia 902,184 0.02
902,184 0.02
AUSTRIA325,610 Immofinanz 1,092,910 0.02
1,092,910 0.02
Total Shares 2,313,288,677 46.00
Bonds
UNITED STATES OF AMERICA500,000 Access Midstream Partners 15.04.21/5.875% 388,146 0.01
5,973,000 Access Midstream Partners 15.05.23/4.875% 4,195,075 0.081,307,000 ADT 15.07.22/3.500% 828,531 0.023,155,000 ADT 15.06.23/4.125% 2,045,977 0.04
762,000 Advanced Micro Devices 01.08.20/7.750% 551,476 0.011,074,000 AES 15.10.17/8.000% 919,522 0.021,600,000 AES 01.06.20/8.000% 1,358,013 0.03
655,000 AES 15.05.23/4.875% 446,662 0.012,517,000 Alcatel-Lucent USA 15.03.29/6.450% 1,621,590 0.03
2,200,000 Ally Financial 26.06.15/4.625% 1,666,338 0.035,600,000 Ally Financial 15.02.17/5.500% 4,408,787 0.096,920,000 Ally Financial 01.12.17/6.250% 5,580,241 0.114,035,000 Ally Financial 15.03.20/8.000% 3,499,240 0.075,834,000 Ally Financial 15.09.20/7.500% 4,949,685 0.104,520,000 Ally Financial 01.11.31/8.000% 3,929,948 0.08
750,000 American Axle & Manufacturing 15.11.19/7.750% 622,397 0.012,975,000 American Express 01.09.66/6.800%* 2,310,357 0.05
9,090,000 American International Group 15.03.37/6.250% 6,621,554 0.133,627,000 American International Group 15.05.58/8.175%* 3,175,442 0.06
80,000 AmeriGas Finance 20.05.20/6.750% 63,727 0.002,803,000 AmeriGas Finance 20.05.22/7.000% 2,222,596 0.04
250,000 AmeriGas Partners 20.08.19/6.250% 195,774 0.00555,000 AmSouth Bancorp 01.11.25/6.750% 426,665 0.01
2,350,000 Anixter 01.05.19/5.625% 1,799,825 0.041,000,000 Arch Coal 15.06.21/7.250% 558,999 0.01
107
JPMorgan Investment Funds - Global Income Fund
Schedule of Investments (Market Value Expressed in EUR) (continued)
As at 31 December 2013
Quantity/Nominal
Value
Name of Securities Maturity/Coupon
MarketValue
%of
NetAssets
Quantity/Nominal
Value
Name of Securities Maturity/Coupon
MarketValue
%of
NetAssets
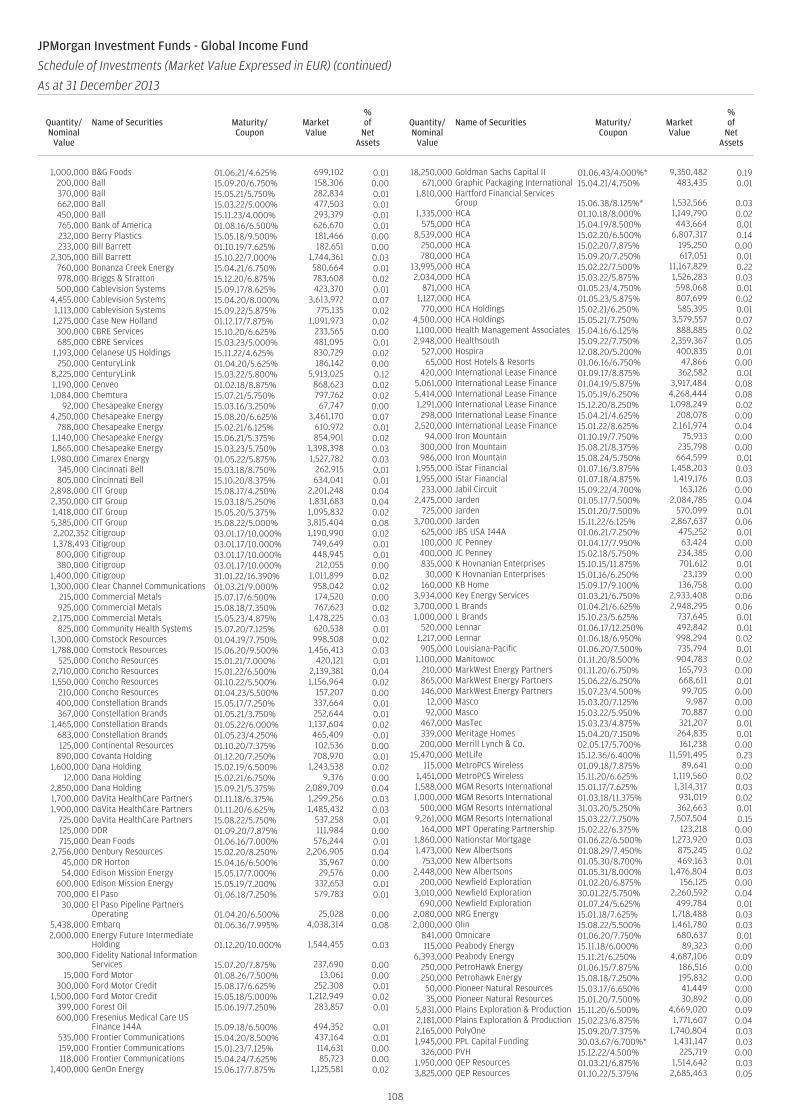
1,000,000 B&G Foods 01.06.21/4.625% 699,102 0.01200,000 Ball 15.09.20/6.750% 158,306 0.00370,000 Ball 15.05.21/5.750% 282,834 0.01662,000 Ball 15.03.22/5.000% 477,503 0.01450,000 Ball 15.11.23/4.000% 293,379 0.01765,000 Bank of America 01.08.16/6.500% 626,670 0.01232,000 Berry Plastics 15.05.18/9.500% 181,466 0.00233,000 Bill Barrett 01.10.19/7.625% 182,651 0.00
2,305,000 Bill Barrett 15.10.22/7.000% 1,744,361 0.03760,000 Bonanza Creek Energy 15.04.21/6.750% 580,664 0.01978,000 Briggs & Stratton 15.12.20/6.875% 783,608 0.02500,000 Cablevision Systems 15.09.17/8.625% 423,370 0.01
4,455,000 Cablevision Systems 15.04.20/8.000% 3,613,972 0.071,113,000 Cablevision Systems 15.09.22/5.875% 775,135 0.021,275,000 Case New Holland 01.12.17/7.875% 1,091,973 0.02300,000 CBRE Services 15.10.20/6.625% 233,565 0.00685,000 CBRE Services 15.03.23/5.000% 481,095 0.01
1,193,000 Celanese US Holdings 15.11.22/4.625% 830,729 0.02250,000 CenturyLink 01.04.20/5.625% 186,142 0.00
8,225,000 CenturyLink 15.03.22/5.800% 5,913,025 0.121,190,000 Cenveo 01.02.18/8.875% 868,623 0.021,084,000 Chemtura 15.07.21/5.750% 797,762 0.02
92,000 Chesapeake Energy 15.03.16/3.250% 67,747 0.004,250,000 Chesapeake Energy 15.08.20/6.625% 3,461,170 0.07
788,000 Chesapeake Energy 15.02.21/6.125% 610,972 0.011,140,000 Chesapeake Energy 15.06.21/5.375% 854,901 0.021,865,000 Chesapeake Energy 15.03.23/5.750% 1,398,398 0.031,980,000 Cimarex Energy 01.05.22/5.875% 1,527,782 0.03
345,000 Cincinnati Bell 15.03.18/8.750% 262,915 0.01805,000 Cincinnati Bell 15.10.20/8.375% 634,041 0.01
2,898,000 CIT Group 15.08.17/4.250% 2,201,248 0.042,350,000 CIT Group 15.03.18/5.250% 1,831,683 0.041,418,000 CIT Group 15.05.20/5.375% 1,095,832 0.025,385,000 CIT Group 15.08.22/5.000% 3,815,404 0.082,202,352 Citigroup 03.01.17/10.000% 1,190,990 0.021,378,493 Citigroup 03.01.17/10.000% 749,649 0.01800,000 Citigroup 03.01.17/10.000% 448,945 0.01380,000 Citigroup 03.01.17/10.000% 212,055 0.00
1,400,000 Citigroup 31.01.22/16.390% 1,011,899 0.021,300,000 Clear Channel Communications 01.03.21/9.000% 958,042 0.02
215,000 Commercial Metals 15.07.17/6.500% 174,520 0.00925,000 Commercial Metals 15.08.18/7.350% 767,623 0.02
2,175,000 Commercial Metals 15.05.23/4.875% 1,478,225 0.03825,000 Community Health Systems 15.07.20/7.125% 620,538 0.01
1,300,000 Comstock Resources 01.04.19/7.750% 998,508 0.021,788,000 Comstock Resources 15.06.20/9.500% 1,456,413 0.03
525,000 Concho Resources 15.01.21/7.000% 420,121 0.012,710,000 Concho Resources 15.01.22/6.500% 2,139,381 0.041,550,000 Concho Resources 01.10.22/5.500% 1,156,964 0.02
210,000 Concho Resources 01.04.23/5.500% 157,207 0.00400,000 Constellation Brands 15.05.17/7.250% 337,664 0.01367,000 Constellation Brands 01.05.21/3.750% 252,644 0.01
1,465,000 Constellation Brands 01.05.22/6.000% 1,137,604 0.02683,000 Constellation Brands 01.05.23/4.250% 465,409 0.01125,000 Continental Resources 01.10.20/7.375% 102,536 0.00
890,000 Covanta Holding 01.12.20/7.250% 708,970 0.011,600,000 Dana Holding 15.02.19/6.500% 1,243,538 0.02
12,000 Dana Holding 15.02.21/6.750% 9,376 0.002,850,000 Dana Holding 15.09.21/5.375% 2,089,709 0.041,700,000 DaVita HealthCare Partners 01.11.18/6.375% 1,299,256 0.031,900,000 DaVita HealthCare Partners 01.11.20/6.625% 1,485,432 0.03
725,000 DaVita HealthCare Partners 15.08.22/5.750% 537,258 0.01125,000 DDR 01.09.20/7.875% 111,984 0.00715,000 Dean Foods 01.06.16/7.000% 576,244 0.01
2,756,000 Denbury Resources 15.02.20/8.250% 2,206,905 0.0445,000 DR Horton 15.04.16/6.500% 35,967 0.0054,000 Edison Mission Energy 15.05.17/7.000% 29,576 0.00
600,000 Edison Mission Energy 15.05.19/7.200% 332,653 0.01700,000 El Paso 01.06.18/7.250% 579,783 0.01
30,000 El Paso Pipeline PartnersOperating 01.04.20/6.500% 25,028 0.00
5,438,000 Embarq 01.06.36/7.995% 4,038,314 0.082,000,000 Energy Future Intermediate
Holding 01.12.20/10.000% 1,544,455 0.03300,000 Fidelity National Information
Services 15.07.20/7.875% 237,690 0.0015,000 Ford Motor 01.08.26/7.500% 13,061 0.00
300,000 Ford Motor Credit 15.08.17/6.625% 252,308 0.011,500,000 Ford Motor Credit 15.05.18/5.000% 1,212,949 0.02
399,000 Forest Oil 15.06.19/7.250% 283,857 0.01600,000 Fresenius Medical Care US
Finance 144A 15.09.18/6.500% 494,352 0.01535,000 Frontier Communications 15.04.20/8.500% 437,164 0.01159,000 Frontier Communications 15.01.23/7.125% 114,631 0.00118,000 Frontier Communications 15.04.24/7.625% 85,723 0.00
1,400,000 GenOn Energy 15.06.17/7.875% 1,125,581 0.02
18,250,000 Goldman Sachs Capital II 01.06.43/4.000%* 9,350,482 0.19671,000 Graphic Packaging International 15.04.21/4.750% 483,435 0.01
1,810,000 Hartford Financial ServicesGroup 15.06.38/8.125%* 1,532,566 0.03
1,335,000 HCA 01.10.18/8.000% 1,149,790 0.02575,000 HCA 15.04.19/8.500% 443,664 0.01
8,539,000 HCA 15.02.20/6.500% 6,807,317 0.14250,000 HCA 15.02.20/7.875% 195,250 0.00780,000 HCA 15.09.20/7.250% 617,051 0.01
13,995,000 HCA 15.02.22/7.500% 11,167,829 0.222,034,000 HCA 15.03.22/5.875% 1,526,283 0.03
871,000 HCA 01.05.23/4.750% 598,068 0.011,127,000 HCA 01.05.23/5.875% 807,699 0.02770,000 HCA Holdings 15.02.21/6.250% 585,395 0.01
4,500,000 HCA Holdings 15.05.21/7.750% 3,579,557 0.071,100,000 Health Management Associates 15.04.16/6.125% 888,885 0.022,948,000 Healthsouth 15.09.22/7.750% 2,359,367 0.05
527,000 Hospira 12.08.20/5.200% 400,835 0.0165,000 Host Hotels & Resorts 01.06.16/6.750% 47,866 0.00
420,000 International Lease Finance 01.09.17/8.875% 362,582 0.015,061,000 International Lease Finance 01.04.19/5.875% 3,917,484 0.085,414,000 International Lease Finance 15.05.19/6.250% 4,268,444 0.081,291,000 International Lease Finance 15.12.20/8.250% 1,098,249 0.02298,000 International Lease Finance 15.04.21/4.625% 208,078 0.00
2,520,000 International Lease Finance 15.01.22/8.625% 2,161,974 0.0494,000 Iron Mountain 01.10.19/7.750% 75,933 0.00
300,000 Iron Mountain 15.08.21/8.375% 235,798 0.00986,000 Iron Mountain 15.08.24/5.750% 664,599 0.01
1,955,000 iStar Financial 01.07.16/3.875% 1,458,203 0.031,955,000 iStar Financial 01.07.18/4.875% 1,419,176 0.03
233,000 Jabil Circuit 15.09.22/4.700% 163,126 0.002,475,000 Jarden 01.05.17/7.500% 2,084,785 0.04
725,000 Jarden 15.01.20/7.500% 570,099 0.013,700,000 Jarden 15.11.22/6.125% 2,867,637 0.06
625,000 JBS USA 144A 01.06.21/7.250% 475,252 0.01100,000 JC Penney 01.04.17/7.950% 63,424 0.00400,000 JC Penney 15.02.18/5.750% 234,385 0.00835,000 K Hovnanian Enterprises 15.10.15/11.875% 701,612 0.0130,000 K Hovnanian Enterprises 15.01.16/6.250% 23,139 0.00
160,000 KB Home 15.09.17/9.100% 136,758 0.003,934,000 Key Energy Services 01.03.21/6.750% 2,933,408 0.063,700,000 L Brands 01.04.21/6.625% 2,948,295 0.061,000,000 L Brands 15.10.23/5.625% 737,645 0.01
520,000 Lennar 01.06.17/12.250% 492,842 0.011,217,000 Lennar 01.06.18/6.950% 998,294 0.02905,000 Louisiana-Pacific 01.06.20/7.500% 735,794 0.01
1,100,000 Manitowoc 01.11.20/8.500% 904,783 0.02210,000 MarkWest Energy Partners 01.11.20/6.750% 165,793 0.00865,000 MarkWest Energy Partners 15.06.22/6.250% 668,611 0.01146,000 MarkWest Energy Partners 15.07.23/4.500% 99,705 0.00
12,000 Masco 15.03.20/7.125% 9,987 0.0092,000 Masco 15.03.22/5.950% 70,887 0.00
467,000 MasTec 15.03.23/4.875% 321,207 0.01339,000 Meritage Homes 15.04.20/7.150% 264,835 0.01200,000 Merrill Lynch & Co. 02.05.17/5.700% 161,238 0.00
15,470,000 MetLife 15.12.36/6.400% 11,591,495 0.23115,000 MetroPCS Wireless 01.09.18/7.875% 89,641 0.00
1,451,000 MetroPCS Wireless 15.11.20/6.625% 1,119,560 0.021,588,000 MGM Resorts International 15.01.17/7.625% 1,314,317 0.031,000,000 MGM Resorts International 01.03.18/11.375% 931,019 0.02
500,000 MGM Resorts International 31.03.20/5.250% 362,663 0.019,261,000 MGM Resorts International 15.03.22/7.750% 7,507,504 0.15
164,000 MPT Operating Partnership 15.02.22/6.375% 123,218 0.001,860,000 Nationstar Mortgage 01.06.22/6.500% 1,273,920 0.031,473,000 New Albertsons 01.08.29/7.450% 875,245 0.02
753,000 New Albertsons 01.05.30/8.700% 469,163 0.012,448,000 New Albertsons 01.05.31/8.000% 1,476,804 0.03
200,000 Newfield Exploration 01.02.20/6.875% 156,125 0.003,010,000 Newfield Exploration 30.01.22/5.750% 2,260,592 0.04
690,000 Newfield Exploration 01.07.24/5.625% 499,784 0.012,080,000 NRG Energy 15.01.18/7.625% 1,718,488 0.032,000,000 Olin 15.08.22/5.500% 1,461,780 0.03
841,000 Omnicare 01.06.20/7.750% 680,637 0.01115,000 Peabody Energy 15.11.18/6.000% 89,323 0.00
6,393,000 Peabody Energy 15.11.21/6.250% 4,687,106 0.09250,000 PetroHawk Energy 01.06.15/7.875% 186,516 0.00250,000 Petrohawk Energy 15.08.18/7.250% 195,832 0.0050,000 Pioneer Natural Resources 15.03.17/6.650% 41,449 0.0035,000 Pioneer Natural Resources 15.01.20/7.500% 30,892 0.00
5,831,000 Plains Exploration & Production 15.11.20/6.500% 4,669,020 0.092,181,000 Plains Exploration & Production 15.02.23/6.875% 1,771,607 0.042,165,000 PolyOne 15.09.20/7.375% 1,740,804 0.031,945,000 PPL Capital Funding 30.03.67/6.700%* 1,431,147 0.03
326,000 PVH 15.12.22/4.500% 225,719 0.001,950,000 QEP Resources 01.03.21/6.875% 1,514,642 0.033,825,000 QEP Resources 01.10.22/5.375% 2,685,463 0.05
108
JPMorgan Investment Funds - Global Income Fund
Schedule of Investments (Market Value Expressed in EUR) (continued)
As at 31 December 2013
Quantity/Nominal
Value
Name of Securities Maturity/Coupon
MarketValue
%of
NetAssets
Quantity/Nominal
Value
Name of Securities Maturity/Coupon
MarketValue
%of
NetAssets
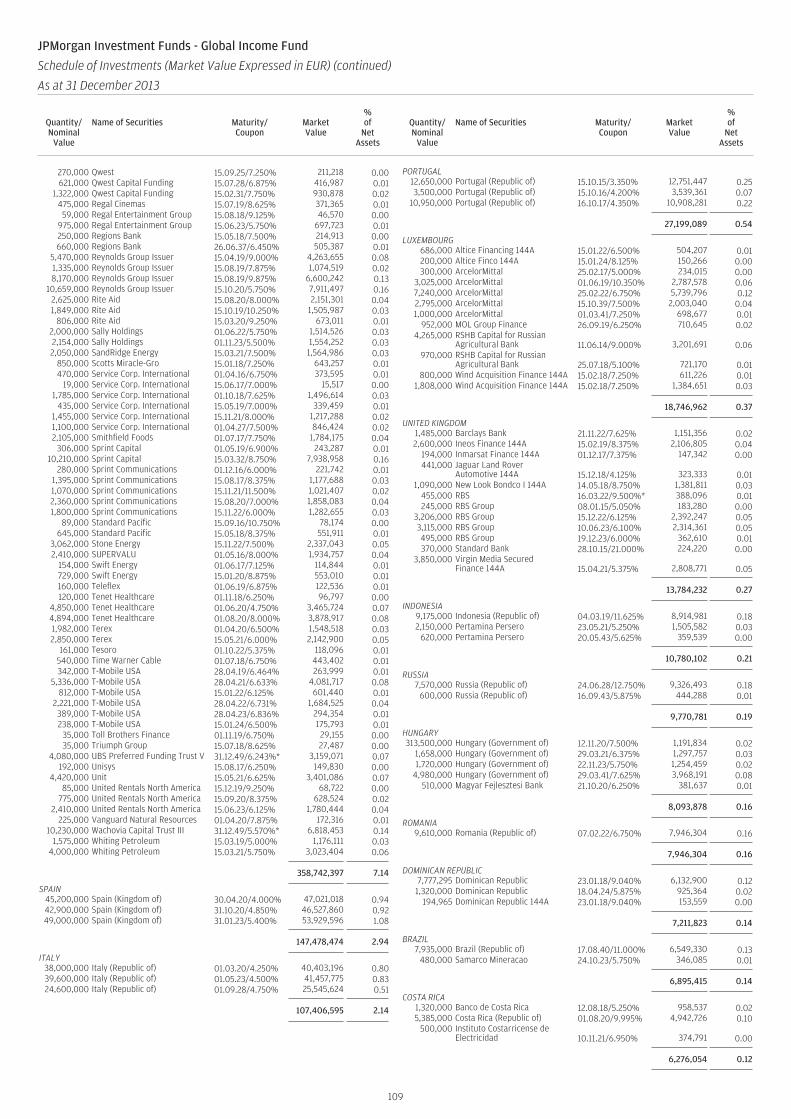
270,000 Qwest 15.09.25/7.250% 211,218 0.00621,000 Qwest Capital Funding 15.07.28/6.875% 416,987 0.01
1,322,000 Qwest Capital Funding 15.02.31/7.750% 930,878 0.02475,000 Regal Cinemas 15.07.19/8.625% 371,365 0.0159,000 Regal Entertainment Group 15.08.18/9.125% 46,570 0.00
975,000 Regal Entertainment Group 15.06.23/5.750% 697,723 0.01250,000 Regions Bank 15.05.18/7.500% 214,913 0.00660,000 Regions Bank 26.06.37/6.450% 505,387 0.01
5,470,000 Reynolds Group Issuer 15.04.19/9.000% 4,263,655 0.081,335,000 Reynolds Group Issuer 15.08.19/7.875% 1,074,519 0.028,170,000 Reynolds Group Issuer 15.08.19/9.875% 6,600,242 0.13
10,659,000 Reynolds Group Issuer 15.10.20/5.750% 7,911,497 0.162,625,000 Rite Aid 15.08.20/8.000% 2,151,301 0.041,849,000 Rite Aid 15.10.19/10.250% 1,505,987 0.03
806,000 Rite Aid 15.03.20/9.250% 673,011 0.012,000,000 Sally Holdings 01.06.22/5.750% 1,514,526 0.032,154,000 Sally Holdings 01.11.23/5.500% 1,554,252 0.032,050,000 SandRidge Energy 15.03.21/7.500% 1,564,986 0.03
850,000 Scotts Miracle-Gro 15.01.18/7.250% 643,257 0.01470,000 Service Corp. International 01.04.16/6.750% 373,595 0.01
19,000 Service Corp. International 15.06.17/7.000% 15,517 0.001,785,000 Service Corp. International 01.10.18/7.625% 1,496,614 0.03
435,000 Service Corp. International 15.05.19/7.000% 339,459 0.011,455,000 Service Corp. International 15.11.21/8.000% 1,217,288 0.021,100,000 Service Corp. International 01.04.27/7.500% 846,424 0.022,105,000 Smithfield Foods 01.07.17/7.750% 1,784,175 0.04
306,000 Sprint Capital 01.05.19/6.900% 243,287 0.0110,210,000 Sprint Capital 15.03.32/8.750% 7,938,958 0.16
280,000 Sprint Communications 01.12.16/6.000% 221,742 0.011,395,000 Sprint Communications 15.08.17/8.375% 1,177,688 0.031,070,000 Sprint Communications 15.11.21/11.500% 1,021,407 0.022,360,000 Sprint Communications 15.08.20/7.000% 1,858,083 0.041,800,000 Sprint Communications 15.11.22/6.000% 1,282,655 0.03
89,000 Standard Pacific 15.09.16/10.750% 78,174 0.00645,000 Standard Pacific 15.05.18/8.375% 551,911 0.01
3,062,000 Stone Energy 15.11.22/7.500% 2,337,043 0.052,410,000 SUPERVALU 01.05.16/8.000% 1,934,757 0.04
154,000 Swift Energy 01.06.17/7.125% 114,844 0.01729,000 Swift Energy 15.01.20/8.875% 553,010 0.01160,000 Teleflex 01.06.19/6.875% 122,536 0.01120,000 Tenet Healthcare 01.11.18/6.250% 96,797 0.00
4,850,000 Tenet Healthcare 01.06.20/4.750% 3,465,724 0.074,894,000 Tenet Healthcare 01.08.20/8.000% 3,878,917 0.081,982,000 Terex 01.04.20/6.500% 1,548,518 0.032,850,000 Terex 15.05.21/6.000% 2,142,900 0.05
161,000 Tesoro 01.10.22/5.375% 118,096 0.01540,000 Time Warner Cable 01.07.18/6.750% 443,402 0.01342,000 T-Mobile USA 28.04.19/6.464% 263,999 0.01
5,336,000 T-Mobile USA 28.04.21/6.633% 4,081,717 0.08812,000 T-Mobile USA 15.01.22/6.125% 601,440 0.01
2,221,000 T-Mobile USA 28.04.22/6.731% 1,684,525 0.04389,000 T-Mobile USA 28.04.23/6.836% 294,354 0.01238,000 T-Mobile USA 15.01.24/6.500% 175,793 0.01
35,000 Toll Brothers Finance 01.11.19/6.750% 29,155 0.0035,000 Triumph Group 15.07.18/8.625% 27,487 0.00
4,080,000 UBS Preferred Funding Trust V 31.12.49/6.243%* 3,159,071 0.07192,000 Unisys 15.08.17/6.250% 149,830 0.00
4,420,000 Unit 15.05.21/6.625% 3,401,086 0.0785,000 United Rentals North America 15.12.19/9.250% 68,722 0.00
775,000 United Rentals North America 15.09.20/8.375% 628,524 0.022,410,000 United Rentals North America 15.06.23/6.125% 1,780,444 0.04
225,000 Vanguard Natural Resources 01.04.20/7.875% 172,316 0.0110,230,000 Wachovia Capital Trust III 31.12.49/5.570%* 6,818,453 0.14
1,575,000 Whiting Petroleum 15.03.19/5.000% 1,176,111 0.034,000,000 Whiting Petroleum 15.03.21/5.750% 3,023,404 0.06
358,742,397 7.14
SPAIN45,200,000 Spain (Kingdom of) 30.04.20/4.000% 47,021,018 0.9442,900,000 Spain (Kingdom of) 31.10.20/4.850% 46,527,860 0.9249,000,000 Spain (Kingdom of) 31.01.23/5.400% 53,929,596 1.08
147,478,474 2.94
ITALY38,000,000 Italy (Republic of) 01.03.20/4.250% 40,403,196 0.8039,600,000 Italy (Republic of) 01.05.23/4.500% 41,457,775 0.8324,600,000 Italy (Republic of) 01.09.28/4.750% 25,545,624 0.51
107,406,595 2.14
PORTUGAL12,650,000 Portugal (Republic of) 15.10.15/3.350% 12,751,447 0.253,500,000 Portugal (Republic of) 15.10.16/4.200% 3,539,361 0.07
10,950,000 Portugal (Republic of) 16.10.17/4.350% 10,908,281 0.22
27,199,089 0.54
LUXEMBOURG686,000 Altice Financing 144A 15.01.22/6.500% 504,207 0.01200,000 Altice Finco 144A 15.01.24/8.125% 150,266 0.00300,000 ArcelorMittal 25.02.17/5.000% 234,015 0.00
3,025,000 ArcelorMittal 01.06.19/10.350% 2,787,578 0.067,240,000 ArcelorMittal 25.02.22/6.750% 5,739,796 0.122,795,000 ArcelorMittal 15.10.39/7.500% 2,003,040 0.041,000,000 ArcelorMittal 01.03.41/7.250% 698,677 0.01
952,000 MOL Group Finance 26.09.19/6.250% 710,645 0.024,265,000 RSHB Capital for Russian
Agricultural Bank 11.06.14/9.000% 3,201,691 0.06970,000 RSHB Capital for Russian
Agricultural Bank 25.07.18/5.100% 721,170 0.01800,000 Wind Acquisition Finance 144A 15.02.18/7.250% 611,226 0.01
1,808,000 Wind Acquisition Finance 144A 15.02.18/7.250% 1,384,651 0.03
18,746,962 0.37
UNITED KINGDOM1,485,000 Barclays Bank 21.11.22/7.625% 1,151,356 0.022,600,000 Ineos Finance 144A 15.02.19/8.375% 2,106,805 0.04
194,000 Inmarsat Finance 144A 01.12.17/7.375% 147,342 0.00441,000 Jaguar Land Rover
Automotive 144A 15.12.18/4.125% 323,333 0.011,090,000 New Look Bondco I 144A 14.05.18/8.750% 1,381,811 0.03
455,000 RBS 16.03.22/9.500%* 388,096 0.01245,000 RBS Group 08.01.15/5.050% 183,280 0.00
3,206,000 RBS Group 15.12.22/6.125% 2,392,247 0.053,115,000 RBS Group 10.06.23/6.100% 2,314,361 0.05495,000 RBS Group 19.12.23/6.000% 362,610 0.01370,000 Standard Bank 28.10.15/21.000% 224,220 0.00
3,850,000 Virgin Media SecuredFinance 144A 15.04.21/5.375% 2,808,771 0.05
13,784,232 0.27
INDONESIA9,175,000 Indonesia (Republic of) 04.03.19/11.625% 8,914,981 0.182,150,000 Pertamina Persero 23.05.21/5.250% 1,505,582 0.03
620,000 Pertamina Persero 20.05.43/5.625% 359,539 0.00
10,780,102 0.21
RUSSIA7,570,000 Russia (Republic of) 24.06.28/12.750% 9,326,493 0.18
600,000 Russia (Republic of) 16.09.43/5.875% 444,288 0.01
9,770,781 0.19
HUNGARY313,500,000 Hungary (Government of) 12.11.20/7.500% 1,191,834 0.02
1,658,000 Hungary (Government of) 29.03.21/6.375% 1,297,757 0.031,720,000 Hungary (Government of) 22.11.23/5.750% 1,254,459 0.02
4,980,000 Hungary (Government of) 29.03.41/7.625% 3,968,191 0.08510,000 Magyar Fejlesztesi Bank 21.10.20/6.250% 381,637 0.01
8,093,878 0.16
ROMANIA9,610,000 Romania (Republic of) 07.02.22/6.750% 7,946,304 0.16
7,946,304 0.16
DOMINICAN REPUBLIC7,777,295 Dominican Republic 23.01.18/9.040% 6,132,900 0.121,320,000 Dominican Republic 18.04.24/5.875% 925,364 0.02
194,965 Dominican Republic 144A 23.01.18/9.040% 153,559 0.00
7,211,823 0.14
BRAZIL7,935,000 Brazil (Republic of) 17.08.40/11.000% 6,549,330 0.13
480,000 Samarco Mineracao 24.10.23/5.750% 346,085 0.01
6,895,415 0.14
COSTA RICA1,320,000 Banco de Costa Rica 12.08.18/5.250% 958,537 0.025,385,000 Costa Rica (Republic of) 01.08.20/9.995% 4,942,726 0.10
500,000 Instituto Costarricense deElectricidad 10.11.21/6.950% 374,791 0.00
6,276,054 0.12
109
JPMorgan Investment Funds - Global Income Fund
Schedule of Investments (Market Value Expressed in EUR) (continued)
As at 31 December 2013
Quantity/Nominal
Value
Name of Securities Maturity/Coupon
MarketValue
%of
NetAssets
Quantity/Nominal
Value
Name of Securities Maturity/Coupon
MarketValue
%of
NetAssets
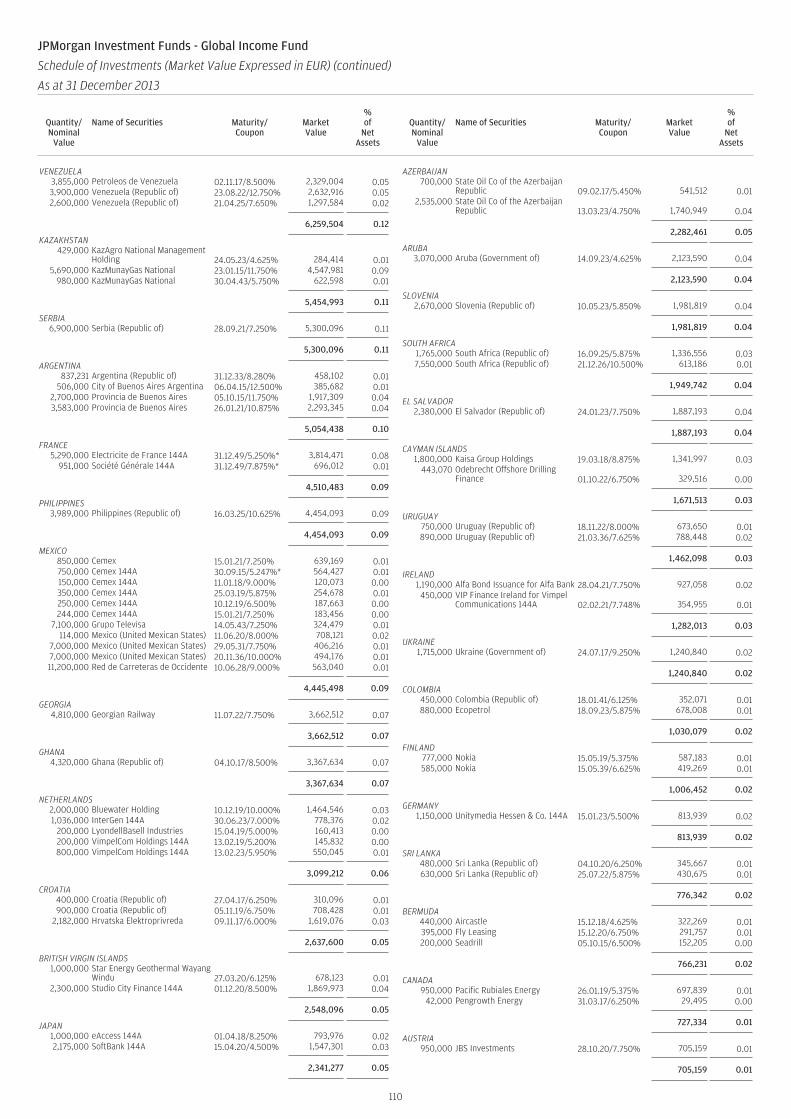
VENEZUELA3,855,000 Petroleos de Venezuela 02.11.17/8.500% 2,329,004 0.053,900,000 Venezuela (Republic of) 23.08.22/12.750% 2,632,916 0.052,600,000 Venezuela (Republic of) 21.04.25/7.650% 1,297,584 0.02
6,259,504 0.12
KAZAKHSTAN429,000 KazAgro National Management
Holding 24.05.23/4.625% 284,414 0.015,690,000 KazMunayGas National 23.01.15/11.750% 4,547,981 0.09
980,000 KazMunayGas National 30.04.43/5.750% 622,598 0.01
5,454,993 0.11
SERBIA6,900,000 Serbia (Republic of) 28.09.21/7.250% 5,300,096 0.11
5,300,096 0.11
ARGENTINA837,231 Argentina (Republic of) 31.12.33/8.280% 458,102 0.01
506,000 City of Buenos Aires Argentina 06.04.15/12.500% 385,682 0.012,700,000 Provincia de Buenos Aires 05.10.15/11.750% 1,917,309 0.043,583,000 Provincia de Buenos Aires 26.01.21/10.875% 2,293,345 0.04
5,054,438 0.10
FRANCE5,290,000 Electricite de France 144A 31.12.49/5.250%* 3,814,471 0.08
951,000 Société Générale 144A 31.12.49/7.875%* 696,012 0.01
4,510,483 0.09
PHILIPPINES3,989,000 Philippines (Republic of) 16.03.25/10.625% 4,454,093 0.09
4,454,093 0.09
MEXICO850,000 Cemex 15.01.21/7.250% 639,169 0.01750,000 Cemex 144A 30.09.15/5.247%* 564,427 0.01150,000 Cemex 144A 11.01.18/9.000% 120,073 0.00350,000 Cemex 144A 25.03.19/5.875% 254,678 0.01250,000 Cemex 144A 10.12.19/6.500% 187,663 0.00244,000 Cemex 144A 15.01.21/7.250% 183,456 0.00
7,100,000 Grupo Televisa 14.05.43/7.250% 324,479 0.01114,000 Mexico (United Mexican States) 11.06.20/8.000% 708,121 0.02
7,000,000 Mexico (United Mexican States) 29.05.31/7.750% 406,216 0.017,000,000 Mexico (United Mexican States) 20.11.36/10.000% 494,176 0.0111,200,000 Red de Carreteras de Occidente 10.06.28/9.000% 563,040 0.01
4,445,498 0.09
GEORGIA4,810,000 Georgian Railway 11.07.22/7.750% 3,662,512 0.07
3,662,512 0.07
GHANA4,320,000 Ghana (Republic of) 04.10.17/8.500% 3,367,634 0.07
3,367,634 0.07
NETHERLANDS2,000,000 Bluewater Holding 10.12.19/10.000% 1,464,546 0.031,036,000 InterGen 144A 30.06.23/7.000% 778,376 0.02
200,000 LyondellBasell Industries 15.04.19/5.000% 160,413 0.00200,000 VimpelCom Holdings 144A 13.02.19/5.200% 145,832 0.00800,000 VimpelCom Holdings 144A 13.02.23/5.950% 550,045 0.01
3,099,212 0.06
CROATIA400,000 Croatia (Republic of) 27.04.17/6.250% 310,096 0.01900,000 Croatia (Republic of) 05.11.19/6.750% 708,428 0.01
2,182,000 Hrvatska Elektroprivreda 09.11.17/6.000% 1,619,076 0.03
2,637,600 0.05
BRITISH VIRGIN ISLANDS1,000,000 Star Energy Geothermal Wayang
Windu 27.03.20/6.125% 678,123 0.012,300,000 Studio City Finance 144A 01.12.20/8.500% 1,869,973 0.04
2,548,096 0.05
JAPAN1,000,000 eAccess 144A 01.04.18/8.250% 793,976 0.022,175,000 SoftBank 144A 15.04.20/4.500% 1,547,301 0.03
2,341,277 0.05
AZERBAIJAN700,000 State Oil Co of the Azerbaijan
Republic 09.02.17/5.450% 541,512 0.012,535,000 State Oil Co of the Azerbaijan
Republic 13.03.23/4.750% 1,740,949 0.04
2,282,461 0.05
ARUBA3,070,000 Aruba (Government of) 14.09.23/4.625% 2,123,590 0.04
2,123,590 0.04
SLOVENIA2,670,000 Slovenia (Republic of) 10.05.23/5.850% 1,981,819 0.04
1,981,819 0.04
SOUTH AFRICA1,765,000 South Africa (Republic of) 16.09.25/5.875% 1,336,556 0.037,550,000 South Africa (Republic of) 21.12.26/10.500% 613,186 0.01
1,949,742 0.04
EL SALVADOR2,380,000 El Salvador (Republic of) 24.01.23/7.750% 1,887,193 0.04
1,887,193 0.04
CAYMAN ISLANDS1,800,000 Kaisa Group Holdings 19.03.18/8.875% 1,341,997 0.03
443,070 Odebrecht Offshore DrillingFinance 01.10.22/6.750% 329,516 0.00
1,671,513 0.03
URUGUAY750,000 Uruguay (Republic of) 18.11.22/8.000% 673,650 0.01890,000 Uruguay (Republic of) 21.03.36/7.625% 788,448 0.02
1,462,098 0.03
IRELAND1,190,000 Alfa Bond Issuance for Alfa Bank 28.04.21/7.750% 927,058 0.02
450,000 VIP Finance Ireland for VimpelCommunications 144A 02.02.21/7.748% 354,955 0.01
1,282,013 0.03
UKRAINE1,715,000 Ukraine (Government of) 24.07.17/9.250% 1,240,840 0.02
1,240,840 0.02
COLOMBIA450,000 Colombia (Republic of) 18.01.41/6.125% 352,071 0.01880,000 Ecopetrol 18.09.23/5.875% 678,008 0.01
1,030,079 0.02
FINLAND777,000 Nokia 15.05.19/5.375% 587,183 0.01585,000 Nokia 15.05.39/6.625% 419,269 0.01
1,006,452 0.02
GERMANY1,150,000 Unitymedia Hessen & Co. 144A 15.01.23/5.500% 813,939 0.02
813,939 0.02
SRI LANKA480,000 Sri Lanka (Republic of) 04.10.20/6.250% 345,667 0.01630,000 Sri Lanka (Republic of) 25.07.22/5.875% 430,675 0.01
776,342 0.02
BERMUDA440,000 Aircastle 15.12.18/4.625% 322,269 0.01395,000 Fly Leasing 15.12.20/6.750% 291,757 0.01200,000 Seadrill 05.10.15/6.500% 152,205 0.00
766,231 0.02
CANADA950,000 Pacific Rubiales Energy 26.01.19/5.375% 697,839 0.01
42,000 Pengrowth Energy 31.03.17/6.250% 29,495 0.00
727,334 0.01
AUSTRIA950,000 JBS Investments 28.10.20/7.750% 705,159 0.01
705,159 0.01
110
JPMorgan Investment Funds - Global Income Fund
Schedule of Investments (Market Value Expressed in EUR) (continued)
As at 31 December 2013
Quantity/Nominal
Value
Name of Securities Maturity/Coupon
MarketValue
%of
NetAssets
Quantity/Nominal
Value
Name of Securities Maturity/Coupon
MarketValue
%of
NetAssets
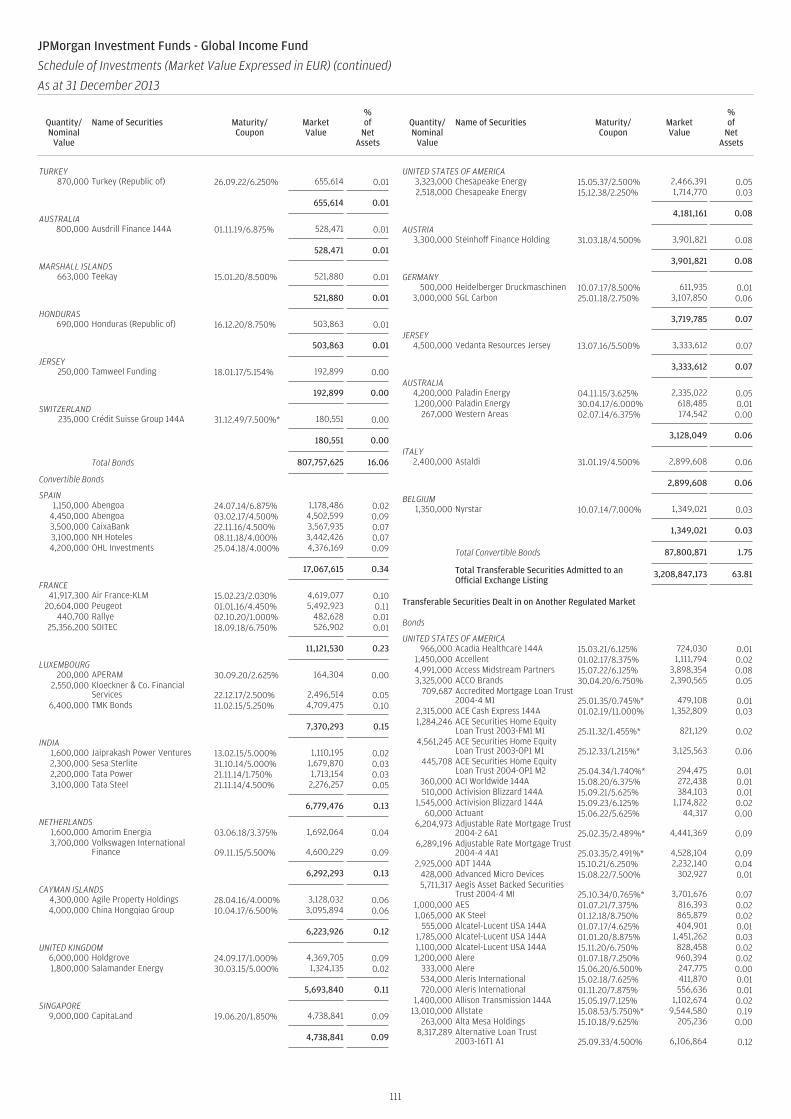
TURKEY870,000 Turkey (Republic of) 26.09.22/6.250% 655,614 0.01
655,614 0.01
AUSTRALIA800,000 Ausdrill Finance 144A 01.11.19/6.875% 528,471 0.01
528,471 0.01
MARSHALL ISLANDS663,000 Teekay 15.01.20/8.500% 521,880 0.01
521,880 0.01
HONDURAS690,000 Honduras (Republic of) 16.12.20/8.750% 503,863 0.01
503,863 0.01
JERSEY250,000 Tamweel Funding 18.01.17/5.154% 192,899 0.00
192,899 0.00
SWITZERLAND235,000 Crédit Suisse Group 144A 31.12.49/7.500%* 180,551 0.00
180,551 0.00
Total Bonds 807,757,625 16.06
Convertible Bonds
SPAIN1,150,000 Abengoa 24.07.14/6.875% 1,178,486 0.02
4,450,000 Abengoa 03.02.17/4.500% 4,502,599 0.093,500,000 CaixaBank 22.11.16/4.500% 3,567,935 0.073,100,000 NH Hoteles 08.11.18/4.000% 3,442,426 0.074,200,000 OHL Investments 25.04.18/4.000% 4,376,169 0.09
17,067,615 0.34
FRANCE41,917,300 Air France-KLM 15.02.23/2.030% 4,619,077 0.10
20,604,000 Peugeot 01.01.16/4.450% 5,492,923 0.11440,700 Rallye 02.10.20/1.000% 482,628 0.01
25,356,200 SOITEC 18.09.18/6.750% 526,902 0.01
11,121,530 0.23
LUXEMBOURG200,000 APERAM 30.09.20/2.625% 164,304 0.00
2,550,000 Kloeckner & Co. FinancialServices 22.12.17/2.500% 2,496,514 0.05
6,400,000 TMK Bonds 11.02.15/5.250% 4,709,475 0.10
7,370,293 0.15
INDIA1,600,000 Jaiprakash Power Ventures 13.02.15/5.000% 1,110,195 0.022,300,000 Sesa Sterlite 31.10.14/5.000% 1,679,870 0.032,200,000 Tata Power 21.11.14/1.750% 1,713,154 0.033,100,000 Tata Steel 21.11.14/4.500% 2,276,257 0.05
6,779,476 0.13
NETHERLANDS1,600,000 Amorim Energia 03.06.18/3.375% 1,692,064 0.043,700,000 Volkswagen International
Finance 09.11.15/5.500% 4,600,229 0.09
6,292,293 0.13
CAYMAN ISLANDS4,300,000 Agile Property Holdings 28.04.16/4.000% 3,128,032 0.064,000,000 China Hongqiao Group 10.04.17/6.500% 3,095,894 0.06
6,223,926 0.12
UNITED KINGDOM6,000,000 Holdgrove 24.09.17/1.000% 4,369,705 0.091,800,000 Salamander Energy 30.03.15/5.000% 1,324,135 0.02
5,693,840 0.11
SINGAPORE9,000,000 CapitaLand 19.06.20/1.850% 4,738,841 0.09
4,738,841 0.09
UNITED STATES OF AMERICA3,323,000 Chesapeake Energy 15.05.37/2.500% 2,466,391 0.052,518,000 Chesapeake Energy 15.12.38/2.250% 1,714,770 0.03
4,181,161 0.08
AUSTRIA3,300,000 Steinhoff Finance Holding 31.03.18/4.500% 3,901,821 0.08
3,901,821 0.08
GERMANY500,000 Heidelberger Druckmaschinen 10.07.17/8.500% 611,935 0.01
3,000,000 SGL Carbon 25.01.18/2.750% 3,107,850 0.06
3,719,785 0.07
JERSEY4,500,000 Vedanta Resources Jersey 13.07.16/5.500% 3,333,612 0.07
3,333,612 0.07
AUSTRALIA4,200,000 Paladin Energy 04.11.15/3.625% 2,335,022 0.051,200,000 Paladin Energy 30.04.17/6.000% 618,485 0.01
267,000 Western Areas 02.07.14/6.375% 174,542 0.00
3,128,049 0.06
ITALY2,400,000 Astaldi 31.01.19/4.500% 2,899,608 0.06
2,899,608 0.06
BELGIUM1,350,000 Nyrstar 10.07.14/7.000% 1,349,021 0.03
1,349,021 0.03
Total Convertible Bonds 87,800,871 1.75
Total Transferable Securities Admitted to anOfficial Exchange Listing
3,208,847,173 63.81
Transferable Securities Dealt in on Another Regulated Market
Bonds
UNITED STATES OF AMERICA966,000 Acadia Healthcare 144A 15.03.21/6.125% 724,030 0.01
1,450,000 Accellent 01.02.17/8.375% 1,111,794 0.024,991,000 Access Midstream Partners 15.07.22/6.125% 3,898,354 0.083,325,000 ACCO Brands 30.04.20/6.750% 2,390,565 0.05
709,687 Accredited Mortgage Loan Trust2004-4 M1 25.01.35/0.745%* 479,108 0.01
2,315,000 ACE Cash Express 144A 01.02.19/11.000% 1,352,809 0.031,284,246 ACE Securities Home Equity
Loan Trust 2003-FM1 M1 25.11.32/1.455%* 821,129 0.024,561,245 ACE Securities Home Equity
Loan Trust 2003-OP1 M1 25.12.33/1.215%* 3,125,563 0.06445,708 ACE Securities Home Equity
Loan Trust 2004-OP1 M2 25.04.34/1.740%* 294,475 0.01360,000 ACI Worldwide 144A 15.08.20/6.375% 272,438 0.01510,000 Activision Blizzard 144A 15.09.21/5.625% 384,103 0.01
1,545,000 Activision Blizzard 144A 15.09.23/6.125% 1,174,822 0.0260,000 Actuant 15.06.22/5.625% 44,317 0.00
6,204,973 Adjustable Rate Mortgage Trust2004-2 6A1 25.02.35/2.489%* 4,441,369 0.09
6,289,196 Adjustable Rate Mortgage Trust2004-4 4A1 25.03.35/2.491%* 4,528,104 0.09
2,925,000 ADT 144A 15.10.21/6.250% 2,232,140 0.04428,000 Advanced Micro Devices 15.08.22/7.500% 302,927 0.015,711,317 Aegis Asset Backed Securities
Trust 2004-4 MI 25.10.34/0.765%* 3,701,676 0.071,000,000 AES 01.07.21/7.375% 816,393 0.021,065,000 AK Steel 01.12.18/8.750% 865,879 0.02
555,000 Alcatel-Lucent USA 144A 01.07.17/4.625% 404,901 0.011,785,000 Alcatel-Lucent USA 144A 01.01.20/8.875% 1,451,262 0.031,100,000 Alcatel-Lucent USA 144A 15.11.20/6.750% 828,458 0.021,200,000 Alere 01.07.18/7.250% 960,394 0.02
333,000 Alere 15.06.20/6.500% 247,775 0.00534,000 Aleris International 15.02.18/7.625% 411,870 0.01720,000 Aleris International 01.11.20/7.875% 556,636 0.01
1,400,000 Allison Transmission 144A 15.05.19/7.125% 1,102,674 0.0213,010,000 Allstate 15.08.53/5.750%* 9,544,580 0.19
263,000 Alta Mesa Holdings 15.10.18/9.625% 205,236 0.008,317,289 Alternative Loan Trust
2003-16T1 A1 25.09.33/4.500% 6,106,864 0.12
111
JPMorgan Investment Funds - Global Income Fund
Schedule of Investments (Market Value Expressed in EUR) (continued)
As at 31 December 2013
Quantity/Nominal
Value
Name of Securities Maturity/Coupon
MarketValue
%of
NetAssets
Quantity/Nominal
Value
Name of Securities Maturity/Coupon
MarketValue
%of
NetAssets
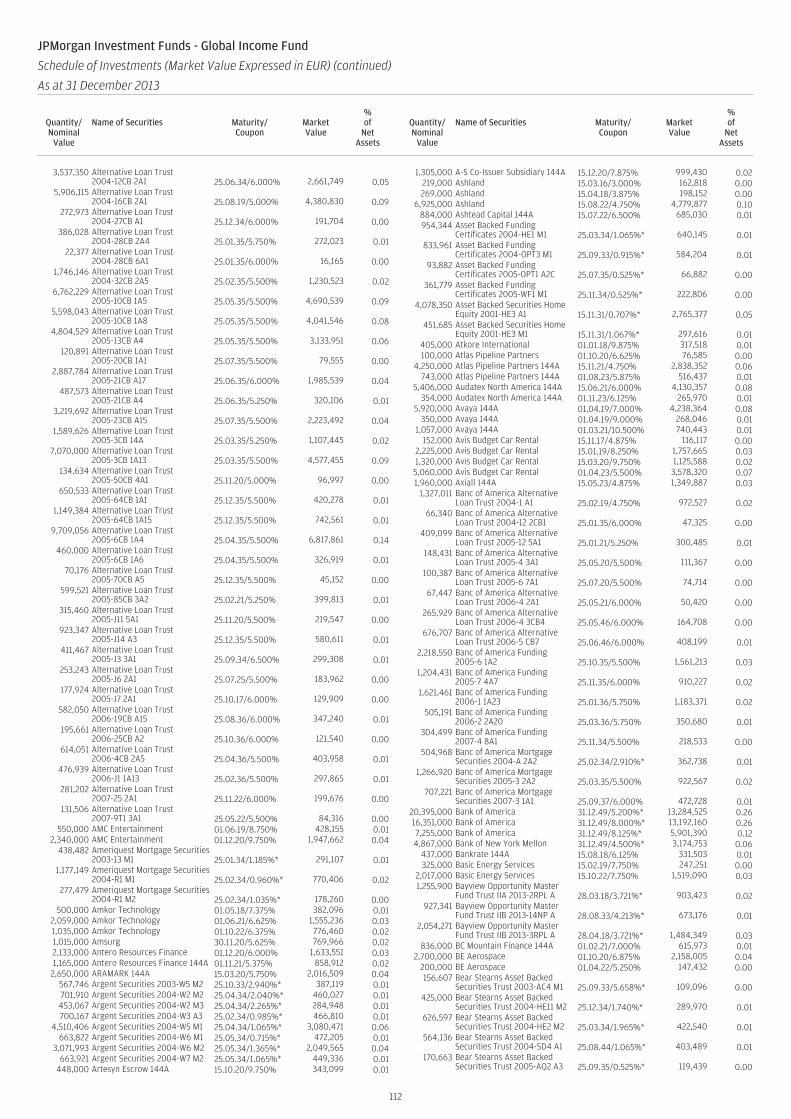
3,537,350 Alternative Loan Trust2004-12CB 2A1 25.06.34/6.000% 2,661,749 0.05
5,906,115 Alternative Loan Trust2004-16CB 2A1 25.08.19/5.000% 4,380,830 0.09
272,973 Alternative Loan Trust2004-27CB A1 25.12.34/6.000% 191,704 0.00
386,028 Alternative Loan Trust2004-28CB 2A4 25.01.35/5.750% 272,023 0.01
22,377 Alternative Loan Trust2004-28CB 6A1 25.01.35/6.000% 16,165 0.00
1,746,146 Alternative Loan Trust2004-32CB 2A5 25.02.35/5.500% 1,230,523 0.02
6,762,229 Alternative Loan Trust2005-10CB 1A5 25.05.35/5.500% 4,690,539 0.09
5,598,043 Alternative Loan Trust2005-10CB 1A8 25.05.35/5.500% 4,041,546 0.08
4,804,529 Alternative Loan Trust2005-13CB A4 25.05.35/5.500% 3,133,951 0.06
120,891 Alternative Loan Trust2005-20CB 1A1 25.07.35/5.500% 79,555 0.00
2,887,784 Alternative Loan Trust2005-21CB A17 25.06.35/6.000% 1,985,539 0.04
487,573 Alternative Loan Trust2005-21CB A4 25.06.35/5.250% 320,106 0.01
3,219,692 Alternative Loan Trust2005-23CB A15 25.07.35/5.500% 2,223,492 0.04
1,589,626 Alternative Loan Trust2005-3CB 14A 25.03.35/5.250% 1,107,445 0.02
7,070,000 Alternative Loan Trust2005-3CB 1A13 25.03.35/5.500% 4,577,455 0.09
134,634 Alternative Loan Trust2005-50CB 4A1 25.11.20/5.000% 96,997 0.00
650,533 Alternative Loan Trust2005-64CB 1A1 25.12.35/5.500% 420,278 0.01
1,149,384 Alternative Loan Trust2005-64CB 1A15 25.12.35/5.500% 742,561 0.01
9,709,056 Alternative Loan Trust2005-6CB 1A4 25.04.35/5.500% 6,817,861 0.14
460,000 Alternative Loan Trust2005-6CB 1A6 25.04.35/5.500% 326,919 0.01
70,176 Alternative Loan Trust2005-70CB A5 25.12.35/5.500% 45,152 0.00
599,521 Alternative Loan Trust2005-85CB 3A2 25.02.21/5.250% 399,813 0.01
315,460 Alternative Loan Trust2005-J11 5A1 25.11.20/5.500% 219,547 0.00
923,347 Alternative Loan Trust2005-J14 A3 25.12.35/5.500% 580,611 0.01
411,467 Alternative Loan Trust2005-J3 3A1 25.09.34/6.500% 299,308 0.01
253,243 Alternative Loan Trust2005-J6 2A1 25.07.25/5.500% 183,962 0.00
177,924 Alternative Loan Trust2005-J7 2A1 25.10.17/6.000% 129,909 0.00
582,050 Alternative Loan Trust2006-19CB A15 25.08.36/6.000% 347,240 0.01
195,661 Alternative Loan Trust2006-25CB A2 25.10.36/6.000% 121,540 0.00
614,051 Alternative Loan Trust2006-4CB 2A5 25.04.36/5.500% 403,958 0.01
476,939 Alternative Loan Trust2006-J1 1A13 25.02.36/5.500% 297,865 0.01
281,202 Alternative Loan Trust2007-25 2A1 25.11.22/6.000% 199,676 0.00
131,506 Alternative Loan Trust2007-9T1 3A1 25.05.22/5.500% 84,316 0.00
550,000 AMC Entertainment 01.06.19/8.750% 428,155 0.012,340,000 AMC Entertainment 01.12.20/9.750% 1,947,662 0.04
438,482 Ameriquest Mortgage Securities2003-13 M1 25.01.34/1.185%* 291,107 0.01
1,177,149 Ameriquest Mortgage Securities2004-R1 M1 25.02.34/0.960%* 770,406 0.02
277,479 Ameriquest Mortgage Securities2004-R1 M2 25.02.34/1.035%* 178,260 0.00
500,000 Amkor Technology 01.05.18/7.375% 382,096 0.012,059,000 Amkor Technology 01.06.21/6.625% 1,555,236 0.031,035,000 Amkor Technology 01.10.22/6.375% 776,460 0.021,015,000 Amsurg 30.11.20/5.625% 769,966 0.022,133,000 Antero Resources Finance 01.12.20/6.000% 1,633,551 0.031,165,000 Antero Resources Finance 144A 01.11.21/5.375% 858,912 0.02
2,650,000 ARAMARK 144A 15.03.20/5.750% 2,016,509 0.04567,746 Argent Securities 2003-W5 M2 25.10.33/2.940%* 387,119 0.01701,910 Argent Securities 2004-W2 M2 25.04.34/2.040%* 460,027 0.01453,067 Argent Securities 2004-W2 M3 25.04.34/2.265%* 284,948 0.01700,167 Argent Securities 2004-W3 A3 25.02.34/0.985%* 466,810 0.01
4,510,406 Argent Securities 2004-W5 M1 25.04.34/1.065%* 3,080,471 0.06663,822 Argent Securities 2004-W6 M1 25.05.34/0.715%* 472,205 0.01
3,071,993 Argent Securities 2004-W6 M2 25.05.34/1.365%* 2,049,565 0.04663,921 Argent Securities 2004-W7 M2 25.05.34/1.065%* 449,336 0.01
448,000 Artesyn Escrow 144A 15.10.20/9.750% 343,099 0.01
1,305,000 A-S Co-Issuer Subsidiary 144A 15.12.20/7.875% 999,430 0.02219,000 Ashland 15.03.16/3.000% 162,818 0.00269,000 Ashland 15.04.18/3.875% 198,152 0.00
6,925,000 Ashland 15.08.22/4.750% 4,779,877 0.10884,000 Ashtead Capital 144A 15.07.22/6.500% 685,030 0.01954,344 Asset Backed Funding
Certificates 2004-HE1 M1 25.03.34/1.065%* 640,145 0.01833,961 Asset Backed Funding
Certificates 2004-OPT3 M1 25.09.33/0.915%* 584,204 0.0193,882 Asset Backed Funding
Certificates 2005-OPT1 A2C 25.07.35/0.525%* 66,882 0.00361,779 Asset Backed Funding
Certificates 2005-WF1 M1 25.11.34/0.525%* 222,806 0.004,078,350 Asset Backed Securities Home
Equity 2001-HE3 A1 15.11.31/0.707%* 2,765,377 0.05451,685 Asset Backed Securities Home
Equity 2001-HE3 M1 15.11.31/1.067%* 297,616 0.01405,000 Atkore International 01.01.18/9.875% 317,518 0.01100,000 Atlas Pipeline Partners 01.10.20/6.625% 76,585 0.00
4,250,000 Atlas Pipeline Partners 144A 15.11.21/4.750% 2,838,352 0.06743,000 Atlas Pipeline Partners 144A 01.08.23/5.875% 516,437 0.01
5,406,000 Audatex North America 144A 15.06.21/6.000% 4,130,357 0.08354,000 Audatex North America 144A 01.11.23/6.125% 265,970 0.01
5,920,000 Avaya 144A 01.04.19/7.000% 4,238,364 0.08350,000 Avaya 144A 01.04.19/9.000% 268,046 0.01
1,057,000 Avaya 144A 01.03.21/10.500% 740,443 0.01152,000 Avis Budget Car Rental 15.11.17/4.875% 116,117 0.00
2,225,000 Avis Budget Car Rental 15.01.19/8.250% 1,757,665 0.031,320,000 Avis Budget Car Rental 15.03.20/9.750% 1,125,588 0.025,060,000 Avis Budget Car Rental 01.04.23/5.500% 3,578,320 0.071,960,000 Axiall 144A 15.05.23/4.875% 1,349,887 0.03
1,327,011 Banc of America AlternativeLoan Trust 2004-1 A1 25.02.19/4.750% 972,527 0.02
66,340 Banc of America AlternativeLoan Trust 2004-12 2CB1 25.01.35/6.000% 47,325 0.00
409,099 Banc of America AlternativeLoan Trust 2005-12 5A1 25.01.21/5.250% 300,485 0.01
148,431 Banc of America AlternativeLoan Trust 2005-4 3A1 25.05.20/5.500% 111,367 0.00
100,387 Banc of America AlternativeLoan Trust 2005-6 7A1 25.07.20/5.500% 74,714 0.00
67,447 Banc of America AlternativeLoan Trust 2006-4 2A1 25.05.21/6.000% 50,420 0.00
265,929 Banc of America AlternativeLoan Trust 2006-4 3CB4 25.05.46/6.000% 164,708 0.00
676,707 Banc of America AlternativeLoan Trust 2006-5 CB7 25.06.46/6.000% 408,199 0.01
2,218,550 Banc of America Funding2005-6 1A2 25.10.35/5.500% 1,561,213 0.03
1,204,431 Banc of America Funding2005-7 4A7 25.11.35/6.000% 910,227 0.02
1,621,461 Banc of America Funding2006-1 1A23 25.01.36/5.750% 1,183,371 0.02
505,191 Banc of America Funding2006-2 2A20 25.03.36/5.750% 350,680 0.01
304,499 Banc of America Funding2007-4 8A1 25.11.34/5.500% 218,533 0.00
504,968 Banc of America MortgageSecurities 2004-A 2A2 25.02.34/2.910%* 362,738 0.01
1,266,920 Banc of America MortgageSecurities 2005-3 2A2 25.03.35/5.500% 922,567 0.02
707,221 Banc of America MortgageSecurities 2007-3 1A1 25.09.37/6.000% 472,728 0.01
20,395,000 Bank of America 31.12.49/5.200%* 13,284,525 0.2616,351,000 Bank of America 31.12.49/8.000%* 13,192,160 0.267,255,000 Bank of America 31.12.49/8.125%* 5,901,390 0.124,867,000 Bank of New York Mellon 31.12.49/4.500%* 3,174,753 0.06
437,000 Bankrate 144A 15.08.18/6.125% 331,503 0.01325,000 Basic Energy Services 15.02.19/7.750% 247,251 0.00
2,017,000 Basic Energy Services 15.10.22/7.750% 1,519,090 0.031,255,900 Bayview Opportunity Master
Fund Trust IIA 2013-2RPL A 28.03.18/3.721%* 903,423 0.02927,341 Bayview Opportunity Master
Fund Trust IIB 2013-14NP A 28.08.33/4.213%* 673,176 0.012,054,271 Bayview Opportunity Master
Fund Trust IIB 2013-3RPL A 28.04.18/3.721%* 1,484,349 0.03836,000 BC Mountain Finance 144A 01.02.21/7.000% 615,973 0.01
2,700,000 BE Aerospace 01.10.20/6.875% 2,158,005 0.04200,000 BE Aerospace 01.04.22/5.250% 147,432 0.00156,607 Bear Stearns Asset Backed
Securities Trust 2003-AC4 M1 25.09.33/5.658%* 109,096 0.00425,000 Bear Stearns Asset Backed
Securities Trust 2004-HE11 M2 25.12.34/1.740%* 289,970 0.01626,597 Bear Stearns Asset Backed
Securities Trust 2004-HE2 M2 25.03.34/1.965%* 422,540 0.01564,136 Bear Stearns Asset Backed
Securities Trust 2004-SD4 A1 25.08.44/1.065%* 403,489 0.01170,663 Bear Stearns Asset Backed
Securities Trust 2005-AQ2 A3 25.09.35/0.525%* 119,439 0.00
112
JPMorgan Investment Funds - Global Income Fund
Schedule of Investments (Market Value Expressed in EUR) (continued)
As at 31 December 2013
Quantity/Nominal
Value
Name of Securities Maturity/Coupon
MarketValue
%of
NetAssets
Quantity/Nominal
Value
Name of Securities Maturity/Coupon
MarketValue
%of
NetAssets
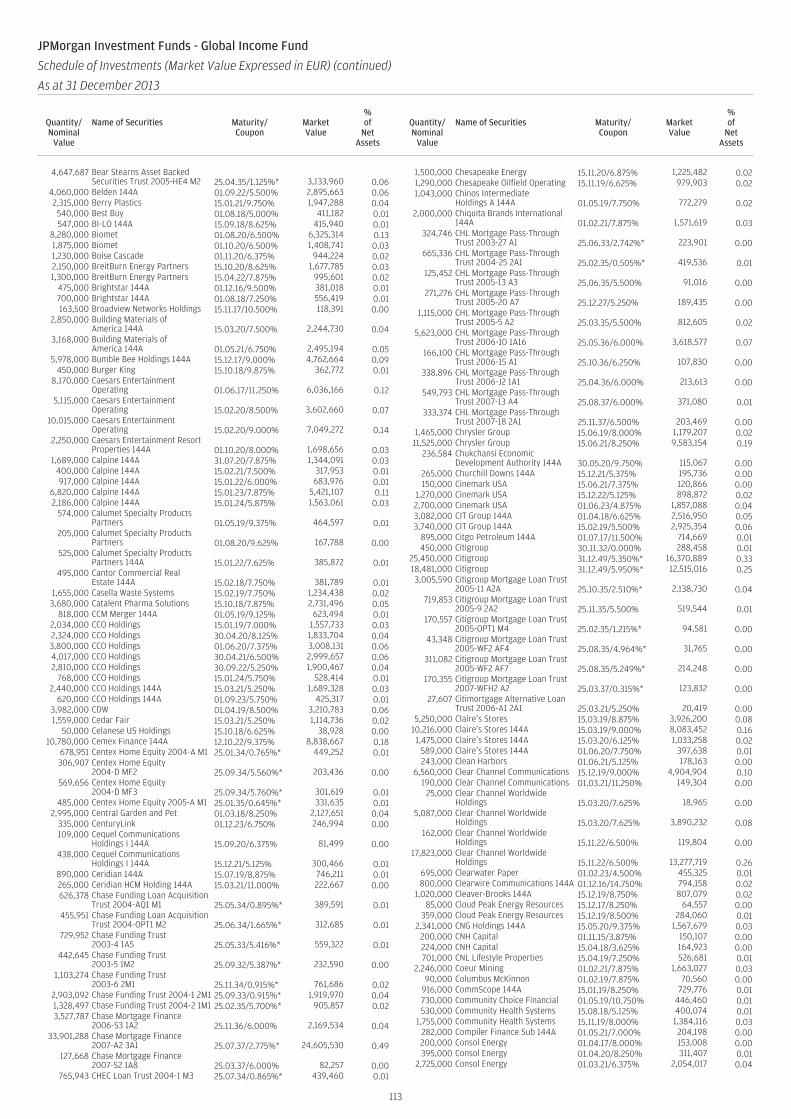
4,647,687 Bear Stearns Asset BackedSecurities Trust 2005-HE4 M2 25.04.35/1.125%* 3,133,960 0.06
4,060,000 Belden 144A 01.09.22/5.500% 2,895,663 0.062,315,000 Berry Plastics 15.01.21/9.750% 1,947,288 0.04540,000 Best Buy 01.08.18/5.000% 411,182 0.01547,000 BI-LO 144A 15.09.18/8.625% 415,940 0.01
8,280,000 Biomet 01.08.20/6.500% 6,325,314 0.131,875,000 Biomet 01.10.20/6.500% 1,408,741 0.031,230,000 Boise Cascade 01.11.20/6.375% 944,224 0.022,150,000 BreitBurn Energy Partners 15.10.20/8.625% 1,677,785 0.031,300,000 BreitBurn Energy Partners 15.04.22/7.875% 995,601 0.02
475,000 Brightstar 144A 01.12.16/9.500% 381,018 0.01700,000 Brightstar 144A 01.08.18/7.250% 556,419 0.01163,500 Broadview Networks Holdings 15.11.17/10.500% 118,391 0.00
2,850,000 Building Materials ofAmerica 144A 15.03.20/7.500% 2,244,730 0.04
3,168,000 Building Materials ofAmerica 144A 01.05.21/6.750% 2,495,194 0.05
5,978,000 Bumble Bee Holdings 144A 15.12.17/9.000% 4,762,664 0.09450,000 Burger King 15.10.18/9.875% 362,772 0.01
8,170,000 Caesars EntertainmentOperating 01.06.17/11.250% 6,036,166 0.12
5,115,000 Caesars EntertainmentOperating 15.02.20/8.500% 3,602,660 0.07
10,015,000 Caesars EntertainmentOperating 15.02.20/9.000% 7,049,272 0.14
2,250,000 Caesars Entertainment ResortProperties 144A 01.10.20/8.000% 1,698,656 0.03
1,689,000 Calpine 144A 31.07.20/7.875% 1,344,091 0.03400,000 Calpine 144A 15.02.21/7.500% 317,953 0.01917,000 Calpine 144A 15.01.22/6.000% 683,976 0.01
6,820,000 Calpine 144A 15.01.23/7.875% 5,421,107 0.112,186,000 Calpine 144A 15.01.24/5.875% 1,563,061 0.03
574,000 Calumet Specialty ProductsPartners 01.05.19/9.375% 464,597 0.01
205,000 Calumet Specialty ProductsPartners 01.08.20/9.625% 167,788 0.00
525,000 Calumet Specialty ProductsPartners 144A 15.01.22/7.625% 385,872 0.01
495,000 Cantor Commercial RealEstate 144A 15.02.18/7.750% 381,789 0.01
1,655,000 Casella Waste Systems 15.02.19/7.750% 1,234,438 0.023,680,000 Catalent Pharma Solutions 15.10.18/7.875% 2,731,496 0.05
818,000 CCM Merger 144A 01.05.19/9.125% 623,494 0.012,034,000 CCO Holdings 15.01.19/7.000% 1,557,733 0.032,324,000 CCO Holdings 30.04.20/8.125% 1,833,704 0.043,800,000 CCO Holdings 01.06.20/7.375% 3,008,131 0.064,017,000 CCO Holdings 30.04.21/6.500% 2,999,657 0.062,810,000 CCO Holdings 30.09.22/5.250% 1,900,467 0.04
768,000 CCO Holdings 15.01.24/5.750% 528,414 0.012,440,000 CCO Holdings 144A 15.03.21/5.250% 1,689,328 0.03
620,000 CCO Holdings 144A 01.09.23/5.750% 425,317 0.013,982,000 CDW 01.04.19/8.500% 3,210,783 0.061,559,000 Cedar Fair 15.03.21/5.250% 1,114,736 0.02
50,000 Celanese US Holdings 15.10.18/6.625% 38,928 0.0010,780,000 Cemex Finance 144A 12.10.22/9.375% 8,838,667 0.18
678,951 Centex Home Equity 2004-A M1 25.01.34/0.765%* 449,252 0.01306,907 Centex Home Equity
2004-D MF2 25.09.34/5.560%* 203,436 0.00569,656 Centex Home Equity
2004-D MF3 25.09.34/5.760%* 301,619 0.01485,000 Centex Home Equity 2005-A M1 25.01.35/0.645%* 331,635 0.01
2,995,000 Central Garden and Pet 01.03.18/8.250% 2,127,651 0.04335,000 CenturyLink 01.12.23/6.750% 246,994 0.00109,000 Cequel Communications
Holdings I 144A 15.09.20/6.375% 81,499 0.00438,000 Cequel Communications
Holdings I 144A 15.12.21/5.125% 300,466 0.01890,000 Ceridian 144A 15.07.19/8.875% 746,211 0.01265,000 Ceridian HCM Holding 144A 15.03.21/11.000% 222,667 0.00626,378 Chase Funding Loan Acquisition
Trust 2004-AQ1 M1 25.05.34/0.895%* 389,591 0.01455,951 Chase Funding Loan Acquisition
Trust 2004-OPT1 M2 25.06.34/1.665%* 312,685 0.01729,952 Chase Funding Trust
2003-4 1A5 25.05.33/5.416%* 559,322 0.01442,645 Chase Funding Trust
2003-5 1M2 25.09.32/5.387%* 232,590 0.001,103,274 Chase Funding Trust
2003-6 2M1 25.11.34/0.915%* 761,686 0.022,903,092 Chase Funding Trust 2004-1 2M1 25.09.33/0.915%* 1,919,970 0.041,328,497 Chase Funding Trust 2004-2 1M1 25.02.35/5.700%* 905,857 0.023,527,787 Chase Mortgage Finance
2006-S3 1A2 25.11.36/6.000% 2,169,534 0.0433,901,288 Chase Mortgage Finance
2007-A2 3A1 25.07.37/2.775%* 24,605,530 0.49127,668 Chase Mortgage Finance
2007-S2 1A8 25.03.37/6.000% 82,257 0.00765,943 CHEC Loan Trust 2004-1 M3 25.07.34/0.865%* 439,460 0.01
1,500,000 Chesapeake Energy 15.11.20/6.875% 1,225,482 0.021,290,000 Chesapeake Oilfield Operating 15.11.19/6.625% 979,903 0.021,043,000 Chinos Intermediate
Holdings A 144A 01.05.19/7.750% 772,279 0.022,000,000 Chiquita Brands International
144A 01.02.21/7.875% 1,571,619 0.03324,746 CHL Mortgage Pass-Through
Trust 2003-27 A1 25.06.33/2.742%* 223,901 0.00665,336 CHL Mortgage Pass-Through
Trust 2004-25 2A1 25.02.35/0.505%* 419,536 0.01125,452 CHL Mortgage Pass-Through
Trust 2005-13 A3 25.06.35/5.500% 91,016 0.00271,276 CHL Mortgage Pass-Through
Trust 2005-20 A7 25.12.27/5.250% 189,435 0.001,115,000 CHL Mortgage Pass-Through
Trust 2005-5 A2 25.03.35/5.500% 812,605 0.025,623,000 CHL Mortgage Pass-Through
Trust 2006-10 1A16 25.05.36/6.000% 3,618,577 0.07166,100 CHL Mortgage Pass-Through
Trust 2006-15 A1 25.10.36/6.250% 107,830 0.00338,896 CHL Mortgage Pass-Through
Trust 2006-J2 1A1 25.04.36/6.000% 213,613 0.00549,793 CHL Mortgage Pass-Through
Trust 2007-13 A4 25.08.37/6.000% 371,080 0.01333,374 CHL Mortgage Pass-Through
Trust 2007-18 2A1 25.11.37/6.500% 203,469 0.001,465,000 Chrysler Group 15.06.19/8.000% 1,179,207 0.0211,525,000 Chrysler Group 15.06.21/8.250% 9,583,154 0.19
236,584 Chukchansi EconomicDevelopment Authority 144A 30.05.20/9.750% 115,067 0.00
265,000 Churchill Downs 144A 15.12.21/5.375% 195,736 0.00150,000 Cinemark USA 15.06.21/7.375% 120,866 0.00
1,270,000 Cinemark USA 15.12.22/5.125% 898,872 0.022,700,000 Cinemark USA 01.06.23/4.875% 1,857,088 0.043,082,000 CIT Group 144A 01.04.18/6.625% 2,516,950 0.053,740,000 CIT Group 144A 15.02.19/5.500% 2,925,354 0.06
895,000 Citgo Petroleum 144A 01.07.17/11.500% 714,669 0.01450,000 Citigroup 30.11.32/0.000% 288,458 0.01
25,450,000 Citigroup 31.12.49/5.350%* 16,370,889 0.3318,481,000 Citigroup 31.12.49/5.950%* 12,515,016 0.253,005,590 Citigroup Mortgage Loan Trust
2005-11 A2A 25.10.35/2.510%* 2,138,730 0.04719,853 Citigroup Mortgage Loan Trust
2005-9 2A2 25.11.35/5.500% 519,544 0.01170,557 Citigroup Mortgage Loan Trust
2005-OPT1 M4 25.02.35/1.215%* 94,581 0.0043,348 Citigroup Mortgage Loan Trust
2005-WF2 AF4 25.08.35/4.964%* 31,765 0.00311,082 Citigroup Mortgage Loan Trust
2005-WF2 AF7 25.08.35/5.249%* 214,248 0.00170,355 Citigroup Mortgage Loan Trust
2007-WFH2 A2 25.03.37/0.315%* 123,832 0.0027,607 Citimortgage Alternative Loan
Trust 2006-A1 2A1 25.03.21/5.250% 20,419 0.005,250,000 Claire’s Stores 15.03.19/8.875% 3,926,200 0.08
10,216,000 Claire’s Stores 144A 15.03.19/9.000% 8,083,452 0.161,475,000 Claire’s Stores 144A 15.03.20/6.125% 1,033,258 0.02
589,000 Claire’s Stores 144A 01.06.20/7.750% 397,638 0.01243,000 Clean Harbors 01.06.21/5.125% 178,163 0.00
6,560,000 Clear Channel Communications 15.12.19/9.000% 4,904,904 0.10190,000 Clear Channel Communications 01.03.21/11.250% 149,304 0.00
25,000 Clear Channel WorldwideHoldings 15.03.20/7.625% 18,965 0.00
5,087,000 Clear Channel WorldwideHoldings 15.03.20/7.625% 3,890,232 0.08
162,000 Clear Channel WorldwideHoldings 15.11.22/6.500% 119,804 0.00
17,823,000 Clear Channel WorldwideHoldings 15.11.22/6.500% 13,277,719 0.26
695,000 Clearwater Paper 01.02.23/4.500% 455,325 0.01800,000 Clearwire Communications 144A 01.12.16/14.750% 794,158 0.02
1,020,000 Cleaver-Brooks 144A 15.12.19/8.750% 807,079 0.0285,000 Cloud Peak Energy Resources 15.12.17/8.250% 64,557 0.00
359,000 Cloud Peak Energy Resources 15.12.19/8.500% 284,060 0.012,341,000 CNG Holdings 144A 15.05.20/9.375% 1,567,679 0.03
200,000 CNH Capital 01.11.15/3.875% 150,107 0.00224,000 CNH Capital 15.04.18/3.625% 164,923 0.00701,000 CNL Lifestyle Properties 15.04.19/7.250% 526,681 0.01
2,246,000 Coeur Mining 01.02.21/7.875% 1,663,027 0.0390,000 Columbus McKinnon 01.02.19/7.875% 70,560 0.00
916,000 CommScope 144A 15.01.19/8.250% 729,776 0.01730,000 Community Choice Financial 01.05.19/10.750% 446,460 0.01530,000 Community Health Systems 15.08.18/5.125% 400,074 0.01
1,755,000 Community Health Systems 15.11.19/8.000% 1,384,116 0.03282,000 Compiler Finance Sub 144A 01.05.21/7.000% 204,198 0.00200,000 Consol Energy 01.04.17/8.000% 153,008 0.00395,000 Consol Energy 01.04.20/8.250% 311,407 0.01
2,725,000 Consol Energy 01.03.21/6.375% 2,054,017 0.04
113
JPMorgan Investment Funds - Global Income Fund
Schedule of Investments (Market Value Expressed in EUR) (continued)
As at 31 December 2013
Quantity/Nominal
Value
Name of Securities Maturity/Coupon
MarketValue
%of
NetAssets
Quantity/Nominal
Value
Name of Securities Maturity/Coupon
MarketValue
%of
NetAssets
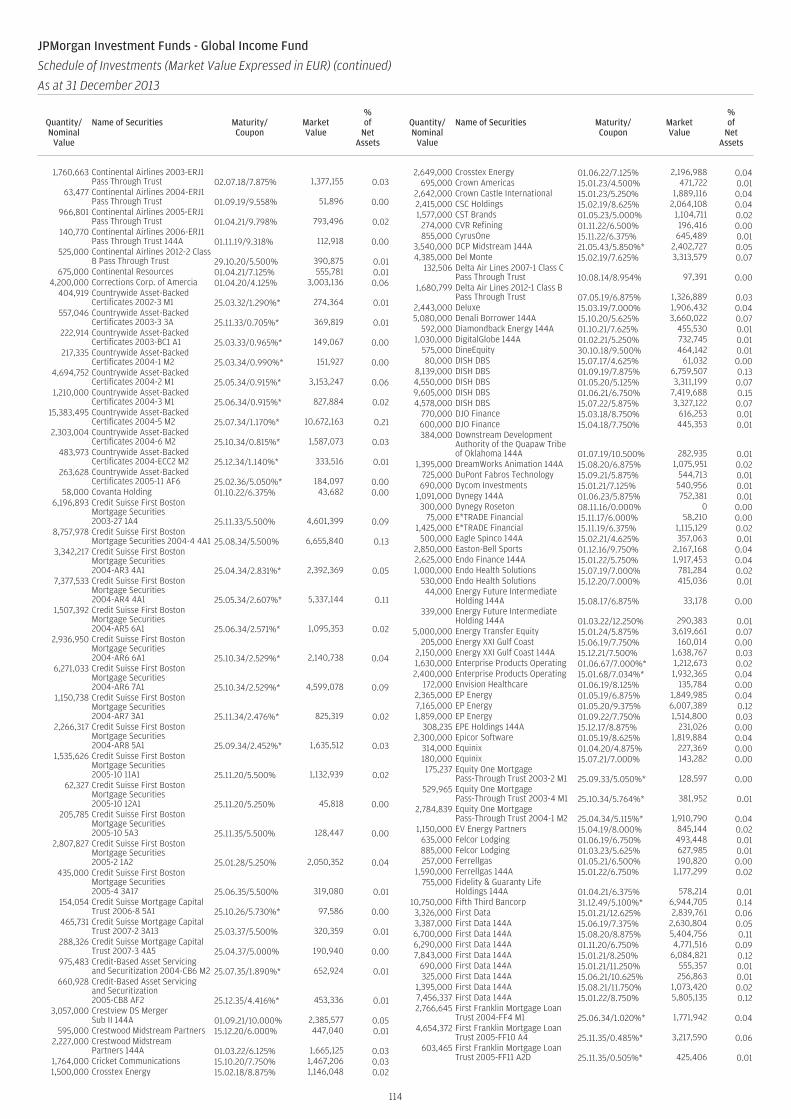
1,760,663 Continental Airlines 2003-ERJ1Pass Through Trust 02.07.18/7.875% 1,377,155 0.03
63,477 Continental Airlines 2004-ERJ1Pass Through Trust 01.09.19/9.558% 51,896 0.00
966,801 Continental Airlines 2005-ERJ1Pass Through Trust 01.04.21/9.798% 793,496 0.02
140,770 Continental Airlines 2006-ERJ1Pass Through Trust 144A 01.11.19/9.318% 112,918 0.00
525,000 Continental Airlines 2012-2 ClassB Pass Through Trust 29.10.20/5.500% 390,875 0.01
675,000 Continental Resources 01.04.21/7.125% 555,781 0.014,200,000 Corrections Corp. of Amercia 01.04.20/4.125% 3,003,136 0.06
404,919 Countrywide Asset-BackedCertificates 2002-3 M1 25.03.32/1.290%* 274,364 0.01
557,046 Countrywide Asset-BackedCertificates 2003-3 3A 25.11.33/0.705%* 369,819 0.01
222,914 Countrywide Asset-BackedCertificates 2003-BC1 A1 25.03.33/0.965%* 149,067 0.00
217,335 Countrywide Asset-BackedCertificates 2004-1 M2 25.03.34/0.990%* 151,927 0.00
4,694,752 Countrywide Asset-BackedCertificates 2004-2 M1 25.05.34/0.915%* 3,153,247 0.06
1,210,000 Countrywide Asset-BackedCertificates 2004-3 M1 25.06.34/0.915%* 827,884 0.02
15,383,495 Countrywide Asset-BackedCertificates 2004-5 M2 25.07.34/1.170%* 10,672,163 0.21
2,303,004 Countrywide Asset-BackedCertificates 2004-6 M2 25.10.34/0.815%* 1,587,073 0.03
483,973 Countrywide Asset-BackedCertificates 2004-ECC2 M2 25.12.34/1.140%* 333,516 0.01
263,628 Countrywide Asset-BackedCertificates 2005-11 AF6 25.02.36/5.050%* 184,097 0.00
58,000 Covanta Holding 01.10.22/6.375% 43,682 0.006,196,893 Credit Suisse First Boston
Mortgage Securities2003-27 1A4 25.11.33/5.500% 4,601,399 0.09
8,757,978 Credit Suisse First BostonMortgage Securities 2004-4 4A1 25.08.34/5.500% 6,655,840 0.13
3,342,217 Credit Suisse First BostonMortgage Securities2004-AR3 4A1 25.04.34/2.831%* 2,392,369 0.05
7,377,533 Credit Suisse First BostonMortgage Securities2004-AR4 4A1 25.05.34/2.607%* 5,337,144 0.11
1,507,392 Credit Suisse First BostonMortgage Securities2004-AR5 6A1 25.06.34/2.571%* 1,095,353 0.02
2,936,950 Credit Suisse First BostonMortgage Securities2004-AR6 6A1 25.10.34/2.529%* 2,140,738 0.04
6,271,033 Credit Suisse First BostonMortgage Securities2004-AR6 7A1 25.10.34/2.529%* 4,599,078 0.09
1,150,738 Credit Suisse First BostonMortgage Securities2004-AR7 3A1 25.11.34/2.476%* 825,319 0.02
2,266,317 Credit Suisse First BostonMortgage Securities2004-AR8 5A1 25.09.34/2.452%* 1,635,512 0.03
1,535,626 Credit Suisse First BostonMortgage Securities2005-10 11A1 25.11.20/5.500% 1,132,939 0.02
62,327 Credit Suisse First BostonMortgage Securities2005-10 12A1 25.11.20/5.250% 45,818 0.00
205,785 Credit Suisse First BostonMortgage Securities2005-10 5A3 25.11.35/5.500% 128,447 0.00
2,807,827 Credit Suisse First BostonMortgage Securities2005-2 1A2 25.01.28/5.250% 2,050,352 0.04
435,000 Credit Suisse First BostonMortgage Securities2005-4 3A17 25.06.35/5.500% 319,080 0.01
154,054 Credit Suisse Mortgage CapitalTrust 2006-8 5A1 25.10.26/5.730%* 97,586 0.00
465,731 Credit Suisse Mortgage CapitalTrust 2007-2 3A13 25.03.37/5.500% 320,359 0.01
288,326 Credit Suisse Mortgage CapitalTrust 2007-3 4A5 25.04.37/5.000% 190,940 0.00
975,483 Credit-Based Asset Servicingand Securitization 2004-CB6 M2 25.07.35/1.890%* 652,924 0.01
660,928 Credit-Based Asset Servicingand Securitization2005-CB8 AF2 25.12.35/4.416%* 453,336 0.01
3,057,000 Crestview DS MergerSub II 144A 01.09.21/10.000% 2,385,577 0.05
595,000 Crestwood Midstream Partners 15.12.20/6.000% 447,040 0.012,227,000 Crestwood Midstream
Partners 144A 01.03.22/6.125% 1,665,125 0.031,764,000 Cricket Communications 15.10.20/7.750% 1,467,206 0.031,500,000 Crosstex Energy 15.02.18/8.875% 1,146,048 0.02
2,649,000 Crosstex Energy 01.06.22/7.125% 2,196,988 0.04695,000 Crown Americas 15.01.23/4.500% 471,722 0.01
2,642,000 Crown Castle International 15.01.23/5.250% 1,889,116 0.042,415,000 CSC Holdings 15.02.19/8.625% 2,064,108 0.041,577,000 CST Brands 01.05.23/5.000% 1,104,711 0.02
274,000 CVR Refining 01.11.22/6.500% 196,416 0.00855,000 CyrusOne 15.11.22/6.375% 645,489 0.01
3,540,000 DCP Midstream 144A 21.05.43/5.850%* 2,402,727 0.054,385,000 Del Monte 15.02.19/7.625% 3,313,579 0.07
132,506 Delta Air Lines 2007-1 Class CPass Through Trust 10.08.14/8.954% 97,391 0.00
1,680,799 Delta Air Lines 2012-1 Class BPass Through Trust 07.05.19/6.875% 1,326,889 0.03
2,443,000 Deluxe 15.03.19/7.000% 1,906,432 0.045,080,000 Denali Borrower 144A 15.10.20/5.625% 3,660,022 0.07
592,000 Diamondback Energy 144A 01.10.21/7.625% 455,530 0.011,030,000 DigitalGlobe 144A 01.02.21/5.250% 732,745 0.01
575,000 DineEquity 30.10.18/9.500% 464,142 0.0180,000 DISH DBS 15.07.17/4.625% 61,032 0.00
8,139,000 DISH DBS 01.09.19/7.875% 6,759,507 0.134,550,000 DISH DBS 01.05.20/5.125% 3,311,199 0.079,605,000 DISH DBS 01.06.21/6.750% 7,419,688 0.154,578,000 DISH DBS 15.07.22/5.875% 3,327,122 0.07
770,000 DJO Finance 15.03.18/8.750% 616,253 0.01600,000 DJO Finance 15.04.18/7.750% 445,353 0.01384,000 Downstream Development
Authority of the Quapaw Tribeof Oklahoma 144A 01.07.19/10.500% 282,935 0.01
1,395,000 DreamWorks Animation 144A 15.08.20/6.875% 1,075,951 0.02725,000 DuPont Fabros Technology 15.09.21/5.875% 544,713 0.01690,000 Dycom Investments 15.01.21/7.125% 540,956 0.01
1,091,000 Dynegy 144A 01.06.23/5.875% 752,381 0.01300,000 Dynegy Roseton 08.11.16/0.000% 0 0.00
75,000 E*TRADE Financial 15.11.17/6.000% 58,210 0.001,425,000 E*TRADE Financial 15.11.19/6.375% 1,115,129 0.02
500,000 Eagle Spinco 144A 15.02.21/4.625% 357,063 0.012,850,000 Easton-Bell Sports 01.12.16/9.750% 2,167,168 0.042,625,000 Endo Finance 144A 15.01.22/5.750% 1,917,453 0.041,000,000 Endo Health Solutions 15.07.19/7.000% 781,284 0.02
530,000 Endo Health Solutions 15.12.20/7.000% 415,036 0.0144,000 Energy Future Intermediate
Holding 144A 15.08.17/6.875% 33,178 0.00339,000 Energy Future Intermediate
Holding 144A 01.03.22/12.250% 290,383 0.015,000,000 Energy Transfer Equity 15.01.24/5.875% 3,619,661 0.07
205,000 Energy XXI Gulf Coast 15.06.19/7.750% 160,014 0.002,150,000 Energy XXI Gulf Coast 144A 15.12.21/7.500% 1,638,767 0.031,630,000 Enterprise Products Operating 01.06.67/7.000%* 1,212,673 0.022,400,000 Enterprise Products Operating 15.01.68/7.034%* 1,932,365 0.04
172,000 Envision Healthcare 01.06.19/8.125% 135,784 0.002,365,000 EP Energy 01.05.19/6.875% 1,849,985 0.047,165,000 EP Energy 01.05.20/9.375% 6,007,389 0.121,859,000 EP Energy 01.09.22/7.750% 1,514,800 0.03
308,235 EPE Holdings 144A 15.12.17/8.875% 231,026 0.002,300,000 Epicor Software 01.05.19/8.625% 1,819,884 0.04
314,000 Equinix 01.04.20/4.875% 227,369 0.00180,000 Equinix 15.07.21/7.000% 143,282 0.00175,237 Equity One Mortgage
Pass-Through Trust 2003-2 M1 25.09.33/5.050%* 128,597 0.00529,965 Equity One Mortgage
Pass-Through Trust 2003-4 M1 25.10.34/5.764%* 381,952 0.012,784,839 Equity One Mortgage
Pass-Through Trust 2004-1 M2 25.04.34/5.115%* 1,910,790 0.041,150,000 EV Energy Partners 15.04.19/8.000% 845,144 0.02
635,000 Felcor Lodging 01.06.19/6.750% 493,448 0.01885,000 Felcor Lodging 01.03.23/5.625% 627,985 0.01257,000 Ferrellgas 01.05.21/6.500% 190,820 0.00
1,590,000 Ferrellgas 144A 15.01.22/6.750% 1,177,299 0.02755,000 Fidelity & Guaranty Life
Holdings 144A 01.04.21/6.375% 578,214 0.0110,750,000 Fifth Third Bancorp 31.12.49/5.100%* 6,944,705 0.143,326,000 First Data 15.01.21/12.625% 2,839,761 0.063,387,000 First Data 144A 15.06.19/7.375% 2,630,804 0.056,700,000 First Data 144A 15.08.20/8.875% 5,404,756 0.116,290,000 First Data 144A 01.11.20/6.750% 4,771,516 0.097,843,000 First Data 144A 15.01.21/8.250% 6,084,821 0.12
690,000 First Data 144A 15.01.21/11.250% 555,357 0.01325,000 First Data 144A 15.06.21/10.625% 256,863 0.01
1,395,000 First Data 144A 15.08.21/11.750% 1,073,420 0.027,456,337 First Data 144A 15.01.22/8.750% 5,805,135 0.122,766,645 First Franklin Mortgage Loan
Trust 2004-FF4 M1 25.06.34/1.020%* 1,771,942 0.044,654,372 First Franklin Mortgage Loan
Trust 2005-FF10 A4 25.11.35/0.485%* 3,217,590 0.06603,465 First Franklin Mortgage Loan
Trust 2005-FF11 A2D 25.11.35/0.505%* 425,406 0.01
114
JPMorgan Investment Funds - Global Income Fund
Schedule of Investments (Market Value Expressed in EUR) (continued)
As at 31 December 2013
Quantity/Nominal
Value
Name of Securities Maturity/Coupon
MarketValue
%of
NetAssets
Quantity/Nominal
Value
Name of Securities Maturity/Coupon
MarketValue
%of
NetAssets
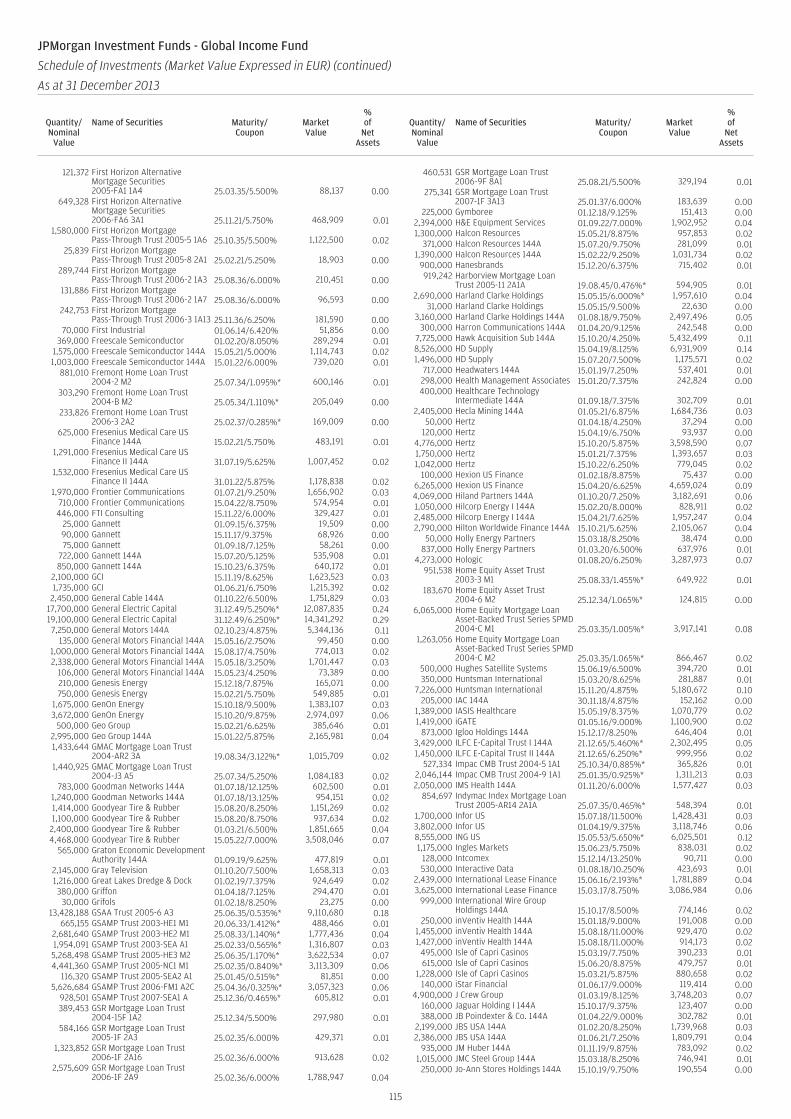
121,372 First Horizon AlternativeMortgage Securities2005-FA1 1A4 25.03.35/5.500% 88,137 0.00
649,328 First Horizon AlternativeMortgage Securities2006-FA6 3A1 25.11.21/5.750% 468,909 0.01
1,580,000 First Horizon MortgagePass-Through Trust 2005-5 1A6 25.10.35/5.500% 1,122,500 0.02
25,839 First Horizon MortgagePass-Through Trust 2005-8 2A1 25.02.21/5.250% 18,903 0.00
289,744 First Horizon MortgagePass-Through Trust 2006-2 1A3 25.08.36/6.000% 210,451 0.00
131,886 First Horizon MortgagePass-Through Trust 2006-2 1A7 25.08.36/6.000% 96,593 0.00
242,753 First Horizon MortgagePass-Through Trust 2006-3 1A13 25.11.36/6.250% 181,590 0.00
70,000 First Industrial 01.06.14/6.420% 51,856 0.00369,000 Freescale Semiconductor 01.02.20/8.050% 289,294 0.01
1,575,000 Freescale Semiconductor 144A 15.05.21/5.000% 1,114,743 0.021,003,000 Freescale Semiconductor 144A 15.01.22/6.000% 739,020 0.01
881,010 Fremont Home Loan Trust2004-2 M2 25.07.34/1.095%* 600,146 0.01
303,290 Fremont Home Loan Trust2004-B M2 25.05.34/1.110%* 205,049 0.00
233,826 Fremont Home Loan Trust2006-3 2A2 25.02.37/0.285%* 169,009 0.00
625,000 Fresenius Medical Care USFinance 144A 15.02.21/5.750% 483,191 0.01
1,291,000 Fresenius Medical Care USFinance II 144A 31.07.19/5.625% 1,007,452 0.02
1,532,000 Fresenius Medical Care USFinance II 144A 31.01.22/5.875% 1,178,838 0.02
1,970,000 Frontier Communications 01.07.21/9.250% 1,656,902 0.03710,000 Frontier Communications 15.04.22/8.750% 574,954 0.01446,000 FTI Consulting 15.11.22/6.000% 329,427 0.01
25,000 Gannett 01.09.15/6.375% 19,509 0.0090,000 Gannett 15.11.17/9.375% 68,926 0.0075,000 Gannett 01.09.18/7.125% 58,261 0.00
722,000 Gannett 144A 15.07.20/5.125% 535,908 0.01850,000 Gannett 144A 15.10.23/6.375% 640,172 0.01
2,100,000 GCI 15.11.19/8.625% 1,623,523 0.031,735,000 GCI 01.06.21/6.750% 1,215,392 0.02
2,450,000 General Cable 144A 01.10.22/6.500% 1,751,829 0.0317,700,000 General Electric Capital 31.12.49/5.250%* 12,087,835 0.2419,100,000 General Electric Capital 31.12.49/6.250%* 14,341,292 0.297,250,000 General Motors 144A 02.10.23/4.875% 5,344,136 0.11
135,000 General Motors Financial 144A 15.05.16/2.750% 99,450 0.001,000,000 General Motors Financial 144A 15.08.17/4.750% 774,013 0.022,338,000 General Motors Financial 144A 15.05.18/3.250% 1,701,447 0.03
106,000 General Motors Financial 144A 15.05.23/4.250% 73,389 0.00210,000 Genesis Energy 15.12.18/7.875% 165,071 0.00750,000 Genesis Energy 15.02.21/5.750% 549,885 0.01
1,675,000 GenOn Energy 15.10.18/9.500% 1,383,107 0.033,672,000 GenOn Energy 15.10.20/9.875% 2,974,097 0.06
500,000 Geo Group 15.02.21/6.625% 385,646 0.012,995,000 Geo Group 144A 15.01.22/5.875% 2,165,981 0.041,433,644 GMAC Mortgage Loan Trust
2004-AR2 3A 19.08.34/3.122%* 1,015,709 0.021,440,925 GMAC Mortgage Loan Trust
2004-J3 A5 25.07.34/5.250% 1,084,183 0.02783,000 Goodman Networks 144A 01.07.18/12.125% 602,500 0.01
1,240,000 Goodman Networks 144A 01.07.18/13.125% 954,151 0.021,414,000 Goodyear Tire & Rubber 15.08.20/8.250% 1,151,269 0.021,100,000 Goodyear Tire & Rubber 15.08.20/8.750% 937,634 0.02
2,400,000 Goodyear Tire & Rubber 01.03.21/6.500% 1,851,665 0.044,468,000 Goodyear Tire & Rubber 15.05.22/7.000% 3,508,046 0.07
565,000 Graton Economic DevelopmentAuthority 144A 01.09.19/9.625% 477,819 0.01
2,145,000 Gray Television 01.10.20/7.500% 1,658,313 0.031,216,000 Great Lakes Dredge & Dock 01.02.19/7.375% 924,649 0.02380,000 Griffon 01.04.18/7.125% 294,470 0.01
30,000 Grifols 01.02.18/8.250% 23,275 0.0013,428,188 GSAA Trust 2005-6 A3 25.06.35/0.535%* 9,110,680 0.18
665,155 GSAMP Trust 2003-HE1 M1 20.06.33/1.412%* 488,466 0.012,681,640 GSAMP Trust 2003-HE2 M1 25.08.33/1.140%* 1,777,436 0.041,954,091 GSAMP Trust 2003-SEA A1 25.02.33/0.565%* 1,316,807 0.035,268,498 GSAMP Trust 2005-HE3 M2 25.06.35/1.170%* 3,622,534 0.074,441,360 GSAMP Trust 2005-NC1 M1 25.02.35/0.840%* 3,113,309 0.06
116,320 GSAMP Trust 2005-SEA2 A1 25.01.45/0.515%* 81,851 0.005,626,684 GSAMP Trust 2006-FM1 A2C 25.04.36/0.325%* 3,057,323 0.06
928,501 GSAMP Trust 2007-SEA1 A 25.12.36/0.465%* 605,812 0.01389,453 GSR Mortgage Loan Trust
2004-15F 1A2 25.12.34/5.500% 297,980 0.01584,166 GSR Mortgage Loan Trust
2005-1F 2A3 25.02.35/6.000% 429,371 0.011,323,852 GSR Mortgage Loan Trust
2006-1F 2A16 25.02.36/6.000% 913,628 0.022,575,609 GSR Mortgage Loan Trust
2006-1F 2A9 25.02.36/6.000% 1,788,947 0.04
460,531 GSR Mortgage Loan Trust2006-9F 8A1 25.08.21/5.500% 329,194 0.01
275,341 GSR Mortgage Loan Trust2007-1F 3A13 25.01.37/6.000% 183,639 0.00
225,000 Gymboree 01.12.18/9.125% 151,413 0.002,394,000 H&E Equipment Services 01.09.22/7.000% 1,902,952 0.041,300,000 Halcon Resources 15.05.21/8.875% 957,853 0.02
371,000 Halcon Resources 144A 15.07.20/9.750% 281,099 0.011,390,000 Halcon Resources 144A 15.02.22/9.250% 1,031,734 0.02
900,000 Hanesbrands 15.12.20/6.375% 715,402 0.01919,242 Harborview Mortgage Loan
Trust 2005-11 2A1A 19.08.45/0.476%* 594,905 0.012,690,000 Harland Clarke Holdings 15.05.15/6.000%* 1,957,610 0.04
31,000 Harland Clarke Holdings 15.05.15/9.500% 22,630 0.003,160,000 Harland Clarke Holdings 144A 01.08.18/9.750% 2,497,496 0.05
300,000 Harron Communications 144A 01.04.20/9.125% 242,548 0.007,725,000 Hawk Acquisition Sub 144A 15.10.20/4.250% 5,432,499 0.118,526,000 HD Supply 15.04.19/8.125% 6,931,909 0.141,496,000 HD Supply 15.07.20/7.500% 1,175,571 0.02
717,000 Headwaters 144A 15.01.19/7.250% 537,401 0.01298,000 Health Management Associates 15.01.20/7.375% 242,824 0.00400,000 Healthcare Technology
Intermediate 144A 01.09.18/7.375% 302,709 0.012,405,000 Hecla Mining 144A 01.05.21/6.875% 1,684,736 0.03
50,000 Hertz 01.04.18/4.250% 37,294 0.00120,000 Hertz 15.04.19/6.750% 93,937 0.00
4,776,000 Hertz 15.10.20/5.875% 3,598,590 0.071,750,000 Hertz 15.01.21/7.375% 1,393,657 0.031,042,000 Hertz 15.10.22/6.250% 779,045 0.02
100,000 Hexion US Finance 01.02.18/8.875% 75,437 0.006,265,000 Hexion US Finance 15.04.20/6.625% 4,659,024 0.094,069,000 Hiland Partners 144A 01.10.20/7.250% 3,182,691 0.061,050,000 Hilcorp Energy I 144A 15.02.20/8.000% 828,911 0.022,485,000 Hilcorp Energy I 144A 15.04.21/7.625% 1,957,247 0.042,790,000 Hilton Worldwide Finance 144A 15.10.21/5.625% 2,105,067 0.04
50,000 Holly Energy Partners 15.03.18/8.250% 38,474 0.00837,000 Holly Energy Partners 01.03.20/6.500% 637,976 0.01
4,273,000 Hologic 01.08.20/6.250% 3,287,973 0.07951,538 Home Equity Asset Trust
2003-3 M1 25.08.33/1.455%* 649,922 0.01183,670 Home Equity Asset Trust
2004-6 M2 25.12.34/1.065%* 124,815 0.006,065,000 Home Equity Mortgage Loan
Asset-Backed Trust Series SPMD2004-C M1 25.03.35/1.005%* 3,917,141 0.08
1,263,056 Home Equity Mortgage LoanAsset-Backed Trust Series SPMD2004-C M2 25.03.35/1.065%* 866,467 0.02
500,000 Hughes Satellite Systems 15.06.19/6.500% 394,720 0.01350,000 Huntsman International 15.03.20/8.625% 281,887 0.01
7,226,000 Huntsman International 15.11.20/4.875% 5,180,672 0.10205,000 IAC 144A 30.11.18/4.875% 152,162 0.00
1,389,000 IASIS Healthcare 15.05.19/8.375% 1,070,779 0.021,419,000 iGATE 01.05.16/9.000% 1,100,900 0.02
873,000 Igloo Holdings 144A 15.12.17/8.250% 646,404 0.013,429,000 ILFC E-Capital Trust I 144A 21.12.65/5.460%* 2,302,495 0.051,450,000 ILFC E-Capital Trust II 144A 21.12.65/6.250%* 999,956 0.02
527,334 Impac CMB Trust 2004-5 1A1 25.10.34/0.885%* 365,826 0.012,046,144 Impac CMB Trust 2004-9 1A1 25.01.35/0.925%* 1,311,213 0.032,050,000 IMS Health 144A 01.11.20/6.000% 1,577,427 0.03
854,697 Indymac Index Mortgage LoanTrust 2005-AR14 2A1A 25.07.35/0.465%* 548,394 0.01
1,700,000 Infor US 15.07.18/11.500% 1,428,431 0.033,802,000 Infor US 01.04.19/9.375% 3,118,746 0.068,555,000 ING US 15.05.53/5.650%* 6,025,501 0.121,175,000 Ingles Markets 15.06.23/5.750% 838,031 0.02
128,000 Intcomex 15.12.14/13.250% 90,711 0.00530,000 Interactive Data 01.08.18/10.250% 423,693 0.01
2,439,000 International Lease Finance 15.06.16/2.193%* 1,781,889 0.043,625,000 International Lease Finance 15.03.17/8.750% 3,086,984 0.06
999,000 International Wire GroupHoldings 144A 15.10.17/8.500% 774,146 0.02
250,000 inVentiv Health 144A 15.01.18/9.000% 191,008 0.001,455,000 inVentiv Health 144A 15.08.18/11.000% 929,470 0.021,427,000 inVentiv Health 144A 15.08.18/11.000% 914,173 0.02
495,000 Isle of Capri Casinos 15.03.19/7.750% 390,233 0.01615,000 Isle of Capri Casinos 15.06.20/8.875% 479,757 0.01
1,228,000 Isle of Capri Casinos 15.03.21/5.875% 880,658 0.02140,000 iStar Financial 01.06.17/9.000% 119,414 0.00
4,900,000 J Crew Group 01.03.19/8.125% 3,748,203 0.07160,000 Jaguar Holding I 144A 15.10.17/9.375% 123,407 0.00388,000 JB Poindexter & Co. 144A 01.04.22/9.000% 302,782 0.01
2,199,000 JBS USA 144A 01.02.20/8.250% 1,739,968 0.032,386,000 JBS USA 144A 01.06.21/7.250% 1,809,791 0.04
935,000 JM Huber 144A 01.11.19/9.875% 783,092 0.021,015,000 JMC Steel Group 144A 15.03.18/8.250% 746,941 0.01
250,000 Jo-Ann Stores Holdings 144A 15.10.19/9.750% 190,554 0.00
115
JPMorgan Investment Funds - Global Income Fund
Schedule of Investments (Market Value Expressed in EUR) (continued)
As at 31 December 2013
Quantity/Nominal
Value
Name of Securities Maturity/Coupon
MarketValue
%of
NetAssets
Quantity/Nominal
Value
Name of Securities Maturity/Coupon
MarketValue
%of
NetAssets
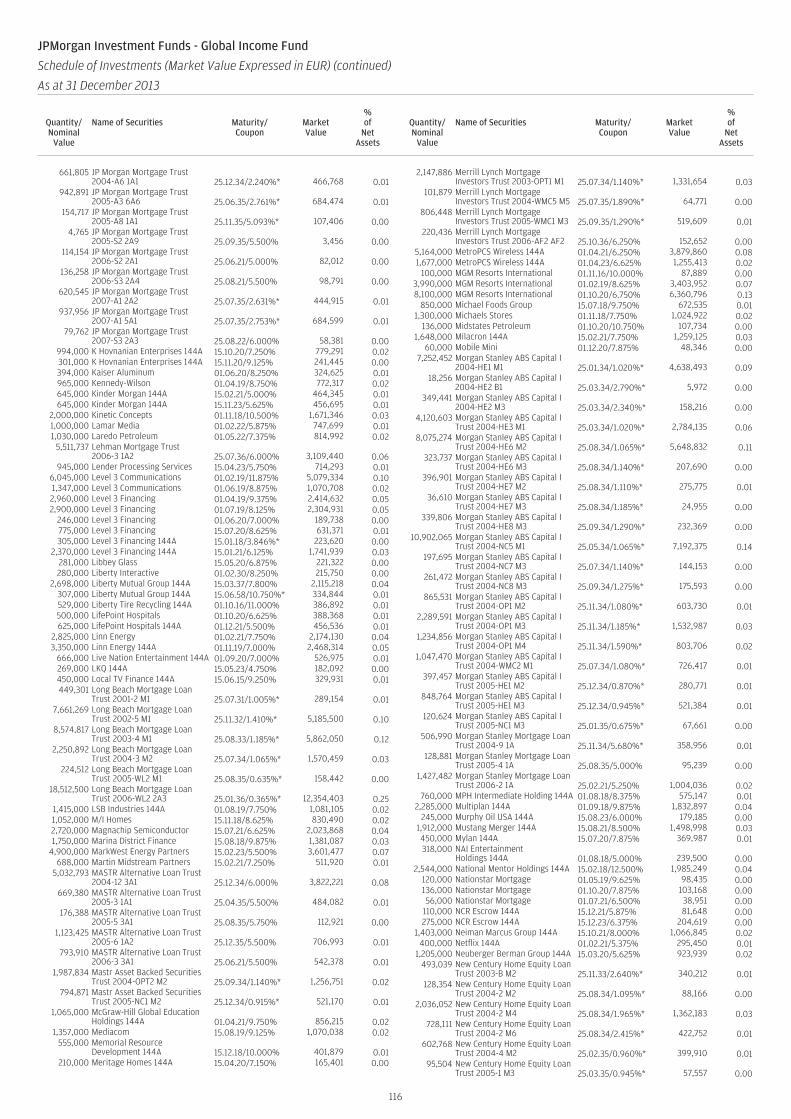
661,805 JP Morgan Mortgage Trust2004-A6 1A1 25.12.34/2.240%* 466,768 0.01
942,891 JP Morgan Mortgage Trust2005-A3 6A6 25.06.35/2.761%* 684,474 0.01
154,717 JP Morgan Mortgage Trust2005-A8 1A1 25.11.35/5.093%* 107,406 0.00
4,765 JP Morgan Mortgage Trust2005-S2 2A9 25.09.35/5.500% 3,456 0.00
114,154 JP Morgan Mortgage Trust2006-S2 2A1 25.06.21/5.000% 82,012 0.00
136,258 JP Morgan Mortgage Trust2006-S3 2A4 25.08.21/5.500% 98,791 0.00
620,545 JP Morgan Mortgage Trust2007-A1 2A2 25.07.35/2.631%* 444,915 0.01
937,956 JP Morgan Mortgage Trust2007-A1 5A1 25.07.35/2.753%* 684,599 0.01
79,762 JP Morgan Mortgage Trust2007-S3 2A3 25.08.22/6.000% 58,381 0.00
994,000 K Hovnanian Enterprises 144A 15.10.20/7.250% 779,291 0.02301,000 K Hovnanian Enterprises 144A 15.11.20/9.125% 241,445 0.00394,000 Kaiser Aluminum 01.06.20/8.250% 324,625 0.01965,000 Kennedy-Wilson 01.04.19/8.750% 772,317 0.02645,000 Kinder Morgan 144A 15.02.21/5.000% 464,345 0.01645,000 Kinder Morgan 144A 15.11.23/5.625% 456,695 0.01
2,000,000 Kinetic Concepts 01.11.18/10.500% 1,671,346 0.031,000,000 Lamar Media 01.02.22/5.875% 747,699 0.011,030,000 Laredo Petroleum 01.05.22/7.375% 814,992 0.02
5,511,737 Lehman Mortgage Trust2006-3 1A2 25.07.36/6.000% 3,109,440 0.06
945,000 Lender Processing Services 15.04.23/5.750% 714,293 0.016,045,000 Level 3 Communications 01.02.19/11.875% 5,079,334 0.101,347,000 Level 3 Communications 01.06.19/8.875% 1,070,708 0.022,960,000 Level 3 Financing 01.04.19/9.375% 2,414,632 0.052,900,000 Level 3 Financing 01.07.19/8.125% 2,304,931 0.05
246,000 Level 3 Financing 01.06.20/7.000% 189,738 0.00775,000 Level 3 Financing 15.07.20/8.625% 631,371 0.01305,000 Level 3 Financing 144A 15.01.18/3.846%* 223,620 0.00
2,370,000 Level 3 Financing 144A 15.01.21/6.125% 1,741,939 0.03281,000 Libbey Glass 15.05.20/6.875% 221,322 0.00280,000 Liberty Interactive 01.02.30/8.250% 215,750 0.00
2,698,000 Liberty Mutual Group 144A 15.03.37/7.800% 2,115,218 0.04307,000 Liberty Mutual Group 144A 15.06.58/10.750%* 334,844 0.01529,000 Liberty Tire Recycling 144A 01.10.16/11.000% 386,892 0.01500,000 LifePoint Hospitals 01.10.20/6.625% 388,368 0.01625,000 LifePoint Hospitals 144A 01.12.21/5.500% 456,536 0.01
2,825,000 Linn Energy 01.02.21/7.750% 2,174,130 0.043,350,000 Linn Energy 144A 01.11.19/7.000% 2,468,314 0.05
666,000 Live Nation Entertainment 144A 01.09.20/7.000% 526,975 0.01269,000 LKQ 144A 15.05.23/4.750% 182,092 0.00450,000 Local TV Finance 144A 15.06.15/9.250% 329,931 0.01449,301 Long Beach Mortgage Loan
Trust 2001-2 M1 25.07.31/1.005%* 289,154 0.017,661,269 Long Beach Mortgage Loan
Trust 2002-5 M1 25.11.32/1.410%* 5,185,500 0.108,574,817 Long Beach Mortgage Loan
Trust 2003-4 M1 25.08.33/1.185%* 5,862,050 0.122,250,892 Long Beach Mortgage Loan
Trust 2004-3 M2 25.07.34/1.065%* 1,570,459 0.03224,512 Long Beach Mortgage Loan
Trust 2005-WL2 M1 25.08.35/0.635%* 158,442 0.0018,512,500 Long Beach Mortgage Loan
Trust 2006-WL2 2A3 25.01.36/0.365%* 12,354,403 0.251,415,000 LSB Industries 144A 01.08.19/7.750% 1,081,105 0.021,052,000 M/I Homes 15.11.18/8.625% 830,490 0.022,720,000 Magnachip Semiconductor 15.07.21/6.625% 2,023,868 0.041,750,000 Marina District Finance 15.08.18/9.875% 1,381,087 0.03
4,900,000 MarkWest Energy Partners 15.02.23/5.500% 3,601,477 0.07688,000 Martin Midstream Partners 15.02.21/7.250% 511,920 0.01
5,032,793 MASTR Alternative Loan Trust2004-12 3A1 25.12.34/6.000% 3,822,221 0.08
669,380 MASTR Alternative Loan Trust2005-3 1A1 25.04.35/5.500% 484,082 0.01
176,388 MASTR Alternative Loan Trust2005-5 3A1 25.08.35/5.750% 112,921 0.00
1,123,425 MASTR Alternative Loan Trust2005-6 1A2 25.12.35/5.500% 706,993 0.01
793,910 MASTR Alternative Loan Trust2006-3 3A1 25.06.21/5.500% 542,378 0.01
1,987,834 Mastr Asset Backed SecuritiesTrust 2004-OPT2 M2 25.09.34/1.140%* 1,256,751 0.02
794,871 Mastr Asset Backed SecuritiesTrust 2005-NC1 M2 25.12.34/0.915%* 521,170 0.01
1,065,000 McGraw-Hill Global EducationHoldings 144A 01.04.21/9.750% 856,215 0.02
1,357,000 Mediacom 15.08.19/9.125% 1,070,038 0.02555,000 Memorial Resource
Development 144A 15.12.18/10.000% 401,879 0.01210,000 Meritage Homes 144A 15.04.20/7.150% 165,401 0.00
2,147,886 Merrill Lynch MortgageInvestors Trust 2003-OPT1 M1 25.07.34/1.140%* 1,331,654 0.03
101,879 Merrill Lynch MortgageInvestors Trust 2004-WMC5 M5 25.07.35/1.890%* 64,771 0.00
806,448 Merrill Lynch MortgageInvestors Trust 2005-WMC1 M3 25.09.35/1.290%* 519,609 0.01
220,436 Merrill Lynch MortgageInvestors Trust 2006-AF2 AF2 25.10.36/6.250% 152,652 0.00
5,164,000 MetroPCS Wireless 144A 01.04.21/6.250% 3,879,860 0.081,677,000 MetroPCS Wireless 144A 01.04.23/6.625% 1,255,413 0.02
100,000 MGM Resorts International 01.11.16/10.000% 87,889 0.003,990,000 MGM Resorts International 01.02.19/8.625% 3,403,952 0.078,100,000 MGM Resorts International 01.10.20/6.750% 6,360,796 0.13
850,000 Michael Foods Group 15.07.18/9.750% 672,535 0.011,300,000 Michaels Stores 01.11.18/7.750% 1,024,922 0.02
136,000 Midstates Petroleum 01.10.20/10.750% 107,734 0.001,648,000 Milacron 144A 15.02.21/7.750% 1,259,125 0.03
60,000 Mobile Mini 01.12.20/7.875% 48,346 0.007,252,452 Morgan Stanley ABS Capital I
2004-HE1 M1 25.01.34/1.020%* 4,638,493 0.0918,256 Morgan Stanley ABS Capital I
2004-HE2 B1 25.03.34/2.790%* 5,972 0.00349,441 Morgan Stanley ABS Capital I
2004-HE2 M3 25.03.34/2.340%* 158,216 0.004,120,603 Morgan Stanley ABS Capital I
Trust 2004-HE3 M1 25.03.34/1.020%* 2,784,135 0.068,075,274 Morgan Stanley ABS Capital I
Trust 2004-HE6 M2 25.08.34/1.065%* 5,648,832 0.11323,737 Morgan Stanley ABS Capital I
Trust 2004-HE6 M3 25.08.34/1.140%* 207,690 0.00396,901 Morgan Stanley ABS Capital I
Trust 2004-HE7 M2 25.08.34/1.110%* 275,775 0.0136,610 Morgan Stanley ABS Capital I
Trust 2004-HE7 M3 25.08.34/1.185%* 24,955 0.00339,806 Morgan Stanley ABS Capital I
Trust 2004-HE8 M3 25.09.34/1.290%* 232,369 0.0010,902,065 Morgan Stanley ABS Capital I
Trust 2004-NC5 M1 25.05.34/1.065%* 7,192,375 0.14197,695 Morgan Stanley ABS Capital I
Trust 2004-NC7 M3 25.07.34/1.140%* 144,153 0.00261,472 Morgan Stanley ABS Capital I
Trust 2004-NC8 M3 25.09.34/1.275%* 175,593 0.00865,531 Morgan Stanley ABS Capital I
Trust 2004-OP1 M2 25.11.34/1.080%* 603,730 0.012,289,591 Morgan Stanley ABS Capital I
Trust 2004-OP1 M3 25.11.34/1.185%* 1,532,987 0.031,234,856 Morgan Stanley ABS Capital I
Trust 2004-OP1 M4 25.11.34/1.590%* 803,706 0.021,047,470 Morgan Stanley ABS Capital I
Trust 2004-WMC2 M1 25.07.34/1.080%* 726,417 0.01397,457 Morgan Stanley ABS Capital I
Trust 2005-HE1 M2 25.12.34/0.870%* 280,771 0.01848,764 Morgan Stanley ABS Capital I
Trust 2005-HE1 M3 25.12.34/0.945%* 521,384 0.01120,624 Morgan Stanley ABS Capital I
Trust 2005-NC1 M3 25.01.35/0.675%* 67,661 0.00506,990 Morgan Stanley Mortgage Loan
Trust 2004-9 1A 25.11.34/5.680%* 358,956 0.01128,881 Morgan Stanley Mortgage Loan
Trust 2005-4 1A 25.08.35/5.000% 95,239 0.001,427,482 Morgan Stanley Mortgage Loan
Trust 2006-2 1A 25.02.21/5.250% 1,004,036 0.02760,000 MPH Intermediate Holding 144A 01.08.18/8.375% 575,147 0.01
2,285,000 Multiplan 144A 01.09.18/9.875% 1,832,897 0.04245,000 Murphy Oil USA 144A 15.08.23/6.000% 179,185 0.00
1,912,000 Mustang Merger 144A 15.08.21/8.500% 1,498,998 0.03450,000 Mylan 144A 15.07.20/7.875% 369,987 0.01318,000 NAI Entertainment
Holdings 144A 01.08.18/5.000% 239,500 0.002,544,000 National Mentor Holdings 144A 15.02.18/12.500% 1,985,249 0.04
120,000 Nationstar Mortgage 01.05.19/9.625% 98,435 0.00136,000 Nationstar Mortgage 01.10.20/7.875% 103,168 0.0056,000 Nationstar Mortgage 01.07.21/6.500% 38,951 0.00
110,000 NCR Escrow 144A 15.12.21/5.875% 81,648 0.00275,000 NCR Escrow 144A 15.12.23/6.375% 204,619 0.00
1,403,000 Neiman Marcus Group 144A 15.10.21/8.000% 1,066,845 0.02400,000 Netflix 144A 01.02.21/5.375% 295,450 0.01
1,205,000 Neuberger Berman Group 144A 15.03.20/5.625% 923,939 0.02493,039 New Century Home Equity Loan
Trust 2003-B M2 25.11.33/2.640%* 340,212 0.01128,354 New Century Home Equity Loan
Trust 2004-2 M2 25.08.34/1.095%* 88,166 0.002,036,052 New Century Home Equity Loan
Trust 2004-2 M4 25.08.34/1.965%* 1,362,183 0.03728,111 New Century Home Equity Loan
Trust 2004-2 M6 25.08.34/2.415%* 422,752 0.01602,768 New Century Home Equity Loan
Trust 2004-4 M2 25.02.35/0.960%* 399,910 0.0195,504 New Century Home Equity Loan
Trust 2005-1 M3 25.03.35/0.945%* 57,557 0.00
116
JPMorgan Investment Funds - Global Income Fund
Schedule of Investments (Market Value Expressed in EUR) (continued)
As at 31 December 2013
Quantity/Nominal
Value
Name of Securities Maturity/Coupon
MarketValue
%of
NetAssets
Quantity/Nominal
Value
Name of Securities Maturity/Coupon
MarketValue
%of
NetAssets
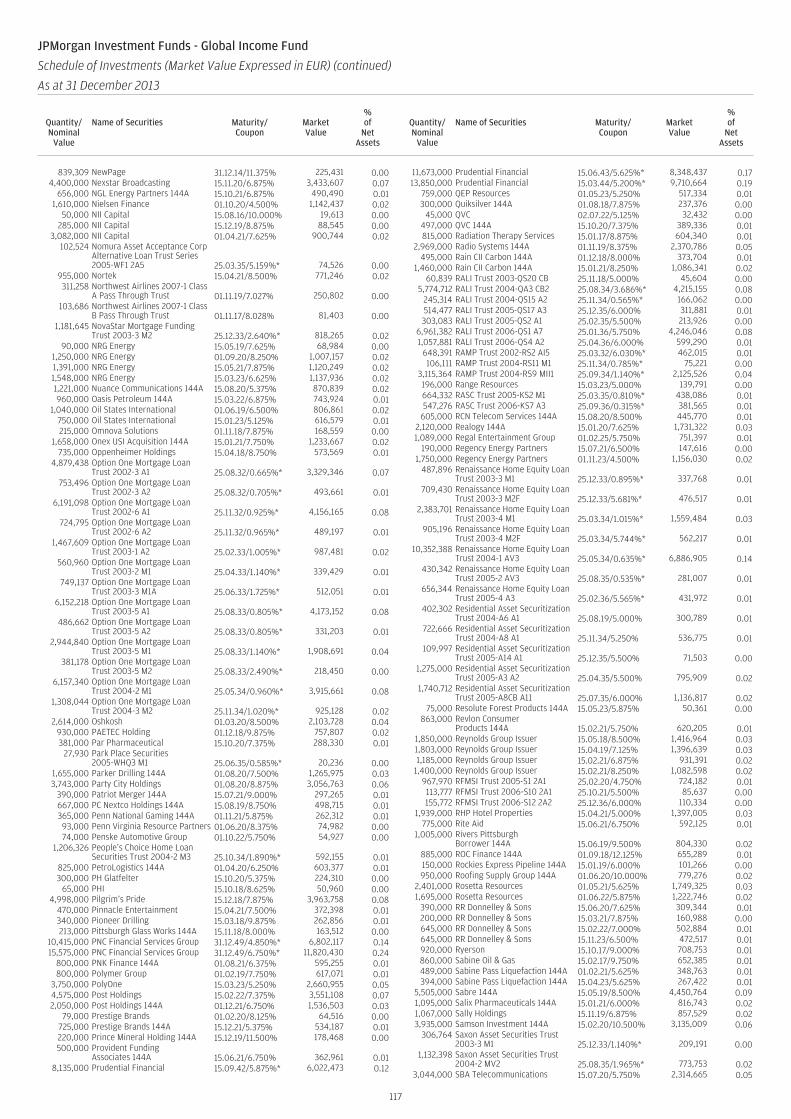
839,309 NewPage 31.12.14/11.375% 225,431 0.004,400,000 Nexstar Broadcasting 15.11.20/6.875% 3,433,607 0.07
656,000 NGL Energy Partners 144A 15.10.21/6.875% 490,490 0.011,610,000 Nielsen Finance 01.10.20/4.500% 1,142,437 0.02
50,000 NII Capital 15.08.16/10.000% 19,613 0.00285,000 NII Capital 15.12.19/8.875% 88,545 0.00
3,082,000 NII Capital 01.04.21/7.625% 900,744 0.02102,524 Nomura Asset Acceptance Corp
Alternative Loan Trust Series2005-WF1 2A5 25.03.35/5.159%* 74,526 0.00
955,000 Nortek 15.04.21/8.500% 771,246 0.02311,258 Northwest Airlines 2007-1 Class
A Pass Through Trust 01.11.19/7.027% 250,802 0.00103,686 Northwest Airlines 2007-1 Class
B Pass Through Trust 01.11.17/8.028% 81,403 0.001,181,645 NovaStar Mortgage Funding
Trust 2003-3 M2 25.12.33/2.640%* 818,265 0.0290,000 NRG Energy 15.05.19/7.625% 68,984 0.00
1,250,000 NRG Energy 01.09.20/8.250% 1,007,157 0.021,391,000 NRG Energy 15.05.21/7.875% 1,120,249 0.021,548,000 NRG Energy 15.03.23/6.625% 1,137,936 0.021,221,000 Nuance Communications 144A 15.08.20/5.375% 870,839 0.02960,000 Oasis Petroleum 144A 15.03.22/6.875% 743,924 0.01
1,040,000 Oil States International 01.06.19/6.500% 806,861 0.02750,000 Oil States International 15.01.23/5.125% 616,579 0.01215,000 Omnova Solutions 01.11.18/7.875% 168,559 0.00
1,658,000 Onex USI Acquisition 144A 15.01.21/7.750% 1,233,667 0.02735,000 Oppenheimer Holdings 15.04.18/8.750% 573,569 0.01
4,879,438 Option One Mortgage LoanTrust 2002-3 A1 25.08.32/0.665%* 3,329,346 0.07
753,496 Option One Mortgage LoanTrust 2002-3 A2 25.08.32/0.705%* 493,661 0.01
6,191,098 Option One Mortgage LoanTrust 2002-6 A1 25.11.32/0.925%* 4,156,165 0.08
724,795 Option One Mortgage LoanTrust 2002-6 A2 25.11.32/0.965%* 489,197 0.01
1,467,609 Option One Mortgage LoanTrust 2003-1 A2 25.02.33/1.005%* 987,481 0.02
560,960 Option One Mortgage LoanTrust 2003-2 M1 25.04.33/1.140%* 339,429 0.01
749,137 Option One Mortgage LoanTrust 2003-3 M1A 25.06.33/1.725%* 512,051 0.01
6,152,218 Option One Mortgage LoanTrust 2003-5 A1 25.08.33/0.805%* 4,173,152 0.08
486,662 Option One Mortgage LoanTrust 2003-5 A2 25.08.33/0.805%* 331,203 0.01
2,944,840 Option One Mortgage LoanTrust 2003-5 M1 25.08.33/1.140%* 1,908,691 0.04
381,178 Option One Mortgage LoanTrust 2003-5 M2 25.08.33/2.490%* 218,450 0.00
6,157,340 Option One Mortgage LoanTrust 2004-2 M1 25.05.34/0.960%* 3,915,661 0.08
1,308,044 Option One Mortgage LoanTrust 2004-3 M2 25.11.34/1.020%* 925,128 0.02
2,614,000 Oshkosh 01.03.20/8.500% 2,103,728 0.04930,000 PAETEC Holding 01.12.18/9.875% 757,807 0.02381,000 Par Pharmaceutical 15.10.20/7.375% 288,330 0.01
27,930 Park Place Securities2005-WHQ3 M1 25.06.35/0.585%* 20,236 0.00
1,655,000 Parker Drilling 144A 01.08.20/7.500% 1,265,975 0.033,743,000 Party City Holdings 01.08.20/8.875% 3,056,763 0.06
390,000 Patriot Merger 144A 15.07.21/9.000% 297,265 0.01667,000 PC Nextco Holdings 144A 15.08.19/8.750% 498,715 0.01365,000 Penn National Gaming 144A 01.11.21/5.875% 262,312 0.0193,000 Penn Virginia Resource Partners 01.06.20/8.375% 74,982 0.0074,000 Penske Automotive Group 01.10.22/5.750% 54,927 0.00
1,206,326 People’s Choice Home LoanSecurities Trust 2004-2 M3 25.10.34/1.890%* 592,155 0.01
825,000 PetroLogistics 144A 01.04.20/6.250% 603,377 0.01300,000 PH Glatfelter 15.10.20/5.375% 224,310 0.00
65,000 PHI 15.10.18/8.625% 50,960 0.004,998,000 Pilgrim’s Pride 15.12.18/7.875% 3,963,758 0.08
470,000 Pinnacle Entertainment 15.04.21/7.500% 372,398 0.01340,000 Pioneer Drilling 15.03.18/9.875% 262,856 0.01213,000 Pittsburgh Glass Works 144A 15.11.18/8.000% 163,512 0.00
10,415,000 PNC Financial Services Group 31.12.49/4.850%* 6,802,117 0.1415,575,000 PNC Financial Services Group 31.12.49/6.750%* 11,820,430 0.24
800,000 PNK Finance 144A 01.08.21/6.375% 595,255 0.01800,000 Polymer Group 01.02.19/7.750% 617,071 0.01
3,750,000 PolyOne 15.03.23/5.250% 2,660,955 0.054,575,000 Post Holdings 15.02.22/7.375% 3,551,108 0.072,050,000 Post Holdings 144A 01.12.21/6.750% 1,536,503 0.03
79,000 Prestige Brands 01.02.20/8.125% 64,516 0.00725,000 Prestige Brands 144A 15.12.21/5.375% 534,187 0.01220,000 Prince Mineral Holding 144A 15.12.19/11.500% 178,468 0.00500,000 Provident Funding
Associates 144A 15.06.21/6.750% 362,961 0.018,135,000 Prudential Financial 15.09.42/5.875%* 6,022,473 0.12
11,673,000 Prudential Financial 15.06.43/5.625%* 8,348,437 0.1713,850,000 Prudential Financial 15.03.44/5.200%* 9,710,664 0.19
759,000 QEP Resources 01.05.23/5.250% 517,334 0.01300,000 Quiksilver 144A 01.08.18/7.875% 237,376 0.00
45,000 QVC 02.07.22/5.125% 32,432 0.00497,000 QVC 144A 15.10.20/7.375% 389,336 0.01815,000 Radiation Therapy Services 15.01.17/8.875% 604,340 0.01
2,969,000 Radio Systems 144A 01.11.19/8.375% 2,370,786 0.05495,000 Rain CII Carbon 144A 01.12.18/8.000% 373,704 0.01
1,460,000 Rain CII Carbon 144A 15.01.21/8.250% 1,086,341 0.0260,839 RALI Trust 2003-QS20 CB 25.11.18/5.000% 45,604 0.00
5,774,712 RALI Trust 2004-QA3 CB2 25.08.34/3.686%* 4,215,155 0.08245,314 RALI Trust 2004-QS15 A2 25.11.34/0.565%* 166,062 0.00514,477 RALI Trust 2005-QS17 A3 25.12.35/6.000% 311,881 0.01303,083 RALI Trust 2005-QS2 A1 25.02.35/5.500% 213,926 0.00
6,961,382 RALI Trust 2006-QS1 A7 25.01.36/5.750% 4,246,046 0.081,057,881 RALI Trust 2006-QS4 A2 25.04.36/6.000% 599,290 0.01
648,391 RAMP Trust 2002-RS2 AI5 25.03.32/6.030%* 462,015 0.01106,111 RAMP Trust 2004-RS11 M1 25.11.34/0.785%* 75,221 0.00
3,115,364 RAMP Trust 2004-RS9 MII1 25.09.34/1.140%* 2,125,526 0.04196,000 Range Resources 15.03.23/5.000% 139,791 0.00664,332 RASC Trust 2005-KS2 M1 25.03.35/0.810%* 438,086 0.01547,276 RASC Trust 2006-KS7 A3 25.09.36/0.315%* 381,565 0.01
605,000 RCN Telecom Services 144A 15.08.20/8.500% 445,770 0.012,120,000 Realogy 144A 15.01.20/7.625% 1,731,322 0.031,089,000 Regal Entertainment Group 01.02.25/5.750% 751,397 0.01
190,000 Regency Energy Partners 15.07.21/6.500% 147,616 0.001,750,000 Regency Energy Partners 01.11.23/4.500% 1,156,030 0.02
487,896 Renaissance Home Equity LoanTrust 2003-3 M1 25.12.33/0.895%* 337,768 0.01
709,430 Renaissance Home Equity LoanTrust 2003-3 M2F 25.12.33/5.681%* 476,517 0.01
2,383,701 Renaissance Home Equity LoanTrust 2003-4 M1 25.03.34/1.015%* 1,559,484 0.03
905,196 Renaissance Home Equity LoanTrust 2003-4 M2F 25.03.34/5.744%* 562,217 0.01
10,352,388 Renaissance Home Equity LoanTrust 2004-1 AV3 25.05.34/0.635%* 6,886,905 0.14
430,342 Renaissance Home Equity LoanTrust 2005-2 AV3 25.08.35/0.535%* 281,007 0.01
656,344 Renaissance Home Equity LoanTrust 2005-4 A3 25.02.36/5.565%* 431,972 0.01
402,302 Residential Asset SecuritizationTrust 2004-A6 A1 25.08.19/5.000% 300,789 0.01
722,666 Residential Asset SecuritizationTrust 2004-A8 A1 25.11.34/5.250% 536,775 0.01
109,997 Residential Asset SecuritizationTrust 2005-A14 A1 25.12.35/5.500% 71,503 0.00
1,275,000 Residential Asset SecuritizationTrust 2005-A3 A2 25.04.35/5.500% 795,909 0.02
1,740,712 Residential Asset SecuritizationTrust 2005-A8CB A11 25.07.35/6.000% 1,136,817 0.02
75,000 Resolute Forest Products 144A 15.05.23/5.875% 50,361 0.00863,000 Revlon Consumer
Products 144A 15.02.21/5.750% 620,205 0.011,850,000 Reynolds Group Issuer 15.05.18/8.500% 1,416,964 0.031,803,000 Reynolds Group Issuer 15.04.19/7.125% 1,396,639 0.031,185,000 Reynolds Group Issuer 15.02.21/6.875% 931,391 0.02
1,400,000 Reynolds Group Issuer 15.02.21/8.250% 1,082,598 0.02967,970 RFMSI Trust 2005-S1 2A1 25.02.20/4.750% 724,182 0.01113,777 RFMSI Trust 2006-S10 2A1 25.10.21/5.500% 85,637 0.00155,772 RFMSI Trust 2006-S12 2A2 25.12.36/6.000% 110,334 0.00
1,939,000 RHP Hotel Properties 15.04.21/5.000% 1,397,005 0.03775,000 Rite Aid 15.06.21/6.750% 592,125 0.01
1,005,000 Rivers PittsburghBorrower 144A 15.06.19/9.500% 804,330 0.02
885,000 ROC Finance 144A 01.09.18/12.125% 655,289 0.01150,000 Rockies Express Pipeline 144A 15.01.19/6.000% 101,266 0.00950,000 Roofing Supply Group 144A 01.06.20/10.000% 779,276 0.02
2,401,000 Rosetta Resources 01.05.21/5.625% 1,749,325 0.031,695,000 Rosetta Resources 01.06.22/5.875% 1,222,746 0.02
390,000 RR Donnelley & Sons 15.06.20/7.625% 309,344 0.01200,000 RR Donnelley & Sons 15.03.21/7.875% 160,988 0.00645,000 RR Donnelley & Sons 15.02.22/7.000% 502,884 0.01645,000 RR Donnelley & Sons 15.11.23/6.500% 472,517 0.01920,000 Ryerson 15.10.17/9.000% 708,753 0.01860,000 Sabine Oil & Gas 15.02.17/9.750% 652,385 0.01489,000 Sabine Pass Liquefaction 144A 01.02.21/5.625% 348,763 0.01394,000 Sabine Pass Liquefaction 144A 15.04.23/5.625% 267,422 0.01
5,505,000 Sabre 144A 15.05.19/8.500% 4,450,764 0.091,095,000 Salix Pharmaceuticals 144A 15.01.21/6.000% 816,743 0.021,067,000 Sally Holdings 15.11.19/6.875% 857,529 0.023,935,000 Samson Investment 144A 15.02.20/10.500% 3,135,009 0.06
306,764 Saxon Asset Securities Trust2003-3 M1 25.12.33/1.140%* 209,191 0.00
1,132,398 Saxon Asset Securities Trust2004-2 MV2 25.08.35/1.965%* 773,753 0.02
3,044,000 SBA Telecommunications 15.07.20/5.750% 2,314,665 0.05
117
JPMorgan Investment Funds - Global Income Fund
Schedule of Investments (Market Value Expressed in EUR) (continued)
As at 31 December 2013
Quantity/Nominal
Value
Name of Securities Maturity/Coupon
MarketValue
%of
NetAssets
Quantity/Nominal
Value
Name of Securities Maturity/Coupon
MarketValue
%of
NetAssets
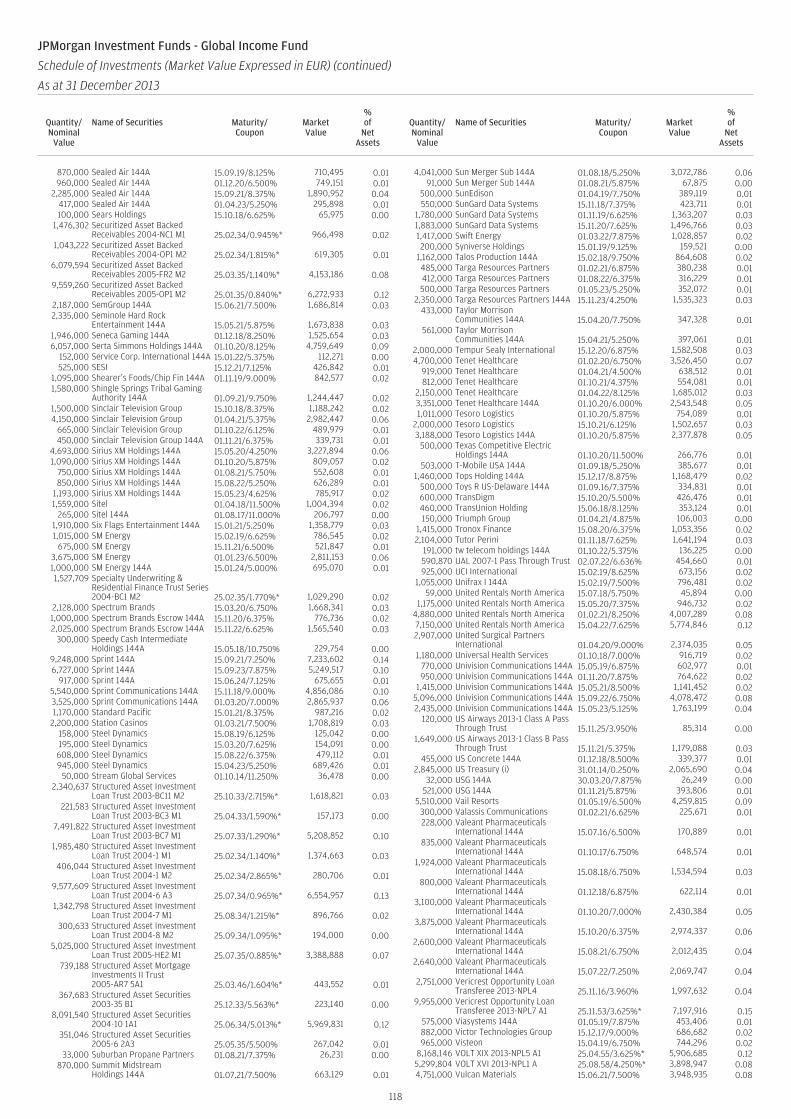
870,000 Sealed Air 144A 15.09.19/8.125% 710,495 0.01960,000 Sealed Air 144A 01.12.20/6.500% 749,151 0.01
2,285,000 Sealed Air 144A 15.09.21/8.375% 1,890,952 0.04417,000 Sealed Air 144A 01.04.23/5.250% 295,898 0.01100,000 Sears Holdings 15.10.18/6.625% 65,975 0.00
1,476,302 Securitized Asset BackedReceivables 2004-NC1 M1 25.02.34/0.945%* 966,498 0.02
1,043,222 Securitized Asset BackedReceivables 2004-OP1 M2 25.02.34/1.815%* 619,305 0.01
6,079,594 Securitized Asset BackedReceivables 2005-FR2 M2 25.03.35/1.140%* 4,153,186 0.08
9,559,260 Securitized Asset BackedReceivables 2005-OP1 M2 25.01.35/0.840%* 6,272,933 0.12
2,187,000 SemGroup 144A 15.06.21/7.500% 1,686,814 0.032,335,000 Seminole Hard Rock
Entertainment 144A 15.05.21/5.875% 1,673,838 0.031,946,000 Seneca Gaming 144A 01.12.18/8.250% 1,525,654 0.036,057,000 Serta Simmons Holdings 144A 01.10.20/8.125% 4,759,649 0.09
152,000 Service Corp. International 144A 15.01.22/5.375% 112,271 0.00525,000 SESI 15.12.21/7.125% 426,842 0.01
1,095,000 Shearer’s Foods/Chip Fin 144A 01.11.19/9.000% 842,577 0.021,580,000 Shingle Springs Tribal Gaming
Authority 144A 01.09.21/9.750% 1,244,447 0.021,500,000 Sinclair Television Group 15.10.18/8.375% 1,188,242 0.024,150,000 Sinclair Television Group 01.04.21/5.375% 2,982,447 0.06
665,000 Sinclair Television Group 01.10.22/6.125% 489,979 0.01450,000 Sinclair Television Group 144A 01.11.21/6.375% 339,731 0.01
4,693,000 Sirius XM Holdings 144A 15.05.20/4.250% 3,227,894 0.061,090,000 Sirius XM Holdings 144A 01.10.20/5.875% 809,057 0.02
750,000 Sirius XM Holdings 144A 01.08.21/5.750% 552,608 0.01850,000 Sirius XM Holdings 144A 15.08.22/5.250% 626,289 0.01
1,193,000 Sirius XM Holdings 144A 15.05.23/4.625% 785,917 0.021,559,000 Sitel 01.04.18/11.500% 1,004,394 0.02
265,000 Sitel 144A 01.08.17/11.000% 206,797 0.001,910,000 Six Flags Entertainment 144A 15.01.21/5.250% 1,358,779 0.031,015,000 SM Energy 15.02.19/6.625% 786,545 0.02
675,000 SM Energy 15.11.21/6.500% 521,847 0.013,675,000 SM Energy 01.01.23/6.500% 2,811,153 0.061,000,000 SM Energy 144A 15.01.24/5.000% 695,070 0.011,527,709 Specialty Underwriting &
Residential Finance Trust Series2004-BC1 M2 25.02.35/1.770%* 1,029,290 0.02
2,128,000 Spectrum Brands 15.03.20/6.750% 1,668,341 0.031,000,000 Spectrum Brands Escrow 144A 15.11.20/6.375% 776,736 0.022,025,000 Spectrum Brands Escrow 144A 15.11.22/6.625% 1,565,540 0.03
300,000 Speedy Cash IntermediateHoldings 144A 15.05.18/10.750% 229,754 0.00
9,248,000 Sprint 144A 15.09.21/7.250% 7,233,602 0.146,727,000 Sprint 144A 15.09.23/7.875% 5,249,517 0.10
917,000 Sprint 144A 15.06.24/7.125% 675,655 0.015,540,000 Sprint Communications 144A 15.11.18/9.000% 4,856,086 0.103,525,000 Sprint Communications 144A 01.03.20/7.000% 2,865,937 0.061,170,000 Standard Pacific 15.01.21/8.375% 987,216 0.02
2,200,000 Station Casinos 01.03.21/7.500% 1,708,819 0.03158,000 Steel Dynamics 15.08.19/6.125% 125,042 0.00195,000 Steel Dynamics 15.03.20/7.625% 154,091 0.00608,000 Steel Dynamics 15.08.22/6.375% 479,112 0.01945,000 Steel Dynamics 15.04.23/5.250% 689,426 0.01
50,000 Stream Global Services 01.10.14/11.250% 36,478 0.002,340,637 Structured Asset Investment
Loan Trust 2003-BC11 M2 25.10.33/2.715%* 1,618,821 0.03221,583 Structured Asset Investment
Loan Trust 2003-BC3 M1 25.04.33/1.590%* 157,173 0.007,491,822 Structured Asset Investment
Loan Trust 2003-BC7 M1 25.07.33/1.290%* 5,208,852 0.101,985,480 Structured Asset Investment
Loan Trust 2004-1 M1 25.02.34/1.140%* 1,374,663 0.03406,044 Structured Asset Investment
Loan Trust 2004-1 M2 25.02.34/2.865%* 280,706 0.019,577,609 Structured Asset Investment
Loan Trust 2004-6 A3 25.07.34/0.965%* 6,554,957 0.131,342,798 Structured Asset Investment
Loan Trust 2004-7 M1 25.08.34/1.215%* 896,766 0.02300,633 Structured Asset Investment
Loan Trust 2004-8 M2 25.09.34/1.095%* 194,000 0.005,025,000 Structured Asset Investment
Loan Trust 2005-HE2 M1 25.07.35/0.885%* 3,388,888 0.07739,188 Structured Asset Mortgage
Investments II Trust2005-AR7 5A1 25.03.46/1.604%* 443,552 0.01
367,683 Structured Asset Securities2003-35 B1 25.12.33/5.563%* 223,140 0.00
8,091,540 Structured Asset Securities2004-10 1A1 25.06.34/5.013%* 5,969,831 0.12
351,046 Structured Asset Securities2005-6 2A3 25.05.35/5.500% 267,042 0.01
33,000 Suburban Propane Partners 01.08.21/7.375% 26,231 0.00870,000 Summit Midstream
Holdings 144A 01.07.21/7.500% 663,129 0.01
4,041,000 Sun Merger Sub 144A 01.08.18/5.250% 3,072,786 0.0691,000 Sun Merger Sub 144A 01.08.21/5.875% 67,875 0.00
500,000 SunEdison 01.04.19/7.750% 389,119 0.01550,000 SunGard Data Systems 15.11.18/7.375% 423,711 0.01
1,780,000 SunGard Data Systems 01.11.19/6.625% 1,363,207 0.031,883,000 SunGard Data Systems 15.11.20/7.625% 1,496,766 0.031,417,000 Swift Energy 01.03.22/7.875% 1,028,857 0.02200,000 Syniverse Holdings 15.01.19/9.125% 159,521 0.00
1,162,000 Talos Production 144A 15.02.18/9.750% 864,608 0.02485,000 Targa Resources Partners 01.02.21/6.875% 380,238 0.01412,000 Targa Resources Partners 01.08.22/6.375% 316,229 0.01500,000 Targa Resources Partners 01.05.23/5.250% 352,072 0.01
2,350,000 Targa Resources Partners 144A 15.11.23/4.250% 1,535,323 0.03433,000 Taylor Morrison
Communities 144A 15.04.20/7.750% 347,328 0.01561,000 Taylor Morrison
Communities 144A 15.04.21/5.250% 397,061 0.012,000,000 Tempur Sealy International 15.12.20/6.875% 1,582,508 0.034,700,000 Tenet Healthcare 01.02.20/6.750% 3,526,450 0.07
919,000 Tenet Healthcare 01.04.21/4.500% 638,512 0.01812,000 Tenet Healthcare 01.10.21/4.375% 554,081 0.01
2,150,000 Tenet Healthcare 01.04.22/8.125% 1,685,012 0.033,351,000 Tenet Healthcare 144A 01.10.20/6.000% 2,543,548 0.051,011,000 Tesoro Logistics 01.10.20/5.875% 754,089 0.01
2,000,000 Tesoro Logistics 15.10.21/6.125% 1,502,657 0.033,188,000 Tesoro Logistics 144A 01.10.20/5.875% 2,377,878 0.05
500,000 Texas Competitive ElectricHoldings 144A 01.10.20/11.500% 266,776 0.01
503,000 T-Mobile USA 144A 01.09.18/5.250% 385,677 0.011,460,000 Tops Holding 144A 15.12.17/8.875% 1,168,479 0.02
500,000 Toys R US-Delaware 144A 01.09.16/7.375% 334,831 0.01600,000 TransDigm 15.10.20/5.500% 426,476 0.01460,000 TransUnion Holding 15.06.18/8.125% 353,124 0.01150,000 Triumph Group 01.04.21/4.875% 106,003 0.00
1,415,000 Tronox Finance 15.08.20/6.375% 1,053,356 0.022,104,000 Tutor Perini 01.11.18/7.625% 1,641,194 0.03
191,000 tw telecom holdings 144A 01.10.22/5.375% 136,225 0.00590,870 UAL 2007-1 Pass Through Trust 02.07.22/6.636% 454,660 0.01925,000 UCI International 15.02.19/8.625% 673,156 0.02
1,055,000 Unifrax I 144A 15.02.19/7.500% 796,481 0.0259,000 United Rentals North America 15.07.18/5.750% 45,894 0.00
1,175,000 United Rentals North America 15.05.20/7.375% 946,732 0.024,880,000 United Rentals North America 01.02.21/8.250% 4,007,289 0.087,150,000 United Rentals North America 15.04.22/7.625% 5,774,846 0.122,907,000 United Surgical Partners
International 01.04.20/9.000% 2,374,035 0.051,180,000 Universal Health Services 01.10.18/7.000% 916,719 0.02
770,000 Univision Communications 144A 15.05.19/6.875% 602,977 0.01950,000 Univision Communications 144A 01.11.20/7.875% 764,622 0.02
1,415,000 Univision Communications 144A 15.05.21/8.500% 1,141,452 0.025,096,000 Univision Communications 144A 15.09.22/6.750% 4,078,472 0.082,435,000 Univision Communications 144A 15.05.23/5.125% 1,763,199 0.04
120,000 US Airways 2013-1 Class A PassThrough Trust 15.11.25/3.950% 85,314 0.00
1,649,000 US Airways 2013-1 Class B PassThrough Trust 15.11.21/5.375% 1,179,088 0.03
455,000 US Concrete 144A 01.12.18/8.500% 339,377 0.012,845,000 US Treasury (i) 31.01.14/0.250% 2,065,690 0.04
32,000 USG 144A 30.03.20/7.875% 26,249 0.00521,000 USG 144A 01.11.21/5.875% 393,806 0.01
5,510,000 Vail Resorts 01.05.19/6.500% 4,259,815 0.09300,000 Valassis Communications 01.02.21/6.625% 225,671 0.01228,000 Valeant Pharmaceuticals
International 144A 15.07.16/6.500% 170,889 0.01835,000 Valeant Pharmaceuticals
International 144A 01.10.17/6.750% 648,574 0.011,924,000 Valeant Pharmaceuticals
International 144A 15.08.18/6.750% 1,534,594 0.03800,000 Valeant Pharmaceuticals
International 144A 01.12.18/6.875% 622,114 0.013,100,000 Valeant Pharmaceuticals
International 144A 01.10.20/7.000% 2,430,384 0.053,875,000 Valeant Pharmaceuticals
International 144A 15.10.20/6.375% 2,974,337 0.062,600,000 Valeant Pharmaceuticals
International 144A 15.08.21/6.750% 2,012,435 0.042,640,000 Valeant Pharmaceuticals
International 144A 15.07.22/7.250% 2,069,747 0.042,751,000 Vericrest Opportunity Loan
Transferee 2013-NPL4 25.11.16/3.960% 1,997,632 0.049,955,000 Vericrest Opportunity Loan
Transferee 2013-NPL7 A1 25.11.53/3.625%* 7,197,916 0.15575,000 Viasystems 144A 01.05.19/7.875% 453,406 0.01882,000 Victor Technologies Group 15.12.17/9.000% 686,682 0.02965,000 Visteon 15.04.19/6.750% 744,296 0.02
8,168,146 VOLT XIX 2013-NPL5 A1 25.04.55/3.625%* 5,906,685 0.125,299,804 VOLT XVI 2013-NPL1 A 25.08.58/4.250%* 3,898,947 0.084,751,000 Vulcan Materials 15.06.21/7.500% 3,948,935 0.08
118
JPMorgan Investment Funds - Global Income Fund
Schedule of Investments (Market Value Expressed in EUR) (continued)
As at 31 December 2013
Quantity/Nominal
Value
Name of Securities Maturity/Coupon
MarketValue
%of
NetAssets
Quantity/Nominal
Value
Name of Securities Maturity/Coupon
MarketValue
%of
NetAssets
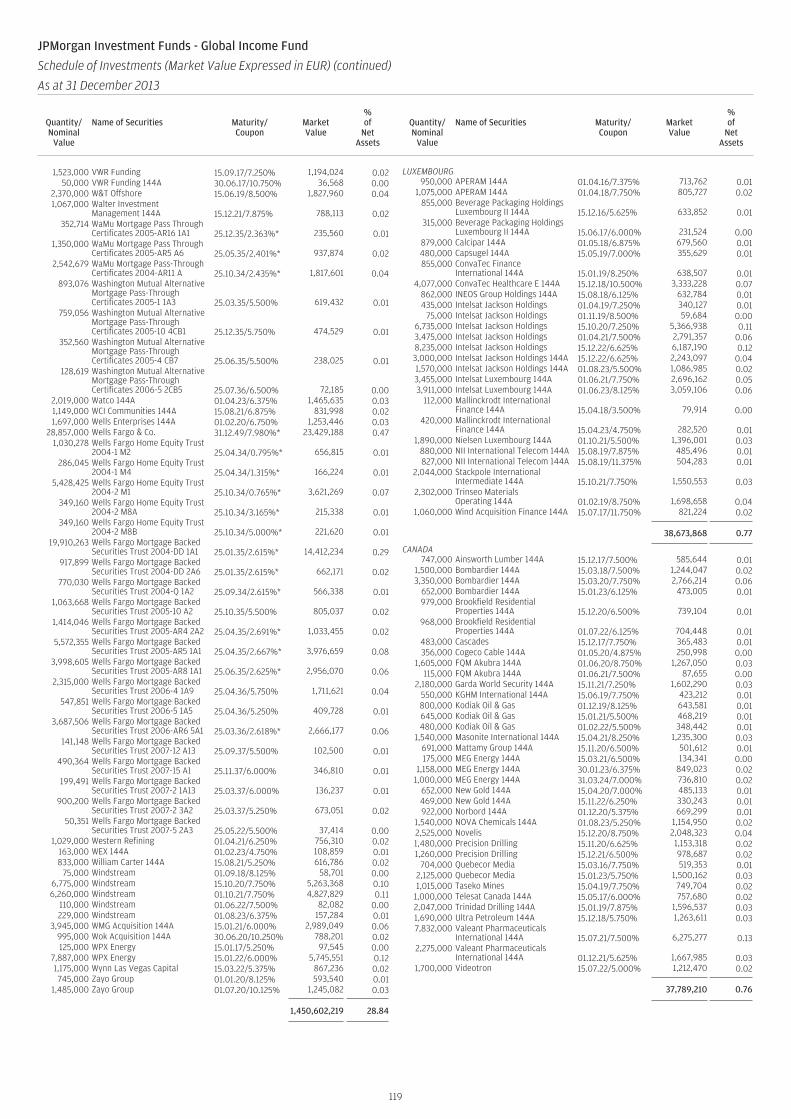
1,523,000 VWR Funding 15.09.17/7.250% 1,194,024 0.0250,000 VWR Funding 144A 30.06.17/10.750% 36,568 0.00
2,370,000 W&T Offshore 15.06.19/8.500% 1,827,960 0.041,067,000 Walter Investment
Management 144A 15.12.21/7.875% 788,113 0.02352,714 WaMu Mortgage Pass Through
Certificates 2005-AR16 1A1 25.12.35/2.363%* 235,560 0.011,350,000 WaMu Mortgage Pass Through
Certificates 2005-AR5 A6 25.05.35/2.401%* 937,874 0.022,542,679 WaMu Mortgage Pass-Through
Certificates 2004-AR11 A 25.10.34/2.435%* 1,817,601 0.04893,076 Washington Mutual Alternative
Mortgage Pass-ThroughCertificates 2005-1 1A3 25.03.35/5.500% 619,432 0.01
759,056 Washington Mutual AlternativeMortgage Pass-ThroughCertificates 2005-10 4CB1 25.12.35/5.750% 474,529 0.01
352,560 Washington Mutual AlternativeMortgage Pass-ThroughCertificates 2005-4 CB7 25.06.35/5.500% 238,025 0.01
128,619 Washington Mutual AlternativeMortgage Pass-ThroughCertificates 2006-5 2CB5 25.07.36/6.500% 72,185 0.00
2,019,000 Watco 144A 01.04.23/6.375% 1,465,635 0.031,149,000 WCI Communities 144A 15.08.21/6.875% 831,998 0.021,697,000 Wells Enterprises 144A 01.02.20/6.750% 1,253,446 0.03
28,857,000 Wells Fargo & Co. 31.12.49/7.980%* 23,429,188 0.471,030,278 Wells Fargo Home Equity Trust
2004-1 M2 25.04.34/0.795%* 656,815 0.01286,045 Wells Fargo Home Equity Trust
2004-1 M4 25.04.34/1.315%* 166,224 0.015,428,425 Wells Fargo Home Equity Trust
2004-2 M1 25.10.34/0.765%* 3,621,269 0.07349,160 Wells Fargo Home Equity Trust
2004-2 M8A 25.10.34/3.165%* 215,338 0.01349,160 Wells Fargo Home Equity Trust
2004-2 M8B 25.10.34/5.000%* 221,620 0.0119,910,263 Wells Fargo Mortgage Backed
Securities Trust 2004-DD 1A1 25.01.35/2.615%* 14,412,234 0.29917,899 Wells Fargo Mortgage Backed
Securities Trust 2004-DD 2A6 25.01.35/2.615%* 662,171 0.02770,030 Wells Fargo Mortgage Backed
Securities Trust 2004-Q 1A2 25.09.34/2.615%* 566,338 0.011,063,668 Wells Fargo Mortgage Backed
Securities Trust 2005-10 A2 25.10.35/5.500% 805,037 0.021,414,046 Wells Fargo Mortgage Backed
Securities Trust 2005-AR4 2A2 25.04.35/2.691%* 1,033,455 0.025,572,355 Wells Fargo Mortgage Backed
Securities Trust 2005-AR5 1A1 25.04.35/2.667%* 3,976,659 0.083,998,605 Wells Fargo Mortgage Backed
Securities Trust 2005-AR8 1A1 25.06.35/2.625%* 2,956,070 0.062,315,000 Wells Fargo Mortgage Backed
Securities Trust 2006-4 1A9 25.04.36/5.750% 1,711,621 0.04547,851 Wells Fargo Mortgage Backed
Securities Trust 2006-5 1A5 25.04.36/5.250% 409,728 0.013,687,506 Wells Fargo Mortgage Backed
Securities Trust 2006-AR6 5A1 25.03.36/2.618%* 2,666,177 0.06141,148 Wells Fargo Mortgage Backed
Securities Trust 2007-12 A13 25.09.37/5.500% 102,500 0.01490,364 Wells Fargo Mortgage Backed
Securities Trust 2007-15 A1 25.11.37/6.000% 346,810 0.01199,491 Wells Fargo Mortgage Backed
Securities Trust 2007-2 1A13 25.03.37/6.000% 136,237 0.01900,200 Wells Fargo Mortgage Backed
Securities Trust 2007-2 3A2 25.03.37/5.250% 673,051 0.0250,351 Wells Fargo Mortgage Backed
Securities Trust 2007-5 2A3 25.05.22/5.500% 37,414 0.001,029,000 Western Refining 01.04.21/6.250% 756,310 0.02
163,000 WEX 144A 01.02.23/4.750% 108,859 0.01833,000 William Carter 144A 15.08.21/5.250% 616,786 0.02
75,000 Windstream 01.09.18/8.125% 58,701 0.006,775,000 Windstream 15.10.20/7.750% 5,263,368 0.106,260,000 Windstream 01.10.21/7.750% 4,827,829 0.11
110,000 Windstream 01.06.22/7.500% 82,082 0.00229,000 Windstream 01.08.23/6.375% 157,284 0.01
3,945,000 WMG Acquisition 144A 15.01.21/6.000% 2,989,049 0.06995,000 Wok Acquisition 144A 30.06.20/10.250% 788,201 0.02125,000 WPX Energy 15.01.17/5.250% 97,545 0.00
7,887,000 WPX Energy 15.01.22/6.000% 5,745,551 0.121,175,000 Wynn Las Vegas Capital 15.03.22/5.375% 867,236 0.02745,000 Zayo Group 01.01.20/8.125% 593,540 0.01
1,485,000 Zayo Group 01.07.20/10.125% 1,245,082 0.03
1,450,602,219 28.84
LUXEMBOURG950,000 APERAM 144A 01.04.16/7.375% 713,762 0.01
1,075,000 APERAM 144A 01.04.18/7.750% 805,727 0.02855,000 Beverage Packaging Holdings
Luxembourg II 144A 15.12.16/5.625% 633,852 0.01315,000 Beverage Packaging Holdings
Luxembourg II 144A 15.06.17/6.000% 231,524 0.00879,000 Calcipar 144A 01.05.18/6.875% 679,560 0.01480,000 Capsugel 144A 15.05.19/7.000% 355,629 0.01855,000 ConvaTec Finance
International 144A 15.01.19/8.250% 638,507 0.014,077,000 ConvaTec Healthcare E 144A 15.12.18/10.500% 3,333,228 0.07
862,000 INEOS Group Holdings 144A 15.08.18/6.125% 632,784 0.01435,000 Intelsat Jackson Holdings 01.04.19/7.250% 340,127 0.01
75,000 Intelsat Jackson Holdings 01.11.19/8.500% 59,684 0.006,735,000 Intelsat Jackson Holdings 15.10.20/7.250% 5,366,938 0.113,475,000 Intelsat Jackson Holdings 01.04.21/7.500% 2,791,357 0.068,235,000 Intelsat Jackson Holdings 15.12.22/6.625% 6,187,190 0.123,000,000 Intelsat Jackson Holdings 144A 15.12.22/6.625% 2,243,097 0.041,570,000 Intelsat Jackson Holdings 144A 01.08.23/5.500% 1,086,985 0.023,455,000 Intelsat Luxembourg 144A 01.06.21/7.750% 2,696,162 0.053,911,000 Intelsat Luxembourg 144A 01.06.23/8.125% 3,059,106 0.06
112,000 Mallinckrodt InternationalFinance 144A 15.04.18/3.500% 79,914 0.00
420,000 Mallinckrodt InternationalFinance 144A 15.04.23/4.750% 282,520 0.01
1,890,000 Nielsen Luxembourg 144A 01.10.21/5.500% 1,396,001 0.03880,000 NII International Telecom 144A 15.08.19/7.875% 485,496 0.01827,000 NII International Telecom 144A 15.08.19/11.375% 504,283 0.01
2,044,000 Stackpole InternationalIntermediate 144A 15.10.21/7.750% 1,550,553 0.03
2,302,000 Trinseo MaterialsOperating 144A 01.02.19/8.750% 1,698,658 0.04
1,060,000 Wind Acquisition Finance 144A 15.07.17/11.750% 821,224 0.02
38,673,868 0.77
CANADA747,000 Ainsworth Lumber 144A 15.12.17/7.500% 585,644 0.01
1,500,000 Bombardier 144A 15.03.18/7.500% 1,244,047 0.023,350,000 Bombardier 144A 15.03.20/7.750% 2,766,214 0.06
652,000 Bombardier 144A 15.01.23/6.125% 473,005 0.01979,000 Brookfield Residential
Properties 144A 15.12.20/6.500% 739,104 0.01968,000 Brookfield Residential
Properties 144A 01.07.22/6.125% 704,448 0.01483,000 Cascades 15.12.17/7.750% 365,483 0.01356,000 Cogeco Cable 144A 01.05.20/4.875% 250,998 0.00
1,605,000 FQM Akubra 144A 01.06.20/8.750% 1,267,050 0.03115,000 FQM Akubra 144A 01.06.21/7.500% 87,655 0.00
2,180,000 Garda World Security 144A 15.11.21/7.250% 1,602,290 0.03550,000 KGHM International 144A 15.06.19/7.750% 423,212 0.01800,000 Kodiak Oil & Gas 01.12.19/8.125% 643,581 0.01645,000 Kodiak Oil & Gas 15.01.21/5.500% 468,219 0.01480,000 Kodiak Oil & Gas 01.02.22/5.500% 348,442 0.01
1,540,000 Masonite International 144A 15.04.21/8.250% 1,235,300 0.03691,000 Mattamy Group 144A 15.11.20/6.500% 501,612 0.01175,000 MEG Energy 144A 15.03.21/6.500% 134,341 0.00
1,158,000 MEG Energy 144A 30.01.23/6.375% 849,023 0.021,000,000 MEG Energy 144A 31.03.24/7.000% 736,810 0.02
652,000 New Gold 144A 15.04.20/7.000% 485,133 0.01469,000 New Gold 144A 15.11.22/6.250% 330,243 0.01922,000 Norbord 144A 01.12.20/5.375% 669,299 0.01
1,540,000 NOVA Chemicals 144A 01.08.23/5.250% 1,154,950 0.022,525,000 Novelis 15.12.20/8.750% 2,048,323 0.041,480,000 Precision Drilling 15.11.20/6.625% 1,153,318 0.021,260,000 Precision Drilling 15.12.21/6.500% 978,687 0.02
704,000 Quebecor Media 15.03.16/7.750% 519,353 0.012,125,000 Quebecor Media 15.01.23/5.750% 1,500,162 0.031,015,000 Taseko Mines 15.04.19/7.750% 749,704 0.02
1,000,000 Telesat Canada 144A 15.05.17/6.000% 757,680 0.022,047,000 Trinidad Drilling 144A 15.01.19/7.875% 1,596,537 0.031,690,000 Ultra Petroleum 144A 15.12.18/5.750% 1,263,611 0.037,832,000 Valeant Pharmaceuticals
International 144A 15.07.21/7.500% 6,275,277 0.132,275,000 Valeant Pharmaceuticals
International 144A 01.12.21/5.625% 1,667,985 0.031,700,000 Videotron 15.07.22/5.000% 1,212,470 0.02
37,789,210 0.76
119
JPMorgan Investment Funds - Global Income Fund
Schedule of Investments (Market Value Expressed in EUR) (continued)
As at 31 December 2013
Quantity/Nominal
Value
Name of Securities Maturity/Coupon
MarketValue
%of
NetAssets
Quantity/Nominal
Value
Name of Securities Maturity/Coupon
MarketValue
%of
NetAssets
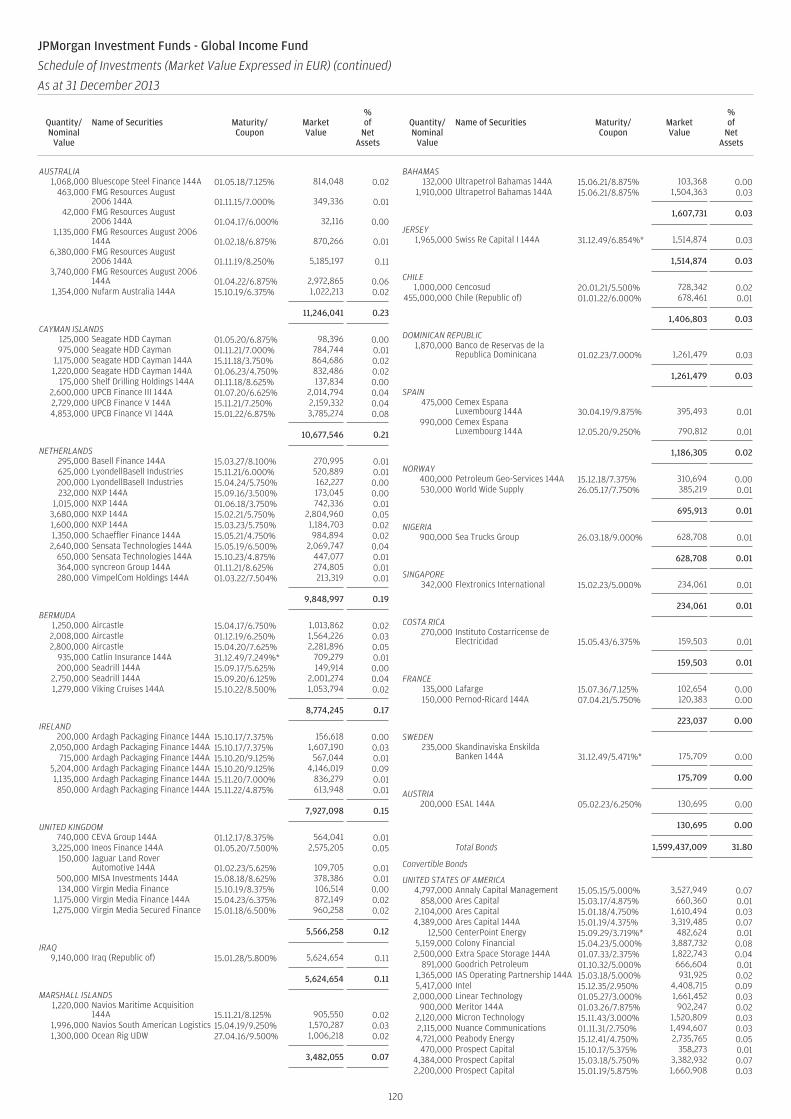
AUSTRALIA1,068,000 Bluescope Steel Finance 144A 01.05.18/7.125% 814,048 0.02
463,000 FMG Resources August2006 144A 01.11.15/7.000% 349,336 0.01
42,000 FMG Resources August2006 144A 01.04.17/6.000% 32,116 0.00
1,135,000 FMG Resources August 2006144A 01.02.18/6.875% 870,266 0.01
6,380,000 FMG Resources August2006 144A 01.11.19/8.250% 5,185,197 0.11
3,740,000 FMG Resources August 2006144A 01.04.22/6.875% 2,972,865 0.06
1,354,000 Nufarm Australia 144A 15.10.19/6.375% 1,022,213 0.02
11,246,041 0.23
CAYMAN ISLANDS125,000 Seagate HDD Cayman 01.05.20/6.875% 98,396 0.00975,000 Seagate HDD Cayman 01.11.21/7.000% 784,744 0.01
1,175,000 Seagate HDD Cayman 144A 15.11.18/3.750% 864,686 0.021,220,000 Seagate HDD Cayman 144A 01.06.23/4.750% 832,486 0.02
175,000 Shelf Drilling Holdings 144A 01.11.18/8.625% 137,834 0.002,600,000 UPCB Finance III 144A 01.07.20/6.625% 2,014,794 0.042,729,000 UPCB Finance V 144A 15.11.21/7.250% 2,159,332 0.044,853,000 UPCB Finance VI 144A 15.01.22/6.875% 3,785,274 0.08
10,677,546 0.21
NETHERLANDS295,000 Basell Finance 144A 15.03.27/8.100% 270,995 0.01625,000 LyondellBasell Industries 15.11.21/6.000% 520,889 0.01200,000 LyondellBasell Industries 15.04.24/5.750% 162,227 0.00232,000 NXP 144A 15.09.16/3.500% 173,045 0.00
1,015,000 NXP 144A 01.06.18/3.750% 742,336 0.013,680,000 NXP 144A 15.02.21/5.750% 2,804,960 0.051,600,000 NXP 144A 15.03.23/5.750% 1,184,703 0.021,350,000 Schaeffler Finance 144A 15.05.21/4.750% 984,894 0.022,640,000 Sensata Technologies 144A 15.05.19/6.500% 2,069,747 0.04
650,000 Sensata Technologies 144A 15.10.23/4.875% 447,077 0.01364,000 syncreon Group 144A 01.11.21/8.625% 274,805 0.01280,000 VimpelCom Holdings 144A 01.03.22/7.504% 213,319 0.01
9,848,997 0.19
BERMUDA1,250,000 Aircastle 15.04.17/6.750% 1,013,862 0.022,008,000 Aircastle 01.12.19/6.250% 1,564,226 0.032,800,000 Aircastle 15.04.20/7.625% 2,281,896 0.05
935,000 Catlin Insurance 144A 31.12.49/7.249%* 709,279 0.01200,000 Seadrill 144A 15.09.17/5.625% 149,914 0.00
2,750,000 Seadrill 144A 15.09.20/6.125% 2,001,274 0.041,279,000 Viking Cruises 144A 15.10.22/8.500% 1,053,794 0.02
8,774,245 0.17
IRELAND200,000 Ardagh Packaging Finance 144A 15.10.17/7.375% 156,618 0.00
2,050,000 Ardagh Packaging Finance 144A 15.10.17/7.375% 1,607,190 0.03715,000 Ardagh Packaging Finance 144A 15.10.20/9.125% 567,044 0.01
5,204,000 Ardagh Packaging Finance 144A 15.10.20/9.125% 4,146,019 0.091,135,000 Ardagh Packaging Finance 144A 15.11.20/7.000% 836,279 0.01850,000 Ardagh Packaging Finance 144A 15.11.22/4.875% 613,948 0.01
7,927,098 0.15
UNITED KINGDOM740,000 CEVA Group 144A 01.12.17/8.375% 564,041 0.01
3,225,000 Ineos Finance 144A 01.05.20/7.500% 2,575,205 0.05150,000 Jaguar Land Rover
Automotive 144A 01.02.23/5.625% 109,705 0.01500,000 MISA Investments 144A 15.08.18/8.625% 378,386 0.01134,000 Virgin Media Finance 15.10.19/8.375% 106,514 0.00
1,175,000 Virgin Media Finance 144A 15.04.23/6.375% 872,149 0.021,275,000 Virgin Media Secured Finance 15.01.18/6.500% 960,258 0.02
5,566,258 0.12
IRAQ9,140,000 Iraq (Republic of) 15.01.28/5.800% 5,624,654 0.11
5,624,654 0.11
MARSHALL ISLANDS1,220,000 Navios Maritime Acquisition
144A 15.11.21/8.125% 905,550 0.021,996,000 Navios South American Logistics 15.04.19/9.250% 1,570,287 0.031,300,000 Ocean Rig UDW 27.04.16/9.500% 1,006,218 0.02
3,482,055 0.07
BAHAMAS132,000 Ultrapetrol Bahamas 144A 15.06.21/8.875% 103,368 0.00
1,910,000 Ultrapetrol Bahamas 144A 15.06.21/8.875% 1,504,363 0.03
1,607,731 0.03
JERSEY1,965,000 Swiss Re Capital I 144A 31.12.49/6.854%* 1,514,874 0.03
1,514,874 0.03
CHILE1,000,000 Cencosud 20.01.21/5.500% 728,342 0.02
455,000,000 Chile (Republic of) 01.01.22/6.000% 678,461 0.01
1,406,803 0.03
DOMINICAN REPUBLIC1,870,000 Banco de Reservas de la
Republica Dominicana 01.02.23/7.000% 1,261,479 0.03
1,261,479 0.03
SPAIN475,000 Cemex Espana
Luxembourg 144A 30.04.19/9.875% 395,493 0.01990,000 Cemex Espana
Luxembourg 144A 12.05.20/9.250% 790,812 0.01
1,186,305 0.02
NORWAY400,000 Petroleum Geo-Services 144A 15.12.18/7.375% 310,694 0.00530,000 World Wide Supply 26.05.17/7.750% 385,219 0.01
695,913 0.01
NIGERIA900,000 Sea Trucks Group 26.03.18/9.000% 628,708 0.01
628,708 0.01
SINGAPORE342,000 Flextronics International 15.02.23/5.000% 234,061 0.01
234,061 0.01
COSTA RICA270,000 Instituto Costarricense de
Electricidad 15.05.43/6.375% 159,503 0.01
159,503 0.01
FRANCE135,000 Lafarge 15.07.36/7.125% 102,654 0.00150,000 Pernod-Ricard 144A 07.04.21/5.750% 120,383 0.00
223,037 0.00
SWEDEN235,000 Skandinaviska Enskilda
Banken 144A 31.12.49/5.471%* 175,709 0.00
175,709 0.00
AUSTRIA200,000 ESAL 144A 05.02.23/6.250% 130,695 0.00
130,695 0.00
Total Bonds 1,599,437,009 31.80
Convertible Bonds
UNITED STATES OF AMERICA4,797,000 Annaly Capital Management 15.05.15/5.000% 3,527,949 0.07
858,000 Ares Capital 15.03.17/4.875% 660,360 0.012,104,000 Ares Capital 15.01.18/4.750% 1,610,494 0.034,389,000 Ares Capital 144A 15.01.19/4.375% 3,319,485 0.07
12,500 CenterPoint Energy 15.09.29/3.719%* 482,624 0.015,159,000 Colony Financial 15.04.23/5.000% 3,887,732 0.082,500,000 Extra Space Storage 144A 01.07.33/2.375% 1,822,743 0.04
891,000 Goodrich Petroleum 01.10.32/5.000% 666,604 0.011,365,000 IAS Operating Partnership 144A 15.03.18/5.000% 931,925 0.025,417,000 Intel 15.12.35/2.950% 4,408,715 0.09
2,000,000 Linear Technology 01.05.27/3.000% 1,661,452 0.03900,000 Meritor 144A 01.03.26/7.875% 902,247 0.02
2,120,000 Micron Technology 15.11.43/3.000% 1,520,809 0.032,115,000 Nuance Communications 01.11.31/2.750% 1,494,607 0.034,721,000 Peabody Energy 15.12.41/4.750% 2,735,765 0.05
470,000 Prospect Capital 15.10.17/5.375% 358,273 0.014,384,000 Prospect Capital 15.03.18/5.750% 3,382,932 0.072,200,000 Prospect Capital 15.01.19/5.875% 1,660,908 0.03
120
JPMorgan Investment Funds - Global Income Fund
Schedule of Investments (Market Value Expressed in EUR) (continued)
As at 31 December 2013
Quantity/Nominal
Value
Name of Securities Maturity/Coupon
MarketValue
%of
NetAssets
Quantity/Nominal
Value
Name of Securities Maturity/Coupon
MarketValue
%of
NetAssets
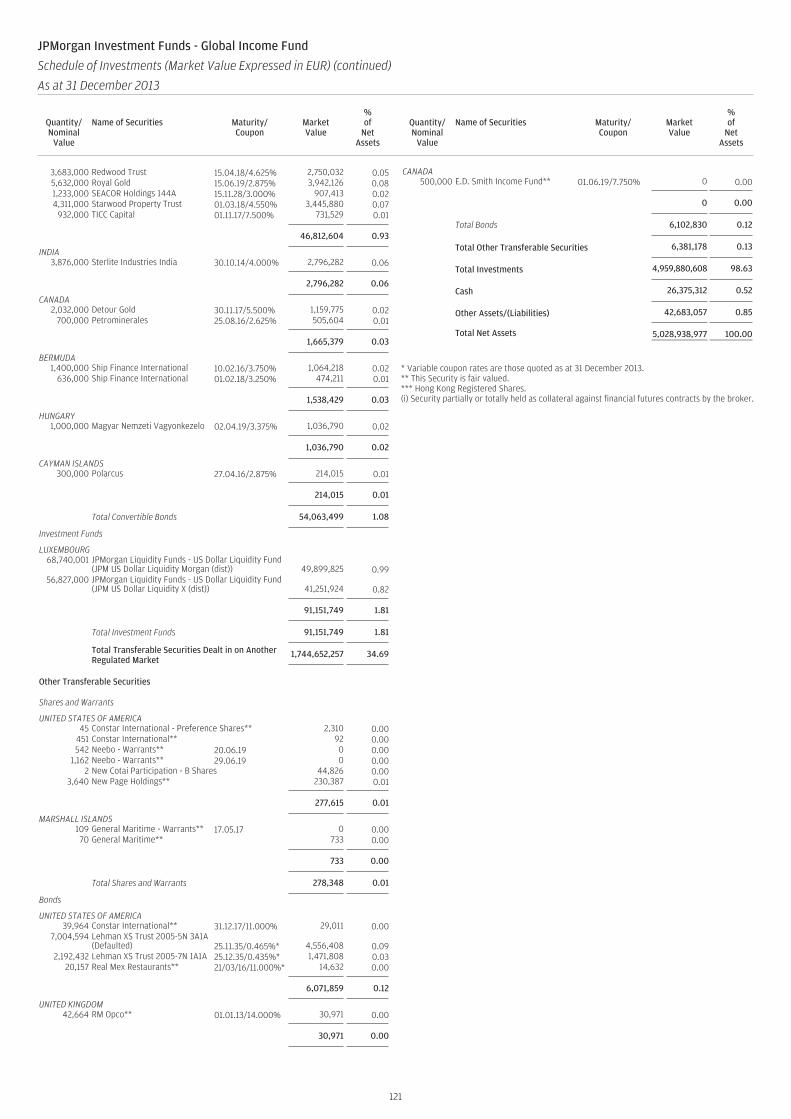
3,683,000 Redwood Trust 15.04.18/4.625% 2,750,032 0.055,632,000 Royal Gold 15.06.19/2.875% 3,942,126 0.081,233,000 SEACOR Holdings 144A 15.11.28/3.000% 907,413 0.024,311,000 Starwood Property Trust 01.03.18/4.550% 3,445,880 0.07
932,000 TICC Capital 01.11.17/7.500% 731,529 0.01
46,812,604 0.93
INDIA3,876,000 Sterlite Industries India 30.10.14/4.000% 2,796,282 0.06
2,796,282 0.06
CANADA2,032,000 Detour Gold 30.11.17/5.500% 1,159,775 0.02
700,000 Petrominerales 25.08.16/2.625% 505,604 0.01
1,665,379 0.03
BERMUDA1,400,000 Ship Finance International 10.02.16/3.750% 1,064,218 0.02
636,000 Ship Finance International 01.02.18/3.250% 474,211 0.01
1,538,429 0.03
HUNGARY1,000,000 Magyar Nemzeti Vagyonkezelo 02.04.19/3.375% 1,036,790 0.02
1,036,790 0.02
CAYMAN ISLANDS300,000 Polarcus 27.04.16/2.875% 214,015 0.01
214,015 0.01
Total Convertible Bonds 54,063,499 1.08
Investment Funds
LUXEMBOURG68,740,001 JPMorgan Liquidity Funds - US Dollar Liquidity Fund
(JPM US Dollar Liquidity Morgan (dist)) 49,899,825 0.9956,827,000 JPMorgan Liquidity Funds - US Dollar Liquidity Fund
(JPM US Dollar Liquidity X (dist)) 41,251,924 0.82
91,151,749 1.81
Total Investment Funds 91,151,749 1.81
Total Transferable Securities Dealt in on AnotherRegulated Market
1,744,652,257 34.69
Other Transferable Securities
Shares and Warrants
UNITED STATES OF AMERICA45 Constar International - Preference Shares** 2,310 0.00
451 Constar International** 92 0.00542 Neebo - Warrants** 20.06.19 0 0.00
1,162 Neebo - Warrants** 29.06.19 0 0.002 New Cotai Participation - B Shares 44,826 0.00
3,640 New Page Holdings** 230,387 0.01
277,615 0.01
MARSHALL ISLANDS109 General Maritime - Warrants** 17.05.17 0 0.0070 General Maritime** 733 0.00
733 0.00
Total Shares and Warrants 278,348 0.01
Bonds
UNITED STATES OF AMERICA39,964 Constar International** 31.12.17/11.000% 29,011 0.00
7,004,594 Lehman XS Trust 2005-5N 3A1A(Defaulted) 25.11.35/0.465%* 4,556,408 0.09
2,192,432 Lehman XS Trust 2005-7N 1A1A 25.12.35/0.435%* 1,471,808 0.0320,157 Real Mex Restaurants** 21/03/16/11.000%* 14,632 0.00
6,071,859 0.12
UNITED KINGDOM42,664 RM Opco** 01.01.13/14.000% 30,971 0.00
30,971 0.00
CANADA500,000 E.D. Smith Income Fund** 01.06.19/7.750% 0 0.00
0 0.00
Total Bonds 6,102,830 0.12
Total Other Transferable Securities 6,381,178 0.13
Total Investments 4,959,880,608 98.63
Cash 26,375,312 0.52
Other Assets/(Liabilities) 42,683,057 0.85
Total Net Assets 5,028,938,977 100.00
* Variable coupon rates are those quoted as at 31 December 2013.** This Security is fair valued.*** Hong Kong Registered Shares.(i) Security partially or totally held as collateral against financial futures contracts by the broker.
121
JPMorgan Investment Funds - Global Income Fund
Schedule of Investments (Market Value Expressed in EUR) (continued)
As at 31 December 2013
Quantity/Nominal
Value
Name of Securities Maturity/Coupon
MarketValue
%of
NetAssets
Quantity/Nominal
Value
Name of Securities Maturity/Coupon
MarketValue
%of
NetAssets
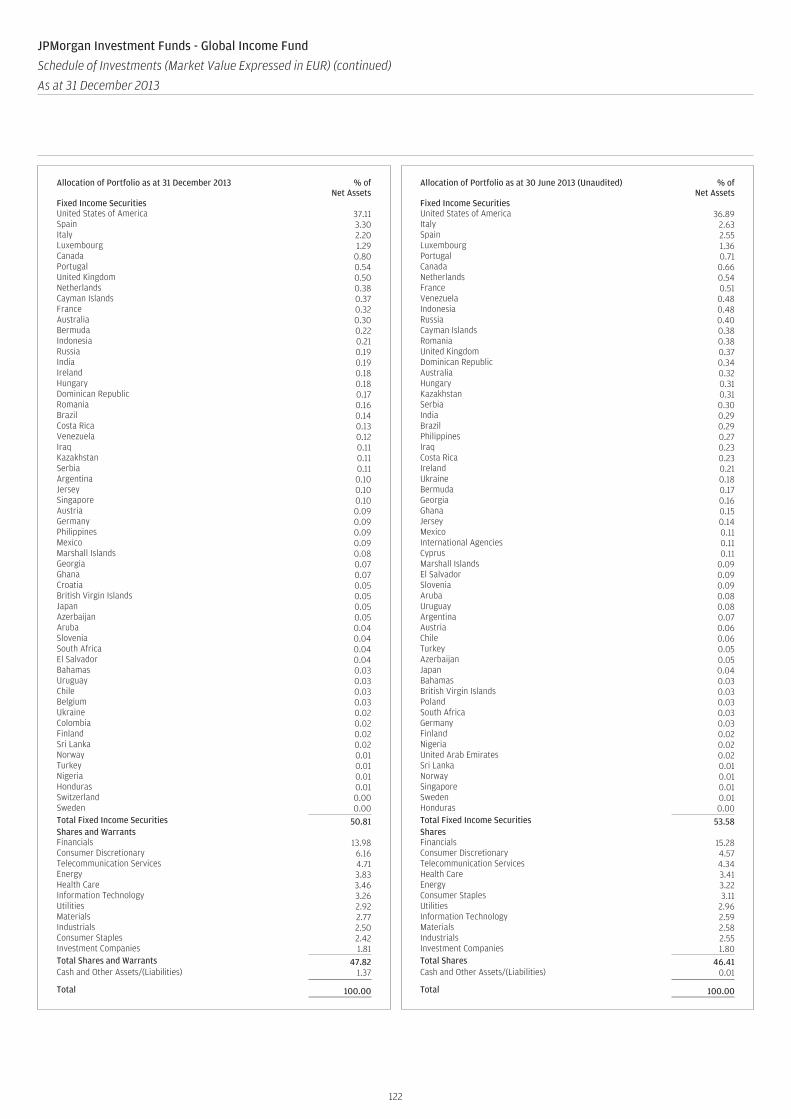
Allocation of Portfolio as at 31 December 2013 % ofNet Assets
Fixed Income SecuritiesUnited States of America 37.11Spain 3.30Italy 2.20Luxembourg 1.29Canada 0.80Portugal 0.54United Kingdom 0.50Netherlands 0.38Cayman Islands 0.37France 0.32Australia 0.30Bermuda 0.22Indonesia 0.21Russia 0.19India 0.19Ireland 0.18Hungary 0.18Dominican Republic 0.17Romania 0.16Brazil 0.14Costa Rica 0.13Venezuela 0.12Iraq 0.11Kazakhstan 0.11Serbia 0.11Argentina 0.10Jersey 0.10Singapore 0.10Austria 0.09Germany 0.09Philippines 0.09Mexico 0.09Marshall Islands 0.08Georgia 0.07Ghana 0.07Croatia 0.05British Virgin Islands 0.05Japan 0.05Azerbaijan 0.05Aruba 0.04Slovenia 0.04South Africa 0.04El Salvador 0.04Bahamas 0.03Uruguay 0.03Chile 0.03Belgium 0.03Ukraine 0.02Colombia 0.02Finland 0.02Sri Lanka 0.02Norway 0.01Turkey 0.01Nigeria 0.01Honduras 0.01Switzerland 0.00Sweden 0.00Total Fixed Income Securities 50.81Shares and WarrantsFinancials 13.98Consumer Discretionary 6.16Telecommunication Services 4.71Energy 3.83Health Care 3.46Information Technology 3.26Utilities 2.92Materials 2.77Industrials 2.50Consumer Staples 2.42Investment Companies 1.81Total Shares and Warrants 47.82Cash and Other Assets/(Liabilities) 1.37
Total 100.00
Allocation of Portfolio as at 30 June 2013 (Unaudited) % ofNet Assets
Fixed Income SecuritiesUnited States of America 36.89Italy 2.63Spain 2.55Luxembourg 1.36Portugal 0.71Canada 0.66Netherlands 0.54France 0.51Venezuela 0.48Indonesia 0.48Russia 0.40Cayman Islands 0.38Romania 0.38United Kingdom 0.37Dominican Republic 0.34Australia 0.32Hungary 0.31Kazakhstan 0.31Serbia 0.30India 0.29Brazil 0.29Philippines 0.27Iraq 0.23Costa Rica 0.23Ireland 0.21Ukraine 0.18Bermuda 0.17Georgia 0.16Ghana 0.15Jersey 0.14Mexico 0.11International Agencies 0.11Cyprus 0.11Marshall Islands 0.09El Salvador 0.09Slovenia 0.09Aruba 0.08Uruguay 0.08Argentina 0.07Austria 0.06Chile 0.06Turkey 0.05Azerbaijan 0.05Japan 0.04Bahamas 0.03British Virgin Islands 0.03Poland 0.03South Africa 0.03Germany 0.03Finland 0.02Nigeria 0.02United Arab Emirates 0.02Sri Lanka 0.01Norway 0.01Singapore 0.01Sweden 0.01Honduras 0.00Total Fixed Income Securities 53.58SharesFinancials 15.28Consumer Discretionary 4.57Telecommunication Services 4.34Health Care 3.41Energy 3.22Consumer Staples 3.11Utilities 2.96Information Technology 2.59Materials 2.58Industrials 2.55Investment Companies 1.80Total Shares 46.41Cash and Other Assets/(Liabilities) 0.01
Total 100.00
122
JPMorgan Investment Funds - Global Income Fund
Schedule of Investments (Market Value Expressed in EUR) (continued)
As at 31 December 2013
Quantity/Nominal
Value
Name of Securities Maturity/Coupon
MarketValue
%of
NetAssets
Quantity/Nominal
Value
Name of Securities Maturity/Coupon
MarketValue
%of
NetAssets
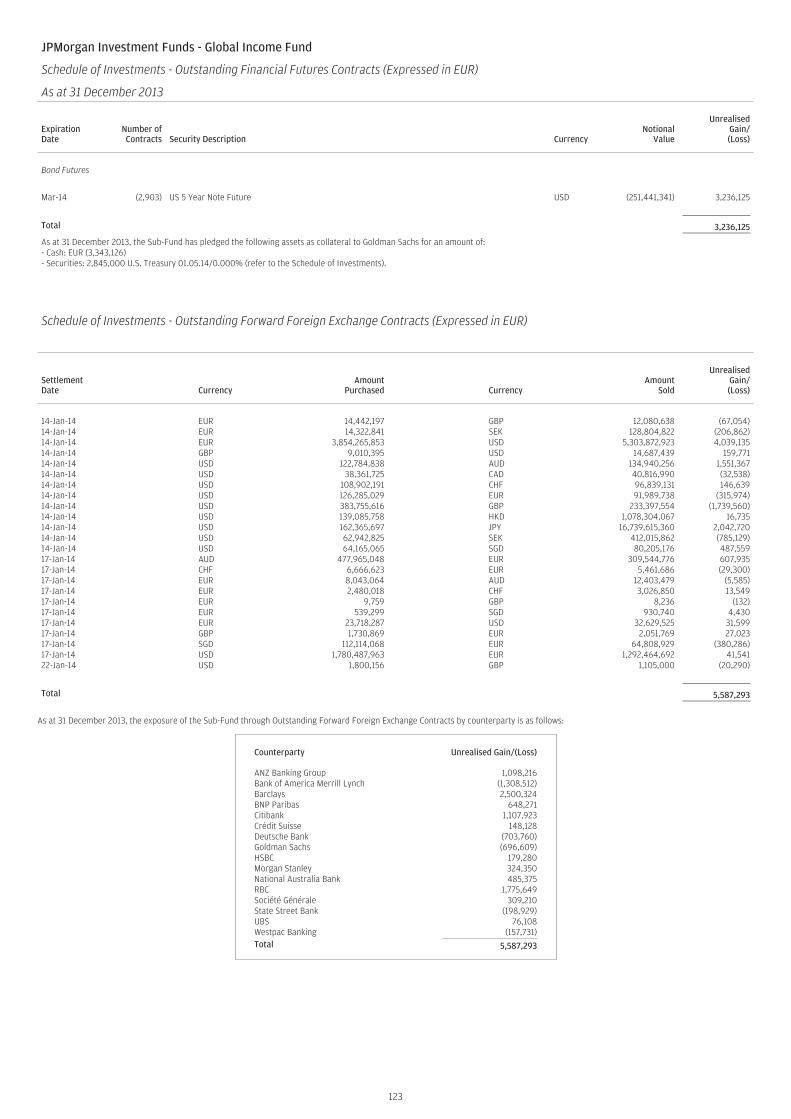
JPMorgan Investment Funds - Global Income Fund
Schedule of Investments - Outstanding Financial Futures Contracts (Expressed in EUR)
As at 31 December 2013
ExpirationDate
Number ofContracts Security Description Currency
NotionalValue
UnrealisedGain/(Loss)
Bond Futures
Mar-14 (2,903) US 5 Year Note Future USD (251,441,341) 3,236,125
Total 3,236,125
As at 31 December 2013, the Sub-Fund has pledged the following assets as collateral to Goldman Sachs for an amount of:- Cash: EUR (3,343,126)- Securities: 2,845,000 U.S. Treasury 01.05.14/0.000% (refer to the Schedule of Investments).
Schedule of Investments - Outstanding Forward Foreign Exchange Contracts (Expressed in EUR)
SettlementDate Currency
AmountPurchased Currency
AmountSold
UnrealisedGain/(Loss)
14-Jan-14 EUR 14,442,197 GBP 12,080,638 (67,054)14-Jan-14 EUR 14,322,841 SEK 128,804,822 (206,862)14-Jan-14 EUR 3,854,265,853 USD 5,303,872,923 4,039,13514-Jan-14 GBP 9,010,395 USD 14,687,439 159,77114-Jan-14 USD 122,784,838 AUD 134,940,256 1,551,36714-Jan-14 USD 38,361,725 CAD 40,816,990 (32,538)14-Jan-14 USD 108,902,191 CHF 96,839,131 146,63914-Jan-14 USD 126,285,029 EUR 91,989,738 (315,974)14-Jan-14 USD 383,755,616 GBP 233,397,554 (1,739,560)14-Jan-14 USD 139,085,758 HKD 1,078,304,067 16,73514-Jan-14 USD 162,365,697 JPY 16,739,615,360 2,042,72014-Jan-14 USD 62,942,825 SEK 412,015,862 (785,129)14-Jan-14 USD 64,165,065 SGD 80,205,176 487,55917-Jan-14 AUD 477,965,048 EUR 309,544,776 607,93517-Jan-14 CHF 6,666,623 EUR 5,461,686 (29,300)17-Jan-14 EUR 8,043,064 AUD 12,403,479 (5,585)17-Jan-14 EUR 2,480,018 CHF 3,026,850 13,54917-Jan-14 EUR 9,759 GBP 8,236 (132)17-Jan-14 EUR 539,299 SGD 930,740 4,43017-Jan-14 EUR 23,718,287 USD 32,629,525 31,59917-Jan-14 GBP 1,730,869 EUR 2,051,769 27,02317-Jan-14 SGD 112,114,068 EUR 64,808,929 (380,286)17-Jan-14 USD 1,780,487,963 EUR 1,292,464,692 41,54122-Jan-14 USD 1,800,156 GBP 1,105,000 (20,290)
Total 5,587,293
As at 31 December 2013, the exposure of the Sub-Fund through Outstanding Forward Foreign Exchange Contracts by counterparty is as follows:
Counterparty Unrealised Gain/(Loss)
ANZ Banking Group 1,098,216Bank of America Merrill Lynch (1,308,512)Barclays 2,500,324BNP Paribas 648,271Citibank 1,107,923Crédit Suisse 148,128Deutsche Bank (703,760)Goldman Sachs (696,609)HSBC 179,280Morgan Stanley 324,350National Australia Bank 485,375RBC 1,775,649Société Générale 309,210State Street Bank (198,929)UBS 76,108Westpac Banking (157,731)Total 5,587,293
123
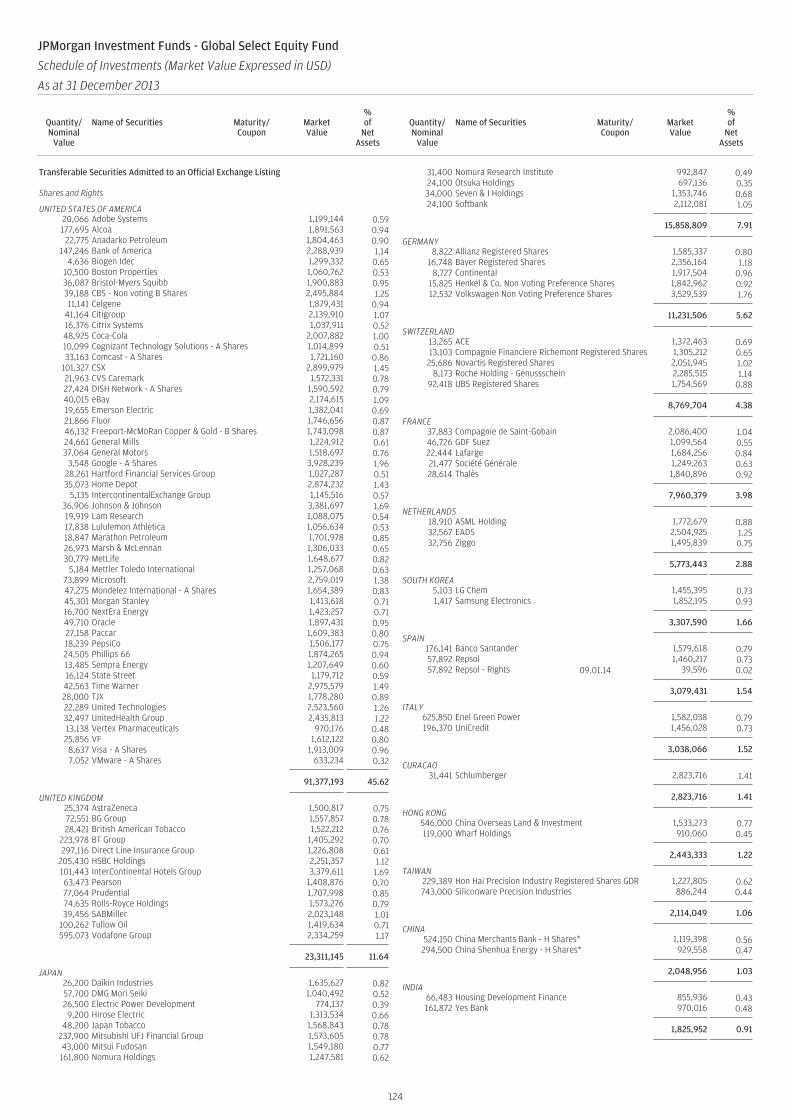
Transferable Securities Admitted to an Official Exchange Listing
Shares and Rights
UNITED STATES OF AMERICA20,066 Adobe Systems 1,199,144 0.59177,695 Alcoa 1,891,563 0.94
22,775 Anadarko Petroleum 1,804,463 0.90147,246 Bank of America 2,288,939 1.14
4,636 Biogen Idec 1,299,332 0.6510,500 Boston Properties 1,060,762 0.5336,087 Bristol-Myers Squibb 1,900,883 0.9539,188 CBS - Non voting B Shares 2,495,884 1.2511,141 Celgene 1,879,431 0.94
41,164 Citigroup 2,139,910 1.0716,376 Citrix Systems 1,037,911 0.5248,925 Coca-Cola 2,007,882 1.0010,099 Cognizant Technology Solutions - A Shares 1,014,899 0.5133,163 Comcast - A Shares 1,721,160 0.86
101,327 CSX 2,899,979 1.4521,963 CVS Caremark 1,572,331 0.7827,424 DISH Network - A Shares 1,590,592 0.7940,015 eBay 2,174,615 1.0919,655 Emerson Electric 1,382,041 0.6921,866 Fluor 1,746,656 0.8746,132 Freeport-McMoRan Copper & Gold - B Shares 1,743,098 0.8724,661 General Mills 1,224,912 0.6137,064 General Motors 1,518,697 0.76
3,548 Google - A Shares 3,928,239 1.9628,261 Hartford Financial Services Group 1,027,287 0.5135,073 Home Depot 2,874,232 1.43
5,135 IntercontinentalExchange Group 1,145,516 0.5736,906 Johnson & Johnson 3,381,697 1.6919,919 Lam Research 1,088,075 0.5417,838 Lululemon Athletica 1,056,634 0.5318,847 Marathon Petroleum 1,701,978 0.8526,973 Marsh & McLennan 1,306,033 0.6530,779 MetLife 1,648,677 0.82
5,184 Mettler Toledo International 1,257,068 0.6373,899 Microsoft 2,759,019 1.3847,275 Mondelez International - A Shares 1,654,389 0.8345,301 Morgan Stanley 1,413,618 0.7116,700 NextEra Energy 1,423,257 0.7149,710 Oracle 1,897,431 0.9527,158 Paccar 1,609,383 0.8018,239 PepsiCo 1,506,177 0.7524,505 Phillips 66 1,874,265 0.9413,485 Sempra Energy 1,207,649 0.6016,124 State Street 1,179,712 0.5942,563 Time Warner 2,975,579 1.4928,000 TJX 1,778,280 0.8922,289 United Technologies 2,523,560 1.2632,497 UnitedHealth Group 2,435,813 1.2213,138 Vertex Pharmaceuticals 970,176 0.4825,856 VF 1,612,122 0.808,637 Visa - A Shares 1,913,009 0.967,052 VMware - A Shares 633,234 0.32
91,377,193 45.62
UNITED KINGDOM25,374 AstraZeneca 1,500,817 0.7572,551 BG Group 1,557,857 0.7828,421 British American Tobacco 1,522,212 0.76
223,978 BT Group 1,405,292 0.70297,116 Direct Line Insurance Group 1,226,808 0.61
205,430 HSBC Holdings 2,251,357 1.12101,443 InterContinental Hotels Group 3,379,611 1.6963,473 Pearson 1,408,876 0.7077,064 Prudential 1,707,998 0.8574,635 Rolls-Royce Holdings 1,573,276 0.7939,456 SABMiller 2,023,148 1.01
100,262 Tullow Oil 1,419,634 0.71595,073 Vodafone Group 2,334,259 1.17
23,311,145 11.64
JAPAN26,200 Daikin Industries 1,635,627 0.8257,700 DMG Mori Seiki 1,040,492 0.5226,500 Electric Power Development 774,137 0.399,200 Hirose Electric 1,313,534 0.66
48,200 Japan Tobacco 1,568,843 0.78237,900 Mitsubishi UFJ Financial Group 1,573,605 0.7843,000 Mitsui Fudosan 1,549,180 0.77161,800 Nomura Holdings 1,247,581 0.62
31,400 Nomura Research Institute 992,847 0.4924,100 Otsuka Holdings 697,136 0.3534,000 Seven & I Holdings 1,353,746 0.6824,100 Softbank 2,112,081 1.05
15,858,809 7.91
GERMANY8,822 Allianz Registered Shares 1,585,337 0.80
16,748 Bayer Registered Shares 2,356,164 1.188,727 Continental 1,917,504 0.96
15,825 Henkel & Co. Non Voting Preference Shares 1,842,962 0.9212,532 Volkswagen Non Voting Preference Shares 3,529,539 1.76
11,231,506 5.62
SWITZERLAND13,265 ACE 1,372,463 0.6913,103 Compagnie Financiere Richemont Registered Shares 1,305,212 0.65
25,686 Novartis Registered Shares 2,051,945 1.028,173 Roche Holding - Genussschein 2,285,515 1.14
92,418 UBS Registered Shares 1,754,569 0.88
8,769,704 4.38
FRANCE37,883 Compagnie de Saint-Gobain 2,086,400 1.0446,726 GDF Suez 1,099,564 0.5522,444 Lafarge 1,684,256 0.8421,477 Société Générale 1,249,263 0.6328,614 Thalès 1,840,896 0.92
7,960,379 3.98
NETHERLANDS18,910 ASML Holding 1,772,679 0.8832,567 EADS 2,504,925 1.2532,756 Ziggo 1,495,839 0.75
5,773,443 2.88
SOUTH KOREA5,103 LG Chem 1,455,395 0.731,417 Samsung Electronics 1,852,195 0.93
3,307,590 1.66
SPAIN176,141 Banco Santander 1,579,618 0.7957,892 Repsol 1,460,217 0.7357,892 Repsol - Rights 09.01.14 39,596 0.02
3,079,431 1.54
ITALY625,850 Enel Green Power 1,582,038 0.79196,370 UniCredit 1,456,028 0.73
3,038,066 1.52
CURACAO31,441 Schlumberger 2,823,716 1.41
2,823,716 1.41
HONG KONG546,000 China Overseas Land & Investment 1,533,273 0.77119,000 Wharf Holdings 910,060 0.45
2,443,333 1.22
TAIWAN229,389 Hon Hai Precision Industry Registered Shares GDR 1,227,805 0.62743,000 Siliconware Precision Industries 886,244 0.44
2,114,049 1.06
CHINA524,150 China Merchants Bank - H Shares* 1,119,398 0.56294,500 China Shenhua Energy - H Shares* 929,558 0.47
2,048,956 1.03
INDIA66,483 Housing Development Finance 855,936 0.43161,872 Yes Bank 970,016 0.48
1,825,952 0.91
124
JPMorgan Investment Funds - Global Select Equity Fund
Schedule of Investments (Market Value Expressed in USD)
As at 31 December 2013
Quantity/Nominal
Value
Name of Securities Maturity/Coupon
MarketValue
%of
NetAssets
Quantity/Nominal
Value
Name of Securities Maturity/Coupon
MarketValue
%of
NetAssets
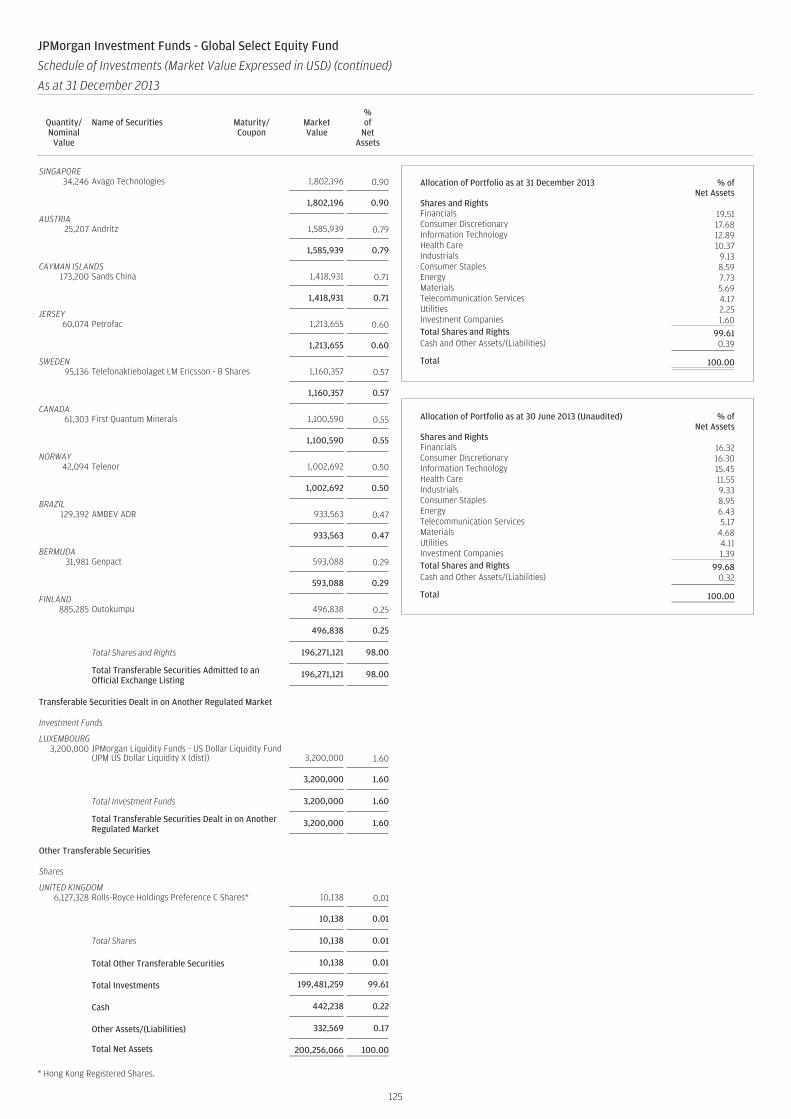
SINGAPORE34,246 Avago Technologies 1,802,196 0.90
1,802,196 0.90
AUSTRIA25,207 Andritz 1,585,939 0.79
1,585,939 0.79
CAYMAN ISLANDS173,200 Sands China 1,418,931 0.71
1,418,931 0.71
JERSEY60,074 Petrofac 1,213,655 0.60
1,213,655 0.60
SWEDEN95,136 Telefonaktiebolaget LM Ericsson - B Shares 1,160,357 0.57
1,160,357 0.57
CANADA61,303 First Quantum Minerals 1,100,590 0.55
1,100,590 0.55
NORWAY42,094 Telenor 1,002,692 0.50
1,002,692 0.50
BRAZIL129,392 AMBEV ADR 933,563 0.47
933,563 0.47
BERMUDA31,981 Genpact 593,088 0.29
593,088 0.29
FINLAND885,285 Outokumpu 496,838 0.25
496,838 0.25
Total Shares and Rights 196,271,121 98.00
Total Transferable Securities Admitted to anOfficial Exchange Listing
196,271,121 98.00
Transferable Securities Dealt in on Another Regulated Market
Investment Funds
LUXEMBOURG3,200,000 JPMorgan Liquidity Funds - US Dollar Liquidity Fund
(JPM US Dollar Liquidity X (dist)) 3,200,000 1.60
3,200,000 1.60
Total Investment Funds 3,200,000 1.60
Total Transferable Securities Dealt in on AnotherRegulated Market
3,200,000 1.60
Other Transferable Securities
Shares
UNITED KINGDOM6,127,328 Rolls-Royce Holdings Preference C Shares* 10,138 0.01
10,138 0.01
Total Shares 10,138 0.01
Total Other Transferable Securities 10,138 0.01
Total Investments 199,481,259 99.61
Cash 442,238 0.22
Other Assets/(Liabilities) 332,569 0.17
Total Net Assets 200,256,066 100.00
* Hong Kong Registered Shares.
Allocation of Portfolio as at 31 December 2013 % ofNet Assets
Shares and RightsFinancials 19.51Consumer Discretionary 17.68Information Technology 12.89Health Care 10.37Industrials 9.13Consumer Staples 8.59Energy 7.73Materials 5.69Telecommunication Services 4.17Utilities 2.25Investment Companies 1.60Total Shares and Rights 99.61Cash and Other Assets/(Liabilities) 0.39
Total 100.00
Allocation of Portfolio as at 30 June 2013 (Unaudited) % ofNet Assets
Shares and RightsFinancials 16.32Consumer Discretionary 16.30Information Technology 15.45Health Care 11.55Industrials 9.33Consumer Staples 8.95Energy 6.43Telecommunication Services 5.17Materials 4.68Utilities 4.11Investment Companies 1.39Total Shares and Rights 99.68Cash and Other Assets/(Liabilities) 0.32
Total 100.00
125
JPMorgan Investment Funds - Global Select Equity Fund
Schedule of Investments (Market Value Expressed in USD) (continued)
As at 31 December 2013
Quantity/Nominal
Value
Name of Securities Maturity/Coupon
MarketValue
%of
NetAssets
Quantity/Nominal
Value
Name of Securities Maturity/Coupon
MarketValue
%of
NetAssets
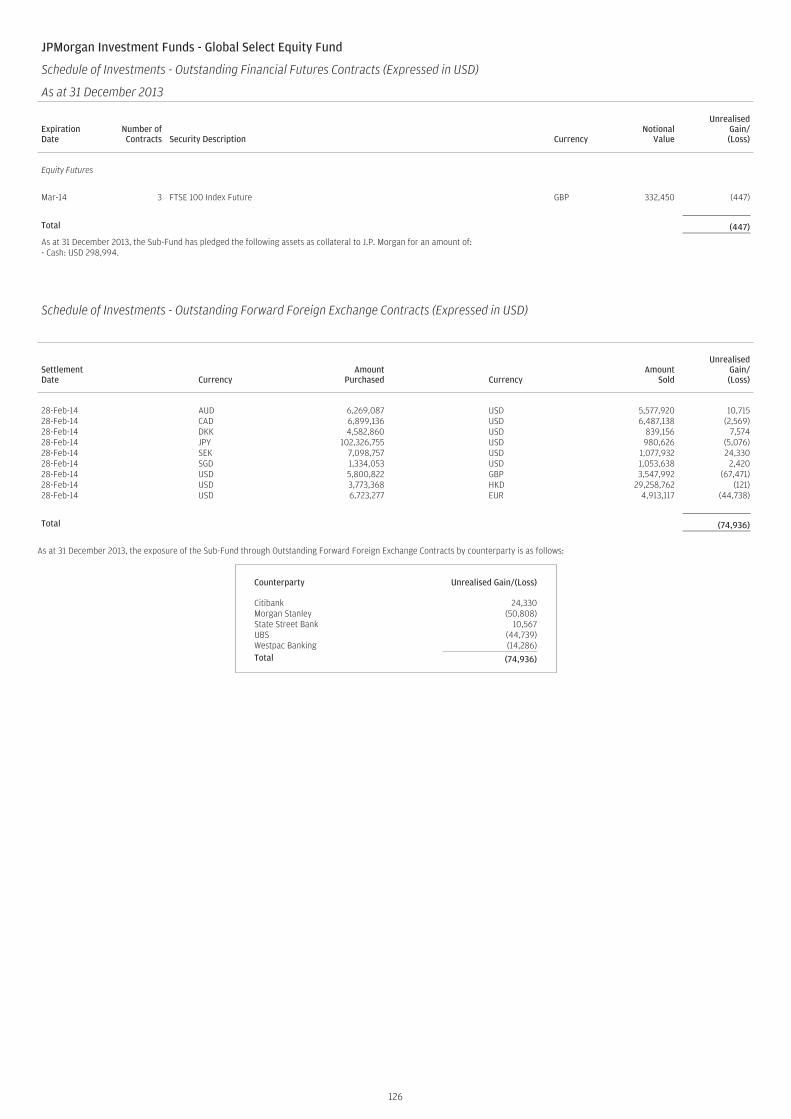
JPMorgan Investment Funds - Global Select Equity Fund
Schedule of Investments - Outstanding Financial Futures Contracts (Expressed in USD)
As at 31 December 2013
ExpirationDate
Number ofContracts Security Description Currency
NotionalValue
UnrealisedGain/(Loss)
Equity Futures
Mar-14 3 FTSE 100 Index Future GBP 332,450 (447)
Total (447)
As at 31 December 2013, the Sub-Fund has pledged the following assets as collateral to J.P. Morgan for an amount of:- Cash: USD 298,994.
Schedule of Investments - Outstanding Forward Foreign Exchange Contracts (Expressed in USD)
SettlementDate Currency
AmountPurchased Currency
AmountSold
UnrealisedGain/(Loss)
28-Feb-14 AUD 6,269,087 USD 5,577,920 10,71528-Feb-14 CAD 6,899,136 USD 6,487,138 (2,569)28-Feb-14 DKK 4,582,860 USD 839,156 7,57428-Feb-14 JPY 102,326,755 USD 980,626 (5,076)28-Feb-14 SEK 7,098,757 USD 1,077,932 24,33028-Feb-14 SGD 1,334,053 USD 1,053,638 2,42028-Feb-14 USD 5,800,822 GBP 3,547,992 (67,471)28-Feb-14 USD 3,773,368 HKD 29,258,762 (121)28-Feb-14 USD 6,723,277 EUR 4,913,117 (44,738)
Total (74,936)
As at 31 December 2013, the exposure of the Sub-Fund through Outstanding Forward Foreign Exchange Contracts by counterparty is as follows:
Counterparty Unrealised Gain/(Loss)
Citibank 24,330Morgan Stanley (50,808)State Street Bank 10,567UBS (44,739)Westpac Banking (14,286)Total (74,936)
126
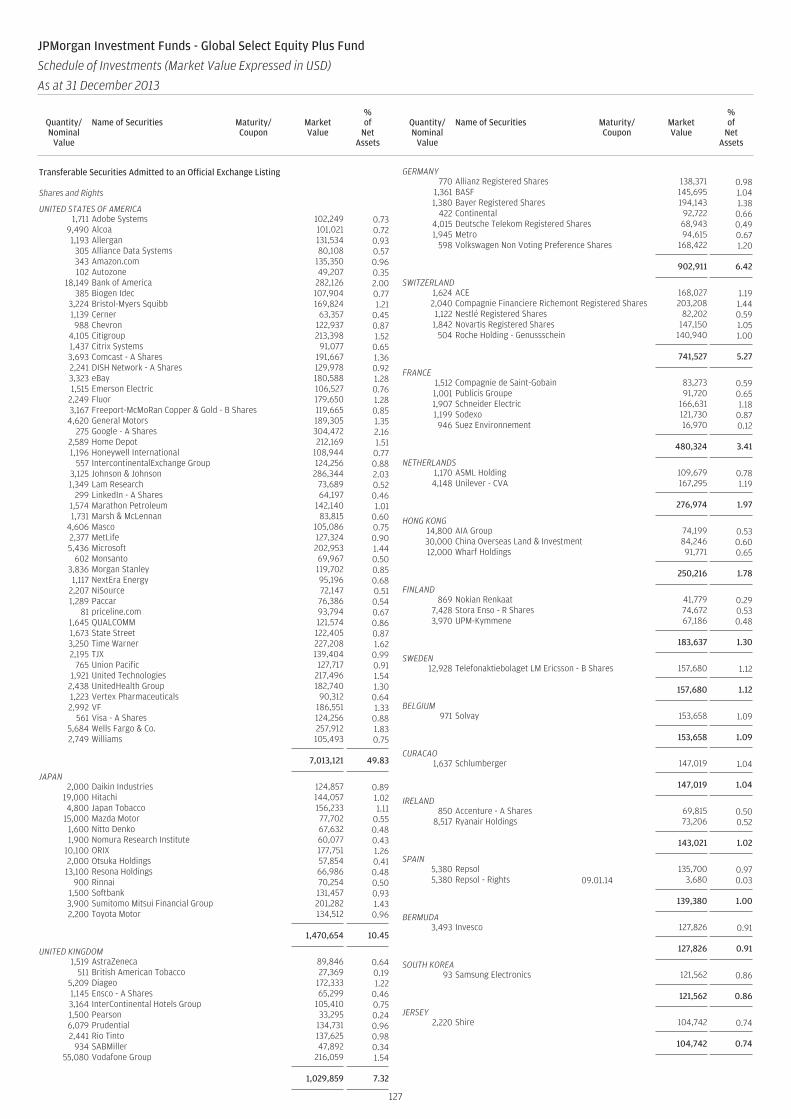
Transferable Securities Admitted to an Official Exchange Listing
Shares and Rights
UNITED STATES OF AMERICA1,711 Adobe Systems 102,249 0.73
9,490 Alcoa 101,021 0.721,193 Allergan 131,534 0.93
305 Alliance Data Systems 80,108 0.57343 Amazon.com 135,350 0.96102 Autozone 49,207 0.35
18,149 Bank of America 282,126 2.00385 Biogen Idec 107,904 0.77
3,224 Bristol-Myers Squibb 169,824 1.211,139 Cerner 63,357 0.45988 Chevron 122,937 0.87
4,105 Citigroup 213,398 1.521,437 Citrix Systems 91,077 0.653,693 Comcast - A Shares 191,667 1.362,241 DISH Network - A Shares 129,978 0.923,323 eBay 180,588 1.281,515 Emerson Electric 106,527 0.76
2,249 Fluor 179,650 1.283,167 Freeport-McMoRan Copper & Gold - B Shares 119,665 0.85
4,620 General Motors 189,305 1.35275 Google - A Shares 304,472 2.16
2,589 Home Depot 212,169 1.511,196 Honeywell International 108,944 0.77
557 IntercontinentalExchange Group 124,256 0.883,125 Johnson & Johnson 286,344 2.031,349 Lam Research 73,689 0.52
299 LinkedIn - A Shares 64,197 0.461,574 Marathon Petroleum 142,140 1.011,731 Marsh & McLennan 83,815 0.60
4,606 Masco 105,086 0.752,377 MetLife 127,324 0.905,436 Microsoft 202,953 1.44
602 Monsanto 69,967 0.503,836 Morgan Stanley 119,702 0.851,117 NextEra Energy 95,196 0.68
2,207 NiSource 72,147 0.511,289 Paccar 76,386 0.54
81 priceline.com 93,794 0.671,645 QUALCOMM 121,574 0.861,673 State Street 122,405 0.873,250 Time Warner 227,208 1.622,195 TJX 139,404 0.99
765 Union Pacific 127,717 0.911,921 United Technologies 217,496 1.54
2,438 UnitedHealth Group 182,740 1.301,223 Vertex Pharmaceuticals 90,312 0.642,992 VF 186,551 1.33
561 Visa - A Shares 124,256 0.885,684 Wells Fargo & Co. 257,912 1.832,749 Williams 105,493 0.75
7,013,121 49.83
JAPAN2,000 Daikin Industries 124,857 0.89
19,000 Hitachi 144,057 1.024,800 Japan Tobacco 156,233 1.11
15,000 Mazda Motor 77,702 0.551,600 Nitto Denko 67,632 0.481,900 Nomura Research Institute 60,077 0.43
10,100 ORIX 177,751 1.262,000 Otsuka Holdings 57,854 0.4113,100 Resona Holdings 66,986 0.48
900 Rinnai 70,254 0.501,500 Softbank 131,457 0.933,900 Sumitomo Mitsui Financial Group 201,282 1.432,200 Toyota Motor 134,512 0.96
1,470,654 10.45
UNITED KINGDOM1,519 AstraZeneca 89,846 0.64
511 British American Tobacco 27,369 0.195,209 Diageo 172,333 1.221,145 Ensco - A Shares 65,299 0.463,164 InterContinental Hotels Group 105,410 0.751,500 Pearson 33,295 0.246,079 Prudential 134,731 0.962,441 Rio Tinto 137,625 0.98
934 SABMiller 47,892 0.3455,080 Vodafone Group 216,059 1.54
1,029,859 7.32
GERMANY770 Allianz Registered Shares 138,371 0.98
1,361 BASF 145,695 1.041,380 Bayer Registered Shares 194,143 1.38
422 Continental 92,722 0.664,015 Deutsche Telekom Registered Shares 68,943 0.491,945 Metro 94,615 0.67
598 Volkswagen Non Voting Preference Shares 168,422 1.20
902,911 6.42
SWITZERLAND1,624 ACE 168,027 1.192,040 Compagnie Financiere Richemont Registered Shares 203,208 1.441,122 Nestlé Registered Shares 82,202 0.591,842 Novartis Registered Shares 147,150 1.05
504 Roche Holding - Genussschein 140,940 1.00
741,527 5.27
FRANCE1,512 Compagnie de Saint-Gobain 83,273 0.591,001 Publicis Groupe 91,720 0.651,907 Schneider Electric 166,631 1.181,199 Sodexo 121,730 0.87946 Suez Environnement 16,970 0.12
480,324 3.41
NETHERLANDS1,170 ASML Holding 109,679 0.784,148 Unilever - CVA 167,295 1.19
276,974 1.97
HONG KONG14,800 AIA Group 74,199 0.5330,000 China Overseas Land & Investment 84,246 0.6012,000 Wharf Holdings 91,771 0.65
250,216 1.78
FINLAND869 Nokian Renkaat 41,779 0.29
7,428 Stora Enso - R Shares 74,672 0.533,970 UPM-Kymmene 67,186 0.48
183,637 1.30
SWEDEN12,928 Telefonaktiebolaget LM Ericsson - B Shares 157,680 1.12
157,680 1.12
BELGIUM971 Solvay 153,658 1.09
153,658 1.09
CURACAO1,637 Schlumberger 147,019 1.04
147,019 1.04
IRELAND850 Accenture - A Shares 69,815 0.50
8,517 Ryanair Holdings 73,206 0.52
143,021 1.02
SPAIN5,380 Repsol 135,700 0.975,380 Repsol - Rights 09.01.14 3,680 0.03
139,380 1.00
BERMUDA3,493 Invesco 127,826 0.91
127,826 0.91
SOUTH KOREA93 Samsung Electronics 121,562 0.86
121,562 0.86
JERSEY2,220 Shire 104,742 0.74
104,742 0.74
127
JPMorgan Investment Funds - Global Select Equity Plus Fund
Schedule of Investments (Market Value Expressed in USD)
As at 31 December 2013
Quantity/Nominal
Value
Name of Securities Maturity/Coupon
MarketValue
%of
NetAssets
Quantity/Nominal
Value
Name of Securities Maturity/Coupon
MarketValue
%of
NetAssets
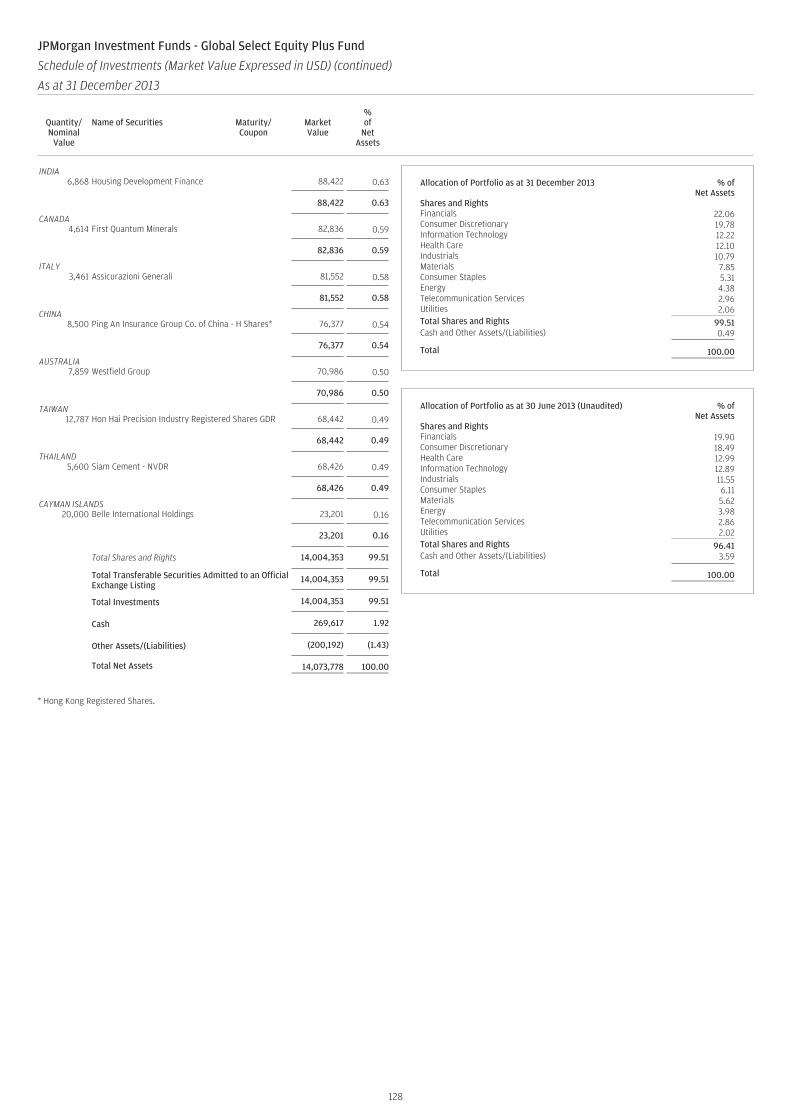
INDIA6,868 Housing Development Finance 88,422 0.63
88,422 0.63
CANADA4,614 First Quantum Minerals 82,836 0.59
82,836 0.59
ITALY3,461 Assicurazioni Generali 81,552 0.58
81,552 0.58
CHINA8,500 Ping An Insurance Group Co. of China - H Shares* 76,377 0.54
76,377 0.54
AUSTRALIA7,859 Westfield Group 70,986 0.50
70,986 0.50
TAIWAN12,787 Hon Hai Precision Industry Registered Shares GDR 68,442 0.49
68,442 0.49
THAILAND5,600 Siam Cement - NVDR 68,426 0.49
68,426 0.49
CAYMAN ISLANDS20,000 Belle International Holdings 23,201 0.16
23,201 0.16
Total Shares and Rights 14,004,353 99.51
Total Transferable Securities Admitted to an OfficialExchange Listing
14,004,353 99.51
Total Investments 14,004,353 99.51
Cash 269,617 1.92
Other Assets/(Liabilities) (200,192) (1.43)
Total Net Assets 14,073,778 100.00
* Hong Kong Registered Shares.
Allocation of Portfolio as at 31 December 2013 % ofNet Assets
Shares and RightsFinancials 22.06Consumer Discretionary 19.78Information Technology 12.22Health Care 12.10Industrials 10.79Materials 7.85Consumer Staples 5.31Energy 4.38Telecommunication Services 2.96Utilities 2.06Total Shares and Rights 99.51Cash and Other Assets/(Liabilities) 0.49
Total 100.00
Allocation of Portfolio as at 30 June 2013 (Unaudited) % ofNet Assets
Shares and RightsFinancials 19.90Consumer Discretionary 18.49Health Care 12.99Information Technology 12.89Industrials 11.55Consumer Staples 6.11Materials 5.62Energy 3.98Telecommunication Services 2.86Utilities 2.02Total Shares and Rights 96.41Cash and Other Assets/(Liabilities) 3.59
Total 100.00
128
JPMorgan Investment Funds - Global Select Equity Plus Fund
Schedule of Investments (Market Value Expressed in USD) (continued)
As at 31 December 2013
Quantity/Nominal
Value
Name of Securities Maturity/Coupon
MarketValue
%of
NetAssets
Quantity/Nominal
Value
Name of Securities Maturity/Coupon
MarketValue
%of
NetAssets
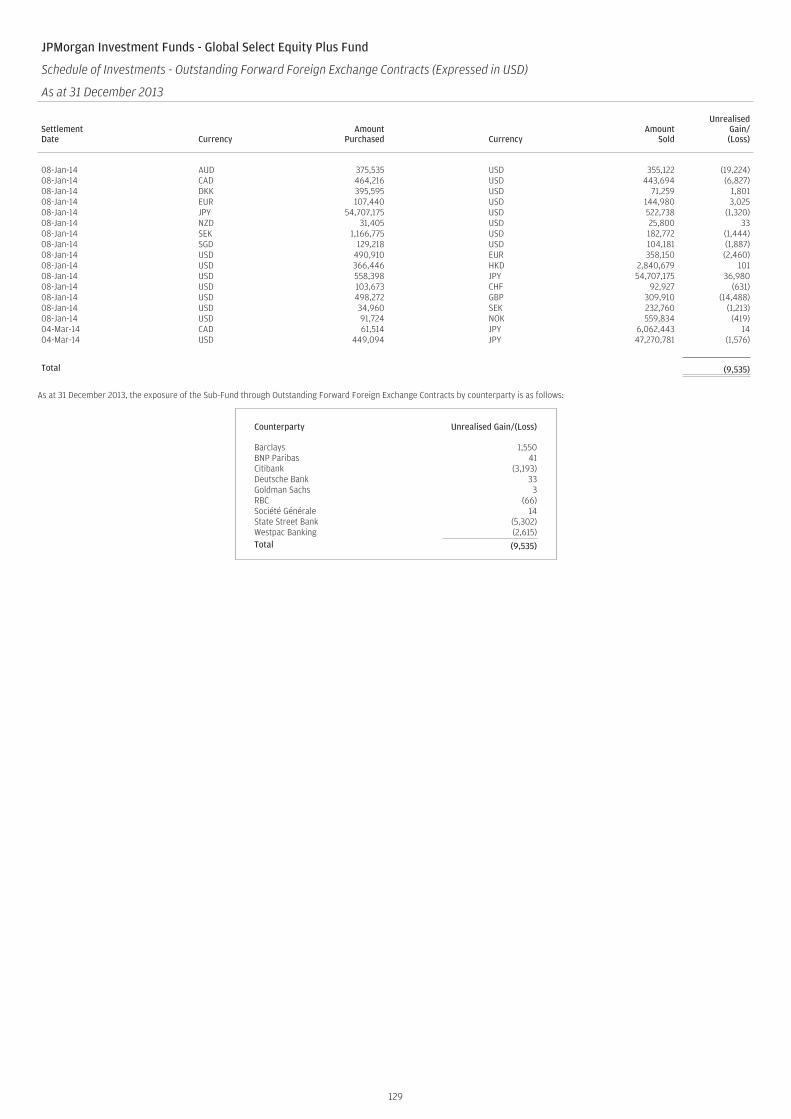
JPMorgan Investment Funds - Global Select Equity Plus Fund
Schedule of Investments - Outstanding Forward Foreign Exchange Contracts (Expressed in USD)
As at 31 December 2013
SettlementDate Currency
AmountPurchased Currency
AmountSold
UnrealisedGain/(Loss)
08-Jan-14 AUD 375,535 USD 355,122 (19,224)08-Jan-14 CAD 464,216 USD 443,694 (6,827)08-Jan-14 DKK 395,595 USD 71,259 1,80108-Jan-14 EUR 107,440 USD 144,980 3,02508-Jan-14 JPY 54,707,175 USD 522,738 (1,320)08-Jan-14 NZD 31,405 USD 25,800 3308-Jan-14 SEK 1,166,775 USD 182,772 (1,444)08-Jan-14 SGD 129,218 USD 104,181 (1,887)08-Jan-14 USD 490,910 EUR 358,150 (2,460)08-Jan-14 USD 366,446 HKD 2,840,679 10108-Jan-14 USD 558,398 JPY 54,707,175 36,98008-Jan-14 USD 103,673 CHF 92,927 (631)08-Jan-14 USD 498,272 GBP 309,910 (14,488)08-Jan-14 USD 34,960 SEK 232,760 (1,213)08-Jan-14 USD 91,724 NOK 559,834 (419)04-Mar-14 CAD 61,514 JPY 6,062,443 1404-Mar-14 USD 449,094 JPY 47,270,781 (1,576)
Total (9,535)
As at 31 December 2013, the exposure of the Sub-Fund through Outstanding Forward Foreign Exchange Contracts by counterparty is as follows:
Counterparty Unrealised Gain/(Loss)
Barclays 1,550BNP Paribas 41Citibank (3,193)Deutsche Bank 33Goldman Sachs 3RBC (66)Société Générale 14State Street Bank (5,302)Westpac Banking (2,615)Total (9,535)
129
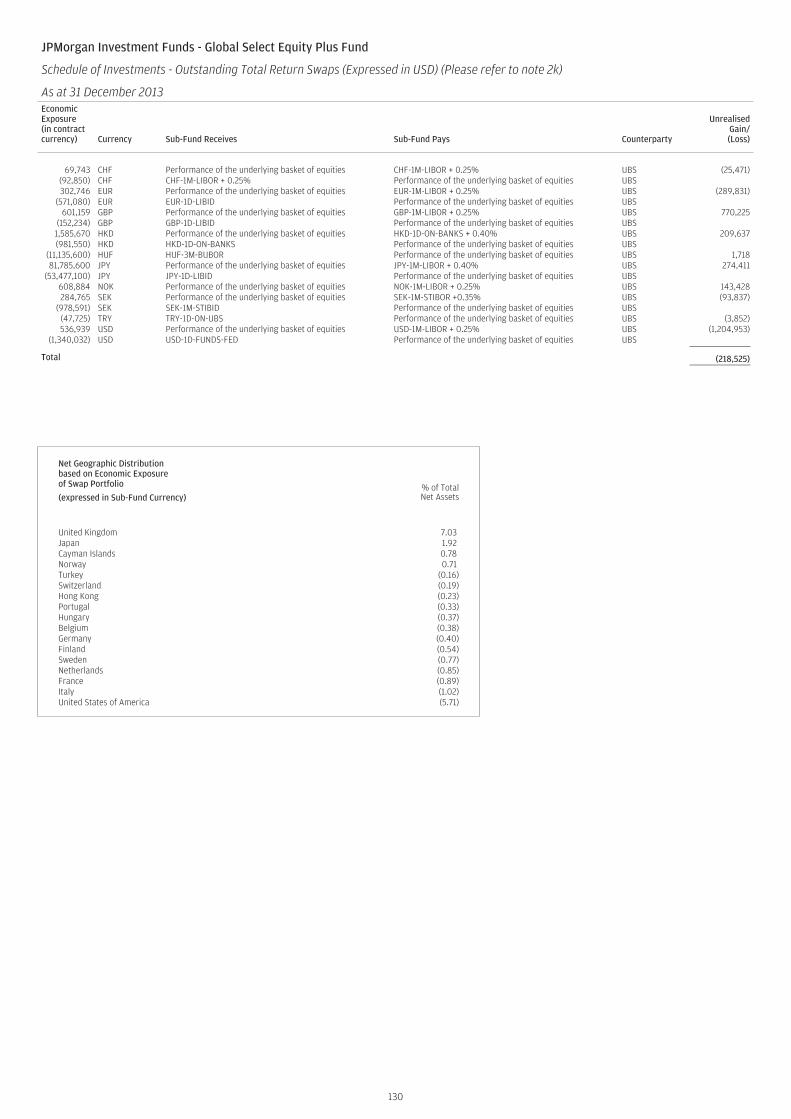
JPMorgan Investment Funds - Global Select Equity Plus Fund
Schedule of Investments - Outstanding Total Return Swaps (Expressed in USD) (Please refer to note 2k)
As at 31 December 2013EconomicExposure(in contractcurrency) Currency Sub-Fund Receives Sub-Fund Pays Counterparty
UnrealisedGain/(Loss)
69,743 CHF Performance of the underlying basket of equities CHF-1M-LIBOR + 0.25% UBS (25,471)(92,850) CHF CHF-1M-LIBOR + 0.25% Performance of the underlying basket of equities UBS302,746 EUR Performance of the underlying basket of equities EUR-1M-LIBOR + 0.25% UBS (289,831)
(571,080) EUR EUR-1D-LIBID Performance of the underlying basket of equities UBS601,159 GBP Performance of the underlying basket of equities GBP-1M-LIBOR + 0.25% UBS 770,225
(152,234) GBP GBP-1D-LIBID Performance of the underlying basket of equities UBS1,585,670 HKD Performance of the underlying basket of equities HKD-1D-ON-BANKS + 0.40% UBS 209,637(981,550) HKD HKD-1D-ON-BANKS Performance of the underlying basket of equities UBS
(11,135,600) HUF HUF-3M-BUBOR Performance of the underlying basket of equities UBS 1,71881,785,600 JPY Performance of the underlying basket of equities JPY-1M-LIBOR + 0.40% UBS 274,411
(53,477,100) JPY JPY-1D-LIBID Performance of the underlying basket of equities UBS608,884 NOK Performance of the underlying basket of equities NOK-1M-LIBOR + 0.25% UBS 143,428284,765 SEK Performance of the underlying basket of equities SEK-1M-STIBOR +0.35% UBS (93,837)
(978,591) SEK SEK-1M-STIBID Performance of the underlying basket of equities UBS(47,725) TRY TRY-1D-ON-UBS Performance of the underlying basket of equities UBS (3,852)536,939 USD Performance of the underlying basket of equities USD-1M-LIBOR + 0.25% UBS (1,204,953)
(1,340,032) USD USD-1D-FUNDS-FED Performance of the underlying basket of equities UBS
Total (218,525)
Net Geographic Distributionbased on Economic Exposureof Swap Portfolio
(expressed in Sub-Fund Currency)% of TotalNet Assets
United Kingdom 7.03Japan 1.92Cayman Islands 0.78Norway 0.71Turkey (0.16)Switzerland (0.19)Hong Kong (0.23)Portugal (0.33)Hungary (0.37)Belgium (0.38)Germany (0.40)Finland (0.54)Sweden (0.77)Netherlands (0.85)France (0.89)Italy (1.02)United States of America (5.71)
130
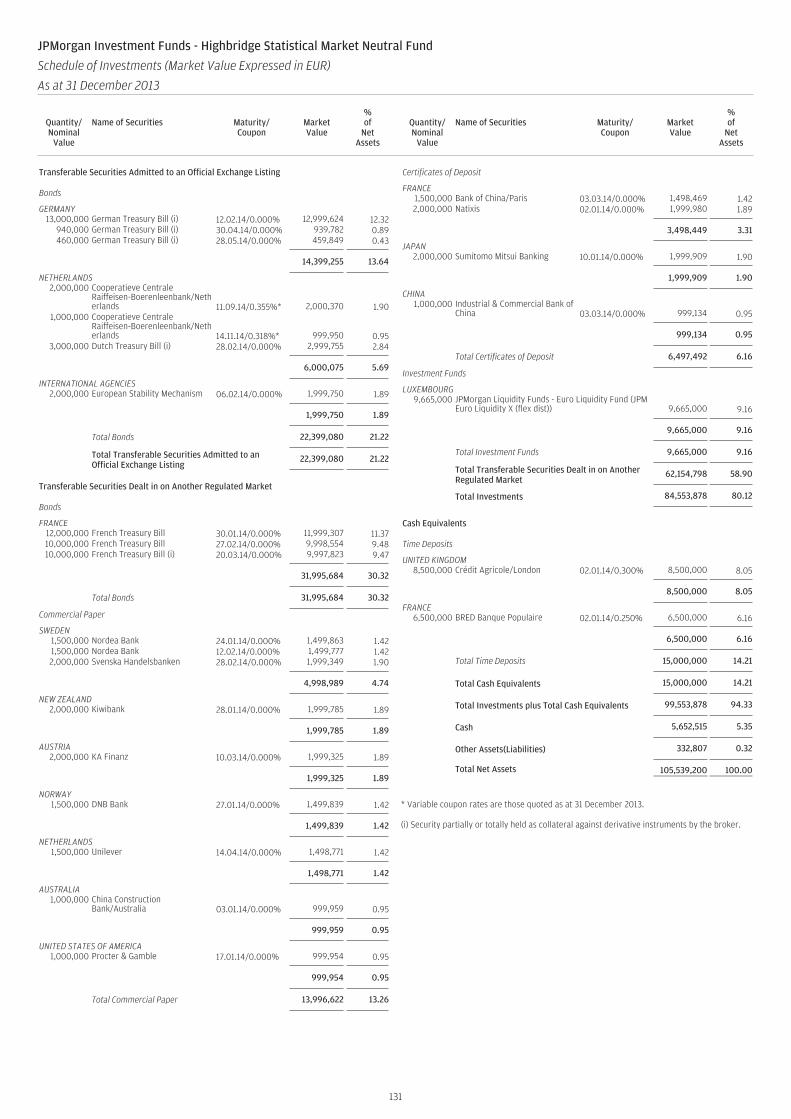
Transferable Securities Admitted to an Official Exchange Listing
Bonds
GERMANY13,000,000 German Treasury Bill (i) 12.02.14/0.000% 12,999,624 12.32
940,000 German Treasury Bill (i) 30.04.14/0.000% 939,782 0.89460,000 German Treasury Bill (i) 28.05.14/0.000% 459,849 0.43
14,399,255 13.64
NETHERLANDS2,000,000 Cooperatieve Centrale
Raiffeisen-Boerenleenbank/Netherlands 11.09.14/0.355%* 2,000,370 1.90
1,000,000 Cooperatieve CentraleRaiffeisen-Boerenleenbank/Netherlands 14.11.14/0.318%* 999,950 0.95
3,000,000 Dutch Treasury Bill (i) 28.02.14/0.000% 2,999,755 2.84
6,000,075 5.69
INTERNATIONAL AGENCIES2,000,000 European Stability Mechanism 06.02.14/0.000% 1,999,750 1.89
1,999,750 1.89
Total Bonds 22,399,080 21.22
Total Transferable Securities Admitted to anOfficial Exchange Listing
22,399,080 21.22
Transferable Securities Dealt in on Another Regulated Market
Bonds
FRANCE12,000,000 French Treasury Bill 30.01.14/0.000% 11,999,307 11.3710,000,000 French Treasury Bill 27.02.14/0.000% 9,998,554 9.4810,000,000 French Treasury Bill (i) 20.03.14/0.000% 9,997,823 9.47
31,995,684 30.32
Total Bonds 31,995,684 30.32
Commercial Paper
SWEDEN1,500,000 Nordea Bank 24.01.14/0.000% 1,499,863 1.421,500,000 Nordea Bank 12.02.14/0.000% 1,499,777 1.422,000,000 Svenska Handelsbanken 28.02.14/0.000% 1,999,349 1.90
4,998,989 4.74
NEW ZEALAND2,000,000 Kiwibank 28.01.14/0.000% 1,999,785 1.89
1,999,785 1.89
AUSTRIA2,000,000 KA Finanz 10.03.14/0.000% 1,999,325 1.89
1,999,325 1.89
NORWAY1,500,000 DNB Bank 27.01.14/0.000% 1,499,839 1.42
1,499,839 1.42
NETHERLANDS1,500,000 Unilever 14.04.14/0.000% 1,498,771 1.42
1,498,771 1.42
AUSTRALIA1,000,000 China Construction
Bank/Australia 03.01.14/0.000% 999,959 0.95
999,959 0.95
UNITED STATES OF AMERICA1,000,000 Procter & Gamble 17.01.14/0.000% 999,954 0.95
999,954 0.95
Total Commercial Paper 13,996,622 13.26
Certificates of Deposit
FRANCE1,500,000 Bank of China/Paris 03.03.14/0.000% 1,498,469 1.422,000,000 Natixis 02.01.14/0.000% 1,999,980 1.89
3,498,449 3.31
JAPAN2,000,000 Sumitomo Mitsui Banking 10.01.14/0.000% 1,999,909 1.90
1,999,909 1.90
CHINA1,000,000 Industrial & Commercial Bank of
China 03.03.14/0.000% 999,134 0.95
999,134 0.95
Total Certificates of Deposit 6,497,492 6.16
Investment Funds
LUXEMBOURG9,665,000 JPMorgan Liquidity Funds - Euro Liquidity Fund (JPM
Euro Liquidity X (flex dist)) 9,665,000 9.16
9,665,000 9.16
Total Investment Funds 9,665,000 9.16
Total Transferable Securities Dealt in on AnotherRegulated Market
62,154,798 58.90
Total Investments 84,553,878 80.12
Cash Equivalents
Time Deposits
UNITED KINGDOM8,500,000 Crédit Agricole/London 02.01.14/0.300% 8,500,000 8.05
8,500,000 8.05
FRANCE6,500,000 BRED Banque Populaire 02.01.14/0.250% 6,500,000 6.16
6,500,000 6.16
Total Time Deposits 15,000,000 14.21
Total Cash Equivalents 15,000,000 14.21
Total Investments plus Total Cash Equivalents 99,553,878 94.33
Cash 5,652,515 5.35
Other Assets(Liabilities) 332,807 0.32
Total Net Assets 105,539,200 100.00
* Variable coupon rates are those quoted as at 31 December 2013.
(i) Security partially or totally held as collateral against derivative instruments by the broker.
131
JPMorgan Investment Funds - Highbridge Statistical Market Neutral Fund
Schedule of Investments (Market Value Expressed in EUR)
As at 31 December 2013
Quantity/Nominal
Value
Name of Securities Maturity/Coupon
MarketValue
%of
NetAssets
Quantity/Nominal
Value
Name of Securities Maturity/Coupon
MarketValue
%of
NetAssets
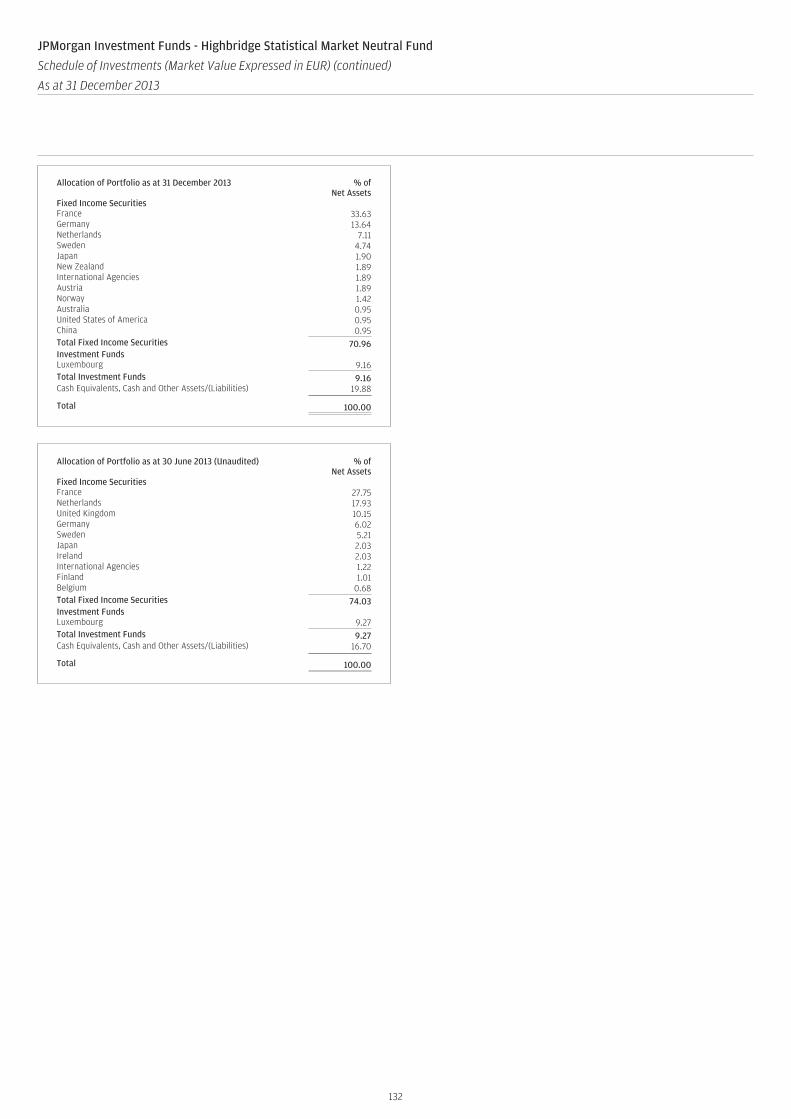
Allocation of Portfolio as at 31 December 2013 % ofNet Assets
Fixed Income SecuritiesFrance 33.63Germany 13.64Netherlands 7.11Sweden 4.74Japan 1.90New Zealand 1.89International Agencies 1.89Austria 1.89Norway 1.42Australia 0.95United States of America 0.95China 0.95Total Fixed Income Securities 70.96Investment FundsLuxembourg 9.16Total Investment Funds 9.16Cash Equivalents, Cash and Other Assets/(Liabilities) 19.88
Total 100.00
Allocation of Portfolio as at 30 June 2013 (Unaudited) % ofNet Assets
Fixed Income SecuritiesFrance 27.75Netherlands 17.93United Kingdom 10.15Germany 6.02Sweden 5.21Japan 2.03Ireland 2.03International Agencies 1.22Finland 1.01Belgium 0.68Total Fixed Income Securities 74.03Investment FundsLuxembourg 9.27Total Investment Funds 9.27Cash Equivalents, Cash and Other Assets/(Liabilities) 16.70
Total 100.00
132
JPMorgan Investment Funds - Highbridge Statistical Market Neutral Fund
Schedule of Investments (Market Value Expressed in EUR) (continued)
As at 31 December 2013
Quantity/Nominal
Value
Name of Securities Maturity/Coupon
MarketValue
%of
NetAssets
Quantity/Nominal
Value
Name of Securities Maturity/Coupon
MarketValue
%of
NetAssets
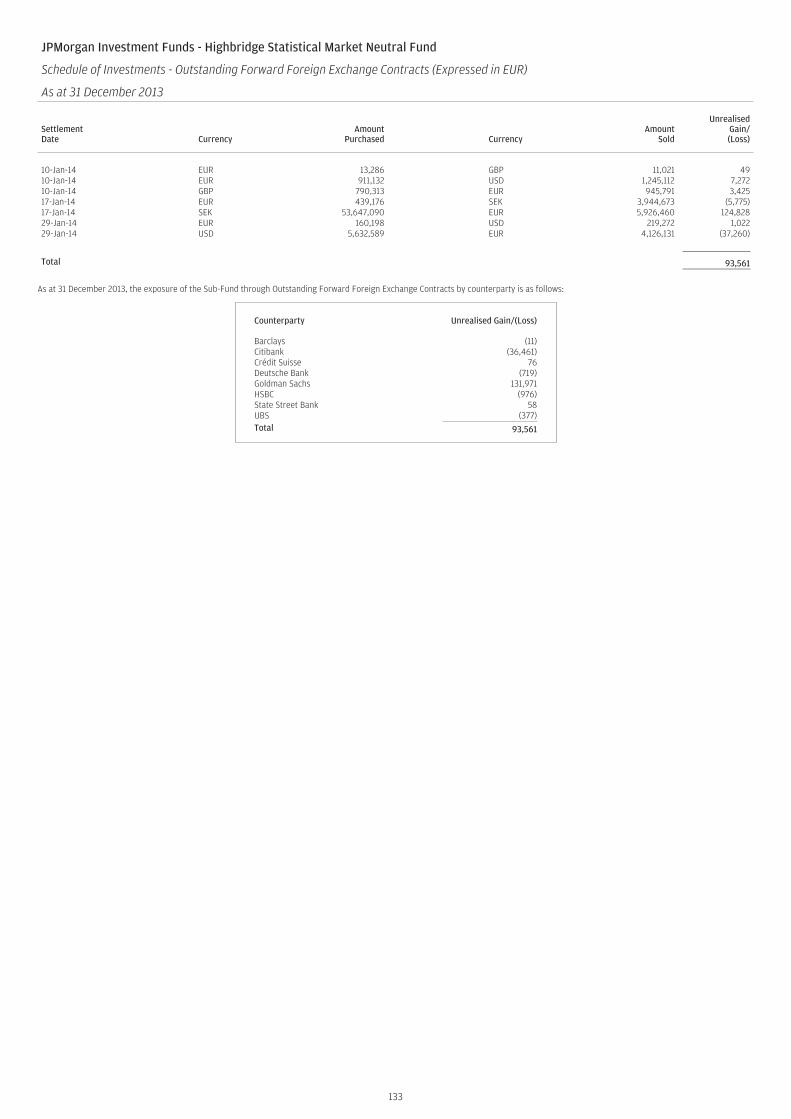
JPMorgan Investment Funds - Highbridge Statistical Market Neutral Fund
Schedule of Investments - Outstanding Forward Foreign Exchange Contracts (Expressed in EUR)
As at 31 December 2013
SettlementDate Currency
AmountPurchased Currency
AmountSold
UnrealisedGain/(Loss)
10-Jan-14 EUR 13,286 GBP 11,021 4910-Jan-14 EUR 911,132 USD 1,245,112 7,27210-Jan-14 GBP 790,313 EUR 945,791 3,42517-Jan-14 EUR 439,176 SEK 3,944,673 (5,775)17-Jan-14 SEK 53,647,090 EUR 5,926,460 124,82829-Jan-14 EUR 160,198 USD 219,272 1,02229-Jan-14 USD 5,632,589 EUR 4,126,131 (37,260)
Total 93,561
As at 31 December 2013, the exposure of the Sub-Fund through Outstanding Forward Foreign Exchange Contracts by counterparty is as follows:
Counterparty Unrealised Gain/(Loss)
Barclays (11)Citibank (36,461)Crédit Suisse 76Deutsche Bank (719)Goldman Sachs 131,971HSBC (976)State Street Bank 58UBS (377)Total 93,561
133
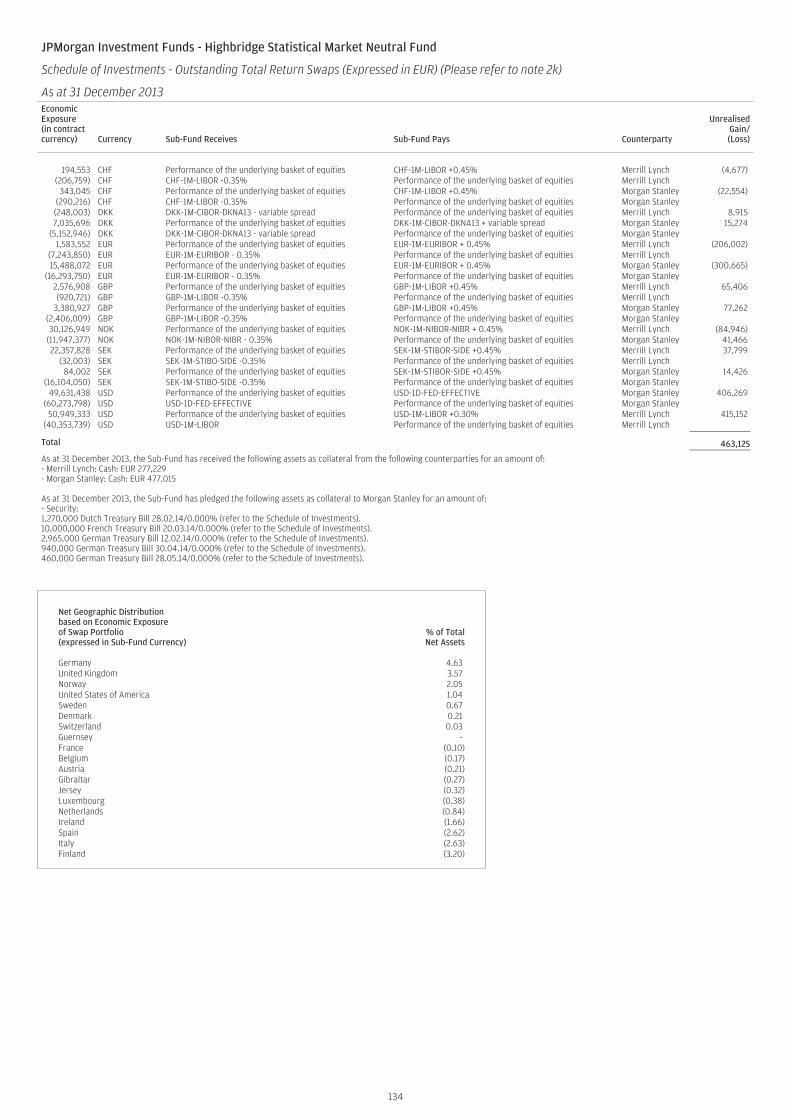
JPMorgan Investment Funds - Highbridge Statistical Market Neutral Fund
Schedule of Investments - Outstanding Total Return Swaps (Expressed in EUR) (Please refer to note 2k)
As at 31 December 2013EconomicExposure(in contractcurrency) Currency Sub-Fund Receives Sub-Fund Pays Counterparty
UnrealisedGain/(Loss)
194,553 CHF Performance of the underlying basket of equities CHF-1M-LIBOR +0.45% Merrill Lynch (4,677)(206,759) CHF CHF-1M-LIBOR -0.35% Performance of the underlying basket of equities Merrill Lynch
343,045 CHF Performance of the underlying basket of equities CHF-1M-LIBOR +0.45% Morgan Stanley (22,554)(290,216) CHF CHF-1M-LIBOR -0.35% Performance of the underlying basket of equities Morgan Stanley(248,003) DKK DKK-1M-CIBOR-DKNA13 - variable spread Performance of the underlying basket of equities Merrill Lynch 8,9157,035,696 DKK Performance of the underlying basket of equities DKK-1M-CIBOR-DKNA13 + variable spread Morgan Stanley 15,274
(5,152,946) DKK DKK-1M-CIBOR-DKNA13 - variable spread Performance of the underlying basket of equities Morgan Stanley1,583,552 EUR Performance of the underlying basket of equities EUR-1M-EURIBOR + 0.45% Merrill Lynch (206,002)
(7,243,850) EUR EUR-1M-EURIBOR - 0.35% Performance of the underlying basket of equities Merrill Lynch15,488,072 EUR Performance of the underlying basket of equities EUR-1M-EURIBOR + 0.45% Morgan Stanley (300,665)
(16,293,750) EUR EUR-1M-EURIBOR - 0.35% Performance of the underlying basket of equities Morgan Stanley2,576,908 GBP Performance of the underlying basket of equities GBP-1M-LIBOR +0.45% Merrill Lynch 65,406(920,721) GBP GBP-1M-LIBOR -0.35% Performance of the underlying basket of equities Merrill Lynch
3,380,927 GBP Performance of the underlying basket of equities GBP-1M-LIBOR +0.45% Morgan Stanley 77,262(2,406,009) GBP GBP-1M-LIBOR -0.35% Performance of the underlying basket of equities Morgan Stanley30,126,949 NOK Performance of the underlying basket of equities NOK-1M-NIBOR-NIBR + 0.45% Merrill Lynch (84,946)
(11,947,377) NOK NOK-1M-NIBOR-NIBR - 0.35% Performance of the underlying basket of equities Morgan Stanley 41,46622,357,828 SEK Performance of the underlying basket of equities SEK-1M-STIBOR-SIDE +0.45% Merrill Lynch 37,799
(32,003) SEK SEK-1M-STIBO-SIDE -0.35% Performance of the underlying basket of equities Merrill Lynch84,002 SEK Performance of the underlying basket of equities SEK-1M-STIBOR-SIDE +0.45% Morgan Stanley 14,426
(16,104,050) SEK SEK-1M-STIBO-SIDE -0.35% Performance of the underlying basket of equities Morgan Stanley49,631,438 USD Performance of the underlying basket of equities USD-1D-FED-EFFECTIVE Morgan Stanley 406,269
(60,273,798) USD USD-1D-FED-EFFECTIVE Performance of the underlying basket of equities Morgan Stanley50,949,333 USD Performance of the underlying basket of equities USD-1M-LIBOR +0.30% Merrill Lynch 415,152
(40,353,739) USD USD-1M-LIBOR Performance of the underlying basket of equities Merrill Lynch
Total 463,125
As at 31 December 2013, the Sub-Fund has received the following assets as collateral from the following counterparties for an amount of:- Merrill Lynch: Cash: EUR 277,229- Morgan Stanley: Cash: EUR 477,015
As at 31 December 2013, the Sub-Fund has pledged the following assets as collateral to Morgan Stanley for an amount of:- Security:1,270,000 Dutch Treasury Bill 28.02.14/0.000% (refer to the Schedule of Investments).10,000,000 French Treasury Bill 20.03.14/0.000% (refer to the Schedule of Investments).2,965,000 German Treasury Bill 12.02.14/0.000% (refer to the Schedule of Investments).940,000 German Treasury Bill 30.04.14/0.000% (refer to the Schedule of Investments).460,000 German Treasury Bill 28.05.14/0.000% (refer to the Schedule of Investments).
Net Geographic Distributionbased on Economic Exposureof Swap Portfolio(expressed in Sub-Fund Currency)
% of TotalNet Assets
Germany 4.63United Kingdom 3.57Norway 2.05United States of America 1.04Sweden 0.67Denmark 0.21Switzerland 0.03Guernsey -France (0.10)Belgium (0.17)Austria (0.21)Gibraltar (0.27)Jersey (0.32)Luxembourg (0.38)Netherlands (0.84)Ireland (1.66)Spain (2.62)Italy (2.63)Finland (3.20)
134
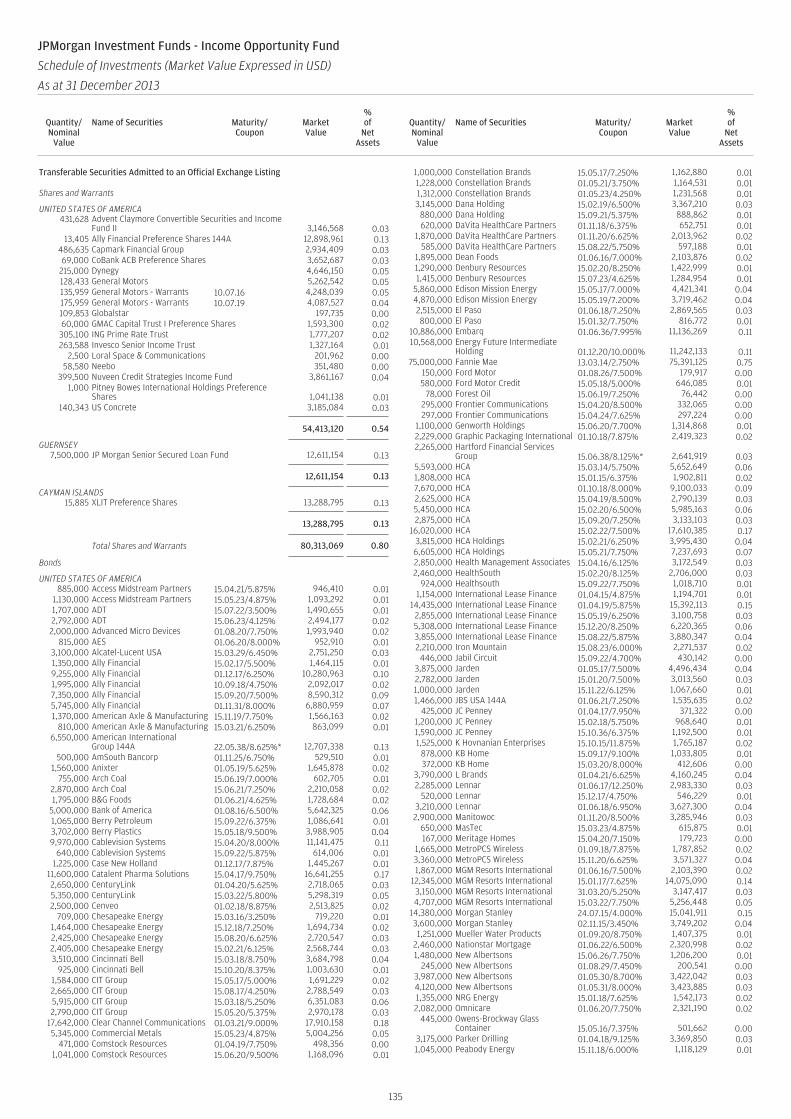
Transferable Securities Admitted to an Official Exchange Listing
Shares and Warrants
UNITED STATES OF AMERICA431,628 Advent Claymore Convertible Securities and Income
Fund II 3,146,568 0.0313,405 Ally Financial Preference Shares 144A 12,898,961 0.13
486,635 Capmark Financial Group 2,934,409 0.0369,000 CoBank ACB Preference Shares 3,652,687 0.03
215,000 Dynegy 4,646,150 0.05128,433 General Motors 5,262,542 0.05135,959 General Motors - Warrants 10.07.16 4,248,039 0.05175,959 General Motors - Warrants 10.07.19 4,087,527 0.04109,853 Globalstar 197,735 0.0060,000 GMAC Capital Trust I Preference Shares 1,593,300 0.02
305,100 ING Prime Rate Trust 1,777,207 0.02263,588 Invesco Senior Income Trust 1,327,164 0.01
2,500 Loral Space & Communications 201,962 0.0058,580 Neebo 351,480 0.00
399,500 Nuveen Credit Strategies Income Fund 3,861,167 0.041,000 Pitney Bowes International Holdings Preference
Shares 1,041,138 0.01140,343 US Concrete 3,185,084 0.03
54,413,120 0.54
GUERNSEY7,500,000 JP Morgan Senior Secured Loan Fund 12,611,154 0.13
12,611,154 0.13
CAYMAN ISLANDS15,885 XLIT Preference Shares 13,288,795 0.13
13,288,795 0.13
Total Shares and Warrants 80,313,069 0.80
Bonds
UNITED STATES OF AMERICA885,000 Access Midstream Partners 15.04.21/5.875% 946,410 0.01
1,130,000 Access Midstream Partners 15.05.23/4.875% 1,093,292 0.011,707,000 ADT 15.07.22/3.500% 1,490,655 0.012,792,000 ADT 15.06.23/4.125% 2,494,177 0.022,000,000 Advanced Micro Devices 01.08.20/7.750% 1,993,940 0.02
815,000 AES 01.06.20/8.000% 952,910 0.013,100,000 Alcatel-Lucent USA 15.03.29/6.450% 2,751,250 0.031,350,000 Ally Financial 15.02.17/5.500% 1,464,115 0.019,255,000 Ally Financial 01.12.17/6.250% 10,280,963 0.101,995,000 Ally Financial 10.09.18/4.750% 2,092,017 0.027,350,000 Ally Financial 15.09.20/7.500% 8,590,312 0.095,745,000 Ally Financial 01.11.31/8.000% 6,880,959 0.071,370,000 American Axle & Manufacturing 15.11.19/7.750% 1,566,163 0.02
810,000 American Axle & Manufacturing 15.03.21/6.250% 863,099 0.016,550,000 American International
Group 144A 22.05.38/8.625%* 12,707,338 0.13500,000 AmSouth Bancorp 01.11.25/6.750% 529,510 0.01
1,560,000 Anixter 01.05.19/5.625% 1,645,878 0.02755,000 Arch Coal 15.06.19/7.000% 602,705 0.01
2,870,000 Arch Coal 15.06.21/7.250% 2,210,058 0.021,795,000 B&G Foods 01.06.21/4.625% 1,728,684 0.02
5,000,000 Bank of America 01.08.16/6.500% 5,642,325 0.061,065,000 Berry Petroleum 15.09.22/6.375% 1,086,641 0.013,702,000 Berry Plastics 15.05.18/9.500% 3,988,905 0.049,970,000 Cablevision Systems 15.04.20/8.000% 11,141,475 0.11
640,000 Cablevision Systems 15.09.22/5.875% 614,006 0.011,225,000 Case New Holland 01.12.17/7.875% 1,445,267 0.01
11,600,000 Catalent Pharma Solutions 15.04.17/9.750% 16,641,255 0.172,650,000 CenturyLink 01.04.20/5.625% 2,718,065 0.035,350,000 CenturyLink 15.03.22/5.800% 5,298,319 0.052,500,000 Cenveo 01.02.18/8.875% 2,513,825 0.02
709,000 Chesapeake Energy 15.03.16/3.250% 719,220 0.011,464,000 Chesapeake Energy 15.12.18/7.250% 1,694,734 0.022,425,000 Chesapeake Energy 15.08.20/6.625% 2,720,547 0.032,405,000 Chesapeake Energy 15.02.21/6.125% 2,568,744 0.033,510,000 Cincinnati Bell 15.03.18/8.750% 3,684,798 0.04
925,000 Cincinnati Bell 15.10.20/8.375% 1,003,630 0.011,584,000 CIT Group 15.05.17/5.000% 1,691,229 0.022,665,000 CIT Group 15.08.17/4.250% 2,788,549 0.035,915,000 CIT Group 15.03.18/5.250% 6,351,083 0.062,790,000 CIT Group 15.05.20/5.375% 2,970,178 0.03
17,642,000 Clear Channel Communications 01.03.21/9.000% 17,910,158 0.185,345,000 Commercial Metals 15.05.23/4.875% 5,004,256 0.05
471,000 Comstock Resources 01.04.19/7.750% 498,356 0.001,041,000 Comstock Resources 15.06.20/9.500% 1,168,096 0.01
1,000,000 Constellation Brands 15.05.17/7.250% 1,162,880 0.011,228,000 Constellation Brands 01.05.21/3.750% 1,164,531 0.011,312,000 Constellation Brands 01.05.23/4.250% 1,231,568 0.013,145,000 Dana Holding 15.02.19/6.500% 3,367,210 0.03
880,000 Dana Holding 15.09.21/5.375% 888,862 0.01620,000 DaVita HealthCare Partners 01.11.18/6.375% 652,751 0.01
1,870,000 DaVita HealthCare Partners 01.11.20/6.625% 2,013,962 0.02585,000 DaVita HealthCare Partners 15.08.22/5.750% 597,188 0.01
1,895,000 Dean Foods 01.06.16/7.000% 2,103,876 0.021,290,000 Denbury Resources 15.02.20/8.250% 1,422,999 0.011,415,000 Denbury Resources 15.07.23/4.625% 1,284,954 0.01
5,860,000 Edison Mission Energy 15.05.17/7.000% 4,421,341 0.044,870,000 Edison Mission Energy 15.05.19/7.200% 3,719,462 0.042,515,000 El Paso 01.06.18/7.250% 2,869,565 0.03800,000 El Paso 15.01.32/7.750% 816,772 0.01
10,886,000 Embarq 01.06.36/7.995% 11,136,269 0.1110,568,000 Energy Future Intermediate
Holding 01.12.20/10.000% 11,242,133 0.1175,000,000 Fannie Mae 13.03.14/2.750% 75,391,125 0.75
150,000 Ford Motor 01.08.26/7.500% 179,917 0.00580,000 Ford Motor Credit 15.05.18/5.000% 646,085 0.01
78,000 Forest Oil 15.06.19/7.250% 76,442 0.00295,000 Frontier Communications 15.04.20/8.500% 332,065 0.00297,000 Frontier Communications 15.04.24/7.625% 297,224 0.00
1,100,000 Genworth Holdings 15.06.20/7.700% 1,314,868 0.012,229,000 Graphic Packaging International 01.10.18/7.875% 2,419,323 0.022,265,000 Hartford Financial Services
Group 15.06.38/8.125%* 2,641,919 0.035,593,000 HCA 15.03.14/5.750% 5,652,649 0.061,808,000 HCA 15.01.15/6.375% 1,902,811 0.027,670,000 HCA 01.10.18/8.000% 9,100,033 0.092,625,000 HCA 15.04.19/8.500% 2,790,139 0.035,450,000 HCA 15.02.20/6.500% 5,985,163 0.062,875,000 HCA 15.09.20/7.250% 3,133,103 0.03
16,020,000 HCA 15.02.22/7.500% 17,610,385 0.173,815,000 HCA Holdings 15.02.21/6.250% 3,995,430 0.046,605,000 HCA Holdings 15.05.21/7.750% 7,237,693 0.072,850,000 Health Management Associates 15.04.16/6.125% 3,172,549 0.032,460,000 HealthSouth 15.02.20/8.125% 2,706,000 0.03
924,000 Healthsouth 15.09.22/7.750% 1,018,710 0.011,154,000 International Lease Finance 01.04.15/4.875% 1,194,701 0.01
14,435,000 International Lease Finance 01.04.19/5.875% 15,392,113 0.152,855,000 International Lease Finance 15.05.19/6.250% 3,100,758 0.035,308,000 International Lease Finance 15.12.20/8.250% 6,220,365 0.063,855,000 International Lease Finance 15.08.22/5.875% 3,880,347 0.042,210,000 Iron Mountain 15.08.23/6.000% 2,271,537 0.02446,000 Jabil Circuit 15.09.22/4.700% 430,142 0.00
3,875,000 Jarden 01.05.17/7.500% 4,496,434 0.042,782,000 Jarden 15.01.20/7.500% 3,013,560 0.031,000,000 Jarden 15.11.22/6.125% 1,067,660 0.011,466,000 JBS USA 144A 01.06.21/7.250% 1,535,635 0.02
425,000 JC Penney 01.04.17/7.950% 371,322 0.001,200,000 JC Penney 15.02.18/5.750% 968,640 0.011,590,000 JC Penney 15.10.36/6.375% 1,192,500 0.011,525,000 K Hovnanian Enterprises 15.10.15/11.875% 1,765,187 0.02
878,000 KB Home 15.09.17/9.100% 1,033,805 0.01372,000 KB Home 15.03.20/8.000% 412,606 0.00
3,790,000 L Brands 01.04.21/6.625% 4,160,245 0.042,285,000 Lennar 01.06.17/12.250% 2,983,330 0.03
520,000 Lennar 15.12.17/4.750% 546,229 0.013,210,000 Lennar 01.06.18/6.950% 3,627,300 0.042,900,000 Manitowoc 01.11.20/8.500% 3,285,946 0.03
650,000 MasTec 15.03.23/4.875% 615,875 0.01167,000 Meritage Homes 15.04.20/7.150% 179,723 0.00
1,665,000 MetroPCS Wireless 01.09.18/7.875% 1,787,852 0.023,360,000 MetroPCS Wireless 15.11.20/6.625% 3,571,327 0.041,867,000 MGM Resorts International 01.06.16/7.500% 2,103,390 0.02
12,345,000 MGM Resorts International 15.01.17/7.625% 14,075,090 0.143,150,000 MGM Resorts International 31.03.20/5.250% 3,147,417 0.034,707,000 MGM Resorts International 15.03.22/7.750% 5,256,448 0.05
14,380,000 Morgan Stanley 24.07.15/4.000% 15,041,911 0.153,600,000 Morgan Stanley 02.11.15/3.450% 3,749,202 0.041,251,000 Mueller Water Products 01.09.20/8.750% 1,407,375 0.01
2,460,000 Nationstar Mortgage 01.06.22/6.500% 2,320,998 0.021,480,000 New Albertsons 15.06.26/7.750% 1,206,200 0.01
245,000 New Albertsons 01.08.29/7.450% 200,541 0.003,987,000 New Albertsons 01.05.30/8.700% 3,422,042 0.034,120,000 New Albertsons 01.05.31/8.000% 3,423,885 0.031,355,000 NRG Energy 15.01.18/7.625% 1,542,173 0.022,082,000 Omnicare 01.06.20/7.750% 2,321,190 0.02
445,000 Owens-Brockway GlassContainer 15.05.16/7.375% 501,662 0.00
3,175,000 Parker Drilling 01.04.18/9.125% 3,369,850 0.031,045,000 Peabody Energy 15.11.18/6.000% 1,118,129 0.01
135
JPMorgan Investment Funds - Income Opportunity Fund
Schedule of Investments (Market Value Expressed in USD)
As at 31 December 2013
Quantity/Nominal
Value
Name of Securities Maturity/Coupon
MarketValue
%of
NetAssets
Quantity/Nominal
Value
Name of Securities Maturity/Coupon
MarketValue
%of
NetAssets
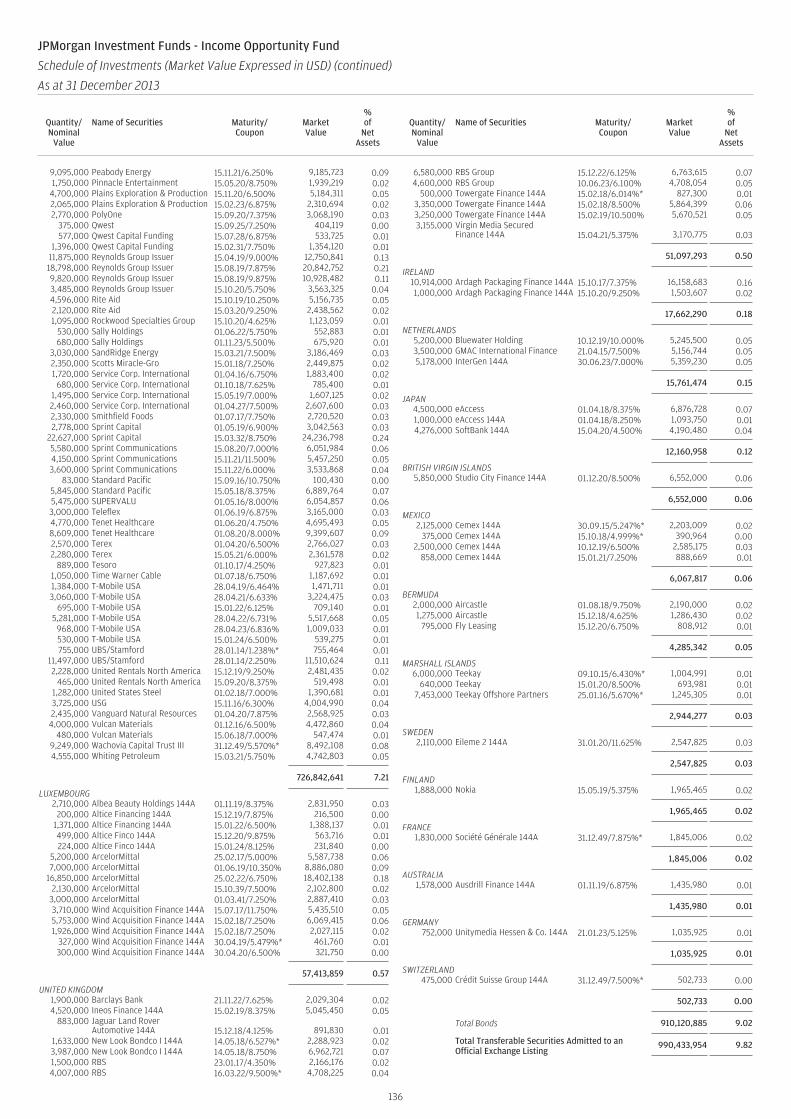
9,095,000 Peabody Energy 15.11.21/6.250% 9,185,723 0.091,750,000 Pinnacle Entertainment 15.05.20/8.750% 1,939,219 0.02
4,700,000 Plains Exploration & Production 15.11.20/6.500% 5,184,311 0.052,065,000 Plains Exploration & Production 15.02.23/6.875% 2,310,694 0.022,770,000 PolyOne 15.09.20/7.375% 3,068,190 0.03
375,000 Qwest 15.09.25/7.250% 404,119 0.00577,000 Qwest Capital Funding 15.07.28/6.875% 533,725 0.01
1,396,000 Qwest Capital Funding 15.02.31/7.750% 1,354,120 0.0111,875,000 Reynolds Group Issuer 15.04.19/9.000% 12,750,841 0.1318,798,000 Reynolds Group Issuer 15.08.19/7.875% 20,842,752 0.219,820,000 Reynolds Group Issuer 15.08.19/9.875% 10,928,482 0.113,485,000 Reynolds Group Issuer 15.10.20/5.750% 3,563,325 0.044,596,000 Rite Aid 15.10.19/10.250% 5,156,735 0.052,120,000 Rite Aid 15.03.20/9.250% 2,438,562 0.021,095,000 Rockwood Specialties Group 15.10.20/4.625% 1,123,059 0.01
530,000 Sally Holdings 01.06.22/5.750% 552,883 0.01680,000 Sally Holdings 01.11.23/5.500% 675,920 0.01
3,030,000 SandRidge Energy 15.03.21/7.500% 3,186,469 0.032,350,000 Scotts Miracle-Gro 15.01.18/7.250% 2,449,875 0.021,720,000 Service Corp. International 01.04.16/6.750% 1,883,400 0.02
680,000 Service Corp. International 01.10.18/7.625% 785,400 0.011,495,000 Service Corp. International 15.05.19/7.000% 1,607,125 0.022,460,000 Service Corp. International 01.04.27/7.500% 2,607,600 0.032,330,000 Smithfield Foods 01.07.17/7.750% 2,720,520 0.032,778,000 Sprint Capital 01.05.19/6.900% 3,042,563 0.03
22,627,000 Sprint Capital 15.03.32/8.750% 24,236,798 0.245,580,000 Sprint Communications 15.08.20/7.000% 6,051,984 0.064,150,000 Sprint Communications 15.11.21/11.500% 5,457,250 0.053,600,000 Sprint Communications 15.11.22/6.000% 3,533,868 0.04
83,000 Standard Pacific 15.09.16/10.750% 100,430 0.005,845,000 Standard Pacific 15.05.18/8.375% 6,889,764 0.075,475,000 SUPERVALU 01.05.16/8.000% 6,054,857 0.063,000,000 Teleflex 01.06.19/6.875% 3,165,000 0.034,770,000 Tenet Healthcare 01.06.20/4.750% 4,695,493 0.058,609,000 Tenet Healthcare 01.08.20/8.000% 9,399,607 0.092,570,000 Terex 01.04.20/6.500% 2,766,027 0.032,280,000 Terex 15.05.21/6.000% 2,361,578 0.02
889,000 Tesoro 01.10.17/4.250% 927,823 0.011,050,000 Time Warner Cable 01.07.18/6.750% 1,187,692 0.011,384,000 T-Mobile USA 28.04.19/6.464% 1,471,711 0.013,060,000 T-Mobile USA 28.04.21/6.633% 3,224,475 0.03
695,000 T-Mobile USA 15.01.22/6.125% 709,140 0.015,281,000 T-Mobile USA 28.04.22/6.731% 5,517,668 0.05
968,000 T-Mobile USA 28.04.23/6.836% 1,009,033 0.01530,000 T-Mobile USA 15.01.24/6.500% 539,275 0.01755,000 UBS/Stamford 28.01.14/1.238%* 755,464 0.01
11,497,000 UBS/Stamford 28.01.14/2.250% 11,510,624 0.112,228,000 United Rentals North America 15.12.19/9.250% 2,481,435 0.02
465,000 United Rentals North America 15.09.20/8.375% 519,498 0.011,282,000 United States Steel 01.02.18/7.000% 1,390,681 0.013,725,000 USG 15.11.16/6.300% 4,004,990 0.042,435,000 Vanguard Natural Resources 01.04.20/7.875% 2,568,925 0.03
4,000,000 Vulcan Materials 01.12.16/6.500% 4,472,860 0.04480,000 Vulcan Materials 15.06.18/7.000% 547,474 0.01
9,249,000 Wachovia Capital Trust III 31.12.49/5.570%* 8,492,108 0.084,555,000 Whiting Petroleum 15.03.21/5.750% 4,742,803 0.05
726,842,641 7.21
LUXEMBOURG2,710,000 Albea Beauty Holdings 144A 01.11.19/8.375% 2,831,950 0.03
200,000 Altice Financing 144A 15.12.19/7.875% 216,500 0.001,371,000 Altice Financing 144A 15.01.22/6.500% 1,388,137 0.01499,000 Altice Finco 144A 15.12.20/9.875% 563,716 0.01224,000 Altice Finco 144A 15.01.24/8.125% 231,840 0.00
5,200,000 ArcelorMittal 25.02.17/5.000% 5,587,738 0.067,000,000 ArcelorMittal 01.06.19/10.350% 8,886,080 0.09
16,850,000 ArcelorMittal 25.02.22/6.750% 18,402,138 0.182,130,000 ArcelorMittal 15.10.39/7.500% 2,102,800 0.02
3,000,000 ArcelorMittal 01.03.41/7.250% 2,887,410 0.033,710,000 Wind Acquisition Finance 144A 15.07.17/11.750% 5,435,510 0.055,753,000 Wind Acquisition Finance 144A 15.02.18/7.250% 6,069,415 0.061,926,000 Wind Acquisition Finance 144A 15.02.18/7.250% 2,027,115 0.02
327,000 Wind Acquisition Finance 144A 30.04.19/5.479%* 461,760 0.01300,000 Wind Acquisition Finance 144A 30.04.20/6.500% 321,750 0.00
57,413,859 0.57
UNITED KINGDOM1,900,000 Barclays Bank 21.11.22/7.625% 2,029,304 0.024,520,000 Ineos Finance 144A 15.02.19/8.375% 5,045,450 0.05
883,000 Jaguar Land RoverAutomotive 144A 15.12.18/4.125% 891,830 0.01
1,633,000 New Look Bondco I 144A 14.05.18/6.527%* 2,288,923 0.023,987,000 New Look Bondco I 144A 14.05.18/8.750% 6,962,721 0.071,500,000 RBS 23.01.17/4.350% 2,166,176 0.024,007,000 RBS 16.03.22/9.500%* 4,708,225 0.04
6,580,000 RBS Group 15.12.22/6.125% 6,763,615 0.074,600,000 RBS Group 10.06.23/6.100% 4,708,054 0.05
500,000 Towergate Finance 144A 15.02.18/6.014%* 827,300 0.013,350,000 Towergate Finance 144A 15.02.18/8.500% 5,864,399 0.063,250,000 Towergate Finance 144A 15.02.19/10.500% 5,670,521 0.053,155,000 Virgin Media Secured
Finance 144A 15.04.21/5.375% 3,170,775 0.03
51,097,293 0.50
IRELAND10,914,000 Ardagh Packaging Finance 144A 15.10.17/7.375% 16,158,683 0.161,000,000 Ardagh Packaging Finance 144A 15.10.20/9.250% 1,503,607 0.02
17,662,290 0.18
NETHERLANDS5,200,000 Bluewater Holding 10.12.19/10.000% 5,245,500 0.053,500,000 GMAC International Finance 21.04.15/7.500% 5,156,744 0.055,178,000 InterGen 144A 30.06.23/7.000% 5,359,230 0.05
15,761,474 0.15
JAPAN4,500,000 eAccess 01.04.18/8.375% 6,876,728 0.071,000,000 eAccess 144A 01.04.18/8.250% 1,093,750 0.014,276,000 SoftBank 144A 15.04.20/4.500% 4,190,480 0.04
12,160,958 0.12
BRITISH VIRGIN ISLANDS5,850,000 Studio City Finance 144A 01.12.20/8.500% 6,552,000 0.06
6,552,000 0.06
MEXICO2,125,000 Cemex 144A 30.09.15/5.247%* 2,203,009 0.02
375,000 Cemex 144A 15.10.18/4.999%* 390,964 0.002,500,000 Cemex 144A 10.12.19/6.500% 2,585,175 0.03
858,000 Cemex 144A 15.01.21/7.250% 888,669 0.01
6,067,817 0.06
BERMUDA2,000,000 Aircastle 01.08.18/9.750% 2,190,000 0.021,275,000 Aircastle 15.12.18/4.625% 1,286,430 0.02
795,000 Fly Leasing 15.12.20/6.750% 808,912 0.01
4,285,342 0.05
MARSHALL ISLANDS6,000,000 Teekay 09.10.15/6.430%* 1,004,991 0.01
640,000 Teekay 15.01.20/8.500% 693,981 0.017,453,000 Teekay Offshore Partners 25.01.16/5.670%* 1,245,305 0.01
2,944,277 0.03
SWEDEN2,110,000 Eileme 2 144A 31.01.20/11.625% 2,547,825 0.03
2,547,825 0.03
FINLAND1,888,000 Nokia 15.05.19/5.375% 1,965,465 0.02
1,965,465 0.02
FRANCE1,830,000 Société Générale 144A 31.12.49/7.875%* 1,845,006 0.02
1,845,006 0.02
AUSTRALIA1,578,000 Ausdrill Finance 144A 01.11.19/6.875% 1,435,980 0.01
1,435,980 0.01
GERMANY752,000 Unitymedia Hessen & Co. 144A 21.01.23/5.125% 1,035,925 0.01
1,035,925 0.01
SWITZERLAND475,000 Crédit Suisse Group 144A 31.12.49/7.500%* 502,733 0.00
502,733 0.00
Total Bonds 910,120,885 9.02
Total Transferable Securities Admitted to anOfficial Exchange Listing
990,433,954 9.82
136
JPMorgan Investment Funds - Income Opportunity Fund
Schedule of Investments (Market Value Expressed in USD) (continued)
As at 31 December 2013
Quantity/Nominal
Value
Name of Securities Maturity/Coupon
MarketValue
%of
NetAssets
Quantity/Nominal
Value
Name of Securities Maturity/Coupon
MarketValue
%of
NetAssets
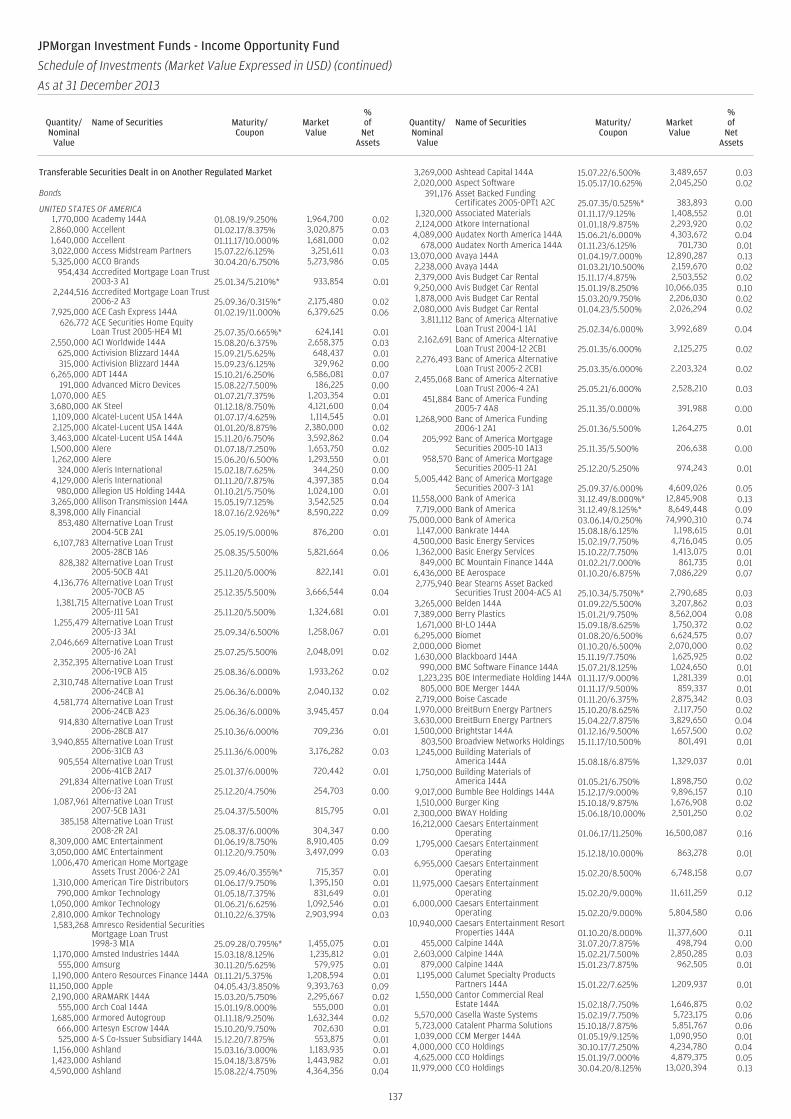
Transferable Securities Dealt in on Another Regulated Market
Bonds
UNITED STATES OF AMERICA1,770,000 Academy 144A 01.08.19/9.250% 1,964,700 0.022,860,000 Accellent 01.02.17/8.375% 3,020,875 0.031,640,000 Accellent 01.11.17/10.000% 1,681,000 0.023,022,000 Access Midstream Partners 15.07.22/6.125% 3,251,611 0.035,325,000 ACCO Brands 30.04.20/6.750% 5,273,986 0.05
954,434 Accredited Mortgage Loan Trust2003-3 A1 25.01.34/5.210%* 933,854 0.01
2,244,516 Accredited Mortgage Loan Trust2006-2 A3 25.09.36/0.315%* 2,175,480 0.02
7,925,000 ACE Cash Express 144A 01.02.19/11.000% 6,379,625 0.06626,772 ACE Securities Home Equity
Loan Trust 2005-HE4 M1 25.07.35/0.665%* 624,141 0.012,550,000 ACI Worldwide 144A 15.08.20/6.375% 2,658,375 0.03
625,000 Activision Blizzard 144A 15.09.21/5.625% 648,437 0.01315,000 Activision Blizzard 144A 15.09.23/6.125% 329,962 0.00
6,265,000 ADT 144A 15.10.21/6.250% 6,586,081 0.07191,000 Advanced Micro Devices 15.08.22/7.500% 186,225 0.00
1,070,000 AES 01.07.21/7.375% 1,203,354 0.013,680,000 AK Steel 01.12.18/8.750% 4,121,600 0.041,109,000 Alcatel-Lucent USA 144A 01.07.17/4.625% 1,114,545 0.012,125,000 Alcatel-Lucent USA 144A 01.01.20/8.875% 2,380,000 0.02
3,463,000 Alcatel-Lucent USA 144A 15.11.20/6.750% 3,592,862 0.041,500,000 Alere 01.07.18/7.250% 1,653,750 0.021,262,000 Alere 15.06.20/6.500% 1,293,550 0.01
324,000 Aleris International 15.02.18/7.625% 344,250 0.004,129,000 Aleris International 01.11.20/7.875% 4,397,385 0.04
980,000 Allegion US Holding 144A 01.10.21/5.750% 1,024,100 0.013,265,000 Allison Transmission 144A 15.05.19/7.125% 3,542,525 0.048,398,000 Ally Financial 18.07.16/2.926%* 8,590,222 0.09
853,480 Alternative Loan Trust2004-5CB 2A1 25.05.19/5.000% 876,200 0.01
6,107,783 Alternative Loan Trust2005-28CB 1A6 25.08.35/5.500% 5,821,664 0.06
828,382 Alternative Loan Trust2005-50CB 4A1 25.11.20/5.000% 822,141 0.01
4,136,776 Alternative Loan Trust2005-70CB A5 25.12.35/5.500% 3,666,544 0.04
1,381,715 Alternative Loan Trust2005-J11 5A1 25.11.20/5.500% 1,324,681 0.01
1,255,479 Alternative Loan Trust2005-J3 3A1 25.09.34/6.500% 1,258,067 0.01
2,046,669 Alternative Loan Trust2005-J6 2A1 25.07.25/5.500% 2,048,091 0.02
2,352,395 Alternative Loan Trust2006-19CB A15 25.08.36/6.000% 1,933,262 0.02
2,310,748 Alternative Loan Trust2006-24CB A1 25.06.36/6.000% 2,040,132 0.02
4,581,774 Alternative Loan Trust2006-24CB A23 25.06.36/6.000% 3,945,457 0.04
914,830 Alternative Loan Trust2006-28CB A17 25.10.36/6.000% 709,236 0.01
3,940,855 Alternative Loan Trust2006-31CB A3 25.11.36/6.000% 3,176,282 0.03
905,554 Alternative Loan Trust2006-41CB 2A17 25.01.37/6.000% 720,442 0.01
291,834 Alternative Loan Trust2006-J3 2A1 25.12.20/4.750% 254,703 0.00
1,087,961 Alternative Loan Trust2007-5CB 1A31 25.04.37/5.500% 815,795 0.01
385,158 Alternative Loan Trust2008-2R 2A1 25.08.37/6.000% 304,347 0.00
8,309,000 AMC Entertainment 01.06.19/8.750% 8,910,405 0.093,050,000 AMC Entertainment 01.12.20/9.750% 3,497,099 0.031,006,470 American Home Mortgage
Assets Trust 2006-2 2A1 25.09.46/0.355%* 715,357 0.011,310,000 American Tire Distributors 01.06.17/9.750% 1,395,150 0.01
790,000 Amkor Technology 01.05.18/7.375% 831,649 0.011,050,000 Amkor Technology 01.06.21/6.625% 1,092,546 0.012,810,000 Amkor Technology 01.10.22/6.375% 2,903,994 0.031,583,268 Amresco Residential Securities
Mortgage Loan Trust1998-3 M1A 25.09.28/0.795%* 1,455,075 0.01
1,170,000 Amsted Industries 144A 15.03.18/8.125% 1,235,812 0.01555,000 Amsurg 30.11.20/5.625% 579,975 0.01
1,190,000 Antero Resources Finance 144A 01.11.21/5.375% 1,208,594 0.0111,150,000 Apple 04.05.43/3.850% 9,393,763 0.092,190,000 ARAMARK 144A 15.03.20/5.750% 2,295,667 0.02
555,000 Arch Coal 144A 15.01.19/8.000% 555,000 0.011,685,000 Armored Autogroup 01.11.18/9.250% 1,632,344 0.02
666,000 Artesyn Escrow 144A 15.10.20/9.750% 702,630 0.01525,000 A-S Co-Issuer Subsidiary 144A 15.12.20/7.875% 553,875 0.01
1,156,000 Ashland 15.03.16/3.000% 1,183,935 0.011,423,000 Ashland 15.04.18/3.875% 1,443,982 0.014,590,000 Ashland 15.08.22/4.750% 4,364,356 0.04
3,269,000 Ashtead Capital 144A 15.07.22/6.500% 3,489,657 0.032,020,000 Aspect Software 15.05.17/10.625% 2,045,250 0.02
391,176 Asset Backed FundingCertificates 2005-OPT1 A2C 25.07.35/0.525%* 383,893 0.00
1,320,000 Associated Materials 01.11.17/9.125% 1,408,552 0.012,124,000 Atkore International 01.01.18/9.875% 2,293,920 0.02
4,089,000 Audatex North America 144A 15.06.21/6.000% 4,303,672 0.04678,000 Audatex North America 144A 01.11.23/6.125% 701,730 0.01
13,070,000 Avaya 144A 01.04.19/7.000% 12,890,287 0.132,238,000 Avaya 144A 01.03.21/10.500% 2,159,670 0.022,379,000 Avis Budget Car Rental 15.11.17/4.875% 2,503,552 0.029,250,000 Avis Budget Car Rental 15.01.19/8.250% 10,066,035 0.101,878,000 Avis Budget Car Rental 15.03.20/9.750% 2,206,030 0.022,080,000 Avis Budget Car Rental 01.04.23/5.500% 2,026,294 0.02
3,811,112 Banc of America AlternativeLoan Trust 2004-1 1A1 25.02.34/6.000% 3,992,689 0.04
2,162,691 Banc of America AlternativeLoan Trust 2004-12 2CB1 25.01.35/6.000% 2,125,275 0.02
2,276,493 Banc of America AlternativeLoan Trust 2005-2 2CB1 25.03.35/6.000% 2,203,324 0.02
2,455,068 Banc of America AlternativeLoan Trust 2006-4 2A1 25.05.21/6.000% 2,528,210 0.03
451,884 Banc of America Funding2005-7 4A8 25.11.35/0.000% 391,988 0.00
1,268,900 Banc of America Funding2006-1 2A1 25.01.36/5.500% 1,264,275 0.01
205,992 Banc of America MortgageSecurities 2005-10 1A13 25.11.35/5.500% 206,638 0.00
958,570 Banc of America MortgageSecurities 2005-11 2A1 25.12.20/5.250% 974,243 0.01
5,005,442 Banc of America MortgageSecurities 2007-3 1A1 25.09.37/6.000% 4,609,026 0.05
11,558,000 Bank of America 31.12.49/8.000%* 12,845,908 0.137,719,000 Bank of America 31.12.49/8.125%* 8,649,448 0.09
75,000,000 Bank of America 03.06.14/0.250% 74,990,310 0.741,147,000 Bankrate 144A 15.08.18/6.125% 1,198,615 0.01
4,500,000 Basic Energy Services 15.02.19/7.750% 4,716,045 0.051,362,000 Basic Energy Services 15.10.22/7.750% 1,413,075 0.01
849,000 BC Mountain Finance 144A 01.02.21/7.000% 861,735 0.016,436,000 BE Aerospace 01.10.20/6.875% 7,086,229 0.072,775,940 Bear Stearns Asset Backed
Securities Trust 2004-AC5 A1 25.10.34/5.750%* 2,790,685 0.033,265,000 Belden 144A 01.09.22/5.500% 3,207,862 0.037,389,000 Berry Plastics 15.01.21/9.750% 8,562,004 0.081,671,000 BI-LO 144A 15.09.18/8.625% 1,750,372 0.02
6,295,000 Biomet 01.08.20/6.500% 6,624,575 0.072,000,000 Biomet 01.10.20/6.500% 2,070,000 0.021,630,000 Blackboard 144A 15.11.19/7.750% 1,625,925 0.02
990,000 BMC Software Finance 144A 15.07.21/8.125% 1,024,650 0.011,223,235 BOE Intermediate Holding 144A 01.11.17/9.000% 1,281,339 0.01805,000 BOE Merger 144A 01.11.17/9.500% 859,337 0.01
2,719,000 Boise Cascade 01.11.20/6.375% 2,875,342 0.031,970,000 BreitBurn Energy Partners 15.10.20/8.625% 2,117,750 0.023,630,000 BreitBurn Energy Partners 15.04.22/7.875% 3,829,650 0.041,500,000 Brightstar 144A 01.12.16/9.500% 1,657,500 0.02
803,500 Broadview Networks Holdings 15.11.17/10.500% 801,491 0.011,245,000 Building Materials of
America 144A 15.08.18/6.875% 1,329,037 0.011,750,000 Building Materials of
America 144A 01.05.21/6.750% 1,898,750 0.029,017,000 Bumble Bee Holdings 144A 15.12.17/9.000% 9,896,157 0.101,510,000 Burger King 15.10.18/9.875% 1,676,908 0.02
2,300,000 BWAY Holding 15.06.18/10.000% 2,501,250 0.0216,212,000 Caesars Entertainment
Operating 01.06.17/11.250% 16,500,087 0.161,795,000 Caesars Entertainment
Operating 15.12.18/10.000% 863,278 0.016,955,000 Caesars Entertainment
Operating 15.02.20/8.500% 6,748,158 0.0711,975,000 Caesars Entertainment
Operating 15.02.20/9.000% 11,611,259 0.126,000,000 Caesars Entertainment
Operating 15.02.20/9.000% 5,804,580 0.0610,940,000 Caesars Entertainment Resort
Properties 144A 01.10.20/8.000% 11,377,600 0.11455,000 Calpine 144A 31.07.20/7.875% 498,794 0.00
2,603,000 Calpine 144A 15.02.21/7.500% 2,850,285 0.03879,000 Calpine 144A 15.01.23/7.875% 962,505 0.01
1,195,000 Calumet Specialty ProductsPartners 144A 15.01.22/7.625% 1,209,937 0.01
1,550,000 Cantor Commercial RealEstate 144A 15.02.18/7.750% 1,646,875 0.02
5,570,000 Casella Waste Systems 15.02.19/7.750% 5,723,175 0.065,723,000 Catalent Pharma Solutions 15.10.18/7.875% 5,851,767 0.061,039,000 CCM Merger 144A 01.05.19/9.125% 1,090,950 0.01
4,000,000 CCO Holdings 30.10.17/7.250% 4,234,780 0.044,625,000 CCO Holdings 15.01.19/7.000% 4,879,375 0.05
11,979,000 CCO Holdings 30.04.20/8.125% 13,020,394 0.13
137
JPMorgan Investment Funds - Income Opportunity Fund
Schedule of Investments (Market Value Expressed in USD) (continued)
As at 31 December 2013
Quantity/Nominal
Value
Name of Securities Maturity/Coupon
MarketValue
%of
NetAssets
Quantity/Nominal
Value
Name of Securities Maturity/Coupon
MarketValue
%of
NetAssets
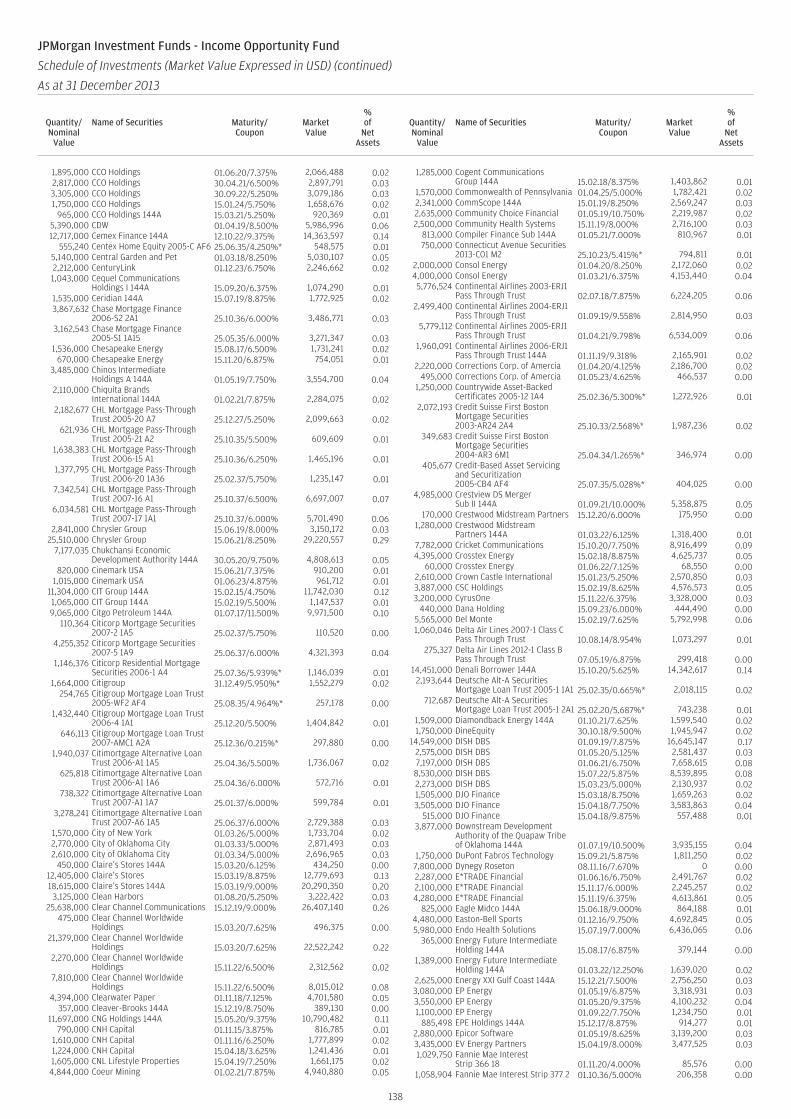
1,895,000 CCO Holdings 01.06.20/7.375% 2,066,488 0.022,817,000 CCO Holdings 30.04.21/6.500% 2,897,791 0.033,305,000 CCO Holdings 30.09.22/5.250% 3,079,186 0.031,750,000 CCO Holdings 15.01.24/5.750% 1,658,676 0.02
965,000 CCO Holdings 144A 15.03.21/5.250% 920,369 0.015,390,000 CDW 01.04.19/8.500% 5,986,996 0.0612,717,000 Cemex Finance 144A 12.10.22/9.375% 14,363,597 0.14
555,240 Centex Home Equity 2005-C AF6 25.06.35/4.250%* 548,575 0.015,140,000 Central Garden and Pet 01.03.18/8.250% 5,030,107 0.052,212,000 CenturyLink 01.12.23/6.750% 2,246,662 0.021,043,000 Cequel Communications
Holdings I 144A 15.09.20/6.375% 1,074,290 0.011,535,000 Ceridian 144A 15.07.19/8.875% 1,772,925 0.023,867,632 Chase Mortgage Finance
2006-S2 2A1 25.10.36/6.000% 3,486,771 0.033,162,543 Chase Mortgage Finance
2005-S1 1A15 25.05.35/6.000% 3,271,347 0.031,536,000 Chesapeake Energy 15.08.17/6.500% 1,731,241 0.02
670,000 Chesapeake Energy 15.11.20/6.875% 754,051 0.013,485,000 Chinos Intermediate
Holdings A 144A 01.05.19/7.750% 3,554,700 0.042,110,000 Chiquita Brands
International 144A 01.02.21/7.875% 2,284,075 0.022,182,677 CHL Mortgage Pass-Through
Trust 2005-20 A7 25.12.27/5.250% 2,099,663 0.02621,936 CHL Mortgage Pass-Through
Trust 2005-21 A2 25.10.35/5.500% 609,609 0.011,638,383 CHL Mortgage Pass-Through
Trust 2006-15 A1 25.10.36/6.250% 1,465,196 0.011,377,795 CHL Mortgage Pass-Through
Trust 2006-20 1A36 25.02.37/5.750% 1,235,147 0.017,342,541 CHL Mortgage Pass-Through
Trust 2007-16 A1 25.10.37/6.500% 6,697,007 0.076,034,581 CHL Mortgage Pass-Through
Trust 2007-17 1A1 25.10.37/6.000% 5,701,490 0.062,841,000 Chrysler Group 15.06.19/8.000% 3,150,172 0.03
25,510,000 Chrysler Group 15.06.21/8.250% 29,220,557 0.297,177,035 Chukchansi Economic
Development Authority 144A 30.05.20/9.750% 4,808,613 0.05820,000 Cinemark USA 15.06.21/7.375% 910,200 0.01
1,015,000 Cinemark USA 01.06.23/4.875% 961,712 0.0111,304,000 CIT Group 144A 15.02.15/4.750% 11,742,030 0.121,065,000 CIT Group 144A 15.02.19/5.500% 1,147,537 0.019,065,000 Citgo Petroleum 144A 01.07.17/11.500% 9,971,500 0.10
110,364 Citicorp Mortgage Securities2007-2 1A5 25.02.37/5.750% 110,520 0.00
4,255,352 Citicorp Mortgage Securities2007-5 1A9 25.06.37/6.000% 4,321,393 0.04
1,146,376 Citicorp Residential MortgageSecurities 2006-1 A4 25.07.36/5.939%* 1,146,039 0.01
1,664,000 Citigroup 31.12.49/5.950%* 1,552,279 0.02254,765 Citigroup Mortgage Loan Trust
2005-WF2 AF4 25.08.35/4.964%* 257,178 0.001,432,440 Citigroup Mortgage Loan Trust
2006-4 1A1 25.12.20/5.500% 1,404,842 0.01646,113 Citigroup Mortgage Loan Trust
2007-AMC1 A2A 25.12.36/0.215%* 297,880 0.001,940,037 Citimortgage Alternative Loan
Trust 2006-A1 1A5 25.04.36/5.500% 1,736,067 0.02625,818 Citimortgage Alternative Loan
Trust 2006-A1 1A6 25.04.36/6.000% 572,716 0.01738,322 Citimortgage Alternative Loan
Trust 2007-A1 1A7 25.01.37/6.000% 599,784 0.013,278,241 Citimortgage Alternative Loan
Trust 2007-A6 1A5 25.06.37/6.000% 2,729,388 0.031,570,000 City of New York 01.03.26/5.000% 1,733,704 0.022,770,000 City of Oklahoma City 01.03.33/5.000% 2,871,493 0.032,610,000 City of Oklahoma City 01.03.34/5.000% 2,696,965 0.03
450,000 Claire’s Stores 144A 15.03.20/6.125% 434,250 0.0012,405,000 Claire’s Stores 15.03.19/8.875% 12,779,693 0.1318,615,000 Claire’s Stores 144A 15.03.19/9.000% 20,290,350 0.203,125,000 Clean Harbors 01.08.20/5.250% 3,222,422 0.03
25,638,000 Clear Channel Communications 15.12.19/9.000% 26,407,140 0.26475,000 Clear Channel Worldwide
Holdings 15.03.20/7.625% 496,375 0.0021,379,000 Clear Channel Worldwide
Holdings 15.03.20/7.625% 22,522,242 0.222,270,000 Clear Channel Worldwide
Holdings 15.11.22/6.500% 2,312,562 0.027,810,000 Clear Channel Worldwide
Holdings 15.11.22/6.500% 8,015,012 0.084,394,000 Clearwater Paper 01.11.18/7.125% 4,701,580 0.05
357,000 Cleaver-Brooks 144A 15.12.19/8.750% 389,130 0.0011,697,000 CNG Holdings 144A 15.05.20/9.375% 10,790,482 0.11
790,000 CNH Capital 01.11.15/3.875% 816,785 0.011,610,000 CNH Capital 01.11.16/6.250% 1,777,899 0.021,224,000 CNH Capital 15.04.18/3.625% 1,241,436 0.011,605,000 CNL Lifestyle Properties 15.04.19/7.250% 1,661,175 0.024,844,000 Coeur Mining 01.02.21/7.875% 4,940,880 0.05
1,285,000 Cogent CommunicationsGroup 144A 15.02.18/8.375% 1,403,862 0.01
1,570,000 Commonwealth of Pennsylvania 01.04.25/5.000% 1,782,421 0.022,341,000 CommScope 144A 15.01.19/8.250% 2,569,247 0.032,635,000 Community Choice Financial 01.05.19/10.750% 2,219,987 0.022,500,000 Community Health Systems 15.11.19/8.000% 2,716,100 0.03
813,000 Compiler Finance Sub 144A 01.05.21/7.000% 810,967 0.01750,000 Connecticut Avenue Securities
2013-C01 M2 25.10.23/5.415%* 794,811 0.012,000,000 Consol Energy 01.04.20/8.250% 2,172,060 0.024,000,000 Consol Energy 01.03.21/6.375% 4,153,440 0.045,776,524 Continental Airlines 2003-ERJ1
Pass Through Trust 02.07.18/7.875% 6,224,205 0.062,499,400 Continental Airlines 2004-ERJ1
Pass Through Trust 01.09.19/9.558% 2,814,950 0.035,779,112 Continental Airlines 2005-ERJ1
Pass Through Trust 01.04.21/9.798% 6,534,009 0.061,960,091 Continental Airlines 2006-ERJ1
Pass Through Trust 144A 01.11.19/9.318% 2,165,901 0.022,220,000 Corrections Corp. of Amercia 01.04.20/4.125% 2,186,700 0.02
495,000 Corrections Corp. of Amercia 01.05.23/4.625% 466,537 0.001,250,000 Countrywide Asset-Backed
Certificates 2005-12 1A4 25.02.36/5.300%* 1,272,926 0.012,072,193 Credit Suisse First Boston
Mortgage Securities2003-AR24 2A4 25.10.33/2.568%* 1,987,236 0.02
349,683 Credit Suisse First BostonMortgage Securities2004-AR3 6M1 25.04.34/1.265%* 346,974 0.00
405,677 Credit-Based Asset Servicingand Securitization2005-CB4 AF4 25.07.35/5.028%* 404,025 0.00
4,985,000 Crestview DS MergerSub II 144A 01.09.21/10.000% 5,358,875 0.05
170,000 Crestwood Midstream Partners 15.12.20/6.000% 175,950 0.001,280,000 Crestwood Midstream
Partners 144A 01.03.22/6.125% 1,318,400 0.017,782,000 Cricket Communications 15.10.20/7.750% 8,916,499 0.094,395,000 Crosstex Energy 15.02.18/8.875% 4,625,737 0.05
60,000 Crosstex Energy 01.06.22/7.125% 68,550 0.002,610,000 Crown Castle International 15.01.23/5.250% 2,570,850 0.033,887,000 CSC Holdings 15.02.19/8.625% 4,576,573 0.053,200,000 CyrusOne 15.11.22/6.375% 3,328,000 0.03
440,000 Dana Holding 15.09.23/6.000% 444,490 0.005,565,000 Del Monte 15.02.19/7.625% 5,792,998 0.061,060,046 Delta Air Lines 2007-1 Class C
Pass Through Trust 10.08.14/8.954% 1,073,297 0.01275,327 Delta Air Lines 2012-1 Class B
Pass Through Trust 07.05.19/6.875% 299,418 0.0014,451,000 Denali Borrower 144A 15.10.20/5.625% 14,342,617 0.14
2,193,644 Deutsche Alt-A SecuritiesMortgage Loan Trust 2005-1 1A1 25.02.35/0.665%* 2,018,115 0.02
712,687 Deutsche Alt-A SecuritiesMortgage Loan Trust 2005-1 2A1 25.02.20/5.687%* 743,238 0.01
1,509,000 Diamondback Energy 144A 01.10.21/7.625% 1,599,540 0.021,750,000 DineEquity 30.10.18/9.500% 1,945,947 0.02
14,549,000 DISH DBS 01.09.19/7.875% 16,645,147 0.172,575,000 DISH DBS 01.05.20/5.125% 2,581,437 0.037,197,000 DISH DBS 01.06.21/6.750% 7,658,615 0.088,530,000 DISH DBS 15.07.22/5.875% 8,539,895 0.082,273,000 DISH DBS 15.03.23/5.000% 2,130,937 0.021,505,000 DJO Finance 15.03.18/8.750% 1,659,263 0.023,505,000 DJO Finance 15.04.18/7.750% 3,583,863 0.04
515,000 DJO Finance 15.04.18/9.875% 557,488 0.013,877,000 Downstream Development
Authority of the Quapaw Tribeof Oklahoma 144A 01.07.19/10.500% 3,935,155 0.04
1,750,000 DuPont Fabros Technology 15.09.21/5.875% 1,811,250 0.027,800,000 Dynegy Roseton 08.11.16/7.670% 0 0.002,287,000 E*TRADE Financial 01.06.16/6.750% 2,491,767 0.022,100,000 E*TRADE Financial 15.11.17/6.000% 2,245,257 0.024,280,000 E*TRADE Financial 15.11.19/6.375% 4,613,861 0.05
825,000 Eagle Midco 144A 15.06.18/9.000% 864,188 0.014,480,000 Easton-Bell Sports 01.12.16/9.750% 4,692,845 0.055,980,000 Endo Health Solutions 15.07.19/7.000% 6,436,065 0.06
365,000 Energy Future IntermediateHolding 144A 15.08.17/6.875% 379,144 0.00
1,389,000 Energy Future IntermediateHolding 144A 01.03.22/12.250% 1,639,020 0.02
2,625,000 Energy XXI Gulf Coast 144A 15.12.21/7.500% 2,756,250 0.033,080,000 EP Energy 01.05.19/6.875% 3,318,931 0.033,550,000 EP Energy 01.05.20/9.375% 4,100,232 0.041,100,000 EP Energy 01.09.22/7.750% 1,234,750 0.01
885,498 EPE Holdings 144A 15.12.17/8.875% 914,277 0.012,880,000 Epicor Software 01.05.19/8.625% 3,139,200 0.033,435,000 EV Energy Partners 15.04.19/8.000% 3,477,525 0.031,029,750 Fannie Mae Interest
Strip 366 18 01.11.20/4.000% 85,576 0.001,058,904 Fannie Mae Interest Strip 377 2 01.10.36/5.000% 206,358 0.00
138
JPMorgan Investment Funds - Income Opportunity Fund
Schedule of Investments (Market Value Expressed in USD) (continued)
As at 31 December 2013
Quantity/Nominal
Value
Name of Securities Maturity/Coupon
MarketValue
%of
NetAssets
Quantity/Nominal
Value
Name of Securities Maturity/Coupon
MarketValue
%of
NetAssets
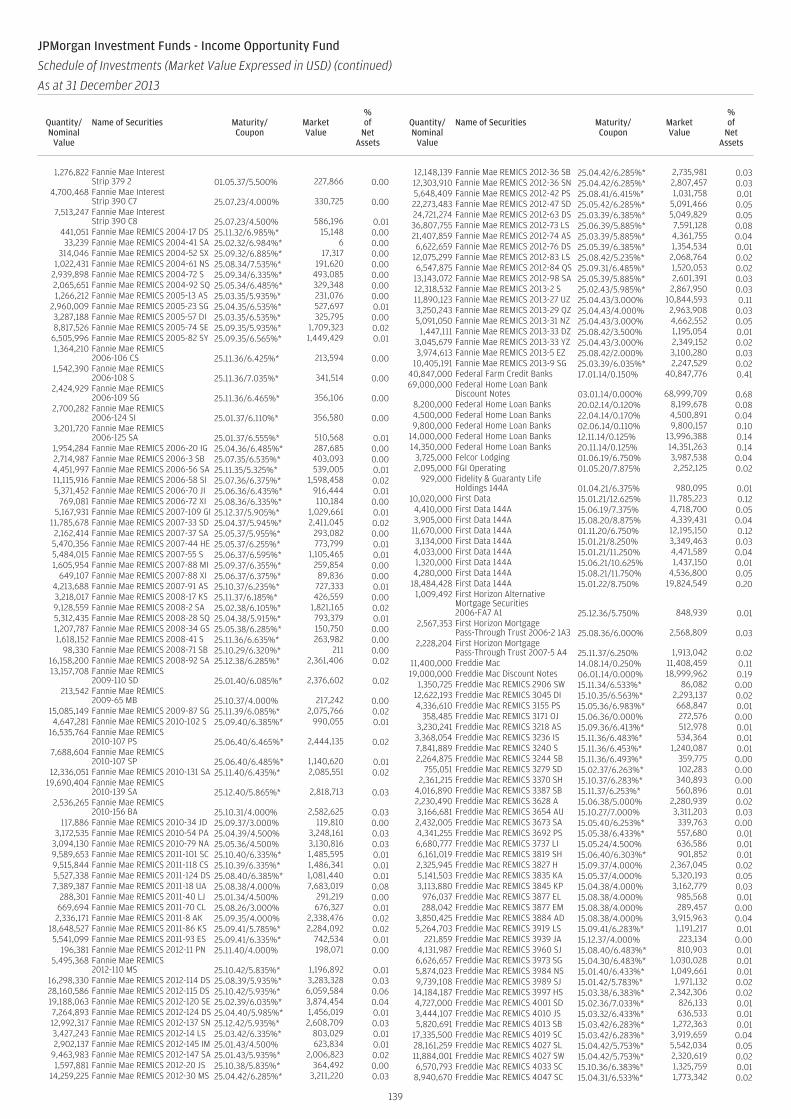
1,276,822 Fannie Mae InterestStrip 379 2 01.05.37/5.500% 227,866 0.00
4,700,468 Fannie Mae InterestStrip 390 C7 25.07.23/4.000% 330,725 0.00
7,513,247 Fannie Mae InterestStrip 390 C8 25.07.23/4.500% 586,196 0.01
441,051 Fannie Mae REMICS 2004-17 DS 25.11.32/6.985%* 15,148 0.0033,239 Fannie Mae REMICS 2004-41 SA 25.02.32/6.984%* 6 0.00
314,046 Fannie Mae REMICS 2004-52 SX 25.09.32/6.885%* 17,317 0.001,022,431 Fannie Mae REMICS 2004-61 NS 25.08.34/7.535%* 191,620 0.00
2,939,898 Fannie Mae REMICS 2004-72 S 25.09.34/6.335%* 493,085 0.002,065,651 Fannie Mae REMICS 2004-92 SQ 25.05.34/6.485%* 329,348 0.001,266,212 Fannie Mae REMICS 2005-13 AS 25.03.35/5.935%* 231,076 0.00
2,960,009 Fannie Mae REMICS 2005-23 SG 25.04.35/6.535%* 527,697 0.013,287,188 Fannie Mae REMICS 2005-57 DI 25.03.35/6.535%* 325,795 0.008,817,526 Fannie Mae REMICS 2005-74 SE 25.09.35/5.935%* 1,709,323 0.02
6,505,996 Fannie Mae REMICS 2005-82 SY 25.09.35/6.565%* 1,449,429 0.011,364,210 Fannie Mae REMICS
2006-106 CS 25.11.36/6.425%* 213,594 0.001,542,390 Fannie Mae REMICS
2006-108 S 25.11.36/7.035%* 341,514 0.002,424,929 Fannie Mae REMICS
2006-109 SG 25.11.36/6.465%* 356,106 0.002,700,282 Fannie Mae REMICS
2006-124 SI 25.01.37/6.110%* 356,580 0.003,201,720 Fannie Mae REMICS
2006-125 SA 25.01.37/6.555%* 510,568 0.011,954,284 Fannie Mae REMICS 2006-20 IG 25.04.36/6.485%* 287,685 0.002,714,987 Fannie Mae REMICS 2006-3 SB 25.07.35/6.535%* 403,093 0.004,451,997 Fannie Mae REMICS 2006-56 SA 25.11.35/5.325%* 539,005 0.0111,115,916 Fannie Mae REMICS 2006-58 SI 25.07.36/6.375%* 1,598,458 0.025,371,452 Fannie Mae REMICS 2006-70 JI 25.06.36/6.435%* 916,444 0.01
769,081 Fannie Mae REMICS 2006-72 XI 25.08.36/6.335%* 110,184 0.005,167,931 Fannie Mae REMICS 2007-109 GI 25.12.37/5.905%* 1,029,661 0.01
11,785,678 Fannie Mae REMICS 2007-33 SD 25.04.37/5.945%* 2,411,045 0.022,162,414 Fannie Mae REMICS 2007-37 SA 25.05.37/5.955%* 293,082 0.005,470,356 Fannie Mae REMICS 2007-44 HE 25.05.37/6.255%* 773,799 0.015,484,015 Fannie Mae REMICS 2007-55 S 25.06.37/6.595%* 1,105,465 0.011,605,954 Fannie Mae REMICS 2007-88 MI 25.09.37/6.355%* 259,854 0.00
649,107 Fannie Mae REMICS 2007-88 XI 25.06.37/6.375%* 89,836 0.004,213,688 Fannie Mae REMICS 2007-91 AS 25.10.37/6.235%* 727,333 0.013,218,017 Fannie Mae REMICS 2008-17 KS 25.11.37/6.185%* 426,559 0.009,128,559 Fannie Mae REMICS 2008-2 SA 25.02.38/6.105%* 1,821,165 0.025,312,435 Fannie Mae REMICS 2008-28 SQ 25.04.38/5.915%* 793,379 0.011,207,787 Fannie Mae REMICS 2008-34 GS 25.05.38/6.285%* 150,750 0.001,618,152 Fannie Mae REMICS 2008-41 S 25.11.36/6.635%* 263,982 0.00
98,330 Fannie Mae REMICS 2008-71 SB 25.10.29/6.320%* 211 0.0016,158,200 Fannie Mae REMICS 2008-92 SA 25.12.38/6.285%* 2,361,406 0.0213,157,708 Fannie Mae REMICS
2009-110 SD 25.01.40/6.085%* 2,376,602 0.02213,542 Fannie Mae REMICS
2009-65 MB 25.10.37/4.000% 217,242 0.0015,085,149 Fannie Mae REMICS 2009-87 SG 25.11.39/6.085%* 2,075,766 0.024,647,281 Fannie Mae REMICS 2010-102 S 25.09.40/6.385%* 990,055 0.01
16,535,764 Fannie Mae REMICS2010-107 PS 25.06.40/6.465%* 2,444,135 0.02
7,688,604 Fannie Mae REMICS2010-107 SP 25.06.40/6.485%* 1,140,620 0.01
12,336,051 Fannie Mae REMICS 2010-131 SA 25.11.40/6.435%* 2,085,551 0.0219,690,404 Fannie Mae REMICS
2010-139 SA 25.12.40/5.865%* 2,818,713 0.032,536,265 Fannie Mae REMICS
2010-156 BA 25.10.31/4.000% 2,582,625 0.03117,886 Fannie Mae REMICS 2010-34 JD 25.09.37/3.000% 119,810 0.00
3,172,535 Fannie Mae REMICS 2010-54 PA 25.04.39/4.500% 3,248,161 0.033,094,130 Fannie Mae REMICS 2010-79 NA 25.05.36/4.500% 3,130,816 0.039,589,653 Fannie Mae REMICS 2011-101 SC 25.10.40/6.335%* 1,485,595 0.019,515,844 Fannie Mae REMICS 2011-118 CS 25.10.39/6.335%* 1,486,341 0.015,527,338 Fannie Mae REMICS 2011-124 DS 25.08.40/6.385%* 1,081,440 0.017,389,387 Fannie Mae REMICS 2011-18 UA 25.08.38/4.000% 7,683,019 0.08
288,301 Fannie Mae REMICS 2011-40 LJ 25.01.34/4.500% 291,219 0.00669,694 Fannie Mae REMICS 2011-70 CL 25.08.26/3.000% 676,327 0.012,336,171 Fannie Mae REMICS 2011-8 AK 25.09.35/4.000% 2,338,476 0.02
18,648,527 Fannie Mae REMICS 2011-86 KS 25.09.41/5.785%* 2,284,092 0.025,541,099 Fannie Mae REMICS 2011-93 ES 25.09.41/6.335%* 742,534 0.01
196,381 Fannie Mae REMICS 2012-11 PN 25.11.40/4.000% 198,071 0.005,495,368 Fannie Mae REMICS
2012-110 MS 25.10.42/5.835%* 1,196,892 0.0116,298,330 Fannie Mae REMICS 2012-114 DS 25.08.39/5.935%* 3,283,328 0.0328,160,586 Fannie Mae REMICS 2012-115 DS 25.10.42/5.935%* 6,059,584 0.0619,188,063 Fannie Mae REMICS 2012-120 SE 25.02.39/6.035%* 3,874,454 0.047,264,893 Fannie Mae REMICS 2012-124 DS 25.04.40/5.985%* 1,456,019 0.0112,992,317 Fannie Mae REMICS 2012-137 SN 25.12.42/5.935%* 2,608,709 0.033,427,243 Fannie Mae REMICS 2012-14 LS 25.03.42/6.335%* 803,029 0.012,902,137 Fannie Mae REMICS 2012-145 IM 25.01.43/4.500% 623,834 0.01
9,463,983 Fannie Mae REMICS 2012-147 SA 25.01.43/5.935%* 2,006,823 0.021,597,881 Fannie Mae REMICS 2012-20 JS 25.10.38/5.835%* 364,492 0.00
14,259,225 Fannie Mae REMICS 2012-30 MS 25.04.42/6.285%* 3,211,220 0.03
12,148,139 Fannie Mae REMICS 2012-36 SB 25.04.42/6.285%* 2,735,981 0.0312,303,910 Fannie Mae REMICS 2012-36 SN 25.04.42/6.285%* 2,807,457 0.035,648,409 Fannie Mae REMICS 2012-42 PS 25.08.41/6.415%* 1,031,758 0.0122,273,483 Fannie Mae REMICS 2012-47 SD 25.05.42/6.285%* 5,091,466 0.0524,721,274 Fannie Mae REMICS 2012-63 DS 25.03.39/6.385%* 5,049,829 0.0536,807,755 Fannie Mae REMICS 2012-73 LS 25.06.39/5.885%* 7,591,128 0.0821,407,859 Fannie Mae REMICS 2012-74 AS 25.03.39/5.885%* 4,361,755 0.046,622,659 Fannie Mae REMICS 2012-76 DS 25.05.39/6.385%* 1,354,534 0.01
12,075,299 Fannie Mae REMICS 2012-83 LS 25.08.42/5.235%* 2,068,764 0.026,547,875 Fannie Mae REMICS 2012-84 QS 25.09.31/6.485%* 1,520,053 0.02
13,143,072 Fannie Mae REMICS 2012-98 SA 25.05.39/5.885%* 2,601,391 0.0312,318,532 Fannie Mae REMICS 2013-2 S 25.02.43/5.985%* 2,867,950 0.0311,890,123 Fannie Mae REMICS 2013-27 UZ 25.04.43/3.000% 10,844,593 0.113,250,243 Fannie Mae REMICS 2013-29 QZ 25.04.43/4.000% 2,963,908 0.035,091,050 Fannie Mae REMICS 2013-31 NZ 25.04.43/3.000% 4,662,552 0.051,447,111 Fannie Mae REMICS 2013-33 DZ 25.08.42/3.500% 1,195,054 0.01
3,045,679 Fannie Mae REMICS 2013-33 YZ 25.04.43/3.000% 2,349,152 0.023,974,613 Fannie Mae REMICS 2013-5 EZ 25.08.42/2.000% 3,100,280 0.03
10,405,191 Fannie Mae REMICS 2013-9 SG 25.03.39/6.035%* 2,247,529 0.0240,847,000 Federal Farm Credit Banks 17.01.14/0.150% 40,847,776 0.4169,000,000 Federal Home Loan Bank
Discount Notes 03.01.14/0.000% 68,999,709 0.688,200,000 Federal Home Loan Banks 20.02.14/0.120% 8,199,678 0.084,500,000 Federal Home Loan Banks 22.04.14/0.170% 4,500,891 0.049,800,000 Federal Home Loan Banks 02.06.14/0.110% 9,800,157 0.10
14,000,000 Federal Home Loan Banks 12.11.14/0.125% 13,996,388 0.1414,350,000 Federal Home Loan Banks 20.11.14/0.125% 14,351,263 0.14
3,725,000 Felcor Lodging 01.06.19/6.750% 3,987,538 0.042,095,000 FGI Operating 01.05.20/7.875% 2,252,125 0.02
929,000 Fidelity & Guaranty LifeHoldings 144A 01.04.21/6.375% 980,095 0.01
10,020,000 First Data 15.01.21/12.625% 11,785,223 0.124,410,000 First Data 144A 15.06.19/7.375% 4,718,700 0.053,905,000 First Data 144A 15.08.20/8.875% 4,339,431 0.04
11,670,000 First Data 144A 01.11.20/6.750% 12,195,150 0.123,134,000 First Data 144A 15.01.21/8.250% 3,349,463 0.034,033,000 First Data 144A 15.01.21/11.250% 4,471,589 0.041,320,000 First Data 144A 15.06.21/10.625% 1,437,150 0.014,280,000 First Data 144A 15.08.21/11.750% 4,536,800 0.05
18,484,428 First Data 144A 15.01.22/8.750% 19,824,549 0.201,009,492 First Horizon Alternative
Mortgage Securities2006-FA7 A1 25.12.36/5.750% 848,939 0.01
2,567,353 First Horizon MortgagePass-Through Trust 2006-2 1A3 25.08.36/6.000% 2,568,809 0.03
2,228,204 First Horizon MortgagePass-Through Trust 2007-5 A4 25.11.37/6.250% 1,913,042 0.02
11,400,000 Freddie Mac 14.08.14/0.250% 11,408,459 0.1119,000,000 Freddie Mac Discount Notes 06.01.14/0.000% 18,999,962 0.19
1,350,725 Freddie Mac REMICS 2906 SW 15.11.34/6.533%* 86,082 0.0012,622,193 Freddie Mac REMICS 3045 DI 15.10.35/6.563%* 2,293,137 0.024,336,610 Freddie Mac REMICS 3155 PS 15.05.36/6.983%* 668,847 0.01
358,485 Freddie Mac REMICS 3171 OJ 15.06.36/0.000% 272,576 0.003,230,241 Freddie Mac REMICS 3218 AS 15.09.36/6.413%* 512,978 0.013,368,054 Freddie Mac REMICS 3236 IS 15.11.36/6.483%* 534,364 0.017,841,889 Freddie Mac REMICS 3240 S 15.11.36/6.453%* 1,240,087 0.012,264,875 Freddie Mac REMICS 3244 SB 15.11.36/6.493%* 359,775 0.00
755,051 Freddie Mac REMICS 3279 SD 15.02.37/6.263%* 102,283 0.002,361,215 Freddie Mac REMICS 3370 SH 15.10.37/6.283%* 340,893 0.00
4,016,890 Freddie Mac REMICS 3387 SB 15.11.37/6.253%* 560,896 0.012,230,490 Freddie Mac REMICS 3628 A 15.06.38/5.000% 2,280,939 0.023,166,681 Freddie Mac REMICS 3654 AU 15.10.27/7.000% 3,311,203 0.032,432,005 Freddie Mac REMICS 3673 SA 15.05.40/6.253%* 339,763 0.004,341,255 Freddie Mac REMICS 3692 PS 15.05.38/6.433%* 557,680 0.016,680,777 Freddie Mac REMICS 3737 LI 15.05.24/4.500% 636,586 0.016,161,019 Freddie Mac REMICS 3819 SH 15.06.40/6.303%* 901,852 0.012,325,945 Freddie Mac REMICS 3827 H 15.09.37/4.000% 2,367,045 0.025,141,503 Freddie Mac REMICS 3835 KA 15.05.37/4.000% 5,320,193 0.053,113,880 Freddie Mac REMICS 3845 KP 15.04.38/4.000% 3,162,779 0.03
976,037 Freddie Mac REMICS 3877 EL 15.08.38/4.000% 985,568 0.01288,042 Freddie Mac REMICS 3877 EM 15.08.38/4.000% 289,457 0.00
3,850,425 Freddie Mac REMICS 3884 AD 15.08.38/4.000% 3,915,963 0.045,264,703 Freddie Mac REMICS 3919 LS 15.09.41/6.283%* 1,191,217 0.01
221,859 Freddie Mac REMICS 3939 JA 15.12.37/4.000% 223,134 0.004,131,987 Freddie Mac REMICS 3960 SJ 15.08.40/6.483%* 810,903 0.016,626,657 Freddie Mac REMICS 3973 SG 15.04.30/6.483%* 1,030,028 0.015,874,023 Freddie Mac REMICS 3984 NS 15.01.40/6.433%* 1,049,661 0.019,739,108 Freddie Mac REMICS 3989 SJ 15.01.42/5.783%* 1,971,132 0.02
14,184,187 Freddie Mac REMICS 3997 HS 15.03.38/6.383%* 2,342,306 0.024,727,000 Freddie Mac REMICS 4001 SD 15.02.36/7.033%* 826,133 0.013,444,107 Freddie Mac REMICS 4010 JS 15.03.32/6.433%* 636,533 0.015,820,691 Freddie Mac REMICS 4013 SB 15.03.42/6.283%* 1,272,363 0.01
17,335,500 Freddie Mac REMICS 4019 SC 15.03.42/6.283%* 3,919,659 0.0428,161,259 Freddie Mac REMICS 4027 SL 15.04.42/5.753%* 5,542,034 0.0511,884,001 Freddie Mac REMICS 4027 SW 15.04.42/5.753%* 2,320,619 0.026,570,793 Freddie Mac REMICS 4033 SC 15.10.36/6.383%* 1,325,759 0.018,940,670 Freddie Mac REMICS 4047 SC 15.04.31/6.533%* 1,773,342 0.02
139
JPMorgan Investment Funds - Income Opportunity Fund
Schedule of Investments (Market Value Expressed in USD) (continued)
As at 31 December 2013
Quantity/Nominal
Value
Name of Securities Maturity/Coupon
MarketValue
%of
NetAssets
Quantity/Nominal
Value
Name of Securities Maturity/Coupon
MarketValue
%of
NetAssets
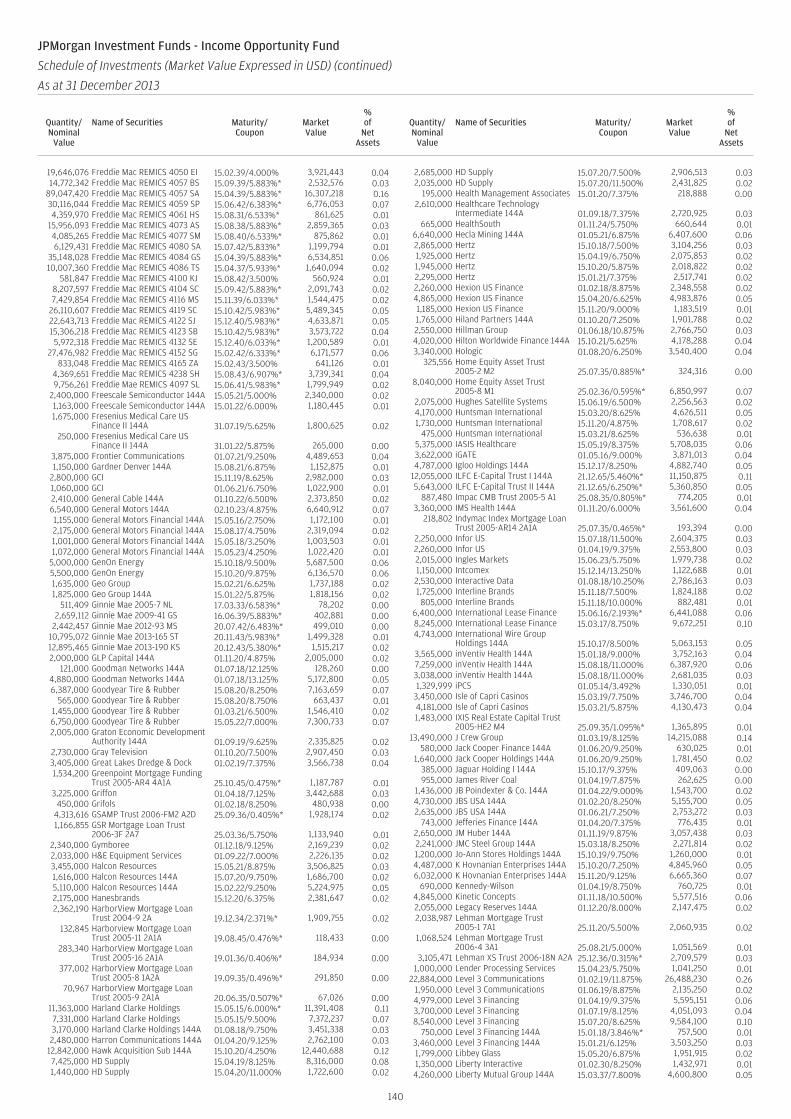
19,646,076 Freddie Mac REMICS 4050 EI 15.02.39/4.000% 3,921,443 0.0414,772,342 Freddie Mac REMICS 4057 BS 15.09.39/5.883%* 2,532,576 0.03
89,047,420 Freddie Mac REMICS 4057 SA 15.04.39/5.883%* 16,307,218 0.1630,116,044 Freddie Mac REMICS 4059 SP 15.06.42/6.383%* 6,776,053 0.074,359,970 Freddie Mac REMICS 4061 HS 15.08.31/6.533%* 861,625 0.01
15,956,093 Freddie Mac REMICS 4073 AS 15.08.38/5.883%* 2,859,365 0.034,085,265 Freddie Mac REMICS 4077 SM 15.08.40/6.533%* 875,862 0.016,129,431 Freddie Mac REMICS 4080 SA 15.07.42/5.833%* 1,199,794 0.01
35,148,028 Freddie Mac REMICS 4084 GS 15.04.39/5.883%* 6,534,851 0.0610,007,360 Freddie Mac REMICS 4086 TS 15.04.37/5.933%* 1,640,094 0.02
581,847 Freddie Mac REMICS 4100 KJ 15.08.42/3.500% 560,924 0.018,207,597 Freddie Mac REMICS 4104 SC 15.09.42/5.883%* 2,091,743 0.027,429,854 Freddie Mac REMICS 4116 MS 15.11.39/6.033%* 1,544,475 0.02
26,110,607 Freddie Mac REMICS 4119 SC 15.10.42/5.983%* 5,489,345 0.0522,643,713 Freddie Mac REMICS 4122 SJ 15.12.40/5.983%* 4,633,871 0.0515,306,218 Freddie Mac REMICS 4123 SB 15.10.42/5.983%* 3,573,722 0.045,972,318 Freddie Mac REMICS 4132 SE 15.12.40/6.033%* 1,200,589 0.01
27,476,982 Freddie Mac REMICS 4152 SG 15.02.42/6.333%* 6,171,577 0.06833,048 Freddie Mac REMICS 4165 ZA 15.02.43/3.500% 641,126 0.01
4,369,651 Freddie Mac REMICS 4238 SH 15.08.43/6.907%* 3,739,341 0.049,756,261 Freddie Mae REMICS 4097 SL 15.06.41/5.983%* 1,799,949 0.02
2,400,000 Freescale Semiconductor 144A 15.05.21/5.000% 2,340,000 0.021,163,000 Freescale Semiconductor 144A 15.01.22/6.000% 1,180,445 0.011,675,000 Fresenius Medical Care US
Finance II 144A 31.07.19/5.625% 1,800,625 0.02250,000 Fresenius Medical Care US
Finance II 144A 31.01.22/5.875% 265,000 0.003,875,000 Frontier Communications 01.07.21/9.250% 4,489,653 0.041,150,000 Gardner Denver 144A 15.08.21/6.875% 1,152,875 0.01
2,800,000 GCI 15.11.19/8.625% 2,982,000 0.031,060,000 GCI 01.06.21/6.750% 1,022,900 0.012,410,000 General Cable 144A 01.10.22/6.500% 2,373,850 0.026,540,000 General Motors 144A 02.10.23/4.875% 6,640,912 0.071,155,000 General Motors Financial 144A 15.05.16/2.750% 1,172,100 0.012,175,000 General Motors Financial 144A 15.08.17/4.750% 2,319,094 0.021,001,000 General Motors Financial 144A 15.05.18/3.250% 1,003,503 0.011,072,000 General Motors Financial 144A 15.05.23/4.250% 1,022,420 0.01
5,000,000 GenOn Energy 15.10.18/9.500% 5,687,500 0.065,500,000 GenOn Energy 15.10.20/9.875% 6,136,570 0.061,635,000 Geo Group 15.02.21/6.625% 1,737,188 0.021,825,000 Geo Group 144A 15.01.22/5.875% 1,818,156 0.02
511,409 Ginnie Mae 2005-7 NL 17.03.33/6.583%* 78,202 0.002,659,112 Ginnie Mae 2009-41 GS 16.06.39/5.883%* 402,881 0.00
2,442,457 Ginnie Mae 2012-93 MS 20.07.42/6.483%* 499,010 0.0010,795,072 Ginnie Mae 2013-165 ST 20.11.43/5.983%* 1,499,328 0.0112,895,465 Ginnie Mae 2013-190 KS 20.12.43/5.380%* 1,515,217 0.022,000,000 GLP Capital 144A 01.11.20/4.875% 2,005,000 0.02
121,000 Goodman Networks 144A 01.07.18/12.125% 128,260 0.004,880,000 Goodman Networks 144A 01.07.18/13.125% 5,172,800 0.056,387,000 Goodyear Tire & Rubber 15.08.20/8.250% 7,163,659 0.07
565,000 Goodyear Tire & Rubber 15.08.20/8.750% 663,437 0.011,455,000 Goodyear Tire & Rubber 01.03.21/6.500% 1,546,410 0.026,750,000 Goodyear Tire & Rubber 15.05.22/7.000% 7,300,733 0.072,005,000 Graton Economic Development
Authority 144A 01.09.19/9.625% 2,335,825 0.022,730,000 Gray Television 01.10.20/7.500% 2,907,450 0.033,405,000 Great Lakes Dredge & Dock 01.02.19/7.375% 3,566,738 0.041,534,200 Greenpoint Mortgage Funding
Trust 2005-AR4 4A1A 25.10.45/0.475%* 1,187,787 0.013,225,000 Griffon 01.04.18/7.125% 3,442,688 0.03
450,000 Grifols 01.02.18/8.250% 480,938 0.004,313,616 GSAMP Trust 2006-FM2 A2D 25.09.36/0.405%* 1,928,174 0.021,166,855 GSR Mortgage Loan Trust
2006-3F 2A7 25.03.36/5.750% 1,133,940 0.012,340,000 Gymboree 01.12.18/9.125% 2,169,239 0.022,033,000 H&E Equipment Services 01.09.22/7.000% 2,226,135 0.023,455,000 Halcon Resources 15.05.21/8.875% 3,506,825 0.031,616,000 Halcon Resources 144A 15.07.20/9.750% 1,686,700 0.025,110,000 Halcon Resources 144A 15.02.22/9.250% 5,224,975 0.052,175,000 Hanesbrands 15.12.20/6.375% 2,381,647 0.022,362,190 HarborView Mortgage Loan
Trust 2004-9 2A 19.12.34/2.371%* 1,909,755 0.02132,845 Harborview Mortgage Loan
Trust 2005-11 2A1A 19.08.45/0.476%* 118,433 0.00283,340 HarborView Mortgage Loan
Trust 2005-16 2A1A 19.01.36/0.406%* 184,934 0.00377,002 HarborView Mortgage Loan
Trust 2005-8 1A2A 19.09.35/0.496%* 291,850 0.0070,967 HarborView Mortgage Loan
Trust 2005-9 2A1A 20.06.35/0.507%* 67,026 0.0011,363,000 Harland Clarke Holdings 15.05.15/6.000%* 11,391,408 0.117,331,000 Harland Clarke Holdings 15.05.15/9.500% 7,372,237 0.073,170,000 Harland Clarke Holdings 144A 01.08.18/9.750% 3,451,338 0.032,480,000 Harron Communications 144A 01.04.20/9.125% 2,762,100 0.03
12,842,000 Hawk Acquisition Sub 144A 15.10.20/4.250% 12,440,688 0.127,425,000 HD Supply 15.04.19/8.125% 8,316,000 0.081,440,000 HD Supply 15.04.20/11.000% 1,722,600 0.02
2,685,000 HD Supply 15.07.20/7.500% 2,906,513 0.032,035,000 HD Supply 15.07.20/11.500% 2,431,825 0.02
195,000 Health Management Associates 15.01.20/7.375% 218,888 0.002,610,000 Healthcare Technology
Intermediate 144A 01.09.18/7.375% 2,720,925 0.03665,000 HealthSouth 01.11.24/5.750% 660,644 0.01
6,640,000 Hecla Mining 144A 01.05.21/6.875% 6,407,600 0.062,865,000 Hertz 15.10.18/7.500% 3,104,256 0.031,925,000 Hertz 15.04.19/6.750% 2,075,853 0.021,945,000 Hertz 15.10.20/5.875% 2,018,822 0.022,295,000 Hertz 15.01.21/7.375% 2,517,741 0.022,260,000 Hexion US Finance 01.02.18/8.875% 2,348,558 0.024,865,000 Hexion US Finance 15.04.20/6.625% 4,983,876 0.051,185,000 Hexion US Finance 15.11.20/9.000% 1,183,519 0.011,765,000 Hiland Partners 144A 01.10.20/7.250% 1,901,788 0.022,550,000 Hillman Group 01.06.18/10.875% 2,766,750 0.034,020,000 Hilton Worldwide Finance 144A 15.10.21/5.625% 4,178,288 0.043,340,000 Hologic 01.08.20/6.250% 3,540,400 0.04
325,556 Home Equity Asset Trust2005-2 M2 25.07.35/0.885%* 324,316 0.00
8,040,000 Home Equity Asset Trust2005-8 M1 25.02.36/0.595%* 6,850,997 0.07
2,075,000 Hughes Satellite Systems 15.06.19/6.500% 2,256,563 0.024,170,000 Huntsman International 15.03.20/8.625% 4,626,511 0.051,730,000 Huntsman International 15.11.20/4.875% 1,708,617 0.02
475,000 Huntsman International 15.03.21/8.625% 536,638 0.015,375,000 IASIS Healthcare 15.05.19/8.375% 5,708,035 0.063,622,000 iGATE 01.05.16/9.000% 3,871,013 0.044,787,000 Igloo Holdings 144A 15.12.17/8.250% 4,882,740 0.05
12,055,000 ILFC E-Capital Trust I 144A 21.12.65/5.460%* 11,150,875 0.115,643,000 ILFC E-Capital Trust II 144A 21.12.65/6.250%* 5,360,850 0.05
887,480 Impac CMB Trust 2005-5 A1 25.08.35/0.805%* 774,205 0.013,360,000 IMS Health 144A 01.11.20/6.000% 3,561,600 0.04
218,802 Indymac Index Mortgage LoanTrust 2005-AR14 2A1A 25.07.35/0.465%* 193,394 0.00
2,250,000 Infor US 15.07.18/11.500% 2,604,375 0.032,260,000 Infor US 01.04.19/9.375% 2,553,800 0.032,015,000 Ingles Markets 15.06.23/5.750% 1,979,738 0.021,150,000 Intcomex 15.12.14/13.250% 1,122,688 0.012,530,000 Interactive Data 01.08.18/10.250% 2,786,163 0.031,725,000 Interline Brands 15.11.18/7.500% 1,824,188 0.02805,000 Interline Brands 15.11.18/10.000% 882,481 0.01
6,400,000 International Lease Finance 15.06.16/2.193%* 6,441,088 0.068,245,000 International Lease Finance 15.03.17/8.750% 9,672,251 0.104,743,000 International Wire Group
Holdings 144A 15.10.17/8.500% 5,063,153 0.053,565,000 inVentiv Health 144A 15.01.18/9.000% 3,752,163 0.047,259,000 inVentiv Health 144A 15.08.18/11.000% 6,387,920 0.063,038,000 inVentiv Health 144A 15.08.18/11.000% 2,681,035 0.031,329,999 iPCS 01.05.14/3.492% 1,330,051 0.01
3,450,000 Isle of Capri Casinos 15.03.19/7.750% 3,746,700 0.044,181,000 Isle of Capri Casinos 15.03.21/5.875% 4,130,473 0.041,483,000 IXIS Real Estate Capital Trust
2005-HE2 M4 25.09.35/1.095%* 1,365,895 0.0113,490,000 J Crew Group 01.03.19/8.125% 14,215,088 0.14
580,000 Jack Cooper Finance 144A 01.06.20/9.250% 630,025 0.011,640,000 Jack Cooper Holdings 144A 01.06.20/9.250% 1,781,450 0.02
385,000 Jaguar Holding I 144A 15.10.17/9.375% 409,063 0.00955,000 James River Coal 01.04.19/7.875% 262,625 0.00
1,436,000 JB Poindexter & Co. 144A 01.04.22/9.000% 1,543,700 0.024,730,000 JBS USA 144A 01.02.20/8.250% 5,155,700 0.052,635,000 JBS USA 144A 01.06.21/7.250% 2,753,272 0.03
743,000 Jefferies Finance 144A 01.04.20/7.375% 776,435 0.012,650,000 JM Huber 144A 01.11.19/9.875% 3,057,438 0.032,241,000 JMC Steel Group 144A 15.03.18/8.250% 2,271,814 0.021,200,000 Jo-Ann Stores Holdings 144A 15.10.19/9.750% 1,260,000 0.014,487,000 K Hovnanian Enterprises 144A 15.10.20/7.250% 4,845,960 0.056,032,000 K Hovnanian Enterprises 144A 15.11.20/9.125% 6,665,360 0.07
690,000 Kennedy-Wilson 01.04.19/8.750% 760,725 0.014,845,000 Kinetic Concepts 01.11.18/10.500% 5,577,516 0.062,055,000 Legacy Reserves 144A 01.12.20/8.000% 2,147,475 0.022,038,987 Lehman Mortgage Trust
2005-1 7A1 25.11.20/5.500% 2,060,935 0.021,068,524 Lehman Mortgage Trust
2006-4 3A1 25.08.21/5.000% 1,051,569 0.013,105,471 Lehman XS Trust 2006-18N A2A 25.12.36/0.315%* 2,709,579 0.03
1,000,000 Lender Processing Services 15.04.23/5.750% 1,041,250 0.0122,884,000 Level 3 Communications 01.02.19/11.875% 26,488,230 0.26
1,950,000 Level 3 Communications 01.06.19/8.875% 2,135,250 0.024,979,000 Level 3 Financing 01.04.19/9.375% 5,595,151 0.063,700,000 Level 3 Financing 01.07.19/8.125% 4,051,093 0.048,540,000 Level 3 Financing 15.07.20/8.625% 9,584,100 0.10
750,000 Level 3 Financing 144A 15.01.18/3.846%* 757,500 0.013,460,000 Level 3 Financing 144A 15.01.21/6.125% 3,503,250 0.031,799,000 Libbey Glass 15.05.20/6.875% 1,951,915 0.021,350,000 Liberty Interactive 01.02.30/8.250% 1,432,971 0.014,260,000 Liberty Mutual Group 144A 15.03.37/7.800% 4,600,800 0.05
140
JPMorgan Investment Funds - Income Opportunity Fund
Schedule of Investments (Market Value Expressed in USD) (continued)
As at 31 December 2013
Quantity/Nominal
Value
Name of Securities Maturity/Coupon
MarketValue
%of
NetAssets
Quantity/Nominal
Value
Name of Securities Maturity/Coupon
MarketValue
%of
NetAssets
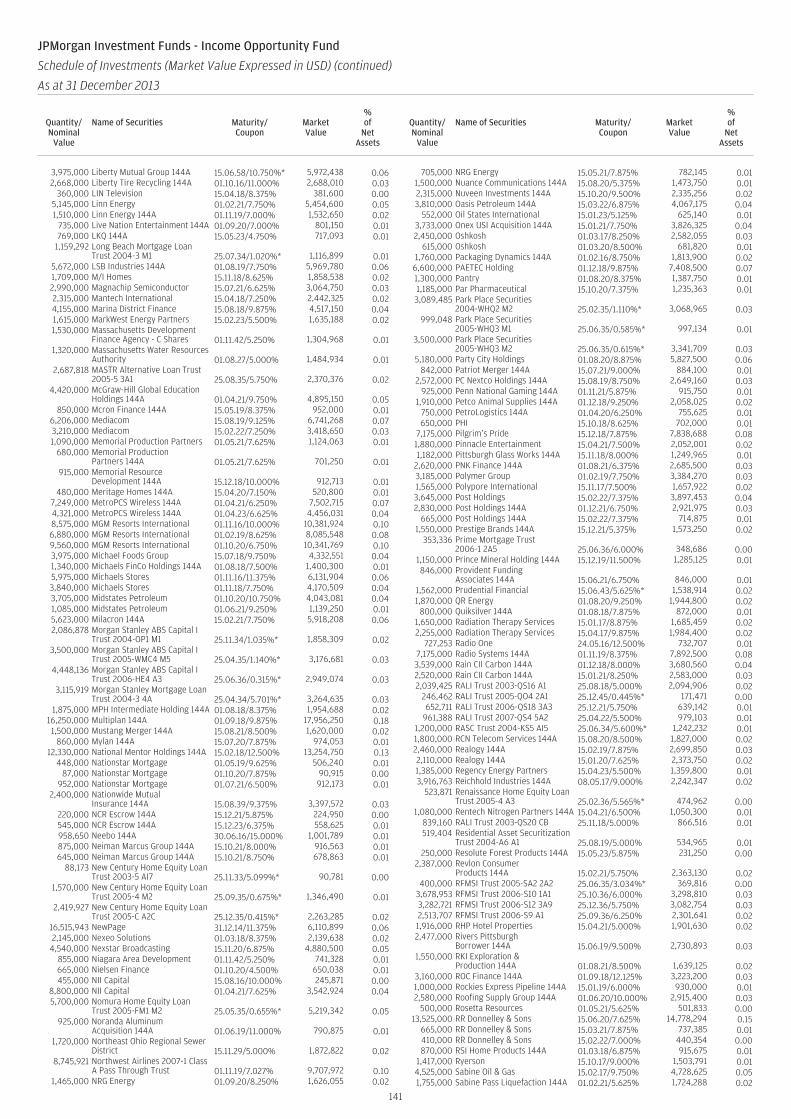
3,975,000 Liberty Mutual Group 144A 15.06.58/10.750%* 5,972,438 0.062,668,000 Liberty Tire Recycling 144A 01.10.16/11.000% 2,688,010 0.03
360,000 LIN Television 15.04.18/8.375% 381,600 0.005,145,000 Linn Energy 01.02.21/7.750% 5,454,600 0.051,510,000 Linn Energy 144A 01.11.19/7.000% 1,532,650 0.02
735,000 Live Nation Entertainment 144A 01.09.20/7.000% 801,150 0.01769,000 LKQ 144A 15.05.23/4.750% 717,093 0.01
1,159,292 Long Beach Mortgage LoanTrust 2004-3 M1 25.07.34/1.020%* 1,116,899 0.01
5,672,000 LSB Industries 144A 01.08.19/7.750% 5,969,780 0.061,709,000 M/I Homes 15.11.18/8.625% 1,858,538 0.022,990,000 Magnachip Semiconductor 15.07.21/6.625% 3,064,750 0.032,315,000 Mantech International 15.04.18/7.250% 2,442,325 0.024,155,000 Marina District Finance 15.08.18/9.875% 4,517,150 0.041,615,000 MarkWest Energy Partners 15.02.23/5.500% 1,635,188 0.021,530,000 Massachusetts Development
Finance Agency - C Shares 01.11.42/5.250% 1,304,968 0.011,320,000 Massachusetts Water Resources
Authority 01.08.27/5.000% 1,484,934 0.012,687,818 MASTR Alternative Loan Trust
2005-5 3A1 25.08.35/5.750% 2,370,376 0.024,420,000 McGraw-Hill Global Education
Holdings 144A 01.04.21/9.750% 4,895,150 0.05850,000 Mcron Finance 144A 15.05.19/8.375% 952,000 0.01
6,206,000 Mediacom 15.08.19/9.125% 6,741,268 0.073,210,000 Mediacom 15.02.22/7.250% 3,418,650 0.031,090,000 Memorial Production Partners 01.05.21/7.625% 1,124,063 0.01
680,000 Memorial ProductionPartners 144A 01.05.21/7.625% 701,250 0.01
915,000 Memorial ResourceDevelopment 144A 15.12.18/10.000% 912,713 0.01
480,000 Meritage Homes 144A 15.04.20/7.150% 520,800 0.017,249,000 MetroPCS Wireless 144A 01.04.21/6.250% 7,502,715 0.074,321,000 MetroPCS Wireless 144A 01.04.23/6.625% 4,456,031 0.048,575,000 MGM Resorts International 01.11.16/10.000% 10,381,924 0.106,880,000 MGM Resorts International 01.02.19/8.625% 8,085,548 0.089,560,000 MGM Resorts International 01.10.20/6.750% 10,341,769 0.103,975,000 Michael Foods Group 15.07.18/9.750% 4,332,551 0.041,340,000 Michaels FinCo Holdings 144A 01.08.18/7.500% 1,400,300 0.015,975,000 Michaels Stores 01.11.16/11.375% 6,131,904 0.063,840,000 Michaels Stores 01.11.18/7.750% 4,170,509 0.043,705,000 Midstates Petroleum 01.10.20/10.750% 4,043,081 0.041,085,000 Midstates Petroleum 01.06.21/9.250% 1,139,250 0.015,623,000 Milacron 144A 15.02.21/7.750% 5,918,208 0.062,086,878 Morgan Stanley ABS Capital I
Trust 2004-OP1 M1 25.11.34/1.035%* 1,858,309 0.023,500,000 Morgan Stanley ABS Capital I
Trust 2005-WMC4 M5 25.04.35/1.140%* 3,176,681 0.034,448,136 Morgan Stanley ABS Capital I
Trust 2006-HE4 A3 25.06.36/0.315%* 2,949,074 0.033,115,919 Morgan Stanley Mortgage Loan
Trust 2004-3 4A 25.04.34/5.701%* 3,264,635 0.031,875,000 MPH Intermediate Holding 144A 01.08.18/8.375% 1,954,688 0.02
16,250,000 Multiplan 144A 01.09.18/9.875% 17,956,250 0.181,500,000 Mustang Merger 144A 15.08.21/8.500% 1,620,000 0.02
860,000 Mylan 144A 15.07.20/7.875% 974,053 0.0112,330,000 National Mentor Holdings 144A 15.02.18/12.500% 13,254,750 0.13
448,000 Nationstar Mortgage 01.05.19/9.625% 506,240 0.0187,000 Nationstar Mortgage 01.10.20/7.875% 90,915 0.00
952,000 Nationstar Mortgage 01.07.21/6.500% 912,173 0.012,400,000 Nationwide Mutual
Insurance 144A 15.08.39/9.375% 3,397,572 0.03220,000 NCR Escrow 144A 15.12.21/5.875% 224,950 0.00545,000 NCR Escrow 144A 15.12.23/6.375% 558,625 0.01958,650 Neebo 144A 30.06.16/15.000% 1,001,789 0.01875,000 Neiman Marcus Group 144A 15.10.21/8.000% 916,563 0.01645,000 Neiman Marcus Group 144A 15.10.21/8.750% 678,863 0.01
88,173 New Century Home Equity LoanTrust 2003-5 AI7 25.11.33/5.099%* 90,781 0.00
1,570,000 New Century Home Equity LoanTrust 2005-4 M2 25.09.35/0.675%* 1,346,490 0.01
2,419,927 New Century Home Equity LoanTrust 2005-C A2C 25.12.35/0.415%* 2,263,285 0.02
16,515,943 NewPage 31.12.14/11.375% 6,110,899 0.062,145,000 Nexeo Solutions 01.03.18/8.375% 2,139,638 0.02
4,540,000 Nexstar Broadcasting 15.11.20/6.875% 4,880,500 0.05855,000 Niagara Area Development 01.11.42/5.250% 741,328 0.01665,000 Nielsen Finance 01.10.20/4.500% 650,038 0.01455,000 NII Capital 15.08.16/10.000% 245,871 0.00
8,800,000 NII Capital 01.04.21/7.625% 3,542,924 0.045,700,000 Nomura Home Equity Loan
Trust 2005-FM1 M2 25.05.35/0.655%* 5,219,342 0.05925,000 Noranda Aluminum
Acquisition 144A 01.06.19/11.000% 790,875 0.011,720,000 Northeast Ohio Regional Sewer
District 15.11.29/5.000% 1,872,822 0.028,745,921 Northwest Airlines 2007-1 Class
A Pass Through Trust 01.11.19/7.027% 9,707,972 0.101,465,000 NRG Energy 01.09.20/8.250% 1,626,055 0.02
705,000 NRG Energy 15.05.21/7.875% 782,145 0.011,500,000 Nuance Communications 144A 15.08.20/5.375% 1,473,750 0.012,315,000 Nuveen Investments 144A 15.10.20/9.500% 2,335,256 0.023,810,000 Oasis Petroleum 144A 15.03.22/6.875% 4,067,175 0.04
552,000 Oil States International 15.01.23/5.125% 625,140 0.013,733,000 Onex USI Acquisition 144A 15.01.21/7.750% 3,826,325 0.042,450,000 Oshkosh 01.03.17/8.250% 2,582,055 0.03
615,000 Oshkosh 01.03.20/8.500% 681,820 0.011,760,000 Packaging Dynamics 144A 01.02.16/8.750% 1,813,900 0.02
6,600,000 PAETEC Holding 01.12.18/9.875% 7,408,500 0.071,300,000 Pantry 01.08.20/8.375% 1,387,750 0.011,185,000 Par Pharmaceutical 15.10.20/7.375% 1,235,363 0.013,089,485 Park Place Securities
2004-WHQ2 M2 25.02.35/1.110%* 3,068,965 0.03999,048 Park Place Securities
2005-WHQ3 M1 25.06.35/0.585%* 997,134 0.013,500,000 Park Place Securities
2005-WHQ3 M2 25.06.35/0.615%* 3,341,709 0.035,180,000 Party City Holdings 01.08.20/8.875% 5,827,500 0.06
842,000 Patriot Merger 144A 15.07.21/9.000% 884,100 0.012,572,000 PC Nextco Holdings 144A 15.08.19/8.750% 2,649,160 0.03
925,000 Penn National Gaming 144A 01.11.21/5.875% 915,750 0.011,910,000 Petco Animal Supplies 144A 01.12.18/9.250% 2,058,025 0.02
750,000 PetroLogistics 144A 01.04.20/6.250% 755,625 0.01650,000 PHI 15.10.18/8.625% 702,000 0.01
7,175,000 Pilgrim’s Pride 15.12.18/7.875% 7,838,688 0.081,880,000 Pinnacle Entertainment 15.04.21/7.500% 2,052,001 0.021,182,000 Pittsburgh Glass Works 144A 15.11.18/8.000% 1,249,965 0.01
2,620,000 PNK Finance 144A 01.08.21/6.375% 2,685,500 0.033,185,000 Polymer Group 01.02.19/7.750% 3,384,270 0.031,565,000 Polypore International 15.11.17/7.500% 1,657,922 0.023,645,000 Post Holdings 15.02.22/7.375% 3,897,453 0.042,830,000 Post Holdings 144A 01.12.21/6.750% 2,921,975 0.03
665,000 Post Holdings 144A 15.02.22/7.375% 714,875 0.011,550,000 Prestige Brands 144A 15.12.21/5.375% 1,573,250 0.02
353,336 Prime Mortgage Trust2006-1 2A5 25.06.36/6.000% 348,686 0.00
1,150,000 Prince Mineral Holding 144A 15.12.19/11.500% 1,285,125 0.01846,000 Provident Funding
Associates 144A 15.06.21/6.750% 846,000 0.011,562,000 Prudential Financial 15.06.43/5.625%* 1,538,914 0.021,870,000 QR Energy 01.08.20/9.250% 1,944,800 0.02
800,000 Quiksilver 144A 01.08.18/7.875% 872,000 0.011,650,000 Radiation Therapy Services 15.01.17/8.875% 1,685,459 0.022,255,000 Radiation Therapy Services 15.04.17/9.875% 1,984,400 0.02
727,253 Radio One 24.05.16/12.500% 732,707 0.017,175,000 Radio Systems 144A 01.11.19/8.375% 7,892,500 0.083,539,000 Rain CII Carbon 144A 01.12.18/8.000% 3,680,560 0.042,520,000 Rain CII Carbon 144A 15.01.21/8.250% 2,583,000 0.032,039,425 RALI Trust 2003-QS16 A1 25.08.18/5.000% 2,094,906 0.02
246,462 RALI Trust 2005-QO4 2A1 25.12.45/0.445%* 171,471 0.00652,711 RALI Trust 2006-QS18 3A3 25.12.21/5.750% 639,142 0.01
961,388 RALI Trust 2007-QS4 5A2 25.04.22/5.500% 979,103 0.011,200,000 RASC Trust 2004-KS5 AI5 25.06.34/5.600%* 1,242,232 0.011,800,000 RCN Telecom Services 144A 15.08.20/8.500% 1,827,000 0.022,460,000 Realogy 144A 15.02.19/7.875% 2,699,850 0.032,110,000 Realogy 144A 15.01.20/7.625% 2,373,750 0.021,385,000 Regency Energy Partners 15.04.23/5.500% 1,359,800 0.013,916,763 Reichhold Industries 144A 08.05.17/9.000% 2,242,347 0.02
523,871 Renaissance Home Equity LoanTrust 2005-4 A3 25.02.36/5.565%* 474,962 0.00
1,080,000 Rentech Nitrogen Partners 144A 15.04.21/6.500% 1,050,300 0.01839,160 RALI Trust 2003-QS20 CB 25.11.18/5.000% 866,516 0.01519,404 Residential Asset Securitization
Trust 2004-A6 A1 25.08.19/5.000% 534,965 0.01250,000 Resolute Forest Products 144A 15.05.23/5.875% 231,250 0.00
2,387,000 Revlon ConsumerProducts 144A 15.02.21/5.750% 2,363,130 0.02
400,000 RFMSI Trust 2005-SA2 2A2 25.06.35/3.034%* 369,816 0.003,678,953 RFMSI Trust 2006-S10 1A1 25.10.36/6.000% 3,298,810 0.033,282,721 RFMSI Trust 2006-S12 3A9 25.12.36/5.750% 3,082,754 0.032,513,707 RFMSI Trust 2006-S9 A1 25.09.36/6.250% 2,301,641 0.021,916,000 RHP Hotel Properties 15.04.21/5.000% 1,901,630 0.022,477,000 Rivers Pittsburgh
Borrower 144A 15.06.19/9.500% 2,730,893 0.031,550,000 RKI Exploration &
Production 144A 01.08.21/8.500% 1,639,125 0.023,160,000 ROC Finance 144A 01.09.18/12.125% 3,223,200 0.031,000,000 Rockies Express Pipeline 144A 15.01.19/6.000% 930,000 0.012,580,000 Roofing Supply Group 144A 01.06.20/10.000% 2,915,400 0.03
500,000 Rosetta Resources 01.05.21/5.625% 501,833 0.0013,525,000 RR Donnelley & Sons 15.06.20/7.625% 14,778,294 0.15
665,000 RR Donnelley & Sons 15.03.21/7.875% 737,385 0.01410,000 RR Donnelley & Sons 15.02.22/7.000% 440,354 0.00870,000 RSI Home Products 144A 01.03.18/6.875% 915,675 0.01
1,417,000 Ryerson 15.10.17/9.000% 1,503,791 0.014,525,000 Sabine Oil & Gas 15.02.17/9.750% 4,728,625 0.051,755,000 Sabine Pass Liquefaction 144A 01.02.21/5.625% 1,724,288 0.02
141
JPMorgan Investment Funds - Income Opportunity Fund
Schedule of Investments (Market Value Expressed in USD) (continued)
As at 31 December 2013
Quantity/Nominal
Value
Name of Securities Maturity/Coupon
MarketValue
%of
NetAssets
Quantity/Nominal
Value
Name of Securities Maturity/Coupon
MarketValue
%of
NetAssets
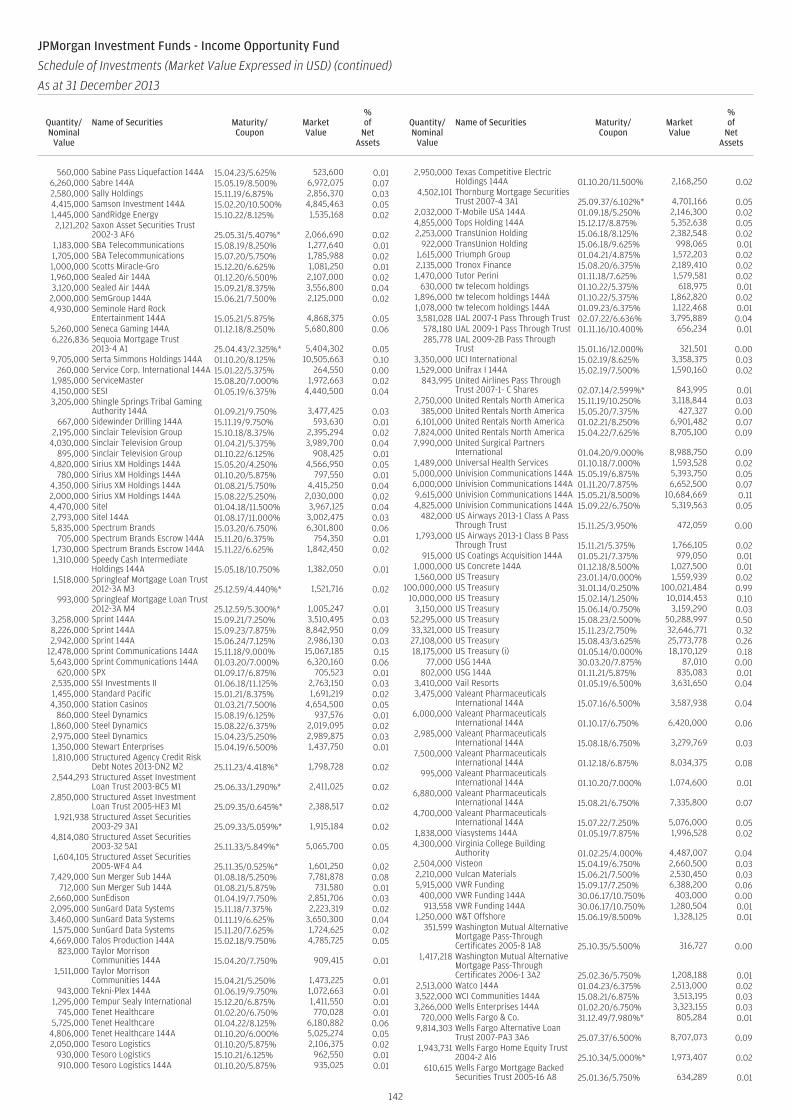
560,000 Sabine Pass Liquefaction 144A 15.04.23/5.625% 523,600 0.016,260,000 Sabre 144A 15.05.19/8.500% 6,972,075 0.072,580,000 Sally Holdings 15.11.19/6.875% 2,856,370 0.034,415,000 Samson Investment 144A 15.02.20/10.500% 4,845,463 0.051,445,000 SandRidge Energy 15.10.22/8.125% 1,535,168 0.022,121,202 Saxon Asset Securities Trust
2002-3 AF6 25.05.31/5.407%* 2,066,690 0.021,183,000 SBA Telecommunications 15.08.19/8.250% 1,277,640 0.011,705,000 SBA Telecommunications 15.07.20/5.750% 1,785,988 0.021,000,000 Scotts Miracle-Gro 15.12.20/6.625% 1,081,250 0.011,960,000 Sealed Air 144A 01.12.20/6.500% 2,107,000 0.023,120,000 Sealed Air 144A 15.09.21/8.375% 3,556,800 0.04
2,000,000 SemGroup 144A 15.06.21/7.500% 2,125,000 0.024,930,000 Seminole Hard Rock
Entertainment 144A 15.05.21/5.875% 4,868,375 0.055,260,000 Seneca Gaming 144A 01.12.18/8.250% 5,680,800 0.066,226,836 Sequoia Mortgage Trust
2013-4 A1 25.04.43/2.325%* 5,404,302 0.059,705,000 Serta Simmons Holdings 144A 01.10.20/8.125% 10,505,663 0.10
260,000 Service Corp. International 144A 15.01.22/5.375% 264,550 0.001,985,000 ServiceMaster 15.08.20/7.000% 1,972,663 0.024,150,000 SESI 01.05.19/6.375% 4,440,500 0.043,205,000 Shingle Springs Tribal Gaming
Authority 144A 01.09.21/9.750% 3,477,425 0.03667,000 Sidewinder Drilling 144A 15.11.19/9.750% 593,630 0.01
2,195,000 Sinclair Television Group 15.10.18/8.375% 2,395,294 0.024,030,000 Sinclair Television Group 01.04.21/5.375% 3,989,700 0.04
895,000 Sinclair Television Group 01.10.22/6.125% 908,425 0.014,820,000 Sirius XM Holdings 144A 15.05.20/4.250% 4,566,950 0.05
780,000 Sirius XM Holdings 144A 01.10.20/5.875% 797,550 0.014,350,000 Sirius XM Holdings 144A 01.08.21/5.750% 4,415,250 0.042,000,000 Sirius XM Holdings 144A 15.08.22/5.250% 2,030,000 0.024,470,000 Sitel 01.04.18/11.500% 3,967,125 0.042,793,000 Sitel 144A 01.08.17/11.000% 3,002,475 0.035,835,000 Spectrum Brands 15.03.20/6.750% 6,301,800 0.06
705,000 Spectrum Brands Escrow 144A 15.11.20/6.375% 754,350 0.011,730,000 Spectrum Brands Escrow 144A 15.11.22/6.625% 1,842,450 0.021,310,000 Speedy Cash Intermediate
Holdings 144A 15.05.18/10.750% 1,382,050 0.011,518,000 Springleaf Mortgage Loan Trust
2012-3A M3 25.12.59/4.440%* 1,521,716 0.02993,000 Springleaf Mortgage Loan Trust
2012-3A M4 25.12.59/5.300%* 1,005,247 0.013,258,000 Sprint 144A 15.09.21/7.250% 3,510,495 0.038,226,000 Sprint 144A 15.09.23/7.875% 8,842,950 0.092,942,000 Sprint 144A 15.06.24/7.125% 2,986,130 0.03
12,478,000 Sprint Communications 144A 15.11.18/9.000% 15,067,185 0.155,643,000 Sprint Communications 144A 01.03.20/7.000% 6,320,160 0.06
620,000 SPX 01.09.17/6.875% 705,523 0.012,535,000 SSI Investments II 01.06.18/11.125% 2,763,150 0.031,455,000 Standard Pacific 15.01.21/8.375% 1,691,219 0.024,350,000 Station Casinos 01.03.21/7.500% 4,654,500 0.05
860,000 Steel Dynamics 15.08.19/6.125% 937,576 0.011,860,000 Steel Dynamics 15.08.22/6.375% 2,019,095 0.022,975,000 Steel Dynamics 15.04.23/5.250% 2,989,875 0.031,350,000 Stewart Enterprises 15.04.19/6.500% 1,437,750 0.011,810,000 Structured Agency Credit Risk
Debt Notes 2013-DN2 M2 25.11.23/4.418%* 1,798,728 0.022,544,293 Structured Asset Investment
Loan Trust 2003-BC5 M1 25.06.33/1.290%* 2,411,025 0.022,850,000 Structured Asset Investment
Loan Trust 2005-HE3 M1 25.09.35/0.645%* 2,388,517 0.021,921,938 Structured Asset Securities
2003-29 3A1 25.09.33/5.059%* 1,915,184 0.024,814,080 Structured Asset Securities
2003-32 5A1 25.11.33/5.849%* 5,065,700 0.051,604,105 Structured Asset Securities
2005-WF4 A4 25.11.35/0.525%* 1,601,250 0.027,429,000 Sun Merger Sub 144A 01.08.18/5.250% 7,781,878 0.08
712,000 Sun Merger Sub 144A 01.08.21/5.875% 731,580 0.012,660,000 SunEdison 01.04.19/7.750% 2,851,706 0.032,095,000 SunGard Data Systems 15.11.18/7.375% 2,223,319 0.023,460,000 SunGard Data Systems 01.11.19/6.625% 3,650,300 0.041,575,000 SunGard Data Systems 15.11.20/7.625% 1,724,625 0.02
4,669,000 Talos Production 144A 15.02.18/9.750% 4,785,725 0.05823,000 Taylor Morrison
Communities 144A 15.04.20/7.750% 909,415 0.011,511,000 Taylor Morrison
Communities 144A 15.04.21/5.250% 1,473,225 0.01943,000 Tekni-Plex 144A 01.06.19/9.750% 1,072,663 0.01
1,295,000 Tempur Sealy International 15.12.20/6.875% 1,411,550 0.01745,000 Tenet Healthcare 01.02.20/6.750% 770,028 0.01
5,725,000 Tenet Healthcare 01.04.22/8.125% 6,180,882 0.064,806,000 Tenet Healthcare 144A 01.10.20/6.000% 5,025,274 0.052,050,000 Tesoro Logistics 01.10.20/5.875% 2,106,375 0.02
930,000 Tesoro Logistics 15.10.21/6.125% 962,550 0.01910,000 Tesoro Logistics 144A 01.10.20/5.875% 935,025 0.01
2,950,000 Texas Competitive ElectricHoldings 144A 01.10.20/11.500% 2,168,250 0.02
4,502,101 Thornburg Mortgage SecuritiesTrust 2007-4 3A1 25.09.37/6.102%* 4,701,166 0.05
2,032,000 T-Mobile USA 144A 01.09.18/5.250% 2,146,300 0.024,855,000 Tops Holding 144A 15.12.17/8.875% 5,352,638 0.052,253,000 TransUnion Holding 15.06.18/8.125% 2,382,548 0.02
922,000 TransUnion Holding 15.06.18/9.625% 998,065 0.011,615,000 Triumph Group 01.04.21/4.875% 1,572,203 0.022,135,000 Tronox Finance 15.08.20/6.375% 2,189,410 0.021,470,000 Tutor Perini 01.11.18/7.625% 1,579,581 0.02
630,000 tw telecom holdings 01.10.22/5.375% 618,975 0.011,896,000 tw telecom holdings 144A 01.10.22/5.375% 1,862,820 0.021,078,000 tw telecom holdings 144A 01.09.23/6.375% 1,122,468 0.013,581,028 UAL 2007-1 Pass Through Trust 02.07.22/6.636% 3,795,889 0.04
578,180 UAL 2009-1 Pass Through Trust 01.11.16/10.400% 656,234 0.01285,778 UAL 2009-2B Pass Through
Trust 15.01.16/12.000% 321,501 0.003,350,000 UCI International 15.02.19/8.625% 3,358,375 0.031,529,000 Unifrax I 144A 15.02.19/7.500% 1,590,160 0.02
843,995 United Airlines Pass ThroughTrust 2007-1- C Shares 02.07.14/2.599%* 843,995 0.01
2,750,000 United Rentals North America 15.11.19/10.250% 3,118,844 0.03385,000 United Rentals North America 15.05.20/7.375% 427,327 0.00
6,101,000 United Rentals North America 01.02.21/8.250% 6,901,482 0.077,824,000 United Rentals North America 15.04.22/7.625% 8,705,100 0.097,990,000 United Surgical Partners
International 01.04.20/9.000% 8,988,750 0.091,489,000 Universal Health Services 01.10.18/7.000% 1,593,528 0.025,000,000 Univision Communications 144A 15.05.19/6.875% 5,393,750 0.056,000,000 Univision Communications 144A 01.11.20/7.875% 6,652,500 0.079,615,000 Univision Communications 144A 15.05.21/8.500% 10,684,669 0.114,825,000 Univision Communications 144A 15.09.22/6.750% 5,319,563 0.05
482,000 US Airways 2013-1 Class A PassThrough Trust 15.11.25/3.950% 472,059 0.00
1,793,000 US Airways 2013-1 Class B PassThrough Trust 15.11.21/5.375% 1,766,105 0.02
915,000 US Coatings Acquisition 144A 01.05.21/7.375% 979,050 0.011,000,000 US Concrete 144A 01.12.18/8.500% 1,027,500 0.011,560,000 US Treasury 23.01.14/0.000% 1,559,939 0.02
100,000,000 US Treasury 31.01.14/0.250% 100,021,484 0.9910,000,000 US Treasury 15.02.14/1.250% 10,014,453 0.10
3,150,000 US Treasury 15.06.14/0.750% 3,159,290 0.0352,295,000 US Treasury 15.08.23/2.500% 50,288,997 0.5033,321,000 US Treasury 15.11.23/2.750% 32,646,771 0.3227,108,000 US Treasury 15.08.43/3.625% 25,773,778 0.2618,175,000 US Treasury (i) 01.05.14/0.000% 18,170,129 0.18
77,000 USG 144A 30.03.20/7.875% 87,010 0.00802,000 USG 144A 01.11.21/5.875% 835,083 0.01
3,410,000 Vail Resorts 01.05.19/6.500% 3,631,650 0.043,475,000 Valeant Pharmaceuticals
International 144A 15.07.16/6.500% 3,587,938 0.046,000,000 Valeant Pharmaceuticals
International 144A 01.10.17/6.750% 6,420,000 0.062,985,000 Valeant Pharmaceuticals
International 144A 15.08.18/6.750% 3,279,769 0.037,500,000 Valeant Pharmaceuticals
International 144A 01.12.18/6.875% 8,034,375 0.08995,000 Valeant Pharmaceuticals
International 144A 01.10.20/7.000% 1,074,600 0.016,880,000 Valeant Pharmaceuticals
International 144A 15.08.21/6.750% 7,335,800 0.074,700,000 Valeant Pharmaceuticals
International 144A 15.07.22/7.250% 5,076,000 0.051,838,000 Viasystems 144A 01.05.19/7.875% 1,996,528 0.024,300,000 Virginia College Building
Authority 01.02.25/4.000% 4,487,007 0.042,504,000 Visteon 15.04.19/6.750% 2,660,500 0.032,210,000 Vulcan Materials 15.06.21/7.500% 2,530,450 0.035,915,000 VWR Funding 15.09.17/7.250% 6,388,200 0.06400,000 VWR Funding 144A 30.06.17/10.750% 403,000 0.00913,558 VWR Funding 144A 30.06.17/10.750% 1,280,504 0.01
1,250,000 W&T Offshore 15.06.19/8.500% 1,328,125 0.01351,599 Washington Mutual Alternative
Mortgage Pass-ThroughCertificates 2005-8 1A8 25.10.35/5.500% 316,727 0.00
1,417,218 Washington Mutual AlternativeMortgage Pass-ThroughCertificates 2006-1 3A2 25.02.36/5.750% 1,208,188 0.01
2,513,000 Watco 144A 01.04.23/6.375% 2,513,000 0.023,522,000 WCI Communities 144A 15.08.21/6.875% 3,513,195 0.033,266,000 Wells Enterprises 144A 01.02.20/6.750% 3,323,155 0.03
720,000 Wells Fargo & Co. 31.12.49/7.980%* 805,284 0.019,814,303 Wells Fargo Alternative Loan
Trust 2007-PA3 3A6 25.07.37/6.500% 8,707,073 0.091,943,731 Wells Fargo Home Equity Trust
2004-2 AI6 25.10.34/5.000%* 1,973,407 0.02610,615 Wells Fargo Mortgage Backed
Securities Trust 2005-16 A8 25.01.36/5.750% 634,289 0.01
142
JPMorgan Investment Funds - Income Opportunity Fund
Schedule of Investments (Market Value Expressed in USD) (continued)
As at 31 December 2013
Quantity/Nominal
Value
Name of Securities Maturity/Coupon
MarketValue
%of
NetAssets
Quantity/Nominal
Value
Name of Securities Maturity/Coupon
MarketValue
%of
NetAssets
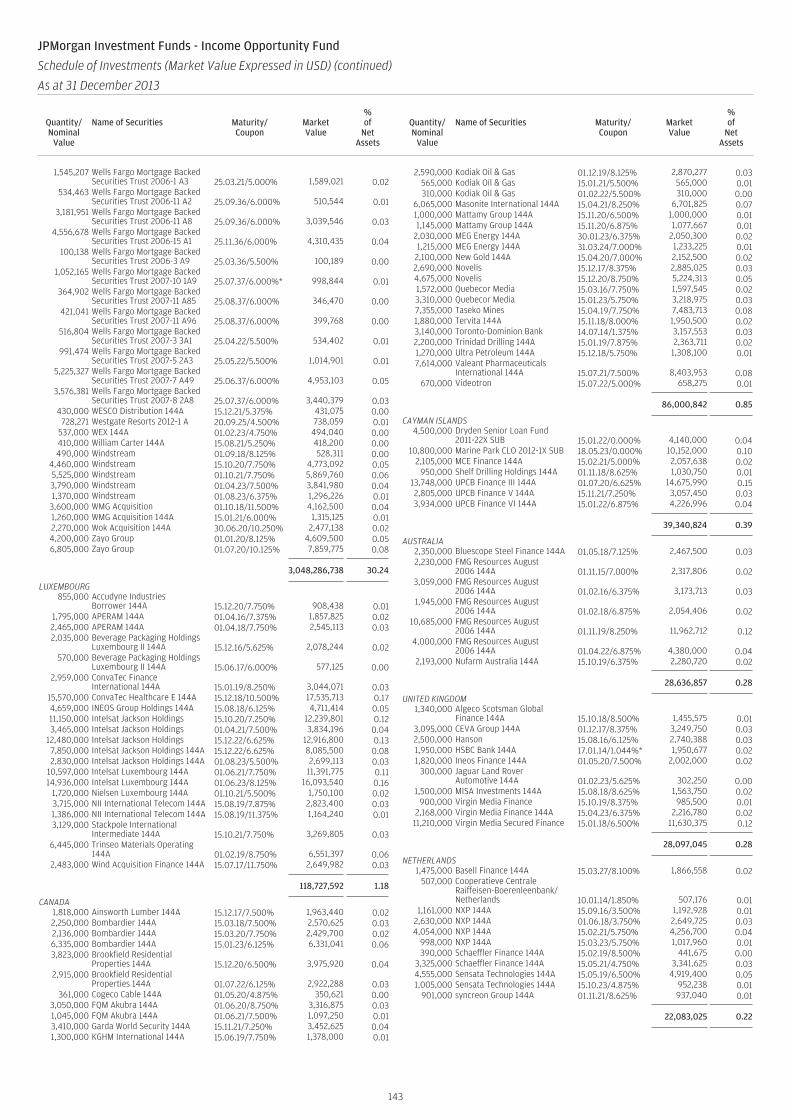
1,545,207 Wells Fargo Mortgage BackedSecurities Trust 2006-1 A3 25.03.21/5.000% 1,589,021 0.02
534,463 Wells Fargo Mortgage BackedSecurities Trust 2006-11 A2 25.09.36/6.000% 510,544 0.01
3,181,951 Wells Fargo Mortgage BackedSecurities Trust 2006-11 A8 25.09.36/6.000% 3,039,546 0.03
4,556,678 Wells Fargo Mortgage BackedSecurities Trust 2006-15 A1 25.11.36/6.000% 4,310,435 0.04
100,138 Wells Fargo Mortgage BackedSecurities Trust 2006-3 A9 25.03.36/5.500% 100,189 0.00
1,052,165 Wells Fargo Mortgage BackedSecurities Trust 2007-10 1A9 25.07.37/6.000%* 998,844 0.01
364,902 Wells Fargo Mortgage BackedSecurities Trust 2007-11 A85 25.08.37/6.000% 346,470 0.00
421,041 Wells Fargo Mortgage BackedSecurities Trust 2007-11 A96 25.08.37/6.000% 399,768 0.00
516,804 Wells Fargo Mortgage BackedSecurities Trust 2007-3 3A1 25.04.22/5.500% 534,402 0.01
991,474 Wells Fargo Mortgage BackedSecurities Trust 2007-5 2A3 25.05.22/5.500% 1,014,901 0.01
5,225,327 Wells Fargo Mortgage BackedSecurities Trust 2007-7 A49 25.06.37/6.000% 4,953,103 0.05
3,576,381 Wells Fargo Mortgage BackedSecurities Trust 2007-8 2A8 25.07.37/6.000% 3,440,379 0.03
430,000 WESCO Distribution 144A 15.12.21/5.375% 431,075 0.00728,271 Westgate Resorts 2012-1 A 20.09.25/4.500% 738,059 0.01
537,000 WEX 144A 01.02.23/4.750% 494,040 0.00410,000 William Carter 144A 15.08.21/5.250% 418,200 0.00490,000 Windstream 01.09.18/8.125% 528,311 0.00
4,460,000 Windstream 15.10.20/7.750% 4,773,092 0.055,525,000 Windstream 01.10.21/7.750% 5,869,760 0.063,790,000 Windstream 01.04.23/7.500% 3,841,980 0.041,370,000 Windstream 01.08.23/6.375% 1,296,226 0.01
3,600,000 WMG Acquisition 01.10.18/11.500% 4,162,500 0.041,260,000 WMG Acquisition 144A 15.01.21/6.000% 1,315,125 0.012,270,000 Wok Acquisition 144A 30.06.20/10.250% 2,477,138 0.024,200,000 Zayo Group 01.01.20/8.125% 4,609,500 0.056,805,000 Zayo Group 01.07.20/10.125% 7,859,775 0.08
3,048,286,738 30.24
LUXEMBOURG855,000 Accudyne Industries
Borrower 144A 15.12.20/7.750% 908,438 0.011,795,000 APERAM 144A 01.04.16/7.375% 1,857,825 0.022,465,000 APERAM 144A 01.04.18/7.750% 2,545,113 0.032,035,000 Beverage Packaging Holdings
Luxembourg II 144A 15.12.16/5.625% 2,078,244 0.02570,000 Beverage Packaging Holdings
Luxembourg II 144A 15.06.17/6.000% 577,125 0.002,959,000 ConvaTec Finance
International 144A 15.01.19/8.250% 3,044,071 0.0315,570,000 ConvaTec Healthcare E 144A 15.12.18/10.500% 17,535,713 0.174,659,000 INEOS Group Holdings 144A 15.08.18/6.125% 4,711,414 0.0511,150,000 Intelsat Jackson Holdings 15.10.20/7.250% 12,239,801 0.123,465,000 Intelsat Jackson Holdings 01.04.21/7.500% 3,834,196 0.04
12,480,000 Intelsat Jackson Holdings 15.12.22/6.625% 12,916,800 0.137,850,000 Intelsat Jackson Holdings 144A 15.12.22/6.625% 8,085,500 0.082,830,000 Intelsat Jackson Holdings 144A 01.08.23/5.500% 2,699,113 0.03
10,597,000 Intelsat Luxembourg 144A 01.06.21/7.750% 11,391,775 0.1114,936,000 Intelsat Luxembourg 144A 01.06.23/8.125% 16,093,540 0.16
1,720,000 Nielsen Luxembourg 144A 01.10.21/5.500% 1,750,100 0.023,715,000 NII International Telecom 144A 15.08.19/7.875% 2,823,400 0.031,386,000 NII International Telecom 144A 15.08.19/11.375% 1,164,240 0.013,129,000 Stackpole International
Intermediate 144A 15.10.21/7.750% 3,269,805 0.036,445,000 Trinseo Materials Operating
144A 01.02.19/8.750% 6,551,397 0.062,483,000 Wind Acquisition Finance 144A 15.07.17/11.750% 2,649,982 0.03
118,727,592 1.18
CANADA1,818,000 Ainsworth Lumber 144A 15.12.17/7.500% 1,963,440 0.022,250,000 Bombardier 144A 15.03.18/7.500% 2,570,625 0.032,136,000 Bombardier 144A 15.03.20/7.750% 2,429,700 0.026,335,000 Bombardier 144A 15.01.23/6.125% 6,331,041 0.063,823,000 Brookfield Residential
Properties 144A 15.12.20/6.500% 3,975,920 0.042,915,000 Brookfield Residential
Properties 144A 01.07.22/6.125% 2,922,288 0.03361,000 Cogeco Cable 144A 01.05.20/4.875% 350,621 0.00
3,050,000 FQM Akubra 144A 01.06.20/8.750% 3,316,875 0.031,045,000 FQM Akubra 144A 01.06.21/7.500% 1,097,250 0.013,410,000 Garda World Security 144A 15.11.21/7.250% 3,452,625 0.041,300,000 KGHM International 144A 15.06.19/7.750% 1,378,000 0.01
2,590,000 Kodiak Oil & Gas 01.12.19/8.125% 2,870,277 0.03565,000 Kodiak Oil & Gas 15.01.21/5.500% 565,000 0.01310,000 Kodiak Oil & Gas 01.02.22/5.500% 310,000 0.00
6,065,000 Masonite International 144A 15.04.21/8.250% 6,701,825 0.071,000,000 Mattamy Group 144A 15.11.20/6.500% 1,000,000 0.011,145,000 Mattamy Group 144A 15.11.20/6.875% 1,077,667 0.01
2,030,000 MEG Energy 144A 30.01.23/6.375% 2,050,300 0.021,215,000 MEG Energy 144A 31.03.24/7.000% 1,233,225 0.01
2,100,000 New Gold 144A 15.04.20/7.000% 2,152,500 0.022,690,000 Novelis 15.12.17/8.375% 2,885,025 0.034,675,000 Novelis 15.12.20/8.750% 5,224,313 0.051,572,000 Quebecor Media 15.03.16/7.750% 1,597,545 0.023,310,000 Quebecor Media 15.01.23/5.750% 3,218,975 0.037,355,000 Taseko Mines 15.04.19/7.750% 7,483,713 0.081,880,000 Tervita 144A 15.11.18/8.000% 1,950,500 0.023,140,000 Toronto-Dominion Bank 14.07.14/1.375% 3,157,553 0.032,200,000 Trinidad Drilling 144A 15.01.19/7.875% 2,363,711 0.021,270,000 Ultra Petroleum 144A 15.12.18/5.750% 1,308,100 0.017,614,000 Valeant Pharmaceuticals
International 144A 15.07.21/7.500% 8,403,953 0.08670,000 Videotron 15.07.22/5.000% 658,275 0.01
86,000,842 0.85
CAYMAN ISLANDS4,500,000 Dryden Senior Loan Fund
2011-22X SUB 15.01.22/0.000% 4,140,000 0.0410,800,000 Marine Park CLO 2012-1X SUB 18.05.23/0.000% 10,152,000 0.10
2,105,000 MCE Finance 144A 15.02.21/5.000% 2,057,638 0.02950,000 Shelf Drilling Holdings 144A 01.11.18/8.625% 1,030,750 0.01
13,748,000 UPCB Finance III 144A 01.07.20/6.625% 14,675,990 0.152,805,000 UPCB Finance V 144A 15.11.21/7.250% 3,057,450 0.033,934,000 UPCB Finance VI 144A 15.01.22/6.875% 4,226,996 0.04
39,340,824 0.39
AUSTRALIA2,350,000 Bluescope Steel Finance 144A 01.05.18/7.125% 2,467,500 0.032,230,000 FMG Resources August
2006 144A 01.11.15/7.000% 2,317,806 0.023,059,000 FMG Resources August
2006 144A 01.02.16/6.375% 3,173,713 0.031,945,000 FMG Resources August
2006 144A 01.02.18/6.875% 2,054,406 0.0210,685,000 FMG Resources August
2006 144A 01.11.19/8.250% 11,962,712 0.124,000,000 FMG Resources August
2006 144A 01.04.22/6.875% 4,380,000 0.042,193,000 Nufarm Australia 144A 15.10.19/6.375% 2,280,720 0.02
28,636,857 0.28
UNITED KINGDOM1,340,000 Algeco Scotsman Global
Finance 144A 15.10.18/8.500% 1,455,575 0.013,095,000 CEVA Group 144A 01.12.17/8.375% 3,249,750 0.032,500,000 Hanson 15.08.16/6.125% 2,740,388 0.031,950,000 HSBC Bank 144A 17.01.14/1.044%* 1,950,677 0.021,820,000 Ineos Finance 144A 01.05.20/7.500% 2,002,000 0.02
300,000 Jaguar Land RoverAutomotive 144A 01.02.23/5.625% 302,250 0.00
1,500,000 MISA Investments 144A 15.08.18/8.625% 1,563,750 0.02900,000 Virgin Media Finance 15.10.19/8.375% 985,500 0.01
2,168,000 Virgin Media Finance 144A 15.04.23/6.375% 2,216,780 0.0211,210,000 Virgin Media Secured Finance 15.01.18/6.500% 11,630,375 0.12
28,097,045 0.28
NETHERLANDS1,475,000 Basell Finance 144A 15.03.27/8.100% 1,866,558 0.02
507,000 Cooperatieve CentraleRaiffeisen-Boerenleenbank/Netherlands 10.01.14/1.850% 507,176 0.01
1,161,000 NXP 144A 15.09.16/3.500% 1,192,928 0.012,630,000 NXP 144A 01.06.18/3.750% 2,649,725 0.034,054,000 NXP 144A 15.02.21/5.750% 4,256,700 0.04
998,000 NXP 144A 15.03.23/5.750% 1,017,960 0.01390,000 Schaeffler Finance 144A 15.02.19/8.500% 441,675 0.00
3,325,000 Schaeffler Finance 144A 15.05.21/4.750% 3,341,625 0.034,555,000 Sensata Technologies 144A 15.05.19/6.500% 4,919,400 0.051,005,000 Sensata Technologies 144A 15.10.23/4.875% 952,238 0.01
901,000 syncreon Group 144A 01.11.21/8.625% 937,040 0.01
22,083,025 0.22
143
JPMorgan Investment Funds - Income Opportunity Fund
Schedule of Investments (Market Value Expressed in USD) (continued)
As at 31 December 2013
Quantity/Nominal
Value
Name of Securities Maturity/Coupon
MarketValue
%of
NetAssets
Quantity/Nominal
Value
Name of Securities Maturity/Coupon
MarketValue
%of
NetAssets
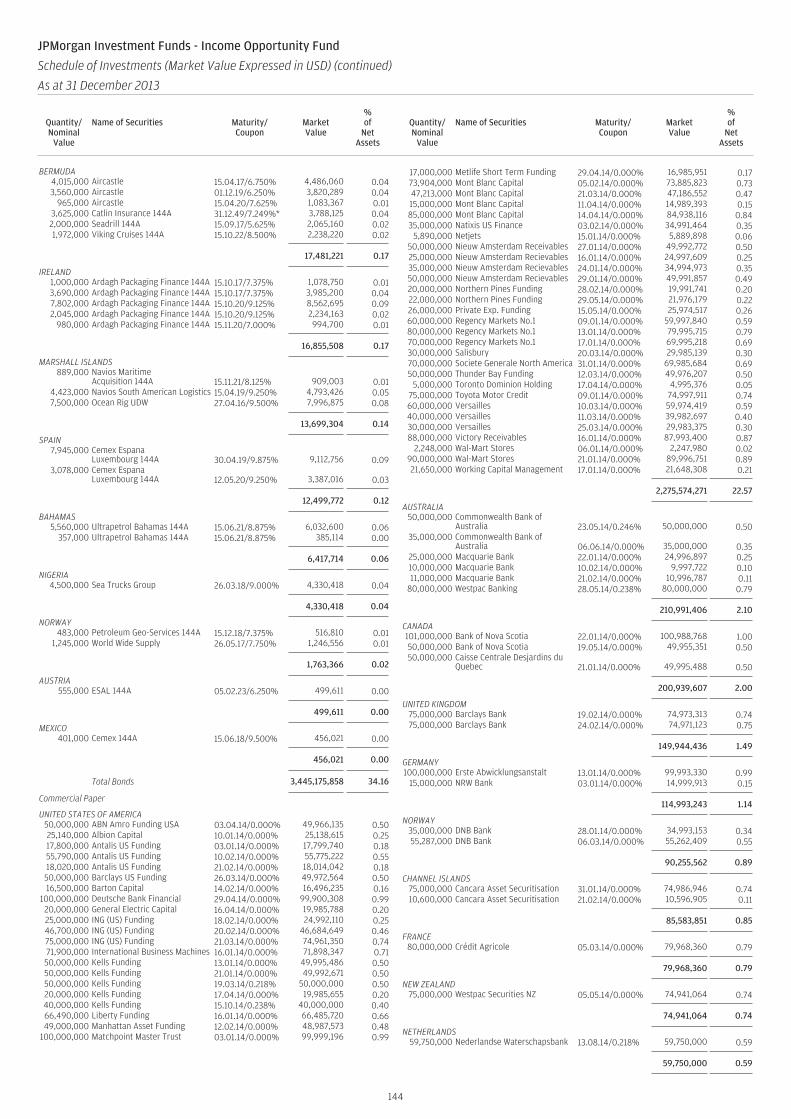
BERMUDA4,015,000 Aircastle 15.04.17/6.750% 4,486,060 0.043,560,000 Aircastle 01.12.19/6.250% 3,820,289 0.04
965,000 Aircastle 15.04.20/7.625% 1,083,367 0.013,625,000 Catlin Insurance 144A 31.12.49/7.249%* 3,788,125 0.042,000,000 Seadrill 144A 15.09.17/5.625% 2,065,160 0.021,972,000 Viking Cruises 144A 15.10.22/8.500% 2,238,220 0.02
17,481,221 0.17
IRELAND1,000,000 Ardagh Packaging Finance 144A 15.10.17/7.375% 1,078,750 0.013,690,000 Ardagh Packaging Finance 144A 15.10.17/7.375% 3,985,200 0.047,802,000 Ardagh Packaging Finance 144A 15.10.20/9.125% 8,562,695 0.092,045,000 Ardagh Packaging Finance 144A 15.10.20/9.125% 2,234,163 0.02
980,000 Ardagh Packaging Finance 144A 15.11.20/7.000% 994,700 0.01
16,855,508 0.17
MARSHALL ISLANDS889,000 Navios Maritime
Acquisition 144A 15.11.21/8.125% 909,003 0.014,423,000 Navios South American Logistics 15.04.19/9.250% 4,793,426 0.057,500,000 Ocean Rig UDW 27.04.16/9.500% 7,996,875 0.08
13,699,304 0.14
SPAIN7,945,000 Cemex Espana
Luxembourg 144A 30.04.19/9.875% 9,112,756 0.093,078,000 Cemex Espana
Luxembourg 144A 12.05.20/9.250% 3,387,016 0.03
12,499,772 0.12
BAHAMAS5,560,000 Ultrapetrol Bahamas 144A 15.06.21/8.875% 6,032,600 0.06
357,000 Ultrapetrol Bahamas 144A 15.06.21/8.875% 385,114 0.00
6,417,714 0.06
NIGERIA4,500,000 Sea Trucks Group 26.03.18/9.000% 4,330,418 0.04
4,330,418 0.04
NORWAY483,000 Petroleum Geo-Services 144A 15.12.18/7.375% 516,810 0.01
1,245,000 World Wide Supply 26.05.17/7.750% 1,246,556 0.01
1,763,366 0.02
AUSTRIA555,000 ESAL 144A 05.02.23/6.250% 499,611 0.00
499,611 0.00
MEXICO401,000 Cemex 144A 15.06.18/9.500% 456,021 0.00
456,021 0.00
Total Bonds 3,445,175,858 34.16
Commercial Paper
UNITED STATES OF AMERICA50,000,000 ABN Amro Funding USA 03.04.14/0.000% 49,966,135 0.5025,140,000 Albion Capital 10.01.14/0.000% 25,138,615 0.2517,800,000 Antalis US Funding 03.01.14/0.000% 17,799,740 0.1855,790,000 Antalis US Funding 10.02.14/0.000% 55,775,222 0.5518,020,000 Antalis US Funding 21.02.14/0.000% 18,014,042 0.1850,000,000 Barclays US Funding 26.03.14/0.000% 49,972,564 0.5016,500,000 Barton Capital 14.02.14/0.000% 16,496,235 0.16
100,000,000 Deutsche Bank Financial 29.04.14/0.000% 99,900,308 0.9920,000,000 General Electric Capital 16.04.14/0.000% 19,985,788 0.2025,000,000 ING (US) Funding 18.02.14/0.000% 24,992,110 0.2546,700,000 ING (US) Funding 20.02.14/0.000% 46,684,649 0.4675,000,000 ING (US) Funding 21.03.14/0.000% 74,961,350 0.7471,900,000 International Business Machines 16.01.14/0.000% 71,898,347 0.7150,000,000 Kells Funding 13.01.14/0.000% 49,995,486 0.5050,000,000 Kells Funding 21.01.14/0.000% 49,992,671 0.5050,000,000 Kells Funding 19.03.14/0.218% 50,000,000 0.5020,000,000 Kells Funding 17.04.14/0.000% 19,985,655 0.2040,000,000 Kells Funding 15.10.14/0.238% 40,000,000 0.4066,490,000 Liberty Funding 16.01.14/0.000% 66,485,720 0.6649,000,000 Manhattan Asset Funding 12.02.14/0.000% 48,987,573 0.48
100,000,000 Matchpoint Master Trust 03.01.14/0.000% 99,999,196 0.99
17,000,000 Metlife Short Term Funding 29.04.14/0.000% 16,985,951 0.1773,904,000 Mont Blanc Capital 05.02.14/0.000% 73,885,823 0.7347,213,000 Mont Blanc Capital 21.03.14/0.000% 47,186,552 0.4715,000,000 Mont Blanc Capital 11.04.14/0.000% 14,989,393 0.1585,000,000 Mont Blanc Capital 14.04.14/0.000% 84,938,116 0.8435,000,000 Natixis US Finance 03.02.14/0.000% 34,991,464 0.35
5,890,000 Netjets 15.01.14/0.000% 5,889,898 0.0650,000,000 Nieuw Amsterdam Receivables 27.01.14/0.000% 49,992,772 0.5025,000,000 Nieuw Amsterdam Recievables 16.01.14/0.000% 24,997,609 0.2535,000,000 Nieuw Amsterdam Recievables 24.01.14/0.000% 34,994,973 0.3550,000,000 Nieuw Amsterdam Recievables 29.01.14/0.000% 49,991,857 0.4920,000,000 Northern Pines Funding 28.02.14/0.000% 19,991,741 0.2022,000,000 Northern Pines Funding 29.05.14/0.000% 21,976,179 0.2226,000,000 Private Exp. Funding 15.05.14/0.000% 25,974,517 0.2660,000,000 Regency Markets No.1 09.01.14/0.000% 59,997,840 0.5980,000,000 Regency Markets No.1 13.01.14/0.000% 79,995,715 0.7970,000,000 Regency Markets No.1 17.01.14/0.000% 69,995,218 0.6930,000,000 Salisbury 20.03.14/0.000% 29,985,139 0.3070,000,000 Societe Generale North America 31.01.14/0.000% 69,985,684 0.6950,000,000 Thunder Bay Funding 12.03.14/0.000% 49,976,207 0.50
5,000,000 Toronto Dominion Holding 17.04.14/0.000% 4,995,376 0.0575,000,000 Toyota Motor Credit 09.01.14/0.000% 74,997,911 0.7460,000,000 Versailles 10.03.14/0.000% 59,974,419 0.5940,000,000 Versailles 11.03.14/0.000% 39,982,697 0.4030,000,000 Versailles 25.03.14/0.000% 29,983,375 0.3088,000,000 Victory Receivables 16.01.14/0.000% 87,993,400 0.87
2,248,000 Wal-Mart Stores 06.01.14/0.000% 2,247,980 0.0290,000,000 Wal-Mart Stores 21.01.14/0.000% 89,996,751 0.8921,650,000 Working Capital Management 17.01.14/0.000% 21,648,308 0.21
2,275,574,271 22.57
AUSTRALIA50,000,000 Commonwealth Bank of
Australia 23.05.14/0.246% 50,000,000 0.5035,000,000 Commonwealth Bank of
Australia 06.06.14/0.000% 35,000,000 0.3525,000,000 Macquarie Bank 22.01.14/0.000% 24,996,897 0.2510,000,000 Macquarie Bank 10.02.14/0.000% 9,997,722 0.1011,000,000 Macquarie Bank 21.02.14/0.000% 10,996,787 0.11
80,000,000 Westpac Banking 28.05.14/0.238% 80,000,000 0.79
210,991,406 2.10
CANADA101,000,000 Bank of Nova Scotia 22.01.14/0.000% 100,988,768 1.0050,000,000 Bank of Nova Scotia 19.05.14/0.000% 49,955,351 0.5050,000,000 Caisse Centrale Desjardins du
Quebec 21.01.14/0.000% 49,995,488 0.50
200,939,607 2.00
UNITED KINGDOM75,000,000 Barclays Bank 19.02.14/0.000% 74,973,313 0.7475,000,000 Barclays Bank 24.02.14/0.000% 74,971,123 0.75
149,944,436 1.49
GERMANY100,000,000 Erste Abwicklungsanstalt 13.01.14/0.000% 99,993,330 0.99
15,000,000 NRW Bank 03.01.14/0.000% 14,999,913 0.15
114,993,243 1.14
NORWAY35,000,000 DNB Bank 28.01.14/0.000% 34,993,153 0.3455,287,000 DNB Bank 06.03.14/0.000% 55,262,409 0.55
90,255,562 0.89
CHANNEL ISLANDS75,000,000 Cancara Asset Securitisation 31.01.14/0.000% 74,986,946 0.7410,600,000 Cancara Asset Securitisation 21.02.14/0.000% 10,596,905 0.11
85,583,851 0.85
FRANCE80,000,000 Crédit Agricole 05.03.14/0.000% 79,968,360 0.79
79,968,360 0.79
NEW ZEALAND75,000,000 Westpac Securities NZ 05.05.14/0.000% 74,941,064 0.74
74,941,064 0.74
NETHERLANDS59,750,000 Nederlandse Waterschapsbank 13.08.14/0.218% 59,750,000 0.59
59,750,000 0.59
144
JPMorgan Investment Funds - Income Opportunity Fund
Schedule of Investments (Market Value Expressed in USD) (continued)
As at 31 December 2013
Quantity/Nominal
Value
Name of Securities Maturity/Coupon
MarketValue
%of
NetAssets
Quantity/Nominal
Value
Name of Securities Maturity/Coupon
MarketValue
%of
NetAssets
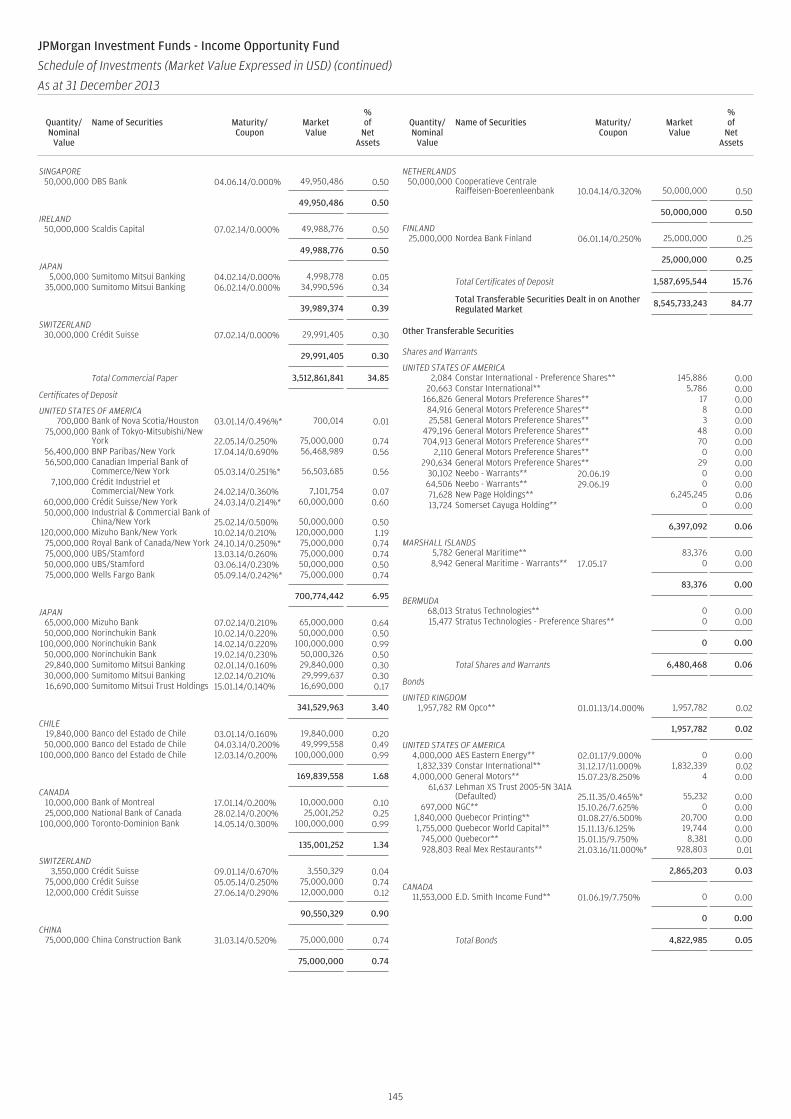
SINGAPORE50,000,000 DBS Bank 04.06.14/0.000% 49,950,486 0.50
49,950,486 0.50
IRELAND50,000,000 Scaldis Capital 07.02.14/0.000% 49,988,776 0.50
49,988,776 0.50
JAPAN5,000,000 Sumitomo Mitsui Banking 04.02.14/0.000% 4,998,778 0.05
35,000,000 Sumitomo Mitsui Banking 06.02.14/0.000% 34,990,596 0.34
39,989,374 0.39
SWITZERLAND30,000,000 Crédit Suisse 07.02.14/0.000% 29,991,405 0.30
29,991,405 0.30
Total Commercial Paper 3,512,861,841 34.85
Certificates of Deposit
UNITED STATES OF AMERICA700,000 Bank of Nova Scotia/Houston 03.01.14/0.496%* 700,014 0.01
75,000,000 Bank of Tokyo-Mitsubishi/NewYork 22.05.14/0.250% 75,000,000 0.74
56,400,000 BNP Paribas/New York 17.04.14/0.690% 56,468,989 0.5656,500,000 Canadian Imperial Bank of
Commerce/New York 05.03.14/0.251%* 56,503,685 0.567,100,000 Crédit Industriel et
Commercial/New York 24.02.14/0.360% 7,101,754 0.0760,000,000 Crédit Suisse/New York 24.03.14/0.214%* 60,000,000 0.6050,000,000 Industrial & Commercial Bank of
China/New York 25.02.14/0.500% 50,000,000 0.50120,000,000 Mizuho Bank/New York 10.02.14/0.210% 120,000,000 1.1975,000,000 Royal Bank of Canada/New York 24.10.14/0.250%* 75,000,000 0.7475,000,000 UBS/Stamford 13.03.14/0.260% 75,000,000 0.7450,000,000 UBS/Stamford 03.06.14/0.230% 50,000,000 0.5075,000,000 Wells Fargo Bank 05.09.14/0.242%* 75,000,000 0.74
700,774,442 6.95
JAPAN65,000,000 Mizuho Bank 07.02.14/0.210% 65,000,000 0.6450,000,000 Norinchukin Bank 10.02.14/0.220% 50,000,000 0.50
100,000,000 Norinchukin Bank 14.02.14/0.220% 100,000,000 0.9950,000,000 Norinchukin Bank 19.02.14/0.230% 50,000,326 0.5029,840,000 Sumitomo Mitsui Banking 02.01.14/0.160% 29,840,000 0.3030,000,000 Sumitomo Mitsui Banking 12.02.14/0.210% 29,999,637 0.3016,690,000 Sumitomo Mitsui Trust Holdings 15.01.14/0.140% 16,690,000 0.17
341,529,963 3.40
CHILE19,840,000 Banco del Estado de Chile 03.01.14/0.160% 19,840,000 0.2050,000,000 Banco del Estado de Chile 04.03.14/0.200% 49,999,558 0.49
100,000,000 Banco del Estado de Chile 12.03.14/0.200% 100,000,000 0.99
169,839,558 1.68
CANADA10,000,000 Bank of Montreal 17.01.14/0.200% 10,000,000 0.1025,000,000 National Bank of Canada 28.02.14/0.200% 25,001,252 0.25
100,000,000 Toronto-Dominion Bank 14.05.14/0.300% 100,000,000 0.99
135,001,252 1.34
SWITZERLAND3,550,000 Crédit Suisse 09.01.14/0.670% 3,550,329 0.04
75,000,000 Crédit Suisse 05.05.14/0.250% 75,000,000 0.7412,000,000 Crédit Suisse 27.06.14/0.290% 12,000,000 0.12
90,550,329 0.90
CHINA75,000,000 China Construction Bank 31.03.14/0.520% 75,000,000 0.74
75,000,000 0.74
NETHERLANDS50,000,000 Cooperatieve Centrale
Raiffeisen-Boerenleenbank 10.04.14/0.320% 50,000,000 0.50
50,000,000 0.50
FINLAND25,000,000 Nordea Bank Finland 06.01.14/0.250% 25,000,000 0.25
25,000,000 0.25
Total Certificates of Deposit 1,587,695,544 15.76
Total Transferable Securities Dealt in on AnotherRegulated Market
8,545,733,243 84.77
Other Transferable Securities
Shares and Warrants
UNITED STATES OF AMERICA2,084 Constar International - Preference Shares** 145,886 0.00
20,663 Constar International** 5,786 0.00166,826 General Motors Preference Shares** 17 0.0084,916 General Motors Preference Shares** 8 0.0025,581 General Motors Preference Shares** 3 0.00
479,196 General Motors Preference Shares** 48 0.00704,913 General Motors Preference Shares** 70 0.00
2,110 General Motors Preference Shares** 0 0.00290,634 General Motors Preference Shares** 29 0.00
30,102 Neebo - Warrants** 20.06.19 0 0.0064,506 Neebo - Warrants** 29.06.19 0 0.0071,628 New Page Holdings** 6,245,245 0.0613,724 Somerset Cayuga Holding** 0 0.00
6,397,092 0.06
MARSHALL ISLANDS5,782 General Maritime** 83,376 0.008,942 General Maritime - Warrants** 17.05.17 0 0.00
83,376 0.00
BERMUDA68,013 Stratus Technologies** 0 0.0015,477 Stratus Technologies - Preference Shares** 0 0.00
0 0.00
Total Shares and Warrants 6,480,468 0.06
Bonds
UNITED KINGDOM1,957,782 RM Opco** 01.01.13/14.000% 1,957,782 0.02
1,957,782 0.02
UNITED STATES OF AMERICA4,000,000 AES Eastern Energy** 02.01.17/9.000% 0 0.00
1,832,339 Constar International** 31.12.17/11.000% 1,832,339 0.024,000,000 General Motors** 15.07.23/8.250% 4 0.00
61,637 Lehman XS Trust 2005-5N 3A1A(Defaulted) 25.11.35/0.465%* 55,232 0.00
697,000 NGC** 15.10.26/7.625% 0 0.001,840,000 Quebecor Printing** 01.08.27/6.500% 20,700 0.001,755,000 Quebecor World Capital** 15.11.13/6.125% 19,744 0.00
745,000 Quebecor** 15.01.15/9.750% 8,381 0.00928,803 Real Mex Restaurants** 21.03.16/11.000%* 928,803 0.01
2,865,203 0.03
CANADA11,553,000 E.D. Smith Income Fund** 01.06.19/7.750% 0 0.00
0 0.00
Total Bonds 4,822,985 0.05
145
JPMorgan Investment Funds - Income Opportunity Fund
Schedule of Investments (Market Value Expressed in USD) (continued)
As at 31 December 2013
Quantity/Nominal
Value
Name of Securities Maturity/Coupon
MarketValue
%of
NetAssets
Quantity/Nominal
Value
Name of Securities Maturity/Coupon
MarketValue
%of
NetAssets
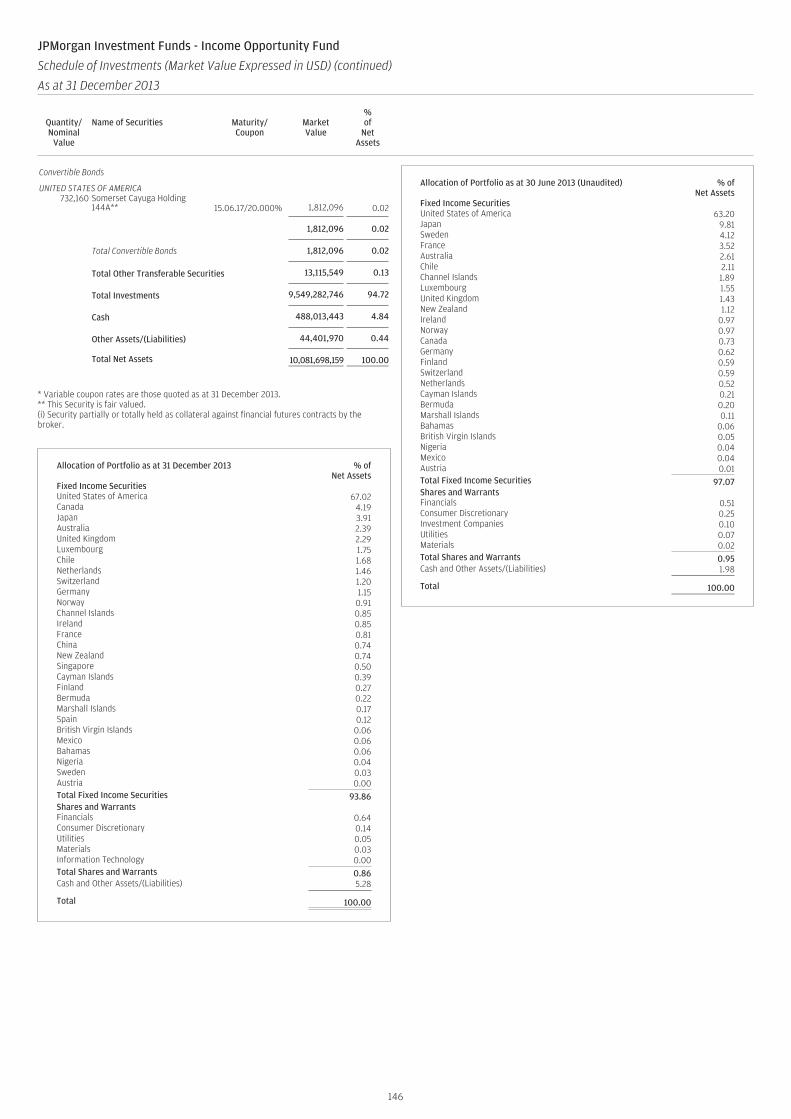
Convertible Bonds
UNITED STATES OF AMERICA732,160 Somerset Cayuga Holding
144A** 15.06.17/20.000% 1,812,096 0.02
1,812,096 0.02
Total Convertible Bonds 1,812,096 0.02
Total Other Transferable Securities 13,115,549 0.13
Total Investments 9,549,282,746 94.72
Cash 488,013,443 4.84
Other Assets/(Liabilities) 44,401,970 0.44
Total Net Assets 10,081,698,159 100.00
* Variable coupon rates are those quoted as at 31 December 2013.** This Security is fair valued.(i) Security partially or totally held as collateral against financial futures contracts by thebroker.
Allocation of Portfolio as at 31 December 2013 % ofNet Assets
Fixed Income SecuritiesUnited States of America 67.02Canada 4.19Japan 3.91Australia 2.39United Kingdom 2.29Luxembourg 1.75Chile 1.68Netherlands 1.46Switzerland 1.20Germany 1.15Norway 0.91Channel Islands 0.85Ireland 0.85France 0.81China 0.74New Zealand 0.74Singapore 0.50Cayman Islands 0.39Finland 0.27Bermuda 0.22Marshall Islands 0.17Spain 0.12British Virgin Islands 0.06Mexico 0.06Bahamas 0.06Nigeria 0.04Sweden 0.03Austria 0.00Total Fixed Income Securities 93.86Shares and WarrantsFinancials 0.64Consumer Discretionary 0.14Utilities 0.05Materials 0.03Information Technology 0.00Total Shares and Warrants 0.86Cash and Other Assets/(Liabilities) 5.28
Total 100.00
Allocation of Portfolio as at 30 June 2013 (Unaudited) % ofNet Assets
Fixed Income SecuritiesUnited States of America 63.20Japan 9.81Sweden 4.12France 3.52Australia 2.61Chile 2.11Channel Islands 1.89Luxembourg 1.55United Kingdom 1.43New Zealand 1.12Ireland 0.97Norway 0.97Canada 0.73Germany 0.62Finland 0.59Switzerland 0.59Netherlands 0.52Cayman Islands 0.21Bermuda 0.20Marshall Islands 0.11Bahamas 0.06British Virgin Islands 0.05Nigeria 0.04Mexico 0.04Austria 0.01Total Fixed Income Securities 97.07Shares and WarrantsFinancials 0.51Consumer Discretionary 0.25Investment Companies 0.10Utilities 0.07Materials 0.02Total Shares and Warrants 0.95Cash and Other Assets/(Liabilities) 1.98
Total 100.00
146
JPMorgan Investment Funds - Income Opportunity Fund
Schedule of Investments (Market Value Expressed in USD) (continued)
As at 31 December 2013
Quantity/Nominal
Value
Name of Securities Maturity/Coupon
MarketValue
%of
NetAssets
Quantity/Nominal
Value
Name of Securities Maturity/Coupon
MarketValue
%of
NetAssets
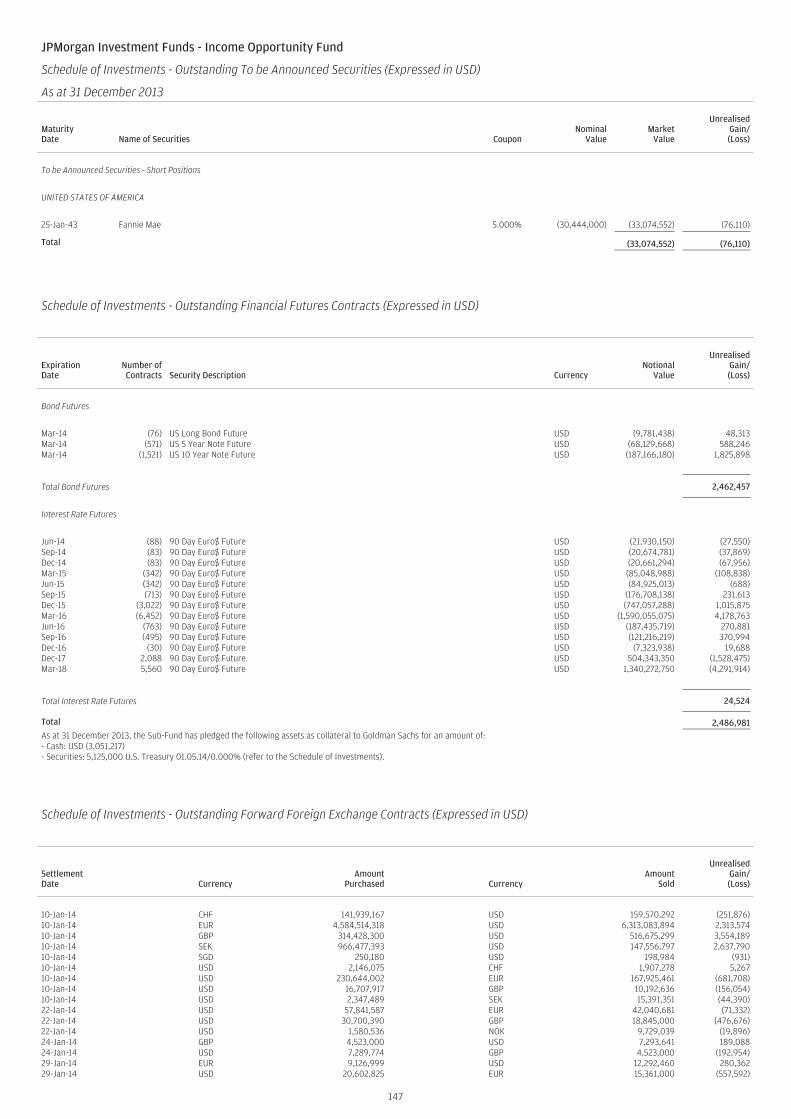
JPMorgan Investment Funds - Income Opportunity Fund
Schedule of Investments - Outstanding To be Announced Securities (Expressed in USD)
As at 31 December 2013
MaturityDate Name of Securities Coupon
NominalValue
MarketValue
UnrealisedGain/(Loss)
To be Announced Securities - Short Positions
UNITED STATES OF AMERICA
25-Jan-43 Fannie Mae 5.000% (30,444,000) (33,074,552) (76,110)
Total (33,074,552) (76,110)
Schedule of Investments - Outstanding Financial Futures Contracts (Expressed in USD)
ExpirationDate
Number ofContracts Security Description Currency
NotionalValue
UnrealisedGain/(Loss)
Bond Futures
Mar-14 (76) US Long Bond Future USD (9,781,438) 48,313Mar-14 (571) US 5 Year Note Future USD (68,129,668) 588,246Mar-14 (1,521) US 10 Year Note Future USD (187,166,180) 1,825,898
Total Bond Futures 2,462,457
Interest Rate Futures
Jun-14 (88) 90 Day Euro$ Future USD (21,930,150) (27,550)Sep-14 (83) 90 Day Euro$ Future USD (20,674,781) (37,869)Dec-14 (83) 90 Day Euro$ Future USD (20,661,294) (67,956)Mar-15 (342) 90 Day Euro$ Future USD (85,048,988) (108,838)Jun-15 (342) 90 Day Euro$ Future USD (84,925,013) (688)Sep-15 (713) 90 Day Euro$ Future USD (176,708,138) 231,613Dec-15 (3,022) 90 Day Euro$ Future USD (747,057,288) 1,015,875Mar-16 (6,452) 90 Day Euro$ Future USD (1,590,055,075) 4,178,763Jun-16 (763) 90 Day Euro$ Future USD (187,435,719) 270,881Sep-16 (495) 90 Day Euro$ Future USD (121,216,219) 370,994Dec-16 (30) 90 Day Euro$ Future USD (7,323,938) 19,688Dec-17 2,088 90 Day Euro$ Future USD 504,343,350 (1,528,475)Mar-18 5,560 90 Day Euro$ Future USD 1,340,272,750 (4,291,914)
Total Interest Rate Futures 24,524
Total 2,486,981As at 31 December 2013, the Sub-Fund has pledged the following assets as collateral to Goldman Sachs for an amount of:- Cash: USD (3,051,217)- Securities: 5,125,000 U.S. Treasury 01.05.14/0.000% (refer to the Schedule of Investments).
JPMorgan Investment Funds - Income Opportunity Fund
Schedule of Investments - Outstanding Forward Foreign Exchange Contracts (Expressed in USD) (continued)
As at 31 December 2013
SettlementDate Currency
AmountPurchased Currency
AmountSold
UnrealisedGain/(Loss)
10-Jan-14 CHF 141,939,167 USD 159,570,292 (251,876)10-Jan-14 EUR 4,584,514,318 USD 6,313,083,894 2,313,57410-Jan-14 GBP 314,428,300 USD 516,675,299 3,554,18910-Jan-14 SEK 966,477,393 USD 147,556,797 2,637,79010-Jan-14 SGD 250,180 USD 198,984 (931)10-Jan-14 USD 2,146,075 CHF 1,907,278 5,26710-Jan-14 USD 230,644,002 EUR 167,925,461 (681,708)10-Jan-14 USD 16,707,917 GBP 10,192,636 (156,054)10-Jan-14 USD 2,347,489 SEK 15,391,351 (44,390)22-Jan-14 USD 57,841,587 EUR 42,040,681 (71,332)22-Jan-14 USD 30,700,390 GBP 18,845,000 (476,676)22-Jan-14 USD 1,580,536 NOK 9,729,039 (19,896)24-Jan-14 GBP 4,523,000 USD 7,293,641 189,08824-Jan-14 USD 7,289,774 GBP 4,523,000 (192,954)29-Jan-14 EUR 9,126,999 USD 12,292,460 280,36229-Jan-14 USD 20,602,825 EUR 15,361,000 (557,592)
147
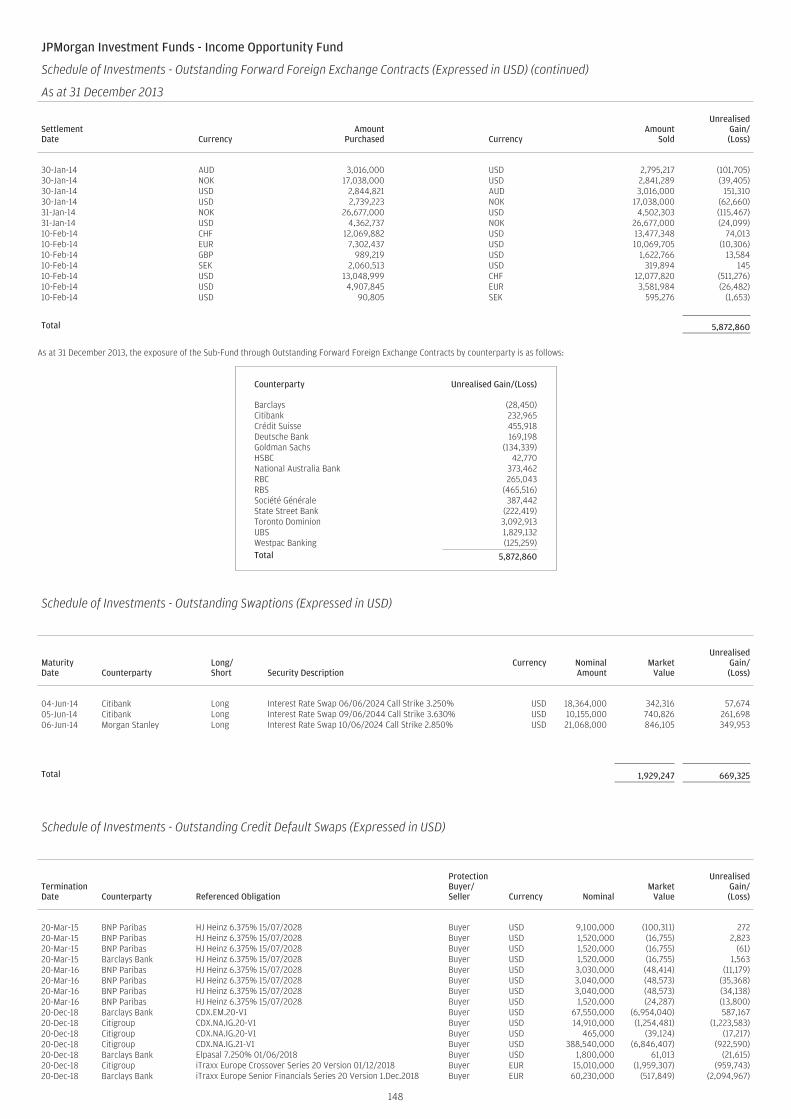
JPMorgan Investment Funds - Income Opportunity Fund
Schedule of Investments - Outstanding Forward Foreign Exchange Contracts (Expressed in USD) (continued)
As at 31 December 2013
SettlementDate Currency
AmountPurchased Currency
AmountSold
UnrealisedGain/(Loss)
30-Jan-14 AUD 3,016,000 USD 2,795,217 (101,705)30-Jan-14 NOK 17,038,000 USD 2,841,289 (39,405)30-Jan-14 USD 2,844,821 AUD 3,016,000 151,31030-Jan-14 USD 2,739,223 NOK 17,038,000 (62,660)31-Jan-14 NOK 26,677,000 USD 4,502,303 (115,467)31-Jan-14 USD 4,362,737 NOK 26,677,000 (24,099)10-Feb-14 CHF 12,069,882 USD 13,477,348 74,01310-Feb-14 EUR 7,302,437 USD 10,069,705 (10,306)10-Feb-14 GBP 989,219 USD 1,622,766 13,58410-Feb-14 SEK 2,060,513 USD 319,894 14510-Feb-14 USD 13,048,999 CHF 12,077,820 (511,276)10-Feb-14 USD 4,907,845 EUR 3,581,984 (26,482)10-Feb-14 USD 90,805 SEK 595,276 (1,653)
Total 5,872,860
As at 31 December 2013, the exposure of the Sub-Fund through Outstanding Forward Foreign Exchange Contracts by counterparty is as follows:
Counterparty Unrealised Gain/(Loss)
Barclays (28,450)Citibank 232,965Crédit Suisse 455,918Deutsche Bank 169,198Goldman Sachs (134,339)HSBC 42,770National Australia Bank 373,462RBC 265,043RBS (465,516)Société Générale 387,442State Street Bank (222,419)Toronto Dominion 3,092,913UBS 1,829,132Westpac Banking (125,259)Total 5,872,860
Schedule of Investments - Outstanding Swaptions (Expressed in USD)
MaturityDate Counterparty
Long/Short Security Description
Currency NominalAmount
MarketValue
UnrealisedGain/(Loss)
04-Jun-14 Citibank Long Interest Rate Swap 06/06/2024 Call Strike 3.250% USD 18,364,000 342,316 57,67405-Jun-14 Citibank Long Interest Rate Swap 09/06/2044 Call Strike 3.630% USD 10,155,000 740,826 261,69806-Jun-14 Morgan Stanley Long Interest Rate Swap 10/06/2024 Call Strike 2.850% USD 21,068,000 846,105 349,953
Total 1,929,247 669,325
JPMorgan Investment Funds - Income Opportunity Fund
Schedule of Investments - Outstanding Credit Default Swaps (Expressed in USD) (continued)
As at 31 December 2013
TerminationDate Counterparty Referenced Obligation
ProtectionBuyer/Seller Currency Nominal
MarketValue
UnrealisedGain/(Loss)
20-Mar-15 BNP Paribas HJ Heinz 6.375% 15/07/2028 Buyer USD 9,100,000 (100,311) 27220-Mar-15 BNP Paribas HJ Heinz 6.375% 15/07/2028 Buyer USD 1,520,000 (16,755) 2,82320-Mar-15 BNP Paribas HJ Heinz 6.375% 15/07/2028 Buyer USD 1,520,000 (16,755) (61)20-Mar-15 Barclays Bank HJ Heinz 6.375% 15/07/2028 Buyer USD 1,520,000 (16,755) 1,56320-Mar-16 BNP Paribas HJ Heinz 6.375% 15/07/2028 Buyer USD 3,030,000 (48,414) (11,179)20-Mar-16 BNP Paribas HJ Heinz 6.375% 15/07/2028 Buyer USD 3,040,000 (48,573) (35,368)20-Mar-16 BNP Paribas HJ Heinz 6.375% 15/07/2028 Buyer USD 3,040,000 (48,573) (34,138)20-Mar-16 BNP Paribas HJ Heinz 6.375% 15/07/2028 Buyer USD 1,520,000 (24,287) (13,800)20-Dec-18 Barclays Bank CDX.EM.20-V1 Buyer USD 67,550,000 (6,954,040) 587,16720-Dec-18 Citigroup CDX.NA.IG.20-V1 Buyer USD 14,910,000 (1,254,481) (1,223,583)20-Dec-18 Citigroup CDX.NA.IG.20-V1 Buyer USD 465,000 (39,124) (17,217)20-Dec-18 Citigroup CDX.NA.IG.21-V1 Buyer USD 388,540,000 (6,846,407) (922,590)20-Dec-18 Barclays Bank Elpasal 7.250% 01/06/2018 Buyer USD 1,800,000 61,013 (21,615)20-Dec-18 Citigroup iTraxx Europe Crossover Series 20 Version 01/12/2018 Buyer EUR 15,010,000 (1,959,307) (959,743)20-Dec-18 Barclays Bank iTraxx Europe Senior Financials Series 20 Version 1.Dec.2018 Buyer EUR 60,230,000 (517,849) (2,094,967)
148
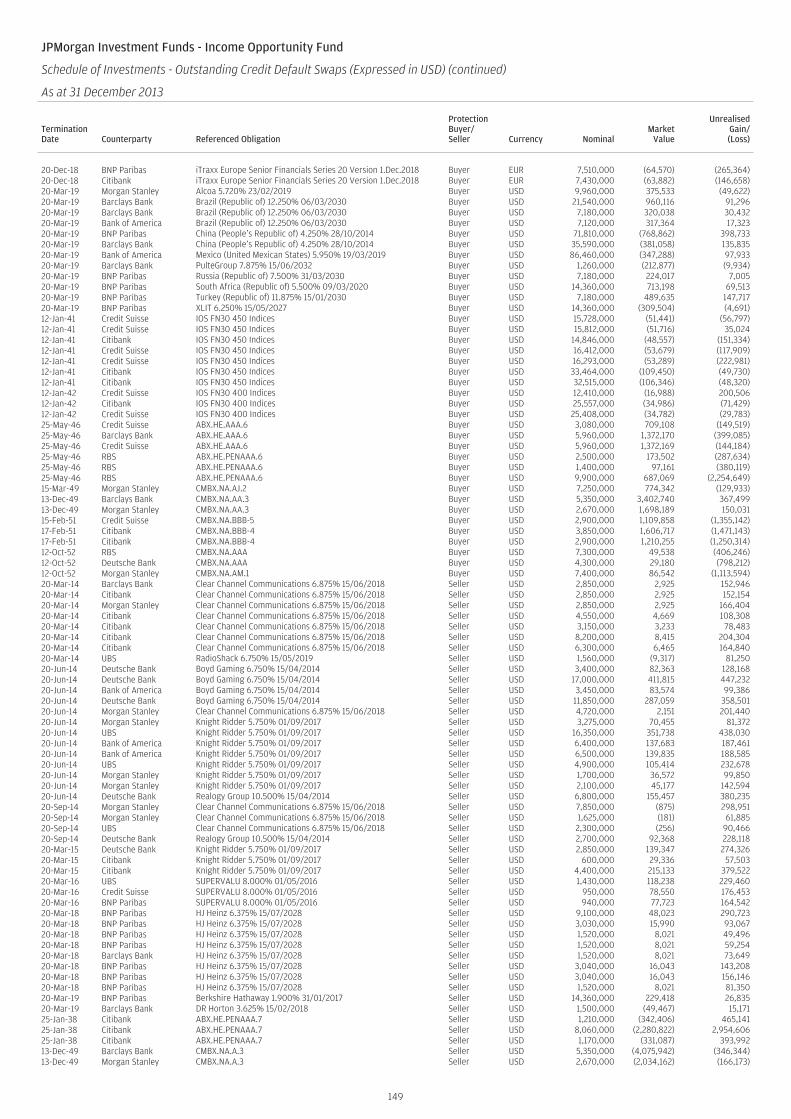
JPMorgan Investment Funds - Income Opportunity Fund
Schedule of Investments - Outstanding Credit Default Swaps (Expressed in USD) (continued)
As at 31 December 2013
TerminationDate Counterparty Referenced Obligation
ProtectionBuyer/Seller Currency Nominal
MarketValue
UnrealisedGain/(Loss)
20-Dec-18 BNP Paribas iTraxx Europe Senior Financials Series 20 Version 1.Dec.2018 Buyer EUR 7,510,000 (64,570) (265,364)20-Dec-18 Citibank iTraxx Europe Senior Financials Series 20 Version 1.Dec.2018 Buyer EUR 7,430,000 (63,882) (146,658)20-Mar-19 Morgan Stanley Alcoa 5.720% 23/02/2019 Buyer USD 9,960,000 375,533 (49,622)20-Mar-19 Barclays Bank Brazil (Republic of) 12.250% 06/03/2030 Buyer USD 21,540,000 960,116 91,29620-Mar-19 Barclays Bank Brazil (Republic of) 12.250% 06/03/2030 Buyer USD 7,180,000 320,038 30,43220-Mar-19 Bank of America Brazil (Republic of) 12.250% 06/03/2030 Buyer USD 7,120,000 317,364 17,32320-Mar-19 BNP Paribas China (People’s Republic of) 4.250% 28/10/2014 Buyer USD 71,810,000 (768,862) 398,73320-Mar-19 Barclays Bank China (People’s Republic of) 4.250% 28/10/2014 Buyer USD 35,590,000 (381,058) 135,83520-Mar-19 Bank of America Mexico (United Mexican States) 5.950% 19/03/2019 Buyer USD 86,460,000 (347,288) 97,93320-Mar-19 Barclays Bank PulteGroup 7.875% 15/06/2032 Buyer USD 1,260,000 (212,877) (9,934)20-Mar-19 BNP Paribas Russia (Republic of) 7.500% 31/03/2030 Buyer USD 7,180,000 224,017 7,00520-Mar-19 BNP Paribas South Africa (Republic of) 5.500% 09/03/2020 Buyer USD 14,360,000 713,198 69,51320-Mar-19 BNP Paribas Turkey (Republic of) 11.875% 15/01/2030 Buyer USD 7,180,000 489,635 147,71720-Mar-19 BNP Paribas XLIT 6.250% 15/05/2027 Buyer USD 14,360,000 (309,504) (4,691)12-Jan-41 Credit Suisse IOS FN30 450 Indices Buyer USD 15,728,000 (51,441) (56,797)12-Jan-41 Credit Suisse IOS FN30 450 Indices Buyer USD 15,812,000 (51,716) 35,02412-Jan-41 Citibank IOS FN30 450 Indices Buyer USD 14,846,000 (48,557) (151,334)12-Jan-41 Credit Suisse IOS FN30 450 Indices Buyer USD 16,412,000 (53,679) (117,909)12-Jan-41 Credit Suisse IOS FN30 450 Indices Buyer USD 16,293,000 (53,289) (222,981)12-Jan-41 Citibank IOS FN30 450 Indices Buyer USD 33,464,000 (109,450) (49,730)12-Jan-41 Citibank IOS FN30 450 Indices Buyer USD 32,515,000 (106,346) (48,320)12-Jan-42 Credit Suisse IOS FN30 400 Indices Buyer USD 12,410,000 (16,988) 200,50612-Jan-42 Citibank IOS FN30 400 Indices Buyer USD 25,557,000 (34,986) (71,429)12-Jan-42 Credit Suisse IOS FN30 400 Indices Buyer USD 25,408,000 (34,782) (29,783)25-May-46 Credit Suisse ABX.HE.AAA.6 Buyer USD 3,080,000 709,108 (149,519)25-May-46 Barclays Bank ABX.HE.AAA.6 Buyer USD 5,960,000 1,372,170 (399,085)25-May-46 Credit Suisse ABX.HE.AAA.6 Buyer USD 5,960,000 1,372,169 (144,184)25-May-46 RBS ABX.HE.PENAAA.6 Buyer USD 2,500,000 173,502 (287,634)25-May-46 RBS ABX.HE.PENAAA.6 Buyer USD 1,400,000 97,161 (380,119)25-May-46 RBS ABX.HE.PENAAA.6 Buyer USD 9,900,000 687,069 (2,254,649)15-Mar-49 Morgan Stanley CMBX.NA.AJ.2 Buyer USD 7,250,000 774,342 (129,933)13-Dec-49 Barclays Bank CMBX.NA.AA.3 Buyer USD 5,350,000 3,402,740 367,49913-Dec-49 Morgan Stanley CMBX.NA.AA.3 Buyer USD 2,670,000 1,698,189 150,03115-Feb-51 Credit Suisse CMBX.NA.BBB-5 Buyer USD 2,900,000 1,109,858 (1,355,142)17-Feb-51 Citibank CMBX.NA.BBB-4 Buyer USD 3,850,000 1,606,717 (1,471,143)17-Feb-51 Citibank CMBX.NA.BBB-4 Buyer USD 2,900,000 1,210,255 (1,250,314)12-Oct-52 RBS CMBX.NA.AAA Buyer USD 7,300,000 49,538 (406,246)12-Oct-52 Deutsche Bank CMBX.NA.AAA Buyer USD 4,300,000 29,180 (798,212)12-Oct-52 Morgan Stanley CMBX.NA.AM.1 Buyer USD 7,400,000 86,542 (1,113,594)20-Mar-14 Barclays Bank Clear Channel Communications 6.875% 15/06/2018 Seller USD 2,850,000 2,925 152,94620-Mar-14 Citibank Clear Channel Communications 6.875% 15/06/2018 Seller USD 2,850,000 2,925 152,15420-Mar-14 Morgan Stanley Clear Channel Communications 6.875% 15/06/2018 Seller USD 2,850,000 2,925 166,40420-Mar-14 Citibank Clear Channel Communications 6.875% 15/06/2018 Seller USD 4,550,000 4,669 108,30820-Mar-14 Citibank Clear Channel Communications 6.875% 15/06/2018 Seller USD 3,150,000 3,233 78,48320-Mar-14 Citibank Clear Channel Communications 6.875% 15/06/2018 Seller USD 8,200,000 8,415 204,30420-Mar-14 Citibank Clear Channel Communications 6.875% 15/06/2018 Seller USD 6,300,000 6,465 164,84020-Mar-14 UBS RadioShack 6.750% 15/05/2019 Seller USD 1,560,000 (9,317) 81,25020-Jun-14 Deutsche Bank Boyd Gaming 6.750% 15/04/2014 Seller USD 3,400,000 82,363 128,16820-Jun-14 Deutsche Bank Boyd Gaming 6.750% 15/04/2014 Seller USD 17,000,000 411,815 447,23220-Jun-14 Bank of America Boyd Gaming 6.750% 15/04/2014 Seller USD 3,450,000 83,574 99,38620-Jun-14 Deutsche Bank Boyd Gaming 6.750% 15/04/2014 Seller USD 11,850,000 287,059 358,50120-Jun-14 Morgan Stanley Clear Channel Communications 6.875% 15/06/2018 Seller USD 4,720,000 2,151 201,44020-Jun-14 Morgan Stanley Knight Ridder 5.750% 01/09/2017 Seller USD 3,275,000 70,455 81,37220-Jun-14 UBS Knight Ridder 5.750% 01/09/2017 Seller USD 16,350,000 351,738 438,03020-Jun-14 Bank of America Knight Ridder 5.750% 01/09/2017 Seller USD 6,400,000 137,683 187,46120-Jun-14 Bank of America Knight Ridder 5.750% 01/09/2017 Seller USD 6,500,000 139,835 188,58520-Jun-14 UBS Knight Ridder 5.750% 01/09/2017 Seller USD 4,900,000 105,414 232,67820-Jun-14 Morgan Stanley Knight Ridder 5.750% 01/09/2017 Seller USD 1,700,000 36,572 99,85020-Jun-14 Morgan Stanley Knight Ridder 5.750% 01/09/2017 Seller USD 2,100,000 45,177 142,59420-Jun-14 Deutsche Bank Realogy Group 10.500% 15/04/2014 Seller USD 6,800,000 155,457 380,23520-Sep-14 Morgan Stanley Clear Channel Communications 6.875% 15/06/2018 Seller USD 7,850,000 (875) 298,95120-Sep-14 Morgan Stanley Clear Channel Communications 6.875% 15/06/2018 Seller USD 1,625,000 (181) 61,88520-Sep-14 UBS Clear Channel Communications 6.875% 15/06/2018 Seller USD 2,300,000 (256) 90,46620-Sep-14 Deutsche Bank Realogy Group 10.500% 15/04/2014 Seller USD 2,700,000 92,368 228,11820-Mar-15 Deutsche Bank Knight Ridder 5.750% 01/09/2017 Seller USD 2,850,000 139,347 274,32620-Mar-15 Citibank Knight Ridder 5.750% 01/09/2017 Seller USD 600,000 29,336 57,50320-Mar-15 Citibank Knight Ridder 5.750% 01/09/2017 Seller USD 4,400,000 215,133 379,52220-Mar-16 UBS SUPERVALU 8.000% 01/05/2016 Seller USD 1,430,000 118,238 229,46020-Mar-16 Credit Suisse SUPERVALU 8.000% 01/05/2016 Seller USD 950,000 78,550 176,45320-Mar-16 BNP Paribas SUPERVALU 8.000% 01/05/2016 Seller USD 940,000 77,723 164,54220-Mar-18 BNP Paribas HJ Heinz 6.375% 15/07/2028 Seller USD 9,100,000 48,023 290,72320-Mar-18 BNP Paribas HJ Heinz 6.375% 15/07/2028 Seller USD 3,030,000 15,990 93,06720-Mar-18 BNP Paribas HJ Heinz 6.375% 15/07/2028 Seller USD 1,520,000 8,021 49,49620-Mar-18 BNP Paribas HJ Heinz 6.375% 15/07/2028 Seller USD 1,520,000 8,021 59,25420-Mar-18 Barclays Bank HJ Heinz 6.375% 15/07/2028 Seller USD 1,520,000 8,021 73,64920-Mar-18 BNP Paribas HJ Heinz 6.375% 15/07/2028 Seller USD 3,040,000 16,043 143,20820-Mar-18 BNP Paribas HJ Heinz 6.375% 15/07/2028 Seller USD 3,040,000 16,043 156,14620-Mar-18 BNP Paribas HJ Heinz 6.375% 15/07/2028 Seller USD 1,520,000 8,021 81,35020-Mar-19 BNP Paribas Berkshire Hathaway 1.900% 31/01/2017 Seller USD 14,360,000 229,418 26,83520-Mar-19 Barclays Bank DR Horton 3.625% 15/02/2018 Seller USD 1,500,000 (49,467) 15,17125-Jan-38 Citibank ABX.HE.PENAAA.7 Seller USD 1,210,000 (342,406) 465,14125-Jan-38 Citibank ABX.HE.PENAAA.7 Seller USD 8,060,000 (2,280,822) 2,954,60625-Jan-38 Citibank ABX.HE.PENAAA.7 Seller USD 1,170,000 (331,087) 393,99213-Dec-49 Barclays Bank CMBX.NA.A.3 Seller USD 5,350,000 (4,075,942) (346,344)13-Dec-49 Morgan Stanley CMBX.NA.A.3 Seller USD 2,670,000 (2,034,162) (166,173)
149
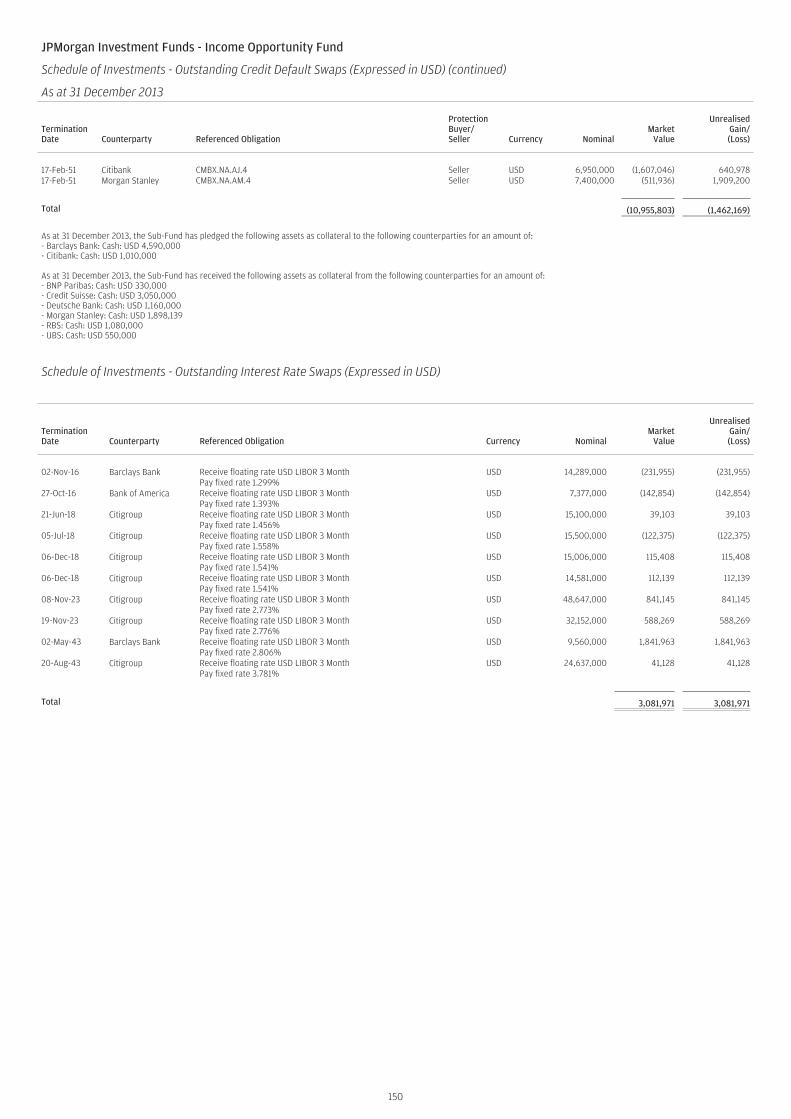
JPMorgan Investment Funds - Income Opportunity Fund
Schedule of Investments - Outstanding Credit Default Swaps (Expressed in USD) (continued)
As at 31 December 2013
TerminationDate Counterparty Referenced Obligation
ProtectionBuyer/Seller Currency Nominal
MarketValue
UnrealisedGain/(Loss)
17-Feb-51 Citibank CMBX.NA.AJ.4 Seller USD 6,950,000 (1,607,046) 640,97817-Feb-51 Morgan Stanley CMBX.NA.AM.4 Seller USD 7,400,000 (511,936) 1,909,200
Total (10,955,803) (1,462,169)
As at 31 December 2013, the Sub-Fund has pledged the following assets as collateral to the following counterparties for an amount of:- Barclays Bank: Cash: USD 4,590,000- Citibank: Cash: USD 1,010,000
As at 31 December 2013, the Sub-Fund has received the following assets as collateral from the following counterparties for an amount of:- BNP Paribas: Cash: USD 330,000- Credit Suisse: Cash: USD 3,050,000- Deutsche Bank: Cash: USD 1,160,000- Morgan Stanley: Cash: USD 1,898,139- RBS: Cash: USD 1,080,000- UBS: Cash: USD 550,000
Schedule of Investments - Outstanding Interest Rate Swaps (Expressed in USD)
TerminationDate Counterparty Referenced Obligation Currency Nominal
MarketValue
UnrealisedGain/(Loss)
02-Nov-16 Barclays Bank Receive floating rate USD LIBOR 3 Month USD 14,289,000 (231,955) (231,955)Pay fixed rate 1.299%
27-Oct-16 Bank of America Receive floating rate USD LIBOR 3 Month USD 7,377,000 (142,854) (142,854)Pay fixed rate 1.393%
21-Jun-18 Citigroup Receive floating rate USD LIBOR 3 Month USD 15,100,000 39,103 39,103Pay fixed rate 1.456%
05-Jul-18 Citigroup Receive floating rate USD LIBOR 3 Month USD 15,500,000 (122,375) (122,375)Pay fixed rate 1.558%
06-Dec-18 Citigroup Receive floating rate USD LIBOR 3 Month USD 15,006,000 115,408 115,408Pay fixed rate 1.541%
06-Dec-18 Citigroup Receive floating rate USD LIBOR 3 Month USD 14,581,000 112,139 112,139Pay fixed rate 1.541%
08-Nov-23 Citigroup Receive floating rate USD LIBOR 3 Month USD 48,647,000 841,145 841,145Pay fixed rate 2.773%
19-Nov-23 Citigroup Receive floating rate USD LIBOR 3 Month USD 32,152,000 588,269 588,269Pay fixed rate 2.776%
02-May-43 Barclays Bank Receive floating rate USD LIBOR 3 Month USD 9,560,000 1,841,963 1,841,963Pay fixed rate 2.806%
20-Aug-43 Citigroup Receive floating rate USD LIBOR 3 Month USD 24,637,000 41,128 41,128Pay fixed rate 3.781%
Total 3,081,971 3,081,971
150
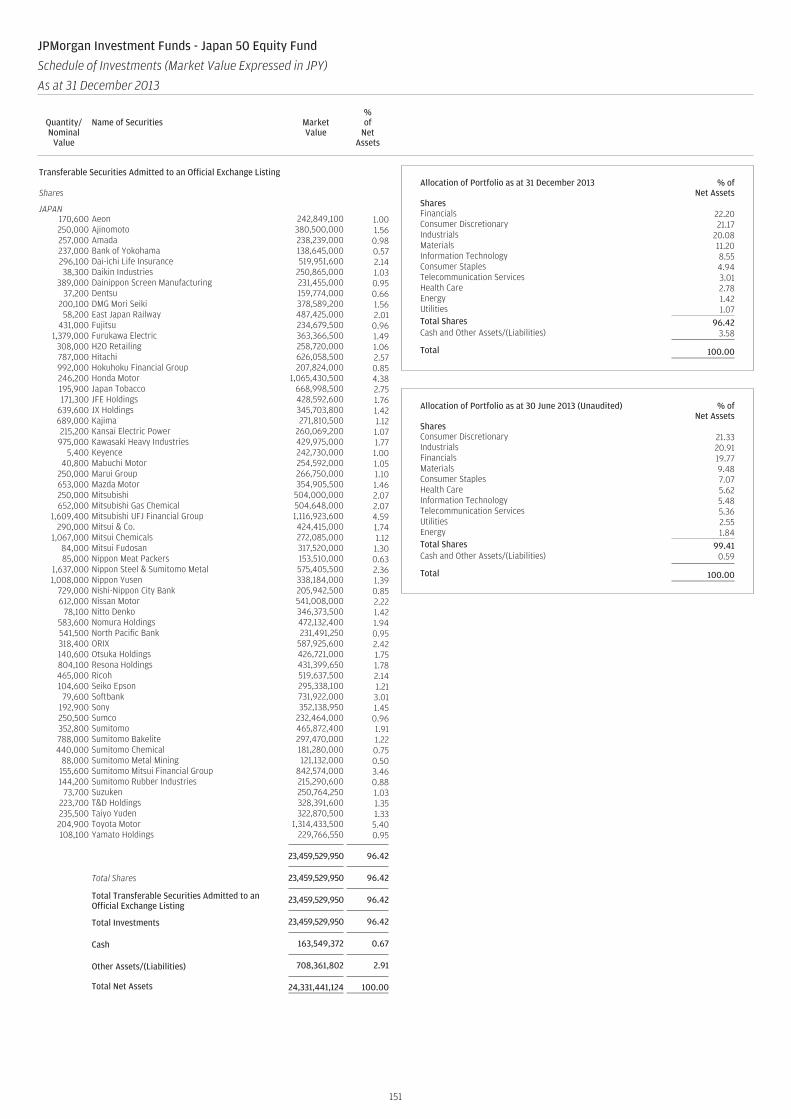
Transferable Securities Admitted to an Official Exchange Listing
Shares
JAPAN170,600 Aeon 242,849,100 1.00250,000 Ajinomoto 380,500,000 1.56257,000 Amada 238,239,000 0.98237,000 Bank of Yokohama 138,645,000 0.57296,100 Dai-ichi Life Insurance 519,951,600 2.1438,300 Daikin Industries 250,865,000 1.03
389,000 Dainippon Screen Manufacturing 231,455,000 0.9537,200 Dentsu 159,774,000 0.66
200,100 DMG Mori Seiki 378,589,200 1.5658,200 East Japan Railway 487,425,000 2.01
431,000 Fujitsu 234,679,500 0.961,379,000 Furukawa Electric 363,366,500 1.49
308,000 H2O Retailing 258,720,000 1.06787,000 Hitachi 626,058,500 2.57992,000 Hokuhoku Financial Group 207,824,000 0.85246,200 Honda Motor 1,065,430,500 4.38195,900 Japan Tobacco 668,998,500 2.75171,300 JFE Holdings 428,592,600 1.76
639,600 JX Holdings 345,703,800 1.42689,000 Kajima 271,810,500 1.12215,200 Kansai Electric Power 260,069,200 1.07975,000 Kawasaki Heavy Industries 429,975,000 1.77
5,400 Keyence 242,730,000 1.0040,800 Mabuchi Motor 254,592,000 1.05
250,000 Marui Group 266,750,000 1.10653,000 Mazda Motor 354,905,500 1.46250,000 Mitsubishi 504,000,000 2.07652,000 Mitsubishi Gas Chemical 504,648,000 2.07
1,609,400 Mitsubishi UFJ Financial Group 1,116,923,600 4.59290,000 Mitsui & Co. 424,415,000 1.74
1,067,000 Mitsui Chemicals 272,085,000 1.1284,000 Mitsui Fudosan 317,520,000 1.3085,000 Nippon Meat Packers 153,510,000 0.63
1,637,000 Nippon Steel & Sumitomo Metal 575,405,500 2.361,008,000 Nippon Yusen 338,184,000 1.39
729,000 Nishi-Nippon City Bank 205,942,500 0.85612,000 Nissan Motor 541,008,000 2.22
78,100 Nitto Denko 346,373,500 1.42583,600 Nomura Holdings 472,132,400 1.94541,500 North Pacific Bank 231,491,250 0.95318,400 ORIX 587,925,600 2.42140,600 Otsuka Holdings 426,721,000 1.75804,100 Resona Holdings 431,399,650 1.78465,000 Ricoh 519,637,500 2.14104,600 Seiko Epson 295,338,100 1.21
79,600 Softbank 731,922,000 3.01192,900 Sony 352,138,950 1.45250,500 Sumco 232,464,000 0.96352,800 Sumitomo 465,872,400 1.91788,000 Sumitomo Bakelite 297,470,000 1.22440,000 Sumitomo Chemical 181,280,000 0.75
88,000 Sumitomo Metal Mining 121,132,000 0.50155,600 Sumitomo Mitsui Financial Group 842,574,000 3.46144,200 Sumitomo Rubber Industries 215,290,600 0.88
73,700 Suzuken 250,764,250 1.03223,700 T&D Holdings 328,391,600 1.35235,500 Taiyo Yuden 322,870,500 1.33204,900 Toyota Motor 1,314,433,500 5.40108,100 Yamato Holdings 229,766,550 0.95
23,459,529,950 96.42
Total Shares 23,459,529,950 96.42
Total Transferable Securities Admitted to anOfficial Exchange Listing
23,459,529,950 96.42
Total Investments 23,459,529,950 96.42
Cash 163,549,372 0.67
Other Assets/(Liabilities) 708,361,802 2.91
Total Net Assets 24,331,441,124 100.00
Allocation of Portfolio as at 31 December 2013 % ofNet Assets
SharesFinancials 22.20Consumer Discretionary 21.17Industrials 20.08Materials 11.20Information Technology 8.55Consumer Staples 4.94Telecommunication Services 3.01Health Care 2.78Energy 1.42Utilities 1.07Total Shares 96.42Cash and Other Assets/(Liabilities) 3.58
Total 100.00
Allocation of Portfolio as at 30 June 2013 (Unaudited) % ofNet Assets
SharesConsumer Discretionary 21.33Industrials 20.91Financials 19.77Materials 9.48Consumer Staples 7.07Health Care 5.62Information Technology 5.48Telecommunication Services 5.36Utilities 2.55Energy 1.84Total Shares 99.41Cash and Other Assets/(Liabilities) 0.59
Total 100.00
151
JPMorgan Investment Funds - Japan 50 Equity Fund
Schedule of Investments (Market Value Expressed in JPY)
As at 31 December 2013
Quantity/Nominal
Value
Name of Securities MarketValue
%of
NetAssets
Quantity/Nominal
Value
Name of Securities MarketValue
%of
NetAssets
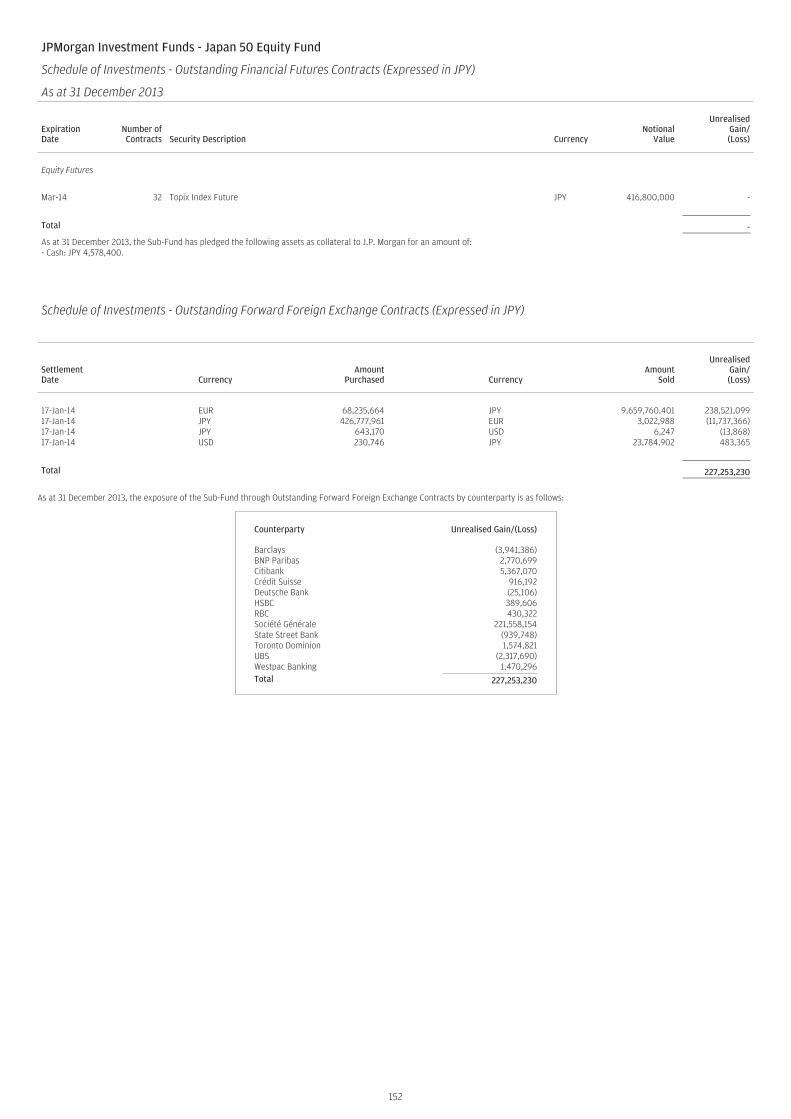
JPMorgan Investment Funds - Japan 50 Equity Fund
Schedule of Investments - Outstanding Financial Futures Contracts (Expressed in JPY)
As at 31 December 2013
ExpirationDate
Number ofContracts Security Description Currency
NotionalValue
UnrealisedGain/(Loss)
Equity Futures
Mar-14 32 Topix Index Future JPY 416,800,000 -
Total -
As at 31 December 2013, the Sub-Fund has pledged the following assets as collateral to J.P. Morgan for an amount of:- Cash: JPY 4,578,400.
Schedule of Investments - Outstanding Forward Foreign Exchange Contracts (Expressed in JPY)
SettlementDate Currency
AmountPurchased Currency
AmountSold
UnrealisedGain/(Loss)
17-Jan-14 EUR 68,235,664 JPY 9,659,760,401 238,521,09917-Jan-14 JPY 426,777,961 EUR 3,022,988 (11,737,366)17-Jan-14 JPY 643,170 USD 6,247 (13,868)17-Jan-14 USD 230,746 JPY 23,784,902 483,365
Total 227,253,230
As at 31 December 2013, the exposure of the Sub-Fund through Outstanding Forward Foreign Exchange Contracts by counterparty is as follows:
Counterparty Unrealised Gain/(Loss)
Barclays (3,941,386)BNP Paribas 2,770,699Citibank 5,367,070Crédit Suisse 916,192Deutsche Bank (25,106)HSBC 389,606RBC 430,322Société Générale 221,558,154State Street Bank (939,748)Toronto Dominion 1,574,821UBS (2,317,690)Westpac Banking 1,470,296Total 227,253,230
152
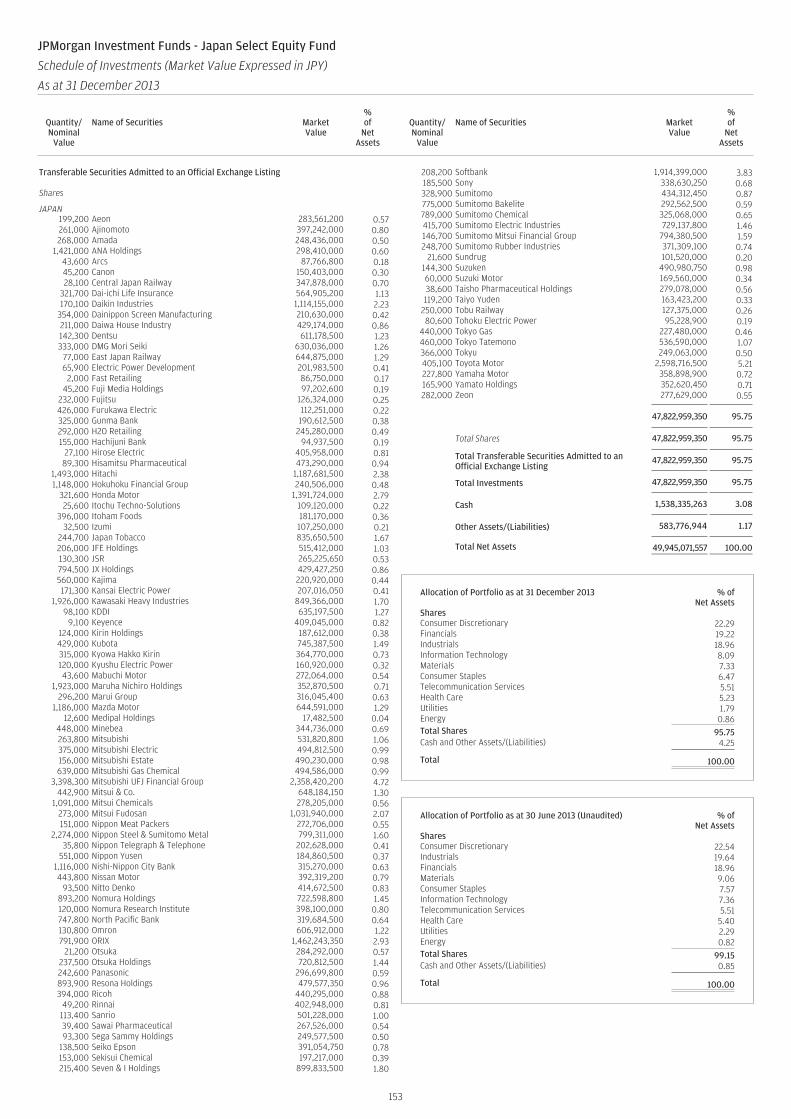
Transferable Securities Admitted to an Official Exchange Listing
Shares
JAPAN199,200 Aeon 283,561,200 0.57261,000 Ajinomoto 397,242,000 0.80268,000 Amada 248,436,000 0.50
1,421,000 ANA Holdings 298,410,000 0.6043,600 Arcs 87,766,800 0.1845,200 Canon 150,403,000 0.3028,100 Central Japan Railway 347,878,000 0.70
321,700 Dai-ichi Life Insurance 564,905,200 1.13170,100 Daikin Industries 1,114,155,000 2.23
354,000 Dainippon Screen Manufacturing 210,630,000 0.42211,000 Daiwa House Industry 429,174,000 0.86142,300 Dentsu 611,178,500 1.23333,000 DMG Mori Seiki 630,036,000 1.26
77,000 East Japan Railway 644,875,000 1.2965,900 Electric Power Development 201,983,500 0.41
2,000 Fast Retailing 86,750,000 0.1745,200 Fuji Media Holdings 97,202,600 0.19
232,000 Fujitsu 126,324,000 0.25426,000 Furukawa Electric 112,251,000 0.22325,000 Gunma Bank 190,612,500 0.38292,000 H2O Retailing 245,280,000 0.49155,000 Hachijuni Bank 94,937,500 0.19
27,100 Hirose Electric 405,958,000 0.8189,300 Hisamitsu Pharmaceutical 473,290,000 0.94
1,493,000 Hitachi 1,187,681,500 2.381,148,000 Hokuhoku Financial Group 240,506,000 0.48
321,600 Honda Motor 1,391,724,000 2.7925,600 Itochu Techno-Solutions 109,120,000 0.22
396,000 Itoham Foods 181,170,000 0.3632,500 Izumi 107,250,000 0.21
244,700 Japan Tobacco 835,650,500 1.67206,000 JFE Holdings 515,412,000 1.03130,300 JSR 265,225,650 0.53794,500 JX Holdings 429,427,250 0.86560,000 Kajima 220,920,000 0.44171,300 Kansai Electric Power 207,016,050 0.41
1,926,000 Kawasaki Heavy Industries 849,366,000 1.7098,100 KDDI 635,197,500 1.27
9,100 Keyence 409,045,000 0.82124,000 Kirin Holdings 187,612,000 0.38429,000 Kubota 745,387,500 1.49315,000 Kyowa Hakko Kirin 364,770,000 0.73120,000 Kyushu Electric Power 160,920,000 0.3243,600 Mabuchi Motor 272,064,000 0.54
1,923,000 Maruha Nichiro Holdings 352,870,500 0.71296,200 Marui Group 316,045,400 0.63
1,186,000 Mazda Motor 644,591,000 1.2912,600 Medipal Holdings 17,482,500 0.04
448,000 Minebea 344,736,000 0.69263,800 Mitsubishi 531,820,800 1.06375,000 Mitsubishi Electric 494,812,500 0.99156,000 Mitsubishi Estate 490,230,000 0.98639,000 Mitsubishi Gas Chemical 494,586,000 0.99
3,398,300 Mitsubishi UFJ Financial Group 2,358,420,200 4.72442,900 Mitsui & Co. 648,184,150 1.30
1,091,000 Mitsui Chemicals 278,205,000 0.56273,000 Mitsui Fudosan 1,031,940,000 2.07151,000 Nippon Meat Packers 272,706,000 0.55
2,274,000 Nippon Steel & Sumitomo Metal 799,311,000 1.6035,800 Nippon Telegraph & Telephone 202,628,000 0.41
551,000 Nippon Yusen 184,860,500 0.371,116,000 Nishi-Nippon City Bank 315,270,000 0.63443,800 Nissan Motor 392,319,200 0.79
93,500 Nitto Denko 414,672,500 0.83893,200 Nomura Holdings 722,598,800 1.45120,000 Nomura Research Institute 398,100,000 0.80747,800 North Pacific Bank 319,684,500 0.64130,800 Omron 606,912,000 1.22791,900 ORIX 1,462,243,350 2.93
21,200 Otsuka 284,292,000 0.57237,500 Otsuka Holdings 720,812,500 1.44242,600 Panasonic 296,699,800 0.59893,900 Resona Holdings 479,577,350 0.96394,000 Ricoh 440,295,000 0.88
49,200 Rinnai 402,948,000 0.81113,400 Sanrio 501,228,000 1.0039,400 Sawai Pharmaceutical 267,526,000 0.5493,300 Sega Sammy Holdings 249,577,500 0.50
138,500 Seiko Epson 391,054,750 0.78153,000 Sekisui Chemical 197,217,000 0.39215,400 Seven & I Holdings 899,833,500 1.80
208,200 Softbank 1,914,399,000 3.83185,500 Sony 338,630,250 0.68328,900 Sumitomo 434,312,450 0.87775,000 Sumitomo Bakelite 292,562,500 0.59789,000 Sumitomo Chemical 325,068,000 0.65415,700 Sumitomo Electric Industries 729,137,800 1.46146,700 Sumitomo Mitsui Financial Group 794,380,500 1.59248,700 Sumitomo Rubber Industries 371,309,100 0.74
21,600 Sundrug 101,520,000 0.20144,300 Suzuken 490,980,750 0.9860,000 Suzuki Motor 169,560,000 0.3438,600 Taisho Pharmaceutical Holdings 279,078,000 0.56119,200 Taiyo Yuden 163,423,200 0.33
250,000 Tobu Railway 127,375,000 0.2680,600 Tohoku Electric Power 95,228,900 0.19
440,000 Tokyo Gas 227,480,000 0.46460,000 Tokyo Tatemono 536,590,000 1.07366,000 Tokyu 249,063,000 0.50405,100 Toyota Motor 2,598,716,500 5.21227,800 Yamaha Motor 358,898,900 0.72165,900 Yamato Holdings 352,620,450 0.71282,000 Zeon 277,629,000 0.55
47,822,959,350 95.75
Total Shares 47,822,959,350 95.75
Total Transferable Securities Admitted to anOfficial Exchange Listing
47,822,959,350 95.75
Total Investments 47,822,959,350 95.75
Cash 1,538,335,263 3.08
Other Assets/(Liabilities) 583,776,944 1.17
Total Net Assets 49,945,071,557 100.00
Allocation of Portfolio as at 31 December 2013 % ofNet Assets
SharesConsumer Discretionary 22.29Financials 19.22Industrials 18.96Information Technology 8.09Materials 7.33Consumer Staples 6.47Telecommunication Services 5.51Health Care 5.23Utilities 1.79Energy 0.86Total Shares 95.75Cash and Other Assets/(Liabilities) 4.25
Total 100.00
Allocation of Portfolio as at 30 June 2013 (Unaudited) % ofNet Assets
SharesConsumer Discretionary 22.54Industrials 19.64Financials 18.96Materials 9.06Consumer Staples 7.57Information Technology 7.36Telecommunication Services 5.51Health Care 5.40Utilities 2.29Energy 0.82Total Shares 99.15Cash and Other Assets/(Liabilities) 0.85
Total 100.00
153
JPMorgan Investment Funds - Japan Select Equity Fund
Schedule of Investments (Market Value Expressed in JPY)
As at 31 December 2013
Quantity/Nominal
Value
Name of Securities MarketValue
%of
NetAssets
Quantity/Nominal
Value
Name of Securities MarketValue
%of
NetAssets
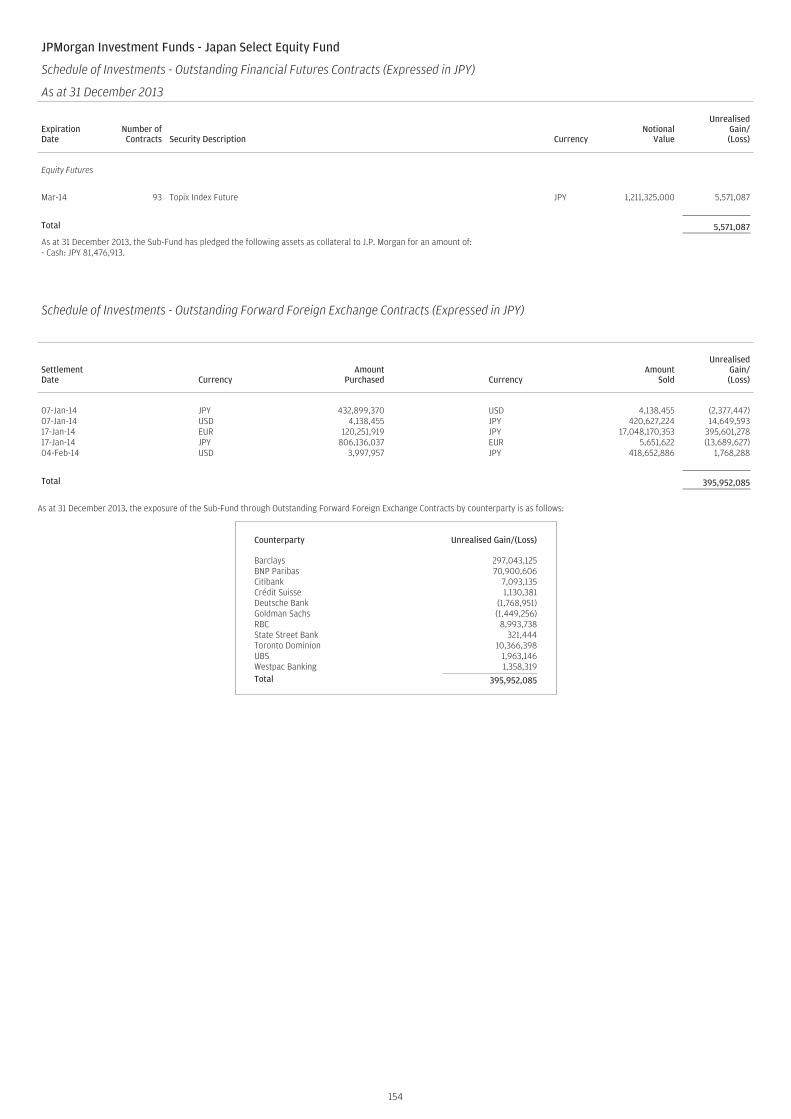
JPMorgan Investment Funds - Japan Select Equity Fund
Schedule of Investments - Outstanding Financial Futures Contracts (Expressed in JPY)
As at 31 December 2013
ExpirationDate
Number ofContracts Security Description Currency
NotionalValue
UnrealisedGain/(Loss)
Equity Futures
Mar-14 93 Topix Index Future JPY 1,211,325,000 5,571,087
Total 5,571,087
As at 31 December 2013, the Sub-Fund has pledged the following assets as collateral to J.P. Morgan for an amount of:- Cash: JPY 81,476,913.
Schedule of Investments - Outstanding Forward Foreign Exchange Contracts (Expressed in JPY)
SettlementDate Currency
AmountPurchased Currency
AmountSold
UnrealisedGain/(Loss)
07-Jan-14 JPY 432,899,370 USD 4,138,455 (2,377,447)07-Jan-14 USD 4,138,455 JPY 420,627,224 14,649,59317-Jan-14 EUR 120,251,919 JPY 17,048,170,353 395,601,27817-Jan-14 JPY 806,136,037 EUR 5,651,622 (13,689,627)04-Feb-14 USD 3,997,957 JPY 418,652,886 1,768,288
Total 395,952,085
As at 31 December 2013, the exposure of the Sub-Fund through Outstanding Forward Foreign Exchange Contracts by counterparty is as follows:
Counterparty Unrealised Gain/(Loss)
Barclays 297,043,125BNP Paribas 70,900,606Citibank 7,093,135Crédit Suisse 1,130,381Deutsche Bank (1,768,951)Goldman Sachs (1,449,256)RBC 8,993,738State Street Bank 321,444Toronto Dominion 10,366,398UBS 1,963,146Westpac Banking 1,358,319Total 395,952,085
154
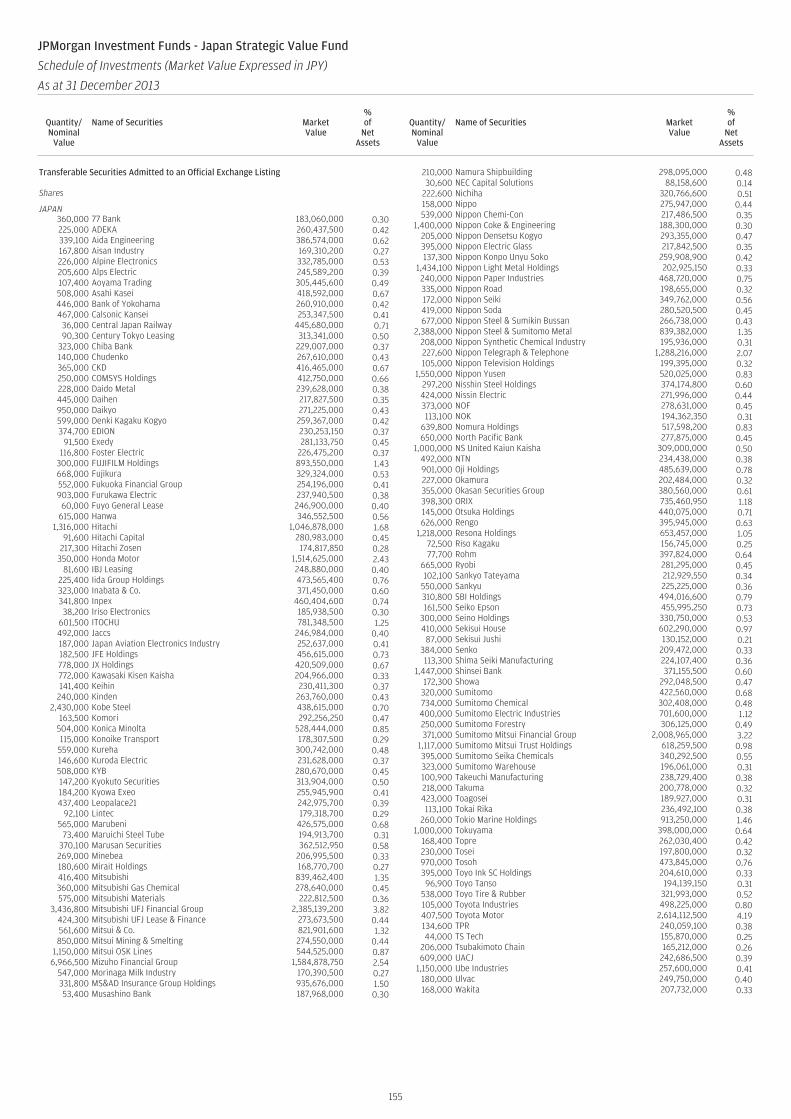
Transferable Securities Admitted to an Official Exchange Listing
Shares
JAPAN360,000 77 Bank 183,060,000 0.30225,000 ADEKA 260,437,500 0.42339,100 Aida Engineering 386,574,000 0.62167,800 Aisan Industry 169,310,200 0.27226,000 Alpine Electronics 332,785,000 0.53205,600 Alps Electric 245,589,200 0.39107,400 Aoyama Trading 305,445,600 0.49508,000 Asahi Kasei 418,592,000 0.67446,000 Bank of Yokohama 260,910,000 0.42467,000 Calsonic Kansei 253,347,500 0.41
36,000 Central Japan Railway 445,680,000 0.7190,300 Century Tokyo Leasing 313,341,000 0.50
323,000 Chiba Bank 229,007,000 0.37140,000 Chudenko 267,610,000 0.43365,000 CKD 416,465,000 0.67250,000 COMSYS Holdings 412,750,000 0.66228,000 Daido Metal 239,628,000 0.38445,000 Daihen 217,827,500 0.35950,000 Daikyo 271,225,000 0.43599,000 Denki Kagaku Kogyo 259,367,000 0.42374,700 EDION 230,253,150 0.37
91,500 Exedy 281,133,750 0.45116,800 Foster Electric 226,475,200 0.37
300,000 FUJIFILM Holdings 893,550,000 1.43668,000 Fujikura 329,324,000 0.53552,000 Fukuoka Financial Group 254,196,000 0.41903,000 Furukawa Electric 237,940,500 0.38
60,000 Fuyo General Lease 246,900,000 0.40615,000 Hanwa 346,552,500 0.56
1,316,000 Hitachi 1,046,878,000 1.6891,600 Hitachi Capital 280,983,000 0.45
217,300 Hitachi Zosen 174,817,850 0.28350,000 Honda Motor 1,514,625,000 2.43
81,600 IBJ Leasing 248,880,000 0.40225,400 Iida Group Holdings 473,565,400 0.76323,000 Inabata & Co. 371,450,000 0.60341,800 Inpex 460,404,600 0.7438,200 Iriso Electronics 185,938,500 0.30
601,500 ITOCHU 781,348,500 1.25492,000 Jaccs 246,984,000 0.40187,000 Japan Aviation Electronics Industry 252,637,000 0.41182,500 JFE Holdings 456,615,000 0.73778,000 JX Holdings 420,509,000 0.67772,000 Kawasaki Kisen Kaisha 204,966,000 0.33141,400 Keihin 230,411,300 0.37
240,000 Kinden 263,760,000 0.432,430,000 Kobe Steel 438,615,000 0.70
163,500 Komori 292,256,250 0.47504,000 Konica Minolta 528,444,000 0.85115,000 Konoike Transport 178,307,500 0.29
559,000 Kureha 300,742,000 0.48146,600 Kuroda Electric 231,628,000 0.37508,000 KYB 280,670,000 0.45147,200 Kyokuto Securities 313,904,000 0.50184,200 Kyowa Exeo 255,945,900 0.41437,400 Leopalace21 242,975,700 0.39
92,100 Lintec 179,318,700 0.29565,000 Marubeni 426,575,000 0.68
73,400 Maruichi Steel Tube 194,913,700 0.31370,100 Marusan Securities 362,512,950 0.58269,000 Minebea 206,995,500 0.33180,600 Mirait Holdings 168,770,700 0.27416,400 Mitsubishi 839,462,400 1.35360,000 Mitsubishi Gas Chemical 278,640,000 0.45575,000 Mitsubishi Materials 222,812,500 0.36
3,436,800 Mitsubishi UFJ Financial Group 2,385,139,200 3.82424,300 Mitsubishi UFJ Lease & Finance 273,673,500 0.44561,600 Mitsui & Co. 821,901,600 1.32850,000 Mitsui Mining & Smelting 274,550,000 0.44
1,150,000 Mitsui OSK Lines 544,525,000 0.876,966,500 Mizuho Financial Group 1,584,878,750 2.54
547,000 Morinaga Milk Industry 170,390,500 0.27331,800 MS&AD Insurance Group Holdings 935,676,000 1.5053,400 Musashino Bank 187,968,000 0.30
210,000 Namura Shipbuilding 298,095,000 0.4830,600 NEC Capital Solutions 88,158,600 0.14
222,600 Nichiha 320,766,600 0.51158,000 Nippo 275,947,000 0.44539,000 Nippon Chemi-Con 217,486,500 0.35
1,400,000 Nippon Coke & Engineering 188,300,000 0.30205,000 Nippon Densetsu Kogyo 293,355,000 0.47395,000 Nippon Electric Glass 217,842,500 0.35137,300 Nippon Konpo Unyu Soko 259,908,900 0.42
1,434,100 Nippon Light Metal Holdings 202,925,150 0.33240,000 Nippon Paper Industries 468,720,000 0.75335,000 Nippon Road 198,655,000 0.32172,000 Nippon Seiki 349,762,000 0.56419,000 Nippon Soda 280,520,500 0.45677,000 Nippon Steel & Sumikin Bussan 266,738,000 0.43
2,388,000 Nippon Steel & Sumitomo Metal 839,382,000 1.35208,000 Nippon Synthetic Chemical Industry 195,936,000 0.31227,600 Nippon Telegraph & Telephone 1,288,216,000 2.07105,000 Nippon Television Holdings 199,395,000 0.32
1,550,000 Nippon Yusen 520,025,000 0.83297,200 Nisshin Steel Holdings 374,174,800 0.60424,000 Nissin Electric 271,996,000 0.44373,000 NOF 278,631,000 0.45113,100 NOK 194,362,350 0.31
639,800 Nomura Holdings 517,598,200 0.83650,000 North Pacific Bank 277,875,000 0.45
1,000,000 NS United Kaiun Kaisha 309,000,000 0.50492,000 NTN 234,438,000 0.38901,000 Oji Holdings 485,639,000 0.78227,000 Okamura 202,484,000 0.32355,000 Okasan Securities Group 380,560,000 0.61398,300 ORIX 735,460,950 1.18145,000 Otsuka Holdings 440,075,000 0.71626,000 Rengo 395,945,000 0.63
1,218,000 Resona Holdings 653,457,000 1.0572,500 Riso Kagaku 156,745,000 0.2577,700 Rohm 397,824,000 0.64
665,000 Ryobi 281,295,000 0.45102,100 Sankyo Tateyama 212,929,550 0.34
550,000 Sankyu 225,225,000 0.36310,800 SBI Holdings 494,016,600 0.79161,500 Seiko Epson 455,995,250 0.73
300,000 Seino Holdings 330,750,000 0.53410,000 Sekisui House 602,290,000 0.97
87,000 Sekisui Jushi 130,152,000 0.21384,000 Senko 209,472,000 0.33113,300 Shima Seiki Manufacturing 224,107,400 0.36
1,447,000 Shinsei Bank 371,155,500 0.60172,300 Showa 292,048,500 0.47
320,000 Sumitomo 422,560,000 0.68734,000 Sumitomo Chemical 302,408,000 0.48400,000 Sumitomo Electric Industries 701,600,000 1.12250,000 Sumitomo Forestry 306,125,000 0.49371,000 Sumitomo Mitsui Financial Group 2,008,965,000 3.22
1,117,000 Sumitomo Mitsui Trust Holdings 618,259,500 0.98395,000 Sumitomo Seika Chemicals 340,292,500 0.55323,000 Sumitomo Warehouse 196,061,000 0.31100,900 Takeuchi Manufacturing 238,729,400 0.38218,000 Takuma 200,778,000 0.32423,000 Toagosei 189,927,000 0.31113,100 Tokai Rika 236,492,100 0.38
260,000 Tokio Marine Holdings 913,250,000 1.461,000,000 Tokuyama 398,000,000 0.64
168,400 Topre 262,030,400 0.42230,000 Tosei 197,800,000 0.32970,000 Tosoh 473,845,000 0.76395,000 Toyo Ink SC Holdings 204,610,000 0.3396,900 Toyo Tanso 194,139,150 0.31
538,000 Toyo Tire & Rubber 321,993,000 0.52105,000 Toyota Industries 498,225,000 0.80407,500 Toyota Motor 2,614,112,500 4.19134,600 TPR 240,059,100 0.3844,000 TS Tech 155,870,000 0.25
206,000 Tsubakimoto Chain 165,212,000 0.26609,000 UACJ 242,686,500 0.39
1,150,000 Ube Industries 257,600,000 0.41180,000 Ulvac 249,750,000 0.40168,000 Wakita 207,732,000 0.33
155
JPMorgan Investment Funds - Japan Strategic Value Fund
Schedule of Investments (Market Value Expressed in JPY)
As at 31 December 2013
Quantity/Nominal
Value
Name of Securities MarketValue
%of
NetAssets
Quantity/Nominal
Value
Name of Securities MarketValue
%of
NetAssets
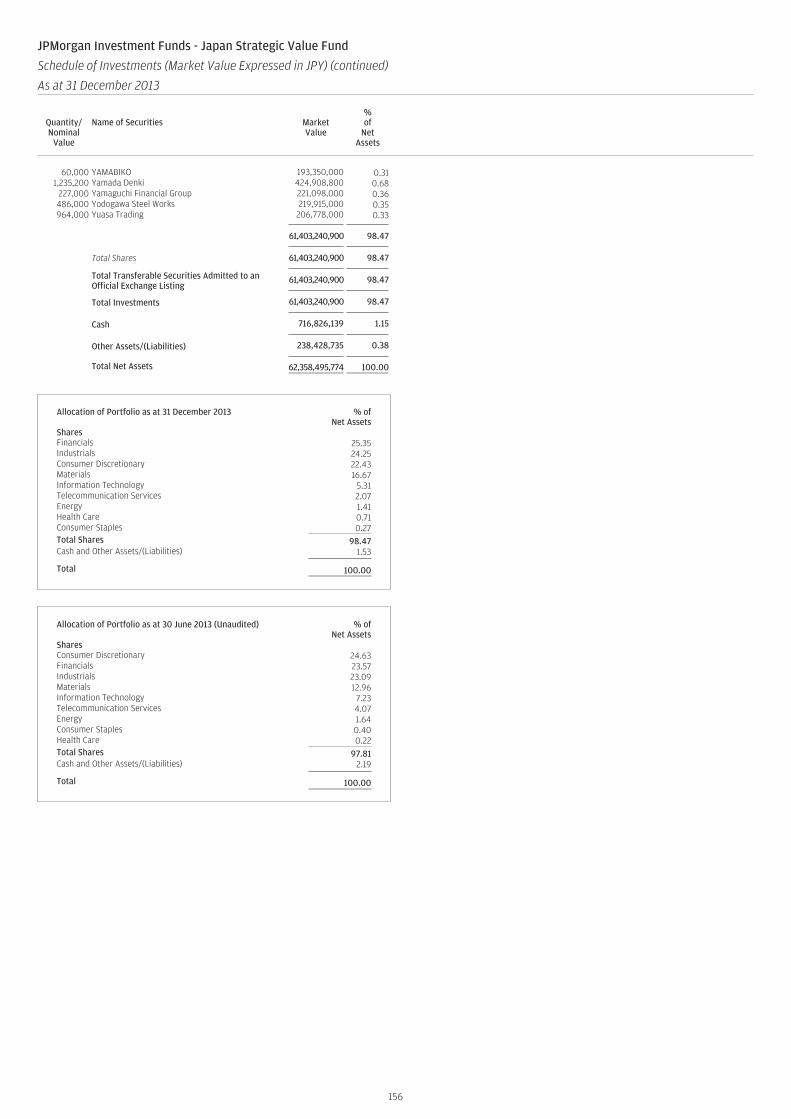
60,000 YAMABIKO 193,350,000 0.311,235,200 Yamada Denki 424,908,800 0.68
227,000 Yamaguchi Financial Group 221,098,000 0.36486,000 Yodogawa Steel Works 219,915,000 0.35964,000 Yuasa Trading 206,778,000 0.33
61,403,240,900 98.47
Total Shares 61,403,240,900 98.47
Total Transferable Securities Admitted to anOfficial Exchange Listing
61,403,240,900 98.47
Total Investments 61,403,240,900 98.47
Cash 716,826,139 1.15
Other Assets/(Liabilities) 238,428,735 0.38
Total Net Assets 62,358,495,774 100.00
Allocation of Portfolio as at 31 December 2013 % ofNet Assets
SharesFinancials 25.35Industrials 24.25Consumer Discretionary 22.43Materials 16.67Information Technology 5.31Telecommunication Services 2.07Energy 1.41Health Care 0.71Consumer Staples 0.27Total Shares 98.47Cash and Other Assets/(Liabilities) 1.53
Total 100.00
Allocation of Portfolio as at 30 June 2013 (Unaudited) % ofNet Assets
SharesConsumer Discretionary 24.63Financials 23.57Industrials 23.09Materials 12.96Information Technology 7.23Telecommunication Services 4.07Energy 1.64Consumer Staples 0.40Health Care 0.22Total Shares 97.81Cash and Other Assets/(Liabilities) 2.19
Total 100.00
156
JPMorgan Investment Funds - Japan Strategic Value Fund
Schedule of Investments (Market Value Expressed in JPY) (continued)
As at 31 December 2013
Quantity/Nominal
Value
Name of Securities MarketValue
%of
NetAssets
Quantity/Nominal
Value
Name of Securities MarketValue
%of
NetAssets
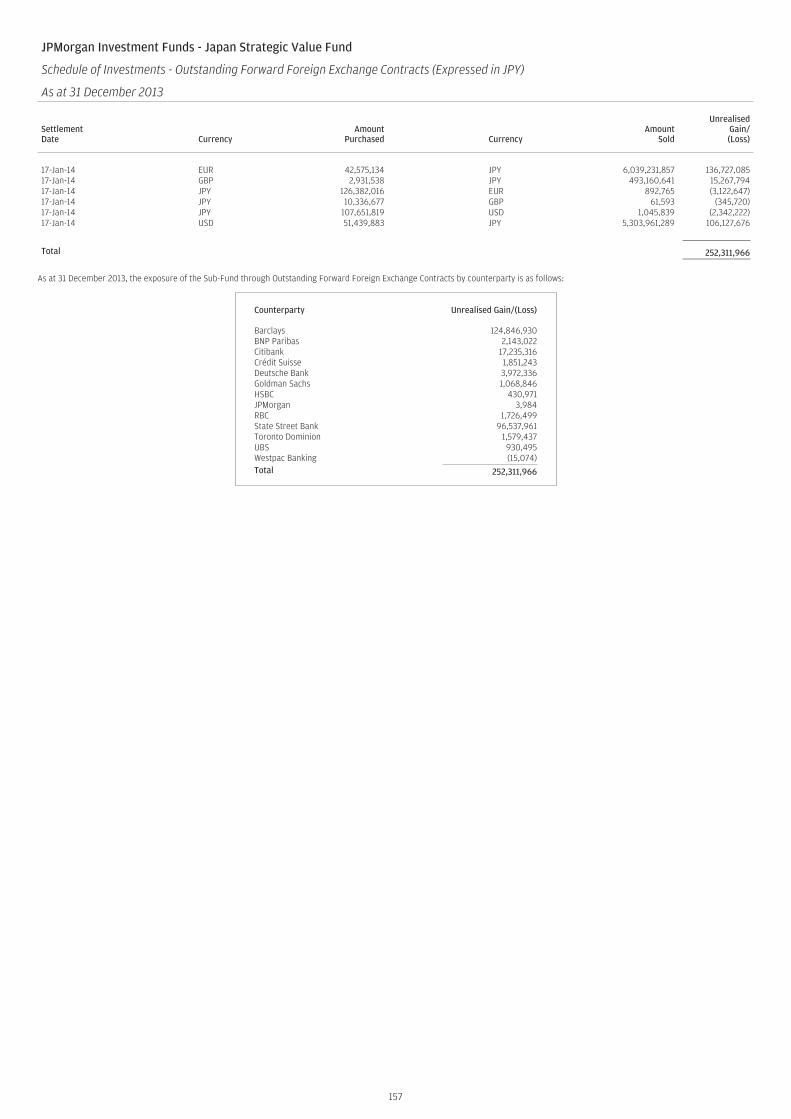
157
JPMorgan Investment Funds - Japan Strategic Value Fund
Schedule of Investments - Outstanding Forward Foreign Exchange Contracts (Expressed in JPY)
As at 31 December 2013
SettlementDate Currency
AmountPurchased Currency
AmountSold
UnrealisedGain/(Loss)
17-Jan-14 EUR 42,575,134 JPY 6,039,231,857 136,727,08517-Jan-14 GBP 2,931,538 JPY 493,160,641 15,267,79417-Jan-14 JPY 126,382,016 EUR 892,765 (3,122,647)17-Jan-14 JPY 10,336,677 GBP 61,593 (345,720)17-Jan-14 JPY 107,651,819 USD 1,045,839 (2,342,222)17-Jan-14 USD 51,439,883 JPY 5,303,961,289 106,127,676
Total 252,311,966
As at 31 December 2013, the exposure of the Sub-Fund through Outstanding Forward Foreign Exchange Contracts by counterparty is as follows:
Counterparty Unrealised Gain/(Loss)
Barclays 124,846,930BNP Paribas 2,143,022Citibank 17,235,316Crédit Suisse 1,851,243Deutsche Bank 3,972,336Goldman Sachs 1,068,846HSBC 430,971JPMorgan 3,984RBC 1,726,499State Street Bank 96,537,961Toronto Dominion 1,579,437UBS 930,495Westpac Banking (15,074)Total 252,311,966
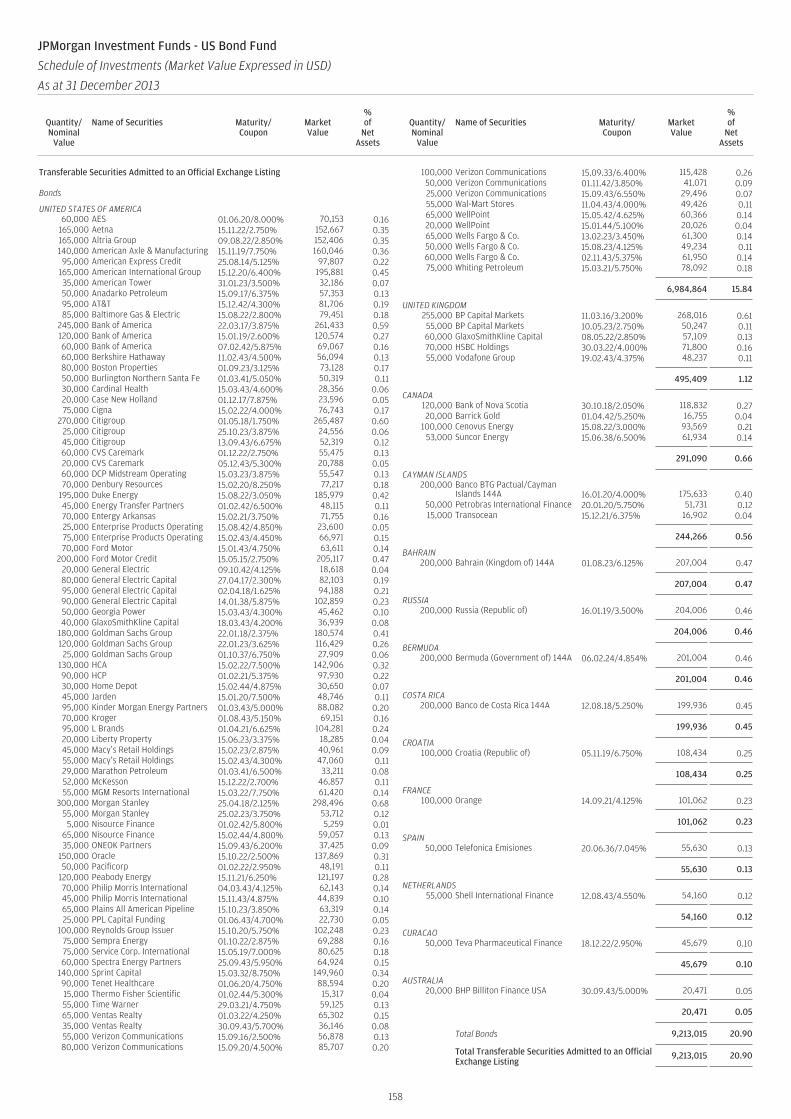
Transferable Securities Admitted to an Official Exchange Listing
Bonds
UNITED STATES OF AMERICA60,000 AES 01.06.20/8.000% 70,153 0.16
165,000 Aetna 15.11.22/2.750% 152,667 0.35165,000 Altria Group 09.08.22/2.850% 152,406 0.35140,000 American Axle & Manufacturing 15.11.19/7.750% 160,046 0.3695,000 American Express Credit 25.08.14/5.125% 97,807 0.22
165,000 American International Group 15.12.20/6.400% 195,881 0.4535,000 American Tower 31.01.23/3.500% 32,186 0.0750,000 Anadarko Petroleum 15.09.17/6.375% 57,353 0.1395,000 AT&T 15.12.42/4.300% 81,706 0.1985,000 Baltimore Gas & Electric 15.08.22/2.800% 79,451 0.18
245,000 Bank of America 22.03.17/3.875% 261,433 0.59120,000 Bank of America 15.01.19/2.600% 120,574 0.2760,000 Bank of America 07.02.42/5.875% 69,067 0.1660,000 Berkshire Hathaway 11.02.43/4.500% 56,094 0.1380,000 Boston Properties 01.09.23/3.125% 73,128 0.1750,000 Burlington Northern Santa Fe 01.03.41/5.050% 50,319 0.1130,000 Cardinal Health 15.03.43/4.600% 28,356 0.0620,000 Case New Holland 01.12.17/7.875% 23,596 0.0575,000 Cigna 15.02.22/4.000% 76,743 0.17
270,000 Citigroup 01.05.18/1.750% 265,487 0.6025,000 Citigroup 25.10.23/3.875% 24,556 0.0645,000 Citigroup 13.09.43/6.675% 52,319 0.1260,000 CVS Caremark 01.12.22/2.750% 55,475 0.1320,000 CVS Caremark 05.12.43/5.300% 20,788 0.0560,000 DCP Midstream Operating 15.03.23/3.875% 55,547 0.1370,000 Denbury Resources 15.02.20/8.250% 77,217 0.18
195,000 Duke Energy 15.08.22/3.050% 185,979 0.4245,000 Energy Transfer Partners 01.02.42/6.500% 48,115 0.1170,000 Entergy Arkansas 15.02.21/3.750% 71,755 0.1625,000 Enterprise Products Operating 15.08.42/4.850% 23,600 0.0575,000 Enterprise Products Operating 15.02.43/4.450% 66,971 0.1570,000 Ford Motor 15.01.43/4.750% 63,611 0.14
200,000 Ford Motor Credit 15.05.15/2.750% 205,117 0.4720,000 General Electric 09.10.42/4.125% 18,618 0.0480,000 General Electric Capital 27.04.17/2.300% 82,103 0.1995,000 General Electric Capital 02.04.18/1.625% 94,188 0.2190,000 General Electric Capital 14.01.38/5.875% 102,859 0.2350,000 Georgia Power 15.03.43/4.300% 45,462 0.1040,000 GlaxoSmithKline Capital 18.03.43/4.200% 36,939 0.08
180,000 Goldman Sachs Group 22.01.18/2.375% 180,574 0.41120,000 Goldman Sachs Group 22.01.23/3.625% 116,429 0.2625,000 Goldman Sachs Group 01.10.37/6.750% 27,909 0.06
130,000 HCA 15.02.22/7.500% 142,906 0.3290,000 HCP 01.02.21/5.375% 97,930 0.2230,000 Home Depot 15.02.44/4.875% 30,650 0.0745,000 Jarden 15.01.20/7.500% 48,746 0.1195,000 Kinder Morgan Energy Partners 01.03.43/5.000% 88,082 0.2070,000 Kroger 01.08.43/5.150% 69,151 0.1695,000 L Brands 01.04.21/6.625% 104,281 0.2420,000 Liberty Property 15.06.23/3.375% 18,285 0.0445,000 Macy’s Retail Holdings 15.02.23/2.875% 40,961 0.0955,000 Macy’s Retail Holdings 15.02.43/4.300% 47,060 0.1129,000 Marathon Petroleum 01.03.41/6.500% 33,211 0.0852,000 McKesson 15.12.22/2.700% 46,857 0.1155,000 MGM Resorts International 15.03.22/7.750% 61,420 0.14
300,000 Morgan Stanley 25.04.18/2.125% 298,496 0.6855,000 Morgan Stanley 25.02.23/3.750% 53,712 0.125,000 Nisource Finance 01.02.42/5.800% 5,259 0.01
65,000 Nisource Finance 15.02.44/4.800% 59,057 0.1335,000 ONEOK Partners 15.09.43/6.200% 37,425 0.09
150,000 Oracle 15.10.22/2.500% 137,869 0.3150,000 Pacificorp 01.02.22/2.950% 48,191 0.11
120,000 Peabody Energy 15.11.21/6.250% 121,197 0.2870,000 Philip Morris International 04.03.43/4.125% 62,143 0.1445,000 Philip Morris International 15.11.43/4.875% 44,839 0.1065,000 Plains All American Pipeline 15.10.23/3.850% 63,319 0.1425,000 PPL Capital Funding 01.06.43/4.700% 22,730 0.05
100,000 Reynolds Group Issuer 15.10.20/5.750% 102,248 0.2375,000 Sempra Energy 01.10.22/2.875% 69,288 0.1675,000 Service Corp. International 15.05.19/7.000% 80,625 0.1860,000 Spectra Energy Partners 25.09.43/5.950% 64,924 0.15
140,000 Sprint Capital 15.03.32/8.750% 149,960 0.3490,000 Tenet Healthcare 01.06.20/4.750% 88,594 0.2015,000 Thermo Fisher Scientific 01.02.44/5.300% 15,317 0.0455,000 Time Warner 29.03.21/4.750% 59,125 0.1365,000 Ventas Realty 01.03.22/4.250% 65,302 0.1535,000 Ventas Realty 30.09.43/5.700% 36,146 0.0855,000 Verizon Communications 15.09.16/2.500% 56,878 0.1380,000 Verizon Communications 15.09.20/4.500% 85,707 0.20
100,000 Verizon Communications 15.09.33/6.400% 115,428 0.2650,000 Verizon Communications 01.11.42/3.850% 41,071 0.0925,000 Verizon Communications 15.09.43/6.550% 29,496 0.0755,000 Wal-Mart Stores 11.04.43/4.000% 49,426 0.1165,000 WellPoint 15.05.42/4.625% 60,366 0.1420,000 WellPoint 15.01.44/5.100% 20,026 0.0465,000 Wells Fargo & Co. 13.02.23/3.450% 61,300 0.1450,000 Wells Fargo & Co. 15.08.23/4.125% 49,234 0.1160,000 Wells Fargo & Co. 02.11.43/5.375% 61,950 0.1475,000 Whiting Petroleum 15.03.21/5.750% 78,092 0.18
6,984,864 15.84
UNITED KINGDOM255,000 BP Capital Markets 11.03.16/3.200% 268,016 0.6155,000 BP Capital Markets 10.05.23/2.750% 50,247 0.1160,000 GlaxoSmithKline Capital 08.05.22/2.850% 57,109 0.1370,000 HSBC Holdings 30.03.22/4.000% 71,800 0.1655,000 Vodafone Group 19.02.43/4.375% 48,237 0.11
495,409 1.12
CANADA120,000 Bank of Nova Scotia 30.10.18/2.050% 118,832 0.2720,000 Barrick Gold 01.04.42/5.250% 16,755 0.04
100,000 Cenovus Energy 15.08.22/3.000% 93,569 0.2153,000 Suncor Energy 15.06.38/6.500% 61,934 0.14
291,090 0.66
CAYMAN ISLANDS200,000 Banco BTG Pactual/Cayman
Islands 144A 16.01.20/4.000% 175,633 0.4050,000 Petrobras International Finance 20.01.20/5.750% 51,731 0.1215,000 Transocean 15.12.21/6.375% 16,902 0.04
244,266 0.56
BAHRAIN200,000 Bahrain (Kingdom of) 144A 01.08.23/6.125% 207,004 0.47
207,004 0.47
RUSSIA200,000 Russia (Republic of) 16.01.19/3.500% 204,006 0.46
204,006 0.46
BERMUDA200,000 Bermuda (Government of) 144A 06.02.24/4.854% 201,004 0.46
201,004 0.46
COSTA RICA200,000 Banco de Costa Rica 144A 12.08.18/5.250% 199,936 0.45
199,936 0.45
CROATIA100,000 Croatia (Republic of) 05.11.19/6.750% 108,434 0.25
108,434 0.25
FRANCE100,000 Orange 14.09.21/4.125% 101,062 0.23
101,062 0.23
SPAIN50,000 Telefonica Emisiones 20.06.36/7.045% 55,630 0.13
55,630 0.13
NETHERLANDS55,000 Shell International Finance 12.08.43/4.550% 54,160 0.12
54,160 0.12
CURACAO50,000 Teva Pharmaceutical Finance 18.12.22/2.950% 45,679 0.10
45,679 0.10
AUSTRALIA20,000 BHP Billiton Finance USA 30.09.43/5.000% 20,471 0.05
20,471 0.05
Total Bonds 9,213,015 20.90
Total Transferable Securities Admitted to an OfficialExchange Listing
9,213,015 20.90
158
JPMorgan Investment Funds - US Bond Fund
Schedule of Investments (Market Value Expressed in USD)
As at 31 December 2013
Quantity/Nominal
Value
Name of Securities Maturity/Coupon
MarketValue
%of
NetAssets
Quantity/Nominal
Value
Name of Securities Maturity/Coupon
MarketValue
%of
NetAssets
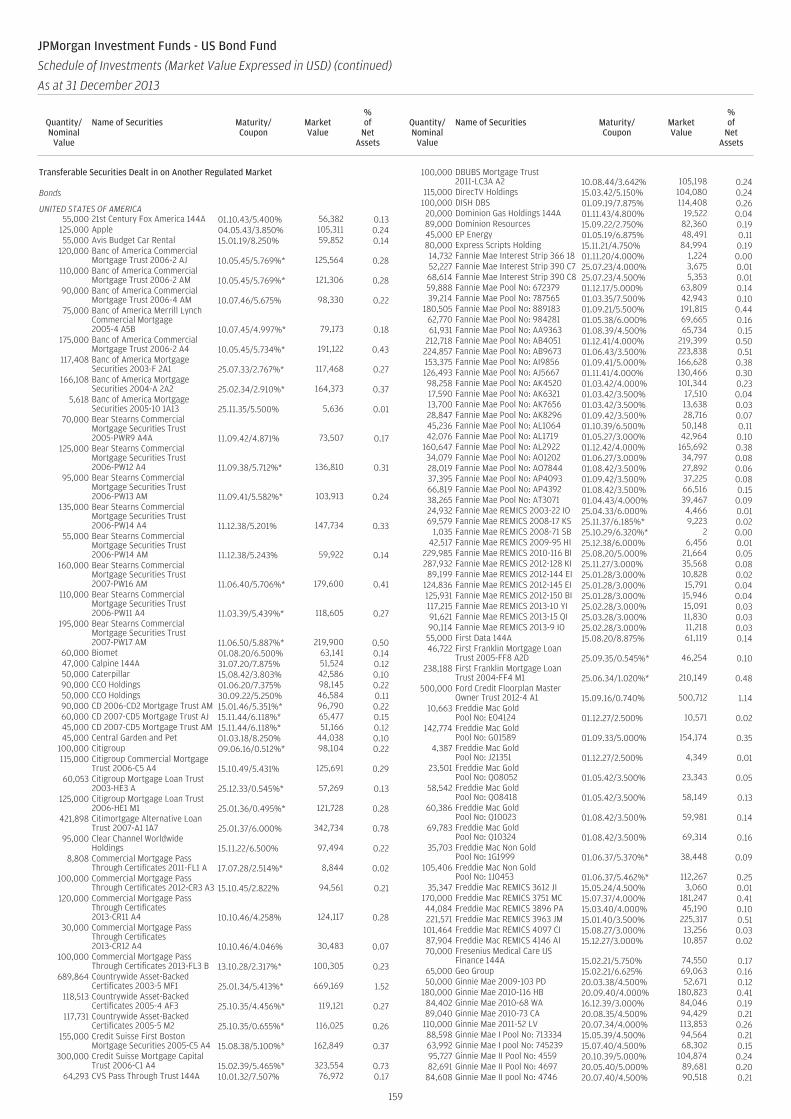
Transferable Securities Dealt in on Another Regulated Market
Bonds
UNITED STATES OF AMERICA55,000 21st Century Fox America 144A 01.10.43/5.400% 56,382 0.13
125,000 Apple 04.05.43/3.850% 105,311 0.2455,000 Avis Budget Car Rental 15.01.19/8.250% 59,852 0.14
120,000 Banc of America CommercialMortgage Trust 2006-2 AJ 10.05.45/5.769%* 125,564 0.28
110,000 Banc of America CommercialMortgage Trust 2006-2 AM 10.05.45/5.769%* 121,306 0.28
90,000 Banc of America CommercialMortgage Trust 2006-4 AM 10.07.46/5.675% 98,330 0.22
75,000 Banc of America Merrill LynchCommercial Mortgage2005-4 A5B 10.07.45/4.997%* 79,173 0.18
175,000 Banc of America CommercialMortgage Trust 2006-2 A4 10.05.45/5.734%* 191,122 0.43
117,408 Banc of America MortgageSecurities 2003-F 2A1 25.07.33/2.767%* 117,468 0.27
166,108 Banc of America MortgageSecurities 2004-A 2A2 25.02.34/2.910%* 164,373 0.37
5,618 Banc of America MortgageSecurities 2005-10 1A13 25.11.35/5.500% 5,636 0.01
70,000 Bear Stearns CommercialMortgage Securities Trust2005-PWR9 A4A 11.09.42/4.871% 73,507 0.17
125,000 Bear Stearns CommercialMortgage Securities Trust2006-PW12 A4 11.09.38/5.712%* 136,810 0.31
95,000 Bear Stearns CommercialMortgage Securities Trust2006-PW13 AM 11.09.41/5.582%* 103,913 0.24
135,000 Bear Stearns CommercialMortgage Securities Trust2006-PW14 A4 11.12.38/5.201% 147,734 0.33
55,000 Bear Stearns CommercialMortgage Securities Trust2006-PW14 AM 11.12.38/5.243% 59,922 0.14
160,000 Bear Stearns CommercialMortgage Securities Trust2007-PW16 AM 11.06.40/5.706%* 179,600 0.41
110,000 Bear Stearns CommercialMortgage Securities Trust2006-PW11 A4 11.03.39/5.439%* 118,605 0.27
195,000 Bear Stearns CommercialMortgage Securities Trust2007-PW17 AM 11.06.50/5.887%* 219,900 0.50
60,000 Biomet 01.08.20/6.500% 63,141 0.1447,000 Calpine 144A 31.07.20/7.875% 51,524 0.1250,000 Caterpillar 15.08.42/3.803% 42,586 0.1090,000 CCO Holdings 01.06.20/7.375% 98,145 0.2250,000 CCO Holdings 30.09.22/5.250% 46,584 0.1190,000 CD 2006-CD2 Mortgage Trust AM 15.01.46/5.351%* 96,790 0.2260,000 CD 2007-CD5 Mortgage Trust AJ 15.11.44/6.118%* 65,477 0.1545,000 CD 2007-CD5 Mortgage Trust AM 15.11.44/6.118%* 51,166 0.1245,000 Central Garden and Pet 01.03.18/8.250% 44,038 0.10
100,000 Citigroup 09.06.16/0.512%* 98,104 0.22115,000 Citigroup Commercial Mortgage
Trust 2006-C5 A4 15.10.49/5.431% 125,691 0.2960,053 Citigroup Mortgage Loan Trust
2003-HE3 A 25.12.33/0.545%* 57,269 0.13125,000 Citigroup Mortgage Loan Trust
2006-HE1 M1 25.01.36/0.495%* 121,728 0.28421,898 Citimortgage Alternative Loan
Trust 2007-A1 1A7 25.01.37/6.000% 342,734 0.7895,000 Clear Channel Worldwide
Holdings 15.11.22/6.500% 97,494 0.228,808 Commercial Mortgage Pass
Through Certificates 2011-FL1 A 17.07.28/2.514%* 8,844 0.02100,000 Commercial Mortgage Pass
Through Certificates 2012-CR3 A3 15.10.45/2.822% 94,561 0.21120,000 Commercial Mortgage Pass
Through Certificates2013-CR11 A4 10.10.46/4.258% 124,117 0.28
30,000 Commercial Mortgage PassThrough Certificates2013-CR12 A4 10.10.46/4.046% 30,483 0.07
100,000 Commercial Mortgage PassThrough Certificates 2013-FL3 B 13.10.28/2.317%* 100,305 0.23
689,864 Countrywide Asset-BackedCertificates 2003-5 MF1 25.01.34/5.413%* 669,169 1.52
118,513 Countrywide Asset-BackedCertificates 2005-4 AF3 25.10.35/4.456%* 119,121 0.27
117,731 Countrywide Asset-BackedCertificates 2005-5 M2 25.10.35/0.655%* 116,025 0.26
155,000 Credit Suisse First BostonMortgage Securities 2005-C5 A4 15.08.38/5.100%* 162,849 0.37
300,000 Credit Suisse Mortgage CapitalTrust 2006-C1 A4 15.02.39/5.465%* 323,554 0.73
64,293 CVS Pass Through Trust 144A 10.01.32/7.507% 76,972 0.17
100,000 DBUBS Mortgage Trust2011-LC3A A2 10.08.44/3.642% 105,198 0.24
115,000 DirecTV Holdings 15.03.42/5.150% 104,080 0.24100,000 DISH DBS 01.09.19/7.875% 114,408 0.2620,000 Dominion Gas Holdings 144A 01.11.43/4.800% 19,522 0.0489,000 Dominion Resources 15.09.22/2.750% 82,360 0.1945,000 EP Energy 01.05.19/6.875% 48,491 0.1180,000 Express Scripts Holding 15.11.21/4.750% 84,994 0.1914,732 Fannie Mae Interest Strip 366 18 01.11.20/4.000% 1,224 0.0052,227 Fannie Mae Interest Strip 390 C7 25.07.23/4.000% 3,675 0.0168,614 Fannie Mae Interest Strip 390 C8 25.07.23/4.500% 5,353 0.0159,888 Fannie Mae Pool No: 672379 01.12.17/5.000% 63,809 0.1439,214 Fannie Mae Pool No: 787565 01.03.35/7.500% 42,943 0.10
180,505 Fannie Mae Pool No: 889183 01.09.21/5.500% 191,815 0.4462,770 Fannie Mae Pool No: 984281 01.05.38/6.000% 69,665 0.1661,931 Fannie Mae Pool No: AA9363 01.08.39/4.500% 65,734 0.15
212,718 Fannie Mae Pool No: AB4051 01.12.41/4.000% 219,399 0.50224,857 Fannie Mae Pool No: AB9673 01.06.43/3.500% 223,838 0.51153,375 Fannie Mae Pool No: AI9856 01.09.41/5.000% 166,628 0.38126,493 Fannie Mae Pool No: AJ5667 01.11.41/4.000% 130,466 0.3098,258 Fannie Mae Pool No: AK4520 01.03.42/4.000% 101,344 0.2317,590 Fannie Mae Pool No: AK6321 01.03.42/3.500% 17,510 0.0413,700 Fannie Mae Pool No: AK7656 01.03.42/3.500% 13,638 0.0328,847 Fannie Mae Pool No: AK8296 01.09.42/3.500% 28,716 0.0745,236 Fannie Mae Pool No: AL1064 01.10.39/6.500% 50,148 0.1142,076 Fannie Mae Pool No: AL1719 01.05.27/3.000% 42,964 0.10
160,647 Fannie Mae Pool No: AL2922 01.12.42/4.000% 165,692 0.3834,079 Fannie Mae Pool No: AO1202 01.06.27/3.000% 34,797 0.0828,019 Fannie Mae Pool No: AO7844 01.08.42/3.500% 27,892 0.0637,395 Fannie Mae Pool No: AP4093 01.09.42/3.500% 37,225 0.0866,819 Fannie Mae Pool No: AP4392 01.08.42/3.500% 66,516 0.1538,265 Fannie Mae Pool No: AT3071 01.04.43/4.000% 39,467 0.0924,932 Fannie Mae REMICS 2003-22 IO 25.04.33/6.000% 4,466 0.0169,579 Fannie Mae REMICS 2008-17 KS 25.11.37/6.185%* 9,223 0.02
1,035 Fannie Mae REMICS 2008-71 SB 25.10.29/6.320%* 2 0.0042,517 Fannie Mae REMICS 2009-95 HI 25.12.38/6.000% 6,456 0.01
229,985 Fannie Mae REMICS 2010-116 BI 25.08.20/5.000% 21,664 0.05287,932 Fannie Mae REMICS 2012-128 KI 25.11.27/3.000% 35,568 0.0889,199 Fannie Mae REMICS 2012-144 EI 25.01.28/3.000% 10,828 0.02
124,836 Fannie Mae REMICS 2012-145 EI 25.01.28/3.000% 15,791 0.04125,931 Fannie Mae REMICS 2012-150 BI 25.01.28/3.000% 15,946 0.04117,215 Fannie Mae REMICS 2013-10 YI 25.02.28/3.000% 15,091 0.0391,621 Fannie Mae REMICS 2013-15 QI 25.03.28/3.000% 11,830 0.0390,114 Fannie Mae REMICS 2013-9 IO 25.02.28/3.000% 11,218 0.0355,000 First Data 144A 15.08.20/8.875% 61,119 0.1446,722 First Franklin Mortgage Loan
Trust 2005-FF8 A2D 25.09.35/0.545%* 46,254 0.10238,188 First Franklin Mortgage Loan
Trust 2004-FF4 M1 25.06.34/1.020%* 210,149 0.48500,000 Ford Credit Floorplan Master
Owner Trust 2012-4 A1 15.09.16/0.740% 500,712 1.1410,663 Freddie Mac Gold
Pool No: E04124 01.12.27/2.500% 10,571 0.02142,774 Freddie Mac Gold
Pool No: G01589 01.09.33/5.000% 154,174 0.354,387 Freddie Mac Gold
Pool No: J21351 01.12.27/2.500% 4,349 0.0123,501 Freddie Mac Gold
Pool No: Q08052 01.05.42/3.500% 23,343 0.0558,542 Freddie Mac Gold
Pool No: Q08418 01.05.42/3.500% 58,149 0.1360,386 Freddie Mac Gold
Pool No: Q10023 01.08.42/3.500% 59,981 0.1469,783 Freddie Mac Gold
Pool No: Q10324 01.08.42/3.500% 69,314 0.1635,703 Freddie Mac Non Gold
Pool No: 1G1999 01.06.37/5.370%* 38,448 0.09105,406 Freddie Mac Non Gold
Pool No: 1J0453 01.06.37/5.462%* 112,267 0.2535,347 Freddie Mac REMICS 3612 JI 15.05.24/4.500% 3,060 0.01
170,000 Freddie Mac REMICS 3751 MC 15.07.37/4.000% 181,247 0.4144,084 Freddie Mac REMICS 3896 PA 15.03.40/4.000% 45,190 0.10221,571 Freddie Mac REMICS 3963 JM 15.01.40/3.500% 225,317 0.51
101,464 Freddie Mac REMICS 4097 CI 15.08.27/3.000% 13,256 0.0387,904 Freddie Mac REMICS 4146 AI 15.12.27/3.000% 10,857 0.0270,000 Fresenius Medical Care US
Finance 144A 15.02.21/5.750% 74,550 0.1765,000 Geo Group 15.02.21/6.625% 69,063 0.1650,000 Ginnie Mae 2009-103 PD 20.03.38/4.500% 52,671 0.12
180,000 Ginnie Mae 2010-116 HB 20.09.40/4.000% 180,823 0.4184,402 Ginnie Mae 2010-68 WA 16.12.39/3.000% 84,046 0.1989,040 Ginnie Mae 2010-73 CA 20.08.35/4.500% 94,429 0.21
110,000 Ginnie Mae 2011-52 LV 20.07.34/4.000% 113,853 0.2688,598 Ginnie Mae I Pool No: 713334 15.05.39/4.500% 94,564 0.2163,992 Ginnie Mae I pool No: 745239 15.07.40/4.500% 68,302 0.1595,727 Ginnie Mae II Pool No: 4559 20.10.39/5.000% 104,874 0.2482,691 Ginnie Mae II Pool No: 4697 20.05.40/5.000% 89,681 0.20
84,608 Ginnie Mae II pool No: 4746 20.07.40/4.500% 90,518 0.21
159
JPMorgan Investment Funds - US Bond Fund
Schedule of Investments (Market Value Expressed in USD) (continued)
As at 31 December 2013
Quantity/Nominal
Value
Name of Securities Maturity/Coupon
MarketValue
%of
NetAssets
Quantity/Nominal
Value
Name of Securities Maturity/Coupon
MarketValue
%of
NetAssets
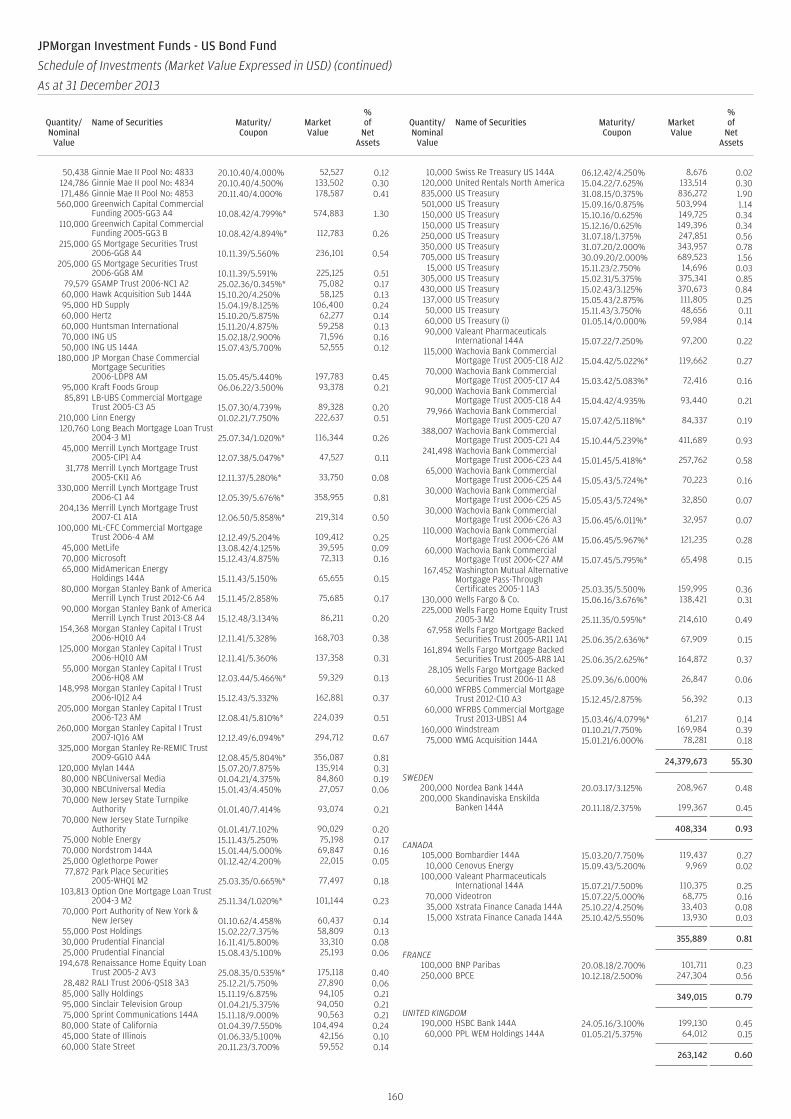
50,438 Ginnie Mae II Pool No: 4833 20.10.40/4.000% 52,527 0.12124,786 Ginnie Mae II pool No: 4834 20.10.40/4.500% 133,502 0.30171,486 Ginnie Mae II Pool No: 4853 20.11.40/4.000% 178,587 0.41
560,000 Greenwich Capital CommercialFunding 2005-GG3 A4 10.08.42/4.799%* 574,883 1.30
110,000 Greenwich Capital CommercialFunding 2005-GG3 B 10.08.42/4.894%* 112,783 0.26
215,000 GS Mortgage Securities Trust2006-GG8 A4 10.11.39/5.560% 236,101 0.54
205,000 GS Mortgage Securities Trust2006-GG8 AM 10.11.39/5.591% 225,125 0.51
79,579 GSAMP Trust 2006-NC1 A2 25.02.36/0.345%* 75,082 0.1760,000 Hawk Acquisition Sub 144A 15.10.20/4.250% 58,125 0.1395,000 HD Supply 15.04.19/8.125% 106,400 0.2460,000 Hertz 15.10.20/5.875% 62,277 0.1460,000 Huntsman International 15.11.20/4.875% 59,258 0.1370,000 ING US 15.02.18/2.900% 71,596 0.1650,000 ING US 144A 15.07.43/5.700% 52,555 0.12
180,000 JP Morgan Chase CommercialMortgage Securities2006-LDP8 AM 15.05.45/5.440% 197,783 0.45
95,000 Kraft Foods Group 06.06.22/3.500% 93,378 0.2185,891 LB-UBS Commercial Mortgage
Trust 2005-C3 A5 15.07.30/4.739% 89,328 0.20210,000 Linn Energy 01.02.21/7.750% 222,637 0.51120,760 Long Beach Mortgage Loan Trust
2004-3 M1 25.07.34/1.020%* 116,344 0.2645,000 Merrill Lynch Mortgage Trust
2005-CIP1 A4 12.07.38/5.047%* 47,527 0.1131,778 Merrill Lynch Mortgage Trust
2005-CKI1 A6 12.11.37/5.280%* 33,750 0.08330,000 Merrill Lynch Mortgage Trust
2006-C1 A4 12.05.39/5.676%* 358,955 0.81204,136 Merrill Lynch Mortgage Trust
2007-C1 A1A 12.06.50/5.858%* 219,314 0.50100,000 ML-CFC Commercial Mortgage
Trust 2006-4 AM 12.12.49/5.204% 109,412 0.2545,000 MetLife 13.08.42/4.125% 39,595 0.0970,000 Microsoft 15.12.43/4.875% 72,313 0.1665,000 MidAmerican Energy
Holdings 144A 15.11.43/5.150% 65,655 0.1580,000 Morgan Stanley Bank of America
Merrill Lynch Trust 2012-C6 A4 15.11.45/2.858% 75,685 0.1790,000 Morgan Stanley Bank of America
Merrill Lynch Trust 2013-C8 A4 15.12.48/3.134% 86,211 0.20154,368 Morgan Stanley Capital I Trust
2006-HQ10 A4 12.11.41/5.328% 168,703 0.38125,000 Morgan Stanley Capital I Trust
2006-HQ10 AM 12.11.41/5.360% 137,358 0.3155,000 Morgan Stanley Capital I Trust
2006-HQ8 AM 12.03.44/5.466%* 59,329 0.13148,998 Morgan Stanley Capital I Trust
2006-IQ12 A4 15.12.43/5.332% 162,881 0.37205,000 Morgan Stanley Capital I Trust
2006-T23 AM 12.08.41/5.810%* 224,039 0.51260,000 Morgan Stanley Capital I Trust
2007-IQ16 AM 12.12.49/6.094%* 294,712 0.67325,000 Morgan Stanley Re-REMIC Trust
2009-GG10 A4A 12.08.45/5.804%* 356,087 0.81120,000 Mylan 144A 15.07.20/7.875% 135,914 0.3180,000 NBCUniversal Media 01.04.21/4.375% 84,860 0.1930,000 NBCUniversal Media 15.01.43/4.450% 27,057 0.0670,000 New Jersey State Turnpike
Authority 01.01.40/7.414% 93,074 0.2170,000 New Jersey State Turnpike
Authority 01.01.41/7.102% 90,029 0.2075,000 Noble Energy 15.11.43/5.250% 75,198 0.1770,000 Nordstrom 144A 15.01.44/5.000% 69,847 0.1625,000 Oglethorpe Power 01.12.42/4.200% 22,015 0.0577,872 Park Place Securities
2005-WHQ1 M2 25.03.35/0.665%* 77,497 0.18103,813 Option One Mortgage Loan Trust
2004-3 M2 25.11.34/1.020%* 101,144 0.2370,000 Port Authority of New York &
New Jersey 01.10.62/4.458% 60,437 0.1455,000 Post Holdings 15.02.22/7.375% 58,809 0.1330,000 Prudential Financial 16.11.41/5.800% 33,310 0.0825,000 Prudential Financial 15.08.43/5.100% 25,193 0.06
194,678 Renaissance Home Equity LoanTrust 2005-2 AV3 25.08.35/0.535%* 175,118 0.40
28,482 RALI Trust 2006-QS18 3A3 25.12.21/5.750% 27,890 0.0685,000 Sally Holdings 15.11.19/6.875% 94,105 0.2195,000 Sinclair Television Group 01.04.21/5.375% 94,050 0.2175,000 Sprint Communications 144A 15.11.18/9.000% 90,563 0.2180,000 State of California 01.04.39/7.550% 104,494 0.2445,000 State of Illinois 01.06.33/5.100% 42,156 0.1060,000 State Street 20.11.23/3.700% 59,552 0.14
10,000 Swiss Re Treasury US 144A 06.12.42/4.250% 8,676 0.02120,000 United Rentals North America 15.04.22/7.625% 133,514 0.30835,000 US Treasury 31.08.15/0.375% 836,272 1.90501,000 US Treasury 15.09.16/0.875% 503,994 1.14150,000 US Treasury 15.10.16/0.625% 149,725 0.34150,000 US Treasury 15.12.16/0.625% 149,396 0.34250,000 US Treasury 31.07.18/1.375% 247,851 0.56350,000 US Treasury 31.07.20/2.000% 343,957 0.78705,000 US Treasury 30.09.20/2.000% 689,523 1.56
15,000 US Treasury 15.11.23/2.750% 14,696 0.03305,000 US Treasury 15.02.31/5.375% 375,341 0.85430,000 US Treasury 15.02.43/3.125% 370,673 0.84137,000 US Treasury 15.05.43/2.875% 111,805 0.2550,000 US Treasury 15.11.43/3.750% 48,656 0.1160,000 US Treasury (i) 01.05.14/0.000% 59,984 0.1490,000 Valeant Pharmaceuticals
International 144A 15.07.22/7.250% 97,200 0.22115,000 Wachovia Bank Commercial
Mortgage Trust 2005-C18 AJ2 15.04.42/5.022%* 119,662 0.2770,000 Wachovia Bank Commercial
Mortgage Trust 2005-C17 A4 15.03.42/5.083%* 72,416 0.1690,000 Wachovia Bank Commercial
Mortgage Trust 2005-C18 A4 15.04.42/4.935% 93,440 0.2179,966 Wachovia Bank Commercial
Mortgage Trust 2005-C20 A7 15.07.42/5.118%* 84,337 0.19388,007 Wachovia Bank Commercial
Mortgage Trust 2005-C21 A4 15.10.44/5.239%* 411,689 0.93241,498 Wachovia Bank Commercial
Mortgage Trust 2006-C23 A4 15.01.45/5.418%* 257,762 0.5865,000 Wachovia Bank Commercial
Mortgage Trust 2006-C25 A4 15.05.43/5.724%* 70,223 0.1630,000 Wachovia Bank Commercial
Mortgage Trust 2006-C25 A5 15.05.43/5.724%* 32,850 0.0730,000 Wachovia Bank Commercial
Mortgage Trust 2006-C26 A3 15.06.45/6.011%* 32,957 0.07110,000 Wachovia Bank Commercial
Mortgage Trust 2006-C26 AM 15.06.45/5.967%* 121,235 0.2860,000 Wachovia Bank Commercial
Mortgage Trust 2006-C27 AM 15.07.45/5.795%* 65,498 0.15167,452 Washington Mutual Alternative
Mortgage Pass-ThroughCertificates 2005-1 1A3 25.03.35/5.500% 159,995 0.36
130,000 Wells Fargo & Co. 15.06.16/3.676%* 138,421 0.31225,000 Wells Fargo Home Equity Trust
2005-3 M2 25.11.35/0.595%* 214,610 0.4967,958 Wells Fargo Mortgage Backed
Securities Trust 2005-AR11 1A1 25.06.35/2.636%* 67,909 0.15161,894 Wells Fargo Mortgage Backed
Securities Trust 2005-AR8 1A1 25.06.35/2.625%* 164,872 0.3728,105 Wells Fargo Mortgage Backed
Securities Trust 2006-11 A8 25.09.36/6.000% 26,847 0.0660,000 WFRBS Commercial Mortgage
Trust 2012-C10 A3 15.12.45/2.875% 56,392 0.1360,000 WFRBS Commercial Mortgage
Trust 2013-UBS1 A4 15.03.46/4.079%* 61,217 0.14160,000 Windstream 01.10.21/7.750% 169,984 0.39
75,000 WMG Acquisition 144A 15.01.21/6.000% 78,281 0.18
24,379,673 55.30
SWEDEN200,000 Nordea Bank 144A 20.03.17/3.125% 208,967 0.48200,000 Skandinaviska Enskilda
Banken 144A 20.11.18/2.375% 199,367 0.45
408,334 0.93
CANADA105,000 Bombardier 144A 15.03.20/7.750% 119,437 0.2710,000 Cenovus Energy 15.09.43/5.200% 9,969 0.02
100,000 Valeant PharmaceuticalsInternational 144A 15.07.21/7.500% 110,375 0.25
70,000 Videotron 15.07.22/5.000% 68,775 0.1635,000 Xstrata Finance Canada 144A 25.10.22/4.250% 33,403 0.0815,000 Xstrata Finance Canada 144A 25.10.42/5.550% 13,930 0.03
355,889 0.81
FRANCE100,000 BNP Paribas 20.08.18/2.700% 101,711 0.23250,000 BPCE 10.12.18/2.500% 247,304 0.56
349,015 0.79
UNITED KINGDOM190,000 HSBC Bank 144A 24.05.16/3.100% 199,130 0.4560,000 PPL WEM Holdings 144A 01.05.21/5.375% 64,012 0.15
263,142 0.60
160
JPMorgan Investment Funds - US Bond Fund
Schedule of Investments (Market Value Expressed in USD) (continued)
As at 31 December 2013
Quantity/Nominal
Value
Name of Securities Maturity/Coupon
MarketValue
%of
NetAssets
Quantity/Nominal
Value
Name of Securities Maturity/Coupon
MarketValue
%of
NetAssets
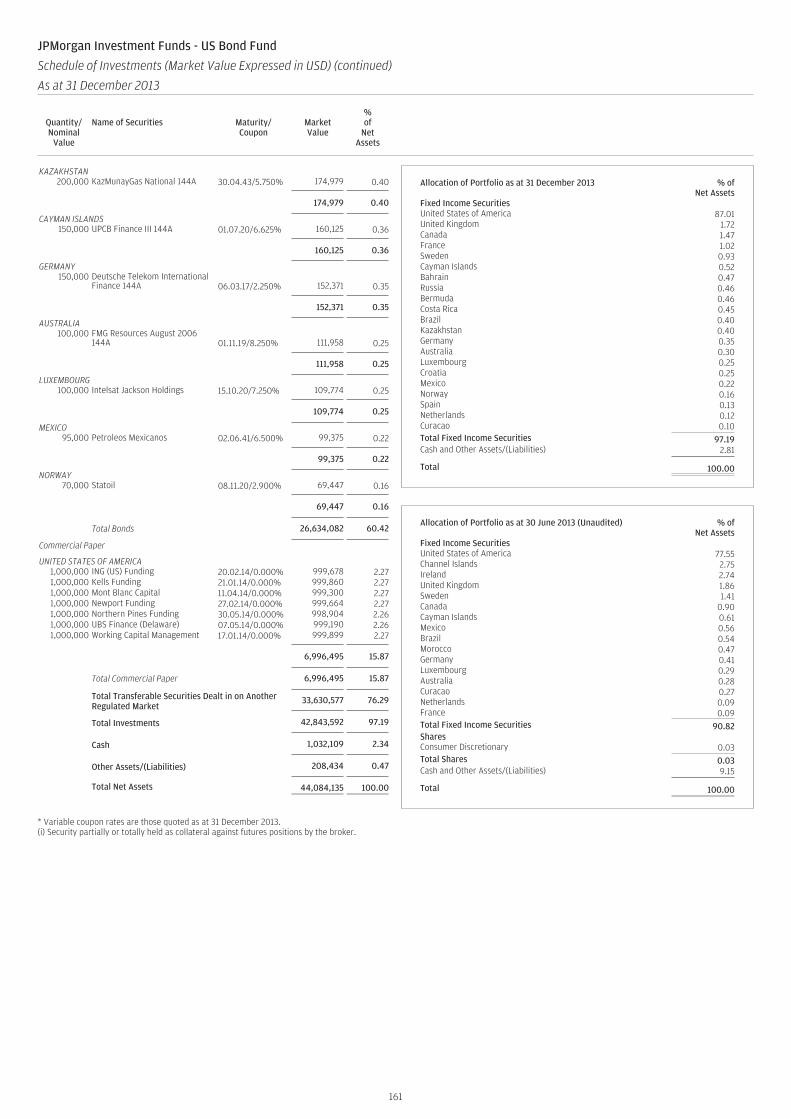
KAZAKHSTAN200,000 KazMunayGas National 144A 30.04.43/5.750% 174,979 0.40
174,979 0.40
CAYMAN ISLANDS150,000 UPCB Finance III 144A 01.07.20/6.625% 160,125 0.36
160,125 0.36
GERMANY150,000 Deutsche Telekom International
Finance 144A 06.03.17/2.250% 152,371 0.35
152,371 0.35
AUSTRALIA100,000 FMG Resources August 2006
144A 01.11.19/8.250% 111,958 0.25
111,958 0.25
LUXEMBOURG100,000 Intelsat Jackson Holdings 15.10.20/7.250% 109,774 0.25
109,774 0.25
MEXICO95,000 Petroleos Mexicanos 02.06.41/6.500% 99,375 0.22
99,375 0.22
NORWAY70,000 Statoil 08.11.20/2.900% 69,447 0.16
69,447 0.16
Total Bonds 26,634,082 60.42
Commercial Paper
UNITED STATES OF AMERICA1,000,000 ING (US) Funding 20.02.14/0.000% 999,678 2.271,000,000 Kells Funding 21.01.14/0.000% 999,860 2.271,000,000 Mont Blanc Capital 11.04.14/0.000% 999,300 2.271,000,000 Newport Funding 27.02.14/0.000% 999,664 2.271,000,000 Northern Pines Funding 30.05.14/0.000% 998,904 2.261,000,000 UBS Finance (Delaware) 07.05.14/0.000% 999,190 2.261,000,000 Working Capital Management 17.01.14/0.000% 999,899 2.27
6,996,495 15.87
Total Commercial Paper 6,996,495 15.87
Total Transferable Securities Dealt in on AnotherRegulated Market
33,630,577 76.29
Total Investments 42,843,592 97.19
Cash 1,032,109 2.34
Other Assets/(Liabilities) 208,434 0.47
Total Net Assets 44,084,135 100.00
* Variable coupon rates are those quoted as at 31 December 2013.(i) Security partially or totally held as collateral against futures positions by the broker.
Allocation of Portfolio as at 31 December 2013 % ofNet Assets
Fixed Income SecuritiesUnited States of America 87.01United Kingdom 1.72Canada 1.47France 1.02Sweden 0.93Cayman Islands 0.52Bahrain 0.47Russia 0.46Bermuda 0.46Costa Rica 0.45Brazil 0.40Kazakhstan 0.40Germany 0.35Australia 0.30Luxembourg 0.25Croatia 0.25Mexico 0.22Norway 0.16Spain 0.13Netherlands 0.12Curacao 0.10Total Fixed Income Securities 97.19Cash and Other Assets/(Liabilities) 2.81
Total 100.00
Allocation of Portfolio as at 30 June 2013 (Unaudited) % ofNet Assets
Fixed Income SecuritiesUnited States of America 77.55Channel Islands 2.75Ireland 2.74United Kingdom 1.86Sweden 1.41Canada 0.90Cayman Islands 0.61Mexico 0.56Brazil 0.54Morocco 0.47Germany 0.41Luxembourg 0.29Australia 0.28Curacao 0.27Netherlands 0.09France 0.09Total Fixed Income Securities 90.82SharesConsumer Discretionary 0.03Total Shares 0.03Cash and Other Assets/(Liabilities) 9.15
Total 100.00
161
JPMorgan Investment Funds - US Bond Fund
Schedule of Investments (Market Value Expressed in USD) (continued)
As at 31 December 2013
Quantity/Nominal
Value
Name of Securities Maturity/Coupon
MarketValue
%of
NetAssets
Quantity/Nominal
Value
Name of Securities Maturity/Coupon
MarketValue
%of
NetAssets
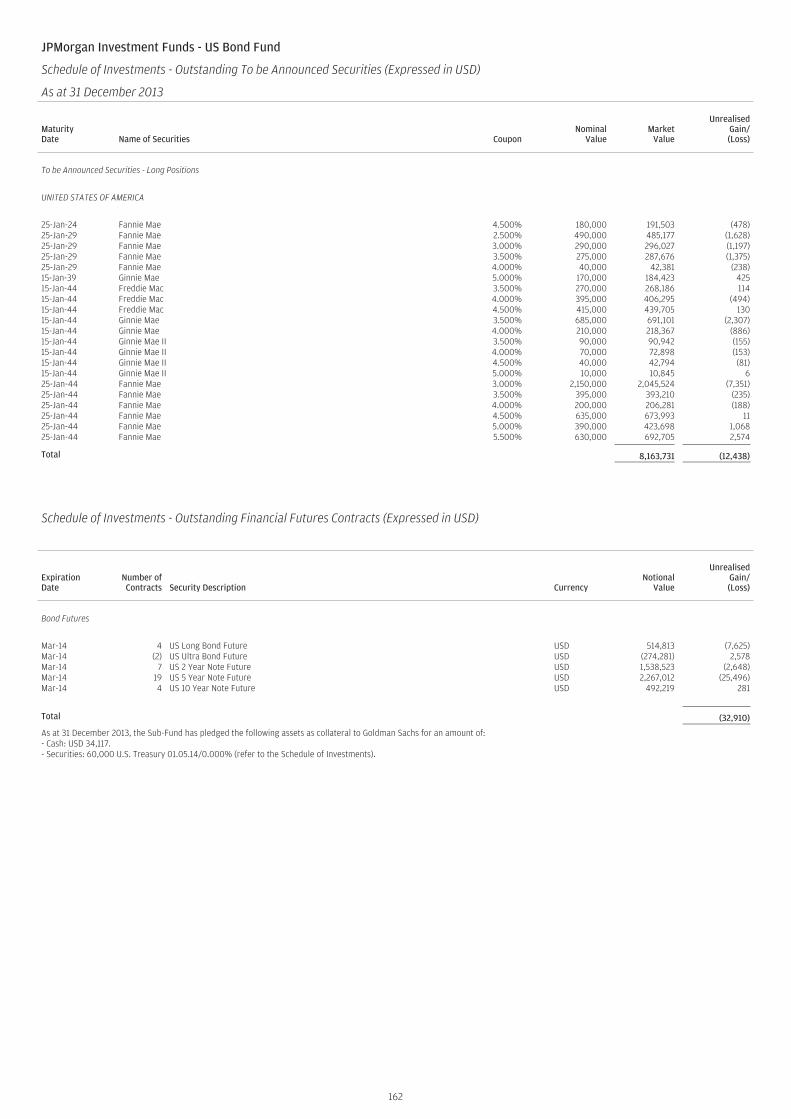
JPMorgan Investment Funds - US Bond Fund
Schedule of Investments - Outstanding To be Announced Securities (Expressed in USD)
As at 31 December 2013
MaturityDate Name of Securities Coupon
NominalValue
MarketValue
UnrealisedGain/(Loss)
To be Announced Securities - Long Positions
UNITED STATES OF AMERICA
25-Jan-24 Fannie Mae 4.500% 180,000 191,503 (478)25-Jan-29 Fannie Mae 2.500% 490,000 485,177 (1,628)25-Jan-29 Fannie Mae 3.000% 290,000 296,027 (1,197)25-Jan-29 Fannie Mae 3.500% 275,000 287,676 (1,375)25-Jan-29 Fannie Mae 4.000% 40,000 42,381 (238)15-Jan-39 Ginnie Mae 5.000% 170,000 184,423 42515-Jan-44 Freddie Mac 3.500% 270,000 268,186 11415-Jan-44 Freddie Mac 4.000% 395,000 406,295 (494)15-Jan-44 Freddie Mac 4.500% 415,000 439,705 13015-Jan-44 Ginnie Mae 3.500% 685,000 691,101 (2,307)15-Jan-44 Ginnie Mae 4.000% 210,000 218,367 (886)15-Jan-44 Ginnie Mae II 3.500% 90,000 90,942 (155)15-Jan-44 Ginnie Mae II 4.000% 70,000 72,898 (153)15-Jan-44 Ginnie Mae II 4.500% 40,000 42,794 (81)15-Jan-44 Ginnie Mae II 5.000% 10,000 10,845 625-Jan-44 Fannie Mae 3.000% 2,150,000 2,045,524 (7,351)25-Jan-44 Fannie Mae 3.500% 395,000 393,210 (235)25-Jan-44 Fannie Mae 4.000% 200,000 206,281 (188)25-Jan-44 Fannie Mae 4.500% 635,000 673,993 1125-Jan-44 Fannie Mae 5.000% 390,000 423,698 1,06825-Jan-44 Fannie Mae 5.500% 630,000 692,705 2,574
Total 8,163,731 (12,438)
Schedule of Investments - Outstanding Financial Futures Contracts (Expressed in USD)
ExpirationDate
Number ofContracts Security Description Currency
NotionalValue
UnrealisedGain/(Loss)
Bond Futures
Mar-14 4 US Long Bond Future USD 514,813 (7,625)Mar-14 (2) US Ultra Bond Future USD (274,281) 2,578Mar-14 7 US 2 Year Note Future USD 1,538,523 (2,648)Mar-14 19 US 5 Year Note Future USD 2,267,012 (25,496)Mar-14 4 US 10 Year Note Future USD 492,219 281
Total (32,910)
As at 31 December 2013, the Sub-Fund has pledged the following assets as collateral to Goldman Sachs for an amount of:- Cash: USD 34,117.- Securities: 60,000 U.S. Treasury 01.05.14/0.000% (refer to the Schedule of Investments).
162
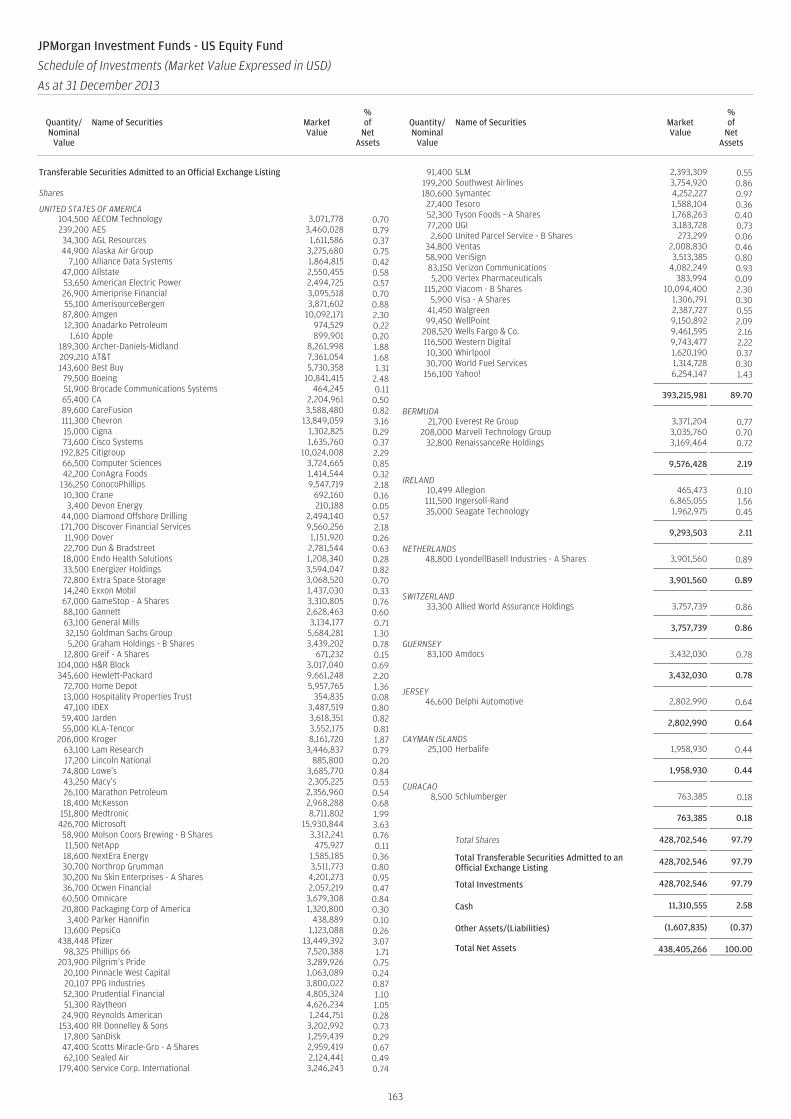
Transferable Securities Admitted to an Official Exchange Listing
Shares
UNITED STATES OF AMERICA104,500 AECOM Technology 3,071,778 0.70239,200 AES 3,460,028 0.7934,300 AGL Resources 1,611,586 0.3744,900 Alaska Air Group 3,275,680 0.75
7,100 Alliance Data Systems 1,864,815 0.4247,000 Allstate 2,550,455 0.5853,650 American Electric Power 2,494,725 0.5726,900 Ameriprise Financial 3,095,518 0.7055,100 AmerisourceBergen 3,871,602 0.8887,800 Amgen 10,092,171 2.3012,300 Anadarko Petroleum 974,529 0.22
1,610 Apple 899,901 0.20189,300 Archer-Daniels-Midland 8,261,998 1.88209,210 AT&T 7,361,054 1.68143,600 Best Buy 5,730,358 1.3179,500 Boeing 10,841,415 2.4851,900 Brocade Communications Systems 464,245 0.1165,400 CA 2,204,961 0.5089,600 CareFusion 3,588,480 0.82111,300 Chevron 13,849,059 3.1615,000 Cigna 1,302,825 0.2973,600 Cisco Systems 1,635,760 0.37
192,825 Citigroup 10,024,008 2.2966,500 Computer Sciences 3,724,665 0.8542,200 ConAgra Foods 1,414,544 0.32
136,250 ConocoPhillips 9,547,719 2.1810,300 Crane 692,160 0.163,400 Devon Energy 210,188 0.05
44,000 Diamond Offshore Drilling 2,494,140 0.57171,700 Discover Financial Services 9,560,256 2.1811,900 Dover 1,151,920 0.2622,700 Dun & Bradstreet 2,781,544 0.6318,000 Endo Health Solutions 1,208,340 0.2833,500 Energizer Holdings 3,594,047 0.8272,800 Extra Space Storage 3,068,520 0.7014,240 Exxon Mobil 1,437,030 0.3367,000 GameStop - A Shares 3,310,805 0.7688,100 Gannett 2,628,463 0.6063,100 General Mills 3,134,177 0.7132,150 Goldman Sachs Group 5,684,281 1.305,200 Graham Holdings - B Shares 3,439,202 0.78
12,800 Greif - A Shares 671,232 0.15104,000 H&R Block 3,017,040 0.69345,600 Hewlett-Packard 9,661,248 2.20
72,700 Home Depot 5,957,765 1.3613,000 Hospitality Properties Trust 354,835 0.0847,100 IDEX 3,487,519 0.8059,400 Jarden 3,618,351 0.8255,000 KLA-Tencor 3,552,175 0.81
206,000 Kroger 8,161,720 1.8763,100 Lam Research 3,446,837 0.7917,200 Lincoln National 885,800 0.2074,800 Lowe’s 3,685,770 0.8443,250 Macy’s 2,305,225 0.5326,100 Marathon Petroleum 2,356,960 0.5418,400 McKesson 2,968,288 0.68
151,800 Medtronic 8,711,802 1.99426,700 Microsoft 15,930,844 3.6358,900 Molson Coors Brewing - B Shares 3,312,241 0.7611,500 NetApp 475,927 0.1118,600 NextEra Energy 1,585,185 0.3630,700 Northrop Grumman 3,511,773 0.8030,200 Nu Skin Enterprises - A Shares 4,201,273 0.9536,700 Ocwen Financial 2,057,219 0.4760,500 Omnicare 3,679,308 0.8420,800 Packaging Corp of America 1,320,800 0.30
3,400 Parker Hannifin 438,889 0.1013,600 PepsiCo 1,123,088 0.26
438,448 Pfizer 13,449,392 3.0798,325 Phillips 66 7,520,388 1.71
203,900 Pilgrim’s Pride 3,289,926 0.7520,100 Pinnacle West Capital 1,063,089 0.2420,107 PPG Industries 3,800,022 0.8752,300 Prudential Financial 4,805,324 1.1051,300 Raytheon 4,626,234 1.0524,900 Reynolds American 1,244,751 0.28
153,400 RR Donnelley & Sons 3,202,992 0.7317,800 SanDisk 1,259,439 0.2947,400 Scotts Miracle-Gro - A Shares 2,959,419 0.6762,100 Sealed Air 2,124,441 0.49
179,400 Service Corp. International 3,246,243 0.74
91,400 SLM 2,393,309 0.55199,200 Southwest Airlines 3,754,920 0.86180,600 Symantec 4,252,227 0.97
27,400 Tesoro 1,588,104 0.3652,300 Tyson Foods - A Shares 1,768,263 0.4077,200 UGI 3,183,728 0.732,600 United Parcel Service - B Shares 273,299 0.06
34,800 Ventas 2,008,830 0.4658,900 VeriSign 3,513,385 0.8083,150 Verizon Communications 4,082,249 0.935,200 Vertex Pharmaceuticals 383,994 0.09
115,200 Viacom - B Shares 10,094,400 2.305,900 Visa - A Shares 1,306,791 0.30
41,450 Walgreen 2,387,727 0.5599,450 WellPoint 9,150,892 2.09
208,520 Wells Fargo & Co. 9,461,595 2.16116,500 Western Digital 9,743,477 2.2210,300 Whirlpool 1,620,190 0.3730,700 World Fuel Services 1,314,728 0.30
156,100 Yahoo! 6,254,147 1.43
393,215,981 89.70
BERMUDA21,700 Everest Re Group 3,371,204 0.77
208,000 Marvell Technology Group 3,035,760 0.7032,800 RenaissanceRe Holdings 3,169,464 0.72
9,576,428 2.19
IRELAND10,499 Allegion 465,473 0.10111,500 Ingersoll-Rand 6,865,055 1.5635,000 Seagate Technology 1,962,975 0.45
9,293,503 2.11
NETHERLANDS48,800 LyondellBasell Industries - A Shares 3,901,560 0.89
3,901,560 0.89
SWITZERLAND33,300 Allied World Assurance Holdings 3,757,739 0.86
3,757,739 0.86
GUERNSEY83,100 Amdocs 3,432,030 0.78
3,432,030 0.78
JERSEY46,600 Delphi Automotive 2,802,990 0.64
2,802,990 0.64
CAYMAN ISLANDS25,100 Herbalife 1,958,930 0.44
1,958,930 0.44
CURACAO8,500 Schlumberger 763,385 0.18
763,385 0.18
Total Shares 428,702,546 97.79
Total Transferable Securities Admitted to anOfficial Exchange Listing
428,702,546 97.79
Total Investments 428,702,546 97.79
Cash 11,310,555 2.58
Other Assets/(Liabilities) (1,607,835) (0.37)
Total Net Assets 438,405,266 100.00
163
JPMorgan Investment Funds - US Equity Fund
Schedule of Investments (Market Value Expressed in USD)
As at 31 December 2013
Quantity/Nominal
Value
Name of Securities MarketValue
%of
NetAssets
Quantity/Nominal
Value
Name of Securities MarketValue
%of
NetAssets
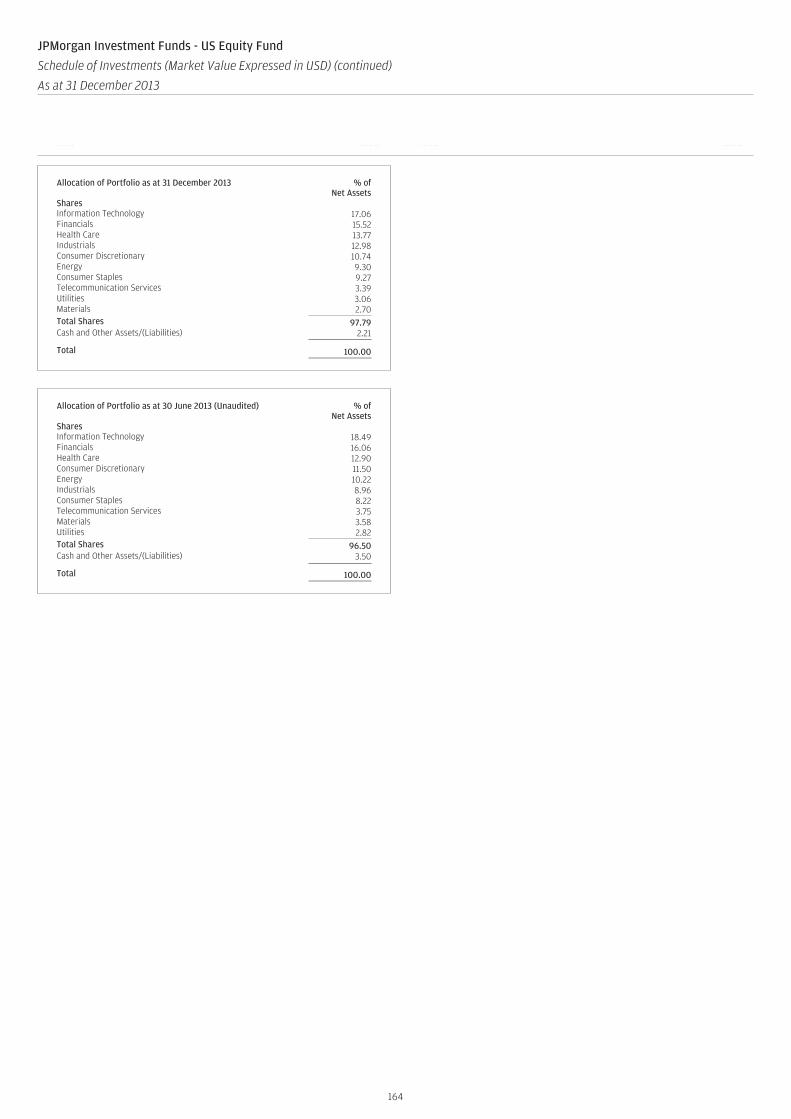
Allocation of Portfolio as at 31 December 2013 % ofNet Assets
SharesInformation Technology 17.06Financials 15.52Health Care 13.77Industrials 12.98Consumer Discretionary 10.74Energy 9.30Consumer Staples 9.27Telecommunication Services 3.39Utilities 3.06Materials 2.70Total Shares 97.79Cash and Other Assets/(Liabilities) 2.21
Total 100.00
Allocation of Portfolio as at 30 June 2013 (Unaudited) % ofNet Assets
SharesInformation Technology 18.49Financials 16.06Health Care 12.90Consumer Discretionary 11.50Energy 10.22Industrials 8.96Consumer Staples 8.22Telecommunication Services 3.75Materials 3.58Utilities 2.82Total Shares 96.50Cash and Other Assets/(Liabilities) 3.50
Total 100.00
164
JPMorgan Investment Funds - US Equity Fund
Schedule of Investments (Market Value Expressed in USD) (continued)
As at 31 December 2013
Quantity/Nominal
Value
Name of Securities MarketValue
%of
NetAssets
Quantity/Nominal
Value
Name of Securities MarketValue
%of
NetAssets
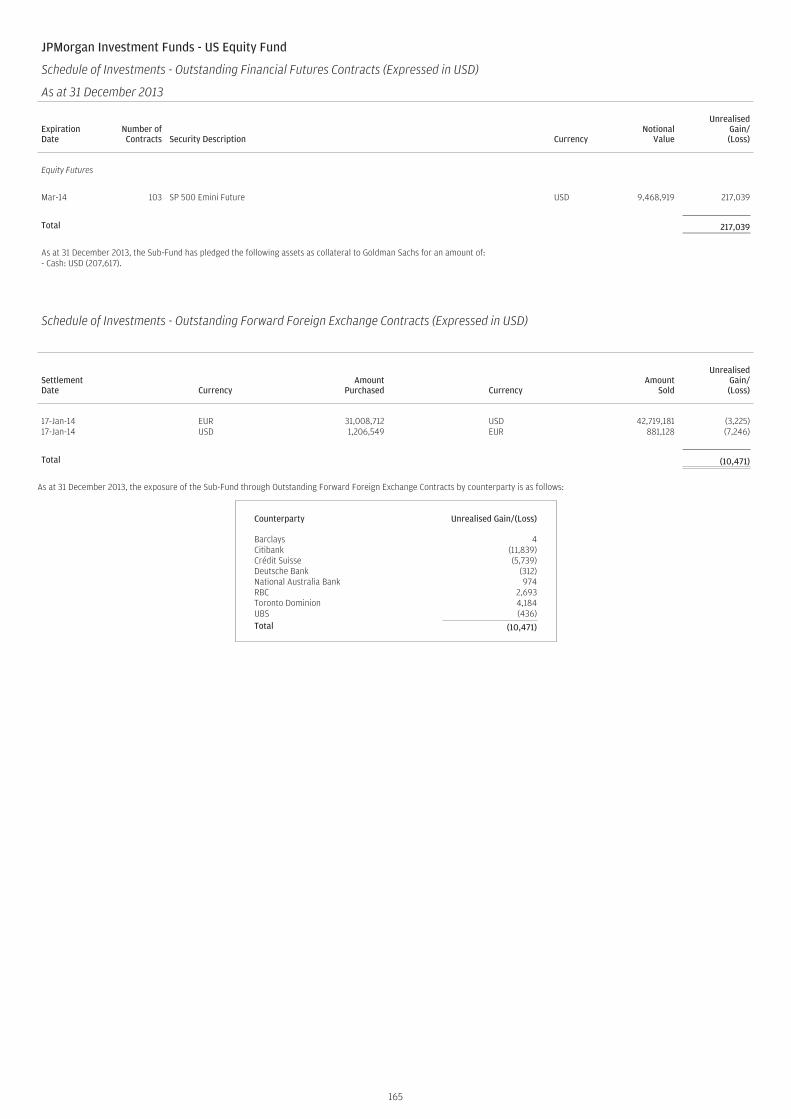
JPMorgan Investment Funds - US Equity Fund
Schedule of Investments - Outstanding Financial Futures Contracts (Expressed in USD)
As at 31 December 2013
ExpirationDate
Number ofContracts Security Description Currency
NotionalValue
UnrealisedGain/(Loss)
Equity Futures
Mar-14 103 SP 500 Emini Future USD 9,468,919 217,039
Total 217,039
As at 31 December 2013, the Sub-Fund has pledged the following assets as collateral to Goldman Sachs for an amount of:- Cash: USD (207,617).
Schedule of Investments - Outstanding Forward Foreign Exchange Contracts (Expressed in USD)
SettlementDate Currency
AmountPurchased Currency
AmountSold
UnrealisedGain/(Loss)
17-Jan-14 EUR 31,008,712 USD 42,719,181 (3,225)17-Jan-14 USD 1,206,549 EUR 881,128 (7,246)
Total (10,471)
As at 31 December 2013, the exposure of the Sub-Fund through Outstanding Forward Foreign Exchange Contracts by counterparty is as follows:
Counterparty Unrealised Gain/(Loss)
Barclays 4Citibank (11,839)Crédit Suisse (5,739)Deutsche Bank (312)National Australia Bank 974RBC 2,693Toronto Dominion 4,184UBS (436)Total (10,471)
165
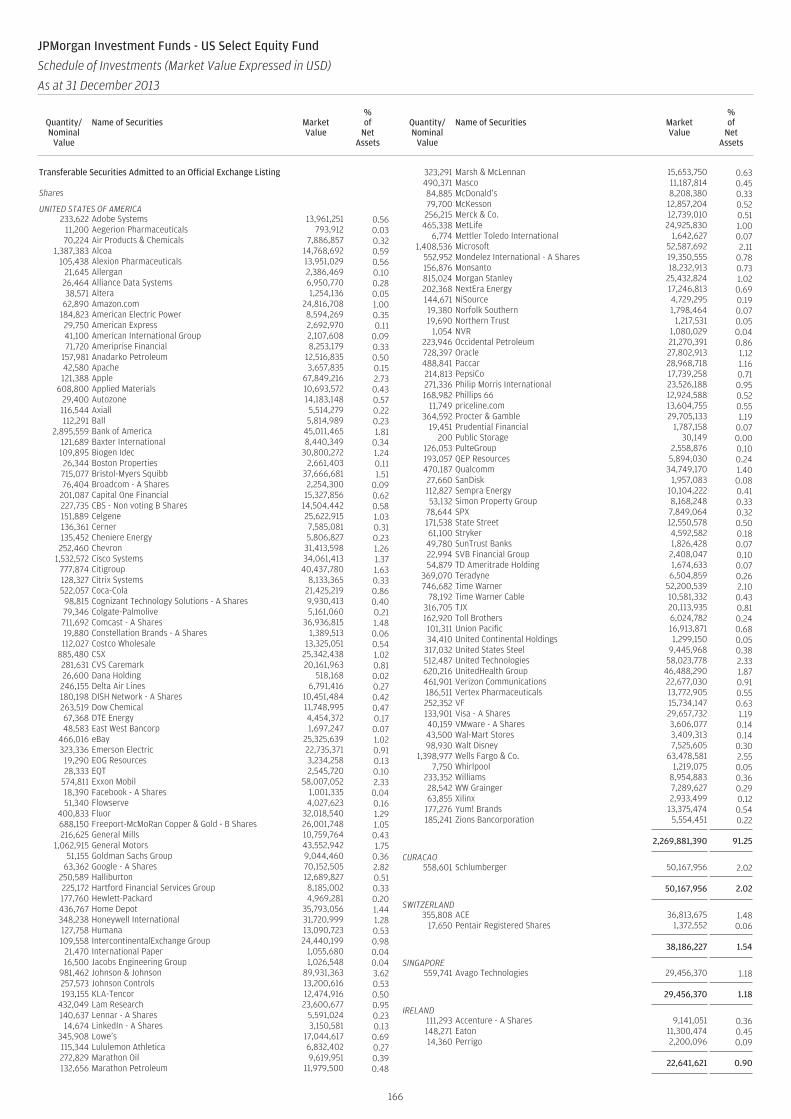
Transferable Securities Admitted to an Official Exchange Listing
Shares
UNITED STATES OF AMERICA233,622 Adobe Systems 13,961,251 0.56
11,200 Aegerion Pharmaceuticals 793,912 0.0370,224 Air Products & Chemicals 7,886,857 0.32
1,387,383 Alcoa 14,768,692 0.59105,438 Alexion Pharmaceuticals 13,951,029 0.56
21,645 Allergan 2,386,469 0.1026,464 Alliance Data Systems 6,950,770 0.2838,571 Altera 1,254,136 0.05
62,890 Amazon.com 24,816,708 1.00184,823 American Electric Power 8,594,269 0.3529,750 American Express 2,692,970 0.1141,100 American International Group 2,107,608 0.0971,720 Ameriprise Financial 8,253,179 0.33
157,981 Anadarko Petroleum 12,516,835 0.5042,580 Apache 3,657,835 0.15121,388 Apple 67,849,216 2.73
608,800 Applied Materials 10,693,572 0.4329,400 Autozone 14,183,148 0.57116,544 Axiall 5,514,279 0.22112,291 Ball 5,814,989 0.23
2,895,559 Bank of America 45,011,465 1.81121,689 Baxter International 8,440,349 0.34109,895 Biogen Idec 30,800,272 1.2426,344 Boston Properties 2,661,403 0.11715,077 Bristol-Myers Squibb 37,666,681 1.5176,404 Broadcom - A Shares 2,254,300 0.09
201,087 Capital One Financial 15,327,856 0.62227,735 CBS - Non voting B Shares 14,504,442 0.58151,889 Celgene 25,622,915 1.03136,361 Cerner 7,585,081 0.31135,452 Cheniere Energy 5,806,827 0.23252,460 Chevron 31,413,598 1.26
1,532,572 Cisco Systems 34,061,413 1.37777,874 Citigroup 40,437,780 1.63128,327 Citrix Systems 8,133,365 0.33522,057 Coca-Cola 21,425,219 0.8698,815 Cognizant Technology Solutions - A Shares 9,930,413 0.4079,346 Colgate-Palmolive 5,161,060 0.21711,692 Comcast - A Shares 36,936,815 1.4819,880 Constellation Brands - A Shares 1,389,513 0.06112,027 Costco Wholesale 13,325,051 0.54
885,480 CSX 25,342,438 1.02281,631 CVS Caremark 20,161,963 0.8126,600 Dana Holding 518,168 0.02246,155 Delta Air Lines 6,791,416 0.27180,198 DISH Network - A Shares 10,451,484 0.42263,519 Dow Chemical 11,748,995 0.4767,368 DTE Energy 4,454,372 0.1748,583 East West Bancorp 1,697,247 0.07
466,016 eBay 25,325,639 1.02323,336 Emerson Electric 22,735,371 0.91
19,290 EOG Resources 3,234,258 0.1328,333 EQT 2,545,720 0.10
574,811 Exxon Mobil 58,007,052 2.3318,390 Facebook - A Shares 1,001,335 0.0451,340 Flowserve 4,027,623 0.16
400,833 Fluor 32,018,540 1.29688,150 Freeport-McMoRan Copper & Gold - B Shares 26,001,748 1.05216,625 General Mills 10,759,764 0.43
1,062,915 General Motors 43,552,942 1.7551,155 Goldman Sachs Group 9,044,460 0.36
63,362 Google - A Shares 70,152,505 2.82250,589 Halliburton 12,689,827 0.51225,172 Hartford Financial Services Group 8,185,002 0.33177,760 Hewlett-Packard 4,969,281 0.20436,767 Home Depot 35,793,056 1.44348,238 Honeywell International 31,720,999 1.28127,758 Humana 13,090,723 0.53109,558 IntercontinentalExchange Group 24,440,199 0.98
21,470 International Paper 1,055,680 0.0416,500 Jacobs Engineering Group 1,026,548 0.04
981,462 Johnson & Johnson 89,931,363 3.62257,573 Johnson Controls 13,200,616 0.53193,155 KLA-Tencor 12,474,916 0.50
432,049 Lam Research 23,600,677 0.95140,637 Lennar - A Shares 5,591,024 0.23
14,674 LinkedIn - A Shares 3,150,581 0.13345,908 Lowe’s 17,044,617 0.69115,344 Lululemon Athletica 6,832,402 0.27272,829 Marathon Oil 9,619,951 0.39132,656 Marathon Petroleum 11,979,500 0.48
323,291 Marsh & McLennan 15,653,750 0.63490,371 Masco 11,187,814 0.4584,885 McDonald’s 8,208,380 0.3379,700 McKesson 12,857,204 0.52256,215 Merck & Co. 12,739,010 0.51
465,338 MetLife 24,925,830 1.006,774 Mettler Toledo International 1,642,627 0.07
1,408,536 Microsoft 52,587,692 2.11552,952 Mondelez International - A Shares 19,350,555 0.78156,876 Monsanto 18,232,913 0.73815,024 Morgan Stanley 25,432,824 1.02202,368 NextEra Energy 17,246,813 0.69144,671 NiSource 4,729,295 0.1919,380 Norfolk Southern 1,798,464 0.0719,690 Northern Trust 1,217,531 0.05
1,054 NVR 1,080,029 0.04223,946 Occidental Petroleum 21,270,391 0.86728,397 Oracle 27,802,913 1.12488,841 Paccar 28,968,718 1.16214,813 PepsiCo 17,739,258 0.71271,336 Philip Morris International 23,526,188 0.95168,982 Phillips 66 12,924,588 0.52
11,749 priceline.com 13,604,755 0.55364,592 Procter & Gamble 29,705,133 1.19
19,451 Prudential Financial 1,787,158 0.07200 Public Storage 30,149 0.00
126,053 PulteGroup 2,558,876 0.10193,057 QEP Resources 5,894,030 0.24470,187 Qualcomm 34,749,170 1.4027,660 SanDisk 1,957,083 0.08112,827 Sempra Energy 10,104,222 0.4153,132 Simon Property Group 8,168,248 0.33
78,644 SPX 7,849,064 0.32171,538 State Street 12,550,578 0.5061,100 Stryker 4,592,582 0.1849,780 SunTrust Banks 1,826,428 0.0722,994 SVB Financial Group 2,408,047 0.1054,879 TD Ameritrade Holding 1,674,633 0.07
369,070 Teradyne 6,504,859 0.26746,682 Time Warner 52,200,539 2.10
78,192 Time Warner Cable 10,581,332 0.43316,705 TJX 20,113,935 0.81162,920 Toll Brothers 6,024,782 0.24101,311 Union Pacific 16,913,871 0.6834,410 United Continental Holdings 1,299,150 0.05
317,032 United States Steel 9,445,968 0.38512,487 United Technologies 58,023,778 2.33620,216 UnitedHealth Group 46,488,290 1.87461,901 Verizon Communications 22,677,030 0.91186,511 Vertex Pharmaceuticals 13,772,905 0.55252,352 VF 15,734,147 0.63133,901 Visa - A Shares 29,657,732 1.1940,159 VMware - A Shares 3,606,077 0.1443,500 Wal-Mart Stores 3,409,313 0.1498,930 Walt Disney 7,525,605 0.30
1,398,977 Wells Fargo & Co. 63,478,581 2.557,750 Whirlpool 1,219,075 0.05
233,352 Williams 8,954,883 0.3628,542 WW Grainger 7,289,627 0.2963,855 Xilinx 2,933,499 0.12
177,276 Yum! Brands 13,375,474 0.54185,241 Zions Bancorporation 5,554,451 0.22
2,269,881,390 91.25
CURACAO558,601 Schlumberger 50,167,956 2.02
50,167,956 2.02
SWITZERLAND355,808 ACE 36,813,675 1.48
17,650 Pentair Registered Shares 1,372,552 0.06
38,186,227 1.54
SINGAPORE559,741 Avago Technologies 29,456,370 1.18
29,456,370 1.18
IRELAND111,293 Accenture - A Shares 9,141,051 0.36148,271 Eaton 11,300,474 0.4514,360 Perrigo 2,200,096 0.09
22,641,621 0.90
166
JPMorgan Investment Funds - US Select Equity Fund
Schedule of Investments (Market Value Expressed in USD)
As at 31 December 2013
Quantity/Nominal
Value
Name of Securities MarketValue
%of
NetAssets
Quantity/Nominal
Value
Name of Securities MarketValue
%of
NetAssets
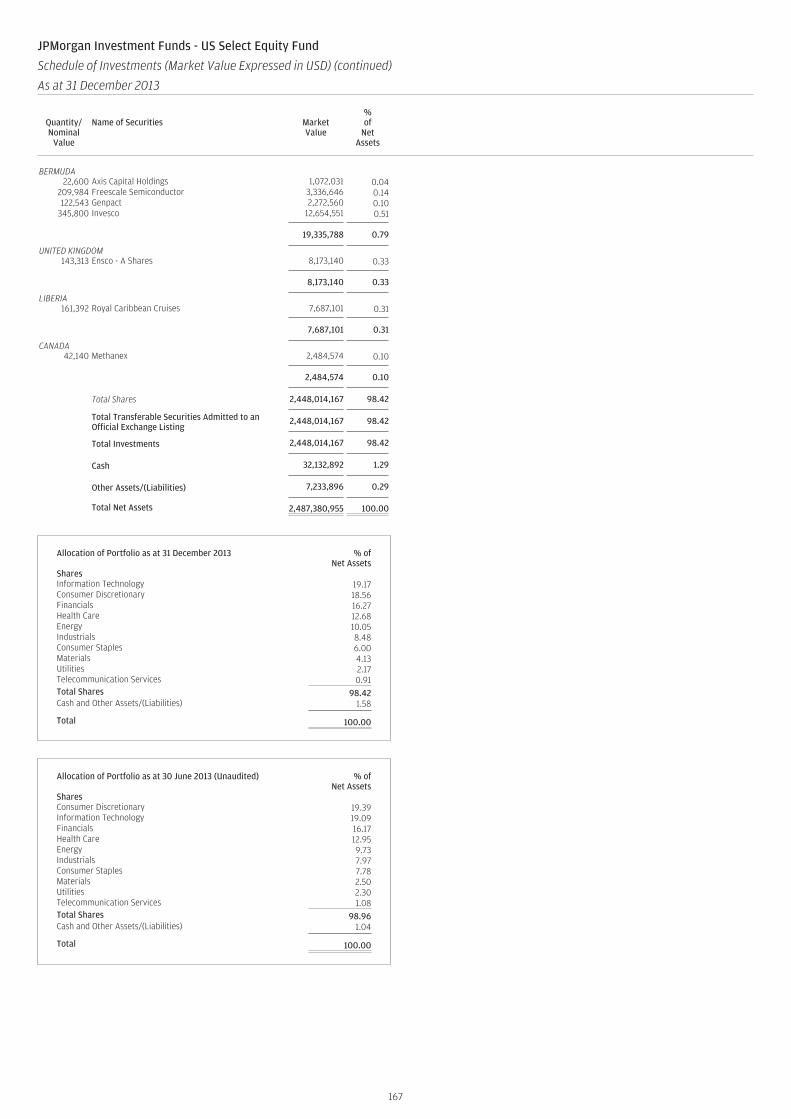
BERMUDA22,600 Axis Capital Holdings 1,072,031 0.04
209,984 Freescale Semiconductor 3,336,646 0.14122,543 Genpact 2,272,560 0.10
345,800 Invesco 12,654,551 0.51
19,335,788 0.79
UNITED KINGDOM143,313 Ensco - A Shares 8,173,140 0.33
8,173,140 0.33
LIBERIA161,392 Royal Caribbean Cruises 7,687,101 0.31
7,687,101 0.31
CANADA42,140 Methanex 2,484,574 0.10
2,484,574 0.10
Total Shares 2,448,014,167 98.42
Total Transferable Securities Admitted to anOfficial Exchange Listing
2,448,014,167 98.42
Total Investments 2,448,014,167 98.42
Cash 32,132,892 1.29
Other Assets/(Liabilities) 7,233,896 0.29
Total Net Assets 2,487,380,955 100.00
Allocation of Portfolio as at 31 December 2013 % ofNet Assets
SharesInformation Technology 19.17Consumer Discretionary 18.56Financials 16.27Health Care 12.68Energy 10.05Industrials 8.48Consumer Staples 6.00Materials 4.13Utilities 2.17Telecommunication Services 0.91Total Shares 98.42Cash and Other Assets/(Liabilities) 1.58
Total 100.00
Allocation of Portfolio as at 30 June 2013 (Unaudited) % ofNet Assets
SharesConsumer Discretionary 19.39Information Technology 19.09Financials 16.17Health Care 12.95Energy 9.73Industrials 7.97Consumer Staples 7.78Materials 2.50Utilities 2.30Telecommunication Services 1.08Total Shares 98.96Cash and Other Assets/(Liabilities) 1.04
Total 100.00
167
JPMorgan Investment Funds - US Select Equity Fund
Schedule of Investments (Market Value Expressed in USD) (continued)
As at 31 December 2013
Quantity/Nominal
Value
Name of Securities MarketValue
%of
NetAssets
Quantity/Nominal
Value
Name of Securities MarketValue
%of
NetAssets
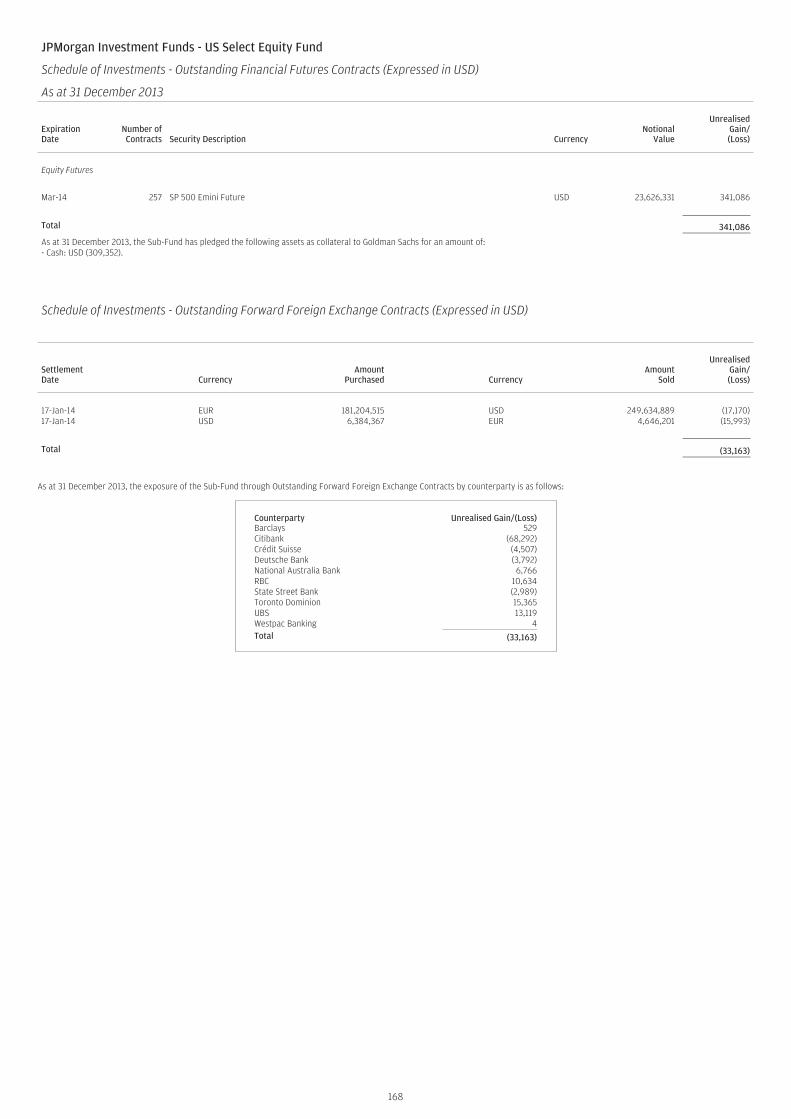
JPMorgan Investment Funds - US Select Equity Fund
Schedule of Investments - Outstanding Financial Futures Contracts (Expressed in USD)
As at 31 December 2013
ExpirationDate
Number ofContracts Security Description Currency
NotionalValue
UnrealisedGain/(Loss)
Equity Futures
Mar-14 257 SP 500 Emini Future USD 23,626,331 341,086
Total 341,086
As at 31 December 2013, the Sub-Fund has pledged the following assets as collateral to Goldman Sachs for an amount of:- Cash: USD (309,352).
Schedule of Investments - Outstanding Forward Foreign Exchange Contracts (Expressed in USD)
SettlementDate Currency
AmountPurchased Currency
AmountSold
UnrealisedGain/(Loss)
17-Jan-14 EUR 181,204,515 USD 249,634,889 (17,170)17-Jan-14 USD 6,384,367 EUR 4,646,201 (15,993)
Total (33,163)
As at 31 December 2013, the exposure of the Sub-Fund through Outstanding Forward Foreign Exchange Contracts by counterparty is as follows:
Counterparty Unrealised Gain/(Loss)Barclays 529Citibank (68,292)Crédit Suisse (4,507)Deutsche Bank (3,792)National Australia Bank 6,766RBC 10,634State Street Bank (2,989)Toronto Dominion 15,365UBS 13,119Westpac Banking 4Total (33,163)
168
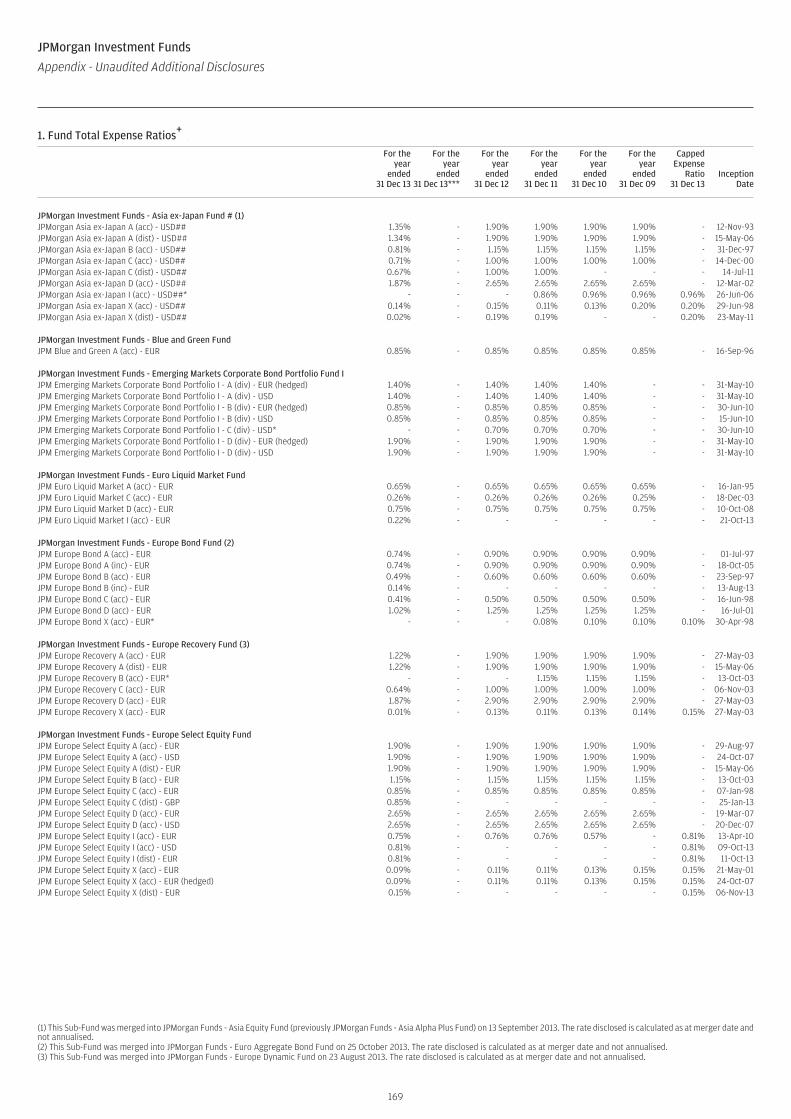
1. Fund Total Expense Ratios+ (continued)
For theyear
ended31 Dec 13
For theyear
ended31 Dec 13***
For theyear
ended31 Dec 12
For theyear
ended31 Dec 11
For theyear
ended31 Dec 10
For theyear
ended31 Dec 09
CappedExpense
Ratio31 Dec 13
InceptionDate
JPMorgan Investment Funds - Asia ex-Japan Fund # (1)JPMorgan Asia ex-Japan A (acc) - USD## 1.35% - 1.90% 1.90% 1.90% 1.90% - 12-Nov-93JPMorgan Asia ex-Japan A (dist) - USD## 1.34% - 1.90% 1.90% 1.90% 1.90% - 15-May-06JPMorgan Asia ex-Japan B (acc) - USD## 0.81% - 1.15% 1.15% 1.15% 1.15% - 31-Dec-97JPMorgan Asia ex-Japan C (acc) - USD## 0.71% - 1.00% 1.00% 1.00% 1.00% - 14-Dec-00JPMorgan Asia ex-Japan C (dist) - USD## 0.67% - 1.00% 1.00% - - - 14-Jul-11JPMorgan Asia ex-Japan D (acc) - USD## 1.87% - 2.65% 2.65% 2.65% 2.65% - 12-Mar-02JPMorgan Asia ex-Japan I (acc) - USD##* - - - 0.86% 0.96% 0.96% 0.96% 26-Jun-06JPMorgan Asia ex-Japan X (acc) - USD## 0.14% - 0.15% 0.11% 0.13% 0.20% 0.20% 29-Jun-98JPMorgan Asia ex-Japan X (dist) - USD## 0.02% - 0.19% 0.19% - - 0.20% 23-May-11
JPMorgan Investment Funds - Blue and Green FundJPM Blue and Green A (acc) - EUR 0.85% - 0.85% 0.85% 0.85% 0.85% - 16-Sep-96
JPMorgan Investment Funds - Emerging Markets Corporate Bond Portfolio Fund IJPM Emerging Markets Corporate Bond Portfolio I - A (div) - EUR (hedged) 1.40% - 1.40% 1.40% 1.40% - - 31-May-10JPM Emerging Markets Corporate Bond Portfolio I - A (div) - USD 1.40% - 1.40% 1.40% 1.40% - - 31-May-10JPM Emerging Markets Corporate Bond Portfolio I - B (div) - EUR (hedged) 0.85% - 0.85% 0.85% 0.85% - - 30-Jun-10JPM Emerging Markets Corporate Bond Portfolio I - B (div) - USD 0.85% - 0.85% 0.85% 0.85% - - 15-Jun-10JPM Emerging Markets Corporate Bond Portfolio I - C (div) - USD* - - 0.70% 0.70% 0.70% - - 30-Jun-10JPM Emerging Markets Corporate Bond Portfolio I - D (div) - EUR (hedged) 1.90% - 1.90% 1.90% 1.90% - - 31-May-10JPM Emerging Markets Corporate Bond Portfolio I - D (div) - USD 1.90% - 1.90% 1.90% 1.90% - - 31-May-10
JPMorgan Investment Funds - Euro Liquid Market FundJPM Euro Liquid Market A (acc) - EUR 0.65% - 0.65% 0.65% 0.65% 0.65% - 16-Jan-95JPM Euro Liquid Market C (acc) - EUR 0.26% - 0.26% 0.26% 0.26% 0.25% - 18-Dec-03JPM Euro Liquid Market D (acc) - EUR 0.75% - 0.75% 0.75% 0.75% 0.75% - 10-Oct-08JPM Euro Liquid Market I (acc) - EUR 0.22% - - - - - - 21-Oct-13
JPMorgan Investment Funds - Europe Bond Fund (2)JPM Europe Bond A (acc) - EUR 0.74% - 0.90% 0.90% 0.90% 0.90% - 01-Jul-97JPM Europe Bond A (inc) - EUR 0.74% - 0.90% 0.90% 0.90% 0.90% - 18-Oct-05JPM Europe Bond B (acc) - EUR 0.49% - 0.60% 0.60% 0.60% 0.60% - 23-Sep-97JPM Europe Bond B (inc) - EUR 0.14% - - - - - - 13-Aug-13JPM Europe Bond C (acc) - EUR 0.41% - 0.50% 0.50% 0.50% 0.50% - 16-Jun-98JPM Europe Bond D (acc) - EUR 1.02% - 1.25% 1.25% 1.25% 1.25% - 16-Jul-01JPM Europe Bond X (acc) - EUR* - - - 0.08% 0.10% 0.10% 0.10% 30-Apr-98
JPMorgan Investment Funds - Europe Recovery Fund (3)JPM Europe Recovery A (acc) - EUR 1.22% - 1.90% 1.90% 1.90% 1.90% - 27-May-03JPM Europe Recovery A (dist) - EUR 1.22% - 1.90% 1.90% 1.90% 1.90% - 15-May-06JPM Europe Recovery B (acc) - EUR* - - - 1.15% 1.15% 1.15% - 13-Oct-03JPM Europe Recovery C (acc) - EUR 0.64% - 1.00% 1.00% 1.00% 1.00% - 06-Nov-03JPM Europe Recovery D (acc) - EUR 1.87% - 2.90% 2.90% 2.90% 2.90% - 27-May-03JPM Europe Recovery X (acc) - EUR 0.01% - 0.13% 0.11% 0.13% 0.14% 0.15% 27-May-03
JPMorgan Investment Funds - Europe Select Equity FundJPM Europe Select Equity A (acc) - EUR 1.90% - 1.90% 1.90% 1.90% 1.90% - 29-Aug-97JPM Europe Select Equity A (acc) - USD 1.90% - 1.90% 1.90% 1.90% 1.90% - 24-Oct-07JPM Europe Select Equity A (dist) - EUR 1.90% - 1.90% 1.90% 1.90% 1.90% - 15-May-06JPM Europe Select Equity B (acc) - EUR 1.15% - 1.15% 1.15% 1.15% 1.15% - 13-Oct-03JPM Europe Select Equity C (acc) - EUR 0.85% - 0.85% 0.85% 0.85% 0.85% - 07-Jan-98JPM Europe Select Equity C (dist) - GBP 0.85% - - - - - - 25-Jan-13JPM Europe Select Equity D (acc) - EUR 2.65% - 2.65% 2.65% 2.65% 2.65% - 19-Mar-07JPM Europe Select Equity D (acc) - USD 2.65% - 2.65% 2.65% 2.65% 2.65% - 20-Dec-07JPM Europe Select Equity I (acc) - EUR 0.75% - 0.76% 0.76% 0.57% - 0.81% 13-Apr-10JPM Europe Select Equity I (acc) - USD 0.81% - - - - - 0.81% 09-Oct-13JPM Europe Select Equity I (dist) - EUR 0.81% - - - - - 0.81% 11-Oct-13JPM Europe Select Equity X (acc) - EUR 0.09% - 0.11% 0.11% 0.13% 0.15% 0.15% 21-May-01JPM Europe Select Equity X (acc) - EUR (hedged) 0.09% - 0.11% 0.11% 0.13% 0.15% 0.15% 24-Oct-07JPM Europe Select Equity X (dist) - EUR 0.15% - - - - - 0.15% 06-Nov-13
(1) This Sub-Fund was merged into JPMorgan Funds - Asia Equity Fund (previously JPMorgan Funds - Asia Alpha Plus Fund) on 13 September 2013. The rate disclosed is calculated as at merger date andnot annualised.(2) This Sub-Fund was merged into JPMorgan Funds - Euro Aggregate Bond Fund on 25 October 2013. The rate disclosed is calculated as at merger date and not annualised.(3) This Sub-Fund was merged into JPMorgan Funds - Europe Dynamic Fund on 23 August 2013. The rate disclosed is calculated as at merger date and not annualised.
169
JPMorgan Investment Funds
Appendix - Unaudited Additional Disclosures
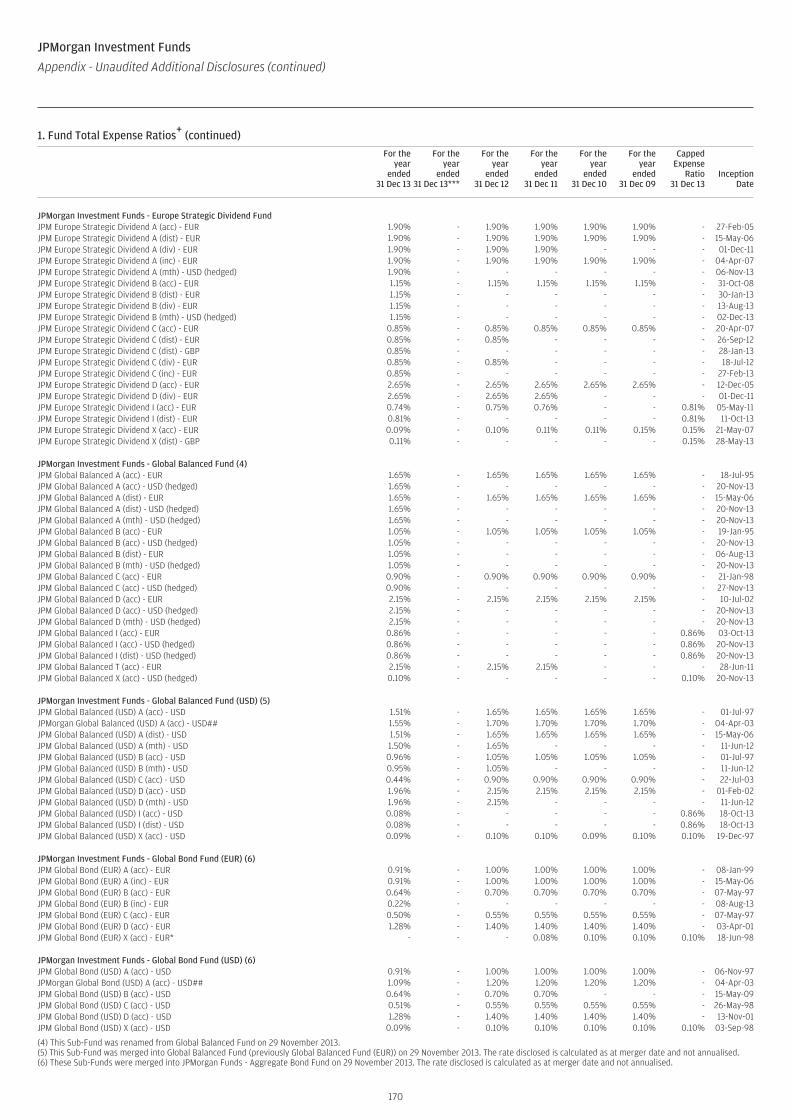
1. Fund Total Expense Ratios+ (continued)
For theyear
ended31 Dec 13
For theyear
ended31 Dec 13***
For theyear
ended31 Dec 12
For theyear
ended31 Dec 11
For theyear
ended31 Dec 10
For theyear
ended31 Dec 09
CappedExpense
Ratio31 Dec 13
InceptionDate
JPMorgan Investment Funds - Europe Strategic Dividend FundJPM Europe Strategic Dividend A (acc) - EUR 1.90% - 1.90% 1.90% 1.90% 1.90% - 27-Feb-05JPM Europe Strategic Dividend A (dist) - EUR 1.90% - 1.90% 1.90% 1.90% 1.90% - 15-May-06JPM Europe Strategic Dividend A (div) - EUR 1.90% - 1.90% 1.90% - - - 01-Dec-11JPM Europe Strategic Dividend A (inc) - EUR 1.90% - 1.90% 1.90% 1.90% 1.90% - 04-Apr-07JPM Europe Strategic Dividend A (mth) - USD (hedged) 1.90% - - - - - - 06-Nov-13JPM Europe Strategic Dividend B (acc) - EUR 1.15% - 1.15% 1.15% 1.15% 1.15% - 31-Oct-08JPM Europe Strategic Dividend B (dist) - EUR 1.15% - - - - - - 30-Jan-13JPM Europe Strategic Dividend B (div) - EUR 1.15% - - - - - - 13-Aug-13JPM Europe Strategic Dividend B (mth) - USD (hedged) 1.15% - - - - - - 02-Dec-13JPM Europe Strategic Dividend C (acc) - EUR 0.85% - 0.85% 0.85% 0.85% 0.85% - 20-Apr-07JPM Europe Strategic Dividend C (dist) - EUR 0.85% - 0.85% - - - - 26-Sep-12JPM Europe Strategic Dividend C (dist) - GBP 0.85% - - - - - - 28-Jan-13JPM Europe Strategic Dividend C (div) - EUR 0.85% - 0.85% - - - - 18-Jul-12JPM Europe Strategic Dividend C (inc) - EUR 0.85% - - - - - - 27-Feb-13JPM Europe Strategic Dividend D (acc) - EUR 2.65% - 2.65% 2.65% 2.65% 2.65% - 12-Dec-05JPM Europe Strategic Dividend D (div) - EUR 2.65% - 2.65% 2.65% - - - 01-Dec-11JPM Europe Strategic Dividend I (acc) - EUR 0.74% - 0.75% 0.76% - - 0.81% 05-May-11JPM Europe Strategic Dividend I (dist) - EUR 0.81% - - - - - 0.81% 11-Oct-13JPM Europe Strategic Dividend X (acc) - EUR 0.09% - 0.10% 0.11% 0.11% 0.15% 0.15% 21-May-07JPM Europe Strategic Dividend X (dist) - GBP 0.11% - - - - - 0.15% 28-May-13
JPMorgan Investment Funds - Global Balanced Fund (4)JPM Global Balanced A (acc) - EUR 1.65% - 1.65% 1.65% 1.65% 1.65% - 18-Jul-95JPM Global Balanced A (acc) - USD (hedged) 1.65% - - - - - - 20-Nov-13JPM Global Balanced A (dist) - EUR 1.65% - 1.65% 1.65% 1.65% 1.65% - 15-May-06JPM Global Balanced A (dist) - USD (hedged) 1.65% - - - - - - 20-Nov-13JPM Global Balanced A (mth) - USD (hedged) 1.65% - - - - - - 20-Nov-13JPM Global Balanced B (acc) - EUR 1.05% - 1.05% 1.05% 1.05% 1.05% - 19-Jan-95JPM Global Balanced B (acc) - USD (hedged) 1.05% - - - - - - 20-Nov-13JPM Global Balanced B (dist) - EUR 1.05% - - - - - - 06-Aug-13JPM Global Balanced B (mth) - USD (hedged) 1.05% - - - - - - 20-Nov-13JPM Global Balanced C (acc) - EUR 0.90% - 0.90% 0.90% 0.90% 0.90% - 21-Jan-98JPM Global Balanced C (acc) - USD (hedged) 0.90% - - - - - - 27-Nov-13JPM Global Balanced D (acc) - EUR 2.15% - 2.15% 2.15% 2.15% 2.15% - 10-Jul-02JPM Global Balanced D (acc) - USD (hedged) 2.15% - - - - - - 20-Nov-13JPM Global Balanced D (mth) - USD (hedged) 2.15% - - - - - - 20-Nov-13JPM Global Balanced I (acc) - EUR 0.86% - - - - - 0.86% 03-Oct-13JPM Global Balanced I (acc) - USD (hedged) 0.86% - - - - - 0.86% 20-Nov-13JPM Global Balanced I (dist) - USD (hedged) 0.86% - - - - - 0.86% 20-Nov-13JPM Global Balanced T (acc) - EUR 2.15% - 2.15% 2.15% - - - 28-Jun-11JPM Global Balanced X (acc) - USD (hedged) 0.10% - - - - - 0.10% 20-Nov-13
JPMorgan Investment Funds - Global Balanced Fund (USD) (5)JPM Global Balanced (USD) A (acc) - USD 1.51% - 1.65% 1.65% 1.65% 1.65% - 01-Jul-97JPMorgan Global Balanced (USD) A (acc) - USD## 1.55% - 1.70% 1.70% 1.70% 1.70% - 04-Apr-03JPM Global Balanced (USD) A (dist) - USD 1.51% - 1.65% 1.65% 1.65% 1.65% - 15-May-06JPM Global Balanced (USD) A (mth) - USD 1.50% - 1.65% - - - - 11-Jun-12JPM Global Balanced (USD) B (acc) - USD 0.96% - 1.05% 1.05% 1.05% 1.05% - 01-Jul-97JPM Global Balanced (USD) B (mth) - USD 0.95% - 1.05% - - - - 11-Jun-12JPM Global Balanced (USD) C (acc) - USD 0.44% - 0.90% 0.90% 0.90% 0.90% - 22-Jul-03JPM Global Balanced (USD) D (acc) - USD 1.96% - 2.15% 2.15% 2.15% 2.15% - 01-Feb-02JPM Global Balanced (USD) D (mth) - USD 1.96% - 2.15% - - - - 11-Jun-12JPM Global Balanced (USD) I (acc) - USD 0.08% - - - - - 0.86% 18-Oct-13JPM Global Balanced (USD) I (dist) - USD 0.08% - - - - - 0.86% 18-Oct-13JPM Global Balanced (USD) X (acc) - USD 0.09% - 0.10% 0.10% 0.09% 0.10% 0.10% 19-Dec-97
JPMorgan Investment Funds - Global Bond Fund (EUR) (6)JPM Global Bond (EUR) A (acc) - EUR 0.91% - 1.00% 1.00% 1.00% 1.00% - 08-Jan-99JPM Global Bond (EUR) A (inc) - EUR 0.91% - 1.00% 1.00% 1.00% 1.00% - 15-May-06JPM Global Bond (EUR) B (acc) - EUR 0.64% - 0.70% 0.70% 0.70% 0.70% - 07-May-97JPM Global Bond (EUR) B (inc) - EUR 0.22% - - - - - - 08-Aug-13JPM Global Bond (EUR) C (acc) - EUR 0.50% - 0.55% 0.55% 0.55% 0.55% - 07-May-97JPM Global Bond (EUR) D (acc) - EUR 1.28% - 1.40% 1.40% 1.40% 1.40% - 03-Apr-01JPM Global Bond (EUR) X (acc) - EUR* - - - 0.08% 0.10% 0.10% 0.10% 18-Jun-98
JPMorgan Investment Funds - Global Bond Fund (USD) (6)JPM Global Bond (USD) A (acc) - USD 0.91% - 1.00% 1.00% 1.00% 1.00% - 06-Nov-97JPMorgan Global Bond (USD) A (acc) - USD## 1.09% - 1.20% 1.20% 1.20% 1.20% - 04-Apr-03JPM Global Bond (USD) B (acc) - USD 0.64% - 0.70% 0.70% - - - 15-May-09JPM Global Bond (USD) C (acc) - USD 0.51% - 0.55% 0.55% 0.55% 0.55% - 26-May-98JPM Global Bond (USD) D (acc) - USD 1.28% - 1.40% 1.40% 1.40% 1.40% - 13-Nov-01JPM Global Bond (USD) X (acc) - USD 0.09% - 0.10% 0.10% 0.10% 0.10% 0.10% 03-Sep-98
(4) This Sub-Fund was renamed from Global Balanced Fund on 29 November 2013.(5) This Sub-Fund was merged into Global Balanced Fund (previously Global Balanced Fund (EUR)) on 29 November 2013. The rate disclosed is calculated as at merger date and not annualised.(6) These Sub-Funds were merged into JPMorgan Funds - Aggregate Bond Fund on 29 November 2013. The rate disclosed is calculated as at merger date and not annualised.
170
JPMorgan Investment Funds
Appendix - Unaudited Additional Disclosures (continued)
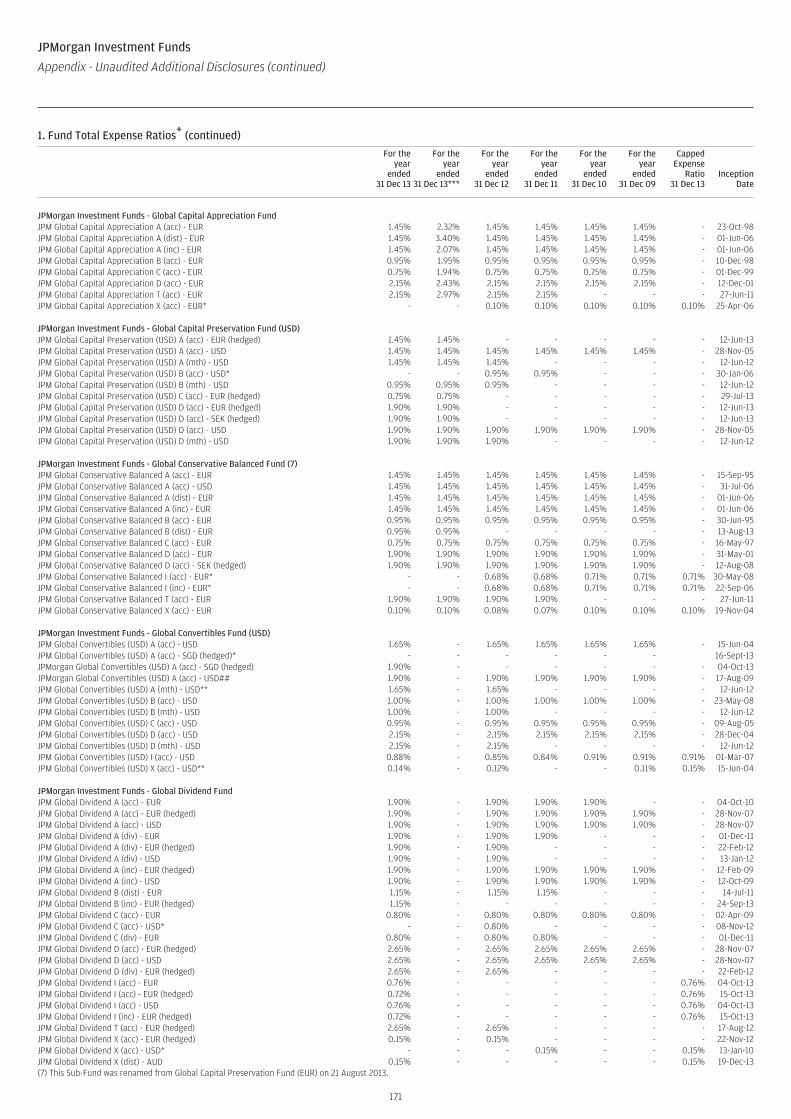
1. Fund Total Expense Ratios+ (continued)
For theyear
ended31 Dec 13
For theyear
ended31 Dec 13***
For theyear
ended31 Dec 12
For theyear
ended31 Dec 11
For theyear
ended31 Dec 10
For theyear
ended31 Dec 09
CappedExpense
Ratio31 Dec 13
InceptionDate
JPMorgan Investment Funds - Global Capital Appreciation FundJPM Global Capital Appreciation A (acc) - EUR 1.45% 2.32% 1.45% 1.45% 1.45% 1.45% - 23-Oct-98JPM Global Capital Appreciation A (dist) - EUR 1.45% 3.40% 1.45% 1.45% 1.45% 1.45% - 01-Jun-06JPM Global Capital Appreciation A (inc) - EUR 1.45% 2.07% 1.45% 1.45% 1.45% 1.45% - 01-Jun-06JPM Global Capital Appreciation B (acc) - EUR 0.95% 1.95% 0.95% 0.95% 0.95% 0.95% - 10-Dec-98JPM Global Capital Appreciation C (acc) - EUR 0.75% 1.94% 0.75% 0.75% 0.75% 0.75% - 01-Dec-99JPM Global Capital Appreciation D (acc) - EUR 2.15% 2.43% 2.15% 2.15% 2.15% 2.15% - 12-Dec-01JPM Global Capital Appreciation T (acc) - EUR 2.15% 2.97% 2.15% 2.15% - - - 27-Jun-11JPM Global Capital Appreciation X (acc) - EUR* - - 0.10% 0.10% 0.10% 0.10% 0.10% 25-Apr-06
JPMorgan Investment Funds - Global Capital Preservation Fund (USD)JPM Global Capital Preservation (USD) A (acc) - EUR (hedged) 1.45% 1.45% - - - - - 12-Jun-13JPM Global Capital Preservation (USD) A (acc) - USD 1.45% 1.45% 1.45% 1.45% 1.45% 1.45% - 28-Nov-05JPM Global Capital Preservation (USD) A (mth) - USD 1.45% 1.45% 1.45% - - - - 12-Jun-12JPM Global Capital Preservation (USD) B (acc) - USD* - - 0.95% 0.95% - - - 30-Jan-06JPM Global Capital Preservation (USD) B (mth) - USD 0.95% 0.95% 0.95% - - - - 12-Jun-12JPM Global Capital Preservation (USD) C (acc) - EUR (hedged) 0.75% 0.75% - - - - - 29-Jul-13JPM Global Capital Preservation (USD) D (acc) - EUR (hedged) 1.90% 1.90% - - - - - 12-Jun-13JPM Global Capital Preservation (USD) D (acc) - SEK (hedged) 1.90% 1.90% - - - - - 12-Jun-13JPM Global Capital Preservation (USD) D (acc) - USD 1.90% 1.90% 1.90% 1.90% 1.90% 1.90% - 28-Nov-05JPM Global Capital Preservation (USD) D (mth) - USD 1.90% 1.90% 1.90% - - - - 12-Jun-12
JPMorgan Investment Funds - Global Conservative Balanced Fund (7)JPM Global Conservative Balanced A (acc) - EUR 1.45% 1.45% 1.45% 1.45% 1.45% 1.45% - 15-Sep-95JPM Global Conservative Balanced A (acc) - USD 1.45% 1.45% 1.45% 1.45% 1.45% 1.45% - 31-Jul-06JPM Global Conservative Balanced A (dist) - EUR 1.45% 1.45% 1.45% 1.45% 1.45% 1.45% - 01-Jun-06JPM Global Conservative Balanced A (inc) - EUR 1.45% 1.45% 1.45% 1.45% 1.45% 1.45% - 01-Jun-06JPM Global Conservative Balanced B (acc) - EUR 0.95% 0.95% 0.95% 0.95% 0.95% 0.95% - 30-Jun-95JPM Global Conservative Balanced B (dist) - EUR 0.95% 0.95% - - - - - 13-Aug-13JPM Global Conservative Balanced C (acc) - EUR 0.75% 0.75% 0.75% 0.75% 0.75% 0.75% - 16-May-97JPM Global Conservative Balanced D (acc) - EUR 1.90% 1.90% 1.90% 1.90% 1.90% 1.90% - 31-May-01JPM Global Conservative Balanced D (acc) - SEK (hedged) 1.90% 1.90% 1.90% 1.90% 1.90% 1.90% - 12-Aug-08JPM Global Conservative Balanced I (acc) - EUR* - - 0.68% 0.68% 0.71% 0.71% 0.71% 30-May-08JPM Global Conservative Balanced I (inc) - EUR* - - 0.68% 0.68% 0.71% 0.71% 0.71% 22-Sep-06JPM Global Conservative Balanced T (acc) - EUR 1.90% 1.90% 1.90% 1.90% - - - 27-Jun-11JPM Global Conservative Balanced X (acc) - EUR 0.10% 0.10% 0.08% 0.07% 0.10% 0.10% 0.10% 19-Nov-04
JPMorgan Investment Funds - Global Convertibles Fund (USD)JPM Global Convertibles (USD) A (acc) - USD 1.65% - 1.65% 1.65% 1.65% 1.65% - 15-Jun-04JPM Global Convertibles (USD) A (acc) - SGD (hedged)* - - - - - - 16-Sept-13JPMorgan Global Convertibles (USD) A (acc) - SGD (hedged) 1.90% - - - - - - 04-Oct-13JPMorgan Global Convertibles (USD) A (acc) - USD## 1.90% - 1.90% 1.90% 1.90% 1.90% - 17-Aug-09JPM Global Convertibles (USD) A (mth) - USD** 1.65% - 1.65% - - - - 12-Jun-12JPM Global Convertibles (USD) B (acc) - USD 1.00% - 1.00% 1.00% 1.00% 1.00% - 23-May-08JPM Global Convertibles (USD) B (mth) - USD 1.00% - 1.00% - - - - 12-Jun-12JPM Global Convertibles (USD) C (acc) - USD 0.95% - 0.95% 0.95% 0.95% 0.95% - 09-Aug-05JPM Global Convertibles (USD) D (acc) - USD 2.15% - 2.15% 2.15% 2.15% 2.15% - 28-Dec-04JPM Global Convertibles (USD) D (mth) - USD 2.15% - 2.15% - - - - 12-Jun-12JPM Global Convertibles (USD) I (acc) - USD 0.88% - 0.85% 0.84% 0.91% 0.91% 0.91% 01-Mar-07JPM Global Convertibles (USD) X (acc) - USD** 0.14% - 0.12% - - 0.11% 0.15% 15-Jun-04
JPMorgan Investment Funds - Global Dividend FundJPM Global Dividend A (acc) - EUR 1.90% - 1.90% 1.90% 1.90% - - 04-Oct-10JPM Global Dividend A (acc) - EUR (hedged) 1.90% - 1.90% 1.90% 1.90% 1.90% - 28-Nov-07JPM Global Dividend A (acc) - USD 1.90% - 1.90% 1.90% 1.90% 1.90% - 28-Nov-07JPM Global Dividend A (div) - EUR 1.90% - 1.90% 1.90% - - - 01-Dec-11JPM Global Dividend A (div) - EUR (hedged) 1.90% - 1.90% - - - - 22-Feb-12JPM Global Dividend A (div) - USD 1.90% - 1.90% - - - - 13-Jan-12JPM Global Dividend A (inc) - EUR (hedged) 1.90% - 1.90% 1.90% 1.90% 1.90% - 12-Feb-09JPM Global Dividend A (inc) - USD 1.90% - 1.90% 1.90% 1.90% 1.90% - 12-Oct-09JPM Global Dividend B (dist) - EUR 1.15% - 1.15% 1.15% - - - 14-Jul-11JPM Global Dividend B (inc) - EUR (hedged) 1.15% - - - - - - 24-Sep-13JPM Global Dividend C (acc) - EUR 0.80% - 0.80% 0.80% 0.80% 0.80% - 02-Apr-09JPM Global Dividend C (acc) - USD* - - 0.80% - - - - 08-Nov-12JPM Global Dividend C (div) - EUR 0.80% - 0.80% 0.80% - - - 01-Dec-11JPM Global Dividend D (acc) - EUR (hedged) 2.65% - 2.65% 2.65% 2.65% 2.65% - 28-Nov-07JPM Global Dividend D (acc) - USD 2.65% - 2.65% 2.65% 2.65% 2.65% - 28-Nov-07JPM Global Dividend D (div) - EUR (hedged) 2.65% - 2.65% - - - - 22-Feb-12JPM Global Dividend I (acc) - EUR 0.76% - - - - - 0.76% 04-Oct-13JPM Global Dividend I (acc) - EUR (hedged) 0.72% - - - - - 0.76% 15-Oct-13JPM Global Dividend I (acc) - USD 0.76% - - - - - 0.76% 04-Oct-13JPM Global Dividend I (inc) - EUR (hedged) 0.72% - - - - - 0.76% 15-Oct-13JPM Global Dividend T (acc) - EUR (hedged) 2.65% - 2.65% - - - - 17-Aug-12JPM Global Dividend X (acc) - EUR (hedged) 0.15% - 0.15% - - - - 22-Nov-12JPM Global Dividend X (acc) - USD* - - - 0.15% - - 0.15% 13-Jan-10JPM Global Dividend X (dist) - AUD 0.15% - - - - - 0.15% 19-Dec-13(7) This Sub-Fund was renamed from Global Capital Preservation Fund (EUR) on 21 August 2013.
171
JPMorgan Investment Funds
Appendix - Unaudited Additional Disclosures (continued)
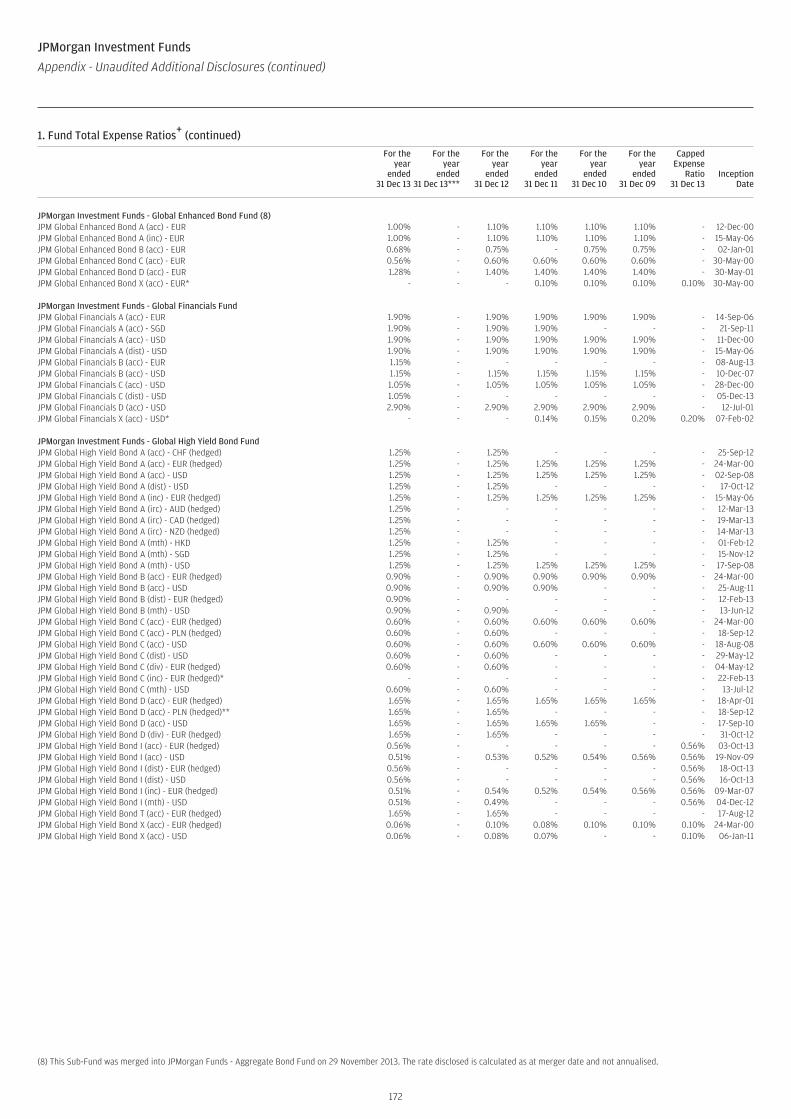
1. Fund Total Expense Ratios+ (continued)
For theyear
ended31 Dec 13
For theyear
ended31 Dec 13***
For theyear
ended31 Dec 12
For theyear
ended31 Dec 11
For theyear
ended31 Dec 10
For theyear
ended31 Dec 09
CappedExpense
Ratio31 Dec 13
InceptionDate
JPMorgan Investment Funds - Global Enhanced Bond Fund (8)JPM Global Enhanced Bond A (acc) - EUR 1.00% - 1.10% 1.10% 1.10% 1.10% - 12-Dec-00JPM Global Enhanced Bond A (inc) - EUR 1.00% - 1.10% 1.10% 1.10% 1.10% - 15-May-06JPM Global Enhanced Bond B (acc) - EUR 0.68% - 0.75% - 0.75% 0.75% - 02-Jan-01JPM Global Enhanced Bond C (acc) - EUR 0.56% - 0.60% 0.60% 0.60% 0.60% - 30-May-00JPM Global Enhanced Bond D (acc) - EUR 1.28% - 1.40% 1.40% 1.40% 1.40% - 30-May-01JPM Global Enhanced Bond X (acc) - EUR* - - - 0.10% 0.10% 0.10% 0.10% 30-May-00
JPMorgan Investment Funds - Global Financials FundJPM Global Financials A (acc) - EUR 1.90% - 1.90% 1.90% 1.90% 1.90% - 14-Sep-06JPM Global Financials A (acc) - SGD 1.90% - 1.90% 1.90% - - - 21-Sep-11JPM Global Financials A (acc) - USD 1.90% - 1.90% 1.90% 1.90% 1.90% - 11-Dec-00JPM Global Financials A (dist) - USD 1.90% - 1.90% 1.90% 1.90% 1.90% - 15-May-06JPM Global Financials B (acc) - EUR 1.15% - - - - - - 08-Aug-13JPM Global Financials B (acc) - USD 1.15% - 1.15% 1.15% 1.15% 1.15% - 10-Dec-07JPM Global Financials C (acc) - USD 1.05% - 1.05% 1.05% 1.05% 1.05% - 28-Dec-00JPM Global Financials C (dist) - USD 1.05% - - - - - - 05-Dec-13JPM Global Financials D (acc) - USD 2.90% - 2.90% 2.90% 2.90% 2.90% - 12-Jul-01JPM Global Financials X (acc) - USD* - - - 0.14% 0.15% 0.20% 0.20% 07-Feb-02
JPMorgan Investment Funds - Global High Yield Bond FundJPM Global High Yield Bond A (acc) - CHF (hedged) 1.25% - 1.25% - - - - 25-Sep-12JPM Global High Yield Bond A (acc) - EUR (hedged) 1.25% - 1.25% 1.25% 1.25% 1.25% - 24-Mar-00JPM Global High Yield Bond A (acc) - USD 1.25% - 1.25% 1.25% 1.25% 1.25% - 02-Sep-08JPM Global High Yield Bond A (dist) - USD 1.25% - 1.25% - - - - 17-Oct-12JPM Global High Yield Bond A (inc) - EUR (hedged) 1.25% - 1.25% 1.25% 1.25% 1.25% - 15-May-06JPM Global High Yield Bond A (irc) - AUD (hedged) 1.25% - - - - - - 12-Mar-13JPM Global High Yield Bond A (irc) - CAD (hedged) 1.25% - - - - - - 19-Mar-13JPM Global High Yield Bond A (irc) - NZD (hedged) 1.25% - - - - - - 14-Mar-13JPM Global High Yield Bond A (mth) - HKD 1.25% - 1.25% - - - - 01-Feb-12JPM Global High Yield Bond A (mth) - SGD 1.25% - 1.25% - - - - 15-Nov-12JPM Global High Yield Bond A (mth) - USD 1.25% - 1.25% 1.25% 1.25% 1.25% - 17-Sep-08JPM Global High Yield Bond B (acc) - EUR (hedged) 0.90% - 0.90% 0.90% 0.90% 0.90% - 24-Mar-00JPM Global High Yield Bond B (acc) - USD 0.90% - 0.90% 0.90% - - - 25-Aug-11JPM Global High Yield Bond B (dist) - EUR (hedged) 0.90% - - - - - - 12-Feb-13JPM Global High Yield Bond B (mth) - USD 0.90% - 0.90% - - - - 13-Jun-12JPM Global High Yield Bond C (acc) - EUR (hedged) 0.60% - 0.60% 0.60% 0.60% 0.60% - 24-Mar-00JPM Global High Yield Bond C (acc) - PLN (hedged) 0.60% - 0.60% - - - - 18-Sep-12JPM Global High Yield Bond C (acc) - USD 0.60% - 0.60% 0.60% 0.60% 0.60% - 18-Aug-08JPM Global High Yield Bond C (dist) - USD 0.60% - 0.60% - - - - 29-May-12JPM Global High Yield Bond C (div) - EUR (hedged) 0.60% - 0.60% - - - - 04-May-12JPM Global High Yield Bond C (inc) - EUR (hedged)* - - - - - - - 22-Feb-13JPM Global High Yield Bond C (mth) - USD 0.60% - 0.60% - - - - 13-Jul-12JPM Global High Yield Bond D (acc) - EUR (hedged) 1.65% - 1.65% 1.65% 1.65% 1.65% - 18-Apr-01JPM Global High Yield Bond D (acc) - PLN (hedged)** 1.65% - 1.65% - - - - 18-Sep-12JPM Global High Yield Bond D (acc) - USD 1.65% - 1.65% 1.65% 1.65% - - 17-Sep-10JPM Global High Yield Bond D (div) - EUR (hedged) 1.65% - 1.65% - - - - 31-Oct-12JPM Global High Yield Bond I (acc) - EUR (hedged) 0.56% - - - - - 0.56% 03-Oct-13JPM Global High Yield Bond I (acc) - USD 0.51% - 0.53% 0.52% 0.54% 0.56% 0.56% 19-Nov-09JPM Global High Yield Bond I (dist) - EUR (hedged) 0.56% - - - - - 0.56% 18-Oct-13JPM Global High Yield Bond I (dist) - USD 0.56% - - - - - 0.56% 16-Oct-13JPM Global High Yield Bond I (inc) - EUR (hedged) 0.51% - 0.54% 0.52% 0.54% 0.56% 0.56% 09-Mar-07JPM Global High Yield Bond I (mth) - USD 0.51% - 0.49% - - - 0.56% 04-Dec-12JPM Global High Yield Bond T (acc) - EUR (hedged) 1.65% - 1.65% - - - - 17-Aug-12JPM Global High Yield Bond X (acc) - EUR (hedged) 0.06% - 0.10% 0.08% 0.10% 0.10% 0.10% 24-Mar-00JPM Global High Yield Bond X (acc) - USD 0.06% - 0.08% 0.07% - - 0.10% 06-Jan-11
(8) This Sub-Fund was merged into JPMorgan Funds - Aggregate Bond Fund on 29 November 2013. The rate disclosed is calculated as at merger date and not annualised.
172
JPMorgan Investment Funds
Appendix - Unaudited Additional Disclosures (continued)
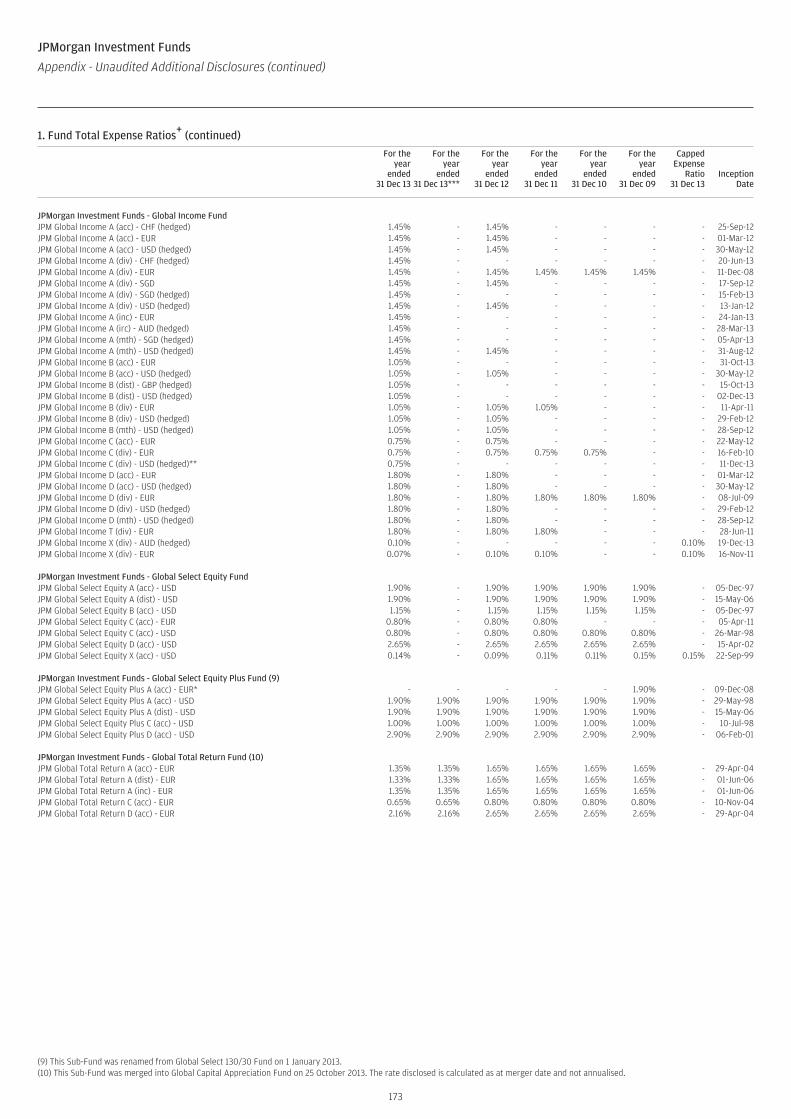
1. Fund Total Expense Ratios+ (continued)
For theyear
ended31 Dec 13
For theyear
ended31 Dec 13***
For theyear
ended31 Dec 12
For theyear
ended31 Dec 11
For theyear
ended31 Dec 10
For theyear
ended31 Dec 09
CappedExpense
Ratio31 Dec 13
InceptionDate
JPMorgan Investment Funds - Global Income FundJPM Global Income A (acc) - CHF (hedged) 1.45% - 1.45% - - - - 25-Sep-12JPM Global Income A (acc) - EUR 1.45% - 1.45% - - - - 01-Mar-12JPM Global Income A (acc) - USD (hedged) 1.45% - 1.45% - - - - 30-May-12JPM Global Income A (div) - CHF (hedged) 1.45% - - - - - - 20-Jun-13JPM Global Income A (div) - EUR 1.45% - 1.45% 1.45% 1.45% 1.45% - 11-Dec-08JPM Global Income A (div) - SGD 1.45% - 1.45% - - - - 17-Sep-12JPM Global Income A (div) - SGD (hedged) 1.45% - - - - - - 15-Feb-13JPM Global Income A (div) - USD (hedged) 1.45% - 1.45% - - - - 13-Jan-12JPM Global Income A (inc) - EUR 1.45% - - - - - - 24-Jan-13JPM Global Income A (irc) - AUD (hedged) 1.45% - - - - - - 28-Mar-13JPM Global Income A (mth) - SGD (hedged) 1.45% - - - - - - 05-Apr-13JPM Global Income A (mth) - USD (hedged) 1.45% - 1.45% - - - - 31-Aug-12JPM Global Income B (acc) - EUR 1.05% - - - - - - 31-Oct-13JPM Global Income B (acc) - USD (hedged) 1.05% - 1.05% - - - - 30-May-12JPM Global Income B (dist) - GBP (hedged) 1.05% - - - - - - 15-Oct-13JPM Global Income B (dist) - USD (hedged) 1.05% - - - - - - 02-Dec-13JPM Global Income B (div) - EUR 1.05% - 1.05% 1.05% - - - 11-Apr-11JPM Global Income B (div) - USD (hedged) 1.05% - 1.05% - - - - 29-Feb-12JPM Global Income B (mth) - USD (hedged) 1.05% - 1.05% - - - - 28-Sep-12JPM Global Income C (acc) - EUR 0.75% - 0.75% - - - - 22-May-12JPM Global Income C (div) - EUR 0.75% - 0.75% 0.75% 0.75% - - 16-Feb-10JPM Global Income C (div) - USD (hedged)** 0.75% - - - - - - 11-Dec-13JPM Global Income D (acc) - EUR 1.80% - 1.80% - - - - 01-Mar-12JPM Global Income D (acc) - USD (hedged) 1.80% - 1.80% - - - - 30-May-12JPM Global Income D (div) - EUR 1.80% - 1.80% 1.80% 1.80% 1.80% - 08-Jul-09JPM Global Income D (div) - USD (hedged) 1.80% - 1.80% - - - - 29-Feb-12JPM Global Income D (mth) - USD (hedged) 1.80% - 1.80% - - - - 28-Sep-12JPM Global Income T (div) - EUR 1.80% - 1.80% 1.80% - - - 28-Jun-11JPM Global Income X (div) - AUD (hedged) 0.10% - - - - - 0.10% 19-Dec-13JPM Global Income X (div) - EUR 0.07% - 0.10% 0.10% - - 0.10% 16-Nov-11
JPMorgan Investment Funds - Global Select Equity FundJPM Global Select Equity A (acc) - USD 1.90% - 1.90% 1.90% 1.90% 1.90% - 05-Dec-97JPM Global Select Equity A (dist) - USD 1.90% - 1.90% 1.90% 1.90% 1.90% - 15-May-06JPM Global Select Equity B (acc) - USD 1.15% - 1.15% 1.15% 1.15% 1.15% - 05-Dec-97JPM Global Select Equity C (acc) - EUR 0.80% - 0.80% 0.80% - - - 05-Apr-11JPM Global Select Equity C (acc) - USD 0.80% - 0.80% 0.80% 0.80% 0.80% - 26-Mar-98JPM Global Select Equity D (acc) - USD 2.65% - 2.65% 2.65% 2.65% 2.65% - 15-Apr-02JPM Global Select Equity X (acc) - USD 0.14% - 0.09% 0.11% 0.11% 0.15% 0.15% 22-Sep-99
JPMorgan Investment Funds - Global Select Equity Plus Fund (9)JPM Global Select Equity Plus A (acc) - EUR* - - - - - 1.90% - 09-Dec-08JPM Global Select Equity Plus A (acc) - USD 1.90% 1.90% 1.90% 1.90% 1.90% 1.90% - 29-May-98JPM Global Select Equity Plus A (dist) - USD 1.90% 1.90% 1.90% 1.90% 1.90% 1.90% - 15-May-06JPM Global Select Equity Plus C (acc) - USD 1.00% 1.00% 1.00% 1.00% 1.00% 1.00% - 10-Jul-98JPM Global Select Equity Plus D (acc) - USD 2.90% 2.90% 2.90% 2.90% 2.90% 2.90% - 06-Feb-01
JPMorgan Investment Funds - Global Total Return Fund (10)JPM Global Total Return A (acc) - EUR 1.35% 1.35% 1.65% 1.65% 1.65% 1.65% - 29-Apr-04JPM Global Total Return A (dist) - EUR 1.33% 1.33% 1.65% 1.65% 1.65% 1.65% - 01-Jun-06JPM Global Total Return A (inc) - EUR 1.35% 1.35% 1.65% 1.65% 1.65% 1.65% - 01-Jun-06JPM Global Total Return C (acc) - EUR 0.65% 0.65% 0.80% 0.80% 0.80% 0.80% - 10-Nov-04JPM Global Total Return D (acc) - EUR 2.16% 2.16% 2.65% 2.65% 2.65% 2.65% - 29-Apr-04
(9) This Sub-Fund was renamed from Global Select 130/30 Fund on 1 January 2013.(10) This Sub-Fund was merged into Global Capital Appreciation Fund on 25 October 2013. The rate disclosed is calculated as at merger date and not annualised.
173
JPMorgan Investment Funds
Appendix - Unaudited Additional Disclosures (continued)
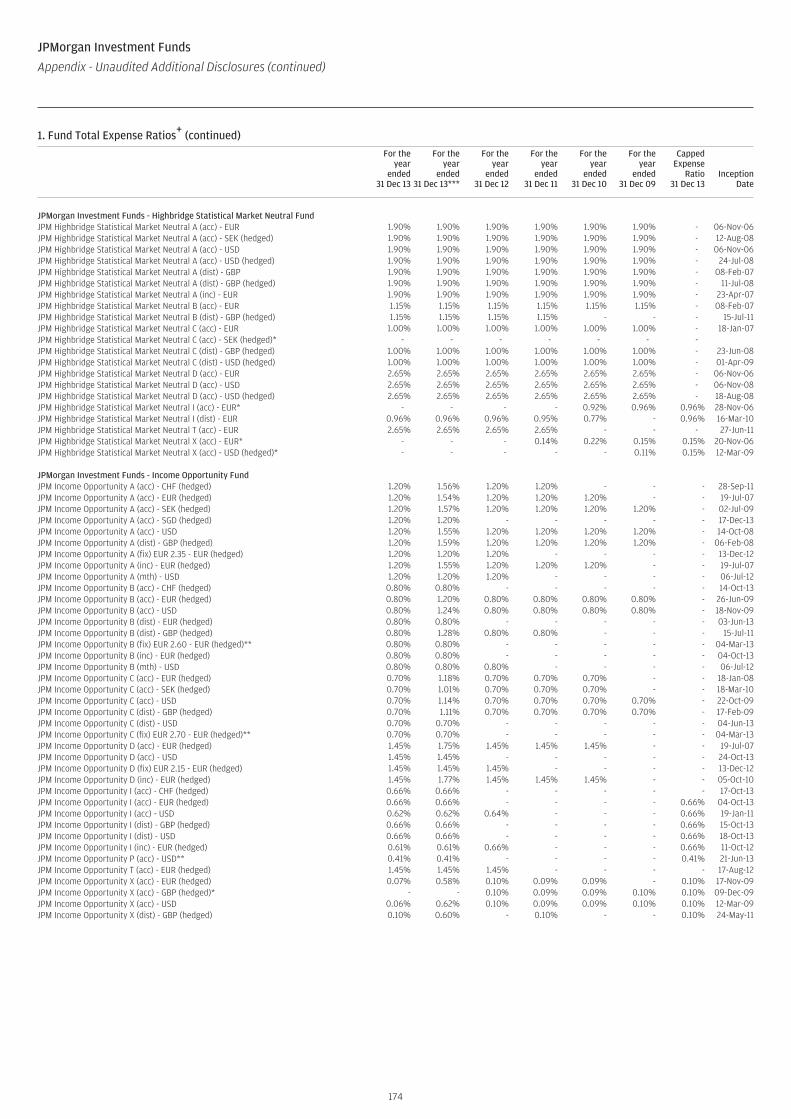
1. Fund Total Expense Ratios+ (continued)
For theyear
ended31 Dec 13
For theyear
ended31 Dec 13***
For theyear
ended31 Dec 12
For theyear
ended31 Dec 11
For theyear
ended31 Dec 10
For theyear
ended31 Dec 09
CappedExpense
Ratio31 Dec 13
InceptionDate
JPMorgan Investment Funds - Highbridge Statistical Market Neutral FundJPM Highbridge Statistical Market Neutral A (acc) - EUR 1.90% 1.90% 1.90% 1.90% 1.90% 1.90% - 06-Nov-06JPM Highbridge Statistical Market Neutral A (acc) - SEK (hedged) 1.90% 1.90% 1.90% 1.90% 1.90% 1.90% - 12-Aug-08JPM Highbridge Statistical Market Neutral A (acc) - USD 1.90% 1.90% 1.90% 1.90% 1.90% 1.90% - 06-Nov-06JPM Highbridge Statistical Market Neutral A (acc) - USD (hedged) 1.90% 1.90% 1.90% 1.90% 1.90% 1.90% - 24-Jul-08JPM Highbridge Statistical Market Neutral A (dist) - GBP 1.90% 1.90% 1.90% 1.90% 1.90% 1.90% - 08-Feb-07JPM Highbridge Statistical Market Neutral A (dist) - GBP (hedged) 1.90% 1.90% 1.90% 1.90% 1.90% 1.90% - 11-Jul-08JPM Highbridge Statistical Market Neutral A (inc) - EUR 1.90% 1.90% 1.90% 1.90% 1.90% 1.90% - 23-Apr-07JPM Highbridge Statistical Market Neutral B (acc) - EUR 1.15% 1.15% 1.15% 1.15% 1.15% 1.15% - 08-Feb-07JPM Highbridge Statistical Market Neutral B (dist) - GBP (hedged) 1.15% 1.15% 1.15% 1.15% - - - 15-Jul-11JPM Highbridge Statistical Market Neutral C (acc) - EUR 1.00% 1.00% 1.00% 1.00% 1.00% 1.00% - 18-Jan-07JPM Highbridge Statistical Market Neutral C (acc) - SEK (hedged)* - - - - - - -JPM Highbridge Statistical Market Neutral C (dist) - GBP (hedged) 1.00% 1.00% 1.00% 1.00% 1.00% 1.00% - 23-Jun-08JPM Highbridge Statistical Market Neutral C (dist) - USD (hedged) 1.00% 1.00% 1.00% 1.00% 1.00% 1.00% - 01-Apr-09JPM Highbridge Statistical Market Neutral D (acc) - EUR 2.65% 2.65% 2.65% 2.65% 2.65% 2.65% - 06-Nov-06JPM Highbridge Statistical Market Neutral D (acc) - USD 2.65% 2.65% 2.65% 2.65% 2.65% 2.65% - 06-Nov-08JPM Highbridge Statistical Market Neutral D (acc) - USD (hedged) 2.65% 2.65% 2.65% 2.65% 2.65% 2.65% - 18-Aug-08JPM Highbridge Statistical Market Neutral I (acc) - EUR* - - - - 0.92% 0.96% 0.96% 28-Nov-06JPM Highbridge Statistical Market Neutral I (dist) - EUR 0.96% 0.96% 0.96% 0.95% 0.77% - 0.96% 16-Mar-10JPM Highbridge Statistical Market Neutral T (acc) - EUR 2.65% 2.65% 2.65% 2.65% - - - 27-Jun-11JPM Highbridge Statistical Market Neutral X (acc) - EUR* - - - 0.14% 0.22% 0.15% 0.15% 20-Nov-06JPM Highbridge Statistical Market Neutral X (acc) - USD (hedged)* - - - - - 0.11% 0.15% 12-Mar-09
JPMorgan Investment Funds - Income Opportunity FundJPM Income Opportunity A (acc) - CHF (hedged) 1.20% 1.56% 1.20% 1.20% - - - 28-Sep-11JPM Income Opportunity A (acc) - EUR (hedged) 1.20% 1.54% 1.20% 1.20% 1.20% - - 19-Jul-07JPM Income Opportunity A (acc) - SEK (hedged) 1.20% 1.57% 1.20% 1.20% 1.20% 1.20% - 02-Jul-09JPM Income Opportunity A (acc) - SGD (hedged) 1.20% 1.20% - - - - - 17-Dec-13JPM Income Opportunity A (acc) - USD 1.20% 1.55% 1.20% 1.20% 1.20% 1.20% - 14-Oct-08JPM Income Opportunity A (dist) - GBP (hedged) 1.20% 1.59% 1.20% 1.20% 1.20% 1.20% - 06-Feb-08JPM Income Opportunity A (fix) EUR 2.35 - EUR (hedged) 1.20% 1.20% 1.20% - - - - 13-Dec-12JPM Income Opportunity A (inc) - EUR (hedged) 1.20% 1.55% 1.20% 1.20% 1.20% - - 19-Jul-07JPM Income Opportunity A (mth) - USD 1.20% 1.20% 1.20% - - - - 06-Jul-12JPM Income Opportunity B (acc) - CHF (hedged) 0.80% 0.80% - - - - - 14-Oct-13JPM Income Opportunity B (acc) - EUR (hedged) 0.80% 1.20% 0.80% 0.80% 0.80% 0.80% - 26-Jun-09JPM Income Opportunity B (acc) - USD 0.80% 1.24% 0.80% 0.80% 0.80% 0.80% - 18-Nov-09JPM Income Opportunity B (dist) - EUR (hedged) 0.80% 0.80% - - - - - 03-Jun-13JPM Income Opportunity B (dist) - GBP (hedged) 0.80% 1.28% 0.80% 0.80% - - - 15-Jul-11JPM Income Opportunity B (fix) EUR 2.60 - EUR (hedged)** 0.80% 0.80% - - - - - 04-Mar-13JPM Income Opportunity B (inc) - EUR (hedged) 0.80% 0.80% - - - - - 04-Oct-13JPM Income Opportunity B (mth) - USD 0.80% 0.80% 0.80% - - - - 06-Jul-12JPM Income Opportunity C (acc) - EUR (hedged) 0.70% 1.18% 0.70% 0.70% 0.70% - - 18-Jan-08JPM Income Opportunity C (acc) - SEK (hedged) 0.70% 1.01% 0.70% 0.70% 0.70% - - 18-Mar-10JPM Income Opportunity C (acc) - USD 0.70% 1.14% 0.70% 0.70% 0.70% 0.70% - 22-Oct-09JPM Income Opportunity C (dist) - GBP (hedged) 0.70% 1.11% 0.70% 0.70% 0.70% 0.70% - 17-Feb-09JPM Income Opportunity C (dist) - USD 0.70% 0.70% - - - - - 04-Jun-13JPM Income Opportunity C (fix) EUR 2.70 - EUR (hedged)** 0.70% 0.70% - - - - - 04-Mar-13JPM Income Opportunity D (acc) - EUR (hedged) 1.45% 1.75% 1.45% 1.45% 1.45% - - 19-Jul-07JPM Income Opportunity D (acc) - USD 1.45% 1.45% - - - - - 24-Oct-13JPM Income Opportunity D (fix) EUR 2.15 - EUR (hedged) 1.45% 1.45% 1.45% - - - - 13-Dec-12JPM Income Opportunity D (inc) - EUR (hedged) 1.45% 1.77% 1.45% 1.45% 1.45% - - 05-Oct-10JPM Income Opportunity I (acc) - CHF (hedged) 0.66% 0.66% - - - - - 17-Oct-13JPM Income Opportunity I (acc) - EUR (hedged) 0.66% 0.66% - - - - 0.66% 04-Oct-13JPM Income Opportunity I (acc) - USD 0.62% 0.62% 0.64% - - - 0.66% 19-Jan-11JPM Income Opportunity I (dist) - GBP (hedged) 0.66% 0.66% - - - - 0.66% 15-Oct-13JPM Income Opportunity I (dist) - USD 0.66% 0.66% - - - - 0.66% 18-Oct-13JPM Income Opportunity I (inc) - EUR (hedged) 0.61% 0.61% 0.66% - - - 0.66% 11-Oct-12JPM Income Opportunity P (acc) - USD** 0.41% 0.41% - - - - 0.41% 21-Jun-13JPM Income Opportunity T (acc) - EUR (hedged) 1.45% 1.45% 1.45% - - - - 17-Aug-12JPM Income Opportunity X (acc) - EUR (hedged) 0.07% 0.58% 0.10% 0.09% 0.09% - 0.10% 17-Nov-09JPM Income Opportunity X (acc) - GBP (hedged)* - - 0.10% 0.09% 0.09% 0.10% 0.10% 09-Dec-09JPM Income Opportunity X (acc) - USD 0.06% 0.62% 0.10% 0.09% 0.09% 0.10% 0.10% 12-Mar-09JPM Income Opportunity X (dist) - GBP (hedged) 0.10% 0.60% - 0.10% - - 0.10% 24-May-11
174
JPMorgan Investment Funds
Appendix - Unaudited Additional Disclosures (continued)
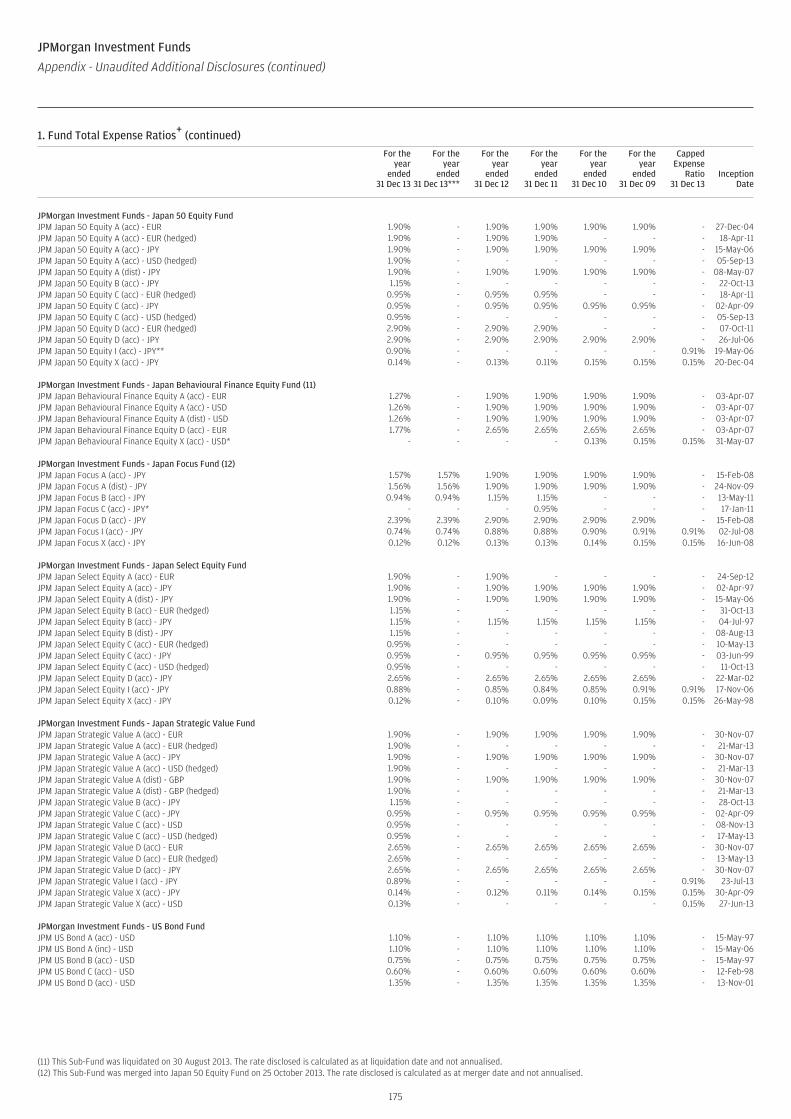
1. Fund Total Expense Ratios+ (continued)
For theyear
ended31 Dec 13
For theyear
ended31 Dec 13***
For theyear
ended31 Dec 12
For theyear
ended31 Dec 11
For theyear
ended31 Dec 10
For theyear
ended31 Dec 09
CappedExpense
Ratio31 Dec 13
InceptionDate
JPMorgan Investment Funds - Japan 50 Equity FundJPM Japan 50 Equity A (acc) - EUR 1.90% - 1.90% 1.90% 1.90% 1.90% - 27-Dec-04JPM Japan 50 Equity A (acc) - EUR (hedged) 1.90% - 1.90% 1.90% - - - 18-Apr-11JPM Japan 50 Equity A (acc) - JPY 1.90% - 1.90% 1.90% 1.90% 1.90% - 15-May-06JPM Japan 50 Equity A (acc) - USD (hedged) 1.90% - - - - - - 05-Sep-13JPM Japan 50 Equity A (dist) - JPY 1.90% - 1.90% 1.90% 1.90% 1.90% - 08-May-07JPM Japan 50 Equity B (acc) - JPY 1.15% - - - - - - 22-Oct-13JPM Japan 50 Equity C (acc) - EUR (hedged) 0.95% - 0.95% 0.95% - - - 18-Apr-11JPM Japan 50 Equity C (acc) - JPY 0.95% - 0.95% 0.95% 0.95% 0.95% - 02-Apr-09JPM Japan 50 Equity C (acc) - USD (hedged) 0.95% - - - - - - 05-Sep-13JPM Japan 50 Equity D (acc) - EUR (hedged) 2.90% - 2.90% 2.90% - - - 07-Oct-11JPM Japan 50 Equity D (acc) - JPY 2.90% - 2.90% 2.90% 2.90% 2.90% - 26-Jul-06JPM Japan 50 Equity I (acc) - JPY** 0.90% - - - - - 0.91% 19-May-06JPM Japan 50 Equity X (acc) - JPY 0.14% - 0.13% 0.11% 0.15% 0.15% 0.15% 20-Dec-04
JPMorgan Investment Funds - Japan Behavioural Finance Equity Fund (11)JPM Japan Behavioural Finance Equity A (acc) - EUR 1.27% - 1.90% 1.90% 1.90% 1.90% - 03-Apr-07JPM Japan Behavioural Finance Equity A (acc) - USD 1.26% - 1.90% 1.90% 1.90% 1.90% - 03-Apr-07JPM Japan Behavioural Finance Equity A (dist) - USD 1.26% - 1.90% 1.90% 1.90% 1.90% - 03-Apr-07JPM Japan Behavioural Finance Equity D (acc) - EUR 1.77% - 2.65% 2.65% 2.65% 2.65% - 03-Apr-07JPM Japan Behavioural Finance Equity X (acc) - USD* - - - - 0.13% 0.15% 0.15% 31-May-07
JPMorgan Investment Funds - Japan Focus Fund (12)JPM Japan Focus A (acc) - JPY 1.57% 1.57% 1.90% 1.90% 1.90% 1.90% - 15-Feb-08JPM Japan Focus A (dist) - JPY 1.56% 1.56% 1.90% 1.90% 1.90% 1.90% - 24-Nov-09JPM Japan Focus B (acc) - JPY 0.94% 0.94% 1.15% 1.15% - - - 13-May-11JPM Japan Focus C (acc) - JPY* - - - 0.95% - - - 17-Jan-11JPM Japan Focus D (acc) - JPY 2.39% 2.39% 2.90% 2.90% 2.90% 2.90% - 15-Feb-08JPM Japan Focus I (acc) - JPY 0.74% 0.74% 0.88% 0.88% 0.90% 0.91% 0.91% 02-Jul-08JPM Japan Focus X (acc) - JPY 0.12% 0.12% 0.13% 0.13% 0.14% 0.15% 0.15% 16-Jun-08
JPMorgan Investment Funds - Japan Select Equity FundJPM Japan Select Equity A (acc) - EUR 1.90% - 1.90% - - - - 24-Sep-12JPM Japan Select Equity A (acc) - JPY 1.90% - 1.90% 1.90% 1.90% 1.90% - 02-Apr-97JPM Japan Select Equity A (dist) - JPY 1.90% - 1.90% 1.90% 1.90% 1.90% - 15-May-06JPM Japan Select Equity B (acc) - EUR (hedged) 1.15% - - - - - - 31-Oct-13JPM Japan Select Equity B (acc) - JPY 1.15% - 1.15% 1.15% 1.15% 1.15% - 04-Jul-97JPM Japan Select Equity B (dist) - JPY 1.15% - - - - - - 08-Aug-13JPM Japan Select Equity C (acc) - EUR (hedged) 0.95% - - - - - - 10-May-13JPM Japan Select Equity C (acc) - JPY 0.95% - 0.95% 0.95% 0.95% 0.95% - 03-Jun-99JPM Japan Select Equity C (acc) - USD (hedged) 0.95% - - - - - - 11-Oct-13JPM Japan Select Equity D (acc) - JPY 2.65% - 2.65% 2.65% 2.65% 2.65% - 22-Mar-02JPM Japan Select Equity I (acc) - JPY 0.88% - 0.85% 0.84% 0.85% 0.91% 0.91% 17-Nov-06JPM Japan Select Equity X (acc) - JPY 0.12% - 0.10% 0.09% 0.10% 0.15% 0.15% 26-May-98
JPMorgan Investment Funds - Japan Strategic Value FundJPM Japan Strategic Value A (acc) - EUR 1.90% - 1.90% 1.90% 1.90% 1.90% - 30-Nov-07JPM Japan Strategic Value A (acc) - EUR (hedged) 1.90% - - - - - - 21-Mar-13JPM Japan Strategic Value A (acc) - JPY 1.90% - 1.90% 1.90% 1.90% 1.90% - 30-Nov-07JPM Japan Strategic Value A (acc) - USD (hedged) 1.90% - - - - - - 21-Mar-13JPM Japan Strategic Value A (dist) - GBP 1.90% - 1.90% 1.90% 1.90% 1.90% - 30-Nov-07JPM Japan Strategic Value A (dist) - GBP (hedged) 1.90% - - - - - - 21-Mar-13JPM Japan Strategic Value B (acc) - JPY 1.15% - - - - - - 28-Oct-13JPM Japan Strategic Value C (acc) - JPY 0.95% - 0.95% 0.95% 0.95% 0.95% - 02-Apr-09JPM Japan Strategic Value C (acc) - USD 0.95% - - - - - - 08-Nov-13JPM Japan Strategic Value C (acc) - USD (hedged) 0.95% - - - - - - 17-May-13JPM Japan Strategic Value D (acc) - EUR 2.65% - 2.65% 2.65% 2.65% 2.65% - 30-Nov-07JPM Japan Strategic Value D (acc) - EUR (hedged) 2.65% - - - - - - 13-May-13JPM Japan Strategic Value D (acc) - JPY 2.65% - 2.65% 2.65% 2.65% 2.65% - 30-Nov-07JPM Japan Strategic Value I (acc) - JPY 0.89% - - - - - 0.91% 23-Jul-13JPM Japan Strategic Value X (acc) - JPY 0.14% - 0.12% 0.11% 0.14% 0.15% 0.15% 30-Apr-09JPM Japan Strategic Value X (acc) - USD 0.13% - - - - - 0.15% 27-Jun-13
JPMorgan Investment Funds - US Bond FundJPM US Bond A (acc) - USD 1.10% - 1.10% 1.10% 1.10% 1.10% - 15-May-97JPM US Bond A (inc) - USD 1.10% - 1.10% 1.10% 1.10% 1.10% - 15-May-06JPM US Bond B (acc) - USD 0.75% - 0.75% 0.75% 0.75% 0.75% - 15-May-97JPM US Bond C (acc) - USD 0.60% - 0.60% 0.60% 0.60% 0.60% - 12-Feb-98JPM US Bond D (acc) - USD 1.35% - 1.35% 1.35% 1.35% 1.35% - 13-Nov-01
(11) This Sub-Fund was liquidated on 30 August 2013. The rate disclosed is calculated as at liquidation date and not annualised.(12) This Sub-Fund was merged into Japan 50 Equity Fund on 25 October 2013. The rate disclosed is calculated as at merger date and not annualised.
175
JPMorgan Investment Funds
Appendix - Unaudited Additional Disclosures (continued)
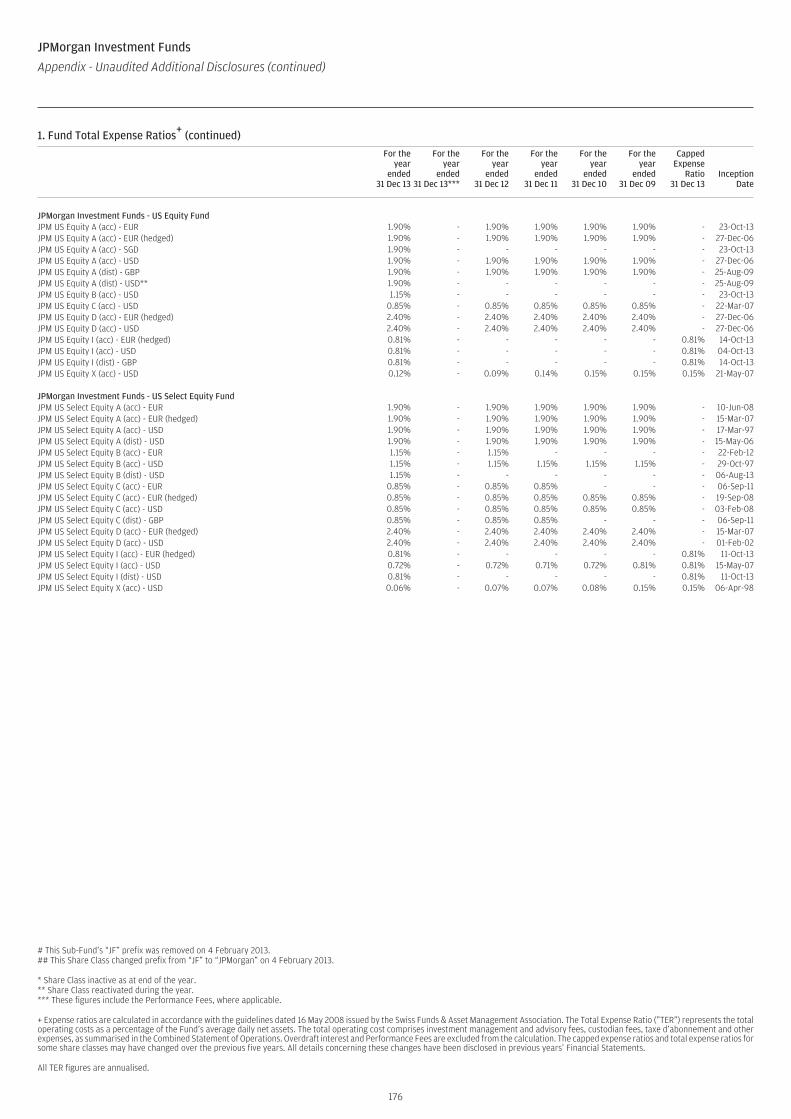
1. Fund Total Expense Ratios+ (continued)
For theyear
ended31 Dec 13
For theyear
ended31 Dec 13***
For theyear
ended31 Dec 12
For theyear
ended31 Dec 11
For theyear
ended31 Dec 10
For theyear
ended31 Dec 09
CappedExpense
Ratio31 Dec 13
InceptionDate
JPMorgan Investment Funds - US Equity FundJPM US Equity A (acc) - EUR 1.90% - 1.90% 1.90% 1.90% 1.90% - 23-Oct-13JPM US Equity A (acc) - EUR (hedged) 1.90% - 1.90% 1.90% 1.90% 1.90% - 27-Dec-06JPM US Equity A (acc) - SGD 1.90% - - - - - - 23-Oct-13JPM US Equity A (acc) - USD 1.90% - 1.90% 1.90% 1.90% 1.90% - 27-Dec-06JPM US Equity A (dist) - GBP 1.90% - 1.90% 1.90% 1.90% 1.90% - 25-Aug-09JPM US Equity A (dist) - USD** 1.90% - - - - - - 25-Aug-09JPM US Equity B (acc) - USD 1.15% - - - - - - 23-Oct-13JPM US Equity C (acc) - USD 0.85% - 0.85% 0.85% 0.85% 0.85% - 22-Mar-07JPM US Equity D (acc) - EUR (hedged) 2.40% - 2.40% 2.40% 2.40% 2.40% - 27-Dec-06JPM US Equity D (acc) - USD 2.40% - 2.40% 2.40% 2.40% 2.40% - 27-Dec-06JPM US Equity I (acc) - EUR (hedged) 0.81% - - - - - 0.81% 14-Oct-13JPM US Equity I (acc) - USD 0.81% - - - - - 0.81% 04-Oct-13JPM US Equity I (dist) - GBP 0.81% - - - - - 0.81% 14-Oct-13JPM US Equity X (acc) - USD 0.12% - 0.09% 0.14% 0.15% 0.15% 0.15% 21-May-07
JPMorgan Investment Funds - US Select Equity FundJPM US Select Equity A (acc) - EUR 1.90% - 1.90% 1.90% 1.90% 1.90% - 10-Jun-08JPM US Select Equity A (acc) - EUR (hedged) 1.90% - 1.90% 1.90% 1.90% 1.90% - 15-Mar-07JPM US Select Equity A (acc) - USD 1.90% - 1.90% 1.90% 1.90% 1.90% - 17-Mar-97JPM US Select Equity A (dist) - USD 1.90% - 1.90% 1.90% 1.90% 1.90% - 15-May-06JPM US Select Equity B (acc) - EUR 1.15% - 1.15% - - - - 22-Feb-12JPM US Select Equity B (acc) - USD 1.15% - 1.15% 1.15% 1.15% 1.15% - 29-Oct-97JPM US Select Equity B (dist) - USD 1.15% - - - - - - 06-Aug-13JPM US Select Equity C (acc) - EUR 0.85% - 0.85% 0.85% - - - 06-Sep-11JPM US Select Equity C (acc) - EUR (hedged) 0.85% - 0.85% 0.85% 0.85% 0.85% - 19-Sep-08JPM US Select Equity C (acc) - USD 0.85% - 0.85% 0.85% 0.85% 0.85% - 03-Feb-08JPM US Select Equity C (dist) - GBP 0.85% - 0.85% 0.85% - - - 06-Sep-11JPM US Select Equity D (acc) - EUR (hedged) 2.40% - 2.40% 2.40% 2.40% 2.40% - 15-Mar-07JPM US Select Equity D (acc) - USD 2.40% - 2.40% 2.40% 2.40% 2.40% - 01-Feb-02JPM US Select Equity I (acc) - EUR (hedged) 0.81% - - - - - 0.81% 11-Oct-13JPM US Select Equity I (acc) - USD 0.72% - 0.72% 0.71% 0.72% 0.81% 0.81% 15-May-07JPM US Select Equity I (dist) - USD 0.81% - - - - - 0.81% 11-Oct-13JPM US Select Equity X (acc) - USD 0.06% - 0.07% 0.07% 0.08% 0.15% 0.15% 06-Apr-98
# This Sub-Fund’s “JF” prefix was removed on 4 February 2013.## This Share Class changed prefix from “JF” to “JPMorgan” on 4 February 2013.
* Share Class inactive as at end of the year.** Share Class reactivated during the year.*** These figures include the Performance Fees, where applicable.
+ Expense ratios are calculated in accordance with the guidelines dated 16 May 2008 issued by the Swiss Funds & Asset Management Association. The Total Expense Ratio (”TER”) represents the totaloperating costs as a percentage of the Fund’s average daily net assets. The total operating cost comprises investment management and advisory fees, custodian fees, taxe d’abonnement and otherexpenses, as summarised in the Combined Statement of Operations. Overdraft interest and Performance Fees are excluded from the calculation. The capped expense ratios and total expense ratios forsome share classes may have changed over the previous five years. All details concerning these changes have been disclosed in previous years’ Financial Statements.
All TER figures are annualised.
176
JPMorgan Investment Funds
Appendix - Unaudited Additional Disclosures (continued)
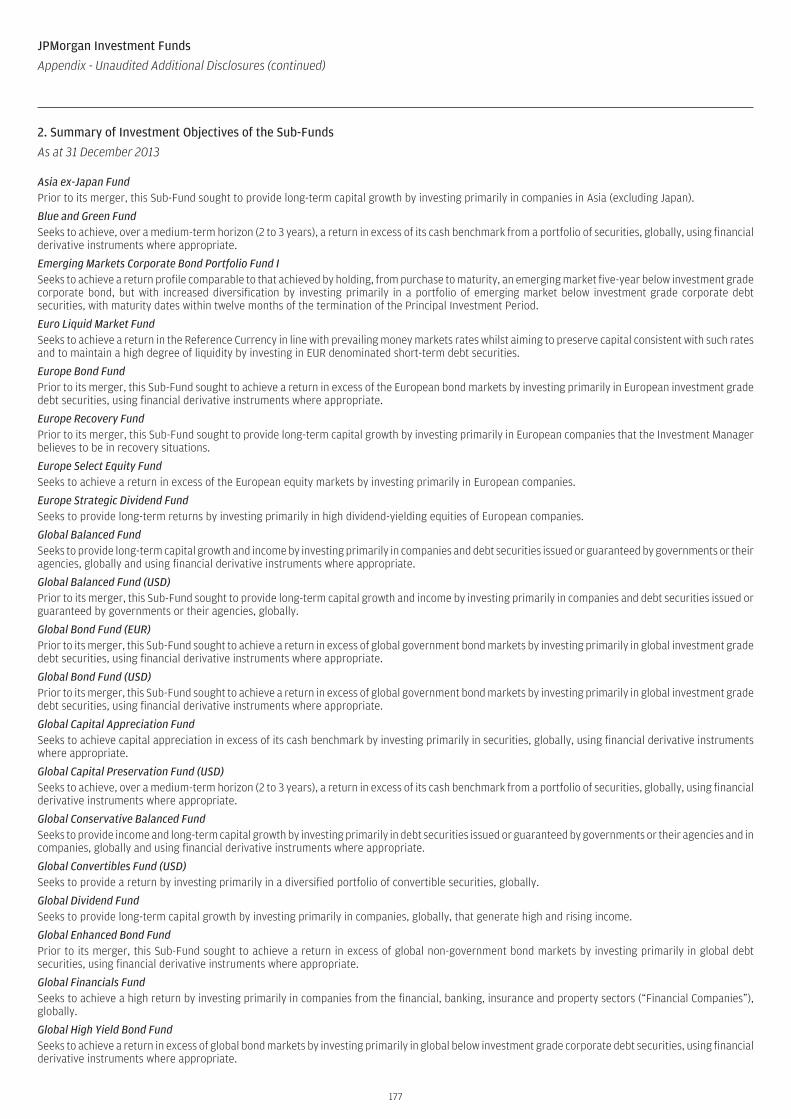
Asia ex-Japan FundPrior to its merger, this Sub-Fund sought to provide long-term capital growth by investing primarily in companies in Asia (excluding Japan).
Blue and Green FundSeeks to achieve, over a medium-term horizon (2 to 3 years), a return in excess of its cash benchmark from a portfolio of securities, globally, using financialderivative instruments where appropriate.
Emerging Markets Corporate Bond Portfolio Fund ISeeks to achieve a return profile comparable to that achieved by holding, from purchase to maturity, an emerging market five-year below investment gradecorporate bond, but with increased diversification by investing primarily in a portfolio of emerging market below investment grade corporate debtsecurities, with maturity dates within twelve months of the termination of the Principal Investment Period.
Euro Liquid Market FundSeeks to achieve a return in the Reference Currency in line with prevailing money markets rates whilst aiming to preserve capital consistent with such ratesand to maintain a high degree of liquidity by investing in EUR denominated short-term debt securities.
Europe Bond FundPrior to its merger, this Sub-Fund sought to achieve a return in excess of the European bond markets by investing primarily in European investment gradedebt securities, using financial derivative instruments where appropriate.
Europe Recovery FundPrior to its merger, this Sub-Fund sought to provide long-term capital growth by investing primarily in European companies that the Investment Managerbelieves to be in recovery situations.
Europe Select Equity FundSeeks to achieve a return in excess of the European equity markets by investing primarily in European companies.
Europe Strategic Dividend FundSeeks to provide long-term returns by investing primarily in high dividend-yielding equities of European companies.
Global Balanced FundSeeks to provide long-term capital growth and income by investing primarily in companies and debt securities issued or guaranteed by governments or theiragencies, globally and using financial derivative instruments where appropriate.
Global Balanced Fund (USD)Prior to its merger, this Sub-Fund sought to provide long-term capital growth and income by investing primarily in companies and debt securities issued orguaranteed by governments or their agencies, globally.
Global Bond Fund (EUR)Prior to its merger, this Sub-Fund sought to achieve a return in excess of global government bond markets by investing primarily in global investment gradedebt securities, using financial derivative instruments where appropriate.
Global Bond Fund (USD)Prior to its merger, this Sub-Fund sought to achieve a return in excess of global government bond markets by investing primarily in global investment gradedebt securities, using financial derivative instruments where appropriate.
Global Capital Appreciation FundSeeks to achieve capital appreciation in excess of its cash benchmark by investing primarily in securities, globally, using financial derivative instrumentswhere appropriate.
Global Capital Preservation Fund (USD)Seeks to achieve, over a medium-term horizon (2 to 3 years), a return in excess of its cash benchmark from a portfolio of securities, globally, using financialderivative instruments where appropriate.
Global Conservative Balanced FundSeeks to provide income and long-term capital growth by investing primarily in debt securities issued or guaranteed by governments or their agencies and incompanies, globally and using financial derivative instruments where appropriate.
Global Convertibles Fund (USD)Seeks to provide a return by investing primarily in a diversified portfolio of convertible securities, globally.
Global Dividend FundSeeks to provide long-term capital growth by investing primarily in companies, globally, that generate high and rising income.
Global Enhanced Bond FundPrior to its merger, this Sub-Fund sought to achieve a return in excess of global non-government bond markets by investing primarily in global debtsecurities, using financial derivative instruments where appropriate.
Global Financials FundSeeks to achieve a high return by investing primarily in companies from the financial, banking, insurance and property sectors (“Financial Companies”),globally.
Global High Yield Bond FundSeeks to achieve a return in excess of global bond markets by investing primarily in global below investment grade corporate debt securities, using financialderivative instruments where appropriate.
177
JPMorgan Investment Funds
Appendix - Unaudited Additional Disclosures (continued)
2. Summary of Investment Objectives of the Sub-Funds
As at 31 December 2013
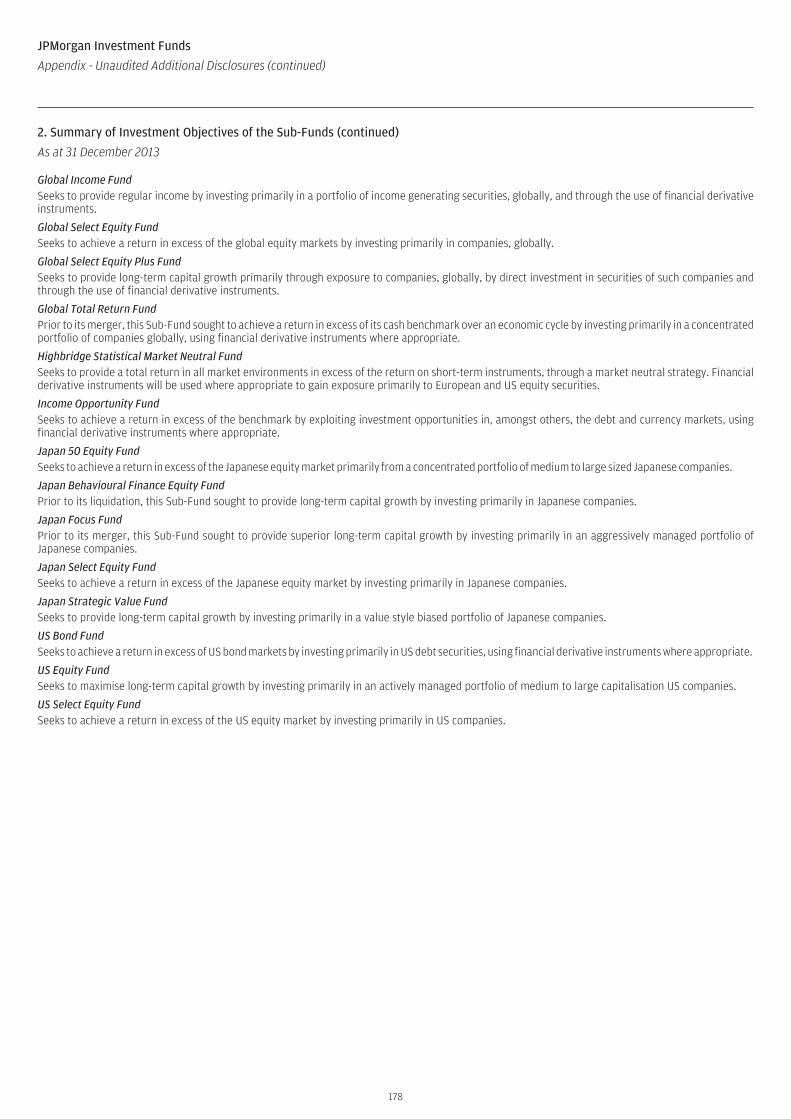
Global Income FundSeeks to provide regular income by investing primarily in a portfolio of income generating securities, globally, and through the use of financial derivativeinstruments.
Global Select Equity FundSeeks to achieve a return in excess of the global equity markets by investing primarily in companies, globally.
Global Select Equity Plus FundSeeks to provide long-term capital growth primarily through exposure to companies, globally, by direct investment in securities of such companies andthrough the use of financial derivative instruments.
Global Total Return FundPrior to its merger, this Sub-Fund sought to achieve a return in excess of its cash benchmark over an economic cycle by investing primarily in a concentratedportfolio of companies globally, using financial derivative instruments where appropriate.
Highbridge Statistical Market Neutral FundSeeks to provide a total return in all market environments in excess of the return on short-term instruments, through a market neutral strategy. Financialderivative instruments will be used where appropriate to gain exposure primarily to European and US equity securities.
Income Opportunity FundSeeks to achieve a return in excess of the benchmark by exploiting investment opportunities in, amongst others, the debt and currency markets, usingfinancial derivative instruments where appropriate.
Japan 50 Equity FundSeeks to achieve a return in excess of the Japanese equity market primarily from a concentrated portfolio of medium to large sized Japanese companies.
Japan Behavioural Finance Equity FundPrior to its liquidation, this Sub-Fund sought to provide long-term capital growth by investing primarily in Japanese companies.
Japan Focus FundPrior to its merger, this Sub-Fund sought to provide superior long-term capital growth by investing primarily in an aggressively managed portfolio ofJapanese companies.
Japan Select Equity FundSeeks to achieve a return in excess of the Japanese equity market by investing primarily in Japanese companies.
Japan Strategic Value FundSeeks to provide long-term capital growth by investing primarily in a value style biased portfolio of Japanese companies.
US Bond FundSeeks to achieve a return in excess of US bond markets by investing primarily in US debt securities, using financial derivative instruments where appropriate.
US Equity FundSeeks to maximise long-term capital growth by investing primarily in an actively managed portfolio of medium to large capitalisation US companies.
US Select Equity FundSeeks to achieve a return in excess of the US equity market by investing primarily in US companies.
178
JPMorgan Investment Funds
Appendix - Unaudited Additional Disclosures (continued)
2. Summary of Investment Objectives of the Sub-Funds (continued)
As at 31 December 2013
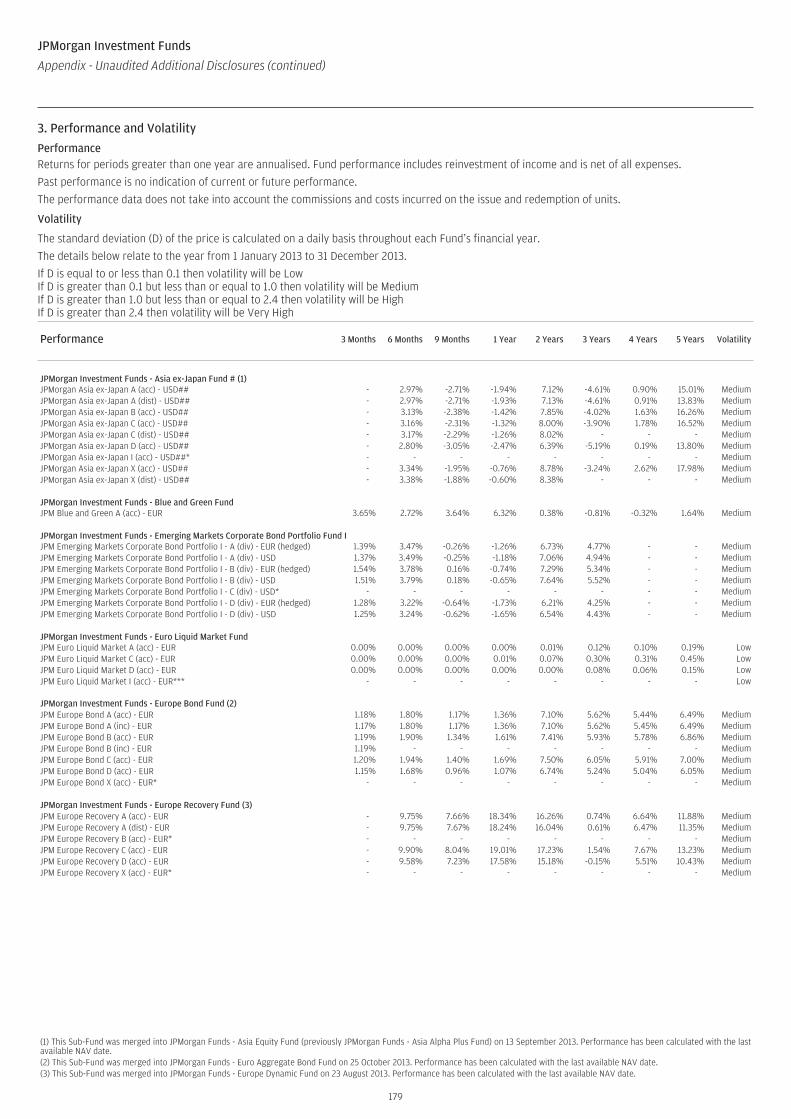
3. Performance and Volatility
PerformanceReturns for periods greater than one year are annualised. Fund performance includes reinvestment of income and is net of all expenses.
Past performance is no indication of current or future performance.
The performance data does not take into account the commissions and costs incurred on the issue and redemption of units.
Volatility
The standard deviation (D) of the price is calculated on a daily basis throughout each Fund’s financial year.
The details below relate to the year from 1 January 2013 to 31 December 2013.
If D is equal to or less than 0.1 then volatility will be LowIf D is greater than 0.1 but less than or equal to 1.0 then volatility will be MediumIf D is greater than 1.0 but less than or equal to 2.4 then volatility will be HighIf D is greater than 2.4 then volatility will be Very High
Performance (continued) 3 Months 6 Months 9 Months 1 Year 2 Years 3 Years 4 Years 5 Years Volatility
JPMorgan Investment Funds - Asia ex-Japan Fund # (1)JPMorgan Asia ex-Japan A (acc) - USD## - 2.97% -2.71% -1.94% 7.12% -4.61% 0.90% 15.01% MediumJPMorgan Asia ex-Japan A (dist) - USD## - 2.97% -2.71% -1.93% 7.13% -4.61% 0.91% 13.83% MediumJPMorgan Asia ex-Japan B (acc) - USD## - 3.13% -2.38% -1.42% 7.85% -4.02% 1.63% 16.26% MediumJPMorgan Asia ex-Japan C (acc) - USD## - 3.16% -2.31% -1.32% 8.00% -3.90% 1.78% 16.52% MediumJPMorgan Asia ex-Japan C (dist) - USD## - 3.17% -2.29% -1.26% 8.02% - - - MediumJPMorgan Asia ex-Japan D (acc) - USD## - 2.80% -3.05% -2.47% 6.39% -5.19% 0.19% 13.80% MediumJPMorgan Asia ex-Japan I (acc) - USD##* - - - - - - - - MediumJPMorgan Asia ex-Japan X (acc) - USD## - 3.34% -1.95% -0.76% 8.78% -3.24% 2.62% 17.98% MediumJPMorgan Asia ex-Japan X (dist) - USD## - 3.38% -1.88% -0.60% 8.38% - - - Medium
JPMorgan Investment Funds - Blue and Green FundJPM Blue and Green A (acc) - EUR 3.65% 2.72% 3.64% 6.32% 0.38% -0.81% -0.32% 1.64% Medium
JPMorgan Investment Funds - Emerging Markets Corporate Bond Portfolio Fund IJPM Emerging Markets Corporate Bond Portfolio I - A (div) - EUR (hedged) 1.39% 3.47% -0.26% -1.26% 6.73% 4.77% - - MediumJPM Emerging Markets Corporate Bond Portfolio I - A (div) - USD 1.37% 3.49% -0.25% -1.18% 7.06% 4.94% - - MediumJPM Emerging Markets Corporate Bond Portfolio I - B (div) - EUR (hedged) 1.54% 3.78% 0.16% -0.74% 7.29% 5.34% - - MediumJPM Emerging Markets Corporate Bond Portfolio I - B (div) - USD 1.51% 3.79% 0.18% -0.65% 7.64% 5.52% - - MediumJPM Emerging Markets Corporate Bond Portfolio I - C (div) - USD* - - - - - - - - MediumJPM Emerging Markets Corporate Bond Portfolio I - D (div) - EUR (hedged) 1.28% 3.22% -0.64% -1.73% 6.21% 4.25% - - MediumJPM Emerging Markets Corporate Bond Portfolio I - D (div) - USD 1.25% 3.24% -0.62% -1.65% 6.54% 4.43% - - Medium
JPMorgan Investment Funds - Euro Liquid Market FundJPM Euro Liquid Market A (acc) - EUR 0.00% 0.00% 0.00% 0.00% 0.01% 0.12% 0.10% 0.19% LowJPM Euro Liquid Market C (acc) - EUR 0.00% 0.00% 0.00% 0.01% 0.07% 0.30% 0.31% 0.45% LowJPM Euro Liquid Market D (acc) - EUR 0.00% 0.00% 0.00% 0.00% 0.00% 0.08% 0.06% 0.15% LowJPM Euro Liquid Market I (acc) - EUR*** - - - - - - - - Low
JPMorgan Investment Funds - Europe Bond Fund (2)JPM Europe Bond A (acc) - EUR 1.18% 1.80% 1.17% 1.36% 7.10% 5.62% 5.44% 6.49% MediumJPM Europe Bond A (inc) - EUR 1.17% 1.80% 1.17% 1.36% 7.10% 5.62% 5.45% 6.49% MediumJPM Europe Bond B (acc) - EUR 1.19% 1.90% 1.34% 1.61% 7.41% 5.93% 5.78% 6.86% MediumJPM Europe Bond B (inc) - EUR 1.19% - - - - - - - MediumJPM Europe Bond C (acc) - EUR 1.20% 1.94% 1.40% 1.69% 7.50% 6.05% 5.91% 7.00% MediumJPM Europe Bond D (acc) - EUR 1.15% 1.68% 0.96% 1.07% 6.74% 5.24% 5.04% 6.05% MediumJPM Europe Bond X (acc) - EUR* - - - - - - - - Medium
JPMorgan Investment Funds - Europe Recovery Fund (3)JPM Europe Recovery A (acc) - EUR - 9.75% 7.66% 18.34% 16.26% 0.74% 6.64% 11.88% MediumJPM Europe Recovery A (dist) - EUR - 9.75% 7.67% 18.24% 16.04% 0.61% 6.47% 11.35% MediumJPM Europe Recovery B (acc) - EUR* - - - - - - - - MediumJPM Europe Recovery C (acc) - EUR - 9.90% 8.04% 19.01% 17.23% 1.54% 7.67% 13.23% MediumJPM Europe Recovery D (acc) - EUR - 9.58% 7.23% 17.58% 15.18% -0.15% 5.51% 10.43% MediumJPM Europe Recovery X (acc) - EUR* - - - - - - - - Medium
(1) This Sub-Fund was merged into JPMorgan Funds - Asia Equity Fund (previously JPMorgan Funds - Asia Alpha Plus Fund) on 13 September 2013. Performance has been calculated with the lastavailable NAV date.(2) This Sub-Fund was merged into JPMorgan Funds - Euro Aggregate Bond Fund on 25 October 2013. Performance has been calculated with the last available NAV date.(3) This Sub-Fund was merged into JPMorgan Funds - Europe Dynamic Fund on 23 August 2013. Performance has been calculated with the last available NAV date.
179
JPMorgan Investment Funds
Appendix - Unaudited Additional Disclosures (continued)
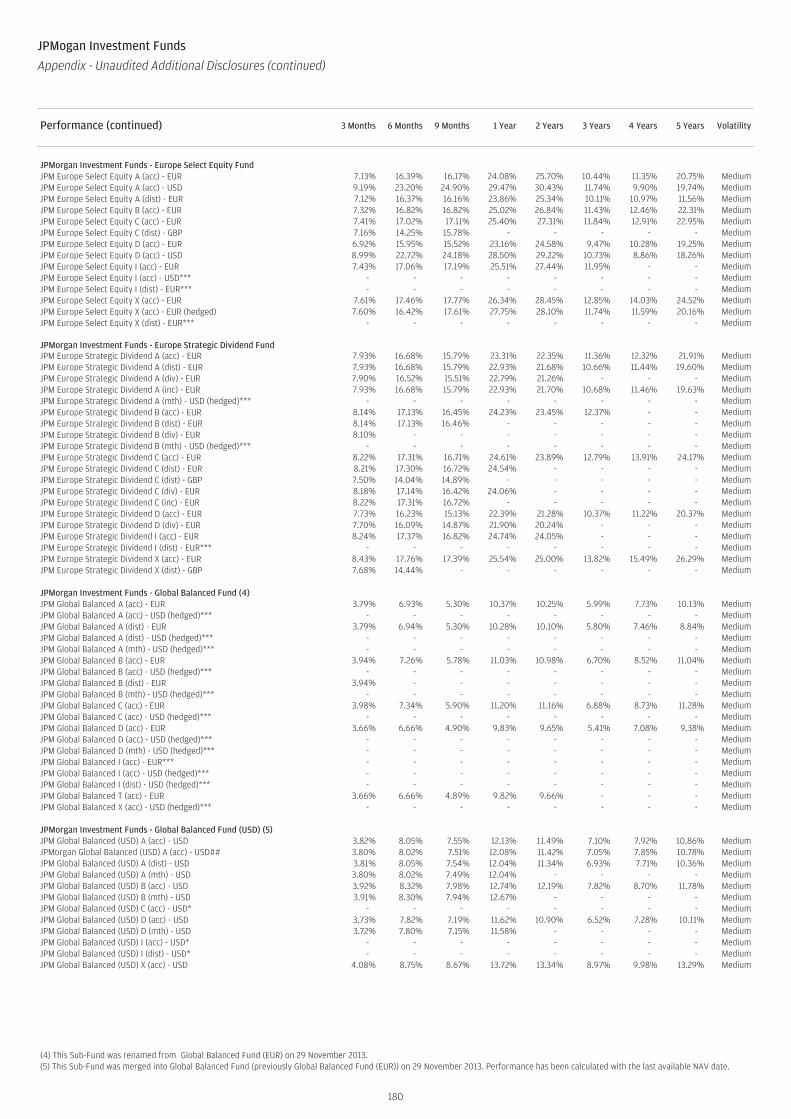
Performance (continued) 3 Months 6 Months 9 Months 1 Year 2 Years 3 Years 4 Years 5 Years Volatility
JPMorgan Investment Funds - Europe Select Equity FundJPM Europe Select Equity A (acc) - EUR 7.13% 16.39% 16.17% 24.08% 25.70% 10.44% 11.35% 20.75% MediumJPM Europe Select Equity A (acc) - USD 9.19% 23.20% 24.90% 29.47% 30.43% 11.74% 9.90% 19.74% MediumJPM Europe Select Equity A (dist) - EUR 7.12% 16.37% 16.16% 23.86% 25.34% 10.11% 10.97% 11.56% MediumJPM Europe Select Equity B (acc) - EUR 7.32% 16.82% 16.82% 25.02% 26.84% 11.43% 12.46% 22.31% MediumJPM Europe Select Equity C (acc) - EUR 7.41% 17.02% 17.11% 25.40% 27.31% 11.84% 12.91% 22.95% MediumJPM Europe Select Equity C (dist) - GBP 7.16% 14.25% 15.78% - - - - - MediumJPM Europe Select Equity D (acc) - EUR 6.92% 15.95% 15.52% 23.16% 24.58% 9.47% 10.28% 19.25% MediumJPM Europe Select Equity D (acc) - USD 8.99% 22.72% 24.18% 28.50% 29.22% 10.73% 8.86% 18.26% MediumJPM Europe Select Equity I (acc) - EUR 7.43% 17.06% 17.19% 25.51% 27.44% 11.95% - - MediumJPM Europe Select Equity I (acc) - USD*** - - - - - - - - MediumJPM Europe Select Equity I (dist) - EUR*** - - - - - - - - MediumJPM Europe Select Equity X (acc) - EUR 7.61% 17.46% 17.77% 26.34% 28.45% 12.85% 14.03% 24.52% MediumJPM Europe Select Equity X (acc) - EUR (hedged) 7.60% 16.42% 17.61% 27.75% 28.10% 11.74% 11.59% 20.16% MediumJPM Europe Select Equity X (dist) - EUR*** - - - - - - - - Medium
JPMorgan Investment Funds - Europe Strategic Dividend FundJPM Europe Strategic Dividend A (acc) - EUR 7.93% 16.68% 15.79% 23.31% 22.35% 11.36% 12.32% 21.91% MediumJPM Europe Strategic Dividend A (dist) - EUR 7.93% 16.68% 15.79% 22.93% 21.68% 10.66% 11.44% 19.60% MediumJPM Europe Strategic Dividend A (div) - EUR 7.90% 16.52% 15.51% 22.79% 21.26% - - - MediumJPM Europe Strategic Dividend A (inc) - EUR 7.93% 16.68% 15.79% 22.93% 21.70% 10.68% 11.46% 19.63% MediumJPM Europe Strategic Dividend A (mth) - USD (hedged)*** - - - - - - - - MediumJPM Europe Strategic Dividend B (acc) - EUR 8.14% 17.13% 16.45% 24.23% 23.45% 12.37% - - MediumJPM Europe Strategic Dividend B (dist) - EUR 8.14% 17.13% 16.46% - - - - - MediumJPM Europe Strategic Dividend B (div) - EUR 8.10% - - - - - - - MediumJPM Europe Strategic Dividend B (mth) - USD (hedged)*** - - - - - - - - MediumJPM Europe Strategic Dividend C (acc) - EUR 8.22% 17.31% 16.71% 24.61% 23.89% 12.79% 13.91% 24.17% MediumJPM Europe Strategic Dividend C (dist) - EUR 8.21% 17.30% 16.72% 24.54% - - - - MediumJPM Europe Strategic Dividend C (dist) - GBP 7.50% 14.04% 14.89% - - - - - MediumJPM Europe Strategic Dividend C (div) - EUR 8.18% 17.14% 16.42% 24.06% - - - - MediumJPM Europe Strategic Dividend C (inc) - EUR 8.22% 17.31% 16.72% - - - - - MediumJPM Europe Strategic Dividend D (acc) - EUR 7.73% 16.23% 15.13% 22.39% 21.28% 10.37% 11.22% 20.37% MediumJPM Europe Strategic Dividend D (div) - EUR 7.70% 16.09% 14.87% 21.90% 20.24% - - - MediumJPM Europe Strategic Dividend I (acc) - EUR 8.24% 17.37% 16.82% 24.74% 24.05% - - - MediumJPM Europe Strategic Dividend I (dist) - EUR*** - - - - - - - - MediumJPM Europe Strategic Dividend X (acc) - EUR 8.43% 17.76% 17.39% 25.54% 25.00% 13.82% 15.49% 26.29% MediumJPM Europe Strategic Dividend X (dist) - GBP 7.68% 14.44% - - - - - - Medium
JPMorgan Investment Funds - Global Balanced Fund (4)JPM Global Balanced A (acc) - EUR 3.79% 6.93% 5.30% 10.37% 10.25% 5.99% 7.73% 10.13% MediumJPM Global Balanced A (acc) - USD (hedged)*** - - - - - - - - MediumJPM Global Balanced A (dist) - EUR 3.79% 6.94% 5.30% 10.28% 10.10% 5.80% 7.46% 8.84% MediumJPM Global Balanced A (dist) - USD (hedged)*** - - - - - - - - MediumJPM Global Balanced A (mth) - USD (hedged)*** - - - - - - - - MediumJPM Global Balanced B (acc) - EUR 3.94% 7.26% 5.78% 11.03% 10.98% 6.70% 8.52% 11.04% MediumJPM Global Balanced B (acc) - USD (hedged)*** - - - - - - - - MediumJPM Global Balanced B (dist) - EUR 3.94% - - - - - - - MediumJPM Global Balanced B (mth) - USD (hedged)*** - - - - - - - - MediumJPM Global Balanced C (acc) - EUR 3.98% 7.34% 5.90% 11.20% 11.16% 6.88% 8.73% 11.28% MediumJPM Global Balanced C (acc) - USD (hedged)*** - - - - - - - - MediumJPM Global Balanced D (acc) - EUR 3.66% 6.66% 4.90% 9.83% 9.65% 5.41% 7.08% 9.38% MediumJPM Global Balanced D (acc) - USD (hedged)*** - - - - - - - - MediumJPM Global Balanced D (mth) - USD (hedged)*** - - - - - - - - MediumJPM Global Balanced I (acc) - EUR*** - - - - - - - - MediumJPM Global Balanced I (acc) - USD (hedged)*** - - - - - - - - MediumJPM Global Balanced I (dist) - USD (hedged)*** - - - - - - - - MediumJPM Global Balanced T (acc) - EUR 3.66% 6.66% 4.89% 9.82% 9.66% - - - MediumJPM Global Balanced X (acc) - USD (hedged)*** - - - - - - - - Medium
JPMorgan Investment Funds - Global Balanced Fund (USD) (5)JPM Global Balanced (USD) A (acc) - USD 3.82% 8.05% 7.55% 12.13% 11.49% 7.10% 7.92% 10.86% MediumJPMorgan Global Balanced (USD) A (acc) - USD## 3.80% 8.02% 7.51% 12.08% 11.42% 7.05% 7.85% 10.78% MediumJPM Global Balanced (USD) A (dist) - USD 3.81% 8.05% 7.54% 12.04% 11.34% 6.93% 7.71% 10.36% MediumJPM Global Balanced (USD) A (mth) - USD 3.80% 8.02% 7.49% 12.04% - - - - MediumJPM Global Balanced (USD) B (acc) - USD 3.92% 8.32% 7.98% 12.74% 12.19% 7.82% 8.70% 11.78% MediumJPM Global Balanced (USD) B (mth) - USD 3.91% 8.30% 7.94% 12.67% - - - - MediumJPM Global Balanced (USD) C (acc) - USD* - - - - - - - - MediumJPM Global Balanced (USD) D (acc) - USD 3.73% 7.82% 7.19% 11.62% 10.90% 6.52% 7.28% 10.11% MediumJPM Global Balanced (USD) D (mth) - USD 3.72% 7.80% 7.15% 11.58% - - - - MediumJPM Global Balanced (USD) I (acc) - USD* - - - - - - - - MediumJPM Global Balanced (USD) I (dist) - USD* - - - - - - - - MediumJPM Global Balanced (USD) X (acc) - USD 4.08% 8.75% 8.67% 13.72% 13.34% 8.97% 9.98% 13.29% Medium
(4) This Sub-Fund was renamed from Global Balanced Fund (EUR) on 29 November 2013.(5) This Sub-Fund was merged into Global Balanced Fund (previously Global Balanced Fund (EUR)) on 29 November 2013. Performance has been calculated with the last available NAV date.
180
JPMogan Investment Funds
Appendix - Unaudited Additional Disclosures (continued)
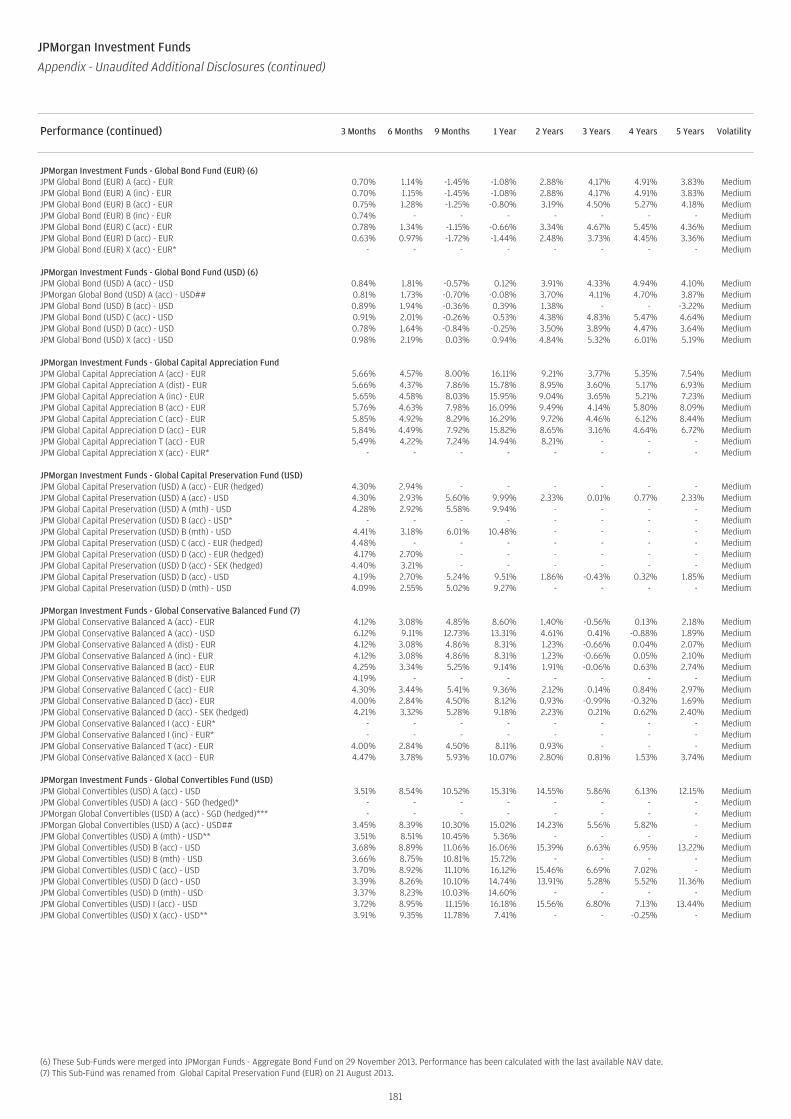
Performance (continued) 3 Months 6 Months 9 Months 1 Year 2 Years 3 Years 4 Years 5 Years Volatility
JPMorgan Investment Funds - Global Bond Fund (EUR) (6)JPM Global Bond (EUR) A (acc) - EUR 0.70% 1.14% -1.45% -1.08% 2.88% 4.17% 4.91% 3.83% MediumJPM Global Bond (EUR) A (inc) - EUR 0.70% 1.15% -1.45% -1.08% 2.88% 4.17% 4.91% 3.83% MediumJPM Global Bond (EUR) B (acc) - EUR 0.75% 1.28% -1.25% -0.80% 3.19% 4.50% 5.27% 4.18% MediumJPM Global Bond (EUR) B (inc) - EUR 0.74% - - - - - - - MediumJPM Global Bond (EUR) C (acc) - EUR 0.78% 1.34% -1.15% -0.66% 3.34% 4.67% 5.45% 4.36% MediumJPM Global Bond (EUR) D (acc) - EUR 0.63% 0.97% -1.72% -1.44% 2.48% 3.73% 4.45% 3.36% MediumJPM Global Bond (EUR) X (acc) - EUR* - - - - - - - - Medium
JPMorgan Investment Funds - Global Bond Fund (USD) (6)JPM Global Bond (USD) A (acc) - USD 0.84% 1.81% -0.57% 0.12% 3.91% 4.33% 4.94% 4.10% MediumJPMorgan Global Bond (USD) A (acc) - USD## 0.81% 1.73% -0.70% -0.08% 3.70% 4.11% 4.70% 3.87% MediumJPM Global Bond (USD) B (acc) - USD 0.89% 1.94% -0.36% 0.39% 1.38% - - -3.22% MediumJPM Global Bond (USD) C (acc) - USD 0.91% 2.01% -0.26% 0.53% 4.38% 4.83% 5.47% 4.64% MediumJPM Global Bond (USD) D (acc) - USD 0.78% 1.64% -0.84% -0.25% 3.50% 3.89% 4.47% 3.64% MediumJPM Global Bond (USD) X (acc) - USD 0.98% 2.19% 0.03% 0.94% 4.84% 5.32% 6.01% 5.19% Medium
JPMorgan Investment Funds - Global Capital Appreciation FundJPM Global Capital Appreciation A (acc) - EUR 5.66% 4.57% 8.00% 16.11% 9.21% 3.77% 5.35% 7.54% MediumJPM Global Capital Appreciation A (dist) - EUR 5.66% 4.37% 7.86% 15.78% 8.95% 3.60% 5.17% 6.93% MediumJPM Global Capital Appreciation A (inc) - EUR 5.65% 4.58% 8.03% 15.95% 9.04% 3.65% 5.21% 7.23% MediumJPM Global Capital Appreciation B (acc) - EUR 5.76% 4.63% 7.98% 16.09% 9.49% 4.14% 5.80% 8.09% MediumJPM Global Capital Appreciation C (acc) - EUR 5.85% 4.92% 8.29% 16.29% 9.72% 4.46% 6.12% 8.44% MediumJPM Global Capital Appreciation D (acc) - EUR 5.84% 4.49% 7.92% 15.82% 8.65% 3.16% 4.64% 6.72% MediumJPM Global Capital Appreciation T (acc) - EUR 5.49% 4.22% 7.24% 14.94% 8.21% - - - MediumJPM Global Capital Appreciation X (acc) - EUR* - - - - - - - - Medium
JPMorgan Investment Funds - Global Capital Preservation Fund (USD)JPM Global Capital Preservation (USD) A (acc) - EUR (hedged) 4.30% 2.94% - - - - - - MediumJPM Global Capital Preservation (USD) A (acc) - USD 4.30% 2.93% 5.60% 9.99% 2.33% 0.01% 0.77% 2.33% MediumJPM Global Capital Preservation (USD) A (mth) - USD 4.28% 2.92% 5.58% 9.94% - - - - MediumJPM Global Capital Preservation (USD) B (acc) - USD* - - - - - - - - MediumJPM Global Capital Preservation (USD) B (mth) - USD 4.41% 3.18% 6.01% 10.48% - - - - MediumJPM Global Capital Preservation (USD) C (acc) - EUR (hedged) 4.48% - - - - - - - MediumJPM Global Capital Preservation (USD) D (acc) - EUR (hedged) 4.17% 2.70% - - - - - - MediumJPM Global Capital Preservation (USD) D (acc) - SEK (hedged) 4.40% 3.21% - - - - - - MediumJPM Global Capital Preservation (USD) D (acc) - USD 4.19% 2.70% 5.24% 9.51% 1.86% -0.43% 0.32% 1.85% MediumJPM Global Capital Preservation (USD) D (mth) - USD 4.09% 2.55% 5.02% 9.27% - - - - Medium
JPMorgan Investment Funds - Global Conservative Balanced Fund (7)JPM Global Conservative Balanced A (acc) - EUR 4.12% 3.08% 4.85% 8.60% 1.40% -0.56% 0.13% 2.18% MediumJPM Global Conservative Balanced A (acc) - USD 6.12% 9.11% 12.73% 13.31% 4.61% 0.41% -0.88% 1.89% MediumJPM Global Conservative Balanced A (dist) - EUR 4.12% 3.08% 4.86% 8.31% 1.23% -0.66% 0.04% 2.07% MediumJPM Global Conservative Balanced A (inc) - EUR 4.12% 3.08% 4.86% 8.31% 1.23% -0.66% 0.05% 2.10% MediumJPM Global Conservative Balanced B (acc) - EUR 4.25% 3.34% 5.25% 9.14% 1.91% -0.06% 0.63% 2.74% MediumJPM Global Conservative Balanced B (dist) - EUR 4.19% - - - - - - - MediumJPM Global Conservative Balanced C (acc) - EUR 4.30% 3.44% 5.41% 9.36% 2.12% 0.14% 0.84% 2.97% MediumJPM Global Conservative Balanced D (acc) - EUR 4.00% 2.84% 4.50% 8.12% 0.93% -0.99% -0.32% 1.69% MediumJPM Global Conservative Balanced D (acc) - SEK (hedged) 4.21% 3.32% 5.28% 9.18% 2.23% 0.21% 0.62% 2.40% MediumJPM Global Conservative Balanced I (acc) - EUR* - - - - - - - - MediumJPM Global Conservative Balanced I (inc) - EUR* - - - - - - - - MediumJPM Global Conservative Balanced T (acc) - EUR 4.00% 2.84% 4.50% 8.11% 0.93% - - - MediumJPM Global Conservative Balanced X (acc) - EUR 4.47% 3.78% 5.93% 10.07% 2.80% 0.81% 1.53% 3.74% Medium
JPMorgan Investment Funds - Global Convertibles Fund (USD)JPM Global Convertibles (USD) A (acc) - USD 3.51% 8.54% 10.52% 15.31% 14.55% 5.86% 6.13% 12.15% MediumJPM Global Convertibles (USD) A (acc) - SGD (hedged)* - - - - - - - - MediumJPMorgan Global Convertibles (USD) A (acc) - SGD (hedged)*** - - - - - - - - MediumJPMorgan Global Convertibles (USD) A (acc) - USD## 3.45% 8.39% 10.30% 15.02% 14.23% 5.56% 5.82% - MediumJPM Global Convertibles (USD) A (mth) - USD** 3.51% 8.51% 10.45% 5.36% - - - - MediumJPM Global Convertibles (USD) B (acc) - USD 3.68% 8.89% 11.06% 16.06% 15.39% 6.63% 6.95% 13.22% MediumJPM Global Convertibles (USD) B (mth) - USD 3.66% 8.75% 10.81% 15.72% - - - - MediumJPM Global Convertibles (USD) C (acc) - USD 3.70% 8.92% 11.10% 16.12% 15.46% 6.69% 7.02% - MediumJPM Global Convertibles (USD) D (acc) - USD 3.39% 8.26% 10.10% 14.74% 13.91% 5.28% 5.52% 11.36% MediumJPM Global Convertibles (USD) D (mth) - USD 3.37% 8.23% 10.03% 14.60% - - - - MediumJPM Global Convertibles (USD) I (acc) - USD 3.72% 8.95% 11.15% 16.18% 15.56% 6.80% 7.13% 13.44% MediumJPM Global Convertibles (USD) X (acc) - USD** 3.91% 9.35% 11.78% 7.41% - - -0.25% - Medium
(6) These Sub-Funds were merged into JPMorgan Funds - Aggregate Bond Fund on 29 November 2013. Performance has been calculated with the last available NAV date.(7) This Sub-Fund was renamed from Global Capital Preservation Fund (EUR) on 21 August 2013.
181
JPMorgan Investment Funds
Appendix - Unaudited Additional Disclosures (continued)
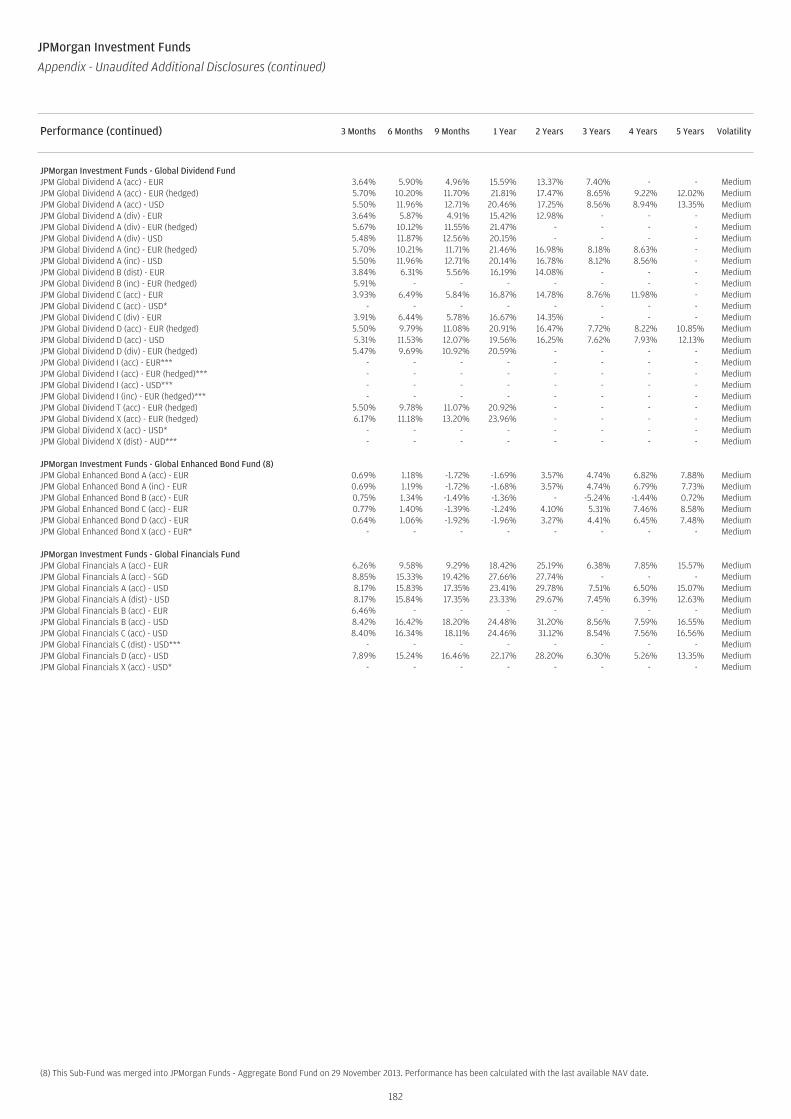
Performance (continued) 3 Months 6 Months 9 Months 1 Year 2 Years 3 Years 4 Years 5 Years Volatility
JPMorgan Investment Funds - Global Dividend FundJPM Global Dividend A (acc) - EUR 3.64% 5.90% 4.96% 15.59% 13.37% 7.40% - - MediumJPM Global Dividend A (acc) - EUR (hedged) 5.70% 10.20% 11.70% 21.81% 17.47% 8.65% 9.22% 12.02% MediumJPM Global Dividend A (acc) - USD 5.50% 11.96% 12.71% 20.46% 17.25% 8.56% 8.94% 13.35% MediumJPM Global Dividend A (div) - EUR 3.64% 5.87% 4.91% 15.42% 12.98% - - - MediumJPM Global Dividend A (div) - EUR (hedged) 5.67% 10.12% 11.55% 21.47% - - - - MediumJPM Global Dividend A (div) - USD 5.48% 11.87% 12.56% 20.15% - - - - MediumJPM Global Dividend A (inc) - EUR (hedged) 5.70% 10.21% 11.71% 21.46% 16.98% 8.18% 8.63% - MediumJPM Global Dividend A (inc) - USD 5.50% 11.96% 12.71% 20.14% 16.78% 8.12% 8.56% - MediumJPM Global Dividend B (dist) - EUR 3.84% 6.31% 5.56% 16.19% 14.08% - - - MediumJPM Global Dividend B (inc) - EUR (hedged) 5.91% - - - - - - - MediumJPM Global Dividend C (acc) - EUR 3.93% 6.49% 5.84% 16.87% 14.78% 8.76% 11.98% - MediumJPM Global Dividend C (acc) - USD* - - - - - - - - MediumJPM Global Dividend C (div) - EUR 3.91% 6.44% 5.78% 16.67% 14.35% - - - MediumJPM Global Dividend D (acc) - EUR (hedged) 5.50% 9.79% 11.08% 20.91% 16.47% 7.72% 8.22% 10.85% MediumJPM Global Dividend D (acc) - USD 5.31% 11.53% 12.07% 19.56% 16.25% 7.62% 7.93% 12.13% MediumJPM Global Dividend D (div) - EUR (hedged) 5.47% 9.69% 10.92% 20.59% - - - - MediumJPM Global Dividend I (acc) - EUR*** - - - - - - - - MediumJPM Global Dividend I (acc) - EUR (hedged)*** - - - - - - - - MediumJPM Global Dividend I (acc) - USD*** - - - - - - - - MediumJPM Global Dividend I (inc) - EUR (hedged)*** - - - - - - - - MediumJPM Global Dividend T (acc) - EUR (hedged) 5.50% 9.78% 11.07% 20.92% - - - - MediumJPM Global Dividend X (acc) - EUR (hedged) 6.17% 11.18% 13.20% 23.96% - - - - MediumJPM Global Dividend X (acc) - USD* - - - - - - - - MediumJPM Global Dividend X (dist) - AUD*** - - - - - - - - Medium
JPMorgan Investment Funds - Global Enhanced Bond Fund (8)JPM Global Enhanced Bond A (acc) - EUR 0.69% 1.18% -1.72% -1.69% 3.57% 4.74% 6.82% 7.88% MediumJPM Global Enhanced Bond A (inc) - EUR 0.69% 1.19% -1.72% -1.68% 3.57% 4.74% 6.79% 7.73% MediumJPM Global Enhanced Bond B (acc) - EUR 0.75% 1.34% -1.49% -1.36% - -5.24% -1.44% 0.72% MediumJPM Global Enhanced Bond C (acc) - EUR 0.77% 1.40% -1.39% -1.24% 4.10% 5.31% 7.46% 8.58% MediumJPM Global Enhanced Bond D (acc) - EUR 0.64% 1.06% -1.92% -1.96% 3.27% 4.41% 6.45% 7.48% MediumJPM Global Enhanced Bond X (acc) - EUR* - - - - - - - - Medium
JPMorgan Investment Funds - Global Financials FundJPM Global Financials A (acc) - EUR 6.26% 9.58% 9.29% 18.42% 25.19% 6.38% 7.85% 15.57% MediumJPM Global Financials A (acc) - SGD 8.85% 15.33% 19.42% 27.66% 27.74% - - - MediumJPM Global Financials A (acc) - USD 8.17% 15.83% 17.35% 23.41% 29.78% 7.51% 6.50% 15.07% MediumJPM Global Financials A (dist) - USD 8.17% 15.84% 17.35% 23.33% 29.67% 7.45% 6.39% 12.63% MediumJPM Global Financials B (acc) - EUR 6.46% - - - - - - - MediumJPM Global Financials B (acc) - USD 8.42% 16.42% 18.20% 24.48% 31.20% 8.56% 7.59% 16.55% MediumJPM Global Financials C (acc) - USD 8.40% 16.34% 18.11% 24.46% 31.12% 8.54% 7.56% 16.56% MediumJPM Global Financials C (dist) - USD*** - - - - - - - - MediumJPM Global Financials D (acc) - USD 7.89% 15.24% 16.46% 22.17% 28.20% 6.30% 5.26% 13.35% MediumJPM Global Financials X (acc) - USD* - - - - - - - - Medium
(8) This Sub-Fund was merged into JPMorgan Funds - Aggregate Bond Fund on 29 November 2013. Performance has been calculated with the last available NAV date.
182
JPMorgan Investment Funds
Appendix - Unaudited Additional Disclosures (continued)
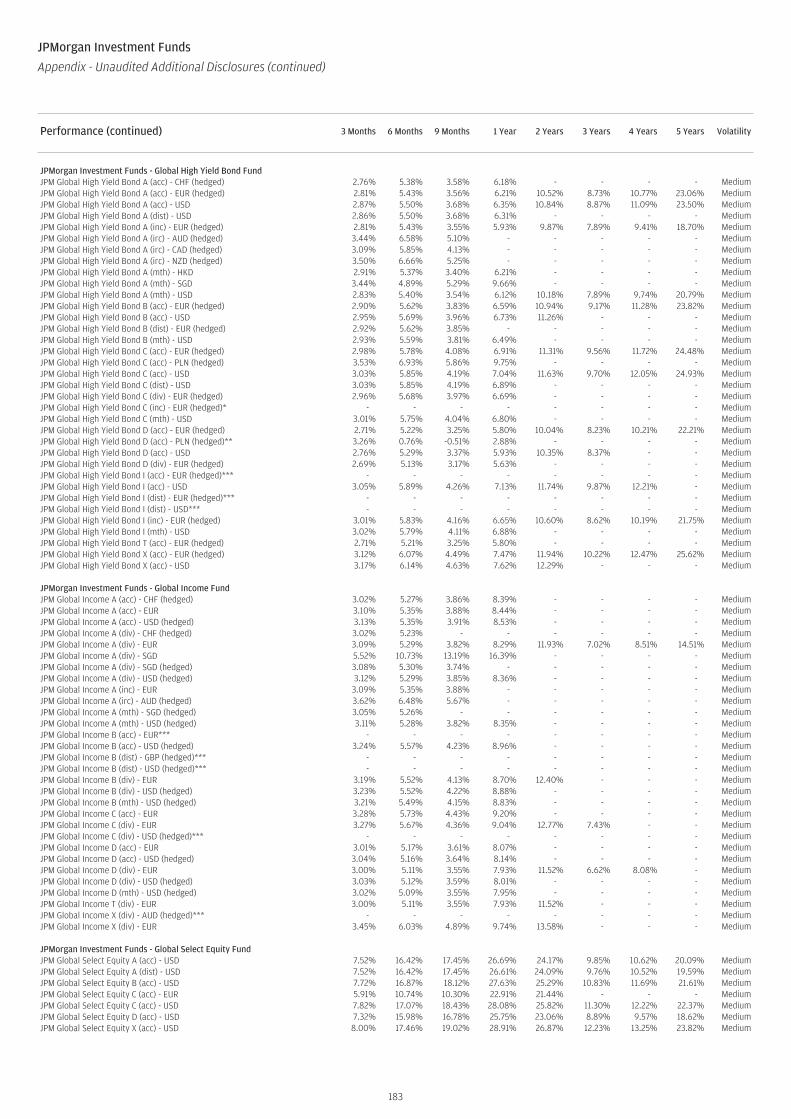
Performance (continued) 3 Months 6 Months 9 Months 1 Year 2 Years 3 Years 4 Years 5 Years Volatility
JPMorgan Investment Funds - Global High Yield Bond FundJPM Global High Yield Bond A (acc) - CHF (hedged) 2.76% 5.38% 3.58% 6.18% - - - - MediumJPM Global High Yield Bond A (acc) - EUR (hedged) 2.81% 5.43% 3.56% 6.21% 10.52% 8.73% 10.77% 23.06% MediumJPM Global High Yield Bond A (acc) - USD 2.87% 5.50% 3.68% 6.35% 10.84% 8.87% 11.09% 23.50% MediumJPM Global High Yield Bond A (dist) - USD 2.86% 5.50% 3.68% 6.31% - - - - MediumJPM Global High Yield Bond A (inc) - EUR (hedged) 2.81% 5.43% 3.55% 5.93% 9.87% 7.89% 9.41% 18.70% MediumJPM Global High Yield Bond A (irc) - AUD (hedged) 3.44% 6.58% 5.10% - - - - - MediumJPM Global High Yield Bond A (irc) - CAD (hedged) 3.09% 5.85% 4.13% - - - - - MediumJPM Global High Yield Bond A (irc) - NZD (hedged) 3.50% 6.66% 5.25% - - - - - MediumJPM Global High Yield Bond A (mth) - HKD 2.91% 5.37% 3.40% 6.21% - - - - MediumJPM Global High Yield Bond A (mth) - SGD 3.44% 4.89% 5.29% 9.66% - - - - MediumJPM Global High Yield Bond A (mth) - USD 2.83% 5.40% 3.54% 6.12% 10.18% 7.89% 9.74% 20.79% MediumJPM Global High Yield Bond B (acc) - EUR (hedged) 2.90% 5.62% 3.83% 6.59% 10.94% 9.17% 11.28% 23.82% MediumJPM Global High Yield Bond B (acc) - USD 2.95% 5.69% 3.96% 6.73% 11.26% - - - MediumJPM Global High Yield Bond B (dist) - EUR (hedged) 2.92% 5.62% 3.85% - - - - - MediumJPM Global High Yield Bond B (mth) - USD 2.93% 5.59% 3.81% 6.49% - - - - MediumJPM Global High Yield Bond C (acc) - EUR (hedged) 2.98% 5.78% 4.08% 6.91% 11.31% 9.56% 11.72% 24.48% MediumJPM Global High Yield Bond C (acc) - PLN (hedged) 3.53% 6.93% 5.86% 9.75% - - - - MediumJPM Global High Yield Bond C (acc) - USD 3.03% 5.85% 4.19% 7.04% 11.63% 9.70% 12.05% 24.93% MediumJPM Global High Yield Bond C (dist) - USD 3.03% 5.85% 4.19% 6.89% - - - - MediumJPM Global High Yield Bond C (div) - EUR (hedged) 2.96% 5.68% 3.97% 6.69% - - - - MediumJPM Global High Yield Bond C (inc) - EUR (hedged)* - - - - - - - - MediumJPM Global High Yield Bond C (mth) - USD 3.01% 5.75% 4.04% 6.80% - - - - MediumJPM Global High Yield Bond D (acc) - EUR (hedged) 2.71% 5.22% 3.25% 5.80% 10.04% 8.23% 10.21% 22.21% MediumJPM Global High Yield Bond D (acc) - PLN (hedged)** 3.26% 0.76% -0.51% 2.88% - - - - MediumJPM Global High Yield Bond D (acc) - USD 2.76% 5.29% 3.37% 5.93% 10.35% 8.37% - - MediumJPM Global High Yield Bond D (div) - EUR (hedged) 2.69% 5.13% 3.17% 5.63% - - - - MediumJPM Global High Yield Bond I (acc) - EUR (hedged)*** - - - - - - - - MediumJPM Global High Yield Bond I (acc) - USD 3.05% 5.89% 4.26% 7.13% 11.74% 9.87% 12.21% - MediumJPM Global High Yield Bond I (dist) - EUR (hedged)*** - - - - - - - - MediumJPM Global High Yield Bond I (dist) - USD*** - - - - - - - - MediumJPM Global High Yield Bond I (inc) - EUR (hedged) 3.01% 5.83% 4.16% 6.65% 10.60% 8.62% 10.19% 21.75% MediumJPM Global High Yield Bond I (mth) - USD 3.02% 5.79% 4.11% 6.88% - - - - MediumJPM Global High Yield Bond T (acc) - EUR (hedged) 2.71% 5.21% 3.25% 5.80% - - - - MediumJPM Global High Yield Bond X (acc) - EUR (hedged) 3.12% 6.07% 4.49% 7.47% 11.94% 10.22% 12.47% 25.62% MediumJPM Global High Yield Bond X (acc) - USD 3.17% 6.14% 4.63% 7.62% 12.29% - - - Medium
JPMorgan Investment Funds - Global Income FundJPM Global Income A (acc) - CHF (hedged) 3.02% 5.27% 3.86% 8.39% - - - - MediumJPM Global Income A (acc) - EUR 3.10% 5.35% 3.88% 8.44% - - - - MediumJPM Global Income A (acc) - USD (hedged) 3.13% 5.35% 3.91% 8.53% - - - - MediumJPM Global Income A (div) - CHF (hedged) 3.02% 5.23% - - - - - - MediumJPM Global Income A (div) - EUR 3.09% 5.29% 3.82% 8.29% 11.93% 7.02% 8.51% 14.51% MediumJPM Global Income A (div) - SGD 5.52% 10.73% 13.19% 16.39% - - - - MediumJPM Global Income A (div) - SGD (hedged) 3.08% 5.30% 3.74% - - - - - MediumJPM Global Income A (div) - USD (hedged) 3.12% 5.29% 3.85% 8.36% - - - - MediumJPM Global Income A (inc) - EUR 3.09% 5.35% 3.88% - - - - - MediumJPM Global Income A (irc) - AUD (hedged) 3.62% 6.48% 5.67% - - - - - MediumJPM Global Income A (mth) - SGD (hedged) 3.05% 5.26% - - - - - - MediumJPM Global Income A (mth) - USD (hedged) 3.11% 5.28% 3.82% 8.35% - - - - MediumJPM Global Income B (acc) - EUR*** - - - - - - - - MediumJPM Global Income B (acc) - USD (hedged) 3.24% 5.57% 4.23% 8.96% - - - - MediumJPM Global Income B (dist) - GBP (hedged)*** - - - - - - - - MediumJPM Global Income B (dist) - USD (hedged)*** - - - - - - - - MediumJPM Global Income B (div) - EUR 3.19% 5.52% 4.13% 8.70% 12.40% - - - MediumJPM Global Income B (div) - USD (hedged) 3.23% 5.52% 4.22% 8.88% - - - - MediumJPM Global Income B (mth) - USD (hedged) 3.21% 5.49% 4.15% 8.83% - - - - MediumJPM Global Income C (acc) - EUR 3.28% 5.73% 4.43% 9.20% - - - - MediumJPM Global Income C (div) - EUR 3.27% 5.67% 4.36% 9.04% 12.77% 7.43% - - MediumJPM Global Income C (div) - USD (hedged)*** - - - - - - - - MediumJPM Global Income D (acc) - EUR 3.01% 5.17% 3.61% 8.07% - - - - MediumJPM Global Income D (acc) - USD (hedged) 3.04% 5.16% 3.64% 8.14% - - - - MediumJPM Global Income D (div) - EUR 3.00% 5.11% 3.55% 7.93% 11.52% 6.62% 8.08% - MediumJPM Global Income D (div) - USD (hedged) 3.03% 5.12% 3.59% 8.01% - - - - MediumJPM Global Income D (mth) - USD (hedged) 3.02% 5.09% 3.55% 7.95% - - - - MediumJPM Global Income T (div) - EUR 3.00% 5.11% 3.55% 7.93% 11.52% - - - MediumJPM Global Income X (div) - AUD (hedged)*** - - - - - - - - MediumJPM Global Income X (div) - EUR 3.45% 6.03% 4.89% 9.74% 13.58% - - - Medium
JPMorgan Investment Funds - Global Select Equity FundJPM Global Select Equity A (acc) - USD 7.52% 16.42% 17.45% 26.69% 24.17% 9.85% 10.62% 20.09% MediumJPM Global Select Equity A (dist) - USD 7.52% 16.42% 17.45% 26.61% 24.09% 9.76% 10.52% 19.59% MediumJPM Global Select Equity B (acc) - USD 7.72% 16.87% 18.12% 27.63% 25.29% 10.83% 11.69% 21.61% MediumJPM Global Select Equity C (acc) - EUR 5.91% 10.74% 10.30% 22.91% 21.44% - - - MediumJPM Global Select Equity C (acc) - USD 7.82% 17.07% 18.43% 28.08% 25.82% 11.30% 12.22% 22.37% MediumJPM Global Select Equity D (acc) - USD 7.32% 15.98% 16.78% 25.75% 23.06% 8.89% 9.57% 18.62% MediumJPM Global Select Equity X (acc) - USD 8.00% 17.46% 19.02% 28.91% 26.87% 12.23% 13.25% 23.82% Medium
183
JPMorgan Investment Funds
Appendix - Unaudited Additional Disclosures (continued)
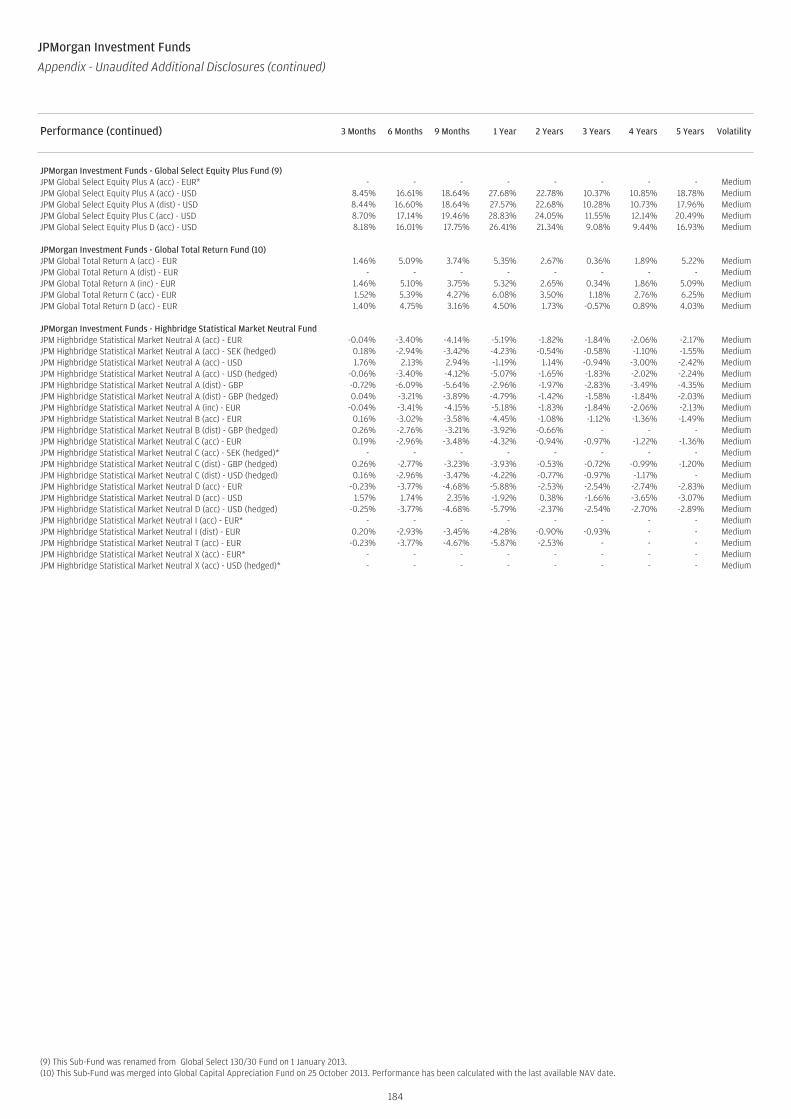
Performance (continued) 3 Months 6 Months 9 Months 1 Year 2 Years 3 Years 4 Years 5 Years Volatility
JPMorgan Investment Funds - Global Select Equity Plus Fund (9)JPM Global Select Equity Plus A (acc) - EUR* - - - - - - - - MediumJPM Global Select Equity Plus A (acc) - USD 8.45% 16.61% 18.64% 27.68% 22.78% 10.37% 10.85% 18.78% MediumJPM Global Select Equity Plus A (dist) - USD 8.44% 16.60% 18.64% 27.57% 22.68% 10.28% 10.73% 17.96% MediumJPM Global Select Equity Plus C (acc) - USD 8.70% 17.14% 19.46% 28.83% 24.05% 11.55% 12.14% 20.49% MediumJPM Global Select Equity Plus D (acc) - USD 8.18% 16.01% 17.75% 26.41% 21.34% 9.08% 9.44% 16.93% Medium
JPMorgan Investment Funds - Global Total Return Fund (10)JPM Global Total Return A (acc) - EUR 1.46% 5.09% 3.74% 5.35% 2.67% 0.36% 1.89% 5.22% MediumJPM Global Total Return A (dist) - EUR - - - - - - - - MediumJPM Global Total Return A (inc) - EUR 1.46% 5.10% 3.75% 5.32% 2.65% 0.34% 1.86% 5.09% MediumJPM Global Total Return C (acc) - EUR 1.52% 5.39% 4.27% 6.08% 3.50% 1.18% 2.76% 6.25% MediumJPM Global Total Return D (acc) - EUR 1.40% 4.75% 3.16% 4.50% 1.73% -0.57% 0.89% 4.03% Medium
JPMorgan Investment Funds - Highbridge Statistical Market Neutral FundJPM Highbridge Statistical Market Neutral A (acc) - EUR -0.04% -3.40% -4.14% -5.19% -1.82% -1.84% -2.06% -2.17% MediumJPM Highbridge Statistical Market Neutral A (acc) - SEK (hedged) 0.18% -2.94% -3.42% -4.23% -0.54% -0.58% -1.10% -1.55% MediumJPM Highbridge Statistical Market Neutral A (acc) - USD 1.76% 2.13% 2.94% -1.19% 1.14% -0.94% -3.00% -2.42% MediumJPM Highbridge Statistical Market Neutral A (acc) - USD (hedged) -0.06% -3.40% -4.12% -5.07% -1.65% -1.83% -2.02% -2.24% MediumJPM Highbridge Statistical Market Neutral A (dist) - GBP -0.72% -6.09% -5.64% -2.96% -1.97% -2.83% -3.49% -4.35% MediumJPM Highbridge Statistical Market Neutral A (dist) - GBP (hedged) 0.04% -3.21% -3.89% -4.79% -1.42% -1.58% -1.84% -2.03% MediumJPM Highbridge Statistical Market Neutral A (inc) - EUR -0.04% -3.41% -4.15% -5.18% -1.83% -1.84% -2.06% -2.13% MediumJPM Highbridge Statistical Market Neutral B (acc) - EUR 0.16% -3.02% -3.58% -4.45% -1.08% -1.12% -1.36% -1.49% MediumJPM Highbridge Statistical Market Neutral B (dist) - GBP (hedged) 0.26% -2.76% -3.21% -3.92% -0.66% - - - MediumJPM Highbridge Statistical Market Neutral C (acc) - EUR 0.19% -2.96% -3.48% -4.32% -0.94% -0.97% -1.22% -1.36% MediumJPM Highbridge Statistical Market Neutral C (acc) - SEK (hedged)* - - - - - - - - MediumJPM Highbridge Statistical Market Neutral C (dist) - GBP (hedged) 0.26% -2.77% -3.23% -3.93% -0.53% -0.72% -0.99% -1.20% MediumJPM Highbridge Statistical Market Neutral C (dist) - USD (hedged) 0.16% -2.96% -3.47% -4.22% -0.77% -0.97% -1.17% - MediumJPM Highbridge Statistical Market Neutral D (acc) - EUR -0.23% -3.77% -4.68% -5.88% -2.53% -2.54% -2.74% -2.83% MediumJPM Highbridge Statistical Market Neutral D (acc) - USD 1.57% 1.74% 2.35% -1.92% 0.38% -1.66% -3.65% -3.07% MediumJPM Highbridge Statistical Market Neutral D (acc) - USD (hedged) -0.25% -3.77% -4.68% -5.79% -2.37% -2.54% -2.70% -2.89% MediumJPM Highbridge Statistical Market Neutral I (acc) - EUR* - - - - - - - - MediumJPM Highbridge Statistical Market Neutral I (dist) - EUR 0.20% -2.93% -3.45% -4.28% -0.90% -0.93% - - MediumJPM Highbridge Statistical Market Neutral T (acc) - EUR -0.23% -3.77% -4.67% -5.87% -2.53% - - - MediumJPM Highbridge Statistical Market Neutral X (acc) - EUR* - - - - - - - - MediumJPM Highbridge Statistical Market Neutral X (acc) - USD (hedged)* - - - - - - - - Medium
(9) This Sub-Fund was renamed from Global Select 130/30 Fund on 1 January 2013.(10) This Sub-Fund was merged into Global Capital Appreciation Fund on 25 October 2013. Performance has been calculated with the last available NAV date.
184
JPMorgan Investment Funds
Appendix - Unaudited Additional Disclosures (continued)
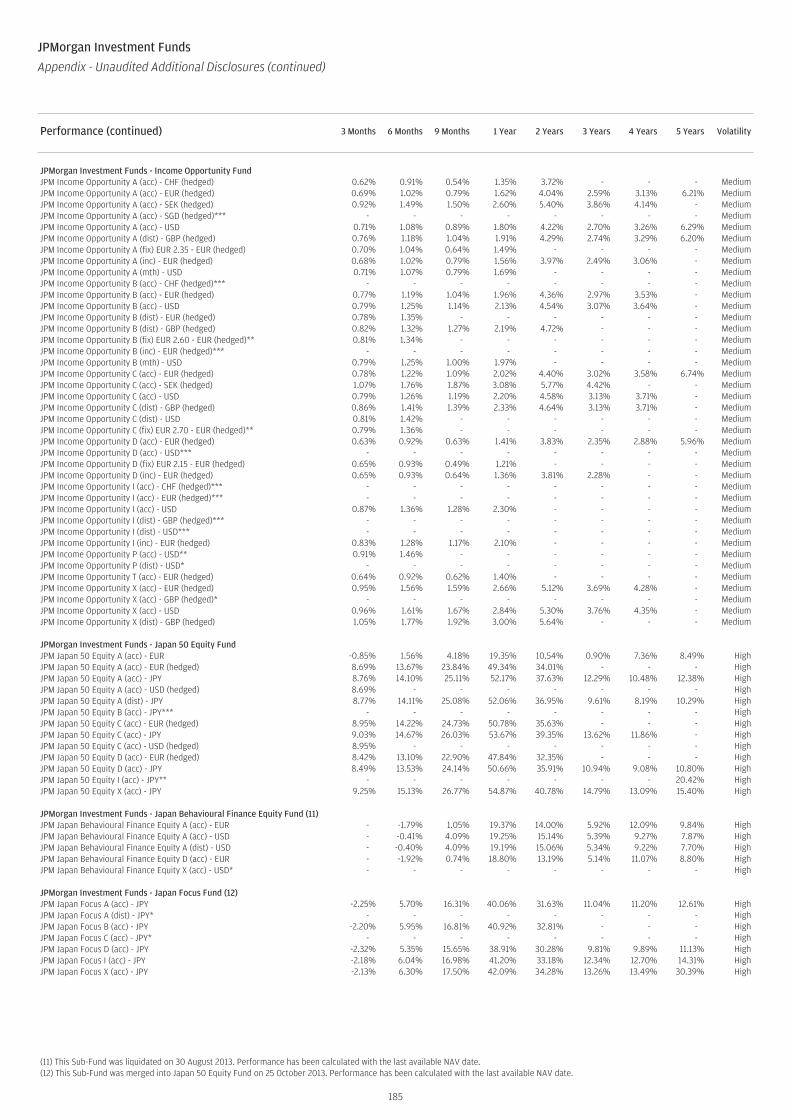
Performance (continued) 3 Months 6 Months 9 Months 1 Year 2 Years 3 Years 4 Years 5 Years Volatility
JPMorgan Investment Funds - Income Opportunity FundJPM Income Opportunity A (acc) - CHF (hedged) 0.62% 0.91% 0.54% 1.35% 3.72% - - - MediumJPM Income Opportunity A (acc) - EUR (hedged) 0.69% 1.02% 0.79% 1.62% 4.04% 2.59% 3.13% 6.21% MediumJPM Income Opportunity A (acc) - SEK (hedged) 0.92% 1.49% 1.50% 2.60% 5.40% 3.86% 4.14% - MediumJPM Income Opportunity A (acc) - SGD (hedged)*** - - - - - - - - MediumJPM Income Opportunity A (acc) - USD 0.71% 1.08% 0.89% 1.80% 4.22% 2.70% 3.26% 6.29% MediumJPM Income Opportunity A (dist) - GBP (hedged) 0.76% 1.18% 1.04% 1.91% 4.29% 2.74% 3.29% 6.20% MediumJPM Income Opportunity A (fix) EUR 2.35 - EUR (hedged) 0.70% 1.04% 0.64% 1.49% - - - - MediumJPM Income Opportunity A (inc) - EUR (hedged) 0.68% 1.02% 0.79% 1.56% 3.97% 2.49% 3.06% - MediumJPM Income Opportunity A (mth) - USD 0.71% 1.07% 0.79% 1.69% - - - - MediumJPM Income Opportunity B (acc) - CHF (hedged)*** - - - - - - - - MediumJPM Income Opportunity B (acc) - EUR (hedged) 0.77% 1.19% 1.04% 1.96% 4.36% 2.97% 3.53% - MediumJPM Income Opportunity B (acc) - USD 0.79% 1.25% 1.14% 2.13% 4.54% 3.07% 3.64% - MediumJPM Income Opportunity B (dist) - EUR (hedged) 0.78% 1.35% - - - - - - MediumJPM Income Opportunity B (dist) - GBP (hedged) 0.82% 1.32% 1.27% 2.19% 4.72% - - - MediumJPM Income Opportunity B (fix) EUR 2.60 - EUR (hedged)** 0.81% 1.34% - - - - - - MediumJPM Income Opportunity B (inc) - EUR (hedged)*** - - - - - - - - MediumJPM Income Opportunity B (mth) - USD 0.79% 1.25% 1.00% 1.97% - - - - MediumJPM Income Opportunity C (acc) - EUR (hedged) 0.78% 1.22% 1.09% 2.02% 4.40% 3.02% 3.58% 6.74% MediumJPM Income Opportunity C (acc) - SEK (hedged) 1.07% 1.76% 1.87% 3.08% 5.77% 4.42% - - MediumJPM Income Opportunity C (acc) - USD 0.79% 1.26% 1.19% 2.20% 4.58% 3.13% 3.71% - MediumJPM Income Opportunity C (dist) - GBP (hedged) 0.86% 1.41% 1.39% 2.33% 4.64% 3.13% 3.71% - MediumJPM Income Opportunity C (dist) - USD 0.81% 1.42% - - - - - - MediumJPM Income Opportunity C (fix) EUR 2.70 - EUR (hedged)** 0.79% 1.36% - - - - - - MediumJPM Income Opportunity D (acc) - EUR (hedged) 0.63% 0.92% 0.63% 1.41% 3.83% 2.35% 2.88% 5.96% MediumJPM Income Opportunity D (acc) - USD*** - - - - - - - - MediumJPM Income Opportunity D (fix) EUR 2.15 - EUR (hedged) 0.65% 0.93% 0.49% 1.21% - - - - MediumJPM Income Opportunity D (inc) - EUR (hedged) 0.65% 0.93% 0.64% 1.36% 3.81% 2.28% - - MediumJPM Income Opportunity I (acc) - CHF (hedged)*** - - - - - - - - MediumJPM Income Opportunity I (acc) - EUR (hedged)*** - - - - - - - - MediumJPM Income Opportunity I (acc) - USD 0.87% 1.36% 1.28% 2.30% - - - - MediumJPM Income Opportunity I (dist) - GBP (hedged)*** - - - - - - - - MediumJPM Income Opportunity I (dist) - USD*** - - - - - - - - MediumJPM Income Opportunity I (inc) - EUR (hedged) 0.83% 1.28% 1.17% 2.10% - - - - MediumJPM Income Opportunity P (acc) - USD** 0.91% 1.46% - - - - - - MediumJPM Income Opportunity P (dist) - USD* - - - - - - - - MediumJPM Income Opportunity T (acc) - EUR (hedged) 0.64% 0.92% 0.62% 1.40% - - - - MediumJPM Income Opportunity X (acc) - EUR (hedged) 0.95% 1.56% 1.59% 2.66% 5.12% 3.69% 4.28% - MediumJPM Income Opportunity X (acc) - GBP (hedged)* - - - - - - - - MediumJPM Income Opportunity X (acc) - USD 0.96% 1.61% 1.67% 2.84% 5.30% 3.76% 4.35% - MediumJPM Income Opportunity X (dist) - GBP (hedged) 1.05% 1.77% 1.92% 3.00% 5.64% - - - Medium
JPMorgan Investment Funds - Japan 50 Equity FundJPM Japan 50 Equity A (acc) - EUR -0.85% 1.56% 4.18% 19.35% 10.54% 0.90% 7.36% 8.49% HighJPM Japan 50 Equity A (acc) - EUR (hedged) 8.69% 13.67% 23.84% 49.34% 34.01% - - - HighJPM Japan 50 Equity A (acc) - JPY 8.76% 14.10% 25.11% 52.17% 37.63% 12.29% 10.48% 12.38% HighJPM Japan 50 Equity A (acc) - USD (hedged) 8.69% - - - - - - - HighJPM Japan 50 Equity A (dist) - JPY 8.77% 14.11% 25.08% 52.06% 36.95% 9.61% 8.19% 10.29% HighJPM Japan 50 Equity B (acc) - JPY*** - - - - - - - - HighJPM Japan 50 Equity C (acc) - EUR (hedged) 8.95% 14.22% 24.73% 50.78% 35.63% - - - HighJPM Japan 50 Equity C (acc) - JPY 9.03% 14.67% 26.03% 53.67% 39.35% 13.62% 11.86% - HighJPM Japan 50 Equity C (acc) - USD (hedged) 8.95% - - - - - - - HighJPM Japan 50 Equity D (acc) - EUR (hedged) 8.42% 13.10% 22.90% 47.84% 32.35% - - - HighJPM Japan 50 Equity D (acc) - JPY 8.49% 13.53% 24.14% 50.66% 35.91% 10.94% 9.08% 10.80% HighJPM Japan 50 Equity I (acc) - JPY** - - - - - - - 20.42% HighJPM Japan 50 Equity X (acc) - JPY 9.25% 15.13% 26.77% 54.87% 40.78% 14.79% 13.09% 15.40% High
JPMorgan Investment Funds - Japan Behavioural Finance Equity Fund (11)JPM Japan Behavioural Finance Equity A (acc) - EUR - -1.79% 1.05% 19.37% 14.00% 5.92% 12.09% 9.84% HighJPM Japan Behavioural Finance Equity A (acc) - USD - -0.41% 4.09% 19.25% 15.14% 5.39% 9.27% 7.87% HighJPM Japan Behavioural Finance Equity A (dist) - USD - -0.40% 4.09% 19.19% 15.06% 5.34% 9.22% 7.70% HighJPM Japan Behavioural Finance Equity D (acc) - EUR - -1.92% 0.74% 18.80% 13.19% 5.14% 11.07% 8.80% HighJPM Japan Behavioural Finance Equity X (acc) - USD* - - - - - - - - High
JPMorgan Investment Funds - Japan Focus Fund (12)JPM Japan Focus A (acc) - JPY -2.25% 5.70% 16.31% 40.06% 31.63% 11.04% 11.20% 12.61% HighJPM Japan Focus A (dist) - JPY* - - - - - - - - HighJPM Japan Focus B (acc) - JPY -2.20% 5.95% 16.81% 40.92% 32.81% - - - HighJPM Japan Focus C (acc) - JPY* - - - - - - - - HighJPM Japan Focus D (acc) - JPY -2.32% 5.35% 15.65% 38.91% 30.28% 9.81% 9.89% 11.13% HighJPM Japan Focus I (acc) - JPY -2.18% 6.04% 16.98% 41.20% 33.18% 12.34% 12.70% 14.31% HighJPM Japan Focus X (acc) - JPY -2.13% 6.30% 17.50% 42.09% 34.28% 13.26% 13.49% 30.39% High
(11) This Sub-Fund was liquidated on 30 August 2013. Performance has been calculated with the last available NAV date.(12) This Sub-Fund was merged into Japan 50 Equity Fund on 25 October 2013. Performance has been calculated with the last available NAV date.
185
JPMorgan Investment Funds
Appendix - Unaudited Additional Disclosures (continued)
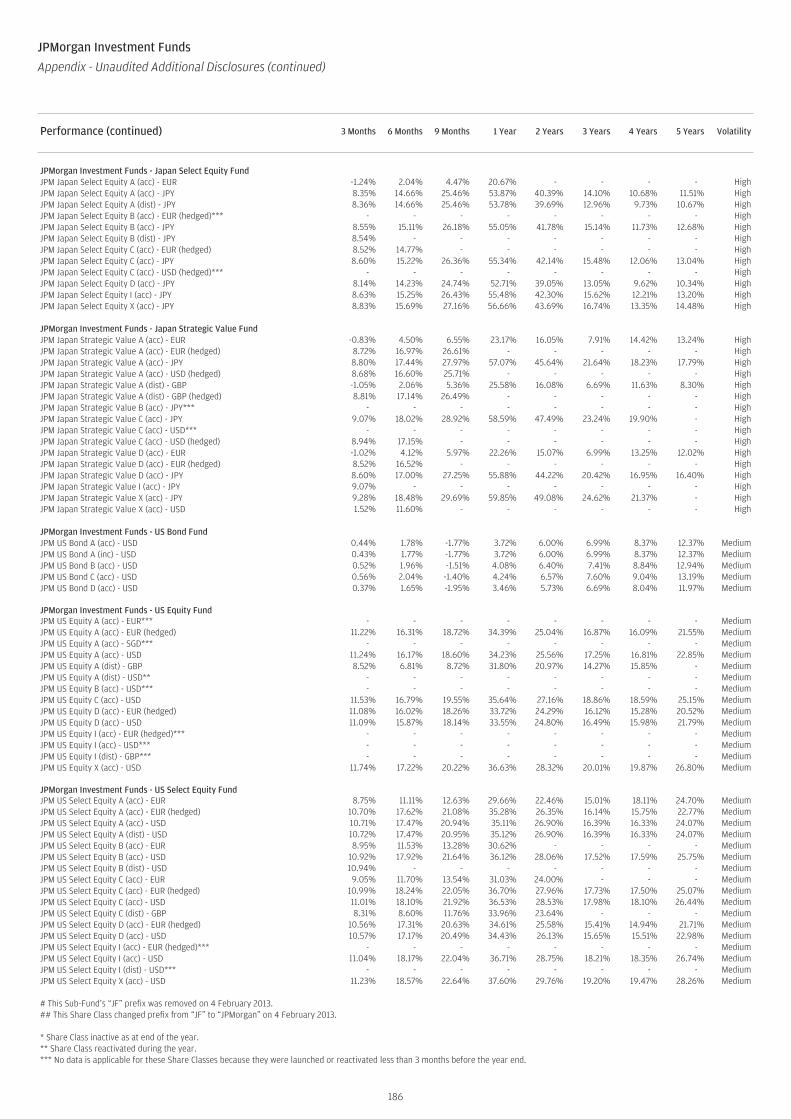
Performance (continued) 3 Months 6 Months 9 Months 1 Year 2 Years 3 Years 4 Years 5 Years Volatility
JPMorgan Investment Funds - Japan Select Equity FundJPM Japan Select Equity A (acc) - EUR -1.24% 2.04% 4.47% 20.67% - - - - HighJPM Japan Select Equity A (acc) - JPY 8.35% 14.66% 25.46% 53.87% 40.39% 14.10% 10.68% 11.51% HighJPM Japan Select Equity A (dist) - JPY 8.36% 14.66% 25.46% 53.78% 39.69% 12.96% 9.73% 10.67% HighJPM Japan Select Equity B (acc) - EUR (hedged)*** - - - - - - - - HighJPM Japan Select Equity B (acc) - JPY 8.55% 15.11% 26.18% 55.05% 41.78% 15.14% 11.73% 12.68% HighJPM Japan Select Equity B (dist) - JPY 8.54% - - - - - - - HighJPM Japan Select Equity C (acc) - EUR (hedged) 8.52% 14.77% - - - - - - HighJPM Japan Select Equity C (acc) - JPY 8.60% 15.22% 26.36% 55.34% 42.14% 15.48% 12.06% 13.04% HighJPM Japan Select Equity C (acc) - USD (hedged)*** - - - - - - - - HighJPM Japan Select Equity D (acc) - JPY 8.14% 14.23% 24.74% 52.71% 39.05% 13.05% 9.62% 10.34% HighJPM Japan Select Equity I (acc) - JPY 8.63% 15.25% 26.43% 55.48% 42.30% 15.62% 12.21% 13.20% HighJPM Japan Select Equity X (acc) - JPY 8.83% 15.69% 27.16% 56.66% 43.69% 16.74% 13.35% 14.48% High
JPMorgan Investment Funds - Japan Strategic Value FundJPM Japan Strategic Value A (acc) - EUR -0.83% 4.50% 6.55% 23.17% 16.05% 7.91% 14.42% 13.24% HighJPM Japan Strategic Value A (acc) - EUR (hedged) 8.72% 16.97% 26.61% - - - - - HighJPM Japan Strategic Value A (acc) - JPY 8.80% 17.44% 27.97% 57.07% 45.64% 21.64% 18.23% 17.79% HighJPM Japan Strategic Value A (acc) - USD (hedged) 8.68% 16.60% 25.71% - - - - - HighJPM Japan Strategic Value A (dist) - GBP -1.05% 2.06% 5.36% 25.58% 16.08% 6.69% 11.63% 8.30% HighJPM Japan Strategic Value A (dist) - GBP (hedged) 8.81% 17.14% 26.49% - - - - - HighJPM Japan Strategic Value B (acc) - JPY*** - - - - - - - - HighJPM Japan Strategic Value C (acc) - JPY 9.07% 18.02% 28.92% 58.59% 47.49% 23.24% 19.90% - HighJPM Japan Strategic Value C (acc) - USD*** - - - - - - - - HighJPM Japan Strategic Value C (acc) - USD (hedged) 8.94% 17.15% - - - - - - HighJPM Japan Strategic Value D (acc) - EUR -1.02% 4.12% 5.97% 22.26% 15.07% 6.99% 13.25% 12.02% HighJPM Japan Strategic Value D (acc) - EUR (hedged) 8.52% 16.52% - - - - - - HighJPM Japan Strategic Value D (acc) - JPY 8.60% 17.00% 27.25% 55.88% 44.22% 20.42% 16.95% 16.40% HighJPM Japan Strategic Value I (acc) - JPY 9.07% - - - - - - - HighJPM Japan Strategic Value X (acc) - JPY 9.28% 18.48% 29.69% 59.85% 49.08% 24.62% 21.37% - HighJPM Japan Strategic Value X (acc) - USD 1.52% 11.60% - - - - - - High
JPMorgan Investment Funds - US Bond FundJPM US Bond A (acc) - USD 0.44% 1.78% -1.77% 3.72% 6.00% 6.99% 8.37% 12.37% MediumJPM US Bond A (inc) - USD 0.43% 1.77% -1.77% 3.72% 6.00% 6.99% 8.37% 12.37% MediumJPM US Bond B (acc) - USD 0.52% 1.96% -1.51% 4.08% 6.40% 7.41% 8.84% 12.94% MediumJPM US Bond C (acc) - USD 0.56% 2.04% -1.40% 4.24% 6.57% 7.60% 9.04% 13.19% MediumJPM US Bond D (acc) - USD 0.37% 1.65% -1.95% 3.46% 5.73% 6.69% 8.04% 11.97% Medium
JPMorgan Investment Funds - US Equity FundJPM US Equity A (acc) - EUR*** - - - - - - - - MediumJPM US Equity A (acc) - EUR (hedged) 11.22% 16.31% 18.72% 34.39% 25.04% 16.87% 16.09% 21.55% MediumJPM US Equity A (acc) - SGD*** - - - - - - - - MediumJPM US Equity A (acc) - USD 11.24% 16.17% 18.60% 34.23% 25.56% 17.25% 16.81% 22.85% MediumJPM US Equity A (dist) - GBP 8.52% 6.81% 8.72% 31.80% 20.97% 14.27% 15.85% - MediumJPM US Equity A (dist) - USD** - - - - - - - - MediumJPM US Equity B (acc) - USD*** - - - - - - - - MediumJPM US Equity C (acc) - USD 11.53% 16.79% 19.55% 35.64% 27.16% 18.86% 18.59% 25.15% MediumJPM US Equity D (acc) - EUR (hedged) 11.08% 16.02% 18.26% 33.72% 24.29% 16.12% 15.28% 20.52% MediumJPM US Equity D (acc) - USD 11.09% 15.87% 18.14% 33.55% 24.80% 16.49% 15.98% 21.79% MediumJPM US Equity I (acc) - EUR (hedged)*** - - - - - - - - MediumJPM US Equity I (acc) - USD*** - - - - - - - - MediumJPM US Equity I (dist) - GBP*** - - - - - - - - MediumJPM US Equity X (acc) - USD 11.74% 17.22% 20.22% 36.63% 28.32% 20.01% 19.87% 26.80% Medium
JPMorgan Investment Funds - US Select Equity FundJPM US Select Equity A (acc) - EUR 8.75% 11.11% 12.63% 29.66% 22.46% 15.01% 18.11% 24.70% MediumJPM US Select Equity A (acc) - EUR (hedged) 10.70% 17.62% 21.08% 35.28% 26.35% 16.14% 15.75% 22.77% MediumJPM US Select Equity A (acc) - USD 10.71% 17.47% 20.94% 35.11% 26.90% 16.39% 16.33% 24.07% MediumJPM US Select Equity A (dist) - USD 10.72% 17.47% 20.95% 35.12% 26.90% 16.39% 16.33% 24.07% MediumJPM US Select Equity B (acc) - EUR 8.95% 11.53% 13.28% 30.62% - - - - MediumJPM US Select Equity B (acc) - USD 10.92% 17.92% 21.64% 36.12% 28.06% 17.52% 17.59% 25.75% MediumJPM US Select Equity B (dist) - USD 10.94% - - - - - - - MediumJPM US Select Equity C (acc) - EUR 9.05% 11.70% 13.54% 31.03% 24.00% - - - MediumJPM US Select Equity C (acc) - EUR (hedged) 10.99% 18.24% 22.05% 36.70% 27.96% 17.73% 17.50% 25.07% MediumJPM US Select Equity C (acc) - USD 11.01% 18.10% 21.92% 36.53% 28.53% 17.98% 18.10% 26.44% MediumJPM US Select Equity C (dist) - GBP 8.31% 8.60% 11.76% 33.96% 23.64% - - - MediumJPM US Select Equity D (acc) - EUR (hedged) 10.56% 17.31% 20.63% 34.61% 25.58% 15.41% 14.94% 21.71% MediumJPM US Select Equity D (acc) - USD 10.57% 17.17% 20.49% 34.43% 26.13% 15.65% 15.51% 22.98% MediumJPM US Select Equity I (acc) - EUR (hedged)*** - - - - - - - - MediumJPM US Select Equity I (acc) - USD 11.04% 18.17% 22.04% 36.71% 28.75% 18.21% 18.35% 26.74% MediumJPM US Select Equity I (dist) - USD*** - - - - - - - - MediumJPM US Select Equity X (acc) - USD 11.23% 18.57% 22.64% 37.60% 29.76% 19.20% 19.47% 28.26% Medium
# This Sub-Fund’s “JF” prefix was removed on 4 February 2013.## This Share Class changed prefix from “JF” to “JPMorgan” on 4 February 2013.
* Share Class inactive as at end of the year.** Share Class reactivated during the year.*** No data is applicable for these Share Classes because they were launched or reactivated less than 3 months before the year end.
186
JPMorgan Investment Funds
Appendix - Unaudited Additional Disclosures (continued)
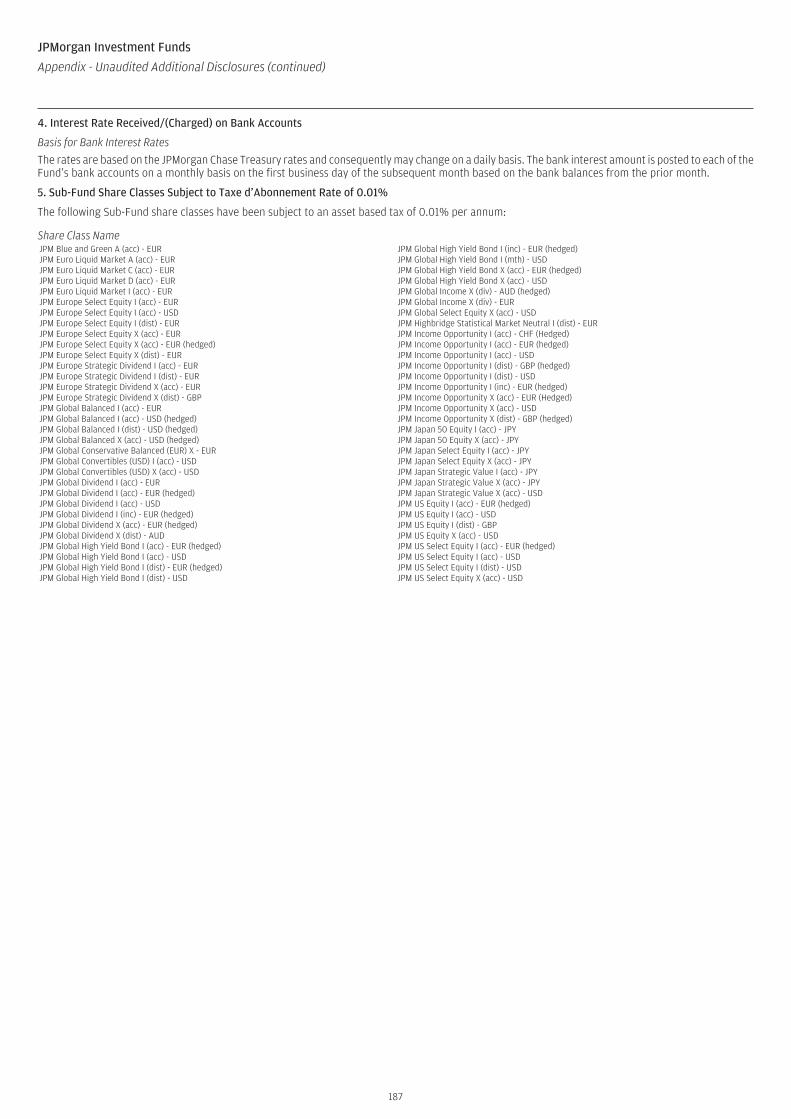
4. Interest Rate Received/(Charged) on Bank Accounts
Basis for Bank Interest Rates
The rates are based on the JPMorgan Chase Treasury rates and consequently may change on a daily basis. The bank interest amount is posted to each of theFund’s bank accounts on a monthly basis on the first business day of the subsequent month based on the bank balances from the prior month.
5. Sub-Fund Share Classes Subject to Taxe d’Abonnement Rate of 0.01%
The following Sub-Fund share classes have been subject to an asset based tax of 0.01% per annum:
Share Class NameJPM Blue and Green A (acc) - EUR JPM Global High Yield Bond I (inc) - EUR (hedged)JPM Euro Liquid Market A (acc) - EUR JPM Global High Yield Bond I (mth) - USDJPM Euro Liquid Market C (acc) - EUR JPM Global High Yield Bond X (acc) - EUR (hedged)JPM Euro Liquid Market D (acc) - EUR JPM Global High Yield Bond X (acc) - USDJPM Euro Liquid Market I (acc) - EUR JPM Global Income X (div) - AUD (hedged)JPM Europe Select Equity I (acc) - EUR JPM Global Income X (div) - EURJPM Europe Select Equity I (acc) - USD JPM Global Select Equity X (acc) - USDJPM Europe Select Equity I (dist) - EUR JPM Highbridge Statistical Market Neutral I (dist) - EURJPM Europe Select Equity X (acc) - EUR JPM Income Opportunity I (acc) - CHF (Hedged)JPM Europe Select Equity X (acc) - EUR (hedged) JPM Income Opportunity I (acc) - EUR (hedged)JPM Europe Select Equity X (dist) - EUR JPM Income Opportunity I (acc) - USDJPM Europe Strategic Dividend I (acc) - EUR JPM Income Opportunity I (dist) - GBP (hedged)JPM Europe Strategic Dividend I (dist) - EUR JPM Income Opportunity I (dist) - USDJPM Europe Strategic Dividend X (acc) - EUR JPM Income Opportunity I (inc) - EUR (hedged)JPM Europe Strategic Dividend X (dist) - GBP JPM Income Opportunity X (acc) - EUR (Hedged)JPM Global Balanced I (acc) - EUR JPM Income Opportunity X (acc) - USDJPM Global Balanced I (acc) - USD (hedged) JPM Income Opportunity X (dist) - GBP (hedged)JPM Global Balanced I (dist) - USD (hedged) JPM Japan 50 Equity I (acc) - JPYJPM Global Balanced X (acc) - USD (hedged) JPM Japan 50 Equity X (acc) - JPYJPM Global Conservative Balanced (EUR) X - EUR JPM Japan Select Equity I (acc) - JPYJPM Global Convertibles (USD) I (acc) - USD JPM Japan Select Equity X (acc) - JPYJPM Global Convertibles (USD) X (acc) - USD JPM Japan Strategic Value I (acc) - JPYJPM Global Dividend I (acc) - EUR JPM Japan Strategic Value X (acc) - JPYJPM Global Dividend I (acc) - EUR (hedged) JPM Japan Strategic Value X (acc) - USDJPM Global Dividend I (acc) - USD JPM US Equity I (acc) - EUR (hedged)JPM Global Dividend I (inc) - EUR (hedged) JPM US Equity I (acc) - USDJPM Global Dividend X (acc) - EUR (hedged) JPM US Equity I (dist) - GBPJPM Global Dividend X (dist) - AUD JPM US Equity X (acc) - USDJPM Global High Yield Bond I (acc) - EUR (hedged) JPM US Select Equity I (acc) - EUR (hedged)JPM Global High Yield Bond I (acc) - USD JPM US Select Equity I (acc) - USDJPM Global High Yield Bond I (dist) - EUR (hedged) JPM US Select Equity I (dist) - USDJPM Global High Yield Bond I (dist) - USD JPM US Select Equity X (acc) - USD
187
JPMorgan Investment Funds
Appendix - Unaudited Additional Disclosures (continued)
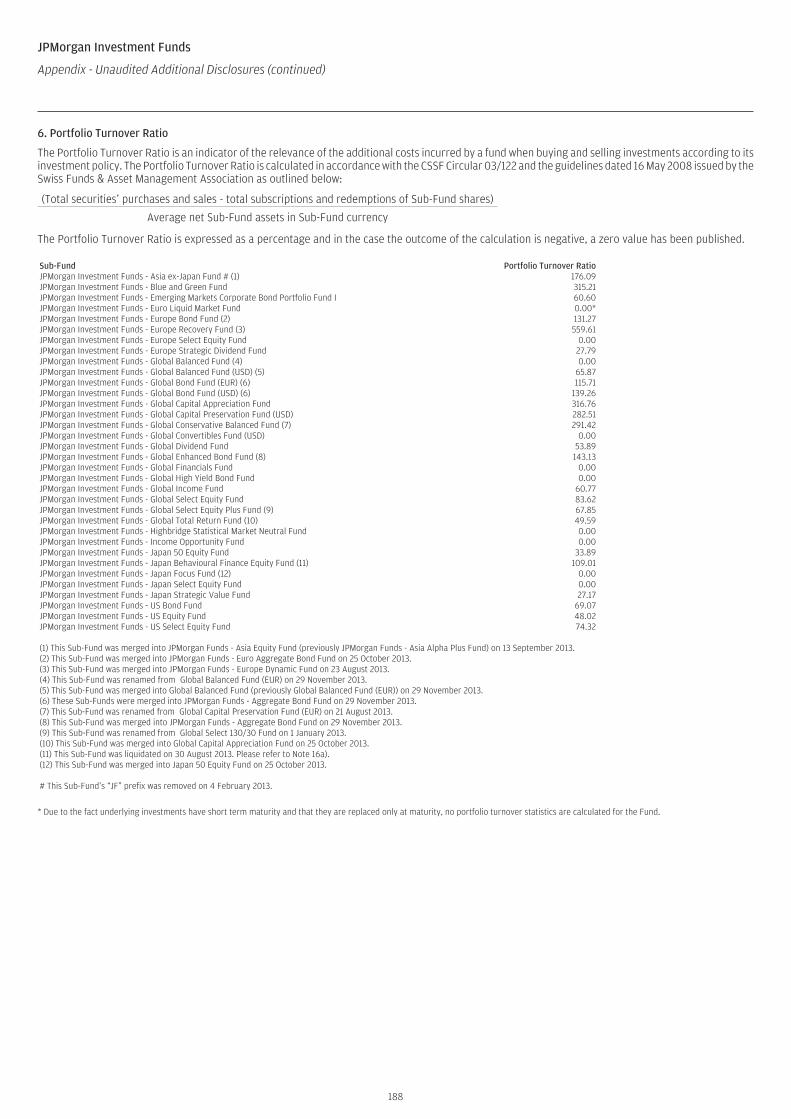
JPMorgan Investment Funds
Appendix - Unaudited Additional Disclosures (continued)
6. Portfolio Turnover Ratio
The Portfolio Turnover Ratio is an indicator of the relevance of the additional costs incurred by a fund when buying and selling investments according to itsinvestment policy. The Portfolio Turnover Ratio is calculated in accordance with the CSSF Circular 03/122 and the guidelines dated 16 May 2008 issued by theSwiss Funds & Asset Management Association as outlined below:
(Total securities’ purchases and sales - total subscriptions and redemptions of Sub-Fund shares)
Average net Sub-Fund assets in Sub-Fund currency
The Portfolio Turnover Ratio is expressed as a percentage and in the case the outcome of the calculation is negative, a zero value has been published.
Sub-Fund Portfolio Turnover RatioJPMorgan Investment Funds - Asia ex-Japan Fund # (1) 176.09JPMorgan Investment Funds - Blue and Green Fund 315.21JPMorgan Investment Funds - Emerging Markets Corporate Bond Portfolio Fund I 60.60JPMorgan Investment Funds - Euro Liquid Market Fund 0.00*JPMorgan Investment Funds - Europe Bond Fund (2) 131.27JPMorgan Investment Funds - Europe Recovery Fund (3) 559.61JPMorgan Investment Funds - Europe Select Equity Fund 0.00JPMorgan Investment Funds - Europe Strategic Dividend Fund 27.79JPMorgan Investment Funds - Global Balanced Fund (4) 0.00JPMorgan Investment Funds - Global Balanced Fund (USD) (5) 65.87JPMorgan Investment Funds - Global Bond Fund (EUR) (6) 115.71JPMorgan Investment Funds - Global Bond Fund (USD) (6) 139.26JPMorgan Investment Funds - Global Capital Appreciation Fund 316.76JPMorgan Investment Funds - Global Capital Preservation Fund (USD) 282.51JPMorgan Investment Funds - Global Conservative Balanced Fund (7) 291.42JPMorgan Investment Funds - Global Convertibles Fund (USD) 0.00JPMorgan Investment Funds - Global Dividend Fund 53.89JPMorgan Investment Funds - Global Enhanced Bond Fund (8) 143.13JPMorgan Investment Funds - Global Financials Fund 0.00JPMorgan Investment Funds - Global High Yield Bond Fund 0.00JPMorgan Investment Funds - Global Income Fund 60.77JPMorgan Investment Funds - Global Select Equity Fund 83.62JPMorgan Investment Funds - Global Select Equity Plus Fund (9) 67.85JPMorgan Investment Funds - Global Total Return Fund (10) 49.59JPMorgan Investment Funds - Highbridge Statistical Market Neutral Fund 0.00JPMorgan Investment Funds - Income Opportunity Fund 0.00JPMorgan Investment Funds - Japan 50 Equity Fund 33.89JPMorgan Investment Funds - Japan Behavioural Finance Equity Fund (11) 109.01JPMorgan Investment Funds - Japan Focus Fund (12) 0.00JPMorgan Investment Funds - Japan Select Equity Fund 0.00JPMorgan Investment Funds - Japan Strategic Value Fund 27.17JPMorgan Investment Funds - US Bond Fund 69.07JPMorgan Investment Funds - US Equity Fund 48.02JPMorgan Investment Funds - US Select Equity Fund 74.32
(1) This Sub-Fund was merged into JPMorgan Funds - Asia Equity Fund (previously JPMorgan Funds - Asia Alpha Plus Fund) on 13 September 2013.(2) This Sub-Fund was merged into JPMorgan Funds - Euro Aggregate Bond Fund on 25 October 2013.(3) This Sub-Fund was merged into JPMorgan Funds - Europe Dynamic Fund on 23 August 2013.(4) This Sub-Fund was renamed from Global Balanced Fund (EUR) on 29 November 2013.(5) This Sub-Fund was merged into Global Balanced Fund (previously Global Balanced Fund (EUR)) on 29 November 2013.(6) These Sub-Funds were merged into JPMorgan Funds - Aggregate Bond Fund on 29 November 2013.(7) This Sub-Fund was renamed from Global Capital Preservation Fund (EUR) on 21 August 2013.(8) This Sub-Fund was merged into JPMorgan Funds - Aggregate Bond Fund on 29 November 2013.(9) This Sub-Fund was renamed from Global Select 130/30 Fund on 1 January 2013.(10) This Sub-Fund was merged into Global Capital Appreciation Fund on 25 October 2013.(11) This Sub-Fund was liquidated on 30 August 2013. Please refer to Note 16a).(12) This Sub-Fund was merged into Japan 50 Equity Fund on 25 October 2013.
# This Sub-Fund’s “JF” prefix was removed on 4 February 2013.
* Due to the fact underlying investments have short term maturity and that they are replaced only at maturity, no portfolio turnover statistics are calculated for the Fund.
188
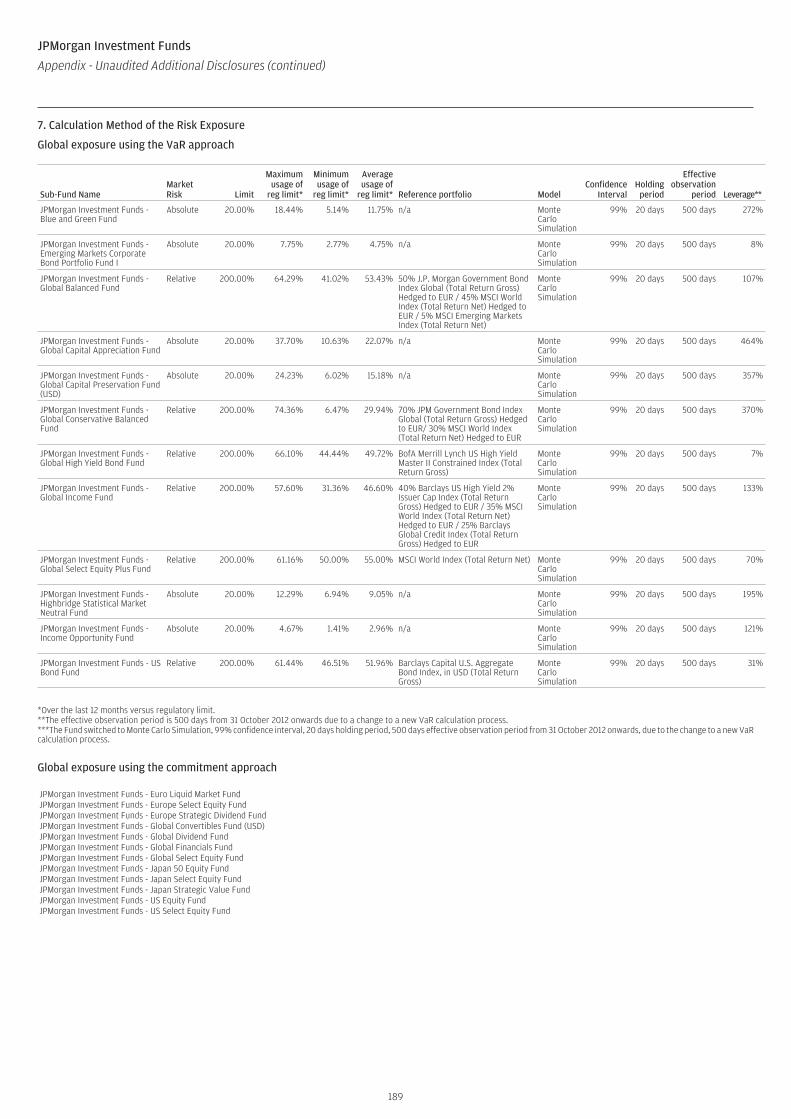
7. Calculation Method of the Risk Exposure
Global exposure using the VaR approach
Sub-Fund NameMarketRisk Limit
Maximumusage of
reg limit*
Minimumusage of
reg limit*
Averageusage of
reg limit* Reference portfolio ModelConfidence
IntervalHolding
period
Effectiveobservation
period Leverage**
JPMorgan Investment Funds -Blue and Green Fund
Absolute 20.00% 18.44% 5.14% 11.75% n/a MonteCarloSimulation
99% 20 days 500 days 272%
JPMorgan Investment Funds -Emerging Markets CorporateBond Portfolio Fund I
Absolute 20.00% 7.75% 2.77% 4.75% n/a MonteCarloSimulation
99% 20 days 500 days 8%
JPMorgan Investment Funds -Global Balanced Fund
Relative 200.00% 64.29% 41.02% 53.43% 50% J.P. Morgan Government BondIndex Global (Total Return Gross)Hedged to EUR / 45% MSCI WorldIndex (Total Return Net) Hedged toEUR / 5% MSCI Emerging MarketsIndex (Total Return Net)
MonteCarloSimulation
99% 20 days 500 days 107%
JPMorgan Investment Funds -Global Capital Appreciation Fund
Absolute 20.00% 37.70% 10.63% 22.07% n/a MonteCarloSimulation
99% 20 days 500 days 464%
JPMorgan Investment Funds -Global Capital Preservation Fund(USD)
Absolute 20.00% 24.23% 6.02% 15.18% n/a MonteCarloSimulation
99% 20 days 500 days 357%
JPMorgan Investment Funds -Global Conservative BalancedFund
Relative 200.00% 74.36% 6.47% 29.94% 70% JPM Government Bond IndexGlobal (Total Return Gross) Hedgedto EUR/ 30% MSCI World Index(Total Return Net) Hedged to EUR
MonteCarloSimulation
99% 20 days 500 days 370%
JPMorgan Investment Funds -Global High Yield Bond Fund
Relative 200.00% 66.10% 44.44% 49.72% BofA Merrill Lynch US High YieldMaster II Constrained Index (TotalReturn Gross)
MonteCarloSimulation
99% 20 days 500 days 7%
JPMorgan Investment Funds -Global Income Fund
Relative 200.00% 57.60% 31.36% 46.60% 40% Barclays US High Yield 2%Issuer Cap Index (Total ReturnGross) Hedged to EUR / 35% MSCIWorld Index (Total Return Net)Hedged to EUR / 25% BarclaysGlobal Credit Index (Total ReturnGross) Hedged to EUR
MonteCarloSimulation
99% 20 days 500 days 133%
JPMorgan Investment Funds -Global Select Equity Plus Fund
Relative 200.00% 61.16% 50.00% 55.00% MSCI World Index (Total Return Net) MonteCarloSimulation
99% 20 days 500 days 70%
JPMorgan Investment Funds -Highbridge Statistical MarketNeutral Fund
Absolute 20.00% 12.29% 6.94% 9.05% n/a MonteCarloSimulation
99% 20 days 500 days 195%
JPMorgan Investment Funds -Income Opportunity Fund
Absolute 20.00% 4.67% 1.41% 2.96% n/a MonteCarloSimulation
99% 20 days 500 days 121%
JPMorgan Investment Funds - USBond Fund
Relative 200.00% 61.44% 46.51% 51.96% Barclays Capital U.S. AggregateBond Index, in USD (Total ReturnGross)
MonteCarloSimulation
99% 20 days 500 days 31%
*Over the last 12 months versus regulatory limit.**The effective observation period is 500 days from 31 October 2012 onwards due to a change to a new VaR calculation process.***The Fund switched to Monte Carlo Simulation, 99% confidence interval, 20 days holding period, 500 days effective observation period from 31 October 2012 onwards, due to the change to a new VaRcalculation process.
Global exposure using the commitment approach
JPMorgan Investment Funds - Euro Liquid Market FundJPMorgan Investment Funds - Europe Select Equity FundJPMorgan Investment Funds - Europe Strategic Dividend FundJPMorgan Investment Funds - Global Convertibles Fund (USD)JPMorgan Investment Funds - Global Dividend FundJPMorgan Investment Funds - Global Financials FundJPMorgan Investment Funds - Global Select Equity FundJPMorgan Investment Funds - Japan 50 Equity FundJPMorgan Investment Funds - Japan Select Equity FundJPMorgan Investment Funds - Japan Strategic Value FundJPMorgan Investment Funds - US Equity FundJPMorgan Investment Funds - US Select Equity Fund
189
JPMorgan Investment Funds
Appendix - Unaudited Additional Disclosures (continued)

JPMorgan Investment Funds
Appendix - Unaudited Additional Disclosures (continued)
Shares Outstandingat the Beginning
of the Year
Shares Subscribed Shares Redeemed Shares Outstandingat the End
of the Year
8. Historical Statement of Changes in the Number of Shares - for the year ended 31 December 2012 (continued)JPMorgan Investment Funds - Blue and Green FundJPM Blue and Green A (acc) - EUR 3,449.615 - 55.866 3,393.749
JPMorgan Investment Funds - Emerging Markets Corporate Bond Portfolio Fund IJPM Emerging Markets Corporate Bond Portfolio I - A (div) - USD 86,028.607 1,489.000 5,957.441 81,560.166JPM Emerging Markets Corporate Bond Portfolio I - A (div) - EUR (hedged) 200,495.743 55.712 12,819.644 187,731.811JPM Emerging Markets Corporate Bond Portfolio I - B (div) - USD 25,003.001 - - 25,003.001JPM Emerging Markets Corporate Bond Portfolio I - B (div) - EUR (hedged) 24,518.818 - - 24,518.818JPM Emerging Markets Corporate Bond Portfolio I - C (div) - USD 136,700.000 - - 136,700.000JPM Emerging Markets Corporate Bond Portfolio I - D (div) - USD 53,253.465 59.863 969.980 52,343.348JPM Emerging Markets Corporate Bond Portfolio I - D (div) - EUR (hedged) 428,194.183 - 17,561.436 410,632.747
JPMorgan Investment Funds - Euro Liquid Market FundJPM Euro Liquid Market A (acc) - EUR 154,769.275 246,147.209 310,884.572 90,031.912JPM Euro Liquid Market C (acc) - EUR 38,424.083 245,753.755 214,574.805 69,603.033JPM Euro Liquid Market D (acc) - EUR 230,546.421 61,802.497 241,092.155 51,256.763
JPMorgan Investment Funds - Europe Bond FundJPM Europe Bond A (acc) - EUR 128,228.102 88,679.365 90,587.573 126,319.894JPM Europe Bond A (inc) - EUR 44,334.283 626.000 13,577.499 31,382.784JPM Europe Bond B (acc) - EUR 29.801 1,227.158 - 1,256.959JPM Europe Bond C (acc) - EUR 2,226.628 110,709.863 70,365.768 42,570.723JPM Europe Bond D (acc) - EUR 30,391.491 13,099.690 8,766.404 34,724.777JPM Europe Bond X (acc) - EUR* 85.589 - 85.589 -
JPMorgan Investment Funds - Europe Recovery FundJPM Europe Recovery A (acc) - EUR 609,561.395 438.553 461,470.981 148,528.967JPM Europe Recovery A (dist) - EUR 182,819.061 365.445 115,485.157 67,699.349JPM Europe Recovery B (acc) - EUR* 999.999 - 999.999 -JPM Europe Recovery C (acc) - EUR 100.500 4,780.302 4,805.838 74.964JPM Europe Recovery D (acc) - EUR 17,711.628 545.157 8,357.158 9,899.627JPM Europe Recovery X (acc) - EUR 175,664.264 73,753.000 248,227.000 1,190.264
JPMorgan Investment Funds - Europe Select Equity FundJPM Europe Select Equity A (acc) - EUR 108,357.386 119,447.156 40,738.672 187,065.870JPM Europe Select Equity A (acc) - USD 8,744.603 1,463.565 6,169.597 4,038.571JPM Europe Select Equity A (dist) - EUR 57,848.342 165,692.100 30,118.125 193,422.317JPM Europe Select Equity B (acc) - EUR 85,970.026 125,824.283 9,585.589 202,208.720JPM Europe Select Equity C (acc) - EUR 797,463.798 917,855.807 413,474.539 1,301,845.066JPM Europe Select Equity D (acc) - EUR 60,278.532 11,294.714 29,172.503 42,400.743JPM Europe Select Equity D (acc) - USD 34.860 - - 34.860JPM Europe Select Equity I (acc) - EUR 330,128.348 - - 330,128.348JPM Europe Select Equity X (acc) - EUR 339,555.536 286,435.920 18,917.962 607,073.494JPM Europe Select Equity X (acc) - EUR (hedged) 329,768.799 - - 329,768.799
JPMorgan Investment Funds - Europe Strategic Dividend FundJPM Europe Strategic Dividend A (acc) - EUR 2,111,407.744 606,051.593 799,935.176 1,917,524.161JPM Europe Strategic Dividend A (dist) - EUR 99,239.863 174,060.324 31,781.971 241,518.216JPM Europe Strategic Dividend A (div) - EUR 310.000 305,895.002 130.326 306,074.676JPM Europe Strategic Dividend A (inc) - EUR 1,191,041.209 282,479.732 91,403.163 1,382,117.778JPM Europe Strategic Dividend B (acc) - EUR 105,102.605 108,256.127 107,176.112 106,182.620JPM Europe Strategic Dividend C (acc) - EUR 1,515,145.782 630,372.995 673,412.345 1,472,106.432JPM Europe Strategic Dividend C (dist) - EUR - 5,074.703 - 5,074.703JPM Europe Strategic Dividend C (div) - EUR - 231,523.227 - 231,523.227JPM Europe Strategic Dividend D (acc) - EUR 224,101.739 53,116.099 91,918.735 185,299.103JPM Europe Strategic Dividend D (div) - EUR 10.000 11,067.387 1,145.299 9,932.088JPM Europe Strategic Dividend I (acc) - EUR 348,975.923 114,880.251 47,311.367 416,544.807JPM Europe Strategic Dividend X (acc) - EUR 58,733.289 126,000.689 72,849.801 111,884.177
JPMorgan Investment Funds - Global Balanced Fund (EUR)JPM Global Balanced (EUR) A (acc) - EUR 71,488.630 53,866.285 32,350.107 93,004.808JPM Global Balanced (EUR) A (dist) - EUR 10,962.220 3,161.558 3,267.493 10,856.285JPM Global Balanced (EUR) B (acc) - EUR 5,888.901 767.445 2,017.231 4,639.115JPM Global Balanced (EUR) C (acc) - EUR 3,588.478 18,563.843 13,195.976 8,956.345JPM Global Balanced (EUR) D (acc) - EUR 346,289.769 128,762.608 111,324.174 363,728.203JPM Global Balanced (EUR) T (acc) - EUR 1,265.625 13,900.860 596.639 14,569.846
JPMorgan Investment Funds - Global Balanced Fund (USD)JF Global Balanced (USD) A (acc) - USD 57,606.463 6,532.056 11,325.805 52,812.714JPM Global Balanced (USD) A (acc) - USD 951,192.359 567,011.837 353,988.395 1,164,215.801JPM Global Balanced (USD) A (dist) - USD 9,944.167 2,755.952 5,465.491 7,234.628JPM Global Balanced (USD) A (mth) - USD - 1,790.761 - 1,790.761JPM Global Balanced (USD) B (acc) - USD 80,069.526 29,520.214 7,382.108 102,207.632JPM Global Balanced (USD) B (mth) - USD - 10.000 - 10.000JPM Global Balanced (USD) C (acc) - USD 45,785.030 2,214.990 47,257.420 742.600JPM Global Balanced (USD) D (acc) - USD 240,427.098 117,261.124 64,750.480 292,937.742JPM Global Balanced (USD) D (mth) - USD - 10.000 - 10.000JPM Global Balanced (USD) X (acc) - USD 33,128.852 - 10,176.073 22,952.779
190
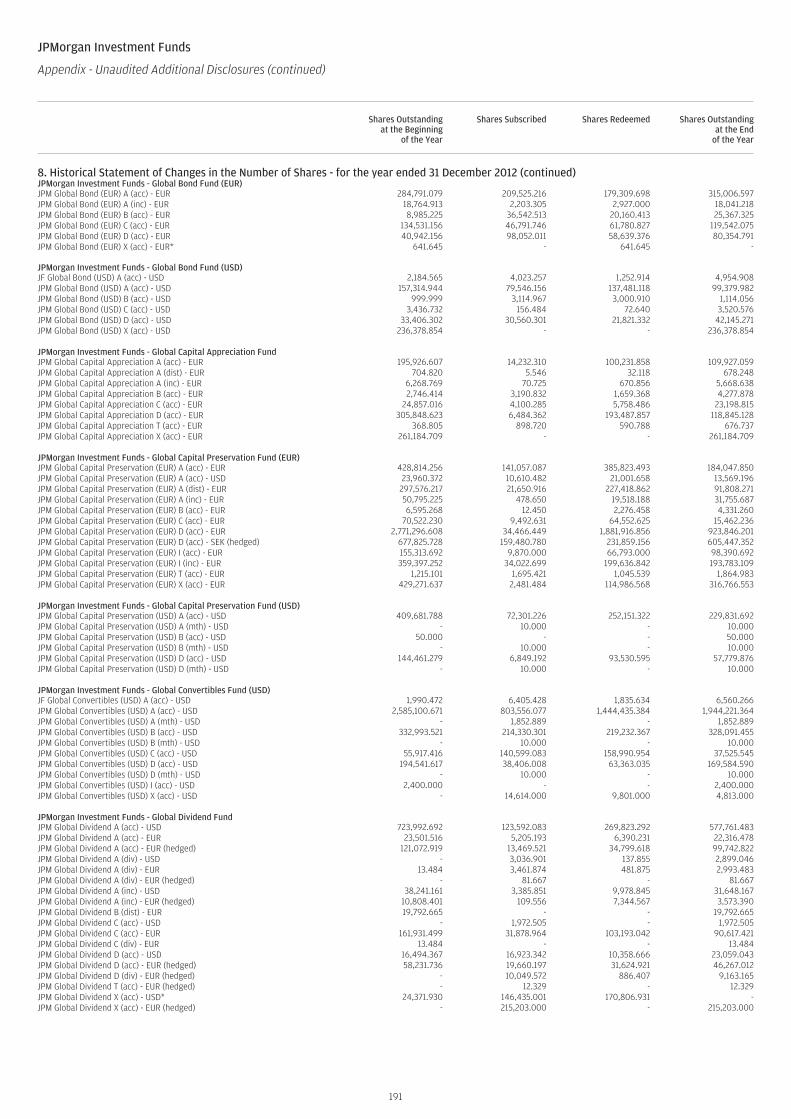
JPMorgan Investment Funds
Appendix - Unaudited Additional Disclosures (continued)
Shares Outstandingat the Beginning
of the Year
Shares Subscribed Shares Redeemed Shares Outstandingat the End
of the Year
8. Historical Statement of Changes in the Number of Shares - for the year ended 31 December 2012 (continued)JPMorgan Investment Funds - Global Bond Fund (EUR)JPM Global Bond (EUR) A (acc) - EUR 284,791.079 209,525.216 179,309.698 315,006.597JPM Global Bond (EUR) A (inc) - EUR 18,764.913 2,203.305 2,927.000 18,041.218JPM Global Bond (EUR) B (acc) - EUR 8,985.225 36,542.513 20,160.413 25,367.325JPM Global Bond (EUR) C (acc) - EUR 134,531.156 46,791.746 61,780.827 119,542.075JPM Global Bond (EUR) D (acc) - EUR 40,942.156 98,052.011 58,639.376 80,354.791JPM Global Bond (EUR) X (acc) - EUR* 641.645 - 641.645 -
JPMorgan Investment Funds - Global Bond Fund (USD)JF Global Bond (USD) A (acc) - USD 2,184.565 4,023.257 1,252.914 4,954.908JPM Global Bond (USD) A (acc) - USD 157,314.944 79,546.156 137,481.118 99,379.982JPM Global Bond (USD) B (acc) - USD 999.999 3,114.967 3,000.910 1,114.056JPM Global Bond (USD) C (acc) - USD 3,436.732 156.484 72.640 3,520.576JPM Global Bond (USD) D (acc) - USD 33,406.302 30,560.301 21,821.332 42,145.271JPM Global Bond (USD) X (acc) - USD 236,378.854 - - 236,378.854
JPMorgan Investment Funds - Global Capital Appreciation FundJPM Global Capital Appreciation A (acc) - EUR 195,926.607 14,232.310 100,231.858 109,927.059JPM Global Capital Appreciation A (dist) - EUR 704.820 5.546 32.118 678.248JPM Global Capital Appreciation A (inc) - EUR 6,268.769 70.725 670.856 5,668.638JPM Global Capital Appreciation B (acc) - EUR 2,746.414 3,190.832 1,659.368 4,277.878JPM Global Capital Appreciation C (acc) - EUR 24,857.016 4,100.285 5,758.486 23,198.815JPM Global Capital Appreciation D (acc) - EUR 305,848.623 6,484.362 193,487.857 118,845.128JPM Global Capital Appreciation T (acc) - EUR 368.805 898.720 590.788 676.737JPM Global Capital Appreciation X (acc) - EUR 261,184.709 - - 261,184.709
JPMorgan Investment Funds - Global Capital Preservation Fund (EUR)JPM Global Capital Preservation (EUR) A (acc) - EUR 428,814.256 141,057.087 385,823.493 184,047.850JPM Global Capital Preservation (EUR) A (acc) - USD 23,960.372 10,610.482 21,001.658 13,569.196JPM Global Capital Preservation (EUR) A (dist) - EUR 297,576.217 21,650.916 227,418.862 91,808.271JPM Global Capital Preservation (EUR) A (inc) - EUR 50,795.225 478.650 19,518.188 31,755.687JPM Global Capital Preservation (EUR) B (acc) - EUR 6,595.268 12.450 2,276.458 4,331.260JPM Global Capital Preservation (EUR) C (acc) - EUR 70,522.230 9,492.631 64,552.625 15,462.236JPM Global Capital Preservation (EUR) D (acc) - EUR 2,771,296.608 34,466.449 1,881,916.856 923,846.201JPM Global Capital Preservation (EUR) D (acc) - SEK (hedged) 677,825.728 159,480.780 231,859.156 605,447.352JPM Global Capital Preservation (EUR) I (acc) - EUR 155,313.692 9,870.000 66,793.000 98,390.692JPM Global Capital Preservation (EUR) I (inc) - EUR 359,397.252 34,022.699 199,636.842 193,783.109JPM Global Capital Preservation (EUR) T (acc) - EUR 1,215.101 1,695.421 1,045.539 1,864.983JPM Global Capital Preservation (EUR) X (acc) - EUR 429,271.637 2,481.484 114,986.568 316,766.553
JPMorgan Investment Funds - Global Capital Preservation Fund (USD)JPM Global Capital Preservation (USD) A (acc) - USD 409,681.788 72,301.226 252,151.322 229,831.692JPM Global Capital Preservation (USD) A (mth) - USD - 10.000 - 10.000JPM Global Capital Preservation (USD) B (acc) - USD 50.000 - - 50.000JPM Global Capital Preservation (USD) B (mth) - USD - 10.000 - 10.000JPM Global Capital Preservation (USD) D (acc) - USD 144,461.279 6,849.192 93,530.595 57,779.876JPM Global Capital Preservation (USD) D (mth) - USD - 10.000 - 10.000
JPMorgan Investment Funds - Global Convertibles Fund (USD)JF Global Convertibles (USD) A (acc) - USD 1,990.472 6,405.428 1,835.634 6,560.266JPM Global Convertibles (USD) A (acc) - USD 2,585,100.671 803,556.077 1,444,435.384 1,944,221.364JPM Global Convertibles (USD) A (mth) - USD - 1,852.889 - 1,852.889JPM Global Convertibles (USD) B (acc) - USD 332,993.521 214,330.301 219,232.367 328,091.455JPM Global Convertibles (USD) B (mth) - USD - 10.000 - 10.000JPM Global Convertibles (USD) C (acc) - USD 55,917.416 140,599.083 158,990.954 37,525.545JPM Global Convertibles (USD) D (acc) - USD 194,541.617 38,406.008 63,363.035 169,584.590JPM Global Convertibles (USD) D (mth) - USD - 10.000 - 10.000JPM Global Convertibles (USD) I (acc) - USD 2,400.000 - - 2,400.000JPM Global Convertibles (USD) X (acc) - USD - 14,614.000 9,801.000 4,813.000
JPMorgan Investment Funds - Global Dividend FundJPM Global Dividend A (acc) - USD 723,992.692 123,592.083 269,823.292 577,761.483JPM Global Dividend A (acc) - EUR 23,501.516 5,205.193 6,390.231 22,316.478JPM Global Dividend A (acc) - EUR (hedged) 121,072.919 13,469.521 34,799.618 99,742.822JPM Global Dividend A (div) - USD - 3,036.901 137.855 2,899.046JPM Global Dividend A (div) - EUR 13.484 3,461.874 481.875 2,993.483JPM Global Dividend A (div) - EUR (hedged) - 81.667 - 81.667JPM Global Dividend A (inc) - USD 38,241.161 3,385.851 9,978.845 31,648.167JPM Global Dividend A (inc) - EUR (hedged) 10,808.401 109.556 7,344.567 3,573.390JPM Global Dividend B (dist) - EUR 19,792.665 - - 19,792.665JPM Global Dividend C (acc) - USD - 1,972.505 - 1,972.505JPM Global Dividend C (acc) - EUR 161,931.499 31,878.964 103,193.042 90,617.421JPM Global Dividend C (div) - EUR 13.484 - - 13.484JPM Global Dividend D (acc) - USD 16,494.367 16,923.342 10,358.666 23,059.043JPM Global Dividend D (acc) - EUR (hedged) 58,231.736 19,660.197 31,624.921 46,267.012JPM Global Dividend D (div) - EUR (hedged) - 10,049.572 886.407 9,163.165JPM Global Dividend T (acc) - EUR (hedged) - 12.329 - 12.329JPM Global Dividend X (acc) - USD* 24,371.930 146,435.001 170,806.931 -JPM Global Dividend X (acc) - EUR (hedged) - 215,203.000 - 215,203.000
191
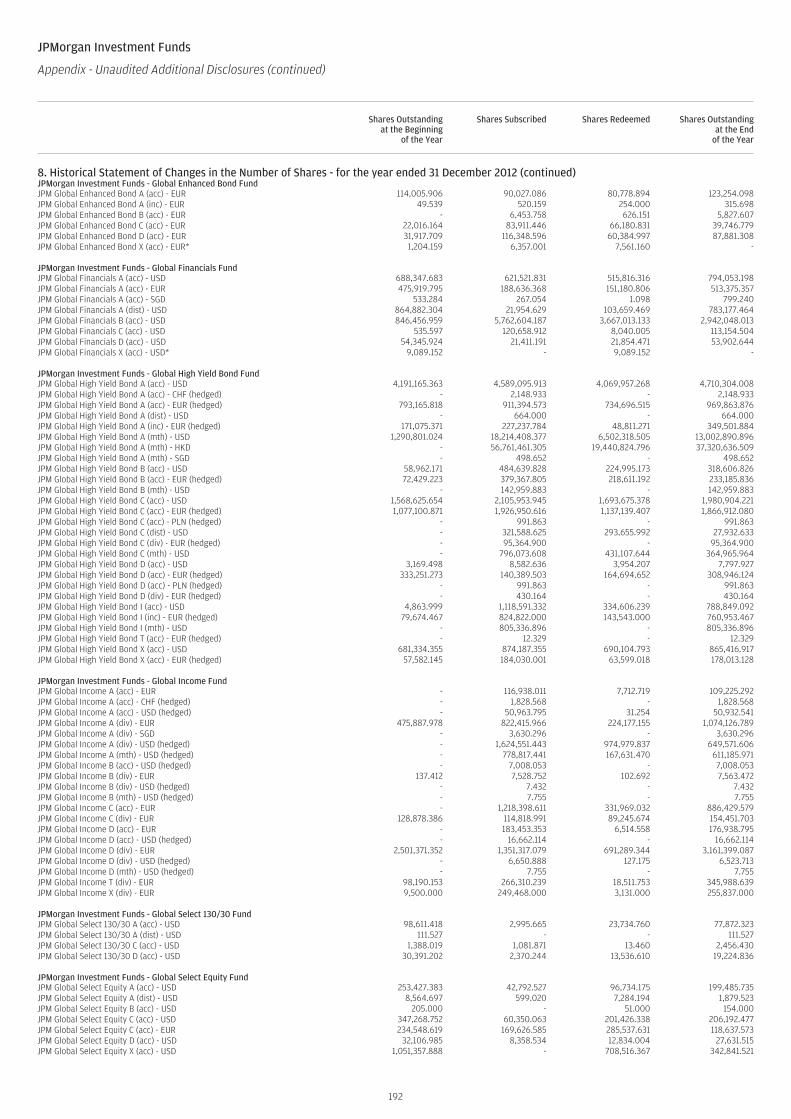
JPMorgan Investment Funds
Appendix - Unaudited Additional Disclosures (continued)
Shares Outstandingat the Beginning
of the Year
Shares Subscribed Shares Redeemed Shares Outstandingat the End
of the Year
8. Historical Statement of Changes in the Number of Shares - for the year ended 31 December 2012 (continued)JPMorgan Investment Funds - Global Enhanced Bond FundJPM Global Enhanced Bond A (acc) - EUR 114,005.906 90,027.086 80,778.894 123,254.098JPM Global Enhanced Bond A (inc) - EUR 49.539 520.159 254.000 315.698JPM Global Enhanced Bond B (acc) - EUR - 6,453.758 626.151 5,827.607JPM Global Enhanced Bond C (acc) - EUR 22,016.164 83,911.446 66,180.831 39,746.779JPM Global Enhanced Bond D (acc) - EUR 31,917.709 116,348.596 60,384.997 87,881.308JPM Global Enhanced Bond X (acc) - EUR* 1,204.159 6,357.001 7,561.160 -
JPMorgan Investment Funds - Global Financials FundJPM Global Financials A (acc) - USD 688,347.683 621,521.831 515,816.316 794,053.198JPM Global Financials A (acc) - EUR 475,919.795 188,636.368 151,180.806 513,375.357JPM Global Financials A (acc) - SGD 533.284 267.054 1.098 799.240JPM Global Financials A (dist) - USD 864,882.304 21,954.629 103,659.469 783,177.464JPM Global Financials B (acc) - USD 846,456.959 5,762,604.187 3,667,013.133 2,942,048.013JPM Global Financials C (acc) - USD 535.597 120,658.912 8,040.005 113,154.504JPM Global Financials D (acc) - USD 54,345.924 21,411.191 21,854.471 53,902.644JPM Global Financials X (acc) - USD* 9,089.152 - 9,089.152 -
JPMorgan Investment Funds - Global High Yield Bond FundJPM Global High Yield Bond A (acc) - USD 4,191,165.363 4,589,095.913 4,069,957.268 4,710,304.008JPM Global High Yield Bond A (acc) - CHF (hedged) - 2,148.933 - 2,148.933JPM Global High Yield Bond A (acc) - EUR (hedged) 793,165.818 911,394.573 734,696.515 969,863.876JPM Global High Yield Bond A (dist) - USD - 664.000 - 664.000JPM Global High Yield Bond A (inc) - EUR (hedged) 171,075.371 227,237.784 48,811.271 349,501.884JPM Global High Yield Bond A (mth) - USD 1,290,801.024 18,214,408.377 6,502,318.505 13,002,890.896JPM Global High Yield Bond A (mth) - HKD - 56,761,461.305 19,440,824.796 37,320,636.509JPM Global High Yield Bond A (mth) - SGD - 498.652 - 498.652JPM Global High Yield Bond B (acc) - USD 58,962.171 484,639.828 224,995.173 318,606.826JPM Global High Yield Bond B (acc) - EUR (hedged) 72,429.223 379,367.805 218,611.192 233,185.836JPM Global High Yield Bond B (mth) - USD - 142,959.883 - 142,959.883JPM Global High Yield Bond C (acc) - USD 1,568,625.654 2,105,953.945 1,693,675.378 1,980,904.221JPM Global High Yield Bond C (acc) - EUR (hedged) 1,077,100.871 1,926,950.616 1,137,139.407 1,866,912.080JPM Global High Yield Bond C (acc) - PLN (hedged) - 991.863 - 991.863JPM Global High Yield Bond C (dist) - USD - 321,588.625 293,655.992 27,932.633JPM Global High Yield Bond C (div) - EUR (hedged) - 95,364.900 - 95,364.900JPM Global High Yield Bond C (mth) - USD - 796,073.608 431,107.644 364,965.964JPM Global High Yield Bond D (acc) - USD 3,169.498 8,582.636 3,954.207 7,797.927JPM Global High Yield Bond D (acc) - EUR (hedged) 333,251.273 140,389.503 164,694.652 308,946.124JPM Global High Yield Bond D (acc) - PLN (hedged) - 991.863 - 991.863JPM Global High Yield Bond D (div) - EUR (hedged) - 430.164 - 430.164JPM Global High Yield Bond I (acc) - USD 4,863.999 1,118,591.332 334,606.239 788,849.092JPM Global High Yield Bond I (inc) - EUR (hedged) 79,674.467 824,822.000 143,543.000 760,953.467JPM Global High Yield Bond I (mth) - USD - 805,336.896 - 805,336.896JPM Global High Yield Bond T (acc) - EUR (hedged) - 12.329 - 12.329JPM Global High Yield Bond X (acc) - USD 681,334.355 874,187.355 690,104.793 865,416.917JPM Global High Yield Bond X (acc) - EUR (hedged) 57,582.145 184,030.001 63,599.018 178,013.128
JPMorgan Investment Funds - Global Income FundJPM Global Income A (acc) - EUR - 116,938.011 7,712.719 109,225.292JPM Global Income A (acc) - CHF (hedged) - 1,828.568 - 1,828.568JPM Global Income A (acc) - USD (hedged) - 50,963.795 31.254 50,932.541JPM Global Income A (div) - EUR 475,887.978 822,415.966 224,177.155 1,074,126.789JPM Global Income A (div) - SGD - 3,630.296 - 3,630.296JPM Global Income A (div) - USD (hedged) - 1,624,551.443 974,979.837 649,571.606JPM Global Income A (mth) - USD (hedged) - 778,817.441 167,631.470 611,185.971JPM Global Income B (acc) - USD (hedged) - 7,008.053 - 7,008.053JPM Global Income B (div) - EUR 137.412 7,528.752 102.692 7,563.472JPM Global Income B (div) - USD (hedged) - 7.432 - 7.432JPM Global Income B (mth) - USD (hedged) - 7.755 - 7.755JPM Global Income C (acc) - EUR - 1,218,398.611 331,969.032 886,429.579JPM Global Income C (div) - EUR 128,878.386 114,818.991 89,245.674 154,451.703JPM Global Income D (acc) - EUR - 183,453.353 6,514.558 176,938.795JPM Global Income D (acc) - USD (hedged) - 16,662.114 - 16,662.114JPM Global Income D (div) - EUR 2,501,371.352 1,351,317.079 691,289.344 3,161,399.087JPM Global Income D (div) - USD (hedged) - 6,650.888 127.175 6,523.713JPM Global Income D (mth) - USD (hedged) - 7.755 - 7.755JPM Global Income T (div) - EUR 98,190.153 266,310.239 18,511.753 345,988.639JPM Global Income X (div) - EUR 9,500.000 249,468.000 3,131.000 255,837.000
JPMorgan Investment Funds - Global Select 130/30 FundJPM Global Select 130/30 A (acc) - USD 98,611.418 2,995.665 23,734.760 77,872.323JPM Global Select 130/30 A (dist) - USD 111.527 - - 111.527JPM Global Select 130/30 C (acc) - USD 1,388.019 1,081.871 13.460 2,456.430JPM Global Select 130/30 D (acc) - USD 30,391.202 2,370.244 13,536.610 19,224.836
JPMorgan Investment Funds - Global Select Equity FundJPM Global Select Equity A (acc) - USD 253,427.383 42,792.527 96,734.175 199,485.735JPM Global Select Equity A (dist) - USD 8,564.697 599.020 7,284.194 1,879.523JPM Global Select Equity B (acc) - USD 205.000 - 51.000 154.000JPM Global Select Equity C (acc) - USD 347,268.752 60,350.063 201,426.338 206,192.477JPM Global Select Equity C (acc) - EUR 234,548.619 169,626.585 285,537.631 118,637.573JPM Global Select Equity D (acc) - USD 32,106.985 8,358.534 12,834.004 27,631.515JPM Global Select Equity X (acc) - USD 1,051,357.888 - 708,516.367 342,841.521
192
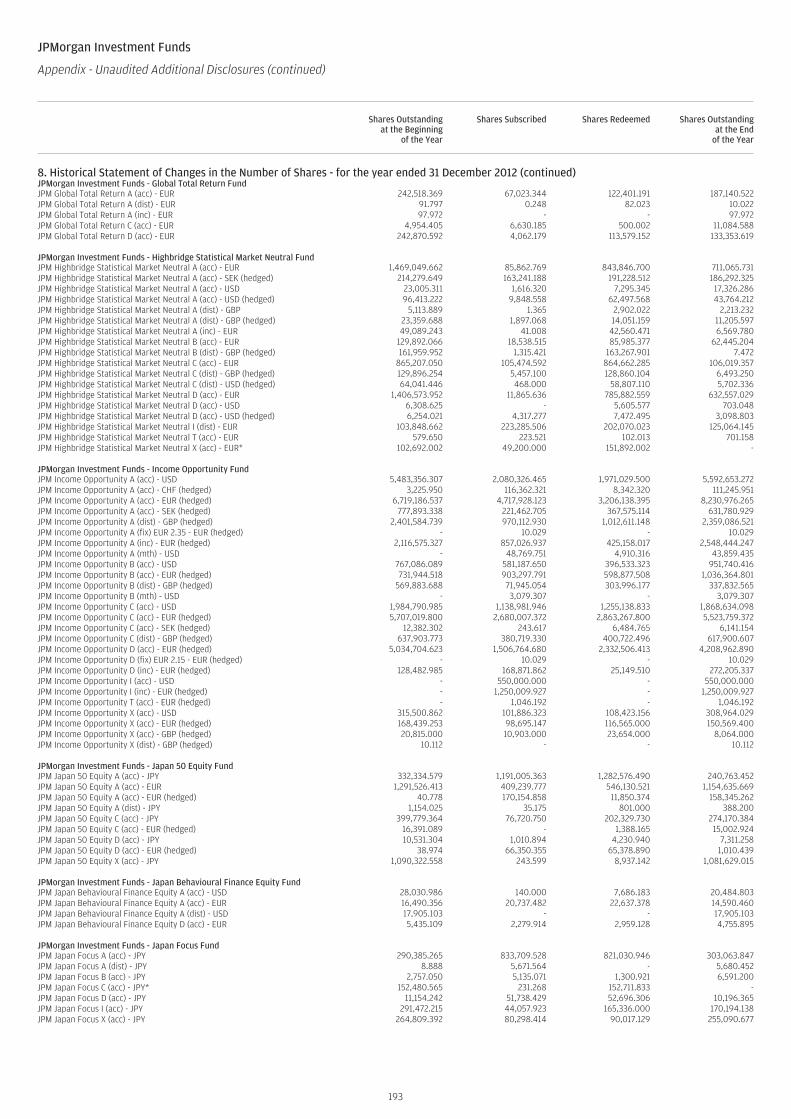
JPMorgan Investment Funds
Appendix - Unaudited Additional Disclosures (continued)
Shares Outstandingat the Beginning
of the Year
Shares Subscribed Shares Redeemed Shares Outstandingat the End
of the Year
8. Historical Statement of Changes in the Number of Shares - for the year ended 31 December 2012 (continued)JPMorgan Investment Funds - Global Total Return FundJPM Global Total Return A (acc) - EUR 242,518.369 67,023.344 122,401.191 187,140.522JPM Global Total Return A (dist) - EUR 91.797 0.248 82.023 10.022JPM Global Total Return A (inc) - EUR 97.972 - - 97.972JPM Global Total Return C (acc) - EUR 4,954.405 6,630.185 500.002 11,084.588JPM Global Total Return D (acc) - EUR 242,870.592 4,062.179 113,579.152 133,353.619
JPMorgan Investment Funds - Highbridge Statistical Market Neutral FundJPM Highbridge Statistical Market Neutral A (acc) - EUR 1,469,049.662 85,862.769 843,846.700 711,065.731JPM Highbridge Statistical Market Neutral A (acc) - SEK (hedged) 214,279.649 163,241.188 191,228.512 186,292.325JPM Highbridge Statistical Market Neutral A (acc) - USD 23,005.311 1,616.320 7,295.345 17,326.286JPM Highbridge Statistical Market Neutral A (acc) - USD (hedged) 96,413.222 9,848.558 62,497.568 43,764.212JPM Highbridge Statistical Market Neutral A (dist) - GBP 5,113.889 1.365 2,902.022 2,213.232JPM Highbridge Statistical Market Neutral A (dist) - GBP (hedged) 23,359.688 1,897.068 14,051.159 11,205.597JPM Highbridge Statistical Market Neutral A (inc) - EUR 49,089.243 41.008 42,560.471 6,569.780JPM Highbridge Statistical Market Neutral B (acc) - EUR 129,892.066 18,538.515 85,985.377 62,445.204JPM Highbridge Statistical Market Neutral B (dist) - GBP (hedged) 161,959.952 1,315.421 163,267.901 7.472JPM Highbridge Statistical Market Neutral C (acc) - EUR 865,207.050 105,474.592 864,662.285 106,019.357JPM Highbridge Statistical Market Neutral C (dist) - GBP (hedged) 129,896.254 5,457.100 128,860.104 6,493.250JPM Highbridge Statistical Market Neutral C (dist) - USD (hedged) 64,041.446 468.000 58,807.110 5,702.336JPM Highbridge Statistical Market Neutral D (acc) - EUR 1,406,573.952 11,865.636 785,882.559 632,557.029JPM Highbridge Statistical Market Neutral D (acc) - USD 6,308.625 - 5,605.577 703.048JPM Highbridge Statistical Market Neutral D (acc) - USD (hedged) 6,254.021 4,317.277 7,472.495 3,098.803JPM Highbridge Statistical Market Neutral I (dist) - EUR 103,848.662 223,285.506 202,070.023 125,064.145JPM Highbridge Statistical Market Neutral T (acc) - EUR 579.650 223.521 102.013 701.158JPM Highbridge Statistical Market Neutral X (acc) - EUR* 102,692.002 49,200.000 151,892.002 -
JPMorgan Investment Funds - Income Opportunity FundJPM Income Opportunity A (acc) - USD 5,483,356.307 2,080,326.465 1,971,029.500 5,592,653.272JPM Income Opportunity A (acc) - CHF (hedged) 3,225.950 116,362.321 8,342.320 111,245.951JPM Income Opportunity A (acc) - EUR (hedged) 6,719,186.537 4,717,928.123 3,206,138.395 8,230,976.265JPM Income Opportunity A (acc) - SEK (hedged) 777,893.338 221,462.705 367,575.114 631,780.929JPM Income Opportunity A (dist) - GBP (hedged) 2,401,584.739 970,112.930 1,012,611.148 2,359,086.521JPM Income Opportunity A (fix) EUR 2.35 - EUR (hedged) - 10.029 - 10.029JPM Income Opportunity A (inc) - EUR (hedged) 2,116,575.327 857,026.937 425,158.017 2,548,444.247JPM Income Opportunity A (mth) - USD - 48,769.751 4,910.316 43,859.435JPM Income Opportunity B (acc) - USD 767,086.089 581,187.650 396,533.323 951,740.416JPM Income Opportunity B (acc) - EUR (hedged) 731,944.518 903,297.791 598,877.508 1,036,364.801JPM Income Opportunity B (dist) - GBP (hedged) 569,883.688 71,945.054 303,996.177 337,832.565JPM Income Opportunity B (mth) - USD - 3,079.307 - 3,079.307JPM Income Opportunity C (acc) - USD 1,984,790.985 1,138,981.946 1,255,138.833 1,868,634.098JPM Income Opportunity C (acc) - EUR (hedged) 5,707,019.800 2,680,007.372 2,863,267.800 5,523,759.372JPM Income Opportunity C (acc) - SEK (hedged) 12,382.302 243.617 6,484.765 6,141.154JPM Income Opportunity C (dist) - GBP (hedged) 637,903.773 380,719.330 400,722.496 617,900.607JPM Income Opportunity D (acc) - EUR (hedged) 5,034,704.623 1,506,764.680 2,332,506.413 4,208,962.890JPM Income Opportunity D (fix) EUR 2.15 - EUR (hedged) - 10.029 - 10.029JPM Income Opportunity D (inc) - EUR (hedged) 128,482.985 168,871.862 25,149.510 272,205.337JPM Income Opportunity I (acc) - USD - 550,000.000 - 550,000.000JPM Income Opportunity I (inc) - EUR (hedged) - 1,250,009.927 - 1,250,009.927JPM Income Opportunity T (acc) - EUR (hedged) - 1,046.192 - 1,046.192JPM Income Opportunity X (acc) - USD 315,500.862 101,886.323 108,423.156 308,964.029JPM Income Opportunity X (acc) - EUR (hedged) 168,439.253 98,695.147 116,565.000 150,569.400JPM Income Opportunity X (acc) - GBP (hedged) 20,815.000 10,903.000 23,654.000 8,064.000JPM Income Opportunity X (dist) - GBP (hedged) 10.112 - - 10.112
JPMorgan Investment Funds - Japan 50 Equity FundJPM Japan 50 Equity A (acc) - JPY 332,334.579 1,191,005.363 1,282,576.490 240,763.452JPM Japan 50 Equity A (acc) - EUR 1,291,526.413 409,239.777 546,130.521 1,154,635.669JPM Japan 50 Equity A (acc) - EUR (hedged) 40.778 170,154.858 11,850.374 158,345.262JPM Japan 50 Equity A (dist) - JPY 1,154.025 35.175 801.000 388.200JPM Japan 50 Equity C (acc) - JPY 399,779.364 76,720.750 202,329.730 274,170.384JPM Japan 50 Equity C (acc) - EUR (hedged) 16,391.089 - 1,388.165 15,002.924JPM Japan 50 Equity D (acc) - JPY 10,531.304 1,010.894 4,230.940 7,311.258JPM Japan 50 Equity D (acc) - EUR (hedged) 38.974 66,350.355 65,378.890 1,010.439JPM Japan 50 Equity X (acc) - JPY 1,090,322.558 243.599 8,937.142 1,081,629.015
JPMorgan Investment Funds - Japan Behavioural Finance Equity FundJPM Japan Behavioural Finance Equity A (acc) - USD 28,030.986 140.000 7,686.183 20,484.803JPM Japan Behavioural Finance Equity A (acc) - EUR 16,490.356 20,737.482 22,637.378 14,590.460JPM Japan Behavioural Finance Equity A (dist) - USD 17,905.103 - - 17,905.103JPM Japan Behavioural Finance Equity D (acc) - EUR 5,435.109 2,279.914 2,959.128 4,755.895
JPMorgan Investment Funds - Japan Focus FundJPM Japan Focus A (acc) - JPY 290,385.265 833,709.528 821,030.946 303,063.847JPM Japan Focus A (dist) - JPY 8.888 5,671.564 - 5,680.452JPM Japan Focus B (acc) - JPY 2,757.050 5,135.071 1,300.921 6,591.200JPM Japan Focus C (acc) - JPY* 152,480.565 231.268 152,711.833 -JPM Japan Focus D (acc) - JPY 11,154.242 51,738.429 52,696.306 10,196.365JPM Japan Focus I (acc) - JPY 291,472.215 44,057.923 165,336.000 170,194.138JPM Japan Focus X (acc) - JPY 264,809.392 80,298.414 90,017.129 255,090.677
193
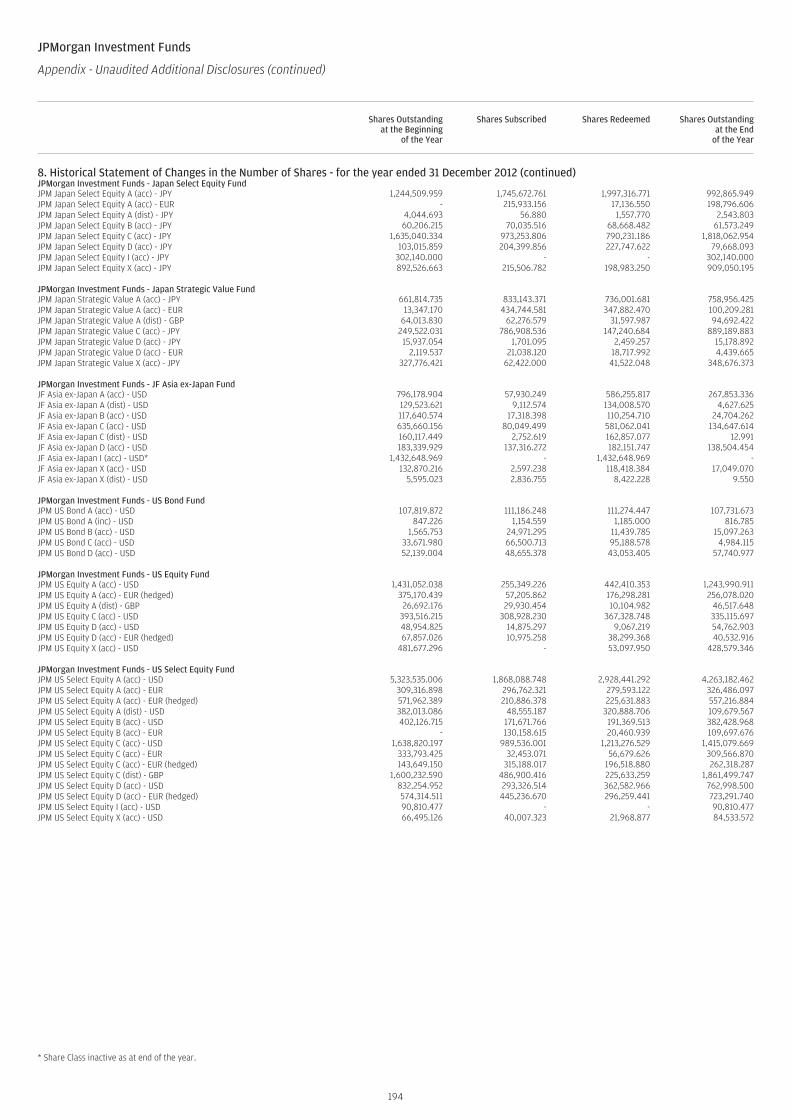
JPMorgan Investment Funds
Appendix - Unaudited Additional Disclosures (continued)
Shares Outstandingat the Beginning
of the Year
Shares Subscribed Shares Redeemed Shares Outstandingat the End
of the Year
8. Historical Statement of Changes in the Number of Shares - for the year ended 31 December 2012 (continued)JPMorgan Investment Funds - Japan Select Equity FundJPM Japan Select Equity A (acc) - JPY 1,244,509.959 1,745,672.761 1,997,316.771 992,865.949JPM Japan Select Equity A (acc) - EUR - 215,933.156 17,136.550 198,796.606JPM Japan Select Equity A (dist) - JPY 4,044.693 56.880 1,557.770 2,543.803JPM Japan Select Equity B (acc) - JPY 60,206.215 70,035.516 68,668.482 61,573.249JPM Japan Select Equity C (acc) - JPY 1,635,040.334 973,253.806 790,231.186 1,818,062.954JPM Japan Select Equity D (acc) - JPY 103,015.859 204,399.856 227,747.622 79,668.093JPM Japan Select Equity I (acc) - JPY 302,140.000 - - 302,140.000JPM Japan Select Equity X (acc) - JPY 892,526.663 215,506.782 198,983.250 909,050.195
JPMorgan Investment Funds - Japan Strategic Value FundJPM Japan Strategic Value A (acc) - JPY 661,814.735 833,143.371 736,001.681 758,956.425JPM Japan Strategic Value A (acc) - EUR 13,347.170 434,744.581 347,882.470 100,209.281JPM Japan Strategic Value A (dist) - GBP 64,013.830 62,276.579 31,597.987 94,692.422JPM Japan Strategic Value C (acc) - JPY 249,522.031 786,908.536 147,240.684 889,189.883JPM Japan Strategic Value D (acc) - JPY 15,937.054 1,701.095 2,459.257 15,178.892JPM Japan Strategic Value D (acc) - EUR 2,119.537 21,038.120 18,717.992 4,439.665JPM Japan Strategic Value X (acc) - JPY 327,776.421 62,422.000 41,522.048 348,676.373
JPMorgan Investment Funds - JF Asia ex-Japan FundJF Asia ex-Japan A (acc) - USD 796,178.904 57,930.249 586,255.817 267,853.336JF Asia ex-Japan A (dist) - USD 129,523.621 9,112.574 134,008.570 4,627.625JF Asia ex-Japan B (acc) - USD 117,640.574 17,318.398 110,254.710 24,704.262JF Asia ex-Japan C (acc) - USD 635,660.156 80,049.499 581,062.041 134,647.614JF Asia ex-Japan C (dist) - USD 160,117.449 2,752.619 162,857.077 12.991JF Asia ex-Japan D (acc) - USD 183,339.929 137,316.272 182,151.747 138,504.454JF Asia ex-Japan I (acc) - USD* 1,432,648.969 - 1,432,648.969 -JF Asia ex-Japan X (acc) - USD 132,870.216 2,597.238 118,418.384 17,049.070JF Asia ex-Japan X (dist) - USD 5,595.023 2,836.755 8,422.228 9.550
JPMorgan Investment Funds - US Bond FundJPM US Bond A (acc) - USD 107,819.872 111,186.248 111,274.447 107,731.673JPM US Bond A (inc) - USD 847.226 1,154.559 1,185.000 816.785JPM US Bond B (acc) - USD 1,565.753 24,971.295 11,439.785 15,097.263JPM US Bond C (acc) - USD 33,671.980 66,500.713 95,188.578 4,984.115JPM US Bond D (acc) - USD 52,139.004 48,655.378 43,053.405 57,740.977
JPMorgan Investment Funds - US Equity FundJPM US Equity A (acc) - USD 1,431,052.038 255,349.226 442,410.353 1,243,990.911JPM US Equity A (acc) - EUR (hedged) 375,170.439 57,205.862 176,298.281 256,078.020JPM US Equity A (dist) - GBP 26,692.176 29,930.454 10,104.982 46,517.648JPM US Equity C (acc) - USD 393,516.215 308,928.230 367,328.748 335,115.697JPM US Equity D (acc) - USD 48,954.825 14,875.297 9,067.219 54,762.903JPM US Equity D (acc) - EUR (hedged) 67,857.026 10,975.258 38,299.368 40,532.916JPM US Equity X (acc) - USD 481,677.296 - 53,097.950 428,579.346
JPMorgan Investment Funds - US Select Equity FundJPM US Select Equity A (acc) - USD 5,323,535.006 1,868,088.748 2,928,441.292 4,263,182.462JPM US Select Equity A (acc) - EUR 309,316.898 296,762.321 279,593.122 326,486.097JPM US Select Equity A (acc) - EUR (hedged) 571,962.389 210,886.378 225,631.883 557,216.884JPM US Select Equity A (dist) - USD 382,013.086 48,555.187 320,888.706 109,679.567JPM US Select Equity B (acc) - USD 402,126.715 171,671.766 191,369.513 382,428.968JPM US Select Equity B (acc) - EUR - 130,158.615 20,460.939 109,697.676JPM US Select Equity C (acc) - USD 1,638,820.197 989,536.001 1,213,276.529 1,415,079.669JPM US Select Equity C (acc) - EUR 333,793.425 32,453.071 56,679.626 309,566.870JPM US Select Equity C (acc) - EUR (hedged) 143,649.150 315,188.017 196,518.880 262,318.287JPM US Select Equity C (dist) - GBP 1,600,232.590 486,900.416 225,633.259 1,861,499.747JPM US Select Equity D (acc) - USD 832,254.952 293,326.514 362,582.966 762,998.500JPM US Select Equity D (acc) - EUR (hedged) 574,314.511 445,236.670 296,259.441 723,291.740JPM US Select Equity I (acc) - USD 90,810.477 - - 90,810.477JPM US Select Equity X (acc) - USD 66,495.126 40,007.323 21,968.877 84,533.572
* Share Class inactive as at end of the year.
194
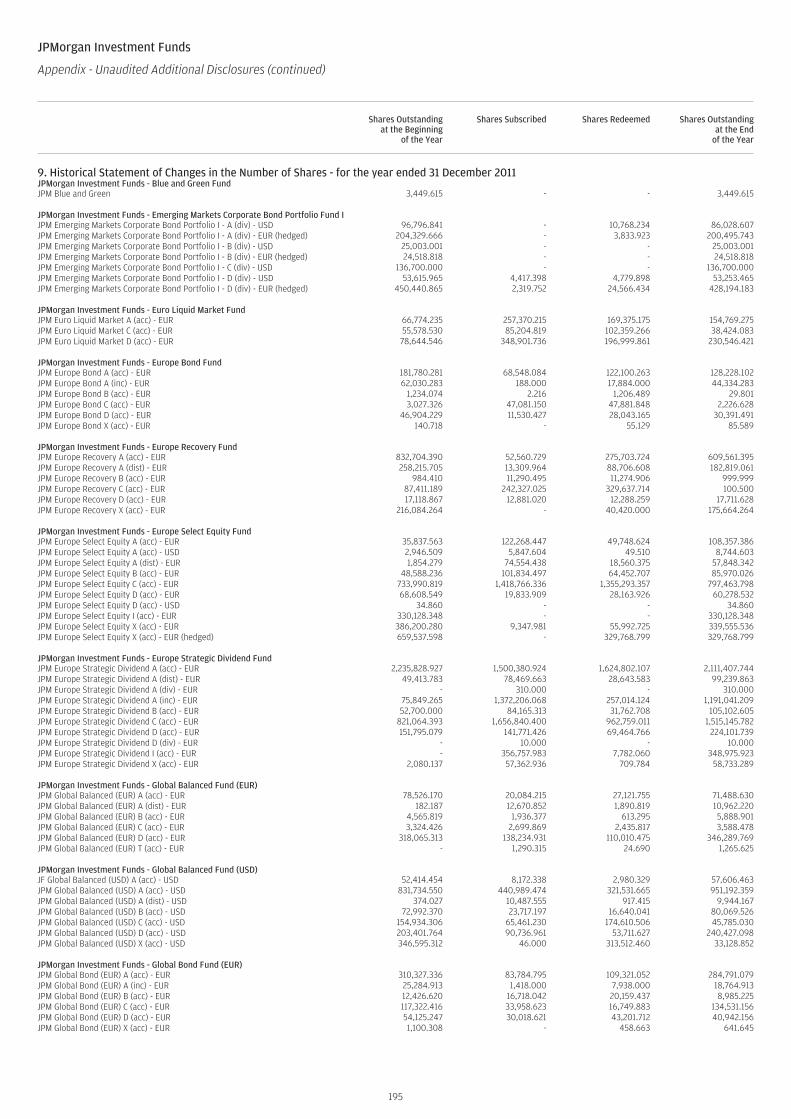
JPMorgan Investment Funds
Appendix - Unaudited Additional Disclosures (continued)
Shares Outstandingat the Beginning
of the Year
Shares Subscribed Shares Redeemed Shares Outstandingat the End
of the Year
9. Historical Statement of Changes in the Number of Shares - for the year ended 31 December 2011 (continued)JPMorgan Investment Funds - Blue and Green FundJPM Blue and Green 3,449.615 - - 3,449.615
JPMorgan Investment Funds - Emerging Markets Corporate Bond Portfolio Fund IJPM Emerging Markets Corporate Bond Portfolio I - A (div) - USD 96,796.841 - 10,768.234 86,028.607JPM Emerging Markets Corporate Bond Portfolio I - A (div) - EUR (hedged) 204,329.666 - 3,833.923 200,495.743JPM Emerging Markets Corporate Bond Portfolio I - B (div) - USD 25,003.001 - - 25,003.001JPM Emerging Markets Corporate Bond Portfolio I - B (div) - EUR (hedged) 24,518.818 - - 24,518.818JPM Emerging Markets Corporate Bond Portfolio I - C (div) - USD 136,700.000 - - 136,700.000JPM Emerging Markets Corporate Bond Portfolio I - D (div) - USD 53,615.965 4,417.398 4,779.898 53,253.465JPM Emerging Markets Corporate Bond Portfolio I - D (div) - EUR (hedged) 450,440.865 2,319.752 24,566.434 428,194.183
JPMorgan Investment Funds - Euro Liquid Market FundJPM Euro Liquid Market A (acc) - EUR 66,774.235 257,370.215 169,375.175 154,769.275JPM Euro Liquid Market C (acc) - EUR 55,578.530 85,204.819 102,359.266 38,424.083JPM Euro Liquid Market D (acc) - EUR 78,644.546 348,901.736 196,999.861 230,546.421
JPMorgan Investment Funds - Europe Bond FundJPM Europe Bond A (acc) - EUR 181,780.281 68,548.084 122,100.263 128,228.102JPM Europe Bond A (inc) - EUR 62,030.283 188.000 17,884.000 44,334.283JPM Europe Bond B (acc) - EUR 1,234.074 2.216 1,206.489 29.801JPM Europe Bond C (acc) - EUR 3,027.326 47,081.150 47,881.848 2,226.628JPM Europe Bond D (acc) - EUR 46,904.229 11,530.427 28,043.165 30,391.491JPM Europe Bond X (acc) - EUR 140.718 - 55.129 85.589
JPMorgan Investment Funds - Europe Recovery FundJPM Europe Recovery A (acc) - EUR 832,704.390 52,560.729 275,703.724 609,561.395JPM Europe Recovery A (dist) - EUR 258,215.705 13,309.964 88,706.608 182,819.061JPM Europe Recovery B (acc) - EUR 984.410 11,290.495 11,274.906 999.999JPM Europe Recovery C (acc) - EUR 87,411.189 242,327.025 329,637.714 100.500JPM Europe Recovery D (acc) - EUR 17,118.867 12,881.020 12,288.259 17,711.628JPM Europe Recovery X (acc) - EUR 216,084.264 - 40,420.000 175,664.264
JPMorgan Investment Funds - Europe Select Equity FundJPM Europe Select Equity A (acc) - EUR 35,837.563 122,268.447 49,748.624 108,357.386JPM Europe Select Equity A (acc) - USD 2,946.509 5,847.604 49.510 8,744.603JPM Europe Select Equity A (dist) - EUR 1,854.279 74,554.438 18,560.375 57,848.342JPM Europe Select Equity B (acc) - EUR 48,588.236 101,834.497 64,452.707 85,970.026JPM Europe Select Equity C (acc) - EUR 733,990.819 1,418,766.336 1,355,293.357 797,463.798JPM Europe Select Equity D (acc) - EUR 68,608.549 19,833.909 28,163.926 60,278.532JPM Europe Select Equity D (acc) - USD 34.860 - - 34.860JPM Europe Select Equity I (acc) - EUR 330,128.348 - - 330,128.348JPM Europe Select Equity X (acc) - EUR 386,200.280 9,347.981 55,992.725 339,555.536JPM Europe Select Equity X (acc) - EUR (hedged) 659,537.598 - 329,768.799 329,768.799
JPMorgan Investment Funds - Europe Strategic Dividend FundJPM Europe Strategic Dividend A (acc) - EUR 2,235,828.927 1,500,380.924 1,624,802.107 2,111,407.744JPM Europe Strategic Dividend A (dist) - EUR 49,413.783 78,469.663 28,643.583 99,239.863JPM Europe Strategic Dividend A (div) - EUR - 310.000 - 310.000JPM Europe Strategic Dividend A (inc) - EUR 75,849.265 1,372,206.068 257,014.124 1,191,041.209JPM Europe Strategic Dividend B (acc) - EUR 52,700.000 84,165.313 31,762.708 105,102.605JPM Europe Strategic Dividend C (acc) - EUR 821,064.393 1,656,840.400 962,759.011 1,515,145.782JPM Europe Strategic Dividend D (acc) - EUR 151,795.079 141,771.426 69,464.766 224,101.739JPM Europe Strategic Dividend D (div) - EUR - 10.000 - 10.000JPM Europe Strategic Dividend I (acc) - EUR - 356,757.983 7,782.060 348,975.923JPM Europe Strategic Dividend X (acc) - EUR 2,080.137 57,362.936 709.784 58,733.289
JPMorgan Investment Funds - Global Balanced Fund (EUR)JPM Global Balanced (EUR) A (acc) - EUR 78,526.170 20,084.215 27,121.755 71,488.630JPM Global Balanced (EUR) A (dist) - EUR 182.187 12,670.852 1,890.819 10,962.220JPM Global Balanced (EUR) B (acc) - EUR 4,565.819 1,936.377 613.295 5,888.901JPM Global Balanced (EUR) C (acc) - EUR 3,324.426 2,699.869 2,435.817 3,588.478JPM Global Balanced (EUR) D (acc) - EUR 318,065.313 138,234.931 110,010.475 346,289.769JPM Global Balanced (EUR) T (acc) - EUR - 1,290.315 24.690 1,265.625
JPMorgan Investment Funds - Global Balanced Fund (USD)JF Global Balanced (USD) A (acc) - USD 52,414.454 8,172.338 2,980.329 57,606.463JPM Global Balanced (USD) A (acc) - USD 831,734.550 440,989.474 321,531.665 951,192.359JPM Global Balanced (USD) A (dist) - USD 374.027 10,487.555 917.415 9,944.167JPM Global Balanced (USD) B (acc) - USD 72,992.370 23,717.197 16,640.041 80,069.526JPM Global Balanced (USD) C (acc) - USD 154,934.306 65,461.230 174,610.506 45,785.030JPM Global Balanced (USD) D (acc) - USD 203,401.764 90,736.961 53,711.627 240,427.098JPM Global Balanced (USD) X (acc) - USD 346,595.312 46.000 313,512.460 33,128.852
JPMorgan Investment Funds - Global Bond Fund (EUR)JPM Global Bond (EUR) A (acc) - EUR 310,327.336 83,784.795 109,321.052 284,791.079JPM Global Bond (EUR) A (inc) - EUR 25,284.913 1,418.000 7,938.000 18,764.913JPM Global Bond (EUR) B (acc) - EUR 12,426.620 16,718.042 20,159.437 8,985.225JPM Global Bond (EUR) C (acc) - EUR 117,322.416 33,958.623 16,749.883 134,531.156JPM Global Bond (EUR) D (acc) - EUR 54,125.247 30,018.621 43,201.712 40,942.156JPM Global Bond (EUR) X (acc) - EUR 1,100.308 - 458.663 641.645
195
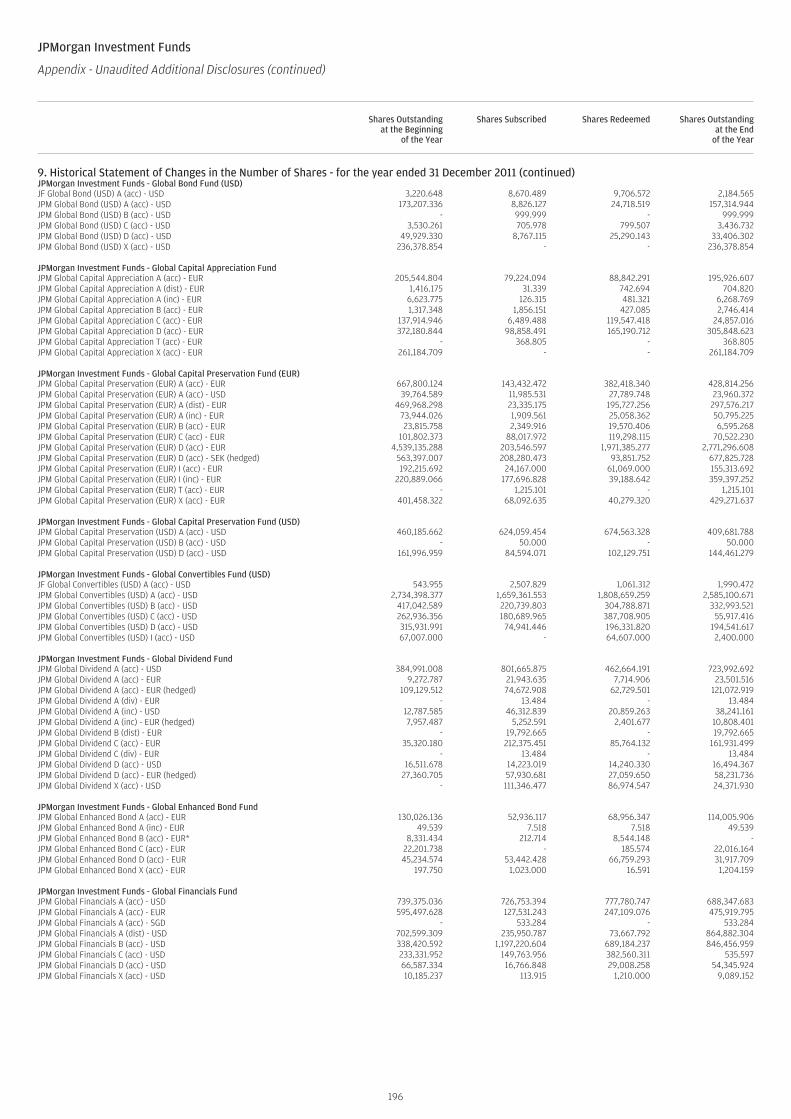
JPMorgan Investment Funds
Appendix - Unaudited Additional Disclosures (continued)
Shares Outstandingat the Beginning
of the Year
Shares Subscribed Shares Redeemed Shares Outstandingat the End
of the Year
9. Historical Statement of Changes in the Number of Shares - for the year ended 31 December 2011 (continued)JPMorgan Investment Funds - Global Bond Fund (USD)JF Global Bond (USD) A (acc) - USD 3,220.648 8,670.489 9,706.572 2,184.565JPM Global Bond (USD) A (acc) - USD 173,207.336 8,826.127 24,718.519 157,314.944JPM Global Bond (USD) B (acc) - USD - 999.999 - 999.999JPM Global Bond (USD) C (acc) - USD 3,530.261 705.978 799.507 3,436.732JPM Global Bond (USD) D (acc) - USD 49,929.330 8,767.115 25,290.143 33,406.302JPM Global Bond (USD) X (acc) - USD 236,378.854 - - 236,378.854
JPMorgan Investment Funds - Global Capital Appreciation FundJPM Global Capital Appreciation A (acc) - EUR 205,544.804 79,224.094 88,842.291 195,926.607JPM Global Capital Appreciation A (dist) - EUR 1,416.175 31.339 742.694 704.820JPM Global Capital Appreciation A (inc) - EUR 6,623.775 126.315 481.321 6,268.769JPM Global Capital Appreciation B (acc) - EUR 1,317.348 1,856.151 427.085 2,746.414JPM Global Capital Appreciation C (acc) - EUR 137,914.946 6,489.488 119,547.418 24,857.016JPM Global Capital Appreciation D (acc) - EUR 372,180.844 98,858.491 165,190.712 305,848.623JPM Global Capital Appreciation T (acc) - EUR - 368.805 - 368.805JPM Global Capital Appreciation X (acc) - EUR 261,184.709 - - 261,184.709
JPMorgan Investment Funds - Global Capital Preservation Fund (EUR)JPM Global Capital Preservation (EUR) A (acc) - EUR 667,800.124 143,432.472 382,418.340 428,814.256JPM Global Capital Preservation (EUR) A (acc) - USD 39,764.589 11,985.531 27,789.748 23,960.372JPM Global Capital Preservation (EUR) A (dist) - EUR 469,968.298 23,335.175 195,727.256 297,576.217JPM Global Capital Preservation (EUR) A (inc) - EUR 73,944.026 1,909.561 25,058.362 50,795.225JPM Global Capital Preservation (EUR) B (acc) - EUR 23,815.758 2,349.916 19,570.406 6,595.268JPM Global Capital Preservation (EUR) C (acc) - EUR 101,802.373 88,017.972 119,298.115 70,522.230JPM Global Capital Preservation (EUR) D (acc) - EUR 4,539,135.288 203,546.597 1,971,385.277 2,771,296.608JPM Global Capital Preservation (EUR) D (acc) - SEK (hedged) 563,397.007 208,280.473 93,851.752 677,825.728JPM Global Capital Preservation (EUR) I (acc) - EUR 192,215.692 24,167.000 61,069.000 155,313.692JPM Global Capital Preservation (EUR) I (inc) - EUR 220,889.066 177,696.828 39,188.642 359,397.252JPM Global Capital Preservation (EUR) T (acc) - EUR - 1,215.101 - 1,215.101JPM Global Capital Preservation (EUR) X (acc) - EUR 401,458.322 68,092.635 40,279.320 429,271.637
JPMorgan Investment Funds - Global Capital Preservation Fund (USD)JPM Global Capital Preservation (USD) A (acc) - USD 460,185.662 624,059.454 674,563.328 409,681.788JPM Global Capital Preservation (USD) B (acc) - USD - 50.000 - 50.000JPM Global Capital Preservation (USD) D (acc) - USD 161,996.959 84,594.071 102,129.751 144,461.279
JPMorgan Investment Funds - Global Convertibles Fund (USD)JF Global Convertibles (USD) A (acc) - USD 543.955 2,507.829 1,061.312 1,990.472JPM Global Convertibles (USD) A (acc) - USD 2,734,398.377 1,659,361.553 1,808,659.259 2,585,100.671JPM Global Convertibles (USD) B (acc) - USD 417,042.589 220,739.803 304,788.871 332,993.521JPM Global Convertibles (USD) C (acc) - USD 262,936.356 180,689.965 387,708.905 55,917.416JPM Global Convertibles (USD) D (acc) - USD 315,931.991 74,941.446 196,331.820 194,541.617JPM Global Convertibles (USD) I (acc) - USD 67,007.000 - 64,607.000 2,400.000
JPMorgan Investment Funds - Global Dividend FundJPM Global Dividend A (acc) - USD 384,991.008 801,665.875 462,664.191 723,992.692JPM Global Dividend A (acc) - EUR 9,272.787 21,943.635 7,714.906 23,501.516JPM Global Dividend A (acc) - EUR (hedged) 109,129.512 74,672.908 62,729.501 121,072.919JPM Global Dividend A (div) - EUR - 13.484 - 13.484JPM Global Dividend A (inc) - USD 12,787.585 46,312.839 20,859.263 38,241.161JPM Global Dividend A (inc) - EUR (hedged) 7,957.487 5,252.591 2,401.677 10,808.401JPM Global Dividend B (dist) - EUR - 19,792.665 - 19,792.665JPM Global Dividend C (acc) - EUR 35,320.180 212,375.451 85,764.132 161,931.499JPM Global Dividend C (div) - EUR - 13.484 - 13.484JPM Global Dividend D (acc) - USD 16,511.678 14,223.019 14,240.330 16,494.367JPM Global Dividend D (acc) - EUR (hedged) 27,360.705 57,930.681 27,059.650 58,231.736JPM Global Dividend X (acc) - USD - 111,346.477 86,974.547 24,371.930
JPMorgan Investment Funds - Global Enhanced Bond FundJPM Global Enhanced Bond A (acc) - EUR 130,026.136 52,936.117 68,956.347 114,005.906JPM Global Enhanced Bond A (inc) - EUR 49.539 7.518 7.518 49.539JPM Global Enhanced Bond B (acc) - EUR* 8,331.434 212.714 8,544.148 -JPM Global Enhanced Bond C (acc) - EUR 22,201.738 - 185.574 22,016.164JPM Global Enhanced Bond D (acc) - EUR 45,234.574 53,442.428 66,759.293 31,917.709JPM Global Enhanced Bond X (acc) - EUR 197.750 1,023.000 16.591 1,204.159
JPMorgan Investment Funds - Global Financials FundJPM Global Financials A (acc) - USD 739,375.036 726,753.394 777,780.747 688,347.683JPM Global Financials A (acc) - EUR 595,497.628 127,531.243 247,109.076 475,919.795JPM Global Financials A (acc) - SGD - 533.284 - 533.284JPM Global Financials A (dist) - USD 702,599.309 235,950.787 73,667.792 864,882.304JPM Global Financials B (acc) - USD 338,420.592 1,197,220.604 689,184.237 846,456.959JPM Global Financials C (acc) - USD 233,331.952 149,763.956 382,560.311 535.597JPM Global Financials D (acc) - USD 66,587.334 16,766.848 29,008.258 54,345.924JPM Global Financials X (acc) - USD 10,185.237 113.915 1,210.000 9,089.152
196
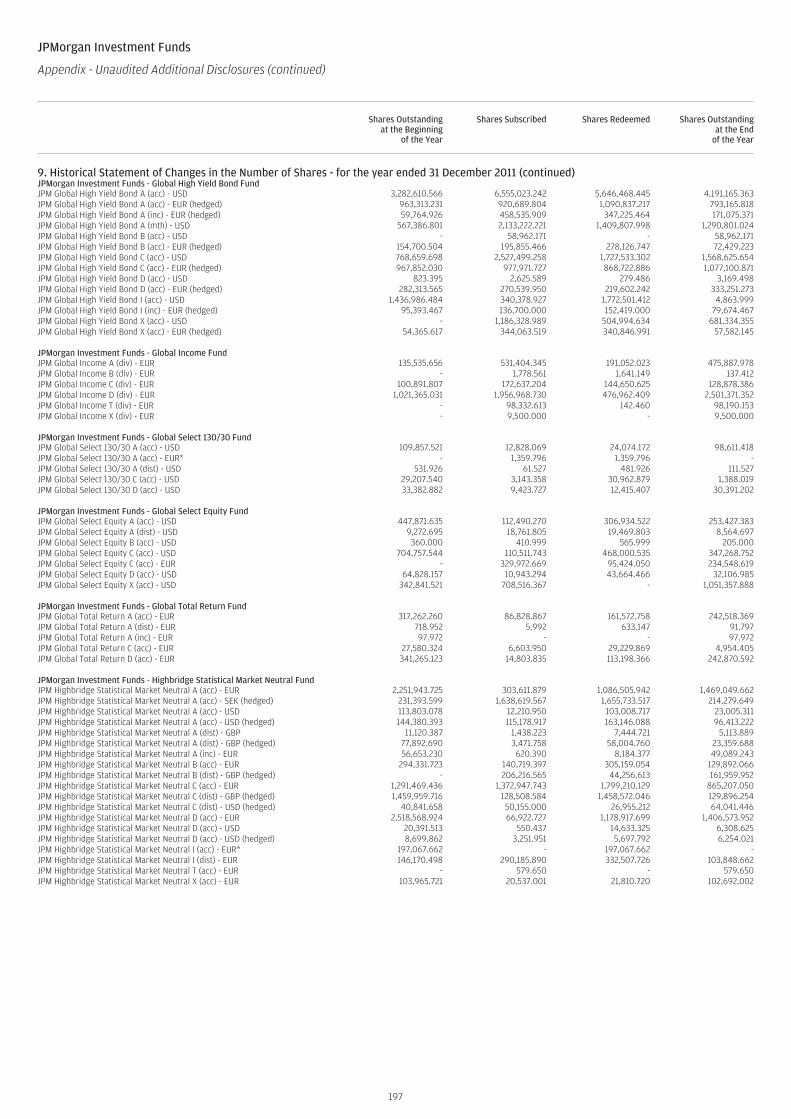
JPMorgan Investment Funds
Appendix - Unaudited Additional Disclosures (continued)
Shares Outstandingat the Beginning
of the Year
Shares Subscribed Shares Redeemed Shares Outstandingat the End
of the Year
9. Historical Statement of Changes in the Number of Shares - for the year ended 31 December 2011 (continued)JPMorgan Investment Funds - Global High Yield Bond FundJPM Global High Yield Bond A (acc) - USD 3,282,610.566 6,555,023.242 5,646,468.445 4,191,165.363JPM Global High Yield Bond A (acc) - EUR (hedged) 963,313.231 920,689.804 1,090,837.217 793,165.818JPM Global High Yield Bond A (inc) - EUR (hedged) 59,764.926 458,535.909 347,225.464 171,075.371JPM Global High Yield Bond A (mth) - USD 567,386.801 2,133,222.221 1,409,807.998 1,290,801.024JPM Global High Yield Bond B (acc) - USD - 58,962.171 - 58,962.171JPM Global High Yield Bond B (acc) - EUR (hedged) 154,700.504 195,855.466 278,126.747 72,429.223JPM Global High Yield Bond C (acc) - USD 768,659.698 2,527,499.258 1,727,533.302 1,568,625.654JPM Global High Yield Bond C (acc) - EUR (hedged) 967,852.030 977,971.727 868,722.886 1,077,100.871JPM Global High Yield Bond D (acc) - USD 823.395 2,625.589 279.486 3,169.498JPM Global High Yield Bond D (acc) - EUR (hedged) 282,313.565 270,539.950 219,602.242 333,251.273JPM Global High Yield Bond I (acc) - USD 1,436,986.484 340,378.927 1,772,501.412 4,863.999JPM Global High Yield Bond I (inc) - EUR (hedged) 95,393.467 136,700.000 152,419.000 79,674.467JPM Global High Yield Bond X (acc) - USD - 1,186,328.989 504,994.634 681,334.355JPM Global High Yield Bond X (acc) - EUR (hedged) 54,365.617 344,063.519 340,846.991 57,582.145
JPMorgan Investment Funds - Global Income FundJPM Global Income A (div) - EUR 135,535.656 531,404.345 191,052.023 475,887.978JPM Global Income B (div) - EUR - 1,778.561 1,641.149 137.412JPM Global Income C (div) - EUR 100,891.807 172,637.204 144,650.625 128,878.386JPM Global Income D (div) - EUR 1,021,365.031 1,956,968.730 476,962.409 2,501,371.352JPM Global Income T (div) - EUR - 98,332.613 142.460 98,190.153JPM Global Income X (div) - EUR - 9,500.000 - 9,500.000
JPMorgan Investment Funds - Global Select 130/30 FundJPM Global Select 130/30 A (acc) - USD 109,857.521 12,828.069 24,074.172 98,611.418JPM Global Select 130/30 A (acc) - EUR* - 1,359.796 1,359.796 -JPM Global Select 130/30 A (dist) - USD 531.926 61.527 481.926 111.527JPM Global Select 130/30 C (acc) - USD 29,207.540 3,143.358 30,962.879 1,388.019JPM Global Select 130/30 D (acc) - USD 33,382.882 9,423.727 12,415.407 30,391.202
JPMorgan Investment Funds - Global Select Equity FundJPM Global Select Equity A (acc) - USD 447,871.635 112,490.270 306,934.522 253,427.383JPM Global Select Equity A (dist) - USD 9,272.695 18,761.805 19,469.803 8,564.697JPM Global Select Equity B (acc) - USD 360.000 410.999 565.999 205.000JPM Global Select Equity C (acc) - USD 704,757.544 110,511.743 468,000.535 347,268.752JPM Global Select Equity C (acc) - EUR - 329,972.669 95,424.050 234,548.619JPM Global Select Equity D (acc) - USD 64,828.157 10,943.294 43,664.466 32,106.985JPM Global Select Equity X (acc) - USD 342,841.521 708,516.367 - 1,051,357.888
JPMorgan Investment Funds - Global Total Return FundJPM Global Total Return A (acc) - EUR 317,262.260 86,828.867 161,572.758 242,518.369JPM Global Total Return A (dist) - EUR 718.952 5.992 633.147 91.797JPM Global Total Return A (inc) - EUR 97.972 - - 97.972JPM Global Total Return C (acc) - EUR 27,580.324 6,603.950 29,229.869 4,954.405JPM Global Total Return D (acc) - EUR 341,265.123 14,803.835 113,198.366 242,870.592
JPMorgan Investment Funds - Highbridge Statistical Market Neutral FundJPM Highbridge Statistical Market Neutral A (acc) - EUR 2,251,943.725 303,611.879 1,086,505.942 1,469,049.662JPM Highbridge Statistical Market Neutral A (acc) - SEK (hedged) 231,393.599 1,638,619.567 1,655,733.517 214,279.649JPM Highbridge Statistical Market Neutral A (acc) - USD 113,803.078 12,210.950 103,008.717 23,005.311JPM Highbridge Statistical Market Neutral A (acc) - USD (hedged) 144,380.393 115,178.917 163,146.088 96,413.222JPM Highbridge Statistical Market Neutral A (dist) - GBP 11,120.387 1,438.223 7,444.721 5,113.889JPM Highbridge Statistical Market Neutral A (dist) - GBP (hedged) 77,892.690 3,471.758 58,004.760 23,359.688JPM Highbridge Statistical Market Neutral A (inc) - EUR 56,653.230 620.390 8,184.377 49,089.243JPM Highbridge Statistical Market Neutral B (acc) - EUR 294,331.723 140,719.397 305,159.054 129,892.066JPM Highbridge Statistical Market Neutral B (dist) - GBP (hedged) - 206,216.565 44,256.613 161,959.952JPM Highbridge Statistical Market Neutral C (acc) - EUR 1,291,469.436 1,372,947.743 1,799,210.129 865,207.050JPM Highbridge Statistical Market Neutral C (dist) - GBP (hedged) 1,459,959.716 128,508.584 1,458,572.046 129,896.254JPM Highbridge Statistical Market Neutral C (dist) - USD (hedged) 40,841.658 50,155.000 26,955.212 64,041.446JPM Highbridge Statistical Market Neutral D (acc) - EUR 2,518,568.924 66,922.727 1,178,917.699 1,406,573.952JPM Highbridge Statistical Market Neutral D (acc) - USD 20,391.513 550.437 14,633.325 6,308.625JPM Highbridge Statistical Market Neutral D (acc) - USD (hedged) 8,699.862 3,251.951 5,697.792 6,254.021JPM Highbridge Statistical Market Neutral I (acc) - EUR* 197,067.662 - 197,067.662 -JPM Highbridge Statistical Market Neutral I (dist) - EUR 146,170.498 290,185.890 332,507.726 103,848.662JPM Highbridge Statistical Market Neutral T (acc) - EUR - 579.650 - 579.650JPM Highbridge Statistical Market Neutral X (acc) - EUR 103,965.721 20,537.001 21,810.720 102,692.002
197
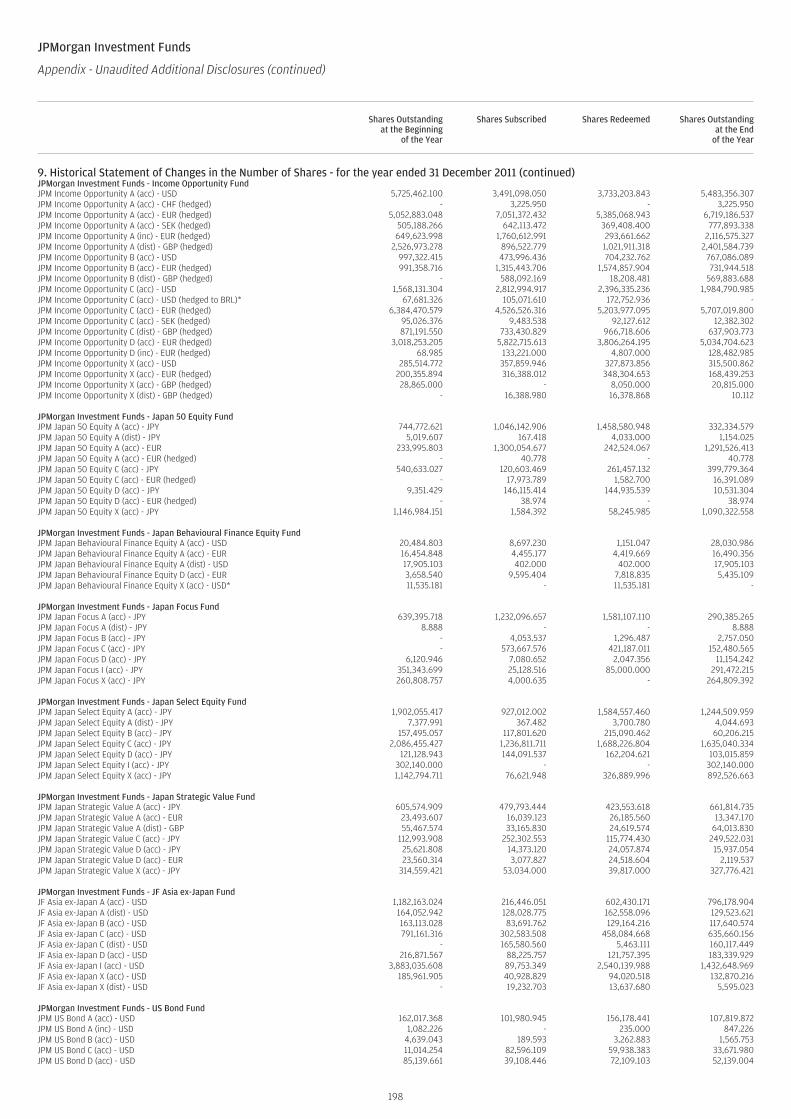
JPMorgan Investment Funds
Appendix - Unaudited Additional Disclosures (continued)
Shares Outstandingat the Beginning
of the Year
Shares Subscribed Shares Redeemed Shares Outstandingat the End
of the Year
9. Historical Statement of Changes in the Number of Shares - for the year ended 31 December 2011 (continued)JPMorgan Investment Funds - Income Opportunity FundJPM Income Opportunity A (acc) - USD 5,725,462.100 3,491,098.050 3,733,203.843 5,483,356.307JPM Income Opportunity A (acc) - CHF (hedged) - 3,225.950 - 3,225.950JPM Income Opportunity A (acc) - EUR (hedged) 5,052,883.048 7,051,372.432 5,385,068.943 6,719,186.537JPM Income Opportunity A (acc) - SEK (hedged) 505,188.266 642,113.472 369,408.400 777,893.338JPM Income Opportunity A (inc) - EUR (hedged) 649,623.998 1,760,612.991 293,661.662 2,116,575.327JPM Income Opportunity A (dist) - GBP (hedged) 2,526,973.278 896,522.779 1,021,911.318 2,401,584.739JPM Income Opportunity B (acc) - USD 997,322.415 473,996.436 704,232.762 767,086.089JPM Income Opportunity B (acc) - EUR (hedged) 991,358.716 1,315,443.706 1,574,857.904 731,944.518JPM Income Opportunity B (dist) - GBP (hedged) - 588,092.169 18,208.481 569,883.688JPM Income Opportunity C (acc) - USD 1,568,131.304 2,812,994.917 2,396,335.236 1,984,790.985JPM Income Opportunity C (acc) - USD (hedged to BRL)* 67,681.326 105,071.610 172,752.936 -JPM Income Opportunity C (acc) - EUR (hedged) 6,384,470.579 4,526,526.316 5,203,977.095 5,707,019.800JPM Income Opportunity C (acc) - SEK (hedged) 95,026.376 9,483.538 92,127.612 12,382.302JPM Income Opportunity C (dist) - GBP (hedged) 871,191.550 733,430.829 966,718.606 637,903.773JPM Income Opportunity D (acc) - EUR (hedged) 3,018,253.205 5,822,715.613 3,806,264.195 5,034,704.623JPM Income Opportunity D (inc) - EUR (hedged) 68.985 133,221.000 4,807.000 128,482.985JPM Income Opportunity X (acc) - USD 285,514.772 357,859.946 327,873.856 315,500.862JPM Income Opportunity X (acc) - EUR (hedged) 200,355.894 316,388.012 348,304.653 168,439.253JPM Income Opportunity X (acc) - GBP (hedged) 28,865.000 - 8,050.000 20,815.000JPM Income Opportunity X (dist) - GBP (hedged) - 16,388.980 16,378.868 10.112
JPMorgan Investment Funds - Japan 50 Equity FundJPM Japan 50 Equity A (acc) - JPY 744,772.621 1,046,142.906 1,458,580.948 332,334.579JPM Japan 50 Equity A (dist) - JPY 5,019.607 167.418 4,033.000 1,154.025JPM Japan 50 Equity A (acc) - EUR 233,995.803 1,300,054.677 242,524.067 1,291,526.413JPM Japan 50 Equity A (acc) - EUR (hedged) - 40.778 - 40.778JPM Japan 50 Equity C (acc) - JPY 540,633.027 120,603.469 261,457.132 399,779.364JPM Japan 50 Equity C (acc) - EUR (hedged) - 17,973.789 1,582.700 16,391.089JPM Japan 50 Equity D (acc) - JPY 9,351.429 146,115.414 144,935.539 10,531.304JPM Japan 50 Equity D (acc) - EUR (hedged) - 38.974 - 38.974JPM Japan 50 Equity X (acc) - JPY 1,146,984.151 1,584.392 58,245.985 1,090,322.558
JPMorgan Investment Funds - Japan Behavioural Finance Equity FundJPM Japan Behavioural Finance Equity A (acc) - USD 20,484.803 8,697.230 1,151.047 28,030.986JPM Japan Behavioural Finance Equity A (acc) - EUR 16,454.848 4,455.177 4,419.669 16,490.356JPM Japan Behavioural Finance Equity A (dist) - USD 17,905.103 402.000 402.000 17,905.103JPM Japan Behavioural Finance Equity D (acc) - EUR 3,658.540 9,595.404 7,818.835 5,435.109JPM Japan Behavioural Finance Equity X (acc) - USD* 11,535.181 - 11,535.181 -
JPMorgan Investment Funds - Japan Focus FundJPM Japan Focus A (acc) - JPY 639,395.718 1,232,096.657 1,581,107.110 290,385.265JPM Japan Focus A (dist) - JPY 8.888 - - 8.888JPM Japan Focus B (acc) - JPY - 4,053.537 1,296.487 2,757.050JPM Japan Focus C (acc) - JPY - 573,667.576 421,187.011 152,480.565JPM Japan Focus D (acc) - JPY 6,120.946 7,080.652 2,047.356 11,154.242JPM Japan Focus I (acc) - JPY 351,343.699 25,128.516 85,000.000 291,472.215JPM Japan Focus X (acc) - JPY 260,808.757 4,000.635 - 264,809.392
JPMorgan Investment Funds - Japan Select Equity FundJPM Japan Select Equity A (acc) - JPY 1,902,055.417 927,012.002 1,584,557.460 1,244,509.959JPM Japan Select Equity A (dist) - JPY 7,377.991 367.482 3,700.780 4,044.693JPM Japan Select Equity B (acc) - JPY 157,495.057 117,801.620 215,090.462 60,206.215JPM Japan Select Equity C (acc) - JPY 2,086,455.427 1,236,811.711 1,688,226.804 1,635,040.334JPM Japan Select Equity D (acc) - JPY 121,128.943 144,091.537 162,204.621 103,015.859JPM Japan Select Equity I (acc) - JPY 302,140.000 - - 302,140.000JPM Japan Select Equity X (acc) - JPY 1,142,794.711 76,621.948 326,889.996 892,526.663
JPMorgan Investment Funds - Japan Strategic Value FundJPM Japan Strategic Value A (acc) - JPY 605,574.909 479,793.444 423,553.618 661,814.735JPM Japan Strategic Value A (acc) - EUR 23,493.607 16,039.123 26,185.560 13,347.170JPM Japan Strategic Value A (dist) - GBP 55,467.574 33,165.830 24,619.574 64,013.830JPM Japan Strategic Value C (acc) - JPY 112,993.908 252,302.553 115,774.430 249,522.031JPM Japan Strategic Value D (acc) - JPY 25,621.808 14,373.120 24,057.874 15,937.054JPM Japan Strategic Value D (acc) - EUR 23,560.314 3,077.827 24,518.604 2,119.537JPM Japan Strategic Value X (acc) - JPY 314,559.421 53,034.000 39,817.000 327,776.421
JPMorgan Investment Funds - JF Asia ex-Japan FundJF Asia ex-Japan A (acc) - USD 1,182,163.024 216,446.051 602,430.171 796,178.904JF Asia ex-Japan A (dist) - USD 164,052.942 128,028.775 162,558.096 129,523.621JF Asia ex-Japan B (acc) - USD 163,113.028 83,691.762 129,164.216 117,640.574JF Asia ex-Japan C (acc) - USD 791,161.316 302,583.508 458,084.668 635,660.156JF Asia ex-Japan C (dist) - USD - 165,580.560 5,463.111 160,117.449JF Asia ex-Japan D (acc) - USD 216,871.567 88,225.757 121,757.395 183,339.929JF Asia ex-Japan I (acc) - USD 3,883,035.608 89,753.349 2,540,139.988 1,432,648.969JF Asia ex-Japan X (acc) - USD 185,961.905 40,928.829 94,020.518 132,870.216JF Asia ex-Japan X (dist) - USD - 19,232.703 13,637.680 5,595.023
JPMorgan Investment Funds - US Bond FundJPM US Bond A (acc) - USD 162,017.368 101,980.945 156,178.441 107,819.872JPM US Bond A (inc) - USD 1,082.226 - 235.000 847.226JPM US Bond B (acc) - USD 4,639.043 189.593 3,262.883 1,565.753JPM US Bond C (acc) - USD 11,014.254 82,596.109 59,938.383 33,671.980JPM US Bond D (acc) - USD 85,139.661 39,108.446 72,109.103 52,139.004
198
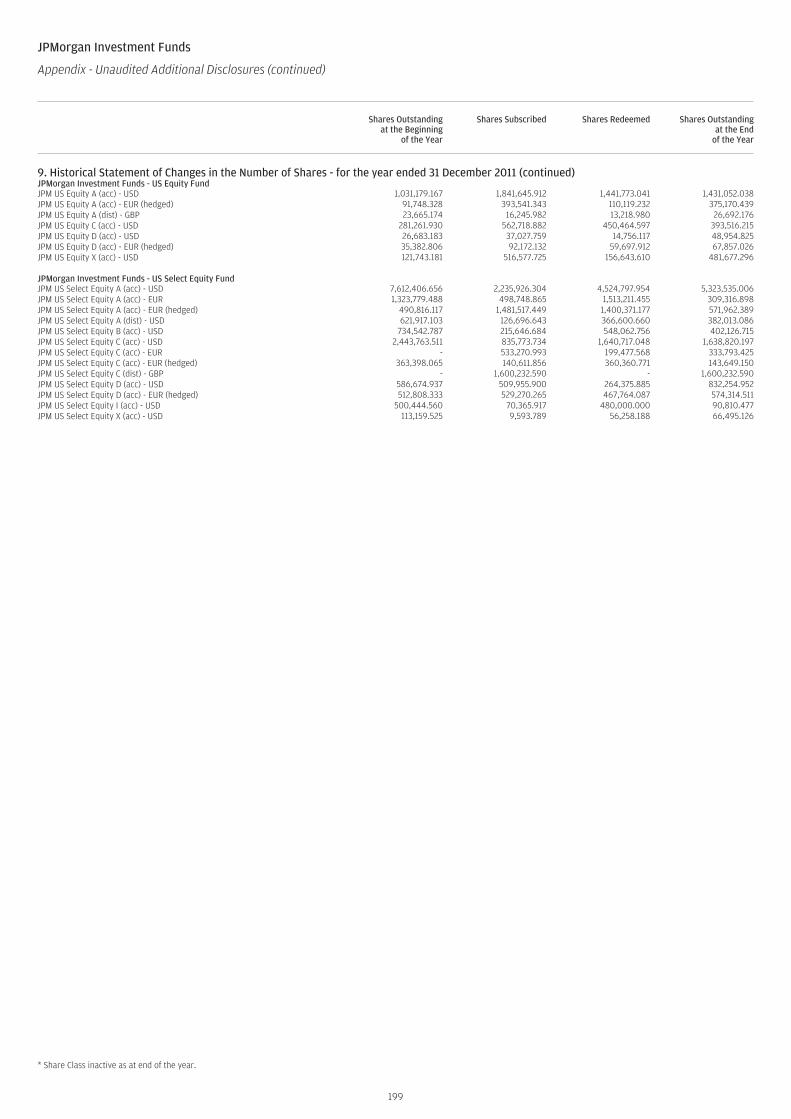
JPMorgan Investment Funds
Appendix - Unaudited Additional Disclosures (continued)
Shares Outstandingat the Beginning
of the Year
Shares Subscribed Shares Redeemed Shares Outstandingat the End
of the Year
9. Historical Statement of Changes in the Number of Shares - for the year ended 31 December 2011 (continued)JPMorgan Investment Funds - US Equity FundJPM US Equity A (acc) - USD 1,031,179.167 1,841,645.912 1,441,773.041 1,431,052.038JPM US Equity A (acc) - EUR (hedged) 91,748.328 393,541.343 110,119.232 375,170.439JPM US Equity A (dist) - GBP 23,665.174 16,245.982 13,218.980 26,692.176JPM US Equity C (acc) - USD 281,261.930 562,718.882 450,464.597 393,516.215JPM US Equity D (acc) - USD 26,683.183 37,027.759 14,756.117 48,954.825JPM US Equity D (acc) - EUR (hedged) 35,382.806 92,172.132 59,697.912 67,857.026JPM US Equity X (acc) - USD 121,743.181 516,577.725 156,643.610 481,677.296
JPMorgan Investment Funds - US Select Equity FundJPM US Select Equity A (acc) - USD 7,612,406.656 2,235,926.304 4,524,797.954 5,323,535.006JPM US Select Equity A (acc) - EUR 1,323,779.488 498,748.865 1,513,211.455 309,316.898JPM US Select Equity A (acc) - EUR (hedged) 490,816.117 1,481,517.449 1,400,371.177 571,962.389JPM US Select Equity A (dist) - USD 621,917.103 126,696.643 366,600.660 382,013.086JPM US Select Equity B (acc) - USD 734,542.787 215,646.684 548,062.756 402,126.715JPM US Select Equity C (acc) - USD 2,443,763.511 835,773.734 1,640,717.048 1,638,820.197JPM US Select Equity C (acc) - EUR - 533,270.993 199,477.568 333,793.425JPM US Select Equity C (acc) - EUR (hedged) 363,398.065 140,611.856 360,360.771 143,649.150JPM US Select Equity C (dist) - GBP - 1,600,232.590 - 1,600,232.590JPM US Select Equity D (acc) - USD 586,674.937 509,955.900 264,375.885 832,254.952JPM US Select Equity D (acc) - EUR (hedged) 512,808.333 529,270.265 467,764.087 574,314.511JPM US Select Equity I (acc) - USD 500,444.560 70,365.917 480,000.000 90,810.477JPM US Select Equity X (acc) - USD 113,159.525 9,593.789 56,258.188 66,495.126
* Share Class inactive as at end of the year.
199
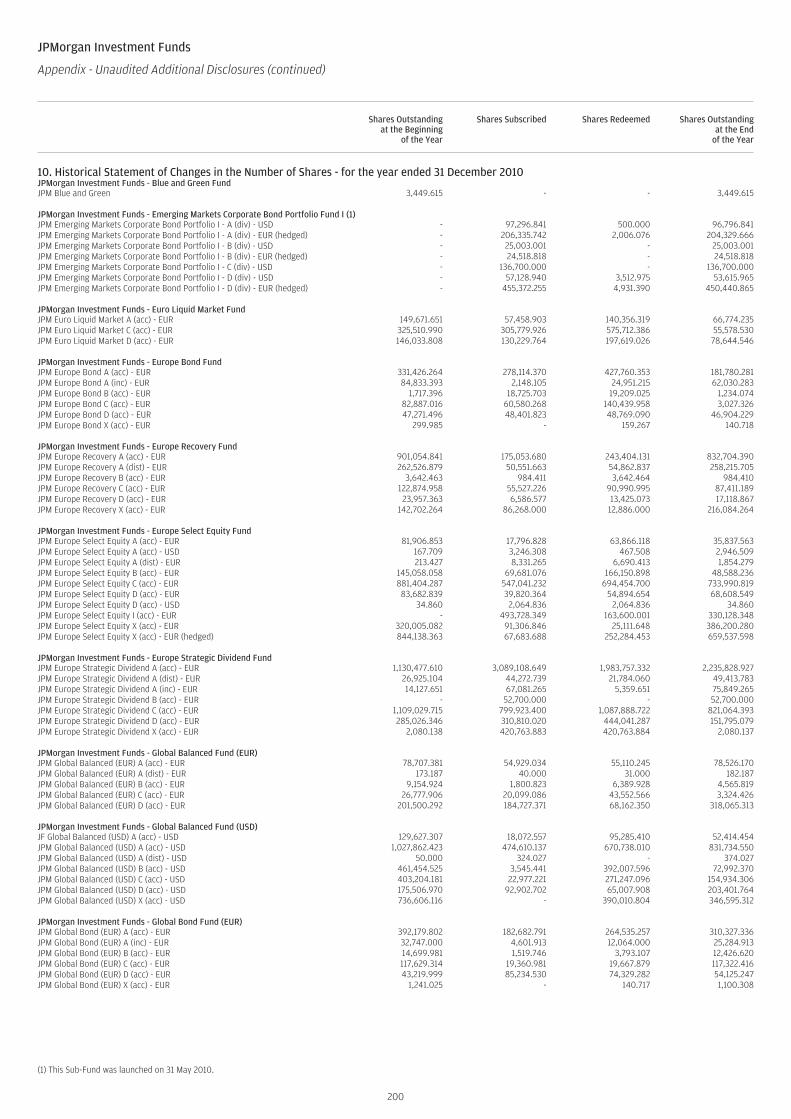
JPMorgan Investment Funds
Appendix - Unaudited Additional Disclosures (continued)
Shares Outstandingat the Beginning
of the Year
Shares Subscribed Shares Redeemed Shares Outstandingat the End
of the Year
10. Historical Statement of Changes in the Number of Shares - for the year ended 31 December 2010 (continued)JPMorgan Investment Funds - Blue and Green FundJPM Blue and Green 3,449.615 - - 3,449.615
JPMorgan Investment Funds - Emerging Markets Corporate Bond Portfolio Fund I (1)JPM Emerging Markets Corporate Bond Portfolio I - A (div) - USD - 97,296.841 500.000 96,796.841JPM Emerging Markets Corporate Bond Portfolio I - A (div) - EUR (hedged) - 206,335.742 2,006.076 204,329.666JPM Emerging Markets Corporate Bond Portfolio I - B (div) - USD - 25,003.001 - 25,003.001JPM Emerging Markets Corporate Bond Portfolio I - B (div) - EUR (hedged) - 24,518.818 - 24,518.818JPM Emerging Markets Corporate Bond Portfolio I - C (div) - USD - 136,700.000 - 136,700.000JPM Emerging Markets Corporate Bond Portfolio I - D (div) - USD - 57,128.940 3,512.975 53,615.965JPM Emerging Markets Corporate Bond Portfolio I - D (div) - EUR (hedged) - 455,372.255 4,931.390 450,440.865
JPMorgan Investment Funds - Euro Liquid Market FundJPM Euro Liquid Market A (acc) - EUR 149,671.651 57,458.903 140,356.319 66,774.235JPM Euro Liquid Market C (acc) - EUR 325,510.990 305,779.926 575,712.386 55,578.530JPM Euro Liquid Market D (acc) - EUR 146,033.808 130,229.764 197,619.026 78,644.546
JPMorgan Investment Funds - Europe Bond FundJPM Europe Bond A (acc) - EUR 331,426.264 278,114.370 427,760.353 181,780.281JPM Europe Bond A (inc) - EUR 84,833.393 2,148.105 24,951.215 62,030.283JPM Europe Bond B (acc) - EUR 1,717.396 18,725.703 19,209.025 1,234.074JPM Europe Bond C (acc) - EUR 82,887.016 60,580.268 140,439.958 3,027.326JPM Europe Bond D (acc) - EUR 47,271.496 48,401.823 48,769.090 46,904.229JPM Europe Bond X (acc) - EUR 299.985 - 159.267 140.718
JPMorgan Investment Funds - Europe Recovery FundJPM Europe Recovery A (acc) - EUR 901,054.841 175,053.680 243,404.131 832,704.390JPM Europe Recovery A (dist) - EUR 262,526.879 50,551.663 54,862.837 258,215.705JPM Europe Recovery B (acc) - EUR 3,642.463 984.411 3,642.464 984.410JPM Europe Recovery C (acc) - EUR 122,874.958 55,527.226 90,990.995 87,411.189JPM Europe Recovery D (acc) - EUR 23,957.363 6,586.577 13,425.073 17,118.867JPM Europe Recovery X (acc) - EUR 142,702.264 86,268.000 12,886.000 216,084.264
JPMorgan Investment Funds - Europe Select Equity FundJPM Europe Select Equity A (acc) - EUR 81,906.853 17,796.828 63,866.118 35,837.563JPM Europe Select Equity A (acc) - USD 167.709 3,246.308 467.508 2,946.509JPM Europe Select Equity A (dist) - EUR 213.427 8,331.265 6,690.413 1,854.279JPM Europe Select Equity B (acc) - EUR 145,058.058 69,681.076 166,150.898 48,588.236JPM Europe Select Equity C (acc) - EUR 881,404.287 547,041.232 694,454.700 733,990.819JPM Europe Select Equity D (acc) - EUR 83,682.839 39,820.364 54,894.654 68,608.549JPM Europe Select Equity D (acc) - USD 34.860 2,064.836 2,064.836 34.860JPM Europe Select Equity I (acc) - EUR - 493,728.349 163,600.001 330,128.348JPM Europe Select Equity X (acc) - EUR 320,005.082 91,306.846 25,111.648 386,200.280JPM Europe Select Equity X (acc) - EUR (hedged) 844,138.363 67,683.688 252,284.453 659,537.598
JPMorgan Investment Funds - Europe Strategic Dividend FundJPM Europe Strategic Dividend A (acc) - EUR 1,130,477.610 3,089,108.649 1,983,757.332 2,235,828.927JPM Europe Strategic Dividend A (dist) - EUR 26,925.104 44,272.739 21,784.060 49,413.783JPM Europe Strategic Dividend A (inc) - EUR 14,127.651 67,081.265 5,359.651 75,849.265JPM Europe Strategic Dividend B (acc) - EUR - 52,700.000 - 52,700.000JPM Europe Strategic Dividend C (acc) - EUR 1,109,029.715 799,923.400 1,087,888.722 821,064.393JPM Europe Strategic Dividend D (acc) - EUR 285,026.346 310,810.020 444,041.287 151,795.079JPM Europe Strategic Dividend X (acc) - EUR 2,080.138 420,763.883 420,763.884 2,080.137
JPMorgan Investment Funds - Global Balanced Fund (EUR)JPM Global Balanced (EUR) A (acc) - EUR 78,707.381 54,929.034 55,110.245 78,526.170JPM Global Balanced (EUR) A (dist) - EUR 173.187 40.000 31.000 182.187JPM Global Balanced (EUR) B (acc) - EUR 9,154.924 1,800.823 6,389.928 4,565.819JPM Global Balanced (EUR) C (acc) - EUR 26,777.906 20,099.086 43,552.566 3,324.426JPM Global Balanced (EUR) D (acc) - EUR 201,500.292 184,727.371 68,162.350 318,065.313
JPMorgan Investment Funds - Global Balanced Fund (USD)JF Global Balanced (USD) A (acc) - USD 129,627.307 18,072.557 95,285.410 52,414.454JPM Global Balanced (USD) A (acc) - USD 1,027,862.423 474,610.137 670,738.010 831,734.550JPM Global Balanced (USD) A (dist) - USD 50.000 324.027 - 374.027JPM Global Balanced (USD) B (acc) - USD 461,454.525 3,545.441 392,007.596 72,992.370JPM Global Balanced (USD) C (acc) - USD 403,204.181 22,977.221 271,247.096 154,934.306JPM Global Balanced (USD) D (acc) - USD 175,506.970 92,902.702 65,007.908 203,401.764JPM Global Balanced (USD) X (acc) - USD 736,606.116 - 390,010.804 346,595.312
JPMorgan Investment Funds - Global Bond Fund (EUR)JPM Global Bond (EUR) A (acc) - EUR 392,179.802 182,682.791 264,535.257 310,327.336JPM Global Bond (EUR) A (inc) - EUR 32,747.000 4,601.913 12,064.000 25,284.913JPM Global Bond (EUR) B (acc) - EUR 14,699.981 1,519.746 3,793.107 12,426.620JPM Global Bond (EUR) C (acc) - EUR 117,629.314 19,360.981 19,667.879 117,322.416JPM Global Bond (EUR) D (acc) - EUR 43,219.999 85,234.530 74,329.282 54,125.247JPM Global Bond (EUR) X (acc) - EUR 1,241.025 - 140.717 1,100.308
(1) This Sub-Fund was launched on 31 May 2010.
200
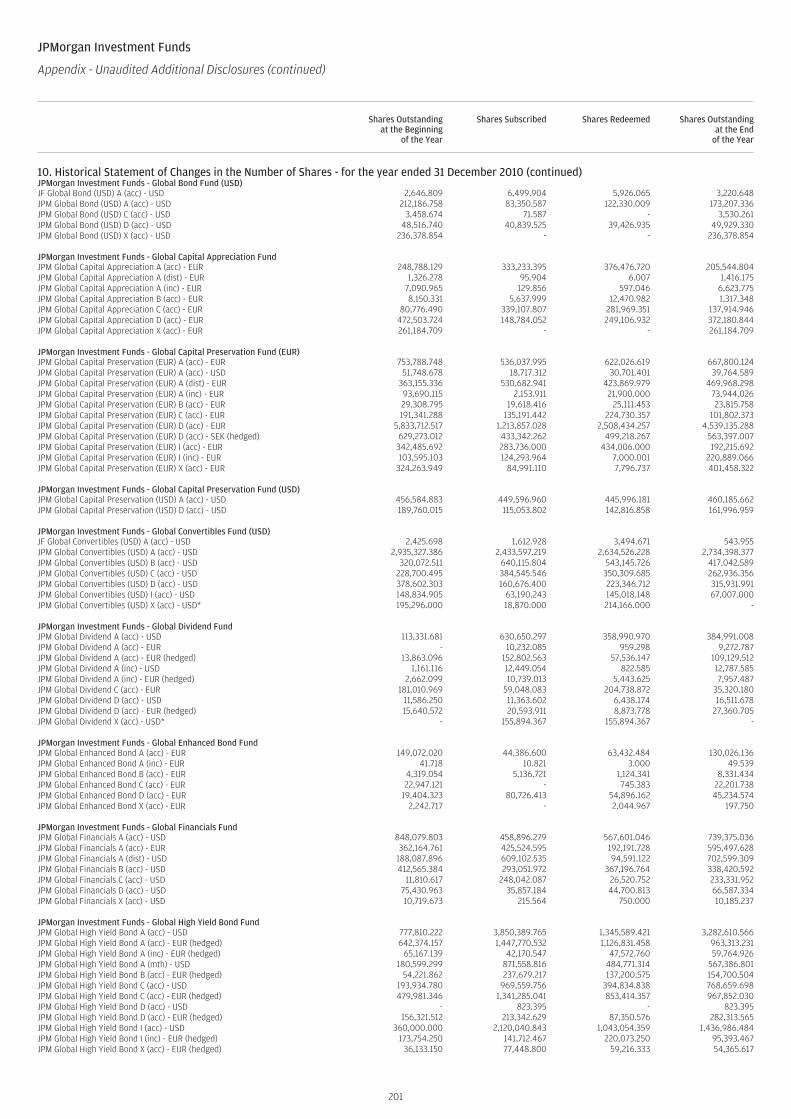
JPMorgan Investment Funds
Appendix - Unaudited Additional Disclosures (continued)
Shares Outstandingat the Beginning
of the Year
Shares Subscribed Shares Redeemed Shares Outstandingat the End
of the Year
10. Historical Statement of Changes in the Number of Shares - for the year ended 31 December 2010 (continued)JPMorgan Investment Funds - Global Bond Fund (USD)JF Global Bond (USD) A (acc) - USD 2,646.809 6,499.904 5,926.065 3,220.648JPM Global Bond (USD) A (acc) - USD 212,186.758 83,350.587 122,330.009 173,207.336JPM Global Bond (USD) C (acc) - USD 3,458.674 71.587 - 3,530.261JPM Global Bond (USD) D (acc) - USD 48,516.740 40,839.525 39,426.935 49,929.330JPM Global Bond (USD) X (acc) - USD 236,378.854 - - 236,378.854
JPMorgan Investment Funds - Global Capital Appreciation FundJPM Global Capital Appreciation A (acc) - EUR 248,788.129 333,233.395 376,476.720 205,544.804JPM Global Capital Appreciation A (dist) - EUR 1,326.278 95.904 6.007 1,416.175JPM Global Capital Appreciation A (inc) - EUR 7,090.965 129.856 597.046 6,623.775JPM Global Capital Appreciation B (acc) - EUR 8,150.331 5,637.999 12,470.982 1,317.348JPM Global Capital Appreciation C (acc) - EUR 80,776.490 339,107.807 281,969.351 137,914.946JPM Global Capital Appreciation D (acc) - EUR 472,503.724 148,784.052 249,106.932 372,180.844JPM Global Capital Appreciation X (acc) - EUR 261,184.709 - - 261,184.709
JPMorgan Investment Funds - Global Capital Preservation Fund (EUR)JPM Global Capital Preservation (EUR) A (acc) - EUR 753,788.748 536,037.995 622,026.619 667,800.124JPM Global Capital Preservation (EUR) A (acc) - USD 51,748.678 18,717.312 30,701.401 39,764.589JPM Global Capital Preservation (EUR) A (dist) - EUR 363,155.336 530,682.941 423,869.979 469,968.298JPM Global Capital Preservation (EUR) A (inc) - EUR 93,690.115 2,153.911 21,900.000 73,944.026JPM Global Capital Preservation (EUR) B (acc) - EUR 29,308.795 19,618.416 25,111.453 23,815.758JPM Global Capital Preservation (EUR) C (acc) - EUR 191,341.288 135,191.442 224,730.357 101,802.373JPM Global Capital Preservation (EUR) D (acc) - EUR 5,833,712.517 1,213,857.028 2,508,434.257 4,539,135.288JPM Global Capital Preservation (EUR) D (acc) - SEK (hedged) 629,273.012 433,342.262 499,218.267 563,397.007JPM Global Capital Preservation (EUR) I (acc) - EUR 342,485.692 283,736.000 434,006.000 192,215.692JPM Global Capital Preservation (EUR) I (inc) - EUR 103,595.103 124,293.964 7,000.001 220,889.066JPM Global Capital Preservation (EUR) X (acc) - EUR 324,263.949 84,991.110 7,796.737 401,458.322
JPMorgan Investment Funds - Global Capital Preservation Fund (USD)JPM Global Capital Preservation (USD) A (acc) - USD 456,584.883 449,596.960 445,996.181 460,185.662JPM Global Capital Preservation (USD) D (acc) - USD 189,760.015 115,053.802 142,816.858 161,996.959
JPMorgan Investment Funds - Global Convertibles Fund (USD)JF Global Convertibles (USD) A (acc) - USD 2,425.698 1,612.928 3,494.671 543.955JPM Global Convertibles (USD) A (acc) - USD 2,935,327.386 2,433,597.219 2,634,526.228 2,734,398.377JPM Global Convertibles (USD) B (acc) - USD 320,072.511 640,115.804 543,145.726 417,042.589JPM Global Convertibles (USD) C (acc) - USD 228,700.495 384,545.546 350,309.685 262,936.356JPM Global Convertibles (USD) D (acc) - USD 378,602.303 160,676.400 223,346.712 315,931.991JPM Global Convertibles (USD) I (acc) - USD 148,834.905 63,190.243 145,018.148 67,007.000JPM Global Convertibles (USD) X (acc) - USD* 195,296.000 18,870.000 214,166.000 -
JPMorgan Investment Funds - Global Dividend FundJPM Global Dividend A (acc) - USD 113,331.681 630,650.297 358,990.970 384,991.008JPM Global Dividend A (acc) - EUR - 10,232.085 959.298 9,272.787JPM Global Dividend A (acc) - EUR (hedged) 13,863.096 152,802.563 57,536.147 109,129.512JPM Global Dividend A (inc) - USD 1,161.116 12,449.054 822.585 12,787.585JPM Global Dividend A (inc) - EUR (hedged) 2,662.099 10,739.013 5,443.625 7,957.487JPM Global Dividend C (acc) - EUR 181,010.969 59,048.083 204,738.872 35,320.180JPM Global Dividend D (acc) - USD 11,586.250 11,363.602 6,438.174 16,511.678JPM Global Dividend D (acc) - EUR (hedged) 15,640.572 20,593.911 8,873.778 27,360.705JPM Global Dividend X (acc) - USD* - 155,894.367 155,894.367 -
JPMorgan Investment Funds - Global Enhanced Bond FundJPM Global Enhanced Bond A (acc) - EUR 149,072.020 44,386.600 63,432.484 130,026.136JPM Global Enhanced Bond A (inc) - EUR 41.718 10.821 3.000 49.539JPM Global Enhanced Bond B (acc) - EUR 4,319.054 5,136.721 1,124.341 8,331.434JPM Global Enhanced Bond C (acc) - EUR 22,947.121 - 745.383 22,201.738JPM Global Enhanced Bond D (acc) - EUR 19,404.323 80,726.413 54,896.162 45,234.574JPM Global Enhanced Bond X (acc) - EUR 2,242.717 - 2,044.967 197.750
JPMorgan Investment Funds - Global Financials FundJPM Global Financials A (acc) - USD 848,079.803 458,896.279 567,601.046 739,375.036JPM Global Financials A (acc) - EUR 362,164.761 425,524.595 192,191.728 595,497.628JPM Global Financials A (dist) - USD 188,087.896 609,102.535 94,591.122 702,599.309JPM Global Financials B (acc) - USD 412,565.384 293,051.972 367,196.764 338,420.592JPM Global Financials C (acc) - USD 11,810.617 248,042.087 26,520.752 233,331.952JPM Global Financials D (acc) - USD 75,430.963 35,857.184 44,700.813 66,587.334JPM Global Financials X (acc) - USD 10,719.673 215.564 750.000 10,185.237
JPMorgan Investment Funds - Global High Yield Bond FundJPM Global High Yield Bond A (acc) - USD 777,810.222 3,850,389.765 1,345,589.421 3,282,610.566JPM Global High Yield Bond A (acc) - EUR (hedged) 642,374.157 1,447,770.532 1,126,831.458 963,313.231JPM Global High Yield Bond A (inc) - EUR (hedged) 65,167.139 42,170.547 47,572.760 59,764.926JPM Global High Yield Bond A (mth) - USD 180,599.299 871,558.816 484,771.314 567,386.801JPM Global High Yield Bond B (acc) - EUR (hedged) 54,221.862 237,679.217 137,200.575 154,700.504JPM Global High Yield Bond C (acc) - USD 193,934.780 969,559.756 394,834.838 768,659.698JPM Global High Yield Bond C (acc) - EUR (hedged) 479,981.346 1,341,285.041 853,414.357 967,852.030JPM Global High Yield Bond D (acc) - USD - 823.395 - 823.395JPM Global High Yield Bond D (acc) - EUR (hedged) 156,321.512 213,342.629 87,350.576 282,313.565JPM Global High Yield Bond I (acc) - USD 360,000.000 2,120,040.843 1,043,054.359 1,436,986.484JPM Global High Yield Bond I (inc) - EUR (hedged) 173,754.250 141,712.467 220,073.250 95,393.467JPM Global High Yield Bond X (acc) - EUR (hedged) 36,133.150 77,448.800 59,216.333 54,365.617
201
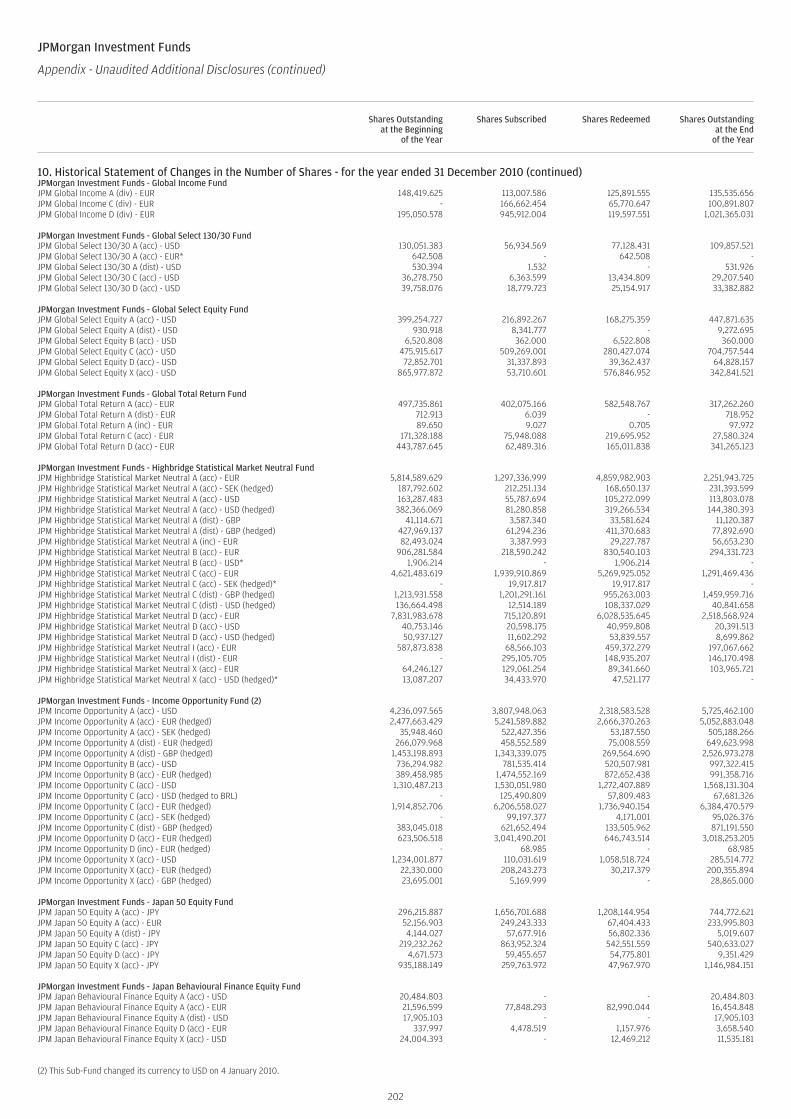
JPMorgan Investment Funds
Appendix - Unaudited Additional Disclosures (continued)
Shares Outstandingat the Beginning
of the Year
Shares Subscribed Shares Redeemed Shares Outstandingat the End
of the Year
10. Historical Statement of Changes in the Number of Shares - for the year ended 31 December 2010 (continued)JPMorgan Investment Funds - Global Income FundJPM Global Income A (div) - EUR 148,419.625 113,007.586 125,891.555 135,535.656JPM Global Income C (div) - EUR - 166,662.454 65,770.647 100,891.807JPM Global Income D (div) - EUR 195,050.578 945,912.004 119,597.551 1,021,365.031
JPMorgan Investment Funds - Global Select 130/30 FundJPM Global Select 130/30 A (acc) - USD 130,051.383 56,934.569 77,128.431 109,857.521JPM Global Select 130/30 A (acc) - EUR* 642.508 - 642.508 -JPM Global Select 130/30 A (dist) - USD 530.394 1.532 - 531.926JPM Global Select 130/30 C (acc) - USD 36,278.750 6,363.599 13,434.809 29,207.540JPM Global Select 130/30 D (acc) - USD 39,758.076 18,779.723 25,154.917 33,382.882
JPMorgan Investment Funds - Global Select Equity FundJPM Global Select Equity A (acc) - USD 399,254.727 216,892.267 168,275.359 447,871.635JPM Global Select Equity A (dist) - USD 930.918 8,341.777 - 9,272.695JPM Global Select Equity B (acc) - USD 6,520.808 362.000 6,522.808 360.000JPM Global Select Equity C (acc) - USD 475,915.617 509,269.001 280,427.074 704,757.544JPM Global Select Equity D (acc) - USD 72,852.701 31,337.893 39,362.437 64,828.157JPM Global Select Equity X (acc) - USD 865,977.872 53,710.601 576,846.952 342,841.521
JPMorgan Investment Funds - Global Total Return FundJPM Global Total Return A (acc) - EUR 497,735.861 402,075.166 582,548.767 317,262.260JPM Global Total Return A (dist) - EUR 712.913 6.039 - 718.952JPM Global Total Return A (inc) - EUR 89.650 9.027 0.705 97.972JPM Global Total Return C (acc) - EUR 171,328.188 75,948.088 219,695.952 27,580.324JPM Global Total Return D (acc) - EUR 443,787.645 62,489.316 165,011.838 341,265.123
JPMorgan Investment Funds - Highbridge Statistical Market Neutral FundJPM Highbridge Statistical Market Neutral A (acc) - EUR 5,814,589.629 1,297,336.999 4,859,982.903 2,251,943.725JPM Highbridge Statistical Market Neutral A (acc) - SEK (hedged) 187,792.602 212,251.134 168,650.137 231,393.599JPM Highbridge Statistical Market Neutral A (acc) - USD 163,287.483 55,787.694 105,272.099 113,803.078JPM Highbridge Statistical Market Neutral A (acc) - USD (hedged) 382,366.069 81,280.858 319,266.534 144,380.393JPM Highbridge Statistical Market Neutral A (dist) - GBP 41,114.671 3,587.340 33,581.624 11,120.387JPM Highbridge Statistical Market Neutral A (dist) - GBP (hedged) 427,969.137 61,294.236 411,370.683 77,892.690JPM Highbridge Statistical Market Neutral A (inc) - EUR 82,493.024 3,387.993 29,227.787 56,653.230JPM Highbridge Statistical Market Neutral B (acc) - EUR 906,281.584 218,590.242 830,540.103 294,331.723JPM Highbridge Statistical Market Neutral B (acc) - USD* 1,906.214 - 1,906.214 -JPM Highbridge Statistical Market Neutral C (acc) - EUR 4,621,483.619 1,939,910.869 5,269,925.052 1,291,469.436JPM Highbridge Statistical Market Neutral C (acc) - SEK (hedged)* - 19,917.817 19,917.817 -JPM Highbridge Statistical Market Neutral C (dist) - GBP (hedged) 1,213,931.558 1,201,291.161 955,263.003 1,459,959.716JPM Highbridge Statistical Market Neutral C (dist) - USD (hedged) 136,664.498 12,514.189 108,337.029 40,841.658JPM Highbridge Statistical Market Neutral D (acc) - EUR 7,831,983.678 715,120.891 6,028,535.645 2,518,568.924JPM Highbridge Statistical Market Neutral D (acc) - USD 40,753.146 20,598.175 40,959.808 20,391.513JPM Highbridge Statistical Market Neutral D (acc) - USD (hedged) 50,937.127 11,602.292 53,839.557 8,699.862JPM Highbridge Statistical Market Neutral I (acc) - EUR 587,873.838 68,566.103 459,372.279 197,067.662JPM Highbridge Statistical Market Neutral I (dist) - EUR - 295,105.705 148,935.207 146,170.498JPM Highbridge Statistical Market Neutral X (acc) - EUR 64,246.127 129,061.254 89,341.660 103,965.721JPM Highbridge Statistical Market Neutral X (acc) - USD (hedged)* 13,087.207 34,433.970 47,521.177 -
JPMorgan Investment Funds - Income Opportunity Fund (2)JPM Income Opportunity A (acc) - USD 4,236,097.565 3,807,948.063 2,318,583.528 5,725,462.100JPM Income Opportunity A (acc) - EUR (hedged) 2,477,663.429 5,241,589.882 2,666,370.263 5,052,883.048JPM Income Opportunity A (acc) - SEK (hedged) 35,948.460 522,427.356 53,187.550 505,188.266JPM Income Opportunity A (dist) - EUR (hedged) 266,079.968 458,552.589 75,008.559 649,623.998JPM Income Opportunity A (dist) - GBP (hedged) 1,453,198.893 1,343,339.075 269,564.690 2,526,973.278JPM Income Opportunity B (acc) - USD 736,294.982 781,535.414 520,507.981 997,322.415JPM Income Opportunity B (acc) - EUR (hedged) 389,458.985 1,474,552.169 872,652.438 991,358.716JPM Income Opportunity C (acc) - USD 1,310,487.213 1,530,051.980 1,272,407.889 1,568,131.304JPM Income Opportunity C (acc) - USD (hedged to BRL) - 125,490.809 57,809.483 67,681.326JPM Income Opportunity C (acc) - EUR (hedged) 1,914,852.706 6,206,558.027 1,736,940.154 6,384,470.579JPM Income Opportunity C (acc) - SEK (hedged) - 99,197.377 4,171.001 95,026.376JPM Income Opportunity C (dist) - GBP (hedged) 383,045.018 621,652.494 133,505.962 871,191.550JPM Income Opportunity D (acc) - EUR (hedged) 623,506.518 3,041,490.201 646,743.514 3,018,253.205JPM Income Opportunity D (inc) - EUR (hedged) - 68.985 - 68.985JPM Income Opportunity X (acc) - USD 1,234,001.877 110,031.619 1,058,518.724 285,514.772JPM Income Opportunity X (acc) - EUR (hedged) 22,330.000 208,243.273 30,217.379 200,355.894JPM Income Opportunity X (acc) - GBP (hedged) 23,695.001 5,169.999 - 28,865.000
JPMorgan Investment Funds - Japan 50 Equity FundJPM Japan 50 Equity A (acc) - JPY 296,215.887 1,656,701.688 1,208,144.954 744,772.621JPM Japan 50 Equity A (acc) - EUR 52,156.903 249,243.333 67,404.433 233,995.803JPM Japan 50 Equity A (dist) - JPY 4,144.027 57,677.916 56,802.336 5,019.607JPM Japan 50 Equity C (acc) - JPY 219,232.262 863,952.324 542,551.559 540,633.027JPM Japan 50 Equity D (acc) - JPY 4,671.573 59,455.657 54,775.801 9,351.429JPM Japan 50 Equity X (acc) - JPY 935,188.149 259,763.972 47,967.970 1,146,984.151
JPMorgan Investment Funds - Japan Behavioural Finance Equity FundJPM Japan Behavioural Finance Equity A (acc) - USD 20,484.803 - - 20,484.803JPM Japan Behavioural Finance Equity A (acc) - EUR 21,596.599 77,848.293 82,990.044 16,454.848JPM Japan Behavioural Finance Equity A (dist) - USD 17,905.103 - - 17,905.103JPM Japan Behavioural Finance Equity D (acc) - EUR 337.997 4,478.519 1,157.976 3,658.540JPM Japan Behavioural Finance Equity X (acc) - USD 24,004.393 - 12,469.212 11,535.181
(2) This Sub-Fund changed its currency to USD on 4 January 2010.
202
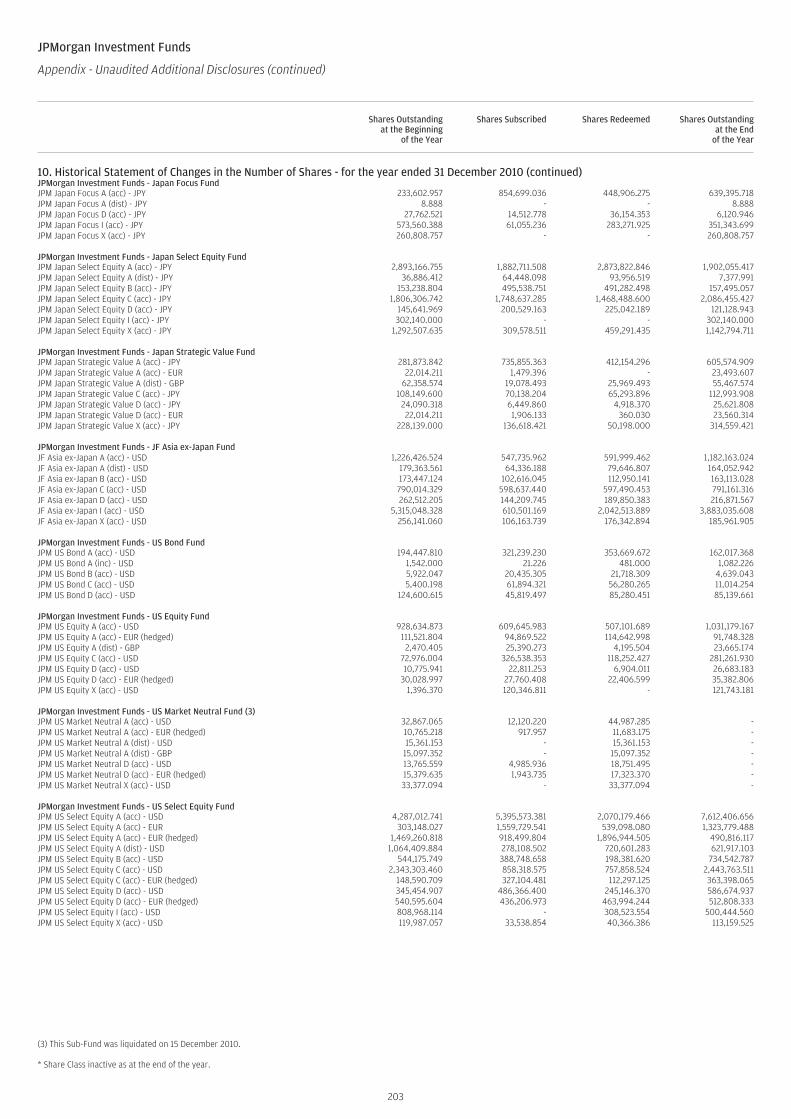
JPMorgan Investment Funds
Appendix - Unaudited Additional Disclosures (continued)
Shares Outstandingat the Beginning
of the Year
Shares Subscribed Shares Redeemed Shares Outstandingat the End
of the Year
10. Historical Statement of Changes in the Number of Shares - for the year ended 31 December 2010 (continued)JPMorgan Investment Funds - Japan Focus FundJPM Japan Focus A (acc) - JPY 233,602.957 854,699.036 448,906.275 639,395.718JPM Japan Focus A (dist) - JPY 8.888 - - 8.888JPM Japan Focus D (acc) - JPY 27,762.521 14,512.778 36,154.353 6,120.946JPM Japan Focus I (acc) - JPY 573,560.388 61,055.236 283,271.925 351,343.699JPM Japan Focus X (acc) - JPY 260,808.757 - - 260,808.757
JPMorgan Investment Funds - Japan Select Equity FundJPM Japan Select Equity A (acc) - JPY 2,893,166.755 1,882,711.508 2,873,822.846 1,902,055.417JPM Japan Select Equity A (dist) - JPY 36,886.412 64,448.098 93,956.519 7,377.991JPM Japan Select Equity B (acc) - JPY 153,238.804 495,538.751 491,282.498 157,495.057JPM Japan Select Equity C (acc) - JPY 1,806,306.742 1,748,637.285 1,468,488.600 2,086,455.427JPM Japan Select Equity D (acc) - JPY 145,641.969 200,529.163 225,042.189 121,128.943JPM Japan Select Equity I (acc) - JPY 302,140.000 - - 302,140.000JPM Japan Select Equity X (acc) - JPY 1,292,507.635 309,578.511 459,291.435 1,142,794.711
JPMorgan Investment Funds - Japan Strategic Value FundJPM Japan Strategic Value A (acc) - JPY 281,873.842 735,855.363 412,154.296 605,574.909JPM Japan Strategic Value A (acc) - EUR 22,014.211 1,479.396 - 23,493.607JPM Japan Strategic Value A (dist) - GBP 62,358.574 19,078.493 25,969.493 55,467.574JPM Japan Strategic Value C (acc) - JPY 108,149.600 70,138.204 65,293.896 112,993.908JPM Japan Strategic Value D (acc) - JPY 24,090.318 6,449.860 4,918.370 25,621.808JPM Japan Strategic Value D (acc) - EUR 22,014.211 1,906.133 360.030 23,560.314JPM Japan Strategic Value X (acc) - JPY 228,139.000 136,618.421 50,198.000 314,559.421
JPMorgan Investment Funds - JF Asia ex-Japan FundJF Asia ex-Japan A (acc) - USD 1,226,426.524 547,735.962 591,999.462 1,182,163.024JF Asia ex-Japan A (dist) - USD 179,363.561 64,336.188 79,646.807 164,052.942JF Asia ex-Japan B (acc) - USD 173,447.124 102,616.045 112,950.141 163,113.028JF Asia ex-Japan C (acc) - USD 790,014.329 598,637.440 597,490.453 791,161.316JF Asia ex-Japan D (acc) - USD 262,512.205 144,209.745 189,850.383 216,871.567JF Asia ex-Japan I (acc) - USD 5,315,048.328 610,501.169 2,042,513.889 3,883,035.608JF Asia ex-Japan X (acc) - USD 256,141.060 106,163.739 176,342.894 185,961.905
JPMorgan Investment Funds - US Bond FundJPM US Bond A (acc) - USD 194,447.810 321,239.230 353,669.672 162,017.368JPM US Bond A (inc) - USD 1,542.000 21.226 481.000 1,082.226JPM US Bond B (acc) - USD 5,922.047 20,435.305 21,718.309 4,639.043JPM US Bond C (acc) - USD 5,400.198 61,894.321 56,280.265 11,014.254JPM US Bond D (acc) - USD 124,600.615 45,819.497 85,280.451 85,139.661
JPMorgan Investment Funds - US Equity FundJPM US Equity A (acc) - USD 928,634.873 609,645.983 507,101.689 1,031,179.167JPM US Equity A (acc) - EUR (hedged) 111,521.804 94,869.522 114,642.998 91,748.328JPM US Equity A (dist) - GBP 2,470.405 25,390.273 4,195.504 23,665.174JPM US Equity C (acc) - USD 72,976.004 326,538.353 118,252.427 281,261.930JPM US Equity D (acc) - USD 10,775.941 22,811.253 6,904.011 26,683.183JPM US Equity D (acc) - EUR (hedged) 30,028.997 27,760.408 22,406.599 35,382.806JPM US Equity X (acc) - USD 1,396.370 120,346.811 - 121,743.181
JPMorgan Investment Funds - US Market Neutral Fund (3)JPM US Market Neutral A (acc) - USD 32,867.065 12,120.220 44,987.285 -JPM US Market Neutral A (acc) - EUR (hedged) 10,765.218 917.957 11,683.175 -JPM US Market Neutral A (dist) - USD 15,361.153 - 15,361.153 -JPM US Market Neutral A (dist) - GBP 15,097.352 - 15,097.352 -JPM US Market Neutral D (acc) - USD 13,765.559 4,985.936 18,751.495 -JPM US Market Neutral D (acc) - EUR (hedged) 15,379.635 1,943.735 17,323.370 -JPM US Market Neutral X (acc) - USD 33,377.094 - 33,377.094 -
JPMorgan Investment Funds - US Select Equity FundJPM US Select Equity A (acc) - USD 4,287,012.741 5,395,573.381 2,070,179.466 7,612,406.656JPM US Select Equity A (acc) - EUR 303,148.027 1,559,729.541 539,098.080 1,323,779.488JPM US Select Equity A (acc) - EUR (hedged) 1,469,260.818 918,499.804 1,896,944.505 490,816.117JPM US Select Equity A (dist) - USD 1,064,409.884 278,108.502 720,601.283 621,917.103JPM US Select Equity B (acc) - USD 544,175.749 388,748.658 198,381.620 734,542.787JPM US Select Equity C (acc) - USD 2,343,303.460 858,318.575 757,858.524 2,443,763.511JPM US Select Equity C (acc) - EUR (hedged) 148,590.709 327,104.481 112,297.125 363,398.065JPM US Select Equity D (acc) - USD 345,454.907 486,366.400 245,146.370 586,674.937JPM US Select Equity D (acc) - EUR (hedged) 540,595.604 436,206.973 463,994.244 512,808.333JPM US Select Equity I (acc) - USD 808,968.114 - 308,523.554 500,444.560JPM US Select Equity X (acc) - USD 119,987.057 33,538.854 40,366.386 113,159.525
(3) This Sub-Fund was liquidated on 15 December 2010.
* Share Class inactive as at the end of the year.
203
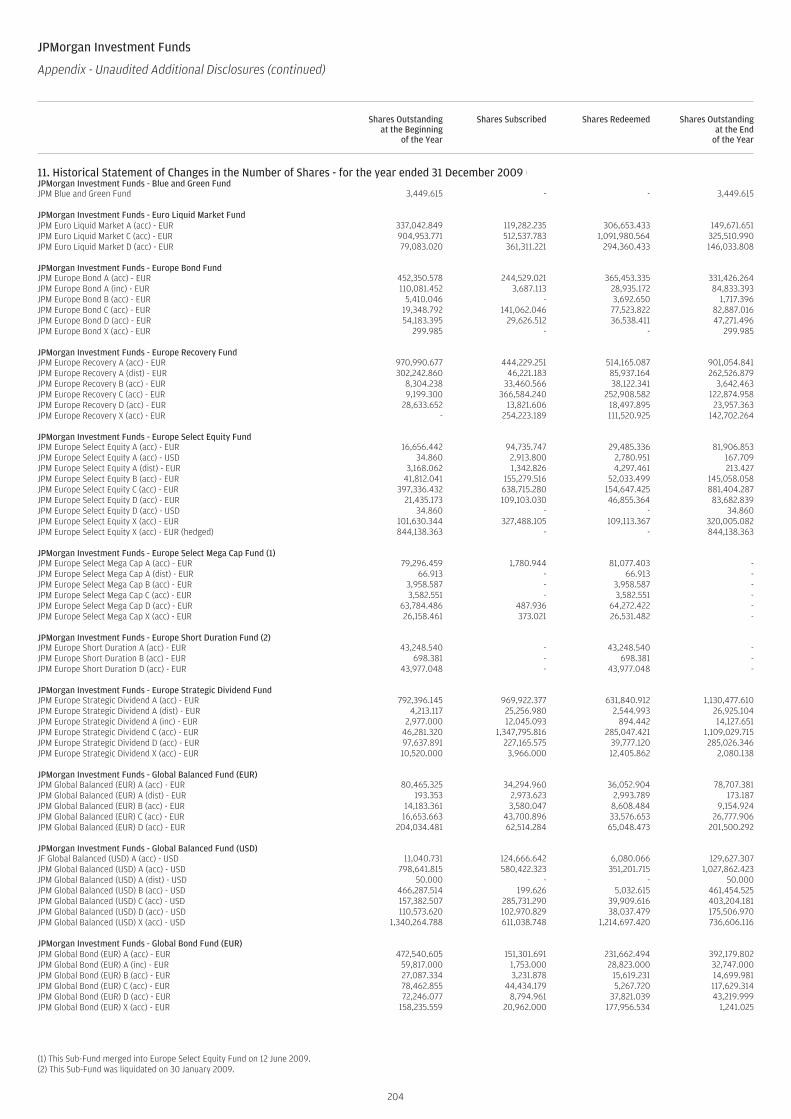
JPMorgan Investment Funds
Appendix - Unaudited Additional Disclosures (continued)
Shares Outstandingat the Beginning
of the Year
Shares Subscribed Shares Redeemed Shares Outstandingat the End
of the Year
11. Historical Statement of Changes in the Number of Shares - for the year ended 31 December 2009 (continued)JPMorgan Investment Funds - Blue and Green FundJPM Blue and Green Fund 3,449.615 - - 3,449.615
JPMorgan Investment Funds - Euro Liquid Market FundJPM Euro Liquid Market A (acc) - EUR 337,042.849 119,282.235 306,653.433 149,671.651JPM Euro Liquid Market C (acc) - EUR 904,953.771 512,537.783 1,091,980.564 325,510.990JPM Euro Liquid Market D (acc) - EUR 79,083.020 361,311.221 294,360.433 146,033.808
JPMorgan Investment Funds - Europe Bond FundJPM Europe Bond A (acc) - EUR 452,350.578 244,529.021 365,453.335 331,426.264JPM Europe Bond A (inc) - EUR 110,081.452 3,687.113 28,935.172 84,833.393JPM Europe Bond B (acc) - EUR 5,410.046 - 3,692.650 1,717.396JPM Europe Bond C (acc) - EUR 19,348.792 141,062.046 77,523.822 82,887.016JPM Europe Bond D (acc) - EUR 54,183.395 29,626.512 36,538.411 47,271.496JPM Europe Bond X (acc) - EUR 299.985 - - 299.985
JPMorgan Investment Funds - Europe Recovery FundJPM Europe Recovery A (acc) - EUR 970,990.677 444,229.251 514,165.087 901,054.841JPM Europe Recovery A (dist) - EUR 302,242.860 46,221.183 85,937.164 262,526.879JPM Europe Recovery B (acc) - EUR 8,304.238 33,460.566 38,122.341 3,642.463JPM Europe Recovery C (acc) - EUR 9,199.300 366,584.240 252,908.582 122,874.958JPM Europe Recovery D (acc) - EUR 28,633.652 13,821.606 18,497.895 23,957.363JPM Europe Recovery X (acc) - EUR - 254,223.189 111,520.925 142,702.264
JPMorgan Investment Funds - Europe Select Equity FundJPM Europe Select Equity A (acc) - EUR 16,656.442 94,735.747 29,485.336 81,906.853JPM Europe Select Equity A (acc) - USD 34.860 2,913.800 2,780.951 167.709JPM Europe Select Equity A (dist) - EUR 3,168.062 1,342.826 4,297.461 213.427JPM Europe Select Equity B (acc) - EUR 41,812.041 155,279.516 52,033.499 145,058.058JPM Europe Select Equity C (acc) - EUR 397,336.432 638,715.280 154,647.425 881,404.287JPM Europe Select Equity D (acc) - EUR 21,435.173 109,103.030 46,855.364 83,682.839JPM Europe Select Equity D (acc) - USD 34.860 - - 34.860JPM Europe Select Equity X (acc) - EUR 101,630.344 327,488.105 109,113.367 320,005.082JPM Europe Select Equity X (acc) - EUR (hedged) 844,138.363 - - 844,138.363
JPMorgan Investment Funds - Europe Select Mega Cap Fund (1)JPM Europe Select Mega Cap A (acc) - EUR 79,296.459 1,780.944 81,077.403 -JPM Europe Select Mega Cap A (dist) - EUR 66.913 - 66.913 -JPM Europe Select Mega Cap B (acc) - EUR 3,958.587 - 3,958.587 -JPM Europe Select Mega Cap C (acc) - EUR 3,582.551 - 3,582.551 -JPM Europe Select Mega Cap D (acc) - EUR 63,784.486 487.936 64,272.422 -JPM Europe Select Mega Cap X (acc) - EUR 26,158.461 373.021 26,531.482 -
JPMorgan Investment Funds - Europe Short Duration Fund (2)JPM Europe Short Duration A (acc) - EUR 43,248.540 - 43,248.540 -JPM Europe Short Duration B (acc) - EUR 698.381 - 698.381 -JPM Europe Short Duration D (acc) - EUR 43,977.048 - 43,977.048 -
JPMorgan Investment Funds - Europe Strategic Dividend FundJPM Europe Strategic Dividend A (acc) - EUR 792,396.145 969,922.377 631,840.912 1,130,477.610JPM Europe Strategic Dividend A (dist) - EUR 4,213.117 25,256.980 2,544.993 26,925.104JPM Europe Strategic Dividend A (inc) - EUR 2,977.000 12,045.093 894.442 14,127.651JPM Europe Strategic Dividend C (acc) - EUR 46,281.320 1,347,795.816 285,047.421 1,109,029.715JPM Europe Strategic Dividend D (acc) - EUR 97,637.891 227,165.575 39,777.120 285,026.346JPM Europe Strategic Dividend X (acc) - EUR 10,520.000 3,966.000 12,405.862 2,080.138
JPMorgan Investment Funds - Global Balanced Fund (EUR)JPM Global Balanced (EUR) A (acc) - EUR 80,465.325 34,294.960 36,052.904 78,707.381JPM Global Balanced (EUR) A (dist) - EUR 193.353 2,973.623 2,993.789 173.187JPM Global Balanced (EUR) B (acc) - EUR 14,183.361 3,580.047 8,608.484 9,154.924JPM Global Balanced (EUR) C (acc) - EUR 16,653.663 43,700.896 33,576.653 26,777.906JPM Global Balanced (EUR) D (acc) - EUR 204,034.481 62,514.284 65,048.473 201,500.292
JPMorgan Investment Funds - Global Balanced Fund (USD)JF Global Balanced (USD) A (acc) - USD 11,040.731 124,666.642 6,080.066 129,627.307JPM Global Balanced (USD) A (acc) - USD 798,641.815 580,422.323 351,201.715 1,027,862.423JPM Global Balanced (USD) A (dist) - USD 50.000 - - 50.000JPM Global Balanced (USD) B (acc) - USD 466,287.514 199.626 5,032.615 461,454.525JPM Global Balanced (USD) C (acc) - USD 157,382.507 285,731.290 39,909.616 403,204.181JPM Global Balanced (USD) D (acc) - USD 110,573.620 102,970.829 38,037.479 175,506.970JPM Global Balanced (USD) X (acc) - USD 1,340,264.788 611,038.748 1,214,697.420 736,606.116
JPMorgan Investment Funds - Global Bond Fund (EUR)JPM Global Bond (EUR) A (acc) - EUR 472,540.605 151,301.691 231,662.494 392,179.802JPM Global Bond (EUR) A (inc) - EUR 59,817.000 1,753.000 28,823.000 32,747.000JPM Global Bond (EUR) B (acc) - EUR 27,087.334 3,231.878 15,619.231 14,699.981JPM Global Bond (EUR) C (acc) - EUR 78,462.855 44,434.179 5,267.720 117,629.314JPM Global Bond (EUR) D (acc) - EUR 72,246.077 8,794.961 37,821.039 43,219.999JPM Global Bond (EUR) X (acc) - EUR 158,235.559 20,962.000 177,956.534 1,241.025
(1) This Sub-Fund merged into Europe Select Equity Fund on 12 June 2009.(2) This Sub-Fund was liquidated on 30 January 2009.
204
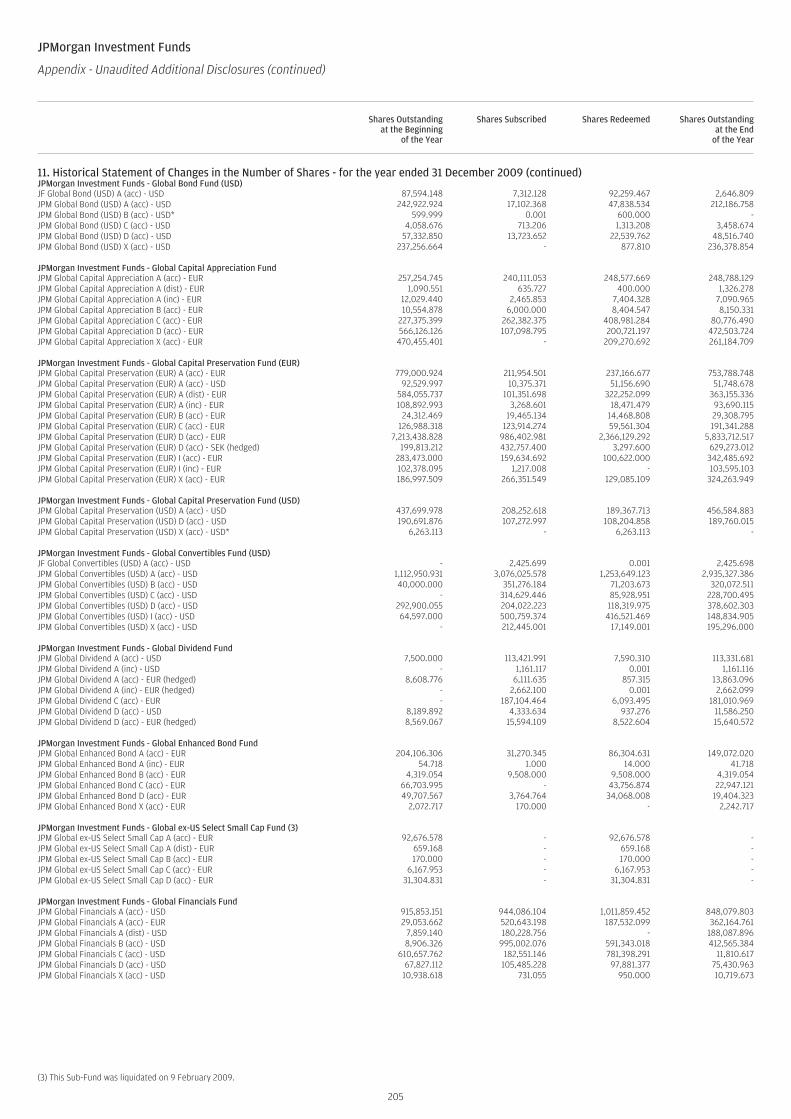
JPMorgan Investment Funds
Appendix - Unaudited Additional Disclosures (continued)
Shares Outstandingat the Beginning
of the Year
Shares Subscribed Shares Redeemed Shares Outstandingat the End
of the Year
11. Historical Statement of Changes in the Number of Shares - for the year ended 31 December 2009 (continued)JPMorgan Investment Funds - Global Bond Fund (USD)JF Global Bond (USD) A (acc) - USD 87,594.148 7,312.128 92,259.467 2,646.809JPM Global Bond (USD) A (acc) - USD 242,922.924 17,102.368 47,838.534 212,186.758JPM Global Bond (USD) B (acc) - USD* 599.999 0.001 600.000 -JPM Global Bond (USD) C (acc) - USD 4,058.676 713.206 1,313.208 3,458.674JPM Global Bond (USD) D (acc) - USD 57,332.850 13,723.652 22,539.762 48,516.740JPM Global Bond (USD) X (acc) - USD 237,256.664 - 877.810 236,378.854
JPMorgan Investment Funds - Global Capital Appreciation FundJPM Global Capital Appreciation A (acc) - EUR 257,254.745 240,111.053 248,577.669 248,788.129JPM Global Capital Appreciation A (dist) - EUR 1,090.551 635.727 400.000 1,326.278JPM Global Capital Appreciation A (inc) - EUR 12,029.440 2,465.853 7,404.328 7,090.965JPM Global Capital Appreciation B (acc) - EUR 10,554.878 6,000.000 8,404.547 8,150.331JPM Global Capital Appreciation C (acc) - EUR 227,375.399 262,382.375 408,981.284 80,776.490JPM Global Capital Appreciation D (acc) - EUR 566,126.126 107,098.795 200,721.197 472,503.724JPM Global Capital Appreciation X (acc) - EUR 470,455.401 - 209,270.692 261,184.709
JPMorgan Investment Funds - Global Capital Preservation Fund (EUR)JPM Global Capital Preservation (EUR) A (acc) - EUR 779,000.924 211,954.501 237,166.677 753,788.748JPM Global Capital Preservation (EUR) A (acc) - USD 92,529.997 10,375.371 51,156.690 51,748.678JPM Global Capital Preservation (EUR) A (dist) - EUR 584,055.737 101,351.698 322,252.099 363,155.336JPM Global Capital Preservation (EUR) A (inc) - EUR 108,892.993 3,268.601 18,471.479 93,690.115JPM Global Capital Preservation (EUR) B (acc) - EUR 24,312.469 19,465.134 14,468.808 29,308.795JPM Global Capital Preservation (EUR) C (acc) - EUR 126,988.318 123,914.274 59,561.304 191,341.288JPM Global Capital Preservation (EUR) D (acc) - EUR 7,213,438.828 986,402.981 2,366,129.292 5,833,712.517JPM Global Capital Preservation (EUR) D (acc) - SEK (hedged) 199,813.212 432,757.400 3,297.600 629,273.012JPM Global Capital Preservation (EUR) I (acc) - EUR 283,473.000 159,634.692 100,622.000 342,485.692JPM Global Capital Preservation (EUR) I (inc) - EUR 102,378.095 1,217.008 - 103,595.103JPM Global Capital Preservation (EUR) X (acc) - EUR 186,997.509 266,351.549 129,085.109 324,263.949
JPMorgan Investment Funds - Global Capital Preservation Fund (USD)JPM Global Capital Preservation (USD) A (acc) - USD 437,699.978 208,252.618 189,367.713 456,584.883JPM Global Capital Preservation (USD) D (acc) - USD 190,691.876 107,272.997 108,204.858 189,760.015JPM Global Capital Preservation (USD) X (acc) - USD* 6,263.113 - 6,263.113 -
JPMorgan Investment Funds - Global Convertibles Fund (USD)JF Global Convertibles (USD) A (acc) - USD - 2,425.699 0.001 2,425.698JPM Global Convertibles (USD) A (acc) - USD 1,112,950.931 3,076,025.578 1,253,649.123 2,935,327.386JPM Global Convertibles (USD) B (acc) - USD 40,000.000 351,276.184 71,203.673 320,072.511JPM Global Convertibles (USD) C (acc) - USD - 314,629.446 85,928.951 228,700.495JPM Global Convertibles (USD) D (acc) - USD 292,900.055 204,022.223 118,319.975 378,602.303JPM Global Convertibles (USD) I (acc) - USD 64,597.000 500,759.374 416,521.469 148,834.905JPM Global Convertibles (USD) X (acc) - USD - 212,445.001 17,149.001 195,296.000
JPMorgan Investment Funds - Global Dividend FundJPM Global Dividend A (acc) - USD 7,500.000 113,421.991 7,590.310 113,331.681JPM Global Dividend A (inc) - USD - 1,161.117 0.001 1,161.116JPM Global Dividend A (acc) - EUR (hedged) 8,608.776 6,111.635 857.315 13,863.096JPM Global Dividend A (inc) - EUR (hedged) - 2,662.100 0.001 2,662.099JPM Global Dividend C (acc) - EUR - 187,104.464 6,093.495 181,010.969JPM Global Dividend D (acc) - USD 8,189.892 4,333.634 937.276 11,586.250JPM Global Dividend D (acc) - EUR (hedged) 8,569.067 15,594.109 8,522.604 15,640.572
JPMorgan Investment Funds - Global Enhanced Bond FundJPM Global Enhanced Bond A (acc) - EUR 204,106.306 31,270.345 86,304.631 149,072.020JPM Global Enhanced Bond A (inc) - EUR 54.718 1.000 14.000 41.718JPM Global Enhanced Bond B (acc) - EUR 4,319.054 9,508.000 9,508.000 4,319.054JPM Global Enhanced Bond C (acc) - EUR 66,703.995 - 43,756.874 22,947.121JPM Global Enhanced Bond D (acc) - EUR 49,707.567 3,764.764 34,068.008 19,404.323JPM Global Enhanced Bond X (acc) - EUR 2,072.717 170.000 - 2,242.717
JPMorgan Investment Funds - Global ex-US Select Small Cap Fund (3)JPM Global ex-US Select Small Cap A (acc) - EUR 92,676.578 - 92,676.578 -JPM Global ex-US Select Small Cap A (dist) - EUR 659.168 - 659.168 -JPM Global ex-US Select Small Cap B (acc) - EUR 170.000 - 170.000 -JPM Global ex-US Select Small Cap C (acc) - EUR 6,167.953 - 6,167.953 -JPM Global ex-US Select Small Cap D (acc) - EUR 31,304.831 - 31,304.831 -
JPMorgan Investment Funds - Global Financials FundJPM Global Financials A (acc) - USD 915,853.151 944,086.104 1,011,859.452 848,079.803JPM Global Financials A (acc) - EUR 29,053.662 520,643.198 187,532.099 362,164.761JPM Global Financials A (dist) - USD 7,859.140 180,228.756 - 188,087.896JPM Global Financials B (acc) - USD 8,906.326 995,002.076 591,343.018 412,565.384JPM Global Financials C (acc) - USD 610,657.762 182,551.146 781,398.291 11,810.617JPM Global Financials D (acc) - USD 67,827.112 105,485.228 97,881.377 75,430.963JPM Global Financials X (acc) - USD 10,938.618 731.055 950.000 10,719.673
(3) This Sub-Fund was liquidated on 9 February 2009.
205
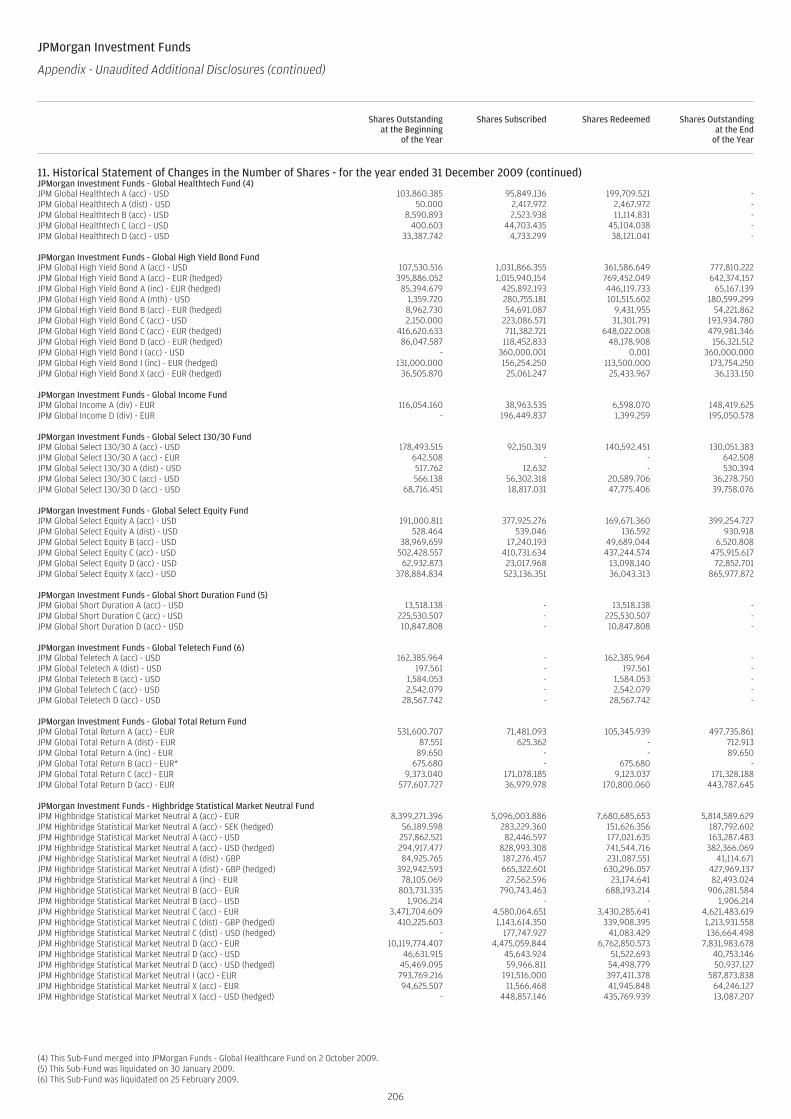
206
JPMorgan Investment Funds
Appendix - Unaudited Additional Disclosures (continued)
Shares Outstandingat the Beginning
of the Year
Shares Subscribed Shares Redeemed Shares Outstandingat the End
of the Year
11. Historical Statement of Changes in the Number of Shares - for the year ended 31 December 2009 (continued)JPMorgan Investment Funds - Global Healthtech Fund (4)JPM Global Healthtech A (acc) - USD 103,860.385 95,849.136 199,709.521 -JPM Global Healthtech A (dist) - USD 50.000 2,417.972 2,467.972 -JPM Global Healthtech B (acc) - USD 8,590.893 2,523.938 11,114.831 -JPM Global Healthtech C (acc) - USD 400.603 44,703.435 45,104.038 -JPM Global Healthtech D (acc) - USD 33,387.742 4,733.299 38,121.041 -
JPMorgan Investment Funds - Global High Yield Bond FundJPM Global High Yield Bond A (acc) - USD 107,530.516 1,031,866.355 361,586.649 777,810.222JPM Global High Yield Bond A (acc) - EUR (hedged) 395,886.052 1,015,940.154 769,452.049 642,374.157JPM Global High Yield Bond A (inc) - EUR (hedged) 85,394.679 425,892.193 446,119.733 65,167.139JPM Global High Yield Bond A (mth) - USD 1,359.720 280,755.181 101,515.602 180,599.299JPM Global High Yield Bond B (acc) - EUR (hedged) 8,962.730 54,691.087 9,431.955 54,221.862JPM Global High Yield Bond C (acc) - USD 2,150.000 223,086.571 31,301.791 193,934.780JPM Global High Yield Bond C (acc) - EUR (hedged) 416,620.633 711,382.721 648,022.008 479,981.346JPM Global High Yield Bond D (acc) - EUR (hedged) 86,047.587 118,452.833 48,178.908 156,321.512JPM Global High Yield Bond I (acc) - USD - 360,000.001 0.001 360,000.000JPM Global High Yield Bond I (inc) - EUR (hedged) 131,000.000 156,254.250 113,500.000 173,754.250JPM Global High Yield Bond X (acc) - EUR (hedged) 36,505.870 25,061.247 25,433.967 36,133.150
JPMorgan Investment Funds - Global Income FundJPM Global Income A (div) - EUR 116,054.160 38,963.535 6,598.070 148,419.625JPM Global Income D (div) - EUR - 196,449.837 1,399.259 195,050.578
JPMorgan Investment Funds - Global Select 130/30 FundJPM Global Select 130/30 A (acc) - USD 178,493.515 92,150.319 140,592.451 130,051.383JPM Global Select 130/30 A (acc) - EUR 642.508 - - 642.508JPM Global Select 130/30 A (dist) - USD 517.762 12.632 - 530.394JPM Global Select 130/30 C (acc) - USD 566.138 56,302.318 20,589.706 36,278.750JPM Global Select 130/30 D (acc) - USD 68,716.451 18,817.031 47,775.406 39,758.076
JPMorgan Investment Funds - Global Select Equity FundJPM Global Select Equity A (acc) - USD 191,000.811 377,925.276 169,671.360 399,254.727JPM Global Select Equity A (dist) - USD 528.464 539.046 136.592 930.918JPM Global Select Equity B (acc) - USD 38,969.659 17,240.193 49,689.044 6,520.808JPM Global Select Equity C (acc) - USD 502,428.557 410,731.634 437,244.574 475,915.617JPM Global Select Equity D (acc) - USD 62,932.873 23,017.968 13,098.140 72,852.701JPM Global Select Equity X (acc) - USD 378,884.834 523,136.351 36,043.313 865,977.872
JPMorgan Investment Funds - Global Short Duration Fund (5)JPM Global Short Duration A (acc) - USD 13,518.138 - 13,518.138 -JPM Global Short Duration C (acc) - USD 225,530.507 - 225,530.507 -JPM Global Short Duration D (acc) - USD 10,847.808 - 10,847.808 -
JPMorgan Investment Funds - Global Teletech Fund (6)JPM Global Teletech A (acc) - USD 162,385.964 - 162,385.964 -JPM Global Teletech A (dist) - USD 197.561 - 197.561 -JPM Global Teletech B (acc) - USD 1,584.053 - 1,584.053 -JPM Global Teletech C (acc) - USD 2,542.079 - 2,542.079 -JPM Global Teletech D (acc) - USD 28,567.742 - 28,567.742 -
JPMorgan Investment Funds - Global Total Return FundJPM Global Total Return A (acc) - EUR 531,600.707 71,481.093 105,345.939 497,735.861JPM Global Total Return A (dist) - EUR 87.551 625.362 - 712.913JPM Global Total Return A (inc) - EUR 89.650 - - 89.650JPM Global Total Return B (acc) - EUR* 675.680 - 675.680 -JPM Global Total Return C (acc) - EUR 9,373.040 171,078.185 9,123.037 171,328.188JPM Global Total Return D (acc) - EUR 577,607.727 36,979.978 170,800.060 443,787.645
JPMorgan Investment Funds - Highbridge Statistical Market Neutral FundJPM Highbridge Statistical Market Neutral A (acc) - EUR 8,399,271.396 5,096,003.886 7,680,685.653 5,814,589.629JPM Highbridge Statistical Market Neutral A (acc) - SEK (hedged) 56,189.598 283,229.360 151,626.356 187,792.602JPM Highbridge Statistical Market Neutral A (acc) - USD 257,862.521 82,446.597 177,021.635 163,287.483JPM Highbridge Statistical Market Neutral A (acc) - USD (hedged) 294,917.477 828,993.308 741,544.716 382,366.069JPM Highbridge Statistical Market Neutral A (dist) - GBP 84,925.765 187,276.457 231,087.551 41,114.671JPM Highbridge Statistical Market Neutral A (dist) - GBP (hedged) 392,942.593 665,322.601 630,296.057 427,969.137JPM Highbridge Statistical Market Neutral A (inc) - EUR 78,105.069 27,562.596 23,174.641 82,493.024JPM Highbridge Statistical Market Neutral B (acc) - EUR 803,731.335 790,743.463 688,193.214 906,281.584JPM Highbridge Statistical Market Neutral B (acc) - USD 1,906.214 - - 1,906.214JPM Highbridge Statistical Market Neutral C (acc) - EUR 3,471,704.609 4,580,064.651 3,430,285.641 4,621,483.619JPM Highbridge Statistical Market Neutral C (dist) - GBP (hedged) 410,225.603 1,143,614.350 339,908.395 1,213,931.558JPM Highbridge Statistical Market Neutral C (dist) - USD (hedged) - 177,747.927 41,083.429 136,664.498JPM Highbridge Statistical Market Neutral D (acc) - EUR 10,119,774.407 4,475,059.844 6,762,850.573 7,831,983.678JPM Highbridge Statistical Market Neutral D (acc) - USD 46,631.915 45,643.924 51,522.693 40,753.146JPM Highbridge Statistical Market Neutral D (acc) - USD (hedged) 45,469.095 59,966.811 54,498.779 50,937.127JPM Highbridge Statistical Market Neutral I (acc) - EUR 793,769.216 191,516.000 397,411.378 587,873.838JPM Highbridge Statistical Market Neutral X (acc) - EUR 94,625.507 11,566.468 41,945.848 64,246.127JPM Highbridge Statistical Market Neutral X (acc) - USD (hedged) - 448,857.146 435,769.939 13,087.207
(4) This Sub-Fund merged into JPMorgan Funds - Global Healthcare Fund on 2 October 2009.(5) This Sub-Fund was liquidated on 30 January 2009.(6) This Sub-Fund was liquidated on 25 February 2009.
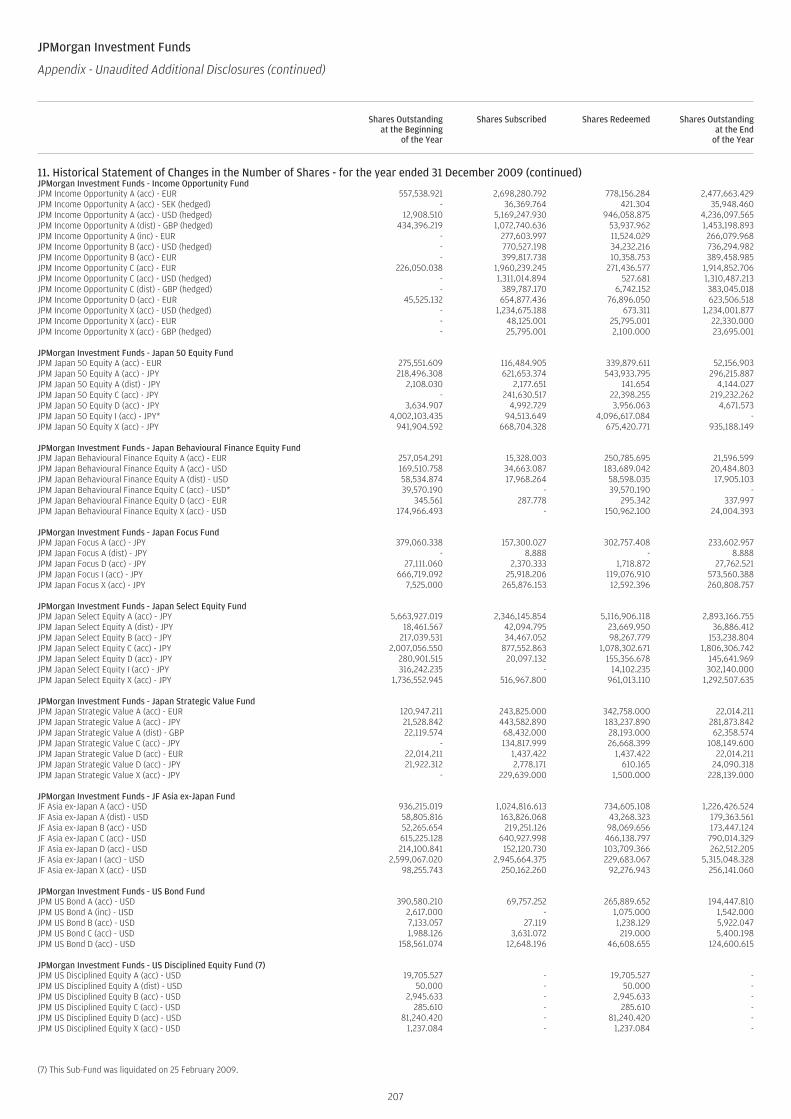
JPMorgan Investment Funds
Appendix - Unaudited Additional Disclosures (continued)
Shares Outstandingat the Beginning
of the Year
Shares Subscribed Shares Redeemed Shares Outstandingat the End
of the Year
11. Historical Statement of Changes in the Number of Shares - for the year ended 31 December 2009 (continued)JPMorgan Investment Funds - Income Opportunity FundJPM Income Opportunity A (acc) - EUR 557,538.921 2,698,280.792 778,156.284 2,477,663.429JPM Income Opportunity A (acc) - SEK (hedged) - 36,369.764 421.304 35,948.460JPM Income Opportunity A (acc) - USD (hedged) 12,908.510 5,169,247.930 946,058.875 4,236,097.565JPM Income Opportunity A (dist) - GBP (hedged) 434,396.219 1,072,740.636 53,937.962 1,453,198.893JPM Income Opportunity A (inc) - EUR - 277,603.997 11,524.029 266,079.968JPM Income Opportunity B (acc) - USD (hedged) - 770,527.198 34,232.216 736,294.982JPM Income Opportunity B (acc) - EUR - 399,817.738 10,358.753 389,458.985JPM Income Opportunity C (acc) - EUR 226,050.038 1,960,239.245 271,436.577 1,914,852.706JPM Income Opportunity C (acc) - USD (hedged) - 1,311,014.894 527.681 1,310,487.213JPM Income Opportunity C (dist) - GBP (hedged) - 389,787.170 6,742.152 383,045.018JPM Income Opportunity D (acc) - EUR 45,525.132 654,877.436 76,896.050 623,506.518JPM Income Opportunity X (acc) - USD (hedged) - 1,234,675.188 673.311 1,234,001.877JPM Income Opportunity X (acc) - EUR - 48,125.001 25,795.001 22,330.000JPM Income Opportunity X (acc) - GBP (hedged) - 25,795.001 2,100.000 23,695.001
JPMorgan Investment Funds - Japan 50 Equity FundJPM Japan 50 Equity A (acc) - EUR 275,551.609 116,484.905 339,879.611 52,156.903JPM Japan 50 Equity A (acc) - JPY 218,496.308 621,653.374 543,933.795 296,215.887JPM Japan 50 Equity A (dist) - JPY 2,108.030 2,177.651 141.654 4,144.027JPM Japan 50 Equity C (acc) - JPY - 241,630.517 22,398.255 219,232.262JPM Japan 50 Equity D (acc) - JPY 3,634.907 4,992.729 3,956.063 4,671.573JPM Japan 50 Equity I (acc) - JPY* 4,002,103.435 94,513.649 4,096,617.084 -JPM Japan 50 Equity X (acc) - JPY 941,904.592 668,704.328 675,420.771 935,188.149
JPMorgan Investment Funds - Japan Behavioural Finance Equity FundJPM Japan Behavioural Finance Equity A (acc) - EUR 257,054.291 15,328.003 250,785.695 21,596.599JPM Japan Behavioural Finance Equity A (acc) - USD 169,510.758 34,663.087 183,689.042 20,484.803JPM Japan Behavioural Finance Equity A (dist) - USD 58,534.874 17,968.264 58,598.035 17,905.103JPM Japan Behavioural Finance Equity C (acc) - USD* 39,570.190 - 39,570.190 -JPM Japan Behavioural Finance Equity D (acc) - EUR 345.561 287.778 295.342 337.997JPM Japan Behavioural Finance Equity X (acc) - USD 174,966.493 - 150,962.100 24,004.393
JPMorgan Investment Funds - Japan Focus FundJPM Japan Focus A (acc) - JPY 379,060.338 157,300.027 302,757.408 233,602.957JPM Japan Focus A (dist) - JPY - 8.888 - 8.888JPM Japan Focus D (acc) - JPY 27,111.060 2,370.333 1,718.872 27,762.521JPM Japan Focus I (acc) - JPY 666,719.092 25,918.206 119,076.910 573,560.388JPM Japan Focus X (acc) - JPY 7,525.000 265,876.153 12,592.396 260,808.757
JPMorgan Investment Funds - Japan Select Equity FundJPM Japan Select Equity A (acc) - JPY 5,663,927.019 2,346,145.854 5,116,906.118 2,893,166.755JPM Japan Select Equity A (dist) - JPY 18,461.567 42,094.795 23,669.950 36,886.412JPM Japan Select Equity B (acc) - JPY 217,039.531 34,467.052 98,267.779 153,238.804JPM Japan Select Equity C (acc) - JPY 2,007,056.550 877,552.863 1,078,302.671 1,806,306.742JPM Japan Select Equity D (acc) - JPY 280,901.515 20,097.132 155,356.678 145,641.969JPM Japan Select Equity I (acc) - JPY 316,242.235 - 14,102.235 302,140.000JPM Japan Select Equity X (acc) - JPY 1,736,552.945 516,967.800 961,013.110 1,292,507.635
JPMorgan Investment Funds - Japan Strategic Value FundJPM Japan Strategic Value A (acc) - EUR 120,947.211 243,825.000 342,758.000 22,014.211JPM Japan Strategic Value A (acc) - JPY 21,528.842 443,582.890 183,237.890 281,873.842JPM Japan Strategic Value A (dist) - GBP 22,119.574 68,432.000 28,193.000 62,358.574JPM Japan Strategic Value C (acc) - JPY - 134,817.999 26,668.399 108,149.600JPM Japan Strategic Value D (acc) - EUR 22,014.211 1,437.422 1,437.422 22,014.211JPM Japan Strategic Value D (acc) - JPY 21,922.312 2,778.171 610.165 24,090.318JPM Japan Strategic Value X (acc) - JPY - 229,639.000 1,500.000 228,139.000
JPMorgan Investment Funds - JF Asia ex-Japan FundJF Asia ex-Japan A (acc) - USD 936,215.019 1,024,816.613 734,605.108 1,226,426.524JF Asia ex-Japan A (dist) - USD 58,805.816 163,826.068 43,268.323 179,363.561JF Asia ex-Japan B (acc) - USD 52,265.654 219,251.126 98,069.656 173,447.124JF Asia ex-Japan C (acc) - USD 615,225.128 640,927.998 466,138.797 790,014.329JF Asia ex-Japan D (acc) - USD 214,100.841 152,120.730 103,709.366 262,512.205JF Asia ex-Japan I (acc) - USD 2,599,067.020 2,945,664.375 229,683.067 5,315,048.328JF Asia ex-Japan X (acc) - USD 98,255.743 250,162.260 92,276.943 256,141.060
JPMorgan Investment Funds - US Bond FundJPM US Bond A (acc) - USD 390,580.210 69,757.252 265,889.652 194,447.810JPM US Bond A (inc) - USD 2,617.000 - 1,075.000 1,542.000JPM US Bond B (acc) - USD 7,133.057 27.119 1,238.129 5,922.047JPM US Bond C (acc) - USD 1,988.126 3,631.072 219.000 5,400.198JPM US Bond D (acc) - USD 158,561.074 12,648.196 46,608.655 124,600.615
JPMorgan Investment Funds - US Disciplined Equity Fund (7)JPM US Disciplined Equity A (acc) - USD 19,705.527 - 19,705.527 -JPM US Disciplined Equity A (dist) - USD 50.000 - 50.000 -JPM US Disciplined Equity B (acc) - USD 2,945.633 - 2,945.633 -JPM US Disciplined Equity C (acc) - USD 285.610 - 285.610 -JPM US Disciplined Equity D (acc) - USD 81,240.420 - 81,240.420 -JPM US Disciplined Equity X (acc) - USD 1,237.084 - 1,237.084 -
(7) This Sub-Fund was liquidated on 25 February 2009.
207
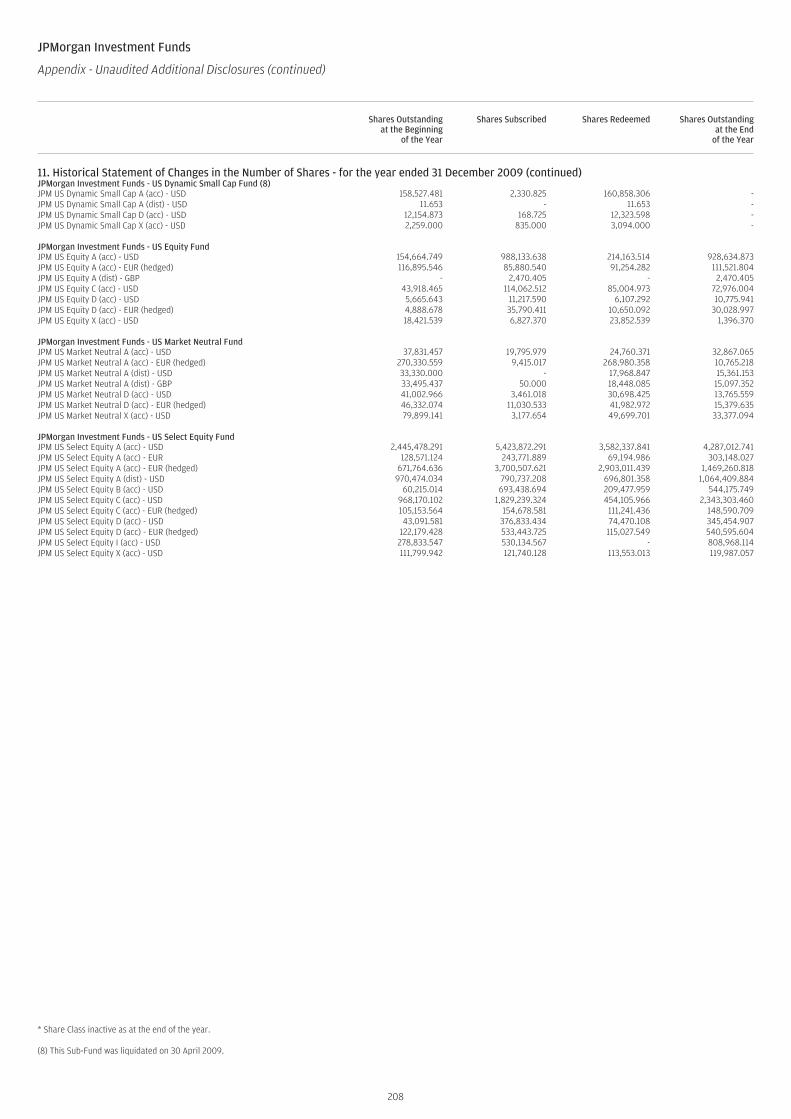
JPMorgan Investment Funds
Appendix - Unaudited Additional Disclosures (continued)
Shares Outstandingat the Beginning
of the Year
Shares Subscribed Shares Redeemed Shares Outstandingat the End
of the Year
11. Historical Statement of Changes in the Number of Shares - for the year ended 31 December 2009 (continued)JPMorgan Investment Funds - US Dynamic Small Cap Fund (8)JPM US Dynamic Small Cap A (acc) - USD 158,527.481 2,330.825 160,858.306 -JPM US Dynamic Small Cap A (dist) - USD 11.653 - 11.653 -JPM US Dynamic Small Cap D (acc) - USD 12,154.873 168.725 12,323.598 -JPM US Dynamic Small Cap X (acc) - USD 2,259.000 835.000 3,094.000 -
JPMorgan Investment Funds - US Equity FundJPM US Equity A (acc) - USD 154,664.749 988,133.638 214,163.514 928,634.873JPM US Equity A (acc) - EUR (hedged) 116,895.546 85,880.540 91,254.282 111,521.804JPM US Equity A (dist) - GBP - 2,470.405 - 2,470.405JPM US Equity C (acc) - USD 43,918.465 114,062.512 85,004.973 72,976.004JPM US Equity D (acc) - USD 5,665.643 11,217.590 6,107.292 10,775.941JPM US Equity D (acc) - EUR (hedged) 4,888.678 35,790.411 10,650.092 30,028.997JPM US Equity X (acc) - USD 18,421.539 6,827.370 23,852.539 1,396.370
JPMorgan Investment Funds - US Market Neutral FundJPM US Market Neutral A (acc) - USD 37,831.457 19,795.979 24,760.371 32,867.065JPM US Market Neutral A (acc) - EUR (hedged) 270,330.559 9,415.017 268,980.358 10,765.218JPM US Market Neutral A (dist) - USD 33,330.000 - 17,968.847 15,361.153JPM US Market Neutral A (dist) - GBP 33,495.437 50.000 18,448.085 15,097.352JPM US Market Neutral D (acc) - USD 41,002.966 3,461.018 30,698.425 13,765.559JPM US Market Neutral D (acc) - EUR (hedged) 46,332.074 11,030.533 41,982.972 15,379.635JPM US Market Neutral X (acc) - USD 79,899.141 3,177.654 49,699.701 33,377.094
JPMorgan Investment Funds - US Select Equity FundJPM US Select Equity A (acc) - USD 2,445,478.291 5,423,872.291 3,582,337.841 4,287,012.741JPM US Select Equity A (acc) - EUR 128,571.124 243,771.889 69,194.986 303,148.027JPM US Select Equity A (acc) - EUR (hedged) 671,764.636 3,700,507.621 2,903,011.439 1,469,260.818JPM US Select Equity A (dist) - USD 970,474.034 790,737.208 696,801.358 1,064,409.884JPM US Select Equity B (acc) - USD 60,215.014 693,438.694 209,477.959 544,175.749JPM US Select Equity C (acc) - USD 968,170.102 1,829,239.324 454,105.966 2,343,303.460JPM US Select Equity C (acc) - EUR (hedged) 105,153.564 154,678.581 111,241.436 148,590.709JPM US Select Equity D (acc) - USD 43,091.581 376,833.434 74,470.108 345,454.907JPM US Select Equity D (acc) - EUR (hedged) 122,179.428 533,443.725 115,027.549 540,595.604JPM US Select Equity I (acc) - USD 278,833.547 530,134.567 - 808,968.114JPM US Select Equity X (acc) - USD 111,799.942 121,740.128 113,553.013 119,987.057
* Share Class inactive as at the end of the year.
(8) This Sub-Fund was liquidated on 30 April 2009.
208

Language Disclaimer Annual


