Embed Size (px)
Citation preview

JPMorgan Fund ICVC31 January 2014
Annual Report & Accounts
Click to enter
Contents
1
> JPM Asia Fund
> JPM Balanced Total Return Fund
> JPM Cautious Managed Fund
> JPM Diversified Real Return Fund
> JPM Emerging Markets Fund
> JPM Emerging Markets Income Fund
> JPM Emerging Markets Infrastructure Fund
> JPM Europe Fund
> JPM Europe Dynamic (ex-UK) Fund
> JPM Global Consumer Trends Fund
> JPM Global Equity Absolute Alpha Fund
> JPM Global Equity Fund
> JPM Global Equity Income Fund
> JPM Global (ex-UK) Bond Fund
> JPM Global Financials Fund
> JPM Global High Yield Bond Fund
> JPM Global Mining Fund
> JPM Global Property Securities Fund
> JPM Institutional Asia Fund
> JPM Japan Fund
> JPM Multi-Asset Income Fund
> JPM Multi-Asset Macro Fund
> JPM Multi-Manager Growth Fund
> JPM Natural Resources Fund
> JPM New Europe Fund
> JPM Sterling Corporate Bond Fund
> JPM Strategic Bond Fund
> JPM UK Active Index Plus Fund
> JPM UK Dynamic Fund
> JPM UK Equity & Bond Income Fund
> JPM UK Equity Fund
> JPM UK Focus Fund
> JPM UK Higher Income Fund
> JPM UK Managed Equity Fund
> JPM UK Strategic Equity Income Fund
> JPM UK Strategic Growth Fund
> JPM US Fund
> JPM US Equity Income Fund
> JPM US Select Fund
> Authorised Corporate Director’s (ACD) Report
> Investment Adviser’s Report for the year ending 31 January 2014
> Aggregated Company financial statements
> Statement of the Authorised Corporate Director
> Report of the Depositary to the Shareholders
> Independent Auditors’ Report to the Members of JPMorgan Fund ICVC

This material should not be relied on as including sufficient information to support an investment decision.
The opinions and views expressed in this document are those held by J.P. Morgan Asset Management as at 14 May 2014, which are subject to changeand are not to be taken as or construed as investment advice.
For up-to-date performance information please contact J.P. Morgan Asset Management using the numbers shown on the back of this document.
You should remember that past performance is not a guide to the future. The price of investments and the income from them may fall as well asrise and investors may not get back the full amount invested. The level of tax benefits and liabilities will depend on individual circumstances andmay change in the future.
The investment objective of a fund may allow some flexibility in terms of portfolio composition.
Funds that invest predominantly in a single market, asset class or sector may be subject to greater volatility than those funds with a morediversified portfolio.
The information in this booklet is based on our understanding of law, regulation and HM Revenue & Customs practice as at 14 May 2014.
2
� Return to Index

We are pleased to present the Annual Report& Accounts for JPMorgan Fund ICVC for the yearended 31 January 2014.
Authorised StatusJPMorgan Fund ICVC is an Open-EndedInvestment Company (“Company”) with variablecapital, authorised under Regulation 12 of theOEIC Regulations by the Financial ServicesAuthority (now known as the Financial ConductAuthority) on 6 October 1997.
The Company was launched as a UCITS Schemeon 16 November 2001 and acts as an umbrellacompany comprising 34 sub-funds. Itsregistration number is IC00005 and itsregistered address is 60 Victoria Embankment,London EC4Y 0JP.
Structure & LiabilitiesThe assets of each sub-fund are treated asseparate from those of every other sub-fundand are invested in accordance with theinvestment objective and investment policiesapplicable to that sub-fund. Details of theinvestment objective, the policies for achievingthese objectives, the performance record anda review of the investment activities for eachof the sub-funds can be found in this report.
The ACD report includes for each sub-fund the:
• Investment objective and policy
• Risk profile
• Fund review
• Fund outlook
• Portfolio statement
• Portfolio movements
Shareholders are not liable for the debts of theCompany. Shareholders are not liable to makeany further payment to the Company after thepurchase of their shares is paid for.
JPM Global Mining FundOn 7 June 2013 shareholders of the JPM GlobalMining Fund were sent a letter informing themof the intention to terminate this Fund subjectto FCA approval, and on 1 July 2013 a furtherletter was sent confirming that FCA approvalhad been received. The termination of this Fundcommenced on 12 August 2013 and the initialtermination proceeds were paid to shareholderson 20 August 2013.
JPM Balanced Total Return FundOn 7 June 2013 shareholders of the JPMBalanced Total Return Fund were sent a letterinforming them of the intention to terminatethis Fund subject to FCA approval, and on 1 July2013 a further letter was sent confirming thatFCA approval had been received. Thetermination of this Fund commenced on 12August 2013 and the initial termination proceedswere paid to shareholders on 20 August 2013.
JPM Global Equity AbsoluteAlpha FundOn 12 July 2013 shareholders of the JPM GlobalEquity Absolute Alpha Fund were sent a letterinforming them of the intention to terminatethis Fund subject to FCA approval, and on 6August 2013 a further letter was sent confirmingthat FCA approval had been received. Thetermination of this Fund commenced on 13August 2013 and the initial termination proceedswere paid to shareholders on 23 September2013.
JPM Emerging MarketsInfrastructure FundOn 16 August 2013 an EGM was held at whichshareholders voted in favour of a proposal tomerge this Fund with the JPM Emerging MarketsFund. On 31 August the merger took place, andshareholders in the JPM Emerging MarketsInfrastructure Fund received shares of anequivalent value in the JPM Emerging MarketsFund.
JPM UK Equity FundOn 16 August 2013 an EGM was held at whichshareholders voted in favour of a proposal tomerge this Fund with the JPM UK StrategicGrowth Fund. On 31 August the merger tookplace, and shareholders in the JPM UK EquityFund received shares of an equivalent valuein the JPM UK Strategic Growth Fund.
JPM UK Active Index Plus FundThe performance fee was removed with effectfrom 1 February 2014.
Changes to the Prospectus andInstrument of Incorporation On 1 December 2013 the prospectus wasamended to remove the ‘net exposure’ wordingfrom the Investment Policy and Risk Warningsections for a number of funds where the globalexposure was being measured using Value atRisk (“VaR”) methodology and replaced by afund specific statement that the fund wassubject to VaR. The reason for this is that webelieve the new wording is more transparentto shareholders. The funds affected are thefollowing:
• JPM Cautious Managed Fund
• JPM Diversified Real Return Fund
• JPM Sterling Corporate Bond Fund
• JPM Strategic Bond Fund
Also on 1 December 2013 the prospectus wasamended in order to comply with regulationsintroducing a ‘protected cell regime’. Thiswording states that the assets of the sub-fundsbelong exclusively to that sub-fund and are notavailable to discharge the liabilities of any othersub-fund or any claim against the Company.
As of 31 March 2014, Schedule 19 Stamp DutyReserve Tax (“SDRT”) no longer applies. Thiswas a negligible tax that applied to UK domiciledfunds that invested in assets liable to SDRTwhen investors sold their shares in the funds.This change in legislation was implemented byHM Revenue and Customs.
On 1 April 2014 the Instrument of Incorporationwas updated to reflect an improvement in thecalculation of the Share Class Allocation Ratio.This new calculation will include the equalisationaspect of share activity within the calculationon the same day, and should improve theongoing alignment of the share classes andreduce the possibility of share class divergenceas a result of shareholder activity.
Authorised Corporate Director’s (ACD) Report
3
Continuation�
� Return to Index

Authorised Corporate Director’s (ACD) Report – continued
Change of Benchmark of the JPMGlobal Equity Income FundOn 1 November 2013 the following changes tookplace to this Fund:
• The benchmark for the JPM Global EquityIncome Fund was amended from the ‘MSCIWorld Index (Net)’ to the ‘MSCI All CountryWorld Index (Net)’.
• The benchmark for the hedged share classeswas amended from the ‘MSCI World Index(Net) hedged to GBP’, to the ‘MSCI All CountryWorld Index (Net) hedged to GBP’.
Change to the InvestmentObjective of the JPM Multi-AssetMacro FundOn 16 December 2013 the investment objectiveof the above Fund was amended to the below:
“The Fund aims to provide positive investmentreturns over rolling 12 month periods in anymarket conditions. There is no guarantee thatpositive investment returns will be achievedover this period or any time period, and yourcapital is in fact at risk.’
The reason for this is to ensure that this Fundremained compliant with new FCA requirementsfor absolute and total return style funds.
Change to the InvestmentObjective of the JPM DiversifiedReal Return FundOn 16 December 2013 the investment objectiveof the above Fund was amended to the below:
“The Fund aims to provide an investment returnin excess of the Retail Prices Index over rolling5 year periods, although this is not guaranteed.Your capital is at risk and there is no guaranteethat positive investment returns will be achievedover any time period.”
The reason for this is to ensure that this Fundremained compliant with new FCA requirementsfor absolute and total return style funds.
Change to the InvestmentObjective of the JPM SterlingCorporate Bond FundOn 16 December 2013 the investment objectiveof the above Fund was amended to the below:
“The Fund’s investment objective is to achievea return based on a combination of income andcapital growth by investing primarily in highquality Sterling denominated Bonds (or otherBonds hedged back to Sterling).”
The reason for this is to ensure that this Fundremained compliant with new FCA requirementsfor absolute and total return style funds.
Changes to the JPM UK FocusFund and JPM UK Dynamic FundOn 16 December 2013 the limit to the numberof shares that were able to be issued by thesefunds were removed.
Launch of new Share Classes inJPM Multi-Asset Income Fundand JPM Global High Yield BondFundOn 3 February 2014 monthly net income payingshare classes were launched for the abovefunds.
Management and AdministrationAuthorised Corporate DirectorJPMorgan Funds Limited3 Lochside View, Edinburgh Park,Edinburgh, EH12 9DH(Authorised and regulated by the Financial Conduct Authority)
DepositaryNational Westminster Bank plc135 Bishopsgate, London, EC2M 3UR
(Authorised by the Prudential Regulation Authority andregulated by the Financial Conduct Authority and thePrudential Regulation Authority)
Independent AuditorsPricewaterhouseCoopers LLPAtria One, 144 Morrison Street, Edinburgh, EH3 8EX
Investment AdviserJPMorgan Asset Management (UK) Limited25 Bank Street, Canary Wharf, London, E14 5JP(Authorised and regulated by the Financial Conduct Authority)
RegistrarJPMorgan Asset Management Marketing Limited25 Bank Street, Canary Wharf, London, E14 5JP (Authorised and regulated by the Financial Conduct Authority)
By order of the Authorised Corporate Director,
Peter SchwichtDirectorJPMorgan Funds Limited14 May 2014
Dan WatkinsDirectorJPMorgan Funds Limited14 May 2014
4
� Return to Index

Market review Global equities outperformed bonds in the 12-month period to the end of January 2014, withthe MSCI World Index up 9.7%, compared tothe 4.9% decline recorded by the BarclaysGlobal Aggregate Index, both in sterling terms(source: Factset, as at 31 January 2014).
Investor sentiment was dominated for much ofthe period by growing speculation that the USFederal Reserve (the Fed) would begin reducing(or tapering) its USD85 billion programme ofmonthly asset purchases. Uncertainty aboutthe potential timing of the withdrawal ofmonetary stimulus was sparked by Fedchairman Ben Bernanke’s comments in Maythat bond buying could be scaled back “in thenext few meetings” of the Federal Open MarketCommittee.
As improving economic indicators—particularlythe falling US unemployment rate—pointed toa more entrenched US recovery, investorsbecame convinced that the Fed would beginthe tapering process in September. As a result,Bernanke’s decision in September to leave theFed’s asset purchase programme unchangedtook markets by surprise. The taper decisionultimately came in December, as the uncertaintybrought about by budgetary wrangling in theUS Congress receded, and conditions in the USlabour market showed sustained improvement.The Fed decided to reduce its monthly bondpurchases by USD10 billion, to USD75 billion,starting in January, with further reductionsexpected to follow during 2014.
The speculation about the scaling back of theFed’s monetary support had a particularlynegative effect on emerging markets (bothequity and debt) and bonds more broadly. Yieldson US and UK government bonds rosesignificantly on expectations for interest rateincreases, while emerging market investorssuffered sizeable losses due to concerns overthe financing of current account deficits in manycountries. The sell-off in emerging marketscontinued for most of the period. Whilecorporate bonds were also adversely affected,losses were less severe.
Equity markets in the US, Europe and Japanmade strong gains in 2013, although a reversalof fortunes saw them underperform in the firstmonth of the new year. Despite unemploymentremaining at a record high in the eurozone,investor sentiment towards the region becamemore positive, particularly as a pick up inpurchasing managers’ indices towards the endof the period suggested that manufacturingactivity was improving. In the second quarterof 2013, the eurozone economy finally emergedfrom recession after 18 months of contraction.Meanwhile, the pace of UK economic recoverycontinued to exceed expectations, with broad-based growth across the manufacturing,services and construction sectors. The UKunemployment rate also fell faster thananticipated.
US equities were among the top performers asthe US economy continued to lead thedeveloped world recovery. Althoughcongressional wrangling over the raising of thedebt ceiling led to a government shutdown thatbrought with it increased uncertainty, the effecton equities was muted. Japanese equities werethe star performers, however, boosted by thepositive effects of prime minister Shinzo Abe’sreform programme aimed at raising the rateof consumer price inflation to 2% in two yearsand returning the Japanese economy to a pathof sustainable growth.
Market outlookAlthough 2014 has so far brought with it areversal in market fortunes—January saw manyof last year’s strongest performing asset classessuffer sizeable losses—the case for optimismabout markets and the global economy remainsintact. Growth in the developed world isgathering momentum, and for the firstsustained period of time since the 2008-9financial crisis, a significant majority ofcountries are benefiting from expansion inmanufacturing activity.
The pace of UK economic recovery, in particular,looks set to continue exceeding expectations.Consensus forecasts for UK growth in 2014 haveroughly doubled since the middle of last year,and unemployment has fallen much faster thananticipated by the Bank of England. Elsewherein Europe, it is early days yet for the eurozonerecovery, with unemployment remaining highand business lending continuing to contract.There is some good news, however, comingfrom the peripheral eurozone countries andcountries such as Germany, where growth hasbeen gathering momentum for some time.
Emerging markets face challenges, amidgrowing investor aversion to countries such asTurkey and South Africa that have beenborrowing from international markets and aretherefore vulnerable to rising US interest rates.However, for those invested for the long term,emerging market equity valuations at currentlows could provide an attractive entry point.
It appears that, very slowly, the US is movingaway from highly accommodative monetarypolicy. With the Federal Reserve starting toscale back its bond buying programme, someparts of the world are going to cope better thanothers in a less accommodative monetary policyenvironment. The long road to a more normalinterest rate environment is unlikely to besmooth, but the withdrawal of stimulusmeasures represents a vote of confidence inthe strength of the global recovery and shouldtherefore, ultimately, be positive for markets.
JPMorgan Asset Management (UK) LimitedMarch 2014
Investment Adviser’s Report for the year ending 31 January 2014
5
� Return to Index

You should remember that past performance is not a guide to the future. The price of investments and the income from them may fall as well as rise andinvestors may not get back the full amount invested.
* For specific risks, including the risk and reward profile, please refer to the Key Investor information Document (KIID) available on the following websitehttp://am.jpmorgan.co.uk/investor/prices-and-factsheets/?list=all&tab=PricesAll equity indices stated as ‘Net’ are calculated net of tax as per the standard published approach by the index vendor unless stated otherwise.All performance returns are calculated using the quoted price of the accumulation shares. Performance returns are in Sterling.Source: J.P. Morgan.A On 01/03/09 the Fund’s benchmark was changed from MSCI AC Far East ex Japan Net to the MSCI All Country Asia ex Japan Index (Net).Benchmark Source: MSCI. Neither MSCI nor any other party involved in or related to compiling, computing or creating the MSCI data makes any express of implied warranties or representations with respect to such data (or theresults to be obtained by the use thereof), and all such parties hereby expressly disclaim all warranties of originality, accuracy, completeness, merchantability or fitness for a particular purpose with respect to any of such data.Without limiting any of the foregoing, in no event shall MSCI, any of its affiliates or any third party involved in or related to compiling computing or creating the data have any liability for any direct, indirect, special, punitive,consequential or any other damages (including lost profits) even if notified of the possibility of such damages. No further distribution or dissemination of the MSCI data is permitted without MSCI’s express written consent.
JPM Asia Fund
Fund outlookSome of the headwinds that have weighed on Asian stock markets remain,such as downward earnings revisions and emerging market redemptions.That said, there is plenty of evidence of a revival in local risk appetite, be itsmall caps in Taiwan, biotech in China or the recent sharp recovery inIndonesian securities. Though one cannot discern the catalyst to revive thesemarkets, there is solid valuation support on the downside. In the nearterm, elections in India and Indonesia will drive sentiment. In China, weexpect the macro environment to be stable in 2014, while reformimplementations become the focus. However, investors should anticipatecontinued volatility as market participants accustomed to high GDP growthprints weigh up the impact of reform.
12 month performance as at 31 January 2014 2013 2012 2011 2010
JPM AsiaA-Class Acc -9.3% 14.0% -13.1% 28.5% 51.5%
JPM AsiaB-Class Acc -8.8% 14.5% -12.6% 29.2% 52.3%
JPM AsiaC-Class Acc -8.6% – – – –
Benchmark IndexA -7.1% 11.8% -6.1% 26.1% 54.5%
Fund statisticsRisk and Reward Profile 6*
Fund size £90.5m
Benchmark IndexA MSCI All Country Asia ex Japan Index (Net)
Fund chargesA-Class Initial 3.00%, Annual 1.50%B-Class Initial Nil, Annual 1.00%C-Class Initial Nil, Annual 0.75%
Top ten holdings %Samsung Electronics 5.8Tencent 4.3Taiwan Semiconductor Manufacturing 4.3POSCO 3.4China Construction Bank ‘H’ 3.1Aia Group 3.0DBS Group 2.1Ping An Insurance ‘H’ 2.0Galaxy Entertainment Group 1.9Infosys Technologies 1.9
Investment objective and policyTo provide long-term capital growth from investment primarily in thesecurities of companies quoted or trading in Asia (excluding Japan).
The Fund aims to provide broad market exposure which will include exposureto Emerging Markets. Smaller company investments and Participation Notesmay be held on an ancillary basis.
Other instruments as permitted in the stated investment and borrowingpowers of the Company including, but not limited to, fixed interest securities,cash and cash equivalents may be held on an ancillary basis, as appropriate.
Risk profileThe value of your investment may fall as well as rise and you may get backless than you originally invested.
The value of Equity and Equity-Linked Securities may fluctuate in responseto the performance of individual companies and general market conditions.Furthermore, Participation Notes run the risk of counterparty default whichmay result in the loss of the full market value of the Note.
Emerging Markets may be subject to increased political, regulatory andeconomic instability, less developed custody and settlement practices,poor transparency and greater financial risks. Emerging Market currenciesmay be subject to volatile price movements. Emerging Market securities mayalso be subject to higher volatility and be more difficult to sell than non-Emerging Market securities.
The Fund may be concentrated in one or more industry sectors and as aresult, may be more volatile than more broadly diversified funds.
Movements in currency exchange rates can adversely affect the return ofyour investment.
Please refer to Part 11 of the Prospectus for details of the general risk factorsaffecting this Fund in addition to the specific risk factors above.
Fund reviewOver the 12 months ending January 2014, Asian equity markets overall wereweak, as the onset of tapering in the US caused currencies to weaken andfund flows to reverse, as well as continued worsening current account balancesin some countries. India continued to be weighed down by slowing economicgrowth, and Thailand’s renewed political impasse caused the Thai marketto underperform. In China, the leadership’s determination regarding economicreform is causing investors to remain cautious.
The Fund delivered a negative return and underperformed its benchmarkin the review period. The majority of the underperformance was attributableto negative asset allocation, most notably the overweight in China and theunderweight in Malaysia. Stock selection overall was positive, but specificstock picks in India and Taiwan further detracted from performance. Stockselection in China was strong.
6
Continuation�
� Return to Index

Portfolio turnover rate31.01.13 177.9%31.01.14 157.0%
The portfolio turnover rate (PTR) reflects the total of security purchases and sales, less the total of shareissues and cancellations, expressed as a percentage of the average daily net asset values over the period.
Portfolio transaction costsBroker Transaction
Commissions Taxes Total31.01.13 0.28% 0.22% 0.50%31.01.14 0.32% 0.25% 0.57%
The percentage figures disclosed above reflect the average broker commissions and transaction taxessuffered during the last 3 years divided by the average assets under management over the same period.
Stamp duty reserve tax31.01.13 0.00%31.01.14 0.00%
The percentage figures disclosed above reflect the total stamp duty reserve tax suffered during the yeardivided by the average assets under management over the same period.
Net asset values and Ongoing chargesNet assetvalue per Net asset
share class Number value per OngoingDate £’000 of shares share chargesA-Class Accumulation Shares31.01.12 104,297 101,044,692 103.2p 1.68%31.01.13 106,312 90,356,659 117.7p 1.68%31.01.14 86,995 81,462,945 106.8p 1.68%A-Class Income Shares31.01.12 580 999,924 57.97p 1.68%31.01.13 741 1,125,886 65.77p 1.68%31.01.14 639 1,075,773 59.44p 1.68%B-Class Accumulation Shares31.01.12 1,033 717,224 144.1p 1.15%31.01.13 2,378 1,440,001 165.2p 1.18%31.01.14 173 115,074 150.6p 1.18%C-Class Accumulation Shares31.01.13 382 330,355 115.6p 0.93%31.01.14 2,678 2,533,696 105.7p 0.93%C-Class Income Shares31.01.13 1 1,000 114.6p 0.93%31.01.14 24 22,970 103.5p 0.93%
The net asset value and the net asset value per income share are shown ex-dividend.
Following the adoption of the requirements of UCITS IV in June 2012, Ongoing charges has replaced theTotal Expense Ratio (“TER”). The Ongoing charges takes into account the ACD fee, the fixed expenses andany expenses paid to an affiliate in respect of stocklending activities, expressed as a percentage of theaverage daily net asset values over the period. The main difference between the two calculations is theinclusion of custodian handling charges and stocklending fees in the Ongoing charges figure. The comparativefigures have not been restated, and the historic TER is disclosed.
Geographical breakdown %China 28.4South Korea 19.5Hong Kong 14.9Taiwan 14.4India 8.8Singapore 4.5Thailand 4.0Malaysia 2.3Indonesia 1.4Philippines 0.6Net other assets 1.2
Highest/lowest share price and distribution recordDistribution
Highest Lowest per shareCalendar year share price share price (net)A-Class Accumulation Shares2009 99.50p 54.94p 0.58p2010 123.8p 91.30p 0.14p2011 126.4p 85.22p 0.19p2012 112.4p 94.00p 0.56p2013 126.0p 106.3p 0.55p2014B 112.4p 105.9p 0.47pA-Class Income Shares2009 56.38p 31.14p 0.31p2010 70.01p 51.66p 0.09p2011 71.49p 48.13p 0.11p2012 63.12p 52.79p 0.32p2013 70.41p 59.44p 0.31p2014B 62.81p 59.22p 0.26pB-Class Accumulation Shares2009 137.4p 75.51p 0.61p2010 171.8p 126.1p 0.00p2011 175.4p 118.8p 0.92p2012 157.7p 131.4p 1.58p2013 177.1p 149.5p 1.52p2014B 158.4p 149.4p 1.41pC-Class Accumulation SharesC
2012 110.3p 95.10p –2013 124.0p 104.7p 0.94p2014B 111.1p 104.8p 1.29pC-Class Income SharesC
2012 110.3p 95.10p –2013C 123.0p 103.9p 0.94p2014B 110.2p 103.9p 1.24p
B To 31 January 2014.C C-Class Accumulation Shares and C-Class Income Shares were launched on 20 August 2012.
7
Continuation�
� Return to Index

Market value Total netInvestment Holding £’000 assets %
Market value Total netInvestment Holding £’000 assets %
Portfolio statementAs at 31 January 2014
Singapore – 4.5% (3.5%)CapitaMalls Asia 1,006,000 839 0.9DBS Group 244,000 1,907 2.1Global Logistic Properties 527,000 701 0.8United Overseas Bank 69,000 655 0.7
Thailand – 4.0% (5.0%)Banpu (Alien Market) 1,008,900 488 0.5Kasikornbank Non-Voting Depositary Receipt 390,900 1,220 1.3LPN Development Public (Alien Market) 1,400,400 374 0.4PTT Exploration & Production (Alien Market) 227,400 639 0.7Siam Cement Non-Voting Depositary Receipt 137,200 1,026 1.1
Malaysia – 2.3% (0.7%)Sapura Kencana Petroleum 1,249,600 997 1.1Tenaga Nasional 505,400 1,073 1.2
Indonesia – 1.4% (3.0%)Bank Central Asia 1,522,000 751 0.8Telekomunikasi Indonesia ‘B’ 4,703,000 529 0.6
Philippines – 0.6% (0.0%)BDO Unibank 487,730 516 0.6
Investment assets 89,461 98.8
Net other assets 1,048 1.2
Net assets 90,509 100.0
Unless otherwise stated the above securities are admitted to official stock exchange listings or trade on aregulated market.
The comparative percentage figures in brackets are at 31 January 2013.
China – 28.4% (26.9%)Agricultural Bank of China ‘H’ 5,606,000 1,483 1.6China Cinda Asset Management ‘H’ 2,097,000 825 0.9China Construction Bank ‘H’ 6,697,460 2,819 3.1China Eastern Airlines ‘H’ 2,500,000 511 0.6China Life Insurance ‘H’ 598,000 990 1.1China Longyuan Power Group ‘H’ 800,000 583 0.6China Minsheng Banking ‘H’ 1,535,000 918 1.0China Oilfield Services ‘H’ 602,000 970 1.1China Overseas Land & Investments 740,000 1,210 1.3China Petroleum & Chemical ‘H’ 2,945,200 1,417 1.6China Resources Gas 530,000 999 1.1China Telecom ‘H’ 1,954,000 550 0.6China Vanke ‘B’ 1,175,008 1,160 1.3CNOOC 954,000 909 1.0Dongfeng Motor Group ‘H’ 614,000 549 0.6Great Wall Motor 282,500 818 0.9Huaneng Renewables ‘H’ 2,834,000 718 0.8MGM China 269,200 646 0.7Ping An Insurance ‘H’ 358,500 1,763 2.0Sands China 228,800 1,071 1.2Tencent 92,300 3,918 4.3Want Want China 1,093,000 893 1.0
South Korea – 19.5% (18.0%)Hyundai Development 3,750 51 0.1Hyundai Heavy Industries 7,800 980 1.1Hyundai Motor 5,800 762 0.8KB Financial Group 68,500 1,430 1.6KIA Motors 33,800 1,022 1.1Korea Investment Holdings 36,780 814 0.9LG Chemical 7,550 1,101 1.2LG Household & Healthcare 1,100 295 0.3POSCO 18,400 3,082 3.4Samsung Electronics 7,300 5,243 5.8Samsung Securities 33,200 809 0.9Shinhan Financial 38,500 986 1.1SK Innovation 15,500 1,105 1.2
Hong Kong – 14.9% (19.7%)AAC Technologies 290,000 758 0.8Aia Group 967,600 2,710 3.0Beijing Enterprises Water Group 2,480,000 850 0.9Cheung Kong 150,000 1,350 1.5China Everbright International 909,000 725 0.8Galaxy Entertainment Group 294,000 1,754 1.9Hutchison Whampoa 205,000 1,545 1.7Intime Retail Group 992,000 605 0.7Lifestyle International 650,000 708 0.8Orient Overseas International 220,500 559 0.6Prada 96,500 430 0.5Tingyi 560,000 881 1.0Wharf 154,200 638 0.7
Taiwan – 14.4% (9.8%)Advanced Semiconductor Engineering 1,720,000 966 1.1Cheng Shin Rubber Industries 148,550 227 0.3China Life Insurance 1,445,480 838 0.9China Steel Chemical 206,000 691 0.8Delta Electronics 330,000 1,097 1.2E. Sun Financial Holding 1,580,000 595 0.7Huaku Development 296,000 441 0.5Innolux Display 2,663,000 560 0.6MediaTek 159,000 1,273 1.4Ruentex Development 473,149 505 0.6Sino-American Silicon Products 396,000 439 0.5Taiwan Semiconductor Manufacturing 1,840,000 3,867 4.3Uni-President Enterprises 659,897 660 0.7United Microelectronics 2,876,000 711 0.8
India – 8.8% (11.8%)ACC 56,700 557 0.6Godrej Industries 348,119 916 1.0HDFC Bank 186,963 1,140 1.3Housing Development Finance 93,585 731 0.8Indusind Bank 215,633 801 0.9Infosys Technologies 48,571 1,739 1.9Mahindra & Mahindra 137,000 1,178 1.3Mahindra & Mahindra Financial Services 200,000 470 0.5Tata Motors 127,000 431 0.5
8
Continuation�
� Return to Index

Portfolio movements For the year ending 31 January 2014
£’000
Total of all sales for the year (Note 10) 94,568
Major sales Proceeds
Hyundai Motor 4,506Samsung Electronics 3,298Industrial & Commercial Bank of China ‘H’ 2,963KIA Motors 2,781KB Financial Group 2,643POSCO 2,539CNOOC 2,447Hyundai Heavy Industries 2,342Agricultural Bank of China ‘H’ 2,151Hyundai Mobis 1,907Shinhan Financial 1,792Krung Thai Bank (Alien Market) 1,757Hutchison Whampoa 1,515Mahindra & Mahindra Financial Services 1,505Prada 1,406Cheung Kong 1,388Jardine Matheson 1,376New World Development 1,371China Construction Bank ‘H’ 1,340New China Life Insurance ‘H’ 1,289
£’000
Total of all purchases for the year (Note 10) 85,626
Major purchases Cost
POSCO 4,172Hyundai Motor 4,134Samsung Electronics 3,162Industrial & Commercial Bank of China ‘H’ 2,994KB Financial Group 2,830China Petroleum & Chemical ‘H’ 2,777CNOOC 2,117Agricultural Bank of China ‘H’ 1,967Hyundai Heavy Industries 1,725SK Innovation 1,559Hutchison Whampoa 1,553Shinhan Financial 1,520Infosys Technologies 1,514China Overseas Land & Investments 1,508China Life Insurance ‘H’ 1,176Cheng Shin Rubber Industries 1,159LG Chemical 1,129KIA Motors 1,099United Microelectronics 1,038Advanced Semiconductor Engineering 1,029
9
Continuation�
� Return to Index

Financial statements
Balance sheetAs at 31 January
2014 2013£’000 £’000 £’000 £’000
ASSETS
Investment assets 89,461 108,004
Debtors (Note 7) 1,687 1,803
Cash and bank balances (Note 8) 599 1,109
Total other assets 2,286 2,912
Total assets 91,747 110,916
LIABILITIES
Creditors (Note 9) (1,235) (1,098)
Distribution payable on income shares (3) (4)
Total liabilities (1,238) (1,102)
Net assets attributable to shareholders 90,509 109,814
The notes to these financial statements are shown on pages 11 to 12.
Statement of total returnFor the year ending 31 January
2014 2013£’000 £’000 £’000 £’000
Income
Net capital (losses)/gains (Note 1) (9,868) 12,779
Revenue (Note 2) 2,222 2,537
Expenses (Note 3) (1,715) (1,724)
Net revenue before taxation 507 813
Taxation (Note 4) (71) (215)
Net revenue after taxation 436 598
Total return before distributions (9,432) 13,377
Finance costs: Distributions (Note 5) (440) (598)
Change in net assets attributable to shareholders from investment activities (9,872) 12,779
Statement of change in net assets attributable to shareholdersFor the year ending 31 January
2014 2013£’000 £’000 £’000 £’000
Opening net assets attributable to shareholders 109,814 105,910
Amounts receivable onissue of shares 5,185 10,922
Amounts payable on cancellation of shares (15,035) (20,319)
(9,850) (9,397)
Change in net assets attributable to shareholders from investment activities (see above) (9,872) 12,779
Retained distributions on accumulation shares 417 522
Closing net assets attributable to shareholders 90,509 109,814
10
Continuation�
� Return to Index

Notes to the financial statements for the year ending 31 January 2014
5. Finance costsDistributionsThe distributions take account of amounts receivable on the issue of shares andamounts payable on the cancellation of shares and comprise:
2014 2013£’000 £’000
Final dividend distribution 420 526Add: Amounts payable on cancellation of shares 47 113Deduct: Amounts receivable on issue of shares (27) (41)Total finance costs 440 598
Details of the distribution per share are set out on page 13.
6. Movement between net revenue after taxation and distributions2014 2013
£’000 £’000Net revenue after taxation 436 598Add: Undistributed revenue brought forward 5 5Deduct: Undistributed revenue carried forward (8) (5)Equalisation on conversions 7 –
440 598
7. Debtors2014 2013
£’000 £’000Accrued income 198 199Due from the ACD for shares created 85 12Overseas tax recoverable 48 1Sales awaiting settlement 1,356 1,591Total debtors 1,687 1,803
8. Cash and bank balances2014 2013
£’000 £’000Cash and bank balances 599 1,109
9. Creditors2014 2013
£’000 £’000Accrued expenses 133 154Due to the ACD for shares cancelled 500 197Purchases awaiting settlement 602 747Total creditors 1,235 1,098
1. Net capital (losses)/gains2014 2013
£’000 £’000Currency losses (268) (40)Non-derivative securities (9,600) 12,819 Net capital (losses)/gains (9,868) 12,779
2. Revenue2014 2013
£’000 £’000Franked income from UK equity investments – 6Income from overseas equity investments 2,162 2,455Interest on bank and term deposits 1 1Management fee rebates – 1Stock dividends 59 74Total revenue 2,222 2,537
3. Expenses2014 2013
£’000 £’000Payable to the ACD or associate of the ACD:ACD fee 1,530 1,539Fixed expenses 185 185Total expenses 1,715 1,724
4. Taxation2014 2013
£’000 £’000a) Analysis of charge in the yearOverseas tax provision (143) 431Overseas tax suffered 214 (216)Current year tax charge (Note 4b) 71 215
b) Factors affecting the tax charge for the yearThe tax assessed for the year is lower than the standard rate of corporation tax inthe UK for an Open-Ended Investment Company (OEIC) (20%). The differences areexplained below.
Net revenue before taxation 507 813Corporation tax at 20% 101 163
Effects of:Dividends not subject to corporation tax (444) (507)Excess expenses for which no relief taken 343 344Overseas tax provision (143) 431Overseas tax suffered 214 (216)
(30) 52Current year tax charge (Note 4a) 71 215
No deferred tax asset has been recognised in the financial statements. At the yearend date, the Fund had a potential unrecognised deferred tax asset of £1,714,979(31.01.13: £1,372,154) in relation to £8,574,897 (31.01.13: £6,860,770) of excessmanagement expenses which would only be utilised to reduce the tax charge if theFund had an excess of unfranked income over expenses in a future period. There isno excess of unfranked income expected in the future.
11
Continuation�
� Return to Index
Notes to the financial statements – continued
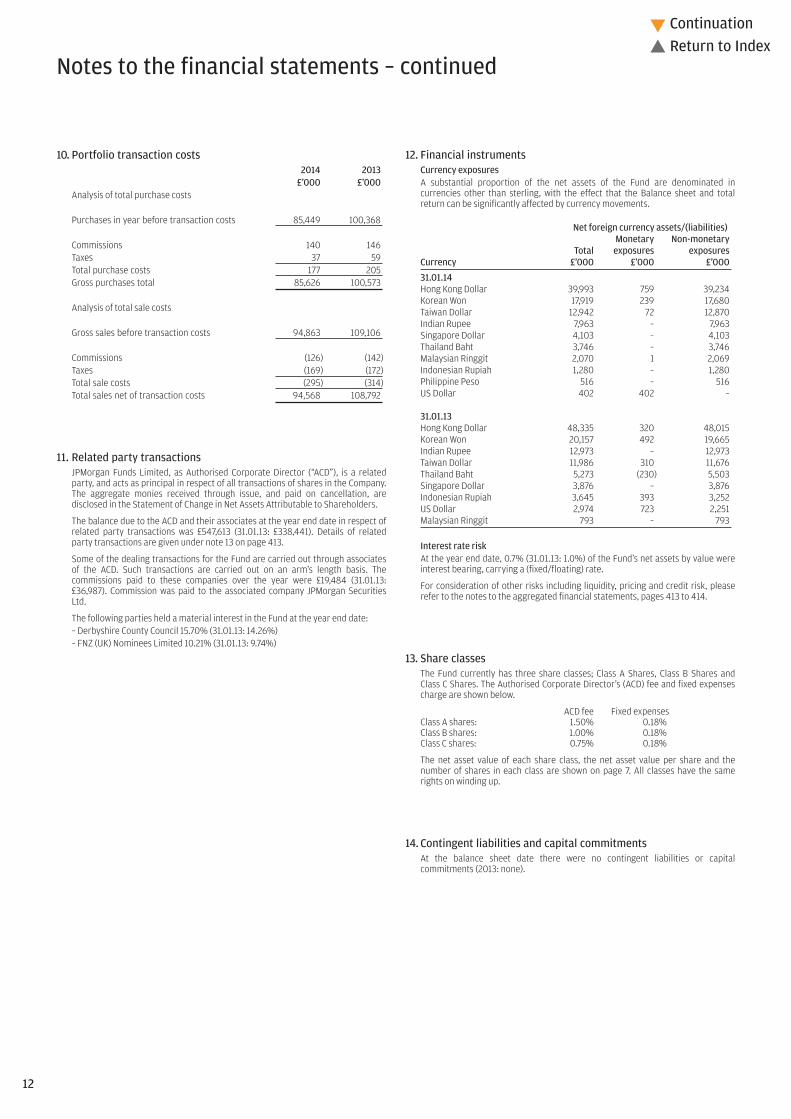
12. Financial instrumentsCurrency exposuresA substantial proportion of the net assets of the Fund are denominated incurrencies other than sterling, with the effect that the Balance sheet and totalreturn can be significantly affected by currency movements.
Net foreign currency assets/(liabilities)Monetary Non-monetary
Total exposures exposuresCurrency £’000 £’000 £’000
31.01.14Hong Kong Dollar 39,993 759 39,234Korean Won 17,919 239 17,680Taiwan Dollar 12,942 72 12,870Indian Rupee 7,963 – 7,963Singapore Dollar 4,103 – 4,103Thailand Baht 3,746 – 3,746Malaysian Ringgit 2,070 1 2,069Indonesian Rupiah 1,280 – 1,280Philippine Peso 516 – 516US Dollar 402 402 –
31.01.13Hong Kong Dollar 48,335 320 48,015Korean Won 20,157 492 19,665Indian Rupee 12,973 – 12,973Taiwan Dollar 11,986 310 11,676Thailand Baht 5,273 (230) 5,503Singapore Dollar 3,876 – 3,876Indonesian Rupiah 3,645 393 3,252US Dollar 2,974 723 2,251Malaysian Ringgit 793 – 793
Interest rate riskAt the year end date, 0.7% (31.01.13: 1.0%) of the Fund’s net assets by value wereinterest bearing, carrying a (fixed/floating) rate.
For consideration of other risks including liquidity, pricing and credit risk, pleaserefer to the notes to the aggregated financial statements, pages 413 to 414.
13. Share classesThe Fund currently has three share classes; Class A Shares, Class B Shares andClass C Shares. The Authorised Corporate Director’s (ACD) fee and fixed expensescharge are shown below.
ACD fee Fixed expensesClass A shares: 1.50% 0.18%Class B shares: 1.00% 0.18%Class C shares: 0.75% 0.18%
The net asset value of each share class, the net asset value per share and thenumber of shares in each class are shown on page 7. All classes have the samerights on winding up.
14. Contingent liabilities and capital commitmentsAt the balance sheet date there were no contingent liabilities or capitalcommitments (2013: none).
10. Portfolio transaction costs2014 2013
£’000 £’000Analysis of total purchase costs
Purchases in year before transaction costs 85,449 100,368
Commissions 140 146Taxes 37 59Total purchase costs 177 205Gross purchases total 85,626 100,573
Analysis of total sale costs
Gross sales before transaction costs 94,863 109,106
Commissions (126) (142)Taxes (169) (172)Total sale costs (295) (314)Total sales net of transaction costs 94,568 108,792
11. Related party transactionsJPMorgan Funds Limited, as Authorised Corporate Director (“ACD”), is a relatedparty, and acts as principal in respect of all transactions of shares in the Company.The aggregate monies received through issue, and paid on cancellation, aredisclosed in the Statement of Change in Net Assets Attributable to Shareholders.
The balance due to the ACD and their associates at the year end date in respect ofrelated party transactions was £547,613 (31.01.13: £338,441). Details of relatedparty transactions are given under note 13 on page 413.
Some of the dealing transactions for the Fund are carried out through associatesof the ACD. Such transactions are carried out on an arm’s length basis. Thecommissions paid to these companies over the year were £19,484 (31.01.13:£36,987). Commission was paid to the associated company JPMorgan SecuritiesLtd.
The following parties held a material interest in the Fund at the year end date:– Derbyshire County Council 15.70% (31.01.13: 14.26%)– FNZ (UK) Nominees Limited 10.21% (31.01.13: 9.74%)
12
Continuation�
� Return to Index

Distribution table
Final distribution in pence per share
Group 1 – Shares purchased prior to 1 February 2013Group 2 – Shares purchased 1 February 2013 to 31 January 2014
DistributionGross Tax Net payable paid
revenue at 10% revenue Equalisation 30.04.14 30.04.13
A-Class Accumulation Shares
Group 1 0.522222 0.052222 0.470000 – 0.470000 0.550000
Group 2 0.312539 0.031254 0.281285 0.188715 0.470000 0.550000
A-Class Income Shares
Group 1 0.288889 0.028889 0.260000 – 0.260000 0.310000
Group 2 0.231146 0.023115 0.208031 0.051969 0.260000 0.310000
B-Class Accumulation Shares
Group 1 1.566667 0.156667 1.410000 – 1.410000 1.520000
Group 2 1.566667 0.156667 1.410000 0.000000 1.410000 1.520000
C-Class Accumulation Shares
Group 1 1.433333 0.143333 1.290000 – 1.290000 0.940000
Group 2 0.155224 0.015522 0.139702 1.150298 1.290000 0.940000
C-Class Income Shares
Group 1 1.377778 0.137778 1.240000 – 1.240000 0.940000
Group 2 0.559852 0.055985 0.503867 0.736133 1.240000 0.940000
Equalisation applies only to shares purchased during the distribution period (group 2 shares). It is the average amount of revenue included in the purchase price of all group 2 shares and is refunded to holders of these
shares as a return of capital. Being capital it is not liable to income tax but must be deducted from the cost of shares for capital gains tax purposes.
13
� Return to Index

JPM Balanced Total Return Fund
Net asset values and Ongoing chargesNet assetvalue per Net asset
share class Number value per OngoingDate £’000 of shares share chargesA-Class Accumulation Shares31.01.12 7,021 13,021,569 53.92p 1.68%31.01.13 5,404 9,610,272 56.23p 1.68%31.01.14 – – – –A-Class Income Shares31.01.12 2,069 4,196,910 49.30p 1.68%31.01.13 1,906 3,783,393 50.38p 1.68%31.01.14 – – – –B-Class Accumulation Shares31.01.13 3 5,000 56.34p 1.18%31.01.14 – – – –C-Class Accumulation Shares31.01.13 47 44,040 105.5p 0.93%31.01.14 – – – –C-Class Income Shares31.01.13 1 1,000 104.7p 0.93%31.01.14 – – – –I-Class Accumulation Shares31.01.12 526 465,872 112.8p 0.75%31.01.13 549 462,227 118.8p 0.75%31.01.14 – – – –I-Class Income Shares31.01.12 449 446,722 100.6p 0.75%31.01.13 458 442,222 103.6p 0.75%31.01.14 – – – –
The net asset value and the net asset value per income share are shown ex-dividend.
Following the adoption of the requirements of UCITS IV in June 2012, Ongoing charges has replaced theTotal Expense Ratio (“TER”). The Ongoing charges takes into account the ACD fee, the fixed expenses andany expenses paid to an affiliate in respect of stocklending activities, expressed as a percentage of theaverage daily net asset values over the period. The main difference between the two calculations is theinclusion of custodian handling charges and stocklending fees in the Ongoing charges figure. The comparativefigures have not been restated, and the historic TER is disclosed.
Important informationThis Fund was terminated on 19 August 2013.
Highest/lowest share price and distribution recordDistribution
Highest Lowest per shareCalendar year share price share price (net)A-Class Accumulation Shares2009 53.46p 43.72p 1.02p2010 57.82p 51.12p 0.87p2011 58.26p 50.95p 1.07p2012 55.90p 52.17p 0.92p2013A 61.97p 54.53p 0.82pA-Class Income Shares2009 50.96p 42.24p 0.99p2010 54.07p 48.21p 0.79p2011 54.10p 46.99p 1.00p2012 51.10p 47.39p 0.83p2013A 55.15p 49.01p 0.73pB-Class Accumulation SharesB
2012 54.46p 52.74p 0.25p2013A 62.15p 54.60p 1.03pC-Class Accumulation SharesC
2012 102.0p 98.77p 0.47p2013A 116.5p 102.3p 1.51pC-Class Income SharesC
2012 101.5p 98.31p 0.47p2013A 114.8p 101.78p 1.44pI-Class Accumulation Shares2009 109.5p 89.20p 2.41p2010 119.6p 105.4p 2.01p2011 121.2p 106.2p 2.40p2012 117.0p 109.5p 2.11p2013A 131.2p 115.1p 1.85pI-Class Income Shares2009 102.4p 84.53p 2.27p2010 109.3p 97.24p 1.85p2011 109.8p 95.63p 2.18p2012 104.3p 96.93p 1.88p2013A 113.7p 100.7p 1.60p
A To 12 August 2013.B B-Class Accumulation Shares was launched on 29 October 2012.C C-Class Accumulation Shares and C-Class Income Shares were launched on 20 August 2012.
14
Continuation�
� Return to Index

Financial statements
Balance sheetAs at 31 January
2014 2013£’000 £’000 £’000 £’000
ASSETS
Investment assets – 7,774
Debtors (Note 7) – 93
Cash and bank balances (Note 8) – 897
Total other assets – 990
Total assets – 8,764
LIABILITIES
Investment liabilities – (277)
Creditors (Note 9) – (110)
Distribution payable on income shares – (9)
Total other liabilities – (119)
Total liabilities – (396)
Net assets attributable to shareholders – 8,368
The notes to these financial statements are shown on pages 16 to 17.
Statement of total returnFor the year ending 31 January
2014 2013£’000 £’000 £’000 £’000
Income
Net capital gains (Note 1) 474 276
Revenue (Note 2) 106 226
Expenses (Note 3) (68) (139)
Net revenue before taxation 38 87
Taxation (Note 4) (8) (16)
Net revenue after taxation 30 71
Total return before distributions 504 347
Finance costs: Distributions (Note 5) (90) (187)
Change in net assets attributable to shareholders from investment activities 414 160
Statement of change in net assets attributable to shareholdersFor the year ending 31 January
2014 2013£’000 £’000 £’000 £’000
Opening net assets attributable to shareholders 8,368 10,065
Amounts receivable on issue of shares 334 261
Amounts payable on cancellation of shares (9,175) (2,249)
(8,841) (1,988)
Change in net assets attributable to shareholders from investment activities (see above) 414 160
Retained distributions on accumulation shares 59 131
Closing net assets attributable to shareholders – 8,368
15
Continuation�
� Return to Index

Notes to the financial statements for the year ending 31 January 2014
1. Net capital gains2014 2013
£’000 £’000Currency gains/(losses) 111 (79)Derivative contracts (131) (549)Forward currency contracts (159) 116Non-derivative securities 653 788Net capital gains 474 276
2. Revenue2014 2013
£’000 £’000Franked income from UK equity investments 12 31Income from Liquidity funds – 1Income from overseas equity investments 78 140Interest on amounts held with futures clearing
houses and brokers – 2Interest on bank and term deposits 1 1Interest on fixed-interest securities 15 51Total revenue 106 226
3. Expenses2014 2013
£’000 £’000Payable to the ACD or associate of the ACD:ACD fee 61 125Fixed expenses 7 14Total expenses 68 139
4. Taxation2014 2013
£’000 £’000a) Analysis of charge in the yearOverseas tax suffered 8 16Current year tax charge (Note 4b) 8 16
b) Factors affecting the tax charge for the yearThe tax assessed for the year is the same as the standard rate of corporation tax inthe UK for an Open-Ended Investment Company (OEIC) (20%). The differences areexplained below.
Net revenue before taxation 38 87Corporation tax at 20% 8 17
Effects of:Dividends not subject to corporation tax (17) (34)Excess expenses for which no relief taken 9 17Overseas tax suffered 8 16
– (1)Current year tax charge (Note 4a) 8 16
No deferred tax asset has been recognised in the financial statements. At the yearend date, the Fund had a potential unrecognised deferred tax asset of £55,145(31.01.13: £45,624) in relation to £275,726 (31.01.13: £228,122) of excess managementexpenses which would only be utilised to reduce the tax charge if the Fund had anexcess of unfranked income over expenses in a future period. There is no excess ofunfranked income expected in the future.
5. Finance costsDistributionsThe distributions take account of amounts receivable on the issue of shares andamounts payable on the cancellation of shares and comprise:
2014 2013£’000 £’000
First interim dividend distribution 53 63Second interim dividend distribution 26 50Third interim dividend distribution 5 38Final dividend distribution – 29Add: Amounts payable on cancellation of shares 7 8Deduct: Amounts receivable on issue of shares (1) (1)Total finance costs 90 187
Details of the distribution per share are set out on pages 18 to 21.
6. Movement between net revenue after taxation and distributions2014 2013
£’000 £’000Net revenue after taxation 30 71Add: ACD fee (net of tax relief) paid from capital 61 116Add: Undistributed revenue brought forward 1 1Deduct: Undistributed revenue carried forward (2) (1)
90 187
7. Debtors2014 2013
£’000 £’000Accrued income – 9Due from the ACD for shares created – 16Overseas tax recoverable – 3Sales awaiting settlement – 65Total debtors – 93
8. Cash and bank balances2014 2013
£’000 £’000Amounts held at futures clearing houses
and brokers – 310Cash and bank balances – 587Total cash and bank balances – 897
9. Creditors2014 2013
£’000 £’000Accrued expenses – 11Due to the ACD for shares cancelled – 1Purchases awaiting settlement – 98Total creditors – 110
16
Continuation�
� Return to Index
Notes to the financial statements – continued
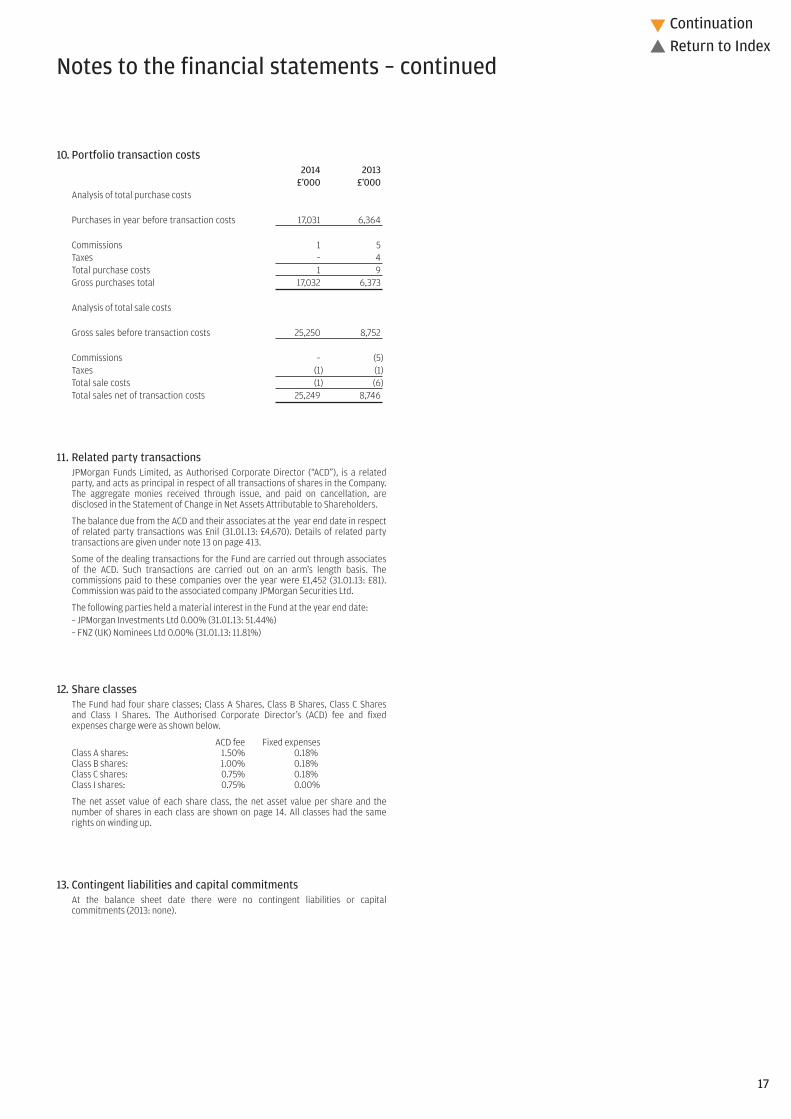
10. Portfolio transaction costs2014 2013
£’000 £’000Analysis of total purchase costs
Purchases in year before transaction costs 17,031 6,364
Commissions 1 5Taxes – 4Total purchase costs 1 9Gross purchases total 17,032 6,373
Analysis of total sale costs
Gross sales before transaction costs 25,250 8,752
Commissions – (5)Taxes (1) (1)Total sale costs (1) (6)Total sales net of transaction costs 25,249 8,746
11. Related party transactionsJPMorgan Funds Limited, as Authorised Corporate Director (“ACD”), is a relatedparty, and acts as principal in respect of all transactions of shares in the Company.The aggregate monies received through issue, and paid on cancellation, aredisclosed in the Statement of Change in Net Assets Attributable to Shareholders.
The balance due from the ACD and their associates at the year end date in respectof related party transactions was £nil (31.01.13: £4,670). Details of related partytransactions are given under note 13 on page 413.
Some of the dealing transactions for the Fund are carried out through associatesof the ACD. Such transactions are carried out on an arm’s length basis. Thecommissions paid to these companies over the year were £1,452 (31.01.13: £81).Commission was paid to the associated company JPMorgan Securities Ltd.
The following parties held a material interest in the Fund at the year end date:– JPMorgan Investments Ltd 0.00% (31.01.13: 51.44%)– FNZ (UK) Nominees Ltd 0.00% (31.01.13: 11.81%)
12. Share classesThe Fund had four share classes; Class A Shares, Class B Shares, Class C Sharesand Class I Shares. The Authorised Corporate Director’s (ACD) fee and fixedexpenses charge were as shown below.
ACD fee Fixed expensesClass A shares: 1.50% 0.18%Class B shares: 1.00% 0.18%Class C shares: 0.75% 0.18%Class I shares: 0.75% 0.00%
The net asset value of each share class, the net asset value per share and thenumber of shares in each class are shown on page 14. All classes had the samerights on winding up.
13. Contingent liabilities and capital commitmentsAt the balance sheet date there were no contingent liabilities or capitalcommitments (2013: none).
17
Continuation�
� Return to Index

Distribution tables
Final distribution in pence per share
Group 1 – Shares purchased prior to 1 November 2013Group 2 – Shares purchased 1 November 2013 to 31 January 2014
DistributionGross Tax Net payable paid
revenue at 10% revenue Equalisation 30.04.14 30.04.13
A-Class Accumulation Shares
Group 1 – – – – – 0.190000
Group 2 – – – – – 0.190000
A-Class Income Shares
Group 1 – – – – – 0.180000
Group 2 – – – – – 0.180000
B-Class Accumulation Shares
Group 1 – – – – – 0.190000
Group 2 – – – – – 0.190000
C-Class Accumulation Shares
Group 1 – – – – – 0.350000
Group 2 – – – – – 0.350000
C-Class Income Shares
Group 1 – – – – – 0.340000
Group 2 – – – – – 0.340000
I-Class Accumulation Shares
Group 1 – – – – – 0.440000
Group 2 – – – – – 0.440000
I-Class Income Shares
Group 1 – – – – – 0.390000
Group 2 – – – – – 0.390000
18
Continuation�
� Return to Index

Distribution tables – continued
Third interim distribution in pence per share
Group 1 – Shares purchased prior to 1 August 2013Group 2 – Shares purchased 1 August 2013 to 31 October 2013
DistributionGross Tax Net paid paid
revenue at 10% revenue Equalisation 08.11.13 31.01.13
A-Class Accumulation Shares
Group 1 0.055556 0.005556 0.050000 – 0.050000 0.250000
Group 2 0.053290 0.005329 0.047961 0.002039 0.050000 0.250000
A-Class Income Shares
Group 1 0.044444 0.004444 0.040000 – 0.040000 0.220000
Group 2 0.044058 0.004406 0.039652 0.000348 0.040000 0.220000
B-Class Accumulation Shares
Group 1 0.044444 0.004444 0.040000 – 0.040000 0.250000
Group 2 0.044444 0.004444 0.040000 0.000000 0.040000 0.250000
C-Class Accumulation Shares
Group 1 0.100000 0.010000 0.090000 – 0.090000 0.470000
Group 2 0.100000 0.010000 0.090000 0.000000 0.090000 0.470000
C-Class Income Shares
Group 1 0.100000 0.010000 0.090000 – 0.090000 0.470000
Group 2 0.100000 0.010000 0.090000 0.000000 0.090000 0.470000
I-Class Accumulation Shares
Group 1 0.122222 0.012222 0.110000 – 0.110000 0.550000
Group 2 0.122222 0.012222 0.110000 0.000000 0.110000 0.550000
I-Class Income Shares
Group 1 0.088889 0.008889 0.080000 – 0.080000 0.490000
Group 2 0.088889 0.008889 0.080000 0.000000 0.080000 0.490000
19
Continuation�
� Return to Index

Distribution tables – continued
Second interim distribution in pence per share
Group 1 – Shares purchased prior to 1 May 2013Group 2 – Shares purchased 1 May 2013 to 31 July 2013
DistributionGross Tax Net paid paid
revenue at 10% revenue Equalisation 31.10.13 31.10.12
A-Class Accumulation Shares
Group 1 0.244444 0.024444 0.220000 – 0.220000 0.310000
Group 2 0.125593 0.012559 0.113034 0.106966 0.220000 0.310000
A-Class Income Shares
Group 1 0.211111 0.021111 0.190000 – 0.190000 0.290000
Group 2 0.142128 0.014213 0.127915 0.062085 0.190000 0.290000
B-Class Accumulation Shares
Group 1 0.244444 0.024444 0.220000 – 0.220000 0.000000
Group 2 0.244444 0.024444 0.220000 0.000000 0.220000 0.000000
C-Class Accumulation Shares
Group 1 0.444444 0.044444 0.400000 – 0.400000 0.000000
Group 2 0.062382 0.006238 0.056144 0.343856 0.400000 0.000000
C-Class Income Shares
Group 1 0.411111 0.041111 0.370000 – 0.370000 0.000000
Group 2 0.396233 0.039623 0.356610 0.013390 0.370000 0.000000
I-Class Accumulation Shares
Group 1 0.533333 0.053333 0.480000 – 0.480000 0.710000
Group 2 0.533333 0.053333 0.480000 0.000000 0.480000 0.710000
I-Class Income Shares
Group 1 0.477778 0.047778 0.430000 – 0.430000 0.630000
Group 2 0.477778 0.047778 0.430000 0.000000 0.430000 0.630000
20
Continuation�
� Return to Index

Distribution tables – continued
First interim distribution in pence per share
Group 1 – Shares purchased prior to 1 February 2013Group 2 – Shares purchased 1 February 2013 to 30 April 2013
DistributionGross Tax Net paid paid
revenue at 10% revenue Equalisation 31.07.13 31.07.12
A-Class Accumulation Shares
Group 1 0.400000 0.040000 0.360000 – 0.360000 0.360000
Group 2 0.273436 0.027343 0.246093 0.113907 0.360000 0.360000
A-Class Income Shares
Group 1 0.355555 0.035555 0.320000 – 0.320000 0.320000
Group 2 0.175384 0.017538 0.157846 0.162154 0.320000 0.320000
B-Class Accumulation Shares
Group 1 0.411111 0.041111 0.370000 – 0.370000 0.000000
Group 2 0.411111 0.041111 0.370000 0.000000 0.370000 0.000000
C-Class Accumulation Shares
Group 1 0.744444 0.074444 0.670000 – 0.670000 0.000000
Group 2 0.403277 0.040327 0.362950 0.307050 0.670000 0.000000
C-Class Income Shares
Group 1 0.711111 0.071111 0.640000 – 0.640000 0.000000
Group 2 0.711111 0.071111 0.640000 0.000000 0.640000 0.000000
I-Class Accumulation Shares
Group 1 0.911111 0.091111 0.820000 – 0.820000 0.850000
Group 2 0.911111 0.091111 0.820000 0.000000 0.820000 0.850000
I-Class Income Shares
Group 1 0.777777 0.077777 0.700000 – 0.700000 0.760000
Group 2 0.777777 0.077777 0.700000 0.000000 0.700000 0.760000
Equalisation applies only to shares purchased during the distribution period (group 2 shares). It is the average amount of revenue included in the purchase price of all group 2 shares and is refunded to holders of these
shares as a return of capital. Being capital it is not liable to income tax but must be deducted from the cost of shares for capital gains tax purposes.
21
� Return to Index

You should remember that past performance is not a guide to the future. The price of investments and the income from them may fall as well as rise andinvestors may not get back the full amount invested. Formerly JPM Cautious Total Return Fund, the Fund name was changed on 29/07/13.All equity indices stated as ‘Net’ are calculated net of tax as per the standard published approach by the index vendor unless stated otherwise.All performance returns are calculated using the quoted price of the accumulation and income shares. Performance returns are in Sterling.Source: J.P. Morgan.A On 29/0713 the benchmark for the Fund was changed from BBA 1 Month GBP LIBOR to 70% J.P. Morgan GBI Global Hedged to GBP, 30% MSCI World Index (Net) Hedged to GBP.Benchmark Source: MSCI. The MSCI data is comprised of a custom index calculated by MSCI for, and as requested by JPMorgan Asset Management (UK) Ltd. The MSCI data is for internal use only and may not be redistributedor used in connection with creating or offering any securities, financial products or indices. Neither MSCI nor any other third party involved in or related to compiling, computing or creating the MSCI data (the “MSCIParties”) makes any express or implied warranties or representations with respect to such data (or the results to be obtained by the use thereof), and the MSCI Parties hereby expressly disclaim all warranties oforiginality, accuracy, completeness, merchantability or fitness for a particular purpose with respect to such data. Without limiting any of the foregoing, in no event shall any of the MSCI Parties have any liability for anydirect, indirect, special, punitive, consequential or any other damages (including lost profits) even if notified of the possibility of such damages.
JPM Cautious Managed Fund
Emerging Markets may be subject to increased political, regulatory andeconomic instability, less developed custody and settlement practices,poor transparency and greater financial risks. Emerging Market currenciesmay be subject to volatile price movements. Emerging Market securities mayalso be subject to higher volatility and be more difficult to sell than non-Emerging Market securities.
To the extent that any underlying assets of the Fund are denominated in acurrency other than Sterling and are not hedged back to Sterling, movementsin currency exchange rates can adversely affect the return of your investment.The currency hedging that may be used to minimise the effect of currencyfluctuations may not always be successful.
Please refer to Part 11 of the Prospectus for details of the general risk factorsaffecting this Fund in addition to the specific risk factors above.
Fund reviewIn the 12 months to 31 January 2014, global equities delivered double-digitreturns as economic data improved, particularly in the US and Europe. Thedecision of the US Federal Reserve to taper its asset purchases contributedto negative performance for bond markets and the underperformance ofemerging vs. developed equity markets.
Against this backdrop, the Fund delivered a positive return and outperformedits benchmark. In equities, we were biased towards developed markets overemerging. In particular, we were overweight the US and Japan, which benefitedperformance, and we favoured the global financials and health care sectors. Infixed income, we reflected US rate normalisation in our fixed income positions,holding low levels of duration, and moved to a long position in Europe.
Fund outlookOur conviction in markets has lowered slightly and we expect increased volatilitythis year. Our concerns centre around the cyclical challenges in emergingeconomies and the resilience of the global economy in the face of rising rates.However, we retain a positive outlook for risk assets as performance driversremain in place for now, namely improving global growth with quiescent inflation,accommodative monetary policy and still-supportive valuations.
12 month performance as at 31 January 2014 2013 2012 2011 2010
JPM Cautious ManagedA-Class Acc 8.0% -4.2% -3.9% 2.7% 6.6%
JPM Cautious ManagedB-Class Acc 8.4% – – – –
JPM Cautious ManagedC-Class Inc 8.5% -3.7% -3.4% 3.3% 7.4%
JPM Cautious ManagedI-Class Acc 8.8% -3.6% -3.2% 3.4% 7.3%
JPM Cautious ManagedX-Class Gross Acc 9.6% -2.7% -2.3% – –
Benchmark IndexA 3.7% 0.6% 0.7% 0.6% 0.7%
Investment objective and policyThe Fund aims to provide income and long-term capital growth by investingin a global portfolio of assets. The Fund will primarily invest in Debt Securities(which may include Below-Investment Grade Bonds and Unrated Securities),Convertible Bonds, Equity securities (which may include smaller companies)and short-term securities.
Issuers of securities may be located in any country, including EmergingMarkets and the Fund may invest in assets denominated in any currency.
The Fund will have a bias towards Bonds.
Asset and country allocations may vary over time to reflect market conditionsand opportunities. The Fund may invest up to 90% in government and publicsecurities (see section 3.11(e) of the Prospectus). The Fund may use FinancialDerivative Instruments (derivatives) for investment purposes or EfficientPortfolio Management, including hedging, where appropriate.
The Fund’s assets will be primarily either denominated in Sterling or hedgedback to Sterling.
Risk profileThe value of your investment may fall as well as rise and you may get backless than you originally invested.
The value of Bonds and other Debt Securities may change significantlydepending on market, economic and interest rate conditions as well as thecreditworthiness of the issuer. Issuers of Bonds and other Debt Securitiesmay fail to meet payment obligations (default) or the credit rating of Bondsand other Debt Securities may be downgraded. These risks are typicallyincreased for Below Investment Grade and certain Unrated securities whichmay also be subject to higher volatility and be more difficult to sell thanInvestment Grade securities.
Bonds and other Debt Securities with a lower credit rating may have a higherrisk of defaulting which may in turn have an adverse effect on the performanceof Funds which invest in them.
The value of Equity and Equity-Linked Securities may fluctuate in responseto the performance of individual companies and general market conditions.
Convertible Bonds are subject to the credit, interest rate and market risksassociated with both Bonds and Equity securities, and to risks specific toConvertible Securities. Convertible Bonds may also be more difficult to sellthan the underlying Equity securities.
The Fund may use Financial Derivative Instruments (derivatives) and/orforward transactions for investment purposes. The value of derivatives canbe volatile. This is because a small movement in the value of the underlyingasset can cause a large movement in the value of the derivative and therefore,investment in derivatives may result in losses in excess of the amount investedby the Fund.
The Fund’s asset allocation is actively managed. There is a risk that theperformance of the Fund will suffer if the allocation to any particular assetclass is low when that asset class is outperforming or high when that assetclass is underperforming.
22
Continuation�
� Return to Index
* For specific risks, including the risk and reward profile, please refer to the Key Investor information Document (KIID) available on the following websitehttp://am.jpmorgan.co.uk/investor/prices-and-factsheets/?list=all&tab=PricesB As agreed from time to time between the ACD and the relevant JPMorgan Chase & Co. entity.
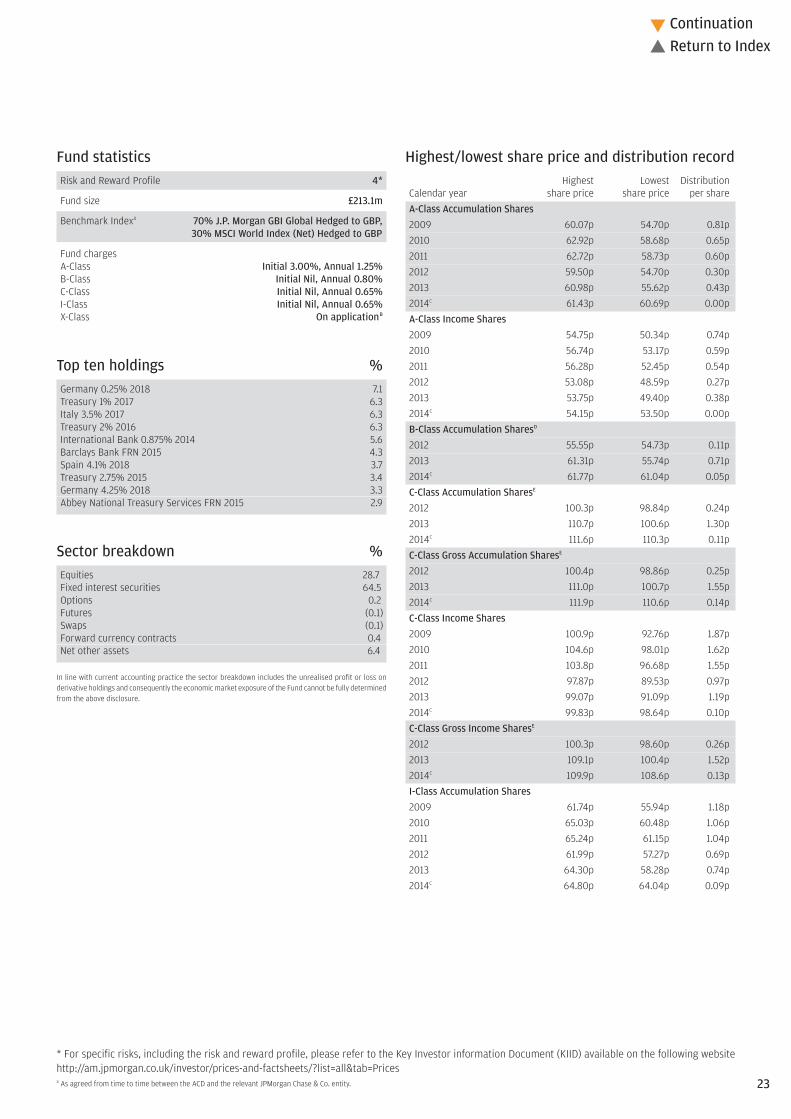
Highest/lowest share price and distribution recordHighest Lowest Distribution
Calendar year share price share price per shareA-Class Accumulation Shares2009 60.07p 54.70p 0.81p2010 62.92p 58.68p 0.65p2011 62.72p 58.73p 0.60p2012 59.50p 54.70p 0.30p2013 60.98p 55.62p 0.43p2014C 61.43p 60.69p 0.00pA-Class Income Shares2009 54.75p 50.34p 0.74p2010 56.74p 53.17p 0.59p2011 56.28p 52.45p 0.54p2012 53.08p 48.59p 0.27p2013 53.75p 49.40p 0.38p2014C 54.15p 53.50p 0.00pB-Class Accumulation SharesD
2012 55.55p 54.73p 0.11p2013 61.31p 55.74p 0.71p2014C 61.77p 61.04p 0.05pC-Class Accumulation SharesE
2012 100.3p 98.84p 0.24p2013 110.7p 100.6p 1.30p2014C 111.6p 110.3p 0.11pC-Class Gross Accumulation SharesE
2012 100.4p 98.86p 0.25p2013 111.0p 100.7p 1.55p2014C 111.9p 110.6p 0.14pC-Class Income Shares2009 100.9p 92.76p 1.87p2010 104.6p 98.01p 1.62p2011 103.8p 96.68p 1.55p2012 97.87p 89.53p 0.97p2013 99.07p 91.09p 1.19p2014C 99.83p 98.64p 0.10pC-Class Gross Income SharesE
2012 100.3p 98.60p 0.26p2013 109.1p 100.4p 1.52p2014C 109.9p 108.6p 0.13pI-Class Accumulation Shares2009 61.74p 55.94p 1.18p2010 65.03p 60.48p 1.06p2011 65.24p 61.15p 1.04p2012 61.99p 57.27p 0.69p2013 64.30p 58.28p 0.74p2014C 64.80p 64.04p 0.09p
Fund statisticsRisk and Reward Profile 4*
Fund size £213.1m
Benchmark IndexA 70% J.P. Morgan GBI Global Hedged to GBP, 30% MSCI World Index (Net) Hedged to GBP
Fund chargesA-Class Initial 3.00%, Annual 1.25%B-Class Initial Nil, Annual 0.80%C-Class Initial Nil, Annual 0.65%I-Class Initial Nil, Annual 0.65%X-Class On applicationB
Top ten holdings %Germany 0.25% 2018 7.1Treasury 1% 2017 6.3Italy 3.5% 2017 6.3Treasury 2% 2016 6.3International Bank 0.875% 2014 5.6Barclays Bank FRN 2015 4.3Spain 4.1% 2018 3.7Treasury 2.75% 2015 3.4Germany 4.25% 2018 3.3Abbey National Treasury Services FRN 2015 2.9
Sector breakdown %Equities 28.7Fixed interest securities 64.5Options 0.2Futures (0.1)Swaps (0.1)Forward currency contracts 0.4Net other assets 6.4
In line with current accounting practice the sector breakdown includes the unrealised profit or loss onderivative holdings and consequently the economic market exposure of the Fund cannot be fully determinedfrom the above disclosure.
23
Continuation�
� Return to Index

Net asset values and Ongoing chargesNet assetvalue per Net asset
share class Number value per OngoingDate £’000 of shares share chargesA-Class Accumulation Shares31.01.12 536,592 910,422,817 58.94p 1.43%31.01.13 294,845 523,467,645 56.33p 1.43%31.01.14 189,823 311,739,192 60.88p 1.43%A-Class Income Shares31.01.12 40,526 77,128,022 52.54p 1.43%31.01.13 20,419 40,993,167 49.81p 1.43%31.01.14 13,456 25,069,161 53.68p 1.43%B-Class Accumulation Shares31.01.13 3 5,000 56.37p 0.98%31.01.14 45 73,514 61.24p 0.98%C-Class Accumulation Shares31.01.13 250 245,132 101.9p 0.83%31.01.14 3,993 3,609,438 110.6p 0.83%C-Class Gross Accumulation Shares31.01.13 1 1,000 102.0p 0.83%31.01.14 56 50,733 110.9p 0.83%C-Class Income Shares31.01.12 736 760,100 96.78p 0.77%31.01.13 86 93,612 91.76p 0.83%31.01.14 917 927,692 98.87p 0.83%C-Class Gross Income Shares31.01.13 1 1,000 101.0p 0.83%31.01.14 1 1,000 108.9p 0.83%I-Class Accumulation Shares31.01.12 7,001 11,403,903 61.40p 0.65%31.01.13 4,697 7,953,999 59.05p 0.65%31.01.14 54 84,048 64.25p 0.65%I-Class Gross Accumulation Shares31.01.12 6,545 5,751,006 113.8p 0.65%31.01.13 5,050 4,598,487 109.8p 0.65%31.01.14 4,236 3,538,677 119.7p 0.65%I-Class Income Shares31.01.12 2,673 5,087,624 52.54p 0.65%31.01.13 551 1,108,109 49.76p 0.65%31.01.14 558 1,040,667 53.65p 0.65%X-Class Gross Accumulation Shares31.01.12 6,172 6,403,096 96.39p 0.06%31.01.13 1 1,500 93.58p 0.06%31.01.14 2 1,500 102.7p 0.06%
The net asset value and the net asset value per income share are shown ex-dividend.
Following the adoption of the requirements of UCITS IV in June 2012, Ongoing charges has replaced theTotal Expense Ratio (“TER”). The Ongoing charges takes into account the ACD fee, the fixed expenses andany expenses paid to an affiliate in respect of stocklending activities, expressed as a percentage of theaverage daily net asset values over the period. The main difference between the two calculations is theinclusion of custodian handling charges and stocklending fees in the Ongoing charges figure. The comparativefigures have not been restated, and the historic TER is disclosed.
Highest/lowest share price and distribution record(continued)
Highest Lowest DistributionCalendar year share price share price per shareI-Class Gross Accumulation Shares2009 113.5p 102.5p 2.77p2010 120.0p 111.4p 2.38p2011 120.8p 113.3p 2.38p2012 114.9p 106.4p 1.58p2013 119.8p 108.4p 1.92p2014C 120.7p 119.3p 0.21pI-Class Income Shares2009 54.80p 50.37p 1.06p2010 56.81p 53.20p 0.92p2011 56.35p 52.49p 0.91p2012 53.14p 48.55p 0.57p2013 53.77p 49.40p 0.72p2014C 54.19p 53.55p 0.07pX-Class Gross Accumulation SharesF
2010 100.3p 98.18p –2011 102.2p 95.93p 2.43p2012 97.32p 90.53p 1.90p2013 102.7p 92.31p 1.96p2014C 103.5p 102.3p 0.35p
C To 31 January 2014.D B-Class Accumulation Shares were launched on 29 October 2012.E C-Class Accumulation Shares, C-Class Gross Accumulation Shares and C-Class Gross Income Shares were
launched on 1 October 2012.F X-Class Gross Accumulation Shares were launched on 15 November 2010.
Portfolio turnover rate31.01.13 294.6%31.01.14 408.0%
The portfolio turnover rate (PTR) reflects the total of security purchases and sales, less the total of shareissues and cancellations, expressed as a percentage of the average daily net asset values over the period.
Portfolio transaction costsBroker Transaction
Commissions Taxes Total31.01.13 0.08% 0.06% 0.14%31.01.14 0.11% 0.07% 0.18%
The percentage figures disclosed above reflect the average broker commissions and transaction taxessuffered during the last 3 years divided by the average assets under management over the same period.
Stamp duty reserve tax31.01.13 (0.01%)31.01.14 0.00%
The percentage figures disclosed above reflect the total stamp duty reserve tax suffered during the yeardivided by the average assets under management over the same period.
24
Continuation�
� Return to Index

Market value Total netInvestment Holding £’000 assets %
Market value Total netInvestment Holding £’000 assets %
Portfolio statementAs at 31 January 2014
Fixed interest securities – 64.5% (40.6%)Sterling – 31.1%Abbey National Treasury Services FRN 2015 £6,000,000 6,086 2.9Barclays Bank FRN 2015 £9,000,000 9,117 4.3International Bank 0.875% 2014 £12,000,000 12,033 5.6Treasury 1% 2017 £13,600,000 13,463 6.3Treasury 2% 2016 £13,000,000 13,347 6.3Treasury 2.25% 2014 £4,800,000 4,808 2.3Treasury 2.75% 2015 £7,200,000 7,360 3.4Euro – 30.2%Finland 2.75% 2028 €6,700,000 5,781 2.7France 1% 2018 €7,100,000 5,907 2.8Germany 0.25% 2018 €18,576,000 15,166 7.1Germany 4.25% 2018 €7,300,000 7,006 3.3Italy 2.25% 2016 €7,000,000 5,888 2.8Italy 3.5% 2017 €15,400,000 13,358 6.3Italy 5.5% 2022 €3,500,000 3,302 1.5Spain 4.1% 2018 €8,900,000 7,945 3.7US Dollar – 3.2%Hutchison Whampoa 6% Perpetual $7,400,000 4,744 2.2US Treasury 1.625% 2022 $3,500,000 1,978 1.0
Options – 0.2% (0.2%)FTSE 100 Put Options 6500 Feb 2014 81 113 0.1SPX Put Options Feb 2014 50 98 –SPXW Put Options Feb 2014 99 134 0.1
Forward currency contracts – 0.4% ((1.1)%)Australian DollarBuy AUD2,015,119 sell MXN23,514,470 dated 18/02/14 4 –Sell AUD6,791,623 buy £3,722,661 dated 18/02/14 132 0.1Canadian DollarBuy CAD7,874,129 sell HKD54,727,055 dated 18/02/14 (11) –Buy CAD4,743,971 sell $4,255,003 dated 18/02/14 (12) –Buy CAD1,944,130 sell SEK11,503,313 dated 18/02/14 (13) –Sell CAD6,688,101 buy £3,739,398 dated 18/02/14 112 –EuroBuy €4,285,464 sell £3,539,517 dated 18/02/14 (12) –Sell €92,394,382 buy £76,953,444 dated 18/02/14 888 0.4Hong Kong DollarBuy HKD27,564,587 sell MXN47,201,599 dated 18/02/14 26 –Buy HKD27,688,366 sell SEK23,122,944 dated 18/02/14 21 –Japanese YenBuy ¥1,232,653,543 sell £7,280,093 dated 18/02/14 47 –Sell ¥3,639,756,043 buy £21,239,545 dated 18/02/14 (397) (0.2)Mexican Peso Sell MXN46,235,528 buy £2,142,812 dated 18/02/14 55 –New Zealand DollarBuy NZD4,515,033 sell £2,305,095 dated 18/02/14 (82) –Sell NZD4,515,033 buy £2,299,646 dated 18/02/14 77 –Norwegian KroneBuy NOK17,493,433 sell HUF636,801,590 dated 18/02/14 19 –Sell NOK4,653,049 buy £455,959 dated 18/02/14 6 –South African RandBuy ZAR37,032,820 sell £2,085,853 dated 18/02/14 (101) –Sell ZAR37,032,820 buy £2,068,618 dated 18/02/14 84 –Swiss FrancBuy CHF2,172,250 sell $2,392,438 dated 18/02/14 9 –Buy CHF1,911,530 sell £1,289,066 dated 18/02/14 (2) –Sell CHF8,856,239 buy £5,992,298 dated 18/02/14 28 –US DollarsBuy $3,897,451 sell HUF880,856,622 dated 18/02/14 56 –Buy $31,111,375 sell £18,898,903 dated 18/02/14 5 –Buy $1,864,710 sell BRL4,526,584 dated 18/02/14 3 –Sell $67,342,454 buy £40,975,927 dated 18/02/14 58 0.1Sell $3,000,000 buy £1,812,597 dated 18/02/14 (10) –
Equities – 28.7% (40.8%)United States of America – 12.2%Actavis 16,177 1,835 0.9Aetna 58,934 2,465 1.1CBS ‘B’ 36,609 1,316 0.6Covidien 40,880 1,703 0.8CVS Caremark 39,950 1,643 0.8HCA 45,802 1,377 0.6Macy’s 46,327 1,517 0.7Metlife 42,691 1,291 0.6Mylan Laboratories 67,416 1,865 0.9Pfizer 89,314 1,672 0.8Prudential Financial 24,893 1,288 0.6St. Jude Medical 50,661 1,885 0.9Thermo Fisher Scientific 19,177 1,339 0.6Time Warner 32,397 1,249 0.6UnitedHealth Group 43,693 1,932 0.9Wells Fargo 58,662 1,641 0.8Japan – 6.4%Asahi Kasei 88,000 411 0.2Bridgestone 19,400 430 0.2Daito Trust Construction 13,700 793 0.4Haseko 88,000 404 0.2Japan Tobacco 50,100 951 0.4Mitsubishi UFJ Financial Group 718,200 2,659 1.2Mizuho Financial Group 1,132,700 1,474 0.7Nippon Telegraph & Telephone 40,500 1,336 0.6ORIX 39,500 373 0.2Sekisui House 45,500 388 0.2Sumitomo Mitsui Financial Group 66,000 1,892 0.9Sumitomo Mitsui Trust 629,000 1,851 0.9Toyota Motor 16,700 588 0.3United Kingdom – 4.1%Berkeley Group ‘B’ 41,477 1,058 0.5BT Group 178,699 678 0.3GKN 132,376 513 0.2GlaxoSmithKline 92,867 1,443 0.7Lancashire 17,870 134 0.1Legal & General Group 503,991 1,074 0.5Next 23,369 1,441 0.7Shire 61,813 1,855 0.9WPP 39,693 494 0.2Switzerland – 1.8%Novartis 26,260 1,260 0.6Roche (Genusscheine) 9,050 1,496 0.7Swiss Re 8,822 463 0.2Zurich Insurance Group 3,830 671 0.3Netherlands – 1.4%ING Groep 110,588 884 0.4Wolters-Kluwer 47,917 804 0.4Nutreco 29,356 791 0.4Reed Elsevier 45,030 561 0.2France – 0.8%Cap Gemini 27,675 1,152 0.5Sanofi 9,175 548 0.3Germany – 0.6%Bayer 12,073 962 0.4Deutsche Wohnen 18,331 209 0.1TAG Immobilien 17,450 128 0.1Norway – 0.6%Marine Harvest 172,115 1,199 0.6Belgium – 0.5%Ageas 38,359 995 0.5Denmark – 0.3%Novo-Nordisk ‘B’ 29,570 714 0.3
25
Continuation�
� Return to Index

Market value Total netInvestment Holding £’000 assets %
Portfolio statement – continuedAs at 31 January 2014
Futures – (0.1)% ((0.3)%)CAC 40 Index Futures Mar 2014 (152) 216 0.1Euro Bund Index Futures Mar 2014 (84) (177) (0.1)FTSE 100 Index Futures Mar 2014 49 (54) –FTSE/JSE 40 Index Futures Mar 2014 (142) 49 –FTSE/MIB Index Futures Mar 2014 (26) 32 –Hang Seng Index Futures Feb 2014 (109) (20) –IBEX 35 Futures Feb 2014 (26) 20 –MDAX Index Futures Mar 2014 78 (241) (0.1)Mini MSCI Futures Mar 2014 (219) 446 0.2Russell 2000 Mini Futures Mar 2014 65 79 –S&P500 E-Mini Futures Mar 2014 439 (426) (0.2)Swiss Market IX Futures Mar 2014 116 (287) (0.1)Topix Index Futures Mar 2014 (43) 186 0.1US 10 Year Note Futures Mar 2014 347 35 –US 5 Year Treasury Note Futures Mar 2014 (180) 22 –
Swaps – (0.1)% (0.0%)Euro Stoxx 50 Equity Variance Swaps 0.05%
20 Jun 2014 3,171 (545) (0.3)FTSE 100 Equity Variance Swaps 0.03%
20 Jun 2014 933 (19) –Hang Seng Equity Variance Swaps 0.07%
27 Jun 2014 26,831 (339) (0.2)Hang Seng Equity Variance Swaps 0.08%
27 Jun 2014 12,422 (247) (0.1)Inflation Rate Swaps UK RPI 0% 26 Feb 2023 (7,400,000) (104) (0.1)Inflation Rate Swaps UK RPI 0% 07 Mar 2023 (7,400,000) (201) (0.1)Inflation Rate Swaps UK RPI 0% 17 Apr 2023 (7,700,000) (184) (0.1)KRX Korea Equity Variance Swaps 0.0324%
12 Jun 2014 1,568,478 (19) –S&P500 Equity Variance Swaps 0.0361%
20 Jun 2014 4,879 547 0.3S&P500 Equity Variance Swaps 0.04%
20 Jun 2014 4,879 547 0.3S&P500 Equity Variance Swaps 0.05%
20 Jun 2014 2,151 363 0.2
Investment assets (including investment liabilities) 199,398 93.6
Net other assets 13,743 6.4
Net assets 213,141 100.0
Unless otherwise stated the above securities are admitted to official stock exchange listings or trade on aregulated market.
The comparative percentage figures in brackets are at 31 January 2013.
Market value Portfolio credit ratings £’000
AAA 57,167AA+ 44,885BBB 35,237
Total bonds 137,289
Equities 61,095Options 345Forward currency contracts 990Futures (120)Swaps (201)
Investment assets (including investment liabilities) 199,398
26
Continuation�
� Return to Index
Counterparty exposure
Equity Forward Indexvariance currency Futures Option
swaps contracts contracts contracts TotalCounterparty £’000 £’000 £’000 £’000 £’000
Barclays – 1 – – 1BNP Paribas 1,457 – – – 1,457CitiBank – 137 – – 137Credit Suisse – 968 – – 968Deutsche Bank – (24) – – (24)Goldman Sachs – (379) 1,082 345 1,048HSBC – 99 – – 99RBC – (24) – – (24)Societe Generale – 80 – – 80State Street – 87 – – 87Toronto Dominion Bank – 50 – – 50Westpac Banking Corp – (6) – – (6)
At the balance sheet date, there was no collateral received by the fund from the above counterparties.
The counterparty exposure on forward currency contracts is reported at their mark to market values butfor futures contracts it is only the positive mark to market values that are reported.

Portfolio movements For the year ending 31 January 2014
£’000
Total of all sales for the year (Note 10) 585,488
Major sales Proceeds
Australia FRN Index Linked 2020 17,702Germany 4% 2018 17,155JPM Global Strategic Bond ‘X’ GBP (Distribution)^ 17,102Treasury 1% 2017 14,735Germany 0% 2015 14,433New Zealand FRN 2025 13,891S&P US Select Sector Source ETF Fund ‘A’ 13,685Wells Fargo ‘A’ Perpetual Convertible Preference 13,025British Land 1.5% Convertible 2017 11,773Italy 4.75% 2016 10,613Bank of America 10,207Siemens 1.65% Convertible 2019 9,858Germany 2.25% 2021 9,370Microsoft 0% Convertible 2013 9,211Treasury 2.25% 2014 8,050Sumitomo Mitsui Financial Group 6,520Sanofi 6,488Mitsubishi UFJ Financial Group 6,422Treasury 2.75% 2015 6,172Italy 5.5% 2022 5,975
£’000
Total of all purchases for the year (Note 10) 459,044
Major purchases Cost
Germany 0.25% 2018 15,523Germany 0% 2015 14,232Treasury 2.75% 2015 13,689Treasury 1% 2017 13,661Treasury 2% 2016 13,479S&P US Select Sector Source ETF Fund ‘A’ 12,967Treasury 2.25% 2014 12,936Italy 5.5% 2022 9,442Germany 2.25% 2021 9,363Finland 2.75% 2028 9,214Spain 4.1% 2018 7,965Mitsubishi UFJ Financial Group 7,590Germany 4.25% 2018 7,292Sumitomo Mitsui Financial Group 7,036Italy 3.5% 2017 6,268Sumitomo Mitsui Trust 6,204France 1% 2018 6,079New Zealand FRN 2025 5,991Italy 2.25% 2016 5,961Mizuho Financial Group 5,649
^ Deemed to be investment in related parties of the ACD
27
Continuation�
� Return to Index

Financial statements
Balance sheetAs at 31 January
2014 2013£’000 £’000 £’000 £’000
ASSETS
Investment assets 202,901 310,091
Debtors (Note 7) 7,137 6,221
Cash and bank balances (Note 8) 12,847 24,561
Total other assets 19,984 30,782
Total assets 222,885 340,873
LIABILITIES
Investment liabilities (3,503) (5,227)
Creditors (Note 9) (6,239) (9,648)
Distribution payable on income shares (2) (94)
Total other liabilities (6,241) (9,742)
Total liabilities (9,744) (14,969)
Net assets attributable to shareholders 213,141 325,904
The notes to these financial statements are shown on pages 29 to 31.
Statement of total returnFor the year ending 31 January
2014 2013£’000 £’000 £’000 £’000
Income
Net capital gains/(losses) (Note 1) 20,503 (30,916)
Revenue (Note 2) 5,271 10,866
Expenses (Note 3) (3,743) (6,314)
Net revenue before taxation 1,528 4,552
Taxation (Note 4) (256) (349)
Net revenue after taxation 1,272 4,203
Total return before distributions 21,775 (26,713)
Finance costs: Distributions (Note 5) (1,346) (4,244)
Change in net assets attributable to shareholders from investment activities 20,429 (30,957)
Statement of change in net assets attributable to shareholdersFor the year ending 31 January
2014 2013£’000 £’000 £’000 £’000
Opening net assets attributable to shareholders 325,904 600,245
Amounts receivable on issue of shares 3,975 1,579
Amounts payable on cancellation of shares (138,122) (247,951)
(134,147) (246,372)
Change in net assets attributable to shareholders from investment activities (see above) 20,429 (30,957)
Retained distributions on accumulation shares 963 2,924
Stamp duty reserve tax (8) 64
Closing net assets attributable to shareholders 213,141 325,904
28
Continuation�
� Return to Index

Notes to the financial statements for the year ending 31 January 2014
5. Finance costsDistributionsThe distributions take account of amounts receivable on the issue of shares andamounts payable on the cancellation of shares and comprise:
2014 2013£’000 £’000
First interim interest distribution 998 406Second interim interest distribution 241 765Third interim interest distribution 14 988Final interest distribution 17 1,778Add: Amounts payable on cancellation of shares 80 309Deduct: Amounts receivable on issue of shares (4) (2)Total finance costs 1,346 4,244
Details of the distribution per share are set out on pages 32 to 35.
6. Movement between net revenue after taxation and distributions2014 2013
£’000 £’000Net revenue after taxation 1,272 4,203Add: Net expense payable from capital 23 –Add: Undistributed revenue brought forward 50 91Deduct: Undistributed revenue carried forward – (50)Equalisation on conversions 1 –
1,346 4,244
7. Debtors2014 2013
£’000 £’000Accrued income 914 882Due from the ACD for shares created 18 154Overseas tax recoverable 131 65Sales awaiting settlement 6,074 5,120Total debtors 7,137 6,221
8. Cash and bank balances2014 2013
£’000 £’000Amounts held at futures clearing houses
and brokers 6,809 8,229Cash and bank balances 6,038 16,332Total cash and bank balances 12,847 24,561
9. Creditors2014 2013
£’000 £’000Accrued expenses 257 396Due to the ACD for shares cancelled 994 2,127Income tax payable (2) 559Purchases awaiting settlement 4,990 6,566Total creditors 6,239 9,648
1. Net capital gains/(losses)2014 2013
£’000 £’000Currency gains/(losses) 825 (3,812)Derivative contracts (5,804) (47,203)Forward currency contracts 8,082 4,919Non-derivative securities 17,400 15,180Net capital gains/(losses) 20,503 (30,916)
2. Revenue2014 2013
£’000 £’000Distributions from overseas investments – 25Franked income from UK equity investments 361 490Income from overseas equity investments 2,337 2,906Interest on amounts held with futures clearing
houses and brokers – 40Interest on bank and term deposits 95 107Interest on fixed-interest securities 2,478 6,892Stock dividends – 406Total revenue 5,271 10,866
3. Expenses2014 2013
£’000 £’000Payable to the ACD or associate of the ACD:ACD fee 3,277 5,528Fixed expenses 466 786Total expenses 3,743 6,314
4. Taxation2014 2013
£’000 £’000a) Analysis of charge in the yearOverseas tax suffered 256 349Current year tax charge (Note 4b) 256 349
b) Factors affecting the tax charge for the yearThe tax assessed for the year is lower than the standard rate of corporation tax inthe UK for an Open-Ended Investment Company (OEIC) (20%). The differences areexplained below.
Net revenue before taxation 1,528 4,552Corporation tax at 20% 306 910
Effects of:Dividends not subject to corporation tax (540) (756)Excess expenses for which no relief taken 234 (69)Interest distributions deductible for tax purposes – (85)Overseas tax suffered 256 349
(50) (561)Current year tax charge (Note 4a) 256 349
No deferred tax asset has been recognised in the financial statements. At the yearend date, the Fund had a potential unrecognised deferred tax asset of £679,151(31.01.13: £444,704) in relation to £3,395,754 (31.01.13: £2,223,520) of excessinterest distributions which would only be utilised to reduce the tax charge if theFund had an excess of unfranked income over expenses in a future period. There isno excess of unfranked income expected in the future.
29
Continuation�
� Return to Index

Notes to the financial statements – continued
12. Financial instrumentsCurrency exposuresA substantial proportion of the net assets of the Fund are denominated incurrencies other than sterling, with the effect that the Balance sheet and totalreturn can be significantly affected by currency movements.
Net foreign currency assets/(liabilities)Monetary Non-monetary
Total exposures exposuresCurrency £’000 £’000 £’000
31.01.14Euro 72,562 1,871 70,691US Dollar 36,108 1,523 34,585Japanese Yen 14,372 636 13,736Swiss Franc 3,464 (140) 3,604Brazilian Real 1,349 1,349 –Norwegian Krone 1,193 (6) 1,199Danish Krone 714 – 714South African Rand 126 77 49Australian Dollar 122 122 –Mexican Peso 115 115 –Canadian Dollar 107 107 –Hungarian Forint 83 83 –Swedish Krona 38 38 –New Zealand Dollar (5) (5) –Korean Won (19) – (19)Hong Kong Dollar (96) 510 (606)
31.01.13Brazilian Real 1,993 1,993 –Japanese Yen 1,574 (21,659) 23,233Singapore Dollar 1,251 (1,546) 2,797Swiss Franc 1,251 (8,199) 9,450Danish Krone 689 – 689Norwegian Krone 533 (2,193) 2,726Euro 196 (66,836) 67,032US Dollar (89) (86,330) 86,241New Zealand Dollar (435) (10,266) 9,831Australian Dollar (488) (17,884) 17,396Hong Kong Dollar (657) (657) –
10. Portfolio transaction costs2014 2013
£’000 £’000Analysis of total purchase costs
Purchases in year before transaction costs 458,696 726,532
Commissions 157 169Taxes 191 208Total purchase costs 348 377Gross purchases total 459,044 726,909
Analysis of total sale costs
Gross sales before transaction costs 585,683 887,974
Commissions (186) (228)Taxes (9) (9)Total sale costs (195) (237)Total sales net of transaction costs 585,488 887,737
11. Related party transactionsJPMorgan Funds Limited, as Authorised Corporate Director (“ACD”), is a relatedparty, and acts as principal in respect of all transactions of shares in the Company.The aggregate monies received through issue, and paid on cancellation, aredisclosed in the Statement of Change in Net Assets Attributable to Shareholders.
The balance due to the ACD and their associates at the year end date in respect ofrelated party transactions was £1,233,050 (31.01.13: £2,369,195). Details of relatedparty transactions are given under note 13 on page 413.
Investments considered to be related parties have been identified in the portfoliostatement on pages 25 to 26 and the revenue from these investments was £nil(31.01.13: £24,883).
Some of the dealing transactions for the Fund are carried out through associatesof the ACD. Such transactions are carried out on an arm’s length basis. Thecommissions paid to these companies over the year were £34,179 (31.01.13: £658).Commission was paid to the associated company JPMorgan Securities Ltd.
The following party held a material interest in the Fund at the year end date:– Scottish Widows Unit Funds Ltd 11.91% (31.01.13: 0.00%)
30
Continuation�
� Return to Index

Notes to the financial statements – continued
Fixed rate financial assetsWeighted
averageWeighted period for
average which rate is Currency interest rate fixed (years)
31.01.14US Dollar 8.5% 8.5Euro 1.4% 5.2UK Sterling 0.7% 1.8
31.01.13Singapore Dollar 2.2% 5.1New Zealand Dollar 1.9% 12.6Euro 1.7% 4.1US Dollar 1.2% 4.2UK Sterling 0.8% 3.6Australian Dollar – 7.6
For consideration of other risks including liquidity, pricing and credit risk, pleaserefer to the notes to the aggregated financial statements, pages 413 to 414.
13. Share classesThe Fund currently has five share classes; Class A Shares, Class B Shares, Class CShares, Class I Shares and Class X Shares. The Authorised Corporate Director’s(ACD) fee and fixed expenses charge are shown below.
ACD fee Fixed expensesClass A shares: 1.25% 0.18%Class B shares: 0.80% 0.18%Class C shares: 0.65% 0.18%Class I shares: 0.65% 0.00%Class X shares: 0.00% 0.06%
The X share class is designed to accommodate an alternative charging structurewhereby the annual fee normally charged to the Fund and then passed on in theshare price is instead administratively levied and collected by the ACD from theshareholder or through the relevant JPMorgan Chase & Co entity.
The net asset value of each share class, the net asset value per share and thenumber of shares in each class are shown on page 24. All classes have the samerights on winding up.
14. Derivatives The Fund enters into derivative transactions in the form of credit default swaps,forward currency contracts, futures and options. The Fund may use derivatives forinvestment purposes or efficient portfolio management including hedging, whereappropriate. The positive mark to market approach has been used to calculate theglobal exposure.
The Investment Adviser assesses the market risk of the Fund’s investments,including derivative exposure, using historical simulation methodology. This processprovides an estimate of the maximum potential loss that could be expected tooccur as a result of changes in market prices over a given period of time in all but agiven percentage of circumstances. The VaR is calculated on a 99% confidencelevel with a 20 day horizon & 500 days of history. As at the balance date the VaRwas 2.61%.
The effective observation period changed to 500 days from 31/10/2012 onwardsdue to a change to a new VaR calculation process.
Further information on the derivative risks can be found in the notes to theaggregated financial statements on page 414.
15. Contingent liabilities and capital commitmentsAt the balance sheet date there were no contingent liabilities or capitalcommitments (2013: none).
Interest rate riskThe tables below detail the interest rate profile of the Fund’s assets and liabilitiesas at the year end.
Financialassets
Floating Fixed notrate rate carrying
Total financial financial anyassets assets assets interest
Currency £’000 £’000 £’000 £’000
31.01.14UK Sterling 85,822 25,059 51,011 9,752Euro 72,562 312 64,353 7,897US Dollar 36,108 5,044 1,978 29,086Japanese Yen 17,001 (78) – 17,079Swiss Franc 4,162 453 – 3,709Brazilian Real 1,349 1,357 – (8)Norwegian Krone 1,193 – – 1,193Danish Krone 714 – – 714South African Rand 126 94 – 32Australian Dollar 122 – – 122Mexican Peso 115 – – 115Canadian Dollar 107 – – 107Hungarian Forint 83 – – 83Swedish Krona 38 – – 38New Zealand Dollar (5) – – (5)Korean Won (19) – – (19)Hong Kong Dollar (95) 553 – (648)
31.01.13UK Sterling 324,258 22,329 38,879 263,050Japanese Yen 3,914 – – 3,914Brazilian Real 1,993 1,993 – –Singapore Dollar 1,669 – 1,653 16Norwegian Krone 1,485 – – 1,485Swiss Franc 1,251 – – 1,251Euro 1,011 815 45,244 (45,048)US Dollar 956 11,763 30,757 (41,564)Danish Krone 689 – – 689New Zealand Dollar (435) – 9,831 (10,266)Australian Dollar (488) 3,008 17,034 (20,530)Hong Kong Dollar (657) 5 – (662)
The floating rate financial assets comprise investments in variable interest ratepaying corporate debt and bank balances that bear interest at rates based onLIBOR or its overseas equivalent.
Floating Financialrate liabilities
Total financial not carryingliabilities liabilities any interest
Currency £’000 £’000 £’000
31.01.14UK Sterling 2,914 – 2,914Japanese Yen 2,629 – 2,629Swiss Franc 698 – 698
31.01.13UK Sterling 4,172 – 4,172Japanese Yen 2,340 – 2,340US Dollar 1,045 – 1,045Norwegian Krone 952 – 952Euro 815 – 815Singapore Dollar 418 – 418
31
Continuation�
� Return to Index

Distribution tables
Final interest distribution in pence per share
Group 1 – Shares purchased prior to 1 November 2013Group 2 – Shares purchased 1 November 2013 to 31 January 2014
DistributionGross Tax Net payable paid
revenue at 20% revenue Equalisation 30.04.14 30.04.13
A-Class Accumulation Shares
Group 1 0.000000 0.000000 0.000000 – 0.000000 0.240000
Group 2 0.000000 0.000000 0.000000 0.000000 0.000000 0.240000
A-Class Income Shares
Group 1 0.000000 0.000000 0.000000 – 0.000000 0.220000
Group 2 0.000000 0.000000 0.000000 0.000000 0.000000 0.220000
B-Class Accumulation Shares
Group 1 0.062500 0.012500 0.050000 – 0.050000 0.360000
Group 2 0.031171 0.006234 0.024937 0.025063 0.050000 0.360000
C-Class Accumulation Shares
Group 1 0.137500 0.027500 0.110000 – 0.110000 0.580000
Group 2 0.095149 0.019030 0.076119 0.033881 0.110000 0.580000
C-Class Gross Accumulation Shares
Group 1 0.140000 0.000000 0.140000 – 0.140000 0.710000
Group 2 0.140000 0.000000 0.140000 0.000000 0.140000 0.710000
C-Class Income Shares
Group 1 0.125000 0.025000 0.100000 – 0.100000 0.540000
Group 2 0.101118 0.020224 0.080894 0.019106 0.100000 0.540000
C-Class Gross Income Shares
Group 1 0.130000 0.000000 0.130000 – 0.130000 0.710000
Group 2 0.130000 0.000000 0.130000 0.000000 0.130000 0.710000
I-Class Accumulation Shares
Group 1 0.112500 0.022500 0.090000 – 0.090000 0.350000
Group 2 0.041074 0.008215 0.032859 0.057141 0.090000 0.350000
I-Class Gross Accumulation Shares
Group 1 0.210000 0.000000 0.210000 – 0.210000 0.810000
Group 2 0.180926 0.000000 0.180926 0.029074 0.210000 0.810000
I-Class Income Shares
Group 1 0.087500 0.017500 0.070000 – 0.070000 0.320000
Group 2 0.087500 0.017500 0.070000 0.000000 0.070000 0.320000
X-Class Gross Accumulation Shares
Group 1 0.350000 0.000000 0.350000 – 0.350000 0.540000
Group 2 0.350000 0.000000 0.350000 0.000000 0.350000 0.540000
32
Continuation�
� Return to Index

Distribution tables – continued
Third interim interest distribution in pence per share
Group 1 – Shares purchased prior to 1 August 2013Group 2 – Shares purchased 1 August 2013 to 31 October 2013
DistributionGross Tax Net paid paid
revenue at 20% revenue Equalisation 31.01.14 31.01.13
A-Class Accumulation Shares
Group 1 0.000000 0.000000 0.000000 – 0.000000 0.110000
Group 2 0.000000 0.000000 0.000000 0.000000 0.000000 0.110000
A-Class Income Shares
Group 1 0.000000 0.000000 0.000000 – 0.000000 0.100000
Group 2 0.000000 0.000000 0.000000 0.000000 0.000000 0.100000
B-Class Accumulation Shares
Group 1 0.062500 0.012500 0.050000 – 0.050000 0.110000
Group 2 0.053650 0.010730 0.042920 0.007080 0.050000 0.110000
C-Class Accumulation Shares
Group 1 0.175000 0.035000 0.140000 – 0.140000 0.240000
Group 2 0.058155 0.011631 0.046524 0.093476 0.140000 0.240000
C-Class Gross Accumulation Shares
Group 1 0.150000 0.000000 0.150000 – 0.150000 0.250000
Group 2 0.000000 0.000000 0.000000 0.150000 0.150000 0.250000
C-Class Income Shares
Group 1 0.162500 0.032500 0.130000 – 0.130000 0.280000
Group 2 0.079146 0.015829 0.063317 0.066683 0.130000 0.280000
C-Class Gross Income Shares
Group 1 0.140000 0.000000 0.140000 – 0.140000 0.260000
Group 2 0.140000 0.000000 0.140000 0.000000 0.140000 0.260000
I-Class Accumulation Shares
Group 1 0.012500 0.002500 0.010000 – 0.010000 0.200000
Group 2 0.012500 0.002500 0.010000 0.000000 0.010000 0.200000
I-Class Gross Accumulation Shares
Group 1 0.240000 0.000000 0.240000 – 0.240000 0.480000
Group 2 0.240000 0.000000 0.240000 0.000000 0.240000 0.480000
I-Class Income Shares
Group 1 0.112500 0.022500 0.090000 – 0.090000 0.160000
Group 2 0.112500 0.022500 0.090000 0.000000 0.090000 0.160000
X-Class Gross Accumulation Shares
Group 1 0.380000 0.000000 0.380000 – 0.380000 0.550000
Group 2 0.380000 0.000000 0.380000 0.000000 0.380000 0.550000
33
Continuation�
� Return to Index
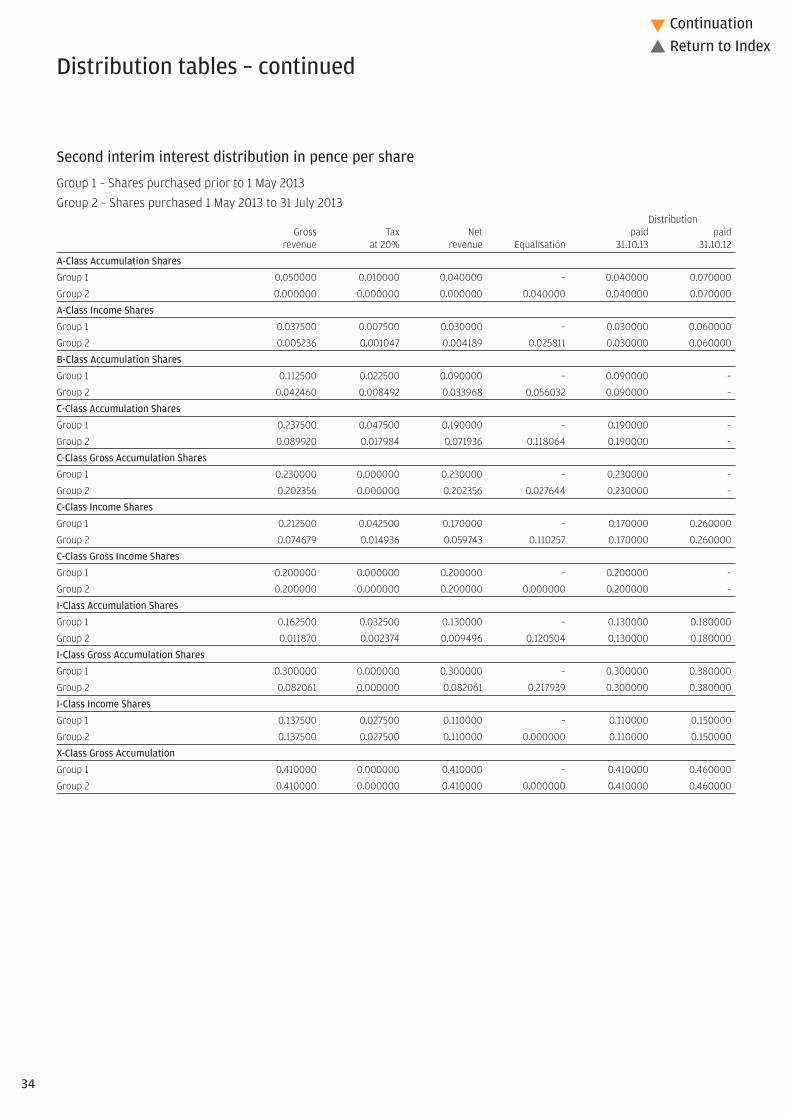
Distribution tables – continued
Second interim interest distribution in pence per share
Group 1 – Shares purchased prior to 1 May 2013Group 2 – Shares purchased 1 May 2013 to 31 July 2013
DistributionGross Tax Net paid paid
revenue at 20% revenue Equalisation 31.10.13 31.10.12
A-Class Accumulation Shares
Group 1 0.050000 0.010000 0.040000 – 0.040000 0.070000
Group 2 0.000000 0.000000 0.000000 0.040000 0.040000 0.070000
A-Class Income Shares
Group 1 0.037500 0.007500 0.030000 – 0.030000 0.060000
Group 2 0.005236 0.001047 0.004189 0.025811 0.030000 0.060000
B-Class Accumulation Shares
Group 1 0.112500 0.022500 0.090000 – 0.090000 –
Group 2 0.042460 0.008492 0.033968 0.056032 0.090000 –
C-Class Accumulation Shares
Group 1 0.237500 0.047500 0.190000 – 0.190000 –
Group 2 0.089920 0.017984 0.071936 0.118064 0.190000 –
C-Class Gross Accumulation Shares
Group 1 0.230000 0.000000 0.230000 – 0.230000 –
Group 2 0.202356 0.000000 0.202356 0.027644 0.230000 –
C-Class Income Shares
Group 1 0.212500 0.042500 0.170000 – 0.170000 0.260000
Group 2 0.074679 0.014936 0.059743 0.110257 0.170000 0.260000
C-Class Gross Income Shares
Group 1 0.200000 0.000000 0.200000 – 0.200000 –
Group 2 0.200000 0.000000 0.200000 0.000000 0.200000 –
I-Class Accumulation Shares
Group 1 0.162500 0.032500 0.130000 – 0.130000 0.180000
Group 2 0.011870 0.002374 0.009496 0.120504 0.130000 0.180000
I-Class Gross Accumulation Shares
Group 1 0.300000 0.000000 0.300000 – 0.300000 0.380000
Group 2 0.082061 0.000000 0.082061 0.217939 0.300000 0.380000
I-Class Income Shares
Group 1 0.137500 0.027500 0.110000 – 0.110000 0.150000
Group 2 0.137500 0.027500 0.110000 0.000000 0.110000 0.150000
X-Class Gross Accumulation
Group 1 0.410000 0.000000 0.410000 – 0.410000 0.460000
Group 2 0.410000 0.000000 0.410000 0.000000 0.410000 0.460000
34
Continuation�
� Return to Index

Distribution tables – continued
First interim interest distribution in pence per share
Group 1 – Shares purchased prior to 1 February 2013Group 2 – Shares purchased 1 February 2013 to 30 April 2013
DistributionGross Tax Net paid paid
revenue at 20% revenue Equalisation 31.07.13 31.07.12
A-Class Accumulation Shares
Group 1 0.187500 0.037500 0.150000 – 0.150000 0.030000
Group 2 0.101713 0.020342 0.081371 0.068629 0.150000 0.030000
A-Class Income Shares
Group 1 0.162500 0.032500 0.130000 – 0.130000 0.020000
Group 2 0.121452 0.024290 0.097162 0.032838 0.130000 0.020000
B-Class Accumulation Shares
Group 1 0.262500 0.052500 0.210000 – 0.210000 –
Group 2 0.240978 0.048195 0.192783 0.017217 0.210000 –
C-Class Accumulation Shares
Group 1 0.487500 0.097500 0.390000 – 0.390000 –
Group 2 0.316670 0.063334 0.253336 0.136664 0.390000 –
C-Class Gross Accumulation Shares
Group 1 0.460000 0.000000 0.460000 – 0.460000 –
Group 2 0.460000 0.000000 0.460000 0.000000 0.460000 –
C-Class Income Shares
Group 1 0.437500 0.087500 0.350000 – 0.350000 0.140000
Group 2 0.189771 0.037954 0.151817 0.198183 0.350000 0.140000
C-Class Gross Income Shares
Group 1 0.470000 0.000000 0.470000 – 0.470000 –
Group 2 0.470000 0.000000 0.470000 0.000000 0.470000 –
I-Class Accumulation Shares
Group 1 0.312500 0.062500 0.250000 – 0.250000 0.110000
Group 2 0.193051 0.038610 0.154441 0.095559 0.250000 0.110000
I-Class Gross Accumulation Shares
Group 1 0.570000 0.000000 0.570000 – 0.570000 0.280000
Group 2 0.387783 0.000000 0.387783 0.182217 0.570000 0.280000
I-Class Income Shares
Group 1 0.250000 0.050000 0.200000 – 0.200000 0.100000
Group 2 0.250000 0.050000 0.200000 0.000000 0.200000 0.100000
X-Class Gross Accumulation Shares
Group 1 0.630000 0.000000 0.630000 – 0.630000 0.370000
Group 2 0.630000 0.000000 0.630000 0.000000 0.630000 0.370000
Equalisation applies only to shares purchased during the distribution period (group 2 shares). It is the average amount of revenue included in the purchase price of all group 2 shares and is refunded to holders of these
shares as a return of capital. Being capital it is not liable to income tax but must be deducted from the cost of shares for capital gains tax purposes.
35
� Return to Index

JPM Diversified Real Return Fund
Emerging Markets may be subject to increased political, regulatory andeconomic instability, less developed custody and settlement practices,poor transparency and greater financial risks. Emerging Market currenciesmay be subject to volatile price movements. Emerging Market securities mayalso be subject to higher volatility and be more difficult to sell than non-Emerging Market securities.
To the extent that any underlying assets of the Fund are denominated in acurrency other than Sterling and are not hedged back to Sterling, movementsin currency exchange rates can adversely affect the return of your investment.The currency hedging that may be used to minimise the effect of currencyfluctuations may not always be successful.
Investments in companies engaged in the business of real estate may besubject to increased liquidity risk and price volatility due to changes ineconomic conditions and interest rates.
The Fund’s asset allocation is actively managed. There is a risk that theperformance of the Fund will suffer if the allocation to any particular assetclass is low when that asset class is outperforming or high when that assetclass is underperforming.
The value of securities in which the Fund invests may be influenced bymovements in commodity prices which can be very volatile.
Please refer to Part 11 of the Prospectus for details of the general risk factorsaffecting this Fund in addition to the specific risk factors above.
Fund reviewIn the 12 months to 31 January 2014, global equities delivered double-digitreturns as economic data improved, particularly in the US and Europe. Thedecision of the US Federal Reserve to taper its asset purchases contributedto negative performance for bond markets and the underperformance ofemerging vs. developed equity markets.
The Fund delivered a negative return in the review period, underperformingits benchmark. It was a challenging period for a number of asset classes thatthe Fund has exposure in, including index-linked bonds. The largest negativecontribution came from our commodities investments and natural resourceequities, which were adversely impacted by the slowdown in emergingmarkets and the end of the commodity supercycle. This negative performancewas partially offset by strong gains from our corporate bond exposure.
Fund outlookWe retain a positive outlook for risk assets, due to improving global growthwith quiescent inflation, accommodative monetary policy and still-supportivevaluations. However, we have slightly lower conviction in markets and expectincreased volatility this year. Our concerns centre around the cyclicalchallenges in emerging economies and the resilience of the global economyin the face of rising rates.
Investment objective and policyA
The Fund aims to provide an investment return in excess of the Retail PricesIndex over rolling 5 year periods, although this is not guaranteed. Your capitalis at risk and there is no guarantee that positive investment returns will beachieved over any time period.
The Fund will primarily invest in Debt Securities (which may include Below-Investment Grade Bonds and Unrated Securities), Index-Linked Debt Securities,Convertible Bonds, Equity and Equity-Linked securities (which may includesmaller companies), Real Estate Investment Trusts (“REITs”), CommodityIndex Instruments and collective investment schemes as the InvestmentAdviser deems appropriate.
Issuers of securities may be located in any country, including EmergingMarkets and the Fund may invest in assets denominated in any currency.The Fund may invest up to 70% in government and public securities (seesection 3.11(e) of the Prospectus). The Fund’s Debt Securities, Index-LinkedDebt Securities and Commodity Index Instruments will typically be eitherdenominated in Sterling or hedged back to Sterling, however, the remainderof the Fund’s non-Sterling denominated assets will not normally be hedgedback to Sterling. The Fund may use Financial Derivative Instruments(derivatives) and forward transactions for investment purposes andEfficient Portfolio Management, including hedging, where appropriate.Other instruments as permitted in the stated investment and borrowingpowers of the Company including, but not limited to, cash and cash equivalentsmay be held on an ancillary basis, as appropriate.
Risk profileThe value of your investment may fall as well as rise and you may get backless than you originally invested.
The Fund aims to provide a return over the long term in excess of the RetailPrices Index. However, you should note that the Fund does not offer anyform of guarantee with respect to the investment objective, and no form ofcapital protection will apply. The Fund should not be used as a substitutefor liquidity funds or cash accounts.
The value of Bonds and other Debt Securities may change significantlydepending on market, economic and interest rate conditions as well as thecreditworthiness of the issuer. Issuers of Bonds and other Debt Securitiesmay fail to meet payment obligations (default) or the credit rating of Bondsand other Debt Securities may be downgraded. These risks are typicallyincreased for Below-Investment Grade Bonds and certain Unrated securitieswhich may also be subject to higher volatility and be more difficult to sellthan Investment Grade Bonds.
Bonds and other Debt Securities with a lower credit rating may have a higherrisk of defaulting which may in turn have an adverse effect on the performanceof Funds which invest in them.
The value of Equity and Equity-Linked Securities may fluctuate in responseto the performance of individual companies and general market conditions.
The Fund may use Financial Derivative Instruments (derivatives) and/orforward transactions for investment purposes. The value of derivatives canbe volatile. This is because a small movement in the value of the underlyingasset can cause a large movement in the value of the derivative and therefore,investment in derivatives may result in losses in excess of the amount investedby the Fund.
36
Continuation�
� Return to Index
A On 13/12/13 the Fund’s investment objective was changed.

You should remember that past performance is not a guide to the future. The price of investments and the income from them may fall as well as rise andinvestors may not get back the full amount invested.
* For specific risks, including the risk and reward profile, please refer to the Key Investor information Document (KIID) available on the following websitehttp://am.jpmorgan.co.uk/investor/prices-and-factsheets/?list=all&tab=PricesAll performance returns are calculated using the quoted price of the accumulation shares. Performance returns are in Sterling.Source: J.P. Morgan.
Sector breakdown %Corporate bonds 38.4Equities 27.9Government bonds 18.0Forward currency contracts 0.1Swaps 0.1Net other assets 15.5
In line with current accounting practice the sector breakdown includes the unrealised profit or loss onderivative holdings and consequently the economic market exposure of the Fund cannot be fully determinedfrom the above disclosure.
Highest/lowest share price and distribution recordDistribution
Highest Lowest per shareCalendar year share price share price (net)A-Class Accumulation SharesB
2012 51.39p 48.69p 0.08p2013 53.46p 49.57p 0.39p2014C 50.34p 49.83p 0.21pA-Class Income SharesB
2012 51.30p 48.69p 0.08p2013 53.18p 49.30p 0.39p2014C 49.88p 49.38p 0.21pB-Class Accumulation SharesD
2012 51.41p 50.68p –2013 53.53p 49.67p 0.49p2014C 50.58p 50.07p 0.26pC-Class Accumulation SharesE
2012 102.6p 100.2p –2013 106.9p 99.17p 1.26p2014C 100.9p 99.90p 0.59pC-Class Income SharesE
2012 102.8p 100.2p –2013 106.3p 98.58p 1.06p2014C 99.90p 98.90p 0.63p
B A-Class Accumulation Shares and A-Class Income Shares were launched on 1 April 2012.C To 31 January 2014.D B-Class Accumulation Shares were launched on 29 October 2012.E C-Class Accumulation Shares and C-Class Income Shares were launched on 20 August 2012.
12 month performance as at 31 January2014
JPM Diversified Real ReturnA-Class Acc -4.7%
JPM Diversified Real ReturnB-Class Acc -4.4%
JPM Diversified Real ReturnC-Class Acc -4.4%
Benchmark Index -1.9%
Fund statisticsRisk and Reward Profile 5*
Fund size £21.2m
Benchmark Index Barclays Inflation-Linked UK Government Bond 1 –10 Years Index
A-Class Initial 3.00%, Annual 1.25%B-Class Initial Nil, Annual 0.80%C-Class Initial Nil, Annual 0.65%
Top ten holdings %iShares Global Infrastructure 5.8iShares Emerging Market Infrastructure 1.7Treasury 2.5% Index-Linked 2016 1.4Treasury 2.5% Index-Linked 2020 1.2Treasury 2.5% Index-Linked 2024 1.2Treasury 1.25% Index-Linked 2027 1.2Treasury 1.75% Index-Linked 2055 1.1Treasury 1.125% Index-Linked 2037 1.1Treasury 2% Index-Linked 2035 1.0Treasury 1.25% Index-Linked 2032 1.0
37
Continuation�
� Return to Index

Net asset values and Ongoing chargesNet assetvalue per Net asset
share class Number value per OngoingDate £’000 of shares share chargesA-Class Accumulation Shares31.01.13 6,512 12,452,069 52.30p 1.43%31.01.14 6,210 12,416,617 50.01p 1.43%A-Class Income Shares31.01.13 6,427 12,355,512 52.02p 1.43%31.01.14 6,100 12,361,496 49.35p 1.43%B-Class Accumulation Shares31.01.13 3 5,000 52.33p 0.98%31.01.14 3 5,000 50.25p 0.98%C-Class Accumulation Shares31.01.13 6,868 6,575,606 104.4p 0.83%31.01.14 8,906 8,883,492 100.3p 0.83%C-Class Income Shares31.01.13 1 1,000 103.9p 0.83%31.01.14 1 1,000 98.63p 0.83%
The net asset value and the net asset value per income share are shown ex-dividend.
The Ongoing charges takes into account the ACD fee, the fixed expenses and any expenses paid to an affiliatein respect of stocklending activities, expressed as a percentage of the average daily net asset values overthe period.
Portfolio turnover rate31.01.13 10.8%31.01.14 59.3%
The portfolio turnover rate (PTR) reflects the total of security purchases and sales (excluding Liquidityfunds), less the total of share issues and cancellations, expressed as a percentage of the average daily netasset values over the period.
Portfolio transaction costsBroker Transaction
Commissions Taxes Total31.01.13 0.03% 0.02% 0.05%31.01.14 0.03% 0.01% 0.04%
The percentage figures disclosed above reflect the average broker commissions and transaction taxessuffered since launch divided by the average assets under management over the same period.
Stamp duty reserve tax31.01.13 0.00%31.01.14 0.00%
The percentage figures disclosed above reflect the total stamp duty reserve tax suffered during the yeardivided by the average assets under management over the same period.
38
Continuation�
� Return to Index

Market value Total netInvestment Holding £’000 assets %
Market value Total netInvestment Holding £’000 assets %
Portfolio statementAs at 31 January 2014
Microsoft 3.5% 2042 $50,000 26 0.1 Morgan Stanley 5.625% 2019 $100,000 69 0.3 Morgan Stanley 5.5% 2021 $25,000 17 0.1 Morgan Stanley 6.375% 2042 $20,000 14 0.1 Nevada Power 5.375% 2040 $25,000 17 0.1 Newmont Mining 4.875% 2042 $15,000 7 –News America 6.15% 2037 $45,000 31 0.1 NiSource Finance 6.8% 2019 $65,000 47 0.2 NiSource Finance 5.8% 2042 $15,000 10 –Oneok Partners 3.375% 2022 $30,000 17 0.1 Oracle 2.5% 2022 $25,000 14 0.1 Oracle 6.125% 2039 $22,000 16 0.1 Orange 4.125% 2021 $35,000 22 0.1 Pacific Gas & Electric 4.45% 2042 $20,000 12 0.1 PacifiCorp 2.95% 2022 $75,000 45 0.2 Pfizer 7.2% 2039 $30,000 25 0.1 Philip Morris International 5.65% 2018 $70,000 49 0.2 Philip Morris International 4.375% 2041 $25,000 14 0.1 Phillips 66 5.875% 2042 $27,000 18 0.1 Plains All American Pipeline 5.75% 2020 $35,000 25 0.1 Plains All American Pipeline 3.85% 2023 $40,000 24 0.1 PPL Capital Funding 3.5% 2022 $75,000 44 0.2 Principal Financial Group 8.875% 2019 $40,000 31 0.1 Prudential Financial 7.375% 2019 $105,000 79 0.4 Prudential Financial 5.8% 2041 $15,000 10 –Rabobank 3.375% 2017 $150,000 97 0.5 Rio Tinto Finance 2.25% 2016 $50,000 31 0.1 Rogers Communications 6.8% 2018 $20,000 15 0.1 Royal Bank of Canada 2.2% 2018 $60,000 37 0.2 Sempra Energy 2.875% 2022 $45,000 26 0.1 Shell International Finance 2.375% 2022 $75,000 42 0.2 Simon Property Group 2.75% 2023 $25,000 14 0.1 Southern Power Companies 5.15% 2041 $35,000 22 0.1 Suncor Energy 6.5% 2038 $40,000 29 0.1 Teva Pharmaceutical Finance 2.4% 2016 $125,000 79 0.4 Time Warner 6.2% 2040 $50,000 35 0.2 Time Warner Cable 5.5% 2041 $35,000 18 0.1 TOTAL Capital S.A 4.125% 2021 $55,000 36 0.2 TOTAL Capital S.A 2.875% 2022 $40,000 24 0.1 Toyota Motor Credit 0.875% 2015 $50,000 31 0.1 Transocean 3.8% 2022 $36,000 21 0.1 UBS (Stamford Branch) 5.875% 2017 $100,000 70 0.3 United Health Group 5.7% 2040 $35,000 24 0.1 United Technologies 4.5% 2042 $30,000 18 0.1 Vale Overseas 5.625% 2019 $75,000 50 0.2 Ventas Realty 4.25% 2022 $65,000 40 0.2 Verizon Communications 5.15% 2023 $110,000 72 0.3 Verizon Communications 7.35% 2039 $40,000 31 0.1 Viacom 4.25% 2023 $35,000 22 0.1 Wal-Mart Stores 6.2% 2038 $75,000 57 0.3 Waste Management 2.6% 2016 $60,000 38 0.2 Wellpoint 5.8% 2040 $20,000 13 0.1 Wellpoint 4.625% 2042 $35,000 20 0.1 Wells Fargo 3.5% 2022 $110,000 67 0.3 Wells Fargo FRN 2016 $145,000 94 0.4 WPP Finance 2010 3.625% 2022 $50,000 30 0.1 Xcel Energy 4.7% 2020 $50,000 34 0.2 Euro – 10.8%ABN Amro Bank 3.625% 2017 € 50,000 45 0.2 Arkema 4% 2017 € 50,000 45 0.2 Atlantia 4.5% 2019 € 100,000 92 0.5 Barclays Bank 4% 2017 € 50,000 45 0.2 BAT International Finance 5.375% 2017 € 50,000 47 0.2 BHP Billiton Finance 6.375% 2016 € 50,000 46 0.2 BMW Finance 3.25% 2019 € 50,000 45 0.2 BPCE 3.75% 2017 € 100,000 89 0.5 Casino Guichard-Perrachon 4.481% 2018 € 50,000 46 0.2 Commonwealth Bank of Australlia 4.375%
2020 € 50,000 47 0.2 Credit Suisse (London Branch) 3.875% 2017 € 50,000 45 0.2 Daimler 2% 2020 € 50,000 42 0.2 Deutsche Telekom International Finance
2.125% 2021 € 60,000 50 0.2 DNB 3.875% 2020 € 50,000 46 0.2 E.ON International Finance 5.5% 2016 € 100,000 90 0.5 Enel Finance International 5.0% 2022 € 60,000 56 0.3 ENI 3.25% 2018 € 50,000 45 0.2 FCE Bank 1.75% 2018 € 100,000 83 0.4 GDF Suez 2.625% 2022 € 55,000 47 0.2 Goldman Sachs Group 5.125% 2019 € 50,000 48 0.2 Hammerson 2.75% 2019 € 100,000 86 0.4
Corporate bonds – 38.4% (39.9%)US Dollar – 23.3%Actavis 4.625% 2042 $25,000 14 0.1 Aetna 2.75% 2022 $50,000 28 0.1 Altria Group 9.95% 2038 $35,000 34 0.2 Amazon 2.5% 2022 $55,000 31 0.1 America Movil 5.625% 2017 $105,000 72 0.3 American International 6.4% 2020 $125,000 90 0.4 AmerisourceBergen 3.5% 2021 $15,000 9 –Anadarko Petroleum 6.375% 2017 $100,000 70 0.3 Anheuser-Busch InBev Worldwide 5.375% 2020 $40,000 28 0.1 Anheuser-Busch InBev Worldwide 3.75% 2042 $30,000 16 0.1 Apache 3.625% 2021 $40,000 25 0.1 Apple 1% 2018 $80,000 47 0.2 AT&T 2.95% 2016 $135,000 86 0.4 AT&T 6.3% 2038 $55,000 37 0.2 Baltimore Gas & Electric 2.8% 2022 $50,000 29 0.1 Bank of America 6.5% 2016 $285,000 195 0.9 Bank of America 5.875% 2042 $40,000 28 0.1 Bank of Montreal 2.375% 2019 $60,000 37 0.2 Bank of Nova Scotia 2.55% 2017 $50,000 32 0.2 Bank of Nova Scotia 4.375% 2021 $50,000 33 0.2 Barrick North America Finance 4.4% 2021 $95,000 57 0.3 Berkshire Hathaway Finance 5.75% 2040 $35,000 24 0.1 BNP Paribas 3.25% 2023 $90,000 52 0.2 Boston Properties 3.85% 2023 $55,000 33 0.2 BP Capital Markets 3.245% 2022 $55,000 33 0.2 British Telecommunications 9.875% FRN 2030 $15,000 14 0.1 Burlington Northern Santa Fe 5.65% 2017 $65,000 45 0.2 Burlington Northern Santa Fe 3.05% 2022 $25,000 15 0.1 Canadian Imperial Bank of Commerce 2.35%
2015 $89,000 56 0.3 Canadian Natural Resources 5.7% 2017 $65,000 45 0.2 Capital One Financial 3.15% 2016 $110,000 70 0.3 Caterpillar 5.2% 2041 $15,000 10 –Cenovus Energy 3.8% 2023 $65,000 39 0.2 Cigna 5.375% 2042 $15,000 10 –Cisco Systems 5.5% 2040 $35,000 23 0.1 Citigroup 4.45% 2017 $75,000 49 0.2 Citigroup 8.5% 2019 $180,000 141 0.7 Comcast 6.55% 2039 $73,000 54 0.3 ConAgra Foods 4.65% 2043 $34,000 20 0.1 ConocoPhillips 6.5% 2039 $18,000 14 0.1 Credit Suisse New York 5.3% 2019 $100,000 69 0.3 CSX 4.1% 2044 $40,000 22 0.1 CVS Caremark 5.75% 2041 $35,000 24 0.1 DCP Midstream Partners 3.875% 2023 $35,000 20 0.1 Deere & Co 3.9% 2042 $20,000 11 0.1 Devon Energy 3.25% 2022 $50,000 29 0.1 DirecTV Holdings 5% 2021 $80,000 52 0.2 DirecTV Holdings 3.8% 2022 $32,000 19 0.1 Dominion Resources 4.45% 2021 $95,000 62 0.3 DTE Energy 6.375% 2033 $30,000 21 0.1 Duke Energy 3.05% 2022 $100,000 59 0.3 Enbridge 4% 2023 $50,000 31 0.1 Energy Transfer Partners 6.5% 2042 $35,000 23 0.1 Enterprise Products 6.125% 2039 $50,000 35 0.2 EOG Resources 2.625% 2023 $70,000 40 0.2 Express Scripts 4.75% 2021 $50,000 33 0.2 General Electric Capital 2.3% 2017 $100,000 63 0.3 General Electric Capital 4.375% 2020 $50,000 33 0.2 General Electric Capital 5.875% 2038 $115,000 80 0.4 Gilead Sciences 4.5% 2021 $50,000 33 0.2 GlaxoSmithKline Capital 5.65% 2018 $20,000 14 0.1 GlaxoSmithKline Capital 2.85% 2022 $45,000 26 0.1 Goldman Sachs Group 3.625% 2023 $80,000 47 0.2 Goldman Sachs Group 6.25% 2041 $60,000 43 0.2 Hartford Financial Services Group 5.125% 2022 $60,000 40 0.2 HCP 5.375% 2021 $45,000 30 0.1 Home Depot 2.25% 2018 $50,000 31 0.1 International Paper 6% 2041 $20,000 14 0.1 Kinder Morgan Energy Partners 3.45% 2023 $35,000 20 0.1 Kinder Morgan Energy Partners 6.375% 2041 $30,000 20 0.1 Kroger 5.15% 2043 $35,000 22 0.1 Liberty Property Trust 4.4% 2024 $30,000 18 0.1 Lloyds TSB Bank 6.375% 2021 $50,000 37 0.2 Macy’s 5.9% 2016 $21,000 14 0.1 Macy’s 4.3% 2043 $38,000 21 0.1 Marathon Petroleum 6.5% 2041 $18,000 13 0.1 Metlife 6.75% 2016 $150,000 103 0.5 Metlife 4.125% 2042 $15,000 8 –
39
Continuation�
� Return to Index

Market value Total netInvestment Holding £’000 assets %
Market value Total netInvestment Holding £’000 assets %
Portfolio statement – continuedAs at 31 January 2014
CubeSmart 1,500 15 0.1 Darling International 468 6 –DCT Industrial Trust 5,900 25 0.1 Deere & Co 1,134 60 0.3 Devon Energy 169 6 –DiamondRock Hospitality 2,000 14 0.1 EOG Resources 121 12 0.1 Equity One 2,300 32 0.2 Equity Residential Properties Trust 500 17 0.1 Essex Property Trust 400 38 0.2 Extra Space Storage 2,700 74 0.3 ExxonMobil 1,589 91 0.5 Freeport-McMoRan Copper & Gold 1,902 37 0.2 Fresh del Monte Produce 107 2 –General Growth Properties 2,900 35 0.2 Health Care Property Investors 1,087 26 0.1 Highwoods Properties 1,100 25 0.1 Host Hotels & Resorts 6,600 73 0.3 Ingredion 227 9 –International Paper 880 25 0.1 Intrepid Potash 162 1 –Kilroy Realty 900 29 0.1 Kimco Realty 3,500 44 0.2 LaSalle Hotel Properties 500 9 –Liberty Property Trust 1,300 29 0.1 Lindsay 38 2 –Meadwestvaco 388 9 –Mid-America Apartment Communities 1,100 43 0.2 Monsanto 1,556 101 0.6 Newmont Mining 901 13 0.1 Nucor 592 17 0.1 Occidental Petroleum 329 18 0.1 PCA 193 7 –Phillips 66 281 13 0.1 Pilgrims Pride 173 2 –Plum Creek Timber 300 8 –Prologis 3,700 87 0.5 Rayonier 300 8 –Rock-Tenn ‘A’ 158 10 –Sanderson Farm 61 3 –Scotts Miracle-Gro ‘A’ 131 5 –Seaboard 1 2 –Sealed Air 384 7 –Simon Property Group 1,517 141 0.8 Southern Copper 306 5 –Sunstone Hotel Investors 3,700 29 0.1 The Mosaic Company 1,008 28 0.1 Titan International 159 2 –Tyson Foods ‘A’ 803 17 0.1 Ventas 2,171 82 0.5 Vornado Realty Trust 1,000 56 0.3 Weyerhaeuser 1,100 21 0.1 Investment funds – 7.5%iShares Emerging Market Infrastructure 26,352 347 1.7 iShares Global Infrastructure 87,130 1,210 5.8 United Kingdom – 2.5%Anglo American 2,489 35 0.2 Antofagasta 615 5 –Associated British Foods 1,056 28 0.1 BG Group 2,030 21 0.1 BP 11,435 54 0.3 British Land 12,924 85 0.5 CNH Industrial 321 2 –Derwent London 1,096 27 0.1 Glencore Xstrata 20,138 65 0.3 Hammerson 10,392 54 0.3 Helical Bar 4,241 15 0.1 Mondi 1,338 12 0.1 Polyus Gold 946 2 –Royal Dutch Shell ‘A’ 2,319 49 0.2 Safestore 22,929 44 0.2 Tate & Lyle 1,375 10 –Japan – 2.4%GLP J-REIT 34 21 0.1 Hokuto 100 1 –Iseki & Co 1,000 2 –Japan Logistics Fund REIT 20 27 0.1 Japan Real Estate Investment Trust 20 63 0.3 JFE 1,000 13 0.1
HSBC 3.875% 2018 € 100,000 92 0.5 Hutchison Whampoa Finance 4.75% 2016 € 50,000 45 0.2 ING Groep 3.875% 2016 € 100,000 88 0.4 Intesa Sanpaolo 4.125% 2020 € 50,000 44 0.2 Linde Finance 1.75% 2019 € 30,000 25 0.1 Lloyds TSB Bank 6.375% 2016 € 50,000 46 0.2 Merck Financial 4.5% 2020 € 25,000 24 0.1 Nordea Bank 3.25% 2022 € 100,000 89 0.5 Pernod Ricard 4.875% 2016 € 50,000 44 0.2 Rabobank 4.25% 2017 € 15,000 13 0.1 Santander International Debt 4.625% 2016 € 100,000 88 0.4 SES 4.625% 2020 € 60,000 56 0.3 Skandinaviska Enskilda Banken 4% 2022 € 100,000 88 0.4 Societe Generale 3.125% 2017 € 100,000 88 0.4 Svenska Handelsbanken 3.75% 2017 € 75,000 67 0.3 Swedbank 3.375% 2017 € 100,000 88 0.4 Telefonica Emision 3.661% 2017 € 50,000 44 0.2 Veolia Environnement 6.125% 2033 € 25,000 26 0.1 Volvo Treasury 5% 2017 € 50,000 46 0.2 Sterling – 4.3%Barclays Bank 5.75% 2021 £50,000 58 0.3 BAT International Finance 6.375% 2019 £40,000 48 0.2 British Telecommunications 5.75% FRN 2028 £25,000 28 0.1 Danske Bank 4% 2015 £50,000 52 0.2 GlaxoSmithKline Capital 5.25% 2033 £25,000 29 0.1 Great Rolling Stock 6.875% 2035 £48,020 59 0.3 Heathrow Funding 6.75% 2028 £50,000 63 0.3 HSBC 6.5% 2024 £50,000 62 0.3 Imperial Tobacco Finance 5.5% 2016 £50,000 55 0.3 National Express Group 6.25% 2017 £50,000 55 0.3 Orange 8% 2017 £40,000 48 0.2 Orange 5.625% 2034 £10,000 11 0.1 Porterbrook Rail Finance 6.5% 2020 £50,000 59 0.3 RWE Finance 5.625% 2023 £20,000 22 0.1 South Eastern Power Networks 5.5% 2026 £25,000 28 0.1 Standard Chartered Bank 6.5% 2014 £50,000 51 0.2 Standard Chartered Bank 7.75% 2018 £50,000 58 0.3 Vodafone Group 5.375% 2017 £50,000 56 0.3 Xstrata Finance Canada 7.375% 2020 £50,000 60 0.3
Government bonds – 18.0% (21.6%)Treasury 2.5% Index-Linked 2016 £87,857 298 1.4 Treasury 1.25% Index-Linked 2017 £136,236 197 0.9 Treasury 2.5% Index-Linked 2020 £75,102 273 1.2 Treasury 0.125% Index-Linked 2024 £65,000 70 0.3 Treasury 2.5% Index-Linked 2024 £81,811 268 1.2 Treasury 1.25% Index-Linked 2027 £169,997 261 1.2 Treasury 0.125% Index-Linked 2029 £130,601 141 0.7 Treasury 4.125% Index-Linked 2030 £54,525 169 0.8 Treasury 1.25% Index-Linked 2032 £144,974 207 1.0 Treasury 0.75% Index-Linked 2034 £117,570 145 0.7 Treasury 2% Index-Linked 2035 £102,880 208 1.0 Treasury 1.125% Index-Linked 2037 £143,246 225 1.1 Treasury 0.625% Index-Linked 2040 £132,732 177 0.8 Treasury 0.625% Index-Linked 2042 £133,146 185 0.9 Treasury 0.125% Index-Linked 2044 £108,500 115 0.5 Treasury 0.75% Index-Linked 2047 £123,881 187 0.9 Treasury 0.5% Index-Linked 2050 £131,496 182 0.9 Treasury 0.25% Index-Linked 2052 £91,000 102 0.5 Treasury 1.75% Index-Linked 2055 £115,289 229 1.1 Treasury 0.375% Index-Linked 2062 £144,199 181 0.9
Equities – 27.9% (24.6%)United States of America – 9.1%AGCO 269 9 –Alcoa 1,976 14 0.1 American Campus Communities 1,000 21 0.1 American Vanguard 71 1 –Anadarko Petroleum 224 11 0.1 Apache 175 9 –Archer-Daniels-Midland 1,949 47 0.2 AvalonBay Communities 700 52 0.2 Boston Properties 1,300 85 0.5 Brandywine Realty Trust 3,100 27 0.1 Bunge 437 20 0.1 Cable & Associates Properties 2,000 20 0.1 Cal Maine Foods 44 1 –CF Industries 170 24 0.1 Chevron 802 57 0.3 ConocoPhillips 508 20 0.1
40
Continuation�
� Return to Index

Market value Total netInvestment Holding £’000 assets %
Market value Total netInvestment Holding £’000 assets %
Portfolio statement – continuedAs at 31 January 2014
Phosagro GDR 235 1 –Rosneft GDR 554 2 –Surgutneftegaz ADR 497 2 –Uralkali GDR 1,006 15 0.1 Finland – 0.3%Stora Enso ‘R’ 2,072 12 0.1 Technopolis 4,204 16 0.1 UPM-Kymmene 1,916 18 0.1 Brazil – 0.2%Brasil Foods ADR 1,914 21 0.1 Fibria Celulose ADR 837 6 –Gerdau ADR Preference 1,628 7 –Petroleo Brasileiro ADS 997 7 –Vale ADR 2,423 20 0.1 Netherlands – 0.1%Nutreco 209 6 –VastNed Retail 919 27 0.1 Norway – 0.1%Marine Harvest 939 7 –Salmar 154 1 –Statoil 635 9 –Yara International 528 13 0.1 South Korea – 0.1%CJ Cheiljedang 25 4 –POSCO ADR 609 25 0.1 Italy – 0.1%ENI 1,610 22 0.1 Luxembourg – 0.1%ArcelorMittal 1,731 17 0.1 China – 0.0%China BlueChemical ‘H’ 6,000 2 –China Yurun Food Group 4,000 1 –CNOOC 10,000 10 –First Tractor ‘H’ 2,000 1 –Petrochina ‘H’ 14,000 8 –Belgium – 0.0%WDP 221 10 –South Africa – 0.0%Sasol ADR 313 9 –Israel – 0.0%ICL Israel Chemicals 1,267 6 –Israel Corporation 8 2 –Spain – 0.0%Repsol 535 8 –India – 0.0%Reliance Industries GDR 423 7 –Ireland – 0.0%Glanbia 512 5 –Chile – 0.0%Sociedad Quimica Y Minera de Chile ADR 279 4 –Colombia – 0.0%Ecopetrol ADR 126 3 –Sweden – 0.0%AarhusKarlshamn 72 3 –Mexico – 0.0%Fresnillo 315 2 –Denmark – 0.0%Auriga Industries ‘B’ 44 1 –
Forward currency contracts – 0.1% ((0.9)%)EuroSell €2,807,897 buy £2,333,339 dated 19/02/14 22 0.1 US DollarBuy $22,529 sell £13,683 dated 19/02/14 – –Buy $27,430 sell £16,758 dated 19/02/14 – –Sell $34,245 buy £20,661 dated 19/02/14 – –Sell $8,294,070 buy £5,043,997 dated 19/02/14 4 –
Kubota 3,000 28 0.1 Maruha Nichiro Holdings 1,000 1 –Mitsubishi Estate 7,000 106 0.6 Mitsui Fudosan 7,000 137 0.7 Nichirei 1,000 3 –Nippon Flour Mills 1,000 3 –Nippon Meat Packers 1,000 10 –Nippon Steel & Sumitomo Metal 17,000 32 0.2 Nippon Suisan Kaisha 800 1 –OJI Paper 4,000 12 0.1 ORIX JREIT 18 14 0.1 Australia – 1.4%Amcor 4,605 26 0.1 BHP Billiton 4,244 82 0.5 Dexus Property Group Stapled Units 58,782 31 0.1 Fortescue Metals Group 3,036 9 –Goodman Group Stapled Units 14,682 36 0.2 GrainCorp ‘A’ 677 3 –Mirvac Group Stapled Units 39,410 35 0.2 Newcrest Mining 1,323 7 –Nufarm 517 1 –Orora 4,605 3 –Rio Tinto 800 28 0.1 Westfield Group Stapled Units 9,559 52 0.2 Woodside Petroleum 380 7 –Canada – 1.2%Agrium 429 23 0.1 Allied Properties Real Estate Investment Trust 1,100 19 0.1 Barrick Gold 1,814 21 0.1 Canadian Natural Resources 658 13 0.1 Canadian Real Estate Investment Trust 1,300 30 0.1 First Capital Realty 1,626 15 0.1 First Quantum Minerals 1,107 12 0.1 Goldcorp 1,479 22 0.1 Imperial Oil 152 4 –Kinross Gold 1,798 5 –Maple Leaf Foods 222 2 –Potash Corporation of Saskatchewan 2,554 48 0.2 Silver Wheaton 642 8 –Suncor Energy 926 18 0.1 Teck Resources ‘B’ 872 13 0.1 Yamana Gold 1,352 8 –France – 0.9%ICADE 425 23 0.1 TOTAL S.A. 1,403 48 0.2 Unibail-Rodamco 686 100 0.6 Vilmorin 15 1 –Hong Kong – 0.6%China Agri-Industries Holdings 7,000 2 –Hong Kong Land 6,000 22 0.1 Link Real Estate Investment Trust 7,500 21 0.1 New World Development 20,000 15 0.1 Sinofert Holdings 6,000 1 –Sun Hung Kai Properties 4,000 30 0.1 Wharf 11,000 45 0.2 Singapore – 0.4%CapitaLand 17,000 22 0.1 CapitaMalls Asia 40,000 33 0.2 First Resources 1,000 1 –Global Logistic Properties 20,000 27 0.1 Golden Agri-Resources 20,000 5 –Indofood Agri Resources 1,000 – –Wilmar International 7,000 10 –Germany – 0.3%Alstria Office Real Estate Investment Trust 2,639 21 0.1 K&S 510 9 –LEG Immobilien 719 26 0.1 Suedzucker 228 3 –ThyssenKrupp 702 11 0.1 Switzerland – 0.3%Barry Callebaut 6 4 –Bucher Industries 20 4 –Syngenta 276 59 0.3 Russia – 0.3%Gazprom ADR 3,709 18 0.1 Lukoil ADR 324 11 0.1 MMC Norilsk Nickel ADR 1,124 10 –Novolipetsk Iron and Steel GDS 105 1 –
41
Continuation�
� Return to Index

Market value Total netInvestment Holding £’000 assets %
Portfolio statement – continuedAs at 31 January 2014
Swaps – 0.1% (0.4%)Commodity Total Return Swaps 24 Feb 2014 2,389,926 24 0.1 Inflation Swaps UK RPI 10 May 2017 (2,000,000) (11) (0.1)Inflation Swaps UK RPI 22 Oct 2017 (1,000,000) 20 0.1 Inflation Swaps UK RPI 28 Feb 2023 (300,000) (5) –
Investment assets (including investment liabilities) 17,938 84.5
Net other assets 3,282 15.5
Net assets 21,220 100.0
Unless otherwise stated the above securities are admitted to official stock exchange listings or trade on aregulated market.
The comparative percentage figures in brackets are at 31 January 2013.
Market value Portfolio credit ratings £’000
AAA 26AA+ 4,043AA 148AA- 587A+ 833A 1,267A- 2,013BBB+ 1,106BBB 1,530BBB- 400
Total bonds 11,953
Equities 5,931Forward currency contracts 26Swaps 28
Investment assets (including investment liabilities) 17,938
Counterparty exposure
CommodityTotal Forward
return Inflation currencyswaps swaps contracts Total
Counterparty £’000 £’000 £’000 £’000
BNP Paribas – 20 – 20CitiBank – – 0 0Deutsche Bank – – 0 0HSBC – – 21 21Merrill Lynch – – 1 1Morgan Stanley – – 0 0Societe Generale – – 0 0UBS 24 – 4 28
At the balance sheet date, there was no collateral received by the fund from the above counterparties.
The counterparty exposure on forward currency contracts is reported at their mark to market values butfor futures contracts it is only the positive mark to market values that are reported.
42
Continuation�
� Return to Index

Portfolio movements For the year ending 31 January 2014
£’000
Total of all sales for the year (Note 10) 7,467
Major sales Proceeds
JPM Sterling Liquidity ‘X’ (Distribution)^ 700JPM Global Infrastructure Trends ‘X’ GBP (Distribution)^ 648JPM Emerging Markets Infrastrusture Equity ‘X’ GBP (Distribution)^ 392Treasury 1.875% Index-Linked 2022 281Treasury 2.5% Index-Linked 2013 192Citigroup 5.5% 2014 161Wells Fargo FRN 2016 112Autoroutes Paris 5% 2017 96Deutsche Telekom 4.75% 2016 92Royal Bank of Scotland 4.75% 2016 91SES Global America 4.875% 2014 89FCE Bank 4.75% 2015 88Imperial Tobacco Finance 7.25% 2014 86Skandinaviska Enskilda Banken 2.5% 2015 86Express Scripts 3.125% 2016 86Nationwide Building Society 3.75% 2015 82Kraft Foods 5.375% 2020 78Enel 4.75% 2018 75Nordea Bank 3.75% 2017 71Rio Tinto 69
£’000
Total of all purchases for the year (Note 10) 9,465
Major purchases Cost
Ishares Global Infrastructure 1,268JPM Sterling Liquidity ‘X’ (Distribution)^ 700Ishares Emerging Market Infrastructure 386Citigroup 8.5% 2019 101BHP Billiton 100ExxonMobil 94Nordea Bank 3.25% 2022 93Atlantia 4.5% 2019 92ING Groep 3.875% 2016 92Santander International 4.625% Debt 2016 90Skandinaviska Enskilda Banken 4% 2022 88FCE Bank 1.75% 2018 83AvalonBay Communities 73Verizon Communications 5.15% 2023 73Extra Space Storage 73Treasury 0.125% Index-Linked 2024 71General Growth Properties 70Glencore Xstrata 69Wells Fargo 3.5% 2022 69Chevron 69
^ Deemed to be investment in related parties of the ACD
43
Continuation�
� Return to Index

Financial statements
Balance sheetAs at 31 January
2014 2013£’000 £’000 £’000 £’000
ASSETS
Investment assets 17,954 17,177
Debtors (Note 7) 151 211
Cash and bank balances (Note 8) 3,293 2,720
Total other assets 3,444 2,931
Total assets 21,398 20,108
LIABILITIES
Investment liabilities (16) (225)
Creditors (Note 9) (136) (47)
Distribution payable on income shares (26) (25)
Total other liabilities (162) (72)
Total liabilities (178) (297)
Net assets attributable to shareholders 21,220 19,811
The notes to these financial statements are shown on pages 45 to 47.
Statement of total returnFor the year ending 31 January
2014 2013£’000 £’000 £’000 £’000
Income
Net capital (losses)/gains (Note 1) (1,096) 655
Revenue (Note 2) 472 255
Expenses (Note 3) (247) (147)
Net revenue before taxation 225 108
Taxation (Note 4) (32) (18)
Net revenue after taxation 193 90
Total return before distributions (903) 745
Finance costs: Distributions (Note 5) (192) (89)
Change in net assets attributable to shareholders from investment activities (1,095) 656
Statement of change in net assets attributable to shareholdersFor the year ending 31 January
2014 2013£’000 £’000 £’000 £’000
Opening net assets attributable to shareholders 19,811 –
Amounts receivable on issue of shares 2,753 19,107
Amounts payable on cancellation of shares (399) (30)
2,354 19,077
Change in net assets attributable to shareholders from investment activities (see above) (1,095) 656
Retained distributions on accumulation shares 150 78
Closing net assets attributable to shareholders 21,220 19,811
44
Continuation�
� Return to Index

Notes to the financial statements for the year ending 31 January 2014
5. Finance costsDistributionsThe distributions take account of amounts receivable on the issue of shares andamounts payable on the cancellation of shares and comprise:
2014 2013£’000 £’000
Interim dividend distribution 95 20Final dividend distribution 104 92Add: Amounts payable on cancellation of shares 1 –Deduct: Amounts receivable on issue of shares (8) (23)Total finance costs 192 89
Details of the distribution per share are set out on page 48.
6. Movement between net revenue after taxation and distributions2014 2013
£’000 £’000Net revenue after taxation 193 90Add: Undistributed revenue brought forward 1 –Deduct: Undistributed revenue carried forward (2) (1)
192 89
7. Debtors2014 2013
£’000 £’000Accrued income 137 130Due from the ACD for shares created – 60Overseas tax recoverable 2 2Sales awaiting settlement 12 19Total debtors 151 211
8. Cash and bank balances2014 2013
£’000 £’000Cash and bank balances 3,293 2,720
9. Creditors2014 2013
£’000 £’000Accrued expenses 21 20Corporation tax payable 21 13Due to the ACD for shares cancelled 68 –Purchases awaiting settlement 26 14Total creditors 136 47
1. Net capital (losses)/gains2014 2013
£’000 £’000Currency (losses)/gains (86) 21Derivative contracts (297) 49Forward currency contracts 397 (251)Non-derivative securities (1,110) 836 Net capital (losses)/gains (1,096) 655
2. Revenue2014 2013
£’000 £’000Distributions from overseas investments 33 5Franked income from UK equity investments 6 5Income from Liquidity funds 1 1Income from overseas equity investments 102 42Interest on bank and term deposits – 7Interest on fixed-interest securities 324 193Management fee rebates 2 –Property income distributions 4 2Total revenue 472 255
3. Expenses2014 2013
£’000 £’000Payable to the ACD or associate of the ACD:ACD fee 210 127Fixed expenses 37 20Total expenses 247 147
4. Taxation2014 2013
£’000 £’000a) Analysis of charge in the yearCorporation tax at 20% 26 15Double tax relief (5) (2)Overseas tax suffered 11 5Current year tax charge (Note 4b) 32 18
b) Factors affecting the tax charge for the yearThe tax assessed for the year is lower than the standard rate of corporation tax inthe UK for an Open-Ended Investment Company (OEIC) (20%). The differences areexplained below.
Net revenue before taxation 225 108Corporation tax at 20% 45 22
Effects of:Dividends not subject to corporation tax (19) (7)Double tax relief (5) (2)Overseas tax suffered 11 5
(13) (4)Current year tax charge (Note 4a) 32 18
45
Continuation�
� Return to Index

Notes to the financial statements – continued
12. Financial instrumentsCurrency exposuresA substantial proportion of the net assets of the Fund are denominated incurrencies other than sterling, with the effect that the Balance sheet and totalreturn can be significantly affected by currency movements.
Net foreign currency assets/(liabilities)Monetary Non-monetary
Total exposures exposuresCurrency £’000 £’000 £’000
31.01.14US Dollar 7,212 138 7,074Euro 2,740 73 2,667Japanese Yen 464 (10) 474Australian Dollar 322 3 319Canadian Dollar 241 1 240Hong Kong Dollar 136 1 135Singapore Dollar 111 12 99Swiss Franc 67 – 67Norwegian Krone 31 1 30Israeli New Shekels 9 – 9Korean Won 4 – 4Swedish Krona 3 – 3Danish Krone 1 – 1
31.01.13US Dollar 6,265 (7) 6,272Canadian Dollar 486 2 484Australian Dollar 337 13 324Hong Kong Dollar 269 – 269Japanese Yen 224 1 223Singapore Dollar 134 1 133Swiss Franc 63 – 63Swedish Krona 50 2 48Norwegian Krone 46 5 41South African Rand 11 2 9Brazilian Real 7 – 7
10. Portfolio transaction costs2014 2013
£’000 £’000Analysis of total purchase costs
Purchases in year before transaction costs 9,460 20,823
Commissions 3 3Taxes 2 3Total purchase costs 5 6Gross purchases total 9,465 20,829
Analysis of total sale costs
Gross sales before transaction costs 7,469 4,566
Commissions (2) (1)Total sale costs (2) (1)Total sales net of transaction costs 7,467 4,565
11. Related party transactionsJPMorgan Funds Limited, as Authorised Corporate Director (“ACD”), is a relatedparty, and acts as principal in respect of all transactions of shares in the Company.The aggregate monies received through issue, and paid on cancellation, aredisclosed in the Statement of Change in Net Assets Attributable to Shareholders.
The balance due to the ACD and their associates at the year end date in respect ofrelated party transactions was £89,485 (31.01.13: £40,077). Details of related partytransactions are given under note 13 on page 413.
Investments considered to be related parties have been identified in the portfoliostatement on pages 39 to 42 and the revenue from these investments was £9,368(31.01.13: £6,242).
Some of the dealing transactions for the Fund are carried out through associatesof the ACD. Such transactions are carried out on an arm’s length basis. Thecommissions paid to these companies over the year were £79 (31.01.13: £30).Commission was paid to the associated company JPMorgan Securities Ltd.
The following parties held a material interest in the Fund at the year end date:– JPMorgan Investments Limited 57.51% (31.01.13: 0.00%)– Cofunds Nominees Ltd 48.68% (31.01.13: 8.56%)
46
Continuation�
� Return to Index

Interest rate riskThe tables below detail the interest rate profile of the Fund’s assets and liabilitiesas at the year end.
Financialassets
Floating Fixed notrate rate carrying
Total financial financial anyassets assets assets interest
Currency £’000 £’000 £’000 £’000
31.01.14UK Sterling 10,015 3,201 4,722 2,092US Dollar 7,212 160 4,855 2,197Euro 2,746 14 2,285 447Japanese Yen 484 10 – 474Australian Dollar 322 – – 322Canadian Dollar 241 1 – 240Hong Kong Dollar 136 – – 136Singapore Dollar 111 – – 111Swiss Franc 67 67Norwegian Krone 31 1 – 30Israeli New Shekels 9 – – 9Korean Won 4 – – 4Swedish Krona 3 – – 3Danish Krone 1 – – 1
31.01.13UK Sterling 9,279 2,669 4,949 1,661US Dollar 6,277 250 4,437 1,590Euro 2,698 12 2,501 185Canadian Dollar 487 2 – 485Australian Dollar 337 11 – 326Hong Kong Dollar 269 – – 269Japanese Yen 224 – – 224Singapore Dollar 134 – – 134Swiss Franc 63 – – 63Swedish Krona 50 2 – 48Norwegian Krone 47 2 – 45South African Rand 11 2 – 9Brazilian Real 7 – – 7
The floating rate financial assets are bank balances that bear interest at ratesbased on LIBOR or its overseas equivalent.
Floating Financialrate liabilities
Total financial not carryingliabilities liabilities any interest
Currency £’000 £’000 £’000
31.01.14UK Sterling 136 – 136Japanese Yen 20 – 20Euro 6 – 6
31.01.13UK Sterling 58 – 58US Dollar 12 – 12Canadian Dollar 1 – 1Norwegian Krone 1 – 1
Notes to the financial statements – continued
13. Share classesThe Fund currently has three share classes; Class A Shares, Class B Shares andClass C Shares. The Authorised Corporate Director’s (ACD) fee and fixed expensescharge are shown below.
ACD fee Fixed expensesClass A shares: 1.25% 0.18%Class B shares: 0.80% 0.18%Class C shares: 0.65% 0.18%
The net asset value of each share class, the net asset value per share and thenumber of shares in each class are shown on page 38. All classes have the samerights on winding up.
14. Derivatives The Fund enters into derivative transactions in the form of forward currencycontracts and swaps. The Fund may use derivatives for investment purposes orefficient portfolio management including hedging, where appropriate.
The Investment Adviser assesses the market risk of the Fund’s investments,including derivative exposure, using Monte Carlo methodology. This process providesan estimate of the maximum potential loss that could be expected to occur as aresult of changes in market prices over a given period of time in all but a givenpercentage of circumstances. The VaR is calculated on a 99% confidence levelwith a 20 day horizon & 500 days of history. As at the balance date the VaR was2.45%.
The effective observation period changed to 500 days from 31/10/2012 onwardsdue to a change to a new VaR calculation process.
Further information on the derivative risks can be found in the notes to theaggregated financial statements on page 414.
15. Contingent liabilities and capital commitmentsAt the balance sheet date there were no contingent liabilities or capitalcommitments (2013: none).
47
Continuation�
� Return to Index

Final distribution in pence per share
Group 1 – Shares purchased prior to 1 August 2013Group 2 – Shares purchased 1 August 2013 to 31 January 2014
Distribution DistributionGross Tax Net payable paid
revenue at 10% revenue Equalisation 30.04.14 30.04.13
A-Class Accumulation Shares
Group 1 0.233333 0.023333 0.210000 – 0.210000 0.200000
Group 2 0.167439 0.016744 0.150695 0.059305 0.210000 0.200000
A-Class Income Shares
Group 1 0.233333 0.023333 0.210000 – 0.210000 0.200000
Group 2 0.202506 0.020251 0.182255 0.027745 0.210000 0.200000
B-Class Accumulation Shares
Group 1 0.288889 0.028889 0.260000 – 0.260000 0.230000
Group 2 0.288889 0.028889 0.260000 0.000000 0.260000 0.230000
C-Class Accumulation Shares
Group 1 0.655556 0.065556 0.590000 – 0.590000 0.650000
Group 2 0.327338 0.032734 0.294604 0.295396 0.590000 0.650000
C-Class Income Shares
Group 1 0.700000 0.070000 0.630000 – 0.630000 0.570000
Group 2 0.700000 0.070000 0.630000 0.000000 0.630000 0.570000
Interim distribution in pence per share
Group 1 – Shares purchased prior to 1 February 2013Group 2 – Shares purchased 1 February 2013 to 31 July 2013
Distribution DistributionGross Tax Net paid paid
revenue at 10% revenue Equalisation 31.10.13 31.10.12
A-Class Accumulation Shares
Group 1 0.211111 0.021111 0.190000 – 0.190000 0.080000
Group 2 0.120349 0.012035 0.108314 0.081686 0.190000 0.080000
A-Class Income Shares
Group 1 0.211111 0.021111 0.190000 – 0.190000 0.080000
Group 2 0.163078 0.016308 0.146770 0.043230 0.190000 0.080000
B-Class Accumulation Shares
Group 1 0.288889 0.028889 0.260000 – 0.260000 –
Group 2 0.288889 0.028889 0.260000 0.000000 0.260000 –
C-Class Accumulation Shares
Group 1 0.677778 0.067778 0.610000 – 0.610000 –
Group 2 0.639899 0.063990 0.575909 0.034091 0.610000 –
C-Class Income Shares
Group 1 0.544444 0.054444 0.490000 – 0.490000 –
Group 2 0.544444 0.054444 0.490000 0.000000 0.490000 –
Equalisation applies only to shares purchased during the distribution period (group 2 shares). It is the average amount of revenue included in the purchase price of all group 2 shares and is refunded to holders of these
shares as a return of capital. Being capital it is not liable to income tax but must be deducted from the cost of shares for capital gains tax purposes.
Distribution tables
48
� Return to Index

Investment objective and policyA
To provide long term capital growth by investing primarily in Equity andEquity-Linked Securities of Emerging Markets companies.
Emerging Markets companies are companies that are incorporated underthe laws of, and have their registered office in, an Emerging Market country,or that derive the predominant part of their economic activity from EmergingMarket countries, even if listed elsewhere. Smaller companies may be heldon an ancillary basis.
Other instruments as permitted in the stated investment and borrowingpowers of the Company including, but not limited to, fixed interest securities,cash and cash equivalents may be held on an ancillary basis, as appropriate.
Risk profileThe value of your investment may fall as well as rise and you may get backless than you originally invested.
The value of Equity and Equity-Linked Securities may fluctuate in responseto the performance of individual companies and general market conditions.
Emerging Markets may be subject to increased political, regulatory andeconomic instability, less developed custody and settlement practices,poor transparency and greater financial risks. Emerging Market currenciesmay be subject to volatile price movements. Emerging Market securities mayalso be subject to higher volatility and be more difficult to sell than non-Emerging Market securities.
Movements in currency exchange rates can adversely affect the return ofyour investment.
Please refer to Part 11 of the Prospectus for details of the general risk factorsaffecting this Fund in addition to the specific risk factors above.
Fund review2013 was a challenging year for emerging market equities, which deliveredtheir worst performance relative to developed markets since the Asianfinancial and Russian current account deficit crises. Growth concerns combinedwith earnings disappointment weighed on the asset class, while politicalnoise in Brazil, Turkey and Egypt added to the negative headlines. The FederalReserve’s tapering comments in May impacted countries running currentaccount deficits and their currencies took much of the hit.
The Fund underperformed its benchmark in the review period, driven byexposure to current account deficit countries (and their currencies) and stockselection in China. South African stocks detracted, in part due to currencyweakness and concerns over the consumer credit cycle. In China, we werehurt by not owning the Chinese instant messaging and e-commerce leader,Tencent. In a growth-starved world, investors chased growth and consequentlycompanies with links to e-commerce performed strongly. We lost performancein Indonesia and Brazil through asset allocation, but stock selection in thesemarkets resulted in a positive impact overall. Our investment ideas in Taiwan,Russia, Brazil and India were among the most significant contributors. Beingunderweight commodity cyclicals contributed positively, as did stock selectionin energy.
Fund outlookWe have long argued that a resumption of sustained emerging marketoutperformance requires a recovery in the emerging market earnings picture,which, to this point, remains elusive. Currency weakness and central banktightening measures have not helped, dampening expectations for profits.However, recent price declines and an acceleration in outflows suggest apoint of capitulation may be near. The double-digit decline in the MSCIEmerging Markets Index over the past three months suggests that long-terminvestors might well consider stepping in at these levels.
12 month performance as at 31 January 2014 2013 2012 2011 2010
JPM Emerging MarketsA-Class Acc -16.2% 6.1% -2.7% 19.5% 51.4%
JPM Emerging Markets B-Class Acc -15.7% 6.6% -2.1% 20.1% 52.1%
JPM Emerging MarketsI-Class Acc -15.6% 6.8% -2.0% 20.3% 52.5%
Benchmark Index -13.3% 7.1% -5.2% 22.5% 62.1%
Fund statisticsRisk and Reward Profile 6*
Fund size £1.085.9m
Benchmark Index MSCI Emerging Markets Index (Net)
Fund chargesA-Class Initial 3.00%, Annual 1.50%B-Class Initial Nil, Annual 1.00%I-Class Initial Nil, Annual 1.00%
JPM Emerging Markets Fund
You should remember that past performance is not a guide to the future. The price of investments and the income from them may fall as well as rise andinvestors may not get back the full amount invested.
* For specific risks, including the risk and reward profile, please refer to the Key Investor information Document (KIID) available on the following websitehttp://am.jpmorgan.co.uk/investor/prices-and-factsheets/?list=all&tab=PricesOn 31/08/13 JPM Emerging Markets infrastructure Fund was merged into this Fund.All equity indices stated as ‘Net’ are calculated net of tax as per the standard published approach by the index vendor unless stated otherwise.All performance returns are calculated using the quoted price of the accumulation shares. Performance returns are in Sterling.Source: J.P. Morgan.A On 02/08/10 the investment objective policy of the Fund was changed.Benchmark Source: MSCI. Neither MSCI nor any other party involved in or related to compiling, computing or creating the MSCI data makes any express of implied warranties or representations with respect to such data (or theresults to be obtained by the use thereof), and all such parties hereby expressly disclaim all warranties of originality, accuracy, completeness, merchantability or fitness for a particular purpose with respect to any of such data.Without limiting any of the foregoing, in no event shall MSCI, any of its affiliates or any third party involved in or related to compiling computing or creating the data have any liability for any direct, indirect, special, punitive,consequential or any other damages (including lost profits) even if notified of the possibility of such damages. No further distribution or dissemination of the MSCI data is permitted without MSCI’s express written consent. 49
Continuation�
� Return to Index

Top ten holdings (excluding Liquidity funds) %Taiwan Semiconductor Manufacturing 4.5Samsung Electronics 4.4Housing Development Finance 3.8Aia Group 2.9Tata Consultancy Services 2.9Hyundai Motor 2.8China Mobile 2.6Delta Electronics 2.6Infosys Technologies 2.6Ambev ADR 2.4
Geographical breakdown %India 16.8South Africa 13.5Brazil 12.6China 11.5Hong Kong 9.3South Korea 8.4Taiwan 8.3Russia 4.1Indonesia 3.6Mexico 2.6Argentina 2.3Liquidity funds 2.2Malaysia 1.6Turkey 1.5Thailand 1.3Chile 0.7Net other liabilities (0.3)
Highest/lowest share price and distribution recordDistribution
Highest Lowest per shareCalendar year share price share price (net)A-Class Accumulation Shares2009 136.3p 76.63p 0.78p2010 166.5p 127.1p 0.37p2011 168.0p 123.6p 0.10p2012 156.0p 134.1p 0.63p2013 169.0p 138.9p 0.67p2014B 142.3p 132.2p 0.90pA-Class Income Shares2009 60.17p 33.85p 0.35p2010 73.25p 56.09p 0.19p2011 73.88p 54.32p 0.04p2012 68.29p 58.72p 0.28p2013 73.63p 60.56p 0.30p2014B 62.03p 57.62p 0.39pB-Class Accumulation Shares2009 179.4p 100.4p 0.21p2010 220.3p 167.3p 1.25p2011 222.2p 164.1p 1.16p2012 207.7p 178.7p 1.87p2013 226.0p 186.3p 1.91p2014B 191.2p 177.6p 2.21pB-Class Income SharesC
2010 103.9p 100.3p –2011 104.8p 77.39p 0.00p2012 97.04p 83.48p 0.88p2013 104.6p 86.24p 0.86p2014B 88.49p 82.23p 1.03pI-Class Accumulation Shares2009 507.7p 283.6p 5.15p2010 624.4p 473.6p 4.17p2011 629.9p 465.7p 4.14p2012 589.9p 507.8p 6.12p2013 643.0p 530.3p 6.30p2014B 544.5p 506.0p 7.25pI-Class Income SharesD
2013 101.2p 91.35p –2014B 92.43p 85.90p 0.17p
B To 31 January 2014.C B-Class Income Shares were launched on 14 December 2010.D I-Class Income Shares were launched on 30 August 2013.
50
Continuation�
� Return to Index

Portfolio turnover rate31.01.13 46.8%31.01.14 11.9%
The portfolio turnover rate (PTR) reflects the total of security purchases and sales (excluding Liquidityfunds), less the total of share issues and cancellations, expressed as a percentage of the average daily netasset values over the period.
Portfolio transaction costsBroker Transaction
Commissions Taxes Total31.01.13 0.06% 0.04% 0.10%31.01.14 0.05% 0.04% 0.09%
The percentage figures disclosed above reflect the average broker commissions and transaction taxessuffered during the last 3 years divided by the average assets under management over the same period.
Stamp duty reserve tax31.01.13 0.00%31.01.14 0.00%
The percentage figures disclosed above reflect the total stamp duty reserve tax suffered during the yeardivided by the average assets under management over the same period.
Net asset values and Ongoing chargesNet assetvalue per Net asset
share class Number value per OngoingDate £’000 of shares share chargesA-Class Accumulation Shares31.01.12 520,947 350,384,991 148.7p 1.68%31.01.13 588,384 373,191,891 157.7p 1.68%31.01.14 582,014 440,432,942 132.2p 1.68%A-Class Income Shares31.01.12 9,549 14,672,764 65.08p 1.68%31.01.13 13,973 20,335,863 68.71p 1.68%31.01.14 18,019 31,497,625 57.21p 1.68%B-Class Accumulation Shares31.01.12 18,971 9,592,054 197.8p 1.15%31.01.13 10,512 4,986,393 210.8p 1.18%31.01.14 80,637 45,409,318 177.6p 1.18%B-Class Income Shares31.01.12 33,304 36,041,826 92.40p 1.15%31.01.13 1,755 1,798,033 97.59p 1.18%31.01.14 12,187 15,014,017 81.17p 1.18%I-Class Accumulation Shares31.01.12 452,272 80,537,340 561.6p 1.00%31.01.13 525,356 87,625,578 599.6p 1.00%31.01.14 392,978 77,685,895 505.9p 1.00%I-Class Income Shares31.01.14 39 45,355 85.70p 1.00%
The net asset value and the net asset value per income share are shown ex-dividend.
Following the adoption of the requirements of UCITS IV in June 2012, Ongoing charges has replaced the TotalExpense Ratio (“TER”). The Ongoing charges takes into account the ACD fee, the fixed expenses and any expensespaid to an affiliate in respect of stocklending activities, expressed as a percentage of the average daily net assetvalues over the period. The main difference between the two calculations is the inclusion of custodian handlingcharges and stocklending fees in the Ongoing charges figure. The comparative figures have not been restated,and the historic TER is disclosed.
51
Continuation�
� Return to Index

India – 16.8% (12.1%)ACC 870,597 8,559 0.8 Ambuja Cements 3,123,450 4,842 0.5 Asian Paints 1,123,980 5,154 0.5 HDFC Bank ADR 688,796 13,161 1.2 Housing Development Finance 5,291,058 41,336 3.8 Infosys Technologies 291,270 10,427 1.0 Infosys Technologies ADR 474,270 17,075 1.6 ITC 5,911,381 18,627 1.7 Kotak Mahindra Bank 920,377 5,858 0.5 Larsen & Toubro 1,050,550 10,043 0.9 Mahindra & Mahindra 1,176,163 10,117 0.9 Mahindra & Mahindra Financial Service 2,443,622 5,742 0.5 Tata Consultancy Services 1,437,413 31,084 2.9
South Africa – 13.5% (11.0%)Bidvest Group 1,536,209 20,238 1.9 Capitec Bank 446,236 4,505 0.4 FirstRand 6,699,976 11,129 1.0 Imperial 377,251 3,738 0.3 Kumba Iron 415,294 9,943 0.9 Massmart 731,399 4,769 0.4 Mr.Price Group 701,089 5,147 0.5 MTN Group 2,224,426 23,333 2.2 Remgro 1,160,830 11,449 1.1 RMB 1,904,724 4,352 0.4 SABMiller 863,162 23,038 2.1 Shoprite 2,280,721 17,461 1.6 Tiger Brands 529,599 7,541 0.7
Brazil – 12.6% (15.6%)Ambev ADR 6,361,105 25,353 2.4 Cielo 912,034 14,473 1.3 Companhia de Concessoes Rodoviarias 3,121,181 12,095 1.1 Itau Unibanco ADR Preference 431,129 3,211 0.3 Itau Unibanco Non-Cum Preference 1,614,496 11,918 1.1 Lojas Renner 522,570 7,231 0.7 Marcopolo 611,800 768 0.1 Marcopolo Preference 2,642,632 3,403 0.3 Petrobras Brasileiro ADR Preference 2,059,207 15,201 1.4 Ultrapar Participacoes 1,199,099 15,745 1.4 Ultrapar Participacoes ADR 15,000 201 –Vale ADR 18,327 150 –Vale ADR Preference 2,239,999 16,767 1.6 WEG 1,455,093 9,998 0.9
China – 11.5% (9.2%)Baidu ADS 170,840 16,682 1.5 China Merchants Bank ‘H’ 7,990,650 8,566 0.8 China Mobile 4,940,000 28,603 2.6 CNOOC 23,699,000 22,586 2.1 Ping An Insurance ‘H’ 2,612,000 12,845 1.2 Sands China 3,329,600 15,592 1.4 Tsingtao Brewery ‘H’ 4,084,000 18,135 1.7 Wumart Stores ‘H’ 2,935,000 2,278 0.2
Hong Kong – 9.3% (11.7%)Aia Group 11,246,400 31,503 2.9 Hang Lung Properties 4,800,000 8,075 0.7 Jardine Matheson 562,655 18,220 1.7 Standard Chartered 1,568,465 19,441 1.8 Sun Art Retail Group 17,742,000 14,104 1.3 Tingyi 6,412,000 10,084 0.9
South Korea – 8.4% (10.2%)Hyundai Mobis 74,411 12,923 1.2 Hyundai Motor 226,944 29,798 2.8 Samsung Electronics 67,029 48,143 4.4
Taiwan – 8.3% (6.7%)Delta Electronics 8,450,000 28,080 2.6 President Chain Store 3,155,000 12,821 1.2 Taiwan Semiconductor Manufacturing 3,952,480 8,308 0.8 Taiwan Semiconductor Manufacturing ADS 3,829,255 39,876 3.7
Russia – 4.1% (3.5%)Magnit 40,224 5,761 0.5 Magnit GDR 619,329 19,547 1.8 Sberbank 9,052,345 14,782 1.4 Sberbank ADR 713,929 4,676 0.4
Indonesia – 3.6% (3.8%)Astra International 52,361,722 16,671 1.5 Bank Rakyat Indonesia 38,453,030 15,925 1.5 Unilever Indonesia 4,571,136 6,492 0.6
Mexico – 2.6% (3.7%)Grupo Financiero Banorte ‘O’ 2,972,343 11,735 1.1 Wal-Mart de Mexico ‘V’ 11,156,821 16,019 1.5
Argentina – 2.3% (2.1%)Tenaris ADR 921,633 25,175 2.3
Malaysia – 1.6% (1.5%)British American Tobacco Malaysia 531,700 5,818 0.5 Public Bank 3,286,800 11,396 1.1
Turkey – 1.5% (2.9%)KOC 4,249,830 8,537 0.8 Turkiye Garanti Bankasi 4,835,710 7,632 0.7
Thailand – 1.3% (1.1%)Siam Commercial Bank (Alien Market) 4,945,140 13,476 1.2 Siam Cement Non-Voting Depository Receipt 135,600 1,014 0.1
Chile – 0.7% (1.4%)Banco Santander Chile ADR 660,283 7,967 0.7
Liquidity funds – 2.2% (0.8%)JPM Sterling Liquidity ‘X’ (Distribution)^$ 24,134,562 24,135 2.2
Investment assets 1,088,603 100.3
Net other liabilities (2,729) (0.3)
Net assets 1,085,874 100.0
Unless otherwise stated the above securities are admitted to official stock exchange listings or trade on aregulated market.
The comparative percentage figures in brackets are at 31 January 2013.
^ Deemed to be investment in related parties of the ACD$ Approved security as defined in the Collective Investment Schemes sourcebook
Portfolio statementAs at 31 January 2014
52
Continuation�
� Return to Index
Market value Total netInvestment Holding £’000 assets %
Market value Total netInvestment Holding £’000 assets %

53
Continuation�
� Return to Index
£’000
Total of all purchases for the year (Note 10) 555,528
Major purchases Cost
JPM Sterling Liquidity ‘X’ (Distribution)^ 229,283Baidu ADS 18,029ITC 17,440Sands China 14,655Remgro 14,415Shoprite 13,013Larsen & Toubro 12,607Mahindra & Mahindra 12,578Lojas Renner 12,187Tata Consultancy Services 11,373Sun Art Retail Group 10,368Magnit GDR 10,269Bidvest Group 10,179Samsung Electronics 9,870Aia Group 9,697SABMiller 8,140Standard Chartered 7,908HDFC Bank ADR 7,022MTN Group 6,830Asian Paints 6,663
^ Deemed to be investment in related parties of the ACD
£’000
Total of all sales for the year (Note 10) 404,640
Major sales Proceeds
JPM Sterling Liquidity ‘X’ (Distribution)^ 214,620Samsung Electronics 15,343Cielo 11,821Hyundai Mobis 10,310Grupo Financiero Banorte ‘O’ 9,527Anhui Conch Cement ‘H’ 9,523Bharti Airtel 9,221OTP Bank 8,527Ping An Insurance ‘H’ 8,351Turkiye Garanti Bankasi 8,151China Merchants Bank ‘H’ 7,789E-mart 6,791New Oriental Education & Technology ADR 6,581Hang Lung Properties 6,309Aia Group 5,952Kumba Iron 5,602Banco Santander Chile ADR 5,145African Bank Investments 4,623Companhia de Bebidas das Americas ADR Preference 4,307Jindal Steel & Power 4,192
Portfolio movements For the year ending 31 January 2014

Statement of total returnFor the year ending 31 January
2014 2013£’000 £’000 £’000 £’000
Income
Net capital (losses)/gains (Note 1) (200,294) 58,435
Revenue (Note 2) 27,017 24,317
Expenses (Note 3) (15,603) (14,128)
Net revenue before taxation 11,414 10,189
Taxation (Note 4) (2,162) (2,150)
Net revenue after taxation 9,252 8,039
Total return before distributions (191,042) 66,474
Finance costs: Distributions (Note 5) (9,378) (8,014)
Change in net assets attributable to shareholders from investment activities (200,420) 58,460
Statement of change in net assets attributable to shareholdersFor the year ending 31 January
2014 2013£’000 £’000 £’000 £’000
Opening net assets attributable to shareholders 1,139,980 1,035,043
Amounts transferred from JPM Emerging Markets Infrastructure Fund 12,772 –
Amounts transferred toother funds (7,592) –
Amounts receivable on issue of shares 280,066 199,875
Amounts payable on cancellation of shares (149,488) (161,501)
130,578 38,374
Change in net assets attributable to shareholders from investment activities (see above) (200,420) 58,460
Retained distributions on accumulation shares 10,600 8,116
Stamp duty reserve tax (44) (13)
Closing net assets attributable to shareholders 1,085,874 1,139,980
Balance sheetAs at 31 January
2014 2013£’000 £’000 £’000 £’000
ASSETS
Investment assets 1,088,603 1,137,847
Debtors (Note 7) 3,961 6,532
Cash and bank balances (Note 8) 1,737 1,762
Total other assets 5,698 8,294
Total assets 1,094,301 1,146,141
LIABILITIES
Creditors (Note 9) (8,149) (6,085)
Distribution payable on income shares (278) (76)
Total liabilities (8,427) (6,161)
Net assets attributable to shareholders 1,085,874 1,139,980
The notes to these financial statements are shown on pages 55 to 56.
Financial statements
54
Continuation�
� Return to Index

55
Continuation�
� Return to Index
1. Net capital (losses)/gains2014 2013
£’000 £’000Currency losses (62) (85)Non-derivative securities (200,232) 58,520Net capital (losses)/gains (200,294) 58,435
2. Revenue2014 2013
£’000 £’000Franked income from UK equity investments 1,212 174Income from Liquidity funds 90 136Income from overseas equity investments 22,820 21,408Interest on bank and term deposits 12 4Interest on fixed-interest securities 2,765 2,130Stock dividends 118 465Total revenue 27,017 24,317
3. Expenses2014 2013
£’000 £’000Payable to the ACD or associate of the ACD:ACD fee 14,397 13,108Fixed expenses 1,206 1,020Total expenses 15,603 14,128
4. Taxation2014 2013
£’000 £’000a) Analysis of charge in the yearOverseas tax suffered 2,162 2,150Current year tax charge (Note 4b) 2,162 2,150
b) Factors affecting the tax charge for the yearThe tax assessed for the year is lower than the standard rate of corporation tax inthe UK for an Open-Ended Investment Company (OEIC) (20%). The differences areexplained below.
Net revenue before taxation 11,414 10,189Corporation tax at 20% 2,283 2,038
Effects of:Dividends not subject to corporation tax (4,732) (4,385)Excess expenses for which no relief taken 2,449 2,347Overseas tax suffered 2,162 2,150
(121) 112Current year tax charge (Note 4a) 2,162 2,150
No deferred tax asset has been recognised in the financial statements. At the yearend date, the Fund had a potential unrecognised deferred tax asset of £10,766,168(31.01.13: £8,316,909) in relation to £53,830,841 (31.01.13: £41,584,546) of excessmanagement expenses which would only be utilised to reduce the tax charge if theFund had an excess of unfranked income over expenses in a future period. There isno excess of unfranked income expected in the future.
5. Finance costsDistributionsThe distributions take account of amounts receivable on the issue of shares andamounts payable on the cancellation of shares and comprise:
2014 2013£’000 £’000
Final dividend distribution 10,878 8,192Add: Amounts payable on cancellation of shares 833 900Deduct: Amounts receivable on issue of shares (2,333) (1,078)Total finance costs 9,378 8,014
Details of the distribution per share are set out on page 57.
6. Movement between net revenue after taxation and distributions2014 2013
£’000 £’000Net revenue after taxation 9,252 8,039Add: Undistributed revenue brought forward 42 17Deduct: Undistributed revenue carried forward (22) (42)Equalisation on conversions 106 -
9,378 8,014
7. Debtors2014 2013
£’000 £’000Accrued income 1,322 1,026Due from the ACD for shares created 2,163 1,272Overseas tax recoverable 220 15Sales awaiting settlement 256 4,219Total debtors 3,961 6,532
8. Cash and bank balances2014 2013
£’000 £’000Cash and bank balances 1,737 1,762
9. Creditors2014 2013
£’000 £’000Accrued expenses 1,347 1,307Due to the ACD for shares cancelled 454 372Purchases awaiting settlement 6,348 4,406Total creditors 8,149 6,085
Notes to the financial statements for the year ending 31 January 2014
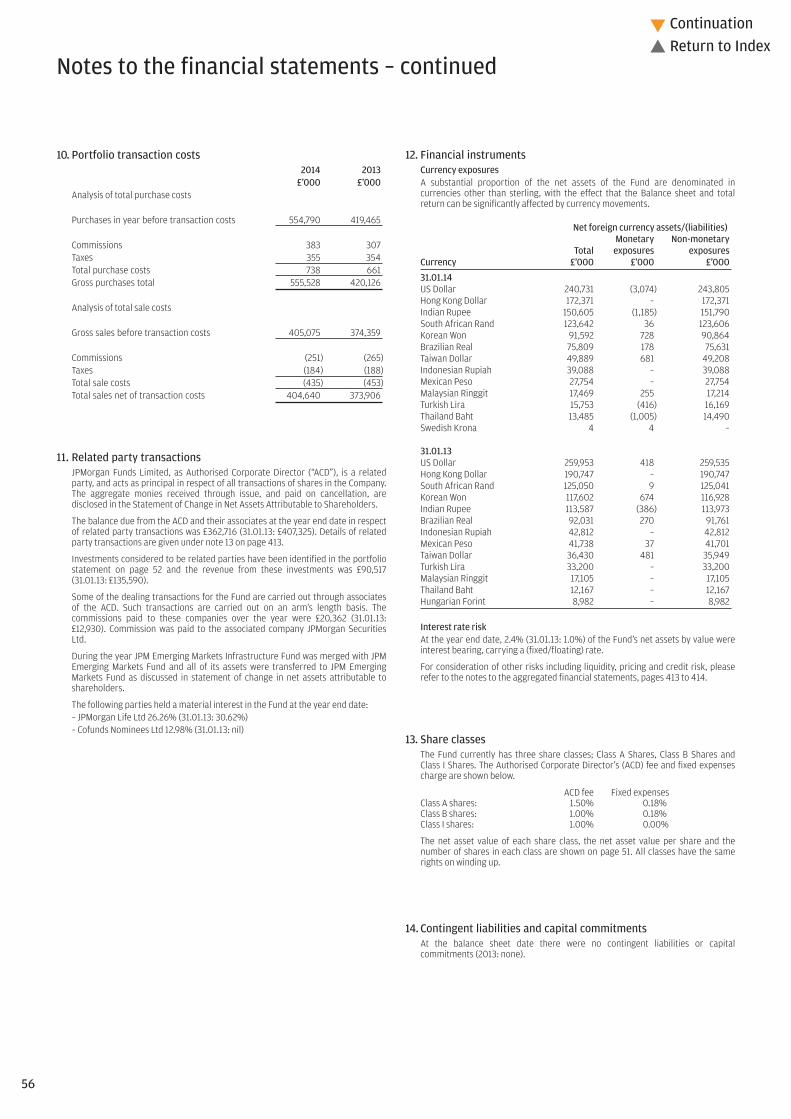
10. Portfolio transaction costs2014 2013
£’000 £’000Analysis of total purchase costs
Purchases in year before transaction costs 554,790 419,465
Commissions 383 307Taxes 355 354Total purchase costs 738 661Gross purchases total 555,528 420,126
Analysis of total sale costs
Gross sales before transaction costs 405,075 374,359
Commissions (251) (265)Taxes (184) (188)Total sale costs (435) (453)Total sales net of transaction costs 404,640 373,906
11. Related party transactionsJPMorgan Funds Limited, as Authorised Corporate Director (“ACD”), is a relatedparty, and acts as principal in respect of all transactions of shares in the Company.The aggregate monies received through issue, and paid on cancellation, aredisclosed in the Statement of Change in Net Assets Attributable to Shareholders.
The balance due from the ACD and their associates at the year end date in respectof related party transactions was £362,716 (31.01.13: £407,325). Details of relatedparty transactions are given under note 13 on page 413.
Investments considered to be related parties have been identified in the portfoliostatement on page 52 and the revenue from these investments was £90,517(31.01.13: £135,590).
Some of the dealing transactions for the Fund are carried out through associatesof the ACD. Such transactions are carried out on an arm’s length basis. Thecommissions paid to these companies over the year were £20,362 (31.01.13:£12,930). Commission was paid to the associated company JPMorgan SecuritiesLtd.
During the year JPM Emerging Markets Infrastructure Fund was merged with JPMEmerging Markets Fund and all of its assets were transferred to JPM EmergingMarkets Fund as discussed in statement of change in net assets attributable toshareholders.
The following parties held a material interest in the Fund at the year end date:– JPMorgan Life Ltd 26.26% (31.01.13: 30.62%)– Cofunds Nominees Ltd 12.98% (31.01.13: nil)
12. Financial instrumentsCurrency exposuresA substantial proportion of the net assets of the Fund are denominated incurrencies other than sterling, with the effect that the Balance sheet and totalreturn can be significantly affected by currency movements.
Net foreign currency assets/(liabilities)Monetary Non-monetary
Total exposures exposuresCurrency £’000 £’000 £’000
31.01.14US Dollar 240,731 (3,074) 243,805Hong Kong Dollar 172,371 – 172,371Indian Rupee 150,605 (1,185) 151,790South African Rand 123,642 36 123,606Korean Won 91,592 728 90,864Brazilian Real 75,809 178 75,631Taiwan Dollar 49,889 681 49,208Indonesian Rupiah 39,088 – 39,088Mexican Peso 27,754 – 27,754Malaysian Ringgit 17,469 255 17,214Turkish Lira 15,753 (416) 16,169Thailand Baht 13,485 (1,005) 14,490Swedish Krona 4 4 –
31.01.13US Dollar 259,953 418 259,535Hong Kong Dollar 190,747 – 190,747South African Rand 125,050 9 125,041Korean Won 117,602 674 116,928Indian Rupee 113,587 (386) 113,973Brazilian Real 92,031 270 91,761Indonesian Rupiah 42,812 – 42,812Mexican Peso 41,738 37 41,701Taiwan Dollar 36,430 481 35,949Turkish Lira 33,200 – 33,200Malaysian Ringgit 17,105 – 17,105Thailand Baht 12,167 – 12,167Hungarian Forint 8,982 – 8,982
Interest rate riskAt the year end date, 2.4% (31.01.13: 1.0%) of the Fund’s net assets by value wereinterest bearing, carrying a (fixed/floating) rate.
For consideration of other risks including liquidity, pricing and credit risk, pleaserefer to the notes to the aggregated financial statements, pages 413 to 414.
13. Share classesThe Fund currently has three share classes; Class A Shares, Class B Shares andClass I Shares. The Authorised Corporate Director’s (ACD) fee and fixed expensescharge are shown below.
ACD fee Fixed expensesClass A shares: 1.50% 0.18%Class B shares: 1.00% 0.18%Class I shares: 1.00% 0.00%
The net asset value of each share class, the net asset value per share and thenumber of shares in each class are shown on page 51. All classes have the samerights on winding up.
14. Contingent liabilities and capital commitmentsAt the balance sheet date there were no contingent liabilities or capitalcommitments (2013: none).
Notes to the financial statements – continued
56
Continuation�
� Return to Index

57
� Return to Index
Final distribution in pence per share
Group 1 – Shares purchased prior to 1 February 2013Group 2 – Shares purchased 1 February 2013 to 31 January 2014
DistributionGross Tax Net payable paid
revenue at 10% revenue Equalisation 30.04.14 30.04.13
A-Class Accumulation Shares
Group 1 1.000000 0.100000 0.900000 – 0.900000 0.670000
Group 2 0.005623 0.000562 0.005061 0.894939 0.900000 0.670000
A-Class Income Shares
Group 1 0.433333 0.043333 0.390000 – 0.390000 0.300000
Group 2 0.010507 0.001051 0.009456 0.380544 0.390000 0.300000
B-Class Accumulation Shares
Group 1 2.455556 0.245556 2.210000 – 2.210000 1.910000
Group 2 0.148298 0.014830 0.133468 2.076532 2.210000 1.910000
B-Class Income Shares
Group 1 1.144444 0.114444 1.030000 – 1.030000 0.860000
Group 2 0.094240 0.009424 0.084816 0.945184 1.030000 0.860000
I-Class Accumulation Shares
Group 1 8.055556 0.805556 7.250000 – 7.250000 6.300000
Group 2 1.327493 0.132749 1.194744 6.055256 7.250000 6.300000
I-Class Income Shares
Group 1 0.188889 0.018889 0.170000 – 0.170000 –
Group 2 0.049053 0.004905 0.044148 0.125852 0.170000 –
Equalisation applies only to shares purchased during the distribution period (group 2 shares). It is the average amount of revenue included in the purchase price of all group 2 shares and is refunded to holders of these
shares as a return of capital. Being capital it is not liable to income tax but must be deducted from the cost of shares for capital gains tax purposes.
Distribution table

Investment objective and policyTo provide a portfolio designed to achieve income by investing primarily inEquity and Equity-Linked Securities of Emerging Markets companies in anyeconomic sector whilst participating in long-term capital growth.
The Fund may also have exposure to Emerging Market fixed and floatingrate Debt Securities, which includes Investment Grade, Non-Investment Gradeand Unrated Bonds, by investing directly or indirectly through collectiveinvestment schemes.
Emerging Markets companies are companies that are incorporated underthe laws of, and have their registered office in, an Emerging Market country,or that derive the predominant part of their economic activity from EmergingMarket countries, even if listed elsewhere. The Fund may invest in smallercompanies and Participation Notes may be held on an ancillary basis.
Other instruments as permitted in the stated investment and borrowingpowers of the Company including, but not limited to, cash and cash equivalentsmay be held on an ancillary basis, as appropriate.
Financial Derivative Instruments may be used for the purpose of EfficientPortfolio Management, including hedging, where appropriate (see section11.14 of the Prospectus for Risk Warnings on derivatives). Subject to atleast 60 days notice to shareholders, the Fund may use derivatives forinvestment purposes which may change the risk profile of the Fund.
Risk profileThe value of your investment may fall as well as rise and you may get backless than you originally invested.
The value of Equity and Equity-Linked Securities may fluctuate in responseto the performance of individual companies and general market conditions.Furthermore, Participation Notes run the risk of counterparty default whichmay result in the loss of the full market value of the Note.
Emerging Markets may be subject to increased political, regulatory andeconomic instability, less developed custody and settlement practices,poor transparency and greater financial risks. Emerging Market currenciesmay be subject to volatile price movements. Emerging Market securities mayalso be subject to higher volatility and be more difficult to sell than non-Emerging Market securities.
The value of Bonds and other Debt Securities may change significantlydepending on market, economic and interest rate conditions as well as thecreditworthiness of the issuer. Issuers of Bonds and other Debt Securitiesmay fail to meet payment obligations (default) or the credit rating of Bondsand other Debt Securities may be downgraded. These risks are typicallyincreased for Below Investment Grade and certain Unrated securities, whichmay also be subject to higher volatility and be more difficult to sell thanInvestment Grade securities.
The Fund invests in securities of smaller companies which may be moredifficult to sell, more volatile and tend to carry greater financial risk thansecurities of larger companies.
As the portfolio of the Fund is primarily focused on generating income, itmay bear little resemblance to the composition of its Benchmark.
Movements in currency exchange rates can adversely affect the return ofyour investment.
This Fund charges the annual fee of the Authorised Corporate Director (ACD)against capital, which will increase the amount of income available fordistribution to Shareholders, but may constrain capital growth. It may alsohave tax implications for certain investors.
The Fund may invest in Credit Linked Notes which involve the risk of theunderlying credit instrument decreasing in value or defaulting and the riskof the issuer of the Credit Linked Note becoming insolvent.
Please refer to Part 11 of the Prospectus for details of the general risk factorsaffecting this Fund in addition to the specific risk factors above.
Fund review2013 was a challenging year for emerging market equities, which deliveredtheir worst performance relative to developed markets since the Asianfinancial and Russian current account deficit crises. Growth concerns combinedwith earnings disappointment weighed on the asset class, while politicalnoise of varying intensity in Brazil, Turkey and Egypt added to the negativeheadlines. The Federal Reserve’s tapering comments at the end of Mayimpacted countries running current account deficits and their currenciestook much of the hit, depreciating more than 15% from their 2012 average.
The Fund underperformed its benchmark in the review period. The primarydriver of returns was stock selection, as should be expected from our bottom-up, stock-picking process. In Brazil, investments across a broad range ofsectors helped, while in China, casino operators performed well on newproject and table announcements. We are structurally underweight Korea,which is a low yielding market with limited attractive investment opportunitiesfor our process. However, this underweight position detracted fromperformance in 2013. Of the current account deficit countries that experiencedforeign exchange pressures over the summer, only Turkey and South Africadetracted significantly.
Fund outlookWe have long argued that a resumption of sustained emerging marketoutperformance requires a recovery in the emerging market earnings picture,which, to this point, remains elusive. Multiple waves of currency weaknessand central bank tightening measures in recent months have not helped,further dampening expectations for profits. However, recent price declinesand an acceleration in outflows suggest that a point of capitulation may benear. The double-digit decline in the MSCI Emerging Markets Index over thepast three months suggests that long-term investors might well considerstepping in at these levels.
JPM Emerging Markets Income Fund
On 31/08/13 JPM Emerging Markets Infrastructure Fund was merged into this Fund.58
Continuation�
� Return to Index

12 month performance as at 31 January2014
JPM Emerging Markets Income A-Class Acc -13.6%
JPM Emerging Markets Income B-Class Inc -13.3%
JPM Emerging Markets Income C-Class AccA –
JPM Emerging Markets Income X-Class Acc -12.4%
Benchmark Index -13.3%
Fund statisticsRisk and Reward Profile 6*
Fund size £107.4m
Benchmark Index MSCI Emerging Markets Index (Net)
Fund chargesA-Class Initial 3.00%, Annual 1.50%B-Class Initial Nil, Annual 1.00%C-Class Initial Nil, Annual 0.75%X-Class On applicationB
Top ten holdings (excluding Liquidity funds) %Sberbank ADR 2.5Delta Electronics 2.5Wynn Macau 2.4Quanta Computer 2.2Bidvest Group 2.1Telekomunikasi Indonesia ‘B’ 2.1Siam Cement Non-Voting Depository Receipt 2.1Advanced Info Service Public (Alien Market) 2.1Qatar Industries 2.0Taiwan Semiconductor Manufacturing ADS 2.0
Geographical breakdown %Taiwan 16.9South Africa 11.9Brazil 10.9China 10.9Russia 8.7Hong Kong 6.4South Korea 6.2Turkey 4.4Thailand 4.2Saudi Arabia 4.1Indonesia 3.8Qatar 2.0India 2.0Poland 1.7Singapore 1.6Liquidity funds 1.4Mexico 1.4UAE 1.2Net other assets 0.3
You should remember that past performance is not a guide to the future. The price of investments and the income from them may fall as well as rise andinvestors may not get back the full amount invested.
* For specific risks, including the risk and reward profile, please refer to the Key Investor information Document (KIID) available on the following websitehttp://am.jpmorgan.co.uk/investor/prices-and-factsheets/?list=all&tab=PricesAll equity indices stated as ‘Net’ are calculated net of tax as per the standard published approach by the index vendor unless stated otherwise.All performance returns are calculated using the quoted price of the accumulation and income shares. Performance returns are in Sterling.Source: J.P. Morgan.A C-Class Accumulation Shares were launched on 28 August 2013, therefore 12 month performance to 31 January is not available.B As agreed from time to time between the ACD and the relevant JPMorgan Chase & Co. entity.Benchmark Source: MSCI. Neither MSCI nor any other party involved in or related to compiling, computing or creating the MSCI data makes any express of implied warranties or representations with respect to such data (or theresults to be obtained by the use thereof), and all such parties hereby expressly disclaim all warranties of originality, accuracy, completeness, merchantability or fitness for a particular purpose with respect to any of such data.Without limiting any of the foregoing, in no event shall MSCI, any of its affiliates or any third party involved in or related to compiling computing or creating the data have any liability for any direct, indirect, special, punitive,consequential or any other damages (including lost profits) even if notified of the possibility of such damages. No further distribution or dissemination of the MSCI data is permitted without MSCI’s express written consent. 59
Continuation�
� Return to Index
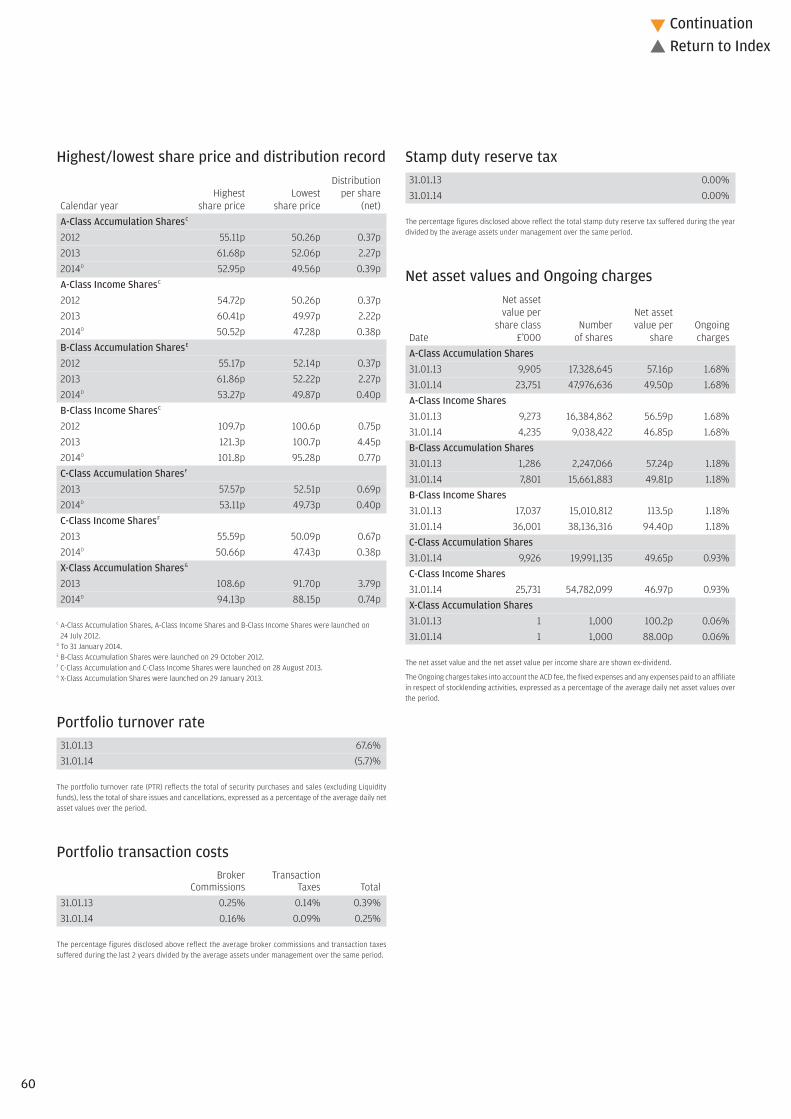
Highest/lowest share price and distribution recordDistribution
Highest Lowest per share Calendar year share price share price (net)A-Class Accumulation SharesC
2012 55.11p 50.26p 0.37p2013 61.68p 52.06p 2.27p2014D 52.95p 49.56p 0.39pA-Class Income SharesC
2012 54.72p 50.26p 0.37p2013 60.41p 49.97p 2.22p2014D 50.52p 47.28p 0.38pB-Class Accumulation SharesE
2012 55.17p 52.14p 0.37p2013 61.86p 52.22p 2.27p2014D 53.27p 49.87p 0.40pB-Class Income SharesC
2012 109.7p 100.6p 0.75p2013 121.3p 100.7p 4.45p2014D 101.8p 95.28p 0.77pC-Class Accumulation SharesF
2013 57.57p 52.51p 0.69p2014D 53.11p 49.73p 0.40pC-Class Income SharesF
2013 55.59p 50.09p 0.67p2014D 50.66p 47.43p 0.38pX-Class Accumulation SharesG
2013 108.6p 91.70p 3.79p2014D 94.13p 88.15p 0.74p
C A-Class Accumulation Shares, A-Class Income Shares and B-Class Income Shares were launched on 24 July 2012.
D To 31 January 2014.E B-Class Accumulation Shares were launched on 29 October 2012.F C-Class Accumulation and C-Class Income Shares were launched on 28 August 2013.G X-Class Accumulation Shares were launched on 29 January 2013.
Portfolio turnover rate31.01.13 67.6%31.01.14 (5.7)%
The portfolio turnover rate (PTR) reflects the total of security purchases and sales (excluding Liquidityfunds), less the total of share issues and cancellations, expressed as a percentage of the average daily netasset values over the period.
Portfolio transaction costsBroker Transaction
Commissions Taxes Total31.01.13 0.25% 0.14% 0.39%31.01.14 0.16% 0.09% 0.25%
The percentage figures disclosed above reflect the average broker commissions and transaction taxessuffered during the last 2 years divided by the average assets under management over the same period.
Stamp duty reserve tax31.01.13 0.00%31.01.14 0.00%
The percentage figures disclosed above reflect the total stamp duty reserve tax suffered during the yeardivided by the average assets under management over the same period.
Net asset values and Ongoing chargesNet assetvalue per Net asset
share class Number value per OngoingDate £’000 of shares share chargesA-Class Accumulation Shares31.01.13 9,905 17,328,645 57.16p 1.68%31.01.14 23,751 47,976,636 49.50p 1.68%A-Class Income Shares31.01.13 9,273 16,384,862 56.59p 1.68%31.01.14 4,235 9,038,422 46.85p 1.68%B-Class Accumulation Shares31.01.13 1,286 2,247,066 57.24p 1.18%31.01.14 7,801 15,661,883 49.81p 1.18%B-Class Income Shares31.01.13 17,037 15,010,812 113.5p 1.18%31.01.14 36,001 38,136,316 94.40p 1.18%C-Class Accumulation Shares31.01.14 9,926 19,991,135 49.65p 0.93%C-Class Income Shares31.01.14 25,731 54,782,099 46.97p 0.93%X-Class Accumulation Shares31.01.13 1 1,000 100.2p 0.06%31.01.14 1 1,000 88.00p 0.06%
The net asset value and the net asset value per income share are shown ex-dividend.
The Ongoing charges takes into account the ACD fee, the fixed expenses and any expenses paid to an affiliatein respect of stocklending activities, expressed as a percentage of the average daily net asset values overthe period.
60
Continuation�
� Return to Index

61
Continuation�
� Return to Index
Taiwan – 16.9% (8.9%)Asustek Computer 141,000 796 0.8Delta Electronics 808,000 2,685 2.5Far Eastone Telecommunications 657,000 785 0.7Novatek Microelectronics 592,000 1,434 1.3President Chain Store 350,000 1,422 1.3Quanta Computer 1,563,000 2,347 2.2Radiant Opto-Electronics 531,000 1,403 1.3Siliconware Precision Industries 2,741,000 2,033 1.9Simplo Technology 205,000 570 0.5Taiwan Mobile 980,000 1,740 1.6Taiwan Semiconductor Manufacturing ADS 205,781 2,143 2.0Tripod Technology 763,000 835 0.8
South Africa – 11.9% (16.8%)AVI 366,650 1,007 1.0Barclays Africa Group 251,400 1,713 1.6Bidvest Group 173,265 2,283 2.1Foschini Group 282,235 1,407 1.3Imperial 184,860 1,832 1.7MTN Group 156,154 1,638 1.5Sasol 56,140 1,596 1.5Tiger Brands 89,297 1,272 1.2
Brazil – 10.9% (14.1%)AES Tiete 37,700 157 0.1Ambev 473,040 1,872 1.7Banco Bradesco Preference 200,144 1,283 1.2Banco do Brasil 416,780 2,100 2.0Cielo 126,400 2,006 1.9Companhia de Concessoes Rodoviarias 177,885 689 0.6Embraer ADR 104,340 1,957 1.8Tractebel Energia 199,063 1,684 1.6
China – 10.9% (8.9%)Bank of China ‘H’ 7,398,000 1,904 1.8China Construction Bank ‘H’ 4,394,000 1,850 1.7China Mobile 350,000 2,027 1.9China Shenhua Energy ‘H’ 1,191,500 1,865 1.7Industrial & Commercial Bank of China ‘H’ 5,039,000 1,896 1.8Jiangsu Expressway ‘H’ 284,000 217 0.2MGM China 713,200 1,710 1.6Zhejiang Expressway ‘H’ 358,000 196 0.2
Russia – 8.7% (8.0%)Lukoil ADR 61,979 2,124 2.0MMC Norilsk Nickel ADR 178,070 1,664 1.5Mobile Telesystems ADR 180,660 1,891 1.8Phosagro GDR 157,690 969 0.9Sberbank ADR 414,483 2,715 2.5
Hong Kong – 6.4% (8.9%)Dah Chong Hong 722,000 258 0.3Hang Seng Bank 171,000 1,632 1.5SJM 812,000 1,538 1.4Vtech 118,700 869 0.8Wynn Macau 1,000,800 2,584 2.4
South Korea – 6.2% (5.5%)Kangwon Land 87,350 1,659 1.6KT&G 40,548 1,720 1.6SK Telecom ADR 147,460 1,960 1.8S-Oil 33,390 1,285 1.2
Turkey – 4.4% (4.1%)Arcelik 302,460 896 0.8Ford Otomotiv San 33,310 172 0.2TOFAS 426,910 1,191 1.1Turk Telekomunikasyon 645,559 964 0.9Turkiye Petrol Rafinerileri 158,010 1,548 1.4
Thailand – 4.2% (1.7%)Advanced Info Service Public (Alien Market) 579,100 2,218 2.1Siam Cement Non-Voting Depository Receipt 296,900 2,220 2.1
Saudi Arabia – 4.1% (1.3%)Al Rajhi Bank ELN 2015 (Credit Suisse) 85,820 994 0.9Etihad Etisalat ELN 2016 (JPMorgan) 140,682 1,995 1.8Yanbu National Petrochemical Company
ELN 2015 (Credit Suisse) 61,240 727 0.7Yanbu National Petrochemical Company
Warrants 2016 (Merril Lynch) 60,695 720 0.7
Indonesia – 3.8% (5.2%)Indo Tambangraya Megah 528,500 698 0.6Perusahaan Gas Negara 4,773,500 1,130 1.1Telekomunikasi Indonesia ‘B’ 20,165,700 2,267 2.1
Qatar – 2.0% (2.3%)Qatar Industries 73,176 2,193 2.0
India – 2.0% (3.7%)Ascendas India Trust Units 315,000 103 0.1Coal India 862,233 2,071 1.9
Poland – 1.7% (3.9%)Powszechny Zaklad Ubezpieczen 22,950 1,824 1.7
Singapore – 1.6% (1.6%)Hutchison Port 4,333,000 1,751 1.6
Mexico – 1.4% (1.0%)Kimberly-Clark de Mexico ‘A’ 990,450 1,478 1.4
UAE – 1.2% (0.0%)First Gulf Bank 394,250 1,304 1.2
Liquidity funds – 1.4% (0.0%)JPM US Dollar Liquidity ‘X’ (Distribution)^$ 2,450,000 1,488 1.4
Investment assets 107,174 99.7
Net other assets 272 0.3
Net assets 107,446 100.0
Unless otherwise stated the above securities are admitted to official stock exchange listings or trade on aregulated market.
The comparative percentage figures in brackets are at 31 January 2013.
^ Deemed to be investment in related parties of the ACD$ Approved security as defined in the Collective Investment Schemes sourcebook
Portfolio statementAs at 31 January 2014
Market value Total netInvestment Holding £’000 assets %
Market value Total netInvestment Holding £’000 assets %

£’000
Total of all purchases for the year (Note 10) 160,753
Major purchases Cost
JPM USD Liquidity ‘X’ (Distribution)^ 28,613Banco do Brasil 3,412Turkiye Petrol Rafinerileri 3,236Coal India 3,174Sberbank ADR 3,025China Shenhua Energy ‘H’ 2,823Barclays Africa Group 2,817Bidvest Group 2,584Perusahaan Gas Negara 2,501Siam Cement Non-Voting Depository Receipt 2,264Powszechny Zaklad Ubezpieczen 2,239Advanced Info Service Public (Alien Market) 2,238Telekomunikasi Indonesia ‘B’ 2,226Companhia de Bebidas das Americas Preference 2,218Siliconware Precision Industries 2,212Wynn Macau 2,193Lukoil ADR 2,170Taiwan Semiconductor Manufacturing ADS 2,132Etihad Etisalat ELN 2016 (JPMorgan) 2,130Turk Telekomunikasyon 2,125
^ Deemed to be investment in related parties of the ACD
£’000
Total of all sales for the year (Note 10) 68,934
Major sales Proceeds
JPM USD Liquidity ‘X’ (Distribution)^ 27,079Perusahaan Gas Negara 2,026Petrochina ‘H’ 1,753Old Mutual 1,697Philippine Long Distance Telephone ADR 1,614KGHM Polska Miedz 1,608Saudi Arabian Fertilizer ELN 2015 (Credit Suisse) 1,603Kumba Iron Ore 1,559Tata Motors ‘A’ 1,542SJM 1,496Growthpoint Properties Units 1,467Energias do Brasil 1,404Banco do Brasil 1,260Cia Souza Cruz ‘E’ 1,246Powszechny Zaklad Ubezpieczen 1,170Tata Motors ELN 2014 (UBS) 1,124Exxaro Resources 1,096Turkiye Petrol Rafinerileri 1,055Coal India ELN 2013 (UBS) 940Dah Chong Hong 881
Portfolio movements For the year ending 31 January 2014
62
Continuation�
� Return to Index

63
Continuation�
� Return to Index
Statement of total returnFor the year ending 31 January
2014 2013£’000 £’000 £’000 £’000
Income
Net capital (losses)/gains (Note 1) (21,520) 2,850
Revenue (Note 2) 5,344 181
Expenses (Note 3) (1,420) (134)
Net revenue before taxation 3,924 47
Taxation (Note 4) (480) (19)
Net revenue after taxation 3,444 28
Total return before distributions (18,076) 2,878
Finance costs: Distributions (Note 5) (4,566) (140)
Change in net assets attributable to shareholders from investment activities (22,642) 2,738
Statement of change in net assets attributable to shareholdersFor the year ending 31 January
2014 2013£’000 £’000 £’000 £’000
Opening net assets attributable to shareholders 37,502 –
Amounts receivable on issue of shares 145,115 35,898
Amounts payable on cancellation of shares (54,853) (1,199)
90,262 34,699
Change in net assets attributable to shareholders from investment activities (see above) (22,642) 2,738
Retained distributions on accumulation shares 2,324 65
Closing net assets attributable to shareholders 107,446 37,502
Balance sheetAs at 31 January
2014 2013£’000 £’000 £’000 £’000
ASSETS
Investment assets 107,174 36,847
Debtors (Note 7) 1,656 2,083
Cash and bank balances (Note 8) 327 598
Total other assets 1,983 2,681
Total assets 109,157 39,528
LIABILITIES
Creditors (Note 9) (1,175) (1,857)
Bank overdrafts – (94)
Distribution payable on income shares (536) (75)
Total liabilities (1,711) (2,026)
Net assets attributable to shareholders 107,446 37,502
The notes to these financial statements are shown on pages 64 to 65.
Financial statements

1. Net capital (losses)/gains2014 2013
£’000 £’000Currency (losses)/gains (28) 8Non-derivative securities (21,492) 2,842 Net capital (losses)/gains (21,520) 2,850
2. Revenue2014 2013
£’000 £’000Franked income from UK equity investments 55 2Income from Liquidity funds 1 –Income from overseas equity investments 5,287 156Interest on bank and term deposits 1 –Interest on fixed-interest securities – 23Total revenue 5,344 181
3. Expenses2014 2013
£’000 £’000Payable to the ACD or associate of the ACD:ACD fee 1,238 118Fixed expenses 182 16Total expenses 1,420 134
4. Taxation2014 2013
£’000 £’000a) Analysis of charge in the yearOverseas tax suffered 480 19Current year tax charge (Note 4b) 480 19
b) Factors affecting the tax charge for the yearThe tax assessed for the year is lower than the standard rate of corporation tax inthe UK for an Open-Ended Investment Company (OEIC) (20%). The differences areexplained below.
Net revenue before taxation 3,924 47Corporation tax at 20% 785 9
Effects of:Dividends not subject to corporation tax (911) (29)Excess expenses for which no relief taken 136 20Overseas tax suffered 480 19Overseas tax expensed (10) -
(305) 10Current year tax charge (Note 4a) 480 19
No deferred tax asset has been recognised in the financial statements. At the yearend date, the Fund had a potential unrecognised deferred tax asset of £157,122(31.01.13: £20,608) in relation to £785,612 (31.01.13: £103,041) of excessmanagement expenses which would only be utilised to reduce the tax charge if theFund had an excess of unfranked income over expenses in a future period. There isno excess of unfranked income expected in the future.
5. Finance costsDistributionsThe distributions take account of amounts receivable on the issue of shares andamounts payable on the cancellation of shares and comprise:
2014 2013£’000 £’000
First interim dividend distribution 1,114 –Second interim dividend distribution 1,554 –Third interim dividend distribution 1,385 118Final dividend distribution 866 109Add: Amounts payable on cancellation of shares 486 3Deduct: Amounts receivable on issue of shares (839) (90)Total finance costs 4,566 140
Details of the distribution per share are set out on pages 66 to 68.
6. Movement between net revenue after taxation and distributions2014 2013
£’000 £’000Net revenue after taxation 3,444 28Add: ACD fee (net of tax relief) paid from capital 1,127 115Add: Undistributed revenue brought forward 3 –Deduct: Undistributed revenue carried forward (8) (3)
4,566 140
7. Debtors2014 2013
£’000 £’000Accrued income 142 44Due from the ACD for shares created 1,429 2,038Overseas tax recoverable 85 1Total debtors 1,656 2,083
8. Cash and bank balances2014 2013
£’000 £’000Cash and bank balances 327 598
9. Creditors2014 2013
£’000 £’000Accrued expenses 99 41Due to the ACD for shares cancelled 104 39Purchases awaiting settlement 972 1,777Total creditors 1,175 1,857
Notes to the financial statements for the year ending 31 January 2014
64
Continuation�
� Return to Index

65
Continuation�
� Return to Index
10. Portfolio transaction costs2014 2013
£’000 £’000Analysis of total purchase costs
Purchases in year before transaction costs 160,548 41,028
Commissions 129 41Taxes 76 23Total purchase costs 205 64Gross purchases total 160,753 41,092
Analysis of total sale costs
Gross sales before transaction costs 68,999 7,088
Commissions (45) (4)Taxes (20) (1)Total sale costs (65) (5)Total sales net of transaction costs 68,934 7,083
11. Related party transactionsJPMorgan Funds Limited, as Authorised Corporate Director (“ACD”), is a relatedparty, and acts as principal in respect of all transactions of shares in the Company.The aggregate monies received through issue, and paid on cancellation, aredisclosed in the Statement of Change in Net Assets Attributable to Shareholders.
The balance due from the ACD and their associates at the year end date in respectof related party transactions was £1,226,109 (31.01.13: £1,958,420). Details ofrelated party transactions are given under note 13 on page 413.
Investments considered to be related parties have been identified in the portfoliostatement on page 61 and the revenue from these investments was £1,093(31.01.13: £205).
Some of the dealing transactions for the Fund are carried out through associatesof the ACD. Such transactions are carried out on an arm’s length basis. Thecommissions paid to these companies over the year were £11,613 (31.01.13:£8,176). Commission was paid to the associated company JPMorgan Securities Ltd.
The following party held a material interest in the Fund at the year end date:– Cofunds Nominees Limited 21.59% (31.01.13: 1.98%)
12. Financial instrumentsCurrency exposuresA substantial proportion of the net assets of the Fund are denominated incurrencies other than sterling, with the effect that the Balance sheet and totalreturn can be significantly affected by currency movements.
Net foreign currency assets/(liabilities)Monetary Non-monetary
Total exposures exposuresCurrency £’000 £’000 £’000
31.01.14US Dollar 23,312 215 23,097Hong Kong Dollar 18,438 (108) 18,546Taiwan Dollar 16,220 169 16,051South African Rand 12,752 5 12,747Brazilian Real 9,713 (79) 9,792Korean Won 4,777 113 4,664Turkish Lira 4,771 – 4,771Thailand Baht 4,438 – 4,438Indonesian Rupiah 4,095 – 4,095Qatari Riyal 2,193 – 2,193Indian Rupee 2,071 – 2,071Polish Zloty 1,852 28 1,824Mexican Peso 1,369 (109) 1,478Arab Emirates Dirham 1,314 10 1,304Singapore Dollar 103 – 103
31.01.13US Dollar 8,091 87 8,004Hong Kong Dollar 6,690 – 6,690South African Rand 5,860 (371) 6,231Brazilian Real 4,870 222 4,648Taiwan Dollar 3,111 321 2,790Indonesian Rupiah 1,844 (75) 1,919Turkish Lira 1,557 – 1,557Korean Won 1,472 (45) 1,517Polish Zloty 1,468 – 1,468Qatari Riyal 810 (38) 848Thailand Baht 643 – 643Mexican Peso 390 1 389Singapore Dollar 143 – 143
Interest rate riskAt the year end date, 0.3% (31.01.13: 1.3%) of the Fund’s net assets by value wereinterest bearing, carrying a (fixed/floating) rate.
For consideration of other risks including liquidity, pricing and credit risk, pleaserefer to the notes to the aggregated financial statements, pages 413 to 414.
13. Share classesThe Fund currently has four share classes; Class A Shares, Class B Shares, Class CShares and Class X Shares. The Authorised Corporate Director’s (ACD) fee andfixed expenses charge are shown below.
ACD fee Fixed expensesClass A shares: 1.50% 0.18%Class B shares: 1.00% 0.18%Class C shares: 0.75% 0.18%Class X shares: 0.00% 0.06%
The net asset value of each share class, the net asset value per share and thenumber of shares in each class are shown on page 60. All classes have the samerights on winding up.
Notes to the financial statements – continued

Final distribution in pence per share
Group 1 – Shares purchased prior to 1 November 2013Group 2 – Shares purchased 1 November 2013 to 31 January 2014
DistributionGross Tax Net payable paid
revenue at 10% revenue Equalisation 30.04.14 30.04.13
A-Class Accumulation Shares
Group 1 0.433333 0.043333 0.390000 – 0.390000 0.170000
Group 2 0.288773 0.028877 0.259896 0.130104 0.390000 0.170000
A-Class Income Shares
Group 1 0.422222 0.042222 0.380000 – 0.380000 0.160000
Group 2 0.207102 0.020710 0.186392 0.193608 0.380000 0.160000
B-Class Accumulation Shares
Group 1 0.444444 0.044444 0.400000 – 0.400000 0.170000
Group 2 0.271361 0.027136 0.244225 0.155775 0.400000 0.170000
B-Class Income Shares
Group 1 0.855556 0.085556 0.770000 – 0.770000 0.330000
Group 2 0.401846 0.040185 0.361661 0.408339 0.770000 0.330000
C-Class Accumulation Shares
Group 1 0.444444 0.044444 0.400000 – 0.400000 –
Group 2 0.186037 0.018604 0.167433 0.232567 0.400000 –
C-Class Income Shares
Group 1 0.422222 0.042222 0.380000 – 0.380000 –
Group 2 0.218441 0.021844 0.196597 0.183403 0.380000 –
X-Class Accumulation Shares
Group 1 0.822222 0.082222 0.740000 – 0.740000 0.000000
Group 2 0.822222 0.082222 0.740000 0.000000 0.740000 0.000000
Distribution tables
66
Continuation�
� Return to Index

67
Continuation�
� Return to Index
Third interim distribution in pence per share
Group 1 – Shares purchased prior to 1 August 2013Group 2 – Shares purchased 1 August 2013 to 31 October 2013
DistributionGross Tax Net paid paid
revenue at 10% revenue Equalisation 31.01.14 31.01.13
A-Class Accumulation Shares
Group 1 0.766667 0.076667 0.690000 – 0.690000 0.370000
Group 2 0.142587 0.014259 0.128328 0.561672 0.690000 0.370000
A-Class Income Shares
Group 1 0.744444 0.074444 0.670000 – 0.670000 0.370000
Group 2 0.167386 0.016739 0.150647 0.519353 0.670000 0.370000
B-Class Accumulation Shares
Group 1 0.766667 0.076667 0.690000 – 0.690000 0.370000
Group 2 0.262478 0.026248 0.236230 0.453770 0.690000 0.370000
B-Class Income Shares
Group 1 1.488889 0.148889 1.340000 – 1.340000 0.750000
Group 2 0.536110 0.053611 0.482499 0.857501 1.340000 0.750000
C-Class Accumulation Shares
Group 1 0.766667 0.076667 0.690000 – 0.690000 –
Group 2 0.056159 0.005616 0.050543 0.639457 0.690000 –
C-Class Income Shares
Group 1 0.744444 0.074444 0.670000 – 0.670000 –
Group 2 0.148220 0.014822 0.133398 0.536602 0.670000 –
X-Class Accumulation Shares
Group 1 1.455556 0.145556 1.310000 – 1.310000 –
Group 2 1.455556 0.145556 1.310000 0.000000 1.310000 –
Distribution tables – continued

Second interim distribution in pence per share
Group 1 – Shares purchased prior to 1 May 2013Group 2 – Shares purchased 1 May 2013 to 31 July 2013
DistributionGross Tax Net paid paid
revenue at 10% revenue Equalisation 31.10.13 31.10.12
A-Class Accumulation Shares
Group 1 0.844444 0.084444 0.760000 – 0.760000 –
Group 2 0.424679 0.042468 0.382211 0.377789 0.760000 –
A-Class Income Shares
Group 1 0.822222 0.082222 0.740000 – 0.740000 –
Group 2 0.309680 0.030968 0.278712 0.461288 0.740000 –
B-Class Accumulation Shares
Group 1 0.844444 0.084444 0.760000 – 0.760000 –
Group 2 0.396254 0.039625 0.356629 0.403371 0.760000 –
B-Class Income Shares
Group 1 1.644444 0.164444 1.480000 – 1.480000 –
Group 2 0.354108 0.035411 0.318697 1.161303 1.480000 –
X-Class Accumulation Shares
Group 1 1.455556 0.145556 1.310000 – 1.310000 –
Group 2 1.455556 0.145556 1.310000 0.000000 1.310000 –
First interim distribution in pence per share
Group 1 – Shares purchased prior to 1 February 2013Group 2 – Shares purchased 1 February 2013 to 30 April 2013
DistributionGross Tax Net paid paid
revenue at 10% revenue Equalisation 31.07.13 31.07.12
A-Class Accumulation Shares
Group 1 0.722222 0.072222 0.650000 – 0.650000 –
Group 2 0.585133 0.058513 0.526620 0.123380 0.650000 –
A-Class Income Shares
Group 1 0.722222 0.072222 0.650000 – 0.650000 –
Group 2 0.384795 0.038479 0.346316 0.303684 0.650000 –
B-Class Accumulation Shares
Group 1 0.722222 0.072222 0.650000 – 0.650000 –
Group 2 0.311911 0.031191 0.280720 0.369280 0.650000 –
B-Class Income Shares
Group 1 1.444444 0.144444 1.300000 – 1.300000 –
Group 2 0.580365 0.058036 0.522329 0.777671 1.300000 –
X-Class Accumulation Shares
Group 1 1.300000 0.130000 1.170000 – 1.170000 –
Group 2 1.300000 0.130000 1.170000 0.000000 1.170000 –
Equalisation applies only to shares purchased during the distribution period (group 2 shares). It is the average amount of revenue included in the purchase price of all group 2 shares and is refunded to holders of these
shares as a return of capital. Being capital it is not liable to income tax but must be deducted from the cost of shares for capital gains tax purposes.
Distribution tables – continued
68
� Return to Index

Important informationOn 31 August 2013 this Fund was merged into JPM Emerging Markets Fund.
Highest/lowest share price and distribution recordDistribution
Highest Lowest per shareCalendar year share price share price (net)A-Class Accumulation Shares2009 68.50p 35.43p 0.00p2010 86.11p 64.41p 0.58p2011 87.25p 62.14p 0.08p2012 78.12p 65.70p 0.47p2013A 79.90p 65.66p 1.28pA-Class Income Shares2009 68.53p 35.43p 0.00p2010 85.32p 63.95p 0.58p2011 86.45p 61.51p 0.05p2012 76.75p 64.62p 0.46p2013A 77.85p 63.97p 1.26pB-Class Accumulation SharesB
2012 105.8p 97.51p -2013A 115.3p 94.94p 2.56pC-Class Accumulation SharesC
2012 104.0p 95.97p –2013A 113.4p 93.40p 2.77pC-Class Income SharesC
2012 104.0p 95.97p –2013A 111.9p 92.13p 2.75p
A To 31 August 2013.B B-Class Accumulation Shares were launched on 9 July 2012.C C-Class Accumulation Shares and C-Class Income Shares were launched on 20 August 2012.
Net asset values and Ongoing chargesNet assetvalue per Net asset
share class Number value per OngoingDate £’000 of shares share chargesA-Class Accumulation Shares31.01.12 25,987 36,111,070 71.96p 1.93%31.01.13 21,391 28,383,454 75.36p 1.93%31.01.14 12 – – –A-Class Income Shares31.01.12 2,575 3,637,821 70.78p 1.93%31.01.13 2,122 2,889,558 73.43p 1.93%31.01.14 1 – – –B-Class Accumulation Shares31.01.13 3 2,500 108.7p 1.33%31.01.14 – – – –C-Class Accumulation Shares31.01.13 32 30,355 106.8p 1.03%31.01.14 – – – –C-Class Income Shares31.01.13 1 1,000 105.4p 1.03%31.01.14 – – – –
The net asset value and the net asset value per income share are shown ex-dividend.
Following the adoption of the requirements of UCITS IV in June 2012, Ongoing charges has replaced theTotal Expense Ratio (“TER”). The Ongoing charges takes into account the ACD fee, the fixed expenses andany expenses paid to an affiliate in respect of stocklending activities, expressed as a percentage of theaverage daily net asset values over the period. The main difference between the two calculations is theinclusion of custodian handling charges and stocklending fees in the Ongoing charges figure. The comparativefigures have not been restated, and the historic TER is disclosed.
JPM Emerging Markets Infrastructure Fund
69
Continuation�
� Return to Index

Financial statements
Statement of total returnFor the year ending 31 January
2014 2013£’000 £’000 £’000 £’000
Income
Net capital (losses)/gains (Note 1) (2,208) 643
Revenue (Note 2) 393 848
Expenses (Note 3) (213) (519)
Net revenue before taxation 180 329
Taxation (Note 4) (34) (55)
Net revenue after taxation 146 274
Total return before distributions (2,062) 917
Finance costs: Distributions (Note 5) (154) (276)
Change in net assets attributable to shareholders from investment activities (2,216) 641
Statement of change in net assets attributable to shareholdersFor the year ending 31 January
2014 2013£’000 £’000 £’000 £’000
Opening net assets attributable to shareholders 23,549 28,562
Amounts transferred to JPM Emerging Markets Fund (12,772) –
Amounts receivable on issue of shares 977 3,964
Amounts payable on cancellation of shares (9,625) (9,815)
(8,648) (5,851)
Change in net assets attributable to shareholders from investment activities (see above) (2,216) 641
Retained distributions on accumulation shares 103 199
Stamp duty reserve tax (3) (2)
Closing net assets attributable to shareholders 13 23,549
Balance sheetAs at 31 January
2014 2013£’000 £’000 £’000 £’000
ASSETS
Investment assets – 23,576
Debtors (Note 7) 1 85
Cash and bank balances (Note 8) 12 100
Total other assets 13 185
Total assets 13 23,761
LIABILITIES
Creditors (Note 9) – (192)
Distribution payable on income shares – (20)
Total liabilities – (212)
Net assets attributable to shareholders 13 23,549
The notes to these financial statements are shown on pages 71 to 72.
70
Continuation�
� Return to Index

Notes to the financial statements for the year ending 31 January 2014
5. Finance costsDistributionsThe distributions take account of amounts receivable on the issue of shares andamounts payable on the cancellation of shares and comprise:
2014 2013£’000 £’000
Final dividend distribution 113 219Add: Amounts payable on cancellation of shares 44 75Deduct: Amounts receivable on issue of shares (3) (18)Total finance costs 154 276
Details of the distribution per share are set out on page 73.
6. Movement between net revenue after taxation and distributions2014 2013
£’000 £’000Net revenue after taxation 146 274Add: Undistributed revenue brought forward 1 3Deduct: Undistributed revenue carried forward 6 (1)Equalisation on conversions 1 –
154 276
7. Debtors2014 2013
£’000 £’000Accrued income 1 67Due from the ACD for shares created – 13Overseas tax recoverable – 5Total debtors 1 85
8. Cash and bank balances2014 2013
£’000 £’000Cash and bank balances 12 100
9. Creditors2014 2013
£’000 £’000Accrued expenses – 39Due to the ACD for shares cancelled – 69Purchases awaiting settlement – 84Total creditors – 192
1. Net capital (losses)/gains2014 2013
£’000 £’000Currency gains 73 22Derivative contracts (83) –Forward currency contracts (1) –Non-derivative securities (2,197) 621Net capital (losses)/gains (2,208) 643
2. Revenue2014 2013
£’000 £’000Franked income from UK equity investments 7 15Income from overseas equity investments 386 784Interest on bank and term deposits – 1Interest on fixed-interest securities – 48Total revenue 393 848
3. Expenses2014 2013
£’000 £’000Payable to the ACD or associate of the ACD:ACD fee 193 471Fixed expenses 20 48Total expenses 213 519
4. Taxation2014 2013
£’000 £’000a) Analysis of charge in the yearOverseas tax suffered 34 55Current year tax charge (Note 4b) 34 55
b) Factors affecting the tax charge for the yearThe tax assessed for the year is lower than the standard rate of corporation tax inthe UK for an Open-Ended Investment Company (OEIC) (20%). The differences areexplained below.
Net revenue before taxation 180 329Corporation tax at 20% 36 66
Effects of:Dividends not subject to corporation tax (71) (142)Excess expenses for which no relief taken 34 77Overseas tax suffered 34 55Overseas tax expensed 1 (1)
(2) (11)Current year tax charge (Note 4a) 34 55
No deferred tax asset has been recognised in the financial statements. At the yearend date, the Fund had a potential unrecognised deferred tax asset of £244,833(31.01.13: £210,838) in relation to £1,224,163 (31.01.13: £1,054,192) of excessmanagement expenses which would only be utilised to reduce the tax charge if theFund had an excess of unfranked income over expenses in a future period. There isno excess of unfranked income expected in the future.
71
Continuation�
� Return to Index

Notes to the financial statements – continued
10. Portfolio transaction costs2014 2013
£’000 £’000Analysis of total purchase costs
Purchases in year before transaction costs 6,347 8,996
Commissions 10 16Taxes 5 3Total purchase costs 15 19Gross purchases total 6,362 9,015
Analysis of total sale costs
Gross sales before transaction costs 27,771 14,521
Commissions (24) (20)Taxes (7) (5)Total sale costs (31) (25)Total sales net of transaction costs 27,740 14,496
11. Related party transactionsJPMorgan Funds Limited, as Authorised Corporate Director (“ACD”), is a relatedparty, and acts as principal in respect of all transactions of shares in the Company.The aggregate monies received through issue, and paid on cancellation, aredisclosed in the Statement of Change in Net Assets Attributable to Shareholders.
The balance due from the ACD and their associates at the year end date in respectof related party transactions was £nil (31.01.13: £95,464). Details of related partytransactions are given under note 13 on page 413.
Some of the dealing transactions for the fund are carried out through associates ofthe ACD. Such transactions are carried out on an arm’s length basis. Thecommissions paid to these companies over the year were £1,852 (31.01.13: £2,584).Commission was paid to the associated company JPMorgan Securities Ltd.
During the year, the Fund merged with the JPM Emerging Markets Fund. The Fundclosed and its assets amounting to £12,772,000 were transferred to JPM EmergingMarkets Fund.
The following parties held a material interest in the Fund at the year end date:– FNZ (UK) Nominees Ltd 0.00% (31.01.13: 25.16%)– FIL (Luxembourg) SA 0.00% (31.01.13: 16.97%)– Cofunds Nominees Ltd 0.00% (31.01.13: 10.13%)
12. Share classesThe Fund had three share classes; Class A Shares, Class B Shares and Class CShares. The Authorised Corporate Director’s (ACD) fee and fixed expenses chargewere as shown below.
ACD fee Fixed expensesClass A shares: 1.75% 0.18%Class B shares: 1.15% 0.18%Class C shares: 0.85% 0.18%
The net asset value of each share class, the net asset value per share and thenumber of shares in each class are shown on page 69. All classes had the samerights on winding up.
13. Contingent liabilities and capital commitmentsAt the balance sheet date there were no contingent liabilities or capitalcommitments (2013: none).
72
Continuation�
� Return to Index

Final distribution in pence per share
Group 1 – Shares purchased prior to 1 February 2013Group 2 – Shares purchased 1 February 2013 to 30 August 2013
DistributionGross Tax Net paid paid
revenue at 10% revenue Equalisation 29.11.13 30.04.13
A-Class Accumulation Shares
Group 1 0.644444 0.064444 0.580000 – 0.580000 0.700000
Group 2 0.413758 0.041376 0.372382 0.207618 0.580000 0.700000
A-Class Income Shares
Group 1 0.633333 0.063333 0.570000 – 0.570000 0.690000
Group 2 0.390013 0.039001 0.351012 0.218988 0.570000 0.690000
B-Class Accumulation Shares
Group 1 1.344444 0.134444 1.210000 – 1.210000 1.350000
Group 2 0.984150 0.098415 0.885735 0.324265 1.210000 1.350000
C-Class Accumulation Shares
Group 1 1.500000 0.150000 1.350000 – 1.350000 1.420000
Group 2 1.004302 0.100430 0.903872 0.446128 1.350000 1.420000
C-Class Income Shares
Group 1 1.444444 0.144444 1.300000 – 1.300000 1.450000
Group 2 1.028283 0.102828 0.925455 0.374545 1.300000 1.450000
Equalisation applies only to shares purchased during the distribution period (group 2 shares). It is the average amount of revenue included in the purchase price of all group 2 shares and is refunded to holders of these
shares as a return of capital. Being capital it is not liable to income tax but must be deducted from the cost of shares for capital gains tax purposes.
Distribution table
73
� Return to Index
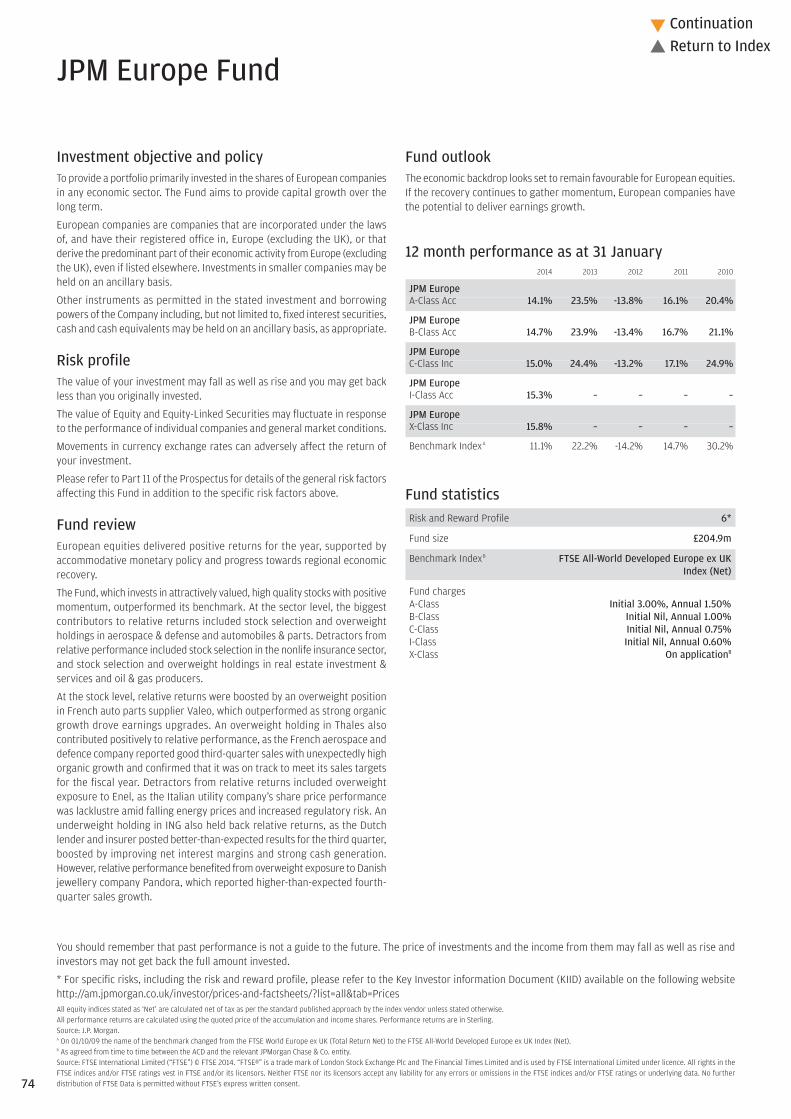
You should remember that past performance is not a guide to the future. The price of investments and the income from them may fall as well as rise andinvestors may not get back the full amount invested.
* For specific risks, including the risk and reward profile, please refer to the Key Investor information Document (KIID) available on the following websitehttp://am.jpmorgan.co.uk/investor/prices-and-factsheets/?list=all&tab=PricesAll equity indices stated as ‘Net’ are calculated net of tax as per the standard published approach by the index vendor unless stated otherwise.All performance returns are calculated using the quoted price of the accumulation and income shares. Performance returns are in Sterling.Source: J.P. Morgan.A On 01/10/09 the name of the benchmark changed from the FTSE World Europe ex UK (Total Return Net) to the FTSE All-World Developed Europe ex UK Index (Net).B As agreed from time to time between the ACD and the relevant JPMorgan Chase & Co. entity.Source: FTSE International Limited (“FTSE”) © FTSE 2014. “FTSE®” is a trade mark of London Stock Exchange Plc and The Financial Times Limited and is used by FTSE International Limited under licence. All rights in theFTSE indices and/or FTSE ratings vest in FTSE and/or its licensors. Neither FTSE nor its licensors accept any liability for any errors or omissions in the FTSE indices and/or FTSE ratings or underlying data. No furtherdistribution of FTSE Data is permitted without FTSE’s express written consent.
JPM Europe Fund
Fund outlookThe economic backdrop looks set to remain favourable for European equities.If the recovery continues to gather momentum, European companies havethe potential to deliver earnings growth.
12 month performance as at 31 January 2014 2013 2012 2011 2010
JPM Europe A-Class Acc 14.1% 23.5% -13.8% 16.1% 20.4%
JPM EuropeB-Class Acc 14.7% 23.9% -13.4% 16.7% 21.1%
JPM EuropeC-Class Inc 15.0% 24.4% -13.2% 17.1% 24.9%
JPM EuropeI-Class Acc 15.3% – – – –
JPM EuropeX-Class Inc 15.8% – – – –
Benchmark IndexA 11.1% 22.2% -14.2% 14.7% 30.2%
Fund statisticsRisk and Reward Profile 6*
Fund size £204.9m
Benchmark IndexB FTSE All-World Developed Europe ex UKIndex (Net)
Fund chargesA-Class Initial 3.00%, Annual 1.50% B-Class Initial Nil, Annual 1.00%C-Class Initial Nil, Annual 0.75%I-Class Initial Nil, Annual 0.60%X-Class On applicationB
Investment objective and policyTo provide a portfolio primarily invested in the shares of European companiesin any economic sector. The Fund aims to provide capital growth over thelong term.
European companies are companies that are incorporated under the lawsof, and have their registered office in, Europe (excluding the UK), or thatderive the predominant part of their economic activity from Europe (excludingthe UK), even if listed elsewhere. Investments in smaller companies may beheld on an ancillary basis.
Other instruments as permitted in the stated investment and borrowingpowers of the Company including, but not limited to, fixed interest securities,cash and cash equivalents may be held on an ancillary basis, as appropriate.
Risk profileThe value of your investment may fall as well as rise and you may get backless than you originally invested.
The value of Equity and Equity-Linked Securities may fluctuate in responseto the performance of individual companies and general market conditions.
Movements in currency exchange rates can adversely affect the return ofyour investment.
Please refer to Part 11 of the Prospectus for details of the general risk factorsaffecting this Fund in addition to the specific risk factors above.
Fund reviewEuropean equities delivered positive returns for the year, supported byaccommodative monetary policy and progress towards regional economicrecovery.
The Fund, which invests in attractively valued, high quality stocks with positivemomentum, outperformed its benchmark. At the sector level, the biggestcontributors to relative returns included stock selection and overweightholdings in aerospace & defense and automobiles & parts. Detractors fromrelative performance included stock selection in the nonlife insurance sector,and stock selection and overweight holdings in real estate investment &services and oil & gas producers.
At the stock level, relative returns were boosted by an overweight positionin French auto parts supplier Valeo, which outperformed as strong organicgrowth drove earnings upgrades. An overweight holding in Thales alsocontributed positively to relative performance, as the French aerospace anddefence company reported good third-quarter sales with unexpectedly highorganic growth and confirmed that it was on track to meet its sales targetsfor the fiscal year. Detractors from relative returns included overweightexposure to Enel, as the Italian utility company’s share price performancewas lacklustre amid falling energy prices and increased regulatory risk. Anunderweight holding in ING also held back relative returns, as the Dutchlender and insurer posted better-than-expected results for the third quarter,boosted by improving net interest margins and strong cash generation.However, relative performance benefited from overweight exposure to Danishjewellery company Pandora, which reported higher-than-expected fourth-quarter sales growth.
74
Continuation�
� Return to Index
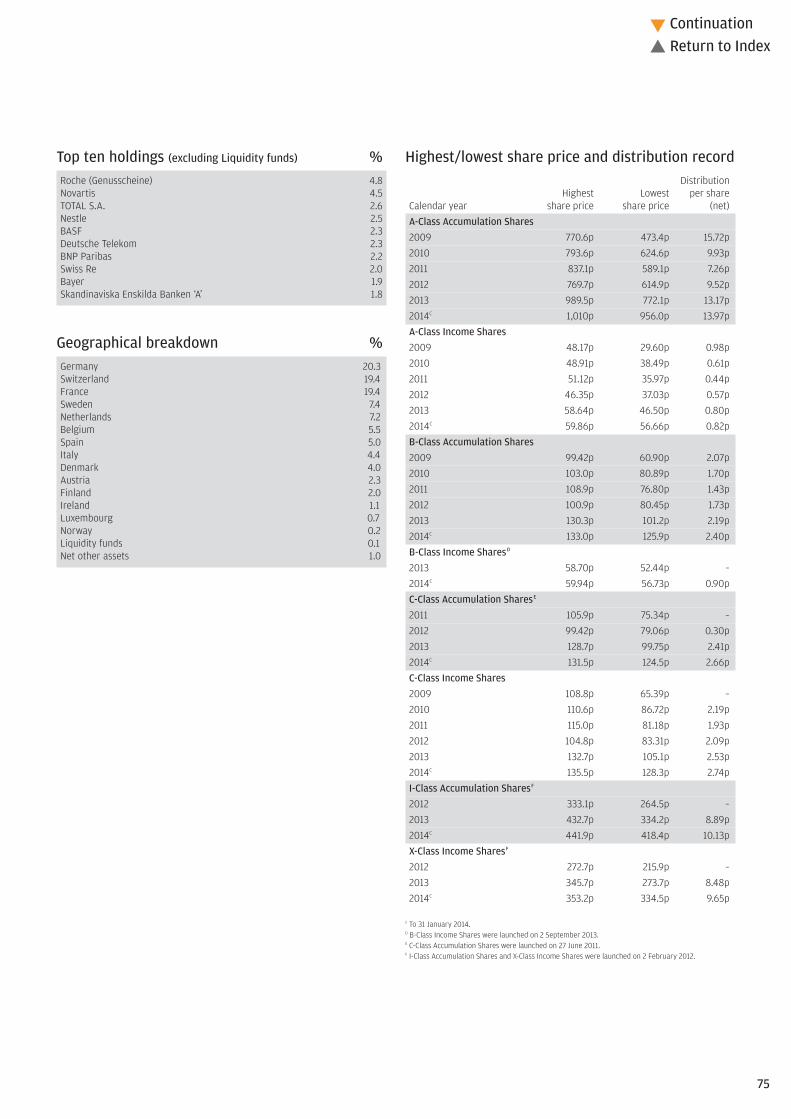
Highest/lowest share price and distribution recordDistribution
Highest Lowest per shareCalendar year share price share price (net)A-Class Accumulation Shares2009 770.6p 473.4p 15.72p2010 793.6p 624.6p 9.93p2011 837.1p 589.1p 7.26p2012 769.7p 614.9p 9.52p2013 989.5p 772.1p 13.17p2014C 1,010p 956.0p 13.97pA-Class Income Shares2009 48.17p 29.60p 0.98p2010 48.91p 38.49p 0.61p2011 51.12p 35.97p 0.44p2012 46.35p 37.03p 0.57p2013 58.64p 46.50p 0.80p2014C 59.86p 56.66p 0.82pB-Class Accumulation Shares2009 99.42p 60.90p 2.07p2010 103.0p 80.89p 1.70p2011 108.9p 76.80p 1.43p2012 100.9p 80.45p 1.73p2013 130.3p 101.2p 2.19p2014C 133.0p 125.9p 2.40pB-Class Income SharesD
2013 58.70p 52.44p –2014C 59.94p 56.73p 0.90pC-Class Accumulation SharesE
2011 105.9p 75.34p –2012 99.42p 79.06p 0.30p2013 128.7p 99.75p 2.41p2014C 131.5p 124.5p 2.66pC-Class Income Shares2009 108.8p 65.39p –2010 110.6p 86.72p 2.19p2011 115.0p 81.18p 1.93p2012 104.8p 83.31p 2.09p2013 132.7p 105.1p 2.53p2014C 135.5p 128.3p 2.74pI-Class Accumulation SharesF
2012 333.1p 264.5p –2013 432.7p 334.2p 8.89p2014C 441.9p 418.4p 10.13pX-Class Income SharesF
2012 272.7p 215.9p –2013 345.7p 273.7p 8.48p2014C 353.2p 334.5p 9.65p
C To 31 January 2014.D B-Class Income Shares were launched on 2 September 2013.E C-Class Accumulation Shares were launched on 27 June 2011.F I-Class Accumulation Shares and X-Class Income Shares were launched on 2 February 2012.
Top ten holdings (excluding Liquidity funds) %Roche (Genusscheine) 4.8Novartis 4.5TOTAL S.A. 2.6Nestle 2.5BASF 2.3Deutsche Telekom 2.3BNP Paribas 2.2Swiss Re 2.0Bayer 1.9Skandinaviska Enskilda Banken ‘A’ 1.8
Geographical breakdown %Germany 20.3Switzerland 19.4France 19.4Sweden 7.4Netherlands 7.2Belgium 5.5Spain 5.0Italy 4.4Denmark 4.0Austria 2.3Finland 2.0Ireland 1.1Luxembourg 0.7Norway 0.2Liquidity funds 0.1Net other assets 1.0
75
Continuation�
� Return to Index

Net asset values and Ongoing chargesNet assetvalue per Net asset
share class Number value per OngoingDate £’000 of shares share chargesA-Class Accumulation Shares31.01.12 158,609 23,386,955 678.2p 1.66%31.01.13 159,132 19,000,978 837.5p 1.69%31.01.14 153,624 16,077,849 955.5p 1.68%A-Class Income Shares31.01.12 1,386 3,394,415 40.84p 1.68%31.01.13 1,222 2,462,049 49.64p 1.69%31.01.14 1,266 2,268,189 55.81p 1.68%B-Class Accumulation Shares31.01.12 1,973 2,226,974 88.57p 1.13%31.01.13 77 69,879 109.8p 1.19%31.01.14 144 114,421 125.9p 1.18%B-Class Income Shares31.01.14 7 13,463 55.81p 1.18%C-Class Accumulation Shares31.01.12 501 575,742 86.98p 0.87%31.01.13 665 614,118 108.3p 0.94%31.01.14 4,100 3,295,936 124.4p 0.93%C-Class Income Shares31.01.12 75 81,711 91.64p 0.87%31.01.13 84 75,869 111.6p 0.94%31.01.14 350 278,876 125.5p 0.93%I-Class Accumulation Shares31.01.13 57,723 15,909,424 362.8p 0.61%31.01.14 45,276 10,825,578 418.2p 0.60%X-Class Income Shares31.01.13 2,504 867,625 288.6p 0.07%31.01.14 168 51,668 324.7p 0.06%
The net asset value and the net asset value per income share are shown ex-dividend.
Following the adoption of the requirements of UCITS IV in June 2012, Ongoing charges has replaced the TotalExpense Ratio (“TER”). The Ongoing charges takes into account the ACD fee, the fixed expenses and any expensespaid to an affiliate in respect of stocklending activities, expressed as a percentage of the average daily net assetvalues over the period. The main difference between the two calculations is the inclusion of custodian handlingcharges and stocklending fees in the Ongoing charges figure. The comparative figures have not been restated,and the historic TER is disclosed.
Portfolio turnover rate31.01.13 135.7%31.01.14 159.4%
The portfolio turnover rate (PTR) reflects the total of security purchases and sales (excluding Liquidityfunds), less the total of share issues and cancellations, expressed as a percentage of the average daily netasset values over the period.
Portfolio transaction costsBroker Transaction
Commissions Taxes Total31.01.13 0.50% 0.03% 0.53%31.01.14 0.37% 0.03% 0.40%
The percentage figures disclosed above reflect the average broker commissions and transaction taxessuffered during the last 3 years divided by the average assets under management over the same period.
Stamp duty reserve tax31.01.13 0.00%31.01.14 0.00%
The percentage figures disclosed above reflect the total stamp duty reserve tax suffered during the yeardivided by the average assets under management over the same period.
76
Continuation�
� Return to Index

Market value Total netInvestment Holding £’000 assets %
Market value Total netInvestment Holding £’000 assets %
Portfolio statementAs at 31 January 2014
Sweden – 7.4% (8.6%)Duni 7,289 60 –Investor ‘B’ 49,912 979 0.5JM 72,005 1,166 0.6Kinnevik Investment ‘B’ 13,856 328 0.2NCC ‘B’ 36,100 700 0.3Nordea Bank 284,986 2,298 1.1Securitas ‘B’ 337,532 2,102 1.0Skandinaviska Enskilda Banken ‘A’ 475,408 3,699 1.8Svenska Cellulosa ‘B’ 5,465 93 -Swedbank ‘A’ 230,249 3,630 1.8TeliaSonera 36,919 165 0.1
Netherlands – 7.2% (5.7%)Ahold 334,353 3,379 1.6Airbus Group 77,353 3,311 1.6Exact 13,743 268 0.1ING Groep 171,935 1,375 0.7Nutreco 97,621 2,629 1.3Philips 4,888 102 –PostNL 77,769 263 0.1Randstad 17,877 689 0.3Unilever 46,856 1,051 0.5Wolters-Kluwer 71,527 1,200 0.6Ziggo 30,269 804 0.4
Belgium – 5.5% (4.4%)Ageas 127,642 3,310 1.7Anheuser-Busch InBev 53,417 3,069 1.5Delhaize Group 47,833 1,865 0.9GBL 1,860 102 –KBC Groep 47,680 1,695 0.8Solvay 14,241 1,209 0.6
Spain – 5.0% (6.1%)Banco Santander 101,780 528 0.3CaixaBank 150,036 542 0.3Elecnor 6,677 61 –Ferrovial 283,736 3,293 1.6Gas Natural 136,312 2,057 1.0INTERNATIONAL 48,593 198 0.1Obrascon Huarte Lain 82,674 2,108 1.0Repsol 98,722 1,410 0.7
Italy – 4.4% (6.6%)Acea 50,254 333 0.2Autostrada Torino-Milano 54,310 495 0.2Azimut 108,899 1,926 0.9Cairo Communications 45,045 232 0.1Enel 693,286 1,894 0.9ENI 265,695 3,646 1.8Reply 8,921 412 0.2UNIPOL GRUPPO FINANZIARIO 38,881 136 0.1
Denmark – 4.0% (4.6%)AP Moller-Maersk ‘B’ 205 1,396 0.7Jyske Bank 36,000 1,101 0.5Pandora 29,517 1,020 0.5Ringkjobing Landbobank 997 128 0.1Royal Unibrew 8,873 685 0.3Schouw & Co 13,366 358 0.3TDC 572,729 3,241 1.6
Austria – 2.3% (1.4%)Oesterreichische Post 24,115 676 0.3OMV 90,528 2,392 1.2Uniqa Insurance Group 73,859 574 0.3Voestalpine 35,111 942 0.5
Finland – 2.0% (1.6%)Nokia 41,010 174 0.1ORIOLA-KD CORPORATION 28,536 61 –Sanoma 89,439 440 0.3Sponda 346,546 1,033 0.5Tikkurila 16,315 246 0.1UPM-Kymmene 222,799 2,071 1.0
Germany – 20.3% (18.2%)Allianz 32,542 3,278 1.6Aurelius 3,465 77 –BASF 72,254 4,674 2.3Bayer 49,452 3,941 1.9Continental 14,708 1,907 0.9Daimler 55,446 2,773 1.4Deutsche Bank 4,338 126 0.1Deutsche Beteiligungs 26,460 474 0.2Deutsche Boerse 1,980 92 0.1Deutsche Post 156,283 3,262 1.6Deutsche Telekom 471,084 4,628 2.3Draegerwerk Non-Voting Preference 1,239 92 0.1Duerr 17,457 894 0.4Freenet 103,002 1,878 0.9Hannover Rueckversicherungs 9,272 450 0.2Henkel Non-Voting Preference 4,069 265 0.1Leoni 18,524 872 0.4Merck 9,132 860 0.4MunichRe 25,572 3,197 1.6Porsche Automobil Non-Voting Preference 30,838 1,830 0.9Rheinmetall 10,094 392 0.2SHW 21,257 907 0.4Siemens 25,404 1,926 0.9Sixt 33,851 658 0.3Talanx 5,918 115 0.1Volkswagen Non-Voting Preference 13,936 2,128 1.0
Switzerland – 19.4% (19.3%)Adecco 39,948 1,903 0.9Baloise Group 4,550 329 0.2BKW 14,704 283 0.1Credit Suisse Group 77,546 1,420 0.7Forbo 3,442 1,713 0.8Implenia 32,482 1,398 0.7Kardex 15,859 417 0.2Lonza Group 10,742 649 0.3Metall Zug ‘B’ 178 290 0.1Nestle 119,383 5,225 2.5Novartis 193,852 9,301 4.5Roche (Genusscheine) 59,585 9,854 4.8Swiss Re 78,127 4,101 2.0Swisscom 2,363 782 0.4Transocean 36,410 947 0.5UBS 108,475 1,296 0.6VP Bank 3,072 192 0.1
France – 19.4% (19.8%)Alcatel-Lucent 129,768 313 0.2BNP Paribas 96,062 4,476 2.2Boiron 3,606 155 0.1Bongrain 1,279 63 –Cap Gemini 53,108 2,211 1.1Ciments Francais ‘A’ 5,944 284 0.1Credit Agricole 167,921 1,351 0.7Danone 20,522 823 0.4EDF 133,890 2,751 1.3Orange 50,075 371 0.2GDF Suez 240,916 3,229 1.6M6-Metropole Television 53,868 701 0.3Natixis 826,740 2,949 1.4Norbert Dentressangle 3,952 327 0.2Plastic Omnium 44,444 681 0.3Safran 85,368 3,636 1.8Sanofi 45,786 2,736 1.3Societe Generale 47,972 1,643 0.8Technicolor 93,207 281 0.1Thales 73,982 2,900 1.4TOTAL S.A. 156,515 5,395 2.6Valeo 29,351 1,956 1.1Vinci 11,208 441 0.2
77
Continuation�
� Return to Index

Market value Total netInvestment Holding £’000 assets %
Portfolio statement – continuedAs at 31 January 2014
Ireland – 1.1% (1.1%)Fyffes 257,068 188 0.1Glanbia 83,320 741 0.4Origin Enterprises 55,988 310 0.2Smurfit Kappa Group 48,181 685 0.4
Luxembourg – 0.7% (0.0%)ArcelorMittal 147,888 1,477 0.7
Norway – 0.2% (2.1%)DNB 19,895 207 0.1Wilh. Wilhelmsen Holding ‘A’ 3,770 73 –Yara International 6,432 160 0.1
Futures – 0.0% (0.0%)Euro Stoxx 50 21/03/2014 60 (36) –
Liquidity funds – 0.1% (0.0%)JPM Euro Liquidity ‘X’ (Flex Distribution)^$ 350,075 288 0.1
Investment assets (including investment liabilities) 202,912 99.0
Net other assets 2,023 1.0
Net assets 204,935 100.0
Unless otherwise stated the above securities are admitted to official stock exchange listings or trade on aregulated market.
The comparative percentage figures in brackets are at 31 January 2013.
^ Deemed to be investment in related parties of the ACD$ Approved security as defined in the Collective Investment Schemes sourcebook
78
Continuation�
� Return to Index

Portfolio movements For the year ending 31 January 2014
£’000
Total of all sales for the year (Note 10) 240,096
Major sales Proceeds
JPM Euro Liquidity ‘X’ Flex (Distribution)^ 19,483SAP 5,174Novo-Nordisk ‘B’ 4,348Sanofi 4,057Zurich Financial Services 3,983Michelin 3,808AXA 3,797Randstad 3,486Credit Suisse Group 3,388Volkswagen Non-Voting Preference 3,330Philips 3,209Banco Santander 3,079Vivendi 3,075Syngenta 3,027Hannover Rueckversicherungs 2,773Anheuser-Busch InBev 2,703Investor ‘B’ 2,608Coloplast ‘B’ 2,563Enel 2,542GAM 2,532
£’000
Total of all purchases for the year (Note 10) 198,690
Major purchases Cost
JPM Euro Liquidity ‘X’ Flex (Distribution)^ 19,870Deutsche Telekom 3,488Natixis 3,478Safran 3,441GDF Suez 3,437Obrascon Huarte Lain 3,413Allianz 3,350Unilever 3,325TDC 3,302Daimler 3,149Randstad 3,117Credit Suisse Group 3,081OMV 3,015UBS 2,975Transocean 2,815EDF 2,715MunichRe 2,676Volkswagen Non-Voting Preference 2,360Carlsberg ‘B’ 2,199Ageas 2,178
^ Deemed to be investment in related parties of the ACD
79
Continuation�
� Return to Index

Financial statements
Balance sheetAs at 31 January
2014 2013£’000 £’000 £’000 £’000
ASSETS
Investment assets 202,948 220,393
Debtors (Note 7) 15,401 8,908
Cash and bank balances (Note 8) 294 51
Total other assets 15,695 8,959
Total assets 218,643 229,352
LIABILITIES
Investment liabilities (36) –
Creditors (Note 9) (13,641) (7,024)
Bank overdrafts – (826)
Distribution payable on income shares (31) (95)
Total other liabilities (13,672) (7,945)
Total liabilities (13,708) (7,945)
Net assets attributable to shareholders 204,935 221,407
The notes to these financial statements are shown on pages 81 to 82.
Statement of total returnFor the year ending 31 January
2014 2013£’000 £’000 £’000 £’000
Income
Net capital gains (Note 1) 24,426 39,293
Revenue (Note 2) 7,871 8,147
Expenses (Note 3) (3,005) (2,777)
Net revenue before taxation 4,866 5,370
Taxation (Note 4) (638) (833)
Net revenue after taxation 4,228 4,537
Total return before distributions 28,654 43,830
Finance costs: Distributions (Note 5) (4,240) (4,538)
Change in net assets attributable to shareholders from investment activities 24,414 39,292
Statement of change in net assets attributable to shareholdersFor the year ending 31 January
2014 2013£’000 £’000 £’000 £’000
Opening net assets attributable to shareholders 221,407 162,544
Amounts transferred from JPM Institutional Europe Fund – 54,653
Amounts receivable on issue of shares 9,594 16,559
Amounts payable on cancellation of shares (53,913) (55,573)
(44,319) (39,014)
Change in net assets attributable to shareholders from investment activities (see above) 24,414 39,292
Retained distributions on accumulation shares 3,433 3,933
Stamp duty reserve tax – (1)
Closing net assets attributable to shareholders 204,935 221,407
80
Continuation�
� Return to Index

Notes to the financial statements for the year ending 31 January 2014
5. Finance costsDistributionsThe distributions take account of amounts receivable on the issue of shares andamounts payable on the cancellation of shares and comprise:
2014 2013£’000 £’000
Final dividend distribution 3,464 4,028Add: Amounts payable on cancellation of shares 851 882Deduct: Amounts receivable on issue of shares (75) (372)Total finance costs 4,240 4,538
Details of the distribution per share are set out on page 83.
6. Movement between net revenue after taxation and distributions2014 2013
£’000 £’000Net revenue after taxation 4,228 4,537Add: Undistributed revenue brought forward 1 2Deduct: Undistributed revenue carried forward (1) (1)Equalisation on conversions 12 –
4,240 4,538
7. Debtors2014 2013
£’000 £’000Due from the ACD for shares created 56 19Overseas tax recoverable 641 476Sales awaiting settlement 14,704 8,413Total debtors 15,401 8,908
8. Cash and bank balances2014 2013
£’000 £’000Amounts held at futures clearing houses
and brokers 169 –Cash and bank balances 125 51Total cash and bank balances 294 51
9. Creditors2014 2013
£’000 £’000Accrued expenses 258 249Due to the ACD for shares cancelled 858 580Purchases awaiting settlement 12,525 6,195Total creditors 13,641 7,024
1. Net capital gains2014 2013
£’000 £’000Currency (losses)/gains (81) 31Derivative contracts 171 –Forward currency contracts 1 –Italian tax credit received 370 –Non-derivative securities 23,965 39,262Net capital gains 24,426 39,293
2. Revenue2014 2013
£’000 £’000Income from Liquidity funds 1 7Income from overseas equity investments 7,671 7,788Interest on bank and term deposits 97 2Stock dividends 42 188Stocklending income 60 162Total revenue 7,871 8,147
3. Expenses2014 2013
£’000 £’000Payable to the ACD or associate of the ACD:ACD fee 2,715 2,508Fixed expenses 290 269Total expenses 3,005 2,777
4. Taxation2014 2013
£’000 £’000a) Analysis of charge in the yearOverseas tax provision – 40Overseas tax suffered 638 793Current year tax charge (Note 4b) 638 833
b) Factors affecting the tax charge for the yearThe tax assessed for the year is lower than the standard rate of corporation tax inthe UK for an Open-Ended Investment Company (OEIC) (20%). The differences areexplained below.
Net revenue before taxation 4,866 5,370Corporation tax at 20% 973 1,074
Effects of:Dividends not subject to corporation tax (1,542) (1,564)Excess expenses for which no relief taken 569 490Overseas tax provision – 40Overseas tax suffered 638 793
(335) (241)Current year tax charge (Note 4a) 638 833
No deferred tax asset has been recognised in the financial statements. At the yearend date, the Fund had a potential unrecognised deferred tax asset of £2,055,215(31.01.13: £1,485,732) in relation to £10,276,073 (31.01.13: £7,428,658) of excessmanagement expenses which would only be utilised to reduce the tax charge if theFund had an excess of unfranked income over expenses in a future period. There isno excess of unfranked income expected in the future.
81
Continuation�
� Return to Index

Notes to the financial statements – continued
13. Financial instrumentsCurrency exposuresA substantial proportion of the net assets of the Fund are denominated incurrencies other than sterling, with the effect that the Balance sheet and totalreturn can be significantly affected by currency movements.
Net foreign currency assets/(liabilities)Monetary Non-monetary
Total exposures exposuresCurrency £’000 £’000 £’000
31.01.14Euro 141,594 2,336 139,258Swiss Franc 40,295 194 40,101Swedish Krona 15,285 65 15,220Danish Krone 7,928 – 7,928Norwegian Krone 533 92 441US Dollar 1 1 –
31.01.13Euro 143,430 234 143,196Swiss Franc 44,820 1,434 43,386Swedish Krona 19,197 27 19,170Danish Krone 9,420 (449) 9,869Norwegian Krone 5,395 623 4,772
Interest rate riskAt the year end date, 0.1% (31.01.13: 0.0%) of the Fund’s net assets by value wereinterest bearing, carrying a (fixed/floating) rate.
For consideration of other risks including liquidity, pricing and credit risk, pleaserefer to the notes to the aggregated financial statements, pages 413 to 414.
14. Share classesThe Fund currently has five share classes; Class A Shares, Class B Shares, Class CShares, Class I Shares and Class X Shares. The Authorised Corporate Director’s(ACD) fee and fixed expenses charge are shown below.
ACD fee Fixed expensesClass A shares: 1.50% 0.18%Class B shares: 1.00% 0.18%Class C shares: 0.75% 0.18%Class I shares: 0.60% 0.00%Class X shares: 0.00% 0.06%
The X share class is designed to accommodate an alternative charging structurewhereby the annual fee normally charged to the Fund and then passed on in theshare price is instead administratively levied and collected by the ACD from theshareholder or through the relevant JPMorgan Chase & Co entity.
The net asset value of each share class, the net asset value per share and thenumber of shares in each class are shown on page 76. All classes have the samerights on winding up.
15. Derivatives The Fund enters into derivative transactions in the form of futures for the purposeof efficient portfolio management. The commitment approach has been used tocalculate the global exposure.
Further information on the derivative risks can be found in the notes to theaggregated financial statements on page 414.
16. Contingent liabilities and capital commitmentsAt the balance sheet date there were no contingent liabilities or capitalcommitments (2013: none).
10. Portfolio transaction costs2014 2013
£’000 £’000Analysis of total purchase costs
Purchases in year before transaction costs 198,193 234,203
Commissions 410 284Taxes 87 51Total purchase costs 497 335Gross purchases total 198,690 234,538
Analysis of total sale costs
Gross sales before transaction costs 240,565 216,340
Commissions (469) (304)Total sale costs (469) (304)Total sales net of transaction costs 240,096 216,036
11. Related party transactionsJPMorgan Funds Limited, as Authorised Corporate Director (“ACD”), is a relatedparty, and acts as principal in respect of all transactions of shares in the Company.The aggregate monies received through issue, and paid on cancellation, aredisclosed in the Statement of Change in Net Assets Attributable to Shareholders.
The balance due to the ACD and their associates at the year end date in respect ofrelated party transactions was £1,060,356 (31.01.13: £809,272). Details of relatedparty transactions are given under note 13 on page 413.
Investments considered to be related parties have been identified in the portfoliostatement on pages 77 to 78 and the revenue from these investments was £764(31.01.13: £6,844).
Some of the dealing transactions for the Fund are carried out through associatesof the ACD. Such transactions are carried out on an arm’s length basis. Thecommissions paid to these companies over the year were £5,039 (31.01.13: £4,531).Commission was paid to the associated company JPMorgan Securities Ltd.
The gross stocklending income received was £69,974 (31.01.13: £191,113), with feesdeducted of £10,382 (31.01.13: £28,790).
The following parties held a material interest in the Fund at the year end date:– JPMorgan Life Ltd 21.92% (31.01.13: 24.32%)– Turnsonic (Nominees) Ltd 17.36% (31.01.13: 16.09%)
12. StocklendingAs at 31 January 2014 the aggregate value of securities on loan was £7,455,659(31.01.13: £7,674,846). The Depositary held £7,652,931 (31.01.13: £7,867,130) ofcollateral assets on behalf of the Fund in respect thereof. The nature of thecollateral was 12.1% bonds and 87.9% cash.
82
Continuation�
� Return to Index

Distribution table
Final distribution in pence per share
Group 1 – Shares purchased prior to 1 February 2013Group 2 – Shares purchased 1 February 2013 to 31 January 2014
DistributionGross Tax Net payable paid
revenue at 10% revenue Equalisation 30.04.14 30.04.13
A-Class Accumulation Shares
Group 1 15.522222 1.552222 13.970000 – 13.970000 13.170000
Group 2 1.360153 0.136015 1.224138 12.745862 13.970000 13.170000
A-Class Income Shares
Group 1 0.911111 0.091111 0.820000 – 0.820000 0.800000
Group 2 0.220856 0.022086 0.198770 0.621230 0.820000 0.800000
B-Class Accumulation Shares
Group 1 2.666667 0.266667 2.400000 – 2.400000 2.190000
Group 2 1.470638 0.147064 1.323574 1.076426 2.400000 2.190000
B-Class Income Shares
Group 1 1.000000 0.100000 0.900000 – 0.900000 –
Group 2 1.000000 0.100000 0.900000 0.000000 0.900000 –
C-Class Accumulation Shares
Group 1 2.955556 0.295556 2.660000 – 2.660000 2.410000
Group 2 1.014197 0.101420 0.912777 1.747223 2.660000 2.410000
C-Class Income Shares
Group 1 3.044444 0.304444 2.740000 – 2.740000 2.530000
Group 2 0.246734 0.024673 0.222061 2.517939 2.740000 2.530000
I-Class Accumulation Shares
Group 1 11.255556 1.125556 10.130000 – 10.130000 8.890000
Group 2 11.255556 1.125556 10.130000 0.000000 10.130000 8.890000
X-Class Income Shares
Group 1 10.722222 1.072222 9.650000 – 9.650000 8.480000
Group 2 10.722222 1.072222 9.650000 0.000000 9.650000 8.480000
Equalisation applies only to shares purchased during the distribution period (group 2 shares). It is the average amount of revenue included in the purchase price of all group 2 shares and is refunded to holders of these
shares as a return of capital. Being capital it is not liable to income tax but must be deducted from the cost of shares for capital gains tax purposes.
83
� Return to Index

You should remember that past performance is not a guide to the future. The price of investments and the income from them may fall as well as rise andinvestors may not get back the full amount invested.
* For specific risks, including the risk and reward profile, please refer to the Key Investor information Document (KIID) available on the following websitehttp://am.jpmorgan.co.uk/investor/prices-and-factsheets/?list=all&tab=PricesAll equity indices stated as ‘Net’ are calculated net of tax as per the standard published approach by the index vendor unless stated otherwise.All performance returns are calculated using the quoted price of the accumulation shares. Performance returns are in Sterling.Source: J.P. Morgan.A On 01/10/09 the name of the benchmark changed from the FTSE World Europe ex UK (Total Return Net) to the FTSE All-World Developed Europe ex UK Index (Net).B C-Class Accumulation (GBP Hedged) Shares were launched on 28 August 2013, therefore 12 month performance to 31 January is not available.Source: FTSE International Limited (“FTSE”) © FTSE 2014. “FTSE®” is a trade mark of London Stock Exchange Plc and The Financial Times Limited and is used by FTSE International Limited under licence. All rights in theFTSE indices and/or FTSE ratings vest in FTSE and/or its licensors. Neither FTSE nor its licensors accept any liability for any errors or omissions in the FTSE indices and/or FTSE ratings or underlying data. No furtherdistribution of FTSE Data is permitted without FTSE’s express written consent.
JPM Europe Dynamic (ex-UK) Fund
At the stock level, the Fund benefited most from an overweight position inPostNL, a Dutch postal operator, which received upgrades after reportingbetter-than-expected third-quarter results. Relative returns were also boostedby an overweight position in Airbus Group, as the passenger jet manufacturerreported stronger-than-expected full-year orders and deliveries, and issueda bullish sales forecast. Among detractors from relative returns wasunderweight exposure to Swiss pharmaceuticals company Roche(Genusscheine), which continued to deliver good sales growth and remainedsupported by an industry-leading new drug pipeline. An overweight positionin Deutsche Lufthansa, also contributed negatively to relative performance,as the German airline’s third-quarter results disappointed and share priceperformance was lacklustre for the year. However, relative performancebenefited from overweight exposure to Danish jewellery company Pandora,which reported higher-than-expected fourth-quarter sales growth.
Fund outlookThe economic backdrop looks set to remain favourable for European equities.If the recovery continues to gather momentum, European companies havethe potential to deliver earnings growth.
12 month performance as at 31 January 2014 2013 2012 2011 2010
JPM Europe Dynamic (ex-UK)A-Class Acc 18.9% 28.7% -15.6% 21.4% 26.0%
JPM Europe Dynamic (ex-UK)B-Class Acc 19.5% 29.3% -15.1% 22.1% 26.6%
JPM Europe Dynamic (ex-UK)C-Class Acc 19.8% – – – –
Benchmark IndexA 11.1% 22.2% -14.2% 14.7% 30.2%
JPM Europe Dynamic (ex-UK)A-Class Acc (GBP Hedged) 25.9% 25.3% -12.4% – –
JPM Europe Dynamic (ex-UK)C-Class Acc (GBP Hedged)B – – – – –
Hedged Benchmark Index 16.6% 19.6% -12.4% – –
Fund statisticsRisk and Reward Profile 6*
Fund size £157.5m
Benchmark IndexA FTSE All-World Developed Europe ex UK Index (Net)
Hedged Benchmark Index FTSE All-World Developed Europe ex UKIndex (Net) hedged to GBP
Fund chargesA-Class Initial 3.00%, Annual 1.50%B-Class Initial Nil, Annual 1.00%C-Class Initial Nil, Annual 0.75%
Investment objective and policyTo maximise long-term capital growth by investing primarily in continentalEuropean Equities.
Continental European Equities are those issued by companies that areincorporated under the laws of, and have their registered office in, continentalEurope, or that derive the predominant part of their economic activityfrom continental Europe, even if listed elsewhere. The Fund may invest insmaller companies.
This Equity based Fund invests in those stocks which the Investment Adviserbelieves will outperform irrespective of their Benchmark weighting.
Other instruments as permitted in the stated investment and borrowingpowers of the Company including, but not limited to, fixed interest securities,cash and cash equivalents may be held on an ancillary basis, as appropriate.
Risk profileThe value of your investment may fall as well as rise and you may get backless than you originally invested.
The value of Equity and Equity-Linked Securities may fluctuate in responseto the performance of individual companies and general market conditions.
The Fund may invest in securities of smaller companies which may be moredifficult to sell, more volatile and tend to carry greater financial risk thansecurities of larger companies.
This Fund is aggressively managed, which may result in higher volatility ofthe Fund’s performance and bigger differences between the performanceof the Fund and its Benchmark.
For investors in Share Classes which are not hedged to Sterling, movementsin currency exchange rates can adversely affect the return of your investment.
Investors in GBP Hedged Share Classes should be aware that any currencyhedging process may not give a precise hedge. Where currency hedging isundertaken, whilst it may protect an investor in Hedged Shares against adecrease in the value of the currency being hedged, it may also prevent theinvestor from participating in an increase in the value of that currency. Pleaserefer to Part 1: Section 1.3 of the Prospectus for more information on HedgedShare Classes.
Please refer to Part 11 of the Prospectus for details of the general risk factorsaffecting this Fund in addition to the specific risk factors above.
Fund reviewEuropean equities delivered positive returns for the year, supported byaccommodative monetary policy and progress towards regional economicrecovery.
The Fund, which has a best ideas approach to investing in attractively valued,high quality stocks with positive momentum, outperformed its benchmark.At the sector level, the biggest contributors to relative returns included stockselection and an overweight holding in industrial transportation, and stockselection and an underweight in personal goods. Detractors from relativeperformance included stock selection and an underweight position inpharmaceuticals & biotechnology, and stock selection in technology hardware& equipment and travel & leisure.
84
Continuation�
� Return to Index

Highest/lowest share price and distribution recordDistribution
Highest Lowest per shareCalendar year share price share price (net)A-Class Accumulation Shares2009 103.3p 62.69p 1.76p2010 113.6p 86.16p 1.22p2011 121.5p 84.53p 0.67p2012 112.4p 90.60p 1.49p2013 153.1p 113.5p 1.25p2014C 158.1p 147.0p 1.50pA-Class Accumulation GBP Hedged SharesD
2010 109.3p 91.67p – 2011 112.7p 80.65p 0.00p2012 114.4p 92.84p 1.40p2013 154.9p 116.0p 1.28p2014C 160.7p 150.9p 1.46pA-Class Income Shares2009 50.44p 30.62p 0.90p2010 54.82p 41.59p 0.52p2011 58.32p 40.57p 0.32p2012 53.09p 42.79p 0.73p2013 71.59p 53.62p 0.58p2014C 73.94p 68.74p 0.71pB-Class Accumulation Shares2009 88.75p 53.74p 1.87p2010 98.38p 74.44p 1.51p2011 105.5p 73.51p 1.04p2012 98.37p 79.10p 1.78p2013 134.6p 99.36p 1.54p2014C 139.1p 129.3p 3.94pB-Class Income Shares2009 94.68p 57.34p 1.21p2010 103.0p 77.95p 1.54p2011 109.3p 76.17p 1.09p2012 99.85p 80.24p 1.85p2013 134.4p 100.9p 1.56p2014C 138.8p 129.0p 1.64pC-Class Accumulation SharesE
2012 112.5p 102.1p –2013 154.3p 113.6p 1.46p2014C 159.4p 148.3p 2.52pC-Class Accumulation GBP Hedged SharesF
2013 155.2p 130.9p -2014C 161.0p 151.1p 1.94pC-Class Income SharesE
2012 53.16p 48.23p –2013 72.10p 53.70p 0.67p2014C 74.48p 69.26p 1.17p
C To 31 January 2014.D A-Class Accumulation GBP Hedged Shares were launched on 1 September 2010.E C-Class Accumulation Shares and C-Class Income Shares were launched on 22 October 2012.F C-Class Accumulation GBP Hedged Shares were launched on 28 August 2013.
Top ten holdings (excluding Liquidity funds) %TOTAL S.A. 2.8Sanofi 2.1BASF 2.1Novartis 2.0Roche (Genusscheine) 2.0ING Groep 1.8Compagnie de Saint-Gobain 1.7Daimler 1.6Airbus Group 1.6Merck 1.5
Geographical breakdown %Germany 20.7France 20.3 Switzerland 10.0 Italy 7.1 Liquidity funds 6.8 Sweden 5.8 Netherlands 5.5 Denmark 4.9 Spain 4.8 Ireland 3.2 Norway 2.9 Belgium 2.6 Finland 2.0 Portugal 1.6 Austria 0.6 Forward currency contracts GBP Hedged share classes 0.1 Futures (0.1)Net other assets 1.2
The forward exchange contracts are only entered into by the A-Class Accumulation GBP Hedged sharesand the C-Class Accumulation GBP Hedged shares.
85
Continuation�
� Return to Index
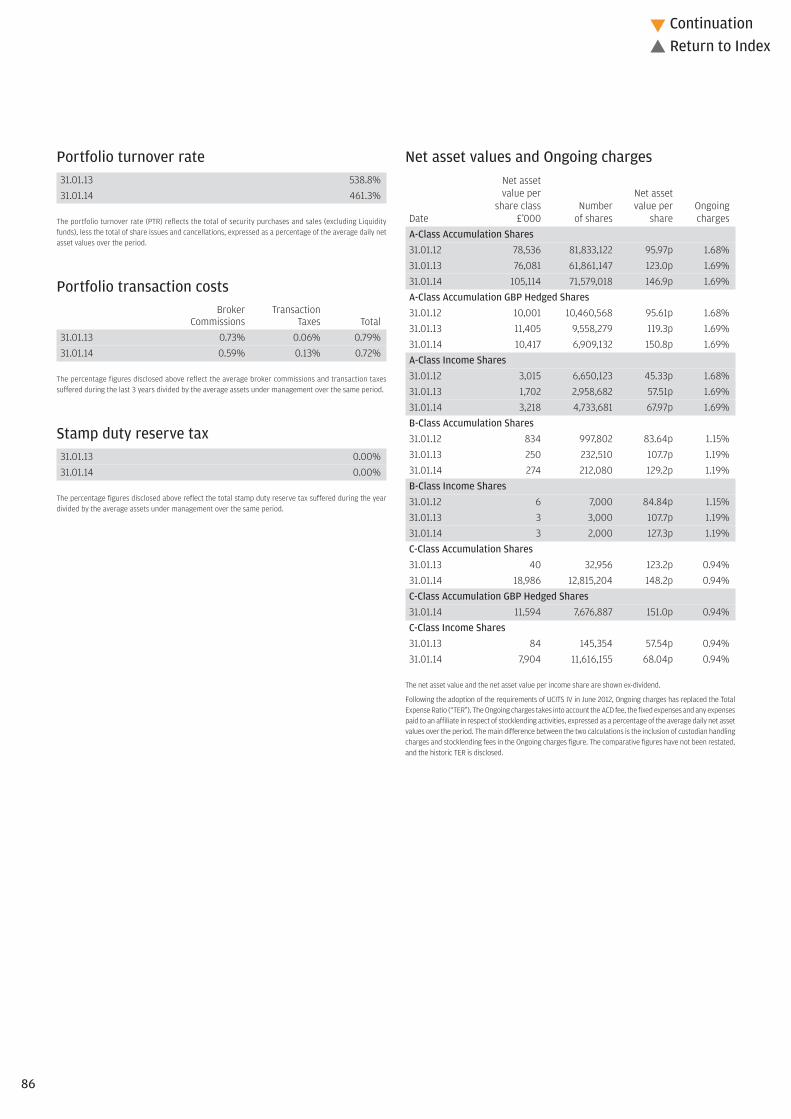
Net asset values and Ongoing chargesNet assetvalue per Net asset
share class Number value per OngoingDate £’000 of shares share chargesA-Class Accumulation Shares31.01.12 78,536 81,833,122 95.97p 1.68%31.01.13 76,081 61,861,147 123.0p 1.69%31.01.14 105,114 71,579,018 146.9p 1.69%A-Class Accumulation GBP Hedged Shares31.01.12 10,001 10,460,568 95.61p 1.68%31.01.13 11,405 9,558,279 119.3p 1.69%31.01.14 10,417 6,909,132 150.8p 1.69%A-Class Income Shares31.01.12 3,015 6,650,123 45.33p 1.68%31.01.13 1,702 2,958,682 57.51p 1.69%31.01.14 3,218 4,733,681 67.97p 1.69%B-Class Accumulation Shares31.01.12 834 997,802 83.64p 1.15%31.01.13 250 232,510 107.7p 1.19%31.01.14 274 212,080 129.2p 1.19%B-Class Income Shares31.01.12 6 7,000 84.84p 1.15%31.01.13 3 3,000 107.7p 1.19%31.01.14 3 2,000 127.3p 1.19%C-Class Accumulation Shares31.01.13 40 32,956 123.2p 0.94%31.01.14 18,986 12,815,204 148.2p 0.94%C-Class Accumulation GBP Hedged Shares31.01.14 11,594 7,676,887 151.0p 0.94%C-Class Income Shares31.01.13 84 145,354 57.54p 0.94%31.01.14 7,904 11,616,155 68.04p 0.94%
The net asset value and the net asset value per income share are shown ex-dividend.
Following the adoption of the requirements of UCITS IV in June 2012, Ongoing charges has replaced the TotalExpense Ratio (“TER”). The Ongoing charges takes into account the ACD fee, the fixed expenses and any expensespaid to an affiliate in respect of stocklending activities, expressed as a percentage of the average daily net assetvalues over the period. The main difference between the two calculations is the inclusion of custodian handlingcharges and stocklending fees in the Ongoing charges figure. The comparative figures have not been restated,and the historic TER is disclosed.
Portfolio turnover rate31.01.13 538.8%31.01.14 461.3%
The portfolio turnover rate (PTR) reflects the total of security purchases and sales (excluding Liquidityfunds), less the total of share issues and cancellations, expressed as a percentage of the average daily netasset values over the period.
Portfolio transaction costsBroker Transaction
Commissions Taxes Total31.01.13 0.73% 0.06% 0.79%31.01.14 0.59% 0.13% 0.72%
The percentage figures disclosed above reflect the average broker commissions and transaction taxessuffered during the last 3 years divided by the average assets under management over the same period.
Stamp duty reserve tax31.01.13 0.00%31.01.14 0.00%
The percentage figures disclosed above reflect the total stamp duty reserve tax suffered during the yeardivided by the average assets under management over the same period.
86
Continuation�
� Return to Index
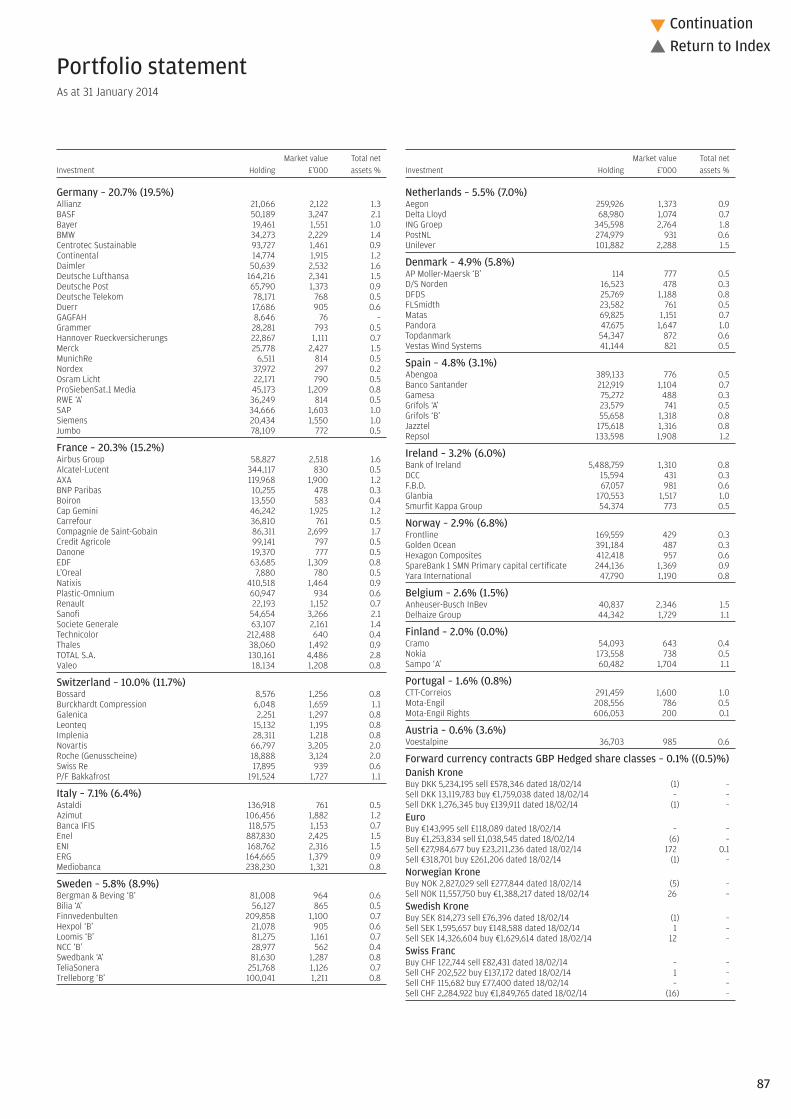
Market value Total netInvestment Holding £’000 assets %
Market value Total netInvestment Holding £’000 assets %
Portfolio statementAs at 31 January 2014
Netherlands – 5.5% (7.0%)Aegon 259,926 1,373 0.9Delta Lloyd 68,980 1,074 0.7ING Groep 345,598 2,764 1.8PostNL 274,979 931 0.6Unilever 101,882 2,288 1.5
Denmark – 4.9% (5.8%)AP Moller-Maersk ‘B’ 114 777 0.5D/S Norden 16,523 478 0.3DFDS 25,769 1,188 0.8FLSmidth 23,582 761 0.5Matas 69,825 1,151 0.7Pandora 47,675 1,647 1.0Topdanmark 54,347 872 0.6Vestas Wind Systems 41,144 821 0.5
Spain – 4.8% (3.1%)Abengoa 389,133 776 0.5Banco Santander 212,919 1,104 0.7Gamesa 75,272 488 0.3Grifols ‘A’ 23,579 741 0.5Grifols ‘B’ 55,658 1,318 0.8Jazztel 175,618 1,316 0.8Repsol 133,598 1,908 1.2
Ireland – 3.2% (6.0%)Bank of Ireland 5,488,759 1,310 0.8DCC 15,594 431 0.3F.B.D. 67,057 981 0.6Glanbia 170,553 1,517 1.0Smurfit Kappa Group 54,374 773 0.5
Norway – 2.9% (6.8%)Frontline 169,559 429 0.3Golden Ocean 391,184 487 0.3Hexagon Composites 412,418 957 0.6SpareBank 1 SMN Primary capital certificate 244,136 1,369 0.9Yara International 47,790 1,190 0.8
Belgium – 2.6% (1.5%)Anheuser-Busch InBev 40,837 2,346 1.5Delhaize Group 44,342 1,729 1.1
Finland – 2.0% (0.0%)Cramo 54,093 643 0.4Nokia 173,558 738 0.5Sampo ‘A’ 60,482 1,704 1.1
Portugal – 1.6% (0.8%)CTT-Correios 291,459 1,600 1.0Mota-Engil 208,556 786 0.5Mota-Engil Rights 606,053 200 0.1
Austria – 0.6% (3.6%)Voestalpine 36,703 985 0.6
Forward currency contracts GBP Hedged share classes – 0.1% ((0.5)%)Danish KroneBuy DKK 5,234,195 sell £578,346 dated 18/02/14 (1) –Sell DKK 13,119,783 buy €1,759,038 dated 18/02/14 – –Sell DKK 1,276,345 buy £139,911 dated 18/02/14 (1) –EuroBuy €143,995 sell £118,089 dated 18/02/14 – –Buy €1,253,834 sell £1,038,545 dated 18/02/14 (6) –Sell €27,984,677 buy £23,211,236 dated 18/02/14 172 0.1Sell €318,701 buy £261,206 dated 18/02/14 (1) –Norwegian KroneBuy NOK 2,827,029 sell £277,844 dated 18/02/14 (5) –Sell NOK 11,557,750 buy €1,388,217 dated 18/02/14 26 –Swedish KroneBuy SEK 814,273 sell £76,396 dated 18/02/14 (1) –Sell SEK 1,595,657 buy £148,588 dated 18/02/14 1 –Sell SEK 14,326,604 buy €1,629,614 dated 18/02/14 12 –Swiss FrancBuy CHF 122,744 sell £82,431 dated 18/02/14 – –Sell CHF 202,522 buy £137,172 dated 18/02/14 1 –Sell CHF 115,682 buy £77,400 dated 18/02/14 – –Sell CHF 2,284,922 buy €1,849,765 dated 18/02/14 (16) –
Germany – 20.7% (19.5%)Allianz 21,066 2,122 1.3BASF 50,189 3,247 2.1Bayer 19,461 1,551 1.0BMW 34,273 2,229 1.4Centrotec Sustainable 93,727 1,461 0.9Continental 14,774 1,915 1.2Daimler 50,639 2,532 1.6Deutsche Lufthansa 164,216 2,341 1.5Deutsche Post 65,790 1,373 0.9Deutsche Telekom 78,171 768 0.5Duerr 17,686 905 0.6GAGFAH 8,646 76 –Grammer 28,281 793 0.5Hannover Rueckversicherungs 22,867 1,111 0.7Merck 25,778 2,427 1.5MunichRe 6,511 814 0.5Nordex 37,972 297 0.2Osram Licht 22,171 790 0.5ProSiebenSat.1 Media 45,173 1,209 0.8RWE ‘A’ 36,249 814 0.5SAP 34,666 1,603 1.0Siemens 20,434 1,550 1.0Jumbo 78,109 772 0.5
France – 20.3% (15.2%)Airbus Group 58,827 2,518 1.6Alcatel-Lucent 344,117 830 0.5AXA 119,968 1,900 1.2BNP Paribas 10,255 478 0.3Boiron 13,550 583 0.4Cap Gemini 46,242 1,925 1.2Carrefour 36,810 761 0.5Compagnie de Saint-Gobain 86,311 2,699 1.7Credit Agricole 99,141 797 0.5Danone 19,370 777 0.5EDF 63,685 1,309 0.8L’Oreal 7,880 780 0.5Natixis 410,518 1,464 0.9Plastic-Omnium 60,947 934 0.6Renault 22,193 1,152 0.7Sanofi 54,654 3,266 2.1Societe Generale 63,107 2,161 1.4Technicolor 212,488 640 0.4Thales 38,060 1,492 0.9TOTAL S.A. 130,161 4,486 2.8Valeo 18,134 1,208 0.8
Switzerland – 10.0% (11.7%)Bossard 8,576 1,256 0.8Burckhardt Compression 6,048 1,659 1.1Galenica 2,251 1,297 0.8Leonteq 15,132 1,195 0.8Implenia 28,311 1,218 0.8Novartis 66,797 3,205 2.0Roche (Genusscheine) 18,888 3,124 2.0Swiss Re 17,895 939 0.6P/F Bakkafrost 191,524 1,727 1.1
Italy – 7.1% (6.4%)Astaldi 136,918 761 0.5Azimut 106,456 1,882 1.2Banca IFIS 118,575 1,153 0.7Enel 887,830 2,425 1.5ENI 168,762 2,316 1.5ERG 164,665 1,379 0.9Mediobanca 238,230 1,321 0.8
Sweden – 5.8% (8.9%)Bergman & Beving ‘B’ 81,008 964 0.6Bilia ‘A’ 56,127 865 0.5Finnvedenbulten 209,858 1,100 0.7Hexpol ‘B’ 21,078 905 0.6Loomis ‘B’ 81,275 1,161 0.7NCC ‘B’ 28,977 562 0.4Swedbank ‘A’ 81,630 1,287 0.8TeliaSonera 251,768 1,126 0.7Trelleborg ‘B’ 100,041 1,211 0.8
87
Continuation�
� Return to Index

Futures – (0.1%) (0.0%)Euro Stoxx 50 Futures Mar 2014 235 (176) (0.1)
Liquidity funds – 6.8% (0.0%) JPM Euro Liquidity ‘X’ Flex (Distribution)^$ 13,031,449 10,727 6.8
Investment assets (including investment liabilities) 155,581 98.8
Net other assets 1,929 1.2
Net assets 157,510 100.0
Unless otherwise stated the above securities are admitted to official stock exchange listings or trade on aregulated market.
The comparative percentage figures in brackets are at 31 January 2013.
^ Deemed to be investment in related parties of the ACD$ Approved security as defined in the Collective Investment Schemes sourcebook
Counterparty exposure
Forwardcurrencycontracts Total
Counterparty £’000 £’000
ANZ 128 128Barclays 1 1CitiBank (3) (3)Goldman Sachs (7) (7)Toronto Dominion Bank 64 64UBS (1) (1)Westpac Banking Corp 0 0
At the balance sheet date, there was no collateral received by the fund from the above counterparties.
The counterparty exposure on forward currency contracts is reported at their mark to market values butfor futures contracts it is only the positive mark to market values that are reported.
Portfolio statement – continuedAs at 31 January 2014
Market value Total netInvestment Holding £’000 assets %
88
Continuation�
� Return to Index

£’000
Total of all purchases for the year (Note 10) 334,474
Major purchases Cost
JPM Euro Liquidity ‘X’ Flex (Distribution)^ 33,804Sanofi 5,938Novartis 5,843TOTAL S.A. 5,788Deutsche Lufthansa 5,323AXA 4,922Roche (Genusscheine) 4,620Auriga Industries ‘B’ 4,504BNP Paribas 4,310ING Groep 4,161EADS 3,938Compagnie de Saint-Gobain 3,923Pandora 3,833Repsol 3,642P/F Bakkafrost 3,451Daimler 3,389Societe Generale 3,322Vestas Wind Systems 3,319BASF 3,281DFDS 3,277
^ Deemed to be investment in related parties of the ACD
£’000
Total of all sales for the year (Note 10) 282,086
Major sales Proceeds
JPM Euro Liquidity ‘X’ Flex (Distribution)^ 22,802Deutsche Lufthansa 5,008Volkswagen Non-Voting Preference 4,987Auriga Industries ‘B’ 4,957EADS 4,847Smurfit Kappa Group 4,764AXA 4,760Credit Agricole 4,705Pandora 4,156BNP Paribas 3,878Marine Harvest 3,819Swedbank ‘A’ 3,760Michelin 3,663Syngenta 3,477Aegon 3,368Orange 2,943Bank of Ireland 2,902Vestas Wind Systems 2,868Novo-Nordisk ‘B’ 2,852DFDS 2,835
Portfolio movements For the year ending 31 January 2014
89
Continuation�
� Return to Index

Statement of total returnFor the year ending 31 January
2014 2013£’000 £’000 £’000 £’000
Income
Net capital gains (Note 1) 14,998 17,801
Revenue (Note 2) 2,881 2,783
Expenses (Note 3) (1,626) (1,360)
Finance costs: Interest (Note 5) (2) (1)
Net revenue before taxation 1,253 1,422
Taxation (Note 4) (245) (212)
Net revenue after taxation 1,008 1,210
Total return before distributions 16,006 19,011
Finance costs: Distributions (Note 5) (1,016) (1,214)
Change in net assets attributable to shareholders from investment activities 14,990 17,797
Statement of change in net assets attributable to shareholdersFor the year ending 31 January
2014 2013£’000 £’000 £’000 £’000
Opening net assets attributable to shareholders 89,565 92,392
Amounts receivable on issue of shares 77,716 7,185
Amounts payable on cancellation of shares (26,414) (28,707)
51,302 (21,522)
Change in net assets attributable to shareholders from investment activities (see above) 14,990 17,797
Retained distributions on accumulation shares 1,655 900
Stamp duty reserve tax (2) (2)
Closing net assets attributable to shareholders 157,510 89,565
Balance sheetAs at 31 January
2014 2013£’000 £’000 £’000 £’000
ASSETS
Investment assets 155,788 88,950
Debtors (Note 7) 6,508 4,191
Cash and bank balances (Note 8) 2,996 392
Total other assets 9,504 4,583
Total assets 165,292 93,533
LIABILITIES
Investment liabilities (207) (416)
Creditors (Note 9) (7,405) (3,534)
Distribution payable on income shares (170) (18)
Total other liabilities (7,575) (3,552)
Total liabilities (7,782) (3,968)
Net assets attributable to shareholders 157,510 89,565
The notes to these financial statements are shown on pages 91 to 93.
Financial statements
90
Continuation�
� Return to Index

91
Continuation�
� Return to Index
1. Net capital gains2014 2013
£’000 £’000Currency gains 2 351Derivative contracts (104) 330Forward currency contracts 846 (375)Non-derivative securities 14,254 17,495Net capital gains 14,998 17,801
The forward currency contracts are only entered into by the A-Class AccumulationGBP Hedged shares.
2. Revenue2014 2013
£’000 £’000Franked income from UK equity investments 28 36Income from Liquidity funds 2 3Income from overseas equity investments 2,800 2,586Interest on bank and term deposits 1 –Stock dividends 14 93Stocklending income 36 65Total revenue 2,881 2,783
3. Expenses2014 2013
£’000 £’000Payable to the ACD or associate of the ACD:ACD fee 1,445 1,214Fixed expenses 181 146Total expenses 1,626 1,360
4. Taxation2014 2013
£’000 £’000a) Analysis of charge in the yearOverseas tax provision (139) 76Overseas tax suffered 384 136Current year tax charge (Note 4b) 245 212
b) Factors affecting the tax charge for the yearThe tax assessed for the year is lower than the standard rate of corporation tax inthe UK for an Open-Ended Investment Company (OEIC) (20%). The differences areexplained below.
Net revenue before taxation 1,253 1,422Corporation tax at 20% 251 284
Effects of:Dividends not subject to corporation tax (569) (513)Excess expenses for which no relief taken 318 229Overseas tax provision (139) 76Overseas tax suffered 384 136
(6) (72)Current year tax charge (Note 4a) 245 212
No deferred tax asset has been recognised in the financial statements. At the yearend date, the Fund had a potential unrecognised deferred tax asset of £1,115,292(31.01.13: £797,463) in relation to £5,576,462 (31.01.13: £3,987,316) of excessmanagement expenses which would only be utilised to reduce the tax charge if theFund had an excess of unfranked income over expenses in a future period. There isno excess of unfranked income expected in the future.
5. Finance costsDistributionsThe distributions take account of amounts receivable on the issue of shares andamounts payable on the cancellation of shares and comprise:
2014 2013£’000 £’000
Final dividend distribution 1,825 918Add: Amounts payable on cancellation of shares 277 400Deduct: Amounts receivable on issue of shares (1,086) (104)Net distributions for the year 1,016 1,214
Interest 2 1
Total finance costs 1,018 1,215
Details of the distribution per share are set out on page 94.
6. Movement between net revenue after taxation and distributions2014 2013
£’000 £’000Net revenue after taxation 1,008 1,210Add: Undistributed revenue brought forward 2 6Deduct: Undistributed revenue carried forward (6) (2)Equalisation on conversions 12 –
1,016 1,214
7. Debtors2014 2013
£’000 £’000Accrued income – 2Due from the ACD for shares created 3,536 1,817Overseas tax recoverable 187 142Sales awaiting settlement 2,785 2,230Total debtors 6,508 4,191
8. Cash and bank balances2014 2013
£’000 £’000Amounts held at futures clearing houses
and brokers 985 –Cash and bank balances 2,011 392Total cash and bank balances 2,996 392
9. Creditors2014 2013
£’000 £’000Accrued expenses 197 121Due to the ACD for shares cancelled 44 57Purchases awaiting settlement 7,164 3,356Total creditors 7,405 3,534
Notes to the financial statements for the year ending 31 January 2014

10. Portfolio transaction costs2014 2013
£’000 £’000Analysis of total purchase costs
Purchases in year before transaction costs 333,888 278,784
Commissions 349 222Taxes 237 108Total purchase costs 586 330Gross purchases total 334,474 279,114
Analysis of total sale costs
Gross sales before transaction costs 282,371 301,433
Commissions (285) (206)Total sale costs (285) (206)Total sales net of transaction costs 282,086 301,227
11. Related party transactionsJPMorgan Funds Limited, as Authorised Corporate Director (“ACD”), is a relatedparty, and acts as principal in respect of all transactions of shares in the Company.The aggregate monies received through issue, and paid on cancellation, aredisclosed in the Statement of Change in Net Assets Attributable to Shareholders.
The balance due from the ACD and their associates at the year end date in respectof related party transactions was £3,294,783 (31.01.13: £1,638,699). Details ofrelated party transactions are given under note 13 on page 413.
Investments considered to be related parties have been identified in the portfoliostatement on pages 87 to 88 and the revenue from these investments was £1,764(31.01.13: £3,288).
Some of the dealing transactions for the Fund are carried out through associatesof the ACD. Such transactions are carried out on an arm’s length basis. Thecommissions paid to these companies over the year were £22,568 (31.01.13:£10,652). Commission was paid to the associated company JPMorgan SecuritiesLtd.
The gross stocklending income received was £41,722 (31.01.13: £77,116), with feesdeducted of £6,175 (31.01.13: £11,586).
The following parties held a material interest in the Fund at the year end date:– Scottish Widows Unit Funds Limited 13.45% (31.01.13: 16.18%)– Scottish Equitable 11.65% (31.01.13: 19.99%)
12. StocklendingAs at 31 January 2014 the aggregate value of securities on loan was £489,433(31.01.13: £1,563,084). The Depositary held £519,290 (31.01.13: £1,633,766) ofcollateral assets on behalf of the Fund in respect thereof. The nature of thecollateral was 66.5% bonds and 33.5% cash.
13. Financial instrumentsCurrency exposuresA substantial proportion of the net assets of the Fund are denominated incurrencies other than sterling, with the effect that the Balance sheet and totalreturn can be significantly affected by currency movements.
Net foreign currency assets/(liabilities)Forward Non-
exchange Monetary monetaryTotal contracts exposures exposures
Currency £’000 £’000 £’000 £’000
31.01.14Euro 102,015 (16,695) 669 118,041Swiss Franc 10,181 (1,671) (2,041) 13,893Swedish Krona 8,018 (1,402) 239 9,181Danish Krone 6,686 (1,011) 2 7,695Norwegian Krone 5,621 (844) 63 6,402
31.01.13Euro 49,956 (7,947) 1,936 55,967Swiss Franc 9,597 (1,468) 92 10,973Norwegian Krone 5,254 (773) (102) 6,129Swedish Krona 5,184 (784) (2,001) 7,969Danish Krone 4,519 (647) – 5,166
The forward currency contracts are only entered into by the A-Class AccumulationGBP Hedged shares.
Interest rate riskThe tables below detail the interest rate profile of the Fund’s assets and liabilitiesas at the year end.
Financialassets
Floating notForward rate carrying
Total exchange financial anyassets contracts assets interest
Currency £’000 £’000 £’000 £’000
31.01.14Euro 105,938 (16,695) 13,636 108,997UK Sterling 26,254 21,804 50 4,400Swiss Franc 12,291 (1,671) 36 13,926Swedish Krona 8,295 (1,402) 1 9,696Danish Krone 6,686 (1,011) – 7,697Norwegian Krone 5,621 (844) – 6,465
31.01.13Euro 50,403 (7,947) 367 57,983UK Sterling 15,795 11,220 27 4,548Swiss Franc 9,767 (1,468) (2) 11,237Swedish Krona 7,199 (784) – 7,983Norwegian Krone 5,434 (773) – 6,207Danish Krone 4,519 (647) – 5,166
The forward currency contracts are only entered into by the A-Class AccumulationGBP Hedged shares and the C-Class Accumulation GBP Hedged shares.
The floating rate financial assets comprise investments in variable interest ratepaying corporate debt and bank balances that bear interest at rates based onLIBOR or its overseas equivalent.
Notes to the financial statements – continued
92
Continuation�
� Return to Index

93
Continuation�
� Return to Index
Floating Financialrate liabilities
Total financial not carryingliabilities liabilities any interest
Currency £’000 £’000 £’000
31.01.14Euro 3,923 – 3,923Swiss Franc 2,110 – 2,110UK Sterling 1,265 – 1,265Swedish Krona 277 – 277
31.01.13Swedish Krona 2,015 – 2,015UK Sterling 740 – 740Euro 447 – 447Norwegian Krone 180 – 180Swiss Franc 170 – 170
For consideration of other risks including liquidity, pricing and credit risk, pleaserefer to the notes to the aggregated financial statements, pages 413 to 414.
14. Share classesThe Fund currently has three share classes; Class A Shares, Class B Shares andClass C Shares. The Authorised Corporate Director’s (ACD) fee and fixed expensescharge are shown below.
ACD fee Fixed expensesClass A shares: 1.50% 0.18%Class B shares: 1.00% 0.18%Class C shares: 0.75% 0.18%
The net asset value of each share class, the net asset value per share and thenumber of shares in each class are shown on page 86. All classes have the samerights on winding up.
15. Derivatives The A-Class Accumulation GBP Hedge share class and the C-Class AccumulationGBP Hedge share class enter into derivative transactions in the form of forwardcurrency contracts. The share classes may use derivatives for investment purposeor efficient portfolio management including hedging, where appropriate. Thecommitment approach has been used to calculate the global exposure.
Further information on the derivative risks can be found in the notes to theaggregated financial statements on page 414.
16. Contingent liabilities and capital commitmentsAt the balance sheet date the fund had the following contingent liabilities:
2014 2013£’000 £’000
Nil/Part Paid Rights 499 –
Notes to the financial statements – continued

Final distribution in pence per share
Group 1 – Shares purchased prior to 1 February 2013Group 2 – Shares purchased 1 February 2013 to 31 January 2014
DistributionGross Tax Net payable paid
revenue at 10% revenue Equalisation 30.04.14 30.04.13
A-Class Accumulation Shares
Group 1 1.666667 0.166667 1.500000 – 1.500000 1.250000
Group 2 0.000000 0.000000 0.000000 1.500000 1.500000 1.250000
A-Class Accumulation GBP Hedged Shares
Group 1 1.622222 0.162222 1.460000 – 1.460000 1.280000
Group 2 0.060069 0.006007 0.054062 1.405938 1.460000 1.280000
A-Class Income Shares
Group 1 0.788889 0.078889 0.710000 – 0.710000 0.580000
Group 2 0.000000 0.000000 0.000000 0.710000 0.710000 0.580000
B-Class Accumulation Shares
Group 1 4.377778 0.437778 3.940000 – 3.940000 1.540000
Group 2 0.000000 0.000000 0.000000 3.940000 3.940000 1.540000
B-Class Income Shares
Group 1 1.822222 0.182222 1.640000 – 1.640000 1.560000
Group 2 1.822222 0.182222 1.640000 0.000000 1.640000 1.560000
C-Class Accumulation Shares
Group 1 2.800000 0.280000 2.520000 – 2.520000 1.460000
Group 2 0.000000 0.000000 0.000000 2.520000 2.520000 1.460000
C-Class Accumulation GBP Hedged Shares
Group 1 2.155556 0.215556 1.940000 – 1.940000 –
Group 2 0.000000 0.000000 0.000000 1.940000 1.940000 –
C-Class Income Shares
Group 1 1.300000 0.130000 1.170000 – 1.170000 0.670000
Group 2 0.000000 0.000000 0.000000 1.170000 1.170000 0.670000
Equalisation applies only to shares purchased during the distribution period (group 2 shares). It is the average amount of revenue included in the purchase price of all group 2 shares and is refunded to holders of these
shares as a return of capital. Being capital it is not liable to income tax but must be deducted from the cost of shares for capital gains tax purposes.
Distribution table
94
� Return to Index

95
Investment objective and policyTo provide long term capital growth by investing primarily in companiesthroughout the world benefiting from consumer driven opportunities.
Investments may include, but are not limited to, companies providing goodsand services relating to consumer related activities, wealth, leisure, lifestyle,health and wellness. Issuers of these securities may be located in any countryand the Fund may invest significantly in Emerging Markets and in smallercompanies (see section 11.8 and 11.11 – Risk Warnings of the Prospectus).
Financial Derivative Instruments (derivatives) may be used for the purposesof Efficient Portfolio Management, including hedging, where appropriate(see section 11.14 – Derivatives of the Prospectus).
Other instruments as permitted in the stated investment and borrowingpowers of the Company including, but not limited to, fixed interest securities,cash and cash equivalents may be held on an ancillary basis, as appropriate.
Risk profileThe value of your investment may fall as well as rise and you may get backless than you originally invested.
The value of Equity and Equity-Linked Securities may fluctuate in response tothe performance of individual companies and general market conditions.
Emerging Markets may be subject to increased political, regulatory and economicinstability, less developed custody and settlement practices, poor transparencyand greater financial risks. Emerging Market currencies may be subject tovolatile price movements. Emerging Market securities may also be subject tohigher volatility and be more difficult to sell than non-Emerging Market securities.
The Fund invests in securities of smaller companies which may be more difficultto sell, more volatile and tend to carry greater financial risk than securities oflarger companies.
This Fund is aggressively managed, which may result in higher volatility ofthe Fund’s performance and bigger differences between the performance ofthe Fund and its Benchmark.
The Fund will be concentrated in companies benefiting from consumer drivenopportunities and, as a result, may be more volatile than more broadly diversifiedfunds.
Movements in currency exchange rates can adversely affect the return of yourinvestment.
Please refer to Part 11 of the Prospectus for details of the general risk factorsaffecting this Fund in addition to the specific risk factors above.
Fund reviewGlobal equities rose in the 12-month period on the back of a pickup inglobal economic growth.
The Fund ended the period in positive territory, but lagged the benchmark.Positive performance came from across a number of themes, with the“mobility” and health & wellness themes contributing the most. In “mobility,”holdings in Hewlett-Packard and Microsoft were key, as the share prices rose36% and 44% respectively. On an absolute basis, the best performinginformation technology stock was Shanda Games, whose share price riseby over 100% in the 12 months after announcing the release of new games.Our best performing health care stock, WuXi PharmaTech, is also Chinese-related. WuXi, whose share price rose 95%, has benefited from health carecompanies outsourcing their research & development, as China attemptsto increase the number of drugs approved there. On the negative side,holdings that detracted were predominantly Chinese and Indian financialstocks, such as Yes Bank and China Merchants Bank. Indian bank stocksslumped in general as the Reserve Bank of India raised interest rates andtightened lenders’ access to cash in an effort to stabilise the rupee.
Fund outlookGrowth in the developed world is gathering momentum, with a significantmajority of countries benefiting from expansion in manufacturing activity.
12 month performance as at 31 January 2014 2013 2012 2011 2010
JPM Global Consumer Trends A-Class Acc 7.3% 10.8% -6.1% 17.4% 41.8%
JPM Global Consumer Trends B-Class Inc 7.8% 11.3% – – –
JPM Global Consumer Trends C-Class Acc 8.1% 11.7% -5.3% – –
Benchmark Index 12.0% 15.3% -1.5% 19.3% 22.9%
Comparator 13.1% 21.1% 7.1% 20.3% 23.9%
JPM Global Consumer Trends Fund
You should remember that past performance is not a guide to the future. The price of investments and the income from them may fall as well as rise andinvestors may not get back the full amount invested. All equity indices stated as ‘Net’ are calculated net of tax as per the standard published approach by the index vendor unless stated otherwise.All performance returns are calculated using the quoted price of the accumulation shares. Performance returns are in Sterling.Source: J.P. Morgan.The Fund is not managed with reference to the indices shown. They are provided for comparison purposes only. The benchmark – the MSCI World Index – shows how the Fund has performed against the broader globalmarket. The Comparator – MSCI World Index Consumer Discretionary/MSCI World Index Consumer Staples – Market Cap Weighted – is a narrower composite index of consumer sectors.Benchmark Source: MSCI. The MSCI data is comprised of a custom index calculated by MSCI for, and as requested by JPMorgan Asset Management (UK) Ltd. The MSCI data is for internal use only and may not be redistributedor used in connection with creating or offering any securities, financial products or indices. Neither MSCI nor any other third party involved in or related to compiling, computing or creating the MSCI data (the “MSCIParties”) makes any express or implied warranties or representations with respect to such data (or the results to be obtained by the use thereof), and the MSCI Parties hereby expressly disclaim all warranties oforiginality, accuracy, completeness, merchantability or fitness for a particular purpose with respect to such data. Without limiting any of the foregoing, in no event shall any of the MSCI Parties have any liability for anydirect, indirect, special, punitive, consequential or any other damages (including lost profits) even if notified of the possibility of such damages.
Continuation�
� Return to Index

Fund statisticsRisk and Reward Profile 6*
Fund size £190.4m
Benchmark Index MSCI World Index (Net)
Comparator MSCI World Index Consumer Discretionary/MSCI World Index Consumer Staples –
Market Cap Weighted (Net)
Fund chargesA-Class Initial 3.00%, Annual 1.50%B-Class Initial Nil, Annual 1.00%C-Class Initial Nil, Annual 0.75%
Top ten holdings (excluding Liquidity funds) %Kering 3.4BG Group 3.2Citigroup 3.0Standard Chartered 2.8Baxter International 2.7Novartis 2.6Sanofi 2.5China Construction Bank ‘H’ 2.5Teva Pharmaceutical Industries ADR 2.4Johnson & Johnson 2.4
Geographical breakdown %United States of America 32.9United Kingdom 16.3China 14.7France 10.1Switzerland 6.6Hong Kong 5.1India 3.2South Korea 3.0Israel 2.4Sweden 1.7Liquidity funds 1.7Germany 1.0Japan 0.9Singapore 0.5Indonesia 0.5Net other liabilities (0.6)
Highest/lowest share price and distribution recordDistribution
Highest Lowest per shareCalendar year share price share price (net)A-Class Accumulation Shares2009 63.15p 37.62p 0.66p2010 75.34p 61.53p 0.32p2011 75.64p 57.26p 0.77p2012 73.55p 63.97p 0.49p2013 85.08p 70.11p 0.38p2014A 84.58p 80.36p 0.45pA-Class Income Shares2009 62.22p 37.07p 0.66p2010 73.87p 60.61p 0.31p2011 74.16p 55.55p 0.75p2012 70.83p 61.61p 0.47p2013 81.53p 67.53p 0.38p2014A 81.04p 77.01p 0.43pB-Class Accumulation SharesB
2012 70.07p 67.10p –2013 85.52p 70.18p 0.48p2014A 85.09p 80.86p 0.84pB-Class Income SharesC
2011 102.8p 78.16p – 2012 99.45p 86.52p 1.08p2013 114.9p 95.11p 0.89p2014A 114.3p 108.6p 1.05pC-Class Accumulation SharesD
2010 115.5p 95.74p –2011 116.1p 88.34p 0.97p2012 113.9p 99.24p 1.58p2013 133.4p 109.2p 1.44p2014A 132.8p 126.2p 1.61pC-Class Income SharesE
2011 103.7p 78.95p –2012 100.4p 87.49p 1.26p2013 116.2p 96.32p 1.28p2014A 115.6p 109.9p 1.40p
A To 31 January 2014.B B-Class Accumulation Shares were launched on 29 October 2012.C B-Class Income Shares were launched on 14 February 2011.D C-Class Accumulation Shares were launched on 9 June 2010.E C-Class Income Shares were launched on 29 March 2011.
96
Continuation�
� Return to Index
* For specific risks, including the risk and reward profile, please refer to the Key Investor information Document (KIID) available on the following websitehttp://am.jpmorgan.co.uk/investor/prices-and-factsheets/?list=all&tab=Prices

Portfolio turnover rate31.01.13 117.8%31.01.14 132.2%
The portfolio turnover rate (PTR) reflects the total of security purchases and sales (excluding Liquidityfunds), less the total of share issues and cancellations, expressed as a percentage of the average daily netasset values over the period.
Portfolio transaction costsBroker Transaction
Commissions Taxes Total31.01.13 0.25% 0.13% 0.38%31.01.14 0.18% 0.12% 0.30%
The percentage figures disclosed above reflect the average broker commissions and transaction taxessuffered during the last 3 years divided by the average assets under management over the same period.
Stamp duty reserve tax31.01.13 0.02%31.01.14 0.02%
The percentage figures disclosed above reflect the total stamp duty reserve tax suffered during the yeardivided by the average assets under management over the same period.
Net asset values and Ongoing chargesNet assetvalue per Net asset
share class Number value per OngoingDate £’000 of shares share chargesA-Class Accumulation Shares31.01.12 63,913 94,090,461 67.93p 1.66%31.01.13 59,820 79,661,102 75.09p 1.68%31.01.14 47,305 58,590,958 80.74p 1.68%A-Class Income Shares31.01.12 11,366 17,373,832 65.42p 1.65%31.01.13 55,121 76,599,122 71.96p 1.68%31.01.14 75,358 97,949,572 76.94p 1.68%B-Class Accumulation Shares31.01.13 56 74,102 75.20p 1.18%31.01.14 1,198 1,474,851 81.24p 1.18%B-Class Income Shares31.01.12 2,285 2,489,770 91.79p 1.15%31.01.13 2,208 2,185,108 101.0p 1.18%31.01.14 96 88,735 108.1p 1.18%C-Class Accumulation Shares31.01.12 14,288 13,598,329 105.1p 0.87%31.01.13 13,957 11,920,795 117.1p 0.93%31.01.14 37,645 29,688,756 126.8p 0.93%C-Class Income Shares31.01.12 2,004 2,163,389 92.63p 0.87%31.01.13 7,488 7,344,239 102.0p 0.93%31.01.14 28,839 26,451,277 109.0p 0.93%
The net asset value and the net asset value per income share are shown ex-dividend.
Following the adoption of the requirements of UCITS IV in June 2012, Ongoing charges has replaced the TotalExpense Ratio (“TER”). The Ongoing charges takes into account the ACD fee, the fixed expenses and any expensespaid to an affiliate in respect of stocklending activities, expressed as a percentage of the average daily net assetvalues over the period. The main difference between the two calculations is the inclusion of custodian handlingcharges and stocklending fees in the Ongoing charges figure. The comparative figures have not been restated,and the historic TER is disclosed.
97
Continuation�
� Return to Index

United States of America – 32.9% (36.1%)Allergan 49,017 3,427 1.8Anadarko Petroleum 70,255 3,477 1.8Baxter International 122,260 5,145 2.7Cisco Systems 250,442 3,344 1.8Citigroup 196,087 5,753 3.0Citrix Systems 32,798 1,062 0.6Coach 51,983 1,524 0.8eBay 29,737 961 0.5EMC 251,733 3,764 2.0Google ‘A’ 6,031 4,153 2.2Humana 31,550 1,881 1.0Johnson & Johnson 85,374 4,641 2.4Lam Research 91,634 2,853 1.5Lululemon Athletica 48,201 1,371 0.7Metlife 94,693 2,863 1.5Microsoft 146,008 3,270 1.7Pfizer 233,109 4,363 2.3Qualcomm 66,637 2,968 1.6Teradyne 276,310 3,205 1.7UnitedHealth Group 57,990 2,564 1.3
United Kingdom – 16.3% (13.0%)APR Energy 153,677 1,317 0.7Barclays 1,442,723 3,864 2.0BG Group 592,552 6,023 3.2Burberry Group 298,378 4,204 2.2GlaxoSmithKline 230,841 3,586 1.9Glencore Xstrata 841,114 2,695 1.4Just Retirement Group 886,565 2,159 1.1Partnership Assurance Group 550,140 1,778 1.0Standard Chartered 432,686 5,363 2.8
China – 14.7% (22.4%)Agile Property 3,174,000 1,768 0.9Baidu ADS 32,393 3,163 1.7Beauty China† 133,000 – –China Construction Bank ‘H’ 11,174,000 4,704 2.5China Hongxing Sports† 22,764,000 – –China Life Insurance ‘H’ 597,000 988 0.5China Merchants Bank ‘H’ 3,358,578 3,600 1.9China Yurun Food Group 258,000 92 –Hengdeli 11,822,800 1,508 0.8Industrial & Commercial Bank of China ‘H’ 3,774,000 1,420 0.7iSoftStone ADS 250,012 799 0.4New World Department Store China 1,591,000 487 0.3Oriental Watch 6,651,680 1,036 0.5Pactera Technology International ADR 178,464 776 0.4Ports Design 2,712,500 1,182 0.6Sands China 122,800 575 0.3Shanda Games ADR ‘A’ 755,877 2,939 1.5Sinopharm Group ‘H’ 1,882,400 3,226 1.7
France – 10.1% (6.7%)AXA 137,300 2,174 1.1Kering 53,243 6,412 3.4LVMH Moet-Hennessy Louis Vuitton 18,841 2,007 1.1Sanofi 80,941 4,837 2.5Technip 71,283 3,715 2.0
Switzerland – 6.6% (6.0%)Compagnie Financiere Richemont ‘A’ 67,629 3,789 2.0Nestle 42,759 1,872 1.0Novartis 104,290 5,004 2.6UBS 158,867 1,898 1.0
Hong Kong – 5.1% (1.4%)Belle International 1,559,000 1,021 0.5Cheung Kong 206,000 1,854 1.0China Overseas Land & Investments 1,160,000 1,897 1.0China Resources Land 660,000 940 0.5Country Garden 4,494,000 1,498 0.8Emperor Watch And Jewellery 36,940,000 1,445 0.8Wharf 207,000 857 0.5
India – 3.2% (2.3%)Axis Bank 135,874 1,479 0.8Federal Bank 1,219,620 941 0.5ICICI Bank 195,866 1,878 1.0Yes Bank 608,256 1,816 0.9
South Korea – 3.0% (1.4%)Hyundai Motor 22,671 2,977 1.6Samsung Electronics 3,893 2,796 1.4
Israel – 2.4% (2.8%)Teva Pharmaceutical Industries ADR 168,030 4,654 2.4
Sweden – 1.7% (0.0%)Svenska Cellulosa ‘B’ 184,702 3,157 1.7
Germany – 1.0% (0.0%)Volkswagen Non-Voting Preference 12,526 1,913 1.0
Japan – 0.9% (0.0%)Nitto Denko 63,100 1,725 0.9
Singapore – 0.5% (1.1%)Jardine Matheson 30,400 984 0.5
Indonesia – 0.5% (0.0%)Astra International 3,063,500 975 0.5
Liquidity funds – 1.7% (2.5%)JPM US Dollar Liquidity ‘X’ (Distribution)^$ 5,160,553 3,135 1.7
Investment assets 191,491 100.6
Net other liabilites (1,050) (0.6)
Net assets 190,441 100.0
Unless otherwise stated the above securities are admitted to official stock exchange listings or trade on aregulated market.
The comparative percentage figures in brackets are at 31 January 2013.
† Suspended security^ Deemed to be investment in related parties of the ACD$ Approved security as defined in the Collective Investment Schemes sourcebook
Portfolio statementAs at 31 January 2014
Market value Total netInvestment Holding £’000 assets %
Market value Total netInvestment Holding £’000 assets %
98
Continuation�
� Return to Index

£’000
Total of all purchases for the year (Note 10) 245,896
Major purchases Cost
JPM USD Liquidity ‘X’ (Distribution)^ 71,303Standard Chartered 6,087Barclays 5,781Citigroup 5,762Kering 5,496Baxter International 5,101Technip 4,984BG Group 4,957Burberry Group 4,778Johnson & Johnson 4,653Allergan 4,491Broadcom ‘A’ 4,434Anadarko Petroleum 3,806Compagnie Financiere Richemont ‘A’ 3,738China Construction Bank ‘H’ 3,632Hyundai Motor 3,016Glencore Xstrata 2,928Svenska Cellulosa ‘B’ 2,915Teradyne 2,839Qualcomm 2,790
^ Deemed to be investment in related parties of the ACD
£’000
Total of all sales for the year (Note 10) 202,962
Major sales Proceeds
JPM USD Liquidity ‘X’ (Distribution)^ 71,408Hewlett Packard 6,899Merck & Co 6,878AstraZeneca 5,578WuXi PharmaTech ADS 5,202Royal Dutch Shell ‘A’ 5,072Apple 4,461Perfect World ADR ‘B’ 4,105Morgan Stanley 3,954Broadcom ‘A’ 3,925Microsoft 3,722Sands China 3,511Mallinckrodt 3,494TOTAL S.A. 3,470Apache 3,452Baidu ADS 3,410Giant Interactive ADR 3,274Credit Suisse Group 3,004Expedia 2,950Avago Technologies 2,815
Portfolio movements For the year ending 31 January 2014
99
Continuation�
� Return to Index

Statement of total returnFor the year ending 31 January
2014 2013£’000 £’000 £’000 £’000
Income
Net capital gains (Note 1) 10,613 9,788
Revenue (Note 2) 4,221 2,231
Expenses (Note 3) (2,582) (1,403)
Net revenue before taxation 1,639 828
Taxation (Note 4) (374) (226)
Net revenue after taxation 1,265 602
Total return before distributions 11,878 10,390
Finance costs: Distributions (Note 5) (1,315) (594)
Change in net assets attributable to shareholders from investment activities 10,563 9,796
Statement of change in net assets attributable to shareholdersFor the year ending 31 January
2014 2013£’000 £’000 £’000 £’000
Opening net assets attributable to shareholders 138,650 93,856
Amounts receivable on issue of shares 72,524 77,017
Amounts payable on cancellation of shares (32,022) (42,475)
40,502 34,542
Change in net assets attributable to shareholders from investment activities (see above) 10,563 9,796
Retained distributions on accumulation shares 754 475
Stamp duty reserve tax (28) (19)
Closing net assets attributable to shareholders 190,441 138,650
Balance sheetAs at 31 January
2014 2013£’000 £’000 £’000 £’000
ASSETS
Investment assets 191,491 137,882
Debtors (Note 7) 9,349 8,315
Cash and bank balances (Note 8) 149 236
Total other assets 9,498 8,551
Total assets 200,989 146,433
LIABILITIES
Creditors (Note 9) (9,756) (7,378)
Distribution payable on income shares (792) (405)
Total liabilities (10,548) (7,783)
Net assets attributable to shareholders 190,441 138,650
The notes to these financial statements are shown on pages 101 to 102.
Financial statements
100
Continuation�
� Return to Index

1. Net capital gains2014 2013
£’000 £’000Currency losses (63) (146)Non-derivative securities 10,676 9,934Net capital gains 10,613 9,788
2. Revenue2014 2013
£’000 £’000Franked income from UK equity investments 626 366Income from Liquidity funds 11 10Income from overseas equity investments 3,584 1,854Interest on bank and term deposits – 1Total revenue 4,221 2,231
3. Expenses2014 2013
£’000 £’000Payable to the ACD or associate of the ACD:ACD fee 2,264 1,248Fixed expenses 318 155Total expenses 2,582 1,403
4. Taxation2014 2013
£’000 £’000a) Analysis of charge in the yearOverseas tax provision – 3Overseas tax suffered 374 223Current year tax charge (Note 4b) 374 226
b) Factors affecting the tax charge for the yearThe tax assessed for the year is higher than the standard rate of corporation tax inthe UK for an Open-Ended Investment Company (OEIC) (20%). The differences areexplained below.
Net revenue before taxation 1,639 828Corporation tax at 20% 328 166
Effects of:Dividends not subject to corporation tax (808) (427)Excess expenses for which no relief taken 485 264Overseas tax expensed (5) (3)Overseas tax provision – 3Overseas tax suffered 374 223
46 60Current year tax charge (Note 4a) 374 226
No deferred tax asset has been recognised in the financial statements. At the yearend date, the Fund had a potential unrecognised deferred tax asset of £1,135,734(31.01.13: £650,716) in relation to £5,678,671 (31.01.13: £3,253,578) of excessmanagement expenses which would only be utilised to reduce the tax charge if theFund had an excess of unfranked income over expenses in a future period. There isno excess of unfranked income expected in the future.
5. Finance costsDistributionsThe distributions take account of amounts receivable on the issue of shares andamounts payable on the cancellation of shares and comprise:
2014 2013£’000 £’000
Final dividend distribution 1,546 880Add: Amounts payable on cancellation of shares 231 186Deduct: Amounts receivable on issue of shares (462) (472)Total finance costs 1,315 594
Details of the distribution per share are set out on page 103.
6. Movement between net revenue after taxation and distributions2014 2013
£’000 £’000Net revenue after taxation 1,265 602Add: Undistributed revenue brought forward 11 3Deduct: Undistributed revenue carried forward (11) (11)Equalisation on conversions 50 –
1,315 594
7. Debtors2014 2013
£’000 £’000Accrued income 42 59Due from the ACD for shares created 1,246 7,539Overseas tax recoverable 97 39Sales awaiting settlement 7,964 678Total debtors 9,349 8,315
8. Cash and bank balances2014 2013
£’000 £’000Cash and bank balances 149 236
9. Creditors2014 2013
£’000 £’000Accrued expenses 236 163Due to the ACD for shares cancelled 151 217Purchases awaiting settlement 9,369 6,998Total creditors 9,756 7,378
Notes to the financial statements for the year ending 31 January 2014
101
Continuation�
� Return to Index

10. Portfolio transaction costs2014 2013
£’000 £’000Analysis of total purchase costs
Purchases in year before transaction costs 245,547 173,098
Commissions 139 108Taxes 210 94Total purchase costs 349 202Gross purchases total 245,896 173,300
Analysis of total sale costs
Gross sales before transaction costs 203,088 138,438
Commissions (112) (77)Taxes (14) (21)Total sale costs (126) (98)Total sales net of transaction costs 202,962 138,340
11. Related party transactionsJPMorgan Funds Limited, as Authorised Corporate Director (“ACD”), is a relatedparty, and acts as principal in respect of all transactions of shares in the Company.The aggregate monies received through issue, and paid on cancellation, aredisclosed in the Statement of Change in Net Assets Attributable to Shareholders.
The balance due from the ACD and their associates at the year end date in respectof related party transactions was £859,004 (31.01.13: £7,159,050). Details ofrelated party transactions are given under note 13 on page 413.
Investments considered to be related parties have been identified in the portfoliostatement on page 98 and the revenue from these investments was £9,738(31.01.13: £10,394).
Some of the dealing transactions for the Fund are carried out through associatesof the ACD. Such transactions are carried out on an arm’s length basis. Thecommissions paid to these companies over the year were £62,434 (31.01.13:£31,047). Commission was paid to the associated company JPMorgan SecuritiesLtd.
The following party held a material interest in the Fund at the year end date:– Chase nominees Ltd Acc 22075 55.15% (31.01.13 34.49%)
12. Financial instrumentsCurrency exposuresA substantial proportion of the net assets of the Fund are denominated incurrencies other than sterling, with the effect that the Balance sheet and totalreturn can be significantly affected by currency movements.
Net foreign currency assets/(liabilities)Monetary Non-monetary
Total exposures exposuresCurrency £’000 £’000 £’000
31.01.14US Dollar 79,188 147 79,041Hong Kong Dollar 29,068 (1,029) 30,097Euro 21,067 9 21,058Swiss Franc 13,485 923 12,562Indian Rupee 6,118 4 6,114Korean Won 5,815 42 5,773Swedish Krona 3,158 1 3,157Japanese Yen 1,725 – 1,725Indonesian Rupiah 975 – 975Taiwan Dollar 9 9 –
31.01.13US Dollar 69,606 (4,095) 73,701Hong Kong Dollar 17,588 - 17,588Euro 9,722 (594) 10,316Swiss Franc 7,927 (446) 8,373Indian Rupee 3,232 5 3,227Korean Won 1,928 6 1,922Japanese Yen 1,557 – 1,557South African Rand 1,437 – 1,437Brazilian Real 1,007 (60) 1,067Singapore Dollar 693 – 693Taiwan Dollar 9 9 –
Interest rate riskAt the year end date, 1.7% (31.01.13: 2.7%) of the Fund’s net assets by value wereinterest bearing, carrying a (fixed/floating) rate.
For consideration of other risks including liquidity, pricing and credit risk, pleaserefer to the notes to the aggregated financial statements, pages 413 to 414.
13. Share classesThe Fund currently has three share classes; Class A Shares, Class B Shares andClass C Shares. The Authorised Corporate Director’s (ACD) fee and fixed expensescharge are shown below.
ACD fee Fixed expensesClass A shares: 1.50% 0.18%Class B shares: 1.00% 0.18%Class C shares: 0.75% 0.18%
The net asset value of each share class, the net asset value per share and thenumber of shares in each class are shown on page 96. All classes have the samerights on winding up.
14. Contingent liabilities and capital commitmentsAt the balance sheet date there were no contingent liabilities or capitalcommitments (2013: none).
Notes to the financial statements – continued
102
Continuation�
� Return to Index
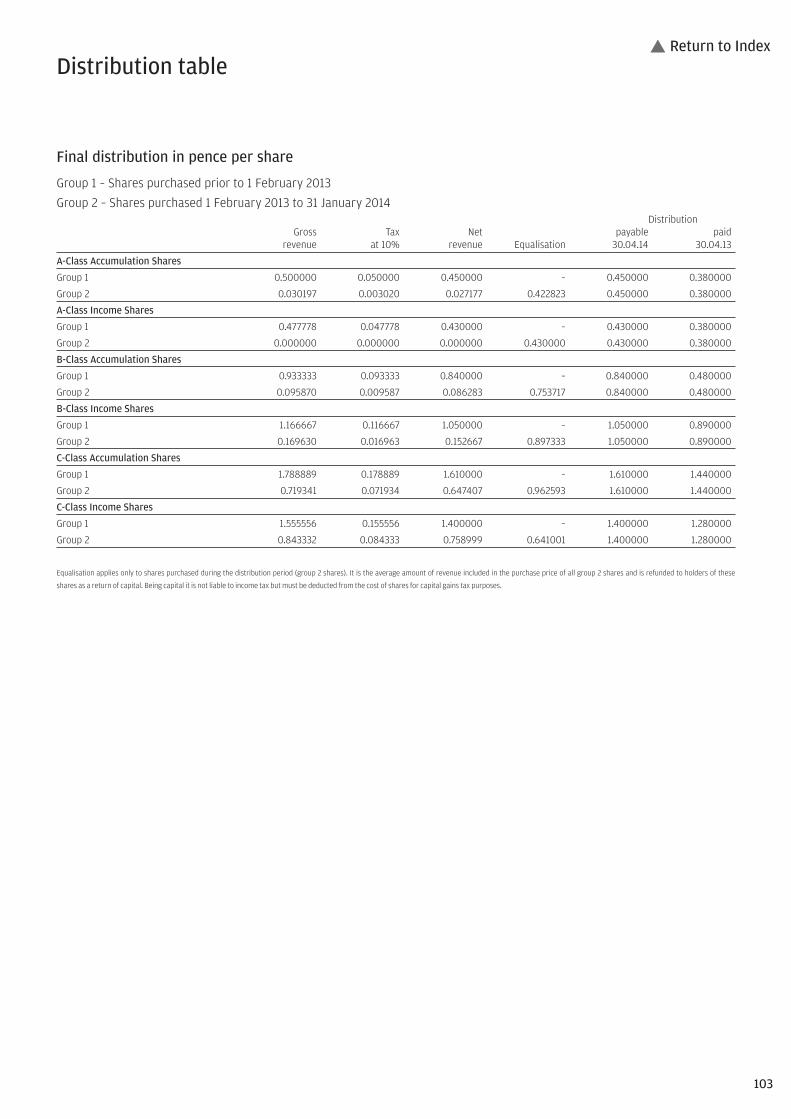
Final distribution in pence per share
Group 1 – Shares purchased prior to 1 February 2013Group 2 – Shares purchased 1 February 2013 to 31 January 2014
DistributionGross Tax Net payable paid
revenue at 10% revenue Equalisation 30.04.14 30.04.13
A-Class Accumulation Shares
Group 1 0.500000 0.050000 0.450000 – 0.450000 0.380000
Group 2 0.030197 0.003020 0.027177 0.422823 0.450000 0.380000
A-Class Income Shares
Group 1 0.477778 0.047778 0.430000 – 0.430000 0.380000
Group 2 0.000000 0.000000 0.000000 0.430000 0.430000 0.380000
B-Class Accumulation Shares
Group 1 0.933333 0.093333 0.840000 – 0.840000 0.480000
Group 2 0.095870 0.009587 0.086283 0.753717 0.840000 0.480000
B-Class Income Shares
Group 1 1.166667 0.116667 1.050000 – 1.050000 0.890000
Group 2 0.169630 0.016963 0.152667 0.897333 1.050000 0.890000
C-Class Accumulation Shares
Group 1 1.788889 0.178889 1.610000 – 1.610000 1.440000
Group 2 0.719341 0.071934 0.647407 0.962593 1.610000 1.440000
C-Class Income Shares
Group 1 1.555556 0.155556 1.400000 – 1.400000 1.280000
Group 2 0.843332 0.084333 0.758999 0.641001 1.400000 1.280000
Equalisation applies only to shares purchased during the distribution period (group 2 shares). It is the average amount of revenue included in the purchase price of all group 2 shares and is refunded to holders of these
shares as a return of capital. Being capital it is not liable to income tax but must be deducted from the cost of shares for capital gains tax purposes.
Distribution table
103
� Return to Index

Important informationThis Fund was terminated on 20 September 2013.
Highest/lowest share price and distribution recordDistribution
Highest Lowest per shareCalendar year share price share price (net)A-Class Accumulation SharesA
2011 50.11p 47.33p –2012 49.79p 47.45p 0.00p2013B 51.12p 48.34p 0.00pA-Class Income SharesA
2011 50.11p 47.33p –2012 49.79p 47.45p 0.00p2013B 51.12p 48.35p 0.00pB-Class Accumulation SharesC
2012 49.22p 48.12p –2013B 51.12p 48.36p 0.00pC-Class Accumulation SharesD
2012 100.2p 97.96p –2013B 104.1p 98.52p 0.00pC-Class Income SharesD
2012 100.2p 97.96p –2013B 104.1p 98.47p 0.00p
A A-Class Accumulation Shares and A-Class Income Shares were launched on 6 July 2011.B To 20 September 2013. C B-Class Accumulation Shares were launched on 29 October 2012.D C-Class Accumulation Shares and C-Class Income Shares were launched on 1 October 2012.
Net asset values and Ongoing chargesNet assetvalue per Net asset
share class Number value per OngoingDate £’000 of shares share chargesA-Class Accumulation Shares31.01.12 3,069 6,312,594 48.61p 1.43%31.01.13 3,174 6,387,467 49.70p 1.43%31.01.14 – – – –A-Class Income Shares31.01.12 3,019 6,211,037 48.61p 1.43%31.01.13 3,085 6,206,507 49.70p 1.43%31.01.14 – – – –B-Class Accumulation Shares31.01.13 3 5,500 49.67p 0.98%31.01.14 – – – –C-Class Accumulation Shares31.01.13 1 1,000 101.2p 0.83%31.01.14 – – – –C-Class Income Shares31.01.13 1 1,000 101.2p 0.83%31.01.14 – – – –
The net asset value and the net asset value per income share are shown ex-dividend.
Following the adoption of the requirements of UCITS IV in June 2012, Ongoing charges has replaced the TotalExpense Ratio (“TER”). The Ongoing charges takes into account the ACD fee, the fixed expenses and any expensespaid to an affiliate in respect of stocklending activities, expressed as a percentage of the average daily net assetvalues over the period. The main difference between the two calculations is the inclusion of custodian handlingcharges and stocklending fees, and the exclusion of Performance fees in the Ongoing charges figure. Thecomparative figures have not been restated, and the historic TER is disclosed.
JPM Global Equity Absolute Alpha Fund
104
Continuation�
� Return to Index

105
Continuation�
� Return to Index
Statement of total returnFor the year ending 31 January
2014 2013£’000 £’000 £’000 £’000
Income
Net capital gains (Note 1) 152 155
Revenue (Note 2) 98 79
Expenses (Note 3) (55) (88)
Performance fee (Note 3) (8) –
Finance costs: Interest (Note 5) – (1)
Net revenue/(expenses) before taxation 35 (10)
Taxation (Note 4) (9) (9)
Net revenue/(expenses) after taxation 26 (19)
Total return before distributions 178 136
Finance costs: Distributions (Note 5) 19 –
Change in net assets attributable to shareholders from investment activities 197 136
Statement of change in net assets attributable to shareholdersFor the year ending 31 January
2014 2013£’000 £’000 £’000 £’000
Opening net assets attributable to shareholders 6,264 6,088
Amounts receivable on issue of shares 5 58
Amounts payable on cancellation of shares (6,466) (18)
(6,461) 40
Change in net assets attributable to shareholders from investment activities (see above) 197 136
Closing net assets attributable to shareholders – 6,264
Balance sheetAs at 31 January
2014 2013£’000 £’000 £’000 £’000
ASSETS
Investment assets – 3,891
Debtors (Note 7) 2 118
Cash and bank balances (Note 8) 5 2,564
Total other assets 7 2,682
Total assets 7 6,573
LIABILITIES
Investment liabilities – (276)
Creditors (Note 9) (7) (33)
Total other liabilities (7) (33)
Total liabilities (7) (309)
Net assets attributable to shareholders – 6,264
The notes to these financial statements are shown on pages 106 to 107.
Financial statements
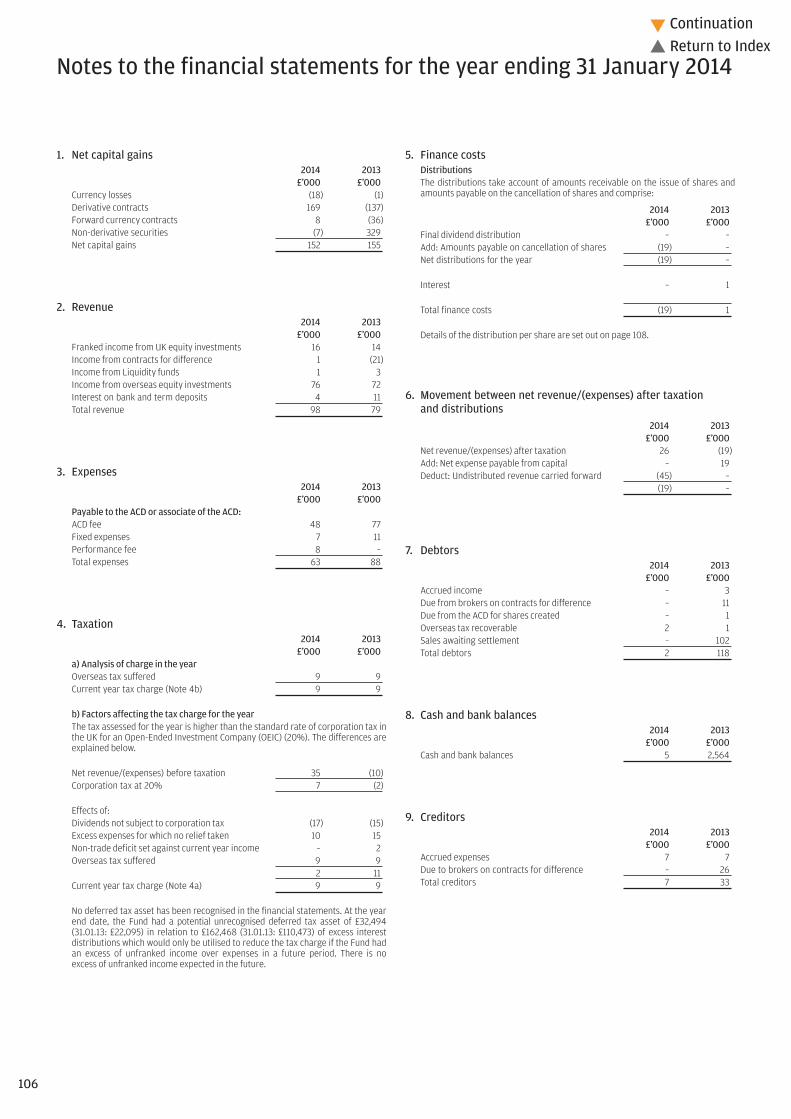
106
Continuation�
� Return to Index
5. Finance costsDistributionsThe distributions take account of amounts receivable on the issue of shares andamounts payable on the cancellation of shares and comprise:
2014 2013£’000 £’000
Final dividend distribution – –Add: Amounts payable on cancellation of shares (19) –Net distributions for the year (19) –
Interest – 1
Total finance costs (19) 1
Details of the distribution per share are set out on page 108.
6. Movement between net revenue/(expenses) after taxation and distributions
2014 2013£’000 £’000
Net revenue/(expenses) after taxation 26 (19)Add: Net expense payable from capital – 19Deduct: Undistributed revenue carried forward (45) –
(19) –
7. Debtors2014 2013
£’000 £’000Accrued income – 3Due from brokers on contracts for difference – 11Due from the ACD for shares created – 1Overseas tax recoverable 2 1Sales awaiting settlement – 102Total debtors 2 118
8. Cash and bank balances2014 2013
£’000 £’000Cash and bank balances 5 2,564
9. Creditors2014 2013
£’000 £’000Accrued expenses 7 7Due to brokers on contracts for difference – 26Total creditors 7 33
1. Net capital gains2014 2013
£’000 £’000Currency losses (18) (1)Derivative contracts 169 (137)Forward currency contracts 8 (36)Non-derivative securities (7) 329Net capital gains 152 155
2. Revenue2014 2013
£’000 £’000Franked income from UK equity investments 16 14Income from contracts for difference 1 (21)Income from Liquidity funds 1 3Income from overseas equity investments 76 72Interest on bank and term deposits 4 11Total revenue 98 79
3. Expenses2014 2013
£’000 £’000Payable to the ACD or associate of the ACD:ACD fee 48 77Fixed expenses 7 11Performance fee 8 –Total expenses 63 88
4. Taxation2014 2013
£’000 £’000a) Analysis of charge in the yearOverseas tax suffered 9 9Current year tax charge (Note 4b) 9 9
b) Factors affecting the tax charge for the yearThe tax assessed for the year is higher than the standard rate of corporation tax inthe UK for an Open-Ended Investment Company (OEIC) (20%). The differences areexplained below.
Net revenue/(expenses) before taxation 35 (10)Corporation tax at 20% 7 (2)
Effects of:Dividends not subject to corporation tax (17) (15)Excess expenses for which no relief taken 10 15Non-trade deficit set against current year income – 2Overseas tax suffered 9 9
2 11Current year tax charge (Note 4a) 9 9
No deferred tax asset has been recognised in the financial statements. At the yearend date, the Fund had a potential unrecognised deferred tax asset of £32,494(31.01.13: £22,095) in relation to £162,468 (31.01.13: £110,473) of excess interestdistributions which would only be utilised to reduce the tax charge if the Fund hadan excess of unfranked income over expenses in a future period. There is noexcess of unfranked income expected in the future.
Notes to the financial statements for the year ending 31 January 2014

107
Continuation�
� Return to Index
10. Portfolio transaction costs2014 2013
£’000 £’000Analysis of total purchase costs
Purchases in year before transaction costs 888 4,333
Commissions 1 3Taxes – 5Total purchase costs 1 8Gross purchases total 889 4,341
Analysis of total sale costs
Gross sales before transaction costs 5,181 2,806
Commissions (3) (3)Total sale costs (3) (3)Total sales net of transaction costs 5,178 2,803
11. Related party transactionsJPMorgan Funds Limited, as Authorised Corporate Director (“ACD”), is a relatedparty, and acts as principal in respect of all transactions of shares in the Company.The aggregate monies received through issue, and paid on cancellation, aredisclosed in the Statement of Change in Net Assets Attributable to Shareholders.
The balance due to the ACD and their associates at the year end date in respect ofrelated party transactions was £nil (31.01.13: £6,023). Details of related partytransactions are given under note 13 on page 413.
Some of the dealing transactions for the fund are carried out through associates ofthe ACD. Such transactions are carried out on an arm’s length basis. Thecommissions paid to these companies over the year were £2,244 (31.01.13: £1,387).Commission was paid to the associated company JPMorgan Securities Ltd.
The following party held a material interest in the Fund at the year end date:– JPMorgan Investments Limited nil (31.01.13: 98.39%)
12. Share classesThe Fund had three share classes; Class A Shares, Class B Shares and Class CShares. The Authorised Corporate Director’s (ACD) fee and fixed expenses chargewere as shown below.
ACD fee Fixed expensesClass A shares: 1.25% 0.18%Class B shares: 0.80% 0.18%Class C shares: 0.65% 0.18%
The net asset value of each share class, the net asset value per share and thenumber of shares in each class are shown on page 104. All classes had the samerights on winding up.
13. Contingent liabilities and capital commitmentsAt the balance sheet date there were no contingent liabilities or capitalcommitments (2013: none).
Notes to the financial statements – continued

108
� Return to Index
Final distribution in pence per share
Group 1 – Shares purchased prior to 1 February 2013Group 2 – Shares purchased 1 February 2013 to 12 September 2013
DistributionGross Tax Net paid paid
revenue at 10% revenue Equalisation 12.12.13 30.04.13
A-Class Accumulation Shares
Group 1 0.000000 0.000000 0.000000 – 0.000000 0.000000
Group 2 0.000000 0.000000 0.000000 0.000000 0.000000 0.000000
A-Class Income Shares
Group 1 0.000000 0.000000 0.000000 – 0.000000 0.000000
Group 2 0.000000 0.000000 0.000000 0.000000 0.000000 0.000000
B-Class Accumulation Shares
Group 1 0.000000 0.000000 0.000000 – 0.000000 0.000000
Group 2 0.000000 0.000000 0.000000 0.000000 0.000000 0.000000
C-Class Accumulation Shares
Group 1 0.000000 0.000000 0.000000 – 0.000000 0.000000
Group 2 0.000000 0.000000 0.000000 0.000000 0.000000 0.000000
C-Class Income Shares
Group 1 0.000000 0.000000 0.000000 – 0.000000 0.000000
Group 2 0.000000 0.000000 0.000000 0.000000 0.000000 0.000000
Equalisation applies only to shares purchased during the distribution period (group 2 shares). It is the average amount of revenue included in the purchase price of all group 2 shares and is refunded to holders of these
shares as a return of capital. Being capital it is not liable to income tax but must be deducted from the cost of shares for capital gains tax purposes.
Distribution table

109
Continuation�
� Return to Index
Investment objective and policyTo provide capital growth over the long term by investing throughout theworld in any economic sector.
The Fund will primarily invest in shares of companies globally and will haveexposure to Emerging Markets. Smaller company investments may be heldon an ancillary basis.
Other instruments as permitted in the stated investment and borrowingpowers of the Company including, but not limited to, fixed interest securities,cash and cash equivalents may be held on an ancillary basis, as appropriate.
Risk profileThe value of your investment may fall as well as rise and you may get backless than you originally invested.
The value of Equity and Equity-Linked Securities may fluctuate in responseto the performance of individual companies and general market conditions.
Emerging Markets may be subject to increased political, regulatory andeconomic instability, less developed custody and settlement practices,poor transparency and greater financial risks. Emerging Market currenciesmay be subject to volatile price movements. Emerging Market securities mayalso be subject to higher volatility and be more difficult to sell than non-Emerging Market securities.
This Fund is aggressively managed, which may result in higher volatility ofthe Fund’s performance and bigger differences between the performanceof the Fund and its Benchmark.
The Fund may be concentrated in one or more industry sectors and/orcountries and as a result, may be more volatile than more broadly diversifiedfunds.
Movements in currency exchange rates can adversely affect the return ofyour investment.
Please refer to Part 11 of the Prospectus for details of the general risk factorsaffecting this Fund in addition to the specific risk factors above.
Fund reviewThe Fund underperformed its benchmark in the 12 months to the end ofJanuary 2014. Stock selection was notably strong in the informationtechnology, materials and health care sectors, but weaker in the consumerdiscretionary and industrials sectors. On a regional basis, stock selectionwas positive in North America and emerging markets, but detracted in Japanand the UK. Our cash weighting throughout the year detracted fromperformance. At the stock level, top contributors to Fund performanceincluded Baidu, Google and Hewlett Packard. Notable detractors includedYes Bank and China Merchants Bank.
Fund outlookAgainst a background of increasing confidence in the strength of the recovery,we have recently added to our financials, information technology and energyexposure. We have also added to our holdings in emerging markets, whichhas been one of the weakest regions this year. In addition, we have marginallyreduced our cash positions. The portfolio remains tilted towards the moreattractive valuations available in UK and Europe, and in aggregate trades ata 10% discount to the market. While the overweight to health care remainsthe biggest, we have taken some profits in that sector, and now have significantoverweight positions in both financials and information technology.
12 month performance as at 31 January2014 2013 2012 2011 2010
JPM Global EquityA-Class Acc 7.7% 16.2% -6.1% 14.9% 25.0%
JPM Global EquityB-Class Acc 8.2% – – – –
JPM Global EquityC-Class Acc 8.5% – – – –
Benchmark IndexA 8.7% 15.3% -1.5% 19.3% 22.9%
Fund statisticsRisk and Reward Profile 6*
Fund size £163.5m
Benchmark IndexA MSCI All Country World Index (Net)
Fund chargesA-Class Initial 3.00%, Annual 1.50%B-Class Initial Nil, Annual 1.00%C-Class Initial Nil, Annual 0.75%
JPM Global Equity Fund
You should remember that past performance is not a guide to the future. The price of investments and the income from them may fall as well as rise andinvestors may not get back the full amount invested.
* For specific risks, including the risk and reward profile, please refer to the Key Investor information Document (KIID) available on the following websitehttp://am.jpmorgan.co.uk/investor/prices-and-factsheets/?list=all&tab=PricesAll equity indices stated as ‘Net’ are calculated net of tax as per the standard published approach by the index vendor unless stated otherwise.All performance returns are calculated using the quoted price of the accumulation shares. Performance returns are in Sterling.Source: J.P. Morgan.Formerly JPM Global Fund, the Fund name was changed on 01/12/12.A On 01/12/12 the Funds benchmark was changed from MSCI World Index (Net) to MSCI All Country World Index (Net).Benchmark Source: MSCI. Neither MSCI nor any other party involved in or related to compiling, computing or creating the MSCI data makes any express of implied warranties or representations with respect to such data (or theresults to be obtained by the use thereof), and all such parties hereby expressly disclaim all warranties of originality, accuracy, completeness, merchantability or fitness for a particular purpose with respect to any of such data.Without limiting any of the foregoing, in no event shall MSCI, any of its affiliates or any third party involved in or related to compiling computing or creating the data have any liability for any direct, indirect, special, punitive,consequential or any other damages (including lost profits) even if notified of the possibility of such damages. No further distribution or dissemination of the MSCI data is permitted without MSCI’s express written consent.

110
Top ten holdings (excluding Liquidity funds) %Citigroup 3.6BG Group 3.1Google ‘A’ 2.9Baxter International 2.9Standard Chartered 2.8Novartis 2.6Teva Pharmaceutical Industries ADR 2.5Sanofi 2.4Industrial & Commercial Bank of China ‘H’ 2.3AXA 2.2
Geographical breakdown %United States of America 41.2United Kingdom 15.4France 9.6China 7.5Switzerland 7.0Germany 2.8Japan 2.7Israel 2.5Liquidity funds 2.5South Korea 1.9India 1.6Netherlands 1.5Belgium 1.4Hong Kong 1.3Indonesia 0.5Net other assets 0.6
Highest/lowest share price and distribution recordDistribution
Highest Lowest per shareCalendar year share price share price (net)A-Class Accumulation Shares2009 654.1p 412.5p 7.03p2010 719.8p 601.4p 4.33p2011 734.1p 561.1p 5.06p2012 716.0p 628.8p 4.29p2013 867.7p 719.6p 4.45p2014B 872.0p 826.1p 4.55pA-Class Income Shares2009 50.30p 31.72p 0.54p2010 54.96p 45.92p 0.34p2011 55.65p 42.54p 0.38p2012 53.88p 47.32p 0.33p2013 64.93p 54.15p 0.32p2014B 65.25p 61.76p 0.34pB-Class Accumulation SharesC
2012 716.5p 672.9p – 2013 872.0p 720.3p 5.40p2014B 877.2p 831.2p 8.59pC-Class Accumulation SharesD
2012 103.3p 96.95p –2013 125.9p 103.8p 1.02p2014B 126.7p 120.1p 1.53pC-Class Income SharesD
2012 103.3p 96.95p –2013 124.8p 103.8p 0.96p2014B 125.6p 118.1p 1.48p
B To 31 January 2014.C B-Class Accumulation Shares were launched on 29 October 2012.D C-Class Accumulation Shares and C-Class Income Shares were launched on 20 August 2012.
Portfolio turnover rate31.01.13 105.8%31.01.14 140.4%
The portfolio turnover rate (PTR) reflects the total of security purchases and sales (excluding Liquidityfunds), less the total of share issues and cancellations, expressed as a percentage of the average daily netasset values over the period.
Portfolio transaction costsBroker Transaction
Commissions Taxes Total31.01.13 0.13% 0.06% 0.19%31.01.14 0.14% 0.08% 0.22%
The percentage figures disclosed above reflect the average broker commissions and transaction taxessuffered during the last 3 years divided by the average assets under management over the same period.
Continuation�
� Return to Index

111
Continuation�
� Return to Index
Stamp duty reserve tax31.01.13 0.00%31.01.14 0.00%
The percentage figures disclosed above reflect the total stamp duty reserve tax suffered during the yeardivided by the average assets under management over the same period.
Net asset values and Ongoing chargesNet assetvalue per Net asset
share class Number value per OngoingDate £’000 of shares share chargesA-Class Accumulation Shares31.01.12 160,567 24,211,529 663.2p 1.67%31.01.13 163,000 21,142,750 770.9p 1.68%31.01.14 159,822 19,257,637 829.9p 1.68%A-Class Income Shares31.01.12 695 1,391,386 49.95p 1.68%31.01.13 1,264 2,190,564 57.69p 1.68%31.01.14 1,936 3,134,131 61.76p 1.68%B-Class Accumulation Shares31.01.13 43 5,605 772.0p 1.18%31.01.14 203 24,301 835.1p 1.18%C-Class Accumulation Shares31.01.13 28 25,445 111.3p 0.93%31.01.14 1,459 1,209,465 120.6p 0.93%C-Class Income Shares31.01.13 1 1,000 110.3p 0.93%31.01.14 116 98,713 118.1p 0.93%
The net asset value and the net asset value per income share are shown ex-dividend.
Following the adoption of the requirements of UCITS IV in June 2012, Ongoing charges has replaced the TotalExpense Ratio (“TER”). The Ongoing charges takes into account the ACD fee, the fixed expenses and any expensespaid to an affiliate in respect of stocklending activities, expressed as a percentage of the average daily net assetvalues over the period. The main difference between the two calculations is the inclusion of custodian handlingcharges and stocklending fees in the Ongoing charges figure. The comparative figures have not been restated,and the historic TER is disclosed.

United States of America – 41.2% (37.6%)ACE 29,340 1,696 1.0Allergan 42,413 2,965 1.8Anadarko Petroleum 60,472 2,992 1.8Baxter International 111,291 4,683 2.9Capital One Financial 54,100 2,332 1.4Cisco Systems 210,228 2,807 1.7Citigroup 198,787 5,832 3.6Citrix 28,107 910 0.6Comcast ‘A’ 61,552 2,026 1.2Continental Resources 26,839 1,775 1.1Ebay 25,505 824 0.5EMC 228,817 3,421 2.1Fluor 49,048 2,274 1.4Freeport-McMoRan Copper & Gold 122,438 2,411 1.5Google ‘A’ 6,855 4,721 2.9Hartford Financial Services Group 84,707 1,737 1.1Johnson & Johnson 61,351 3,336 2.0Lululemon Athletica 41,457 1,179 0.7Metlife 76,494 2,313 1.4Microsoft 125,125 2,802 1.7Pfizer 92,829 1,738 1.1Qualcomm 66,590 2,965 1.8Teradyne 234,990 2,725 1.7Time Warner 68,716 2,650 1.6United Technologies 27,740 1,933 1.2UnitedHealth Group 51,286 2,268 1.4
United Kingdom – 15.4% (17.5%)Barclays 1,252,505 3,354 2.0BG Group 507,802 5,162 3.1Glencore Xstrata 758,431 2,430 1.5Just Retirement Group 803,545 1,957 1.2Partnership Assurance Group 493,868 1,596 1.0Premier Oil 785,152 2,106 1.3Prudential 182,688 2,227 1.4Standard Chartered 370,683 4,595 2.8Vodafone Group 839,852 1,862 1.1
France – 9.6% (6.2%)AXA 236,005 3,737 2.2Kering 28,014 3,374 2.1Renault 29,918 1,554 1.0Sanofi 65,230 3,898 2.4Technip 61,146 3,187 1.9
China – 7.5% (6.7%)Baidu ADS 27,751 2,710 1.7China Merchants Bank ‘H’ 3,198,142 3,428 2.1China Overseas Land & Investments 398,000 651 0.4Industrial & Commercial Bank of China ‘H’ 10,043,000 3,780 2.3Sinopharm Group ‘H’ 967,600 1,658 1.0
Switzerland – 7.0% (6.9%)Compagnie Financiere Richemont ‘A’ 58,461 3,275 2.0Nestle 36,675 1,605 1.0Novartis 87,118 4,180 2.6UBS 204,958 2,448 1.4
Germany – 2.8% (7.6%)Bayer 27,686 2,207 1.4Volkswagen Non-Voting Preference 14,984 2,288 1.4
Japan – 2.7% (3.7%)Komatsu 221,800 2,830 1.7Nitto Denko 55,300 1,512 1.0
Israel – 2.5% (2.7%)Teva Pharmaceutical Industries ADR 148,922 4,125 2.5
South Korea – 1.9% (0.0%)Hyundai Motors 6,336 832 0.5Samsung Electronics 3,096 2,224 1.4
India – 1.6% (1.6%)ICICI Bank 160,709 1,541 0.9Yes Bank 365,315 1,090 0.7
Netherlands – 1.5% (0.0%)NXP Semiconductors 86,754 2,521 1.5
Belgium – 1.4% (2.1%)Anheuser-Busch InBev 39,666 2,279 1.4
Hong Kong – 1.3% (1.1%)Emperor Watch And Jewellery 23,160,000 906 0.6KWG Property 1,601,500 505 0.3Wharf 177,000 733 0.4
Indonesia – 0.5% (0.5%)Bank Rakyat Indonesia 2,149,000 890 0.5
Canada – 0.0% (0.0%)JPY Holdings† 85,600 – –
Liquidity funds – 2.5% (4.5%)JPM Sterling Liquidity ‘X’ (Distribution)^$ 4,048,149 4,048 2.5
Investment assets 162,620 99.4
Net other assets 916 0.6
Net assets 163,536 100.0
Unless otherwise stated the above securities are admitted to official stock exchange listings or trade on aregulated market.
The comparative percentage figures in brackets are at 31 January 2013.
† Suspended security^ Deemed to be investment in related parties of the ACD$ Approved security as defined in the Collective Investment Schemes sourcebook
Portfolio statementAs at 31 January 2014
Market value Total netInvestment Holding £’000 assets %
Market value Total netInvestment Holding £’000 assets %
112
Continuation�
� Return to Index
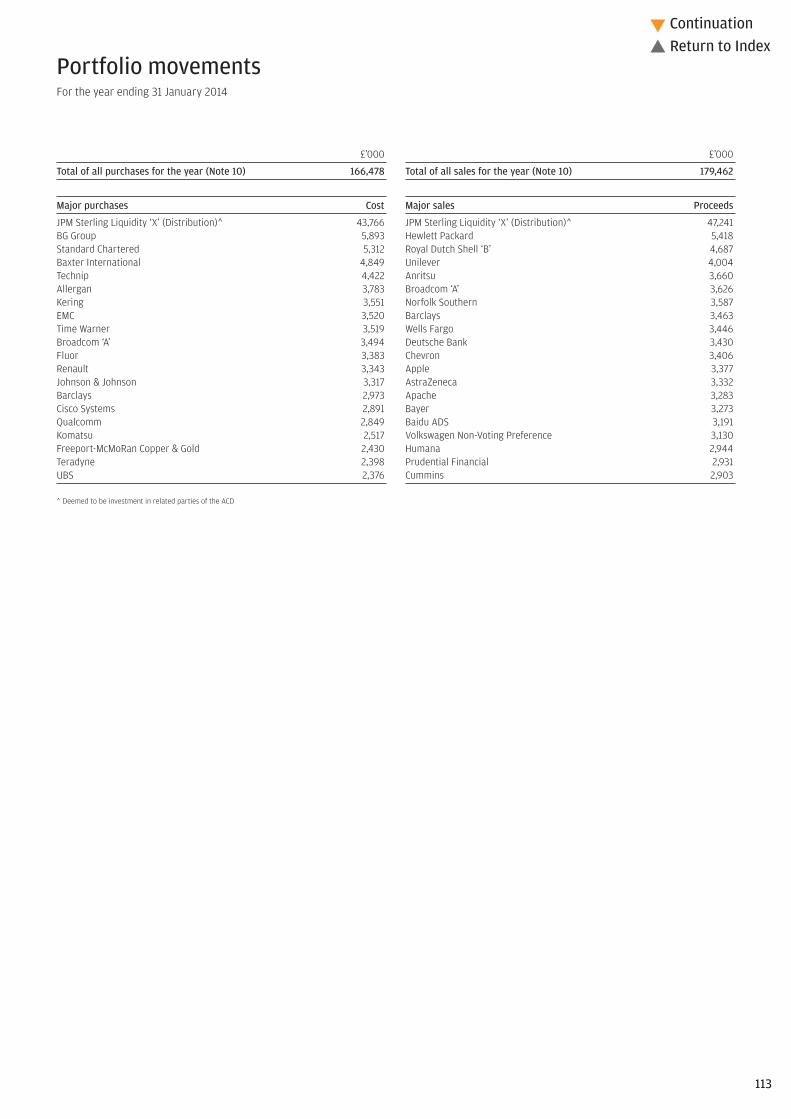
113
Continuation�
� Return to Index
£’000
Total of all purchases for the year (Note 10) 166,478
Major purchases Cost
JPM Sterling Liquidity ‘X’ (Distribution)^ 43,766BG Group 5,893Standard Chartered 5,312Baxter International 4,849Technip 4,422Allergan 3,783Kering 3,551EMC 3,520Time Warner 3,519Broadcom ‘A’ 3,494Fluor 3,383Renault 3,343Johnson & Johnson 3,317Barclays 2,973Cisco Systems 2,891Qualcomm 2,849Komatsu 2,517Freeport-McMoRan Copper & Gold 2,430Teradyne 2,398UBS 2,376
^ Deemed to be investment in related parties of the ACD
£’000
Total of all sales for the year (Note 10) 179,462
Major sales Proceeds
JPM Sterling Liquidity ‘X’ (Distribution)^ 47,241Hewlett Packard 5,418Royal Dutch Shell ‘B’ 4,687Unilever 4,004Anritsu 3,660Broadcom ‘A’ 3,626Norfolk Southern 3,587Barclays 3,463Wells Fargo 3,446Deutsche Bank 3,430Chevron 3,406Apple 3,377AstraZeneca 3,332Apache 3,283Bayer 3,273Baidu ADS 3,191Volkswagen Non-Voting Preference 3,130Humana 2,944Prudential Financial 2,931Cummins 2,903
Portfolio movements For the year ending 31 January 2014

Statement of total returnFor the year ending 31 January
2014 2013£’000 £’000 £’000 £’000
Income
Net capital gains (Note 1) 11,491 23,256
Revenue (Note 2) 4,205 4,185
Expenses (Note 3) (2,816) (2,682)
Net revenue before taxation 1,389 1,503
Taxation (Note 4) (421) (421)
Net revenue after taxation 968 1,082
Total return before distributions 12,459 24,338
Finance costs: Distributions (Note 5) (975) (1,081)
Change in net assets attributable to shareholders from investment activities 11,484 23,257
Statement of change in net assets attributable to shareholdersFor the year ending 31 January
2014 2013£’000 £’000 £’000 £’000
Opening net assets attributable to shareholders 164,336 161,262
Amounts receivable on issue of shares 3,978 8,333
Amounts payable on cancellation of shares (17,156) (29,455)
(13,178) (21,122)
Change in net assets attributable to shareholders from investment activities (see above) 11,484 23,257
Retained distributions on accumulation shares 897 941
Stamp duty reserve tax (3) (2)
Closing net assets attributable to shareholders 163,536 164,336
Balance sheetAs at 31 January
2014 2013£’000 £’000 £’000 £’000
ASSETS
Investment assets 162,620 163,964
Debtors (Note 7) 8,168 1,847
Cash and bank balances (Note 8) 99 1,466
Total other assets 8,267 3,313
Total assets 170,887 167,277
LIABILITIES
Creditors (Note 9) (7,339) (2,933)
Bank overdrafts – (1)
Distribution payable on income shares (12) (7)
Total liabilities (7,351) (2,941)
Net assets attributable to shareholders 163,536 164,336
The notes to these financial statements are shown on pages 115 to 116.
Financial statements
114
Continuation�
� Return to Index

115
Continuation�
� Return to Index
1. Net capital gains2014 2013
£’000 £’000Currency (losses)/gains (105) 89Non-derivative securities 11,596 23,167Net capital gains 11,491 23,256
2. Revenue2014 2013
£’000 £’000Franked income from UK equity investments 864 1,013Income from Liquidity funds 17 36Income from overseas equity investments 3,323 3,135Interest on bank and term deposits 1 1Total revenue 4,205 4,185
3. Expenses2014 2013
£’000 £’000Payable to the ACD or associate of the ACD:ACD fee 2,514 2,395Fixed expenses 302 287Total expenses 2,816 2,682
4. Taxation2014 2013
£’000 £’000a) Analysis of charge in the yearOverseas tax suffered 421 421Current year tax charge (Note 4b) 421 421
b) Factors affecting the tax charge for the yearThe tax assessed for the year is higher than the standard rate of corporation tax inthe UK for an Open-Ended Investment Company (OEIC) (20%). The differences areexplained below.
Net revenue before taxation 1,389 1,503Corporation tax at 20% 278 301
Effects of:Dividends not subject to corporation tax (804) (801)Excess expenses for which no relief taken 531 500Overseas tax suffered 421 421Relief for overseas tax expensed (5) -
143 120Current year tax charge (Note 4a) 421 421
No deferred tax asset has been recognised in the financial statements. At the yearend date, the Fund had a potential unrecognised deferred tax asset of £5,104,732(31.01.13: £4,573,974) in relation to £25,523,658 (31.01.13: £22,869,871) of excessmanagement expenses which would only be utilised to reduce the tax charge if theFund had an excess of unfranked income over expenses in a future period. There isno excess of unfranked income expected in the future.
5. Finance costsDistributionsThe distributions take account of amounts receivable on the issue of shares andamounts payable on the cancellation of shares and comprise:
2014 2013£’000 £’000
Final dividend distribution 909 948Add: Amounts payable on cancellation of shares 96 172Deduct: Amounts receivable on issue of shares (30) (39)Total finance costs 975 1,081
Details of the distribution per share are set out on page 117.
6. Movement between net revenue after taxation and distributions2014 2013
£’000 £’000Net revenue after taxation 968 1,082Add: Undistributed revenue brought forward 1 –Deduct: Undistributed revenue carried forward (1) (1)Equalisation on conversions 7 –
975 1,081
7. Debtors2014 2013
£’000 £’000Accrued income 61 105Due from the ACD for shares created 35 18Overseas tax recoverable 153 113Sales awaiting settlement 7,919 1,611Total debtors 8,168 1,847
8. Cash and bank balances2014 2013
£’000 £’000Cash and bank balances 99 1,466
9. Creditors2014 2013
£’000 £’000Accrued expenses 240 234Due to the ACD for shares cancelled 177 150Purchases awaiting settlement 6,922 2,549Total creditors 7,339 2,933
Notes to the financial statements for the year ending 31 January 2014

10. Portfolio transaction costs2014 2013
£’000 £’000Analysis of total purchase costs
Purchases in year before transaction costs 166,266 146,809
Commissions 82 70Taxes 130 91Total purchase costs 212 161Gross purchases total 166,478 146,970
Analysis of total sale costs
Gross sales before transaction costs 179,539 167,722
Commissions (72) (90)Taxes (5) (18)Total sale costs (77) (108)Total sales net of transaction costs 179,462 167,614
11. Related party transactionsJPMorgan Funds Limited, as Authorised Corporate Director (“ACD”), is a relatedparty, and acts as principal in respect of all transactions of shares in the Company.The aggregate monies received through issue, and paid on cancellation, aredisclosed in the Statement of Change in Net Assets Attributable to Shareholders.
The balance due to the ACD and their associates at the year end date in respect ofrelated party transactions was £381,672 (31.01.13: £365,631). Details of relatedparty transactions are given under note 13 on page 413.
Investments considered to be related parties have been identified in the portfoliostatement on page 112 and the revenue from these investments was £16,614(31.01.13: £36,366).
Some of the dealing transactions for the Fund are carried out through associatesof the ACD. Such transactions are carried out on an arm’s length basis. Thecommissions paid to these companies over the year were £12,480 (31.01.13:£17,267). Commission was paid to the associated company JPMorgan SecuritiesLtd.
The following party held a material interest in the Fund at the year end date:– FNZ (UK) Nominees Ltd 23.98% (31.01.13: 23.33%)
12. Financial instrumentsCurrency exposuresA substantial proportion of the net assets of the Fund are denominated incurrencies other than sterling, with the effect that the Balance sheet and totalreturn can be significantly affected by currency movements.
Net foreign currency assets/(liabilities)Monetary Non-monetary
Total exposures exposuresCurrency £’000 £’000 £’000
31.01.14US Dollar 77,647 974 76,673Euro 22,571 49 22,522Swiss Franc 12,522 1,013 11,509Hong Kong Dollar 10,578 (1,082) 11,660Japanese Yen 4,342 – 4,342Indian Rupee 2,632 – 2,632Korean Won 2,238 (818) 3,056Canadian Dollar 1,745 1,745 –Indonesian Rupiah 890 – 890Taiwan Dollar 20 20 –
31.01.13US Dollar 70,037 62 69,975Euro 23,749 (2,444) 26,193Swiss Franc 11,327 50 11,277Hong Kong Dollar 8,715 – 8,715Japanese Yen 5,979 – 5,979Indian Rupee 2,634 – 2,634Danish Krone 1,739 – 1,739Taiwan Dollar 1,248 1,248 –Indonesian Rupiah 897 – 897
Interest rate riskAt the year end date, 2.5% (31.01.13: 5.5%) of the Fund’s net assets by value wereinterest bearing, carrying a (fixed/floating) rate.
For consideration of other risks including liquidity, pricing and credit risk, pleaserefer to the notes to the aggregated financial statements, pages 413 to 414.
13. Share classesThe Fund currently has three share classes; Class A Shares, Class B Shares andClass C Shares. The Authorised Corporate Director’s (ACD) fee and fixed expensescharge are shown below.
ACD fee Fixed expensesClass A shares: 1.50% 0.18%Class B shares: 1.00% 0.18%Class C shares: 0.75% 0.18%
The net asset value of each share class, the net asset value per share and thenumber of shares in each class are shown on page 111. All classes have the samerights on winding up.
14. Contingent liabilities and capital commitmentsAt the balance sheet date there were no contingent liabilities or capitalcommitments (2013: none).
Notes to the financial statements – continued
116
Continuation�
� Return to Index

117
� Return to Index
Final distribution in pence per share
Group 1 – Shares purchased prior to 1 February 2013Group 2 – Shares purchased 1 February 2013 to 31 January 2014
DistributionGross Tax Net payable paid
revenue at 10% revenue Equalisation 30.04.14 30.04.13
A-Class Accumulation Shares
Group 1 5.055556 0.505556 4.550000 – 4.550000 4.450000
Group 2 0.000000 0.000000 0.000000 4.550000 4.550000 4.450000
A-Class Income Shares
Group 1 0.377778 0.037778 0.340000 – 0.340000 0.320000
Group 2 0.000000 0.000000 0.000000 0.340000 0.340000 0.320000
B-Class Accumulation Shares
Group 1 9.544444 0.954444 8.590000 – 8.590000 5.400000
Group 2 1.208004 0.120800 1.087204 7.502796 8.590000 5.400000
C-Class Accumulation Shares
Group 1 1.700000 0.170000 1.530000 – 1.530000 1.020000
Group 2 0.033428 0.003343 0.030085 1.499915 1.530000 1.020000
C-Class Income Shares
Group 1 1.644444 0.164444 1.480000 – 1.480000 0.960000
Group 2 0.058720 0.005872 0.052848 1.427152 1.480000 0.960000
Equalisation applies only to shares purchased during the distribution period (group 2 shares). It is the average amount of revenue included in the purchase price of all group 2 shares and is refunded to holders of these
shares as a return of capital. Being capital it is not liable to income tax but must be deducted from the cost of shares for capital gains tax purposes.
Distribution table

Investment objective and policyTo provide a portfolio designed to achieve high and rising income by investingglobally, primarily in Equities, in any economic sector whilst participatingin long term capital growth.
The Fund will have exposure to Emerging Markets. Smaller companyinvestments may be held on an ancillary basis.
Other instruments as permitted in the stated investment and borrowingpowers of the Company including, but not limited to, fixed interest securities,cash and cash equivalents may be held on an ancillary basis, as appropriate.
Risk profileThe value of your investment may fall as well as rise and you may get backless than you originally invested.
The value of Equity and Equity-Linked Securities may fluctuate in responseto the performance of individual companies and general market conditions.
Emerging Markets may be subject to increased political, regulatory andeconomic instability, less developed custody and settlement practices,poor transparency and greater financial risks. Emerging Market currenciesmay be subject to volatile price movements. Emerging Market securities mayalso be subject to higher volatility and be more difficult to sell than non-Emerging Market securities.
As the portfolio of the Fund is primarily focused on generating income, itmay bear little resemblance to the composition of its Benchmark.
The Fund may be concentrated in one or more countries and as a result,may be more volatile than more broadly diversified funds.
For investors in Share Classes which are not hedged to Sterling movementsin currency exchange rates can adversely affect the return of your investment.
Investors in GBP Hedged Share Classes should be aware that any currencyhedging process may not give a precise hedge. Where currency hedging isundertaken, whilst it may protect an investor in Hedged Shares against adecrease in the value of the currency being hedged, it may also prevent aninvestor from participating in an increase in the value of that currency. Pleaserefer to Part 1: Section 1.3 of the Prospectus for more information on HedgedShare Classes.
This Fund charges the annual fee of the Authorised Corporate Director (ACD)against capital, which will increase the amount of income available fordistribution to Shareholders, but may constrain capital growth. It may alsohave tax implications for certain investors.
Please refer to Part 11 of the Prospectus for details of the general risk factorsaffecting this Fund in addition to the specific risk factors above.
Fund reviewGlobal equities rose in the 12 months to the end of January 2014 on the backof a pickup in global economic growth.
The Fund aims to provide our clients with a high and rising income stream.Over the 12-month period the Fund has grown its income stream by over20%, significantly outperforming global equity markets, while deliveringstrong capital growth as well, although the Fund underperformed its hedgedbenchmark over the review period on a total return basis. A number ofcompanies in the portfolio have recently raised their dividends, includingSwiss Re, Wells Fargo, Japan Tobacco, Schneider Electric, Hutchison Whampoaand Time Warner. These dividend increases highlight that companies aregenerating strong levels of profitability and returning excess cash toshareholders. With many investors seeking to add risk to portfolios whilemaintaining a focus on income, dividend investing therefore continues tolook attractive. Compared to bond alternatives, defensive dividend growthstocks offer compelling growth opportunities. The dividend yield of theportfolio is 4.0% vs. the benchmark, which is yielding 2.6%, and we continueto forecast strong dividend growth over the next few years.
Fund outlookGrowth in the developed world is gathering momentum, and for the firstsustained period of time since the 2008-9 financial crisis, a significant majorityof countries are benefiting from expansion in manufacturing activity.
12 month performance as at 31 January 2014 2013 2012 2011 2010
JPM Global Equity Income A-Class Acc (GBP Hedged) 13.0% 15.1% -5.3% 15.0% 20.3%
JPM Global Equity IncomeC-Class Inc (GBP Hedged) 13.5% 16.2% -4.5% 15.9% 21.2%
Hedged Benchmark IndexA 17.5% 16.5% -3.6% 16.1% 27.5%
JPM Global Equity IncomeA-Class Acc 6.7% 14.2% – – –
JPM Global Equity Income B-Class Acc 7.0% – – – –
JPM Global Equity IncomeC-Class Acc 7.3% – – – –
JPM Global Equity Income X-Class Acc 8.4% – – – –
Benchmark Index 10.8% 15.4% – – –
JPM Global Equity Income Fund
You should remember that past performance is not a guide to the future. The price of investments and the income from them may fall as well as rise andinvestors may not get back the full amount invested. All equity indices stated as ‘Net’ are calculated net of tax as per the standard published approach by the index vendor unless stated otherwise.All performance returns are calculated using the quoted price of the accumulation and income shares. Performance returns are in Sterling.Source: J.P. Morgan.On 16/12/11 the Fund switched to currency hedging at share class level and existing share classes were renamed GBP Hedged Shares.A On 01/05/09 the benchmark for the Fund was changed from MSCI World Index (Net) to MSCI World Index Hedged into GBP (Net). On 01/11/13 the benchmark for the Fund was changed from MSCI World Index hedged
into GBP (Net) to MSCI All Country World Index (Net) hedged to GBP.Benchmark Source: MSCI. Neither MSCI nor any other party involved in or related to compiling, computing or creating the MSCI data makes any express of implied warranties or representations with respect to such data (or theresults to be obtained by the use thereof), and all such parties hereby expressly disclaim all warranties of originality, accuracy, completeness, merchantability or fitness for a particular purpose with respect to any of such data.Without limiting any of the foregoing, in no event shall MSCI, any of its affiliates or any third party involved in or related to compiling computing or creating the data have any liability for any direct, indirect, special, punitive,consequential or any other damages (including lost profits) even if notified of the possibility of such damages. No further distribution or dissemination of the MSCI data is permitted without MSCI’s express written consent.118
Continuation�
� Return to Index

Fund statisticsRisk and Reward Profile 6*
Fund size £85.4m
Hedged Benchmark IndexA MSCI All Country World Index Hedged into GBP (Net)
Benchmark Index MSCI All Country World Index (Net)
Fund chargesA-Class Initial 3.00%, Annual 1.50%B-Class Initial Nil, Annual 1.00%C-Class Initial Nil, Annual 0.75%X-Class On applicationB
Top ten holdings (excluding Liquidity funds) %Vodafone Group 2.9Royal Dutch Shell ‘A’ 2.9Swiss Re 2.6ConocoPhillips 2.4ENI 2.3Johnson & Johnson 2.3Seven & I 2.3Microsoft 2.1Time Warner 2.0Unibail-Rodamco 2.0
Geographical breakdown %United States of America 36.4United Kingdom 10.9Japan 7.6France 7.1Switzerland 6.0Germany 4.5Australia 4.3Sweden 3.9Netherlands 2.9Hong Kong 2.7Italy 2.3Belgium 2.0Canada 1.9Denmark 1.5Finland 1.0Norway 0.8China 0.7Taiwan 0.7South Korea 0.4Portugal 0.3Forward currency contracts GBP Hedged share classes 0.6Liquidity funds 0.2Forward currency contracts fund level (0.2)Net other assets 1.5
The forward currency contracts are entered into at fund level, and additional forward currency contractsare entered into by the A-Class Accumulation GBP Hedged shares, A-Class Income GBP Hedged shares, C-Class Accumulation GBP Hedged shares and the C-Class Income GBP Hedged shares.
Highest/lowest share price and distribution recordDistribution
Highest Lowest per shareCalendar year share price share price (net)A-Class Accumulation SharesC
2011 50.00p 50.00p –2012 54.51p 48.96p 1.74p2013 65.79p 54.19p 2.37p2014D 64.38p 61.34p 0.41pA-Class Accumulation GBP Hedged SharesE
2009 44.13p 29.50p 1.59p2010 48.64p 40.78p 1.55p2011 50.06p 40.47p 1.84p2012 50.77p 44.83p 1.83p2013 61.92p 50.93p 2.18p2014D 62.00p 59.55p 0.39pA-Class Income SharesC
2011 50.00p 50.00p –2012 53.38p 48.37p 1.72p2013 62.41p 52.44p 2.26p2014D 59.97p 57.13p 0.39pA-Class Income GBP Hedged SharesE
2009 39.41p 27.34p 1.46p2010 41.94p 35.87p 1.36p2011 42.89p 33.89p 1.57p2012 40.59p 36.57p 1.49p2013 47.70p 40.70p 1.71p2014D 47.76p 45.85p 0.31pB-Class Accumulation SharesF
2012 100.0p 52.01p 0.44p2013 65.98p 54.26p 2.36p2014D 64.69p 61.65p 0.42pB-Class Income SharesF
2012 52.43p 50.32p 0.43p2013 62.58p 52.49p 2.28p2014D 60.26p 57.42p 0.40pC-Class Accumulation SharesG
2012 102.1p 97.48p 0.85p2013 123.8p 101.7p 4.41p2014D 121.7p 115.9p 0.78pC-Class Accumulation GBP Hedged SharesH
2012 102.3p 96.43p 0.85p2013 125.6p 102.7p 4.37p2014D 125.8p 120.8p 0.81pC-Class Income SharesG
2012 102.1p 96.65p 0.85p2013 120.4p 100.9p 4.28p2014D 116.1p 110.7p 0.74p
* For specific risks, including the risk and reward profile, please refer to the Key Investor information Document (KIID) available on the following websitehttp://am.jpmorgan.co.uk/investor/prices-and-factsheets/?list=all&tab=PricesB As agreed from time to time between the ACD and the relevant JPMorgan Chase & Co. entity. 119
Continuation�
� Return to Index

Highest/lowest share price and distribution record(continued)
DistributionHighest Lowest per share
Calendar year share price share price (net)C-Class Income GBP Hedged SharesE
2009 92.05p 63.42p 3.42p2010 98.66p 83.99p 3.29p2011 101.2p 80.18p 3.73p2012 96.93p 87.03p 3.60p2013 114.5p 97.27p 4.10p2014D 114.7p 110.2p 0.73pX-Class Accumulation SharesI
2009 88.78p 58.74p 3.18p2010 99.42p 82.57p 3.28p2011J 102.8p 83.68p 2.97p2012 – – –2013 114.7p 99.19p 3.59p2014D 113.5p 108.2p 0.84pX-Class Income Shares2009 81.91p 56.16p 2.99p2010 88.42p 74.93p 2.99p2011J 90.88p 72.23p 2.61p
C A-Class Accumulation Shares and A-Class Income Shares were launched on 30 December 2011.D To 31 January 2014.E A-Class Accumulation Shares, A-Class Income Shares and C-Class Income Shares changed name to GBP
Hedged shares on 16 December 2011.F B-Class Accumulation Shares and B-Class Income Shares were launched on 29 October 2012.G C-Class Accumulation Shares and C-Class Income Shares were launched on 1 October 2012.H C-Class Accumulation GBP Hedged Shares were launched on 20 August 2012.I X-Class Accumulation Shares were launched on 28 January 2013.J X-Class Accumulation Shares and X-Class Income Shares were closed on 12 October 2011.
Portfolio turnover rate31.01.13 72.0%31.01.14 171.8%
The portfolio turnover rate (PTR) reflects the total of security purchases and sales (excluding Liquidityfunds), less the total of share issues and cancellations, expressed as a percentage of the average daily netasset values over the period.
Portfolio transaction costsBroker Transaction
Commissions Taxes Total31.01.13 0.09% 0.03% 0.12%31.01.14 0.11% 0.04% 0.15%
The percentage figures disclosed above reflect the average broker commissions and transaction taxessuffered during the last 3 years divided by the average assets under management over the same period.
Stamp duty reserve tax31.01.13 0.01%31.01.14 0.02%
The percentage figures disclosed above reflect the total stamp duty reserve tax suffered during the yeardivided by the average assets under management over the same period.
Net asset values and Ongoing chargesNet assetvalue per Net asset
share class Number value per OngoingDate £’000 of shares share chargesA-Class Accumulation Shares31.01.12 3 5,000 50.41p 1.68%31.01.13 2,013 3,496,835 57.56p 1.68%31.01.14 5,940 9,675,103 61.40p 1.68%A-Class Accumulation GBP Hedged Shares31.01.12 83,943 183,385,494 45.77p 1.68%31.01.13 80,963 153,661,995 52.69p 1.68%31.01.14 43,654 73,335,082 59.53p 1.68%A-Class Income Shares31.01.12 3 5,000 50.40p 1.68%31.01.13 2,090 3,778,988 55.30p 1.68%31.01.14 5,486 9,658,347 56.80p 1.68%A-Class Income GBP Hedged Shares31.01.12 18,068 47,820,860 37.78p 1.67%31.01.13 19,368 46,330,554 41.80p 1.68%31.01.14 17,163 37,698,157 45.53p 1.68%B-Class Accumulation Shares31.01.13 3 5,000 57.64p 1.18%31.01.14 18 29,706 61.71p 1.18%B-Class Income Shares31.01.13 3 5,000 55.37p 1.18%31.01.14 13 22,985 57.08p 1.18%C-Class Accumulation Shares31.01.13 1 1,000 108.1p 0.93%31.01.14 99 84,826 116.06p 0.93%C-Class Accumulation GBP Hedged Shares31.01.13 452 425,575 106.3p 0.93%31.01.14 2,030 1,681,632 120.74p 0.93%C-Class Income Shares31.01.13 1 1,000 106.4p 0.93%31.01.14 248 225,670 110.03p 0.93%C-Class Income GBP Hedged Shares31.01.12 2,982 3,327,317 89.63p 0.87%31.01.13 1,353 1,353,563 99.98p 0.93%31.01.14 10,779 9,850,774 109.42p 0.93%X-Class Accumulation Shares31.01.13 1 1,000 99.88p 0.06%31.01.14 1 1,000 108.32p 0.06%
The net asset value and the net asset value per income share are shown ex-dividend.
Following the adoption of the requirements of UCITS IV in June 2012, Ongoing charges has replaced theTotal Expense Ratio (“TER”). The Ongoing charges takes into account the ACD fee, the fixed expenses andany expenses paid to an affiliate in respect of stocklending activities, expressed as a percentage of theaverage daily net asset values over the period. The main difference between the two calculations is theinclusion of custodian handling charges and stocklending fees in the Ongoing charges figure. The comparativefigures have not been restated, and the historic TER is disclosed.
120
Continuation�
� Return to Index

United States of America – 36.4% (30.0%)Accenture ‘A’ 17,917 879 1.0Applied Materials 146,644 1,495 1.7Bristol-Myers Squibb 44,482 1,364 1.6Cisco Systems 53,170 710 0.8CME Group ‘A’ 27,089 1,223 1.4ConocoPhillips 50,491 2,017 2.4Ensco ‘A’ 16,451 506 0.6ExxonMobil 15,017 857 1.0Fifth Third Bancorp 110,735 1,429 1.7Freeport-McMoRan Copper & Gold 30,157 594 0.7Home Depot 27,280 1,275 1.5Johnson & Johnson 36,547 1,987 2.3Lorillard 39,343 1,176 1.4Masco 69,355 894 1.0McDonald’s 26,915 1,534 1.8Merck & Co 41,317 1,344 1.6Metlife 26,809 811 1.0Microsoft 81,274 1,820 2.1Nextera Energy 16,650 920 1.1Paccar 39,245 1,370 1.6Sempra Energy 22,747 1,264 1.5Time Warner 44,557 1,718 2.0United Technologies 20,295 1,414 1.7Verizon Communications 37,415 1,082 1.3Wells Fargo 48,893 1,368 1.6
United Kingdom – 10.9% (15.0%)3i Group 330,953 1,241 1.4AstraZeneca 35,324 1,355 1.6Aviva 189,182 836 1.0British Sky Broadcasting Group 145,152 1,242 1.5Direct Line Insurance Group 273,060 718 0.8Pearson 46,815 514 0.6Persimmon 71,539 914 1.1Vodafone Group 1,100,900 2,441 2.9
Japan – 7.6% (8.6%)Japan Tobacco 71,200 1,351 1.6Seven & I 80,300 1,957 2.3Sumitomo Mitsui Financial Group 55,200 1,582 1.9Toyota Motor 44,700 1,572 1.8
France – 7.1% (7.8%)AXA 58,600 928 1.1GDF Suez 49,351 661 0.8Schneider Electric 24,783 1,200 1.4Sodexo 10,623 641 0.7Unibail-Rodamco 11,702 1,702 2.0Vinci 24,013 946 1.1
Switzerland – 6.0% (5.5%)Novartis 27,663 1,327 1.5Roche (Genusscheine) 9,717 1,607 1.9Swiss Re 42,137 2,212 2.6
Germany – 4.5% (4.9%)BASF 17,434 1,128 1.3Daimler 25,340 1,267 1.5Deutsche Telekom 145,358 1,428 1.7
Australia – 4.3% (5.5%)Australia & New Zealand Bank Group 54,838 874 1.0Goodman Group Stapled Units 314,747 778 0.9Transurban Group 295,861 1,080 1.3Westfield Group Stapled Units 162,668 877 1.1
Sweden – 3.9% (2.7%)Electrolux ‘B’ 47,459 616 0.7Ericsson ‘B’ 176,305 1,323 1.6Swedbank ‘A’ 88,250 1,391 1.6
Netherlands – 2.9% (2.0%)Royal Dutch Shell ‘A’ 114,932 2,439 2.9
Hong Kong – 2.7% (2.6%)Hutchison Whampoa 164,000 1,236 1.4Wynn Macau 428,800 1,107 1.3
Italy – 2.3% (2.0%)ENI 145,784 2,000 2.3
Belgium – 2.0% (0.9%)RTL Group 12,988 964 1.1Solvay 9,285 788 0.9
Canada – 1.9% (0.0%)Bank of Montreal 42,161 1,585 1.9
Denmark – 1.5% (0.0%)TDC 219,915 1,245 1.5
Finland – 1.0% (0.0%)UPM-Kymmene 93,496 869 1.0
Norway – 0.8% (1.3%)Telenor 57,202 717 0.8
China – 0.7% (1.7%)China Shenhua Energy ‘H’ 390,500 611 0.7
Taiwan – 0.7% (1.0%)Siliconware Precision Industries 783,000 581 0.7
South Korea – 0.4% (0.0%)SK Telecom ADR 27,459 365 0.4
Portugal – 0.3% (0.0%)CTT-Correios 50,927 280 0.3
Forward currency contracts GBP Hedged share classes – 0.6% ((0.9)%)Australian DollarSell AUD3,939,376 buy £2,115,469 dated 18/02/14 33 –Canadian DollarSell CAD4,981,920 buy £2,784,676 dated 18/02/14 82 0.1 Danish KroneSell DKK4,687,211 buy £523,949 dated 18/02/14 7 –EuroBuy €490,888 sell £404,889 dated 18/02/14 (1) –Sell €10,319,336 buy £8,605,587 dated 18/02/14 109 0.1 Hong Kong DollarBuy HKD2,938,890 sell £228,392 dated 18/02/14 2 –Sell HKD12,027,906 buy £949,074 dated 18/02/14 8 –Japanese YenSell ¥1,014,633,424 buy £5,929,985 dated 18/02/14 (101) (0.1)Norwegian KroneSell NOK4,453,508 buy £443,157 dated 18/02/14 13 –Singapore DollarBuy SGD 939,865 sell £451,004 dated 18/02/14 (4) –Sell SGD 1,291,346 buy £620,963 dated 18/02/14 7 –Swedish KroneSell SEK12,354,741 buy £1,170,107 dated 18/02/14 24 –Swiss FrancBuy CHF522,817 sell £351,368 dated 18/02/14 1 –Sell CHF3,842,126 buy £2,594,019 dated 18/02/14 6 –US DollarsBuy $3,234,908 sell £1,951,598 dated 18/02/14 14 –Buy $1,218,154 sell £740,817 dated 18/02/14 (1) –Sell $73,345,612 buy £44,911,422 dated 18/02/14 345 0.5 Sell $2,868,118 buy £1,729,814 dated 18/02/14 (13) –
Portfolio statementAs at 31 January 2014
Market value Total netInvestment Holding £’000 assets %
Market value Total netInvestment Holding £’000 assets %
121
Continuation�
� Return to Index

Forward currency contracts fund level – (0.2)% ((0.7)%)Australian DollarBuy AUD433,976 sell £236,924 dated 18/02/14 (7) –Sell AUD2,942,715 buy £1,708,586 dated 18/02/14 153 0.2 Canadian DollarBuy CAD2,571,668 sell £1,529,371 dated 18/02/14 (134) (0.2)Danish KroneSell DKK4,713,111 buy £530,662 dated 18/02/14 11 –EuroBuy €3,667,327 sell £3,042,829 dated 18/02/14 (24) –Sell €10,649,379 buy £8,927,518 dated 18/02/14 160 0.2 Hong Kong DollarSell HKD5,835,492 buy £453,282 dated 18/02/14 (3) –Sell HKD16,491,648 buy £1,321,627 dated 18/02/14 31 –Japanese YenBuy ¥86,064,271 sell £505,939 dated 18/02/14 6 –Buy ¥152,744,000 sell £957,574 dated 18/02/14 (51) –Sell ¥53,312,903 buy £317,010 dated 18/02/14 – –Sell ¥143,558,423 buy £838,830 dated 18/02/14 (15) –Norwegian KroneSell NOK5,686,421 buy £570,000 dated 18/02/14 20 –Singapore DollarBuy SGD4,293,804 sell £2,047,922 dated 18/02/14 (7) –Sell SGD3,955,597 buy £1,955,075 dated 18/02/14 75 0.1 Swedish KroneSell SEK24,329,418 buy £2,280,535 dated 18/02/14 23 –Swiss FrancBuy CHF620,757 sell £421,096 dated 18/02/14 (3) –Sell CHF4,395,601 buy £2,996,009 dated 18/02/14 36 –US DollarsBuy $3,444,563 sell £2,075,368 dated 18/02/14 18 –Buy $839,420 sell HKD6,507,254 dated 18/02/14 1 –Buy $40,327,996 sell £24,991,437 dated 18/02/14 (487) (0.6)Sell $7,266,397 buy £4,463,099 dated 18/02/14 48 0.1 Sell $5,503,637 buy £3,334,443 dated 18/02/14 (10) –
Liquidity funds – 0.2% (2.7%)JPM Sterling Liquidity ‘X’ (Distribution)^$ 203,402 203 0.2
Investment assets (including investment liabilities) 84,122 98.5
Net other assets 1,309 1.5
Net assets 85,431 100.0
Unless otherwise stated the above securities are admitted to official stock exchange listings or trade on aregulated market.
The comparative percentage figures in brackets are at 31 January 2013.
The forward currency contracts are entered into at fund level, and additional forward currency contractsare entered into by the A-Class Accumulation GBP Hedged shares, A-Class Income GBP Hedged shares, C-Class Accumulation GBP Hedged shares and the C-Class Income GBP Hedged shares.
^ Deemed to be investment in related parties of the ACD$ Approved security as defined in the Collective Investment Schemes sourcebook
Counterparty exposure
Forwardcurrencycontracts Total
Counterparty £’000 £’000
ANZ (5) (5)Barclays (15) (15)BNP Paribas 4 4CitiBank (1) (1)Commonwealth Bank of Australia 0 0Credit Suisse 165 165Deutsche Bank (29) (29)Goldman Sachs 10 10HSBC 149 149Morgan Stanley (3) (3)RBC (617) (617)Societe Generale 170 170State Street 17 17UBS 531 531Westpac Banking Corp (3) (3)
At the balance sheet date, there was no collateral received by the fund from the above counterparties.
The counterparty exposure on forward currency contracts is reported at their mark to market values butfor futures contracts it is only the positive mark to market values that are reported.
Portfolio statement – continuedAs at 31 January 2014
Market value Total netInvestment Holding £’000 assets %
122
Continuation�
� Return to Index

£’000
Total of all purchases for the year (Note 10) 107,515
Major purchases Cost
JPM Sterling Liquidity ‘X’ (Distribution)^ 24,507Seven & I 2,705Sumitomo Mitsui Financial Group 2,328Applied Materials 1,977Cisco Systems 1,967Bank of Montreal 1,964McDonald’s 1,932Bristol-Myers Squibb 1,860Toyota Motor 1,777Novartis 1,701United Technologies 1,698GDF Suez 1,579TDC 1,556Australia & New Zealand Bank Group 1,496Paccar 1,432Fifth Third Bancorp 1,380Williams Companies 1,366British Sky Broadcasting Group 1,324Home Depot 1,311Deutsche Telekom 1,310
^ Deemed to be investment in related parties of the ACD
£’000
Total of all sales for the year (Note 10) 136,009
Major sales Proceeds
JPM Sterling Liquidity ‘X’ (Distribution)^ 27,153Time Warner 2,521Allianz 2,497EDF 2,444Pfizer 2,377Cisco Systems 2,360Singapore Telecommunications 2,332Emerson Electric 2,091Merck & Co 2,054Sanofi 2,051Nippon Telegraph & Telephone 1,992Canon 1,957HSBC 1,874Dow Chemical 1,873GlaxoSmithKline 1,788Centrica 1,738Philip Morris International 1,686Roche (Genusscheine) 1,680Nissan Motor 1,647AstraZeneca 1,638
Portfolio movements For the year ending 31 January 2014
123
Continuation�
� Return to Index

Statement of total returnFor the year ending 31 January
2014 2013£’000 £’000 £’000 £’000
Income
Net capital gains (Note 1) 9,171 12,150
Revenue (Note 2) 4,569 5,042
Expenses (Note 3) (1,614) (1,764)
Net revenue before taxation 2,955 3,278
Taxation (Note 4) (386) (474)
Net revenue after taxation 2,569 2,804
Total return before distributions 11,740 14,954
Finance costs: Distributions (Note 5) (4,006) (4,379)
Change in net assets attributable to shareholders from investment activities 7,734 10,575
Statement of change in net assets attributable to shareholdersFor the year ending 31 January
2014 2013£’000 £’000 £’000 £’000
Opening net assets attributable to shareholders 106,248 104,999
Amounts receivable on issue of shares 28,880 10,829
Amounts payable on cancellation of shares (60,037) (23,583)
(31,157) (12,754)
Change in net assets attributable to shareholders from investment activities (see above) 7,734 10,575
Retained distributions on accumulation shares 2,626 3,436
Stamp duty reserve tax (20) (8)
Closing net assets attributable to shareholders 85,431 106,248
Balance sheetAs at 31 January
2014 2013£’000 £’000 £’000 £’000
ASSETS
Investment assets 84,982 108,173
Debtors (Note 7) 646 929
Cash and bank balances (Note 8) 1,284 1,277
Total other assets 1,930 2,206
Total assets 86,912 110,379
LIABILITIES
Investment liabilities (860) (2,297)
Creditors (Note 9) (393) (1,666)
Distribution payable on income shares (228) (168)
Total other liabilities (621) (1,834)
Total liabilities (1,481) (4,131)
Net assets attributable to shareholders 85,431 106,248
The notes to these financial statements are shown on pages 125 to 127.
Financial statements
124
Continuation�
� Return to Index

1. Net capital gains2014 2013
£’000 £’000Currency gains 1,837 687Derivative contracts 15 (303)Forward currency contracts 2,615 187Non-derivative securities 4,704 11,579Net capital gains 9,171 12,150
2. Revenue2014 2013
£’000 £’000Franked income from UK equity investments 528 686Income from Liquidity funds 7 10Income from overseas equity investments 3,991 4,231Interest on bank and term deposits – 1Option income 7 105Stock dividends 36 –Stocklending income – 9Total revenue 4,569 5,042
3. Expenses2014 2013
£’000 £’000Payable to the ACD or associate of the ACD:ACD fee 1,437 1,573Fixed expenses 177 190Stocklending fees – 1Total expenses 1,614 1,764
4. Taxation2014 2013
£’000 £’000a) Analysis of charge in the yearOverseas tax suffered 386 474Current year tax charge (Note 4b) 386 474
b) Factors affecting the tax charge for the yearThe tax assessed for the year is lower than the standard rate of corporation tax inthe UK for an Open-Ended Investment Company (OEIC) (20%). The differences areexplained below.
Net revenue before taxation 2,955 3,278Corporation tax at 20% 591 656
Effects of:Dividends not subject to corporation tax (892) (958)Excess expenses for which no relief taken 301 304Overseas tax expensed – (2)Overseas tax suffered 386 474
(205) (182)Current year tax charge (Note 4a) 386 474
No deferred tax asset has been recognised in the financial statements. At the yearend date, the Fund had a potential unrecognised deferred tax asset of £1,217,904(31.01.13: £916,844) in relation to £6,089,522 (31.01.13: £4,584,218) of excessmanagement expenses which would only be utilised to reduce the tax charge if theFund had an excess of unfranked income over expenses in a future period. There isno excess of unfranked income expected in the future.
5. Finance costsDistributionsThe distributions take account of amounts receivable on the issue of shares andamounts payable on the cancellation of shares and comprise:
2014 2013£’000 £’000
First interim dividend distribution 1,545 1,302Second interim dividend distribution 1,016 1,409Third interim dividend distribution 552 856Final dividend distribution 568 769Add: Amounts payable on cancellation of shares 453 112Deduct: Amounts receivable on issue of shares (128) (69)Total finance costs 4,006 4,379
Details of the distribution per share are set out on pages 128 to 131.
6. Movement between net revenue after taxation and distributions2014 2013
£’000 £’000Net revenue after taxation 2,569 2,804Add: ACD fee (net of tax relief) paid from capital 1,437 1,566Add: Undistributed revenue brought forward 9 18Deduct: Undistributed revenue carried forward (9) (9)
4,006 4,379
7. Debtors2014 2013
£’000 £’000Accrued income 131 238Due from the ACD for shares created 165 263Overseas tax recoverable 155 130Sales awaiting settlement 195 298Total debtors 646 929
8. Cash and bank balances2014 2013
£’000 £’000Amounts held at futures clearing houses
and brokers – 158Cash and bank balances 1,284 1,119Total cash and bank balances 1,284 1,277
9. Creditors2014 2013
£’000 £’000Accrued expenses 120 147Due to the ACD for shares cancelled 273 196Purchases awaiting settlement – 1,323Total creditors 393 1,666
Notes to the financial statements for the year ending 31 January 2014
125
Continuation�
� Return to Index

10. Portfolio transaction costs2014 2013
£’000 £’000Analysis of total purchase costs
Purchases in year before transaction costs 107,397 75,998
Commissions 55 42Taxes 63 40Total purchase costs 118 82Gross purchases total 107,515 76,080
Analysis of total sale costs
Gross sales before transaction costs 136,099 84,072
Commissions (79) (47)Taxes (11) (3)Total sale costs (90) (50)Total sales net of transaction costs 136,009 84,022
11. Related party transactionsJPMorgan Funds Limited, as Authorised Corporate Director (“ACD”), is a relatedparty, and acts as principal in respect of all transactions of shares in the Company.The aggregate monies received through issue, and paid on cancellation, aredisclosed in the Statement of Change in Net Assets Attributable to Shareholders.
The balance due to the ACD and their associates at the year end date in respect ofrelated party transactions was £227,207 (31.01.13: £80,197). Details of relatedparty transactions are given under note 13 on page 413.
Investments considered to be related parties have been identified in the portfoliostatement on pages 121 to 122 and the revenue from these investments was £6,893(31.01.13: £9,970).
The gross stocklending income received was £nil (31.01.13: £9,486), with feesdeducted of £nil (31.01.13: £1,423).
The following parties held a material interest in the Fund at the year end date:– Hargreaves Lansdown Nominees Ltd Acc 21.64% (31.01.13: 15.93%)– Chase Nominees Ltd Acc 22107 19.18% (31.01.13: 51.46%)– Cofunds Nominees Ltd 11.48% (31.01.13: 5.86%)
12. Financial instrumentsCurrency exposuresA proportion of the net assets of the Fund are denominated in currencies otherthan sterling, with the effect that the Balance sheet and total return can beaffected by currency movements.
Net foreign currency assets/(liabilities)Forward Non-
exchange Monetary monetaryTotal contracts exposures exposures
Currency £’000 £’000 £’000 £’000
31.01.14US Dollar 7,182 (43,603) 19,370 31,415Euro 1,025 (8,091) (5,688) 14,804Japanese Yen 813 (6,031) 381 6,463Taiwan Dollar 591 – 10 581Swiss Franc 434 (2,236) (2,476) 5,146Australian Dollar 316 (2,083) (1,210) 3,609Canadian Dollar 293 (2,703) 1,411 1,585Danish Krone 207 (517) (520) 1,244Hong Kong Dollar 32 (711) (2,211) 2,954Singapore Dollar (6) (167) 161 –Swedish Krona (70) (1,146) (2,254) 3,330Norwegian Krone (238) (430) (525) 717
31.01.13US Dollar 3,085 (50,698) 20,755 33,028Taiwan Dollar 1,116 – 8 1,108Indonesian Rupiah 891 – – 891Japanese Yen 671 (4,462) (3,957) 9,090South African Rand 585 – 1 584Australian Dollar 388 (3,676) (1,760) 5,824Euro 383 (13,499) (5,908) 19,790Norwegian Krone 320 (439) (629) 1,388Hong Kong Dollar 292 (1,155) (3,101) 4,548Swedish Krona 263 (1,418) (1,235) 2,916Singapore Dollar 213 (804) (1,766) 2,783Canadian Dollar 95 (4,781) 4,876 –New Zealand Dollar (33) (248) (846) 1,061Swiss Franc (375) (4,261) (1,917) 5,803
The forward currency contracts are entered into at fund level and are disclosedwithin Monetary exposures, and additional forward currency contracts areentered into by the A-Class Accumulation GBP Hedged shares, A-Class Income GBPHedged shares, C-Class Accumulation GBP Hedged shares and the C-Class IncomeGBP Hedged shares.
Interest rate riskAt the year end date, 1.5% (31.01.13: 3.9%) of the Fund’s net assets by value wereinterest bearing, carrying a (fixed/floating) rate.
For consideration of other risks including liquidity, pricing and credit risk, pleaserefer to the notes to the aggregated financial statements, pages 413 to 414.
13. Share classesThe Fund currently has four share classes; Class A Shares, Class B Shares, Class CShares and Class X Shares. The Authorised Corporate Director’s (ACD) fee andfixed expenses charge are shown below.
ACD fee Fixed expensesClass A shares: 1.50% 0.18%Class B shares: 1.00% 0.18%Class C shares: 0.75% 0.18%Class X shares: 0.00% 0.06%
The X share class is designed to accommodate an alternative charging structurewhereby the annual fee normally charged to the Fund and then passed on in theshare price is instead administratively levied and collected by the ACD from theshareholder or through the relevant JPMorgan Chase & Co entity.
The net asset value of each share class, the net asset value per share and thenumber of shares in each class are shown on page 120. All classes have the samerights on winding up except the hedged share classes where any realised gains orlosses and any costs arising from closing out the foreign currency contracts, thatwere executed solely for the benefit of the hedged share class holders, wouldremain in the relevant hedged share class.
Notes to the financial statements – continued
126
Continuation�
� Return to Index

14. Derivatives The Fund enters into derivative transactions in the form of forward currencycontracts. The Fund may use derivatives for the purpose of efficient portfoliomanagement including hedging, where appropriate. The A-Class AccumulationGBP Hedged shares, A-Class Income GBP Hedged shares, C-Class AccumulationGBP Hedged shares and the C-Class Income GBP Hedged shares enter intoadditional forward currency contracts. The share classes may use derivatives forefficient portfolio management including hedging, where appropriate. Thepositive mark to market approach has been used to calculate the global exposure.
Further information on the derivative risks can be found in the notes to theaggregated financial statements on page 414.
15. Contingent liabilities and capital commitmentsAt the balance sheet date there were no contingent liabilities or capitalcommitments (2013: none).
Notes to the financial statements – continued
127
Continuation�
� Return to Index

Final distribution in pence per share
Group 1 – Shares purchased prior to 1 November 2013Group 2 – Shares purchased 1 November 2013 to 31 January 2014
DistributionGross Tax Net payable paid
revenue at 10% revenue Equalisation 30.04.14 30.04.13
A-Class Accumulation Shares
Group 1 0.455556 0.045556 0.410000 – 0.410000 0.400000
Group 2 0.205808 0.020581 0.185227 0.224773 0.410000 0.400000
A-Class Accumulation GBP Hedged Shares
Group 1 0.433333 0.043333 0.390000 – 0.390000 0.380000
Group 2 0.193978 0.019398 0.174580 0.215420 0.390000 0.380000
A-Class Income Shares
Group 1 0.433333 0.043333 0.390000 – 0.390000 0.390000
Group 2 0.175928 0.017593 0.158335 0.231665 0.390000 0.390000
A-Class Income GBP Hedged Shares
Group 1 0.344444 0.034444 0.310000 – 0.310000 0.310000
Group 2 0.159309 0.015931 0.143378 0.166622 0.310000 0.310000
B-Class Accumulation Shares
Group 1 0.466667 0.046667 0.420000 – 0.420000 0.410000
Group 2 0.466667 0.046667 0.420000 0.000000 0.420000 0.410000
B-Class Income Shares
Group 1 0.444444 0.044444 0.400000 – 0.400000 0.390000
Group 2 0.444444 0.044444 0.400000 0.000000 0.400000 0.390000
C-Class Accumulation Shares
Group 1 0.866667 0.086667 0.780000 – 0.780000 0.760000
Group 2 0.114176 0.011418 0.102758 0.677242 0.780000 0.760000
C-Class Accumulation GBP Hedged Shares
Group 1 0.900000 0.090000 0.810000 – 0.810000 0.740000
Group 2 0.244260 0.024426 0.219834 0.590166 0.810000 0.740000
C-Class Income Shares
Group 1 0.822222 0.082222 0.740000 – 0.740000 0.750000
Group 2 0.098679 0.009868 0.088811 0.651189 0.740000 0.750000
C-Class Income GBP Hedged Shares
Group 1 0.811111 0.081111 0.730000 – 0.730000 0.730000
Group 2 0.185699 0.018570 0.167129 0.562871 0.730000 0.730000
X-Class Accumulation Shares
Group 1 0.933333 0.093333 0.840000 – 0.840000 0.030000
Group 2 0.933333 0.093333 0.840000 0.000000 0.840000 0.030000
Distribution tables
128
Continuation�
� Return to Index
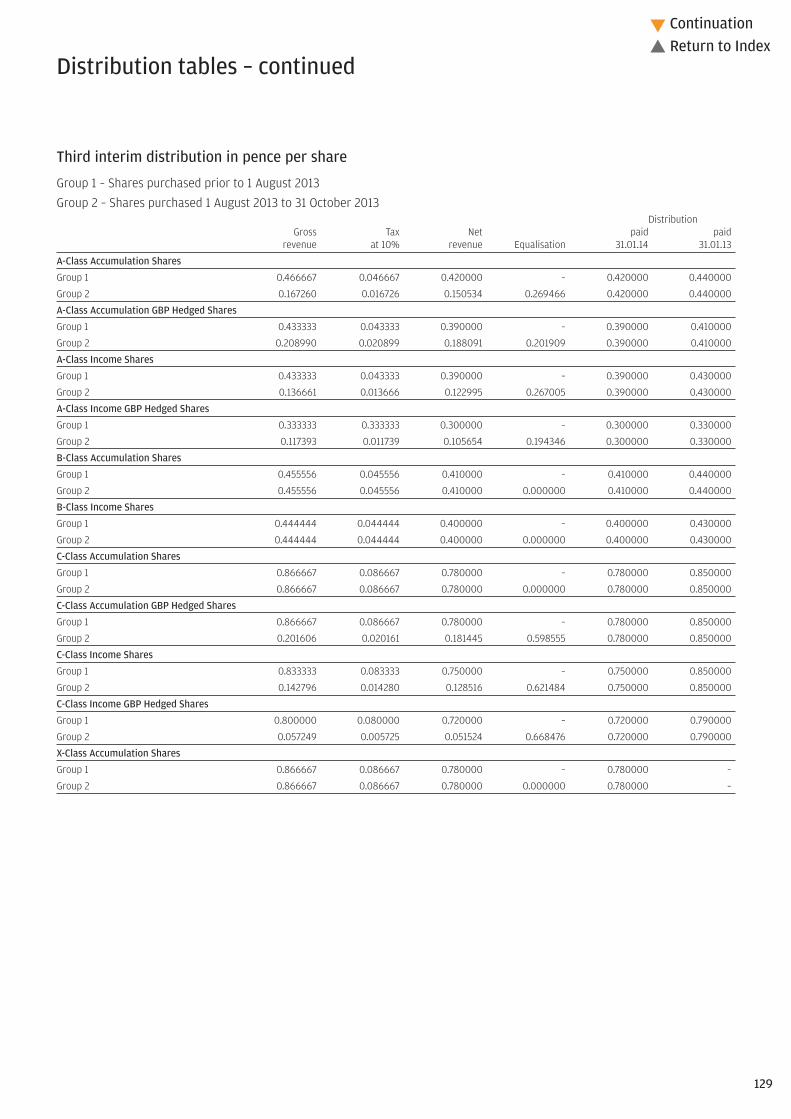
Third interim distribution in pence per share
Group 1 – Shares purchased prior to 1 August 2013Group 2 – Shares purchased 1 August 2013 to 31 October 2013
DistributionGross Tax Net paid paid
revenue at 10% revenue Equalisation 31.01.14 31.01.13
A-Class Accumulation Shares
Group 1 0.466667 0.046667 0.420000 – 0.420000 0.440000
Group 2 0.167260 0.016726 0.150534 0.269466 0.420000 0.440000
A-Class Accumulation GBP Hedged Shares
Group 1 0.433333 0.043333 0.390000 – 0.390000 0.410000
Group 2 0.208990 0.020899 0.188091 0.201909 0.390000 0.410000
A-Class Income Shares
Group 1 0.433333 0.043333 0.390000 – 0.390000 0.430000
Group 2 0.136661 0.013666 0.122995 0.267005 0.390000 0.430000
A-Class Income GBP Hedged Shares
Group 1 0.333333 0.333333 0.300000 – 0.300000 0.330000
Group 2 0.117393 0.011739 0.105654 0.194346 0.300000 0.330000
B-Class Accumulation Shares
Group 1 0.455556 0.045556 0.410000 – 0.410000 0.440000
Group 2 0.455556 0.045556 0.410000 0.000000 0.410000 0.440000
B-Class Income Shares
Group 1 0.444444 0.044444 0.400000 – 0.400000 0.430000
Group 2 0.444444 0.044444 0.400000 0.000000 0.400000 0.430000
C-Class Accumulation Shares
Group 1 0.866667 0.086667 0.780000 – 0.780000 0.850000
Group 2 0.866667 0.086667 0.780000 0.000000 0.780000 0.850000
C-Class Accumulation GBP Hedged Shares
Group 1 0.866667 0.086667 0.780000 – 0.780000 0.850000
Group 2 0.201606 0.020161 0.181445 0.598555 0.780000 0.850000
C-Class Income Shares
Group 1 0.833333 0.083333 0.750000 – 0.750000 0.850000
Group 2 0.142796 0.014280 0.128516 0.621484 0.750000 0.850000
C-Class Income GBP Hedged Shares
Group 1 0.800000 0.080000 0.720000 – 0.720000 0.790000
Group 2 0.057249 0.005725 0.051524 0.668476 0.720000 0.790000
X-Class Accumulation Shares
Group 1 0.866667 0.086667 0.780000 – 0.780000 –
Group 2 0.866667 0.086667 0.780000 0.000000 0.780000 –
Distribution tables – continued
129
Continuation�
� Return to Index
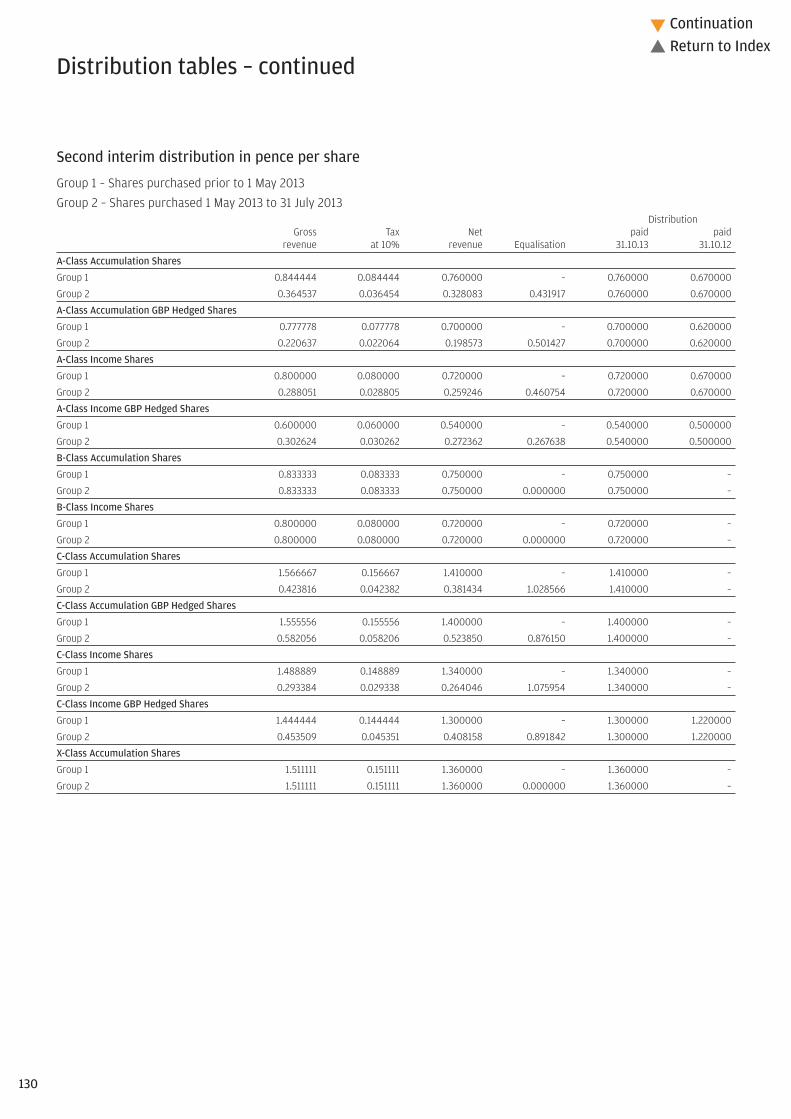
Second interim distribution in pence per share
Group 1 – Shares purchased prior to 1 May 2013Group 2 – Shares purchased 1 May 2013 to 31 July 2013
DistributionGross Tax Net paid paid
revenue at 10% revenue Equalisation 31.10.13 31.10.12
A-Class Accumulation Shares
Group 1 0.844444 0.084444 0.760000 – 0.760000 0.670000
Group 2 0.364537 0.036454 0.328083 0.431917 0.760000 0.670000
A-Class Accumulation GBP Hedged Shares
Group 1 0.777778 0.077778 0.700000 – 0.700000 0.620000
Group 2 0.220637 0.022064 0.198573 0.501427 0.700000 0.620000
A-Class Income Shares
Group 1 0.800000 0.080000 0.720000 – 0.720000 0.670000
Group 2 0.288051 0.028805 0.259246 0.460754 0.720000 0.670000
A-Class Income GBP Hedged Shares
Group 1 0.600000 0.060000 0.540000 – 0.540000 0.500000
Group 2 0.302624 0.030262 0.272362 0.267638 0.540000 0.500000
B-Class Accumulation Shares
Group 1 0.833333 0.083333 0.750000 – 0.750000 –
Group 2 0.833333 0.083333 0.750000 0.000000 0.750000 –
B-Class Income Shares
Group 1 0.800000 0.080000 0.720000 – 0.720000 –
Group 2 0.800000 0.080000 0.720000 0.000000 0.720000 –
C-Class Accumulation Shares
Group 1 1.566667 0.156667 1.410000 – 1.410000 –
Group 2 0.423816 0.042382 0.381434 1.028566 1.410000 –
C-Class Accumulation GBP Hedged Shares
Group 1 1.555556 0.155556 1.400000 – 1.400000 –
Group 2 0.582056 0.058206 0.523850 0.876150 1.400000 –
C-Class Income Shares
Group 1 1.488889 0.148889 1.340000 – 1.340000 –
Group 2 0.293384 0.029338 0.264046 1.075954 1.340000 –
C-Class Income GBP Hedged Shares
Group 1 1.444444 0.144444 1.300000 – 1.300000 1.220000
Group 2 0.453509 0.045351 0.408158 0.891842 1.300000 1.220000
X-Class Accumulation Shares
Group 1 1.511111 0.151111 1.360000 – 1.360000 –
Group 2 1.511111 0.151111 1.360000 0.000000 1.360000 –
Distribution tables – continued
130
Continuation�
� Return to Index

First interim distribution in pence per share
Group 1 – Shares purchased prior to 1 February 2013Group 2 – Shares purchased 1 February 2013 to 30 April 2013
DistributionGross Tax Net paid paid
revenue at 10% revenue Equalisation 31.07.13 31.07.12
A-Class Accumulation Shares
Group 1 0.877777 0.087777 0.790000 – 0.790000 0.620000
Group 2 0.438836 0.043883 0.394953 0.395047 0.790000 0.620000
A-Class Accumulation GBP Hedged Shares
Group 1 0.788888 0.078888 0.710000 – 0.710000 0.570000
Group 2 0.756633 0.075663 0.680970 0.029030 0.710000 0.570000
A-Class Income Shares
Group 1 0.844444 0.084444 0.760000 – 0.760000 0.610000
Group 2 0.390102 0.039010 0.351092 0.408908 0.760000 0.610000
A-Class Income GBP Hedged Shares
Group 1 0.622222 0.062222 0.560000 – 0.560000 0.470000
Group 2 0.428704 0.042870 0.385834 0.174166 0.560000 0.470000
B-Class Accumulation Shares
Group 1 0.877777 0.087777 0.790000 – 0.790000 –
Group 2 0.877777 0.087777 0.790000 0.000000 0.790000 –
B-Class Income Shares
Group 1 0.855555 0.085555 0.770000 – 0.770000 –
Group 2 0.855555 0.085555 0.770000 0.000000 0.770000 –
C-Class Accumulation Shares
Group 1 1.622222 0.162222 1.460000 – 1.460000 –
Group 2 0.469706 0.046970 0.422736 1.037264 1.460000 –
C-Class Accumulation GBP Hedged Shares
Group 1 1.611111 0.161111 1.450000 – 1.450000 –
Group 2 0.947623 0.094762 0.852861 0.597139 1.450000 –
C-Class Income Shares
Group 1 1.600000 0.160000 1.440000 – 1.440000 –
Group 2 1.600000 0.160000 1.440000 0.000000 1.440000 –
C-Class Income GBP Hedged Shares
Group 1 1.500000 0.150000 1.350000 – 1.350000 1.120000
Group 2 0.826520 0.082652 0.743868 0.606132 1.350000 1.120000
X-Class Accumulation Shares
Group 1 1.577777 0.157777 1.420000 – 1.420000 –
Group 2 1.577777 0.157777 1.420000 0.000000 1.420000 –
Equalisation applies only to shares purchased during the distribution period (group 2 shares). It is the average amount of revenue included in the purchase price of all group 2 shares and is refunded to holders of these
shares as a return of capital. Being capital it is not liable to income tax but must be deducted from the cost of shares for capital gains tax purposes.
Distribution tables – continued
131
� Return to Index

Investment objective and policyTo provide income with the prospect of capital growth from investmentanywhere in the world in non-Sterling denominated interest-bearing securitiesin any economic sector. The Fund is primarily hedged back into Sterling. TheFund may invest up to 100% in government and public securities (see section3.11(e) of the Prospectus).
This Bond Fund invests primarily in a broad range of Investment Gradegovernment securities (outside the UK). The Fund may also invest in otherinterest bearing securities including Below Investment Grade Bonds.
Risk profileThe value of your investment may fall as well as rise and you may get backless than you originally invested.
Bond funds may not behave like direct investments in the underlying Bondsthemselves. By investing in Bond funds, the certainty of receiving a regularfixed amount of income for a defined period of time with the prospect of afuture known return of capital is lost.
The value of Bonds and other Debt Securities may change significantlydepending on market, economic and interest rate conditions as well as thecreditworthiness of the issuer. Issuers of Bonds and other Debt Securitiesmay fail to meet payment obligations (default) or the credit rating of Bondsand other Debt Securities may be downgraded.
Bond funds will normally distribute a combination of Coupon and the expecteddiscount/premium on the securities. Therefore, a Fund’s distribution willcomprise income received and an element of projected capital gains orlosses. This could result in an element of capital gain being taxed as incomein the hands of an investor.
To the extent that any underlying assets of the Fund are denominated in acurrency other than Sterling and are not hedged back to Sterling, movementsin currency exchange rates can adversely affect the return of your investment.The currency hedging that may be used to minimise the effect of currencyfluctuations may not always be successful.
Please refer to Part 11 of the Prospectus for details of the general risk factorsaffecting this Fund in addition to the specific risk factors above.
Fund reviewFor investors, 2013 was largely a year of falling uncertainty and rising markets.The Federal Reserve’s decision to begin phasing out quantitative easingremoved some policy uncertainty in the US without imposing any significantheadwinds for the economy. A return to economic growth in developedmarkets and Abenomics in Japan appear to have reduced tail risks to theglobal economy. Financial markets have responded to these developmentsby bidding up the value of risk assets.
The Fund outperformed the benchmark on a gross of fees basis over theperiod. Given the more supportive risk backdrop, our allocation to investmentgrade corporate credit contributed positively, with our largest allocationbeing the financial institutions sector. We increased our overweight in highquality covered bonds, which contributed positively as swap spreadscompressed. Our overweight in supranational positions also contributedpositively. In cross markets, our long 10-year Belgium vs. Germany contributedpositively. Our long 10-year Italy vs. Germany and long 5-year Spain vs.Germany positions also contributed positively, as economic conditionsimproved in the periphery.
Fund outlookWe expect economies to continue to gradually recover, backed by strongerdata and central bank policy in developed markets remaining expansionary.However, our optimism is restrained by the potential for deflation in Europe,the failure of Abenomics to stimulate trade and widespread sub-trend growthin emerging markets. Government bond yields should continue to rise andinvestor appetite for spread product is likely to remain robust.
12 month performance as at 31 January 2014 2013 2012 2011 2010
JPM Global (ex-UK) BondA-Class Acc 1.4% 3.9% 5.8% 2.6% 2.9%
JPM Global (ex-UK) BondB-Class Acc 1.8% – – – –
JPM Global (ex-UK) BondC-Class Acc 1.6% – – – –
JPM Global (ex-UK) BondI-Class Acc 1.9% 4.3% 6.2% 3.0% 3.2%
Benchmark Index 2.3% 3.4% 7.1% 3.1% 3.4%
Fund statisticsRisk and Reward Profile 3*
Fund size £58.6m
Benchmark Index J.P. Morgan GBI Global ex UK hedged to GBP
Fund chargesA-Class Initial 3.00%, Annual 0.75%B-Class Initial Nil, Annual 0.50%C-Class Initial Nil, Annual 0.40%I-Class Initial Nil, Anual 0.45%
JPM Global (ex-UK) Bond Fund
You should remember that past performance is not a guide to the future. The price of investments and the income from them may fall as well as rise andinvestors may not get back the full amount invested.
* For specific risks, including the risk and reward profile, please refer to the Key Investor information Document (KIID) available on the following websitehttp://am.jpmorgan.co.uk/investor/prices-and-factsheets/?list=all&tab=PricesAll performance returns are calculated using the quoted price of the accumulation shares. Performance returns are in Sterling.Source: J.P. Morgan.132
Continuation�
� Return to Index

Top ten holdings (excluding Liquidity funds) %Qatar 4% 2015 5.3Italy 0% Sept 2014 4.2Spain 0% Sept 2014 4.2Japan 2.5% 2035 3.0Japan 1.9% 2023 2.6Japan 1.9% 2025 2.4Spain 0% Jun 2014 2.1European Investment Bank 1.125% 2017 2.1Germany 1% 2018 2.0Japan 2% 2030 1.9
Sector breakdown %Government stock 67.4Corporate debt 26.9Supra-National Bank 4.3Liquidity funds 1.2Forward currency contracts 0.3Futures 0.0Net other liabilities (0.1)
Highest/lowest share price and distribution recordHighest Lowest Distribution
Calendar year share price share price per shareA-Class Accumulation Shares2009 206.0p 194.8p 4.04p2010 217.4p 203.6p 2.82p2011 221.3p 208.5p 2.54p2012 233.0p 219.5p 2.63p2013 238.2p 227.7p 2.43p2014A 234.2p 231.2p 1.22pA-Class Income Shares2009 173.4p 164.4p 3.44p2010 179.5p 170.5p 2.41p2011 180.7p 171.4p 2.09p2012 188.0p 179.2p 2.14p2013 191.2p 181.8p 1.96p2014A 187.0p 184.6p 0.97pB-Class Accumulation SharesB
2012 233.0p 230.2p –2013 238.4p 228.3p 2.83p2014A 235.3p 232.2p 1.70pC-Class Accumulation SharesC
2012 101.3p 99.85p –2013 103.7p 99.14p 1.34p2014A 102.1p 100.8p 0.68pC-Class Gross Accumulation SharesC
2012 101.3p 99.85p –2013 103.9p 99.59p 1.71p2014A 103.0p 101.6p 0.98pC-Class Gross Income SharesC
2012 101.3p 99.87p –2013 103.1p 97.98p 1.70p2014A 101.2p 99.81p 0.96pC-Class Income SharesC
2012 101.3p 99.85p –2013 103.0p 97.89p 1.36p2014A 100.8p 99.50p 0.68pI-Class Accumulation Shares2009 128.5p 121.4p 2.89p2010 136.1p 127.1p 2.29p2011 139.1p 130.7p 2.10p2012 147.1p 138.1p 2.19p2013 150.7p 144.2p 2.07p2014A 148.6p 146.6p 1.08pI-Class Gross Accumulation Shares2009 106.0p 99.93p 3.05p2010 112.7p 104.9p 2.36p2011 115.6p 108.3p 2.17p2012 122.8p 114.9p 2.28p2013 125.9p 120.6p 2.13p2014A 124.4p 122.7p 1.06p
133
Continuation�
� Return to Index

Highest/lowest share price and distribution record(continued)
Highest Lowest DistributionCalendar year share price share price per shareI-Class Income Shares2009 107.5p 101.9p 2.45p2010 111.2p 105.7p 1.89p2011 111.9p 106.1p 1.73p2012 116.5p 111.1p 1.76p2013 118.5p 112.6p 1.64p2014A 116.1p 114.5p 0.84p
A To 31 January 2014.B B-Class Accumulation Shares were launched on 29 October 2012.C C-Class Accumulation Shares, C-Class Gross Accumulation Shares, C-Class Gross Income Shares and
C-Class Income Shares were launched on 1 October 2012.
Portfolio turnover rate31.01.13 247.8%31.01.14 143.6%
The portfolio turnover rate (PTR) reflects the total of security purchases and sales (excluding Liquidityfunds), less the total of share issues and cancellations, expressed as a percentage of the average daily netasset values over the period.
Portfolio transaction costsBroker Transaction
Commissions Taxes Total31.01.13 0.00% 0.00% 0.00%31.01.14 0.00% 0.00% 0.00%
The percentage figures disclosed above reflect the average broker commissions and transaction taxessuffered during the last 3 years divided by the average assets under management over the same period.
Stamp duty reserve tax31.01.13 0.00%31.01.14 0.00%
The percentage figures disclosed above reflect the total stamp duty reserve tax suffered during the yeardivided by the average assets under management over the same period.
Net asset values and Ongoing chargesNet assetvalue per Net asset
share class Number value per OngoingDate £’000 of shares share chargesA-Class Accumulation Shares31.01.12 26,754 12,047,696 222.1p 0.93%31.01.13 38,906 16,863,515 230.7p 0.93%31.01.14 36,889 15,761,314 234.1p 0.93%A-Class Income Shares31.01.12 2,447 1,358,319 180.1p 0.93%31.01.13 2,435 1,315,171 185.2p 0.93%31.01.14 1,839 989,255 185.9p 0.93%B-Class Accumulation Shares31.01.13 3 1,500 230.8p 0.68%31.01.14 9 3,869 235.1p 0.68%C-Class Accumulation Shares31.01.13 1 1,000 100.3p 0.58%31.01.14 312 306,019 102.0p 0.58%C-Class Gross Accumulation Shares31.01.13 1 1,000 100.5p 0.58%31.01.14 1 1,000 102.9p 0.58%C-Class Gross Income Shares31.01.13 1 1,000 99.67p 0.58%31.01.14 1 1,000 100.1p 0.58%C-Class Income Shares31.01.13 1 1,000 99.67p 0.58%31.01.14 1,048 1,047,475 100.1p 0.58%I-Class Accumulation Shares31.01.12 94 67,193 139.8p 0.45%31.01.13 93 63,841 145.8p 0.45%31.01.14 49 33,060 148.5p 0.45%I-Class Gross Accumulation Shares31.01.12 23,685 20,367,485 116.3p 0.45%31.01.13 25,431 20,894,761 121.7p 0.45%31.01.14 18,431 14,828,414 124.3p 0.45%I-Class Income Shares31.01.12 63 57,000 111.5p 0.45%31.01.13 84 73,398 114.7p 0.45%31.01.14 26 22,146 115.2p 0.45%
The net asset value and the net asset value per income share are shown ex-dividend.
Following the adoption of the requirements of UCITS IV in June 2012, Ongoing charges has replaced theTotal Expense Ratio (“TER”). The Ongoing charges takes into account the ACD fee, the fixed expenses andany expenses paid to an affiliate in respect of stocklending activities, expressed as a percentage of theaverage daily net asset values over the period. The main difference between the two calculations is theinclusion of custodian handling charges and stocklending fees in the Ongoing charges figure. The comparativefigures have not been restated, and the historic TER is disclosed.
134
Continuation�
� Return to Index

Government stock – 67.4% (66.7%)Australia – 0.5%Australia 6% 2017 $85,000 49 0.1Australia 5.75% 2022 $310,000 187 0.3Australia 4.75% 2027 $80,000 44 0.1Belgium – 1.8%Belgium 3% 2019 €755,000 681 1.2Belgium 2.6% 2024 €90,000 76 0.1Belgium 5.5% 2028 €235,000 256 0.4Belgium 4.25% 2041 €82,000 81 0.1Canada – 1.3%Canada 1.5% 2017 CAD430,000 236 0.4Canada 3.5% 2020 CAD420,000 250 0.4Canada 2.75% 2022 CAD228,000 129 0.2Canada 5.75% 2033 CAD242,000 188 0.3Canada 3.5% 2045 CAD40,000 24 –Denmark – 1.2%Denmark 4% 2017 DKK5,800,000 727 1.2Finland – 1.1%Finland 3.5% 2021 €470,000 443 0.8Finland 2.625% 2042 €220,000 182 0.3France – 7.3%France 2.5% 2016 €1,250,000 1,086 1.9France 1% 2018 €1,030,000 857 1.5France 3.25% 2021 €1,039,166 955 1.6France 2.25% 2022 €440,000 373 0.6France 4.25% 2023 €90,000 88 0.2France 5.75% 2032 €380,000 443 0.8France 3.25% 2045 €350,000 291 0.5France 4% 2055 €120,000 116 0.2Germany – 3.5%Germany 1% 2018 €1,370,000 1,151 2.0Germany 4.75% 2028 €190,000 207 0.4Germany 4.75% 2034 €321,000 364 0.6Germany 4.75% 2040 €210,000 249 0.4Germany 2.5% 2044 €95,000 79 0.1Italy – 12.9%Italy 0% Aug 2014 €1,000,000 821 1.4Italy 0% Sept 2014 €3,000,000 2,460 4.2Italy 2.75% 2015 €340,000 289 0.5Italy 3.5% 2017 €1,040,000 902 1.5Italy 3.5% 2018 €530,000 459 0.8Italy 4.75% 2021 €874,000 793 1.4Italy 5.5% 2022 €440,000 415 0.7Italy 4.5% 2023 €340,000 299 0.5Italy 5% 2025 €379,000 343 0.6Italy 4.75% 2028 €280,000 245 0.4Italy 4% 2037 €355,000 278 0.5Italy 5% 2040 €175,000 154 0.3Italy 4.75% 2044 €100,000 84 0.1Japan – 12.1%Japan 1.1% 2021 ¥51,500,000 321 0.5Japan 1.9% 2023 ¥229,500,000 1,529 2.6Japan 1.9% 2025 ¥213,200,000 1,430 2.4Japan 2% 2030 ¥166,100,000 1,109 1.9Japan 2.5% 2035 ¥247,750,000 1,735 3.0Japan 2% 2042 ¥18,000,000 116 0.2Japan 2.4% 2048 ¥97,550,000 688 1.2Japan 2.2% 2051 ¥30,050,000 203 0.3Mexico – 1.6%Mexico 5.625% 2017 $910,000 615 1.0Mexico 2.75% 2023 €420,000 332 0.6Netherlands – 0.7%Netherlands 4.5% 2017 €250,000 234 0.4Netherlands 4% 2018 €207,000 195 0.3Qatar – 5.5%Qatar 4% 2015 $4,920,000 3,085 5.3Qatar 3.125% 2017 $200,000 127 0.2Russia – 0.8%Russia 7.5% 2030 $650,650 456 0.8South Korea – 0.9%Korea 5.75% 2014 $850,000 522 0.9
Spain – 10.8%Spain 0% Jun 2014 €1,500,000 1,232 2.1Spain 0% Sept 2014 €3,000,000 2,460 4.2Spain 3.3% 2014 €110,000 92 0.2Spain 4.25% 2016 €550,000 487 0.8Spain 4.1% 2018 €555,000 495 0.8Spain 5.85% 2022 €490,000 474 0.8Spain 5.4% 2023 €132,000 124 0.2Spain 3.8% 2024 €875,000 723 1.2Spain 4.65% 2025 €85,000 75 0.1Spain 5.15% 2044 €247,000 219 0.4Sweden – 0.6%Sweden 4.25% 2019 SEK3,130,000 329 0.6United States of America – 4.8%US Treasury 0.625% 2016 $550,000 335 0.6US Treasury 1.25% 2019 $1,050,000 629 1.1US Treasury 2.5% 2023 $160,000 96 0.2US Treasury 5.375% 2031 $536,000 414 0.7US Treasury 4.5% 2039 $780,000 551 0.9US Treasury 3.125% 2041 $90,000 50 0.1US Treasury 2.75% Aug 2042 $700,000 358 0.6US Treasury 2.75% Nov 2042 $640,000 326 0.6
Corporate debt – 26.9% (22.3%)Australia – 4.3%Australia & New Zealand Bank Group 1%
2015 $850,000 520 0.9Australia & New Zealand Bank Group 1.5%
2018 €414,000 346 0.6Australia & New Zealand Bank Group 1.125%
2020 €440,000 354 0.6Commonwealth Bank of Australia 2.625%
2017 €950,000 828 1.4Westpac Banking 1.25% 2017 $800,000 480 0.8Canada – 1.9%Canadian Imperial Bank of Commerce 1.25%
2018 €206,000 172 0.3Royal Bank of Canada 1.2% 2017 $920,000 555 0.9Xstrata Finance Canada 5.25% 2017 €430,000 395 0.7Finland – 0.7%Nordea Bank 2.375% 2017 €500,000 435 0.7France – 3.2%Autoroutes Paris 5% 2017 €300,000 274 0.5BNP Paribas 3.375% 2017 €500,000 445 0.8Casino Guichard-Perrachon 5.5% 2015 €300,000 258 0.4Compagnie De Financement Foncier 4.5%
2018 €545,000 514 0.9Societe Generale 3.75% EMTN 2017 €400,000 356 0.6Netherlands – 3.0%BMW Finance 3.25% 2019 €390,000 350 0.6ING Bank 3.375% 2018 €430,000 388 0.7Rabobank 4.2% 2014 $470,000 289 0.5Rabobank 3.375% Jan 2017 $330,000 214 0.4Rabobank 3.375% Apr 2017 €500,000 441 0.8New Zealand – 1.4%ASB Finance 1.5% 2018 €1,000,000 832 1.4Norway – 2.7%DNB 1% 2018 €1,035,000 858 1.5DNB 1.125% 2018 €166,000 137 0.2SpareBank 1 Boligkreditt 1.75% 2019 $980,000 576 1.0South Korea – 0.7%Korea Development Bank 3.25% 2016 $200,000 127 0.2Korea Development Bank 3.5% 2017 $460,000 294 0.5Sweden – 0.6%Nordea Bank 4.625% 2022 €400,000 355 0.6United Kingdom – 5.0%Abbey National Treasury Services 3.625% 2018 €810,000 734 1.3Barclays Bank 3.625% 2016 €610,000 537 0.9BAT International Finance 5.375% 2017 €500,000 471 0.8Heathrow Funding 4.6% FRN ‘A’ 2016 €350,000 295 0.5Lloyds Banking Group 4.625% 2017 €290,000 264 0.5Royal Bank of Scotland 4.875% 2015 €350,000 305 0.5Royal Bank of Scotland 4% 2016 €330,000 292 0.5
Portfolio statementAs at 31 January 2014
Market value Total netInvestment Holding £’000 assets %
Market value Total netInvestment Holding £’000 assets %
135
Continuation�
� Return to Index

United States of America – 3.4%Bank of America 4.625% 2017 €350,000 320 0.5Citigroup 7.375% 2019 €220,000 234 0.4General Electric Capital 1.25% 2016 $540,000 328 0.6Goldman Sachs Group 2.625% 2020 €220,000 184 0.3Morgan Stanley 2.25% 2018 €330,000 279 0.5Novartis Capital 2.4% 2022 $250,000 142 0.2Procter & Gamble 2% 2022 $323,000 265 0.5Wells Fargo 2.625% 2022 $289,000 243 0.4
Supra-National Bank – 4.3% (8.2%)European Investment Bank 1.125% 2017 $2,000,000 1,213 2.1European Financial Stability Facility 1.25% 2019 €1,000,000 830 1.4
European Financial Stability Facility 1.625% 2020 €610,000 506 0.8
Forward currency contracts – 0.3% (3.3%)Australian DollarSell AUD 467,504 buy £248,136 dated 05/03/14 5 –Sell AUD 467,504 buy £251,983 dated 05/02/14 1 –Canadian DollarSell CAD 1,452,528 buy £826,989 dated 05/02/14 39 –Sell CAD 1,452,528 buy £789,587 dated 05/03/14 2 –Danish KroneSell DKK 6,346,803 buy £709,054 dated 05/02/14 9 –Sell DKK 6,346,803 buy £700,025 dated 05/03/14 – –EuroBuy €1,902,448 sell £1,578,313 dated 05/03/14 (12) –Buy €3,173,416 sell £2,639,061 dated 05/02/14 (27) –Sell €41,443,321 buy £34,533,859 dated 05/02/14 418 0.7Sell €2,433,621 buy £2,005,488 dated 05/03/14 2 –Sell €4,240,686 buy £3,488,600 dated 05/02/14 (2) –Sell €42,510,591 buy £34,975,802 dated 05/03/14 (25) –Japanese YenBuy ¥7,364,383 sell £42,479 dated 05/02/14 1 –Sell ¥1,212,898,118 buy £7,203,126 dated 05/03/14 (8) –Sell ¥1,204,698,780 buy £6,952,683 dated 05/02/14 (209) (0.4)Swedish KroneSell SEK 3,102,330 buy £292,839 dated 05/02/14 5 –Sell SEK 3,102,330 buy £288,415 dated 05/03/14 1 –US DollarBuy $1,236,902 sell £747,436 dated 05/03/14 4 –Buy $194,690 sell £117,958 dated 05/02/14 – –Sell $21,512,802 buy £13,026,870 dated 05/02/14 (43) –Sell $327,611 buy £199,286 dated 05/02/14 – –Sell $135,336 buy £82,001 dated 05/03/14 – –Sell $21,645,723 buy £13,162,935 dated 05/03/14 9 –
Futures – 0.00% (0.00%)10 Year Mini JGB Futures Mar 2014 22 –Australia 10 Year Bond Futures Mar 2014 3 –Australia 3 Year Bond Futures Mar 2014 1 –Euro-BOBL Futures Mar 2014 (84) (0.1)Euro-BTP Futures Mar 2014 3 –Euro Bund Index Futures Mar 2014 – –Euro Schatz Futures Mar 2014 (9) –US 2 Year Treasury Note Futures Mar 2014 – –US 5 Year Treasury Note Futures Mar 2014 – –US 10 Year Treasury Note Futures Mar 2014 32 –US Ultra Bond Futures Mar 2014 54 0.1
Liquidity funds – 1.2% (4.2%)JPM Sterling Liquidity ‘X’ (Distribution)^$ 700,765 701 1.2
Investment assets (including investment liabilities) 58,648 100.1
Net other liabilities (43) (0.1)
Net assets 58,605 100.0
Unless otherwise stated the above securities are admitted to official stock exchange listings or trade on aregulated market.
The comparative percentage figures in brackets are at 31 January 2013.
^ Deemed to be investment in related parties of the ACD$ Approved security as defined in the Collective Investment Schemes sourcebook
AAA 17,728AA+ 4,723AA 4,624AA- 2,485A+ 8,286A 1,568A- 1,071BBB+ 4,412BBB 8,405BBB- 4,453
Total bonds 57,755
Forward currency contracts 170Futures 22Liquidity funds 701
Investment assets (including investment liabilities) 58,648
Counterparty exposure
Forwardcurrency Futurescontracts contracts Total
Counterparty £’000 £’000
Barclays 39 – 39BNP Paribas (64) – (64)Commonwealth Bank of Australia 3 – 3Credit Suisse 12 – 12Deutsche Bank (18) – (18)HSBC (2) – (2)JP Morgan – 115 115RBS (12) – (12)Societe Generale 1 – 1State Street (1) – (1)Westpac Banking Corp 213 – 213
At the balance sheet date, there was no collateral received by the fund from the above counterparties.
The counterparty exposure on forward currency contracts is reported at their mark to market values butfor futures contracts it is only the positive mark to market values that are reported.
Portfolio statement – continuedAs at 31 January 2014
Market value Portfolio credit ratings £’000
Market value Total netInvestment Holding £’000 assets %
136
Continuation�
� Return to Index

£’000
Total of all purchases for the year 65,081
Major purchases Cost
JPM Sterling Liquidity ‘X’ (Distribution)^ 12,702Spain 4.1% 2018 3,008US Treasury 1.125% 2020 2,529Italy 0% Sept 2014 2,447Spain 0% Sept 2014 2,446Belgium 2.25% 2023 2,249Germany 0.25% 2018 1,339Spain 4.5% 2018 1,335Japan 0.2% 2017 1,332France 1% 2018 1,320US Treasury 1.25% 2020 1,315Italy 3.5% 2018 1,266Spain 0% Jun 2014 1,233Germany 1% 2018 1,149Europe Financial Stability Facility 0.875% 2018 1,061Italy 3.5% 2017 903Japan 1.9% 2023 876ASB Finance 1.5% 2018 846European Financial Stability Facility 1.25% 2019 828Italy 0% Aug 2014 821
^ Deemed to be investment in related parties of the ACD
£’000
Total of all sales for the year 71,254
Major sales Proceeds
JPM Sterling Liquidity ‘X’ (Distribution)^ 14,801Spain 4.1% 2018 3,008US Treasury 1.125% 2020 2,408US Treasury 2% 2022 2,252Spain 4.5% 2018 2,238Belgium 2.25% 2023 2,175Mexico 8% 2013 1,718Japan 1.1% 2020 1,708European Investment Bank 3.125% 2015 1,421Germany 0.25% 2018 1,363US Treasury 1.25% 2020 1,311Japan 0.2% 2017 1,276Italy 3.5% 2018 1,214New Zealand 4.5% 2016 1,186Spain 3.3% 2014 1,075Europe Financial Stability Facility 0.875% 2018 1,051France 3.5% 2020 979Germany 4.75% 2028 963Italy 4.75% 2021 906US Treasury 3.125% 2041 845
Portfolio movements For the year ending 31 January 2014
137
Continuation�
� Return to Index

Statement of total returnFor the year ending 31 January
2014 2013£’000 £’000 £’000 £’000
Income
Net capital gains (Note 1) 138 1,550
Revenue (Note 2) 1,349 1,439
Expenses (Note 3) (471) (460)
Net revenue before taxation 878 979
Taxation (Note 4) (1) –
Net revenue after taxation 877 979
Total return before distributions 1,015 2,529
Finance costs: Distributions (Note 5) (878) (978)
Change in net assets attributable to shareholders from investment activities 137 1,551
Statement of change in net assets attributable to shareholdersFor the year ending 31 January
2014 2013£’000 £’000 £’000 £’000
Opening net assets attributable to shareholders 66,956 53,043
Amounts receivable on issue of shares 6,527 22,554
Amounts payable on cancellation of shares (15,741) (11,105)
(9,214) 11,449
Change in net assets attributable to shareholders from investment activities (see above) 137 1,551
Retained distributions on accumulation shares 725 912
Unclaimed distributions 1 1
Closing net assets attributable to shareholders 58,605 66,956
Balance sheetAs at 31 January
2014 2013£’000 £’000 £’000 £’000
ASSETS
Investment assets 59,067 68,298
Debtors (Note 7) 536 899
Cash and bank balances (Note 8) 652 1,028
Total other assets 1,188 1,927
Total assets 60,255 70,225
LIABILITIES
Investment liabilities (419) (2,605)
Creditors (Note 9) (1,214) (650)
Distribution payable on income shares (17) (14)
Total other liabilities (1,231) (664)
Total liabilities (1,650) (3,269)
Net assets attributable to shareholders 58,605 66,956
The notes to these financial statements are shown on pages 139 to 141.
Financial statements
138
Continuation�
� Return to Index

1. Net capital gains2014 2013
£’000 £’000Currency gains 136 653Derivative contracts (248) (57)Forward currency contracts 3,143 495Non-derivative securities (2,893) 459Net capital gains 138 1,550
2. Revenue2014 2013
£’000 £’000Income from Liquidity funds 3 8Interest on bank and term deposits 1 2Interest on fixed-interest securities 1,345 1,429Total revenue 1,349 1,439
3. Expenses2014 2013
£’000 £’000Payable to the ACD or associate of the ACD:ACD fee 397 395Fixed expenses 74 65Total expenses 471 460
4. Taxation2014 2013
£’000 £’000a) Analysis of charge in the yearOverseas tax suffered 1 –Current year tax charge (Note 4b) 1 –
b) Factors affecting the tax charge for the yearThe tax assessed for the year is lower than the standard rate of corporation tax inthe UK for an Open-Ended Investment Company (OEIC) (20%). The differences areexplained below.
Net revenue before taxation 878 979Corporation tax at 20% 176 196
Effects of:Interest distributions deductible for tax purposes (176) (196)Overseas tax suffered 1 –
(175) (196)Current year tax charge (Note 4a) 1 –
No deferred tax asset has been recognised in the financial statements. At the yearend date, the Fund had a potential unrecognised deferred tax asset of £2,040(31.01.13: £1,626) in relation to £10,199 (31.01.13: £8,131) of excess interestdistributions which would only be utilised to reduce the tax charge if the Fund hadan excess of unfranked income over expenses in a future period. There is noexcess of unfranked income expected in the future.
5. Finance costsDistributionsThe distributions take account of amounts receivable on the issue of shares andamounts payable on the cancellation of shares and comprise:
2014 2013£’000 £’000
Interim interest distribution 441 469Final interest distribution 421 567Add: Amounts payable on cancellation of shares 36 28Deduct: Amounts receivable on issue of shares (20) (86)Total finance costs 878 978
Details of the distribution per share are set out on pages 142 to 143.
6. Movement between net revenue after taxation and distributions2014 2013
£’000 £’000Net revenue after taxation 877 979Add: Undistributed revenue brought forward 3 2Deduct: Undistributed revenue carried forward (2) (3)
878 978
7. Debtors2014 2013
£’000 £’000Accrued income 508 670Due from the ACD for shares created 26 –Overseas tax recoverable 2 1Sales awaiting settlement – 228Total debtors 536 899
8. Cash and bank balances2014 2013
£’000 £’000Amounts held at futures clearing houses
and brokers 268 223Cash and bank balances 384 805Total cash and bank balances 652 1,028
9. Creditors2014 2013
£’000 £’000Accrued expenses 38 43Due to the ACD for shares cancelled 96 6Income tax payable 46 51Purchases awaiting settlement 1,034 550Total creditors 1,214 650
10. Portfolio transaction costsNo portfolio transactions costs were incurred during the current or prior year.
Notes to the financial statements for the year ending 31 January 2014
139
Continuation�
� Return to Index

11. Related party transactionsJPMorgan Funds Limited, as Authorised Corporate Director (“ACD”), is a relatedparty, and acts as principal in respect of all transactions of shares in the Company.The aggregate monies received through issue, and paid on cancellation, aredisclosed in the Statement of Change in Net Assets Attributable to Shareholders.
The balance due to the ACD and their associates at the year end date in respect ofrelated party transactions was £107,824 (31.01.13: £48,943). Details of relatedparty transactions are given under note 13 on page 413.
Investments considered to be related parties have been identified in the portfoliostatement on pages 135 to 136 and the revenue from these investments was£3,140 (31.01.13: £7,858).
The gross stocklending income received was £nil (31.01.13: £13), with feesdeducted of £nil (31.01.13: £2).
The following parties held a material interest in the Fund at the year end date:– Chase Nominees Ltd Acc 22107 52.82% (31.01.13: 47.73%)– JPMorgan Life Ltd 31.45% (31.01.13: 0.00%)
12. Financial instrumentsCurrency exposuresA substantial proportion of the net assets of the Fund are denominated incurrencies other than sterling, with the effect that the Balance sheet and totalreturn can be significantly affected by currency movements.
Net foreign currency assets/(liabilities)Monetary Non-monetary
Total exposures exposuresCurrency £’000 £’000 £’000
31.01.14Euro 35,923 (144) 36,067US Dollar 12,499 110 12,389Japanese Yen 7,027 (126) 7,153Canadian Dollar 870 44 826Danish Krone 742 15 727Swedish Krona 345 16 329Australian Dollar 303 18 285New Zealand Dollar 2 2 –Singapore Dollar 1 1 –
31.01.13Euro 30,002 (1,491) 31,493US Dollar 17,251 (286) 17,537Japanese Yen 10,039 199 9,840New Zealand Dollar 1,650 (29) 1,679Mexican Peso 1,386 13 1,373Canadian Dollar 960 (10) 970Danish Krone 736 (35) 771Brazilian Real 544 24 520Swedish Krona 357 (3) 360Korean Won 337 – 337Australian Dollar 319 17 302Singapore Dollar 1 1 –
Interest rate riskThe tables below detail the interest rate profile of the Fund’s assets and liabilitiesas at the year end.
Financialassets
Floating Fixed notrate rate carrying
Total financial financial anyassets assets assets interest
Currency £’000 £’000 £’000 £’000
31.01.14Euro 36,957 163 36,158 636US Dollar 12,499 66 12,303 130Swiss Franc 7,027 52 7,132 (157)UK Sterling 1,090 1,064 – 26Canadian Dollar 870 (2) 826 46Danish Krone 742 – 727 15Swedish Krona 345 (1) 329 17Australian Dollar 303 10 280 13New Zealand Dollar 2 – – 2Singapore Dollar 1 1 – –
31.01.13Euro 30,553 98 31,489 (1,034)US Dollar 17,251 145 17,574 (468)Japanese Yen 10,039 47 9,839 153UK Sterling 3,487 3,487 – –New Zealand Dollar 1,650 3 1,679 (32)Mexican Peso 1,386 – 1,373 13Canadian Dollar 960 – 970 (10)Danish Krone 736 – 771 (35)Brazilian Real 544 24 520 –Swedish Krona 357 – 360 (3)Korean Won 337 – 337 –Australian Dollar 319 23 306 (10)Singapore Dollar 1 1 – –
The floating rate financial assets comprise investments in variable interest ratepaying corporate debt and bank balances that bear interest at rates based onLIBOR or its overseas equivalent.
Floating Financialrate liabilities
Total financial not carryingliabilities liabilities any interest
Currency £’000 £’000 £’000
31.01.14Euro 1,034 – 1,034UK Sterling 197 – 197
31.01.13Euro 551 – 551UK Sterling 113 – 113
Notes to the financial statements – continued
140
Continuation�
� Return to Index

Fixed rate financial assetsWeighted
averageWeighted period for
average which rate is Currency interest rate fixed (years)
31.01.14Australian Dollar 3.7% 8.3Canadian Dollar 2.0% 9.4Euro 1.5% 5.9Swedish Krona 1.5% 5.1US Dollar 1.4% 5.9Japanese Yen 1.1% 17.3UK Sterling 0.5% 0.0Danish Krone 0.3% 3.8
31.01.13Brazilian Real 9.2% 7.9Mexican Peso 7.8% 0.9Australian Dollar 3.3% 8.4Korean Won 2.6% 1.6Euro 2.1% 7.2New Zealand Dollar 2.1% 5.3Canadian Dollar 2.0% 11.2US Dollar 1.7% 8.4Swedish Krona 1.6% 6.1Japanese Yen 1.1% 14.6Danish Krone 0.7% 4.8
For consideration of other risks including liquidity, pricing and credit risk, pleaserefer to the notes to the aggregated financial statements, pages 413 to 414.
13. Share classesThe Fund currently has four share classes; Class A Shares, Class B Shares, Class CShares and Class I Shares. The Authorised Corporate Director’s (ACD) fee and fixedexpenses charge are shown below.
ACD fee Fixed expensesClass A shares: 0.75% 0.18% Class B shares: 0.50% 0.18%Class C shares: 0.40% 0.18%Class I shares: 0.45% 0.00%
The net asset value of each share class, the net asset value per share and thenumber of shares in each class are shown on page 134. All classes have the samerights on winding up.
14. Derivatives The F und enters into derivative transactions in the form of forward currencycontracts, futures, options and credit default swaps for the purpose of efficientportfolio management. The positive mark to market approach has been used tocalculate the global exposure.
Further information on the derivative risks can be found in the notes to theaggregated financial statements on page 414.
15. Contingent liabilities and capital commitmentsAt the balance sheet date there were no contingent liabilities or capitalcommitments (2013: none).
Notes to the financial statements – continued
141
Continuation�
� Return to Index

Final interest distribution in pence per share
Group 1 – Shares purchased prior to 1 August 2013Group 2 – Shares purchased 1 August 2013 to 31 January 2014
DistributionGross Tax Net payable paid
revenue at 20% revenue Equalisation 30.04.14 30.04.13
A-Class Accumulation Shares
Group 1 1.525000 0.305000 1.220000 – 1.220000 1.240000
Group 2 0.682246 0.136449 0.545797 0.674203 1.220000 1.240000
A-Class Income Shares
Group 1 1.212500 0.242500 0.970000 – 0.970000 1.000000
Group 2 0.652836 0.130567 0.522269 0.447731 0.970000 1.000000
B-Class Accumulation Shares
Group 1 2.125000 0.425000 1.700000 – 1.700000 1.350000
Group 2 2.125000 0.425000 1.700000 0.000000 1.700000 1.350000
C-Class Accumulation Shares
Group 1 0.850000 0.170000 0.680000 – 0.680000 0.680000
Group 2 0.364923 0.072985 0.291938 0.388062 0.680000 0.680000
C-Class Gross Accumulation Shares
Group 1 0.980000 0.000000 0.980000 – 0.980000 0.820000
Group 2 0.980000 0.000000 0.980000 0.000000 0.980000 0.820000
C-Class Gross Income Shares
Group 1 0.960000 0.000000 0.960000 – 0.960000 0.820000
Group 2 0.960000 0.000000 0.960000 0.000000 0.960000 0.820000
C-Class Income Shares
Group 1 0.850000 0.170000 0.680000 – 0.680000 0.680000
Group 2 0.280991 0.056198 0.224793 0.455207 0.680000 0.680000
I-Class Accumulation Shares
Group 1 1.350000 0.270000 1.080000 – 1.080000 1.060000
Group 2 1.350000 0.270000 1.080000 0.000000 1.080000 1.060000
I-Class Gross Accumulation Shares
Group 1 1.060000 0.000000 1.060000 – 1.060000 1.100000
Group 2 0.076424 0.000000 0.076424 0.983576 1.060000 1.100000
I-Class Income Shares
Group 1 1.050000 0.210000 0.840000 – 0.840000 0.840000
Group 2 0.744481 0.148896 0.595585 0.244415 0.840000 0.840000
Distribution tables
142
Continuation�
� Return to Index

Interim interest distribution in pence per share
Group 1 – Shares purchased prior to 1 February 2013Group 2 – Shares purchased 1 February 2013 to 31 July 2013
DistributionGross Tax Net paid paid
revenue at 20% revenue Equalisation 31.10.13 31.10.12
A-Class Accumulation Shares
Group 1 1.487500 0.297500 1.190000 – 1.190000 1.210000
Group 2 0.853916 0.170783 0.683133 0.506867 1.190000 1.210000
A-Class Income Shares
Group 1 1.200000 0.240000 0.960000 – 0.960000 0.970000
Group 2 0.630136 0.126027 0.504109 0.455891 0.960000 0.970000
B-Class Accumulation Shares
Group 1 1.850000 0.370000 1.480000 – 1.480000 –
Group 2 1.850000 0.370000 1.480000 0.000000 1.480000 –
C-Class Accumulation Shares
Group 1 0.825000 0.165000 0.660000 – 0.660000 –
Group 2 0.566336 0.113267 0.453069 0.206931 0.660000 –
C-Class Gross Accumulation Shares
Group 1 0.890000 0.000000 0.890000 – 0.890000 –
Group 2 0.890000 0.000000 0.890000 0.000000 0.890000 –
C-Class Gross Income Shares
Group 1 0.880000 0.000000 0.880000 – 0.880000 –
Group 2 0.880000 0.000000 0.880000 0.000000 0.880000 –
C-Class Income Shares
Group 1 0.850000 0.170000 0.680000 – 0.680000 –
Group 2 0.379844 0.075969 0.303875 0.376125 0.680000 –
I-Class Accumulation Shares
Group 1 1.262500 0.252500 1.010000 – 1.010000 1.030000
Group 2 1.262500 0.252500 1.010000 0.000000 1.010000 1.030000
I-Class Gross Accumulation Shares
Group 1 1.030000 0.000000 1.030000 – 1.030000 1.070000
Group 2 0.235858 0.000000 0.235858 0.794142 1.030000 1.070000
I-Class Income Shares
Group 1 1.000000 0.200000 0.800000 – 0.800000 0.820000
Group 2 1.000000 0.200000 0.800000 0.000000 0.800000 0.820000
Equalisation applies only to shares purchased during the distribution period (group 2 shares). It is the average amount of revenue included in the purchase price of all group 2 shares and is refunded to holders of these
shares as a return of capital. Being capital it is not liable to income tax but must be deducted from the cost of shares for capital gains tax purposes.
Distribution tables – continued
143
� Return to Index

Investment objective and policyTo provide capital growth over the long term by investing throughout theworld primarily in financial services sectors.
The Fund will primarily invest in shares of financial services sector companiesglobally and will have exposure to Emerging Markets. Smaller companyinvestments may be held on an ancillary basis.
Other instruments as permitted in the stated investment and borrowingpowers of the Company including, but not limited to, fixed interest securities,cash and cash equivalents may be held on an ancillary basis, as appropriate.
Risk profileThe value of your investment may fall as well as rise and you may get backless than you originally invested.
The value of Equity and Equity-Linked Securities may fluctuate in responseto the performance of individual companies and general market conditions.
Emerging Markets may be subject to increased political, regulatory andeconomic instability, less developed custody and settlement practices,poor transparency and greater financial risks. Emerging Market currenciesmay be subject to volatile price movements. Emerging Market securities mayalso be subject to higher volatility and be more difficult to sell than non-Emerging Market securities.
The Fund will be concentrated in financial services companies and may beconcentrated in one or more countries. As a result, the Fund may be morevolatile than more broadly diversified funds.
This Fund is aggressively managed, which may result in higher volatility ofthe Fund’s performance and bigger differences between the performanceof the Fund and its Benchmark.
Movements in currency exchange rates can adversely affect the return ofyour investment.
Please refer to Part 11 of the Prospectus for details of the general risk factorsaffecting this Fund in addition to the specific risk factors above.
Fund reviewGlobal equities rose in the 12 months to the end of January 2014 on the backof a pickup in global economic growth.
Over the 12-month period the Fund underperformed its benchmark. Stock-picking was strong across a number of sectors, in particular life and healthinsurance and capital markets. By region, stock picking in North Americaadded significant alpha, while our exposure to emerging markets detractedfrom performance. Holding cash in a strongly rising market detracted fromour relative returns. The financials sector has come a long way since thecrisis, as macro risks have been neutralised by central banks and investorrisk aversion to the sector has moderated. We are now in a period ofaccelerating growth across developed markets, stable inflation and robustcorporate earnings. All these factors are beneficial for financial stocks.
Fund outlookGrowth in the developed world is gathering momentum, and for the firstsustained period of time since the 2008-9 financial crisis, a significant majorityof countries are benefiting from expansion in manufacturing activity.
12 month performance as at 31 January 2014 2013 2012 2011 2010
JPM Global Financials A-Class Acc 5.4% 24.3% -16.4% 11.3% 42.6%
JPM Global Financials B-Class Acc 5.9% – – – –
JPM Global Financials C-Class Acc 6.1% – – – –
Benchmark Index 10.7% 25.9% -13.6% 14.2% 36.9%
Fund statisticsRisk and Reward Profile 6*
Fund size £115.7m
Benchmark Index MSCI World Financials Index (Net)
Fund chargesA-Class Initial 3.00%, Annual 1.50%B-Class Initial Nil, Annual 1.00%C-Class Initial Nil, Annual 0.75%
Top ten holdings (excluding Liquidity funds) %Wells Fargo 5.4HSBC 5.2Bank of America 4.8Citigroup 4.6AXA 2.4ACE 2.3Allianz 2.3Metlife 2.1Morgan Stanley 2.0UBS 1.9
JPM Global Financials Fund
You should remember that past performance is not a guide to the future. The price of investments and the income from them may fall as well as rise andinvestors may not get back the full amount invested.
* For specific risks, including the risk and reward profile, please refer to the Key Investor information Document (KIID) available on the following websitehttp://am.jpmorgan.co.uk/investor/prices-and-factsheets/?list=all&tab=PricesAll equity indices stated as ‘Net’ are calculated net of tax as per the standard published approach by the index vendor unless stated otherwise.All performance returns are calculated using the quoted price of the accumulation shares. Performance returns are in Sterling.Source: J.P. Morgan.Benchmark Source: MSCI. Neither MSCI nor any other party involved in or related to compiling, computing or creating the MSCI data makes any express of implied warranties or representations with respect to such data (or theresults to be obtained by the use thereof), and all such parties hereby expressly disclaim all warranties of originality, accuracy, completeness, merchantability or fitness for a particular purpose with respect to any of such data.Without limiting any of the foregoing, in no event shall MSCI, any of its affiliates or any third party involved in or related to compiling computing or creating the data have any liability for any direct, indirect, special, punitive,consequential or any other damages (including lost profits) even if notified of the possibility of such damages. No further distribution or dissemination of the MSCI data is permitted without MSCI’s express written consent.144
Continuation�
� Return to Index

Geographical breakdown %United States of America 36.5United Kingdom 14.5China 6.2Canada 6.1Australia 4.7Switzerland 4.5India 4.2Germany 3.9France 3.9Hong Kong 3.7Japan 2.9Italy 2.3Liquidity funds 1.6Sweden 1.1Spain 1.0South Korea 1.0Indonesia 0.9Russia 0.6South Africa 0.6Austria 0.4Forward currency contracts (0.2)Net other liabilities (0.4)
Highest/lowest share price and distribution recordDistribution
Highest Lowest per shareCalendar year share price share price (net)A-Class Accumulation Shares2009 610.9p 276.2p 17.59p2010 626.5p 510.7p 4.99p2011 611.0p 395.3p 3.87p2012 558.6p 442.7p 5.25p2013 682.4p 563.2p 4.83p2014A 683.9p 641.5p 5.18pA-Class Income Shares2009 36.59p 16.54p 1.11p2010 37.16p 30.29p 0.30p2011 35.99p 23.29p 0.23p2012 32.57p 25.81p 0.31p2013 39.47p 32.83p 0.28p2014A 39.56p 37.11p 0.30pB-Class Accumulation SharesB
2012 559.1p 515.0p –2013 685.8p 563.7p 5.60p2014A 688.0p 645.5p 8.37pB-Class Income SharesC
2013 39.44p 37.82p –2014A 39.58p 37.13p 0.33pC-Class Accumulation SharesD
2012 112.1p 97.22p –2013 137.8p 113.0p 1.37p2014A 138.3p 129.8p 2.00pC-Class Income SharesD
2012 112.1p 97.22p –2013 136.2p 113.0p 1.38p2014A 136.7p 128.2p 1.96p
A To 31 January 2014.B B-Class Accumulation Shares were launched on 29 October 2012.C B-Class Income Shares were launched on 5 November 2013.D C-Class Accumulation Shares and C-Class Income Shares were launched on 20 August 2012.
Portfolio turnover rate31.01.13 61.4%31.01.14 77.5%
The portfolio turnover rate (PTR) reflects the total of security purchases and sales (excluding Liquidityfunds), less the total of share issues and cancellations, expressed as a percentage of the average daily netasset values over the period.
Portfolio transaction costsBroker Transaction
Commissions Taxes Total31.01.13 0.11% 0.05% 0.16%31.01.14 0.06% 0.03% 0.09%
The percentage figures disclosed above reflect the average broker commissions and transaction taxessuffered during the last 3 years divided by the average assets under management over the same period.
Stamp duty reserve tax31.01.13 0.00%31.01.14 0.00%
The percentage figures disclosed above reflect the total stamp duty reserve tax suffered during the yeardivided by the average assets under management over the same period.
Net asset values and Ongoing chargesNet assetvalue per Net asset
share class Number value per OngoingDate £’000 of shares share chargesA-Class Accumulation Shares31.01.12 100,024 20,430,665 489.6p 1.68%31.01.13 115,475 18,974,508 608.6p 1.68%31.01.14 109,529 17,069,688 641.7p 1.68%A-Class Income Shares31.01.12 1,941 6,800,801 28.54p 1.68%31.01.13 2,374 6,745,282 35.20p 1.68%31.01.14 2,342 6,361,248 36.81p 1.68%B-Class Accumulation Shares31.01.13 29 4,706 609.4p 1.18%31.01.14 206 31,887 645.6p 1.18%B-Class Income Shares31.01.14 3 7,000 36.8p 1.18%C-Class Accumulation Shares31.01.13 25 19,913 122.2p 0.93%31.01.14 2,747 2,116,948 129.8p 0.93%C-Class Income Shares31.01.13 5 4,369 120.8p 0.93%31.01.14 869 688,339 126.3p 0.93%
The net asset value and the net asset value per income share are shown ex-dividend.
Following the adoption of the requirements of UCITS IV in June 2012, Ongoing charges has replaced the TotalExpense Ratio (“TER”). The Ongoing charges takes into account the ACD fee, the fixed expenses and any expensespaid to an affiliate in respect of stocklending activities, expressed as a percentage of the average daily net assetvalues over the period. The main difference between the two calculations is the inclusion of custodian handlingcharges and stocklending fees in the Ongoing charges figure. The comparative figures have not been restated,and the historic TER is disclosed.
145
Continuation�
� Return to Index

United States of America – 36.5% (35.9%)ACE 46,755 2,702 2.3AFLAC 26,918 1,033 0.9American Express 39,015 2,054 1.8Ameriprise Financial 18,900 1,222 1.0Bank of America 540,121 5,556 4.8Capital One Financial 48,126 2,075 1.8Citigroup 180,884 5,307 4.6Everest Re Group 11,195 1,007 0.9Hartford Financial Services Group 100,382 2,058 1.8Intercontinental Exchange Group 6,185 786 0.7Invesco 69,535 1,415 1.2Metlife 81,385 2,461 2.1Morgan Stanley 129,505 2,359 2.0PNC Financial Services Group 43,706 2,167 1.9State Street 53,250 2,207 1.9US Bancorp Delaware 65,873 1,605 1.4Wells Fargo 222,255 6,217 5.4
United Kingdom – 14.5% (11.7%)Aviva 406,528 1,796 1.6Barclays 794,665 2,128 1.8British Land 125,776 824 0.7Direct Line Insurance Group 361,946 952 0.8HSBC 966,787 5,985 5.2Just Retirement Group 475,708 1,158 1.0Partnership Assurance Group 195,128 631 0.6Prudential 184,171 2,245 1.9Standard Chartered 88,193 1,093 0.9
China – 6.2% (7.6%)China Construction Bank ‘H’ 4,616,770 1,944 1.7China Merchants Bank ‘H’ 2,055,614 2,204 1.9China Overseas Land & Investments 706,000 1,155 1.0Industrial & Commercial Bank of China ‘H’ 3,018,000 1,136 1.0Ping An Insurance ‘H’ 142,000 698 0.6
Canada – 6.1% (6.3%)Bank of Nova Scotia 49,106 1,645 1.4Canadian Imperial Bank of Commerce 33,197 1,563 1.4Royal Bank of Canada 46,626 1,761 1.5Toronto-Dominion Bank 39,332 2,074 1.8
Australia – 4.7% (5.1%)Australia & New Zealand Bank Group 136,703 2,179 1.9Commonwealth Bank of Australia 28,936 1,136 1.0National Australia Bank 65,300 1,149 1.0Westpac Banking 59,667 974 0.8
Switzerland – 4.5% (3.8%)Credit Suisse Group 73,689 1,350 1.2UBS 187,963 2,245 1.9Zurich Insurance Group 9,052 1,585 1.4
India – 4.2% (2.8%)Axis Bank 90,278 983 0.8Housing Development Finance 160,303 1,252 1.1Yes Bank 490,825 1,465 1.3ICICI Bank 115,648 1,109 1.0
Germany – 3.9% (2.7%)Allianz 26,541 2,673 2.3Deutsche Bank 63,038 1,838 1.6
France – 3.9% (5.2%)AXA 175,835 2,784 2.4BNP Paribas 36,136 1,684 1.5
Hong Kong – 3.7% (3.6%)Agile Property 1,706,000 950 0.8Aia Group 203,000 569 0.5Cheung Kong 69,000 621 0.5Hang Lung Properties 440,000 740 0.7Henderson Land Development 189,200 618 0.5Sun Hung Kai Properties 109,000 807 0.7
Japan – 2.9% (2.2%)Mitsubishi UFJ Financial Group 476,600 1,765 1.5Sumitomo Mitsui Financial Group 54,500 1,562 1.4
Italy – 2.3% (0.4%)Assicurazioni Generali 77,501 1,016 0.9UniCredit 363,395 1,630 1.4
Sweden – 1.1% (1.5%)Nordea Bank 157,410 1,269 1.1
Spain – 1.0% (1.2%)Banco Santander 232,371 1,205 1.0Banco Santander (Rfd) 5,403 28 –
South Korea – 1.0% (0.9%)Samsung Fire & Marine 8,449 1,171 1.0
Indonesia – 0.9% (1.1%)Bank Rakyat Indonesia 2,631,500 1,090 0.9
Russia – 0.6% (0.8%)Sberbank ADR 112,857 739 0.6
South Africa – 0.6% (1.1%)African Bank Investments 1,140,207 646 0.6
Austria – 0.4% (0.0%)Raiffeisen Bank (Placing) 15,747 368 0.3Raiffeisen Bank (Placing subject to clawback) 4,251 100 0.1
Forward currency contracts – (0.2)% ((0.4)%)Australian DollarBuy AUD 7,554,436 sell £4,162,066 dated 13/03/14 (174) (0.2)Sell AUD 1,275,302 buy £700,193 dated 13/03/14 27 –Canadian DollarBuy CAD 2,930,170 sell £1,676,350 dated 13/03/14 (87) (0.1)Danish KroneBuy DKK 4,043,430 sell £453,758 dated 13/03/14 (7) –EuroBuy €4,349,935 sell £3,620,572 dated 13/03/14 (39) –Sell €448,790 buy £369,192 dated 13/03/14 0 –Hong Kong DollarBuy HKD17,570,491 sell £1,380,343 dated 13/03/14 (5) –Sell HKD123,872,582 buy £9,770,513 dated 13/03/14 75 0.1Japanese YenBuy ¥122,373,900 sell £703,880 dated 13/03/14 24 –Buy ¥1,160,458,923 sell £6,954,624 dated 13/03/14 (55) –Sell ¥120,991,067 buy £711,063 dated 13/03/14 (8) –Norwegian KroneBuy NOK 3,062,969 sell £302,574 dated 13/03/14 (7) –Singapore DollarBuy SGD 3,622,107 sell £1,767,804 dated 13/03/14 (46) –Swedish KroneBuy SEK 10,799,152 sell £1,011,534 dated 13/03/14 (10) –Swiss FrancBuy CHF 1,840,637 sell £1,230,093 dated 13/03/14 10 –Sell CHF 3,172,111 buy £2,167,705 dated 13/03/14 30 –US DollarBuy $4,246,678 sell £2,591,848 dated 13/03/14 (11) –Sell $3,502,291 buy £2,142,386 dated 13/03/14 14 –Sell $2,955,479 buy £1,792,421 dated 13/03/14 (4) –
Liquidity funds – 1.6% (4.8%)JPM Sterling Liquidity ‘X’ (Distribution)^$ 1,873,075 1,873 1.6
Investment assets (including investment liabilities) 116,123 100.4
Net other liabilities (427) (0.4)
Net assets 115,696 100.0
Unless otherwise stated the above securities are admitted to official stock exchange listings or trade on aregulated market.
The comparative percentage figures in brackets are at 31 January 2013.
^ Deemed to be investment in related parties of the ACD$ Approved security as defined in the Collective Investment Schemes sourcebook
Portfolio statementAs at 31 January 2014
Market value Total netInvestment Holding £’000 assets %
Market value Total netInvestment Holding £’000 assets %
146
Continuation�
� Return to Index

147
Continuation�
� Return to Index
Counterparty exposure
Forwardcurrencycontracts Total
Counterparty £’000 £’000
Barclays (1) (1)CitiBank (2) (2)Commonwealth Bank of Australia (1) (1)Credit Suisse (37) (37)Deutsche Bank (17) (17)Morgan Stanley (97) (97)Societe Generale 6 6State Street 23 23UBS (184) (184)Westpac Banking Corp 37 37
At the balance sheet date, there was no collateral received by the fund from the above counterparties.
The counterparty exposure on forward currency contracts is reported at their mark to market values butfor futures contracts it is only the positive mark to market values that are reported.
Portfolio statement – continuedAs at 31 January 2014

£’000
Total of all purchases for the year (Note 10) 52,421
Major purchases Cost
JPM Sterling Liquidity ‘X’ (Distribution)^ 16,912HSBC 2,453Aviva 1,913Deutsche Bank 1,908Zurich Financial Services 1,601Yes Bank 1,582Unicredit 1,439UBS 1,401Assicurazioni Generali 1,251Danske Bank 1,226Nordea Bank 1,185ICICI Bank 1,090Just Retirement Group 1,076China Merchants Bank ‘H’ 889China Overseas Land & Investments 860Partnership Assurance Group 769Banca Generali 738Swiss Re 722ING Groep 642Cheung Kong 639
^ Deemed to be investment in related parties of the ACD
£’000
Total of all sales for the year (Note 10) 63,066
Major sales Proceeds
JPM Sterling Liquidity ‘X’ (Distribution)^ 20,650Prudential Financial 4,058Societe Generale 3,113ING Groep 2,059Nordea Bank 2,031Swiss Re 1,670Zurich Financial Services 1,596Royal Bank of Scotland Group 1,555Ameriprise Financial 1,502Danske Bank 1,330China Minsheng Banking ‘H’ 1,272Banca Generali 1,230Metlife 1,210CME Group ‘A’ 1,058Delta Lloyd 1,036Cielo 989Axis Capital 937Deutsche Boerse 919Wells Fargo 883AXA 873
Portfolio movements For the year ending 31 January 2014
148
Continuation�
� Return to Index

Statement of total returnFor the year ending 31 January
2014 2013£’000 £’000 £’000 £’000
Income
Net capital gains (Note 1) 5,521 22,181
Revenue (Note 2) 3,257 2,921
Expenses (Note 3) (2,033) (1,708)
Net revenue before taxation 1,224 1,213
Taxation (Note 4) (224) (241)
Net revenue after taxation 1,000 972
Total return before distributions 6,521 23,153
Finance costs: Distributions (Note 5) (1,008) (973)
Change in net assets attributable to shareholders from investment activities 5,513 22,180
Statement of change in net assets attributable to shareholdersFor the year ending 31 January
2014 2013£’000 £’000 £’000 £’000
Opening net assets attributable to shareholders 117,908 101,965
Amounts receivable on issue of shares 8,270 11,669
Amounts payable on cancellation of shares (16,920) (18,820)
(8,650) (7,151)
Change in net assets attributable to shareholders from investment activities (see above) 5,513 22,180
Retained distributions on accumulation shares 929 917
Stamp duty reserve tax (4) (3)
Closing net assets attributable to shareholders 115,696 117,908
Balance sheetAs at 31 January
2014 2013£’000 £’000 £’000 £’000
ASSETS
Investment assets 116,576 119,802
Debtors (Note 7) 198 1,348
Cash and bank balances (Note 8) 238 257
Total other assets 436 1,605
Total assets 117,012 121,407
LIABILITIES
Investment liabilities (453) (961)
Creditors (Note 9) (830) (2,519)
Distribution payable on income shares (33) (19)
Total other liabilities (863) (2,538)
Total liabilities (1,316) (3,499)
Net assets attributable to shareholders 115,696 117,908
The notes to these financial statements are shown on pages 150 to 151.
Financial statements
149
Continuation�
� Return to Index
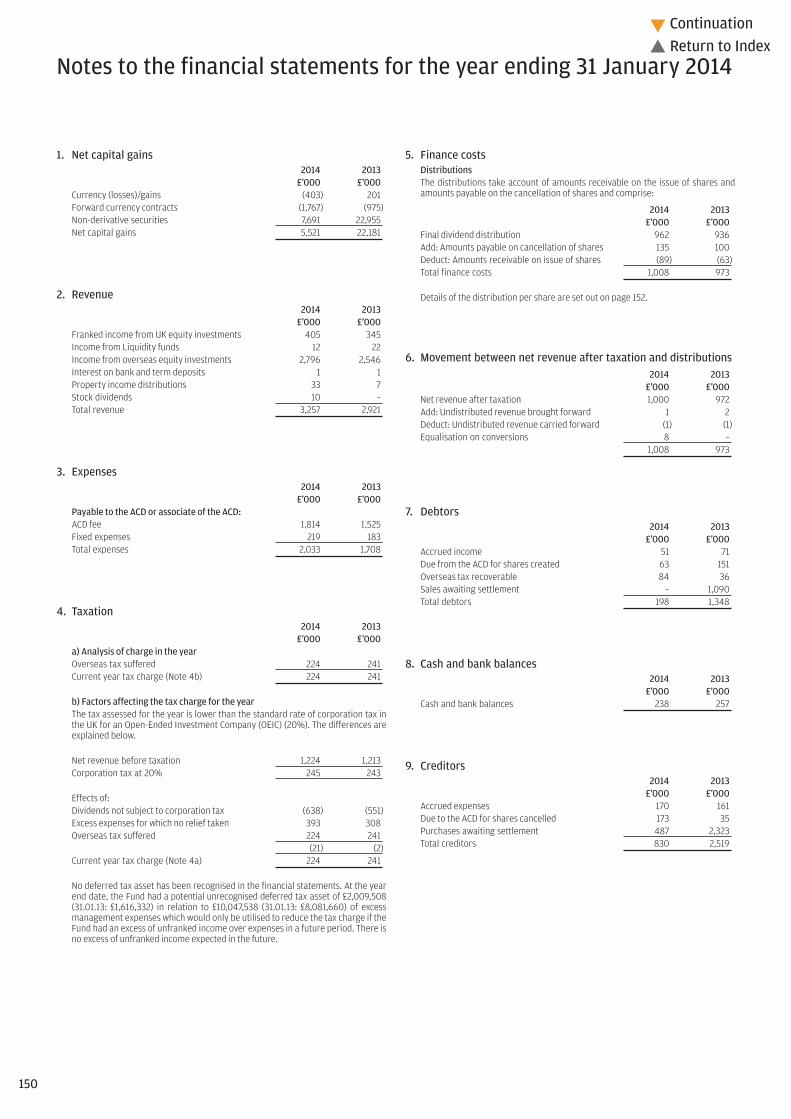
1. Net capital gains2014 2013
£’000 £’000Currency (losses)/gains (403) 201Forward currency contracts (1,767) (975)Non-derivative securities 7,691 22,955Net capital gains 5,521 22,181
2. Revenue2014 2013
£’000 £’000Franked income from UK equity investments 405 345Income from Liquidity funds 12 22Income from overseas equity investments 2,796 2,546Interest on bank and term deposits 1 1Property income distributions 33 7Stock dividends 10 –Total revenue 3,257 2,921
3. Expenses2014 2013
£’000 £’000Payable to the ACD or associate of the ACD:ACD fee 1,814 1,525Fixed expenses 219 183Total expenses 2,033 1,708
4. Taxation2014 2013
£’000 £’000a) Analysis of charge in the yearOverseas tax suffered 224 241Current year tax charge (Note 4b) 224 241
b) Factors affecting the tax charge for the yearThe tax assessed for the year is lower than the standard rate of corporation tax inthe UK for an Open-Ended Investment Company (OEIC) (20%). The differences areexplained below.
Net revenue before taxation 1,224 1,213Corporation tax at 20% 245 243
Effects of:Dividends not subject to corporation tax (638) (551)Excess expenses for which no relief taken 393 308Overseas tax suffered 224 241
(21) (2)Current year tax charge (Note 4a) 224 241
No deferred tax asset has been recognised in the financial statements. At the yearend date, the Fund had a potential unrecognised deferred tax asset of £2,009,508(31.01.13: £1,616,332) in relation to £10,047,538 (31.01.13: £8,081,660) of excessmanagement expenses which would only be utilised to reduce the tax charge if theFund had an excess of unfranked income over expenses in a future period. There isno excess of unfranked income expected in the future.
5. Finance costsDistributionsThe distributions take account of amounts receivable on the issue of shares andamounts payable on the cancellation of shares and comprise:
2014 2013£’000 £’000
Final dividend distribution 962 936Add: Amounts payable on cancellation of shares 135 100Deduct: Amounts receivable on issue of shares (89) (63)Total finance costs 1,008 973
Details of the distribution per share are set out on page 152.
6. Movement between net revenue after taxation and distributions2014 2013
£’000 £’000Net revenue after taxation 1,000 972Add: Undistributed revenue brought forward 1 2Deduct: Undistributed revenue carried forward (1) (1)Equalisation on conversions 8 –
1,008 973
7. Debtors2014 2013
£’000 £’000Accrued income 51 71Due from the ACD for shares created 63 151Overseas tax recoverable 84 36Sales awaiting settlement – 1,090Total debtors 198 1,348
8. Cash and bank balances2014 2013
£’000 £’000Cash and bank balances 238 257
9. Creditors2014 2013
£’000 £’000Accrued expenses 170 161Due to the ACD for shares cancelled 173 35Purchases awaiting settlement 487 2,323Total creditors 830 2,519
Notes to the financial statements for the year ending 31 January 2014
150
Continuation�
� Return to Index

10. Portfolio transaction costs2014 2013
£’000 £’000Analysis of total purchase costs
Purchases in year before transaction costs 52,338 76,718
Commissions 33 44Taxes 50 28Total purchase costs 83 72Gross purchases total 52,421 76,790
Analysis of total sale costs
Gross sales before transaction costs 63,102 80,973
Commissions (33) (42)Taxes (3) (10)Total sale costs (36) (52)Total sales net of transaction costs 63,066 80,921
11. Related party transactionsJPMorgan Funds Limited, as Authorised Corporate Director (“ACD”), is a relatedparty, and acts as principal in respect of all transactions of shares in the Company.The aggregate monies received through issue, and paid on cancellation, aredisclosed in the Statement of Change in Net Assets Attributable to Shareholders.
The balance due to the ACD and their associates at the year end date in respect ofrelated party transactions was £280,154 (31.01.13: £45,767). Details of relatedparty transactions are given under note 13 on page 413.
Investments considered to be related parties have been identified in the portfoliostatement on page 146 and the revenue from these investments was £12,105(31.01.13: £22,087).
Some of the dealing transactions for the Fund are carried out through associatesof the ACD. Such transactions are carried out on an arm’s length basis. Thecommissions paid to these companies over the year were £16,260 (31.01.13: £nil).Commission was paid to the associated company JPMorgan Securities Ltd.
12. Financial instrumentsCurrency exposuresA substantial proportion of the net assets of the Fund are denominated incurrencies other than sterling, with the effect that the Balance sheet and totalreturn can be significantly affected by currency movements.
Net foreign currency assets/(liabilities)Monetary Non-monetary
Total exposures exposuresCurrency £’000 £’000 £’000
31.01.14US Dollar 41,472 (1,499) 42,971Euro 16,482 3,156 13,326Japanese Yen 10,235 6,908 3,327Australian Dollar 8,753 3,315 5,438Canadian Dollar 8,662 1,619 7,043Indian Rupee 4,837 28 4,809Swiss Franc 4,283 (897) 5,180Hong Kong Dollar 3,121 (8,320) 11,441Swedish Krona 2,271 1,002 1,269Singapore Dollar 1,722 1,722 –Korean Won 1,182 11 1,171Indonesian Rupiah 1,090 – 1,090South African Rand 646 – 646Danish Krone 446 446 –Norwegian Krone 296 296 –
31.01.13US Dollar 40,103 (3,124) 43,227Euro 16,078 2,898 13,180Australian Dollar 10,705 4,669 6,036Canadian Dollar 9,554 2,154 7,400Japanese Yen 9,374 6,731 2,643Swiss Franc 4,099 (434) 4,533Hong Kong Dollar 4,050 (9,111) 13,161Indian Rupee 3,352 33 3,319Swedish Krona 2,155 355 1,800Singapore Dollar 1,855 1,855 –Indonesian Rupiah 1,351 1 1,350South African Rand 1,329 3 1,326Korean Won 1,085 – 1,085Brazilian Real 900 – 900Norwegian Krone 353 353 –
Interest rate riskAt the year end date, 1.8% (31.01.13: 5.0%) of the Fund’s net assets by value wereinterest bearing, carrying a (fixed/floating) rate.
For consideration of other risks including liquidity, pricing and credit risk, pleaserefer to the notes to the aggregated financial statements, pages 413 to 414.
13. Share classesThe Fund currently has three share classes; Class A Shares, Class B Shares andClass C Shares. The Authorised Corporate Director’s (ACD) fee and fixed expensescharge are shown below.
ACD fee Fixed expensesClass A shares: 1.50% 0.18%Class B shares: 1.00% 0.18%Class C shares: 0.75% 0.18%
The net asset value of each share class, the net asset value per share and thenumber of shares in each class are shown on page 145. All classes have the samerights on winding up.
14. Derivatives The Fund enters into derivative transactions in the form of forward currencycontracts for the purpose of efficient portfolio management. The commitmentapproach has been used to calculate the global exposure.
Further information on the derivative risks can be found in the notes to theaggregated financial statements on page 414.
15. Contingent liabilities and capital commitmentsAt the balance sheet date there were no contingent liabilities or capitalcommitments (2013: none).
Notes to the financial statements – continued
151
Continuation�
� Return to Index

Final distribution in pence per share
Group 1 – Shares purchased prior to 1 February 2013Group 2 – Shares purchased 1 February 2013 to 31 January 2014
DistributionGross Tax Net payable paid
revenue at 10% revenue Equalisation 30.04.14 30.04.13
A-Class Accumulation Shares
Group 1 5.755556 0.575556 5.180000 – 5.180000 4.830000
Group 2 1.967640 0.196764 1.770876 3.409124 5.180000 4.830000
A-Class Income Shares
Group 1 0.333333 0.033333 0.300000 – 0.300000 0.280000
Group 2 0.096301 0.009630 0.086671 0.213329 0.300000 0.280000
B-Class Accumulation Shares
Group 1 9.300000 0.930000 8.370000 – 8.370000 5.600000
Group 2 6.399831 0.639983 5.759848 2.610152 8.370000 5.600000
B-Class Income Shares
Group 1 0.366667 0.036667 0.330000 – 0.330000 –
Group 2 0.366667 0.036667 0.330000 0.000000 0.330000 –
C-Class Accumulation Shares
Group 1 2.222222 0.222222 2.000000 – 2.000000 1.370000
Group 2 0.104111 0.010411 0.093700 1.906300 2.000000 1.370000
C-Class Income Shares
Group 1 2.177778 0.217778 1.960000 – 1.960000 1.380000
Group 2 0.030194 0.003019 0.027175 1.932825 1.960000 1.380000
Equalisation applies only to shares purchased during the distribution period (group 2 shares). It is the average amount of revenue included in the purchase price of all group 2 shares and is refunded to holders of these
shares as a return of capital. Being capital it is not liable to income tax but must be deducted from the cost of shares for capital gains tax purposes.
Distribution table
152
� Return to Index

Investment objective and policyTo provide a high return from a diversified portfolio of Bond and other DebtSecurities. The Fund will invest primarily in Bond and other Debt Securities(mainly Below Investment Grade securities or Unrated securities) of issuersin developed countries, primarily corporations and banks. The Fund mayalso invest in Bond and other Debt Securities of issuers of Emerging countries.The Fund will aim to hedge non-Sterling securities back to Sterling.
Risk profileThe value of your investment may fall as well as rise and you may get backless than you originally invested.
Bond funds may not behave like direct investments in the underlying Bondsthemselves. By investing in Bond funds, the certainty of receiving a regularfixed amount of income for a defined period of time with the prospect of afuture known return of capital is lost.
The value of Bonds and other Debt Securities may change significantlydepending on market, economic and interest rate conditions as well as thecreditworthiness of the issuer. Issuers of Bonds and other Debt Securitiesmay fail to meet payment obligations (default) or the credit rating of Bondsand other Debt Securities may be downgraded. These risks are typicallyincreased for Below Investment Grade and certain Unrated securities, whichmay also be subject to higher volatility and be more difficult to sell thanInvestment Grade securities.
Bonds and other Debt Securities with a lower credit rating may have a higherrisk of defaulting which may in turn have an adverse effect on the performanceof Funds which invest in them.
This Fund charges the annual fee of the Authorised Corporate Director (ACD)against capital, which will increase the amount of income available fordistribution to Shareholders, but may constrain capital growth. It may alsohave tax implications for certain investors.
The capital growth of an investment in a monthly Share Class may beconstrained when compared to the equivalent quarterly Share Class of thesame Fund. This is a result of quarterly Share Classes effectively investingmore in the Fund than monthly Share Classes due to the less frequent paymentof income.
Monthly Share Classes may receive less income than equivalent quarterlyShare Classes of the same Fund. This is a result of the monthly Share Classeseffectively investing less in the Fund due to the more frequent payment ofincome, which means that they will receive a smaller proportion of anyincome received by the Fund during any given quarterly period.
Bond funds will normally distribute a combination of Coupon and the expecteddiscount/premium on the securities. Therefore, a Fund’s distribution willcomprise income received and an element of projected capital gains orlosses. This could result in an element of capital gain being taxed as incomein the hands of an investor.
To the extent that any underlying assets of the Fund are denominated in acurrency other than Sterling and are not hedged back to Sterling, movementsin currency exchange rates can adversely affect the return of your investment.The currency hedging that may be used to minimise the effect of currencyfluctuations may not always be successful.
The Fund may invest in Structured Products which will involve additionalrisks including the movements in the value of the underlying asset and therisk of the issuer of the Structured Product becoming insolvent.
The Fund may invest in Credit Linked Notes which involve the risk of theunderlying credit instrument decreasing in value or defaulting and the riskof the issuer of the Credit Linked Note becoming insolvent.
Please refer to Part 11 of the Prospectus for details of the general risk factorsaffecting this Fund in addition to the specific risk factors above.
Fund reviewDespite uncertainty over monetary and fiscal policy and persistent interestrate pressure, steadily improving macro fundamentals and wide spreads relativeto low defaults produced coupon-type returns for high yield bonds in the 12-month period. Overall, the asset class outperformed Treasuries, investmentgrade and emerging market bonds. Investors’ desire for yield and positivecorporate fundamentals continue to drive interest in the asset class.
The Fund underperformed its benchmark for the 12-month period. On a relativebasis, contributions from banking/financials, media non-cable and paperdetracted from Fund performance. Specifically, our weightings in SprintCorporation, Reichhold Industries, Clear Channel Communications, SpringleafFinance Corporation and DISH DBS Corporation hindered annual results. Onthe positive side, security selection in health care, independent energy andtechnology enhanced performance. The largest positive contributions camefrom relative weightings in NII Holdings, Radiation Therapy Services, CevaGroup, First Data Corporation and Reynolds Group.
Fund outlookWe expect improving growth in the US and modestly positive growth globallyin 2014. We anticipate corporate earnings will strengthen and corporatebalance sheets will remain healthy and supportive of the high yield market.Default rates are forecast to remain below 2% through 2015. We expecttapering to continue throughout 2014 as US economic data improves, pushingTreasury rates gradually higher throughout the year. Importantly, we expecthigh yield to continue to exhibit strong relative performance vs. most otherfixed income assets in 2014.
12 month performance as at 31 January 2014 2013 2012 2011 2010
JPM Global High Yield BondA-Class Acc 4.3% 12.0% 4.1% 12.5% 41.4%
JPM Global High Yield BondB-Class Inc 4.6% 12.5% 4.4% 12.8% –
JPM Global High Yield BondC-Class Acc 4.9% – – – –
JPM Global High Yield BondI-Class Acc 5.0% 12.9% 4.9% 13.2% 42.8%
JPM Global High Yield BondX-Class Gross Acc 6.5% 15.3% – – –
Benchmark IndexA 6.9% 13.8% 5.0% 15.3% 37.8%
JPM Global High Yield Bond Fund
You should remember that past performance is not a guide to the future. The price of investments and the income from them may fall as well as rise andinvestors may not get back the full amount invested. All performance returns are calculated using the quoted price of the accumulation or income shares. Performance returns are in Sterling.Source: J.P. Morgan.A Please note the benchmark for the JPM Global High Yield Bond Fund changed on 1 January 2010. The old benchmark was BofA Merrill Lynch US High Yield master II Constrained Index Hedged to GBP and the new
benchmark is BofA Merrill Lynch US High Yield Master II Constrained Index hedged to GBP. However, over the period 1 January 2010 to 1 July 2012, the name of the benchmark was incorrectly reported as its predecessoralthough the underlying performance data was that of the correct benchmark BofA Merrill Lynch US High Yield Master II Constrained Index hedged to GBP. This has had no impact on the performance of the Fund. 153
Continuation�
� Return to Index

Fund statisticsRisk and Reward Profile 5*
Fund size £245.4m
Benchmark IndexA BofA Merrill Lynch US High Yield Master II Constrained Index Hedged to GBP
Fund chargesA-Class Initial 3.00%, Annual 1.10%B-Class Initial Nil, Annual 0.75%C-Class Initial Nil, Annual 0.55%I-Class Initial Nil, Annual 0.45%X-Class On applicationB
Top ten holdings %HCA 7.5% 2022 1.5Sprint Capital 8.75% 2032 1.3Reynolds Group 9% 2019 1.0First Data 8.75% 2022 1.0Intelsat Jackson 7.25% 2020 0.9Dish DBS 7.875% 2019 0.8Ally Financial 6.25% 2017 0.8Clear Channel Worldwide ‘B’ 6.5% 2022 0.7HCA 7.75% 2021 0.7Caesars Entertainment Operating 9% 2020 0.7
Sector breakdown %Corporate debt 97.2Forward currency contracts (0.7)Swaps 0.1Net other assets 3.4
In line with current accounting practice the sector breakdown includes the unrealised profit or loss onderivative holdings and consequently the economic market exposure of the Fund cannot be fully determinedfrom the above disclosure.
Highest/lowest share price and distribution recordHighest Lowest Distribution
Calendar year share price share price per shareA-Class Accumulation Shares2009 71.79p 46.39p 4.06p2010 80.28p 70.48p 4.87p2011 83.64p 75.53p 5.07p2012 93.59p 82.44p 4.98p2013 98.33p 92.63p 5.02p2014C 99.32p 98.41p 1.22pA-Class Income Shares2009 38.07p 25.79p 2.23p2010 40.07p 36.76p 2.51p2011 40.59p 35.86p 2.46p2012 41.29p 38.25p 2.28p2013 42.22p 39.78p 2.17p2014C 41.58p 41.21p 0.51p
Highest/lowest share price and distribution record(continued)
Highest Lowest DistributionCalendar year share price share price per shareB-Class Accumulation SharesD
2013 100.0p 92.67p 3.69p2014C 99.55p 98.62p 1.23pB-Class Income SharesE
2009 104.5p 100.0p 0.22p2010 110.3p 100.8p 6.86p2011 111.9p 99.01p 6.83p2012 114.5p 105.8p 6.33p2013 117.2p 110.5p 6.02p2014C 115.7p 114.6p 1.43pC-Class Accumulation SharesF
2012 103.3p 99.75p 1.33p2013 109.2p 102.6p 5.54p2014C 110.3p 109.3p 1.36pC-Class Gross Accumulation SharesF
2012 103.6p 99.75p 1.44p2013 110.5p 103.4p 6.80p2014C 111.7p 110.6p 1.63pC-Class Income SharesF
2012 101.9p 98.53p 1.33p2013 104.4p 98.43p 5.37p2014C 103.2p 102.2p 1.27pC-Class Gross Income SharesF
2012 102.1p 98.61p 1.44p2013 104.7p 98.63p 6.53p2014C 103.4p 102.4p 1.51pI-Class Accumulation Shares2009 122.3p 78.39p 7.14p2010 137.5p 120.2p 8.40p2011 144.1p 130.3p 8.92p2012 163.1p 142.5p 8.92p2013 172.5p 162.0p 9.04p2014C 174.3p 172.7p 2.21pI-Class Gross Accumulation Shares2009 111.5p 70.91p 7.89p2010 127.4p 109.9p 9.72p2011 134.9p 122.5p 10.34p2012 155.7p 134.4p 10.40p2013 166.6p 155.5p 10.49p2014C 168.4p 166.7p 2.54p
* For specific risks, including the risk and reward profile, please refer to the Key Investor information Document (KIID) available on the following websitehttp://am.jpmorgan.co.uk/investor/prices-and-factsheets/?list=all&tab=PricesB As agreed from time to time between the ACD and the relevant JPMorgan Chase & Co. entity.154
Continuation�
� Return to Index

Highest/lowest share price and distribution record(Continued)
Highest Lowest DistributionCalendar year share price share price per shareI-Class Income Shares2009 90.33p 60.96p 5.49p2010 95.56p 87.30p 6.03p2011 97.12p 86.07p 6.02p2012 99.87p 92.18p 5.62p2013 102.4p 96.52p 5.40p2014C 101.2p 100.3p 1.28pI-Class Gross Income SharesG
2011 101.5p 91.70p 2.61p2012 106.1p 97.98p 7.40p2013 108.9p 102.6p 6.96p2014C 107.6p 106.5p 1.62pX-Class Gross Accumulation SharesH
2012 114.6p 100.4p 5.24p2013 123.1p 104.5p 7.65p2014C 124.5p 123.2p 1.86p
C To 31 January 2014.D B-Class Accumulation Shares were launched on 21 February 2013.E B-Class Income Shares were launched on 14 October 2009.F C-Class Accumulation Shares, C-Class Gross Accumulation Shares, C-Class Income Shares and C-ClassGross Income Shares were launched on 1 October 2012.
G I-Class Gross Income Shares were launched 1 July 2011.H X-Class Gross Accumulation Shares were launched on 20 January 2012.
Portfolio turnover rate31.01.13 53.5%31.01.14 48.2%
The portfolio turnover rate (PTR) reflects the total of security purchases and sales (excluding Liquidityfunds), less the total of share issues and cancellations, expressed as a percentage of the average daily netasset values over the period.
Portfolio transaction costsBroker Transaction
Commissions Taxes Total31.01.13 0.00% 0.00% 0.00%31.01.14 0.00% 0.00% 0.00%
The percentage figures disclosed above reflect the average broker commissions and transaction taxessuffered during the last 3 years divided by the average assets under management over the same period.
Stamp duty reserve tax31.01.13 0.00%31.01.14 0.00%
The percentage figures disclosed above reflect the total stamp duty reserve tax suffered during the yeardivided by the average assets under management over the same period.
Net asset values and Ongoing chargesNet assetvalue per Net asset
share class Number value per OngoingDate £’000 of shares share chargesA-Class Accumulation Shares31.01.12 62,726 74,454,052 84.25p 1.28%31.01.13 95,904 101,607,198 94.39p 1.28%31.01.14 68,130 69,213,333 98.44p 1.28%A-Class Income Shares31.01.12 87,978 227,047,334 38.75p 1.28%31.01.13 104,700 254,955,667 41.07p 1.28%31.01.14 84,097 206,603,372 40.70p 1.28%B-Class Accumulation Shares31.01.14 369 374,243 98.67p 0.93%B-Class Income Shares31.01.12 1,296 1,210,511 107.1p 0.90%31.01.13 2,024 1,776,883 113.9p 0.93%31.01.14 2,821 2,490,535 113.3p 0.93%C-Class Accumulation Shares31.01.13 18 17,154 104.3p 0.73%31.01.14 18,838 17,224,970 109.4p 0.73%C-Class Gross Accumulation Shares31.01.13 1 1,000 104.6p 0.73%31.01.14 4,029 3,636,964 110.8p 0.73%C-Class Income Shares31.01.13 50 48,922 101.4p 0.73%31.01.14 38,987 38,597,996 101.0p 0.73%C-Class Gross Income Shares31.01.13 425 419,347 101.4p 0.73%31.01.14 758 750,627 101.0p 0.73%I-Class Accumulation Shares31.01.12 6 4,000 145.7p 0.45%31.01.13 17 10,441 164.6p 0.45%31.01.14 95 54,679 172.8p 0.45%I-Class Gross Accumulation Shares31.01.12 15,326 11,145,161 137.5p 0.45%31.01.13 5,679 3,609,784 157.3p 0.45%31.01.14 3,715 2,224,354 167.0p 0.45%I-Class Income Shares31.01.12 3,308 3,551,212 93.16p 0.45%31.01.13 5,738 5,774,518 99.37p 0.45%31.01.14 6,780 6,843,353 99.08p 0.45%I-Class Gross Income Shares31.01.12 1,456 1,472,479 98.85p 0.45%31.01.13 1,630 1,546,395 105.4p 0.45%31.01.14 1,051 1,000,110 105.1p 0.45%X-Class Gross Accumulation Shares31.01.12 505 502,512 100.6p 0.06%31.01.13 9,886 8,528,512 115.9p 0.06%31.01.14 15,727 12,737,781 123.5p 0.06%
The net asset value and the net asset value per income share are shown ex-dividend.
Following the adoption of the requirements of UCITS IV in June 2012, Ongoing charges has replaced theTotal Expense Ratio (“TER”). The Ongoing charges takes into account the ACD fee, the fixed expenses andany expenses paid to an affiliate in respect of stocklending activities, expressed as a percentage of theaverage daily net asset values over the period. The main difference between the two calculations is theinclusion of custodian handling charges and stocklending fees in the Ongoing charges figure. The comparativefigures have not been restated, and the historic TER is disclosed.
155
Continuation�
� Return to Index

Corporate debt – 97.2% (93.0%)US Dollar – 96.8%Academy 9.25% 2019 $700,000 464 0.2Accellent 8.375% 2017 $970,000 617 0.3Accellent 10% 2017 $690,000 449 0.2Access Midstream Partners 5.875% 2021 $335,000 216 0.1Access Midstream Partners 6.125% 2022 $620,000 401 0.2Access Midstream Partners 4.875% 2023 $425,000 253 0.1Acco Brands 6.75% 2020 $2,005,000 1,212 0.5ACI Worldwide 6.375% 2020 $585,000 371 0.2Activision Blizzard 5.625% 2021 $225,000 141 0.1Activision Blizzard 6.125% 2023 $110,000 69 –ADT 6.25% 2021 $525,000 335 0.1ADT 3.5% 2022 $475,000 249 0.1AES 8% 2020 $190,000 134 0.1AES 7.375% 2021 $225,000 151 0.1AES 4.875% 2023 $255,000 145 0.1Aircastle 4.625% 2018 $430,000 264 0.1Aircastle 7.625% 2020 $795,000 548 0.2Albea Beauty 8.375% 2019 $925,000 590 0.2Alcatel-Lucent USA 6.75% 2020 $415,000 260 0.1Alcatel-Lucent USA 8.875% 2020 $845,000 572 0.2Alere 6.5% 2020 $245,000 153 0.1Algeco Scotsman Global Finance 8.5% 2018 $920,000 606 0.2Allegion US Holding 5.75% 2021 $390,000 245 0.1Alliant Techsystems 5.25% 2021 $440,000 270 0.1Allison Transport 7.125% 2019 $1,300,000 853 0.3Ally Financial FRN 2016 $565,000 351 0.1Ally Financial 5.5% 2017 $135,000 88 –Ally Financial 6.25% 2017 $3,030,000 2,046 0.8Ally Financial 3.5% 2019 $1,215,000 731 0.3Ally Financial 7.5% 2020 $1,445,000 1,034 0.4AMC Entertainments 8.75% 2019 $460,000 298 0.1AMC Entertainments 9.75% 2020 $1,450,000 1,011 0.4American Axle & Manufacturing 7.75% 2019 $600,000 415 0.2American Tire Distributors 9.75% 2017 $560,000 361 0.1Amkor Technology 7.375% 2018 $215,000 136 0.1Amkor Technology 6.625% 2021 $525,000 333 0.1Amkor Technology 6.375% 2022 $130,000 81 –Amsted Industries 8.125% 2018 $510,000 325 0.1Anixter 5.625% 2019 $370,000 235 0.1Antero Resources Finance 5.375% 2021 $480,000 295 0.1Arcelormittal 6% 2021 $795,000 505 0.2Arch Coal 7% 2019 $610,000 288 0.1Arch Coal 8% 2019 $225,000 136 0.1Arch Coal 7.25% 2021 $850,000 389 0.2Ardagh Packaging Finance 7.375% 2017 $345,000 224 0.1Ardagh Packaging Finance 7% 2020 $78,529 48 –Ardagh Packaging Finance 9.125% 2020 $2,180,000 1,450 0.6Armored Autogroup 9.25% 2018 $700,000 410 0.2Ashland 4.75% 2022 $1,560,000 907 0.4Ashtead Capital 6.5% 2022 $895,000 582 0.2Aspect Software 10.625% 2017 $645,000 398 0.2Associated Material Finance 9.125% 2017 $505,000 324 0.1Atkore International 9.875% 2018 $814,000 532 0.2Atwood Oceanics 6.5% 2020 $295,000 192 0.1Audatex North America 6% 2021 $930,000 589 0.2Avaya 7% 2019 $1,225,000 735 0.3Avis Budget Car Rental 4.875% 2017 $65,000 41 –Avis Budget Car Rental 8.25% 2019 $1,595,000 1,043 0.3Avis Budget Car Rental 5.5% 2023 $730,000 429 0.2B&G Foods 4.625% 2021 $300,000 177 0.1Bank of America 8% FRN Perpetual $1,735,000 1,181 0.5BC Mountain 7% 2021 $210,000 131 0.1Belden 5.5% 2022 $1,235,000 732 0.3Berry Petroleum 6.375% 2022 $380,000 235 0.1Biomet 6.5% 2020 $2,225,000 1,441 0.6Blackboard 7.75% 2019 $645,000 398 0.2BMC Software Finance 8.125% 2021 $300,000 189 0.1BOE Intermediate Holding 9% 2017 $324,105 210 0.1BOE Merger 9.5% 2017 $365,000 234 –Bombardier 7.75% 2020 $925,000 621 0.3Bombardier 6.125% 2023 $765,000 458 0.2Breitburn Energy Partners 8.625% 2020 $590,000 386 0.2Breitburn Energy Partners 7.875% 2022 $930,000 603 0.2Building Materials 6.875% 2018 $445,000 285 0.1Building Materials 7.5% 2020 $225,000 148 0.1Building Materials 6.75% 2021 $460,000 300 0.1Bumble Bee Acquisiton 9% 2017 $1,327,000 883 0.4BWAY 10% 2018 $855,000 561 0.2Caesars Entertainment Operating
11.25% 2017 $1,700,000 1,051 0.4Caesars Entertainment Operating 8% 2020 $885,000 561 0.2
Caesars Entertainment Operating 8.5% 2020 $1,995,000 1,154 0.5Caesars Entertainment Operating 9% 2020 $2,900,000 1,709 0.7Calpine 7.875% 2020 $232,000 154 0.1Calpine 7.5% 2021 $760,000 504 0.2CBS Outdoor Americas Capital 5.25% 2022 $135,000 82 –CCO Holdings 7% 2019 $1,400,000 897 0.4CCO Holdings 7.375% 2020 $940,000 620 0.3CCO Holdings 5.25% 2021 $1,065,000 626 0.3CCO Holdings 5.25% 2022 $140,000 82 –CDW Financial 8.5% 2019 $1,865,000 1,245 0.5Central Garden & Pet 8.25% 2018 $1,930,000 1,152 0.5CenturyLink 5.8% 2022 $2,265,000 1,361 0.6CenturyLink 6.75% 2023 $1,655,000 1,021 0.4CEVA Group 8.375% 2017 $1,145,000 729 0.3Chesapeake Energy 6.625% 2020 $920,000 624 0.3Chesapeake Energy 6.875% 2020 $205,000 139 0.1Chesapeake Energy 6.125% 2021 $330,000 216 0.1Chinos Intermediate Holdings 7.75% 2019 $590,000 368 0.1Chiquita Brands International 7.875% 2021 $1,000,000 656 0.3Chrysler Group 8.25% 2021 $2,470,000 1,683 0.7Cinemark USA 7.375% SNR 2021 $585,000 394 0.2Cinemark USA 4.875% 2023 $455,000 261 0.1CIT Group 4.25% 2017 $1,030,000 650 0.3CIT Group 5.25% 2018 $1,180,000 765 0.3CIT Group 5.5% 2019 $790,000 511 0.2Claires Stores 8.875% 2019 $835,000 493 0.2Claires Stores 9% 2019 $1,895,000 1,209 0.5Clean Harbors 5.25% 2020 $1,225,000 760 0.3Clear Channel Communications 9% 2021 $1,800,000 1,107 0.5Clear Channel Worldwide 7.625% 2020 $65,000 41 –Clear Channel Worldwide ‘B’ 7.625% 2020 $1,390,000 890 0.4Clear Channel Worldwide 6.5% 2022 $925,000 575 0.2Clear Channel Worldwide ‘B’ 6.5% 2022 $3,165,000 1,976 0.7Cogent Communications 8.375% 2018 $485,000 321 0.1Commscope 8.25% 2019 $809,000 534 0.2Constellation Brands 3.75% 2021 $305,000 178 0.1Constellation Brands 4.25% 2023 $35,000 20 –Corrections Corporation of America
4.125% 2020 $890,000 523 0.2Corrections Corporation of America
4.625% 2023 $185,000 106 –Crestwood Midstream Partners 6% 2020 $75,000 47 –Crosstex Energy 8.875% 2018 $1,410,000 899 0.4Crosstex Energy 7.125% 2022 $415,000 289 0.1Crown Castle International 5.25% 2023 $955,000 576 0.2CSC Holdings 8.625% 2019 $1,585,000 1,127 0.5Dana Holding 6.5% 2019 $720,000 466 0.2Dana Holding 5.375% 2021 $235,000 143 0.1Dana Holding 6.75% 2021 $635,000 417 0.2Dana Holding 6% 2023 $310,000 188 0.1DaVita Healthcare 6.375% 2018 $255,000 162 0.1DaVita Healthcare 6.625% 2020 $710,000 463 0.2Del Monte 7.625% 2019 $2,165,000 1,367 0.6Denali Finance 5.625% 2020 $1,545,000 929 0.4Denbury Resources 8.25% 2020 $520,000 346 0.1Denbury Resources 4.625% 2023 $575,000 321 0.1Dish DBS 7.875% 2019 $2,985,000 2,070 0.8Dish DBS 5.125% 2020 $465,000 283 –Dish DBS 6.75% SNR 2021 $1,610,000 1,047 0.4Dish DBS 5.875% 2022 $1,740,000 1,061 0.4DJO Finance 7.75% SNR 2018 $1,520,000 944 0.4DJO Finance 8.75% 2018 $530,000 355 0.1DJO Finance 9.875% 2018 $215,000 142 0.1Donnelley RR & Sons 7% 2022 $160,000 104 –Eagle Midco 9% 2018 $365,000 232 0.1Easton-Bell Sports 9.75% 2016 $1,780,000 1,126 0.5Eileme 11.625% 2020 $720,000 518 0.2El Paso 7.25% 2018 $895,000 621 0.3Epicor Software 8.625% 2019 $1,060,000 699 0.3EV Energy Partner 8% 2019 $1,365,000 843 0.3Everest Acquisition 6.875% 2019 $965,000 630 0.3Everest Acquisition 9.375% 2020 $1,485,000 1,038 0.4Everest Acquisition 7.75% 2022 $1,055,000 708 0.3FGI Operating 7.875% 2020 $745,000 484 0.2First Data 7.375% 2019 $1,010,000 657 0.3First Data 6.75% 2020 $735,000 471 0.2First Data 8.875% 2020 $1,600,000 1,072 0.4First Data 8.25% 2021 $500,000 322 0.1First Data 12.625% 2021 $1,827,000 1,295 0.5First Data 8.75% 2022 $3,654,000 2,359 1.0FMG Resources 6.875% 2018 $735,000 470 0.2FMG Resources 8.25% 2019 $1,475,000 990 0.4Fresenius Medical Care 5.625% 2019 $500,000 324 0.1
Portfolio statementAs at 31 January 2014
Market value Total netInvestment Holding £’000 assets %
Market value Total netInvestment Holding £’000 assets %
156
Continuation�
� Return to Index

FWCT-2 Escrow 5.125% 2021 $240,000 147 0.1FWCT-2 Escrow 6.875% 2022 $485,000 302 0.1Gardner Denver 6.875% 2021 $455,000 277 0.1GCI 8.625% 2019 $980,000 633 0.3GCI 6.75% 2021 $535,000 314 0.1Gencorp 7.125% 2021 $1,275,000 831 0.3General Cable 5.75% 2022 $945,000 567 0.2General Motors Financials 3.25% 2018 $245,000 150 0.1General Motors Financials 4.25% 2023 $350,000 204 0.1General Motors Financials 4.875% 2023 $2,485,000 1,525 0.6Geo Group 6.625% 2021 $640,000 411 0.2Geo Group 5.875% 2022 $695,000 421 0.2Goodyear Tire & Rubber 8.25% 2020 $770,000 520 0.2Goodyear Tire & Rubber 8.75% 2020 $375,000 269 0.1Goodyear Tire & Rubber 6.5% 2021 $635,000 411 0.2Great Lakes Dredge & Dock 7.375% 2019 $1,215,000 775 0.3Griffon 7.125% 2018 $685,000 441 0.2Gymboree 9.125% 2018 $920,000 497 0.2H&E Equipment Services 7% 2022 $510,000 338 0.1Halcon Resources 9.25% 2020 $170,000 107 –Halcon Resources 8.875% 2021 $1,430,000 864 0.4Halcon Resources 9.25% 2022 $290,000 178 0.1Hanesbrands 6.375% 2020 $820,000 543 0.2Harrahs Operating 10% 2018 $603,000 185 0.1Hawk Acquisition 4.25% 2020 $1,695,000 1,007 0.4HCA 6.5% 2020 $1,005,000 674 0.3HCA 6.25% 2021 $380,000 246 0.1HCA 7.75% 2021 $2,645,000 1,764 0.7HCA 7.5% 2022 $5,355,000 3,676 1.5HD Supply 8.125% 2019 $1,450,000 979 0.4HD Supply 11% 2020 $560,000 404 0.2HD Supply 11.5% 2020 $700,000 504 0.2Healthcare Technology Intermediate
FRN 2018 $235,000 148 0.1HealthSouth 8.125% 2020 $605,000 402 0.2HealthSouth 7.75% 2022 $546,000 364 0.1HealthSouth 5.75% 2024 $250,000 151 0.1Hertz 7.5% 2018 $1,100,000 714 0.3Hertz 5.875% 2020 $920,000 581 0.2Hertz 7.375% 2021 $295,000 195 0.1Hexion Nova Scotia 8.875% 2018 $945,000 598 0.2Hexion Nova Scotia 6.625% 2020 $1,595,000 1,008 0.4Hexion Nova Scotia 9% 2020 $505,000 308 0.1Hiland Partners 7.25% 2020 $690,000 449 0.2Hillman Group 10.875% 2018 $1,090,000 712 0.3Hilton Worldwide 5.625% 2021 $580,000 364 0.1Hologic 6.25% 2020 $1,305,000 831 0.3Hughes Satellite System 6.5% 2019 $755,000 500 0.2Huntsman International 4.875% 2020 $1,255,000 752 0.3Huntsman International 8.625% 2020 $340,000 228 0.1Huntsman International 8.625% 2021 $470,000 322 0.1IMS Health 6% 2020 $950,000 613 0.2Ineos Finance 8.375% 2019 $1,875,000 1,262 0.5Ineos Group 6.125% 2018 $430,000 267 0.1Ineos Group 7.5% 2020 $645,000 428 0.2Infor 11.50% 2020 $1,050,000 737 0.3Infor 9.375% 2019 $770,000 527 0.2Intelsat Jackson 7.25% 2020 $3,400,000 2,241 0.9Intelsat Jackson 7.5% 2021 $610,000 409 0.2Intelsat Jackson 6.625% 2022 $930,000 583 0.2Intelsat Luxembourg 7.75% 2021 $1,330,000 868 0.4Interactive Data 10.25% 2018 $925,000 617 0.3Interline Brands 7% 2018 $635,000 408 0.2Interline Brands 10% 2018 $295,000 196 0.1International Lease Finance 8.75% 2017 $2,275,000 1,612 0.7International Lease Finance 5.875% 2019 $2,055,000 1,342 0.5International Lease Finance 6.25% 2019 $1,500,000 989 0.4Inventiv Health 9% 2018 $840,000 537 0.2Inventiv Health 10% 2018 $450,000 248 0.1Inventiv Health 10% SNR 2018 $365,000 202 0.1Iron Mountain 6% 2023 $805,000 501 0.2Isle Of Capri Casinos 5.875% 2021 $1,210,000 748 0.3J Crew Group 8.125% 2019 $505,000 321 0.1Jack Cooper 9.25% 2020 $830,000 551 0.2James River Coal 7.785% 2019 $425,000 68 –Jarden 7.5% 2020 $1,080,000 709 0.3JC Penney 7.95% 2017 $160,000 79 –JC Penney 5.75% 2018 $560,000 252 0.1JC Penney 6.375% 2036 $650,000 265 0.1Kinetic Concepts 10.5% 2018 $1,885,000 1,323 0.5Kodiak Oil & Gas 8.125% 2019 $1,080,000 727 0.3Kodiak Oil & Gas 5.5% 2021 $55,000 33 –Kodiak Oil & Gas 5.5% 2022 $125,000 75 –
Laredo Petroleum 5.625% 2022 $245,000 148 0.1Legacy Reserves Finance 8% 2020 $745,000 474 0.2Level 3 Financing 8.125% 2019 $965,000 645 0.3Level 3 Financing 8.625% 2020 $785,000 534 0.2Libbey Glass 6.875% 2020 $658,000 431 0.2Limited Brands 6.625% 2021 $1,110,000 736 0.3Linn Energy 6.25% 2019 $1,065,000 659 0.3Linn Energy 7.75% 2021 $1,555,000 1,004 0.4LSB Industries 7.75% 2021 $975,000 628 0.3Lucent Technologie 6.45% 2029 $430,000 236 0.1Lynx I 5.375% 2021 $1,010,000 614 0.3Lynx II 6.375% 2023 $200,000 124 0.1Magnachip Semiconductor 6.625% 2021 $885,000 551 0.2Manitowoc 8.5% 2020 $1,075,000 737 0.3Mantech International 7.25% 2018 $830,000 527 0.2Marina District Finance 9.875% 2018 $1,590,000 1,038 0.4Markwest Energy 6.50% 2021 $385,000 251 0.1Markwest Energy Partners 5.5% 2023 $800,000 487 0.2McGraw-Hill 9.75% 2021 $395,000 259 0.1MEG Energy 6.375% 2023 $655,000 399 0.2MEG Energy 7% 2024 $620,000 386 0.2Memorial Production Finance 7.625% 2021 $175,000 110 –Memorial Production Partners 7.625% 2021 $500,000 314 0.1Metropcs Wireless 7.875% 2018 $70,000 45 –Metropcs Wireless 6.25% 2021 $520,000 328 0.1MGM Resorts International 8.625% 2019 $1,425,000 1,017 0.4MGM Resorts International 5.25% 2020 $1,815,000 1,105 0.5MGM Resorts International 6.75% 2020 $1,225,000 806 0.3MGM Resorts International 7.75% 2022 $1,590,000 1,087 0.4Michael Foods 9.75% SNR 2018 $635,000 417 0.2Michaels Finco Holdings 7.5% 2018 $480,000 300 0.1Michaels Stores 7.75% 2018 $1,595,000 1,034 0.4Midstates Petroleum 10.75% 2020 $530,000 351 0.1Midstates Petroleum 9.25% 2021 $485,000 309 0.1Mueller Water Products 8.75% 2020 $357,000 243 0.1Neiman Marcus Group 8% 2021 $500,000 318 0.1Neiman Marcus Group 8.75% 2021 $500,000 319 0.1Nexeo Solutions 8.375% 2018 $610,000 371 0.2Nexstar Broadcasting 6.875% 2020 $1,050,000 683 0.3Nielsen 5.5% 2021 $350,000 218 0.1Nielsen Finance LLC 4.5% 2020 $310,000 186 0.1NII International Telecom 7.875% 2019 $365,000 166 0.1Noranda Aluminium 11% 2019 $395,000 211 0.1Novelis 8.375% 2017 $435,000 282 0.1Novelis 8.75% 2020 $460,000 311 0.1NRG Energy 7.625% 2018 $255,000 174 0.1NRG Energy 8.25% 2020 $405,000 269 0.1NRG Energy 7.875% 2021 $205,000 136 0.1NRG Energy 6.25% 2022 $670,000 408 0.2Nuveen Investments 9.5% 2020 $920,000 579 0.2NXP Semiconductors 3.75% 2018 $595,000 362 0.1NXP Funding 5.75% 2021 $1,195,000 753 0.3NXP 5.75% 2023 $245,000 149 0.1Oasis Petroleum 6.875% 2022 $565,000 365 0.1Oshkosh 8.25% 2017 $625,000 397 0.2Oshkosh 8.5% 2020 $665,000 443 0.2Packaging Dynamics 8.75% 2016 $740,000 462 0.2Paetec 9.875% 2018 $805,000 542 0.2Paris Las Vegas 8% 2020 $15,000 9 –Party City 8.875% 2020 $1,525,000 1,033 0.4PC Nextco Holdings FRN 2019 $355,000 222 0.1Peabody Energy 6.25% 2021 $1,230,000 757 0.3Petco Animal Supplies 9.25% 2018 $785,000 511 0.2Plains Exploration & Production 6.5% 2020 $1,715,000 1,142 0.5Plains Exploration & Production 6.875% 2023 $855,000 574 0.2PNK Finance 6.375% 08/21 $245,000 153 0.1Polymer Group 7.75% 2019 $1,400,000 899 0.4Polyone 7.375% 2020 $805,000 538 0.2Polypore International 7.5% 2017 $580,000 373 0.2Post Holdings 6.75% 2021 $225,000 143 0.1Post Holdings 7.375% 2022 $1,590,000 1,031 0.4Post Holdings 7.375% 2022 144A $90,000 58 –QR Energy 9.25% 2020 $690,000 438 0.2Quebecor Media 5.75% 2023 $1,010,000 598 0.2Radiation Therapy Services 8.875% 2017 $690,000 434 0.2Radiation Therapy Services 9.875% 2017 $710,000 409 0.2Radio Systems 8.375% 2019 $795,000 533 0.2Rain CII Carbon 8% 2018 $245,000 156 0.1Rain CII Carbon 8.25% 2021 $200,000 125 0.1Realogy 7.875% 2019 $1,050,000 694 0.3Realogy 7.625% 2020 $700,000 475 0.2Regency Energy Partners 5.5% 2023 $590,000 350 0.1Reichhold Industries 9% 2017 $1,450,144 529 0.2
Portfolio statement – continuedAs at 31 January 2014
Market value Total netInvestment Holding £’000 assets %
Market value Total netInvestment Holding £’000 assets %
157
Continuation�
� Return to Index

Rentech Nitrogen 6.5% 2021 $465,000 275 0.1Reynolds Group 9% 2019 $3,890,000 2,523 1.0Reynolds Group 9.875% 2019 $2,030,000 1,364 0.6Reynolds Group 5.75% 2020 $1,600,000 996 0.4RHP Hotel Properties 5% 2021 $305,000 182 0.1Rite Aid 9.25% 2020 $965,000 669 0.3RKI Exploration & Production 8.5% 2021 $610,000 393 0.2Rockwood Specialties Group 4.625% 2020 $415,000 257 0.1RSC Equipment Rental 8.25% 2021 $2,135,000 1,456 0.6RSI Home Products 6.875% 2018 $345,000 219 0.1Sabine Pass Liquefaction 6.25% 2022 $595,000 363 0.1Sabine Pass LNG 5.625% 2023 $525,000 302 0.1Sabre 8.5% 2019 $1,935,000 1,299 0.5Sally 6.875% 2019 $575,000 384 0.2Sally 5.75% 2022 $330,000 204 0.1Sally 5.5% 2023 $625,000 374 0.2Sandridge Energy 7.5% 2021 $400,000 252 0.1Sandridge Energy 8.125% 2022 $825,000 525 0.2SBA Telecommunications 8.25% 2019 $561,000 365 0.1SBA Telecommunications 5.75% 2020 $145,000 92 –Schaeffler Finance 8.5% 2019 $265,000 180 0.1Schaeffler Finance 4.75% 2021 $655,000 396 0.2Scotts Miracle-Gro 6.625% 2020 $1,145,000 750 0.3Sealed Air 6.5% 2020 $350,000 229 0.1Sealed Air 8.375% 2021 $905,000 628 0.3Sensata Technologies 6.5% 2019 $1,430,000 934 0.4Serta Simmons 8.125% 2020 $2,155,000 1,422 0.6Service Corporation International 7% 2017 $295,000 202 0.1Service Corporation International 7.625%
2018 $140,000 98 –Service Corporation International 7% 2019 $445,000 288 0.1Service Corporation International 7.5%
2027 $1,410,000 906 0.4Servicemaster 7% 2020 $740,000 455 0.2Silver II Borrower 7.75% 2020 $460,000 296 0.1Sinclair Broadcast Group 6.125% 2013 $400,000 245 0.1Sinclair Television 8.375% 2018 $225,000 148 0.1Sinclair Television Group 5.375% 2021 $1,090,000 652 0.3Sirius XM Radio 4.25% 2020 $1,260,000 714 0.3Sirius XM Radio 5.75% 2021 $800,000 486 0.2Sirius XM Radio 4.625% 2023 $35,000 19 –Spectrum Brands 6.375% 2020 $270,000 175 0.1Spectrum Brands 6.75% 2020 $380,000 248 0.1Spectrum Brands 6.625% 2022 $420,000 272 0.1Sprint 7.125% 2024 $460,000 282 0.1Sprint 7.25% 2021 $460,000 301 0.1Sprint 7.875% 2023 $2,350,000 1,528 0.6Sprint Capital 8.75% 2032 $4,680,000 3,085 1.3Sprint Nextel 9% 2018 $2,240,000 1,643 0.7Sprint Nextel 7% 2020 $365,000 250 0.1SSI Investment Management 11.125% 2018 $880,000 579 0.2Stewart Enterprises 6.5% 2019 $440,000 281 0.1Sungard Data Systems 7.375% 2018 $580,000 373 0.2Sungard Data Systems 6.625% 2019 $920,000 585 0.2Sungard Data Systems 7.625% 2020 $520,000 347 0.1Tekni-Plex 9.75% 2019 $256,000 178 0.1Tempur Sealy International 6.875% 2020 $470,000 313 0.1Tenet Healthcare 4.75% 2020 $1,480,000 897 0.4Tenet Healthcare 6% 2020 $730,000 468 0.2Tenet Healthcare 6.75% 2020 $560,000 355 0.1Tenet Healthcare 8% 2020 $2,405,000 1,597 0.7Tenet Healthcare 8.125% 2022 $665,000 442 0.2Terex 6.5% 2020 $790,000 516 0.2Terex 6% 2021 $1,115,000 703 0.3Tervita 8% 2018 $735,000 458 0.2Tesoro 5.875% 2020 $1,120,000 696 0.3Tesoro 6.125% 2021 $365,000 229 0.1T-Mobile USA 6.633% 2021 $735,000 470 0.2T-Mobile USA 6.731% 2022 $1,300,000 829 0.3Trinidad Drilling 7.875% SNR 2019 $775,000 504 0.2Trinseo Materials Operating 8.75% 2019 $945,000 590 0.2Triumph Group 4.875% 2021 $595,000 351 0.1TW Telecom Holdings 5.375% 2022 $265,000 159 0.1TW Telecom Holdings 5.375% 2022 $445,000 268 0.1TW Telecom Holdings 6.375% 2023 $140,000 89 –UCI International 8.625% 2019 $1,240,000 742 0.3United Rentals 7.375% 2020 $120,000 81 –United Rentals 8.375% 2020 $175,000 118 –United Rentals 7.625% 2022 $570,000 390 0.2United Surgical Partners 9% 2020 $1,040,000 708 0.3UPCB Finance III 6.625% 2020 $1,445,000 928 0.4UPCB Finance 7.25% 2021 $325,000 214 0.1
UPCB Finance 6.875% 2022 $1,270,000 828 0.3US Coatings 7.375% 2021 $370,000 242 0.1Vail Resorts 6.5% 2019 $1,225,000 785 0.3Valeant Pharmaceuticals 7% 2020 $895,000 586 0.2Valeant Pharmaceuticals 6.75% 2021 $1,160,000 753 0.3Valeant Pharmaceuticals 7.25% 2022 $1,320,000 870 0.4Vanguard Natural Resources 7.875% 2020 $780,000 500 0.2Videotron 5% 2022 $250,000 149 0.1Visteon 6.75% 2019 $954,000 610 0.2VPI Escrow 7.5% 2021 $2,460,000 1,666 0.7Vulcan Materials 7% 2018 $335,000 236 0.1Vulcan Materials 7.5% 2021 $555,000 389 0.2Watco 6.375% 2023 $470,000 283 –Wesco Distribution 5.375% 2021 $170,000 104 –Whiting Petroleum 5.75% 2021 $1,835,000 1,168 0.5William Carter 5.25% 2021 $160,000 99 –Wind Acquisition Finance 7.25% 2018 $280,000 178 0.1Wind Acquisition Finance 7.25% SNR 2018 $915,000 584 0.2Wind Acquisition Finance 6.5% 2020 $200,000 132 0.1Windstream 7.75% 2020 $10,000 6 –Windstream 7.75% 2021 $1,965,000 1,257 0.5Windstream 6.375% 2023 $595,000 337 0.1Windstream 7.5% 2023 $750,000 457 0.2WMG Acquisition 11.5% 2018 $425,000 294 0.1WMG Acquisition 6% 2021 $311,000 195 0.1Zayo Group 8.125% 2020 $765,000 514 0.2
Liquidation claim – 0.0% (0.0%)Quebecor Liquidation Claim‡ $900,000 8 –
Sterling – 0.4% (0.0%)Crown Newco 7% 2018 £1,000,000 1,049 0.4
Swaps – 0.1% (0.2%)US Dollar – 0.1%Credit Index Swaps CDI CDX HY 5%
20 Jun 2018 5,000,000 249 0.1Credit Index Swaps CDI CDX HY 5%
20 Jun 2018 (5,000,000) – –
Forward currency contracts – (0.7)% (0.4%)US Dollar – (0.7)%Buy $19,650,421 sell £11,861,166 dated 28/02/14 80 –Sell $431,015,441 buy £260,226,391 dated 28/02/14 (1,683) (0.7)
Investment assets (including investment liabilities) 237,116 96.6
Net other assets 8,281 3.4
Net assets 245,397 100.0
Unless otherwise stated the above securities are admitted to official stock exchange listings or trade on aregulated market.
The comparative percentage figures in brackets are at 31 January 2013.
‡ Delisted security
Market value Portfolio credit ratings £’000
BBB 11,558BBB- 1,716BB+ 4,392BB 906BB- 35,051B+ 43,532B 42,673B- 44,027CCC+ 40,407CCC 12,930C 1,270
Total bonds 238,462
Forward currency contracts (1,603)Swaps 249 Liquidation claim 8
Investment assets (including investment liabilities) 237,116
Portfolio statement – continuedAs at 31 January 2014
Market value Total netInvestment Holding £’000 assets %
Market value Total netInvestment Holding £’000 assets %
158
Continuation�
� Return to Index

159
Continuation�
� Return to Index
Counterparty exposure
Credit Forwarddefault currencyswaps contracts Total
Counterparty £’000 £’000 £’000
Credit Suisse 249 58 308HSBC – (1,680) (1,680)Morgan Stanley – (1) (1)NAB Ltd – – –State Street – 14 14UBS – 4 4Westpac Banking Corp – 1 1
At the balance sheet date, there was no collateral received by the fund from the above counterparties.
The counterparty exposure on forward currency contracts is reported at their mark to market values butfor futures contracts it is only the positive mark to market values that are reported.
Portfolio statement – continuedAs at 31 January 2014

160
Continuation�
� Return to Index
£’000
Total of all purchases for the year 145,820
Major purchases Cost
Clear Channel Worldwide ‘B’ 6.5% 2022 2,269Tenet Healthcare 4.75% 2020 1,955Caesars Entertainment Operating 9% 2020 1,865VPI Escrow 7.5% 2021 1,647General Motors Financials 4.875% 2023 1,549Sprint 7.875% 2023 1,524Kinetic Concepts 10.5% 2018 1,347Acco Brands 6.75% 2020 1,267Intelsat Jackson 7.25% 2020 1,262Hawk Acquisition 4.25% 2020 1,215Whiting Petroleum 5.75% 2021 1,170MGM Resorts International 7.75% 2022 1,158MGM Resorts International 5.25% 2020 1,110Crown Newco 7% 2018 1,055Ally Financial 7.5% 2020 1,040CenturyLink 6.75% 2023 1,034Chrysler Group 8.25% 2021 1,015HD Supply 8.125% 2019 1,014Party City 8.875% 2020 992Denali Finance 5.625% 2020 959
£’000
Total of all sales for the year 105,254
Major sales Proceeds
Clear Channel Worldwide ‘B’ 6.5% 2022 1,943Ally Financial 5.5% 2017 1,554Intelsat Jackson 6.625% 2022 1,363Sealy Mattress 8.25% 2014 1,254Caesars Entertainment Operating 9% 2020 1,249Chiron Merger 10.5% 2018 1,122Spectrum Brands 9.5% 2018 1,100NRG Energy 7.625% 2018 1,012Party City 8.875% 2020 992Tenet Healthcare 4.75% 2020 980MGM Resorts International 8.625% 2019 946Halcon Resources 8.875% 2021 887Mylan 7.875% 2020 882RBS Global & Rexnord 8.5% 2018 831Gencorp 7.125% 2021 821HD Supply 8.125% 2019 794Citycenter 7.625% 2016 788AES 8% 2017 788MGM Resorts International 6.75% 2020 783Sungard Data Systems 6.625% 2019 781
Portfolio movements For the year ending 31 January 2014

161
Continuation�
� Return to Index
Statement of total returnFor the year ending 31 January
2014 2013£’000 £’000 £’000 £’000
Income
Net capital gains (Note 1) 106 13,630
Revenue (Note 2) 16,735 14,771
Expenses (Note 3) (2,837) (2,418)
Net revenue before taxation 13,898 12,353
Taxation (Note 4) (2) (15)
Net revenue after taxation 13,896 12,338
Total return before distributions 14,002 25,968
Finance costs: Distributions (Note 5) (16,308) (14,422)
Change in net assets attributable to shareholders from investment activities (2,306) 11,546
Statement of change in net assets attributable to shareholdersFor the year ending 31 January
2014 2013£’000 £’000 £’000 £’000
Opening net assets attributable to shareholders 226,072 172,601
Amounts receivable on issue of shares 94,352 89,702
Amounts payable on cancellation of shares (79,103) (53,818)
15,249 35,884
Change in net assets attributable to shareholders from investment activities (see above) (2,306) 11,546
Retained distributions on accumulation shares 6,376 6,034
Unclaimed distributions 6 7
Closing net assets attributable to shareholders 245,397 226,072
Balance sheetAs at 31 January
2014 2013£’000 £’000 £’000 £’000
ASSETS
Investment assets 238,799 211,498
Debtors (Note 7) 6,425 6,120
Cash and bank balances (Note 8) 6,840 14,404
Total other assets 13,265 20,524
Total assets 252,064 232,022
LIABILITIES
Investment liabilities (1,683) –
Creditors (Note 9) (3,289) (4,322)
Distribution payable on income shares (1,695) (1,628)
Total other liabilities (4,984) (5,950)
Total liabilities (6,667) (5,950)
Net assets attributable to shareholders 245,397 226,072
The notes to these financial statements are shown on pages 162 to 163.
Financial statements

162
Continuation�
� Return to Index
1. Net capital gains2014 2013
£’000 £’000Currency losses (1,185) (4,248)Derivative contracts 347 672Forward currency contracts 12,786 3,813Non-derivative securities (11,842) 13,393Net capital gains 106 13,630
2. Revenue2014 2013
£’000 £’000Interest on bank and term deposits 18 28Interest on derivatives 306 534Interest on fixed-interest securities 16,411 14,208Stocklending income* – 1Total revenue 16,735 14,771
* Stocklending income is disclosed net of fees. See note 11.
3. Expenses2014 2013
£’000 £’000Payable to the ACD or associate of the ACD:ACD fee 2,424 2,085Fixed expenses 413 333Total expenses 2,837 2,418
4. Taxation2014 2013
£’000 £’000a) Analysis of charge in the yearOverseas tax suffered 2 15Current year tax charge (Note 4b) 2 15
b) Factors affecting the tax charge for the yearThe tax assessed for the year is lower than the standard rate of corporation tax inthe UK for an Open-Ended Investment Company (OEIC) (20%). The differences areexplained below.
Net revenue before taxation 13,898 12,353Corporation tax at 20% 2,780 2,471
Effects of:Interest distributions deductible for tax purposes (3,264) (2,885)Excess expenses for which no relief taken 484 414Overseas tax suffered 2 15
(2,778) (2,456)Current year tax charge (Note 4a) 2 15
No deferred tax asset has been recognised in the financial statements. At the yearend date, the Fund had a potential unrecognised deferred tax asset of £2,979,245(31.01.13: £1,710,818) in relation to £14,896,227 (31.01.13: £8,554,092) of excessinterest distributions which would only be utilised to reduce the tax charge if theFund had an excess of unfranked income over expenses in a future period. There isno excess of unfranked income expected in the future.
5. Finance costsDistributionsThe distributions take account of amounts receivable on the issue of shares andamounts payable on the cancellation of shares and comprise:
2014 2013£’000 £’000
First interim interest distribution 4,292 3,356Second interim interest distribution 4,244 3,770Third interim interest distribution 3,933 3,635Final interest distribution 3,915 3,943Add: Amounts payable on cancellation of shares 489 368Deduct: Amounts receivable on issue of shares (565) (650)Total finance costs 16,308 14,422
Details of the distribution per share are set out on pages 164 to 167.
6. Movement between net revenue after taxation and distributions2014 2013
£’000 £’000Net revenue after taxation 13,896 12,338Add: ACD fee (net of tax relief) paid from capital 2,424 2,085Add: Undistributed revenue brought forward 15 14Deduct: Undistributed revenue carried forward (24) (15)Equalisations on conversions (3) –
16,308 14,422
7. Debtors2014 2013
£’000 £’000Accrued income 4,921 4,443Due from the ACD for shares created 59 810Overseas tax recoverable 11 –Sales awaiting settlement 1,434 867Total debtors 6,425 6,120
8. Cash and bank balances2014 2013
£’000 £’000Cash and bank balances 6,840 14,404
9. Creditors2014 2013
£’000 £’000Accrued expenses 218 227Due to the ACD for shares cancelled 1,133 516Income tax payable 1,328 1,347Purchases awaiting settlement 610 2,232Total creditors 3,289 4,322
10. Portfolio transaction costsNo portfolio transactions costs were incurred during the current or prior year.
Notes to the financial statements for the year ending 31 January 2014

163
Continuation�
� Return to Index
11. Related party transactionsJPMorgan Funds Limited, as Authorised Corporate Director (“ACD”), is a relatedparty, and acts as principal in respect of all transactions of shares in the Company.The aggregate monies received through issue, and paid on cancellation, aredisclosed in the Statement of Change in Net Assets Attributable to Shareholders.
The balance due to the ACD and their associates at the year end date in respect ofrelated party transactions was £1,292,067 (31.01.13: £67,449). Details of relatedparty transactions are given under note 13 on page 413.
The following party held a material interest in the Fund at the year end date:– FNZ (UK) Nominess Ltd 11.5% (2013: 0.00%)
12. Financial instrumentsCurrency exposuresA proportion of the net assets of the Fund are denominated in currencies otherthan sterling, with the effect that the Balance sheet and total return can beaffected by currency movements.
Net foreign currency assets/(liabilities)Monetary Non-monetary
Total exposures exposuresCurrency £’000 £’000 £’000
31.01.14US Dollar (538) (238,208) 237,670
31.01.13Euro 3 3 –US Dollar (340) (210,997) 210,657
Interest rate riskThe tables below detail the interest rate profile of the Fund’s assets and liabilitiesas at the year end.
Financialassets
Floating Fixed notrate rate carrying
Total financial financial anyassets assets assets interest
Currency £’000 £’000 £’000 £’000
31.01.14UK Sterling 250,919 – 1,049 249,870US Dollar (538) 12,074 232,186 (244,798)
31.01.13UK Sterling 230,127 7,815 – 222,312US Dollar 1,892 8,087 208,879 (215,074)Euro 3 3 – –
The floating rate financial assets comprise investments in variable interest ratepaying corporate debt and bank balances that bear interest at rates based onLIBOR or its overseas equivalent.
Floating Financialrate liabilities
Total financial not carryingliabilities liabilities any interest
Currency £’000 £’000 £’000
31.01.14UK Sterling 4,984 – 4,984
31.01.13UK Sterling 3,718 – 3,718US Dollar 2,232 – 2,232
Fixed rate financial assetsWeighted
averageWeighted period for
average which rate is Currency interest rate fixed (years)
31.01.14US Dollar 5.5% 6.5UK Sterling 5.1% 4.0
31.01.13US Dollar 5.9% 6.8
For consideration of other risks including liquidity, pricing and credit risk, pleaserefer to thenotes to the aggregated financial statements, pages 413 to 414.
13. Share classesThe Fund currently has five share classes; Class A Shares, Class B Shares, Class CShares, Class I Shares and Class X Shares. The Authorised Corporate Director’s(ACD) fee and fixed expenses charge are shown below.
ACD fee Fixed expensesClass A shares: 1.10% 0.18%Class B shares: 0.75% 0.18%Class C shares: 0.55% 0.18%Class I shares: 0.45% 0.00%Class X shares: 0.00% 0.06%
The X share class is designed to accommodate an alternative charging structurewhereby the annual fee normally charged to the Fund and then passed on in theshare price is instead administratively levied and collected by the ACD from theshareholder or through the relevant JPMorgan Chase & Co entity.
The net asset value of each share class, the net asset value per share and thenumber of shares in each class are shown on page 155. All classes have the samerights on winding up.
14. Derivatives The Fund enters into derivative transactions in the form of forward currencycontracts, and credit default swaps for the purpose of efficient portfoliomanagement. The positive mark to market approach has been used to calculatethe global exposure.
Further information on the derivative risks can be found in the notes to theaggregated financial statements on page 414.
15. Contingent liabilities and capital commitmentsAt the balance sheet date there were no contingent liabilities or capitalcommitments (2013: none).
Notes to the financial statements – continued

Final interest distribution in pence per share
Group 1 – Shares purchased prior to 1 November 2013Group 2 – Shares purchased 1 November 2013 to 31 January 2014
DistributionGross Tax Net payable paid
revenue at 20% revenue Equalisation 30.04.14 30.04.13
A-Class Accumulation Shares
Group 1 1.525000 0.305000 1.220000 – 1.220000 1.310000
Group 2 0.772271 0.154454 0.617817 0.602183 1.220000 1.310000
A-Class Income Shares
Group 1 0.637500 0.127500 0.510000 – 0.510000 0.580000
Group 2 0.302529 0.060506 0.242023 0.267977 0.510000 0.580000
B-Class Accumulation Shares
Group 1 1.537500 0.307500 1.230000 – 1.230000 –
Group 2 1.370800 0.274160 1.096640 0.133360 1.230000 –
B-Class Income Shares
Group 1 1.787500 0.357500 1.430000 – 1.430000 1.600000
Group 2 0.459246 0.091849 0.367397 1.062603 1.430000 1.600000
C-Class Accumulation Shares
Group 1 1.700000 0.340000 1.360000 – 1.360000 1.440000
Group 2 0.695101 0.139020 0.556081 0.803919 1.360000 1.440000
C-Class Gross Accumulation Shares
Group 1 1.630000 0.000000 1.630000 – 1.630000 1.810000
Group 2 0.551859 0.000000 0.551859 1.078141 1.630000 1.810000
C-Class Income Shares
Group 1 1.587500 0.317500 1.270000 – 1.270000 1.440000
Group 2 0.793785 0.158757 0.635028 0.634972 1.270000 1.440000
C-Class Gross Income Shares
Group 1 1.510000 0.000000 1.510000 – 1.510000 1.780000
Group 2 0.810452 0.000000 0.810452 0.699548 1.510000 1.780000
I-Class Accumulation Shares
Group 1 2.762500 0.552500 2.210000 – 2.210000 2.370000
Group 2 2.370070 0.474014 1.896056 0.313944 2.210000 2.370000
I-Class Gross Accumulation Shares
Group 1 2.540000 0.000000 2.540000 – 2.540000 2.790000
Group 2 2.540000 0.000000 2.540000 0.000000 2.540000 2.790000
I-Class Income Shares
Group 1 1.600000 0.320000 1.280000 – 1.280000 1.440000
Group 2 1.600000 0.320000 1.280000 0.000000 1.280000 1.440000
I-Class Gross Income Shares
Group 1 1.620000 0.000000 1.620000 – 1.620000 1.880000
Group 2 1.620000 0.000000 1.620000 0.000000 1.620000 1.880000
X-Class Gross Accumulation Shares
Group 1 1.860000 0.000000 1.860000 – 1.860000 2.010000
Group 2 1.860000 0.000000 1.860000 0.000000 1.860000 2.010000
Distribution tables
164
Continuation�
� Return to Index

165
Continuation�
� Return to Index
Third interim interest distribution in pence per share
Group 1 – Shares purchased prior to 1 August 2013Group 2 – Shares purchased 1 August 2013 to 31 October 2013
DistributionGross Tax Net paid paid
revenue at 20% revenue Equalisation 31.01.14 31.01.13
A-Class Accumulation Shares
Group 1 1.475000 0.295000 1.180000 – 1.180000 1.190000
Group 2 0.723133 0.144627 0.578506 0.601494 1.180000 1.190000
A-Class Income Shares
Group 1 0.625000 0.125000 0.500000 – 0.500000 0.530000
Group 2 0.351584 0.070317 0.281267 0.218733 0.500000 0.530000
B-Class Accumulation Shares
Group 1 1.475000 0.295000 1.180000 – 1.180000 –
Group 2 1.440418 0.288084 1.152334 0.027666 1.180000 –
B-Class Income Shares
Group 1 1.737500 0.347500 1.390000 – 1.390000 1.480000
Group 2 1.336403 0.267281 1.069122 0.320878 1.390000 1.480000
C-Class Accumulation Shares
Group 1 1.637500 0.327500 1.310000 – 1.310000 1.330000
Group 2 0.777741 0.155548 0.622193 0.687807 1.310000 1.330000
C-Class Gross Accumulation Shares
Group 1 1.530000 0.000000 1.530000 – 1.530000 1.440000
Group 2 0.142250 0.000000 0.142250 1.387750 1.530000 1.440000
C-Class Income Shares
Group 1 1.537500 0.307500 1.230000 – 1.230000 1.330000
Group 2 0.564371 0.112874 0.451497 0.778503 1.230000 1.330000
C-Class Gross Income Shares
Group 1 1.420000 0.000000 1.420000 – 1.420000 1.440000
Group 2 0.203858 0.000000 0.203858 1.216142 1.420000 1.440000
I-Class Accumulation Shares
Group 1 2.662500 0.532500 2.130000 – 2.130000 2.200000
Group 2 2.484264 0.496853 1.987411 0.142589 2.130000 2.200000
I-Class Gross Accumulation Shares
Group 1 2.370000 0.000000 2.370000 – 2.370000 2.500000
Group 2 1.195849 0.000000 1.195849 1.174151 2.370000 2.500000
I-Class Income Shares
Group 1 1.562500 0.312500 1.250000 – 1.250000 1.310000
Group 2 0.742161 0.148432 0.593729 0.656271 1.250000 1.310000
I-Class Gross Income Shares
Group 1 1.540000 0.000000 1.540000 – 1.540000 1.730000
Group 2 0.661562 0.000000 0.661562 0.878438 1.540000 1.730000
X-Class Gross Accumulation Shares
Group 1 1.740000 0.000000 1.740000 – 1.740000 1.790000
Group 2 0.664795 0.000000 0.664795 1.075205 1.740000 1.790000
Distribution tables – continued

Second interim interest distribution in pence per share
Group 1 – Shares purchased prior to 1 May 2013Group 2 – Shares purchased 1 May 2013 to 31 July 2013
DistributionGross Tax Net paid paid
revenue at 20% revenue Equalisation 31.10.13 31.10.12
A-Class Accumulation Shares
Group 1 1.600000 0.320000 1.280000 – 1.280000 1.310000
Group 2 0.862994 0.172599 0.690395 0.589605 1.280000 1.310000
A-Class Income Shares
Group 1 0.687500 0.137500 0.550000 – 0.550000 0.600000
Group 2 0.336499 0.067300 0.269199 0.280801 0.550000 0.600000
B-Class Accumulation Shares
Group 1 1.587500 0.317500 1.270000 – 1.270000 –
Group 2 1.073031 0.214606 0.858425 0.411575 1.270000 –
B-Class Income Shares
Group 1 1.900000 0.380000 1.520000 – 1.520000 1.650000
Group 2 1.113146 0.222629 0.890517 0.629483 1.520000 1.650000
C-Class Accumulation Shares
Group 1 1.762500 0.352500 1.410000 – 1.410000 –
Group 2 0.824154 0.164831 0.659323 0.750677 1.410000 –
C-Class Gross Accumulation Shares
Group 1 1.730000 0.000000 1.730000 – 1.730000 –
Group 2 1.033382 0.000000 1.033382 0.696618 1.730000 –
C-Class Income Shares
Group 1 1.700000 0.340000 1.360000 – 1.360000 –
Group 2 0.612436 0.122487 0.489949 0.870051 1.360000 –
C-Class Gross Income Shares
Group 1 1.650000 0.000000 1.650000 – 1.650000 –
Group 2 0.388600 0.000000 0.388600 1.261400 1.650000 –
I-Class Accumulation Shares
Group 1 2.875000 0.575000 2.300000 – 2.300000 2.320000
Group 2 1.931488 0.386298 1.545190 0.754810 2.300000 2.320000
I-Class Gross Accumulation Shares
Group 1 2.660000 0.000000 2.660000 – 2.660000 2.750000
Group 2 0.567115 0.000000 0.567115 2.092885 2.660000 2.750000
I-Class Income Shares
Group 1 1.700000 0.340000 1.360000 – 1.360000 1.470000
Group 2 1.027321 0.205464 0.821857 0.538143 1.360000 1.470000
I-Class Gross Income Shares
Group 1 1.750000 0.000000 1.750000 – 1.750000 1.930000
Group 2 1.750000 0.000000 1.750000 0.000000 1.750000 1.930000
X-Class Gross Accumulation Shares
Group 1 1.940000 0.000000 1.940000 – 1.940000 1.570000
Group 2 0.675229 0.000000 0.675229 1.264771 1.940000 1.570000
Distribution tables – continued
166
Continuation�
� Return to Index

167
� Return to Index
First interim interest distribution in pence per share
Group 1 – Shares purchased prior to 1 February 2013Group 2 – Shares purchased 1 February 2013 to 30 April 2013
DistributionGross Tax Net paid paid
revenue at 20% revenue Equalisation 31.07.13 31.07.12
A-Class Accumulation Shares
Group 1 1.562500 0.312500 1.250000 – 1.250000 1.190000
Group 2 0.658852 0.131770 0.527082 0.722918 1.250000 1.190000
A-Class Income Shares
Group 1 0.675000 0.135000 0.540000 – 0.540000 0.540000
Group 2 0.362193 0.072438 0.289755 0.250245 0.540000 0.540000
B-Class Accumulation Shares
Group 1 1.550000 0.310000 1.240000 – 1.240000 –
Group 2 0.620622 0.124124 0.496498 0.743502 1.240000 –
B-Class Income Shares
Group 1 1.887500 0.377500 1.510000 – 1.510000 1.520000
Group 2 0.535480 0.107096 0.428384 1.081616 1.510000 1.520000
C-Class Accumulation Shares
Group 1 1.725000 0.345000 1.380000 – 1.380000 –
Group 2 0.962527 0.192505 0.770022 0.609978 1.380000 –
C-Class Gross Accumulation Shares
Group 1 1.730000 0.000000 1.730000 – 1.730000 –
Group 2 1.652744 0.000000 1.652744 0.077256 1.730000 –
C-Class Income Shares
Group 1 1.675000 0.335000 1.340000 – 1.340000 –
Group 2 0.632827 0.126565 0.506262 0.833738 1.340000 –
C-Class Gross Income Shares
Group 1 1.680000 0.000000 1.680000 – 1.680000 –
Group 2 0.973955 0.000000 0.973955 0.706045 1.680000 –
I-Class Accumulation Shares
Group 1 2.800000 0.560000 2.240000 – 2.240000 2.110000
Group 2 2.706221 0.541244 2.164977 0.075023 2.240000 2.110000
I-Class Gross Accumulation Shares
Group 1 2.670000 0.000000 2.670000 – 2.670000 2.480000
Group 2 0.550780 0.000000 0.550780 2.119220 2.670000 2.480000
I-Class Income Shares
Group 1 1.687500 0.337500 1.350000 – 1.350000 1.350000
Group 2 0.889217 0.177843 0.711374 0.638626 1.350000 1.350000
I-Class Gross Income Shares
Group 1 1.790000 0.000000 1.790000 – 1.790000 1.780000
Group 2 0.437799 0.000000 0.437799 1.352201 1.790000 1.780000
X-Class Gross Accumulation Shares
Group 1 1.960000 0.000000 1.960000 – 1.960000 1.800000
Group 2 0.386207 0.000000 0.386207 1.573793 1.960000 1.800000
Equalisation applies only to shares purchased during the distribution period (group 2 shares). It is the average amount of revenue included in the purchase price of all group 2 shares and is refunded to holders of these
shares as a return of capital. Being capital it is not liable to income tax but must be deducted from the cost of shares for capital gains tax purposes.
Distribution tables – continued
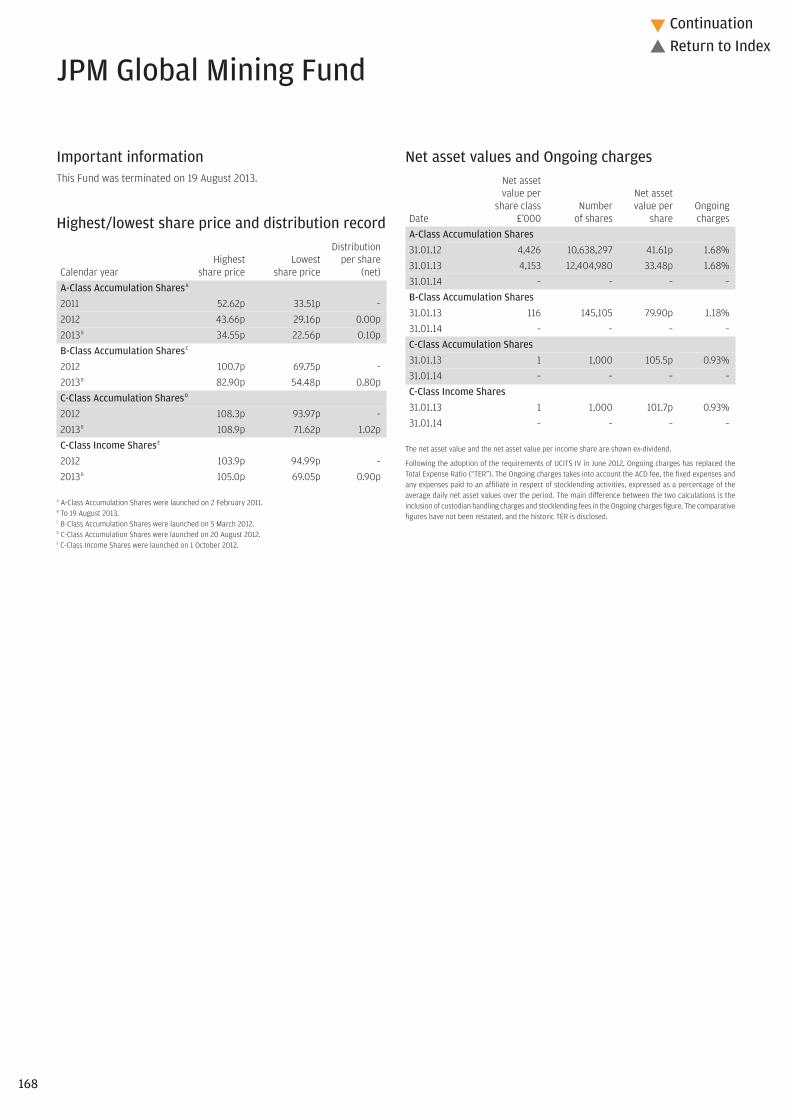
Important informationThis Fund was terminated on 19 August 2013.
Highest/lowest share price and distribution recordDistribution
Highest Lowest per shareCalendar year share price share price (net)A-Class Accumulation SharesA
2011 52.62p 33.51p –2012 43.66p 29.16p 0.00p2013B 34.55p 22.56p 0.10pB-Class Accumulation SharesC
2012 100.7p 69.75p –2013B 82.90p 54.48p 0.80pC-Class Accumulation SharesD
2012 108.3p 93.97p –2013B 108.9p 71.62p 1.02pC-Class Income SharesE
2012 103.9p 94.99p –2013B 105.0p 69.05p 0.90p
A A-Class Accumulation Shares were launched on 2 February 2011.B To 19 August 2013.C B-Class Accumulation Shares were launched on 5 March 2012.D C-Class Accumulation Shares were launched on 20 August 2012.E C-Class Income Shares were launched on 1 October 2012.
Net asset values and Ongoing chargesNet assetvalue per Net asset
share class Number value per OngoingDate £’000 of shares share chargesA-Class Accumulation Shares31.01.12 4,426 10,638,297 41.61p 1.68%31.01.13 4,153 12,404,980 33.48p 1.68%31.01.14 – – – –B-Class Accumulation Shares31.01.13 116 145,105 79.90p 1.18%31.01.14 – – – –C-Class Accumulation Shares31.01.13 1 1,000 105.5p 0.93%31.01.14 – – – –C-Class Income Shares31.01.13 1 1,000 101.7p 0.93%31.01.14 – – – –
The net asset value and the net asset value per income share are shown ex-dividend.
Following the adoption of the requirements of UCITS IV in June 2012, Ongoing charges has replaced theTotal Expense Ratio (“TER”). The Ongoing charges takes into account the ACD fee, the fixed expenses andany expenses paid to an affiliate in respect of stocklending activities, expressed as a percentage of theaverage daily net asset values over the period. The main difference between the two calculations is theinclusion of custodian handling charges and stocklending fees in the Ongoing charges figure. The comparativefigures have not been restated, and the historic TER is disclosed.
JPM Global Mining Fund
168
Continuation�
� Return to Index

169
Continuation�
� Return to Index
Base metals & diversified – 0.00% (66.8%)Kagara† 170,000 – –Regulus Resources Warrants 2014 (CAD 1.60)# 6,469 – –
Gold & silver – 0.00% (19.7%)Aureus Mining Warrant 2014 (GBP 0.625)# 4,250 – –
Investment assets – –
Net other assets – –
Net assets – –
Unless otherwise stated the above securities are admitted to official stock exchange listings or trade on aregulated market.
The comparative percentage figures in brackets are at 31 January 2013.
# Unquoted security† Suspended security
Portfolio statementAs at 31 January 2014
Market value Total netInvestment Holding £’000 assets %

170
Continuation�
� Return to Index
Statement of total returnFor the year ending 31 January
2014 2013£’000 £’000 £’000 £’000
Income
Net capital losses (Note 1) (1,018) (954)
Revenue (Note 2) 50 73
Expenses (Note 3) (30) (70)
Net revenue before taxation 20 3
Taxation (Note 4) (4) (4)
Net revenue/(expenses) after taxation 16 (1)
Total return before distributions (1,002) (955)
Finance costs: Distributions (Note 5) (16) 1
Change in net assets attributable to shareholders from investment activities (1,018) (954)
Statement of change in net assets attributable to shareholdersFor the year ending 31 January
2014 2013£’000 £’000 £’000 £’000
Opening net assets attributable to shareholders 4,271 4,426
Amounts receivable on issue of shares 559 1,444
Amounts payable on cancellation of shares (3,819) (643)
(3,260) 801
Change in net assets attributable to shareholders from investment activities (see above) (1,018) (954)
Retained distributions onaccumulation shares 8 –
Stamp duty reserve tax (1) (2)
Closing net assets attributable to shareholders – 4,271
Balance sheetAs at 31 January
2014 2013£’000 £’000 £’000 £’000
ASSETS
Investment assets – 4,131
Debtors (Note 7) – 6
Cash and bank balances (Note 8) – 154
Total other assets – 160
Total assets – 4,291
LIABILITIES
Creditors (Note 9) – (20)
Total liabilities – (20)
Net assets attributable to shareholders – 4,271
The notes to these financial statements are shown on pages 171 to 172.
Financial statements

171
Continuation�
� Return to Index
1. Net capital losses2014 2013
£’000 £’000Currency losses (7) (6)Non-derivative securities (1,011) (948)Net capital losses (1,018) (954)
2. Revenue2014 2013
£’000 £’000Franked income from UK equity investments 19 33Income from overseas equity investments 31 39Interest on bank and term deposits – 1Total revenue 50 73
3. Expenses2014 2013
£’000 £’000Payable to the ACD or associate of the ACD:ACD fee 27 62Fixed expenses 3 8Total expenses 30 70
4. Taxation2014 2013
£’000 £’000a) Analysis of charge in the yearOverseas tax suffered 4 4Current year tax charge (Note 4b) 4 4
b) Factors affecting the tax charge for the yearThe tax assessed for the year is equal to the standard rate of corporation tax in theUK for an Open-Ended Investment Company (OEIC) (20%). The differences areexplained below.
Net revenue before taxation 20 3Corporation tax at 20% 4 1
Effects of:Dividends not subject to corporation tax (10) (15)Excess expenses for which no relief taken 6 14Overseas tax suffered 4 4
– 3Current year tax charge (Note 4a) 4 4
No deferred tax asset has been recognised in the financial statements. At the yearend date, the Fund had a potential unrecognised deferred tax asset of £31,752(31.01.13: £25,734) in relation to £158,761 (31.01.13: £128,671) of excessmanagement expenses which would only be utilised to reduce the tax charge if theFund had an excess of unfranked income over expenses in a future period. There isno excess of unfranked income expected in the future.
5. Finance costsDistributionsThe distributions take account of amounts receivable on the issue of shares andamounts payable on the cancellation of shares and comprise:
2014 2013£’000 £’000
Final dividend distribution 8 –Add: Amounts payable on cancellation of shares 9 1Deduct: Amounts receivable on issue of shares (1) (2)Total finance costs 16 (1)
Details of the distribution per share are set out on page 173.
6. Movement between net revenue/(expenses) after taxation anddistributions
2014 2013£’000 £’000
Net revenue/(expenses) after taxation 16 (1)
7. Debtors2014 2013
£’000 £’000Accrued income – 2Due from the ACD for shares created – 3Overseas tax recoverable – 1Total debtors – 6
8. Cash and bank balances2014 2013
£’000 £’000Cash and bank balances – 154
9. Creditors2014 2013
£’000 £’000Accrued expenses – 6Due to the ACD for shares cancelled – 14Total creditors – 20
Notes to the financial statements for the year ending 31 January 2014

172
Continuation�
� Return to IndexNotes to the financial statements – continued
10. Portfolio transaction costs2014 2013
£’000 £’000Analysis of total purchase costs
Purchases in year before transaction costs 947 1,895
Commissions – 2Total purchase costs – 2Gross purchases total 947 1,897
Analysis of total sale costs
Gross sales before transaction costs 4,068 1,082
Commissions – (2)Total sale costs – (2)Total sales net of transaction costs 4,068 1,080
11. Related party transactionsJPMorgan Funds Limited, as Authorised Corporate Director (“ACD”), is a relatedparty, and acts as principal in respect of all transactions of shares in the Company.The aggregate monies received through issue, and paid on cancellation, aredisclosed in the Statement of Change in Net Assets Attributable to Shareholders.
The balance due from the ACD and their associates at the year end date in respectof related party transactions was £nil (31.01.13: £16,844). Details of related partytransactions are given under note 13 on page 413.
Some of the dealing transactions for the fund are carried out through associates ofthe ACD. Such transactions are carried out on an arm’s length basis. Thecommissions paid to these companies over the year were £429 (31.01.13: £49).Commission was paid to the associated company JPMorgan Securities Ltd.
The following parties held a material interest in the Fund at the year end date:– JPMorgan Investments Limited 00.00% (31.01.13: 29.32%)– Hargreaves Lansdown Nominees 00.00% (31.01.13: 22.89%)
12. Share classesThe Fund had three share classes; Class A Shares, Class B Shares and Class CShares. The Authorised Corporate Director’s (ACD) fee and fixed expenses chargewere as shown below.
ACD fee Fixed expensesClass A shares: 1.50% 0.18%Class B shares: 1.00% 0.18%Class C shares: 0.75% 0.18%
The net asset value of each share class, the net asset value per share and thenumber of shares in each class are shown on page 168. All classes had the samerights on winding up.
13. Contingent liabilities and capital commitmentsAt the balance sheet date there were no contingent liabilities or capitalcommitments (2013: none).

173
� Return to IndexDistribution table
Final distribution in pence per share
Group 1 – Shares purchased prior to 1 February 2013Group 2 – Shares purchased 1 February 2013 to 19 August 2013
DistributionGross Tax Net paid paid
revenue at 10% revenue Equalisation 08.11.13 30.04.13
A-Class Accumulation Shares
Group 1 0.111111 0.011111 0.000000 – 0.100000 0.000000
Group 2 0.044730 0.004473 0.040257 0.059743 0.100000 0.000000
B-Class Accumulation Shares
Group 1 0.455556 0.045556 0.410000 – 0.410000 0.390000
Group 2 0.455556 0.045556 0.410000 0.000000 0.410000 0.390000
C-Class Accumulation Shares
Group 1 0.711111 0.071111 0.640000 – 0.640000 0.380000
Group 2 0.711111 0.071111 0.640000 0.000000 0.640000 0.380000
C-Class Income Shares
Group 1 0.700000 0.070000 0.630000 – 0.630000 0.270000
Group 2 0.499497 0.049950 0.449547 0.180453 0.630000 0.270000
Equalisation applies only to shares purchased during the distribution period (group 2 shares). It is the average amount of revenue included in the purchase price of all group 2 shares and is refunded to holders of these
shares as a return of capital. Being capital it is not liable to income tax but must be deducted from the cost of shares for capital gains tax purposes.

Investment objective and policyA
To provide long-term capital growth by investing primarily in Real EstateInvestment Trusts (REITs) and in Equity and Equity-Linked Securities of otherreal estate companies that, at the time of investment, are significant owners,developers or financiers of real estate or that provide real estate relatedservices.
The Fund will invest in smaller companies and may invest in Emerging Marketson an ancillary basis.
Other instruments as permitted in the stated investment and borrowing powersof the Company including, but not limited to, fixed interest securities, cash andcash equivalents may be held on an ancillary basis, as appropriate.
The Fund will aim to hedge non-Sterling exposures back to Sterling.
Risk profileThe value of your investment may fall as well as rise and you may get backless than you originally invested.
The value of Equity and Equity-Linked Securities may fluctuate in responseto the performance of individual companies and general market conditions.
Investments in companies engaged in the business of real estate may bemore difficult to sell and may experience increased price volatility due tochanges in economic conditions and interest rates.
The Fund invests in securities of smaller companies which may be moredifficult to sell, more volatile and tend to carry greater financial risk thansecurities of larger companies.
The Fund will be concentrated in real estate companies and may beconcentrated in one or more countries. As a result, the Fund may be morevolatile than more broadly diversified funds.
Movements in currency exchange rates can adversely affect the return ofyour investment. The currency hedging that may be used to minimise theeffect of currency fluctuations may not always be successful.
Please refer to Part 11 of the Prospectus for details of the general risk factorsaffecting this Fund in addition to the specific risk factors above.
Fund reviewThe global REIT index moved up in the 12-month period, as support continuedto build for real estate exposure.
The Fund underperformed the REIT benchmark for the 12-month period.On a relative basis, overall investment performance in the US, China, Singaporeand Sweden detracted the most. In terms of stock selection, the US andJapan were the biggest detractors. An underweight position in SumitomoRealty & Development and an overweight position in Capitaland were thelargest detractors from relative performance. In contrast, stock selectionin the UK and Canada contributed the most to relative performance. In termsof individual names, Mitsui Fudosan and Nippon Prologis added value.
Fund outlookIn terms of our outlook, the US Federal Reserve confirmed that base rates(short end) would stay low for a long time, even if employment were to hit6.5%. We expect that the US, European and UK central banks will operatein a similarly accommodative fashion. While this is supportive, we believethe key to market and REIT performance moving forward will be the trajectoryof global growth in 2014. Finally, we continue to assert that an allocation toglobal real estate securities offers investors an interesting opportunity toearn a dividend that is still attractive vs. core bonds, to enjoy capitalappreciation and to hedge against two possible economic scenarios byperforming acceptably in either a higher-growth or low-growth environment.
12 month performance as at 31 January 2014 2013 2012 2011 2010
JPM Global Property SecuritiesA-Class Acc 0.4% 23.8% -2.2% 21.9% 31.1%
JPM Global Property SecuritiesB-Class Acc 0.7% – – – –
JPM Global Property SecuritiesC-Class Acc 1.0% – – – –
JPM Global Property SecuritiesI-Class Acc 1.2% 24.5% -1.4% 23.0% 32.1%
JPM Global Property SecuritiesX-Class Acc 1.7% 24.9% -1.4% 23.9% 32.8%
Benchmark IndexB 3.8% 23.8% -1.9% 23.1% 37.8%
Fund statisticsRisk and Reward Profile 6*
Fund size £33.5m
Benchmark IndexB FTSE EPRA/NAREIT Developed Index (Net) hedged to GBP
Fund chargesA-Class Initial 3.00%, Annual 1.50%B-Class Initial Nil, Annual 1.00%C-Class Initial Nil, Annual 0.75%I-Class Initial Nil, Annual 0.75%X-Class On applicationC
JPM Global Property Securities Fund
You should remember that past performance is not a guide to the future. The price of investments and the income from them may fall as well as rise andinvestors may not get back the full amount invested.
* For specific risks, including the risk and reward profile, please refer to the Key Investor information Document (KIID) available on the following websitehttp://am.jpmorgan.co.uk/investor/prices-and-factsheets/?list=all&tab=PricesAll equity indices stated as ‘Net’ are calculated net of tax as per the standard published approach by the index vendor unless stated otherwise.All performance returns are calculated using the quoted price of the accumulation shares. Performance returns are in Sterling.Source: J.P. Morgan.A On 02/08/10 the investment objective and policy of the Fund was changed.B On 01/04/10 the benchmark for the Fund was changed from GPR 250 (Total Return Net) Hedged to GBP to FTSE EPRA/NAREIT Developed Index (Net) hedged to GBP.C As agreed from time to time between the ACD and the relevant JPMorgan Chase & Co. entity.Source: FTSE International Limited (“FTSE”) © FTSE 2014. “FTSE®” is a trade mark of London Stock Exchange Plc and The Financial Times Limited and is used by FTSE International Limited under licence. All rights in theFTSE indices and/or FTSE ratings vest in FTSE and/or its licensors. Neither FTSE nor its licensors accept any liability for any errors or omissions in the FTSE indices and/or FTSE ratings or underlying data. No furtherdistribution of FTSE Data is permitted without FTSE’s express written consent.174
Continuation�
� Return to Index

175
Continuation�
� Return to Index
Top ten holdings %Mitsui Fudosan 5.5Simon Property Group 5.1 Unibail-Rodamco 4.1 Prologis 3.8 Ventas 3.7 Boston Properties 3.2 Host Hotels & Resorts 3.1 Mitsubishi Estate 2.9 British Land 2.7Vornado Realty Trust 2.7
Geographical breakdown %United States of America 47.9Japan 15.6United Kingdom 9.1Australia 6.3France 5.0Hong Kong 4.6Singapore 3.6Canada 2.8Germany 1.8Netherlands 0.9Finland 0.5Belgium 0.4Austria 0.1Italy 0.1Norway 0.1Forward currency contracts 0.2Net other assets 1.0
Highest/lowest share price and distribution recordDistribution
Highest Lowest per shareCalendar year share price share price (net)A-Class Accumulation Shares2009 33.83p 18.47p 1.02p2010 40.09p 31.61p 0.79p2011 41.97p 32.22p 0.41p2012 46.17p 36.23p 0.60p2013 54.22p 45.80p 0.49p2014D 49.38p 47.80p 0.14pA-Class Income Shares2009 31.41p 17.46p 0.98p2010 36.36p 29.00p 0.73p2011 38.03p 28.91p 0.40p2012 40.86p 32.56p 0.57p2013 47.79p 40.37p 0.44p2014D 43.26p 41.87p 0.12pB-Class Accumulation SharesE
2012 46.20p 42.94p –2013 54.33p 45.90p 0.61p2014D 49.57p 47.99p 0.21pC-Class Accumulation SharesF
2012 107.7p 99.46p –2013 126.8p 107.1p 1.73p2014D 115.9p 112.2p 0.66pC-Class Income SharesF
2012 107.6p 99.46p –2013 125.8p 106.3p 1.73p2014D 114.0p 110.4p 0.65pI-Class Accumulation Shares2009 69.38p 37.64p 2.51p2010 82.88p 64.91p 2.22p2011 87.32p 67.17p 1.51p2012 97.04p 75.66p 1.68p2013 114.3p 96.63p 1.87p2014D 104.5p 101.2p 0.54pI-Class Income Shares2009 62.94p 34.88p 2.36p2010 72.81p 57.92p 2.02p2011 76.21p 57.85p 1.41p2012 81.90p 65.17p 1.46p2013 95.74p 80.92p 1.45p2014D 86.70p 83.93p 0.47pX-Class Accumulation Shares2009 66.92p 36.14p 2.72p2010 80.41p 62.65p 2.57p2011 84.63p 65.18p 1.66p2012 94.54p 73.51p 1.92p2013 111.5p 94.32p 2.18p2014D 102.5p 99.21p 0.94p
D To 31 January 2014.E B-Class Accumulation Shares were launched on 29 October 2012.F C-Class Accumulation Shares and C-Class Income Shares were launched on 20 August 2012.

Portfolio turnover rate31.01.13 130.6%31.01.14 131.2%
The portfolio turnover rate (PTR) reflects the total of security purchases and sales (excluding Liquidityfunds), less the total of share issues and cancellations, expressed as a percentage of the average daily netasset values over the period.
Portfolio transaction costsBroker Transaction
Commissions Taxes Total31.01.13 0.19% 0.04% 0.23%31.01.14 0.17% 0.06% 0.23%
The percentage figures disclosed above reflect the average broker commissions and transaction taxessuffered during the last 3 years divided by the average assets under management over the same period.
Stamp duty reserve tax31.01.13 0.00%31.01.14 0.01%
The percentage figures disclosed above reflect the total stamp duty reserve tax suffered during the yeardivided by the average assets under management over the same period.
Net asset values and Ongoing chargesNet assetvalue per Net asset
share class Number value per OngoingDate £’000 of shares share chargesA-Class Accumulation Shares31.01.12 6,893 17,778,549 38.77p 1.68%31.01.13 12,613 26,329,621 47.90p 1.68%31.01.14 14,144 29,399,525 48.11p 1.68%A-Class Income Shares31.01.12 953 2,756,999 34.57p 1.68%31.01.13 1,016 2,406,066 42.22p 1.68%31.01.14 1,049 2,495,615 42.02p 1.68%B-Class Accumulation Shares31.01.13 3 6,000 47.95p 1.18%31.01.14 8 15,717 48.29p 1.18%C-Class Accumulation Shares31.01.13 62 55,281 111.8p 0.93%31.01.14 3,781 3,348,953 113.0p 0.93%C-Class Income Shares31.01.13 1 1,000 110.9p 0.93%31.01.14 45 40,564 110.4p 0.93%I-Class Accumulation Shares31.01.12 1,929 2,385,012 80.86p 0.75%31.01.13 1,188 1,179,336 100.7p 0.75%31.01.14 1 1,500 101.8p 0.75%I-Class Income Shares31.01.12 6 9,000 69.06p 0.75%31.01.13 1 1,500 84.41p 0.75%31.01.14 1 1,500 84.00p 0.75%X-Class Accumulation Shares31.01.12 6,982 8,899,205 78.46p 0.06%31.01.13 7,836 7,980,642 98.19p 0.06%31.01.14 14,494 14,514,741 99.86p 0.06%
The net asset value and the net asset value per income share are shown ex-dividend.
Following the adoption of the requirements of UCITS IV in June 2012, Ongoing charges has replaced theTotal Expense Ratio (“TER”). The Ongoing charges takes into account the ACD fee, the fixed expenses andany expenses paid to an affiliate in respect of stocklending activities, expressed as a percentage of theaverage daily net asset values over the period. The main difference between the two calculations is theinclusion of custodian handling charges and stocklending fees in the Ongoing charges figure. The comparativefigures have not been restated, and the historic TER is disclosed.
176
Continuation�
� Return to Index

177
Continuation�
� Return to Index
United States of America – 47.9% (45.3%)American Campus Communities 12,000 256 0.8 AvalonBay Communities 10,600 787 2.3 Boston Properties 16,350 1,073 3.2 Brandywine Realty Trust 45,200 392 1.2 CubeSmart 27,500 273 0.8 DCT Industrial Trust 91,400 395 1.2 DiamondRock Hospitality 34,500 242 0.7 Equity One 33,200 456 1.4 Equity Residential Properties Trust 10,700 358 1.1 Essex Property Trust 6,300 599 1.8 Extra Space Storage 18,400 507 1.5 General Growth Properties 51,900 630 1.9 Highwoods Properties 23,500 528 1.6 Hong Kong Land 84,000 306 0.9 Host Hotels & Resorts 92,500 1,030 3.1 Kilroy Realty 14,000 445 1.3 Kimco Realty 53,700 680 2.0 LaSalle Hotel Properties 16,000 297 0.9 Liberty Property Trust 20,800 457 1.4 Mid-America Apartment Communities 19,000 737 2.2 Prologis 53,656 1,265 3.8 Simon Property Group 18,526 1,721 5.1 Sunstone Hotel Investors 57,000 444 1.3 Ventas 33,253 1,249 3.7 Vornado Realty Trust 16,200 899 2.7
Japan – 15.6% (10.8%)GLP J-REIT 503 316 0.9 Japan Hotel REIT Investment 418 122 0.4 Japan Logistics Fund REIT 235 317 0.9 Japan Real Estate Investment Trust 208 653 1.9 Mitsubishi Estate 64,000 966 2.9 Mitsui Fudosan 95,000 1,856 5.5 Nippon Building Fund REIT 58 201 0.6 ORIX JREIT 208 168 0.5 Sumitomo Realty & Development 24,000 654 2.0
United Kingdom – 9.1% (4.9%)British Land 137,508 901 2.7 Derwent London 16,465 408 1.2 Hammerson 118,155 617 1.8 Helical Bar 61,988 219 0.7 Safestore 310,986 592 1.8 St Modwen Properties 76,875 299 0.9
Australia – 6.3% (8.5%)BGP# 577,927 – –Dexus Property Group Stapled Units 408,668 215 0.6 Goodman Group Stapled Units 270,271 668 2.0 Mirvac Group Stapled Units 573,665 505 1.5 Westfield Group Stapled Units 133,770 721 2.2
France – 5.0% (4.2%)ICADE 5,399 289 0.9 Unibail-Rodamco 9,563 1,391 4.1
Hong Kong – 4.6% (12.8%)China Overseas Land & Investments 60,000 98 0.3 Link Real Estate Investment Trust 58,000 159 0.5 New World Development 216,000 164 0.5 Sun Hung Kai Properties 54,000 400 1.2 Wharf 167,600 694 2.1
Singapore – 3.6% (5.5%)CapitaCommercial Trust Units 365,000 245 0.7 CapitaLand 219,000 287 0.9 CapitaMalls Asia 242,000 202 0.6 Global Logistic Properties 346,000 460 1.4
Canada – 2.8% (3.7%)Allied Properties Real Estate Investment Trust 17,500 307 0.9 Canadian Real Estate Investment Trust 18,100 412 1.2 First Capital Realty 25,285 239 0.7
Germany – 1.8% (0.7%)Alstria Office Real Estate Investment Trust 32,439 256 0.8 LEG Immobilien 9,211 332 1.0
Netherlands – 0.9% (1.7%)VastNed Retail 10,910 316 0.9
Finland – 0.5% (0.2%)Technopolis 46,119 174 0.5
Belgium – 0.4% (0.2%)Warehouses de Pauw 3,220 140 0.4
Austria – 0.1% (0.2%)Atrium European Real Estate 11,940 41 0.1
Italy – 0.1% (0.3%)Beni Stabili 78,963 36 0.1
Norway – 0.1% (0.0%)Norwegian Property 42,765 30 0.1
Forward currency contracts – 0.2% (1.3%)Australian DollarBuy AUD131,991 sell £69,939 dated 14/02/14 – –Sell AUD4,164,365 buy £2,260,723 dated 14/02/14 59 0.2 Canadian DollarSell CAD1,699,382 buy £956,236 dated 14/02/14 34 0.1 EuroSell €3,568,007 buy £2,953,356 dated 14/02/14 16 –Hong Kong DollarBuy HKD1,000,543 sell £78,803 dated 14/02/14 (1) –Buy HKD959,901 sell £74,502 dated 14/02/14 1 –Sell HKD20,617,354 buy £1,620,221 dated 14/02/14 7 –Japanese YenBuy ¥203,430,445 sell £1,190,739 dated 14/02/14 19 0.1 Sell ¥1,090,879,048 buy £6,371,603 dated 14/02/14 (113) (0.3)Singapore DollarBuy SGD234,110 sell £111,425 dated 14/02/14 – –Sell SGD2,781,285 buy £1,332,606 dated 14/02/14 11 –US DollarBuy $1,182,954 sell £714,608 dated 14/02/14 4 –Buy $506,501 sell £308,437 dated 14/02/14 (1) –Sell $124,214 buy AUD 142,235 dated 14/02/14 - –Sell $27,023,389 buy £16,468,273 dated 14/02/14 49 0.1 Sell $404,836 buy £244,287 dated 14/02/14 (2) –
Investment assets (including investment liabilities) 33,179 99.0
Net other assets 344 1.0
Net assets 33,523 100.0
Unless otherwise stated the above securities are admitted to official stock exchange listings or trade on aregulated market.
The comparative percentage figures in brackets are at 31 January 2013.
# Unquoted security
Counterparty exposure
Forwardcurrencycontracts Total
Counterparty £’000 £’000
BNP Paribas 0 0CitiBank 0 0Credit Suisse 97 97Deutsche Bank 8 8Merrill Lynch (1) (1)Morgan Stanley 60 60RBC 0 0Societe Generale 14 14State Street 6 6Toront Dominion Bank (1) (1)UBS (109) (109)Westpac Banking Corp 9 9
At the balance sheet date, there was no collateral received by the fund from the above counterparties.
The counterparty exposure on forward currency contracts is reported at their mark to market values butfor futures contracts it is only the positive mark to market values that are reported.
Portfolio statementAs at 31 January 2014
Market value Total netInvestment Holding £’000 assets %
Market value Total netInvestment Holding £’000 assets %

£’000
Total of all purchases for the year (Note 10) 53,987
Major purchases Cost
Simon Property Group 1,791Mitsubishi Estate 1,712Mitsui Fudosan 1,697Host Hotels & Resorts 1,634Ventas 1,492Prologis 1,482AvalonBay Communities 1,383Westfield Group Stapled Units 1,379Health Care Property Investors 1,347Boston Properties 1,320Unibail-Rodamco 1,269Vornado Realty Trust 1,184Extra Space Storage 1,159Equity Residential Properties Trust 1,076General Growth Properties 1,034Wharf 872Kimco Realty 816Liberty Property Trust 787Mirvac Group Stapled Units 783Highwoods Properties 783
£’000
Total of all sales for the year (Note 10) 40,650
Major sales Proceeds
Health Care Property Investors 1,822Simon Property Group 1,420Mitsubishi Estate 1,397Westfield Group Stapled Units 1,065Equity Residential Properties Trust 1,039Public Storage 966Apartment Investment & Management ‘A’ 846AvalonBay Communities 839Extra Space Storage 839Duke Realty 829Mitsui Fudosan 801Digital Realty Trust 799Boston Properties 793Ventas 782Cable & Associates Properties 707Host Hotels & Resorts 696Regency Centers 694Nippon Prologis REIT 690Camden Property Trust 661General Growth Properties 634
Portfolio movements For the year ending 31 January 2014
178
Continuation�
� Return to Index

179
Continuation�
� Return to Index
Statement of total returnFor the year ending 31 January
2014 2013£’000 £’000 £’000 £’000
Income
Net capital (losses)/gains (Note 1) (238) 3,447
Revenue (Note 2) 863 523
Expenses (Note 3) (333) (166)
Net revenue before taxation 530 357
Taxation (Note 4) (94) (45)
Net revenue after taxation 436 312
Total return before distributions 198 3,759
Finance costs: Distributions (Note 5) (445) (294)
Change in net assets attributable to shareholders from investment activities (247) 3,465
Statement of change in net assets attributable to shareholdersFor the year ending 31 January
2014 2013£’000 £’000 £’000 £’000
Opening net assets attributable to shareholders 22,720 16,763
Amounts receivable on issue of shares 33,743 8,777
Amounts payable on cancellation of shares (23,114) (6,584)
10,629 2,193
Change in net assets attributable to shareholders from investment activities (see above) (247) 3,465
Retained distributions on accumulation shares 425 300
Stamp duty reserve tax (4) (1)
Closing net assets attributable to shareholders 33,523 22,720
Balance sheetAs at 31 January
2014 2013£’000 £’000 £’000 £’000
ASSETS
Investment assets 33,296 22,535
Debtors (Note 7) 1,045 497
Cash and bank balances (Note 8) 959 381
Total other assets 2,004 878
Total assets 35,300 23,413
LIABILITIES
Investment liabilities (117) (338)
Creditors (Note 9) (1,657) (351)
Distribution payable on income shares (3) (4)
Total other liabilities (1,660) (355)
Total liabilities (1,777) (693)
Net assets attributable to shareholders 33,523 22,720
The notes to these financial statements are shown on pages 180 to 181.
Financial statements

1. Net capital (losses)/gains2014 2013
£’000 £’000Currency (losses)/gains (433) 150Forward currency contracts 2,930 3Non-derivative securities (2,735) 3,294Net capital (losses)/gains (238) 3,447
2. Revenue2014 2013
£’000 £’000Franked income from UK equity investments 23 7Income from overseas equity investments 806 482Interest on bank and term deposits 1 1Property income distributions 33 28Stock dividends – 3Stocklending income – 2Total revenue 863 523
3. Expenses2014 2013
£’000 £’000Payable to the ACD or associate of the ACD:ACD fee 290 146Fixed expenses 43 20Total expenses 333 166
4. Taxation2014 2013
£’000 £’000a) Analysis of charge in the yearCorporation tax at 20% 55 22Double tax relief (55) (37)Overseas tax suffered 84 54Prior year adjustments 10 6Current year tax charge (Note 4b) 94 45
b) Factors affecting the tax charge for the yearThe tax assessed for the year is lower than the standard rate of corporation tax inthe UK for an Open-Ended Investment Company (OEIC) (20%). The differences areexplained below.
Net revenue before taxation 530 357Corporation tax at 20% 106 72
Effects of:Dividends not subject to corporation tax (51) (32)Double tax relief (55) (37)Overseas tax suffered 84 54Prior year adjustments 10 6Taxable gains on offshore funds – (18)
(12) (27)Current year tax charge (Note 4a) 94 45
5. Finance costsDistributionsThe distributions take account of amounts receivable on the issue of shares andamounts payable on the cancellation of shares and comprise:
2014 2013£’000 £’000
Interim dividend distribution 232 170Final dividend distribution 203 141Add: Amounts payable on cancellation of shares 86 31Deduct: Amounts receivable on issue of shares (76) (48)Total finance costs 445 294
Details of the distribution per share are set out on pages 182 to 183.
6. Movement between net revenue after taxation and distributions2014 2013
£’000 £’000Net revenue after taxation 436 312Add: Undistributed revenue brought forward 3 3Deduct: Undistributed revenue carried forward (4) (3)Deduct: Tax on capital offshore gains 10 (18)
445 294
7. Debtors2014 2013
£’000 £’000Accrued income 78 34Corporation tax recoverable – 17Due from the ACD for shares created 130 195Overseas tax recoverable 2 4Property income tax recoverable 6 4Sales awaiting settlement 829 243Total debtors 1,045 497
8. Cash and bank balances2014 2013
£’000 £’000Cash and bank balances 959 381
9. Creditors2014 2013
£’000 £’000Accrued expenses 26 18Due to the ACD for shares cancelled 441 3Purchases awaiting settlement 1,190 330Total creditors 1,657 351
Notes to the financial statements for the year ending 31 January 2014
180
Continuation�
� Return to Index
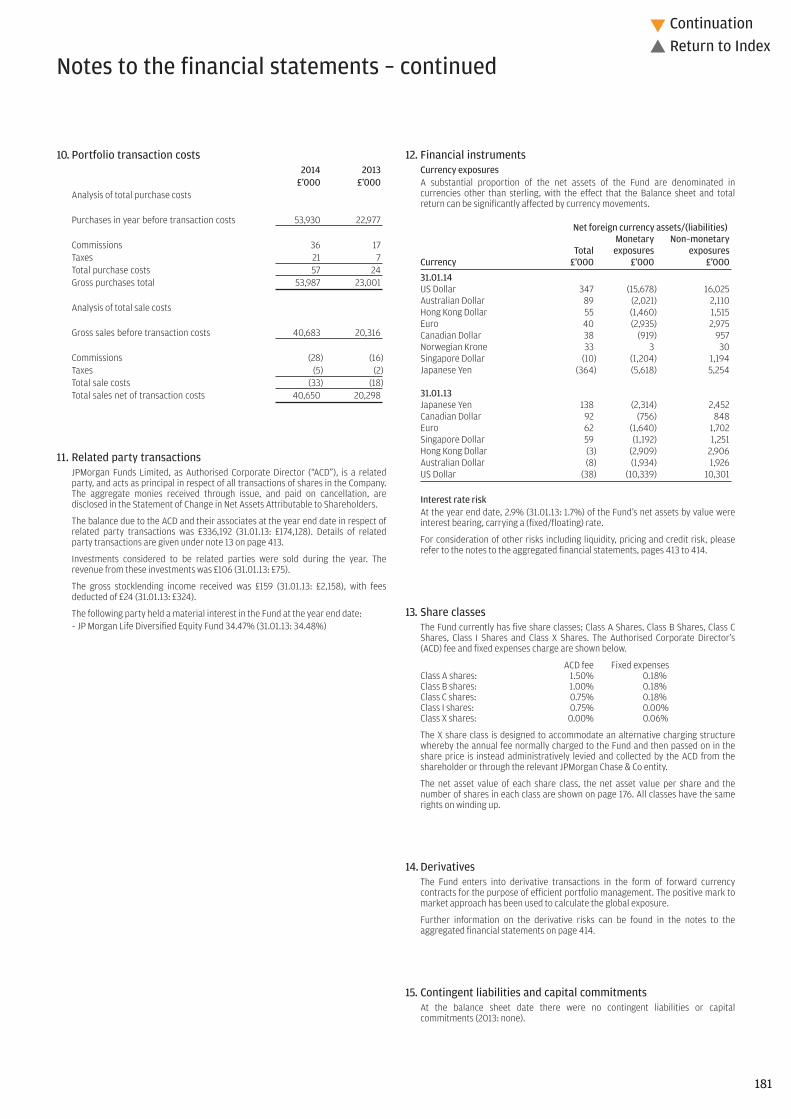
181
Continuation�
� Return to Index
10. Portfolio transaction costs2014 2013
£’000 £’000Analysis of total purchase costs
Purchases in year before transaction costs 53,930 22,977
Commissions 36 17Taxes 21 7Total purchase costs 57 24Gross purchases total 53,987 23,001
Analysis of total sale costs
Gross sales before transaction costs 40,683 20,316
Commissions (28) (16)Taxes (5) (2)Total sale costs (33) (18)Total sales net of transaction costs 40,650 20,298
11. Related party transactionsJPMorgan Funds Limited, as Authorised Corporate Director (“ACD”), is a relatedparty, and acts as principal in respect of all transactions of shares in the Company.The aggregate monies received through issue, and paid on cancellation, aredisclosed in the Statement of Change in Net Assets Attributable to Shareholders.
The balance due to the ACD and their associates at the year end date in respect ofrelated party transactions was £336,192 (31.01.13: £174,128). Details of relatedparty transactions are given under note 13 on page 413.
Investments considered to be related parties were sold during the year. Therevenue from these investments was £106 (31.01.13: £75).
The gross stocklending income received was £159 (31.01.13: £2,158), with feesdeducted of £24 (31.01.13: £324).
The following party held a material interest in the Fund at the year end date:– JP Morgan Life Diversified Equity Fund 34.47% (31.01.13: 34.48%)
12. Financial instrumentsCurrency exposuresA substantial proportion of the net assets of the Fund are denominated incurrencies other than sterling, with the effect that the Balance sheet and totalreturn can be significantly affected by currency movements.
Net foreign currency assets/(liabilities)Monetary Non–monetary
Total exposures exposuresCurrency £’000 £’000 £’000
31.01.14US Dollar 347 (15,678) 16,025Australian Dollar 89 (2,021) 2,110Hong Kong Dollar 55 (1,460) 1,515Euro 40 (2,935) 2,975Canadian Dollar 38 (919) 957Norwegian Krone 33 3 30Singapore Dollar (10) (1,204) 1,194Japanese Yen (364) (5,618) 5,254
31.01.13Japanese Yen 138 (2,314) 2,452Canadian Dollar 92 (756) 848Euro 62 (1,640) 1,702Singapore Dollar 59 (1,192) 1,251Hong Kong Dollar (3) (2,909) 2,906Australian Dollar (8) (1,934) 1,926US Dollar (38) (10,339) 10,301
Interest rate riskAt the year end date, 2.9% (31.01.13: 1.7%) of the Fund’s net assets by value wereinterest bearing, carrying a (fixed/floating) rate.
For consideration of other risks including liquidity, pricing and credit risk, pleaserefer to the notes to the aggregated financial statements, pages 413 to 414.
13. Share classesThe Fund currently has five share classes; Class A Shares, Class B Shares, Class CShares, Class I Shares and Class X Shares. The Authorised Corporate Director’s(ACD) fee and fixed expenses charge are shown below.
ACD fee Fixed expensesClass A shares: 1.50% 0.18%Class B shares: 1.00% 0.18%Class C shares: 0.75% 0.18%Class I shares: 0.75% 0.00%Class X shares: 0.00% 0.06%
The X share class is designed to accommodate an alternative charging structurewhereby the annual fee normally charged to the Fund and then passed on in theshare price is instead administratively levied and collected by the ACD from theshareholder or through the relevant JPMorgan Chase & Co entity.
The net asset value of each share class, the net asset value per share and thenumber of shares in each class are shown on page 176. All classes have the samerights on winding up.
14. Derivatives The Fund enters into derivative transactions in the form of forward currencycontracts for the purpose of efficient portfolio management. The positive mark tomarket approach has been used to calculate the global exposure.
Further information on the derivative risks can be found in the notes to theaggregated financial statements on page 414.
15. Contingent liabilities and capital commitmentsAt the balance sheet date there were no contingent liabilities or capitalcommitments (2013: none).
Notes to the financial statements – continued

Final distribution in pence per share
Group 1 – Shares purchased prior to 1 August 2013Group 2 – Shares purchased 1 August 2013 to 31 January 2014
DistributionGross Tax Net payable paid
revenue at 10% revenue Equalisation 30.04.14 30.04.13
A-Class Accumulation Shares
Group 1 0.155556 0.015556 0.140000 – 0.140000 0.190000
Group 2 0.069834 0.006983 0.062851 0.077149 0.140000 0.190000
A-Class Income Shares
Group 1 0.133333 0.013333 0.120000 – 0.120000 0.170000
Group 2 0.050792 0.005079 0.045713 0.074287 0.120000 0.170000
B-Class Accumulation Shares
Group 1 0.233333 0.023333 0.210000 – 0.210000 0.230000
Group 2 0.156982 0.015698 0.141284 0.068716 0.210000 0.230000
C-Class Accumulation Shares
Group 1 0.733333 0.073333 0.660000 – 0.660000 0.710000
Group 2 0.280370 0.028037 0.252333 0.407667 0.660000 0.710000
C-Class Income Shares
Group 1 0.722222 0.072222 0.650000 – 0.650000 0.720000
Group 2 0.478014 0.047801 0.430213 0.219787 0.650000 0.720000
I-Class Accumulation Shares
Group 1 0.600000 0.060000 0.540000 – 0.540000 0.870000
Group 2 0.600000 0.060000 0.540000 0.000000 0.540000 0.870000
I-Class Income Shares
Group 1 0.522222 0.052222 0.470000 – 0.470000 0.640000
Group 2 0.522222 0.052222 0.470000 0.000000 0.470000 0.640000
X-Class Accumulation Shares
Group 1 1.044444 0.104444 0.940000 – 0.940000 0.950000
Group 2 0.798160 0.079816 0.718344 0.221656 0.940000 0.950000
Distribution tables
182
Continuation�
� Return to Index

183
� Return to Index
Interim distribution in pence per share
Group 1 – Shares purchased prior to 1 February 2013Group 2 – Shares purchased 1 February 2013 to 31 July 2013
DistributionGross Tax Net paid paid
revenue at 10% revenue Equalisation 31.10.13 31.10.12
A-Class Accumulation Shares
Group 1 0.333333 0.033333 0.300000 – 0.300000 0.330000
Group 2 0.192733 0.019273 0.173460 0.126540 0.300000 0.330000
A-Class Income Shares
Group 1 0.300000 0.030000 0.270000 – 0.270000 0.300000
Group 2 0.203651 0.020365 0.183286 0.086714 0.270000 0.300000
B-Class Accumulation Shares
Group 1 0.422222 0.042222 0.380000 – 0.380000 –
Group 2 0.422222 0.042222 0.380000 0.000000 0.380000 –
C-Class Accumulation Shares
Group 1 1.133333 0.113333 1.020000 – 1.020000 –
Group 2 0.322667 0.032267 0.290400 0.729600 1.020000 –
C-Class Income Shares
Group 1 1.122222 0.112222 1.010000 – 1.010000 –
Group 2 1.001334 0.100133 0.901201 0.108799 1.010000 –
I-Class Accumulation Shares
Group 1 1.111111 0.111111 1.000000 – 1.000000 1.000000
Group 2 1.111111 0.111111 1.000000 0.000000 1.000000 1.000000
I-Class Income Shares
Group 1 0.900000 0.090000 0.810000 – 0.810000 0.850000
Group 2 0.900000 0.090000 0.810000 0.000000 0.810000 0.850000
X-Class Accumulation Shares
Group 1 1.366667 0.136667 1.230000 – 1.230000 1.230000
Group 2 1.209530 0.120953 1.088577 0.141423 1.230000 1.230000
Equalisation applies only to shares purchased during the distribution period (group 2 shares). It is the average amount of revenue included in the purchase price of all group 2 shares and is refunded to holders of these
shares as a return of capital. Being capital it is not liable to income tax but must be deducted from the cost of shares for capital gains tax purposes.
Distribution tables – continued

184
Continuation�
� Return to Index
Investment objective and policyTo invest in a portfolio of securities in the markets of Asia (excluding Japan)and Australasia. The current policy is to invest for capital growth withoutany distribution target.
The Fund will invest in the securities of companies that are incorporatedunder the laws of, and have their registered office in an Asian (excludingJapan) or Australasian country, or that derive the predominant part of theireconomic activity from Asian (excluding Japan) and/or Australasian countries,even if listed elsewhere.
The Fund aims to provide broad market exposure which will include exposureto Emerging Markets. Smaller company investments and Participation Notesmay be held on an ancillary basis.
Risk profileThe value of your investment may fall as well as rise and you may get backless than you originally invested.
The value of Equity and Equity-Linked Securities may fluctuate in responseto the performance of individual companies and general market conditions.Furthermore, Participation Notes run the risk of counterparty default whichmay result in the loss of the full market value of the Note.
Emerging Markets may be subject to increased political, regulatory andeconomic instability, less developed custody and settlement practices,poor transparency and greater financial risks. Emerging Market currenciesmay be subject to volatile price movements. Emerging Market securities mayalso be subject to higher volatility and be more difficult to sell than non-Emerging Market securities.
The Fund may be concentrated in one or more industry sectors and as aresult, may be more volatile than more broadly diversified funds.
Movements in currency exchange rates can adversely affect the return ofyour investment.
Please refer to Part 11 of the Prospectus for details of the general risk factorsaffecting this Fund in addition to the specific risk factors above.
Fund reviewOver the 12 months ending January 2014, Asian equity markets overall wereweak, as the onset of tapering in the US caused currencies to weaken andfund flows to reverse, as well as continued worsening current account balancesin some countries. India continued to be weighed down by slowing economicgrowth, and Thailand’s renewed political impasse caused the Thai marketto underperform. In China, the leadership’s determination regarding economicreform is causing investors to remain cautious.
The Fund delivered a negative return and underperformed its benchmarkin the review period. The majority of the underperformance was attributableto negative asset allocation, most notably the overweight in China and theunderweight in Malaysia. Stock selection overall was positive, but specificstock picks in India and Taiwan further detracted from performance. Stockselection in China was strong.
Fund outlookSome of the headwinds that have weighed on Asian stock markets remain,such as downward earnings revisions and emerging market redemptions.That said, there is plenty of evidence of a revival in local risk appetite, be itsmall caps in Taiwan, biotech in China or the recent sharp recovery inIndonesian securities. Though one cannot discern the catalyst to revive thesemarkets, there is solid valuation support on the downside. In the nearterm, elections in India and Indonesia will drive sentiment. In China, weexpect the macro environment to be stable in 2014, while reformimplementations become the focus. However, investors should anticipatecontinued volatility as market participants accustomed to high GDP growthprints weigh up the impact of reform.
12 month performance as at 31 January 2014 2013 2012 2011 2010
JPM Institutional Asia I-Class Acc -8.8% 12.6% -8.4% 27.4% 50.4%
JPM Institutional AsiaX-Class Inc -8.2% 13.3% -7.7% 28.1% 51.3%
Benchmark IndexA -7.9% 13.7% -4.2% 25.6% 56.2%
Fund statisticsRisk and Reward Profile 6*
Fund size £83.5m
Benchmark IndexA FTSE All-World Asia Pacific ex Japan Index (Net)
Fund chargesI-Class Initial Nil, Annual 0.70%X-Class On applicationB
Top ten holdings %Samsung Electronics 4.6Australia & New Zealand Bank Group 3.6Tencent 3.3BHP Billiton 3.3Taiwan Semiconductor Manufacturing 3.3POSCO 2.4Commonwealth Bank of Australia 2.3China Construction Bank ‘H’ 2.3Aia Group 2.2DBS Group 1.9
JPM Institutional Asia Fund
You should remember that past performance is not a guide to the future. The price of investments and the income from them may fall as well as rise andinvestors may not get back the full amount invested.
* For specific risks, including the risk and reward profile, please refer to the Key Investor information Document (KIID) available on the following websitehttp://am.jpmorgan.co.uk/investor/prices-and-factsheets/?list=all&tab=PricesAll equity indices stated as ‘Net’ are calculated net of tax as per the standard published approach by the index vendor unless stated otherwise.All performance returns are calculated using the quoted price of the accumulation or income shares. Performance returns are in Sterling.Source: J.P. Morgan.A On 01/03/13 the Fund’s benchmark was changed from FSTE All World Asia Pacific ex Japan Index (Net) to MSCI All Country Asia Pacific ex Japan Index (Net). On 01/08/09 the benchmark for the Fund changed from
FTSE World Asia Pacific ex Japan (Total Return Net) to FTSE All-World Asia Pacific ex Japan Index (Net).B As agreed from time to time between the ACD and the relevant JPMorgan Chase & Co. entity.Benchmark Source: MSCI. Neither MSCI nor any other party involved in or related to compiling, computing or creating the MSCI data makes any express of implied warranties or representations with respect to such data (or theresults to be obtained by the use thereof), and all such parties hereby expressly disclaim all warranties of originality, accuracy, completeness, merchantability or fitness for a particular purpose with respect to any of such data.Without limiting any of the foregoing, in no event shall MSCI, any of its affiliates or any third party involved in or related to compiling computing or creating the data have any liability for any direct, indirect, special, punitive,consequential or any other damages (including lost profits) even if notified of the possibility of such damages. No further distribution or dissemination of the MSCI data is permitted without MSCI’s express written consent.
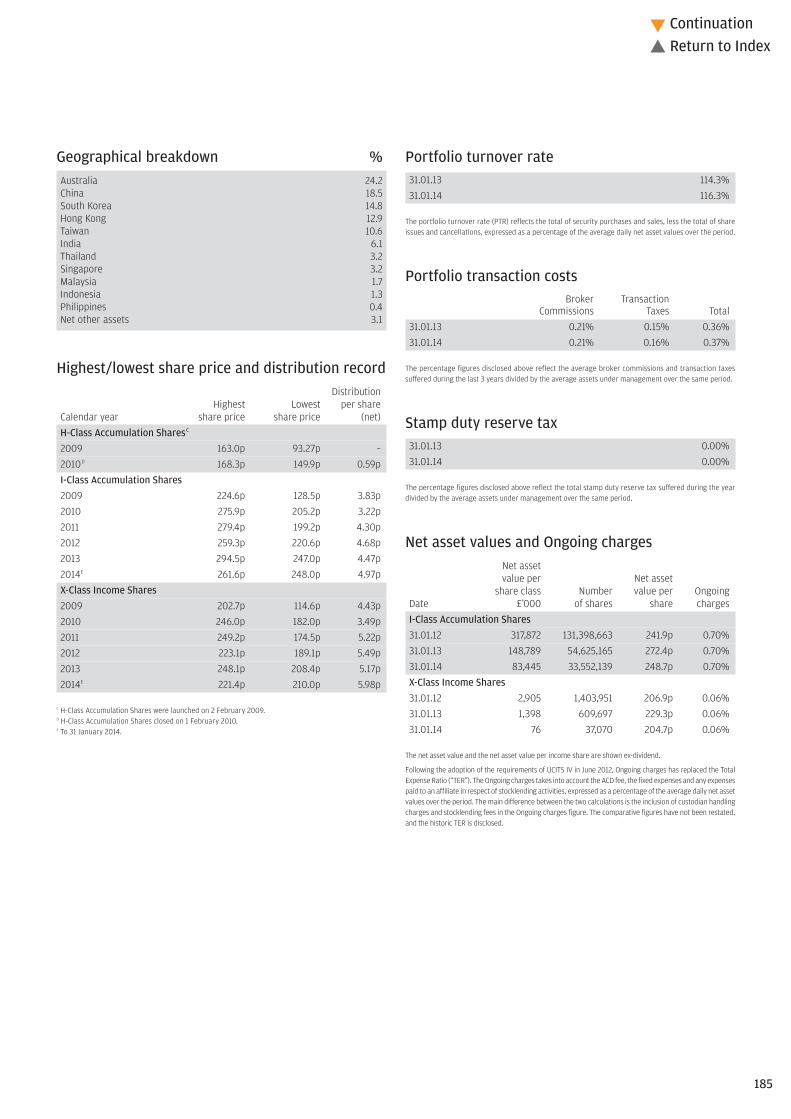
185
Continuation�
� Return to Index
Geographical breakdown %Australia 24.2China 18.5South Korea 14.8Hong Kong 12.9Taiwan 10.6India 6.1Thailand 3.2Singapore 3.2Malaysia 1.7Indonesia 1.3Philippines 0.4Net other assets 3.1
Highest/lowest share price and distribution recordDistribution
Highest Lowest per shareCalendar year share price share price (net)H-Class Accumulation SharesC
2009 163.0p 93.27p –2010D 168.3p 149.9p 0.59pI-Class Accumulation Shares2009 224.6p 128.5p 3.83p2010 275.9p 205.2p 3.22p2011 279.4p 199.2p 4.30p2012 259.3p 220.6p 4.68p2013 294.5p 247.0p 4.47p2014E 261.6p 248.0p 4.97pX-Class Income Shares2009 202.7p 114.6p 4.43p2010 246.0p 182.0p 3.49p2011 249.2p 174.5p 5.22p2012 223.1p 189.1p 5.49p2013 248.1p 208.4p 5.17p2014E 221.4p 210.0p 5.98p
C H-Class Accumulation Shares were launched on 2 February 2009.D H-Class Accumulation Shares closed on 1 February 2010.E To 31 January 2014.
Portfolio turnover rate31.01.13 114.3%31.01.14 116.3%
The portfolio turnover rate (PTR) reflects the total of security purchases and sales, less the total of shareissues and cancellations, expressed as a percentage of the average daily net asset values over the period.
Portfolio transaction costsBroker Transaction
Commissions Taxes Total31.01.13 0.21% 0.15% 0.36%31.01.14 0.21% 0.16% 0.37%
The percentage figures disclosed above reflect the average broker commissions and transaction taxessuffered during the last 3 years divided by the average assets under management over the same period.
Stamp duty reserve tax31.01.13 0.00%31.01.14 0.00%
The percentage figures disclosed above reflect the total stamp duty reserve tax suffered during the yeardivided by the average assets under management over the same period.
Net asset values and Ongoing chargesNet assetvalue per Net asset
share class Number value per OngoingDate £’000 of shares share chargesI-Class Accumulation Shares31.01.12 317,872 131,398,663 241.9p 0.70%31.01.13 148,789 54,625,165 272.4p 0.70%31.01.14 83,445 33,552,139 248.7p 0.70%X-Class Income Shares31.01.12 2,905 1,403,951 206.9p 0.06%31.01.13 1,398 609,697 229.3p 0.06%31.01.14 76 37,070 204.7p 0.06%
The net asset value and the net asset value per income share are shown ex-dividend.
Following the adoption of the requirements of UCITS IV in June 2012, Ongoing charges has replaced the TotalExpense Ratio (“TER”). The Ongoing charges takes into account the ACD fee, the fixed expenses and any expensespaid to an affiliate in respect of stocklending activities, expressed as a percentage of the average daily net assetvalues over the period. The main difference between the two calculations is the inclusion of custodian handlingcharges and stocklending fees in the Ongoing charges figure. The comparative figures have not been restated,and the historic TER is disclosed.

Australia – 24.2% (21.3%)Amcor 197,146 1,117 1.3Asciano Group 316,736 942 1.1Aurizon Holdings 312,624 812 1.0Australia & New Zealand Bank Group 187,000 2,980 3.6BHP Billiton 141,812 2,744 3.3Boral 353,000 887 1.1Brambles 234,999 1,120 1.3Commonwealth Bank of Australia 50,000 1,964 2.3Cover-More Group 400,000 389 0.5CSL 36,292 1,350 1.6Insurance Australia Group 480,031 1,395 1.7Oil Search 268,784 1,142 1.4QBE Insurance Group 64,311 391 0.5Rio Tinto 26,083 906 1.1Stockland Trust Group 437,152 840 1.0Telstra Corporation 378,422 1,029 1.2Treasury Wine Estates 102,158 197 0.2
China – 18.5% (14.0%)Agricultural Bank of China ‘H’ 3,981,000 1,053 1.3Beijing Enterprises Water Group 1,920,000 658 0.8China Construction Bank ‘H’ 4,534,990 1,909 2.3China Life Insurance ‘H’ 456,000 755 0.9China Longyuan Power Group ‘H’ 918,000 669 0.8China Minsheng Banking ‘H’ 1,389,000 830 1.0China Oilfield Services ‘H’ 424,000 683 0.8China Overseas Land & Investments 564,000 922 1.1China Petroleum & Chemical ‘H’ 2,335,200 1,124 1.3China Resources Gas Group 356,000 671 0.8China Telecom ‘H’ 1,502,000 423 0.5China Vanke ‘B’ 788,176 778 0.9CNOOC 616,000 587 0.7Dongfeng Motor Group ‘H’ 466,000 416 0.5Great Wall Motor 199,500 578 0.7Huaneng Renewables ‘H’ 1,440,000 365 0.4MGM China 207,200 497 0.6Ping An Insurance ‘H’ 235,000 1,156 1.4Sands China 156,800 734 0.9Want Want China 804,000 657 0.8
South Korea – 14.8% (15.1%)Hyundai Development 26,210 357 0.4Hyundai Heavy Industries 4,301 541 0.6Hyundai Motor 3,404 447 0.5KB Financial Group 65,243 1,362 1.6KIA Motors 21,835 660 0.8Korea Investment 20,350 451 0.5LG Chemical 5,087 742 0.9LG Household & Healthcare 500 134 0.2POSCO 11,972 2,005 2.4Samsung Electronics 5,310 3,814 4.6Samsung Securities 20,860 508 0.6Shinhan Financial 26,460 678 0.8SK Innovation 10,389 740 0.9
Hong Kong – 12.9% (20.1%)AAC Technologies 236,500 618 0.7Aia Group 666,200 1,866 2.2Cheung Kong 99,000 891 1.1Galaxy Entertainment Group 202,000 1,205 1.4Hutchison Whampoa 138,000 1,040 1.3Intime Retail Group 735,500 449 0.5Lifestyle International 463,500 505 0.6Orient Overseas International 157,500 399 0.5Tencent 65,000 2,759 3.3Tingyi 414,000 651 0.8Wharf 100,800 417 0.5
Taiwan – 10.6% (6.7%)Advanced Semiconductor Engineering 1,387,000 779 0.9Cheng Shin Rubber Industries 109,200 167 0.2China Life Insurance 1,189,300 689 0.8China Steel Chemical 149,000 500 0.6Delta Electronics 243,000 807 1.0E Sun Financial 1,227,000 462 0.6Innolux 1,954,000 411 0.5MediaTek 106,000 849 1.0Ruentex Development 356,160 380 0.5Taiwan Semiconductor Manufacturing 1,296,237 2,725 3.3Uni-President Enterprises 516,483 516 0.6United Microelectronics 2,145,000 530 0.6
India – 6.1% (8.9%)Ambuja Cements 245,000 380 0.5Godrej Industries 227,723 599 0.7HDFC Bank 205,000 1,249 1.5Housing Development Finance 88,928 695 0.8Infosys Technologies 31,809 1,139 1.4Tata Motors ADR 56,297 971 1.2
Thailand – 3.2% (5.8%)Banpu (Alien Market) 699,400 338 0.4Kasikornbank (Alien Market) 186,300 581 0.7Kasikornbank Non-Voting Depositary Receipt 74,700 233 0.3LPN Development Public (Alien Market) 1,515,000 405 0.5PTT Exploration & Production (Alien Market) 157,000 441 0.5Siam Cement Non-Voting Depositary Receipt 92,200 689 0.8
Singapore – 3.2% (4.9%)CapitaMalls Asia 701,000 585 0.7DBS Group 204,000 1,594 1.9Global Logistic Properties 357,000 475 0.6
Malaysia – 1.7% (0.0%)Sapura Kencana Petroleum 878,100 700 0.8Tenaga Nasional 348,500 740 0.9
Indonesia – 1.3% (2.3%)Bank Central Asia 1,114,000 550 0.7Telekomunikasi Indonesia ‘B’ 4,186,000 471 0.6
Philippines – 0.4% (0.0%)BDO Unibank 313,190 332 0.4
Investment assets 80,891 96.9
Net other assets 2,630 3.1
Net assets 83,521 100.0
Unless otherwise stated the above securities are admitted to official stock exchange listings or trade on aregulated market.
The comparative percentage figures in brackets are at 31 January 2013.
Portfolio statementAs at 31 January 2014
Market value Total netInvestment Holding £’000 assets %
Market value Total netInvestment Holding £’000 assets %
186
Continuation�
� Return to Index

187
Continuation�
� Return to Index
£’000
Total of all purchases for the year (Note 10) 93,049
Major purchases Cost
China Petroleum & Chemical ‘H’ 3,399Samsung Electronics 2,873POSCO 2,708Industrial & Commercial Bank of China ‘H’ 2,575Commonwealth Bank of Australia 1,976CNOOC 1,764Taiwan Semiconductor Manufacturing 1,599Agricultural Bank of China ‘H’ 1,529China Construction Bank ‘H’ 1,483China Minsheng Banking ‘H’ 1,463KB Financial Group 1,447BHP Billiton 1,408Hutchison Whampoa 1,392Hyundai Motor 1,289Westfield Group Stapled Units 1,174Hyundai Heavy Industries 1,134Great Wall Motor 1,067MediaTek 1,052Cheng Shin Rubber Industries 1,038SK Innovation 1,022
£’000
Total of all sales for the year (Note 10) 153,275
Major sales Proceeds
Samsung Electronics 6,048Jardine Strategic 4,287Westpac Banking 4,058Industrial & Commercial Bank of China ‘H’ 3,990China Construction Bank ‘H’ 3,614Hyundai Motor 3,430CNOOC 3,088Australia & New Zealand Bank Group 2,935Aia Group 2,833BHP Billiton 2,728Tencent 2,723KB Financial Group 2,708KIA Motors 2,666Kasikornbank (Alien Market) 2,389POSCO 2,355Cheung Kong 2,262Wharf 2,229China Petroleum & Chemical ‘H’ 2,202Telekomunikasi Indonesia ‘B’ 2,133Infrastructure Development Finance 2,047
Portfolio movements For the year ending 31 January 2014
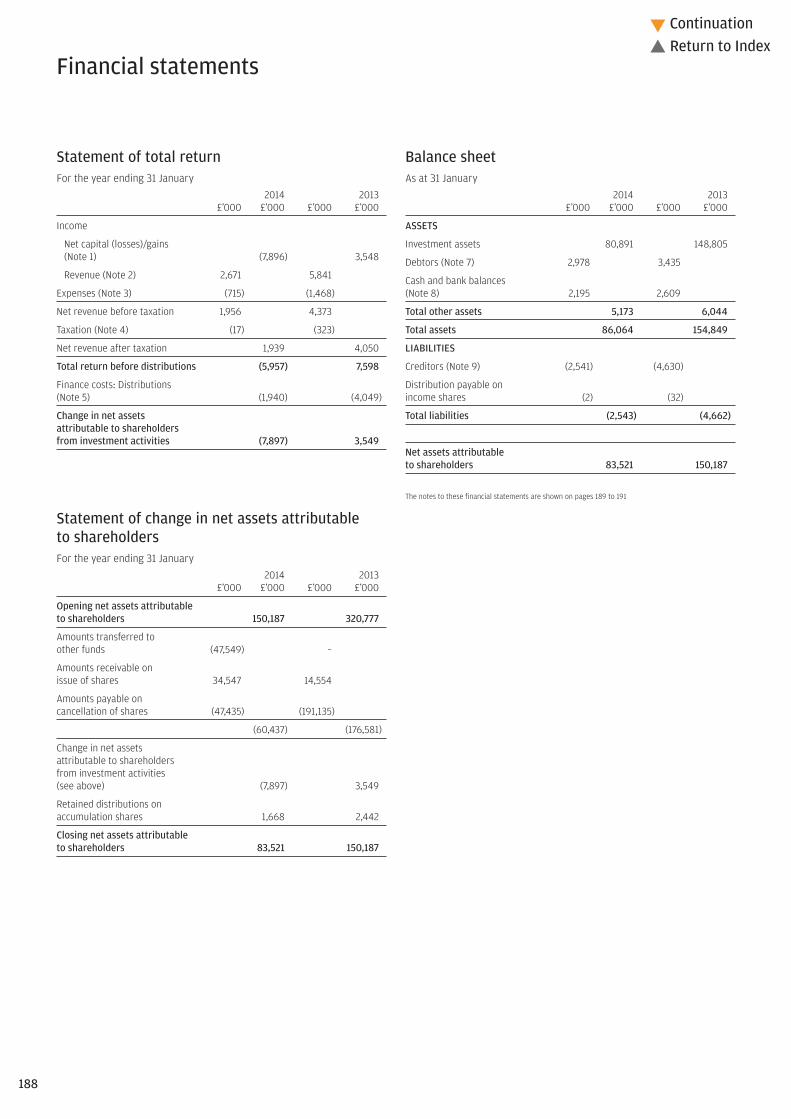
Statement of total returnFor the year ending 31 January
2014 2013£’000 £’000 £’000 £’000
Income
Net capital (losses)/gains(Note 1) (7,896) 3,548
Revenue (Note 2) 2,671 5,841
Expenses (Note 3) (715) (1,468)
Net revenue before taxation 1,956 4,373
Taxation (Note 4) (17) (323)
Net revenue after taxation 1,939 4,050
Total return before distributions (5,957) 7,598
Finance costs: Distributions (Note 5) (1,940) (4,049)
Change in net assets attributable to shareholders from investment activities (7,897) 3,549
Statement of change in net assets attributable to shareholdersFor the year ending 31 January
2014 2013£’000 £’000 £’000 £’000
Opening net assets attributable to shareholders 150,187 320,777
Amounts transferred to other funds (47,549) –
Amounts receivable on issue of shares 34,547 14,554
Amounts payable on cancellation of shares (47,435) (191,135)
(60,437) (176,581)
Change in net assets attributable to shareholders from investment activities (see above) (7,897) 3,549
Retained distributions on accumulation shares 1,668 2,442
Closing net assets attributable to shareholders 83,521 150,187
Balance sheetAs at 31 January
2014 2013£’000 £’000 £’000 £’000
ASSETS
Investment assets 80,891 148,805
Debtors (Note 7) 2,978 3,435
Cash and bank balances (Note 8) 2,195 2,609
Total other assets 5,173 6,044
Total assets 86,064 154,849
LIABILITIES
Creditors (Note 9) (2,541) (4,630)
Distribution payable on income shares (2) (32)
Total liabilities (2,543) (4,662)
Net assets attributable to shareholders 83,521 150,187
The notes to these financial statements are shown on pages 189 to 191
Financial statements
188
Continuation�
� Return to Index

189
Continuation�
� Return to Index
1. Net capital (losses)/gains2014 2013
£’000 £’000Currency (losses)/gains (182) 141Derivative contracts – 616Non-derivative securities (7,714) 2,791Net capital (losses)/gains (7,896) 3,548
2. Revenue2014 2013
£’000 £’000Franked income from UK equity investments – 13Income from overseas equity investments 2,607 5,394Interest on bank and term deposits 1 11Stock dividends 63 423Total revenue 2,671 5,841
3. Expenses2014 2013
£’000 £’000Payable to the ACD or associate of the ACD:ACD fee 715 1,467Fixed expenses – 1Total expenses 715 1,468
4. Taxation2014 2013
£’000 £’000a) Analysis of charge in the yearOverseas tax provision – 11Overseas tax suffered 17 312Current year tax charge (Note 4b) 17 323
b) Factors affecting the tax charge for the yearThe tax assessed for the year is lower than the standard rate of corporation tax inthe UK for an Open-Ended Investment Company (OEIC) (20%). The differences areexplained below.
Net revenue before taxation 1,956 4,373Corporation tax at 20% 391 875
Effects of:Dividends not subject to corporation tax (529) (1,137)Excess expenses for which no relief taken 138 265Overseas tax expensed – (3)Overseas tax provision – 11Overseas tax suffered 17 312
(374) (552)Current year tax charge (Note 4a) 17 323
No deferred tax asset has been recognised in the financial statements. At the yearend date, the Fund had a potential unrecognised deferred tax asset of £1,997,271(31.01.13: £1,859,760) in relation to £9,986,356 (31.01.13: £9,298,801) of excessmanagement expenses which would only be utilised to reduce the tax charge if theFund had an excess of unfranked income over expenses in a future period. There isno excess of unfranked income expected in the future.
5. Finance costsDistributionsThe distributions take account of amounts receivable on the issue of shares andamounts payable on the cancellation of shares and comprise:
2014 2013£’000 £’000
Final dividend distribution 1,670 2,474Add: Amounts payable on cancellation of shares 627 1,646Deduct: Amounts receivable on issue of shares (357) (71)Total finance costs 1,940 4,049
Details of the distribution per share are set out on page 192.
6. Movement between net revenue after taxation and distributions2014 2013
£’000 £’000Net revenue after taxation 1,939 4,050Add: Undistributed revenue brought forward 3 2Deduct: Undistributed revenue carried forward (2) (3)
1,940 4,049
7. Debtors2014 2013
£’000 £’000Accrued income 171 251Due from the ACD for shares created 2 24Overseas tax recoverable 41 –Sales awaiting settlement 2,764 3,160Total debtors 2,978 3,435
8. Cash and bank balances2014 2013
£’000 £’000Cash and bank balances 2,195 2,609Total cash and bank balances 2,195 2,609
9. Creditors2014 2013
£’000 £’000Accrued expenses 52 87Due to the ACD for shares cancelled 76 74Purchases awaiting settlement 2,413 4,469Total creditors 2,541 4,630
Notes to the financial statements for the year ending 31 January 2014

10. Portfolio transaction costs2014 2013
£’000 £’000Analysis of total purchase costs
Purchases in year before transaction costs 92,874 154,248
Commissions 134 232Taxes 41 69Total purchase costs 175 301Gross purchases total 93,049 154,549
Analysis of total sale costs
Gross sales before transaction costs 153,584 303,040
Commissions (131) (230)Taxes (178) (348)Total sale costs (309) (578)Total sales net of transaction costs 153,275 302,462
11. Related party transactionsJPMorgan Funds Limited, as Authorised Corporate Director (“ACD”), is a relatedparty, and acts as principal in respect of all transactions of shares in the Company.The aggregate monies received through issue, and paid on cancellation, aredisclosed in the Statement of Change in Net Assets Attributable to Shareholders
The balance due to the ACD and their associates at the year end date in respect ofrelated party transactions was £125,857 (31.01.13: £137,345). Details of relatedparty transactions are given under note 13 on page 413.
Some of the dealing transactions for the Fund are carried out through associatesof the ACD. Such transactions are carried out on an arm’s length basis. Thecommissions paid to these companies over the year/period were £7,474 (31.01.13:£115,394). Commission was paid to the associated company JPMorgan SecuritiesLtd.
The following party held a material interest in the Fund at the year end date:– JP Morgan Life Ltd 97.80% (31.01.13: 97.79%)
12. Financial instrumentsCurrency exposuresA substantial proportion of the net assets of the Fund are denominated incurrencies other than sterling, with the effect that the Balance sheet and totalreturn can be significantly affected by currency movements.
Net foreign currency assets/(liabilities)Monetary Non-monetary
Total exposures exposuresCurrency £’000 £’000 £’000
31.01.14Hong Kong Dollar 26,802 537 26,265Australian Dollar 20,162 (43) 20,205Korean Won 12,619 180 12,439Taiwan Dollar 9,133 318 8,815Indian Rupee 4,062 – 4,062US Dollar 2,777 1,806 971Thailand Baht 2,687 – 2,687Singapore Dollar 2,654 – 2,654Malaysian Ringgit 1,440 – 1,440Indonesian Rupiah 1,021 – 1,021Philippine Peso 284 (48) 332
31.01.13Hong Kong Dollar 47,999 (605) 48,604Australian Dollar 31,937 8 31,929Korean Won 22,541 (98) 22,639Indian Rupee 10,833 (501) 11,334US Dollar 10,210 1,467 8,743Taiwan Dollar 10,156 44 10,112Thailand Baht 8,693 (82) 8,775Singapore Dollar 4,125 902 3,223Indonesian Rupiah 3,760 314 3,446
Notes to the financial statements – continued
190
Continuation�
� Return to Index

191
Continuation�
� Return to Index
Interest rate riskThe tables below detail the interest rate profile of the Fund’s assets and liabilitiesas at the year end.
Financialassets
Floating Fixed notrate rate carrying
Total financial financial anyassets assets assets interest
Currency £’000 £’000 £’000 £’000
31.01.14Hong Kong Dollar 27,047 57 – 26,990Australian Dollar 22,180 28 – 22,152Korean Won 12,721 – – 12,721Taiwan Dollar 9,133 295 – 8,838Indian Rupee 4,062 – – 4,062US Dollar 2,777 1,807 – 970Thailand Baht 2,687 – – 2,687Singapore Dollar 2,654 – – 2,654Malaysian Ringgit 1,440 – – 1,440Indonesian Rupiah 1,021 – – 1,021Philippine Peso 332 – – 332UK Sterling 10 8 – 2
31.01.13Hong Kong Dollar 48,998 49 – 48,949Australian Dollar 32,118 – – 32,118Korean Won 22,979 – – 22,979Indian Rupee 11,644 – – 11,644US Dollar 10,946 1,826 – 9,120Taiwan Dollar 10,435 323 – 10,112Thailand Baht 9,719 – – 9,719Singapore Dollar 4,125 310 – 3,815Indonesian Rupiah 3,760 – – 3,760UK Sterling 125 101 – 24
The floating rate financial assets are bank balances that bear interest at ratesbased on LIBOR or its overseas equivalent.
The floating rate financial assets comprise investments in variable interest ratepaying corporate debt and bank balances that bear interest at rates based onLIBOR or its overseas equivalent.
Floating Financialrate liabilities
Total financial not carryingliabilities liabilities any interest
Currency £’000 £’000 £’000
31.01.14Australian Dollar 2,018 – 2,018Hong Kong Dollar 245 – 245UK Sterling 130 – 130Korean Won 102 – 102Philippine Peso 48 – 48
31.01.13Thailand Baht 1,026 – 1,026Hong Kong Dollar 999 – 999Indian Rupee 811 – 811US Dollar 736 – 736Korean Won 438 – 438Taiwan Dollar 279 – 279UK Sterling 192 – 192Australian Dollar 181 – 181
For consideration of other risks including liquidity, pricing and credit risk, pleaserefer to thenotes to the aggregated financial statements, pages 413 to 414.
13. Share classesThe Fund currently has two share classes; Class I Shares and Class X Shares. TheAuthorised Corporate Director’s (ACD) fee and fixed expenses charge are shownbelow.
ACD fee Fixed expensesClass I shares: 0.70% 0.00%Class X shares: 0.00% 0.06%
The X share class is designed to accommodate an alternative charging structurewhereby the annual fee normally charged to the Fund and then passed on in theshare price is instead administratively levied and collected by the ACD from theshareholder or through the relevant JPMorgan Chase & Co entity.
The net asset value of each share class, the net asset value per share and thenumber of shares in each class are shown on page 185. All classes have the samerights on winding up.
14. Derivatives The Fund enters into derivative transactions in the form of futures for the purposeof efficient portfolio management. The commitment approach has been used tocalculate the global exposure.
Further information on the derivative risks can be found in the notes to theaggregated financial statements on page 414.
15. Contingent liabilities and capital commitmentsAt the balance sheet date there were no contingent liabilities or capitalcommitments (2013: none).
Notes to the financial statements – continued

Final distribution in pence per share
Group 1 – Shares purchased prior to 1 February 2013Group 2 – Shares purchased 1 February 2013 to 31 January 2014
DistributionGross Tax Net paid paid
revenue at 10% revenue Equalisation 16.03.14 16.03.13
I-Class Accumulation Shares
Group 1 5.522222 0.552222 4.970000 – 4.970000 4.470000
Group 2 4.888609 0.488861 4.399748 0.570252 4.970000 4.470000
X-Class Income Shares
Group 1 6.644444 0.664444 5.980000 – 5.980000 5.170000
Group 2 2.209548 0.220955 1.988593 3.991407 5.980000 5.170000
Equalisation applies only to shares purchased during the distribution period (group 2 shares). It is the average amount of revenue included in the purchase price of all group 2 shares and is refunded to holders of these
shares as a return of capital. Being capital it is not liable to income tax but must be deducted from the cost of shares for capital gains tax purposes.
Distribution table
192
� Return to Index

193
Continuation�
� Return to Index
Investment objective and policyTo provide capital growth over the long term by investing primarily in theshares of Japanese companies.
Japanese companies are companies that are incorporated under the lawsof, and have their registered office in, Japan, or that derive the predominantpart of their economic activity from Japan, even if listed elsewhere.
The Fund may have exposure to smaller companies.
Other instruments as permitted in the stated investment and borrowingpowers of the Company including, but not limited to, fixed interest securities,cash and cash equivalents may be held on an ancillary basis, as appropriate.
Risk profileThe value of your investment may fall as well as rise and you may get backless than you originally invested.
The value of Equity and Equity-Linked Securities may fluctuate in responseto the performance of individual companies and general market conditions.
This Fund is aggressively managed, which may result in higher volatility ofthe Fund’s performance and bigger differences between the performanceof the Fund and its Benchmark.
The single market in which the Fund primarily invests, in this case Japan,may be subject to particular political and economic risks and, as a result,the Fund may be more volatile than more broadly diversified funds.
The Fund may be concentrated in a limited number of securities and, as aresult, may be more volatile than more broadly diversified funds.
The Fund invests in securities of smaller companies which may be moredifficult to sell, more volatile and tend to carry greater financial risk thansecurities of larger companies.
For investors in Share Classes which are not hedged to Sterling movementsin currency exchange rates can adversely affect the return of your investment.
Investors in GBP Hedged Share Classes should be aware that any currencyhedging process may not give a precise hedge. Where currency hedging isundertaken, whilst it may protect an investor in Hedged Shares against adecrease in the value of the currency being hedged, it may also prevent theinvestor from participating in an increase in the value of the currency. Inaddition, in the unlikely event that some of the assets in the Fund chosenby the Investment Adviser are not denominated in Japanese Yen, the impactof the currency hedging from Japanese Yen to GBP will mean that some overhedging will occur leading to some currency exposure. Please refer toPart 1: Section 1.3 of the Prospectus for more information on Hedged ShareClasses.
Please refer to Part 11 of the Prospectus for details of the general risk factorsaffecting this Fund in addition to the specific risk factors above.
Fund reviewFollowing the December 2012 lower house election, the Liberal DemocraticParty, under leader Shinzo Abe, also won in the summer upper house election.Prime minister Abe continues to enjoy high support rates, which shouldallow him to push forward with his policies. In April, the new governor ofthe Bank of Japan announced aggressive monetary easing to help achievea 2% inflation target. Partly as a result of this easing, inflation returned andthe Japanese yen continued to weaken. Macroeconomic data, such as GDPgrowth and unemployment, was generally strong. Results from the corporatesector were good, particularly export-related companies, which benefitedfrom the weaker currency. In September, Tokyo was awarded the 2020Summer Olympics. Sino-Japanese relations continued to be difficult and weare watching developments closely.
The Fund rose in absolute terms and outperformed the benchmark in thereview period, almost entirely due to stock selection. Real estate-relatedcompanies Hulic, Orix and Tokyo Tatemono benefited from the improvedeconomic outlook, while Kakaku.com is rapidly winning new customers forits restaurant website. The top contributor was Asahi Intecc, a medicalequipment manufacturer.
Fund outlookThe outlook is positive: government policy is supportive, the yen is weakening,the global economic outlook is improving and valuations remain attractive.We are particularly optimistic on the effect the end of deflation will have onthe economy. Our primary overweight positions are in financials, real estate,services and retail, as we expect the domestic economy to receive a significantboost as inflation returns. We also focus on areas such as the increasingpenetration of internet shopping, growth in online content as peopleincreasingly use mobile devices, the ageing population and consolidationin domestic Japan.
12 month performance as at 31 January 2014 2013 2012 2011 2010
JPM JapanA-Class Acc 26.6% 2.1% -3.6% 8.1% 2.2%
JPM JapanB-Class Acc 27.0% – – – –
JPM JapanC-Class Acc 27.6% 2.9% -2.7% 8.9% 3.1%
Benchmark Index 14.1% 5.9% -7.5% 13.8% 2.9%
JPM JapanC-Class Acc (GBP Hedged)A – – – – –
Hedged Benchmark Index – – – – –
JPM Japan Fund
You should remember that past performance is not a guide to the future. The price of investments and the income from them may fall as well as rise andinvestors may not get back the full amount invested. All equity indices stated as ‘Net’ are calculated net of tax as per the standard published approach by the index vendor unless stated otherwise.All performance returns are calculated using the quoted price of the accumulation shares. Performance returns are in Sterling.Source: J.P. Morgan.A C-Class Accumulation Shares (GBP Hedged) were launched on 29 July 2013, therefore 12 month performance to 31 January is not available.

194
Fund statisticsRisk and Reward Profile 6*
Fund size £80.2m
Benchmark Index TOPIX (Net)Hedged Benchmark Index TOPIX (Net) hedged to GBP
Fund chargesA-Class Initial 3.00%, Annual 1.50%B-Class Initial Nil, Annual 1.00%C-Class Initial Nil, Annual 0.75%
Top ten holdings %Sumitomo Mitsui Financial Group 5.1Mitsubishi UFJ Financial Group 4.5Softbank 3.9Mazda Motor 3.6ORIX 2.8Rakuten 2.6Asahi Intecc 2.5Sumitomo Realty & Development 2.2Fuji Heavy Industries 2.2Kakaku.com 2.1
Sector breakdown %Industrials 23.6Financials 22.1Consumer services 17.8Consumer goods 17.5Health care 7.8Telecommunications 6.3Technology 4.9Net other liabilities 0.0
Highest/lowest share price and distribution recordDistribution
Highest Lowest per shareCalendar year share price share price (net)A-Class Accumulation Shares2009 184.6p 131.3p 0.83p2010 212.6p 164.2p 0.00p2011 207.3p 156.7p 0.00p2012 193.9p 169.4p 0.03p2013 251.9p 176.7p 0.49p2014B 249.0p 236.3p 0.00pA-Class Income Shares2009 44.57p 44.11p 0.14p2010 51.34p 39.65p 0.00p2011 50.05p 37.83p 0.00p2012 46.81p 40.89p 0.00p2013 60.61p 42.64p 0.10p2014B 59.93p 56.86p 0.00pB-Class Accumulation SharesC
2012 177.5p 169.8p –2013 252.8p 176.9p 0.73p2014B 250.2p 237.4p 0.00pC-Class Accumulation Shares2009 95.67p 68.38p 0.89p2010 110.8p 85.88p 0.39p2011 109.0p 82.18p 0.69p2012 102.4p 90.04p 0.82p2013 134.8p 94.07p 1.01p2014B 133.5p 126.7p 0.24pC-Class Accumulation GBP Hedged SharesD
2013 119.2p 99.16p – 2014B 120.5p 113.2p 0.00pC-Class Income SharesE
2012 100.4p 95.71p –2013 142.4p 100.0p 0.64p2014B 141.0p 133.8p 0.20p
B To 31 January 2014.C B-Class Accumulation Shares were launched on 29 October 2012.D C-Class Accumulation GBP Hedged Shares were launched on 29 July 2013.E C-Class Income Shares were launched on 20 August 2012.
* For specific risks, including the risk and reward profile, please refer to the Key Investor information Document (KIID) available on the following websitehttp://am.jpmorgan.co.uk/investor/prices-and-factsheets/?list=all&tab=Prices
Continuation�
� Return to Index

195
Continuation�
� Return to Index
Portfolio turnover rate31.01.13 344.9%31.01.14 25.1%
The portfolio turnover rate (PTR) reflects the total of security purchases and sales, less the total of shareissues and cancellations, expressed as a percentage of the average daily net asset values over the period.
Portfolio transaction costsBroker Transaction
Commissions Taxes Total31.01.13 0.24% 0.00% 0.24%31.01.14 0.15% 0.00% 0.22%
The percentage figures disclosed above reflect the average broker commissions and transaction taxessuffered during the last 3 years divided by the average assets under management over the same period.
Stamp duty reserve tax31.01.13 0.00%31.01.14 0.00%
The percentage figures disclosed above reflect the total stamp duty reserve tax suffered during the yeardivided by the average assets under management over the same period.
Net asset values and Ongoing chargesNet assetvalue per Net asset
share class Number value per OngoingDate £’000 of shares share chargesA-Class Accumulation Shares31.01.12 73,408 40,002,768 183.5p 1.67%31.01.13 63,061 33,658,190 187.4p 1.68%31.01.14 75,400 31,772,821 237.3p 1.68%A-Class Income Shares31.01.12 299 674,148 44.32p 1.65%31.01.13 289 640,448 45.10p 1.68%31.01.14 413 723,914 57.11p 1.68%B-Class Accumulation Shares31.01.13 3 1,500 187.7p 1.18%31.01.14 66 27,767 238.5p 1.18%C-Class Accumulation Shares31.01.12 2,038 2,102,190 96.95p 0.87%31.01.13 1,862 1,866,613 99.78p 0.93%31.01.14 3,388 2,661,745 127.3p 0.93%C-Class Accumulation GBP Hedged Shares31.01.14 160 141,480 113.0p 0.93%C-Class Income Shares31.01.13 1 1,098 105.4p 0.93%31.01.14 804 598,932 134.2p 0.93%
The net asset value and the net asset value per income share are shown ex-dividend.
Following the adoption of the requirements of UCITS IV in June 2012, Ongoing charges has replaced the TotalExpense Ratio (“TER”). The Ongoing charges takes into account the ACD fee, the fixed expenses and any expensespaid to an affiliate in respect of stocklending activities, expressed as a percentage of the average daily net assetvalues over the period. The main difference between the two calculations is the inclusion of custodian handlingcharges and stocklending fees in the Ongoing charges figure. The comparative figures have not been restated,and the historic TER is disclosed.
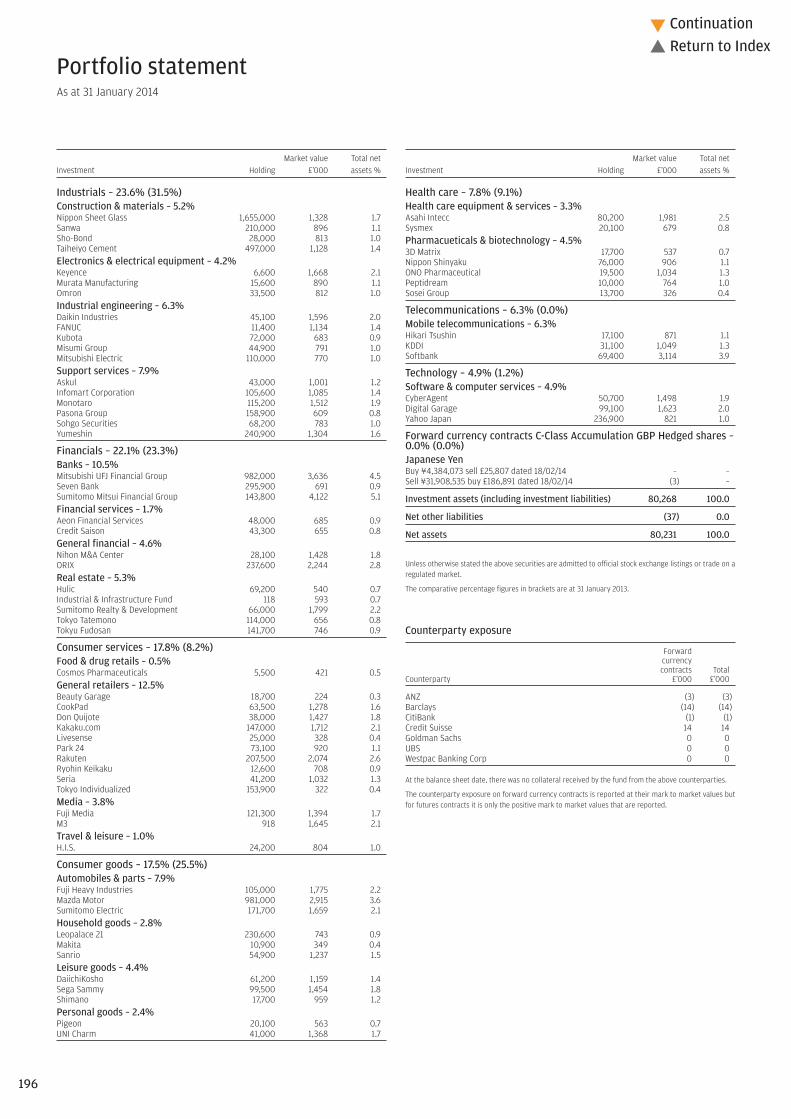
Industrials – 23.6% (31.5%)Construction & materials – 5.2% Nippon Sheet Glass 1,655,000 1,328 1.7Sanwa 210,000 896 1.1Sho-Bond 28,000 813 1.0Taiheiyo Cement 497,000 1,128 1.4Electronics & electrical equipment – 4.2% Keyence 6,600 1,668 2.1Murata Manufacturing 15,600 890 1.1Omron 33,500 812 1.0Industrial engineering – 6.3% Daikin Industries 45,100 1,596 2.0FANUC 11,400 1,134 1.4Kubota 72,000 683 0.9Misumi Group 44,900 791 1.0Mitsubishi Electric 110,000 770 1.0Support services – 7.9% Askul 43,000 1,001 1.2Infomart Corporation 105,600 1,085 1.4Monotaro 115,200 1,512 1.9Pasona Group 158,900 609 0.8Sohgo Securities 68,200 783 1.0Yumeshin 240,900 1,304 1.6
Financials – 22.1% (23.3%)Banks – 10.5% Mitsubishi UFJ Financial Group 982,000 3,636 4.5Seven Bank 295,900 691 0.9Sumitomo Mitsui Financial Group 143,800 4,122 5.1Financial services – 1.7% Aeon Financial Services 48,000 685 0.9Credit Saison 43,300 655 0.8General financial – 4.6% Nihon M&A Center 28,100 1,428 1.8ORIX 237,600 2,244 2.8Real estate – 5.3% Hulic 69,200 540 0.7Industrial & Infrastructure Fund 118 593 0.7Sumitomo Realty & Development 66,000 1,799 2.2Tokyo Tatemono 114,000 656 0.8Tokyu Fudosan 141,700 746 0.9
Consumer services – 17.8% (8.2%)Food & drug retails – 0.5% Cosmos Pharmaceuticals 5,500 421 0.5General retailers – 12.5% Beauty Garage 18,700 224 0.3CookPad 63,500 1,278 1.6Don Quijote 38,000 1,427 1.8Kakaku.com 147,000 1,712 2.1Livesense 25,000 328 0.4Park 24 73,100 920 1.1Rakuten 207,500 2,074 2.6Ryohin Keikaku 12,600 708 0.9Seria 41,200 1,032 1.3Tokyo Individualized 153,900 322 0.4Media – 3.8% Fuji Media 121,300 1,394 1.7M3 918 1,645 2.1Travel & leisure – 1.0% H.I.S. 24,200 804 1.0
Consumer goods – 17.5% (25.5%)Automobiles & parts – 7.9% Fuji Heavy Industries 105,000 1,775 2.2Mazda Motor 981,000 2,915 3.6Sumitomo Electric 171,700 1,659 2.1Household goods – 2.8% Leopalace 21 230,600 743 0.9Makita 10,900 349 0.4Sanrio 54,900 1,237 1.5Leisure goods – 4.4% DaiichiKosho 61,200 1,159 1.4Sega Sammy 99,500 1,454 1.8Shimano 17,700 959 1.2Personal goods – 2.4% Pigeon 20,100 563 0.7UNI Charm 41,000 1,368 1.7
Health care – 7.8% (9.1%)Health care equipment & services – 3.3% Asahi Intecc 80,200 1,981 2.5Sysmex 20,100 679 0.8Pharmacueticals & biotechnology – 4.5% 3D Matrix 17,700 537 0.7Nippon Shinyaku 76,000 906 1.1ONO Pharmaceutical 19,500 1,034 1.3Peptidream 10,000 764 1.0Sosei Group 13,700 326 0.4
Telecommunications – 6.3% (0.0%)Mobile telecommunications – 6.3% Hikari Tsushin 17,100 871 1.1KDDI 31,100 1,049 1.3Softbank 69,400 3,114 3.9
Technology – 4.9% (1.2%)Software & computer services – 4.9% CyberAgent 50,700 1,498 1.9Digital Garage 99,100 1,623 2.0Yahoo Japan 236,900 821 1.0
Forward currency contracts C-Class Accumulation GBP Hedged shares –0.0% (0.0%)Japanese YenBuy ¥4,384,073 sell £25,807 dated 18/02/14 – –Sell ¥31,908,535 buy £186,891 dated 18/02/14 (3) –
Investment assets (including investment liabilities) 80,268 100.0
Net other liabilities (37) 0.0
Net assets 80,231 100.0
Unless otherwise stated the above securities are admitted to official stock exchange listings or trade on aregulated market.
The comparative percentage figures in brackets are at 31 January 2013.
Counterparty exposure
Forwardcurrencycontracts Total
Counterparty £’000 £’000
ANZ (3) (3)Barclays (14) (14)CitiBank (1) (1)Credit Suisse 14 14Goldman Sachs 0 0UBS 0 0Westpac Banking Corp 0 0
At the balance sheet date, there was no collateral received by the fund from the above counterparties.
The counterparty exposure on forward currency contracts is reported at their mark to market values butfor futures contracts it is only the positive mark to market values that are reported.
Portfolio statementAs at 31 January 2014
Market value Total netInvestment Holding £’000 assets %
Market value Total netInvestment Holding £’000 assets %
196
Continuation�
� Return to Index

197
Continuation�
� Return to Index
£’000
Total of all purchases for the year (Note 10) 60,571
Major purchases Cost
Softbank 2,681Mazda Motor 2,406Nippon Sheet Glass 1,952Sumitomo Mitsui Trust 1,775Sega Sammy 1,672Fuji Media 1,526ONO Pharmaceutical 1,407Fuji Heavy Industries 1,403Credit Saison 1,389Digital Garage 1,369Astellas Pharma 1,303Keyence 1,217Daikin Industries 1,154Yumeshin 1,140Tokai Tokyo Financial 1,082CyberAgent 1,069CookPad 1,062Monotaro 1,055Peptidream 1,037Sanrio 1,028
£’000
Total of all sales for the year (Note 10) 63,244
Major sales Proceeds
Isuzu Motors 2,385Hitachi 2,306ORIX 2,056Tokio Marine 1,816Hulic 1,729Taiheiyo Cement 1,698Honda Motor 1,694Mizuho Financial Group 1,669Jin 1,594Itochu 1,537Sumitomo Mitsui Trust 1,498Japan Tobacco 1,460Mitsubishi Electric 1,414Tokyo Tatemono 1,413Nissan Motor 1,373Makita 1,352Shinsei Bank 1,288Obayashi 1,251Enplas 1,238Astellas Pharma 1,177
Portfolio movements For the year ending 31 January 2014

Statement of total returnFor the year ending 31 January
2014 2013£’000 £’000 £’000 £’000
Income
Net capital gains (Note 1) 17,949 954
Revenue (Note 2) 999 1,436
Expenses (Note 3) (1,327) (1,109)
Net (expenses)/revenue before taxation (328) 327
Taxation (Note 4) (77) (101)
Net (expenses)/revenue after taxation (405) 226
Total return before distributions 17,544 1,180
Finance costs: Distributions (Note 5) 21 (228)
Change in net assets attributable to shareholders from investment activities 17,565 952
Statement of change in net assets attributable to shareholdersFor the year ending 31 January
2014 2013£’000 £’000 £’000 £’000
Opening net assets attributable to shareholders 65,216 75,745
Amounts receivable on issue of shares 51,660 7,567
Amounts payable on cancellation of shares (54,216) (19,231)
(2,556) (11,664)
Change in net assets attributable to shareholders from investment activities (see above) 17,565 952
Retained distributions on accumulation shares 6 183
Closing net assets attributable to shareholders 80,231 65,216
Balance sheetAs at 31 January
2014 2013£’000 £’000 £’000 £’000
ASSETS
Investment assets 80,271 65,082
Debtors (Note 7) 2,829 1,372
Cash and bank balances (Note 8) 90 355
Total other assets 2,919 1,727
Total assets 83,190 66,809
LIABILITIES
Investment liabilities (3) –
Creditors (Note 9) (2,955) (1,592)
Distribution payable on income shares (1) (1)
Total other liabilities (2,956) (1,593)
Total liabilities (2,959) (1,593)
Net assets attributable to shareholders 80,231 65,216
The notes to these financial statements are shown on pages 199 to 200.
Financial statements
198
Continuation�
� Return to Index

199
Continuation�
� Return to Index
1. Net capital gains2014 2013
£’000 £’000Currency gains/(losses) 31 (42)Forward currency contracts 57 –Non-derivative securities 17,861 996Net capital gains 17,949 954
2. Revenue2014 2013
£’000 £’000Income from overseas equity investments 997 1,435Interest on bank and term deposits 2 1Total revenue 999 1,436
3. Expenses2014 2013
£’000 £’000Payable to the ACD or associate of the ACD:ACD fee 1,182 990Fixed expenses 145 119Total expenses 1,327 1,109
4. Taxation2014 2013
£’000 £’000a) Analysis of charge in the yearOverseas tax suffered 77 101Current year tax charge (Note 4b) 77 101
b) Factors affecting the tax charge for the yearThe tax assessed for the year is higher than the standard rate of corporation tax inthe UK for an Open-Ended Investment Company (OEIC) (20%). The differences areexplained below.
Net (expenses)/revenue before taxation (328) 327Corporation tax at 20% (66) 65
Effects of:Dividends not subject to corporation tax (195) (280)Excess expenses for which no relief taken 261 215Overseas tax suffered 77 101
143 36Current year tax charge (Note 4a) 77 101
No deferred tax asset has been recognised in the financial statements. At the yearend date, the Fund had a potential unrecognised deferred tax asset of £8,655,844(31.01.13: £8,395,205) in relation to £43,279,219 (31.01.13: £41,976,027) of excessmanagement expenses which would only be utilised to reduce the tax charge if theFund had an excess of unfranked income over expenses in a future period. There isno excess of unfranked income expected in the future.
5. Finance costsDistributionsThe distributions take account of amounts receivable on the issue of shares andamounts payable on the cancellation of shares and comprise:
2014 2013£’000 £’000
Final dividend distribution 7 184Add: Amounts payable on cancellation of shares (55) 62Deduct: Amounts receivable on issue of shares 27 (18)Total finance costs (21) 228
Details of the distribution per share are set out on page 201.
6. Movement between net (expenses)/revenue after taxation anddistributions
2014 2013£’000 £’000
Net (expenses)/revenue after taxation (405) 226Add: Net expense payable from capital 383 –Add: Undistributed revenue brought forward – 2Equalisation on conversions 1 –
(21) 228
7. Debtors2014 2013
£’000 £’000Accrued income 42 38Due from the ACD for shares created 1,100 19Sales awaiting settlement 1,687 1,315Total debtors 2,829 1,372
8. Cash and bank balances2014 2013
£’000 £’000Cash and bank balances 90 355
9. Creditors2014 2013
£’000 £’000Accrued expenses 117 90Due to the ACD for shares cancelled 2,513 1,303Purchases awaiting settlement 325 199Total creditors 2,955 1,592
Notes to the financial statements for the year ending 31 January 2014

10. Portfolio transaction costs2014 2013
£’000 £’000Analysis of total purchase costs
Purchases in year before transaction costs 60,530 124,103
Commissions 41 57Total purchase costs 41 57Gross purchases total 60,571 124,160
Analysis of total sale costs
Gross sales before transaction costs 63,276 135,473
Commissions (32) (69)Total sale costs (32) (69)Total sales net of transaction costs 63,244 135,404
11. Related party transactionsJPMorgan Funds Limited, as Authorised Corporate Director (“ACD”), is a relatedparty, and acts as principal in respect of all transactions of shares in the Company.The aggregate monies received through issue, and paid on cancellation, aredisclosed in the Statement of Change in Net Assets Attributable to Shareholders.
The balance due to the ACD and their associates at the year end date in respect ofrelated party transactions was £1,529,528 (31.01.13: £1,374,161). Details of relatedparty transactions are given under note 13 on page 413.
Some of the dealing transactions for the Fund are carried out through associatesof the ACD. Such transactions are carried out on an arm’s length basis. Thecommissions paid to these companies over the year were £4,078 (31.01.13:£15,934). Commission was paid to the associated company JPMorgan SecuritiesLtd.
12. Financial instrumentsCurrency exposuresA substantial proportion of the net assets of the Fund are denominated incurrencies other than sterling, with the effect that the Balance sheet and totalreturn can be significantly affected by currency movements.
Net foreign currency assetsMonetary Non-monetary
Total exposures exposuresCurrency £’000 £’000 £’000
31.01.14Japanese Yen 81,761 1,490 80,271
31.01.13Japanese Yen 65,304 222 65,082
Interest rate riskAt the year end date, 0.1% (31.01.13: 0.5%) of the Fund’s net assets by value wereinterest bearing, carrying a (fixed/floating) rate.
For consideration of other risks including liquidity, pricing and credit risk, pleaserefer to the notes to the aggregated financial statements, pages 413 to 414.
13. Share classesThe Fund currently has three share classes; Class A Shares, Class B Shares andClass C Shares. The Authorised Corporate Director’s (ACD) fee and fixed expensescharge are shown below.
ACD fee Fixed expensesClass A shares: 1.50% 0.18%Class B shares: 1.00% 0.18%Class C shares: 0.75% 0.18%
The net asset value of each share class, the net asset value per share and thenumber of shares in each class are shown on page 195. All classes have the samerights on winding up.
14. DerivativesThe Fund enters into derivative transactions in the form of forward currencycontracts for the purpose of efficient portfolio management. The positive mark tomarket approach has been used to calculate the global exposure.
Further information on the derivative risks can be found in the notes to theaggregated financial statements on page 414.
15. Contingent liabilities and capital commitmentsAt the balance sheet date there were no contingent liabilities or capitalcommitments (2013: none).
Notes to the financial statements – continued
200
Continuation�
� Return to Index

201
� Return to Index
Final distribution in pence per share
Group 1 – Shares purchased prior to 1 February 2013Group 2 – Shares purchased 1 February 2013 to 31 January 2014
DistributionGross Tax Net payable paid
revenue at 10% revenue Equalisation 30.04.14 30.04.13
A-Class Accumulation Shares
Group 1 0.000000 0.000000 0.000000 – 0.000000 0.490000
Group 2 0.000000 0.000000 0.000000 0.000000 0.000000 0.490000
A-Class Income Shares
Group 1 0.000000 0.000000 0.000000 – 0.000000 0.100000
Group 2 0.000000 0.000000 0.000000 0.000000 0.000000 0.100000
B-Class Accumulation Shares
Group 1 0.000000 0.000000 0.000000 – 0.000000 0.730000
Group 2 0.000000 0.000000 0.000000 0.000000 0.000000 0.730000
C-Class Accumulation Shares
Group 1 0.266667 0.026667 0.240000 – 0.240000 1.010000
Group 2 0.000000 0.000000 0.000000 0.240000 0.240000 1.010000
C-Class Accumulation GBP Hedged SharesF
Group 1 0.000000 0.000000 0.000000 – 0.000000 –
Group 2 0.000000 0.000000 0.000000 0.000000 0.000000 –
C-Class Income Shares
Group 1 0.222222 0.022222 0.200000 – 0.200000 0.640000
Group 2 0.000000 0.000000 0.000000 0.200000 0.200000 0.640000
Equalisation applies only to shares purchased during the distribution period (group 2 shares). It is the average amount of revenue included in the purchase price of all group 2 shares and is refunded to holders of these
shares as a return of capital. Being capital it is not liable to income tax but must be deducted from the cost of shares for capital gains tax purposes.
F C-Class Accumulation GBP Hedged share were launched on 29 July 2013.
Distribution table

202
Continuation�
� Return to Index
Investment objective and policyTo provide income by investing primarily in a global portfolio of incomegenerating securities.
The Fund will predominantly invest in fixed and floating rate Debt Securitiesand Equity and Equity Linked Securities to generate income. The Fund mayinvest in High-Yield Bonds, Convertible Bonds, Investment Grade, Below-Investment Grade and Unrated securities, Real Estate Investment Trusts(“REITS”), smaller companies and collective investment schemes as theInvestment Adviser deems appropriate. Issuers of securities may be locatedin any country, including Emerging Markets and the Fund may invest in assetsdenominated in any currency. Non-Sterling currency exposure (excludingEmerging Markets local currency) will be hedged back to Sterling. TheFund may use Financial Derivative Instruments (derivatives) and forwardtransactions for investment purposes and Efficient Portfolio Management,including hedging.
Risk profileThe value of your investment may fall as well as rise and you may get backless than you originally invested.
The value of Bonds and other Debt Securities may change significantlydepending on market, economic and interest rate conditions as well as thecreditworthiness of the issuer. Issuers of Bonds and other Debt Securitiesmay fail to meet payment obligations (default) or the credit rating of Bondsand other Debt Securities may be downgraded. These risks are typicallyincreased for Below-Investment Grade Bonds which may also be subject tohigher volatility and be more difficult to sell than Investment Grade Bonds.
The Fund may have a significant exposure to Asset and Mortgage BackedSecurities (ABS and MBS). ABS/MBS may be difficult to sell, subject to adversechanges to interest rates and to the risk that the payment obligations ofthe underlying asset are not met.
The Fund may use Financial Derivative Instruments (derivatives) and/orforward transactions for investment purposes. The value of derivatives canbe volatile. This is because a small movement in the value of the underlyingasset can cause a large movement in the value of the derivative and therefore,investment in derivatives may result in losses in excess of the amount investedby the Fund.
The value of Equity and Equity-Linked Securities may fluctuate in responseto the performance of individual companies and general market conditions.
Emerging Markets may be subject to increased political, regulatory andeconomic instability, less developed custody and settlement practices,poor transparency and greater financial risks. Emerging Market currenciesmay be subject to volatile price movements. Emerging Market securities mayalso be subject to higher volatility and be more difficult to sell than non-Emerging Market securities.
Investments in companies engaged in the business of real estate may bemore difficult to sell and may experience increased price volatility due tochanges in economic conditions and interest rates.
The Fund’s asset allocation is actively managed. There is a risk that theperformance of the Fund will suffer if the allocation to any particular assetclass is low when that asset class is outperforming or high when that assetclass is underperforming.
This Fund is aggressively managed, which may result in higher volatility ofthe Fund’s performance and bigger differences between the performanceof the Fund and its Benchmark.
This Fund charges the annual fee of the Authorised Corporate Director (ACD)against capital, which will increase the amount of income available fordistribution to Shareholders, but may constrain capital growth. It may alsohave tax implications for certain investors.
The capital growth of an investment in a monthly Share Class may beconstrained when compared to the equivalent quarterly Share Class of thesame Fund. This is a result of quarterly Share Classes effectively investingmore in the Fund than monthly Share Classes due to the less frequent paymentof income.
Monthly Share Classes may receive less income than equivalent quarterlyShare Classes of the same Fund. This is a result of the monthly Share Classeseffectively investing less in the Fund due to the more frequent payment ofincome, which means that they will receive a smaller proportion of anyincome received by the Fund during any given quarterly period.
As the portfolio of the Fund is primarily focused on generating income, itmay bear little resemblance to the composition of its Benchmark.
Movements in currency exchange rates can adversely affect the return ofyour investment. The currency hedging that may be used to minimise theeffect of currency fluctuations may not always be successful.
Please refer to Part 11 of the Prospectus for details of the general risk factorsaffecting this Fund in addition to the specific risk factors above.
Fund reviewIn the 12-month period, global equities delivered double-digit returns aseconomic data improved, particularly in the US and Europe. The FederalReserve’s tapering of its asset purchases contributed to negative performancefor bond markets and the underperformance of emerging vs. developedequity markets.
The Fund delivered a positive return, distributing an IMA yield of 4% as at31 January 2014. We remain positive on global growth, expressed by ourhigh allocation to developed market equities. We do, however, remain welldiversified across geography and asset class, with equity volatility in Januaryacting as a reminder of this need. Our emerging market equity exposureremains defensive. High yield remains near lows but continues to play asignificant part in the strategy. Yields remain attractive relative to the riskof default. Specific sleeves for European fixed income and equities have beenadded, bringing an attractive yield and the benefits of diversification.
Fund outlookOur conviction in markets has lowered slightly and we expect increasedvolatility this year. Our concerns centre around the cyclical challenges inemerging economies and the resilience of the global economy in the faceof rising rates. However, we retain a positive outlook for risk assets.
JPM Multi-Asset Income Fund

203
Continuation�
� Return to Index
12 month performance to 31 January 2014 2013 2012 2011
JPM Multi-Asset IncomeA-Class Acc 4.8% 14.4% -0.7% 12.5%
JPM Multi-Asset IncomeB-Class Inc 5.2% – – –
JPM Multi-Asset IncomeC-Class Inc 5.3% – – –
JPM Multi-Asset IncomeX-Class Inc 6.0% 15.6% 0.4% –
Benchmark IndexA 10.1% 13.5% 2.2% 15.0%
Fund statisticsRisk and Reward Profile 5*
Fund size £276.2m
Benchmark IndexB 40% MSCI World Index (Net) – hedged to GBP,30% Barclays US High Yield 2% Issuer
Cap Index (Gross) – hedged to GBP,30% Barclays Global Credit Index – hedged to GBP
Fund chargesA-Class Initial 3.00%, Annual 1.25%B-Class Initial Nil, Annual 0.80%C-Class Initial Nil, Annual 0.65%X-Class On applicationB
Top ten holdings %Vodafone Group 1.1Microsoft 1.1Royal Dutch Shell ‘A’ 1.0Swiss Re 0.9ConocoPhillips 0.8Seven & I 0.8ENI 0.8Time Warner 0.7Unibail-Rodamco 0.7Toyota Motor 0.7
Sector breakdown %Equities 50.9Corporate bonds 37.4Government bonds 5.5Convertible bonds 3.2Forward currency contracts 0.4Futures 0.0Net other assets 2.6
In line with current accounting practice the sector breakdown includes the unrealised profit or loss onderivative holdings and consequently the economic market exposure of the Fund cannot be fully determinedfrom the above disclosure.
You should remember that past performance is not a guide to the future. The price of investments and the income from them may fall as well as rise andinvestors may not get back the full amount invested.
* For specific risks, including the risk and reward profile, please refer to the Key Investor information Document (KIID) available on the following websitehttp://am.jpmorgan.co.uk/investor/prices-and-factsheets/?list=all&tab=PricesAll equity indices stated as ‘Net’ are calculated net of tax as per the standard published approach by the index vendor unless stated otherwise.All performance returns are calculated using the quoted price of the accumulation or income shares. Performance returns are in Sterling.Blended benchmarks have been calculated by JPMAM.Source: J.P. Morgan.A On 01/04/10 part of the element of the composite benchmark for the Fund changed from 10% Global Property Research 250 (Net) hedged into GBP to 10% FTSE EPRA/NAREIT Developed Index (Net) hedged into GBP.
On 01/03/11 the composite benchmark changed from 10% JPM GBI – Emerging Markets Global Index in GBP, 45% BofA Merrill Lynch High Yield BB-B Constrained Index hedged to GBP, 10% FTSE EPRA/NAREIT DevelopedIndex hedged to GBP, 25% MSCI World Index hedged to GBP, 10% BofA Merrill Lynch Sterling Broad Market Index in GBP to 40% MSCI World Index (Net) – hedged to GBP, 30% Barclays U.S. High Yield 2% Issuer CapIndex (Gross) – hedged to GBP, 30% Barclays Global Credit Index – hedged to GBP.
B As agreed from time to time between the ACD and the relevant JPMorgan Chase & Co. entity.Benchmark Source: MSCI. The MSCI data is comprised of a custom index calculated by MSCI for, and as requested by JPMorgan Asset Management (UK) Ltd. The MSCI data is for internal use only and may not be redistributedor used in connection with creating or offering any securities, financial products or indices. Neither MSCI nor any other third party involved in or related to compiling, computing or creating the MSCI data (the “MSCIParties”) makes any express or implied warranties or representations with respect to such data (or the results to be obtained by the use thereof), and the MSCI Parties hereby expressly disclaim all warranties oforiginality, accuracy, completeness, merchantability or fitness for a particular purpose with respect to such data. Without limiting any of the foregoing, in no event shall any of the MSCI Parties have any liability for anydirect, indirect, special, punitive, consequential or any other damages (including lost profits) even if notified of the possibility of such damages.

Highest/lowest share price and distribution recordDistribution
Highest Lowest per shareCalendar year share price share price (net)A-Class Accumulation SharesC
2009 59.42p 50.24p 0.94p2010 65.78p 58.35p 3.36p2011 68.50p 59.77p 3.51p2012 73.31p 64.25p 3.29p2013 80.84p 73.60p 3.11p2014D 80.82p 79.08p 0.64pA-Class Income SharesC
2009 58.42p 50.24p 0.94p2010 61.36p 55.91p 3.23p2011 62.75p 53.50p 3.18p2012 61.65p 56.69p 2.85p2013 66.61p 61.43p 2.57p2014D 65.30p 63.90p 0.52pB-Class Accumulation SharesE
2013 80.98p 74.70p 3.11p2014D 81.15p 79.42p 0.64pB-Class Income SharesF
2012 61.68p 59.58p 0.72p2013 66.74p 61.56p 2.57p2014D 65.59p 64.18p 0.52pC-Class Accumulation SharesG
2012 107.8p 96.58p 2.67p2013 119.1p 108.2p 4.58p2014D 119.5p 116.9p 0.95pC-Class Income SharesH
2012 105.7p 97.20p 2.75p2013 114.4p 105.5p 4.42p2014D 112.5p 110.1p 0.90pX-Class Accumulation SharesI
2013 107.6p 99.27p 3.33p2014D 108.3p 106.1p 0.89pX-Class Income SharesJ
2010 110.3p 100.0p 1.53p2011 113.4p 97.09p 5.90p2012 113.3p 103.1p 5.33p2013 122.8p 113.4p 4.86p2014D 121.2p 118.7p 0.99p
C A-Class Accumulation Shares and A-Class Income Shares were launched on 30 June 2009.D To 31 January 2014.E B-Class Accumulation Shares were launched on 28 January 2013.F B-Class Income Shares were launched on 29 October 2012.G C-Class Accumulation Shares were launched on 1 May 2012.H C-Class Income Shares were launched on 25 April 2012.I X-Class Accumulation Shares were launched on 29 January 2013.J X-Class Income Shares were launched on 7 July 2010.
Portfolio turnover rate31.01.13 78.1%31.01.14 91.9%
The portfolio turnover rate (PTR) reflects the total of security purchases and sales, less the total of shareissues and cancellations, expressed as a percentage of the average daily net asset values over the period.
Portfolio transaction costsBroker Transaction
Commissions Taxes Total31.01.13 0.05% 0.03% 0.08%31.01.14 0.07% 0.06% 0.13%
The percentage figures disclosed above reflect the average broker commissions and transaction taxessuffered during the last 3 years divided by the average assets under management over the same period.
Stamp duty reserve tax31.01.13 0.00%31.01.14 0.00%
The percentage figures disclosed above reflect the total stamp duty reserve tax suffered during the yeardivided by the average assets under management over the same period.
Net asset values and Ongoing chargesNet assetvalue per Net asset
share class Number value per OngoingDate £’000 of shares share chargesA-Class Accumulation Shares31.01.12 23,278 35,379,772 65.79p 1.43%31.01.13 47,184 62,662,824 75.30p 1.43%31.01.14 57,256 72,575,034 78.89p 1.43%A-Class Income Shares31.01.12 13,415 23,346,692 57.46p 1.43%31.01.13 27,280 43,473,746 62.75p 1.43%31.01.14 32,490 51,389,749 63.22p 1.43%B-Class Accumulation Shares31.01.13 17 21,971 75.30p 0.98%31.01.14 1,163 1,468,220 79.22p 0.98%B-Class Income Shares31.01.13 75 119,776 62.81p 0.98%31.01.14 2,448 3,854,874 63.51p 0.98%C-Class Accumulation Shares31.01.13 823 742,814 110.8p 0.83%31.01.14 26,658 22,852,714 116.7p 0.83%C-Class Income Shares31.01.13 3,110 2,889,495 107.6p 0.83%31.01.14 24,729 22,697,688 109.0p 0.83%X-Class Accumulation Shares31.01.13 18,640 18,664,290 99.87p 0.06%31.01.14 115,264 108,947,920 105.8p 0.06%X-Class Income Shares31.01.12 14,047 13,429,180 104.6p 0.06%31.01.13 20,544 17,803,989 115.4p 0.06%31.01.14 16,195 13,792,632 117.4p 0.06%
The net asset value and the net asset value per income share are shown ex-dividend.
Following the adoption of the requirements of UCITS IV in June 2012, Ongoing charges has replaced theTotal Expense Ratio (“TER”). The Ongoing charges takes into account the ACD fee, the fixed expenses andany expenses paid to an affiliate in respect of stocklending activities, expressed as a percentage of theaverage daily net asset values over the period. The main difference between the two calculations is theinclusion of custodian handling charges and stocklending fees in the Ongoing charges figure. The comparativefigures have not been restated, and the historic TER is disclosed.
204
Continuation�
� Return to Index

205
Continuation�
� Return to Index
Equities – 50.9% (42.8%)United States of America – 16.8%Accenture ‘A’ 20,021 982 0.4 Applied Materials 154,097 1,571 0.6 AvalonBay Communities 2,600 193 0.1 Aviv REIT 4,783 71 – Bank of America Corp Convertible 7.25%
Preference 347 235 0.1 Bank of New York Mellon Preference 25,200 328 0.1 BB&T Preference ‘E’ 2,200 29 – BB&T Preference ‘F’ 22,000 269 0.1 BB&T Preference ‘G’ 2,000 24 – Biomed Realty Trust 12,400 146 0.1 Boston Properties 2,000 131 0.1 Boston Properties Preference 4,000 49 – Brandywine Realty Trust 19,100 165 0.1 Bristol-Myers Squibb 52,556 1,612 0.6 Chesapeake Energy 5.75% Convertible
Preference 35 25 – Cisco Systems 125,981 1,682 0.6 CME Group ‘A’ 30,575 1,380 0.5 Cobank Non Cumulative Preference ‘D’ 700 22 – ConocoPhillips 53,355 2,131 0.8 Constar International ‘A’ 450 – – Constar International Preference ‘A’ 45 – – CubeSmart 5,500 55 – DCT Industrial Trust 44,500 192 0.1 Digital Realty Trust 2,400 73 – Dominion Resources Virginia Preference ‘A’ Unit 770 26 – Dominion Resources Virginia Preference ‘B’ Unit 2,260 76 – Dow Chemical 43,555 1,199 0.4 Duke Realty 12,600 118 0.1 Dynegy Deleware 500 6 – Education Realty Trust 19,300 105 0.1 Equity One 8,500 117 0.1 Extra Space Storage 2,700 74 – ExxonMobil 17,194 982 0.4 Freeport-McMoRan Copper & Gold 49,864 982 0.4 General Growth Properties 8,500 103 – General Maritime 16 – – General Maritime Warrants 2017 (US$1.00) 26 – – GMAC Capital Trust Preference 2040 4,175 70 – Goldman Sachs Group FRN Preference ‘I’
Perpetual 23,000 311 0.1 Goldman Sachs Group Preference 25,000 351 0.1 Health Care Property Investors 9,339 221 0.1 Health Care REIT 1,110 39 – Health Care REIT 6.5% Convertible Preference
2018 ‘I’ 2,150 70 – Healthcare Realty Trust 7,900 109 0.1 Highwoods Properties 7,400 166 0.1 Home Depot 31,511 1,473 0.5 Hospitality Properties 3,683 58 – iStar Financial 4.5% Convertible ‘J’ Preference 1,237 49 – Johnson & Johnson 31,212 1,697 0.6 Kilroy Realty 1,900 60 – Kimco Realty 9,300 118 0.1 LaSalle Hotel Properties 9,500 176 0.1 Liberty Property Trust 5,570 122 0.1 Lorrilard 49,251 1,472 0.5 Masco 76,159 982 0.4 McDonald’s 29,289 1,669 0.6 Merck & Co 45,302 1,473 0.5 Metlife 29,218 883 0.3 Microsoft 131,496 2,945 1.1 Mid-American Apartment 3,100 120 0.1 National Retail Properties 5,200 105 0.1 Neebo Warrants 2019 (USD 1.00) 134 – – Neebo Warrants Jun 2019 (USD 1.00) 288 – – Nextera Energy 23,265 1,286 0.5 Nextera Energy Equity Units 9,990 319 0.1 Paccar 42,909 1,497 0.6 Pennsylvania REIT 3,600 41 – PPL 7,450 233 0.1 Prologis 7,000 165 0.1 Realty Income 6,100 151 0.1 Regency Centers 3,800 111 0.1 RM Holdings# 50,000 – – SCE Preference 11,400 136 0.1 Select Income REIT 3,300 55 – Sempra Energy 23,664 1,315 0.5 Simon Property Group 1,894 176 0.1
Stanley Black & Decker 1,437 89 – State Street Preference ‘C’ 23,200 312 0.1 Time Warner 50,981 1,966 0.7 United Technologies 14,158 987 0.4 United Technologies (Units) 2,740 108 0.1 US Bancorp Delware 48,338 1,178 0.4 US Bancorp Delware Perpetual ‘H’ Preference 15,000 191 0.1 US Concrete 1,546 21 – Ventas 4,703 177 0.1 Verizon Communications 40,716 1,178 0.4 Vornado Realty Trust 2,100 117 0.1 Vornado Realty Trust ‘G’ Preference 5,100 76 – Wells Fargo 54,389 1,521 0.6 Wells Fargo ‘A’ Perpetual Convertible Preference 459 322 0.1 Weyerhaeuser 6.375% Convertible Preference
2016 3,392 113 0.1 XL Group Preference ‘D’ 160 82 – United Kingdom – 6.2%Aberdeen Asset Management 15,976 62 – Admiral Group 6,263 89 – Amec 8,174 84 – AstraZeneca 45,274 1,736 0.6 Aviva 220,306 973 0.4 BAE Systems 23,470 100 – BHP Billiton 7,802 139 0.1 BP 47,975 227 0.1 British Land 91,262 598 0.2 British Sky Broadcasting Group 129,173 1,106 0.4 Direct Line Insurance Group 352,276 926 0.3 Ensco ‘A’ 22,326 687 0.3 GlaxoSmithKline 99,436 1,545 0.6 Hammerson 82,535 431 0.2 Helical Bar 63,853 226 0.1 HSBC 185,589 1,149 0.4 ICAP 15,633 61 – IMI 2,722 40 – ITV 23,634 46 – Legal & General Group 44,900 96 – Lloyds Banking Group 143,186 117 0.1 Marks & Spencer Group 8,783 41 – National Grid 14,150 111 0.1 Next 858 53 – Old Mutual 50,136 85 – Pearson 62,276 683 0.3 Persimmon 91,347 1,167 0.4 Resolution 24,734 86 – Rio Tinto 4,200 135 0.1 Royal Dutch Shell ‘B’ 14,082 316 0.1 Safestore 229,576 437 0.2 Sainsbury (J) 23,906 82 – Segro 81,259 271 0.1 Standard Life 25,042 91 – TUI Travel 10,172 42 – Vodafone Group 1,372,548 3,043 1.1 Japan – 3.4%GLP J-REIT 89 56 – Japan Airlines 22,700 695 0.3 Japan Logistics Fund REIT 60 81 – Japan Real Estate Investment Trust 44 138 0.1 Japan Retail Fund Investment REIT 32 39 – Japan Tobacco 70,100 1,330 0.5 Kenedix Realty Investment 25 75 – Mitsubishi Estate 7,000 106 0.1 Mitsui Fudosan 12,000 234 0.1 Nippon Prologis REIT 26 159 0.1 ORIX JREIT 157 127 0.1 Seven & I 86,400 2,106 0.8 Sumitomo Mitsui Financial Group 59,700 1,711 0.6 Toyota Motor 53,800 1,893 0.7 United Urban Investment REIT 74 67 – France – 3.1%AXA 78,359 1,241 0.5 BNP Paribas 28,151 1,312 0.5 Bouygues 3,550 82 – Casino Guichard-Perrachon 814 51 – CNP Assurances 6,572 79 – EDF 44,140 907 0.3 Fonciere des Regions 1,606 80 – GDF Suez 7,860 105 0.1 Gecina 654 49 – ICADE 4,320 231 0.1
Portfolio statementAs at 31 January 2014
Market value Total netInvestment Holding £’000 assets %
Market value Total netInvestment Holding £’000 assets %

Klepierre 1,406 37 – Lagardere Group 3,779 80 – Orange 13,195 98 – Rexel 3,605 56 – Schneider Electric 15,915 771 0.3 SCOR 4,057 80 – Suez Environment 7,503 81 – TOTAL S.A. 5,811 200 0.1 Unibail-Rodamco 13,236 1,925 0.7 Veolia Environnement 8,589 83 – Vinci 26,931 1,061 0.4 Vivendi 7,045 114 0.1 Switzerland – 2.1%Banque Cantonale Vaudoise 107 35 – Cembra Money Bank 2,005 78 – Givaudan 31 28 – Novartis 31,091 1,492 0.5 Roche (Genusscheine) 10,739 1,776 0.7 Swiss Re 46,968 2,465 0.9 Swisscom 142 47 – Transocean 1,636 43 – Germany – 1.9%Alstria Office Real Estate Investment Trust 17,279 137 0.1 Axel Springer 1,020 39 – BASF 26,288 1,701 0.6 Daimler 30,431 1,522 0.6 Deutsche Telekom 158,915 1,561 0.6 Hannover Rueckversicherungs 1,664 81 – MunichRe 690 86 – ProsiebenSat.1 Media 3,112 83 – Australia – 1.8%Australia & New Zealand Bank Group 57,828 922 0.3 Dexus Property Group Stapled Units 598,352 315 0.1 Goodman Group Stapled Units 569,463 1,407 0.5 Mirvac Group Stapled Units 352,061 310 0.1 Transurban Group 400,821 1,463 0.5 Westfield Group Stapled Units 122,756 662 0.2 Westfield Retail Trust Units 132,431 212 0.1 Sweden – 1.4%Electrolux ‘B’ 64,068 831 0.3 Ericsson ‘B’ 178,483 1,339 0.5 Hennes & Mauritz ‘B’ 2,358 61 – Investor ‘B’ 2,280 45 – Nordea Bank 14,492 117 0.1 Sandvik 8,147 68 – Securitas ‘B’ 12,361 77 – Skandinaviska Enskilda Banken ‘A’ 9,812 76 – Skanska ‘B’ 5,172 62 – Svenska Handelsbanken ‘A’ 2,810 81 – Swedbank ‘A’ 90,286 1,423 0.5 TeliaSonera 20,022 90 – Hong Kong – 1.3%Dah Chong Hong 63,000 23 – Hang Seng Bank 25,600 244 0.1 Hutchison Whampoa 109,000 821 0.3 Link Real Estate Investment Trust 92,500 254 0.1 New World Development 74,000 56 – SJM 165,000 312 0.1 Vtech 21,400 157 0.1 Wharf 33,000 137 0.1 Wynn Macau 512,800 1,324 0.5 Taiwan – 1.3%Asustek Computer 22,000 124 0.1 Delta Electronics 126,000 419 0.2 Far Eastone Telecommunications 102,000 122 0.1 Novatek Microelectronics 98,000 237 0.1 President Chain Store 62,000 252 0.1 Quanta Computer 246,000 369 0.1 Radiant Opto-Electronics 81,000 214 0.1 Siliconware Precision Industries 834,000 619 0.2 Simplo Technology 32,000 89 – Taiwan Mobile 145,000 257 0.1 Taiwan Semiconductor Manufacturing ADS 30,104 313 0.1 Tripod Technology 111,000 122 0.1 Netherlands – 1.1%Ahold 6,240 63 – Delta Lloyd 5,367 84 – Philips 2,451 51 – Royal Dutch Shell ‘A’ 122,555 2,601 1.0 VastNed Retail 6,712 194 0.1 Wereldhave 1,510 70 –
Canada – 1.1%Allied Properties Real Estate Investment Trust 14,300 250 0.1 Artis Real Estate Investment Units 23,787 195 0.1 Bank of Montreal 44,369 1,668 0.6 Canadian Real Estate Investment Trust 4,700 107 0.1 First Capital Realty 14,756 139 0.1 Riocan Real Estate Trust 17,906 242 0.1 China – 1.0%Bank of China ‘H’ 1,257,000 324 0.1 China Construction Bank ‘H’ 705,000 297 0.1 China Mobile 53,000 307 0.1 China Shenhua Energy ‘H’ 673,000 1,053 0.4 Industrial & Commercial Bank of China ‘H’ 781,000 294 0.1 Jiangsu Expressway ‘H’ 150,000 115 0.1 MGM China 102,400 246 0.1 Zhejiang Expressway ‘H’ 186,000 102 – Brazil – 0.9%AES Tiete 14,301 60 – Ambev ADR 266,134 1,061 0.4 Banco Bradesco Preference 28,228 181 0.1 Banco do Brasil 63,954 322 0.1 Cia Energetica Minas Gerais-Cemig ADR
Preference 1 – – Cielo 21,396 340 0.1 Companhia de Concessoes Rodoviarias 26,700 103 – Embraer ADR 14,336 269 0.1 Tractebel Energia 30,404 257 0.1 Singapore – 0.9%Ascendas REIT 83,000 84 – Ascott Residence REIT 100,804 57 – CapitaCommercial Trust Units 169,000 113 0.1 CapitaLand 91,000 119 0.1 CapitaMalls Asia 72,000 60 – Global Logistic Properties 107,000 142 0.1 Hutchison Port 591,000 239 0.1 Keppel REIT 17,000 9 – Singapore Telecommunications 876,000 1,461 0.5 Italy – 0.8%Atlantia 4,075 57 – ENI 151,309 2,076 0.8 SNAM 27,333 91 – TERNA 19,118 56 – South Africa – 0.8%AVI 48,210 132 0.1 Barclays Africa group 36,307 247 0.1 Bidvest Group 22,189 292 0.1 Foschini Group 41,467 207 0.1 Imperial 30,050 298 0.1 MTN Group 25,270 265 0.1 Sasol 9,455 269 0.1 Tiger Brands 12,059 172 0.1 Denmark – 0.6%TDC 269,218 1,523 0.6 Tryg 1,434 83 – South Korea – 0.6%Kangwon Land 13,450 255 0.1 KT&G 6,804 289 0.1 SK Telecom ADR 61,246 814 0.3 S-Oil 4,959 191 0.1 Russia – 0.6%Lukoil ADR 8,954 307 0.1 MMC Norilsk Nickel ADR 26,431 247 0.1 Mobile Telesystems ADR 22,174 232 0.1 Phosagro GDR 23,389 144 0.1 Sberbank ADR 64,218 421 0.2 Finland – 0.5%Elisa 5,204 80 – Fortum 6,683 88 – Nokian Renkaat 1,860 48 – Pohjola Bank ‘A’ 4,951 59 – Sampo ‘A’ 2,557 72 – Stora Enso ‘R’ 10,015 57 – Technopolis 59,048 223 0.1 UPM-Kymmene 105,065 976 0.4 Turkey – 0.4%Arcelik 44,823 133 0.1 Ford Otomotiv San 9,251 48 – TOFAS 59,356 166 0.1 Turk Telekomunikasyon 95,762 143 0.1 Turkiye Petrol Rafinerileri 24,306 238 0.1
Portfolio statement – continuedAs at 31 January 2014
Market value Total netInvestment Holding £’000 assets %
Market value Total netInvestment Holding £’000 assets %
206
Continuation�
� Return to Index

207
Continuation�
� Return to Index
Saudi Arabia – 0.4%Al Rajhi Bank ELN 2015 (Credit Suisse) 9,700 112 0.1 Etihad Etisalat ELN 2016 (JPMorgan) 17,712 251 0.1 Yanbu National Petrochemical Company ELN
2015 (Credit Suisse) 9,800 116 0.1 Yanbu National Petrochemical Company
Warrants 2016 (Merril Lynch) 9,630 114 0.1 Belgium – 0.3%Belgacom 3,146 55 – GBL 1,150 63 – Solvay 10,547 896 0.3 Warehouses de Pauw 2,055 89 – Norway – 0.3%Gjensidige Forsikring 6,922 80 – Seadrill 3,072 66 – Statoil 5,350 77 – Telenor 63,762 799 0.3 Yara International 2,448 61 – Indonesia – 0.3%Indo Tambangraya Megah 88,000 116 0.1 Perusahaan Gas Negara 686,100 162 0.1 Telekomunikasi Indonesia ‘B’ 2,629,000 296 0.1 Spain – 0.2%Abertis Infraestructuras 4,706 63 – ACS Actividades de Construccion y Servicios 2,760 59 – ACS Actividades de Construccion y Servicios
Rights 2014 2,760 1 – Ferrovial 4,872 57 – Gas Natural 4,199 63 – Iberdrola 28,102 105 0.1 Iberdrola (Rfd) 698 3 – Mapfre 22,084 55 – Red Electrica Corporacion 1,997 85 – Repsol 4,818 69 – Telefonica 11,357 106 0.1 Thailand – 0.2%Advanced Info Service Public (Alien Market) 82,100 314 0.1 Bangkok Expressway (Alien Market) 61,000 36 – Siam Cement Non-Voting Depository Receipt 42,200 315 0.1 India – 0.1%Ascendas India Trust Units 193,000 63 – Coal India 121,286 291 0.1 Qatar – 0.1%Qatar Industries 10,215 306 0.1 Poland – 0.1%Powszechny Zaklad Ubezpieczen 3,618 288 0.1 Luxembourg – 0.1%ArcelorMittal 6% Convertible Preference 2013 12,196 183 0.1 RTL Group 760 56 – Mexico – 0.1%Kimberly-Clark de Mexico ‘A’ 144,406 215 0.1 United Arab Emirates – 0.1%First Gulf Bank 45,600 151 0.1 Malaysia – 0.0%Lafarge Malaysia 60,700 93 – Austria – 0.0%Immofinanz 28,549 82 – Portugal – 0.0%Energias de Portugal 37,267 85 –
Corporate bonds – 37.4% (41.8%)US Dollar – 37.2%ABFC Asset Backed Certificates FRN 2033 $122,297 71 – ABFC Asset Backed Certificates FRN Mar 2034 $70,752 39 – ABFC Asset Backed Certificates FRN Nov 2034 $132,936 69 – ABS Home Equity Loan FRN Sep 2031 $153,587 87 – ABS Home Equity Loan FRN Nov 2031 $73,753 41 – Acadia Healthcare 6.125% 2021 $39,000 24 – Accellent 8.375% 2017 $125,000 80 – Access Midstream Partner 4.875% 2023 $551,000 328 0.1 Access Midstream Partners 5.875% 2021 $24,000 15 – Access Midstream Partners 6.125% 2022 $161,000 104 0.1 ACCO Brands 6.75% 2020 $210,000 127 0.1 Accredited Mortgage Loan Trust FRN 2035 $104,946 59 – Ace Cash Express 11% 2019 $125,000 62 – ACE Securities FRN 2033 $337,905 193 0.1 ACE Securities Home Equity Asset Backed
FRN 2034 $66,765 37 – ACE Securities Home Equity Loan Trust FRN 2032 $97,667 52 –
ACI Worldwide 6.375% 2020 $20,000 13 – Activision Blizzard 5.625% 2021 $25,000 16 – Activision Blizzard 6.125% 2023 $85,000 54 – Actuant 5.625% 2022 $10,000 6 – Adjustable Rate Mortgage Trust 2004-2 6-A-1
FRN 2035 $467,557 284 0.1 Adjustable Rate Mortgage Trust 2004-4 4-A-1
FRN 2035 $472,338 288 0.1 ADT 3.5% 2022 $143,000 75 – ADT 4.125% 2023 $125,000 67 – ADT 6.25% 2021 $175,000 112 0.1 Advanced Micro Devices 7.5% 2022 $24,000 14 – Advanced Micro Devices 7.75% 2020 $25,000 15 – Aegis Asset Backed Securities Trust Services
FRN 2034 $570,165 309 0.1 AES 4.875% 2023 $50,000 28 – AES 7.375% 2021 $100,000 67 – AES 8% 2017 $10,000 7 – AES 8% 2020 $150,000 105 0.1 Ainsworth Lumber 7.5% 2017 $9,000 6 – Aircastle 4.625% 2018 $8,000 5 – Aircastle 6.75% 2017 $200,000 136 0.1 Aircastle 7.625% 2020 $45,000 31 – Aircastle 9.75% 2018 $35,000 23 – AK STEEL 8.75% 2018 $55,000 38 – Albertsons 7.45% 2029 $139,000 68 – Albertsons 8% 2031 $38,000 19 – Albertsons 8.7% 2030 $40,000 21 – Alcatel-Lucent USA 8.875% 2020 $400,000 271 0.1 Alere 6.5% 2020 $12,000 7 – Aleris International 7.625% SNR 2018 $31,000 20 – Aleris International 7.875% 2020 $40,000 26 – Alfa Bond Issuance 7.75% 2021 $200,000 131 0.1 Alliant Techsystems 5.25% 2021 $31,000 19 – Alliant Techsystems 6.875% 2020 $15,000 10 – Allison Transport 7.125% 2019 $125,000 82 – Allstate FRN 2053 $1,020,000 626 0.2 Ally Financial 4.625% 2015 $30,000 19 – Ally Financial 5.5% 2017 $370,000 242 0.1 Ally Financial 6.25% 2017 $465,000 314 0.1 Ally Financial 7% Perpetual $147 86 – Ally Financial 7.5% 2020 $530,000 379 0.1 Ally Financial 8% 2020 $135,000 98 – Ally Financial 8% 2031 $261,000 191 0.1 Alta Mesa Finance Services 9.625% 2018 $24,000 16 – Alternative Loan Trust 5.25% 2035 $45,103 27 – Alternative Loan Trust 5.5% 2035 $417,725 246 0.1 Alternative Loan Trust 5.5% 2036 $23,272 12 – Alternative Loan Trust 6% 2022 $42,845 25 – Alternative Loan Trust 6% 2036 $22,107 12 – AMC Entertainments 9.75% 2020 $200,000 139 0.1 American Axle & Manufacturing 7.75% 2019 $100,000 69 – American Express 6.8% 2066 $310,000 203 0.1 American International Group 6.25% 2087 $665,000 404 0.2 American International Group 8.175% 2058 $172,000 130 0.1 AmeriGas Financial 6.25% 2019 $45,000 29 – AmeriGas Financial 6.25% 2020 $10,000 7 – AmeriGas Financial 7% 2022 $88,000 58 – Ameriquest Mortgage FRN 2034 $68,151 38 – Ameriquest Securities FRN 2034 (CL’M-2’) $33,580 18 – Ameriquest Securities FRN 2034 $179,443 98 – Ameristar Casinos 7.5% 2021 $20,000 13 – Amkor Technology 6.375% 2022 $27,000 17 – Amkor Technology 6.625% 2021 $120,000 76 – Amkor Technology 7.375% 2018 $79,000 50 – Amsurg 5.625% 2020 $80,000 50 – Anixter 5.625% 2019 $215,000 136 0.1 Antero Resources Finance 5.375% 2021 $75,000 46 – Antero Resources Finance 6% 2020 $125,000 80 – Aramark 5.75% 2020 $68,000 43 – ArcelorMittal 9.85% 2019 $150,000 114 0.1 ArcelorMittal 4.5% 2017 $50,000 32 – ArcelorMittal 6.75% 2022 $485,000 318 0.1 ArcelorMittal 7.5% 2039 $36,000 22 – Ardagh Packaging Finance 7.375% 2017 $200,000 130 0.1 Ardagh Packaging Finance 9.125% 2020 $450,000 299 0.1 Ares Capital 4.75% Convertible 2018 $113,000 74 – Ares Capital 4.875% Convertible 2017 $136,000 88 – Argent Securities 0.789% FRN 2034 $79,645 47 – Argent Securities FRN 2033 $64,707 37 – Argent Securities FRN 2034 (HM6) $443,773 253 0.1 Argent Securities FRN 2034 (M2) $150,964 84 – Argent Securities FRN 2034 (2004-W7 CL M2) $43,771 25 –
Portfolio statement – continuedAs at 31 January 2014
Market value Total netInvestment Holding £’000 assets %
Market value Total netInvestment Holding £’000 assets %

Argent Securities FRN 2034 $58,717 31 – Argent Securities FRN 2034 (US$25,000) $86,488 47 – Artesyn Escrow 9.75% 2020 $17,000 11 – A-S Co-Issuer 7.875% 2020 $47,000 30 – Ashland 3% 2016 $28,000 17 – Ashland 3.875% 2018 $35,000 22 – Ashland 4.75% 2022 $423,000 246 0.1 Atkore International 9.875% 2018 $45,000 29 – Atlas Pipeline Finance 4.75% 2021 $50,000 28 – Atlas Pipeline Finance 5.875% 2023 $40,000 23 – Atlas Pipeline Finance 6.625% 2020 $13,000 8 – Audatex North America 6% 2021 $345,000 219 0.1 Audatex North America 6.125% 2023 $20,000 13 – Autonation 5.5% 2020# $25,000 16 – Avaya 10.5% 2021 $41,000 23 – Avaya 7% 2019 $370,000 222 0.1 Avaya 9% 2019 $65,000 41 – Avis Budget Car Rental 5.5% 2023 $216,000 127 0.1 Avis Budget Car Rental 8.25% 2019 $310,000 203 0.1 Avis Budget Car Rental 9.75% 2020 $62,000 44 – B&G Foods 4.625% 2021 $50,000 29 – Ball 5% 2022 $125,000 75 – Banc of America Alternative Loan Trust 5.5%
2020 $21,236 13 – Banc of America Alternative Loan Trust 6%
2021 $36,363 22 – Banc of America Alternative Loan Trust 6%
2035 $65,848 40 – Banc of America Alternative Loan Trust 6%
May 2046 $9,287 5 – Banc of America Alternative Loan Trust 6%
Jun 2046 $25,620 13 – Banc of America Funding 2.6426% 2036 $88,728 54 – Banc of America Funding 5.5% 2034 $42,100 25 – Banc of America Funding 5.5% 2035 $171,660 103 – Banc of America Funding 6% 2035 $159,756 103 – Banc of America Mortgage Securties 5.5% 2035 $12,162 7 – Banc of America Mortgage Trust 6% 2037 $92,107 52 – Banco de Costa Rica 5.25% 2018 $200,000 121 0.1 Banco de Reservas 7% 2023 $180,000 102 – Bank of America 4.18% 2034 $75,803 46 – Bank of America 5.2% Perpetual $1,630,000 887 0.3 Bank of America 5.5% 2020 $14,607 9 – Bank of America 5.875% 2021 $55,000 38 – Bank of America 6.5% 2016 $30,000 21 – Bank of America 7.8% 2016 $25,000 18 – Bank of America 8% FRN Perpetual $1,161,000 790 0.3 Bank of America FRN Perpetual $265,000 179 0.1 Bank of New York Mellon Perpetual $313,000 172 0.1 Bankrate 6.125% 2018 $23,000 15 – Basic Energy Services 7.75% 2019 $5,000 3 – Basic Energy Services 7.75% 2022 $92,000 59 – BC Mountain 7% 2021 $46,000 29 – B/E Aerospace 5.25% 2022 $50,000 31 – B/E Aerospace 6.875% 2020 $135,000 90 – Bear Stearns ABS Trust FRN 2034 $88,524 50 – Bear Stearns ABS Trust FRN Aug 2035 $455,814 256 0.1 Bear Stearns ABS Trust FRN Sep 2035 $78,869 46 – Bear Stearns ABS Trust FRN Aug 2044 $86,429 52 – Bear Stearns ABS Trust FRN Dec 2044 $75,000 43 – Belden 5.5% 2022 $150,000 89 – Berry Plastics 9.5% 2018 $48,000 31 – Berry Plastics 9.75% 2021 $117,000 82 – Beverage Packaging 5.625% 2016 $55,000 34 – Beverage Packaging 6% 2017 $10,000 6 – Bill Barrett 7% 2022 $83,000 53 – Bill Barrett 7.625% 2019 $52,000 34 – BI-LO Finance 8.625% 2018 $22,000 14 – Biomet 6.5% Aug 2020 $351,000 227 0.1 Biomet 6.5% Oct 2020 $100,000 63 – Blueline Rental 7% 2019 $35,000 22 – Bluescope Steel 7.125% 2018 $33,000 21 – Bluewater Holdings 10% 2019 $100,000 61 – Boise Cascade 6.375% 2020 $64,000 41 – Bombardier 4.25% 2016 $32,000 20 – Bombardier 6.125% 2023 $105,000 63 – Bombardier 7.75% 2020 $325,000 218 0.1 Bonanza Creek Energy 6.75% 2021 $42,000 27 – Breitburn Energy Partners 7.875% 2022 $100,000 65 – Breitburn Energy Partners 8.625% 2020 $100,000 65 – Briggs & Stratton 6.875% 2020 $100,000 67 – Brightstar Corporation 9.5% 2016 $45,000 30 – Brookfield Residential Properties 6.125% 2022 $45,000 27 –
Brookfield Residential Properties 6.5% 2020 $55,000 35 – Building Materials 6.75% 2021 $156,000 102 – Building Materials 7.5% 2020 $150,000 98 – Bumble Bee Acquisiton 9% 2017 $369,000 245 0.1 Burger King 9.875% 2018 $40,000 27 – Cablevision Systems 8% 2020 $265,000 181 0.1 Caesars Entertainment Operating 11.25% 2017 $515,000 318 0.1 Caesars Entertainment Operating 8% 2020 $119,000 75 – Caesars Entertainment Operating 8.5% 2020 $535,000 310 0.1 Caesars Entertainment Operating 9% 2020 $500,000 295 0.1 Calpine 5.875% 2024 $84,000 51 – Calpine 6% 2022 $50,000 31 – Calpine 7.875% 2020 $160,000 106 0.1 Calpine 7.875% 2023 $386,000 259 0.1 Calumet Specialty Products 7.625% 2022 $30,000 19 – Calumet Specialty Products 9.375% 2019 $28,000 19 – Calumet Specialty Products 9.625% 2020 $51,000 35 – Cantor Commercial Real Estate 7.75% 2018 $25,000 16 – Capsugel 7% 2019 $60,000 37 – Case New Holland 7.875% SNR 2017 $175,000 125 0.1 Casella Waste Systems 7.75% 2019 $80,000 50 – Catalent Pharma Solutions 7.875% 2018 $142,000 88 – CB Richard Ellis Services 6.625% 2020 $50,000 33 – CBS Outdoor Americas Capital 5.25% 2022 $15,000 9 – CBS Outdoor Americas Capital 5.625% 2024 $15,000 9 – CCM Merger 9.125% 2019 $25,000 16 – CCO Holdings 5.25% 2021 $194,000 114 0.1 CCO Holdings 5.75% 2023 $15,000 9 – CCO Holdings 5.75% 2024 $6,000 4 – CCO Holdings 6.5% 2021 $185,000 117 0.1 CCO Holdings 7% 2019 $165,000 106 0.1 CCO Holdings 7.375% 2020 $200,000 132 0.1 CCO Holdings 8.125% 2020 $150,000 99 – CDW Financial 8.5% 2019 $275,000 184 0.1 Cedar Fair 5.25% 2021 $93,000 56 – Celanese US 4.625% 2022 $143,000 84 – Cemex 6.5% 2019 $200,000 124 0.1 Cemex 9% 2018 $100,000 66 – Cemex Finance 9.375% 2022 $400,000 273 0.1 Cencosud 5.5% 2021 $150,000 90 – Centex Home Equity Loan Trust 5.56% 2034 $34,651 19 – Centex Home Equity Loan Trust FRN Jan 2034 $103,251 57 – Centex Home Equity Loan Trust FRN Sep 2034 $68,570 30 – Centex Home Equity Loan Trust FRN 2035 $70,000 40 – Central Garden & Pet 8.25% 2018 $250,000 149 0.1 CenturyLink 5.8% 2022 $500,000 300 0.1 CenturyLink 6.75% 2023 $250,000 154 0.1 Cenveo 8.875% 2018 $55,000 33 – Ceridian 8.875% 2019 $40,000 28 – Ceridian HCM Holdings 11% 2021 $28,000 19 – CEVA Group 8.375% 2017 $75,000 48 – Chase Funding Mortgage Loan 5.641% 2032 $72,816 32 – Chase Funding Mortgage Loan FRN May 2033 $100,162 64 – Chase Funding Mortgage Loan FRN Sep 2033 $109,197 60 – Chase Funding Mortgage Loan FRN 2034 $93,628 49 – Chase Funding Mortgage Loan FRN 2035 $168,591 95 – Chase Funding Trust FRN Jun 2034 $156,219 90 – Chase Funding Trust FRN Jul 2034 $136,367 78 – Chase Mortgage Trust 6% 2036 $346,822 178 0.1 Chase Mortgage Trust FRN 2037 $1,251,675 764 0.3 Chemtura Corporation 5.75% 2021 $55,000 34 – Chesapeake Energy 3.25% 2016 $12,000 7 – Chesapeake Energy 5.375% 2021 $24,000 15 – Chesapeake Energy 5.75% 2023 $24,000 15 – Chesapeake Energy 6.125% 2021 $72,000 47 – Chesapeake Energy 6.625% 2020 $150,000 102 – Chesapeake Energy 6.875% 2020 $250,000 170 0.1 Chesapeake Oilfield 6.625% 2019 $45,000 29 – China Overseas IV 0% 2021 $200,000 121 0.1 Chinos Intermediate Holdings 7.75% 2019 $33,000 21 – Chiquita Brands International 7.875% 2021 $125,000 82 – CHL Mortgage Pass Through Trust 6% Apr 2036 $25,236 15 – CHL Mortgage Pass Through Trust 6% May 2036 $546,478 299 0.1 CHL Mortgage Pass Through Trust 6% 2037 $53,430 31 – CHL Mortgage Pass Through Trust 6.25% 2036 $82,697 46 – CHL Mortgage Pass Through Trust 6.5% 2037 $97,892 51 – Chrysler Group 8.25% 2021 $600,000 409 0.2 Cimarex Energy 5.875% 2022 $78,000 51 – Cincinnati Bell 8.375% 2020 $45,000 29 – Cincinnati Bell 8.75% 2018 $20,000 13 – Cinemark USA 4.875% 2023 $200,000 115 0.1 Cinemark USA 5.125% 2022 $55,000 33 – Cinemark USA 7.375% 2021 $100,000 67 –
Portfolio statement – continuedAs at 31 January 2014
Market value Total netInvestment Holding £’000 assets %
Market value Total netInvestment Holding £’000 assets %
208
Continuation�
� Return to Index

209
Continuation�
� Return to Index
CIT Group 4.25% 2017 $42,000 27 – CIT Group 5% 2017 $30,000 19 – CIT Group 5% 2022 $298,000 180 0.1 CIT Group 5.25% 2018 $360,000 233 0.1 CIT Group 5.375% 2020 $70,000 45 – CIT Group 5.5% 2019 $325,000 210 0.1 CIT Group 6.625% 2018 $40,000 27 – Citgo Petroleum 11.5% 2017 $30,000 19 – Citigroup 5.35% FRN Perpetual $1,630,000 877 0.3 Citigroup 5.95% Perpetual $1,475,000 856 0.3 Citigroup Capital 7.875% 2040 $1,850 31 – Citigroup Mortgage Loan Trust 5.5% 2035 $184,594 111 0.1 Citigroup Mortgage Loan Trust 7% 2035 $98,034 58 – Citigroup Mortgage Loan Trust FRN Feb 2035 $31,979 15 – Citigroup Mortgage Loan Trust FRN Oct 2035 $196,571 118 0.1 Citigroup Mortgage Loan Trust FRN 2035 STEP $11,619 7 – Citigroup Mortgage Loan Trust FRN 2037 $12,252 7 – Claires Stores 6.125% 2020 $141,000 81 – Claires Stores 7.75% 2020 $22,000 12 – Claires Stores 8.875% 2019 $285,000 168 0.1 Claires Stores 9% 2019 $467,000 298 0.1 Clear Channel Communications 11.25% 2021 $25,000 17 – Clear Channel Communications 9% 2019 $245,000 152 0.1 Clear Channel Communications 9% 2021 $125,000 77 – Clear Channel Worldwide 6.5% 2022 $19,000 12 – Clear Channel Worldwide 7.625% 2020 $5,000 3 – Clear Channel Worldwide ‘B’ 6.5% 2022 $976,000 609 0.2 Clear Channel Worldwide ‘B’ 7.625% 2020 $577,000 369 0.1 Clearwater Paper 4.5% 2023 $10,000 6 – Clearwire Communications 14.75% 2016 $60,000 49 – Cleaver-Brooks 8.75% 2019 $37,000 25 – Cloud Peak Energy Resources 8.25% 2017 $30,000 19 – CNG Holdings 9.375% 2020 $128,000 73 – CNH Capital 3.625% 2018 $21,000 13 – CNL Lifestyle Properties 7.25% 2019 $20,000 13 – Coeur Mining 7.875% 2021 $76,000 47 – Cogeco Cable 4.875% 2020 $20,000 12 – Commercial Metals 4.875% 2023 $25,000 14 – Commercial Metals 6.5% 2017 $50,000 34 – Commercial Metals 7.35% 2018 $25,000 17 – Community Choice Financial 10.75% 2019 $19,000 10 – Community Health Systems 5.125% 2018 $57,000 36 – Community Health Systems 7.125% 2020 $67,000 43 – Community Health Systems 8% 2019 $80,000 53 – Comstock Resources 7.75% 2019 $45,000 29 – Comstock Resources 9.5% 2020 $147,000 101 – Concho Resources 5.5% 2022 $50,000 31 – Concho Resources 6.5% 2022 $115,000 75 – Concho Resources 7% 2021 $125,000 83 – Consol Energy 6.375% 2021 $90,000 57 – Consol Energy 8% 2017 $10,000 6 – Consol Energy 8.25% 2020 $25,000 16 – Constar International 11% 2017 $39,964 4 – Constellation Brands 3.75% 2021 $10,000 6 – Constellation Brands 4.25% 2023 $19,000 11 – Constellation Brands 6% 2022 $20,000 13 – Continental Airlines 7.875% 2020 $57,670 38 – Continental Airlines 9.318% 2021 $11,162 8 – Continental Airlines 9.558% 2021 $10,455 7 – Continental Airlines 9.798% 2021 $165,822 114 0.1 Convatec Healthcare 10.5% 2018 $200,000 135 0.1 Corrections Corporation of America 4.125%
2020 $300,000 177 0.1 Countrywide Capital III 8.05% Preference 2027 $45,000 32 – Countrywide Home Loan 5.5% 2035 $130,000 81 – Countrywide Home Loan FRN Oct 2034 $116,934 67 – Countrywide Home Loan FRN Dec 2034 $58,684 34 – Countrywide Home Loan FRN 2035 $81,786 44 – Countrywide Securities 2.56375% 2032 $52,615 30 – Credit Based Asset Servicing And Securities
5.303% 2035 $126,133 72 – Credit Suisse First Boston Mortgage Securities
5.5% 2034 $657,376 425 0.2 Credit Suisse First Boston Mortgage Securities
FRN 2034 $555,729 341 0.1 Crestview DS Merger Sub II 10% 2021 $80,000 53 – Crestwood Midstream Partners 6% 2020 $8,000 5 – Crestwood Midstream Partners 6.125% 2022 $45,000 28 – Cricket Communications 7.75% 2020 $125,000 86 – Crosstex Energy 7.125% 2022 $21,000 15 – Crosstex Energy 8.875% 2018 $200,000 128 0.1 Crown Americas 4.5% 2023 $49,000 28 – Crown Castle International 4.5% 2016 $2,294 136 0.1
Crown Castle International 5.25% 2023 $267,000 161 0.1 CS First Boston Mortgage Securities 5.25%
2028 $482,803 301 0.1 CS First Boston Mortgage Securities 5.5% 2035 $31,759 17 – CSC Holdings 8.625% 2019 $200,000 142 0.1 CSFB Mortgage Backed 5.25% 2020 $6,237 4 – CSFB Mortgage Backed 5.5% 2020 $331,456 204 0.1 CSFB Mortgage Backed 5.5% 2035 $69,000 43 – CSFB Mortgage Backed FRN Jun 2034 $113,314 70 – CSFB Mortgage Backed FRN Oct 2034 $236,377 147 0.1 CSMC Mortgage Backed Trust 5% 2037 $36,465 21 – CSMC Mortgage Backed Trust 5.5% 2037 $46,235 27 – CST Brands 5% 2023 $94,000 55 – CVR Refining 6.5% 2022 $51,000 31 – CWAB FRN 2034 $364,471 203 0.1 CWABS 0.987% 2033 $30,358 17 – CWABS 5.05% 2036 $39,180 23 – CWABS FRN 2033 $65,944 37 – CWABS FRN Mar 2034 $41,212 24 – CWABS FRN Jun 2034 $185,000 101 – CWABS FRN Jul 2034 $841,678 485 0.2 CWALT 5% 2034 $61,366 39 – CWALT 5.25% 2021 $61,348 34 – CWALT 5.25% 2035 $75,270 44 – CWALT 5.5% 2020 $47,632 28 – CWALT 5.5% Jul 2025 $47,587 30 – CWALT 5.5% Feb 2035 $263,258 158 0.1 CWALT 5.5% Mar 2035 $410,000 227 0.1 CWALT 5.5% Apr 2035 $60,000 36 – CWALT 5.5% Apr 2035 (2005-6CB CL) $455,305 273 0.1 CWALT 5.5% May 2035 1A1 $120,116 67 – CWALT 5.5% May 2035 $503,697 302 0.1 CWALT 5.5% May 2035 (2005-13CB) $544,068 336 0.1 CWALT 5.5% Jul 2035 $55,186 31 – CWALT 5.5% Dec 2035 (2005-64CB 1A1) $79,859 44 – CWALT 5.5% Dec 2035 (2005-J14 A3) $67,551 36 – CWALT 5.5% Dec 2035 MTG BDS $173,342 96 – CWALT 5.5% 2036 $94,351 53 – CWALT 5.75% 2035 $74,296 45 – CWALT 6% 2017 $34,564 21 – CWALT 6% Jun 2034 $132,974 85 – CWALT 6% Dec 2034 $33,106 20 – CWALT 6% Jan 2035 $9,060 6 – CWALT 6% Jun 2035 $349,145 211 0.1 CWALT 6% 2036 $61,084 31 – CWALT 6.5% 2034 $62,676 38 – CWMBS 4.5% 2033 $807,657 509 0.2 CWMBS 5.25% 2027 $181,670 108 0.1 CWMBS 5.5% 2035 $11,561 7 – CWMBS FRN 2033 $23,688 14 – Cyrusone 6.375% 2022 $21,000 13 – Dana Holding 5.375% 2021 $250,000 153 0.1 Darling International 5.375% 2022 $35,000 21 – DaVita 5.75% 2022 $35,000 22 – DaVita Healthcare 6.375% 2018 $63,000 40 – DaVita Healthcare 6.625% 2020 $95,000 62 – DCP Midstream 5.85% 2043 $200,000 112 0.1 Dean Foods 7% 2016 $11,000 7 – Del Monte 7.625% 2019 $250,000 158 0.1 Delta Air Lines 6.875% 2019 $51,159 34 – Deluxe 7% 2019 $100,000 65 – Denali Finance 5.625% 2020 $244,000 147 0.1 Denbury Resources 8.25% 2020 $200,000 133 0.1 Diamondback Energy 7.625% 2021 $31,000 20 – DigitalGlobe 5.25% 2021 $60,000 36 – DineEquity 9.5% SNR 2018 $40,000 27 – Discover Financial Services 6.5% Preference
Perpetual $23,700 343 0.1 Dish DBS 4.625% 2017 $3,000 2 – Dish DBS 5.125% 2020 $85,000 52 – Dish DBS 5.875% 2022 $369,000 225 0.1 Dish DBS 6.75% SNR 2021 $515,000 335 0.1 Dish DBS 7.125% 2016 $250,000 167 0.1 Dish DBS 7.875% 2019 $420,000 291 0.1 DJO Finance 7.75% SNR 2018 $100,000 62 – DJO Finance 8.75% 2018 $25,000 17 – DR Horton 6.5% 2016 $5,000 3 – Dreamworks 6.875% 2020 $85,000 55 – Duke Energy 5.125% Preference 2073 $12,400 162 0.1 Dupont Fabros Technology 5.875% 2021 $37,000 23 – Dycom 7.125% 2021 $31,000 20 – Dynegy 5.875% 2023 $36,000 21 – Dynrgy Escrow 7.125% 2018# $100,000 – –
Portfolio statement – continuedAs at 31 January 2014
Market value Total netInvestment Holding £’000 assets %
Market value Total netInvestment Holding £’000 assets %

E Trade Financial 6.375% 2019 $40,000 26 – Easton-Bell Sports 9.75% 2016 $225,000 142 0.1 Ecopetrol 5.875% 2023 $60,000 38 – EDF 5.25% FRN Perpetual $430,000 254 0.1 EDF 5.625% FRN Perpetual $320,000 189 0.1 Edison Mission Energy 7% 2017# $100,000 47 – Edison Mission Energy 7.2% 2019# $50,000 24 – Embarq Corporation 7.995% 2036 $289,000 182 0.1 Emergency Medical Services 8.125% 2019 $32,000 21 – Endo Finance 5.75% 2022 $45,000 27 – Endo Health Solutions 7% 2019 $45,000 29 – Endo Health Solutions 7% 2020 $30,000 19 – Energy Future International 10% 2020 $175,000 113 0.1 Energy Future International 11.75% 2022 $21,000 15 – Energy Transfer Equity 5.875% 2024 $150,000 91 – Energy XXI Gulf Coast 7.5% 2021 $75,000 47 – Energy XXI Gulf Coast 9.25% 2017 $6,000 4 – Enterprise Products 7% FRN 2067 $150,000 94 – Enterprise Products 7.034% FRN 2068 $110,000 74 – EPE 8.125% 2017 $14,158 9 – Epicor Software 8.625% 2019 $175,000 115 0.1 Equinix 4.875% 2020 $11,000 7 – Equinix 7% 2021 $20,000 13 – Equity One Mortgage Trust 5.05% 2033 $32,658 20 – Equity One Mortgage Trust 5.115% 2034 $275,424 157 0.1 Equity One Mortgage Trust FRN 2034 $65,083 39 – EV Energy Partner 8% 2019 $150,000 93 – Everest Acquisition 6.875% 2019 $295,000 193 0.1 Everest Acquisition 7.75% 2022 $128,000 86 – Everest Acquisition 9.375% 2020 $288,000 201 0.1 Extra Space Storage 2.375% Convertible 2033 $75,000 47 – Felcor Lodging 5.625% 2023 $50,000 30 – Felcor Lodging 6.75% 2019 $35,000 23 – Ferrellgas Finance 6.5% 2021 $70,000 44 – Ferrellgas Finance 6.75% 2022 $23,000 14 – GS Mortgage Securities FRN 2035 $80,815 47 – Fidelity & Guaranty Life 6.375% 2021 $51,000 33 – Fidelity National Financial 5% 2022 $13,000 8 – Fifth Third Bancorp 5.1% Perpetual $635,000 340 0.1 First Data 10.625% 2021 $25,000 17 – First Data 11.25% 2021 $23,000 15 – First Data 11.75% 2021 $60,000 38 – First Data 11.75% 2021 (144A) $75,000 47 – First Data 12.625% 2021 $87,000 62 – First Data 14.5% 2019 $89,997 51 – First Data 6.75% 2020 $555,000 355 0.1 First Data 7.375% 2019 $40,000 26 – First Data 8.25% 2021 $514,000 331 0.1 First Data 8.75% 2022 $643,460 415 0.2 First Data 8.875% 2020 $465,000 311 0.1 First Franklin Mortgage Linked Asset Backed
FRN 2035 $340,116 196 0.1 First Franklin Mortgage Loan Trust 0.809%
FRN 2034 $424,981 227 0.1 First Franklin Mortgage Loan Trust A1 FRN 2034 $378,162 213 0.1 First Horizon Alternative Mortgage Securities
Trust 5.5% 2035 $18,672 12 – First Horizon Alternative Mortgage Securities
Trust 5.75% 2021 $104,401 63 – First Horizon Mortgage Pass Through Trust
5.25% 2021 $3,874 2 – First Horizon Mortgage Pass Through Trust
5.5% 2035 $240,000 145 0.1 First Horizon Mortgage Pass Through Trust
6% 2036 $43,750 26 – Flextronics International 5% 2023 $20,000 12 – FMG Resources 6% 2017 $7,000 4 – FMG Resources 6.375% 2016 $15,000 9 – FMG Resources 6.875% 2018 $40,000 26 – FMG Resources 6.875% 2022 $93,000 61 – FMG Resources 7% 2015 $72,000 46 – FMG Resources 8.25% 2019 $395,000 265 0.1 Ford Motor Credit 6.625% 2017 $250,000 176 0.1 Forest Labs 4.375% 2019 $45,000 27 – Forest Labs 4.875% 2021 $25,000 15 – Freescale Semiconductor 5% 2021 $45,000 27 – Freescale Semiconductor 6% 2022 $52,000 33 – Freescale Semiconductor 8.05% 2020 $27,000 18 – Fremont Home Loan Trust 5.44% FRN 2037 $16,689 10 – Fremont Home Loan Trust FRN May 2034 $49,399 28 – Fremont Home Loan Trust FRN Jul 2034 $133,763 76 – Fresenius Medical Care 5.625% 2019 $166,000 107 0.1 Fresenius Medical Care 5.75% 2021 $50,000 32 –
Fresenius Medical Care 5.875% 2022 $135,000 87 – Fresenius Medical Care 6.5% 2018 $70,000 48 – Frontier Communications 7.125% 2019 $10,000 7 – Frontier Communications 7.125% 2023 $31,000 19 – Frontier Communications 7.625% 2024 $5,000 3 – Frontier Communications 8.5% 2020 $30,000 20 – Frontier Communications 8.75% 2022 $30,000 20 – Frontier Communications 9.25% 2021 $62,000 43 – FTI CONSULTING 6% 2022 $14,000 9 – FTI Consulting 6.75% 2020 $25,000 16 – FWCT-2 Escrow 5.125% 2021 $55,000 34 – FWCT-2 Escrow 6.875% 2022 $110,000 68 – Gannett 5.125% 2020 $43,000 26 – Gannett 6.375% 2015 $15,000 10 – Gannett 6.375% 2023 $45,000 28 – Gannett 7.125% 2018 $15,000 10 – Garda World Security 7.25% 2021 $80,000 50 – GCI 6.75% 2021 $100,000 59 – GCI 8.625% 2019 $150,000 97 – Gencorp 7.125% 2021 $11,000 7 – General Cable 5.75% 2022 $250,000 150 0.1 General Electric Capital 5.25% 2049 $1,100,000 632 0.2 General Electric Capital 6.25% FRN Perpetual $1,600,000 1,017 0.4 General Motors Financials 2.75% 2016 $12,000 7 – General Motors Financials 3.25% 2018 $181,000 111 0.1 General Motors Financials 4.25% 2023 $9,000 5 – General Motors Financials 4.75% 2017 $50,000 32 – General Motors Financials 4.875% 2023 $375,000 230 0.1 Genesis Energy 5.75% 2021 $150,000 93 – Genesis Energy 7.875% 2018 $31,000 20 – Genon Escrow 9.5% 2018 $100,000 65 – Genon Escrow 9.875% 2020 $200,000 127 0.1 Geo Group 5.875% 2022 $250,000 152 0.1 Georgian Railway LIC 7.75% 2022 $400,000 257 0.1 GMACM Mortgage Loan Trust FRN 2034 $112,139 66 – Goldman Sachs 5.793% FRN 2043 $1,235,000 562 0.2 Goodman Networks FRN 2018 $116,000 74 – Goodrich Petroleum 5% Convertible 2032 $101,000 66 – Goodyear Tire & Rubber 7% 2022 $175,000 116 0.1 Goodyear Tire & Rubber 8.25% 2020 $200,000 135 0.1 Goodyear Tire & Rubber 8.75% 2020 $100,000 72 – Graham Packaging International 7.875% 2018 $32,000 21 – Graphic Packaging International 4.75% 2021 $24,000 14 – Graton Economic Development Authority
9.625% 2019 $45,000 31 – Gray Television 7.5% 2020 $120,000 78 – Great Lakes Dredge & Dock 7.375% 2019 $100,000 64 – Griffon 7.125% 2018 $25,000 16 – GS Mortgage Securities 6% 2035 $40,540 25 – GS Mortgage Securities 6% 2036 $315,606 186 0.1 GS Mortgage Securities FRN 2033 $104,656 59 – GS Mortgage Securities FRN 2045 $27,895 16 – GSAA Home Equity Trust FRN 2035 $200,194 115 0.1 GSAMP Trust FRN Jun 2033 $77,136 47 – GSAMP Trust FRN Aug 2033 $133,959 74 – GSAMP Trust FRN Feb 2035 $284,415 166 0.1 GSAMP Trust FRN Jun 2035 $518,170 306 0.1 GSAMP Trust FRN Apr 2036 $419,638 190 0.1 GSAMP Trust FRN Dec 2036 $119,985 65 – GSR Mortgage Loan Trust 5.5% 2021 $74,398 45 – GSR Mortgage Loan Trust 5.5% 2034 $52,159 34 – GSR Mortgage Loan Trust 6% 2036 $87,849 52 – GSR Mortgage Loan Trust 6% 2037 $43,261 25 – Gymboree 9.125% 2018 $25,000 14 – H&E Equipment Services 7% 2022 $140,000 93 – Halcon Resources 8.875% 2021 $125,000 76 – Halcon Resources 9.25% 2020 $22,000 14 – Halcon Resources 9.25% 2022 $90,000 55 – Harborview Mortgage Loan Trust FRN 2045 $34,709 19 – Harland Clarke 6.875% 2020 $20,000 12 – Harland Clarke 9.25% 2021 $35,000 21 – Harland Clarke 9.75% 2018 $130,000 86 – Harland Clarke FRN 2015 $120,000 73 – Harron Communications 9.125% 2020 $20,000 14 – Hartford Financial Services Group 8.125% 2038 $115,000 81 – Hawk Acquisition 4.25% 2020 $465,000 276 0.1 HCA 4.75% 2023 $20,000 12 – HCA 5.875% 2022 $115,000 74 – HCA 5.875% 2023 $50,000 31 – HCA 6.25% 2021 $75,000 49 – HCA 6.5% 2020 $485,000 325 0.1 HCA 7.25% 2020 $50,000 33 – HCA 7.5% 2022 $671,000 461 0.2
Portfolio statement – continuedAs at 31 January 2014
Market value Total netInvestment Holding £’000 assets %
Market value Total netInvestment Holding £’000 assets %
210
Continuation�
� Return to Index

211
Continuation�
� Return to Index
HCA 7.75% 2021 $850,000 567 0.2 HCA 7.875% 2020 $20,000 13 – HCA 8% 2018 $85,000 61 – HD Supply 7.5% 2020 $77,000 50 – HD Supply 8.125% 2019 $345,000 233 0.1 Headwaters 7.25% 2019 $36,000 23 – Healthcare Technology Intermediate FRN 2018 $22,000 14 – HealthSouth 7.75% 2022 $250,000 167 0.1 Heat FRN 2033 $71,277 41 – Hecla Mining 6.875% 2021 $117,000 68 – Hertz 4.25% 2018 $13,000 8 – Hertz 5.875% 2020 $250,000 158 0.1 Hertz 6.25% 2022 $10,000 6 – Hertz 6.75% 2019 $7,000 5 – Hertz 7.375% 2021 $85,000 56 – Hexion Nova Scotia 6.625% 2020 $375,000 237 0.1 Hexion Nova Scotia 8.875% 2018 $100,000 63 – Hiland Partners 7.25% 2020 $206,000 134 0.1 Hilcorp Energy 7.625% 2021 $124,000 82 – Hilcorp Energy 8% 2020 $80,000 52 – Hilton Worldwide Finance 5.625% 2021 $95,000 60 – Holly Energy 8.25% 2018 $15,000 10 – Hologic 6.25% 2020 $280,000 178 0.1 Home Equity Asset Trust FRN 2034 $27,234 15 – Hospira 5.2% 2020 $7,000 5 – Hovnanian Enterprises 11.875% 2015 $60,000 42 – Hovnanian Enterprises 6.25% 2016 $2,000 1 – Hovnanian Enterprises 7% 2019 $12,000 7 – Hovnanian Enterprises 7.25% 2020 $23,000 15 – Hovnanian Enterprises 9.125% 2020 $16,000 11 – Hrvatska Elektroprivreda 6% 2017 $200,000 124 0.1 Huntsman International 4.875% 2020 $300,000 180 0.1 Huntsman International 8.625% 2020 $150,000 100 – IAC 4.875% 2018 $10,000 6 – IAS Partnership 5% 2018 $80,000 46 – Iasis Healthcare 8.375% 2019 $58,000 38 – ICAHN Enterprises Finance 3.5% 2017 $91,000 55 – ICAHN Enterprises Finance 4.875% 2019 $45,000 27 – iGate 9% 2016 $80,000 51 – Igloo 8.25% 2017 $69,000 43 – ILFC E-Capital Index Linked Trust 5.9% 2065 $255,000 142 0.1 ILFC E-Capital Index Linked Trust 6.25% 2065 $100,000 57 – Impac CMB Trust FRN 2034 $79,941 47 – Impac CMB Trust FRN 2035 $76,940 42 – IMS Health 6% 2020 $150,000 97 – Indymac ABS FRN 2035 $158,472 90 – Indymac MBS FRN Mar 2035 $360,000 194 0.1 Indymac MBS FRN Apr 2035 $72,305 40 – Ineos Group 7.5% 2020 $300,000 199 0.1 Infor 11.50% 2020 $100,000 70 – Infor 9.375% 2019 $298,000 204 0.1 ING US 5.65% FRN 2053 $520,000 303 0.1 Ingles Markets 5.75% 2023 $50,000 30 – Inmet Mining 7.5% 2021 $10,000 7 – Inmet Mining 8.75% 2020 $75,000 52 – Intelsat Luxembourg 7.75% 2021 $168,000 110 0.1 Intelsat Luxembourg 8.125% 2023 $158,000 104 0.1 Intelsat Jackson 5.5% 2023 $100,000 58 – Intelsat Jackson 6.625% 2022 $465,000 292 0.1 Intelsat Jackson 6.625% 2022 144A $100,000 63 – Intelsat Jackson 7.25% 2020 $595,000 392 0.2 Intelsat Jackson 7.5% 2021 $350,000 234 0.1 Interactive Data 10.25% 2018 $65,000 43 – Intergen 7% 2023 $200,000 126 0.1 International Lease Finance 4.625% 2021 $6,000 3 – International Lease Finance 5.875% 2019 $225,000 147 0.1 International Lease Finance 6.25% 2019 $395,000 260 0.1 International Lease Finance 8.25% 2020 $110,000 79 – International Lease Finance 8.625% 2022 $185,000 133 0.1 International Lease Finance 8.75% 2017 $465,000 329 0.1 International Wire Group 8.5% 2017 $56,000 37 – Inventiv Health 10% 2018 $54,000 30 – Inventiv Health 10% SNR 2018 $27,000 15 – Inventiv Health 9% 2018 $20,000 13 – Iron Mountain 5.75% 2024 $50,000 28 – Iron Mountain 7.75% 2019 $50,000 34 – Isle of Capri Casinos 5.875% 2021 $98,000 61 – Isle of Capri Casinos 7.75% 2019 $37,000 24 – Isle of Capri Casinos 8.875% 2020 $10,000 7 – ISTAR Financial 4.875% 2018 $110,000 67 – ISTAR Financial 9% 2017 $20,000 14 – J Crew Group 8.125% 2019 $350,000 222 0.1 Jabil Circuit 4.7% 2022 $7,000 4 –
Jaguar Holding 9.375% 2017 $5,000 3 – Jarden 7.5% 2017 $325,000 228 0.1 JBS 7.25% 2021 $100,000 63 – JBS 7.75% 2020 $200,000 125 0.1 JBS 8.25% 2020 $33,000 22 – JC Penney 5.75% 2018 $100,000 45 – JM Huber 9.875% 2019 $15,000 10 – JMC Steel Group 8.25% 2018 $40,000 25 – JPMorgan Mortgage Trust 4.768% 2035^ $45,655 28 – JPMorgan Mortgage Trust 5% 2021^ $16,555 10 – JPMorgan Mortgage Trust 5.41% 2035^ $25,540 15 – JPMorgan Mortgage Trust 6% 2022^ $12,320 8 – JPMorgan Mortgage Trust FRN 2034^ $24,182 14 – JPMorgan Mortgage Trust FRN 2035^ $70,446 43 – Jurassic Holding III 6.875% 2021 $40,000 24 – Kaisa Group 8.875% 2018 $200,000 121 0.1 Kaiser Aluminum 8.25% 2020 $56,000 38 – KazMunaiGaz Finance 11.75% 2015 $460,000 305 0.1 Kennedy Wilson 8.75% 2019 $15,000 10 – Key Energy Services 6.75% 2021 $160,000 100 – Kinder Morgan 5% 2021 $40,000 24 – Kinder Morgan 5.625% 2023 $40,000 24 – Kinetic Concepts 10.5% 2018 $150,000 105 0.1 Kodiak Oil & Gas 5.5% 2021 $12,000 7 – Kodiak Oil & Gas 5.5% 2022 $26,000 16 – Kodiak Oil & Gas 8.125% 2019 $100,000 67 – L Brands 5.625% 2023 $50,000 30 – Lafarge 7.125% 2036 $25,000 16 – Lamar Media 5% 2023 $12,000 7 – Lamar Media 5.875% 2022 $105,000 66 – Laredo Pete 7.375% 2022 $28,000 19 – Lehman Mortgage Trust 6% 2036 $274,175 132 0.1 Lehman Mortgage Trust FRN Nov 2035 $554,474 297 0.1 Lehman Mortgage Trust FRN Dec 2035 $259,062 148 0.1 Lender Processing 5.75% 2023 $20,000 13 – Lennar 12.25% 2017 $20,000 16 – Lennar 6.95% 2018 $60,000 41 – Level 3 Communications 11.875% SNR 2019 $325,000 227 0.1 Level 3 Communications 8.875% 2019 $44,000 29 – Level 3 Financing 6.125% 2021 $142,000 88 – Level 3 Financing 7% 2020 $62,000 40 – Level 3 Financing 8.125% 2019 $279,000 186 0.1 Level 3 Financing 8.625% 2020 $129,000 88 – Level 3 Financing 9.375% SNR 2019 $103,000 70 – Level 3 Financing FRN 2018 $20,000 12 – Libbey Glass 6.875% 2020 $156,000 102 – Liberty Media 8.25% 2030 $30,000 19 – Liberty Mutual Group 7.8% 2087 $109,000 71 – Liberty Mutual Group FRN 2088 $41,000 38 – Liberty Tire Recycling 11% 2016 $24,000 14 – Lifepoint Hospitals 5.5% 2021 $30,000 19 – Lifepoint Hospitals 6.625% 2020 $18,000 12 – Limited Brands 6.625% 2021 $250,000 166 0.1 LIN Television 8.375% 2018 $50,000 32 – Linn Energy 6.25% 2019 $350,000 217 0.1 Linn Energy 7.75% 2021 $100,000 65 – Live Nation Entertainment 7% 2020 $37,000 24 – LKQ 4.75% 2023 $19,000 11 – Long Beach Mortgage Loan Trust FRN 2031 $54,123 29 – Long Beach Mortgage Loan Trust FRN 2032 $285,727 161 0.1 Long Beach Mortgage Loan Trust FRN 2034 $233,904 136 0.1 Long Beach Mortgage Loan Trust FRN 2035 $72,627 43 – Louisiana Pacific 7.5% 2020 $43,000 29 – LSB Industries 7.75% 2021 $78,000 50 – Lucent Technologie 6.45% 2029 $57,000 31 – Lynx I 5.375% 2021 $200,000 122 0.1 M/I Homes 8.625% 2018 $56,000 37 – Magnachip Semiconductor 6.625% 2021 $190,000 118 0.1 Mallinckrodt International Finance 3.5% 2018 $6,000 4 – Mallinckrodt International Finance 4.75% 2023 $22,000 13 – Manitowoc 8.5% 2020 $255,000 175 0.1 Marathon Oil 6% 2023 $9,000 5 – Marina District Finance 9.875% 2018 $250,000 163 0.1 Markwest Energy Partners 4.5% 2023 $18,000 10 – Markwest Energy Partners 5.5% 2023 $500,000 305 0.1 Markwest Energy Partners 6.25% 2022 $13,000 8 – Markwest Energy Partners 6.75% 2020 $15,000 10 – Martin Midstream Partners 7.25% 2021 $113,000 71 – Masco 5.95% 2022 $11,000 7 – Masco 7.125% 2020 $2,000 1 – Masonite International 8.25% 2021 $96,000 64 – Mastec 4.875% 2023 $23,000 13 – Master Alternative Loan Trust 5.5% Jun 2021 $19,748 11 –
Portfolio statement – continuedAs at 31 January 2014
Market value Total netInvestment Holding £’000 assets %
Market value Total netInvestment Holding £’000 assets %

Master Alternative Loan Trust 5.5% Apr 2035 $35,301 22 – Master Alternative Loan Trust 5.5% Dec 2035 $88,590 48 – Master Alternative Loan Trust 5.75% 2035 $105,163 57 – Master Alternative Loan Trust 6% Dec 2034 $186,540 120 0.1 Master Asset Backed Securities Trust 0.8953%
2034 $274,745 145 0.1 Master Asset Backed Securities Trust FRN 2034 $118,145 65 – Mattamy Group 6.5% 2020 $34,000 20 – McGraw-Hill 9.75% 2021 $54,000 35 – Mediacom Capital 9.125% 2019 $51,000 34 – MEG Energy 6.375% 2023 $28,000 17 – MEG Energy 6.5% 2021 $25,000 16 – MEG Energy 7% 2024 $55,000 34 – Memorial Resource Development 10% 2018 $25,000 15 – Meritage Homes 7.15% 2020 $27,000 18 – Meritor 7.875% 2026 $30,000 26 – Merrill Lynch Mortgage Investors FRN 2034 $81,980 43 – Merrill Lynch Mortgage Investors FRN 2035 $12,625 7 – Metlife 6.4% 2066 $1,070,000 674 0.3 Metropcs Wireless 6.25% 2021 $277,000 175 0.1 Metropcs Wireless 6.625% 2020 $20,000 13 – T-Mobile USA 6.625% 2023 $103,000 65 – Metropcs Wireless 7.875% 2018 $40,000 26 – MGM Resorts 10% 2016 $75,000 55 – MGM Resorts 11.375% 2018 $50,000 39 – MGM Resorts 5.25% 2020 $100,000 61 – MGM Resorts 6.625% 2021 $60,000 39 – MGM Resorts 6.75% 2020 $325,000 214 0.1 MGM Resorts 7.625% 2017 $326,000 225 0.1 MGM Resorts 7.75% 2022 $527,000 360 0.1 MGM Resorts International 8.625% 2019 $45,000 32 – Michael Foods 9.75% SNR 2018 $50,000 33 – Michaels Stores 7.75% 2018 $250,000 162 0.1 Micron Technology 3% Convertible 2043 $139,000 90 – Midstates Petroleum 10.75% 2020 $7,000 5 – Milacron Finance 7.75% 2021 $80,000 52 – MISA Investments 8.625% 2018 $20,000 13 – Mobile Mini 7.875% 2020 $25,000 17 – MOL Group Finance 10% 2019 $200,000 128 0.1 Montell America Finance 8.1% 2027 $38,000 29 – Morgan Stanley 7.125% Preference $19,000 301 0.1 Morgan Stanley ABS Capital FRN Jan 2034
(2004-HE) $763,853 425 0.2 Morgan Stanley ABS Capital FRN Mar 2034 HE2 $52,343 20 – Morgan Stanley ABS Capital FRN Mar 2034 HE3 $209,081 118 0.1 Morgan Stanley ABS Capital FRN Mar 2034 $188,030 108 0.1 Morgan Stanley ABS Capital FRN May 2034 $406,008 223 0.1 Morgan Stanley ABS Capital FRN Jul 2034 $128,145 74 – Morgan Stanley ABS Capital FRN Jul 2034 $29,460 18 – Morgan Stanley ABS Capital FRN Aug 2034 $45,938 25 – Morgan Stanley ABS Capital FRN Aug 2034 $4,121 2 – Morgan Stanley ABS Capital FRN Aug 2034
HE7 M2 $46,689 27 – Morgan Stanley ABS Capital FRN Aug 2034
HE6 M2 $324,732 189 0.1 Morgan Stanley ABS Capital FRN Sep 2034
(US$1.00) $45,220 26 – Morgan Stanley ABS Capital FRN Sep 2034 $33,950 19 – Morgan Stanley ABS Capital FRN Nov 2034 M3 $81,158 45 – Morgan Stanley ABS Capital FRN Nov 2034 $103,294 60 – Morgan Stanley ABS Capital FRN Dec 2034 M3 $113,730 58 – Morgan Stanley ABS Capital FRN Dec 2034 M2 $30,166 18 – Morgan Stanley ABS Capital FRN 2035 $19,116 9 – Morgan Stanley Mortgage Loan Trust 5% 2035 $17,897 11 – Morgan Stanley Mortgage Loan Trust 5.25%
2021 $52,756 31 – Morgan Stanley Mortgage Loan Trust FRN 2034 $78,201 47 – MPH International 8.375% 2018 $53,000 33 – Multiplan 9.875% 2018 $205,000 135 0.1 Mustang Merger 8.5% 2021 $65,000 43 – Mylan 7.875% 2020 $250,000 171 0.1 National Financial Partners 9% 2021 $21,000 13 – National Mentor 12.5% 2018 $115,000 74 – Nationstar Mortgage 6.5% 2022 $35,000 20 – Nationstar Mortgage 7.875% 2020 $48,000 30 – Nationstar Mortgage 9.625% 2019 $29,000 20 – Navios Maritime Acquisition 8.125% 2021 $21,000 13 – Navios South American Logistics 9.25% 2019 $118,000 77 – NCR Escrow 5.875% 2021 $5,000 3 – NCR Escrow 6.375% 2023 $15,000 9 – Neiman Marcus Group 8% 2021 $150,000 95 – Netflix 5.375% 2021 $29,000 18 – Neuberger Berman 5.875% 2022 $25,000 16 –
New Century Home Equity Loan Trust 1.0403% 2035 $87,105 48 –
New Century Home Equity Loan Trust 2.7203% 2033 $83,448 48 –
New Century Home Equity Loan Trust FRN Aug 2034 M4 $76,603 43 –
New Century Home Equity Loan Trust FRN Aug 2034 M2 $16,924 10 –
New Century Home Equity Loan Trust FRN 2034 $95,120 46 – New Century Home Equity Loan Trust FRN 2035 $13,583 7 – New Gold 6.25% 2022 $22,000 13 – New Gold 7% 2020 $6,000 4 – Newfield Exploration 5.625% 2024 $12,000 7 – Newfield Exploration 5.75% 2022 $25,000 16 – Newfield Exploration 6.875% 2020 $30,000 19 – Newford Capital 0% Convertible 2016 $200,000 126 0.1 NewPage 11.375% 2014# $138,348 31 – Nexstar Broadcasting 6.875% 2020 $257,000 167 0.1 NFR Energy 9.75% 2017 $40,000 25 – NGL Energy Partners 6.875% 2021 $35,000 22 – Nielsen 5.5% 2021 $155,000 97 – Nielsen Finance LLC 4.5% 2020 $25,000 15 – NII Capital 7.625% 2021 $201,000 53 – NII Capital 8.875% 2019 $55,000 16 – NII International Telecom 7.875% 2019 $32,000 15 – NII International Telecom 11.375% 2019 $56,000 28 – Nokia 5.375% 2019 $41,000 26 – Nokia 6.625% 2039 $17,000 10 – Nomura Asset Acceptance 5.159% 2035 $32,625 20 – Norbord 5.375% 2020 $48,000 29 – Nortek 8.5% 2021 $50,000 34 – Nova Chemicals 5.25% 2023 $20,000 12 – Novastar Mortgage Funding Trust FRN 2033 $81,422 47 – Novelis 8.75% 2020 $90,000 61 – NRG Energy 6.25% 2022 $125,000 76 – NRG Energy 6.625% 2023 $39,000 24 – NRG Energy 7.625% 2018 $220,000 150 0.1 NRG Energy 7.625% 2019 $20,000 13 – NRG Energy 7.875% 2021 $70,000 46 – NRG Energy 8.25% 2020 $75,000 50 – Nuance Communications 5.375% 2020 $58,000 34 – Nufarm 6.375% 2019 $77,000 48 – NXP Funding 5.75% 2021 $400,000 252 0.1 Oasis Petroleum 6.875% 2022 $50,000 32 – Oil States International 5.125% 2023 $125,000 85 – Oil States International 6.5% 2019# $80,000 52 – Olin 5.5% 2022 $170,000 105 0.1 Omnicare 7.75% 2020 $24,000 16 – Omnova Solutions 7.875% 2018 $50,000 33 – Onex USI Acquisition 7.75% 2021 $52,000 32 – Oppenheimer 8.75% 2018 $30,000 19 – Option One Mortgage Acceptance FRN 2033 $283,689 154 0.1 Option One Mortgage Acceptance FRN 2033
2003-5 $28,262 14 – Option One Mortgage Loan Trust FRN 2032 A1 $368,774 210 0.1 Option One Mortgage Loan Trust FRN 2032 A2 $56,969 31 – Option One Mortgage Loan Trust FRN 2032 6A1 $232,373 130 0.1 Option One Mortgage Loan Trust FRN 2032 A2 $54,795 31 – Option One Mortgage Loan Trust FRN Apr 2033 $40,902 21 – Option One Mortgage Loan Trust FRN 2033 1A $81,896 47 – Option One Mortgage Loan Trust FRN 2033 5A1 $463,261 263 0.1 Option One Mortgage Loan Trust FRN 2033 1A2 $110,843 62 – Option One Mortgage Loan Trust FRN Aug 2033 $36,606 21 – Option One Mortgage Loan Trust FRN May 2034 $539,731 287 0.1 Option One Mortgage Loan Trust FRN Nov 2034 $198,596 117 0.1 Oshkosh 8.5% 2020 $150,000 100 – Pacific Rubiales Energy 5.375% 2019 $100,000 61 – Paetec 9.875% 2018 $20,000 13 – PAR Pharmaceutical 7.375% 2020 $10,000 6 – Parker Drilling 6.75% 2022 $18,000 11 – Parker Drilling 7.5% 2020 $80,000 51 – Party City 8.875% 2020 $254,000 172 0.1 PC Nextco Holdings FRN 2019 $33,000 21 – Peabody Energy 6% 2018 $5,000 3 – Peabody Energy 6.25% 2021 $340,000 209 0.1 PENN National Gaming 5.875% 2021 $5,000 3 – PENN Virgina Partners 8.375% 2020 $12,000 8 – Penske Automotive 5.75% 2022 $10,000 6 – Peoples Choice Home Loan Securities Trust
FRN 2034 $384,230 158 0.1 Pertamina 5.25% 2021 $200,000 116 0.1 Petrohawk Energy 7.875% 2015 $250,000 155 0.1 Petroleos de Venezuela 8.5% 2017 $297,000 143 0.1
Portfolio statement – continuedAs at 31 January 2014
Market value Total netInvestment Holding £’000 assets %
Market value Total netInvestment Holding £’000 assets %
212
Continuation�
� Return to Index
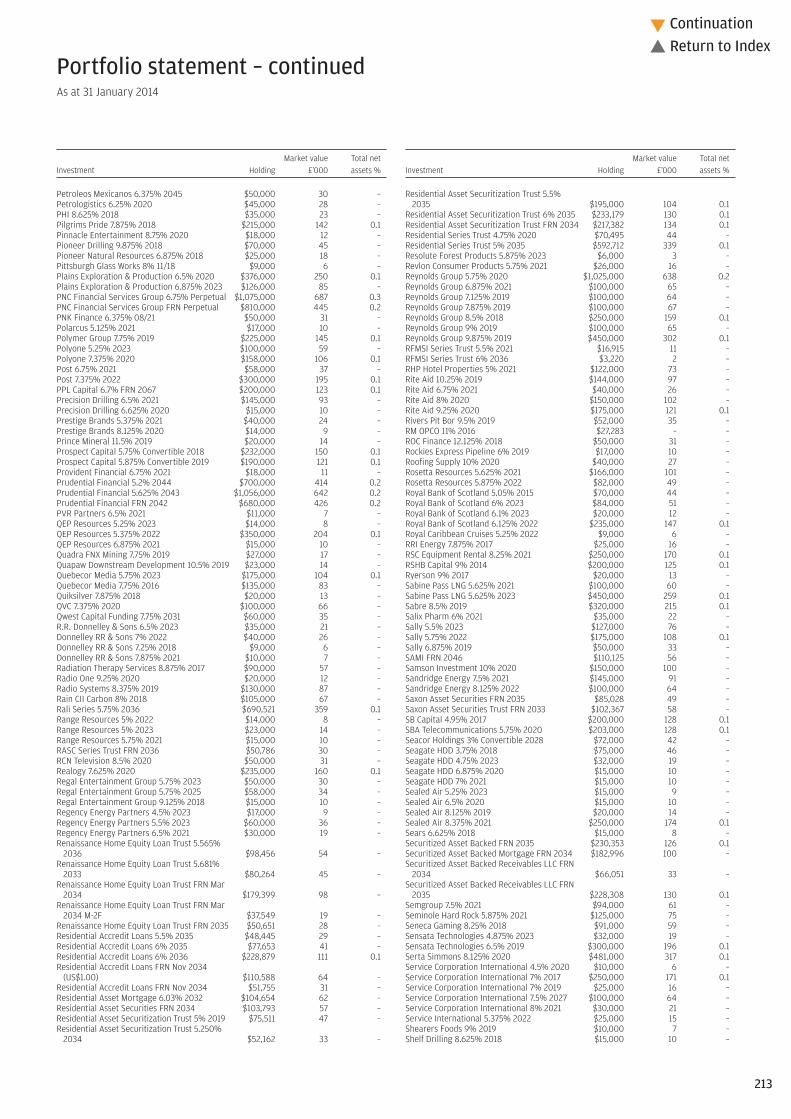
213
Continuation�
� Return to Index
Petroleos Mexicanos 6.375% 2045 $50,000 30 – Petrologistics 6.25% 2020 $45,000 28 – PHI 8.625% 2018 $35,000 23 – Pilgrims Pride 7.875% 2018 $215,000 142 0.1 Pinnacle Entertainment 8.75% 2020 $18,000 12 – Pioneer Drilling 9.875% 2018 $70,000 45 – Pioneer Natural Resources 6.875% 2018 $25,000 18 – Pittsburgh Glass Works 8% 11/18 $9,000 6 – Plains Exploration & Production 6.5% 2020 $376,000 250 0.1 Plains Exploration & Production 6.875% 2023 $126,000 85 – PNC Financial Services Group 6.75% Perpetual $1,075,000 687 0.3 PNC Financial Services Group FRN Perpetual $810,000 445 0.2 PNK Finance 6.375% 08/21 $50,000 31 – Polarcus 5.125% 2021 $17,000 10 – Polymer Group 7.75% 2019 $225,000 145 0.1 Polyone 5.25% 2023 $100,000 59 – Polyone 7.375% 2020 $158,000 106 0.1 Post 6.75% 2021 $58,000 37 – Post 7.375% 2022 $300,000 195 0.1 PPL Capital 6.7% FRN 2067 $200,000 123 0.1 Precision Drilling 6.5% 2021 $145,000 93 – Precision Drilling 6.625% 2020 $15,000 10 – Prestige Brands 5.375% 2021 $40,000 24 – Prestige Brands 8.125% 2020 $14,000 9 – Prince Mineral 11.5% 2019 $20,000 14 – Prospect Capital 5.75% Convertible 2018 $232,000 150 0.1 Prospect Capital 5.875% Convertible 2019 $190,000 121 0.1 Provident Financial 6.75% 2021 $18,000 11 – Prudential Financial 5.2% 2044 $700,000 414 0.2 Prudential Financial 5.625% 2043 $1,056,000 642 0.2 Prudential Financial FRN 2042 $680,000 426 0.2 PVR Partners 6.5% 2021 $11,000 7 – QEP Resources 5.25% 2023 $14,000 8 – QEP Resources 5.375% 2022 $350,000 204 0.1 QEP Resources 6.875% 2021 $15,000 10 – Quadra FNX Mining 7.75% 2019 $27,000 17 – Quapaw Downstream Development 10.5% 2019 $23,000 14 – Quebecor Media 5.75% 2023 $175,000 104 0.1 Quebecor Media 7.75% 2016 $135,000 83 – Quiksilver 7.875% 2018 $20,000 13 – QVC 7.375% 2020 $100,000 66 – Qwest Capital Funding 7.75% 2031 $60,000 35 – R.R. Donnelley & Sons 6.5% 2023 $35,000 21 – Donnelley RR & Sons 7% 2022 $40,000 26 – Donnelley RR & Sons 7.25% 2018 $9,000 6 – Donnelley RR & Sons 7.875% 2021 $10,000 7 – Radiation Therapy Services 8.875% 2017 $90,000 57 – Radio One 9.25% 2020 $20,000 12 – Radio Systems 8.375% 2019 $130,000 87 – Rain CII Carbon 8% 2018 $105,000 67 – Rali Series 5.75% 2036 $690,521 359 0.1 Range Resources 5% 2022 $14,000 8 – Range Resources 5% 2023 $23,000 14 – Range Resources 5.75% 2021 $15,000 10 – RASC Series Trust FRN 2036 $50,786 30 – RCN Television 8.5% 2020 $50,000 31 – Realogy 7.625% 2020 $235,000 160 0.1 Regal Entertainment Group 5.75% 2023 $50,000 30 – Regal Entertainment Group 5.75% 2025 $58,000 34 – Regal Entertainment Group 9.125% 2018 $15,000 10 – Regency Energy Partners 4.5% 2023 $17,000 9 – Regency Energy Partners 5.5% 2023 $60,000 36 – Regency Energy Partners 6.5% 2021 $30,000 19 – Renaissance Home Equity Loan Trust 5.565%
2036 $98,456 54 – Renaissance Home Equity Loan Trust 5.681%
2033 $80,264 45 – Renaissance Home Equity Loan Trust FRN Mar
2034 $179,399 98 – Renaissance Home Equity Loan Trust FRN Mar
2034 M-2F $37,549 19 – Renaissance Home Equity Loan Trust FRN 2035 $50,651 28 – Residential Accredit Loans 5.5% 2035 $48,445 29 – Residential Accredit Loans 6% 2035 $77,653 41 – Residential Accredit Loans 6% 2036 $228,879 111 0.1 Residential Accredit Loans FRN Nov 2034
(US$1.00) $110,588 64 – Residential Accredit Loans FRN Nov 2034 $51,755 31 – Residential Asset Mortgage 6.03% 2032 $104,654 62 – Residential Asset Securities FRN 2034 $103,793 57 – Residential Asset Securitization Trust 5% 2019 $75,511 47 – Residential Asset Securitization Trust 5.250%
2034 $52,162 33 –
Residential Asset Securitization Trust 5.5% 2035 $195,000 104 0.1
Residential Asset Securitization Trust 6% 2035 $233,179 130 0.1 Residential Asset Securitization Trust FRN 2034 $217,382 134 0.1 Residential Series Trust 4.75% 2020 $70,495 44 – Residential Series Trust 5% 2035 $592,712 339 0.1 Resolute Forest Products 5.875% 2023 $6,000 3 – Revlon Consumer Products 5.75% 2021 $26,000 16 – Reynolds Group 5.75% 2020 $1,025,000 638 0.2 Reynolds Group 6.875% 2021 $100,000 65 – Reynolds Group 7.125% 2019 $100,000 64 – Reynolds Group 7.875% 2019 $100,000 67 – Reynolds Group 8.5% 2018 $250,000 159 0.1 Reynolds Group 9% 2019 $100,000 65 – Reynolds Group 9.875% 2019 $450,000 302 0.1 RFMSI Series Trust 5.5% 2021 $16,915 11 – RFMSI Series Trust 6% 2036 $3,220 2 – RHP Hotel Properties 5% 2021 $122,000 73 – Rite Aid 10.25% 2019 $144,000 97 – Rite Aid 6.75% 2021 $40,000 26 – Rite Aid 8% 2020 $150,000 102 – Rite Aid 9.25% 2020 $175,000 121 0.1 Rivers Pit Bor 9.5% 2019 $52,000 35 – RM OPCO 11% 2016 $27,283 – – ROC Finance 12.125% 2018 $50,000 31 – Rockies Express Pipeline 6% 2019 $17,000 10 – Roofing Supply 10% 2020 $40,000 27 – Rosetta Resources 5.625% 2021 $166,000 101 – Rosetta Resources 5.875% 2022 $82,000 49 – Royal Bank of Scotland 5.05% 2015 $70,000 44 – Royal Bank of Scotland 6% 2023 $84,000 51 – Royal Bank of Scotland 6.1% 2023 $20,000 12 – Royal Bank of Scotland 6.125% 2022 $235,000 147 0.1 Royal Caribbean Cruises 5.25% 2022 $9,000 6 – RRI Energy 7.875% 2017 $25,000 16 – RSC Equipment Rental 8.25% 2021 $250,000 170 0.1 RSHB Capital 9% 2014 $200,000 125 0.1 Ryerson 9% 2017 $20,000 13 – Sabine Pass LNG 5.625% 2021 $100,000 60 – Sabine Pass LNG 5.625% 2023 $450,000 259 0.1 Sabre 8.5% 2019 $320,000 215 0.1 Salix Pharm 6% 2021 $35,000 22 – Sally 5.5% 2023 $127,000 76 – Sally 5.75% 2022 $175,000 108 0.1 Sally 6.875% 2019 $50,000 33 – SAMI FRN 2046 $110,125 56 – Samson Investment 10% 2020 $150,000 100 – Sandridge Energy 7.5% 2021 $145,000 91 – Sandridge Energy 8.125% 2022 $100,000 64 – Saxon Asset Securities FRN 2035 $85,028 49 – Saxon Asset Securities Trust FRN 2033 $102,367 58 – SB Capital 4.95% 2017 $200,000 128 0.1 SBA Telecommunications 5.75% 2020 $203,000 128 0.1 Seacor Holdings 3% Convertible 2028 $72,000 42 – Seagate HDD 3.75% 2018 $75,000 46 – Seagate HDD 4.75% 2023 $32,000 19 – Seagate HDD 6.875% 2020 $15,000 10 – Seagate HDD 7% 2021 $15,000 10 – Sealed Air 5.25% 2023 $15,000 9 – Sealed Air 6.5% 2020 $15,000 10 – Sealed Air 8.125% 2019 $20,000 14 – Sealed Air 8.375% 2021 $250,000 174 0.1 Sears 6.625% 2018 $15,000 8 – Securitized Asset Backed FRN 2035 $230,353 126 0.1 Securitized Asset Backed Mortgage FRN 2034 $182,996 100 – Securitized Asset Backed Receivables LLC FRN
2034 $66,051 33 – Securitized Asset Backed Receivables LLC FRN
2035 $228,308 130 0.1 Semgroup 7.5% 2021 $94,000 61 – Seminole Hard Rock 5.875% 2021 $125,000 75 – Seneca Gaming 8.25% 2018 $91,000 59 – Sensata Technologies 4.875% 2023 $32,000 19 – Sensata Technologies 6.5% 2019 $300,000 196 0.1 Serta Simmons 8.125% 2020 $481,000 317 0.1 Service Corporation International 4.5% 2020 $10,000 6 – Service Corporation International 7% 2017 $250,000 171 0.1 Service Corporation International 7% 2019 $25,000 16 – Service Corporation International 7.5% 2027 $100,000 64 – Service Corporation International 8% 2021 $30,000 21 – Service International 5.375% 2022 $25,000 15 – Shearers Foods 9% 2019 $10,000 7 – Shelf Drilling 8.625% 2018 $15,000 10 –
Portfolio statement – continuedAs at 31 January 2014
Market value Total netInvestment Holding £’000 assets %
Market value Total netInvestment Holding £’000 assets %

Shingle Springs Tribal Gaming 9.75% 2021 $50,000 33 – Sinclair Broadcast Group 6.125% 2013 $20,000 12 – Sinclair Television Group 8.375% 2018 $100,000 66 – Sinclair Television Group 5.375% 2021 $256,000 153 0.1 Sinclair Television Group 6.375% 2021 $25,000 16 – Sirius XM Radio 4.25% 2020 $316,000 179 0.1 Sirius XM Radio 4.625% 2023 $41,000 22 – Sirius XM Radio 5.25% 2022 $40,000 25 – Sirius XM Radio 5.75% 2021 $71,000 43 – Sirius XM Radio 5.875% 2020 $35,000 22 – Sitel 11% 2017 $17,000 11 – Sitel 11.5% 2018 $79,000 45 – Six Flags Entertainment 5.25% 2021 $125,000 75 – Skandinaviska Enskilda Banken 5.471% FRN
Perpetual $100,000 62 – SM Energy 5% 2024 $36,000 21 – SM Energy 6.5% 2021 $100,000 65 – SM Energy 6.5% 2023 $100,000 63 – SM Energy 6.625% 2019 $90,000 58 – Smithfield Foods 5.25% 2018 $151,000 96 – Smithfield Foods 5.875% 2021 $15,000 9 – Smithfield Foods 7.75% 2017 $116,000 82 – Societe Generale 7.875% FRN Perpetual $200,000 124 0.1 Softbank Corp 4.5% 2020 $200,000 120 0.1 Speciality Underwriting & Resenditial Services
FRN 2035 $168,311 94 – Spectrum Brands 6.375% 2020 $75,000 49 – Spectrum Brands 6.625% 2022 $123,000 80 – Spectrum Brands 6.75% 2020 $320,000 209 0.1 Speedy Cash 10.75% 2018 $25,000 16 – Sprint 7.125% 2024 $46,000 28 – Sprint 7.25% 2021 $581,000 381 0.1 Sprint 7.875% 2023 $478,000 311 0.1 Sprint Capital 6.9% 2019 $11,000 7 – Sprint Capital 8.75% 2032 $815,000 537 0.2 Sprint Nextel 11.5% 2021 $7,000 6 – Sprint Nextel 6% 2016 $52,000 34 – Sprint Nextel 6% 2022 $110,000 66 – Sprint Nextel 7% Mar 2020 $90,000 62 – Sprint Nextel 7% Aug 2020 $146,000 96 – Sprint Nextel 8.375% 2017 $60,000 42 – Sprint Nextel 9% 2018 $363,000 266 0.1 Sprint Nextel 9.125% 2017 $40,000 29 – Stackpole 7.75% 2021 $45,000 29 – Standard Pacific 10.75% 2016 $10,000 7 – Standard Pacific 8.375% 2018 $40,000 28 – Standard Pacific 8.375% 2021 $50,000 36 – State Oil 4.75% 2023 $200,000 114 0.1 Station Casinos 7.5% 2021 $75,000 49 – Steel Dynamics 5.25% 2023 $53,000 33 – Steel Dynamics 6.125% 2019 $9,000 6 – Steel Dynamics 6.375% 2022 $9,000 6 – Steel Dynamics 7.625% 2020 $25,000 16 – Stone Energy 7.5% 2022 $238,000 153 0.1 Stream Global 11.25% 2014 $8,000 5 – Structured Asset Investment Loan Trust FRN
Apr 2033 $34,076 20 – Structured Asset Investment Loan Trust FRN
2033 BC7 $489,084 283 0.1 Structured Asset Investment Loan Trust FRN
Sep 2034 $39,548 21 – Structured Asset Investment Loan Trust FRN
2035 $190,000 107 0.1 Structured Asset Investment Loan Trust FRN
Feb 2034 M1 $259,715 150 0.1 Structured Asset Investment Loan Trust FRN
Feb 2034 M2 $53,351 31 – Structured Asset Investment Loan Trust FRN
Jul 2034 $746,599 426 0.2 Structured Asset Investment Loan Trust FRN
Oct 2034 $100,334 58 – Structured Asset Securities 5.5% 2035 $42,041 26 – Structured Asset Securities FRN 2034 $602,308 380 0.1 Studio City Finance 8.5% 2020 $250,000 169 0.1 Suburban Propane Partners 7.375% SNR 2021 $4,000 3 – Summit Midstream Partners 7.5% 2021 $43,000 28 – Sungard Data Systems 6.625% 2019 $46,000 29 – Sungard Data Systems 7.375% 2018 $100,000 64 – Sungard Data Systems 7.625% 2020 $127,000 85 – SUPERVALU 8% 2016 $100,000 67 – Swift Energy 7.875% 2022 $41,000 25 – Swift Energy 8.875% 2020 $50,000 32 – Swiss Re 6.854% FRN Perpetual $100,000 65 –
Talos Production 9.75% 2018 $23,000 14 – Targa Resources 4.25% 2023 $150,000 82 – Targa Resources 6.375% 2022 $42,000 27 – Targa Resources 6.875% 2021 $45,000 29 – Taseko Mines 7.75% 2019 $45,000 28 – Taylor Morrison 5.25% 2021 $34,000 20 – Taylor Morrison 7.75% 2020 $16,000 11 – Teekay 8.5% 2020 $40,000 27 – Telesat 6% 2017 $50,000 32 – Tempur Sealy International 6.875% 2020 $125,000 83 – Tenet Healthcare 4.375% 2021 $46,000 27 – Tenet Healthcare 4.5% 2021 $46,000 27 – Tenet Healthcare 4.75% 2020 $300,000 182 0.1 Tenet Healthcare 6% 2020 $163,000 105 0.1 Tenet Healthcare 6.25% 2018 $15,000 10 – Tenet Healthcare 6.75% 2020 $350,000 222 0.1 Tenet Healthcare 8% 2020 $235,000 156 0.1 Tenet Healthcare 8.125% 2022 $253,000 168 0.1 Terex 6% 2021 $165,000 104 0.1 Terex 6.5% 2020 $150,000 98 – Tesoro 4.25% 2017 $4,000 3 – Tesoro 5.375% 2022 $7,000 4 – Tesoro 5.875% 2020 $457,000 284 0.1 Tesoro 6.125% 2021 $50,000 31 – Texas Competitive Electric 11.5% 2020 $10,000 4 – Thermadyne 9% 2017 $50,000 33 – Time Warner Cable 6.75% 2018 $30,000 21 – T-Mobile USA 5.25% 2018 $27,000 17 – T-Mobile USA 6.464% 2019 $18,000 12 – T-Mobile USA 6.633% 2021 $170,000 109 0.1 T-Mobile USA 6.125% 2022 $10,000 6 – T-Mobile USA 6.731% 2022 $413,000 263 0.1 T-Mobile USA 6.836% 2023 $23,000 15 – T-Mobile USA 6.5% 2024 $10,000 6 – Tops Holdings 8.875% 2017 $80,000 53 – Toys R Us 7.375% 2016 $50,000 27 – Transdigm 5.5% 2020 $60,000 36 – Transdigm 7.75% 2018 $100,000 65 – TransUnion 8.125% 2018 $16,000 10 – TransUnion 9.625% 2018 $24,000 16 – Trinidad Drilling 7.875% SNR 2019 $170,000 111 0.1 Trinseo Materials Operating 8.75% 2019 $170,000 106 0.1 Triumph Group 4.875% 2021 $20,000 12 – Tronox Finance 6.375% 2020 $70,000 43 – Tutor Perini 7.625% 2018 $86,000 56 – TW Telecom Holdings 5.375% 2022 $100,000 60 – UBS Preferred Funding Trust 6.243% FRN
Perpetual $295,000 191 0.1 UCI International 8.625% 2019 $50,000 30 – Ultra Petroleum 5.75% 2018 $85,000 53 – Ultrapetrol 8.875% Jun 2021 $100,000 65 – Ultrapetrol 8.875% Jun 2021 (US$1,000) $7,000 5 – Unifrax 7.5% 2019 $35,000 22 – Unisys Corporation 6.25% 2017 $23,000 15 – Unit 6.625% 2021 $225,000 144 0.1 United Rentals 5.75% 2018 $8,000 5 – United Rentals 6.125% 2023 $149,000 94 – United Rentals 7.375% 2020 $12,000 8 – United Rentals 7.625% 2022 $446,000 305 0.1 United Rentals 8.375% 2020 $115,000 78 – United States Steel 0.25% 2015 $435,000 265 0.1 United States Steel 7% 2018 $50,000 33 – United Surgical Partners 9% 2020 $195,000 133 0.1 Univision Communications 5.125% 2023 $100,000 60 – Univision Communications 6.75% 2022 $275,000 183 0.1 Univision Communications 7.875% 2020 $90,000 60 – Univision Communications 8.5% 2021 $20,000 13 – UPCB Finance 6.875% 2022 $300,000 195 0.1 UPCB Finance 7.25% 2021 $150,000 99 – UPCB Finance III 6.625% 2020 $150,000 96 – US Airways 3.95% 2027 $10,000 6 – US Airways 5.375% 2023 $105,000 63 – US Concrete 8.5% 2018 $25,000 16 – US West Capital Funding 6.875% 2028 $6,000 3 – US West Communications 7.25% 2025 $15,000 10 – USG 7.875% 2020 $2,000 1 – USG 5.875% 2021 $27,000 17 – Vail Resorts 6.5% 2019 $425,000 272 0.1 Valassis Communications 6.625% 2021 $70,000 43 – Valeant Pharmaceuticals 6.75% 2021 $290,000 188 0.1 Valeant Pharmaceuticals 6.875% 2018 $50,000 32 – Valeant Pharmaceuticals 7% 2020 $300,000 196 0.1 Valeant Pharmaceuticals 7.25% 2022 $115,000 76 –
Portfolio statement – continuedAs at 31 January 2014
Market value Total netInvestment Holding £’000 assets %
214
Continuation�
� Return to Index
Market value Total netInvestment Holding £’000 assets %

215
Continuation�
� Return to Index
Valent Pharmaceuticals 5.625% 2021 $90,000 57 – Vanguard Natural Resources 7.875% 2020 $28,000 18 – Viasystems 7.875% 2019 $29,000 19 – Videotron 5% 2022 $50,000 30 – Viking Cruises 8.5% 2022 $80,000 55 – Virgin Media Finance 8.375% 2019 $34,000 22 – Visteon 6.75% 2019 $60,000 38 – Volt 3.625% 2053 $658,226 398 0.2 Volt FRN 2016 $203,574 124 0.1 Volt FRN 2058 $196,830 120 0.1 Volt XIX FRN 2055 $304,250 184 0.1 VPI Escrow 6.375% 2021 $120,000 78 – VPI Escrow 6.75% 2018 $138,000 92 – VPI Escrow 7.5% 2021 $544,000 369 0.1 Vulcan Materials 7.5% 2021 $390,000 273 0.1 VWR Funding 7.25% 2017 $65,000 42 – W & T Offshore 8.5% 2019 $90,000 59 – Wachovia Capital Trust I 5.8% 2042 $1,083,000 615 0.2 Water Jet Holding 7.625% 2020 $12,000 7 – Walter Investment Management 7.875% 2021 $53,000 33 – WAMU Mortgage FRN 2034 $191,928 116 0.1 WAMU Mortgage FRN May 2035 $150,000 88 – WAMU Mortgage FRN Dec 2035 $57,180 32 – Washington Mutual Mortgage 5.5% Mar 2035 $134,095 80 – Washington Mutual Alternative 5.5% Jun 2035 $98,794 59 – Washington Mutual Mortgage 5.75% 2035# $87,924 50 – Watco 6.375% 2023 $69,000 41 – WCI Communities 6.875% 2021 $55,000 33 – Wells Enterprises 6.75% 2020 $71,000 44 – Wells Fargo ‘A’ 7.98% FRN Perpetual $1,695,000 1,164 0.4 Wells Fargo Home Equity FRN 2033 8A $26,001 14 – Wells Fargo Home Equity FRN 2033 $26,001 14 – Wells Fargo Home Equity 1.3953% 2034 $86,095 42 – Wells Fargo Home Equity FRN 2034 M2 $38,437 20 – Wells Fargo Home Equity FRN 2034 $177,374 99 – Wells Fargo Mortgage Backed Securities Trust
5.250% 2036 $91,671 57 – Wells Fargo Mortgage Backed Securities Trust
5.5% 2035 $39,877 26 – Wells Fargo Mortgage Backed Securities Trust
5.75% 2036 $305,000 193 0.1 Wells Fargo Mortgage Backed Securities Trust
6% Mar 2037 $32,631 19 – Wells Fargo Mortgage Backed Securities Trust
6% Nov 2037 $67,796 41 – Wells Fargo Mortgage Backed Securities Trust
FRN 2034 $57,340 36 – Wells Fargo Mortgage Backed Securities Trust
FRN 2035 $310,440 192 0.1 Wells Fargo Mortgage Backed Securities Trust
FRN 2035 AR4 $52,459 32 – Wells Fargo Mortgage Backed Securities Trust
FRN 2035 AR8 $300,404 186 0.1 Wells Fargo Mortgage Backed Securities Trust
FRN 2035 DD $32,823 20 – Wells Fargo Mortgage Backed Securities Trust
FRN Jan 2035 $749,688 460 0.2 Wells Fargo Mortgage Backed Securities Trust
FRN Mar 2035 $210,343 127 0.1 Wells Fargo Mortgage Backed Securities Trust
FRN 2036 $264,762 159 0.1 Western Refining 6.25% 2021 $53,000 33 – WEX 4.75% 2023 $14,000 8 – Whiting Petroleum 5% 2019 $85,000 53 – Whiting Petroleum 5.75% 2021 $350,000 223 0.1 William Carter 5.25% 2021 $42,000 26 – Windstream 7.75% 2020 $219,000 142 0.1 Windstream 7.75% 2021 $690,000 441 0.2 Windstream 8.125% 2018 $25,000 16 – WMG Acquisition 6% 2021 $258,000 162 0.1 Wok Acquisition 10.25% 2020 $40,000 26 – World Wide Supply 7.75% 2017 $30,000 18 – WPX Energy 5.25% 2017 $40,000 26 – WPX Energy 6% 2022 $405,000 245 0.1 Zayo Group 10.125% 2020 $60,000 42 – Zayo Group 8.125% 2020 $50,000 34 – Euro – 0.1%Unity Media 5.5% 2023 €200,000 122 0.1 Sterling – 0.1%New Look 8.75% 2018 £100,000 107 0.1
Government bonds – 5.5% (5.2%)Direct – 5.3%Argentina 8.28% 2033 $93,395 50 – Aruba 4.625% 2023 $200,000 115 0.1 Brazil 11% 2040 $565,000 390 0.1 Buenos Aires 11.75% 2015 $200,000 106 0.1 Buenos Aires 10.875% 2021 $170,000 76 – Chile 6% 2022 $40,000,000 44 – Costa Rica 9.995% 2020 $362,000 277 0.1 Croatia 6.25% 2017 $200,000 129 0.1 Dominican Republic 9.04% 2018 $32,016 21 – Dominican Republic 9.04% 2018 Reg S $505,976 336 0.1 Dominican Republic 5.875% 2024 $100,000 58 – El Salvador 7.75% 2023 $180,000 117 0.1 Ghana 8.5% 2017 $330,000 209 0.1 Hungary 7.5% 2020 $20,700,000 60 – Hungary 6.375% 2021 $40,000 26 – Hungary 5.75% 2023 $170,000 103 – Hungary 7.625% 2041 $372,000 244 0.1 Indonesia 11.625% 2019 $600,000 481 0.2 Iraq 5.8% 2028# $750,000 383 0.1 Italy 4.25% 2020 $835,000 743 0.3 Italy 4.5% 2023 $1,198,000 1,053 0.4 Italy 4.75% 2023 $946,000 848 0.3 Italy 4.75% 2028 $655,000 574 0.2 Mexico 10% FRN 2036 $5,200 29 – Mexico 7.75% 2031 $5,000 23 – Mexico 8% 2020 $8,000 40 – Philippines 10.625% 2025 $274,000 256 0.1 Portugal 3.35% 2015 $267,500 226 0.1 Portugal 4.2% 2016 $500,000 429 0.2 Portugal 4.35% 2017 $182,000 156 0.1 Portugal 4.75% 2019 $449,000 382 0.1 Romania 6.75% 2022 $696,000 479 0.2 Romania 6.125% 2044 $60,000 36 – Russia 12.75% 2028 $515,000 526 0.2 Russia 5.875% 2043 $200,000 121 0.1 Serbia 7.25% 2021 $500,000 320 0.1 Slovenia 5.85% 2023 $300,000 186 0.1 South Africa 4.665% 2024 $100,000 57 – South Africa 10.5% 2027 $495,000 30 – Spain 4% 2020 $753,000 665 0.2 Spain 4.85% 2020 $952,000 875 0.3 Spain 5.4% 2023 $1,923,000 1,803 0.7 Sri Lanka 6.25% 2020 $100,000 61 – Turkey 6% 2041 $200,000 110 0.1 Ukraine 9.25% 2017 $220,000 126 0.1 Uruguay 8% 2022 $80,000 60 – Uruguay 7.625% 2036 $60,000 44 – Venezuela 12.75% 2022 $250,000 128 0.1 Venezuela 7.65% 2025 $330,000 120 0.1 Credit linked – 0.2%Citigroup Funding Brazil Linked 0% Jan 2017 $350,000 147 0.1 Citigroup Funding Brazil Linked 0% 2017 $240,000 101 – Citigroup Funding Nigeria Linked FRN 2022 $200,000 112 0.1
Convertible bonds – 3.2% (2.8%)US Dollar – 2.3%Agile Property 4% Convertible 2016 $300,000 182 0.1 Annaly Capital Management 5% Convertible
2015 $276,000 171 0.1 Ares Capital 4.375% Convertible 2019 $315,000 202 0.1 Capitaland 1.85% Convertible 2020 $500,000 214 0.1 Centerpoint Energy FRN Convertible 2029 $1,300 41 – Chesapeake Energy 2.25% Covertible 2038 $217,000 123 0.1 Chesapeake Energy 2.5% Convertible 2037 $143,000 88 – China Hongqiao Group 6.5% Convertible 2017 $200,000 128 0.1 Colony Financial 5% Convertible 2023 $324,000 206 0.1 Detour Gold 5.5% Convertible 2017 $218,000 114 0.1 Holdgrove 1% Convertible 2017 $400,000 240 0.1 Intel 2.95% Convertible 2035 $344,000 232 0.1 Jaiprakash Power Ventures 5% Convertible 2015 $200,000 117 0.1 Paladin Energy 3.625% Convertible 2015 $200,000 108 0.1 Peabody Energy 4.75% Convertible 2041 $396,000 189 0.1 Polarcus 2.875% Convertible 2016 $200,000 116 0.1 Prospect Capital 5.375% Convertible 2017 $50,000 32 – Redwood Trust 4.625% Convertible 2018 $334,000 208 0.1 RM OPCO 1.12% Convertible 2018# $10,182 6 – Royal Gold 2.875% Convertible 2019 $212,000 129 0.1 Salamander Energy 5% Convertible 2015 $100,000 61 – Sesa Goa 5% Convertible 2014 $200,000 121 0.1 SGL Carbon 2.75% Convertible 2018 $200,000 169 0.1
Portfolio statement – continuedAs at 31 January 2014
Market value Total netInvestment Holding £’000 assets %
Market value Total netInvestment Holding £’000 assets %

216
Ship Finance International 3.25% Convertible 2018 $82,000 53 –
Ship Finance International 3.75% Convertible 2016 $100,000 63 –
Starwood Property Trust 4.55% Convertible 2018 $268,000 186 0.1
Sterlite Industries 4% Convertible 2014 $317,000 191 0.1 Tata Steel 4.5% Convertible 2014 $300,000 184 0.1 TMK 5.25% Convertible 2015 $400,000 245 0.1 Vedanta Res Jersey 5.5% Convertible 2016 $300,000 184 0.1 Euro – 0.9%Abengoa 4.5% Convertible 2017 £350,000 292 0.1 Acciona 3% Covertible 2019 £200,000 163 0.1 Air France – KLM 2.03% Convertible 2023 £3,674,800 354 0.1 Amorim Energia BV 3.375% Convertible 2018 £100,000 87 – Astaldi 4.5% Convertible 2019 £100,000 93 – Beni Stabili Spa 2.625% Convertible 2019 £100,000 84 – Caixabank 4.5% Convertible 2016 £200,000 161 0.1 CGG 1.75% Convertible 2016 £370,900 83 – Hungarian National Asset Management 3.375%
Convertible 2019 £200,000 174 0.1 Kloeckner 2.5% Convertible 2017 £50,000 40 – NH Hotels 4% Convertible 2018 £100,000 96 – Nexan 2.5% Convertible 2019 £140,200 84 – Nyrstar 7% Convertible 2014 £100,000 83 – OHL Investments 4% Convertible 2018 £300,000 255 0.1 Peugeot 4.45% Convertible 2016 £1,294,000 284 0.1 Rallye 1% Convertible 2020 £25,500 23 – Soitec 6.75% Convertible 2018 £1,463,300 25 – Steinhoff Finance 4.5% Convertible 2018 £200,000 189 0.1 Volkswagen 5.5% Convertible 2015 £200,000 188 0.1
Forward currency contracts – 0.4% ((1.4)%)Australian Dollar – 0.1%Sell AUD 10,238,266 buy $9,124,158 dated 14/02/14 130 0.1 Canadian Dollar – 0.00%Sell CAD 3,619,173 buy $3,343,514 dated 14/02/14 68 – Danish Krone – 0.0%Sell DKK 10,437,924 buy $1,900,929 dated 14/02/14 3 – Euro – 0.1%Sell €333,901 buy $275,399 dated 14/02/14 (1) – Sell €41,904,350 buy $56,951,360 dated 14/02/14 106 0.1 Hong Kong Dollar – 0.0%Sell HKD 80,101,942 buy $10,330,256 dated 14/02/14 8 – Japanese Yen – (0.1)%Sell ¥1,302,326,725 buy $12,461,944 dated 14/02/14 (169) (0.1)Norwegian Krone – 0.0%Sell NOK 6,925,753 buy $1,114,906 dated 14/02/14 8 – Singapore Dollar – 0.0%Sell SGD 6,032,645 buy $4,745,611 dated 14/02/14 17 – Swedish Krona – 0.0%Sell SEK 36,043,319 buy $5,493,764 dated 14/02/14 (6) – Swiss Franc – 0.0%Sell CHF 7,600,017 buy $8,352,741 dated 14/02/14 (43) – US Dollar – 0.3%Buy $1,316,289 sell £794,140 dated 14/02/14 6 – Buy $3,336,136 sell £2,038,901 dated 14/02/14 (12) – Sell $1,173,014 buy AUD 1,338,672 dated 14/02/14 (5) – Sell $3,133,525 buy €2,316,822 dated 14/02/14 3 – Sell $2,188,587 buy €1,601,695 dated 14/02/14 (11) – Sell $1,308,040 buy SGD 1,674,082 dated 14/02/14 1 – Sell $3,89,613,799 buy £237,416,749 dated 14/02/14 689 0.3
Futures – 0.0% (0.0%)Euro Stoxx 50 Futures Mar 2014 1 (1) – FTSE 100 Index Futures Mar 2014 1 (1) – US 5 Year Treasury Note Futures Mar 2014 (441) (105) –
Investment assets (including investment liabilities) 269,008 97.4
Net other assets 7,195 2.6
Net assets 276,203 100.0
Unless otherwise stated the above securities are admitted to official stock exchange listings or trade ona regulated market.
The comparative percentage figures in brackets are at 31 January 2013.
# Unquoted security^ Deemed to be investment in related parties of the ACD
A 300 A– 536 A+ 1,052 AA– 1,649 AA+ 1,793 AAA 16 B 11,479 B– 10,288 B+ 11,386 B1 32 B2 746 B3 255 Ba1 181 Ba2 238 Ba3 176 Baa1 128 Baa2 1,627 Baa3 336 BB 13,617 BB– 14,585 BB+ 14,954 BBB 6,506 BBB– 7,040 BBB+ 5,666 Caa1 128 Caa2 473 Caa3 25 CC 1,309 CCC 6,478 CCC– 118 CCC+ 6,497 D 996Unrated 11,289WR 13
Total bonds 131,912
Equities 136,411 Forward currency contracts 792 Futures (107)
Investment assets (including investment liabilities) 269,008
Counterparty exposure
Forwardcurrencycontracts Total
Counterparty £’000 £’000
ANZ Banking 130 130Barclays 661 661BNP Paribas (169) (169)CitiBank (43) (43)Credit Suisse 90 90Deutsche Bank 4 4Goldman Sachs (2) (2)HSBC 94 94Morgan Stanley 13 13State Street 14 14
At the balance sheet date, there was no collateral received by the fund from the above counterparties.
The counterparty exposure on forward currency contracts is reported at their mark to market values butfor futures contracts it is only the positive mark to market values that are reported.
Continuation�
� Return to IndexPortfolio statement – continuedAs at 31 January 2014
Market value Total netInvestment Holding £’000 assets %
Market value Portfolio credit ratings £’000

217
Continuation�
� Return to Index
£’000
Total of all purchases for the year (Note 10) 266,177
Major purchases Cost
Cisco Systems 2,408Vodafone Group 2,287Toyota Motor 2,119Spain 5.4% 2023 2,112Seven & I 2,106Australia & New Zealand Bank Group 2,036Microsoft 1,990Unibail-Rodamco 1,869Sumitomo Mitsui Financial Group 1,866McDonald’s 1,826Bank of Montreal 1,814Royal Dutch Shell ‘A’ 1,740Swiss Re 1,710Deutsche Telekom 1,674ENI 1,666ConocoPhillips 1,647GDF Suez 1,641Time Warner 1,632AstraZeneca 1,614Applied Materials 1,559
£’000
Total of all sales for the year (Note 10) 94,967
Major sales Proceeds
Centrica 1,636Allianz 1,551Williams Companies 1,498Sanofi 1,352Philip Morris International 1,315Nippon Telegraph & Telephone 1,308GDF Suez 1,304Nissan Motor 1,292Emerson Electric 1,192TOTAL S.A. 1,131Australia & New Zealand Bank Group 1,121Chevron 1,106Pfizer 1,103China Construction Bank ‘H’ 1,068Merck & Co 982Unilever 964Xcel Energy 933Perusahaan Gas Negara 931Kabel Deutschland 928Spain 4% 2020 885
Portfolio movements For the year ending 31 January 2014
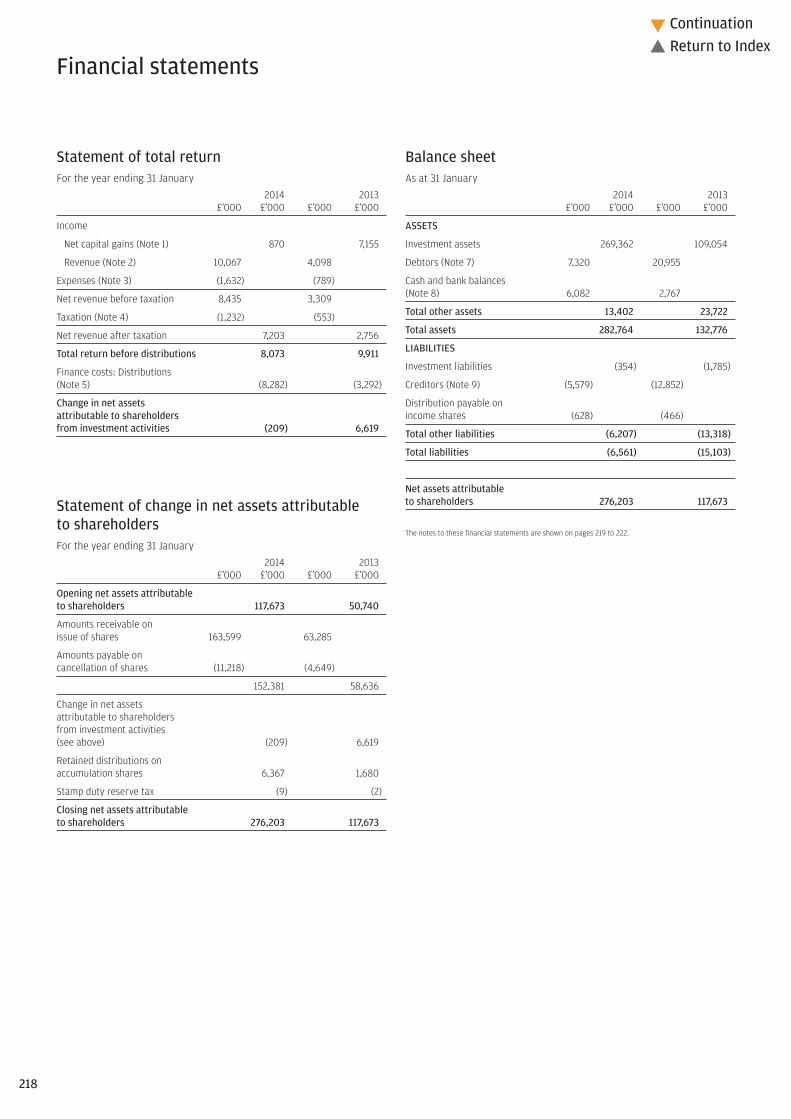
Statement of total returnFor the year ending 31 January
2014 2013£’000 £’000 £’000 £’000
Income
Net capital gains (Note 1) 870 7,155
Revenue (Note 2) 10,067 4,098
Expenses (Note 3) (1,632) (789)
Net revenue before taxation 8,435 3,309
Taxation (Note 4) (1,232) (553)
Net revenue after taxation 7,203 2,756
Total return before distributions 8,073 9,911
Finance costs: Distributions (Note 5) (8,282) (3,292)
Change in net assets attributable to shareholders from investment activities (209) 6,619
Statement of change in net assets attributable to shareholdersFor the year ending 31 January
2014 2013£’000 £’000 £’000 £’000
Opening net assets attributable to shareholders 117,673 50,740
Amounts receivable on issue of shares 163,599 63,285
Amounts payable on cancellation of shares (11,218) (4,649)
152,381 58,636
Change in net assets attributable to shareholders from investment activities (see above) (209) 6,619
Retained distributions on accumulation shares 6,367 1,680
Stamp duty reserve tax (9) (2)
Closing net assets attributable to shareholders 276,203 117,673
Balance sheetAs at 31 January
2014 2013£’000 £’000 £’000 £’000
ASSETS
Investment assets 269,362 109,054
Debtors (Note 7) 7,320 20,955
Cash and bank balances (Note 8) 6,082 2,767
Total other assets 13,402 23,722
Total assets 282,764 132,776
LIABILITIES
Investment liabilities (354) (1,785)
Creditors (Note 9) (5,579) (12,852)
Distribution payable on income shares (628) (466)
Total other liabilities (6,207) (13,318)
Total liabilities (6,561) (15,103)
Net assets attributable to shareholders 276,203 117,673
The notes to these financial statements are shown on pages 219 to 222.
Financial statements
218
Continuation�
� Return to Index

1. Net capital gains2014 2013
£’000 £’000Currency (losses)/gains (4,367) 719Derivative contracts (310) (191)Forward currency contracts 17,487 (1,057)Non-derivative securities (11,940) 7,684Net capital gains 870 7,155
2. Revenue2014 2013
£’000 £’000Franked income from UK equity investments 383 112Income from overseas equity investments 4,113 995Interest on bank and term deposits 4 3Interest on fixed-interest securities 5,446 2,617Option income 94 176Property income distributions 21 194Stock dividends 6 1Total revenue 10,067 4,098
3. Expenses2014 2013
£’000 £’000Payable to the ACD or associate of the ACD:ACD fee 1,357 680Fixed expenses 274 109
1,631 789
Payable to third parties:Professional fees 1 –Total expenses 1,632 789
4. Taxation2014 2013
£’000 £’000a) Analysis of charge in the yearCorporation tax at 20% 872 440Double tax relief (35) (17)Overseas tax suffered 395 135Taxable gain on offshore funds – (5)Current year tax charge (Note 4b) 1,232 553
b) Factors affecting the tax charge for the yearThe tax assessed for the year is lower than the standard rate of corporation tax inthe UK for an Open-Ended Investment Company (OEIC) (20%). The differences areexplained below.
Net revenue before taxation 8,435 3,309Corporation tax at 20% 1,687 662
Effects of:Dividends not subject to corporation tax (815) (222)Double tax relief (35) (17)Overseas tax suffered 395 135Taxable gain on offshore funds – (5)
(455) (109)Current year tax charge (Note 4a) 1,232 553
5. Finance costsDistributionsThe distributions take account of amounts receivable on the issue of shares andamounts payable on the cancellation of shares and comprise:
2014 2013£’000 £’000
First interim dividend distribution 2,046 719Second interim dividend distribution 2,645 921Third interim dividend distribution 2,178 959Final dividend distribution 2,289 903Add: Amounts payable on cancellation of shares 51 39Deduct: Amounts receivable on issue of shares (927) (249)Total finance costs 8,282 3,292
Details of the distribution per share are set out on pages 223 to 226.
6. Movement between net revenue after taxation and distributions2014 2013
£’000 £’000Net revenue after taxation 7,203 2,756Add: ACD fee (net of tax relief) paid from capital 1,086 544Add: Tax on capital offshore gains 12 (5)Add: Undistributed revenue brought forward 5 2Deduct: Undistributed revenue carried forward (23) (5)Equalisation on conversions (1) –
8,282 3,292
7. Debtors2014 2013
£’000 £’000Accrued income 2,038 882Due from the ACD for shares created 2,781 19,801Income tax recoverable 2 –Overseas tax recoverable 99 56Sales awaiting settlement 2,400 216Total debtors 7,320 20,955
8. Cash and bank balances2014 2013
£’000 £’000Amounts held at futures clearing houses
and brokers 79 223Cash and bank balances 6,003 2,544Total cash and bank balances 6,082 2,767
9. Creditors2014 2013
£’000 £’000Accrued expenses 156 92Corporation tax payable 447 208Due to the ACD for shares cancelled 258 629Purchases awaiting settlement 4,718 11,923Total creditors 5,579 12,852
Notes to the financial statements for the year ending 31 January 2014
219
Continuation�
� Return to Index

10. Portfolio transaction costs2014 2013
£’000 £’000Analysis of total purchase costs
Purchases in year before transaction costs 265,940 84,757
Commissions 102 27Taxes 135 29Total purchase costs 237 56Gross purchases total 266,177 84,813
Analysis of total sale costs
Gross sales before transaction costs 95,025 32,820
Commissions (50) (13)Taxes (8) (2)Total sale costs (58) (15)Total sales net of transaction costs 94,967 32,805
11. Related party transactionsJPMorgan Funds Limited, as Authorised Corporate Director (“ACD”), is a relatedparty, and acts as principal in respect of all transactions of shares in the Company.The aggregate monies received through issue, and paid on cancellation, aredisclosed in the Statement of Change in Net Assets Attributable to Shareholders.
The balance due from the ACD and their associates at the year end date in respectof related party transactions was £2,368,078 (31.01.13: £19,078,873). Details ofrelated party transactions are given under note 13 on page 413.
Investments considered to be related parties have been identified in the portfoliostatement on pages 205 to 216 and the revenue from these investments was £nil(31.01.13: £nil).
Some of the dealing transactions for the Fund are carried out through associatesof the ACD. Such transactions are carried out on an arm’s length basis. Thecommissions paid to these companies over the year were £2,670 (31.01.13: £1,477).Commission was paid to the associated company JPMorgan Securities Ltd.
The following party held a material interest in the Fund at the year end date:– JPM Global Multi-Strategy Income Fund 41.73% (31.01.13: 15.84%)
12. Financial instrumentsCurrency exposuresA substantial proportion of the net assets of the Fund are denominated incurrencies other than Sterling, with the effect that the Balance sheet and totalreturn can be significantly affected by currency movements.
Net foreign currency assets/(liabilities)Monetary Non-monetary
Total exposures exposuresCurrency £’000 £’000 £’000
31.01.14US Dollar 174,458 4,553 169,905Euro 31,306 358 30,948Japanese Yen 7,996 (822) 8,818Hong Kong Dollar 6,403 339 6,064Australian Dollar 6,155 864 5,291Swiss Franc 5,939 (25) 5,964Swedish Krona 4,273 3 4,270Taiwan Dollar 3,375 551 2,824Canadian Dollar 2,693 91 2,602Singapore Dollar 2,352 29 2,323South African Rand 1,916 4 1,912Danish Krone 1,619 13 1,606Brazilian Real 1,268 5 1,263Norwegian Krone 1,105 22 1,083Turkish Lira 786 59 727Korean Won 754 19 735Thailand Baht 666 – 666Indonesian Rupiah 574 – 574Mexican Peso 314 6 308Qatari Riyal 306 – 306Polish Zloty 293 5 288Indian Rupee 291 – 291Arab Emirates Dirham 151 – 151Malaysian Ringgit 93 – 93Hungarian Forint 65 5 60Chilean Peso 44 – 44
31.01.13US Dollar 1,361 (73,163) 74,524South African Rand 1,196 (454) 1,650Taiwan Dollar 1,118 187 931Brazilian Real 1,057 (298) 1,355Indonesian Rupiah 525 (170) 695Australian Dollar 431 (1,865) 2,296Japanese Yen 411 (3,435) 3,846Turkish Lira 356 (74) 430Swedish Krona 342 (625) 967Thailand Baht 327 – 327Norwegian Krone 269 (151) 420Polish Zloty 230 (98) 328Canadian Dollar 198 (334) 532Singapore Dollar 195 (1,291) 1,486Indian Rupee 191 (95) 286Hong Kong Dollar 190 (3,557) 3,747Swiss Franc 176 (1,570) 1,746Euro 174 (6,868) 7,042New Zealand Dollar 170 (117) 287Korean Won 167 (119) 286Mexican Peso 139 1 138Malaysian Ringgit 121 – 121Qatari Riyal 94 (47) 141Chinese Renminbi 21 – 21
Notes to the financial statements – continued
220
Continuation�
� Return to Index

Interest rate riskThe tables below detail the interest rate profile of the Fund’s assets and liabilitiesas at the year end.
Financialassets
Floating Fixed notrate rate carrying
Total financial financial anyassets assets assets interest
Currency £’000 £’000 £’000 £’000
31.01.14US Dollar 177,756 20,828 103,683 53,245Euro 31,680 – 10,595 21,085UK Sterling 22,497 340 107 22,050Japanese Yen 8,679 1 – 8,678Australian Dollar 6,490 4 – 6,486Hong Kong Dollar 6,403 34 – 6,369Swiss Franc 5,967 16 – 5,951Swedish Krona 4,273 – – 4,273Taiwan Dollar 3,375 540 – 2,835Canadian Dollar 2,693 – – 2,693Singapore Dollar 2,352 – 214 2,138South African Rand 1,916 3 30 1,883Danish Krone 1,619 – – 1,619Brazilian Real 1,268 – – 1,268Norwegian Krone 1,105 – – 1,105Turkish Lira 786 59 – 727Korean Won 754 – – 754Thailand Baht 666 – – 666Indonesian Rupiah 574 – – 574Qatari Riyal 306 – – 306Mexican Peso 314 5 92 217Polish Zloty 293 – – 293Indian Rupee 291 – – 291Arab Emirates Dirham 151 – – 151Malaysian Ringgit 93 – – 93Hungarian Forint 65 4 60 1Chilean Peso 44 – 44 –
31.01.13UK Sterling 110,259 503 106 109,650US Dollar 8,467 8,725 50,870 (51,128)South African Rand 1,759 – – 1,759Brazilian Real 1,357 – – 1,357Taiwan Dollar 1,118 187 – 931Hong Kong Dollar 862 – – 862Japanese Yen 830 1 – 829Euro 812 – 825 (13)Indonesian Rupiah 695 – – 695Australian Dollar 634 – 212 422Turkish Lira 466 2 – 464Swedish Krona 428 1 – 427Norwegian Krone 396 – – 396Singapore Dollar 392 – – 392Canadian Dollar 350 2 – 348Swiss Franc 337 – – 337Polish Zloty 333 4 – 329Thailand Baht 327 – – 327Korean Won 291 – – 291Indian Rupee 286 – – 286New Zealand Dollar 170 – – 170Qatari Riyal 141 – – 141Mexican Peso 139 1 – 138Malaysian Ringgit 121 – – 121Chinese Renminbi 21 – 21 –
The floating rate financial assets comprise investment in variable interest ratepaying corporate debt and bank balances that bear interest at rates based onLIBOR or its overseas equivalent.
Floating Financialrate liabilities
Total financial not carryingliabilities liabilities any interest
Currency £’000 £’000 £’000
31.01.14US Dollar 3,403 – 3,403UK Sterling 1,491 – 1,491Japanese Yen 683 – 683Euro 374 – 374Australian Dollar 335 – 335Swiss Franc 28 – 28
31.01.13US Dollar 7,106 – 7,106UK Sterling 2,045 – 2,045Hong Kong Dollar 672 – 672Euro 638 – 638South African Rand 563 – 563Japanese Yen 419 – 419Brazilian Real 300 – 300Australian Dollar 203 – 203Singapore Dollar 197 – 197Indonesian Rupiah 170 – 170Swiss Franc 161 – 161Canadian Dollar 152 – 152Norwegian Krone 127 – 127Korean Won 124 – 124Turkish Lira 110 – 110Polish Zloty 103 – 103Indian Rupee 95 – 95Swedish Krona 86 – 86Qatari Riyal 47 – 47
Fixed rate financial assetsWeighted
averageWeighted period for
average which rate is Currency interest rate fixed (years)
31.01.14South African Rand 8.9% 12.9Mexican Peso 7.5% 14.3UK Sterling 6.2% 4.3Hungarian Forint 5.5% 6.8US Dollar 5.3% 10.8Singapore Dollar 3.5% 6.4Euro 2.9% 6.9
31.01.13US Dollar 5.3% 10.7Australian Dollar 2.0% 3.6Euro 1.9% 3.6UK Sterling 1.8% 1.7
For consideration of other risks including liquidity, pricing and credit risk, pleaserefer to the notes to the aggregated financial statements, pages 413 to 414.
Notes to the financial statements – continued
221
Continuation�
� Return to Index

13. Share classesThe Fund currently has four share classes; Class A Shares, Class B Shares, Class CShares and Class X Shares. The Authorised Corporate Director’s (ACD) fee andfixed expenses charge are shown below.
ACD fee Fixed expensesClass A shares: 1.25% 0.18%Class B shares: 0.80% 0.18%Class C shares: 0.65% 0.18%Class X shares: 0.00% 0.06%
The X share class is designed to accommodate an alternative charging structurewhereby the annual fee normally charged to the Fund and then passed on in theshare price is instead administratively levied and collected by the ACD from theshareholder or through the relevant JPMorgan Chase & Co entity.
The net asset value of each share class, the net asset value per share and thenumber of shares in each class are shown on page 204. All classes have the samerights on winding up.
14. DerivativesThe Fund enters into derivative transactions in the form of forward currencycontracts, futures and options. The Fund may use derivatives for investmentpurposes or efficient portfolio management including hedging, whereappropriate.
The Investment Adviser assesses the market risk of the Fund’s investments,including derivative exposure, using Monte Carlo methodology. This processprovides an estimate of the maximum potential loss that could be expected tooccur as a result of changes in market prices over a given period of time in all but agiven percentage of circumstances. The VaR is calculated on a 99% confidencelevel with a 20 day horizon & 500 days of history. As at the balance date the VaRwas 3.29%.
The effective observation period changed to 500 days from 31/10/2012 onwardsdue to a change to a new VaR calculation process.
Further information on the derivative risks can be found in the notes to theaggregated financial statements on page 414.
15. Contingent liabilities and capital commitmentsAt the year end date the Fund had the following contingent liabilities:
2014 2013£’000 £’000
Warrants 6 –
Notes to the financial statements – continued
222
Continuation�
� Return to Index

Final distribution in pence per share
Group 1 – Shares purchased prior to 1 November 2013Group 2 – Shares purchased 1 November 2013 to 31 January 2014
DistributionGross Tax Net payable paid
revenue at 10% revenue Equalisation 30.04.14 30.04.13
A-Class Accumulation Shares
Group 1 0.711111 0.071111 0.640000 – 0.640000 0.680000
Group 2 0.286924 0.028692 0.258232 0.381768 0.640000 0.680000
A-Class Income Shares
Group 1 0.577778 0.057778 0.520000 – 0.520000 0.570000
Group 2 0.277480 0.027748 0.249732 0.270268 0.520000 0.570000
B-Class Accumulation Shares
Group 1 0.711111 0.071111 0.640000 – 0.640000 0.680000
Group 2 0.200437 0.020044 0.180393 0.459607 0.640000 0.680000
B-Class Income Shares
Group 1 0.577778 0.057778 0.520000 – 0.520000 0.560000
Group 2 0.225212 0.022521 0.202691 0.317309 0.520000 0.560000
C-Class Accumulation Shares
Group 1 1.055556 0.105556 0.950000 – 0.950000 0.990000
Group 2 0.487708 0.048771 0.438937 0.511063 0.950000 0.990000
C-Class Income Shares
Group 1 1.000000 0.100000 0.900000 – 0.900000 0.980000
Group 2 0.426463 0.042646 0.383817 0.516183 0.900000 0.980000
X-Class Accumulation Shares
Group 1 0.988889 0.098889 0.890000 – 0.890000 0.020000
Group 2 0.439634 0.043963 0.395671 0.494329 0.890000 0.020000
X-Class Income Shares
Group 1 1.100000 0.110000 0.990000 – 0.990000 1.060000
Group 2 0.338621 0.033862 0.304759 0.685241 0.990000 1.060000
Distribution tables
223
Continuation�
� Return to Index

Third interim distribution in pence per share
Group 1 – Shares purchased prior to 1 August 2013Group 2 – Shares purchased 1 August 2013 to 31 October 2013
DistributionGross Tax Net paid paid
revenue at 10% revenue Equalisation 31.01.14 31.01.13
A-Class Accumulation Shares
Group 1 0.733333 0.073333 0.660000 – 0.660000 0.840000
Group 2 0.399266 0.039927 0.359339 0.300661 0.660000 0.840000
A-Class Income Shares
Group 1 0.600000 0.060000 0.540000 – 0.540000 0.720000
Group 2 0.276933 0.027693 0.249240 0.290760 0.540000 0.720000
B-Class Accumulation Shares
Group 1 0.744444 0.074444 0.670000 – 0.670000 –
Group 2 0.339608 0.033961 0.305647 0.364353 0.670000 –
B-Class Income Shares
Group 1 0.600000 0.060000 0.540000 – 0.540000 0.720000
Group 2 0.425791 0.042579 0.383212 0.156788 0.540000 0.720000
C-Class Accumulation Shares
Group 1 1.088889 0.108889 0.980000 – 0.980000 1.250000
Group 2 0.561343 0.056134 0.505209 0.474791 0.980000 1.250000
C-Class Income Shares
Group 1 1.033333 0.103333 0.930000 – 0.930000 1.240000
Group 2 0.467531 0.046753 0.420778 0.509222 0.930000 1.240000
X-Class Accumulation Shares
Group 1 1.011111 0.101111 0.910000 – 0.910000 –
Group 2 0.252140 0.025214 0.226926 0.683074 0.910000 –
X-Class Income Shares
Group 1 1.144444 0.114444 1.030000 – 1.030000 1.350000
Group 2 1.144444 0.114444 1.030000 0.000000 1.030000 1.350000
Distribution tables – continued
224
Continuation�
� Return to Index

Second interim distribution in pence per share
Group 1 – Shares purchased prior to 1 May 2013Group 2 – Shares purchased 1 May 2013 to 31 July 2013
DistributionGross Tax Net paid paid
revenue at 10% revenue Equalisation 31.10.13 31.10.12
A-Class Accumulation Shares
Group 1 0.988889 0.098889 0.890000 – 0.890000 0.980000
Group 2 0.457374 0.045737 0.411637 0.478363 0.890000 0.980000
A-Class Income Shares
Group 1 0.800000 0.080000 0.720000 – 0.720000 0.840000
Group 2 0.367614 0.036761 0.330853 0.389147 0.720000 0.840000
B-Class Accumulation Shares
Group 1 0.977778 0.097778 0.880000 – 0.880000 –
Group 2 0.335196 0.033520 0.301676 0.578324 0.880000 –
B-Class Income Shares
Group 1 0.811111 0.081111 0.730000 – 0.730000 –
Group 2 0.359039 0.035904 0.323135 0.406865 0.730000 –
C-Class Accumulation Shares
Group 1 1.444444 0.144444 1.300000 – 1.300000 1.420000
Group 2 0.544982 0.054498 0.490484 0.809516 1.300000 1.420000
C-Class Income Shares
Group 1 1.388889 0.138889 1.250000 – 1.250000 1.460000
Group 2 0.557432 0.055743 0.501689 0.748311 1.250000 1.460000
X-Class Accumulation Shares
Group 1 1.333333 0.133333 1.200000 – 1.200000 –
Group 2 0.678612 0.067861 0.610751 0.589249 1.200000 –
X-Class Income Shares
Group 1 1.533333 0.153333 1.380000 – 1.380000 1.560000
Group 2 1.533333 0.153333 1.380000 0.000000 1.380000 1.560000
Distribution tables – continued
225
Continuation�
� Return to Index

226
� Return to Index
First interim distribution in pence per share
Group 1 – Shares purchased prior to 1 February 2013Group 2 – Shares purchased 1 February 2013 to 30 April 2013
DistributionGross Tax Net paid paid
revenue at 10% revenue Equalisation 31.07.13 31.07.12
A-Class Accumulation Shares
Group 1 0.977777 0.097777 0.880000 – 0.880000 0.800000
Group 2 0.554774 0.055477 0.499297 0.380703 0.880000 0.800000
A-Class Income Shares
Group 1 0.822222 0.082222 0.740000 – 0.740000 0.700000
Group 2 0.388315 0.038831 0.349484 0.390516 0.740000 0.700000
B-Class Accumulation Shares
Group 1 0.977777 0.097777 0.880000 – 0.880000 –
Group 2 0.366350 0.036635 0.329715 0.550285 0.880000 –
B-Class Income Shares
Group 1 0.822222 0.082222 0.740000 – 0.740000 –
Group 2 0.163717 0.016371 0.147346 0.592654 0.740000 –
C-Class Accumulation Shares
Group 1 1.455555 0.145555 1.310000 – 1.310000 –
Group 2 0.749722 0.074972 0.674750 0.635250 1.310000 –
C-Class Income Shares
Group 1 1.400000 0.140000 1.260000 – 1.260000 0.050000
Group 2 0.712695 0.071269 0.641426 0.618574 1.260000 0.050000
X-Class Accumulation Shares
Group 1 1.333333 0.133333 1.200000 – 1.200000 –
Group 2 0.606425 0.060642 0.545783 0.654217 1.200000 –
X-Class Income Shares
Group 1 1.544444 0.154444 1.390000 – 1.390000 1.320000
Group 2 1.544444 0.154444 1.390000 0.000000 1.390000 1.320000
Equalisation applies only to shares purchased during the distribution period (group 2 shares). It is the average amount of revenue included in the purchase price of all group 2 shares and is refunded to holders of these
shares as a return of capital. Being capital it is not liable to income tax but must be deducted from the cost of shares for capital gains tax purposes.
Distribution tables – continued

227
Continuation�
� Return to Index
Investment objective and policyThe Fund aims to provide positive investment returns over rolling 12 monthperiods in any market conditions. There is no guarantee that positiveinvestment returns will be achieved over this period or any time period,and your capital is in fact at risk.
The Investment Adviser manages the Fund with a high level of discretion totry to achieve this aim. The Investment Adviser will seek to exploit marketinefficiencies through active asset allocation to various asset classes, andsecurity selection within them. These assets will include, but are not limitedto, Global Equities, Bonds, Commodity Index Instruments, currencies,Convertible Securities, Collective Investment Schemes and other linkedinstruments, including Financial Derivative Instruments (derivatives). Issuersof securities may be located in any country, including Emerging Markets andsmaller companies. Asset and country allocations and exposure to the marketsmay vary significantly over a short period of time depending upon marketconditions and opportunities. The Fund may have a significant exposure toany one asset class, country, sector or issuer at any time. The Fund cantake Long and Short Positions in markets, securities, groups of securities,Commodity Index Instruments and currencies. Long Positions will be achieveddirectly or through the use of Financial Derivative Instruments, and ShortPositions will be achieved via the use of Financial Derivative Instrumentsonly.
Subject to market conditions the Fund may invest up to 100% in Equity andEquity-Linked Securities. Subject to market conditions the Fund may investup to 90% in cash and cash equivalents. The Fund may invest up to 100%in government and public securities (see Section 3.11(e)) of the Prospectus.
The Fund may use Financial Derivative Instruments (derivatives) forinvestment purposes or Efficient Portfolio Management including hedging,where appropriate (see Section 11.14 of the Prospectus for Risk Warningson derivatives).
Although most of the non-Sterling securities will be hedged back into Sterling,the Investment Adviser will also use opportunities in the foreign exchangemarket to maximise returns.
Risk profileThe value of your investment may fall as well as rise and you may get backless than you originally invested.
The Fund aims to provide a positive return in any market conditions over arolling 12 month period, although this is not guaranteed.
The Fund can use sophisticated investment techniques that differ from thoseused in traditional Equity funds.
The Fund should not be used as a substitute for liquidity funds or cashaccounts.
The Fund may use Financial Derivative Instruments (derivatives) and/orforward transactions for investment purposes. The value of derivatives canbe volatile. This is because a small movement in the value of the underlyingasset can cause a large movement in the value of the derivative and therefore,investment in derivatives may result in losses in excess of the amount investedby the Fund.
The value of Equity and Equity-Linked Securities may fluctuate in responseto the performance of individual companies and general market conditions.
The value of Bonds and other Debt Securities may change significantlydepending on market, economic and interest rate conditions as well as thecreditworthiness of the issuer. Issuers of Bonds and other Debt Securitiesmay fail to meet payment obligations (default) or the credit rating of Bondsand other Debt Securities may be downgraded. These risks are typicallyincreased for Below Investment Grade and certain Unrated securities, whichmay also be subject to higher volatility and be more difficult to sell thanInvestment Grade securities.
The Fund invests opportunistically and exposure to the markets may varysubstantially over a short period of time depending on market conditions.Therefore the Fund may not be fully invested in rising markets; converselythe Fund could be more than fully invested in a falling market. In bothcircumstances the performance of the Fund would suffer.
To the extent that any underlying assets of the Fund are denominated in acurrency other than Sterling and are not hedged back to Sterling, movementsin currency exchange rates can adversely affect the return of your investment.The currency hedging that may be used to minimise the effect of currencyfluctuations may not always be successful.
The value of securities in which the Fund invests may be influenced bymovements in commodity prices which can be very volatile.
Emerging Markets may be subject to increased political, regulatory andeconomic instability, less developed custody and settlement practices,poor transparency and greater financial risks. Emerging Market currenciesmay be subject to volatile price movements. Emerging Market securities mayalso be subject to higher volatility and be more difficult to sell than non-Emerging Market securities.
The Fund invests in securities of smaller companies which may be moredifficult to sell, more volatile and tend to carry greater financial risk thansecurities of larger companies.
The possible loss from taking a Short Position on a security (using FinancialDerivative Instruments) may be unlimited as there is no restriction on theprice to which a security may rise. The Short Selling of investments may besubject to changes in regulations, which could adversely impact returns toinvestors.
The Fund may be concentrated in a limited number of securities, industrysectors or countries and as a result, may be more volatile than more broadlydiversified funds.
Please refer to Part 11 of the Prospectus for details of the general risk factorsaffecting this Fund in addition to the specific risk factors above.
Fund reviewIn the 12-month period, global equities delivered double-digit returns aseconomic data improved, particularly in the US and Europe. The decision ofthe US Federal Reserve to taper its asset purchases contributed to negativeperformance for bond markets and the underperformance of emerging vs.developed equity markets.
The Fund delivered a positive return from its inception on 15 February 2013to 31 January 2014. We held an average delta of 39% through the period.Our stock selection reflected longstanding views that favoured globalfinancials, European value and Japanese reflation. We reflected US ratenormalisation in our fixed income positions, holding particularly low levelsof duration in the third quarter. In currency, we were long the US dollaragainst a basket of predominantly emerging market currencies.
Fund outlookOur conviction in markets has lowered slightly and we expect increasedvolatility this year. Our concerns centre around the cyclical challenges inemerging economies and the resilience of the global economy in the faceof rising rates. However, we retain a positive outlook for risk assets asperformance drivers remain in place, namely improving global growth withquiescent inflation, accommodative monetary policy and still-supportivevaluations.
JPM Multi-Asset Macro Fund

228
Performance to 31 January Since launch 15/02/13
JPM Multi-Asset Macro A-Class Acc 9.2%
JPM Multi-Asset Macro B-Class Acc 9.6%
JPM Multi-Asset Macro C-Class Acc 9.9%
Benchmark Index 0.5%
Fund statisticsRisk and Reward Profile 6*
Fund size £7.0m
Benchmark Index ICE 1 Month GBP LIBOR
Fund chargesA-Class Initial 3.00%, Annual 1.50%B-Class Initial Nil, Annual 1.00%C-Class Initial Nil, Annual 0.75%
Top ten holdings %Denmark 4% 2017 7.2Lyxor MSCI World Health Care ‘A’ EUR (Accumulation) 6.4Mitsubishi UFJ Financial Group 2.2Treasury 1.25% 2018 2.1Aetna 2.1UnitedHealth Group 1.6Sumitomo Mitsui Financial Group 1.6St. Jude Medical 1.6Shire 1.6Sumitomo Mitsui Trust 1.6
Sector breakdown %Equities 51.9Government bonds 9.3Investment funds 6.4Forward currency contracts 3.7Options 0.9Swaps 0.7Futures 0.7Contracts for difference 0.1Net other assets 26.3
In line with current accounting practice the sector breakdown includes the unrealised profit or loss onderivative holdings and consequently the economic market exposure of the Fund cannot be fully determinedfrom the above disclosure.
Highest/lowest share price and distribution recordDistribution
Highest Lowest per share Calendar year share price share price (net)A-Class Accumulation SharesA
2013 53.83p 49.81p –2014B 54.94p 53.95p 0.00pA-Class Income SharesA
2013 53.83p 49.81p –2014B 54.94p 53.95p 0.00pB-Class Accumulation SharesA
2013 108.0p 99.83p –2014B 110.3p 108.3p 0.21pC-Class Accumulation SharesA
2013 108.2p 99.95p –2014B 110.5p 108.5p 0.40pC-Class Income SharesA
2013 108.2p 99.95p –2014B 110.5p 108.5p 0.40p
A A-Class Accumulation Shares, A-Class Income Shares, B-Class Accumulation Shares, C-Class Accumulation Shares and C-Class Income Shares were launched on 15 February 2013.
B To 31 January 2014.
Portfolio turnover rate31.01.14 422.9%
The portfolio turnover rate (PTR) reflects the total of security purchases and sales (excluding Liquidityfunds), less the total of share issues and cancellations, expressed as a percentage of the average daily netasset values over the period.
Portfolio transaction costsBroker Transaction
Commissions Taxes Total31.01.14 0.23% 0.17% 0.40%
The percentage figures disclosed above reflect the average broker commissions and transaction taxessuffered since launch divided by the average assets under management over the same period.
Stamp duty reserve tax31.01.14 0.00%
The percentage figures disclosed above reflect the total stamp duty reserve tax suffered since launch dividedby the average assets under management over the same period.
You should remember that past performance is not a guide to the future. The price of investments and the income from them may fall as well as rise andinvestors may not get back the full amount invested.
* For specific risks, including the risk and reward profile, please refer to the Key Investor information Document (KIID) available on the following websitehttp://am.jpmorgan.co.uk/investor/prices-and-factsheets/?list=all&tab=PricesAll performance returns are calculated using the quoted price of the accumulation or income shares. Performance returns are in Sterling.Source: J.P. Morgan.
Continuation�
� Return to Index

229
Continuation�
� Return to Index
Net asset values and Ongoing chargesNet assetvalue per Net asset
share class Number value per OngoingDate £’000 of shares share chargesA-Class Accumulation Shares31.01.14 1,441 2,644,108 54.49p 1.68%A-Class Income Shares31.01.14 1,382 2,536,846 54.49p 1.68%B-Class Accumulation Shares31.01.14 1,381 1,262,500 109.4p 1.18%C-Class Accumulation Shares31.01.14 1,382 1,261,000 109.6p 0.93%C-Class Income Shares31.01.14 1,377 1,261,000 109.2p 0.93%
The net asset value and the net asset value per income share are shown ex-dividend.
The Ongoing charges takes into account the ACD fee, the fixed expenses and any expenses paid to an affiliatein respect of stocklending activities, expressed as a percentage of the average daily net asset values overthe period.

Equities – 51.9%United States of America – 22.3%Actavis 953 108 1.6 Aetna 3,477 145 2.1 Allstate 936 – –CBS ‘B’ 2,124 76 1.1 Covidien 2,154 101 1.5 CVS Caremark 1,970 97 1.4 HCA 3,194 96 1.4 Macy’s 2,737 90 1.3 Metlife 2,476 75 1.1 Mylan Laboratories 3,908 108 1.6 Pfizer 4,478 99 1.4 Prudential Financial 1,444 75 1.1 St. Jude Medical 2,008 111 1.6 Thermo Fisher Scientific 1,113 78 1.1 Time Warner 1,879 72 1.0 UnitedHealth Group 2,575 114 1.6 Wells Fargo 3,434 96 1.4 Japan – 11.2%Asahi Kasei 5,000 23 0.3 Bridgestone 1,100 24 0.3 Daito Trust Construction 900 52 0.7 Haseko 5,200 24 0.3 Japan Tobacco 3,000 57 0.8 Mitsubishi UFJ Financial Group 41,700 154 2.2 Mizuho Financial Group 65,700 86 1.2 Nippon Telegraph & Telephone 2,400 79 1.1 ORIX 2,300 22 0.3 Sekisui House 2,700 23 0.3 Sumitomo Mitsui Financial Group 3,900 112 1.6 Sumitomo Mitsui Trust 37,000 109 1.6 Toyota Motor 1,000 35 0.5 United Kingdom – 7.3%Berkeley Group 2,441 62 0.9 BT Group 10,361 39 0.6 GKN 7,800 30 0.4 GlaxoSmithKline 5,486 85 1.2 Lancashire 1,038 8 0.1 Legal & General Group 29,771 63 0.9 Next 1,356 84 1.2 Shire 3,447 110 1.6 WPP 2,339 29 0.4 Switzerland – 3.3%Novartis 1,553 74 1.1 Roche (Genusscheine) 525 87 1.2 Swiss Re 521 27 0.4 Zurich Insurance Group 222 39 0.6 Netherlands – 2.6%ING Groep 6,415 51 0.7 Nutreco 1,702 46 0.7 Reed Elsevier 2,610 33 0.5 Wolters-Kluwer 2,779 47 0.7 France – 1.5%Cap Gemini 1,606 67 1.0 Sanofi 532 32 0.5 Germany – 1.1%Bayer 701 56 0.8 Deutsche Wohnen 1,066 12 0.2 TAG Immobilien 1,212 9 0.1 Norway – 1.0%Marine Harvest 10,007 70 1.0 Belgium – 0.8%Ageas 2,258 59 0.8 Denmark – 0.6%Novo-Nordisk ‘B’ 1,658 40 0.6 Singapore – 0.2%First REIT 18,000 9 0.1 Lippo Malls Indonesia Retail Trust 43,000 8 0.1
Government bonds – 9.3%Denmark – 7.2%Denmark 4% 2017 DKK4,000,000 502 7.2 United Kingdom – 2.1%Treasury 1.25% 2018 £150,000 148 2.1
Investment funds – 6.4%Lyxor MSCI World Health Care ‘A’ EUR
(Accumulation) 3,477 446 6.4
Forward currency contracts – 3.7%Australian DollarBuy AUD240,323 sell MXN2,804,167 dated 14/02/14 0 –Buy AUD273,077 sell MXN3,231,951 dated 14/02/14 (2) –Sell AUD553,208 buy £325,800 dated 14/02/14 33 0.5 Canadian DollarBuy CAD498,183 sell AUD505,896 dated 14/02/14 3 –Buy CAD365,287 sell $327,658 dated 14/02/14 (1) –Buy CAD769,453 sell HKD5,348,419 dated 14/02/14 (1) –Buy CAD287,464 sell SEK1,700,941 dated 14/02/14 (2) –Sell CAD734,134 buy £436,634 dated 14/02/14 37 0.5 Danish KroneBuy DKK 219,484 sell £24,245 dated 14/02/14 0 –Sell DKK 5,282,794 buy £599,710 dated 14/02/14 17 0.2 EuroBuy €286,611 sell HUF87,440,887 dated 14/02/14 6 0.1 Buy €82,403 sell £67,792 dated 14/02/14 0 –Buy €1,411,468 sell £1,182,127 dated 14/02/14 (20) (0.3)Sell €2,509,042 buy £2,106,163 dated 14/02/14 41 0.7 Sell €64,240 buy £52,825 dated 14/02/14 0 –Hong Kong DollarBuy HKD3,059,317 sell €286,360 dated 14/02/14 4 0.1 Buy HKD3,111,244 sell MXN5,323,948 dated 14/02/14 3 –Buy HKD3,116,629 sell SEK2,602,552 dated 14/02/14 2 –Japanese YenBuy ¥84,297,489 sell £493,226 dated 14/02/14 8 0.1 Buy ¥39,550,000 sell £234,598 dated 13/05/14 1 –Buy ¥44,250,631 sell £281,110 dated 14/02/14 (18) (0.3)Sell ¥257,056,762 buy £1,617,988 dated 14/02/14 90 1.4 Sell ¥44,984,922 buy £264,229 dated 14/02/14 (3) –Mexican PesoBuy MXN3,670,725 sell HUF61,997,445 dated 14/02/14 3 –Buy MXN2,205,937 sell CAD180,269 dated 14/02/14 2 –Buy MXN9,665,951 sell £454,135 dated 14/02/14 (18) (0.3)New Zealand DollarBuy NZD269,575 sell ZAR 2,238,775 dated 14/02/14 13 0.2 Buy NZD319,665 sell £160,733 dated 14/02/14 (3) – Sell NZD589,240 buy £303,194 dated 14/02/14 13 0.2 Norwegian KroneBuy NOK2,122,514 sell HUF77,257,369 dated 14/02/14 2 – Buy NOK1,831,427 sell £190,290 dated 14/02/14 (13) (0.2)Sell NOK856,042 buy £87,489 dated 14/02/14 5 0.1 Polish ZlotyBuy PLN938,564 sell $307,585 dated 14/02/14 (5) (0.1)Sell PLN938,564 buy £187,809 dated 14/02/14 6 0.1 Russian RubleBuy RUB4,205,104 sell $126,717 dated 14/02/14 (5) (0.1)Singapore DollarBuy SGD22,715 sell £11,392 dated 14/02/14 (1) –Sell SGD70,730 buy £35,406 dated 14/02/14 2 –South African RandBuy ZAR 2,238,775 sell £126,176 dated 14/02/14 (6) (0.1)Swedish KronaBuy SEK1,847,529 sell HUF64,661,664 dated 14/02/14 2 –Swiss FrancBuy CHF718,846 sell MXN10,518,444 dated 14/02/14 9 0.1 Buy CHF139,442 sell $153,571 dated 14/02/14 1 –Buy CHF101,284 sell £68,617 dated 14/02/14 0 –Buy CHF181,670 sell £122,101 dated 14/02/14 0 –Sell CHF1,356,779 buy £926,087 dated 14/02/14 12 0.2 Sell CHF61,287 buy £40,951 dated 14/02/14 0 –Sell CHF45,000 buy £30,320 dated 13/05/14 0 –
Portfolio statementAs at 31 January 2014
230
Continuation�
� Return to Index
Market value Total netInvestment Holding £’000 assets %
Market value Total netInvestment Holding £’000 assets %

231
Continuation�
� Return to Index
US DollarBuy $222,415 sell CAD236,530 dated 14/02/14 7 0.1 Buy $545,798 sell MXN7,186,315 dated 14/02/14 7 0.1 Buy $127,698 sell RUB 4,205,104 dated 14/02/14 5 0.1 Buy $299,747 sell NOK1,831,427 dated 14/02/14 5 0.1 Buy $58,172 sell AUD63,816 dated 14/02/14 2 –Buy $204,805 sell £123,875 dated 14/02/14 1 –Buy $2,284,738 sell £1,412,074 dated 14/02/14 (24) (0.3)Sell $3,313,852 buy £2,051,508 dated 14/02/14 38 0.5 Sell $59,750 buy £36,338 dated 13/05/14 0 –Sell $301,954 buy £182,621 dated 14/02/14 (1) –
Options – 0.9%Foreign Exchange Call Options CNY/USD 6.1425
Jul 2014 1,700,000 4 0.1 Foreign Exchange Put Options HKD/USD 7.7275
Jul 2014 1,700,000 1 –Foreign Exchange Put Options MXN/USD 13.40
Feb 2014 1,200,000 4 0.1 FTSE 100 Put Options 6500 Feb 2014 8 11 0.2 SPX Put Options Feb 2014 10 19 0.3 SPXW Put Options Feb 2014 11 15 0.2
Futures – 0.7%Australia 3 Year Bond Futures Mar 2014 17 3 –Australia 10 Year Bond Futures Mar 2014 4 7 0.1 CAC 40 Index Futures Mar 2014 (8) 12 0.2 Euro-BOBL Futures Mar 2014 16 13 0.2 Euro-BUXL 30 Year Bond Futures Mar 2014 1 3 –Euro Stoxx 50 Index Futures Dec 2014 (54) (14) (0.2)Euro Stoxx 50 Index Futures Dec 2015 54 14 0.2 Euro Stoxx 50 Index Futures Dec 2018 (21) 3 –FTSE 100 Index Futures Mar 2014 6 (13) (0.2)FTSE/JSE 40 Index Futures Mar 2014 (12) 4 0.1 FTSE/MIB Index Futures Mar 2014 (1) 1 –Hang Seng Index Futures Feb 2014 (4) (1) –IBEX 35 Futures Feb 2014 (2) 2 –MDAX Index Futures Mar 2014 4 (12) (0.2)Mini MSCI Futures Mar 2014 (18) 37 0.6 S&P500 E-Mini Futures Mar 2014 4 (1) –SPI 200 Futures Mar 2014 (3) 5 0.1 Stoxx 600 Bas Futures Mar 2014 (40) (14) (0.2)US 5 Year Treasury Note Futures Mar 2014 (20) 2 –
Swaps – 0.7%Euro Stoxx 50 Equity Variance Swaps 0.05%
19 Dec 2014 88 (5) (0.1)Euro Stoxx 50 Equity Variance Swaps 0.05%
20 Jun 2014 86 (14) (0.2)FTSE 100 Equity Variance Swaps 0.0289%
20 Jun 2014 87 (2) –Hang Seng Equity Variance Swaps 0.0729%
27 Jun 2014 576 (7) (0.1)Hang Seng Equity Variance Swaps 0.0729%
27 Jun 2014 727 (9) (0.1)Inflation Rate Swaps UK RPI 0% 17 Apr 2023 (150,000) (4) (0.1)Inflation Rate Swaps UK RPI 0% 26 Feb 2023 (150,000) (2) –iTraxx Asia 2018 Credit Default Swap Buy
Protection 900,000 12 0.2 iTraxx Asia 2018 Credit Default Swap Buy
Protection 900,000 12 0.2 iTraxx Asia 2018 Credit Default Swap Buy
Protection 800,000 10 0.1 iTraxx Asia 2018 Credit Default Swap Buy
Protection 800,000 10 0.1 KRX Korea Equity Variance Swaps 0.03%
12 Jun 2014 135,870 (2) –S&P500 Equity Variance Swaps 0.0361%
19 Dec 2014 140 4 0.1 S&P500 Equity Variance Swaps 0.04%
20 Jun 2014 101 13 0.2 S&P500 Equity Variance Swaps 0.04%
20 Jun 2014 132 15 0.2 S&P500 Equity Variance Swaps 0.04%
20 Jun 2014 132 15 0.2
Investment assets (including investment liabilities) 5,121 73.5
Net other assets 1,842 26.5
Net assets 6,963 100.0
Unless otherwise stated the above securities are admitted to official stock exchange listings or trade on aregulated market.
Portfolio statement – continuedAs at 31 January 2014
Market value Total netInvestment Holding £’000 assets %
Market value Portfolio credit ratings £’000
AAA 502 AA+ 148
Total bonds 650
Equities 3,617 Investment funds 446 Forward currency contracts 257 Options 54 Futures 51 Swaps 46
Investment assets (including investment liabilities) 5,121
Counterparty exposure
Equity Credit Forward Indexvariance default currency Futures Currency Option
swaps swaps contracts contracts options contracts TotalCounterparty £’000 £’000 £’000 £’000 £’000 £’000 £’000
Barclays – – 8 – – – 8BNP Paribas 42 44 (5) – – – 82CitiBank – – 9 – – – 9Commonwealth
Bank of Australia – – 0 – – – 0Credit Suisse – – 28 – – – 28Deutsche Bank – – 33 – – – 33Goldman Sachs – – 40 212 – 46 298HSBC – – 30 – – – 30Merrill Lynch – – (1) – – – (1)Morgan Stanley – – (1) – – – (1)RBC – – (2) – – – (2)Societe Generale – – (9) – – – (9)State Street – – 71 – – – 71Toronto Dominion
Bank – – 9 – – – 9UBS 4 – 43 – 9 – 56Westpac Banking Corp – – 4 – – – 4
At the balance sheet date, there was no collateral received by the fund from the above counterparties.
The counterparty exposure on forward currency contracts is reported at their mark to market values butfor futures contracts it is only the positive mark to market values that are reported.

£’000
Total of all purchases for the period (Note 10) 19,171
Major purchases Cost
US Treasury 0.75% 2017 683Lyxor MSCI World Health Care ‘A’ EUR (Accumulation) 654JPM Sterling Liquidity ‘X’ (Distribution)^ 551Denmark 4% 2017 519Italy 3.5% 2017 409Germany 0.25% 2018 362S&P US Select Sector Source ETF Fund ‘A’ 338Spain(Kingdom of) 3.75% 2018 333Treasury 2% 2016 330Germany 0% 2015 327Wells Fargo ‘A’ Perpetual Convertible Preference 322Mitsubishi UFJ Financial Group 319Spain(Kingdom of) 4.6% 2019 318New Zealand FRN 2025 311British Land 1.5% Convertible 2017 308Bank of America 7.25% Preference ‘L’ 296Treasury 1.25% 2018 283Sumitomo Mitsui Trust 251Sumitomo Mitsui Financial Group 250QBE Funding Trust V 0% Convertible 2030 216
^ Deemed to be investment in related parties of the ACD
£’000
Total of all sales for the period (Note 10) 14,716
Major sales Proceeds
US Treasury 0.75% 2017 691JPM Sterling Liquidity ‘X’ (Distribution)^ 550Italy 3.5% 2017 411Germany 0.25% 2018 369S&P US Select Sector Source ETF Fund ‘A’ 357Germany 0% 2015 332Spain(Kingdom of) 3.75% 2018 332Treasury 2% 2016 330British Land 1.5% Convertible 2017 327Spain(Kingdom of) 4.6% 2019 321Wells Fargo ‘A’ Perpetual Convertible Preference 309Bank of America 7.25% Preference ‘L’ 279New Zealand FRN 2025 255QBE Funding Trust V 0% Convertible 2030 221Lyxor MSCI World Health Care ‘A’ EUR (Accumulation) 220Bank of America 177Germany 4.25% 2018 172EADS 164Toyota Motor 163Citigroup 159
Portfolio movements For the period from 15 February 2013 to 31 January 2014
232
Continuation�
� Return to Index

233
Continuation�
� Return to Index
Statement of total returnFor the period from 15 February 2013 to 31 January 2014
2014£’000 £’000
Income
Net capital gains (Note 1) 583
Revenue (Note 2) 96
Expenses (Note 3) (80)
Net revenue before taxation 16
Taxation (Note 4) (7)
Net revenue after taxation 9
Total return before distributions 592
Finance costs: Distributions (Note 5) (13)
Change in net assets attributable to shareholders from investment activities 579
Statement of change in net assets attributable to shareholdersFor the period from 15 February 2013 to 31 January 2014
2014£’000 £’000
Opening net assets attributable to shareholders –
Amounts receivable on issue of shares 6,377
Amounts payable on cancellation of shares (1)
6,376
Change in net assets attributable to shareholders from investment activities (see above) 579
Retained distributions on accumulation shares 8
Closing net assets attributable to shareholders 6,963
Balance sheetAs at
31 January 2014£’000 £’000
ASSETS
Investment assets 5,344
Debtors (Note 7) 356
Cash and bank balances (Note 8) 1,816
Total other assets 2,172
Total assets 7,516
LIABILITIES
Investment liabilities (223)
Creditors (Note 9) (325)
Distribution payable on income shares (5)
Total other liabilities (330)
Total liabilities (553)
Net assets attributable to shareholders 6,963
The notes to these financial statements are shown on pages 234 to 236.
Financial statements

1. Net capital gains2014
£’000Currency gains 33Derivative contracts (155)Forward currency contracts 494Non-derivative securities 211Net capital gains 583
2. Revenue2014
£’000Franked income from UK equity investments 13Income from overseas equity investments 74Interest on bank and term deposits 2Interest on derivatives (7)Interest on fixed-interest securities 14Total revenue 96
3. Expenses2014
£’000Payable to the ACD or associate of the ACD:ACD fee 69Fixed expenses 11Total expenses 80
4. Taxation2014
£’000a) Analysis of charge in the periodOverseas tax suffered 7Current period tax charge (Note 4b) 7
b) Factors affecting the tax charge for the periodThe tax assessed for the period is higher than the standard rate of corporation taxin the UK for an Open-Ended Investment Company (OEIC) (20%). The differencesare explained below.
Net revenue before taxation 16Corporation tax at 20% 3
Effects of:Dividends not subject to corporation tax (17)Excess expenses for which no relief taken 14Overseas tax suffered 7
4Current period tax charge (Note 4a) 7
No deferred tax asset has been recognised in the financial statements. At the periodend date, the Fund had a potential unrecognised deferred tax asset of £13,810 inrelation to £69,050 of excess management expenses which would only be utilised toreduce the tax charge if the Fund had an excess of unfranked income over expensesin a future period. There is no excess of unfranked income expected in the future.
5. Finance costsDistributionsThe distributions take account of amounts receivable on the issue of shares andamounts payable on the cancellation of shares and comprise:
2014£’000
Final dividend distribution 13Total finance costs 13
Details of the distribution per share are set out on page 237.
6. Movement between net revenue after taxation and distributions2014
£’000Net revenue after taxation 9Add: Net expense payable from capital 4
13
7. Debtors2014
£’000Overseas tax recoverable 2Sales awaiting settlement 354Total debtors 356
8. Cash and bank balances2014
£’000Amounts held at futures clearing houses and brokers 358Cash and bank balances 1,458Total cash and bank balances 1,816
9. Creditors2014
£’000Accrued expenses 8Purchases awaiting settlement 317Total creditors 325
Notes to the financial statements for the period from 15 February2013 to 31 January 2014
234
Continuation�
� Return to Index
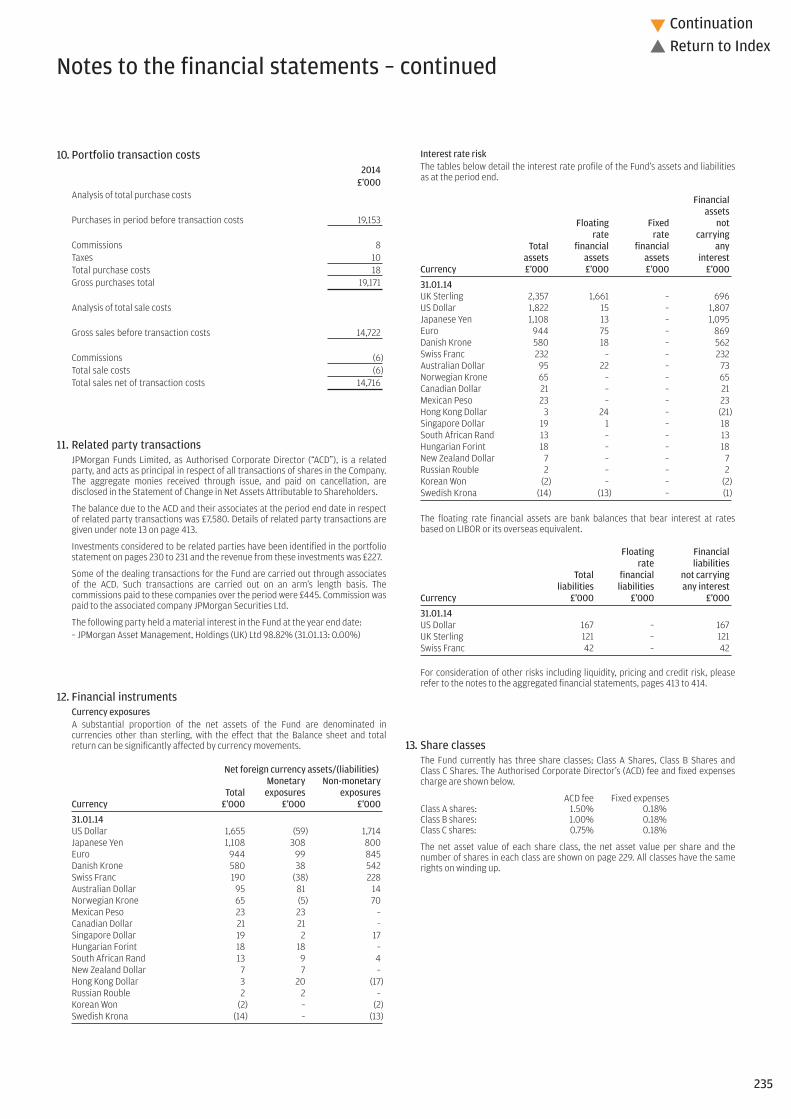
235
Continuation�
� Return to Index
10. Portfolio transaction costs2014
£’000Analysis of total purchase costs
Purchases in period before transaction costs 19,153
Commissions 8Taxes 10Total purchase costs 18Gross purchases total 19,171
Analysis of total sale costs
Gross sales before transaction costs 14,722
Commissions (6)Total sale costs (6)Total sales net of transaction costs 14,716
11. Related party transactionsJPMorgan Funds Limited, as Authorised Corporate Director (“ACD”), is a relatedparty, and acts as principal in respect of all transactions of shares in the Company.The aggregate monies received through issue, and paid on cancellation, aredisclosed in the Statement of Change in Net Assets Attributable to Shareholders.
The balance due to the ACD and their associates at the period end date in respectof related party transactions was £7,580. Details of related party transactions aregiven under note 13 on page 413.
Investments considered to be related parties have been identified in the portfoliostatement on pages 230 to 231 and the revenue from these investments was £227.
Some of the dealing transactions for the Fund are carried out through associatesof the ACD. Such transactions are carried out on an arm’s length basis. Thecommissions paid to these companies over the period were £445. Commission waspaid to the associated company JPMorgan Securities Ltd.
The following party held a material interest in the Fund at the year end date:– JPMorgan Asset Management, Holdings (UK) Ltd 98.82% (31.01.13: 0.00%)
12. Financial instrumentsCurrency exposuresA substantial proportion of the net assets of the Fund are denominated incurrencies other than sterling, with the effect that the Balance sheet and totalreturn can be significantly affected by currency movements.
Net foreign currency assets/(liabilities)Monetary Non-monetary
Total exposures exposuresCurrency £’000 £’000 £’000
31.01.14US Dollar 1,655 (59) 1,714Japanese Yen 1,108 308 800Euro 944 99 845Danish Krone 580 38 542Swiss Franc 190 (38) 228Australian Dollar 95 81 14Norwegian Krone 65 (5) 70Mexican Peso 23 23 –Canadian Dollar 21 21 –Singapore Dollar 19 2 17Hungarian Forint 18 18 –South African Rand 13 9 4New Zealand Dollar 7 7 –Hong Kong Dollar 3 20 (17)Russian Rouble 2 2 –Korean Won (2) – (2)Swedish Krona (14) – (13)
Interest rate riskThe tables below detail the interest rate profile of the Fund’s assets and liabilitiesas at the period end.
Financialassets
Floating Fixed notrate rate carrying
Total financial financial anyassets assets assets interest
Currency £’000 £’000 £’000 £’000
31.01.14UK Sterling 2,357 1,661 – 696US Dollar 1,822 15 – 1,807Japanese Yen 1,108 13 – 1,095Euro 944 75 – 869Danish Krone 580 18 – 562Swiss Franc 232 – – 232Australian Dollar 95 22 – 73Norwegian Krone 65 – – 65Canadian Dollar 21 – – 21Mexican Peso 23 – – 23Hong Kong Dollar 3 24 – (21)Singapore Dollar 19 1 – 18South African Rand 13 – – 13Hungarian Forint 18 – – 18New Zealand Dollar 7 – – 7Russian Rouble 2 – – 2Korean Won (2) – – (2)Swedish Krona (14) (13) – (1)
The floating rate financial assets are bank balances that bear interest at ratesbased on LIBOR or its overseas equivalent.
Floating Financialrate liabilities
Total financial not carryingliabilities liabilities any interest
Currency £’000 £’000 £’000
31.01.14US Dollar 167 – 167UK Sterling 121 – 121Swiss Franc 42 – 42
For consideration of other risks including liquidity, pricing and credit risk, pleaserefer to the notes to the aggregated financial statements, pages 413 to 414.
13. Share classesThe Fund currently has three share classes; Class A Shares, Class B Shares andClass C Shares. The Authorised Corporate Director’s (ACD) fee and fixed expensescharge are shown below.
ACD fee Fixed expensesClass A shares: 1.50% 0.18%Class B shares: 1.00% 0.18%Class C shares: 0.75% 0.18%
The net asset value of each share class, the net asset value per share and thenumber of shares in each class are shown on page 229. All classes have the samerights on winding up.
Notes to the financial statements – continued

236
Continuation�
� Return to Index
14. Derivatives The Fund enters into derivative transactions in the form of forward currencycontracts, futures, options and credit default swaps for the purpose of efficientportfolio management. The positive mark to market approach has been used tocalculate the global exposure.
The Investment Adviser assesses the market risk of the Fund’s investments,including derivative exposure, using historical simulation methodology. Thisprocess provides an estimate of the maximum potential loss that could beexpected to occur as a result of changes in market prices over a given period oftime in all but a given percentage of circumstances. The VaR is calculated on a99% confidence level with a 20 day horizon & 500 days of history. As at thebalance date the VaR was 4.09%.
The effective observation period changed to 500 days from 31/10/2012 onwardsdue to a change to a new VaR calculation process.
Further information on the derivative risks can be found in the notes to theaggregated financial statements on page 414.
15. Contingent liabilities and capital commitmentsAt the balance sheet date there were no contingent liabilities or capitalcommitments (2013: none).
Notes to the financial statements – continued

Final distribution in pence per share
Group 1 – Shares purchased on 15 February 2013Group 2 – Shares purchased 15 February 2013 to 31 January 2014
DistributionGross Tax Net payable
revenue at 10% revenue Equalisation 30.04.14
A-Class Accumulation Shares
Group 1 0.000000 0.000000 0.000000 – 0.000000
Group 2 0.000000 0.000000 0.000000 0.000000 0.000000
A-Class Income Shares
Group 1 0.000000 0.000000 0.000000 – 0.000000
Group 2 0.000000 0.000000 0.000000 0.000000 0.000000
B-Class Accumulation Shares
Group 1 0.233333 0.023333 0.210000 – 0.210000
Group 2 0.233333 0.023333 0.210000 0.000000 0.210000
C-Class Accumulation Shares
Group 1 0.444444 0.044444 0.400000 – 0.400000
Group 2 0.444444 0.044444 0.400000 0.000000 0.400000
C-Class Income Shares
Group 1 0.444444 0.044444 0.400000 – 0.400000
Group 2 0.444444 0.044444 0.400000 0.000000 0.400000
Equalisation applies only to shares purchased during the distribution period (group 2 shares). It is the average amount of revenue included in the purchase price of all group 2 shares and is refunded to holders of these
shares as a return of capital. Being capital it is not liable to income tax but must be deducted from the cost of shares for capital gains tax purposes.
Distribution table
237
� Return to Index

Investment objective and policyTo invest worldwide in any economic sector primarily through investmenttrusts. The Fund aims to provide capital growth over the long term.
Currently, in addition to investment trusts, the Fund may also invest in otherclosed-ended and open-ended funds.
The Fund may have exposure to Emerging Markets and smaller companies.
Other instruments as permitted in the stated investment and borrowingpowers of the Company including, but not limited to, fixed interest securities,cash and cash equivalents may be held on an ancillary basis, as appropriate.
Risk profileThe value of your investment may fall as well as rise and you may get backless than you originally invested.
The value of Equity and Equity-Linked Securities may fluctuate in responseto the performance of individual companies and general market conditions.
Shares of investment trusts can trade at a premium or at a discount to theirnet assets and this might affect the performance of a Fund. Investment trustsmay use gearing which will exaggerate market movements, both down andup. Some investment trusts may have warrants in issue, which if exercisedmay affect share values. Shares of investment trusts may become illiquidand be difficult to sell.
Emerging Markets may be subject to increased political, regulatory andeconomic instability, less developed custody and settlement practices,poor transparency and greater financial risks. Emerging Market currenciesmay be subject to volatile price movements. Emerging Market securities mayalso be subject to higher volatility and be more difficult to sell than non-Emerging Market securities.
The Fund invests in securities of smaller companies which may be moredifficult to sell, more volatile and tend to carry greater financial risk thansecurities of larger companies.
This Fund is aggressively managed, which may result in higher volatility ofthe Fund’s performance and bigger differences between the performanceof the Fund and its Benchmark.
Please refer to Part 11 of the Prospectus for details of the general risk factorsaffecting this Fund in addition to the specific risk factors above.
Fund reviewIn the 12 months to 31 January 2014, global equities delivered double-digitreturns as economic data improved, particularly in the US and Europe. Thedecision of the US Federal Reserve to taper its asset purchases contributedto negative performance for bond markets and the underperformance ofemerging vs. developed equity markets.
In this environment, the Fund outperformed the benchmark. The largestpositive contributors to relative performance included overweight positionsto the Mercantile Investment Trust and RCM Technology Trust. We alsobenefited from our decision not to allocate to the Murray International TrustPlc, which experienced a significant decline over the period and was heldin the benchmark with an average weight of 2%, and the Genesis EmergingMarkets Fund. The most significant negative contributors to relative
performance were an overweight to the JPM Emerging Markets InvestmentTrust and underweight to the Aberforth Smaller Companies Trust Plc. Inaddition, overweight positions in both the JPM Asia Investment Trust andTempleton Emerging Markets Investment Trust relative to benchmark weredetrimental. In the market in general, UK smaller companies trusts were thestrongest performers. Japanese investment trusts, particularly those biasedtowards smaller companies, were among the top performing regionalstrategies. In contrast, emerging market investment trusts, particularly thosefocused on Latin America, suffered in the 12-month period.
Fund outlookOur conviction in markets has lowered slightly and we expect increasedvolatility this year. Our concerns centre around the cyclical challenges inemerging economies and the resilience of the global economy in the faceof rising rates. However, we retain a positive outlook for risk assets asperformance drivers remain in place for now, namely improving global growthwith quiescent inflation, accommodative monetary policy and still-supportivevaluations.
12 month performance as at 31 January 2014 2013 2012 2011 2010
JPM Multi-Manager GrowthA-Class Acc 11.2% 13.3% -9.2% 24.5% 31.6%
JPM Multi-Manager GrowthB-Class Acc 11.7% – – – –
JPM Multi-Manager GrowthC-Class Acc 11.9% – – – –
Benchmark Index 10.0% 16.9% -4.5% 23.8% 34.9%
Fund statisticsRisk and Reward Profile 6*
Fund size £314.4m
Benchmark Index FTSE All-Share Equity Investment Instruments Index (Net)
Fund chargesA-Class Initial 3.00%, Annual 1.25%B-Class Initial Nil, Annual 0.80%C-Class Initial Nil, Annual 0.65%
JPM Multi-Manager Growth Fund
You should remember that past performance is not a guide to the future. The price of investments and the income from them may fall as well as rise andinvestors may not get back the full amount invested.
* For specific risks, including the risk and reward profile, please refer to the Key Investor information Document (KIID) available on the following websitehttp://am.jpmorgan.co.uk/investor/prices-and-factsheets/?list=all&tab=PricesAll equity indices stated as ‘Net’ are calculated net of tax as per the standard published approach by the index vendor unless stated otherwise.All performance returns are calculated using the quoted price of the accumulation shares. Performance returns are in Sterling.Source: J.P. Morgan.Source: FTSE International Limited (“FTSE”) © FTSE 2014. “FTSE®” is a trade mark of London Stock Exchange Plc and The Financial Times Limited and is used by FTSE International Limited under licence. All rights in theFTSE indices and/or FTSE ratings vest in FTSE and/or its licensors. Neither FTSE nor its licensors accept any liability for any errors or omissions in the FTSE indices and/or FTSE ratings or underlying data. No furtherdistribution of FTSE Data is permitted without FTSE’s express written consent.238
Continuation�
� Return to Index

Top ten holdings (excluding Liquidity funds) %The Mercantile Investment Trust^ 5.9Alliance Trust 4.4Scottish Mortgage Investment Trust 4.3Monks Investment Trust 3.7Templeton Emerging Markets Investment Trust 3.2JPMorgan Emerging Markets Investment Trust^ 2.8Witan Investment Trust 2.7RIT Capital Partners 2.4BH Macro 2.33i Infrastructure 2.2
^ Deemed to be investment in related parties of the ACD
Sector breakdown %Investment funds 99.4Liquidity funds 0.6Net other assets 0.0
Highest/lowest share price and distribution recordDistribution
Highest Lowest per shareCalendar year share price share price (net)A-Class Accumulation Shares2009 470.0p 301.0p 4.98p2010 571.2p 446.9p 1.34p2011 582.9p 474.0p 0.61p2012 544.8p 486.3p 0.93p2013 657.5p 550.8p 2.44p2014A 669.6p 644.0p 2.72pA-Class Income Shares2009 446.9p 288.7p 4.78p2010 541.6p 424.5p 1.28p2011 552.8p 449.0p 0.58p2012 515.1p 459.8p 0.88p2013 619.0p 520.8p 2.31p2014A 630.5p 606.3p 2.56pB-Class Accumulation SharesB
2012 545.1p 517.5p –2013 660.2p 551.2p 3.04p2014A 673.1p 647.4p 5.48pB-Class Income SharesC
2013 620.7p 547.6p -2014A 632.7p 608.6p 4.96pC-Class Accumulation SharesD
2012 103.9p 98.57p –2013 125.9p 105.0p 0.66p2014A 128.4p 123.5p 1.22pC-Class Income SharesD
2012 103.8p 98.57p –2013 125.1p 105.0p 0.69p2014A 127.6p 122.7p 1.20p
A To 31 January 2014.B B-Class Accumulation Shares were launched on 29 October 2012.C B-Class Income Shares were launched on 15 March 2013.D C-Class Accumulation Shares and C-Class Income Shares were launched on 1 October 2012.
Portfolio turnover rate31.01.13 22.0%31.01.14 19.0%
The portfolio turnover rate (PTR) reflects the total of security purchases and sales (excluding Liquidityfunds), less the total of share issues and cancellations, expressed as a percentage of the average daily netasset values over the period.
Portfolio transaction costsBroker Transaction
Commissions Taxes Total31.01.13 0.03% 0.02% 0.05%31.01.14 0.04% 0.04% 0.08%
The percentage figures disclosed above reflect the average broker commissions and transaction taxessuffered during the last 3 years divided by the average assets under management over the same period.
Stamp duty reserve tax31.01.13 0.00%31.01.14 0.00%
The percentage figures disclosed above reflect the total stamp duty reserve tax suffered during the yeardivided by the average assets under management over the same period.
Net asset values and Ongoing chargesNet assetvalue per Net asset
share class Number value per OngoingDate £’000 of shares share chargesA-Class Accumulation Shares31.01.12 130,672 25,640,089 509.6p 1.43%31.01.13 137,171 23,714,751 578.4p 1.43%31.01.14 139,504 21,672,886 643.7p 1.43%A-Class Income Shares31.01.12 156,400 32,456,094 481.9p 1.43%31.01.13 166,050 30,489,749 544.6p 1.43%31.01.14 171,481 28,414,277 603.5p 1.43%B-Class Accumulation Shares31.01.13 3 500 579.0p 0.98%31.01.14 48 7,368 647.2p 0.98%B-Class Income Shares31.01.14 118 19,591 603.4p 0.98%C-Class Accumulation Shares31.01.13 20 17,876 110.3p 0.83%31.01.14 1,641 1,328,496 123.5p 0.83%C-Class Income Shares31.01.13 369 336,236 109.6p 0.83%31.01.14 1,572 1,294,064 121.5p 0.83%
The net asset value and the net asset value per income share are shown ex-dividend.
Following the adoption of the requirements of UCITS IV in June 2012, Ongoing charges has replaced the TotalExpense Ratio (“TER”). The Ongoing charges takes into account the ACD fee, the fixed expenses and any expensespaid to an affiliate in respect of stocklending activities, expressed as a percentage of the average daily net assetvalues over the period. The main difference between the two calculations is the inclusion of custodian handlingcharges and stocklending fees in the Ongoing charges figure. The comparative figures have not been restated,and the historic TER is disclosed.
239
Continuation�
� Return to Index

Investment funds – 99.4% (98.7%)3i Infrastructure 5,172,157 6,993 2.2Aberforth Split Level Trust Units† 465,000 – –Aberforth Smaller Companies Trust 139,743 1,547 0.5Alliance Trust 3,173,837 13,816 4.4Artemis Alpha Trust 805,651 2,483 0.8Artemis Alpha Trust Subscription Shares
(GBP 3.45) 89,025 41 –Ashmore Global Opportunities 83,680 377 0.1BH Macro 366,092 7,329 2.3Biotech Growth Trust 1,104,336 5,638 1.8BlackRock Frontier 3,246,012 3,741 1.2BlackRock North American Income Trust 1,980,000 2,168 0.7BlackRock World Mining Trust 881,710 4,119 1.3British Empire Securities & General Trust 1,111,732 5,251 1.7Caledonia Investments 324,538 6,244 2.0Damille Investments‡ 2,476,208 – –Damille Investments II 1,800,000 1,674 0.5Diverse Income Trust 5,390,218 4,514 1.4Doric Nimrod Air Two Preference 1,200,000 2,712 0.9Edinburgh Dragon Trust 1,262,750 2,919 0.9Edinburgh Dragon Trust 3.5% CULS 2018 922,307 959 0.3Edinburgh Investment Trust 542,353 3,132 1.0Edinburgh Worldwide Investment Trust 1,284,281 5,201 1.7Electra Private Equity 220,609 5,332 1.7Fidelity European Values 339,072 4,957 1.6Fidelity Special Values 259,132 2,374 0.8Finsbury Growth & Income Trust 1,349,300 6,807 2.2Foreign & Colonial Investment Trust 1,093,500 3,989 1.3GEIIT Securities Zero Dividend Preference† 750,000 – –Govett Strategic Investment Trust‡ 1,400,670 – –Graphite Enterprise Trust 361,076 2,033 0.7Hansa Trust ‘A’ Non-Voting 136,229 1,137 0.4Henderson Eurotrust 450,319 3,447 1.1HG Capital Trust 286,313 3,095 1.0Impax Environmental Markets 4,346,254 6,259 2.0International Public Partnerships 1,825,000 2,338 0.7John Laing Infrastructure Fund 1,400,000 1,616 0.5JPMorgan American Investment Trust^ 563,146 6,397 2.0JPMorgan Asian Investment Trust Subscription
shares (GBp 203)^ 232,000 2 –JPMorgan Asian Investment Trust^ 2,310,636 4,390 1.4JPMorgan Brazil Investment Trust^ 1,772,000 1,041 0.3JPMorgan Chinese Investment Trust^ 392,000 585 0.2JPMorgan Claverhouse Investment Trust^ 468,000 2,780 0.9JPMorgan Emerging Markets Investment
Trust^ 1,745,395 8,797 2.8JPMorgan European Investment Trust
(Growth)^ 1,140,500 2,501 0.8JPMorgan European Smaller Companies
Trust^ 201,414 2,334 0.7JPMorgan Global Convertibles Income Fund^ 1,560,000 1,677 0.5JPMorgan Income & Capital Trust^ 1,638,037 1,507 0.5JPMorgan Income & Growth Investment Trust
(Capital)^ 4,836,729 653 0.2JPMorgan Income & Growth Investment Trust
(Income)^ 133,333 124 –JPMorgan Indian Investment Trust^ 841,260 2,684 0.9JPMorgan Japanese Investment Trust^ 2,364,959 5,439 1.7JPMorgan Japanese Smaller Companies
Investment Trust^ 1,346,186 2,561 0.8JPMorgan Overseas Investment Trust
Subscription shares (GBp 900)^ 69,460 35 –JPMorgan Overseas Investment Trust^ 347,301 3,138 1.0JPMorgan Russian Securities^ 663,400 3,133 1.0JPMorgan Senior Secured Loan Fund^ 1,330,000 1,343 0.4JPMorgan Smaller Companies Investment
Trust^ 614,951 5,018 1.6JPMorgan US Smaller Companies Investment
Trust^ 192,450 2,964 0.9Jupiter European Opportunities Trust 481,155 2,067 0.7Law Debenture 541,211 2,817 0.9Lowland Investment 369,112 5,204 1.7Monks Investment Trust 3,041,060 11,666 3.7Montanaro European Smaller Companies Trust 483,738 2,513 0.8Montanaro UK Smaller Companies Investment
Trust 956,467 4,902 1.6Pacific Horizon Investment Trust 1,768,993 2,852 0.9Perpetual Income & Growth Investment Trust 1,616,904 5,991 1.9RCM Technology Trust 1,136,813 6,008 1.9RIT Capital Partners 615,208 7,629 2.4Schroder Asia Pacific Fund 1,427,655 3,184 1.0
Schroder Japan Growth Fund 1,190,000 1,392 0.4Schroder UK Growth Fund 2,290,000 4,397 1.4Schroder UK Mid & Small Cap Fund 426,000 2,033 0.7Scottish Mortgage Investment Trust 1,312,728 13,534 4.3SVG Capital 515,442 2,179 0.7Temple Bar Investment Trust 194,400 2,352 0.7Templeton Emerging Markets Investment Trust 2,020,130 9,967 3.2The Mercantile Investment Trust^ 1,186,433 18,402 5.9TR Property Investment Trust 2,321,001 5,413 1.7Witan Investment Trust 1,321,800 8,612 2.7Worldwide Healthcare Trust 465,024 5,883 1.9
Liquidity funds – 0.6% (1.9%)JPM Sterling Liquidity ‘X’ (Distribution)^$ 2,007,353 2,007 0.6
Investment assets 314,349 100.0
Net other assets 15 0.0
Net assets 314,364 100.0
Unless otherwise stated the above securities are admitted to official stock exchange listings or trade on aregulated market.
The comparative percentage figures in brackets are at 31 January 2013.
† Suspended security‡ Delisted security^ Deemed to be investment in related parties of the ACD$ Approved security as defined in the Collective Investment Schemes sourcebook
Portfolio statementAs at 31 January 2014
Market value Total netInvestment Holding £’000 assets %
Market value Total netInvestment Holding £’000 assets %
240
Continuation�
� Return to Index

£’000
Total of all purchases for the year (Note 10) 52,349
Major purchases Cost
JPM Sterling Liquidity ‘X’ (Distribution)^ 17,112Witan Investment Trust 7,901JPMorgan Claverhouse Investment Trust^ 2,612Graphite Enterprise Trust 1,960Foreign & Colonial Investment Trust 1,857Schroder Japan Growth Fund 1,671John Laing Infrastructure Fund 1,608JPMorgan Global Convertibles Income Fund^ 1,560Worldwide Healthcare Trust 1,455BH Macro 1,388JPMorgan Senior Secured Loan Fund^ 1,330Schroder UK Growth Fund 1,284Perpetual Income & Growth Investment Trust 1,262Scottish Mortgage Investment Trust 1,235Templeton Emerging Markets Investment Trust 1,223JPMorgan Japanese Investment Trust^ 1,020Edinburgh Worldwide Investment Trust 899JPMorgan Emerging Markets Investment Trust^ 721Biotech Growth Trust 698Temple Bar Investment Trust 639
^ Deemed to be investment in related parties of the ACD
£’000
Total of all sales for the year (Note 10) 75,053
Major sales Proceeds
JPM Sterling Liquidity ‘X’ (Distribution)^ 20,800Scottish Mortgage Investment Trust 5,979Advance Developing Markets 4,153Hansa Trust ‘A’ Non-Voting 3,320Alliance Trust 3,259Ecofin Water & Power Opportunities 3,232British Empire Securities & General Trust 2,895Caledonia Investments 2,532City Natural Resources High Yield Trust 1,841BlackRock North American Income Trust 1,614The Mercantile Investment Trust^ 1,573Henderson Value Trust 1,556Ashmore Global Opportunities 1,540Henderson Eurotrust 1,438BlueCrest BlueTrend 1,322Finsbury Growth & Income Trust 1,160RIT Capital Partners 1,131JPMorgan US Smaller Companies Investment Trust^ 1,074Henderson Fledgling Trust 1,044JPMorgan Smaller Companies Investment Trust^ 946
Portfolio movements For the year ending 31 January 2014
241
Continuation�
� Return to Index

Statement of total returnFor the year ending 31 January
2014 2013£’000 £’000 £’000 £’000
Income
Net capital gains (Note 1) 32,116 35,363
Revenue (Note 2) 5,886 5,399
Expenses (Note 3) (4,499) (4,066)
Net revenue before taxation 1,387 1,333
Taxation (Note 4) – –
Net revenue after taxation 1,387 1,333
Total return before distributions 33,503 36,696
Finance costs: Distributions (Note 5) (1,394) (1,331)
Change in net assets attributable to shareholders from investment activities 32,109 35,365
Statement of change in net assets attributable to shareholdersFor the year ending 31 January
2014 2013£’000 £’000 £’000 £’000
Opening net assets attributable to shareholders 303,613 287,072
Amounts receivable on issue of shares 1,098 915
Amounts payable on cancellation of shares (23,060) (20,320)
(21,962) (19,405)
Change in net assets attributable to shareholders from investment activities (see above) 32,109 35,365
Retained distributions on accumulation shares 606 578
Stamp duty reserve tax (11) (7)
Unclaimed distributions 9 10
Closing net assets attributable to shareholders 314,364 303,613
Balance sheetAs at 31 January
2014 2013£’000 £’000 £’000 £’000
ASSETS
Investment assets 314,349 305,555
Debtors (Note 7) 618 865
Cash and bank balances (Note 8) 699 339
Total other assets 1,317 1,204
Total assets 315,666 306,759
LIABILITIES
Creditors (Note 9) (558) (2,439)
Distribution payable on income shares (744) (707)
Total liabilities (1,302) (3,146)
Net assets attributable to shareholders 314,364 303,613
The notes to these financial statements are shown on pages 243 to 244.
Financial statements
242
Continuation�
� Return to Index

1. Net capital gains2014 2013
£’000 £’000Currency losses – (4)Non-derivative securities 32,116 35,367Net capital gains 32,116 35,363
2. Revenue2014 2013
£’000 £’000Franked income from UK equity investments 5,105 4,879Income from Liquidity funds 11 22Income from overseas equity investments 669 649Interest distributions from Investment Trusts 33 37Interest on bank and term deposits 2 1Interest on fixed-interest securities – (237)Property income distributions 66 –Stock dividends – 48Total revenue 5,886 5,399
3. Expenses2014 2013
£’000 £’000Payable to the ACD or associate of the ACD:ACD fee 3,931 3,554Fixed expenses 568 512Total expenses 4,499 4,066
4. Taxation2014 2013
£’000 £’000a) Analysis of charge in the yearCorporation tax at 20% – –Current year tax charge (Note 4b) – –
b) Factors affecting the tax charge for the yearThe tax assessed for the year is lower than the standard rate of corporation tax inthe UK for an Open-Ended Investment Company (OEIC) (20%). The differences areexplained below.
Net revenue before taxation 1,387 1,333Corporation tax at 20% 277 267
Effects of:Dividends not subject to corporation tax (1,155) (1,115)Excess expenses for which no relief taken 878 813Non-trade deficit set against current year income – 35
(277) (267)Current year tax charge (Note 4a) – –
No deferred tax asset has been recognised in the financial statements. At the yearend date, the Fund had a potential unrecognised deferred tax asset of £16,942,006(31.01.13: £16,064,443) in relation to £84,710,030 (31.01.13: £80,322,214) of excessmanagement expenses which would only be utilised to reduce the tax charge if theFund had an excess of unfranked income over expenses in a future period. There isno excess of unfranked income expected in the future.
5. Finance costsDistributionsThe distributions take account of amounts receivable on the issue of shares andamounts payable on the cancellation of shares and comprise:
2014 2013£’000 £’000
Final dividend distribution 1,350 1,285Add: Amounts payable on cancellation of shares 50 50Deduct: Amounts receivable on issue of shares (6) (4)Total finance costs 1,394 1,331
Details of the distribution per share are set out on page 245.
6. Movement between net revenue after taxation and distributions2014 2013
£’000 £’000Net revenue after taxation 1,387 1,333Add: Undistributed revenue brought forward (4) 2Deduct: Undistributed revenue carried forward 4 (4)Equalisation on conversions 7 –
1,394 1,331
7. Debtors2014 2013
£’000 £’000Accrued income 207 355Due from the ACD for shares created – 40Income tax recoverable – 28Overseas tax recoverable 14 1Sales awaiting settlement 397 441Total debtors 618 865
8. Cash and bank balances2014 2013
£’000 £’000Cash and bank balances 699 339
9. Creditors2014 2013
£’000 £’000Accrued expenses 392 363Due to the ACD for shares cancelled 166 416Purchases awaiting settlement – 1,660Total creditors 558 2,439
Notes to the financial statements for the year ending 31 January 2014
243
Continuation�
� Return to Index

10. Portfolio transaction costs2014 2013
£’000 £’000Analysis of total purchase costs
Purchases in year before transaction costs 52,158 60,459
Commissions 47 45Taxes 144 134Total purchase costs 191 179Gross purchases total 52,349 60,638
Analysis of total sale costs
Gross sales before transaction costs 75,144 76,338
Commissions (91) (90)Total sale costs (91) (90)Total sales net of transaction costs 75,053 76,248
11. Related party transactionsJPMorgan Funds Limited, as Authorised Corporate Director (“ACD”), is a relatedparty, and acts as principal in respect of all transactions of shares in the Company.The aggregate monies received through issue, and paid on cancellation, aredisclosed in the Statement of Change in Net Assets Attributable to Shareholders.
The balance due to the ACD and their associates at the year end date in respect ofrelated party transactions was £557,971 (31.01.13: £739,069). Details of relatedparty transactions are given under note 13 on page 413.
Investments considered to be related parties have been identified in the portfoliostatement on page 240 and the revenue from these investments was £716,481(31.01.13: £1,137,677).
Some of the dealing transactions for the Fund are carried out through associatesof the ACD. Such transactions are carried out on an arm’s length basis. Thecommissions paid to these companies over the year were £nil (31.01.13: £14,212).Commission was paid to the associated company JPMorgan Securities Ltd.
The following party held a material interest in the Fund at the year end date:– HSBC Global Custody Nominee (UK), Limited 11.25% (31.01.13: 10.51%)
12. Financial instrumentsCurrency exposuresAt the year end date, the majority of the Fund’s financial assets and liabilities weredenominated in Sterling. As a result, the Fund has no material exposure tocurrency movements.
Interest rate riskAt the year end date, 1.17% (31.01.13: 2.3%) of the Fund’s net assets by value wereinterest bearing, carrying a (fixed/floating) rate.
For consideration of other risks including liquidity, pricing and credit risk, pleaserefer to the notes to the aggregated financial statements, pages 413 to 414.
13. Share classesThe Fund currently has three share classes; Class A Shares, Class B Shares andClass C Shares. The Authorised Corporate Director’s (ACD) fee and fixed expensescharge are shown below.
ACD fee Fixed expensesClass A shares: 1.25% 0.18%Class B shares: 0.80% 0.18%Class C shares: 0.65% 0.18%
The net asset value of each share class, the net asset value per share and thenumber of shares in each class are shown on page 239. All classes have the samerights on winding up.
14. Contingent liabilities and capital commitmentsAt the balance sheet date there were no contingent liabilities or capitalcommitments (2013: none).
Notes to the financial statements – continued
244
Continuation�
� Return to Index

Final distribution in pence per share
Group 1 – Shares purchased prior to 1 February 2013Group 2 – Shares purchased 1 February 2013 to 31 January 2014
DistributionGross Tax Net payable paid
revenue at 10% revenue Equalisation 30.04.13 30.04.12
A-Class Accumulation Shares
Group 1 3.022222 0.302222 2.720000 – 2.720000 2.440000
Group 2 1.633864 0.163386 1.470478 1.249522 2.720000 2.440000
A-Class Income Shares
Group 1 2.844444 0.284444 2.560000 – 2.560000 2.310000
Group 2 1.422862 0.142286 1.280576 1.279424 2.560000 2.310000
B-Class Accumulation Shares
Group 1 6.088889 0.608889 5.480000 – 5.480000 3.040000
Group 2 5.084816 0.508482 4.576334 0.903666 5.480000 3.040000
B-Class Income Shares
Group 1 5.511111 0.551111 4.960000 – 4.960000 –
Group 2 5.511111 0.551111 4.960000 0.000000 4.960000 –
C-Class Accumulation Shares
Group 1 1.355556 0.135556 1.220000 – 1.220000 0.660000
Group 2 0.090412 0.009041 0.081371 1.138629 1.220000 0.660000
C-Class Income Shares
Group 1 1.333333 0.133333 1.200000 – 1.200000 0.690000
Group 2 0.286063 0.028606 0.257457 0.942543 1.200000 0.690000
Equalisation applies only to shares purchased during the distribution period (group 2 shares). It is the average amount of revenue included in the purchase price of all group 2 shares and is refunded to holders of these
shares as a return of capital. Being capital it is not liable to income tax but must be deducted from the cost of shares for capital gains tax purposes.
Distribution table
245
� Return to Index

Investment objective and policyTo invest, primarily in the shares of, companies throughout the world engagedin the production and marketing of commodities. The Fund aims to providecapital growth over the long term.
The Fund will have exposure to smaller companies and may invest in EmergingMarkets.
Other instruments as permitted in the stated investment and borrowingpowers of the Company including, but not limited to, fixed interest securities,cash and cash equivalents may be held on an ancillary basis, as appropriate.
Risk profileThe value of your investment may fall as well as rise and you may get backless than you originally invested.
The value of Equity and Equity-Linked Securities may fluctuate in responseto the performance of individual companies and general market conditions.
Emerging Markets may be subject to increased political, regulatory andeconomic instability, less developed custody and settlement practices,poor transparency and greater financial risks. Emerging Market currenciesmay be subject to volatile price movements. Emerging Market securities mayalso be subject to higher volatility and be more difficult to sell than non-Emerging Market securities.
The Fund invests in securities of smaller companies which may be moredifficult to sell, more volatile and tend to carry greater financial risk thansecurities of larger companies.
The Fund will be concentrated in natural resources companies and may beconcentrated in one or more countries. As a result, the Fund may be morevolatile than more broadly diversified funds.
The value of companies in which the Fund invests may be influenced bymovements in commodity prices which can be very volatile.
This Fund is aggressively managed, which may result in higher volatility ofthe Fund’s performance and bigger differences between the performanceof the Fund and its Benchmark.
Movements in currency exchange rates can adversely affect the return ofyour investment.
Please refer to Part 11 of the Prospectus for details of the general risk factorsaffecting this Fund in addition to the specific risk factors above.
Fund reviewThe Fund underperformed its benchmark in the 12 months to the end ofJanuary 2014. The Fund’s small to mid cap bias was a hindrance for relativeperformance in the first six months of the period, but small to mid capresource stocks started to perform in line with the large cap end of theresources sector from July 2013 onwards. Our underweight exposure to goldmining equities contributed positively, as gold equities fell close to 50% overthe period. We also had some stock-picking success in the energy and miningsectors. On the energy side, DNO International, Exillon Energy and GranTierra all comfortably outperformed the energy sector. On the mining sidewe capitalised on stock-specific catalysts that have defied the broader sell-off in the sector; holdings such as Freeport McMoran, Lucara Diamond andPlatinum Group Metals would fall within this category.
Fund outlookWe expect a more benign macroeconomic environment in 2014 to positivelyaffect commodity prices, which remain close to the marginal cost of productionin many instances. At the same time, we believe consensus expectations onthe level of supply likely to hit the market this year are too high, particularlyin copper and iron ore. As such, we anticipate commodity prices to surpriseto the upside. At the same time, we are optimistic regarding the bottom-upself-help being exercised by new management teams within the sector. Webelieve that changes in senior leadership and the clear demands ofshareholders have substantially raised the probability that companies willfind a better balance between allocating the free cashflow for re-investmentin new projects and returning cash to shareholders.
12 month performance as at 31 January 2014 2013 2012 2011 2010
JPM Natural ResourcesA-Class Acc -23.7% -20.7% -15.5% 47.4% 79.4%
JPM Natural ResourcesB-Class Acc -23.3% -20.3% -15.1% 48.1% 80.4%
JPM Natural ResourcesC-Class Acc -23.1% – – – –
Benchmark Index -22.8% -10.2% -2.0% 34.0% 39.3%
Fund statisticsRisk and Reward Profile 7*
Fund size £994.3m
Benchmark Index Euromoney Gold Mining, Gold and Energy Index (Net)
Fund chargesA-Class Initial 3.00%, Annual 1.50%B-Class Initial Nil, Annual 1.00%C-Class Initial Nil, Annual 0.75%
Top ten holdings (excluding Liquidity funds) %Freeport-McMoRan Copper & Gold 5.6Glencore Xstrata 5.3BHP Billiton 5.2First Quantum Minerals 5.2Rio Tinto 5.1Anadarko Petroleum 3.4Royal Dutch Shell ‘B’ 3.3Lundin Mining 3.1Petra Diamonds 2.4Cenovus Energy 2.2
JPM Natural Resources Fund
You should remember that past performance is not a guide to the future. The price of investments and the income from them may fall as well as rise andinvestors may not get back the full amount invested.
*For specific risks, including the risk and reward profile, please refer to the Key Investor information Document (KIID) available on the following websitehttp://am.jpmorgan.co.uk/investor/prices-and-factsheets/?list=all&tab=PricesAll equity indices stated as ‘Net’ are calculated net of tax as per the standard published approach by the index vendor unless stated otherwise.All performance returns are calculated using the quoted price of the accumulation shares. Performance returns are in Sterling.Source: J.P. Morgan.246
Continuation�
� Return to Index

Sector breakdown %Base metals & diversified 42.4Oil & gas 29.8Gold & silver 12.6Diamonds & precious stones 5.3Liquidity funds 3.1Others 3.1Platinum 1.7Uranium 1.7Coal 0.5Net other liabilities (0.2)
Highest/lowest share price and distribution recordDistribution
Highest Lowest per shareCalendar year share price share price (net)A-Class Accumulation Shares2009 827.4p 387.7p 0.00p2010 1,182p 729.7p 0.00p2011 1,194p 762.0p 0.00p2012 969.8p 668.7p 0.00p2013 758.6p 521.6p 0.00p2014A 588.0p 562.3p 0.16pA-Class Income Shares2009 58.66p 27.49p 0.00p2010 83.83p 51.73p 0.00p2011 84.60p 54.03p 0.00p2012 68.76p 47.41p 0.00p2013 53.79p 36.98p 0.00p2014A 41.69p 39.87p 0.01pB-Class Accumulation Shares2009 93.46p 43.59p 0.00p2010 134.3p 82.49p 0.00p2011 135.5p 86.91p 0.00p2012 110.8p 76.59p 0.00p2013 87.11p 60.00p 0.00p2014A 67.85p 64.89p 0.36pB-Class Income SharesB
2013 43.73p 39.72p 0.00p2014A 41.72p 39.90p 0.04pC-Class Accumulation SharesC
2012 783.1p 707.0p 0.00p2013 759.9p 524.0p 0.00p2014A 593.4p 567.5p 4.74pC-Class Income SharesC
2012 55.53p 50.13p 0.00p2013 53.87p 37.15p 0.00p2014A 42.06p 40.23p 0.33p
A To 31 January 2014.B B-Class Income shares were launched on 6 November 2013.C C-Class Accumulation Shares and C-Class Income Shares were launched on 22 October 2012.
Portfolio turnover rate31.01.13 42.0%31.01.14 37.0%
The portfolio turnover rate (PTR) reflects the total of security purchases and sales, (excluding Liquidityfunds) less the total of share issues and cancellations, expressed as a percentage of the average daily netasset values over the period.
Portfolio transaction costsBroker Transaction
Commissions Taxes Total31.01.13 0.07% 0.02% 0.09%31.01.14 0.07% 0.03% 0.10%
The percentage figures disclosed above reflect the average broker commissions and transaction taxessuffered during the last 3 years divided by the average assets under management over the same period.
Stamp duty reserve tax31.01.13 0.01%31.01.14 0.02%
The percentage figures disclosed above reflect the total stamp duty reserve tax suffered during the yeardivided by the average assets under management over the same period.
Net asset values and Ongoing chargesNet assetvalue per Net asset
share class Number value per OngoingDate £’000 of shares share chargesA-Class Accumulation Shares31.01.12 2,144,226 230,377,642 930.7p 1.68%31.01.13 1,495,315 201,593,014 741.8p 1.68%31.01.14 878,476 155,879,519 563.6p 1.68%A-Class Income Shares31.01.12 49,978 75,735,140 65.99p 1.68%31.01.13 42,147 80,140,439 52.59p 1.68%31.01.14 19,175 47,995,762 39.95p 1.68%B-Class Accumulation Shares31.01.12 40,571 38,153,191 106.3p 1.15%31.01.13 28,602 33,574,463 85.19p 1.18%31.01.14 10,809 16,621,096 65.04p 1.18%B-Class Income Shares31.01.14 43 107,683 39.95p 1.18%C-Class Accumulation Shares31.01.13 3,805 512,047 743.1p 0.93%31.01.14 74,993 13,184,313 568.8p 0.93%C-Class Income Shares31.01.13 643 1,220,117 52.69p 0.93%31.01.14 10,765 26,915,969 39.99p 0.93%
The net asset value and the net asset value per income share are shown ex-dividend.
Following the adoption of the requirements of UCITS IV in June 2012, Ongoing charges has replaced the TotalExpense Ratio (“TER”). The Ongoing charges takes into account the ACD fee, the fixed expenses and any expensespaid to an affiliate in respect of stocklending activities, expressed as a percentage of the average daily net assetvalues over the period. The main difference between the two calculations is the inclusion of custodian handlingcharges and stocklending fees in the Ongoing charges figure. The comparative figures have not been restated,and the historic TER is disclosed.
247
Continuation�
� Return to Index

Base metals & diversified – 42.4% (38.0%)Antofagasta 1,834,723 15,742 1.6AQM Copper Warrants 2014 (CAD 1.00)# 2,238,777 – –Archipelago Metals# 1,531,897 – –Augusta Resource (CAD) 4,985,239 5,383 0.5Augusta Resource (USD) 543,023 591 0.1BHP Billiton (AUD) 624,952 12,094 1.2BHP Billiton (USD) 2,249,369 40,208 4.0Cape Lambert Resources 17,382,276 1,058 0.1Capstone Mining 2,423,000 3,852 0.4Duluth Metals 2,929,464 1,478 0.1Equatorial Resources 2,803,545 831 0.1Ferrexpo 6,552,113 9,815 1.0Ferrox# 150,825 – –Ferrox Warrants 2014 (CAD 0.80) 75,413 – –First Quantum Minerals 4,702,016 51,692 5.2Fortescue Metals Group 7,155,108 20,143 2.0Freeport-McMoRan Copper & Gold 2,814,191 55,414 5.6Glencore Xstrata 16,314,548 52,264 5.3Hudbay Minerals 1,154,431 5,632 0.6Indophil Resources 1,838,473 146 –Ivernia 23,221,362 1,701 0.2Kagara† 15,814,343 – –Lundin Mining 10,502,439 27,868 2.8Lundin Mining SDR 952,671 2,502 0.3Marengo Mining 20,497,959 167 –Mawson West 7,616,285 2,438 0.2MMC Norilsk Nickel ADR 1,435,628 13,415 1.3Mwana Africa 36,886,912 516 –Ormonde Mining 20,095,599 1,105 0.1Panoro Minerals 10,288,850 1,703 0.2Papillon Resources 1,467,114 908 0.1Papua Mining 1,309,923 393 –Regulus Resources Warrants 2014
(CAD 1.60)# 1,516,882 – –Reservoir Minerals 1,226,201 4,125 0.4Rex Minerals 3,514,363 818 0.1Rio Tinto 1,563,334 50,261 5.1Sable Mining Africa 47,648,789 5,122 0.5Sandfire Resources 2,121,007 6,510 0.7Sirius Resources 2,486,755 2,882 0.3Sundance Resources 18,387,486 973 0.1Teck Resources ‘B’ 826,442 12,189 1.2Tiger Resources 12,670,548 2,514 0.3Timah 26,529,906 1,689 0.2Trevali Mining 4,603,800 2,573 0.3Western Areas 1,710,900 2,408 0.2Windimurra Vanadium# 843,814 – –
Oil & gas – 29.8% (25.5%)3Legs Resources 2,893,311 687 0.1Africa Oil 773,908 3,426 0.3African Petroleum 2,508,701 319 –Amerisur Resources 16,228,118 8,398 0.8Anadarko Petroleum 690,687 34,179 3.4Apache 202,000 9,970 1.0Argos Resources 5,216,122 587 0.1Armour Energy 9,526,713 832 0.1Armour Energy Warrants 2014 (AUD 0.50)# 2,381,678 – –Aurora Oil & Gas 10,977,444 15,858 1.6Beach Energy 7,336,792 5,513 0.6Borders & Southern Petroleum 7,101 1 –Calvalley Petroleum 3,107,983 2,816 0.3Caracal Energy 1,388,227 6,108 0.6Cenovus Energy 1,351,282 21,469 2.2Continental Resources 185,000 12,234 1.2DNO International 11,294,623 21,805 2.2Eland Oil & Gas 1,150,375 1,122 0.1Energy XXI (Bermuda) 243,427 3,507 0.4Gran Tierra Energy 2,800,915 12,584 1.3Hurricane Energy# 9,982,418 4,292 0.4IGAS Energy 1,279,327 1,615 0.2International Petroleum† 24,141,040 – –Jordan Energy and Mining# 218,970 299 –Lundin Petroleum 1,400,997 14,782 1.5Mitra Energy# 2,224,487 4,392 0.4Neon Energy 5,977,100 130 –Nostrum Oil & Gas GDR 2,819,907 18,417 1.9Occidental Petroleum 327,719 17,577 1.8Pancontinental Oil & Gas 16,643,986 388 –Parex Resources 2,294,969 9,203 0.9President Energy 4,463,200 1,964 0.2
Providence Resources 1,714,808 3,944 0.4Royal Dutch Shell ‘B’ 1,449,551 32,506 3.3Sino Gas & Energy 30,095,455 3,265 0.3Strata-X Energy 6,826,161 1,192 0.1Suncor Energy 253,000 5,000 0.5Tethys Petroleum 12,666,717 3,979 0.4Trap Oil Group 9,491,608 854 0.1Tullow Oil 900,000 7,092 0.7WesternZagros Resources 7,869,065 4,227 0.4
Gold & silver – 12.6% (23.7%)Alamos Gold 508,364 2,805 0.3Amara Mining 7,802,664 1,053 0.1Asanko Gold 3,197,327 3,036 0.3Aureus Mining 11,294,141 3,501 0.4Aureus Mining Warrant 2014 (CAD 0.625)# 1,306,493 – –B2Gold 3,689,010 5,205 0.5Banro 6,705,444 2,074 0.2Barrick Gold 1,500,000 17,516 1.8Beadell Resources 5,334,959 2,047 0.2Eldorado Gold 1,354,288 5,225 0.5Endeavour Mining 4,901,494 1,660 0.2Gascoyne Resources 6,414,785 526 0.1Goldcorp 724,030 10,572 1.1Gryphon Minerals 4,279,581 396 –Highland Gold Mining* 4,963,417 3,102 0.3KalNorth Gold Mines 2,538,036 19 –Kinross Gold 3,206,838 8,909 0.9Kinross Gold Warrants 2014 (USD 21.30) 237,358 4 –Loncor Resources 2,592,113 197 –Minera IRL* 3,841,362 403 –New Gold 1,746,167 6,140 0.6Norseman Gold CDI† 762,137 – –Norseman Gold†* 2,245,867 – –Northern Star Mining# 1,305,160 – –Northern Star Mining (R1933)† 8,500,000 1 –Northern Star Resources 3,783,802 1,762 0.2Nyota Minerals 33,795,687 127 –Oceanagold 5,754,134 6,181 0.6Pan American Silver Warrants 2014
(CAD 35.00)# 211,493 – –Randgold Resources ADS 320,098 13,292 1.3Real Gold Mining† 2,943,500 – –Reed Resources 10,792,868 291 –Romarco Minerals 7,398,187 2,208 0.2Romarco Minerals (Restricted Mar 2014)# 8,041,799 2,400 0.3Sarama Resources 2,347,382 210 –Sarama Resources Warrants 2014# 1,173,691 – –Silver Wheaton 971,725 12,813 1.3Silvercrest Mines 788,812 903 0.1Swan Gold Mining† 6,577,726 – –Yamana Gold 1,877,388 10,870 1.1
Diamonds & precious stones – 5.3% (2.6%)Dominion Diamond 685,469 5,977 0.6Firestone Diamond (Placing)# 26,635,561 799 0.1Firestone Diamonds 27,926,748 1,047 0.1Gem Diamonds 1,429,007 2,247 0.2Kennady Diamonds 461,524 1,007 0.1Kennady Diamonds (Restricted Apr 2014) 58,100 127 –Lucara Diamond 12,206,517 10,068 1.0Mantle Diamonds# 1,613,220 47 –Mink International‡ 107,000 – –Mountain Province Diamonds 2,692,228 7,377 0.8Petra Diamonds* 17,795,787 24,220 2.4Tabora# 1,905,343 – –Sayona Mining 1,617,325 2 –Stornoway Diamond Warrants 2014 (CAD 1.20)# 166,717 – –Target Resources‡ 5,864,454 – –Tsar Emerald‡ 8,955,110 – –
Others – 3.1% (3.3%)Altus Renewables# 681,160 – –Base Resources 6,316,982 1,387 0.1Energizer Resources 12,946,000 1,019 0.1Energizer Resources (Placing 2013)# 6,473,000 – –Kenmare Resources 45,427,612 8,177 0.8Leaf Clean Energy 2,983,052 1,432 0.2Mineral Deposits 1,267,053 1,495 0.2New Britain Palm Oil 715,859 2,362 0.2Pathfinder Minerals 45,728,221 183 –Sierra Rutile 22,826,674 13,867 1.4World Titanium Resources† 13,891,832 581 0.1
Portfolio statement As at 31 January 2014
Market value Total netInvestment Holding £’000 assets %
Market value Total netInvestment Holding £’000 assets %
248
Continuation�
� Return to Index

Platinum – 1.7% (1.3%)Aquarius Platinum 3,175,180 1,246 0.1Impala Platinum 637,301 3,944 0.4Jubilee Platinum* 1,153,065 21 –Platinum Group Metals 17,481,681 12,332 1.2Sylvania Platinum 4,741,305 261 –
Uranium – 1.7% (0.2%)Alpha Exploration 268,850 92 –Cameco Corporation 495,275 6,590 0.7Denison Mines 2,880,544 2,470 0.3Fission 3,963,000 333 –Fission Uranium 8,572,852 5,582 0.6Global Atomic Fuels# 2,057,770 1,418 0.1
Coal – 0.5% (1.8%) Bathurst Resources 20,291,647 1,933 0.2Eastcoal 1,166,011 9 –Mongolian Mining 7,326,500 470 0.1New Hope Coal 1,252,327 2,319 0.2
Liquidity funds – 3.1% (3.9%)JPM Sterling Liquidity ‘X’ (Distribution)^$ 30,571,641 30,572 3.1
Investment assets 996,117 100.2
Net other liabilities (1,856) (0.2)
Net assets 994,261 100.0
Unless otherwise stated the above securities are admitted to official stock exchange listings or trade on aregulated market.
The comparative percentage figures in brackets are at 31 January 2013.
* Listed on Alternative Investment Market (AIM)† Suspended security# Unquoted security‡ Delisted security^ Deemed to be investment in related parties of the ACD$ Approved security as defined in the Collective Investment Schemes sourcebook
Portfolio statement – continuedAs at 31 January 2014
Market value Total netInvestment Holding £’000 assets %
249
Continuation�
� Return to Index

£’000
Total of all purchases for the year (Note 10) 450,780
Major purchases Cost
JPM Sterling Liquidity ‘X’ (Distribution)^ 180,696Royal Dutch Shell ‘B’ 29,664BHP Billiton (USD) 20,323Barrick Gold 17,252Freeport-McMoRan Copper & Gold 12,187Lundin Mining 11,747Continental Resources 11,581Apache 11,200MMC Norilsk Nickel ADR 10,329First Quantum Minerals 8,944Tullow Oil 7,819Sandfire Resources 6,214Suncor Energy 5,688Antofagasta 5,131Cenovus Energy 5,130Rio Tinto 4,667Fission Uranium 4,517Caracal Energy 4,293Capstone Mining 3,964Africa Oil 3,711
^ Deemed to be investment in related parties of the ACD
£’000
Total of all sales for the year (Note 10) 673,423
Major sales Proceeds
JPM Sterling Liquidity ‘X’ (Distribution)^ 210,800Canadian Natural Resources 26,496Rio Tinto 22,164Exillon Energy 20,049Afren 16,274Eurasian Natural Resources 15,320Coastal Energy 14,406Newmont Mining 13,512DNO International 13,286Pacific Rubiales Energy 13,283Fortescue Metals Group 13,255First Quantum Minerals 12,495Barrick Gold 12,024Newcrest Mining 10,570Glencore Xstrata 10,334Energy XXI (Bermuda) 9,727African Minerals 9,710Rio Alto Mining 9,175Eldorado Gold 8,520SEMAFO 8,495
Portfolio movements For the year ending 31 January 2014
250
Continuation�
� Return to Index

Statement of total returnFor the year ending 31 January
2014 2013£’000 £’000 £’000 £’000
Income
Net capital losses (Note 1) (356,396) (437,623)
Revenue (Note 2) 21,879 21,710
Expenses (Note 3) (19,201) (29,620)
Net revenue/(expenses) before taxation 2,678 (7,910)
Taxation (Note 4) (1,899) (1,551)
Net revenue/(expenses) after taxation 779 (9,461)
Total return before distributions (355,617) (447,084)
Finance costs: Distributions (Note 5) (1,032) 542
Change in net assets attributable to shareholders from investment activities (356,649) (446,542)
Statement of change in net assets attributable to shareholdersFor the year ending 31 January
2014 2013£’000 £’000 £’000 £’000
Opening net assets attributable to shareholders 1,570,512 2,234,775
Amounts transferred to other funds (57,574) –
Amounts receivable on issue of shares 70,892 39,136
Amounts payable on cancellation of shares (233,673) (256,608)
(220,355) (217,472)
Change in net assets attributable to shareholders from investment activities (see above) (356,649) (446,542)
Retained distributions on accumulation shares 934 –
Stamp duty reserve tax (181) (249)
Closing net assets attributable to shareholders 994,261 1,570,512
Balance sheetAs at 31 January
2014 2013£’000 £’000 £’000 £’000
ASSETS
Investment assets 996,117 1,575,130
Debtors (Note 7) 4,540 2,753
Cash and bank balances (Note 8) 122 22
Total other assets 4,662 2,775
Total assets 1,000,779 1,577,905
LIABILITIES
Creditors (Note 9) (6,424) (7,393)
Distribution payable on income shares (94) –
Total liabilities (6,518) (7,393)
Net assets attributable to shareholders 994,261 1,570,512
The notes to these financial statements are shown on pages 252 to 253.
Financial statements
251
Continuation�
� Return to Index

1. Net capital losses2014 2013
£’000 £’000Currency losses (27) (774)Non-derivative securities (356,369) (436,849)Net capital losses (356,396) (437,623)
2. Revenue2014 2013
£’000 £’000Franked income from UK equity investments 4,511 5,146Income from Liquidity funds 140 290Income from overseas equity investments 17,227 16,229*Interest on bank and term deposits 1 2Interest on fixed-interest securities – 43*Total revenue 21,879 21,710
* The prior year comparatives have been restated to ensure consistent disclosurewith the current year.
3. Expenses2014 2013
£’000 £’000Payable to the ACD or associate of the ACD:ACD fee 17,107 26,423Fixed expenses 2,094 3,197Total expenses 19,201 29,620
4. Taxation2014 2013
£’000 £’000a) Analysis of charge in the yearOverseas tax provision – 9Overseas tax suffered 1,899 1,542Current year tax charge (Note 4b) 1,899 1,551
b) Factors affecting the tax charge for the yearThe tax assessed for the year is higher than the standard rate of corporation tax inthe UK for an Open-Ended Investment Company (OEIC) (20%). The differences areexplained below.
Net revenue/(expenses) before taxation 2,678 (7,910)Corporation tax at 20% 536 (1,582)
Effects of:Dividends not subject to corporation tax (4,198) (4,164)Excess expenses for which no relief taken 3,677 5,760Overseas tax expensed (15) (14)Overseas tax provision – 9Overseas tax suffered 1,899 1,542
1,363 3,133Current year tax charge (Note 4a) 1,899 1,551
No deferred tax asset has been recognised in the financial statements. At the yearend date, the Fund had a potential unrecognised deferred tax asset of £34,097,189(31.01.13: £30,419,441) in relation to £170,485,946 (31.01.13: £152,097,204) ofexcess management expenses which would only be utilised to reduce the taxcharge if the Fund had an excess of unfranked income over expenses in a futureperiod. There is no excess of unfranked income expected in the future.
5. Finance costsDistributionsThe distributions take account of amounts receivable on the issue of shares andamounts payable on the cancellation of shares and comprise:
2014 2013£’000 £’000
Final dividend distribution 1,028 –Add: Amounts payable on cancellation of shares 340 (607)Deduct: Amounts receivable on issue of shares (336) 65Total finance costs 1,032 (542)
Details of the distribution per share are set out on page 254.
6. Movement between net revenue/(expenses) after taxation anddistributions
2014 2013£’000 £’000
Net revenue/(expenses) after taxation 779 (9,461)Add: Net expense payable from capital – 8,919Deduct: Undistributed revenue carried forward (18) –Equalisation on conversions 271 –
1,032 (542)
7. Debtors2014 2013
£’000 £’000Accrued income 481 500Due from the ACD for shares created 2,650 860Overseas tax recoverable 137 35Sales awaiting settlement 1,272 1,358Total debtors 4,540 2,753
8. Cash and bank balances2014 2013
£’000 £’000Cash and bank balances 122 22
9. Creditors2014 2013
£’000 £’000Accrued expenses 1,404 2,271Due to the ACD for shares cancelled 3,699 4,870Purchases awaiting settlement 1,321 252Total creditors 6,424 7,393
Notes to the financial statements for the year ending 31 January 2014
252
Continuation�
� Return to Index

10. Portfolio transaction costs2014 2013
£’000 £’000Analysis of total purchase costs
Purchases in year before transaction costs 450,153 730,959
Commissions 224 369Taxes 403 117Total purchase costs 627 486Gross purchases total 450,780 731,445
Analysis of total sale costs
Gross sales before transaction costs 673,942 947,130
Commissions (506) (933)Taxes (13) (104)Total sale costs (519) (1,037)Total sales net of transaction costs 673,423 946,093
11. Related party transactionsJPMorgan Funds Limited, as Authorised Corporate Director (“ACD”), is a relatedparty, and acts as principal in respect of all transactions of shares in the Company.The aggregate monies received through issue, and paid on cancellation, aredisclosed in the Statement of Change in Net Assets Attributable to Shareholders.
The balance due to the ACD and their associates at the year end date in respect ofrelated party transactions was £2,452,885 (31.01.13: £6,280,715). Details of relatedparty transactions are given under note 13 on page 413.
Investments considered to be related parties have been identified in the portfoliostatement on pages 248 to 249 and the revenue from these investments was£139,954 (31.01.13: £290,312).
Some of the dealing transactions for the Fund are carried out through associatesof the ACD. Such transactions are carried out on an arm’s length basis. Thecommissions paid to these companies over the year were £30,505 (31.01.13:£177,997). Commission was paid to the associated company JPMorgan SecuritiesLtd.
The following party held a material interest in the Fund at the year end date:– Cofunds Nominees Ltd 10.98% (31.01.13: 10.39%)
12. Financial instrumentsCurrency exposuresA substantial proportion of the net assets of the Fund are denominated incurrencies other than sterling, with the effect that the Balance sheet and totalreturn can be significantly affected by currency movements.
Net foreign currency assets/(liabilities)Monetary Non-monetary
Total exposures exposuresCurrency £’000 £’000 £’000
31.01.14Canadian Dollar 287,531 1,279 286,252US Dollar 222,746 475 222,271Australian Dollar 99,380 – 99,380Norwegian Krone 21,805 – 21,805Swedish Krona 20,709 – 20,709South African Rand 3,944 – 3,944Indonesian Rupiah 1,689 – 1,689Hong Kong Dollar 470 – 470
31.01.13Canadian Dollar 544,197 145 544,052Australian Dollar 251,994 (3) 251,997US Dollar 237,157 376 236,781Swedish Krona 23,595 – 23,595Norwegian Krone 20,747 – 20,747South African Rand 9,520 83 9,437Hong Kong Dollar 8,554 – 8,554Indonesian Rupiah 7,442 – 7,442
Interest rate riskAt the year end date, 0.0% (31.01.13: 3.9%) of the Fund’s net assets by value wereinterest bearing, carrying a (fixed/floating) rate.
For consideration of other risks including liquidity, pricing and credit risk, pleaserefer to the notes to the aggregated financial statements, pages 413 to 414.
13. Share classesThe Fund currently has three share classes; Class A Shares, Class B Shares andClass C Shares. The Authorised Corporate Director’s (ACD) fee and fixed expensescharge are shown below.
ACD fee Fixed expensesClass A shares: 1.50% 0.18% Class B shares: 1.00% 0.18%Class C shares: 0.75% 0.18%
The net asset value of each share class, the net asset value per share and thenumber of shares in each class are shown on page 247. All classes have the samerights on winding up.
14. Contingent liabilities and capital commitmentsAt the year end date the fund had the following contingent liabilities:
2014 2013£’000 £’000
Warrants 12,153 –
Notes to the financial statements – continued
253
Continuation�
� Return to Index

Final distribution in pence per share
Group 1 – Shares purchased prior to 1 February 2013Group 2 – Shares purchased 1 February 2013 to 31 January 2014
DistributionGross Tax Net payable paid
revenue at 10% revenue Equalisation 30.04.14 30.04.13
A-Class Accumulation Shares
Group 1 0.177778 0.017778 0.160000 – 0.160000 0.000000
Group 2 0.000000 0.000000 0.000000 0.160000 0.160000 0.000000
A-Class Income Shares
Group 1 0.011111 0.001111 0.010000 – 0.010000 0.000000
Group 2 0.000000 0.000000 0.000000 0.010000 0.010000 0.000000
B-Class Accumulation Shares
Group 1 0.400000 0.040000 0.360000 – 0.360000 0.000000
Group 2 0.078452 0.007845 0.070607 0.289393 0.360000 0.000000
B-Class Income Shares
Group 1 0.044444 0.004444 0.040000 – 0.040000 –
Group 2 0.044444 0.004444 0.040000 0.000000 0.040000 –
C-Class Accumulation Shares
Group 1 5.266667 0.526667 4.740000 – 4.740000 0.000000
Group 2 0.476690 0.047669 0.429021 4.310979 4.740000 0.000000
C-Class Income Shares
Group 1 0.366667 0.036667 0.330000 – 0.330000 0.000000
Group 2 0.090432 0.009043 0.081389 0.248611 0.330000 0.000000
Equalisation applies only to shares purchased during the distribution period (group 2 shares). It is the average amount of revenue included in the purchase price of all group 2 shares and is refunded to holders of these
shares as a return of capital. Being capital it is not liable to income tax but must be deducted from the cost of shares for capital gains tax purposes.
Distribution table
254
� Return to Index

Investment objective and policyTo provide long-term capital growth by investing primarily in companiesoperating or investing in central and eastern Europe and Russia.
The Fund will invest in companies that are incorporated under the laws of,and have their registered office in an Emerging European country or Russia,or that derive the predominant part of their economic activity from EmergingEuropean countries and/or Russia, even if listed elsewhere.
The Fund will have exposure to smaller companies.
Other instruments as permitted in the stated investment and borrowingpowers of the Company including, but not limited to, fixed interest securities,cash and cash equivalents may be held on an ancillary basis, as appropriate.
Risk profileThe value of your investment may fall as well as rise and you may get backless than you originally invested.
The value of Equity and Equity-Linked Securities may fluctuate in responseto the performance of individual companies and general market conditions.
This Fund is aggressively managed, which may result in higher volatility ofthe Fund’s performance and bigger differences between the performanceof the Fund and its Benchmark.
Emerging Markets may be subject to increased political, regulatory andeconomic instability, less developed custody and settlement practices,poor transparency and greater financial risks. Emerging Market currenciesmay be subject to volatile price movements. Emerging Market securities mayalso be subject to higher volatility and be more difficult to sell than non-Emerging Market securities.
The Fund invests in securities of smaller companies which may be moredifficult to sell, more volatile and tend to carry greater financial risk thansecurities of larger companies.
The Fund may be concentrated in a limited number of securities, industrysectors or countries and as a result, may be more volatile than more broadlydiversified funds.
Movements in currency exchange rates can adversely affect the return ofyour investment.
Please refer to Part 11 of the Prospectus for details of the general risk factorsaffecting this Fund in addition to the specific risk factors above.
Fund review2013 was a challenging year for emerging market equities, which deliveredtheir worst performance relative to developed markets since the Asianfinancial and Russian current account deficit crises. Growth concerns combinedwith earnings disappointment weighed on the asset class, while politicalnoise in Brazil, Turkey and Egypt added to the negative headlines. The FederalReserve’s tapering comments at the end of May impacted countries runningcurrent account deficits and their currencies took much of the hit.
The Fund outperformed its index in the period, but delivered a negativereturn in a challenging year for the region. Both stock selection and assetallocation contributed positively, with Russia the key contributor. In Russia,underweight positions in weaker names benefited, as did active positionsin stocks we favour. Our zero weight in utilities across the region was a strongpositive contributor as the sector underperformed. Names in Turkey detractedas the market had a difficult second half to the year, but our cautious approachand underweight exposure mitigated these losses. Greece rejoined theuniverse in November, and our zero exposure to the market detracted as itperformed strongly on re-entry, benefiting from strong flows.
Fund outlookThe first quarter showed that it does not take much to spark a rally in anoversold asset class like emerging market equities. Eastern Europe haslagged the broader asset class recently, as Russia and the Crimea questionhave dominated investor concerns. That said, even Russian stocks rallied atthe end of March, due to an apparent easing of tensions. We have not madematerial changes to our portfolios based on the developments in Ukraine,although we are now more cautious on that market, despite the compellingvaluations on offer.
12 month performance as at 31 January 2014 2013 2012 2011 2010
JPM New EuropeA-Class Acc -17.5% 14.8% -19.9% 22.2% 137.7%
JPM New EuropeB-Class Acc -17.1% 15.3% -19.4% 22.8% 138.8%
JPM New EuropeC-Class Acc -16.9% – – – –
Benchmark Index -19.2% 11.4% -12.5% 16.9% 98.9%
Fund statisticsRisk and Reward Profile 7*
Fund size £128.1m
Benchmark Index MSCI Emerging Markets Europe Index (Net)
Fund chargesA-Class Initial 3.00%, Annual 1.50%B-Class Initial Nil, Annual 1.00%C-Class Initial Nil, Annual 0.75%
JPM New Europe Fund
You should remember that past performance is not a guide to the future. The price of investments and the income from them may fall as well as rise andinvestors may not get back the full amount invested.
* For specific risks, including the risk and reward profile, please refer to the Key Investor information Document (KIID) available on the following websitehttp://am.jpmorgan.co.uk/investor/prices-and-factsheets/?list=all&tab=PricesAll equity indices stated as ‘Net’ are calculated net of tax as per the standard published approach by the index vendor unless stated otherwise.All performance returns are calculated using the quoted price of the accumulation shares. Performance returns are in Sterling.Source: J.P. Morgan.Benchmark Source: MSCI. Neither MSCI nor any other party involved in or related to compiling, computing or creating the MSCI data makes any express of implied warranties or representations with respect to such data (or theresults to be obtained by the use thereof), and all such parties hereby expressly disclaim all warranties of originality, accuracy, completeness, merchantability or fitness for a particular purpose with respect to any of such data.Without limiting any of the foregoing, in no event shall MSCI, any of its affiliates or any third party involved in or related to compiling computing or creating the data have any liability for any direct, indirect, special, punitive,consequential or any other damages (including lost profits) even if notified of the possibility of such damages. No further distribution or dissemination of the MSCI data is permitted without MSCI’s express written consent. 255
Continuation�
� Return to Index

Top ten holdings (excluding Liquidity funds) %Lukoil ADR 9.8 Sberbank 9.6 Gazprom ADR 9.1 Magnit 4.8 Novatek GDR 4.7 Powszechna Kasa Oszczednosci Bank Polski 4.1 Mobile Telesystems 4.1 MMC Norilsk Nickel ADR 4.0 JPMorgan Russian Securities^ 3.8 Powszechny Zaklad Ubezpieczen 3.0
^ Deemed to be investment in related parties of the ACD
Geographical breakdown %Russia 69.8Poland 12.9Turkey 8.2Kazakhstan 2.9Turkmenistan 2.9Ukraine 1.7Liquidity funds 1.0Sweden 1.0Net other liabilities (0.4)
Highest/lowest share price and distribution recordDistribution
Highest Lowest per shareCalendar year share price share price (net)A-Class Accumulation Shares2009 185.1p 74.22p 2.16p2010 241.2p 183.2p 0.14p2011 250.2p 155.9p 0.00p2012 204.3p 162.0p 1.51p2013 222.8p 187.3p 3.30p2014A 196.4p 175.7p 3.96pA-Class Income Shares2009 47.43p 18.90p 0.55p2010 61.77p 46.92p 0.04p2011 64.08p 39.93p 0.00p2012 51.23p 40.64p 0.98p2013 55.65p 46.82p 0.23p2014A 49.06p 43.88p 1.00pB-Class Accumulation Shares2009 89.34p 35.67p 1.33p2010 117.1p 88.50p 0.43p2011 121.4p 75.96p 0.37p2012 99.77p 79.21p 1.26p2013 109.4p 92.02p 2.10p2014A 96.77p 86.64p 2.38pB-Class Income SharesB
2013 51.88p 48.30p 0.00p2014A 49.09p 43.94p 1.06pC-Class Accumulation SharesC
2012 200.9p 184.0p –2013 223.6p 188.4p 3.70p2014A 198.3p 177.5p 5.52pC-Class Income SharesC
2012 50.41p 46.15p –2013 55.08p 46.42p 0.91p2014A 48.86p 43.74p 1.35p
A To 31 January 2014.B B-Class Income Shares were launched on 5 November 2013.C C-Class Accumulation Shares and C-Class Income Shares were launched on 22 October 2012.
256
Continuation�
� Return to Index

Portfolio turnover rate31.01.13 65.7%31.01.14 32.4%
The portfolio turnover rate (PTR) reflects the total of security purchases and sales (excluding Liquidityfunds), less the total of share issues and cancellations, expressed as a percentage of the average daily netasset values over the period.
Portfolio transaction costsBroker Transaction
Commissions Taxes Total31.01.13 0.06% 0.02% 0.08%31.01.14 0.09% 0.01% 0.10%
The percentage figures disclosed above reflect the average broker commissions and transaction taxessuffered during the last 3 years divided by the average assets under management over the same period.
Stamp duty reserve tax31.01.13 0.00%31.01.14 0.00%
The percentage figures disclosed above reflect the total stamp duty reserve tax suffered during the yeardivided by the average assets under management over the same period.
Net asset values and Ongoing chargesNet assetvalue per Net asset
share class Number value per OngoingDate £’000 of shares share chargesA-Class Accumulation Shares31.01.12 189,446 102,229,669 185.3p 1.68%31.01.13 192,754 90,565,413 212.8p 1.68%31.01.14 111,851 63,768,575 175.4p 1.68%A-Class Income Shares31.01.12 2,121 4,564,105 46.48p 1.68%31.01.13 2,425 4,561,434 53.17p 1.68%31.01.14 1,436 3,355,052 42.81p 1.68%B-Class Accumulation Shares31.01.12 4,973 5,497,662 90.45p 1.15%31.01.13 4,830 4,623,515 104.4p 1.18%31.01.14 6,008 6,946,466 86.49p 1.18%B-Class Income Shares31.01.14 2 5,500 42.80p 1.18%C-Class Accumulation Shares31.01.13 227 106,365 213.4p 0.93%31.01.14 8,491 4,791,019 177.2p 0.93%C-Class Income Shares31.01.13 2 4,337 52.58p 0.93%31.01.14 359 847,224 42.32p 0.93%
The net asset value and the net asset value per income share are shown ex-dividend.
Following the adoption of the requirements of UCITS IV in June 2012, Ongoing charges has replaced the TotalExpense Ratio (“TER”). The Ongoing charges takes into account the ACD fee, the fixed expenses and any expensespaid to an affiliate in respect of stocklending activities, expressed as a percentage of the average daily net assetvalues over the period. The main difference between the two calculations is the inclusion of custodian handlingcharges and stocklending fees in the Ongoing charges figure. The comparative figures have not been restated,and the historic TER is disclosed.
257
Continuation�
� Return to Index

Russia – 69.8% (62.8%)AO Tatneft ADS 175,886 3,558 2.8 Cherkizovo Group GDR 216,748 1,501 1.2 Dixy Group 312,289 1,787 1.4 EPAM Systems 34,990 884 0.7 EurAsia Drilling Company GDR 97,987 2,036 1.6 Gazprom ADR 2,329,600 11,634 9.1 JPMorgan Russian Securities^ 1,039,279 4,908 3.8 Lukoil ADR 365,210 12,514 9.8 Luxoft Holding 33,510 763 0.6 Magnit 42,980 6,156 4.8 Magnitogorsk Iron & Steel Works GDR 621,149 997 0.8 Mechel ADR Preference 541,018 138 0.1 Mechel Preference 240,697 136 0.1 MegaFon GDR 75,500 1,372 1.1 MMC Norilsk Nickel ADR 554,751 5,184 4.0 Mobile Telesystems 562,531 2,808 2.2 Mobile Telesystems ADR 230,139 2,409 1.9 Mostotrest 755,347 1,547 1.2 Novatek GDR 81,200 6,029 4.7 Phosagro GDR 105,400 647 0.5 Ros Agro GDR 277,000 994 0.8 Sberbank 2,977,927 4,863 3.8 Sberbank ADR 1,129,835 7,400 5.8 Severstal GDR 108,400 529 0.4 Sistema GDR 176,983 2,801 2.2 Sollers 74,200 908 0.7 Surgutneftegaz Preference 6,404,720 2,773 2.2 TCS Group GDR 244,494 1,604 1.2 TMK GDR 54,370 355 0.3
Poland – 12.9% (9.0%)Alior Bank 89,639 1,515 1.2 Bank Zachodni WBK 18,100 1,321 1.0 Eurocash 224,109 1,738 1.4 KGHM Polska Miedz 139,900 2,876 2.2 Powszechna Kasa Oszczednosci Bank Polski 678,901 5,318 4.1 Powszechny Zaklad Ubezpieczen 48,346 3,842 3.0
Turkey – 8.2% (17.6%)Akbank T.A.S. 449,700 693 0.5 Arcelik 209,660 621 0.5 Bim Birlesik Magazalar 160,630 1,626 1.3 Enka Insaat 384,000 637 0.5 TAV Havalimanlari 264,321 1,201 0.9 Turkcell Iletisim Hizmetleri 686,725 2,003 1.6 Turkiye Garanti Bankasi† 1,279,447 2,019 1.6 Turkiye Halk Bankasi 578,010 1,720 1.3
Kazakhstan – 2.9% (2.7%)Kcell GDR 144,500 1,457 1.1 Nostrum Oil & Gas GDR 325,759 2,128 1.7 Steppe Cement 413,335 180 0.1
Turkmenistan – 2.9% (2.8%)Dragon Oil 634,764 3,691 2.9
Ukraine – 1.7% (1.4%)Kernel 195,400 1,462 1.1 MHP GDR 76,700 732 0.6
Sweden – 1.0% (1.0%)Oriflame Cosmetics SDR 78,051 1,291 1.0
Liquidity funds – 1.0% (2.9%)JPM Sterling Liquidity ‘X’ (Distribution)^$ 1,317,588 1,318 1.0
Investment assets 128,624 100.4
Net other liabilites (477) (0.4)
Net assets 128,147 100.0
Unless otherwise stated the above securities are admitted to official stock exchange listings or trade on aregulated market.
The comparative percentage figures in brackets are at 31 January 2013.
† Suspended security^ Deemed to be investment in related parties of the ACD$ Approved security as defined in the Collective Investment Schemes sourcebook
Portfolio statement As at 31 January 2014
Market value Total netInvestment Holding £’000 assets %
258
Continuation�
� Return to Index

£’000
Total of all purchases for the year (Note 10) 56,455
Major purchases Cost
JPM Sterling Liquidity ‘X’ (Distribution)^ 22,711Gazprom ADR 4,722Magnit 4,089KGHM Polska Miedz 2,926Magnit GDR 1,995Lukoil ADR 1,687MegaFon GDR 1,653Turkiye Halk Bankasi 1,523TCS Group GDR 2,355TAV Havalimanlari 1,101Akbank T.A.S. 997Bank Zachodni WBK 986Phosagro GDR 886Arcelik 831EurAsia Drilling Company GDR 817MHP GDR 817Bim Birlesik Magazalar 799AO Tatneft ADS 790Enka Insaat 780EPAM Systems 765
^ Deemed to be investment in related parties of the ACD
£’000
Total of all sales for the year (Note 10) 96,556
Major sales Proceeds
JPM Sterling Liquidity ‘X’ (Distribution)^ 27,250Magnit GDR 5,668Lukoil ADR 5,205Turkiye Garanti Bankasi 4,825Turkiye Petrol Rafinerileri 4,644CTC Media 3,747Yapi ve Kredi Bankasi 3,648Uralkali GDR 3,364Novatek GDR 3,077Turkiye Halk Bankasi 3,074Mobile Telesystems ADR 2,682Sberbank ADR 2,675Powszechna Kasa Oszczednosci Bank Polski 2,355Alliance Oil SDR 2,288Novolipetsk Iron and Steel GDS 2,219Dragon Oil 2,183Turkiye Is Bankasi ‘C’ 1,965Sistema GDR 1,641JPMorgan Russian Securities^ 1,586Tofas Turk Otomobil 1,500
Portfolio movements For the year ending 31 January 2014
259
Continuation�
� Return to Index

Statement of total returnFor the year ending 31 January
2014 2013£’000 £’000 £’000 £’000
Income
Net capital (losses)/gains(Note 1) (32,698) 23,032
Revenue (Note 2) 6,467 7,359
Expenses (Note 3) (2,771) (3,172)
Net revenue before taxation 3,696 4,187
Taxation (Note 4) (239) (781)
Net revenue after taxation 3,457 3,406
Total return before distributions (29,241) 26,438
Finance costs: Distributions (Note 5) (3,503) (3,377)
Change in net assets attributable to shareholders from investment activities (32,744) 23,061
Statement of change in net assets attributable to shareholdersFor the year ending 31 January
2014 2013£’000 £’000 £’000 £’000
Opening net assets attributable to shareholders 200,238 196,540
Amounts receivable on issue of shares 5,832 10,618
Amounts payable on cancellation of shares (48,130) (33,064)
(42,298) (22,446)
Change in net assets attributable to shareholders from investment activities (see above) (32,744) 23,061
Retained distributions on accumulation shares 2,955 3,089
Stamp duty reserve tax (4) (6)
Closing net assets attributable to shareholders 128,147 200,238
Balance sheetAs at 31 January
2014 2013£’000 £’000 £’000 £’000
ASSETS
Investment assets 128,624 201,313
Debtors (Note 7) 440 1,373
Cash and bank balances (Note 8) 124 1,254
Total other assets 564 2,627
Total assets 129,188 203,940
LIABILITIES
Creditors (Note 9) (996) (3,691)
Distribution payable on income shares (45) (11)
Total liabilities (1,041) (3,702)
Net assets attributable to shareholders 128,147 200,238
The notes to these financial statements are shown on pages 261 to 262.
Financial statements
260
Continuation�
� Return to Index

1. Net capital (losses)/gains2014 2013
£’000 £’000Currency losses (110) –Non-derivative securities (32,588) 23,032Net capital (losses)/gains (32,698) 23,032
2. Revenue2014 2013
£’000 £’000Income from Liquidity funds 11 16Income from overseas equity investments 6,455 7,339Interest on bank and term deposits 1 4Total revenue 6,467 7,359
3. Expenses2014 2013
£’000 £’000Payable to the ACD or associate of the ACD:ACD fee 2,467 2,831Fixed expenses 304 341Total expenses 2,771 3,172
4. Taxation2014 2013
£’000 £’000a) Analysis of charge in the yearOverseas tax suffered 239 781Current year tax charge (Note 4b) 239 781
b) Factors affecting the tax charge for the yearThe tax assessed for the year is lower than the standard rate of corporation tax inthe UK for an Open-Ended Investment Company (OEIC) (20%). The differences areexplained below.
Net revenue before taxation 3,696 4,187Corporation tax at 20% 739 837
Effects of:Dividends not subject to corporation tax (523) (757)Excess expenses for which no relief taken (139) (80)Overseas tax expensed (77) –Overseas tax suffered 239 781
(500) (56)Current year tax charge (Note 4a) 239 781
No deferred tax asset has been recognised in the financial statements. At the yearend date, the Fund had a potential unrecognised deferred tax asset of £706,218(31.01.13: £845,132) in relation to £3,531,089 (31.01.13: £4,225,659) of excessmanagement expenses which would only be utilised to reduce the tax charge if theFund had an excess of unfranked income over expenses in a future period. There isno excess of unfranked income expected in the future.
5. Finance costsDistributionsThe distributions take account of amounts receivable on the issue of shares andamounts payable on the cancellation of shares and comprise:
2014 2013£’000 £’000
Final dividend distribution 3,000 3,100Add: Amounts payable on cancellation of shares 566 404Deduct: Amounts receivable on issue of shares (63) (127)Total finance costs 3,503 3,377
Details of the distribution per share are set out on page 263.
6. Movement between net revenue after taxation and distributions2014 2013
£’000 £’000Net revenue after taxation 3,457 3,406Add: Undistributed revenue brought forward 6 4Deduct: Prior year adjustment – (27)Deduct: Undistributed revenue carried forward (4) (6)Equalisation on conversions 44 –
3,503 3,377
7. Debtors2014 2013
£’000 £’000Accrued income – 48Due from the ACD for shares created 207 113Overseas tax recoverable 233 –Sales awaiting settlement – 1,212Total debtors 440 1,373
8. Cash and bank balances2014 2013
£’000 £’000Cash and bank balances 124 1,254
9. Creditors2014 2013
£’000 £’000Accrued expenses 184 272Due to the ACD for shares cancelled 812 910Purchases awaiting settlement – 2,509Total creditors 996 3,691
Notes to the financial statements for the year ending 31 January 2014
261
Continuation�
� Return to Index

10. Portfolio transaction costs2014 2013
£’000 £’000Analysis of total purchase costs
Purchases in year before transaction costs 56,410 122,645
Commissions 45 109Total purchase costs 45 109Gross purchases total 56,455 122,754
Analysis of total sale costs
Gross sales before transaction costs 96,660 142,190
Commissions (104) (140)Total sale costs (104) (140)Total sales net of transaction costs 96,556 142,050
11. Related party transactionsJPMorgan Funds Limited, as Authorised Corporate Director (“ACD”), is a relatedparty, and acts as principal in respect of all transactions of shares in the Company.The aggregate monies received through issue, and paid on cancellation, aredisclosed in the Statement of Change in Net Assets Attributable to Shareholders.
The balance due to the ACD and their associates at the year end date in respect ofrelated party transactions was £789,004 (31.01.13: £1,069,412). Details of relatedparty transactions are given under note 13 on page 413.
Investments considered to be related parties have been identified in the portfoliostatement on page 258 and the revenue from these investments was £11,046(31.01.13: £15,942).
The following party held a material interest in the Fund at the year end date:– FIL (Luxembourg) SA 11.22% (31.01.13: 11.80%)
12. Financial instrumentsCurrency exposuresA substantial proportion of the net assets of the Fund are denominated incurrencies other than sterling, with the effect that the Balance sheet and totalreturn can be significantly affected by currency movements.
Net foreign currency assets/(liabilities)Monetary Non-monetary
Total exposures exposuresCurrency £’000 £’000 £’000
31.01.14US Dollar 88,643 – 88,643Polish Zloty 18,305 232 18,073Turkish Lira 10,521 – 10,521Swedish Krona 1,291 – 1,291
31.01.13US Dollar 120,468 (199) 120,667Turkish Lira 35,186 – 35,186Polish Zloty 20,914 – 20,914Swedish Krona 4,276 – 4,276Czech Koruna 542 – 542
Interest rate riskAt the year end date, 1.1% (31.01.13: 3.6%) of the Fund’s net assets by value wereinterest bearing, carrying a (fixed/floating) rate.
For consideration of other risks including liquidity, pricing and credit risk, pleaserefer to the notes to the aggregated financial statements, pages 413 to 414.
13. Share classesThe Fund currently has three share classes; Class A Shares, Class B Shares andClass C Shares. The Authorised Corporate Director’s (ACD) fee and fixed expensescharge are shown below.
ACD fee Fixed expensesClass A shares: 1.50% 0.18%Class B shares: 1.00% 0.18%Class C shares: 0.75% 0.18%
The net asset value of each share class, the net asset value per share and thenumber of shares in each class are shown on page 257. All classes have the samerights on winding up.
14. Derivatives The Fund enters into derivative transactions in the form of forward currencycontracts for the purpose of efficient portfolio management. The positive mark tomarket approach has been used to calculate the global exposure.
Further information on the derivative risks can be found in the notes to theaggregated financial statements on page 414.
15. Contingent liabilities and capital commitmentsAt the balance sheet date there were no contingent liabilities or capitalcommitments (2013: none).
Notes to the financial statements – continued
262
Continuation�
� Return to Index

Final distribution in pence per share
Group 1 – Shares purchased prior to 1 February 2013Group 2 – Shares purchased 1 February 2013 to 31 January 2014
DistributionGross Tax Net payable paid
revenue at 10% revenue Equalisation 30.04.14 30.04.13
A-Class Accumulation Shares
Group 1 4.400000 0.440000 3.960000 – 3.960000 3.300000
Group 2 1.957018 0.195702 1.761316 2.198684 3.960000 3.300000
A-Class Income Shares
Group 1 1.111111 0.111111 1.000000 – 1.000000 0.230000
Group 2 0.611303 0.061130 0.550173 0.449827 1.000000 0.230000
B-Class Accumulation Shares
Group 1 2.644444 0.264444 2.380000 – 2.380000 2.100000
Group 2 2.021416 0.202142 1.819274 0.560726 2.380000 2.100000
B-Class Income Shares
Group 1 1.177778 0.117778 1.060000 – 1.060000 –
Group 2 1.177778 0.117778 1.060000 0.000000 1.060000 –
C-Class Accumulation Shares
Group 1 6.133333 0.613333 5.520000 – 5.520000 3.700000
Group 2 0.630552 0.063055 0.567497 4.952503 5.520000 3.700000
C-Class Income Shares
Group 1 1.500000 0.150000 1.350000 – 1.350000 0.910000
Group 2 0.166260 0.016626 0.149634 1.200366 1.350000 0.910000
Equalisation applies only to shares purchased during the distribution period (group 2 shares). It is the average amount of revenue included in the purchase price of all group 2 shares and is refunded to holders of these
shares as a return of capital. Being capital it is not liable to income tax but must be deducted from the cost of shares for capital gains tax purposes.
Distribution table
263
� Return to Index

Investment objective and policyThe Fund's investment objective is to achieve a return based on a combinationof income and capital growth by investing primarily in high quality Sterlingdenominated Bonds (or other Bonds hedged back to Sterling).
The Fund’s investment policy will focus on Investment Grade corporate issues.The Fund may also invest in Below-Investment Grade securities, includingcorporate and Emerging Market Bonds when the Investment Adviser believesthese offer significant opportunities. The Fund may use Financial DerivativeInstruments (derivatives) for investment purposes or Efficient PortfolioManagement including hedging, where appropriate.
Although most of the non-Sterling securities will be hedged back to Sterling,the Investment Adviser will also use opportunities in the foreign exchangemarket to maximise returns.
Risk profileThe value of your investment may fall as well as rise and you may get backless than you originally invested.
Bond funds may not behave like direct investments in the underlying Bondsthemselves. By investing in Bond funds, the certainty of receiving a regularfixed amount of income for a defined period of time with the prospect of afuture known return of capital is lost.
The value of Bonds and other Debt Securities may change significantlydepending on market, economic and interest rate conditions as well as thecreditworthiness of the issuer. Issuers of Bonds and other Debt Securitiesmay fail to meet payment obligations (default) or the credit rating of Bondsand other Debt Securities may be downgraded. These risks are typicallyincreased for Below Investment Grade and certain Unrated securities, whichmay also be subject to higher volatility and be more difficult to sell thanInvestment Grade securities.
Bonds and other Debt Securities with a lower credit rating may have a higherrisk of defaulting which may in turn have an adverse effect on the performanceof Funds which invest in them.
The Fund may use Financial Derivative Instruments (derivatives) and/orforward transactions for investment purposes. The value of derivatives canbe volatile. This is because a small movement in the value of the underlyingasset can cause a large movement in the value of the derivative and therefore,investment in derivatives may result in losses in excess of the amount investedby the Fund.
Bond funds will normally distribute a combination of Coupon and the expecteddiscount/premium on the securities. Therefore, a Fund’s distribution willcomprise income received and an element of projected capital gains orlosses. This could result in an element of capital gain being taxed as incomein the hands of an investor.
To the extent that any underlying assets of the Fund are denominated in acurrency other than Sterling and are not hedged back to Sterling, movementsin currency exchange rates can adversely affect the return of your investment.The currency hedging that may be used to minimise the effect of currencyfluctuations may not always be successful.
Please refer to Part 11 of the Prospectus for details of the general risk factorsaffecting this Fund in addition to the specific risk factors above.
Fund reviewThe trailing 12-month period has been characterised by gradual economicimprovement in the UK, Europe and the US. Tapering was introduced to themarkets in the summer of 2013, and this has had a dominant role in corporatebond markets. We have seen a broad-based improvement in corporate health,particularly in UK and European banks, with regulation promptingdeleveraging and balance sheet strengthening. Rates have risen over thepast year, with the UK 10-year Gilt yield rising from 2.097% to 2.707%,while sterling corporate spreads ended the period 50 basis points tighter.
The Fund outperformed the benchmark over the 12 months. The Fund waswell positioned for both higher rates and tighter spreads. The allocation tohigh yield was also a strong contributor to performance: consistently lowdefault rates coupled with increasing investor demand for higher yieldingrisk assets caused this area of the market to outperform. The overweightposition in financials also boosted performance. In particular, owning bondsfurther down the capital structure in select credits where we werefundamentally comfortable was beneficial to the Fund’s return.
Fund outlookWe expect the strong technical tailwinds that we have seen over the pastyear to continue, with net-negative supply and consistent inflows. The Bankof England remains committed to forward rate guidance, which should anchorthe front end of the Gilt curve. However, with spreads moving back towardstheir tights, we remain very selective in our overweights in the sterlingcorporate market.
12 month performance as at 31 January 2014 2013 2012 2011 2010
JPM Sterling Corporate BondA-Class Acc 3.8% 8.5% 9.1% 3.5% 17.4%
JPM Sterling Corporate BondB-Class Acc 4.2% – – – –
JPM Sterling Corporate BondC-Class Inc 4.3% 8.9% – – –
JPM Sterling Corporate BondI-Class Acc 4.9% 9.2% 9.7% 4.2% 18.1%
Benchmark IndexA 4.0% 10.6% 9.6% 5.5% 18.9%
Fund statisticsRisk and Reward Profile 4*
Fund size £118.9m
Benchmark IndexA Markit iBoxx GBP Non-Gilts Index
Fund chargesA-Class Initial 3.00%, Annual 1.00%B-Class Initial Nil, Annual 0.65% C-Class Initial Nil, Annual 0.50% I-Class Initial Nil, Annual 0.40%
JPM Sterling Corporate Bond Fund
You should remember that past performance is not a guide to the future. The price of investments and the income from them may fall as well as rise andinvestors may not get back the full amount invested.
* For specific risks, including the risk and reward profile, please refer to the Key Investor information Document (KIID) available on the following websitehttp://am.jpmorgan.co.uk/investor/prices-and-factsheets/?list=all&tab=PricesAll performance returns are calculated using the quoted price of the accumulation shares. Performance returns are in Sterling.Source: J.P. Morgan.A On 01/09/12 the benchmark for was changed from Barclays Sterling Aggregate Corporate Index to Markit iBoxx GBP Non-Gilts Index.264
Continuation�
� Return to Index

Top ten holdings (excluding Liquidity funds) %European Investment Bank 6% 2028 4.2KFW 6% 2028 4.0European Investment Bank 5% 2039 3.5Lloyds Banking Group 5.75% 2025 1.6Hammerson 6.875% FRN 2020 1.5Southern Gas Network 4.875% 2023 1.4General Electric Capital UK 6.25% 2038 1.3Land Securities Capital Markets 5.391% 2026 1.3HSBC Capital Funding 8.208% FRN Perpetual 1.3Gatwick Funding 5.25% 2024 1.2
Sector breakdown %Corporate debt 88.3Liquidity funds 10.0Forward currency contracts 0.0Futures 0.0Net other assets 1.7
In line with current accounting practice the sector breakdown includes the unrealised profit or loss onderivative holdings and consequently the economic market exposure of the Fund cannot be fully determinedfrom the above disclosure.
Highest/lowest share price and distribution recordHighest Lowest Distribution
Calendar year share price share price per shareA-Class Accumulation Shares2009 59.04p 49.70p 2.04p2010 64.21p 58.11p 2.29p2011 65.75p 61.20p 2.28p2012 73.93p 65.52p 1.79p2013 76.35p 72.01p 1.55p2014B 76.03p 74.37p 0.41pA-Class Income Shares2009 43.58p 37.63p 1.54p2010 45.95p 42.37p 1.66p2011 45.04p 43.07p 1.60p2012 49.28p 44.82p 1.21p2013 50.38p 47.25p 1.02p2014B 49.63p 48.54p 0.27pB-Class Accumulation SharesD
2012 73.76p 72.61p 0.41p2013 76.45p 72.12p 1.76p2014B 76.30p 74.62p 0.48pB-Class Income SharesC
2012 49.28p 48.39p 0.27p2013 50.40p 47.25p 1.15p2014B 49.65p 48.55p 0.31p
Highest/lowest share price and distribution record(continued)
Highest Lowest DistributionCalendar year share price share price per shareC-Class Accumulation SharesD
2012 102.6p 99.99p 0.62p2013 106.1p 100.1p 2.53p2014B 105.9p 103.6p 0.69pC-Class Gross Accumulation SharesD
2012 102.6p 99.99p 0.67p2013 106.5p 100.5p 3.10p2014B 106.7p 104.3p 0.81pC-Class Income SharesE
2011 102.1p 98.58p 1.34p2012 111.7p 101.6p 3.21p2013 114.3p 107.1p 2.75p2014B 112.5p 110.1p 0.74pC-Class Gross Income SharesF
2011 100.4p 100.0p –2012 110.9p 100.3p 3.25p2013 113.6p 106.4p 3.31p2014B 111.8p 109.3p 0.85pI-Class Accumulation Shares2009 104.2p 87.36p 4.15p2010 113.9p 102.7p 4.72p2011 117.4p 108.7p 4.77p2012 132.9p 117.1p 3.99p2013 137.6p 129.9p 3.97p2014B 138.2p 135.1p 1.23pI-Class Gross Accumulation SharesG
2011 103.5p 98.78p 1.66p2012 117.9p 103.3p 4.36p2013 122.5p 115.4p 3.88p2014B 122.9p 120.2p 1.02pI-Class Income Shares2009 82.94p 71.57p 3.37p2010 87.43p 80.58p 3.71p2011 85.71p 81.90p 3.54p2012 93.72p 85.31p 2.85p2013 95.95p 89.94p 2.51p2014B 94.54p 92.43p 0.68p
B To 31 January 2014.C B-Class Accumulation Shares and B-Class Income Shares were launched on 29 October 2012.D C-Class Accumulation Shares and C-Class Gross Accumulation Shares were launched on 1 October 2012.E C-Class Income Shares were launched on 14 June 2011.F C-Class Gross Income Shares were launched on 28 December 2011.G I-Class Gross Accumulation Shares were launched on 21 June 2011.
265
Continuation�
� Return to Index
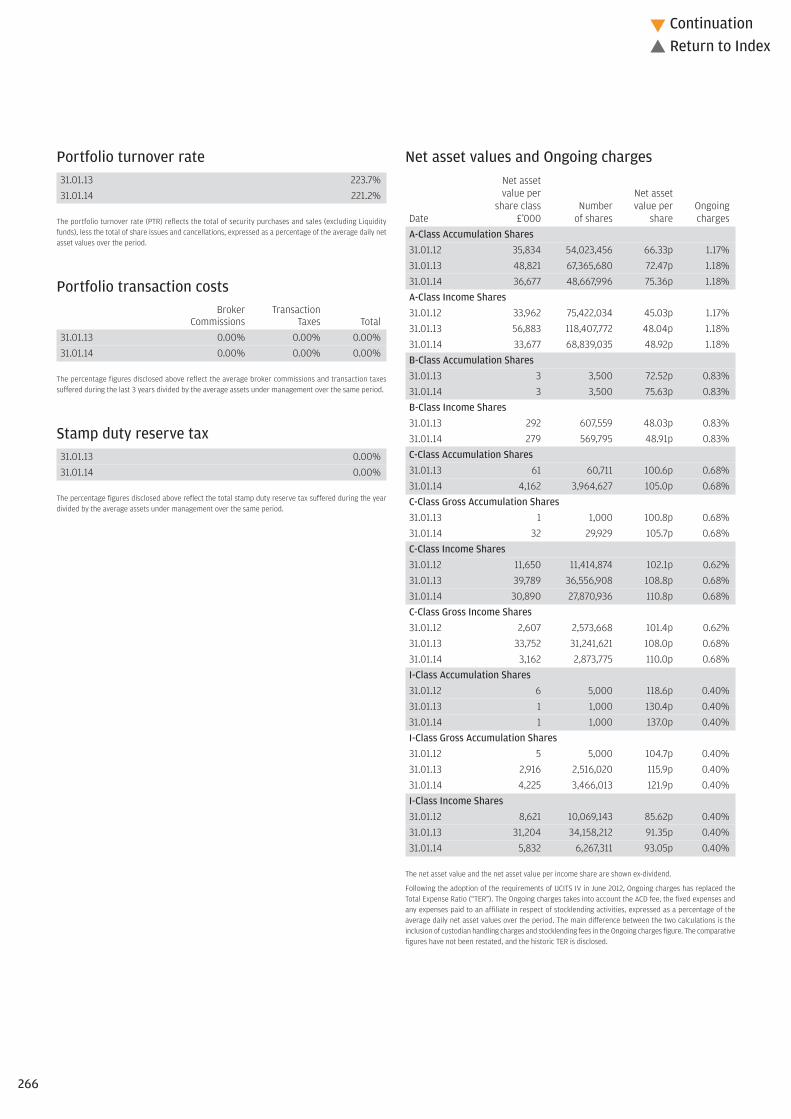
Portfolio turnover rate31.01.13 223.7%31.01.14 221.2%
The portfolio turnover rate (PTR) reflects the total of security purchases and sales (excluding Liquidityfunds), less the total of share issues and cancellations, expressed as a percentage of the average daily netasset values over the period.
Portfolio transaction costsBroker Transaction
Commissions Taxes Total31.01.13 0.00% 0.00% 0.00%31.01.14 0.00% 0.00% 0.00%
The percentage figures disclosed above reflect the average broker commissions and transaction taxessuffered during the last 3 years divided by the average assets under management over the same period.
Stamp duty reserve tax31.01.13 0.00%31.01.14 0.00%
The percentage figures disclosed above reflect the total stamp duty reserve tax suffered during the yeardivided by the average assets under management over the same period.
Net asset values and Ongoing chargesNet assetvalue per Net asset
share class Number value per OngoingDate £’000 of shares share chargesA-Class Accumulation Shares31.01.12 35,834 54,023,456 66.33p 1.17%31.01.13 48,821 67,365,680 72.47p 1.18%31.01.14 36,677 48,667,996 75.36p 1.18%A-Class Income Shares31.01.12 33,962 75,422,034 45.03p 1.17%31.01.13 56,883 118,407,772 48.04p 1.18%31.01.14 33,677 68,839,035 48.92p 1.18%B-Class Accumulation Shares31.01.13 3 3,500 72.52p 0.83%31.01.14 3 3,500 75.63p 0.83%B-Class Income Shares31.01.13 292 607,559 48.03p 0.83%31.01.14 279 569,795 48.91p 0.83%C-Class Accumulation Shares31.01.13 61 60,711 100.6p 0.68%31.01.14 4,162 3,964,627 105.0p 0.68%C-Class Gross Accumulation Shares31.01.13 1 1,000 100.8p 0.68%31.01.14 32 29,929 105.7p 0.68%C-Class Income Shares31.01.12 11,650 11,414,874 102.1p 0.62%31.01.13 39,789 36,556,908 108.8p 0.68%31.01.14 30,890 27,870,936 110.8p 0.68%C-Class Gross Income Shares31.01.12 2,607 2,573,668 101.4p 0.62%31.01.13 33,752 31,241,621 108.0p 0.68%31.01.14 3,162 2,873,775 110.0p 0.68%I-Class Accumulation Shares31.01.12 6 5,000 118.6p 0.40%31.01.13 1 1,000 130.4p 0.40%31.01.14 1 1,000 137.0p 0.40%I-Class Gross Accumulation Shares31.01.12 5 5,000 104.7p 0.40%31.01.13 2,916 2,516,020 115.9p 0.40%31.01.14 4,225 3,466,013 121.9p 0.40%I-Class Income Shares31.01.12 8,621 10,069,143 85.62p 0.40%31.01.13 31,204 34,158,212 91.35p 0.40%31.01.14 5,832 6,267,311 93.05p 0.40%
The net asset value and the net asset value per income share are shown ex-dividend.
Following the adoption of the requirements of UCITS IV in June 2012, Ongoing charges has replaced theTotal Expense Ratio (“TER”). The Ongoing charges takes into account the ACD fee, the fixed expenses andany expenses paid to an affiliate in respect of stocklending activities, expressed as a percentage of theaverage daily net asset values over the period. The main difference between the two calculations is theinclusion of custodian handling charges and stocklending fees in the Ongoing charges figure. The comparativefigures have not been restated, and the historic TER is disclosed.
266
Continuation�
� Return to Index

Corporate debt – 88.3% (92.3%)Aegon 6.625% 2039 £100,000 130 0.1Allianz 4.75% Perpetual £400,000 339 0.3America Movil 5.75% 2030 £350,000 389 0.3American International 5% 2023 £800,000 883 0.7Anglian Water (Osprey) Financing 7% 2018 £750,000 806 0.7Anglian Water 4.5% 2026 £400,000 396 0.3Anglian Water 4.5% 2027 £984,000 1,017 0.9Anheuser-Busch InBev 9.75% 2024 £350,000 533 0.4Assicurazioni Generali 2.875% 2020 £100,000 84 0.1Assicurazioni Generali 7.75% FRN 2042 £300,000 288 0.2AT&T 4.25% 2043 £815,000 723 0.6Atlantia 6.25% 2022 £700,000 792 0.7Aviva 6.875% FRN 2058 £500,000 566 0.5Axa 5.125% 2043 £400,000 355 0.3Axa FRN 2054 £480,000 481 0.4Bank of America 7% 2028 £1,050,000 1,371 1.2Barclays Bank 10% 2021 £550,000 724 0.6Barclays Bank 7.625% 2022 £1,350,000 875 0.7BNP Paribas 7.436% FRN Perpetual £600,000 635 0.5BNP Paribas 7.781% FRN Perpetual £300,000 288 0.2BPCE 5.7% 2023 £695,000 434 0.4BPCE 9% FRN Perpetual £800,000 697 0.6British Telecommunications 6.375% 2037 £550,000 672 0.6Centrica 5.375% 2043 £800,000 506 0.4Citigroup 5.125% 2018 £700,000 759 0.6Citigroup 6.8% 2038 £500,000 669 0.6Citigroup 6.675% 2043 £500,000 347 0.3CNH Industrial Finance 6.25% 2018 £385,000 356 0.3Compagnie de Saint-Gobain 4.625% 2029 £720,000 723 0.6Credit Agricole 8.125% FRN Perpetual £450,000 494 0.4Credit Suisse 6.5% 2023 £905,000 586 0.5Credit Suisse 5.75% FRN 2025 £295,000 257 0.2Credit Suisse 7.5% FRN Perpetual £885,000 569 0.5Crown Newco 8.875% 2019 £350,000 366 0.3Danske Bank 5.375% 2021 £1,250,000 1,288 1.1Direct Line Insurance 9.25% 2042 £500,000 629 0.5DirecTV 4.375% 2029 £290,000 269 0.2DirecTV 5.2% 2033 £261,000 260 0.2DNB 7.25% 2020 £300,000 320 0.3DNB 6.0116% FRN Perpetual £550,000 578 0.5E.ON International Finance 6.75% 2039 £750,000 980 0.8EDF 5.5% 2037 £800,000 870 0.7EDF 6% 2114 £700,000 770 0.6EDF 5.875% Perpetual £200,000 197 0.2EDF 6% Perpetual £800,000 811 0.7EDP Finance 5.25% 2021 £360,000 223 0.2Electricity North West 8.875% 2026 £650,000 946 0.8ELM 6.3024 FRN Perpetual £900,000 978 0.8Enel 6.5% 2074 £300,000 261 0.2Enel 5% 2075 £105,000 85 0.1Enel 7.75% 2075 £550,000 583 0.5Enel Finance International 5.75% 2040 £1,000,000 971 0.8ENI Coordination Centre 5% 2019 £780,000 848 0.7European Investment Bank 6% 2028 £3,900,000 4,974 4.2European Investment Bank 5% 2039 £3,450,000 4,114 3.5Eversholt Funding 6.359% 2025 £900,000 1,076 0.9FirstGroup 5.25% 2022 £600,000 628 0.5Gas Natural Fenosa 3.875% 2022 £600,000 527 0.4Gatwick Funding 5.25% 2024 £1,300,000 1,426 1.2GDF Suez 7% 2028 £1,000,000 1,310 1.1GDF Suez 4.75%-FRN Perpetual £400,000 342 0.3General Electric Capital UK 6.25% 2038 £1,242,000 1,576 1.3GlaxoSmithKline Capital 3.375% 2027 £475,000 445 0.4GlaxoSmithKline Capital 5.25% 2033 £1,000,000 1,149 1.0Goldman Sachs Group 5.5% 2021 £1,150,000 1,243 1.0Goldman Sachs Group 4.25% 2026 £500,000 498 0.4Great Rolling Stock 6.5% 2031 £950,000 1,149 1.0Hammerson 6.875% FRN 2020 £1,440,000 1,723 1.5Harbour Funding 5.28% 2044 £700,000 784 0.7HBOS Capital Funding 6.461% FRN Perpetual £600,000 625 0.5Health Care 4.8% 2028 £198,000 200 0.2Heathrow Funding 6% 2020 £1,050,000 1,168 1.0Heathrow Funding 5.875% FRN 2043 £1,100,000 1,294 1.1HeidelbergCement 9.5% 2018 £100,000 106 0.1HeidelbergCement 3.25% 2021 £600,000 485 0.4HIT Finance 5.75% 2018 £1,000,000 947 0.8HSBC 6% 2040 £1,150,000 1,295 1.1HSBC Capital Funding 8.208% FRN Perpetual £1,400,000 1,488 1.3Imperial Tobacco Finance 5.5% 2026 £900,000 1,002 0.8ING Bank 5.8% 2023 £250,000 159 0.1KFW 6% 2028 £3,650,000 4,795 4.0KPN 5% 2026 £500,000 518 0.4
Lafarge 4.75% 2020 £450,000 391 0.3Land Securities Capital Markets 5.391% 2026 £1,315,000 1,518 1.3Legal & General Group 10% FRN 2041 £500,000 673 0.6Lloyds Banking Group 5.75% 2025 £1,800,000 1,908 1.6London & Quadrant Housing Trust 4.625%
2033 £870,000 931 0.8London Power Networks 5.125% 2023 £250,000 275 0.2Munich Re FRN 2042 £600,000 689 0.6National Capital Trust 5.62% FRN Perpetual £350,000 365 0.3National Express Group 6.25% 2017 £500,000 550 0.5National Express Group 6.625% 2020 £500,000 582 0.5National Grid 6.5% 2028 £300,000 375 0.3National Grid Electricity 5.875% FRN 2024 £461,000 544 0.5NGG Finance 5.625% 2073 £1,000,000 1,003 0.8Northumbrian Water Finance 5.125% 2042 £700,000 761 0.6Orange 5.25% 2025 £800,000 871 0.7Orange 5.625% 2034 £300,000 332 0.3Orange 5.875% Perpetual £550,000 547 0.5Pfizer 6.5% 2038 £500,000 666 0.6Porterbrook Rail Finance 7.125% 2026 £600,000 769 0.6Prologis 3% 2022 £200,000 166 0.1Prudential 11.375% FRN 2039 £600,000 812 0.7Prudential 5.7% FRN 2063 £250,000 254 0.2Renault 4.625% 2017 £310,000 277 0.2Rexel 5.125% 2020 £325,000 280 0.2Rio Tinto 3.5% 2022 £850,000 510 0.4Royal Bank of Scotland FRN 2022 £789,000 560 0.5RWE Finance 6.125% 2039 £1,200,000 1,401 1.2Santander 5% 2023 £250,000 154 0.1Santander Issuances 7.3% 2019 £250,000 255 0.2Scottish Widows 5.5% 2023 £450,000 461 0.4Shell 4.55% 2043 £500,000 308 0.3Skandinaviska Enskilda Banken 7.0922%
FRN Perpetual £600,000 560 0.5Societe Generale 8.25% FRN Perpetual £900,000 583 0.5Societe Generale 8.875% FRN Perpetual £400,000 442 0.4South Eastern Power Networks 5.5% 2026 £1,000,000 1,137 1.0Southern Gas Network 4.875% 2023 £1,500,000 1,625 1.4Standard Chartered 4.375% 2038 £250,000 239 0.2Standard Life 5.5% 2042 £600,000 629 0.5Standard Life 6.546% FRN Perpetual £700,000 768 0.6Telefonica 6.5% FRN Perpetual £400,000 346 0.3Telefonica Emisiones 5.375% 2026 £750,000 778 0.7Tesco 6.125% 2022 £1,000,000 1,147 1.0Tesco Property Finance 5.744% 2040 £49,487 54 -Thames Water Utilities Finance 4.625% 2046 £600,000 594 0.5Treasury 2.25% 2014 £1,000,000 1,002 0.8UBS 4.75% 2023 £650,000 394 0.3Veolia Environnement 6.125% 2037 £750,000 870 0.7Verizon 6.55% 2043 £350,000 254 0.2Volkswagen 3.875% Perpetual £593,000 503 0.4Vougeot 7.875% 2020 £300,000 321 0.3Wal-Mart Stores 5.25% 2035 £200,000 232 0.2Wal-Mart Stores 5% 2040 £450,000 295 0.2Wells Fargo 5.25% 2023 £600,000 656 0.6Wendel 3.75% 2021 £100,000 82 0.1Wessex Water Services Finance 5.75% 2033 £500,000 588 0.5Western Power Distribution 3.875% 2024 £181,000 180 0.2Western Power Distribution 5.75% 2032 £450,000 517 0.4Western Power Distribution 6.25% VAR 2040 £300,000 373 0.3WPP Finance 6.375% 2020 £400,000 473 0.4Xstrata Finance Canada 7.375% 2020 £750,000 895 0.8Yorkshire Water Services Finance 3.625%
2029 £500,000 468 0.4Yorkshire Water Services Finance 6.375%
2039 £400,000 508 0.4Zurich Finance (UK) 6.625% FRN Perpetual £300,000 332 0.3
Forward currency contracts – 0.0% (0.0%)EuroBuy €7,100,127 sell £5,838,824 dated 05/02/14 6 –Buy €1,400,000 sell £1,153,971 dated 05/03/14 (1) –Sell €7,100,127 buy £5,912,628 dated 05/02/14 67 –Sell €4,852,466 buy £4,002,991 dated 05/03/14 8 –Sell €6,626,848 buy £5,451,080 dated 05/03/14 (5) –US DollarBuy $29,131,115 sell £17,710,983 dated 05/02/14 (12) –Buy $400,000 sell £241,561 dated 05/03/14 2 –Sell $904,821 buy £550,445 dated 05/02/14 1 –Sell $28,226,294 buy £17,096,216 dated 05/02/14 (53) –Sell $29,012,411 buy £17,642,805 dated 05/03/14 12 –Sell $2,407,021 buy £1,454,965 dated 05/03/14 (8) –
Portfolio statementAs at 31 January 2014
Market value Total netInvestment Holding £’000 assets %
Market value Total netInvestment Holding £’000 assets %
267
Continuation�
� Return to Index

Futures – 0.0% (0.0%)Euro BOBL Futures Mar 2014 (35) (32) –Euro Bund Index Futures Mar 2014 (18) (39) –Euro Schatz Futures Mar 2014 (8) (1) –Long Gilt Futures Mar 2014 97 58 –US 2 Year Treasury Note Futures Mar 2014 (43) (2) –US 5 Year Treasury Note Futures Mar 2014 (46) 4 –US 10 Year Treasury Note Futures Mar 2014 (78) (17) –US Long Bond Futures Mar 2014 (6) (11) –US Ultra Bond Futures Mar 2014 (16) (58) –
Liquidity funds – 10.0% (6.6%)JPM Global High Yield Bond ‘X’ USD
(Accumulation)^$ £150,048 11,885 10.0
Investment assets (including investment liabilities) 116,860 98.3
Net other assets 2,080 1.7
Net assets 118,940 100.0
Unless otherwise stated the above securities are admitted to official stock exchange listings or trade on aregulated market.
The comparative percentage figures in brackets are at 31 January 2013.
^ Deemed to be investment in related parties of the ACD$ Approved security as defined in the Collective Investment Schemes sourcebook
Market value Portfolio credit ratings £’000
AAA 13,883AA+ 1,002AA 2,045AA- 784A+ 7,302A 4,440A- 13,804BBB+ 19,656BBB 24,277BBB- 9,956BB+ 3,701BB- 1,375B 687Unrated 2,144
Total bonds 105,056
Forward currency contracts 17Futures (98) Liquidity funds 11,885
Investment assets (including investment liabilities) 116,860
Counterparty exposure
Forwardcurrency Futurescontracts contracts Total
Counterparty £’000 £’000
Barclays 64 – 64BNP Paribas 1 – 1Commonwealth Bank of Australia 0 – 0Credit Suisse 2 – 2JP Morgan – 62 62Toronto Dominian Bank 6 – 6UBS 3 – 3Westpac Banking Corp (59) – (59)
At the balance sheet date, there was no collateral received by the fund from the above counterparties.
The counterparty exposure on forward currency contracts is reported at their mark to market values butfor futures contracts it is only the positive mark to market values that are reported.
Portfolio statement – continuedAs at 31 January 2014
Market value Total netInvestment Holding £’000 assets %
268
Continuation�
� Return to Index

£’000
Total of all purchases for the year 297,831
Major purchases Cost
JPM Sterling Liquidity ‘X’ (Distribution)^ 64,529JPM Global High Yield Bond ‘X’ USD (Accumulation)^ 14,663European Investment Bank 2.5% 2022 8,101European Investment Bank 6% 2028 7,840Network Rail Infrastructure 4.75% 2024 7,110KFW 6% 2028 6,958E.ON International Finance 6.75% 2039 5,083GlaxoSmithKline Capital 3.375% 2027 4,860European Investment Bank 5% 2039 4,794Network Rail Infrastructure 4.625% 2020 4,792General Electric Capital UK 4.375% 2019 4,446Wal-Mart Stores 5.25% 2035 3,875General Electric Capital UK 6.25% 2038 3,802Veolia Environnement 6.125% 2037 3,603Standard Chartered 8.103% Perpetual 3,310RWE Finance 6.125% 2039 3,289Scottish Widows 5.5% 2023 3,015Time Warner Cable 5.75% 2031 2,967AT&T 4.25% 2043 2,888BAA Funding 6.75% 2028 2,575
^ Deemed to be investment in related parties of the ACD
£’000
Total of all sales for the year 388,168
Major sales Proceeds
JPM Sterling Liquidity ‘X’ (Distribution)^ 78,685Network Rail Infrastructure 4.75% 2024 11,143Network Rail Infrastructure 4.625% 2020 8,864European Investment Bank 2.5% 2022 8,074Network Rail Infrastructure 1% 2017 7,485Barclays Bank 10% 2021 5,869GlaxoSmithKline Capital 3.375% 2027 5,784Lloyds Banking Group 5.75% 2025 4,804Wal-Mart Stores 5.25% 2035 4,622European Investment Bank 6% 2028 4,595Time Warner Cable 5.75% 2031 4,401BAA Funding 6.75% 2028 4,364General Electric Capital UK 4.375% 2019 4,332General Electric Capital UK 4.125% 2017 4,316Svenska Handelsbanken 4% 2019 4,314E.ON International Finance 6.75% 2039 4,150European Investment Bank 2.25% 2015 4,101HSBC Capital Funding 8.208% FRN Perpetual 3,909KFW 6% 2028 3,784Comcast 5.5% 2029 3,737
Portfolio movements For the year ending 31 January 2014
269
Continuation�
� Return to Index
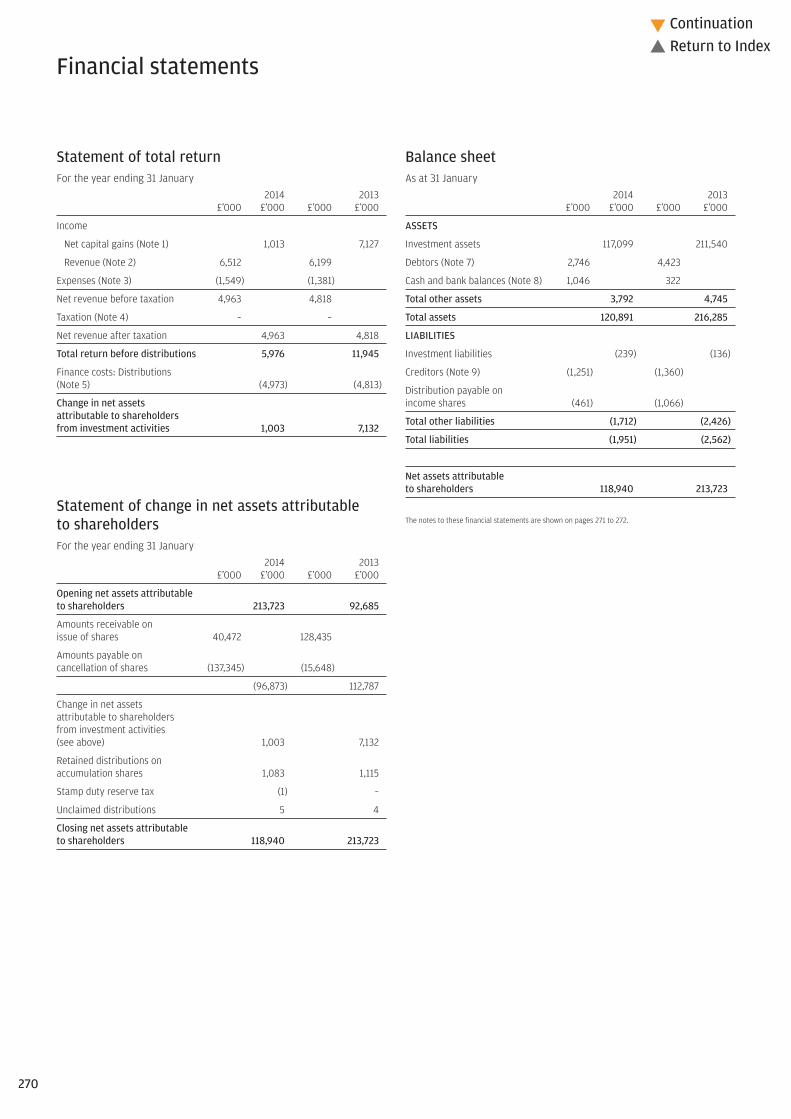
Statement of total returnFor the year ending 31 January
2014 2013£’000 £’000 £’000 £’000
Income
Net capital gains (Note 1) 1,013 7,127
Revenue (Note 2) 6,512 6,199
Expenses (Note 3) (1,549) (1,381)
Net revenue before taxation 4,963 4,818
Taxation (Note 4) – –
Net revenue after taxation 4,963 4,818
Total return before distributions 5,976 11,945
Finance costs: Distributions (Note 5) (4,973) (4,813)
Change in net assets attributable to shareholders from investment activities 1,003 7,132
Statement of change in net assets attributable to shareholdersFor the year ending 31 January
2014 2013£’000 £’000 £’000 £’000
Opening net assets attributable to shareholders 213,723 92,685
Amounts receivable on issue of shares 40,472 128,435
Amounts payable on cancellation of shares (137,345) (15,648)
(96,873) 112,787
Change in net assets attributable to shareholders from investment activities (see above) 1,003 7,132
Retained distributions on accumulation shares 1,083 1,115
Stamp duty reserve tax (1) –
Unclaimed distributions 5 4
Closing net assets attributable to shareholders 118,940 213,723
Balance sheetAs at 31 January
2014 2013£’000 £’000 £’000 £’000
ASSETS
Investment assets 117,099 211,540
Debtors (Note 7) 2,746 4,423
Cash and bank balances (Note 8) 1,046 322
Total other assets 3,792 4,745
Total assets 120,891 216,285
LIABILITIES
Investment liabilities (239) (136)
Creditors (Note 9) (1,251) (1,360)
Distribution payable on income shares (461) (1,066)
Total other liabilities (1,712) (2,426)
Total liabilities (1,951) (2,562)
Net assets attributable to shareholders 118,940 213,723
The notes to these financial statements are shown on pages 271 to 272.
Financial statements
270
Continuation�
� Return to Index
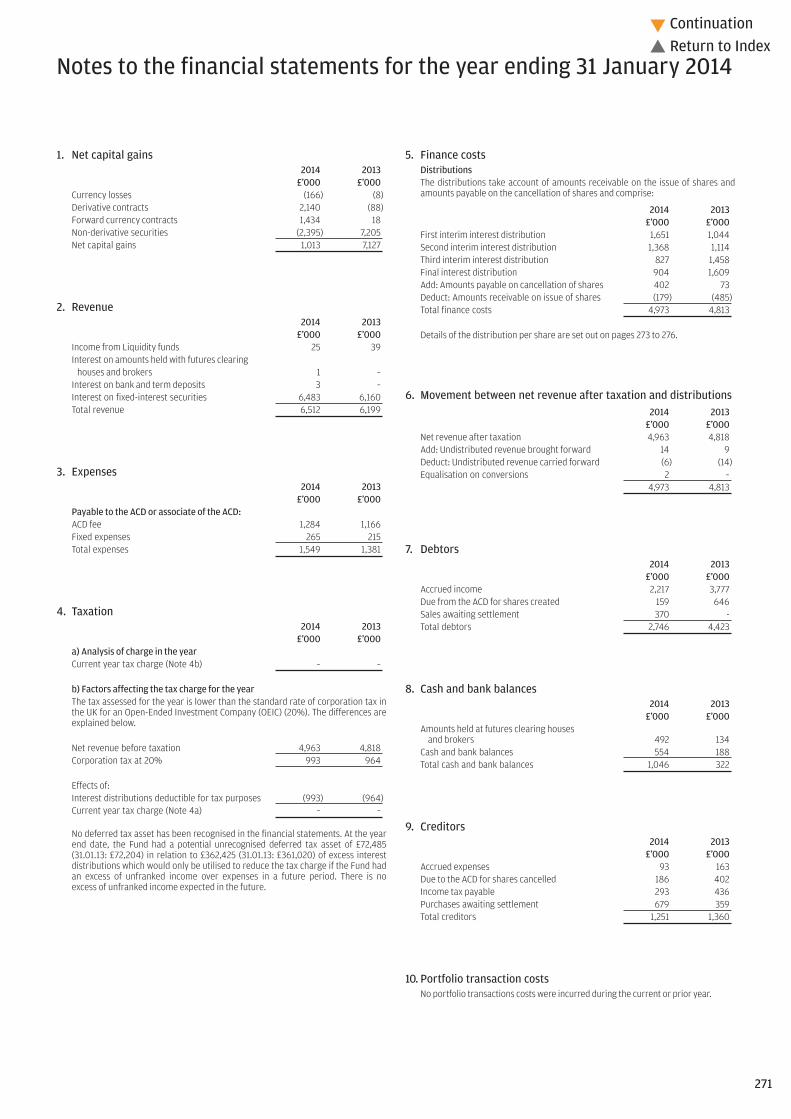
1. Net capital gains2014 2013
£’000 £’000Currency losses (166) (8)Derivative contracts 2,140 (88)Forward currency contracts 1,434 18Non-derivative securities (2,395) 7,205Net capital gains 1,013 7,127
2. Revenue2014 2013
£’000 £’000Income from Liquidity funds 25 39Interest on amounts held with futures clearing
houses and brokers 1 –Interest on bank and term deposits 3 –Interest on fixed-interest securities 6,483 6,160Total revenue 6,512 6,199
3. Expenses2014 2013
£’000 £’000Payable to the ACD or associate of the ACD:ACD fee 1,284 1,166Fixed expenses 265 215Total expenses 1,549 1,381
4. Taxation2014 2013
£’000 £’000a) Analysis of charge in the yearCurrent year tax charge (Note 4b) – –
b) Factors affecting the tax charge for the yearThe tax assessed for the year is lower than the standard rate of corporation tax inthe UK for an Open-Ended Investment Company (OEIC) (20%). The differences areexplained below.
Net revenue before taxation 4,963 4,818Corporation tax at 20% 993 964
Effects of:Interest distributions deductible for tax purposes (993) (964)Current year tax charge (Note 4a) – –
No deferred tax asset has been recognised in the financial statements. At the yearend date, the Fund had a potential unrecognised deferred tax asset of £72,485(31.01.13: £72,204) in relation to £362,425 (31.01.13: £361,020) of excess interestdistributions which would only be utilised to reduce the tax charge if the Fund hadan excess of unfranked income over expenses in a future period. There is noexcess of unfranked income expected in the future.
5. Finance costsDistributionsThe distributions take account of amounts receivable on the issue of shares andamounts payable on the cancellation of shares and comprise:
2014 2013£’000 £’000
First interim interest distribution 1,651 1,044Second interim interest distribution 1,368 1,114Third interim interest distribution 827 1,458Final interest distribution 904 1,609Add: Amounts payable on cancellation of shares 402 73Deduct: Amounts receivable on issue of shares (179) (485)Total finance costs 4,973 4,813
Details of the distribution per share are set out on pages 273 to 276.
6. Movement between net revenue after taxation and distributions2014 2013
£’000 £’000Net revenue after taxation 4,963 4,818Add: Undistributed revenue brought forward 14 9Deduct: Undistributed revenue carried forward (6) (14)Equalisation on conversions 2 –
4,973 4,813
7. Debtors2014 2013
£’000 £’000Accrued income 2,217 3,777Due from the ACD for shares created 159 646Sales awaiting settlement 370 -Total debtors 2,746 4,423
8. Cash and bank balances2014 2013
£’000 £’000Amounts held at futures clearing houses
and brokers 492 134Cash and bank balances 554 188Total cash and bank balances 1,046 322
9. Creditors2014 2013
£’000 £’000Accrued expenses 93 163Due to the ACD for shares cancelled 186 402Income tax payable 293 436Purchases awaiting settlement 679 359Total creditors 1,251 1,360
10. Portfolio transaction costsNo portfolio transactions costs were incurred during the current or prior year.
Notes to the financial statements for the year ending 31 January 2014
271
Continuation�
� Return to Index

11. Related party transactionsJPMorgan Funds Limited, as Authorised Corporate Director (“ACD”), is a relatedparty, and acts as principal in respect of all transactions of shares in the Company.The aggregate monies received through issue, and paid on cancellation, aredisclosed in the Statement of Change in Net Assets Attributable to Shareholders.
The balance due to the ACD and their associates at the year end date in respect ofrelated party transactions was £119,543 (31.01.13: £80,571 due from the ACD).Details of related party transactions are given under note 13 on page 413.
Investments considered to be related parties have been identified in the portfoliostatement on pages 267 to 268 and the revenue from these investments was£25,240 (31.01.13: £39,124).
The following parties held a material interest in the Fund at the year end date:– Cofunds Nominees Ltd 31.02% (31.01.13: 20.24%)– FNZ (UK) Nominees Ltd 22.30% (31.01.13: 13.08%)
12. Financial instrumentsCurrency exposuresAt the year end date, the majority of the Fund’s financial assets and liabilities aredenominated in Sterling. As a result, the Fund has no material exposure tocurrency movements.
Interest rate riskThe tables below detail the interest rate profile of the Fund’s assets and liabilitiesas at the year end.
Financialassets
Floating Fixed notrate rate carrying
Total financial financial anyassets assets assets interest
Currency £’000 £’000 £’000 £’000
31.01.14UK Sterling 120,537 828 90,276 29,433Euro 147 79 8,024 (7,956)US Dollar (32) 139 6,756 (6,927)
31.01.13UK Sterling 215,898 15,473 193,120 7,305Euro 195 2 187 6US Dollar 56 20 3,027 (2,991)
The floating rate financial assets comprise investments in variable interest ratepaying corporate debt and bank balances that bear interest at rates based onLIBOR or its overseas equivalent.
Floating Financialrate liabilities
Total financial not carryingliabilities liabilities any interest
Currency £’000 £’000 £’000
31.01.14UK Sterling 1,578 – 1,578Euro 134 – 134
31.01.13UK Sterling 2,426 – 2,426
Fixed rate financial assetsWeighted
averageWeighted period for
average which rate is Currency interest rate fixed (years)
31.01.14US Dollar 12.9% 15.0UK Sterling 10.3% 18.0Euro 9.6% 12.9
31.01.13Euro 5.8% 5.7UK Sterling 3.6% 11.7US Dollar 3.5% 6.6
For consideration of other risks including liquidity, pricing and credit risk, pleaserefer to the notes to the aggregated financial statements, pages 413 to 414.
13. Share classesThe Fund currently has four share classes; Class A Shares, Class B Shares, Class CShares and Class I Shares. The Authorised Corporate Director’s (ACD) fee and fixedexpenses charge are shown below.
ACD fee Fixed expensesClass A shares: 1.00% 0.18%Class B shares: 0.65% 0.18%Class C shares: 0.50% 0.18%Class I shares: 0.40% 0.00%
The net asset value of each share class, the net asset value per share and thenumber of shares in each class are shown on page 266. All classes have the samerights on winding up.
14. Derivatives The Fund enters into derivative transactions in the form of forward currencycontracts and futures. The Fund may use derivatives for investment purposes orefficient portfolio management including hedging, where appropriate.
The Investment Adviser assesses the market risk of the Fund’s investments,including derivative exposure, using historical simulation methodology. Thisprocess provides an estimate of the maximum potential loss that could beexpected to occur as a result of changes in market prices over a given period oftime in all but a given percentage of circumstances. The VaR is calculated on a99% confidence level with a 20 day horizon & 500 days of history. As at thebalance date the VaR was 2.66%.
The effective observation period changed to 500 days from 31/10/2012 onwardsdue to a change to a new VaR calculation process.
Further information on the derivative risks can be found in the notes to theaggregated financial statements on page 414.
15. Contingent liabilities and capital commitmentsAt the balance sheet date there were no contingent liabilities or capitalcommitments (2013: none).
Notes to the financial statements – continued
272
Continuation�
� Return to Index

273
Continuation�
� Return to Index
Final interest distribution in pence per share
Group 1 – Shares purchased prior to 1 November 2013Group 2 – Shares purchased 1 November 2013 to 31 January 2014
DistributionGross Tax Net payable paid
revenue at 20% revenue Equalisation 30.04.14 30.04.13
A-Class Accumulation Shares
Group 1 0.512500 0.102500 0.410000 – 0.410000 0.400000
Group 2 0.240443 0.048089 0.192354 0.217646 0.410000 0.400000
A-Class Income Shares
Group 1 0.337500 0.067500 0.270000 – 0.270000 0.260000
Group 2 0.186000 0.037200 0.148800 0.121200 0.270000 0.260000
B-Class Accumulation Shares
Group 1 0.600000 0.120000 0.480000 – 0.480000 0.440000
Group 2 0.600000 0.120000 0.480000 0.000000 0.480000 0.440000
B-Class Income Shares
Group 1 0.387500 0.077500 0.310000 – 0.310000 0.300000
Group 2 0.297004 0.059401 0.237603 0.072397 0.310000 0.300000
C-Class Accumulation Shares
Group 1 0.862500 0.172500 0.690000 – 0.690000 0.630000
Group 2 0.348864 0.069773 0.279091 0.410909 0.690000 0.630000
C-Class Gross Accumulation Shares
Group 1 0.810000 0.000000 0.810000 – 0.810000 0.810000
Group 2 0.111870 0.000000 0.111870 0.698130 0.810000 0.810000
C-Class Income Shares
Group 1 0.925000 0.185000 0.740000 – 0.740000 0.710000
Group 2 0.073697 0.014739 0.058958 0.681042 0.740000 0.710000
C-Class Gross Income Shares
Group 1 0.850000 0.000000 0.850000 – 0.850000 0.880000
Group 2 0.268016 0.000000 0.268016 0.581984 0.850000 0.880000
I-Class Accumulation Shares
Group 1 1.537500 0.307500 1.230000 – 1.230000 0.870000
Group 2 1.537500 0.307500 1.230000 0.000000 1.230000 0.870000
I-Class Gross Accumulation Shares
Group 1 1.020000 0.000000 1.020000 – 1.020000 1.010000
Group 2 1.020000 0.000000 1.020000 0.000000 1.020000 1.010000
I-Class Income Shares
Group 1 0.850000 0.170000 0.680000 – 0.680000 0.650000
Group 2 0.145129 0.029026 0.116103 0.563897 0.680000 0.650000
Distribution tables

Third interim interest distribution in pence per share
Group 1 – Shares purchased prior to 1 August 2013Group 2 – Shares purchased 1 August 2013 to 31 October 2013
DistributionGross Tax Net paid paid
revenue at 20% revenue Equalisation 31.01.14 31.01.13
A-Class Accumulation Shares
Group 1 0.500000 0.100000 0.400000 – 0.400000 0.400000
Group 2 0.261471 0.052294 0.209177 0.190823 0.400000 0.400000
A-Class Income Shares
Group 1 0.325000 0.065000 0.260000 – 0.260000 0.270000
Group 2 0.181275 0.036255 0.145020 0.114980 0.260000 0.270000
B-Class Accumulation Shares
Group 1 0.587500 0.117500 0.470000 – 0.470000 0.410000
Group 2 0.587500 0.117500 0.470000 0.000000 0.470000 0.410000
B-Class Income Shares
Group 1 0.362500 0.072500 0.290000 – 0.290000 0.270000
Group 2 0.236784 0.047357 0.189427 0.100573 0.290000 0.270000
C-Class Accumulation Shares
Group 1 0.825000 0.165000 0.660000 – 0.660000 0.620000
Group 2 0.359635 0.071927 0.287708 0.372292 0.660000 0.620000
C-Class Gross Accumulation Shares
Group 1 0.790000 0.000000 0.790000 – 0.790000 0.670000
Group 2 0.790000 0.000000 0.790000 0.000000 0.790000 0.670000
C-Class Income Shares
Group 1 0.887500 0.177500 0.710000 – 0.710000 0.730000
Group 2 0.540426 0.108085 0.432341 0.277659 0.710000 0.730000
C-Class Gross Income Shares
Group 1 0.820000 0.000000 0.820000 – 0.820000 0.900000
Group 2 0.404505 0.000000 0.404505 0.415495 0.820000 0.900000
I-Class Accumulation Shares
Group 1 1.425000 0.285000 1.140000 – 1.140000 0.940000
Group 2 1.425000 0.285000 1.140000 0.000000 1.140000 0.940000
I-Class Gross Accumulation Shares
Group 1 0.990000 0.000000 0.990000 – 0.990000 1.010000
Group 2 0.484084 0.000000 0.484084 0.505916 0.990000 1.010000
I-Class Income Shares
Group 1 0.812500 0.162500 0.650000 – 0.650000 0.650000
Group 2 0.632900 0.126580 0.506320 0.143680 0.650000 0.650000
Distribution tables – continued
274
Continuation�
� Return to Index

275
Continuation�
� Return to Index
Second interim interest distribution in pence per share
Group 1 – Shares purchased prior to 1 May 2013Group 2 – Shares purchased 1 May 2013 to 31 July 2013
DistributionGross Tax Net paid paid
revenue at 20% revenue Equalisation 31.10.13 31.10.12
A-Class Accumulation Shares
Group 1 0.462500 0.092500 0.370000 – 0.370000 0.420000
Group 2 0.191971 0.038394 0.153577 0.216423 0.370000 0.420000
A-Class Income Shares
Group 1 0.300000 0.060000 0.240000 – 0.240000 0.290000
Group 2 0.134674 0.026935 0.107739 0.132261 0.240000 0.290000
B-Class Accumulation Shares
Group 1 0.537500 0.107500 0.430000 – 0.430000 –
Group 2 0.537500 0.107500 0.430000 0.000000 0.430000 –
B-Class Income Shares
Group 1 0.350000 0.070000 0.280000 – 0.280000 –
Group 2 0.154776 0.030955 0.123821 0.156179 0.280000 –
C-Class Accumulation Shares
Group 1 0.750000 0.150000 0.600000 – 0.600000 –
Group 2 0.358843 0.071769 0.287074 0.312926 0.600000 –
C-Class Gross Accumulation Shares
Group 1 0.720000 0.000000 0.720000 – 0.720000 –
Group 2 0.720000 0.000000 0.720000 0.000000 0.720000 –
C-Class Income Shares
Group 1 0.812500 0.162500 0.650000 – 0.650000 0.770000
Group 2 0.352303 0.070461 0.281842 0.368158 0.650000 0.770000
C-Class Gross Income Shares
Group 1 0.770000 0.000000 0.770000 – 0.770000 0.950000
Group 2 0.461594 0.000000 0.461594 0.308406 0.770000 0.950000
I-Class Accumulation Shares
Group 1 1.300000 0.260000 1.040000 – 1.040000 0.970000
Group 2 1.300000 0.260000 1.040000 0.000000 1.040000 0.970000
I-Class Gross Accumulation Shares
Group 1 0.890000 0.000000 0.890000 – 0.890000 1.060000
Group 2 0.296773 0.000000 0.296773 0.593227 0.890000 1.060000
I-Class Income Shares
Group 1 0.737500 0.147500 0.590000 – 0.590000 0.690000
Group 2 0.633411 0.126682 0.506729 0.083271 0.590000 0.690000
Distribution tables – continued

First interim interest distribution in pence per share
Group 1 – Shares purchased prior to 1 February 2013Group 2 – Shares purchased 1 February 2013 to 30 April 2013
DistributionGross Tax Net paid paid
revenue at 20% revenue Equalisation 31.07.13 31.07.12
A-Class Accumulation Shares
Group 1 0.475000 0.095000 0.380000 – 0.380000 0.460000
Group 2 0.257903 0.051580 0.206323 0.173677 0.380000 0.460000
A-Class Income Shares
Group 1 0.325000 0.065000 0.260000 – 0.260000 0.310000
Group 2 0.144076 0.028815 0.115261 0.144739 0.260000 0.310000
B-Class Accumulation Shares
Group 1 0.525000 0.105000 0.420000 – 0.420000 –
Group 2 0.525000 0.105000 0.420000 0.000000 0.420000 –
B-Class Income Shares
Group 1 0.350000 0.070000 0.280000 – 0.280000 –
Group 2 0.110296 0.022059 0.088237 0.191763 0.280000 –
C-Class Accumulation Shares
Group 1 0.800000 0.160000 0.640000 – 0.640000 –
Group 2 0.364261 0.072852 0.291409 0.348591 0.640000 –
C-Class Gross Accumulation Shares
Group 1 0.780000 0.000000 0.780000 – 0.780000 –
Group 2 0.138043 0.000000 0.138043 0.641957 0.780000 –
C-Class Income Shares
Group 1 0.850000 0.170000 0.680000 – 0.680000 0.820000
Group 2 0.183102 0.036620 0.146482 0.533518 0.680000 0.820000
C-Class Gross Income Shares
Group 1 0.840000 0.000000 0.840000 – 0.840000 1.020000
Group 2 0.374189 0.000000 0.374189 0.465811 0.840000 1.020000
I-Class Accumulation Shares
Group 1 1.150000 0.230000 0.920000 – 0.920000 1.000000
Group 2 1.150000 0.230000 0.920000 0.000000 0.920000 1.000000
I-Class Gross Accumulation Shares
Group 1 0.990000 0.000000 0.990000 – 0.990000 1.100000
Group 2 0.990000 0.000000 0.990000 0.000000 0.990000 1.100000
I-Class Income Shares
Group 1 0.775000 0.155000 0.620000 – 0.620000 0.720000
Group 2 0.436905 0.087381 0.349524 0.270476 0.620000 0.720000
Equalisation applies only to shares purchased during the distribution period (group 2 shares). It is the average amount of revenue included in the purchase price of all group 2 shares and is refunded to holders of these
shares as a return of capital. Being capital it is not liable to income tax but must be deducted from the cost of shares for capital gains tax purposes.
Distribution tables – continued
276
� Return to Index
277
Continuation�
� Return to Index
Investment objective and policyTo maximise returns by investing primarily in a global portfolio of fixed andfloating rate Debt Securities.
In the fund manager’s view, maximising returns means generating higherreturns than those available from money market instruments denominatedin Sterling.
The Fund may invest in developed and Emerging Market countries and holdInvestment Grade, Below-Investment Grade and Unrated Bonds. The Fundmay have a concentrated portfolio and may have a significant exposure toany one country, sector or issuer, which may include Emerging Markets andBelow-Investment Grade or Unrated Bonds, at any time. Allocations betweencountries, sectors and ratings of Bonds may vary significantly at any time.The Fund may use Financial Derivative Instruments (derivatives) forinvestment purposes or Efficient Portfolio Management including hedging,where appropriate.
The Fund is also permitted to invest up to 100% in government and publicsecurities (see section 3.11(e) of the Prospectus). The Fund’s assets will beprimarily either denominated in Sterling or hedged back to Sterling.
Risk profileThe value of your investment may fall as well as rise and you may get backless than you originally invested.
Positive returns are not guaranteed and the Fund should not be used as asubstitute for traditional liquidity funds or cash accounts.
Bond funds may not behave like direct investments in the underlying Bondsthemselves. By investing in Bond funds, the certainty of receiving a regularfixed amount of income for a defined period of time with the prospect of afuture known return of capital is lost.
The value of bonds and other debt securities may change significantlydepending on market, economic and interest rate conditions as well as thecreditworthiness of the issuer. Issuers of Bonds and other Debt Securitiesmay fail to meet payment obligations (default) or the credit rating of Bondsand other Debt Securities may be downgraded. These risks are typicallyincreased for Below Investment Grade and certain Unrated securities whichmay also be subject to higher volatility and be more difficult to sell thanInvestment Grade securities.
Convertible Bonds are subject to the credit, interest rate and market risksassociated with both Bonds and Equity securities, and to risks specific toConvertible Securities. Convertible Bonds may also be more difficult to sellthan the underlying Equity securities.
Emerging Markets may be subject to increased political, regulatory andeconomic instability, less developed custody and settlement practices,poor transparency and greater financial risks. Emerging Market currenciesmay be subject to volatile price movements. Emerging Market securities mayalso be subject to higher volatility and be more difficult to sell than non-Emerging Market securities.
Bonds and other Debt Securities with a lower credit rating may have a higherrisk of defaulting which may in turn have an adverse effect on the performanceof Funds which invest in them.
The Fund may use Financial Derivative Instruments (derivatives) and/orforward transactions for investment purposes. The value of derivatives canbe volatile. This is because a small movement in the value of the underlyingasset can cause a large movement in the value of the derivative and therefore,investment in derivatives may result in losses in excess of the amount investedby the Fund.
The possible loss from taking a Short Position on a security (using FinancialDerivative Instruments) may be unlimited as there is no restriction on theprice to which a security may rise. The Short Selling of investments may besubject to changes in regulations, which could adversely impact returns toinvestors.
The Fund may have a significant exposure to Asset and Mortgage BackedSecurities (ABS and MBS). ABS / MBS may be difficult to sell, subject toadverse changes to interest rates and to the risk that the payment obligationsrelating to the underlying asset are not met.
The Fund may be concentrated in a limited number of securities, industrysectors or countries and as a result, may be more volatile than more broadlydiversified funds.
Bond funds will normally distribute a combination of coupon and the expecteddiscount/premium on the securities. Therefore, a Fund’s distribution willcomprise income received and an element of projected capital gains orlosses. This could result in an element of capital gain being taxed as incomein the hands of an investor.
To the extent that any underlying assets of the Fund are denominated in acurrency other than Sterling and are not hedged back to Sterling, movementsin currency exchange rates can adversely affect the return of your investment.The currency hedging that may be used to minimise the effect of currencyfluctuations may not always be successful.
The Fund may invest in Structured Products which will involve additionalrisks including the movements in the value of the underlying asset and therisk of the issuer of the Structured Product becoming insolvent.
The Fund may invest in Credit Linked Notes which involve the risk of theunderlying credit instrument decreasing in value or defaulting and the riskof the issuer of the Credit Linked Note becoming insolvent.
Please refer to Part 11 of the Prospectus for details of the general risk factorsaffecting this Fund in addition to the specific risk factors above.
Fund reviewIt proved to be a year for risky assets, with high yield being the best performingasset class within fixed income.
The Fund delivered a positive absolute return for the 12-month period to 31January 2014, driven by its high yield and securitised products exposure. Inthe period, we remained overweight high yield and reduced our allocationto investment grade corporate bonds. We sold our covered bond and agencymortgage-backed securities (MBS) exposure and increased our non-agencyMBS exposure. We held short government positions to reduce the durationof the Fund and protect against rising rates.
Fund outlookWe expect economies to continue to gradually recover, backed by strongerdata and central bank policy in developed markets remaining expansionary.However, our optimism is restrained by the potential for deflation in Europe,led by falling prices in the periphery, the failure of Abenomics to stimulatetrade, and widespread sub-trend growth in emerging markets. Governmentbond yields should continue to rise and investor appetite for spread productis likely to remain robust. Emerging markets remain under pressure andwe are closely watching for attractive entry points to accumulate both localbonds and currencies.
JPM Strategic Bond Fund

278
12 month performance as at 31 January 2014 2013 2012 2011
JPM Strategic BondA-Class Acc 1.1% 4.5% 3.7% 7.0%
JPM Strategic BondB-Class Acc 1.4% – – –
JPM Strategic BondC-Class Inc 1.4% 4.8% 4.1% 7.0%
JPM Strategic Bond I-Class Gross Acc 2.6% 6.0% 5.2% 8.9%
JPM Strategic BondX-Class Acc 1.9% 5.4% – –
Benchmark IndexA 0.5% 2.7% 16.0% 4.9%
Fund statisticsRisk and Reward Profile 4*
Fund size £589.2m
Benchmark IndexA ICE Overnight GBP LIBOR
Fund chargesA-Class Initial 3.00%, Annual 1.00%B-Class Initial Nil, Annual 0.65%C-Class Initial Nil, Annual 0.50%I-Class Initial Nil, Annual 0.40%X-Class On applicationB
Top ten holdings (excluding Liquidity funds) %US Treasury 0% Mar 2014 1.0Mexico 3.625% 2022 1.0South Africa 5.875% 2025 1.0Russia 4.875% 2023 1.0GS Mortgage Securities Mortgage 2045 0.8HBOS Capital Funding 6.461% FRN Perpetual 0.7JPMorgan Senior Secured Loan Fund 0.7Sequoia Mortgage Trust FRN 2043 0.6General Electric Capital 6.3750% FRN 2067 0.6Bear Stearns Mortgage Securities FRN 2041 0.6
Sector breakdown %Fixed interest securities 82.4Liquidity funds 6.5Government bonds 5.2Equity 0.7Forward currency contracts 0.2Futures (0.2)Swaps (0.2)Net other assets 5.4
In line with current accounting practice the sector breakdown includes the unrealised profit or loss onderivative holdings and consequently the economic market exposure of the Fund cannot be fully determinedfrom the above disclosure.
Highest/lowest share price and distribution recordHighest Lowest Distribution
Calendar year share price share price per shareA-Class Accumulation SharesC
2009 57.46p 49.55p 0.89p2010 61.78p 57.39p 2.02p2011 63.31p 60.94p 1.79p2012 66.99p 62.96p 1.79p2013 68.86p 65.31p 2.08p2014D 68.32p 67.81p 0.48pA-Class Income SharesC
2009 56.53p 49.55p 0.89p2010 58.71p 56.07p 1.97p2011 59.52p 56.70p 1.56p2012 60.28p 57.81p 1.65p2013 60.94p 57.80p 1.85p2014D 59.49p 59.04p 0.41pB-Class Accumulation SharesE
2012 67.01p 65.97p 0.35p2013 68.97p 65.44p 2.27p2014D 68.56p 68.05p 0.52pB-Class Income SharesF
2012 103.6p 99.29p 2.30p2013 104.7p 99.32p 3.46p2014D 102.3p 101.5p 0.78pC-Class Accumulation SharesG
2012 101.5p 99.94p 0.58p2013 104.1p 98.80p 3.57p2014D 103.6p 102.8p 0.82pC-Class Gross Accumulation SharesG
2012 101.7p 100.0p 0.64p2013 105.1p 99.78p 4.51p2014D 105.1p 104.4p 1.05pC-Class Income SharesH
2009 104.0p 99.80p 0.13p2010 107.9p 103.0p 4.16p2011 109.4p 104.2p 3.46p2012 110.8p 106.2p 3.51p2013 111.9p 106.2p 3.83p2014D 109.4p 108.5p 0.87pC-Class Gross Income SharesI
2012 103.4p 98.90p 1.62p2013 104.5p 99.04p 4.48p2014D 102.0p 101.3p 1.02pI-Class Accumulation SharesJ
2011 100.6p 97.04p 1.52p2012 107.5p 100.4p 3.50p2013 110.7p 105.1p 4.00p2014D 110.3p 109.5p 0.94p
You should remember that past performance is not a guide to the future. The price of investments and the income from them may fall as well as rise andinvestors may not get back the full amount invested.
* For specific risks, including the risk and reward profile, please refer to the Key Investor information Document (KIID) available on the following websitehttp://am.jpmorgan.co.uk/investor/prices-and-factsheets/?list=all&tab=PricesAll performance returns are calculated using the quoted price of the accumulation and income shares. Performance returns are in Sterling.Source: J.P. Morgan.A On 11/06/12 the benchmark for the Fund was changed from BofA Merrill Lynch GBP Broad Market Index to BBA Overnight GBP LIBOR. B As agreed from time to time between the ACD and the relevant JPMorgan Chase & Co. entity.
Continuation�
� Return to Index

279
Continuation�
� Return to Index
Highest/lowest share price and distribution record(continued)
Highest Lowest DistributionCalendar year share price share price per shareI-Class Gross Accumulation SharesK
2009 112.2p 100.0p 1.98p2010 122.6p 112.2p 5.86p2011 126.8p 122.3p 5.36p2012 136.8p 126.8p 5.57p2013 141.4p 134.3p 6.90p2014D 141.7p 140.7p 1.51pI-Class Income SharesJ
2011 100.5p 96.40p 1.50p2012 102.5p 98.19p 3.41p2013 103.6p 98.26p 3.76p2014D 101.2p 100.5p 0.86pI-Class Gross Income SharesL
2010 102.7p 98.44p 2.93p2011 104.2p 99.19p 4.40p2012 105.4p 100.9p 4.36p2013 106.6p 101.0p 4.85p2014D 104.0p 103.3p 1.10pX-Class Accumulation SharesM
2011 100.9p 99.16p –2012 108.2p 100.8p 3.80p2013 111.6p 106.0p 4.33p2014D 111.5p 110.6p 1.03pX-Class Gross Accumulation SharesN
2012 104.6p 98.43p 2.85p2013 108.3p 102.9p 5.27p2014D 108.8p 108.0p 1.24pX-Class Gross Income SharesO
2013 101.7p 96.35p 4.08p2014D 99.29p 98.58p 1.14p
C A-Class Accumulation Shares and A-Class Income Shares were launched on 7 May 2009.D To 31 January 2014.E B-Class Accumulation Shares were launched on 29 October 2012.F B-Class Income Shares were launched on 18 January 2012.G C-Class Accumulation Shares and C-Class Gross Accumulation Shares were launched on 1 October 2012.H C-Class Income Shares were launched on 19 October 2009.I C-Class Gross Income Shares were launched on 24 April 2012.J I-Class Accumulation Shares and I-Class Income Shares were launched on 21 April 2011.K I-Class Gross Accumulation Shares were launched on 1 July 2009.L I-Class Gross Income Shares were launched on 6 April 2010.M X-Class Accumulation Shares were launched on 2 November 2011.N X-Class Gross Accumulation Shares were launched on 29 February 2012.O X-Class Gross Income Shares were launched on 9 January 2013.
Portfolio turnover rate31.01.13 469.9%31.01.14 210.5%
The portfolio turnover rate (PTR) reflects the total of security purchases and sales (excluding Liquidityfunds), less the total of share issues and cancellations, expressed as a percentage of the average daily netasset values over the period.
Portfolio transaction costsBroker Transaction
Commissions Taxes Total31.01.13 0.00% 0.00% 0.00%31.01.14 0.00% 0.00% 0.00%
The percentage figures disclosed above reflect the average broker commissions and transaction taxessuffered during the last 3 years divided by the average assets under management over the same period.
Stamp duty reserve tax31.01.13 0.00%31.01.14 0.00%
The percentage figures disclosed above reflect the total stamp duty reserve tax suffered during the yeardivided by the average assets under management over the same period.
Net asset values and Ongoing chargesNet assetvalue per Net asset
share class Number value per OngoingDate £’000 of shares share chargesA-Class Accumulation Shares31.01.12 89,516 140,270,479 63.82p 1.18%31.01.13 112,912 168,818,240 66.88p 1.18%31.01.14 59,101 87,441,789 67.59p 1.18%A-Class Income Shares31.01.12 58,965 100,864,947 58.46p 1.18%31.01.13 84,529 141,661,206 59.67p 1.18%31.01.14 29,537 50,543,380 58.44p 1.18%B-Class Accumulation Shares31.01.13 53 79,581 66.91p 0.83%31.01.14 502 740,098 67.83p 0.83%B-Class Income Shares31.01.12 5 5,000 100.4p 0.80%31.01.13 961 937,517 102.5p 0.83%31.01.14 1,629 1,622,689 100.4p 0.83%C-Class Accumulation Shares31.01.13 3,374 3,340,008 101.0p 0.68%31.01.14 28,667 27,975,574 102.5p 0.68%C-Class Gross Accumulation Shares31.01.13 5 4,750 101.7p 0.68%31.01.14 1,201 1,154,269 104.0p 0.68%C-Class Income Shares31.01.12 81,568 75,987,808 107.3p 0.62%31.01.13 102,339 93,393,434 109.6p 0.68%31.01.14 113,785 106,025,502 107.3p 0.68%C-Class Gross Income Shares31.01.13 13,771 13,493,410 102.1p 0.68%31.01.14 31,285 31,305,771 99.93p 0.68%I-Class Accumulation Shares31.01.12 6 6,000 101.8p 0.40%31.01.13 105 97,926 107.4p 0.40%31.01.14 829 759,475 109.2p 0.40%

Net asset values and Ongoing charges (continued)Net assetvalue per Net asset
share class Number value per OngoingDate £’000 of shares share chargesI-Class Gross Accumulation Shares31.01.12 5,427 4,217,453 128.7p 0.40%31.01.13 4,035 2,951,759 136.7p 0.40%31.01.14 10 7,475 140.3p 0.40%I-Class Income Shares31.01.12 15,822 15,936,969 99.28p 0.40%31.01.13 22,519 22,220,680 101.3p 0.40%31.01.14 26,347 26,536,348 99.29p 0.40%I-Class Gross Income Shares31.01.12 34,191 33,533,941 102.0p 0.40%31.01.13 39,590 38,048,331 104.0p 0.40%31.01.14 60,295 59,195,426 101.9p 0.40%X-Class Accumulation Shares31.01.12 70,626 69,048,871 102.3p 0.06%31.01.13 97,188 89,834,603 108.2p 0.06%31.01.14 76,144 69,043,871 110.3p 0.06%X-Class Gross Accumulation Shares31.01.13 99,653 95,244,828 104.6p 0.06%31.01.14 101,773 94,506,270 107.7p 0.06%X-Class Gross Income Shares31.01.13 59,360 59,821,538 99.23p 0.06%31.01.14 58,101 59,821,538 97.12p 0.06%
The net asset value and the net asset value per income share are shown ex-dividend.
Following the adoption of the requirements of UCITS IV in June 2012, Ongoing charges has replaced theTotal Expense Ratio (“TER”). The Ongoing charges takes into account the ACD fee, the fixed expenses andany expenses paid to an affiliate in respect of stocklending activities, expressed as a percentage of theaverage daily net asset values over the period. The main difference between the two calculations is theinclusion of custodian handling charges and stocklending fees in the Ongoing charges figure. The comparativefigures have not been restated, and the historic TER is disclosed.
280
Continuation�
� Return to Index

281
Continuation�
� Return to Index
Equity – 0.7% (0.0%)United Kingdom – 0.7% JPMorgan Senior Secured Loan Fund 3,825,000 3,863 0.7
Fixed interest securities – 82.4% (96.5%)US Dollar – 70.5% A10 Revolving Asset Financing FRN 2019 $3,750,000 2,278 0.4ABFC Asset Backed Certificates FRN 2035 $92,864 55 – ABS Home Equity Loan Trust FRN 2034 $127,055 72 – Accellent 8.375% 2017 $2,195,000 1,397 0.2Ace Cash Express 11% 2019 $305,000 150 – ACE Securities Corporation FRN Sep 2033 $1,662,608 941 0.2ACE Securities Corporation FRN Dec 2033 $4,144,267 2,368 0.4ACE Securities Home Equity FRN 2035 $15,435 9 – ADT 6.25% 2021 $70,000 45 – Advanced Micro Devices 7.75% 2020 $25,000 15 – Advanced Micro Devices 7.5% 2022 $15,000 9 – Aircastle 6.75% 2017 $1,180,000 803 0.1Aircastle 7.625% 2020 $1,210,000 833 0.1AK Steel 8.75% 2018 $195,000 134 – Albertsons 7.45% 2029 $150,000 74 – Albertsons 8.7% 2030 $50,000 26 – Alere 7.25% 2018 $190,000 126 – Aleris International 7.875% 2020 $175,000 112 – Allison Transport 7.125% 2019 $1,180,000 774 0.1Ally Financial FRN 2016 $200,000 124 – Ally Financial 6.25% 2017 $1,735,000 1,171 0.2Ally Financial 8% 2031 $95,000 70 – Alternative Loan Trust 6% 2022 $321,334 190 – Altria Group 2.85% 2022 $780,000 444 0.1Altria Group 4.25% 2042 $1,820,000 967 0.2AMC Entertainments 8.75% 2019 $1,580,000 1,022 0.2AMC Entertainments 9.75% 2020 $1,250,000 871 0.2Amer Airlines 4.95% 2024 $1,552,641 1,005 0.2American Airlines 4% 2025 $2,189,045 1,300 0.2American Axle & Manufacturing 7.75% 2019 $1,700,000 1,175 0.2American Home Mortgage Assets FRN 2046 $126,174 53 – American International Group 6.25% 2087 $1,205,000 732 0.1Ameriquest Mortgage FRN Jan 2034 $771,522 427 0.1Ameriquest Mortgage FRN Sep 2034 $1,145,000 684 0.1Ameristar Casinos 7.5% 2021 $28,000 18 – Amkor Technology 6.625% 2021 $220,000 140 – Amkor Technology 6.375% 2022 $45,000 28 – Aperam 7.375% 2016 $200,000 126 – Arcelormittal 9.85% 2019 $670,000 509 0.1Ardagh Packaging Finance 7.375% 2017 $200,000 129 – Ardagh Packaging Finance 7.375% 2017 144A $200,000 130 – Ardagh Packaging Finance 9.125% 2020 $2,800,000 1,863 0.3A-S Co-Issuer 7.875% 2020 $90,000 58 – Audatex North America 6% 2021 $26,000 16 – Audatex North America 6.125% 2023 $12,000 8 – Avaya 7% 2019 $1,770,000 1,062 0.2Avaya 10.5% 2021 $47,000 26 – Avis Budget Car Rental 8.25% 2019 $100,000 65 – Avis Budget Car Rental 9.75% 2020 $25,000 18 – Banc of America Alternative Loan Trust 5.5%
2019 $1,272,667 785 0.1Banc of America Alternative Loan Trust 5.5%
2033 $5,247,149 3,323 0.6Banc of America Alternative Loan Trust 6%
2035 $158,034 96 – Banc of America Alternative Loan Trust 6%
2046 $250,705 129 – Banc of America Commercial Mortgage
4.18% 2034 $978,107 594 0.1Banc of America Commercial Mortgage
5.118% 2045 $1,200,000 724 0.1Banc of America Commercial Mortgage
5.39% 2045 $4,300,000 2,835 0.5Banc of America Commercial Mortgage
FRN 2045 $4,285,000 2,750 0.5Banc of America Commercial Mortgage
5.675% 2046 $1,400,000 927 0.2Bank of America 3.3% 2023 $3,170,000 1,839 0.3Bank of America FRN 2045 $4,950,000 3,309 0.6Bankinter III FRN 2038 $2,710,581 2,086 0.4Barclays Bank 7.625% 2022 $4,100,000 2,658 0.5Basic Energy Services 7.75% 2022 $250,000 159 – Bayview Financial Mortgage Trust FRN 2041 $254,844 155 – B/E Aerospace 6.875% 2020 $115,000 76 – Bear Stearns ABS Trust FRN 2036 $1,777,763 1,062 0.2
Bear Stearns CMS Trust 5.237% 2038 $2,400,000 1,437 0.2Bear Stearns CMS Trust 5.71% 2040 $1,400,000 955 0.2Bear Stearns FRN 2039 $700,000 445 0.1Bear Stearns Mortgage Securities FRN 2040 $2,400,000 1,393 0.2Bear Stearns Mortgage Securities FRN 2041 $5,000,000 3,328 0.6Belden 5.5% 2022 $750,000 444 0.1Berry Plastics 9.5% 2018 $75,000 49 – Berry Plastics 9.75% 2021 $200,000 140 – Beverage Packaging Holdings 5.625% 2016 $25,000 16 – Billion Express Investment 0.75% 2015 $2,900,000 1,770 0.3BI-LO Finance 8.625% 2018 $12,000 8 – Biomet 6.5% 2020 $2,655,000 1,720 0.3Blucora 4.25% 2019 $2,375,000 1,952 0.3Bluewater Holding 10% 2019 $100,000 61 – Boise Cascade Finance 6.375% 2020 $50,000 32 – Bombardier 7.5% 2018 $300,000 203 – Boston Properties 3.125% 2023 $1,880,000 1,065 0.2BPCE 5.7% 2023 $3,615,000 2,258 0.4Breitburn Energy Partners 8.625% 2020 $2,200,000 1,440 0.3Breitburn Energy Partners 7.875% 2022 $845,000 548 0.1Brookfield Residential Property 6.5% 2020 $25,000 16 – Brookfield Residential Property 6.125% 2022 $75,000 46 – Bumble Bee Acquisiton 9% 2017 $3,047,000 2,027 0.4Cablevision Systems 8% 2020 $175,000 119 – Caesars Entertainment Operating 11.25%
2017 $2,650,000 1,638 0.3Caesars Entertainment Operating 8.5% 2020 $585,000 339 0.1Caesars Entertainment Operating 9% 2020 $1,560,000 919 0.2Calpine 7.875% 2020 $355,000 236 – Capsugel 7% 2019 $30,000 19 – Casella Waste Systems 7.75% 2019 $200,000 125 – Catalent Pharma Solutions 7.875% 2018 $500,000 309 0.1CBS Outdoor Americas Capital 5.25% 2022 $10,000 6 – CBS Outdoor Americas Capital 5.625% 2024 $10,000 6 – CCM Merger 9.125% 2019 $20,000 13 – CCO Holdings 7.375% 2020 $2,985,000 1,968 0.3CCO Holdings 8.125% 2020 $350,000 231 – CCO Holdings 6.5% 2021 $95,000 60 – CD Mortgage Trust FRN 2044 $3,900,000 2,617 0.5Cemex Espana 9.875% 2019 $150,000 103 – Cemex Finance 9.375% 2022 $400,000 273 0.1Central Garden & Pet 8.25% 2018 $2,550,000 1,522 0.3CenturyLink 5.8% 2022 $1,025,000 616 0.1CenturyLink 6.75% 2023 $880,000 543 0.1Cenveo 8.875% 2018 $90,000 54 – Chase Funding Mortgage Loan FRN 2033 $1,360,540 866 0.2Chrysler Group 8.25% 2021 $3,420,000 2,330 0.4CIT Group 5% 2017 $285,000 185 – CIT Group 5.25% 2018 $2,585,000 1,677 0.3CIT Group 5% 2022 $2,650,000 1,600 0.3Citgo Petroleum 11.5% 2017 $305,000 198 – Citigroup 6.675% 2043 $1,325,000 921 0.2Citigroup Commercial Mortgage Loan Trust
FRN 2046 $600,000 324 0.1Citigroup Mortgage Loan Trust 5.5% 2035 $200,417 121 – Citigroup Mortgage Loan Trust FRN 2035
STEP $6,455 4 – Citigroup Mortgage Loan Trust FRN 2037 $176,733 107 – Citigroup/Deutsche Bank Mortgage Loan
Trust FRN 2044 $2,000,000 1,384 0.2Citigroup/Deutsche Bank Mortgage Loan
Trust 5.688% 2048 $550,000 314 0.1Citigroup/Deutsche Commercial Mortgage
Loan Trust FRN 2044 $3,700,000 2,375 0.4Claires Stores 8.875% 2019 $400,000 236 – Claires Stores 9% 2019 $2,020,000 1,289 0.2Clear Channel Communication 9% 2019 $950,000 590 0.1Clear Channel Worldwide 7.625% 2020 ‘B’ $400,000 256 – Clear Channel Worldwide 6.5% 2022 ‘B’ $3,750,000 2,341 0.4Coeur Mining 7.875% 2021 $175,000 109 – Commercial Mortgage Trust FRN 2046 $500,000 260 0.1Constellation Brands 3.75% 2021 $750,000 437 0.1Constellation Brands 4.25% 2023 $750,000 430 0.1Continental Airlines 7.25% 2019 $330,431 231 – Continental Airlines 7.875% 2020 $86,505 57 – Continental Airlines 4% 2026 $1,815,000 1,103 0.2Convatec Healthcare 10.5% 2018 $850,000 575 0.1Countrywide Securities 2.56375% 2032 $239,157 135 – CPS Auto 4.3% 2019 $2,400,000 1,478 0.3Credit Suisse 5.4% 2020 $2,840,000 1,948 0.3Credit Suisse 6.5% 2023 $580,000 375 0.1
Portfolio statement As at 31 January 2014
Market value Total netInvestment Holding £’000 assets %
Market value Total netInvestment Holding £’000 assets %

Credit Suisse 7.5% FRN Perpetual $1,445,000 928 0.2Credit Suisse Mortgage Capital 5.465% 2039 $3,419,000 2,219 0.4Credit-Based Asset Servicing FRN 2035 $54,403 33 – Crestview DS Merger Sub II 10% 2021 $400,000 266 0.1Crown Castle International 5.25% 2023 $2,130,000 1,284 0.2CSFB Mortgage Backed FRN Jun 2034 $1,325,565 816 0.1CSFB Mortgage Backed FRN Sep 2034 $2,915,542 1,813 0.3CSFB Mortgage Backed 5.5% 2035 $725,000 454 0.1CSMC Mortgage Backed Trust 5.5% 2037 $1,117,347 654 0.1CWABS FRN Mar 2034 $453,334 265 0.1CWABS FRN Jun 2034 $2,233,000 1,221 0.2CWABS FRN Jul 2034 $1,351,284 779 0.1CWALT 6% 2034 $780,215 490 0.1CWALT 5.75% 2035 $988,134 594 0.1CWALT 6% 2035 $975,657 584 0.1Darling International 5.375% 2022 $15,000 9 – DaVita Healthcare 6.375% 2018 $100,000 64 – DaVita Healthcare 6.625% 2020 $962,000 628 0.1DCP Midstream Partners 3.875% 2023 $1,130,000 653 0.1DDR 7.875% 2020 $1,405,000 1,062 0.2Del Monte 7.625% 2019 $2,450,000 1,547 0.3Delta Air Lines 6.2% 2018 $1,066,221 727 0.1Delta Air Lines ‘A’ 7.75% 2021 $165,779 118 – Denali Finance 5.625% 2020 $191,000 115 – Denbury Resources 8.25% 2020 $1,885,000 1,255 0.2Diamondback Energy 7.625% 2021 $174,000 111 – DirecTV 5.15% 2042 $1,160,000 648 0.1Dish DBS 7.875% 2019 $1,490,000 1,033 0.2Dish DBS 6.75% SNR 2021 $2,610,000 1,697 0.3Dish DBS 5.875% 2022 $425,000 259 – DJO Finance 7.75% SNR 2018 $1,500,000 932 0.2DJO Finance 8.75% 2018 $1,265,000 847 0.1Dupont Fabros Technology 5.875% 2021 $12,000 8 – E Trade Financial 6.75% 2016 $95,000 63 – EDF 5.25% Perpetual $710,000 420 0.1EDP Finance 5.25% 01/21 $1,845,000 1,141 0.2Embarq 7.995% 2036 $267,000 168 – Energy Transfer Partners 6.5% 2042 $1,305,000 867 0.2Energy XXI Gulf Coast 7.5% 2021 $131,000 83 – Entergy Arkansas 3.75% 2021 $1,330,000 849 0.2Enterprise Products 5.7% 2042 $1,065,000 709 0.1Epicor Software 8.625% 2019 $875,000 577 0.1Equinix 3% 2014 $2,000,000 1,994 0.3Everest Acquisition 6.875% 2019 $1,450,000 947 0.2Everest Acquisition 9.375% 2020 $1,715,000 1,198 0.2Exeter Automobile 4.35% 2019 $3,000,000 1,872 0.3FDIC 4.5% 2018 $378,645 232 – FHLM 5% 2021 $1,526,312 65 – FHLM FRN 2036 $1,967,550 213 – First Data 7.375% 2019 $150,000 98 – First Data 14.5% 2019 $41,249 23 – First Data 6.75% 2020 $1,575,000 1,008 0.2First Data 8.875% 2020 $750,000 502 0.1First Data 8.25% 2021 $193,000 124 – First Data 11.75% 2021 $47,000 30 – First Data 11.75% 2021 (144A) $80,000 50 – First Data 12.625% 2021 $248,000 176 – First Data 8.75% 2022 $1,640,000 1,059 0.2First Horizon Alternative Mortgage Securities
Trust 5% 2020 $801,168 500 0.1First Horizon Alternative Mortgage Securities
Trust 5.5% 2035 $933,584 576 0.1First Horizon Mortgage Pass Through Trust
5.5% Nov 2035 $2,900,000 1,757 0.3FMG Resources 7% 2015 $41,000 26 – FMG Resources 8.25% 2019 $2,025,000 1,359 0.2FNMA 3.5% 30 Yrs Mar 2027 $4,037,589 344 0.1FNMA 3% 30 Yrs May 2027 $2,150,150 156 – FNMA 3.5% 30 Yrs Jun 2027 $9,369,218 752 0.1FNMA 3.5% 30 Yrs Jul 2027 $12,045,605 1,015 0.2FNMA 3% 30 Yrs Aug 2027 $5,608,420 410 0.1FNMA 3.5% 30 Yrs Sep 2027 $5,635,616 505 0.1FNMA 3% 30 Yrs 15 Nov 2027 $2,051,976 149 – FNMA 3% 30 Yrs 25 Nov 2027 $11,588,809 879 0.2FNMA 3% 30 Yrs Dec 2027 $4,000,411 290 0.1FNMA 2012-144 3% 30 Yrs Jan 2028 $3,402,679 247 – FNMA 2012-145 3% 30 Yrs Jan 2028 $9,556,809 710 0.1FNMA 2012-149 3% 30 Yrs Jan 2028 $2,285,270 172 – FNMA 2012-150 3% 30 Yrs Jan 2028 $7,049,823 522 0.1FNMA 2012-9 3% 30 Yrs Feb 2028 $2,894,767 212 – FNMA 2013-5 3% 30 Yrs Feb 2028 $14,511,922 1,127 0.2
FNMA 2013-10 3% 30 Yrs Feb 2028 $4,455,084 328 0.1FNMA 3.5% 30 Yrs Feb 2028 $3,775,894 337 0.1FNMA 3% 30 Yrs Mar 2028 $2,875,005 217 – FNMA 3% 30 Yrs Apr 2028 $7,597,155 591 0.1FNMA 3.5% 30 Yrs Apr 2028 $15,135,439 1,276 0.2FNMA 4% 30 Yrs Nov 2029 $2,256,086 213 – FNMA FRN 30 Yrs 2034 $1,922,338 180 – FNMA FRN 30 Yrs Feb 2035 $1,073,066 96 – FNMA FRN 30 Yrs Mar 2035 $2,796,113 277 0.1FNMA 2005-67 FRN 30 Yrs Aug 2035 $1,018,365 100 – FNMA 2005-69 FRN 30 Yrs Aug 2035 $200,394 20 – FNMA FRN 30 Yrs 2036 $1,502,395 142 – FNMA FRN 30 Yrs May 2039 $8,553,744 770 0.1FNMA FRN 30 Yrs Mar 2040 $5,294,163 539 0.1FNMA FRN 30 Yrs Jul 2040 $1,222,454 120 – FNMA 2012-93 FRN 30 Yrs Feb 2041 $6,435,877 899 0.2FNMA 2012-99 FRN 30 Yrs Feb 2041 $1,081,675 143 – FNMA 4.5% 30 Yrs Mar 2041 $8,187,709 970 0.2FNMA FRN 30 Yrs Apr 2042 $8,841,755 1,288 0.2FNMA FRN 30 Yrs Jul 2042 $8,194,760 871 0.2FNMA FRN 30 Yrs Jan 2043 $15,047,736 1,933 0.3FNMA FRN 30 Yrs Feb 2043 $8,158,275 1,091 0.2Ford Motor 4.75% 2043 $1,360,000 767 0.1Freeport-McMoran Copper & Gold 5.45%
2043 $818,000 473 0.1Freescale Semiconductor 6% 2022 $47,000 30 – Fresenius Medical Care 6.5% 2018 $150,000 103 – Frontier Communications 9.25% 2021 $75,000 52 – GCI 8.625% 2019 $3,000,000 1,937 0.3General Cable 5.75% 2022 $500,000 300 0.1General Cable 5% 2029 $3,045,000 1,992 0.3General Electric Capital 6.3750% FRN 2067 $5,375,000 3,584 0.6General Motor 6.25% 2043 $1,585,000 1,021 0.2General Motors Financials 4.75% 2017 $200,000 128 – General Motors Financials 3.25% 2018 $730,000 447 0.1Genesis Energy 7.875% 2018 $100,000 66 – Genon Escrow 9.5% 2018 $150,000 97 – Genon Escrow 9.875% 2020 $250,000 159 – Geo Group 6.625% 2021 $750,000 482 0.1GMAT Trust 5.00% 2053 $5,100,000 2,972 0.5Goodman Networks 12.125% 2018 $200,000 128 – Goodyear Tire & Rubber 8.25% 2020 $475,000 321 0.1Goodyear Tire & Rubber 8.75% 2020 $665,000 478 0.1Gray Television 7.5% 2020 $200,000 130 – Great Lakes Dredge & Dock 7.375% 2019 $590,000 376 0.1Greenwich Capital Commercial Funding
5.661% 2036 $850,000 524 0.1Greenwich Capital Commercial Funding
FRN 2042 $2,500,000 1,558 0.3Griffon 4% 2017 $3,865,000 2,816 0.5GS Mortgage Securities 5.5% 2034 $1,425,674 928 0.2GS Mortgage Securities FRN 2035 $448,974 264 0.1GS Mortgage Securities 5.622% 2039 $3,400,000 2,015 0.3GS Mortgage Securities Mortgage 2045 $6,700,000 4,475 0.8GSAMP Trust FRN 2033 $890,025 547 0.1Halcon Resources 9.25% 2022 $300,000 184 – Hanesbrands 6.375% 2020 $1,500,000 993 0.2Harborview Mortgage Loan Trust FRN 2037 $5,478,562 2,769 0.5Harland Clarke Holding FRN 2015 $500,000 304 0.1Hawk Acquisition 4.25% 2020 $3,295,000 1,957 0.3HCA 8% 2018 $100,000 72 – HCA 6.5% 2020 $100,000 67 – HCA 7.5% 2022 $3,975,000 2,729 0.5HCP 3.15% 2022 $2,480,000 1,414 0.2HD Supply 8.125% 2019 $1,830,000 1,236 0.2HealthSouth 7.75% 2022 $769,000 513 0.1Hecla Mining 6.875% 2021 $175,000 102 – Hertz 5.875% 2020 $3,708,000 2,340 0.4Hertz 7.375% 2021 $575,000 380 0.1Hexion Nova Scotia 8.875% 2018 $2,860,000 1,809 0.3Hilton Worldwide Finance 5.625% 2021 $10,000 6 – HLSS Services Advance 1.4853% 2044 $1,110,000 674 0.1HLSS Services Advance 1.7337% 2044 $575,000 349 0.1HLSS Services Advance 2.2296% 2044 $460,000 279 0.1Home Equity Asset Trust FRN 2036 $3,149,733 1,847 0.3Hovnanian Enterprises 6.25% 2016 $14,000 9 – Hovnanian Enterprises 7% 2019 $5,000 3 – Hovnanian Enterprises 9.125% 2020 $125,000 84 – HT Intermediate Holding 12% 2019 $25,000 15 – Hughes Satellite System 6.5% 2019 $1,000,000 662 0.1Huntsman International 4.875% 2020 $865,000 518 0.1
Portfolio statement – continuedAs at 31 January 2014
Market value Total netInvestment Holding £’000 assets %
Market value Total netInvestment Holding £’000 assets %
282
Continuation�
� Return to Index

283
Continuation�
� Return to Index
Huntsman International 8.625% 2021 $1,000,000 685 0.1Iasis Healthcare 8.375% 2019 $80,000 52 – Icahn Enterprises 5.875% 2022 $98,000 59 – Iconix Brand 1.5% 2018 $2,580,000 2,049 0.4iGate 9% 2016 $20,000 13 – ILFC E-Capital Index Linked Trust 5.9% 2065 $100,000 56 – ILFC E-Capital Index Linked Trust 6.25% 2065 $100,000 57 – IndyMac ABS FRN 2034 $2,785,000 1,561 0.3IndyMac Mortgage Backed Securities 2034 $431,924 233 – Ineos Finance 8.375% 2019 $2,410,000 1,622 0.3Ineos Group 7.5% 2020 $570,000 378 0.1Infor 9.375% 2019 $450,000 308 0.1ING US 5.65% FRN 2053 $2,955,000 1,724 0.3Inmet Mining 8.75% 2020 $96,000 66 – Intelsat Jackson 7.25% 2020 $1,280,000 844 0.1Intelsat Jackson 6.625% 2022 $2,120,000 1,330 0.2Intelsat Luxembourg 6.75% 2018 $50,000 32 – Intelsat Luxembourg 7.75% 2021 $300,000 196 – Intelsat Luxembourg 8.125% 2023 $50,000 33 – International Lease Finance 8.75% 2017 $1,790,000 1,268 0.2International Lease Finance 5.875% 2019 $600,000 392 0.1International Lease Finance 5.875% 2022 $455,000 280 0.1International Paper 6% 2041 $965,000 665 0.1International Wire Group 8.5% 2017 $200,000 131 – Inventiv Health 10% 2018 $40,000 22 – Inventiv Health 10% SNR 2018 $220,000 122 – Isle of Capri Casinos 7.75% 2019 $150,000 99 – J Crew Group 8.125% 2019 $220,000 140 – Jarden 7.5% 2017 $350,000 245 – Jarden 1.875% 2018 $1,845,000 1,576 0.3JBS 8.25% 2020 $105,000 69 – JC Penney 7.95% 2017 $100,000 50 – JC Penney 5.75% 2018 $1,650,000 742 0.1JMC Steel Group 8.25% 2018 $100,000 63 – JPMorgan Commercial Mortgage FRN Jul
2042^ $875,000 548 0.1JPMorgan Commercial Mortgage FRN Dec
2042 144A^ $3,276,000 2,137 0.4JPMorgan Mortgage Trust 4.5% 2020^ $3,419 2 – Kinder Morgan Energy Partners 3.95% 2022 $1,505,000 908 0.2Kinder Morgan Energy Partners 5% 2043 $660,000 377 0.1Kinetic Concepts 10.5% 2018 $2,500,000 1,754 0.3Kroger 5.15% 2043 $2,315,000 1,430 0.2LB-UBS Commercial Mortgage FRN 2040 $3,700,000 2,487 0.4Lehman Mortgage Trust 5.5% 2035 $454,433 260 0.1Lennar 12.25% 2017 $75,000 59 – Level 3 Communications 8.875% 2019 $550,000 366 0.1Level 3 Communications 11.875% 2019 $360,000 252 – Level 3 Financing FRN 2018 $15,000 9 – Level 3 Financing 8.125% 2019 $1,635,000 1,093 0.2Liberty Property Trust 3.375% 2023 $2,200,000 1,245 0.2Liberty Property Trust 4.4% 2024 $1,340,000 816 0.1Liberty Tire Recycling 11% 2016 $200,000 119 – Linn Energy 7.75% 2021 $3,210,000 2,072 0.4Live Nation Entertainment 7% 2020 $34,000 22 – Long Beach Mortgage Loan Trust FRN 2034 $2,270,000 1,292 0.2LSB Industries 7.75% 2021 $100,000 64 – Lucent Technologie 6.45% 2029 $2,250,000 1,235 0.2LV Tower 52 7.5% 2018 $2,891,173 1,757 0.3M/I Homes 8.625% 2018 $50,000 33 – Macy’s 4.3% 2043 $2,035,000 1,110 0.2Manitowoc 8.5% 2020 $2,400,000 1,646 0.3Marathon Petroleum 6.5% 2041 $1,315,000 943 0.2Marina District Finance 9.875% 2018 $1,900,000 1,241 0.2Martin Midstream Partners 8.875% 2018 $100,000 64 – Masonite International 8.25% 2021 $200,000 133 – Master Alternative Loan Trust 6% 2034 $4,027,284 2,588 0.4Master Alternative Loan Trust 5.5% 2035 $405,958 251 – Master Alternative Loan Trust 5.75% 2035 $250,387 136 – Master Asset Backed Securities Trust FRN
2033 $25,021 15 – Mattamy Group 6.5% 2020 $45,000 27 – McGraw-Hill 9.75% 2021 $80,000 52 – Mediacom Capital 9.125% 2019 $100,000 66 – Meritage Homes 7.15% 2020 $13,000 9 – Merrill Lynch CFC Commercial Mortgage
Trust 5.204% 2049 $4,580,000 3,039 0.5Merrill Lynch CFC Commercial Mortgage
Trust 5.239% 2049 $1,500,000 893 0.2Metlife 6.4% 2066 $2,010,000 1,266 0.2Metropcs Wireless 7.875% 2018 $2,003,000 1,301 0.2
MGM Resorts International 8.625% 2019 $2,080,000 1,485 0.3MGM Resorts International 7.75% 2022 $250,000 171 – Milacron Finance 7.75% 2021 $50,000 32 – Misa Investments 8.625% 2018 $192,000 121 – Morgan Stanley 2.125% 2018 $1,995,000 1,210 0.2Morgan Stanley 3.75% 2023 $430,000 257 – Morgan Stanley ABS Capital FRN Jul 2034 $125,770 77 – Morgan Stanley ABS Capital FRN Sep 2034 $1,450,000 835 0.1Morgan Stanley ABS Capital FRN Nov 2034 $1,192,576 693 0.1Morgan Stanley ABS Capital FRN Mar 2044 $2,400,000 1,523 0.3Morgan Stanley ABS Capital FRN Jun 2044 $1,000,000 624 0.1Morgan Stanley Capital FRN Nov 2034 $3,012,187 1,696 0.3Morgan Stanley Capital 5.389% 2041 $2,000,000 1,229 0.2Morgan Stanley Capital 5.21% 2042 $405,000 258 – Morgan Stanley Capital 5.793% 2044 $1,450,000 946 0.2Morgan Stanley Mortgage Loan Trust 6.57%
2034 $637,934 412 0.1Morgan Stanley Mortgage Loan Trust FRN
2034 $590,193 357 0.1MPH International 8.375% 2018 $80,000 50 – Morgan Stanley BAML Trust 4.3% 2046 $850,000 444 0.1Mustang Merger 8.5% 2021 $200,000 132 – Mylan 7.875% 2020 $3,010,000 2,063 0.4National Mentor 12.5% 2018 $685,000 443 0.1Navios Maritime Acquisition 8.125% 2021 $17,000 11 – Navios South American Logistics 9.25% 2019 $100,000 65 – NCR Escrow 5.875% 2021 $5,000 3 – NCR Escrow 6.375% 2023 $5,000 3 – New Century Home Equity Loan Trust FRN
2034 $119,526 69 – New Century Home Equity Loan Trust
1.0403% 2035 $1,180,762 652 0.1New Gold 7% 2020 $50,000 31 – New Gold 6.25% 2022 $50,000 29 – Nexstar Broadcasting 6.875% 2020 $410,000 267 0.1Nielsen 5.5% 2021 $15,000 9 – NII International Telecom 7.875% 2019 $500,000 228 – NiSource Finance 5.8% 2042 $1,035,000 691 0.1NiSource Finance 4.8% 2044 $1,010,000 586 0.1Nisource Finance 5.65% 2045 $1,125,000 732 0.1Nordstrom 5% 2044 $1,380,000 862 0.2Novelis 8.75% 2020 $75,000 51 – Nufarm 6.375% 2019 $150,000 94 – NXP 3.5% 2016 $200,000 124 – NXP Semiconductors 3.75% 2018 $1,700,000 1,035 0.2Oasis Petroleum 6.875% 2022 $20,000 13 – Ocean Rig 9.5% 2016 $100,000 64 – Omnicare 7.75% 2020 $100,000 67 – Opteum Mortgage FRN 2035 $45,313 28 – Option One Mortgage Loan Trust 0.8953%
2034 $120,008 68 – Option One Mortgage Loan Trust FRN May
2034 $6,048,712 3,217 0.6Option One Mortgage Loan Trust FRN Nov
2034 $259,039 153 – Paetec 9.875% 2018 $55,000 37 – Park Place Securities FRN Jun 2035 $55,987 34 – Parker Drilling 7.5% 2020 $250,000 159 – Party City 8.875% 2020 $1,615,000 1,094 0.2Peabody Energy 6.25% 2021 $2,100,000 1,292 0.2Petrohawk Energy 7.875% 2015 $2,375,000 1,471 0.3Philip Morris International 3.875% 2042 $1,545,000 822 0.1Pilgrims Pride 7.875% 2018 $368,000 242 – Pittsburgh Glass Works 8% 2018 $9,000 6 – Plains All American Pipeline 5.75% 2020 $580,000 409 0.1Plains Exploration & Production 6.5% 2020 $3,295,000 2,195 0.4Post 7.375% 2022 $515,000 334 0.1Post Holdings 6.75% 2021 $17,000 11 – PPL 5.375% 2021 $750,000 499 0.1PPL Capital Funding 3.5% 2022 $1,395,000 823 0.1PPL Capital Funding 4.7% 2043 $1,180,000 680 0.1Prestige Brands 5.375% 2021 $25,000 15 – Progreso Receivable Funding 4% 2018 $3,000,000 1,804 0.3Prudential Financial FRN 2042 $2,940,000 1,840 0.3Quebecor Media 5.75% 2023 $2,895,000 1,715 0.3R.R. Donnelley & Sons 6.5% 2023 $15,000 9 – Radiation Therapy Services 8.875% 2017 $1,480,000 931 0.2Radio Systems 8.375% 2019 $200,000 134 – Rain CII Carbon 8% 2018 $150,000 96 – RBSHD Trust 4.685% 2047 $1,700,000 1,038 0.2RCN Television 8.5% 2020 $100,000 62 –
Portfolio statement – continuedAs at 31 January 2014
Market value Total netInvestment Holding £’000 assets %
Market value Total netInvestment Holding £’000 assets %

Realogy 7.625% 2020 $1,495,000 1,015 0.2Regal Cinemas 8.625% 2019 $50,000 32 – Renaissance Home Equity Loan Trust FRN
2034 $2,365,363 1,246 0.2Renaissance Home Equity Loan Trust FRN
2035 $1,620,837 884 0.2Residential Accredit Loans FRN 2034 $250,494 148 – Residential Asset Securitization Trust 5% 2019 $209,856 131 – Residential Asset Securitization Trust 5.5%
2035 $3,077,000 1,640 0.3Residential Asset Securitization Trust 6%
2035 $1,265,826 704 0.1Residential Asset Securitization Trust FRN
2035 $3,000,000 1,787 0.3Reynolds Group 7.125% 2019 $300,000 193 – Reynolds Group 9% 2019 $2,600,000 1,686 0.3Reynolds Group 9.875% 2019 $250,000 168 – Reynolds Group 5.75% 2020 $660,000 411 0.1RFMSI Series Trust 6% 2036 $68,996 42 – Rite Aid 8% 2020 $250,000 170 – Rivers Pit Bor 9.5% 2019 $38,000 25 – ROC Finance 12.125% 2018 $39,000 24 – Roofing Supply 10% 2020 $100,000 68 – Rowan 5.85% 2044 $425,000 260 0.1Royal Bank of Scotland 6.125% 2022 $200,000 125 – Royal Bank of Scotland FRN 2022 $35,000 25 – Royal Bank of Scotland 6% 2023 $1,230,000 754 0.1RSC Equipment Rental 8.25% 2021 $730,000 498 0.1Sabre 8.5% 2019 $3,340,000 2,242 0.4Salix Pharm 6% 2021 $25,000 16 – Sally 6.875% 2019 $1,907,000 1,274 0.2SAMI FRN 2046 $2,026,292 1,037 0.2SASC FRN 2035 $137,482 70 – Saxon Asset Securities Trust FRN 2036 $303,911 163 – Schaeffler Finance 4.75% 2021 $1,000,000 605 0.1Scotts Miracle-Gro 6.625% 2020 $1,466,000 961 0.2Seadrill 6.125% 2020 $200,000 122 – Sealed Air 8.125% 2019 $75,000 51 – Sealed Air 8.375% 2021 $2,760,000 1,916 0.3Seminole Hard Rock 5.875% 2021 $175,000 105 – Sempra Energy 2.875% 2022 $2,075,000 1,185 0.2Seneca Gaming 8.25% 2018 $171,000 112 – Sensata Technologies 6.5% 2019 $1,800,000 1,176 0.2Sequoia Mortgage Trust FRN 2034 $1,035,416 623 0.1Sequoia Mortgage Trust FRN 2043 $6,562,037 3,677 0.6Serta Simmons 8.125% 2020 $2,465,000 1,627 0.3Servicemaster 7% 2020 $805,000 495 0.1Shingle Springs Tribal Gaming 9.75% 2021 $61,000 40 – Sinclair Television Group 5.375% 2021 $700,000 419 0.1Sirius XM Holdings 5.875% 2020 $10,000 6 – Sitel 11% 2017 $300,000 194 – Sitel 11.5% 2018 $121,000 69 – Six Flags Entertainment 5.25% 2021 $125,000 75 – Smithfield Foods 5.25% 2018 $500,000 317 0.1Societe Generale 8.25% FRN Perpetual $3,400,000 2,202 0.4Softbank Corp 4.5% 2020 $200,000 120 – Southern Power Companies 5.25% 2043 $815,000 519 0.1Spectra Energy Partners 5.95% 2043 $1,730,000 1,185 0.2Sprint 7.25% 2021 $184,000 121 – Sprint 7.875% 2023 $185,000 120 – Sprint 7.125% 2024 $21,000 13 – Sprint Capital 8.75% 2032 $3,985,000 2,627 0.5Sprint Nextel 9% 2018 $750,000 550 0.1Sprint Nextel 7% Mar 2020 $178,000 122 – Sprint Nextel 7% Aug 2020 $20,000 13 – Sprint Nextel 6% 2022 $188,000 113 – Stackpole International 7.75% 2021 $106,000 67 – Standard Pacific 8.375% 2021 $125,000 89 – Station Casinos 7.5% 2021 $173,000 112 – Structured Asset Investment Loan Trust FRN
Apr 2033 $2,151,300 1,276 0.2Structured Asset Investment Loan Trust FRN
Feb 2034 $2,906,302 1,679 0.3Structured Asset Investment Loan Trust FRN
Jul 2034 $5,148,962 2,935 0.5Structured Asset Investment Loan Trust FRN
Aug 2034 $1,253,278 701 0.1Structured Asset Investment Loan Trust FRN
Sep 2034 $249,589 135 – Structured Asset Securities 4.72% 2035 $213,055 136 – Structured Asset Securities 5.5% 2035 $3,153,344 1,950 0.3
Structured Asset Securities FRN 2035 $52,518 32 – Studio City Finance 8.5% 2020 $250,000 169 – Sungard Data Systems 7.375% 2018 $1,000,000 643 0.1Sungard Data Systems 6.625% 2019 $850,000 541 0.1Swiss Re 6.854% FRN Perpetual $710,000 462 0.1Talos Production 9.75% 2018 $250,000 156 – Taseko Mines 7.75% 2019 $150,000 93 – Teekay 8.5% 2020 $45,000 30 – Tenet Healthcare 6.25% 2018 $50,000 34 – Tenet Healthcare 4.75% 2020 $515,000 312 0.1Tenet Healthcare 6% 2020 $60,000 39 – Tenet Healthcare 8% 2020 $2,100,000 1,395 0.2Tenet Healthcare 8.125% 2022 $18,000 12 – Terex 6.5% 2020 $590,000 385 0.1Time Warner Cable 6.75% 2018 $20,000 14 – T-Mobile USA 5.25% 2018 $265,000 170 – T-Mobile USA 6.464% 2019 $181,000 116 – T-Mobile USA 6.125% 2022 $5,000 3 – T-Mobile USA 6.625% 2023 $80,000 50 – T-Mobile USA 6.5% 2024 $5,000 3 – Tops Holdings 8.875% 2017 $75,000 50 – Trinseo Materials Operating 8.75% 2019 $1,465,000 915 0.2TW Telecom Holdings 6.375% 2023 $44,000 28 – UBS 7.625% 2022 $3,605,000 2,537 0.4UBS 4.75% 2023 $2,620,000 1,587 0.3UBS Commercial Mortgage Trust 5.378%
2038 $2,100,000 1,381 0.2UCI International 8.625% 2019 $890,000 533 0.1Ultrapetrol 8.875% 2021 $100,000 65 – Ultrapetrol 8.875% 2021 144A $36,000 24 – United Rentals 7.375% 2020 $385,000 259 – United Rentals 7.625% 2022 $3,000,000 2,050 0.4UPCB Finance 7.25% 2021 $1,405,000 924 0.2UPCB Finance 6.875% 2022 $1,115,000 727 0.1UPCB Finance III 6.625% 2020 $1,100,000 707 0.1US Airways 3.95% 2027 $2,325,000 1,405 0.2US West Capital Funding 6.875% 2028 $7,000 4 – Vail Resorts 6.5% 2019 $1,785,000 1,144 0.2Valeant Pharmaceuticals 6.75% 2018 $250,000 167 – Valeant Pharmaceuticals 6.875% 2018 $200,000 130 – Valeant Pharmaceuticals 7% 2020 $1,365,000 894 0.2Valeant Pharmaceuticals 6.75% 2021 $1,850,000 1,201 0.2Ventas Realty 4% 2019 $2,010,000 1,296 0.2Ventas Realty 3.25% 2022 $1,000,000 577 0.1Ventas Realty 4.25% 2022 $1,135,000 705 0.1Verizon Communications FRN 2016 $4,565,000 2,853 0.5Verizon Communications 3.85% 2042 $1,045,000 532 0.1VFC 3.13% 2026 $736,063 451 0.1Viacom 4.375% 2043 $1,250,000 665 0.1Viasystems 7.875% 2019 $50,000 33 – Virgin Media Finance 8.375% 2019 $100,000 66 – Visteon 6.75% 2019 $1,840,000 1,177 0.2Volt 2013-NPL7 5.2525% 2053 $3,645,000 2,142 0.4Volt 2013-NPL6 5.25% 2054 $3,643,561 2,138 0.4Volt 2013-NPL5 5.5% 2055 $3,498,801 2,065 0.4VWR Funding 7.25% 2017 $200,000 129 – Wachovia Bank FRN 2042 $3,250,000 2,055 0.4Wachovia Bank 5.962% 2045 $3,000,000 2,014 0.3Wachovia Bank FRN 2045 $4,210,000 2,795 0.5WCI Communities 6.875% 2021 $100,000 61 – WebMD 1.5% 2020 $1,090,000 733 0.1Weingarten Realty Investors 3.375% 2022 $1,805,000 1,037 0.2Wells Enterprises 6.75% 2020 $25,000 16 – Wells Fargo 5.375% 2043 $1,955,000 1,223 0.2Wells Fargo Home Equity FRN 2035 $2,000,000 1,157 0.2Wells Fargo Mortgage Backed Securities
Trust 4.75% 2020 $49,906 31 – Wells Fargo Mortgage Backed Securities
Trust FRN 2035 $4,016,933 2,494 0.4Wells Fargo Mortgage Backed Securities
Trust 5.250% 2036 $3,437,665 2,144 0.4WFRBS Commercial Mortgage Trust FRN
2044 $480,000 311 0.1WFRBS Commercial Mortgage Trust 3.36%
2048 $1,150,000 686 0.1Wind Acquisition Finance 7.25% 2018 $200,000 128 – Windstream 7.75% 2020 $55,000 36 – Windstream 7.75% 2021 $2,555,000 1,634 0.3WMG Acquisition 11.5% 2018 $100,000 69 – WMG Acquisition 6% 2021 $25,000 16 – Wok Acquisition 10.25% 2020 $100,000 66 –
Portfolio statement – continuedAs at 31 January 2014
Market value Total netInvestment Holding £’000 assets %
Market value Total netInvestment Holding £’000 assets %
284
Continuation�
� Return to Index

285
Continuation�
� Return to Index
World Wide Supply 7.75% 2017 $20,000 12 – Xstrata Finance Canada 4% 2022 $1,445,000 841 0.1Xstrata Finance Canada 5.3% 2042 $1,235,000 698 0.1Zayo Group 10.125% 2020 $210,000 148 – Euro – 8.0% Agrokor 9.125% 2020 €750,000 689 0.1Allianz 4.816% FRN Perpetual €1,400,000 1,188 0.2Ardagh Packaging Finance 9.25% 2020 €1,000,000 894 0.2Assicurazioni Generali 2.875% 2020 €402,000 337 0.1Assicurazioni Generali 7.75% FRN 2042 €1,600,000 1,533 0.3Atlantia 2.875% 2021 €1,936,000 1,624 0.3AXA 5.125% 2043 €675,000 601 0.1Banco Santander 4.625% 2016 €1,700,000 1,496 0.3Berica 8 Residential FRN 2048 €1,412,488 1,102 0.2BNP Paribas 7.781% FRN Perpetual €1,300,000 1,247 0.2BPCE 9% FRN Perpetual €700,000 610 0.1Capsugel Finance 9.875% 2019 €750,000 683 0.1Compagnie De Saint-Gobain 3.625% 2022 €279,000 247 – Credit Suisse 5.75% 2025 €1,465,000 1,281 0.2Deutsche Raststatten Gruppe 6.75% 2020 €500,000 433 0.1Eileme 11.75% 2020 €750,000 743 0.1Elior Finance 6.5% 2020 €1,000,000 892 0.2Enel 6.5% 2074 €320,000 279 – Fleet Street Finance Three FRN 2016 €18,328 15 – FoodCorp 8.75% 2018 €675,000 601 0.1Gas Natural Fenosa 3.875% 2022 €2,300,000 2,019 0.3Geo Travel Finance 7.5% 2018 €750,000 658 0.1Granite Master FRN 2030 €1,250,000 977 0.2Granite Master FRN 2054 €1,400,000 1,091 0.2Hannover Finance 5% 2043 €1,300,000 1,177 0.2Intesa Securities Mortgage 0% 2033 €906,000 662 0.1Krauss-Maffei 8.75% 2020 €750,000 688 0.1Lafarge 4.75% 2020 €2,500,000 2,172 0.4Matterhorn Mobile 8.25% 2020 €1,000,000 899 0.2NGG Finance 4.25% 2076 €1,629,000 1,351 0.2Ontex IV 7.5% 2018 €750,000 639 0.1Repsol International Finance 2.625% 2020 €1,900,000 1,564 0.3Rexel 5.125% 2020 €750,000 646 0.1Rhino Bondco 7.25% 2020 €750,000 640 0.1Schaeffler Finance 7.75% 2017 €750,000 709 0.1Skandinaviska Enskilda Banken 7.0922% FRN
Perpetual €1,400,000 1,306 0.2Smurfit Kappa Acquisition 5.125% 2018 €1,000,000 884 0.2Societe Generale 6.999% FRN Perpetual €1,450,000 1,311 0.2Spie Bondco 3 11% Perpetual €750,000 704 0.1TDA CAM FRN 2039 €1,793,609 1,372 0.2Techem 6.125% 2019 €750,000 669 0.1Telefonica 6.5% FRN Perpetual €3,100,000 2,683 0.5Telenet Finance 6.25% 2022 €1,000,000 885 0.2Trionista TopCo 5% 2020 €1,000,000 844 0.1UBS 4.28% FRN Perpetual €2,050,000 1,704 0.3Unitymedia 9.5% 2021 €1,000,000 952 0.2UPC 6.375% 2022 €750,000 630 0.1Sterling – 3.9% Anglian Water (Osprey) Financing 7% 2018 £1,098,000 1,180 0.2Auburn Securities FRN 2041 £850,000 738 0.1Boparan 9.875% 2018 £750,000 811 0.1Credit Agricole 8.125% FRN Perpetual £2,350,000 2,579 0.4Crown Newco 8.875% 2019 £500,000 523 0.1Direct Line Insurance 9.25% 2042 £400,000 503 0.1DNB 6.0116% FRN Perpetual £1,350,000 1,417 0.2Enel 7.75% 2075 £1,005,000 1,065 0.2Gatwick Funding 5.25% 2024 £1,000,000 1,097 0.2HBOS Capital Funding 6.461% FRN Perpetual £4,195,000 4,367 0.7Lloyds Banking Group 5.75% 2025 £589,000 624 0.1Lowell Group Financing 10.75% 2019 £500,000 566 0.1NGG Finance 5.625% 2073 £850,000 853 0.2Paragon Mortgages 0.93% 2034 £1,191,945 1,111 0.2Santander Issuances 7.3% 2019 £1,400,000 1,435 0.2Standard Life 5.5% 2042 £930,000 975 0.2Standard Life 6.75% Perpetual £433,000 476 0.1Swiss Reinsurance FRN Perpetual £850,000 924 0.2UBS 5.24% FRN 2021 £456,000 487 0.1Virgin Media Finance 8.875% 2019 £500,000 542 0.1Zurich Finance (UK) 6.625% FRN Perpetual £750,000 830 0.1
Government bonds – 5.2% (6.3%)Brazil – 0.5% Brazil 10% 2017 BRL13,000 3,067 0.5Mexico – 1.0% Mexico 3.625% 2022 $9,900,000 5,913 1.0Russia – 1.0% Russia 4.875% 2023 $9,400,000 5,744 1.0South Africa – 1.0% South Africa 5.875% 2025 $9,300,000 5,784 1.0United States of America – 1.7% US Treasury 0% Mar 2014 $10,000,000 6,075 1.0US Treasury 0% Jul 2014 $3,534,000 2,147 0.4US Treasury 0.75% 2042 $3,165,000 1,707 0.3
Forward currency contracts – 0.2% ((1.8)%)Brazilian RealSell BRL 2,281,613 buy $943,010 dated 17/03/14 7 – EuroBuy €5,196,068 sell £4,287,119 dated 17/03/14 (8) – Sell €65,278,187 buy £54,033,740 dated 17/03/14 282 – Japanese YenSell ¥2,619,522,622 buy £15,294,044 dated 17/03/14 (283) – US DollarBuy $6,295,233 sell £3,829,631 dated 17/03/14 (4) – Buy $9,287,144 sell £5,610,597 dated 17/03/14 34 – Sell $12,509,293 buy £7,560,437 dated 17/03/14 (42) – Sell $782,910,770 buy £476,901,530 dated 17/03/14 1,100 0.2
Futures – (0.2)% (0.2%)Euro BOBL Futures Mar 2014 (123) (116) – Euro Bund Index Futures Mar 2014 (228) (494) (0.1)Long Gilt Futures Mar 2014 31 81 – US 5 Year Treasury Note Futures Mar 2014 59 (7) – US 10 Year Treasury Note Futures Mar 2014 (2,618) (465) (0.1)US Long Bond Futures Mar 2014 83 147 – US Ultra Bond Futures Mar 2014 (39) (140) –
Swaps – (0.2)% (0.2%)Credit Default Swaps FSL 4.5% 20 Sep 2017 870,000 – – Credit Default Swaps FSL 4.5% 20 Sep 2017 (870,000) (52) – Credit Default Swaps TRW Automotive 1%
20 Dec 2017 2,350,000 – – Credit Default Swaps TRW Automotive 1%
20 Dec 2017 (2,350,000) (4) – Credit Index Swaps CDX.NA.HY 5%
20 Dec 2018 27,000,000 (1,179) (0.2)
Liquidity funds – 6.5% (5.5%)JPM Sterling Liquidity ‘X’ (Distribution)^$ 38,006,272 38,006 6.5
Investment assets (including investment liabilities) 557,520 94.6
Net other assets 31,686 5.4
Net assets 589,206 100.0
Unless otherwise stated the above securities are admitted to official stock exchange listings or trade on aregulated market.
The comparative percentage figures in brackets are at 31 January 2013.
^ Deemed to be investment in related parties of the ACD$ Approved security as defined in the collective investment scheme sourcebook
Portfolio statement – continuedAs at 31 January 2014
Market value Total netInvestment Holding £’000 assets %
Market value Total netInvestment Holding £’000 assets %

286
Continuation�
� Return to Index
AAA 34,719AA 706AA- 3,309A+ 2,322A 22,883A- 21,018BBB+ 29,118BBB 51,316BBB- 44,159BB+ 20,024BB 26,689BB- 30,873B+ 43,162B 54,052B- 35,661CCC+ 28,559CCC 29,404C 12,856Unrated 25,964
Total bonds 516,794
Equity 3,863Liquidity funds 38,006Futures (994)Swaps (1,235)Forward currency contracts 1,086
Investment assets (including investment liabilities) 557,520
Counterparty exposure
Forwardcurrency Futurescontracts contracts Total
Counterparty £’000 £’000
Barclays 0 – 0BNP Paribas 6 – 6CitiBank 3 – 3Credit Suisse 353 – 353Deutsche Bank 354 – 354Goldman Sachs 5 – 5HSBC 65 – 65JP Morgan – 226 226Merrill Lynch 319 – 319NAB Ltd 0 – 0RBC (5) – (5)Societe Generale 251 – 251State Street 35 – 35Toronto Dominion Bank 2 – 2UBS (310) – (310)Westpac Banking Corp 7 – 7
At the balance sheet date, there was no collateral received by the fund from the above counterparties.
The counterparty exposure on forward currency contracts is reported at their mark to market values butfor futures contracts it is only the positive mark to market values that are reported.
Portfolio statement – continuedAs at 31 January 2014
Market value Portfolio credit ratings £’000

£’000
Total of all purchases for the year 937,420
Major purchases Cost
JPM Sterling Liquidity ‘X’ (Distribution)^ 224,716FNMA 3% 30 Yrs Mar 2043 54,535FNMA 3.50% 30 Yrs Aug 2043 50,779FNMB 3.50% 30 Yrs Sep 2043 40,658Federal Home Loan 3.5% 2043 40,329FNMA 4.5% 30 Yrs Sep 2033 23,962Russia 7.6% 2022 12,866Mexico 7.75% 2017 12,764GNMA 3% 30 Yrs Mar 2042 9,813US Treasury 0% Aug 2013 6,456US Treasury 0% Mar 2014 6,368Russian Federation 7% 2023 6,167Mexico 3.625% 2022 6,110Mexico 10% 2024 6,110South Africa 5.875% 2025 6,104South Africa 10.5% 2026 6,072Brazil 2.625% 2023 6,060Turkey (Republic of) 7.1% 2023 6,053Russia 4.875% 2023 6,008Sequoia Mortgage Trust FRN 2043 4,381
^ Deemed to be investment in related parties of the ACD
£’000
Total of all sales for the year 1,042,479
Major sales Proceeds
JPM Sterling Liquidity ‘X’ (Distribution)^ 222,147FNMA 3% 30 Yrs Mar 2043 54,682FNMA 3% 30 Yrs Feb 2042 54,682FNMA 3.50% 30 Yrs Aug 2043 50,381FNMB 3.50% 30 Yrs Sep 2043 40,442Federal Home Loan 3.5% 2043 38,943FNMA 4.5% 30 Yrs Sep 2033 23,432Mexico 10% 2024 20,996South Africa 7.75% 2023 12,791Mexico 7.75% 2017 12,138Russia 7.6% 2022 11,816GNMA 3% 30 Yrs Feb 2042 9,837GNMA 3% 30 Yrs Mar 2042 9,830Turkey 8.5% 2022 6,620US Treasury 0% Aug 2013 6,363Turkey (Republic of) 7.1% 2023 6,213South Africa 10.5% 2026 6,185Russian Federation 7% 2023 6,079US Treasury 0% Mar 2013 5,922Brazil 2.625% 2023 5,900
Portfolio movements For the year ending 31 January 2014
287
Continuation�
� Return to Index

Statement of total returnFor the year ending 31 January
2014 2013£’000 £’000 £’000 £’000
Income
Net capital (losses)/gains (Note 1) (13,570) 8,477
Revenue (Note 2) 31,902 23,075
Expenses (Note 3) (3,286) (3,156)
Net revenue before taxation 28,616 19,919
Taxation (Note 4) 8 (10)
Net revenue after taxation 28,624 19,909
Total return before distributions 15,054 28,386
Finance costs: Distributions (Note 5) (28,671) (19,894)
Change in net assets attributable to shareholders from investment activities (13,617) 8,492
Statement of change in net assets attributable to shareholdersFor the year ending 31 January
2014 2013£’000 £’000 £’000 £’000
Opening net assets attributable to shareholders 640,394 356,126
Amounts receivable on issue of shares 117,666 332,324
Amounts payable on cancellation of shares (166,769) (66,345)
(49,103) 265,979
Change in net assets attributable to shareholders from investment activities (see above) (13,617) 8,492
Retained distributions on accumulation shares 11,532 9,797
Closing net assets attributable to shareholders 589,206 640,394
Balance sheetAs at 31 January
2014 2013£’000 £’000 £’000 £’000
ASSETS
Investment assets 560,314 698,760
Debtors (Note 7) 8,238 68,989
Cash and bank balances (Note 8) 42,728 23,613
Total other assets 50,966 92,602
Total assets 611,280 791,362
LIABILITIES
Investment liabilities (2,794) (14,483)
Creditors (Note 9) (16,257) (134,148)
Distribution payable on income shares (3,023) (2,337)
Total other liabilities (19,280) (136,485)
Total liabilities (22,074) (150,968)
Net assets attributable to shareholders 589,206 640,394
The notes to these financial statements are shown on pages 289 to 291.
Financial statements
288
Continuation�
� Return to Index

1. Net capital (losses)/gains2014 2013
£’000 £’000Currency (losses)/gains (413) 2,353Derivative contracts (4,643) (7,188)Forward currency contracts 19,373 (244)Non-derivative securities (27,887) 13,556Net capital (losses)/gains (13,570) 8,477
2. Revenue2014 2013
£’000 £’000Income from Liquidity funds 179 261Interest on bank and term deposits 44 83Interest on derivatives 186 (583)Interest on fixed-interest securities 31,493 23,314Total revenue 31,902 23,075
3. Expenses2014 2013
£’000 £’000Payable to the ACD or associate of the ACD:ACD fee 2,586 2,593Fixed expenses 700 563Total expenses 3,286 3,156
4. Taxation2014 2013
£’000 £’000a) Analysis of charge in the yearOverseas tax suffered (8) 10Current year tax charge (Note 4b) (8) 10
b) Factors affecting the tax charge for the yearThe tax assessed for the year is lower than the standard rate of corporation tax inthe UK for an Open-Ended Investment Company (OEIC) (20%). The differences areexplained below.
Net revenue before taxation 28,616 19,919Corporation tax at 20% 5,723 3,984
Effects of:Excess expenses for which no relief taken 25 64Interest distributions deductible for tax purposes (5,748) (4,048)Overseas tax suffered (8) 10
(5,731) (3,974)Current year tax charge (Note 4a) (8) 10
5. Finance costsDistributionsThe distributions take account of amounts receivable on the issue of shares andamounts payable on the cancellation of shares and comprise:
2014 2013£’000 £’000
First interim interest distribution 7,675 5,395Second interim interest distribution 7,851 4,563Third interim interest distribution 6,700 4,581Final interest distribution 6,256 5,968Add: Amounts payable on cancellation of shares 705 262Deduct: Amounts receivable on issue of shares (516) (875)Total finance costs 28,671 19,894
Details of the distribution per share are set out on pages 292 to 295.
6. Movement between net revenue after taxation and distributions2014 2013
£’000 £’000Net revenue after taxation 28,624 19,909Add: Undistributed revenue brought forward 40 25Deduct: Undistributed revenue carried forward (29) (40)Equalisation on conversions 36 –
28,671 19,894
7. Debtors2014 2013
£’000 £’000Accrued income 6,646 8,361Due from the ACD for shares created 558 1,849Overseas tax recoverable 38 318Sales awaiting settlement 996 58,461Total debtors 8,238 68,989
8. Cash and bank balances2014 2013
£’000 £’000Amounts held at futures clearing houses
and brokers 1,309 (1,197)Cash and bank balances 41,419 24,810Total cash and bank balances 42,728 23,613
9. Creditors2014 2013
£’000 £’000Accrued expenses 244 310Due to the ACD for shares cancelled 13,842 707Income tax payable 1,425 1,496Purchases awaiting settlement 746 131,635Total creditors 16,257 134,148
10. Portfolio transaction costsNo portfolio transactions costs were incurred during the current or prior year.
Notes to the financial statements for the year ending 31 January 2014
289
Continuation�
� Return to Index

11. Related party transactionsJPMorgan Funds Limited, as Authorised Corporate Director (“ACD”), is a relatedparty, and acts as principal in respect of all transactions of shares in the Company.The aggregate monies received through issue, and paid on cancellation, aredisclosed in the Statement of Change in Net Assets Attributable to Shareholders.
The balance due to the ACD and their associates at the year end date in respect ofrelated party transactions was £13,528,856 (31.01.13: £(831,114)). Details of relatedparty transactions are given under note 13 on page 413.
Investments considered to be related parties have been identified in the portfoliostatement on pages 281 to 285 and the revenue from these investments was£310,583 (31.01.13: £260,997).
The gross stocklending income received was £nil (31.01.13: £284), with fees deductedof £nil (31.01.13: £36).
The following parties held a material interest in the Fund at the year end date:– Leicestershire County Council, Pension Fund 15.50% (31.01.13: 12.46%)– Cofunds Nominees Ltd 14.73% (31.01.13: 10.71%)– London Borough of Hillingdon, Pension Fund 12.92% (31.01.13: 11.66%)
12. Financial instrumentsCurrency exposuresA substantial proportion of the net assets of the Fund are denominated incurrencies other than sterling, with the effect that the Balance sheet and totalreturn can be significantly affected by currency movements.
Net foreign currency assets/(liabilities)Monetary Non-monetary
Total exposures exposuresCurrency £’000 £’000 £’000
31.01.14US Dollar 486,332 45,829 440,503Euro 50,748 2,938 47,810Brazilian Real 3,633 556 3,067Japanese Yen (283) (283) –
31.01.13Chinese Renminbi 13,107 13,107 –Mexican Peso 12,821 (796) 13,617Turkish Lira 6,537 167 6,370South African Rand 6,167 (6,075) 12,242Indian Rupee 4,597 4,597 –Russian Rouble 4,504 4,504 –Philippine Peso 4,494 4,494 –Korean Won 4,356 4,356 –Malaysian Ringgit 4,345 4,345 –Brazilian Real (12) (12) –Australian Dollar (45) 1,229 (1,274)Euro (258) (52,055) 51,797US Dollar (62,219) (620,157) 557,938
Interest rate riskThe tables below detail the interest rate profile of the Fund’s assets and liabilitiesas at the year end.
Financialassets
Floating Fixed notrate rate carrying
Total financial financial anyassets assets assets interest
Currency £’000 £’000 £’000 £’000
31.01.14US Dollar 486,341 153,689 327,909 4,743UK Sterling 67,311 42,609 19,820 4,882Euro 51,484 4,643 45,234 1,607Brazilian Real 3,633 558 3,067 8Japanese Yen (283) – – (283)
31.01.13UK Sterling 646,850 36,617 20,380 589,853US Dollar 65,646 494,694 75,995 (505,043)Chinese Renminbi 13,107 – – 13,107Mexican Peso 12,821 – 13,617 (796)Turkish Lira 6,537 – 6,370 167South African Rand 6,167 – 12,242 (6,075)Indian Rupee 4,597 – – 4,597Russian Rouble 4,504 – – 4,504Philippine Peso 4,494 – – 4,494Korean Won 4,356 – – 4,356Malaysian Ringgit 4,345 – – 4,345Euro 3,512 2,588 48,002 (47,078)Brazilian Real (12) 711 – (723)Australian Dollar (45) 5,303 – (5,348)
The floating rate financial assets comprise investments in variable interest ratepaying corporate debt and bank balances that bear interest at rates based onLIBOR or its overseas equivalent.
Floating Financialrate liabilities
Total financial not carryingliabilities liabilities any interest
Currency £’000 £’000 £’000
31.01.14UK Sterling 18,535 – 18,535US Dollar 9 – 9Euro 736 – 736
31.01.13US Dollar 127,865 – 127,865UK Sterling 4,851 – 4,851Euro 3,770 – 3,770
Fixed rate financial assetsWeighted
averageWeighted period for
average which rate is Currency interest rate fixed (years)
31.01.14Brazilian Real 12.4% 2.9UK Sterling 5.5% 21.4Euro 4.5% 13.2US Dollar 4.5% 12.9
31.01.13Turkish Lira 7.5% 9.6Mexican Peso 7.0% 11.9South African Rand 6.9% 10.1UK Sterling 4.5% 9.9US Dollar 3.8% 13.2Euro 3.7% 7.2
For consideration of other risks including liquidity, pricing and credit risk, pleaserefer to the notes to the aggregated financial statements, pages 413 to 414.
Notes to the financial statements – continued
290
Continuation�
� Return to Index

13. Share classesThe Fund currently has five share classes; Class A Shares, Class B Shares, Class CShares, Class I Shares and Class X Shares. The Authorised Corporate Director’s(ACD) fee and fixed expenses charge are shown below.
ACD fee Fixed expensesClass A shares: 1.00% 0.18%Class B shares: 0.65% 0.18%Class C shares: 0.50% 0.18%Class I shares: 0.40% 0.00%Class X shares: 0.00% 0.06%
The X share class is designed to accommodate an alternative charging structurewhereby the annual fee normally charged to the Fund and then passed on in theshare price is instead administratively levied and collected by the ACD from theshareholder or through the relevant JPMorgan Chase & Co entity.
The net asset value of each share class, the net asset value per share and thenumber of shares in each class are shown on pages 279 and 280. All classes havethe same rights on winding up.
14. Derivatives The Fund enters into derivative transactions in the form of forward currencycontracts, futures and credit default swaps. The Fund may use derivatives forinvestment purposes or efficient portfolio management including hedging, whereappropriate. The positive mark to market approach has been used to calculate theglobal exposure.
The Investment Adviser assesses the market risk of the Fund’s investments,including derivative exposure, using historical simulation methodology. Thisprocess provides an estimate of the maximum potential loss that could beexpected to occur as a result of changes in market prices over a given period oftime in all but a given percentage of circumstances. The VaR is calculated on a99% confidence level with a 20 day horizon & 500 days of history. As at thebalance date the VaR was 1.07%.
The effective observation period changed to 500 days from 31/10/2012 onwardsdue to a change to a new VAR calculation process.
Further information on the derivative risks can be found in the notes to theaggregated financial statements on page 414.
15. Contingent liabilities and capital commitmentsAt the balance sheet date there were no contingent liabilities or capitalcommitments (2013: none).
Notes to the financial statements – continued
291
Continuation�
� Return to Index

Final interest distribution in pence per share
Group 1 – Shares purchased prior to 1 November 2013Group 2 – Shares purchased 1 November 2013 to 31 January 2014
DistributionGross Tax Net payable paid
revenue at 20% revenue Equalisation 30.04.14 30.04.13
A-Class Accumulation Shares
Group 1 0.600000 0.120000 0.480000 – 0.480000 0.470000
Group 2 0.308305 0.061661 0.246644 0.233356 0.480000 0.470000
A-Class Income Shares
Group 1 0.512500 0.102500 0.410000 – 0.410000 0.420000
Group 2 0.267678 0.053536 0.214142 0.195858 0.410000 0.420000
B-Class Accumulation Shares
Group 1 0.650000 0.130000 0.520000 – 0.520000 0.510000
Group 2 0.375351 0.075070 0.300281 0.219719 0.520000 0.510000
B-Class Income Shares
Group 1 0.975000 0.195000 0.780000 – 0.780000 0.800000
Group 2 0.561259 0.112252 0.449007 0.330993 0.780000 0.800000
C-Class Accumulation Shares
Group 1 1.025000 0.205000 0.820000 – 0.820000 0.840000
Group 2 0.553989 0.110798 0.443191 0.376809 0.820000 0.840000
C-Class Gross Accumulation Shares
Group 1 1.050000 0.000000 1.050000 – 1.050000 1.030000
Group 2 0.978883 0.000000 0.978883 0.071117 1.050000 1.030000
C-Class Income Shares
Group 1 1.087500 0.217500 0.870000 – 0.870000 0.880000
Group 2 0.571598 0.114320 0.457278 0.412722 0.870000 0.880000
C-Class Gross Income Shares
Group 1 1.020000 0.000000 1.020000 – 1.020000 1.030000
Group 2 0.548304 0.000000 0.548304 0.471696 1.020000 1.030000
I-Class Accumulation Shares
Group 1 1.175000 0.235000 0.940000 – 0.940000 0.920000
Group 2 0.487661 0.097532 0.390129 0.549871 0.940000 0.920000
I-Class Gross Accumulation Shares
Group 1 1.510000 0.000000 1.510000 – 1.510000 1.450000
Group 2 1.403777 0.000000 1.403777 0.106223 1.510000 1.450000
I-Class Income Shares
Group 1 1.075000 0.215000 0.860000 – 0.860000 0.880000
Group 2 0.431565 0.086313 0.345252 0.514748 0.860000 0.880000
I-Class Gross Income Shares
Group 1 1.100000 0.000000 1.100000 – 1.100000 1.110000
Group 2 0.494133 0.000000 0.494133 0.605867 1.100000 1.110000
X-Class Accumulation Shares
Group 1 1.287500 0.257500 1.030000 – 1.030000 1.000000
Group 2 1.287500 0.257500 1.030000 0.000000 1.030000 1.000000
X-Class Gross Accumulation Shares
Group 1 1.240000 0.000000 1.240000 – 1.240000 1.190000
Group 2 0.883834 0.000000 0.883834 0.356166 1.240000 1.190000
X-Class Gross Income Shares
Group 1 1.140000 0.000000 1.140000 – 1.140000 0.260000
Group 2 1.140000 0.000000 1.140000 0.000000 1.140000 0.260000
Distribution tables
292
Continuation�
� Return to Index

Third interim interest distribution in pence per share
Group 1 – Shares purchased prior to 1 August 2013Group 2 – Shares purchased 1 August 2013 to 31 October 2013
DistributionGross Tax Net paid paid
revenue at 20% revenue Equalisation 31.01.14 31.01.13
A-Class Accumulation Shares
Group 1 0.625000 0.125000 0.500000 – 0.500000 0.350000
Group 2 0.333154 0.066631 0.266523 0.233477 0.500000 0.350000
A-Class Income Shares
Group 1 0.550000 0.110000 0.440000 – 0.440000 0.320000
Group 2 0.243240 0.048648 0.194592 0.245408 0.440000 0.320000
B-Class Accumulation Shares
Group 1 0.700000 0.140000 0.560000 – 0.560000 0.350000
Group 2 0.430799 0.086160 0.344639 0.215361 0.560000 0.350000
B-Class Income Shares
Group 1 1.037500 0.207500 0.830000 – 0.830000 0.610000
Group 2 0.542014 0.108403 0.433611 0.396389 0.830000 0.610000
C-Class Accumulation Shares
Group 1 1.062500 0.212500 0.850000 – 0.850000 0.580000
Group 2 0.483580 0.096716 0.386864 0.463136 0.850000 0.580000
C-Class Gross Accumulation Shares
Group 1 1.100000 0.000000 1.100000 – 1.100000 0.640000
Group 2 0.598372 0.000000 0.598372 0.501628 1.100000 0.640000
C-Class Income Shares
Group 1 1.150000 0.230000 0.920000 – 0.920000 0.710000
Group 2 0.644576 0.128915 0.515661 0.404339 0.920000 0.710000
C-Class Gross Income Shares
Group 1 1.070000 0.000000 1.070000 – 1.070000 0.830000
Group 2 0.510474 0.000000 0.510474 0.559526 1.070000 0.830000
I-Class Accumulation Shares
Group 1 1.225000 0.245000 0.980000 – 0.980000 0.720000
Group 2 1.225000 0.245000 0.980000 0.000000 0.980000 0.720000
I-Class Gross Accumulation Shares
Group 1 1.130000 0.000000 1.130000 – 1.130000 1.150000
Group 2 1.128000 0.000000 1.128000 0.002000 1.130000 1.150000
I-Class Income Shares
Group 1 1.125000 0.225000 0.900000 – 0.900000 0.700000
Group 2 0.649766 0.129953 0.519813 0.380187 0.900000 0.700000
I-Class Gross Income Shares
Group 1 1.170000 0.000000 1.170000 – 1.170000 0.880000
Group 2 0.658809 0.000000 0.658809 0.511191 1.170000 0.880000
X-Class Accumulation Shares
Group 1 1.325000 0.265000 1.060000 – 1.060000 0.800000
Group 2 1.325000 0.265000 1.060000 0.000000 1.060000 0.800000
X-Class Gross Accumulation Shares
Group 1 1.300000 0.000000 1.300000 – 1.300000 0.970000
Group 2 0.670369 0.000000 0.670369 0.629631 1.300000 0.970000
X-Class Gross Income Shares
Group 1 1.190000 0.000000 1.190000 – 1.190000 –
Group 2 1.190000 0.000000 1.190000 0.000000 1.190000 –
Distribution tables – continued
293
Continuation�
� Return to Index

Second interim interest distribution in pence per share
Group 1 – Shares purchased prior to 1 May 2013Group 2 – Shares purchased 1 May 2013 to 31 July 2013
DistributionGross Tax Net paid paid
revenue at 20% revenue Equalisation 31.10.13 31.10.12
A-Class Accumulation Shares
Group 1 0.712500 0.142500 0.570000 – 0.570000 0.360000
Group 2 0.377775 0.075555 0.302220 0.267780 0.570000 0.360000
A-Class Income Shares
Group 1 0.637500 0.127500 0.510000 – 0.510000 0.330000
Group 2 0.331449 0.066290 0.265159 0.244841 0.510000 0.330000
B-Class Accumulation Shares
Group 1 0.762500 0.152500 0.610000 – 0.610000 –
Group 2 0.397041 0.079408 0.317633 0.292367 0.610000 –
B-Class Income Shares
Group 1 1.162500 0.232500 0.930000 – 0.930000 0.650000
Group 2 0.509095 0.101819 0.407276 0.522724 0.930000 0.650000
C-Class Accumulation Shares
Group 1 1.212500 0.242500 0.970000 – 0.970000 –
Group 2 0.402934 0.080587 0.322347 0.647653 0.970000 –
C-Class Gross Accumulation Shares
Group 1 1.210000 0.000000 1.210000 – 1.210000 –
Group 2 0.550426 0.000000 0.550426 0.659574 1.210000 –
C-Class Income Shares
Group 1 1.287500 0.257500 1.030000 – 1.030000 0.730000
Group 2 0.638323 0.127665 0.510658 0.519342 1.030000 0.730000
C-Class Gross Income Shares
Group 1 1.210000 0.000000 1.210000 – 1.210000 0.700000
Group 2 0.593458 0.000000 0.593458 0.616542 1.210000 0.700000
I-Class Accumulation Shares
Group 1 1.337500 0.267500 1.070000 – 1.070000 0.740000
Group 2 0.853159 0.170632 0.682527 0.387473 1.070000 0.740000
I-Class Gross Accumulation Shares
Group 1 2.650000 0.000000 2.650000 – 2.650000 1.190000
Group 2 2.650000 0.000000 2.650000 0.000000 2.650000 1.190000
I-Class Income Shares
Group 1 1.262500 0.252500 1.010000 – 1.010000 0.710000
Group 2 0.706848 0.141370 0.565478 0.444522 1.010000 0.710000
I-Class Gross Income Shares
Group 1 1.300000 0.000000 1.300000 – 1.300000 0.920000
Group 2 0.388696 0.000000 0.388696 0.911304 1.300000 0.920000
X-Class Accumulation Shares
Group 1 1.450000 0.290000 1.160000 – 1.160000 0.820000
Group 2 1.450000 0.290000 1.160000 0.000000 1.160000 0.820000
X-Class Gross Accumulation Shares
Group 1 1.420000 0.000000 1.420000 – 1.420000 0.990000
Group 2 0.511679 0.000000 0.511679 0.908321 1.420000 0.990000
X-Class Gross Income Shares
Group 1 1.330000 0.000000 1.330000 – 1.330000 –
Group 2 1.330000 0.000000 1.330000 0.000000 1.330000 –
Distribution tables – continued
294
Continuation�
� Return to Index

First interim interest distribution in pence per share
Group 1 – Shares purchased prior to 1 February 2013Group 2 – Shares purchased 1 February 2013 to 30 April 2013
DistributionGross Tax Net paid paid
revenue at 20% revenue Equalisation 31.07.13 31.07.12
A-Class Accumulation Shares
Group 1 0.675000 0.135000 0.540000 – 0.540000 0.560000
Group 2 0.289290 0.057858 0.231432 0.308568 0.540000 0.560000
A-Class Income Shares
Group 1 0.600000 0.120000 0.480000 – 0.480000 0.510000
Group 2 0.281760 0.056352 0.225408 0.254592 0.480000 0.510000
B-Class Accumulation Shares
Group 1 0.737500 0.147500 0.590000 – 0.590000 –
Group 2 0.438582 0.087716 0.350866 0.239134 0.590000 –
B-Class Income Shares
Group 1 1.125000 0.225000 0.900000 – 0.900000 0.930000
Group 2 0.551186 0.110237 0.440949 0.459051 0.900000 0.930000
C-Class Accumulation Shares
Group 1 1.137500 0.227500 0.910000 – 0.910000 –
Group 2 0.714592 0.142918 0.571674 0.338326 0.910000 –
C-Class Gross Accumulation Shares
Group 1 1.170000 0.000000 1.170000 – 1.170000 –
Group 2 0.679825 0.000000 0.679825 0.490175 1.170000 –
C-Class Income Shares
Group 1 1.250000 0.250000 1.000000 – 1.000000 1.060000
Group 2 0.747421 0.149484 0.597937 0.402063 1.000000 1.060000
C-Class Gross Income Shares
Group 1 1.170000 0.000000 1.170000 – 1.170000 0.090000
Group 2 0.653236 0.000000 0.653236 0.516764 1.170000 0.090000
I-Class Accumulation Shares
Group 1 1.287500 0.257500 1.030000 – 1.030000 1.040000
Group 2 1.287500 0.257500 1.030000 0.000000 1.030000 1.040000
I-Class Gross Accumulation Shares
Group 1 1.670000 0.000000 1.670000 – 1.670000 1.660000
Group 2 1.089906 0.000000 1.089906 0.580094 1.670000 1.660000
I-Class Income Shares
Group 1 1.212500 0.242500 0.970000 – 0.970000 1.020000
Group 2 0.611812 0.122362 0.489450 0.480550 0.970000 1.020000
I-Class Gross Income Shares
Group 1 1.270000 0.000000 1.270000 – 1.270000 1.310000
Group 2 0.674061 0.000000 0.674061 0.595939 1.270000 1.310000
X-Class Accumulation Shares
Group 1 1.387500 0.277500 1.110000 – 1.110000 1.120000
Group 2 1.387500 0.277500 1.110000 0.000000 1.110000 1.120000
X-Class Gross Accumulation Shares
Group 1 1.360000 0.000000 1.360000 – 1.360000 0.890000
Group 2 0.941046 0.000000 0.941046 0.418954 1.360000 0.890000
X-Class Gross Income Shares
Group 1 1.300000 0.000000 1.300000 – 1.300000 –
Group 2 1.300000 0.000000 1.300000 0.000000 1.300000 –
Equalisation applies only to shares purchased during the distribution period (group 2 shares). It is the average amount of revenue included in the purchase price of all group 2 shares and is refunded to holders of these
shares as a return of capital. Being capital it is not liable to income tax but must be deducted from the cost of shares for capital gains tax purposes.
Distribution tables – continued
295
� Return to Index

Investment objective and policyA
The Fund aims to provide capital growth and outperform the FTSE™ All-ShareIndex over the long term by investing primarily in a portfolio of UK companies.
UK companies are companies that are incorporated under the laws of, andhave their registered office in, the UK, or that derive the predominant partof their economic activity from the UK, even if listed elsewhere. Smallercompanies may be held on an ancillary basis.
This Equity based fund is conservatively managed and designed to give broadmarket exposure to UK companies.
Other instruments as permitted in the stated investment and borrowing powersof the Company including, but not limited to, fixed income securities, cashand cash equivalents may be held on an ancillary basis, as appropriate.
Risk profileThe value of your investment may fall as well as rise and you may get backless than you originally invested.
The value of Equity and Equity-Linked Securities may fluctuate in responseto the performance of individual companies and general market conditions.
The single market in which the Fund primarily invests, in this case the UK,may be subject to particular political and economic risks and, as a result,the Fund may be more volatile than more broadly diversified funds.
Please refer to Part 11 of the Prospectus for details of the general risk factorsaffecting this Fund in addition to the specific risk factors above.
Fund reviewThe UK stock market delivered a strong positive return for the year, supportedby accommodative monetary policy and the faster-than-expected domesticeconomic recovery.
The Fund, which aims to provide low cost, actively managed exposure to theUK stock market, outperformed its benchmark. Positive contributors torelative returns included stock selection in the support services and oil &gas producers sectors. Stock selection detracted moderately in food &drug retailers and financial services.
At the stock level, the Fund benefited in relative terms from an underweightposition in Tullow Oil, which fell over the period, hurt by disappointing drillingresults in Africa and South America. An overweight position in Ashtead wasalso positive as rising market share and an improving property market inthe US helped the equipment rental company to deliver strong earningsgrowth. Stock-level detractors from relative returns included an overweightposition in iron ore producer Ferrexpo, which was hurt by concerns overdeclining demand from China. Not holding Ocado was also detrimental asthe online grocer rose sharply over the period following the announcementof a deal to provide delivery and logistics services to Morrisons. However,relative returns were boosted by the Fund’s overweight position in sportsclothing retailer JD Sports Fashion, which benefited from improving salesmomentum and had a strong Christmas 2013 trading period.
Fund outlookThe economic backdrop looks set to remain favourable for UK stocks. If therecovery continues to gather momentum, UK companies have the potentialto deliver earnings growth this year.
12 month performance as at 31 January2014 2013 2012 2011 2010
JPM Active Index PlusE-Class AccB 11.7% 15.7% 0.2% 19.0% 31.7%
Benchmark IndexC 10.1% 16.3% -0.3% 18.1% 32.7%
Fund statisticsRisk and Reward Profile 6*
Fund size £84.8m
Benchmark IndexC FTSE All-Share Index (Net)
Fund chargesE-Class Initial Nil, Annual 0.25%
Top ten holdings (excluding Liquidity funds) %Royal Dutch Shell ‘B’ 6.6HSBC 5.8Vodafone Group 5.5BP 4.6GlaxoSmithKline 3.4JPM UK Smaller Companies ‘I’ (Accumulation)^ 2.9AstraZeneca 2.6British American Tobacco 2.6Rio Tinto 2.2Lloyds Banking Group 2.2
^ Deemed to be investment in related parties of the ACD
JPM UK Active Index Plus Fund
You should remember that past performance is not a guide to the future. The price of investments and the income from them may fall as well as rise andinvestors may not get back the full amount invested.
* For specific risks, including the risk and reward profile, please refer to the Key Investor information Document (KIID) available on the following websitehttp://am.jpmorgan.co.uk/investor/prices-and-factsheets/?list=all&tab=PricesAll equity indices stated as ‘Net’ are calculated net of tax as per the standard published approach by the index vendor unless stated otherwise.All performance returns are calculated using the quoted price of the accumulation shares. Performance returns are in Sterling.Source: J.P. Morgan.Formerly JPM UK Active 350 Fund, the Fund name was changed on 01/02/11.A On 01/02/11 the investment objective and policy of the Fund was changed.B The E-Class Shares were launched on 01/02/11 upon consolidation of the A and I Share Classes.C The benchmark of the Fund was changed from the FTSE™350 Index to the FTSE™ All-Share Index (Net) on 01/02/11.Source: FTSE International Limited (“FTSE”) © FTSE 2014. “FTSE®” is a trade mark of London Stock Exchange Plc and The Financial Times Limited and is used by FTSE International Limited under licence. All rights in theFTSE indices and/or FTSE ratings vest in FTSE and/or its licensors. Neither FTSE nor its licensors accept any liability for any errors or omissions in the FTSE indices and/or FTSE ratings or underlying data. No furtherdistribution of FTSE Data is permitted without FTSE’s express written consent.296
Continuation�
� Return to Index

Sector breakdown %Financials 21.6Oil & gas 14.1Consumer goods 12.8Consumer services 11.1Industrials 9.3Basic materials 7.6Health care 7.4Telecommunications 7.4Utilities 3.3Equity investment instruments 2.9Technology 1.0Liquidity funds 0.8Futures 0.0Net other assets 0.7
Highest/lowest share price and distribution recordDistribution
Highest Lowest per shareCalendar year share price share price (net)A-Class Accumulation Shares2009 174.0p 108.1p 5.43p2010 203.1p 160.7p 4.24p2011D 206.4p 199.0p 3.63pA-Class Income Shares2009 38.73p 24.06p 1.08p2010 44.08p 34.87p 0.94p2011D 44.80p 43.18p 0.79pE-Class Accumulation SharesE
2011 210.8p 170.8p –2012 219.0p 189.1p 6.31p2013 266.7p 221.0p 6.73p2014F 271.3p 257.7p 7.74pE-Class Income SharesE
2011 44.89p 36.37p – 2012 45.17p 39.01p 1.33p2013 53.41p 45.58p 1.38p2014F 54.34p 51.60p 1.55pI-Class Accumulation Shares2009 184.8p 114.3p 6.74p2010 216.9p 171.1p 5.37p2011D 220.5p 212.7p 4.99pI-Class Income Shares2009 78.26p 48.41p 2.93p2010 89.12p 70.30p 2.27p2011D 90.59p 87.26p 2.06p
D A-Class Accumulation Shares, A-Class Income Shares, I-Class Accumulation Shares and I-Class IncomeShares were closed on 1 February 2011.
E E-Class Accumulation Shares and E-Class Income Shares were launched on 1 February 2011.F To 31 January 2014.
Portfolio turnover rate31.01.13 56.2%31.01.14 46.4%
The portfolio turnover rate (PTR) reflects the total of security purchases and sales (excluding Liquidityfunds), less the total of share issues and cancellations, expressed as a percentage of the average daily netasset values over the period.
Portfolio transaction costsBroker Transaction
Commissions Taxes Total31.01.13 0.11% 0.17% 0.28%31.01.14 0.08% 0.17% 0.25%
The percentage figures disclosed above reflect the average broker commissions and transaction taxessuffered during the last 3 years divided by the average assets under management over the same period.
Stamp duty reserve tax31.01.13 0.00%31.01.14 0.00%
The percentage figures disclosed above reflect the total stamp duty reserve tax suffered during the yeardivided by the average assets under management over the same period.
Net asset values and Ongoing chargesNet assetvalue per Net asset
share class Number value per OngoingDate £’000 of shares share chargesA-Class Accumulation Shares31.01.11 59,545 29,936,871 198.9p 1.17%A-Class Income Shares31.01.11 25 58,998 42.37p 1.18%E-Class Accumulation Shares31.01.12 63,808 32,015,959 199.3p 0.41%31.01.13 73,607 31,925,004 230.6p 0.40%31.01.14 83,460 32,409,496 257.5p 0.40%E-Class Income Shares31.01.12 68 166,565 41.11p 0.41%31.01.13 1,232 2,668,850 46.17p 0.40%31.01.14 1,366 2,731,478 50.02p 0.40%I-Class Accumulation Shares31.01.11 4,692 2,207,615 212.5p 0.60%I-Class Income Shares31.01.11 1 1,165 85.14p 0.60%
The net asset value and the net asset value per income share are shown ex-dividend.
Following the adoption of the requirements of UCITS IV in June 2012, Ongoing charges has replaced the TotalExpense Ratio (“TER”). The Ongoing charges takes into account the ACD fee, the fixed expenses and any expensespaid to an affiliate in respect of stocklending activities, expressed as a percentage of the average daily net assetvalues over the period. The main difference between the two calculations is the inclusion of custodian handlingcharges and stocklending fees, and the exclusion of Performance fees in the Ongoing charges figure. Thecomparative figures have not been restated, and the historic TER is disclosed.
297
Continuation�
� Return to Index

Financials – 21.6% (21.2%)Banks – 11.5% Bank of Georgia 10,989 230 0.3Barclays 680,076 1,821 2.1HSBC 790,652 4,895 5.8Lloyds Banking Group 2,287,518 1,868 2.2Royal Bank of Scotland Group 22,304 75 0.1Standard Chartered 66,462 824 1.0Financial services – 1.3% IG Group 56,765 351 0.4Investec 79,478 309 0.4Provident Financial 3,143 51 0.1Schroders 12,266 301 0.4General financials – 1.2% 3i Group 88,106 330 0.4Aberdeen Asset Management 36,144 141 0.2Close Brothers Group 23,156 305 0.4London Stock Exchange Group 9,484 174 0.2Life insurance – 4.2% Aviva 81,044 358 0.4Legal & General Group 316,228 674 0.8Old Mutual 322,772 547 0.6Prudential 121,173 1,477 1.7Resolution 22,514 78 0.1Standard Life 133,975 485 0.6Nonlife insurance – 1.4% Amlin 77,669 328 0.4Beazley Group 106,338 271 0.3Direct Line Insurance 26,396 69 0.1Hiscox 51,146 324 0.4Jardine Lloyd Thompson 3,060 33 –Workspace Group 25,071 136 0.2Real estate – 2.0% Daejan Holdings 3,395 162 0.2Derwent London 4,212 104 0.1Foxtons Group 39,374 134 0.2Great Portland Estates 37,926 230 0.3Hammerson 28,776 150 0.2Land Securities Group 56,793 580 0.7Unite Group 68,034 280 0.3
Oil & gas – 14.1% (16.0%)Oil & gas producers – 13.6% BG Group 122,913 1,249 1.5BP 818,009 3,868 4.6Cairn Energy 49,973 106 0.1Enquest 222,054 289 0.3Premier Oil 42,484 114 0.1Royal Dutch Shell ‘B’ 251,284 5,635 6.6Soco International 69,036 282 0.3Tullow Oil 10,424 82 0.1Oil equipment, services & distribution – 0.5% AMEC 35,985 369 0.4Petrofac 9,482 110 0.1
Consumer goods – 12.8% (13.4%)Automobiles & parts – 0.6% GKN 133,322 517 0.6Beverages – 3.4% Britvic 46,012 317 0.4Diageo 97,369 1,722 2.0SABMiller 30,827 823 1.0Food producers – 2.3% Associated British Foods 4,473 119 0.1Cranswick 19,159 249 0.3Dairy Crest Group 51,787 263 0.3Greencore Group 117,242 292 0.3Unilever 47,449 1,095 1.3Household goods – 2.6% Barratt Development 74,406 278 0.3Bellway 17,538 270 0.3Berkeley Group 6,617 169 0.2Bovis Homes Group 6,659 54 0.1Persimmon 30,412 389 0.5Reckitt Benckiser Group 21,323 956 1.1Taylor Wimpey 97,291 108 0.1
Personal goods – 0.0% Burberry Group 1,307 18 –Tobacco – 3.9% British American Tobacco 74,475 2,167 2.6Imperial Tobacco Group 50,296 1,120 1.3
Consumer services – 11.1% (9.9%)Food & drug retails – 2.0% Morrison (Wm.) Supermarkets 174,047 414 0.5Sainsbury (J) 120,661 416 0.5Tesco 272,475 869 1.0General retailers – 2.4% Home Retail Group 132,779 236 0.3JD Sports Fashion 16,299 259 0.3Kingfisher 38,487 140 0.2Marks & Spencer Group 67,514 314 0.4Next 10,262 633 0.7Ted Baker 3,679 79 0.1WH Smith 30,184 314 0.4Media – 3.1% British Sky Broadcasting Group 70,476 603 0.7ITV 278,821 547 0.6Pearson 14,929 164 0.2Reed Elsevier 76,734 674 0.8WPP 51,671 643 0.8Travel & leisure – 3.6% Carnival 8,411 208 0.2Compass Group 47,137 428 0.5Easyjet 25,443 412 0.5Go-Ahead Group 15,908 311 0.4Greene King 37,574 318 0.4International Consolidated Airline 114,298 466 0.6Mitchells & Butlers 65,732 293 0.3Stagecoach Group 38,503 139 0.2TUI Travel 81,785 341 0.4Wetherspoon (J.D.) 13,333 106 0.1Whitbread 955 36 –
Industrials – 9.3% (7.8%)Aerospace & defence – 2.6% BAE Systems 190,235 810 1.0Cobham 75,477 217 0.3Rolls Royce 97,071 1,133 1.3Construction & materials – 0.9% CRH 14,378 224 0.3Galliford Try 24,982 293 0.3Keller Group 22,269 264 0.3Electronics & electrical equipment – 0.2% Morgan Advanced Materials 48,613 148 0.2General industrials – 0.5% Rexam 59,902 294 0.3RPC Group 6,164 37 –Smith (DS) 46,077 151 0.2Industrial engineering – 0.6% Bodycote 27,158 176 0.2IMI 24,113 357 0.4Industrial transportation – 0.5% BBA Aviation 42,528 130 0.2Royal Mail 45,087 266 0.3Support services – 4.0% Ashtead Group 42,223 328 0.4Atkins (WS) 21,982 298 0.4Babcock International Group 31,138 429 0.5Berendsen 32,578 299 0.4Capita Group 2,794 27 –Carillion 95,100 324 0.4DCC 12,248 338 0.4Experian 18,608 192 0.2Hays 250,787 335 0.4Interserve 42,832 265 0.3Serco Group 31,293 135 0.2Travis Perkins 13,042 224 0.3Wolseley 3,396 110 0.1
Portfolio statementAs at 31 January 2014
Market value Total netInvestment Holding £’000 assets %
Market value Total netInvestment Holding £’000 assets %
298
Continuation�
� Return to Index

Basic materials – 7.6% (10.3%)Chemicals – 0.5% AZ Electronics Materials 26,326 104 0.1Elementis 44,306 112 0.1Johnson Matthey 2,598 84 0.1Synthomer 54,235 148 0.2Forestry & paper – 0.3% Mondi 31,685 289 0.3Mining – 6.8% Anglo American 41,063 585 0.7BHP Billiton 100,907 1,804 2.1Ferrexpo 126,481 189 0.2Glencore Xstrata 363,606 1,165 1.4Rio Tinto 58,615 1,885 2.2Vedanta Resources 24,824 198 0.2
Health care – 7.4% (6.6%)Health care equipment & services – 0.3% Smith & Nephew 28,744 251 0.3Pharmaceuticals & biotechnology – 7.1% AstraZeneca 58,249 2,234 2.6GlaxoSmithKline 187,321 2,910 3.4Shire 31,530 946 1.1
Telecommunications – 7.4% (6.2%)Fixed line telecommunications – 1.9% BT Group 386,169 1,466 1.7KCOM Group 165,077 164 0.2Mobile telecommunications – 5.5% Vodafone Group 2,107,091 4,671 5.5
Utilities – 3.3% (3.1%)Electricity – 0.9% Drax Group 47,133 381 0.5SSE 24,333 320 0.4Gas, water & multiutilities – 2.4% Centrica 277,041 864 1.0National Grid 143,617 1,128 1.3United Utilities Group 6,356 46 0.1
Equity investment instruments – 2.9% (2.4%)JPM UK Smaller Companies ‘I’ (Accumulation)^$ 359,862 2,483 2.9
Technology – 1.0% (1.3%)Software & computer services – 0.4% Computacenter 13,337 86 0.1Micro Focus International 35,554 263 0.3Technology hardware & equipment – 0.6% ARM Holdings 32,148 299 0.4CSR 11,857 78 0.1Pace 23,506 83 0.1
Futures – 0.0% (0.1%)FTSE 100 Index Futures Mar 2014 12 (13) –
Liquidity funds – 0.8% (1.4%)JPM Sterling Liquidity ‘X’ (Distribution)^$ 701,002 701 0.8
Investment assets (including investment liabilities) 84,216 99.3
Net other assets 610 0.7
Net assets 84,826 100.0
Unless otherwise stated the above securities are admitted to official stock exchange listings or trade on aregulated market.
The comparative percentage figures in brackets are at 31 January 2013.
^ Deemed to be investment in related parties of the ACD$ Approved security as defined in the Collective Investment Schemes sourcebook
Portfolio statement – continuedAs at 31 January 2014
Market value Total netInvestment Holding £’000 assets %
299
Continuation�
� Return to Index

£’000
Total of all purchases for the year (Note 10) 36,941
Major purchases Cost
JPM Sterling Liquidity ‘X’ (Distribution)^ 2,503HSBC 931Royal Dutch Shell ‘B’ 876Vodafone Group 742Barclays 730BP 707Lloyds Banking Group 696Centrica 607Rolls Royce 605GlaxoSmithKline 569British American Tobacco 563Shire 534Old Mutual 504Reed Elsevier 481GKN 476BHP Billiton 447Unilever 429Glencore Xstrata 427Diageo 395AstraZeneca 384
^ Deemed to be investment in related parties of the ACD
£’000
Total of all sales for the year (Note 10) 33,356
Major sales Proceeds
JPM Sterling Liquidity ‘X’ (Distribution)^ 2,873GlaxoSmithKline 876Royal Dutch Shell ‘B’ 655British American Tobacco 617HSBC 612Diageo 600BP 575Vodafone Group 517Smiths Group 505Sage Group 496Workspace Group 460Intermediate Capital Group 442Anglo American 396William Hill 382Barclays 370Associated British Foods 368Royal Bank of Scotland Group 367Aberdeen Asset Management 359Debenhams 342International Personal Finance 338
Portfolio movements For the year ending 31 January 2014
300
Continuation�
� Return to Index

Statement of total returnFor the year ending 31 January
2014 2013£’000 £’000 £’000 £’000
Income
Net capital gains (Note 1) 6,124 7,984
Revenue (Note 2) 2,792 2,440
Expenses (Note 3) (317) (269)
Performance fee (Note 3) (46) –
Net revenue before taxation 2,429 2,171
Taxation (Note 4) (2) –
Net revenue after taxation 2,427 2,171
Total return before distributions 8,551 10,155
Finance costs: Distributions (Note 5) (2,425) (2,173)
Change in net assets attributable to shareholders from investment activities 6,126 7,982
Statement of change in net assets attributable to shareholdersFor the year ending 31 January
2014 2013£’000 £’000 £’000 £’000
Opening net assets attributable to shareholders 74,839 63,876
Amounts receivable on issue of shares 14,803 1,242
Amounts payable on cancellation of shares (13,448) (409)
1,355 833
Change in net assets attributable to shareholders from investment activities (see above) 6,126 7,982
Retained distributions on accumulation shares 2,508 2,149
Stamp duty reserve tax (2) (1)
Closing net assets attributable to shareholders 84,826 74,839
Balance sheetAs at 31 January
2014 2013£’000 £’000 £’000 £’000
ASSETS
Investment assets 84,229 74,626
Debtors (Note 7) 229 182
Cash and bank balances (Note 8) 507 102
Total other assets 736 284
Total assets 84,965 74,910
LIABILITIES
Investment liabilities (13) –
Creditors (Note 9) (84) (34)
Distribution payable on income shares (42) (37)
Total other liabilities (126) (71)
Total liabilities (139) (71)
Net assets attributable to shareholders 84,826 74,839
The notes to these financial statements are shown on pages 302 to 303.
Financial statements
301
Continuation�
� Return to Index

1. Net capital gains2014 2013
£’000 £’000Derivative contracts 59 256Non-derivative securities 6,065 7,728Net capital gains 6,124 7,984
2. Revenue2014 2013
£’000 £’000Distributions from authorised ICVCs 26 14Franked income from UK equity investments 2,590 2,267Income from Liquidity funds 3 14Income from overseas equity investments 116 80Interest on bank and term deposits – 1Management fee rebates 13 9Property income distributions 24 19Stock dividends 18 27Underwriting commission 2 9Total revenue 2,792 2,440
3. Expenses2014 2013
£’000 £’000Payable to the ACD or associate of the ACD:ACD fee 198 168Fixed expenses 119 101Performance fee 46 –Total expenses 363 269
4. Taxation2014 2013
£’000 £’000a) Analysis of charge in the yearOverseas tax suffered 2 –Current year tax charge (Note 4b) 2 –
b) Factors affecting the tax charge for the yearThe tax assessed for the year is lower than the standard rate of corporation tax inthe UK for an Open-Ended Investment Company (OEIC) (20%). The differences areexplained below.
Net revenue before taxation 2,429 2,171Corporation tax at 20% 486 434
Effects of:Dividends not subject to corporation tax (550) (477)Excess expenses for which no relief taken 64 43Overseas tax suffered 2 –
(484) (434)Current year tax charge (Note 4a) 2 –
No deferred tax asset has been recognised in the financial statements. At the yearend date, the Fund had a potential unrecognised deferred tax asset of £1,441,743(31.01.13: £1,377,587) in relation to £7,208,714 (31.01.13: £6,887,934) of excessmanagement expenses which would only be utilised to reduce the tax charge if theFund had an excess of unfranked income over expenses in a future period. There isno excess of unfranked income expected in the future.
5. Finance costsDistributionsThe distributions take account of amounts receivable on the issue of shares andamounts payable on the cancellation of shares and comprise:
2014 2013£’000 £’000
Final dividend distribution 2,550 2,186Add: Amounts payable on cancellation of shares 238 9Deduct: Amounts receivable on issue of shares (363) (22)Total finance costs 2,425 2,173
Details of the distribution per share are set out on page 304.
6. Movement between net revenue after taxation and distributions2014 2013
£’000 £’000Net revenue after taxation 2,427 2,171Add: Undistributed revenue brought forward 1 3Deduct: Undistributed revenue carried forward (3) (1)
2,425 2,173
7. Debtors2014 2013
£’000 £’000Accrued income 162 144Due from the ACD for shares created 65 –Overseas tax recoverable 2 4Sales awaiting settlement – 34Total debtors 229 182
8. Cash and bank balances2014 2013
£’000 £’000Amounts held at futures clearing houses
and brokers 47 28Cash and bank balances 460 74Total cash and bank balances 507 102
9. Creditors2014 2013
£’000 £’000Accrued expenses 76 25Due to the ACD for shares cancelled 8 9Total creditors 84 34
Notes to the financial statements for the year ending 31 January 2014
302
Continuation�
� Return to Index

10. Portfolio transaction costs2014 2013
£’000 £’000Analysis of total purchase costs
Purchases in year before transaction costs 36,750 25,241
Commissions 34 29Taxes 157 100Total purchase costs 191 129Gross purchases total 36,941 25,370
Analysis of total sale costs
Gross sales before transaction costs 33,386 21,786
Commissions (30) (21)Total sale costs (30) (21)Total sales net of transaction costs 33,356 21,765
11. Related party transactionsJPMorgan Funds Limited, as Authorised Corporate Director (“ACD”), is a relatedparty, and acts as principal in respect of all transactions of shares in the Company.The aggregate monies received through issue, and paid on cancellation, aredisclosed in the Statement of Change in Net Assets Attributable to Shareholders.
The balance due from the ACD and their associates at the year end date in respectof related party transactions was £17,146 (31.01.13: £34,352). Details of relatedparty transactions are given under note 13 on page 413.
Investments considered to be related parties have been identified in the portfoliostatement on pages 298 to 299 and the revenue from these investments was£28,780 (31.01.13: £28,218).
Some of the dealing transactions for the Fund are carried out through associatesof the ACD. Such transactions are carried out on an arm’s length basis. Thecommissions paid to these companies over the year were £15,375 (31.01.13: £40).Commission was paid to the associated company JPMorgan Securities Ltd.
The following parties held a material interest in the Fund at the year end date:– S&P Pensions Ltd 64.45% (31.01.13: 73.92%)– JP Morgan Life Diversified Equity 17.55% (31.01.13: 0.00%)
12. Financial instrumentsCurrency exposuresAt the year end date, the majority of the Fund’s financial assets and liabilities weredenominated in Sterling. As a result, the Fund has no material exposure tocurrency movements.
Interest rate riskAt the year end date, 1.4% (31.01.13: 1.6%) of the Fund’s net assets by value wereinterest bearing, carrying a (fixed/floating) rate.
For consideration of other risks including liquidity, pricing and credit risk, pleaserefer to the notes to the aggregated financial statements, pages 413 to 414.
13. Share classesThe Fund currently has one share class; Class E Shares. The Authorised CorporateDirector’s (ACD) fee and fixed expenses charge are shown below.
ACD fee Fixed expenses Performance feeClass E shares: 0.25% 0.15% maximum of 10%
The performance fee is calculated as 10% of any outperformance of the Fundagainst its benchmark, FTSE™ All-Share (Total Return Net), with a cap of 1.5% abovebenchmark return. If the net asset value per share under-performs the benchmarkfor one or more accounting periods the ACD will not receive a performance fee untilthe under-performance has been recovered. Full details on how the performancefee is calculated can be found in the Prospectus.
The net asset value, the net asset value per share and the number of shares areshown on page 297.
14. Derivatives The Fund enters into derivative transactions in the form of futures for the purposeof efficient portfolio management. The commitment approach has been used tocalculate the global exposure.
Further information on the derivative risks can be found in the notes to theaggregated financial statements on page 414.
15. Contingent liabilities and capital commitmentsAt the balance sheet date there were no contingent liabilities or capitalcommitments (2013: none).
Notes to the financial statements – continued
303
Continuation�
� Return to Index

Final distribution in pence per share
Group 1 – Shares purchased prior to 1 February 2013Group 2 – Shares purchased 1 February 2013 to 31 January 2014
DistributionGross Tax Net payable paid
revenue at 10% revenue Equalisation 30.04.14 30.04.13
E-Class Accumulation Shares
Group 1 8.600000 0.860000 7.740000 – 7.740000 6.730000
Group 2 1.866840 0.186684 1.680156 6.059844 7.740000 6.730000
E-Class Income Shares
Group 1 1.722222 0.172222 1.550000 – 1.550000 1.380000
Group 2 0.903870 0.090387 0.813483 0.736517 1.550000 1.380000
Equalisation applies only to shares purchased during the distribution period (group 2 shares). It is the average amount of revenue included in the purchase price of all group 2 shares and is refunded to holders of these
shares as a return of capital. Being capital it is not liable to income tax but must be deducted from the cost of shares for capital gains tax purposes.
Distribution table
304
� Return to Index

Investment objective and policyTo maximise long-term capital growth by investing primarily in UK Equities.
UK Equities are issued by companies that are incorporated under the lawsof, and have their registered office in, the UK, or that derive the predominantpart of their economic activity from the UK, even if listed elsewhere. Smallercompanies may be held on an ancillary basis.
This Equity based Fund invests in those stocks which the Investment Adviserbelieves will outperform, irrespective of their Benchmark weighting.
Other instruments as permitted in the stated investment and borrowingpowers of the Company including, but not limited to, fixed income securities,cash and cash equivalents may be held on an ancillary basis, as appropriate.
Risk profileThe value of your investment may fall as well as rise and you may get backless than you originally invested.
The value of Equity and Equity-Linked Securities may fluctuate in responseto the performance of individual companies and general market conditions.
This Fund is aggressively managed, which may result in higher volatility ofthe Fund’s performance and bigger differences between the performanceof the Fund and its Benchmark.
The single market in which the Fund primarily invests, in this case the UK,may be subject to particular political and economic risks and, as a result,the Fund may be more volatile than more broadly diversified funds.
Please refer to Part 11 of the Prospectus for details of the general risk factorsaffecting this Fund in addition to the specific risk factors above.
Fund reviewThe UK stock market delivered a strong positive return for the year, supportedby accommodative monetary policy and the faster-than-expected domesticeconomic recovery.
The Fund, which has a best ideas approach to investing in attractively valued,high quality stocks with positive momentum, outperformed its benchmark.At the sector level, the biggest contributors to relative returns included stockselection and overweight holdings in household goods & home constructionand travel & leisure. Detractors from relative returns included stock selectionand an underweight holding in pharmaceuticals & biotechnology, as well asan overweight in industrial metals & mining.
The biggest stock level contributor to relative performance was an overweightposition in Ashtead, as the equipment rental company raised its guidancefor capital expenditure in fiscal year 2014, reflecting a commitment to growingits US market share. An overweight holding in easyJet also boosted relativereturns, as the budget airline delivered strong annualised earnings growthfor the 2013 fiscal year. Detractors from relative performance includedoverweight exposure to London-listed miner Kazakhmys, shares in whichunderperformed due to weakness in its copper operations and fallingcommodity prices. An underweight position in GlaxoSmithKline also heldback relative returns, as the pharmaceuticals company reported a solid setof third-quarter results, despite facing currency headwinds and weaknessin China. However, relative performance benefited from an overweight holdingin Greencore, as the food producer announced strong fiscal-year results.
Fund outlookThe economic backdrop looks set to remain favourable for UK stocks. If therecovery continues to gather momentum, UK companies have the potentialto deliver earnings growth this year.
12 month performance as at 31 January2014 2013 2012 2011 2010
JPM UK Dynamic A-Class Acc 21.3% 19.4% -3.9% 23.6% 24.6%
JPM UK Dynamic B-Class Acc 21.8% 20.1% -3.4% 24.2% 25.2%
JPM UK Dynamic C-Class Acc 22.2% – – – –
Benchmark Index 10.1% 16.3% -0.3% 18.1% 33.2%
Fund statisticsRisk and Reward Profile 6*
Fund size £147.3m
Benchmark Index FTSE All-Share Index (Net)
Fund chargesA-Class Initial 3.00%, Annual 1.50%B-Class Initial Nil, Annual 1.00%C-Class Initial Nil, Annual 0.75%
Top ten holdings (excluding Liquidity funds) %BP 6.6Vodafone Group 5.1Royal Dutch Shell ‘A’ 4.8BT Group 3.9HSBC 3.6GlaxoSmithKline 3.1Rio Tinto 2.9Lloyds Banking Group 2.9British American Tobacco 2.7Shire 2.3
JPM UK Dynamic Fund
You should remember that past performance is not a guide to the future. The price of investments and the income from them may fall as well as rise andinvestors may not get back the full amount invested.
* For specific risks, including the risk and reward profile, please refer to the Key Investor information Document (KIID) available on the following websitehttp://am.jpmorgan.co.uk/investor/prices-and-factsheets/?list=all&tab=PricesAll equity indices stated as ‘Net’ are calculated net of tax as per the standard published approach by the index vendor unless stated otherwise.All performance returns are calculated using the quoted price of the accumulation shares. Performance returns are in Sterling.Source: J.P. Morgan.Source: FTSE International Limited (“FTSE”) © FTSE 2014. “FTSE®” is a trade mark of London Stock Exchange Plc and The Financial Times Limited and is used by FTSE International Limited under licence. All rights in theFTSE indices and/or FTSE ratings vest in FTSE and/or its licensors. Neither FTSE nor its licensors accept any liability for any errors or omissions in the FTSE indices and/or FTSE ratings or underlying data. No furtherdistribution of FTSE Data is permitted without FTSE’s express written consent. 305
Continuation�
� Return to Index

Sector breakdown %Financials 18.0Consumer services 16.2Consumer goods 15.3Oil & gas 12.9Industrials 10.5Telecommunications 9.0Health care 7.5Basic materials 7.2Liquidity funds 1.4Technology 1.0Net other assets 1.0
Highest/lowest share price and distribution recordDistribution
Highest Lowest per shareCalendar year share price share price (net)A-Class Accumulation Shares2009 88.64p 57.47p 2.24p2010 102.7p 80.07p 1.08p2011 106.5p 86.13p 0.81p2012 112.2p 91.24p 1.80p2013 145.8p 113.8p 1.73p2014A 149.7p 142.6p 0.73pA-Class Income Shares2009 78.51p 51.80p 2.03p2010 89.86p 70.60p 0.96p2011 93.04p 74.80p 0.71p2012 95.64p 78.50p 1.54p2013 122.7p 97.01p 1.49p2014A 125.9p 120.0p 0.61pB-Class Accumulation Shares2009 89.93p 58.11p 2.64p2010 104.8p 81.54p 1.56p2011 109.0p 88.30p 1.37p2012 115.7p 93.86p 2.36p2013 151.2p 117.4p 2.38p2014A 155.3p 147.9p 1.07pC-Class Accumulation SharesB
2012 112.3p 103.4p –2013 147.2p 114.0p 2.37p2014A 151.2p 144.0p 1.27pC-Class Income SharesB
2012 95.74p 88.20p – 2013 123.2p 97.13p 2.02p2014A 126.5p 120.5p 1.06p
A To 31 January 2014.B C-Class Accumulation Shares and C-Class Income Shares were launched on 22 October 2012.
Portfolio turnover rate31.01.13 235.1%31.01.14 246.7%
The portfolio turnover rate (PTR) reflects the total of security purchases and sales (excluding Liquidityfunds), less the total of share issues and cancellations, expressed as a percentage of the average daily netasset values over the period.
Portfolio transaction costsBroker Transaction
Commissions Taxes Total31.01.13 0.42% 0.13% 0.55%31.01.14 0.44% 0.33% 0.77%
The percentage figures disclosed above reflect the average broker commissions and transaction taxessuffered during the last 3 years divided by the average assets under management over the same period.
Stamp duty reserve tax31.01.13 0.02%31.01.14 0.02%
The percentage figures disclosed above reflect the total stamp duty reserve tax suffered during the yeardivided by the average assets under management over the same period.
Net asset values and Ongoing chargesNet assetvalue per Net asset
share class Number value per OngoingDate £’000 of shares share chargesA-Class Accumulation Shares31.01.12 103,445 104,819,162 98.69p 1.67%31.01.13 109,488 93,161,368 117.5p 1.68%31.01.14 120,238 84,374,828 142.5p 1.68%A-Class Income Shares31.01.12 70,389 82,733,057 85.08p 1.67%31.01.13 25,076 25,128,957 99.79p 1.68%31.01.14 25,061 21,010,234 119.3p 1.68%B-Class Accumulation Shares31.01.12 2,885 2,847,093 101.4p 1.14%31.01.13 2,862 2,359,198 121.3p 1.18%31.01.14 407 275,317 147.8p 1.18%C-Class Accumulation Shares31.01.13 1 1,000 117.8p 0.93%31.01.14 1,298 901,883 144.0p 0.93%C-Class Income Shares31.01.13 17 17,110 99.80p 0.93%31.01.14 306 256,485 119.4p 0.93%
The net asset value and the net asset value per income share are shown ex-dividend.
Following the adoption of the requirements of UCITS IV in June 2012, Ongoing charges has replaced theTotal Expense Ratio (“TER”). The Ongoing charges takes into account the ACD fee, the fixed expenses andany expenses paid to an affiliate in respect of stocklending activities, expressed as a percentage of theaverage daily net asset values over the period. The main difference between the two calculations is theinclusion of custodian handling charges and stocklending fees in the Ongoing charges figure. The comparativefigures have not been restated, and the historic TER is disclosed.
306
Continuation�
� Return to Index

Financials – 18.0% (28.1%)Banks – 8.6%Barclays 1,150,472 3,081 2.1 HSBC 851,027 5,269 3.6 Lloyds Banking Group 5,261,205 4,295 2.9 Financial services – 2.4%International Personal Finance 168,426 776 0.5 Jupiter Fund Management 505,967 1,869 1.3 Provident Financial 58,114 943 0.6 Life insurance – 3.8%Aviva 591,330 2,612 1.8 Legal & General Group 723,979 1,543 1.0 Prudential 124,677 1,520 1.0 Nonlife insurance – 1.2%Henderson Group 779,985 1,722 1.2 Real estate – 2.0%Countrywide 323,251 1,838 1.3 Foxtons Group 314,258 1,068 0.7
Consumer services – 16.2% (16.0%)Food & drug retails – 1.2%Booker Group 1,188,091 1,823 1.2 General retailers – 7.0%Darty 785,649 1,027 0.7 Halfords Group 470,813 2,121 1.4 Next 49,811 3,071 2.1 Sports Direct International 120,518 802 0.6 WH Smith 311,633 3,241 2.2 Media – 3.0%Daily Mail & General Trust ‘A’ 168,060 1,586 1.1 ITV 980,620 1,923 1.3 Rightmove 32,461 811 0.6 Travel & leisure – 4.3%International Consolidated Airlines 410,354 1,674 1.1 Easyjet 118,919 1,924 1.3 Wetherspoon (J.D.) 131,690 1,050 0.7 Thomas Cook Group 999,009 1,752 1.2 Food producers – 0.7%Unilever 45,729 1,055 0.7
Consumer goods – 15.3% (20.9%)Automobiles & parts – 1.3%GKN 501,957 1,946 1.3 Beverages – 1.7%Diageo 140,437 2,484 1.7 Food producers – 1.6%Greencore Group 929,066 2,313 1.6 Household goods – 6.7%Barratt Development 321,801 1,202 0.8 Berkeley Group 64,549 1,647 1.1 Crest Nicholson 263,639 956 0.6 Persimmon 60,437 772 0.5 Reckitt Benckiser Group 64,976 2,913 2.0 Redrow 432,041 1,379 1.0 Taylor Wimpey 964,542 1,074 0.7 Tobacco – 4.0%British American Tobacco 134,922 3,925 2.7 Imperial Tobacco Group 83,390 1,856 1.3
Oil & gas – 12.9% (4.0%)Oil & gas producers – 11.4%BP 2,068,980 9,782 6.6 Royal Dutch Shell ‘A’ 330,110 7,005 4.8 Oil equipment, services & distribution – 1.5%Kentz 348,058 2,259 1.5
Industrials – 10.5% (11.6%)Aerospace & defence – 1.6%BAE Systems 426,692 1,818 1.2 Rolls Royce 48,490 566 0.4 General industrials – 1.8%Smith (DS) 816,026 2,682 1.8 Support services – 6.2%Ashtead Group 267,164 2,076 1.4 Babcock International Group 234,932 3,240 2.2 DCC 28,463 786 0.5 Interserve 186,199 1,151 0.8 SIG 985,145 1,891 1.3 Transportation – 0.9%Royal Mail 214,235 1,266 0.9
Telecommunications – 9.0% (0.8%)Fixed line telecommunications – 3.9%BT Group 1,502,517 5,704 3.9 Mobile telecommunications – 5.1%Vodafone Group 3,409,658 7,559 5.1
Health care – 7.5% (2.2%)Pharmaceuticals & biotechnology – 7.5%AstraZeneca 81,933 3,142 2.1 GlaxoSmithKline 293,265 4,556 3.1 Shire 113,358 3,402 2.3
Basic materials – 7.2% (11.4%)Forestry & paper – 0.5%Mondi 99,328 906 0.5 Mining – 6.7%Glencore Xstrata 664,280 2,128 1.5 BHP Billiton 155,454 2,779 1.9 Ferrexpo 342,947 514 0.4 Rio Tinto 134,054 4,310 2.9
Technology – 1.0% (1.4%)Software & computer services – 1.0%Blinkx 254,733 323 0.3 Micro Focus International 148,842 1,099 0.7
Liquidity funds – 1.4% (2.6%)JPM Sterling Liquidity ‘X’ (Distribution)^$ 2,000,000 2,000 1.4
Investment assets 145,807 99.0
Net other assets 1,503 1.0
Net assets 147,310 100.0
Unless otherwise stated the above securities are admitted to official stock exchange listings or trade on aregulated market.
The comparative percentage figures in brackets are at 31 January 2013.
^ Deemed to be investment in related parties of the ACD$ Approved security as defined in the Collective Investment Schemes sourcebook
Portfolio statementAs at 31 January 2014
Market value Total netInvestment Holding £’000 assets %
Market value Total netInvestment Holding £’000 assets %
307
Continuation�
� Return to Index

£’000
Total of all purchases for the year (Note 10) 240,898
Major purchases Cost
JPM Sterling Liquidity ‘X’ (Distribution)^ 57,861 Royal Dutch Shell ‘A’ 10,111 BP 8,905 Vodafone Group 8,143 BT Group 7,453 HSBC 6,922 GlaxoSmithKline 5,673 Barclays 4,907 International Consolidated Airlines 4,697 Diageo 4,680 Thomas Cook Group 4,611 Rio Tinto 4,414 Reckitt Benckiser Group 3,939 BG Group 3,578 Countrywide 3,553 Mondi 3,179 Standard Life 3,030 Lloyds Banking Group 3,014 BHP Billiton 2,963AstraZeneca 2,936
^ Deemed to be investment in related parties of the ACD
£’000
Total of all sales for the year (Note 10) 255,957
Major sales Proceeds
JPM Sterling Liquidity ‘X’ (Distribution)^ 59,441 Barclays 9,695 Easyjet 8,151 Ashtead Group 7,572 Lloyds Banking Group 6,969 Rio Tinto 6,677 Diageo 6,134 Prudential 6,028 Royal Dutch Shell ‘A’ 5,617 Taylor Wimpey 4,565 Thomas Cook Group 4,463 Barratt Development 4,228 Persimmon 4,197 ITV 3,897 Berkeley Group 3,707 Ferrexpo 3,497 BG Group 3,477 Lancashire 3,355 International Consolidated Airlines 3,272Countrywide 3,152
Portfolio movements For the year ending 31 January 2014
308
Continuation�
� Return to Index

Statement of total returnFor the year ending 31 January
2014 2013£’000 £’000 £’000 £’000
Income
Net capital gains (Note 1) 25,171 21,760
Revenue (Note 2) 4,614 3,985
Expenses (Note 3) (2,409) (2,177)
Net revenue before taxation 2,205 1,808
Taxation (Note 4) (41) (22)
Net revenue after taxation 2,164 1,786
Total return before distributions 27,335 23,546
Finance costs: Distributions (Note 5) (2,164) (1,790)
Change in net assets attributable to shareholders from investment activities 25,171 21,756
Statement of change in net assets attributable to shareholdersFor the year ending 31 January
2014 2013£’000 £’000 £’000 £’000
Opening net assets attributable to shareholders 137,444 176,719
Amounts receivable on issue of shares 3,878 3,612
Amounts payable on cancellation of shares (20,924) (66,006)
(17,046) (62,394)
Change in net assets attributable to shareholders from investment activities (see above) 25,171 21,756
Retained distributions on accumulation shares 1,764 1,385
Stamp duty reserve tax (24) (22)
Unclaimed distributions 1 –
Closing net assets attributable to shareholders 147,310 137,444
Balance sheetAs at 31 January
2014 2013£’000 £’000 £’000 £’000
ASSETS
Investment assets 145,807 136,067
Debtors (Note 7) 1,347 2,044
Cash and bank balances (Note 8) 601 733
Total other assets 1,948 2,777
Total assets 147,755 138,844
LIABILITIES
Investment liabilities – (15)
Creditors (Note 9) (314) (1,280)
Distribution payable on income shares (131) (105)
Total other liabilities (445) (1,385)
Total liabilities (445) (1,400)
Net assets attributable to shareholders 147,310 137,444
The notes to these financial statements are shown on pages 310 to 311.
Financial statements
309
Continuation�
� Return to Index

1. Net capital gains2014 2013
£’000 £’000Currency gains/(losses) 2 (2)Derivative contracts 226 332Forward currency contracts – (1)Non-derivative securities 24,943 21,431Net capital gains 25,171 21,760
2. Revenue2014 2013
£’000 £’000Franked income from UK equity investments 3,734 3,540Income from Liquidity funds 15 22Income from overseas equity investments 813 380Stock dividends 6 43Underwriting commission 46 –Total revenue 4,614 3,985
3. Expenses2014 2013
£’000 £’000Payable to the ACD or associate of the ACD:ACD fee 2,149 1,943Fixed expenses 260 234Total expenses 2,409 2,177
4. Taxation2014 2013
£’000 £’000a) Analysis of charge in the yearOverseas tax suffered 41 22Current year tax charge (Note 4b) 41 22
b) Factors affecting the tax charge for the yearThe tax assessed for the year is lower than the standard rate of corporation tax inthe UK for an Open-Ended Investment Company (OEIC) (20%). The differences areexplained below.
Net revenue before taxation 2,205 1,808Corporation tax at 20% 441 362
Effects of:Dividends not subject to corporation tax (910) (793)Excess expenses for which no relief taken 469 431Overseas tax suffered 41 22
(400) (340)Current year tax charge (Note 4a) 41 22
No deferred tax asset has been recognised in the financial statements. At the yearend date, the Fund had a potential unrecognised deferred tax asset of £8,834,209(31.01.13: £8,364,837) in relation to £44,171,046 (31.01.13: £41,824,183) of excessmanagement expenses which would only be utilised to reduce the tax charge if theFund had an excess of unfranked income over expenses in a future period. There isno excess of unfranked income expected in the future.
5. Finance costsDistributionsThe distributions take account of amounts receivable on the issue of shares andamounts payable on the cancellation of shares and comprise:
2014 2013£’000 £’000
Interim dividend distribution 1,363 1,105Final dividend distribution 761 581Add: Amounts payable on cancellation of shares 65 117Deduct: Amounts receivable on issue of shares (25) (13)Total finance costs 2,164 1,790
Details of the distribution per share are set out on page 312.
6. Movement between net revenue after taxation and distributions2014 2013
£’000 £’000Net revenue after taxation 2,164 1,786Add: Undistributed revenue brought forward 5 9Deduct: Undistributed revenue carried forward (5) (5)
2,164 1,790
7. Debtors2014 2013
£’000 £’000Accrued income 333 124Due from the ACD for shares created 49 33Overseas tax recoverable 20 18Sales awaiting settlement 945 1,869Total debtors 1,347 2,044
8. Cash and bank balances2014 2013
£’000 £’000Amounts held at futures clearing houses
and brokers – 165Cash and bank balances 601 568Total cash and bank balances 601 733
9. Creditors2014 2013
£’000 £’000Accrued expenses 217 193Due to the ACD for shares cancelled 97 144Purchases awaiting settlement – 943Total creditors 314 1,280
Notes to the financial statements for the year ending 31 January 2014
310
Continuation�
� Return to Index

10. Portfolio transaction costs2014 2013
£’000 £’000Analysis of total purchase costs
Purchases in year before transaction costs 239,928 256,288
Commissions 170 149Taxes 800 750Total purchase costs 970 899Gross purchases total 240,898 257,187
Analysis of total sale costs
Gross sales before transaction costs 256,151 315,925
Commissions (193) (203)Taxes (1) –Total sale costs (194) (203)Total sales net of transaction costs 255,957 315,722
11. Related party transactionsJPMorgan Funds Limited, as Authorised Corporate Director (“ACD”), is a relatedparty, and acts as principal in respect of all transactions of shares in the Company.The aggregate monies received through issue, and paid on cancellation, aredisclosed in the Statement of Change in Net Assets Attributable to Shareholders.
The balance due to the ACD and their associates at the year end date in respect ofrelated party transactions was £266,164 (31.01.13: £303,421). Details of relatedparty transactions are given under note 13 on page 413.
Investments considered to be related parties have been identified in the portfoliostatement on page 307 and the revenue from these investments was £14,887(31.01.13: £22,301).
Some of the dealing transactions for the Fund are carried out through associatesof the ACD. Such transactions are carried out on an arm’s length basis. Thecommissions paid to these companies over the year were £35,138 (31.01.13:£7,630). Commission was paid to the associated company JPMorgan Securities Ltd.
The following parties held a material interest in the Fund at the year end date:– Chase Nominees Limited Acc 22107 31.75% (31.01.13: 31.36%)– JP Morgan Elect Plc 14.29% (31.01.13: 11.91%)
12. Financial instrumentsCurrency exposuresAt the year end date, the majority of the Fund’s financial assets and liabilities weredenominated in Sterling. As a result, the Fund has no material exposure tocurrency movements.
Net foreign currency assetsMonetary Non-monetary
Total exposures exposuresCurrency £’000 £’000 £’000
31.01.14Euro 29 29 -
31.01.13Euro 4,702 43 4,659
Interest rate riskAt the year end date, 1.8% (31.01.13: 3.1%) of the Fund’s net assets by value wereinterest bearing, carrying a (fixed/floating) rate.
For consideration of other risks including liquidity, pricing and credit risk, pleaserefer to the notes to the aggregated financial statements, pages 413 to 414.
13. Share classesThe Fund currently has three share classes; Class A Shares, Class B Shares andClass C Shares. The Authorised Corporate Director’s (ACD) fee and fixed expensescharge are shown below.
ACD fee Fixed expensesClass A shares: 1.50% 0.18%Class B shares: 1.00% 0.18%Class C shares: 0.75% 0.18%
The net asset value of each share class, the net asset value per share and thenumber of shares in each class are shown on page 306. All classes have the samerights on winding up.
14. Contingent liabilities and capital commitmentsAt the balance sheet date there were no contingent liabilities or capitalcommitments (2013: none).
Notes to the financial statement – continued
311
Continuation�
� Return to Index

Final distribution in pence per share
Group 1 – Shares purchased prior to 1 August 2013Group 2 – Shares purchased 1 August 2013 to 31 January 2014
DistributionGross Tax Net payable paid
revenue at 10% revenue Equalisation 30.04.14 30.04.13
A-Class Accumulation Shares
Group 1 0.811111 0.081111 0.730000 – 0.730000 0.490000
Group 2 0.190169 0.019017 0.171152 0.558848 0.730000 0.490000
A-Class Income Shares
Group 1 0.677778 0.067778 0.610000 – 0.610000 0.420000
Group 2 0.107664 0.010766 0.096898 0.513102 0.610000 0.420000
B-Class Accumulation Shares
Group 1 1.188889 0.118889 1.070000 – 1.070000 0.790000
Group 2 0.332286 0.033229 0.299057 0.770943 1.070000 0.790000
C-Class Accumulation Shares
Group 1 1.411111 0.141111 1.270000 – 1.270000 0.680000
Group 2 0.224123 0.022412 0.201711 1.068289 1.270000 0.680000
C-Class Income Shares
Group 1 1.177778 0.117778 1.060000 – 1.060000 0.580000
Group 2 0.858104 0.085810 0.772294 0.287706 1.060000 0.580000
Interim distribution in pence per share
Group 1 – Shares purchased prior to 1 February 2013Group 2 – Shares purchased 1 February 2013 to 31 July 2013
DistributionGross Tax Net paid paid
revenue at 10% revenue Equalisation 31.10.13 31.10.12
A-Class Accumulation Shares
Group 1 1.377778 0.137778 1.240000 – 1.240000 0.890000
Group 2 0.179574 0.017957 0.161617 1.078383 1.240000 0.890000
A-Class Income Shares
Group 1 1.188889 0.118889 1.070000 – 1.070000 0.750000
Group 2 0.374899 0.037490 0.337409 0.732591 1.070000 0.750000
B-Class Accumulation Shares
Group 1 1.766667 0.176667 1.590000 – 1.590000 1.170000
Group 2 1.185378 0.118538 1.066840 0.523160 1.590000 1.170000
C-Class Accumulation Shares
Group 1 1.877778 0.187778 1.690000 – 1.690000 –
Group 2 0.090722 0.009072 0.081650 1.608350 1.690000 –
C-Class Income Shares
Group 1 1.600000 0.160000 1.440000 – 1.440000 –
Group 2 0.321700 0.032170 0.289530 1.150470 1.440000 –
Equalisation applies only to shares purchased during the distribution period (group 2 shares). It is the average amount of revenue included in the purchase price of all group 2 shares and is refunded to holders of these
shares as a return of capital. Being capital it is not liable to income tax but must be deducted from the cost of shares for capital gains tax purposes.
Distribution tables
312
� Return to Index

Investment objective and policyTo provide a high and stable income, with the prospect of capital and incomegrowth over the long term, by investing in a balanced portfolio of securities.
The Fund currently invests predominantly in a balanced portfolio of blueChip UK Equities, gilt edged securities and other UK fixed interest instruments.
UK Equities are Equities issued by companies that are incorporated underthe laws of, and have their registered office in, the UK, or that derive thepredominant part of their economic activity from the UK, even if listedelsewhere. Smaller companies may be held on an ancillary basis.
UK fixed interest instruments may include Sterling denominated Bonds andother Debt Securities of non-UK issuers.
The Fund may invest up to 100% in government and public securities (seesection 3.11 (e) of the Prospectus).
Other instruments as permitted in the stated investment and borrowingpowers of the Company including, but not limited to cash and cash equivalentsmay be held on an ancillary basis, as appropriate.
Risk profileThe value of your investment may fall as well as rise and you may get backless than you originally invested.
The value of Equity and Equity-Linked Securities may fluctuate in responseto the performance of individual companies and general market conditions.
The value of Bonds and other Debt Securities may change significantlydepending on market, economic and interest rate conditions as well as thecreditworthiness of the issuer. Issuers of Bonds and other Debt Securitiesmay fail to meet payment obligations (default) or the credit rating of Bondsand other Debt Securities may be downgraded.
This Fund charges the annual fee of the Authorised Corporate Director (ACD)against capital, which will increase the amount of income available fordistribution to Shareholders, but may constrain capital growth. It may alsohave tax implications for certain investors.
The Fund will have significant exposure to the UK and may therefore be morevolatile than more broadly diversified funds.
As the portfolio of the Fund is primarily focused on generating income, itmay bear little resemblance to the composition of its Benchmark.
Please refer to Part 11 of the Prospectus for details of the general risk factorsaffecting this Fund in addition to the specific risk factors above.
Fund reviewThe UK stock market delivered a strong positive return for the year, supportedby accommodative monetary policy and the faster-than-expected domesticeconomic recovery. An improving outlook for UK company earnings waspositive for both stocks and corporate bonds.
The Fund, which invests in a balanced portfolio of UK equities and bonds,outperformed its benchmark.
In the equity portfolio, the biggest contributor to relative returns was stockselection in the support services sector, while stock selection and anunderweight position in food & drug retailers detracted. At the stock level,an overweight holding in EasyJet added the most to relative performance,as the budget airline delivered strong annualised earnings growth for the2013 fiscal year. The biggest detractor from relative performance wasoverweight exposure to Rio Tinto, which suffered in the period due to emergingmarket volatility and concerns about industry oversupply.
The bond portfolio produced a positive return. We remained short durationrelative to the benchmark for most of the year. A long corporate creditposition versus an underweight in mortgage-backed and agency credit inthe second half of the period added to performance. On a sector basis, wemoved overweight financials, transportation and communications.
Fund outlookWe expect company earnings to strengthen and balance sheets to remainhealthy, which should be favourable for stocks and corporate bonds.
12 month performance as at 31 January2014 2013 2012 2011 2010
JPM UK Equity & Bond IncomeA-Class Acc 12.1% 14.6% 0.2% 14.8% 22.9%
JPM UK Equity & Bond IncomeB-Class Acc 12.6% – – – –
JPM UK Equity & Bond IncomeC-Class Acc 12.8% – – – –
Benchmark Index 7.5% 13.3% 3.2% 14.2% 25.0%
Fund statisticsRisk and Reward Profile 5*
Fund size £167.1m
Benchmark Index 70% FTSE All-Share Index (Net)/30% BofA Merrill Lynch Euro-Sterling
AA1-AAA Rated Index
Fund chargesA-Class Initial 3.00%, Annual 1.50%B-Class Initial Nil, Annual 1.00%C-Class Initial Nil, Annual 0.75%
JPM UK Equity & Bond Income Fund
You should remember that past performance is not a guide to the future. The price of investments and the income from them may fall as well as rise andinvestors may not get back the full amount invested.
* For specific risks, including the risk and reward profile, please refer to the Key Investor information Document (KIID) available on the following websitehttp://am.jpmorgan.co.uk/investor/prices-and-factsheets/?list=all&tab=PricesAll equity indices stated as ‘Net’ are calculated net of tax as per the standard published approach by the index vendor unless stated otherwise.All performance returns are calculated using the quoted price of the accumulation shares. Performance returns are in Sterling.Blended benchmarks have been calculated by JPMAM.Source: J.P. Morgan.Source: FTSE International Limited (“FTSE”) © FTSE 2014. “FTSE®” is a trade mark of London Stock Exchange Plc and The Financial Times Limited and is used by FTSE International Limited under licence. All rights inthe FTSE indices and/or FTSE ratings vest in FTSE and/or its licensors. Neither FTSE nor its licensors accept any liability for any errors or omissions in the FTSE indices and/or FTSE ratings or underlying data. Nofurther distribution of FTSE Data is permitted without FTSE’s express written consent. 313
Continuation�
� Return to Index

Top ten holdings (excluding Liquidity funds) %Royal Dutch Shell ‘B’ 4.8Vodafone Group 4.6HSBC 4.6BP 4.4AstraZeneca 2.7GlaxoSmithKline 2.6Rio Tinto 2.5BT Group 2.5Lloyds Banking Group 1.9BAE Systems 1.8
Sector breakdown %Financials 19.6Corporate bonds 18.8Oil & gas 10.8Consumer services 8.2Industrials 7.7Consumer goods 7.4Telecommunications 7.2Health care 5.8Basic materials 5.8Government bonds 3.6Liquidity funds 2.2Utilities 1.6Technology 0.9Futures 0.0Net other assets 0.4
Highest/lowest share price and distribution recordDistribution
Highest Lowest per shareCalendar year share price share price (net)A-Class Accumulation Shares2009 90.63p 65.29p 3.37p2010 102.3p 85.92p 3.24p2011 106.0p 91.16p 3.65p2012 111.8p 97.92p 4.02p2013 131.7p 112.6p 4.29p2014A 134.4p 130.2p 0.79pA-Class Income Shares2009 65.27p 48.65p 2.49p2010 71.03p 60.64p 2.30p2011 72.45p 61.69p 2.50p2012 72.08p 64.35p 2.66p2013 82.26p 72.55p 2.72p2014A 83.66p 80.41p 0.50pB-Class Accumulation SharesB
2013 132.3p 113.6p 4.33p2014A 135.0p 130.8p 0.84pB-Class Income SharesC
2012 72.14p 69.13p 0.74p2013 82.61p 72.61p 2.80p2014A 84.08p 81.47p 0.53pC-Class Accumulation SharesD
2012 105.1p 98.84p 1.10p2013 124.7p 105.8p 4.11p2014A 127.3p 123.3p 0.72pC-Class Income SharesD
2012 104.0p 98.84p 1.10p2013 119.5p 104.7p 3.96p2014A 121.7p 117.9p 0.69p
A To 31 January 2014.B B-Class Accumulation Shares were launched on 8 January 2013.C B-Class Income Shares were launched on 29 October 2012.D C-Class Accumulation Shares and C-Class Income Shares were launched on 20 August 2012.
314
Continuation�
� Return to Index

Portfolio turnover rate31.01.13 55.9%31.01.14 63.6%
The portfolio turnover rate (PTR) reflects the total of security purchases and sales, less the total of shareissues and cancellations, expressed as a percentage of the average daily net asset values over the period.
Portfolio transaction costsBroker Transaction
Commissions Taxes Total31.01.13 0.13% 0.12% 0.25%31.01.14 0.13% 0.14% 0.27%
The percentage figures disclosed above reflect the average broker commissions and transaction taxessuffered during the last 3 years divided by the average assets under management over the same period.
Stamp duty reserve tax31.01.13 0.01%31.01.14 0.01%
The percentage figures disclosed above reflect the total stamp duty reserve tax suffered during the yeardivided by the average assets under management over the same period.
Net asset values and Ongoing chargesNet assetvalue per Net asset
share class Number value per OngoingDate £’000 of shares share chargesA-Class Accumulation Shares31.01.12 96,319 95,278,700 101.1p 1.67%31.01.13 100,183 86,459,544 115.9p 1.68%31.01.14 101,974 78,476,187 129.9p 1.68%A-Class Income Shares31.01.12 62,963 93,722,072 67.18p 1.67%31.01.13 63,077 85,049,385 74.17p 1.68%31.01.14 62,680 77,951,921 80.41p 1.68%B-Class Accumulation Shares31.01.13 14 12,183 115.9p 1.18%31.01.14 33 25,636 130.5p 1.18%B-Class Income Shares31.01.13 3 4,000 74.26p 1.18%31.01.14 16 19,594 80.79p 1.18%C-Class Accumulation Shares31.01.13 23 21,192 109.0p 0.93%31.01.14 1,429 1,160,632 123.1p 0.93%C-Class Income Shares31.01.13 1 1,000 107.1p 0.93%31.01.14 935 798,907 117.1p 0.93%
The net asset value and the net asset value per income share are shown ex-dividend.
Following the adoption of the requirements of UCITS IV in June 2012, Ongoing charges has replaced theTotal Expense Ratio (“TER”). The Ongoing charges takes into account the ACD fee, the fixed expenses andany expenses paid to an affiliate in respect of stocklending activities, expressed as a percentage of theaverage daily net asset values over the period. The main difference between the two calculations is theinclusion of custodian handling charges and stocklending fees in the Ongoing charges figure. The comparativefigures have not been restated, and the historic TER is disclosed.
315
Continuation�
� Return to Index
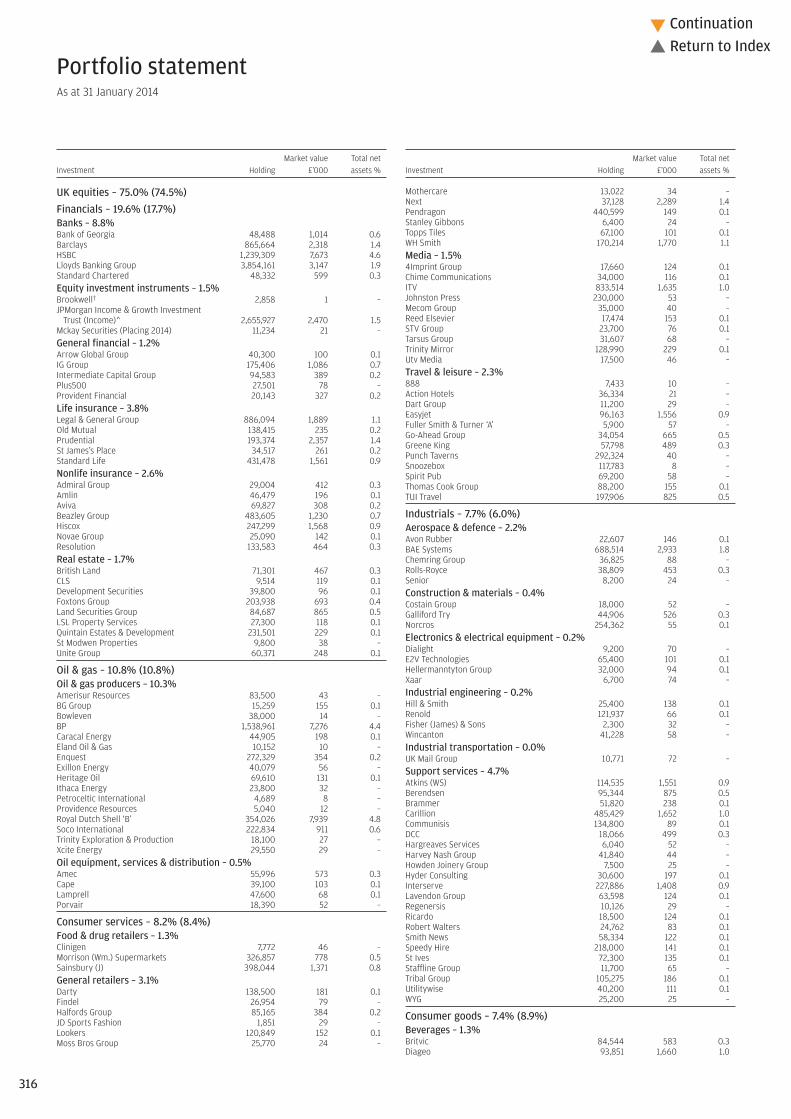
UK equities – 75.0% (74.5%)Financials – 19.6% (17.7%)Banks – 8.8%Bank of Georgia 48,488 1,014 0.6Barclays 865,664 2,318 1.4HSBC 1,239,309 7,673 4.6Lloyds Banking Group 3,854,161 3,147 1.9Standard Chartered 48,332 599 0.3Equity investment instruments – 1.5%Brookwell† 2,858 1 –JPMorgan Income & Growth Investment
Trust (Income)^ 2,655,927 2,470 1.5Mckay Securities (Placing 2014) 11,234 21 – General financial – 1.2%Arrow Global Group 40,300 100 0.1IG Group 175,406 1,086 0.7Intermediate Capital Group 94,583 389 0.2Plus500 27,501 78 –Provident Financial 20,143 327 0.2Life insurance – 3.8%Legal & General Group 886,094 1,889 1.1Old Mutual 138,415 235 0.2Prudential 193,374 2,357 1.4St James’s Place 34,517 261 0.2Standard Life 431,478 1,561 0.9Nonlife insurance – 2.6%Admiral Group 29,004 412 0.3Amlin 46,479 196 0.1Aviva 69,827 308 0.2Beazley Group 483,605 1,230 0.7Hiscox 247,299 1,568 0.9Novae Group 25,090 142 0.1Resolution 133,583 464 0.3Real estate – 1.7%British Land 71,301 467 0.3CLS 9,514 119 0.1Development Securities 39,800 96 0.1Foxtons Group 203,938 693 0.4Land Securities Group 84,687 865 0.5LSL Property Services 27,300 118 0.1Quintain Estates & Development 231,501 229 0.1St Modwen Properties 9,800 38 –Unite Group 60,371 248 0.1
Oil & gas – 10.8% (10.8%)Oil & gas producers – 10.3%Amerisur Resources 83,500 43 – BG Group 15,259 155 0.1Bowleven 38,000 14 –BP 1,538,961 7,276 4.4Caracal Energy 44,905 198 0.1Eland Oil & Gas 10,152 10 –Enquest 272,329 354 0.2Exillon Energy 40,079 56 –Heritage Oil 69,610 131 0.1Ithaca Energy 23,800 32 –Petroceltic International 4,689 8 – Providence Resources 5,040 12 –Royal Dutch Shell ‘B’ 354,026 7,939 4.8Soco International 222,834 911 0.6Trinity Exploration & Production 18,100 27 –Xcite Energy 29,550 29 –Oil equipment, services & distribution – 0.5%Amec 55,996 573 0.3Cape 39,100 103 0.1Lamprell 47,600 68 0.1Porvair 18,390 52 –
Consumer services – 8.2% (8.4%)Food & drug retailers – 1.3%Clinigen 7,772 46 –Morrison (Wm.) Supermarkets 326,857 778 0.5Sainsbury (J) 398,044 1,371 0.8General retailers – 3.1%Darty 138,500 181 0.1Findel 26,954 79 –Halfords Group 85,165 384 0.2JD Sports Fashion 1,851 29 –Lookers 120,849 152 0.1Moss Bros Group 25,770 24 –
Mothercare 13,022 34 –Next 37,128 2,289 1.4Pendragon 440,599 149 0.1Stanley Gibbons 6,400 24 –Topps Tiles 67,100 101 0.1WH Smith 170,214 1,770 1.1Media – 1.5%4Imprint Group 17,660 124 0.1Chime Communications 34,000 116 0.1ITV 833,514 1,635 1.0Johnston Press 230,000 53 –Mecom Group 35,000 40 –Reed Elsevier 17,474 153 0.1STV Group 23,700 76 0.1Tarsus Group 31,607 68 –Trinity Mirror 128,990 229 0.1Utv Media 17,500 46 –Travel & leisure – 2.3%888 7,433 10 –Action Hotels 36,334 21 –Dart Group 11,200 29 –Easyjet 96,163 1,556 0.9Fuller Smith & Turner ‘A’ 5,900 57 –Go-Ahead Group 34,054 665 0.5Greene King 57,798 489 0.3Punch Taverns 292,324 40 –Snoozebox 117,783 8 –Spirit Pub 69,200 58 –Thomas Cook Group 88,200 155 0.1TUI Travel 197,906 825 0.5
Industrials – 7.7% (6.0%)Aerospace & defence – 2.2%Avon Rubber 22,607 146 0.1BAE Systems 688,514 2,933 1.8Chemring Group 36,825 88 –Rolls-Royce 38,809 453 0.3Senior 8,200 24 – Construction & materials – 0.4%Costain Group 18,000 52 –Galliford Try 44,906 526 0.3Norcros 254,362 55 0.1Electronics & electrical equipment – 0.2%Dialight 9,200 70 – E2V Technologies 65,400 101 0.1Hellermanntyton Group 32,000 94 0.1Xaar 6,700 74 –Industrial engineering – 0.2%Hill & Smith 25,400 138 0.1Renold 121,937 66 0.1Fisher (James) & Sons 2,300 32 –Wincanton 41,228 58 –Industrial transportation – 0.0%UK Mail Group 10,771 72 –Support services – 4.7%Atkins (WS) 114,535 1,551 0.9Berendsen 95,344 875 0.5Brammer 51,820 238 0.1Carillion 485,429 1,652 1.0Communisis 134,800 89 0.1DCC 18,066 499 0.3Hargreaves Services 6,040 52 –Harvey Nash Group 41,840 44 –Howden Joinery Group 7,500 25 – Hyder Consulting 30,600 197 0.1Interserve 227,886 1,408 0.9Lavendon Group 63,598 124 0.1Regenersis 10,126 29 –Ricardo 18,500 124 0.1Robert Walters 24,762 83 0.1Smith News 58,334 122 0.1Speedy Hire 218,000 141 0.1St Ives 72,300 135 0.1Staffline Group 11,700 65 –Tribal Group 105,275 186 0.1Utilitywise 40,200 111 0.1WYG 25,200 25 –
Consumer goods – 7.4% (8.9%)Beverages – 1.3%Britvic 84,544 583 0.3Diageo 93,851 1,660 1.0
Portfolio statement As at 31 January 2014
Market value Total netInvestment Holding £’000 assets %
Market value Total netInvestment Holding £’000 assets %
316
Continuation�
� Return to Index

Food producers – 1.8%Anglo-Eastern Plantations 4,476 30 – Asian Plantations 11,631 26 – Cranswick 53,986 701 0.4Dairy Crest Group 138,034 701 0.4Greencore Group 211,112 526 0.3Hilton Food Group 22,000 102 0.1Premier Foods 71,900 99 0.1Unilever 36,377 840 0.5General retailers – 0.0%Homebuy Group ‘A’ 27,954 – – Household goods – 1.8%Barratt Developments 96,089 359 0.2Bellway 71,955 1,110 0.7Berkeley Group 7,584 193 0.1Crest Nicholson 7,080 26 – Persimmon 25,118 321 0.2Taylor Wimpey 904,487 1,007 0.6Technology hardware & equipment – 0.4%GKN 171,337 664 0.4Tobacco – 2.1%British American Tobacco 65,435 1,904 1.1Imperial Tobacco Group 74,924 1,668 1.0
Telecommunications – 7.2% (5.7%)Fixed line telecommunications – 2.6%BT Group 1,073,492 4,075 2.5KCOM Group 216,864 216 0.1Mobile telecommunications – 4.6%Vodafone Group 3,478,773 7,712 4.6
Health care – 5.8% (5.5%)Pharmaceuticals & biotechnology – 5.8%AstraZeneca 118,566 4,547 2.7GlaxoSmithKline 280,281 4,354 2.6Shire 20,605 618 0.4Vectura Group 117,500 189 0.1
Basic materials – 5.8% (8.8%)Chemicals – 0.3%Carclo 27,133 44 – Synthomer 174,573 477 0.3Treatt 3,700 26 –Forestry & paper – 0.1%Mondi 26,935 246 0.1Mining – 5.0%BHP Billiton 146,063 2,611 1.6Ferrexpo 283,337 424 0.3Glencore Xstrata 324,110 1,038 0.6Rio Tinto 130,818 4,206 2.5Software & computer services – 0.4%Accesso Technology 4,100 27 – Anite 38,000 35 – Blinkx 9,500 12 –Fusionex International 13,859 103 0.1Innovation Group 412,000 137 0.1Iomart Group 31,551 88 0.1NCC Group 77,000 156 0.1Optimal Payments (Placing 2014) 4,876 19 –Wandisco 2,600 31 –
Utilities – 1.6% (1.2%)Electricity – 0.4%Drax Group 80,205 648 0.4OPG Power Venture 38,985 28 – Gas, water & multiutilities – 1.2%Centrica 241,913 754 0.5National Grid 138,077 1,085 0.7
Technology – 0.9% (1.5%)Software & computer services – 0.8%Advanced Computer Software 47,500 53 – Computacenter 34,853 225 0.1Globo 34,000 19 – Micro Focus International 149,164 1,102 0.7Technology hardware & equipment – 0.1%IQE 79,400 18 – Sepura 39,803 52 0.1Telit Communications 27,920 50 –
Fixed Interest – 22.4% (24.1%)
Corporate bonds – 18.8% (19.7%)Non-convertible – 18.8%Anglian Water 4.5% 2027 £500,000 517 0.3Bank Nederlandse Gemeenten 5.375% 2021 £889,000 1,038 0.6Bank of America 6.125% 2021 £350,000 412 0.2Bank of Scotland 9.375% 2021 £1,750,000 2,240 1.3Citigroup 5.125% 2018 £2,000,000 2,169 1.3EDF 5.875% 2031 £1,000,000 1,148 0.7General Electric Capital 6.25% 2020 £1,691,000 2,015 1.2General Electric Capital 6.75% 2020 £1,000,000 1,186 0.7GlaxoSmithKline Capital 5.25% 2033 £1,500,000 1,724 1.0Goldman Sachs Group 5.25% 2015 £350,000 373 0.2KFW International Finance 3.25% 2014 £1,000,000 1,001 0.6Lloyds Banking Group 7.5% 2024 £1,000,000 1,299 0.8National Westminster Bank 6.5% 2021 £1,200,000 1,319 0.8Orange 5.625% 2034 £750,000 829 0.5Orange 8% 2017 £800,000 964 0.6Procter & Gamble 6.25% 2030 £1,397,000 1,791 1.1Prudential 6.875% 2023 £1,400,000 1,755 1.1Reseau Ferre de France 5.25% 2028 £2,145,000 2,465 1.5SLM Student Loan Trust 5.15% 2015 £1,539,000 1,470 0.9Thames Water Utilities Finance 6.75% 2028 £500,000 632 0.4UBS 6.625% 2018 £350,000 412 0.2United Parcel Service 5.5% 2031 £2,000,000 2,391 1.4Vodafone Group 5.375% 2017 £1,200,000 1,343 0.8Wal-Mart Stores 5.75% 2030 £817,000 997 0.6
Government bonds – 3.6% (4.4%)International authority – 3.6%European Investment Bank 5.5% 2025 £1,000,000 1,207 0.7European Investment Bank 5.625% 2032 £560,000 700 0.4European Investment Bank 6.25% 2014 £1,000,000 1,011 0.6International Bank for Reconstruction &
Development 5.75% 2032 £400,000 526 0.3International Finance 5.375% 2028 £2,043,000 2,501 1.6
Futures – 0.0% (0.0%)FTSE 100 Index Futures Mar 2014 7 (18) –
Liquidity funds – 2.2% (0.6%)JPM Sterling Liquidity ‘X’ (Distribution)^$ 3,751,117 3,751 2.2
Investment assets (including investment liabilities) 166,444 99.6
Net other assets 623 0.4
Net assets 167,067 100.0
Unless otherwise stated the above securities are admitted to official stock exchange listings or trade on aregulated market.
The comparative percentage figures in brackets are at 31 January 2013.
† Suspended security^ Deemed to be investment in related parties of the ACD$ Approved security as defined in the Collective Investment Schemes sourcebook
Market value Portfolio credit ratings £’000
AAA 6,946AA+ 5,709AA 3,462AA- 1,791A+ 5,263A 412A- 3,277A2 3,054BBB 2,240BBB+ 3,962BBB- 1,319
Total bonds 37,435
Equities 125,276Liquidity funds 3,751Futures (18)
Investment assets (including investment liabilities) 166,444
Portfolio statement – continuedAs at 31 January 2014
Market value Total netInvestment Holding £’000 assets %
Market value Total netInvestment Holding £’000 assets %
317
Continuation�
� Return to Index

£’000
Total of all purchases for the year (Note 10) 55,036
Major purchases Cost
JPM Sterling Liquidity ‘X’ (Distribution)^ 9,112Standard Life 2,168Schroders 1,944Sainsbury (J) 1,727Hiscox 1,585Carillion 1,411Bank of Georgia 1,306Atkins (WS) 1,297Reckitt Benckiser Group 1,288Morrison (Wm.) Supermarkets 1,216Unite Group 1,157Intermediate Capital Group 1,052IG Group 1,019Lloyds Banking Group 961Centrica 852Unilever 816Land Securities Group 789Dairy Crest Group 787Soco International 762Glencore Xstrata 740
^ Deemed to be investment in related parties of the ACD
£’000
Total of all sales for the year (Note 10) 65,951
Major sales Proceeds
JPM Sterling Liquidity ‘X’ (Distribution)^ 6,320Mondi 2,640Schroders 2,339Unilever 2,171Easyjet 1,930Lancashire 1,665Wal-Mart Stores 5.25% 2035 1,286QinetiQ Group 1,284GlaxoSmithKline 1,268Reckitt Benckiser Group 1,238ITV 1,193Taylor Wimpey 1,183International Personal Finance 1,175Unite Group 1,167Provident Financial 1,101Tesco 1,020Persimmon 990Barclays Rights 2013 962William Hill Rights 2013 942WPP 871
Portfolio movements For the year ending 31 January 2014
318
Continuation�
� Return to Index

Statement of total returnFor the year ending 31 January
2014 2013£’000 £’000 £’000 £’000
Income
Net capital gains (Note 1) 15,704 17,667
Revenue (Note 2) 6,382 6,620
Expenses (Note 3) (2,822) (2,652)
Net revenue before taxation 3,560 3,968
Taxation (Note 4) (1) –
Net revenue after taxation 3,559 3,968
Total return before distributions 19,263 21,635
Finance costs: Distributions (Note 5) (5,797) (6,019)
Change in net assets attributable to shareholders from investment activities 13,466 15,616
Statement of change in net assets attributable to shareholdersFor the year ending 31 January
2014 2013£’000 £’000 £’000 £’000
Opening net assets attributable to shareholders 163,301 159,282
Amounts receivable on issue of shares 3,255 560
Amounts payable on cancellation of shares (16,472) (15,756)
(13,217) (15,196)
Change in net assets attributable to shareholders from investment activities (see above) 13,466 15,616
Retained distributions on accumulation shares 3,528 3,602
Stamp duty reserve tax (17) (9)
Unclaimed distributions 6 6
Closing net assets attributable to shareholders 167,067 163,301
Balance sheetAs at 31 January
2014 2013£’000 £’000 £’000 £’000
ASSETS
Investment assets 166,462 162,003
Debtors (Note 7) 1,056 5,753
Cash and bank balances (Note 8) 577 863
Total other assets 1,633 6,616
Total assets 168,095 168,619
LIABILITIES
Investment liabilities (18) –
Creditors (Note 9) (614) (4,876)
Distribution payable on income shares (396) (442)
Total other liabilities (1,010) (5,318)
Total liabilities (1,028) (5,318)
Net assets attributable to shareholders 167,067 163,301
The notes to these financial statements are shown on pages 320 to 321.
Financial statements
319
Continuation�
� Return to Index

1. Net capital gains2014 2013
£’000 £’000Derivative contracts 50 –Non–derivative securities 15,654 17,667Net capital gains 15,704 17,667
2. Revenue2014 2013
£’000 £’000Franked income from UK equity investments 4,332 4,445Income from Liquidity funds 12 15Income from overseas equity investments 356 272Interest on bank and term deposits 1 1Interest on fixed–interest securities 1,653 1,844Property income distributions 6 6Stock dividends 6 23Underwriting commission 16 14Total revenue 6,382 6,620
3. Expenses2014 2013
£’000 £’000Payable to the ACD or associate of the ACD:ACD fee 2,519 2,368Fixed expenses 303 284Total expenses 2,822 2,652
4. Taxation2014 2013
£’000 £’000a) Analysis of charge in the yearOverseas tax provision – 5Overseas tax suffered 1 (5)Current year tax charge (Note 4b) 1 –
b) Factors affecting the tax charge for the yearThe tax assessed for the year is lower than the standard rate of corporation tax inthe UK for an Open-Ended Investment Company (OEIC) (20%). The differences areexplained below.
Net revenue before taxation 3,560 3,968Corporation tax at 20% 712 794
Effects of:Dividends not subject to corporation tax (938) (948)Excess expenses for which no relief taken 226 154Overseas tax provision – 5Overseas tax suffered 1 (5)
(711) (794)Current year tax charge (Note 4a) 1 –
No deferred tax asset has been recognised in the financial statements. At the yearend date, the Fund had a potential unrecognised deferred tax asset of £689,407(31.01.13: £462,949) in relation to £3,447,035 (31.01.13: £2,314,743) of excessmanagement expenses which would only be utilised to reduce the tax charge if theFund had an excess of unfranked income over expenses in a future period. There isno excess of unfranked income expected in the future.
5. Finance costsDistributionsThe distributions take account of amounts receivable on the issue of shares andamounts payable on the cancellation of shares and comprise:
2014 2013£’000 £’000
First interim dividend distribution 1,864 1,755Second interim dividend distribution 1,339 1,387Third interim dividend distribution 1,499 1,646Final dividend distribution 1,024 1,143Add: Amounts payable on cancellation of shares 75 91Deduct: Amounts receivable on issue of shares (4) (3)Total finance costs 5,797 6,019
Details of the distribution per share are set out on pages 322 to 323.
6. Movement between net revenue after taxation and distributions2014 2013
£’000 £’000Net revenue after taxation 3,559 3,968Add: ACD fee (net of tax relief) paid from capital 2,242 2,048Add: Undistributed revenue brought forward 1 4Deduct: Undistributed revenue carried forward (5) (1)
5,797 6,019
7. Debtors2014 2013
£’000 £’000Accrued income 938 910Due from the ACD for shares created 14 94Overseas tax recoverable 2 3Sales awaiting settlement 102 4,746Total debtors 1,056 5,753
8. Cash and bank balances2014 2013
£’000 £’000Amounts held at futures clearing houses and brokers 38 –Cash and bank balances 539 863Total cash and bank balances 577 863
9. Creditors2014 2013
£’000 £’000Accrued expenses 244 232Due to the ACD for shares cancelled 322 542Purchases awaiting settlement 48 4,102Total creditors 614 4,876
Notes to the financial statements for the year ending 31 January 2014
320
Continuation�
� Return to Index

10. Portfolio transaction costs2014 2013
£’000 £’000Analysis of total purchase costs
Purchases in year before transaction costs 54,759 55,745
Commissions 76 66Taxes 201 167Total purchase costs 277 233Gross purchases total 55,036 55,978
Analysis of total sale costs
Gross sales before transaction costs 66,046 70,382
Commissions (95) (81)Total sale costs (95) (81)Total sales net of transaction costs 65,951 70,301
11. Related party transactionsJPMorgan Funds Limited, as Authorised Corporate Director (“ACD”), is a relatedparty, and acts as principal in respect of all transactions of shares in the Company.The aggregate monies received through issue, and paid on cancellation, aredisclosed in the Statement of Change in Net Assets Attributable to Shareholders.
The balance due to the ACD and their associates at the year end date in respect ofrelated party transactions was £552,004 (31.01.13: £680,171). Details of relatedparty transactions are given under note 13 on page 413.
Investments considered to be related parties have been identified in the portfoliostatement on page 316 to 317 and the revenue from these investments was£133,716 (31.01.13: £181,745).
Some of the dealing transactions for the Fund are carried out through associatesof the ACD. Such transactions are carried out on an arm’s length basis. Thecommissions paid to these companies over the year were £3,510 (31.01.13:£6,805). Commission was paid to the associated company JPMorgan SecuritiesLtd.
The gross stocklending income received was £nil (31.01.13: £77), with feesdeducted of £nil (31.01.13: £13).The following party held a material interest in the Fund at the year end date:– FNZ (UK) Nominees Limited 27.95% (31.01.13: 27.58%)
12. Financial instrumentsCurrency exposuresAt the year end date, the majority of the Fund’s financial assets and liabilities weredenominated in Sterling. As a result, the Fund has no material exposure tocurrency movements.
Interest rate riskThe tables below detail the interest rate profile of the Fund’s assets and liabilitiesas at the year end.
Financialassets
Floating Fixed notrate rate carrying
Total financial financial anyassets assets assets interest
Currency £’000 £’000 £’000 £’000
31.01.14UK Sterling 168,076 4,329 37,435 126,312Euro 1 – – 1
31.01.13UK Sterling 168,617 1,822 39,483 127,312US Dollar 2 1 – 1
The floating rate financial assets are bank balances that bear interest at ratesbased on LIBOR or its overseas equivalent.
Floating Financialrate liabilities
Total financial not carryingliabilities liabilities any interest
Currency £’000 £’000 £’000
31.01.14UK Sterling 1,010 – 1,010
31.01.13UK Sterling 5,318 – 5,318
For consideration of other risks including liquidity, pricing and credit risk, pleaserefer to the notes to the aggregated financial statements, pages 413 to 414.
13. Share classesThe Fund currently has three share classes; Class A Shares, Class B Shares andClass C Shares. The Authorised Corporate Director’s (ACD) fee and fixed expensescharge are shown below.
ACD fee Fixed expensesClass A shares: 1.50% 0.18%Class B shares: 1.00% 0.18%Class C shares: 0.75% 0.18%
The net asset value of each share class, the net asset value per share and thenumber of shares in each class are shown on page 315.
14. Contingent liabilities and capital commitmentsAt the balance sheet date there were no contingent liabilities or capitalcommitments (2013: none).
Notes to the financial statements – continued
321
Continuation�
� Return to Index
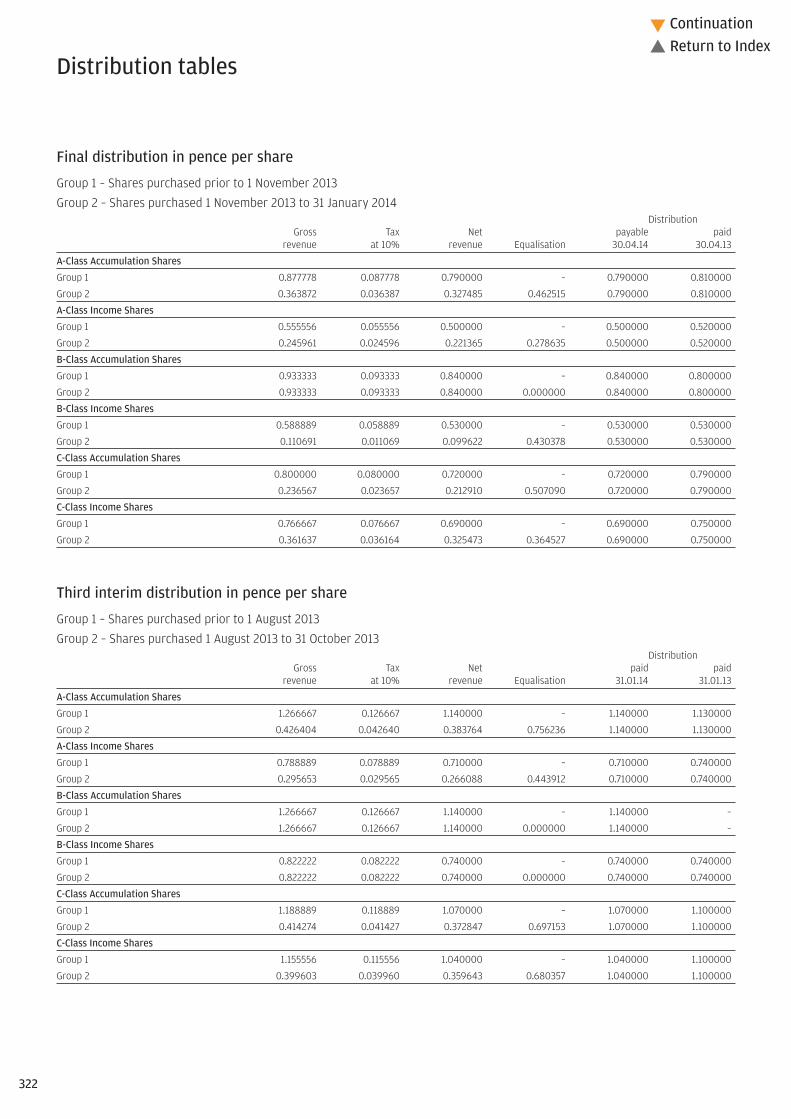
322
Continuation�
� Return to Index
Final distribution in pence per share
Group 1 – Shares purchased prior to 1 November 2013Group 2 – Shares purchased 1 November 2013 to 31 January 2014
DistributionGross Tax Net payable paid
revenue at 10% revenue Equalisation 30.04.14 30.04.13
A-Class Accumulation Shares
Group 1 0.877778 0.087778 0.790000 – 0.790000 0.810000
Group 2 0.363872 0.036387 0.327485 0.462515 0.790000 0.810000
A-Class Income Shares
Group 1 0.555556 0.055556 0.500000 – 0.500000 0.520000
Group 2 0.245961 0.024596 0.221365 0.278635 0.500000 0.520000
B-Class Accumulation Shares
Group 1 0.933333 0.093333 0.840000 – 0.840000 0.800000
Group 2 0.933333 0.093333 0.840000 0.000000 0.840000 0.800000
B-Class Income Shares
Group 1 0.588889 0.058889 0.530000 – 0.530000 0.530000
Group 2 0.110691 0.011069 0.099622 0.430378 0.530000 0.530000
C-Class Accumulation Shares
Group 1 0.800000 0.080000 0.720000 – 0.720000 0.790000
Group 2 0.236567 0.023657 0.212910 0.507090 0.720000 0.790000
C-Class Income Shares
Group 1 0.766667 0.076667 0.690000 – 0.690000 0.750000
Group 2 0.361637 0.036164 0.325473 0.364527 0.690000 0.750000
Third interim distribution in pence per share
Group 1 – Shares purchased prior to 1 August 2013Group 2 – Shares purchased 1 August 2013 to 31 October 2013
DistributionGross Tax Net paid paid
revenue at 10% revenue Equalisation 31.01.14 31.01.13
A-Class Accumulation Shares
Group 1 1.266667 0.126667 1.140000 – 1.140000 1.130000
Group 2 0.426404 0.042640 0.383764 0.756236 1.140000 1.130000
A-Class Income Shares
Group 1 0.788889 0.078889 0.710000 – 0.710000 0.740000
Group 2 0.295653 0.029565 0.266088 0.443912 0.710000 0.740000
B-Class Accumulation Shares
Group 1 1.266667 0.126667 1.140000 – 1.140000 –
Group 2 1.266667 0.126667 1.140000 0.000000 1.140000 –
B-Class Income Shares
Group 1 0.822222 0.082222 0.740000 – 0.740000 0.740000
Group 2 0.822222 0.082222 0.740000 0.000000 0.740000 0.740000
C-Class Accumulation Shares
Group 1 1.188889 0.118889 1.070000 – 1.070000 1.100000
Group 2 0.414274 0.041427 0.372847 0.697153 1.070000 1.100000
C-Class Income Shares
Group 1 1.155556 0.115556 1.040000 – 1.040000 1.100000
Group 2 0.399603 0.039960 0.359643 0.680357 1.040000 1.100000
Distribution tables

323
� Return to Index
Second interim distribution in pence per share
Group 1 – Shares purchased prior to 1 May 2013Group 2 – Shares purchased 1 May 2013 to 31 July 2013
DistributionGross Tax Net paid paid
revenue at 10% revenue Equalisation 31.10.13 31.10.12
A-Class Accumulation Shares
Group 1 1.100000 0.110000 0.990000 – 0.990000 0.930000
Group 2 0.368193 0.036819 0.331374 0.658626 0.990000 0.930000
A-Class Income Shares
Group 1 0.700000 0.070000 0.630000 – 0.630000 0.610000
Group 2 0.300349 0.030035 0.270314 0.359686 0.630000 0.610000
B-Class Accumulation Shares
Group 1 1.111111 0.111111 1.000000 – 1.000000 –
Group 2 1.111111 0.111111 1.000000 0.000000 1.000000 –
B-Class Income Shares
Group 1 0.733333 0.073333 0.660000 – 0.660000 –
Group 2 0.733333 0.073333 0.660000 0.000000 0.660000 –
C-Class Accumulation Shares
Group 1 1.044444 0.104444 0.940000 – 0.940000 –
Group 2 0.310240 0.031024 0.279216 0.660784 0.940000 –
C-Class Income Shares
Group 1 1.011111 0.101111 0.910000 – 0.910000 –
Group 2 0.697778 0.069778 0.628000 0.282000 0.910000 –
First interim distribution in pence per share
Group 1 – Shares purchased prior to 1 February 2013Group 2 – Shares purchased 1 February 2013 to 30 April 2013
DistributionGross Tax Net paid paid
revenue at 10% revenue Equalisation 31.07.13 31.07.12
A-Class Accumulation Shares
Group 1 1.500000 0.150000 1.350000 – 1.350000 1.140000
Group 2 0.715800 0.071580 0.644220 0.705780 1.350000 1.140000
A-Class Income Shares
Group 1 0.955555 0.095555 0.860000 – 0.860000 0.760000
Group 2 0.395805 0.039580 0.356225 0.503775 0.860000 0.760000
B-Class Accumulation Shares
Group 1 1.544444 0.154444 1.390000 – 1.390000 –
Group 2 0.459742 0.045974 0.413768 0.976232 1.390000 –
B-Class Income Shares
Group 1 0.966666 0.096666 0.870000 – 0.870000 –
Group 2 0.966666 0.096666 0.870000 0.000000 0.870000 –
C-Class Accumulation Shares
Group 1 1.455555 0.145555 1.310000 – 1.310000 –
Group 2 0.560850 0.056085 0.504765 0.805235 1.310000 –
C-Class Income Shares
Group 1 1.400000 0.140000 1.260000 – 1.260000 –
Group 2 0.397314 0.039731 0.357583 0.902417 1.260000 –
Equalisation applies only to shares purchased during the distribution period (group 2 shares). It is the average amount of revenue included in the purchase price of all group 2 shares and is refunded to holders of these
shares as a return of capital. Being capital it is not liable to income tax but must be deducted from the cost of shares for capital gains tax purposes.
Distribution tables – continued

324
Continuation�
� Return to Index
Important informationThis Fund was merged into JPM UK Strategic Growth Fund on 31 August 2013.
Highest/lowest share price and distribution recordDistribution
Highest Lowest per shareCalendar year share price share price (net)A-Class Accumulation Shares2009 280.2p 186.2p 6.79p2010 322.6p 255.0p 5.19p2011 335.3p 265.9p 4.66p2012 346.1p 293.0p 5.62p2013A 417.6p 349.6p 12.49pA-Class Income Shares2009 34.76p 23.10p 0.89p2010 39.24p 31.03p 0.65p2011 40.20p 31.87p 0.56p2012 40.73p 34.49p 0.67p2013A 48.25p 41.15p 1.46pB-Class Accumulation SharesB
2012 346.4p 326.1p –2013A 419.0p 349.9p 13.92pC-Class Accumulation SharesC
2012 106.0p 98.01p –2013A 128.4p 107.1p 4.66pC-Class Income SharesC
2012 106.0p 98.01p –2013A 125.5p 107.1p 4.61p
A To 31 January 2014.B B-Class Accumulation Shares were launched on 29 October 2012.C C-Class Accumulation Shares and C-Class Income Shares were launched on 20 August 2012.
Net asset values and Ongoing chargesNet assetvalue per Net asset
share class Number value per OngoingDate £’000 of shares share chargesA-Class Accumulation Shares31.01.12 235,100 76,997,542 305.3p 1.67%31.01.13 256,366 70,595,366 363.2p 1.68%31.01.14 18 – – – A-Class Income Shares31.01.12 341 949,751 35.93p 1.68%31.01.13 376 897,773 41.96p 1.68%31.01.14 – – – –B-Class Accumulation Shares31.01.13 4 1,000 363.5p 1.18%31.01.14 – – – –C-Class Accumulation Shares31.01.13 31 27,811 111.3p 0.93%31.01.14 – – – –C-Class Income Shares31.01.13 1 1,000 108.9p 0.93%31.01.14 – – – –
The net asset value and the net asset value per income share are shown ex-dividend.
Following the adoption of the requirements of UCITS IV in June 2012, Ongoing charges has replaced theTotal Expense Ratio (“TER”). The Ongoing charges takes into account the ACD fee, the fixed expenses andany expenses paid to an affiliate in respect of stocklending activities, expressed as a percentage of theaverage daily net asset values over the period. The main difference between the two calculations is theinclusion of the custodian handling charges and stocklending fees in the Ongoing charges figure. Thecomparative figures have not been restated, and the historic TER is disclosed.
JPM UK Equity Fund
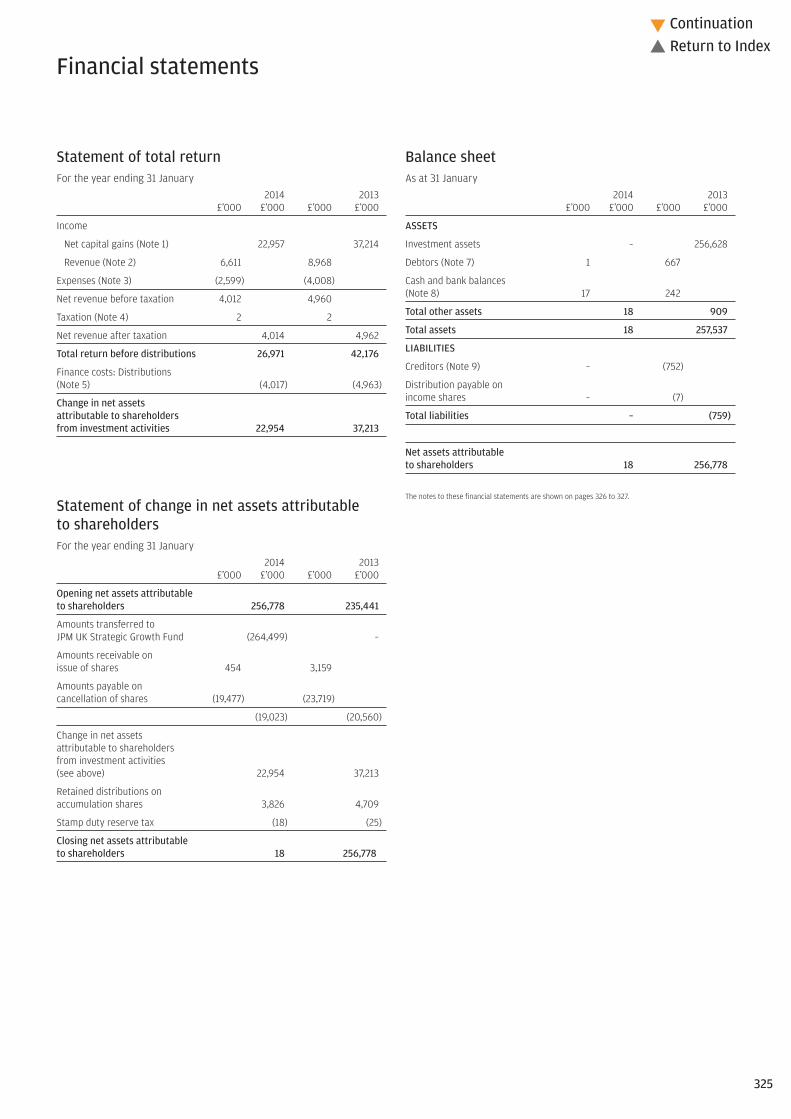
325
Continuation�
� Return to Index
Statement of total returnFor the year ending 31 January
2014 2013£’000 £’000 £’000 £’000
Income
Net capital gains (Note 1) 22,957 37,214
Revenue (Note 2) 6,611 8,968
Expenses (Note 3) (2,599) (4,008)
Net revenue before taxation 4,012 4,960
Taxation (Note 4) 2 2
Net revenue after taxation 4,014 4,962
Total return before distributions 26,971 42,176
Finance costs: Distributions (Note 5) (4,017) (4,963)
Change in net assets attributable to shareholders from investment activities 22,954 37,213
Statement of change in net assets attributable to shareholdersFor the year ending 31 January
2014 2013£’000 £’000 £’000 £’000
Opening net assets attributable to shareholders 256,778 235,441
Amounts transferred to JPM UK Strategic Growth Fund (264,499) –
Amounts receivable on issue of shares 454 3,159
Amounts payable on cancellation of shares (19,477) (23,719)
(19,023) (20,560)
Change in net assets attributable to shareholders from investment activities (see above) 22,954 37,213
Retained distributions on accumulation shares 3,826 4,709
Stamp duty reserve tax (18) (25)
Closing net assets attributable to shareholders 18 256,778
Balance sheetAs at 31 January
2014 2013£’000 £’000 £’000 £’000
ASSETS
Investment assets – 256,628
Debtors (Note 7) 1 667
Cash and bank balances (Note 8) 17 242
Total other assets 18 909
Total assets 18 257,537
LIABILITIES
Creditors (Note 9) – (752)
Distribution payable on income shares – (7)
Total liabilities – (759)
Net assets attributable to shareholders 18 256,778
The notes to these financial statements are shown on pages 326 to 327.
Financial statements

326
Continuation�
� Return to Index
1. Net capital gains2014 2013
£’000 £’000Currency losses – (1)Derivative contracts 177 893Non-derivative securities 22,780 36,322Net capital gains 22,957 37,214
2. Revenue2014 2013
£’000 £’000Distributions from authorised ICVCs 10 109Income from Liquidity funds 12 25Franked income from UK equity investments 5,954 8,160Income from overseas equity investments 445 489Interest on bank and term deposits 1 1Management fee rebates 18 23Property income distributions 21 44Stock dividends 79 49Underwriting commission 71 68Total revenue 6,611 8,968
3. Expenses2014 2013
£’000 £’000Payable to the ACD or associate of the ACD:ACD fee 2,320 3,579Fixed expenses 279 429Total expenses 2,599 4,008
4. Taxation2014 2013
£’000 £’000a) Analysis of charge in the yearOverseas tax suffered (2) (2)Current year tax charge (Note 4b) (2) (2)
b) Factors affecting the tax charge for the yearThe tax assessed for the year is lower than the standard rate of corporation tax inthe UK for an Open-Ended Investment Company (OEIC) (20%). The differences areexplained below.
Net revenue before taxation 4,012 4,960Corporation tax at 20% 802 992
Effects of:Dividends not subject to corporation tax (1,298) (1,761)Excess expenses for which no relief taken 499 769Expenses not deductible for tax purposes (3) –Overseas tax suffered (2) (2)
(804) (994)Current year tax charge (Note 4a) (2) (2)
No deferred tax asset has been recognised in the financial statements. At the yearend date, the Fund had a potential unrecognised deferred tax asset of £20,654,011(31.01.13: £20,155,262) in relation to £103,270,055 (31.01.13: £100,776,310) of excessmanagement expenses
5. Finance costsDistributionsThe distributions take account of amounts receivable on the issue of shares andamounts payable on the cancellation of shares and comprise:
2014 2013£’000 £’000
Final dividend distribution 3,834 4,716Add: Amounts payable on cancellation of shares 186 290Deduct: Amounts receivable on issue of shares (3) (43)Total finance costs 4,017 4,963
Details of the distribution per share are set out on page 328.
6. Movement between net revenue after taxation and distributions2014 2013
£’000 £’000Net revenue after taxation 4,014 4,962Add: Undistributed revenue brought forward 1 2Deduct: Undistributed revenue carried forward 1 (1)Equalisation on conversions 1 –
4,017 4,963
7. Debtors2014 2013
£’000 £’000Accrued income – 521Due from the ACD for shares created – 8Overseas tax recoverable – 13Sales awaiting settlement – 125Prepaid Expenses 1 –Total debtors 1 667
8. Cash and bank balances2014 2013
£’000 £’000Amounts held at futures clearing houses
and brokers – 70Cash and bank balances 17 172Total cash and bank balances 17 242
9. Creditors2014 2013
£’000 £’000Accrued expenses – 361Due to the ACD for shares cancelled – 391Total creditors – 752
Notes to the financial statements for the year ending 31 January 2014

327
Continuation�
� Return to Index
10. Portfolio transaction costs2014 2013
£’000 £’000Analysis of total purchase costs
Purchases in year before transaction costs 187,194 157,751
Commissions 334 242Taxes 706 610Total purchase costs 1,040 852Gross purchases total 188,234 158,603
Analysis of total sale costs
Gross sales before transaction costs 466,601 172,625
Commissions (375) (263)Taxes – (1)Total sale costs (375) (264)Total sales net of transaction costs 466,226 172,361
11. Related party transactionsJPMorgan Funds Limited, as Authorised Corporate Director (“ACD”), is a relatedparty, and acts as principal in respect of all transactions of shares in the Company.The aggregate monies received through issue, and paid on cancellation, aredisclosed in the Statement of Change in Net Assets Attributable to Shareholders.
The balance due from the ACD and their associates at the year end date in respectof related party transactions was £12 (31.01.13: £742,659). Details of related partytransactions are given under note 13 on page 413.
Investments considered to be related parties were transferred JPM UK StrategicGrowth during the year, the revenue from these investments was £10,247(31.01.13: £25,434).
During the year, the Fund merged with JPM UK Strategic Growth. The Fund closedand its asset amounting to £264,499,000 were transferred to JPM UK StrategicGrowth.
Some of the dealing transactions for the fund are carried out through associates ofthe ACD. Such transactions are carried out on an arm's length basis. Thecommissions paid to these companies over the period were £93,221 (31.01.13:£140,589). Commission was paid to the associated company JPMorgan SecuritiesLtd.
The following parties held a material interest in the Fund at the year end date: – J.P. Morgan Nominees Ltd 0.00% (31.01.13: 28.55%) – FNZ (UK) Nominees Limited 0.00% (31.01.13: 14.96%)
12. Share classesThe Fund had three share classes; Class A Shares, Class B Shares and Class CShares. The Authorised Corporate Director’s (ACD) fee and fixed expenses chargewere as shown below.
ACD fee Fixed expensesClass A shares: 1.50% 0.18%Class B shares: 1.00% 0.18%Class C shares: 0.75% 0.18%
The net asset value of each share class, the net asset value per share and thenumber of shares in each class are shown on page 324. All classes had the samerights on winding up.
13. Contingent liabilities and capital commitmentsAt the balance sheet date there were no contingent liabilities or capitalcommitments (2013: none).
Notes to the financial statements – continued

328
� Return to Index
Final distribution in pence per share
Group 1 – Shares purchased prior to 1 February 2013Group 2 – Shares purchased 1 February 2013 to 30 August 2013
DistributionGross Tax Net paid paid
revenue at 10% revenue Equalisation 29.11.13 30.04.13
A-Class Accumulation Shares
Group 1 6.466667 0.646667 5.820000 – 5.820000 6.670000
Group 2 2.807324 0.280732 2.526592 3.293408 5.820000 6.670000
A-Class Income Shares
Group 1 0.755556 0.075556 0.680000 – 0.680000 0.780000
Group 2 0.313630 0.031363 0.282267 0.397733 0.680000 0.780000
B-Class Accumulation Shares
Group 1 7.633333 0.763333 6.870000 – 6.870000 7.050000
Group 2 4.690300 0.469030 4.221270 2.648730 6.870000 7.050000
C-Class Accumulation Shares
Group 1 2.500000 0.250000 2.250000 – 2.250000 2.410000
Group 2 1.404759 0.140476 1.264283 0.985717 2.250000 2.410000
C-Class Income Shares
Group 1 2.455556 0.245556 2.210000 – 2.210000 2.400000
Group 2 2.455556 0.245556 2.210000 0.000000 2.210000 2.400000
Equalisation applies only to shares purchased during the distribution period (group 2 shares). It is the average amount of revenue included in the purchase price of all group 2 shares and is refunded to holders of these
shares as a return of capital. Being capital it is not liable to income tax but must be deducted from the cost of shares for capital gains tax purposes.
Distribution table

Investment objective and policyTo provide long-term capital growth by investing in a portfolio primarily ofUK securities.
UK securities are securities issued by companies that are incorporated underthe laws of, and have their registered office in, the UK, or that derive thepredominant part of their economic activity from the UK, even if listedelsewhere. Smaller companies may be held on an ancillary basis.
This Equity based Fund invests in those stocks which the Investment Adviserbelieves will outperform with little regard for their Benchmark weighting.
Other instruments as permitted in the stated investment and borrowingpowers of the Company including, but not limited to, fixed income securities,cash and cash equivalents may be held on an ancillary basis, as appropriate.
Risk profileThe value of your investment may fall as well as rise and you may get backless than you originally invested.
The value of Equity and Equity-Linked Securities may fluctuate in responseto the performance of individual companies and general market conditions.
This Fund is aggressively managed, which may result in higher volatility ofthe Fund’s performance and bigger differences between the performanceof the Fund and its Benchmark.
The single market in which the Fund primarily invests, in this case the UK,may be subject to particular political and economic risks and, as a result,the Fund may be more volatile than more broadly diversified funds.
Please refer to Part 11 of the Prospectus for details of the general risk factorsaffecting this Fund in addition to the specific risk factors above.
Fund reviewThe UK stock market delivered a strong positive return for the year, supportedby accommodative monetary policy and the faster-than-expected domesticeconomic recovery.
The Fund, which invests in a focused portfolio of stocks with attractive intrinsicvalue, backed with quality and supported by a catalyst, outperformed itsbenchmark. Positive contributors to relative returns included stock selectionand overweight positions in the transport, services & trading and construction,building & property sectors, and stock selection and an underweight positionin banks. Stock selection and an underweight position in general industrydetracted, as did stock selection in oil and insurance.
At the stock level, the Fund benefited in relative terms from an overweightposition in van rental company Northgate, which saw a strong rise in customernumbers as new sites in London performed ahead of expectations. Anoverweight position in Persimmon was also positive as homebuilders benefitedfrom UK government measures to support the housing market. Stock-leveldetractors from relative returns included an overweight position in PartnershipAssurance. The provider of specialist annuities, which listed in June, fell afterwarning that fourth-quarter sales were unlikely to increase from a yearearlier. An overweight position Salamander Energy was also detrimental as
the oil explorer was hurt by disappointing drilling results in the Gulf ofThailand. However, relative returns were boosted by the Fund’s overweightposition in Lloyds Banking Group, which rose over the period as itsrestructuring efforts lifted investor sentiment.
Fund outlookThe economic backdrop looks set to remain favourable for UK stocks. If therecovery continues to gather momentum, UK companies have the potentialto deliver earnings growth this year.
12 month performance as at 31 January2014 2013 2012 2011 2010
JPM UK FocusA-Class Acc 16.9% 17.0% -4.9% 16.7% 37.8%
JPM UK FocusB-Class Acc 17.3% – – – –
JPM UK FocusC-Class Acc 17.6% 17.9% -4.1% – –
Benchmark Index 10.1% 16.3% -0.3% 18.1% 33.2%
Fund statisticsRisk and Reward Profile 6*
Fund size £51.3m
Benchmark Index FTSE All-Share Index (Net)
Fund chargesA-Class Initial 3.00%, Annual 1.50%B-Class Initial Nil, Annual 1.00%C-Class Initial Nil, Annual 0.75%
Top ten holdings %Royal Dutch Shell 4.1British American Tobacco 3.6Vodafone Group 3.1Glencore Xstrata 3.0Lloyds Banking Group 2.9GlaxoSmithKline 2.8Barclays 2.8DCC 2.8ITV 2.7Brammer 2.7
JPM UK Focus Fund
You should remember that past performance is not a guide to the future. The price of investments and the income from them may fall as well as rise andinvestors may not get back the full amount invested.
* For specific risks, including the risk and reward profile, please refer to the Key Investor information Document (KIID) available on the following websitehttp://am.jpmorgan.co.uk/investor/prices-and-factsheets/?list=all&tab=PricesAll equity indices stated as ‘Net’ are calculated net of tax as per the standard published approach by the index vendor unless stated otherwise.All performance returns are calculated using the quoted price of the accumulation shares. Performance returns are in Sterling.Source: J.P. Morgan.Source: FTSE International Limited (“FTSE”) © FTSE 2014. “FTSE®” is a trade mark of London Stock Exchange Plc and The Financial Times Limited and is used by FTSE International Limited under licence. All rights inthe FTSE indices and/or FTSE ratings vest in FTSE and/or its licensors. Neither FTSE nor its licensors accept any liability for any errors or omissions in the FTSE indices and/or FTSE ratings or underlying data. Nofurther distribution of FTSE Data is permitted without FTSE’s express written consent. 329
Continuation�
� Return to Index

Sector breakdown %Industrials 18.0Financials 17.5Consumer services 15.4Consumer goods 14.0Oil & gas 12.7Health care 7.8Telecommunications 5.2Basic materials 4.4Equity investment instruments 3.0Technology 1.6Net other assets 0.4
Highest/lowest share price and distribution recordDistribution
Highest Lowest per shareCalendar year share price share price (net)A-Class Accumulation Shares2009 49.36p 29.99p 1.04p2010 56.04p 44.06p 0.70p2011 58.23p 45.14p 0.59p2012 58.19p 49.30p 0.95p2013 74.52p 59.04p 0.94p2014A 76.33p 72.17p 0.12pA-Class Income Shares2009 45.33p 27.99p 0.97p2010 50.74p 40.30p 0.63p2011 52.66p 40.43p 0.54p2012 51.32p 43.91p 0.84p2013 64.63p 51.95p 0.83p2014A 66.20p 62.59p 0.11pB-Class Accumulation SharesB
2012 58.23p 54.50p – 2013 74.79p 59.09p 1.12p2014A 76.65p 72.49p 0.24pC-Class Accumulation SharesC
2010 104.2p 96.19p –2011 108.6p 84.50p 1.44p2012 110.0p 92.77p 2.57p2013 141.7p 111.6p 2.62p2014A 145.3p 137.4p 0.22pC-Class Income SharesD
2012 105.4p 97.70p –2013 132.8p 106.9p 2.35p2014A 136.2p 128.8p 0.41p
A To 31 January 2014.B B-Class Accumulation Shares were launched on 29 October 2012.C C-Class Accumulation Shares were launched on 15 November 2010.D C-Class Income Shares were launched on 20 August 2012.
Portfolio turnover rate31.01.13 43.9%31.01.14 41.9%
The portfolio turnover rate (PTR) reflects the total of security purchases and sales, less the total of shareissues and cancellations, expressed as a percentage of the average daily net asset values over the period.
Portfolio transaction costsBroker Transaction
Commissions Taxes Total31.01.13 0.06% 0.09% 0.15%31.01.14 0.08% 0.06% 0.14%
The percentage figures disclosed above reflect the average broker commissions and transaction taxessuffered during the last 3 years divided by the average assets under management over the same period.
Stamp duty reserve tax31.01.13 0.01%31.01.14 0.00%
The percentage figures disclosed above reflect the total stamp duty reserve tax suffered during the yeardivided by the average assets under management over the same period.
Net asset values and Ongoing chargesNet assetvalue per Net asset
share class Number value per OngoingDate £’000 of shares share chargesA-Class Accumulation Shares31.01.12 49,723 94,362,224 52.69p 1.68%31.01.13 53,196 86,261,507 61.67p 1.68%31.01.14 51,185 71,048,928 72.04p 1.68%A-Class Income Shares31.01.12 57 120,998 46.94p 1.68%31.01.13 34 62,935 53.94p 1.68%31.01.14 37 59,475 62.37p 1.68%B-Class Accumulation Shares31.01.13 3 5,000 61.74p 1.18%31.01.14 3 3,500 72.36p 1.18%C-Class Accumulation Shares31.01.12 3,638 3,678,796 98.89p 0.87%31.01.13 2,841 2,435,323 116.7p 0.93%31.01.14 40 28,955 137.2p 0.93%C-Class Income Shares31.01.13 1 1,000 110.7p 0.93%31.01.14 1 1,043 128.1p 0.93%
The net asset value and the net asset value per income share are shown ex-dividend.
Following the adoption of the requirements of UCITS IV in June 2012, Ongoing charges has replaced the TotalExpense Ratio (“TER”). The Ongoing charges takes into account the ACD fee, the fixed expenses and any expensespaid to an affiliate in respect of stocklending activities, expressed as a percentage of the average daily net assetvalues over the period. The main difference between the two calculations is the inclusion of custodian handlingcharges and stocklending fees in the Ongoing charges figure. The comparative figures have not been restated,and the historic TER is disclosed.
330
Continuation�
� Return to Index

Industrials – 18.0% (14.3%)Industrial engineering – 2.0%Bodycote 67,673 439 0.9Fenner 141,567 576 1.1Industrial metals – 0.1% International Ferro MetalsA 704,762 72 0.1Industrial transportation – 1.2% Global Ports Investments GDRB 78,754 608 1.2Support services – 14.7% Brammer 304,491 1,399 2.7DCC 51,627 1,426 2.8Essentra 44,194 364 0.7Howden Joinery Group 201,228 678 1.3Northgate 177,313 983 1.9Premier Farnell 112,359 241 0.5Regus 443,552 915 1.8SIG 482,959 927 1.8Travis Perkins 35,439 608 1.2
Financials – 17.5% (16.1%)Banks – 10.7% Bank of Georgia 65,061 1,361 2.7Barclays 536,246 1,436 2.8HSBC 193,301 1,197 2.3Lloyds Banking Group 1,805,538 1,474 2.9General financial – 0.8% International Personal Finance 93,427 431 0.8Life insurance – 3.8% Partnership Assurance Group 243,621 787 1.5Prudential 95,699 1,167 2.3Nonlife insurance – 2.2% Beazley Group 169,542 431 0.8Direct Line Insurance Group 271,162 713 1.4
Consumer services – 15.4% (13.6%)Food & drug retails – 1.2% Morrison (Wm.) Supermarkets 254,532 606 1.2General retailers – 4.0% Debenhams 607,397 447 0.9Folli FollieC 33,088 616 1.2Inchcape 63,634 366 0.7Kering 358 43 0.1Kingfisher 150,524 545 1.1Media – 4.9% ITV 715,818 1,404 2.7Pearson 39,402 432 0.8UBM 101,954 695 1.4Travel & leisure – 5.3% Dominos Pizza 181,282 959 1.9Intercontinental Hotels Group 52,853 1,028 2.0Playtech 104,073 713 1.4
Consumer goods – 14.0% (12.7%)Beverages – 2.1% SABMiller 40,198 1,073 2.1Food producers – 3.9% Associated British Foods 40,570 1,078 2.1Premier Foods 677,684 933 1.8Household goods – 4.4% Persimmon 58,497 748 1.5Redrow 154,849 494 1.0Taylor Wimpey 882,887 983 1.9Tobacco – 3.6% British American Tobacco 63,092 1,835 3.6
Oil & gas – 12.7% (16.2%)Oil & gas producers – 9.9% Afren 446,608 654 1.3BG Group 49,956 508 1.0BP 289,220 1,367 2.7Royal Dutch Shell ‘A’ 47,498 1,008 2.0Royal Dutch Shell ‘B’ 48,500 1,088 2.1Salamander Energy 399,350 421 0.8Oil equipment, services & distribution – 2.8% LSL Property Services 211,289 914 1.8Petrofac 44,281 515 1.0
Health care – 7.8% (5.1%)Pharmaceuticals & biotechnology – 7.8% Benchmark Holdings* 725,000 921 1.8GlaxoSmithKline 93,513 1,453 2.8MDxHealth 234,834 563 1.1Shire 25,538 766 1.5Thrombogenics 20,932 321 0.6
Telecommunications – 5.2% (4.6%)Fixed line telecommunications – 2.1% BT Group 290,168 1,101 2.1Mobile telecommunications – 3.1% Vodafone Group 720,682 1,598 3.1
Basic materials – 4.4% (7.9%)Mining – 4.4% Glencore Xstrata 480,311 1,539 3.0Highland Gold Mining* 282,451 176 0.3Rio Tinto 17,964 578 1.1
Equity investment instruments – 3.0% (1.2%)Burford Capital* 549,454 648 1.3Greencoat UK Wind 829,268 850 1.7
Technology – 1.6% (2.9%)Software & computer services – 1.6% AVEVA Group 14,280 304 0.6Computacenter 81,131 525 1.0
Investment assets 51,049 99.6
Net other assets 217 0.4
Net assets 51,266 100.0
Unless otherwise stated the above securities are admitted to official stock exchange listings or trade on aregulated market.
The comparative percentage figures in brackets are at 31 January 2013.
* Listed on Alternative Investment Market (AIM)A South AfricaB RussiaC Greece
Portfolio statement As at 31 January 2014
Market value Total netInvestment Holding £’000 assets %
Market value Total netInvestment Holding £’000 assets %
331
Continuation�
� Return to Index

£’000
Total of all purchases for the year (Note 10) 19,048
Major purchases Cost
JPM Sterling Liquidity ‘X’ (Distribution)^ 5,902Bank of Georgia 1,273British American Tobacco 1,151Partnership Assurance Group 1,077Greencoat UK Wind 857DCC 758Glencore Xstrata 735GlaxoSmithKline 612Global Ports Investments GDR 548Bpost 548Folli Follie 504PostNL 502Benchmark Holdings 480MDxHealth 434Dominos Pizza 361SABMiller 342Premier Foods 260Pearson 255SBM Offshore 251Barclays 204
^ Deemed to be investment in related parties of the ACD
£’000
Total of all sales for the year (Note 10) 31,641
Major sales Proceeds
JPM Sterling Liquidity ‘X’ (Distribution)^ 7,403Imperial Tobacco Group 1,143Centrica 1,113Playtech 856Royal Dutch Shell ‘B’ 845Bayer 806PostNL 778Lonza Group 776International Personal Finance 733HeidelbergCement 718Paragon Group of Companies 665Solvay 634BP 624Atos 622BG Group 617Barclays 617Persimmon 607Vodafone Group 588Bpost 578HSBC 548
Portfolio movements For the year ending 31 January 2014
332
Continuation�
� Return to Index

Statement of total returnFor the year ending 31 January
2014 2013£’000 £’000 £’000 £’000
Income
Net capital gains (Note 1) 7,947 7,260
Revenue (Note 2) 1,510 1,900
Expenses (Note 3) (890) (860)
Net revenue before taxation 620 1,040
Taxation (Note 4) (19) (19)
Net revenue after taxation 601 1,021
Total return before distributions 8,548 8,281
Finance costs: Distributions (Note 5) (599) (1,021)
Change in net assets attributable to shareholders from investment activities 7,949 7,260
Statement of change in net assets attributable to shareholdersFor the year ending 31 January
2014 2013£’000 £’000 £’000 £’000
Opening net assets attributable to shareholders 56,075 53,418
Amounts receivable on issue of shares 843 991
Amounts payable on cancellation of shares (14,133) (6,550)
(13,290) (5,559)
Change in net assets attributable to shareholders from investment activities (see above) 7,949 7,260
Retained distributions on accumulation shares 533 959
Stamp duty reserve tax (1) (3)
Closing net assets attributable to shareholders 51,266 56,075
Balance sheetAs at 31 January
2014 2013£’000 £’000 £’000 £’000
ASSETS
Investment assets 51,049 55,810
Debtors (Note 7) 90 125
Cash and bank balances (Note 8) 204 534
Total other assets 294 659
Total assets 51,343 56,469
LIABILITIES
Creditors (Note 9) (77) (370)
Bank overdrafts – (24)
Total liabilities (77) (394)
Net assets attributable to shareholders 51,266 56,075
The notes to these financial statements are shown on pages 334 to 335.
Financial statements
333
Continuation�
� Return to Index

1. Net capital gains2014 2013
£’000 £’000Currency gains – 3Derivative contracts (8) 182Non-derivative securities 7,955 7,075Net capital gains 7,947 7,260
2. Revenue2014 2013
£’000 £’000Franked income from UK equity investments 1,123 1,523Income from Liquidity funds 3 5Income from overseas equity investments 384 312Stock dividends – 60Total revenue 1,510 1,900
3. Expenses2014 2013
£’000 £’000Payable to the ACD or associate of the ACD:ACD fee 794 767Fixed expenses 96 93Total expenses 890 860
4. Taxation2014 2013
£’000 £’000a) Analysis of charge in the yearOverseas tax suffered 19 19Current year tax charge (Note 4b) 19 19
b) Factors affecting the tax charge for the yearThe tax assessed for the year is lower than the standard rate of corporation tax inthe UK for an Open-Ended Investment Company (OEIC) (20%). The differences areexplained below.
Net revenue before taxation 620 1,040Corporation tax at 20% 124 208
Effects of:Dividends not subject to corporation tax (302) (379)Excess expenses for which no relief taken 178 171Overseas tax suffered 19 19
(105) (189)Current year tax charge (Note 4a) 19 19
No deferred tax asset has been recognised in the financial statements. At the yearend date, the Fund had a potential unrecognised deferred tax asset of £1,049,762(31.01.13: £872,336) in relation to £5,248,811 (31.01.13: £4,361,682) of excessmanagement expenses which would only be utilised to reduce the tax charge if theFund had an excess of unfranked income over expenses in a future period. There isno excess of unfranked income expected in the future.
5. Finance costsDistributionsThe distributions take account of amounts receivable on the issue of shares andamounts payable on the cancellation of shares and comprise:
2014 2013£’000 £’000
Interim dividend distribution 448 623Final dividend distribution 85 337Add: Amounts payable on cancellation of shares 70 68Deduct: Amounts receivable on issue of shares (4) (7)Total finance costs 599 1,021
Details of the distribution per share are set out on page 336.
6. Movement between net revenue after taxation and distributions2014 2013
£’000 £’000Net revenue after taxation 601 1,021Add: Undistributed revenue brought forward 4 4Deduct: Undistributed revenue carried forward (6) (4)
599 1,021
7. Debtors2014 2013
£’000 £’000Accrued income 75 102Overseas tax recoverable 15 23Total debtors 90 125
8. Cash and bank balances2014 2013
£’000 £’000Amounts held at futures clearing houses
and brokers 15 –Cash and bank balances 189 534Total cash and bank balances 204 534
9. Creditors2014 2013
£’000 £’000Accrued expenses 77 77Due to the ACD for shares cancelled – 293Total creditors 77 370
Notes to the financial statements for the year ending 31 January 2014
334
Continuation�
� Return to Index

10. Portfolio transaction costs2014 2013
£’000 £’000Analysis of total purchase costs
Purchases in year before transaction costs 18,981 15,394
Commissions 25 25Taxes 42 46Total purchase costs 67 71Gross purchases total 19,048 15,465
Analysis of total sale costs
Gross sales before transaction costs 31,679 20,048
Commissions (38) (33)Total sale costs (38) (33)Total sales net of transaction costs 31,641 20,015
11. Related party transactionsJPMorgan Funds Limited, as Authorised Corporate Director (“ACD”), is a relatedparty, and acts as principal in respect of all transactions of shares in the Company.The aggregate monies received through issue, and paid on cancellation, aredisclosed in the Statement of Change in Net Assets Attributable to Shareholders.
The balance due to the ACD and their associates at the year end date in respect ofrelated party transactions was £76,576 (31.01.13: £369,657). Details of relatedparty transactions are given under note 13 on page 413.
Investments considered to be related parties have been identified in the portfoliostatement on page 331 and the revenue from these investments was £2,328(31.01.13: £4,408).
Some of the dealing transactions for the Fund are carried out through associatesof the ACD. Such transactions are carried out on an arm’s length basis. Thecommissions paid to these companies over the year were £535 (31.01.13: £510).Commission was paid to the associated company JPMorgan Securities Ltd.
The following parties held a material interest in the Fund at the year end date:– Chase Nominees Ltd Acc 22107 79.54% (31.01.13: 68.73%)– Chase Nominees Ltd Acc 22075 13.76% (31.01.13: 14.92%)
12. Financial instrumentsCurrency exposuresA proportion of the net assets of the Fund are denominated in currencies otherthan sterling, with the effect that the Balance sheet and total return can beaffected by currency movements.
Net foreign currency assetsMonetary Non-monetary
Total exposures exposuresCurrency £’000 £’000 £’000
31.01.14Euro 1,561 18 1,543US Dollar 612 4 608Norwegian Krone 5 5 –Swedish Krona 1 1 –
31.01.13Euro 3,854 33 3,821Swiss Franc 596 – 596Swedish Krona 172 1 171Norwegian Krone 11 11 –US Dollar 5 5 –
Interest rate riskAt the year end date, 0.4% (31.01.13: 3.6%) of the Fund’s net assets by value wereinterest bearing, carrying a (fixed/floating) rate.
For consideration of other risks including liquidity, pricing and credit risk, pleaserefer to the notes to the aggregated financial statements, pages 413 to 414.
13. Share classesThe Fund currently has three share classes; Class A Shares, Class B Shares andClass C Shares. The Authorised Corporate Director’s (ACD) fee and fixed expensescharge are shown below.
ACD fee Fixed expensesClass A shares: 1.50% 0.18%Class B shares: 1.00% 0.18%Class C shares: 0.75% 0.18%
The net asset value of each share class, the net asset value per share and thenumber of shares in each class are shown on page 330. All classes have the samerights on winding up.
14. Contingent liabilities and capital commitmentsAt the balance sheet date there were no contingent liabilities or capitalcommitments (2013: none).
Notes to the financial statements – continued
335
Continuation�
� Return to Index

Final distribution in pence per share
Group 1 – Shares purchased prior to 1 August 2013Group 2 – Shares purchased 1 August 2013 to 31 January 2014
DistributionGross Tax Net payable paid
revenue at 10% revenue Equalisation 30.04.14 30.04.13
A-Class Accumulation Shares
Group 1 0.133333 0.013333 0.120000 – 0.120000 0.360000
Group 2 0.000000 0.000000 0.000000 0.120000 0.120000 0.360000
A-Class Income Shares
Group 1 0.122222 0.012222 0.110000 – 0.110000 0.320000
Group 2 0.111016 0.011102 0.099914 0.010086 0.110000 0.320000
B-Class Accumulation Shares
Group 1 0.266667 0.026667 0.240000 – 0.240000 0.430000
Group 2 0.266667 0.026667 0.240000 0.000000 0.240000 0.430000
C-Class Accumulation Shares
Group 1 0.244444 0.024444 0.220000 – 0.220000 1.100000
Group 2 0.093518 0.009352 0.084166 0.135834 0.220000 1.100000
C-Class Income Shares
Group 1 0.455556 0.045556 0.410000 – 0.410000 1.020000
Group 2 0.455556 0.045556 0.410000 0.000000 0.410000 1.020000
Interim distribution in pence per share
Group 1 – Shares purchased prior to 1 February 2013Group 2 – Shares purchased 1 February 2013 to 31 July 2013
DistributionGross Tax Net paid paid
revenue at 10% revenue Equalisation 31.10.13 31.10.12
A-Class Accumulation Shares
Group 1 0.644444 0.064444 0.580000 – 0.580000 0.660000
Group 2 0.014886 0.001489 0.013397 0.566603 0.580000 0.660000
A-Class Income Shares
Group 1 0.566667 0.056667 0.510000 – 0.510000 0.580000
Group 2 0.507992 0.050799 0.457193 0.052807 0.510000 0.580000
B-Class Accumulation Shares
Group 1 0.766667 0.076667 0.690000 – 0.690000 –
Group 2 0.766667 0.076667 0.690000 0.000000 0.690000 –
C-Class Accumulation Shares
Group 1 1.688889 0.168889 1.520000 – 1.520000 1.650000
Group 2 1.137119 0.113712 1.023407 0.496593 1.520000 1.650000
C-Class Income Shares
Group 1 1.477778 0.147778 1.330000 – 1.330000 –
Group 2 1.410678 0.141068 1.269610 0.060390 1.330000 –
Equalisation applies only to shares purchased during the distribution period (group 2 shares). It is the average amount of revenue included in the purchase price of all group 2 shares and is refunded to holders of these
shares as a return of capital. Being capital it is not liable to income tax but must be deducted from the cost of shares for capital gains tax purposes.
Distribution tables
336
� Return to Index
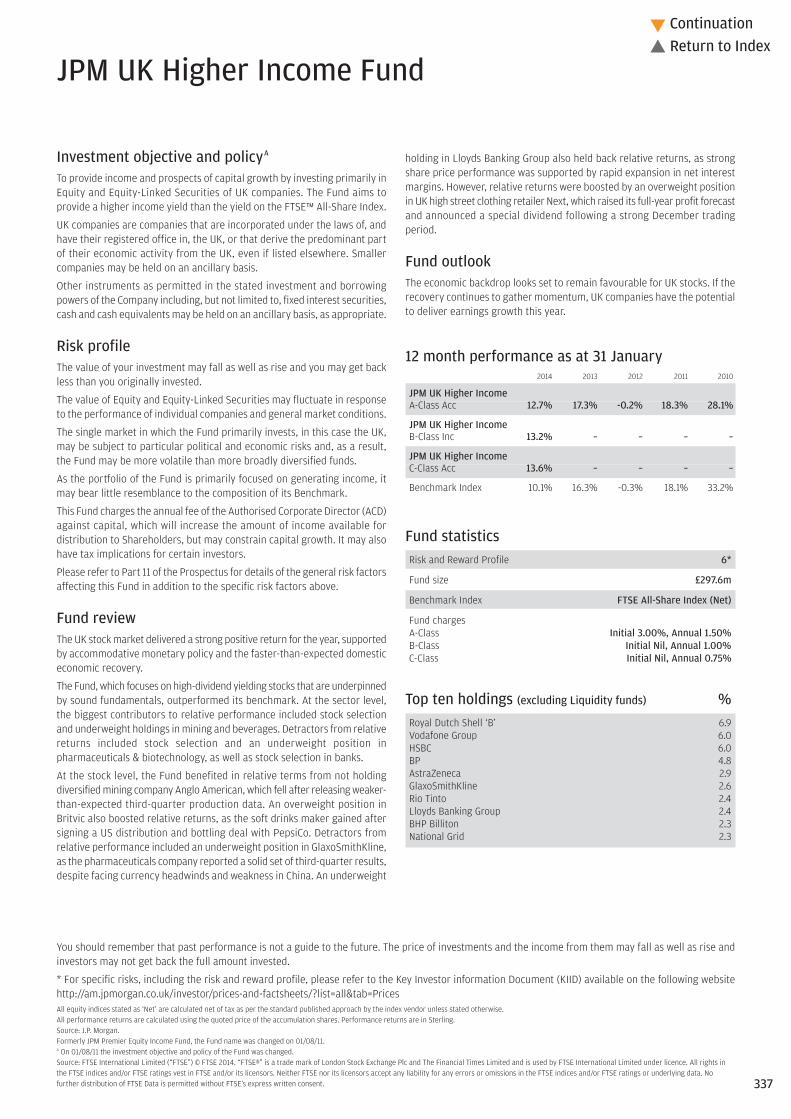
Investment objective and policyA
To provide income and prospects of capital growth by investing primarily inEquity and Equity-Linked Securities of UK companies. The Fund aims toprovide a higher income yield than the yield on the FTSE™ All-Share Index.
UK companies are companies that are incorporated under the laws of, andhave their registered office in, the UK, or that derive the predominant partof their economic activity from the UK, even if listed elsewhere. Smallercompanies may be held on an ancillary basis.
Other instruments as permitted in the stated investment and borrowingpowers of the Company including, but not limited to, fixed interest securities,cash and cash equivalents may be held on an ancillary basis, as appropriate.
Risk profileThe value of your investment may fall as well as rise and you may get backless than you originally invested.
The value of Equity and Equity-Linked Securities may fluctuate in responseto the performance of individual companies and general market conditions.
The single market in which the Fund primarily invests, in this case the UK,may be subject to particular political and economic risks and, as a result,the Fund may be more volatile than more broadly diversified funds.
As the portfolio of the Fund is primarily focused on generating income, itmay bear little resemblance to the composition of its Benchmark.
This Fund charges the annual fee of the Authorised Corporate Director (ACD)against capital, which will increase the amount of income available fordistribution to Shareholders, but may constrain capital growth. It may alsohave tax implications for certain investors.
Please refer to Part 11 of the Prospectus for details of the general risk factorsaffecting this Fund in addition to the specific risk factors above.
Fund reviewThe UK stock market delivered a strong positive return for the year, supportedby accommodative monetary policy and the faster-than-expected domesticeconomic recovery.
The Fund, which focuses on high-dividend yielding stocks that are underpinnedby sound fundamentals, outperformed its benchmark. At the sector level,the biggest contributors to relative performance included stock selectionand underweight holdings in mining and beverages. Detractors from relativereturns included stock selection and an underweight position inpharmaceuticals & biotechnology, as well as stock selection in banks.
At the stock level, the Fund benefited in relative terms from not holdingdiversified mining company Anglo American, which fell after releasing weaker-than-expected third-quarter production data. An overweight position inBritvic also boosted relative returns, as the soft drinks maker gained aftersigning a US distribution and bottling deal with PepsiCo. Detractors fromrelative performance included an underweight position in GlaxoSmithKline,as the pharmaceuticals company reported a solid set of third-quarter results,despite facing currency headwinds and weakness in China. An underweight
holding in Lloyds Banking Group also held back relative returns, as strongshare price performance was supported by rapid expansion in net interestmargins. However, relative returns were boosted by an overweight positionin UK high street clothing retailer Next, which raised its full-year profit forecastand announced a special dividend following a strong December tradingperiod.
Fund outlookThe economic backdrop looks set to remain favourable for UK stocks. If therecovery continues to gather momentum, UK companies have the potentialto deliver earnings growth this year.
12 month performance as at 31 January 2014 2013 2012 2011 2010
JPM UK Higher IncomeA-Class Acc 12.7% 17.3% -0.2% 18.3% 28.1%
JPM UK Higher IncomeB-Class Inc 13.2% – – – –
JPM UK Higher IncomeC-Class Acc 13.6% – – – –
Benchmark Index 10.1% 16.3% -0.3% 18.1% 33.2%
Fund statisticsRisk and Reward Profile 6*
Fund size £297.6m
Benchmark Index FTSE All-Share Index (Net)
Fund chargesA-Class Initial 3.00%, Annual 1.50%B-Class Initial Nil, Annual 1.00%C-Class Initial Nil, Annual 0.75%
Top ten holdings (excluding Liquidity funds) %Royal Dutch Shell ‘B’ 6.9Vodafone Group 6.0HSBC 6.0BP 4.8AstraZeneca 2.9GlaxoSmithKline 2.6Rio Tinto 2.4Lloyds Banking Group 2.4BHP Billiton 2.3National Grid 2.3
JPM UK Higher Income Fund
You should remember that past performance is not a guide to the future. The price of investments and the income from them may fall as well as rise andinvestors may not get back the full amount invested.
* For specific risks, including the risk and reward profile, please refer to the Key Investor information Document (KIID) available on the following websitehttp://am.jpmorgan.co.uk/investor/prices-and-factsheets/?list=all&tab=PricesAll equity indices stated as ‘Net’ are calculated net of tax as per the standard published approach by the index vendor unless stated otherwise.All performance returns are calculated using the quoted price of the accumulation shares. Performance returns are in Sterling.Source: J.P. Morgan.Formerly JPM Premier Equity Income Fund, the Fund name was changed on 01/08/11.A On 01/08/11 the investment objective and policy of the Fund was changed.Source: FTSE International Limited (“FTSE”) © FTSE 2014. “FTSE®” is a trade mark of London Stock Exchange Plc and The Financial Times Limited and is used by FTSE International Limited under licence. All rights inthe FTSE indices and/or FTSE ratings vest in FTSE and/or its licensors. Neither FTSE nor its licensors accept any liability for any errors or omissions in the FTSE indices and/or FTSE ratings or underlying data. Nofurther distribution of FTSE Data is permitted without FTSE’s express written consent. 337
Continuation�
� Return to Index

Sector breakdown %Financials 31.2Oil & gas 13.2Industrials 11.8Consumer services 10.8Telecommunications 9.7Basic materials 7.3Health care 5.5Consumer goods 3.8Liquidity funds 3.0Utilities 2.9Technology 1.5Futures (0.1)Net other liabilities (0.6)
Highest/lowest share price and distribution recordDistribution
Highest Lowest per shareCalendar year share price share price (net)A-Class Accumulation Shares2009 559.2p 356.7p 23.45p2010 644.9p 512.9p 18.88p2011 674.3p 552.4p 21.88p2012 708.2p 609.4p 26.41p2013 854.4p 714.8p 30.09p2014B 873.6p 838.2p 13.91pA-Class Income Shares2009 409.1p 268.1p 17.91p2010 456.0p 369.9p 13.64p2011 470.7p 377.4p 15.35p2012 464.3p 408.8p 17.85p2013 538.6p 468.6p 19.63p2014B 550.7p 528.5p 8.77pB-Class Accumulation SharesC
2013 856.5p 50.00p 17.86p2014B 876.0p 840.7p 13.90pB-Class Income SharesD
2012 464.7p 437.2p – 2013 541.7p 469.0p 19.55p2014B 554.0p 531.7p 8.80pC-Class Accumulation SharesE
2012 104.3p 97.44p –2013 126.8p 105.3p 4.46p2014B 129.7p 124.5p 2.06pC-Class Income SharesE
2012 104.4p 97.44p –2013 122.0p 105.4p 4.43p2014B 124.8p 119.8p 1.98p
B To 31 January 2014.C B-Class Accumulation Shares were launched on 17 June 2013.D B-Class Income Shares were launched on 29 October 2012.E C-Class Accumulation Shares and C-Class Income Shares were launched on 20 August 2012.
Portfolio turnover rate31.01.13 87.0%31.01.14 152.5%
The portfolio turnover rate (PTR) reflects the total of security purchases and sales (excluding Liquidityfunds), less the total of share issues and cancellations, expressed as a percentage of the average daily netasset values over the period.
Portfolio transaction costsBroker Transaction
Commissions Taxes Total31.01.13 0.23% 0.21% 0.44%31.01.14 0.18% 0.22% 0.40%
The percentage figures disclosed above reflect the average broker commissions and transaction taxessuffered during the last 3 years divided by the average assets under management over the same period.
Stamp duty reserve tax31.01.13 0.00%31.01.14 0.01%
The percentage figures disclosed above reflect the total stamp duty reserve tax suffered during the yeardivided by the average assets under management over the same period.
Net asset values and Ongoing chargesNet assetvalue per Net asset
share class Number value per OngoingDate £’000 of shares share chargesA-Class Accumulation Shares31.01.12 155,271 24,521,746 633.2p 1.68%31.01.13 167,720 22,568,314 743.2p 1.68%31.01.14 175,387 20,942,138 837.5p 1.68%A-Class Income Shares31.01.12 116,876 27,512,678 424.8p 1.68%31.01.13 122,705 25,607,237 479.2p 1.68%31.01.14 118,868 22,894,385 519.2p 1.68%B-Class Accumulation Shares31.01.14 76 9,100 839.9p 1.18%B-Class Income Shares31.01.13 5 1,000 479.8p 1.18%31.01.14 65 12,463 522.4p 1.18%C-Class Accumulation Shares31.01.13 17 15,927 109.6p 0.93%31.01.14 1,106 889,015 124.4p 0.93%C-Class Income Shares31.01.13 118 109,036 107.8p 0.93%31.01.14 2,115 1,796,278 117.7p 0.93%
The net asset value and the net asset value per income share are shown ex-dividend.
Following the adoption of the requirements of UCITS IV in June 2012, Ongoing charges has replaced theTotal Expense Ratio (“TER”). The Ongoing charges takes into account the ACD fee, the fixed expenses andany expenses paid to an affiliate in respect of stocklending activities, expressed as a percentage of theaverage daily net asset values over the period. The main difference between the two calculations is theinclusion of custodian handling charges and stocklending fees in the Ongoing charges figure. The comparativefigures have not been restated, and the historic TER is disclosed.
338
Continuation�
� Return to Index

Financials – 31.2% (28.8%)Banks – 9.2%Bank of Georgia 114,435 2,394 0.8HSBC 2,866,523 17,747 6.0Lloyds Banking Group 8,763,150 7,154 2.4Equity investment instruments – 0.0%Brookwell† 6,303 3 –Financial services – 1.6%Aberdeen Asset Management 469,077 1,835 0.6Jupiter Fund Management 283,773 1,048 0.4Provident Financial 116,398 1,888 0.6General financial – 2.1%Brewin Dolphin 539,170 1,628 0.5Close Brothers Group 216,133 2,842 1.0IG Group 307,221 1,902 0.6Life insurance – 6.4%Aviva 813,702 3,595 1.2Chesnara 70,000 241 0.1Legal & General Group 2,146,880 4,577 1.5Old Mutual 1,530,632 2,594 0.9Phoenix Group 246,241 1,801 0.6Resolution 1,003,472 3,484 1.2Standard Life 791,506 2,863 0.9Nonlife insurance – 6.2%Admiral Group 150,129 2,133 0.7Amlin 465,618 1,965 0.6Beazley Group 701,023 1,783 0.6Catlin Group 323,944 1,701 0.6Direct Line Insurance Group 827,066 2,174 0.7Esure Group 671,861 1,795 0.6Henderson Group 1,414,985 3,124 1.0Hiscox 179,677 1,139 0.4Lancashire 223,788 1,676 0.6Novae Group 194,000 1,101 0.4Real estate – 5.7%Big Yellow Group 359,631 1,854 0.6British Land 394,652 2,585 0.9Foxtons Group 851,320 2,894 1.0Hansteen 1,558,441 1,644 0.6Land Securities Group 193,911 1,980 0.7LondonMetric Property 1,185,028 1,613 0.5LSL Property Services 295,000 1,276 0.4Savills 148,789 925 0.3Segro 637,154 2,123 0.7
Oil & gas – 13.2% (13.9%)Oil & gas producers – 12.2%BP 3,004,617 14,206 4.8Royal Dutch Shell ‘B’ 909,918 20,405 6.9Soco International 430,294 1,760 0.5Oil equipment, services & distribution – 1.0%AMEC 189,878 1,944 0.7Cape 340,000 895 0.3
Industrials – 11.8% (9.1%)Aerospace & defence – 1.2%BAE Systems 826,896 3,523 1.2Construction & materials – 2.4%Galliford Try 253,625 2,972 1.0Henry Boot 550,000 1,182 0.4Kier Group 103,007 1,926 0.7Morgan Sindall Group 125,000 1,019 0.3Electronics & electrical equipment – 0.3%Morgan Advanced Materials 275,000 837 0.3General industrials – 0.6%Smith (DS) 516,000 1,696 0.6Industrial engineering – 1.4%IMI 148,048 2,191 0.7Melrose Industries 675,588 2,065 0.7Industrial transportation – 0.7%BBA Aviation 551,958 1,690 0.6UK Mail Group 40,000 266 0.1Whitnash Preference† 220,000 – –
Support services – 5.2%Atkins (WS) 103,695 1,404 0.5Berendsen 189,833 1,743 0.6Brammer 75,000 345 0.1Electrocomponents 979,990 2,597 0.9Hyder Consulting 170,000 1,096 0.4Interserve 296,232 1,831 0.6Lavendon Group 240,000 468 0.1Mitie Group 556,286 1,761 0.6Paypoint 96,368 1,039 0.3Ricardo 138,719 927 0.3Vesuvius 385,773 1,702 0.6VP 87,000 579 0.2
Consumer services – 10.8% (15.7%)Food & drug retails – 0.6%Sainsbury (J) 548,370 1,889 0.6General retailers – 3.3%Halfords Group 350,612 1,580 0.5Marks & Spencer Group 538,119 2,503 0.9Next 69,017 4,255 1.4WH Smith 145,520 1,513 0.5Media – 1.6%Chime Communications 250,000 851 0.3ITV 2,019,782 3,961 1.3Travel & leisure – 5.3%Dunelm Group 115,821 1,068 0.4Easyjet 139,360 2,255 0.8Go-Ahead Group 130,500 2,550 0.9Greene King 193,557 1,637 0.5Lookers 600,000 756 0.3Marston’s 1,039,483 1,549 0.5National Express Group 604,287 1,740 0.6Spirit Pub 1,200,000 1,005 0.3TUI Travel 744,814 3,107 1.0
Telecommunications – 9.7% (5.7%)Fixed line telecommunications – 3.4%BT Group 1,764,060 6,696 2.2Cable & Wireless Communications 4,145,705 2,193 0.7KCOM Group 1,644,324 1,638 0.5Mobile telecommunications – 6.3%Talk Talk Telecom Group 300,177 921 0.3Vodafone Group 8,056,900 17,862 6.0
Basic materials – 7.3% (6.2%)Forestry & paper – 0.6%Mondi 194,117 1,771 0.6Mining – 6.7%BHP Billiton 383,665 6,858 2.3Glencore Xstrata 1,825,500 5,848 2.0Rio Tinto 223,532 7,187 2.4
Health care – 5.5% (4.2%)Pharmaceuticals & biotechnology – 5.5%AstraZeneca 221,700 8,502 2.9GlaxoSmithKline 501,827 7,796 2.6
Consumer goods – 3.8% (7.9%)Beverages – 1.0%Britvic 453,900 3,127 1.0Food producers – 0.0%Anglo-Eastern Plantations 7,032 46 –Household goods – 2.2%Berkeley Group 129,710 3,309 1.1Homebuy Group ‘A’ 58,525 – –Persimmon 251,252 3,211 1.1Tobacco – 0.6%Dairy Crest Group 329,940 1,674 0.6
Utilities – 2.9% (5.3%)Electricity – 0.6%Drax Group 210,567 1,701 0.6Gas, water & multiutilities – 2.3%National Grid 860,150 6,756 2.3
Portfolio statementAs at 31 January 2014
Market value Total netInvestment Holding £’000 assets %
Market value Total netInvestment Holding £’000 assets %
339
Continuation�
� Return to Index

Technology – 1.5% (2.2%)Software & computer services – 0.8%Micro Focus International 303,550 2,242 0.8Technology hardware & equipment – 0.7%Laird Group 620,101 1,994 0.7
Futures – (0.1)% (0.0%)FTSE 100 Index Futures Mar 2014 10 (277) (0.1)
Liquidity funds – 3.0% (1.2%)JPM Sterling Liquidity ‘X’ (Distribution)^$ 9,000,552 9,001 3.0
Investment assets (including investment liabilities) 299,425 100.6
Net other liabilities (1,808) (0.6)
Net assets 297,617 100.0
Unless otherwise stated the above securities are admitted to official stock exchange listings or trade on aregulated market.
The comparative percentage figures in brackets are at 31 January 2013.
† Suspended security^ Deemed to be investment in related parties of the ACD$ Approved security as defined in the Collective Investment Scheme sourcebook
Portfolio statement – continuedAs at 31 January 2014
Market value Total netInvestment Holding £’000 assets %
340
Continuation�
� Return to Index

£’000
Total of all purchases for the year (Note 10) 269,082
Major purchases Cost
JPM Sterling Liquidity ‘X’ (Distribution)^ 39,006GlaxoSmithKline 13,726British American Tobacco 11,492Vodafone Group 8,841Royal Dutch Shell ‘B’ 7,589Lloyds Banking Group 7,535AstraZeneca 7,413Rio Tinto 6,972BP 6,876Glencore Xstrata 6,068Aviva 3,399Aberdeen Asset Management 3,133Resolution 3,042IG Group 2,940ITV 2,876Electrocomponents 2,788Lancashire 2,597Britvic 2,472Inmarsat 2,370Bank of Georgia 2,341
^ Deemed to be investment in related parties of the ACD
£’000
Total of all sales for the year (Note 10) 288,382
Major sales Proceeds
JPM Sterling Liquidity ‘X’ (Distribution)^ 33,577British American Tobacco 10,322GlaxoSmithKline 10,165Royal Dutch Shell ‘B’ 9,327BP 7,202Barclays 6,728AstraZeneca 6,547Tesco 6,193Standard Chartered 5,946Rio Tinto 5,743Reckitt Benckiser Group 5,363Centrica 5,249Unilever 5,208Prudential 5,153SSE 4,775Imperial Tobacco Group 4,494Inmarsat 3,960RSA Insurance Group 3,812Compass Group 3,326WPP 3,166
Portfolio movements For the year ending 31 January 2014
341
Continuation�
� Return to Index

Statement of total returnFor the year ending 31 January
2014 2013£’000 £’000 £’000 £’000
Income
Net capital gains (Note 1) 27,859 37,243
Revenue (Note 2) 12,499 11,774
Expenses (Note 3) (4,986) (4,615)
Finance costs: Interest (Note 5) (6) -
Net revenue before taxation 7,507 7,159
Taxation (Note 4) (5) 1
Net revenue after taxation 7,502 7,160
Total return before distributions 35,361 44,403
Finance costs: Distributions (Note 5) (11,951) (11,279)
Change in net assets attributable to shareholders from investment activities 23,410 33,124
Statement of change in net assets attributable to shareholdersFor the year ending 31 January
2014 2013£’000 £’000 £’000 £’000
Opening net assets attributable to shareholders 290,565 272,147
Amounts receivable on issue of shares 625 519
Amounts payable on cancellation of shares (23,924) (21,643)
(23,299) (21,124)
Change in net assets attributable to shareholders from investment activities (see above) 23,410 33,124
Retained distributions on accumulation shares 6,821 6,288
Stamp duty reserve tax (17) (11)
Unclaimed distributions 137 141
Closing net assets attributable to shareholders 297,617 290,565
Balance sheetAs at 31 January
2014 2013£’000 £’000 £’000 £’000
ASSETS
Investment assets 299,702 291,178
Debtors (Note 7) 991 2,406
Cash and bank balances (Note 8) 1,198 179
Total other assets 2,189 2,585
Total assets 301,891 293,763
LIABILITIES
Investment liabilities (277) –
Creditors (Note 9) (1,952) (1,147)
Distribution payable on income shares (2,045) (2,051)
Total other liabilities (3,997) (3,198)
Total liabilities (4,274) (3,198)
Net assets attributable to shareholders 297,617 290,565
The notes to these financial statements are shown on pages 343 to 344.
Financial statements
342
Continuation�
� Return to Index

1. Net capital gains2014 2013
£’000 £’000Currency losses - (1)Derivative contracts (98) 314Non-derivative securities 27,957 36,930Net capital gains 27,859 37,243
2. Revenue2014 2013
£’000 £’000Franked income from UK equity investments 11,214 11,019Income from Liquidity funds 10 13Income from overseas equity investments 827 517Interest on bank and term deposits – 1Property income distributions 275 151Stock dividends 101 40Underwriting commission 72 33Total revenue 12,499 11,774
3. Expenses2014 2013
£’000 £’000Payable to the ACD or associate of the ACD:ACD fee 4,451 4,120Fixed expenses 535 495Total expenses 4,986 4,615
4. Taxation2014 2013
£’000 £’000a) Analysis of charge in the yearOverseas tax suffered 5 (1)Current year tax charge (Note 4b) 5 (1)
b) Factors affecting the tax charge for the yearThe tax assessed for the year is lower than the standard rate of corporation tax inthe UK for an Open-Ended Investment Company (OEIC) (20%). The differences areexplained below.
Net revenue before taxation 7,507 7,159Corporation tax at 20% 1,501 1,432
Effects of:Dividends not subject to corporation tax (2,428) (2,315)Excess expenses for which no relief taken 927 883Overseas tax suffered 5 (1)
(1,496) (1,433)Current year tax charge (Note 4a) 5 (1)
No deferred tax asset has been recognised in the financial statements. At the yearend date, the Fund had a potential unrecognised deferred tax asset of £26,518,792(31.01.13: £25,591,792) in relation to £132,593,959 (31.01.13: £127,958,960) of excessmanagement expenses which would only be utilised to reduce the tax charge if theFund had an excess of unfranked income over expenses in a future period. There isno excess of unfranked income expected in the future.
5. Finance costsDistributionsThe distributions take account of amounts receivable on the issue of shares andamounts payable on the cancellation of shares and comprise:
2014 2013£’000 £’000
Interim dividend distribution 6,682 6,212Final dividend distribution 4,977 4,804Add: Amounts payable on cancellation of shares 301 270Deduct: Amounts receivable on issue of shares (9) (7)Net distributions for the year 11,951 11,279
Interest 6 –
Total finance costs 11,957 11,279
Details of the distribution per share are set out on page 345.
6. Movement between net revenue after taxation and distributions2014 2013
£’000 £’000Net revenue after taxation 7,502 7,160Add: ACD fee (net of tax relief) paid from capital 4,451 4,120Add: Undistributed revenue brought forward 2 1Deduct: Undistributed revenue carried forward (4) (2)
11,951 11,279
7. Debtors2014 2013
£’000 £’000Accrued income 649 689Due from the ACD for shares created 108 35Property income tax recoverable – 1Sales awaiting settlement 234 1,681Total debtors 991 2,406
8. Cash and bank balances2014 2013
£’000 £’000Amounts held at futures clearing houses
and brokers 604 (39)Cash and bank balances 594 218Total cash and bank balances 1,198 179
9. Creditors2014 2013
£’000 £’000Accrued expenses 438 410Due to the ACD for shares cancelled 322 672Purchases awaiting settlement 1,192 65Total creditors 1,952 1,147
Notes to the financial statements for the year ending 31 January 2014
343
Continuation�
� Return to Index

10. Portfolio transaction costs2014 2013
£’000 £’000Analysis of total purchase costs
Purchases in year before transaction costs 267,707 123,692
Commissions 350 164Taxes 1,025 468Total purchase costs 1,375 632Gross purchases total 269,082 124,324
Analysis of total sale costs
Gross sales before transaction costs 288,764 143,648
Commissions (381) (209)Taxes (1) (1)Total sale costs (382) (210)Total sales net of transaction costs 288,382 143,438
11. Related party transactionsJPMorgan Funds Limited, as Authorised Corporate Director (“ACD”), is a relatedparty, and acts as principal in respect of all transactions of shares in the Company.The aggregate monies received through issue, and paid on cancellation, aredisclosed in the Statement of Change in Net Assets Attributable to Shareholders.
The balance due to the ACD and their associates at the year end date in respect ofrelated party transactions was £652,343 (31.01.13: £1,047,301). Details of relatedparty transactions are given under note 13 on page 413.
Investments considered to be related parties have been identified in the portfoliostatement on pages 339 to 340 and the revenue from these investments was£10,258 (31.01.13: £12,777).
Some of the dealing transactions for the Fund are carried out through associatesof the ACD. Such transactions are carried out on an arm’s length basis. Thecommissions paid to these companies over the year were £11,594 (31.01.13:£8,266). Commission was paid to the associated company JPMorgan SecuritiesLtd.
The gross stocklending income received was £nil (31.01.13: £162), with feesdeducted of £nil (31.01.13: £24).
The following parties held a material interest in the Fund at the year end date:- FNZ (UK) Nominees Limited 21.76% (31.01.13:0.00%)
12. Financial instrumentsCurrency exposuresAt the year end date, the majority of the Fund’s financial assets and liabilities weredenominated in Sterling. As a result, the Fund has no material exposure tocurrency movements.
Interest rate riskAt the year end date, 0.4% (31.01.13: 1.3%) of the Fund’s net assets by value wereinterest bearing, carrying a (fixed/floating) rate.
For consideration of other risks including liquidity, pricing and credit risk, pleaserefer to the notes to the aggregated financial statements, pages 413 to 414.
13. Share classesThe Fund currently has three share classes; Class A Shares, Class B Shares andClass C Shares. The Authorised Corporate Director’s (ACD) fee and fixed expensescharge are shown below.
ACD fee Fixed expensesClass A shares: 1.50% 0.18%Class B shares: 1.00% 0.18%Class C shares: 0.75% 0.18%
The net asset value of each share class, the net asset value per share and thenumber of shares in each class are shown on page 338. All classes have the samerights on winding up.
14. Derivatives The Fund enters into derivative transactions in the form of futures for the purposeof efficient portfolio management. The mark to market approach has been used tocalculate the global exposure.
Further information on the derivative risks can be found in the notes to theaggregated financial statements on page 414.
15. Contingent liabilities and capital commitmentsAt the balance sheet date there were no contingent liabilities or capitalcommitments (2013: none).
Notes to the financial statements – continued
344
Continuation�
� Return to Index

Final distribution in pence per share
Group 1 – Shares purchased prior to 1 August 2013Group 2 – Shares purchased 1 August 2013 to 31 January 2014
DistributionGross Tax Net payable paid
revenue at 10% revenue Equalisation 30.04.14 30.04.13
A-Class Accumulation Shares
Group 1 15.455556 1.545556 13.910000 – 13.910000 12.200000
Group 2 5.812340 0.581234 5.231106 8.678894 13.910000 12.200000
A-Class Income Shares
Group 1 9.744444 0.974444 8.770000 – 8.770000 8.000000
Group 2 3.185710 0.318571 2.867139 5.902861 8.770000 8.000000
B-Class Accumulation Shares
Group 1 15.444444 1.544444 13.900000 – 13.900000 –
Group 2 15.444444 1.544444 13.900000 0.000000 13.900000 –
B-Class Income Shares
Group 1 9.777778 0.977778 8.800000 – 8.800000 8.020000
Group 2 9.777778 0.977778 8.800000 0.000000 8.800000 8.020000
C-Class Accumulation Shares
Group 1 2.288889 0.228889 2.060000 – 2.060000 1.810000
Group 2 0.164507 0.016451 0.148056 1.911944 2.060000 1.810000
C-Class Income Shares
Group 1 2.200000 0.220000 1.980000 – 1.980000 1.830000
Group 2 1.107696 0.110770 0.996926 0.983074 1.980000 1.830000
Interim distribution in pence per share
Group 1 – Shares purchased prior to prior to 1 February 2013Group 2 – Shares purchased 1 February 2013 to 31 July 2013
DistributionGross Tax Net paid paid
revenue at 10% revenue Equalisation 31.10.13 31.10.12
A-Class Accumulation Shares
Group 1 19.877778 1.987778 17.890000 – 17.890000 15.050000
Group 2 8.177009 0.817701 7.359308 10.530692 17.890000 15.050000
A-Class Income Shares
Group 1 12.922222 1.292222 11.630000 – 11.630000 10.090000
Group 2 5.546300 0.554630 4.991670 6.638330 11.630000 10.090000
B-Class Accumulation Shares
Group 1 19.844444 1.984444 17.860000 – 17.860000 –
Group 2 19.844444 1.984444 17.860000 0.000000 17.860000 –
B-Class Income Shares
Group 1 12.811111 1.281111 11.530000 – 11.530000 –
Group 2 12.811111 1.281111 11.530000 0.000000 11.530000 –
C-Class Accumulation Shares
Group 1 2.944444 0.294444 2.650000 – 2.650000 –
Group 2 0.451403 0.045140 0.406263 2.243737 2.650000 –
C-Class Income Shares
Group 1 2.888889 0.288889 2.600000 – 2.600000 –
Group 2 1.770493 0.177049 1.593444 1.006556 2.600000 –
Equalisation applies only to shares purchased during the distribution period (group 2 shares). It is the average amount of revenue included in the purchase price of all group 2 shares and is refunded to holders of these
shares as a return of capital. Being capital it is not liable to income tax but must be deducted from the cost of shares for capital gains tax purposes.
Distribution tables
345
� Return to Index
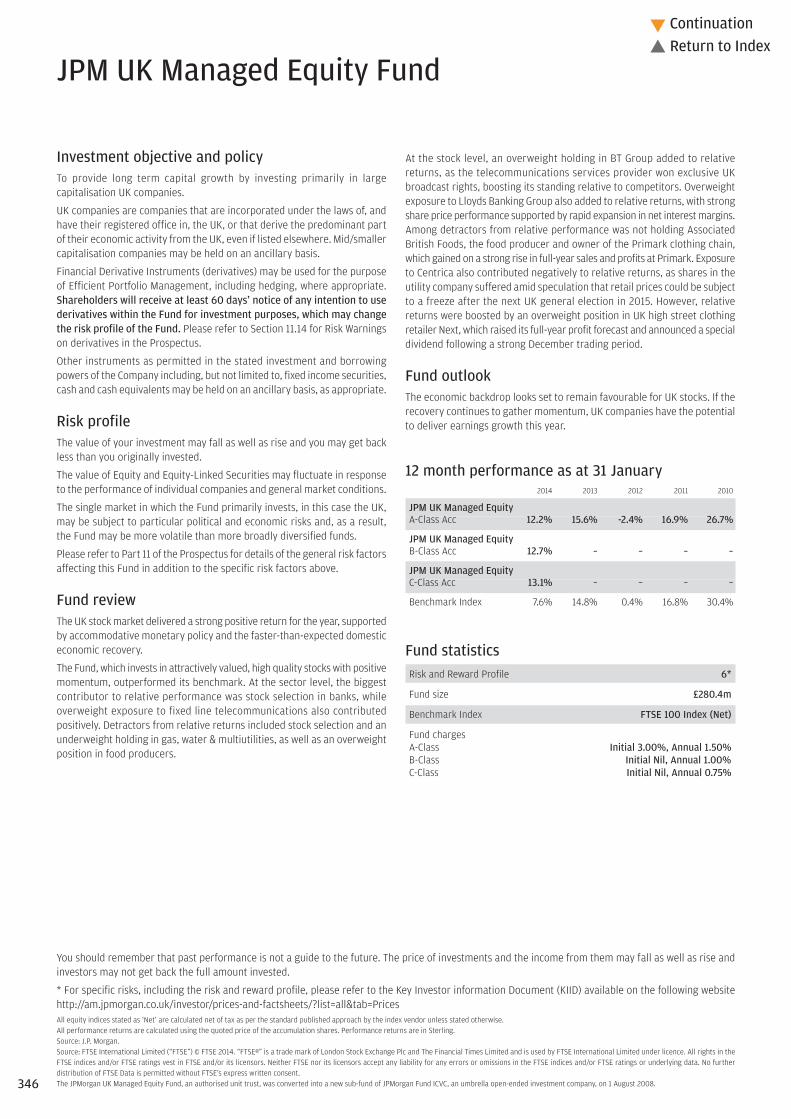
Investment objective and policyTo provide long term capital growth by investing primarily in largecapitalisation UK companies.
UK companies are companies that are incorporated under the laws of, andhave their registered office in, the UK, or that derive the predominant partof their economic activity from the UK, even if listed elsewhere. Mid/smallercapitalisation companies may be held on an ancillary basis.
Financial Derivative Instruments (derivatives) may be used for the purposeof Efficient Portfolio Management, including hedging, where appropriate.Shareholders will receive at least 60 days’ notice of any intention to usederivatives within the Fund for investment purposes, which may changethe risk profile of the Fund. Please refer to Section 11.14 for Risk Warningson derivatives in the Prospectus.
Other instruments as permitted in the stated investment and borrowingpowers of the Company including, but not limited to, fixed income securities,cash and cash equivalents may be held on an ancillary basis, as appropriate.
Risk profileThe value of your investment may fall as well as rise and you may get backless than you originally invested.
The value of Equity and Equity-Linked Securities may fluctuate in responseto the performance of individual companies and general market conditions.
The single market in which the Fund primarily invests, in this case the UK,may be subject to particular political and economic risks and, as a result,the Fund may be more volatile than more broadly diversified funds.
Please refer to Part 11 of the Prospectus for details of the general risk factorsaffecting this Fund in addition to the specific risk factors above.
Fund reviewThe UK stock market delivered a strong positive return for the year, supportedby accommodative monetary policy and the faster-than-expected domesticeconomic recovery.
The Fund, which invests in attractively valued, high quality stocks with positivemomentum, outperformed its benchmark. At the sector level, the biggestcontributor to relative performance was stock selection in banks, whileoverweight exposure to fixed line telecommunications also contributedpositively. Detractors from relative returns included stock selection and anunderweight holding in gas, water & multiutilities, as well as an overweightposition in food producers.
At the stock level, an overweight holding in BT Group added to relativereturns, as the telecommunications services provider won exclusive UKbroadcast rights, boosting its standing relative to competitors. Overweightexposure to Lloyds Banking Group also added to relative returns, with strongshare price performance supported by rapid expansion in net interest margins.Among detractors from relative performance was not holding AssociatedBritish Foods, the food producer and owner of the Primark clothing chain,which gained on a strong rise in full-year sales and profits at Primark. Exposureto Centrica also contributed negatively to relative returns, as shares in theutility company suffered amid speculation that retail prices could be subjectto a freeze after the next UK general election in 2015. However, relativereturns were boosted by an overweight position in UK high street clothingretailer Next, which raised its full-year profit forecast and announced a specialdividend following a strong December trading period.
Fund outlookThe economic backdrop looks set to remain favourable for UK stocks. If therecovery continues to gather momentum, UK companies have the potentialto deliver earnings growth this year.
12 month performance as at 31 January2014 2013 2012 2011 2010
JPM UK Managed EquityA-Class Acc 12.2% 15.6% -2.4% 16.9% 26.7%
JPM UK Managed EquityB-Class Acc 12.7% – – – –
JPM UK Managed EquityC-Class Acc 13.1% – – – –
Benchmark Index 7.6% 14.8% 0.4% 16.8% 30.4%
Fund statisticsRisk and Reward Profile 6*
Fund size £280.4m
Benchmark Index FTSE 100 Index (Net)
Fund chargesA-Class Initial 3.00%, Annual 1.50%B-Class Initial Nil, Annual 1.00%C-Class Initial Nil, Annual 0.75%
JPM UK Managed Equity Fund
You should remember that past performance is not a guide to the future. The price of investments and the income from them may fall as well as rise andinvestors may not get back the full amount invested.
* For specific risks, including the risk and reward profile, please refer to the Key Investor information Document (KIID) available on the following websitehttp://am.jpmorgan.co.uk/investor/prices-and-factsheets/?list=all&tab=PricesAll equity indices stated as ‘Net’ are calculated net of tax as per the standard published approach by the index vendor unless stated otherwise.All performance returns are calculated using the quoted price of the accumulation shares. Performance returns are in Sterling.Source: J.P. Morgan.Source: FTSE International Limited (“FTSE”) © FTSE 2014. “FTSE®” is a trade mark of London Stock Exchange Plc and The Financial Times Limited and is used by FTSE International Limited under licence. All rights in theFTSE indices and/or FTSE ratings vest in FTSE and/or its licensors. Neither FTSE nor its licensors accept any liability for any errors or omissions in the FTSE indices and/or FTSE ratings or underlying data. No furtherdistribution of FTSE Data is permitted without FTSE’s express written consent.The JPMorgan UK Managed Equity Fund, an authorised unit trust, was converted into a new sub-fund of JPMorgan Fund ICVC, an umbrella open-ended investment company, on 1 August 2008.346
Continuation�
� Return to Index
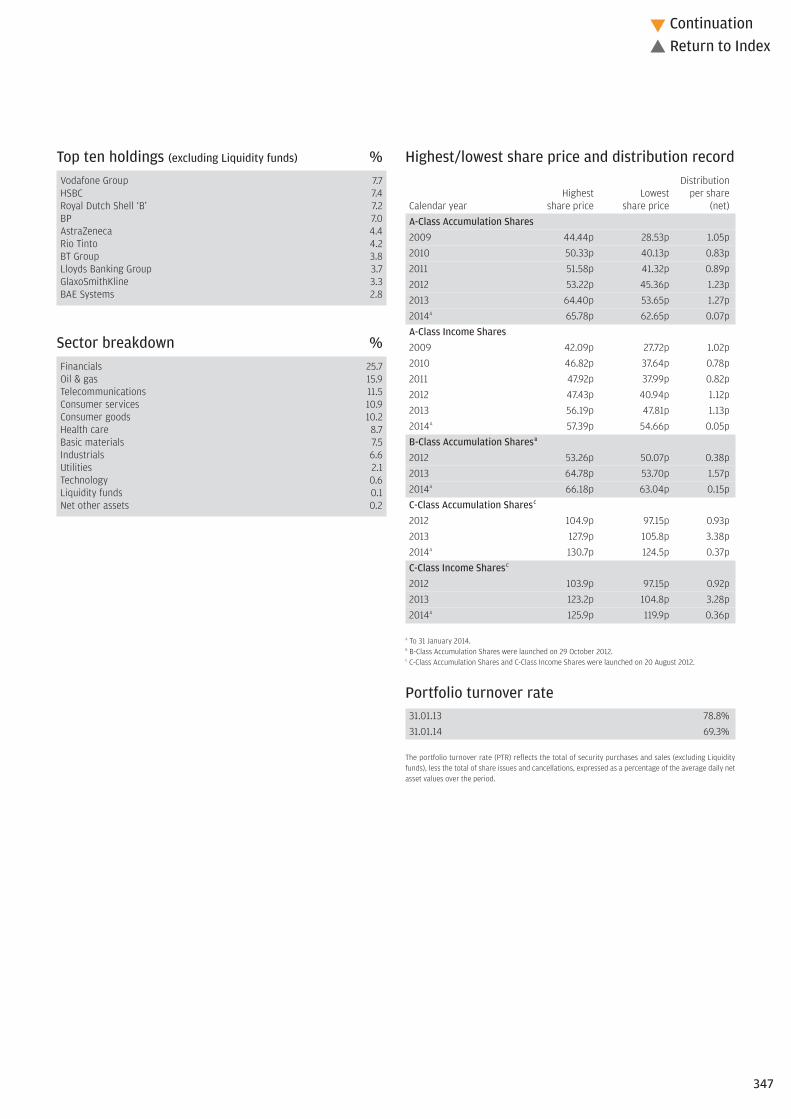
Top ten holdings (excluding Liquidity funds) %Vodafone Group 7.7HSBC 7.4Royal Dutch Shell ‘B’ 7.2BP 7.0AstraZeneca 4.4Rio Tinto 4.2BT Group 3.8Lloyds Banking Group 3.7GlaxoSmithKline 3.3BAE Systems 2.8
Sector breakdown %Financials 25.7Oil & gas 15.9Telecommunications 11.5Consumer services 10.9Consumer goods 10.2Health care 8.7Basic materials 7.5Industrials 6.6Utilities 2.1Technology 0.6Liquidity funds 0.1Net other assets 0.2
Highest/lowest share price and distribution recordDistribution
Highest Lowest per shareCalendar year share price share price (net)A-Class Accumulation Shares2009 44.44p 28.53p 1.05p2010 50.33p 40.13p 0.83p2011 51.58p 41.32p 0.89p2012 53.22p 45.36p 1.23p2013 64.40p 53.65p 1.27p2014A 65.78p 62.65p 0.07pA-Class Income Shares2009 42.09p 27.72p 1.02p2010 46.82p 37.64p 0.78p2011 47.92p 37.99p 0.82p2012 47.43p 40.94p 1.12p2013 56.19p 47.81p 1.13p2014A 57.39p 54.66p 0.05pB-Class Accumulation SharesB
2012 53.26p 50.07p 0.38p2013 64.78p 53.70p 1.57p2014A 66.18p 63.04p 0.15pC-Class Accumulation SharesC
2012 104.9p 97.15p 0.93p2013 127.9p 105.8p 3.38p2014A 130.7p 124.5p 0.37pC-Class Income SharesC
2012 103.9p 97.15p 0.92p2013 123.2p 104.8p 3.28p2014A 125.9p 119.9p 0.36p
A To 31 January 2014.B B-Class Accumulation Shares were launched on 29 October 2012.C C-Class Accumulation Shares and C-Class Income Shares were launched on 20 August 2012.
Portfolio turnover rate31.01.13 78.8%31.01.14 69.3%
The portfolio turnover rate (PTR) reflects the total of security purchases and sales (excluding Liquidityfunds), less the total of share issues and cancellations, expressed as a percentage of the average daily netasset values over the period.
347
Continuation�
� Return to Index

Portfolio transaction costsBroker Transaction
Commissions Taxes Total31.01.13 0.20% 0.20% 0.40%31.01.14 0.15% 0.19% 0.34%
The percentage figures disclosed above reflect the average broker commissions and transaction taxessuffered during the last 3 years divided by the average assets under management over the same period.
Stamp duty reserve tax31.01.13 0.00%31.01.14 0.01%
The percentage figures disclosed above reflect the total stamp duty reserve tax suffered during the yeardivided by the average assets under management over the same period.
Net asset values and Ongoing chargesNet assetvalue per Net asset
share class Number value per OngoingDate £’000 of shares share chargesA-Class Accumulation Shares31.01.12 226,644 469,282,408 48.30p 1.68%31.01.13 241,023 431,735,451 55.83p 1.68%31.01.14 253,073 404,113,992 62.62p 1.68%A-Class Income Shares31.01.12 24,526 55,778,914 43.97p 1.68%31.01.13 24,958 50,244,671 49.67p 1.68%31.01.14 24,711 45,265,372 54.59p 1.68%B-Class Accumulation Shares31.01.13 3 5,000 55.90p 1.18%31.01.14 61 97,122 63.02p 1.18%C-Class Accumulation Shares31.01.13 92 83,702 110.1p 0.93%31.01.14 1,868 1,500,877 124.4p 0.93%C-Class Income Shares31.01.13 56 51,395 108.8p 0.93%31.01.14 648 542,102 119.5p 0.93%
The net asset value and the net asset value per income share are shown ex-dividend.
Following the adoption of the requirements of UCITS IV in June 2012, Ongoing charges has replaced theTotal Expense Ratio (“TER”). The Ongoing charges takes into account the ACD fee, the fixed expenses andany expenses paid to an affiliate in respect of stocklending activities, expressed as a percentage of theaverage daily net asset values over the period. The main difference between the two calculations is theinclusion of custodian handling charges and stocklending fees in the Ongoing charges figure. The comparativefigures have not been restated, and the historic TER is disclosed.
348
Continuation�
� Return to Index

Financials – 25.7% (22.8%)Banks – 14.1%Bank of Georgia 60,147 1,258 0.5Barclays 2,636,632 7,061 2.5HSBC 3,350,513 20,743 7.4Lloyds Banking Group 12,524,492 10,225 3.7General financial – 1.0%3i Group 363,959 1,365 0.5IG Group 221,272 1,370 0.5Life insurance – 6.5%Aviva 319,827 1,413 0.5Legal & General Group 1,895,111 4,040 1.4Old Mutual 857,535 1,454 0.5Prudential 468,474 5,711 2.0St James’s Place 62,046 469 0.2Standard Life 1,450,760 5,247 1.9Nonlife insurance – 2.4%Admiral Group 150,423 2,138 0.8Amlin 273,709 1,155 0.4Beazley Group 551,949 1,404 0.5Hiscox 210,472 1,334 0.4Jardine Lloyd Thompson 68,264 727 0.3Real estate – 1.7%British Land 170,104 1,114 0.4Foxtons Group 242,668 825 0.3Land Securities Group 180,156 1,839 0.7Unite Group 216,674 891 0.3
Oil & gas – 15.9% (16.7%)Oil & gas producers – 15.9%BG Group 222,320 2,260 0.8BP 4,132,568 19,539 7.0Enquest 771,750 1,003 0.4Royal Dutch Shell ‘B’ 904,984 20,294 7.2Soco International 336,629 1,377 0.5
Telecommunications – 11.5% (8.8%)Fixed line telecommunications – 3.8%BT Group 2,798,279 10,622 3.8Mobile telecommunications – 7.7%Vodafone Group 9,731,382 21,574 7.7
Consumer services – 10.9% (10.6%)Food & drug retails – 1.8%Sainsbury (J) 1,021,560 3,518 1.3Tesco 461,846 1,474 0.5General retailers – 3.3%Halfords Group 171,359 772 0.3Next 114,692 7,071 2.5WH Smith 137,135 1,426 0.5Media – 2.2%ITV 2,151,418 4,219 1.5Reed Elsevier 244,960 2,151 0.7Travel & leisure – 3.6%Easyjet 239,799 3,880 1.4Go-Ahead Group 8,434 165 0.1Greene King 74,321 629 0.2International Consolidated Airlines 306,013 1,249 0.5Playtech 82,243 563 0.2TUI Travel 833,797 3,478 1.2
Consumer goods – 10.2% (12.0%)Automobiles & parts – 1.0%GKN 733,056 2,842 1.0Beverages – 2.5%Britvic 199,776 1,376 0.5Diageo 322,896 5,712 2.0Food producers – 1.6%Cranswick 100,030 1,299 0.4Greencore Group 488,308 1,216 0.4Unilever 92,611 2,137 0.8Household goods – 1.9%Barratt Developments 331,495 1,238 0.4Bellway 21,747 335 0.1Persimmon 46,905 600 0.2Reckitt Benckiser Group 41,900 1,878 0.7Taylor Wimpey 1,228,536 1,367 0.5Tobacco – 3.2%British American Tobacco 206,196 5,998 2.1Imperial Tobacco Group 132,768 2,955 1.1
Health care – 8.7% (8.5%)Pharmaceuticals & biotechnology – 8.7%AstraZeneca 319,375 12,248 4.4GlaxoSmithKline 591,805 9,194 3.3Shire 89,617 2,690 1.0
Basic materials – 7.5% (11.6%)Forestry & paper – 0.4%Mondi 131,503 1,200 0.4Mining – 7.1%BHP Billiton 331,737 5,930 2.1Glencore Xstrata 714,699 2,290 0.8Rio Tinto 363,874 11,699 4.2
Industrials – 6.6% (6.6%)Aerospace & defence – 3.7%BAE Systems 1,848,497 7,875 2.8Rolls-Royce 213,211 2,488 0.9Industrial transportation – 0.5%Royal Mail 220,306 1,302 0.5Support services – 2.4%Atkins (WS) 99,311 1,345 0.5Berendsen 145,443 1,335 0.4Carillion 420,109 1,430 0.5DCC 50,248 1,388 0.5Interserve 214,231 1,324 0.5
Utilities – 2.1% (1.3%)Electricity – 0.3%Drax Group 116,255 939 0.3Gas, water & multiutilities – 1.8%Centrica 1,488,303 4,639 1.7National Grid 37,611 295 0.1
Technology – 0.6% (0.7%)Software & computer services – 0.6%Computacenter 84,743 548 0.2Micro Focus International 161,102 1,190 0.4
Liquidity funds – 0.1% (0.3%)JPM Sterling Liquidity ‘X’ (Distribution)^$ 401,216 401 0.1
Investment assets 279,750 99.8
Net other assets 611 0.2
Net assets 280,361 100.0
Unless otherwise stated the above securities are admitted to official stock exchange listings or trade on aregulated market.
The comparative percentage figures in brackets are at 31 January 2013.
^ Deemed to be investment in related parties of the ACD$ Approved security as defined in the Collective Investment Schemes sourcebook
Portfolio statement As at 31 January 2014
Market value Total netInvestment Holding £’000 assets %
Market value Total netInvestment Holding £’000 assets %
349
Continuation�
� Return to Index

£’000
Total of all purchases for the year (Note 10) 116,731
Major purchases Cost
JPM Sterling Liquidity ‘X’ (Distribution)^ 12,755Unilever 6,512Centrica 5,625Tesco 4,603Standard Life 4,464Reckitt Benckiser Group 3,986Glencore Xstrata 2,778GKN 2,695Royal Dutch Shell ‘B’ 2,645BG Group 2,632Lloyds Banking Group 2,378Shire 2,229Schroders 2,041Admiral Group 1,981Old Mutual 1,856Reed Elsevier 1,842Vodafone Group 1,831Land Securities Group 1,670Easyjet 1,658Rolls-Royce 1,438
^ Deemed to be investment in related parties of the ACD
£’000
Total of all sales for the year (Note 10) 128,719
Major sales Proceeds
JPM Sterling Liquidity ‘X’ (Distribution)^ 13,066Unilever 7,536GlaxoSmithKline 5,725Aberdeen Asset Management 3,566Rexam 3,525National Grid 3,161Reckitt Benckiser Group 3,017Tesco 2,757RSA Insurance Group 2,728Schroders 2,482Glencore Xstrata 2,372Sainsbury (J) 2,366BAE Systems 2,328Barclays 2,165BHP Billiton 2,147Royal Dutch Shell ‘B’ 2,078HSBC 2,075BT Group 2,035Diageo 2,021ITV 1,997
Portfolio movements For the year ending 31 January 2014
350
Continuation�
� Return to Index

Statement of total returnFor the year ending 31 January
2014 2013£’000 £’000 £’000 £’000
Income
Net capital gains (Note 1) 25,905 30,862
Revenue (Note 2) 10,440 10,019
Expenses (Note 3) (4,655) (4,193)
Net revenue before taxation 5,785 5,826
Taxation (Note 4) (1) –
Net revenue after taxation 5,784 5,826
Total return before distributions 31,689 36,688
Finance costs: Distributions (Note 5) (5,773) (5,854)
Change in net assets attributable to shareholders from investment activities 25,916 30,834
Statement of change in net assets attributable to shareholdersFor the year ending 31 January
2014 2013£’000 £’000 £’000 £’000
Opening net assets attributable to shareholders 266,132 251,170
Amounts receivable on issue of shares 5,670 326
Amounts payable on cancellation of shares (22,507) (21,396)
(16,837) (21,070)
Change in net assets attributable to shareholders from investment activities (see above) 25,916 30,834
Retained distributions on accumulation shares 5,174 5,208
Stamp duty reserve tax (24) (10)
Closing net assets attributable to shareholders 280,361 266,132
Balance sheetAs at 31 January
2014 2013£’000 £’000 £’000 £’000
ASSETS
Investment assets 279,750 265,865
Debtors (Note 7) 1,529 994
Cash and bank balances (Note 8) 126 261
Total other assets 1,655 1,255
Total assets 281,405 267,120
LIABILITIES
Creditors (Note 9) (1,019) (948)
Distribution payable on income shares (25) (40)
Total liabilities (1,044) (988)
Net assets attributable to shareholders 280,361 266,132
The notes to these financial statements are shown on pages 352 to 353.
Financial statements
351
Continuation�
� Return to Index

1. Net capital gains2014 2013
£’000 £’000Currency (losses)/gains (1) 1Derivative contracts 33 –Non-derivative securities 25,873 30,861Net capital gains 25,905 30,862
2. Revenue2014 2013
£’000 £’000Franked income from UK equity investments 9,948 9,558Income from Liquidity funds 5 7Income from overseas equity investments 395 392Interest on bank and term deposits 1 1Property income distributions 27 2Stock dividends 29 46Underwriting commission 35 13Total revenue 10,440 10,019
3. Expenses2014 2013
£’000 £’000Payable to the ACD or associate of the ACD:ACD fee 4,156 3,744Fixed expenses 499 449Total expenses 4,655 4,193
4. Taxation2014 2013
£’000 £’000a) Analysis of charge in the yearOverseas tax suffered 1 –Current year tax charge (Note 4b) 1 –
b) Factors affecting the tax charge for the yearThe tax assessed for the year is lower than the standard rate of corporation tax inthe UK for an Open-Ended Investment Company (OEIC) (20%). The differences areexplained below.
Net revenue before taxation 5,785 5,826Corporation tax at 20% 1,157 1,165
Effects of:Dividends not subject to corporation tax (2,074) (1,999)Excess expenses for which no relief taken 917 834Overseas tax suffered 1 –
(1,156) (1,165)Current year tax charge (Note 4a) 1 –
No deferred tax asset has been recognised in the financial statements. At the yearend date, the Fund had a potential unrecognised deferred tax asset of £5,606,607(31.01.13: £4,689,142) in relation to £28,033,034 (31.01.13: £23,445,710) of excessmanagement expenses which would only be utilised to reduce the tax charge if theFund had an excess of unfranked income over expenses in a future period. There isno excess of unfranked income expected in the future.
5. Finance costsDistributionsThe distributions take account of amounts receivable on the issue of shares andamounts payable on the cancellation of shares and comprise:
2014 2013£’000 £’000
First interim dividend distribution 2,520 2,137Second interim dividend distribution 1,183 1,296Third interim dividend distribution 1,695 1,847Final dividend distribution 313 473Add: Amounts payable on cancellation of shares 96 102Deduct: Amounts receivable on issue of shares (34) (1)Total finance costs 5,773 5,854
Details of the distribution per share are set out on pages 354 to 355.
6. Movement between net revenue after taxation and distributions2014 2013
£’000 £’000Net revenue after taxation 5,784 5,826Add: Undistributed revenue brought forward 8 36Deduct: Undistributed revenue carried forward (19) (8)
5,773 5,854
7. Debtors2014 2013
£’000 £’000Accrued income 617 563Due from the ACD for shares created 151 61Overseas tax recoverable 3 15Sales awaiting settlement 758 355Total debtors 1,529 994
8. Cash and bank balances2014 2013
£’000 £’000Cash and bank balances 126 261
9. Creditors2014 2013
£’000 £’000Accrued expenses 413 373Due to the ACD for shares cancelled 606 575Total creditors 1,019 948
Notes to the financial statements for the year ending 31 January 2014
352
Continuation�
� Return to Index

10. Portfolio transaction costs2014 2013
£’000 £’000Analysis of total purchase costs
Purchases in year before transaction costs 116,069 119,540
Commissions 179 192Taxes 483 455Total purchase costs 662 647Gross purchases total 116,731 120,187
Analysis of total sale costs
Gross sales before transaction costs 128,923 136,254
Commissions (204) (226)Total sale costs (204) (226)Total sales net of transaction costs 128,719 136,028
11. Related party transactionsJPMorgan Funds Limited, as Authorised Corporate Director (“ACD”), is a relatedparty, and acts as principal in respect of all transactions of shares in the Company.The aggregate monies received through issue, and paid on cancellation, aredisclosed in the Statement of Change in Net Assets Attributable to Shareholders.
The balance due to the ACD and their associates at the year end date in respect ofrelated party transactions was £868,969 (31.01.13: £886,406). Details of relatedparty transactions are given under note 13 on page 413.
Investments considered to be related parties have been identified in the portfoliostatement on page 349 and the revenue from these investments was £4,664(31.01.13: £7,193).
Some of the dealing transactions for the Fund are carried out through associatesof the ACD. Such transactions are carried out on an arm’s length basis. Thecommissions paid to these companies over the year were £30,849 (31.01.13:£22,545). Commission was paid to the associated company JPMorgan SecuritiesLtd.
The gross stocklending income received was £nil (31.01.13: £3), with fees deductedof £nil (31.01.13: £1).
The following party held a material interest in the Fund at the year end date:– FNZ (UK) Nominees Limited 56.42% (31.12.13: 56.91%)
12. Financial instrumentsCurrency exposuresAt the year end date, the majority of the Fund’s financial assets and liabilities weredenominated in Sterling. As a result, the Fund has no material exposure tocurrency movements.
Interest rate riskAt the year end date, 0.2% (31.01.13: 0.4%) of the Fund’s net assets by value wereinterest bearing, carrying a (fixed/floating) rate.
For consideration of other risks including liquidity, pricing and credit risk, pleaserefer to the notes to the aggregated financial statements, pages 413 to 414.
13. Share classesThe Fund currently has three share classes; Class A Shares, Class B Shares andClass C Shares. The Authorised Corporate Director’s (ACD) fee and fixed expensescharge are shown below.
ACD fee Fixed expensesClass A shares: 1.50% 0.18%Class B shares: 1.00% 0.18%Class C shares: 0.75% 0.18%
The net asset value of each share class, the net asset value per share and thenumber of shares in each class are shown on page 348. All classes have the samerights on winding up.
14. Contingent liabilities and capital commitmentsAt the balance sheet date there were no contingent liabilities or capitalcommitments (2013: none).
Notes to the financial statements – continued
353
Continuation�
� Return to Index

Final distribution in pence per share
Group 1 – Shares purchased prior to 1 November 2013Group 2 – Shares purchased 1 November 2013 to 31 January 2014
DistributionGross Tax Net payable paid
revenue at 10% revenue Equalisation 30.04.14 30.04.13
A-Class Accumulation Shares
Group 1 0.077778 0.007778 0.070000 – 0.070000 0.100000
Group 2 0.000000 0.000000 0.000000 0.070000 0.070000 0.100000
A-Class Income Shares
Group 1 0.055556 0.005556 0.050000 – 0.050000 0.080000
Group 2 0.000000 0.000000 0.000000 0.050000 0.050000 0.080000
B-Class Accumulation Shares
Group 1 0.166667 0.016667 0.150000 – 0.150000 0.170000
Group 2 0.166667 0.016667 0.150000 0.000000 0.150000 0.170000
C-Class Accumulation Shares
Group 1 0.411111 0.041111 0.370000 – 0.370000 0.380000
Group 2 0.000000 0.000000 0.000000 0.370000 0.370000 0.380000
C-Class Income Shares
Group 1 0.400000 0.040000 0.360000 – 0.360000 0.380000
Group 2 0.388104 0.038810 0.349294 0.010706 0.360000 0.380000
Third interim distribution in pence per share
Group 1 – Shares purchased prior to 1 August 2013Group 2 – Shares purchased 1 August 2013 to 31 October 2013
DistributionGross Tax Net paid paid
revenue at 10% revenue Equalisation 31.01.14 31.01.13
A-Class Accumulation Shares
Group 1 0.411111 0.041111 0.370000 – 0.370000 0.380000
Group 2 0.011899 0.001190 0.010709 0.359291 0.370000 0.380000
A-Class Income Shares
Group 1 0.377778 0.037778 0.340000 – 0.340000 0.340000
Group 2 0.110364 0.011036 0.099328 0.240672 0.340000 0.340000
B-Class Accumulation Shares
Group 1 0.511111 0.051111 0.460000 – 0.460000 0.380000
Group 2 0.511111 0.051111 0.460000 0.000000 0.460000 0.380000
C-Class Accumulation Shares
Group 1 1.100000 0.110000 0.990000 – 0.990000 0.930000
Group 2 1.100000 0.110000 0.990000 0.000000 0.990000 0.930000
C-Class Income Shares
Group 1 1.055556 0.105556 0.950000 – 0.950000 0.920000
Group 2 0.176222 0.017622 0.158600 0.791400 0.950000 0.920000
Distribution tables
354
Continuation�
� Return to Index

Second interim distribution in pence per share
Group 1 – Shares purchased prior to 1 May 2013Group 2 – Shares purchased 1 May 2013 to 31 July 2013
DistributionGross Tax Net paid paid
revenue at 10% revenue Equalisation 31.10.13 31.10.12
A-Class Accumulation Shares
Group 1 0.288889 0.028889 0.260000 – 0.260000 0.260000
Group 2 0.051473 0.005147 0.046326 0.213674 0.260000 0.260000
A-Class Income Shares
Group 1 0.244444 0.024444 0.220000 – 0.220000 0.240000
Group 2 0.046824 0.004682 0.042142 0.177858 0.220000 0.240000
B-Class Accumulation Shares
Group 1 0.355556 0.035556 0.320000 – 0.320000 –
Group 2 0.355556 0.035556 0.320000 0.000000 0.320000 –
C-Class Accumulation Shares
Group 1 0.766667 0.076667 0.690000 – 0.690000 –
Group 2 0.640850 0.064085 0.576765 0.113235 0.690000 –
C-Class Income Shares
Group 1 0.755556 0.075556 0.680000 – 0.680000 –
Group 2 0.687616 0.068762 0.618854 0.061146 0.680000 –
First interim distribution in pence per share
Group 1 – Shares purchased prior to 1 February 2013Group 2 – Shares purchased 1 February 2013 to 30 April 2013
DistributionGross Tax Net paid paid
revenue at 10% revenue Equalisation 31.07.13 31.07.12
A-Class Accumulation Shares
Group 1 0.600000 0.060000 0.540000 – 0.540000 0.420000
Group 2 0.142328 0.014232 0.128096 0.411904 0.540000 0.420000
A-Class Income Shares
Group 1 0.544444 0.054444 0.490000 – 0.490000 0.380000
Group 2 0.115148 0.011514 0.103634 0.386366 0.490000 0.380000
B-Class Accumulation Shares
Group 1 0.688888 0.068888 0.620000 – 0.620000 –
Group 2 0.688888 0.068888 0.620000 0.000000 0.620000 –
C-Class Accumulation Shares
Group 1 1.466666 0.146666 1.320000 – 1.320000 –
Group 2 1.094551 0.109455 0.985096 0.334904 1.320000 –
C-Class Income Shares
Group 1 1.411111 0.141111 1.270000 – 1.270000 –
Group 2 1.411111 0.141111 1.270000 0.000000 1.270000 –
Equalisation applies only to shares purchased during the distribution period (group 2 shares). It is the average amount of revenue included in the purchase price of all group 2 shares and is refunded to holders of these
shares as a return of capital. Being capital it is not liable to income tax but must be deducted from the cost of shares for capital gains tax purposes.
Distribution tables – continued
355
� Return to Index

Investment objective and policyTo provide long-term capital growth and income through investment in avalue style biased portfolio of UK companies.
UK companies are companies that are incorporated under the laws of, andhave their registered office in, the UK, or that derive the predominant partof their economic activity from the UK, even if listed elsewhere. Smallercompanies may be held on an ancillary basis.
This Equity based fund invests in those stocks which the Investment Adviserbelieves to be undervalued (value stocks).
Other instruments as permitted in the stated investment and borrowingpowers of the Company including, but not limited to, fixed income securities,cash and cash equivalents may be held on an ancillary basis, as appropriate.
Risk profileThe value of your investment may fall as well as rise and you may get backless than you originally invested.
The value of Equity and Equity-Linked Securities may fluctuate in responseto the performance of individual companies and general market conditions.
The Fund may have greater volatility compared to broader market indicesas a result of the Fund’s focus on value stocks.
The single market in which the Fund primarily invests, in this case the UK,may be subject to particular political and economic risks and, as a result,the Fund may be more volatile than more broadly diversified funds.
This Fund charges the annual fee of the Authorised Corporate Director (ACD)against capital, which will increase the amount of income available fordistribution to Shareholders, but may constrain capital growth. It may alsohave tax implications for certain investors.
Please refer to Part 11 of the Prospectus for details of the general risk factorsaffecting this Fund in addition to the specific risk factors above.
Fund reviewThe UK stock market delivered a strong positive return for the year, supportedby accommodative monetary policy and the faster-than-expected domesticeconomic recovery.
The Fund, which focuses on stocks underpinned by sound fundamentals andwith strong value characteristics, outperformed its benchmark. At the sectorlevel, the biggest contributors to relative performance included stock selectionand an overweight position in travel & leisure, as well as stock selection inhousehold goods & home construction. Detractors from relative returnsincluded stock selection and an overweight holding in food & drug retailers,and stock selection in gas, water & multiutilities.
At the stock level, overweight exposure to Thomas Cook boosted relativeperformance. The UK tour operator reported its first full-year operatingprofit since 2010 as its three-year recovery plan began to pay off. Overweightexposure to Barratt Developments also added to relative returns, with theUK property developer performing strongly in the final quarter of the year,seeing significant increases in profit margins. Detractors from relativeperformance included not holding Associated British Foods, the owner ofPrimark. The food and retail company launched its first Primark store inFrance, representing a significant new growth opportunity for the group.Not holding National Grid was also detrimental as the electricity providerwas supported by its limited exposure to political and regulatory risk relativeto its UK peers. However, overweight exposure to easyJet added to relativeperformance, as the budget airline reported solid passenger volume growthin January and guided for a slight rise in average revenue per seat.
Fund outlookThe economic backdrop looks set to remain favourable for UK stocks. If therecovery continues to gather momentum, UK companies have the potentialto deliver earnings growth this year.
12 month performance as at 31 January 2014 2013 2012 2011 2010
JPM UK Strategic Equity IncomeA-Class Acc 16.5% 18.1% -3.7% 21.1% 35.2%
JPM UK Strategic Equity IncomeB-Class Inc 17.0% – – – –
JPM UK Strategic Equity IncomeC-Class Acc 17.4% – – – –
JPM UK Strategic Equity IncomeI-Class Acc 17.8% 19.3% -2.7% 22.4% 36.7%
Benchmark Index 10.1% 16.3% -0.3% 18.1% 33.2%
Fund statisticsRisk and Reward Profile 6*
Fund size £134.9m
Benchmark Index FTSE All-Share Index (Net)
Fund chargesA-Class Initial 3.00%, Annual 1.50%B-Class Initial Nil, Annual 1.00%C-Class Initial Nil, Annual 0.75%I-Class Initial Nil, Annual 0.60%
JPM UK Strategic Equity Income Fund
You should remember that past performance is not a guide to the future. The price of investments and the income from them may fall as well as rise andinvestors may not get back the full amount invested.
* For specific risks, including the risk and reward profile, please refer to the Key Investor information Document (KIID) available on the following websitehttp://am.jpmorgan.co.uk/investor/prices-and-factsheets/?list=all&tab=PricesAll equity indices stated as ‘Net’ are calculated net of tax as per the standard published approach by the index vendor unless stated otherwise.All performance returns are calculated using the quoted price of the accumulation shares. Performance returns are in Sterling.Source: J.P. Morgan.Source: FTSE International Limited (“FTSE”) © FTSE 2014. “FTSE®” is a trade mark of London Stock Exchange Plc and The Financial Times Limited and is used by FTSE International Limited under licence. All rights in theFTSE indices and/or FTSE ratings vest in FTSE and/or its licensors. Neither FTSE nor its licensors accept any liability for any errors or omissions in the FTSE indices and/or FTSE ratings or underlying data. No furtherdistribution of FTSE Data is permitted without FTSE’s express written consent.356
Continuation�
� Return to Index

Top ten holdings (excluding Liquidity funds) %Royal Dutch Shell ‘B’ 6.7HSBC 5.9Vodafone Group 5.6BP 4.7GlaxoSmithKline 4.1AstraZeneca 2.8Barclays 2.5Rio Tinto 2.4Lloyds Banking Group 2.3BHP Billiton 2.2
Sector breakdown %Financials 25.8Consumer services 14.9Oil & gas 13.0Industrials 11.5Telecommunications 8.0Consumer goods 7.5Basic materials 7.2Health care 6.9Liquidity funds 4.5Technology 1.8Utilities 1.7Net other liabilities (2.8)
Highest/lowest share price and distribution recordDistribution
Highest Lowest per shareCalendar year share price share price (net)A-Class Accumulation Shares2009 93.40p 56.14p 2.98p2010 108.0p 83.77p 2.97p2011 111.8p 88.80p 3.51p2012 115.7p 96.99p 4.52p2013 145.3p 116.6p 4.64p2014A 148.9p 141.6p 0.68pA-Class Income Shares2009 75.24p 46.42p 2.45p2010 83.84p 66.01p 2.35p2011 86.38p 67.32p 2.70p2012 83.26p 71.32p 3.35p2013 100.9p 83.92p 3.29p2014A 103.5p 98.39p 0.48pB-Class Accumulation SharesB
2013 145.6p 122.0p 2.35p2014A 149.3p 142.0p 0.66pB-Class Income SharesC
2012 83.32p 77.77p 0.86p2013 101.4p 83.98p 3.27p2014A 104.0p 98.87p 0.45pC-Class Accumulation SharesD
2012 106.5p 97.29p 1.09p2013 134.6p 107.3p 4.23p2014A 138.1p 131.3p 0.63pC-Class Income SharesD
2012 105.3p 97.29p 1.08p 2013 128.6p 106.2p 4.14p2014A 131.9p 125.5p 0.60pI-Class Accumulation Shares2009 99.40p 59.30p 3.30p2010 116.2p 89.71p 3.30p2011 120.5p 96.39p 3.98p2012 127.2p 106.0p 5.09p2013 161.4p 128.2p 5.33p2014A 165.6p 157.5p 0.82pI-Class Income Shares2009 91.82p 56.32p 3.10p2010 103.4p 81.06p 3.00p2011 106.6p 83.63p 3.50p2012 104.6p 89.12p 4.30p2013 127.9p 105.5p 4.32p2014A 131.2p 124.8p 0.66p
A To 31 January 2014.B B-Class Accumulation Shares were launched on 27 June 2013.C B-Class Income Shares were launched on 29 October 2012.D C-Class Accumulation Shares and C-Class Income Shares were launched on 20 August 2012.
357
Continuation�
� Return to Index

Portfolio turnover rate31.01.13 54.7%31.01.14 58.1%
The portfolio turnover rate (PTR) reflects the total of security purchases and sales (excluding Liquidityfunds), less the total of share issues and cancellations, expressed as a percentage of the average daily netasset values over the period.
Portfolio transaction costsBroker Transaction
Commissions Taxes Total31.01.13 0.18% 0.25% 0.43%31.01.14 0.13% 0.17% 0.30%
The percentage figures disclosed above reflect the average broker commissions and transaction taxessuffered during the last 3 years divided by the average assets under management over the same period.
Stamp duty reserve tax31.01.13 0.01%31.01.14 0.03%
The percentage figures disclosed above reflect the total stamp duty reserve tax suffered during the yeardivided by the average assets under management over the same period.
Net asset values and Ongoing chargesNet assetvalue per Net asset
share class Number value per OngoingDate £’000 of shares share chargesA-Class Accumulation Shares31.01.12 123,176 119,761,097 102.9p 1.68%31.01.13 120,835 99,569,745 121.4p 1.68%31.01.14 117,901 83,321,375 141.5p 1.68%A-Class Income Shares31.01.12 5,606 7,321,103 76.57p 1.68%31.01.13 7,433 8,557,543 86.86p 1.68%31.01.14 7,859 8,033,346 97.84p 1.68%B-Class Accumulation Shares31.01.14 10 7,215 141.9p 1.18%B-Class Income Shares31.01.13 3 3,500 86.96p 1.18%31.01.14 3 3,500 98.34p 1.18%C-Class Accumulation Shares31.01.13 1 1,000 111.7p 0.93%31.01.14 259 197,314 131.2p 0.93%C-Class Income Shares31.01.13 1 1,000 110.0p 0.93%31.01.14 219 175,147 124.8p 0.93%I-Class Accumulation Shares31.01.12 4,825 4,307,561 112.0p 0.60%31.01.13 3,753 2,809,136 133.6p 0.60%31.01.14 212 134,602 157.1p 0.60%I-Class Income Shares31.01.12 6,588 6,907,625 95.37p 0.60%31.01.13 7,959 7,290,711 109.2p 0.60%31.01.14 8,450 6,811,573 124.1p 0.60%
The net asset value and the net asset value per income share are shown ex-dividend.
Following the adoption of the requirements of UCITS IV in June 2012, Ongoing charges has replaced theTotal Expense Ratio (“TER”). The Ongoing charges takes into account the ACD fee, the fixed expenses andany expenses paid to an affiliate in respect of stocklending activities, expressed as a percentage of theaverage daily net asset values over the period. The main difference between the two calculations is theinclusion of custodian handling charges and stocklending fees in the Ongoing charges figure. The comparativefigures have not been restated, and the historic TER is disclosed.
358
Continuation�
� Return to Index

Financials – 25.8% (26.1%)Banks – 11.1%Bank of Georgia 23,700 496 0.4 Barclays 1,282,644 3,435 2.5 HSBC 1,286,050 7,962 5.9 Lloyds Banking Group 3,905,149 3,188 2.3 General financial – 3.6%Aberdeen Asset Management 170,681 668 0.5 Ashmore Group 183,903 600 0.5 Close Brothers Group 44,580 586 0.4 ICAP 120,750 468 0.3 IG Group 116,067 718 0.5 Intermediate Capital Group 160,948 662 0.5 Paragon Group of Companies 196,625 707 0.5 Provident Financial 31,500 511 0.4 Life insurance – 6.8%Aviva 329,837 1,457 1.1 Legal & General Group 675,694 1,441 1.1 Old Mutual 622,678 1,055 0.8 Prudential 214,162 2,611 1.9 Resolution 198,500 689 0.5 St James’s Place 98,486 745 0.6 Standard Life 313,286 1,133 0.8 Nonlife insurance – 4.3%Amlin 146,000 616 0.4 Beazley Group 276,283 703 0.5 Catlin Group 126,608 665 0.5 Direct Line Insurance Group 337,831 888 0.7 Esure Group 197,433 527 0.4 Henderson Group 281,600 622 0.5 Hiscox 118,693 752 0.6 Lancashire 71,554 536 0.4 Novae Group 80,000 454 0.3
Consumer services – 14.9% (15.2%)Food & drug retails – 1.2%Sainsbury (J) 248,002 854 0.7 United Drug 203,704 715 0.5 General retailers – 3.3%Dixons Retail 1,559,449 686 0.5 Halfords Group 162,019 730 0.5 Inchcape 131,545 756 0.6 Lookers 350,000 441 0.3 Marks & Spencer Group 231,470 1,077 0.8 WH Smith 72,847 758 0.6 Media – 3.1%Chime Communications 156,000 531 0.4 Entertainment One 170,319 527 0.4 Informa 152,130 777 0.6 Johnston Press 400,000 92 0.1 Quindell 1,962,000 584 0.4 Reed Elsevier 150,477 1,321 1.0 Trinity Mirror 200,000 356 0.2 Travel & leisure – 7.3%Easyjet 58,451 946 0.7 Enterprise Inns 409,908 641 0.5 First Group 372,641 490 0.4 Go-Ahead Group 37,693 737 0.5 Greene King 89,823 760 0.6 International Consolidated Airlines 293,384 1,197 0.9 Marston’s 435,271 649 0.5 Mitchells & Butlers 162,563 726 0.5 National Express Group 263,841 760 0.6 Spirit Pub 700,000 586 0.4 Stagecoach Group 200,364 725 0.5 Thomas Cook Group 484,353 850 0.6 TUI Travel 195,147 814 0.6
Oil & gas – 13.0% (13.1%)Oil & gas producers – 11.7%BP 1,336,671 6,320 4.7 Ithaca Energy 309,625 418 0.3 Royal Dutch Shell ‘B’ 403,196 9,042 6.7 Oil equipment, services & distribution – 1.3%AMEC 72,302 740 0.6 Cape 100,000 263 0.2 Kentz 108,108 702 0.5
Industrials – 11.5% (10.9%)Aerospace & defence – 1.7%BAE Systems 344,646 1,468 1.1 Cobham 286,423 825 0.6 Construction & materials – 2.3%Balfour Beatty 235,777 682 0.5 Costain Group 40,000 117 0.1 Galliford Try 57,934 679 0.5 Keller Group 38,300 453 0.3 Kier Group 35,476 663 0.5 Morgan Sindall Group 60,000 489 0.4 Electronics & electrical equipment – 1.0%Hellermanntyton Group 191,667 563 0.4 Morgan Advanced Materials 199,092 606 0.4 TT Electronics 125,000 256 0.2 General industrials – 1.6%Rexam 149,805 736 0.6 RPC Group 85,477 512 0.4 Smith (DS) 262,146 862 0.6 Industrial metals – 0.2%International Ferro Metals 2,000,000 205 0.2 Industrial engineering – 0.4%Fenner 148,198 603 0.4 Support services – 4.3%Atkins (WS) 52,931 717 0.5 Carillion 215,912 735 0.5 Hays 601,375 803 0.6 Hyder Consulting 70,000 451 0.3 Interserve 113,106 699 0.5 Lavendon Group 310,000 604 0.5 Mitie Group 195,258 618 0.5 Rentokil Initial 687,691 825 0.6 RPS Group 109,685 376 0.3
Telecommunications – 8.0% (7.4%)Fixed line telecommunications – 2.4%BT Group 677,800 2,573 1.9 KCOM Group 687,043 684 0.5 Mobile telecommunications – 5.6%Vodafone Group 3,404,245 7,547 5.6
Consumer goods – 7.5% (5.7%)Automobiles & parts – 0.8%GKN 282,638 1,096 0.8 Food producers – 1.6%Cranswick 56,997 740 0.5 Dairy Crest Group 131,013 665 0.5 Greencore Group 322,302 803 0.6 Household goods – 3.6%Barratt Development 247,340 924 0.7 Bellway 48,798 752 0.6 Bovis Homes Group 90,612 738 0.5 Persimmon 65,734 840 0.6 Redrow 220,754 704 0.5 Taylor Wimpey 797,378 887 0.7 Tobacco – 1.5%Imperial Tobacco Group 89,900 2,001 1.5
Basic materials – 7.2% (8.0%)Chemicals – 0.3%Synthomer 157,898 431 0.3 Forestry & paper – 0.5%Mondi 66,575 607 0.5 Mining – 6.4%BHP Billiton 168,847 3,018 2.2 Ferrexpo 205,600 308 0.2 Glencore Xstrata 687,448 2,202 1.6 Rio Tinto 99,805 3,209 2.4
Health care – 6.9% (6.5%)Pharmaceuticals & biotechnology – 6.9%AstraZeneca 98,884 3,792 2.8 GlaxoSmithKline 354,993 5,515 4.1
Portfolio statement As at 31 January 2014
Market value Total netInvestment Holding £’000 assets %
Market value Total netInvestment Holding £’000 assets %
359
Continuation�
� Return to Index

Technology – 1.8% (1.2%)Software & computer services – 1.2%Anite 300,000 273 0.2 Computacenter 109,608 709 0.6 Micro Focus International 77,685 574 0.4 Technology hardware & equipment – 0.6%Pace 234,512 828 0.6
Utilities – 1.7% (2.3%)Electricity – 0.6%Drax Group 96,471 779 0.6 Gas, water & multiutilities – 1.1%Centrica 496,754 1,548 1.1
Futures – 0.0% (0.0%)FTSE 100 Index Futures Mar 2014 23 (29) –
Liquidity funds – 4.5% (0.1%)JPM Sterling Liquidity ‘X’ (Distribution)^$ 6,000,853 6,001 4.5
Investment assets (including investment liabilities) 138,732 102.8
Net other liabilities (3,819) (2.8)
Net assets 134,913 100.0
Unless otherwise stated the above securities are admitted to official stock exchange listings or trade on aregulated market.
The comparative percentage figures in brackets are at 31 January 2013.
^ Deemed to be investment in related parties of the ACD$ Approved security as defined in the Collective Investment Schemes sourcebook
Portfolio statement – continuedAs at 31 January 2014
Market value Total netInvestment Holding £’000 assets %
360
Continuation�
� Return to Index

£’000
Total of all purchases for the year (Note 10) 64,790
Major purchases Cost
JPM Sterling Liquidity ‘X’ (Distribution)^ 25,008Royal Dutch Shell ‘B’ 10,015HSBC 9,487BP 6,760Vodafone Group 5,877GlaxoSmithKline 5,094JPM UK Smaller Companies ‘I’ (Accumulation)^ 4,328BHP Billiton 4,049AstraZeneca 3,126Barclays 2,984BG Group 2,982Standard Chartered 2,611Tesco 2,570Rio Tinto 2,063Imperial Tobacco Group 1,812Centrica 1,684Glencore Xstrata 1,636Lloyds Banking Group 1,607Prudential 1,325Fenner 1,265
^ Deemed to be investment in related parties of the ACD
£’000
Total of all sales for the year (Note 10) 80,138
Major sales Proceeds
JPM Sterling Liquidity ‘X’ (Distribution)^ 19,007JPM UK Smaller Companies ‘I’ (Accumulation)^ 5,835Standard Chartered 2,664BG Group 2,589Tesco 2,364Royal Dutch Shell ‘B’ 1,822SSE 1,387ITV 1,338Savills 1,181Tullett Prebon 1,148Smiths Group 1,037London Stock Exchange Group 999Travis Perkins 967Royal Bank of Scotland Group 939Berendsen 924Bodycote 895Playtech 884BHP Billiton 880Antofagasta 823BBA Aviation 805
Portfolio movements For the year ending 31 January 2014
361
Continuation�
� Return to Index

Statement of total returnFor the year ending 31 January
2014 2013£’000 £’000 £’000 £’000
Income
Net capital gains (Note 1) 18,659 18,864
Revenue (Note 2) 5,123 5,538
Expenses (Note 3) (2,197) (2,100)
Finance costs: Interest (Note 5) (9) –
Net revenue before taxation 2,917 3,438
Taxation (Note 4) (5) 1
Net revenue after taxation 2,912 3,439
Total return before distributions 21,571 22,303
Finance costs: Distributions (Note 5) (4,876) (5,324)
Change in net assets attributable to shareholders from investment activities 16,695 16,979
Statement of change in net assets attributable to shareholdersFor the year ending 31 January
2014 2013£’000 £’000 £’000 £’000
Opening net assets attributable to shareholders 139,985 140,195
Amounts receivable on issue of shares 7,501 2,942
Amounts payable on cancellation of shares (33,446) (24,752)
(25,945) (21,810)
Change in net assets attributable to shareholders from investment activities (see above) 16,695 16,979
Retained distributions on accumulation shares 4,214 4,629
Stamp duty reserve tax (43) (12)
Unclaimed distributions 7 4
Closing net assets attributable to shareholders 134,913 139,985
Balance sheetAs at 31 January
2014 2013£’000 £’000 £’000 £’000
ASSETS
Investment assets 138,761 139,909
Debtors (Note 7) 446 371
Cash and bank balances (Note 8) 598 96
Total other assets 1,044 467
Total assets 139,805 140,376
LIABILITIES
Investment liabilities (29) –
Creditors (Note 9) (4,778) (302)
Distribution payable on income shares (85) (89)
Total other liabilities (4,863) (391)
Total liabilities (4,892) (391)
Net assets attributable to shareholders 134,913 139,985
The notes to these financial statements are shown on pages 363 to 364.
Financial statements
362
Continuation�
� Return to Index

1. Net capital gains2014 2013
£’000 £’000Currency gains 1 –Derivative contracts 138 214Non-derivative securities 18,520 18,650Net capital gains 18,659 18,864
2. Revenue2014 2013
£’000 £’000Distributions from authorised ICVCs – 41Franked income from UK equity investments 4,620 5,050Income from Liquidity funds 10 12Income from overseas equity investments 333 307Interest on bank and term deposits 1 1Management fee rebates 22 25Property income distributions – 41Stock dividends 68 20Underwriting commission 69 41Total revenue 5,123 5,538
3. Expenses2014 2013
£’000 £’000Payable to the ACD or associate of the ACD:ACD fee 1,968 1,882Fixed expenses 229 218Total expenses 2,197 2,100
4. Taxation2014 2013
£’000 £’000a) Analysis of charge in the yearOverseas tax provision – (2)Overseas tax suffered 5 1Current year tax charge (Note 4b) 5 (1)
b) Factors affecting the tax charge for the yearThe tax assessed for the year is lower than the standard rate of corporation tax inthe UK for an Open-Ended Investment Company (OEIC) (20%). The differences areexplained below.
Net revenue before taxation 2,917 3,438Corporation tax at 20% 583 688
Effects of:Dividends not subject to corporation tax (1,004) (1,084)Excess expenses for which no relief taken 421 396Overseas tax provision – (2)Overseas tax suffered 5 1
(578) (689)Current year tax charge (Note 4a) 5 (1)
No deferred tax asset has been recognised in the financial statements. At the yearend date, the Fund had a potential unrecognised deferred tax asset of £3,895,075(31.01.13: £3,474,357) in relation to £19,475,376 (31.01.13: £17,371,783) of excessmanagement expenses which would only be utilised to reduce the tax charge if theFund had an excess of unfranked income over expenses in a future period. There isno excess of unfranked income expected in the future.
5. Finance costsDistributionsThe distributions take account of amounts receivable on the issue of shares andamounts payable on the cancellation of shares and comprise:
2014 2013£’000 £’000
First interim dividend distribution 1,775 1,632Second interim dividend distribution 1,141 1,372Third interim dividend distribution 1,221 1,390Final dividend distribution 654 788Add: Amounts payable on cancellation of shares 112 164Deduct: Amounts receivable on issue of shares (27) (22)Net distributions for the year 4,876 5,324
Interest 9 –
Total finance costs 4,885 5,324
Details of the distribution per share are set out on pages 365 to 368.
6. Movement between net revenue after taxation and distributions2014 2013
£’000 £’000Net revenue after taxation 2,912 3,439Add: ACD fee (net of tax relief) paid from capital 1,967 1,882Add: Undistributed revenue brought forward 2 5Deduct: Undistributed revenue carried forward (5) (2)
4,876 5,324
7. Debtors2014 2013
£’000 £’000Accrued income 322 286Due from the ACD for shares created 3 3Overseas tax recoverable 5 7Sales awaiting settlement 116 75Total debtors 446 371
8. Cash and bank balances2014 2013
£’000 £’000Amounts held at futures clearing houses
and brokers 308 –Cash and bank balances 290 96Total cash and bank balances 598 96
9. Creditors2014 2013
£’000 £’000Accrued expenses 191 186Due to the ACD for shares cancelled 191 116Purchases awaiting settlement 4,396 –Total creditors 4,778 302
Notes to the financial statements for the year ending 31 January 2014
363
Continuation�
� Return to Index

10. Portfolio transaction costs2014 2013
£’000 £’000Analysis of total purchase costs
Purchases in year before transaction costs 64,546 55,158
Commissions 59 94Taxes 185 194Total purchase costs 244 288Gross purchases total 64,790 55,446
Analysis of total sale costs
Gross sales before transaction costs 80,218 73,765
Commissions (80) (113)Total sale costs (80) (113)Total sales net of transaction costs 80,138 73,652
11. Related party transactionsJPMorgan Funds Limited, as Authorised Corporate Director (“ACD”), is a relatedparty, and acts as principal in respect of all transactions of shares in the Company.The aggregate monies received through issue, and paid on cancellation, aredisclosed in the Statement of Change in Net Assets Attributable to Shareholders.
The balance due to the ACD and their associates at the year end date in respect ofrelated party transactions was £379,386 (31.01.13: £299,045). Details of relatedparty transactions are given under note 13 on page 413.
Investments considered to be related parties have been identified in the portfoliostatement on pages 359 to 360 and the revenue from these investments was£9,532 (31.01.13: £47,473).
Some of the dealing transactions for the Fund are carried out through associatesof the ACD. Such transactions are carried out on an arm’s length basis.Thecommissions paid to these companies over the year were £13,072 (31.01.13:£38,908). Commission was paid to the associated company JPMorgan SecuritiesLtd.
The following parties held a material interest in the Fund at the year end date:– Chase Nominees Ltd Acc 22107 27.42% (31.01.13: 28.50%)– RBC Dexia Investor Services Bank 27.28% (31.01.13: 25.43%)
12. Financial instrumentsCurrency exposuresAt the year end date, the majority of the Fund’s financial assets and liabilities weredenominated in Sterling. As a result, the Fund has no material exposure tocurrency movements.
Interest rate riskAt the year end date, 0.4% (31.01.13: 0.2%) of the Fund’s net assets by value wereinterest bearing, carrying a (fixed/floating) rate.
For consideration of other risks including liquidity, pricing and credit risk, pleaserefer to the notes to the aggregated financial statements, pages 413 to 414.
13. Share classesThe Fund currently has four share classes; Class A Shares, Class B Shares, Class CShares and Class I Shares. The Authorised Corporate Director’s (ACD) fee and fixedexpenses charge are shown below.
ACD fee Fixed expensesClass A shares: 1.50% 0.18% Class B shares: 1.00% 0.18%Class C shares: 0.75% 0.18%Class I shares: 0.60% 0.00%
The net asset value of each share class, the net asset value per share and thenumber of shares in each class are shown on page 358. All classes have the samerights on winding up.
14. Derivatives The Fund enters into derivative transactions in the form of futures for the purposeof efficient portfolio management. The positive mark to market approach hasbeen used to calculate the global exposure.
Further information on the derivative risks can be found in the notes to theaggregated financial statements on page 414.
15. Contingent liabilities and capital commitmentsAt the balance sheet date there were no contingent liabilities or capitalcommitments (2013: none).
Notes to the financial statements – continued
364
Continuation�
� Return to Index

Final distribution in pence per share
Group 1 – Shares purchased prior to 1 November 2013Group 2 – Shares purchased 1 November 2013 to 31 January 2014
DistributionGross Tax Net payable paid
revenue at 10% revenue Equalisation 30.04.14 30.04.13
A-Class Accumulation Shares
Group 1 0.755556 0.075556 0.680000 – 0.680000 0.680000
Group 2 0.233861 0.023386 0.210475 0.469525 0.680000 0.680000
A-Class Income Shares
Group 1 0.533333 0.053333 0.480000 – 0.480000 0.480000
Group 2 0.162228 0.016223 0.146005 0.333995 0.480000 0.480000
B-Class Accumulation Shares
Group 1 0.733333 0.073333 0.660000 – 0.660000 –
Group 2 0.733333 0.073333 0.660000 0.000000 0.660000 –
B-Class Income Shares
Group 1 0.500000 0.050000 0.450000 – 0.450000 0.480000
Group 2 0.500000 0.050000 0.450000 0.000000 0.450000 0.480000
C-Class Accumulation Shares
Group 1 0.700000 0.070000 0.630000 – 0.630000 0.600000
Group 2 0.511420 0.051142 0.460278 0.169722 0.630000 0.600000
C-Class Income Shares Shares
Group 1 0.666667 0.066667 0.600000 – 0.600000 0.590000
Group 2 0.634352 0.063435 0.570917 0.029083 0.600000 0.590000
I-Class Accumulation Shares
Group 1 0.911111 0.091111 0.820000 – 0.820000 0.790000
Group 2 0.911111 0.091111 0.820000 0.000000 0.820000 0.790000
I-Class Income Shares
Group 1 0.733333 0.073333 0.660000 – 0.660000 0.650000
Group 2 0.233513 0.023351 0.210162 0.449838 0.660000 0.650000
Distribution tables
365
Continuation�
� Return to Index

Third interim distribution in pence per share
Group 1 – Shares purchased prior to 1 August 2013Group 2 – Shares purchased 1 August 2013 to 31 October 2013
DistributionGross Tax Net paid paid
revenue at 10% revenue Equalisation 31.01.14 31.01.13
A-Class Accumulation Shares
Group 1 1.388889 0.138889 1.250000 – 1.250000 1.170000
Group 2 0.644967 0.064497 0.580470 0.669530 1.250000 1.170000
A-Class Income Shares Shares
Group 1 0.977778 0.097778 0.880000 – 0.880000 0.860000
Group 2 0.436119 0.043612 0.392507 0.487493 0.880000 0.860000
B-Class Accumulation Shares
Group 1 1.388889 0.138889 1.250000 – 1.250000 –
Group 2 1.388889 0.138889 1.250000 0.000000 1.250000 –
B-Class Income Shares
Group 1 0.955556 0.095556 0.860000 – 0.860000 0.860000
Group 2 0.955556 0.095556 0.860000 0.000000 0.860000 0.860000
C-Class Accumulation Shares
Group 1 1.266667 0.126667 1.140000 – 1.140000 1.090000
Group 2 0.501059 0.050106 0.450953 0.689047 1.140000 1.090000
C-Class Income Shares
Group 1 1.233333 0.123333 1.110000 – 1.110000 1.080000
Group 2 1.233333 0.123333 1.110000 0.000000 1.110000 1.080000
I-Class Accumulation Shares
Group 1 1.600000 0.160000 1.440000 – 1.440000 1.330000
Group 2 1.600000 0.160000 1.440000 0.000000 1.440000 1.330000
I-Class Income Shares
Group 1 1.288889 0.128889 1.160000 – 1.160000 1.110000
Group 2 1.063983 0.106398 0.957585 0.202415 1.160000 1.110000
Distribution tables – continued
366
Continuation�
� Return to Index
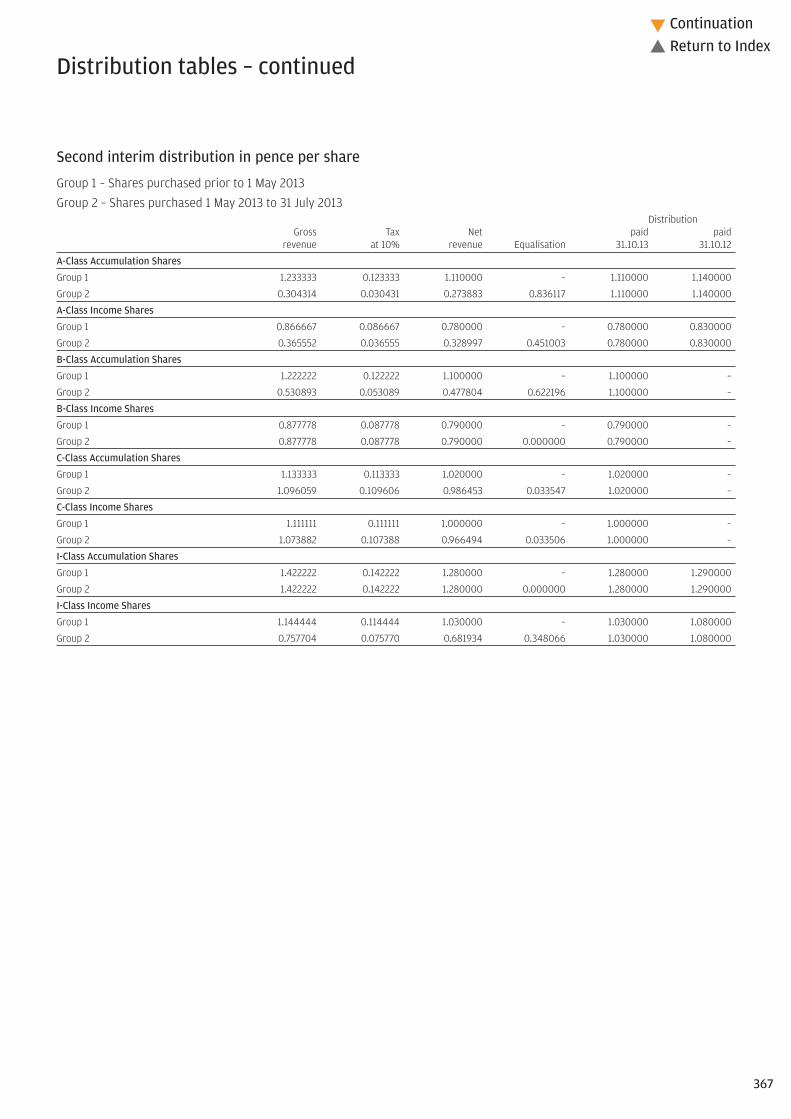
Second interim distribution in pence per share
Group 1 – Shares purchased prior to 1 May 2013Group 2 – Shares purchased 1 May 2013 to 31 July 2013
DistributionGross Tax Net paid paid
revenue at 10% revenue Equalisation 31.10.13 31.10.12
A-Class Accumulation Shares
Group 1 1.233333 0.123333 1.110000 – 1.110000 1.140000
Group 2 0.304314 0.030431 0.273883 0.836117 1.110000 1.140000
A-Class Income Shares
Group 1 0.866667 0.086667 0.780000 – 0.780000 0.830000
Group 2 0.365552 0.036555 0.328997 0.451003 0.780000 0.830000
B-Class Accumulation Shares
Group 1 1.222222 0.122222 1.100000 – 1.100000 –
Group 2 0.530893 0.053089 0.477804 0.622196 1.100000 –
B-Class Income Shares
Group 1 0.877778 0.087778 0.790000 – 0.790000 –
Group 2 0.877778 0.087778 0.790000 0.000000 0.790000 –
C-Class Accumulation Shares
Group 1 1.133333 0.113333 1.020000 – 1.020000 –
Group 2 1.096059 0.109606 0.986453 0.033547 1.020000 –
C-Class Income Shares
Group 1 1.111111 0.111111 1.000000 – 1.000000 –
Group 2 1.073882 0.107388 0.966494 0.033506 1.000000 –
I-Class Accumulation Shares
Group 1 1.422222 0.142222 1.280000 – 1.280000 1.290000
Group 2 1.422222 0.142222 1.280000 0.000000 1.280000 1.290000
I-Class Income Shares
Group 1 1.144444 0.114444 1.030000 – 1.030000 1.080000
Group 2 0.757704 0.075770 0.681934 0.348066 1.030000 1.080000
Distribution tables – continued
367
Continuation�
� Return to Index
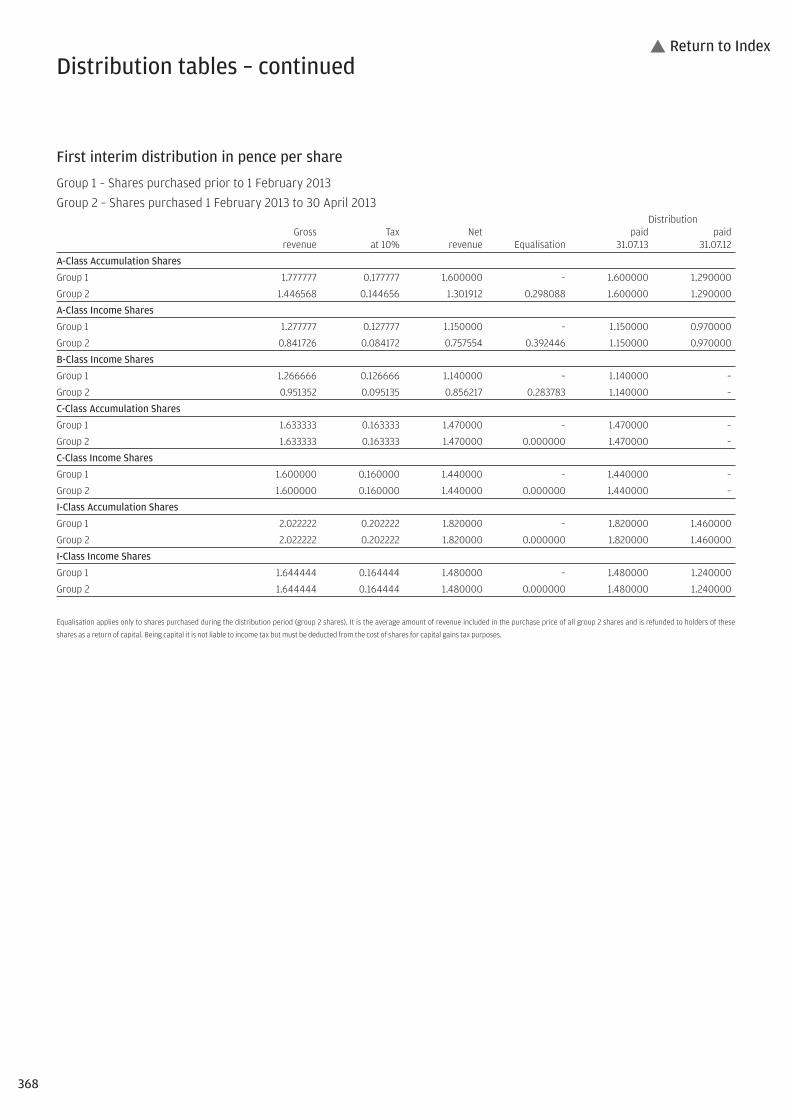
368
� Return to Index
First interim distribution in pence per share
Group 1 – Shares purchased prior to 1 February 2013Group 2 – Shares purchased 1 February 2013 to 30 April 2013
DistributionGross Tax Net paid paid
revenue at 10% revenue Equalisation 31.07.13 31.07.12
A-Class Accumulation Shares
Group 1 1.777777 0.177777 1.600000 – 1.600000 1.290000
Group 2 1.446568 0.144656 1.301912 0.298088 1.600000 1.290000
A-Class Income Shares
Group 1 1.277777 0.127777 1.150000 – 1.150000 0.970000
Group 2 0.841726 0.084172 0.757554 0.392446 1.150000 0.970000
B-Class Income Shares
Group 1 1.266666 0.126666 1.140000 – 1.140000 –
Group 2 0.951352 0.095135 0.856217 0.283783 1.140000 –
C-Class Accumulation Shares
Group 1 1.633333 0.163333 1.470000 – 1.470000 –
Group 2 1.633333 0.163333 1.470000 0.000000 1.470000 –
C-Class Income Shares
Group 1 1.600000 0.160000 1.440000 – 1.440000 –
Group 2 1.600000 0.160000 1.440000 0.000000 1.440000 –
I-Class Accumulation Shares
Group 1 2.022222 0.202222 1.820000 – 1.820000 1.460000
Group 2 2.022222 0.202222 1.820000 0.000000 1.820000 1.460000
I-Class Income Shares
Group 1 1.644444 0.164444 1.480000 – 1.480000 1.240000
Group 2 1.644444 0.164444 1.480000 0.000000 1.480000 1.240000
Equalisation applies only to shares purchased during the distribution period (group 2 shares). It is the average amount of revenue included in the purchase price of all group 2 shares and is refunded to holders of these
shares as a return of capital. Being capital it is not liable to income tax but must be deducted from the cost of shares for capital gains tax purposes.
Distribution tables – continued

369
Continuation�
� Return to Index
Investment objective and policyTo provide long-term capital growth through investment primarily in a growthstyle biased portfolio of UK companies.
UK companies are companies that are incorporated under the laws of, andhave their registered office in, the UK, or that derive the predominant partof their economic activity from the UK, even if listed elsewhere. Smallercompanies may be held on an ancillary basis.
This Equity based fund invests in those stocks which the Investment Adviserbelieves to have the potential for above-average growth (growth stocks).
Financial Derivative Instruments (derivatives) may be used for the purposeof Efficient Portfolio Management, including hedging, where appropriate(see section 11.14 for Risk Warnings on derivatives of the Prospectus).Subject to at least 60 days notice to shareholders, the Fund may usederivatives for investment purposes which may change the risk profile ofthe Fund.
Other instruments as permitted in the stated investment and borrowingpowers of the Company including, but not limited to, fixed income securities,cash and cash equivalents may be held on an ancillary basis, as appropriate.
Risk profileThe value of your investment may fall as well as rise and you may get backless than you originally invested
The value of Equity and Equity-Linked Securities may fluctuate in responseto the performance of individual companies and general market conditions.
The Fund may have greater volatility compared to broader market indicesas a result of the Fund’s focus on growth stocks.
The single market in which the Fund primarily invests, in this case the UK,may be subject to particular political and economic risks and, as a result,the Fund may be more volatile than more broadly diversified funds.
Please refer to Part 11 of the Prospectus for details of the general risk factorsaffecting this Fund in addition to the specific risk factors above.
Fund reviewThe UK stock market delivered a strong positive return for the year, supportedby accommodative monetary policy and the faster-than-expected domesticeconomic recovery.
The Fund, which focuses on stocks with strong momentum and qualitycharacteristics, outperformed its benchmark. At the sector level, the biggestcontributors to relative performance included stock selection in supportservices, an underweight holding in mining, and stock selection and anoverweight position in travel & leisure. Detractors from relative returnsincluded underweight exposure to pharmaceuticals & biotechnology, andstock selection and an underweight holding in gas, water & multiutilities.
At the stock level, positive contributors to relative returns included notholding Anglo American, as shares made gains after the mining companyreported improving output at most of its key mines in the fourth quarter of2014. Overweight exposure to easyJet also added to relative performance,with the budget airline reporting solid passenger volume growth in Januaryand guiding for a slight rise in average revenue per seat. Detractors from
relative returns included an underweight position in GlaxoSmithKline, as thepharmaceuticals company reported a solid set of third-quarter results,despite facing currency headwinds and weakness in China. Underweightexposure to National Grid was also detrimental as the electricity providerwas supported by its limited exposure to political and regulatory risk relativeto its UK peers. However, overweight exposure to Supergroup was of relativebenefit, as the food products manufacturer delivered first-half results thatwere ahead of expectations.
Fund outlookThe economic backdrop looks set to remain favourable for UK stocks. If therecovery continues to gather momentum, UK companies have the potentialto deliver earnings growth this year.
12 month performance as at 31 January2014 2013 2012 2011 2010
JPM UK Strategic GrowthA-Class Acc 22.1% 20.1% -4.1% 21.8% 19.1%
JPM UK Strategic GrowthB-Class Acc 22.6% – – – –
JPM UK Strategic GrowthC-Class Acc 22.7% – – – –
Benchmark Index 10.1% 16.3% -0.3% 18.1% 33.2%
Fund statisticsRisk and Reward Profile 6*
Fund size £279.7m
Benchmark Index FTSE All-Share Index (Net)
Fund chargesA-Class Initial 3.00%, Annual 1.50%B-Class Initial Nil, Annual 1.00%C-Class Initial Nil, Annual 0.75%
Top ten holdings (excluding Liquidity funds) %Vodafone Group 5.6Royal Dutch Shell ‘B’ 2.7Lloyds Banking Group 2.7AstraZeneca 2.3Prudential 2.1BT Group 2.1HSBC 2.1Rio Tinto 2.0BHP Billiton 1.8Shire 1.6
JPM UK Strategic Growth Fund
You should remember that past performance is not a guide to the future. The price of investments and the income from them may fall as well as rise andinvestors may not get back the full amount invested.
* For specific risks, including the risk and reward profile, please refer to the Key Investor information Document (KIID) available on the following websitehttp://am.jpmorgan.co.uk/investor/prices-and-factsheets/?list=all&tab=PricesOn 31/08/13 JPM UK Equity Fund was merged into this Fund.All equity indices stated as ‘Net’ are calculated net of tax as per the standard published approach by the index vendor unless stated otherwise.All performance returns are calculated using the quoted price of the accumulation shares. Performance returns are in Sterling.Source: J.P. Morgan.Source: FTSE International Limited (“FTSE”) © FTSE 2014. “FTSE®” is a trade mark of London Stock Exchange Plc and The Financial Times Limited and is used by FTSE International Limited under licence. All rights inthe FTSE indices and/or FTSE ratings vest in FTSE and/or its licensors. Neither FTSE nor its licensors accept any liability for any errors or omissions in the FTSE indices and/or FTSE ratings or underlying data. Nofurther distribution of FTSE Data is permitted without FTSE’s express written consent.

370
Continuation�
� Return to Index
Sector breakdown %Financials 24.2Consumer services 20.9Industrials 19.4Consumer goods 9.9Telecommunications 9.0Health care 4.7Basic materials 4.5Oil & gas 4.2Technology 2.3Utilities 0.6Liquidity funds 0.3Net other assets 0.0
Highest/lowest share price and distribution recordDistribution
Highest Lowest per shareCalendar year share price share price (net)A-Class Accumulation Shares2009 62.55p 43.33p 0.00p2010 73.56p 57.65p 0.81p2011 77.25p 60.84p 0.42p2012 79.50p 67.83p 0.77p2013 103.3p 80.24p 1.25p2014A 106.9p 101.0p 0.96pA-Class Income Shares2009 62.55p 43.33p 0.00p2010 72.56p 56.86p 0.81p2011 75.76p 59.67p 0.41p2012 77.10p 65.79p 0.75p2013 98.70p 77.83p 1.22p2014A 102.1p 96.46p 1.11pB-Class Accumulation SharesB
2012 79.55p 75.47p –2013 103.9p 80.32p 1.36p2014A 107.4p 101.5p 1.87pC-Class Accumulation SharesC
2012 105.6p 98.57p –2013 138.1p 106.7p 2.03p2014A 142.8p 135.0p 1.59pC-Class Income SharesC
2012 105.6p 98.57p –2013 135.6p 106.7p 2.04p2014A 140.2p 132.6p 1.98p
A To 31 January 2014.B B-Class Accumulation Shares were launched on 29 October 2012.C C-Class Accumulation Shares and C-Class Income Shares were launched on 20 August 2012.
Portfolio turnover rate31.01.13 131.6%31.01.14 409.2%
The portfolio turnover rate (PTR) reflects the total of security purchases and sales (excluding Liquidityfunds), less the total of share issues and cancellations, expressed as a percentage of the average daily netasset values over the period.
Portfolio transaction costsBroker Transaction
Commissions Taxes Total31.01.13 0.24% 0.44% 0.68%31.01.14 0.37% 0.45% 0.82%
The percentage figures disclosed above reflect the average broker commissions and transaction taxessuffered during the last 3 years divided by the average assets under management over the same period.
Stamp duty reserve tax31.01.13 0.00%31.01.14 0.01%
The percentage figures disclosed above reflect the total stamp duty reserve tax suffered during the yeardivided by the average assets under management over the same period.
Net asset values and Ongoing chargesNet assetvalue per Net asset
share class Number value per OngoingDate £’000 of shares share chargesA-Class Accumulation Shares31.01.12 2,264 3,265,020 69.34p 1.68%31.01.13 2,785 3,344,827 83.27p 1.68%31.01.14 276,836 272,497,495 101.6p 1.68%A-Class Income Shares31.01.12 2,043 3,038,075 67.26p 1.68%31.01.13 2,416 3,037,391 79.54p 1.68%31.01.14 589 613,873 95.93p 1.68%B-Class Accumulation Shares31.01.13 3 3,500 83.37p 1.18%31.01.14 10 10,334 102.2p 1.18%C-Class Accumulation Shares31.01.13 1 1,000 110.7p 0.93%31.01.14 2,157 1,587,902 135.8p 0.93%C-Class Income Shares31.01.13 1 1,000 108.7p 0.93%31.01.14 77 58,339 131.4p 0.93%
The net asset value and the net asset value per income share are shown ex-dividend.
Following the adoption of the requirements of UCITS IV in June 2012, Ongoing charges has replaced theTotal Expense Ratio (“TER”). The Ongoing charges takes into account the ACD fee, the fixed expenses andany expenses paid to an affiliate in respect of stocklending activities, expressed as a percentage of theaverage daily net asset values over the period. The main difference between the two calculations is theinclusion of custodian handling charges and stocklending fees in the Ongoing charges figure. The comparativefigures have not been restated, and the historic TER is disclosed.

Financials – 24.2% (21.9%)Banks – 5.3%Bank of Georgia 62,773 1,313 0.5HSBC 959,765 5,942 2.1Lloyds Banking Group 9,129,318 7,453 2.7General financial – 6.3%Brewin Dolphin 134,908 407 0.1Close Brothers Group 145,854 1,918 0.7Hargreaves Lansdown 162,172 2,394 0.9Henderson Group 1,109,742 2,450 0.9IG Group 384,890 2,382 0.9International Personal Finance 257,885 1,188 0.4Jupiter Fund Management 496,811 1,835 0.7London Stock Exchange Group 107,321 1,970 0.7Provident Financial 64,490 1,046 0.4Schroders 67,809 1,664 0.6Life insurance – 5.9%Aviva 587,542 2,596 0.9Chesnara 140,000 483 0.2Legal & General Group 1,701,736 3,628 1.3Prudential 491,344 5,990 2.1Resolution 434,782 1,510 0.5St James’s Place 347,192 2,627 0.9Nonlife insurance – 2.8%Beazley Group 455,586 1,159 0.4Hiscox 334,382 2,120 0.8Jardine Lloyd Thompson 212,348 2,262 0.8Novae Group 125,000 709 0.3Workspace Group 248,715 1,351 0.5Real estate – 3.9%Big Yellow Group 250,968 1,294 0.5Countrywide 217,979 1,239 0.4Foxtons Group 645,868 2,195 0.8Grainger 473,881 1,016 0.4Land Securities Group 185,000 1,889 0.7LSL Property Services 240,000 1,038 0.4Shaftesbury 177,184 1,112 0.4St Modwen Properties 241,000 937 0.3
Consumer services – 20.9% (15.7%)Food & drug retailers – 1.2%Booker Group 536,963 824 0.3Ocado Group 495,471 2,549 0.9General retailers – 6.9%ASOS 37,100 2,278 0.8Dixons Retail 2,989,763 1,314 0.5Halfords Group 453,704 2,044 0.7Home Retail Group 582,598 1,036 0.4Inchcape 275,775 1,586 0.6Lookers 1,192,973 1,503 0.5Next 57,292 3,532 1.3Pendragon 3,000,000 1,013 0.4Savills 148,104 920 0.3Sports Direct International 172,434 1,148 0.4Topps Tiles 360,000 544 0.2WH Smith 219,003 2,278 0.8Media – 5.4%Daily Mail & General Trust ‘A’ 144,785 1,366 0.5ITE Group 309,961 853 0.3ITV 1,636,095 3,208 1.1Reed Elsevier 303,201 2,662 1.0Rightmove 96,599 2,412 0.9Unite Group 350,381 1,440 0.5WPP 236,500 2,942 1.1Travel & leisure -– 7.4%Compass Group 341,664 3,104 1.1Dart Group 271,947 697 0.2Easyjet 179,110 2,898 1.0Enterprise Inns 898,941 1,406 0.5Go-Ahead Group 57,640 1,126 0.4Greene King 147,801 1,250 0.4International Consolidated Airlines 497,122 2,028 0.7Merlin Entertainments 260,558 951 0.3Mitchells & Butlers 210,338 939 0.3Playtech 133,183 912 0.3Restaurant Group 372,247 2,258 0.8Stagecoach Group 188,463 682 0.2TUI Travel 303,749 1,267 0.5Whitbread 51,200 1,921 0.7
Industrials – 19.4% (11.8%)Aerospace & defence – 2.7%BAE Systems 674,848 2,875 1.0Derwent London 48,569 1,203 0.4Rolls-Royce 313,612 3,660 1.3Construction & materials – 0.9%Galliford Try 103,542 1,214 0.4Keller Group 126,604 1,499 0.5Electronics & electrical equipment – 0.9%Hellermanntyton Group 308,333 906 0.3Xaar 145,831 1,611 0.6General industrials – 1.4%RPC Group 174,620 1,046 0.4Smith (DS) 404,279 1,329 0.5Vesuvius 329,558 1,454 0.5Industrial engineering – 1.5%BBA Aviation 505,076 1,546 0.6IMI 130,863 1,937 0.7Renold 220,000 120 0.0Spirax-Sarco Engineering 20,606 596 0.2Industrial transportation – 1.2%Fisher (James) & Sons 64,230 890 0.3Royal Mail 259,980 1,537 0.5UK Mail Group 155,000 1,031 0.4Support services – 10.8%Ashtead Group 359,947 2,797 1.0Atkins (WS) 175,606 2,378 0.9Babcock International Group 204,598 2,821 1.0Berendsen 246,559 2,263 0.8Capita Group 214,804 2,093 0.7DCC 46,163 1,275 0.5Grafton Group Units 352,084 2,007 0.7Hays 1,897,492 2,535 0.9Howden Joinery Group 730,184 2,461 0.9Interserve 156,368 966 0.3Northgate 125,000 693 0.2Optimal Payments 563,241 2,233 0.8Paypoint 54,961 593 0.2Ricardo 85,000 568 0.2Robert Walters 180,000 605 0.2RPS Group 99,716 342 0.1SIG 465,595 894 0.3Travis Perkins 105,854 1,816 0.6Tribal Group 485,000 858 0.3VP 71,361 475 0.2
Consumer goods – 9.9% (17.6%)Automobiles & parts – 0.7%GKN 472,994 1,834 0.7Beverages – 1.0%Britvic 390,647 2,692 1.0Food producers – 2.9%Associated British Foods 84,750 2,252 0.8Greencore Group 904,358 2,252 0.8Tate & Lyle 3,055 23 0.0Unilever 163,250 3,768 1.3Household goods – 4.3%Barratt Development 479,740 1,792 0.6Bellway 99,726 1,538 0.5Berkeley Group 75,538 1,927 0.7Crest Nicholson 228,703 829 0.3Gleeson (M.J.) Group 60,000 241 0.1Persimmon 142,342 1,819 0.7Redrow 447,935 1,429 0.5Taylor Wimpey 2,181,013 2,427 0.9Personal goods – 1.0%Supergroup 120,500 1,841 0.7Ted Baker 44,414 950 0.3
Telecommunications – 9.0% (7.4%)Fixed line telecommunications – 3.4%BT Group 1,567,089 5,949 2.1KCOM Group 842,000 839 0.3Telecom Plus 144,322 2,733 1.0Mobile telecommunications – 5.6%Vodafone Group 7,038,000 15,603 5.6
Portfolio statement As at 31 January 2014
Market value Total netInvestment Holding £’000 assets %
Market value Total netInvestment Holding £’000 assets %
371
Continuation�
� Return to Index

372
Continuation�
� Return to Index
Health care – 4.7% (1.3%)Pharmaceuticals & biotechnology – 4.7%AstraZeneca 168,850 6,475 2.3Hikma Pharmaceuticals 181,180 2,180 0.8Shire 151,157 4,536 1.6
Basic materials – 4.5% (7.7%)Chemicals – 0.7%Johnson Matthey 57,628 1,852 0.7Mining – 3.8%BHP Billiton 281,240 5,027 1.8Rio Tinto 174,000 5,594 2.0
Oil & gas – 4.2% (8.1%)Oil & gas producers – 4.2%Afren 697,000 1,020 0.4Kentz 326,547 2,119 0.8Royal Dutch Shell ‘B’ 335,000 7,512 2.7Soco International 235,000 961 0.3
Technology – 2.3% (3.7%)Software & computer services – 0.8%Blinkx 574,050 729 0.3Computacenter 136,927 886 0.3Fidessa Group 24,340 565 0.2Technology hardware & equipment – 1.5%CSR 154,870 1,016 0.4Pace 715,863 2,528 0.9Sepura 400,000 527 0.2
Utilities – 0.6% (1.5%)Electricity – 0.6%Drax Group 205,251 1,658 0.6
Liquidity funds – 0.3% (0.0%)JPM Sterling Liquidity ‘X’ (Distribution)^$ 700,956 701 0.3
Investment assets 279,759 100.0
Net other liabilities (90) 0.0
Net assets 279,669 100.0
Unless otherwise stated the above securities are admitted to official stock exchange listings or trade on aregulated market.
The comparative percentage figures in brackets are at 31 January 2013.
^ Deemed to be investment in related parties of the ACD$ Approved security as defined in the Collective Investment Schemes sourcebook
Portfolio statement – continuedAs at 31 January 2014
Market value Total netInvestment Holding £’000 assets %

£’000
Total of all purchases for the year (Note 10) 396,018
Major purchases Cost
JPM Sterling Liquidity ‘X’ (Distribution)^ 19,102Vodafone Group 14,613GlaxoSmithKline 11,819HSBC 11,620JPM UK Smaller Companies ‘I’ (Accumulation)^ 10,255Royal Dutch Shell ‘B’ 8,131Lloyds Banking Group 6,954AstraZeneca 6,578Prudential 5,967BG Group 5,751Barclays 5,688Rio Tinto 5,566BHP Billiton 5,427BT Group 5,425Compass Group 4,920Rolls-Royce 4,407Unilever 4,027BAE Systems 4,015Shire 3,739Legal & General Group 3,299
^ Deemed to be investment in related parties of the ACD
£’000
Total of all sales for the year (Note 10) 145,598
Major sales Proceeds
JPM Sterling Liquidity ‘X’ (Distribution)^ 18,401GlaxoSmithKline 11,247JPM UK Smaller Companies ‘I’ (Accumulation)^ 10,652Barclays 6,005HSBC 5,366BG Group 5,084Thomas Cook Group 3,424Reckitt Benckiser Group 2,891Capital & Counties Properties 2,1523i Group 2,143Intermediate Capital Group 2,035Bovis Homes Group 1,821Compass Group 1,764Senior 1,753Mondi 1,740Wetherspoon (J.D.) 1,682Micro Focus International 1,681Centrica 1,644Dunelm Group 1,634Brown (N.) Group 1,474
Portfolio movements For the year ending 31 January 2014
373
Continuation�
� Return to Index

374
Continuation�
� Return to Index
Statement of total returnFor the year ending 31 January
2014 2013£’000 £’000 £’000 £’000
Income
Net capital gains (Note 1) 24,104 792
Revenue (Note 2) 2,282 156
Expenses (Note 3) (1,996) (78)
Finance costs: Interest (Note 5) (3) –
Net revenue before taxation 283 78
Taxation (Note 4) (4) –
Net revenue after taxation 279 78
Total return before distributions 24,383 870
Finance costs: Distributions (Note 5) (260) (78)
Change in net assets attributable to shareholders from investment activities 24,123 792
Statement of change in net assets attributable to shareholdersFor the year ending 31 January
2014 2013£’000 £’000 £’000 £’000
Opening net assets attributable to shareholders 5,206 4,307
Amounts transferred fromJPM UK Equity Fund 264,499 –
Amounts receivable on issue of shares 789 97
Amounts payable on cancellation of shares (17,583) (32)
(16,794) 65
Change in net assets attributable to shareholders from investment activities (see above) 24,123 792
Retained distributions on accumulation shares 2,642 42
Stamp duty reserve tax (7) –
Closing net assets attributable to shareholders 279,669 5,206
Balance sheetAs at 31 January
2014 2013£’000 £’000 £’000 £’000
ASSETS
Investment assets 279,759 5,189
Debtors (Note 7) 651 13
Cash and bank balances (Note 8) 235 48
Total other assets 886 61
Total assets 280,645 5,250
LIABILITIES
Creditors (Note 9) (968) (7)
Distribution payable on income shares (8) (37)
Total liabilities (976) (44)
Net assets attributable to shareholders 279,669 5,206
The notes to these financial statements are shown on pages 375 to 376.
Financial statements

1. Net capital gains2014 2013
£’000 £’000Currency losses (1) –Derivative contracts (45) 25Non-derivative securities 24,150 767Net capital gains 24,104 792
2. Revenue2014 2013
£’000 £’000Distributions from authorised ICVCs – 2Franked income from UK equity investments 2,044 142Income from Liquidity funds 3 –Income from overseas equity investments 94 8Interest on bank and term deposits 1 –Management fee rebates 7 1Property income distributions 53 1Stock dividends 28 1Underwriting commission 52 1Total revenue 2,282 156
3. Expenses2014 2013
£’000 £’000Payable to the ACD or associate of the ACD:ACD fee 1,782 70Fixed expenses 214 8Total expenses 1,996 78
4. Taxation2014 2013
£’000 £’000a) Analysis of charge in the yearOverseas tax suffered 4 –Current year tax charge (Note 4b) 4 –
b) Factors affecting the tax charge for the yearThe tax assessed for the year is lower than the standard rate of corporation tax inthe UK for an Open-Ended Investment Company (OEIC) (20%). The differences areexplained below.
Net revenue before taxation 283 78Corporation tax at 20% 57 16
Effects of:Dividends not subject to corporation tax (434) (31)Excess expenses for which no relief taken 377 15Overseas tax suffered 4 –
(53) (16)Current year tax charge (Note 4a) 4 –
No deferred tax asset has been recognised in the financial statements. At the yearend date, the Fund had a potential unrecognised deferred tax asset of £428,905(31.01.13: £52,551) in relation to £2,144,524 (31.01.13: £262,757) of excessmanagement expenses which would only be utilised to reduce the tax charge if theFund had an excess of unfranked income over expenses in a future period. There isno excess of unfranked income expected in the future.
5. Finance costsDistributionsThe distributions take account of amounts receivable on the issue of shares andamounts payable on the cancellation of shares and comprise:
2014 2013£’000 £’000
Final dividend distribution 2,650 79Add: Amounts payable on cancellation of shares 164 –Deduct: Amounts receivable on issue of shares (2,554) (1)Net distributions for the year 260 78
Interest 3 –
Total finance costs 263 78
Details of the distribution per share are set out on page 377.
6. Movement between net revenue after taxation and distributions2014 2013
£’000 £’000Net revenue after taxation 279 78Deduct: Undistributed revenue carried forward (20) –Equalisation on conversions 1 –
260 78
7. Debtors2014 2013
£’000 £’000Accrued income 492 11Due from the ACD for shares created 17 –Overseas tax recoverable 6 –Sales awaiting settlement 136 2Total debtors 651 13
8. Cash and bank balances2014 2013
£’000 £’000Cash and bank balances 235 48
9. Creditors2014 2013
£’000 £’000Accrued expenses 411 7Due to the ACD for shares cancelled 105 –Purchases awaiting settlement 452 –Total creditors 968 7
Notes to the financial statements for the year ending 31 January 2014
375
Continuation�
� Return to Index

376
Continuation�
� Return to Index
10. Portfolio transaction costs2014 2013
£’000 £’000Analysis of total purchase costs
Purchases in year before transaction costs 395,256 3,543
Commissions 221 6Taxes 541 17Total purchase costs 762 23Gross purchases total 396,018 3,566
Analysis of total sale costs
Gross sales before transaction costs 145,834 3,424
Commissions (236) (6)Total sale costs (236) (6)Total sales net of transaction costs 145,598 3,418
11. Related party transactionsJPMorgan Funds Limited, as Authorised Corporate Director (“ACD”), is a relatedparty, and acts as principal in respect of all transactions of shares in the Company.The aggregate monies received through issue, and paid on cancellation, aredisclosed in the Statement of Change in Net Assets Attributable to Shareholders.
The balance due to the ACD and their associates at the year end date in respect ofrelated party transactions was £499,432 (31.01.13: £7,305). Details of related partytransactions are given under note 13 on page 413.
Investments considered to be related parties have been identified in the portfoliostatement on pages 371 to 372 and the revenue from these investments was£3,280 (31.01.13: £1,971).
Some of the dealing transactions for the Fund are carried out through associates ofthe ACD. Such transactions are carried out on an arm’s length basis. Thecommissions paid to these companies over the year were £3,906 (31.01.13: £4,020).Commission was paid to the associated company JPMorgan Securities Ltd.
The following party held a material interest in the Fund at the year end date:– J.P. Morgan Nominees Ltd 31.17% (31.01.13: 0.00%)– FNZ (UK) Nominees Limited 15.63% (31.01.13: 0.00%)
12. Financial instrumentsCurrency exposuresThe Fund’s financial assets and liabilities are all denominated in Sterling. As aresult, the Fund has no material exposure to currency movements.
Interest rate riskAt the year end date, 0.3% (31.01.13: 0.9%) of the Fund’s net assets by value wereinterest bearing, carrying a (fixed/floating) rate.
For consideration of other risks including liquidity, pricing and credit risk, pleaserefer to the notes to the aggregated financial statements, pages 413 to 414.
13. Share classesThe Fund currently has three share classes; Class A Shares, Class B Shares andClass C Shares. The Authorised Corporate Director’s (ACD) fee and fixed expensescharge are shown below.
ACD fee Fixed expensesClass A shares: 1.50% 0.18%Class B shares: 1.00% 0.18%Class C shares: 0.75% 0.18%
The net asset value of each share class, the net asset value per share and thenumber of shares in each class are shown on page 370. All classes have the samerights on winding up.
14. DerivativesThe Fund enters into derivative transactions in the form of futures for the purposeof efficient portfolio management. The commitment approach has been used tocalculate the global exposure.
Further information on the derivative risks can be found in the notes to theaggregated financial statements on page 414.
15. Contingent liabilities and capital commitmentsAt the balance sheet date there were no contingent liabilities or capitalcommitments (2013: none).
Notes to the financial statements – continued

377
Final distribution in pence per share
Group 1 – Shares purchased prior to 1 February 2013Group 2 – Shares purchased 1 February 2013 to 31 January 2014
DistributionGross Tax Net payable paid
revenue at 10% revenue Equalisation 30.04.14 30.04.13
A-Class Accumulation Shares
Group 1 1.066667 0.106667 0.960000 – 0.960000 1.250000
Group 2 1.061330 0.106133 0.955197 0.004803 0.960000 1.250000
A-Class Income Shares
Group 1 1.233333 0.123333 1.110000 – 1.110000 1.220000
Group 2 1.024263 0.102426 0.921837 0.188163 1.110000 1.220000
B-Class Accumulation Shares
Group 1 2.077778 0.207778 1.870000 – 1.870000 1.360000
Group 2 1.810062 0.181006 1.629056 0.240944 1.870000 1.360000
C-Class Accumulation Shares
Group 1 1.766667 0.176667 1.590000 – 1.590000 2.030000
Group 2 0.847171 0.084717 0.762454 0.827546 1.590000 2.030000
C-Class Income Shares
Group 1 2.200000 0.220000 1.980000 – 1.980000 2.040000
Group 2 1.634307 0.163431 1.470876 0.509124 1.980000 2.040000
Equalisation applies only to shares purchased during the distribution period (group 2 shares). It is the average amount of revenue included in the purchase price of all group 2 shares and is refunded to holders of these
shares as a return of capital. Being capital it is not liable to income tax but must be deducted from the cost of shares for capital gains tax purposes.
Distribution table� Return to Index

378
Continuation�
� Return to Index
Investment objective and policyTo provide capital growth over the long term by investing primarily througha portfolio invested in the shares of US companies.
US companies are companies that are incorporated under the laws of, andhave their registered office in, the US, or that derive the predominant partof their economic activity from the US, even if listed elsewhere.
Other instruments as permitted in the stated investment and borrowingpowers of the Company including, but not limited to, fixed interest securities,cash and cash equivalents may be held on an ancillary basis, as appropriate.
Risk profileThe value of your investment may fall as well as rise and you may get backless than you originally invested.
The value of Equity and Equity-Linked Securities may fluctuate in responseto the performance of individual companies and general market conditions.
The single market in which the Fund primarily invests, in this case the US,may be subject to particular political and economic risks and, as a result,the Fund may be more volatile than more broadly diversified funds.
Movements in currency exchange rates can adversely affect the return ofyour investment.
Please refer to Part 11 of the Prospectus for details of the general risk factorsaffecting this Fund in addition to the specific risk factors above.
Fund reviewUS equity markets delivered strong returns in the 12-month period, as taperingconcerns were outweighed by the strengthening economic recovery.
The Fund delivered a positive return but underperformed its benchmarkfor the review period. In terms of relative detractors, the consumerdiscretionary and the health care sectors were the most significantunderperforming sectors. In particular, overweight positions in Best Buy andGameStop in the consumer discretionary space and a lack of exposure toGilead Sciences in the health care sector detracted. In contrast, stock selectionin the industrials and consumer staples sectors helped performance, withoverweight positions in Raytheon in the industrial sector and Nu SkinEnterprises in the consumer staple space adding value.
Fund outlookWhile acknowledging that markets may remain volatile and not materiallyrise in the short term, we find no reason to change our constructive viewon US equity markets. The economic data thus far has not differed fromour expectations heading into the year. We see continued expansion in theUS and continued improvement in both Europe and Japan. Even if investorsbegin to extrapolate the current emerging market concerns into a widercrisis, we do not believe the risk to US markets would be significant. The USeconomy is mostly driven by domestic consumption and is therefore notdependent on the rest of the world for its growth.
12 month performance as at 31 January2014 2013 2012 2011 2010
JPM USA-Class Acc 16.6% 13.9% 4.7% 19.1% 14.6%
JPM USB-Class Acc 17.2% – – – –
JPM USC-Class Acc 17.4% – – – –
JPM USI-Class Acc 17.8% 15.2% 5.8% 20.0% 15.9%
JPM USX-Class Inc 18.5% 15.8% 6.4% 21.0% 17.0%
Benchmark Index 16.9% 15.8% 5.5% 21.9% 19.4%
Fund statisticsRisk and Reward Profile 6*
Fund size £368.0m
Benchmark Index S&P 500 Index (Net of 15% witholding tax)
Fund chargesA-Class Initial 3.00%, Annual 1.50%B-Class Initial Nil, Annual 1.00%C-Class Initial Nil, Annual 0.75%I-Class Initial Nil, Annual 0.60%X-Class On applicationA
Top ten holdings %Microsoft 3.8 Pfizer 3.3 Chevron 3.1 Amgen 2.5 Hewlett Packard 2.5 Boeing 2.4 Viacom ‘B’ Non-Voting 2.3 Wells Fargo 2.3 Discover Financial Services 2.3 Citigroup 2.2
Sector breakdown %Technology 17.8Consumer services 16.7Financials 16.2Health care 11.3Industrials 10.1Oil & gas 9.5Consumer goods 9.3Utilities 2.6Telecommunications 2.6Basic materials 1.8Futures (0.1)Net other assets 2.2
JPM US Fund
You should remember that past performance is not a guide to the future. The price of investments and the income from them may fall as well as rise andinvestors may not get back the full amount invested.
* For specific risks, including the risk and reward profile, please refer to the Key Investor information Document (KIID) available on the following websitehttp://am.jpmorgan.co.uk/investor/prices-and-factsheets/?list=all&tab=PricesAll equity indices stated as ‘Net’ are calculated net of tax as per the standard published approach by the index vendor unless stated otherwise.All performance returns are calculated using the quoted price of the accumulation or income shares. Performance returns are in Sterling.Source: J.P. Morgan.A As agreed from time to time between the ACD and the relevant JPMorgan Chase & Co. entity.
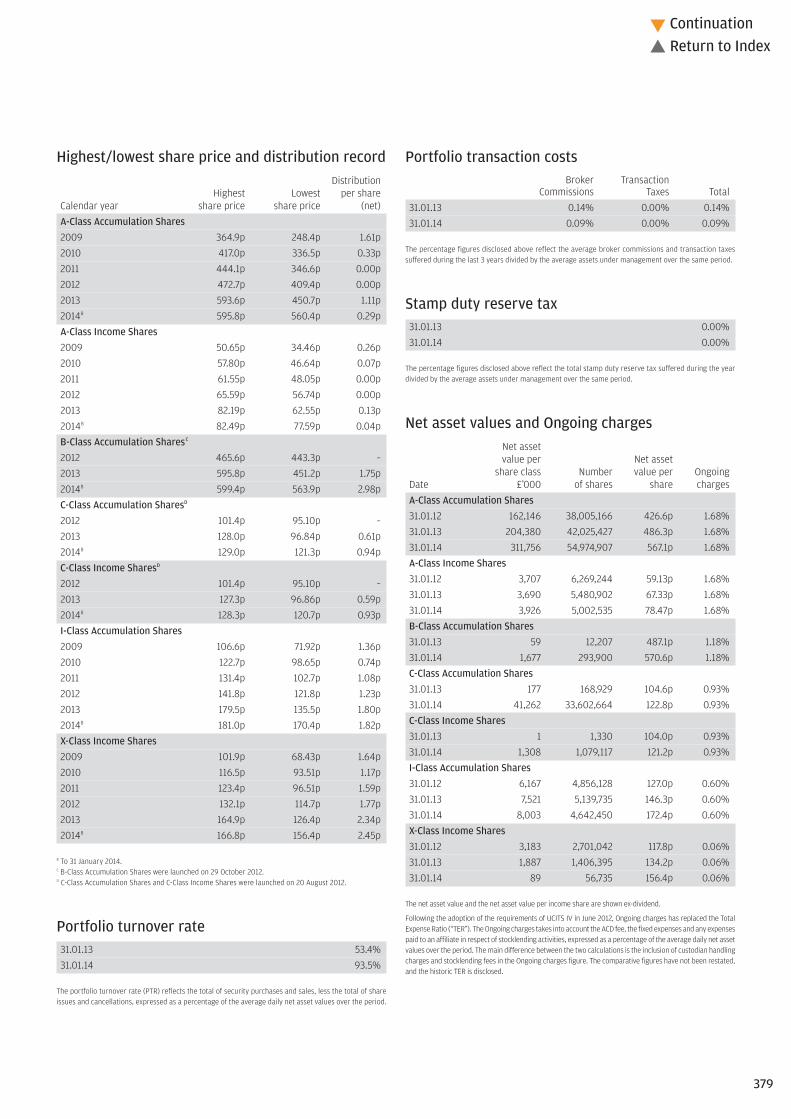
Highest/lowest share price and distribution recordDistribution
Highest Lowest per shareCalendar year share price share price (net)A-Class Accumulation Shares2009 364.9p 248.4p 1.61p2010 417.0p 336.5p 0.33p2011 444.1p 346.6p 0.00p2012 472.7p 409.4p 0.00p2013 593.6p 450.7p 1.11p2014B 595.8p 560.4p 0.29pA-Class Income Shares2009 50.65p 34.46p 0.26p2010 57.80p 46.64p 0.07p2011 61.55p 48.05p 0.00p2012 65.59p 56.74p 0.00p2013 82.19p 62.55p 0.13p2014B 82.49p 77.59p 0.04pB-Class Accumulation SharesC
2012 465.6p 443.3p – 2013 595.8p 451.2p 1.75p2014B 599.4p 563.9p 2.98pC-Class Accumulation SharesD
2012 101.4p 95.10p –2013 128.0p 96.84p 0.61p2014B 129.0p 121.3p 0.94pC-Class Income SharesD
2012 101.4p 95.10p – 2013 127.3p 96.86p 0.59p2014B 128.3p 120.7p 0.93pI-Class Accumulation Shares2009 106.6p 71.92p 1.36p2010 122.7p 98.65p 0.74p2011 131.4p 102.7p 1.08p2012 141.8p 121.8p 1.23p2013 179.5p 135.5p 1.80p2014B 181.0p 170.4p 1.82pX-Class Income Shares2009 101.9p 68.43p 1.64p2010 116.5p 93.51p 1.17p2011 123.4p 96.51p 1.59p2012 132.1p 114.7p 1.77p2013 164.9p 126.4p 2.34p2014B 166.8p 156.4p 2.45p
B To 31 January 2014.C B-Class Accumulation Shares were launched on 29 October 2012.D C-Class Accumulation Shares and C-Class Income Shares were launched on 20 August 2012.
Portfolio turnover rate31.01.13 53.4%31.01.14 93.5%
The portfolio turnover rate (PTR) reflects the total of security purchases and sales, less the total of shareissues and cancellations, expressed as a percentage of the average daily net asset values over the period.
Portfolio transaction costsBroker Transaction
Commissions Taxes Total31.01.13 0.14% 0.00% 0.14%31.01.14 0.09% 0.00% 0.09%
The percentage figures disclosed above reflect the average broker commissions and transaction taxessuffered during the last 3 years divided by the average assets under management over the same period.
Stamp duty reserve tax31.01.13 0.00%31.01.14 0.00%
The percentage figures disclosed above reflect the total stamp duty reserve tax suffered during the yeardivided by the average assets under management over the same period.
Net asset values and Ongoing chargesNet assetvalue per Net asset
share class Number value per OngoingDate £’000 of shares share chargesA-Class Accumulation Shares31.01.12 162,146 38,005,166 426.6p 1.68%31.01.13 204,380 42,025,427 486.3p 1.68%31.01.14 311,756 54,974,907 567.1p 1.68%A-Class Income Shares31.01.12 3,707 6,269,244 59.13p 1.68%31.01.13 3,690 5,480,902 67.33p 1.68%31.01.14 3,926 5,002,535 78.47p 1.68%B-Class Accumulation Shares31.01.13 59 12,207 487.1p 1.18%31.01.14 1,677 293,900 570.6p 1.18%C-Class Accumulation Shares31.01.13 177 168,929 104.6p 0.93%31.01.14 41,262 33,602,664 122.8p 0.93%C-Class Income Shares31.01.13 1 1,330 104.0p 0.93%31.01.14 1,308 1,079,117 121.2p 0.93%I-Class Accumulation Shares31.01.12 6,167 4,856,128 127.0p 0.60%31.01.13 7,521 5,139,735 146.3p 0.60%31.01.14 8,003 4,642,450 172.4p 0.60%X-Class Income Shares31.01.12 3,183 2,701,042 117.8p 0.06%31.01.13 1,887 1,406,395 134.2p 0.06%31.01.14 89 56,735 156.4p 0.06%
The net asset value and the net asset value per income share are shown ex-dividend.
Following the adoption of the requirements of UCITS IV in June 2012, Ongoing charges has replaced the TotalExpense Ratio (“TER”). The Ongoing charges takes into account the ACD fee, the fixed expenses and any expensespaid to an affiliate in respect of stocklending activities, expressed as a percentage of the average daily net assetvalues over the period. The main difference between the two calculations is the inclusion of custodian handlingcharges and stocklending fees in the Ongoing charges figure. The comparative figures have not been restated,and the historic TER is disclosed.
379
Continuation�
� Return to Index
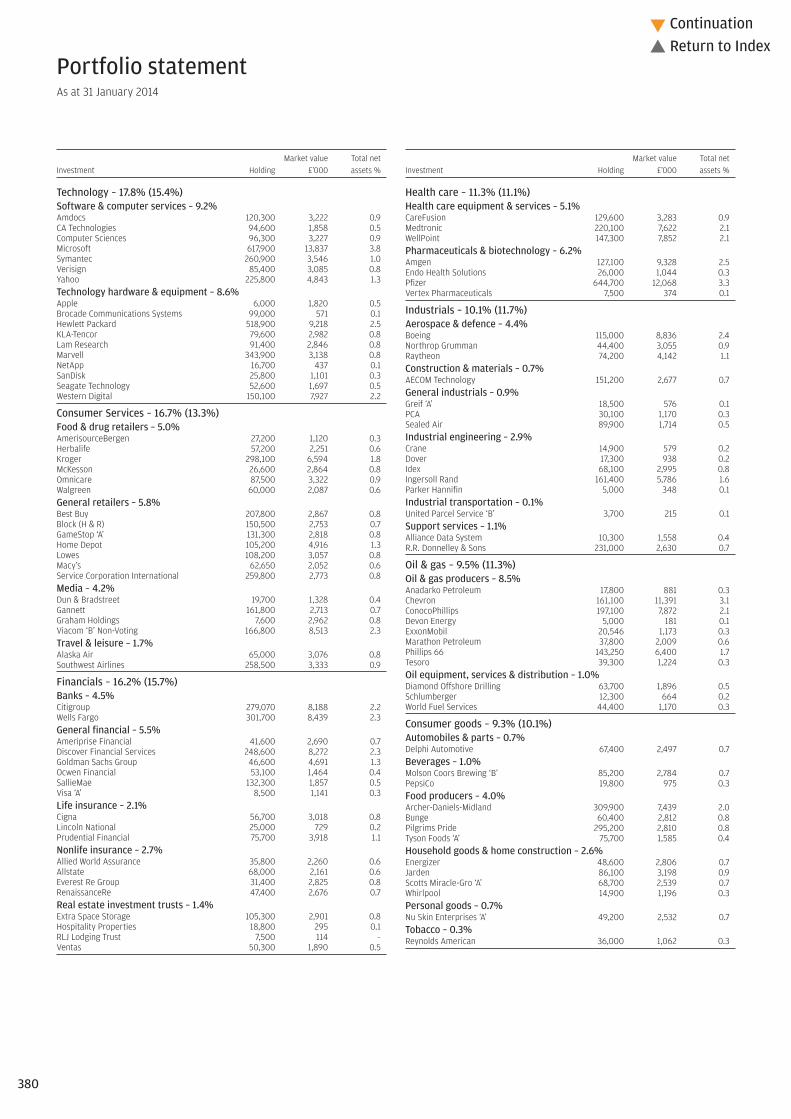
Technology – 17.8% (15.4%)Software & computer services – 9.2%Amdocs 120,300 3,222 0.9 CA Technologies 94,600 1,858 0.5 Computer Sciences 96,300 3,227 0.9 Microsoft 617,900 13,837 3.8 Symantec 260,900 3,546 1.0 Verisign 85,400 3,085 0.8 Yahoo 225,800 4,843 1.3 Technology hardware & equipment – 8.6%Apple 6,000 1,820 0.5 Brocade Communications Systems 99,000 571 0.1 Hewlett Packard 518,900 9,218 2.5 KLA-Tencor 79,600 2,982 0.8 Lam Research 91,400 2,846 0.8 Marvell 343,900 3,138 0.8 NetApp 16,700 437 0.1 SanDisk 25,800 1,101 0.3 Seagate Technology 52,600 1,697 0.5 Western Digital 150,100 7,927 2.2
Consumer Services – 16.7% (13.3%)Food & drug retailers – 5.0%AmerisourceBergen 27,200 1,120 0.3 Herbalife 57,200 2,251 0.6 Kroger 298,100 6,594 1.8 McKesson 26,600 2,864 0.8 Omnicare 87,500 3,322 0.9 Walgreen 60,000 2,087 0.6 General retailers – 5.8%Best Buy 207,800 2,867 0.8 Block (H & R) 150,500 2,753 0.7 GameStop ‘A’ 131,300 2,818 0.8 Home Depot 105,200 4,916 1.3 Lowes 108,200 3,057 0.8 Macy’s 62,650 2,052 0.6 Service Corporation International 259,800 2,773 0.8 Media – 4.2%Dun & Bradstreet 19,700 1,328 0.4 Gannett 161,800 2,713 0.7 Graham Holdings 7,600 2,962 0.8 Viacom ‘B’ Non-Voting 166,800 8,513 2.3 Travel & leisure – 1.7%Alaska Air 65,000 3,076 0.8 Southwest Airlines 258,500 3,333 0.9
Financials – 16.2% (15.7%)Banks – 4.5%Citigroup 279,070 8,188 2.2 Wells Fargo 301,700 8,439 2.3 General financial – 5.5%Ameriprise Financial 41,600 2,690 0.7 Discover Financial Services 248,600 8,272 2.3 Goldman Sachs Group 46,600 4,691 1.3 Ocwen Financial 53,100 1,464 0.4 SallieMae 132,300 1,857 0.5 Visa ‘A’ 8,500 1,141 0.3 Life insurance – 2.1%Cigna 56,700 3,018 0.8 Lincoln National 25,000 729 0.2 Prudential Financial 75,700 3,918 1.1 Nonlife insurance – 2.7%Allied World Assurance 35,800 2,260 0.6 Allstate 68,000 2,161 0.6 Everest Re Group 31,400 2,825 0.8 RenaissanceRe 47,400 2,676 0.7 Real estate investment trusts – 1.4%Extra Space Storage 105,300 2,901 0.8 Hospitality Properties 18,800 295 0.1 RLJ Lodging Trust 7,500 114 –Ventas 50,300 1,890 0.5
Health care – 11.3% (11.1%)Health care equipment & services – 5.1%CareFusion 129,600 3,283 0.9 Medtronic 220,100 7,622 2.1 WellPoint 147,300 7,852 2.1Pharmaceuticals & biotechnology – 6.2%Amgen 127,100 9,328 2.5 Endo Health Solutions 26,000 1,044 0.3 Pfizer 644,700 12,068 3.3 Vertex Pharmaceuticals 7,500 374 0.1
Industrials – 10.1% (11.7%)Aerospace & defence – 4.4%Boeing 115,000 8,836 2.4 Northrop Grumman 44,400 3,055 0.9 Raytheon 74,200 4,142 1.1 Construction & materials – 0.7%AECOM Technology 151,200 2,677 0.7 General industrials – 0.9%Greif ‘A’ 18,500 576 0.1 PCA 30,100 1,170 0.3 Sealed Air 89,900 1,714 0.5 Industrial engineering – 2.9%Crane 14,900 579 0.2 Dover 17,300 938 0.2 Idex 68,100 2,995 0.8 Ingersoll Rand 161,400 5,786 1.6 Parker Hannifin 5,000 348 0.1 Industrial transportation – 0.1%United Parcel Service ‘B’ 3,700 215 0.1 Support services – 1.1%Alliance Data System 10,300 1,558 0.4 R.R. Donnelley & Sons 231,000 2,630 0.7
Oil & gas – 9.5% (11.3%)Oil & gas producers – 8.5%Anadarko Petroleum 17,800 881 0.3 Chevron 161,100 11,391 3.1 ConocoPhillips 197,100 7,872 2.1 Devon Energy 5,000 181 0.1 ExxonMobil 20,546 1,173 0.3 Marathon Petroleum 37,800 2,009 0.6 Phillips 66 143,250 6,400 1.7 Tesoro 39,300 1,224 0.3 Oil equipment, services & distribution – 1.0%Diamond Offshore Drilling 63,700 1,896 0.5 Schlumberger 12,300 664 0.2 World Fuel Services 44,400 1,170 0.3
Consumer goods – 9.3% (10.1%)Automobiles & parts – 0.7%Delphi Automotive 67,400 2,497 0.7 Beverages – 1.0%Molson Coors Brewing ‘B’ 85,200 2,784 0.7 PepsiCo 19,800 975 0.3 Food producers – 4.0%Archer-Daniels-Midland 309,900 7,439 2.0 Bunge 60,400 2,812 0.8 Pilgrims Pride 295,200 2,810 0.8 Tyson Foods ‘A’ 75,700 1,585 0.4 Household goods & home construction – 2.6%Energizer 48,600 2,806 0.7 Jarden 86,100 3,198 0.9 Scotts Miracle-Gro ‘A’ 68,700 2,539 0.7 Whirlpool 14,900 1,196 0.3 Personal goods – 0.7%Nu Skin Enterprises ‘A’ 49,200 2,532 0.7 Tobacco – 0.3%Reynolds American 36,000 1,062 0.3
Portfolio statement As at 31 January 2014
Market value Total netInvestment Holding £’000 assets %
Market value Total netInvestment Holding £’000 assets %
380
Continuation�
� Return to Index

Utilities – 2.6% (2.9%)Electricity – 1.4%AES 346,200 2,932 0.8 Nextera Energy 27,000 1,492 0.4 Pinnacle West Capital 29,100 923 0.2 Gas, water & multiutilities – 1.2%AGL Resources 49,700 1,442 0.4 UGI 111,700 2,876 0.8
Telecommunications – 2.6% (3.2%)Fixed line telecommunications – 2.6%AT&T 302,800 6,133 1.7 Verizon Communications 120,300 3,480 0.9
Basic materials – 1.8% (2.4%)Chemicals – 1.8%LyondellBasell Industries 70,700 3,354 0.9 PPG Industries 29,031 3,258 0.9
Futures – (0.1)% (0.0%)S&P500 E-Mini Futures Mar 2014 161 (255) (0.1)
Investment assets (including investment liabilities) 359,804 97.8
Net other assets 8,217 2.2
Net assets 368,021 100.0
Unless otherwise stated the above securities are admitted to official stock exchange listings or trade on aregulated market.
The comparative percentage figures in brackets are at 31 January 2013.
Portfolio statement – continuedAs at 31 January 2014
Market value Total netInvestment Holding £’000 assets %
381
Continuation�
� Return to Index

£’000
Total of all purchases for the year (Note 10) 306,953
Major purchases Cost
Hewlett Packard 9,322Boeing 8,779WellPoint 7,918Archer-Daniels-Midland 7,393Western Digital 7,287Microsoft 6,580Medtronic 6,125Kroger 6,034AT&T 5,622Chevron 5,564ConocoPhillips 5,560Lilly (Eli) & Co 5,166Phillips 66 5,132Viacom ‘B’ Non-Voting 5,082Best Buy 5,043Yahoo 5,008Lowes 4,310Cisco Systems 4,289Pfizer 4,076KLA-Tencor 3,648
£’000
Total of all sales for the year (Note 10) 196,709
Major sales Proceeds
Apple 10,670ExxonMobil 9,832Lilly (Eli) & Co 6,184Honeywell International 5,881Macy’s 5,475Cisco Systems 4,309Symantec 4,136Covidien 3,800Wal-Mart Stores 3,692Philip Morris International 3,505United Health Group 3,119CenturyLink 2,932Huntington Ingalls Industries 2,758Qualcomm 2,694General Mills 2,663Campbell Soup 2,651Marathon Oil 2,602Lender Processing Services 2,593Bemis 2,581Brinker International 2,574
Portfolio movements For the year ending 31 January 2014
382
Continuation�
� Return to Index

Statement of total returnFor the year ending 31 January
2014 2013£’000 £’000 £’000 £’000
Income
Net capital gains (Note 1) 39,043 25,859
Revenue (Note 2) 6,022 4,244
Expenses (Note 3) (4,919) (3,085)
Net revenue before taxation 1,103 1,159
Taxation (Note 4) (828) (581)
Net revenue after taxation 275 578
Total return before distributions 39,318 26,437
Finance costs: Distributions (Note 5) (388) (574)
Change in net assets attributable to shareholders from investment activities 38,930 25,863
Statement of change in net assets attributable to shareholdersFor the year ending 31 January
2014 2013£’000 £’000 £’000 £’000
Opening net assets attributable to shareholders 217,715 175,203
Amounts receivable on issue of shares 212,165 125,766
Amounts payable on cancellation of shares (101,358) (109,677)
110,807 16,089
Change in net assets attributable to shareholders from investment activities (see above) 38,930 25,863
Retained distributions on accumulation shares 569 560
Closing net assets attributable to shareholders 368,021 217,715
Balance sheetAs at 31 January
2014 2013£’000 £’000 £’000 £’000
ASSETS
Investment assets 360,059 211,411
Debtors (Note 7) 7,069 2,053
Cash and bank balances (Note 8) 14,828 6,021
Total other assets 21,897 8,074
Total assets 381,956 219,485
LIABILITIES
Investment liabilities (255) –
Creditors (Note 9) (13,667) (1,730)
Distribution payable on income shares (13) (40)
Total other liabilities (13,680) (1,770)
Total liabilities (13,935) (1,770)
Net assets attributable to shareholders 368,021 217,715
The notes to these financial statements are shown on pages 384 to 385.
Financial statements
383
Continuation�
� Return to Index

1. Net capital gains2014 2013
£’000 £’000Currency (losses)/gains (797) 125Derivative contracts 1,378 297Non-derivative securities 38,462 25,437Net capital gains 39,043 25,859
2. Revenue2014 2013
£’000 £’000Income from overseas equity investments 6,015 4,239Interest on bank and term deposits 7 5Total revenue 6,022 4,244
3. Expenses2014 2013
£’000 £’000Payable to the ACD or associate of the ACD:ACD fee 4,387 2,757Fixed expenses 532 328 Total expenses 4,919 3,085
4. Taxation2014 2013
£’000 £’000a) Analysis of charge in the yearOverseas tax suffered 828 581Current year tax charge (Note 4b) 828 581
b) Factors affecting the tax charge for the yearThe tax assessed for the year is higher than the standard rate of corporation tax inthe UK for an Open-Ended Investment Company (OEIC) (20%). The differences areexplained below.
Net revenue before taxation 1,103 1,159Corporation tax at 20% 221 232
Effects of:Dividends not subject to corporation tax (1,173) (835)Excess expenses for which no relief taken 957 603Overseas tax suffered 828 581Overseas tax expensed (5) –
607 349Current year tax charge (Note 4a) 828 581
No deferred tax asset has been recognised in the financial statements. At the yearend date, the Fund had a potential unrecognised deferred tax asset of £2,747,679(31.01.13: £1,790,547) in relation to £13,738,393 (31.01.13: £8,952,733) of excessmanagement expenses which would only be utilised to reduce the tax charge if theFund had an excess of unfranked income over expenses in a future period. There isno excess of unfranked income expected in the future.
5. Finance costsDistributionsThe distributions take account of amounts receivable on the issue of shares andamounts payable on the cancellation of shares and comprise:
2014 2013£’000 £’000
Final dividend distribution 582 600Add: Amounts payable on cancellation of shares 94 116Deduct: Amounts receivable on issue of shares (288) (142)Total finance costs 388 574
Details of the distribution per share are set out on page 386.
6. Movement between net revenue after taxation and distributions2014 2013
£’000 £’000Net revenue after taxation 275 578Add: Undistributed revenue brought forward 4 –Deduct: Undistributed revenue carried forward (4) (4)Equalisation on conversions 113 –
388 574
7. Debtors2014 2013
£’000 £’000Accrued income 216 231Due from the ACD for shares created 6,846 387Overseas tax recoverable 7 3Sales awaiting settlement – 1,432Total debtors 7,069 2,053
8. Cash and bank balances2014 2013
£’000 £’000Amounts held at futures clearing houses
and brokers 1,123 299Cash and bank balances 13,705 5,722Total cash and bank balances 14,828 6,021
9. Creditors2014 2013
£’000 £’000Accrued expenses 494 290Due to the ACD for shares cancelled 948 640Purchases awaiting settlement 12,225 800Total creditors 13,667 1,730
Notes to the financial statements for the year ending 31 January 2014
384
Continuation�
� Return to Index

10. Portfolio transaction costs2014 2013
£’000 £’000Analysis of total purchase costs
Purchases in year before transaction costs 306,820 171,843
Commissions 133 103Total purchase costs 133 103Gross purchases total 306,953 171,946
Analysis of total sale costs
Gross sales before transaction costs 196,799 156,893
Commissions (86) (84)Taxes (4) (3)Total sale costs (90) (87)Total sales net of transaction costs 196,709 156,806
11. Related party transactionsJPMorgan Funds Limited, as Authorised Corporate Director (“ACD”), is a relatedparty, and acts as principal in respect of all transactions of shares in the Company.The aggregate monies received through issue, and paid on cancellation, aredisclosed in the Statement of Change in Net Assets Attributable to Shareholders.
The balance due from the ACD and their associates at the year end date in respectof related party transactions was £5,403,786 (31.01.13: £543,700). Details ofrelated party transactions are given under note 13 on page 413.
The gross stocklending income received was £nil (31.01.13: £167), with feesdeducted of £nil (31.01.13: £29).
The following parties held a material interest in the Fund at the year end date:– Cofunds Nominees Ltd 10.77% (31.01.13: 12.52%)– Funds Direct Nominees Limited 10.61% (31.01.13: 3.46%)
12. Financial instrumentsCurrency exposuresA substantial proportion of the net assets of the Fund are denominated incurrencies other than sterling, with the effect that the Balance sheet and totalreturn can be significantly affected by currency movements.
Net foreign currency assetsMonetary Non-monetary
Total exposures exposuresCurrency £’000 £’000 £’000
31.01.14US Dollar 362,624 2,820 359,804Euro 7 7 –
31.01.13US Dollar 218,292 6,881 211,411Euro 7 7 –
Interest rate riskAt the year end date, 4.0% (31.01.13: 2.8%) of the Fund’s net assets by value wereinterest bearing, carrying a (fixed/floating) rate.
For consideration of other risks including liquidity, pricing and credit risk, pleaserefer to the notes to the aggregated financial statements, pages 413 to 414.
13. Share classesThe Fund currently has five share classes; Class A Shares, Class B Shares, Class CShares, Class I Shares and Class X Shares. The Authorised Corporate Director’s(ACD) fee and fixed expenses charge are shown below.
ACD fee Fixed expensesClass A shares: 1.50% 0.18%Class B shares: 1.00% 0.18%Class C shares: 0.75% 0.18%Class I shares: 0.60% 0.00%Class X shares: 0.00% 0.06%
The net asset value of each share class, the net asset value per share and thenumber of shares in each class are shown on page 379. All classes have the samerights on winding up.
14. Derivatives The Fund enters into derivative transactions in the form of futures for the purposeof efficient portfolio management. The commitment approach has been used tocalculate the global exposure.
Further information on the derivative risks can be found in the notes to theaggregated financial statements on page 414.
15. Contingent liabilities and capital commitmentsAt the balance sheet date there were no contingent liabilities or capitalcommitments (2013: none).
Notes to the financial statements – continued
385
Continuation�
� Return to Index

Final distribution in pence per share
Group 1 – Shares purchased prior to 1 February 2013Group 2 – Shares purchased 1 February 2013 to 31 January 2014
DistributionGross Tax Net payable paid
revenue at 10% revenue Equalisation 30.04.14 30.04.13
A-Class Accumulation Shares
Group 1 0.322222 0.032222 0.290000 – 0.290000 1.110000
Group 2 0.000000 0.000000 0.000000 0.290000 0.290000 1.110000
A-Class Income Shares
Group 1 0.044444 0.004444 0.040000 – 0.040000 0.130000
Group 2 0.000000 0.000000 0.000000 0.040000 0.040000 0.130000
B-Class Accumulation Shares
Group 1 3.311111 0.331111 2.980000 – 2.980000 1.750000
Group 2 0.837647 0.083765 0.753882 2.226118 2.980000 1.750000
C-Class Accumulation Shares
Group 1 1.044444 0.104444 0.940000 – 0.940000 0.610000
Group 2 0.189111 0.018911 0.170200 0.769800 0.940000 0.610000
C-Class Income Shares
Group 1 1.033333 0.103333 0.930000 – 0.930000 0.590000
Group 2 0.234201 0.023420 0.210781 0.719219 0.930000 0.590000
I-Class Accumulation Shares
Group 1 2.022222 0.202222 1.820000 – 1.820000 1.800000
Group 2 0.612783 0.061278 0.551505 1.268495 1.820000 1.800000
X-Class Income Shares
Group 1 2.722222 0.272222 2.450000 – 2.450000 2.340000
Group 2 2.722222 0.272222 2.450000 0.000000 2.450000 2.340000
Equalisation applies only to shares purchased during the distribution period (group 2 shares). It is the average amount of revenue included in the purchase price of all group 2 shares and is refunded to holders of these
shares as a return of capital. Being capital it is not liable to income tax but must be deducted from the cost of shares for capital gains tax purposes.
Distribution table
386
� Return to Index

Investment objective and policyTo provide a portfolio designed to achieve income by investing primarily inUS Equities in any economic sector whilst participating in long term capitalgrowth.
US Equities are securities issued by companies that are incorporated underthe laws of, and have their registered office in, the US, or that derive thepredominant part of their economic activity from the US, even if listedelsewhere.
Financial Derivative Instruments (derivatives) may be used for the purposeof Efficient Portfolio Management, including hedging, where appropriate(see section 11.14 for Risk Warnings on derivatives in the Prospectus).Subject to at least 60 days notice to shareholders, the Fund may usederivatives for investment purposes which may change the risk profile ofthe Fund.
Other instruments as permitted in the stated investment and borrowingpowers of the Company including, but not limited to, fixed interest securities,cash and cash equivalents may be held on an ancillary basis, as appropriate.
Risk profileThe value of your investment may fall as well as rise and you may get backless than you originally invested.
The value of Equity and Equity-Linked Securities may fluctuate in responseto the performance of individual companies and general market conditions.
As the portfolio of the Fund is primarily focused on generating income, itmay bear little resemblance to the composition of its Benchmark.
The single market in which the Fund primarily invests, in this case the US,may be subject to particular political and economic risks and, as a result,the Fund may be more volatile than more broadly diversified funds.
For investors in Share Classes which are not hedged to Sterling movementsin currency exchange rates can adversely affect the return of your investment.
Investors in GBP Hedged Share Classes should be aware that any currencyhedging process may not give a precise hedge. Where currency hedging isundertaken, whilst it may protect an investor in Hedged Shares against adecrease in the value of the currency being hedged, it may also prevent theinvestor from participating in an increase in the value of that currency. Pleaserefer to Part 1: Section 1.3 of the Prospectus for more information on HedgedShare Classes.
This Fund charges the annual fee of the Authorised Corporate Director (ACD)against capital, which will increase the amount of income available fordistribution to Shareholders, but may constrain capital growth. It may alsohave tax implications for certain investors.
Please refer to Part 11 of the Prospectus for details of the general risk factorsaffecting this Fund in addition to the specific risk factors above.
Fund reviewUS equity markets delivered strong returns in the 12-month period, as taperingconcerns were outweighed by the strengthening economic recovery.
The Fund delivered a positive return but underperformed its benchmarkfor the 12-month period. In terms of relative detractors, health care wasthe most significant underperforming sector. In particular, a lack of exposureto Gilead Sciences and Biogen IDEC negatively impacted relative performance.In contrast, strong stock selection in the financials and materials sectorsproved beneficial, with names such as Prudential Financial and Wells Fargoadding value to performance.
Fund outlookWhile acknowledging that markets may remain volatile and not materiallyrise in the short term, we find no reason to change our constructive viewon US equity markets. The economic data thus far has not differed fromour expectations heading into the year. We see continued expansion in theUS and continued improvement in both Europe and Japan. Even if investorsbegin to extrapolate the current emerging market concerns into a widercrisis, we do not believe the risk to US markets would be significant. The USeconomy is mostly driven by domestic consumption and is therefore notdependent on the rest of the world for its growth.
12 month performance as at 31 January2014 2013 2012 2011 2010
JPM US Equity Income A-Class Acc 14.1% 14.6% 11.0% 20.2% 8.0%
JPM US Equity Income B-Class Inc 14.7% 15.2% 11.5% 20.8% –
JPM US Equity Income C-Class Inc 15.0% 15.5% 11.9% 21.2% 8.2%
JPM US Equity Income X-Class AccA – – – – –
Benchmark Index 16.9% 15.8% 5.5% 21.9% 19.4%
JPM US Equity IncomeA-Class Inc (GBP Hedged) 19.3% 14.4% 10.2% 19.9% –
JPM US Equity Income C Class Inc (GBP Hedged) 20.0% – – – –
Hedged Benchmark Index 21.3% 16.1% 3.3% 19.3% –
JPM US Equity Income Fund
You should remember that past performance is not a guide to the future. The price of investments and the income from them may fall as well as rise andinvestors may not get back the full amount invested. All equity indices stated as ‘Net’ are calculated net of tax as per the standard published approach by the index vendor unless stated otherwise.All performance returns are calculated using the quoted price of the accumulation or income shares. Performance returns are in Sterling.Source: J.P. Morgan.A X-Class Accumulation Shares were launched on 11 June 2013, therefore 12 month performance to 31 January is not available. 387
Continuation�
� Return to Index

Fund statisticsRisk and Reward Profile 6*
Fund size £2,001.2m
Benchmark Index S&P 500 Index (Net of 15% witholding tax) Hedged Benchmark Index S&P 500 Index (Net of 15% witholding tax)
hedged to GBP
Fund chargesA-Class Initial 3.00%, Annual 1.50%B-Class Initial Nil, Annual 1.00%C-Class Initial Nil, Annual 0.75%X-Class On applicationB
Top ten holdings %Wells Fargo 4.4Johnson & Johnson 3.7Pfizer 2.9ConocoPhillips 2.4ExxonMobil 2.3Merck & Co 2.2Occidental Petroleum 2.2PNC Financial Services Group 2.1Chevron 2.0Philip Morris International 1.7
Sector breakdown %Financials 23.7Industrials 19.2Health care 13.1Consumer services 11.9Oil & gas 10.7Consumer goods 9.5Utilities 6.4Basic materials 2.4Telecommunications 1.4Forward currency contracts GBP Hedged share classes 0.0Net other assets 1.7
The forward exchange contracts are only entered into by the A-Class Income GBP Hedged shares and theC-Class Income GBP Hedged shares.
Highest/lowest share price and distribution recordDistribution
Highest Lowest per shareCalendar year share price share price (net)A-Class Accumulation Shares2009 58.98p 42.99p 1.18p2010 70.31p 56.37p 1.66p2011 74.94p 60.09p 1.69p2012 82.45p 74.03p 1.94p2013 103.9p 79.25p 2.34p2014C 101.8p 97.09p 0.50pA-Class Income Shares2009 57.70p 42.90p 1.15p2010 66.99p 55.04p 1.59p2011 69.68p 56.20p 1.60p2012 75.25p 68.18p 1.79p2013 92.42p 71.88p 2.10p2014C 90.12p 85.92p 0.45pA-Class Income GBP Hedged SharesD
2010 65.35p 53.25p 1.15p2011 70.66p 58.45p 1.62p2012 76.53p 67.73p 1.79p2013 93.87p 74.13p 2.08p2014C 94.15p 90.04p 0.46pB-Class Accumulation SharesE
2011 104.8p 94.69p –2012 115.8p 103.5p 2.78p2013 146.5p 111.4p 3.27p2014C 144.0p 137.3p 0.72pB-Class Income SharesF
2009 112.3p 83.31p 2.12p2010 131.0p 107.2p 3.11p2011 137.0p 110.3p 3.18p2012 148.5p 134.3p 3.56p2013 183.1p 142.0p 4.15p2014C 179.0p 170.7p 0.89pC-Class Accumulation SharesG
2011 102.2p 81.67p 0.68p2012 113.1p 101.0p 2.73p2013 143.4p 108.9p 3.20p2014C 141.0p 134.5p 0.70pC-Class Income SharesH
2009 113.3p 83.86p 2.20p2010 132.6p 108.2p 3.17p2011 139.0p 111.7p 3.25p2012 151.0p 136.3p 3.66p2013 186.4p 144.4p 4.22p2014C 182.4p 174.0p 0.91p
* For specific risks, including the risk and reward profile, please refer to the Key Investor information Document (KIID) available on the following websitehttp://am.jpmorgan.co.uk/investor/prices-and-factsheets/?list=all&tab=PricesB As agreed from time to time between the ACD and the relevant JPMorgan Chase & Co. entity.388
Continuation�
� Return to Index

Highest/lowest share price and distribution record(continued)
Highest Lowest DistributionCalendar year share price share price per shareC-Class Income GBP Hedged SharesI
2012 103.2p 95.87p 0.62p2013 127.7p 100.3p 2.82p2014C 128.0p 122.5p 0.63pX-Class Accumulation SharesJ
2013 107.7p 97.30p 0.80p2014C 106.4p 101.5p 0.56p
C To 31 January 2014.D A-Class Income GBP Hedged Shares were launched on 1 February 2010.E B-Class Accumulation Shares were launched on 31 October 2011.F B-Class Income Shares were launched on 3 February 2009.G C-Class Accumulation Shares were launched on 11 July 2011.H C-Class Income Shares were launched on 15 January 2009.I C-Class Income GBP Hedged Shares were launched on 20 August 2012.J X-Class Accumulation Shares were launched on 11 June 2013.
Portfolio turnover rate31.01.13 58.4%31.01.14 52.9%
The portfolio turnover rate (PTR) reflects the total of security purchases and sales, less the total of shareissues and cancellations, expressed as a percentage of the average daily net asset values over the period.
Portfolio transaction costsBroker Transaction
Commissions Taxes Total31.01.13 0.07% 0.00% 0.07%31.01.14 0.05% 0.00% 0.05%
The percentage figures disclosed above reflect the average broker commissions and transaction taxessuffered during the last 3 years divided by the average assets under management over the same period.
Stamp duty reserve tax31.01.13 0.00%31.01.14 0.00%
The percentage figures disclosed above reflect the total stamp duty reserve tax suffered during the yeardivided by the average assets under management over the same period.
Net asset values and Ongoing chargesNet assetvalue per Net asset
share class Number value per OngoingDate £’000 of shares share chargesA-Class Accumulation Shares31.01.12 25,917 34,480,452 75.16p 1.68%31.01.13 208,692 241,734,261 86.33p 1.68%31.01.14 238,821 242,723,927 98.39p 1.68%A-Class Income Shares31.01.12 234,325 337,430,121 69.44p 1.68%31.01.13 154,464 198,897,575 77.66p 1.68%31.01.14 150,638 173,897,830 86.62p 1.68%A-Class Income GBP Hedged Shares31.01.12 30,155 43,398,046 69.49p 1.68%31.01.13 29,506 38,026,151 77.59p 1.68%31.01.14 78,123 86,342,242 90.48p 1.68%B-Class Accumulation Shares31.01.12 325 308,621 105.2p 1.15%31.01.13 2,776 2,285,350 121.5p 1.18%31.01.14 6,663 4,789,634 139.1p 1.18%B-Class Income Shares31.01.12 10,929 8,000,199 136.6p 1.15%31.01.13 12,887 8,393,531 153.5p 1.18%31.01.14 28,520 16,571,846 172.1p 1.18%C-Class Accumulation Shares31.01.12 3,866 3,769,391 102.6p 0.87%31.01.13 23,348 19,668,169 118.7p 0.93%31.01.14 173,609 127,376,231 136.3p 0.93%C-Class Income Shares31.01.12 199,202 143,751,880 138.6p 0.87%31.01.13 718,959 460,496,735 156.1p 0.93%31.01.14 1,206,770 687,942,970 175.4p 0.93%C-Class Income GBP Hedged Shares31.01.13 25,517 24,297,863 105.0p 0.93%31.01.14 46,582 37,832,005 123.1p 0.93%X-Class Accumulation Shares31.01.14 71,518 69,538,610 102.9p 0.06%
The net asset value and the net asset value per income share are shown ex-dividend.
Following the adoption of the requirements of UCITS IV in June 2012, Ongoing charges has replaced theTotal Expense Ratio (“TER”). The Ongoing charges takes into account the ACD fee, the fixed expenses andany expenses paid to an affiliate in respect of stocklending activities, expressed as a percentage of theaverage daily net asset values over the period. The main difference between the two calculations is theinclusion of custodian handling charges and stocklending fees in the Ongoing charges figure. The comparativefigures have not been restated, and the historic TER is disclosed.
389
Continuation�
� Return to Index

Financials – 23.7% (23.0%)Banks – 9.8%BB&T 896,950 20,637 1.0Cullen Frost Bankers 247,360 11,253 0.6M&T Bank 243,480 16,688 0.8PNC Financial Services Group 835,490 41,420 2.1US Bancorp Delaware 746,350 18,188 0.9Wells Fargo 3,160,100 88,393 4.4General financial – 5.4%Ameriprise Financial 224,880 14,541 0.7BlackRock ‘A’ 132,830 24,646 1.2CME Group ‘A’ 604,414 27,284 1.4Northern Trust 612,360 22,735 1.1T. Rowe Price 422,180 20,397 1.0Life insurance – 2.3%Metlife 659,080 19,929 1.0Prudential Financial 512,690 26,535 1.3Nonlife insurance – 5.2%Arthur J. Gallagher & Co 632,580 17,890 0.9Cincinnati Financial 341,839 10,218 0.5Hartford Financial Services Group 1,132,040 23,212 1.2The Travelers Companies 669,210 33,478 1.7Validus 778,020 17,570 0.9Real estate – 1.0%Alexandria Real Estate Equities 188,910 7,949 0.4AvalonBay Communities 83,810 6,220 0.3Simon Property Group 64,780 6,017 0.3
Industrials – 19.2% (9.2%)Aerospace & defence – 1.5%United Technologies 436,720 30,433 1.5Electronics & electrical equipment – 0.4%Emerson Electric 181,110 7,324 0.4General industrials – 2.3%3M 272,190 21,171 1.1Honeywell International 426,190 23,739 1.2Industrial engineering – 2.6%Illinois Tool Works 446,240 21,491 1.1Paccar 885,060 30,887 1.5Industrial transportation – 2.4%Norfolk Southern 278,920 15,719 0.8Union Pacific 87,330 9,355 0.5United Parcel Service ‘B’ 378,120 22,012 1.1Support services – 2.7%Accenture ‘A’ 388,300 19,040 0.9Automatic Data Processing 373,420 17,535 0.9Fidelity National Information Services 573,620 18,018 0.9Software & computer services – 1.1%Microsoft 998,130 22,352 1.1Technology hardware & equipment – 6.2%Analog Devices 669,590 19,882 1.0Apple 110,930 33,641 1.7KLA-Tencor 580,630 21,755 1.1Qualcomm 319,510 14,229 0.7Texas Instruments 623,160 16,159 0.8Xilinx 634,600 18,032 0.9
Health care – 13.1% (11.0%)Health care equipment & services – 1.9%Baxter International 415,660 17,491 0.9Becton Dickinson & Co 308,760 20,254 1.0Pharmaceuticals & biotechnology – 11.2%AbbVie 607,920 17,839 0.9Bristol-Myers Squibb 965,100 29,599 1.5Johnson & Johnson 1,366,040 74,271 3.7Merck & Co 1,333,230 43,360 2.2Pfizer 3,060,283 57,284 2.9
Consumer services – 11.9% (13.3%)General retailers – 4.4%Gap 682,670 15,777 0.8Home Depot 468,240 21,882 1.1L Brands 557,130 17,821 0.9Macy’s 329,870 10,804 0.5Tiffany & Co 145,980 7,420 0.4Williams-Sonoma 421,719 13,582 0.7Media – 4.7%Comcast ‘A’ (Special) 561,230 17,802 0.9McGraw-Hill 327,990 15,294 0.8Omnicom Group 485,590 21,817 1.1Time Warner 646,350 24,925 1.2Time Warner Cable 164,750 13,429 0.7Travel & leisure – 2.8%Brinker International 429,310 12,655 0.6Cinemark 605,920 10,834 0.5Dunkin Brands 337,171 9,464 0.5McDonald’s 160,180 9,128 0.5Yum Brands 366,350 14,824 0.7
Oil & gas – 10.7% (12.0%)Oil & gas producers – 9.8%Chevron 575,340 40,681 2.0ConocoPhillips 1,213,990 48,487 2.4ExxonMobil 812,620 46,399 2.3Marathon Petroleum 350,880 18,649 0.9Occidental Petroleum 807,500 43,310 2.2Oil equipment, services & distribution – 0.9%Kinder Morgan 391,130 8,153 0.4Williams Companies 410,450 10,007 0.5
Consumer goods – 9.5% (10.3%)Automobiles & parts – 0.9%Genuine Parts 375,050 18,696 0.9Beverages – 1.0%Coca-Cola 901,560 20,913 1.0Food producers – 2.0%Hershey 227,572 13,718 0.7Mondelez International 892,210 17,845 0.9Smucker (J.M.) 136,450 8,114 0.4Household goods – 2.2%Procter & Gamble 632,530 29,533 1.5Snap-On 112,131 6,862 0.3Tupperware Brands 178,220 8,578 0.4Personal goods – 0.9%VF 508,620 18,352 0.9Tobacco – 2.5%Lorrilard 516,260 15,432 0.8Philip Morris International 721,410 34,656 1.7
Utilities – 6.4% (5.6%)Electricity – 4.0%CMS Energy 713,390 11,806 0.6DTE ENERGY 218,770 8,942 0.4Edison International 824,550 24,021 1.2Nextera Energy 419,190 23,164 1.2Xcel Energy 655,850 11,440 0.6Gas, water & multiutilities – 2.4%Nisource 1,032,630 21,481 1.1Sempra Energy 479,000 26,625 1.3
Basic materials – 2.4% (3.0%)Chemicals – 2.4%Air Products & Chemicals 345,700 22,242 1.1Du Pont de Nemours 382,810 14,308 0.7PPG Industries 104,290 11,704 0.6
Telecommunications – 1.4% (4.1%)Fixed line telecommunications – 1.4%Verizon Communications 989,710 28,628 1.4
Portfolio statement As at 31 January 2014
Market value Total netInvestment Holding £’000 assets %
Market value Total netInvestment Holding £’000 assets %
390
Continuation�
� Return to Index

Forward currency contracts GBP Hedged share classes – 0.0% ((0.1)%)Buy $5,852,385 sell £3,535,522 dated 06/03/14 21 –Buy $1,334,280 sell £808,908 dated 07/02/14 2 –Buy $3,134 sell £1,894 dated 07/02/14 – –Buy $112,584 sell £67,927 dated 06/03/14 – –Buy $2,564,641 sell £1,564,989 dated 07/02/14 (7) –Buy $213,472,183 sell £129,762,425 dated 07/02/14 (64) –Sell $209,015,929 buy £127,076,959 dated 06/03/14 62 –Sell $2,667,142 buy £1,630,114 dated 07/02/14 9 –Sell $2,463,876 buy £1,503,523 dated 07/02/14 7 –Sell $1,459,293 buy £886,404 dated 07/02/14 – –Sell $383,283 buy £232,286 dated 06/03/14 (1) –Sell $599,458 buy £362,439 dated 06/03/14 (2) –Sell $211,160,961 buy £128,118,177 dated 07/02/14 (175) –
Investment assets (including investment liabilities) 1,968,128 98.3
Net other assets 33,116 1.7
Net assets 2,001,244 100.0
Unless otherwise stated the above securities are admitted to official stock exchange listings or trade on aregulated market.
The comparative percentage figures in brackets are at 31 January 2013.
The forward exchange contracts are only entered into by the A-Class Income GBP Hedged shares and theC-Class Income GBP Hedged shares.
Counterparty exposure
Forwardcurrencycontracts Total
Counterparty £’000 £’000
Barclays 5 5CitiBank 2 2Credit Suisse (6) (6)Deutsche Bank (1) (1)Goldman Sachs 0 0HSBC 1 1Morgan Stanley (174) (174)Societe Generale 2 2State Street 0 0UBS 11 11Westpac Banking Corp 12 12
At the balance sheet date, there was no collateral received by the fund from the above counterparties.
The counterparty exposure on forward currency contracts is reported at their mark to market values butfor futures contracts it is only the positive mark to market values that are reported.
Portfolio statement – continuedAs at 31 January 2014
Market value Total netInvestment Holding £’000 assets %
391
Continuation�
� Return to Index

£’000
Total of all purchases for the year (Note 10) 1,116,702
Major purchases Cost
Johnson & Johnson 55,944PNC Financial Services Group 37,352Wells Fargo 30,497Bristol-Myers Squibb 28,282ExxonMobil 27,174Apple 26,433Philip Morris International 25,834Occidental Petroleum 24,609Xcel Energy 24,490Edison International 24,018ConocoPhillips 23,720Chevron 23,409Procter & Gamble 23,189Omnicom Group 20,265Metlife 19,551Illinois Tool Works 19,309Paccar 19,115Merck & Co 18,945Pfizer 18,875Qualcomm 17,320
£’000
Total of all sales for the year (Note 10) 477,360
Major sales Proceeds
Merck & Co 20,435Marathon Petroleum 17,647AT&T 16,332Prudential Financial 16,062BlackRock ‘A’ 14,878Emerson Electric 14,412Linear Technology 13,703Nordstrom 13,328Home Depot 13,084Republic Services 12,767Williams Companies 12,262Lorrilard 11,903Xcel Energy 11,850Molex 11,727NV Energy 11,220TJX Companies 11,164PPG Industries 10,849Microsoft 10,730Verizon Communications 9,806L Brands 9,784
Portfolio movements For the year ending 31 January 2014
392
Continuation�
� Return to Index

Statement of total returnFor the year ending 31 January
2014 2013£’000 £’000 £’000 £’000
Income
Net capital gains (Note 1) 170,541 115,234
Revenue (Note 2) 45,828 28,499
Expenses (Note 3) (19,126) (10,518)
Net revenue before taxation 26,702 17,981
Taxation (Note 4) (6,508) (4,127)
Net revenue after taxation 20,194 13,854
Total return before distributions 190,735 129,088
Finance costs: Distributions (Note 5) (36,317) (23,059)
Change in net assets attributable to shareholders from investment activities 154,418 106,029
Statement of change in net assets attributable to shareholdersFor the year ending 31 January
2014 2013£’000 £’000 £’000 £’000
Opening net assets attributable to shareholders 1,176,149 504,719
Amounts receivable on issue of shares 785,613 850,950
Amounts payable on cancellation of shares (123,630) (289,473)
661,983 561,477
Change in net assets attributable to shareholders from investment activities (see above) 154,418 106,029
Retained distributions on accumulation shares 8,694 3,924
Closing net assets attributable to shareholders 2,001,244 1,176,149
Balance sheetAs at 31 January
2014 2013£’000 £’000 £’000 £’000
ASSETS
Investment assets 1,968,377 1,162,771
Debtors (Note 7) 29,121 9,967
Cash and bank balances (Note 8) 34,846 21,678
Total other assets 63,967 31,645
Total assets 2,032,344 1,194,416
LIABILITIES
Investment liabilities (249) (1,381)
Creditors (Note 9) (23,025) (9,103)
Distribution payable on income shares (7,826) (7,783)
Total other liabilities (30,851) (16,886)
Total liabilities (31,100) (18,267)
Net assets attributable to shareholders 2,001,244 1,176,149
The notes to these financial statements are shown on pages 394 to 395.
Financial statements
393
Continuation�
� Return to Index

1. Net capital gains2014 2013
£’000 £’000Currency losses (2,746) (55)Forward currency contracts 7,077 (678)Non-derivative securities 166,210 115,967Net capital gains 170,541 115,234
The forward currency contracts are only entered into by the A-Class Income GBPHedged shares and C-Class Income GBP Hedged shares.
2. Revenue2014 2013
£’000 £’000Income from overseas equity investments 45,788 28,483Interest on bank and term deposits 40 16Total revenue 45,828 28,499
3. Expenses2014 2013
£’000 £’000Payable to the ACD or associate of the ACD:ACD fee 16,143 9,207Fixed expenses 2,983 1,311Total expenses 19,126 10,518
4. Taxation2014 2013
£’000 £’000a) Analysis of charge in the yearOverseas tax suffered 6,508 4,127Current year tax charge (Note 4b) 6,508 4,127
b) Factors affecting the tax charge for the yearThe tax assessed for the year is higher than the standard rate of corporation tax inthe UK for an Open-Ended Investment Company (OEIC) (20%). The differences areexplained below.
Net revenue before taxation 26,702 17,981Corporation tax at 20% 5,340 3,596
Effects of:Dividends not subject to corporation tax (9,118) (5,592)Excess expenses for which no relief taken 3,778 1,996Overseas tax suffered 6,508 4,127
1,168 531Current year tax charge (Note 4a) 6,508 4,127
No deferred tax asset has been recognised in the financial statements. At the yearend date, the Fund had a potential unrecognised deferred tax asset of £7,181,202(31.01.13: £3,403,165) in relation to £35,906,012 (31.01.13: £17,015,823) of excessmanagement expenses which would only be utilised to reduce the tax charge if theFund had an excess of unfranked income over expenses in a future period. There isno excess of unfranked income expected in the future.
5. Finance costsDistributionsThe distributions take account of amounts receivable on the issue of shares andamounts payable on the cancellation of shares and comprise:
2014 2013£’000 £’000
First interim dividend distribution 8,183 4,415Second interim dividend distribution 9,723 5,186Third interim dividend distribution 10,280 6,012Final dividend distribution 10,355 9,711Add: Amounts payable on cancellation of shares 456 429Deduct: Amounts receivable on issue of shares (2,680) (2,694)Total finance costs 36,317 23,059
Details of the distribution per share are set out on pages 396 to 399.
6. Movement between net revenue after taxation and distributions2014 2013
£’000 £’000Net revenue after taxation 20,194 13,854Add: ACD fee (net of tax relief) paid from capital 16,143 9,207Add: Undistributed revenue brought forward 46 44Deduct: Undistributed revenue carried forward (68) (46)Equalisation on conversions 2 –
36,317 23,059
7. Debtors2014 2013
£’000 £’000Accrued income 1,442 1,473Due from the ACD for shares created 19,869 6,074Sales awaiting settlement 7,810 2,420Total debtors 29,121 9,967
8. Cash and bank balances2014 2013
£’000 £’000Cash and bank balances 34,846 21,678
9. Creditors2014 2013
£’000 £’000Accrued expenses 1,851 1,127Due to the ACD for shares cancelled 1,136 7,976Purchases awaiting settlement 20,038 –Total creditors 23,025 9,103
Notes to the financial statements for the year ending 31 January 2014
394
Continuation�
� Return to Index

10. Portfolio transaction costs2014 2013
£’000 £’000Analysis of total purchase costs
Purchases in year before transaction costs 1,116,290 818,457
Commissions 412 386Total purchase costs 412 386Gross purchases total 1,116,702 818,843
Analysis of total sale costs
Gross sales before transaction costs 477,583 262,143
Commissions (214) (151)Taxes (9) (5)Total sale costs (223) (156)Total sales net of transaction costs 477,360 261,987
11. Related party transactionsJPMorgan Funds Limited, as Authorised Corporate Director (“ACD”), is a relatedparty, and acts as principal in respect of all transactions of shares in the Company.The aggregate monies received through issue, and paid on cancellation, aredisclosed in the Statement of Change in Net Assets Attributable to Shareholders.
The balance due from the ACD and their associates at the year end date in respectof related party transactions was £16,881,947 (31.01.13: £3,028,801). Details ofrelated party transactions are given under note 13 on page 413.
Some of the dealing transactions for the Fund are carried out through associatesof the Manager. Such transactions are carried out on an arm’s length basis. Thecommissions paid to these companies over the period were £nil (31.01.13: £nil).
The following party held a material interest in the Fund at the year end date:– Cofunds Nominees Limited 10.83% (31.01.13: 2.32%)
12. Financial instrumentsCurrency exposuresA substantial proportion of the net assets of the Fund are denominated incurrencies other than sterling, with the effect that the Balance sheet and totalreturn can be significantly affected by currency movements.
Net foreign currency assets/(liabilities)Forward Non-
exchange Monetary monetaryTotal contracts exposures exposures
Currency £’000 £’000 £’000 £’000
31.01.14US Dollar 1,868,120 (124,216) 24,060 1,968,276
31.01.13US Dollar 1,131,620 (56,962) 25,836 1,162,746
The forward exchange contracts are only entered into by the A-Class Income GBPHedged shares and the C-Class Income GBP Hedged shares.
Interest rate riskAt the year end date, 1.7% (31.01.13: 1.8%) of the Fund’s net assets by value wereinterest bearing, carrying a (fixed/floating) rate.
For consideration of other risks including liquidity, pricing and credit risk, pleaserefer to the notes to the aggregated financial statements, pages 413 to 414.
13. Share classesThe Fund currently has four share classes; Class A Shares, Class B Shares, Class CShares and Class X Shares. The Authorised Corporate Director’s (ACD) fee andfixed expenses charge are shown below.
ACD fee Fixed expensesClass A shares: 1.50% 0.18%Class B shares: 1.00% 0.18%Class C shares: 0.75% 0.18%Class X shares: 0.00% 0.06%
The net asset value of each share class, the net asset value per share and thenumber of shares in each class are shown on page 389. All classes have the samerights on winding up.
14. Derivatives The A-Class Income GBP Hedged share class and the C-Class Income GBP Hedgedshare class enter into derivative transactions in the form of forward currencycontracts. The share classes may use derivatives for investment purposes orefficient portfolio management including hedging, where appropriate. Thepositive mark to market approach has been used to calculate the global exposure.
Further information on the derivative risks can be found in the notes to theaggregated financial statements on page 414.
15. Contingent liabilities and capital commitmentsAt the balance sheet date there were no contingent liabilities or capitalcommitments (2013: none).
Notes to the financial statements – continued
395
Continuation�
� Return to Index

Final distribution in pence per share
Group 1 – Shares purchased prior to 1 November 2013Group 2 – Shares purchased 1 November 2013 to 31 January 2014
DistributionGross Tax Net payable paid
revenue at 10% revenue Equalisation 30.04.14 30.04.13
A-Class Accumulation Shares
Group 1 0.555556 0.055556 0.500000 – 0.500000 0.710000
Group 2 0.215508 0.021551 0.193957 0.306043 0.500000 0.710000
A-Class Income Shares
Group 1 0.500000 0.050000 0.450000 – 0.450000 0.640000
Group 2 0.119706 0.011971 0.107735 0.342265 0.450000 0.640000
A-Class Income GBP Hedged Shares
Group 1 0.511111 0.051111 0.460000 – 0.460000 0.650000
Group 2 0.175137 0.017514 0.157623 0.302377 0.460000 0.650000
B-Class Accumulation Shares
Group 1 0.800000 0.080000 0.720000 – 0.720000 0.980000
Group 2 0.250294 0.025029 0.225265 0.494735 0.720000 0.980000
B-Class Income Shares
Group 1 0.988889 0.098889 0.890000 – 0.890000 1.270000
Group 2 0.448468 0.044847 0.403621 0.486379 0.890000 1.270000
C-Class Accumulation Shares
Group 1 0.777778 0.077778 0.700000 – 0.700000 0.960000
Group 2 0.216503 0.021650 0.194853 0.505147 0.700000 0.960000
C-Class Income Shares
Group 1 1.011111 0.101111 0.910000 – 0.910000 1.290000
Group 2 0.385632 0.038563 0.347069 0.562931 0.910000 1.290000
C-Class Income GBP Hedged Shares
Group 1 0.700000 0.070000 0.630000 – 0.630000 0.890000
Group 2 0.266551 0.026655 0.239896 0.390104 0.630000 0.890000
X-Class Accumulation Shares
Group 1 0.622222 0.062222 0.560000 – 0.560000 –
Group 2 0.209140 0.020914 0.188226 0.371774 0.560000 –
Distribution tables
396
Continuation�
� Return to Index

Third interim distribution in pence per share
Group 1 – Shares purchased prior to 1 August 2013Group 2 – Shares purchased 1 August 2013 to 31 October 2013
DistributionGross Tax Net paid paid
revenue at 10% revenue Equalisation 31.01.14 31.01.13
A-Class Accumulation Shares
Group 1 0.600000 0.060000 0.540000 – 0.540000 0.490000
Group 2 0.266107 0.026611 0.239496 0.300504 0.540000 0.490000
A-Class Income Shares
Group 1 0.533333 0.053333 0.480000 – 0.480000 0.450000
Group 2 0.185367 0.018537 0.166830 0.313170 0.480000 0.450000
A-Class Income GBP Hedged Shares
Group 1 0.533333 0.053333 0.480000 – 0.480000 0.450000
Group 2 0.441369 0.044137 0.397232 0.082768 0.480000 0.450000
B-Class Accumulation Shares
Group 1 0.833333 0.083333 0.750000 – 0.750000 0.710000
Group 2 0.265526 0.026553 0.238973 0.511027 0.750000 0.710000
B-Class Income Shares
Group 1 1.044444 0.104444 0.940000 – 0.940000 0.900000
Group 2 0.424382 0.042438 0.381944 0.558056 0.940000 0.900000
C-Class Accumulation Shares
Group 1 0.811111 0.081111 0.730000 – 0.730000 0.700000
Group 2 0.307659 0.030766 0.276893 0.453107 0.730000 0.700000
C-Class Income Shares
Group 1 1.055556 0.105556 0.950000 – 0.950000 0.930000
Group 2 0.416792 0.041679 0.375113 0.574887 0.950000 0.930000
C-Class Income GBP Hedged Shares
Group 1 0.711111 0.071111 0.640000 – 0.640000 0.620000
Group 2 0.285080 0.028508 0.256572 0.383428 0.640000 0.620000
X-Class Accumulation Shares
Group 1 0.644444 0.064444 0.580000 – 0.580000 –
Group 2 0.105094 0.010509 0.094585 0.485415 0.580000 –
Distribution tables – continued
397
Continuation�
� Return to Index

Second interim distribution in pence per share
Group 1 – Shares purchased prior to 1 May 2013Group 2 – Shares purchased 1 May 2013 to 31 July 2013
DistributionGross Tax Net paid paid
revenue at 10% revenue Equalisation 31.10.13 31.10.12
A-Class Accumulation Shares
Group 1 0.611111 0.061111 0.550000 – 0.550000 0.490000
Group 2 0.223278 0.022328 0.200950 0.349050 0.550000 0.490000
A-Class Income Shares
Group 1 0.544444 0.054444 0.490000 – 0.490000 0.450000
Group 2 0.229002 0.022900 0.206102 0.283898 0.490000 0.450000
A-Class Income GBP Hedged Shares
Group 1 0.533333 0.053333 0.480000 – 0.480000 0.450000
Group 2 0.030293 0.003029 0.027264 0.452736 0.480000 0.450000
B-Class Accumulation Shares
Group 1 0.866667 0.086667 0.780000 – 0.780000 0.690000
Group 2 0.246461 0.024646 0.221815 0.558185 0.780000 0.690000
B-Class Income Shares
Group 1 1.088889 0.108889 0.980000 – 0.980000 0.900000
Group 2 0.548006 0.054801 0.493205 0.486795 0.980000 0.900000
C-Class Accumulation Shares
Group 1 0.855556 0.085556 0.770000 – 0.770000 0.690000
Group 2 0.254231 0.025423 0.228808 0.541192 0.770000 0.690000
C-Class Income Shares
Group 1 1.111111 0.111111 1.000000 – 1.000000 0.920000
Group 2 0.393186 0.039319 0.353867 0.646133 1.000000 0.920000
C-Class Income GBP Hedged Shares
Group 1 0.733333 0.073333 0.660000 – 0.660000 –
Group 2 0.299901 0.029990 0.269911 0.390089 0.660000 –
X-Class Accumulation Shares
Group 1 0.244444 0.024444 0.220000 – 0.220000 –
Group 2 0.210554 0.021055 0.189499 0.030501 0.220000 –
Distribution tables – continued
398
Continuation�
� Return to Index
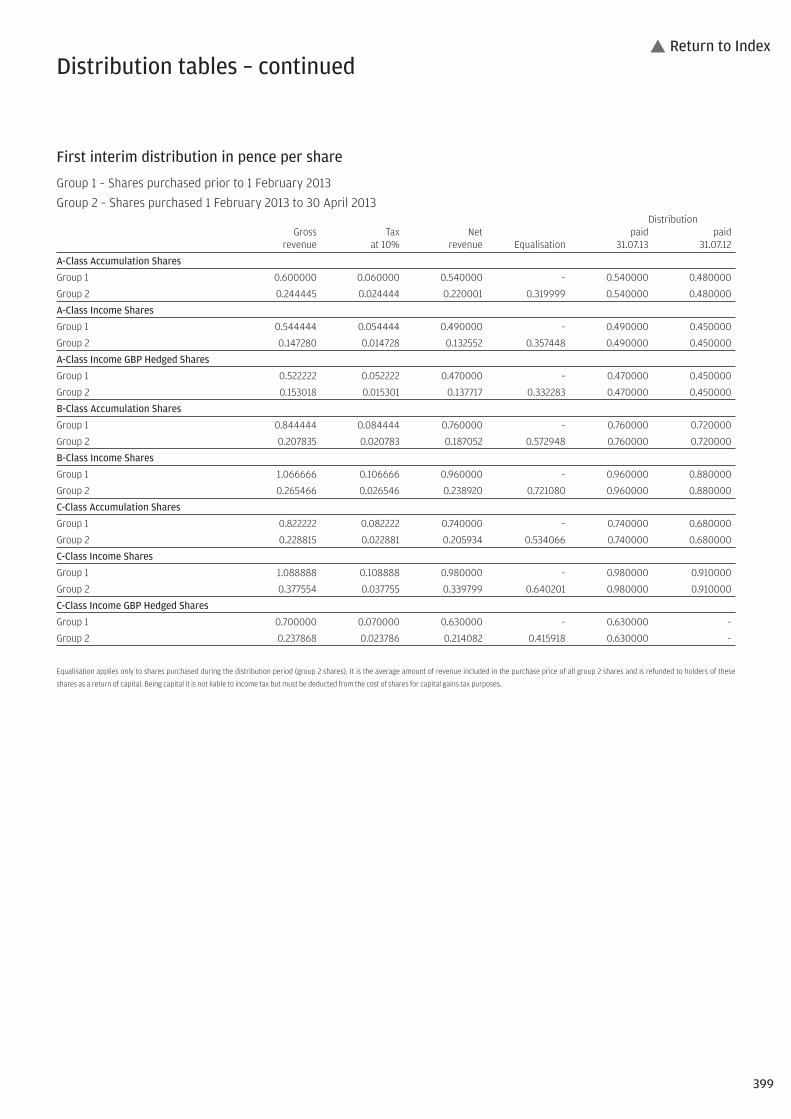
First interim distribution in pence per share
Group 1 – Shares purchased prior to 1 February 2013Group 2 – Shares purchased 1 February 2013 to 30 April 2013
DistributionGross Tax Net paid paid
revenue at 10% revenue Equalisation 31.07.13 31.07.12
A-Class Accumulation Shares
Group 1 0.600000 0.060000 0.540000 – 0.540000 0.480000
Group 2 0.244445 0.024444 0.220001 0.319999 0.540000 0.480000
A-Class Income Shares
Group 1 0.544444 0.054444 0.490000 – 0.490000 0.450000
Group 2 0.147280 0.014728 0.132552 0.357448 0.490000 0.450000
A-Class Income GBP Hedged Shares
Group 1 0.522222 0.052222 0.470000 – 0.470000 0.450000
Group 2 0.153018 0.015301 0.137717 0.332283 0.470000 0.450000
B-Class Accumulation Shares
Group 1 0.844444 0.084444 0.760000 – 0.760000 0.720000
Group 2 0.207835 0.020783 0.187052 0.572948 0.760000 0.720000
B-Class Income Shares
Group 1 1.066666 0.106666 0.960000 – 0.960000 0.880000
Group 2 0.265466 0.026546 0.238920 0.721080 0.960000 0.880000
C-Class Accumulation Shares
Group 1 0.822222 0.082222 0.740000 – 0.740000 0.680000
Group 2 0.228815 0.022881 0.205934 0.534066 0.740000 0.680000
C-Class Income Shares
Group 1 1.088888 0.108888 0.980000 – 0.980000 0.910000
Group 2 0.377554 0.037755 0.339799 0.640201 0.980000 0.910000
C-Class Income GBP Hedged Shares
Group 1 0.700000 0.070000 0.630000 – 0.630000 –
Group 2 0.237868 0.023786 0.214082 0.415918 0.630000 –
Equalisation applies only to shares purchased during the distribution period (group 2 shares). It is the average amount of revenue included in the purchase price of all group 2 shares and is refunded to holders of these
shares as a return of capital. Being capital it is not liable to income tax but must be deducted from the cost of shares for capital gains tax purposes.
Distribution tables – continued
399
� Return to Index

Investment objective and policyTo invest in a portfolio of North American securities. The current policy isto invest for capital growth without any distribution target.
North American securities are securities issued by companies that areincorporated under the laws of, and have their registered office in, NorthAmerica, or that derive the predominant part of their economic activity fromNorth America, even if listed elsewhere.
Risk profileThe value of your investment may fall as well as rise and you may get backless than you originally invested.
The value of Equity and Equity-Linked Securities may fluctuate in responseto the performance of individual companies and general market conditions.
The single market in which the Fund primarily invests, in this case the US,may be subject to particular political and economic risks and, as a result,the Fund may be more volatile than more broadly diversified funds.
Movements in currency exchange rates can adversely affect the return ofyour investment.
Please refer to Part 11 of the Prospectus for details of the general risk factorsaffecting this Fund in addition to the specific risk factors above.
Fund reviewUS equity markets delivered strong returns in the 12-month period, as taperingconcerns were outweighed by the strengthening economic recovery.
The Fund delivered a positive return and outperformed its benchmark forthe 12-month period, with strong stock and sector selection contributingpositively to the outperformance. Performance was primarily driven byselections in the auto & transportation and pharmaceuticals/medtech sectors,where overweight positions in Delta Air Lines and Biogen IDEC added value.On the negative side, our stock selection in the health services & system andsystems & network hardware sectors proved lacklustre. In terms of individualnames, a lack of exposure to Gilead Sciences and an overweight position inJohnson & Johnson detracted the most.
Fund outlookWhile acknowledging that markets may remain volatile and not materiallyrise in the short term, we find no reason to change our constructive viewon US equity markets. The economic data thus far has not differed fromour expectations heading into the year. We see continued expansion in theUS and continued improvement in both Europe and Japan. Even if investorsbegin to extrapolate the current emerging market concerns into a widercrisis, we do not believe the risk to US markets would be significant. The USeconomy is mostly driven by domestic consumption and is therefore notdependent on the rest of the world for its growth.
12 month performance as at 31 January2014 2013 2012 2011 2010
JPM US Select A-Class Acc 18.5% 16.0% 2.2% 18.9% 19.7%
JPM US SelectB-Class Acc 19.0% – – – –
JPM US Select C-Class Acc 19.3% 16.9% 3.0% 19.8% –
JPM US Select I-Class Acc 19.7% 17.2% 3.3% 19.9% 21.0%
JPM US Select X-Class Inc 20.3% 17.9% 3.9% 20.7% 21.6%
Benchmark Index 16.9% 15.8% 5.5% 21.9% 19.4%
Fund statisticsRisk and Reward Profile 6*
Fund size £172.0m
Benchmark Index S&P 500 Index (Net of 15% witholding tax)
Fund chargesA-Class Initial 3.00%, Annual 1.50%B-Class Initial Nil, Annual 1.00%C-Class Initial Nil, Annual 0.75%I-Class Initial Nil, Annual 0.60%X-Class On applicationA
Top ten holdings %Johnson & Johnson 4.4Schlumberger 3.1Google ‘A’ 3.0Time Warner 3.0Wells Fargo 2.9Apple 2.8UnitedHealth Group 2.4General Motors 2.2Microsoft 2.1United Technologies 2.1
Sector breakdown %Technology 17.8Financials 15.3Consumer services 14.2Health care 13.6Industrials 11.6Oil & gas 10.7Consumer goods 8.8Basic materials 4.1Telecommunications 1.8Utilities 1.2Net other assets 0.9
JPM US Select Fund
You should remember that past performance is not a guide to the future. The price of investments and the income from them may fall as well as rise andinvestors may not get back the full amount invested.
* For specific risks, including the risk and reward profile, please refer to the Key Investor information Document (KIID) available on the following websitehttp://am.jpmorgan.co.uk/investor/prices-and-factsheets/?list=all&tab=PricesAll equity indices stated as ‘Net’ are calculated net of tax as per the standard published approach by the index vendor unless stated otherwise.All performance returns are calculated using the quoted price of the accumulation or income shares. Performance returns are in Sterling.Source: J.P. Morgan.A As agreed from time to time between the ACD and the relevant JPMorgan Chase & Co. entity.400
Continuation�
� Return to Index

Highest/lowest share price and distribution recordDistribution
Highest Lowest per shareCalendar year share price share price (net)A-Class Accumulation Shares2009 56.71p 37.02p 0.19p2010 64.97p 53.23p 0.21p2011 66.50p 52.63p 0.00p2012 70.91p 61.96p 0.02p2013 91.38p 68.88p 0.12p2014B 92.58p 87.83p 0.00pA-Class Income Shares2009 56.38p 36.78p 0.19p2010 64.35p 52.72p 0.22p2011 65.87p 52.13p 0.00p2012 70.21p 61.37p 0.02p2013 90.30p 68.19p 0.11p2014B 91.48p 86.78p 0.00pB-Class Accumulation SharesC
2012 70.00p 66.82p –2013 91.90p 68.95p 0.22p2014B 93.13p 88.36p 0.31pC-Class Accumulation SharesD
2009 135.6p 101.1p –2010 156.5p 127.7p 0.98p2011 160.9p 127.5p 1.09p2012 173.4p 150.5p 1.25p2013 225.4p 168.7p 1.61p2014B 228.4p 216.7p 1.31pC-Class Income SharesE
2012 101.1p 95.33p –2013 130.8p 98.41p 0.57p2014B 132.6p 125.8p 0.77pI-Class Accumulation Shares2009 249.8p 161.6p 2.93p2010 288.5p 235.2p 2.42p2011 297.0p 235.4p 2.72p2012 321.1p 278.2p 3.05p2013 419.0p 312.7p 3.86p2014B 424.7p 403.0p 3.65pX-Class Income Shares2009 235.4p 151.8p 3.60p2010 269.4p 219.3p 3.01p2011 274.1p 217.4p 3.87p2012 293.7p 257.4p 4.19p2013 379.3p 286.3p 5.04p2014B 384.6p 365.0p 5.08p
B To 31 January 2014.C B-Class Accumulation Shares were launched on 29 October 2012.D C-Class Accumulation Shares were launched on 24 March 2009.E C-Class Income Shares were launched on 20 August 2012.
Portfolio turnover rate31.01.13 110.6%31.01.14 140.9%
The portfolio turnover rate (PTR) reflects the total of security purchases and sales, less the total of shareissues and cancellations, expressed as a percentage of the average daily net asset values over the period.
Portfolio transaction costsBroker Transaction
Commissions Taxes Total31.01.13 0.13% 0.00% 0.13%31.01.14 0.12% 0.00% 0.12%
The percentage figures disclosed above reflect the average broker commissions and transaction taxessuffered during the last 3 years divided by the average assets under management over the same period.
Stamp duty reserve tax31.01.13 0.00%31.01.14 0.00%
The percentage figures disclosed above reflect the total stamp duty reserve tax suffered during the yeardivided by the average assets under management over the same period.
401
Continuation�
� Return to Index

Net asset values and Ongoing chargesNet assetvalue per Net asset
share class Number value per OngoingDate £’000 of shares share chargesA-Class Accumulation Shares31.01.12 69,676 107,497,639 64.82p 1.67%31.01.13 80,090 106,580,847 75.14p 1.68%31.01.14 101,937 114,502,181 89.01p 1.68%A-Class Income Shares31.01.12 2,547 3,969,047 64.18p 1.67%31.01.13 2,867 3,860,321 74.27p 1.68%31.01.14 5,112 5,811,325 87.97p 1.68%B-Class Accumulation Shares31.01.13 3 4,000 75.24p 1.18%31.01.14 334 373,162 89.57p 1.18%C-Class Accumulation Shares31.01.12 31,825 20,200,179 157.5p 0.87%31.01.13 10,897 5,918,206 184.1p 0.93%31.01.14 26,838 12,215,094 219.7p 0.93%C-Class Income Shares31.01.13 17 15,533 106.8p 0.93%31.01.14 1,613 1,272,469 126.8p 0.93%I-Class Accumulation Shares31.01.12 1,249 428,808 291.2p 0.60%31.01.13 1,387 406,224 341.3p 0.60%31.01.14 36,028 8,817,852 408.6p 0.60%X-Class Income Shares31.01.12 3,031 1,141,885 265.3p 0.06%31.01.13 1,713 556,937 307.6p 0.06%31.01.14 131 35,920 365.0p 0.06%
The net asset value and the net asset value per income share are shown ex-dividend.
Following the adoption of the requirements of UCITS IV in June 2012, Ongoing charges has replaced the TotalExpense Ratio (“TER”). The Ongoing charges takes into account the ACD fee, the fixed expenses and any expensespaid to an affiliate in respect of stocklending activities, expressed as a percentage of the average daily net assetvalues over the period. The main difference between the two calculations is the inclusion of custodian handlingcharges and stocklending fees in the Ongoing charges figure. The comparative figures have not been restated,and the historic TER is disclosed.
402
Continuation�
� Return to Index

Technology – 17.8% (17.8%)Software & computer services – 7.4%Adobe Systems 19,640 709 0.4Cerner 15,630 534 0.3Citrix Systems 11,080 359 0.2Cognizant Technology Solutions 9,000 539 0.3Google ‘A’ 7,605 5,237 3.0Microsoft 162,994 3,650 2.1Oracle 86,507 1,966 1.1Technology hardware & equipment – 10.4%Apple 15,667 4,751 2.8Applied Materials 76,220 777 0.5Avago Technologies 75,420 2,522 1.5Cisco Systems 191,680 2,560 1.5EMC 73,760 1,103 0.6Freescale Semiconductor 28,940 319 0.2Hewlett Packard 17,270 307 0.2KLA-Tencor 32,520 1,218 0.7Lam Research 30,127 938 0.5Qualcomm 57,221 2,548 1.5SanDisk 3,880 166 0.1Teradyne 25,500 296 0.2Xilinx 7,140 203 0.1
Financials – 15.3% (16.0%)Banks – 6.3%Bank of America 273,640 2,815 1.6Citigroup 81,721 2,398 1.4SunTrust Banks 12,080 277 0.2Wells Fargo 179,316 5,016 2.9Zions Bancorporation 21,260 379 0.2General financial – 5.3%American Express 7,200 379 0.2Ameriprise Financial 14,840 960 0.6Capital One Financial 19,830 855 0.5Goldman Sachs Group 7,464 751 0.4Intercontinental Exchange 7,229 919 0.5Invesco 52,750 1,073 0.6Morgan Stanley 91,040 1,658 1.0State Street 13,600 564 0.3TD Ameritrade 9,576 183 0.1Visa ‘A’ 14,090 1,891 1.1Life insurance – 0.9%Metlife 49,680 1,502 0.9Nonlife insurance – 2.8%ACE 56,770 3,281 1.9Axis Capital 6,130 171 0.1Hartford Financial Services Group 11,140 228 0.1Marsh & McLennan 41,260 1,160 0.7
Consumer services – 14.2% (12.4%)Food & drug retails – 1.0%CVS Caremark 25,570 1,051 0.6McKesson 6,540 704 0.4General retailers – 4.7%Amazon 6,480 1,583 0.9Autozone 2,580 782 0.5Costco Wholesale 11,630 796 0.5eBay 25,581 826 0.5Home Depot 48,060 2,246 1.3Lowes 30,540 863 0.5TJX Companies 22,600 790 0.5Media – 6.0%CBS ‘B’ 23,850 858 0.5Comcast ‘A’ 73,510 2,420 1.4Dish Network ‘A’ 13,140 451 0.3Time Warner 135,738 5,234 3.0Time Warner Cable 4,910 400 0.2Walt Disney 23,980 1,067 0.6Travel & leisure – 2.5%Delta Air Lines 41,440 770 0.4Priceline.com 1,760 1,239 0.7Royal Caribbean Cruises 14,450 446 0.3Starbucks 9,110 398 0.2Starwood Hotels and Resorts Worldwide ‘B’ 9,230 423 0.2United Continental 27,200 767 0.4Yum Brands 13,470 545 0.3
Health care – 13.6% (12.8%)Health care equipment & services – 3.4%Humana 11,800 704 0.4Stryker 20,250 961 0.6UnitedHealth Group 91,770 4,058 2.4Pharmaceuticals & biotechnology – 10.2%Aegerion Pharmaceuticals 2,720 99 0.1Alexion Pharmaceutical 8,780 864 0.5Allergan 5,200 364 0.2Biogen Idec 11,449 2,214 1.3Bristol-Myers Squibb 69,500 2,132 1.2Celgene 15,626 1,461 0.8Johnson & Johnson 137,450 7,473 4.4Merck & Co 56,604 1,841 1.1Perrigo 3,480 330 0.2Vertex Pharmaceuticals 14,070 702 0.4
Industrials – 11.6% (10.9%)Aerospace & defence – 2.1%United Technologies 50,653 3,530 2.1Construction & materials – 2.0%Fluor 51,450 2,386 1.4Jacobs Engineering Group 9,780 367 0.2Martin Marietta Materials 950 62 –Masco 49,990 644 0.4Electronics & electrical equipment – 0.5%Emerson Electric 21,420 866 0.5General industrials – 3.2%Eaton 40,830 1,833 1.1Honeywell International 63,340 3,528 2.1Industrial engineering – 1.4%Flowserve 12,450 549 0.3Paccar 41,731 1,456 0.8Pentair 4,270 194 0.1SPX 5,840 355 0.2Industrial transportation – 1.5%CSX 102,220 1,662 1.0Union Pacific 7,500 803 0.5Support services – 0.9%Accenture ‘A’ 19,800 971 0.6Alliance Data System 2,010 304 0.2Grainger (W.W.) 1,620 233 0.1
Oil & gas – 10.7% (11.4%)Oil & gas producers – 7.0%Anadarko Petroleum 11,590 574 0.3Cheniere Energy 9,970 265 0.2Chevron 21,380 1,512 0.9ConocoPhillips 12,830 512 0.3EOG Resources 9,430 952 0.6ExxonMobil 57,864 3,304 1.9Marathon Oil 13,368 268 0.2Marathon Petroleum 5,840 310 0.2Occidental Petroleum 53,481 2,868 1.7Phillips 66 13,480 602 0.4Southwestern Energy 7,500 187 0.1Valero Energy 8,790 274 0.2Oil equipment, services & distribution – 3.7%Ensco ‘A’ 10,490 323 0.2Halliburton 22,680 681 0.4Schlumberger 98,863 5,335 3.1
Portfolio statement As at 31 January 2014
Market value Total netInvestment Holding £’000 assets %
Market value Total netInvestment Holding £’000 assets %
403
Continuation�
� Return to Index

Consumer goods – 8.8% (12.2%)Automobiles & parts – 2.4%General Motors 172,680 3,864 2.2TRW Automotive 8,890 402 0.2Beverages – 2.4%Coca-Cola 47,638 1,105 0.6Constellation Brands ‘A’ 6,770 319 0.2Dr Pepper Snapple Group 14,780 433 0.3Molson Coors Brewing ‘B’ 21,690 709 0.4PepsiCo 31,420 1,548 0.9Food producers – 0.8%General Mills 18,414 543 0.3Mondelez International 40,739 815 0.5Household goods – 1.5%Lennar 16,110 380 0.2Procter & Gamble 34,904 1,630 0.9Toll Brothers 25,370 557 0.3Whirlpool 1,880 151 0.1Leisure goods – 0.0%Harman International Industries 900 56 –Personal goods – 0.9%Colgate-Palmolive 14,290 534 0.3Lululemon Athletica 12,870 366 0.2VF 17,010 614 0.4Tobacco – 0.8%Philip Morris International 27,920 1,341 0.8
Basic materials – 4.1% (3.2%)Chemicals – 1.7%Air Products & Chemicals 1,180 76 –Axiall 17,229 422 0.2Dow Chemical 31,800 875 0.5Methanex 10,220 381 0.2Monsanto 21,450 1,398 0.8Forestry & paper – 0.1%International Paper 5,204 149 0.1Industrial metals – 2.3%Alcoa 146,126 1,060 0.6Freeport-McMoRan Copper & Gold 118,411 2,332 1.4United States Steel 31,780 506 0.3
Telecommunications – 1.8% (1.0%)Fixed line telecommunications – 1.8%Verizon Communications 107,320 3,104 1.8
Utilities – 1.2% (1.6%)Electricity – 0.8%American Electric Power 11,730 344 0.2Nextera Energy 19,264 1,064 0.6Gas, water & multiutilities – 0.4%Nisource 8,390 175 0.1Sempra Energy 9,450 525 0.3
Futures – 0.0% (0.0%)S&P500 E-Mini Futures Mar 2014 3 (2) –
Investment assets (including investment liabilities) 170,510 99.1
Net other assets 1,483 0.9
Net assets 171,993 100.0
Unless otherwise stated the above securities are admitted to official stock exchange listings or trade on aregulated market.
The comparative percentage figures in brackets are at 31 January 2013.
Portfolio statement – continuedAs at 31 January 2014
Market value Total netInvestment Holding £’000 assets %
404
Continuation�
� Return to Index

£’000
Total of all purchases for the year (Note 10) 208,133
Major purchases Cost
Johnson & Johnson 8,125Schlumberger 6,759Time Warner 4,453Google ‘A’ 4,425ExxonMobil 4,147Wells Fargo 4,041UnitedHealth Group 3,822Apple 3,648General Motors 3,229eBay 3,222Occidental Petroleum 3,174Verizon Communications 3,141Bristol-Myers Squibb 2,982Cisco Systems 2,976Qualcomm 2,959United Technologies 2,829Freeport-McMoRan Copper & Gold 2,823Microsoft 2,758Avago Technologies 2,696Honeywell International 2,677
£’000
Total of all sales for the year (Note 10) 153,728
Major sales Proceeds
Schlumberger 4,003Google ‘A’ 2,994Merck & Co 2,953Time Warner 2,705Johnson Controls 2,529Chevron 2,391Johnson & Johnson 2,390Apple 2,389Occidental Petroleum 2,382United Technologies 2,347eBay 2,319Wells Fargo 2,180Biogen Idec 2,177ExxonMobil 2,161Microsoft 2,048Dow Chemical 2,024Cisco Systems 1,955Bank of America 1,920Qualcomm 1,765CME Group ‘A’ 1,741
Portfolio movements For the year ending 31 January 2014
405
Continuation�
� Return to Index

Statement of total returnFor the year ending 31 January
2014 2013£’000 £’000 £’000 £’000
Income
Net capital gains (Note 1) 19,666 15,381
Revenue (Note 2) 2,398 2,249
Expenses (Note 3) (1,963) (1,509)
Net revenue before taxation 435 740
Taxation (Note 4) (315) (305)
Net revenue after taxation 120 435
Total return before distributions 19,786 15,816
Finance costs: Distributions (Note 5) (258) (435)
Change in net assets attributable to shareholders from investment activities 19,528 15,381
Statement of change in net assets attributable to shareholdersFor the year ending 31 January
2014 2013£’000 £’000 £’000 £’000
Opening net assets attributable to shareholders 96,974 108,328
Amounts receivable on issue of shares 122,427 38,626
Amounts payable on cancellation of shares (67,418) (65,600)
55,009 (26,974)
Change in net assets attributable to shareholders from investment activities (see above) 19,528 15,381
Retained distributions on accumulation shares 483 239
Stamp duty reserve tax (1) –
Closing net assets attributable to shareholders 171,993 96,974
Balance sheetAs at 31 January
2014 2013£’000 £’000 £’000 £’000
ASSETS
Investment assets 170,512 96,261
Debtors (Note 7) 5,540 1,272
Cash and bank balances (Note 8) 3,239 728
Total other assets 8,779 2,000
Total assets 179,291 98,261
LIABILITIES
Investment liabilities (2) –
Creditors (Note 9) (7,284) (1,255)
Distribution payable on income shares (12) (32)
Total other liabilities (7,296) (1,287)
Total liabilities (7,298) (1,287)
Net assets attributable to shareholders 171,993 96,974
The notes to these financial statements are shown on pages 407 to 408.
Financial statements
406
Continuation�
� Return to Index

1. Net capital gains2014 2013
£’000 £’000Currency (losses)/gains (207) 181Derivative contracts 20 93Non-derivative securities 19,853 15,107Net capital gains 19,666 15,381
2. Revenue2014 2013
£’000 £’000Franked income from UK equity investments 19 8Income from overseas equity investments 2,378 2,240Interest on bank and term deposits 1 1Total revenue 2,398 2,249
3. Expenses2014 2013
£’000 £’000Payable to the ACD or associate of the ACD:ACD fee 1,749 1,339Fixed expenses 214 170Total expenses 1,963 1,509
4. Taxation2014 2013
£’000 £’000a) Analysis of charge in the yearOverseas tax suffered 315 305Current year tax charge (Note 4b) 315 305
b) Factors affecting the tax charge for the yearThe tax assessed for the year is higher than the standard rate of corporation tax inthe UK for an Open-Ended Investment Company (OEIC) (20%). The differences areexplained below.
Net revenue before taxation 435 740Corporation tax at 20% 87 148
Effects of:Dividends not subject to corporation tax (478) (450)Excess expenses for which no relief taken 391 302Overseas tax suffered 315 305
228 157Current year tax charge (Note 4a) 315 305
No deferred tax asset has been recognised in the financial statements. At the yearend date, the Fund had a potential unrecognised deferred tax asset of £1,051,456(31.01.13: £660,269) in relation to £5,257,280 (31.01.13: £3,301,345) of excessmanagement expenses which would only be utilised to reduce the tax charge if theFund had an excess of unfranked income over expenses in a future period. There isno excess of unfranked income expected in the future.
5. Finance costsDistributionsThe distributions take account of amounts receivable on the issue of shares andamounts payable on the cancellation of shares and comprise:
2014 2013£’000 £’000
Final dividend distribution 495 271Add: Amounts payable on cancellation of shares 48 206Deduct: Amounts receivable on issue of shares (285) (42)Total finance costs 258 435
Details of the distribution per share are set out on page 409.
6. Movement between net revenue after taxation and distributions2014 2013
£’000 £’000Net revenue after taxation 120 435Add: Net expense payable from capital 90 -Add: Undistributed revenue brought forward 6 6Deduct: Undistributed revenue carried forward (1) (6)Equalisation on conversions 43 -
258 435
7. Debtors2014 2013
£’000 £’000Accrued income 94 74Due from the ACD for shares created 4,228 76Overseas tax recoverable 4 7Sales awaiting settlement 1,214 1,115Total debtors 5,540 1,272
8. Cash and bank balances2014 2013
£’000 £’000Amounts held at futures clearing houses and brokers 33 -Cash and bank balances 3,206 728Total cash and bank balances 3,239 728
9. Creditors2014 2013
£’000 £’000Accrued expenses 191 124Due to the ACD for shares cancelled 55 111Purchases awaiting settlement 7,038 1,020Total creditors 7,284 1,255
Notes to the financial statements for the year ending 31 January 2014
407
Continuation�
� Return to Index

10. Portfolio transaction costs2014 2013
£’000 £’000Analysis of total purchase costs
Purchases in year before transaction costs 208,049 94,789
Commissions 84 57Total purchase costs 84 57Gross purchases total 208,133 94,846
Analysis of total sale costs
Gross sales before transaction costs 153,795 121,409
Commissions (64) (67)Taxes (3) (3)Total sale costs (67) (70)Total sales net of transaction costs 153,728 121,339
11. Related party transactionsJPMorgan Funds Limited, as Authorised Corporate Director (“ACD”), is a relatedparty, and acts as principal in respect of all transactions of shares in the Company.The aggregate monies received through issue, and paid on cancellation, aredisclosed in the Statement of Change in Net Assets Attributable to Shareholders.
The balance due from the ACD and their associates at the year end date in respectof related party transactions was £3,981,698 (31.01.13: £158,765). Details of relatedparty transactions are given under note 13 on page 413.
Some of the dealing transactions for the Fund are carried out through associatesof the ACD. Such transactions are carried out on an arm’s length basis. Thecomissions paid to these companies over the year were £83 (31.01.13: £nil).Commission was paid to the associated company JP Morgan Securities Ltd.
The following parties held a material interest in the Fund at the year end date:– Chase Nominees Limited 17.53% (31.01.13: 19.59%) – JP Morgan Life Diversified Equity 17.02% (31.01.13: 0.00%)– Axa Wealth Ltd 11.99% (31.01.13: 0.00%)– R C Greig Nominees Ltd 3.57% (31.01.13: 21.45%)
12. Financial instrumentsCurrency exposuresA substantial proportion of the net assets of the Fund are denominated incurrencies other than sterling, with the effect that the Balance sheet and totalreturn can be significantly affected by currency movements.
Net foreign currency assets/(liabilities)Monetary Non-monetary
Total exposures exposuresCurrency £’000 £’000 £’000
31.01.14US Dollar 168,007 (2,503) 170,510
31.01.13US Dollar 97,165 904 96,261
Interest rate riskAt the year end date, 1.9% (31.01.13: 0.8%) of the Fund’s net assets by value wereinterest bearing, carrying a (fixed/floating) rate.
For consideration of other risks including liquidity, pricing and credit risk, pleaserefer to the notes to the aggregated financial statements, pages 413 to 414.
13. Share classesThe Fund currently has five share classes; Class A Shares, Class B Shares, Class CShares, Class I Shares and Class X Shares. The Authorised Corporate Director’s(ACD) fee and fixed expenses charge are shown below.
ACD fee Fixed expensesClass A shares: 1.50% 0.18%Class B shares: 1.00% 0.18%Class C shares: 0.75% 0.18%Class I shares: 0.60% 0.00%Class X shares: 0.00% 0.06%
The X share class is designed to accommodate an alternative charging structurewhereby the annual fee normally charged to the Fund and then passed on in theshare price is instead administratively levied and collected by the ACD from theshareholder or through the relevant JPMorgan Chase & Co entity.
The net asset value of each share class, the net asset value per share and thenumber of shares in each class are shown on page 402. All classes have the samerights on winding up.
14. Derivatives The Fund enters into derivative transactions in the form of futures for the purposeof efficient portfolio management. The commitment approach has been used tocalculate the global exposure.
Further information on the derivative risks can be found in the notes to theaggregated financial statements on page 414.
15. Contingent liabilities and capital commitmentsAt the balance sheet date there were no contingent liabilities or capitalcommitments (2013: none).
Notes to the financial statements – continued
408
Continuation�
� Return to Index

Final distribution in pence per share
Group 1 – Shares purchased prior to 1 February 2013Group 2 – Shares purchased 1 February 2013 to 31 January 2014
DistributionGross Tax Net payable paid
revenue at 10% revenue Equalisation 30.04.14 30.04.13
A-Class Accumulation Shares
Group 1 0.000000 0.000000 0.000000 – 0.000000 0.120000
Group 2 0.000000 0.000000 0.000000 0.000000 0.000000 0.120000
A-Class Income Shares
Group 1 0.000000 0.000000 0.000000 – 0.000000 0.110000
Group 2 0.000000 0.000000 0.000000 0.000000 0.000000 0.110000
B-Class Accumulation Shares
Group 1 0.344444 0.034444 0.310000 – 0.310000 0.220000
Group 2 0.092916 0.009292 0.083624 0.226376 0.310000 0.220000
C-Class Accumulation Shares
Group 1 1.455556 0.145556 1.310000 – 1.310000 1.610000
Group 2 0.262982 0.026298 0.236684 1.073316 1.310000 1.610000
C-Class Income Shares
Group 1 0.855556 0.085556 0.770000 – 0.770000 0.570000
Group 2 0.183592 0.018359 0.165233 0.604767 0.770000 0.570000
I-Class Accumulation Shares
Group 1 4.055556 0.405556 3.650000 – 3.650000 3.860000
Group 2 1.307988 0.130799 1.177189 2.472811 3.650000 3.860000
X-Class Income Shares
Group 1 5.644444 0.564444 5.080000 – 5.080000 5.040000
Group 2 5.644444 0.564444 5.080000 0.000000 5.080000 5.040000
Equalisation applies only to shares purchased during the distribution period (group 2 shares). It is the average amount of revenue included in the purchase price of all group 2 shares and is refunded to holders of these
shares as a return of capital. Being capital it is not liable to income tax but must be deducted from the cost of shares for capital gains tax purposes.
Distribution table
409
� Return to Index

Aggregated statement of total returnFor the year ending 31 January
2014 2013£’000 £’000 £’000 £’000
Income
Net capital (losses)/gains (Note 3) (92,999) 171,172
Revenue (Note 4) 279,904 242,974
Expenses (Note 5) (124,350) (118,867)
Performance fee (Note 5) (54) –
Finance costs: Interest (Note 7) (20) (2)
Net revenue before taxation 155,480 124,105
Taxation (Note 6) (16,631) (13,671)
Net revenue after taxation 138,849 110,434
Total return before distributions 45,850 281,606
Finance costs: Distributions (Note 7) (170,966) (141,031)
Change in net assets attributable to shareholders from investment activities (125,116) 140,575
Aggregated statement of change in net assetsattributable to shareholdersFor the year ending 31 January
2014 2013£’000 £’000 £’000 £’000
Opening net assets attributable to shareholders 8,972,044 8,509,029
Amounts transferred from JPM Emerging Markets Infrastructure Fund (12,772) –
Amounts transferred to JPM Emerging Markets Fund 12,772 –
Amounts transferred to JPM Europe Fund – 54,653
Amounts transferred from JPM UK Equity Fund (264,499) –
Amounts transferred to JPM UK Strategic Growth Fund 264,499 –
Amounts transferred to other funds (112,715) –
8,859,329 8,563,682
Amounts receivable on issue of shares 2,424,720 2,151,357
Amounts payable on cancellation of shares (1,907,569) (1,965,858)
517,151 185,499
Change in net assets attributable to shareholders from investment activities (see above) (125,116) 140,575
Retained distributions on accumulation shares 98,359 82,461
Stamp duty reserve tax (477) (346)
Unclaimed distributions 172 173
Closing net assets attributable to shareholders 9,349,418 8,972,044
Aggregated balance sheetAs at 31 January
2014 2013£’000 £’000 £’000 £’000
ASSETS
Investment assets 9,248,498 8,963,775
Debtors (Note 9) 141,006 180,218
Cash and bank balances (Note 10) 144,209 116,723
Total other assets 285,215 296,941
Total assets 9,533,713 9,260,716
LIABILITIES
Investment liabilities (11,758) (32,863)
Creditors (Note 11) (153,133) (239,376)
Bank overdrafts – (945)
Distribution payable on income shares (19,404) (15,488)
Total other liabilities (172,537) (255,809)
Total liabilities (184,295) (288,672)
Net assets attributable to shareholders 9,349,418 8,972,044
The notes to these financial statements are shown on pages 411 to 414.
This report has been prepared in accordance with the Financial Conduct Authority’sCollective Investment Schemes Sourcebook and was approved by the AuthorisedCorporate Director on 14 May 2014.
Peter SchwichtDirectorJPMorgan Funds Limited14 May 2014
Dan WatkinsxDirectorJPMorgan Funds Limited14 May 2014
Aggregated Company financial statements
410
Continuation�
� Return to Index

1. Accounting policies(a) The financial statements have been prepared under the historical cost basis
as modified by the revaluation of investments and in accordance with theStatement of Recommended Practice for Authorised Funds issued by the IMAin October 2010.
All of the sub-funds have been prepared on a going concern basis with theexception of the JPM Balanced Total Return, JPM Emerging MarketsInfrastructure, JPM Global Equity Absolute Alpha, JPM Global Mining and JPMUK Equity funds which have been prepared on a basis other than goingconcern. In applying this basis of preparation, the assets and liabilities ofthese Funds continue to be stated at their fair values which materially equateto their residual values.
(b) The aggregate financial statements represent the sum of the individual sub-funds within the Company. Further analysis of the distribution and net assetposition can be found within the financial statements of the individual sub-funds.
(c) Revenue on debt securities is recognised on the effective interest rate basiswhich takes account of the amortisation of any discounts or premium arisingon the purchase price, compared to the final maturity value, over theremaining life of the security. Future cash flows on all assets are consideredwhen calculating revenue on an effective interest rate basis and where, in theACD’s view there is doubt as to the final maturity value, an estimate of thefinal redemption proceeds will be made in determining those cash flows.Accrued interest purchased or sold is excluded from the cost of the securityand is dealt with as revenue.
(d) Dividends on equities and other Collective Investment Schemes arerecognised when the security goes ex-dividend. Accumulation distributionsfrom shares held in other Collective Investment Schemes are reflected asrevenue of the respective sub-fund, and equalisation on distributionsreceived from other Collective Investment Schemes is deducted from the costof the investment. Interest on deposits and other revenue is accounted for onan accruals basis. Underwriting commission is recognised when the issuetakes place. Where the Fund is required to take up all of the sharesunderwritten, the commission received is treated as a deduction from thecost of the shares taken up. Where the Fund is required to take up aproportion of the shares underwritten, the same proportion of thecommission received is treated as a deduction from the cost of the sharestaken up and the balance is taken to revenue.
(e) Dividends from US Real Estate Investment Trusts (“REITs”) are initiallyrecognised as revenue when the security goes ex-dividend. The US REITcompanies issue information on the revenue/capital split of these dividendson an annual basis based on the calendar year. When this information isreceived, the relevant portion is then reallocated to capital.
(f) Management fee rebates received from underlying funds are recognised asrevenue or capital in the same way as the underlying investments account fortheir management fee, and form part of the distribution where theunderlying fund pays its management fee from revenue.
(g) Premiums received in respect of written call options, where the expresspurpose is to generate extra revenue, are accrued to the revenue account ona straight line basis over the life of the contract. All other premiums onwritten and bought options are treated as capital. In determining theaccounting treatment for other derivatives, consideration is given to theinstrument itself and the sub-fund’s objectives for investment in derivativeinstruments. Income from Contracts for difference and interest paid on Creditdefault swaps and Interest rate swaps are taken to revenue. All othergains/losses from derivatives are taken to capital.
(h) Revenue from Stocklending is accounted for gross of bank and agent fees andis recognised on a receipts basis.
(i) The underlying circumstances behind special dividends are reviewed on acase by case basis in determining whether the amount is capital or revenue innature. Any tax treatment thereon will follow the accounting treatment of theprincipal amount. Amounts recognised as revenue will form part of theFund’s distribution.
(j) Where Funds hold assets in other funds managed by an associate of the ACDthen these funds are excluded from the calculation of the ACD fees paid.Management fee rebates received from underlying funds are recognised asrevenue or capital in the same way as the underlying investments account fortheir management fee, and form part of the distribution where theunderlying fund pays its management fee from revenue. Fixed expenses arealso charged to revenue. Stamp duty reserve tax, transaction charges andexpenses relating to the purchase and sale of investments are chargeddirectly to the capital of the Fund. Taxation is computed by reference to therevenue after expenses attributable to each class.
(k) Performance fees are calculated on a daily basis, and reflected in the netasset value per share on the following dealing day. If the benchmark isexceeded, the amount of excess is multiplied by the pre-determinedperformance fee rate (see relevant sub-fund for the rate). A performance feewill only be accrued when the net asset value per share class exceeds boththe performance fee benchmark and high water mark. Below that level, noperformance fee is accrued. A Fund with a high water mark will not accrue aperformance fee until any prior losses are recovered by subsequent returns.For sub-funds with a performance fee cap in place no additional fee can beaccrued once the share class return exceeds the benchmark return by thelevel of the cap. The cap is a percentage limit and not a monetary limit.
(l) The charge for taxation is based at the current rate on taxable revenue for theperiod less allowable expenses. UK dividend income is disclosed net of anyrelated tax credit. Overseas dividends are disclosed gross of any foreign taxsuffered, with the tax element being separately disclosed in the taxation note.
(m) Deferred taxation is provided for on all timing differences that haveoriginated but not reversed by the balance sheet date, other than thosedifferences regarded as permanent. Any liability to deferred taxation isprovided for at the average rate of taxation expected to apply. Deferred taxassets and liabilities are not discounted to reflect the time value of money.
(n) The listed investments of the sub-funds and investments traded on regulatedmarkets have been valued at market value at 12 noon on 31 January 2014.Market value is defined, by the SORP, as fair value which generally is the bidvalue of each security excluding any accrued interest in the case of floating orfixed rate securities. The valuation of unlisted investments are based on theACD’s assessment of their estimated realisable value. Suspended securitiesare valued initially at the suspended price but are subject to constant reviewby the Pricing committee on a regular basis. Exchange traded derivatives,including futures and options, are priced at the market value at 12 noon on 31January 2014. Non-exchange traded derivatives, including swaps andcontracts for difference, are valued using information provided by therelevant third party brokers and as a consequence are the close of businessvalues on the prior business day, and are then translated to sterling using theexchange rate at 12 noon on 31 January 2014.
(o) All transactions in foreign currencies are converted into sterling at the ratesof exchange ruling at the date of such transactions. The unrealised asset orliability position of each forward foreign currency contract held at the yearend is determined with reference to the spot currency rate and the expectedinterest rate return over the currency contract to settlement date. Foreigncurrency assets and liabilities at the end of the accounting period aretranslated at the exchange rate at 12 noon on 31 January 2014.
(p) The sub-funds may apply a dilution adjustment, intended to cover certaindealing charges which could have a diluting effect on the performance of thesub-funds. This adjustment is at the discretion of the ACD. Where applied it isincluded within the dealing price available to shareholders and is notdisclosed separately in the financial statements.
2. Distribution policies(a) The income available for distribution for each sub-fund is the total revenue
earned by the sub-fund, less deductible expenses and taxation charged torevenue. When calculating revenue on an effective interest rate basis allfuture cash flows are considered, and where, in the ACD’s view there is doubtas to the final maturity value, an estimate of the final redemption proceedswill be made in determining those cash flows. The impact of this will be toreduce the revenue recognised from debt securities, and therefore therevenue distributed, whilst preserving capital within the sub-fund.Accumulation distributions from shares held in other Collective InvestmentSchemes are reflected as revenue of the respective sub-fund and form part ofthe distribution.
The final distribution was distributed on 16 March 2014 for JPM InstitutionalAsia Fund, and will be distributed on 30 April 2014 for all other sub-funds.
(b) The sub-funds are not more than 60% invested in qualifying investments (asdefined by SI2006/964) and where applicable will pay a dividend distributionapart from JPM Cautious Managed Fund, JPM Global (ex-UK) Bond Fund, JPMGlobal High Yield Bond Fund, JPM Sterling Corporate Bond Fund and JPMStrategic Bond Fund which are more than 60% invested in qualifyinginvestments (as defined by SI2006/964) and where applicable will pay aninterest distribution.
(c) The ordinary element of stocks received in lieu of cash dividends isrecognised as revenue of the respective Fund, and forms part of thedistribution. Any excess in value of shares received over the amount of cashforgone is reviewed on a case by case basis and treated appropriately asincome or capital.
Notes to the Aggregated Company financial statements for the year ending 31 January 2014
411
Continuation�
� Return to Index

(d) Revenue is allocated each day pro rata to the value of assets attributable toeach class. The ACD’s annual fee is charged to revenue of the respective shareclass except for the following funds, which initially recognise the ACD fee asrevenue but transferred to capital for revenue distribution purposes – JPMEmerging Markets Income Fund, JPM Global Equity Income Fund, JPM GlobalHigh Yield Bond Fund, JPM Multi-Asset Income Fund, JPM UK Equity and BondIncome Fund, JPM UK Higher Income Fund, JPM UK Strategic Equity IncomeFund and JPM US Equity Income Fund.
3. Net capital (losses)/gains2014 2013
£’000 £’000Currency losses (8,705) (3,610)Derivative contracts (7,004) (51,443)Forward currency contracts 97,583 5,976Italian TaxCredit received 370 –Non-derivative securities (175,243) 220,249Net capital (losses)/gains (92,999) 171,172
4. Revenue2014 2013
£’000 £’000Distributions from authorised ICVCs 36 166Distributions from overseas investments 33 5Income from Liquidity funds 585 956Franked income from UK equity investments 59,752 59,085Income from overseas equity investments 148,336 120,384Income paid on contracts for difference 1 (21)Interest distributions from Investment Trusts 33 37Interest on amounts held with futures clearing
houses and brokers 1 42Interest on bank and term deposits 347 303Interest on derivatives 485 (49)Interest on fixed-interest securities 68,427 58,762Management fee rebates 62 59Option income 101 281Property income distributions 563 495Stock dividends 683 2,010Stocklending income 96 280Underwriting commission 363 179Total revenue 279,904 242,974
5. Expenses2014 2013
£’000 £’000Payable to the ACD or associate of the ACD:ACD fee 109,595 105,892Fixed expenses 14,754* 12,933Performance fee 54 –Stocklending fees – 42
124,403 118,867
Professional fees 1 –1 –
Total expenses 124,404 118,867
* Includes the ACD paid fees to the auditor of £195,000 for the year ending January2014.
6. Taxation2014 2013
£’000 £’000a) Analysis of charge in the yearCorporation tax at 20% 953 477Double tax relief (95) (56)Overseas tax provision (282) 158Overseas tax suffered 16,045 13,091Prior year adjustments 10 6Tax on gain in offshore funds – (5)Current year tax charge (Note 6b) 16,631 13,671
b) Factors affecting the tax charge for the yearThe tax assessed for the year is lower than the standard rate of corporation tax inthe UK for an Open-Ended Investment Company (OEIC) (20%). The differences areexplained below.
Net revenue before taxation 155,480 124,105Corporation tax at 20% 31,097 24,825
Effects of:Dividends not subject to corporation tax (40,204) (34,994)Double tax relief (95) (56)Excess expenses for which no relief taken 20,360 18,908Expenses not deductible for tax purposes (3) –Interest distributions deductible for tax purposes (10,181) (8,178)Non-trade deficit set against current year income – 37Overseas tax expensed (116) (103)Overseas tax provision (282) 158Overseas tax suffered 16,045 13,091Prior year adjustments 10 6Taxable gain on offshore funds – (23)
(14,466) (11,154)Current year tax charge (Note 6a) 16,631 13,671
At the year end date there is a potential unrecognised deferred tax asset inrelation to excess management expenses which would only be utilised to reducethe tax charge if the Fund had an excess of unfranked income over expenses in afuture period. The disclosures for the potential unrecognised deferred tax assetsare shown within each individual sub-fund.
7. Finance costsDistributionsThe distributions take account of amounts receivable on the issue of shares andamounts payable on the cancellation of shares and comprise:
2014 2013£’000 £’000
First interim distribution 33,716 22,224Second interim distribution 41,592 30,432Third interim distribution 30,289 23,528Final distribution 71,016 65,287Add: Amounts payable on cancellation of shares 8,733 7,479Deduct: Amounts receivable on issue of shares (14,380) (7,919)Net distributions for the year 170,966 141,031
Interest 20 2
Total finance costs 170,986 141,033
Notes to the Aggregated Company financial statements – continued
412
Continuation�
� Return to Index

8. Movement between net revenue after taxation and distributions2014 2013
£’000 £’000Net revenue after taxation 138,849 110,434Add: ACD fee (net of tax relief) paid from capital 30,950 21,683Add: Net expense payable from capital 500 8,938Add: Undistributed revenue brought forward 301 325Deduct: Prior year adjustment – (27)Deduct: Tax on capital offshore gains 10 (23)Deduct: Undistributed revenue carried forward (365) (299)Equalisations on conversions 721 -
170,966 141,031
9. Debtors2014 2013
£’000 £’000Accrued income 25,648 27,324Corporation tax recoverable – 17Due from brokers on contracts for difference – 11Due from the ACD for shares created 47,818 44,504Income tax recoverable 2 28Overseas tax recoverable 2,215 1,534Prepaid expenses 1 –Property income tax recoverable 239 9Sales awaiting settlement 65,083 106,791Total debtors 141,006 180,218
10.Cash and bank balances2014 2013
£’000 £’000Amounts held at futures clearing houses
and brokers 12,637 8,603Cash and bank balances 131,572 108,120Total cash and bank balances 144,209 116,723
11. Creditors2013 2012
£’000 £’000Accrued expenses 10,620 10,397Corporation tax payable 468 221Due to brokers on contracts for difference – 26Due to the ACD for shares cancelled 30,808 25,359Income tax payable 3,090 3,889Purchases awaiting settlement 108,147 199,484Total creditors 153,133 239,376
12. Portfolio transaction costsThe disclosures for Portfolio transaction costs are shown within each individualsub-fund.
13. Related party transactionsJPMorgan Fund Limited, as Authorised Corporate Director (ACD), is a related party,and acts as principal in respect of all transactions of shares in the Company. Theaggregate monies received through issue, and paid on cancellation, are disclosedin the Statement of Change in Net Assets Attributable to Shareholders.
ACD fees and fixed expenses paid to JPMorgan Funds Limited and their associatesare shown in Note 5 and details of shares issued and cancelled by the ACD areshown in the Statement of change in net assets attributable to shareholders. Thebalance due from the ACD and their associates at the year end in respect of thesetransactions was £6,399,262 (31.01.13: £8,747,664 due to the ACD).
Investments considered to be related parties have been identified in the portfoliostatement on each sub-fund and the revenue from these investments is disclosedin the respective sub-fund’s account.
Material holdings in the funds are disclosed in the respective fund's account.
14. Financial instrumentsIn pursuing its investment objective as stated for each individual sub-fund, theCompany holds a number of financial instruments. The Company’s financialinstruments, other than derivatives, comprise securities and other investments,cash balances, debtors and creditors that arise directly from its operations, forexample, in respect of sales and purchases awaiting settlement, amountsreceivable for creations and payable for redemptions and debtors for accruedincome.
The main risks arising from the Company’s financial instruments and the ACD’spolicies for managing these risks are summarised below. These policies have beenapplied throughout the year.
Market price riskMarket price risk is the risk that the value of the Company’s investment holdingswill fluctuate as a result of changes in market prices caused by factors other thaninterest rate or foreign currency movement. Market price risk arises mainly fromuncertainty about future prices of financial instruments the Company holds. Itrepresents the potential loss the Company might suffer through holding marketpositions in the face of price movements. The Company’s investment portfolio isexposed to market price fluctuations, which are monitored by the ACD inpursuance of the investment objective and policy as set out in the Prospectus.
Adherence to investment guidelines and to investment and borrowing powers setout in the Instrument of Incorporation and in the Financial Services Authority’sCollective Investment Schemes Sourcebook mitigates the risk of excessiveexposure to any particular type of security or issuer.
Foreign currency riskForeign currency risk is the risk that the value of the Company’s investmentholdings will fluctuate as a result of changes in foreign currency exchange rates.
A proportion of some of the Company’s investment portfolios are invested inoverseas securities and the balance sheet can be affected by movements inforeign exchange rates. The ACD may seek to manage exposure to currencymovements by using forward exchange contracts or by hedging the sterling valueof investments that are priced in other currencies. Income received in othercurrencies is converted to sterling on the date of the transaction.
See the respective fund for its foreign currency profile.
Interest rate riskInterest rate risk is the risk that the value of the Company’s investment holdingswill fluctuate as a result of changes in interest rates.
Some of the sub-funds may invest in fixed and floating rate securities. The incomeof the sub-fund may be affected by changes to interest rates relevant to particularsecurities or as a result of the ACD being unable to secure similar returns on theexpiry of contracts or sale of securities. The value of fixed interest securities maybe affected by interest rate movements or the expectation of such movements inthe future. Interest receivable on bank deposits or payable on bank overdraftpositions will be affected by fluctuations in interest rates.
See the respective fund for its interest rate profile.
Notes to the Aggregated Company financial statements – continued
413
Continuation�
� Return to Index

Liquidity riskThe Company’s assets comprise mainly of readily realisable securities. If insufficientcash is available to finance shareholder redemptions then securities held by theCompany may need to be sold.
The risk of low market liquidity, through reduced trading volumes, may affect theability of the fund to trade financial instruments at values indicated by market datavendors. From time to time, liquidity may also be affected by stock specific oreconomic events.
To manage these risks the Investment Manager undertakes detailed research toselect appropriate investment opportunities in line with the individual sub-fund’sobjective. All stocks are valued daily but those stocks identified as being less liquidare reviewed on a regular basis for pricing accuracy.
Credit risk/Counterparty riskCertain transactions in securities that the Company enters into expose it to the riskthat the counterparty will not deliver the investment for a purchase, or cash for asale after the Company has fulfilled its responsibilities. The Company only buysand sells investments through brokers which have been approved by the ACD asan acceptable counterparty. In addition, limits are set to the exposure to anyindividual broker that may exist at any time and changes in brokers’ financialratings are reviewed.
In order to trade derivative instruments the ACD enters into an agreement with anapproved counterparty. The ACD assesses the credit worthiness of thecounterparty, however the sub-fund remains at risk that the counterparty will notsettle its obligations under the contract. Any collateral due to or from the sub-fundunder the terms of the contract may not be settled.
The sub-funds restrict their exposure to credit losses on derivative instruments bytrading via an International Swap and Derivative Association (ISDA) MasterArrangements with each counterparty.
Derivative riskThe company enters into derivative transactions in the form of currency forwards,futures, swaps, contracts for difference, and options for the purpose of efficientportfolio management. The JPM Balanced Total Return Fund, JPM CautiousManaged Fund, JPM Diversified Real Return Fund, JPM Global Equity AbsoluteAlpha Fund, JPM Multi-Asset Income Fund, JPM Strategic Bond Fund and JPMSterling Corporate Bond Fund may also enter into derivatives for investmentpurposes. It is the ACD’s intention that the use of derivatives for investmentpurposes will not materially change the risk profile of these sub-funds.
The sub-funds used the following derivative instruments in the year:
For sub-funds where an element of the investment portfolio is invested inoverseas instruments, the Balance sheet can be affected by movements inexchange rates. The ACD may seek to manage exposure to currency movementsby using currency forwards or by hedging the sterling value of investments thatare priced in other currencies.
Futures provide exposure to underlying securities in an index and act as a moreliquid alternative to direct investment. Futures provide an efficient tool toimplement future interest and equity movement views, as well as curveselection.The decision to buy or sell futures will be made to benefit from anychange in value of the futures (from the underlying capital value).
Swaps are used to express an opinion on the price direction of either a singlesecurity or a basket of securities. These instruments are used for capital gainspurposes.
The basic rationale for using options is a method of implementing an opinion onthe direction of either interest rates or a specific index. Although the ACD mayeither pay or receive an initial premium in the transaction, the economic impact ofthe option is influenced by exposure to market movements.
Where derivatives are used, such instruments are inherently volatile and thosesub-funds could potentially be exposed to additional risk and costs should themarket move against them. In aiming to reduce volatility the ACD utilises a riskmanagement process. The sub-funds that make use of derivatives are required tomeasure and limit their global exposure arising from these contracts. Exposure ismonitored to ensure the sub-fund’s exposure is within the limits set out by theACD, the scheme documents and the COLL Sourcebook. None of the sub-fundshave exceeded the limits set during the year.
Fair value of financial assets and financial liabilitiesThere is no material difference between the value of the financial assets andliabilities, as shown in the balance sheet, and their fair value.
Notes to the Aggregated Company financial statements – continued
414
� Return to Index

Statement of the Authorised Corporate Director
Statement of the AuthorisedCorporate Director’sresponsibilities in relation to the financial statements of the schemeThe Rules of the Financial Services Authority’sCollective Investment Schemes Sourcebookrequire the Authorised Corporate Director toprepare financial statements for each annualaccounting period which give a true and fairview of the financial affairs of the company andof its income and expenditure for the period.
In preparing those financial statements theAuthorised Corporate Director is required to:
• comply with the Prospectus and applicableaccounting standards, subject to any materialdepartures which are required to be disclosedand explained in the financial statements;
The depositary is responsible for thesafekeeping of all of the property of thecompany (other than tangible moveableproperty) which is entrusted to it and for the collection of revenue that arises from that property.
It is the duty of the depositary to takereasonable care to ensure that the company ismanaged in accordance with the FinancialServices Authority’s Collective InvestmentSchemes Sourcebook (COLL), as amended, theOpen-Ended Investment Companies Regulations2001 (SI 2001/1228), as amended (’the OEICRegulations’), the company’s Instrument ofIncorporation and Prospectus, in relation to
the pricing of, and dealings in, shares in thecompany; the application of revenue of thecompany; and the investment and borrowingpowers applicable to the company.
Having carried out such procedures as we consider necessary to discharge ourresponsibilities as depositary of the company,it is our opinion, based on the informationavailable to us and the explanations provided,that in all material respects the company, actingthrough the Authorised Corporate Director:
(i) has carried out the issue, sale, redemptionand cancellation, and calculation of the priceof the company’s shares and the application ofthe company’s revenue in accordance with COLL
and, where applicable, the OEIC Regulations,the Instrument of Incorporation and Prospectusof the company, and
(ii) has observed the investment and borrowingpowers and restrictions applicable to thecompany.
National Westminster Bank plcLondon14 May 2014
• comply with the Statement of RecommendedPractice for Authorised Funds issued by theIMA in 2010;
• select suitable accounting policies and thenapply them consistently;
• make judgements and estimates that arereasonable and prudent;
• prepare the financial statements on the goingconcern basis unless it is inappropriate topresume that the company will continue inoperation for the foreseeable future; and
• take reasonable steps for the prevention anddetection of fraud, error and non-compliancewith law or regulations.
The Authorised Corporate Director is requiredto keep proper accounting records and tomanage the company in accordance with theregulations and the Prospectus.
The report has been prepared in accordancewith the Financial Services Authority’s CollectiveInvestment Schemes Sourcebook. Theshareholders of the ICVC are not liable for thedebts of the ICVC.
Peter SchwichtDirectorJPMorgan Funds Limited14 May 2014
Dan WatkinsDirectorJPMorgan Funds Limited14 May 2014
Report of the Depositary to the Shareholders For the year ending 31 January 2014 for the JPMorgan Fund ICVC (’the company’)
415
� Return to Index

416
Continuation�
� Return to Index
Independent Auditors’ Report to the Members of JPMorgan Fund ICVCReport on the financial statementsOur opinionIn our opinion the financial statements, definedbelow:
• give a true and fair view of the financialposition of the Company and each of the sub-funds as at 31 January 2014 and of the netrevenue/(expenses) and the net capitalgains/(losses) of the scheme property of theCompany and each of the sub-funds for theyear then ended; and
• have been properly prepared in accordancewith United Kingdom Generally AcceptedAccounting Practice, the Statement ofRecommended Practice for Authorised Funds,the Collective Investment Schemes sourcebookand the Instrument of Incorporation.
This opinion is to be read in the context of whatwe say in the remainder of this report.
Emphasis of Matter – Basis ofpreparation In forming our opinion on the financialstatements, which is not modified, we haveconsidered the adequacy of the disclosuresmade in note 1 to the financial statementsconcerning the going concern basis ofaccounting for the JPM Balanced Total ReturnFund, JPM Emerging Markets InfrastructureFund, JPM Global Equity Absolute Alpha Fund,JPM Global Mining Fund and JPM UK Equity Fundwhich have ceased investment activity.Accordingly, the going concern basis ofaccounting is no longer appropriate and thefinancial statements have been prepared on abasis other than going concern as described innote 1 to the financial statements. Noadjustments have been required in thesefinancial statements to reduce assets to theirrealisable values, to provide for liabilities arisingfrom the decision and to reclassify fixed assetsand long-term liabilities as current assets andliabilities.
What we have auditedThe financial statements of JP Morgan Fund ICVC(the “Company”), which are prepared by JPMorgan Funds Limited (the “AuthorisedCorporate Director”), comprise :
• the aggregated balance sheet of the Companyas at 31 January 2014;
• the aggregated statement of total return ofthe Company for the year then ended;
• the aggregated statement of change in netassets attributable to shareholders of theCompany for the year then ended;
• the balance sheets as at 31 January 2014together with the statements of total returnand statements of changes in net assetsattributable to shareholders for each of theCompany’s sub-funds;
• the notes to the Company’s financialstatements and each of the Company’s sub-funds, which include a summary of significantaccounting policies and other explanatoryinformation; and
• the distribution tables.
The financial reporting framework that has beenapplied in their preparation is applicable lawand United Kingdom Accounting Standards(United Kingdom Generally Accepted AccountingPractice), the Statement of RecommendedPractice ‘Financial Statements of AuthorisedFunds’ issued by the Investment ManagementAssociation (the “Statement of RecommendedPractice for Authorised Funds”), the CollectiveInvestment Schemes sourcebook and theInstrument of Incorporation.
In applying the financial reporting framework,the Authorised Corporate Director has made anumber of subjective judgements, for examplein respect of significant accounting estimates.In making such estimates, they have madeassumptions and considered future events.
What an audit of financialstatements involves We conducted our audit in accordance withInternational Standards on Auditing (UK andIreland) (ISAs (UK & Ireland)). An audit involvesobtaining evidence about the amounts anddisclosures in the financial statements sufficientto give reasonable assurance that the financialstatements are free from materialmisstatement, whether caused by fraud orerror. This includes an assessment of:
• whether the accounting policies areappropriate to the Company’s circumstancesand have been consistently applied andadequately disclosed;
• the reasonableness of significant accountingestimates made by the Authorised CorporateDirector; and
• the overall presentation of the financialstatements.
In addition, we read all the financial and non-financial information in the Annual Report andAccounts (the “Annual Report”) to identifymaterial inconsistencies with the auditedfinancial statements and to identify anyinformation that is apparently materiallyincorrect based on, or materially inconsistentwith, the knowledge acquired by us in thecourse of performing the audit. If we becomeaware of any apparent material misstatementsor inconsistencies we consider the implicationsfor our report.
Opinions on matters prescribedby the Collective InvestmentSchemes sourcebook In our opinion:
• we have obtained all the information andexplanations we consider necessary for thepurposes of the audit; and
• the information given in the AuthorisedCorporate Director’s Report for the financialyear for which the financial statements areprepared is consistent with the financialstatements.

417
Other matters on which we arerequired to report by exception Propriety of accounting records andinformation and explanations receivedUnder the Collective Investment Schemessourcebook we are required to report to youif, in our opinion:
• proper accounting records have not beenkept; or
• the financial statements are not in agreementwith the accounting records and returns.
We have no exceptions to report arising fromthis responsibility.
Responsibilities for the financialstatements and the audit Our responsibilities and those of theAuthorised Corporate DirectorAs explained more fully in the AuthorisedCorporate Director’s Responsibilities Statementset out on page 415, the Authorised CorporateDirector is responsible for the preparation ofthe financial statements and for being satisfiedthat they give a true and fair view.
Our responsibility is to audit and express anopinion on the financial statements inaccordance with applicable law and ISAs (UK& Ireland). Those standards require us tocomply with the Auditing Practices Board’sEthical Standards for Auditors.
This report, including the opinions, has beenprepared for and only for the Company’smembers as a body in accordance withparagraph 4.5.12 of the Collective InvestmentSchemes sourcebook as required by paragraph67(2) of the Open-Ended Investment CompaniesRegulations 2001 and for no other purpose.
We do not, in giving these opinions, accept orassume responsibility for any other purpose orto any other person to whom this report isshown or into whose hands it may come savewhere expressly agreed by our prior consentin writing.
PricewaterhouseCoopers LLPChartered Accountants and Statutory AuditorsEdinburgh14 May 2014
� Return to Index
The maintenance and integrity of the JP Morgan Asset Management website is the responsibility of the directors; the work carried out by the auditors does not involve consideration of these matters and,accordingly, the auditors accept no responsibility for any changes that may have occurred to the financial statements since they were initially presented on the website.
Legislation in the United Kingdom governing the preparation and dissemination of financial statements may differ from legislation in other jurisdictions.
Independent Auditors’ Report to the Members of JPMorgan Fund ICVC– continued

Issued by JPMorgan Funds Limited which is authorised and regulated by the Financial Conduct Authority.Registered in Scotland No: SC019438. Registered address: 3 Lochside View, Edinburgh Park, Edinburgh EH12 9DH.
GB 05/14
Who to contact
Intermediaries
0800 727 770
If you are an investor with us please call
0800 20 40 20
Lines are open 9.00am to 5.30pm Monday to Friday.Telephone lines are recorded to ensure compliance with our legal and regulatory obligations and internal policies.
www.jpmorganassetmanagement.co.uk