Embed Size (px)
Citation preview
CD ~~~~~~~~~~~~~~~~~~~~~~~~~~~~~~~~CLC\I
Pub
lic D
iscl
osur
e A
utho
rized
Pub
lic D
iscl
osur
e A
utho
rized
Pub
lic D
iscl
osur
e A
utho
rized
Pub
lic D
iscl
osur
e A
utho
rized

- - --
-- -s s
| |-* s- -- -
Table ot Contents
Page
President's Letter of Transmittal ............................................ 2The Record for Ten Years-1 960-1969 ....................................... 3
Part One: The Year's Activities .......................... 5
The Year's Lending:Introduction ........ ......... ............................... 5Financing Agriculture ..................... 7Financing Education .................................................. 9Financing Public Services .13Financing Industry .................................................... 16New Areas of Assistance.. 18
Technical Assistance and Other Activities:Technical Assistance .................. . 19Economic Development Institute ........................................ 21Aid Coordination ........................................ 21Commodity Study .................................................... 23Other Studies ........... 23Commission on International Development . .............................. 24Centre for Settlemenl of Investment Disputes .24
Borrowings and Finance:World Cap!tal Markets .24The Bank's Borrowings .25Other Financial Operations: Bank .27Income and Expenditure: Bank ......................................... 27Finances: IDA .................. 28
Organization and Administration:Departmental Recrganization ........................................... 29Staff Changes ............................... ....................... 29Recruitment ......................................................... 30New Faci ities .31
Membership and Executive Directors. 31
Part Two: Trends and Outlook in Development and in Development Finance . 33
Trends in Growth and Trade .33The Flow of Official and Private Capital to Developing Countries .36External Debt and Its Servicing .39The Commodity Problem ............................................... 40Statistical Annex ..................................................... 45
Bank Appendices .63IDA Appendices .............. ...... 7........ ... 77Bank/IDA Appendices ................. 89
International Bank for Reconstruction and DevelopmentInternational Development Association
Office of the President
September 29, 1969
Dear Mr. Chairman:
In accordance with Section 10 of the By-Laws of theInternational Bank for Reconstruction and Developmentand Section 2 of the By-Laws of the International Develop-ment Association, I have been authorized by the ExecutiveDirectors of the Bank and the Association to submit tothe Boards of Governors this Annual Report for the fiscalyear July 1, 1968 to June 30, 1969.
I have also been authorized by the Executive Directorsof the Bank and the Association to submit to the Boardsof Governors, in accordance with Section 19 of theBy-Laws of the Bank and Section 8 of the By-Laws of theAssociation, the audited financial statements as of June30, 1969, and the Administrative Budgets for the fiscalyear ending June 30, 1970. They are contained in theAppendices of the Report.
Sincerely,
Robert S. McNamara
ChairmanBoards of GovernorsInternational Bank for Reconstruction and Developmentand International Development Association
2
The Record lor Ten Years-1060-1860
Expressed in millions of Unitec States Dollars
F scal Year
1960 1961 1962 1963 1964 965 1t966 1967 19r8 1969
World Bank
Loans: Number 31 27 29 28 37 38 37 47 44 84
Loans: Amount $ 659 $ 610 5 882 $ 449 $ 810 $ 1,023 $ 839 $ 877 $ 847 $ 1,399
Disbursements 544 398 485 620 559 606 668 790 772 762
Repayments to Bank 74 101 104 1?3 117 137 166 188 237 298
Gross Income 151 167 188 204 219 267 292 331 356 410
Net Income 59 63 70 83 97 137 144 170 169 171
Total Reserves 506 602 699 813 846 895 954 1,023 1,160 1,254
Borrowings: Gross 374 787 271 121 100 598 288 729 735 1,224
Borrowings: Net 187 300 104 -5 -32 250 64 503 215 698
Subscribed Capital 19,308 20 093 20,485 20,730 21,186 21,669 22,426 22,850 22,942 23,036
Member Countries 68 68 75 85 102 102 103 106 107 110
IDA
Credits: Number - 4 18 17 18 20 12 20 18 38
Credits: Amount $ - $ 101 $ 134 $ 260 5 283 $ 309 $ 284 $ 354 $ 107 5 385
Disbursements - - 12 56 124 222 267 342 319 256
Member Countries - 51 62 76 93 94 96 97 98 102
Professional Staff 283 317 349 406 444 496 615 685 740 917
3
Students at a secondary school in Tanga, carrying out anexperiment in the science laboratory. This school isorne of nearly 55 secondary schools in Tanzania whichhave received assistance from an IDA credit.
~I *
_I_~~~~~~~~~~~~~~~~~~~I
Part One:The Year's Activities
Ihe 1969 fiscal year was one oa considerable expansion 18 credits worth $107 million in the previous year. The geo-for the World Bank Group. The new commitments made by graphical distribution of IDA assistance was notably wider
the Bank and its affiliates, the International Development in fiscal 1969 than in the past. From IDA's inception in 1960Association (IDA) and the lnternational Finance Corporation to the end of fiscal 1 968, India and Pakistan, countries whose(IFC), to member countries rose to a level substantially higher combined populations represent nearly 20% of the worldthan in any prevous year in the Group's history and 87% total, and whose need for large amounts of external financeabove the leve! for 'iscal year 1968. As far as the Bank and on concessionary terms is acute, had received two-thirds ofIDA were concerned, the economic sectors where lending al IDA lending, despite a very sharp drop in 1968. The ex-expanded most rapid y were agr culture and education; in pansion of IDA activities in 1969 enabled the Assoc,ation toterms of geographical areas, the growth of Bank and IDA raise the value of tne credits t extended to India and Pakistanlend ng to African courtries was particularly mar•ed. The new to an amount approaching those of earlier years, while atoverall lending peak reflects the Bank Group's determinatior, the same time greatly increasing its ending to other ccuntries,as voiced by the President at the 1968 Annual Meeling, to in- notably in Africa. As a result, the percentage share of Indiacrease still further Its contribution to the worldw de develop- and Pakistan in the year's record total of IDA commitmentsment effort over the coming years. was reduced to just over 50% (39.6% for India and 12.5%
The comoined total of the commitments made by the Bank, for Pakistan).IDA and IFC during the yea, amounted to $1,877 milion. com- The investments made by IFC, the Bank's affiliate whichpared with $' 004 mii ion in fiscal year 1968. The Bank made encourages private enterprise ventures in tne developing84 loans during the year for a total of $1,399 millon. com- world, a so rose substantial y both 'n number and value: 27pared with 44 loans totaling $847 million in fiscal 1968; at investments totaling $92.9 mil ion were made in the yearthe same time, more Bank bonds were successfully placed under review, compared with 16 valued at $50.7 millon inor world markets than in any previous year, enabling the the 1968 fiscal year. Details of Bank loans and IDA credits byBank to undertake an expanded lending program and to add purpose and area during the year may be found on pp 8 andsubstantially to ts liquidity position. 10-11; IFC's operaticns are described in its Annual Report.
The operationis of IDA, the Bank's affiliate which extends The developing countries nave actileved some notableassistance on concessionary terms to the poorer developing successes during the year under review. Over this period theycountries, conTinued to be restricted by shortages of funds have added approximately $15 billion to their comb ned grossattributab e to further delays in the bringing into effect of the national product, thus keeping as a group almost exactly tosecond general replenishrnent of the Association's rescurces. the first Development Decade target of a 5% annual rate ofNevertheless, thanks mainly to advance contributions to the growth to be achieved in the late 1960s; they have laid downreplenishment by a number of donor countries the Associ- an impressive amourt of new economic infrastructure; gov-ation was able to extend 38 credits to the value of $385 million ernments and peoples have in general continued to respondin fiscal 1969, a record high level which compared with only positively to the social, economic and cultural problems
5
posed by a period of unprecedentedly rapid change. More- tries; this has limited in varying degrees the availability of in-over, the developing countries have financed 85% of the in- vestment to improve the average standard of living. The nelvestment made in their economies out of their own resources, total flcw of resources from the developed to the developincoften at significant sacrifice in terms of their current levels world has continued to grow in absolute terms, but hasof consumption. diminished as a proportion of the gross national product ol
Within the general situation a number of encouraging indi- the developed couritr es. Official flows remained roughly alvidual trends have been apparent. The prospects for major the previous year's evel: vihile a number of countries in-increases in agr cultural production resulting from recent ad- creased their aid programs substantially, some of the mosivances in agricultural technology remain good. A few coun- important donors held 'heir commitments at previous levelstries have made notable advances ir industrialization, while or even reduced them. The increase in the total flow of re-the availability of basic public services has grown consider- sources to the deve op ng world during the year was morEably in a number of countries. Exports of developing coun- than accounted for by a sharp rise in the inflow of privatetries rose at an overall rate of nearly 8% in 1968, twice the capital to the develooinc countries and to multilateral insti-rate for the previous year and well above the average for the tutions; a number of developing countries, recognizing the1960s as a whole. More and more countries are becoming importance of attrac:ino such investment, have adoptecaware of the threat to their economic growth posed by un- iiberal policies desigred to encourage its further expansioncontrolled rates of population increase, and of the need to The developmert effort is beginning to pay off in manyadopt policies to meet this problem. developing countries Their ability to put new investment
But other less desirable factors in the situation of the public and private, domestic and external, to productive usedeveloping world cannot be ignored. The problem of many is rising steadily, as is the capacity of a number of countriescountries' dependence on a few primary commodities for to service new debt incurred on reasonable terms, It istheir fore gn trade earn ngs persists; at the same time, devel- against this backgrourd of much hopeful progress but man)oping countries' access to some markets for their products persisting problems in tne developing world, combined witfrremains restricted. The need to provide for continuing high an urgent need for a marked rise in assistance to capitalizerates of population growth in many areas has absorbed a on earlier investment, that the Bank's expanded activitieslarge proportion of available savings in a number of coun- during the year shou d be seen.
BANK/IDA ASSiSTANCE 1964-69: SOME EXAMPLES
Between July 1, 1964, and June 30, 1969, the Bank and IDA made commitments totaling $6,424 million for
357 projects in 84 countries. Inter alia, this provided finance for:
-the creation or rehabilitation of irrigation and drainage systems for more than 29,000,000 acres of land
-the construction or improvement of schools involving more than 635,000 school places
-the installation of more than 12,000 megawatts of new electricity generating capacity
-the installation of nearly 1,400,000 subscriber telephone lines
-the construction or improvement of nearly 12,000 miles of roads
-the provision by Bank-assisted development finance companies of assistance totaling nearly $1,700
million for over 11,000 projects*.
'During calendar years 1964-68
6
THE YEAR'S LENDING industries. The total cost of the project, in which an agency
Financing Agriculture of the Bank of Mexico and a number of Mexican commercialbanks are participating, is estimated at $200 million.
Agriculture remains the sector whose rapid growth is most Recent advances in agricultural technology, notably theurgently needed in the majority of developing countries. In development of new high-yielding cereal varieties, hold outsome countries, increases in agricultural production are the real hope for a radically improved world food situation. Butonly alternative to serious phivation; in many others, the the ordinary peasant-farmer in a developing country oftendominance of agriculture in the economy makes its modern- cannot take full advantage of the new technology. Workingization the key to general economic growth. at or near subsistence level, he finds it difficult to purchase
The Bank Group's assistance to agriculture has risen sub- necessary inputs such as improved seed, fertilizer or pesti-stantially in recent years. During the year urder review agr- cides, or to make essential on-farm investments. The Bankcu tural loans and credits extended by the Bank and IDA and IDA recognize the seriousness of this impediment toreached a total of $367.3 million, more than double the level agricultural development and have devoted a substantialachieved in the immediately preceding year and about three proportion of their assistance to agriculture in the 1969 fiscaltimes that of the average over the previous five years. year to the provision of finance for agricultura! credit to
n expanding its financing of agriculture, the Group has farmers. Such finance usually supports a well-formulatedspread its assistance far more widely than in the past by program for on-farm development. and is made availableproviding support to new types of projects and by assisting to farmers through existing lending institutions. Four agricul-countries which had previously received little or no Bank tural credit projects were approved during the year in Colom-Group finance. As in past years, loans for irrigation projects bia, Pakistan, the Philippines and Senegal, for a total of $69.0absorbed the largest share of Bank and IDA egricultural lend- mi lion. Projects of this kind can have an important impacting-S134.0 million for projects in six countries. This total on the growth of agricultural production by channeling badlyincluded the Group's first measure of assistance to Indonesia needed funds to individual farmers. The Bank Group takes a-a $5 million IDA credit for a project to rehabilitate the coun- close interest in the operation of credit institutions associ-try's three most important rice irrigation systems'. Irrigation or ated with projects it supports, and helps them to strengthenflood control loans and credits were also made during the their managerial, financ al and technical capabil ties.year to Guyana, Iran, Korea, Pakistan and Turkey.
P'olicies for increasing agricultural production in the devel- Many developing countries neeo to transform their agri-Poping world ineredtoake acricuntural profecnom efficency ndv culture from a subsistence-based activity to one based on
oping world need to take acco.nt of economicefficiencyproduct on for the market, and to diversifv their agriculturalmarket possibilities. The desirablilty of diverstficat on in agri-cultural output and exports combined with increasing aware- product on. The Bank Group continues to encourage theseness of the importance of improving the quality o- diets in Utends through its lending for general agricultural develop-nevelopingf countries the mselvne s ha i the qualy nw diem asin ment, which totaled $72.2 million in the 1969 financial year.developing countries themselves, has led to a new emphasis Diversification into new crops which provide a source of cashon projects for //vestock development. Livestock projects pro- icm,o mrvdpouto 'eitn ns a nvide a locally-produced protein source; they also serve to income, or improved production o existing ones, was en-diversify a country's agriculture, and hence reduce the dan- couraged by loans or credits to support traditional coffee
divesif a ounry' agicutur, ad hnceredce he an- production in Burundi at its normal level. palm Oili develop-gers inherent in dependence on a small number of export poutin InmBrund atom al level, palm onl dvop-
2 , ment in Cameroon, Dahomey, the Ivory Coast and Pacua,and staple crops. The Bank and IDA have greatly expanded 'forestation in Zambia, ano mechanization of sorghum,their assistance to livestock development during the yearunder review. Seven livestock projects were approved, for sesame ano cotton farming in the Sudan. A $16 mi lionan overall Bank Group commitment of $86.8 million, in Kenya, IDA credit to Indonesia will finance the rehabilitation of twothe Malagasy Republic. Mexico, Paraguay. Tanzania, Uganda groups of rubber and palm oil estates, surveys of otherand Zambia. The Mexican project involved the largest single estates and a feasibility study of smallholder rubber rehabili-loan ever made by the Bank fo, agriculture, $65 million. Most tation. A $13 million Bank loan to India wi I finance the pro-of this sum will be used to help finance credits to individual duction of seeds of new high-yielding varieties of foodgrains;farmers for beef and dairy cattle development, to be achieved at full development the project wil produce enough seedsthrough improved breeding stock, land improvement and tCt plant seven million acres a year with the new varieties. Thisthrough~ ~ ~ ~ ~ ~ ~ ~ ~~ ~i impove breedn stock land impoveen and mad y oedpoutodevelopment, on-farm construction and new equipment and s the first loan the Bank has made for seed productionmachinery. Most of the remainder of the Bank loan will be A new field of agricultural development which the Bankused for crop development credits and for loans to agro- and IDA consider of special importance is that of agro-indus-'OtDer credits made to Indonesaa are noTed on this page ans on pp 14 and 19 tries and related activities such as fisheries. The absence of
7
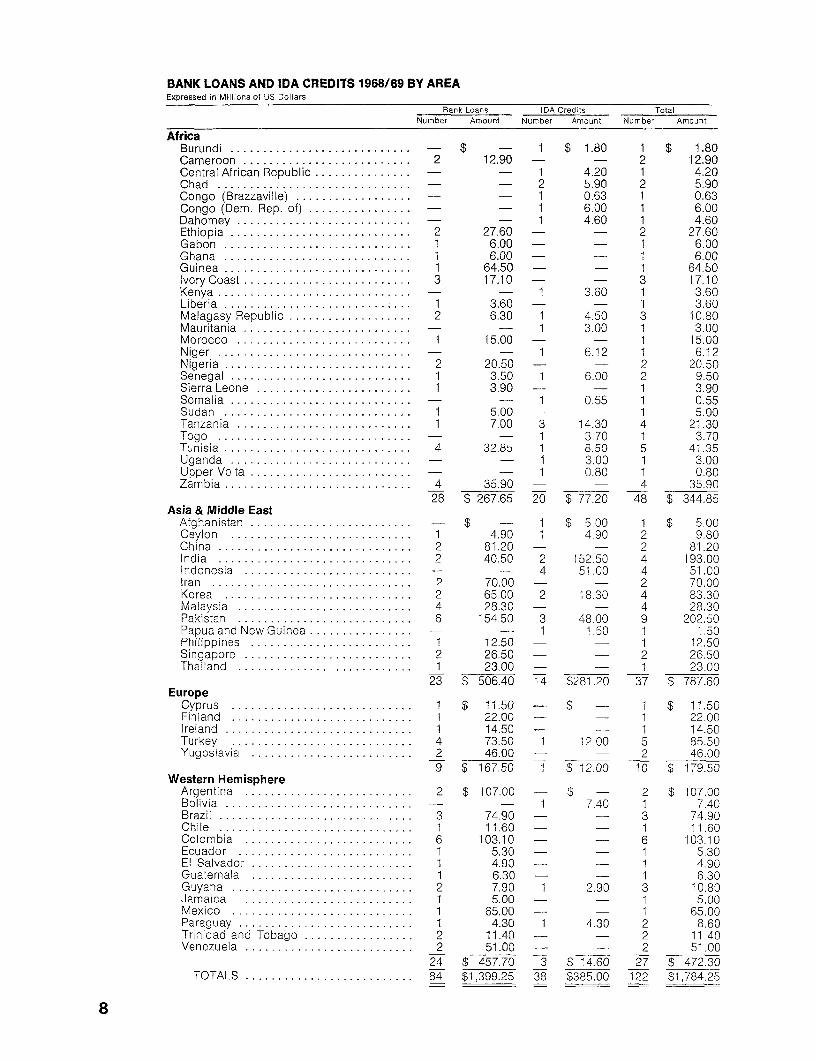
BANK LOANS AND IDA CREDITS 1968/69 BY AREAExpressed in Millions of US Dollars
Bank Loans IDA Credits TotalNumber Amount Number Amount Number Amount
AfricaBurundi ............................ - $ - 1 $ 1.80 1 $ 1.80Cameroon ....... .................. 2 12.90 - - 2 12.90Central African Republic ...... ......... - - 1 4.20 1 4.20Chad ..................... - - 2 5.90 2 5.90Congo (Brazzaville) ....... ........... - - 1 0.63 1 0.63Congo (Dem. Rep. of) ....... ......... - - 1 6.00 1 6.00Dahomey ................ ........... - - 1 4.60 1 4.60Ethiopia ............................. 2 27.60 - - 2 27.60Gabon ........ .................... 1 6.00 - - 1 6.00Ghana ............................ 1 6.00 - - 1 6.00Guinea ............................ 1 64.50 - - 1 64.50Ivory Coast ............ .............. 3 17.10 - - 3 17.10Kenya .............................. - - 1 3.60 1 3.60Liberia ....................... .... 1 3.60 - - 1 3.60Malagasy Republic ........... ....... 2 6.30 1 4.50 3 10.80Mauritania .............. ............ - - 1 3.00 1 3.00Morocco ................ ........... 1 15.00 - - 1 15.00Niger .............................. - - 1 6.12 1 6.12Nigeria ............................. 2 20.50 - - 2 20.50Senegal ............................. 1 3.50 1 6.00 2 9.50Sierra Leone .......... .............. 1 3.90 - - 1 3.90Somalia ............................. - - 1 0.55 1 0.55Sudan ........... ................. 1 5.00 - 1 5.00Tanzania ................ ........... 1 7.00 3 14.30 4 21.30Togo .........................- - 1 3.70 1 3.70Tunisia ............................. 4 32.85 1 8.50 5 41.35Uganda .... ...................... - - 1 3.00 1 3.00Upper Volta ........... .............. - - 1 0.80 1 0.80Zambia .................. .......... 4 35.90 - - 4 35.90
28 $ 267.65 20 $ 77.20 48 $ 344.85Asia & Middle East
Afghanistan ......... ......... - $ - 1 $ 5.00 1 $ 5.00Ceylon .............. ........ 1 4.90 1 4.90 2 9.80China ............................... 2 81.20 - - 2 81.20India ............................... 2 40.50 2 152.50 4 193.00Indonesia ............ .............. - - 4 51.00 4 51.00Iran ............................... 2 70.00 - - 2 70.00Korea . ........................... 2 65.00 2 18.30 4 83.30Malaysia . .......................... 4 28.30 - - 4 28.30Pakistan ............. .............. 6 154.50 3 48.00 9 202.50Papua and New Guinea ...... .......... - - 1 1.50 1 1.50Philippines ........... .............. 1 12.50 - - 1 12.50Singapore ............ .............. 2 26.50 - - 2 26.50Thailand .... ..................... 1 23.00 - - 1 23.00
23 $ 506.40 14 S281.20 37 $ 787.60Europe
Cyprus ............................ 1 $ 11.50 - S - 1 $ 11.50Finland ..................... ..... 1 22.00 - - 1 22.00Ireland ............................ . 1 14.50 - - 1 14.50Turkey ............................ 4 73.50 1 12.00 5 85.50Yugoslavia ........... .............. 2 46.00 - - 2 46.00
9 $ 167.50 1 3 12.00 10 $ 179.50Western Hemisphere
Argentina .............. ............ 2 $ 107.00 - $ 2 $ 107.00Bolivia ................ ............. - - 1 7.40 1 7.40Brazil .............................. 3 74.90 - - 3 74.90Chile ............................ .. 1 11.60 - - 1 11.60Colombia .............. ............ 6 103.10 - - 6 103.10Ecuador ................ ........... 1 5.30 - - 1 5.30El Salvador ............. ............ 1 4.90 - - 1 4.90Guatemala ............ ......... ... 1 6.30 - - 1 6.30Guyana ... 2 7.90 1 2.90 3 10.80Jamaica ................ ........... 1 5.00 - - 1 5.00Mexico ............................. 1 65.00 - - 1 65,00Paraguay ................ ........... 1 4.30 1 4.30 2 8.60Trinidad and Tobago ....... .......... 2 11.40 - - 2 11.40Venezuela .......................... 2 51.00 - - 2 51.00
24 $ 457.70 3 S 14.60 27 $ 472.30TOTALS .......................... 84 .$1,399.25 38 $385.00 122 $1,784.25
8
facilities for processing, storage, distribution and marketing Financing Educationof crops and livestock production can seriously reduce thebenefits of the new agricultural technology to producers and The priority placed by the Bank Group on investment de-consumers. The Group recognizes the importance of sup- signed to develop human resources is reflected in the rapidporting the processing stages of agricultural development growth of loans and credits for education projects since theand expects to finance an increasing number of projects of Bank first entered this field in 1962. At the end of the 1969
this nature in the years ahead. During fiscal 1969, in addition fiscal year the total of Bank Group assistance to education
to the Mexican project already mentioned, $5.3 million was stood at $244 million: 32 projects have been assisted in 28made available for a fisheries project in Ecuador, and several countries. The 1969 fiscal year saw a considerable increase
other projects in the field of agro-industries were at advanced in the number and value of education loans and credits ap-stages of appraisal at the end of the year. proved; projects with a total value of $81.8 million were ini-
stagesiof apraisual atvethemendth yaear possible byscien tiated in Chad, Colombia, El Salvador, Guatemala, Guyana,Rapid agricultural development, made possible by scion- Korea, Malaysia, Tanzania, Trinidad and Tobago, and Zambia.
tific innovation and improved technology, requires a com- None of these countries except Tanzania had received previ-
prehensive operational approach. A well defined program of ous oanso crits edcanzfrom hank oreiDous loans or credits for education from the Bank or IDA.action, encompassing all the elements necessary for success As an institution whose function is specif cally to promote
and stati.g clearly the objectives to be achieved, is a neces- economic development, the Bank considers that it shouldsary prerequisite for project implementation. But many of the concentrate its assistance on those areas of education whereBank's member countries continue to need help in this it can have the greatest impact on member countries' eco-process of project identification and preparation. During the nomic growth. The general ojective of the Bank Group's
year under review, the Bank has again benefited from its co- lending for education is to modernize education systems,operative arrangement with the Food and Agriculture Organi- to m t o e fficien and more evatoontes'zation of the United Nations (FAO), which works with govern- to maxe the contributo of ntheed
needs, and thus to maximize the contribution of the edu-ments to establish priority projects which can usefully be cational process to economic growth within countries' givensubmitted to the Bank for possible financing: FAG sent 67 aonlpcesteoomcgwhwiinoure'gvnsubmitted to thevelopingk for thsupossiblefinancin Aseint f l resources. In particular, the Group's strategy for educationalmissions to developing countries for this purpose in fiscal lending emphasizes projects which increase the availability1969, and participatec in 22 of the Bank's 211 missions con- of trained manpower-industrial, technical, administrative ornected with its agricultural development activities. In Africa,the Bank's permanent missions in Abidjan and Nairobi have agriutral.
alsoconinud t hel Afica mebercounrie wih ari- Before making a loan or credit, the Group undertakes aalso continued to help African member countries with agri- careful study of the structure of the potential borrower's edu-cultural project preparation and identification during the year, careful steM th stur ow effetial outputr's edu-often in cooperation with FAO, or with bilateral technical cational system to assess how effectively its output is gearedassistance organizations. The Bank's Agricultural Develop- to the country's manpower needs and how relevant the cur-ment Service has continued to assist African governments rculum IS to its existing or future level of development.by providing managers for projects where they are required. The Bank pays special attention to the possibility of quali-
The size and geographical distribution of loans and credits tative changes in the system through curriculum reform andduring the year reflect the greater diversity and flexibility other improvements in the overall framework of education.which the Group is introducing into its assistance to agricul- Many developing countries have inherited educational sys-ture. While a number of large loans of a traditional kind, such tems which are inappropriate to their immediate needs, em-
as those for irrigation, were approved, no fewer than 16 of phasizing academic rather than practical subjects, andthe year's 27 lending operations were for smaller projects in designed to prepare pupils for further education at a uni-pivotal areas of developing countries' economies, costing versity rather than to train them in everyday skills. Curriculum$10 million or less each. Eleven of the 24 countries assisted reform, designed to introduce subjects more relevant bothduring the year were in Africa, an area which had formerly to pupils' interests and countries' needs, is central to theobtained relatively little agricultural assistance from the Bank's educational strategy.Group. Loans or credits were extended in 1968/69 to seven Ir many developing countries the lack of adequate sec-countries which had not previously received Bank or IDA ondary schooling facilities is the main impediment to theagricultural assistance: Burundi, Indonesia, the Ivory Coast, supply of school leavers able to contribute to their countries'Korea, the Malagasy Republic, Senegal and Zambia. economic development, and to the training of suitably quali-
Over 100 agricultural projects have reached an active fied entrants to post-secondary institutions. Consequently, thestage of preparation for Bank Group assistance during the Bank and IDA place special emphasis in their lending on im-next few years. provements in secondary education: nine of the ten education
9
BANK LOANS AND IDA CREDITS 1968/69 BY PURPOSEExpressed in Millions of US Dollars
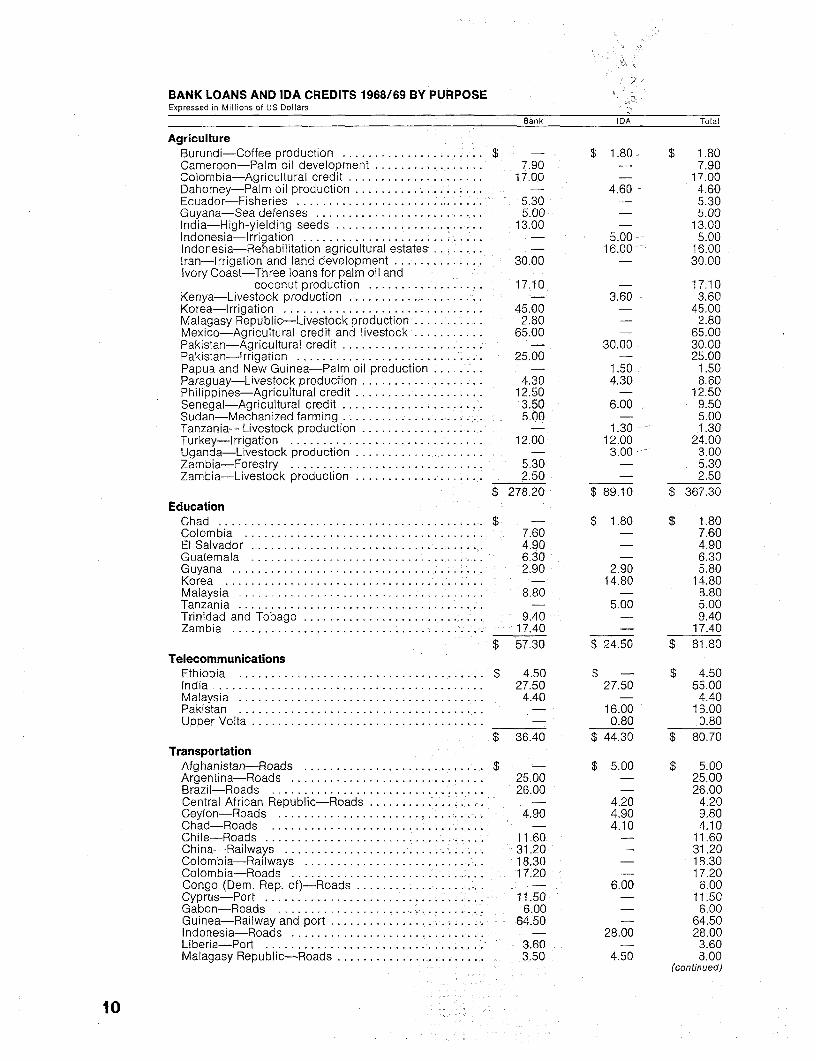
Bank IDA Total
AgricultureBurundi-Coffee production .......... I .......... $ - 1.80. $ 1.80Cameroon-Palm oil development ............... 7.90 - 7.90Colombia-Agricultural credit ..................... 17.00 - 17.00Dahomey-Palm oil production ......... I .......... - 4.60 4.60Ecuador-Fisheries ............................. 5.30 - 5.30Guyana-Sea defenses . ......................... 5.00 - 5.00India-High-yielding seeds ....... ................ 13.00 - 13.00Indonesia-irrigation ......... .............- 5.00 5.00Indonesia-Rehabilitation agricultural estates .. ; ..... - 16.00 16.00Iran-Irrigation and land development .............. 30.00 - 30.00Ivory Coast-Three loans for palm oil and
coconut production ...... ............ 17.10 - 17.10Kenya-Livestock production ......... - 3.60 3.60Korea-Irrigation ............ ................... 45.00 - 45.00Malagasy Republic-Livestock production ..... ...... 2.80 - 2.80Mexico-Agricultural credit and livestock ...... .... 65.00 - 65.00Pakistan-Agricultural credit ....... - 30.00 30.00Pakistan-irrigation .......... ................... 25.00 - 25.00Papua and New Guinea-Palm oil production ... - 1.50 1.50Paraguay-Livestock production ...... ............. 4.30 4.30 8.60Philippines-Agricultural credit ...... .............. 12.50 - 12.50Senegal-Agricultural credit .......... :50 6.00 9.50Sudan-Mechanized farming . 5.00 - 5.00Tanzania-Livestock production . - 1.30--- 1.30Turkey-Irrigation ........... ................... 12.00 12.00 24.00Uganda-Livestock production ...... .............. - 3.00 3.00Zambia-Forestry .............................. 5.30 - 5.30Zambia-Livestock production ...... .............. 2.50 - 2.50
$ 278.20 $ 89.10 $ 367.30Education
Chad ...... ... . $ - $ 1.80 $ 1.80Colombia ...... . .................. 7.60 - 7.60El Salvador .4.90 - 4.90Guatemala ....... . ........................... 6.30 - 6.30Guyana .2.90 2.90 5.80Korea ............................ - 14.80 14.80Malaysia ... ................................... 8.80 - 8.80Tanzania ........................... ...... 5.00 5.00Trinidad and Tobago .9.40 - 9.40Zambia .17.40 - 17.40
$ 57.30 $ 24.50 $ 81.80Telecommunications
Ethiopia .... $ 4.50 $ - $ 4.50India ......................................... 27.50 27.50 55.00Malaysia .4.40 - 4.40Pakistan .- 16.00 16.00Upper Volta .................................... - 0.80 0.80
$ 36.40 $ 44.30 $ 80.70Transportation
Afghanistan-Roads ........................ $ - $ 5.00 $ 5.00Argentina-Roads .............................. 25.00 - 25.00Brazil-Roads ......................... :.... 26.00 - 26.00Central African Republic-Roads .................. - 4.20 4.20Ceylon-Roads ............. 4.90 4.90 9.80Chad-Roads ..................... - 4.10 4.10Chile-Roads ........... 11.60 - 11.60China-Railways ........... 31.20 - 31.20Colombia-Railways ............................ 18.30 - 18.30Colombia-Roads .. . ........................... 17.20 - 17.20Congo (Dem. Rep. of)-Roads ......... 1- ....... - 6.00 6.00Cyprus-Port .............. 11.50 - 11.50Gabon-Roads . . ........................ 6.00 - 6.00Guinea-Railway and port ................... :.:. 64.50 - 64.50Indonesia-Roads ............ - 28.00 28.00Liberia-Port ...........-.... 3.60 - 3.60Malagasy Republic-Roads ...................... 3.50 4.50 8.00
(continued)
10
BANK LOANS AND IDA CREDITS 1968/69 BY PURPOSE (continued)Expressed in Millions of US Dollars
Bank IDA Total
Mauritania-Roads ............................. $ $ 3.00 $ 3.00Niger-Roads ................................. - 6.12 6.12Pakistan-Natural gas pipeline .................... 8.00 - 8.00Pakistan-Railways ............................. 14.50 - 14.50Pakistan-Roads ............................... 35.00 - 35.00Tanzania-Roads .............................. 7.00 8.00 15.00Thailand-Roads ............................... 23.00 - 23.00Togo-Roads .................................. - 3.70 3.70Tunisia-Ports ................................. 8.50 - 8.50Tunisia-Railways .............................. 8.50 8.50 17.00Venezuela-Roads ............................. 20.00 - 20.00Yugoslavia-Roads . ............................. 3030.00Zambia-Roads .................... ........... 10.70 - 10.70
$ 388.50 $ 86.02 $ 474.52Electric Power
Argentina.... . $ 82.00 $ - $ 82.00Bolivia ..... - 7.40 7.40Brazil ..... 26.60 - 26.60Brazil ..... 22.30 - 22.30China ..... 50.00 - 50.00Colombia ..... 18.00 - 18.00Ethiopia ..... 23.10 - 23.10Ghana ..... 6.00 - 6.00Ireland ..... 14.50 - 14.50Malaysia ..... 11.50 - 11.50Nigeria ..... 14.50 - 14.50Sierra Leone ...... 3.90 - 3.90Singapore ..... 20.50 - 20.50Trinidad and Tobago ..... 2.00 - 2.00Turkey ........................................ 25.00 - 25.00Turkey ........................................ 11.50 - 11.50Venezuela ..................................... 31.00 - 31.00
$ 362.40 $ 7.40 $ 369.80Industry
Colombia-Development finance company ..... ..... $ 25.00 $ - $ 25.00Finland-Development finance company ..... ....... 22.00 - 22.00Iran-Development finance company ..... .......... 40.00 - 40.00Korea-Development finance company ..... ........ 20.00 - 20.00Morocco-Development finance company ..... ...... 15.00 - 15.00Nigeria-Development finance company ..... ....... 6.00 - 6.00Pakistan-Development finance company ..... ...... 40.00 - 40.00Pakistan-Fertilizer plant ........ ................. 32.00 - 32.00Turkey-Development finance company ..... ........ 25.00 - 25.00Yugoslavia-Various industries ...... .............. 16.00 - 16.00
$ 241.00 $ - $ 241.00Technical Assistance and Project Preparation
Congo (Brazzaville)-Road engineering & studies .... $ - $ 0.63 $ 0.63Indonesia-Technical assistance .................. - 2.00 2.00Korea-Technical assistance & studies ............. - 3.50 3.50Pakistan-Technical assistance to EPWAPDA ........ - 2.00 2.00Somalia-Port engineering ....................... - 0.55 0.55Tunisia-Road engineering ....................... 0.85 - 0.85
$ 0.85 $ 8.68 $ 9.53Water Supply and Sewer Systems
Cameroon-Water supply ................... ,.$ 5.00 $ - $ 5.00Jamaica-Water supply ......... ................. 5.00 - 5.00Malaysia-Water supply ......... ................. 3.60 - 3.60Singapore-Sewer system ......... .............. 6.00 - 6.00Tunisia-Water supply ......... .................. 15.00 - 15.00
$ 34.60 $ - $ 34.60
Program and General DevelopmentIndia-Industrial imports ................ $ - $125.00 $ 125.00
$ - $125.00 $ 125.00
TOTALS ... $1,399.25 $385.00 $1,784.25
11
loans and credits made by the Bank and IDA during the year These included a $1.8 million IDA credit to Chad, which willcontained an element of secondary school assistance. Sec- help construct a primary school training center for 400 full-ondary schooling offers major opportunities for beneficial time students, a $6.3 million Bank loan to Guatemala, whichqualitative reform as well as quantitative expansion. In Colom- will help establish a 700-student training center, stressingbia and Zambia, for example, funds were provided during practical subjects, for secondary school teachers, and thethe year for the construction of "comprehensive" secondary $5.8 million provided jointly by the Bank and IDA to Guyanaschools, which provide pupils with both academic and pre- for a primary teacher training college with a capacity for 600vocational options. When a country has an educational sys- students, the construction and equipment of five new compre-tem based on schools specializing exclusively in either hensive secondary schools and the conversion to the com-academic or technical training, there is a tendency for pupils prehensive system of two others.who enter the technical schools to be the rejects of the The technique of lending for a number of sub-projects atacademic ones; a comprehensive school system reduces this once is being used increasingly by the Bank in the educa-tendency, and also ensures that the academic pupil, while tional field: simultaneous action on a number of fronts en-able to advance in his chosen field, absorbs a certain amount courages an integrated rather than a piecemeal approach toof practical training at the same time. educational development, and enables a country's whole
In the Colombian program, which is being assisted by a educational system to move forward in balance. It is intendedBank loan of $7.6 million, the ten schools to be built will oper- to broaden the scope o' the lending package further by ap-ate on a two-shift basis, from early n the morning to early plying to education loans the process used in other projectevening. This will make large enrollments possible (an aver- sectors, whereby funds for studies of future projects areage of 4,800 pupils will attend each school) and hence signifi- included in a given loan. The Bank also intends to includecant reductions in unit costs. At the same time provision is provision in more loans for technical assistance, in the formmade in the project for facilities not found in smaller schools. of finance for experts to help implement the project, and for
The Zambian project, for which the Bank has lent $17.4 the simultaneous training abroad of nationals of the borrowingmillion, covers not only the building of nine comprehensive country to take over the project as soon as possible.secondary schools, but also a number of other sub-projects, Apart from helping countries to restructure and expandincluding the rehabilitation of a further 56 existing secondary their educational systems, the Bank Group is also investi-schools and the provision of new facilities for technical edu- gating the possibilities for qualitative improvements offered bycation and teacher training. the application of modern technology to the educational
Technical education is another area with which the Bank process, through the use of educational television, pro-and IDA are especially concerned in their lending. The short- grammed instruction, and other recently developed teachingage of skilled manpower in many developing countries is a aids, and through the adoption of new administrative tech-major obstacle to their rapid economic growth: six Bank and niques. Modern teachinc aids can sometimes produce nota-IDA loans and credits during the year under review con- ble benefits, either by reducing the number of teacherstained an element of assistance for technical schooling, and needed in a school or oy increasing the efficiency of the learn-the Group intends to increase its efforts in this field. Technical ing process, thus reducing pupil wastage and its attendanteducation projects embrace both qualitative and quantitative costs. The economic and social implications of new teach-improvements. In Korea, for example, an IDA credit of $14.8 ing methods need careful scrutiny, however, to ensure thalmillion was provided for improvements and extensions at 32 they are appropriate to local conditions, and that the bene-schools, one university agricultural education department and fits obtained will be fully utilized and will outweigh the oftenthree university science teacher training departments. The considerable costs o' sophisticated equipment.credit will also finance overseas fellowships and technical The Bank Group has continued to benefit from its co-assistance. The number of students trained in agricultural, operative arrangement with the United Nations Educational,commercial, scientific and industrial subjects at the schools Scientific and Cultural Organization (Unesco) in the fie d oiassisted is expected to increase from 27,820 to 36,340 over general education, and its arrangement with FAO in that olthe next five years; the credit will also make for a marked im- agricultural education. Unesco organized or participated irprovement in the quality of the training provided. 29 of the Bank Group's 84 educational missions during the
The Bank's concern with the improvement of the quality year, while FAO cooperated in ten joint missions concernedof education at all levels has led it to pay special attention to with agricultural training.investment in teacher training facilities. Seven of the year's The Bank and IDA intend to expand considerably theirloans and credits contained a teacher training component. assistance to education in the coming years. Apart from
12
cortinuing the various activities already mentioned, the Bank IDA investment in public services reached the record levelGroup is also considering investment in new fields such as of $960 million.informal adult education programs, perhaps assisted by masscommunications media; the development of rural education Transportationcenters to upgrade the level of education and agriculturalskills in rural communities; and the extension of Bank or IDA Transportation loans and credits during the year doubledassistance for technical education to cover projects for train- both in number and in value compared with the previous year.
ing in simpler skills than those hitherto financed by the Group. 34 loans and credits totaling $474.5 million were made to 26countries. Of this total, $297.4 million was for roads, $145.5
Financing Public Services million for railways, $23.6 million for ports and $8.0 millionfor pipelines.
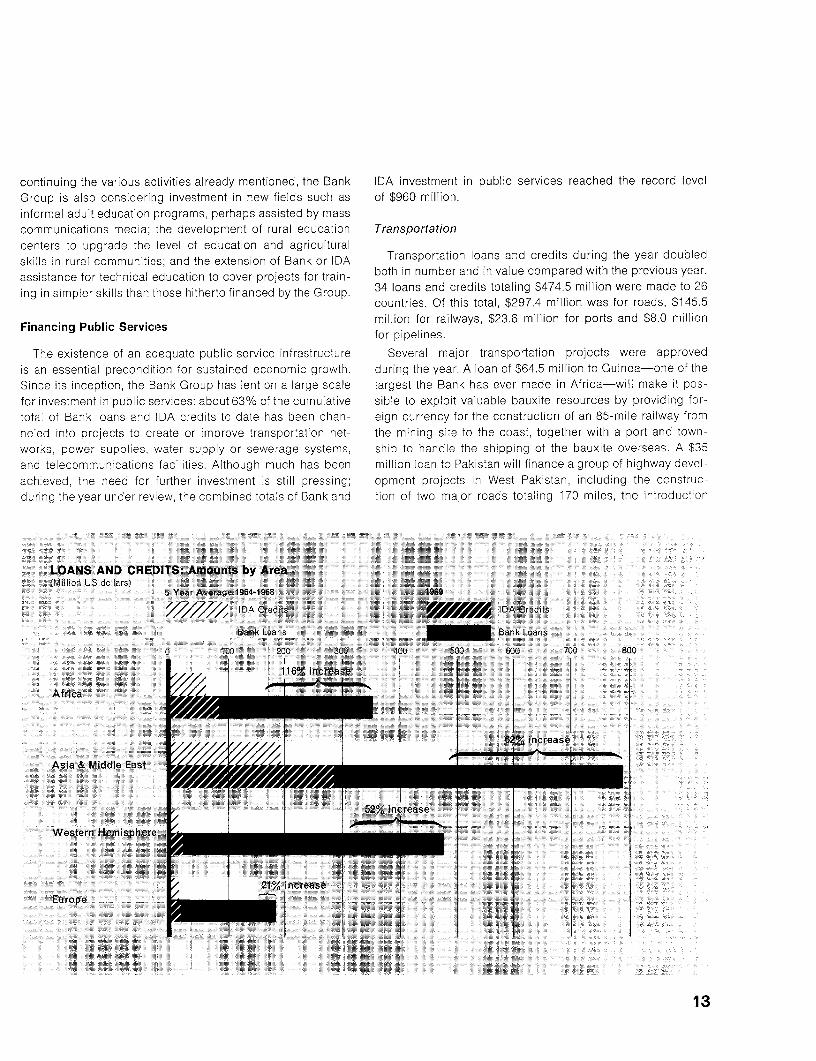
The existence of an adequate public service infrastructure Several major transportation projects were approvedis an essential precondition for sustained economic growth. during the year. A loan of $64.5 million to Guinea-one of theSince its inception, the Bank Group has lent on a large scale largest the Bank has ever made in Africa-will make it pos-for investment in public services: about 63 % o' the cumulative sible to exploit valuable bauxite resources by providing for-total of Bank loans and IDA credits to date has been chan- eign currency for the construction of an 85-mile railway fromneled into projects to create or improve transportation net- the mining site to the coast, together with a port and town-works, power supplies, water supply or sewerage systems, ship to handle the shipping of the bauxite overseas. A $35and telecommunications facilities. Although much has been million loan to Pakistan will finance a group of highway devel-
achieved, the need for further investment is still pressing; opment projects in West Pakistan, including the construc-during the year under review, the combined totals of Bank and tion of two major roads totaling 170 miles, the introduction
LOANS AND CREDITS: Amounts by Area(Million US dollars)
a Year Average 1964-1968 1969
IDA Credits WZE IDA Credits
Bank Loans Bank Loans
0 100 200 300 400 500 600 700 800
116% increase
Africa
Asia & Middle East - - 2 i nc_eas
52% increase
Western Hemisphere
/ 21% increaseEurope
13
of a three-year highway maintenance program, a transport Many of the loans ard credits approved during the yearcoordination study, studies for future road construction, and are important not only for the physical infrastructure they willthe continuation of consultants' services for an administra- provide, but also for the component of institution-building theytive reorganization of West Pakistan s Highway Department. contain. Training scnemes. proposals for and assistanceBrazil's highway sector has been assisted by a $26 million with administrative recrganization, the provision of advisersloan for the construction of 102 miles of new roads, the pav- and other ftrms of technical cooperation, are becoming aing of 166 miles of existing roads and connected consultants' regular part of Bank Group transportation projects. The Bankservices. This project was based on the findings of the first believes that its assistance in this respect can be at least asphase of a comprehensive transport survey which the Bank valuable in the long run as its provision of finance for physicalhad helped finance, and is intended to be 'he first of a series construction. Twenty-one loans and credits made to 17 coun-of major highway projects in Brazil for which the Bank will tries during the year con[ain institution-building components.provide funds. Other large projects approved during the year The year's highway loans again showed a continuation ofincluded highway loans to Yugoslavia and Argentina, a rail- the trend toward the provision of finance for maintenanceway loan to China, and an IDA credit of $28 million to Indo- projects, and for tertiary and feeder roads. Where countriesnesia for roads; the Indonesian project covers the rehabli- already have reasonab e trLnk networks, loans for mainte-tation of about 2,000 miles of roads, the improvement of nance programs or for minor road extensions can providemaintenance services in 20 provinces, and training and other significant benefits at a relatively low cost. Loans for mainte-technical assistance. nance or for improvements in feeder roads were made to
At the same time, the Bank Group has expanded the vol- twelve countries in fisca 1969.ume of its lending for smaller transportation projects, which In the case of railways. the Bank is continuing its efforts tomay nevertheless have a large impact on borrowing coun- support rehabilitation and effective management, and to im-tries' economies. In keeping with the Group's special em- prove operations. The proper coordination of road and railphasis on agricultural development, finance has been sup- transport is also a major concern of the Bank when makingplied-usually in the form of IDA credits or a 'blend" of Bank railway loans, such as the loans made to China, Colombia,and IDA finance-for a number of projects designed to Guinea, Pakistan and Tunisia during the year.facilitate the transportation of agricultural produce to markets.Countries assisted in this way included Ceylon, and, in Africa, Power
the Central African Republic, Chad, Gabon, the Malagasy The Bank and IDA lent $369.8 million for power develop-Republic, Niger and Togo. ment to 15 countries n the 1969 fiscal year.
Developing countries' foreign trade depends on The exist- All Bank Group financing must be for high-priority produc-ence of adequate port outlets. The Bank has been active in tive projects; much of it is designed to remove constraints onport deve opment during the year, making its first port loans economic development by making possible a higher degreeto Cyprus and Liberia, and its second to Tunisia. One pipe- of utilization of existing factors of production. This was theline loan was made during the year, to Pakistan, for the trans- case with a number of The Bank's power loans during theportation of gas from the Sui fields (the exploitation of which year-for example, those to Brazil, China, Malaysia and Sierrahad been assisted by earlier Bank lending). The Sui gas will Leone, all of which wil provide badly needed new capacitybe used as a raw material in a fertilizer manufacturing project, to help relieve present or expected shortfalls of electricitydesigned to assist Pakistan's agricultural production; this supplies to these countries' expanding industrial and com-project, too, is being assisted by a Bank loan (see page 18). mercial sectors. Other loans will maximize the benefits obtain-
An increasingly important component of Bank Group lend- able from earlier power projects, for instance a loan to Colom-ing for transportation is the provision of finance for engineer- bia that will integrate into a single system the operation ofing studies of future requirements. In this way the Bank can four separate generat ng authorities and thereby obtain sig-identify a country's needs over the coming years, and can nificant economies of scale.plan ahead for their fulfillment. Another source of new While a number of loans were made to countries whoseprojects is the series of United Nations Development Pro- power sectors had not previously received Bank Groupgramme (UNDP) and other technical assistance studies in assistance - China for example - most borrowers had ob-which the Bank Group's staff is engaged; about 50 such tained previous power loans from the Group. The establish-studies are currently under way. ment over the years of a continuing relationship between
14
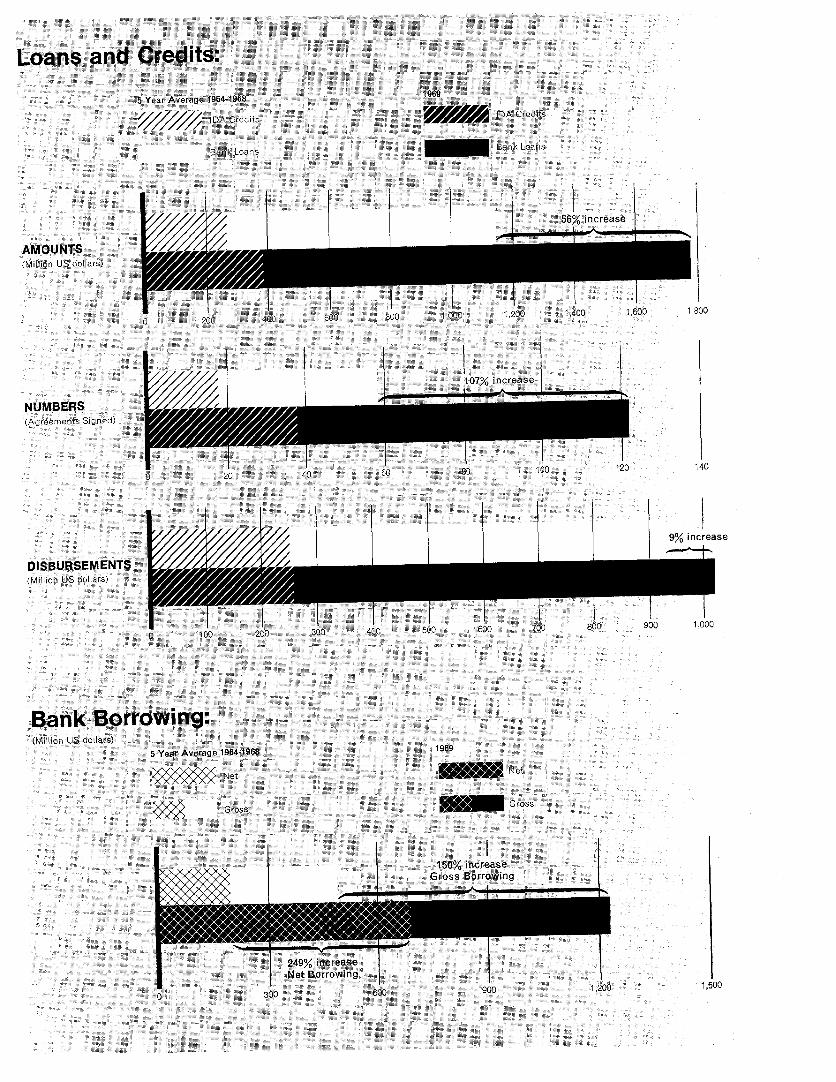
Loans and Credits:
5 Year Average 1964-196S 1969
I/ DA Credits IDA Creciits
Bank Loans Bank Loans
////////;/ ~~~~~~~~~~~~~~~~560/,increase
AMOUNTS(Million US dollars)
o 200 400 600 800 1,000 1,200 1,400 1,600 1,800
107% increase
NUMBERS(Aoreements Signed) I |
0 20 40 60 80 100 120 140
9% increase
DISBURSEMENTS(Million US dollars)
0 100 200 300 400 5co 600 700 800 900 1,000
Bank Borrowing:(Million US dollars)
5 Year Average 1964-1968 1969
N8t f$*J4tA Net
Gross Gross
2xx% inc e50% increaseX ~~~~~~~~~~~Gross Borrowing
2,49% incesNet Borrowing
0 300 600 900 1,200 1,500
lender and borrower is mutually beneficial; it makes it easier Pakistan and Upper Volta during the year for telecommuni-to determine priorities, and reduces the likelihood of delays cations development This sector has already seen a sig-in project implementation. nificant expansion of lending in recent years, and further
While anxious to foster such continuing relationships, the increases are likely. Up to June 30, 1964, the Bank had madeBank and IDA at the same time encourage successful power only eight loans for telecommunications, of which only fourauthorities to diversify their sources of capital for further were solely for this purpose; during the subsequent fiveprojects as far as possible. During the year under review, years, finance was provided for a further 14 telecommuni-Bank lending for new projects in Argentina, Colombia, Ghana cations projects, bringing the total to 22 by June 30, 1969.and Malaysiawas supplemented byvarious sources of finance of which five were apprcved during the latest fiscal year. Mosifrom developed countries. telecommunications oans have been designed to improve
The Bank also encourages international cooperation in member countries' irternal telecommunications, an essentialpower development, since joint ventures between two or prerequisite for the ef-ective expansion of international links.more countries can reduce unk costs by achieving economies During the year the Bank joined the Special Autonomousof scale. During the year under review, the Bank participated Group No. 5 of the International Telegraph and TelephonEin discussions designed to lead to two such schemes in Consul-ative Committee of the International Telecommuni-Africa-one for a joint Kenya-Uganda power development cations Union (ITU). Tr s Group deals with the economicprogram, and one for a cooperative arrangement whereby analysis of telecommnunica:ions projects, and the Bank'sGhana would supply power to Togo and Dahomey from the membership reflects its determination to refine its project ap-Volta Dam (a Bank financed project for which the Bank made praisal techniques in this sector through cooperation witha supplementary loan during the year). The transmission line the appropriate spec a 'zed agency of the United Nations.to Togo and Dahomey is expected to be financed under theCanadian external aid program. Financing Industry
The pattern of Bank Group financing as a whole is de-signed to provide deve oping countries with a stock of physi-
The Bank Group made loans totaling $34.6 million to cal infrastructure and an economic climate conducive tcCameroon, Jamaica, Malaysia, Singapore and Tunisia for further growth through rew produc-ive investment. The Bankwater supply during the year. This is a relatively new area of believes that Sts work snould, inter alia, create a favorableBank operations, and borrowers frequently need special help environment for foreign private capital flows into the develop-in the implementation of projects; this may include assistance ing world for the establisnment of new industries and the con-in institution-building and detailed supervision of operations sequent beneficial civersification of developing countriesfor some time a-ter the completion of the physical construc- economies. Industrial zation in developing member countriestion work involved. As a result each loan takes up a propor- of the Bank and IDA is also encouraged by the element 0
tionately greater amount of time than it might in a sector orocurement policy (wv'hich ordinarily requires internationawhere the borrower is more experienced. Project identifi- competitive bidding to ensure the lowest economic cost in thecation and preparation in this field also present problems; execution of projects) providing a margin of preference-the Bank has benefited from the help of the World Health usually of 155%0, or toe actual tariff rate if it is lower-to do-Organization (WHO) in identifying suitable projects for Bank mestic suppliers in the borrowing countries which participateGroup financing under the institutions' cooperative arrange- in the bidding. Fina ly. the Bank Group provides membeiment. The Bank Group expects to expand its lending for countries with finance which directly assists the process owater supply during the next five years. industrial development: apart from the work of its affiliate, the
International Finance Corporation (IFC) with the privateTelecommunications sector, the Bank and iDA lent a total of $366.0 million for in-
dustry during the 1969 'iscal year. C f this total, $193.0 mil-The existence of adequate telecommunications facilities is was aunte 1c6 by loans O d opmen financ m-
of fndaentl iportnceto eveopig contres,encur- lion was accounted fo, by loans to development finance com-of fundamental Importance to ceveloping countries, encour- panies in Colombia, 2 inlanc, Iran, Korea, Morocco, Nigeriaaging the growth of a uni ied and efficient administration and Pakistan, and Turkey. -ar ier Bank loans had been made to alstimulating balanced and rapid economic advance by in- 'hese borrowers exceot N geria, which had previously ob-proving links between producers and consumers, both do- tained assistance from tIe International Finance Corporationmestic and foreign.
'rhis figbre ocluoes the n.cs<rrea.t to ird,ia of 5125 ml',',on for irnaustriaA total of $80.7 million was lent to Ethiopia, India, Malaysia, imports.
16
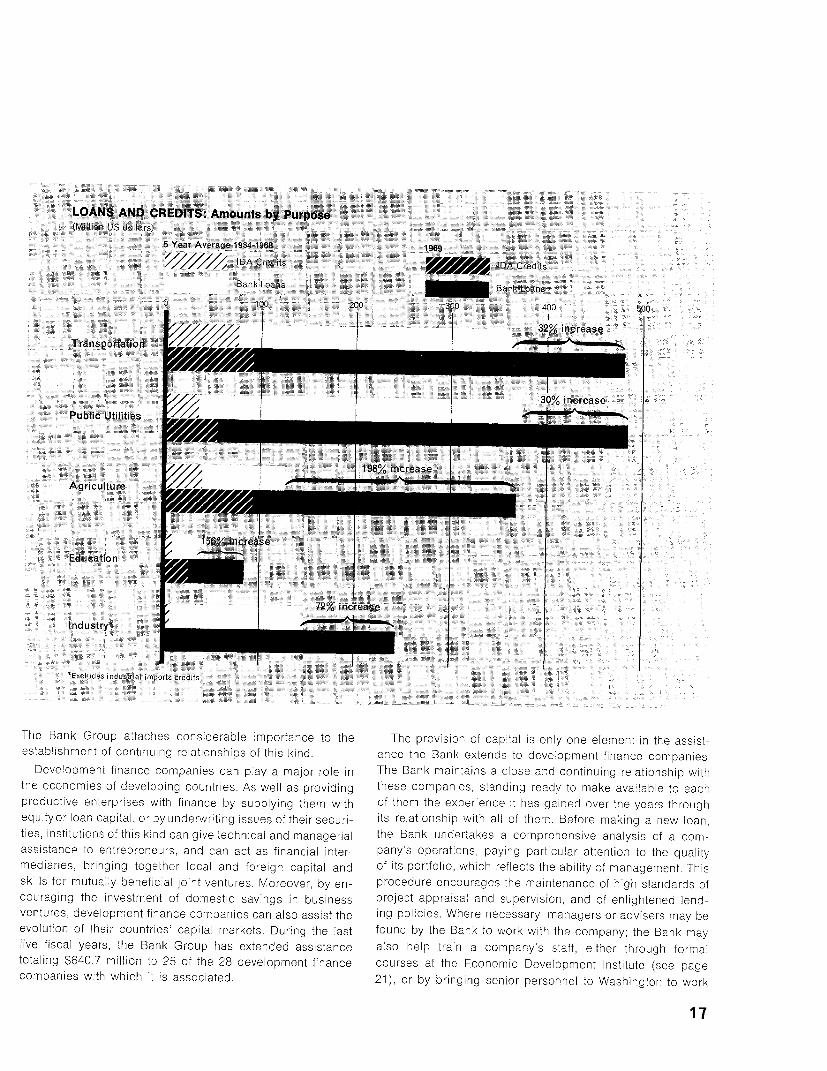
LOANS AND CREDITS: Amounts by Purpose(Miltion US dollars)
5 Year Average 19S4-1968 1969
IDA Credits IDA Credits
Bank Loans _ Bank Loans
0 100 200 300 400 500
g/////// j l l 32% increaseTransportation // Ai/n I | l
30% increase
Public Utilities /
198% increase
Agriculture I.. .
156% increase
Education
72% increase
Industry*
.. ... ... ..........
'Excludes industriaf imports credits
The Bank Group attaches considerable importance to the The provision of capital is only one element in the assist-establishment of continuing relationships of this kind. ance the Bank extends to development f nance companies.
Development f nance companies can play a major role in The Bank maintains a close and continuing relationship withthe economies of developing countries. As well as providing these compan es, standing ready to make available to eachproductive enterprises with finance by supplying them with of them the experience it has gained over the years throughequity or loan capital, or by underwriting issues of their securi- its relationship with all of them. Before making a new loan,ties, institutions of this kind can give technical and managerial the Bank undertakes a comprehensive analysis of a com-assistance to entrepreneurs, and can act as financial inter- pany's operations, paying particular attention to the qualitymediaries, bringing together local and foreign capital and of its portfolio, which reflects the ability of management. Thisskills for mutually beneficial joint ventures. Moreover, by en- procedure encourages the maintenance of high standards ofcouraging the investment of domestic savings in business project appraisal and supervision, and of enlightened lend-ventures, development f nance companies can also assist the ing policies. Where necessary, managers or advisers may beevolution of their countries' capital markets. During the last found by the Bank to work with the company; the Bank mayfive fiscal years, the Bank Group has extended assistance also help train a company's staff, either through formaltotaling $640.7 million to 25 of the 28 development finance courses at the Economic Development Institute (see pagecompanies with which it is associated. 21), or by bringing senior personnel to Washington to work
17
for a few months in its offices, or in those of the International and social well-being of our member states . . .In terms cFinance Corporation; alternatively, placement may be ar- the gap between rich countries and poor, . . .studies sho\ranged for them in the more experienced companies associ- that more than anything else it is the population explosioated with the Bank Group. The Bank also helps companies which, by holding back the advancement of the poor, is blowto improve their operations by commenting on their appraisals ing apart the rich and the poor and widening the alreadof the larger projects they finance. dangerous gap between them."
In November 1968, the Department responsible for devel- It is the Bank's policy not to impose programs in this sensiopment finance companies was transferred from IFC to the tive area but to encourage awareness among member counBank, which provides the bulk of the financing for these com- tries of the consequences of unchecked population increasepanies. The Executive Directors also reviewed the policies and to develop programs to assist those countries whicand procedures governing lending to development finance ask fo, help. During the year a Population Projects Departcompanies during the year, and agreed that the Bank should ment and a Population Studies Division in the Economicnot be debarred from lending to publicly owned as well as Department were set up. Country economic reports now conto private development finance companies. tain a section dealing with population questions, and sta
Apart from assisting development finance companies, the members specializing in pooulation studies have participateBank also made loans to industry in Pakistan, Yugoslavia and in a number of ecoromc missions. Specialist staff memberIndia during the year. The Bank made $32 million available have also been in close and frequent contact with outsidfor a fertilizer project in Pakistan; IFC also participated in experts in the field of oopulation studies. Discussions havthis operation. This project will enable domestically produced been held with the Worid Health Organization as to the propefertilizer, based on locally available natural gas piped from roles of the two insti:ut.ons in this field.the Sui fields (see page 14), to replace imports, thus saving The Bank's first population mission, composed of threforeign exchange and contributing to Pakistan's program for staff rnembers and lhree outside experts, visited Jamaicagricultural self-sufficiency. during the year to assist the Government in preparing a long
A total of $16 million was lent to Yugoslavia to cover the range family planning program. Requests for similar assistcosts of equipment imports essential for the modernization of ance have been rece ved from other member countriesten important industrial enterprises. The Bank loan will help Although the Bank is still in the early stages of policy formuthese enterprises to comoete more effectively in international lation in this sphere, its work on population planning is exmarkets and to increase their export earnings substantially. pected to expand significantly in the coming years.
An IDA credit of $125 million to India, agreed in principleduring the previous financial year but held up by delays in the Tourismreplenishment of IDA's funds, was signed in January 1969.This, the only such credit to India since December 1966, will Investment in toursm has been recognized as a potenfinance imports of vehicles, machinery and other essential tially important area of Bank activity. In the past, tourism ha(industrial inputs required to increase the productivity of a been dealt with as a part of the Bank's other project workselected group of key Indian industres. but in view of its growing importance as a source of foreig
exchange earnings for a number of developing countries,
New Areas of Assistance new Tourism Projec's Department was set up during th,year with the specific task of identifying, preparing and imple
Population menting projects in this field.Tourism embraces not just vacation travel but the whol
Conscious of the extent to which countries' efforts to field of foreign travel, ncluding business trave . The availdevelop their economies may be eroded by excessive rates of ability of adequate facilities for visitors provides a stimulupopulation growth, the Bank has begun to take an active not only to earnings directly associated with tourist traffic, bLinterest in studies and action programs related to popula- also to general economic development by encouraging potion questions. tential foreign investors to visit developing countries.
The President of the Bank, in his speech to the Governors A loan for tourism may take the form of Bank tinancing fcon September 30, 1968, explained the reason for this new an integrated program of infrastructure works-road or aireffort, when he said: ". .., the World Bank is concerned above port construction, provision of water or power supplies, etcalI with economic development, and the rapid growth of popu- -in an area whose main existing activity s tourism, or wherlation is one of the greatest barriers to the economic growth tourism is the most promising activity. Alternatively, the Ban
18
may make such a loan to an institution in the borrower country lished Resident Staff in Indonesia are an important form ofwhose function is to create and develop a tourism complex. Bank-sponsored technical ass stance.Finally, the Bank might make a loan for 'superstructure" The demand for technical assistance has been growingrather than infrastructure, i.e. hotels and other related facili- in recent years. The countries which have advanced suffi-ties designed to attract visitors to an area already possessing ciently to be able to do without external help of this kind areadequate basic infrastructure. In such a case, finance could heavily outnum3ered by the newly emergent nations; thebe provided directly to individual enterprises, or to a financial urgency of their need for project assistance, and the diffi-intermediary for onward lending to various enterprises. culties they face in doing the necessary but highly complex
The Bank's Tourism Projects Department will provide the preliminary work for themselves, have rnade the provision ofInternational Finance Corporation with technical advice on technical assistance a matter of top priority.possible new IFC tourist investments. The Corporation has During the 1 968/69 fiscal year, provision was made in Bankalready made five tourism investments, with a total value of or IDA project loans or credits for technical assistance activ-$16.8 million. The latest and by far the largest of these is a ities having a total value of $39.5 million. Of this total. $9.1$9.9 million commitment for a new type of development com- million was for feasibility studies of future projects. $28.9pany in Tunisia. which will specialize in the promotion and million was provided for the help of consultants or outsidefinancing of hotel construction or modernization and other experts in setting up projects and providing managerial oract vities related to tourism. technical services during their early stages-services which
Fourteen Bank tourism missions have visited 16 coun- are essential in a country where the initial supply of localtries during the year. Some of this preparatory work is expertise is low. The remaining $1.5 million was providedexpected to lead to loans for tourism during the year begin- for training and overseas fellowships to enable countries toning July 1, 1969, and the rate of lending for tourism is become self-supporting in management and other essentialexpected to expand during the following years. prolect skills as soon as possible.
As noted ear ier, the Bank or IDA may make a loan or aTECHNICAL ASSISTANCE AND OTHER ACTIVITIES credit, the whole of which is devoted to technical assistance,
rather than a part only, as in project loans with a technicalassistance component. During the year under review, three
One of the most serious impediments to the rapid expan- such credits were made to Indonesia, Korea and Pakistan.sion of Bank Group financing lies in the fact that mrany devel- Indonesia, which faces a particularly acute shortage ofoping countries lack the expertise to undertake for themselves technical experts and is in urgent need of project assistance,the extensive analysis required for proper project formula- was assisted by a $2 million credit for pre-investment andtion. The Bank's technical assistance program is directed feasibility studies. The specific sub-projects for which thetoward easing this difficulty by providing funds for project proceeds will be used were not laid down at the time theidentificaticn and preparation and thereby helping to main- credit was made. This credit is intended to fill gaps in thefair the tempo of project lending. Already a major provider provision of technical assistance to Indonesia, i.e., to coverof technical assistance, the Bank expec-s its work in this cases in which other funds are not readily available on ap-sphere to increase still further with the expansion of its lend- propriate terms or cannot be used to provide in time the typeing program, to which much of its technical assistance is or quality of assistance required. The individual technicalclosely geared. assistance projects to be undertaken will be chosen by the
Bank Group technical assistance takes a number of forms. Indonesian Government in association with the Bank's resi-Finance may be provided in a project loan or credit for dent staff in Indonesia (see page 20, below); it is hoped thatstudies designed to identify possible further projects; a loan these projects will lead to financing from a variety of sourcesor credit may be provided by the Bank or IDA for engineering rather than purely from the Bank or IDA.studies; the Bank may provide grant financing (up to The credit to Korea, amounting to $3.5 millicn, will finance$200,000) for smaller pre-investment studies; or the Bank feasibility and engineering studies of roads, consultants'Group may act as Executing Agency for a study financed by analyses of transport policies, and their recommendations forthe United Nations Development Programme (UNDP). The improved coordination. The credit will also provide for studiesBank also provides member countries with advice on devel- in the improvement of highway administration: new agenciesopment planning, seconding staff members to work with for administration and coordination are expected to be estab-governments where necessary. Finally, the Bank's Permanent lished, and the credit provides for the training of KoreanMissions in Eastern and Western Africa and its recently estab- personnel to operate them.
19
1 L .~~~~~~~~~~~~~1In a project jointly financed by an IDA credit and a UNDP
grant, Pakistan was provided with $3.9 million to employ general consultants for the East Pakistan Water and PowerDevelopment Authority, set up in 1958 to coordinate the de-velopment of the Province's water and power resources. The J 4 l@
IDA credit was for $2.0 million; the balance was provided 5' t" '
by UNDP. The consultants will assist the Authority's staff indeveloping a unified action program and will help the Au- ithority improve its own organization, thus enabling it to do -
without future consultancy services. ~The member of the United Nations family with primary
responsibility for technical assistance grants is the UnitedNations Development Programme. So as to draw a clear line l.
of demarcation between its activities in this field and thoseof the UNDP, the Bank provides grants for such studiesonly if they cost $200,000 or less-and in every case, irre-spective of cost, gives the UNDP the first option to finance thestudy. By June 30, 1969, a total of 38 Bank-financed studieshad been completed, and a further six were under way. Two A survey team working on a new route for the Accra-technical assistance grants were made during the year, one of Kumasi road in Ghana. Funds tor this survey were$200,000 for a project in Congo (Kinshasa), and the cther of provided by the United Nations Development Programme$1 50,000 for a project in Tunisia. The grant to the Congo will (UNDP) and are administered by the World Bank.finance the establishment of an investment advisory teamin the Office of the President of the Republic; the Tunisian projects in their respective fields suitable for Bank or IDAgrant will finance a study for a water resources master plan in lending. FAO and Unesco staff members also participate innorthern Tunisia. Bank and IDA missions to borrower countries, as mentioned
Apart from technical assistance components in regular in earlier sections (see pages 9 and 12). This cooperativeloans or credits, loans or credits made solely for technical provision of technical assistance is valuable to the Bank,assistance studies, and Bank technical assistance grants, the and represents an important contribution to the developmentother general category of project-related technical assistance effort as a whole.undertaken by the Bank is that of organizing and supervising As noted above, the Bank has adopted the policy of sta-studies financed by the UNDP. By the end cf the 1968/69 tioning staff members in a number of developing countriesfinancial year, the Bank had acted as Executing Agency for to provide their governments with on-the-spot assistance in57 UNDP-financed studies, for a total value of $49.1 million. project identification and preparation. The Permanent Mis-Eight studies were completed during the year, and a further33 sions in Eastern and Western Africa have continued to assistwere under way, of which ten, in Afghanistan (2), Colombia, African countries in putting forward priority projects suitableCongo (B), Congo (K) (2), Indonesia, Lesotho, Pakistan and for Bank or IDA financing, especially in agriculture.Somalia were commissioned by the UNDP during the year. The Bank's newly established Resident Staff in Indonesia
It is, of course, helpful and gratifying if pre-investment stud- (set up at the end of the 1968 fiscal year) has now becomeies lead to the formulation of projects suitable for financing by fully operational, and has identified several priority areasthe Bank or IDA. By the end of the 1968/69 fiscal year, eight for Bank Group lending. The combination of a serious short-of the 24 completed studies the Bank had undertaken as age of local expertise, severe current economic difficultiesExecuting Agency for the UNDP had led to Bank or IDA and great long-term economic potential, makes Indonesia aproject financing, totaling $714.7 million. particularly important candidate for urgent and massive
The Bank's cooperative agreements with FAO and Unesco assistance. The purpose of the mission is to assist and advisehave continued to be of value in the field of project identi- the Government in the formulation of its economic policiesfication and preparation. Under the cooperative arrange- and its overall economic plans and program; in the imple-ments between the Bank and these fellow-agencies of the mentation of economic policy decisions; in the preparationUnited Nations, the Bank finances the work of a number of and execution of specific sectoral and project programs andFAO and Unesco staff members who identify and prepare plans; and in the coordination and mobilization of financial
20
and technical assistance. The Bank hopes that its technical In fiscal 1969 EDI again offered six courses: the six-monthassistance activities in Indonesia during the year under review general course on development problems and policies pluswill provide the foundation for a significant expansion of lend- five project-oriented courses, including one in French anding by the Bank Group and others during 1969/70. one in Spanish. The three English project courses covered
The Bank's East Pakistan Agricultural and Water Develop- infrastructure, agiculture and industry, respectively. Thement Program continued to operate during the year. The present cycle of courses mears that there are two coursesprogram, which involves a special allocation of staff and in session simultaneously for most of the year.consultants, was set up in 1967 to assist the East Pakistan In addition to its Washington courses the Institute hasGovernment and its agencies in determining pr orities, re- assisted agencies in member countries in conducting regionalviewing and advising on development measures, and in training programs overseas. In March a four-week projectidentifying, preparing, and implementing projects. evaluation course was conducted in Guyana for English-
The Bank continues to provide advice on the organization speaking countries of the Caribbean region. This course wasof development planring to member countries, some of sponsored by the Government of Guyana in cooperation withwhich require assistance in the establishment of suitable new that country's national university, In June the Institute joinedplanning organizations while others need help in reexamining two inst tutions in Africa (the Institute for Economic Develop-existing systems and machinery, with a view to their im- ment and Planning in Dakar and the Institute for Developmentpravemert. During the year, staff members visited Haiti, Stud es at University Collogo, Nairobi) in sponsoring an cight-the Sudan and Upper Volta to give advice on the establish- week project analysis course for English-speaking Africanment or adaptation of suitable organizations for formulating participants. Both of these courses were undertaken on theand implementing development programs and to advise on understand ng that they would be repeated by their sponsorsplan administration. Advice was also provided on require- in future years. In addition to EDI's primary role in providingments for technical assistance in the formulat on and imple- curricula, teaching materials and staff for these two courses.mentation of development plans. The secondment continued individual staff members served as lecturers in a number ofof a planning adviser to the Government of Haiti, and an agri- other overseas courses, including two-week contributions tocultural economist was seconded to the Government of the a course at the Asian Development Institute in Bangkok andSudan to help in the preparation or a public sector invest- to a UNIDO-sponsored industrial project course in Nairobi.ment program.
Both in its lending operations and in connection with its Aid Coordinationtechnical assistance activities. the Bank provides funds for Aid coordination continued to be an important activityoverseas training of experts from developing countries in for the Bark during the year. Meetings were held for ninethe new skills they need. While the Bank normally does not groups (including three in which the Bank participates butprovide such training itself, it does assist in the arrange- which it does not chair): Ceylon. Colombia, East Africaments for its administration. Whi e previously this had been (Kenya, Tanzania, Uganda, and the East African Community),handled on an ad hoc bas s, the decision was made in Ghana, Guyana, India, Indonesia, Korea, and Pakistan. For1968/69 to set up a special new unit to coordinate and these meetings and also for most of the groups which did notadm nister this type of assistance. meet during the year, the Bank distributed to members con-
siderable amounts of documentation, such as economic re-Economic Development Institute (EDI) ports on the recipient country, reports on its utilization of aid,
information on technical assistance, lists of projects to beThe creation and fostering of development expertise in financed and the like. In addit on, the Bank participated in
each of the Bane's member countries is one of the most im- a meeting called by the Development Assistance Committeeportant pmerequisites for their Further economic growth. of the OECD to consider the prob!ems and prosoects of aid
The Bank assists the tra ning of senior officials from mem- coordination from the point of view of the donor countries.ber countries by maintaining a staff college, the Economic With more than ten years of experience n aid coordinationDevelopment Institute, wh ch runs a number of courses each behind it, the Bank believes that aid coordination will con-year. During 1968/69 the Institute's courses were attended tinue to be important in the development efforts of the com-by 149 participants; these came from 65 developing countries ing years and this view seems to be widely shared by otherand one international organization. With the French Course, agencies, national and international. concerned with thewh ch began in March, EDI welcomed its 1,000th participant administration of development aid. This means more intensivesince the Institute's establishment in 1956. activity on the part of existing groups and possibly also the
21
creation of new groups from time to time, where the need aid on a rational basis. Aid coordinating groups tend tCfor such machinery can be demonstrated, and where con- make aid more effective by causing the donors and thestructivo results can be expected from these efforts. There recipient to focus constructively on the impor-ant issue,are several reasons for this view, relating to the development of the latter; this can lead tc
First, because the total of bilateral aid is not expanding, decisions by both parties which have a significant impacit is all the more important .o deploy it as effectively as pos- on the development o' the country. In addition, aid coordisible. One major step in this direction is the coordination of tion reduces duplication of effort, It imposes a certair
MEETINGS OF THE PRINCIPAL AID COORDINATING GROUPS, JULY 1, 1967-JUNE 30,1969
Date of Meeting Place ChairmanA. Bank-Sponsored Groups1. Consortia
India ............... Sept. 1967 Paris IBRDNov. 1967 Paris IBRDMarch 1968 Paris IBRDMay 1968 Washington iBRDMay 1969 Paris IBRD
Pakistan ................................ March 1968 Paris IBRDMay 1968 Washington IBRDMay 1969 Paris IBRD
2. Consultative GroupsColombia . .............................. Jan. 1969 Paris IBRDEast Africa ............ .................. April 1968 Paris IBRD
informal Sector Meeting ..... .......... March 1968 London IBRDInformal Technical
Assistance Meeting ...... ............ Dec. 1968 Arusha IBRDAgriculture Meeting (Uganda) ........ .. June 1969 Kampala IBRD
Korea ................................... April 1968 Paris IBRDApril 1969 Paris IBRD
Tunisia ... ............................. May 1969 Paris IBRDWorking Party on
Agriculture ......... ................. Feb. 1968 Tunis IBRD
3. OtherCeylon ................................. March 1968 Paris IBRD
March 1969 Paris IBRDB. Other Aid Coordination Groups in which the Bank Participates
Ghana ... Feb 1968 Paris IMFMay 1969 Paris IMF
Guyana ... Nov. 1967 Georgetown GuyanaSept. 1968 Georgetown Guyana
Indonesia ..... Nov. 1967 Amsterdam NetherlandsApril 1968 Rotterdam Netherlands
Informal .... July1968 The Hague NetherlandsOct. 1968 Scheveningen Netherlands
Informal .... Feb.1969 The Hague NetherlandsAprii 1969 Scheveningen Netherlands
Turkey ... July 1967 Paris OECDDec.1967 Paris OECDJan.1968 Paris OECDJune 1968 Paris OECDDec.1968 Paris OECDMarch 1969 Paris OECD
22
degree of discipline on both donors and recipients which A staff report was made on specific financial measures andtends to make the provision and use of aid more effective other ways in which the World Bank Group might assist inand realistic. finding feasible solutions to the problem of the stabilization
Second, a number of Ihe so-called "smaller" dorors prefer of prices of primary products. After extensive deliberations,to provide much or all of their aid to countries for which an the Executive Directors adopted a number of decisions cov-aid coordinating group exists. They feel that their aid is more ering the feasible role of the Bank Group in assisting membereffectively used as a result of coordination, and that serv- countries to diversify their production, to strengthen theices provided through the aid coordination exercise enable competitiveness of their primary products in world trade, andthem to administer their aid programs with lower overhead to assist international commodity arrangements more effec-costs than would otherwise be necessary. Many of these tively, and thus contribute to the solution of the commodity"smaller" donors have adopted programs which will sub- problem. The decisions of the Executive Directors and thestantially increase their aid by the early or mid-70s. staff report were transmitted to the Governors.
Third, for some of the very poorest countries, the first needis for technical assistance. This is a field in which coordina- Other Studiestion is particularly important to avoid wasted effort and to The Bank undertakes from time to time studies requested
identify and secure agreement on the priorities. lt seems by or in collaboration with other international organizations.likely, therefore, that some groups will be formed primarily Work continued or was concluded during the year on afor the purpose of coordinating technical assistance, number of such studies.
But it also seems likely that much of this increased co- The study jointly sponsored by the Bank, FAQ and the
ordinating aotivity will be carried on in a somewhat more International Coffee Organization (ICO), dealing with long-informal manner than in the past. Examples of this trend are
term trends in coffee supply and demand, was terminatedthe informal meeting on assistance to the East African during the year, and its principal findings were made avail-Community held in Arusha. Tanzania. in December 1968, able to the organizations concerned.and the informal meeting on Ugandan agriculture held in The sthe pr o ns thernedKampala in June 1969. The Arusha meeting was attended The study produced by the Bank's staff at the request ofby the local representatives of the members of the Consulta- UNCTAD, on Supplementary Financial Measures to sup-five Group for East Africa ard chaired by the Chief of the port development programs of countries whose export earn-Bank's Permanent Mission in Eastern Africa. These informal logs had failed to meet expectations, remained under con-sector meetings attract specialists and participation by inter- sideration by the Intergovernmental Group set up by UNCTADested specialized agencies such as FAO. The UNDP Resident to examine its findings; the Bank provided technical supportRepresentatives are playing an increasingly important role in to the Intergovernmental Group's deliberations.assisting in the coorcination of technical assistance pro- The Bank's Executive Directors have had before themgrams at the local level, The Bank believes that this trend during the year a revised draft of Articles of Agreement fortoward sector meetings is a useful development, leading to an international investment insurance agency. Furthera better understanding of the issues by both donors and detailed discussion of the scheme has, however, been post-recipients. poned, pending indications of sufficient support for its pro-
visions from the Bank's member governments.
Commodity Study Apart from special studies of this kind, and the economicanalysis it undertakes in connection with individual projects
At the 1967 Annual Meetings of the Bank Grouo and the or the problems of particular member countries, an importantIMF, the Boards of Governors requested the staffs of the two part of the Bank's economic work takes the form of otherinstitutions to undertake a special study of the problem of general studies relevant either to economic development asthe stabilization of prices of primary products at a remuner- a whole or the Bank's own work. These may include theatve level and the economic feasibility of possible solutions examination of economic problems of whole sectors ofto it. The analytical part of the study was transmitted to the activity, of major commodities, of international trade, or ofGovernors at the 1968 Annual Meetings. Following a further methodological questions associated with the Bank's activ-request at that time from the Governors, the Executive Di- ities. In addition the Bank maintains, in cooperation withrectors of the Bank Group considered, on the basis of a OECD and the regional development banks, a comprehensivenumber of working papers prepared by the staff, various international reporting system on the external debt of devel-alternative actions that might be taken by the Bank Group. oping countries.
23
While much of the Bank's economic work remains Centre for Settlement of investment Disputesrestricted, reflecting the confidential nature of its relationswith member countries, some material of general interest has Fifty States have noIv becosme parfies fo the Convention onbeen made publicly available, notably in the World Bank the Settlement of Investment Disputes between States andStaff Occasional Papers. During the year under review, the Nationals of Other States, and have thus become members
of the International Centre for the Settlement of Investmentfollowing three new monographs In this sor es were released:The Economics of Road User Charges by Professor A. A. Disputes (ICSID); eleven additional States have sgned but
not yet ratified the Convention. Details of the Centre's mem-Walters; Nofes on the Mechanics of Growth and Debt byBenjamin B. King;, Reappraisal of a Road Projoct in Iran by bership and affairs are contained in its Anrua Report.
Herman G. van der Tak and Jan de Weille
The first four Occasional Papers published in previous BORROWINGS AND FINANCEyears are now available in French and Spanish. World Capital Markeis
During the year, The Johns Hopkins Press published onthe Bank's behalf The Water and Power Resources of West The Bank obtains :he hulk of the funds required for itsPakistan, a three-volume report of a World Bank Study lending program -hrough bond issues in the capital marketsGroup under the direction of Dr. Pie.er Lieftirnck, an Execu- of the world. The Bank's borrowings should, therefore, betive Director of the Bank. The report is the result of four seen in the context of tre overall pattern of activity in theseyears' study of the developmental potentia of the province, markets during the year. Sales of bonds on world capitalexamining overall economic trends as well as the specific markets surged to a new peak in calendar 1968 and at $7,691sectors concerned-power and agriculture. The study is of million were up nearly 75%,o over 1967 and about 130 %/c overparticular interest in that it includes the Study Group's analyt- 1966 (see Table 12). Th s was the fifth consecutive year thatical work as well as its conclusions and thLus contributes not financing on the international markets registered an increase.only to Pakistan's development s-rategy, but also to the As in previous years, the facilities of the world capital mar-general methodology of development planning. kets were employed pr nc cally by issuers ir the industrialized
countries. Offerings and placements in this categoryCommission on International Development amounted -o $5,412 min ion or 70% of the total, and an in-
crease of $2,603 million over 1967.In August 1968, Mr. Lester Pearson, former Prime Minister The developing countries sold obligations equivalent to
of Canada, accepted the President's invitation to become $616.9 mil on internationa ly, about 8% of the 1968 total; andChairman of an international commission to examine the issues floated by internat.onal development institutions ag-progress and problems experiencec in the field of interna- gregated $1,403.2 million or 18% of all 1968 sales. Thus ational aid and development ass,starce over the last 20 total of $2,020 million aised in these markets was chan-years, and to make recommendations on the best policies neled directly into economic development, compared witnand methods to help promote the economic growth of the $1,359 million in 1967.developing world in the years to come. The establishment The main feature of 'orld caoital markets in the year vasof such a commission had first been proposed by the formerPresident of the Bank, Mr. George D. Woods. a very shap rise in offerings and placements in Europe by
corporate and goverrmental issuers. Within the EuropeanThe Commission is financed by the Bank but works in com- market Germany was by far the largest souice of long-term
plete independence from it. The Commission has seven mem- capital, as domestic bond rates continued to decline andbers selected by Mr. Pearson. They are: Sir Edward Boyle the German authorities encouraged capital outflows. More-(United Kingdom); Roberto de Oliveira Camnpos (Brazil); C. over there was a sharp gain in Eurobond o'ferings denomi-Dougias Dillon (United States of America); W:Ifried Guth nated in Deutsche mark.(Federal Republic of Germany); Sir W. Arthur Lewis (West In all, $4,274 million of obligations were sold in EuropeIndies); Robert E. Marjo in (France); and Saburo Okita by issuers in the industrialized countries during the year, an(Japan). A small international secretariat of 16 experts has increase of more than 1500/o above the volume reported forbeen recruited to assist the Commissioners. 1967. Affiliates of US corporations alone sold $2,025 mil-
The Commission has held a number of meetings, including lion of obligations in Europe in 1968, the bulk of them onseven regional hearings in the developing world. It intends the Eurobond market. The larger part of these issues was into present its Report in the autumn of 1969. the form of bonds convertible into shares of the parent
24
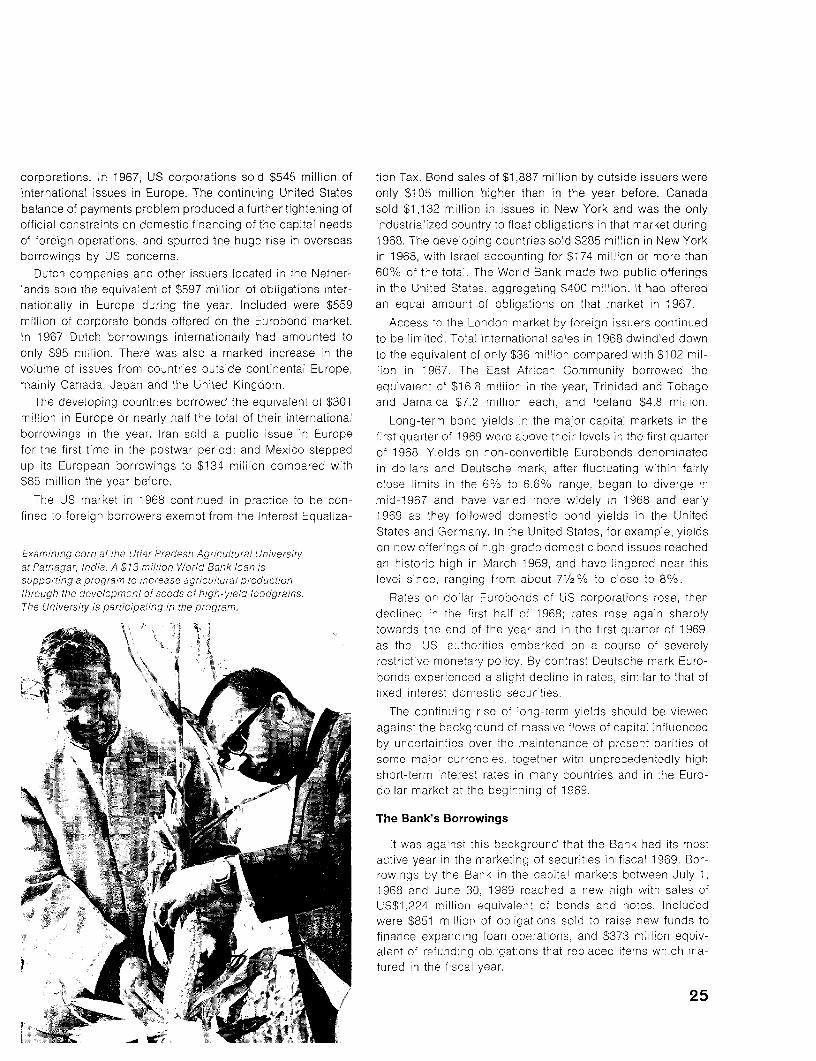
corporations- In 1967, US corporations sold $545 million of tion Tax. Bond sales of $1,887 million by outside issuers wereinternational issues in Europe. The continuing United States only $105 million higher than in the year before. Canadabalance of payments problem produced a furthertightening of sold $1,132 million in issues in New York and was the onlyofficial constraints on domestic financing of the capital needs industrialized country to float obligations in that market duringof foreign operations, and spurred the huge rise in overseas 1968. The developing countries sold $285 million in New Yorkborrowings by US concerns. in 1968, with Israel accounting for $174 million or more than
Dutch companies and other issuers located in the Nether- 60% of the total. The World Bank made two public offeringslands sold the equivalent of $597 million of obligations inter- in the United States, aggregating $400 million. It had offerednationally in Europe during the year. Included were $559 an equal amount of obligations on that market in 1967.million of corporate bonds offered on the Eurobond market. Access to the London market by foreign issuers continuedin 1967 Dutch borrowings internationally had amounted to to be limited. Total international sales in 1968 dwindled downonly $95 million. There was also a marked increase in the to the equivalent of only $36 million compared with $102 mil-volume of issues from countries outside continental Europe, lion in 1967. The East African Community borrowed themainly Canada, Japan and the United Kingdom. equivalent of $16.8 million in the year, Trinidad and Tobago
The developing countries borrowed the equivalent of $301 and Jamaica $7.2 million each, and Iceland $4.8 million.million in Europe or nearly half the total of their international Long-term bond yields in the major capital markets in theborrowings in the year. Iran sold a public issue in Europe first quarter of 1969 were above their levels in the first quarterfor the first time in the postwar period; and Mexico stepped of 1968. Yields on non-convertible Eurobonds denominatedup its European borrowings .o $134 million compared with in dollars and Deutsche mark, after fluctuating within fairly$85 million the year before. close limits in the 6% to 6.6% range, began to diverge in
The US market in 1968 continued in practice to be con- mid-1967 and have varied more widely in 1968 and earlyfined to foreign borrowers exempt from the Interest Equaliza- 1969 as they followed domestic bond yields in the United
States and Germany. In the United States, for example, yields
Examining corn at the Utter Praoesn Agricultural Jnversity on new offerings of high-grade domest c bond issues reachedat Patnagar, India. A $13 mil,/ion World Bank loan is an historic high in March 1969, and have lingered near thissupporting a program to increase agricultural production level since, ranging from about 71/2% to close to 8%.through the development of seeds of high-yield foodgrains. Rates on dollar Eurobonds of US corporations rose, thenThe University is participating In the program. declined in the first half of 1968; rates rose again sharply
;,, \ ; ~1 ifir E *towards the end of the year and in the first quarter of 1969,as the US authorities embarked on a course of severelyrestrictive monetary policy. By contrast Deutsche mark Euro-bonds experienced a slight decline in rates, similar to that offixed interest domestic securties.
The continuing rise of long-term yields should be viewedP4 sX.-.against the background of massive flows of capital influencedby uncertainties over the maintenance of present parities ofsome major currencies, together with unprecedentedly highshort-term interest rates in many countries and in the Euro-dollar market at the beginning of 1969.
The Bank's Borrowings
It was against this background that the Bank had its mostacieyear in the marketing of securities in fiscal 1969. Bor-
rowings by the Bank in the capital markets between July 1,1968 and June 30, 1969 reached a new high with sales ofUS$1,224 million equivalent of bonds and notes. Includedwere $851 million of obligations sold to raise new funds tonfinance expanding loan operations, and $373 million equiv-
alent of refunding obligations that replaced items which ma-tured in the fiscal year.
25
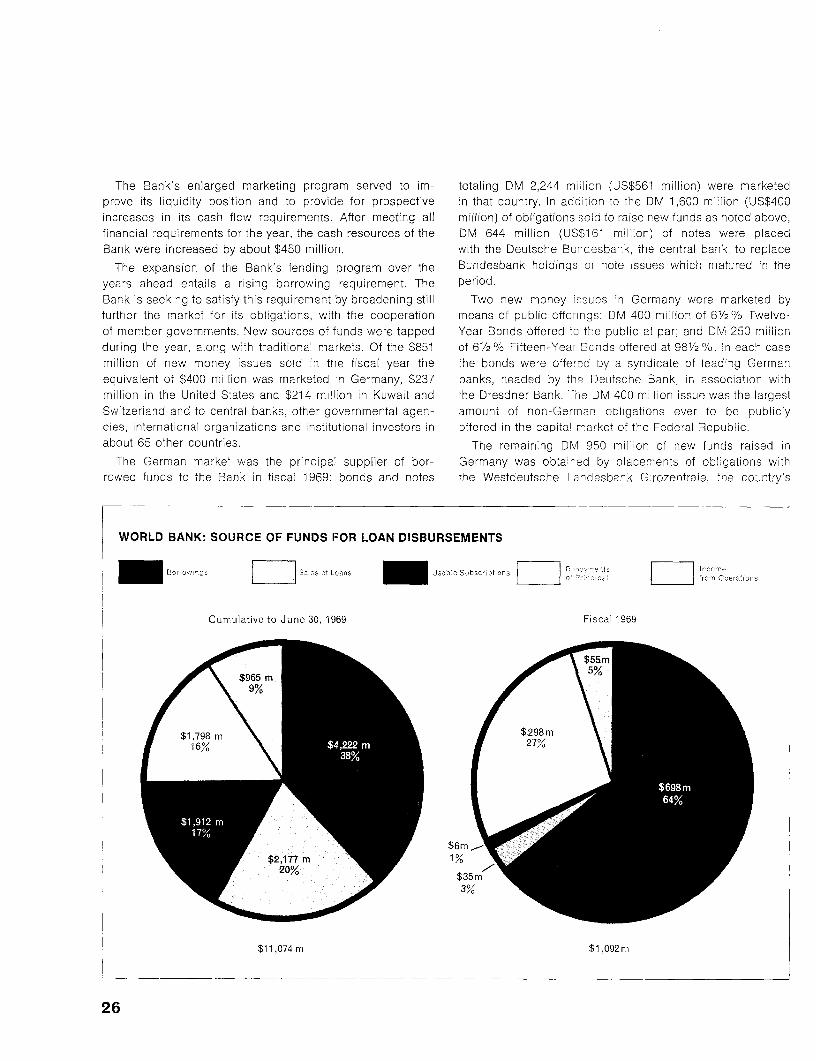
The Bank's enlarged marketing program served to im- totaling DM 2,244 milion (US$561 million) were marketedprove its liquidity position and to provide for prospective in that country. In addition to the DM 1,600 million (US$400increases in its cash flow requirements. After meeting all million) of obligations sold to raise new funds as noted above,financial requirements for the year, the cash resources of the DM 644 million (US$161 million) of notes were placedBank were increased by about $450 million. with the Deutsche Bundesbank, the central bank, to replace
The expansion of the Bank's lending program over the Bundesbank holdings of note issues which matured in theyears ahead entails a rising borrowing requirement. The period.Bank is seeking to satisfy this requirement by broadening still Two new money issues in Germany were marketed byfurther the market for its obligations, with the cooperation means of public offerings: DM 400 million of 61/2% Twelve-of member governments. New sources of funds were tapped Year Bonds offered to the public at par; and DM 250 millionduring the year, along with traditional markets. Of the $851 of 61/2 % Fifteen-Year Bonds offered at 981/2 %/o. In each casemillion of new money issues sold in the fiscal year the the bonds were offered by a syndicate of leading Germanequivalent of $400 million was marketed n Germany, S237 banks, headed by the Deutsche Bank, in association withmillion in the United S-ates and $214 million in Kuwait and the Dresdner Bank. The DM 400 mi lion issue was the largestSwitzerland and to central banks, other governmental agen- amount of non-German obligations ever to be publiclycies, international organizations and institutional investors in offered in the capital m arket of the Federal Republic.about 65 other countries. The remaining DM 950 million of new funds raised in
The German market was the principal supplier of bor- Germany was obtained by placemnents of obligations withrowed funds to the Bank in fiscal 1969: bonds and notes the Westdeutsche Landesbank Girozentrale, the country's
WORLD BANK: SOURCE OF FUNDS l:OR LOAN DISBURSEMENTS
_~ BfQof~rLarow s esa^f Loans _ Usable SubscriPtio,ors
Cunmulative to June 30, 1969 Fiscal 1969
| D ~~$1,798 m \$298m \
16\ 27% _
3%
$11,074 m $1 ,092 m
26
largest bank, and the Deutsche Girozentrale-Deutsche Kom- patible with the maintenance of a sound financial position, onmunalbank (DGZ). This is a significant new source of funds which its ability to raise funds in the capital markets depends.to the World Bark. The Bank, however, is afforded some degree of flexibility in
The market in Kuwait was another new source of funds responding to upward movements in borrowing costs, owingin the fiscal year. With the assistance of the Kuwait Invest- to the sizable amount of funds it derives frcm paid-in capitalment Company (S.A.K.), the World Bank pub icly offered KD and from accumulated earnings.15 million (US$42 million) of 61/2% Twenty-Year Bonds at99%. The issue was fully subscribed and was the first public Other Financial Operations: Bankoffering of a World Bank issue in the Middle East. Loans held by the Bank on June 30, 1969, including those
Other public offerings in the fiscal year included the Bank's not yet effective, and net of exchange adjustments. totaledonly issue in the United States, $250 million of 63//% Twenty- $8,621 million, an increase of $1,045 million in the fiscal year.Six-Year Bonds, of which about $13 million was purchased Disbursements on loans amounted to $762 million. Aggregateby investors abroad; and SwF 80 million (US$18.6 million) disbursements to June 30. 1969, were $9,583 million, andof 5'/4 % Sixteen-Year Bonds offered on the market in the undisbursed portion of loans was $3,039 million.Switzerland. The equivaent of $7 million of the Swiss issue Repayments by the Bank's borrowers in the period wererepresented new money and $11.6 mi lion served to replace $403 million; $298 million paid to the Bank and $108 milliona maturing Issue of an equal amount.
to investors who had pLirchased borrowers' obligations fromTwo major placements of Two-Year US dollar bond issues the Bank. Aggregate repayments to June 30, 1969, were
were purchased by central banks and other governmental $3,321 million: $1,798 million having been repaid to theaccounts in about 65 countries, and by interna-ional agencies. Bank and $1,523 million to loan purchasers.The issues aggregated $337 million: $200 million replaced _
two maturing issues and $137 million of the proceeds were To help alleviate the burden of India's long-term debt onadded to the Bank's funds. In addition, $15 million of long- its foreign exchange resources, the Bank has pos-poned forterm US dollar bonds were placed with a central bank out- ten years the equivalent of $30 million of principal repaymentsside the United States. due to it on certain loans to India during the two-year period
A total of $471 million equivalent of debt matured during ending March 31, 1969.the year including $50 million of 31/2 0/% Fifteen-Year Bonds Meanwhile, the deposits previously made by the Bank withheld in the United States. The remaining $421 million of ma- the Reserve Bank of 'ndia to offset tempora,rily part of theturities we-e held by investors outside the United States and balance of payments effect on Ind a of debt service pay-included Belgian franc 500 mi lion (US $10 million) of 5°/O ments to the Bank during the year ending March 31, 1968,Ten-Year Belgian Franc Bonds. The Bank also retired a were drawn down during the year. As of June 30, 1969, thefurther $55 million equivalent of debt by means of sinking equivalent of $15 million was held in the Reserve Bankfund and purchase fund operations during the year. as interest-bearing demand deposits denominated in US
At June 30, 1969, the Bank's outstanding funded debt dollars, Deutsche mark and Japanese yen. These depositsstood at $4,081 million, an increase of neary $800 million are expected to be eliminated by March 1970, and no furtnerfor the year. The broadening international character of the deposits are expected to be mademarket for the Dank's issues is indicated by the estimated Sales of participations in loans and of items from the Bank'sdivision of holdings by investors as of June 30, 1969: about loan portfolio after rising in fiscal 1968. resumed the dec in-40% in the United States, 30% in Germany, 6%/o in Switzer- ing trend that began in fiscal 1963. The total fo the yearland, 4% in Canada, and 20% in about 75 other countries, amounted to $35 million, the lowest figure for such trans-
The World Bank, in common with other borrowers in calen- actions reported in 15 years, and a decline of $72 milliondar 1968 and fiscal 1969, found the cost of funds in the mar- below the $107 million reported in fiscal 1968. The very sharpket moving generally upward. As a result, borrowing costs rise in yields on competing securities and continuation ofof the Bank in the fiscal year averaged 6.46% compared with restrictions on overseas investments by some capital ex-costs averaging 6.17% in 1967/68 and 5.52%/o in 1966/67. porting countries contributed to the year's decrease inThe rising cost of borrowings was reflected in the decisionreached in August 1968 to increase the Bank's lending ratefrom 61/4o to 61//2%. After the end of the 1969 fiscal year, Income and Expenditure: Bankthe Bank's lending rate was raised to 7% as of 1 August, 1969.
It should be emphasized that the Bank continues its policy Net income for the fiscal year was $171 million, approxi-of establishing rates on its loans at as low a level as is com- mately equal to the $169 mil ion reported as net income in
27
each of the two preceding years. Net income in the last three fications of acceptance (for further details of the terms of thefiscal years has been on a substantially higher plateau than replenishment, see the Annual Report for fiscal year 1968)in previous years, owing to continuing higher yields on the Of the 18 Part I member countries party to the proposal, 14Bank's investments and to rising interest income on loans with pledges aggregating $638.6 million had notified thEresulting from the rising level of loans held by the Bank. Association by June 30, 1969 that they would make thei
Commission still charged on outstanding portions of a specified contributions. These countries were: Australiafew of the Bank's earliest loans amounted to S0.5 million and Austria, Canada, Denmark, Finland, France, Germany, Japanwas credited to the Special Reserve, raising it to $291.5 mil- Kuwait, the Netherlands, Norway, South Africa, Sweden, anclion at June 30, 1969. the United Kingdom. Luxembourg's notification was receivec
Gross income was $410 million compared with $356 mil- on July 16, and the United States' on July 23, thus makinclion in f scal 1968. The increase largely reflected rises of $22 the replenishment effective. Belgium and Italy had not actecmillion in investment income to $88 million, $28 mil ion in as of that date, but were expected to do so soon thereafterinterest income on loans to $303 million and $3 million in Under the proposal. which was transmitted to the membeiincome from commitment charges on loans to $11 million. countries by IDA's Executive Directors in March 1968, it wae
Expenses for fiscal 1969 totaled $239 million, an increase provided that payment of the three installments was to beof $52 million over the preceding year. For the second con- made on November 8, I968 (or 30 days after the date whersecutive year bond and note interest and issuance costs rose the replenishment became effective, whichever was later,sharply, reaching $197 million in the year compared with and November 8, 1969 and November 8, 1970. Since thE$153 million in fiscal 1968. The rise in these costs stems from replenishment became effective on July 23, 1969, the pay-the substantial increase in funded debt outstanding and from ment of the first insta Iment was to be made by Augus- 22the higher costs of borrowing in the market. Administrative 1969.costs of the Bank and IDA aggregated $45 million, compared Since the effective date for the second replenishment camewith S38 million in the previous year. After the deduction of after the end of the fiscal year, the Association continued tc$4 million as a management fee for IDA, administrative costs operate for most of tne year with a serious shortage of re-of the Bank aggregated S41 million compared with $34 mil- sources; however, substantial relief was provided during thelion in the previous year. second half of the fisca year by advance contributions to the
Under a decision approved by the Board of Governors at second replenishment made by a number of Part I countriesthe Annual Meeting in October 1968, $75 million of the Bank's Prior to these advance contributions, IDA had less tharnet income for fiscal 1968 was set aside for transfer to IDA $150 million availab'e for nevv credit commitments during thein the form of a grant, after $94 million from net income had fiscal year, of which atout half was orovided by the $75 mil-been al ocated to the Supplemental Reserve Against Losses lion transfer of prof ts from the Bank in October 1968 ancen Loans and Guarantees and from Currency Devaluations. half from a variety of scurces, including a loan from the SwisaAfter the close of the 1969 fiscal year the Executive Directors Confederation of $12.1 million, a special supplementary con-allocated $71 million of net income for the period to the Sup- tricution from Sweden of $21.4 million (these two items wereplemental Reserve, raising it to $1,034 million and total noted in last year's Annual Report), and a further speciareserves to $1.326 million. The Executive Directors, at the supplementary contribution provided by Denmark in Januarbsame time, recommended that afurtherSlQO million betrans- 1969 in the amount of $15 mllion. Because of the shortageferred to IDA as a grant (see page 29). of available resources, new credit commitments by IDA
Finances: IDA amounted to less than 550 million in the first half of the yearHowever, commencing in November 1968, a number o
On July 23, 1969, the second general replenishment of Part I countries agreed to make substantial advance contri-IDA's resources came into force. On that date, the United butions toward the second replenishment of IDA's resourceEStates deposited its formal notification of acceptance, thus even before the second replenishment became effective. Ac-fulfilling the minimum requirements to make the proposal tion along these lines was taken by eleven Part I countrieseffective. pledging additional resources to IDA totaling $244.5 millor
The second replenishment proposal provided for expand- and thereby enabling IDA to make new credit commitmentEing IDA's resources by $1,200 million equivalent, payable in up to that amount. Canada and Australia made available theiothree annual installments of $400 million each, and was de- entire second replenishment contribution of $75 million ancsigned to become effective as soon as at least twelve Part I $24 million respectively; Austria, Denmark, Finland, Germanycountries pledging not less than $950 million deposited noti- Japan, the Netherlards, Norway, Sweden, and the Unitec
28

Kingdom each made available one-third (i.e-, the first annual The Projects Department was divided into a number ofinstallment) of its share in the second replenishment. separate Departments each with responsibility for a particular
As a result, despite the delay in full implementation of the sector. The four former divisions of the Projects Departmentsecond replenishment, IDA was able to sign new credits became the Agriculture Projects Department, the Educationtotaling $385 million in fiscal 1969, an amount higher than in Projects Department, the Pub ic Utilities Projects Departmentany previous fiscal year, and marking a very substantial re- and the Transportation Projects Department. In addition, threecovery from the $107 million of new credits signed in fiscal new Projects Departments were set up. These were a Tourism1968. After taking account of the other resources available Projects Department, a Population Projects Department andto IDA, this volume of lending involved the commitment of a Special Projects Department. The Bank established depart-some $250 million out of the $1,200 million of the second ments to deal with tourism and population projects believingreplenishment, leaving $950 mi lion of the second replenish- that these are important new areas of potential investment;ment resources available at the end of the fiscal year for the Special Projects Department is intended to deal with proj-future comrrmitrnents. ects which do not fall naturally into any existing project cate-
The total of credits made by IDA since its inception came gory, notably intersectoral and multi-purpose projects into S2,216.6 million as of June 30, 1969. Disbursements in fields such as the use of water resources.the fiscal year 1969 fell off to $256 mi lion from $319 million To supervise and coordinate the work of the Projects De-in the previous year. as the receding level of commitment in partments, an Office of the Director, Projects, was set upfiscal 1968 and early 1969 tooktheirtoll. Total disbursements under Mr. S. Aldewereld. Mr. B. Chadenet became Deputyby IDA since its inception reached $1,598 million as of Director, Projects, and Mr. W. C. Baum became AssociateJune 30, 1969. Director. Details of other staff changes resulting from the re-
Annual transfers from net income have been made by the organization are listed on page 30.Bank to IDA every year since 1964, the five-year total com- The Treasurer's Department was reorganized on May 1,ing to $285 million. These transfers have been of amounts 1969. A new Treasurer's Department deals with market andwhich wou:d otherwise have been available for distribution investment operations, including fund raising, investment ofas dividends to the Bank's member countries. At the close liquid funds, and receipts and payments. A new Controller'sof the 1969 fiscal year, the Bank's Executive Directors recom- Department deals with accounts, loan disbursements andmended to the Board of Governors a further transfer to IDA administrative expenses.in the amount of $100 million. This recommendation will be As no-ed earlier in the Report, the Development Financeconsidered by the Governors at the 1969 Annual Meeting Compan es Department was transferred from the Internationalin Washington. Finance Corporation to the Bank as from November 1, 1968.
ORGANIZATION AND ADMINISTRATION Staff Changes
Departmental Reorganization Mr. Eugene H. Rotberg became Treasurer of the Bank uponthe retirement of Mr. Robert W. Cavanaugh on December 31,
To sustain a higher vclume of lending without any diminu- 1968, after more than 21 years' service with the Bank. Mr.tion in the quality of the staff's work, a number of organi- Rotberg joined the Bank from the United States Securitieszational changes have been made during the year. Major and Exchange Commission where he had been Associatechanges were made in the structure of the Area, Economics Director of the Division of Trading and Markets. After the re-and Projects Departments during October 1968, and in the organization of .he Department in May, Mr. Rotberg remainedTreasurer's Department in April 1969. Treasurer, while Mr. Francis R. Poore, formerly Deputy Treas-
Under the Area Departments' reorganization, the Africa urer, became Controller.and Asia Departments were each split into two new Depart- A number of new appointments became effective on No-ments, while the Europe and the Middle East and North vember 1, 1968, after the reorganization of the Area andAfrica Departments were merged. Details of the resulting staff Projects Departments. Mr. Aboel G. El Emary became Direc-changes are given below. tor of the Eastern Africa Department; Mr. Roger Chaufournier
The Economics Department was divided into eight new became Director of the Western Africa Department; Mr. I. P.divisions. In addition, six special economic study units were M. Cargill becamTie Director of the South Asia Department;established, which repent directly to The Economic Adviser Mr. Raymond Goodman became Director of the East Asiato the President. and Pacific Department; Mr. Michael L. Lejeune became
29
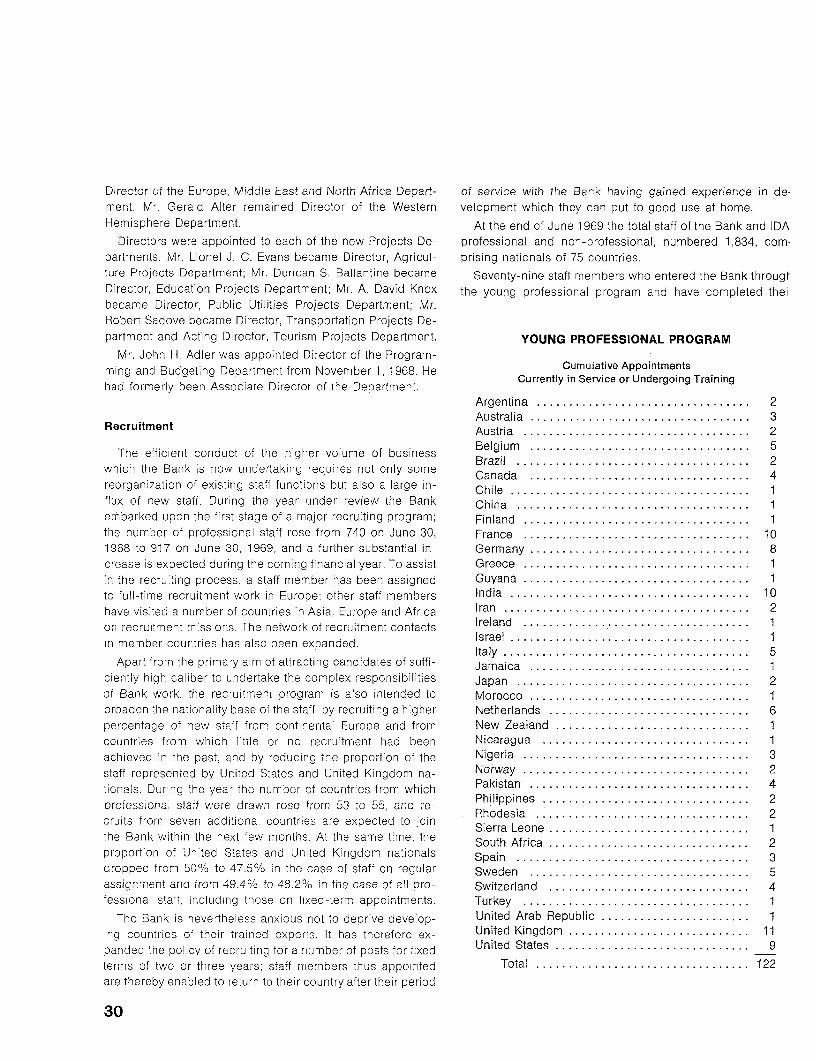
Director of the Europe, Middle East and North Africa Depart- of service with the Bank having gained experience in dement. Mr. Gerald Alter remained Director of the Western velopment which they can put to good use at home.Hemisphere Department. At the end of June 1969 the total staff of the Bank and IDA
Directors were appointed to each of the new Projects De- professional and non-professional, numbered 1,834, com-partments. Mr. Lionel J. C. Evans became Director, Agricul- prising nationals of 75 countries.ture Projects Department; Mr. Duncan S. Ballantine became Seventy-nine staff members who entered the Bank througlDirector, Education Projects Department; Mr. A. David Knox the young professional program and have completed theibecame Director, Public Utilities Projects Department; Mr.Robert Sadove became Director, Transportation Projects De-partment and Acting Director, Tourism Projects Department. YOUNG PROFESSIONAL PROGRAM
Mr. John H. Adler was appointed Director of the Program-ming and Budgeting Department from November 1, 1968. He Cumuiative Appointmentshad formerly been Associate Director of the Department.
Argentina .................................. 2Australia .................................. 3
Recruitment Austria ................................... 2
The efficient conduct of the higher volume of business Belgium ................................. 2which the Bank is now undertaking requires not only some Canada .................................... 4reorganization of existing staff functions but also a large in- Chile ..................................... 1flux of new staff. During the year under review the Bank China ............... .................... 1embarked upon the first stage of a major recruiting program; Finland .................................... 1the number of professional staff rose from 740 on June 30, France ............. ..................... 101968 to 917 on June 30, 1969, and a further substantial in- Germany . ................................. 8crease is expected during the coming financial year. To assist Greece .................................... 1in the recruiting process, a staff member has been assigned Guyana .................................... 1to full-time recruitment work in Europe; other staff members India ..................................... 10have visited a number of countries in Asia, Europe and Africa Iran ...................................... 2on recruitment missions. The network of recruitment contacts Ireland ... .............................. 1in member countries has also been expanded. Israel ................................ 5I .... 1
Italy ................. I..................... .5Apart from the primary aim of attracting candidates of suffi- Jamaica ....... .......................... 1
ciently high caliber to undertake the complex responsibilities Japan .................................... 2of Bank work, the recruitment program is also intended to Morocco . ................................. 1
broaden -he nationality base of the staff, by recruiting a higher Netherlands ............ ................... 6percentage of new staff from continenta Europe and from New Zealand .............. ................ 1countries from which little or no recruitment had been Nicaragua .............. .................. 1achieved in the past, and by reducing the proportion of the Nigeria ................................... 3staff represented by United States and United Kingdom na- Norway ................................ 2tionals. During the yea, the number of countries from which Pakistan . ............................... 4professional staff were drawn rose from 53 to 55, and re- Philippines . ............................... 2cruits from seven additional countries are expected to join SRierra ................................. 1the Bank within the next few months. At the same time, the South Leone ............ ................... 2
proportion of United States and Un ted Kingdom nationals Spain .................................... 3dropped from 50% to 47.5% in the case of staff on regular Sweden . ................................. 5assignment and from 49.4% to 48.2% in the case of all pro- Switzerland . ............................... 4fessional staff, including those on fixed-term appointments. Turkey .................................... 1
The Bank is nevertheless anxious not to deprive develop- United Arab Republic ................. ..... 1ing countries of their trained experts. It has therefore ex- United Kingdom .......... .................. 11panded the policy of recruiting for a number of posts for fixed United States ........... ................... 9terms of two or three years; staff members thus appointed Total . ................................. 122are thereby enabled to return to their country after their period
30
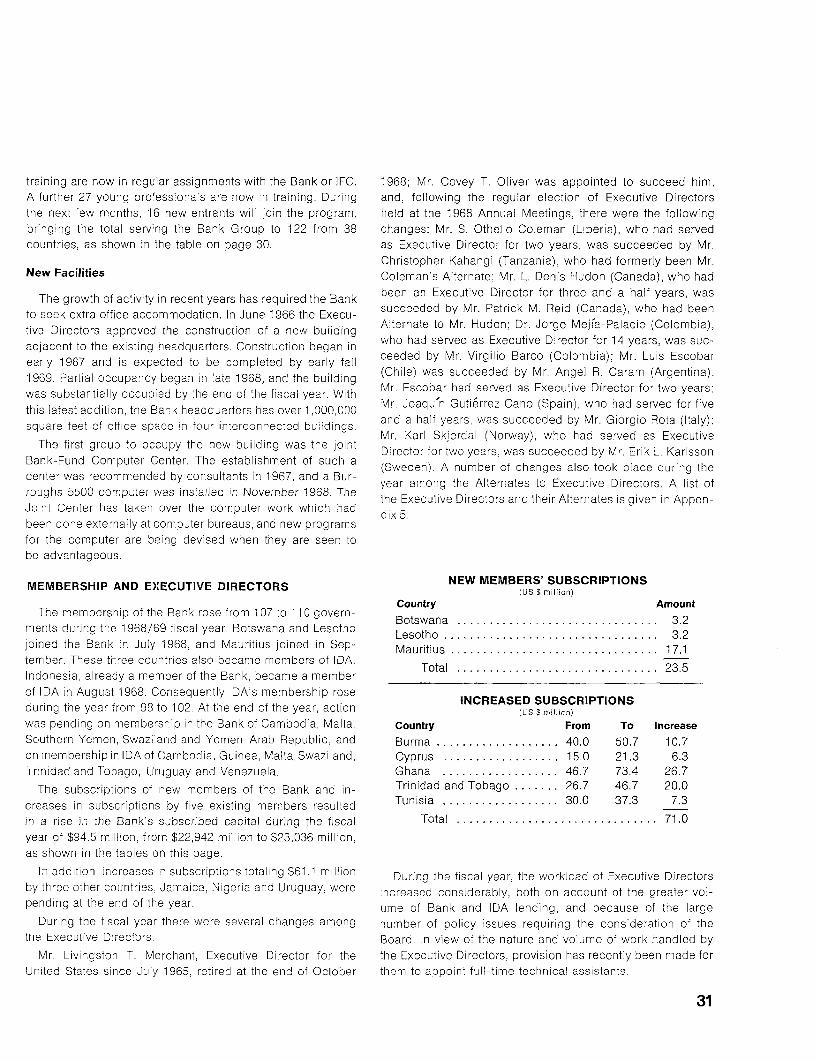
training are now in regular assignments with the Bank or IFC. 1968; Mr. Covey T. Oliver was appointed to succeed him,A further 27 young pro'essionals are now in training. During and, following the regular election of Executive Directorsthe next few months, 16 new entrants will join the program, held at the 1968 Annual Meetings, there were the followingbringing the total serving the Bank Group to 122 from 38 changes: Mr. S. Othello Coleman (Liberia), who had servedcountries, as shown in the table on page 30. as Executive Director for two years, was succeeded by Mr.
Christopher Kahangi (Tanzania), who had formerly been Mr.New Facilities Coleman's Alternate: Mr. L. Denis Hudon (Canada), who had
The growth of activity in recent years has required the Bank been an Executive Director for three and a half years, wassucceeded by Mr. Patrick M. Reid (Canada), who had beento seek extra office accommodation. In June 1966 the Execu- suceeded by Mr. PatrickDr. reid (anada)wo hadobeen
tive Directors approved the construction of a new building Alteraterto Mr Hudon veDr.eJorg Mera-Para , (Coom uiaadjacent to th.xsighaqatrs osrcinbgni who had served as Executive Director for 14 years, was suc-adjacent to the existing headquarters, Construction began in ceemyM.Vrii aco(ooba;M.Li soa
early 1967 and is expected to be completed by early fall ceeded by Mr. Vi Bo lombiar. Luisescobar1969. Partial occupancy began in late 1968, and the building (Chile) was succeeded by Mr. Angel R. Caram (Argentina).
Mr. Escobar had served as Executive Director for two years;was substantially occupied by the end of the fiscal year, Wth Ivr oqi, uire ao(pi) h a evdfrfvthis latest addition, the Bank headquarters has over 1,000,000 Mr. Joaqufn Gutierrez Cano (Spain), who had served for five
feet o offic spacein for inreconneced buidings and a half years, was succeeded by Mr. Giorgio Rota (Italy):square feet of office space In four Interconnected buildings.sqae first group to occupy the new building wasthejoint Mr. Karl Skjerdal (Norway), who had served as ExecutiveT'he first group to occupy the new building was the joint Director for two years. was succeeded by Mr. Erik L. Karlsson
Bank-Fund Computer Center. The establishment of such a (Sweden). A number of changes also took place during thecenter was recommended by consultants in 1967, and a Bur-
year among the Alternates to Executive Directors. A list ofJoughs 5500e computer h as takerinsvrtaled c r vvov erk w h Tha the Executive Directors and their Alternates is given in Appen-Joint Certer has taken over the computer work which had dix 5.been done externally at computer bureaus, and new programsfor the computer are being devised when they are seen tobe advantageous.
MEMBERSHIP AND EXECUTIVE DIRECTORS (NS SUmillion)country Amount
The membership of the Bank rose from 107 to 110 govern- Botryanm.3.2ments during the 1968/69 fiscal year. Botswana and Lesotho Lesotho. .......... 3.2joined the Bank in July 1968, and Mauritius joined in Sep- Mauritius ......... ....................... 17.1tember. Tnese three countries also became members of IDA. Total . 23.5Indonesia, already a member of the Bank, became a memberof IDA in August 1968. Consequently IDA's membership roseduring the year from 98 to 102. At the end of the year, action (us $ million)was pending on membership in the Bank of Cambodia, Malta, Country From To IncreaseSouthorn Yemen, Swaziland and Yemen Arab Republic, and Burma .40.0 50.7 10.7on membership in IDA of Cambodia, Guinea, Malta,Swaziland, Cyprus. 15.0 21.3 6.3Tr nidad and Tobago, Uruguay and Venezuela. Ghana .46.7 73.4 26.7
The subscriptions of new members of the Bank and in- Trinidad and Tobago .26.7 46.7 20.0creases in subscriptions by five existing members resulted Tunisia .30.0 37.3 7.3in a rise in the Bank's subscribed capital during the fiscal Total .. . 71.0year of $94.5 million, from $22,942 million to $23,036 million,as shown in the tables on this page.
In addition, increases in subscriptions totaling $61.1 million During the fiscal year, the workload of Executive Directorsby three other countries, Jamaica, Nigeria and Uruguay, were increased considerably, both on account of the greater vol-pending at the end of the year. ume of Bank and IDA lending, and because of the large
During the fiscal year there were several changes among number of policy issues requiring the consideration of thethe Executive Directors. Board. In view ot the nature and volume of work handled by
Mr. Livingston T. Merchant, Executive Director for the the Executive Directors, provision has recently been made forUrited States since July 1965, retired at the end of October them to appoint full-time technical assistants.
31
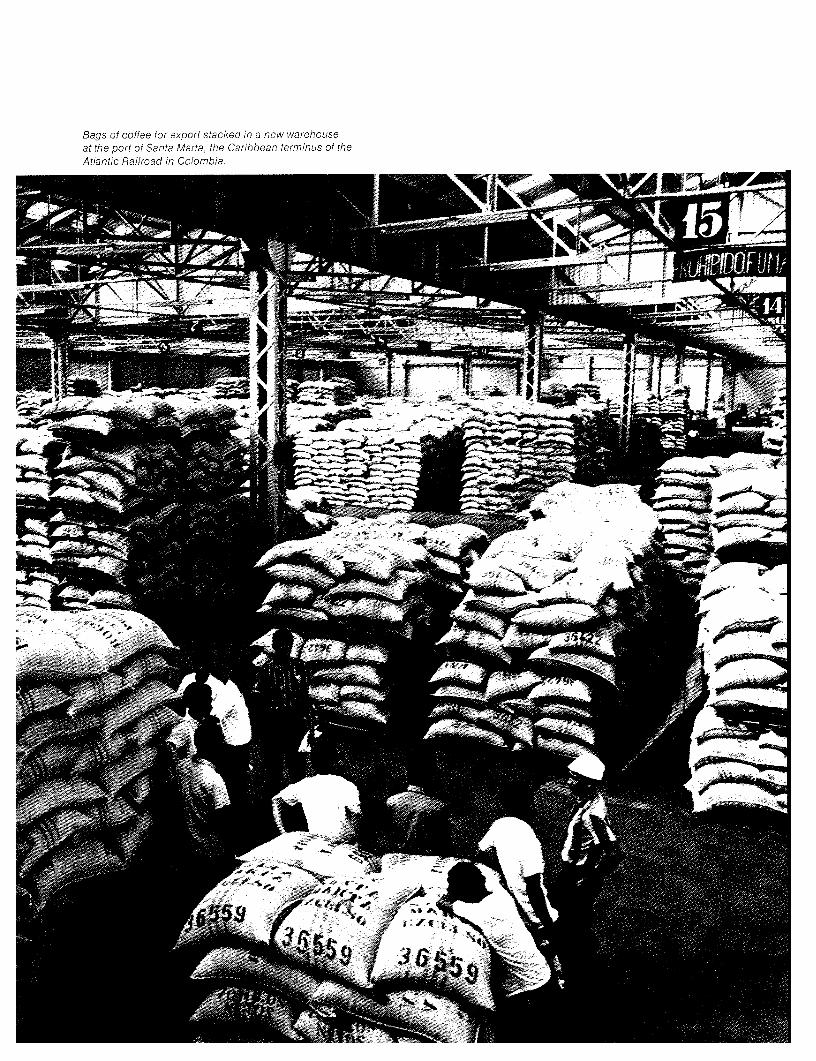
Bags of coffee for export stacked in a new warehouseat the port of Santa Marta, the Caribbean terminus of theAtlantic Railroad in Cclombia.
tWU
Part Two:Trends and Outlook in Develoument and in Development Finance
I he economic progress of developing countries can be way and Sweden-have committed themselves firmly to de-appraised meaningfully only in the context of the world velopment assistance. But the five major donors-France,
economy as a who e. Economic developments in the major in- Germany, Japan, the United Kingdom and the United Statesdustrial nations affect, materially and directly, the exports and -still account for 83% of the total of official and private flowsgrowth of developing countries. The year 1968 was a mixed from all DAC countries' to developing countries and multi-one. Buoyant economic activity in :he industrialized countries lateral institutions. The United States alone accounts for al-provided an excellent opportunity for substantial growth in most one-half of the total, and its policies remain crucial formany developing countries' export earnings, and a number of the development effort as a whole.them made good use of it. On the other hand, the balance of During the seven years since 1961, the addition to thepayments problems of some of the most important aid donors combined GNP of DAC countries has been of the order ofand recurrent international monetary difficulties led to a lower $500 billion. Total net capital flows, public and private, to thepriority being given to the developing countries than their developing countries increased during the same period byproblems and their potential for more rapid growth appeared $3.5 bil ion, from $9.3 billion in 1961 (nearly 1% of DACto justify. countries' combined GNP at that time) to $12.8 billion in 1968
TRENDS IN GROWTH AND TRADE (about 0.75% of DAC countries' combined GNP for that year).While there are wide differences among countries, the ag-
High levels of investment, output and trade, and high and gregate real gross national product of industrialized countriesrising interest rates, continued to characterize the industrial- increased by over 5 % in 1968, as against 3.5% in 1967.ized world during 1968 and the first half of 1969. Concern Industrial production was expanding at a rapid rate towardover their balance of payments situation remained a major the end of 1968 and early in 1969 in the developed cointriesfactor in a number of developed countries' economic policy- taken as a grouc, and an overall growth rate of 4-5% in GNPmaking in 1969 as in 1968. In addition, the international s projected for 1969. The recent expansion of the Japanesemonetary situation, with intermittent agitation in the currency economy has been particularly rapid. During the five yearsand gold markets, has required close attention. The net f ow 1963-68, Japan doubled its national product, industrial output,of capital to developing countries has not increased in step and exports. If the high growth rates of this decade shouldwitn the growth of the national product of the developed coun- continue into the 1970s, Japan may well move ahead of mosttries. And this has happened precisely at a time when devel- other industrialized countries in per capita income. Anotheropment assistance on an expanded scale would enable many notable feature of the present decade in contrast to the 1 950sdeveloping countries to consolidate the gains they have made is the higher rate of growth in the United States than in thein recent years, and could help others to initiate a genuine European OECD area.development effort. 'Members of the DevelopmenW Assistance Committee of the Organization for
Economic Cooperation and Development (OECD); participants are: Australia,Among the developed countries, a number of the smaller Austria, Belgium, Canada, Denmark, France, Germany, Italy, Japan, the Nether-
lands. Norway, Portugal, Sweden, Switzerland, UK, USA, and the E.E.C.donors-Australia, Canada, Denmark, the Netherlands, Nor- Commission.
33
In many of the industrialized countries, the dominant con- to support the growth in the rest of the economy. Strenuouscern in 1968 has been to restrain the buoyancy of their econ- efforts are also being made in education, although the rapidomies, and a monetary squeeze has been applied, together growth in the number of children of school age makes it al-with fiscal action. Such measures may affect not only the pace most impossible for the education authorities to keep paceof expansion in the industrialized countries, but also the rate with demand. While some growth of industry has also takenof growth of their imports from the developing countries. place, only a few courtries-the Republic of China, Korea,
The target of growth in GNP for the developing countries Iran, Mexico-have made major advances in incustrial output.during the first Development Decade was set by the UN Gen- Agriculture remains the main occupation in most developingeral Assembly at 5% per annum for the late 1960s; this ap- countries, and what happens in this sector largely influencespears to have been attained, if all developing countries are overall rates of econom c growth. Just as drought in manytaken together. Their overall growth rate reached 6% in 1967, parts of Asia and Africa resulted in the stagnation or declinereflecting mainly improvements in agricultural output; for of agricultural production in 1964/65 and 1965/66, generally1968 it was probably at least 5%. There are noticeable differ- better weather in 1967/68, and to some extent in 1968/69ences from region to region (see Tables 1 and 2).1 The contributed to the large grain crops in these years. The riceexperience of individual countries varies even more wldely. crop indevelopng countr eswas particularly good in 1967/68,With population rising at 2.5%, per capita income growth has as was the wheat crop in 1968/69. With 1957-59 - 100,averaged only 2.5% for all developing countries together; for the index of per capita agricultural production in the devel-Latin America, Africa and South Asia, it was lower still-about oping countries was 102 in 1967 and 1968. as against only1.5% per annum. 97 in 1966; in South Asia it was 104 in 1968, as against 89
India provides a good illustration of the population prob- in 1966. But per capita agricultural production n the devel-lem, and also of the recognition of the need to meet it. With oping areas as a whole s still no higher -han in 1961.an estimated population of 525 million (at mid-1968), India The increase in production in the last two years is nothas 15% of the world's population, only 2.4 % of the world's wholly attributable to cood weather or to the extension ofland area and hardly 2% of the world's income. There are areas under cultivatior; agricultural productivity is also rising21 million births a year; improved health and medical serv- as a result of the increasing application of modern technologyices have reduced death rates, and average life expectancy to tradtional agriculture. In India, Indonesia, Pakstan, thehas increased to 51 years, as against 32 years in 1950. With Philippines and other countries, high-yielding varieties of rice,a per capita income level around $75, and GNP growing at developed in the Philippines, are beginning to make an impor-4-5% a year, the imperative need for action to curb popula- tant contribution although the shortage of land with regulatedtion growth is clear, A vigorous new policy was formulated in
water supply remains a ma,or limitation on their use. The1967, aiming to reduce the birth rate by almost one-half by wider use of chemica ertilzers insecticides and pestiides1975, and progress is being made in carrying it out. In many is an integral part of tne nascent "green revolution." A numberother developirg countries too, the crucial importance of con- of technical and economic problems arise with increases introlling population growth is now beginning to be reflected in agricultural productivity: there is a need for more storage,the objectives and priorities of national economic policies. marketing, credit, and agric tural extenson services,
The implications of rapid poculation growth for a number for more equitable sharing of new resources and techno ogyof developing countries were pointed out in the Bank's 1968 so that the gains are not confined mainly to a small number ofAnnual Report. In Latin America, and only to a slightly lesser favored farmers. As these issues are faced, the 'green revo-extent in other areas, the growth of urban populations has lution" could help to mprove living standards, strengthen thebeen particular y rapid; the current rate of urbanization greatly basis for successful deve opment by increasing tne economiccompoinds the problem of improving living standards. The size of domest c markets, and improve the balance of pay-process of urbanization is an offshoot both of population ments of the countries involved.growth and of development itself; greater efforts to under- Most developing co_otries are committed to development.stand and to guide this process are clearly becoming But this commitment eeds to be translated intc more effec-necessary. tive policies and actions For instance, sustained efforts are
In the main, with help from abroad, the developing coun- required to mobilize domestic savings for investment throughtries have made substantial progress in providing the mini- better tax systems and an improved framework for savings,mum economic infrastructure of power and transport needed including realistic interesT rates on deposits. The difficulty of
increasing savings rates in countries with very low income1As co,roared w'th th?e tab!es oresenoed 'n ia^t yearx ReporT. this yea, thacounory coverage is coasiderab'y expanaed, especia
1'y 'n the case oT Africa levels is a serious corstraint on the development effort.
34
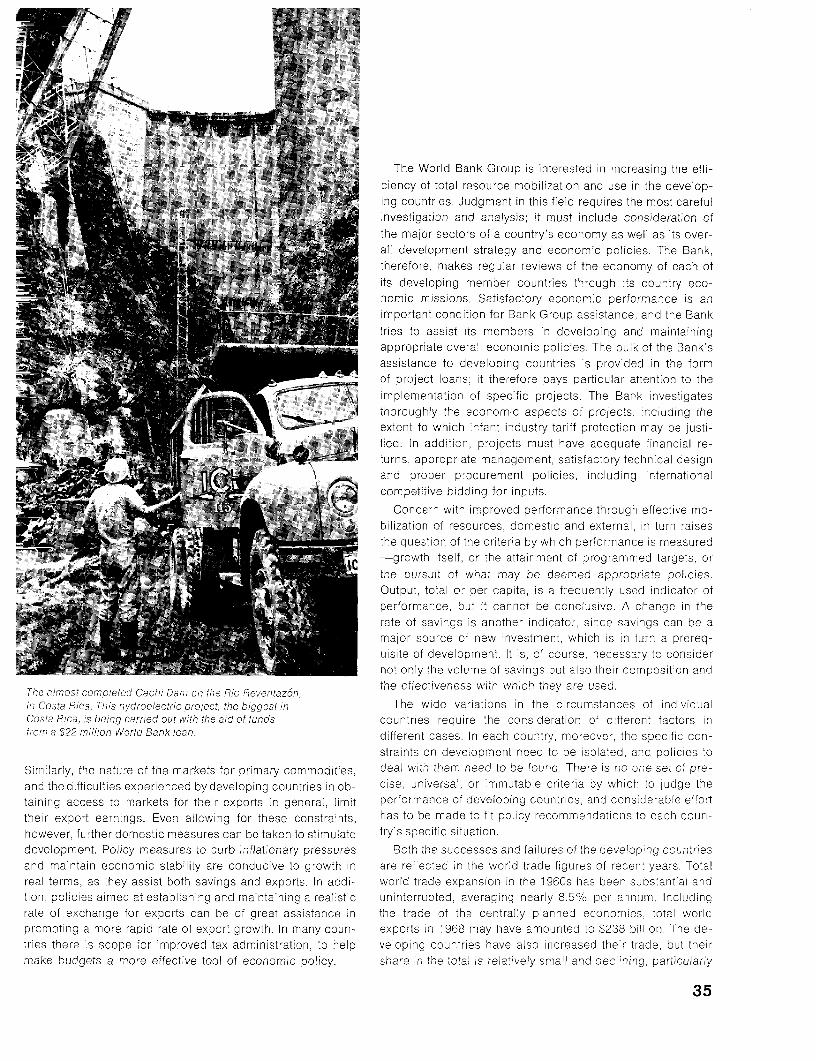
The World Bank Group is interested in increasng the effi-ciency of total resource mobilization and use in the develop-ing countries. Judgment in this ield requires the most caretulinvestigation and analysis; it must include consideration of~he major sectors of a country's economy as well as its over-all development strategy and economic policies. The Bank,therefore, makes regular reviews of the economy of each otits developing member countries through its country eco-nomic missions. Satisfactory economic performance is animnportant condition for Bank Group assistance, and the Bank
K. -gtries to assist its members in developog and maintainingappropriate overall economic polies. The bulk of the Bank'sassistance to developing countries is provided in the formof project loanss it therefore pays particular attention to the
Nisitimplementation of specific projects. The Bank investigatesthoroughly the economic aspects of projects. ncuding theextent to which infant industry tariff protection may be justi-Tied. In addition, projects must have adequate financial re-
troa92nilioWorn diffeturns, appropriate management, satisfactory technial designand proper procurement policies, includ ng internationalcompetitive bidoing for inputs.
Concern with improved performance through effective mo-bilization of resources, domest c and external, in turn raisesthe question of the criteria by which performance is measured-growth itself, or the attainment of programmed targets, orthe pursuit of what may be deemed appropriate policies.
however, furtherdomesticOutput, total or per capita, is a trequently used indicator of
performance, but it cannot be conclusive. A change in therate of savings is another indicator, since savings can be amajor source oa new investment, which is in turn a prereq-uisite of development. It is, of course, necessary to considernot only the- volume ot savings but also their composition and
The pornost comoreed Cachi Darate co the Rio Reventaz6n, the effectiveness with which they are used.in Costa Rica. This hydroeiectric project, the biggest in The wide variations in the circumstances of inc vidualCosta Rica, is being carried out with theaid ot funds countries require the consideration of different factors infrorn a $22 mid/ion World Bank loan, different cases. In each country, moreover, the specitic con-
straints on development need to be isolated, and policies toSimilarly, thie nature of the markets for primary commodifies, deal wvith them need to be found. There is no one set of pre-and the difficulties experienced bydeveloping countries in oh- ose. universal, or immatable criteria by which to judge thetaming access to markets for their exports in genera, limit performance of developing countries. and considerable effortthe r export earnings. Even allowing for these constraints, has to be made to ft polcy recommendations to each coun-however, further domestic measures can be taken fo stimulate try's specific situation.development. Policy measures to) curb inflationary pressures Both the successes and failures of the developing countriesand maintain economic stability are conducive to growth in are reflected in the world trade figures of recent years. Totalreal terms, as they assist bofh savings and exports. In acdi- world frade expansion in fhe 1960s has been substanf a[ andtion, policies aimed at establishing and maintaining a realistic uninterrupted, averaging nearly 8.50/ per annum. Includingrate of exchange for exports can be of great assistance in the trade of the centrally planned economies, total worldpromoting a more rapid rate of export growth. In many coun- exports in 1968 may have amounted to $238 billion. The ce-tries there is scope for improved tax administration, to help veloping countr as have also increased their trade, but theimake budgets a more effective tool of economic policy, share in the total is reiatively small and dco ning, particularly
35
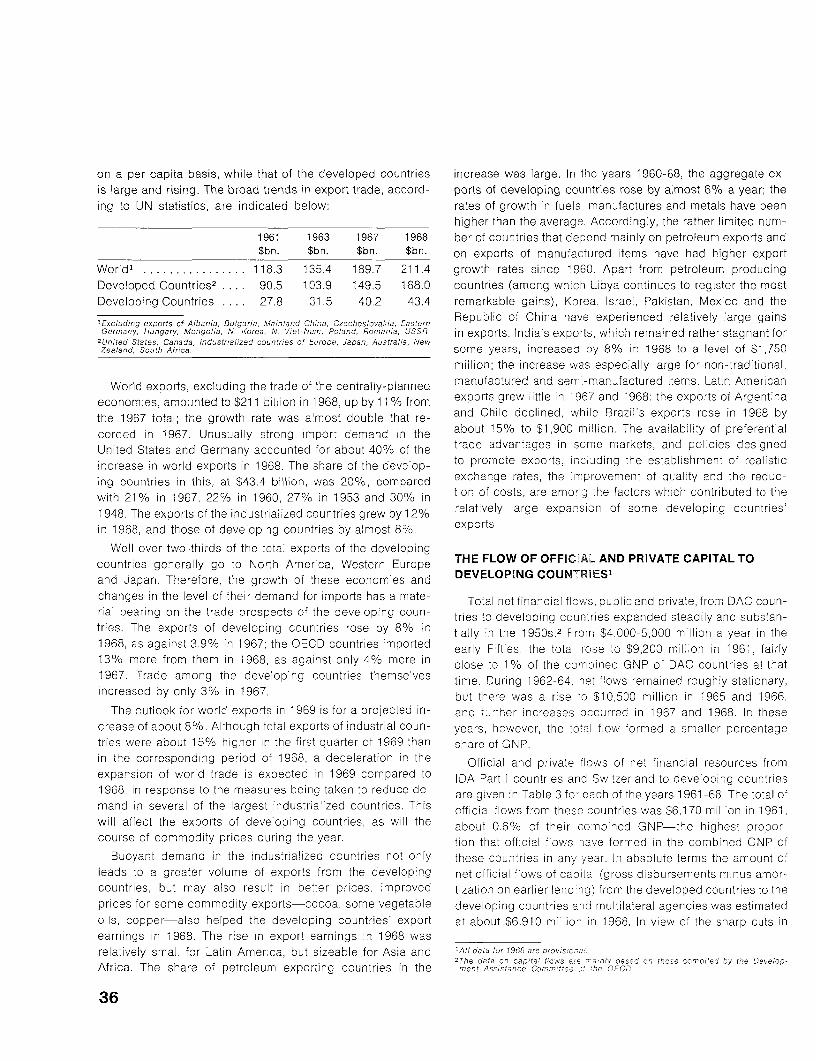
on a per capita basis, while that of the developed countries increase was large. In tho years 1960-68, the aggregate ex-is large and rising. The broad trends in export trade, accord- ports of developing countries rose by almost 6% a year; theing to UN statistics, are indicated below: rates of growth in fuels. manufactures and metals have been
higher than the average. Accordingly, the rather limited num-1961 1963 1967 1968 ber of countries that depend mainly on petroleum exports and$bn. $bn. $bn. $bn. on exports of manufactured items have had higher export
World' ................ 118.3 135.4 189.7 211.4 growth rates since 1960. Apart from petroleum producingDeveloped Countries2
... . 90.5 103.9 149.5 168.0 countries (among which Libya continues to register the mostDeveloping Countries ... . 27.8 31.5 40.2 43.4 remarkable gains), Korea, Israel, Pakistan, Mexico and the
'Excluding exports of Albania, Bulgaria, Mainland China, Czechos!ovakia, Eastern Republic of China have experienced relatively large gainsGermany, Hlungary, Mongolia, N. Korea, N. Viet-Nam, Poland, Romania, USSR. in exports. India's exports, which remained rather stagnant for
2United States, Canada, industrialized countries of Europe, Japan, Australia, NewZealand, South Africa. some years, increased by 8% in 1968 to a level of $1,750
million; the increase was especially large for non-traditional,
World exports, excluding the trade of the centrally-planned manufactured and semi-manufactured items. Latin Americaneconomies, amounted to $211 billion in 1968, up by 11 % from exports grew little in 1967 and 1968: the exports of Argentinathe 1967 total; the growth rate was almost double that re- and Chile declined, while Brazil's exports rose in 1968 bycorded in 1967. Unusually strong impor: demand in the about 15% to $1,900 million. The availability of preferentialUnited States and Germany accounted for about 40% of the trade advantages in some markets, and policies designedincrease in world exports in 1968. The share of the develop- to promote exports, inc;uding the establishment of realisticing countries in this, at $43.4 billion, was 20 %, compared exchange rates, the improvement of quality and the reduc-with 21 % in 1967, 22% in 1960, 27% in 1953 and 30% in tion of costs, are among the factors which contributed to the1948. The experts of the industrialized countries grew by 12% relatively large exparsion of some developing countries'in 1968, and those of developing countries by almost 8%. exports.
Well over two-thirds of the total exports of the developingcountries generally go to North America, Western Europe THE FLOW OF OFFICEAL AND PRIVATE CAPITAL TOand Japan. Therefore, the growth of these economies and DEVELOPING COUNTRIES1
changes in the level of their demand for imports has a mate- Total net financial flows, public and private, from DAC coun-rial bearing on the trade prospects of the developing coun- tries to developing countries expanded steadily and substan-tries. The exports of developing countries rose by 8% in tially in the 1950s.2 From $4,000-5,000 million a year in the1968, as against 3.9% in 1967; the OECD countries imported early Fifties, the total rose to $9,200 million in 1961, fairly13% more from them in 1968, as aga nst only 4% more in close to 1 % of the combined GNP of DAC countries at that1967. Trade among the developing countries themselves time. During 1962-64, net flows remained roughly stationary,increased by only 3% in 1967. but there was a rise to $10,500 million in 1965 and 1966,
The outlook for world exports in 1969 is for a projected in- and further increases occurred in 1967 and 1968. In thesecrease of about 8%, Although total exports of industrial coun- years, however, the to'al flow formed a smaller percentagetries were about 150/% higher in the first quarter of 1969 than sharo of GNP.in the corresponding period of 1968, a deceleration in the Official and private f ows of net financial resources fromexpansion of world trade is expected in 1969 compared to IDA Part I countries and Switzerland to developing countries1968, in response to the measures being taken to reduce de- are given in Table 3 for each of the years 1961-68. The total ofmand in several of the largest industrialized countries. This official flows from these countries was 36,170 mil ion in 1961,will affect the exports of developing countries, as will the about 0.6% of their comnbined GNP-the highest propor-course of commodity prices during the year. tion that official flows have formed in the combined GNP of
Buoyant demand in the industrialized countries not only these countries in any year. In absolute terms the amount ofleads to a greater volume of exports from the developing net official flows of capita (gross disbursements minus amor-countries, but may also result in better prices. Improved tization on earlier lending) from the developed countries to theprices for some commodity exports-cocoa, some vegetable developing countries and multilateral agencies was estimatedoils, copper-also helped the developing countries' export at about $6,910 million in 1968. In view of the sharp cuts inearnings in 1968. The rise in export earnings in 1968 wasrelatively small for Latin America, but sizeable for Asia and 'All oata or 1958 are provisfona!.2
rhe data on capital fioes x'n mainx'y based on tnose co.mol'ed by the Develop-Africa. The share of petroleum exporting countries in the ment Assistance Cmrnm,ttee on the DEeC.
36
US foreign economic assistance appropriations in recent even faster rate and offset the decline in multilateral assist-years, there is the distinct possibility that the net flow of dis- ance and in grants; but the total fell slightly in 1968. Capitalbursements of official assistance in the years immediately flows from non-DAC countries have been relatively modestahead may be significantly reduced. In 1960, when DAC was and limited to official transfers. The estimated net flow fromset up, over 80% of total flows of official capital was ac- the centrally planned economies remained level at aboutcounted for by three countries-France, the United Kingdom $350 million per year during the period 1966-1968.and the United States. Since then, the degree of concentra- The nature and terms of the flow of capital need to betion of aid has been reduced, although in 1968 five countries considered as well as their volume. The main relevant con--France, Germany, Japan, the United Kingdom and the siderations are the proportion of official aid programs in theUnited States-still accounted for 83 % of the total, a propor- form of grants, the interest rates, grace periods and maturitiestion that roughly corresponds to their combined share in of official loans, the extent to which aid is tied to specifiedtotal GNP. Canada, Denmark, Germany, the Netherlands, kinds of goods and/or purchases in particular countries, andNorway and Sweden have set quantitative rmediurn-term tar- the extent to which orficial aid is tailored to the debt-servicinggets to increase their aid substantially. In some cases the c ity o a oping country. In the ler-termiper-targets are in terms of budgetary appropriations for develop- specti of developmnt assitane ln t er-espel
men fiancng;in thes teyrelte o ofical nd rivte spective of development assistance, loan terms-especiallyment financing; in others they relate to oed.cal and private interest charges-have considerable significance. Efforts to-flows combined.
warcs the liberalization and harmonization of the terms ofIn 1968, there was a mnarked decl ne in official flows from assistance by member countries culminated in the adoption
the United Kingdorm and the United States offset by increases by DAC in 1965 of a standard for the terms of assistance. Thein flows from France, Germany, the Netherlands and others. DAC recommendation called on member countries to useMoreover in 1968, as in 1967, past accumulations of uncom- their best efforts to meet one of two standards. The first wasmitted balances were drawn down. Net official assistance that 7 0 % or more of official commitments be in the form offrom France rose by about 10%/ in 1967 and reached $826
grants. The second included the followng provisions: (1) 81 %million after declining over a period of several years since of total official commitments should consist of grants and1962; net disbursements of official loans in particular rose loans at 3/ interest charges or less; (2) 82% of total official
some~ ~ ~ ~ ~ ~ ~~~~~~~~~on at/o Bugear apprprraion forge ofora external f otloficasome 40%. Budgetary appropriaticns for official external commitments should be in the form of grants and loans with
assistance in 1968 were marginally lower than in 1967, butpublic expenditures in calendar 1968 rose from $660 million a maturity of 25 years or more; and (3) the weighted averageto 3690 million. Net official assistance for calendar 1968 was grace period of official loan commitments should be not less$855 million equivalent. The United Kingdom experienced a than 7 years. The so-called "DAC average" terms (25 yearsperiod of economic difficulty culminating in the devaluation maturity, 7 years grace period, 3/ interest) came to be ac-of the pound in November 1967. Consequently, there was a cepted by many countries in practice as a norm for develop-decline of about 5% in the net flow of official capital from the ment loan terms. Overall, the performance of DAC countriesUnited Kingdom in that year compared with the high level of in 1967 was somewhat less satisfactory than in 1966. Thedisbursements in 1966. Net disbursements of official funds in proportion of grants and grant-like assistance in their total1968 were $428 mill on equivalent as against $498 million in official assistance declined to 54.7% from 59.7%. The share1967. Germany increased the level of its net official flows by of loans in the total had thus risen; and the weighted averageabout one-eighth in 1967 to $547 million; this increase was interest rate on loans rose from 3.1% per annum to 3 .8 %mainly due to larger technical assistance grants and a sharp per annum. There was, however, no significant change in theincrease in multilateral assistance: net bilateral loans showed weighted average maturity or grace period of official loans.virtually no change. The budget request for cash payment au- The share of grants in total official flows fell again in 1968,thorizations in 1968 was about 25% higher than in 1967: net to an estimated 50%. However, the weighted average interestofficial flows in 1968 rose to $595 million; most of this in- rate on loans also declined, to about 3.3%, and there was acrease was in the form of official loans and contributions to slight increase in both gracc and maturity periods.multilateral agencies. The net flow of official capital from The scheduled 1968 review of the DAC recommendationJapan reached $500 million in 1967, an increase of about has been completed and the new recommendation went intoone-quarter above its 1966 level. There was a further slight effect in February 1969. This provides for further softeningincrease in 1968, to about $507 million. In absolute terms, the of the terms of loans. Under the "supplement to the 1965flow of net official funds from Italy grew by more than 2 5% in recommendation', countries that provide at least 7 0% of1967 over 1966, to $154 million; loan assistance grew at an development assistance in grants and grant-like assistance
37
would, as before, be regarded as having met DAC standards. rectly from the capital markets. Direct investment and exportTwo new alternative tests were agreed upon: a donor should credits are much more impor'ant types of private capital flows
(a) provide at least 85% of official development assistance to developing countries. Private capital has contributed sub-commitments in such a way that each transaction has stantially to the transfer of resources to developing countries,a minimum concessional element of 61 %; or and there appears to ce an upward trend in the flow of private
(b) ensure that 85% of such commitments contain an aver- capital, although it tends to be erratic from year to year. Theage concessional element of at least 85%. total net flow of private capital from DAC countries to de-
The "concessional element' is defined as the difference be- veloping countries reached S3,800 million in 1957-a leveltween the face value of a financial commitment and the not attained in any subsequent year until 1965. Net privatepresent value of the prospective stream of amortization and capital flows from DAC countries totaled $2,500 million ininterest payments thereon discounted at a conventional rate 1963, and 33,200 miirion in 1964; they remained relativelyof 10%.1 stable at around S4,000 million per annum in 1965-67, rising
The new reoommendation recognizes that in judging oom- to $4,200 million in 1967. According to early data, substantial
pliance with the terms target, account should also be taken increases in flows fromn some countries led to a rise in theof the volume of assistance; countries whcse volume of loan total net flow of private capital to developing countries to aassistance meeting the new terms is significantly below the record of about $5,900 million in 1968. In that year, largeDAC average as a percentage of GNP will not be considered increases were reportec by a number of DAC countries, par-as having met the terms target. Thus, assistance which is ticularly Germany, Ita'y, Japan and the United States.very concessional but very small in relatior to a donor's GNP In recent years, direct investment has represented overwould not qualify. one-half of total private capital flows. Direct investments,
The reformulated recommendation applies only to official which include reinvested earnings, ranged from a high ofdevelopment assistance fairly strictly defined; all export cred- $2,500 million in 1965 to a low of $2,000 million in 1967, theits, for example, including official ones, are excluded. DAC fluctuations being due to a large extent to changes in themembers have agreed to review more fully the differences new flow of capital into The petroleum-producing countries.in their basic approaches to export credi s. whether official There was a sharp recovery in 1968, to about $2,700 million.or officially guaranteed, and the relationship of such credits Net private export cred ts have also increased sharply, fromto wider development considerations. Although the tying of $900 million in 1965 to S1,200 million in 1967 and aboutassistance to purchases in the donor countries need not nec- $1,800 million in 1968. The use of export credits to financeessarily involve a harden ng of terms, it may involve foregoing the capital requirements of developing countries was par-the procurement of goods and services at the lowest cost, ticularly noticeable in 1966 when they amounted to roughlyand to that extent may reduce the quantum of resources which 13.5% of the aggregate net ftow of financial resources fromcould be obtained with a civen amount of financial assistance. DAC countries; the trerd seems to be toward an increasingIn this regard, there appears to have been some improvement use of such credits associated with a lengthening in maturi-in 1967 and 1968. Even so, a larce proportion of total assist- ties. The Bank has expressed in the past its concern overance remains tied. In a resolution on terms and conditions excessive use of expodt credits.of aid, UNCTAD II requested the Bank to prepare a study, in The aggregate net receipts of financial resources from allconsultation with the Secretary-Gencral of UNCTAD and the sources, official and crivate, bilateral and multilateral, byIMF, of possible improvements in techniques of lending, developing countries nave been increasing steadily sincehaving to do among other things with the conditions and 1962. Generally, terms have not improved in recent years, bulscheduling of repayments. The study has been undertaken notable improvemenrts have been made by a number of coun-by Bank staff and should be completed in he course of 1969. tries. In 1967 the total amounted to $11,400 million as com-
The data on private capital flows are less exact than on paed with $11,000 mi ion in 1965 and S9,300 million in 1963.official flows. The data on international capital markets gath- According to prelim nary estimates there was again an inered by the Bank and discussed n Part I of this Report show crease in '968, raisino total receipts to about $13 billion,that on y a few developing countries are able to borrow di- primarily as a result of :ncreases in private capital flows. Some
caution must be observed in nterpreting these figures, sincethey are in terms o' current prices; price inflaticon must have
'This oefiition, difiors somewhat form toat vsed in Tablos 6-8 of this Repcrt. Inrhe tables, the grant eiernent is based on the diierence brtvleen' the present reduced the quantum o- goods and services financed by themvalue of proiected oisbursemen.s 'rather than the face value of cc.rormitment),and the proscnt valuc of proiieted scrvice paymcnts. Granrt element according although it is not possible to quantify its imoact. Similarlyto thi's cefim,tfon woudd tensf tc be somevwhat 'ess th-mn tc .w'. o the DACdesinitsion. d the effect on the rea level of resource transfers of aid tying
38
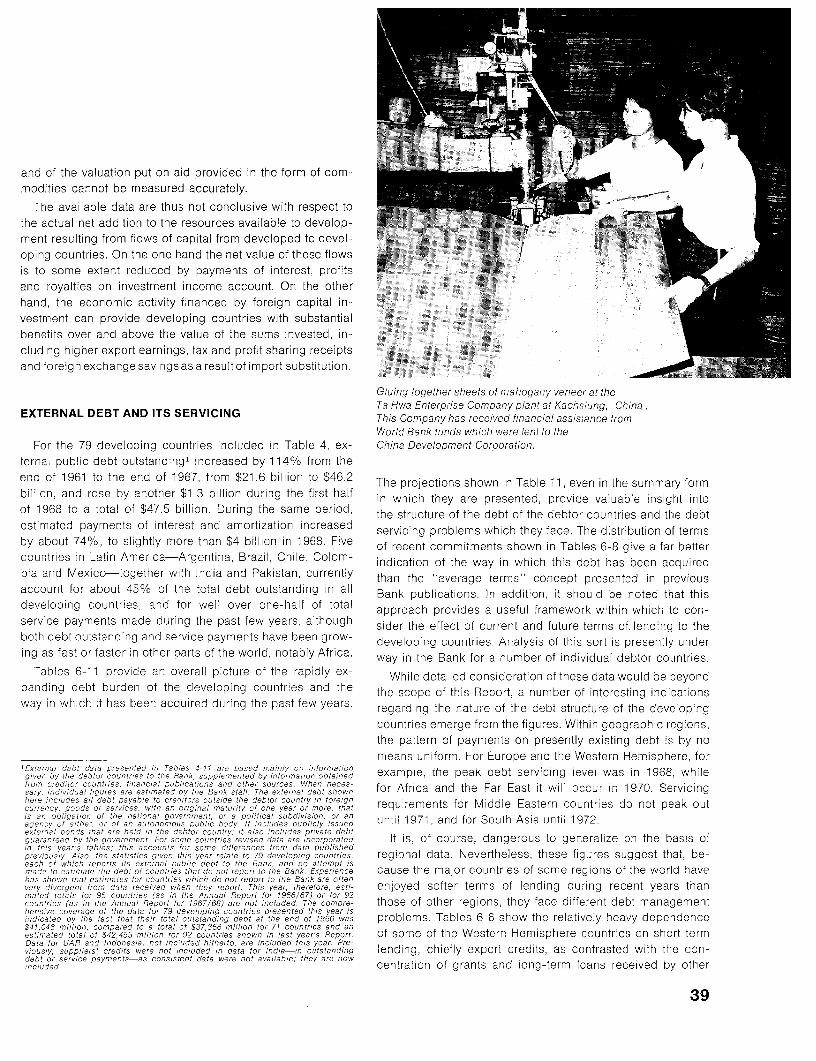
and of the valuation put on aid provided in the form of com-modities cannot be measured accurately.
The available data are thus not conclusive with respect to ,, - -
the actual net addition to the resources available to develop- :. 1ment resulting from flows of capital from developed to devel- --
oping countries. On the one hand the net value of these flowsis to some extent reduced by payments of interest, profitsand royalties on investment income account. On the otherhand, the economic activity financed by foreign capital in-vestment can provide developing countries with substantialbenefits over and above the value of the sums invested, in-clud ng higher export earnings, tax and profit sharing receiptsand foreign exchange savingsas a result of import substitution.
Gluing together sheets of mahogany veneer at theTa Hwa Enterprise Company plant at Kachsiung, Ch ina.
EXTERNAL DEBT AND ITS SERVICING This Company has received financial assistance fromWorld Bank funds which were lent to the
For the 79 develooing countries included in Table 4, ex- China Development Corporation.
ternal public debt outstanding' increased by 114% from theend of 1961 to the end of 1967, from $21.6 billion to $46.2 The projections shown in Table 11, even in the summary formbillion, and rose by another $1.3 billion during the first half in which they are presented, provide valuable insight intoof 1968 to a total of $47.5 billion. During the same period, the structure of the debt of the debtor countries and the debtestimated payments of interest and amortization increased servicing problems which they face. The distribution of termsby about 74%, to slightly more than $z4 billion in 1968. Five of recent commitments shown in Tables 6-8 give a far bettercountries in Latin America-Argentina, Brazil, Chile, Colom- indication of the way in which this debt has been acquiredbia and Mexico-together with India and Pakistan, currently than the "average terms" concept presented in previousaccount for about 45% of the total debt outstanding in all Bank publications. In addition, it should be noted that thisdeveloping countries, and for well over one-half of total approach provides a useful framework within which to con-service payments made during the past few years, although sider the effect of current and future terms of. lending to theboth debt outstanding and service payments have been grow- developing countries Analysis of this sort is presently undering as fast or faster in other parts of the world, notably Africa. way in the Bank for a number of individual debtor countries.
Tables 6-11 provide an overall picture of the rapidly ex- While deta led consideration of these data would be beyondpanding debt burden of the developing countries and the the scope of this Report, a number of interesting indicationsway in which it has been acquired during the past few years. regarding the nature of the debt structure of the developing
countries emerge from the figures. Within geographic regions,the pattern of payments on presently existing debt is by nomeans uniform. For Europe and the Western Hemisphere, for
'E 'erna., oebt data pcresemedno a Tablen 4411 are based mainly on iQfoima!ronthgiver by the debtor countries to the 3ank, supplemented by information obtained example, the peak debt servicing level was in 1968, whilefrom creditor countries, financial publications and other neurons, When neces-sary, individual figures are estimated by the Bank staff The erternal debt shown for Africa and the Far East it will occur in 1970. Servicinghere includes ail debt payable to creditors cutside the debtor country in foreigncurrency, goods or services, with an origlnal maturity of one year or more, that equirements for Middle Eastern countries do not peak outis an obligation of the national government, or a political subdivision, or an uagency of eithev, or of an autonomous public bDdy It includes publicly issued ntil 1971, and for South Asia Lntil 1972.external bonds that car held in the debtor country; it also 'ncludes private debtguaranteed by the government For some countries revised data are incorporated It is, of course, dangerous to generalize on the basis ofin this year s tables, this accounts for some differences from data publishedpreviously. Also, the statistics given this year relate to 79 developing countries, regional data. Nevertheless, these figures suggest that, be-each of which reports its externat public debt to the Bank, and no attempt ismace to esnmate tie cOot of cozjntries that do not report to the Bank Experience cause the major countries of some regions of the world havehas shown that estimates for countries v,hich do not report to the Bank are oftenvery divergent from data received ewhen they report. This year, therefore, esti- enjoyed softer terms of lending dunng recent years thanmated totals for Sb countries (an in the Annual Report for 1966167) or for 92countaries (as in the Annual Report for 19657168 are not included The compre- those of other regions, they face different debt managementhens one coverage of the data for 79 developing countries presentedf this year inindicated by the fact that their total outstanding debt at the end of 1966 was problems. Tables 6-8 show the relatively heavy dependence$41,.046 mfllon, compared to a total of 537,366 million for 7t couintries and anestimated total of $42,465 million for 92 countries shown in last year's Report. of some of the Western Hemisphere countries on short-termData for UAR and Indonesia, not inc;uded hitherto, are included this year Pre-viously, supptiers' credits were not included in data for India-in outstanding lending, chiefly export credits, as contrasted with the con-debt or service payments-as consistent data were not available: they are nowincluded. centration of grants and long-term loans received by other
39
countries. The differing structures of outstanding debt in the tries, they amount to about 18% of foreign exchange earn-Western Hemisphere and South Asia are clearly indicated by ings, as compared with an average of less than 10% foithe projected debt service streams of these areas. By 1972, all developing countries. Debt charges have increasecservice on existing debt of Western Hemisphere countries steadily in relation to exports of goods and services sincewill have declined by over 35%, while service payments for 1964. For Pakistan, debt service has increased by almost 80%South Asian countries, chiefly India and Pakistan, will still be in the last four years, as has the debt service ratio. Argen-increasing. tina's outstanding debt has increased only slightly since 1964
The fact that debt service payments for the developing but debt service charges have grown by about 20%; durinccountries as a whole have not increased as fast as total debt this period, the debt service ratio increased by 10%/. Mexico'coutstanding since 1961, and most noticeably since 1965, is experience has been somewhat different. Although both out-due in part to improvements in the terms of lending which standing debt and service payments have risen by about 60%have taken place during the period. It is also, however, a since 1963, her debt service ratio has declined slightly sincEreflection of the increasing pace of international debt relief 1964. Both Argentina and Mexico have adopted economicoperations. policies which have enabled them to attract fatrly large grose
Since 1956, when the first major post-World War II debt inflows of private direct investment and to roll over and gradu-consolidation agreement was arranged for Argentina, almost ally stretch out short-term credits.$3 billion of external debt of the developing countries has In the appraisal of debt servicing capacity by the Bankbeen rescheduled. Almost half this amount of rescheduling the level and structure of existing and orospective externahas taken place within the past four years, including a total debt of a country on one side, and a projection of foreigrof $350 million in 1968 alone. In May 1968, postponement exchange earnings on the other, are two main elements oof about $100 million in debt service payments for each of analysis, but other factors are also taken into considerationthe three fiscal years beginning April 1, 1968, was agreed For example, the ability to transfer payments is governed iron in the case of India, subject to bilateral agreements. The part by the extent to which a country's foreign exchangemost recent rearrangements were those made in October receipts are freely available, i.e., not tied to particu ar coun-1968 for Indonesia and Ghana. tries or specific projects, or limited by procurement condi-
Debt relief operat ons have been partly of an emergency tions. Moreover, the service obligation which the borroweicharacter; but partly they have been a mneans of improving undertakes extends into the future; therefore, a country'<the terms of aid, and providing greater flexibilitv in the use prospective ability and willingness to service debt are im-of resources transferred to the developing countries. portant factors when the decision to extend a credit is made
Analysis and judgment must be brought to bear on the un-One of the elements considered when assessing a coun-One ofthe elmentsconsidred whn assssing coun certainties inherent in any consideratior, of the future. Sucl-try's debt position is the debt service ratio: the ratio of anties inh a cide ratioe of the fueSceanalysis deals with a wine range of elements which influenceamortization and interest payments to the value of exports directly or indirectly, a country's potential to service loansof goods and services and factor income prom abroad. A low it cannot be estacished on the basis of a simple formuladebt service ratio does not, of course, necessarily imply a From an economic vewpoint, it may be regarded as orhigh credit rating; it may simply be due to a low level of out- assessment of the 'ong-term balance of payments implica-standing debt, and the country's economic performance and tions of the country's development programs and policiesgrowth prospects may irdeed be poor. Conversely, a rela- This calls for an aysis of the country's present resourcEtively high debt service ratio may not be particularly serious base, its development strategy and the likely course of itEif the country is investing in highly productive projects, and
economy over the long term. Thus, as in the developmen'if exports are rising and continued growth in export earnings process itself, the assessment of a country's debt bearincis likely. Table 5 illustrates developments in the debt service pacity recuire aloertm pesetive wit whict
rati of nuber f dveloingcounrie cluingthe ast capacity recuires a longer-term perspecfive within which tcratio of a number of developing counties durng the past consider the currert situation and short-term outlook.few years.
As in other matters, generalizations covering a number ofcountries would be misleading; the situation of each country THE COMMODITY PROBLEMdiffers from that of another. India has the largest externalpublic debt among developing countries. While debt serv- Earlier in the Report, it was noted tha: the share of devel-ice charges as a proportion of total outstanding debt (about oping countries in world exports declined from 220% in 196C5%) are no higher than the average for all developing coun- to 20% in 1968; in 1950, developing countries' exports hac
40
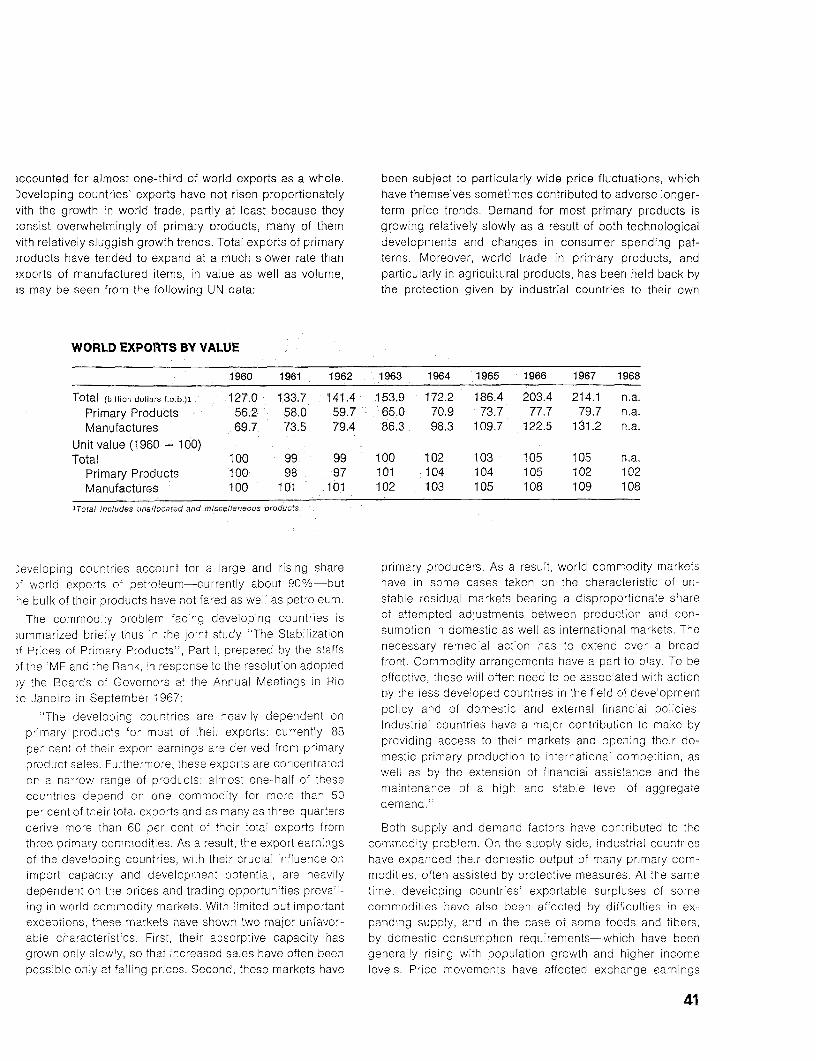
iccounted for almost one-third of world exports as a whole. been subject to particularly wide price fluctuations, whichDeveloping countries' exports have not risen proportionately have themselves sometimes contributed to adverse longer-vith the growth in world trade, partly at least because they term price trends. Demand for most primary products is.onsist overwhelmingly of primary products, many of them growing relatively slowly as a result of both technologicalvith relatively sluggish growth trends. Total exports of primary developments and changes in consumer spendirig pat-)roducts have tended to expand at a much slower rate than terns. Moreover, world trade in primary products, andtxports of manufactured items, in va'ue as well as volume, particularly in agricultural products, has been held back byis may be seen from the following UN data: the protection given by industrial countries to their own
WORLD EXPORTS BY VALUE
1960 1961 1962 1963 1964 1965 1966 1967 1968
Total (billiondoilarsf.o.b)l 127.0 133.7 141.4 153.9 172.2 186.4 203.4 214.1 n.a.Primary Products 56.2 58.0 59.7 65.0 70.9 73.7 77.7 79.7 n.a.Manufactures 69.7 73.5 79.4 86.3 98.3 109.7 122.5 131.2 n.a.
Unit value (1960 = 100)Total 100 99 99 100 102 103 105 105 n.a.
Primary Products 100 98 97 101 104 104 105 102 102Manufactures 100 101 101 102 103 105 108 109 108
'Total includes unallocated and miscellaneous produc1s.
Developing countries account for a large and rising share primary producers. As a result, world commodity markets)f world exports of petroleum-currently about 900/%-but have in some cases taken on the characteristic of un-he bulk of their products have not fared as well as petroleum. stable residual markets bearing a disproportionate share
The commodity problern facing developing countries is of attempted adjustments between production and con-Tummarized briefly thus in the joint study 'The Stabilization sumption in domestic as well as international markets. The)f Prices of Primary Products", Part I, prepared by the staffs necessary remecial action has to extend over a broadf the IMF and the Bank, in response to the resolution adopted front. Commodity arrangements have a part to play. To be
)y the Boards of Governors a, the Annual Meetings in Rio effective, these will often need to be associated with actionJe Janeiro in September 1967: by the less developed countries in the field of development
"The developing countries are heavily dependent on policy and of domestic and external financial policies.primary products for most of their exports: currently, 88 Industrial countries have a major contribution to make by
providing access to their markets and opening their do-
product sales. Furthermore, these exports are codrceptrated mestic primary production to international competition, as
on a narrow range of products: almost one-half of these well as by the extension of financial assistance and thecountries depend on one commodity for more than 50 maintenance of a high and stable level of aggregateper cent of their total exports and as many as three-quarters demand."derive more than 60 per cent of their total exports from Both supply and demand factors have contributed to thethree primary commodities. As a result, the export earnings commodity problem. On the supply side, industrial countriesof the developing countries, with their crucial influence on have expanded their domestic output of many primary com-import capacity and development potential, are heavily modities, often assisted by protective measures. At the samedependent on tne prices and trading opportunities prevail- time, develocing countries' exportable surpluses of someing in world commodity markets. With limited but important commodities have also been affected by difficulties in ex-exceptions, these markets have shown two major unfavor- panding supply, and in the case of some foods and fibers,able characteristics. First, their absorptive capacity has by domestic consumption requirements-which have beengrown only slowly, so that increased sales have often been generally rising with population growth and higher incomepossible only at falling prices. Second, these markets have levels. Price movements have affected exchange earnings
41
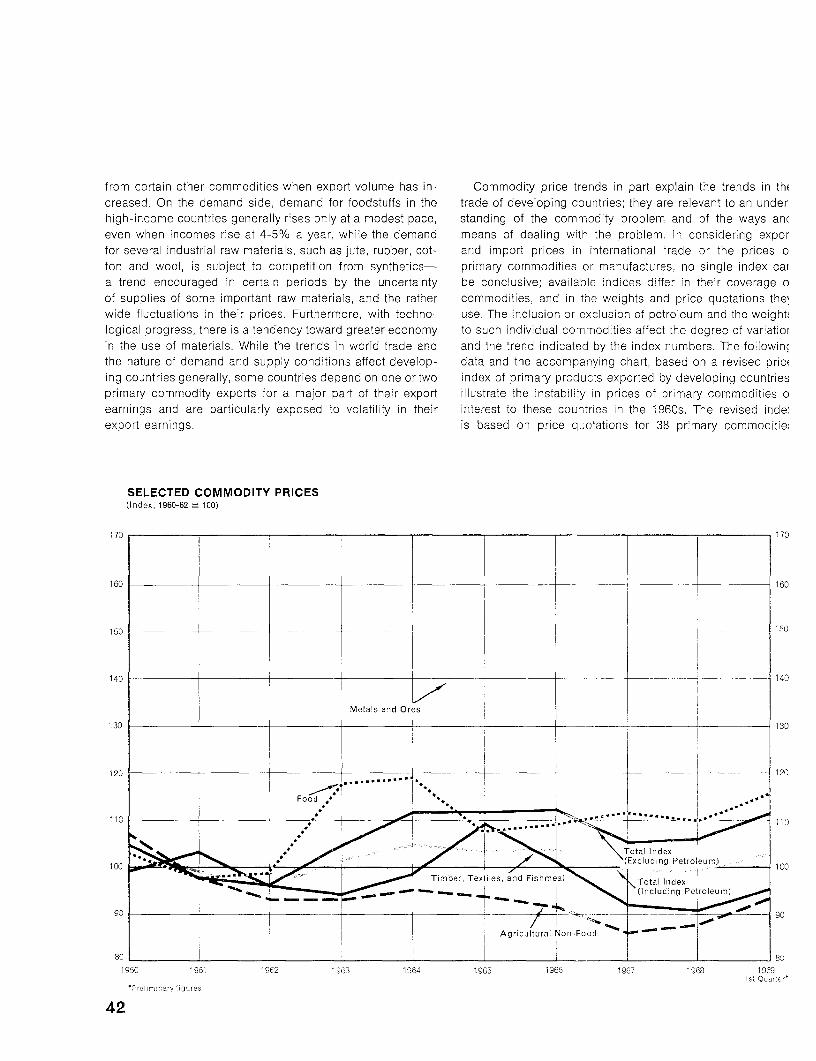
from certain other commodities when export volume has in- Commodity price trends in part explain the trends in th(creased. On the demand side, demand for foodstuffs in the trade of developing countries; they are relevant to an underhigh-income countries generally rises only at a modest pace, standing of the commodity problem and of the ways anceven when incomes rise at 4-5% a year, while the demand means of dealing with the problem. In considering exporfor several industrial raw materials, such as jute, rubber, cot- and import prices in international trade or the prices oton and wool, is subject to competition from synthetics- primary commodities or manufactures, no single index cara trend encouraged in certain periods by the uncertainty be conclusive; available indices differ in their coverage oof supplies of some important raw materials, and the rather commodities, and in the weights and price quotations the\wide fluctuations in their prices. Furthermore, with techno- use. The inclusion or exclusion of petroleum and the weightlogical progress, there is a tendency toward greater economy to such individual commodities affect the degree of variatiorin the use of materials. While the trends in world trade and and the trend indicated by the index numbers. The followincthe nature of demand and supply conditions affect develop- data and the accompanying chart, based on a revised priceing countries generally, some countries depend on one or two index of primary products exported by developing countriesprimary commodity exports for a major part of their export illustrate the instability in prices of primary commodities oearnings and are particularly exposed to volatility in their interest to these countries in the 1960s. The revised inde:export earnings. is based on price quotations for 38 primary commocitIe
SELECTED COMMODITY PRICES(Index, 1960-62 100)
170 1 1 70
160 _ _ _ _ _ -- _ _ _ _ _ _ _ _ _ _ _ _ _ _ _ _ _ _ . 4160
1450 _ _______ - ___ 140
Metals and Ores
130 1__ _ 30
120 Foo d ,, , __._ .- 120
110 .1 ........ A________________~~~~~~~~~~~~~~ 110.....rsc ~~~~~~~~~ ~~~~~~~~~~~~~~~~~~~~~~ al. / ndex'1ax10C , / _ ___ \(Exclud[ng Petroleum) 100
Timber, Textiles, and Fishmeal Total Index(Including Petroleum)
90 7__ _ _ _ __ _. - ..-. ~90Agricultural Non-Food
or I_______ __________________________I________ _______ 80
1960 196 1962 1963 1964 1965 1965 1967 1968 196 9Q
*Prn rn rary c g-res
42
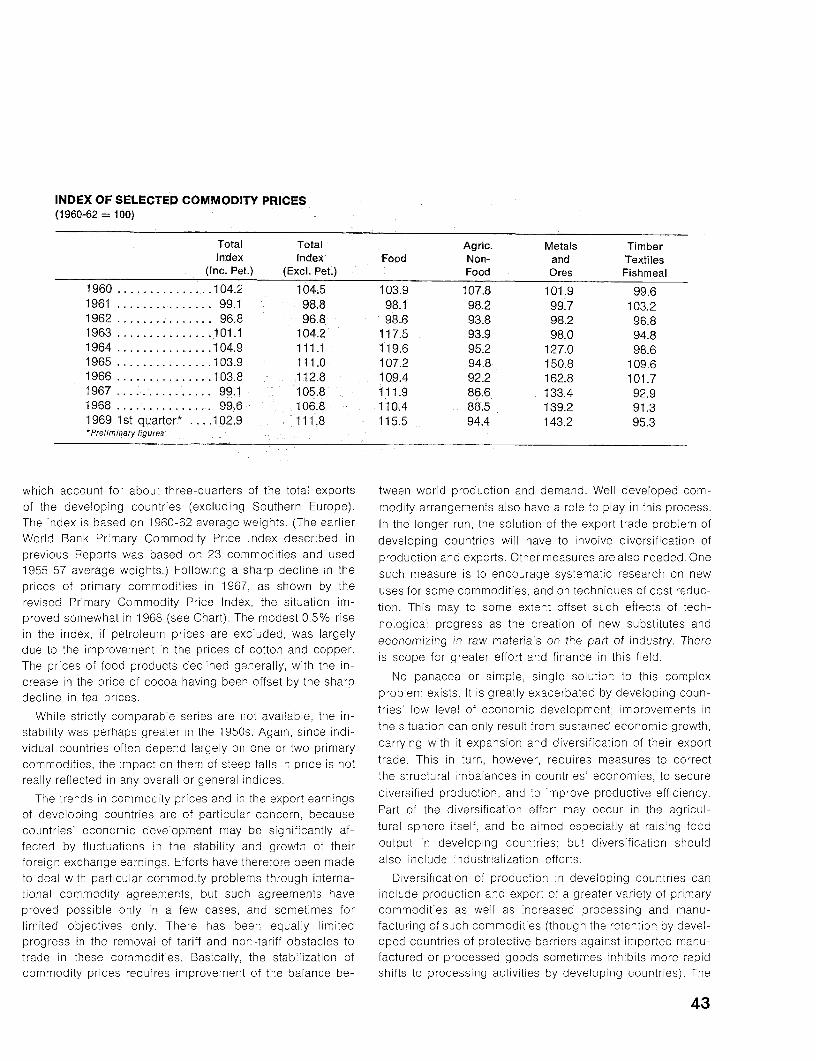
INDEX OF SELECTED COMMODITY PRICES(1960-62 = 100)
Total Total Agric. Metals TimberIndex Index Food Non- and Textiles
(Inc. Pet.) (Excl. Pet.) Food Ores Fishmeal
1960 . 104.2 104.5 103.9 107.8 101.9 99.61961 . 99.1 98.8 98.1 98.2 99.7 103.21962 . 96.8 96.8 98.6 93.8 98.2 96.81963 .............. 101.1 104.2 117.5 93.9 98.0 94.81964 .... 104.9 111.1 119.6 95.2 127.0 98.61965 . 103.9 111.0 107.2 94.8 150.8 109.61966 . 103.8 112.8 109.4 92.2 162.8 101.71967 . 99.1 105.8 111.9 86.6 133.4 92.91968 . 99.6 106.8 110.4 88.5 139.2 91.31969 1st quarter* .... 102.9 111.8 115.5 94.4 143.2 95.3*Preliminary figures
which account for about three-quarters of the total exports tween world production and demand. Well developed com-of the developing countries (excluding Southern Europe). modity arrangements also have a role to play in this process.The index is based on 1960-62 average weights. (The earlier In the longer run, the solution of the export trade problem ofWorld Bank Primary Commodity Price Index described in developing countries will have to involve diversification ofprevious Reports was based on 23 commodities and used production and exports. Othermeasures are also needed. One1955-57 average weights.) Following a sharp decline in the such measure is to encourage systematic research on newprices of primary commodities in 1967, as shown by the uses for some commodities, and on techniques of cost reduc-rev sed Primary Commodity Price Index, the situation im- tion. This may to some extent offset such effects of tech-proved somewhat in 1968 (see Chart). The modest 0.5% rise nological progress as the creation of new substitutes andin the index, if petroleum prices are excluded, was largely economizing in raw materials on the part of industry. Theredue to the improvement in the prices of cotton and copper. is scope for greater effort and finance in this field.The prices of food products declined generally, with the in-crease in the price of cocoa having been offset by the sharp No panacea or simple. single solution to this complexdecline in tea prices. problem exists. It is greatly exacerbated by developing coun-
While strictly comparable series are not ava lable, the in- tries' low level of economic development: improvements instability was perhaps greater in the 1950s. Again, since indi- the situation can only result from sustained economic growth,vidual countries often depend largely on one or two primary carrying with it expansion and diversification of their exportcommodities, the impact on them of steep falls n price is not trade. This in turn, however, requires measures to correctreally reflected in any overall or general indices. the structural imbalances in countries' economies, to secure
The trends in commodity prices and in the export earnings diversified production, and to improve productive efficiency.of developing countries are of particular concern, because Part of the diversification effort may occur in the agricul-countries' economic development may be significantly af- tural sphere itself, and be aimed especially at raising foodfected by fluctuations in the stability and growth of their output in developing countries: but diversification shouldforeign exchange earnings. Efforts have therefore been made also include industrializat on effcrts.to deal with particular commodity problems through interna- Diversification of production in developing countries cantional commodity agreements, but such agreements have include production and export of a greater variety of primaryproved possible only in a few cases, and sometimes for commodities as well as increased processing and manu-limited objectives only. There has been equally limited facturing of such commodi.ies (though the retention by devel-progress in the removal of tariff and non-tariff obstacles to oped countries of protective barriers against imported manu-trade in these commodities. Basically, the stabilization of factured or processed goods sometimes inhibits more ra,idcommodity prices requires improvement of the balance be- shifts to processing activities by developing countries). The
43
latter type of development is sometimes referred to as "verti- an instrument of a commodity agreement, has to be equippedcal diversification". On the other hand, "horizontal diversi- with adequate funds; these may be raised in various ways,fication" or "commodity-oriented diversification" generally for example by levies on producers and importers of the com-involves shifting into the productior for export of commodi- modity in question. While these resources are being built up,ties other than those which are currently predominant, the the buffer stock management requires some initial finance-production of new primary products for domestic consump- what may be termed prefinancing. Conceivably, such initialtion, or of import-substituting commodities. financing may sometimes be needed not just for short pe-
Internatioral commodity arrangements, involving export riods, but over a somewhat longer term, so as to provide suf-quotas and production controls, cannot eliminate the danger ficient time for the buffer stock's resources to be built up byof disruption of markets by excess supplies. unless the devel- such means as levies or other contributions by participatingoping countries are encouraged and assisted in providing countries, or by any profits from sales.alternative production and employment opportunities through During the 1969 fiscal year, the Bretton Woods institutionsdiversification. This may in some cases require the shifting have made further studies of ways in which they can con-of resources out of a particular field of production. It may at tribute to solutions to tne commodity problem facing thea minimum require restraint in the commitment of additional less-developed countries, as requested by their Boards ofresources to surplus commodities and turning to alternative Governors at their 1968 Annual Meetings. To the extent thatactivities. Meanwhile, as the developing ccuntries take steps greater price stability of orimary products also stabilizes theto modernize their economies, and as their capacity to ex- foreign currency earnings of developing countries, suchport non-traditional items improves, the developed countries stability is a matter of interest to the International Monetarycould help by liberalizing the regulations governing these Fund. Similarly, to the extent that it contributes to the moreitems to their markets. effective economic deve.opment of the less-developed pro-
The stabil zation of commodity prices and increased ac- ducing countries, commodity price stability is also of interestcess to the markets of industrial countries through commodity to the World Bank.arrangements represent the trade approach for influencing The World Bank's Executive Directors have taken a numberthe foreign exchange receipts of developing countries. By of decisions, financia and other, on the present scope forreducing the amplitude of price fluctuations and by seeking Bank Group action in this field, and have transmitted themto deal with the slow growth of demand for primary com- to the Governors of the Bank. These decisions elate mainlymodities, such arrangements aim at improving the level and to policies for the dyvers fication of productive activity in thetrend of export earn ngs. Commodity arrangements take dif- primary producing countries, and for assistance to appro-ferent forms, varying almost from case to case. Buffer stock priate in-ernational commodity arrangements. The Bankarrargements have in recent years attracted particular atten- Group believes it can provide assistance to deal with thetion from the developing countries as a means of reducing commodity problem through its own established procedures,the instability of prices of primary products. A buffer stock, as employing the regular vehicles of Bank Group lending.
44
Slatistical Annex
Table Page
I Real Gross Domestic Product, Population and Gross Domestic ProductPer Capita-Regional Summary ......................................................... 46
2 Economic Indicators for Developing and Industrialized Countries-Regional Summary . .............. .................. .............................. 47
3 Flow of Net Financial Resources from IDA Part I Countries and Switzerlandto Developing Countries and Multilateral Institutiolis .................................... 47
4 External Public Debt Outstanding and Debt Service Payments ofDeveloping Countries ................................................................ 48
5 Service Payments on External Official Debt as Percentage ofExports of Goods and Services ........................... ............................ 49
6 External Public Debt and Grants Incurred in 1965 by 33 Countries,Distribution by Terms of Grants and Loans, and Grant Element ... ..................... 50
7 External Public Debt and Grants Incurred in 1966 by 33 Countries,Distribution by Terms of Grants and Loans, and Grant Element ..... ................... 52
8 External Public Debt and Grants Incurred in 1967 by 33 Countries,Distribution by Terms of Grants and Loans, and Grant Element ..................... .... 54
9 Grants and Disbursements on Loans to Developing Countries, 1965-1967 ...... .......... 56
10 Debt Service of Developing Countries, 1965-1967 ...................... ._ ........... 58
11 Estimated Service Payments on Existing External Public Debt of 79 DevelopingCountries as of December 31, 1967, 1968-1977 by Category of Indebtedness ..... ......... 59
12 Bond Issues Placed Internationally by Market and Country of BorrowingEntity, 1966-1968, First Half 1969 .......................................... ............ 60
13 Average Yield of New Foreign and International Bonds, 1967-1968, First Half 1969 ......... 62
45
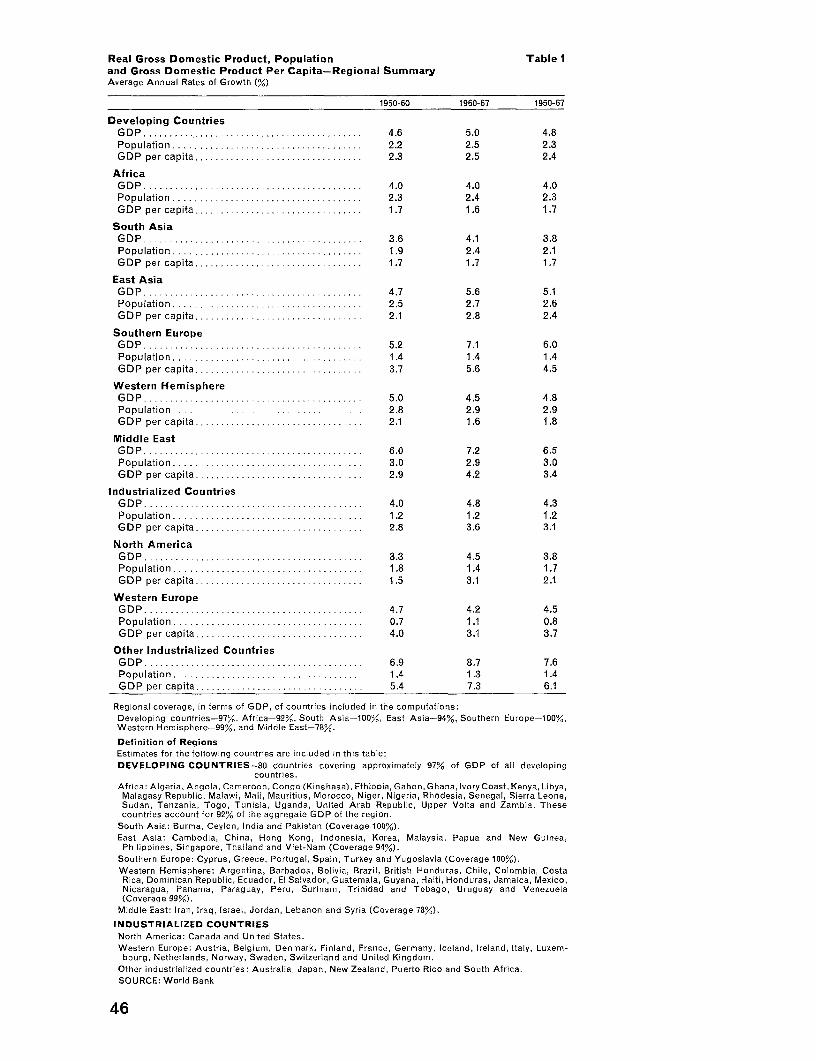
Real Gross Domestic Product, Population Table Iand Gross Domestic Product Per Capita-Regional SummaryAverage Annual Rates of Growth (%)
1950-60 1960-67 1950-67
Developing CountriesGDP ......................... 4.6 5.0 4.8Population ................................ 2.2 2.5 2.3GDP per capita ......................... 2.3 2.5 2.4
AfricaGDP ......................... 4.0 4.0 4.0Population ................ ................ 2.3 2.4 2.3GDP per capita ......................... 1.7 1.6 1.7
South AsiaGDP ......................... 3.6 4.1 3.8Population ................................ 1.9 2.4 2.1GDP per capita ....................... .. 1.7 1.7 1.7
East AsiaGDP .......................... 4.7 5.6 5.1Population ................................ 2.5 2.7 2.6GDP per capita ......................... 2.1 2.8 2.4
Southern EuropeGDP ......................... 5.2 7.1 6.0Population ............................... 1.4 1.4 1.4GDP per capita ......................... 3.7 5.6 4.5
Western HemisphereGDP ......................... 5.0 4.5 4.8Population ---------- .............. 2.8 2.9 2.9GDP per capita ......................... 2.1 1.6 1.8
Middle EastGOP ......................... 6.0 7.2 6.5Population ................................ 3.0 2.9 3.0GDP per capita .................... ..... 2.9 4.2 3.4
Industrialized CountriesGDP ......................... 4.0 4.8 4.3Population ...................... .......... 1.2 1.2 1.2GDP per capita ......................... 2.8 3.6 3.1
North AmericaGDP. ......................... 3.3 4.5 3.8Population ................................ 1.8 1.4 1.7GDP per capita ........... .............. 1.5 3.1 2.1
Western EuropeGDP ......................... 4.7 4.2 4.5Population .............................. .. 0.7 1.1 0.8GDP per capita .................... ......... 4.0 3.1 3.7
Other Industrialized CountriesGDP. ......................... 6.9 8.7 7.6Population . .................. ............. 1.4 1.3 1.4GDP per capita ......................... 5.4 7.3 6.1
Regional coverage, in terms of GDP, of countries included in the computations:Developing countries-97%, Africa-92%, South Asia-100%, East Asia-94%, Southern Europe-100%,Western Hemisphere-99%, and Middle East-78%.
Definition of RegionsEstimates for the following countries are included in this table:DEVELOPING COUNTRIES-80 countries covering approximately 97% of GDP of all developing
countries.Africa: Algeria, Angola, Cameroon, Congo (Kinshasa), Ethiopia, Gabon, Ghana, IvoryCoast, Kenya, Libya,Malagasy Republic, Malawi, Mali, Mauritius, Morocco, Niger, Nigeria, Rhodesia, Senegal, Sierra Leone,Sudan, Tanzania, Togo, Tunisia, Uganda, United Arab Republic, Upper Volta and Zambia. Thesecountries account for 92% of the aggregate GDP of the region.
South Asia: Burma, Ceylon, India and Pakistan (Coverage 100%).East Asia: Cambodia, China, Hong Kong, Indonesia, Korea, Malaysia, Papua and New Guinea,Philippines, Singapore, Thailand and Viet-Nam (Coverage 94%).
Southern Europe: Cyprus, Greece, Portugal, Spain, Turkey and Yugoslavia (Coverage 100%).Western Hemisphere: Argentina, Barbados, Bolivia, Brazil, British Honduras, Chile, Colombia, Costa
Rica, Dominican Republic, Ecuador, El Salvador, Guatemala, Guyana, Haiti, Honduras, Jamaica, Mexico,Nicaragua, Panama, Paraguay, Peru, Surinam, Trinidad and Tobago, Uruguay and Venezuela(Coverage 99%).
Middle East: Iran, Iraq, Israel, Jordan, Lebanon and Syria (Coverage 78%).
INDUSTRIALIZED COUNTRIESNorth America: Canada and United States.Western Europe: Austria, Belgium, Denmark, Finland, France, Germany, Iceland, Ireland, Italy, Luxem-bourg, Netherlands, Norway, Sweden, Switzerland and United Kingdom.
Other industrialized countries: Australia, Japan, New Zealand, Puerto Rico and South Africa.SOURCE: World Bank
46
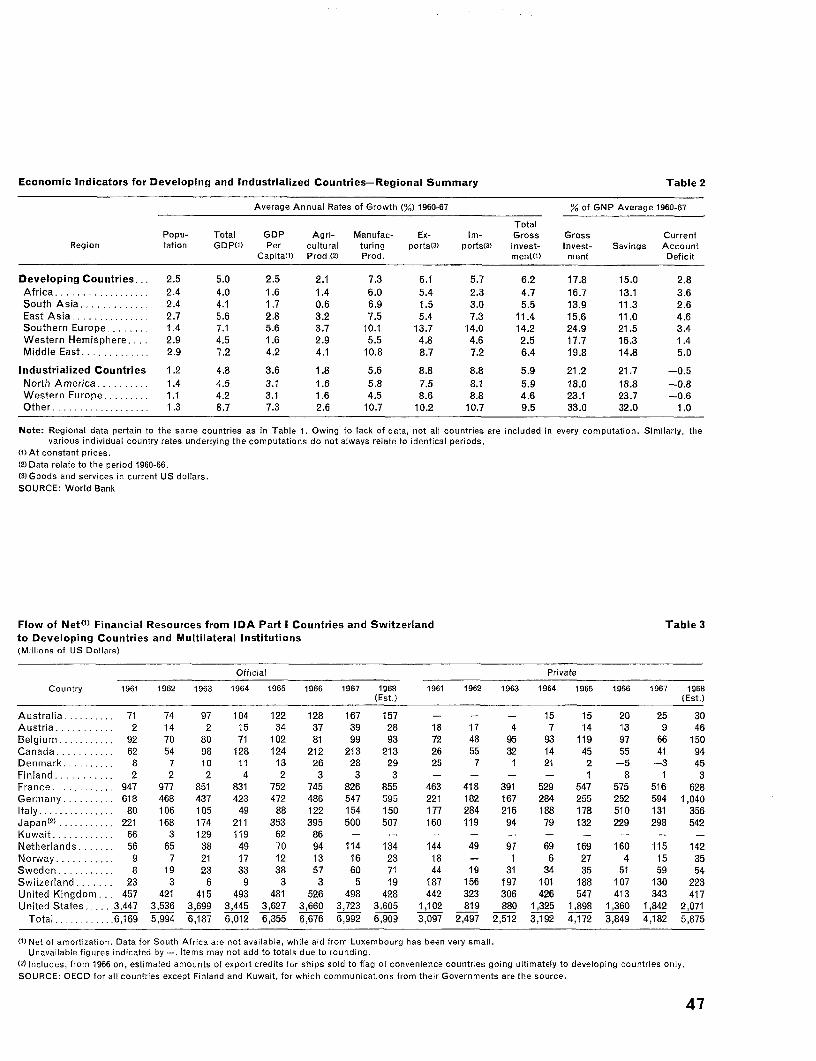
Economic Indicators for Developing and Industrialized Countries-Regional Summary Table 2
Average Annual Rates of Growth (%) 1960-67 % of GNP Average 1960-67
TotalPopu- Total GDP Agri- Manufac- Ex- Im- Gross Gross Current
Region lation GDP9) Per cultural turing ports(3 ) ports(3) Invest- Invest- Savings AccountCapitatl) Prod,(2) Prod. ment(l) ment Deficit
Developing Countries... 2.5 5.0 2.5 2.1 7.3 6.1 5.7 6.2 17.8 15.0 2.8Africa .................. 2.4 4.0 1.6 1.4 6.0 5.4 2.3 4.7 16.7 13.1 3.6South Asia ............. 2.4 4.1 1.7 0.6 6.9 1.5 3.0 5.5 13.9 11.3 2.6East Asia ............... 2.7 5.6 2.8 3.2 7.5 5.4 7.3 11.4 15.6 11.0 4.6Southern Europe ........ 1.4 7.1 5.6 3.7 10.1 13.7 14.0 14.2 24.9 21.5 3.4Western Hemisphere .... 2.9 4.5 1.6 2.9 5.5 4.8 4.6 2.5 17.7 16.3 1.4Middle East ............. 2.9 7.2 4.2 4.1 10.8 8.7 7.2 6.4 19.8 14.8 5.0
Industrialized Countries 1.2 4.8 3.6 1.8 5.6 8.8 8.8 5.9 21.2 21.7 -0.5North America .......... 1.4 4.5 3.1 1.6 5.8 7.5 8.1 5.9 18.0 18.8 -0.8Western Europe ......... 1.1 4.2 3.1 1.6 4.5 8.6 8.8 4.6 23.1 23.7 -0.6Other ................... 1.3 8.7 7.3 2.6 10.7 10.2 10.7 9.5 33.0 32.0 1.0
Note: Regional data pertain to the same countries as in Table 1. Owing to lack of data, not all countries are included in every computation. Similarly, thevarious individual country rates underlying the computations do not always relate to identical periods.
9)At constant prices.(2) Data relate to the period 1960-66.(3) Goods and services in current US dollars.SOURCE: World Bank
Flow of NetVt ) Financial Resources from IDA Part I Countries and Switzerland Table 3to Developing Countries and Multilateral Institutions(Millions of US Dollars)
Official Private
Country 1961 1962 1963 1964 1965 1966 1967 1968 1961 1962 1963 1964 1965 1966 1967 1968(Est.) (Est.)
Australia ......... 71 74 97 104 122 128 167 157 - - - 15 15 20 25 30Austria ........... 2 14 2 15 34 37 39 28 18 17 4 7 14 13 9 46Belgium ......... 92 70 80 71 102 81 99 93 72 48 95 93 119 97 66 150Canada ........... 62 54 98 128 124 212 213 213 26 55 32 14 45 55 41 94Denmark .......... 8 7 10 11 13 26 28 29 25 7 1 21 2 -5 -3 45Finland ........... 2 2 2 4 2 3 3 3 - - - - 1 8 1 3France ............ 947 977 851 831 752 745 826 855 463 418 391 529 547 575 516 628Germany .......... 618 468 437 423 472 486 547 595 221 182 167 284 255 252 594 1,040Italy ...... ........ 80 106 105 49 88 122 154 150 177 284 216 188 178 510 131 356Japan(2) ........... 221 168 174 211 353 395 500 507 160 119 94 79 132 229 298 542Kuwait ............ 66 3 129 119 62 86 - - - - - - - - - -
Netherlands ....... 56 65 38 49 70 94 114 134 144 49 97 69 169 160 115 142Norway ........... 9 7 21 17 12 13 16 23 18 - 1 6 27 4 15 35Sweden ....... .. 8 19 23 33 38 57 60 71 44 19 31 34 35 51 59 54Switzerland ....... 23 3 6 9 3 3 5 19 187 156 197 101 188 107 130 223United Kingdom ... 457 421 415 493 481 526 498 428 442 323 306 426 547 413 343 417United States ...... 3,447 3,536 3,699 3,445 3,627 3,660 3,723 3,605 1,102 819 880 1,325 1,898 1,360 1,842 2,071
Total ........... 6,169 5,994 6,187 6,012 6,355 6,676 6,992 6,909 3,097 2,497 2,512 3,192 4,172 3,849 4,182 5,875
(1) Net of amortization. Data for South Africa are not available, while aid from Luxembourg has been very small.Unavailable figures indicated by -. Items may not add to totals due to rounding.
(2) Includes, from 1966 on, estimated amounts of export credits for ships sold to flag of convenience countries going ultimately to developing countries only.SOURCE: OECD for all countries except Finland and Kuwait, for which communications from their Governments are the source.
47
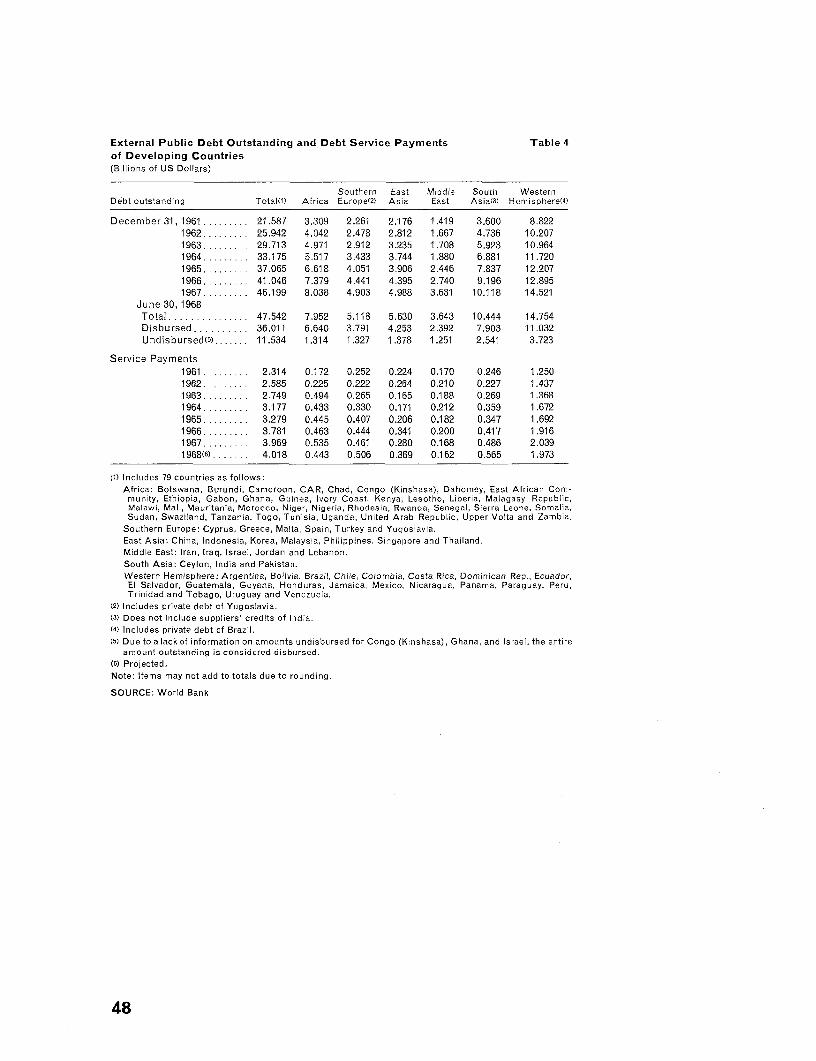
External Public Debt Outstanding and Debt Service Payments Table 4of Developing Countries(Billions of US Dollars)
Southern East Middle South WesternDebt outstanding Totall) Africa Europe(2) Asia East Asia(3) Hemisphere(4)
December 31, 1961 .... 21.587 3.309 2.261 2.176 1.419 3.600 8.8221962 ....... 25.942 4.042 2.478 2.812 1.667 4.736 10.2071963 ....... 29.713 4.971 2.912 3.235 1.708 5.923 10.9641964 ....... 33.175 5.517 3.433 3.744 1.880 6.881 11.7201965. ..... 37.065 6.618 4.051 3.906 2.446 7.837 12.2071966, .. 41.046 7.379 4.441 4.395 2.740 9.196 12.8951967 ....... 46.199 8.038 4.903 4.988 3.631 10.118 14.521
June 30, 1968Total ......... 47.542 7.952 5.118 5.630 3.643 10.444 14.754Disbursed ....... 36.011 6.640 3.791 4.253 2.392 7.903 11.032Undisbursed(l5 ....... 11.534 1.314 1.327 1.378 1.251 2.541 3.723
Service Payments1961 ......... 2.314 0.172 0.252 0.224 0.170 0.246 1.2501962 . 2.585 0.225 0.222 0.264 0.210 0.227 1.4371963 ......... 2.749 0.494 0.265 0.165 0.188 0.269 1.3681964 ......... 3.177 0.433 0.330 0.171 0.212 0.359 1.6721965 ..... ... 3.279 0.445 0.407 0.206 0.182 0.347 1.6921966 ......... 3.781 0.463 0.444 0.341 0.200 0.417 1.9161967 ......... 3.969 0.535 0.461 0.280 0.168 0.486 2.0391968(6) ....... 4.018 0.443 0.506 0.369 0.162 0.565 1.973
fl) Includes 79 countries as follows:Africa: Botswana, Burundi, Cameroon, CAR, Chad, Congo (Kinshasa), Dahomey, East African Com-munity, Ethiopia, Gabon, Ghana, Guinea, Ivory Coast, Kenya, Lesotho, Liberia, Malagasy Republic,Malawi, Mali, Mauritania, Morocco, Niger, Nigeria, Rhodesia, Rwanda, Senegal, Sierra Leone, Somalia,Sudan, Swaziland, Tanzania, Togo, Tunisia, Uganda, United Arab Republic, Upper Volta and Zambia.
Southern Europe: Cyprus, Greece, Malta, Spain, Turkey and Yugoslavia.East Asia: China, Indonesia, Korea, Malaysia, Philippines, Singapore and Thailand.Middle East: Iran, Iraq, Israel, Jordan and Lebanon.South Asia: Ceylon, India and Pakistan.Western Hemisphere: Argentina, Bolivia, Brazil, Chile, Colombia, Costa Rica, Dominican Rep., Ecuador,El Salvador, Guatemala, Guyana, Honduras, Jamaica, Mexico, Nicaragua, Panama, Paraguay, Peru,Trinidad and Tobago, Uruguay and Venezuela,
(2) Includes private debt of Yugoslavia.13) Does not include suppliers' credits of India.(4) Includes private debt of Brazil.(5) Due to a lack of information on amounts undisbursed for Congo (Kinshasa), Ghana, and Israel, the entire
amount outstanding is considered disbursed.(t) Projected.Note: Items may not add to totals due to rounding.
SOURCE: World Bank
48
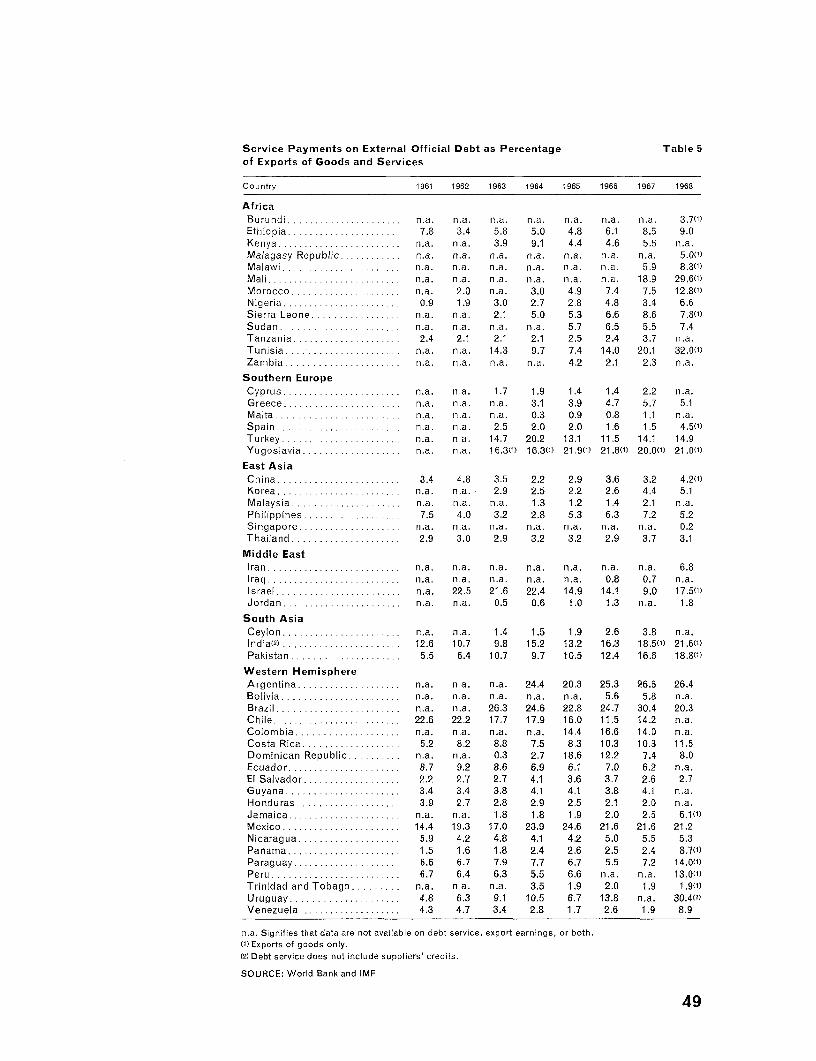
Service Payments on External Official Debt as Percentage Table 5of Exports of Goods and Services
Country 1961 1962 1963 1964 1965 1966 1967 1969
AfricaBurundi............ n.a. n.a. n.a. n.a. n. a. n. a. n. a. 3.7(1)Ethiopia ............ 7.8 3.4 5.8 5.0 4.8 6.1 8.5 9.0Kenva ............ . na. n.a. 3.9 9.1 4.4 4.6 5.5 n.a.Malagasy Republic...... . n.a. n.a. n.a. n.a. n.a. n. a. n. a. 5.0(1)Malawi..... .. .... n.a. n.a. n.a. n.a. n.a. n.ea. 5.9 8.3(1)Mali ...... ........ n.a. n.a. n.a. n.a. n. a. n. a. 18.9 29.6(1)Morocco........... . n a. 2.0 n.a. 3.0 4,9 7.4 7.5 12.8(1)Nigeria...... ...... 0.9 1.9 3.0 2.7 2.8 4.8 3.4 6.6Sierra Leone......... . n.ea. n.e. 2.1 5.0 5.3 6.6 8.6 7.8(1)Sudan ..... ........ n.a. n.a. n.a. n.e. 5.7 6.5 5.5 7.4Tanzania .... .... ... 2.4 2.1 2.1 2.1 2.5 2.4 3.7 n.a.Tunisia. . ... ...... n.ea. n.ea. 14.3 9.7 7.4 14.0 20.1 32.0(1)Zambia ......... ..... n.a. n. a. n.a. n.ea. 4.2 2.1 2.3 n.a.
Southern EuropeCyprus .. ... ... ..... n.a. n.e. 1.7 1.9 1.4 1.4 2.2 n.a.Greece .............. n.ea. n.ea. n.e. 3.1 3.9 4.7 5.7 5.1Malta ............. n.e. n.a. n.e. 0.3 0.9 0.8 1.1 n.e.Spain. .......... n.ea. n.ea. 2.5 2.0 2.0 1.6 1.5 4.5(1)Turkey............ . n.e. n.ea. 14.7 20.2 13.1 11.5 14.1 14.9Yugoslavia.......... . n.e. n.ea. 16.3(1) 16.3(l) 21.9(1) 21.8(l) 20.0(l) 21 .0(1
East AsiaChina...... ........ 3.4 4.8 3.5 2.2 2.9 3.6 3.2 4.20))Korea ...... ..... . n.e. n.e. 2.9 2.5 2.2 2.6 4.4 5.1Malaysia........... . n.e. n.e. n.e. 1.3 1.2 1.4 2.1 n.a.Philippines..... ....... 7.5 4.0 3.2 2.8 5.3 6.3 7.2 5.2Singapore .......... . F.e. n.e. n.a. n.e. n.e. n.e. n.e. 0.2Thailand ..... ....... 2.9 3.0 2.9 3.2 3,2 2.9 3.7 3.1
Middle EastIran ... ...... ..... n.e. n.e. n.e. n.e. n.e. n.e. n.e. 6.8Iraq ............... n.e. n.e. n.a. n.a. n.e. 0.8 0.7 n.e.Israel...... ........ n.e. 22.5 21.6 22.4 14.9 14.1 9.0 17.5(1)Jordan............ . n.e. n.e. 0.5 0.6 1.0 1.3 n.e. 1.8
South AsiaCeylon............ . n.e. n.e. 1.4 1.5 1.9 2.6 3.8 n.e.lndia(2) ............ 12.6 10.7 9.8 15.2 13.2 16.3 18.5(1) 21.6(1)Pakistan ..... ....... 5.5 6.4 10.7 9.7 10.5 12.4 16.6 18.8(1)
Western HemisphereArgentina .......... . n.e. n.e. n.e. 24.4 20.3 25.3 26.6 26.4Bolivia............ . n.e. n.e. n.e. n.a. n.a. 5.6 5.8 n.e.Brazil ............ . n.e. n.e. 26.3 24.6 22.8 24.7 30.4 20.3Chile ...... ........ 22.6 22.2 17.7 17.9 16.0 11.5 14.2 n.e.Colombia .......... . n.e. n.e. n.e. n.e. 14.4 16.6 14.0 n.e.Costa Rice .... ....... 5.2 8.2 8.8 7.5 8.3 10.3 10.3 11.5Dominican Republic..... . n.a. n.e. 0.3 2.7 18.6 12.2 7.4 8.0Ecuador...... ....... 8.7 9.2 8.6 6.9 6.1 7.0 6.2 n.e.El Salvador..... ....... 2.2 2.7 2.7 4.1 3.6 3.7 2.6 2.7Guyana ..... ........ 3.4 3.4 3.8 4.1 4.1 3.8 4.1 n.e.Honduras..... ....... 3.9 2.7 2.8 2.9 2.5 2.1 2.0 n.e.Jamaica ........... . n.e. n.e. 1.8 1.8 1.9 2.0 2.5 6.1(1)Mexico ..... ........ 14.4 19.3 17.0 23.9 24.6 21.6 21.6 21.2Nicaragua..... ....... 5.9 4.2 4.8 4.1 4.2 5.0 5.5 5.3Panama ..... ........ 1.5 1.6 1.8 2.4 2.6 2.5 2.4 8.70))Paraguay .. ..... . 6.6 6.7 7.9 7.7 6.7 5.5 7.2 14.00)1Peru ...... ........ 6.7 6.4 6.3 5.5 6.6 n.e. n.e. 13.00))Trinidad and Tobago .. .- n.e. n.e. n.e. 3.5 1.9 2.0 1.9 1.9(l)Uruguay ..... ....... 4.8 6.3 9.1 10.5 6.7 13.8 n.a. 30.4(1)
Venezuela ........... 4.3 4.7 3.4 2.8 1.7 2.6 1.9 8.9
n.a. Signifies that data are not available on debt service, export earnings, or both.1)(Exports of goods only.
(2) Debt service does not include suppliers' credits.
SOURCE: World Bank and IMF
49
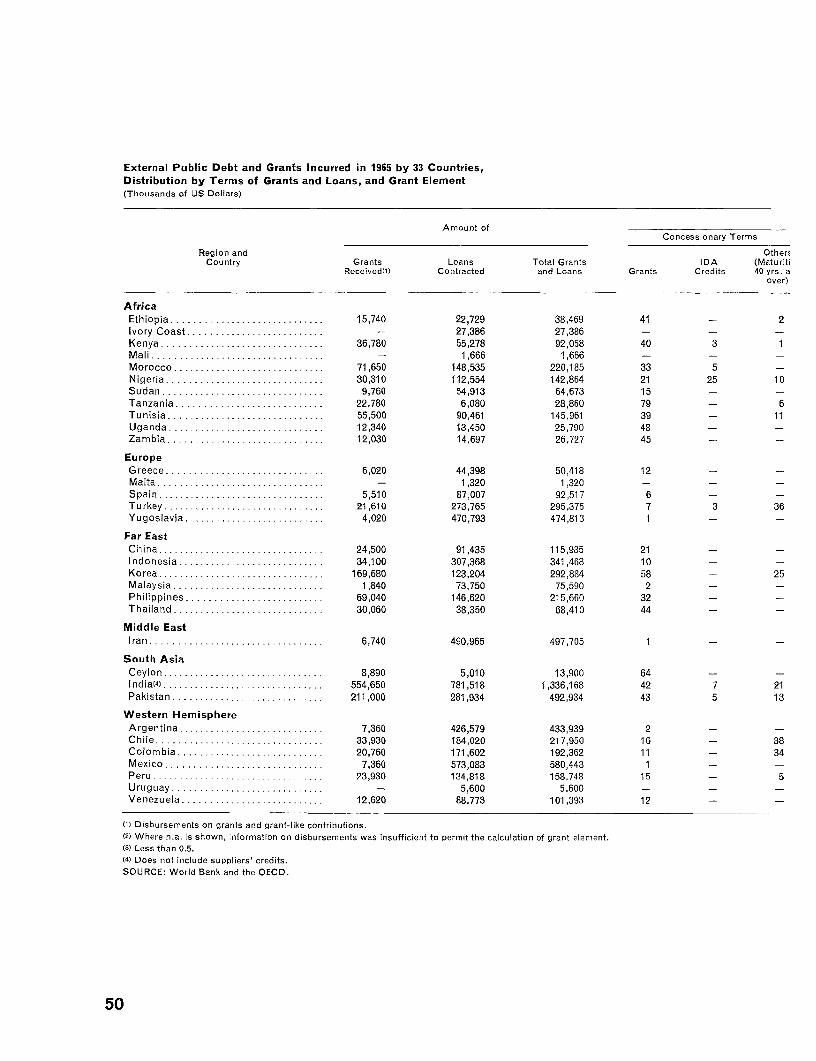
External Public Debt and Grants Incurred in 1965 by 33 Countries,Distribution by Terms of Grants and Loans, and Grant Element(Thousands of US Dollars)
Amount ofConcessionary Terms
Region and OtherzCountry Grants Loans Total Grants IDA (Maturiti
Receivedl0) Contracted and Loans Grants Credits 40 yrs. aover)
AfricaEthiopia ............................ 15,740 22,729 38,469 41 - 2Ivory Coast ..... ................... 27,386 27,386 - - -Kenya ..... ......................... 36,780 55,278 92,058 40 3 1Mali .............. - 1,666 1,666 - -
Morocco ............................. 71,650 148,535 220,185 33 5Nigeria .............................. 30,310 112,554 142,864 21 25 10Sudan .............................. 9,760 54,913 64,673 15 - -Tanzania ............................ 22,780 6,080 28,860 79 - 6Tunisia ................ 55,500 90,461 145,961 39 - 11Uganda ................. ............ 12,340 13,450 25,790 48 -Zambia ....... ...................... 12,030 14,697 26,727 45 -
EuropeGreece ........ ................ 6,020 44,398 50,418 12 -Malta ................................ - 1,320 1,320 - -
Spain ................................ 5,510 87,007 92,517 6 -Turkey ............................... 21,610 273,765 295,375 7 3 36Yugoslavia ........................... 4,020 470,793 474,813 1 -
Far EastChina ...... ............... 24,500 91,435 115,935 21 -Indonesia ............................ 34,100 307,368 341,468 10 -
Korea ............. ................. 169,680 123,204 292,884 58 - 25Malaysia ...... ............. 1,840 73,750 75,590 2 -Philippines .......................... 69,040 146,620 215,660 32 -Thailand ............... ........ .... 30,060 38,350 68,410 44 -
Middle EastIran ................. ............ 6,740 490,965 497,705 1 -
South AsiaCeylon ............................... 8,890 5,010 13,900 64 -Indial4). .. ............... 554,650 781,518 1,336,168 42 7 21Pakistan ......... . ................. 211,000 281,934 492,934 43 5 13
Western HemisphereArgentina .................... ....... 7,360 426,579 433,939 2 -Chile ................................ 33,930 184,020 217,950 16 - 38Colombia. ........................... 20,760 171,602 192,362 11 - 34Mexico .............................. 7,360 573,083 580,443 1 -Peru ........ ..................... 23,930 134,818 158,748 15 - 5Uruguay ................. .... .... - 5,600 5,600 - -
Venezuela .................... .... 12,620 88,773 101,393 12 -
(1) Disbursements on grants and grant-like contributions.(2) Where n.a. is shown, information on disbursements was insufficient to permit the calculation of grant element.(3) Less than 0.5.(4) Does not include suppliers' credits.SOURCE: World Bank and the OECD
50
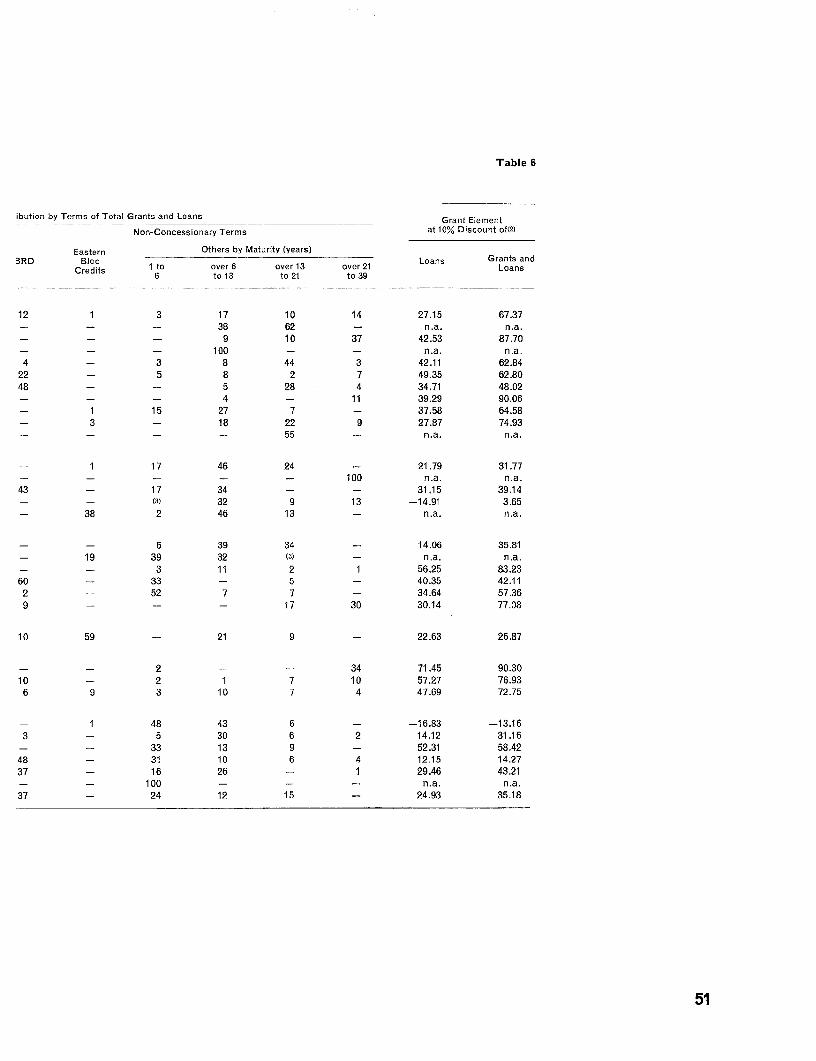
Table 6
ibution by Terms of Total Grants and Loans Grant Element
Non-Concessionary Terms at 10% Discount of(2)
Eastern Others by Maturity (years)3RD Bloc Loans Grants andCredits I to over 6 over 13 over 21 Loans
6 to 13 to 21 to 39
12 1 3 17 10 14 27.15 67.37- - - 38 62 - n.a. n.a.- - - 9 10 37 42.53 87.70- - - 100 - - n.a. n.a.4 - 3 8 44 3 42.11 62.84
22 - 5 8 2 7 49.35 62.8048 - - 5 28 4 34.71 48.02- - - 4 - 11 39.29 90.06
- 1 15 27 7 - 37.58 64.58- 3 - 18 22 9 27.87 74.93- - - - 55 - n.a. n.a.
- 1 17 46 24 - 21.79 31.77- - - - - 100 n.a. n.a.43 - 17 34 - - 31.15 39.14- - (3) 32 9 13 -14.91 3.65- 38 2 46 13 - n.a. n.a.
- - 6 39 34 - 14.06 35.81- 19 39 32 (31 - n.a. n.a.- - 3 11 2 1 56.25 83.2360 - 33 - 5 - 40.35 42.112 - 52 7 7 - 34.64 57.369 - - - 17 30 30.14 77.08
10 59 - 21 9 - 22.63 26.87
- - 2 - - 34 71.45 90.3010 - 2 1 7 10 57.27 76.936 9 3 10 7 4 47.69 72.75
- 1 48 43 6 - -16.83 -13.163 - 5 30 6 2 14.12 31.16
- - 33 13 9 - 52.31 58.4248 - 31 10 6 4 12.15 14.2737 - 16 26 - 1 29.46 43.21
- - 100 - - - n.a. n.a.
37 - 24 12 15 - 24.93 35.18
51
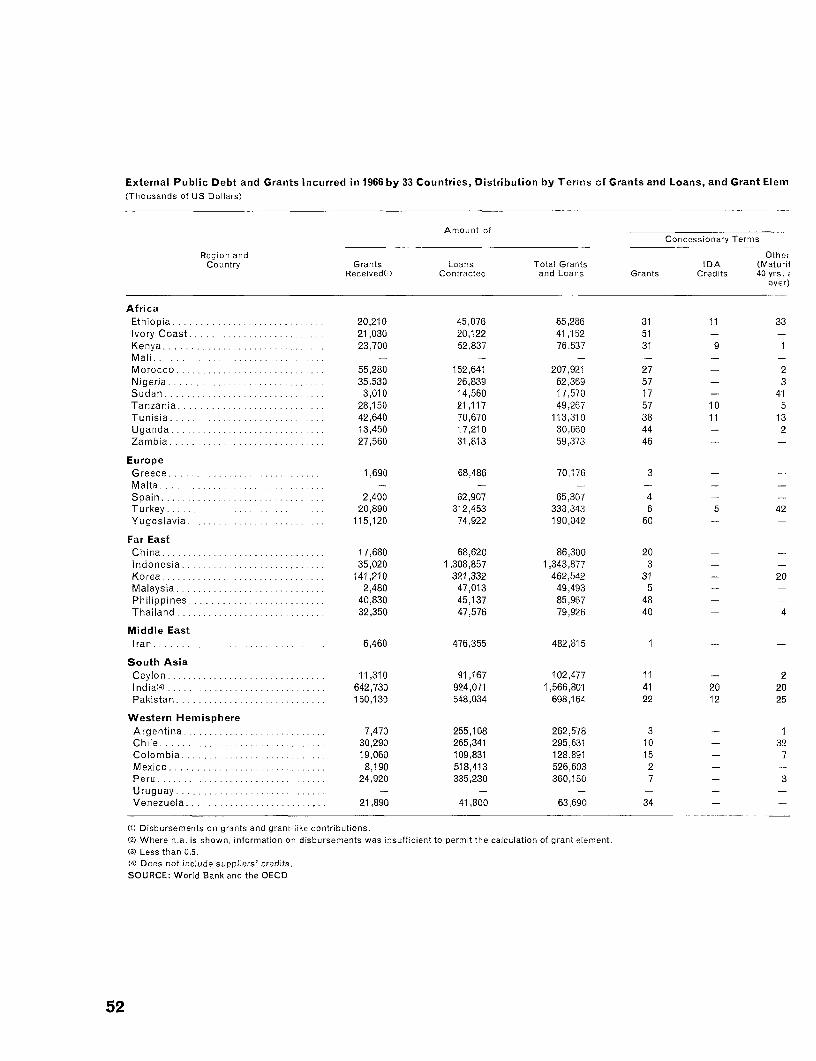
External Public Debt and Grants Incurred in 1966 by 33 Countries, Distribution by Terms of Grants and Loans, and Grant Elem(Thousands of US Dollars)
Amount of ......Concessioinary Terms
Region and OtherCountry Grants Loans Total Grants IDA (Maturil
Received(li) Contracted and Loans Grants Credits 40 yrs. sover)
AfricaEthiopia ............................. 20,210 45,076 65,286 31 11 33ivory Coast .......................... 21,030 20,122 41,152 51 - -Kenya ............................... 23,700 52,837 76,537 31 9 1Mali ... ................................Morocco ............................. 55,280 152,641 207,921 27 - 2Nigeria .............................. 35,530 26,839 62,369 57 - 3Sudan .............. ................ 3,010 14,560 17,570 17 - 41Tanzania .................. ......... 28,150 21,117 49,267 57 10 5Tunisia ......... 42,640 70,670 113,310 38 11 13Uganda .............................. 13,450 17,210 30,660 44 - 2Zambia .............................. 27,560 31,813 59,373 46 -
EuropeGreece .............................. 1,690 68,486 70,176 3Malta ...... ................. - -Spain ............................ ... 2,400 62,907 65,307 4 - -
Turkey .......... .................... 20,890 312,453 333,343 6 5 42Yugoslavia ...... ................. 115,120 74,922 190,042 60 - -
Far EastChina ................................ 17,680 68,620 86,300 20 -
Indonesia .................... ....... 35,020 1,308,857 1,343,877 3 - -
Korea ............................... 141,210 321,332 462,542 31 - 20Malaysia ............. 2,480 47,013 49,493 5 - -
Philippines .......................... 40,830 45,137 85,967 48 - -
Thailand ....................... ..... 32,350 47,576 79,926 40 - 4
Middle EastIran ....... ........................ 6,460 476,355 482,815 1 - -
South AsiaCeylon ............................... 11,310 91,167 102,477 11 - 2lndial4) ............................... 642,730 924,071 1,566,801 41 20 20Pakistan ............................. 150,130 548,034 698,164 22 12 25
Western HemisphereArgentina ............................ 7,470 255,108 262,578 3 - 1Chile ................................ 30,290 265,341 295,631 10 - 32Colombia ............................ 19,060 109,831 128,891 15 - 7Mexico ...................... ... 8,190 518,413 526,603 2 - -
Peru ................................. 24,920 335,230 360,150 7 - 3Uruguay . ........................... - - - - - -Venezuela ........................... 21,890 41,800 63,690 34 -
(O) Disbursements on grants and grant-like contributions.(2) Where n.a. is shown, information on disbursements was insufficient to permit the calculation of grant element.(3) Less than 0.5.(4) Does not include suppliers' credits.SOURCE: World Bank and the OECD
52
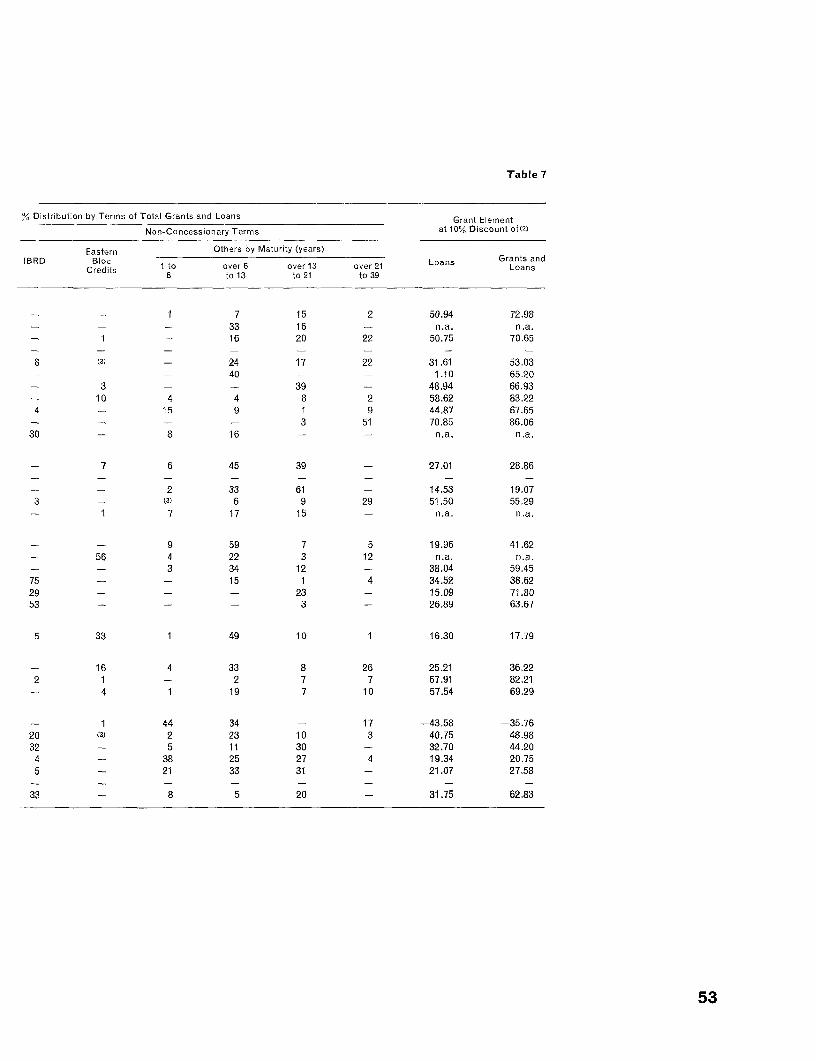
Table 7
% Distribution by Terms of Total Grants and Loans Grant Element
Non-Concessionary Terms at 10°% Discount of(2)
Eastern Others by Maturity (years)IBRD Bl oc LasGrants and
Credits I to over 6 over 13 over 21 Loans Loans6 to 13 to 21 to 39
1 7 15 2 50.94 72.98- - - 33 16 - n.a. n.a.- 1 - 16 20 22 50.75 70.65
8 (3) - 24 17 22 31.61 53.03- - - 40 - 1.10 65.20
3 - - 39 - 48.94 66.93- 10 4 4 8 2 58.62 83.224 - 15 9 1 9 44.87 67.65
- - - 3 51 70.85 86.0630 - 8 16 - - n.a. n.a.
- 7 6 45 39 - 27.01 28.86
- - 2 33 61 - 14.53 19.073 - (3) 6 9 29 51.50 55.29
1 7 17 15 - n.a. n.a.
- 9 59 7 5 19.96 41.6256 4 22 3 12 n.a. n.a.
- - 3 34 12 - 38.04 59.4575 - - 15 1 4 34.52 38.6229 - - - 23 - 15.09 71.8053 - - - 3 - 26.89 63.67
5 33 1 49 10 1 16.30 17.79
- 16 4 33 8 26 25.21 36.222 1 - 2 7 7 67.91 82.21
- 4 1 19 7 10 57.54 69.29
- 1 44 34 - 17 -43.58 -35.7620 (3) 2 23 10 3 40.75 48.9832 - 5 11 30 - 32.70 44.204 - 38 25 27 4 19.34 20.755 - 21 33 31 - 21.07 27.58
33 - 8 5 20 - 31.75 62.83
53
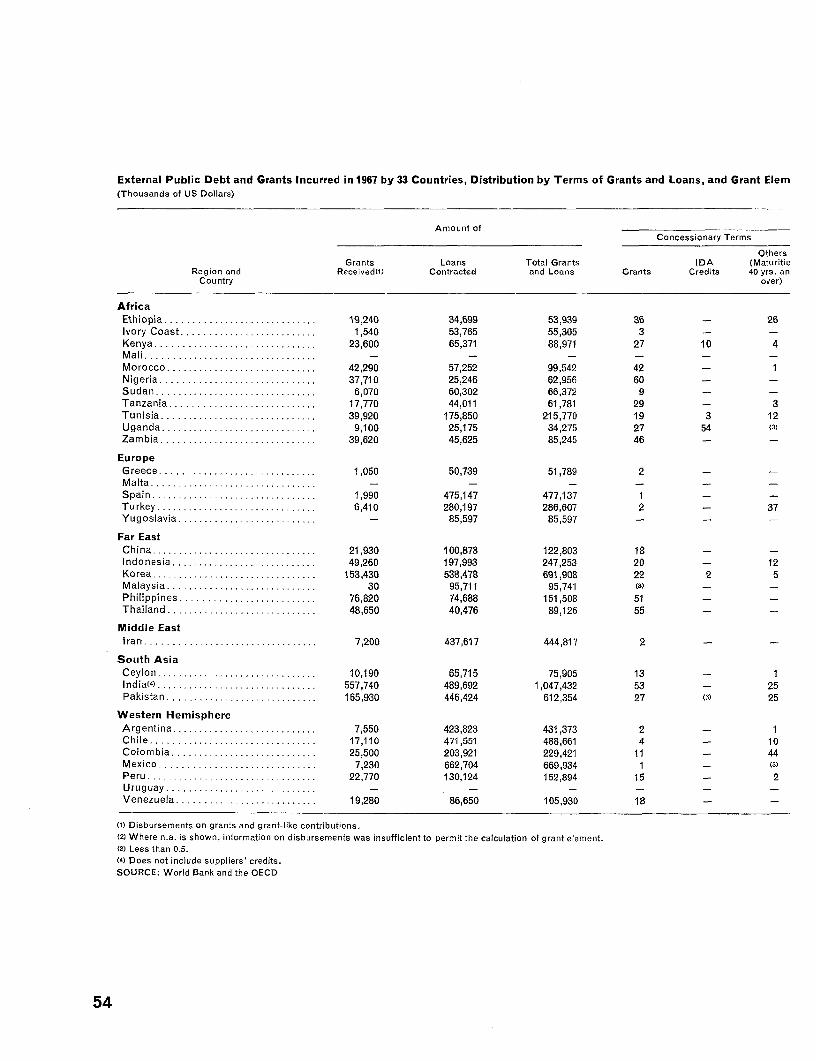
External Public Debt and Grants Incurred in 1967 by 33 Countries, Distribution by Terms of Grants and Loans, and Grant Elem(Thousands of US Dollars)
Amount ofConcessionary Terms
OthersGrants Loans Total Grants IDA (Maturitis
Region and Received(1) Contracted and Loans Grants Credits 40 yrs. anCountry over)
AfricaEthiopia ............................. 19,240 34,699 53,939 36 - 26Ivory Coast ........ ................. 1,540 53,765 55,305 3 -
Kenya ............................... 23,600 65,371 88,971 27 10 4Mali ............................... ...- - - -
Morocco .... ........................ 42,290 57,252 99,542 42 - INigeria .............................. 37,710 25,246 62,956 60 -Sudan ............................... 6,070 60,302 66,372 9 -Tanzania ............ ................ 17,770 44,011 61,781 29 - 3Tunisia . . ......................... 39,920 175,850 215,770 19 3 12Uganda .............. ............... 9,100 25,175 34,275 27 54 (3)Zambia ....................... ...... 39,620 45,625 85,245 46 - -
EuropeGreece . ............................ 1,050 50,739 51,789 2Malta ................................ - - - - -
Spain ................................ 1,990 475,147 477,137 1 -
Turkey ............................... 6,410 280,197 286,607 2 - 37Yugoslavia ........................ 85,597 85,597 - -
Far EastChina . ............................... 21,930 100,873 122,803 18 -
Indonesia ................. ......... 49,260 197,993 247,253 20 - 12Korea ............................... 153,430 538,478 691,908 22 2 5Malaysia ............................. 30 95,711 95,741 (3) -
Philippines .......................... 76,820 74,688 151,508 51 - -Thailand . ............................ 48,650 40,476 89,126 55 - -
Middle EastIran .............. . 7,200 437,617 444,817 2 -
South AsiaCeylon ............................... 10,190 65,715 75,905 13 - 1India(4) .......... .................... 557,740 489,692 1,047,432 53 - 25Pakistan .......... .................. 165,930 446,424 612,354 27 (3) 25
Western HemisphereArgentina .............. .............. 7,550 423,823 431,373 2 - 1Chile ................................ 17,110 471,551 488,661 4 - 10Colombia ............................ 25,500 203,921 229,421 11 - 44Mexico .............................. 7,230 662,704 669,934 1 - (3)Peru ....... ......................... 22,770 130,124 152,894 15 - 2Uruguay y.- - - -
Venezuela ...................... .... 19,280 86,650 105,930 18 -
(1) Disbursements on grants and grant-like contributions.(2) Where n.a. is shown, information on disbursements was insufficient to permit the calculation of grant element.(3) Less than 0.5.(4) Does not include suppliers' credits.SOURCE: World Bank and the OECD
54
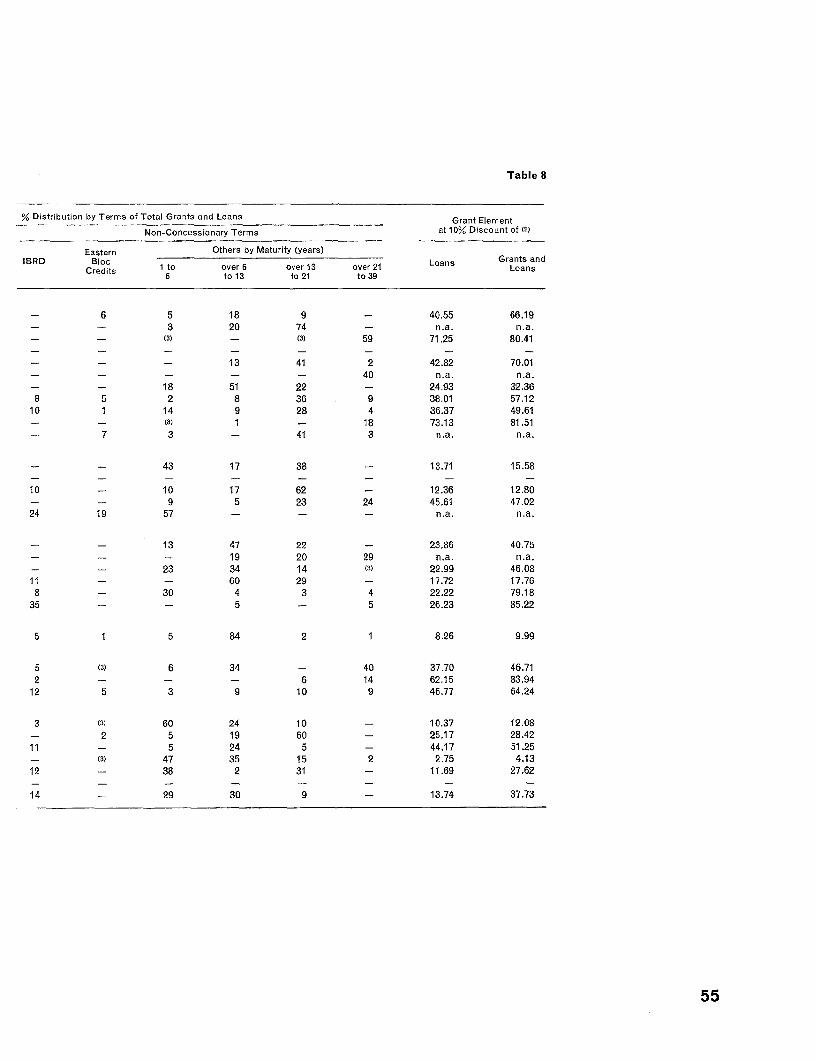
Table 8
% Distribution by Terms of Total Grants and Loans Grant Element
Non-Concessionary Terms at 10% Discount of (2)
Eastern Others by Maturity (years)IBRD Bl oc LasGrants endCredits I to over 6 over 13 over 21 Loans Goans
6 to 13 to 21 to 39
- 6 5 18 9 - 40.55 66.19- - 3 20 74 - n.a. n.a.- - (3) - (3) 59 71.25 80.41
- - - 13 41 2 42.82 70.01- - - - - 40 n.a. n.a.- - 18 51 22 - 24.93 32.368 5 2 8 36 9 38.01 57.12
10 1 14 9 28 4 36.37 49.61- - (3) 1 - 18 73.13 81.51- 7 3 - 41 3 n.a. n.a.
- - 43 17 38 - 13.71 15.58
10 - 10 17 62 - 12.36 12.80- - 9 5 23 24 45.61 47.0224 19 57 - - - n.a. n.a.
- - 1 3 47 22 - 23.86 40.75- 1 9 20 29 n.a. n.a.23 34 14 (3) 22.99 46.08
11 - - 60 29 - 17.72 17.768 - 30 4 3 4 22.22 79.18
35 - - 5 - 5 26.23 85.22
5 1 5 84 2 1 8.26 9.99
5 (3) 6 34 - 40 37.70 46.712 - - - 6 14 62.15 83.94
12 5 3 9 10 9 46.77 64.24
3 (3) 60 24 10 - 10.37 12.08- 2 5 19 60 - 25.17 28.4211 - 5 24 5 - 44.17 51.25- (3) 47 35 15 2 2.75 4.1312 - 38 2 31 - 11.69 27.62
14 - 29 30 9 - 13.74 37.73
55
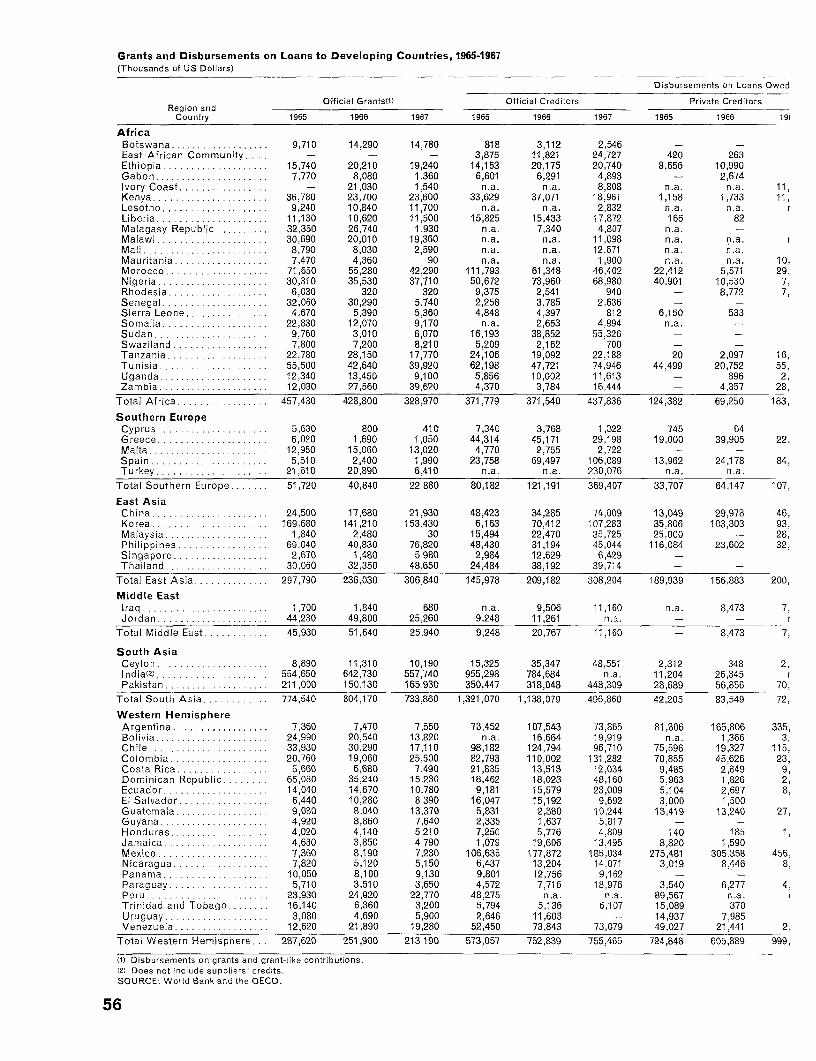
Grants and Disbursements on Loans to Developing Countries, 1965-1967(Thousands of US Dollars)
Disbursements on Loans Owed
Official GrantsU) Official Creditors Private CreditorsR egion and__ _ _ _ _ _ _ _ _ _ _ _ _ _ _ _ _ _ _ _ _ _ _ _ _ _ _ _ _ _ _ _ _ _ _ _ _ _ _ _ _ _ _ _ _ _ _ _ _ _
Country 1965 1966 1967 1965 1966 1967 1965 1966 19i
AfricaBotswana ... ............... 9,710 14,290 14,780 818 3,112 2,546 - -East African Communitv .... - - - 3,875 11,821 24,727 420 263Ethiopia .................... 15,740 20,210 19,240 14,153 20,175 20,740 8,656 10,990Gabon ...... ............... 7,770 8,080 1,360 6,601 6,291 4,893 - 2,674Ivory Coast ................. - 21,030 1,540 n.a. n.a. 8,808 n.a. n.a. 11,Kenya ...................... 36,780 23,700 23,600 33,629 37,071 18,961 1,158 1,733 11,Lesotho .................... 9,240 10,840 11,700 n.a. n.a. 2,832 n.a. na.aLiberia .... .... 11,130 10,620 11,500 15,825 15,433 17,872 166 82Malagasy Republic .......... 32,350 26,740 1,930 n.a. 7,340 4,807 n.a. -Malawi ..................... 30,690 20,010 19,360 n.a. n.a. 11,098 n.a. n.a.Mali ...................... 8,790 8,030 2,590 n.a. n.a. 12,671 n.a. n.a.Mauritania .................. 7,470 4,360 90 n.a. n.a. 1,900 n.a. n.a. 10,Morocco ................. 71,650 55,280 42,290 111,793 61,348 46,402 22,412 5,571 29,Nigeria ............. ....... 30,310 35,530 37,710 50,672 73,960 68,980 40,901 10,530 7,Rhodesia ................... 6,030 320 320 9,375 2,541 940 - 8,772 7,Senegal .................... 32,060 30,290 5,740 2,258 3,785 2,636 - -Sierra Leone ................ 4,670 5,390 5,360 4,848 4,397 812 6,150 533Somalia .................... 22,830 12,070 9,170 n.a. 2,653 4,994 n.a. -Sudan ...................... 9,760 3,010 6,070 16,193 38,852 55,326Swaziland ................. 7,800 7,200 8,210 5,209 2,162 700 - -Tanzania .................. 22,780 28,150 17,770 24,106 19,092 22,188 20 2,097 16,Tunisia .................. _ 55,500 42,640 39,920 62,198 47,721 74,946 44,499 20,752 55,Uganda ..................... 12,340 13,450 9,100 5,856 10,002 11,613 - 896 2,Zambia ..................... 12,030 27,560 39,620 4,370 3,784 16,444 - 4,357 28,
Total Africa ................. 457,430 428,800 328,970 371,779 371,540 437,836 124,382 69,250 183,
Southern EuropeCyprus ..................... 5,630 800 410 7,340 3,768 1,322 745 64Greece ..... .......... 6,020 1,690 1,050 44,314 45,171 29,198 19,000 39,905 22,Malta . .......... 12,950 15,060 13,020 4,770 2,755 2,722 - -Spain . ............. 5,510 2,400 1,990 23,758 69,497 106,089 13,962 24,178 84,Turkey .......... .......... 21,610 20,890 6,410 n.a. n.a. 230,076 n.a. n.a.
Total Southern Europe ....... 51,720 40,840 22,880 80,182 121,191 369,407 33,707 64,147 107,
East AsiaChina ...................... 24,500 17,680 21,930 48,423 34,285 74,009 13,049 29,978 46,Korea ...................... 169,680 141,210 153,430 6,163 70,412 107,283 35,806 103,303 93,Malaysia .. .................. 1,840 2,480 30 15,494 22,470 35,725 25,000 - 28,Philippines ................. 69,040 40,830 76,820 48,430 31,194 45,044 116,084 23,602 32,Singapore .................. 2,670 1,480 5,980 2,984 12,629 6,429 - -Thailand .................... 30,060 32,350 48,650 24,484 38,192 39,714 - -
Total East Asia ..... ........ 297,790 236,030 306,840 145,978 209,182 308,204 189,939 156,883 200,
Middle EastIraq ....................... 1,700 1,840 680 n.a. 9,506 11,160 n.a. 8,473 7,Jordan .. . .. 4. 44,230 49,800 25,260 9,248 11,261 n.a. - -
Total Middle East ............ 45,930 51,640 25,940 9,248 20,767 11,160 - 8,473 7,
South AsiaCeylon ................... 8,890 11,310 10,190 15,325 35,347 48,551 2,312 348 2,India(2) .......... .......... 554,650 642,730 557,740 955,298 784,684 n.a. 11,204 26,345 rPakistan .................... 211,000 150,130 165,930 350,447 318,048 448,309 28,689 56,856 70,
Total South Asia . ........ 774,540 804,170 733,860 1,321,070 1,138,079 496,860 42,205 83,549 72,
Western HemisphereArgentina .................. 7,360 7,470 7,550 73,452 107,543 73,865 81,806 165,806 335.Bolivia ...... . ...... 24,990 20,540 13,820 n.a. 16,664 19,919 n.a. 1,366 3,Chile ....................... 33,930 30,290 17,110 98,182 124,794 96,710 75,596 19,327 115,Colombia ............ ...... 20,760 19,060 25,500 82,793 110,002 131,282 70,855 45,626 23,Costa Rica ................. 5,660 6,680 7,490 21,835 13,513 12,034 9,485 2,849 9,Dominican Republic ........ 65,080 35,240 15,230 18,462 18,023 48,160 5,963 1,826 2,Ecuador .................... 14,040 14,670 10,780 9,181 15,579 23,009 5,104 2,697 8,El Salvador ................. 6,440 10,280 8,390 16,047 15,192 9,692 3,000 1,500Guatemala .................. 9,080 8,040 13,370 5,831 2,380 10,244 13,419 13,240 27.Guyana .................. 4,920 8,860 7,640 2,335 1,637 5,817 - -Honduras .... 4,020 4,140 5,210 7,250 5,776 4,809 140 185 1.Jamaica .................... 4,630 3,850 4,790 1,079 19,606 13,495 8,820 1,590Mexico ............ ........ 7,360 8,190 7,230 106,635 177,872 185,034 275,481 305,358 456Nicaragua .................. 7,820 5,120 5,150 6,437 13,204 14,071 3,019 8,446 8Panama .................... 10,050 8,100 9,130 9,801 12,756 9,162 - -Paraguay ................... 5,710 3,510 3,650 4,572 7,716 18,976 3,540 6,277 4Peru ...................... 23,930 24,920 22,770 48,275 n.a. n.a. 89,567 n.a.Trinidad and Tobago ........ 16,140 6,360 3,200 5,794 5,136 6,107 15,089 370Uruguay .................... 3,080 4,690 5,900 2,646 11,603 - 14,937 7,985Venezuela .................. 12,620 21,890 19,280 52,450 73,843 73,079 49,027 21,441 2
Total Western Hemisphere ... 287,620 251,900 213,190 573,057 752,839 755,465 724,848 605,889 999,
Ill Disbursements on grants and grant-like contributions.(2) Does not include suppliers credits.SOURCE: World Bank and the OECD.
56
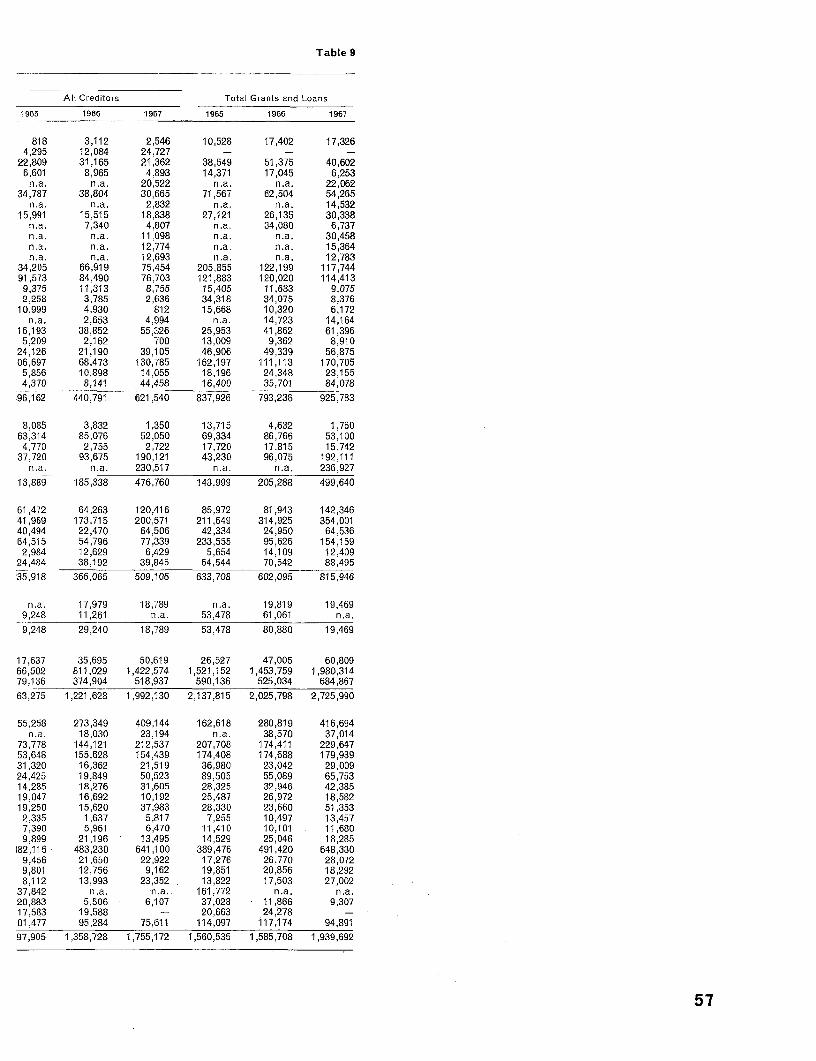
Table 9
All Creditors Total Grants and Loans
1965 1966 1967 1965 1966 1967
818 3,112 2,546 10,528 17,402 17,3264,295 12,084 24,727 - - -
22,809 31,165 21,362 38,549 51,375 40,6026,601 8,965 4.893 14,371 17,045 6,253n.a. n.a. 20,522 n.a. n.a. 22,062
34,787 38,804 30,665 71,567 62,504 54,265n.a. n.a. 2,832 n.a. n.a. 14,532
15,991 15,515 18,838 27,121 26,135 30,338n.a. 7,340 4,807 n.a. 34,080 6,737n.a. n.a. 11,098 n.a. n.a. 30,458n.a. n.a. 12,774 n.a. n.a. 15,364n.a. n.a. 12.693 n.a. n.a. 12,783
34,205 66,919 75,454 205,855 122,199 117,74491,573 84,490 76,703 121,883 120,020 114,4139,375 11,313 8,755 15,405 11,633 9,0752,258 3,785 2,636 34,318 34,075 8,376
10,999 4,930 812 15,668 10,320 6,172n.a. 2,653 4,994 n.a. 14,723 14,164
16,193 38,852 55,326 25,953 41,862 61,3965,209 2,162 700 13,009 9,362 8,910
24,126 21,190 39,105 46,906 49,339 56,87506,697 68,473 130,785 162,197 111,113 170,7055,856 10,898 14,055 18,196 24,348 23,1554,370 8,141 44,458 16,400 35,701 84,078
96,162 440,791 621,540 837,926 793,236 925,783
8,085 3,832 1,350 13,715 4,632 1,76063,314 85,076 52,050 69,334 86,766 53,1004,770 2,755 2,722 17,720 17,815 15,742
37,720 93,675 190,121 43,230 96,075 192,111n.a. n.a. 230,517 n.a. n.a. 236,927
13,889 185,338 476,760 143,999 205,288 499,640
61,472 64,263 120,416 85,972 81,943 142,34641,969 173,715 200,571 211,649 314,925 354,00140,494 22,470 64,506 42,334 24,950 64,53664,515 54,796 77,339 233,555 95,626 154,1592,984 12,629 6,429 5,654 14,109 12,409
24,484 38,192 39,845 54,544 70,542 88,495'35,918 366,065 509,106 633,708 602,095 815,946
n.a. 17,979 18,789 n.a. 19,819 19,4699,248 11,261 n.a. 53,478 61,061 n.a.9,248 29,240 18,789 53,478 80,880 19,469
17,637 35,695 50,619 26,527 47,005 60,80966,502 811,029 1,422,574 1,521,152 1,453,759 1,980,31479,136 374,904 518,937 590,136 525,034 684,86763,275 1,221,628 1,992,130 2,137,815 2,025,798 2,725,990
55,258 273,349 409,144 162,618 280,819 416,694n.a. 18,030 23,194 n.a. 38,570 37,014
73,778 144,121 212,537 207,708 174,411 229,64753,648 155,628 154,439 174,408 174,688 179,93931,320 16,362 21,519 36,980 23,042 29,00924,425 19,849 50,523 89,505 55,089 65,75314,285 18,276 31,605 28,325 32,946 42,38519,047 16,692 10,192 25,487 26,972 18,58219,250 15,620 37,983 28,330 23,660 51,3532,335 1,637 5,817 7,255 10,497 13,4577,390 5,961 6,470 11,410 10,101 11,6809,899 21,196 13,495 14,529 25,046 18,285
182,116 483,230 641,100 389,476 491,420 648,3309,456 21,650 22,922 17,276 26,770 28,0729,801 12,756 9,162 19,851 20,856 18,2928,112 13,993 23,352 13,822 17,503 27,002
37,842 n.a. *n.a. 161,772 n.a. n.a.20,883 5,506 6,107 31,023 11,866 9,30717,583 19,588 - 20,663 24,278 -01,477 95,284 75,611 114,097 117,174 94,89197,905 1,358,728 1,755,172 1,560,535 1,585,708 1,939,692
57
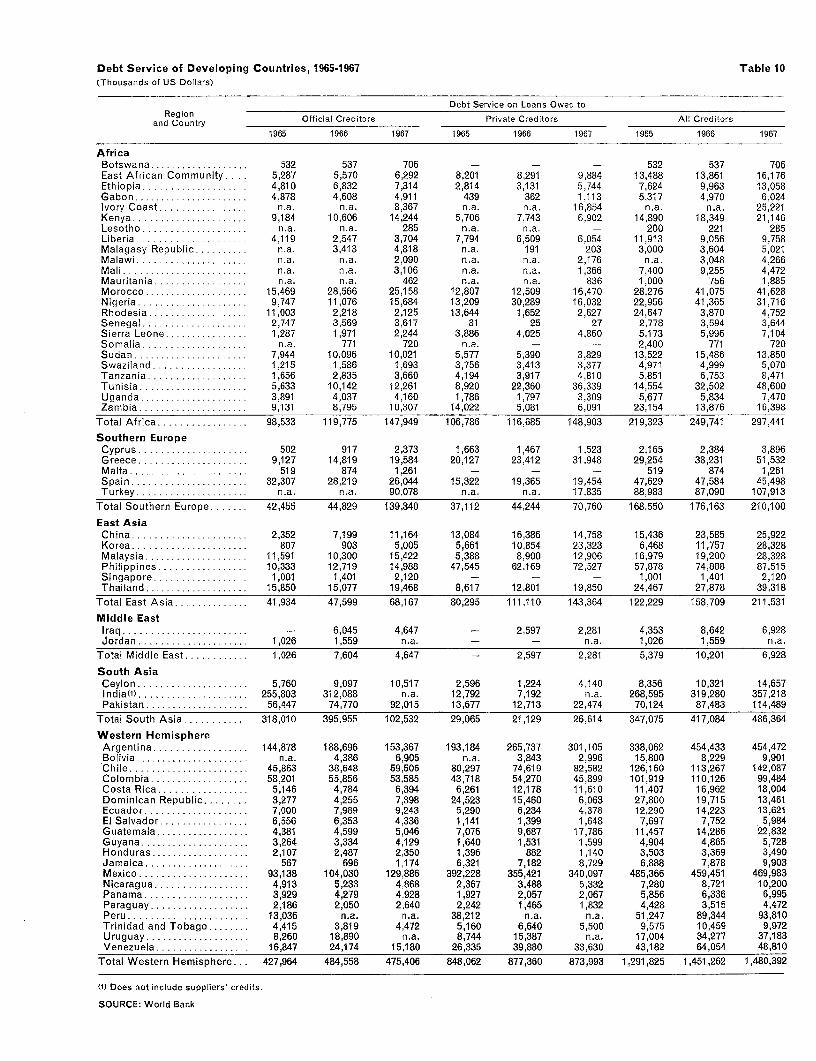
Debt Service of Developing Countries, 1965-1967 Table 10(Thousands of US Dollars)
Debt Service on Loans Owed toRegion
and Country Official Creditors Private Creditors All Creditors1965 1966 1967 1965 1966 1967 1965 1966 1967
AfricaBotswana ........ 532 ....... 5 537 706 - - - 532 537 706East African Community. ... 5,287 5,570 6,292 8,201 8,291 9,884 13,488 13,861 16,176Ethiopia .................... 4,810 6,832 7,314 2,814 3,131 5,744 7,624 9,963 13,058Gabon ............ ........ 4,878 4,608 4,911 439 362 1,113 5,317 4,970 6,024Ivory Coast ............. ... n.a. n.a. 8,367 n.a. n.a. 16,854 n.a. n.a. 25,221Kenya .. , 9,184 10,606 14,244 5,706 7,743 6,902 14,890 18,349 21,146Lesotho .................... n.a. n.na. 285 n.a. n.a. - 200 221 285Liberia .................... 4,119 2,547 3,704 7,794 6,509 6,054 11,913 9,056 9,758Malagasy Republic .......... n.a. 3,413 4,818 n.a. 191 203 3,000 3,604 5,021Malawi .............. ..... n.a. n.ea. 2,090 n.a. n.a. 2,176 n.a. 3,048 4,266Mali ...................... n.a. n.a. 3,106 n.a. n.a. 1,366 7,400 9,255 4,472Mauritania ...... n.a. n.a. 462 n.a. n.a. 836 1,000 756 1,885Morocco .................... 15,469 28,566 25,158 12,807 12,509 16,470 28,276 41,075 41,628Nigeria ..................... 9,747 11,076 15,684 13,209 30,289 16,032 22,956 41,365 31,716Rhodesia ................... 11,003 2,218 2,125 13,644 1,652 2,627 24,647 3,870 4,752Senegal .................... 2,747 3,569 3,617 31 25 27 2,778 3,594 3,644Sierra Leone ................ 1,287 1,971 2,244 3,886 4,025 4,860 5,173 5,996 7,104Somalia .................... n.a. 771 720 n.a. - - 2,400 771 720Sudan ..................... 7,944 10,096 10,021 5,577 5,390 3,829 13,522 15,486 13,850Swaziland .................. 1,215 1,586 1,693 3,756 3,413 3,377 4,971 4,999 5,070Tanzania ................... 1,656 2,835 3,660 4,194 3,917 4,810 5,851 6,753 8,471Tunisia ... 5,633 10,142 12,261 8,920 22,360 36,339 14,554 32,502 48,600Uganda....... ........ 3,891 4,037 4,160 1,786 1,797 3,309 5,677 5,834 7,470Zambia .... . .. 9,131 8,795 10,307 14,022 5,081 6,091 23,154 13,876 16,398
Total Africa .......... ...... 98,533 119,775 147,949 106,786 116,685 148,903 219,323 249,741 297,441
Southern EuropeCyprus ..................... 502 917 2,373 1,663 1,467 1,523 2,165 2,384 3,896Greece ..................... 9,127 14,819 19,584 20,127 23,412 31,948 29,254 38,231 51,532Malta ......... ......... 519 874 1,261 - - - 519 874 1,261Spain .. ,. 32,307 28,219 26,044 15,322 19,365 19,454 47,629 47,584 45,498Turkey ........... ......... n.a. n.a. 90,078 n.a. n.a. 17,835 88,983 87,090 107,913
Total Southern Europe ....... 42,455 44,829 139,340 37,112 44,244 70,760 168,550 176,163 210,100
East AsiaChina .................... 2,352 7,199 11,164 13,084 16,386 14,758 15,436 23,585 25,922Korea .......... ........... 807 903 5,005 5,661 10,854 23,323 6,468 11,757 28,328Malaysia .......... ... 11,591 10,300 15,422 5,388 8,900 12,906 16,979 19,200 28,328Philippines ................. 10,333 12,719 14,988 47,545 62,169 72,527 57,878 74,888 87,515Singapore ...... ,. 1,001 1,401 2,120 - - - 1,001 1,401 2,120Thailand .................... 15,850 15,077 19,468 8,617 12,801 19,850 24,467 27,878 39,318
Total East Asia .............. 41,934 47,599 68,167 80,295 111,110 143,364 122,229 158,709 211,531
Middle EastIraq ....................... - 6,045 4,647 - 2,597 2,281 4,353 8,642 6,928Jordan ..................... 1,026 1,559 n.a. - - n.a. 1,026 1,559 n.a.
Total Middle East .......... 1,026 7,604 4,647 - 2,597 2,281 5,379 10,201 6,928
South AsiaCeylon ................... 5,760 9,097 10,517 2,596 1,224 4,140 8,356 10,321 14,657India(l) .......... .......... 255,803 312,088 n.a. 12,792 7,192 n.a. 268,595 319,280 357,218Pakistan .................... 56,447 74,770 92,015 13,677 12,713 22,474 70,124 87,483 114,489
Total South Asia ............ 318,010 395.955 102,532 29,065 21,129 26,614 347,075 417,084 486,364
Western HemisphereArgentina .................. 144,878 188,696 153,367 193,184 265,737 301,105 338,062 454,433 454,472Bolivia ........ ............. n.a. 4,386 6,905 n.a. 3,843 2,996 15,800 8,229 9,901Chile .................. 45,863 38,648 59,505 80,297 74,619 82,582 126,160 113,267 142,087Colombia .................. 58,201 55,856 53,585 43,718 54,270 45,899 101,919 110,126 99,484Costa Rica .... . ........ 5,146 4,784 6,394 6,261 12,178 11,610 11,407 16,962 18,004Dominican Republic ........ 3,277 4,255 7,398 24,523 15,460 6,063 27,800 19,715 13,461Ecuador ......... ......... 7,000 7,989 9,243 5,290 6,234 4,378 12,290 14,223 13,621El Salvador ............... 6,556 6,353 4,336 1,141 1,399 1,648 7,697 7,752 5,984Guatemala ............. .... 4,381 4,599 5,046 7,076 9,687 17,786 11,457 14,286 22,832Guyana ..................... 3,264 3,334 4,129 1,640 1,531 1,599 4,904 4,865 5,728Honduras .................. 2,107 2,487 2,350 1,396 882 1,140 3,503 3,369 3,490Jamaica .................... 567 696 1,174 6,321 7,182 8,729 6,888 7,878 9,903Mexico ............. ....... 93,138 104,030 129,886 392,228 355,421 340,097 485,366 459,451 469,983Nicaragua . ................. 4,913 5,233 4,868 2,367 3,488 5,332 7,280 8,721 10,200Panama .................... 3,929 4,279 4,928 1,927 2,057 2,067 5,856 6,336 6,995Paraguay ................... 2,186 2,050 2,640 2,242 1,465 1,832 4,428 3,515 4,472Peru ....................... 13,036 n.a. n.a. 38,212 n.a. n.a. 51,247 89,344 93,810Trinidad and Tobago ....... 4,415 3,819 4,472 5,160 6,640 5,500 9,575 10,459 9,972Uruguay... ................. 8,260 18,890 n.a. 8,744 15,387 n.a. 17,004 34,277 37,183Venezuela ....... .. 16,847 24,174 15,180 26,335 39,880 33,630 43,182 64,054 48,810
Total Western Hemisphere. . . 427,964 484,558 475,406 848,062 877,360 873,993 1,291,825 1,451,262 1,480,392
(1) Does not include suppliers' credits.
SOURCE: World Bank
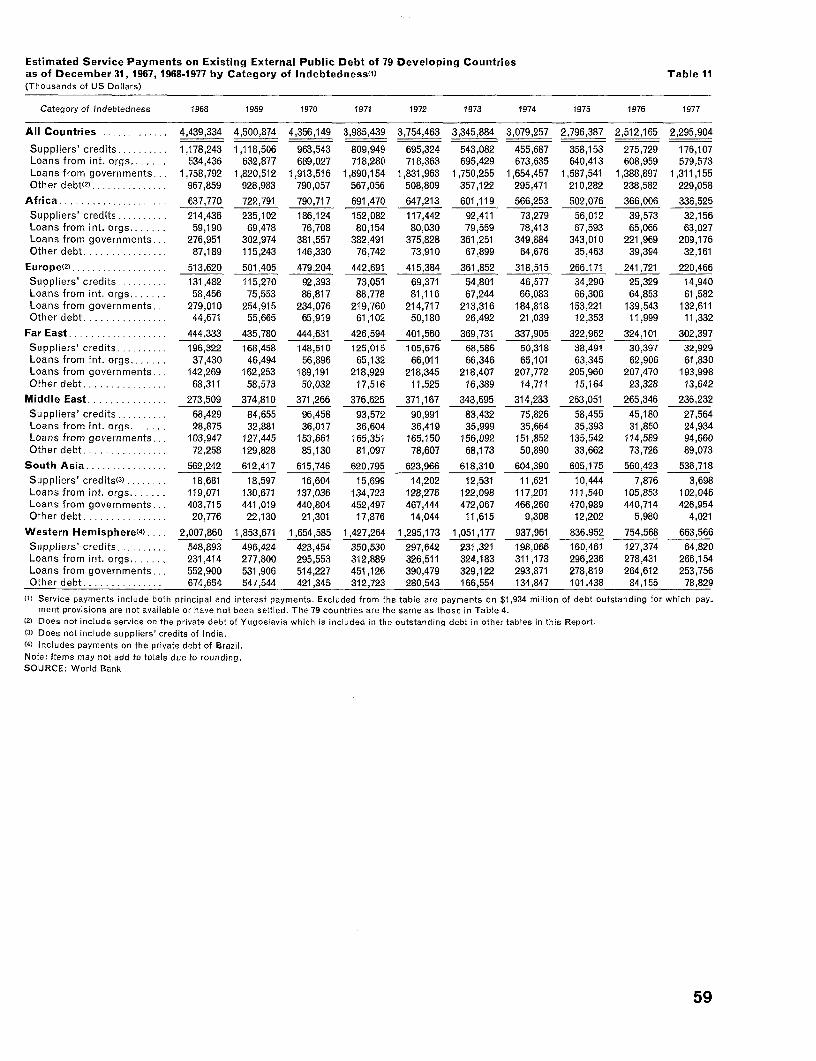
Estimated Service Payments on Existing External Public Debt of 79 Developing Countriesas of December 31, 1967, 1968-1977 by Category of Indebtedness(') Table 11(Thousands of US Dollars)
Category of Indebtedness 1968 1969 1970 1971 1972 1973 1974 1975 1976 1977
All Countries ... ......... 4,439,334 4,500,874 4,356,149 3,985,439 3,754,463 3,345,884 3,079,257 2,796,387 2,512,165 2,295,904
Suppliers' credits ........ 1,178,243 1,118,506 963,543 809,949 695,324 543,082 455,687 358,153 275,729 176,107Loans from int. orgs .. ..-. . 534,436 632,877 689,027 718,280 718,363 695,429 673,635 640,413 608,959 579,573Loans from governments .. 1,758,792 1,820,512 1,913,516 1,890,154 1,831,963 1,750,255 1,654,457 1,587,541 1,388,897 1,311,155Other debt(2) . ......... 967,859 928,983 790,057 567,056 508,809 357,122 295,471 210,282 238,582 229,058
Africa . .................... 637,770 722,791 790,717 691,470 647,213 601,119 566,253 502,076 366,006 336,525Suppliers' credits . ...... 214,436 235,102 186,124 152,082 117,442 92,411 73,279 56,012 39,573 32,156Loans from int. orgs ....... 59,190 69,478 76,708 80,154 80,030 79,559 78,413 67,593 65,066 63,027Loans from governments .. 276,951 302,974 381,557 382,491 375,828 361,251 349,884 343,010 221,969 209,176Other debt . ......... 87,189 115,243 146,330 76,742 73,910 67,899 64,676 35,463 39,394 32,161
Europe(52 ................... 513,620 501,405 479,204 442,691 415,384 361,852 318,515 266,171 241,721 220,466Suppliers' credits . ...... 131,482 115,270 92,393 73,051 69,371 54,801 46,577 34,290 25,329 14,940Loans from int. orgs... ..... 58,456 75,553 86,817 88,778 81,116 67,244 66,083 66,306 64,853 61,582Loans from governments.. . 279,010 254,915 234,076 219,760 214,717 213,316 184,818 153,221 139,543 132,611Other debt . ......... 44,671 55,665 65,919 61,102 50,180 26,492 21,039 12,353 11,999 11,332
Far East . .... ...... 444,333 435,780 444,631 426,594 401,560 369,731 337,905 322,962 324,101 302,397Suppliers' credits . . 1..... 96,322 168,458 148,510 125,015 105,676 68,586 50,318 38,491 30,397 32,929Loans from int. orgs ....... 37,430 46,494 56,896 65,132 66,011 66,346 65,101 63,345 62,906 61,830Loans from governments.. . 142,269 162,253 189,191 218,929 218,345 218,407 207,772 205,960 207,470 193,998Other debt . .. ...... 68,311 58,573 50,032 17,516 11,525 16,389 14,711 15,164 23,328 13,642
Middle East . ......... 273,509 374,810 371,266 376,625 371,167 343,695 314,233 263,051 265,346 236,232Suppliers' credits . . 6..... 8,429 84,655 96,458 93,572 90,991 83,432 75,826 58,455 45,180 27,564Loans from int. orgs..... . 28,875 32,881 36,017 36,604 36,419 35,999 35,664 35,393 31,850 24,934Loans from governments, 103,947 127,445 153,661 165,351 165,150 156,092 151,852 135,542 114,589 94,660Other debt . ..... 72,258 129,828 85,130 81,097 78,607 68,173 50,890 33,662 73,726 89,073
South Asia . . ....... 562,242 612,417 615,746 620,795 623,966 618,310 604,390 605,175 560,423 536,718Suppliers' credits(3) .. 18,681 18,597 16,604 15,699 14,202 12,531 11,621 10,444 7,876 3,698Loans from int. orgs ....... 119,071 130,671 137,036 134,723 128,276 122,098 117,201 111,540 105,853 102,046Loans from governments.. . 403,715 441,019 440,804 452,497 467,444 472,067 466,260 470,989 440,714 426,954Other debt ................ 20,776 22,130 21,301 17,876 14,044 11,615 9,308 12,202 5,980 4,021
Western Hemisphere(4) ... 2,007,860 1,853,671 1,654,585 1,427,264 1,295,173 1,051,177 937,961 836,952 754,568 663,566Suppliers' credits . ...... 548,893 496,424 423,454 350,530 297,642 231,321 198,066 160,461 127,374 64,820Loans from int. orgs ....... 231,414 277,800 295,553 312,889 326,511 324,183 311,173 296,236 278,431 266,154Loans from governments. .. 552,900 531,906 514,227 451,126 390,479 329,122 293,871 278,819 264,612 253,756Other debt . .......... 674,654 547,544 421,345 312,723 280,543 166,554 134,847 101,438 84,155 78,829
(1t Service payments include both principal and interest payments. Excluded from the table are payments on $1,934 million of debt outstanding for which pay-ment provisions are not available or have not been settled. The 79 countries are the same as those in Table 4.
(2) Does not include service on the private debt of Yugoslavia which is included in the outstanding debt in other tables in this Report.(3) Does not include suppliers' credits of India.(4) Includes payments on the private debt of Brazil.Note: Items may not add to totals due to rounding.SOURCE: World Bank
59
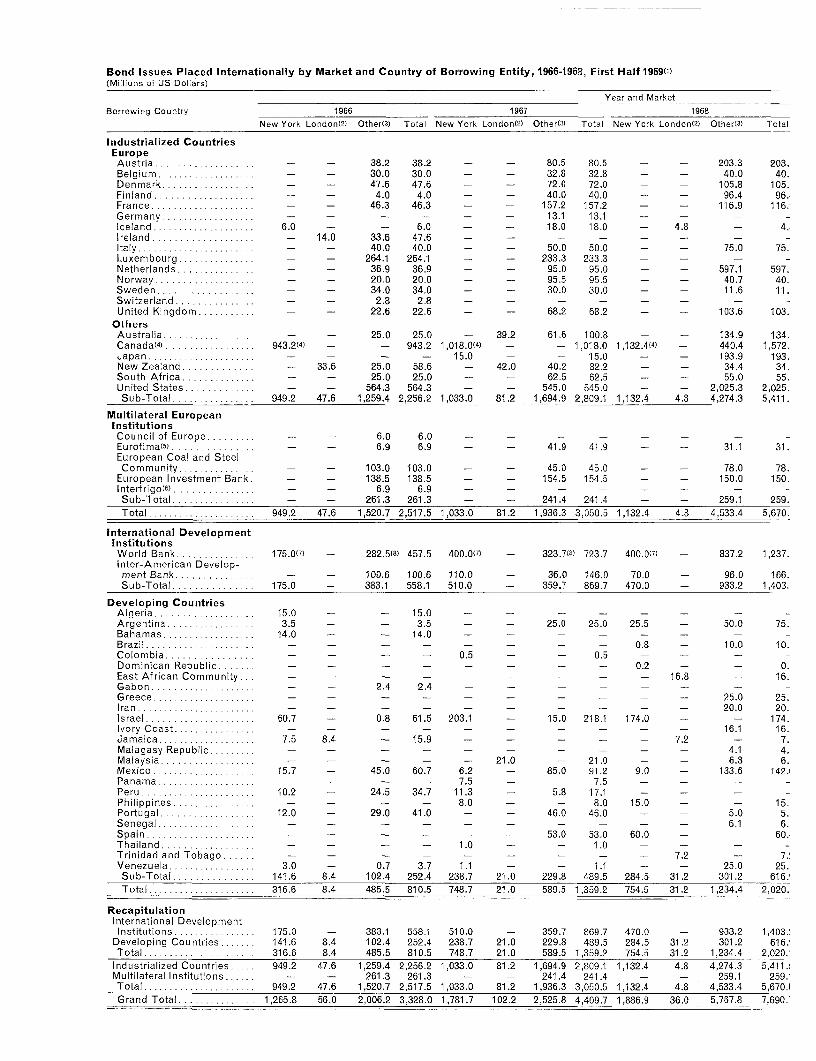
Bond Issues Placed Internationally by Market and Country of Borrowing Entity, 1966-1968, First Half 196911)(Mi[lons of US Dollars)
Year and MarketBorrowing Country 1966 1967 1968
New York London(2) OtherM7 Total New York Londont2) Other(3) Total New York Londont)) Other3)3 Total
Industrialized CountriesEuropeAustria ..... ...... 38.2 38.2 - - 80.5 80.5 - - 203.3 203.Belgium ..... ...... - - 30.0 30.0 - - 32.8 32.8 - - 40.0 40.Denmark. ~.. ....... - - 47.6 47.6 - - 72.0 72.0 - - 105.8 105.Finland. .~.. ....... - - 4.0 4.0 - - 40.0 40.0 - - 96.4 9&"Franca ..... ....... - - 46.3 46.3 - - 157.2 157.2 - - 116.9 116.,Germany..... ...... - - - - - - 13.1 13.1 - - - -
Iceland. .......... 6.0 - - 6.0 - - 18.0 18.0 - 4.8 -4..
Ireland ..... ...... - 14.0 33.6 47.6 - - - - - - --
Italy .. ... ....... - - 40.0 40.0 - - 50.0 50.0 - - 75.0 75.Luxembourg. ...... - - 264.1 264.1 - - 233.3 233.3 - - - -Netherlands .......... - - 36.9 36.9 - - 95.0 95.0 - - 597.1 597.Norway .... ..... - - 20.0 20.0 - - 95.5 95.5 - - 40.7 40.Sweden .......... - - 34.0 34.0 - - 30.0 30.0 - - 11.6 II.Switzerland ......... - - 2.8 2.8 - - - - - - - -
Unitedi Kingdom ...... - - 22.6 22.6 - - 68.2 68.2 - -- 103.6 103.OthersAustralia .......... - - 25.0 25.0 - 39.2 61.6 1 00.8 - - 134.9 134.Canada4) .... .... 943.24)4 - - 943.2 1,018.0141 - - 1,018.0 1,132.4)4) - 440.4 1,572.Japan. . ... ..... - - - - 15.0 - - 15.0 - - 193.9 193.New Zealand. ........ - 33.6 25.0 58.6 - 42.0 40.2 82.2 - - 34.4 34.South Africa. ......... - - 25.0 25.0 - - 62.5 62.5 - - 55.0 55.United States....... . - - 564.3 564.3 - - 545.0 545.0 - - 2,025.3 2,025.Sub-Total ......... 949.2 47.6 1,259.4 2,256.2 1,033.0 81.2 1,694.9 2,809.1 1,132.4 4.8 4,274.3 5,411.
Multilateral EuropeanInstitutions
Council ofEurope..... - - 6.0 6.0 - - - - - - - -
Eurofima(5)..-....... - - 6.9 6.9 - - 41.9 41.9 - - 31.1 31.European Coal and SteelCommunity.. ...... - - 103.0 103.0 - - 45.0 45.0 - - 78.0 78.
European Investment Bank. - - 138.5 138.5 - - 154.5 154.5 - - 150.0 150.Interfrigo6))......... - - 6.9 6.9 - - - - - - - -
Sub-Total ......... - - 261.3 261.3 - - 241.4 241 .4 - - 259.1 259.Total............ 949.2 47.6 1,520.7 2,517.5 1,033.0 81.2 1,936.3 3,050.5 1,132.4 4.8 4,533.4 5,670.
International DevelopmnentInstitutionsWorld Bank......... 175.017) - 282.5)8) 457.5 400.0l7) - 323.7s)8 723.7 400.0)7) - 837.2 1,237.inter-American Develop-ment Bank......... - - 100.6 100.6 110.0 - 36.0 146.0 70.0 - 96.0 166.Sub-Total......... 175.0 - 383.1 558.1 510.0 - 359.7 869.7 470.0 - 933.2 1,403.
Developing CountriesAlgeria..... ....... 15.0 - - 15.0 - - - - - -. - -
Argentina..... ...... 3.5 - - 3.5 - - 25.0 25.0 25.5 - 50.0 75.Bahamas. ......... 14.0 - - 14.0 - - - - - - -
Brazil ....... .... - - - - - - - - 0.8 - 10.0 10.Colombia ......... - - - - 0.5 - - 0.5 - - - -
Dominican Republic..... - - .- - - - - - 0.2 - - 0.East African Community.. - - - - - - - - - 16.8 - 16.Gabon ........... - 2.4 2.4 Greece ............- - - - - - - - - 25.0 25.Iran .............- - - - - - - - - 20.0 20.Israel ........... 60.7 - 0.8 61.5 203.1 - 15.0 218.1 174.0 - - 174.Ivory Coast. ......... - - - - - - - - - 16.1 16.Jamaica........... 7.5 8.4 - 15.9 - - - - - 7.2 - 7.Malagasy Republic......... - - - - - - 4.1 4.Malaysia .......... - - - - -- 21.0 - 21.0 - 6.3 6.Mexico.......... 15.7 - 45.0 60.7 6.2 - 85.0 91.2 9.0 - 133.6 142.'Panama.. ........ - - - - 7.5 - - 7.5 - -- -.
Peru ............ 10.2 - 24.5 34.7 11.3 - 5.8 17.1 - ---Philippines........ - - - - 8.0 - - 8.0 15.0 -- 15.Portugal .......... 12.0 - 29.0 41.0 - - 46.0 46.0 -. - 5.0 5.Senegal........... - - - - - - - - - 6.1 6.Spain............ - - - - - - 53.0 53.0 60.0 -- 60.1Thailand .......... - - - - 1.0 - - 1.0 - -
Trinidad and Tobago .... - - - - - - - - - 7.2 -7:
Venezuela .... ..... 3.0 - 0.7 3.7 1.1 - - 1.1 - - 25.0 25.1Sub-Total ........ 141.6 8.4 102.4 252.4 238.7 21.0 229.8 489.5 284.5 31.2 301.2 616.,Total....... ....... 316.6 8.4 485.5 810.5 748.7 21.0 589.5 1,35-9.2 754.5 31.2 1,234.4 2_,020.
RecapitulationInternational DevelopmentInstitutions ......... 175.0 - 383.1 558.1 510.0 - 359.7 869.7 470.0 - 933.2 1,403.:
Developing Countries..... 141.6 8.4 102.4 252.4 238.7 21.0 229.8 489.5 284.5 31.2 301.2 616.!Total ............ 316.6 8.4 485.5 81 0.5 748.7 21.0 589.5 1,359.2 754.5 31.2 1,234.4 2,020:'
Industrialized Countries ... 949.2 47.6 1,259.4 2,256.2 1,033.0 81.2 1,694.9 2,809.1 1,132.4 4.8 4,274.3 5,41 1 .Multilateral Institutions .... - - 261.3 261.3 - - 241.4 241.4 - - 259.1 259:'Total ............ 949.2 47.6 1,520.7 2,517.5 1,033.0 81.2 1,936.3 3,050.5 1,132.4 4.8 4,533.4 5,670.1Grand Total. . ........ 1,265.8 56.0 2,006.2 3,328.0 1,781.7 102.2 2,525.8 4,409.7 1,886.9 36.0 5,767.8 7,690:-
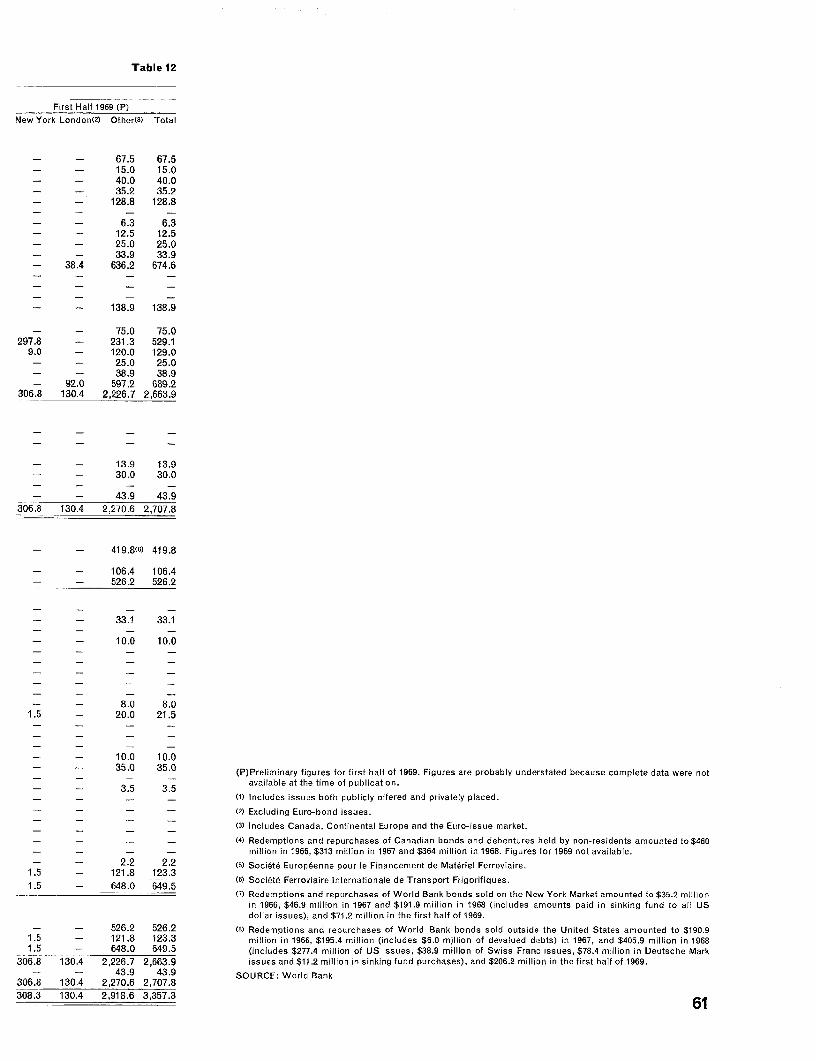
Table 12
First Half 1969 (P)New York London(2) Other(3) Total
- - 67.5 67.5- - 15.0 15.0- - 40.0 40.0- - 35.2 35.2- - 128.8 128.8
- - 6.3 6.3- - 12.5 12.5- - 25.0 25.0- - 33.9 33.9- 38.4 636.2 674.6
- - 138.9 138.9
- - 75.0 75.0297.8 - 231.3 529.1
9.0 - 120.0 129.0- - 25.0 25.0- - 38.9 38.9- 92.0 597.2 689.2
306.8 130.4 2,226.7 2,663.9
- - 13.9 13.9* - 30.0 30.0
- - 43.9 43.9306.8 130.4 2,270.6 2,707.8
- - 419.818) 419.8
- - 106.4 106.4- - 526.2 526.2
33.1 33.1
10.0 10.0
- - 8.0 8.01.5 - 20.0 21.5
- - 10.0 10.035.0 35.0 (P)Preliminary figures for first half of 1969. Figures are probably understated because complete data were not
- -3.5 3.5 available at the time of publication.- -- - (1) Includes issues both publicly offered and privately placed.
-- - 1 t2) Excluding Euro-bond issues.
(3) Includes Canada, Continental Europe and the Euro-issue market.
- - _ 1(4) Redemptions and repurchases of Canadian bonds and debentures held by non-residents amounted to $460-- _ _ million in 1966, $313 million in 1967 and $364 million in 1968. Figures for 1969 not available.
- - 2.2 2.2 (t) Soci6te Europ6enne pour le Financement de Materiel Ferroviaire.1.5 - 1218 123.3 (6) Societe Ferroviaire Internationale de Transport Frigorifiques.
(7) Redemptions and repurchases of World Bank bonds sold on the New York Market amounted to $35.2 millionin 1966, $46.9 million in 1967 and $191.9 million in 1968 (includes amounts paid in sinking fund to all USdollar issues), and $71.2 million in the first half of 1969.
- - 526.2 526.2 (8) Redemptions and repurchases of World Bank bonds sold outside the United States amounted to $190.91.5 - 121.8 123.3 million in 1966, $195.4 million (includes $6.0 million of devalued debts) in 1967, and $405.9 million in 19681.5 - 648.0 649.5 (includes $277.4 million of US issues, $38.9 million of Swiss Franc issues, $78.4 million in Deutsche Mark
306.8 130.4 2,226.7 2,663.9 issues and $11.2 million in sinking fund purchases), and $206.2 million in thefirst half of 1969.- - 43.9 43.9 SOURCE: World Bank
306.8 130.4 2,270.6 2,707.8308.3 130.4 2,918.6 3,357.3 61
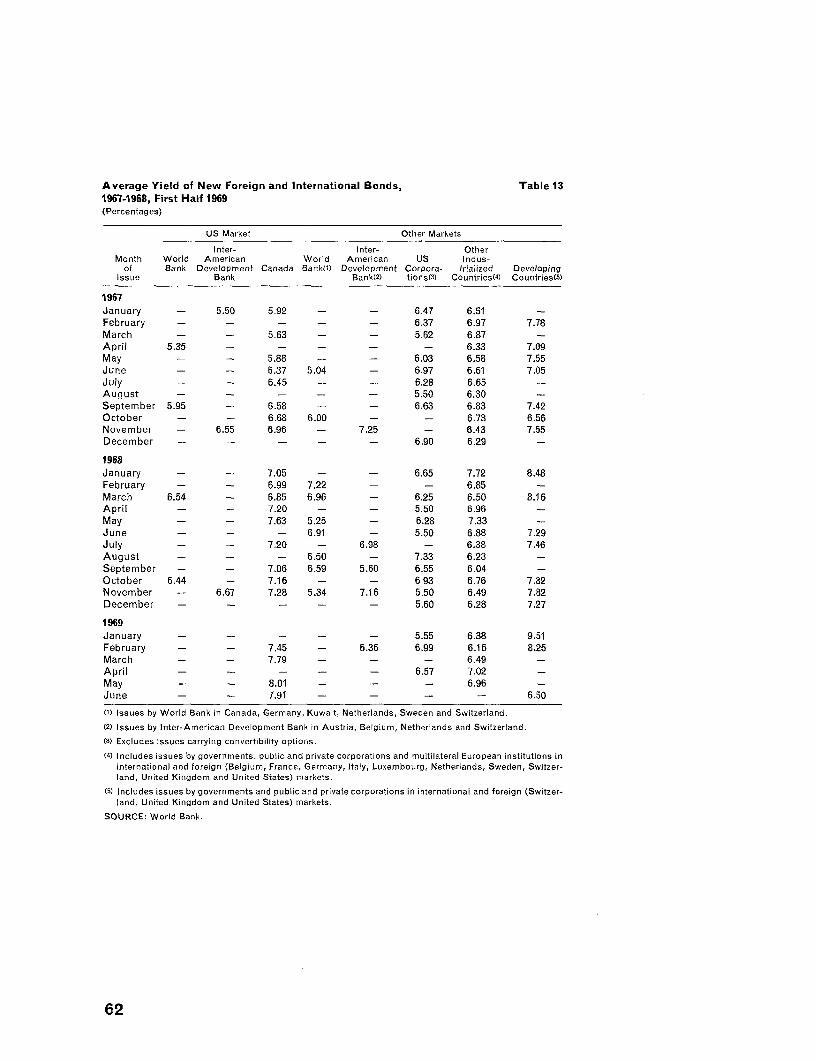
Average Yield of New Foreign and International Bonds, Table 131967-1968, First Half 1969(Percentages)
US Market Other Markets
inter- Inter- OtherMonth World American World American US Indus-
of Bank Development Canada Bank(l) Development Corpora- trialized DevelopingIssue Bank Bank(2) tions(3) Countries(4) Countries(5)
1967January - 5.50 5.92 - - 6.47 6.51 -
February - - - - - 6.37 6.97 7.78March - - 5.63 - - 5.62 6.87 -April 5.35 - - - - - 6.33 7.09May - - 5.88 - - 6.03 6.58 7.55June - - 6.37 5.04 - 6.97 6.61 7.05July - - 6.45 - - 6.28 6.65 -August - - - - - 5.50 6.30 -
September 5.95 - 6.58 - - 6.63 6.83 7.42October - - 6.68 6.00 - - 6.73 6.56November - 6.55 6.96 - 7.25 - 6.43 7.55December - - - - - 6.90 6.29 -
1968January - - 7.05 - - 6.65 7.72 8.48February - - 6.99 7.22 - - 6.85 -
March 6.54 - 6.85 6.96 - 6.25 6.50 8.16April - - 7.20 - - 5.50 6.96May - - 7.63 5.25 - 6.28 7.33 -
June - - - 6.91 - 5.50 6.88 7.29July - - 7.20 - 6.98 - 6.38 7.46August - - - 6.50 - 7.33 6.23 -September - - 7.06 6.59 5.60 6.55 6.04 -
October 6.44 - 7.16 - - 6.93 6.76 7.32November - 6.67 7.28 5.34 7.16 5.50 6.49 7.82December - - - - - 5.60 6.28 7.27
1969January - - - - - 5.55 6.38 9.51February - - 7.45 - 6.36 6.99 6.16 8.25March - - 7.79 - - - 6.49 -
April - - - - - 6.57 7.02May - - 8.01 - - - 6.96June - - 7.91 - - - - 6.50
(1) Issues by World Bank in Canada, Germany, Kuwait, Netherlands, Sweden and Switzerland.
(2) Issues by Inter-American Development Bank in Austria, Belgium, Netherlands and Switzerland.
(3) Excludes issues carrying convertibility options.
(4) Includes issues by governments, public and private corporations and multilateral European institutions ininternational and foreign (Belgium, France, Germany, Italy, Luxembourg, Netherlands, Sweden, Switzer-land, United Kingdom and United States) markets.
(5) Includes issues by governments and public and private corporations in international and foreign (Switzer-land, United Kingdom and United States) markets.
SOURCE: World Bank.
62
Bank Appendices
Page
A Balance Sheet . . .............................................. 64B Comparative Statement of Income and Expenses ............ I ...... 66C Statement of Subscriptions to Capital Stock and Voting Power ..... 67D Summary Statement of Loans . ......................... ... 69E Summary Statement of Funded Debt ..................... . - - . 71F Notes to Financial Statements .......... ......... ............ 72
OPINION OF INDEPENDENT AUDITOR ..... ....... ............... 73
G Statement of Loans Signed During the Fiscal Year 1968/69 ......... 74
63
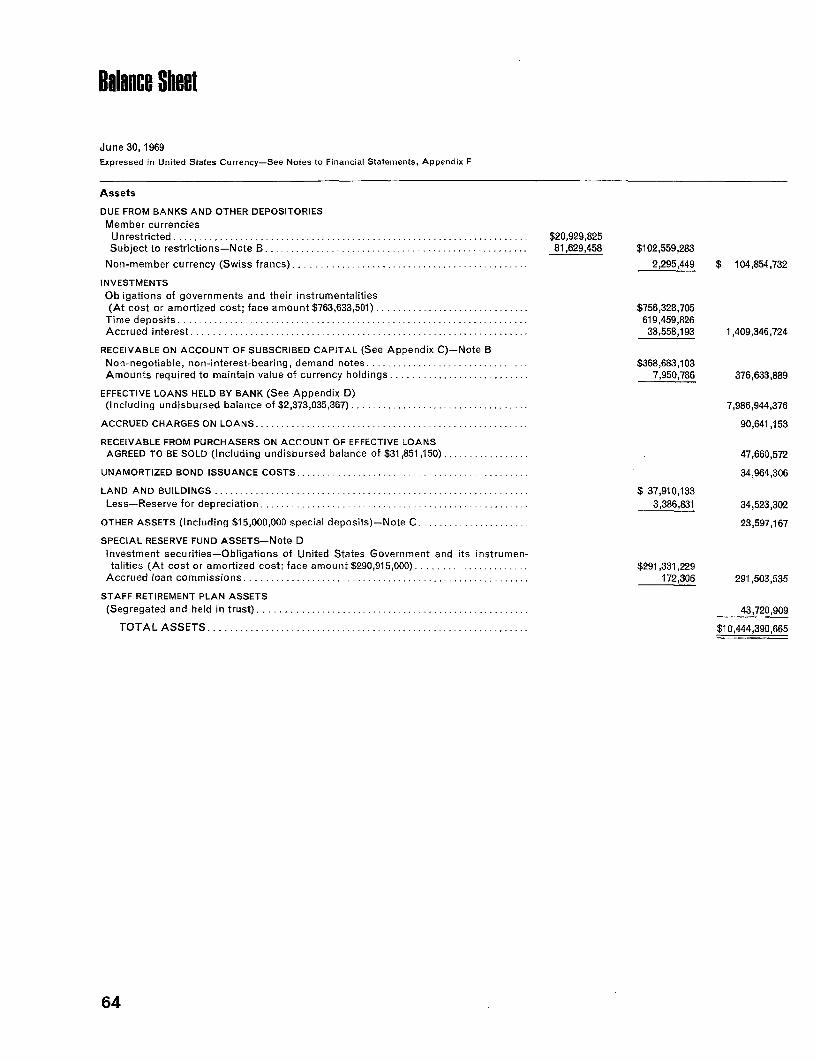
Balance Sheet
June 30, 1969Expressed in United States Currency-See Notes to Financial Statements, Appendix F
Assets
DUE FROM BANKS AND OTHER DEPOSITORIESMember currencies
Unrestricted ............................ ........ $20,929,825Subject to restrictions-Note B .............................. __ ................. 81,629,458 $102,559,283
Non-member currency (Swiss francs) .. 2,295,449 $ 104,854,732
INVESTMENTSObligations of governments and their instrumentalities(At cost or amortized cost; face amount $763,633,501) .. $756,328,705
Time deposits .. 619,459,826Accrued interest .. 33,558,193 1,409,346,724
RECEIVABLE ON ACCOUNT OF SUBSCRIBED CAPITAL (See Appendix C)-Note BNon-negotiable, non-interest-bearing, demand notes. .$368,683,103Amounts required to maintain value of currency holdings .. 7,950,786 376,633,889
EFFECTIVE LOANS HELD BY BANK (See Appendix D)(Including undisbursed balance of $2,373,035,367) 7,986,944,376
ACCRUED CHARGES ON LOANS .90,641,153
RECEIVABLE FROM PURCHASERS ON ACCOUNT OF EFFECTIVE LOANSAGREED TO BE SOLD (Including undisbursed balance of $31,851,150) . 47,660,572
UNAMORTIZED BOND ISSUANCE COSTS .34,964,306
LAND AND BUILDINGS .. $ 37,910,133Less-Reserve for depreciation .. 3,386,831 34,523,302
OTHER ASSETS (Including $15,000,000 special deposits)-Note C 23,597,167
SPECIAL RESERVE FUND ASSETS-Note DInvestment securities-Obligations of United States Government and its instrumen-talities (At cost or amortized cost; face amount $290,915,000) $291,331,229
Accrued loan commissions .. 172,306 291,503,535
STAFF RETIREMENT PLAN ASSETS(Segregated and held in trust) .43,720,909
TOTAL ASSETS .$10,444,390,665
64
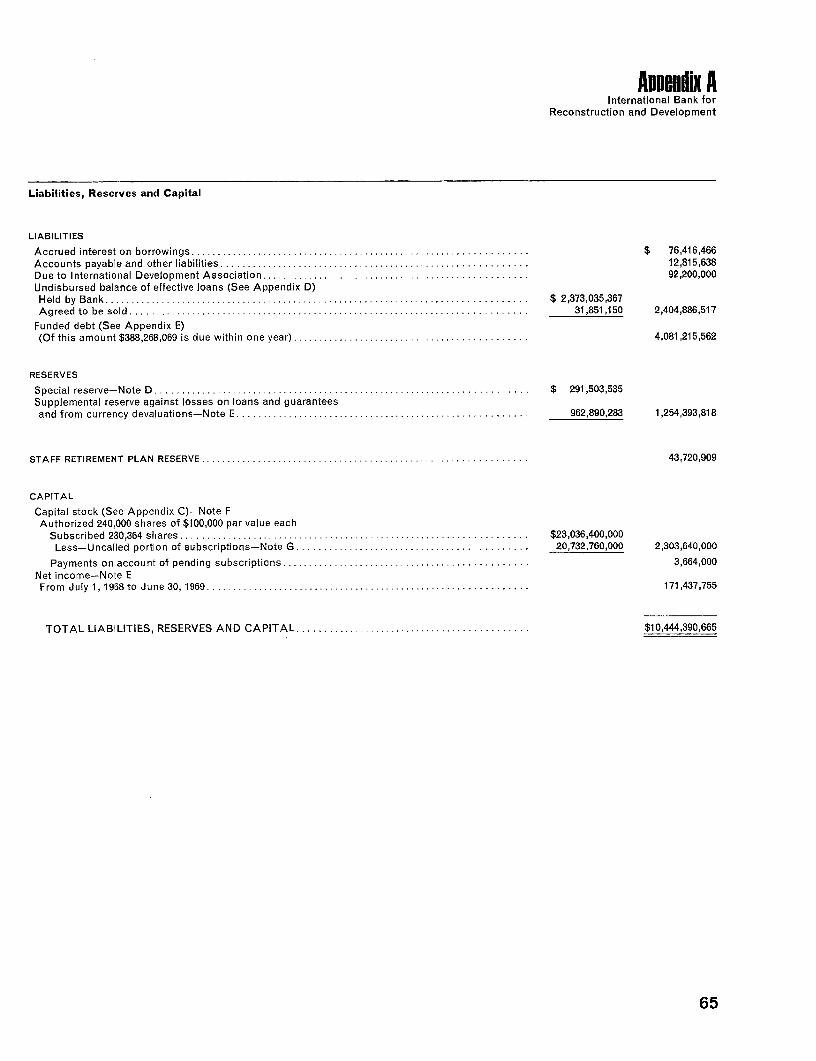
Appendix AInternational Bank for
Reconstruction and Development
Liabilities, Reserves and Capital
LIABILITIES
Accrued interest on borrowings ...... ......................................................... $ 76,416,466Accounts payable and other liabilities .............................. ........................... 12,815,638Due to International Development Association ..... 92,200,000Undisbursed balance of effective loans (See Appendix D)Held by Bank ......................................................................... ....... $ 2,373,035,367Agreed to be sold ...... .................. ................................................. 31,851,150 2,404,886,517
Funded debt (See Appendix E)(Of this amount $388,268,069 is due within one year) . . ........................................... 4,081,215,562
RESERVES
Special reserve-Note D ................................... ........... .............. $ 291,503,535Supplemental reserve against losses on loans and guaranteesand from currency devaluations-Note E ........... .............. 962,890,283 1,254,393,818
STAFF RETIREMENT PLAN RESERVE ...................... ................ ............. 43,720,909
CAPITAL
Capital stock (See Appendix C)-Note FAuthorized 240,000 shares of $100,000 par value each
Subscribed 230,364 shares ................................................................ $ 23,036,400,000Less-Uncalled portion of subscriptions-Note G ....... . ................................... 20,732,760,000 2,303,640,000
Payments on account of pending subscriptions ... 3,664,000Net income-Note EFrom July 1, 1958 to June 30, 1969 ... 171,437,755
TOTAL LIABILITIES, RESERVES AND CAPITAL ............................................ $10,444,390,665
65
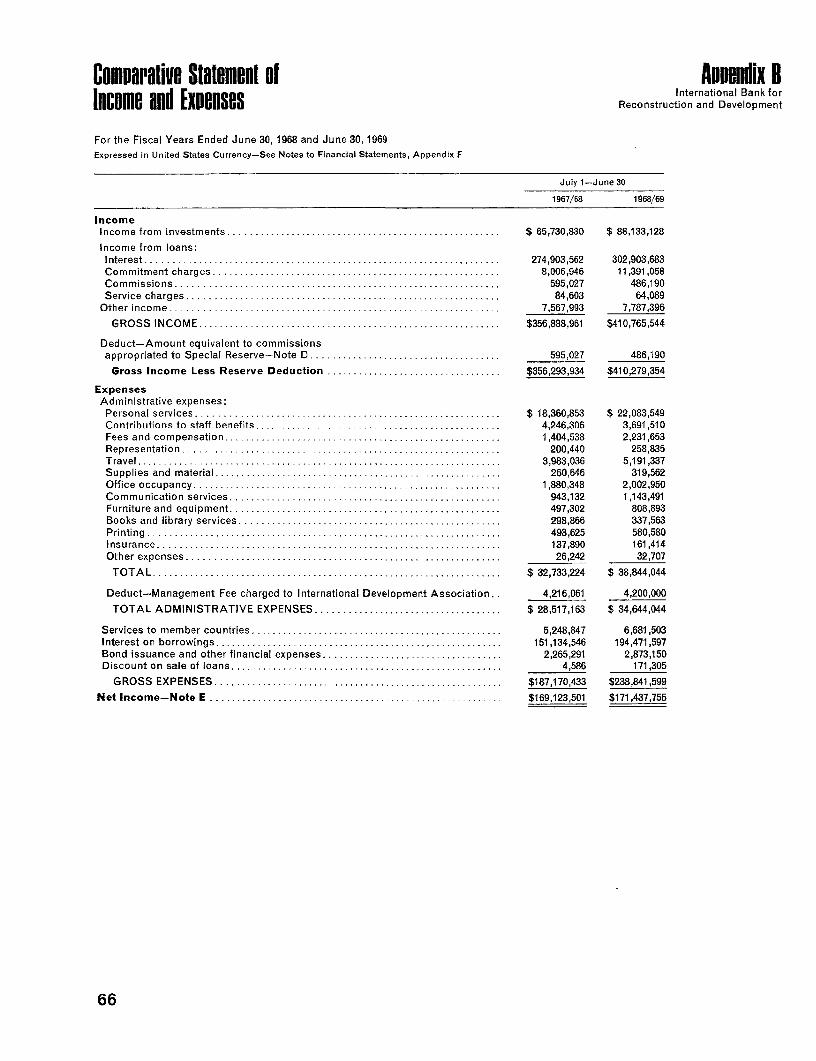
Comaprative Statement of Appendix 8I nternatio nal Ba nk fo rIncome and Expenses Reconstruction and Development
For the Fiscal Years Ended June 30, 1968 and June 30,1969Expressed in United States Currency-See Notes to Financial Statements, Appendix F
July 1-June 30
1967/68 1968/69
IncomeIncome from investments .......................... ..................... $ 65,730,830 $ 88,133,128
Income from loans:Interest .......................................... ................ .... 274,903,562 302,903,683Commitment charges ............... ..................................... 8,006,946 11,391,058Commissions ........ ,. 595,027 486,190Service charges ............................................................. 84,603 64,089
Other income ... . ......................................................... 7,567,993 7,787,396
GROSS INCOME ...................................................... ... $356,888,961 $410,765,544
Deduct-Amount equivalent to commissionsappropriated to Special Reserve-Note 0 ..................................... 595,027 486,190
Gross Income Less Reserve Deduction ....... ......................... $356,293,934 $410,279,354
ExpensesAdministrative expenses:
Personal services ............................................ .......... $ 18,360,853 $ 22,083,549Contributions to staff benefits .............. . ............. ......... ... 4,246,306 3,691,510Fees and compensation ...... .............................................. 1,404,538 2,231,653Representation ............................................................ 200,440 258,835Travel ............................................................ .... 3,983,036 5,191,337Supplies and material ....................................................... 260,646 319,562Office occupancy .............. .......................................... 1,880,348 2,002,950Communication services ................................... __ .............. 943,132 1,143,491Furniture and equipment ................. ........ ..................... 497,302 808,893Books and library services ........................... ..................... 298,866 337,563Printing .......... ,,,, 493,625 580,580Insurance ...... .,.., .,, ..... ,.,.,.137,890 161,414Other expenses . . ,, ,..... 26,242 32,707
TOTAL ................................................. ............ $ 32,733,224 $ 38,844,044
Deduct-Management Fee charged to International Development Association. . 4,216,061 4,200,000
TOTAL ADMINISTRATIVE EXPENSES ..... .............................. $ 28,517,163 $ 34,644,044
Services to member countries ...................... , . ,, 5,248,847 6,681,503Interest on borrowings ................. ,.,... 151,134,546 194,471,597Bond issuance and other financial expenses ........ ........................... 2,265,291 2,873,150Discount on sale of loans ....... ......... . . , 4,586 171,305
GROSS EXPENSES ................... $187,170,433 $238,841,599Net Income-Note E ................... . $169,123,501 $171,437,755
66
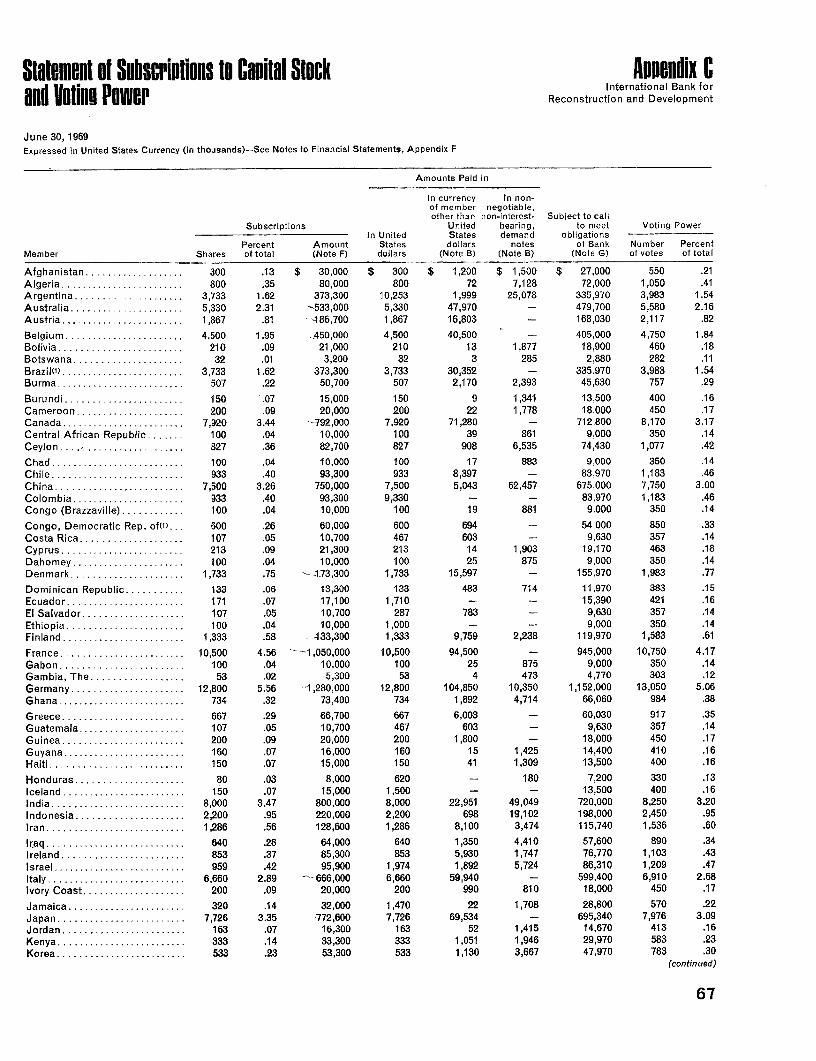
Statement of Subscriptions to Canital Stock Appendix CInternational Bank for
UInd VoUIIII rUlilebl Reconstruction and Development
June 30, 1969Expressed in United States Currency (in thousands)-See Notes to Financial Statements, Appendix F
Amounts Paid in
In currency In non-of member negotiable,other than non-interest- Subject to call
Subscriptions United bearing, to meet Voting PowerIn United States demand obligations
Percent Amount States dollars notes of Bank Number PercentMember Shares of total (Note F) dollars (Note B) (Note B) (Note G) of votes of total
Afghanistan ................... 300 .13 $ 30,000 $ 300 $ 1,200 $ 1,500 $ 27,000 550 .21Algeria ................ 8........ 00 .35 80,000 800 72 7,128 72,000 1,050 .41Argentina ...... .............. 3,733 1.62 373,300 10,253 1,999 25,078 335,970 3,983 1.54Australia ... .................. 5,330 2.31 -533,000 5,330 47,970 - 479,700 5,580 2.16Austria .......... 1,867 .81 - 486,700 1,867 16,803 - 168,030 2,117 .82
Belgium ....................... 4,500 1.95 _ 450,000 4,500 40,500 - 405,000 4,750 1.84Bolivia ........................ 210 .09 21,000 210 13 1,877 18,900 460 .18Botswana .................. 32 .01 3,200 32 3 285 2,880 282 .11Brazil(') ............ ..... 3,733 1.62 373,300 3,733 30,352 - 335,970 3,983 1.54Burma ........................ 507 .22 50,700 507 2,170 2,393 45,630 757 .29
Burundi ....................... 1 50 .07 15,000 150 9 1,341 13,500 400 .16Cameroon .............. .... 200 .09 20,000 200 22 1,778 18,000 450 .17Canada ....... ................ 7,920 3.44 -792,000 7,920 71,280 - 712,800 8,170 3.17Central African Republic ....... 100 .04 10,000 100 39 861 9,000 350 .14Ceylon .................. 827 .36 82,700 827 908 6,535 74,430 1,077 .42
Chad ....... 100 .04 10,000 100 17 883 9,000 350 .14Chile ........................ 933 .40 93,300 933 8,397 - 83,970 1,183 .46China ........ ............... 7,500 3.26 750,000 7,500 5,043 62,457 675,000 7,750 3.00Colombia ............ -....... 933 .40 93,300 9,330 - - 83,970 1,183 .46Congo (Brazzaville) ............ 100 .04 10,000 100 19 881 9,000 350 .14
Congo, Democratic Rep. oft) ... 600 .26 60,000 600 694 - 54,000 850 .33Costa Rica .................... 107 .05 10,700 467 603 - 9,630 357 .14Cyprus ............. .......... 213 .09 21,300 213 14 1,903 19,170 463 .18Dahomey ...................... 100 .04 10,000 100 25 875 9,000 350 .14Denmark ..................... 1,733 .75 173,300 1,733 15,597 - 155,970 1,983 .77
Dominican Republic ...... ... 133 .06 13,300 133 483 714 11,970 383 .15Ecuador.. ..................... 171 .07 17,100 1,710 - - 15,390 421 .16El Salvador .................... 107 .05 10,700 287 783 - 9,630 357 .14Ethiopia ....................... 100 .04 10,000 1,000 - - 9,000 350 .14Finland ........................ 1,333 .58 133,300 1,333 9,759 2,238 119,970 1,583 .61
France ....... ........ ... 10,500 4.56 -1,050,000 10,500 94,500 - 945,000 10,750 4.17Gabon ..................... _ 100 .04 10,000 100 25 875 9,000 350 .14Gambia, The .............. 53 .02 5,300 53 4 473 4,770 303 .12Germany ........ ...... 12,800 5.56 -1,280,000 12,800 104,850 10,350 1,152,000 13,050 5.06Ghana ....................... 734 .32 73,400 734 1,892 4,714 66,060 984 .38
Greece .............. ..... 667 .29 66,700 667 6,003 - 60,030 917 .35Guatemala ..................... 107 .05 10,700 467 603 - 9,630 357 .14Guinea ............. ... 200 .09 20,000 200 1,800 - 18,000 450 .17Guyana ......... ............. 160 .07 16,000 160 15 1,425 14,400 410 .16Haiti ........................ 150 .07 15,000 150 41 1,309 13,500 400 .16
Honduras .... ....... 80 .03 8,000 620 - 180 7,200 330 .13Iceland .... ........ ....... 150 .07 15,000 1,500 - - 13,500 400 .16India ........................ 8,000 3.47 800,000 8,000 22,951 49,049 720,000 8,250 3.20Indonesia ...... ...... 2,200 .95 220,000 2,200 698 19,102 198,000 2,450 .95Iran ........................ 1,286 .56 128,600 1,286 8,100 3,474 115,740 1,536 .60
Iraq ....................... . 640 .28 64,000 640 1,350 4,410 57,600 890 .34Ireland ......... ___ ........ 853 .37 85,300 853 5,930 1,747 76,770 1,103 .43Israel ........................ 959 .42 95,900 1,974 1,892 5,724 86,310 1,209 .47Italy ........................ 6,660 2.89 666,000 6,660 59,940 - 599,400 6,910 2.68Ivory Coast .................... 200 .09 20,000 200 990 810 18,000 450 .17
Jamaica ........... ........... 320 .14 32,000 1,470 22 1,708 28,800 570 .22Japan ......... ......... 7,726 3.35 -772,600 7,726 69,534 - 695,340 7,976 3.09Jordan ................ _ .... 163 .07 16,300 163 52 1,415 14,670 413 .16Kenya ....................... 333 .14 33,300 333 1,051 1,946 29,970 583 .23Korea ....................... 533 .23 53,300 533 1,130 3,667 47,970 783 .30
(continued)
67
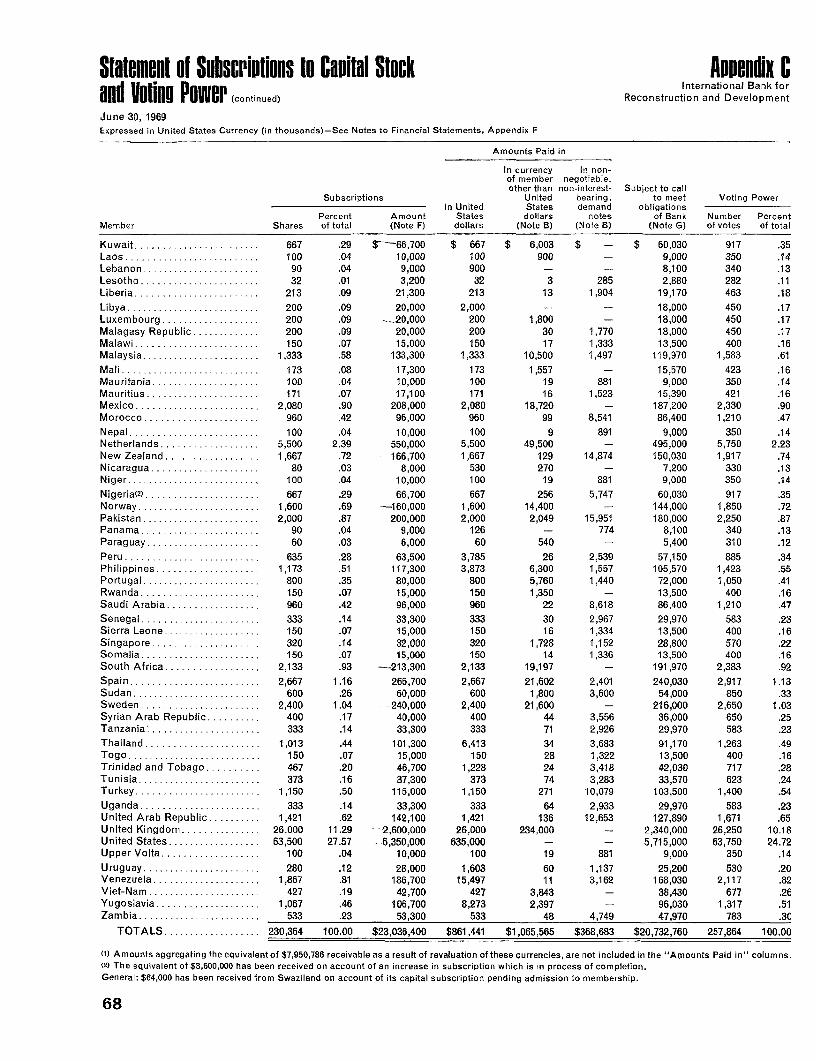
Statement of Subscriotions to Capital Stock Ampenix CInternational Bank forand Ubtins Power (continued) Reconstruction and Development
June 30, 1969Expressed in United States Currency (in thousands)-See Notes to Financial Statements, Appendix F
Amounts Paid in
In currency In non-of member negotiable,other than non-interest- Subject to call
Subscriptions United bearing, to meet Voting PowerIn United States demand obligations
Percent Amount States dollars notes of Bank Number PercentMember Shares of total (Note F) dollars (Note B) (Note B) (Note G) of votes of total
Kuwait ........................ 667 .29 $-66,700 $ 667 $ 6,003 $ - $ 60,030 917 .35Laos ...................... ... 100 .04 10,000 100 900 - 9,000 350 .14Lebanon ... ................... 90 .04 9,000 900 - - 8,100 340 .13Lesotho ........... . ....... 32 .01 3,200 32 3 285 2,880 282 .11Liberia ................... .... 213 .09 21,300 213 13 1,904 19,170 463 .18Libya .......................... 200 .09 20,000 2,000 - - 18,000 450 .17Luxembourg ................... 200 .09 - 20,000 200 1,800 - 18,000 450 .17Malagasy Republic ............. 200 .09 20,000 200 30 1,770 18,000 450 .17Malawi ................... ... 150 .07 15,000 150 17 1,333 13,500 400 .16Malaysia ....................... 1,333 .58 133,300 1,333 10,500 1,497 119,970 1,583 .61Mali .... 173....... .1 7 3 173 .08 17,300 173 1,557 - 15,570 423 .16Mauritania ..................... 100 .04 10,000 100 19 881 9,000 350 .14Mauritius ...................... 171 .07 17,100 171 16 1,523 15,390 421 .16Mexico ............... ........ 2,080 .90 208,000 2,080 18,720 - 187,200 2,330 .90Morocco .................... 960 .42 96,000 960 99 8,541 86,400 1,210 .47Nepal ......................... 100 .04 10,000 100 9 891 9,000 350 .14Netherlands ............ _ ... 5,500 2.39 550,000 5,500 49,500 - 495,000 5,750 2.23New Zealand .................. 1,667 .72 166,700 1,667 129 14,874 150,030 1,917 .74Nicaragua .................... 80 .03 8,000 530 270 - 7,200 330 .13Niger .................. ....... 100 .04 10,000 100 19 881 9,000 350 .14Nigeria(2) .................... . 667 .29 66,700 667 256 5,747 60,030 917 .35Norway ....................... 1,600 .69 -160,000 1,600 14,400 - 144,000 1,850 .72Pakistan ....................... 2,000 .87 200,000 2,000 2,049 15,951 180,000 2,250 .87Panama ....................... 90 .04 9,000 126 - 774 8,100 340 .13Paraguay ...................... 60 .03 6,000 60 540 - 5,400 310 .12Peru .......................... 635 .28 63,500 3,785 26 2,539 57,150 885 .34Philippines ......... .......... 1,173 .51 117,300 3,873 6,300 1,557 105,570 1,423 .55Portugal .... ................... 800 .35 80,000 800 5,760 1,440 72,000 1,050 .41Rwanda ....................... 150 .07 15,000 150 1,350 - 13,500 400 .16Saudi Arabia ..... ............ 960 .42 96,000 960 22 8,618 86,400 1,210 .47Senegal ..................... 333 .14 33,300 333 30 2,967 29,970 583 .23Sierra Leone ................... 150 .07 15,000 150 16 1,334 13,500 400 .16Singapore ............. ...... 320 .14 32,000 320 1,728 1,152 28,800 570 .22Somalia ....................... 150 .07 15,000 150 14 1,336 13,500 400 .16South Africa .................. 2,133 .93 -213,300 2,133 19,197 - 191,970 2,383 .92Spain ......................... 2,667 1.16 265,700 2,667 21,602 2,401 240,030 2,917 1.13Sudan ........................ 600 .26 60,000 600 1,800 3,600 54,000 850 .33Sweden ....................... 2,400 1.04 -240,000 2,400 21,600 - 216,000 2,650 1.03Syrian Arab Republic ....... 400 .17 40,000 400 44 3,556 36,000 650 .25Tanzania ...................... 333 .14 33,300 333 71 2,926 29,970 583 .23Thailand ...................... 1,013 .44 101,300 6,413 34 3,683 91,170 1,263 .49Togo .......................... 150 .07 15,000 150 28 1,322 13,500 400 .16Trinidad and Tobago ......... 467 .20 46,700 1,228 24 3,418 42,030 717 .28Tunisia ....................... 373 .16 37,300 373 74 3,283 33,570 623 .24Turkey ........................ 1,150 .50 115,000 1,150 271 10,079 103,500 1,400 .54Uganda ......... ............ 333 .14 33,300 333 64 2,933 29,970 583 .23United Arab Republic .......... 1,421 .62 142,100 1,421 136 12,653 127,890 1,671 .65United Kingdom .............. 26,000 11.29 --2,600,000 26,000 234,000 - 2,340,000 26,250 10.18United States .................. 63,500 27.57 .6,350,000 635,000 - - 5,715,000 63,750 24.72Upper Volta ................... 100 .04 10,000 100 19 881 9,000 350 .14Uruguay ....................... 280 .12 28,000 1,603 60 1,137 25,200 530 .20Venezuela ..................... 1,867 .81 186,700 15,497 11 3,162 168,030 2,117 .82Viet-Nam ...................... 427 .19 42,700 427 3,843 - 38,430 677 .26Yugoslavia .................... 1,067 .46 106,700 8,273 2,397 - 96,030 1,317 .51Zambia ............... ........ 533 .23 53,300 533 48 4,749 47,970 783 .3C
TOTALS ................... 230,364 100.00 $23,036,400 $861,441 $1,065,565 $368,683 $20,732,760 257,864 100.00
(1) Amounts aggregating the equivalent of $7,950,786 receivable as a result of revaluation of these currencies, are not included in the "Am ounts Paid in" colum ns,(2) The equivalent of $3,600,000 has been received on account of an increase in subscription which is in process of completion.General: $64,000 has been received from Swaziland on account of its capital subscription pending admission to membership.
68
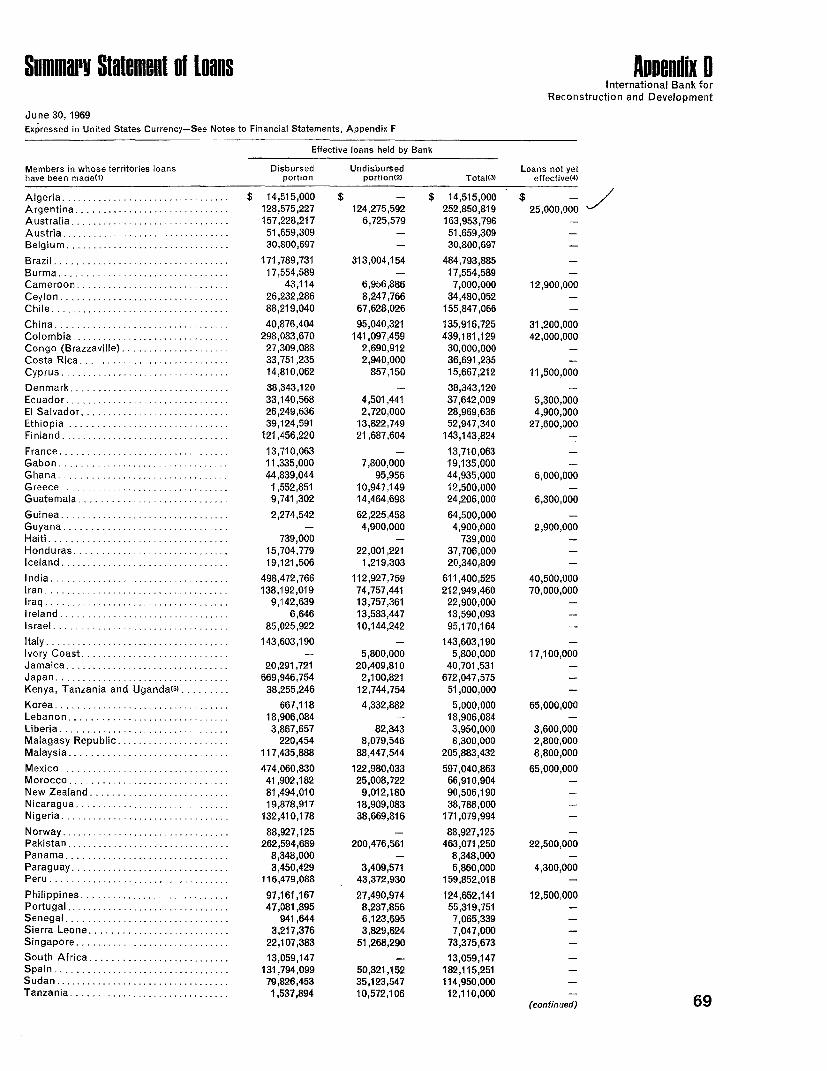
Snummary Statement oft loans Appendix 0International Bank for
Reconstruction and Development
June 30, 1969Expressed in United States Currency-See Notes to Financial Statements, Appendix F
Effective loans held by Bank
Members in whose territories loans Disbursed Undisbursed Loans not yethave been made(') portion portiont2) Totalt3) effective(4)
Algeria ............ ................... $ 14,515,000 $ - $ 14,515,000 $ -
Argentina . . ............................ 128,575,227 124,275,592 252,850,819 25,000,000Australia .......... . ............... - 157,228,217 6,725,579 163,953,796 -
Austria ........ ......... . . 51,659,309 - 51,659,309 -
Belgium . . ......................... _ 30,800,697 - 30,800,697 -
Brazil .............. __............... 171,789,731 313,004,154 484,793,885 -
Burma ....... . ........................ 17,554,589 - 17,554,589 -
Cameroon ... ..... . ............ ... 43,114 6,956,886 7,000,000 12,900,000Ceylon . ..................- ........... 26,232,286 8,247,766 34,480,052 -
Chile . ............... ............... 88,219,040 67,628,026 155,847,066 -
China ................................ 40,876,404 95,040,321 135,916,725 31,200,000Colombia . . ............................. 298,083,670 141,097,459 439,181,129 42,000,000Congo (Brazzaville) . . ...... 27,309,088 2,690,912 30,000,000 -
Costa Rica ............. . .............. 33,751,235 2,940,000 36,691,235 -
Cyprus . ................. .............. 14,810,062 857,150 15,667,212 11,500,000
Denmark . . ................. ........... 38,343,120 - 38,343,120 -
Ecuador ....... ............ ........... 33,140,568 4,501,441 37,642,009 5,300,000El Salvador . . ........................... 26,249,636 2,720,000 28,969,636 4,900,000Ethiopia . ............................. 39,124,591 13,822,749 52,947,340 27,600,000Finland ................................ 121,456,220 21,687,604 143,143,824 -
France ............................. . 13,710,063 . 13,710,063Gabon ................................ 11,335,000 7,800,000 19,135,000 -
Ghana . ............ .................. 44,839,044 95,956 44,935,000 6,000,000Greece . .. ....... ............... 1,552,851 10,947,149 12,500,000 -
Guatemala .. . ......................... 9,741,302 14,464,698 24,206,000 6,300,000
Guinea . . .............................. 2,274,542 62,225,458 64,500,000 -
Guyana .... . .......................... - 4,900,000 4,900,000 2,900,000Haiti ...... . ......................... 739,000 - 739,000 -
Honduras .......... ................... 15,704,779 22,001,221 37,706,000Iceland . . .............................. 19,121,506 1,219,303 20,340,809 -
India ... . ............................ 498,472,766 112,927,759 611,400,525 40,500,000Iran . . ...................... ........ 138,192,019 74,757,441 212,949,460 70,000,000Iraq ............ .................... 9,142,639 13,757,361 22,900,000 -
Ireland . . .............................. 6,646 13,583,447 13,590,093 -
Israel . . ........... ........ ...... 85,025,922 10,144,242 95,170,164 -
Italy . . .............................. 143,603,190 - 143,603,190 -
Ivory Coast . . ............ .............. - 5,800,000 5,800,000 17,100,000Jamaica ............................... 20,291,721 20,409,810 40,701,531 -
Japan . . .............................. 669,946,754 2,100,821 672,047,575Kenya, Tanzania and Ugandats) ......... 38,255,246 12,744,754 51,000,000 -
Korea ....... . ........................ 667,118 4,332,882 5,000,000 65,000,000Lebanon . . ............................. 18,906,084 - 18,906,084 -
Liberia . . .............................. 3,867,657 82,343 3,950,000 3,600,000Malagasy Republic . . .... 220,454 8,079,546 8,300,000 2,800,000Malaysia ............................. . 117,435,888 88,447,544 205,883,432 8,800,000
Mexico ........ ...... 474,060,830 122,980,033 597,040,863 65,000,000Morocco . . ...... 41,902,182 25,008,722 66,910,904 -
New Zealand .................. . ... 81,494,010 9,012,180 90,506,190 -
Nicaragua . ........ 19,878,917 18,909,083 38,788,000 -
Nigeria ............. ................... 132,410,178 38,669,816 171,079,994 -
Norway . ................ ............... 88,927,125 - 88,927,125 -
Pakistan ................................ 262,594,689 200,476,561 463,071,250 22,500,000Panama . . .............................. 8,348,000 - 8,348,000 -
Paraguay ................ . . 3,450,429 3,409,571 6,860,000 4,300,000Peru . . .............................. 116,479,088 43,372,930 159,852,018 -
Philippines . . . 97,161,167 27,490,974 124,652,141 12,500,000Portugal ...................... __...... 47,081,895 8,237,856 55,319,751 -
Senegal ................................ 941,644 6,123,695 7,065,339 -
Sierra Leone . . ...................... 3,217,376 3,829,624 7,047,000 -
Singapore . . ............................ 22,107,383 51,268,290 73,375,673 -
South Africa . . ........ 13,059,147 - 13,059,147 -
Spain . . .............................. 131,794,099 50,321,152 182,115,251 -
Sudan . . ............................. 79,826,453 35,123,547 114,950,000 -
Tanzania . . ....................... ..... 1,537,894 10,572,106 12,110,000 -(continued) 69
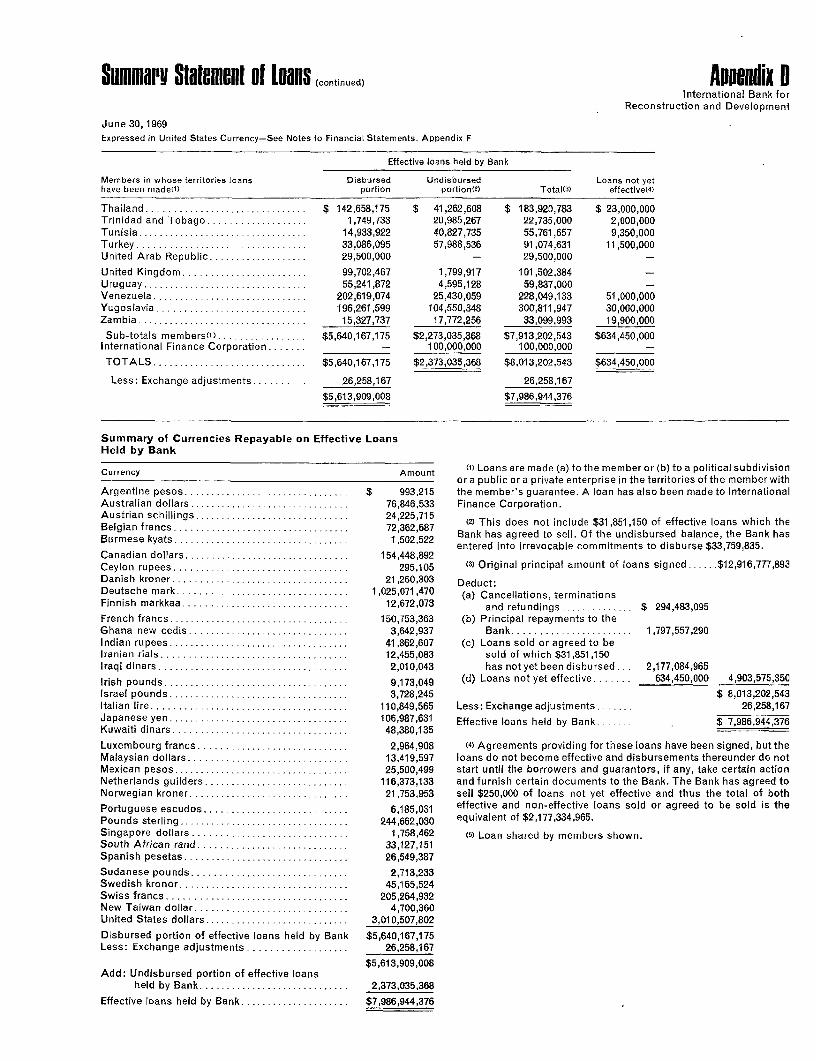
Summary Stalement of loans (continued) Aliendix 0International Bank for
Reconstruction and Development
June 30,1969Expressed in United States Currency-See Notes to Financial Statements, Appendix F
Effective loans held by Bank
Members in whose territories loans Disbursed Undisbursed Loans not yethave been madel) portion portion(2) Total(3) effective(4)
Thailand ............................... $ 142,658,175 $ 41,262,608 $ 183,920,783 $ 23,000,000Trinidad and Tobago ................... 1,749,733 20,985,267 22,735,000 2,000,000Tunisia .............. ............. 14,933,922 40,827,735 55,761,657 9,350,000Turkey ... ........................ 33,086,095 57,988,536 91,074,631 11,500,000United Arab Republic ..... ........ 29,500,000 - 29,500,000
United Kingdom ........................ 99,702,467 1,799,917 101,502,384Uruguay ................................ 55,241,872 4,595,128 59,837,000Venezuela ............................. 202,619,074 25,430,059 228,049,133 51,000,000Yugoslavia ...... .............. 196,261,599 104,550,348 300,811,947 30,000,000Zambia ... __ .......................... 15,327,737 17,772,256 33,099,993 19,900,000
Sub-totals members)) ................. $5,640,167,175 $2,273,035,368 $7,913,202,543 $634,450,000International Finance Corporation - 100,000,000 100,000,000
TOTALS ..... . $5,640,167,175 $2,373,035,368 $8,013,202,543 $634,450,000
Less: Exchange adjustments ...... ... 26,258,167 26,258,167
$5,613,909,008 $7,986,944,376
Summary of Currencies Repayable on Effective LoansHeld by Bank
Currency Amount (1) Loans are made (a) to the member or (b) to a political subdivisionora public or a private enterprise in the territories of the memberwith
Argentine pesos ................................ $ 993,215 the member's guarantee. A loan has also been made to InternationalAustralian dollars . ........ ...... 76,846,533 Finance Corporation.Austrian schillings .......... ... .. 24,225,715 (2) This does not include $31,851,150 of effective loans which theBelgian francs ........ .. ... .. 72,362,687 Bank has agreed to sell. Of the undisbursed balance, the Bank hasBurmese kyats .. 1,502,522 entered into irrevocable commitments to disburse $33,759,835.Canadian dollars ................................ 154,448,892Ceylon rupees ................. 295,105 (3) Original principal amount of loans signed ...... $12,916,777,893Danish kroner .. .......... 21,260,303 Deduct:Deutsche mark . .................. 1,025,071,470 (a) Cancellations, terminationsFinnish markkaa ................. 12,672,073 and refundings . ......... $ 294,483,095French francs ... .............. 150,753,363 (b) Principal repayments to theGhana new cedis ............... ............. 3,642,937 Bank ............. ... 1,797,557,290Indian rupees ................................... 41,862,607 (c) Loans sold or agreed to beIranian rials ................. 12,455,083 sold of which $31,851,150Iraqi dinars .................................... 2,010,043 has notyet been disbursed ... 2,177,084,965Irish pounds .................................... 9,173,049 (d) Loans not yet effective ....... 634,450,000 4,903,575,350Israel pounds .................. 3,728,245 $ 8,013,202,543Italian lire .................. .................. 110,849,565 Less: Exchange adjustments. 26,258,167Japanese yen .................... ............ 106,987,631 Effective loans held by Bank. $ 7,986,944,376Kuwaiti dinars ................ ................. 48,380,135
Luxembourg francs ...................... ..... 2,964,908 (4) Agreements providing for these loans have been signed, but theMalaysian dollars ........................---- _. 13,419,597 loans do not become effective and disbursements thereunder do notMexican pesos .................. 25,500,499 start until the borrowers and guarantors, if any, take certain actionNetherlands guilders ............... ....... 116,373,133 and furnish certain documents to the Bank. The Bank has agreed toNorwegian kroner . ......... ..... 21,753,953 sell $250,000 of loans not yet effective and thus the total of bothPortuguese escudos . ........ .... 6,185,031 effective and non-effective loans sold or agreed to be sold is thePounds sterling .... .244,662,030 equivalent of $2,177,334,965.Singapore dollars .............................. 1,758,462 (2) Loan shared by members shown.South African rand . ............... 33,127,151Spanish pesetas . .............. ................ 26,549,387Sudanese pounds ...... ................ ...... 2,713,233Swedish kronor ... ............................ 45,165,524Swiss francs ................... 205,264,932New Taiwan dollar . .............. 4,700,360United States dollars . ............... 3,010,507,802
Disbursed portion of effective loans held by Bank $5,640,167,175Less: Exchange adjustments . ........ 2......... 26,258,167
$5,613,909,008Add: Undisbursed portion of effective loans
held by Bank ........ .................... 2,373,035,368
Effective loans held by Bank ...... . ....... $7,986,944,376
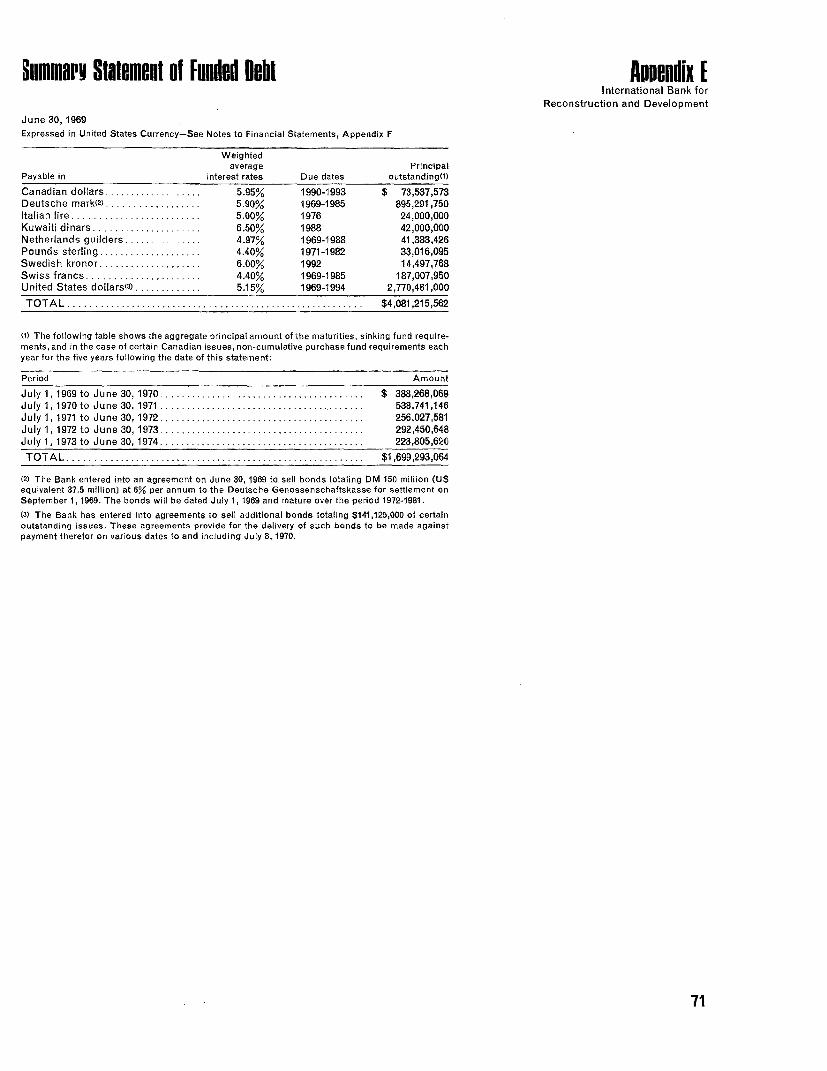
Smmnary Statement ot Funded Debt Appendix EInternational Bank for
Reconstruction and Development
June 30,1969Expressed in United States Currency-See Notes to Financial Statements, Appendix F
Weightedaverage Principal
Payable in interest rates Due dates outstanding(l)
Canadian dollars ............... 5.95%y 1990-1993 $ 73,537,573Deutsche mark(2) ................ 5.90% 1969-1985 895,291,750Italian lire .... . ................... 5.00% 1976 24,000,000Kuwaiti dinars ................ ,. 6.50% 1988 42,000,000Netherlands guilders ... . 4.97% 1969-1988 41,383,426Pounds sterling ................. 4.40% 1971-1982 33,016,095Swedish kronor ................. 6.00% 1992 14,497,768Swiss francs ... ..... , 4.40%0/ 1969-1985 187,007,950United States dollarsl3 .n.... 5.15% 1969-1994 2,770,481,000
TOTAL ..................... .......................... $4,081,215,562
(I) The following table shows the aggregate principal amount of the maturities, sinking fund require-ments, and in the case of certain Canadian issues, non-cumulative purchase fund requirements eachyear for the five years following the date of this statement:
Period Amount
July 1, 1969 to June 30,1970 ................................... $ 388,268,069July 1, 1970 to June 30,1971 .......................... .......... 538,741,146July 1, 1971 to June 30, 1972 .................................... 256,027,581July 1, 1972 to June 30, 1973 ........................ ............ 292,450,648July 1,1973 to June 30, 1974...................... 223,805,620
TOTAL ............................ $1,699,293,064
(2) The Bank entered into an agreement on June 30, 1969 to sell bonds totaling DM 150 million (USequivalent 37.5 million) at 6% per annum to the Deutsche Genossenschaftskasse for settlement onSeptember 1, 1969. The bonds will be dated July 1, 1969 and mature over the period 1972-1981.
(3) The Bank has entered into agreements to sell additional bonds totaling $141,125,000 of certainoutstanding issues. These agreements provide for the delivery of such bonds to be made againstpayment thereior on various dates to and including July 8, 1970,
71
Notes to Financial Statements Appendix IInternational Bank fo
Reconstruction and Developmen
June 30, 1969
Note A entirely called, such restricted currencies "United States dollars" and, where relevantAmounts in currencies other than United may, without restriction by the members as "unrestricted".States dollars have been translated into whose currencies are offered, be used orUnited States dollars: exchanged for the currencies required to Note C
meet contractual payments of interest, other The Bank has three interest-bearing demani(i) In the cases of 80 members, at the par charges or amortization on the Bank's own deposit accounts with the Reserve Bank ovalues as specified in the "Schedule of Par borrowings or to meet the Bank's liabilities India denominated in US dollars, DeutschValues", published by the International with respect to contractual payments on mark and yen. The Bank intends to withdravMonetary Fund; loans guaranteed by it. these funds from time to tirne but not late
(ii) In the cases of the remaining 30 mem- Under Article II, Section 9, each member is than March 31, 1971.bers (Algeria, Argentina, Bolivia, Brazil, required, if the par value of its currency is Note DCameroon, Central African Republic, reduced or if the foreign exchange value of Amounts of commissions set aside pursuChad, Chile, China, Colombia, Congo its currency depreciates to a significant ant to Article IV, Section 6, as a Specia(Brazzaville), Democratic Republic of extent in its territories, to maintain the value Reserve to be held in liquid form and to bCongo, Dahomey, Gabon, Guinea, Indo- of the Bank's holdings of its restricted cur- used only for the purpose of meeting liabilinesia, Ivory Coast, Korea, Laos, Malagasy rency, including the principal amount of any ties of the Bank on its borrowings an(Republic, Mali, Mauritania, Mauritius, notes substituted therefor, and the Bank is guarantees.Niger, Paraguay, Peru, Senegal, Togo, required, if the par value of a member'sUpper Volta and Viet-Nam), at the rates currency is increased, to return to the mem- Note Eused bysuch members in making payments ber the increase in the value of such Ofthe$171,437,755 net income earned in thof capital subscriptions to the Bank; and restricted currency held by the Bank. fiscal yearended June30,1969, the Executiv
Directors in Juiy 1969, allocated $71,437,75(iii) In the case of Swiss francs, non-mem- The equivalent of $7,950,786 is receivable totheSupplemental Reserve Against Losseber currency, at the rate of 4.2975 Swiss from 2 members in order to maintain the on Loans and Guarantees and from Curfrancs to 1 United States dollar. value of their restricted currencies. To the rency Devaluations and have recommende
extent such restricted currencies are out on to the Board of Governors that an additionrSee also Note B. loan, the Bank and the members are obli- amount equal to the balance of $100,000,00
No representation is made that any currency gated to make payments under Article II, be transferred by way of grant to the Interheld by the Bank is convertible into any Section 9 only when such restricted cur- national Development Association.heldby he ankis onvrtile ntoany rencies are recovered by the Bank. Theother currency at any rate or rates. dollar equivalent of such restricted curren- Consistent with past practice, the SuppIE
Note B cies on loan includes $34,283,010 which mental Reserve Against Losses on Loanwould be receivable from 2 members to and Guarantees and from Currency DevaluT hese currencies of thesera mebs, maintain the value of their currencies, if ations has been charged during the currer
and the notes issued by them in substitu- these currencies had been recovered at fiscal year with $217,255 representing a lostion for any part of such currencies as per- June 30 1969 to the Bank as a result of the revaluation cmitted under the provisions of Article V, the amount of earnings in Argentine pesoSection 12, are derived from the portion of Some members have converted part or all held by the Bank at the date of devaluatiorthe subscriptions to the capital stock of the of the Bank's holdings of their restrictedBank which is payable in the currencies of currency into United States dollars to be Note Fthe respective members (such portion being used and reused as United States dollars In terms of United States dollars of thhereinafter called restricted currency). Such in the Bank's operations, subject to the right weight and fineness in effect on July 1, 194'restricted currencies may be loaned by the of the Bank or the member to reverse theBank, and funds received by the Bank on transactions at any time, with immediate Note Gaccount of principal of loans made by the effect as to dollars then held by the Bank, Subject to call by the Bank only when rtBank out of such restricted currencies may and, as to dollars loaned, upon repayment quired to meet the obligations of the Banbe exchanged for other currencies or re- of the loans. Such dollars while held by the created by borrowing or by guaranteeinloaned, only with the approval in each case Bank or on loan are not subject to the pro- loans. As to $18,429,120,000 the restrictioof the member whose restricted currency is visions of Article II, Section 9. Such dollars on calls is imposed by the Articles of Agretinvolved; provided, however, that, if neces- held by the Bank or repayable on loans are ment; as to $2,303,640,000 by resolutionssary, after the Bank's subscribed capital is shown in these financial statements under the Board of Governors.
72
Opinion of Independent Auditor Financial Stalements Coveredby the Forenoins Opinion
1707 L STREET, N.W.WASHINGTON, D.C. 20036
AUGUST 1, 1969
ToINTERNATIONAL BANK FORRECONSTRUCTION AND DEVELOPMENTWASHINGTON, D.C.
In our opinion, the accompanying financial statements present fairly, Balance Sheet ........................... Appendix A (page 64)in terms of United States currency, the financial position of Interna-tional Bank for Reconstruction and Development at June 30, 1969, Comparative Statement of Income andandthe resultsofitsoperationsfortheyearthen ended, inconform- Expenses.AppendixB(page66)ity with generally accepted accounting principles applied on a basis Statement of Subscriptions to Capitalconsistent with that of the preceding year. Our examination of these Stock and Voting Power ....... .......... Appendix C (page 67)statements was made in accordance with generally accepted audit-ing standards, and accordingly included such tests ofthe accounting Summary Statement of Loans ............... Appendix D (page 69)records and such other auditing procedures as we considered Summary Statement of Funded Debt ....... Appendix E (page 71)necessary in the circumstances.
Notes to Financial Statements .............. Appendix F (page 72)
PRICE WATERHOUSE & CO.
73
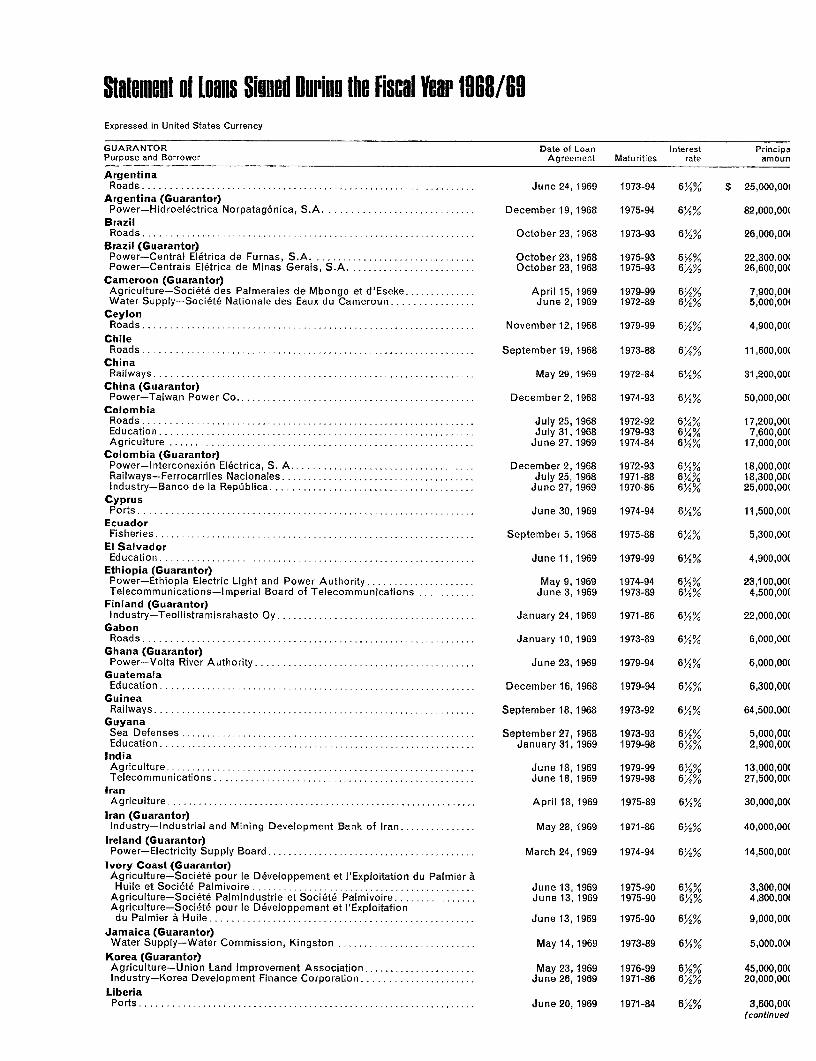
Stalement ot loans Sioned Durins the Fiscal Year 1i88/O IExpressed in United States Currency
GUARANTOR Date of Loan Interest PrincipaPurpose and Borrower Agreement Maturities rate amoun
ArgentinaRoads ............ ................................................ June 24, 1969 1973-94 6Y2/% $ 25,000,001
Argentina (Guarantor)Power-Hidroelectrica Norpatag6nica, S.A ............................ December 19, 1968 1975-94 6 Y2% 82,000,001
BrazilRoads ........................................... ................... October23, 1968 1973-93 6Y2% 26,000,001
Brazil (Guarantor)Power-Central Eletrica de Furnas, S.A .................. .......... October23, 1968 1975-93 6/2% 22,300,001Power-Centrais Eietrica de Minas Gerais, S.A .............. .......... October 23, 1968 1975-93 6Y2% 26,600,00(
Cameroon (Guarantor)Agriculture-Soci6te des Palmerales de Mbongo et d'Eseke ... .......... April 15, 1969 1979-99 6/2% 7,900,001Water Supply-Societe Nationale des Eaux du Cameroun ................ June 2,1969 1972-89 6y2% 5,000,00'
CeylonRoads ..................................... ................... November 12, 1968 1979-99 6Y2% 4,900,00(
ChileRoads .............................................................. September 19, 1968 1973-88 6/2% 11,600,00(
ChinaRailways ................ ............. ............... May 29,1969 1972-84 6%/2% 31,200,001
China (Guarantor)Power-Taiwan Power Co .......................... .................... December 2,1968 1974-93 6%2% 50,000,00(
ColombiaRoads ................................. ......................... July 25,1968 1972-92 6X2% 17,200,00(Education .............................................................. July 31,1968 1979-93 6%% 7,600,00(Agriculture ...................................................... ... June 27,1969 1974-84 62Y2% 17,000,00(
Colombia (Guarantor)Power-Interconexi6n Electrica, S. A........ . ................... December 2,1968 1972-93 6%% 18,000,001Railways-Ferrocarriles Nacionales .................................... July 25, 1968 1971-88 62/% 18,300,00(Industry-Banco de la Republica ............. ____ ................ June 27, 1969 1970-86 6Y2% 25,000,00(
CyprusPorts .............................................................. June 30, 1969 1974-94 65/% 11,500,00(
EcuadorFisheries ........... ................................................ September 5,1968 1975-88 62/4% 5,300,00(
El SalvadorEducation ............................................................. June 11, 1969 1979-99 6%/% 4,900,00(
Ethiopia (Guarantor)Power-Ethiopia Electric Light and Power Authority .................... May 9,1969 1974-94 62/2% 23,100,00(Telecommunications-Imperial Board of Telecommunications ........... June 3,1969 1973-89 6%% 4,500,00(
Finland (Guarantor)Industry-Teollistramisrahasto Oy ................................... January 24, 1969 1971-86 6Y% 22,000,00(
GabonRoads ............................................................. January 10,1969 1973-89 6%% 6,000,00(
Ghana (Guarantor)Power-Volta River Authority .................................... ... June 23,1969 1979-94 6%% 6,000,00(
GuatemalaEducation ............................................................. December 16,1968 1979-94 6Y/% 6,300,00(
GuineaRailways . ............................................................ September 18,1968 1973-92 6%Y 64,500,00(
GuyanaSea Defenses .......................................................... September 27, 1968 1973-93 6%% 5,000,00(Education . ................................................ January 31,1969 1979-98 6Y2% 2,900,00(
IndiaAgriculture .... .................................................... June 18,1969 1979-99 6%% 13,000,00(Telecommunications .............................. _ ................. June 18, 1969 1979-98 6Y2% 27,500,00(
IranAgriculture ............................................................ April 18, 1969 1975-89 6%% 30,000,00(
Iran (Guarantor)Industry-Industrial and Mining Development Bank of Iran ............... May 28, 1969 1971-86 6%% 40,000,00(
Ireland (Guarantor)Power-Electricity Supply Board . .................... ....... March 24, 1969 1974-94 6Y2% 14,500,00(
Ivory Coast (Guarantor)Agriculture-Societe pour le Developpement et l'Exploitation du Palmier aHuile et Societe Palmivoire ............ ................................ June 13,1969 1975-90 6Y2% 3,300,001
Agriculture-Societe Palmindustrie et Societe Palmivoire ................ June 13,1969 1975-90 61/2% 4,800,001Agriculture-Societe pour le Developpement et I'Exploitationdu Palmier a Huile ................ .................................. June 13,1969 1975-90 6%% 9,000,00(
Jamaica (Guarantor)Water Supply-Water Commission, Kingston ...... ..................... May 14,1969 1973-89 6%% 5,000,001
Korea (Guarantor)Agriculture-Union Land Improvement Association ..... __ . ............ May 23,1969 1976-99 6Y2% 45,000,00(Industry-Korea Development Finance Corporation ........... .......... June 26, 1969 1971-86 6/2% 20,000,00(
LiberiaPorts ... ........ June 20, 1969 1971-84 62% 3,600,00(
(continued
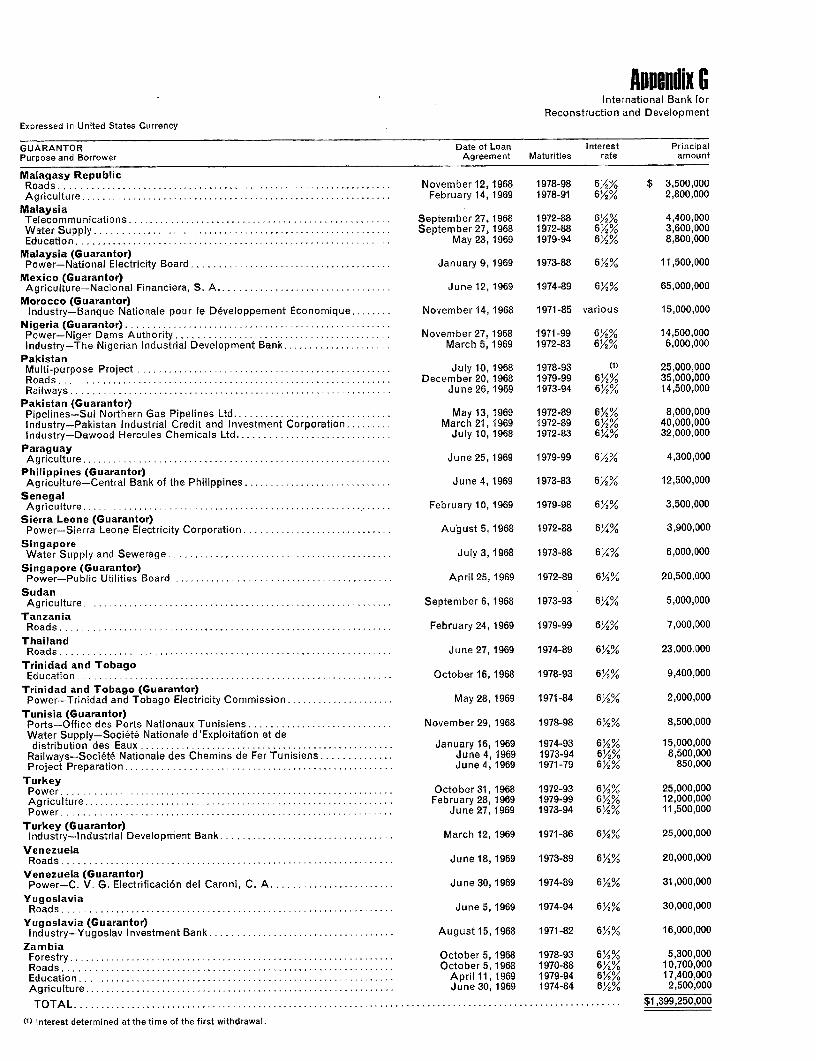
Aueendix GInternational Bank for
Reconstruction and DevelopmentExpressed in United States Currency
GUARANTOR Date of Loan Interest PrincipalPurpose and Borrower Agreement Maturities rate amount
Malagasy RepublicRoads ............... ............ ........ ........ November 12, 1968 1978-98 6/2% $ 3,500,000Agriculture ...................... .................................... February 14, 1969 1978-91 6y/2% 2,800,000
MalaysiaTelecommunications ........ ...... ..... September 27, 1968 1972-88 6/2% 4,400,000Water Supply................... ___ ................ September 27, 1968 1972-88 6Y2% 3,600,000Education ...... ........... ............. ................ May 23, 1969 1979-94 6Y2% 8,800,000
Malaysia (Guarantor)Power-National Electricity Board . ....................... __ ........ January 9, 1969 1973-88 6 /2% 11,500,000
Mexico (Guarantor)Agriculture-Nacional Financiera, S. A ............. I....... June 12, 1969 1974-89 6%% 65,000,000
Morocco (Guarantor)Industry-Banque Nationale pour le Developpement Economique ..... _ November 14, 1968 1971-85 various 15,000,000
Nigeria (Guarantor).Power-Niger Dams Authority ....... __ ................. __ .... November 27, 1968 1971-99 6/% 14,500,000Industry-The Nigerian Industrial Development Bank ...... .............. March 5, 1969 1972-83 6%2% 6,000,000
PakistanMulti-purpose Project . ............ ......................... July 10, 1968 1978-93 (') 25,000,000Roads ................ .... December 20, 1968 1979-99 62%Y 35,000,000Railways ................................................... __ ...... June 26, 1969 1973-94 6/%% 14,500,000
Pakistan (Guarantor)Pipelines-Sui Northern Gas Pipelines Ltd .... __ . ............ .... May 13, 1969 1972-89 6Y2% 8,000,000Industry-Pakistan Industrial Credit and Investment Corporation ........ March 21, 1969 1972-89 6 %A 40,000,000Industry-Dawood Hercules Chemicals Ltd........ __ . ................. July 10, 1968 1972-83 6%% 32,000,000
ParaguayAgriculture .......... .................... .................... June 25, 1969 1979-99 6%% 4,300,000
Philippines (Guarantor)Agriculture-Central Bank of the Philippines ................. ___ ..... June 4, 1969 1973-83 6%% 12,500,000
SenegalAgriculture ............................... ......................... February 10, 1969 1979-98 62 % 3,500,000
Sierra Leone (Guarantor)Power-Sierra Leone Electricity Corporation ....................... August 5, 1968 1972-88 6%% 3,900,000
SingaporeWater Supply and Sewerage ........ .............................. July 3, 1968 1973-88 6%% 6,000,000
Singapore (Guarantor)Power-Public Utilities Board ...... ...................... ...... April 25, 1969 1972-89 6Y% 20,500,000
SudanAgriculture ....... ............. September 6, 1968 1973-93 6%% 5,000,000
TanzaniaRoads ............................................. _...... February 24, 1969 1979-99 6%2% 7,000,000
ThailandRoads ................................ ..................... June 27, 1969 1974-89 6%% 23,000,000
Trinidad and TobagoEducation ............................................. __ .......... October 16, 1968 1978-93 6Y2% 9,400,000
Trinidad and Tobago (Guarantor)Power-Trinidad and Tobago Electricity Commission ........... ......... May 28, 1969 1971-84 6%% 2,000,000
Tunisia (Guarantor)Ports-Office des Ports Nationaux Tunisiens ........ ................... November 29, 1968 1978-98 62%% 8,500,000Water Supply-Societ6 Nationale d'Exploitation et de
distribution des Eaux ......... ....... ................... January 16, 1969 1974-93 6/2% 15,000,000Railways-Societe Nationale des Chemins de Fer Tunisiens . ............ June 4, 1969 1973-94 6/2% 8,500,000Project Preparation ............. .................. ....... June 4, 1969 1971-79 63.2% 850,000
TurkeyPower ........................................................... October31, 1968 1972-93 6 /2% 25,000,000Agriculture . ..................................... ............ February 28, 1969 1979-99 6X2% 12,000,000Power ................................ .............. ........... June 27, 1969 1973-94 6%% 11,500,000
Turkey (Guarantor)Industry-Industrial Development Bank ............................... March 12, 1969 1971-86 6Y2% 25,000,000
VenezuelaRoads ............................................ ___ .......... June 18, 1969 1973-89 6/2% 20,000,000
Venezuela (Guarantor)Power-C. V. G. Electrificaci6n del Caroni, C. A .............. ......... June 30, 1969 1974-89 6y2% 31,000,000
YugoslaviaRoads ..................................................... ........ June 5, 1969 1974-94 6%% 30,000,000
Yugoslavia (Guarantor)Industry-Yugoslav Investment Bank .................................... August 15, 1968 1971-82 6%% 16,000,000
ZambiaForestry ............. .............................................. October 5, 1968 1978-93 63Y2% 5,300,000Roads ..... .............................. ................... October 5, 1968 1970-88 632% 10,700,000Education ..... . . April 11, 1969 1979-94 6%2% 17,400,000Agriculture ... . ......................... ....... ... June 30, 1969 1974-84 6%z% 2,500,000
TOTAL. $1,399,250,000
(1) Interest determined at the time of the first withdrawal.

IDA Anpendices
Page
A Statement of Condition .......... ............... ........ .. 78B Comparative Statement of Income and Expenses ........... .. .. . 79C Statement of Holdings of Currencies and Obligations ....... . ... 80D Summary Statement of Development Credits ........... .... ... 82E Statement of Subscriptions, Voting Power and
Supplementary Resources ......... ............... ..... ... 83F Notes to Financial Statements ..... .......... ................. 85
OPINION OF INDEPENDENT AUDITOR ......... . ......... .. ........ 86
G Statement of Development Credits Signed During theFiscal Year 1968/69 . ........................................... 87
77
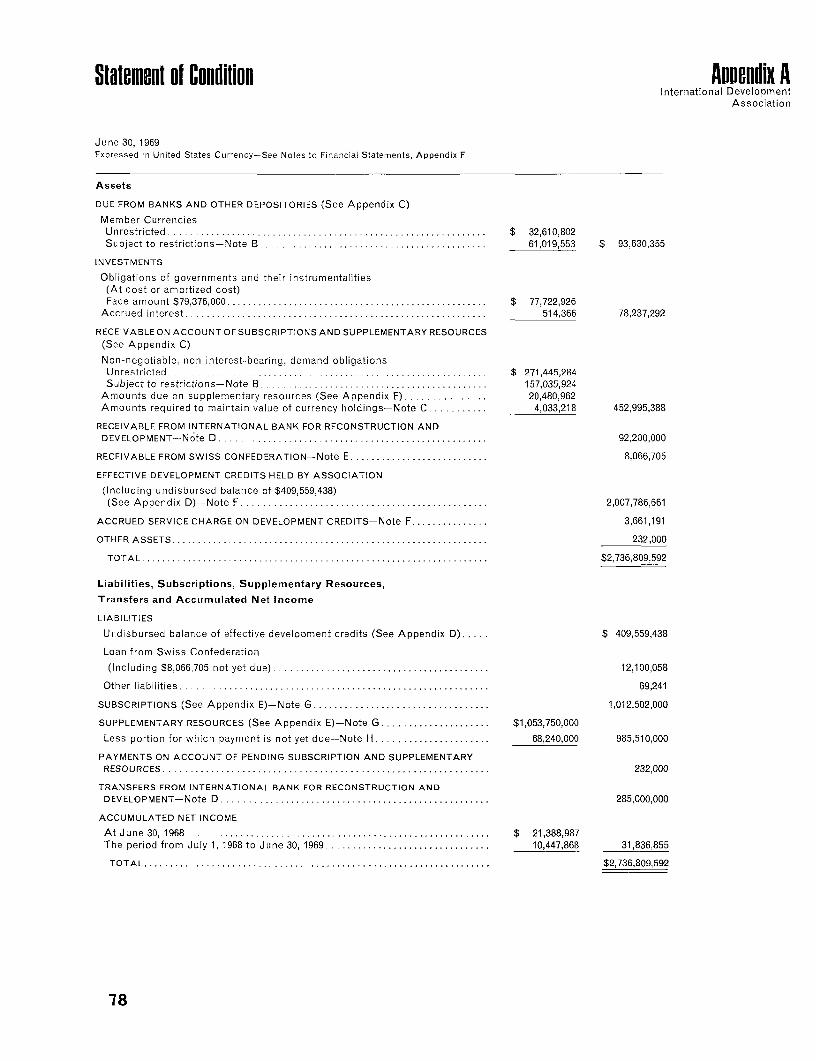
Statement of Condition Appendix AInternational Development
Association
June 30, 1969Expressed in United States Currency-See Notes to Financial Statements, Appendix F
Assets
DUE FROM BANKS AND OTHER DEPOSITORIES (See Appendix C)
Member CurrenciesUnrestricted .......... , .............................. $ 32,610,802Subject to restrictions-Note B ............................. ,,,,... 61,019,553 $ 93,630,355
INVESTMENTS
Obligations of governments and their instrumentalities(At cost or amortized cost)Face amount $79,376,000 ................................................... $ 77,722,926
Accrued interest ............................. 514,366 78,237,292
RECEIVABLEON ACCOUNT OF SUBSCRIPTIONS AND SUPPLEMENTARY RESOURCES(See Appendix C)
Non-negotiable, non-interest-bearing, demand obligationsUnrestricted. $ 271,445,284Subject to restrictions-Note B ............................................ 157,035,924
Amounts due on supplementary resources (See Appendix E) ............... 20,480,962Amounts required to maintain value of currency holdings-Note C 4,033,218 452,995,388
RECEIVABLE FROM INTERNATIONAL BANK FOR RECONSTRUCTION ANDDEVELOPMENT-Note D ......................... , , , , . . 92,200,000
RECEIVABLE FROM SWISS CONFEDERATION-Note E ........................... 8,066,705
EFFECTIVE DEVELOPMENT CREDITS HELD BY ASSOCIATION
(Including undisbursed balance of $409,559,438)(See Appendix D)-Note F ....................... , .......... 2,007,786,661
ACCRUED SERVICE CHARGE ON DEVELOPMENT CREDITS-Note F 3,661,191
OTHER ASSETS .................................. , . .... 232,000
TOTAL . .. $2,736,809,592
Liabilities, Subscriptions, Supplementary Resources,Transfers and Accumulated Net Income
LIABILITIES
Undisbursed balance of effective development credits (See Appendix D),,,,.. $ 409,559,438
Loan from Swiss Confederation
(Including $8,066,705 not yet due) ............. 12,100,058
Other liabilities ....................... ,,,,...............,.,........ 69,241
SUBSCRIPTIONS (See Appendix E)-Note G .......... 1,012,502,000
SUPPLEMENTARY RESOURCES (See Appendix E)-Note G ..................... $1,053,750,000
Less portion for which payment is not yet due-Note H ..................... 68,240,000 985,510,000
PAYMENTS ON ACCOUNT OF PENDING SUBSCRIPTION AND SUPPLEMENTARYRESOURCES ..................................................... . 232,000
TRANSFERS FROM INTERNATIONAL BANK FOR RECONSTRUCTION ANDDEVELOPMENT-Note D .................................................... 285,000,000
ACCUMULATED NET INCOME
At June 30, 1968 ........................ ,.,,.,.,................ $ 21,388,987The period from July 1, 1968 to June 30, 1969 .. 10,447,868 31,836,855
TOTAL ................. .......... , ............................... $2,736,809,592
78
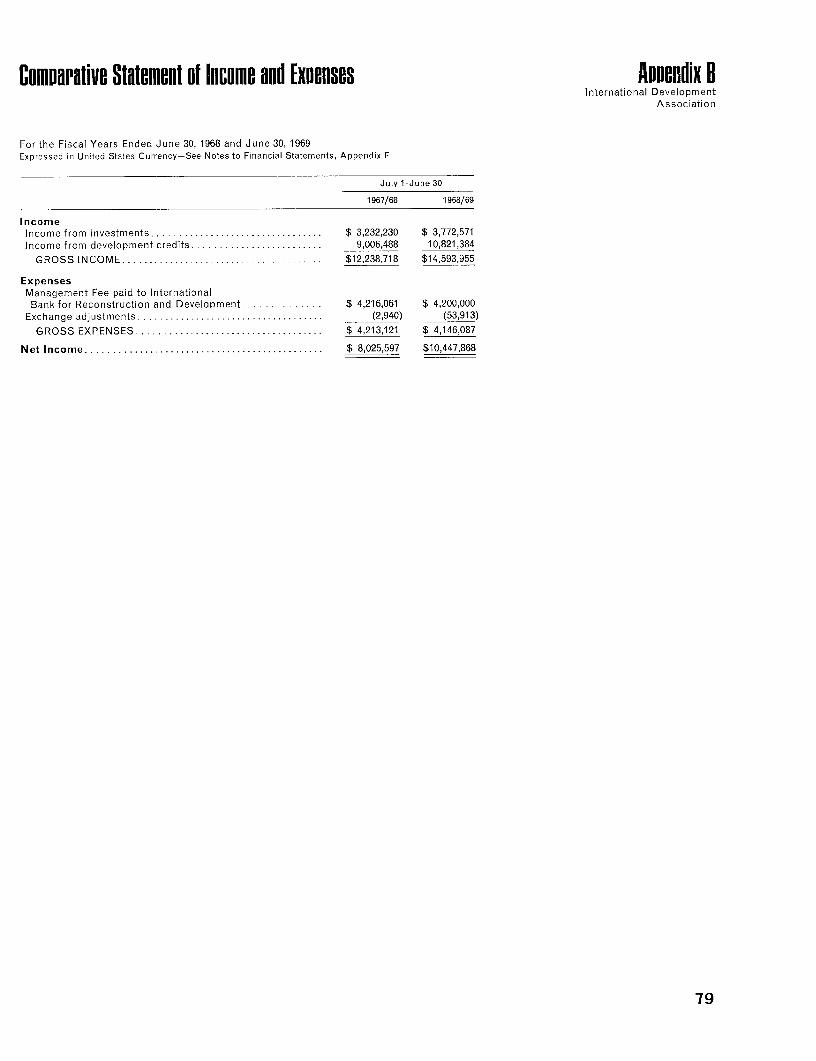
Comparative Statement of Income and Exoenses Appendix BInternational Development
Association
For the Fiscal Years Ended June 30, 1968 and June 30, 1969Expressed in United States Currency-See Notes to Financial Statements, Appendix F
July 1-June 30
1967/68 1968/69
IncomeIncome from investments ................................. $ 3,232,230 $ 3,772,571Income from development credits ......................... 9,006,488 10,821,384
GROSS INCOME ............ ......................... $12,238,718 $14,593,955
ExpensesManagement Fee paid to International
Bank for Reconstruction and Development .............. $ 4,216,061 $ 4,200,000Exchange adjustments .................................... (2,940) (53,913)
GROSS EXPENSES .................................... $ 4,213,121 $ 4,146,087
Net Income .............. ............................... $ 8,025,597 $10,447,868
79
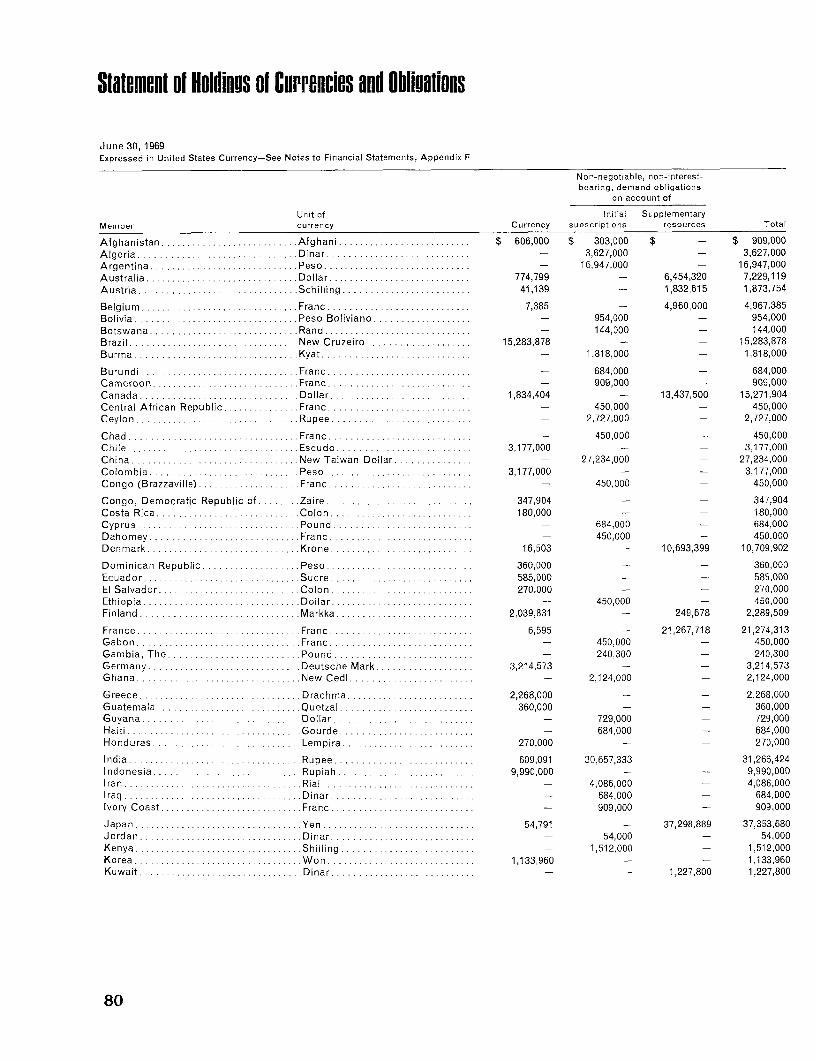
Statement of Holdinus of Currencies and Ohliuations
June 30, 1969Expressed in United States Currency-See Notes to Financial Statements, Appendix F
Non-negotiable, non-interest-bearing,' demand obligations
on account of
Unit of Initial SupplementaryMember currency Currency subscriptiona resources Total
Afghanistan ..... ......... Afghani ............. $ 606,000 $ 303,000 $ - $ 909,000Algeria ............ .... Dinar ...............- 3,627,000 - 3,627,000Argentina .......... ..... Peso . ..............- 16,947,000 - 16,947,000Australia ................ Dollar ................ 774,799 - 6,454,320 7,229,119Austria ................ Schilling...............41,139 -1,832,61 5 1,873,754
Belgium.................Franc ............... 7,385 - 4,960,000 4,967,385Bolivia ................. Peso Boliviano........ - 954,000 - 954,000Botswana................Rand . ..............- 144,000 - 1 44,000Brazil..................New Cruzeiro. ............ 15,283,878 - - 1 5,283,878Burma .............. ... Kyat . ..............- 1,818,000 - 1,818,000
Burundi . ........... ..... Franc .............. 684,000 - 684,000Carneroon................Franc ...............- 909,000 - 909,000Canada.................Dollar ............... 1,834,404 - 13,437,500 15,271,904Central African Republic.........Franc . ............- 450,000 - 450,000Ceylon .............. ... Rupee . .............- 2,727,000 - 2,727,000
Chad ........... .. ..... Franc ...............- 450,000 - 450,000Chile .. ............... Escudo .. ............ 3,177,000 - - 3,177,000China ............. ... .New Taiwan Dollar . .......- 27,234,000 - 27,234,000Colombia ............... .Peso................ 3,177,000 - - 3,177,000Congo (Brazzaville) ............ Franc ...............- 450,000 - 450,000
Congo, Democratic Republic of .. ... Zaire . ... ........... 347,904 - - 347,904Costa Rica .......... ..... Colon ............... 180,000 - - 180,000Cyprus. .... .... Pound. .... - 684,000 - 684,000Dahomey ...... .... ...... Franc ....... ...... - 450,000 - 450,000Denmark ................ .Krone ............... 16,503 - 1 0,693,399 10,709,902
Dominican Republic ........... Peso............... 360,000 -. - 360,000Ecuador, .. ............. Sucre. ............. 585,000 - - 585,000El Salvador ..... .... . ...... Colon ............... 270,000 - - 270,000Ethiopia ............ ...... Dollar ................- 450,000 450,000Finland ................. .Markka.............. 2,039,831 - 249,678 2,289,509
France .................. Franc .............. 6,595 - 21,267,718 21,274,313Gabon .................. Franc .............. - 450.000 - 450,000Gambia, The ............... Pound . .............- 240,300 - 240,300Germany ................. Deutsche Mark.......... 3,214,573 - - 3,21 4,573Ghana ......... ... .... New Cedi ..... ...... - 2,124,000 - 2,124,000
Greece .................. Drachma............. 2,268,000 - - 2,268,000Guatemala ............ ..... Quetzal ........ .... 360,000 -. - 360,000Guyana ................. Dollar .............. - 729,000 - 729,000Haiti. - ........... ...... Gourde ............. - 684,000 - 684,000Honduras ........... ...... Lempira. ... ......... 270,000 - - 270,000
India ............... ..... Rupee...............609,091 30,657,333 - 31,266,424Indonesia ................ .Rupiah.............. 9,990,000 - 9,990,000Iran ................... Rial ..... ......... - 4,086,000 - 4,086,000I raq ................ ..... Dinar .............. - 684,000 - 684,000Ivory Coast .... ... .. ...... .Franc ...............- 909,000 - 909,000Japan ............... ..... Yen ............... 54,791 - 37,298,889 37,353,680Jordan. ........ ........ Dinar .............. - 54,000 - 54,000Kenya .... ............... Shilling ............. - 1,512,000 - 1,512,000Korea. - ............... Won............... 1,133,960 - - 1,133,960Kuwait .................. Dinar .............. - - 1,227,800 1,227,800
80
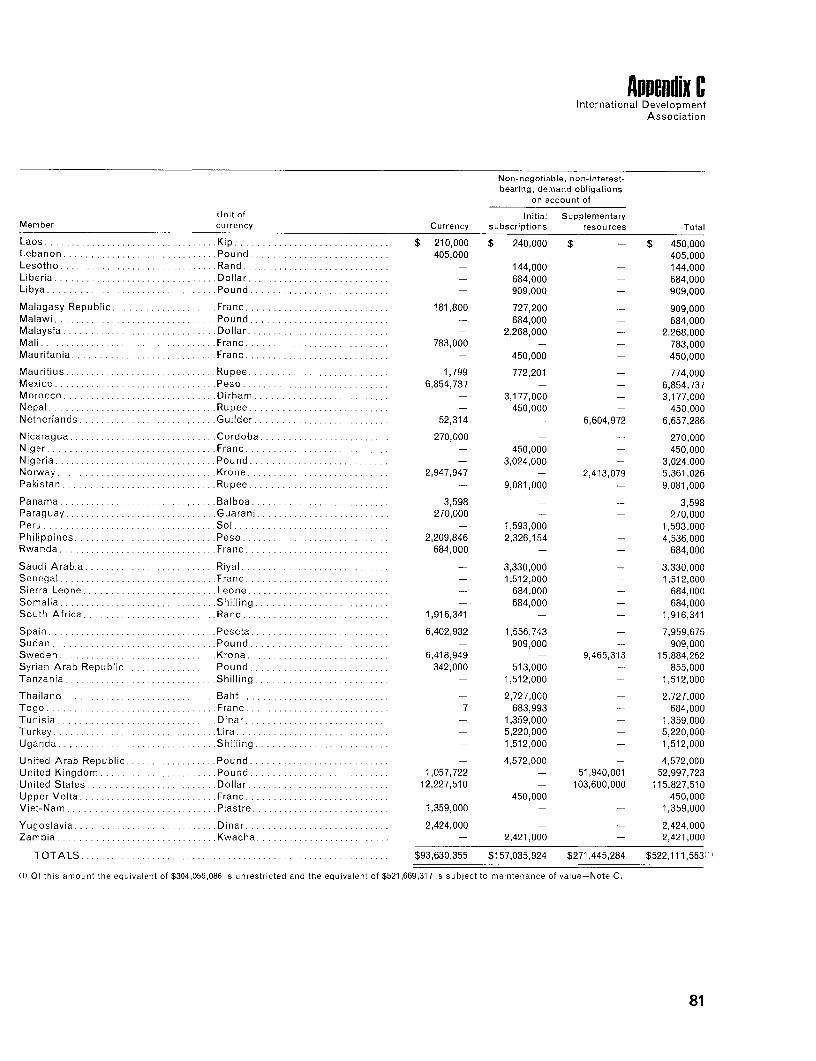
Appendix CInternational Development
Association
Non-negotiable, non-interest-bearing, demand obligations
on account of
Unit of Initial SupplementaryMember currency Currency subscriptions resources Total
Laos .................. Kip .. ... ...... $ 210,000 $ 240,000 $ - $ 450,000Lebanon, .............. Pound................405,000 - - 405,000Lesotho ............. ... Rand.......... ...... - 1 44,000 - 144,000Liberia ................. Dollar.................684,000 - 684,000Libya..................Pound ... ...........- 909,000 - 909,000
Malagasy Republic .. ...... ... Franc ............ .. 181,800 727,200 - 909,000Malawi .............. ... Pound . ....... ......- 684,000 - 684,000Malaysia ............ .... Dollar ............ ..- 2,268,000 - 2,268,000Mali . ............... .. Franc ............ .. 783,000 - - 783,000Mauritania ............... Franc ............ ..- 450,000 - 450,000
Mauritius. .......... ..... Rupee . ............. 1,799 772,201 - 774,000Mexico ................. Peso . .............. 6,854,737 - - 6,854,737Morocco .............. Dirham .............. - 3,177,000 - 3,177,000Nepal ............. .. Rupee . .............- 450,000 - 450,000Netherlands .......... .... Guilder .............. 52,314 - 6,604,972 6,657,286
Nicaragua ................ Cordoba............. 270,000 - - 270,000Niger ............. .. .. Franc ............ ..- 450,000 -450,000
Nigeria ................. Pound . .............- 3,024,000 - 3,024,000Norway ................ Kronie ............... 2,947,947 - 2,413,079 5,361,026Pakistan ........... ... Rupee . .............- 9,081,000 - 9,081,000
Panama ........ ..... ... Balboa . ............. 3,598 - - 3,598Paraguay. . .......... .... Guarani .............. 270,000 - - 270,000Peru .................. Sol .............. . - 1,593,000 - 1,593,000Philippines .............. Peso . .............. 2,209,846 2,326,154 - 4,536,000Rwanda ......... ... ... Franc ............... 684,000 - - 684,000
Saudi Arabia ....... ... ... Riyal . ..............- 3,330,000 - 3,330,000Senegal ............. ... Franc ..... . ........- 1,512,000 1,512,000Sierra Leone ............. Leone ...............- 684,000 - 684,000Somalia ............. ... Shilling . ............- 684,000 - 684,000South Africa........ ...... Rand .............. 1,916,341 - - 1,916,341
Spain ............... .. Peseta . ............. 6,402,932 1,556,743 - 7,959,675Sudan ................. Pound . .............- 909,000 - 909,000Sweden ......... .... .. ..Krona ............ .. 6,418,949 - 9,465,313 15,884,262Syrian Arab Republic... .. .... Pound . ............. 342,000 513,000 - 855,000Tanzania.. .. ... ... ....... Shilling ........... ..- 1,512,000 - 1,512,000
Thailandi ............ ..... Baht. . .... ........ - 2,727,000 - 2,727,000Togoa ................ Franc . ............ 7 683,993 - 684,000Tunisia ....... ....... Dinar ............... - 1,359,000 - 1,359,000Turkey .... .. ... ....... Lira ................ - 5,220,000 - 5,220,000Uganda.... ... ........... Shilling ........... - 1,512,000 - 1,512,000
United Arab Republic.... .. ..... Pound ..............- 4,572,000 4,572,000United Kingdom..... ......... Pound . ............. 1,057,722 - 51,940,001 52,997,723United States ..... .. ....... Dollar ............ .. 12,227,510 - 103,600,000 115,827,510Upper Volta. ............... Franc ...............- 450,000 - 450,000Viet-Nam ................ Piastre . ............. 1,359,000 - - 1,359,000
Yugoslavia. ................ Diner ............... 2,424,000 - - 2,424,000Zambia ................. Kwacha .............. - 2,421,000 - 2,421,000
TOTALS .......... _..................... $93,630,355 $1 57,035,924 $271,445,284 $522,111,563111
(II Of this amount the equivalent at $304,056,086 is unrestricted and the equivalent of $521,669,317 is subject to maintenance of value-Note C.
81
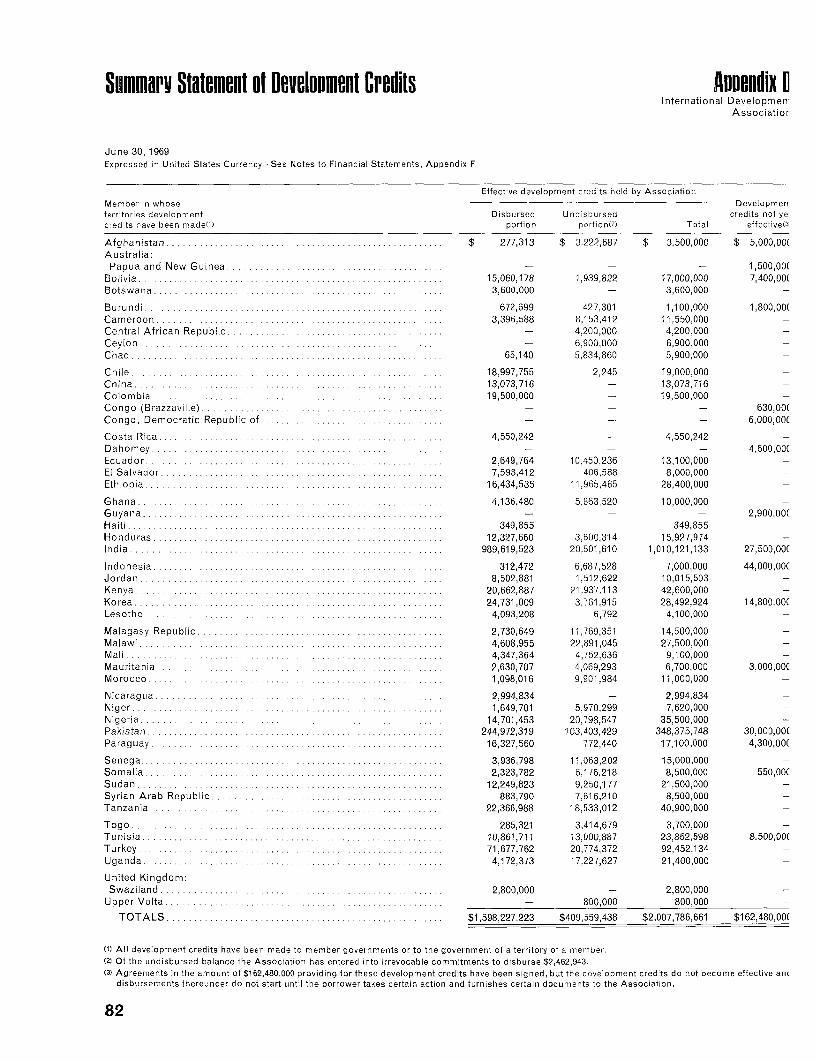
Summary Statement of Development Credits Apnendix IInternational Developmen
Associati or
June 30, 1969Expressed in United States Currency-See Notes to Financial Statements, Appendix F
Effective development credits held by AssociationMember in whose Developmenterritories deveiopment Disbirsed Undisbursed credits not yecredits have been made(U) portion portion(2) Total effective(3
Afghanistan ............................... ...................... $ 277,313 $ 3.222,687 $ 3,500,000 $ 5,000,00(Australia:Papua and New Guinea ......................................... - - - 1,500,00(
Bolivia .......................................................... 15,060,178 1,939,822 17,000,000 7,400,00(Botswanea ............................. 3,600,000 - 3,600,000
Burundi .......................................................... 672,699 427,301 1,100,000 1,800,00(Cameroon ............ ...................... ........... 3,396,588 8,153,412 11,550,000Central African Republic ............ - 4,200,000 4,200,000Ceylon. .............. .................................... - 6,900,000 6,900,000Chad .................... ...................................... 65,140 5,834,860 5,900,000
Chile .......................................................... 18,997,755 2,245 19,000,000China .................................. .............. ... 13,073,716 - 13,073,716Colombia 1.............. ...... ........ 19,500,000 19,500,000Congo (Brazzaville) ............................................. - - - 630,00(Congo, Democratic Republic of ............... .......... .......... - - - 6,000,00C
Costa Rica ... ........ ..................... .................... 4,550,242 - 4,550,242Dahomey ........ ............... - - - 4,600,00(Ecuador ................ 2.................................... 2,649,764 10,450,236 13,100,000El Salvador ....................................................... 7,593,412 406,588 8,000,000Ethiopia .................................. 16,434,535 11,965,465 28,400,000
Ghana .... ...................... 4,136,480 5,863,520 10,000,000Guyana ............................ ......................... - - - 2,900,00(Haiti ........ ....... ....................................... 349,855 - 349,855Honduras ......................................................... 12,327,660 3,600,314 15,927,974India .. ........................................... 989,619,523 20,501,610 1,010,121,133 27,500,00(
Indonesia ..................................... ................... 312,472 6,687,528 7,000,000 44,000,00CJordan .......................................................... 8,502,881 1,512,622 10,015,503Kenya .... .......... ..... ............ 20,662,887 21,937,113 42,600,000Korea ......................................... 24,731,009 3,761,915 28,492,924 1 4,800,00CLesotho ......................................................... 4,093,208 6,792 4,100,000
Malagasy Republic ........ ................. ............... 2,730,649 11,769,351 14,500,000Malawi ................ ............. .. .......... ..... 4,608,955 22,891,045 27,500,000Mali .. ...... ................................................. 4,347,364 4,752,636 9,100,000Mauritania ....................................................... 2,630,707 4,069,293 6,700,000 3,000,OOCMorocco ................... ....... ............ ........ 1,098,016 9,901,984 11,000,000
Nicaragua ...................................................... 2,994,834 - 2,994,834Niger 1,649,701 .5,970,299 7,620,000N i e . . . .. . . . . . . . . . . . . . . .. .. . . . . . .. .. . .. . . . . . . . .. . . . . . .. . . . . . , 4 , 0 , 7 , 9 , 2 , 0 Nigeria .......................... .............. ............ 14,701,453 20,798,547 35,500,000Pakistan ......................................................... 244,972,319 103,403,429 348,375,748 30,000,00(Paraguay .............................................. 16,327,560 772,440 17,100,000 4,300,00(
Senegal .................................................. .... 3,936,798 11,063,202 15,000,000Somalia ......................................................... 2,323,782 6,'76,218 8,500,000 550,00CSudan .. , 12,249,823 9,250,177 21,500,000Syrian Arab Republic ............................................. 883,790 7,616,210 8,500,000Tanzania .................... ................................... 22,366,988 18,533,012 40,900,000
Togo . ........................... 285,321 3,414,679 3,700,000 -Tunisia .......................................................... 10,861,711 13,000,887 23,862,598 8,500,00CTurkey ........ .................................................. 71,677,762 20,774,372 92,452,134Uganda ........................................ 4,172,373 17,227,627 21,400,000
United Kingdom:Swaziland .......................... ...................... 2,800,000 - 2,800,000
Upper Volta .................................... ................. - 800,000 800,000
TOTALS ...................................................... $1,598,227,223 $409,559,438 $2,007,786,661 $162,480,00(
(1) All development credits have been made to member governments or to the government of a territory of a member.(2) Of the undisbursed balance the Association has entered into irrevocable commitments to disburse $2,462,943.(3) Agreements in the amount of $162,480,000 providing for these development credits have been signed, but the development credits do not become effective anc
disbursements thereunder do not start until the borrower takes certain action and furnishes certain documents to the Association.
82
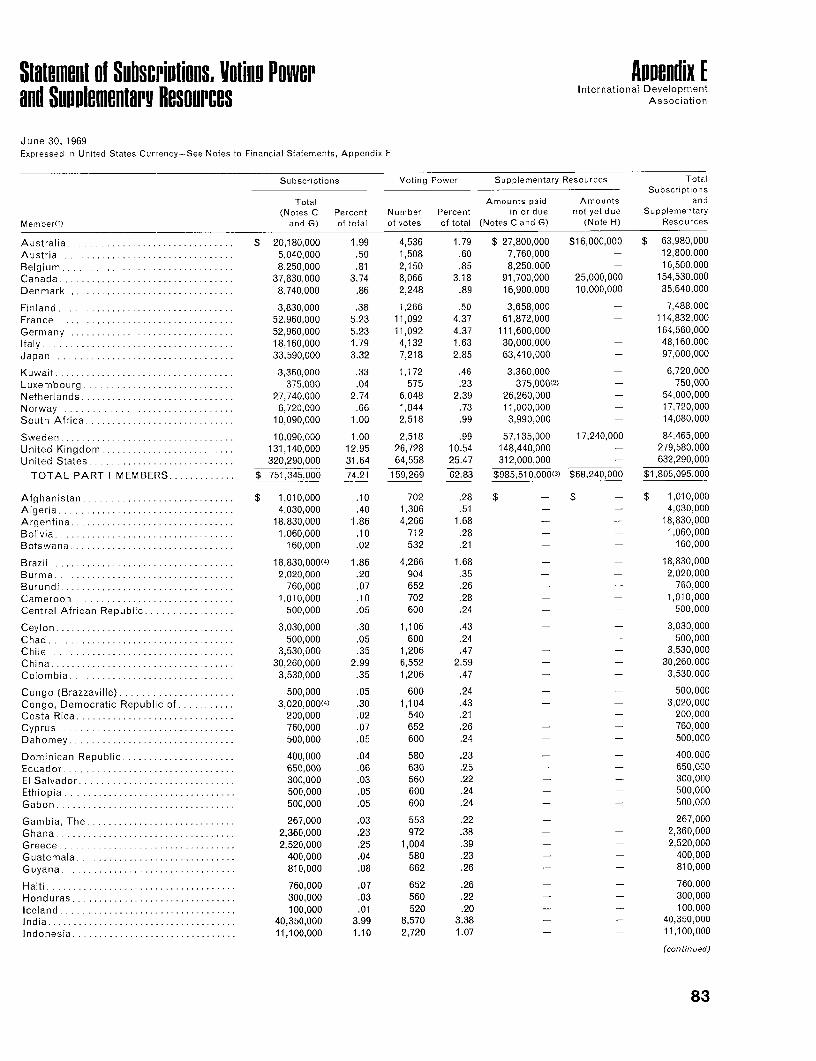
Statemenl of Subscrirtions. Voting Power Appendix [International Developmentand Supplementary Resources Association
June 30, 1969Expressed in United States Currency-See Notes to Financial Statements, Appendix F
Subscriptions Voting Power Supplementary Resources TotalSubscriptions
Total Amounts paid Amounts and(Notes C Percent Number Percent in or due not yet due Supplementary
Member(1) and G) of total of votes of total (Notes C and G) (Note H) Resources
Australia . ........................ $ 20,180,000 1.99 4,536 1.79 $ 27,800,000 $16,000,000 $ 63,980,000Austria .. 5,040,000 .50 1,508 .60 7,760,000 - 12,800,000Belgium .. 8,250,000 .81 2,150 .85 8,250,000 - 16,500,000Canada .. 37,830,000 3.74 8,066 3.18 91,700,000 25,000,000 154,530,000Denmark .. 8,740,000 .86 2,248 .89 16,900,000 10,000,000 35,640,000
Finland .... .... ....................... 3,830,000 .38 1,266 .50 3,658,000 - 7,488,000France .52,960,000 5.23 11,092 4.37 61,872,000 - 114,832,000Germany .52,960,000 5.23 11,092 4.37 111,600,000 - 164,560,000Italy ................... 18,160,000 1.79 4,132 1.63 30,000,000 - 48,160,000Japan .33,590,000 3.32 7,218 2.85 63,410,000 - 97,000,000
Kuwait . .. ... 3,360,000 .33 1,172 .46 3,360,000 - 6,720,000Luxembourg .375,000 .04 575 .23 375,000(2) - 750,000Netherlands .27,740,000 2.74 6,048 2.39 26,260,000 - 54,000,000Norway ................................ 6,720,000 .66 1,844 .73 11,000,000 - 17,720,000South Africa .10,090,00 10,090,000 1.00 2,518 .99 3,990,000 - 14,080,000
Sweden .. . ............... 10,090,000 1.00 2,518 .99 57,135,000 17,240,000 84,465,000United Kingdom 131,140,000 12.95 26,728 10.54 148,440,000 - 279,580,000United States .320,290,000 31.64 64,558 25.47 312,000,000 - 632,290,000
TOTAL PART I MEMBERS .$ 751,345,000 74.21 159,269 62.83 $985,510,000(3) $68,240,000 $1,805,095,000
Afghanistan .$ 1,010,000 .10 702 .28 $ - $ - $ 1,010,000Algeria .. 4,030,000 .40 1,306 .51 - - 4,030,000Argentina . .18,830,000 1.86 4,266 1.68 - - 18,830,000Bolivia .. 1,060,000 .10 712 .28 - - 1,060,000Botswana .............................. 160,000 .02 532 .21 - - 160,000
Brazil ................................ 18,830,OOt4t 1.86 4,266 1.68 - - 18,830,000Burma . ......................... 2,020,000 .20 904 .35 - - 2,020,000Burundi . .760,000 .07 652 .26 - - 760,000Cameroon r , 1 , 00t.......... 1,010,000 .10 702 .28 - - 1,010,000Central African Republic . .500,000 .05 600 .24 - - 500,000
Ceylon ................. 3,030,000 .30 1,106 .43 - - 3,030,000Chad ................ 500,000 .05 600 .24 - - 500,000Chile .. 3,530,000 .35 1,206 .47 - - 3,530,000China .. 30,260,000 2.99 6,552 2.59 - - 30,260,000Colombia 3,530 0. 00 ....... 3,530,000 .35 1,206 .47 - - 3,530,000
Congo (Brazzaville) . .500,000 .05 600 .24 - - 500,000Congo, Democratic Republic of . .3,020,000(4) .30 1,104 .43 - - 3,020,000Costa Rica . .200,000 .02 540 .21 - - 200,000Cyprus . .760,000 .07 652 .26 - - 760,000Dahomey .500,000 .05 600 .24 - - 500.000
Dominican Republic . .400,000 .04 580 .23 - - 400,000Ecuador . .650,000 .06 630 .25 - - 650,000El Salvador . .300,000 .03 560 .22 - - 300,000Ethiopia . .500,000 .05 600 .24 - - 500,000Gabon ......................... 500,000 .05 600 .24 - - 500,000
Gambia, The .267,000 .03 553 .22 - - 267,000Ghana .............. 2,360,000 .23 972 .38 - - 2,360,000Greece . . ............................. 2,520,000 .25 1,004 .39 - - 2,520,000Guatemala .400,000 .04 580 .23 - - 400,000Guyana .810,000 .08 662 .26 - - 810,000
Haiti .760,000 .07 652 .26 - - 760,000Honduras .300,000 .03 560 .22 - - 300,000Iceland .100,000 .01 520 .20 - - 100,000India .40,350,000 3.99 8,570 3.38 - - 40,350,000Indonesia .11,100,000 1.10 2,720 1.07 - - 11,100,000
(continued)
83
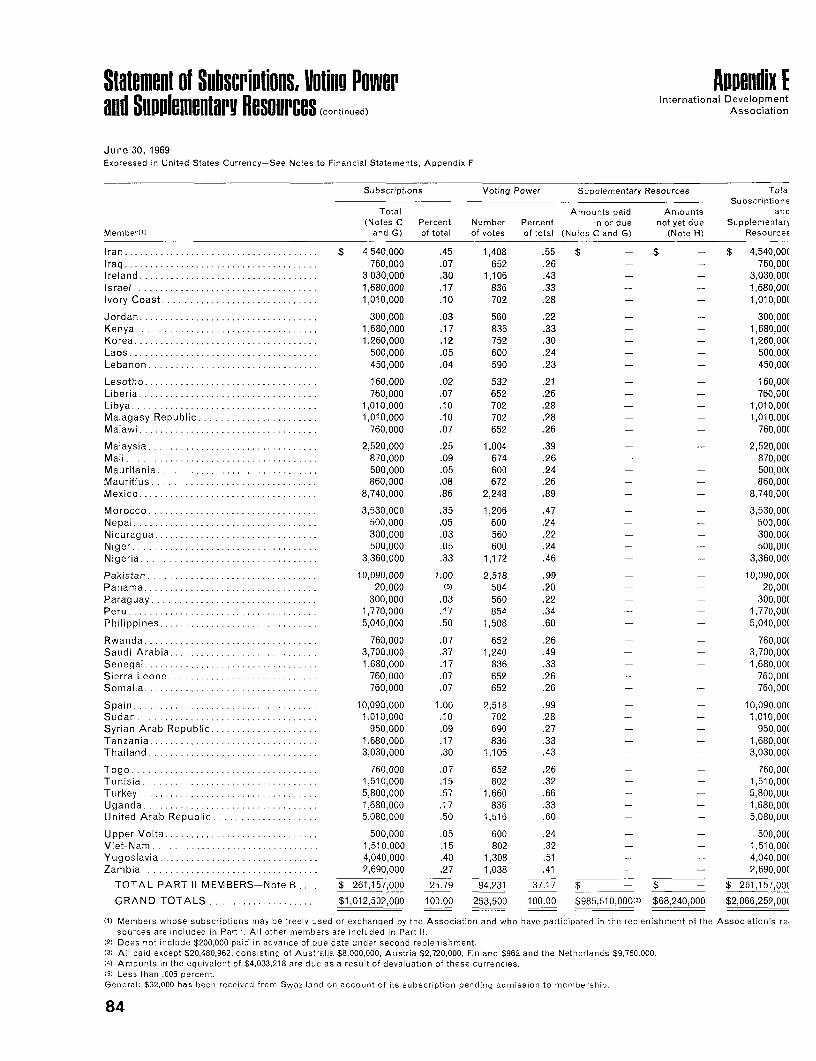
Statement of Suhscriptions, Voting Power Appendix EInternational DevelopmentBud SuppIemeniarY Resources (continued) Association
June 30, 1969Expressed in United States Currency-See Notes to Financial Statements, Appendix F
Subscriptions Voting Power Supplementary Resources TotaSubscriptions
Total Amounts paid Amounts anc(Notes C Percent Number Percent in or due not yet due Supplementart
Member(1) and G) of total of votes of total (Notes C and G) (Note H) ResourceE
Iran .$ 4,540,000 .45 1,408 .55 $ - $ - $ 4,540,00(Iraq ................... 760,000 .07 652 .26 - - 760,00(Ireland ............ ..... 3,030,000 .30 1,106 .43 - - 3,030,00(Israel .... ,,,, ..........,,.,........ 1,680,000 .17 836 .33 - - 1,680,00(Ivory Coast ................ 1,010,000 .10 702 .28 - - 1,010,00(
Jordan ................. 300,000 .03 560 .22 - - 300,00(Kenya 1,6 8 0,0 0 0 ..................... 1,680,000 .17 836 .33 - - 1,680,00(Korea ............................ 1,260,000 .12 752 .30 - - 1,260,00(Laos .. 500,000 .05 600 .24 - - 500,00(Lebanon . .450,000 .04 590 .23 - - 450,00(
Lesotho .160,000 .02 532 .21 - - 160,001Liberia .760,000 .07 652 .26 - - 760,00(Libya .................................... 1,010,000 .10 702 .28 - 1,010,00(Malagasy Republic ....................... 1,010,000 .10 702 .28 - - 1,010,00(Malawi .760,000 .07 652 .26 - - 760,00(
Malaysia ................. 2,520,000 .25 1,004 .39 - - 2,520,00(Mali .. 870,000 .09 674 .26 - - 870,00(Mauritania . .500,000 .05 600 .24 - - 500,00(Mauritius.................. 860,000 .08 672 .26 - - 860,00(Mexico . .8,740,000 .86 2,248 .89 - - 8,740,00(
Morocco .3,530,000 .35 1,206 .47 - - 3,530,00(Nepal .500,000 .05 600 .24 - - 500,00(Nicaragua .300,000 .03 560 .22 - - 300,00(Niger .................................... 500,000 .05 600 .24 - - 500,00(Nigeria. 3 ....... ........................ 3,360,000 .33 1,172 .46 - - 3,360,00(
Pakistan .10,090,000 1.00 2,518 .99 - 10,090,00(Panama .20,000 (5) 504 .20 - - 20,00(Paraguay .300,000 .03 560 .22 - - 300,00(Peru .1,770,000 .17 854 .34 - - 1,770,00(Philippines .5 040,000 5,040,000 .50 1,508 .60 - - 5,040,00(
Rwanda .760,000 .07 652 .26 - - 760,00(Saudi Arabia .3,700,000 .37 1,240 .49 - - 3,700,00(Senegal ......... ........................ 1,680,000 .17 836 .33 - - 1,680,00(Sierra Leone .760,000 .07 652 .26 - - 760,00(Somalia .760,000 .07 652 .26 - - 760,00(
Spain .10,090,000 1.00 2,518 .99 - - 10,090,00(Sudan ............ 1.010,000 .10 702 .28 - - 1,010,00(Syrian Arab Republic .950,000 .09 690 .27 - - 950,00(Tanzania. 1,680,000 .17 836 .33 - - 1,680,00(Thailand .3,030,000 .30 1,106 .43 - - 3,030,00(
Togo .760,000 .07 652 .26 - - 760,00(Tunisia ........................... . 1,510,000 .15 802 .32 - - 1,510,00(Turkey. 5 ................................. 5,800,000 .57 1,660 .66 - - 5,800,00(Uganda. 1,680,000 1,680,000 .17 836 .33 - - 1,680,00(United Arab Republic .5,080,000 .50 1,516 .60 - - 5,080,00(
Upper Volta .500,000 .05 600 .24 - - 500,00(Viet-Nam 1,510,000 ......... 1,510,000 .15 802 .32 - - 1,510,00(Yugoslavia 4,040,000 .40 1,308 .51 - - 4,040,00(Zambia..................................2,690,000 .27 1,038 .41 - - 2,690,00(
TOTAL PART II MEMBERS-Note B $ 261,157,000 25.79 94,231 37.17 $ - $ - $ 261,157,00(
GRAND TOTALS. ............. $1,012,502,000 100 .00 253,500 100.00 $985,510,000D31 $68,240,000 $2,066,252,00(
(1) Members whose subscriptions may be freely used or exchanged by the Association and who have participated in the replenishment of the Association's resources are included in Part 1. All other members are included in Part 11.
(2) Does not include $200,000 paid in advance of due date under second replenishment.(3) All oaid except 520,480,962, consist ng of Australia $8,000,000, Austria $2,720,000, Finland $962 and the Netherlancs $9,760,000.(4) Amounts in the equivalent of $4,033,218 are due as a result of devaluation of these currencies.(5) Less than .005 percent.General: $32,000 has been received frcm Swaziland on account of its subscription pending admission to membership.
84
Notes to Financial Statements Appendix FInternational Development
Association
June 30, 1969
Note A have been initially disbursed or exchanged are expressed in terms of United States
Amounts in currencies other than United for the currency of another member. dollars of the weight and fineness in effect
States dollars have been translated into SupplementaryresourcesoftheAssociation on January 1,1960.Umted~ ~ ~ ~ ~~~~~ ~u ptaeme ntryrsolceltaheAsscato
United States dollars: have, by agreement, the same respective Note H
(i) In the cases of 73 members, at the par rights and obligations as to maintenance of These supplementary resources are to he
values as specified in the "Schedule of Par value as are set forth in Article IV, Section received from the following members:
Values", published by the International 2, of the Articles of the Association. $25,000,000 from Canada to be paid in fiscalMonetary Fund; The equivalent of $4,033,218 is due from two year 1970 (see "General" below);
(ii) In the cases of the remaining 29 mem- members in order to maintain the value of $10,000,000 from Denmark to be paid in thebers [Algeria, Argentina, Bolivia, Brazil, the Association's currency holdings as re- fiscal years 1970 and 1971;Cameroon, Central African Republic, Chad, quired under Article IV, Section 2. $17,240,000 from Sweden to be paid in the
Chile, China, Colombia, Congo (Brazza- fiscal years 1970 and 1971; and
ville), Democratic Republic of Congo, Note D $16,000,000 from Australia to be paid in theDahomey, Gabon, Indonesia, Ivory Coast, The International Bank for Reconstruction fiscal years 1970 and 1971 (see 'General"Korea, Laos, Malagasy R,epublic, Mali, and Development has authorized transfers, below).Mauritania, Mauritius, Niger, Paraguay, by way of grants, to the Association totalingPeru, Senegal, Togo, Upper Volta and $285,000,000 from the net income of the Bank GeneralViet-Nam], at the rates used by such mem- for the fiscal years ended June 30, 1964, The Board of Governors has authorized the
bers in making payments of subscriptions 1965, 1966, 1967 and 1968. Of this amount, Association to accept from Part I Countriesto the Association. $192,800,000 has been received as of June additional contributions as a second replen-
Note B 30, 1969. ishment of the resources of the Association
Pursuant to Article IV, Section 1 (a), these Note E aggregating $1,188 million in freely convert-amounts may be used by -the Association The Association has entered into an agree- ible currencies in three equal instalments.for administrative expenses incurred by the ment to borrow SwF 52 million (approxi- The second replenishment became effectiveAssociation in the territories of any member mately US equivalent $12.1 million) from on July 23, 1969. The first instalment will bewhose currency is involved and, insofar as the Swiss Confederation. Of this amount payable on August 22, 1969 and the otherconsistent with sound monetary policies, in SwF 17.3 million had been received prior to two will be payable on or before November 8paymentfor goods and services produced in June 30,1969; an additional SwF 17.3 million in each of the years 1969 and 1970. In addi-the territories of such member and required was received in July 1969and the balancewill tion, the Government of Norway has agreedfor projects financed by the Association and be received in July 1970. The loan carries no to make a supplementary contribution oflocated in such territories; and in addition interest and is repayable in forty annual in- $1,320,000.
when and to the extent justified by the eco- stalments beginning July 1, 1979. The first The following Governments have made con-
nomic and financial situation of the member ten instalments will be at 1% each of the tributions in advance of the effective date of
concerned as determined by agreement be- principal amount and the remaining thirty the second replenishment:tween the member and the Association, instalments will be at 3o, of such prin-such currency shall be freely convertible or cipal amount. Amountotherwise usable for projects financed by (in miilions)the Association and located outside the Note F Australia $24.00territories of the member. The principal disbursed and outstanding on Austria $ 2.72
development credits and the accrued service Canada $75.00Note C charge are expressed in terms of United Denmark $ 4.40
Under Article IV, Section 2, each member is States dollars of the weight and fineness in Finland $ 1.36required, if the par value of its currency is effect on January 1, 1960 and the equivalent Gernrany $39.00
reduced or the foreign exchange value of its is payable by the borrowers in currencies Japan $22.16
currency has in the opinion of the Associa- which the Association determines to be Netherlands $ 9.76
tion depreciated to a significant extent with- freely convertible or freely exchangeable by Norway $ 4.40
in that member's territories, to maintain the the Association forcurrencies of other mem- Sweden $ 9.88
value of the Association's holdings of its bers of the Association, except that such United Kingdom $51.84
ninety percent currency, including the prin- amount would be reduced if (a) there is acipal amount of any notes substituted there- uniform proportionate reduction in the par Denmark, Germany, Japan, Norway, Swedenfor, and the Association is required if the values of the currencies of all members of and the United Kingdom have paid their en-
par value of the member's currency is in- the International Monetary Fund or (b) the tire advance contributions, Finland has paid
creased, or the foreign exchange value of Association so decides because of a sub- substantially all of its advance contributionsthe member's currency has in the opinion stantial reduiction in the value of one or more and Canada has paid its first two instal-
of the Association appreciated to a signifi- major currencies of members. The foregoing ments totaling $50 million. These contribu-
cant extent within that member's territories, does not apply to a credit of $9,000,000 tions are deemed to constitute the entire
to return to the member the increase in the which is expressed and is repayable in legal contributions of Australia and Canada and
va ue of such ninety percent currency held tender dollars. the first instalments of Austria, Denmark,by the Association: provided, however, that Finland, Germany, Japan, Netherlands, Nor-the foregoing shall apply only so long as and Note G way, Sweden and the United Kingdom under
to the extent that such currency shall not Subscriptions and supplementary resources the second replenishment.
85
ODinion of Independent Auditor Financial Statements Coveredby the Foregoing DOinion
1707 L STREET, N.W.WASHINGTON, D.C. 20036
AUGUST 1, 1969
ToINTERNATIONAL DEVELOPMENT ASSOCIATIONWASHINGTON, D.C.
In ouropinion,theaccompanyingfinancial statements presentfairly, Statement of Condition .. .................. Appendix A (page 78)in terms of United States currency, the financial position of Interna-tional Development Association at June 30, 1969, and the results of Comparative Statement of Income andits operations for the year then ended, in conformity with generally Expenses ............. Appendix B (page 79)accepted accounting principles applied on a basis consistent with Statement of Holdings of Currencies andthat of the preceding year. Our examination of these statements Obligations ........ Appendix C (page 80)was made in accordancewith generally accepted auditing standards,and accordingly included such tests of the accounting records and Summary Statement of Development Credits.Appendix D (page 82)such other auditing procedures as we considered necessary in Statement of Subscriptions, Voting Powerthe circumstances. and Supplementary Resources ............ Appendix E (page 83)
Notes to Financial Statements .............. Appendix F (page 85)PRICE WATERHOUSE & CO.
86
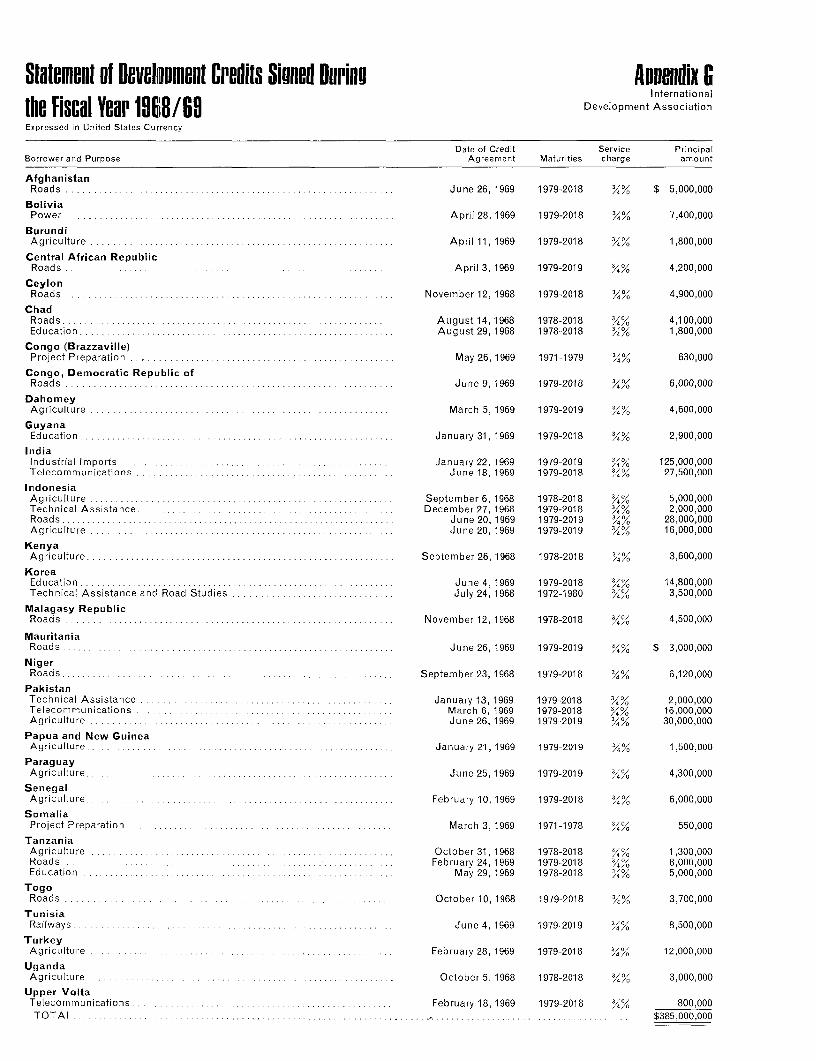
Stalement of Develnopment Credits Signed Durini Appendix Gthe fiscal Year 10Of8I6f Development AssociationExpressed in United States Currency
Date of Credit Service PrincipalBorrower and Purpose Agreement Maturities charge amount
AfghanistanRoads ............................... .June 26, 1969 1979-201 8 3/% 5,000,000
BoliviaPower ..................... ........... April 28, 1969 1979-2018 Y4 Y 7,400,000
Buru ndiAgriculture ........................... ..... April 1 1, 1969 1979-2018 Y4 Y 1,800,000
Central African RepublicRoads . ... April 3, 1969 1979-2019 3/4 Y 4,200,000
CeylonRoads ...................... ...... ..... November 12, 1968 1979-2018 Y4% 4,900,000
ChadRoads ................ ...... .......... August 14, 1968 1978-2018 %% 4,100,000Education ... .. . ....................... August 29, 1968 1978-2018 Y4% 1,800,000
Congo (Brazzaville)Project Preparation ......................... May 26, 1969 1971-1979 %% 630,000
Congo, Democratic Republic ofRoads............ .................... June 9, 1969 1979-2018 Y4% 6,000,000
DahomeyAgriculture................................ March 5, 1969 1979-2019 3403 4,600,000
GuyanaEducation ...................... ...... .... January 31, 1969 1979-2018 40Y 2,900,000
IndiaIndustrial Imports ........................... January 22, 1969 1979-2019 %% 125,000,000Telecommunications ...................... June 18, 1969 1979-2018 1%3 27,500,000
IndonesiaAgriculture ........ .............. .. ...... September 6, 1968 1978-2018 Y4 5,000,000Technical Assistance ... .............. ...... December 27, 1968 1979-201 8 %/4% 2,000,000Roads ................... ............... June 20, 1969 1979-2019 Y4o% 28,000,000Agriculture ......... .. ......... . ... June 20, 1969 1979-2019 3/43 16,000,000
KenyaAgriculture..................... ....... ..... September 26, 1968 1978-2018 3400. 3,600,000
KoreaEducation ..... . ................ ....... June 4, 1969 1979-2018 %4~ 14,800,000Technical Assistance and Road Studies ...... ... ... . .. July 24, 1968 1972-1980 3400 3,500,000
Malagasy RepublicRoads . . ...... ......... ...... .... November 12, 1968 1978-2018 3403 4,500,000
MauritaniaRoads ............................. J une 26, 1969 1979-2019 Y, $ 3,000,000
NigerRoads . ... ... . ......... ............ .. September 23, 1968 1979-2018 3// 6,120,000
PakistanTechnical Assistance .... ........ I...January 13, 1969 1979-2018 Y4 % 2,000,000Telecommnunications ..... ... ... ...... ... ..... March 6, 1969 1979-2018 34 % 16,000,000Agriculture ...... .. ........ ..... . ....... Juna 26, 1969 1979-2019 % 30,000,000
Papua and New GuineaAgriculture .......... I........... .. January 21, 1969 1979-2019 %%1,500,000
ParaguayAgriculture. . .. .... .... . ........... June 25, 1969 1979-2019 Y4 4,300,000
SenegalAgriculture .......... ........ .. ..... February 10, 1969 1979-2018 34 % 6,000,000
SomaliaProject Preparation . . ..... March 3, 1969 1971-1978 Y4 % 550,000
TanzaniaAgriculture ..... ...... .. .. October 31, 1968 1978-2018 Y4%1,300,000
Roads .. . ....... ....... .... .. February 24, 1969 1979-2018 Y4O% 8,000,000Education . .... . .. ....... .... May 29, 1969 1978-2018 34 % 5,000,000
TogoRoads ..... .... ........ October 10, 1968 1979-2018 3/4% 3,700,000
TunisiaRailways .... ... . ...... I.... ..... June 4, 1969 1979-2019 3403 8,500,000
TurkeyAgriculture ..... .... February 28, 1909 1979-2018 Y4% 12,000,000
UgandaAgriculture. . October 5, 1968 1978-2018 %0 3,000,000
Upper VoltaTelecommunications ...... ...... ............. February 18, 1969 1979-2018 34 800,000
TO TA L ... . .. . . . . . . . . . . . . . . . . . . . . . . . . .. . . . . . . - . . . . . .I . . .$385,000,000

Bank/IDA Ampendices
Page
1 Bank Loans and IDA Credits by Purpose and Area .......... 902 Bank Loans and IDA Credits by Country .................. ....... 923 Administrative Budgets of the Bank and IDA ...................... 944 Governors and Alternates of the Bank and IDA ....... ........... 955 Executive Directors and Alternates of the Bank and IDA and their
Voting Power ... . ............................................ 976 Principal Officers and Department Directors of the Bank and IDA., 98
89
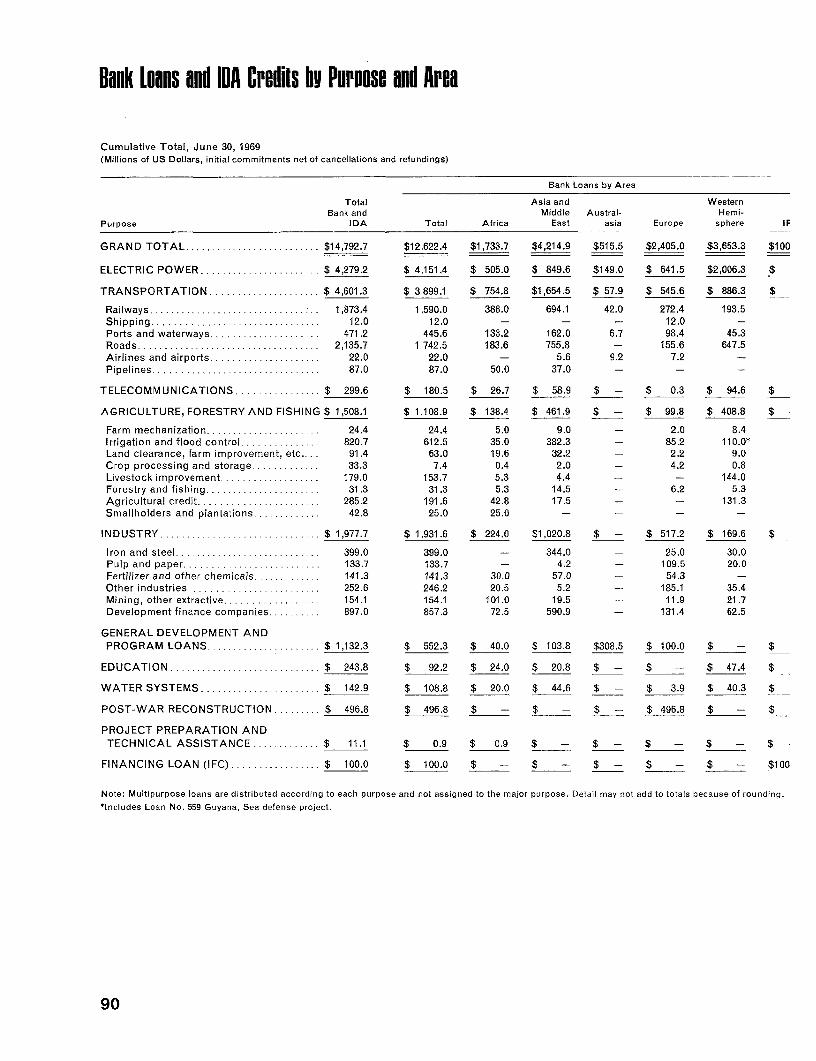
Bank loans and IDA Credits by Purnose and Area
Cumulative Total, June 30, 1969(Millions of US Dollars, initial commitments net of cancellations and refundings)
Bank Loans by Area
Total Asia and WesternBank and Middle Austral- Hemi-
Purpose IDA Total Africa East asia Europe sphere IF
GRAND TOTAL .......................... $14,792.7 $12,622.4 $1,733.7 $4,214.9 $515.5 $2,405.0 $3,653.3 $100
ELECTRIC POWER .... .................. $ 4,279.2 $ 4,151.4 $ 505.0 $ 849.6 $149.0 $ 641.5 $2,006.3 $
TRANSPORTATION ... ................. $ 4,601.3 $ 3,899.1 $ 754.8 $1,654.5 $ 57.9 $ 545.6 $ 886.3 $
Railways ............... ................ 1,873.4 1,590.0 388.0 694.1 42.0 272.4 193.5Shipping ............................... 12.0 12.0 - - - 12.0 -Ports and waterways ..................... 471.2 445.6 133.2 162.0 6.7 98.4 45.3Roads ............................. 2,135.7 1,742.5 183.6 755.8 - 155.6 647.5Airlines and airports ..................... 22.0 22.0 - 5.6 9.2 7.2 -
Pipelines ...................... ........ 87.0 87.0 50.0 37.0 - - -
TELECOMMUNICATIONS . ....... $ 299.6 $ 180.5 $ 26.7 $ 58.9 $ - $ 0.3 $ 94.6 $
AGRICULTURE, FORESTRY AND FISHING $ 1,508.1 $ 1,108.9 $ 138.4 $ 461.9 $ - $ 99.8 $ 408.8 $
Farm mechanization ...................... 24.4 24.4 5.0 9.0 - 2.0 8.4Irrigation and flood control ............... 820.7 612.5 35.0 382.3 - 85.2 110.0*Land clearance, farm improvement, etc... . 91.4 63.0 19.6 32.2 - 2.2 9.0Crop processing and storage ............. 33.3 7.4 0.4 2.0 - 4.2 0.8Livestock improvement ................... 179.0 153.7 5.3 4.4 - 144.0Forestry and fishing ...................... 31.3 31.3 5.3 14.5 - 6.2 5.3Agricultural credit ....................... 285.2 191.6 42.8 17.5 - 131.3Smaliholders and plantations ............. 42.8 25.0 25.0 - - -
INDUSTRY ........................ ...... $ 1,977.7 $ 1,931.6 $ 224.0 $1,020.8 $ - $ 517.2 $ 169.6 $
Iron and steel ............................ 399.0 399.0 - 344.0 - 25.0 30.0Pulp and paper ......................... 133.7 133.7 - 4.2 - 109.5 20.0Fertilizer and other chemicals ............. 141.3 141.3 30.0 57.0 - 54.3 -
Other industries ......................... 252.6 246.2 20.5 5.2 - 185.1 35.4Mining, other extractive .................. 154.1 154.1 101.0 19.5 11.9 21.7Development finance companies .......... 897.0 857.3 72.5 590.9 - 131.4 62.5
GENERAL DEVELOPMENT ANDPROGRAM LOANS... ................... $ 1,132.3 $ 552.3 $ 40.0 $ 103.8 $308.5 $ 100.0 $ - $
EDUCATION ............................ $ 243.8 $ 92.2 $ 24.0 $ 20.8 $ - $ - $ 47.4 $
WATER SYSTEMS .... .................. $ 142.9 $ 108.8 $ 20.0 $ 44.6 $ - $ 3.9 $ 40.3 $
POST-WAR RECONSTRUCTION ......... $ 496.8 $ 496.8 $ - $ - $ - $ 496.8 $ - $
PROJECT PREPARATION ANDTECHNICAL ASSISTANCE .......... $ 11.1 $ 0.9 $ 0.9 $ - $ $ - $ - $
FINANCING LOAN (IFC) ................. $ 100.0 $ 100.0 $ - $ - $ - $ - $ - $100
Note: Multipurpose loans are distributed according to each purpose and not assigned to the major purpose. Detail may not add to totals because of rounding.'includes Loan No. 559 Guyana, Sea defense project.
90
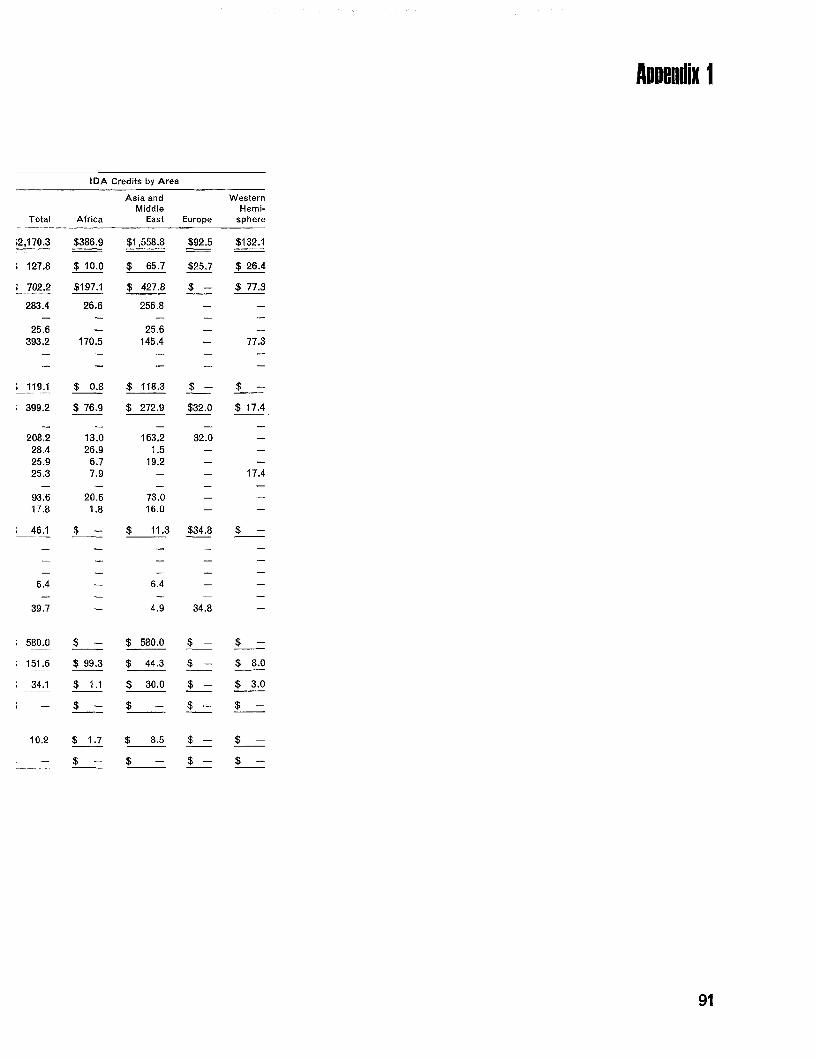
AnneRdix 1
IDA Credits by Area
Asia and WesternMiddle Hemi-
Total Africa East Europe sphere
;2,170.3 $386.9 $1,558.8 $92.5 $132.1
127.8 $ 10.0 $ 65.7 $25.7 $ 26.4
702.2 $197.1 $ 427.8 $ - $ 77.3
283.4 26.6 256.8 - -
25.6 - 25.6 -393.2 170.5 145.4 - 77.3
119.1 $ 0.8 $ 118.3 $ - $ -
399.2 $ 76.9 $ 272.9 $32.0 $ 17.4
208,2 13.0 163.2 32.028.4 26.9 1.5 -25.9 6.7 19.2 -25.3 7.9 - - 17.4
93.6 20.6 73.0 -17.8 1.8 16.0 -
46.1 $ - $ 11.3 $34.8 $
6.4 - 6.4 -
39.7 - 4.9 34.8
580.0 $ - $ 580.0 $ - $ -
151.6 $ 99.3 $ 44.3 $ - $ 8.0
34.1 $ 1.1 $ 30.0 $ - $ 3.0
- $ - $ - $ $
10.2 $ 1.7 $ 8.5 $ - $
-$ - $ - $ - $ -
91
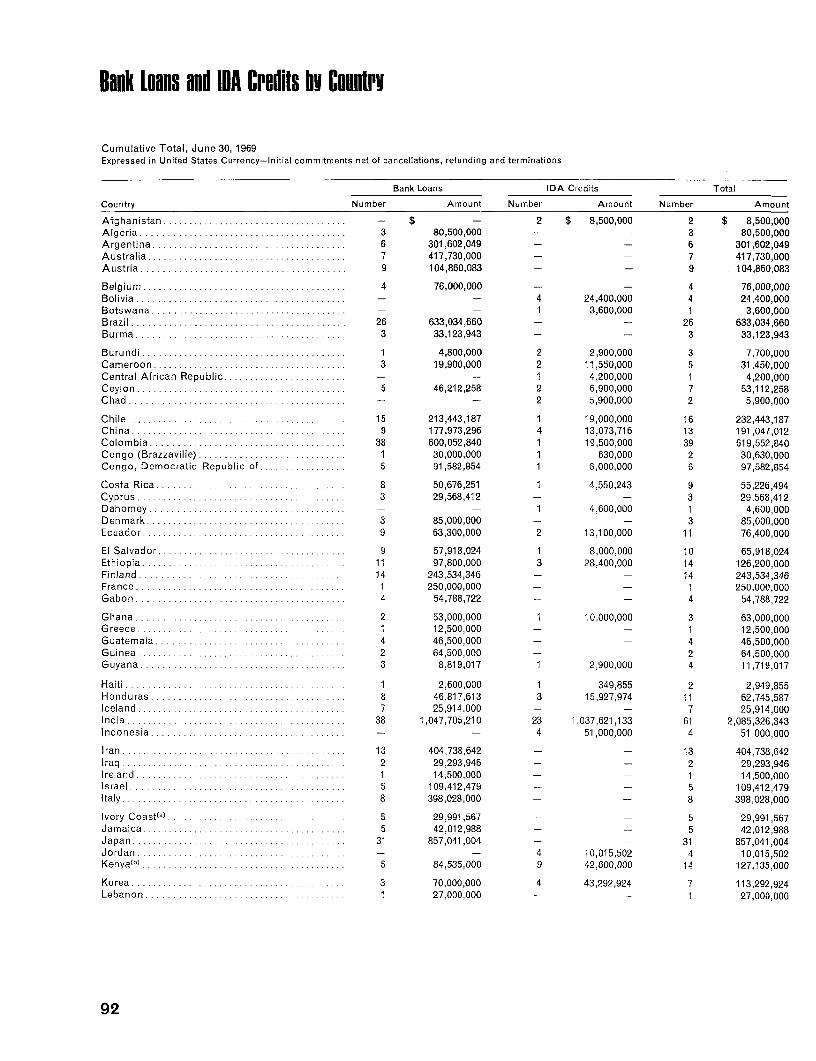
Bank loans and IDA Credits hY Coenirv
Cumulative Total, June 30, 1969Expressed in United States Currency-Initial commitments net of cancellations, refunding and terminations
Bank Loans IDA Credits Total
Country Number Amount Number Amount Number Amount
Afghanistan .................................... - $ - 2 $ 8,500,000 2 $ 8,500,000Algeria ........................................ 3 80,500,000 - - 3 80,500,000Argentina ................................. 6 301,602,049 - - 6 301,602,049Australia ....................................... 7 417,730,000 - - 7 417,730,000Austria .... ................................... 9 104,860,083 - - 9 104,860,083
Belgium .4 76,000,000 - - 4 76,000,000Bolivia ......................................... - - 4 24,400,000 4 24,400,000Botswana .................. ................... - - 1 3,600,000 1 3,600,000Brazil .26 633,034,660 - - 26 633,034,660Burma ........................................ 3 33,123,943 - - 3 33,123,943
Burundi ................................. ...... 1 4,800,000 2 2,900,000 3 7,700,000Cameroon ...................................... 3 19,900,000 2 11,550,000 5 31,450,000Central African Republic ....................... - - 1 4,200,000 1 4,200,000Ceylon ......................................... 5 46,212,258 2 6,900,000 7 53,112,258Chad ......................................... - - 2 5,900,000 2 5,900,000
Chile ......................................... 15 213,443,187 1 19,000,000 16 232,443,187China ......................................... 9 177,973,296 4 13,073,716 13 191,047,012Colombia .................................... 38 600,052,840 1 19,500,000 39 619,552,840Congo (Brazzaville) ............................. 1 30,000,000 1 630,000 2 30,630,000Congo, Democratic Republic of ................. 5 91,582,854 1 6,000,000 6 97,582,854
Costa Rica ............. 8 50,676,251 1 4,550,243 9 55,226,494Cyprus ................... .................... 3 29,568,412 - - 3 29,568,412Dahomey ...................................... - - 1 4,600,000 1 4,600,000Denmark ...................................... 3 85,000,000 - - 3 85,000,000Ecuador ....................................... 9 63,300,000 2 13,100,000 11 76,400,000
El Salvador ..................................... 9 57,918,024 1 8,000,000 10 65,918,024Ethiopia ....................................... 11 97,800,000 3 28,400,000 14 126,200,000Finland ....................................... 14 243,534,346 - - 14 243,534,346France ......................................... 1 250,000,000 - - 1 250,000,000Gabon ....................................... 4 54,788,722 - - 4 54,788,722
Ghana ......................................... 2 53,000,000 1 10,000,000 3 63,000,000Greece .......... 1 12,500,000 - - 1 12,500,000Guatemala ..................................... 4 46,500,000 - - 4 46,500,000Guinea ........................................ 2 64,500,000 - - 2 64,500,000Guyana ........... ............................ 3 8,819,017 1 2,900,000 4 11,719,017
Haiti ......................................... 1 2,600,000 1 349,855 2 2,949,855Honduras ............. _ ..................... 8 46,817,613 3 15,927,974 11 62,745,587Iceland ......................................... 7 25,914,000 - - 7 25,914,000India ......................................... 38 1,047,705,210 23 1,037,621,133 61 2,085,326,343Indonesia ..... .. .... _ .. ..... - - 4 51,000,000 4 51,000,000
Iran ....................... __................ 13 404,738,642 - - 13 404,738,642Iraq ......................................... 2 29,293,946 - - 2 29,293,946Ireland ........................................ 1 14,500,000 - - 1 14,500,000Israel ......................................... 5 109,412,479 - - 5 109,412,479Italy .............................. ....... 8 398,028,000 - - 8 398,028,000
Ivory Coast(,) .............................. .. 5 29,991,567 - 5 29,991,567Jamaica .............. ......................... 5 42,012,988 - - 5 42,012,988Japan ......... ............... ........ ....... 31 857,041,004 - - 31 857,041,004Jordan .......... ............................ - - 4 10,015,502 4 10,015,502Kenya(b) ....................... . .... 5 84,535,000 9 42,600,000 14 127,135,000
Korea ......................................... 3 70,000,000 4 43,292,924 7 113,292,924Lebanon ................ ...................... 1 27,000,000 - - 1 27,000,000
92
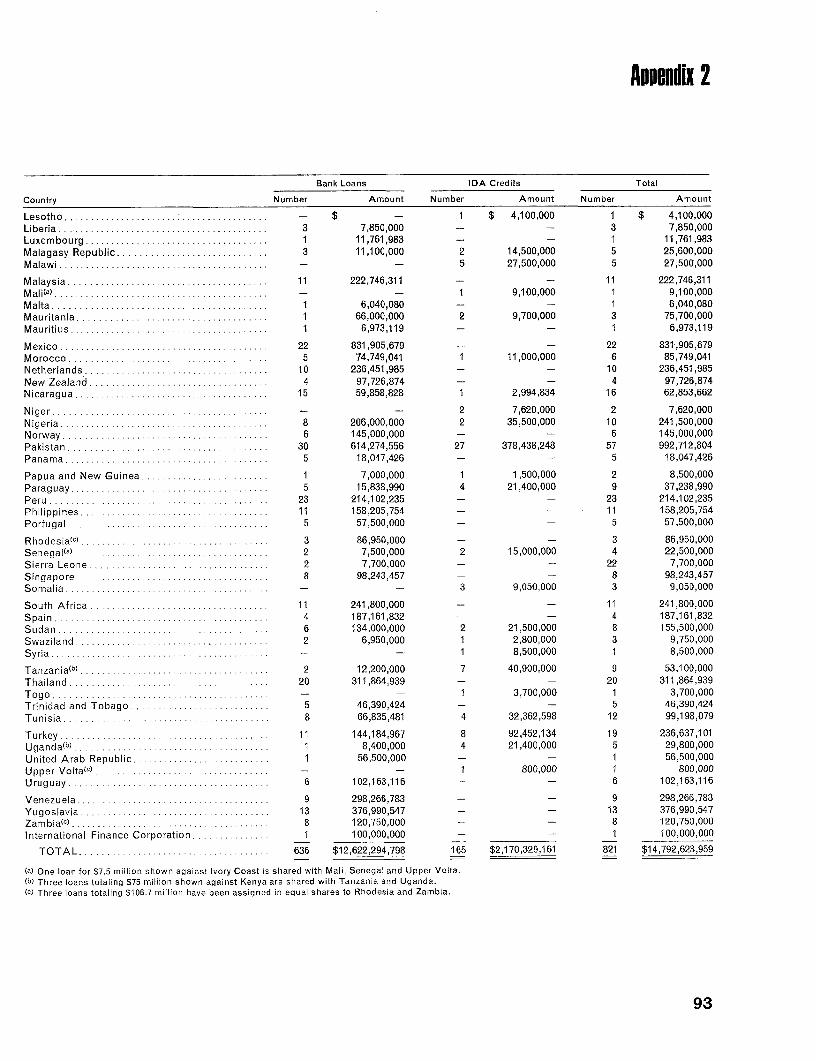
Appendix 2
Bank Loans IDA Credits Total
Country Number Amount Number Amount Number Amount
Lesotho . ... : - $ - 1 $ 4,100,000 1 $ 4,100,000Liberia ....................................... 3 7,850,000 - - 3 7,850,000Luxembourg .................................. 1 11,761,983 - - 1 11,761,983Malagasy Republic ............................. 3 11,100,000 2 14,500,000 5 25,600,000Malawi ....................................... - - 5 27,500,000 5 27,500,000
Malaysia ................. ................... 11 222,746,311 - - 11 222,746,311Mali(,) ........ - - 1 9,100,000 1 9,100,000
Malta ........................ ....... 1 6,040,080 - - 1 6,040,080M auritania ................................... 1 66,000,000 2 9,700,000 3 75,700,000Mauritius ............ ............... 1 6,973,119 - - 1 6,973,119
Mexico ... ............................. ....... 22 831,905,679 - - 22 831,905,679Morocco ... ................................ 5 74,749,041 1 11,000,000 6 85,749,041Netherlands ................................... 10 236,451,985 - - 10 236,451,985New Zealand ................................... 4 97,726,874 - - 4 97,726,874Nicaragua ................. ................... 15 59,858,828 1 2,994,834 16 62,853,662
Niger ........... .......--- ...... . 2 7,620,000 2 7,620,000Nigeria ....................................... 8 206,000,000 2 35,500,000 10 241,500,000Norway ..................................... 6 145,000,000 - - 6 145,000,000Pakistan ................. ................... 30 614,274,556 27 378,438,248 57 992,712,804Panama ......-........................... 5 18,047,426 - - 5 18,047,426
Papua and New Guinea ............ ........... 1 7,000,000 1 1,500,000 2 8,500,000Paraguay ............................... .... 5 15,838,990 4 21,400,000 9 37,238,990Peru . . ....... 23 214,102,235 - - 23 214,102,235Philippines .......- ....... .. 11 158,205,754 - - 11 158,205,754Portugal .................. 5 57,500,000 - - 5 57,500,000
Rhodesia( C) .............. ........... ... 3 86,950,000 - - 3 86,950,000Senegal(a) .................. ................. 2 7,500,000 2 15,000,000 4 22,500,000Sierra Leone . ............ ........ .... 2 7,700,000 - - 22 7,700,000Singapore ................................ 8 98,243,457 - - 8 98,243,457Somalia ................... .. ... ...... - - 3 9,050,000 3 9,050,000
South Africa ................. ....... ..... 11 241,800,000 - - 11 241,800,000Spain ..................................... 4 187,161,832 - - 4 187,161,832Sudan ........... .......... ...... 6 134,000,000 2 21,500,000 8 155,500,000Swaziland .......... ............. ... 2 6,950,000 1 2,800,000 3 9,750,000Syria ..................... .... .. .... - - 1 8,500,000 1 8,500,000
Tanzania(b) .......... .................... 2 12,200,000 7 40,900,000 9 53,100,000Thailand .............................. .... 20 311,864,939 - - 20 311,864,939Togo ......... ............. ........ ...... - - 1 3,700,000 1 3,700,000Trinidad and Tobago ............ ........... .. 5 46,390,424 - - 5 46,390,424Tunisia ......... ......... ......... .... 8 66,835,481 4 32,362,598 12 99,198,079
Turkey .......................... ............ 11 144,184,967 8 92,452,134 19 236,637,101Uganda(b) . ...... .... . ........... 1 8,400,000 4 21,400,000 5 29,800,000United Arab Republic ......................... 1 56,500,000 - - 1 56,500,000Upper Volta(a) ............ . .... ..t ....... - - 1 800,000 1 800,000Uruguay ................................... 6 102,163,116 - - 6 102,163,116
Venezuela ....... .............. ......... . 9 298,266,783 - - 9 298,266,783Yugoslavia ...................... .....e 13 376,990,547 - - 13 376,990,547Zambia(c ) ................................ ...... 8 120,750,000 - - 8 120,750,000International Finance Corporation 1............... 100,000,000 - - 1 100,000,000
TOTAL... 636 $12,622,294,798 165 $2,170,329,161 821 $14,792,623,959
(a) One loan for $7.5 million shown against Ivory Coast is shared with Mali, Senegal and Upper Volta.(b) Three loans totaling $75 million shown against Kenya are shared with Tanzania and Uganda.(") Three loans totaling $106.7 million have been assigned in equal shares to Rhodesia and Zambia.
93
Administrative Budsets of the Bank and IDA Appendix 3For the Fiscal Year Ending June 30,1970
Actual Expenses Budgets1969 1970
(thousands of US Dollars)
BY ORGANIZATIONAL UNITBoard of Governors ............................ 699 763Executive Directors ................... 1,880 2,326Office of the President ., 983 1,030Area departments .............................. 9,083 13,512Projects departments .................. 12,154 18,187Development Finance Companies Department .. 652 1,114Economic Staff. .................... 3,856 4,741Controller's and Treasurer's Departments,
Internal Auditor ............... ,.,,..... 2,419 3,121Administration Department .................... 5,625 7,198Other departments ....... ..................... 4,681 5,322Training programs, EDI ....................... 1,598 1,664Settlement of Investment Disputes, ICSID ....... 69 84Grants for consultants to member countries ._ 510 272Commission on international development .. 627 240
Reimbursement to IFC ........................ 689 676Contingency allowance -.......... ...... , 865
TOTALS. .......................... 45,525 61,116
BY EXPENSE CATEGORYPersonal services .......................... 28,531 38,463Operational travel ...... .................... 3,967 4,792Other travel .......................... 2,468 3,038Representation. ................. , , 301 322Consultants ............................... 1,553 2,762Contractual services .................. , .. 658 618Printing ............ ,,,,,,................. 609 612Office occupancy .............................. 2,482 3,801Communications ............................... 1,204 1,366Cooperative programs, FAO and Unesco ........ 1,702 2,431
Grants for consultants to member countries. 510 272Other expenses. ......................... 1,540 2,639
Bank .................... ,,,,,,,,,,,......... 41,325 45,316IDA ......................................... 4,200 15,800
TOTALS ...... .. ,. . 45,525 61,116
The Administrative Budgets for the fiscal year ending June 30, 1970, were preparedby the President and approved by the Executive Directors in accordance with theBy-Laws ofthe Bankand IDA. For purposes of comparisonthe administrative expensesincurred during the fiscal year ended June 30, 1969, are also showni.
The Association reimburses the Bank a single Management Fee for administrativeexpenses incurred on its behalf. After being held at about $4.2 million forthreeyears,the Management Fee, which comprises the Association's Budget for the year, hasbeen established at $15.5 million for the fiscal year ending June 30, 1970.
94
Governors and Alternates ADDendix 4of the Hank and IDAJune 30, 1969
Member Governor Alternate
Afghanistan...Mohammed Enwer Ziyaie......Abdul Aziz AtayeeAlgeria .... Cherif Belkracem...........Kamal Abdellsth KhodiaArgentina ............. Egidio lannella ........... Ernesto MalaccortoAustralia..............William McMahon..........Sir Roland WilsonAustria............ Stephan Koran ........... Walter NeuddrterBelgium .............. Barorn Snoy et d'Oppuers ... . Hubert AnsiauxBolivia.............I-Oscar Vega L6pez..........Enrique Vargas GuzmAnBotswana ............. M. K. Segokgo ........... S. W. AssaelBrazil ............... Antonio Delfim Netto ........ Ernane Galv6asBurma ... .... I......U Kyaw Nyein ..... ...... U Chit MoungBu rundi .J............ oseph Hicuburundi...... .. Bonus KamwenubusaCamveroon ............. Laurent Ntamag ............ M. KoullaCanada.........Edgar John Benson.........A. B. HockinCentral Af rican Republic ...... Louis Alazoula ........... Andr6 Zanift&TouambonaCeylon...............U. B. Wanninayake .... . . . Murugeysen RajendraChad ............... Georges Diguimbaye ........ Jean NendiguiChile................Curios Macsad Abud ........ Jorge Marshall SileaChina ..... ....... Kuo-Hwa YuColombia ............. Abd6n Espinosa Valderrama.....Jorge Meifa-PalacloCongo (Brazzaville).........Bernard Banza Bouiti ........ Jean MoumbouliCongo, Democratic Republic of. .... Victor Nendaka.... ........ Cyrille AdoulaCosta Rica.............Omar Dengo 0 ........ Alvaro Verges E.Cyprus...............A. C. Patsal idesDahomey ............. Stanislas Kpognon ........ Guy PognonDenmnark..............Otto MG.ller ............. Karl Otto BredahiDominican Republic. ...... Di6genes H. FernAndez. .. ... Luis M. Guerrero G6mezEcuador .............. Benito Ottati ....... .... Carios Mantilla-OrtegaEl Salvador.. .......... Edgardo SuArez C .... _...Armando InterianoEthiopia .............. Mammo Tadesse....Moulatou KassayeFinland ....... Mauno Koivisto.......... . Jussi LinnamoFrance...............Minister of Finance ........ ~.Bernard ClappierGabon .. .......... Edouard Alexiz M'Bouy-Boutzit....Albert ChavihotGambia, The...........S. M. Dibba.............H. R. Monday, Jr.Germany..............Karl Schiller.............Franz Joset StraussGhana...............Joseph Henry Mensah. ...... E. N. OmaboeGreece...............John Rodinos-Orlandos.......Achilles CominosGuaremTala.............Mario Fuentes Pieruccini ...... Jos6 Luis BouscayrolGuinea .............. Lammna Kond ......... _ N'Faly SangarLsGuyana .............. P. A. Reid ............ _H. 0. E. BarkerHaiti ............... Clovis Desinor ........... Antonio Andr6Honduras.............Manuel Acosta Bonilla........Ricardo Z6fiiga AugustinusIceland...............Gylfi Gislason............Maganfs J6nssonIndia ....... I... .. . G. Patel(l)............C. S. Swaminathanir)Indonesia ............. Ali Wardhana............Djoeana KoesoemohardiaIran .......... ..... Jamshid Amouzegar ........ Jahangir AmuzegarIraq ................ Amin Abdul Karim Kalawnchi.....Sa'adi IbrahimIreland...............Charles J. Haughey ......... C. H. MurrayIsrael ............... David Horowitz ........... Jacob ArnonItaly ................ Guido Carli.............Paolo BaffiIvory Coast.............Konan Bkdi6 ~. ......... Mohamed DiawaraJamaical ...... ....... Edward Seaga............G. Arthur BrownJapan...............Takeo Fukuda............Makoto UsamiJordan...............Hatim S. Zu'bi ........... Adel ShamaylehKenya ............... J. S. Gichuru ............ John Njoroge MichukiKorea...............Jong Ryul Whang ......... Jin Soo SuhKuwait .... ..... Abdul Rahman Salim AI-Ateeqi. .AbdIatif Y. Al-HamadLaos., , ......... Oudong Souvannavongtrl),. . Sitha SisombatiriLebanon,. _..........Khalil Salem ............ Raja HimadehLesotho ........... P. N. Peete ...... ...... E. Waddington(')Liberia .............. J. Milton Weeks...........Cyril BrightLibya ............... Gruma Saleh Et-Turki ........ K. M. SherlalaLuxembourg ............ Pierre Werner............Albert Dondelinger
(continued)+Member of the Bank only.lrAppointnment effective atter June 30, 1969.
95
Governors and Alternates Annendix Aof the Bank and IDA (continued)
June 30, 1969
Member Governor Alternate
Malagasy Republic ............. Rakotovao Ralison ................. Raymond RandriamandrantoMalawi .... , Aleke K. Banda .K. J. BarnesMalaysia ...... , Ali bin Haji Ahmad(1 ) .............. Mohamed Sharit bin Abdul SamadMali ...... , Tieoule Konate .................... Sekou SangareMauritania ....... Mcktar Ould Haiba ............ Mamadou CissokoMauritius .......... ,.,. Veerasamy Ringadoo ............ Ramaswamy Pyndiah(l)Mexico ......... ............... Antonio Ortiz Mena .... __.------Jose Hernandez DelgadoMorocco ....... .. , Mamoun Tahiri ....... ..... Mohamed BenkiraneNepal .......... Kirti Nidhi Bista ............ Bhekh Bahadur ThapaNetherlands ......... H. J. Witteveen .................... J. H. 0. graaf van den BoschNew Zealandi .... ...... H. G. Lang .... ...... C. F. Sproule(1 )Nicaragua ........................ Guillermo Sevilla-Sacasa .Juan Jose Martinez L.Niger ......... Alidou Barkire ....... Abdoulaye DialloNigeria ......................... 0. Awolowo .Abdul Aziz AttaNorway ... ....... Kare Willoch . ....... Christian BrinchPakistan ....... Ghulam Ishaq Khan ........ ...... M. Majid AliPanama ....... Jose Antonio de la Ossa .......... Ram6n GarciaParaguay. Cesar Romeo Acosta ..... ....... Oscar Stark RivarolaPeru ....... Fernando Berckemeyer ............ Tulio De AndreaPhilippines ....... Eduardo Z. Romualdez ........... Roberto S. BenedictoPortugal'; ....... Joao Augusto Dias Rosas ........ Luis M. Teixeira PintoRwanda ....... Fidele Nzanana .................... Fidele NkuuidabagerziSaudi Arabia ......... Ahmed Zaki SaadSenegal ........ Abdou Diouf ............ Hamet DiopSierra Leone ................. ,.M. S. Forna ............... _...... Elkanah Laurence CokerSingaporeT ........ Goh Keng Swee . Hon Sui SenSomalia ........ Sufi Omer Mohamed ............... Giuseppe MorascaSouth Africa ........ Nicolaas Diederichs ............... Theunis Willem de JonghSpain . ...................... Juan Jose Espinosa ............... Mariano Navarro RubioSudan ........ Mohamed El Makkawi Mustafa ...... Mahdi AhmedSweden .... G. E. Stranc ... ..... Krister WickmanSyrian Arab Republic .... ..... .. Nour Allah Nour Allah ............ Ammar JammalTanzania .... P. Bomani ..................... J. D. NarilfuaThailand .... , Serm Vinicchayakul ............... Bisudhi NimmanahaemindaTcgo ............................ Boukari Djobo .................... Jean TeviTrinidad and Tobagot ............ F. C. Prevatt .............. William G. DemasTunisia .. Ahnied Ben Salah ................. Ali ZouaouiTurkey ....... Cihat Bilgehan .................... Kemal CantGrkUganda ................ Laurence Kalule-Settala ............ E. B. WakhweyaUnited Arab Republic ...... ...... Hassan Abbas Zaki ................ Hamed Abdel Latif El SayehUnited Kingdom ................ Sir Leslie O'Brien .. .............. Sir Douglas AllenUnited States ......... David M. KennedyUpper Volta ......... .Pierre Claver Damiba .............. Pierre TahitaUruguay± ..... Cesar CharloneVenezuela .. R A..... R fae t Afonzo R avar d .Pedro Miguel ParelesViet-Nam .. Nguyen Van DongYugoslavia ....... Janko Smole. llija MarjanovicZambia ... V. S. Musakanya ................ E. G. Kasonde
f-Member of the Bank only.(1) Appointment effective after June 30, 1969.
96
Executive Directors and Allernates of the Bank and IDA and their Votine Power Anpendix 5
June 30, 1969
Total Votes
Executive Director Alternate Casting Votes of Bank IDA
AppointedCovey T. Oliver .......... .... Emmett J. Rice ........... United States .. .................. 63,750 64,558E. W. Maude .................. M. P. J. Lynch ............. . United Kingdom ................................... 26,250 26,728Ernst vom Hofe . ........... Jbrg Jaeckel ............ Germany ...... .................................. . 13,050 11,092Georges Plescoff . .......... Jean P. Carriere ............ France ................. ................ ......... . 10,750 11,092S. Jagannathan M............ . R. Shroff ............ I ndia ...... . ...................................... 8,250 8,570ElectedHideo Suzuki ........ H. Jinadasa Samarakkody ...... Burma, Ceylon, Japan, Nepal, Singaporeti, Thailand. 11,993 10,934
(Japan) (Ceylon)Giorgio Rota .......... Juan Moro ............. Greece, Italy, Portugal(r), Spain ...................... 11,794 7,654
(Italy) (Spain)Patrick M. Reid .......... A. Roy MacMillan .......... Canada, Guyana, Ireland, Jamaica(l) ........... ..... 10,253 9,834
(Canada) (Canada)J. 0. Stone .......... A. W. Young ............. Australia, New Zealand('), South Africa ....... ..... 9,880 7,054
(Australia) (New Zealand)S. Osman Ali ......... Abdol Ali Jahanshahi ......... Iran, Iraq, Jordan, Kuwait, Lebanon, Pakistan, Saudi
(Pakistan) (Iran) Arabia, Syrian Arab Republic, United Arab Republic. 9,877 10,346Reignson C. Chen . .......... C. L. Chow .................... China, Korea, Viet-Nam ............................. 9,210 8,106
(China) (China)Christopher Kahangi .......... Donatien Bihute ....... ..... Botswana, Burundi, Ethiopia, The Gambia, Guinea('),
(Tanzania) (Burundi) Kenya, Lesotho, Liberia, Malawi, Mali, Nigeria,Sierra Leone, Sudan, Tanzania, Trinidad andTobago('), Uganda, Zambia ........ ............ 8,769 10,919
Pieter Lieftinck . ........... Vladimir Ceric ................. Cyprus, Israel, Netherlands, Yugoslavia ............. 8,739 8,844(Netherlands) (Yugoslavia)
Andr6 van Campenhout ....... Friedrich T. Krieger ........... Austria, Belgium, Luxembourg, Turkey .............. 8,717 5,893(Belgium) (Austria)
Abderrahman Tazi . ......... Mohammed Younos Rafik ...... Afghanistan, Algeria, Ghana, Indonesia, Laos,(Morocco) (Afghanistan) Libya, Malaysia, Morocco ......... . ..... ... 8,627 9,212
Erik L. Karlsson . .... ...... Erik Hauge ................. Denmark, Finland, Iceland, Norway, Sweden ........ 8,466 8,396(Sweden) (Norway)
Luis Machado ......... Arnoldo Ramirez-Eva ... __ ... Costa Rica, El Salvador, Guatemala, Haiti, Honduras,(Cuba) (Nicaragua) Mexico, Nicaragua, Panama, Peru, Venezuela(t) ...... 7,803 7,058
Virgilio Barco ......... Oscar Alviar-Ramirez ........ . Brazil, Colombia, Dominican Republic, Ecuador,(Colombia) (Colombia) Philippines ....................................... 7,393 8,190
Mohamed Nassim Kochman .... Michel Bako ........ Cameroon, Central African Republic, Chad, Congo(Mauritania) (Chad) (Brazzaville), Congo, Democratic Republic of,
Dahomey, Gabon, Ivory Coast, Malagasy Republic,Mauritania, Mauritius, Niger, Rwanda, Senegal,Somalia, Togo, Upper Volta ........................ 7,204 11,474
Angel R. Caram ........... Abelardo Brugada Saldivar ..... Argentina, Bolivia, Chile, Paraguay, Uruguay(i' . ..... 6,466 6,744(Argentina) (Paraguay)
in addition to the Alternates shown in theforegoing list, thefollowing also served as Alternates after October 31, 1968:
Alternate Executive Director End of period of service
S. Guhan . .......................... November 5,1968(India)
Maung Gyi ............. .. November 7, 1968(Burma)
Alfredo Valencia ............. January 15, 1969(Peru)
Zoran Zagar . ............. .. January 22, 1969(Yugoslavia)
Jos6 Camacho .................. .May 15, 1969(Colombia)
Note: Tunisia not formally represented by an Executive Director.fi) Member of the Bank only.
97
PrinciPal Officers and DePartiMent Directors of the Bank and IDA Aniendix C
June 30, 1969
Robert S. McNamara ....... PresidentJ. Burke Knapp .......... Vice President and Chairman, Loan CommitteeS. Aldewereld .............. Vice President-Finance and Director of ProjectsA. Broches ................ General CounselRichard H. Demuth. ..... Director, Development ServicesIrving S. Friedman .......... The Economic Adviser to the PresidentSir Denis Rickett ........... Vice PresidentMohamed Shoaib ........... Vice PresidentEugene H. Rotberg ....... TreasurerFrancis R. Poore ... ... ControllerM. M. Mendels ............. Secretary
John H. Adler .............. Director, Programming and Budgeting DepartmentGerald Alter ........ ...... Director, Western Hemisphere DepartmentDuncan S. Ballantine ....... Director, Education Projects DepartmentWarren C. Baum ........... Associate Director of ProjectsBernard R. Bell ............. Director, Resident Staff in Indonesia1. P. M. Cargill ............. Director, South Asia DepartmentBernard Chadenet .......... Deputy Director of ProjectsRoger Chaufournier ........ Director, Western Africa DepartmentWilliam Clark .............. Director of Information and Public AffairsS. R. Cope ................ Deputy Chairman, Loan CommitteeWilliam Diamond ........... Director, Development Finance Companies DepartmentAbdel G. El Emary .......... Director, Eastern Africa DepartmentLionel J. C. Evans .......... Director, Agriculture Projects DepartmentRaymond J. Goodman ...... Director, East Asia and Pacific DepartmentAndrew M. Kamarck ........ Director, Economics DepartmentArthur Karasz ............ Director, European OfficeA. David Knox ... ......... Director, Public Utilities Projects DepartmentK. S. Krishnaswamy .... ... Director, Economic Development InstituteMichael L. Lejeune ......... Director, Europe, Middle East and North Africa DepartmentLester Nurick ............... Associate General CounselHugh B. Ripman .... . ..... Director of AdministrationRobert Sadove ............. Director, Transportation Projects Department, and
Acting Director, Tourism Projects Department
98


WORLD BANKINTERNATIONAL DEVELOPMENT ASSOCIATION
Headquarters / 1818 H Street, N.W., Washington, D.C. 20433, U.S.A. Telephone: EXecutive 3-6360
New York Office / 20 Exchange Place, New York, N.Y. 10005, U.S.A. Telephone: WHitehall 3-5400
European Office J 4 Ave. d'lena, Paris 16e, France. Telephone: 553-2510
London Office / New Zealand House, Haymarket, London S.W. 1, England. Telephone: 930-3886
Cable Addresses / World Bank: INTBAFRAD, International Development Association: INDEVAS


![The Pricean [1969] - Internet Archive](https://img.pdfslide.net/doc/110x75/6325f0726d480576770c88f7/the-pricean-1969-internet-archive.jpg)