Embed Size (px)
Citation preview
KAZAKH STEEL PLC
Competent Person’s Report on the Kokbulak Iron Ore Project
Republic of Kazakhstan
[April] 2022
APPENDIX III COMPETENT PERSON’S REPORT
– III-1 –
THIS DOCUMENT IS IN DRAFT FORM, INCOMPLETE AND SUBJECT TO CHANGE AND THAT
THE INFORMATION MUST BE READ IN CONJUNCTION WITH THE SECTION HEADED
‘‘WARNING’’ ON THE COVER OF THIS DOCUMENT
DATE ISSUED: [11th April] 2022
JOB NUMBER: ZT61–2028
VERSION: V20.0
REPORT NUMBER: MM1539
STATUS: Draft
KAZAKH STEEL PLC
Competent Person’s Report on the Kokbulak Iron Ore Project, Republic of Kazakhstan
[April] 2022
Prepared by: Dr Phil Newall BSC, PhD, CEng, FIMMM
This report has been prepared by Wardell Armstrong International with all reasonable skill,
care and diligence, within the terms of the Contract with the Client. The report is
confidential to the Client and Wardell Armstrong International accepts no responsibility of
whatever nature to third parties to whom this report may be made known.
No part of this document may be reproduced without the prior written approval of Wardell
Armstrong International.
APPENDIX III COMPETENT PERSON’S REPORT
– III-2 –
THIS DOCUMENT IS IN DRAFT FORM, INCOMPLETE AND SUBJECT TO CHANGE AND THAT
THE INFORMATION MUST BE READ IN CONJUNCTION WITH THE SECTION HEADED
‘‘WARNING’’ ON THE COVER OF THIS DOCUMENT
CONTENTS
EXECUTIVE SUMMARY . . . . . . . . . . . . . . . . . . . . . . . . . . . . . . . . . . . . . . . . . . . . . . . . . . . . . . . . . [‧]
Location and Access . . . . . . . . . . . . . . . . . . . . . . . . . . . . . . . . . . . . . . . . . . . . . . . . . . . . . . . . . . [‧]
Licencing . . . . . . . . . . . . . . . . . . . . . . . . . . . . . . . . . . . . . . . . . . . . . . . . . . . . . . . . . . . . . . . . . . . . . . [‧]
History . . . . . . . . . . . . . . . . . . . . . . . . . . . . . . . . . . . . . . . . . . . . . . . . . . . . . . . . . . . . . . . . . . . . . . . . [‧]
Infrastructure . . . . . . . . . . . . . . . . . . . . . . . . . . . . . . . . . . . . . . . . . . . . . . . . . . . . . . . . . . . . . . . . . [‧]
Geology & Mineralisation . . . . . . . . . . . . . . . . . . . . . . . . . . . . . . . . . . . . . . . . . . . . . . . . . . . . . [‧]
Mineral Resource . . . . . . . . . . . . . . . . . . . . . . . . . . . . . . . . . . . . . . . . . . . . . . . . . . . . . . . . . . . . . . [‧]
Mining . . . . . . . . . . . . . . . . . . . . . . . . . . . . . . . . . . . . . . . . . . . . . . . . . . . . . . . . . . . . . . . . . . . . . . . . [‧]
Ore Reserves . . . . . . . . . . . . . . . . . . . . . . . . . . . . . . . . . . . . . . . . . . . . . . . . . . . . . . . . . . . . . . . . . . [‧]
Processing . . . . . . . . . . . . . . . . . . . . . . . . . . . . . . . . . . . . . . . . . . . . . . . . . . . . . . . . . . . . . . . . . . . . . [‧]
Environmental & Social . . . . . . . . . . . . . . . . . . . . . . . . . . . . . . . . . . . . . . . . . . . . . . . . . . . . . . . [‧]
Financial Analysis . . . . . . . . . . . . . . . . . . . . . . . . . . . . . . . . . . . . . . . . . . . . . . . . . . . . . . . . . . . . . [‧]
Risks . . . . . . . . . . . . . . . . . . . . . . . . . . . . . . . . . . . . . . . . . . . . . . . . . . . . . . . . . . . . . . . . . . . . . . . . . . [‧]
1 INTRODUCTION . . . . . . . . . . . . . . . . . . . . . . . . . . . . . . . . . . . . . . . . . . . . . . . . . . . . . . . . . . . . [‧]
1.1 Purpose of the Report and Terms of Reference . . . . . . . . . . . . . . . . . . . . . . . . . . . [‧]
1.2 Reporting Standard . . . . . . . . . . . . . . . . . . . . . . . . . . . . . . . . . . . . . . . . . . . . . . . . . . . . . . . [‧]
1.3 Consultants and Interests . . . . . . . . . . . . . . . . . . . . . . . . . . . . . . . . . . . . . . . . . . . . . . . . . [‧]
1.4 Sources of Information and Reliance on other Experts . . . . . . . . . . . . . . . . . . . [‧]
1.5 Personal Inspections . . . . . . . . . . . . . . . . . . . . . . . . . . . . . . . . . . . . . . . . . . . . . . . . . . . . . . [‧]
1.6 Units and Currency . . . . . . . . . . . . . . . . . . . . . . . . . . . . . . . . . . . . . . . . . . . . . . . . . . . . . . . [‧]
1.7 WAI Warranty . . . . . . . . . . . . . . . . . . . . . . . . . . . . . . . . . . . . . . . . . . . . . . . . . . . . . . . . . . . [‧]
APPENDIX III COMPETENT PERSON’S REPORT
– III-3 –
THIS DOCUMENT IS IN DRAFT FORM, INCOMPLETE AND SUBJECT TO CHANGE AND THAT
THE INFORMATION MUST BE READ IN CONJUNCTION WITH THE SECTION HEADED
‘‘WARNING’’ ON THE COVER OF THIS DOCUMENT
2 PROPERTY DESCRIPTION AND LOCATION . . . . . . . . . . . . . . . . . . . . . . . . . . . . . . [‧]
2.1 Location . . . . . . . . . . . . . . . . . . . . . . . . . . . . . . . . . . . . . . . . . . . . . . . . . . . . . . . . . . . . . . . . . . [‧]
2.2 Licences and Tenure or Title, Encumbrances and Obligations . . . . . . . . . . . . . [‧]
3 ACCESSIBILITY, CLIMATE, PHYSIOGRAPHY, FLORA/FAUNA AND
LOCAL INFRASTRUCTURE . . . . . . . . . . . . . . . . . . . . . . . . . . . . . . . . . . . . . . . . . . . . . . [‧]
3.1 Accessibility . . . . . . . . . . . . . . . . . . . . . . . . . . . . . . . . . . . . . . . . . . . . . . . . . . . . . . . . . . . . . . [‧]
3.2 Climate . . . . . . . . . . . . . . . . . . . . . . . . . . . . . . . . . . . . . . . . . . . . . . . . . . . . . . . . . . . . . . . . . . . [‧]
3.3 Physiography . . . . . . . . . . . . . . . . . . . . . . . . . . . . . . . . . . . . . . . . . . . . . . . . . . . . . . . . . . . . . [‧]
3.4 Fauna and Flora . . . . . . . . . . . . . . . . . . . . . . . . . . . . . . . . . . . . . . . . . . . . . . . . . . . . . . . . . [‧]
3.5 Local Infrastructure . . . . . . . . . . . . . . . . . . . . . . . . . . . . . . . . . . . . . . . . . . . . . . . . . . . . . . [‧]
4 EXPLORATION HISTORY . . . . . . . . . . . . . . . . . . . . . . . . . . . . . . . . . . . . . . . . . . . . . . . . . . [‧]
4.1 Introduction . . . . . . . . . . . . . . . . . . . . . . . . . . . . . . . . . . . . . . . . . . . . . . . . . . . . . . . . . . . . . . [‧]
4.2 Exploration . . . . . . . . . . . . . . . . . . . . . . . . . . . . . . . . . . . . . . . . . . . . . . . . . . . . . . . . . . . . . . . [‧]
4.3 Drilling . . . . . . . . . . . . . . . . . . . . . . . . . . . . . . . . . . . . . . . . . . . . . . . . . . . . . . . . . . . . . . . . . . . [‧]
4.4 Confirmatory Sampling . . . . . . . . . . . . . . . . . . . . . . . . . . . . . . . . . . . . . . . . . . . . . . . . . . . [‧]
4.5 Recent Work . . . . . . . . . . . . . . . . . . . . . . . . . . . . . . . . . . . . . . . . . . . . . . . . . . . . . . . . . . . . . [‧]
5 GEOLOGICAL SETTING AND MINERALISATION . . . . . . . . . . . . . . . . . . . . . . . . [‧]
5.1 Structure & Lithology . . . . . . . . . . . . . . . . . . . . . . . . . . . . . . . . . . . . . . . . . . . . . . . . . . . . [‧]
5.2 Deposit Geology . . . . . . . . . . . . . . . . . . . . . . . . . . . . . . . . . . . . . . . . . . . . . . . . . . . . . . . . . . [‧]
5.3 Mineralisation Types . . . . . . . . . . . . . . . . . . . . . . . . . . . . . . . . . . . . . . . . . . . . . . . . . . . . . [‧]
6 MINERAL RESOURCES . . . . . . . . . . . . . . . . . . . . . . . . . . . . . . . . . . . . . . . . . . . . . . . . . . . . . [‧]
6.1 Introduction . . . . . . . . . . . . . . . . . . . . . . . . . . . . . . . . . . . . . . . . . . . . . . . . . . . . . . . . . . . . . . [‧]
6.2 Central Area of the Kokbulak Iron Ore Project . . . . . . . . . . . . . . . . . . . . . . . . . . [‧]
6.3 Mineral Resource Estimation for the Southern Area & Northern Area . . . . [‧]
APPENDIX III COMPETENT PERSON’S REPORT
– III-4 –
THIS DOCUMENT IS IN DRAFT FORM, INCOMPLETE AND SUBJECT TO CHANGE AND THAT
THE INFORMATION MUST BE READ IN CONJUNCTION WITH THE SECTION HEADED
‘‘WARNING’’ ON THE COVER OF THIS DOCUMENT
7 MINING . . . . . . . . . . . . . . . . . . . . . . . . . . . . . . . . . . . . . . . . . . . . . . . . . . . . . . . . . . . . . . . . . . . . . . [‧]
7.1 Overview . . . . . . . . . . . . . . . . . . . . . . . . . . . . . . . . . . . . . . . . . . . . . . . . . . . . . . . . . . . . . . . . . [‧]
7.2 Open Pit Optimisation . . . . . . . . . . . . . . . . . . . . . . . . . . . . . . . . . . . . . . . . . . . . . . . . . . . . [‧]
7.3 Parameters . . . . . . . . . . . . . . . . . . . . . . . . . . . . . . . . . . . . . . . . . . . . . . . . . . . . . . . . . . . . . . . [‧]
7.4 Optimisation Results . . . . . . . . . . . . . . . . . . . . . . . . . . . . . . . . . . . . . . . . . . . . . . . . . . . . . [‧]
7.5 Optimised Pit Shell Selection . . . . . . . . . . . . . . . . . . . . . . . . . . . . . . . . . . . . . . . . . . . . . [‧]
7.6 Cut-Off Grade . . . . . . . . . . . . . . . . . . . . . . . . . . . . . . . . . . . . . . . . . . . . . . . . . . . . . . . . . . . . [‧]
7.7 Mine Scheduling . . . . . . . . . . . . . . . . . . . . . . . . . . . . . . . . . . . . . . . . . . . . . . . . . . . . . . . . . . [‧]
7.8 Mine Operating Procedures . . . . . . . . . . . . . . . . . . . . . . . . . . . . . . . . . . . . . . . . . . . . . . . [‧]
8 MINERAL PROCESSING . . . . . . . . . . . . . . . . . . . . . . . . . . . . . . . . . . . . . . . . . . . . . . . . . . . . [‧]
8.1 Introduction . . . . . . . . . . . . . . . . . . . . . . . . . . . . . . . . . . . . . . . . . . . . . . . . . . . . . . . . . . . . . . [‧]
8.2 Soviet Data . . . . . . . . . . . . . . . . . . . . . . . . . . . . . . . . . . . . . . . . . . . . . . . . . . . . . . . . . . . . . . . [‧]
8.3 JSC ‘‘Centre of Geosciences, Metallurgy and Processing’’ Testwork . . . . . . . [‧]
8.4 Processing section of Project XXI 2013 Feasibility Study . . . . . . . . . . . . . . . . . [‧]
8.5 Conclusions . . . . . . . . . . . . . . . . . . . . . . . . . . . . . . . . . . . . . . . . . . . . . . . . . . . . . . . . . . . . . . [‧]
9 ENVIRONMENT, SOCIAL, HEALTH & SAFETY . . . . . . . . . . . . . . . . . . . . . . . . . . . [‧]
9.1 Introduction . . . . . . . . . . . . . . . . . . . . . . . . . . . . . . . . . . . . . . . . . . . . . . . . . . . . . . . . . . . . . . [‧]
9.2 Environmental and Social Setting and Context . . . . . . . . . . . . . . . . . . . . . . . . . . . [‧]
9.3 Project Status, Activities, Effects, Releases and Controls . . . . . . . . . . . . . . . . . [‧]
9.4 Permitting . . . . . . . . . . . . . . . . . . . . . . . . . . . . . . . . . . . . . . . . . . . . . . . . . . . . . . . . . . . . . . . . [‧]
9.5 Environmental Management . . . . . . . . . . . . . . . . . . . . . . . . . . . . . . . . . . . . . . . . . . . . . . [‧]
9.6 Social and Community Management . . . . . . . . . . . . . . . . . . . . . . . . . . . . . . . . . . . . . . [‧]
9.7 Mine Closure and Rehabilitation . . . . . . . . . . . . . . . . . . . . . . . . . . . . . . . . . . . . . . . . . [‧]
9.8 Conclusions . . . . . . . . . . . . . . . . . . . . . . . . . . . . . . . . . . . . . . . . . . . . . . . . . . . . . . . . . . . . . . [‧]
APPENDIX III COMPETENT PERSON’S REPORT
– III-5 –
THIS DOCUMENT IS IN DRAFT FORM, INCOMPLETE AND SUBJECT TO CHANGE AND THAT
THE INFORMATION MUST BE READ IN CONJUNCTION WITH THE SECTION HEADED
‘‘WARNING’’ ON THE COVER OF THIS DOCUMENT
10 FINANCIAL ANALYSIS . . . . . . . . . . . . . . . . . . . . . . . . . . . . . . . . . . . . . . . . . . . . . . . . . . . . . . [‧]
10.1 Introduction . . . . . . . . . . . . . . . . . . . . . . . . . . . . . . . . . . . . . . . . . . . . . . . . . . . . . . . . . . . . . . [‧]
10.2 DCF Model . . . . . . . . . . . . . . . . . . . . . . . . . . . . . . . . . . . . . . . . . . . . . . . . . . . . . . . . . . . . . . [‧]
10.3 Sensitivity Analysis . . . . . . . . . . . . . . . . . . . . . . . . . . . . . . . . . . . . . . . . . . . . . . . . . . . . . . . [‧]
10.4 Conclusions & Recommendations . . . . . . . . . . . . . . . . . . . . . . . . . . . . . . . . . . . . . . . . . [‧]
11 RISKS ASSOCIATED WITH THE KAZAKH STEEL PLC KOKBULAK
IRON ORE PROJECT . . . . . . . . . . . . . . . . . . . . . . . . . . . . . . . . . . . . . . . . . . . . . . . . . . . . . [‧]
12 CONCLUSIONS & RECOMMENDATIONS . . . . . . . . . . . . . . . . . . . . . . . . . . . . . . . . . [‧]
13 JORC TABLE 1 . . . . . . . . . . . . . . . . . . . . . . . . . . . . . . . . . . . . . . . . . . . . . . . . . . . . . . . . . . . . . . . [‧]
APPENDIX III COMPETENT PERSON’S REPORT
– III-6 –
THIS DOCUMENT IS IN DRAFT FORM, INCOMPLETE AND SUBJECT TO CHANGE AND THAT
THE INFORMATION MUST BE READ IN CONJUNCTION WITH THE SECTION HEADED
‘‘WARNING’’ ON THE COVER OF THIS DOCUMENT
TABLES
Table 2.1 : Production Licence Area Coordinates — Northern & Central
Area . . . . . . . . . . . . . . . . . . . . . . . . . . . . . . . . . . . . . . . . . . . . . . . . . . . . . . . . . . [‧]
Table 2.2 : Production Licence Area Coordinates — Southern Area . . . . . . . . . [‧]
Table 4.1 : Kokbulak Deposit Sampling Inventory . . . . . . . . . . . . . . . . . . . . . . . . . . [‧]
Table 4.2 : Core Recovery for Kokbulak Deposit . . . . . . . . . . . . . . . . . . . . . . . . . . . . [‧]
Table 5.1 : Dimensions of Lens 2 . . . . . . . . . . . . . . . . . . . . . . . . . . . . . . . . . . . . . . . . . . . . [‧]
Table 6.1 : Composition of Exploration Database — Entirety . . . . . . . . . . . . . . . [‧]
Table 6.2 : Composition of Exploration Database — Central Area . . . . . . . . . . [‧]
Table 6.3 : Statistics for Fe of Selected Samples by Domain (Central Area) . [‧]
Table 6.4 : Statistics for Other Components (Central Area) . . . . . . . . . . . . . . . . . . [‧]
Table 6.5 : Statistics for Fe of Composited Samples by Domain
(Central Area) . . . . . . . . . . . . . . . . . . . . . . . . . . . . . . . . . . . . . . . . . . . . . . . . [‧]
Table 6.6 : Composited Sample Statistics for Other Components
(Central Area) . . . . . . . . . . . . . . . . . . . . . . . . . . . . . . . . . . . . . . . . . . . . . . . . [‧]
Table 6.7 : Summary of Variogram Models . . . . . . . . . . . . . . . . . . . . . . . . . . . . . . . . . . [‧]
Table 6.8 : Summary of Block Model Parameters . . . . . . . . . . . . . . . . . . . . . . . . . . . . [‧]
Table 6.9 : Mineral Resource Estimate, Central Area of the Kokbulak
Iron Ore Project . . . . . . . . . . . . . . . . . . . . . . . . . . . . . . . . . . . . . . . . . . . . . . [‧]
Table 6.10 : Composition of Exploration Database . . . . . . . . . . . . . . . . . . . . . . . . . . . [‧]
Table 6.11 : Pit Optimisation Parameters . . . . . . . . . . . . . . . . . . . . . . . . . . . . . . . . . . . . . [‧]
Table 6.12 : Mineral Resource Estimate, Northern Area & Southern Area . . . . [‧]
Table 7.1 : Pit Optimisation Parameters . . . . . . . . . . . . . . . . . . . . . . . . . . . . . . . . . . . . . [‧]
Table 7.2 : Mine Schedule for the Kokbulak Iron Ore Project
(Central Area) . . . . . . . . . . . . . . . . . . . . . . . . . . . . . . . . . . . . . . . . . . . . . . . . [‧]
Table 7.3 : Project Mining Equipment Requirements and Costs . . . . . . . . . . . . . [‧]
Table 8.1 : Metallurgical Samples Composition — Soviet Reports
1954/1955 . . . . . . . . . . . . . . . . . . . . . . . . . . . . . . . . . . . . . . . . . . . . . . . . . . . . . [‧]
APPENDIX III COMPETENT PERSON’S REPORT
– III-7 –
THIS DOCUMENT IS IN DRAFT FORM, INCOMPLETE AND SUBJECT TO CHANGE AND THAT
THE INFORMATION MUST BE READ IN CONJUNCTION WITH THE SECTION HEADED
‘‘WARNING’’ ON THE COVER OF THIS DOCUMENT
Table 8.2 : Mineral Processing Tests Results — Soviet Reports 1954/1955 . . . [‧]
Table 8.3 : Kokbulak JSC CGMP Samples Chemical Analysis . . . . . . . . . . . . . . . [‧]
Table 8.4 : Kokbulak and Lisakovskoye Mineralisations Chemical
Analysis . . . . . . . . . . . . . . . . . . . . . . . . . . . . . . . . . . . . . . . . . . . . . . . . . . . . . . . [‧]
Table 8.5 : Kokbulak Iron Ore Project XXI 2013 Feasibility Study Basic
Metallurgical . . . . . . . . . . . . . . . . . . . . . . . . . . . . . . . . . . . . . . . . . . . . . . . . . . [‧]
Table 8.6 : Kokbulak Iron Ore Project Basic Process Plant Consumables . . . . [‧]
Table 8.7 : Processing Capital Costs Summary (US$’000) . . . . . . . . . . . . . . . . . . . . [‧]
Table 8.8 : Project Processing Costs . . . . . . . . . . . . . . . . . . . . . . . . . . . . . . . . . . . . . . . . . [‧]
Table 9.1 : Ground Water Resources Availability . . . . . . . . . . . . . . . . . . . . . . . . . . . [‧]
Table 9.2 : Waste Management Provisions . . . . . . . . . . . . . . . . . . . . . . . . . . . . . . . . . . . [‧]
Table 9.3 : Recommendations for Environmental & Social Action Plan . . . . . . [‧]
Table 10.1 : Project Production Costs . . . . . . . . . . . . . . . . . . . . . . . . . . . . . . . . . . . . . . . . [‧]
Table 10.2 : Project Capital Investments . . . . . . . . . . . . . . . . . . . . . . . . . . . . . . . . . . . . . . [‧]
Table 10.3 : Infrastructure Capex . . . . . . . . . . . . . . . . . . . . . . . . . . . . . . . . . . . . . . . . . . . . . [‧]
Table 10.4 : Sustaining Capital Costs for 2030 to 2040 . . . . . . . . . . . . . . . . . . . . . . . [‧]
Table 10.5 : Production & Financial Highlights . . . . . . . . . . . . . . . . . . . . . . . . . . . . . . . [‧]
Table 11.1 : Kokbulak Risk Matrix . . . . . . . . . . . . . . . . . . . . . . . . . . . . . . . . . . . . . . . . . . . [‧]
APPENDIX III COMPETENT PERSON’S REPORT
– III-8 –
THIS DOCUMENT IS IN DRAFT FORM, INCOMPLETE AND SUBJECT TO CHANGE AND THAT
THE INFORMATION MUST BE READ IN CONJUNCTION WITH THE SECTION HEADED
‘‘WARNING’’ ON THE COVER OF THIS DOCUMENT
FIGURES
Figure 2.1 : Location of the Kokbulak Iron Ore Project,
Western Kazakhstan . . . . . . . . . . . . . . . . . . . . . . . . . . . . . . . . . . . . . . . . . . [‧]
Figure 2.2 : Detailed Location of Kokbulak Iron Ore Project . . . . . . . . . . . . . . . . [‧]
Figure 2.3 : Combined Central Area and Northern Area (Red), . . . . . . . . . . . . . . [‧]
Figure 2.4 : Location of Optimised Open Pits (White),
within Exploration Licence (Green) . . . . . . . . . . . . . . . . . . . . . . . . . . . [‧]
Figure 2.5 : Location of Northern Optimised Open Pits (4) within . . . . . . . . . . . [‧]
Figure 2.6 : Location of Southern Optimised Open Pits (1) within . . . . . . . . . . . . [‧]
Figure 6.1 : Location of all Drillhole and Shaft Collars in Exploration
Database . . . . . . . . . . . . . . . . . . . . . . . . . . . . . . . . . . . . . . . . . . . . . . . . . . . . . . [‧]
Figure 6.2 : Location of Exploration Drillhole and Shaft Collars
in Central Area . . . . . . . . . . . . . . . . . . . . . . . . . . . . . . . . . . . . . . . . . . . . . . . [‧]
Figure 6.3 : 5m Contours of Area Covered by Mineral Resource Estimate . . . . [‧]
Figure 6.4 : Plan View of Mineralised Envelopes. Drillhole Collars
in Red (Central Area) . . . . . . . . . . . . . . . . . . . . . . . . . . . . . . . . . . . . . . . . . [‧]
Figure 6.5 : Histogram of Fe For All Domains . . . . . . . . . . . . . . . . . . . . . . . . . . . . . . . [‧]
Figure 6.6 : Variogram Models for Fe — Mineralised Domain 1 . . . . . . . . . . . . . [‧]
Figure 6.7 : Isometric View Looking North of Estimated Fe Grades
(Central Area) . . . . . . . . . . . . . . . . . . . . . . . . . . . . . . . . . . . . . . . . . . . . . . . . [‧]
Figure 6.8 : Classification Following the Guidelines of the JORC Code
(2012) at the Central Area . . . . . . . . . . . . . . . . . . . . . . . . . . . . . . . . . . . . [‧]
Figure 6.9 : Kokbulak Grade Tonnage Curve — All Classifications . . . . . . . . . . [‧]
Figure 6.10 : Location of all Drillhole and Shaft Collars
in Exploration Database . . . . . . . . . . . . . . . . . . . . . . . . . . . . . . . . . . . . . . [‧]
Figure 6.11 : Location of Exploration Drillholes for Northern Area and
Southern Area . . . . . . . . . . . . . . . . . . . . . . . . . . . . . . . . . . . . . . . . . . . . . . . . [‧]
Figure 6.12 : The Resultant Block Model for Southern Area and
Northern Area . . . . . . . . . . . . . . . . . . . . . . . . . . . . . . . . . . . . . . . . . . . . . . . . [‧]
Figure 6.13 : Isometric View Looking North of Optimised Pit Shell . . . . . . . . . . . [‧]
APPENDIX III COMPETENT PERSON’S REPORT
– III-9 –
THIS DOCUMENT IS IN DRAFT FORM, INCOMPLETE AND SUBJECT TO CHANGE AND THAT
THE INFORMATION MUST BE READ IN CONJUNCTION WITH THE SECTION HEADED
‘‘WARNING’’ ON THE COVER OF THIS DOCUMENT
Figure 6.14 : Isometric View Looking North of Optimised Pit Shell . . . . . . . . . . . [‧]
Figure 6.15 : NPV Sensitivity Analysis, Southern Area . . . . . . . . . . . . . . . . . . . . . . . . [‧]
Figure 6.16 : NPV Sensitivity Analysis, Northern Area . . . . . . . . . . . . . . . . . . . . . . . . [‧]
Figure 7.1 : LG Phase Analysis . . . . . . . . . . . . . . . . . . . . . . . . . . . . . . . . . . . . . . . . . . . . . . . [‧]
Figure 8.1 : Grade Recovery Relationship . . . . . . . . . . . . . . . . . . . . . . . . . . . . . . . . . . . . [‧]
Figure 8.2 : Concentration Ratio vs Mass Yield — HIMS . . . . . . . . . . . . . . . . . . . . [‧]
Figure 8.3 : JSC CGMP Recommended Flowsheet . . . . . . . . . . . . . . . . . . . . . . . . . . . [‧]
Figure 8.4 : Project XXI 2013 Feasibility Study Conceptual Flowsheet
— Gravity/Magnetic . . . . . . . . . . . . . . . . . . . . . . . . . . . . . . . . . . . . . . . . . . [‧]
Figure 8.5 : Project XXI 2013 Feasibility Study Conceptual Flowsheet
— Dephosphorisation . . . . . . . . . . . . . . . . . . . . . . . . . . . . . . . . . . . . . . . . . [‧]
Figure 8.6 : Gravity-Magnetic Metallurgical Design Criteria . . . . . . . . . . . . . . . . . [‧]
Figure 10.1 : Production Costs by Percentage . . . . . . . . . . . . . . . . . . . . . . . . . . . . . . . . . [‧]
Figure 10.2 : Kokbulak (Central Area) Sensitivity Analysis . . . . . . . . . . . . . . . . . . . . [‧]
Figure 10.3 : NPV at Various Discount Rates . . . . . . . . . . . . . . . . . . . . . . . . . . . . . . . . . [‧]
APPENDIX III COMPETENT PERSON’S REPORT
– III-10 –
THIS DOCUMENT IS IN DRAFT FORM, INCOMPLETE AND SUBJECT TO CHANGE AND THAT
THE INFORMATION MUST BE READ IN CONJUNCTION WITH THE SECTION HEADED
‘‘WARNING’’ ON THE COVER OF THIS DOCUMENT
PHOTOGRAPHS
Photo 3.1 : Typical Scenery in the Central Area . . . . . . . . . . . . . . . . . . . . . . . . . . . . . [‧]
Photo 3.2 : Outcropping Mineralisation in Tassay Drainage . . . . . . . . . . . . . . . . . [‧]
Photo 3.3 : Beyneu-Shalkar Line, Near Begimbet . . . . . . . . . . . . . . . . . . . . . . . . . . . . [‧]
Photo 5.1 : Brown Cemented Ores Above Black Unconsolidated Ores
on Profile 21 . . . . . . . . . . . . . . . . . . . . . . . . . . . . . . . . . . . . . . . . . . . . . . . . . . [‧]
Photo 5.2 : Outcropping Soft Black Ores in Stream Bed . . . . . . . . . . . . . . . . . . . . . [‧]
APPENDIX III COMPETENT PERSON’S REPORT
– III-11 –
THIS DOCUMENT IS IN DRAFT FORM, INCOMPLETE AND SUBJECT TO CHANGE AND THAT
THE INFORMATION MUST BE READ IN CONJUNCTION WITH THE SECTION HEADED
‘‘WARNING’’ ON THE COVER OF THIS DOCUMENT
EXECUTIVE SUMMARY
Wardell Armstrong International Limited (‘‘WAI’’) was commissioned by KAZAKH
STEEL PLC (the ‘‘Client’’ or the ‘‘Company’’), to prepare a Competent Person’s Report
(‘‘CPR’’ or the ‘‘Report’’), for the Kokbulak iron ore project in the Republic of Kazakhstan
(the ‘‘Kokbulak Iron Ore Project’’) for the purpose of the [REDACTED] of the Company on
the Main Board of The Stock Exchange of Hong Kong Limited (the ‘‘Stock Exchange’’) in
accordance with Chapter 18 of the Rules Governing the Listing of Securities (the ‘‘Listing
Rules’’) on the Stock Exchange.
In this report, WAI has considered all aspects of the Kokbulak Iron Ore Project
including but not limited to geology, mineral resources, mining, processing, geotechnical,
infrastructure, economics, and environmental and social issues.
Location and Access
The majority of the Kokbulak Iron Ore Project is located in the Shalkar District of
Aktobe Region, whilst a small part of the southeast corner of the Kokbulak Iron Ore
Project lies within the territory of the Aral District of Kyzyl-Orda Region, Republic of
Kazakhstan.
The Kokbulak Iron Ore Project lies approximately 250km southeast of Aktobe, the
regional capital of Aktobe Region, and some 100km southeast of Shalkar, a town within the
Shalkar District, Aktobe Region and close to the main road and rail corridor. The nearest
rail station, situated on the West-Kazakhstan railway, is at Togus, located 85km directly to
the northeast of the Kokbulak Iron Ore Project.
The village of Begimbet (a town in Aktobe Region) is located 60km to the west of the
Kokbulak Iron Ore Project and is located close to the Beyneu-Shalkar Line (a railway and
power line) connecting Beyneu (a village of Beyneu District, Mangystau Region and is
located to the southwest of the Kokbulak Iron Ore Project) with Shalkar. The
Beyneu-Shalkar Line lies approximately 40km to the west of the Kokbulak Iron Ore
Project.
A number of small villages are located on the Aral Sea, which is some 60–120km
southeast to the Kokbulak Iron Ore Project.
Licencing
Aktobe Steel Production LLP (‘‘ASP’’), a wholly owned subsidiary of Kazakh Steel
Plc, holds the subsoil use contract for the Kokbulak Iron Ore Project under contract
number 3734-TPI dated October 4, 2010. Six addenda pertaining to the main contract were
subsequently entered into. The expiry date of the subsoil use contract is 23 September 2021.
Nevertheless, according to the Client, the subsoil use contract is still legally valid, given the
Client had submitted an application for a production license (‘‘Production Licence’’) on 21
September 2021, which is prior to the expiration date of the exploration subsoil use
contract. The area of the subsoil use contract for exploration is currently stated at
307.2km2.
APPENDIX III COMPETENT PERSON’S REPORT
– III-12 –
THIS DOCUMENT IS IN DRAFT FORM, INCOMPLETE AND SUBJECT TO CHANGE AND THAT
THE INFORMATION MUST BE READ IN CONJUNCTION WITH THE SECTION HEADED
‘‘WARNING’’ ON THE COVER OF THIS DOCUMENT
WAI has been informed that the area applied by the Client for production (the
‘‘Production Licence Area’’) is 127.51km2 (which falls within the contract area of the subsoil
use contract for exploration of 307.2km2). The Production Licence Area comprises 2 major
areas for development, namely a ‘‘Combined Area and Northern Area’’ (which consist of
Central Area and Northern Area when separately referred to in this Report) and a
‘‘Southern Area’’.
The Client will return the remaining contract territory of 179.69km2 to the relevant
competent authority. ASP is awaiting the approval from relevant competent authority for
the Production Licence as at the date of this CPR.
History
The huge sedimentary-hosted iron deposits of the Kokbulak Iron Ore Project were
originally discovered and explored by the Soviets in the 1950s. Processing studies on the
iron mineralisation of the Kokbulak deposits were also carried out in the first half of the
1950s and samples were sent to the Moscow Institute of Steels and Alloys and the Thematic
Technological Party Central Laboratory of the Ural Geological Office. Testwork on
dephosphorisation was conducted by the Centre of Geosciences, Metallurgy and Processing
in 2011, followed by mineralogical and mineral processing studies performed at
VNIItsvetmet in 2013.
60 confirmatory drill holes were undertaken by ASP in 2013 to verify the exploration
works conducted in the 1950s which then led to the completion of a feasibility study by
Project XXI, a local Aktobe consultancy, dated 10th October 2013 (the ‘‘Project XXI 2013
Feasibility Study’’). This study which pulled the historical data and testwork together, set
out a mine plan to develop the Central Area of the Kokbulak Iron Ore Project. However,
WAI believes that much of the Project XXI 2013 Feasibility Study is only at pre-feasibility
level and parts only at Scoping Study Level, hence no Ore Reserves can be declared in
accordance with the guidelines of the JORC Code (2012) as to do so, requires all areas of
the report to be at Pre-Feasibility Study Level (PFS) level or greater. Furthermore, the
‘‘Project XXI 2013 Feasibility Study’’ has been completed in accordance with GKZ
requirements and not in accordance with the guidelines of the JORC Code (2012), hence
again Ore Reserves cannot currently be declared.
In 2020, further drilling works were conducted by ASP in the Southern Area.
Infrastructure
Apart from the Beyneu-Shalkar Line which provides the source of power and
transportation, a new gas pipeline extending across the country was completed in 2020,
passing at one point within 10km of the Kokbulak Iron Ore Project.
A possible water supply for the Kokbulak Iron Ore Project has been located near the
village of Begimbet (a town in Aktobe Region), which lies close to the path of the
Beyneu-Shalkar Line. A study in 1976 defined a water resource in the Aishuaksky sand
aquifer (near Begimbet) of some 62,000 m3/day was available for a minimum of 25 years
since 1976.
APPENDIX III COMPETENT PERSON’S REPORT
– III-13 –
THIS DOCUMENT IS IN DRAFT FORM, INCOMPLETE AND SUBJECT TO CHANGE AND THAT
THE INFORMATION MUST BE READ IN CONJUNCTION WITH THE SECTION HEADED
‘‘WARNING’’ ON THE COVER OF THIS DOCUMENT
In 2016–2017, confirmatory drilling in the area of wells numbered 1793 and 1723 was
conducted which reportedly yielded some 1.5–2dm3/sec.
Therefore, although the site is relatively remote, the generally benign environmental
situation coupled with flat terrain should overcome some major impediments to the
development of the Kokbulak Iron Ore Project. However, the importance of water to the
operation cannot be over emphasised and therefore a hydrological investigation will be
required to ensure sufficient water supplies are available and at minimal impact to the
environment and surrounding communities
Geology & Mineralisation
The sediment hosted Fe mineralisation identified at Kokbulak, which lies within both
sands and clays, has a strike extent of over 30km in a northwesterly direction, and a width
varying from 1.5 to 2.5km.
Mineralisation has been divided up into three areas, with the Central having had the
majority of exploration efforts, whilst the Northern and Southern less so.
The most widespread ore types identified are:
. Oolitic oxidised brown ores — Type 1, generally found above the water table;
. Loose black ores without cement — Type 2, found above and below the water
table, and
. Green or dark-grey ores of siderite-chlorite cement — Type 3, found below the
water table.
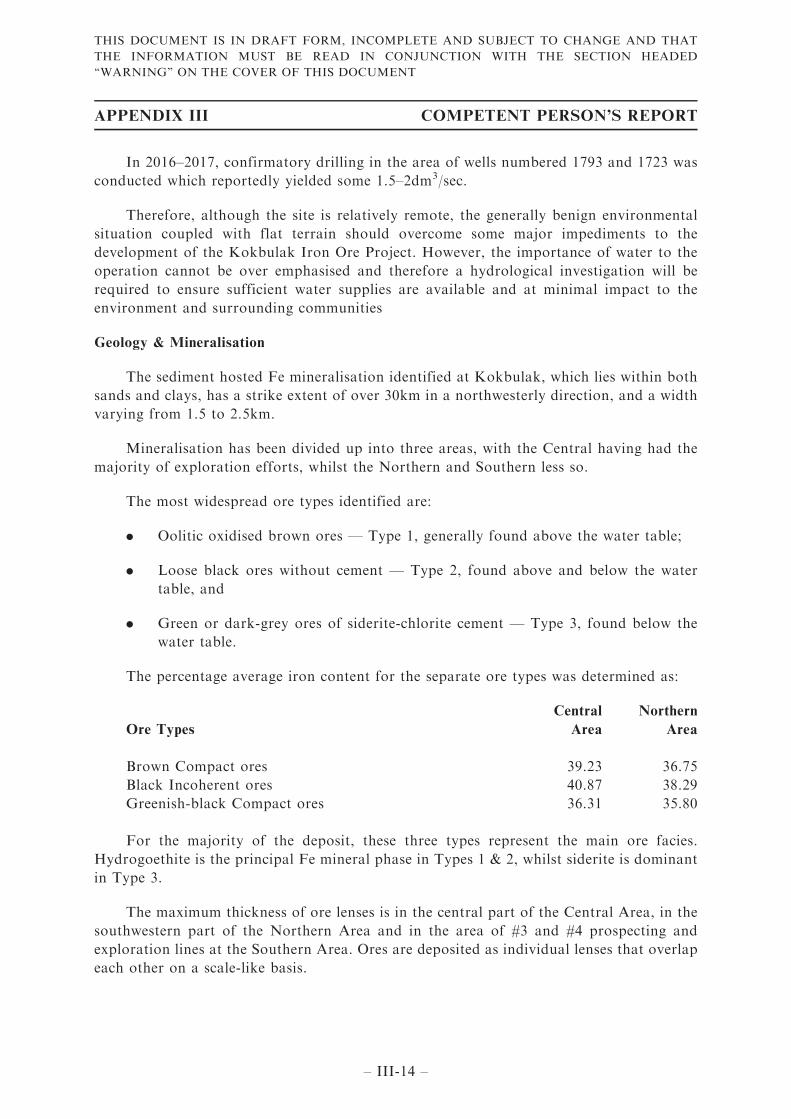
The percentage average iron content for the separate ore types was determined as:
Ore Types
Central
Area
Northern
Area
Brown Compact ores 39.23 36.75
Black Incoherent ores 40.87 38.29
Greenish-black Compact ores 36.31 35.80
For the majority of the deposit, these three types represent the main ore facies.
Hydrogoethite is the principal Fe mineral phase in Types 1 & 2, whilst siderite is dominant
in Type 3.
The maximum thickness of ore lenses is in the central part of the Central Area, in the
southwestern part of the Northern Area and in the area of #3 and #4 prospecting and
exploration lines at the Southern Area. Ores are deposited as individual lenses that overlap
each other on a scale-like basis.
APPENDIX III COMPETENT PERSON’S REPORT
– III-14 –
THIS DOCUMENT IS IN DRAFT FORM, INCOMPLETE AND SUBJECT TO CHANGE AND THAT
THE INFORMATION MUST BE READ IN CONJUNCTION WITH THE SECTION HEADED
‘‘WARNING’’ ON THE COVER OF THIS DOCUMENT
In broad terms, ore bodies of the Central Area and Northern Area are similar in that
they are characterised by a north-south strike and are flatly inclined to the west-southwest,
in many cases overlapping each other. Ore bodies in the Southern Area have a different
structure. All mineralisation can be identified visually.
These are three main lenses at the Central Area of the deposit, with the 1st and 2nd
lenses being the largest. All three lenses are also traced to the Northern Area. Moreover,
two more lenses (4th and 5th) are observed the western part of this site. As with all the
lenses seen at Kokbulak, thickness variations and bifurcations are common, particularly
near the edges, although in the main parts, the lens does show a high degree of
homogeneity. Thicknesses can exceed 50m.
Mineral Resource
Central Area
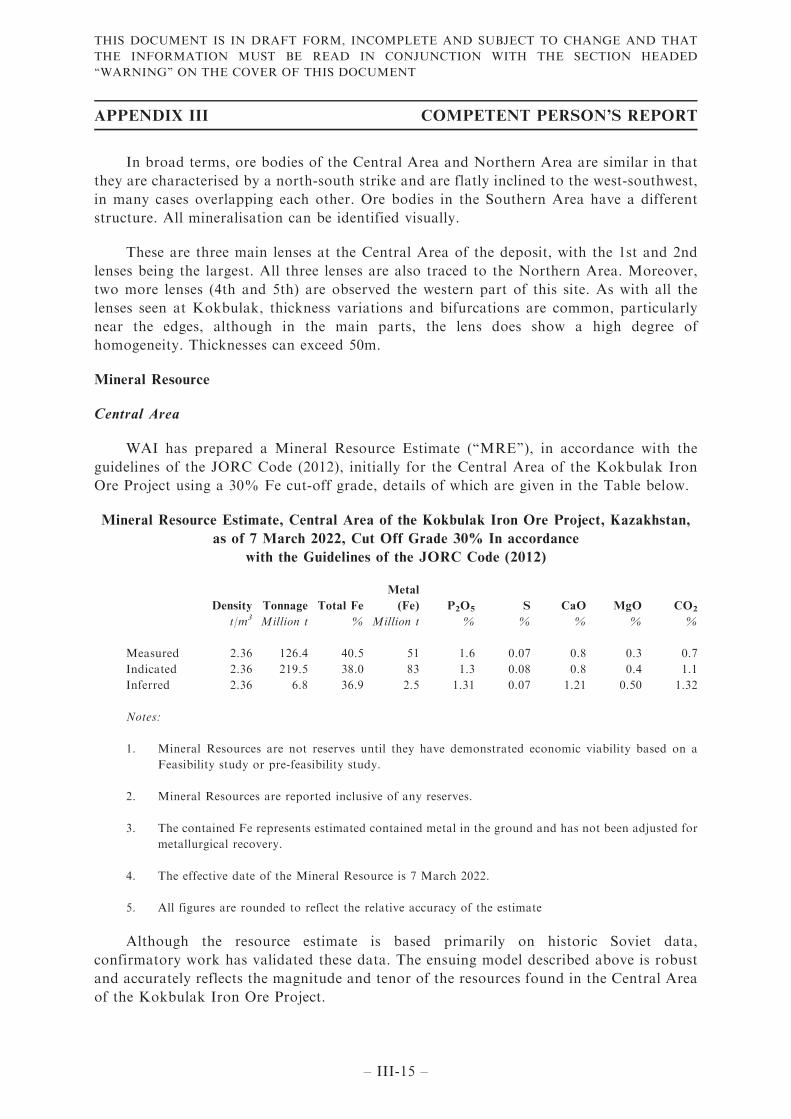
WAI has prepared a Mineral Resource Estimate (‘‘MRE’’), in accordance with the
guidelines of the JORC Code (2012), initially for the Central Area of the Kokbulak Iron
Ore Project using a 30% Fe cut-off grade, details of which are given in the Table below.
Mineral Resource Estimate, Central Area of the Kokbulak Iron Ore Project, Kazakhstan,
as of 7 March 2022, Cut Off Grade 30% In accordance
with the Guidelines of the JORC Code (2012)
Density Tonnage Total Fe
Metal
(Fe) P2O5 S CaO MgO CO2
t/m3 Million t % Million t % % % % %
Measured 2.36 126.4 40.5 51 1.6 0.07 0.8 0.3 0.7
Indicated 2.36 219.5 38.0 83 1.3 0.08 0.8 0.4 1.1
Inferred 2.36 6.8 36.9 2.5 1.31 0.07 1.21 0.50 1.32
Notes:
1. Mineral Resources are not reserves until they have demonstrated economic viability based on a
Feasibility study or pre-feasibility study.
2. Mineral Resources are reported inclusive of any reserves.
3. The contained Fe represents estimated contained metal in the ground and has not been adjusted for
metallurgical recovery.
4. The effective date of the Mineral Resource is 7 March 2022.
5. All figures are rounded to reflect the relative accuracy of the estimate
Although the resource estimate is based primarily on historic Soviet data,
confirmatory work has validated these data. The ensuing model described above is robust
and accurately reflects the magnitude and tenor of the resources found in the Central Area
of the Kokbulak Iron Ore Project.
APPENDIX III COMPETENT PERSON’S REPORT
– III-15 –
THIS DOCUMENT IS IN DRAFT FORM, INCOMPLETE AND SUBJECT TO CHANGE AND THAT
THE INFORMATION MUST BE READ IN CONJUNCTION WITH THE SECTION HEADED
‘‘WARNING’’ ON THE COVER OF THIS DOCUMENT
It is the resources of the Central Area only which have been used to define the mine
schedule.
Northern Area & Southern Area
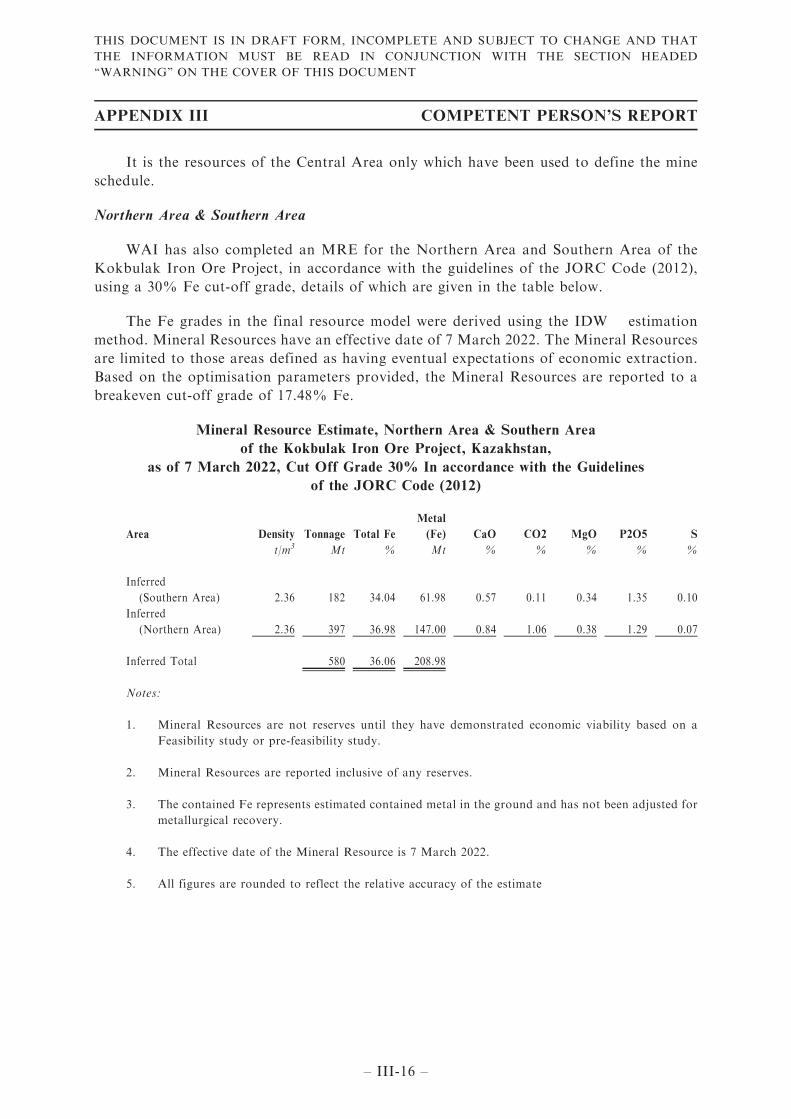
WAI has also completed an MRE for the Northern Area and Southern Area of the
Kokbulak Iron Ore Project, in accordance with the guidelines of the JORC Code (2012),
using a 30% Fe cut-off grade, details of which are given in the table below.
The Fe grades in the final resource model were derived using the IDWᶟ estimation
method. Mineral Resources have an effective date of 7 March 2022. The Mineral Resources
are limited to those areas defined as having eventual expectations of economic extraction.
Based on the optimisation parameters provided, the Mineral Resources are reported to a
breakeven cut-off grade of 17.48% Fe.
Mineral Resource Estimate, Northern Area & Southern Area
of the Kokbulak Iron Ore Project, Kazakhstan,
as of 7 March 2022, Cut Off Grade 30% In accordance with the Guidelines
of the JORC Code (2012)
Area Density Tonnage Total Fe
Metal
(Fe) CaO CO2 MgO P2O5 S
t/m3 Mt % Mt % % % % %
Inferred
(Southern Area) 2.36 182 34.04 61.98 0.57 0.11 0.34 1.35 0.10
Inferred
(Northern Area) 2.36 397 36.98 147.00 0.84 1.06 0.38 1.29 0.07
Inferred Total 580 36.06 208.98
Notes:
1. Mineral Resources are not reserves until they have demonstrated economic viability based on a
Feasibility study or pre-feasibility study.
2. Mineral Resources are reported inclusive of any reserves.
3. The contained Fe represents estimated contained metal in the ground and has not been adjusted for
metallurgical recovery.
4. The effective date of the Mineral Resource is 7 March 2022.
5. All figures are rounded to reflect the relative accuracy of the estimate
APPENDIX III COMPETENT PERSON’S REPORT
– III-16 –
THIS DOCUMENT IS IN DRAFT FORM, INCOMPLETE AND SUBJECT TO CHANGE AND THAT
THE INFORMATION MUST BE READ IN CONJUNCTION WITH THE SECTION HEADED
‘‘WARNING’’ ON THE COVER OF THIS DOCUMENT
Mining
Development of the Kokbulak Iron Ore Project will begin with the commercial
production in the Central Area which contains Measured and Indicated mineral resources.
Traditional open-pit mining will be adopted. In order to estimate the ‘‘minable’’ resources
of the Central Area, WAI has carried out an open-pit optimisation for the Central Area
based upon the technical and financial parameters presented in the Project XXI 2013
Feasibility Study with necessary updates.
The optimisation comprises a series of pit shells which were generated at varying metal
revenue factors ranging from 30% to 120%. A nominal Net Present Value (‘‘NPV’’) was
reported for each pit shell, enabling comparison of the economic value of the pit shell and
determination of the optimum economic return mining scenario.
The analysis demonstrates that the theoretical discounted NPV of the project increases
rapidly up to the 52% revenue factor, but thereafter increases slowly with only a marginal
increase in NPV for a significant increase in ore/waste tonnage.
Selection of the optimised pit shell to be utilised for the financial analysis has been
made to optimise the nominal NPV whilst minimising the quantity of material extracted and
thus minimise the stripping ratio due to the sensitivity of NPV to early waste extraction.
At revenue factor 65%, a nominal NPV of US$3,353M is generated with 337Mt of ore
and 400Mt of waste. These values provide an NPV value of 99% of the maximum value,
extracting 95% of the available mineralised tonnage and moving only 60% of the waste
tonnage.
From this optimisation work, WAI has derived a Mineable Resource on which to base
a mine schedule with a production rate of 24Mtpa of ore containing a total of
approximately 337Mt of ore and 400Mt of waste over a 15-year mine life.
APPENDIX III COMPETENT PERSON’S REPORT
– III-17 –
THIS DOCUMENT IS IN DRAFT FORM, INCOMPLETE AND SUBJECT TO CHANGE AND THAT
THE INFORMATION MUST BE READ IN CONJUNCTION WITH THE SECTION HEADED
‘‘WARNING’’ ON THE COVER OF THIS DOCUMENT
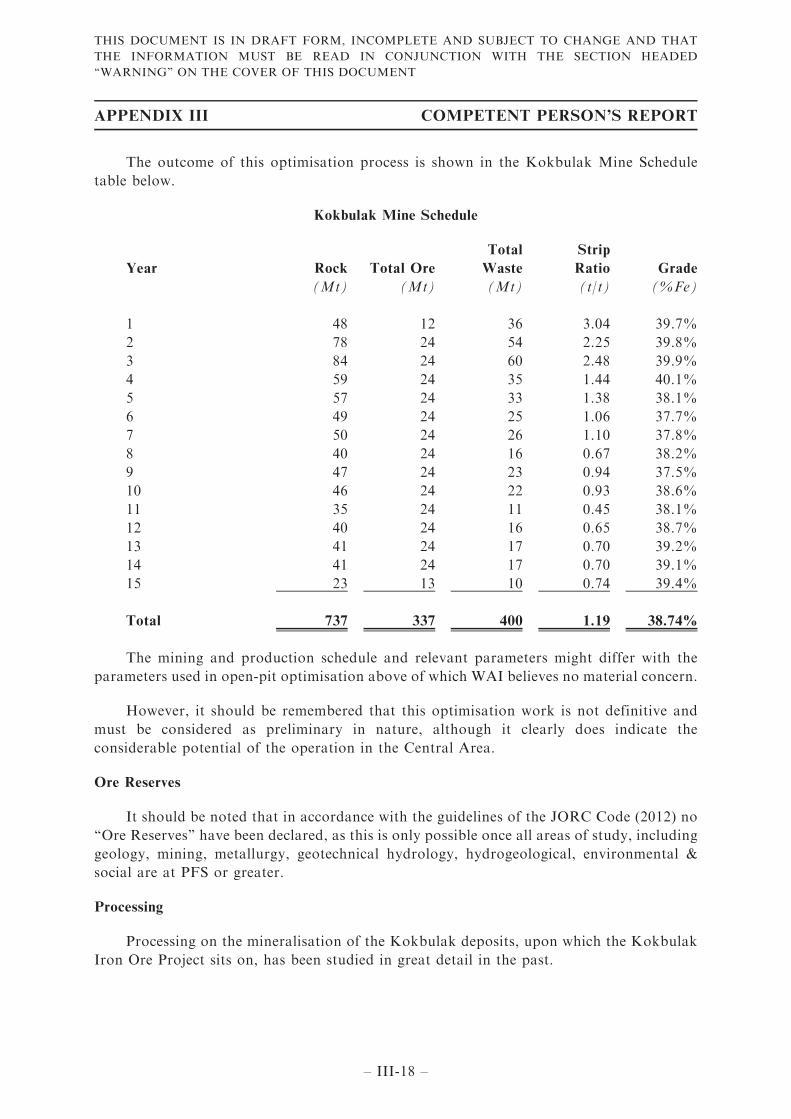
The outcome of this optimisation process is shown in the Kokbulak Mine Schedule
table below.
Kokbulak Mine Schedule
Year Rock Total Ore
Total
Waste
Strip
Ratio Grade
(Mt) (Mt) (Mt) (t/t) (%Fe)
1 48 12 36 3.04 39.7%
2 78 24 54 2.25 39.8%
3 84 24 60 2.48 39.9%
4 59 24 35 1.44 40.1%
5 57 24 33 1.38 38.1%
6 49 24 25 1.06 37.7%
7 50 24 26 1.10 37.8%
8 40 24 16 0.67 38.2%
9 47 24 23 0.94 37.5%
10 46 24 22 0.93 38.6%
11 35 24 11 0.45 38.1%
12 40 24 16 0.65 38.7%
13 41 24 17 0.70 39.2%
14 41 24 17 0.70 39.1%
15 23 13 10 0.74 39.4%
Total 737 337 400 1.19 38.74%
The mining and production schedule and relevant parameters might differ with the
parameters used in open-pit optimisation above of which WAI believes no material concern.
However, it should be remembered that this optimisation work is not definitive and
must be considered as preliminary in nature, although it clearly does indicate the
considerable potential of the operation in the Central Area.
Ore Reserves
It should be noted that in accordance with the guidelines of the JORC Code (2012) no
‘‘Ore Reserves’’ have been declared, as this is only possible once all areas of study, including
geology, mining, metallurgy, geotechnical hydrology, hydrogeological, environmental &
social are at PFS or greater.
Processing
Processing on the mineralisation of the Kokbulak deposits, upon which the Kokbulak
Iron Ore Project sits on, has been studied in great detail in the past.
APPENDIX III COMPETENT PERSON’S REPORT
– III-18 –
THIS DOCUMENT IS IN DRAFT FORM, INCOMPLETE AND SUBJECT TO CHANGE AND THAT
THE INFORMATION MUST BE READ IN CONJUNCTION WITH THE SECTION HEADED
‘‘WARNING’’ ON THE COVER OF THIS DOCUMENT
In 1950s, the Moscow Institute of Steels and Alloys, performed agglomeration and
sintering studies on the unprocessed iron ore samples from the Kokbulak deposit.
Furthermore, the Thematic Technological Party Central Laboratory of the Ural Geological
Office conducted mineral beneficiation tests involving heavy liquid, magnetic, gravity and
roasting-magnetic separation technologies.
Sintering tests by the Moscow Institute of Steels and Alloys showed that
hydrogoethite-rich Kokbulak iron ores have good reducibility, but high levels of
impurities. Therefore, Kokbulak ores and concentrates will require blending with ores
and concentrates from other projects in order to produce a suitable feed for sale.
Phosphorous, the major impurity, is present with values constantly above 1% and
roughly one order of magnitude higher than the desirable level, and at this level will drive
the requirement for treatment and blending of the concentrates. The Kokbulak ores are also
characterised by high silica and alumina contents, which will further drive the need for the
production of a heavily fluxed agglomerate.
Testwork by the Thematic Technological Party Central Laboratory of the Ural
Geological Office extensively investigated the possibility to upgrade Kokbulak iron ores by
means of gravity and magnetic separation and roasting plus magnetic separation. They
succeeded in demonstrating that concentrates grading in excess of 48% iron can be obtained
by Dry High Intensity Magnetic Separation (‘‘HIMS’’) from brown and black ores with
reasonable recoveries. However, the same results could not be obtained with the green ores.
The roasting plus magnetic separation route was not considered economically justified. In
summary all concentrates obtained showed a high phosphorus content, which ranges from
0.51 to 0.72%.
The testwork conducted by the Centre of Geosciences, Metallurgy and Processing in
2011 provides laboratory evidence that the thermo acid dephosphorisation of brown iron
samples from the Kokbulak deposit, in particular from the Central area, is technically
feasible and low-phosphorus and low-silica brown iron ore concentrates can be obtained. In
2013, a testwork programme was commissioned and was performed at VNIItsvetmet, a filial
agency of the National Center for Complex Processing of Mineral Raw Materials,
Industrial Development Committee of the Ministry of Industry and Infrastructural
Development of the Republic of Kazakhstan. The report of this testwork covering
mineralogical and mineral processing studies on two bulk samples from the Kokbulak Iron
Ore Project was issued in 2014. However, given the unrepresentative grades, sample
collection method and lower phosphate content, WAI has discounted the testwork results of
the Centre of Geosciences, Metallurgy and Processing and VNIItsvetmet.
In terms of the dephosphorisation technology, in both the processing section and
CAPEX and OPEX sections of the Project XXI 2013 Feasibility Study, this was estimated
‘‘by analogy’’ with the processing facilities of the Lisakovsk mine (in North Kazakhstan)
which had similar mineralogical and chemical composition to the Kokbulak Iron Ore
Project.
APPENDIX III COMPETENT PERSON’S REPORT
– III-19 –
THIS DOCUMENT IS IN DRAFT FORM, INCOMPLETE AND SUBJECT TO CHANGE AND THAT
THE INFORMATION MUST BE READ IN CONJUNCTION WITH THE SECTION HEADED
‘‘WARNING’’ ON THE COVER OF THIS DOCUMENT
However, the dephosphorisation technology applied at the processing facilities in
Lisakovsk, whose scientific background is well understood, has yet not seen widespread use.
WAI understands Lisakovsk chose not to pursue such dephosphorisation technology and
WAI is not aware of any commercial operations of this type as at the date of this CPR.
Nevertheless, WAI is of the view that the major assumptions used in the financial
model e.g. CAPEX and OPEX are considered reasonable and the Kokbulak Iron Ore
Project is undoubtedly attractive, and also appears robust to significant price falls.
Although the testworks performed to date confirm a good repeatability in terms of
gravity and magnetic separation results, giving confidence in the metallurgical
performances of the flowsheet, WAI is of the opinion that additional gravity-magnetic
testwork and dephosphorisation testwork on samples that are representative of the project
are required to better confirm the processing workflow of the Kokbulak Iron Ore Project.
Nevertheless, in WAI’s opinion, the processing plant of the Kokbulak Iron Ore Project
could be designed on combination of processes researched by the Client and described in
public domain technical literature.
In addition, WAI is of the view that an iron ore concentrate grading 58.4% Fe with a
low level of impurities (P50.30%) is potentially achievable and hence saleable and hence
saleable.
As stated in the Industry Report prepared by Ipsos Asia Limited for the purpose of the
[REDACTED] of the Company on the Main Board of the Stock Exchange, such an Iron ore
concentrate with a Phosphorus level<0.30%, is able to meet the technical requirement in
the Russian and PRC Markets to be potentially saleable.
Environmental & Social
Whilst the development of the Kokbulak Iron Ore Project will affect the environment,
due to the distance from the nearest settlement and any sensitive receptors, environmental
and social conditions are considered favourable for the Kokbulak Iron Ore Project.
Financial Analysis
For this CPR, WAI has reviewed the latest financial model for the operation of Central
Area of the Kokbulak Iron Ore Project developed by the Client which is based on the
Project XXI 2013 Feasibility Study with major updates including (i) updated mining
schedule prepared by WAI according to the latest open-pit optimization results and (ii)
updated economic parameters such as iron ore concentrate price, CAPEX and OPEX.
In general, the model assumes a mine schedule with a production rate of approximately
24Mtpa of ore at an average grade of around 39% Fe over a mine life of 15 years, to
produce concentrate grading 58.4% Fe using a long-term price of US$100/t for 62% Fe
concentrate.
APPENDIX III COMPETENT PERSON’S REPORT
– III-20 –
THIS DOCUMENT IS IN DRAFT FORM, INCOMPLETE AND SUBJECT TO CHANGE AND THAT
THE INFORMATION MUST BE READ IN CONJUNCTION WITH THE SECTION HEADED
‘‘WARNING’’ ON THE COVER OF THIS DOCUMENT
On the basis of the above and at a 10% discount rate, the Central Area of the
Kokbulak Iron Ore Project has an NPV of US$2.3 billion under Discounted Cash Flow
Model (DCF) model, with a payback of only 2 years. A sensitivity analysis shows that the
project economics are dominated by the iron ore concentrate price.
Further work is required to bring plant CAPEX and plant OPEX estimates to the level
of accuracy of a Feasibility Study (+/–15%). The project appears to be more sensitive to
plant OPEX rather than to plant CAPEX, and almost 85–90% of the plant OPEX is
composed of four items — namely power, natural gas, sulphuric acid and limestone, whose
consumption is principally derived by analogy from the Lisakovsk mine process plant and
from industry standards.
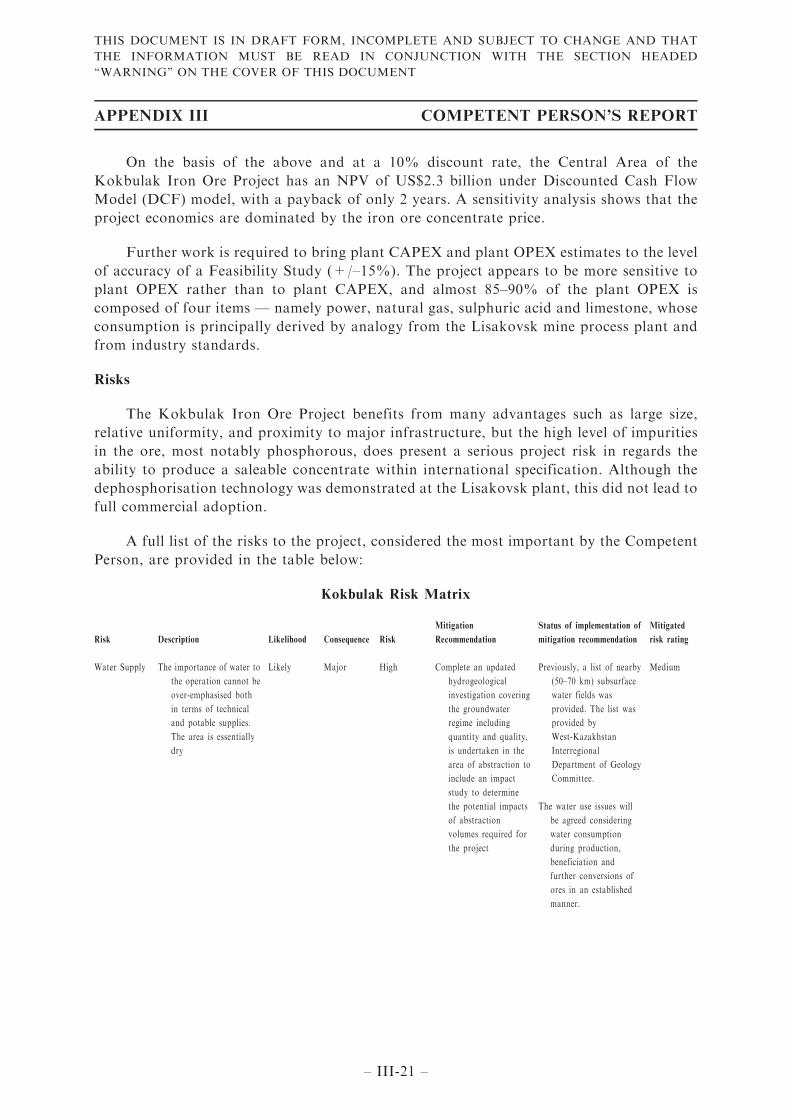
Risks
The Kokbulak Iron Ore Project benefits from many advantages such as large size,
relative uniformity, and proximity to major infrastructure, but the high level of impurities
in the ore, most notably phosphorous, does present a serious project risk in regards the
ability to produce a saleable concentrate within international specification. Although the
dephosphorisation technology was demonstrated at the Lisakovsk plant, this did not lead to
full commercial adoption.
A full list of the risks to the project, considered the most important by the Competent
Person, are provided in the table below:
Kokbulak Risk Matrix
Risk Description Likelihood Consequence Risk
Mitigation
Recommendation
Status of implementation of
mitigation recommendation
Mitigated
risk rating
Water Supply The importance of water to
the operation cannot be
over-emphasised both
in terms of technical
and potable supplies.
The area is essentially
dry
Likely Major High Complete an updated
hydrogeological
investigation covering
the groundwater
regime including
quantity and quality,
is undertaken in the
area of abstraction to
include an impact
study to determine
the potential impacts
of abstraction
volumes required for
the project
Previously, a list of nearby
(50–70 km) subsurface
water fields was
provided. The list was
provided by
West-Kazakhstan
Interregional
Department of Geology
Committee.
The water use issues will
be agreed considering
water consumption
during production,
beneficiation and
further conversions of
ores in an established
manner.
Medium
APPENDIX III COMPETENT PERSON’S REPORT
– III-21 –
THIS DOCUMENT IS IN DRAFT FORM, INCOMPLETE AND SUBJECT TO CHANGE AND THAT
THE INFORMATION MUST BE READ IN CONJUNCTION WITH THE SECTION HEADED
‘‘WARNING’’ ON THE COVER OF THIS DOCUMENT
Risk Description Likelihood Consequence Risk
Mitigation
Recommendation
Status of implementation of
mitigation recommendation
Mitigated
risk rating
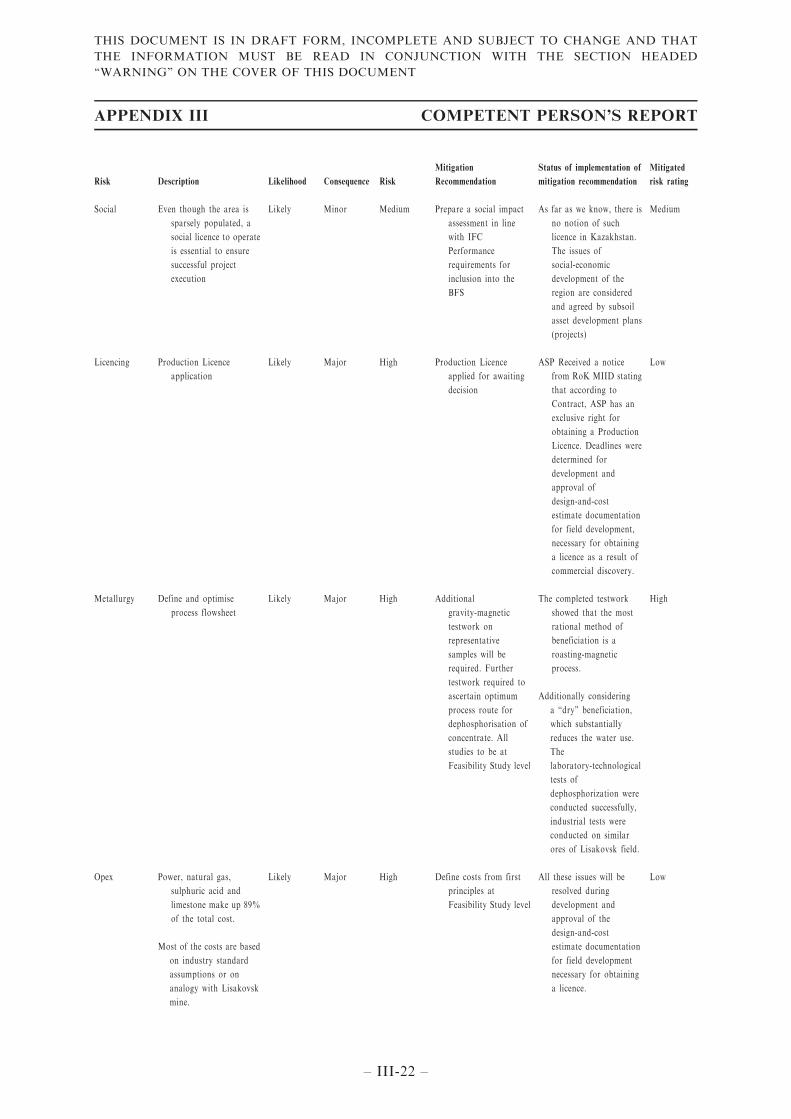
Social Even though the area is
sparsely populated, a
social licence to operate
is essential to ensure
successful project
execution
Likely Minor Medium Prepare a social impact
assessment in line
with IFC
Performance
requirements for
inclusion into the
BFS
As far as we know, there is
no notion of such
licence in Kazakhstan.
The issues of
social-economic
development of the
region are considered
and agreed by subsoil
asset development plans
(projects)
Medium
Licencing Production Licence
application
Likely Major High Production Licence
applied for awaiting
decision
ASP Received a notice
from RoK MIID stating
that according to
Contract, ASP has an
exclusive right for
obtaining a Production
Licence. Deadlines were
determined for
development and
approval of
design-and-cost
estimate documentation
for field development,
necessary for obtaining
a licence as a result of
commercial discovery.
Low
Metallurgy Define and optimise
process flowsheet
Likely Major High Additional
gravity-magnetic
testwork on
representative
samples will be
required. Further
testwork required to
ascertain optimum
process route for
dephosphorisation of
concentrate. All
studies to be at
Feasibility Study level
The completed testwork
showed that the most
rational method of
beneficiation is a
roasting-magnetic
process.
Additionally considering
a ‘‘dry’’ beneficiation,
which substantially
reduces the water use.
The
laboratory-technological
tests of
dephosphorization were
conducted successfully,
industrial tests were
conducted on similar
ores of Lisakovsk field.
High
Opex Power, natural gas,
sulphuric acid and
limestone make up 89%
of the total cost.
Most of the costs are based
on industry standard
assumptions or on
analogy with Lisakovsk
mine.
Likely Major High Define costs from first
principles at
Feasibility Study level
All these issues will be
resolved during
development and
approval of the
design-and-cost
estimate documentation
for field development
necessary for obtaining
a licence.
Low
APPENDIX III COMPETENT PERSON’S REPORT
– III-22 –
THIS DOCUMENT IS IN DRAFT FORM, INCOMPLETE AND SUBJECT TO CHANGE AND THAT
THE INFORMATION MUST BE READ IN CONJUNCTION WITH THE SECTION HEADED
‘‘WARNING’’ ON THE COVER OF THIS DOCUMENT
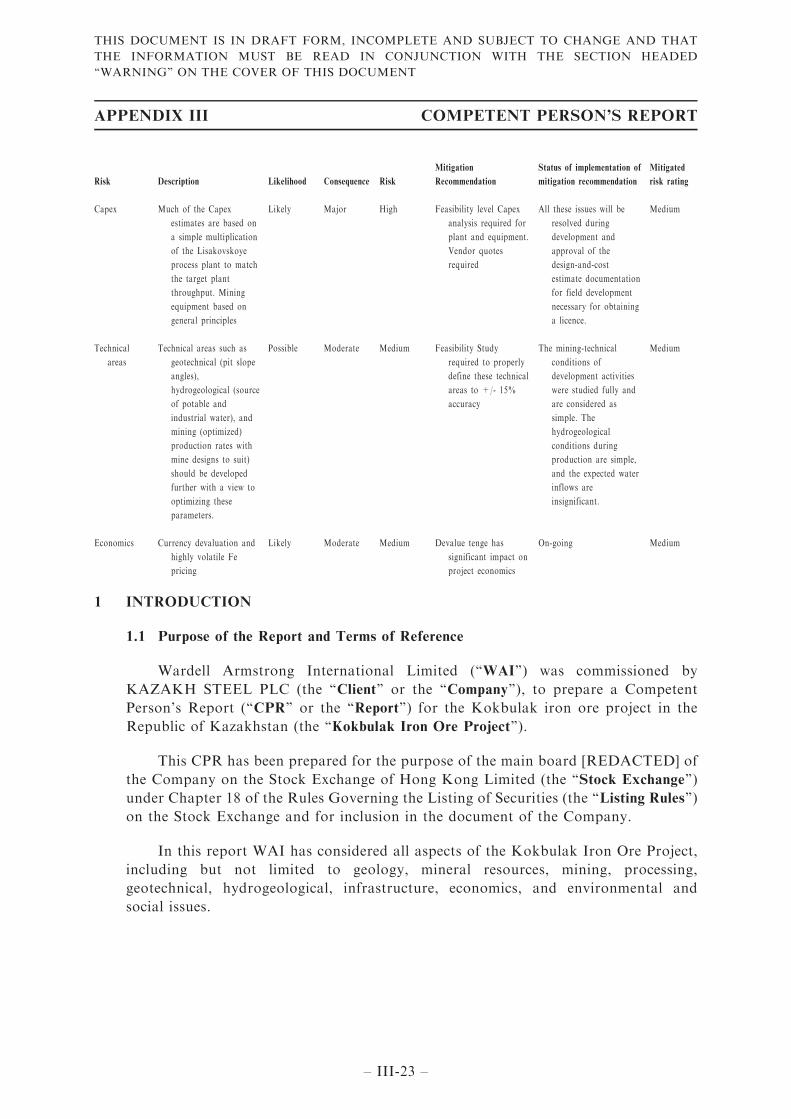
Risk Description Likelihood Consequence Risk
Mitigation
Recommendation
Status of implementation of
mitigation recommendation
Mitigated
risk rating
Capex Much of the Capex
estimates are based on
a simple multiplication
of the Lisakovskoye
process plant to match
the target plant
throughput. Mining
equipment based on
general principles
Likely Major High Feasibility level Capex
analysis required for
plant and equipment.
Vendor quotes
required
All these issues will be
resolved during
development and
approval of the
design-and-cost
estimate documentation
for field development
necessary for obtaining
a licence.
Medium
Technical
areas
Technical areas such as
geotechnical (pit slope
angles),
hydrogeological (source
of potable and
industrial water), and
mining (optimized)
production rates with
mine designs to suit)
should be developed
further with a view to
optimizing these
parameters.
Possible Moderate Medium Feasibility Study
required to properly
define these technical
areas to +/- 15%
accuracy
The mining-technical
conditions of
development activities
were studied fully and
are considered as
simple. The
hydrogeological
conditions during
production are simple,
and the expected water
inflows are
insignificant.
Medium
Economics Currency devaluation and
highly volatile Fe
pricing
Likely Moderate Medium Devalue tenge has
significant impact on
project economics
On-going Medium
1 INTRODUCTION
1.1 Purpose of the Report and Terms of Reference
Wardell Armstrong International Limited (‘‘WAI’’) was commissioned by
KAZAKH STEEL PLC (the ‘‘Client’’ or the ‘‘Company’’), to prepare a Competent
Person’s Report (‘‘CPR’’ or the ‘‘Report’’) for the Kokbulak iron ore project in the
Republic of Kazakhstan (the ‘‘Kokbulak Iron Ore Project’’).
This CPR has been prepared for the purpose of the main board [REDACTED] of
the Company on the Stock Exchange of Hong Kong Limited (the ‘‘Stock Exchange’’)
under Chapter 18 of the Rules Governing the Listing of Securities (the ‘‘Listing Rules’’)
on the Stock Exchange and for inclusion in the document of the Company.
In this report WAI has considered all aspects of the Kokbulak Iron Ore Project,
including but not limited to geology, mineral resources, mining, processing,
geotechnical, hydrogeological, infrastructure, economics, and environmental and
social issues.
APPENDIX III COMPETENT PERSON’S REPORT
– III-23 –
THIS DOCUMENT IS IN DRAFT FORM, INCOMPLETE AND SUBJECT TO CHANGE AND THAT
THE INFORMATION MUST BE READ IN CONJUNCTION WITH THE SECTION HEADED
‘‘WARNING’’ ON THE COVER OF THIS DOCUMENT
1.2 Reporting Standard
The CPR has been prepared in accordance with the guidelines of the JORC Code
(2012) and the rules and guidelines issued by such bodies as the Stock Exchange,
including Listing Rules (with specific emphasis on Chapter 18 which sets out
additional listing conditions, disclosure requirements and continuing obligations for
Mineral Companies) and Guidance Note 7 (Suggested Risk Assessment for Mineral
Companies).
1.3 Consultants and Interests
WAI has provided the mineral industry with specialised geological, mining, and
processing expertise since 1987, initially as an independent company, but from 1999 as
part of the Wardell Armstrong Group. WAI’s experience is worldwide and has been
developed in the metalliferous and coal mining sector.
The parent company of WAI is a mining engineering/environmental consultancy
that services the industrial minerals sector from twelve regional offices in the UK and
international offices in Almaty, Kazakhstan, and Moscow, Russia. Total worldwide
staff complement is now over 500.
Details of the principal consultants involved in the preparation of this CPR are as
follows:
Phil Newall, BSc (ARSM), PhD (ACSM), CEng, FIMMM, Managing Director of WAI
Phil is a mining geologist with nearly 30 years’ experience of providing
consultancy services to minerals companies throughout the world, with particular
specialisation in CIS, Europe, and Africa. He has a Mining Geology degree from Royal
School of Mines in London, and a PhD in Exploration Geochemistry from Camborne
School of Mines in Cornwall, UK. During his long career as a consulting geologist,
Phil has undertaken a large variety of exploration and mining-related contracts, from
project management through to technical audits of both metalliferous (specifically gold
and base metals) and industrial mineral deposits. In addition, Phil is responsible for
Wardell Armstrong’s Mining Division as well as managing the company’s Moscow and
Almaty offices. From a technical standpoint, most recently, Phil has been responsible
for Project Managing the Mineral Expert Report for the successful Glencore Initial
Public Offering.
Dr Phil Newall is the Competent Person defined in Chapter 18 of the Listing
Rules and fulfilled Rules 18.21 and 18.22 and in that capacity takes overall
responsibility for this CPR for the purpose of Listing Rule 18.21(3).
APPENDIX III COMPETENT PERSON’S REPORT
– III-24 –
THIS DOCUMENT IS IN DRAFT FORM, INCOMPLETE AND SUBJECT TO CHANGE AND THAT
THE INFORMATION MUST BE READ IN CONJUNCTION WITH THE SECTION HEADED
‘‘WARNING’’ ON THE COVER OF THIS DOCUMENT
Ualikhan Aknazarov, MSc, MIMMM, Mining Engineer
Ualikhan is an experienced mining industry professional specializing in mine
design and mine planning, through reserves optimization, project development, and
business and mine operation improvements. Ualikhan started his career in 2007 with
Kazakhmys as a Drilling operator assistant at Belousovskii & Irtishskii mines (East
Kazakhstan), Shift Foreman at USR and Belousovskii mines, before becoming a
Mining Engineer (2010) in Karaganda (Kazakhstan) responsible for mine planning and
implementation of mine planning software (Datamine, Surpac, GEMS (PCSLC)). In
2012, Ualikhan took a position with Polymetal, initially as Lead Mine Planning
Engineer (Lunnoe/Arylakh mine, Magadan, Russia) and then shortly afterwards as a
Senior Mine Planning Engineer (Mayskoe mine, Chukotka, Russia) responsible for
mine planning and scheduling (short-, mid- and long-term planning), production
efficiency analysis, ore reserve estimation, and optimisation and mine design. In 2016,
Ualikhan was promoted to Lead Mining Engineer. This role was more diverse taking in
risk assessment, safety audits, budgeting, routine production and mine schedule
analysis, reconciliation, plus other tasks. In 2019 Ualikhan took a position with
Datamine as a Senior Consultant (Mining Engineer) to support the Central Asia and
Russian Client base. In this role he assisted the development team to improve Open Pit
software and provided tutorials and training for several key mining companies
(including Altynalmas, Kores, Koza Gold, Kazakhmys, Polymetal, Kumtor, and
KazZink). Ualikhan is very experienced in the use of Datamine Studio NPV Scheduler,
Studio OP, Studio UG, Mineable Shape Optimizer for Open Pit and Underground
mining, and EPS (Enhanced Production Scheduler), and is multilingual (Native
Kazakh, fluent Russian, advance English).
Alan Clarke, CGeol, BSc, MSc, MCSM, FGS,> Principal Resource Geologist
Alan is a mining geologist with 10 years’ experience within the minerals sector. He
has previously worked in underground and open pit operations within the industrial
minerals sector in the UK and as a geological consultant with Datamine International.
He has conducted resource reports for annual corporate financial reporting and has
been responsible for pit optimisation, production scheduling, grade control and
reconciliation. As a resource modelling geologist with WAI, Alan has worked on
numerous resource modelling projects including the Kuranakh, Kimkan and Sutara
and Garinskoe iron ore projects for IRC in FE Russia, the Bissa gold deposit, Burkina
Faso and the Vasgold gold deposits, Kazakhstan.
Ruslan Erzhanov, MSc, FGS, CGeol, PONEN RoK, General Director — WAI
Kazakhstan
Ruslan is a General Director and Principal Resource Geologist for the
Kazakhstan office. He has more than 15 years’ experience as a mining and
exploration geologist. He has worked on numerous metalliferous projects in CIS.
Responsibilities included managing the implementation of drill programmes; grade
control; development and maintenance of QA/QC systems in assaying; he was involved
in resource and reserve estimates according to GKZ standard for a number of mineral
APPENDIX III COMPETENT PERSON’S REPORT
– III-25 –
THIS DOCUMENT IS IN DRAFT FORM, INCOMPLETE AND SUBJECT TO CHANGE AND THAT
THE INFORMATION MUST BE READ IN CONJUNCTION WITH THE SECTION HEADED
‘‘WARNING’’ ON THE COVER OF THIS DOCUMENT
projects. Working with WAI he involved with undertaking mineral resource
estimations and other technical studies including technical due diligence,
pre-feasibility/feasibility studies, NI43–101s and Competent Person’s Reports mainly
for metalliferous projects across Central Asia, Russia and Europe. As a resource
modelling geologist with WAI since 2013, he has modelled several polymetallic
deposits in CIS for such companies as Kazakhmys, Kazzinc, Polymetal, Polyus,
Nornickel as well as gold and iron ore deposits throughout Asia. He possesses a high
level of computer proficiency in Mining and geological software packages such as
Micromine, Supervisor and Leapfrog, Open Pit Optimisation Packages, database
administration. Ruslan has multilingual communication skills, proficient in both
Russian and English.
Stuart Richardson, ACSM, BEng, ProfGradIMMM; Senior Mining Engineer
Stuart is a mining engineer, graduating from Camborne School of Mines in 2006.
He was employed as a student mining engineer by Deno Gold, Republic of Armenia, in
2005 gaining experience in metalliferous mining methodologies. He joined Wardell
Armstrong in early 2007 as a Graduate Mining Engineer and has been involved in
several projects, including the analysis of coal resources in Kentucky, USA. He has
also gained experience in managing site works, acting as the Resident Engineer for a
project at the Great Laxey Mine on the Isle of Man and as Quality Control Engineer
for drilling works at Sutton Courtenay Landfill Site, Oxfordshire. In 2008, Stuart
transferred to Wardell Armstrong International, working as a mining engineer and
assisting in the production of a number of pre- feasibility and feasibility studies and
has considerable experience is the field of mine design, scheduling and optimisation
with the CAE Mining software suite.
Ruslan Sevostianov, Regional Director, WAI Russia
Ruslan is a Chartered Mining Engineer and Surveyor and has an Honours Master
of Science in Mine Engineering and Surveying from the Kyrgyz State Mining
Metallurgical University, Bishkek, Kyrgyzstan. Ruslan has over nine years of diverse
experience in the mining industry including mining operations, implementation of
innovative technologies in mining production, business improvement, mine
development, implementation of automation systems of mining, design, drilling and
blasting, geotechnical and dewatering experience with major gold mining companies in
the CIS.
Philip King, BSc (Eng) Mineral Technology (Hons), Technical Director (Mineral
Processing)
Philip has over 35 years minerals processing experience ranging from laboratory
test work and pilot plant operations through to plant commissioning, operations and
trouble-shooting. He has considerable experience in the technical and financial
evaluation of many mining projects through the completion of both pre-feasibility and
feasibility studies, and has been involved in process design and engineering studies,
equipment selection, and capital and operating cost estimates. He has also participated
in a number of multi-disciplinary projects throughout Africa, Europe and Central Asia
APPENDIX III COMPETENT PERSON’S REPORT
– III-26 –
THIS DOCUMENT IS IN DRAFT FORM, INCOMPLETE AND SUBJECT TO CHANGE AND THAT
THE INFORMATION MUST BE READ IN CONJUNCTION WITH THE SECTION HEADED
‘‘WARNING’’ ON THE COVER OF THIS DOCUMENT
involving base and precious metals and industrial minerals. In particular, Philip has
considerable experience of the metallurgy and extraction from gold and base metal
ores. Philip is a Fellow of the IMMM and is joint author of the SME Handbook ‘‘Ore
Body Sampling and Metallurgical Testing’’.
Alison Allen MSc, BSc, CEnv, MIEMA, MIEEM, Technical Director
Alison is Associate Director for the Environmental, social and sustainability
management team at WAI and a Chartered Environmental Specialist. Alison has
extensive experience of managing technical commissions involving environmental
impact assessment, Environmental Risk Management and Assessment, Environmental
Due Diligence and brownfield redevelopment. Alison has provided environmental
impact assessments, sustainability assessments, strategic environmental assessments,
environmental audits and human health risk assessments for various drivers including
DMRB, IFC Performance Standards, Equator Principles and International Financial
institution requirements. She is fully conversant with national and international
guidelines, procedures, regulations and standards for mining and ESIAs.
WAI is independent of the Client, its directors/senior management and advisors
pursuant to LR18.22.
WAI, its directors, employees and associates neither has nor holds:
. Any rights to subscribe for shares in KAZAKH STEEL PLC either now or in
the future;
. Any vested interests in any concessions held by KAZAKH STEEL PLC;
. Any rights to subscribe to any interests in any of the concessions held by
KAZAKH STEEL PLC, either now or in the future;
. Any vested interests in either any concessions held by KAZAKH STEEL
PLC or any adjacent concessions; or
. Any right to subscribe to any interests or concessions adjacent to those held
by KAZAKH STEEL PLC, either now or in the future.
WAI’s only financial interest is the right to charge professional fees at normal
commercial rates, plus normal overhead costs, for work carried out in connection with
this Report. Payment of professional fees by the Client is not contingent on the results
of this Report.
1.4 Sources of Information and Reliance on other Experts
All information WAI relied on in compiling this Report was supplied by
KAZAKH STEEL PLC, including but not limited to previous exploration data, in
particular the large volume of Soviet data prepared during the main exploration phase
for the project in the 1950s.
APPENDIX III COMPETENT PERSON’S REPORT
– III-27 –
THIS DOCUMENT IS IN DRAFT FORM, INCOMPLETE AND SUBJECT TO CHANGE AND THAT
THE INFORMATION MUST BE READ IN CONJUNCTION WITH THE SECTION HEADED
‘‘WARNING’’ ON THE COVER OF THIS DOCUMENT
Previous metallurgical testwork and other relevant published and unpublished
data were made available to WAI at the time of preparing this report. WAI has not
carried out any independent exploration work, drilled any holes or carried out any
sampling and assaying for the Kokbulak Iron Ore Project.
The metallurgical, geological, mineralisation, exploration techniques and certain
procedural descriptions, figures and tables used in this report are taken from reports
prepared by other parties and provided to WAI by KAZAKH STEEL PLC.
As mentioned above, in preparing this report, WAI has extensively relied on
information derived and collated by the Client and other parties. Nevertheless, the
authors have critically examined this information, made our own determinations, and
applied our general geological competence to conclude that the information presented
in this CPR complies with the definitions and guidelines of the JORC Codes, in
particular, WAI has:
. Reviewed all historical documentation pertaining to the Kokbulak Iron Ore
Project;
. Reviewed the Project XXI 2013 Feasibility Study;
. Undertaken a site visit to the Kokbulak Iron Ore Project and to meet and
discuss with the geologists and engineers of the Company;
. Identified drill and sample sites of Soviet’s work in 1950s as well as of the
Company’s confirmatory drill programme in 2013 and 2020;
. Reviewed the geology and exploration database of the Kokbulak Iron Ore
Project;
. Audited the sampling methodology including quality assurance, quality
control and assay procedures;
. Examined the geological model for the Kokbulak Iron Ore Project;
. Evaluated historical and recent metallurgical testwork data;
. Reviewed the transportation requirements of the Kokbulak Iron Ore Project;
. Reviewed the water supply and management issues;
. Highlighted any technical issues/challenges/fatal flaws;
. Considered environmental and social issues;
. Scrutinised the latest financial model for the operation in the Central Area;
and
. Provided recommendations going forward.
APPENDIX III COMPETENT PERSON’S REPORT
– III-28 –
THIS DOCUMENT IS IN DRAFT FORM, INCOMPLETE AND SUBJECT TO CHANGE AND THAT
THE INFORMATION MUST BE READ IN CONJUNCTION WITH THE SECTION HEADED
‘‘WARNING’’ ON THE COVER OF THIS DOCUMENT
Though WAI is confident that our opinions presented in this CPR are reasonable,
a substantial amount of data has been accepted in good faith. Whilst WAI has
endeavored to validate as much of the information as possible, WAI cannot be held
responsible nor liable for any omissions, errors or inadequacies of the data received.
With regards to the current legal status of the subsoil use rights, WAI has relied
on information provided by the Company and its legal advisers. WAI makes no other
assessment or assertion as to the legal title of subsoil use rights and is not qualified to
do so.
WAI has not undertaken any accounting, financial or legal due diligence of the
asset or the associated company structures of the Kokbulak Iron Ore Project, and the
comments and opinions contained in this report are restricted to technical and
economic aspects associated with the Kokbulak Iron Ore Project.
1.5 Personal Inspections
A team from WAI including Dr Phil Newall initially visited the Central Area of
the Kokbulak Iron Ore Project from 23–25 April 2014 inclusive, followed by a return
visit on 7th September 2021 by Ualikhan Aknazarov, Senior Mining Engineer with
WAI.
WAI considered that no visit was required for the Northern Area and Southern
Area given the early stage of development in both areas. During the site visit, the
following items were completed:
. Held discussions with company senior personnel;
. Viewed the Kokbulak deposits;
. Viewed the railway;
. Viewed the gas pipeline; and
. Viewed the power line.
WAI is of the opinion that all information inspected during the site visits
corresponds to the information provided by the Client.
1.6 Units and Currency
All units of measurement used in this report are metric unless otherwise stated.
Tonnages are reported as metric tonnes (‘‘t’’) and, base metal values are reported in
weight percentage (‘‘%’’).
Unless otherwise stated, all references to currency or ‘‘$’’ are to United States
Dollars (‘‘US$’’).
APPENDIX III COMPETENT PERSON’S REPORT
– III-29 –
THIS DOCUMENT IS IN DRAFT FORM, INCOMPLETE AND SUBJECT TO CHANGE AND THAT
THE INFORMATION MUST BE READ IN CONJUNCTION WITH THE SECTION HEADED
‘‘WARNING’’ ON THE COVER OF THIS DOCUMENT
1.7 WAI Warranty
The Consultant provides the services using the reasonable skill, care and diligence
expected of competent and properly qualified persons of the relevant disciplines who
are experienced in carrying out such services in relation to works of a similar size,
scope and nature to the Works.
2 PROPERTY DESCRIPTION AND LOCATION
2.1 Location
The majority of the Kokbulak Iron Ore Project is located in the Shalkar District
of Aktobe Region, whilst a small part of the southeast corner of the deposit of the
Kokbulak Iron Ore Project lies within the territory of the Aral District of Kyzyl-Orda
Region, Republic of Kazakhstan.
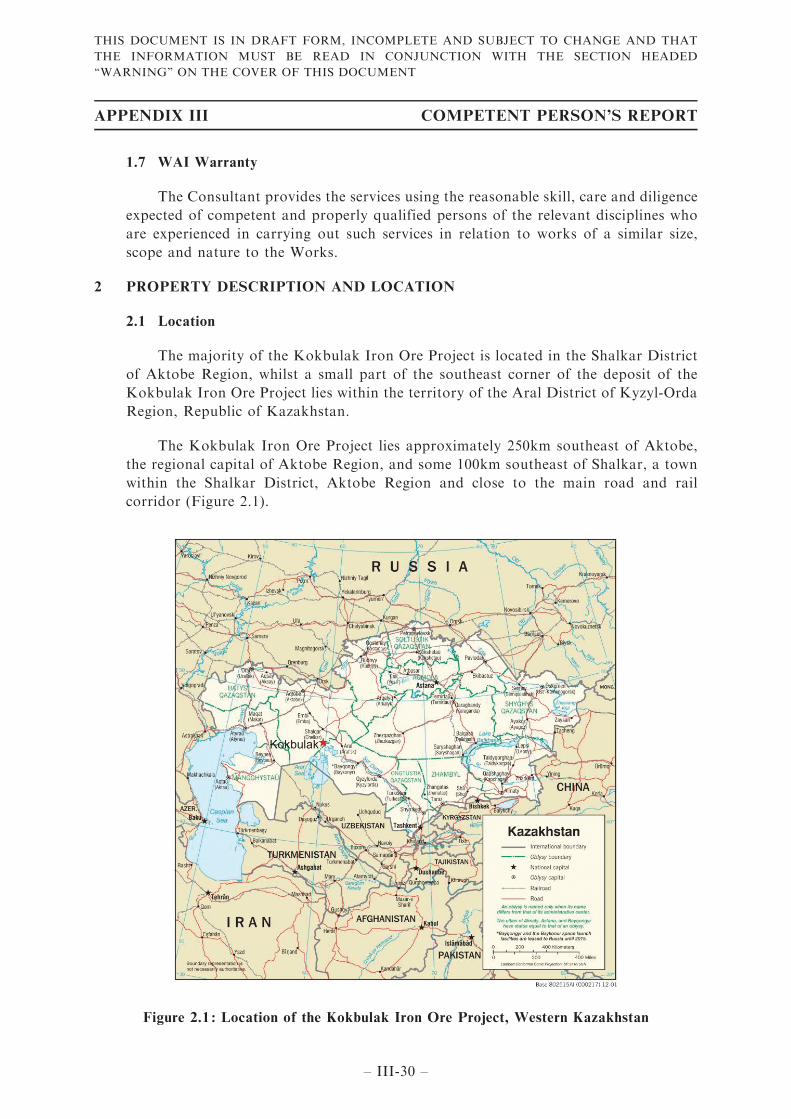
The Kokbulak Iron Ore Project lies approximately 250km southeast of Aktobe,
the regional capital of Aktobe Region, and some 100km southeast of Shalkar, a town
within the Shalkar District, Aktobe Region and close to the main road and rail
corridor (Figure 2.1).
Figure 2.1 : Location of the Kokbulak Iron Ore Project, Western Kazakhstan
APPENDIX III COMPETENT PERSON’S REPORT
– III-30 –
THIS DOCUMENT IS IN DRAFT FORM, INCOMPLETE AND SUBJECT TO CHANGE AND THAT
THE INFORMATION MUST BE READ IN CONJUNCTION WITH THE SECTION HEADED
‘‘WARNING’’ ON THE COVER OF THIS DOCUMENT
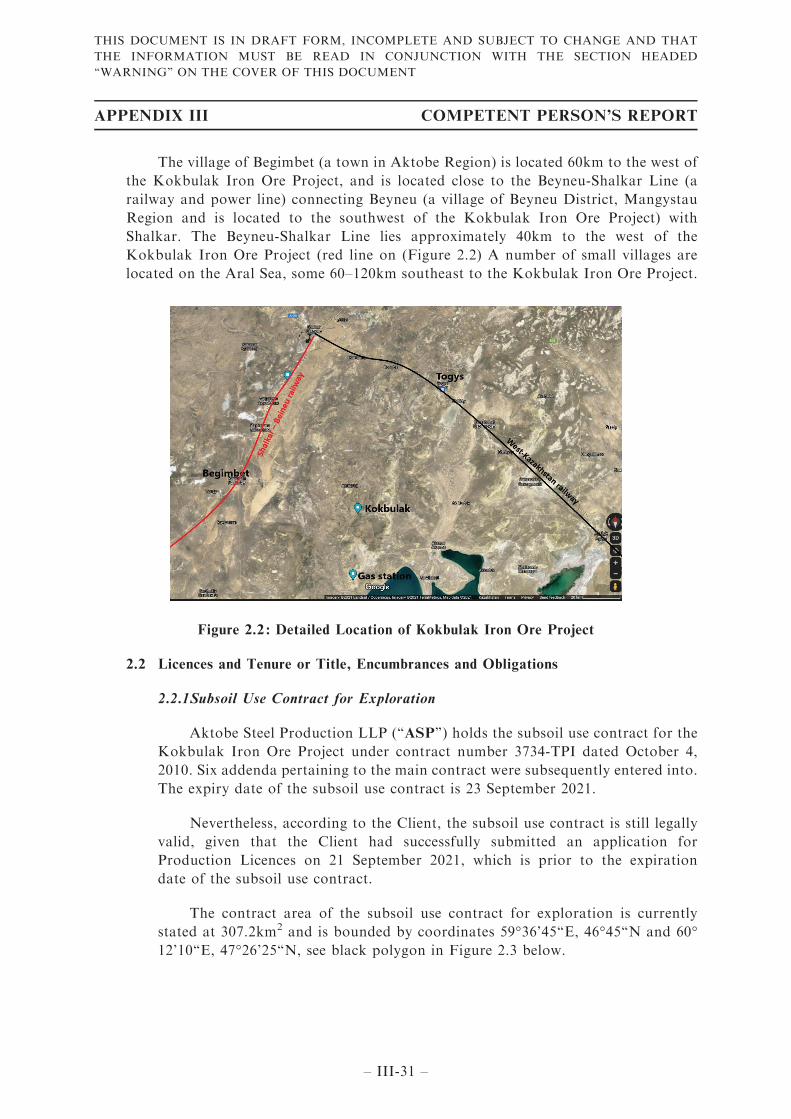
The village of Begimbet (a town in Aktobe Region) is located 60km to the west of
the Kokbulak Iron Ore Project, and is located close to the Beyneu-Shalkar Line (a
railway and power line) connecting Beyneu (a village of Beyneu District, Mangystau
Region and is located to the southwest of the Kokbulak Iron Ore Project) with
Shalkar. The Beyneu-Shalkar Line lies approximately 40km to the west of the
Kokbulak Iron Ore Project (red line on (Figure 2.2) A number of small villages are
located on the Aral Sea, some 60–120km southeast to the Kokbulak Iron Ore Project.
Figure 2.2 : Detailed Location of Kokbulak Iron Ore Project
2.2 Licences and Tenure or Title, Encumbrances and Obligations
2.2.1Subsoil Use Contract for Exploration
Aktobe Steel Production LLP (‘‘ASP’’) holds the subsoil use contract for the
Kokbulak Iron Ore Project under contract number 3734-TPI dated October 4,
2010. Six addenda pertaining to the main contract were subsequently entered into.
The expiry date of the subsoil use contract is 23 September 2021.
Nevertheless, according to the Client, the subsoil use contract is still legally
valid, given that the Client had successfully submitted an application for
Production Licences on 21 September 2021, which is prior to the expiration
date of the subsoil use contract.
The contract area of the subsoil use contract for exploration is currently
stated at 307.2km2 and is bounded by coordinates 59°36’45‘‘E, 46°45‘‘N and 60°12’10‘‘E, 47°26’25‘‘N, see black polygon in Figure 2.3 below.
APPENDIX III COMPETENT PERSON’S REPORT
– III-31 –
THIS DOCUMENT IS IN DRAFT FORM, INCOMPLETE AND SUBJECT TO CHANGE AND THAT
THE INFORMATION MUST BE READ IN CONJUNCTION WITH THE SECTION HEADED
‘‘WARNING’’ ON THE COVER OF THIS DOCUMENT
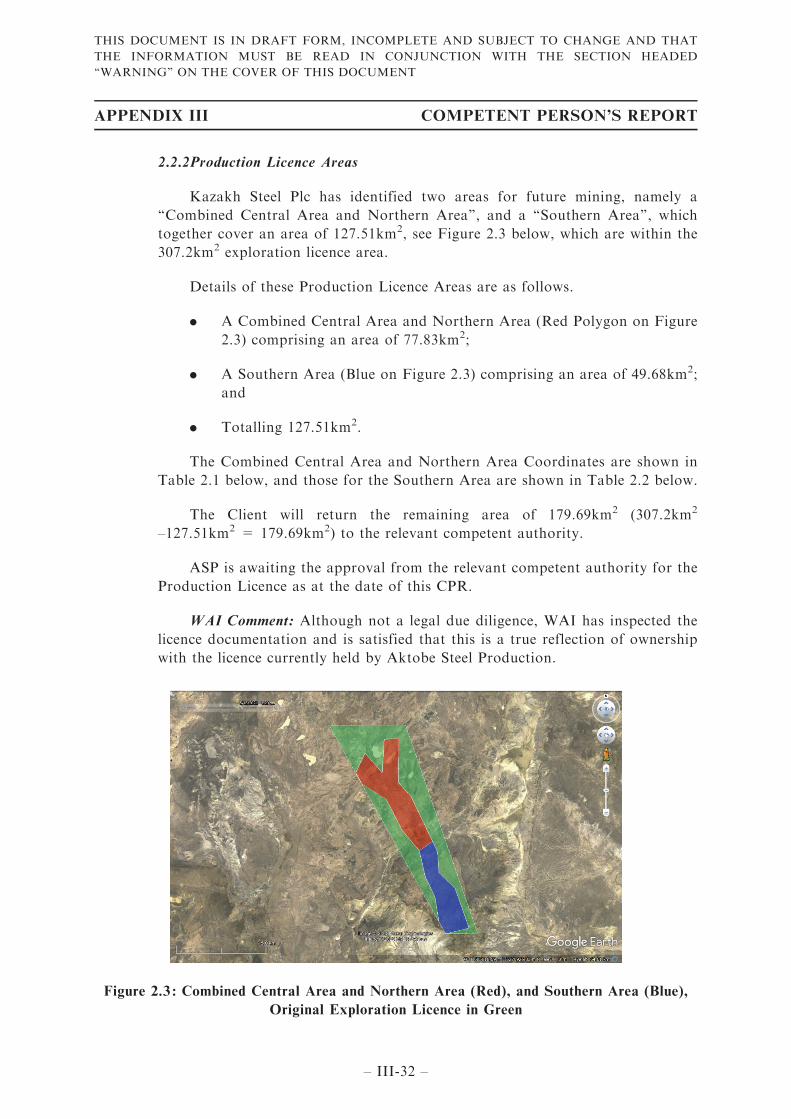
2.2.2Production Licence Areas
Kazakh Steel Plc has identified two areas for future mining, namely a
‘‘Combined Central Area and Northern Area’’, and a ‘‘Southern Area’’, which
together cover an area of 127.51km2, see Figure 2.3 below, which are within the
307.2km2 exploration licence area.
Details of these Production Licence Areas are as follows.
. A Combined Central Area and Northern Area (Red Polygon on Figure
2.3) comprising an area of 77.83km2;
. A Southern Area (Blue on Figure 2.3) comprising an area of 49.68km2;
and
. Totalling 127.51km2.
The Combined Central Area and Northern Area Coordinates are shown in
Table 2.1 below, and those for the Southern Area are shown in Table 2.2 below.
The Client will return the remaining area of 179.69km2 (307.2km2
–127.51km2 = 179.69km2) to the relevant competent authority.
ASP is awaiting the approval from the relevant competent authority for the
Production Licence as at the date of this CPR.
WAI Comment: Although not a legal due diligence, WAI has inspected the
licence documentation and is satisfied that this is a true reflection of ownership
with the licence currently held by Aktobe Steel Production.
Figure 2.3 : Combined Central Area and Northern Area (Red), and Southern Area (Blue),
Original Exploration Licence in Green
APPENDIX III COMPETENT PERSON’S REPORT
– III-32 –
THIS DOCUMENT IS IN DRAFT FORM, INCOMPLETE AND SUBJECT TO CHANGE AND THAT
THE INFORMATION MUST BE READ IN CONJUNCTION WITH THE SECTION HEADED
‘‘WARNING’’ ON THE COVER OF THIS DOCUMENT
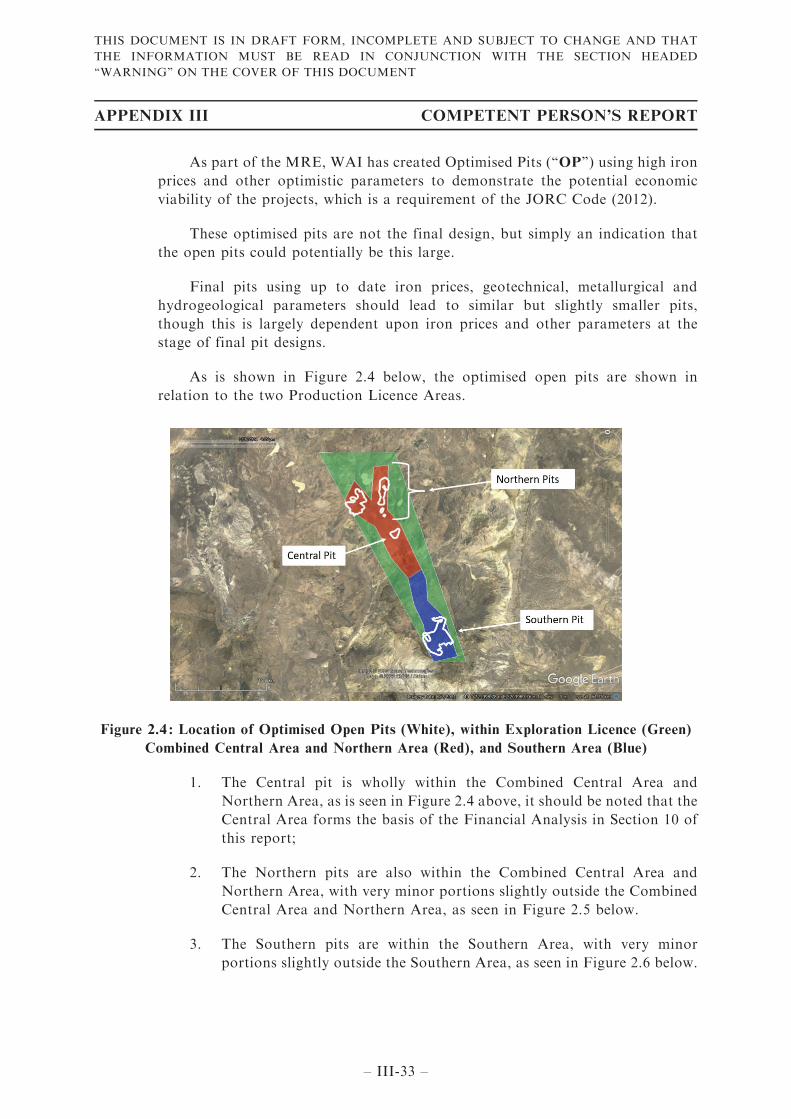
As part of the MRE, WAI has created Optimised Pits (‘‘OP’’) using high iron
prices and other optimistic parameters to demonstrate the potential economic
viability of the projects, which is a requirement of the JORC Code (2012).
These optimised pits are not the final design, but simply an indication that
the open pits could potentially be this large.
Final pits using up to date iron prices, geotechnical, metallurgical and
hydrogeological parameters should lead to similar but slightly smaller pits,
though this is largely dependent upon iron prices and other parameters at the
stage of final pit designs.
As is shown in Figure 2.4 below, the optimised open pits are shown in
relation to the two Production Licence Areas.
Figure 2.4 : Location of Optimised Open Pits (White), within Exploration Licence (Green)
Combined Central Area and Northern Area (Red), and Southern Area (Blue)
1. The Central pit is wholly within the Combined Central Area and
Northern Area, as is seen in Figure 2.4 above, it should be noted that the
Central Area forms the basis of the Financial Analysis in Section 10 of
this report;
2. The Northern pits are also within the Combined Central Area and
Northern Area, with very minor portions slightly outside the Combined
Central Area and Northern Area, as seen in Figure 2.5 below.
3. The Southern pits are within the Southern Area, with very minor
portions slightly outside the Southern Area, as seen in Figure 2.6 below.
APPENDIX III COMPETENT PERSON’S REPORT
– III-33 –
THIS DOCUMENT IS IN DRAFT FORM, INCOMPLETE AND SUBJECT TO CHANGE AND THAT
THE INFORMATION MUST BE READ IN CONJUNCTION WITH THE SECTION HEADED
‘‘WARNING’’ ON THE COVER OF THIS DOCUMENT
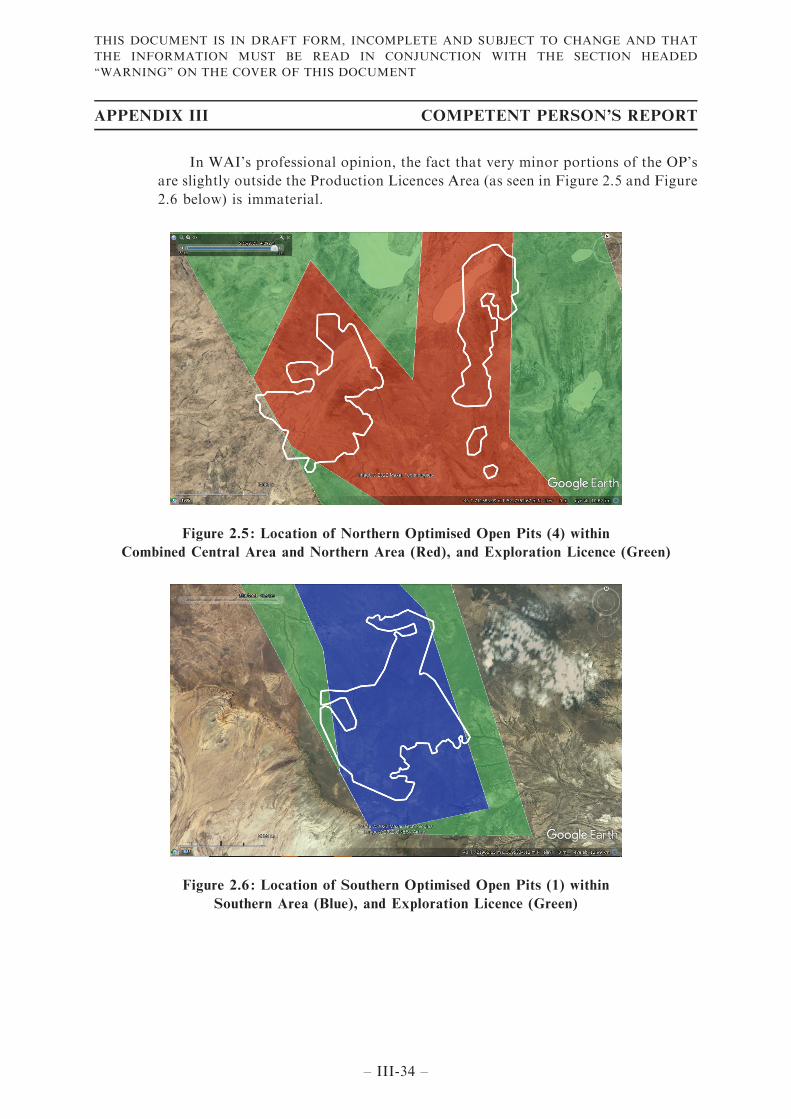
In WAI’s professional opinion, the fact that very minor portions of the OP’s
are slightly outside the Production Licences Area (as seen in Figure 2.5 and Figure
2.6 below) is immaterial.
Figure 2.5 : Location of Northern Optimised Open Pits (4) within
Combined Central Area and Northern Area (Red), and Exploration Licence (Green)
Figure 2.6 : Location of Southern Optimised Open Pits (1) within
Southern Area (Blue), and Exploration Licence (Green)
APPENDIX III COMPETENT PERSON’S REPORT
– III-34 –
THIS DOCUMENT IS IN DRAFT FORM, INCOMPLETE AND SUBJECT TO CHANGE AND THAT
THE INFORMATION MUST BE READ IN CONJUNCTION WITH THE SECTION HEADED
‘‘WARNING’’ ON THE COVER OF THIS DOCUMENT
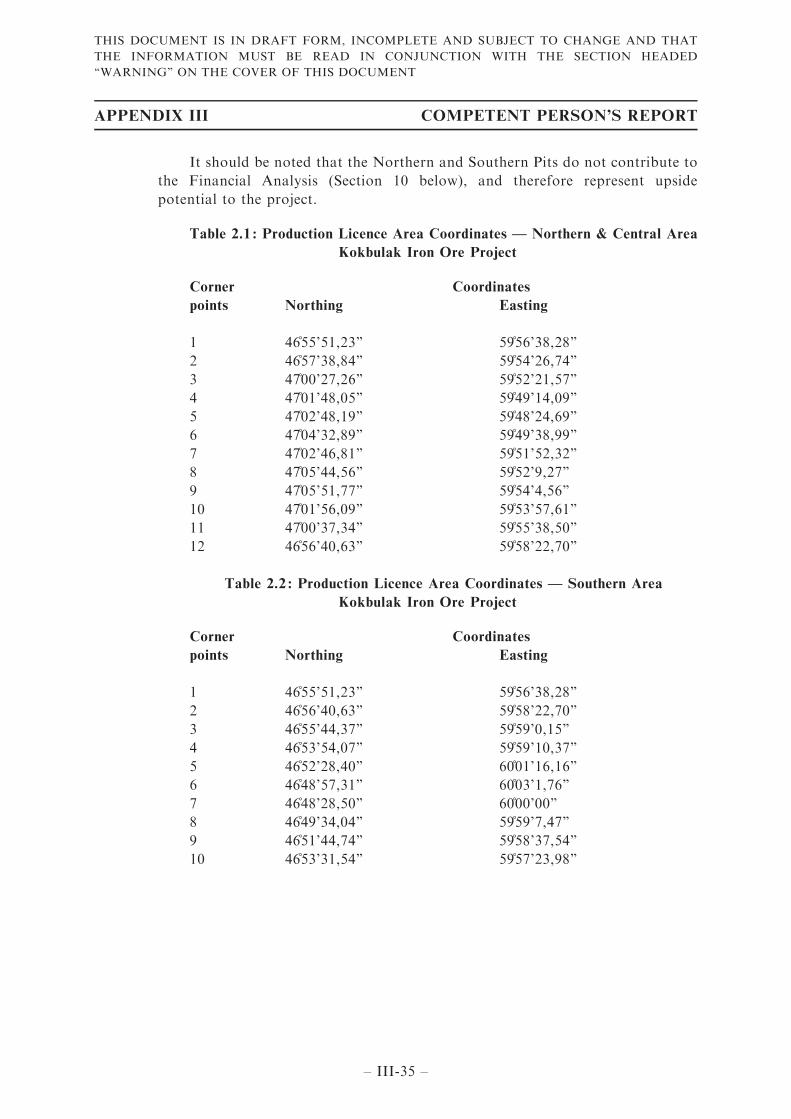
It should be noted that the Northern and Southern Pits do not contribute to
the Financial Analysis (Section 10 below), and therefore represent upside
potential to the project.
Table 2.1 : Production Licence Area Coordinates — Northern & Central Area
Kokbulak Iron Ore Project
Corner
points
Coordinates
Northing Easting
1 46˚55’51,23’’ 59˚56’38,28’’
2 46˚57’38,84’’ 59˚54’26,74’’
3 47˚00’27,26’’ 59˚52’21,57’’
4 47˚01’48,05’’ 59˚49’14,09’’
5 47˚02’48,19’’ 59˚48’24,69’’
6 47˚04’32,89’’ 59˚49’38,99’’
7 47˚02’46,81’’ 59˚51’52,32’’
8 47˚05’44,56’’ 59˚52’9,27’’
9 47˚05’51,77’’ 59˚54’4,56’’
10 47˚01’56,09’’ 59˚53’57,61’’
11 47˚00’37,34’’ 59˚55’38,50’’
12 46˚56’40,63’’ 59˚58’22,70’’
Table 2.2 : Production Licence Area Coordinates — Southern Area
Kokbulak Iron Ore Project
Corner
points
Coordinates
Northing Easting
1 46˚55’51,23’’ 59˚56’38,28’’
2 46˚56’40,63’’ 59˚58’22,70’’
3 46˚55’44,37’’ 59˚59’0,15’’
4 46˚53’54,07’’ 59˚59’10,37’’
5 46˚52’28,40’’ 60˚01’16,16’’
6 46˚48’57,31’’ 60˚03’1,76’’
7 46˚48’28,50’’ 60˚00’00’’
8 46˚49’34,04’’ 59˚59’7,47’’
9 46˚51’44,74’’ 59˚58’37,54’’
10 46˚53’31,54’’ 59˚57’23,98’’
APPENDIX III COMPETENT PERSON’S REPORT
– III-35 –
THIS DOCUMENT IS IN DRAFT FORM, INCOMPLETE AND SUBJECT TO CHANGE AND THAT
THE INFORMATION MUST BE READ IN CONJUNCTION WITH THE SECTION HEADED
‘‘WARNING’’ ON THE COVER OF THIS DOCUMENT
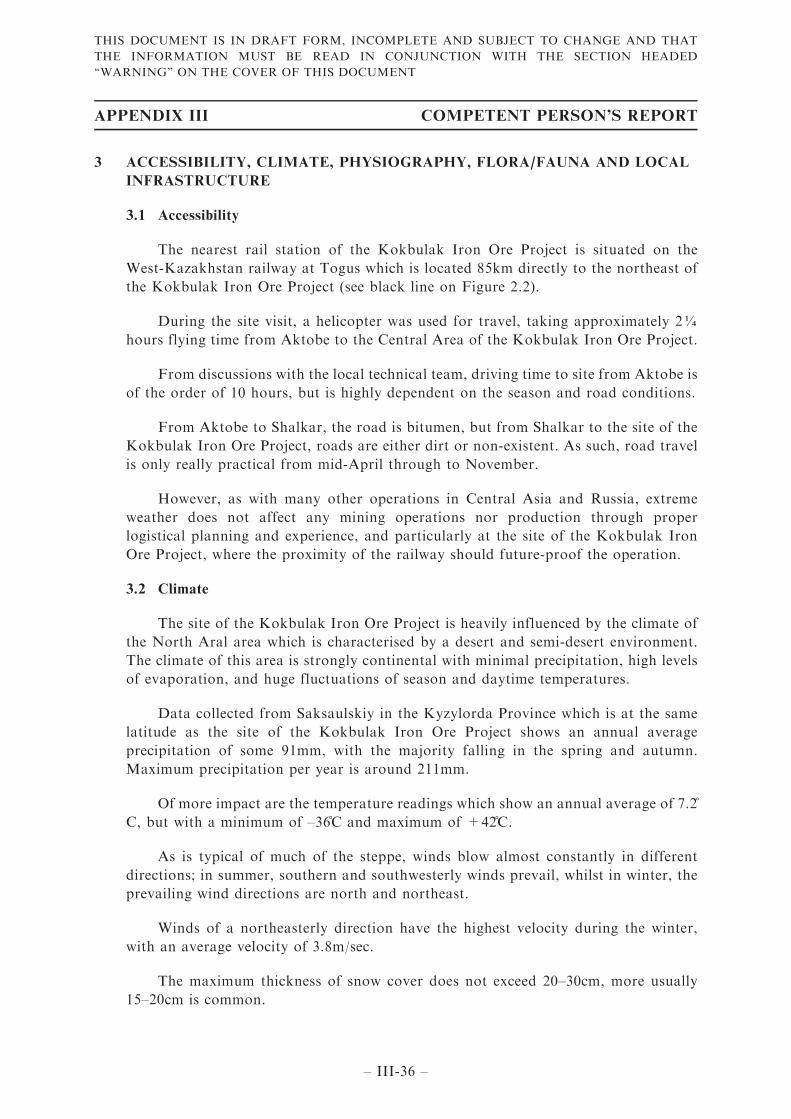
3 ACCESSIBILITY, CLIMATE, PHYSIOGRAPHY, FLORA/FAUNA AND LOCAL
INFRASTRUCTURE
3.1 Accessibility
The nearest rail station of the Kokbulak Iron Ore Project is situated on the
West-Kazakhstan railway at Togus which is located 85km directly to the northeast of
the Kokbulak Iron Ore Project (see black line on Figure 2.2).
During the site visit, a helicopter was used for travel, taking approximately 2¼
hours flying time from Aktobe to the Central Area of the Kokbulak Iron Ore Project.
From discussions with the local technical team, driving time to site from Aktobe is
of the order of 10 hours, but is highly dependent on the season and road conditions.
From Aktobe to Shalkar, the road is bitumen, but from Shalkar to the site of the
Kokbulak Iron Ore Project, roads are either dirt or non-existent. As such, road travel
is only really practical from mid-April through to November.
However, as with many other operations in Central Asia and Russia, extreme
weather does not affect any mining operations nor production through proper
logistical planning and experience, and particularly at the site of the Kokbulak Iron
Ore Project, where the proximity of the railway should future-proof the operation.
3.2 Climate
The site of the Kokbulak Iron Ore Project is heavily influenced by the climate of
the North Aral area which is characterised by a desert and semi-desert environment.
The climate of this area is strongly continental with minimal precipitation, high levels
of evaporation, and huge fluctuations of season and daytime temperatures.
Data collected from Saksaulskiy in the Kyzylorda Province which is at the same
latitude as the site of the Kokbulak Iron Ore Project shows an annual average
precipitation of some 91mm, with the majority falling in the spring and autumn.
Maximum precipitation per year is around 211mm.
Of more impact are the temperature readings which show an annual average of 7.2˚
C, but with a minimum of –36˚C and maximum of +42˚C.
As is typical of much of the steppe, winds blow almost constantly in different
directions; in summer, southern and southwesterly winds prevail, whilst in winter, the
prevailing wind directions are north and northeast.
Winds of a northeasterly direction have the highest velocity during the winter,
with an average velocity of 3.8m/sec.
The maximum thickness of snow cover does not exceed 20–30cm, more usually
15–20cm is common.
APPENDIX III COMPETENT PERSON’S REPORT
– III-36 –
THIS DOCUMENT IS IN DRAFT FORM, INCOMPLETE AND SUBJECT TO CHANGE AND THAT
THE INFORMATION MUST BE READ IN CONJUNCTION WITH THE SECTION HEADED
‘‘WARNING’’ ON THE COVER OF THIS DOCUMENT
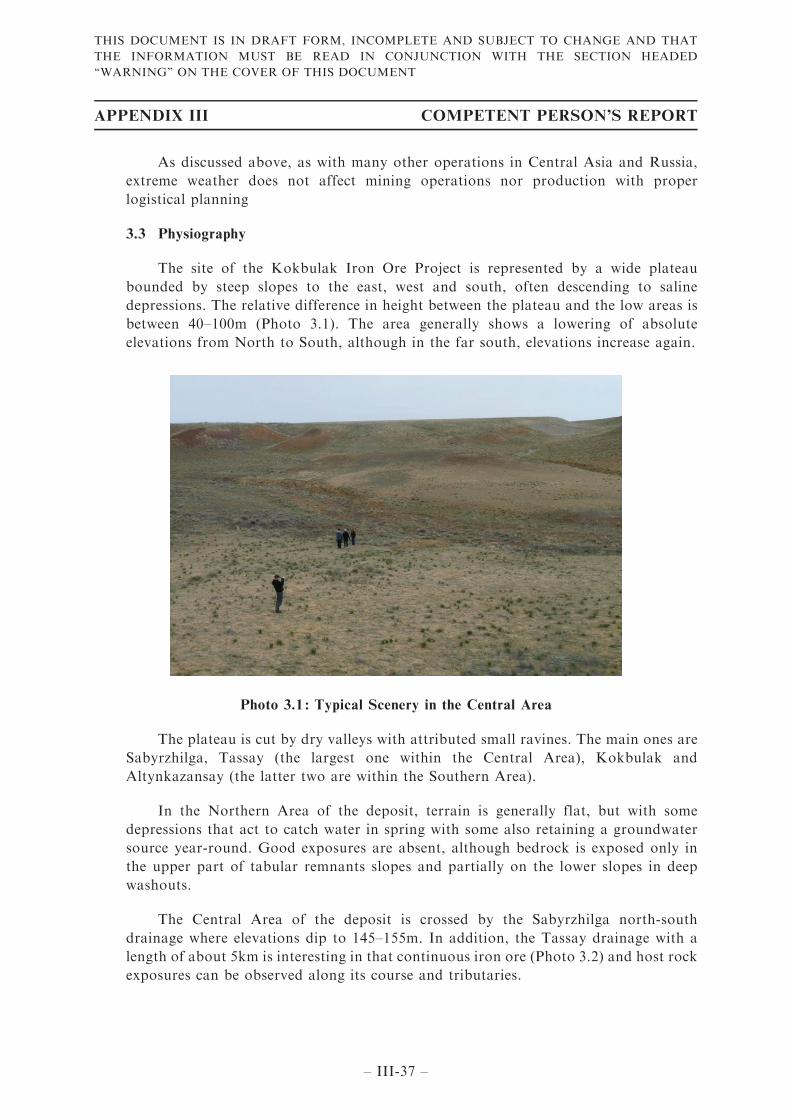
As discussed above, as with many other operations in Central Asia and Russia,
extreme weather does not affect mining operations nor production with proper
logistical planning
3.3 Physiography
The site of the Kokbulak Iron Ore Project is represented by a wide plateau
bounded by steep slopes to the east, west and south, often descending to saline
depressions. The relative difference in height between the plateau and the low areas is
between 40–100m (Photo 3.1). The area generally shows a lowering of absolute
elevations from North to South, although in the far south, elevations increase again.
Photo 3.1 : Typical Scenery in the Central Area
The plateau is cut by dry valleys with attributed small ravines. The main ones are
Sabyrzhilga, Tassay (the largest one within the Central Area), Kokbulak and
Altynkazansay (the latter two are within the Southern Area).
In the Northern Area of the deposit, terrain is generally flat, but with some
depressions that act to catch water in spring with some also retaining a groundwater
source year-round. Good exposures are absent, although bedrock is exposed only in
the upper part of tabular remnants slopes and partially on the lower slopes in deep
washouts.
The Central Area of the deposit is crossed by the Sabyrzhilga north-south
drainage where elevations dip to 145–155m. In addition, the Tassay drainage with a
length of about 5km is interesting in that continuous iron ore (Photo 3.2) and host rock
exposures can be observed along its course and tributaries.
APPENDIX III COMPETENT PERSON’S REPORT
– III-37 –
THIS DOCUMENT IS IN DRAFT FORM, INCOMPLETE AND SUBJECT TO CHANGE AND THAT
THE INFORMATION MUST BE READ IN CONJUNCTION WITH THE SECTION HEADED
‘‘WARNING’’ ON THE COVER OF THIS DOCUMENT
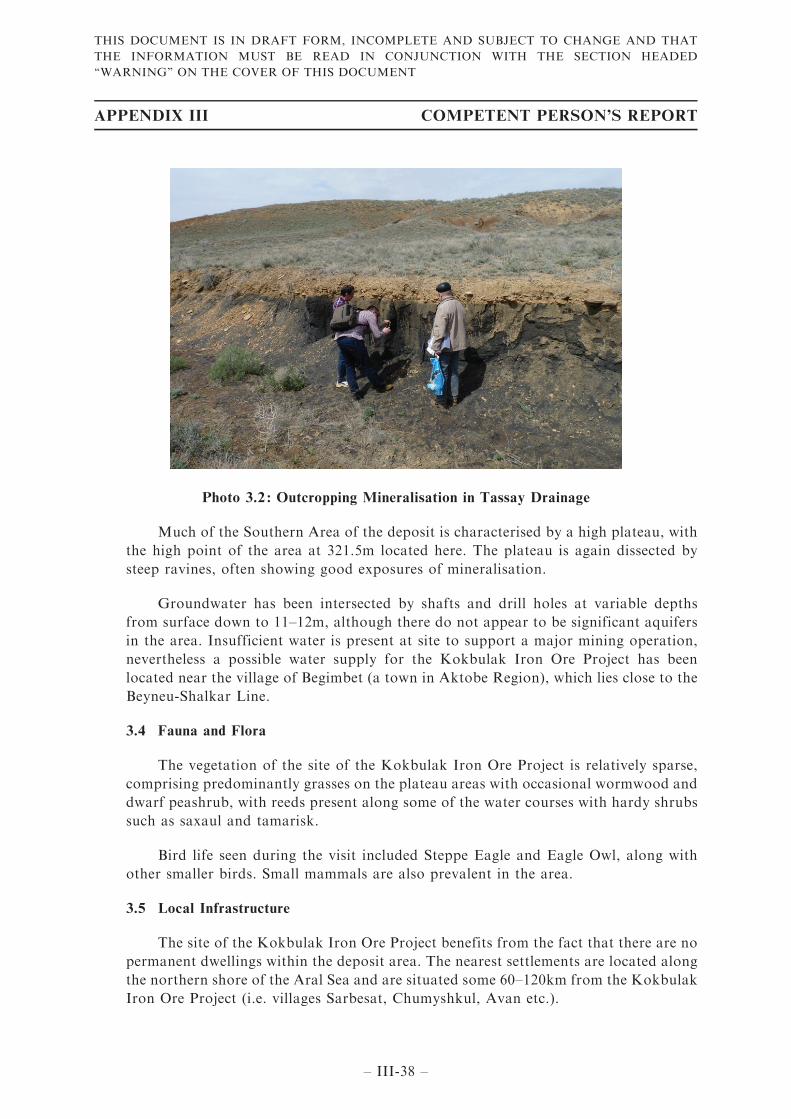
Photo 3.2 : Outcropping Mineralisation in Tassay Drainage
Much of the Southern Area of the deposit is characterised by a high plateau, with
the high point of the area at 321.5m located here. The plateau is again dissected by
steep ravines, often showing good exposures of mineralisation.
Groundwater has been intersected by shafts and drill holes at variable depths
from surface down to 11–12m, although there do not appear to be significant aquifers
in the area. Insufficient water is present at site to support a major mining operation,
nevertheless a possible water supply for the Kokbulak Iron Ore Project has been
located near the village of Begimbet (a town in Aktobe Region), which lies close to the
Beyneu-Shalkar Line.
3.4 Fauna and Flora
The vegetation of the site of the Kokbulak Iron Ore Project is relatively sparse,
comprising predominantly grasses on the plateau areas with occasional wormwood and
dwarf peashrub, with reeds present along some of the water courses with hardy shrubs
such as saxaul and tamarisk.
Bird life seen during the visit included Steppe Eagle and Eagle Owl, along with
other smaller birds. Small mammals are also prevalent in the area.
3.5 Local Infrastructure
The site of the Kokbulak Iron Ore Project benefits from the fact that there are no
permanent dwellings within the deposit area. The nearest settlements are located along
the northern shore of the Aral Sea and are situated some 60–120km from the Kokbulak
Iron Ore Project (i.e. villages Sarbesat, Chumyshkul, Avan etc.).
APPENDIX III COMPETENT PERSON’S REPORT
– III-38 –
THIS DOCUMENT IS IN DRAFT FORM, INCOMPLETE AND SUBJECT TO CHANGE AND THAT
THE INFORMATION MUST BE READ IN CONJUNCTION WITH THE SECTION HEADED
‘‘WARNING’’ ON THE COVER OF THIS DOCUMENT
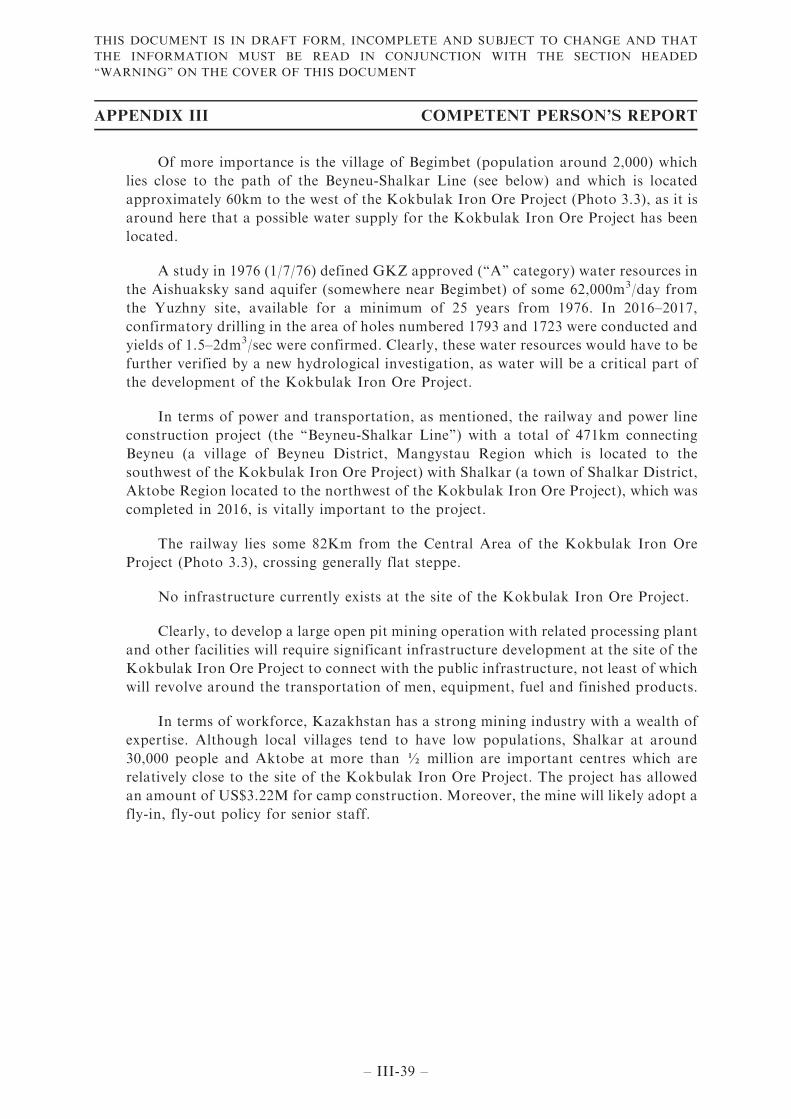
Of more importance is the village of Begimbet (population around 2,000) which
lies close to the path of the Beyneu-Shalkar Line (see below) and which is located
approximately 60km to the west of the Kokbulak Iron Ore Project (Photo 3.3), as it is
around here that a possible water supply for the Kokbulak Iron Ore Project has been
located.
A study in 1976 (1/7/76) defined GKZ approved (‘‘A’’ category) water resources in
the Aishuaksky sand aquifer (somewhere near Begimbet) of some 62,000m3/day from
the Yuzhny site, available for a minimum of 25 years from 1976. In 2016–2017,
confirmatory drilling in the area of holes numbered 1793 and 1723 were conducted and
yields of 1.5–2dm3/sec were confirmed. Clearly, these water resources would have to be
further verified by a new hydrological investigation, as water will be a critical part of
the development of the Kokbulak Iron Ore Project.
In terms of power and transportation, as mentioned, the railway and power line
construction project (the ‘‘Beyneu-Shalkar Line’’) with a total of 471km connecting
Beyneu (a village of Beyneu District, Mangystau Region which is located to the
southwest of the Kokbulak Iron Ore Project) with Shalkar (a town of Shalkar District,
Aktobe Region located to the northwest of the Kokbulak Iron Ore Project), which was
completed in 2016, is vitally important to the project.
The railway lies some 82Km from the Central Area of the Kokbulak Iron Ore
Project (Photo 3.3), crossing generally flat steppe.
No infrastructure currently exists at the site of the Kokbulak Iron Ore Project.
Clearly, to develop a large open pit mining operation with related processing plant
and other facilities will require significant infrastructure development at the site of the
Kokbulak Iron Ore Project to connect with the public infrastructure, not least of which
will revolve around the transportation of men, equipment, fuel and finished products.
In terms of workforce, Kazakhstan has a strong mining industry with a wealth of
expertise. Although local villages tend to have low populations, Shalkar at around
30,000 people and Aktobe at more than ½ million are important centres which are
relatively close to the site of the Kokbulak Iron Ore Project. The project has allowed
an amount of US$3.22M for camp construction. Moreover, the mine will likely adopt a
fly-in, fly-out policy for senior staff.
APPENDIX III COMPETENT PERSON’S REPORT
– III-39 –
THIS DOCUMENT IS IN DRAFT FORM, INCOMPLETE AND SUBJECT TO CHANGE AND THAT
THE INFORMATION MUST BE READ IN CONJUNCTION WITH THE SECTION HEADED
‘‘WARNING’’ ON THE COVER OF THIS DOCUMENT
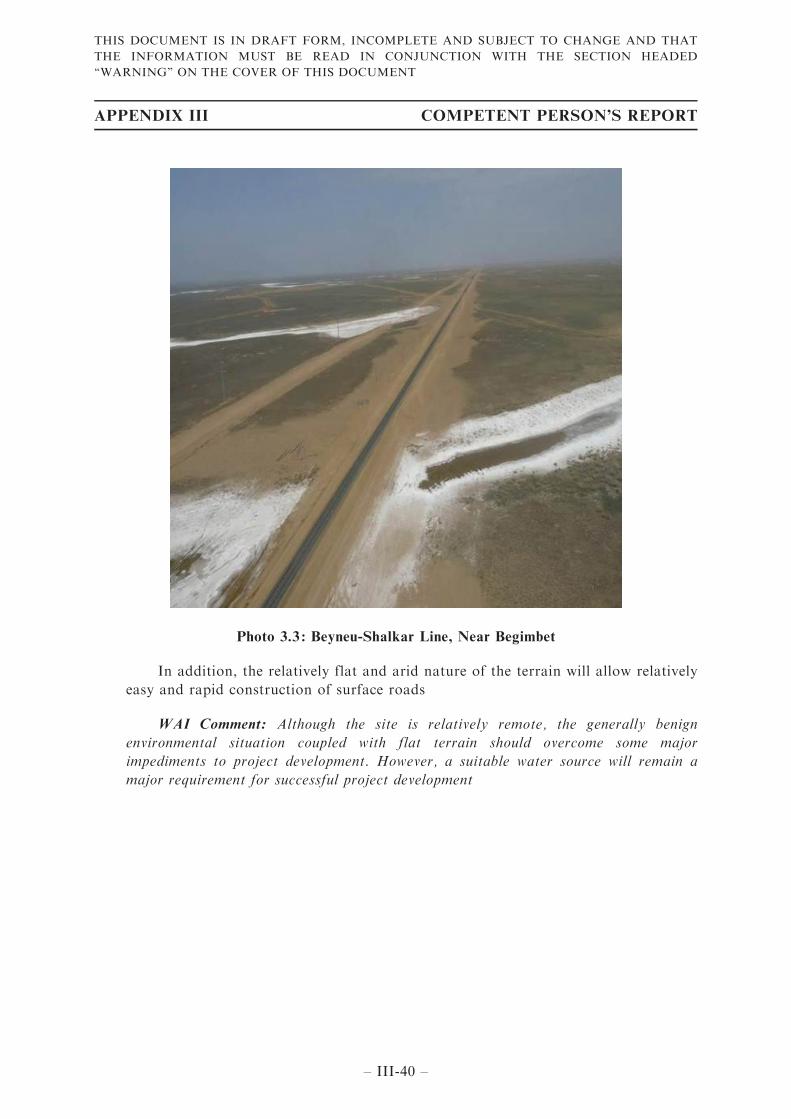
Photo 3.3 : Beyneu-Shalkar Line, Near Begimbet
In addition, the relatively flat and arid nature of the terrain will allow relatively
easy and rapid construction of surface roads
WAI Comment: Although the site is relatively remote, the generally benign
environmental situation coupled with flat terrain should overcome some major
impediments to project development. However, a suitable water source will remain a
major requirement for successful project development
APPENDIX III COMPETENT PERSON’S REPORT
– III-40 –
THIS DOCUMENT IS IN DRAFT FORM, INCOMPLETE AND SUBJECT TO CHANGE AND THAT
THE INFORMATION MUST BE READ IN CONJUNCTION WITH THE SECTION HEADED
‘‘WARNING’’ ON THE COVER OF THIS DOCUMENT
4 EXPLORATION HISTORY
4.1 Introduction
The Kokbulak deposit, upon which the Kokbulak Iron Ore Project sits on, has
been known about for over 70 years with preliminary geological survey work in 1949,
then more detailed investigations over the deposit area (covering some 500km2) in
1950.
From 1950–54, detailed topographic surveys were undertaken which tied in all the
exploration works being executed at the time, including drilling and limited
underground exploration.
This allowed the completion of the first geological map of the area in 1954 along
with a report on the exploration activities and an initial ‘‘reserve’’ estimation (in
accordance with local GKZ standards).
It was not until 2013 that further exploratory works were undertaken by ASP at
the site of the Kokbulak Iron Ore Project leading to the completion of Project XXI
2013 Feasibility Study.
In 2020, further drilling works were conducted by ASP in the Southern Area of the
Kokbulak Iron Ore Project.
4.2 Exploration
The ore lenses at Kokbulak have a general elongated north-northwestern strike
and a flat southwestern dip. They are longer along strike than width. This led to a
relatively straightforward rectangular exploration network over the area, but with
some minor variations.
From the recognised strike direction of the orebodies, a grid orientated 026o was
established across the Central Area, whilst in the Northern Area, this was set to 000o
and in the Southern Area to 75o.
Drillhole spacing was initially 200m in the Central Area, with lines 400m apart,
decreased to 200m apart in later drilling.
Due to the general shallowness of the ore zones (<50m), drilling results could be
controlled with test pits (1.25m2 in section) and shafts which also provided bulk
density values.
APPENDIX III COMPETENT PERSON’S REPORT
– III-41 –
THIS DOCUMENT IS IN DRAFT FORM, INCOMPLETE AND SUBJECT TO CHANGE AND THAT
THE INFORMATION MUST BE READ IN CONJUNCTION WITH THE SECTION HEADED
‘‘WARNING’’ ON THE COVER OF THIS DOCUMENT
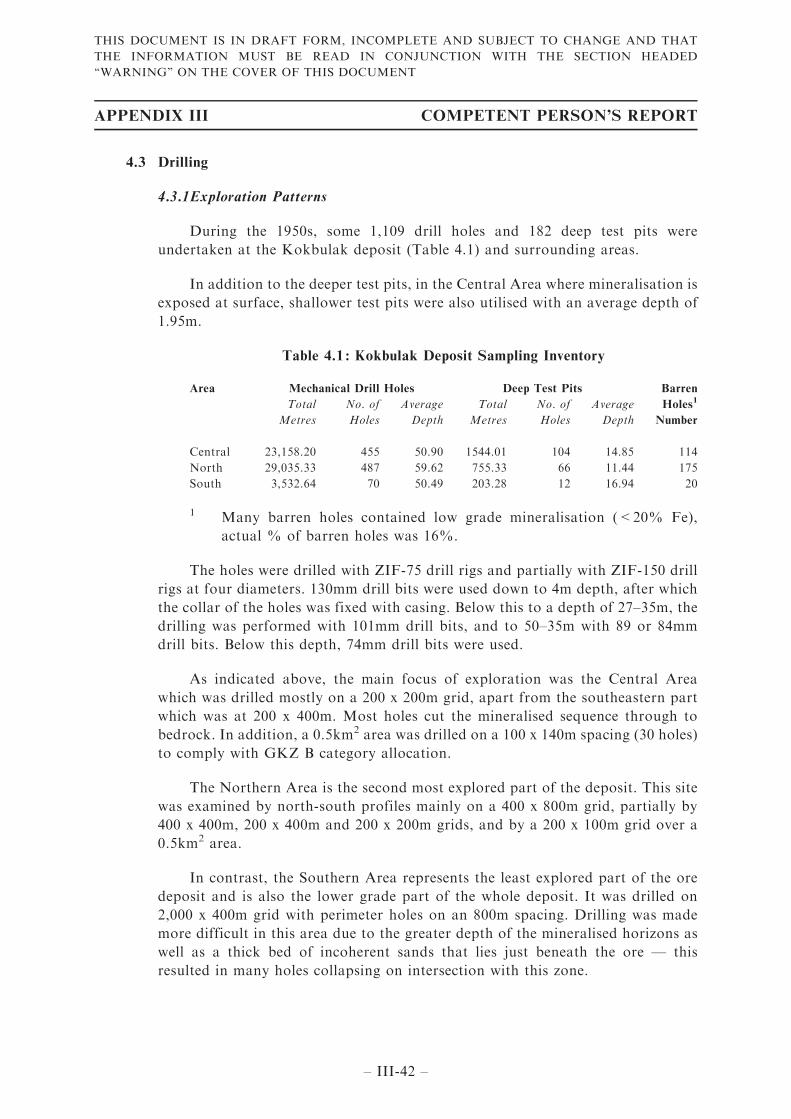
4.3 Drilling
4.3.1Exploration Patterns
During the 1950s, some 1,109 drill holes and 182 deep test pits were
undertaken at the Kokbulak deposit (Table 4.1) and surrounding areas.
In addition to the deeper test pits, in the Central Area where mineralisation is
exposed at surface, shallower test pits were also utilised with an average depth of
1.95m.
Table 4.1 : Kokbulak Deposit Sampling Inventory
Area Mechanical Drill Holes Deep Test Pits Barren
Holes1
Number
Total
Metres
No. of
Holes
Average
Depth
Total
Metres
No. of
Holes
Average
Depth
Central 23,158.20 455 50.90 1544.01 104 14.85 114
North 29,035.33 487 59.62 755.33 66 11.44 175
South 3,532.64 70 50.49 203.28 12 16.94 20
1 Many barren holes contained low grade mineralisation (<20% Fe),
actual % of barren holes was 16%.
The holes were drilled with ZIF-75 drill rigs and partially with ZIF-150 drill
rigs at four diameters. 130mm drill bits were used down to 4m depth, after which
the collar of the holes was fixed with casing. Below this to a depth of 27–35m, the
drilling was performed with 101mm drill bits, and to 50–35m with 89 or 84mm
drill bits. Below this depth, 74mm drill bits were used.
As indicated above, the main focus of exploration was the Central Area
which was drilled mostly on a 200 x 200m grid, apart from the southeastern part
which was at 200 x 400m. Most holes cut the mineralised sequence through to
bedrock. In addition, a 0.5km2 area was drilled on a 100 x 140m spacing (30 holes)
to comply with GKZ B category allocation.
The Northern Area is the second most explored part of the deposit. This site
was examined by north-south profiles mainly on a 400 x 800m grid, partially by
400 x 400m, 200 x 400m and 200 x 200m grids, and by a 200 x 100m grid over a
0.5km2 area.
In contrast, the Southern Area represents the least explored part of the ore
deposit and is also the lower grade part of the whole deposit. It was drilled on
2,000 x 400m grid with perimeter holes on an 800m spacing. Drilling was made
more difficult in this area due to the greater depth of the mineralised horizons as
well as a thick bed of incoherent sands that lies just beneath the ore — this
resulted in many holes collapsing on intersection with this zone.
APPENDIX III COMPETENT PERSON’S REPORT
– III-42 –
THIS DOCUMENT IS IN DRAFT FORM, INCOMPLETE AND SUBJECT TO CHANGE AND THAT
THE INFORMATION MUST BE READ IN CONJUNCTION WITH THE SECTION HEADED
‘‘WARNING’’ ON THE COVER OF THIS DOCUMENT
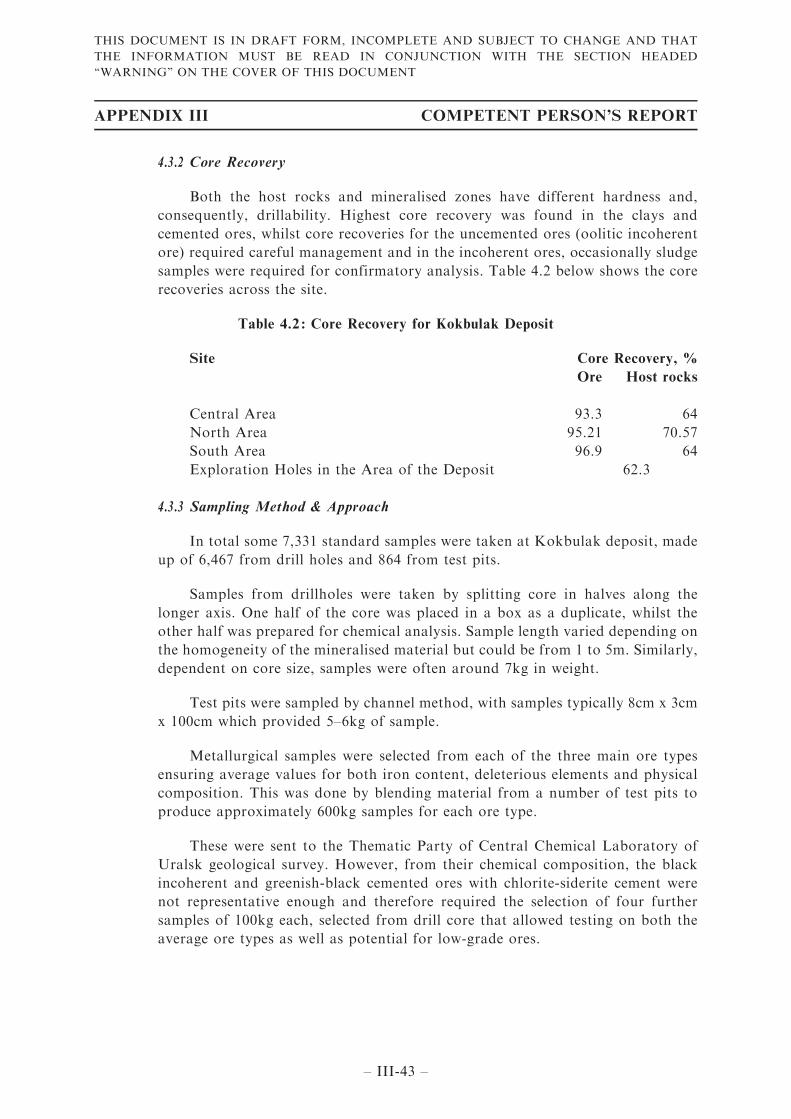
4.3.2 Core Recovery
Both the host rocks and mineralised zones have different hardness and,
consequently, drillability. Highest core recovery was found in the clays and
cemented ores, whilst core recoveries for the uncemented ores (oolitic incoherent
ore) required careful management and in the incoherent ores, occasionally sludge
samples were required for confirmatory analysis. Table 4.2 below shows the core
recoveries across the site.
Table 4.2 : Core Recovery for Kokbulak Deposit
Site Core Recovery, %
Ore Host rocks
Central Area 93.3 64
North Area 95.21 70.57
South Area 96.9 64
Exploration Holes in the Area of the Deposit 62.3
4.3.3 Sampling Method & Approach
In total some 7,331 standard samples were taken at Kokbulak deposit, made
up of 6,467 from drill holes and 864 from test pits.
Samples from drillholes were taken by splitting core in halves along the
longer axis. One half of the core was placed in a box as a duplicate, whilst the
other half was prepared for chemical analysis. Sample length varied depending on
the homogeneity of the mineralised material but could be from 1 to 5m. Similarly,
dependent on core size, samples were often around 7kg in weight.
Test pits were sampled by channel method, with samples typically 8cm x 3cm
x 100cm which provided 5–6kg of sample.
Metallurgical samples were selected from each of the three main ore types
ensuring average values for both iron content, deleterious elements and physical
composition. This was done by blending material from a number of test pits to
produce approximately 600kg samples for each ore type.
These were sent to the Thematic Party of Central Chemical Laboratory of
Uralsk geological survey. However, from their chemical composition, the black
incoherent and greenish-black cemented ores with chlorite-siderite cement were
not representative enough and therefore required the selection of four further
samples of 100kg each, selected from drill core that allowed testing on both the
average ore types as well as potential for low-grade ores.
APPENDIX III COMPETENT PERSON’S REPORT
– III-43 –
THIS DOCUMENT IS IN DRAFT FORM, INCOMPLETE AND SUBJECT TO CHANGE AND THAT
THE INFORMATION MUST BE READ IN CONJUNCTION WITH THE SECTION HEADED
‘‘WARNING’’ ON THE COVER OF THIS DOCUMENT
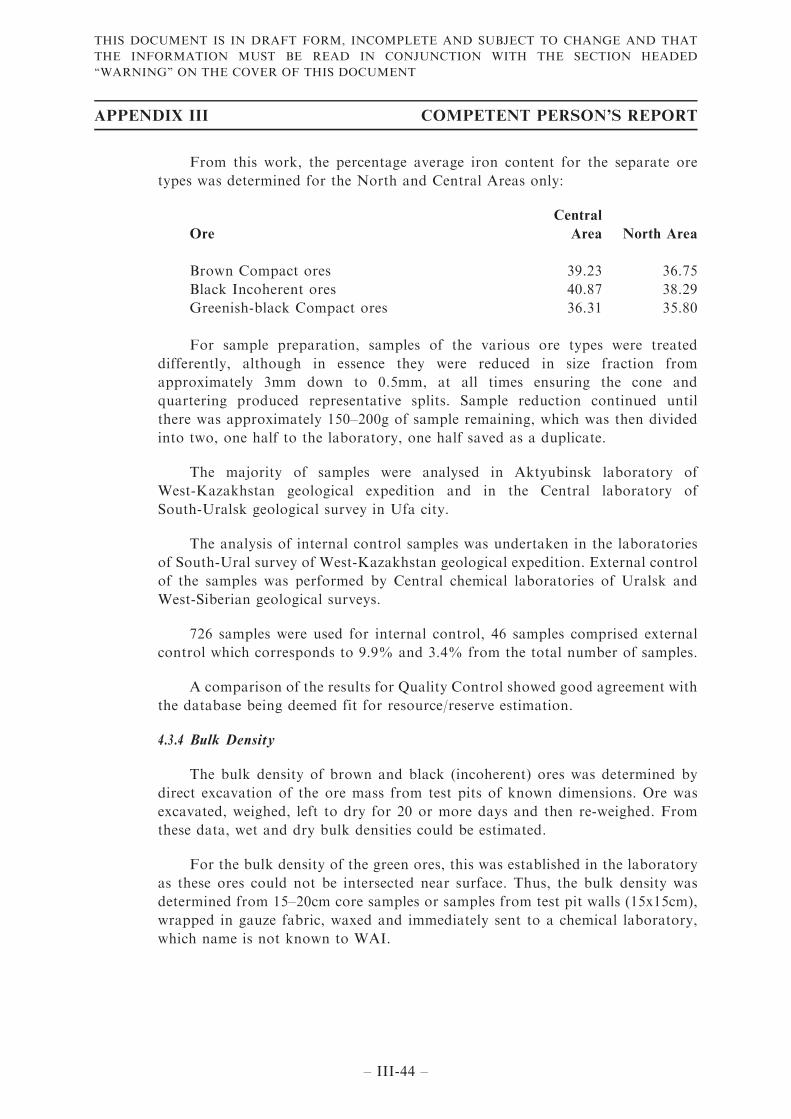
From this work, the percentage average iron content for the separate ore
types was determined for the North and Central Areas only:
Ore
Central
Area North Area
Brown Compact ores 39.23 36.75
Black Incoherent ores 40.87 38.29
Greenish-black Compact ores 36.31 35.80
For sample preparation, samples of the various ore types were treated
differently, although in essence they were reduced in size fraction from
approximately 3mm down to 0.5mm, at all times ensuring the cone and
quartering produced representative splits. Sample reduction continued until
there was approximately 150–200g of sample remaining, which was then divided
into two, one half to the laboratory, one half saved as a duplicate.
The majority of samples were analysed in Aktyubinsk laboratory of
West-Kazakhstan geological expedition and in the Central laboratory of
South-Uralsk geological survey in Ufa city.
The analysis of internal control samples was undertaken in the laboratories
of South-Ural survey of West-Kazakhstan geological expedition. External control
of the samples was performed by Central chemical laboratories of Uralsk and
West-Siberian geological surveys.
726 samples were used for internal control, 46 samples comprised external
control which corresponds to 9.9% and 3.4% from the total number of samples.
A comparison of the results for Quality Control showed good agreement with
the database being deemed fit for resource/reserve estimation.
4.3.4 Bulk Density
The bulk density of brown and black (incoherent) ores was determined by
direct excavation of the ore mass from test pits of known dimensions. Ore was
excavated, weighed, left to dry for 20 or more days and then re-weighed. From
these data, wet and dry bulk densities could be estimated.
For the bulk density of the green ores, this was established in the laboratory
as these ores could not be intersected near surface. Thus, the bulk density was
determined from 15–20cm core samples or samples from test pit walls (15x15cm),
wrapped in gauze fabric, waxed and immediately sent to a chemical laboratory,
which name is not known to WAI.
APPENDIX III COMPETENT PERSON’S REPORT
– III-44 –
THIS DOCUMENT IS IN DRAFT FORM, INCOMPLETE AND SUBJECT TO CHANGE AND THAT
THE INFORMATION MUST BE READ IN CONJUNCTION WITH THE SECTION HEADED
‘‘WARNING’’ ON THE COVER OF THIS DOCUMENT
4.4 Confirmatory Sampling
In an effort to verify the previous exploration works, 60 confirmatory drill holes
were completed by ASP in 2013. These holes were spread across the Kokbulak Iron Ore
Project with 34 being completed in the Central Area (CV1–34), 21 in the Northern
Area (CV35–55) and 5 in the Southern Area (CV56–60).
The verification holes were located by GPS in relation to the existing drill
network. The holes were drilled to depths ranging from 2 to 54m with a total length of
1659m. In total 551 core samples were taken. Ore intersections thickness and iron
content of the historical drilling were validated.
Drill holes were made with an AVB-1 vibratory-percussion rig producing 108mm
core. The technique avoided core washing and produced 100% core recovery.
These works were undertaken by "Project XXI’’, whilst analyses were completed
in the certified laboratory ‘‘Akrobe-Temir’’ LLP. ‘‘Project XXI’’ also checked the
laboratory data for errors and deviations
The results of this small drill programme showed that thickness variation did not
exceed 1m and any deviation could be accounted for by possible inaccuracy of drillhole
locations. Similarly, the average difference of Fe content values did not exceed 2%
which is broadly acceptable.
An exception was noted of 4.24% Fe content between ordinary (hole# 280) and
control values (hole#6) can be explained by the complexity of the interval structure
that is presented by interbedding of different-type ores.
However, notwithstanding the above, ‘‘Project XXI’’ considered the results of
data validation for the Kokbulak deposit as relevant and reliable for reserve
estimation. WAI agrees with this assessment.
4.5 Recent Work
4.5.1 Southern Area
Information provided by the Client has indicated that in accordance with the
recommendations from the Republic of Kazakhstan State Revenue Committee for
the purposes of follow-up study of the hydrogeology and the Southern Area of the
Kokbulak Iron Ore Project, a project titled ‘‘Project of Geological Exploration
Work at the Southern Area of Kokbulak Iron Ore Deposit’’ was developed. This
work was completed in autumn 2020.
APPENDIX III COMPETENT PERSON’S REPORT
– III-45 –
THIS DOCUMENT IS IN DRAFT FORM, INCOMPLETE AND SUBJECT TO CHANGE AND THAT
THE INFORMATION MUST BE READ IN CONJUNCTION WITH THE SECTION HEADED
‘‘WARNING’’ ON THE COVER OF THIS DOCUMENT
The main types of work were as follows:
. Topographic work (positioning and staking out drill holes);
. Core drilling;
. Core sampling; and
. Analytical work.
Since then, WAI has completed an MRE on both the Northern Area and
Southern Area, see Section 6.3 below.
5 GEOLOGICAL SETTING AND MINERALISATION
5.1 Structure & Lithology
The sediments associated with the Kokbulak deposit, which are hosted by the
Kutanbulak suite, are related to the axial part of the Dzhylan synclinal structure which
extends in a south-southeast to north- northwest direction for 33.9km with a width of
1.5–2.5km. From a mineralisation standpoint, the deposit has been divided into North,
Central and South areas.
The oldest rocks seen at the site are those of the Chegan suite which are composed
of grey and dark- grey clays (montmorillonite) with siltstone as well as two thin beds of
marly sandstone (thickness of 0.2–0.3m). Erosion at the end of Eocene has resulted in
the formation of an uneven, corrugated surface to these Chegan clays. Drilling
intersected only the upper parts of this unit.
Tectonic uplift in the area has elevated the Chegan suite rocks in both the North
Area as well as the South with respect to the Central Area.
Above the Chegan suite, fresh and saltwater sediments of Upper Oligocene age
were deposited (the Tugan series) which are divided into four suites; the most
important for the deposit is the Kutanbulak suite which is represented by sands, clays,
various sandstones, and three types of iron ores, and in its lower part by clays,
containing ore and siderite layers of variable thickness.
The sands, which are mostly observed in upper parts of section, are grey,
yellowish-grey and brownish- yellow, and are often ferruginous, containing 10–15% of
iron. These were sampled if they contained more concentrated Fe-rich zones.
The clay within the upper levels of the Kutanbulak suite is grey, dark-grey with
thin silty-sands parallel to bedding, whilst at the lower levels, clays tend to be
dark-grey with occasional greenish-grey silty clays observed.
APPENDIX III COMPETENT PERSON’S REPORT
– III-46 –
THIS DOCUMENT IS IN DRAFT FORM, INCOMPLETE AND SUBJECT TO CHANGE AND THAT
THE INFORMATION MUST BE READ IN CONJUNCTION WITH THE SECTION HEADED
‘‘WARNING’’ ON THE COVER OF THIS DOCUMENT
In the upper parts of the suite, there is some interbedding of greenish-grey clays
and greenish-black well-cemented and black unconsolidated ores with brown gypsum
and siderite sublayers. However, there is variability across the site, although
differences are clearly observed.
These sands in the southeast part of the Central Area have thickness from
13–20m, up to 30m, whilst the same ones are observed in southern and northern parts
of the Southern Area. They are also widespread in the southwest part of the Northern
Area. Clays of this suite, in many cases interbedded with sands, are also widespread
within all sites of the deposit. The ores lie within both sands and clays.
The maximum thickness of ore lenses is in the central part of the Central Area, in
the southwestern part of the North Area and in the area of #3 and #4 prospecting and
exploration lines at the South Area. Ores are deposited as individual lenses that
overlap each other on a scale-like basis. Forms and dimensions of the lenses are
highlighted below, although large thicknesses of this suite appear to be related to
depressions in the roof of the Chegan clays.
Sediments of the Chiliktinsky suite, which are predominantly brown-grey
gypsum-bearing clays, lie on the uneven surface of the Kutanbulak suite and are
found in isolated parts of the South and North Areas and in the northeast part of the
Central Area.
Thus, in general, ore bodies are related to the lowest part of Turgay series —
Kutanbulak suite, deposited on the variable surface of pelagic Palaeogene clays.
5.2 Deposit Geology
5.2.1 Introduction
In broad terms, ore bodies of the Central and Northern Areas are similar in
that they are characterised by a north-south strike and are flatly inclined to the
west-southwest, in many cases overlapping each other in the manner of scales. Ore
bodies in the Southern Area have a different structure. All mineralisation can be
identified visually.
These are three main lenses at the Central Area of the deposit, with the 1st
and 2nd lenses being the largest. All three lenses are also traced to the Northern
Area. Moreover, two more lenses (4th and 5th) are observed in the western part of
the Northern Area.
At the Southern Area, there is quite a large, embedded lens observed between
exploration lines #1 and #6, in some places this lens is split into eastern and
western parts.
APPENDIX III COMPETENT PERSON’S REPORT
– III-47 –
THIS DOCUMENT IS IN DRAFT FORM, INCOMPLETE AND SUBJECT TO CHANGE AND THAT
THE INFORMATION MUST BE READ IN CONJUNCTION WITH THE SECTION HEADED
‘‘WARNING’’ ON THE COVER OF THIS DOCUMENT
5.2.2 First Lens
This major mineralised unit has been traced along the eastern part of the
deposit from exploration line #13 in southern part of the Central Area to
exploration line #62 on the Northern Area. Its total length is 17.7km with a width
1.6km and occupying an area of about 25km2. It appears to be localised in a
north-south depression in the roof of the underlying rocks of the Chegan suite.
As with all the lenses seen at the Kokbulak Iron Ore Project, thickness
variations and bifurcations are common, particularly near the edges, although in
the main parts, the lens does show a high degree of homogeneity. Thicknesses can
exceed 40m, and reaches 51.7m at hole #655, although equally wedges from the
main lens can tail off to around 1m in thickness.
5.2.3 Second Lens
The second lens starts from exploration line #7 at the Southern Area and it is
clearly wedged in the northern part of the Northern Area near exploration line
#62. Its total length by strike is 23.9km, width is 1.26km.
The dimensions of the lens by site is shown in Table 5.1 below:
Table 5.1 : Dimensions of Lens 2
Site Length Width Area
(m) (m) (km2)
Southern Area 4,000 1,450 5.8
Central Area 5,900 1,100 6.49
Northern Area 14,000 1,240 17.36
Total 23,900 29.63
As with Lens 1, the lens shows good continuity along strike, but wedging,
thickness variations and lithology change are common on the peripheries of the
main body. Thickness again varies considerably from a few metres to >40m.
5.2.4 Third Lens
The 3rd lens is located to the west of the 2nd lens in the northern part of the
Central Area and in the southern part of the Northern Area. The lens is not large
with strike length not exceeding 2.8km, width 0.46km with an area of 1.26km2.
The lens is traced from the exploration line #35 to line #38.
The structure is quite simple and does not change either down dip or along
strike. Thickness varies from 2.7 to 7.9m in its axial part from where it is
symmetrically wedged to the periphery.
APPENDIX III COMPETENT PERSON’S REPORT
– III-48 –
THIS DOCUMENT IS IN DRAFT FORM, INCOMPLETE AND SUBJECT TO CHANGE AND THAT
THE INFORMATION MUST BE READ IN CONJUNCTION WITH THE SECTION HEADED
‘‘WARNING’’ ON THE COVER OF THIS DOCUMENT
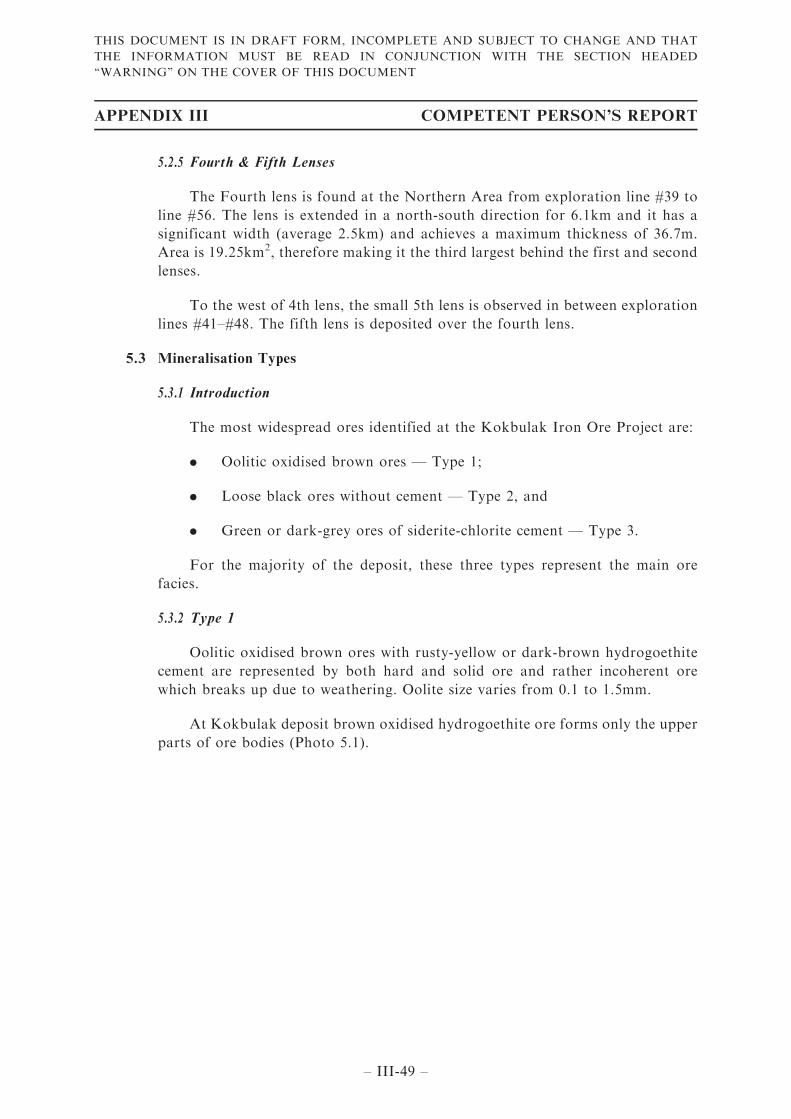
5.2.5 Fourth & Fifth Lenses
The Fourth lens is found at the Northern Area from exploration line #39 to
line #56. The lens is extended in a north-south direction for 6.1km and it has a
significant width (average 2.5km) and achieves a maximum thickness of 36.7m.
Area is 19.25km2, therefore making it the third largest behind the first and second
lenses.
To the west of 4th lens, the small 5th lens is observed in between exploration
lines #41–#48. The fifth lens is deposited over the fourth lens.
5.3 Mineralisation Types
5.3.1 Introduction
The most widespread ores identified at the Kokbulak Iron Ore Project are:
. Oolitic oxidised brown ores — Type 1;
. Loose black ores without cement — Type 2, and
. Green or dark-grey ores of siderite-chlorite cement — Type 3.
For the majority of the deposit, these three types represent the main ore
facies.
5.3.2 Type 1
Oolitic oxidised brown ores with rusty-yellow or dark-brown hydrogoethite
cement are represented by both hard and solid ore and rather incoherent ore
which breaks up due to weathering. Oolite size varies from 0.1 to 1.5mm.
At Kokbulak deposit brown oxidised hydrogoethite ore forms only the upper
parts of ore bodies (Photo 5.1).
APPENDIX III COMPETENT PERSON’S REPORT
– III-49 –
THIS DOCUMENT IS IN DRAFT FORM, INCOMPLETE AND SUBJECT TO CHANGE AND THAT
THE INFORMATION MUST BE READ IN CONJUNCTION WITH THE SECTION HEADED
‘‘WARNING’’ ON THE COVER OF THIS DOCUMENT
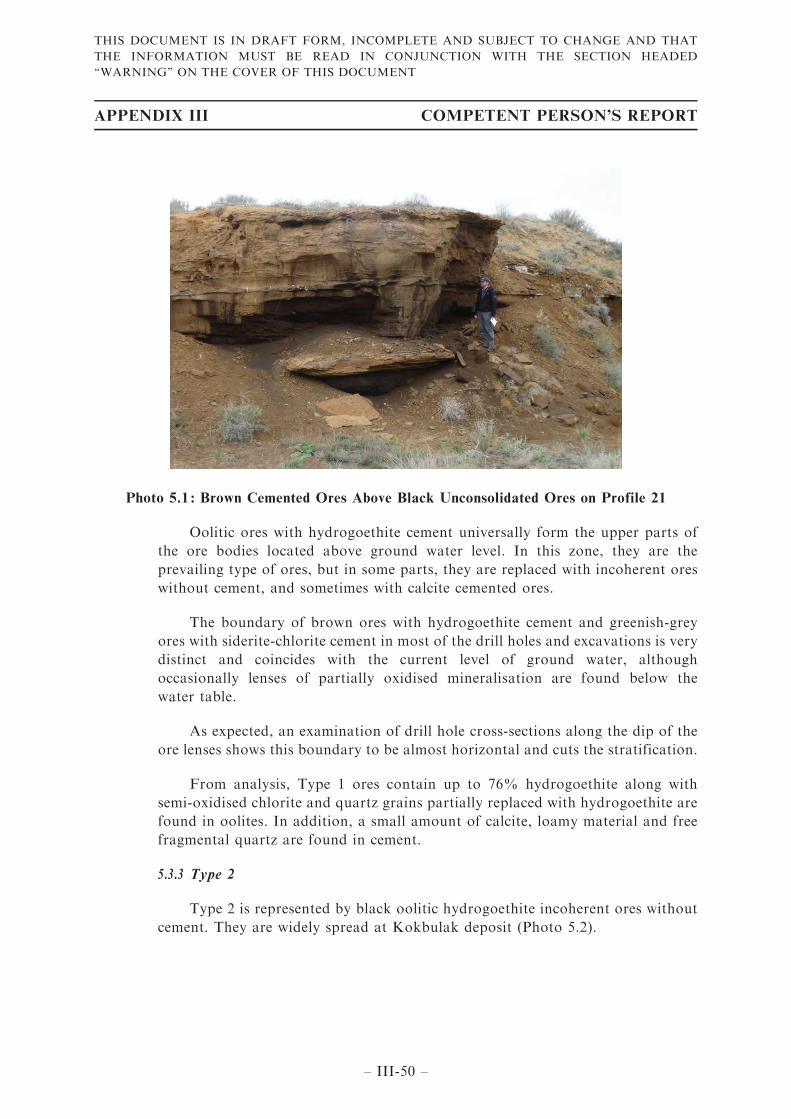
Photo 5.1 : Brown Cemented Ores Above Black Unconsolidated Ores on Profile 21
Oolitic ores with hydrogoethite cement universally form the upper parts of
the ore bodies located above ground water level. In this zone, they are the
prevailing type of ores, but in some parts, they are replaced with incoherent ores
without cement, and sometimes with calcite cemented ores.
The boundary of brown ores with hydrogoethite cement and greenish-grey
ores with siderite-chlorite cement in most of the drill holes and excavations is very
distinct and coincides with the current level of ground water, although
occasionally lenses of partially oxidised mineralisation are found below the
water table.
As expected, an examination of drill hole cross-sections along the dip of the
ore lenses shows this boundary to be almost horizontal and cuts the stratification.
From analysis, Type 1 ores contain up to 76% hydrogoethite along with
semi-oxidised chlorite and quartz grains partially replaced with hydrogoethite are
found in oolites. In addition, a small amount of calcite, loamy material and free
fragmental quartz are found in cement.
5.3.3 Type 2
Type 2 is represented by black oolitic hydrogoethite incoherent ores without
cement. They are widely spread at Kokbulak deposit (Photo 5.2).
APPENDIX III COMPETENT PERSON’S REPORT
– III-50 –
THIS DOCUMENT IS IN DRAFT FORM, INCOMPLETE AND SUBJECT TO CHANGE AND THAT
THE INFORMATION MUST BE READ IN CONJUNCTION WITH THE SECTION HEADED
‘‘WARNING’’ ON THE COVER OF THIS DOCUMENT
Photo 5.2 : Outcropping Soft Black Ores in Stream Bed
Incoherent ores are found everywhere at Kokbulak deposit, both above and
below ground water level. There are represented by oolitic material primarily
deprived of cement. The thickness of incoherent ores in some drill holes from the
Central Area can be 30m or more.
Incoherent ores consist of oolites 0.1–1mm in diameter (in rare cases they are
a little bigger). These are black, sometimes dark-grey and dark brown oolites with
small additions of thin quartzitic siltstones, sometimes with subrounded
incrustations of black ferrous nodules.
Under the microscope it can be seen that oolites of incoherent ores have no
obvious concentric structure and are fissured. This is connected with oxidation of
their chlorite and compaction, re- crystallisation and conversion of hydrogoethite
into less hydrous forms of ferrous oxides. Such oolites are either uniform by their
composition or include quartz grains.
Type 2 ores have a higher content of iron, which is 70–80% of hydrogoethite,
with iron concentrated in oolites rather than in cement. They contain significant
Al2O3 (7–8%) and variable P2O5 (up to 2%).
5.3.4 Type 3
Type 3 ores are represented by oolitic compact green, greyish-green or
blackish-green ores with a chlorite-siderite cement (siderite usually dominant over
chlorite). These ores are widespread at the deposit and make up the majority of
ore below the water table.
APPENDIX III COMPETENT PERSON’S REPORT
– III-51 –
THIS DOCUMENT IS IN DRAFT FORM, INCOMPLETE AND SUBJECT TO CHANGE AND THAT
THE INFORMATION MUST BE READ IN CONJUNCTION WITH THE SECTION HEADED
‘‘WARNING’’ ON THE COVER OF THIS DOCUMENT
Ores of this type, where siderite is the major element, are characterised by
cohesiveness and hardness. The amount of siderite is significant and reaches up to
one third of the rock weight. The siderite content does have an impact on the
beneficiation process.
Oolites of these ores are formed with either just hydrogoethite or with
hydrogoethite and chlorite.
There are almost no chlorite-siderite cemented ores in the Southern Area due
to the higher, well drained and highly oxidised nature of the rocks there.
6 MINERAL RESOURCES
6.1 Introduction
A Mineral Resource Estimate (‘‘MRE’’) was undertaken by WAI following the
guidelines of the JORC Code (2012) initially only for the better explored Central Area
of the Kokbulak Iron Ore Project, see Section 8.2 below.
An additional MRE was also completed for the Northern Area and Southern
Area, see Section 8.3 below.
The MRE is effective as at 7 March 2022. There has been no material change to
the MRE, conclusions and opinions in this report since 7 March 2022.
6.2 Central Area of the Kokbulak Iron Ore Project
The work was completed using a 3d block modelling approach utilising CAE
Mining Studio 3 software. Sample data were imported and verified before mineralised
envelopes were defined by creating 3d wireframes based on a cut-off grade of 30% Fe.
Sample data were selected and allocated using these mineralised zone wireframes and
selected samples were composited and used as the basis of a geostatistical study. The
mineralised zone envelopes were used as a basis for the creation of a volumetric block
model based on a parent block size of 25m x 25m x 5m.
Variogram models were constructed using composited data and estimation was
carried out using ordinary kriging as the principle method, but with estimation also
using inverse-distance weighting and nearest neighbour estimation which were used for
validation purposes. The resultant block model was verified against the input
composite grades and classification was carried out based on an assessment of
geological and grade continuity.
6.2.1 Data Source
The exploration database comprises diamond drillholes from the original
exploration campaigns carried out between 1950–1954, shallow exploration shafts
excavated during the same period and verification diamond drillholes (twinned
holes) completed during 2013 that are contained within the database (these
APPENDIX III COMPETENT PERSON’S REPORT
– III-52 –
THIS DOCUMENT IS IN DRAFT FORM, INCOMPLETE AND SUBJECT TO CHANGE AND THAT
THE INFORMATION MUST BE READ IN CONJUNCTION WITH THE SECTION HEADED
‘‘WARNING’’ ON THE COVER OF THIS DOCUMENT
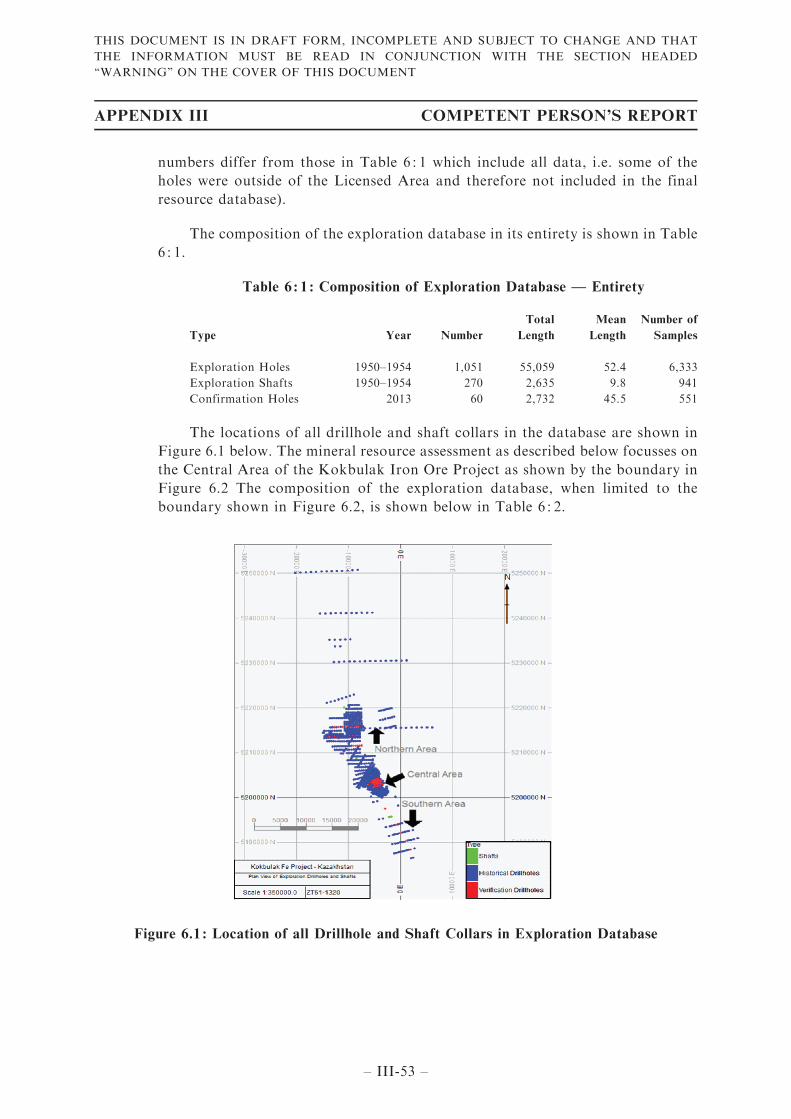
numbers differ from those in Table 6 : 1 which include all data, i.e. some of the
holes were outside of the Licensed Area and therefore not included in the final
resource database).
The composition of the exploration database in its entirety is shown in Table
6 : 1.
Table 6 : 1 : Composition of Exploration Database — Entirety
Type Year Number
Total
Length
Mean
Length
Number of
Samples
Exploration Holes 1950–1954 1,051 55,059 52.4 6,333
Exploration Shafts 1950–1954 270 2,635 9.8 941
Confirmation Holes 2013 60 2,732 45.5 551
The locations of all drillhole and shaft collars in the database are shown in
Figure 6.1 below. The mineral resource assessment as described below focusses on
the Central Area of the Kokbulak Iron Ore Project as shown by the boundary in
Figure 6.2 The composition of the exploration database, when limited to the
boundary shown in Figure 6.2, is shown below in Table 6 : 2.
Figure 6.1 : Location of all Drillhole and Shaft Collars in Exploration Database
APPENDIX III COMPETENT PERSON’S REPORT
– III-53 –
THIS DOCUMENT IS IN DRAFT FORM, INCOMPLETE AND SUBJECT TO CHANGE AND THAT
THE INFORMATION MUST BE READ IN CONJUNCTION WITH THE SECTION HEADED
‘‘WARNING’’ ON THE COVER OF THIS DOCUMENT
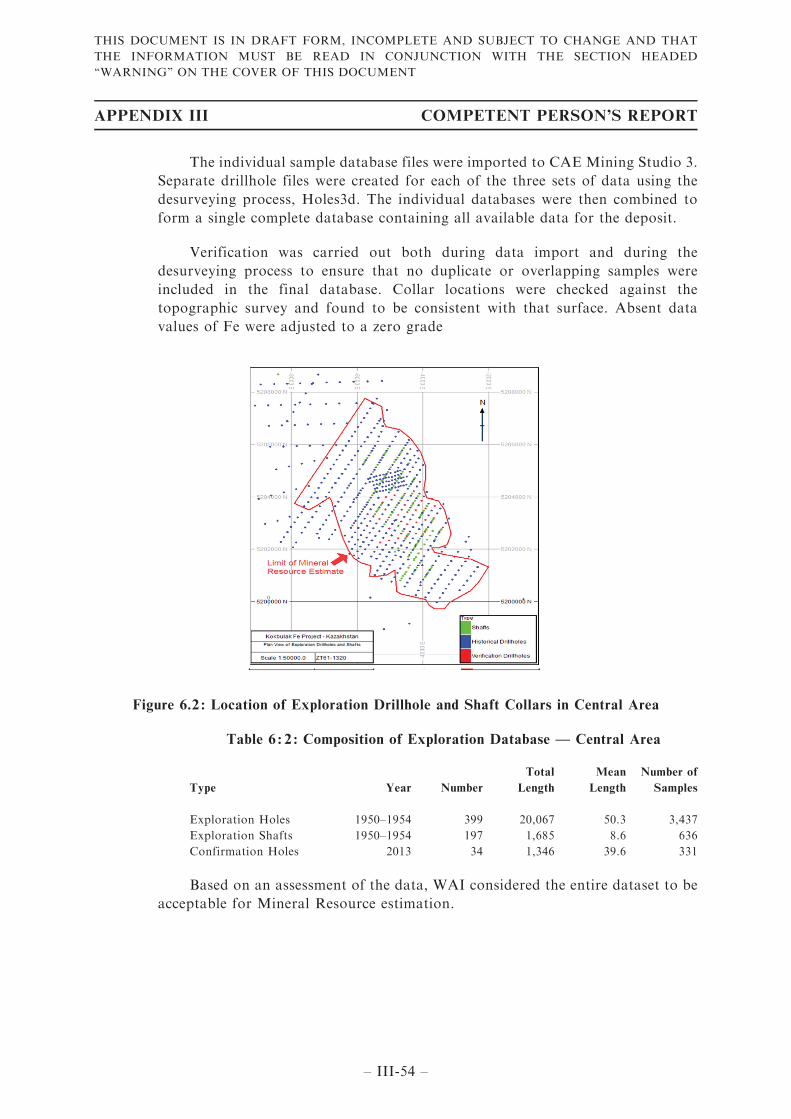
The individual sample database files were imported to CAE Mining Studio 3.
Separate drillhole files were created for each of the three sets of data using the
desurveying process, Holes3d. The individual databases were then combined to
form a single complete database containing all available data for the deposit.
Verification was carried out both during data import and during the
desurveying process to ensure that no duplicate or overlapping samples were
included in the final database. Collar locations were checked against the
topographic survey and found to be consistent with that surface. Absent data
values of Fe were adjusted to a zero grade
Figure 6.2 : Location of Exploration Drillhole and Shaft Collars in Central Area
Table 6 : 2 : Composition of Exploration Database — Central Area
Type Year Number
Total
Length
Mean
Length
Number of
Samples
Exploration Holes 1950–1954 399 20,067 50.3 3,437
Exploration Shafts 1950–1954 197 1,685 8.6 636
Confirmation Holes 2013 34 1,346 39.6 331
Based on an assessment of the data, WAI considered the entire dataset to be
acceptable for Mineral Resource estimation.
APPENDIX III COMPETENT PERSON’S REPORT
– III-54 –
THIS DOCUMENT IS IN DRAFT FORM, INCOMPLETE AND SUBJECT TO CHANGE AND THAT
THE INFORMATION MUST BE READ IN CONJUNCTION WITH THE SECTION HEADED
‘‘WARNING’’ ON THE COVER OF THIS DOCUMENT
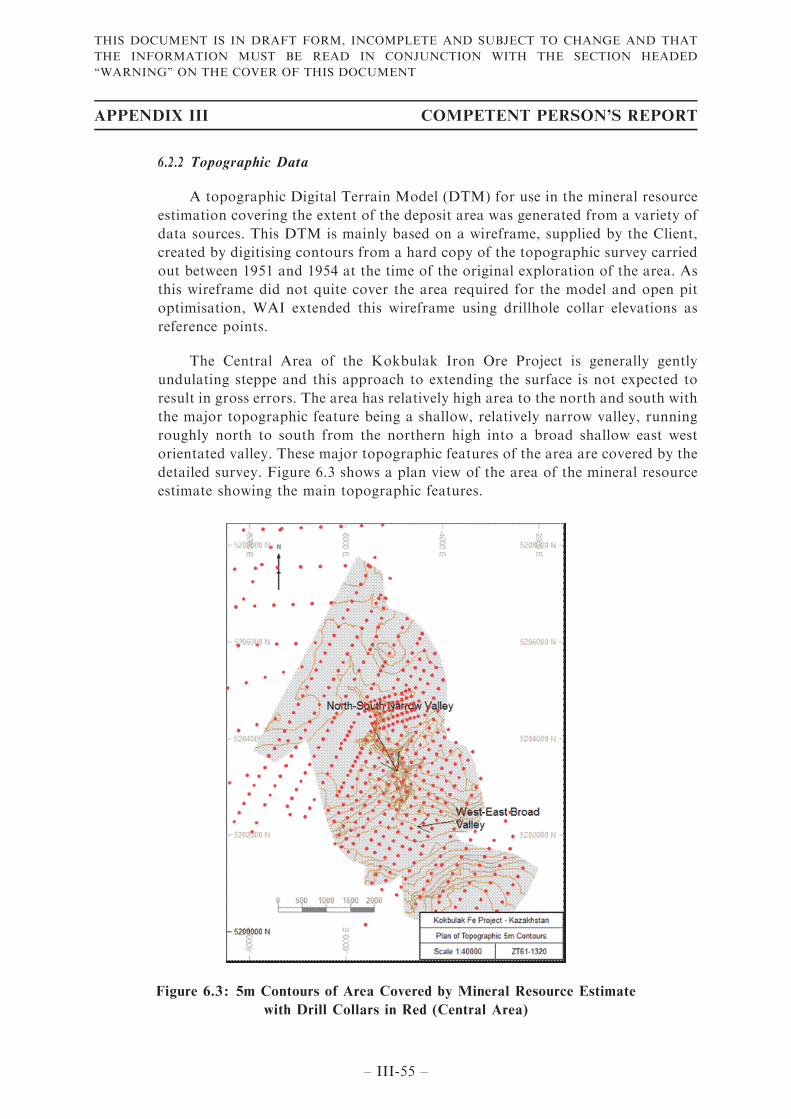
6.2.2 Topographic Data
A topographic Digital Terrain Model (DTM) for use in the mineral resource
estimation covering the extent of the deposit area was generated from a variety of
data sources. This DTM is mainly based on a wireframe, supplied by the Client,
created by digitising contours from a hard copy of the topographic survey carried
out between 1951 and 1954 at the time of the original exploration of the area. As
this wireframe did not quite cover the area required for the model and open pit
optimisation, WAI extended this wireframe using drillhole collar elevations as
reference points.
The Central Area of the Kokbulak Iron Ore Project is generally gently
undulating steppe and this approach to extending the surface is not expected to
result in gross errors. The area has relatively high area to the north and south with
the major topographic feature being a shallow, relatively narrow valley, running
roughly north to south from the northern high into a broad shallow east west
orientated valley. These major topographic features of the area are covered by the
detailed survey. Figure 6.3 shows a plan view of the area of the mineral resource
estimate showing the main topographic features.
Figure 6.3 : 5m Contours of Area Covered by Mineral Resource Estimate
with Drill Collars in Red (Central Area)
APPENDIX III COMPETENT PERSON’S REPORT
– III-55 –
THIS DOCUMENT IS IN DRAFT FORM, INCOMPLETE AND SUBJECT TO CHANGE AND THAT
THE INFORMATION MUST BE READ IN CONJUNCTION WITH THE SECTION HEADED
‘‘WARNING’’ ON THE COVER OF THIS DOCUMENT
6.2.3 Domaining for the Central Area
6.2.3.1 Mineralised Envelopes
Delineation of the mineralised domains by the creation of wireframe
envelopes was first carried out by the Client with subsequent verification by
WAI.
The following parameters were used to determine zones of
mineralisation:
. Cut-off grade of 30% Fe;
. Minimum thickness above cut-off grade of 1m; and
. Maximum thickness of internal waste of 1m.
The mineralised domains were defined using string outlines digitised on
vertical sections along the exploration profiles that are spaced 100m to 400m
apart. Strings were snapped to the beginning or end of sample locations. In
some areas discrepancies were found between close spaced drilling. In these
situations priority was given to the drilling carried out in 2013 as these were
deemed more reliable. A total of 5 separate mineralised envelopes were
defined for the Central Area of the Kokbulak Iron Ore Project. Figure 6.4 is
a plan view of the mineralised envelopes. Zones 1 and 2 are the largest of the
interpreted mineralised zones.
Extrapolation along strike was up to half the distance between adjacent
exploration profiles where mineralisation was not deemed continuous
between them with the thickness of mineralised zones being reduced over
this distance. Extrapolation along strike was up to 1/3 of drillhole spacing at
the limits of the mineralised envelopes. In some cases, to achieve continuity,
the wireframes were allowed to pass through intersections below the cut-off
grade if mineralisation above cut-off grade were found on either side.
The Central Area of the Kokbulak Iron Ore Project covered by this
Mineral Resource estimate is split in to five mineralised envelopes. These
strike roughly NW to SE and are shallowly dipping (1–3°) towards the SW.
At the longest point, the mineralised zones are 5.8km long along strike and
4.1km across strike. The largest of the mineralised zones are 1 (4km x 2.5km
maximum dimensions) and 2 (4.4km x 1.6km maximum dimensions). The
mineralised zones can be up to 30m thick vertically which due to the very
shallow dip of the deposit is close to true thickness.
APPENDIX III COMPETENT PERSON’S REPORT
– III-56 –
THIS DOCUMENT IS IN DRAFT FORM, INCOMPLETE AND SUBJECT TO CHANGE AND THAT
THE INFORMATION MUST BE READ IN CONJUNCTION WITH THE SECTION HEADED
‘‘WARNING’’ ON THE COVER OF THIS DOCUMENT
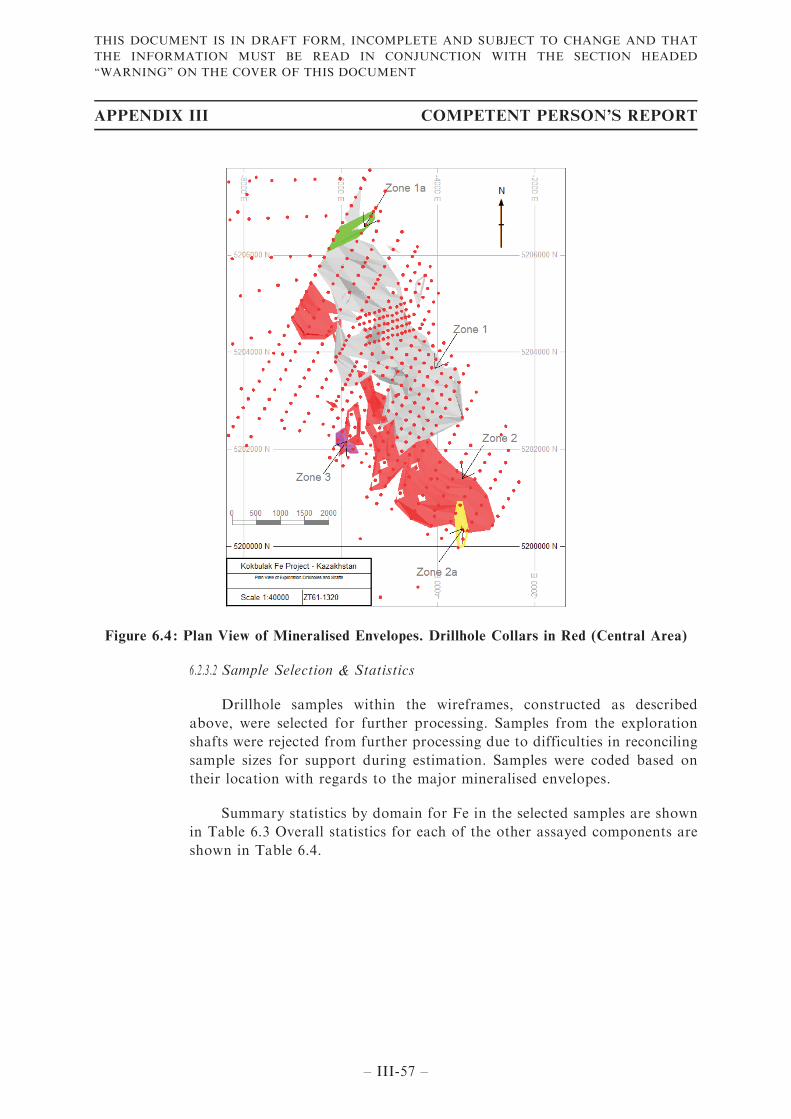
Figure 6.4 : Plan View of Mineralised Envelopes. Drillhole Collars in Red (Central Area)
6.2.3.2 Sample Selection & Statistics
Drillhole samples within the wireframes, constructed as described
above, were selected for further processing. Samples from the exploration
shafts were rejected from further processing due to difficulties in reconciling
sample sizes for support during estimation. Samples were coded based on
their location with regards to the major mineralised envelopes.
Summary statistics by domain for Fe in the selected samples are shown
in Table 6.3 Overall statistics for each of the other assayed components are
shown in Table 6.4.
APPENDIX III COMPETENT PERSON’S REPORT
– III-57 –
THIS DOCUMENT IS IN DRAFT FORM, INCOMPLETE AND SUBJECT TO CHANGE AND THAT
THE INFORMATION MUST BE READ IN CONJUNCTION WITH THE SECTION HEADED
‘‘WARNING’’ ON THE COVER OF THIS DOCUMENT
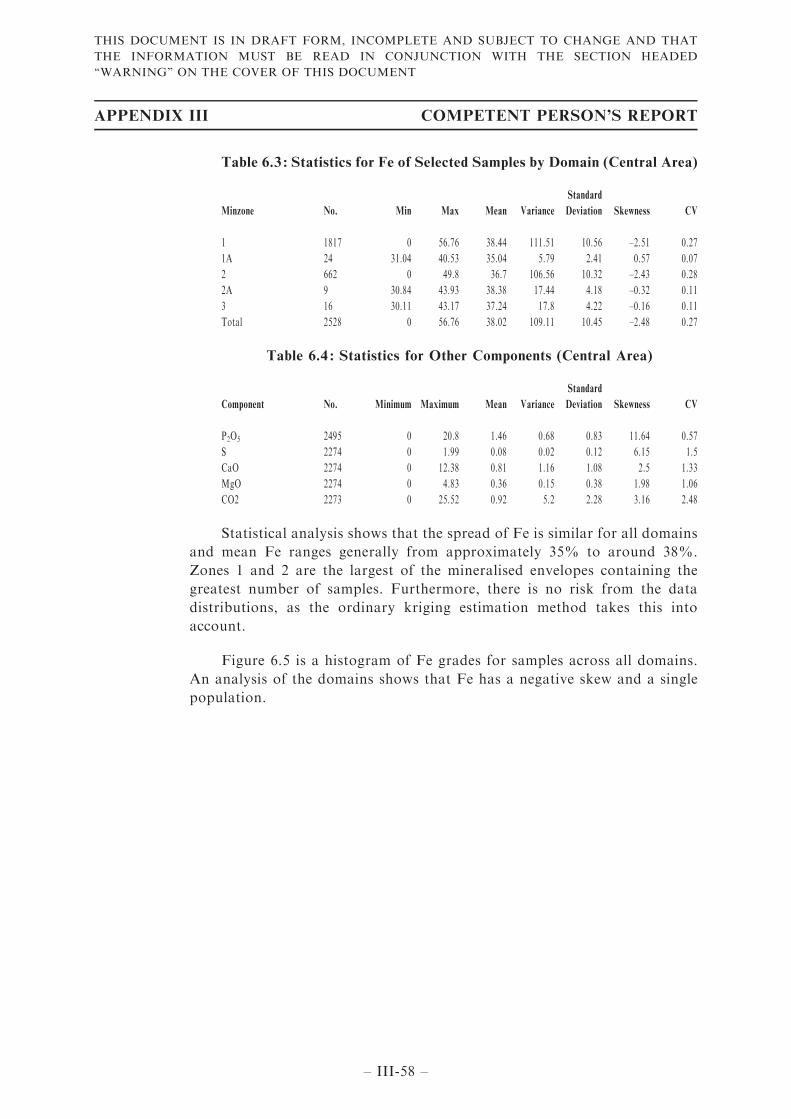
Table 6.3 : Statistics for Fe of Selected Samples by Domain (Central Area)
Minzone No. Min Max Mean Variance
Standard
Deviation Skewness CV
1 1817 0 56.76 38.44 111.51 10.56 –2.51 0.27
1A 24 31.04 40.53 35.04 5.79 2.41 0.57 0.07
2 662 0 49.8 36.7 106.56 10.32 –2.43 0.28
2A 9 30.84 43.93 38.38 17.44 4.18 –0.32 0.11
3 16 30.11 43.17 37.24 17.8 4.22 –0.16 0.11
Total 2528 0 56.76 38.02 109.11 10.45 –2.48 0.27
Table 6.4 : Statistics for Other Components (Central Area)
Component No. Minimum Maximum Mean Variance
Standard
Deviation Skewness CV
P2O5 2495 0 20.8 1.46 0.68 0.83 11.64 0.57
S 2274 0 1.99 0.08 0.02 0.12 6.15 1.5
CaO 2274 0 12.38 0.81 1.16 1.08 2.5 1.33
MgO 2274 0 4.83 0.36 0.15 0.38 1.98 1.06
CO2 2273 0 25.52 0.92 5.2 2.28 3.16 2.48
Statistical analysis shows that the spread of Fe is similar for all domains
and mean Fe ranges generally from approximately 35% to around 38%.
Zones 1 and 2 are the largest of the mineralised envelopes containing the
greatest number of samples. Furthermore, there is no risk from the data
distributions, as the ordinary kriging estimation method takes this into
account.
Figure 6.5 is a histogram of Fe grades for samples across all domains.
An analysis of the domains shows that Fe has a negative skew and a single
population.
APPENDIX III COMPETENT PERSON’S REPORT
– III-58 –
THIS DOCUMENT IS IN DRAFT FORM, INCOMPLETE AND SUBJECT TO CHANGE AND THAT
THE INFORMATION MUST BE READ IN CONJUNCTION WITH THE SECTION HEADED
‘‘WARNING’’ ON THE COVER OF THIS DOCUMENT
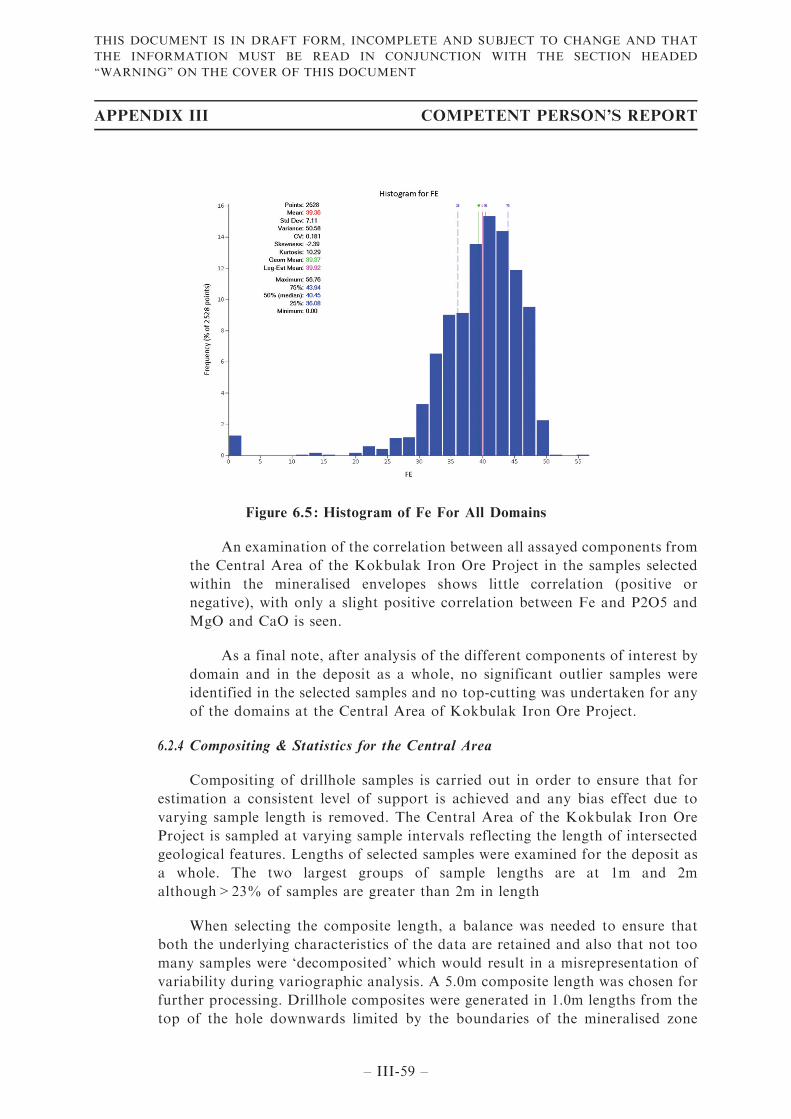
Figure 6.5 : Histogram of Fe For All Domains
An examination of the correlation between all assayed components from
the Central Area of the Kokbulak Iron Ore Project in the samples selected
within the mineralised envelopes shows little correlation (positive or
negative), with only a slight positive correlation between Fe and P2O5 and
MgO and CaO is seen.
As a final note, after analysis of the different components of interest by
domain and in the deposit as a whole, no significant outlier samples were
identified in the selected samples and no top-cutting was undertaken for any
of the domains at the Central Area of Kokbulak Iron Ore Project.
6.2.4 Compositing & Statistics for the Central Area
Compositing of drillhole samples is carried out in order to ensure that for
estimation a consistent level of support is achieved and any bias effect due to
varying sample length is removed. The Central Area of the Kokbulak Iron Ore
Project is sampled at varying sample intervals reflecting the length of intersected
geological features. Lengths of selected samples were examined for the deposit as
a whole. The two largest groups of sample lengths are at 1m and 2m
although>23% of samples are greater than 2m in length
When selecting the composite length, a balance was needed to ensure that
both the underlying characteristics of the data are retained and also that not too
many samples were ‘decomposited’ which would result in a misrepresentation of
variability during variographic analysis. A 5.0m composite length was chosen for
further processing. Drillhole composites were generated in 1.0m lengths from the
top of the hole downwards limited by the boundaries of the mineralised zone
APPENDIX III COMPETENT PERSON’S REPORT
– III-59 –
THIS DOCUMENT IS IN DRAFT FORM, INCOMPLETE AND SUBJECT TO CHANGE AND THAT
THE INFORMATION MUST BE READ IN CONJUNCTION WITH THE SECTION HEADED
‘‘WARNING’’ ON THE COVER OF THIS DOCUMENT
wireframes. Small adjustments in composite lengths were allowed whilst keeping
as close as possible to the composite interval so as to minimise sample loss during
the compositing process. A minimum composite length of 0.5m was allowed
against wireframe boundaries and at the end of holes. After processing the
average composite length was 4.8m.
The summary statistics for Fe by domain are shown in Table 6.5 and for
other components across the Central Area of the Kokbulak Iron Ore Project as a
whole in Table 6.6.
Table 6.5 : Statistics for Fe of Composited Samples by Domain (Central Area)
Minzone No. Minimum Maximum Mean Variance
Standard
Deviation Skewness CV
1 695 0.00 49.83 38.44 95.66 9.78 –2.69 0.25
1A 7 34.05 37.37 35.04 1.45 1.20 1.25 0.03
2 229 0.00 49.31 36.70 91.13 9.55 –2.79 0.26
2A 5 34.41 40.48 38.38 4.57 2.14 –0.74 0.06
3 6 34.29 41.72 37.24 4.35 2.09 0.81 0.06
Total 942 0.00 49.83 38.02 93.47 9.67 –2.69 0.25
Table 6.6 : Composited Sample Statistics for Other Components (Central Area)
Component No. Minimum Maximum Mean Variance
Standard
Deviation Skewness CV
P2O5 914 0.00 7.87 1.46 0.34 0.59 3.25 0.40
S 791 0.00 0.98 0.08 0.01 0.10 4.05 1.25
CaO 791 0.00 5.83 0.82 0.76 0.87 1.79 1.06
MgO 791 0.00 2.02 0.36 0.10 0.31 1.11 0.86
CO2 791 0.00 12.71 0.92 3.56 1.89 2.66 2.05
6.2.5 Variography for the Central Area
6.2.5.1 Analysis
Variographic analysis was performed using Supervisor 8.2 and was
attempted for each variable in each of the 5 mineralised domains as well as
for the deposit as a whole using the 5m composited samples contained within
the mineralised domain wireframes
The methodology for producing experimental variograms and
variogram models was as follows
. Experimental variograms with small lag distances were generated
downhole to aid in estimation of nugget effect. Nugget effect is the
variance between sample pairs at the same direction containing
components of inherent variability, sampling error and analytical
error;
APPENDIX III COMPETENT PERSON’S REPORT
– III-60 –
THIS DOCUMENT IS IN DRAFT FORM, INCOMPLETE AND SUBJECT TO CHANGE AND THAT
THE INFORMATION MUST BE READ IN CONJUNCTION WITH THE SECTION HEADED
‘‘WARNING’’ ON THE COVER OF THIS DOCUMENT
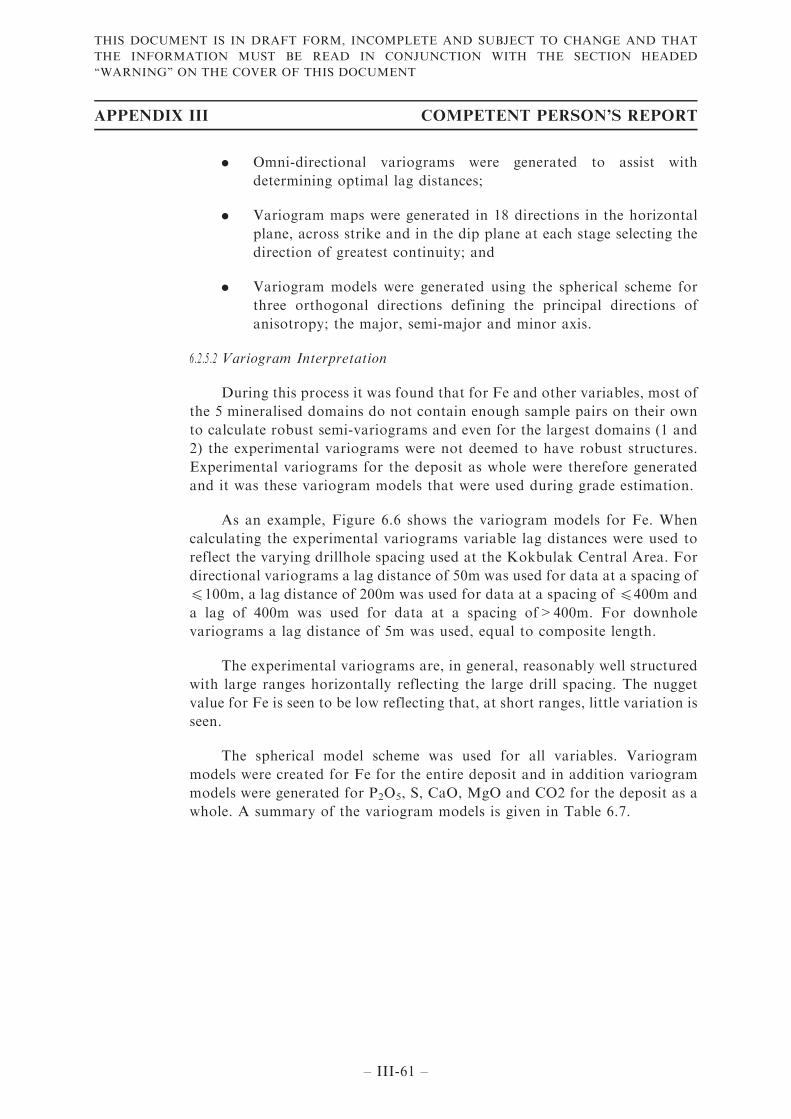
. Omni-directional variograms were generated to assist with
determining optimal lag distances;
. Variogram maps were generated in 18 directions in the horizontal
plane, across strike and in the dip plane at each stage selecting the
direction of greatest continuity; and
. Variogram models were generated using the spherical scheme for
three orthogonal directions defining the principal directions of
anisotropy; the major, semi-major and minor axis.
6.2.5.2 Variogram Interpretation
During this process it was found that for Fe and other variables, most of
the 5 mineralised domains do not contain enough sample pairs on their own
to calculate robust semi-variograms and even for the largest domains (1 and
2) the experimental variograms were not deemed to have robust structures.
Experimental variograms for the deposit as whole were therefore generated
and it was these variogram models that were used during grade estimation.
As an example, Figure 6.6 shows the variogram models for Fe. When
calculating the experimental variograms variable lag distances were used to
reflect the varying drillhole spacing used at the Kokbulak Central Area. For
directional variograms a lag distance of 50m was used for data at a spacing of
4100m, a lag distance of 200m was used for data at a spacing of 4400m and
a lag of 400m was used for data at a spacing of>400m. For downhole
variograms a lag distance of 5m was used, equal to composite length.
The experimental variograms are, in general, reasonably well structured
with large ranges horizontally reflecting the large drill spacing. The nugget
value for Fe is seen to be low reflecting that, at short ranges, little variation is
seen.
The spherical model scheme was used for all variables. Variogram
models were created for Fe for the entire deposit and in addition variogram
models were generated for P2O5, S, CaO, MgO and CO2 for the deposit as a
whole. A summary of the variogram models is given in Table 6.7.
APPENDIX III COMPETENT PERSON’S REPORT
– III-61 –
THIS DOCUMENT IS IN DRAFT FORM, INCOMPLETE AND SUBJECT TO CHANGE AND THAT
THE INFORMATION MUST BE READ IN CONJUNCTION WITH THE SECTION HEADED
‘‘WARNING’’ ON THE COVER OF THIS DOCUMENT
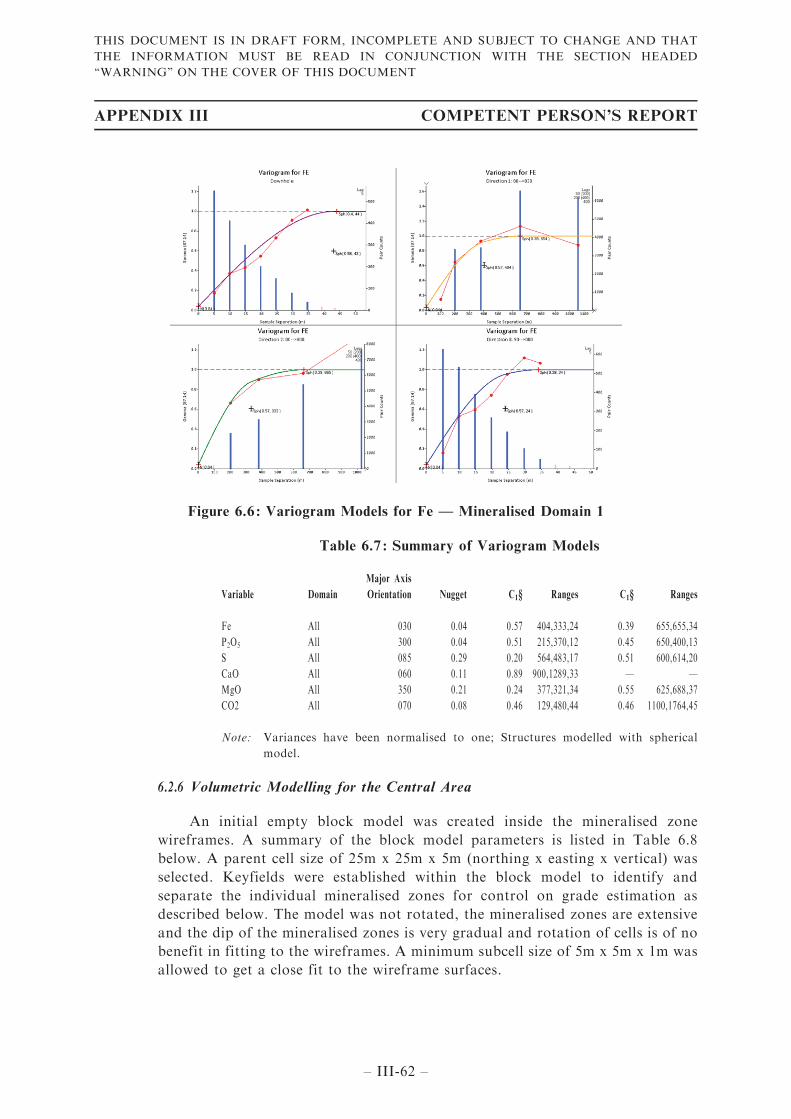
Figure 6.6 : Variogram Models for Fe — Mineralised Domain 1
Table 6.7 : Summary of Variogram Models
Variable Domain
Major Axis
Orientation Nugget C1§ Ranges C1§ Ranges
Fe All 030 0.04 0.57 404,333,24 0.39 655,655,34
P2O5 All 300 0.04 0.51 215,370,12 0.45 650,400,13
S All 085 0.29 0.20 564,483,17 0.51 600,614,20
CaO All 060 0.11 0.89 900,1289,33 — —
MgO All 350 0.21 0.24 377,321,34 0.55 625,688,37
CO2 All 070 0.08 0.46 129,480,44 0.46 1100,1764,45
Note: Variances have been normalised to one; Structures modelled with spherical
model.
6.2.6 Volumetric Modelling for the Central Area
An initial empty block model was created inside the mineralised zone
wireframes. A summary of the block model parameters is listed in Table 6.8
below. A parent cell size of 25m x 25m x 5m (northing x easting x vertical) was
selected. Keyfields were established within the block model to identify and
separate the individual mineralised zones for control on grade estimation as
described below. The model was not rotated, the mineralised zones are extensive
and the dip of the mineralised zones is very gradual and rotation of cells is of no
benefit in fitting to the wireframes. A minimum subcell size of 5m x 5m x 1m was
allowed to get a close fit to the wireframe surfaces.
APPENDIX III COMPETENT PERSON’S REPORT
– III-62 –
THIS DOCUMENT IS IN DRAFT FORM, INCOMPLETE AND SUBJECT TO CHANGE AND THAT
THE INFORMATION MUST BE READ IN CONJUNCTION WITH THE SECTION HEADED
‘‘WARNING’’ ON THE COVER OF THIS DOCUMENT
Table 6.8 : Summary of Block Model Parameters
Property Direction Metres
(m)
Model Origin
X –7600
Y 5199700
Z 90
Parent Cell Size
X 25
Y 25
Z 5
No. of Cells
X 224
Y 320
Z 25
6.2.7 Densities for the Central Area
The average bulk density is recorded as 2.36t/m3 from extensive historical
testing, although the position of samples used for density measurement is not
recorded. Thus, this value was therefore assigned to the whole of the mineralised
zones at the Central Area of the Kokbulak Iron Ore Project.
6.2.8 Grade Estimation for the Central Area
6.2.8.1 KNA
Kriging Neighbourhood Analysis (KNA) is a method used for
optimising block sizes and search parameters used during grade estimation.
The process was carried out using Supervisor v8.2 software which enables a
series of tasks to be carried out in turn to determine:
. The optimum block sizes;
. The minimum and maximum samples to be used during estimation;
. The optimum search ellipse size; and
. The optimum block discretisation.
For each of these tasks a series of estimation runs are carried out using
the variogram parameters calculated as shown above on a block centre
location selected for its representivity of the deposit. The variable used to run
the KNA tests was Fe.
In terms of block size, the analysis showed that 25m x 25m x 5m was the
optimum size for modelling. This block size was a compromise between
gaining acceptable statistical results in this test and the block being small
enough for pit optimisation to be carried out at an adequate resolution.
APPENDIX III COMPETENT PERSON’S REPORT
– III-63 –
THIS DOCUMENT IS IN DRAFT FORM, INCOMPLETE AND SUBJECT TO CHANGE AND THAT
THE INFORMATION MUST BE READ IN CONJUNCTION WITH THE SECTION HEADED
‘‘WARNING’’ ON THE COVER OF THIS DOCUMENT
A series of tests were carried out at the selected block size of 25m x 25m
x 5m to determine the optimum minimum and maximum samples to be used
during the estimation process. This showed that a minimum of 6 and a
maximum of 16 samples were optimum and duly selected for the estimate.
Next, further tests were carried out to determine the optimum search
ellipse size using the selected block size of 25m x 25m x 5m and using a
minimum of 6 samples and a maximum of 16 samples. This showed that a
search ellipse with dimensions of 650m x 650m x 35m was appropriate.
Finally, using a block size of 25m x 25m x 5m, a minimum number of 6
samples and a maximum number of 16 samples with a search ellipse of 650m
x 650m x 35m, a series of estimation runs was carried out to determine the
optimum block discretisation parameters which proved to be 5 x 5 x 2.
6.2.8.2 Estimation Plan
Grade estimation was carried out using Ordinary Kriging (OK) as the
principal interpolation method. (IDW2) and Nearest Neighbour (NN) were
also used for comparative purposes for each element. The OK method used
estimation parameters defined by the variography and KNA as described
above. The estimation was performed on mineralised material domains
defined during the domaining process described above and only drillhole
composites contained within a domain were used in the grade estimation of
that domain.
For the mineralised zones, the OK estimation was run in a three pass
estimation plan, the second and third passes using progressively larger search
radii to enable the estimation of blocks not estimated on the previous pass.
The search ellipses were derived from the variographic analysis, with the first
search distances corresponding to the distance at roughly half of the
variogram sill value and the second search distance approximating the
variogram range and the third search ellipse approximating twice the
variogram range.
An isometric view of the resultant block model after estimation of Fe
grades is shown in Figure 6.7.
6.2.9 Model Validation for the Central Area
Following grade estimation a statistical and visual assessment of the block
model was undertaken to ensure the model was valid. This included a visual
assessment of grade, global statistical grade validation and Swath plot (model
grade profile) analysis.
The results of this work showed that globally no indications of significant
over or under estimation are apparent in the model nor were any obvious
interpolation issues identified. From the perspective of conformance of the
APPENDIX III COMPETENT PERSON’S REPORT
– III-64 –
THIS DOCUMENT IS IN DRAFT FORM, INCOMPLETE AND SUBJECT TO CHANGE AND THAT
THE INFORMATION MUST BE READ IN CONJUNCTION WITH THE SECTION HEADED
‘‘WARNING’’ ON THE COVER OF THIS DOCUMENT
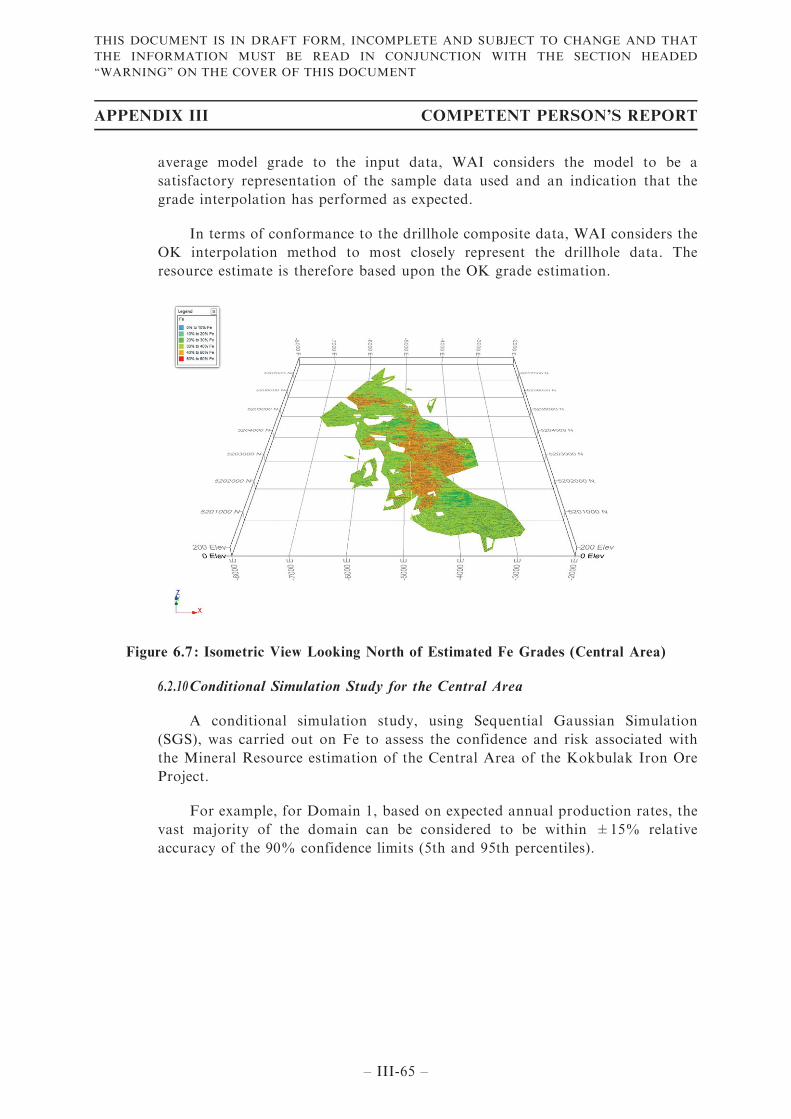
average model grade to the input data, WAI considers the model to be a
satisfactory representation of the sample data used and an indication that the
grade interpolation has performed as expected.
In terms of conformance to the drillhole composite data, WAI considers the
OK interpolation method to most closely represent the drillhole data. The
resource estimate is therefore based upon the OK grade estimation.
Figure 6.7 : Isometric View Looking North of Estimated Fe Grades (Central Area)
6.2.10Conditional Simulation Study for the Central Area
A conditional simulation study, using Sequential Gaussian Simulation
(SGS), was carried out on Fe to assess the confidence and risk associated with
the Mineral Resource estimation of the Central Area of the Kokbulak Iron Ore
Project.
For example, for Domain 1, based on expected annual production rates, the
vast majority of the domain can be considered to be within ±15% relative
accuracy of the 90% confidence limits (5th and 95th percentiles).
APPENDIX III COMPETENT PERSON’S REPORT
– III-65 –
THIS DOCUMENT IS IN DRAFT FORM, INCOMPLETE AND SUBJECT TO CHANGE AND THAT
THE INFORMATION MUST BE READ IN CONJUNCTION WITH THE SECTION HEADED
‘‘WARNING’’ ON THE COVER OF THIS DOCUMENT
6.2.11Mineral Resource Classification for the Central Area
6.2.11.1 Classification Indicators
The mineral resource of the Central Area of the Kokbulak Iron Ore
Project is classified following the guidelines of the Australian Code for
Reporting of Exploration Results, Mineral Resources and Ore Reserves
[JORC Code (2012)].
To classify the mineral resource of the Central Area of the Kokbulak
Iron Ore Project, WAI has taken into account the following indicators:
. Geological Continuity and Complexity;
. QAQC Results — Quality of Data;
. Spatial Grade Continuity — Results of Geostatistical Analysis;
. Quality of Block Model;
. Simulated Grade Variability; and
. Expectations of Economic Extraction.
Addressing these in turn, with the current drillhole spacing, clear
geological continuity both between exploration profiles along strike and
down dip is seen and this continuity of mineralisation is seen in field
outcrops. The current drillhole spacing allows for interpretation of
continuous zones of mineralisation based on the cut-off grade of 30% Fe.
The Mineral Resource estimate relies to a significant extent on historical
drilling data from the early 1950s. Core from historical drilling is not
available for study or re-assay, but verification drilling (twinned holes) has
been completed which confirms grade, mineralisation intersection points and
mineralised zone thicknesses of the historical drilling.
An assessment of spatial grade continuity is important when assigning
resource classification. The confidence that can be placed in the variogram
parameters is a major consideration when assessing classification. The data
used in geostatistical analysis resulted in reasonably robust along strike and
down dip variogram structures for Fe allowing the determination of
appropriate search parameters through the KNA process.
Validation of the block model has shown the estimated grades to be a
good reflection of the input composite grades. Visual and statistical checks
reveal no evidence of major under or over estimation.
Furthermore, conditional simulation demonstrated that the grade of the
majority of blocks could be estimated at ±15% at 90% confidence intervals.
APPENDIX III COMPETENT PERSON’S REPORT
– III-66 –
THIS DOCUMENT IS IN DRAFT FORM, INCOMPLETE AND SUBJECT TO CHANGE AND THAT
THE INFORMATION MUST BE READ IN CONJUNCTION WITH THE SECTION HEADED
‘‘WARNING’’ ON THE COVER OF THIS DOCUMENT
Finally, given the shallow and relatively continuous nature of the
mineralisation and thin overburden, WAI considers that the Central Area of
the Kokbulak Iron Ore Project can be considered to have reasonable
prospects for economic extraction for the purposes of mineral resource
reporting in accordance with the guidelines of the JORC Code (2012).
6.2.11.2 Final Classification
WAI considers that the Central Area of the Kokbulak Iron Ore Project
has been sufficiently explored to estimate Measured, Indicated and Inferred
Mineral Resources as defined by JORC Code (2012).
Criteria for defining resource categories were also derived from the
geostatistical studies. The key criteria for the allocation of resources by area
can be summarised as follows:
. Measured resources — Measured resources were outlined where
drillhole spacing was up to 150m x 250m in areas where 2013
drilling has been carried out;
. Indicated resources — Indicated resources were outlined where
drillhole spacing was up to 400m x 200m and where the conditional
simulation study indicated that recoverable metal in blocks of
annual production increments were known with a relative accuracy
of ±15% at 90% confidence; and
. Inferred resources — within defined mineralised zones outside of
the Indicated Resource criteria.
Classification was assigned to the block model by assessing the model on
the criteria above. Strings were digitised around those portions deemed to be
indicated on a zone by zone basis and wireframes created to delineate the
indicated zones. Blocks were selected inside or outside these wireframes,
again on a zone by zone basis, and the correct classification code assigned to
the final block model.
A plan view of classification following the guidelines of the JORC Code
(2012) at the Central Area of the Kokbulak Iron Ore Project is shown in
Figure 6.8 which also shows the 2013 drilling in purple and 1950s in Orange.
APPENDIX III COMPETENT PERSON’S REPORT
– III-67 –
THIS DOCUMENT IS IN DRAFT FORM, INCOMPLETE AND SUBJECT TO CHANGE AND THAT
THE INFORMATION MUST BE READ IN CONJUNCTION WITH THE SECTION HEADED
‘‘WARNING’’ ON THE COVER OF THIS DOCUMENT
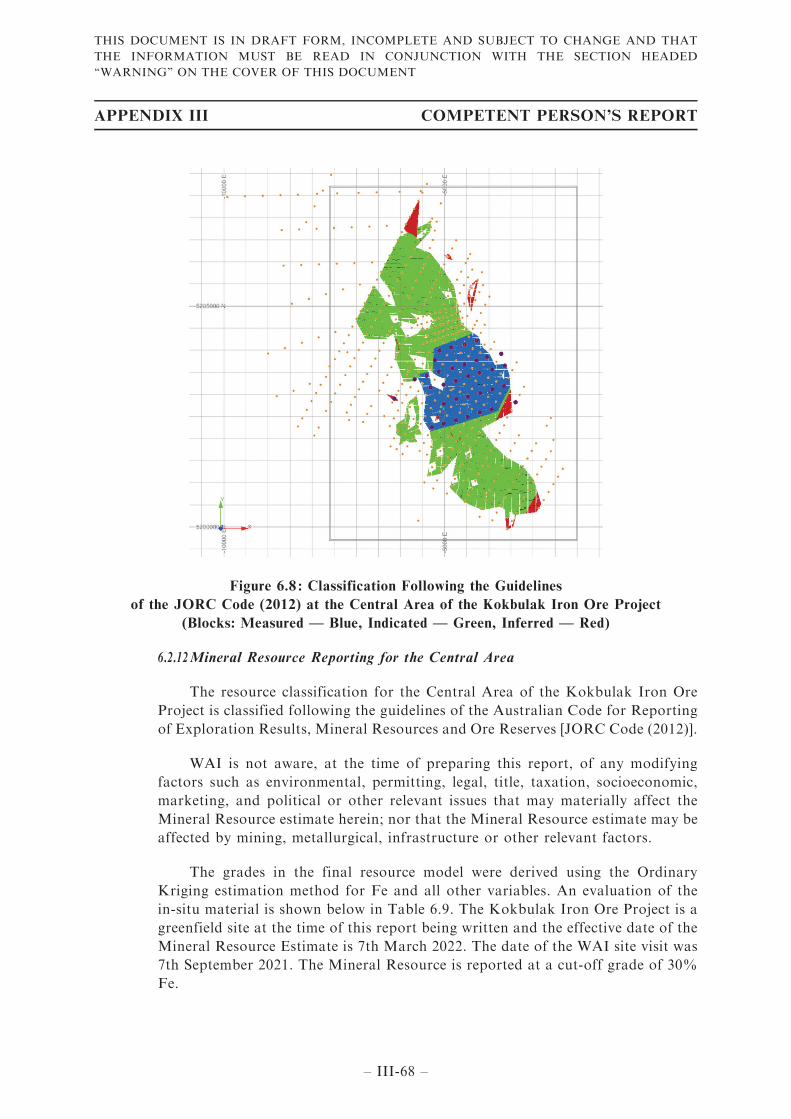
Figure 6.8 : Classification Following the Guidelines
of the JORC Code (2012) at the Central Area of the Kokbulak Iron Ore Project
(Blocks: Measured — Blue, Indicated — Green, Inferred — Red)
6.2.12Mineral Resource Reporting for the Central Area
The resource classification for the Central Area of the Kokbulak Iron Ore
Project is classified following the guidelines of the Australian Code for Reporting
of Exploration Results, Mineral Resources and Ore Reserves [JORC Code (2012)].
WAI is not aware, at the time of preparing this report, of any modifying
factors such as environmental, permitting, legal, title, taxation, socioeconomic,
marketing, and political or other relevant issues that may materially affect the
Mineral Resource estimate herein; nor that the Mineral Resource estimate may be
affected by mining, metallurgical, infrastructure or other relevant factors.
The grades in the final resource model were derived using the Ordinary
Kriging estimation method for Fe and all other variables. An evaluation of the
in-situ material is shown below in Table 6.9. The Kokbulak Iron Ore Project is a
greenfield site at the time of this report being written and the effective date of the
Mineral Resource Estimate is 7th March 2022. The date of the WAI site visit was
7th September 2021. The Mineral Resource is reported at a cut-off grade of 30%
Fe.
APPENDIX III COMPETENT PERSON’S REPORT
– III-68 –
THIS DOCUMENT IS IN DRAFT FORM, INCOMPLETE AND SUBJECT TO CHANGE AND THAT
THE INFORMATION MUST BE READ IN CONJUNCTION WITH THE SECTION HEADED
‘‘WARNING’’ ON THE COVER OF THIS DOCUMENT
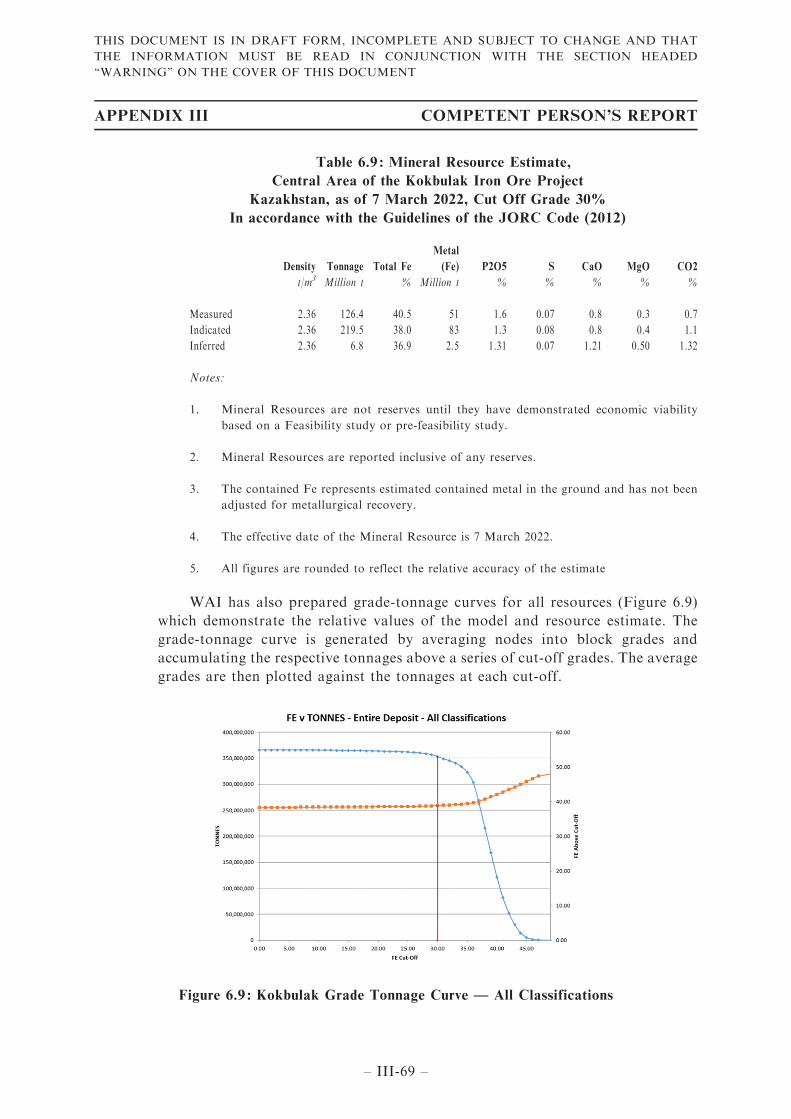
Table 6.9 : Mineral Resource Estimate,
Central Area of the Kokbulak Iron Ore Project
Kazakhstan, as of 7 March 2022, Cut Off Grade 30%
In accordance with the Guidelines of the JORC Code (2012)
Density Tonnage Total Fe
Metal
(Fe) P2O5 S CaO MgO CO2
t/m3 Million t % Million t % % % % %
Measured 2.36 126.4 40.5 51 1.6 0.07 0.8 0.3 0.7
Indicated 2.36 219.5 38.0 83 1.3 0.08 0.8 0.4 1.1
Inferred 2.36 6.8 36.9 2.5 1.31 0.07 1.21 0.50 1.32
Notes:
1. Mineral Resources are not reserves until they have demonstrated economic viability
based on a Feasibility study or pre-feasibility study.
2. Mineral Resources are reported inclusive of any reserves.
3. The contained Fe represents estimated contained metal in the ground and has not been
adjusted for metallurgical recovery.
4. The effective date of the Mineral Resource is 7 March 2022.
5. All figures are rounded to reflect the relative accuracy of the estimate
WAI has also prepared grade-tonnage curves for all resources (Figure 6.9)
which demonstrate the relative values of the model and resource estimate. The
grade-tonnage curve is generated by averaging nodes into block grades and
accumulating the respective tonnages above a series of cut-off grades. The average
grades are then plotted against the tonnages at each cut-off.
Figure 6.9 : Kokbulak Grade Tonnage Curve — All Classifications
APPENDIX III COMPETENT PERSON’S REPORT
– III-69 –
THIS DOCUMENT IS IN DRAFT FORM, INCOMPLETE AND SUBJECT TO CHANGE AND THAT
THE INFORMATION MUST BE READ IN CONJUNCTION WITH THE SECTION HEADED
‘‘WARNING’’ ON THE COVER OF THIS DOCUMENT
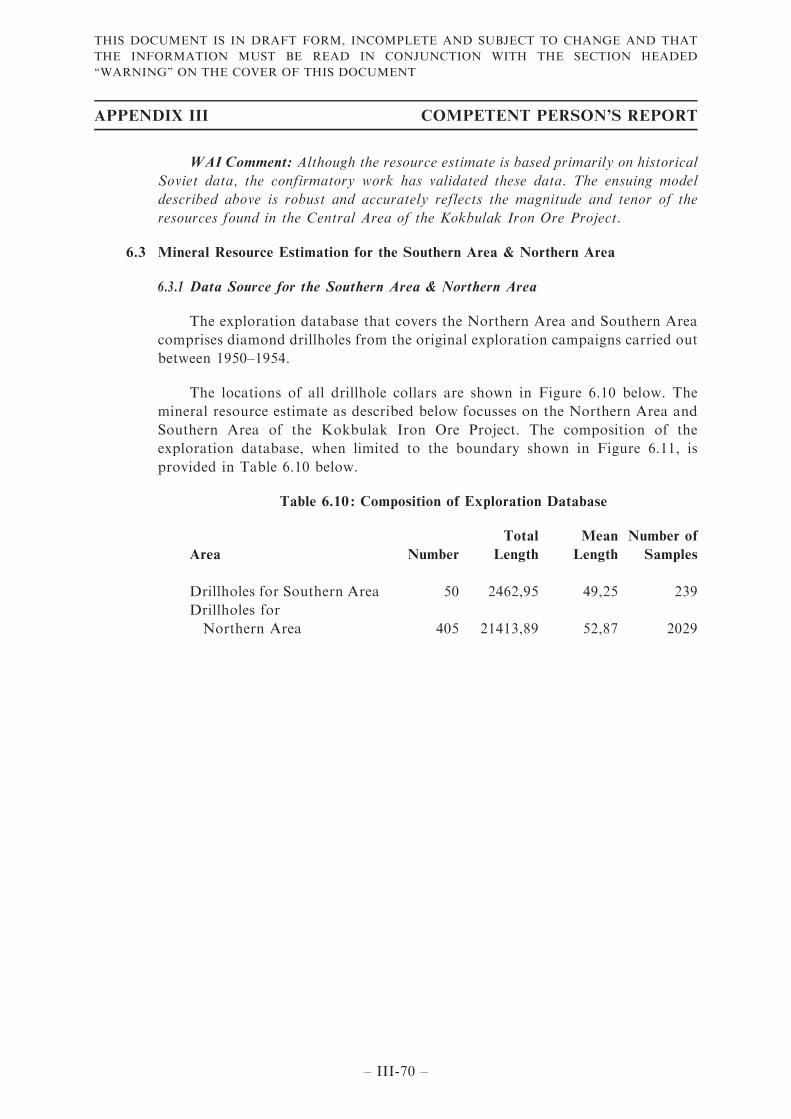
WAI Comment: Although the resource estimate is based primarily on historical
Soviet data, the confirmatory work has validated these data. The ensuing model
described above is robust and accurately reflects the magnitude and tenor of the
resources found in the Central Area of the Kokbulak Iron Ore Project.
6.3 Mineral Resource Estimation for the Southern Area & Northern Area
6.3.1 Data Source for the Southern Area & Northern Area
The exploration database that covers the Northern Area and Southern Area
comprises diamond drillholes from the original exploration campaigns carried out
between 1950–1954.
The locations of all drillhole collars are shown in Figure 6.10 below. The
mineral resource estimate as described below focusses on the Northern Area and
Southern Area of the Kokbulak Iron Ore Project. The composition of the
exploration database, when limited to the boundary shown in Figure 6.11, is
provided in Table 6.10 below.
Table 6.10 : Composition of Exploration Database
Area Number
Total
Length
Mean
Length
Number of
Samples
Drillholes for Southern Area 50 2462,95 49,25 239
Drillholes for
Northern Area 405 21413,89 52,87 2029
APPENDIX III COMPETENT PERSON’S REPORT
– III-70 –
THIS DOCUMENT IS IN DRAFT FORM, INCOMPLETE AND SUBJECT TO CHANGE AND THAT
THE INFORMATION MUST BE READ IN CONJUNCTION WITH THE SECTION HEADED
‘‘WARNING’’ ON THE COVER OF THIS DOCUMENT
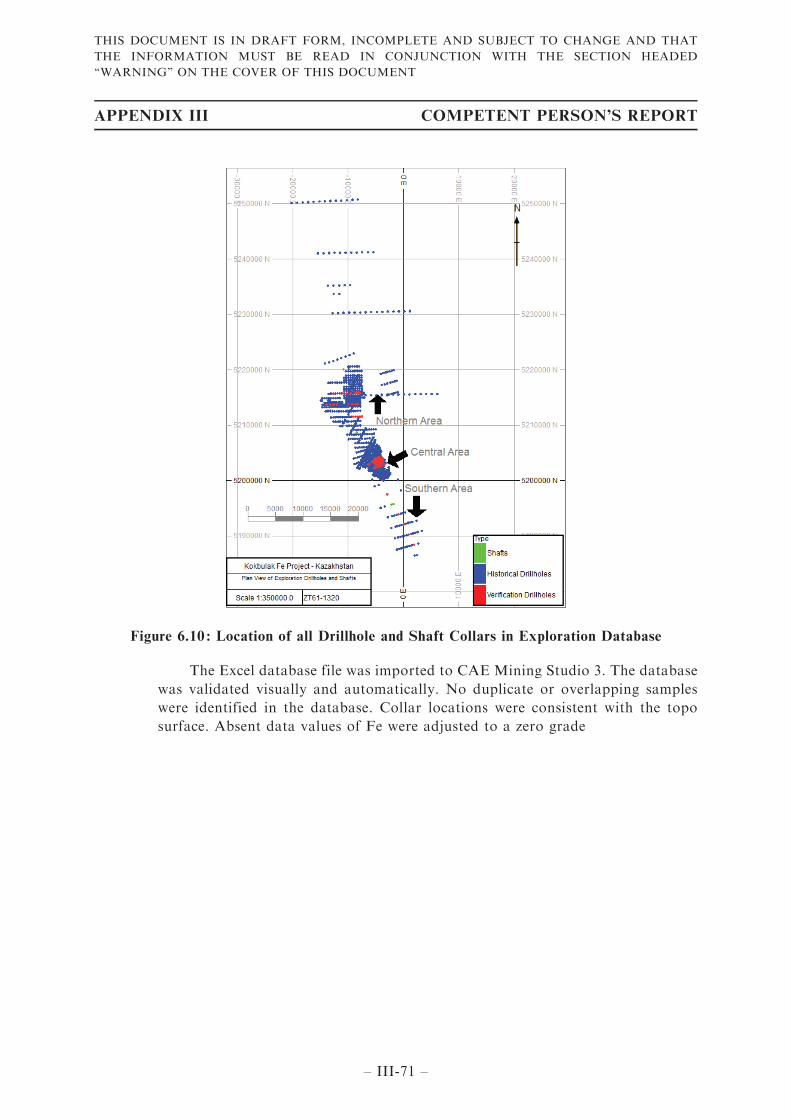
Figure 6.10 : Location of all Drillhole and Shaft Collars in Exploration Database
The Excel database file was imported to CAE Mining Studio 3. The database
was validated visually and automatically. No duplicate or overlapping samples
were identified in the database. Collar locations were consistent with the topo
surface. Absent data values of Fe were adjusted to a zero grade
APPENDIX III COMPETENT PERSON’S REPORT
– III-71 –
THIS DOCUMENT IS IN DRAFT FORM, INCOMPLETE AND SUBJECT TO CHANGE AND THAT
THE INFORMATION MUST BE READ IN CONJUNCTION WITH THE SECTION HEADED
‘‘WARNING’’ ON THE COVER OF THIS DOCUMENT
Figure 6.11 : Location of Exploration Drillholes for Northern Area and Southern Area
(historic drillholes — green, verification drillholes — red)
6.3.2 Topographic Data for the Southern & Northern Areas
The topographic surface was based on the drillhole collars and was created in
Leapfrog software.
6.3.3 Mineralised Zones for the Southern Area & Northern Area
Mineralised wireframes were created in Leapfrog software. All mineralised
wireframes were checked against errors.
The following parameters were used to determine zones of mineralisation:
. Cut-off grade of 30% Fe for delineation;
. Minimum thickness of mineralised material of 1m; and
. Maximum thickness of internal waste of 1m.
APPENDIX III COMPETENT PERSON’S REPORT
– III-72 –
THIS DOCUMENT IS IN DRAFT FORM, INCOMPLETE AND SUBJECT TO CHANGE AND THAT
THE INFORMATION MUST BE READ IN CONJUNCTION WITH THE SECTION HEADED
‘‘WARNING’’ ON THE COVER OF THIS DOCUMENT
The approach used for the wireframing was based on half distance between
profiles.
The following parameters were used for the Southern Area:
. Mean distance between profiles of about 2,000m; and
. Mean distance between drillholes of about 400m.
The following parameters were used for the Northern Area:
. Distance between profiles of 200, 400 and sometimes 800m; and
. Distance between drillholes of 100, 200 and sometimes 400m.
6.3.4 Grade Estimation for the Southern Area & Northern Area
Grade estimation for Fe was carried out using Inverse Distance Squared
(IDW2) as the principle interpolation method. Ordinary Kriging (OK) and
Nearest Neighbour (NN) were also used for comparative purposes. The IDW2
method used estimation parameters defined by the variography and Quantitative
Kriging Neighbourhood Analysis (‘‘QKNA’’). The estimation was performed both
on the mineralised domains and keyfields within the solid wireframe domains.
Domains (defined by the BODY code) were treated as hard boundaries with only
drillhole composite samples contained within a domain used in the grade
estimation of that domain.
Estimation using Inverse Distance Squared method was run in a three-pass
plan; the second and third passes using progressively larger search radii to enable
the estimation of blocks not estimated on the previous pass. The search
parameters were derived from the variographic analysis, with the first search
distances corresponding to the distance at roughly half of the variogram sill value
and the second search distance approximating the variogram range and the third
search ellipse approximating twice the variogram range.
APPENDIX III COMPETENT PERSON’S REPORT
– III-73 –
THIS DOCUMENT IS IN DRAFT FORM, INCOMPLETE AND SUBJECT TO CHANGE AND THAT
THE INFORMATION MUST BE READ IN CONJUNCTION WITH THE SECTION HEADED
‘‘WARNING’’ ON THE COVER OF THIS DOCUMENT
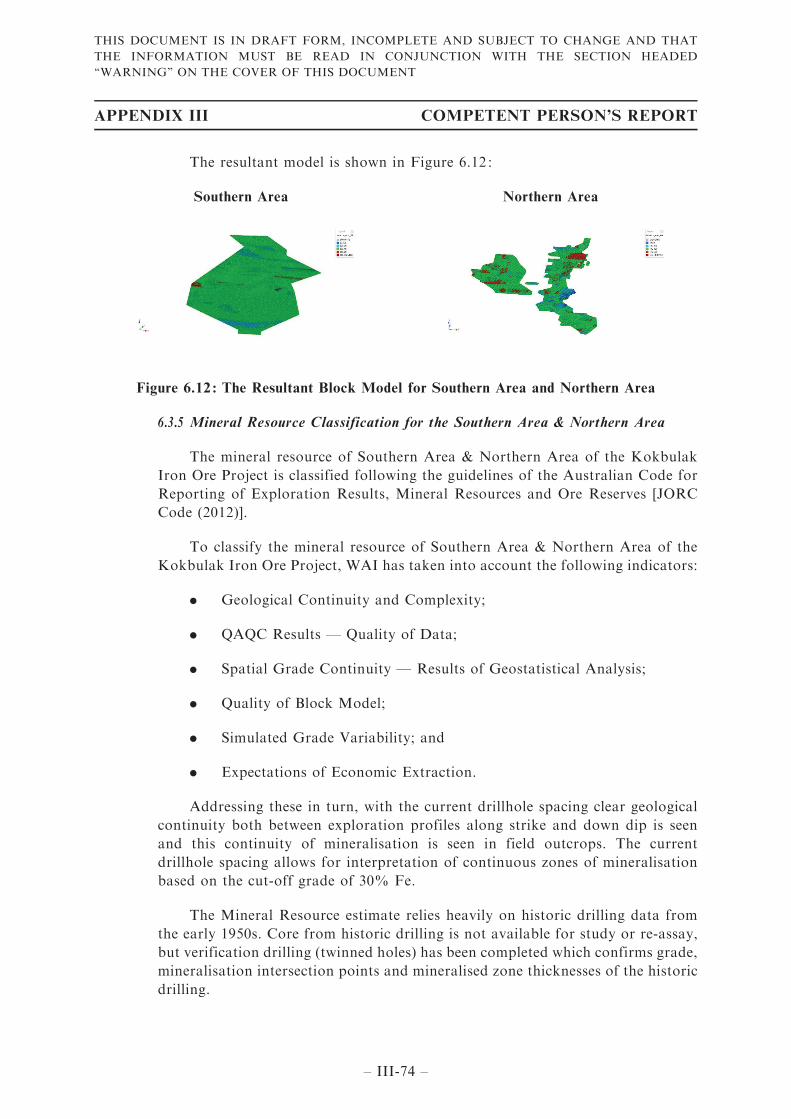
The resultant model is shown in Figure 6.12 :
Southern Area Northern Area
Figure 6.12 : The Resultant Block Model for Southern Area and Northern Area
6.3.5 Mineral Resource Classification for the Southern Area & Northern Area
The mineral resource of Southern Area & Northern Area of the Kokbulak
Iron Ore Project is classified following the guidelines of the Australian Code for
Reporting of Exploration Results, Mineral Resources and Ore Reserves [JORC
Code (2012)].
To classify the mineral resource of Southern Area & Northern Area of the
Kokbulak Iron Ore Project, WAI has taken into account the following indicators:
. Geological Continuity and Complexity;
. QAQC Results — Quality of Data;
. Spatial Grade Continuity — Results of Geostatistical Analysis;
. Quality of Block Model;
. Simulated Grade Variability; and
. Expectations of Economic Extraction.
Addressing these in turn, with the current drillhole spacing clear geological
continuity both between exploration profiles along strike and down dip is seen
and this continuity of mineralisation is seen in field outcrops. The current
drillhole spacing allows for interpretation of continuous zones of mineralisation
based on the cut-off grade of 30% Fe.
The Mineral Resource estimate relies heavily on historic drilling data from
the early 1950s. Core from historic drilling is not available for study or re-assay,
but verification drilling (twinned holes) has been completed which confirms grade,
mineralisation intersection points and mineralised zone thicknesses of the historic
drilling.
APPENDIX III COMPETENT PERSON’S REPORT
– III-74 –
THIS DOCUMENT IS IN DRAFT FORM, INCOMPLETE AND SUBJECT TO CHANGE AND THAT
THE INFORMATION MUST BE READ IN CONJUNCTION WITH THE SECTION HEADED
‘‘WARNING’’ ON THE COVER OF THIS DOCUMENT
An assessment of spatial grade continuity is important when assigning
resource classification. The confidence that can be placed in the variogram
parameters is a major consideration when assessing classification. The data used
in geostatistical analysis resulted in reasonably robust along strike and down dip
variogram structures for Fe allowing the determination of appropriate search
parameters through the KNA process.
Validation of the block model has shown the estimated grades to be a good
reflection of the input composite grades. Visual and statistical checks reveal no
evidence of major under or over estimation.
Furthermore, conditional simulation demonstrated that the grade of the
majority of blocks could be estimated at ±15% at 90% confidence intervals.
Finally, given the shallow and relatively continuous nature of the
mineralisation and thin overburden, WAI considers that the mineral resource of
Southern Area & Northern Area of the Kokbulak Iron Ore Project can be
considered to have reasonable prospects for economic extraction for the purposes
of mineral resource reporting in accordance with the guidelines of the JORC Code
(2012).
6.3.6 Optimisation and Cut-Off Grade Analysis for the Southern Area & Northern
Area
6.3.6.1 Economic and Technical Input Parameters for Open Pit Optimisation
For a deposit, or portion of a deposit, to be classified as a Mineral
Resource there must be reasonable prospects for eventual economic
extraction (the JORC Code [2012]). The model classified as described
above was therefore further limited by suitable economic and technical
parameters.
The prospects for eventual economic extraction were tested in the first
instance by running an open pit optimisation using Studio NPVS based on
the technical, financial and economic parameters listed in Table 6.11, which
WAI believes they are reasonable and is the same used for Central Area. The
resultant optimised pit shell is shown in Table 6.11 and Figure 6.13 and
Figure 6.14 below.
APPENDIX III COMPETENT PERSON’S REPORT
– III-75 –
THIS DOCUMENT IS IN DRAFT FORM, INCOMPLETE AND SUBJECT TO CHANGE AND THAT
THE INFORMATION MUST BE READ IN CONJUNCTION WITH THE SECTION HEADED
‘‘WARNING’’ ON THE COVER OF THIS DOCUMENT
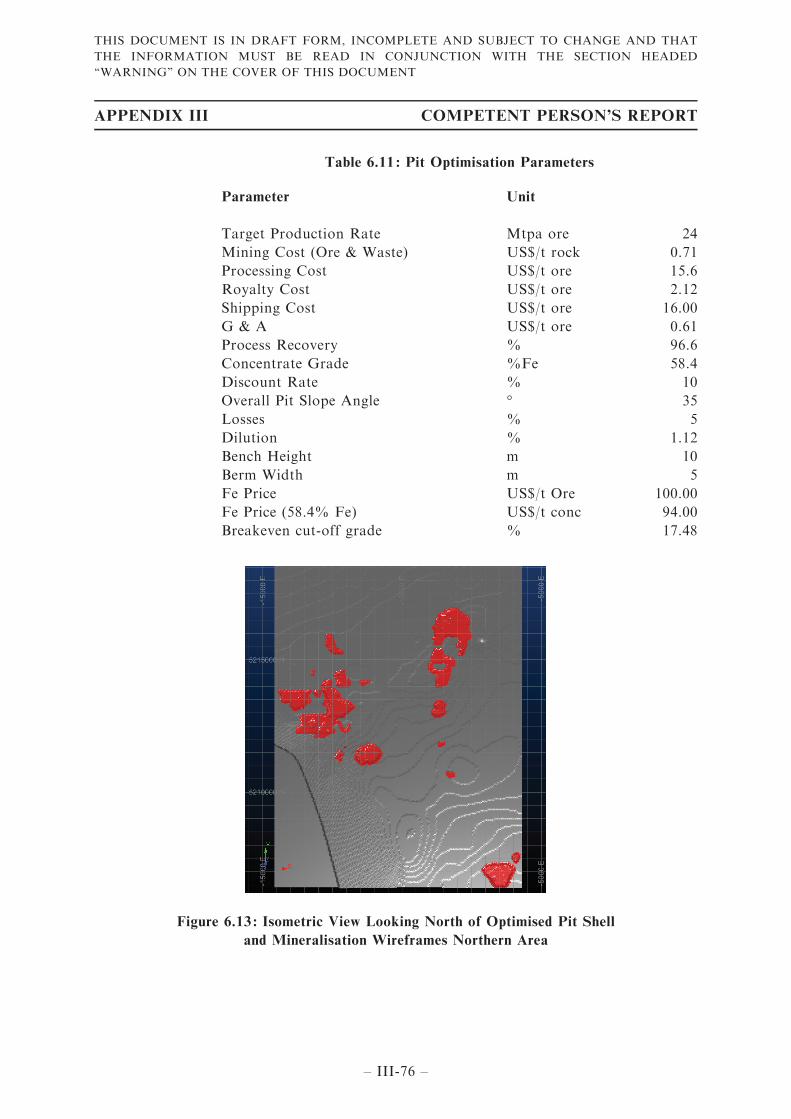
Table 6.11 : Pit Optimisation Parameters
Parameter Unit
Target Production Rate Mtpa ore 24
Mining Cost (Ore & Waste) US$/t rock 0.71
Processing Cost US$/t ore 15.6
Royalty Cost US$/t ore 2.12
Shipping Cost US$/t ore 16.00
G & A US$/t ore 0.61
Process Recovery % 96.6
Concentrate Grade %Fe 58.4
Discount Rate % 10
Overall Pit Slope Angle ° 35
Losses % 5
Dilution % 1.12
Bench Height m 10
Berm Width m 5
Fe Price US$/t Ore 100.00
Fe Price (58.4% Fe) US$/t conc 94.00
Breakeven cut-off grade % 17.48
Figure 6.13 : Isometric View Looking North of Optimised Pit Shell
and Mineralisation Wireframes Northern Area
APPENDIX III COMPETENT PERSON’S REPORT
– III-76 –
THIS DOCUMENT IS IN DRAFT FORM, INCOMPLETE AND SUBJECT TO CHANGE AND THAT
THE INFORMATION MUST BE READ IN CONJUNCTION WITH THE SECTION HEADED
‘‘WARNING’’ ON THE COVER OF THIS DOCUMENT
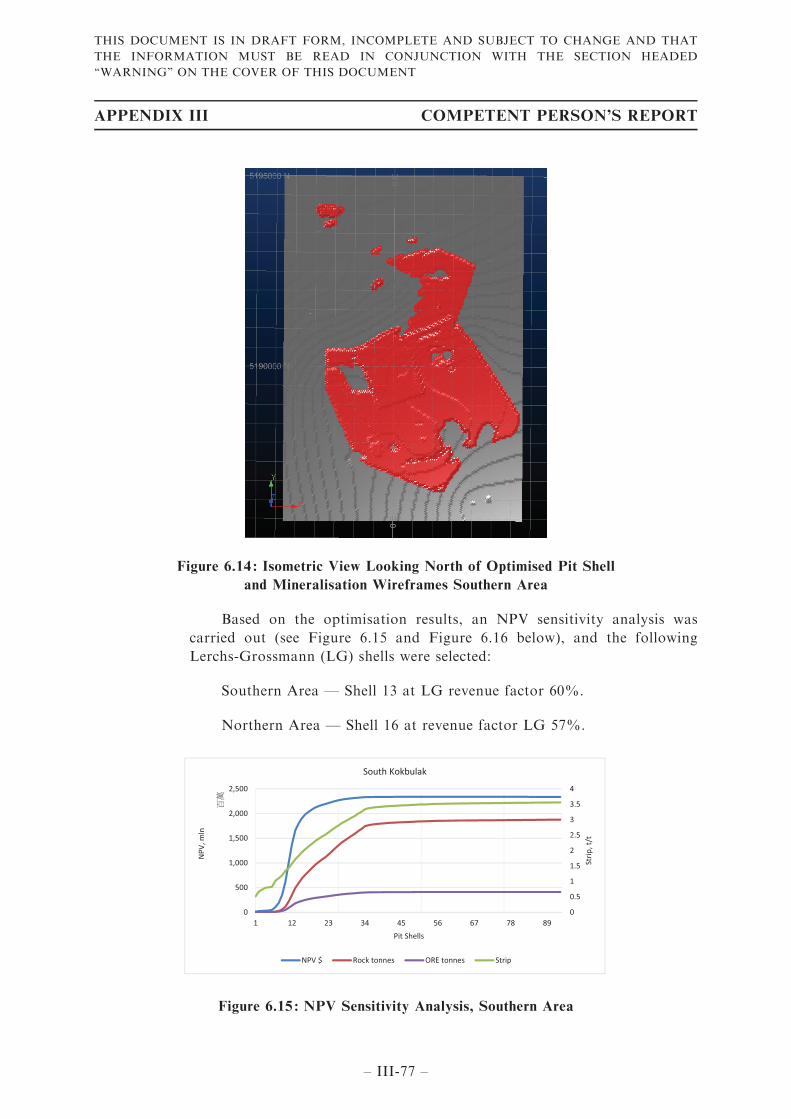
Figure 6.14 : Isometric View Looking North of Optimised Pit Shell
and Mineralisation Wireframes Southern Area
Based on the optimisation results, an NPV sensitivity analysis was
carried out (see Figure 6.15 and Figure 6.16 below), and the following
Lerchs-Grossmann (LG) shells were selected:
Southern Area — Shell 13 at LG revenue factor 60%.
Northern Area — Shell 16 at revenue factor LG 57%.
0
0.5
1
1.5
2
2.5
3
3.5
4
0
500
1,000
1,500
2,000
2,500
1 12 23 34 45 56 67 78 89
Strip
,t/t
NPV
,mln
Pit Shells
South Kokbulak
NPV $ Rock tonnes ORE tonnes Strip
Figure 6.15 : NPV Sensitivity Analysis, Southern Area
APPENDIX III COMPETENT PERSON’S REPORT
– III-77 –
THIS DOCUMENT IS IN DRAFT FORM, INCOMPLETE AND SUBJECT TO CHANGE AND THAT
THE INFORMATION MUST BE READ IN CONJUNCTION WITH THE SECTION HEADED
‘‘WARNING’’ ON THE COVER OF THIS DOCUMENT
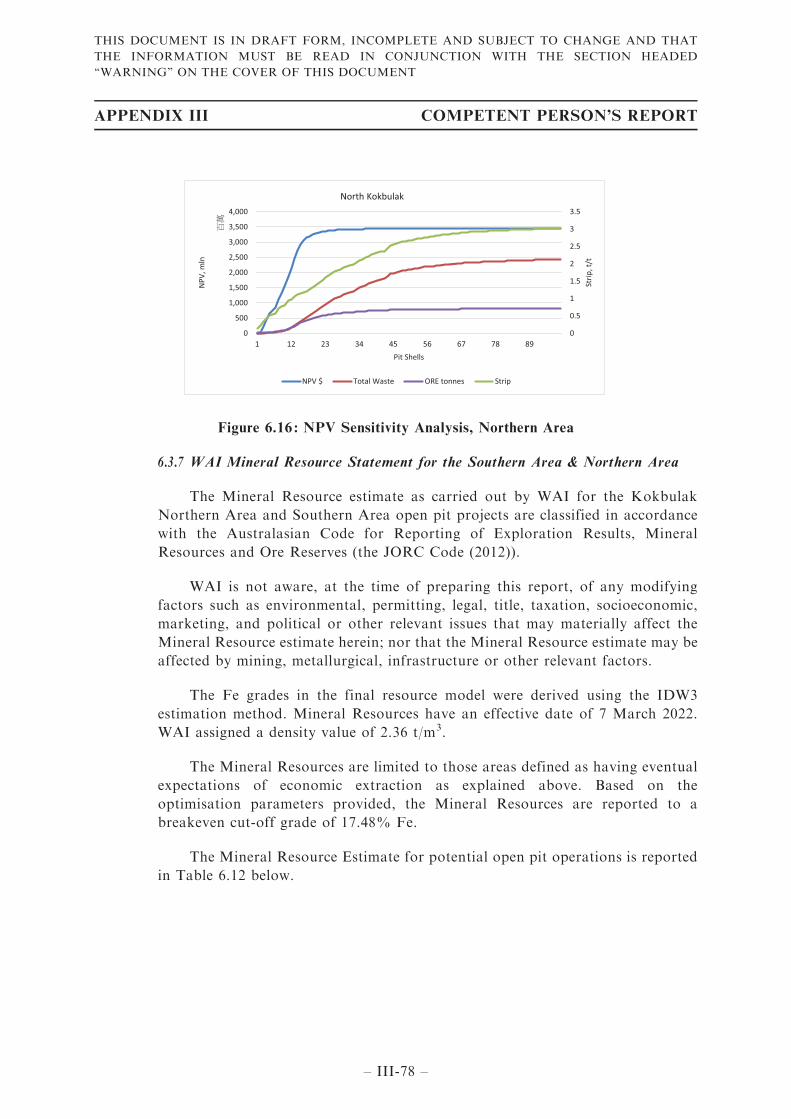
0
0.5
1
1.5
2
2.5
3
3.5
0
500
1,000
1,500
2,000
2,500
3,000
3,500
4,000
1 12 23 34 45 56 67 78 89
Strip
, t/t
NPV
, mln
Pit Shells
North Kokbulak
NPV $ Total Waste ORE tonnes Strip
Figure 6.16 : NPV Sensitivity Analysis, Northern Area
6.3.7 WAI Mineral Resource Statement for the Southern Area & Northern Area
The Mineral Resource estimate as carried out by WAI for the Kokbulak
Northern Area and Southern Area open pit projects are classified in accordance
with the Australasian Code for Reporting of Exploration Results, Mineral
Resources and Ore Reserves (the JORC Code (2012)).
WAI is not aware, at the time of preparing this report, of any modifying
factors such as environmental, permitting, legal, title, taxation, socioeconomic,
marketing, and political or other relevant issues that may materially affect the
Mineral Resource estimate herein; nor that the Mineral Resource estimate may be
affected by mining, metallurgical, infrastructure or other relevant factors.
The Fe grades in the final resource model were derived using the IDW3
estimation method. Mineral Resources have an effective date of 7 March 2022.
WAI assigned a density value of 2.36 t/m3.
The Mineral Resources are limited to those areas defined as having eventual
expectations of economic extraction as explained above. Based on the
optimisation parameters provided, the Mineral Resources are reported to a
breakeven cut-off grade of 17.48% Fe.
The Mineral Resource Estimate for potential open pit operations is reported
in Table 6.12 below.
APPENDIX III COMPETENT PERSON’S REPORT
– III-78 –
THIS DOCUMENT IS IN DRAFT FORM, INCOMPLETE AND SUBJECT TO CHANGE AND THAT
THE INFORMATION MUST BE READ IN CONJUNCTION WITH THE SECTION HEADED
‘‘WARNING’’ ON THE COVER OF THIS DOCUMENT
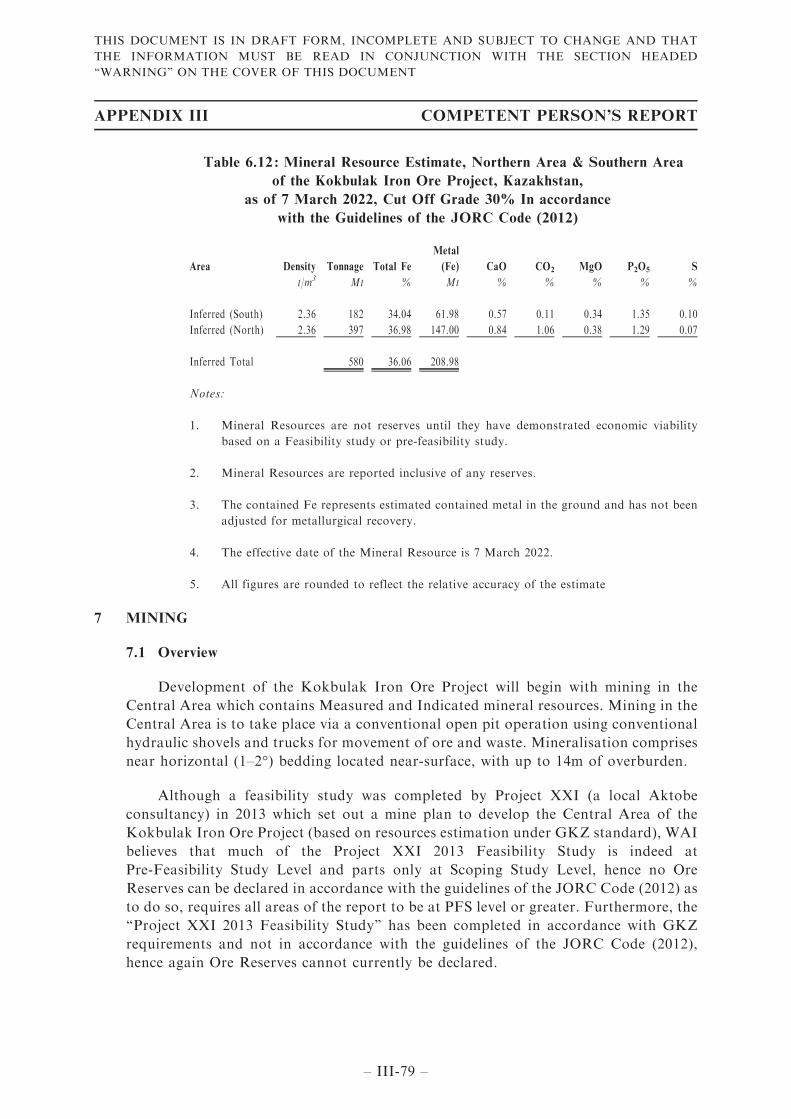
Table 6.12 : Mineral Resource Estimate, Northern Area & Southern Area
of the Kokbulak Iron Ore Project, Kazakhstan,
as of 7 March 2022, Cut Off Grade 30% In accordance
with the Guidelines of the JORC Code (2012)
Area Density Tonnage Total Fe
Metal
(Fe) CaO CO2 MgO P2O5 S
t/m3 Mt % Mt % % % % %
Inferred (South) 2.36 182 34.04 61.98 0.57 0.11 0.34 1.35 0.10
Inferred (North) 2.36 397 36.98 147.00 0.84 1.06 0.38 1.29 0.07
Inferred Total 580 36.06 208.98
Notes:
1. Mineral Resources are not reserves until they have demonstrated economic viability
based on a Feasibility study or pre-feasibility study.
2. Mineral Resources are reported inclusive of any reserves.
3. The contained Fe represents estimated contained metal in the ground and has not been
adjusted for metallurgical recovery.
4. The effective date of the Mineral Resource is 7 March 2022.
5. All figures are rounded to reflect the relative accuracy of the estimate
7 MINING
7.1 Overview
Development of the Kokbulak Iron Ore Project will begin with mining in the
Central Area which contains Measured and Indicated mineral resources. Mining in the
Central Area is to take place via a conventional open pit operation using conventional
hydraulic shovels and trucks for movement of ore and waste. Mineralisation comprises
near horizontal (1–2°) bedding located near-surface, with up to 14m of overburden.
Although a feasibility study was completed by Project XXI (a local Aktobe
consultancy) in 2013 which set out a mine plan to develop the Central Area of the
Kokbulak Iron Ore Project (based on resources estimation under GKZ standard), WAI
believes that much of the Project XXI 2013 Feasibility Study is indeed at
Pre-Feasibility Study Level and parts only at Scoping Study Level, hence no Ore
Reserves can be declared in accordance with the guidelines of the JORC Code (2012) as
to do so, requires all areas of the report to be at PFS level or greater. Furthermore, the
‘‘Project XXI 2013 Feasibility Study’’ has been completed in accordance with GKZ
requirements and not in accordance with the guidelines of the JORC Code (2012),
hence again Ore Reserves cannot currently be declared.
APPENDIX III COMPETENT PERSON’S REPORT
– III-79 –
THIS DOCUMENT IS IN DRAFT FORM, INCOMPLETE AND SUBJECT TO CHANGE AND THAT
THE INFORMATION MUST BE READ IN CONJUNCTION WITH THE SECTION HEADED
‘‘WARNING’’ ON THE COVER OF THIS DOCUMENT
As such, for this CPR, WAI has undertaken an independent review of the Project
XXI 2013 Feasibility Study and updated the relevant technical and financial
parameters such as ‘‘mineable’’ resources, mine plan and schedule based upon a
re-calculated ‘‘mineable’’ resources and grade derived from the Mineral Resources
Estimate for the Central Area.
7.2 Open Pit Optimisation
WAI undertook open pit optimisation work to delineate the ‘‘mineable’’ resource
for the Central Area.
To complete the works, WAI has followed the standard recommended workflow.
NPV Scheduler software is used for strategic long-term planning, including pit
optimisation and the generation of different strategic production scenarios. NPV
Scheduler has also been used to determine the optimum pushback shells for different
conditions.
Pit optimisation is a recognised technique by which different open pit shells may
be generated based on a supplied geological resource block model and a number of
user-defined economic and operating parameters. NPV Scheduler compares the
estimated value of the individual mining blocks at the pit boundary versus the cost
for waste stripping.
The main input data and parameters for pit optimisation include:
. Resource block model;
. Economic parameters;
. Processing parameters;
. Slope parameters; and
. Any existing pit limits.
The principal output data from pit optimisation includes:
. Block models and surface wireframes of optimal pit shells;
. Evaluation and economic data for optimal pits;
. Wireframes of suggested pushbacks; and
. Evaluation and economic data for long term mining schedules.
The optimisation was run to target a 24Mtpa of ore production rate with a 50%
reduction factor in the first year of production. The optimisation have been based on
the Mineral Resource block model ‘‘k_pmod.dm’’ generated by WAI, as presented in
this report.
APPENDIX III COMPETENT PERSON’S REPORT
– III-80 –
THIS DOCUMENT IS IN DRAFT FORM, INCOMPLETE AND SUBJECT TO CHANGE AND THAT
THE INFORMATION MUST BE READ IN CONJUNCTION WITH THE SECTION HEADED
‘‘WARNING’’ ON THE COVER OF THIS DOCUMENT
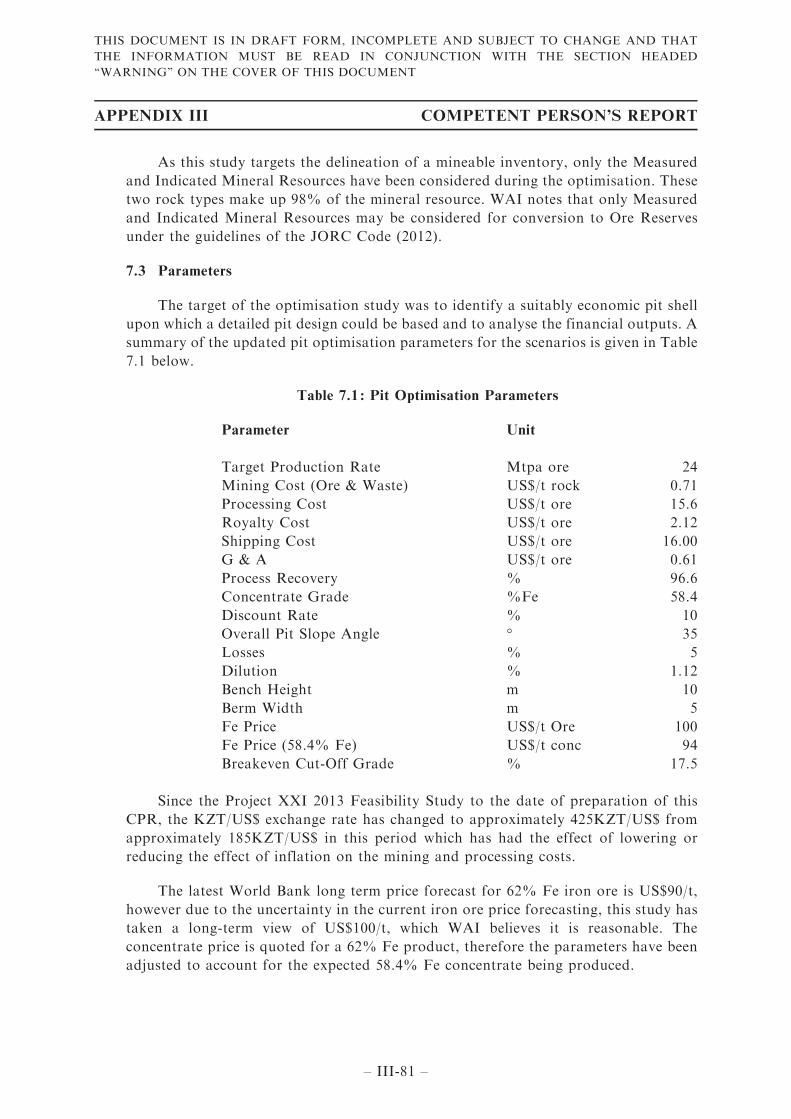
As this study targets the delineation of a mineable inventory, only the Measured
and Indicated Mineral Resources have been considered during the optimisation. These
two rock types make up 98% of the mineral resource. WAI notes that only Measured
and Indicated Mineral Resources may be considered for conversion to Ore Reserves
under the guidelines of the JORC Code (2012).
7.3 Parameters
The target of the optimisation study was to identify a suitably economic pit shell
upon which a detailed pit design could be based and to analyse the financial outputs. A
summary of the updated pit optimisation parameters for the scenarios is given in Table
7.1 below.
Table 7.1 : Pit Optimisation Parameters
Parameter Unit
Target Production Rate Mtpa ore 24
Mining Cost (Ore & Waste) US$/t rock 0.71
Processing Cost US$/t ore 15.6
Royalty Cost US$/t ore 2.12
Shipping Cost US$/t ore 16.00
G & A US$/t ore 0.61
Process Recovery % 96.6
Concentrate Grade %Fe 58.4
Discount Rate % 10
Overall Pit Slope Angle ° 35
Losses % 5
Dilution % 1.12
Bench Height m 10
Berm Width m 5
Fe Price US$/t Ore 100
Fe Price (58.4% Fe) US$/t conc 94
Breakeven Cut-Off Grade % 17.5
Since the Project XXI 2013 Feasibility Study to the date of preparation of this
CPR, the KZT/US$ exchange rate has changed to approximately 425KZT/US$ from
approximately 185KZT/US$ in this period which has had the effect of lowering or
reducing the effect of inflation on the mining and processing costs.
The latest World Bank long term price forecast for 62% Fe iron ore is US$90/t,
however due to the uncertainty in the current iron ore price forecasting, this study has
taken a long-term view of US$100/t, which WAI believes it is reasonable. The
concentrate price is quoted for a 62% Fe product, therefore the parameters have been
adjusted to account for the expected 58.4% Fe concentrate being produced.
APPENDIX III COMPETENT PERSON’S REPORT
– III-81 –
THIS DOCUMENT IS IN DRAFT FORM, INCOMPLETE AND SUBJECT TO CHANGE AND THAT
THE INFORMATION MUST BE READ IN CONJUNCTION WITH THE SECTION HEADED
‘‘WARNING’’ ON THE COVER OF THIS DOCUMENT
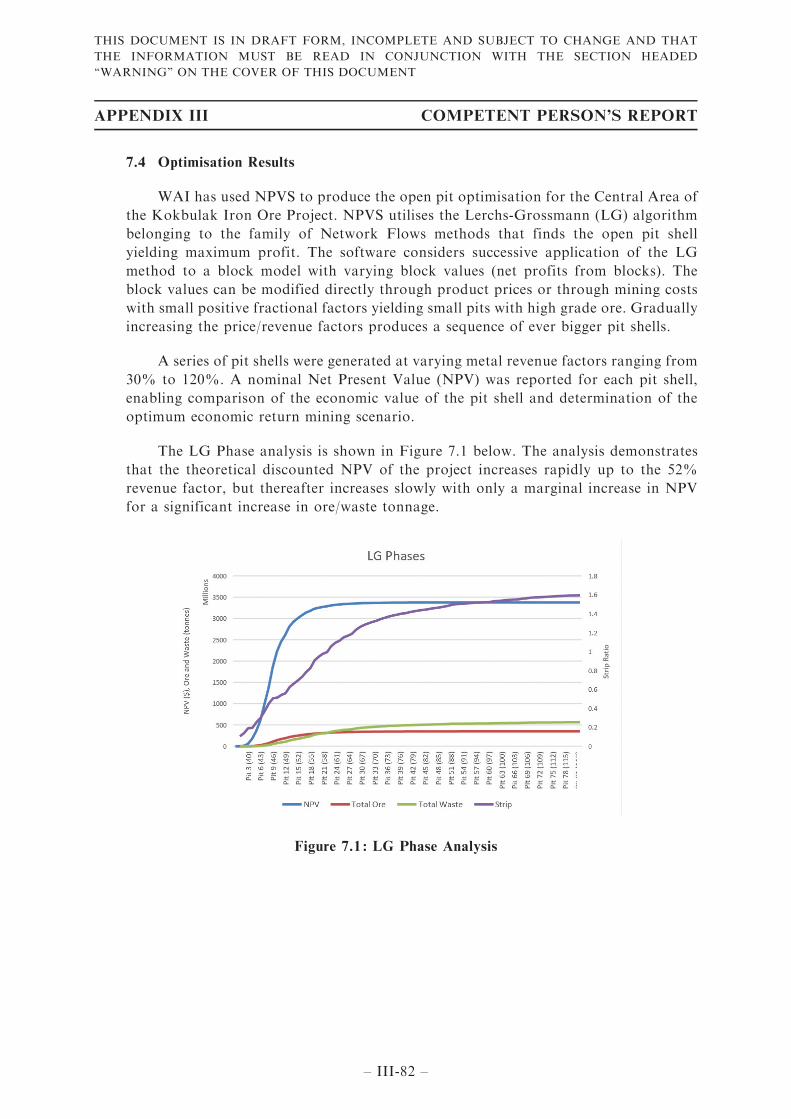
7.4 Optimisation Results
WAI has used NPVS to produce the open pit optimisation for the Central Area of
the Kokbulak Iron Ore Project. NPVS utilises the Lerchs-Grossmann (LG) algorithm
belonging to the family of Network Flows methods that finds the open pit shell
yielding maximum profit. The software considers successive application of the LG
method to a block model with varying block values (net profits from blocks). The
block values can be modified directly through product prices or through mining costs
with small positive fractional factors yielding small pits with high grade ore. Gradually
increasing the price/revenue factors produces a sequence of ever bigger pit shells.
A series of pit shells were generated at varying metal revenue factors ranging from
30% to 120%. A nominal Net Present Value (NPV) was reported for each pit shell,
enabling comparison of the economic value of the pit shell and determination of the
optimum economic return mining scenario.
The LG Phase analysis is shown in Figure 7.1 below. The analysis demonstrates
that the theoretical discounted NPV of the project increases rapidly up to the 52%
revenue factor, but thereafter increases slowly with only a marginal increase in NPV
for a significant increase in ore/waste tonnage.
Figure 7.1 : LG Phase Analysis
APPENDIX III COMPETENT PERSON’S REPORT
– III-82 –
THIS DOCUMENT IS IN DRAFT FORM, INCOMPLETE AND SUBJECT TO CHANGE AND THAT
THE INFORMATION MUST BE READ IN CONJUNCTION WITH THE SECTION HEADED
‘‘WARNING’’ ON THE COVER OF THIS DOCUMENT
7.5 Optimised Pit Shell Selection
The pit optimisation process in NPV Scheduler generates nested pit shells using
incremental revenue factors ranging from 30% — 120%, with a 1% step size to
generate 81 pit shells. A pseudoflow optimisation algorithm has been used, targeting a
maximum cash flow ore selection method. A revenue factor of 100% corresponds to
the price of US$94/t concentrate used in the optimisation.
Typically, the pit with a revenue factor equal to 100% is referred to as the
economic optimal pit, however this is not always the pit which generates the maximum
cash flow based on the specific inputs. Final selection of the optimum pit will also
depend on consideration of net cashflow, average mining cost, strip ratio, total ore,
and corporate life of mine scheduling requirements.
Selection of the optimised pit shell to be utilised for the financial analysis has been
made to optimise the nominal NPV whilst minimising the quantity of material
extracted and thus minimise the stripping ratio due to the sensitivity of NPV to early
waste extraction.
At revenue factor 65% (i.e. a smaller pit shell), a nominal NPV of US$3,353M is
generated with 337Mt of ore and 400Mt of waste. These values provide an NPV value
of 99% of the maximum value, extracting 95% of the available mineralised tonnage
and moving only 60% of the waste tonnage. The blue line on Figure 7.1 highlights the
position on the curve on which the 65% revenue factor shell sits.
7.6 Cut-Off Grade
The cut-off grade for the operations has been calculated based upon the
operational and cost parameters input into NPVS. As the iron ore concentrate price
is quoted for a 62% Fe product, the parameters were adapted to account for the
concentrate grade of 58.4% Fe expected from the processing operation.
The breakeven cut-off grade output by NPV’S for the Central Area of the
Kokbulak Iron Ore Project at the given parameters is 17.8% Fe, however it must be
reiterated that this value has not been utilised as an input, but rather is calculated
because of the optimisation parameters.
APPENDIX III COMPETENT PERSON’S REPORT
– III-83 –
THIS DOCUMENT IS IN DRAFT FORM, INCOMPLETE AND SUBJECT TO CHANGE AND THAT
THE INFORMATION MUST BE READ IN CONJUNCTION WITH THE SECTION HEADED
‘‘WARNING’’ ON THE COVER OF THIS DOCUMENT
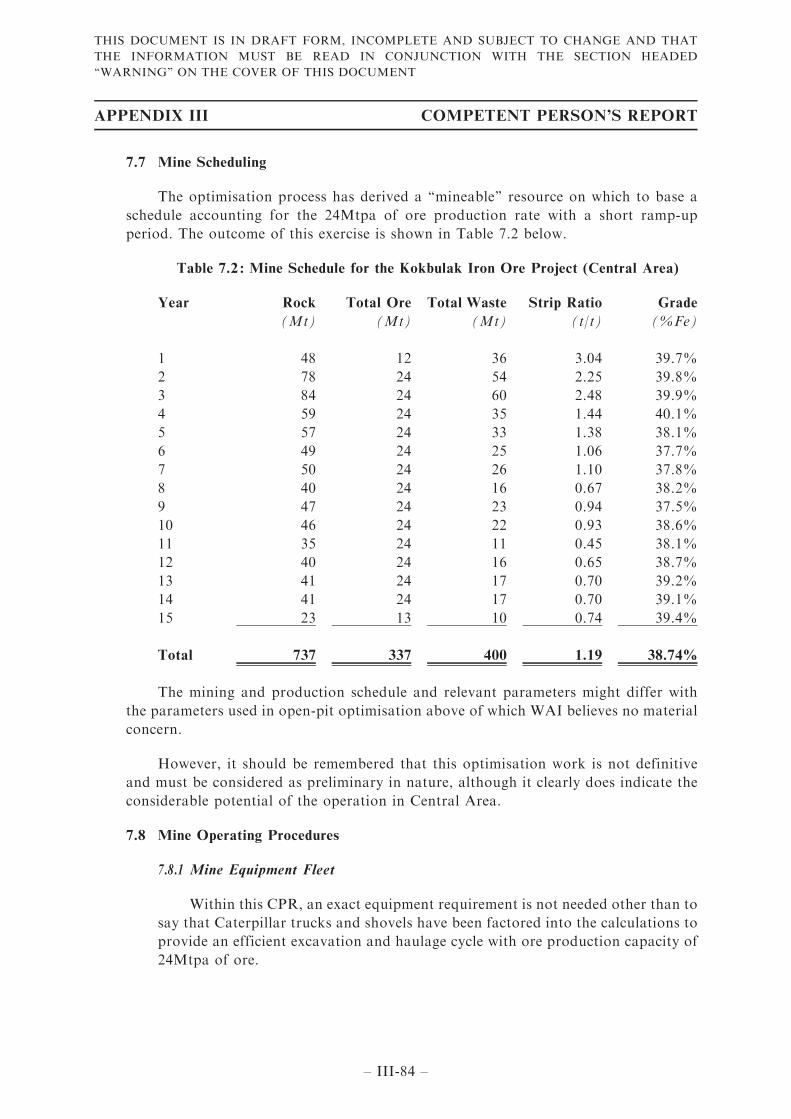
7.7 Mine Scheduling
The optimisation process has derived a ‘‘mineable’’ resource on which to base a
schedule accounting for the 24Mtpa of ore production rate with a short ramp-up
period. The outcome of this exercise is shown in Table 7.2 below.
Table 7.2 : Mine Schedule for the Kokbulak Iron Ore Project (Central Area)
Year Rock Total Ore Total Waste Strip Ratio Grade
(Mt) (Mt) (Mt) (t/t) (%Fe)
1 48 12 36 3.04 39.7%
2 78 24 54 2.25 39.8%
3 84 24 60 2.48 39.9%
4 59 24 35 1.44 40.1%
5 57 24 33 1.38 38.1%
6 49 24 25 1.06 37.7%
7 50 24 26 1.10 37.8%
8 40 24 16 0.67 38.2%
9 47 24 23 0.94 37.5%
10 46 24 22 0.93 38.6%
11 35 24 11 0.45 38.1%
12 40 24 16 0.65 38.7%
13 41 24 17 0.70 39.2%
14 41 24 17 0.70 39.1%
15 23 13 10 0.74 39.4%
Total 737 337 400 1.19 38.74%
The mining and production schedule and relevant parameters might differ with
the parameters used in open-pit optimisation above of which WAI believes no material
concern.
However, it should be remembered that this optimisation work is not definitive
and must be considered as preliminary in nature, although it clearly does indicate the
considerable potential of the operation in Central Area.
7.8 Mine Operating Procedures
7.8.1 Mine Equipment Fleet
Within this CPR, an exact equipment requirement is not needed other than to
say that Caterpillar trucks and shovels have been factored into the calculations to
provide an efficient excavation and haulage cycle with ore production capacity of
24Mtpa of ore.
APPENDIX III COMPETENT PERSON’S REPORT
– III-84 –
THIS DOCUMENT IS IN DRAFT FORM, INCOMPLETE AND SUBJECT TO CHANGE AND THAT
THE INFORMATION MUST BE READ IN CONJUNCTION WITH THE SECTION HEADED
‘‘WARNING’’ ON THE COVER OF THIS DOCUMENT
Based on the Project XXI 2013 Feasibility Study, it is assumed that the
haulage distance from the open pit to the processing plant will not exceed 4.8km.
At the early stage of the pit life the waste dump will be located beyond the pit, but
later in life of mine the waste will be backfilled within the pit. Hence, the
assumption is that the waste haulage distance will not exceed 2km.
Since the mining method includes no drilling and blasting, it is recommended
that heavy track- mounted ripper bulldozers such as Caterpillar D9T or
Caterpillar D10T be added into the mining fleet to deal with difficult areas and
trim bench floors and for waste dump maintenance.
To reduce the movement of the main excavators, it is recommended to add to
the loading fleet heavy wheel-mounted loaders, whose main purpose will be to
remove the material ripped by bulldozers from the bench floor to support ore
stockpiles and backup the main excavators on production faces.
WAI considers the equipment selected for purchase is well suited to the
intended purpose.
7.8.2 Mine Workforce
According to the mine design, the mine will be operating 354 days in a year
on shift rotation basis. The daily shift pattern will be 2 shifts a day 11 hours each.
Based on the Project XXI 2013 Feasibility Study, the mining department will
consist of 299 personnel in total, including mining supervisors, drillers, samplers,
shotfiring crew, magazine supervisors and all the mobile machinery operators.
Should alterations to the mining fleet be made, the personal requirements will also
require revision. The plant manpower is 492, with mining and technical
comprising 299 staff, with additional head office manpower at 36, therefore the
total work force is 827. WAI believes the number of personnel required to perform
all the necessary tasks during the life of the mine to be accurate and suitable given
the operating conditions and the region.
7.8.3 Topsoil Harvesting
The topsoil at the project area is considered to have little value due to high
salt content and the absence of a homogenous layer as a result of natural
environment and climatic factors. As such, during the open pit mine construction
the topsoil shall be removed as waste rock.
7.8.4 Grade Control
To ensure efficient grade control and consistent feed to the processing plant,
grade control drilling will be used. Drill grid density of 100x100m was selected
based on experience of similar mines.
APPENDIX III COMPETENT PERSON’S REPORT
– III-85 –
THIS DOCUMENT IS IN DRAFT FORM, INCOMPLETE AND SUBJECT TO CHANGE AND THAT
THE INFORMATION MUST BE READ IN CONJUNCTION WITH THE SECTION HEADED
‘‘WARNING’’ ON THE COVER OF THIS DOCUMENT
7.8.5 Drill and Blast
Since the ore and waste consists of friable and loose cemented material, the
mining method will not include drilling and blasting. Where direct excavation will
be difficult, the material will be ripped with a bulldozer and removed with a
front-end loader.
7.8.6 Water Management
A dam will be constructed in Sabyrzhylga valley as a water catchment
reservoir to retain the ground water pumped from the open pit and surface runoff
water. This reservoir may have a positive impact on creation of a good
microclimate in the camp, which will be located nearby. As this water will not
be sufficient to cover the water requirement for ore processing, the mine design
allows for construction of a water pipeline from the Aishuaksky fresh-water
aquifer located 65km from the site, near Begimbet village.
7.8.7 Drainage and Pumping
Given the arid nature of the site area, at the early stage of the project life the
drainage system will only include culverts to divert seasonal rainfall and melt
water.
Within the mine life, the open pit is expected to hit a non-confined
underground aquifer below 170mASL. To deal with this water inflow, it is
proposed to construct a sump and remove the water with a 30m3/h mobile
overhung centrifugal pump through a pipeline into the water catchment reservoirs
outside of the open pit.
7.8.8 Equipment Costs
WAI considers that the production capacity of 24Mtpa of ore will require
higher capital costs to purchase equipment with appropriate capacity. The cost
estimate for the mining equipment proposed has been estimated at US$100.3M
(excluding contingency of US$10M and sustaining capital cost of US$31.2M). The
estimation was done based on the average market prices and WAI considers it is
reasonable.
APPENDIX III COMPETENT PERSON’S REPORT
– III-86 –
THIS DOCUMENT IS IN DRAFT FORM, INCOMPLETE AND SUBJECT TO CHANGE AND THAT
THE INFORMATION MUST BE READ IN CONJUNCTION WITH THE SECTION HEADED
‘‘WARNING’’ ON THE COVER OF THIS DOCUMENT
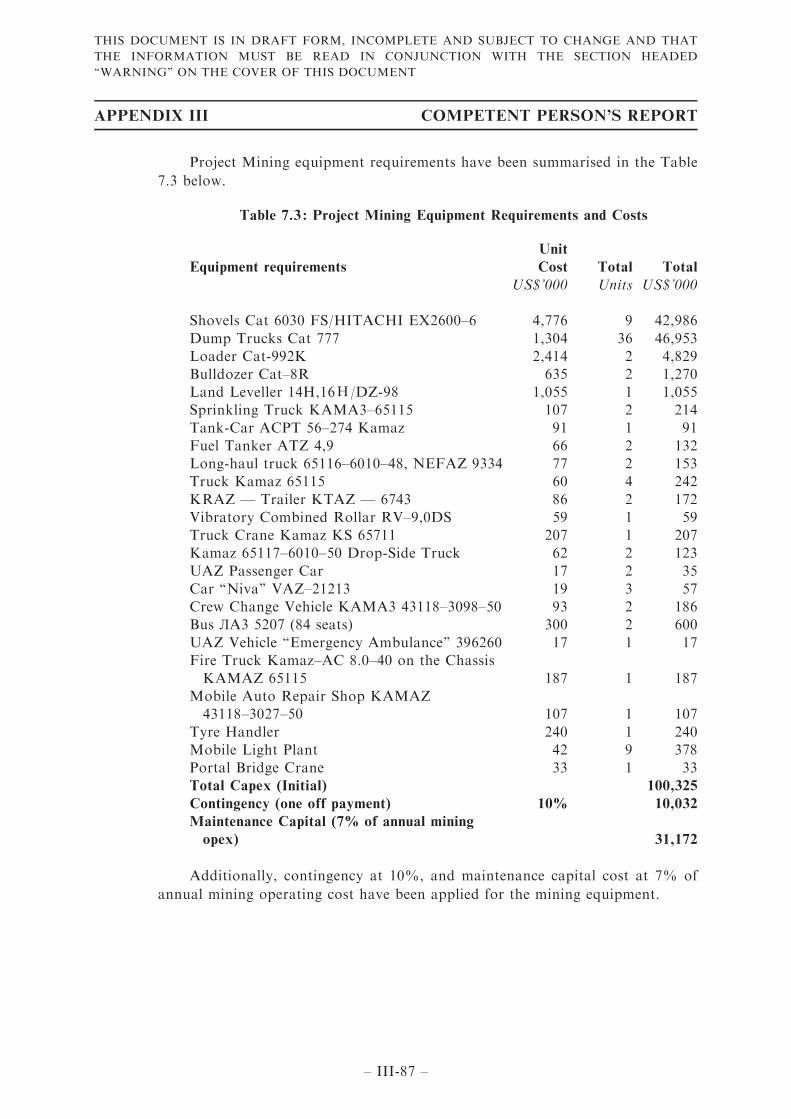
Project Mining equipment requirements have been summarised in the Table
7.3 below.
Table 7.3 : Project Mining Equipment Requirements and Costs
Equipment requirements
Unit
Cost Total Total
US$’000 Units US$’000
Shovels Cat 6030 FS/HITACHI EX2600–6 4,776 9 42,986
Dump Trucks Cat 777 1,304 36 46,953
Loader Cat-992K 2,414 2 4,829
Bulldozer Cat–8R 635 2 1,270
Land Leveller 14H,16Н/DZ-98 1,055 1 1,055
Sprinkling Truck KAMA3–65115 107 2 214
Tank-Car ACPT 56–274 Kamaz 91 1 91
Fuel Tanker ATZ 4,9 66 2 132
Long-haul truck 65116–6010–48, NEFAZ 9334 77 2 153
Truck Kamaz 65115 60 4 242
KRAZ — Trailer KTAZ — 6743 86 2 172
Vibratory Combined Rollar RV–9,0DS 59 1 59
Truck Crane Kamaz KS 65711 207 1 207
Kamaz 65117–6010–50 Drop-Side Truck 62 2 123
UAZ Passenger Car 17 2 35
Car ‘‘Niva’’ VAZ–21213 19 3 57
Crew Change Vehicle KAMA3 43118–3098–50 93 2 186
Bus ЛA3 5207 (84 seats) 300 2 600
UAZ Vehicle ‘‘Emergency Ambulance’’ 396260 17 1 17
Fire Truck Kamaz–AC 8.0–40 on the Chassis
KAMAZ 65115 187 1 187
Mobile Auto Repair Shop KAMAZ
43118–3027–50 107 1 107
Tyre Handler 240 1 240
Mobile Light Plant 42 9 378
Portal Bridge Crane 33 1 33
Total Capex (Initial) 100,325
Contingency (one off payment) 10% 10,032
Maintenance Capital (7% of annual mining
opex) 31,172
Additionally, contingency at 10%, and maintenance capital cost at 7% of
annual mining operating cost have been applied for the mining equipment.
APPENDIX III COMPETENT PERSON’S REPORT
– III-87 –
THIS DOCUMENT IS IN DRAFT FORM, INCOMPLETE AND SUBJECT TO CHANGE AND THAT
THE INFORMATION MUST BE READ IN CONJUNCTION WITH THE SECTION HEADED
‘‘WARNING’’ ON THE COVER OF THIS DOCUMENT
7.8.9 Mine Operating Costs
WAI has used a mining operating cost of US$0.71/t rock as we believe that
this is a reasonable assumption for the given production rate and equipment fleet.
However, the updated fleet will allow the achievement of economies of scale and
therefore the mining operating cost has the potential to be lower upon detailed
re-modelling.
7.8.10 Mining Workforce Costs
The average annual payroll for mining workforce is estimated to vary
between US$2 million/annum to US$4.5 million/annum depending on the stage of
the mine life. The average cost of workforce is estimated in the Project XXI 2013
Feasibility Study to be US$3.5 million/annum. WAI believes that these costs are
reasonable as at the date of this CPR.
8 MINERAL PROCESSING
8.1 Introduction
Processing on the mineralisation of the Kokbulak deposits, upon which the
Kokbulak Iron Ore Project sits on, has been studied in great detail in the past.
In 1950s, the Moscow Institute of Steels and Alloys, performed agglomeration
and sintering studies on the unprocessed iron ore samples from the Kokbulak deposit
and the Thematic Technological Party Central Laboratory of the Ural Geological
Office conducted mineral beneficiation tests involving heavy liquid, magnetic, gravity
and roasting-magnetic separation technologies.
The testwork conducted by the Centre of Geosciences, Metallurgy and Processing
in 2011 provides laboratory evidence that the thermo acid dephosphorisation of brown
iron samples from the Kokbulak Iron Ore Project, in particular from the Central Area,
is technically feasible and low-phosphorus and low-silica brown iron ore concentrates
can be obtained for the further cast iron melting.
In 2013 a testwork programme was commissioned and was performed at
VNIItsvetmet. A report of this testwork covering mineralogical and mineral
processing studies on two bulk samples from the Kokbulak Iron Ore Project was
issued in 2014.
APPENDIX III COMPETENT PERSON’S REPORT
– III-88 –
THIS DOCUMENT IS IN DRAFT FORM, INCOMPLETE AND SUBJECT TO CHANGE AND THAT
THE INFORMATION MUST BE READ IN CONJUNCTION WITH THE SECTION HEADED
‘‘WARNING’’ ON THE COVER OF THIS DOCUMENT
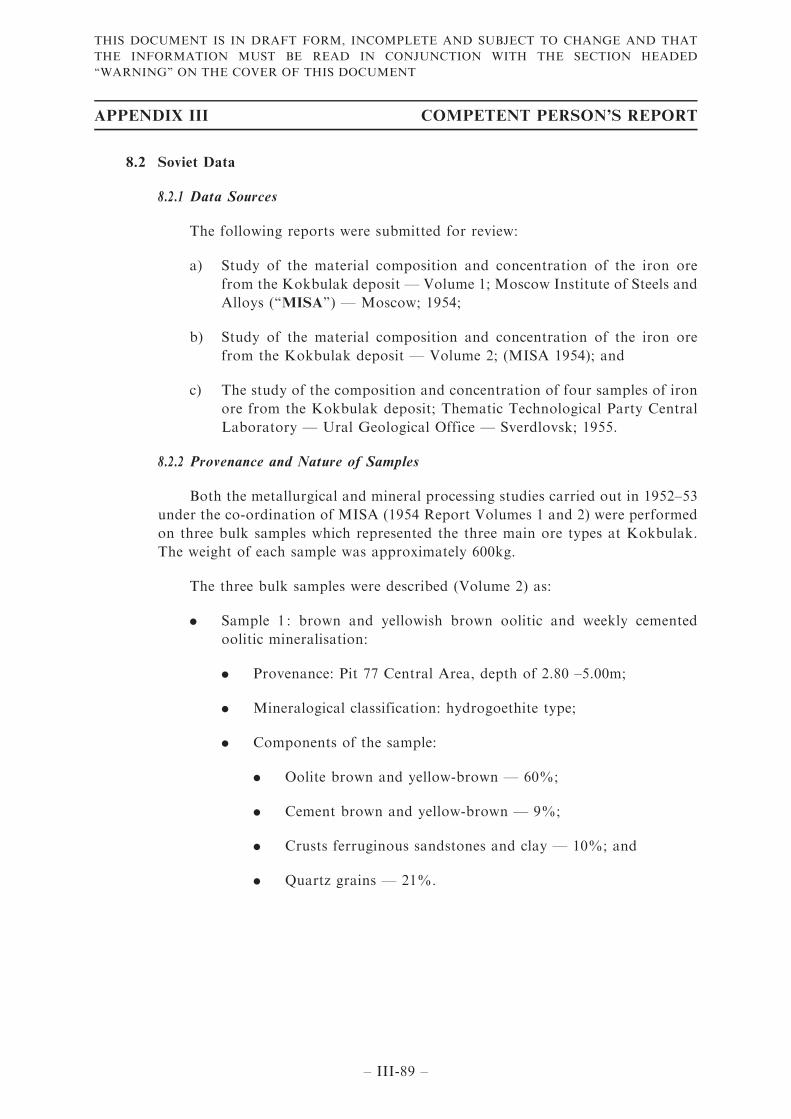
8.2 Soviet Data
8.2.1 Data Sources
The following reports were submitted for review:
a) Study of the material composition and concentration of the iron ore
from the Kokbulak deposit — Volume 1; Moscow Institute of Steels and
Alloys (‘‘MISA’’) — Moscow; 1954;
b) Study of the material composition and concentration of the iron ore
from the Kokbulak deposit — Volume 2; (MISA 1954); and
c) The study of the composition and concentration of four samples of iron
ore from the Kokbulak deposit; Thematic Technological Party Central
Laboratory — Ural Geological Office — Sverdlovsk; 1955.
8.2.2 Provenance and Nature of Samples
Both the metallurgical and mineral processing studies carried out in 1952–53
under the co-ordination of MISA (1954 Report Volumes 1 and 2) were performed
on three bulk samples which represented the three main ore types at Kokbulak.
The weight of each sample was approximately 600kg.
The three bulk samples were described (Volume 2) as:
. Sample 1 : brown and yellowish brown oolitic and weekly cemented
oolitic mineralisation:
. Provenance: Pit 77 Central Area, depth of 2.80 –5.00m;
. Mineralogical classification: hydrogoethite type;
. Components of the sample:
. Oolite brown and yellow-brown — 60%;
. Cement brown and yellow-brown — 9%;
. Crusts ferruginous sandstones and clay — 10%; and
. Quartz grains — 21%.
APPENDIX III COMPETENT PERSON’S REPORT
– III-89 –
THIS DOCUMENT IS IN DRAFT FORM, INCOMPLETE AND SUBJECT TO CHANGE AND THAT
THE INFORMATION MUST BE READ IN CONJUNCTION WITH THE SECTION HEADED
‘‘WARNING’’ ON THE COVER OF THIS DOCUMENT
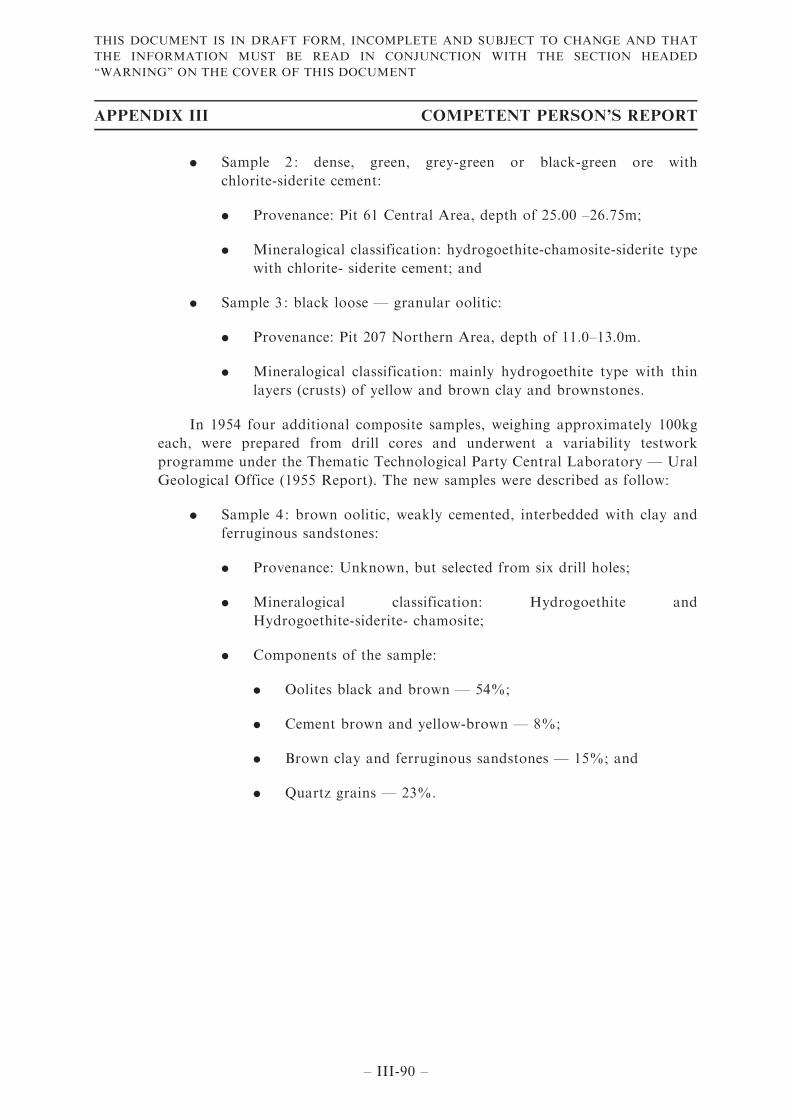
. Sample 2 : dense, green, grey-green or black-green ore with
chlorite-siderite cement:
. Provenance: Pit 61 Central Area, depth of 25.00 –26.75m;
. Mineralogical classification: hydrogoethite-chamosite-siderite type
with chlorite- siderite cement; and
. Sample 3 : black loose — granular oolitic:
. Provenance: Pit 207 Northern Area, depth of 11.0–13.0m.
. Mineralogical classification: mainly hydrogoethite type with thin
layers (crusts) of yellow and brown clay and brownstones.
In 1954 four additional composite samples, weighing approximately 100kg
each, were prepared from drill cores and underwent a variability testwork
programme under the Thematic Technological Party Central Laboratory — Ural
Geological Office (1955 Report). The new samples were described as follow:
. Sample 4 : brown oolitic, weakly cemented, interbedded with clay and
ferruginous sandstones:
. Provenance: Unknown, but selected from six drill holes;
. Mineralogical classification: Hydrogoethite and
Hydrogoethite-siderite- chamosite;
. Components of the sample:
. Oolites black and brown — 54%;
. Cement brown and yellow-brown — 8%;
. Brown clay and ferruginous sandstones — 15%; and
. Quartz grains — 23%.
APPENDIX III COMPETENT PERSON’S REPORT
– III-90 –
THIS DOCUMENT IS IN DRAFT FORM, INCOMPLETE AND SUBJECT TO CHANGE AND THAT
THE INFORMATION MUST BE READ IN CONJUNCTION WITH THE SECTION HEADED
‘‘WARNING’’ ON THE COVER OF THIS DOCUMENT
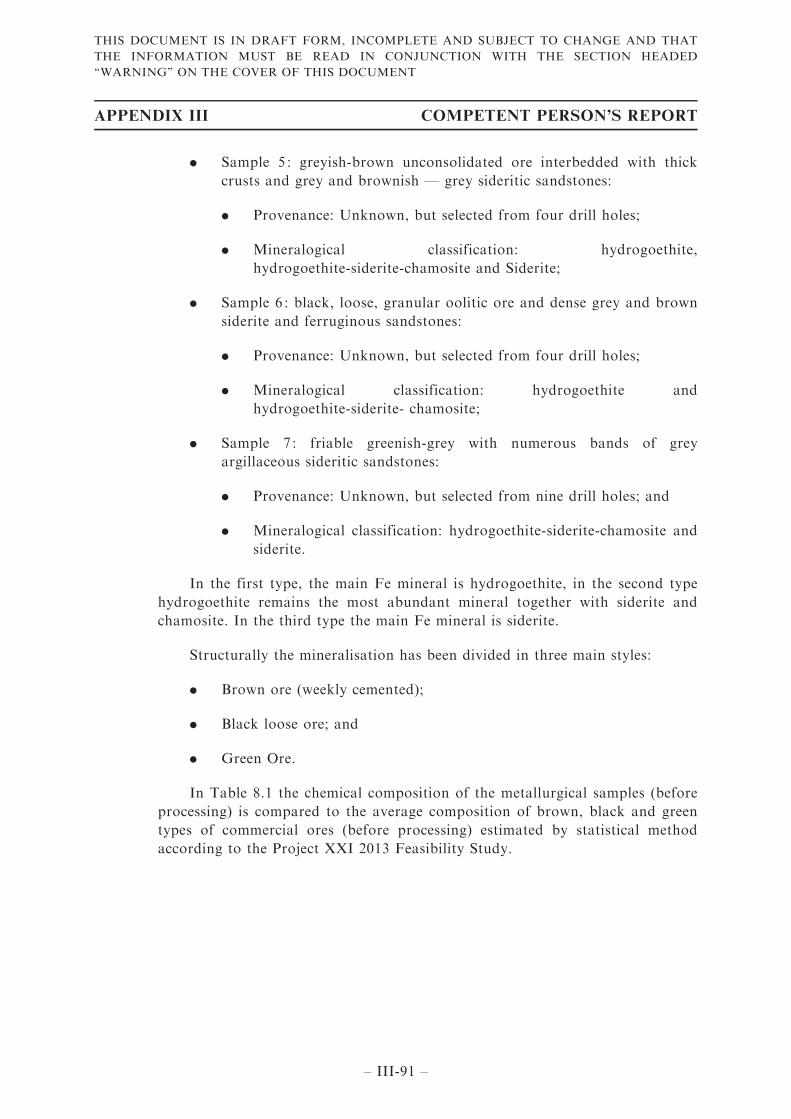
. Sample 5 : greyish-brown unconsolidated ore interbedded with thick
crusts and grey and brownish — grey sideritic sandstones:
. Provenance: Unknown, but selected from four drill holes;
. Mineralogical classification: hydrogoethite,
hydrogoethite-siderite-chamosite and Siderite;
. Sample 6 : black, loose, granular oolitic ore and dense grey and brown
siderite and ferruginous sandstones:
. Provenance: Unknown, but selected from four drill holes;
. Mineralogical classification: hydrogoethite and
hydrogoethite-siderite- chamosite;
. Sample 7 : friable greenish-grey with numerous bands of grey
argillaceous sideritic sandstones:
. Provenance: Unknown, but selected from nine drill holes; and
. Mineralogical classification: hydrogoethite-siderite-chamosite and
siderite.
In the first type, the main Fe mineral is hydrogoethite, in the second type
hydrogoethite remains the most abundant mineral together with siderite and
chamosite. In the third type the main Fe mineral is siderite.
Structurally the mineralisation has been divided in three main styles:
. Brown ore (weekly cemented);
. Black loose ore; and
. Green Ore.
In Table 8.1 the chemical composition of the metallurgical samples (before
processing) is compared to the average composition of brown, black and green
types of commercial ores (before processing) estimated by statistical method
according to the Project XXI 2013 Feasibility Study.
APPENDIX III COMPETENT PERSON’S REPORT
– III-91 –
THIS DOCUMENT IS IN DRAFT FORM, INCOMPLETE AND SUBJECT TO CHANGE AND THAT
THE INFORMATION MUST BE READ IN CONJUNCTION WITH THE SECTION HEADED
‘‘WARNING’’ ON THE COVER OF THIS DOCUMENT
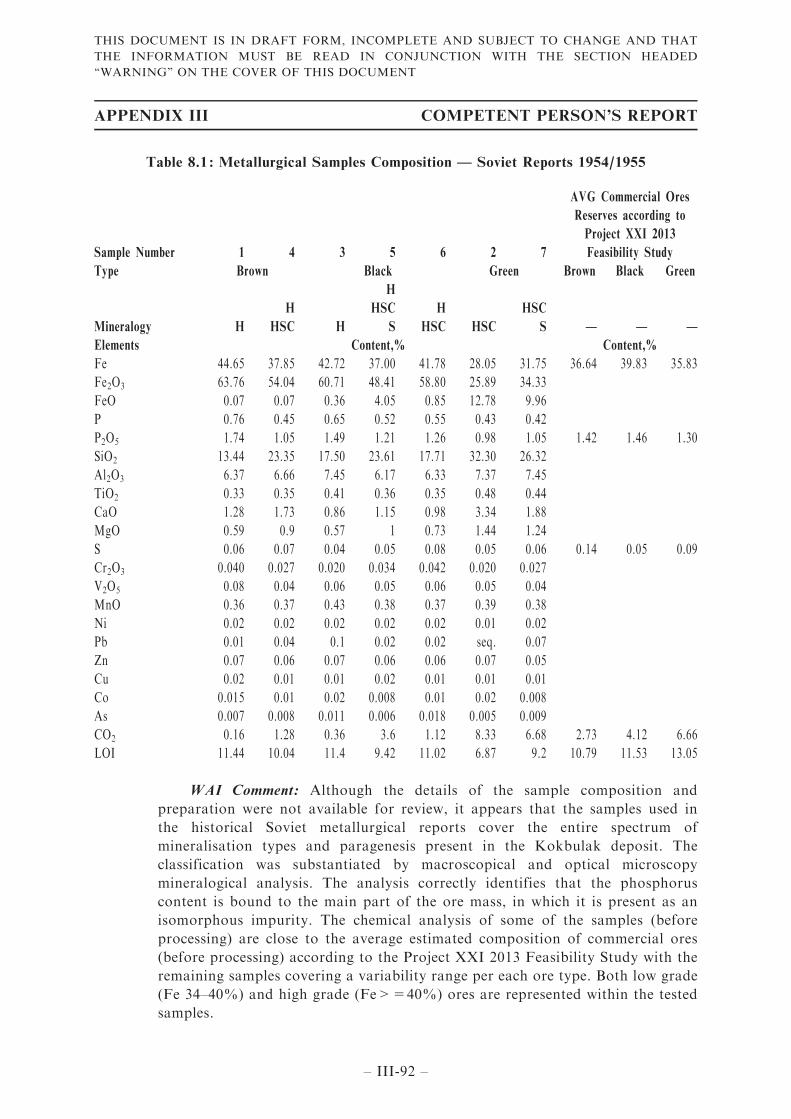
Table 8.1 : Metallurgical Samples Composition — Soviet Reports 1954/1955
Sample Number 1 4 3 5 6 2 7
AVG Commercial Ores
Reserves according to
Project XXI 2013
Feasibility Study
Type Brown Black Green Brown Black Green
Mineralogy H
H
HSC H
H
HSC
S
H
HSC HSC
HSC
S — — —
Elements Content,% Content,%
Fe 44.65 37.85 42.72 37.00 41.78 28.05 31.75 36.64 39.83 35.83
Fe2O3 63.76 54.04 60.71 48.41 58.80 25.89 34.33
FeO 0.07 0.07 0.36 4.05 0.85 12.78 9.96
P 0.76 0.45 0.65 0.52 0.55 0.43 0.42
P2O5 1.74 1.05 1.49 1.21 1.26 0.98 1.05 1.42 1.46 1.30
SiO2 13.44 23.35 17.50 23.61 17.71 32.30 26.32
Al2O3 6.37 6.66 7.45 6.17 6.33 7.37 7.45
TiO2 0.33 0.35 0.41 0.36 0.35 0.48 0.44
CaO 1.28 1.73 0.86 1.15 0.98 3.34 1.88
MgO 0.59 0.9 0.57 1 0.73 1.44 1.24
S 0.06 0.07 0.04 0.05 0.08 0.05 0.06 0.14 0.05 0.09
Cr2O3 0.040 0.027 0.020 0.034 0.042 0.020 0.027
V2O5 0.08 0.04 0.06 0.05 0.06 0.05 0.04
MnO 0.36 0.37 0.43 0.38 0.37 0.39 0.38
Ni 0.02 0.02 0.02 0.02 0.02 0.01 0.02
Pb 0.01 0.04 0.1 0.02 0.02 seq. 0.07
Zn 0.07 0.06 0.07 0.06 0.06 0.07 0.05
Cu 0.02 0.01 0.01 0.02 0.01 0.01 0.01
Co 0.015 0.01 0.02 0.008 0.01 0.02 0.008
As 0.007 0.008 0.011 0.006 0.018 0.005 0.009
CO2 0.16 1.28 0.36 3.6 1.12 8.33 6.68 2.73 4.12 6.66
LOI 11.44 10.04 11.4 9.42 11.02 6.87 9.2 10.79 11.53 13.05
WAI Comment: Although the details of the sample composition and
preparation were not available for review, it appears that the samples used in
the historical Soviet metallurgical reports cover the entire spectrum of
mineralisation types and paragenesis present in the Kokbulak deposit. The
classification was substantiated by macroscopical and optical microscopy
mineralogical analysis. The analysis correctly identifies that the phosphorus
content is bound to the main part of the ore mass, in which it is present as an
isomorphous impurity. The chemical analysis of some of the samples (before
processing) are close to the average estimated composition of commercial ores
(before processing) according to the Project XXI 2013 Feasibility Study with the
remaining samples covering a variability range per each ore type. Both low grade
(Fe 34–40%) and high grade (Fe>=40%) ores are represented within the tested
samples.
APPENDIX III COMPETENT PERSON’S REPORT
– III-92 –
THIS DOCUMENT IS IN DRAFT FORM, INCOMPLETE AND SUBJECT TO CHANGE AND THAT
THE INFORMATION MUST BE READ IN CONJUNCTION WITH THE SECTION HEADED
‘‘WARNING’’ ON THE COVER OF THIS DOCUMENT
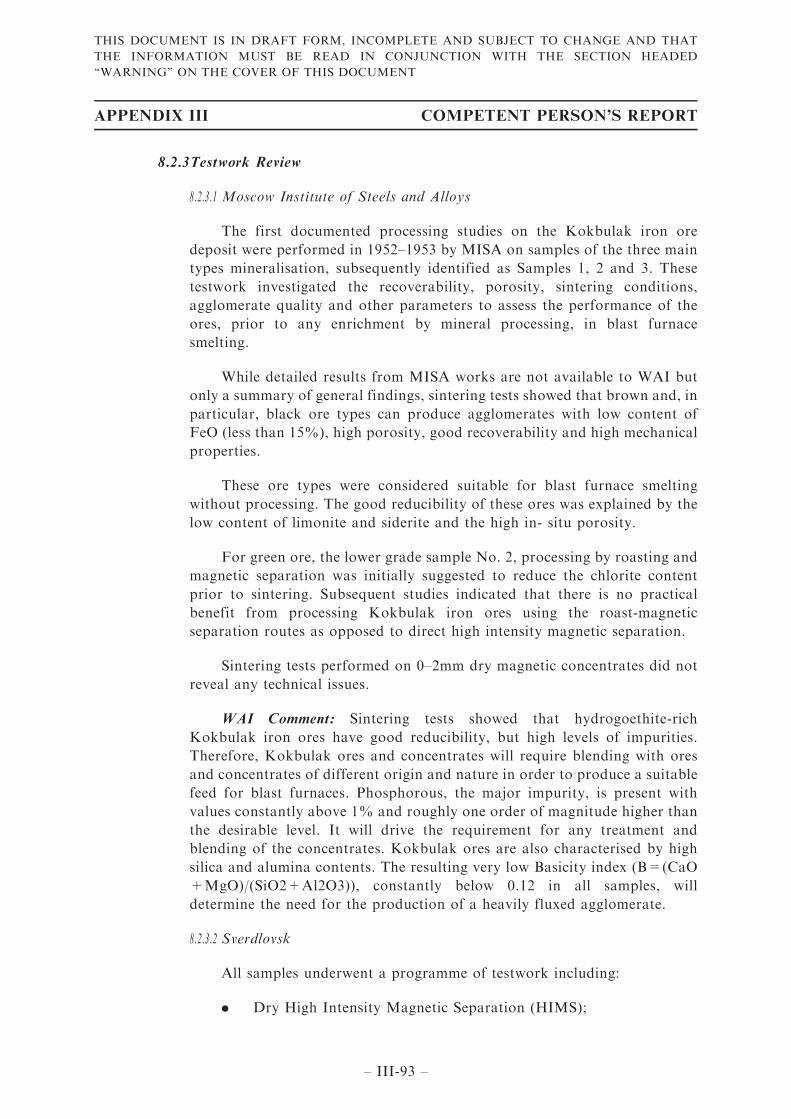
8.2.3Testwork Review
8.2.3.1 Moscow Institute of Steels and Alloys
The first documented processing studies on the Kokbulak iron ore
deposit were performed in 1952–1953 by MISA on samples of the three main
types mineralisation, subsequently identified as Samples 1, 2 and 3. These
testwork investigated the recoverability, porosity, sintering conditions,
agglomerate quality and other parameters to assess the performance of the
ores, prior to any enrichment by mineral processing, in blast furnace
smelting.
While detailed results from MISA works are not available to WAI but
only a summary of general findings, sintering tests showed that brown and, in
particular, black ore types can produce agglomerates with low content of
FeO (less than 15%), high porosity, good recoverability and high mechanical
properties.
These ore types were considered suitable for blast furnace smelting
without processing. The good reducibility of these ores was explained by the
low content of limonite and siderite and the high in- situ porosity.
For green ore, the lower grade sample No. 2, processing by roasting and
magnetic separation was initially suggested to reduce the chlorite content
prior to sintering. Subsequent studies indicated that there is no practical
benefit from processing Kokbulak iron ores using the roast-magnetic
separation routes as opposed to direct high intensity magnetic separation.
Sintering tests performed on 0–2mm dry magnetic concentrates did not
reveal any technical issues.
WAI Comment: Sintering tests showed that hydrogoethite-rich
Kokbulak iron ores have good reducibility, but high levels of impurities.
Therefore, Kokbulak ores and concentrates will require blending with ores
and concentrates of different origin and nature in order to produce a suitable
feed for blast furnaces. Phosphorous, the major impurity, is present with
values constantly above 1% and roughly one order of magnitude higher than
the desirable level. It will drive the requirement for any treatment and
blending of the concentrates. Kokbulak ores are also characterised by high
silica and alumina contents. The resulting very low Basicity index (B=(CaO
+MgO)/(SiO2+Al2O3)), constantly below 0.12 in all samples, will
determine the need for the production of a heavily fluxed agglomerate.
8.2.3.2 Sverdlovsk
All samples underwent a programme of testwork including:
. Dry High Intensity Magnetic Separation (HIMS);
APPENDIX III COMPETENT PERSON’S REPORT
– III-93 –
THIS DOCUMENT IS IN DRAFT FORM, INCOMPLETE AND SUBJECT TO CHANGE AND THAT
THE INFORMATION MUST BE READ IN CONJUNCTION WITH THE SECTION HEADED
‘‘WARNING’’ ON THE COVER OF THIS DOCUMENT
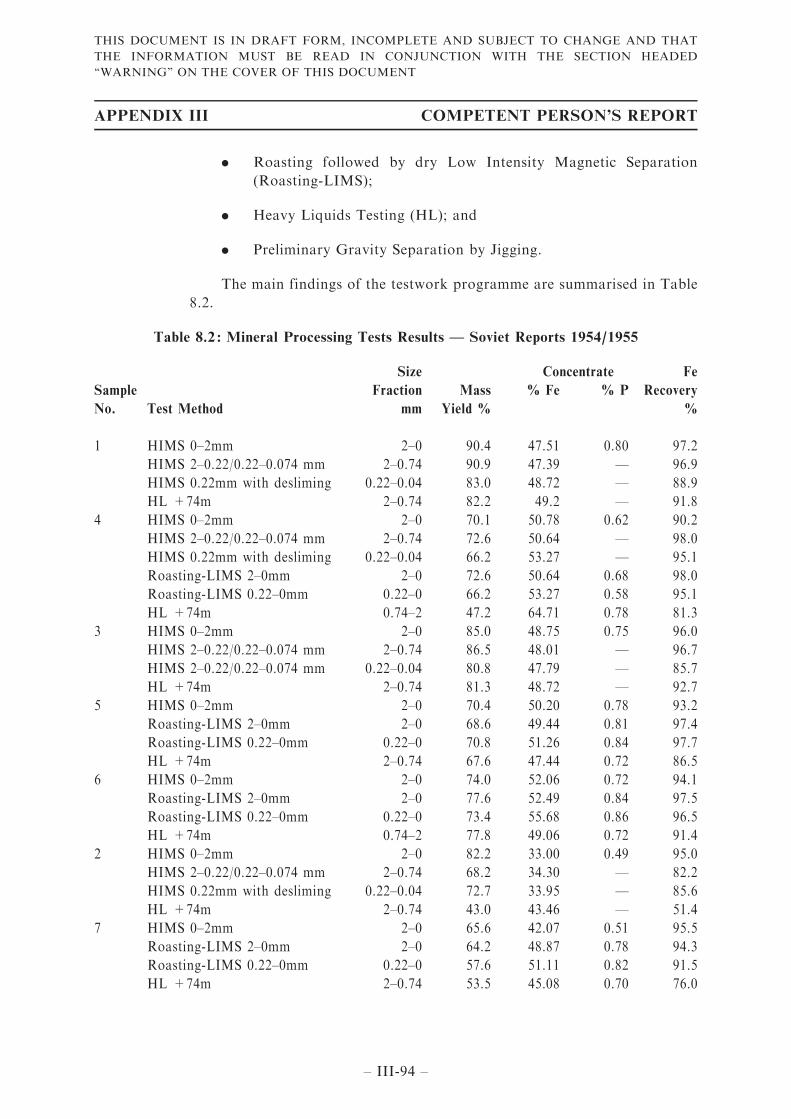
. Roasting followed by dry Low Intensity Magnetic Separation
(Roasting-LIMS);
. Heavy Liquids Testing (HL); and
. Preliminary Gravity Separation by Jigging.
The main findings of the testwork programme are summarised in Table
8.2.
Table 8.2 : Mineral Processing Tests Results — Soviet Reports 1954/1955
Sample
No. Test Method
Size
Fraction
mm
Mass
Yield %
Concentrate Fe
Recovery
%
% Fe % P
1 HIMS 0–2mm 2–0 90.4 47.51 0.80 97.2
HIMS 2–0.22/0.22–0.074 mm 2–0.74 90.9 47.39 — 96.9
HIMS 0.22mm with desliming 0.22–0.04 83.0 48.72 — 88.9
HL +74m 2–0.74 82.2 49.2 — 91.8
4 HIMS 0–2mm 2–0 70.1 50.78 0.62 90.2
HIMS 2–0.22/0.22–0.074 mm 2–0.74 72.6 50.64 — 98.0
HIMS 0.22mm with desliming 0.22–0.04 66.2 53.27 — 95.1
Roasting-LIMS 2–0mm 2–0 72.6 50.64 0.68 98.0
Roasting-LIMS 0.22–0mm 0.22–0 66.2 53.27 0.58 95.1
HL +74m 0.74–2 47.2 64.71 0.78 81.3
3 HIMS 0–2mm 2–0 85.0 48.75 0.75 96.0
HIMS 2–0.22/0.22–0.074 mm 2–0.74 86.5 48.01 — 96.7
HIMS 2–0.22/0.22–0.074 mm 0.22–0.04 80.8 47.79 — 85.7
HL +74m 2–0.74 81.3 48.72 — 92.7
5 HIMS 0–2mm 2–0 70.4 50.20 0.78 93.2
Roasting-LIMS 2–0mm 2–0 68.6 49.44 0.81 97.4
Roasting-LIMS 0.22–0mm 0.22–0 70.8 51.26 0.84 97.7
HL +74m 2–0.74 67.6 47.44 0.72 86.5
6 HIMS 0–2mm 2–0 74.0 52.06 0.72 94.1
Roasting-LIMS 2–0mm 2–0 77.6 52.49 0.84 97.5
Roasting-LIMS 0.22–0mm 0.22–0 73.4 55.68 0.86 96.5
HL +74m 0.74–2 77.8 49.06 0.72 91.4
2 HIMS 0–2mm 2–0 82.2 33.00 0.49 95.0
HIMS 2–0.22/0.22–0.074 mm 2–0.74 68.2 34.30 — 82.2
HIMS 0.22mm with desliming 0.22–0.04 72.7 33.95 — 85.6
HL +74m 2–0.74 43.0 43.46 — 51.4
7 HIMS 0–2mm 2–0 65.6 42.07 0.51 95.5
Roasting-LIMS 2–0mm 2–0 64.2 48.87 0.78 94.3
Roasting-LIMS 0.22–0mm 0.22–0 57.6 51.11 0.82 91.5
HL +74m 2–0.74 53.5 45.08 0.70 76.0
APPENDIX III COMPETENT PERSON’S REPORT
– III-94 –
THIS DOCUMENT IS IN DRAFT FORM, INCOMPLETE AND SUBJECT TO CHANGE AND THAT
THE INFORMATION MUST BE READ IN CONJUNCTION WITH THE SECTION HEADED
‘‘WARNING’’ ON THE COVER OF THIS DOCUMENT
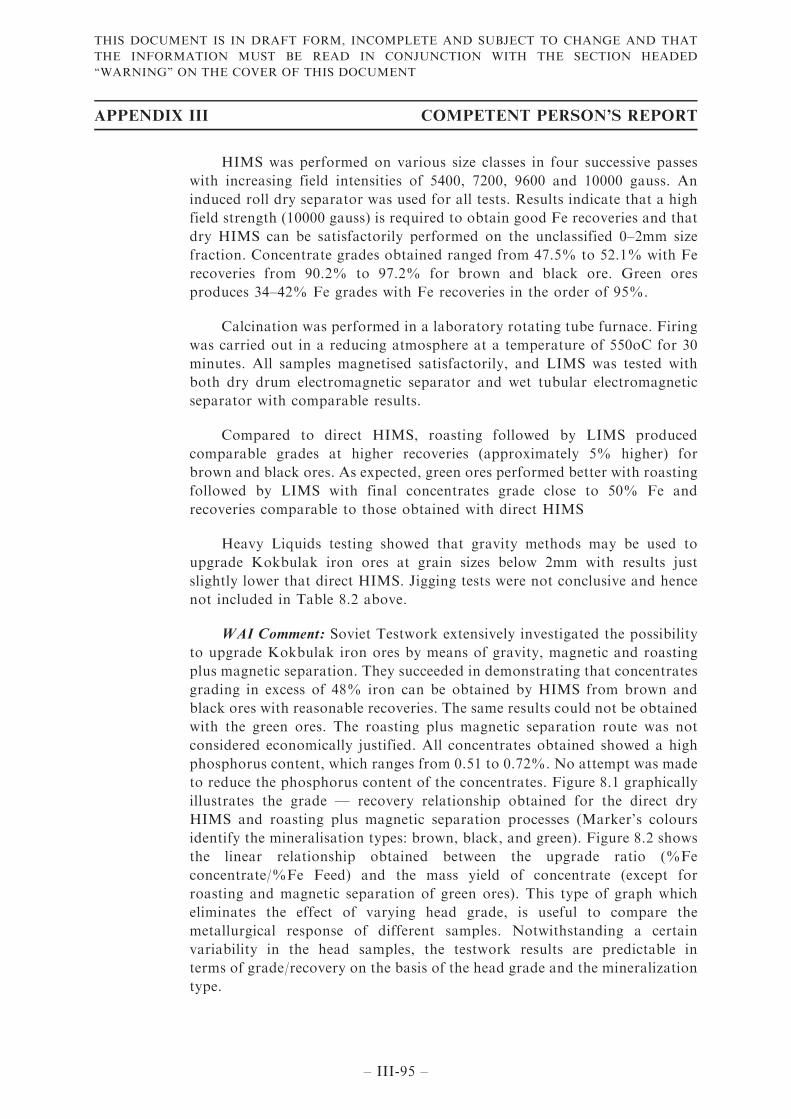
HIMS was performed on various size classes in four successive passes
with increasing field intensities of 5400, 7200, 9600 and 10000 gauss. An
induced roll dry separator was used for all tests. Results indicate that a high
field strength (10000 gauss) is required to obtain good Fe recoveries and that
dry HIMS can be satisfactorily performed on the unclassified 0–2mm size
fraction. Concentrate grades obtained ranged from 47.5% to 52.1% with Fe
recoveries from 90.2% to 97.2% for brown and black ore. Green ores
produces 34–42% Fe grades with Fe recoveries in the order of 95%.
Calcination was performed in a laboratory rotating tube furnace. Firing
was carried out in a reducing atmosphere at a temperature of 550oC for 30
minutes. All samples magnetised satisfactorily, and LIMS was tested with
both dry drum electromagnetic separator and wet tubular electromagnetic
separator with comparable results.
Compared to direct HIMS, roasting followed by LIMS produced
comparable grades at higher recoveries (approximately 5% higher) for
brown and black ores. As expected, green ores performed better with roasting
followed by LIMS with final concentrates grade close to 50% Fe and
recoveries comparable to those obtained with direct HIMS
Heavy Liquids testing showed that gravity methods may be used to
upgrade Kokbulak iron ores at grain sizes below 2mm with results just
slightly lower that direct HIMS. Jigging tests were not conclusive and hence
not included in Table 8.2 above.
WAI Comment: Soviet Testwork extensively investigated the possibility
to upgrade Kokbulak iron ores by means of gravity, magnetic and roasting
plus magnetic separation. They succeeded in demonstrating that concentrates
grading in excess of 48% iron can be obtained by HIMS from brown and
black ores with reasonable recoveries. The same results could not be obtained
with the green ores. The roasting plus magnetic separation route was not
considered economically justified. All concentrates obtained showed a high
phosphorus content, which ranges from 0.51 to 0.72%. No attempt was made
to reduce the phosphorus content of the concentrates. Figure 8.1 graphically
illustrates the grade — recovery relationship obtained for the direct dry
HIMS and roasting plus magnetic separation processes (Marker’s colours
identify the mineralisation types: brown, black, and green). Figure 8.2 shows
the linear relationship obtained between the upgrade ratio (%Fe
concentrate/%Fe Feed) and the mass yield of concentrate (except for
roasting and magnetic separation of green ores). This type of graph which
eliminates the effect of varying head grade, is useful to compare the
metallurgical response of different samples. Notwithstanding a certain
variability in the head samples, the testwork results are predictable in
terms of grade/recovery on the basis of the head grade and the mineralization
type.
APPENDIX III COMPETENT PERSON’S REPORT
– III-95 –
THIS DOCUMENT IS IN DRAFT FORM, INCOMPLETE AND SUBJECT TO CHANGE AND THAT
THE INFORMATION MUST BE READ IN CONJUNCTION WITH THE SECTION HEADED
‘‘WARNING’’ ON THE COVER OF THIS DOCUMENT
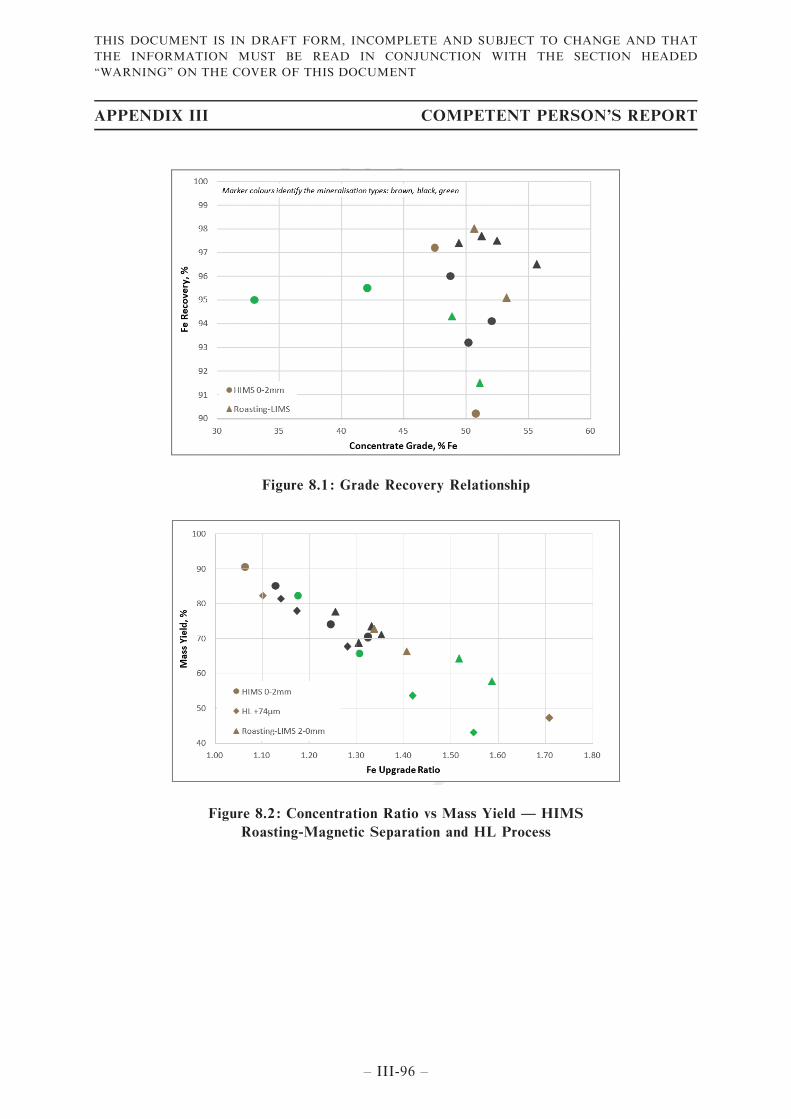
Figure 8.1 : Grade Recovery Relationship
Figure 8.2 : Concentration Ratio vs Mass Yield — HIMS
Roasting-Magnetic Separation and HL Process
APPENDIX III COMPETENT PERSON’S REPORT
– III-96 –
THIS DOCUMENT IS IN DRAFT FORM, INCOMPLETE AND SUBJECT TO CHANGE AND THAT
THE INFORMATION MUST BE READ IN CONJUNCTION WITH THE SECTION HEADED
‘‘WARNING’’ ON THE COVER OF THIS DOCUMENT
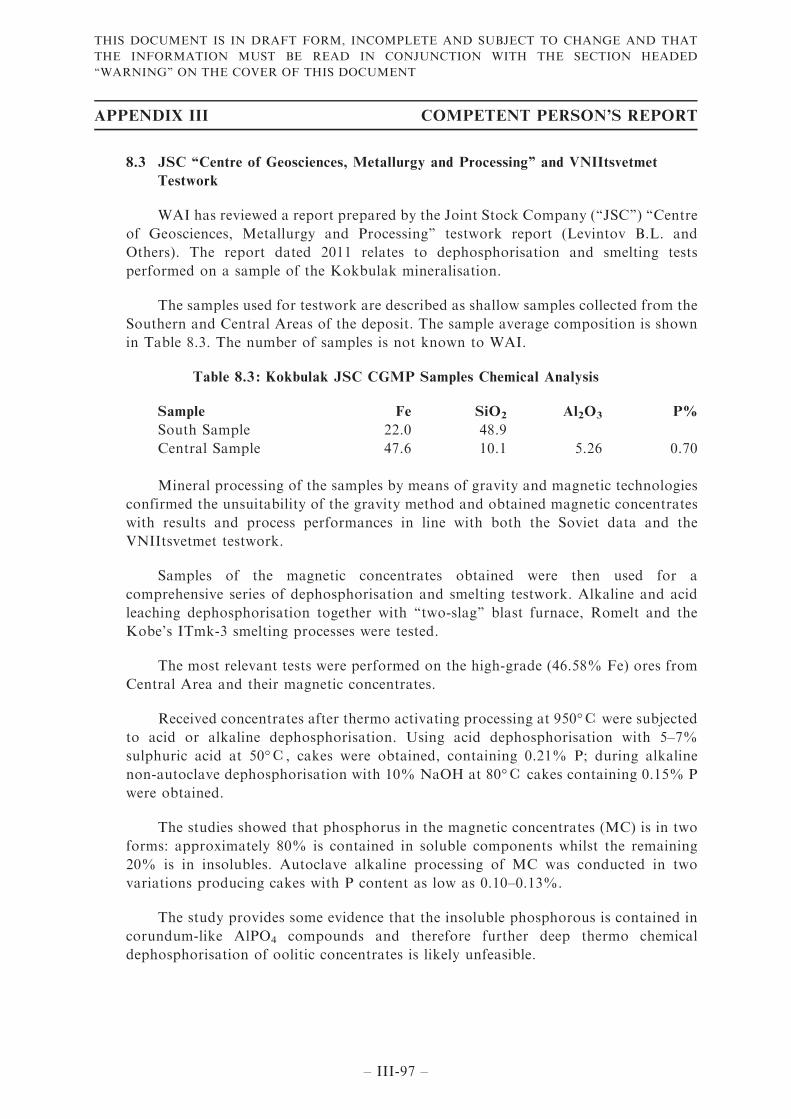
8.3 JSC ‘‘Centre of Geosciences, Metallurgy and Processing’’ and VNIItsvetmet
Testwork
WAI has reviewed a report prepared by the Joint Stock Company (‘‘JSC’’) ‘‘Centre
of Geosciences, Metallurgy and Processing’’ testwork report (Levintov B.L. and
Others). The report dated 2011 relates to dephosphorisation and smelting tests
performed on a sample of the Kokbulak mineralisation.
The samples used for testwork are described as shallow samples collected from the
Southern and Central Areas of the deposit. The sample average composition is shown
in Table 8.3. The number of samples is not known to WAI.
Table 8.3 : Kokbulak JSC CGMP Samples Chemical Analysis
Sample Fe SiO2 Al2O3 P%
South Sample 22.0 48.9
Central Sample 47.6 10.1 5.26 0.70
Mineral processing of the samples by means of gravity and magnetic technologies
confirmed the unsuitability of the gravity method and obtained magnetic concentrates
with results and process performances in line with both the Soviet data and the
VNIItsvetmet testwork.
Samples of the magnetic concentrates obtained were then used for a
comprehensive series of dephosphorisation and smelting testwork. Alkaline and acid
leaching dephosphorisation together with ‘‘two-slag’’ blast furnace, Romelt and the
Kobe’s ITmk-3 smelting processes were tested.
The most relevant tests were performed on the high-grade (46.58% Fe) ores from
Central Area and their magnetic concentrates.
Received concentrates after thermo activating processing at 950°С were subjected
to acid or alkaline dephosphorisation. Using acid dephosphorisation with 5–7%
sulphuric acid at 50°С, cakes were obtained, containing 0.21% P; during alkaline
non-autoclave dephosphorisation with 10% NaOH at 80°С cakes containing 0.15% P
were obtained.
The studies showed that phosphorus in the magnetic concentrates (MC) is in two
forms: approximately 80% is contained in soluble components whilst the remaining
20% is in insolubles. Autoclave alkaline processing of MC was conducted in two
variations producing cakes with P content as low as 0.10–0.13%.
The study provides some evidence that the insoluble phosphorous is contained in
corundum-like AlPO4 compounds and therefore further deep thermo chemical
dephosphorisation of oolitic concentrates is likely unfeasible.
APPENDIX III COMPETENT PERSON’S REPORT
– III-97 –
THIS DOCUMENT IS IN DRAFT FORM, INCOMPLETE AND SUBJECT TO CHANGE AND THAT
THE INFORMATION MUST BE READ IN CONJUNCTION WITH THE SECTION HEADED
‘‘WARNING’’ ON THE COVER OF THIS DOCUMENT
Studies of thermo acid dephosphorisation were in particular performed on
samples of Kokbulak MC containing 49.0% Fe, 0.7% Р, 4.74% SiO2, 5.25% Аl2O3,
0.55% CaO and 1.1% MgO.
Roasting was carried out in a muffle furnace with carborundum heaters in
oxidising atmosphere at 800, 900, 950 and 1000°С.
The process yielded 85.5–85.7% of scoria by weight containing 57.3% Fe, 0.82%
Р, 5.6% SiO2, 6.1% Аl2O3, 0.65% CaO, 1.2% MgO.
Acid leaching of the scoria was performed with sulphuric acid at 50°С with a
solid to liquid ratio of 1 : 3, acid concentrations of 50 and 75g/dm3. The best results
were obtained at 900–950°С with 50g/dm3 H2SO4 : phosphorus grade in cakes was
reduced to 0.19–0.21%, silica and alumina to 4–6% and the iron losses did not exceed
1–2%. The phosphorus extraction was 75–77%.
The most advanced ironmaking method is two-slag melting, which allows
adjustment of temperature, alkalinity ratio and oxidation of the metal bath. Romelt
and ITmk-3 are less flexible, but less expensive. The testwork shows that with all the
above technologies the production of cast iron with less than 0.3%P is feasible.
Tests on liquid-phase reduction of cakes from thermo acid dephosphorisation
were carried out at 1300–1500°С and holding time 20–60min. Cast iron production
yielded 60.5–61.7% by weight with phosphorus content of 0.13–0.19%.
Tests with the Romelt process showed that the iron recovery into cast iron
averages 95–98.5% and the phosphorus content fluctuates between 0.13% and 0.25%
depending on the amount of lime in the slag.
Dephosphorisation of alkaline cakes and roasted at 1000°С RMC
(Roast-Magnetic Concentrates) was tested using ITmk-3 method. Results were not
satisfactory and further studies were recommended on slag composition and process
temperatures.
The flowsheet in Figure 8.3 was recommended for treatment of Kokbulak ores.
APPENDIX III COMPETENT PERSON’S REPORT
– III-98 –
THIS DOCUMENT IS IN DRAFT FORM, INCOMPLETE AND SUBJECT TO CHANGE AND THAT
THE INFORMATION MUST BE READ IN CONJUNCTION WITH THE SECTION HEADED
‘‘WARNING’’ ON THE COVER OF THIS DOCUMENT
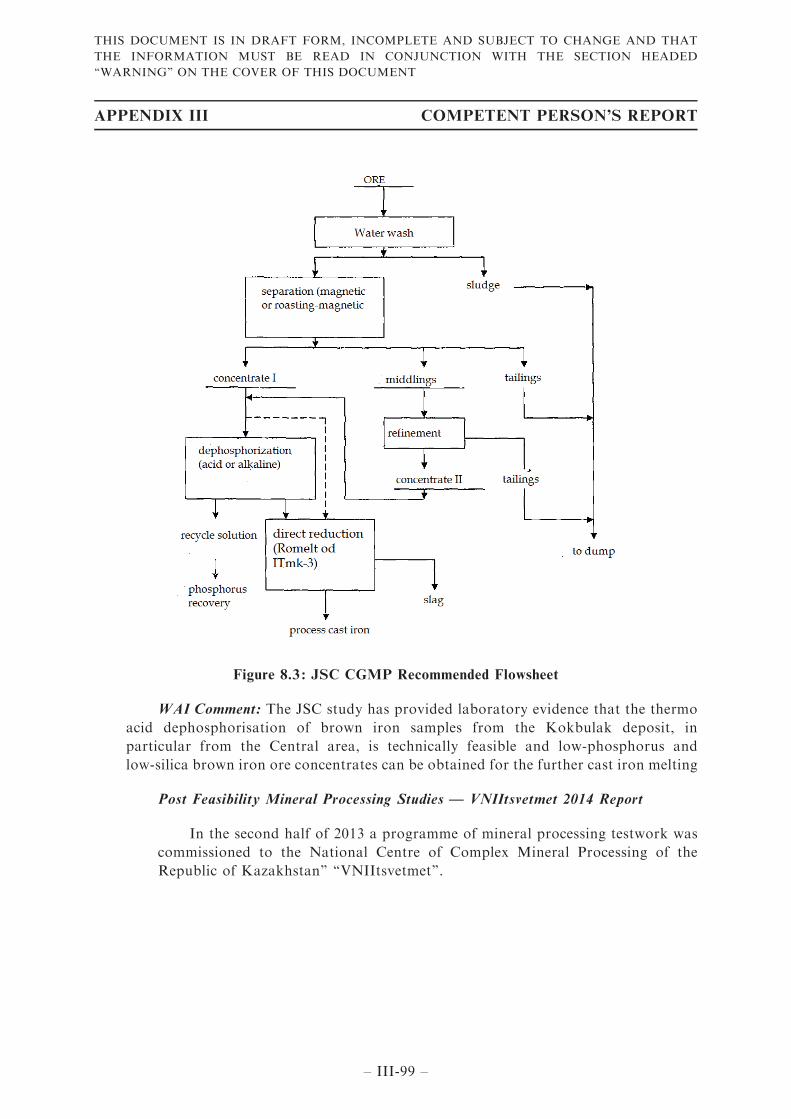
Figure 8.3 : JSC CGMP Recommended Flowsheet
WAI Comment: The JSC study has provided laboratory evidence that the thermo
acid dephosphorisation of brown iron samples from the Kokbulak deposit, in
particular from the Central area, is technically feasible and low-phosphorus and
low-silica brown iron ore concentrates can be obtained for the further cast iron melting
Post Feasibility Mineral Processing Studies — VNIItsvetmet 2014 Report
In the second half of 2013 a programme of mineral processing testwork was
commissioned to the National Centre of Complex Mineral Processing of the
Republic of Kazakhstan’’ ‘‘VNIItsvetmet’’.
APPENDIX III COMPETENT PERSON’S REPORT
– III-99 –
THIS DOCUMENT IS IN DRAFT FORM, INCOMPLETE AND SUBJECT TO CHANGE AND THAT
THE INFORMATION MUST BE READ IN CONJUNCTION WITH THE SECTION HEADED
‘‘WARNING’’ ON THE COVER OF THIS DOCUMENT
The two samples submitted are described as:
. Sample 1 : friable ore without cementing (coded KBS, also called ‘‘black
crumble’’); and
. Sample 2 : oolitic brown and oxidised ore (coded KBZ, also called
‘‘lumpy ore’’).
Total iron content in the sample of black crumble KBS is 52.64%, and in
lumpy sample KBZ is 44.77%, significantly higher than the average in the
commercial reserves of the Kokbulak deposit (39.38%). According to the report
the two bulk samples were apparently taken from the middle layers of
mineralisation without any dilution host rocks and internal layered waste.
Content of phosphorus pentoxide in ore samples is 0.74–0.97%, which is less than
the average for the Central Area of the deposit, but close enough to ores of
Northern Area and Southern Area (1.39–1.38% P2O5).
The Kokbulak Iron Ore Metallurgical Sampling Passport further explained
that, due to shortage of time, the metallurgical sample had to be collected quickly
in June 2013 from bedrock outcrops in the left flank of Tassay Gullet, part of the
Central area. No data for drill holes was prepared. The samples have been
composited from individual 15.0–35.0kg increment samples collected in 23 points
located in Tassay Gullet. Only friable and cemented mineralisation were sampled
and the third ore type (green) was excluded.
Given the unrepresentative grades, sample collection method and lower
phosphate content, WAI has discounted the testwork results of the Centre of
Geosciences, Metallurgy and Processing and VNIItsvetmet and no further details
are provided here.
APPENDIX III COMPETENT PERSON’S REPORT
– III-100 –
THIS DOCUMENT IS IN DRAFT FORM, INCOMPLETE AND SUBJECT TO CHANGE AND THAT
THE INFORMATION MUST BE READ IN CONJUNCTION WITH THE SECTION HEADED
‘‘WARNING’’ ON THE COVER OF THIS DOCUMENT
8.4 Processing section of Project XXI 2013 Feasibility Study
8.4.1 Background
In the Project XXI 2013 Feasibility Study, the processing section is developed
by analogy with the processing facilities at the Lisakovsk mine in North
Kazakhstan. Project XXI justified this decision on the basis of the genetic and
mineralogical similarities between the Kokbulak and Lisakovskoye mineral
deposits and WAI agrees. Table 8.4 shows a comparison between the average
compositions of the two deposits.
Table 8.4 : Kokbulak and Lisakovskoye Mineralisations Chemical Analysis
Deposit Fe FeO Fe2O3 SiO2 CaO MgO Al2O3 MnO P S
Kokbulak 39.4 3.70 58.8 20.6 0.98 1.07 6.81 0.30 0.69 0.07
Lisakovskoye 41.3 0.30 58.7 24.3 0.28 0.36 4.32 0.22 0.57 0.01
The Process Design Criteria for the whole flowsheet are contained in the
Project XXI 2013 Feasibility Study and have been further clarified in a document
recently provided to WAI by the Client titled ‘‘Kok-Bulak Ore Process Design
Basis’’.
The Kokbulak flowsheet comprises two main sections:
1) Gravity Magnetic Circuit (GMC); and
2) Dephosphorisation Circuit (DC).
The gravity magnetic circuit includes
. Crushing with hammer crusher to –30mm;
. Wet screening of the –2mm size fraction;
. Grinding of +2mm oversize in rod mills to –2mm;
. Desliming in screw-type classifier at 0.1mm;
. Gravity processing: two stages jigging to produce final concentrate and
middling;
. Magnetic separation: three stages of dewatering and magnetic
separation of jigging middling to produce concentrate and tailings; and
. Dewatering and filtration of concentrate.
APPENDIX III COMPETENT PERSON’S REPORT
– III-101 –
THIS DOCUMENT IS IN DRAFT FORM, INCOMPLETE AND SUBJECT TO CHANGE AND THAT
THE INFORMATION MUST BE READ IN CONJUNCTION WITH THE SECTION HEADED
‘‘WARNING’’ ON THE COVER OF THIS DOCUMENT
The dephosphorisation circuit includes:
. Roasting of gravity magnetic concentrate in cylindrical rotating kiln at
900–920°С;
. Magnetic separation of roasted concentrate;
. Sulphuric acid leaching of the magnetic fraction followed by washing
and neutralization of the concentrate;
. Filtration of cleared concentrate.
Gravity-magnetic concentrate with 10% moisture is sent to the rotating kiln
feed hoppers. The concentrate is roasted in counter-flow, natural gas fuelled,
rotating cylindrical kiln.
After roasting, the concentrate is sent for temperature reduction from 900°Cto 80°C and conveyed into a storage bin. The roasted concentrate is screened to
remove coarse (+2mm) sinters and the undersize product is sent to the dry
magnetic separation. Non-magnetic and magnetic fractions are re-pulped and
respectively pumped to the leaching circuit and the mine waste facility.
Leaching is performed with sulphuric acid in Pachuca tanks and the reacted
slurry is pumped to the thickener. Sand from thickener (concentrate) is washed in
two stages in spiral classifiers. Lime milk is added for neutralization before the
pulp is pumped to filtration on vacuum belt filters. Filtrated concentrate is
conveyed for storage and then is dried (in wintertime).
Spent solutions are neutralised in agitators by limestone pulp and lime milk.
Neutral pulp is combined with tailings of the processing plant and pumped to the
tailings dam.
The gravity magnetic flowsheet is illustrated in Figure 8.4.
APPENDIX III COMPETENT PERSON’S REPORT
– III-102 –
THIS DOCUMENT IS IN DRAFT FORM, INCOMPLETE AND SUBJECT TO CHANGE AND THAT
THE INFORMATION MUST BE READ IN CONJUNCTION WITH THE SECTION HEADED
‘‘WARNING’’ ON THE COVER OF THIS DOCUMENT
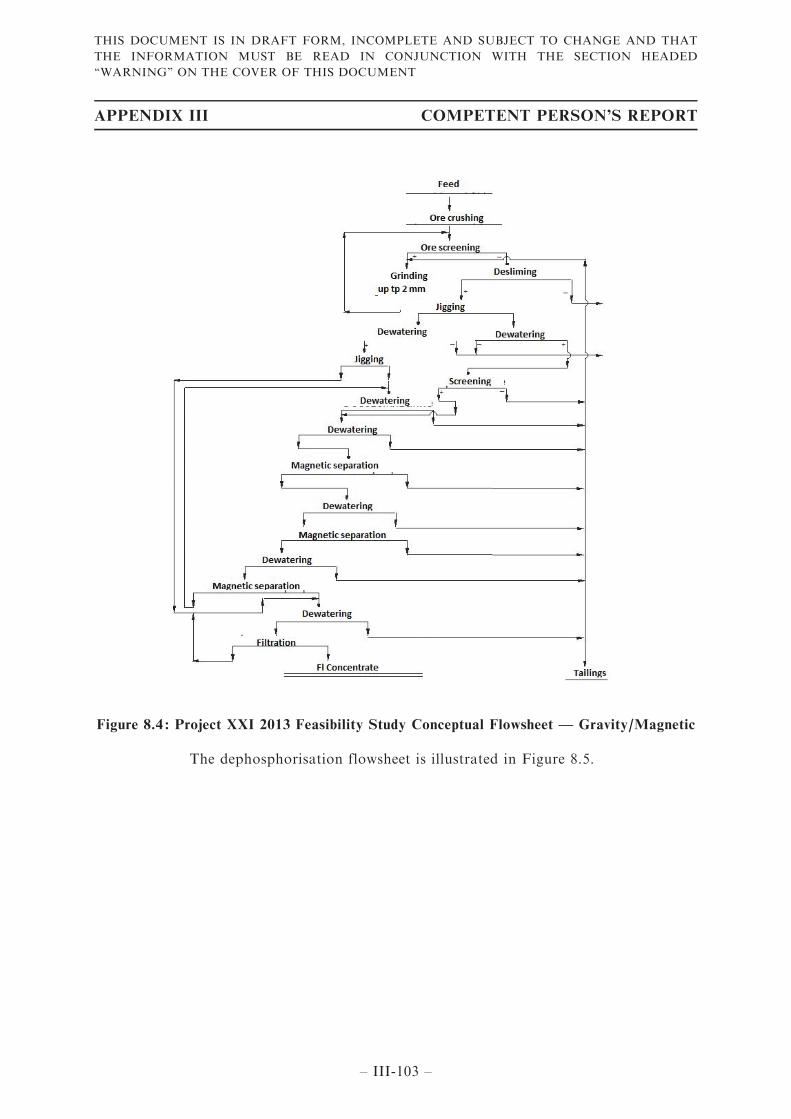
Figure 8.4 : Project XXI 2013 Feasibility Study Conceptual Flowsheet — Gravity/Magnetic
The dephosphorisation flowsheet is illustrated in Figure 8.5.
APPENDIX III COMPETENT PERSON’S REPORT
– III-103 –
THIS DOCUMENT IS IN DRAFT FORM, INCOMPLETE AND SUBJECT TO CHANGE AND THAT
THE INFORMATION MUST BE READ IN CONJUNCTION WITH THE SECTION HEADED
‘‘WARNING’’ ON THE COVER OF THIS DOCUMENT
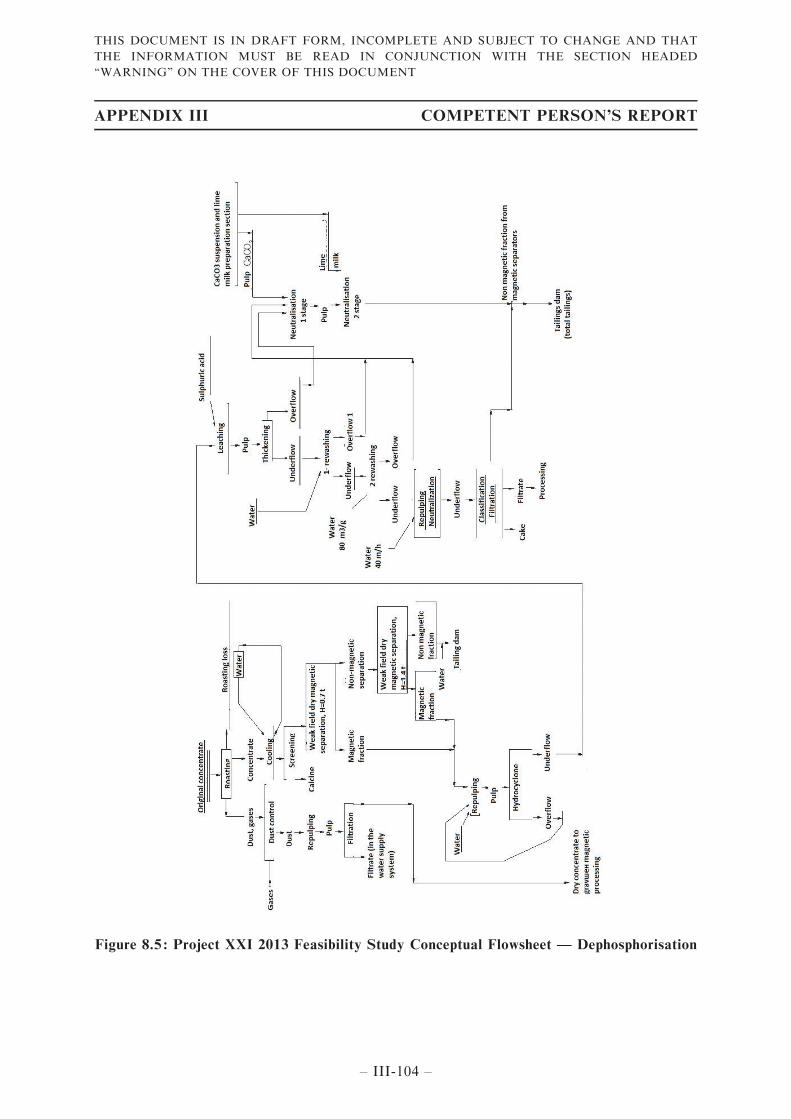
Figure 8.5 : Project XXI 2013 Feasibility Study Conceptual Flowsheet — Dephosphorisation
APPENDIX III COMPETENT PERSON’S REPORT
– III-104 –
THIS DOCUMENT IS IN DRAFT FORM, INCOMPLETE AND SUBJECT TO CHANGE AND THAT
THE INFORMATION MUST BE READ IN CONJUNCTION WITH THE SECTION HEADED
‘‘WARNING’’ ON THE COVER OF THIS DOCUMENT
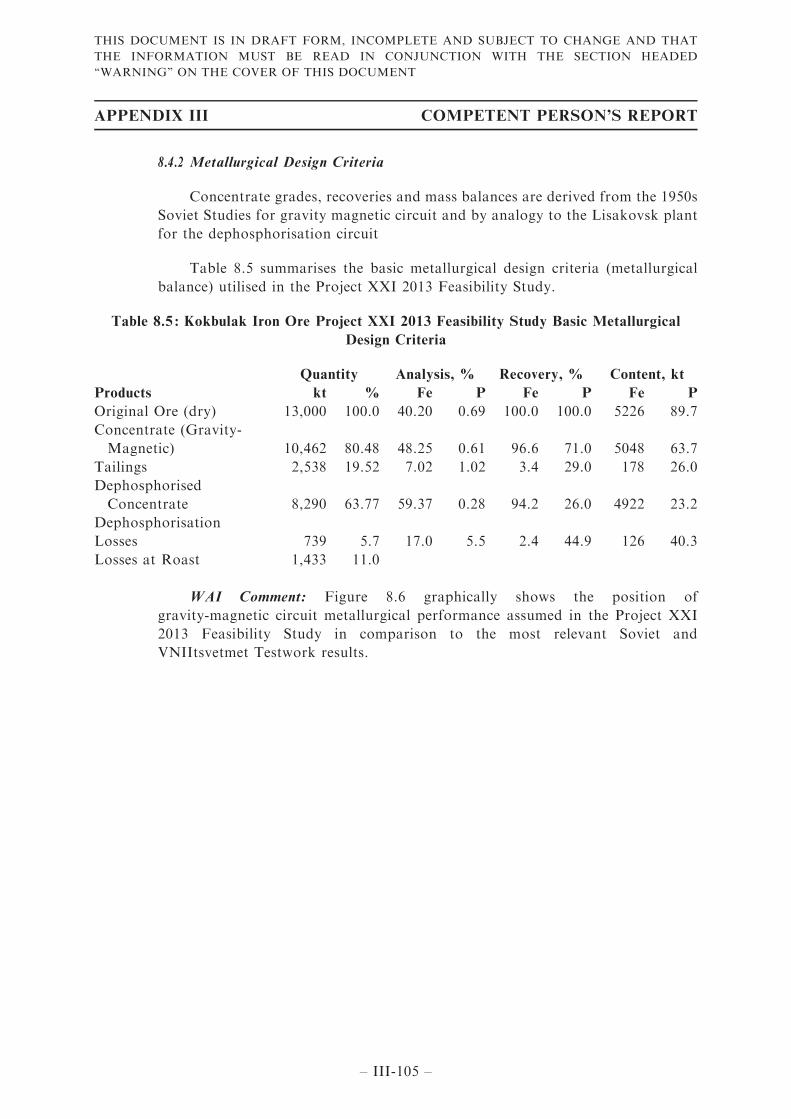
8.4.2 Metallurgical Design Criteria
Concentrate grades, recoveries and mass balances are derived from the 1950s
Soviet Studies for gravity magnetic circuit and by analogy to the Lisakovsk plant
for the dephosphorisation circuit
Table 8.5 summarises the basic metallurgical design criteria (metallurgical
balance) utilised in the Project XXI 2013 Feasibility Study.
Table 8.5 : Kokbulak Iron Ore Project XXI 2013 Feasibility Study Basic Metallurgical
Design Criteria
Products
Quantity Analysis, % Recovery, % Content, kt
kt % Fe P Fe P Fe P
Original Ore (dry) 13,000 100.0 40.20 0.69 100.0 100.0 5226 89.7
Concentrate (Gravity-
Magnetic) 10,462 80.48 48.25 0.61 96.6 71.0 5048 63.7
Tailings 2,538 19.52 7.02 1.02 3.4 29.0 178 26.0
Dephosphorised
Concentrate 8,290 63.77 59.37 0.28 94.2 26.0 4922 23.2
Dephosphorisation
Losses 739 5.7 17.0 5.5 2.4 44.9 126 40.3
Losses at Roast 1,433 11.0
WAI Comment: Figure 8.6 graphically shows the position of
gravity-magnetic circuit metallurgical performance assumed in the Project XXI
2013 Feasibility Study in comparison to the most relevant Soviet and
VNIItsvetmet Testwork results.
APPENDIX III COMPETENT PERSON’S REPORT
– III-105 –
THIS DOCUMENT IS IN DRAFT FORM, INCOMPLETE AND SUBJECT TO CHANGE AND THAT
THE INFORMATION MUST BE READ IN CONJUNCTION WITH THE SECTION HEADED
‘‘WARNING’’ ON THE COVER OF THIS DOCUMENT
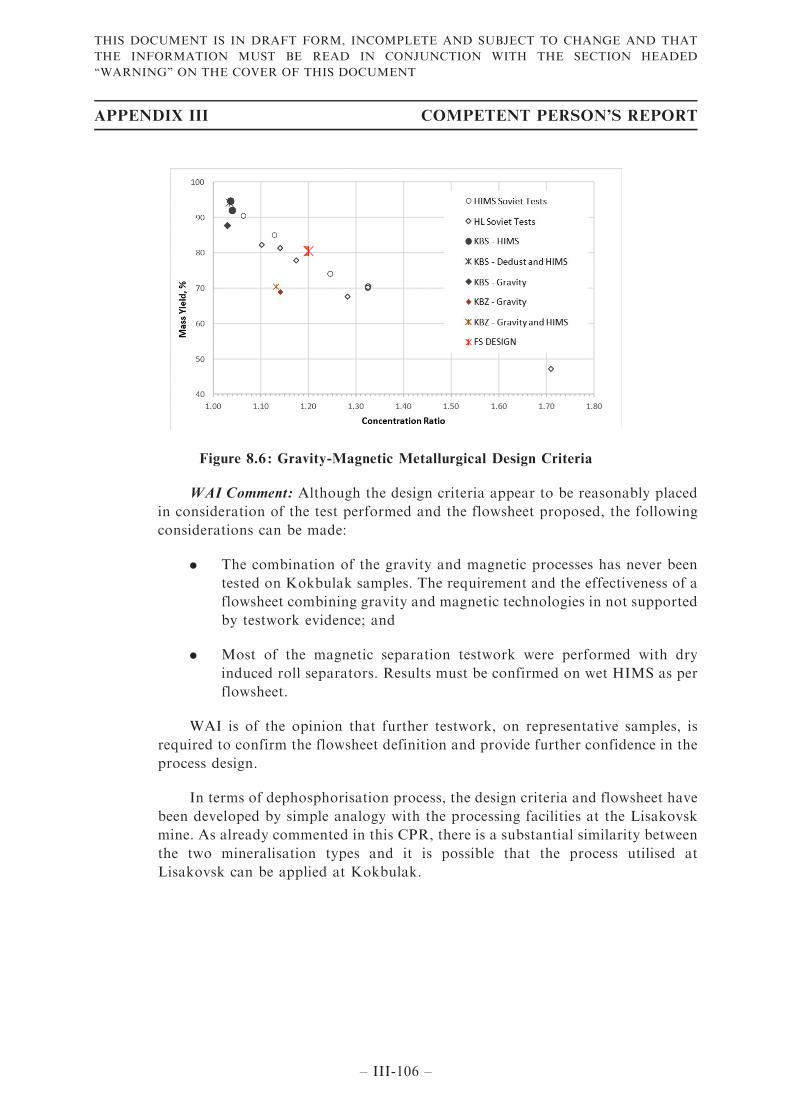
Figure 8.6 : Gravity-Magnetic Metallurgical Design Criteria
WAI Comment: Although the design criteria appear to be reasonably placed
in consideration of the test performed and the flowsheet proposed, the following
considerations can be made:
. The combination of the gravity and magnetic processes has never been
tested on Kokbulak samples. The requirement and the effectiveness of a
flowsheet combining gravity and magnetic technologies in not supported
by testwork evidence; and
. Most of the magnetic separation testwork were performed with dry
induced roll separators. Results must be confirmed on wet HIMS as per
flowsheet.
WAI is of the opinion that further testwork, on representative samples, is
required to confirm the flowsheet definition and provide further confidence in the
process design.
In terms of dephosphorisation process, the design criteria and flowsheet have
been developed by simple analogy with the processing facilities at the Lisakovsk
mine. As already commented in this CPR, there is a substantial similarity between
the two mineralisation types and it is possible that the process utilised at
Lisakovsk can be applied at Kokbulak.
APPENDIX III COMPETENT PERSON’S REPORT
– III-106 –
THIS DOCUMENT IS IN DRAFT FORM, INCOMPLETE AND SUBJECT TO CHANGE AND THAT
THE INFORMATION MUST BE READ IN CONJUNCTION WITH THE SECTION HEADED
‘‘WARNING’’ ON THE COVER OF THIS DOCUMENT
However, successful dephosphorisation testwork of Kokbulak concentrates
using the Lisavosrsk flowsheet has yet to be performed.
According to published information1 at Lisakovsk GOK, following several
trials and technology adjustments, an experimental hydrometallurgical plant for
dephosphorisation of the iron gravity-magnetic concentrate was placed in
operation during late 2011. The implemented technology included roasting at
900°C in neutral media to hematite followed by dry high intensity magnetic
separation and leaching in pachucas with sulphuric acid. Laboratory tests showed
that the level of phosphorus can be decreased down to 0.15 — 0.20%, although,
the paper also states that ‘‘unfortunately, up to now, such level of P removal is
still not attained at plant scale.’’
WAI believes that this technology was not pursued further and that there are
no commercial plants of this type around the world.
8.4.3 Plant Design Criteria
Consequently, even though the Project XXI 2013 Feasibility Study uses a
process flowsheet which is commercially unproven, WAI has utilised the flowsheet
as no other option is available as at the date of this CPR and clearly additional
testwork is required to both optimise the flowsheet and solve the
dephosphorisation issue.
From the Project XXI 2013 Feasibility Study, the process plant is devised as
being made of a large number of parallel identical lines. The plant comprises up to
four crushing circuits followed by 10/11 gravity-magnetic and dephosphorisation
lines.
Plant operation is planned over 330d/year and 7,920h/year giving an overall
plant utilisation of 90%. The processing plant is proposed to be continuously
operated with three 8 hours, shifts per day.
The number of employees based in the plant is 492 people.
1 Removal of phosphorus through roasting of oolitic iron ore with alkaline earth additives — K. Ionkov
and others — XXVI International Mineral Processing Congress (IMPC) 2012 — September 2012
APPENDIX III COMPETENT PERSON’S REPORT
– III-107 –
THIS DOCUMENT IS IN DRAFT FORM, INCOMPLETE AND SUBJECT TO CHANGE AND THAT
THE INFORMATION MUST BE READ IN CONJUNCTION WITH THE SECTION HEADED
‘‘WARNING’’ ON THE COVER OF THIS DOCUMENT
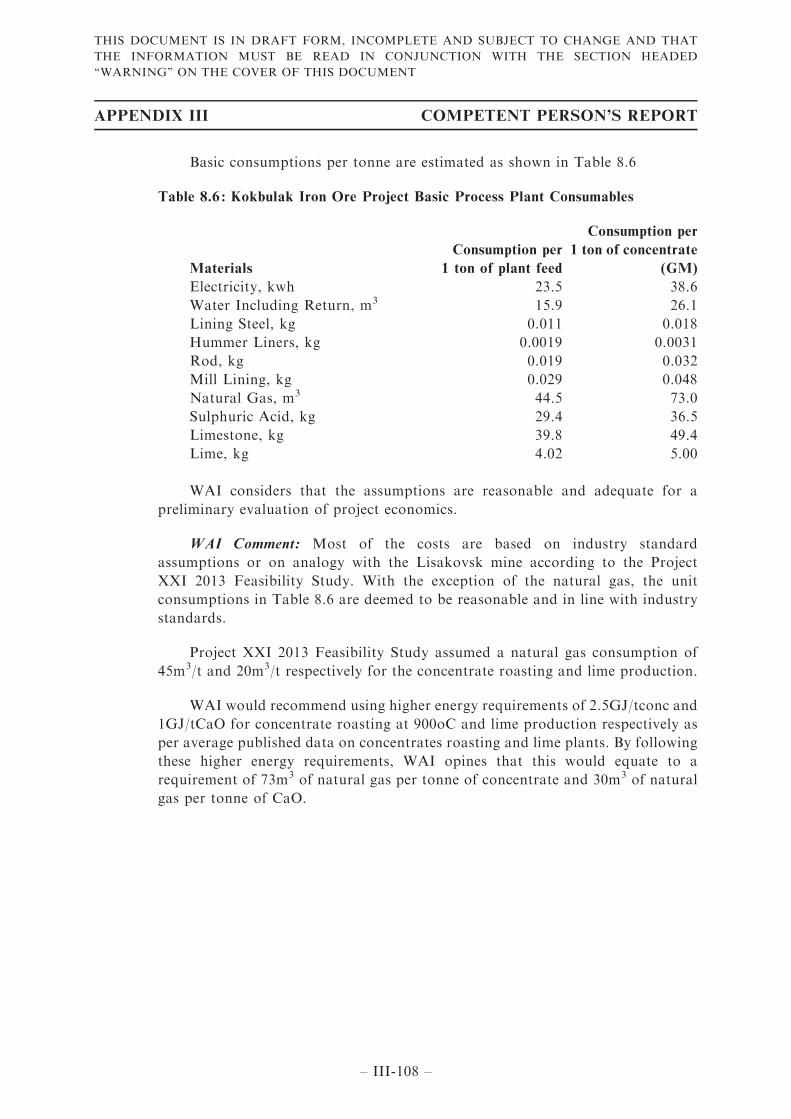
Basic consumptions per tonne are estimated as shown in Table 8.6
Table 8.6 : Kokbulak Iron Ore Project Basic Process Plant Consumables
Materials
Consumption per
1 ton of plant feed
Consumption per
1 ton of concentrate
(GM)
Electricity, kwh 23.5 38.6
Water Including Return, m3 15.9 26.1
Lining Steel, kg 0.011 0.018
Hummer Liners, kg 0.0019 0.0031
Rod, kg 0.019 0.032
Mill Lining, kg 0.029 0.048
Natural Gas, m3 44.5 73.0
Sulphuric Acid, kg 29.4 36.5
Limestone, kg 39.8 49.4
Lime, kg 4.02 5.00
WAI considers that the assumptions are reasonable and adequate for a
preliminary evaluation of project economics.
WAI Comment: Most of the costs are based on industry standard
assumptions or on analogy with the Lisakovsk mine according to the Project
XXI 2013 Feasibility Study. With the exception of the natural gas, the unit
consumptions in Table 8.6 are deemed to be reasonable and in line with industry
standards.
Project XXI 2013 Feasibility Study assumed a natural gas consumption of
45m3/t and 20m3/t respectively for the concentrate roasting and lime production.
WAI would recommend using higher energy requirements of 2.5GJ/tconc and
1GJ/tCaO for concentrate roasting at 900oC and lime production respectively as
per average published data on concentrates roasting and lime plants. By following
these higher energy requirements, WAI opines that this would equate to a
requirement of 73m3 of natural gas per tonne of concentrate and 30m3 of natural
gas per tonne of CaO.
APPENDIX III COMPETENT PERSON’S REPORT
– III-108 –
THIS DOCUMENT IS IN DRAFT FORM, INCOMPLETE AND SUBJECT TO CHANGE AND THAT
THE INFORMATION MUST BE READ IN CONJUNCTION WITH THE SECTION HEADED
‘‘WARNING’’ ON THE COVER OF THIS DOCUMENT
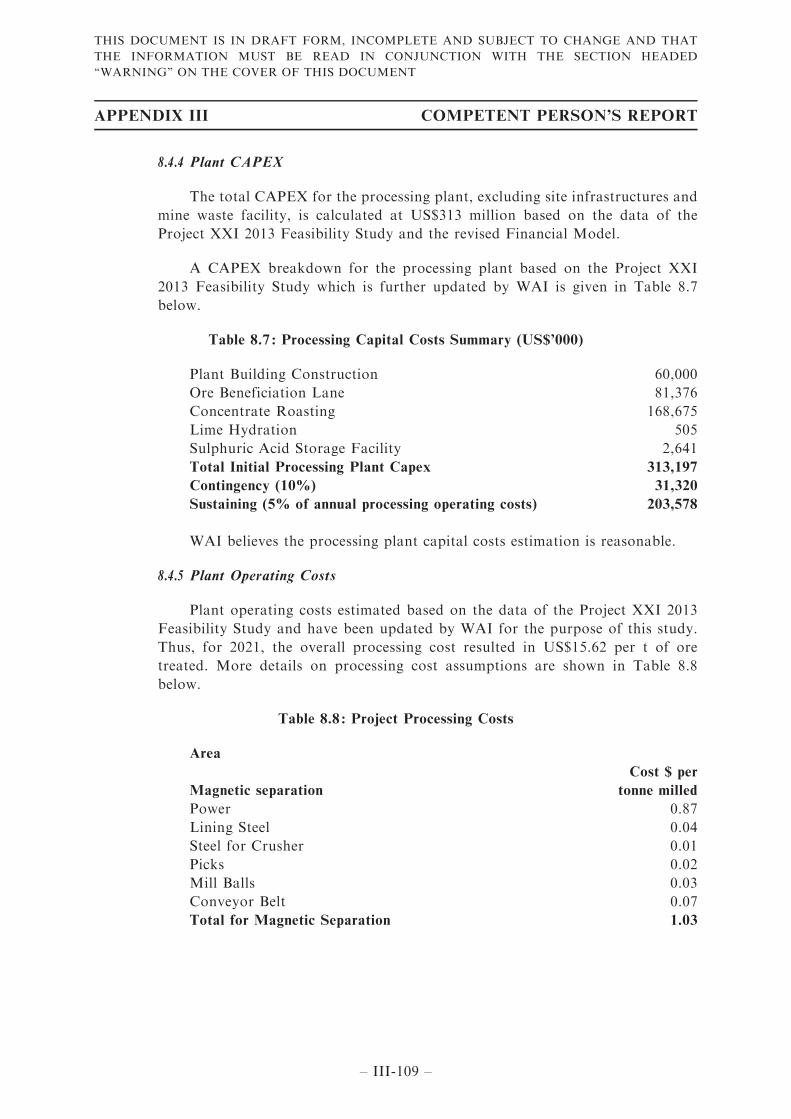
8.4.4 Plant CAPEX
The total CAPEX for the processing plant, excluding site infrastructures and
mine waste facility, is calculated at US$313 million based on the data of the
Project XXI 2013 Feasibility Study and the revised Financial Model.
A CAPEX breakdown for the processing plant based on the Project XXI
2013 Feasibility Study which is further updated by WAI is given in Table 8.7
below.
Table 8.7 : Processing Capital Costs Summary (US$’000)
Plant Building Construction 60,000
Ore Beneficiation Lane 81,376
Concentrate Roasting 168,675
Lime Hydration 505
Sulphuric Acid Storage Facility 2,641
Total Initial Processing Plant Capex 313,197
Contingency (10%) 31,320
Sustaining (5% of annual processing operating costs) 203,578
WAI believes the processing plant capital costs estimation is reasonable.
8.4.5 Plant Operating Costs
Plant operating costs estimated based on the data of the Project XXI 2013
Feasibility Study and have been updated by WAI for the purpose of this study.
Thus, for 2021, the overall processing cost resulted in US$15.62 per t of ore
treated. More details on processing cost assumptions are shown in Table 8.8
below.
Table 8.8 : Project Processing Costs
Area
Magnetic separation
Cost $ per
tonne milled
Power 0.87
Lining Steel 0.04
Steel for Crusher 0.01
Picks 0.02
Mill Balls 0.03
Conveyor Belt 0.07
Total for Magnetic Separation 1.03
APPENDIX III COMPETENT PERSON’S REPORT
– III-109 –
THIS DOCUMENT IS IN DRAFT FORM, INCOMPLETE AND SUBJECT TO CHANGE AND THAT
THE INFORMATION MUST BE READ IN CONJUNCTION WITH THE SECTION HEADED
‘‘WARNING’’ ON THE COVER OF THIS DOCUMENT
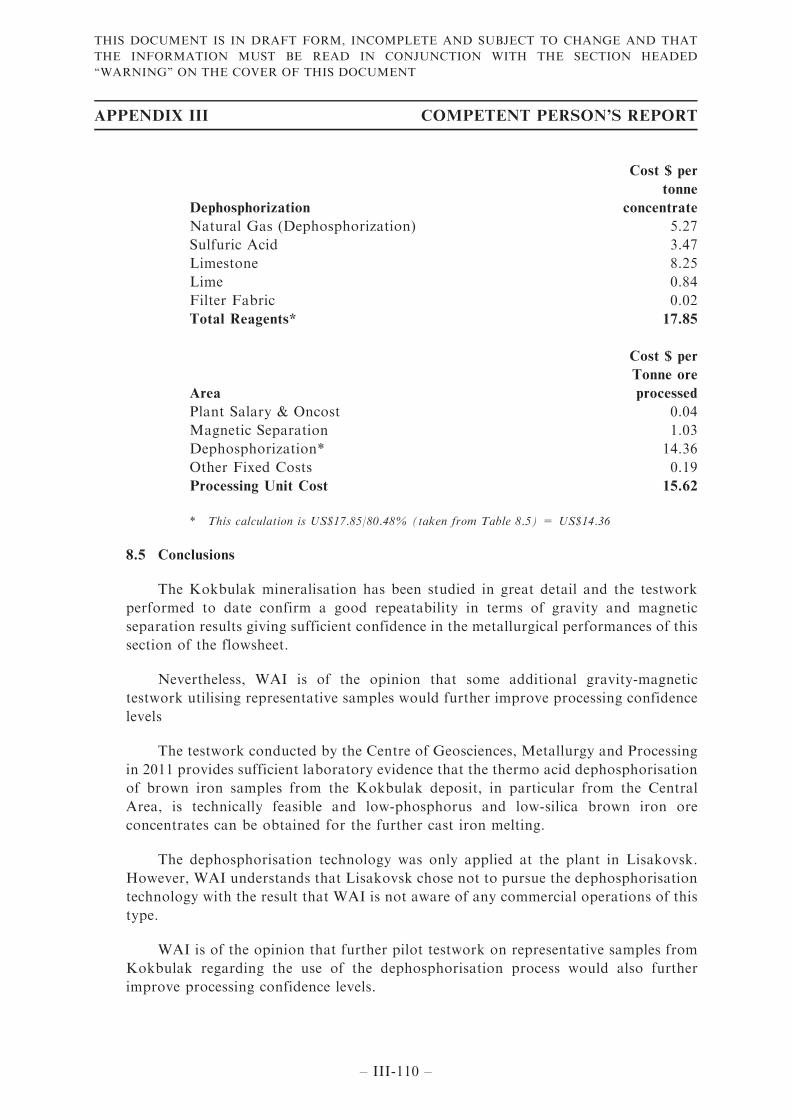
Dephosphorization
Cost $ per
tonne
concentrate
Natural Gas (Dephosphorization) 5.27
Sulfuric Acid 3.47
Limestone 8.25
Lime 0.84
Filter Fabric 0.02
Total Reagents* 17.85
Area
Cost $ per
Tonne ore
processed
Plant Salary & Oncost 0.04
Magnetic Separation 1.03
Dephosphorization* 14.36
Other Fixed Costs 0.19
Processing Unit Cost 15.62
* This calculation is US$17.85/80.48% (taken from Table 8.5) = US$14.36
8.5 Conclusions
The Kokbulak mineralisation has been studied in great detail and the testwork
performed to date confirm a good repeatability in terms of gravity and magnetic
separation results giving sufficient confidence in the metallurgical performances of this
section of the flowsheet.
Nevertheless, WAI is of the opinion that some additional gravity-magnetic
testwork utilising representative samples would further improve processing confidence
levels
The testwork conducted by the Centre of Geosciences, Metallurgy and Processing
in 2011 provides sufficient laboratory evidence that the thermo acid dephosphorisation
of brown iron samples from the Kokbulak deposit, in particular from the Central
Area, is technically feasible and low-phosphorus and low-silica brown iron ore
concentrates can be obtained for the further cast iron melting.
The dephosphorisation technology was only applied at the plant in Lisakovsk.
However, WAI understands that Lisakovsk chose not to pursue the dephosphorisation
technology with the result that WAI is not aware of any commercial operations of this
type.
WAI is of the opinion that further pilot testwork on representative samples from
Kokbulak regarding the use of the dephosphorisation process would also further
improve processing confidence levels.
APPENDIX III COMPETENT PERSON’S REPORT
– III-110 –
THIS DOCUMENT IS IN DRAFT FORM, INCOMPLETE AND SUBJECT TO CHANGE AND THAT
THE INFORMATION MUST BE READ IN CONJUNCTION WITH THE SECTION HEADED
‘‘WARNING’’ ON THE COVER OF THIS DOCUMENT
In addition, WAI is of the view that an iron ore concentrate grading 58.4% Fe
with a low level of impurities (P50.30%) is potentially achievable and hence saleable.
As stated in the Industry Report prepared by Ipsos Asia Limited for the purpose
of the listing of the Company on the Main Board of the Stock Exchange, such an Iron
ore concentrate with a phosphorous level<0.30%, is able to meet the technical
requirement in the Russian and PRC Markets to be potentially saleable.
The project appears to be more sensitive to plant OPEX rather than to plant
CAPEX and almost 85–90% of the plant OPEX is determined by four items — namely
power, natural gas, sulphuric acid and limestone — whose consumption is derived by
analogy from the Lisakovsk mine process plant and from industry standards.
9 ENVIRONMENT, SOCIAL, HEALTH & SAFETY
9.1 Introduction
This review of the environmental and social performance of the Kokbulak Iron
Ore Project is based on a brief site visit and reconnaissance, together with discussions
with staff of the Client. The following sections provide an overview of the Project and
the way that the company manages its health, safety, environmental and social
obligations.
Whilst WAI believes it has gained sufficient insight into the key issues and
performance, there may be additional information that was not seen, or variations in
interpretation of the available data that could not be explored further.
A site visit was undertaken on the 7th of September 2021. Documents and plans
provided by the company staff included:
. Environmental Impact Assessment (‘‘OVOS’’) section from Kokbulak
Mining Plan, Turebekova IE, 2021;
. Draft Mine Closure and Rehabilitation Plan, QAZTAUKEN Scientific
Design Institute LLP, 2021;
. Minutes of Public Consultation Meeting, 2021;
. State Approvals of Kobulak Mine Plan and a Draft Closure and
Rehabilitation Plan; and
. Exploration and Mining Contract for Subsoil, 2010
9.2 Environmental and Social Setting and Context
The environmental setting for the site has been previously described in Section 5
of this report, although it is worth elaborating on the water issue pertaining to the site
in a little more detail.
APPENDIX III COMPETENT PERSON’S REPORT
– III-111 –
THIS DOCUMENT IS IN DRAFT FORM, INCOMPLETE AND SUBJECT TO CHANGE AND THAT
THE INFORMATION MUST BE READ IN CONJUNCTION WITH THE SECTION HEADED
‘‘WARNING’’ ON THE COVER OF THIS DOCUMENT
The OVOS states there are no surface water courses in the deposit area as in
general, there is very limited water within the North Aral region. Ground water in the
area of the deposit is between 7–11m below surface, whilst within the proposed central
pit area, ground waters were observed between 0- 35m, and on the northern area site it
has depths of about 8–27.8m. There are gully pools near the Kokbulak spring and a
group of wells in Altynkazak gully which are preserved all year round.
Whilst there is a seasonal farm building near the property which uses borehole
water for cattle and drinking water, the low levels of water in the area of the deposit
means there is a potential issue with regards water supply. It is understood the current
plan considers three options for the mine potable water supply including abstracting
water from Oligocene sediments, from a confined aquifer of Saksaul and Tasaran
formations, and from Small Barsuki Sand Massif located 50km to the east of deposit.
Use of melt water and drainage wells water is suggested for technical waters supply.
For this purpose, construction of water collection dam is recommended in the
Sabyrzhilga valley.
Hydrogeological surveys and drilling are recommended to further assess the
quality and quantity of groundwater resources.
Studies on the aquifers were undertaken in the 1970–1980s by the local geological
committee, and it is thought this shows sufficient water for the projects’ needs. The
information provided by the Client with regards to groundwater resources availability
is presented in Table 9.1 below. More detailed information about water resources will
be available at the water use licence obtaining stage.
APPENDIX III COMPETENT PERSON’S REPORT
– III-112 –
THIS DOCUMENT IS IN DRAFT FORM, INCOMPLETE AND SUBJECT TO CHANGE AND THAT
THE INFORMATION MUST BE READ IN CONJUNCTION WITH THE SECTION HEADED
‘‘WARNING’’ ON THE COVER OF THIS DOCUMENT
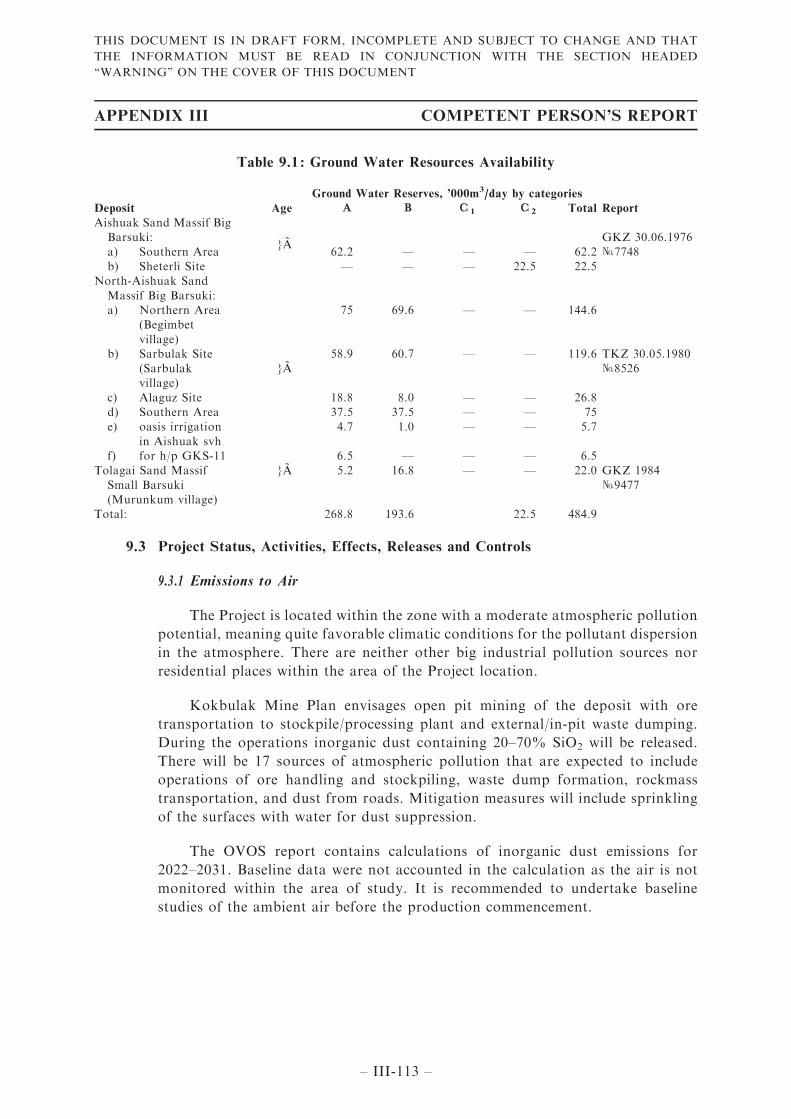
Table 9.1 : Ground Water Resources Availability
Deposit Age
Ground Water Reserves, ’000m3/day by categories
ReportА В С1 С2 Total
Aishuak Sand Massif BigBarsuki:
}AGKZ 30.06.1976
№7748a) Southern Area 62.2 — — — 62.2b) Sheterli Site — — — 22.5 22.5
North-Aishuak Sand
Massif Big Barsuki:
}ATKZ 30.05.1980№8526
a) Northern Area(Begimbet
village)
75 69.6 — — 144.6
b) Sarbulak Site(Sarbulakvillage)
58.9 60.7 — — 119.6
c) Alaguz Site 18.8 8.0 — — 26.8d) Southern Area 37.5 37.5 — — 75e) oasis irrigation
in Aishuak svh
4.7 1.0 — — 5.7
f) for h/p GKS-11 6.5 — — — 6.5Tolagai Sand Massif
Small Barsuki(Murunkum village)
}A 5.2 16.8 — — 22.0 GKZ 1984
№9477
Total: 268.8 193.6 22.5 484.9
9.3 Project Status, Activities, Effects, Releases and Controls
9.3.1 Emissions to Air
The Project is located within the zone with a moderate atmospheric pollution
potential, meaning quite favorable climatic conditions for the pollutant dispersion
in the atmosphere. There are neither other big industrial pollution sources nor
residential places within the area of the Project location.
Kokbulak Mine Plan envisages open pit mining of the deposit with ore
transportation to stockpile/processing plant and external/in-pit waste dumping.
During the operations inorganic dust containing 20–70% SiO2 will be released.
There will be 17 sources of atmospheric pollution that are expected to include
operations of ore handling and stockpiling, waste dump formation, rockmass
transportation, and dust from roads. Mitigation measures will include sprinkling
of the surfaces with water for dust suppression.
The OVOS report contains calculations of inorganic dust emissions for
2022–2031. Baseline data were not accounted in the calculation as the air is not
monitored within the area of study. It is recommended to undertake baseline
studies of the ambient air before the production commencement.
APPENDIX III COMPETENT PERSON’S REPORT
– III-113 –
THIS DOCUMENT IS IN DRAFT FORM, INCOMPLETE AND SUBJECT TO CHANGE AND THAT
THE INFORMATION MUST BE READ IN CONJUNCTION WITH THE SECTION HEADED
‘‘WARNING’’ ON THE COVER OF THIS DOCUMENT
9.3.2 Water Management
Potential sources of water impact will include abstraction of fresh water for
drinking, technical, and fire-fighting needs and discharge of domestic wastewater,
rainwater, technical and pit waters generated during the operation of the mine
facilities. Planned measures to control and mitigate the impact include drilling of
five monitoring wells and interception of surface run-off to prevent inflow into the
open pit.
The importance of water to the operation cannot be overemphasised and it is
therefore recommended that an updated hydrogeological investigation covering
the groundwater regime including quantity and quality, is undertaken in the area
of abstraction to include an impact study to determine the potential impacts of
abstraction volumes required for the project.
9.3.3 Mine Waste
Mine waste will include host and overburden rock. At the first stage of the
deposit development, overburden material will be used for filling the grounds for
the construction of the processing plant, field camp, and roads. Some overburden
will be used to construct a barrier along the eastern pit wall to prevent the surface
runoff inflow into the open pit. At the initial stage, this barrier will be used as an
external waste dump. At the later stages, waste will be dumped into the mined-out
areas.
9.3.4 Waste Management
According to the Environmental Code and other environmental regulations
of the Republic of Kazakhstan, all production and domestic wastes must be
collected, stored, treated, transported, and disposed of with due cognisance of
their potential environmental impact. According to p. 3–1 of Art. 288 of the
Environmental Code, waste can be temporarily kept in special containers
(bunkers, containers, pads, spaces for collection and accumulation) for 6
months maximum and then removed from the site under agreements with
specialised services.
APPENDIX III COMPETENT PERSON’S REPORT
– III-114 –
THIS DOCUMENT IS IN DRAFT FORM, INCOMPLETE AND SUBJECT TO CHANGE AND THAT
THE INFORMATION MUST BE READ IN CONJUNCTION WITH THE SECTION HEADED
‘‘WARNING’’ ON THE COVER OF THIS DOCUMENT
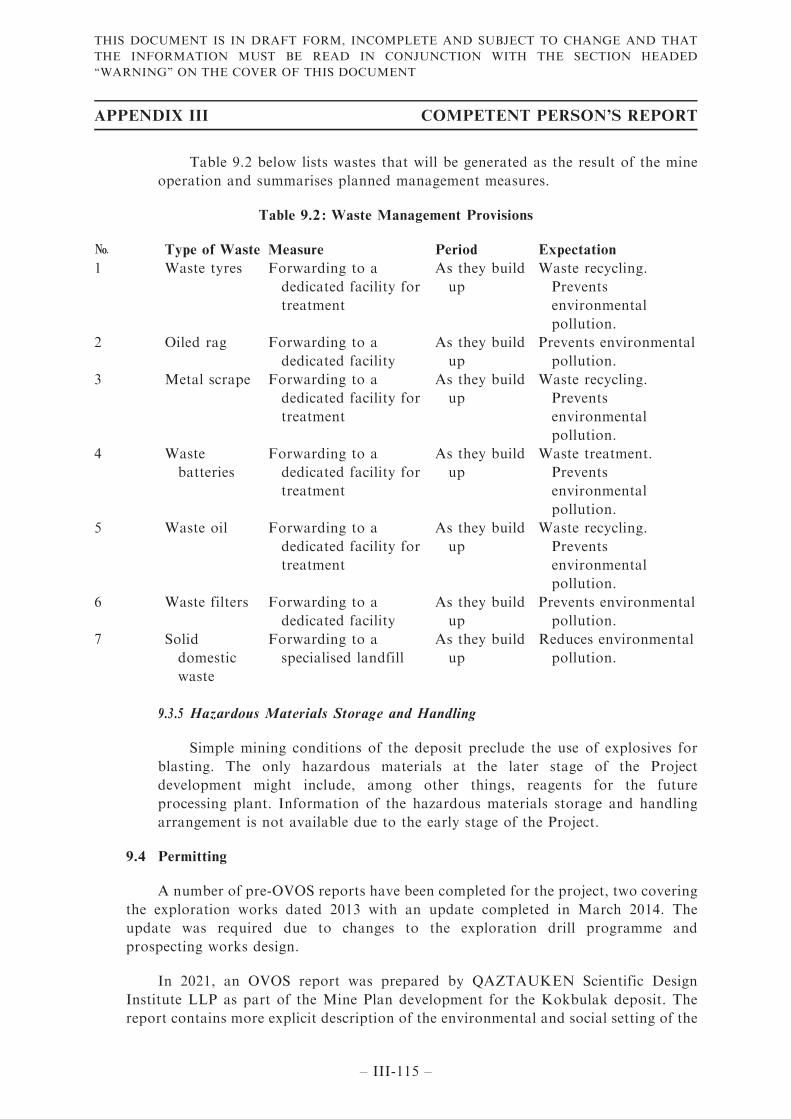
Table 9.2 below lists wastes that will be generated as the result of the mine
operation and summarises planned management measures.
Table 9.2 : Waste Management Provisions
№ Type of Waste Measure Period Expectation
1 Waste tyres Forwarding to a
dedicated facility for
treatment
As they build
up
Waste recycling.
Prevents
environmental
pollution.
2 Oiled rag Forwarding to a
dedicated facility
As they build
up
Prevents environmental
pollution.
3 Metal scrape Forwarding to a
dedicated facility for
treatment
As they build
up
Waste recycling.
Prevents
environmental
pollution.
4 Waste
batteries
Forwarding to a
dedicated facility for
treatment
As they build
up
Waste treatment.
Prevents
environmental
pollution.
5 Waste oil Forwarding to a
dedicated facility for
treatment
As they build
up
Waste recycling.
Prevents
environmental
pollution.
6 Waste filters Forwarding to a
dedicated facility
As they build
up
Prevents environmental
pollution.
7 Solid
domestic
waste
Forwarding to a
specialised landfill
As they build
up
Reduces environmental
pollution.
9.3.5 Hazardous Materials Storage and Handling
Simple mining conditions of the deposit preclude the use of explosives for
blasting. The only hazardous materials at the later stage of the Project
development might include, among other things, reagents for the future
processing plant. Information of the hazardous materials storage and handling
arrangement is not available due to the early stage of the Project.
9.4 Permitting
A number of pre-OVOS reports have been completed for the project, two covering
the exploration works dated 2013 with an update completed in March 2014. The
update was required due to changes to the exploration drill programme and
prospecting works design.
In 2021, an OVOS report was prepared by QAZTAUKEN Scientific Design
Institute LLP as part of the Mine Plan development for the Kokbulak deposit. The
report contains more explicit description of the environmental and social setting of the
APPENDIX III COMPETENT PERSON’S REPORT
– III-115 –
THIS DOCUMENT IS IN DRAFT FORM, INCOMPLETE AND SUBJECT TO CHANGE AND THAT
THE INFORMATION MUST BE READ IN CONJUNCTION WITH THE SECTION HEADED
‘‘WARNING’’ ON THE COVER OF THIS DOCUMENT
deposit area compared to the pre-OVOS. However, it seems that no baseline studies of
air, water and soils have been conducted for the Project so far. Appropriate
recommendations are made in the OVOS report with regards to the baseline studies
to be completed before commencement of the production. According to the
conclusions made in the report, in general the Project will have an insignificant
environmental impact and a quite positive social and economic effect.
WAI is of the opinion based on the information provided that the Project is in
compliance with its environmental obligations to date. No incidence of
non-compliance was reported for the property. The Client has shown a commitment
to satisfying Kazakh requirements and laws at this stage.
In addition to the Kazakh OVOS requirements, should the company require
international funding, it is recommended that an internationally compliant ESIA
document is completed for IFC and Equator Principle compliance.
Data that are usually contained in an OVOS report are largely sufficient to
provide a preliminary evaluation of the project’s impact on the environment and
evaluate the project setting for potentially significant environmental constraints. Some
gaps to international standards exist, and some additional studies will be needed
namely:
. Geochemistry;
. Soils;
. Hydrology and hydrogeology;
. Cultural heritage and archaeology;
. Socioeconomic baseline — stakeholder mapping;
. Biodiversity and ecosystem services;
. Climate and Energy Use;
. Air Quality; and
. Noise and vibrations.
9.5 Environmental Management
The OVOS report discusses the requirements to the programme of an industrial
environmental control that must be conducted at the operational stage of the Project.
It includes monitoring of surface and groundwater quality, emissions, and air quality
monitoring, soil quality monitoring, and monitoring of radiation and physical impact
factors. Environmental samples shall be analysed by an accredited laboratory. Apart
APPENDIX III COMPETENT PERSON’S REPORT
– III-116 –
THIS DOCUMENT IS IN DRAFT FORM, INCOMPLETE AND SUBJECT TO CHANGE AND THAT
THE INFORMATION MUST BE READ IN CONJUNCTION WITH THE SECTION HEADED
‘‘WARNING’’ ON THE COVER OF THIS DOCUMENT
from industrial control of an environmental media, the Project shall also control and
report volumes of emissions, water consumption and waste generation and disposal
rates. This will be a responsibility of an environmental manager.
WAI recommends that the Client employs a dedicated environmental manager
engaged at the Kokbulak Iron Ore Project to provide for ongoing day to day
management, control and reporting of environmental issues at the sites.
At present the Project does not hold any formalised environmental, social and
health and safety management systems or policies. The Project is in a development
stage and as such these will be formulated as the Project progresses.
9.6 Social and Community Management
The number of employees expected at the site is unknown at this time, although it
is likely to be >>100 persons. It is expected that a large number of these will be from
the local area.
The remoteness of the project some 100km from the nearest settlement would
indicate the project is a low risk with regards social impacts. However, a social impact
assessment is essential to assess the project.
It is recommended that the social baseline collection and subsequent impact
assessment should be run in conjunction with the environmental baseline.
9.7 Mine Closure and Rehabilitation
In June 2018, a new Subsoil Use Code of the Republic of Kazakhstan took force
stipulating new requirements to mine closure and rehabilitation and bringing them
closer in line with the international standards. Under these new requirements, a
formalised Mine Closure Plan is required to obtain a Production Licence i.e. at the
very beginning of the project implementation. A Mine Closure Plan will be a basis for a
Mine Closure Design that should be developed not later than two years before the
licence expiry date. Mine closure and rehabilitation are supposed to be implemented in
accordance with this Design.
As per the new requirements a Draft Mine Closure Plan for Kokbulak was
prepared in 2021 by QAZTAUKEN Scientific Design Institute LLC. The Draft Plan
was prepared as an Appendix to the Production Licence application and approved by
the Ministry of Industry and Infrastructure Development in March 2021 as evidenced
by the provided Expertise Conclusion. Later, it will be developed into a full plan in line
with the provisions of the mine closure planning guidance approved by the order 386 of
the Minister for Investments and Development of the Republic of Kazakhstan. The
guidance covers such important components of the closure process as the reclamation
of disturbed soil from Project activities with a due cognisance paid to acid rock
drainage and metal leaching aspects, financial provisions, and post-closure period
monitoring.
APPENDIX III COMPETENT PERSON’S REPORT
– III-117 –
THIS DOCUMENT IS IN DRAFT FORM, INCOMPLETE AND SUBJECT TO CHANGE AND THAT
THE INFORMATION MUST BE READ IN CONJUNCTION WITH THE SECTION HEADED
‘‘WARNING’’ ON THE COVER OF THIS DOCUMENT
The current Draft Plan covers preliminary closure and reclamation concept of the
designed open pit and waste dump with estimation of required expenditures. It was
discussed in the course of public consultations that took place in Begimbet village on
10.02.2021 according to the provided minutes of meeting. The minutes include a
description of the case at hand as well as a report from the question- and-answer
session. The public consultation attendees included local Akim, few community
leaders, and workers from other job sectors. The reviewed document suggests that the
community has no concerns with regard to the proposed closure and reclamation
activities.
As for the financial provision of the closure and rehabilitation, according to
paragraph 20.5 of Addendum No. 3 to the Contract, deductions to the abandonment
fund amount to 1% of the cost of geological exploration work and are to be transferred
by the Subsoil User to a special account. Deductions to the abandonment fund during
the production period will be approved by the Competent Body when signing an
Addendum for transition to production.
9.8 Conclusions
To date, the Kokbulak Project is compliant with the terms of subsoil use rights
(SSU Contract/Exploration Licence). Whilst the Project will affect the environment,
due to the distance from the nearest settlement and any sensitive receptors,
environmental and social conditions are considered favourable for the Project.
As the project develops, the Company must undertake an Environmental and
Social scoping study and subsequent impact assessment to highlight any sensitive
receptors and to determine any impacts requiring mitigation.
The importance of water to the operation cannot be over-emphasised and it is
therefore recommended that an updated hydrogeological investigation covering the
groundwater regime including quantity and quality, is undertaken in the area of
abstraction to include an impact study to determine the potential impacts of
abstraction volumes required for the project.
WAI recommends that the Company adopt, and make public, procedures and
instruments for the management of environmental, social and health and safety issues
and apply relevant national laws and regulations as well as international best practice
guidelines for the necessary management, control and reporting.
Furthermore, WAI recommends instigating an Environmental & Social Action
Plan the details of which are provided in Table 9.3 below.
APPENDIX III COMPETENT PERSON’S REPORT
– III-118 –
THIS DOCUMENT IS IN DRAFT FORM, INCOMPLETE AND SUBJECT TO CHANGE AND THAT
THE INFORMATION MUST BE READ IN CONJUNCTION WITH THE SECTION HEADED
‘‘WARNING’’ ON THE COVER OF THIS DOCUMENT
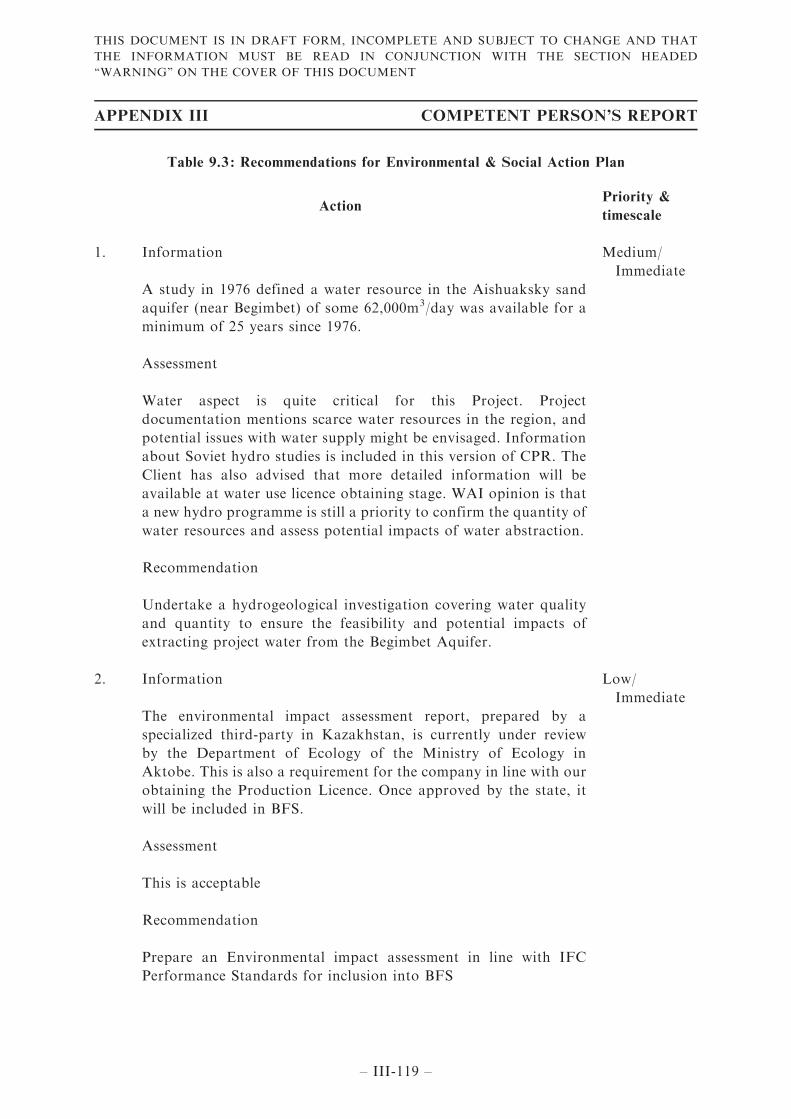
Table 9.3 : Recommendations for Environmental & Social Action Plan
ActionPriority &
timescale
1. Information Medium/
Immediate
A study in 1976 defined a water resource in the Aishuaksky sand
aquifer (near Begimbet) of some 62,000m3/day was available for a
minimum of 25 years since 1976.
Assessment
Water aspect is quite critical for this Project. Project
documentation mentions scarce water resources in the region, and
potential issues with water supply might be envisaged. Information
about Soviet hydro studies is included in this version of CPR. The
Client has also advised that more detailed information will be
available at water use licence obtaining stage. WAI opinion is that
a new hydro programme is still a priority to confirm the quantity of
water resources and assess potential impacts of water abstraction.
Recommendation
Undertake a hydrogeological investigation covering water quality
and quantity to ensure the feasibility and potential impacts of
extracting project water from the Begimbet Aquifer.
2. Information
The environmental impact assessment report, prepared by a
specialized third-party in Kazakhstan, is currently under review
by the Department of Ecology of the Ministry of Ecology in
Aktobe. This is also a requirement for the company in line with our
obtaining the Production Licence. Once approved by the state, it
will be included in BFS.
Assessment
This is acceptable
Recommendation
Prepare an Environmental impact assessment in line with IFC
Performance Standards for inclusion into BFS
Low/
Immediate
APPENDIX III COMPETENT PERSON’S REPORT
– III-119 –
THIS DOCUMENT IS IN DRAFT FORM, INCOMPLETE AND SUBJECT TO CHANGE AND THAT
THE INFORMATION MUST BE READ IN CONJUNCTION WITH THE SECTION HEADED
‘‘WARNING’’ ON THE COVER OF THIS DOCUMENT
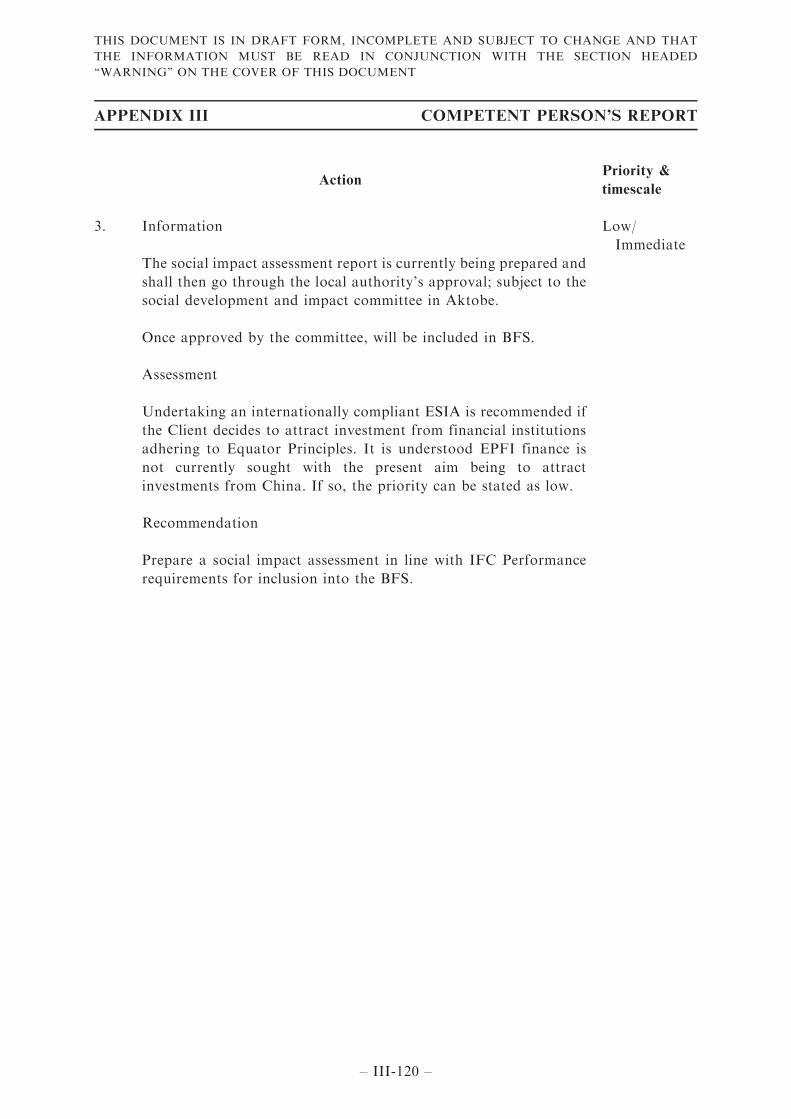
ActionPriority &
timescale
3. Information
The social impact assessment report is currently being prepared and
shall then go through the local authority’s approval; subject to the
social development and impact committee in Aktobe.
Once approved by the committee, will be included in BFS.
Assessment
Undertaking an internationally compliant ESIA is recommended if
the Client decides to attract investment from financial institutions
adhering to Equator Principles. It is understood EPFI finance is
not currently sought with the present aim being to attract
investments from China. If so, the priority can be stated as low.
Recommendation
Prepare a social impact assessment in line with IFC Performance
requirements for inclusion into the BFS.
Low/
Immediate
APPENDIX III COMPETENT PERSON’S REPORT
– III-120 –
THIS DOCUMENT IS IN DRAFT FORM, INCOMPLETE AND SUBJECT TO CHANGE AND THAT
THE INFORMATION MUST BE READ IN CONJUNCTION WITH THE SECTION HEADED
‘‘WARNING’’ ON THE COVER OF THIS DOCUMENT
ActionPriority &
timescale
4. Information
In line with the HKSE listing requirements, Kazakh Steel PLC has
engaged a professional party to prepare an internal control report.
The report will consist of the assessment of current company
policies and systems on environmental and social management, as
well as recommendations going forward. The report will be part of
the document. As the company develops and moves into the mining
stage, the Environmental and Social Management Systems will get
more detailed and get broader implementation within the company.
Assessment
This is considered acceptable
Recommendation
Prepare an overarching, company-wide Environmental and Social
Management System to incorporate the following elements:
Low/
Immediate
. Policy;
. Identification of risks and impacts;
. Management programmes;
. Organizational capacity and competency;
. Emergency preparedness and response;
. Stakeholder Engagement; and Monitoring and Review.
10 FINANCIAL ANALYSIS
10.1 Introduction
WAI has reviewed the financial model developed by KAZAKH STEEL PLC for
the operation of Central Area of the Kokbulak Iron Ore Project which is based on the
Project XXI 2013 Feasibility Study with major updates including (i) updated mining
schedule prepared by WAI according to the latest open-pit optimisation results and (ii)
updated economic parameters such as iron ore concentrate price, CAPEX and OPEX.
From this, a financial analysis for the operation of Central Area of the Kokbulak
Iron Ore Project was performed using a Discounted Cash Flow (‘‘DCF’’) analysis, from
which the post-tax Net Present Value (‘‘NPV’’), Internal Rate of Return (‘‘IRR’’),
payback period and other measures of project viability were determined.
APPENDIX III COMPETENT PERSON’S REPORT
– III-121 –
THIS DOCUMENT IS IN DRAFT FORM, INCOMPLETE AND SUBJECT TO CHANGE AND THAT
THE INFORMATION MUST BE READ IN CONJUNCTION WITH THE SECTION HEADED
‘‘WARNING’’ ON THE COVER OF THIS DOCUMENT
In general, the model assumes a mine schedule with a production rate of
approximately 24Mtpa of ore at an average grade of around 39% Fe over a mine life of
15 years, or 14.8Mtpa of concentrate grading 58.4% Fe using a long-term price of
US$100/t for 62% Fe concentrate (or US$94/t for 58.4% Fe concentrate).
Assessments of NPV are generally accepted within the mining industry as
representing the economic value of a project after allowing for the cost of capital
invested. WAI has not completed any financial analysis using the Northern Area and
Southern Area as the MRE is only at the Inferred level, and as such more works are
required before such a study could be completed.
10.2 DCF Model
Given the level of study, WAI believes this to be a reasonable reflection on the
likely CAPEX that might be involved in the operation of Central Area of the Kokbulak
Iron Ore Project, particularly given the new infrastructure already constructed in the
area.
Life of Mine capital investments are shown in Table 10.2 below.
On the basis of the mine schedule developed by WAI, the CAPEX and OPEX,
revenue and taxes, the Client has undertaken a DCF Analysis that shows that at a 10%
Discount rate, the Project has an NPV of US$2.3 billion, with a payback of only 2
years, following first year of the concentrate production.
It is important to note that the purpose of the analysis is only to demonstrate the
economic viability of the Central Area of the Kokbulak Iron Ore Project. The derived
NPV do not indicate the fair market values of the Central Area of the Kokbulak Iron
Ore Project.
The majority of operating costs are informed by the production costs shown in
Table 10.1 below and shown graphically as percentages in Figure 10.1.
Table 10.1 : Project Production Costs
US$/t
conc. sold US$ M
Mineral Extraction Tax (‘‘MET’’) 2.6 550
Shipping 15.0 3,130
Mining 2.1 445
Processing 29.1 6,074
Cash Cost 48.8 10,199
G&A 1.0 217
Total Cash Cost 49.8 10,416
Capital Expenditure (sustaining) 1.32 275
All-in Sustaining Cost (AISC) 51.1 10,691
APPENDIX III COMPETENT PERSON’S REPORT
– III-122 –
THIS DOCUMENT IS IN DRAFT FORM, INCOMPLETE AND SUBJECT TO CHANGE AND THAT
THE INFORMATION MUST BE READ IN CONJUNCTION WITH THE SECTION HEADED
‘‘WARNING’’ ON THE COVER OF THIS DOCUMENT
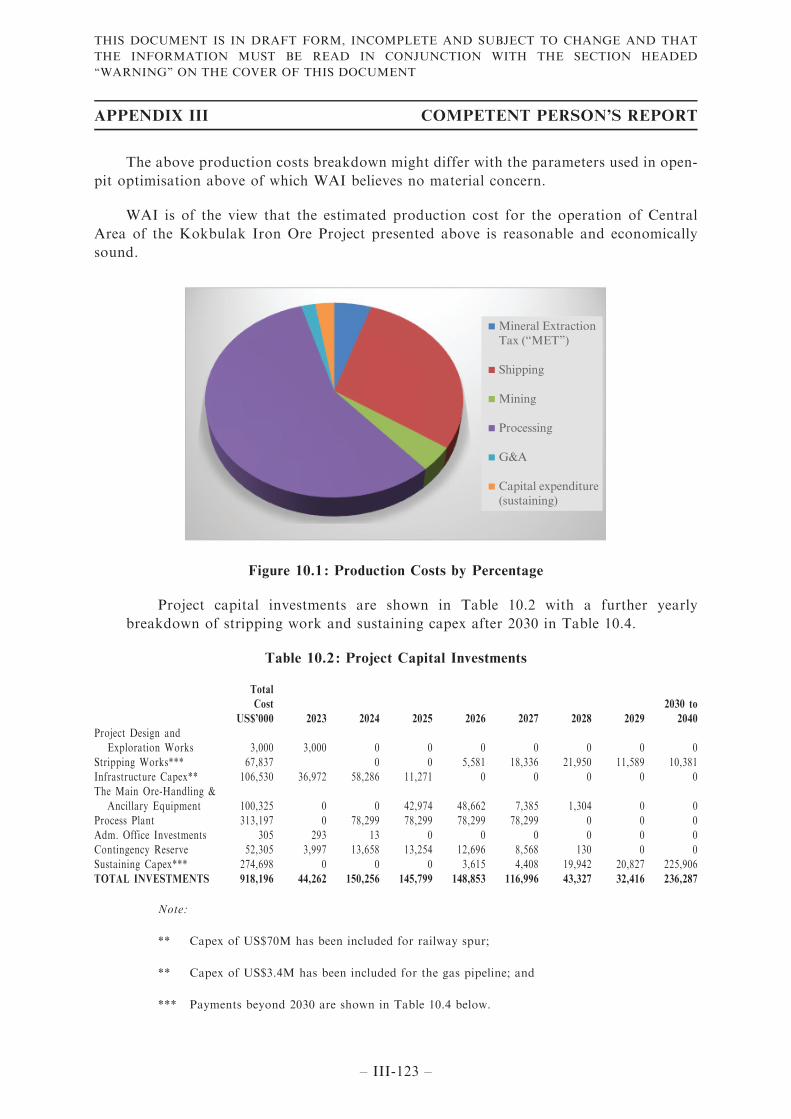
The above production costs breakdown might differ with the parameters used in open-
pit optimisation above of which WAI believes no material concern.
WAI is of the view that the estimated production cost for the operation of Central
Area of the Kokbulak Iron Ore Project presented above is reasonable and economically
sound.
Mineral ExtractionTax (“MET”)
Shipping
Mining
Processing
G&A
Capital expenditure(sustaining)
Figure 10.1 : Production Costs by Percentage
Project capital investments are shown in Table 10.2 with a further yearly
breakdown of stripping work and sustaining capex after 2030 in Table 10.4.
Table 10.2 : Project Capital Investments
Total
Cost
US$’000 2023 2024 2025 2026 2027 2028 2029
2030 to
2040
Project Design andExploration Works 3,000 3,000 0 0 0 0 0 0 0
Stripping Works*** 67,837 0 0 5,581 18,336 21,950 11,589 10,381Infrastructure Capex** 106,530 36,972 58,286 11,271 0 0 0 0 0The Main Ore-Handling &
Ancillary Equipment 100,325 0 0 42,974 48,662 7,385 1,304 0 0Process Plant 313,197 0 78,299 78,299 78,299 78,299 0 0 0Adm. Office Investments 305 293 13 0 0 0 0 0 0Contingency Reserve 52,305 3,997 13,658 13,254 12,696 8,568 130 0 0
Sustaining Capex*** 274,698 0 0 0 3,615 4,408 19,942 20,827 225,906TOTAL INVESTMENTS 918,196 44,262 150,256 145,799 148,853 116,996 43,327 32,416 236,287
Note:
** Capex of US$70M has been included for railway spur;
** Capex of US$3.4M has been included for the gas pipeline; and
*** Payments beyond 2030 are shown in Table 10.4 below.
APPENDIX III COMPETENT PERSON’S REPORT
– III-123 –
THIS DOCUMENT IS IN DRAFT FORM, INCOMPLETE AND SUBJECT TO CHANGE AND THAT
THE INFORMATION MUST BE READ IN CONJUNCTION WITH THE SECTION HEADED
‘‘WARNING’’ ON THE COVER OF THIS DOCUMENT
Apparent errors may occur due to rounding
See detail below regarding the Infrastructure Capex in Table 10.3.
Table 10.3 : Infrastructure Capex
Item
Total per
unit, VAT
free, $’000
Power Supply 13,300
Water Supply 7,900
Gas Supply 3,400
Construction of Rail Road (70 km) 70,000
Communications, Video Surveillance System and Computerization 270
Construction of Roads 980
Tailings 7,000
Ancillary Facilities 520
Field Camp 3,160
Total 106,530
Table 10.4 : Sustaining Capital Costs for 2030 to 2040
Item
Total
Cost
US$’000 2030 2031 2032 2033 2034 2035 2036 2037 2038 2039 2040
Stripping Works 10,380 0 0 0 5,224 5,156 0 0 0 0 0 0
Sustaining Capex 225,906 21,553 21,042 20,773 20,498 20,430 20,473 20,269 20,386 20,384 20,420 19,678
Total Investments 236,286 21,553 21,042 20,773 25,722 25,587 20,473 20,269 20,386 20,384 20,420 19,678
WAI is of the view that the estimated CAPEX for the operation of Central Area of
the Kokbulak Iron Ore Project presented above is believed to be economically sound.
APPENDIX III COMPETENT PERSON’S REPORT
– III-124 –
THIS DOCUMENT IS IN DRAFT FORM, INCOMPLETE AND SUBJECT TO CHANGE AND THAT
THE INFORMATION MUST BE READ IN CONJUNCTION WITH THE SECTION HEADED
‘‘WARNING’’ ON THE COVER OF THIS DOCUMENT
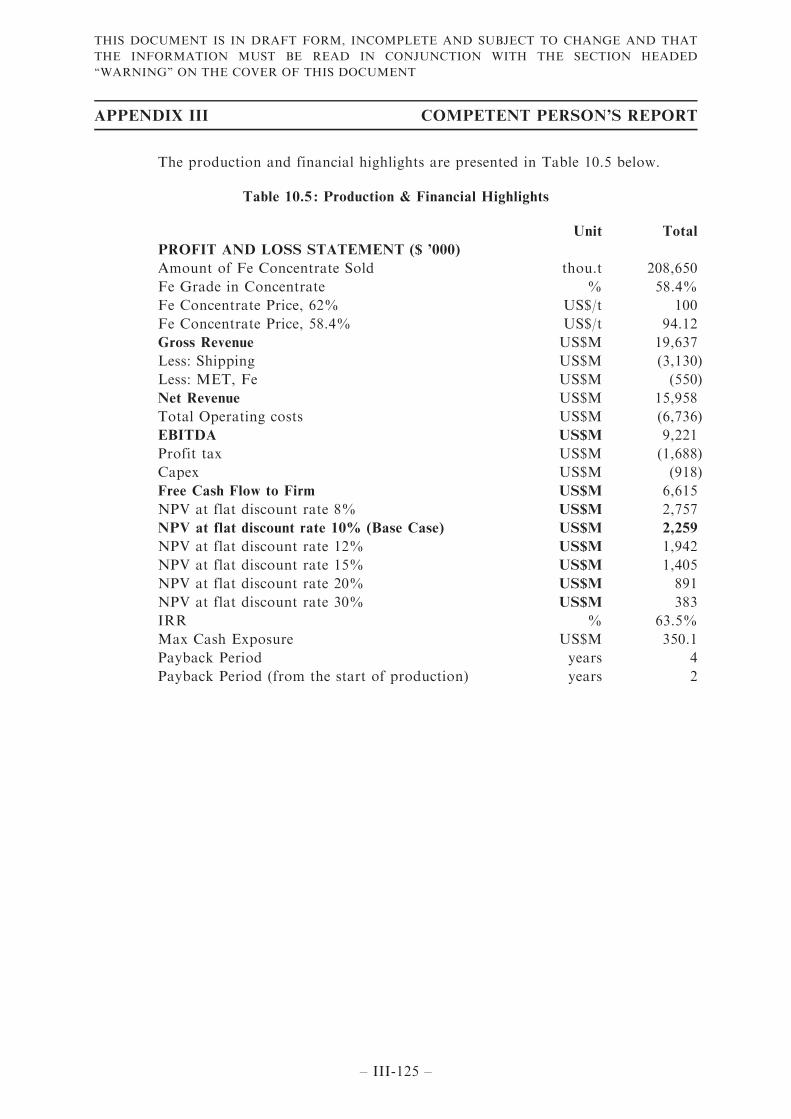
The production and financial highlights are presented in Table 10.5 below.
Table 10.5 : Production & Financial Highlights
Unit Total
PROFIT AND LOSS STATEMENT ($ ’000)
Amount of Fe Concentrate Sold thou.t 208,650
Fe Grade in Concentrate % 58.4%
Fe Concentrate Price, 62% US$/t 100
Fe Concentrate Price, 58.4% US$/t 94.12
Gross Revenue US$M 19,637
Less: Shipping US$M (3,130)
Less: MET, Fe US$M (550)
Net Revenue US$M 15,958
Total Operating costs US$M (6,736)
EBITDA US$M 9,221
Profit tax US$M (1,688)
Capex US$M (918)
Free Cash Flow to Firm US$M 6,615
NPV at flat discount rate 8% US$M 2,757
NPV at flat discount rate 10% (Base Case) US$M 2,259
NPV at flat discount rate 12% US$M 1,942
NPV at flat discount rate 15% US$M 1,405
NPV at flat discount rate 20% US$M 891
NPV at flat discount rate 30% US$M 383
IRR % 63.5%
Max Cash Exposure US$M 350.1
Payback Period years 4
Payback Period (from the start of production) years 2
APPENDIX III COMPETENT PERSON’S REPORT
– III-125 –
THIS DOCUMENT IS IN DRAFT FORM, INCOMPLETE AND SUBJECT TO CHANGE AND THAT
THE INFORMATION MUST BE READ IN CONJUNCTION WITH THE SECTION HEADED
‘‘WARNING’’ ON THE COVER OF THIS DOCUMENT
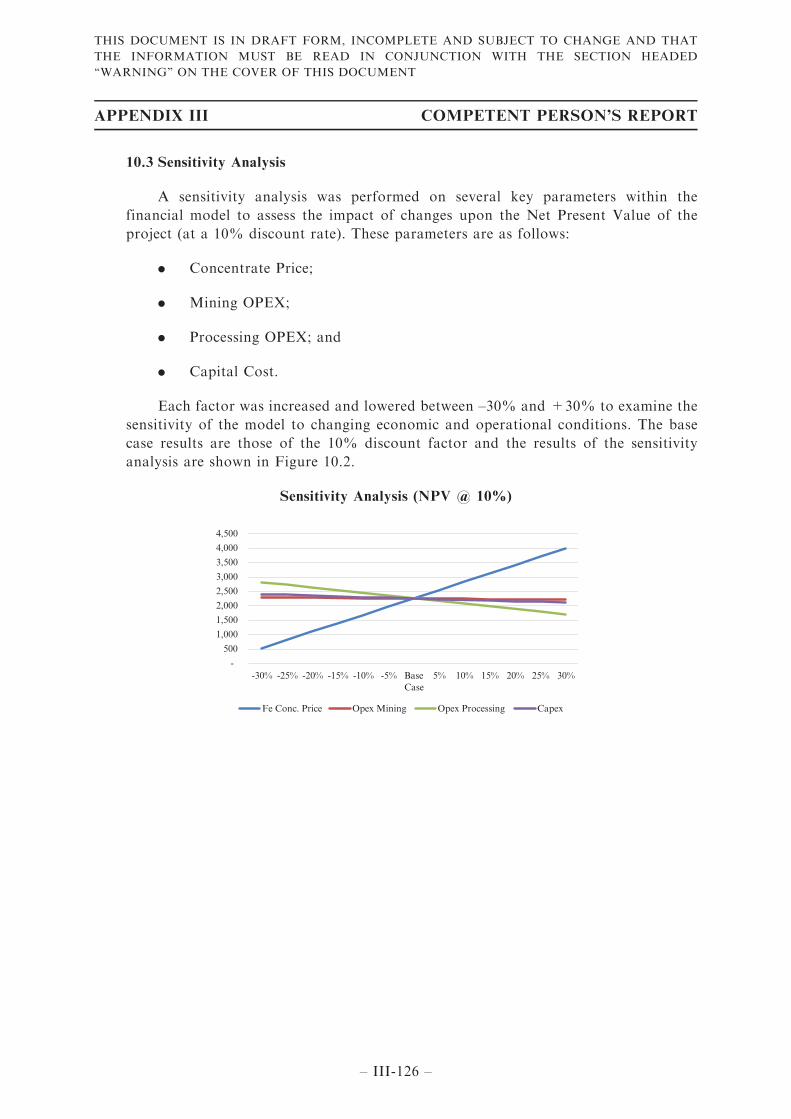
10.3 Sensitivity Analysis
A sensitivity analysis was performed on several key parameters within the
financial model to assess the impact of changes upon the Net Present Value of the
project (at a 10% discount rate). These parameters are as follows:
. Concentrate Price;
. Mining OPEX;
. Processing OPEX; and
. Capital Cost.
Each factor was increased and lowered between –30% and +30% to examine the
sensitivity of the model to changing economic and operational conditions. The base
case results are those of the 10% discount factor and the results of the sensitivity
analysis are shown in Figure 10.2.
Sensitivity Analysis (NPV @ 10%)
-
500
1,000
1,500
2,000
2,500
3,000
3,500
4,000
4,500
-30% -25% -20% -15% -10% -5% BaseCase
5% 10% 15% 20% 25% 30%
Fe Conc. Price Opex Mining Opex Processing Capex
APPENDIX III COMPETENT PERSON’S REPORT
– III-126 –
THIS DOCUMENT IS IN DRAFT FORM, INCOMPLETE AND SUBJECT TO CHANGE AND THAT
THE INFORMATION MUST BE READ IN CONJUNCTION WITH THE SECTION HEADED
‘‘WARNING’’ ON THE COVER OF THIS DOCUMENT
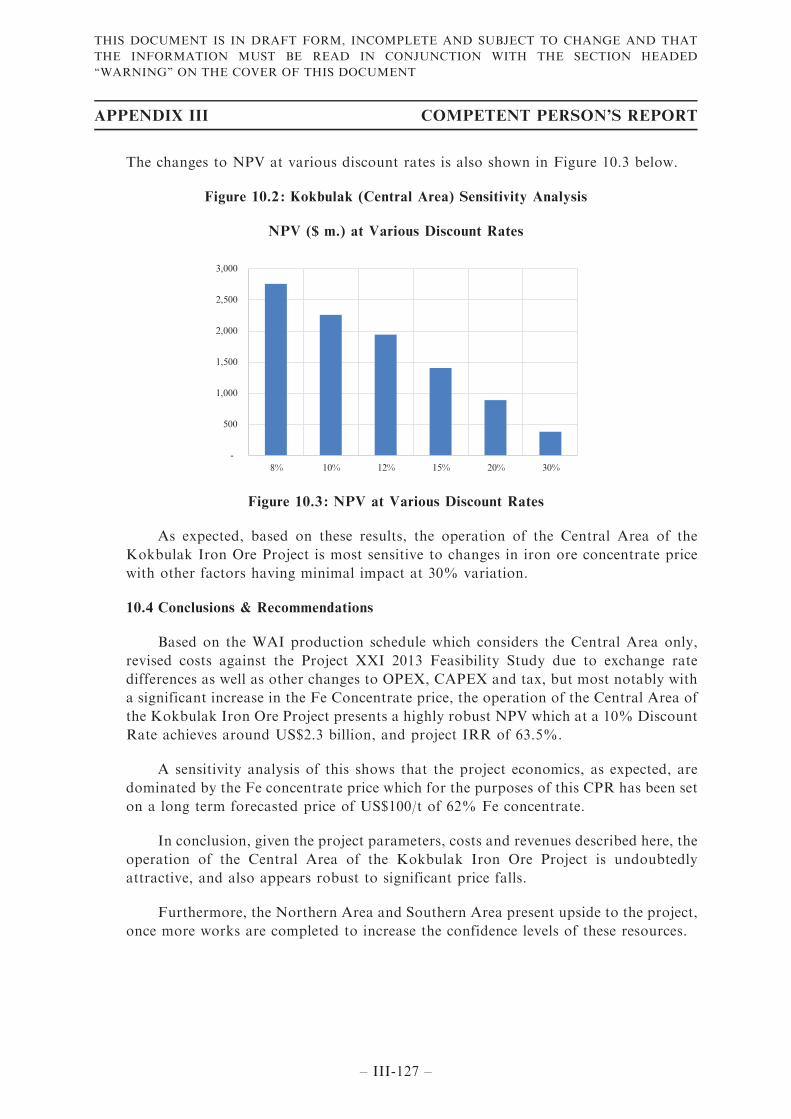
The changes to NPV at various discount rates is also shown in Figure 10.3 below.
Figure 10.2 : Kokbulak (Central Area) Sensitivity Analysis
NPV ($ m.) at Various Discount Rates
-
500
1,000
1,500
2,000
2,500
3,000
8% 10% 12% 15% 20% 30%
Figure 10.3 : NPV at Various Discount Rates
As expected, based on these results, the operation of the Central Area of the
Kokbulak Iron Ore Project is most sensitive to changes in iron ore concentrate price
with other factors having minimal impact at 30% variation.
10.4 Conclusions & Recommendations
Based on the WAI production schedule which considers the Central Area only,
revised costs against the Project XXI 2013 Feasibility Study due to exchange rate
differences as well as other changes to OPEX, CAPEX and tax, but most notably with
a significant increase in the Fe Concentrate price, the operation of the Central Area of
the Kokbulak Iron Ore Project presents a highly robust NPV which at a 10% Discount
Rate achieves around US$2.3 billion, and project IRR of 63.5%.
A sensitivity analysis of this shows that the project economics, as expected, are
dominated by the Fe concentrate price which for the purposes of this CPR has been set
on a long term forecasted price of US$100/t of 62% Fe concentrate.
In conclusion, given the project parameters, costs and revenues described here, the
operation of the Central Area of the Kokbulak Iron Ore Project is undoubtedly
attractive, and also appears robust to significant price falls.
Furthermore, the Northern Area and Southern Area present upside to the project,
once more works are completed to increase the confidence levels of these resources.
APPENDIX III COMPETENT PERSON’S REPORT
– III-127 –
THIS DOCUMENT IS IN DRAFT FORM, INCOMPLETE AND SUBJECT TO CHANGE AND THAT
THE INFORMATION MUST BE READ IN CONJUNCTION WITH THE SECTION HEADED
‘‘WARNING’’ ON THE COVER OF THIS DOCUMENT
11 RISKS ASSOCIATED WITH THE KAZAKH STEEL PLC KOKBULAK IRON ORE
PROJECT
The specific risk of the Project has been classified as follow:
Major The factor poses an immediate danger of a failure, which if uncorrected,
will have a material effect (>15% to 20%) on the project cash flow and
performance and could potentially lead to project failure.
Moderate The factor, if uncorrected, could have a significant effect (10% to 15%)
on the project cash flow and performance unless mitigated by some
corrective action.
Minor The factor, if uncorrected, will have little or no effect (<10%) on project
cash flow and performance.
The Likelihood of a risk is considered within 7-year time frame as:
Likely: Will probably occur
Possible: May occur
Unlikely: Unlikely to occur
WAI completed a risk assessment of the specific risks identified for the project in
relation to their likelihood of occurrence within a seven-year period and consequence in
accordance with Guidance Note 7 of the Listing Rules.
Table 11.1 below sets forth a risk assessment undertaken by the Competent Person
which considers the key project risks and recommended mitigation strategy where
appropriate.
WAI believes the mitigation recommendation is appropriate and the identified risks
can be generally managed if the mitigation recommendation as stated in Table 11.1 above
are implemented.
APPENDIX III COMPETENT PERSON’S REPORT
– III-128 –
THIS DOCUMENT IS IN DRAFT FORM, INCOMPLETE AND SUBJECT TO CHANGE AND THAT
THE INFORMATION MUST BE READ IN CONJUNCTION WITH THE SECTION HEADED
‘‘WARNING’’ ON THE COVER OF THIS DOCUMENT
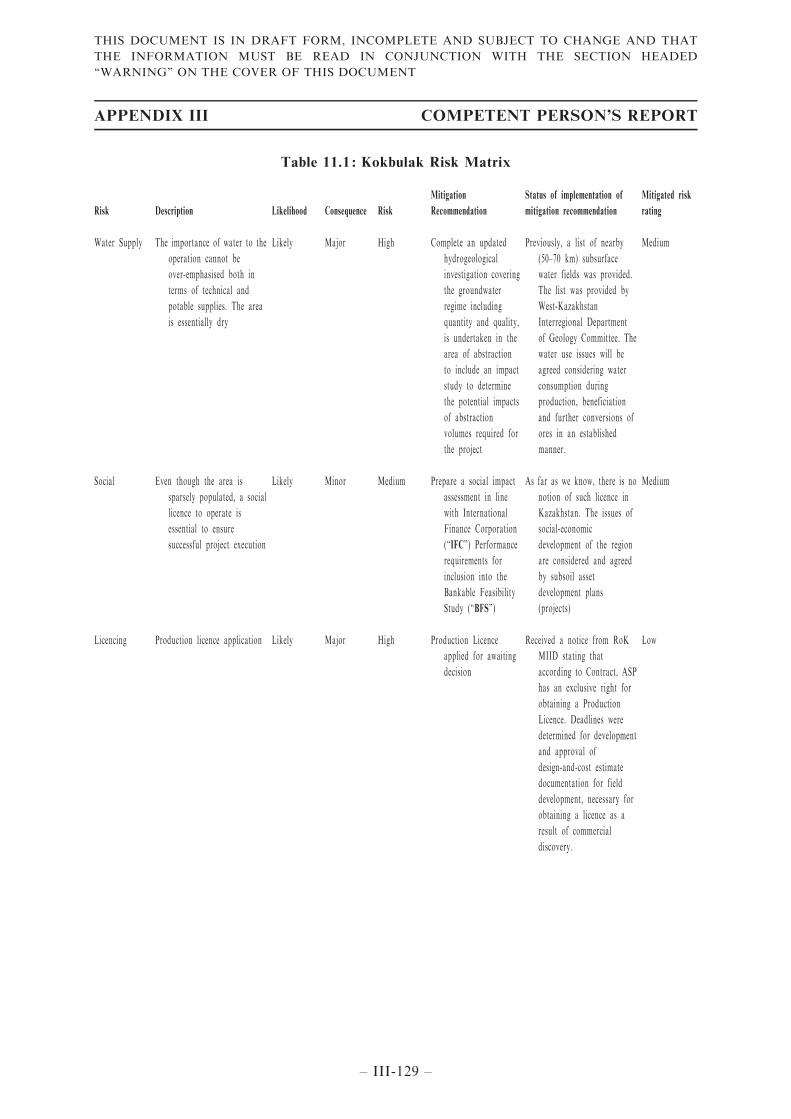
Table 11.1 : Kokbulak Risk Matrix
Risk Description Likelihood Consequence Risk
Mitigation
Recommendation
Status of implementation of
mitigation recommendation
Mitigated risk
rating
Water Supply The importance of water to the
operation cannot be
over-emphasised both in
terms of technical and
potable supplies. The area
is essentially dry
Likely Major High Complete an updated
hydrogeological
investigation covering
the groundwater
regime including
quantity and quality,
is undertaken in the
area of abstraction
to include an impact
study to determine
the potential impacts
of abstraction
volumes required for
the project
Previously, a list of nearby
(50–70 km) subsurface
water fields was provided.
The list was provided by
West-Kazakhstan
Interregional Department
of Geology Committee. The
water use issues will be
agreed considering water
consumption during
production, beneficiation
and further conversions of
ores in an established
manner.
Medium
Social Even though the area is
sparsely populated, a social
licence to operate is
essential to ensure
successful project execution
Likely Minor Medium Prepare a social impact
assessment in line
with International
Finance Corporation
(‘‘IFC’’) Performance
requirements for
inclusion into the
Bankable Feasibility
Study (‘‘BFS’’)
As far as we know, there is no
notion of such licence in
Kazakhstan. The issues of
social-economic
development of the region
are considered and agreed
by subsoil asset
development plans
(projects)
Medium
Licencing Production licence application Likely Major High Production Licence
applied for awaiting
decision
Received a notice from RoK
MIID stating that
according to Contract, ASP
has an exclusive right for
obtaining a Production
Licence. Deadlines were
determined for development
and approval of
design-and-cost estimate
documentation for field
development, necessary for
obtaining a licence as a
result of commercial
discovery.
Low
APPENDIX III COMPETENT PERSON’S REPORT
– III-129 –
THIS DOCUMENT IS IN DRAFT FORM, INCOMPLETE AND SUBJECT TO CHANGE AND THAT
THE INFORMATION MUST BE READ IN CONJUNCTION WITH THE SECTION HEADED
‘‘WARNING’’ ON THE COVER OF THIS DOCUMENT
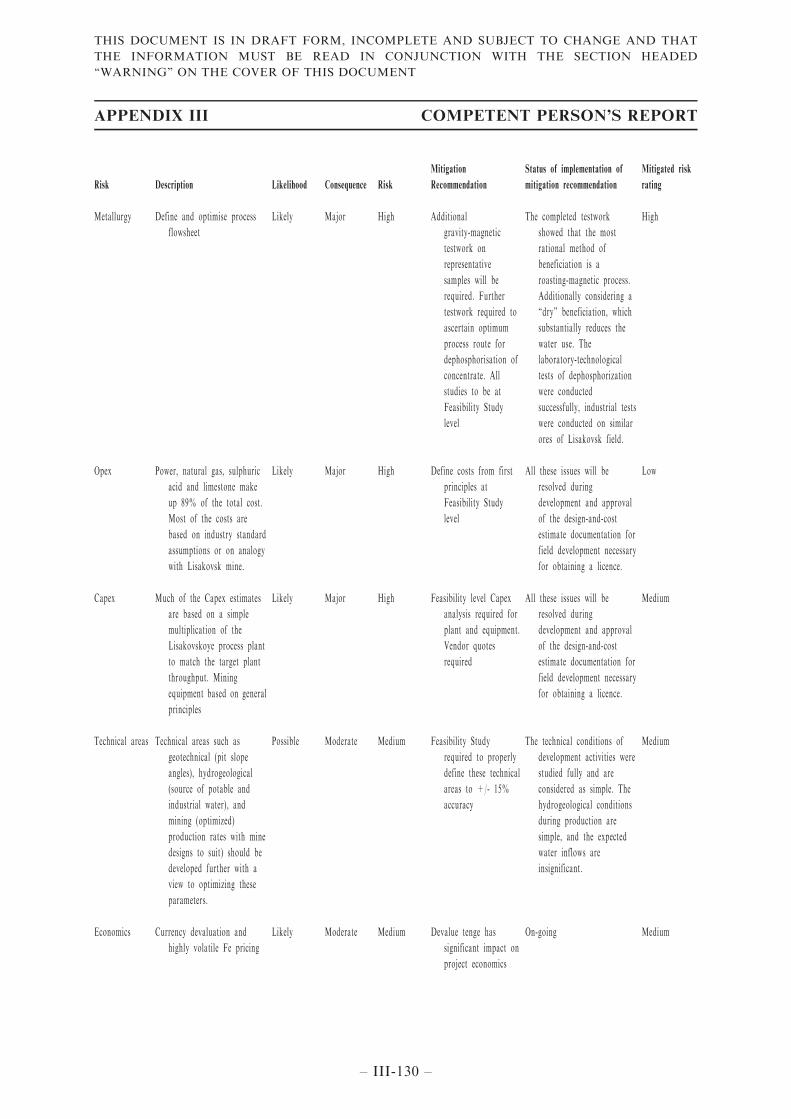
Risk Description Likelihood Consequence Risk
Mitigation
Recommendation
Status of implementation of
mitigation recommendation
Mitigated risk
rating
Metallurgy Define and optimise process
flowsheet
Likely Major High Additional
gravity-magnetic
testwork on
representative
samples will be
required. Further
testwork required to
ascertain optimum
process route for
dephosphorisation of
concentrate. All
studies to be at
Feasibility Study
level
The completed testwork
showed that the most
rational method of
beneficiation is a
roasting-magnetic process.
Additionally considering a
‘‘dry’’ beneficiation, which
substantially reduces the
water use. The
laboratory-technological
tests of dephosphorization
were conducted
successfully, industrial tests
were conducted on similar
ores of Lisakovsk field.
High
Opex Power, natural gas, sulphuric
acid and limestone make
up 89% of the total cost.
Most of the costs are
based on industry standard
assumptions or on analogy
with Lisakovsk mine.
Likely Major High Define costs from first
principles at
Feasibility Study
level
All these issues will be
resolved during
development and approval
of the design-and-cost
estimate documentation for
field development necessary
for obtaining a licence.
Low
Capex Much of the Capex estimates
are based on a simple
multiplication of the
Lisakovskoye process plant
to match the target plant
throughput. Mining
equipment based on general
principles
Likely Major High Feasibility level Capex
analysis required for
plant and equipment.
Vendor quotes
required
All these issues will be
resolved during
development and approval
of the design-and-cost
estimate documentation for
field development necessary
for obtaining a licence.
Medium
Technical areas Technical areas such as
geotechnical (pit slope
angles), hydrogeological
(source of potable and
industrial water), and
mining (optimized)
production rates with mine
designs to suit) should be
developed further with a
view to optimizing these
parameters.
Possible Moderate Medium Feasibility Study
required to properly
define these technical
areas to +/- 15%
accuracy
The technical conditions of
development activities were
studied fully and are
considered as simple. The
hydrogeological conditions
during production are
simple, and the expected
water inflows are
insignificant.
Medium
Economics Currency devaluation and
highly volatile Fe pricing
Likely Moderate Medium Devalue tenge has
significant impact on
project economics
On-going Medium
APPENDIX III COMPETENT PERSON’S REPORT
– III-130 –
THIS DOCUMENT IS IN DRAFT FORM, INCOMPLETE AND SUBJECT TO CHANGE AND THAT
THE INFORMATION MUST BE READ IN CONJUNCTION WITH THE SECTION HEADED
‘‘WARNING’’ ON THE COVER OF THIS DOCUMENT
12 CONCLUSIONS & RECOMMENDATIONS
The operation in the Central Area of the Kokbulak Iron Ore Project represents a
significant potential iron ore mining project which at the current iron ore prices appears
highly robust. At a 10% discount rate, the project commands an NPV of some US$2.3
billion.
Further weight is given to the importance of the project by the fact that the current
study is only based on the better-known Central Area, although WAI is in no doubt that the
580Mt of iron-rich mineralisation are also available in the Northern Area and Southern
Area, which, should a mine be developed in the Central Area, will greatly extend the life of
mine.
The overall economic viability of the operation in the Central Area of the Kokbulak
Iron Ore Project is enhanced by a number of factors such as the free-digging nature of the
ore, very low strip ratio, proposed metallurgical concentration route, and generally modest
capital cost outlay. The current new infrastructure already constructed in the area (the
Beyneu-Shalkar Line) have significantly improved the chances of developing a project in
what was previously a relatively remote area.
For this study, WAI has reviewed the main technical and economic parameters
provided in the Project XXI 2013 Feasibility Study and adjusted these where appropriate.
In addition, WAI has estimated a Mineral Resource for the Central Area, as well as a
‘‘mineable’’ resource.
WAI has also completed an MRE on the Northern Area and Southern Area.
In WAI’s opinion, it should be noted that as the project progresses, technical areas
such as geotechnical (pit slope angles), hydrogeological (source of potable and industrial
water), mining (optimised production rates with mine designs to suit) and metallurgical
(dephosphorisation process) should be developed further with a view to optimising these
parameters.
Notwithstanding the above, the Kokbulak Iron Ore Project represents a strategic asset
to both the Client and the Kazakh State and certainly warrants further progress.
APPENDIX III COMPETENT PERSON’S REPORT
– III-131 –
THIS DOCUMENT IS IN DRAFT FORM, INCOMPLETE AND SUBJECT TO CHANGE AND THAT
THE INFORMATION MUST BE READ IN CONJUNCTION WITH THE SECTION HEADED
‘‘WARNING’’ ON THE COVER OF THIS DOCUMENT
13 JORC TABLE 1
Section 1 Sampling Techniques and Data
(Criteria in this section apply to all succeeding sections)
Criteria JORC Code explanation Commentary
Sampling
techniques
‧ Nature and quality ofsampling (eg cut channels,random chips, or specific
specialised industry standardmeasurement toolsappropriate to the mineralsunder investigation, such as
down hole gamma sondes, orhandheld XRF instruments,etc). These examples should
not be taken as limiting thebroad meaning of sampling.
. Include reference to measurestaken to ensure samplerepresentivity and theappropriate calibration of any
measurement tools or systemsused.
. Aspects of the determinationof mineralisation that areMaterial to the Public Report.
. In cases where ‘industrystandard’ work has been done
this would be relatively simple(eg ‘reverse circulationdrilling was used to obtain 1 msamples from which 3 kg was
pulverised to produce a 30 gcharge for fire assay’). Inother cases more explanation
may be required, such aswhere there is coarse gold thathas inherent sampling
problems. Unusualcommodities or mineralisationtypes (eg submarine nodules)may warrant disclosure of
detailed information.
‧ The deposit is sampled using diamond andvibratory percussion drill holes on asemi-regular pattern generally on 100m or
greater spacing.
. Diamond drilling was used to retrieve core thatwas cut for half core samples sent for sample
preparation using industry standardmethodology and fire assay analysis for gold.
. Diamond core was sampled at 1–2m intervalsexcept where geological intervals dictatedotherwise. Core has been cut using a diamond
core saw for half core samples.
. For the drilling programme completed between1950 and 1954, the majority of samples were
analysed at the Aktyubinsk laboratory ofWest-Kazakhstan geological expedition andthe Central laboratory of South-Uralsk
geological survey in Ufa. A minority of thesamples were analysed at the Central chemicallaboratory of Middle-Asian Geological survey
in Tashkent and in the chemical laboratory ofNovosibirsk geological expedition ofWest-Siberian geological expedition.
. In 2013 Samples were analysed at theAktobe-Temir-Sun laboratory.
. For mineralised domain samples, samples weredried, crushed and pulverised to produce0.15–0.2kg sub sample from which a charge
was taken for analysis by atomic absorption.
APPENDIX III COMPETENT PERSON’S REPORT
– III-132 –
THIS DOCUMENT IS IN DRAFT FORM, INCOMPLETE AND SUBJECT TO CHANGE AND THAT
THE INFORMATION MUST BE READ IN CONJUNCTION WITH THE SECTION HEADED
‘‘WARNING’’ ON THE COVER OF THIS DOCUMENT
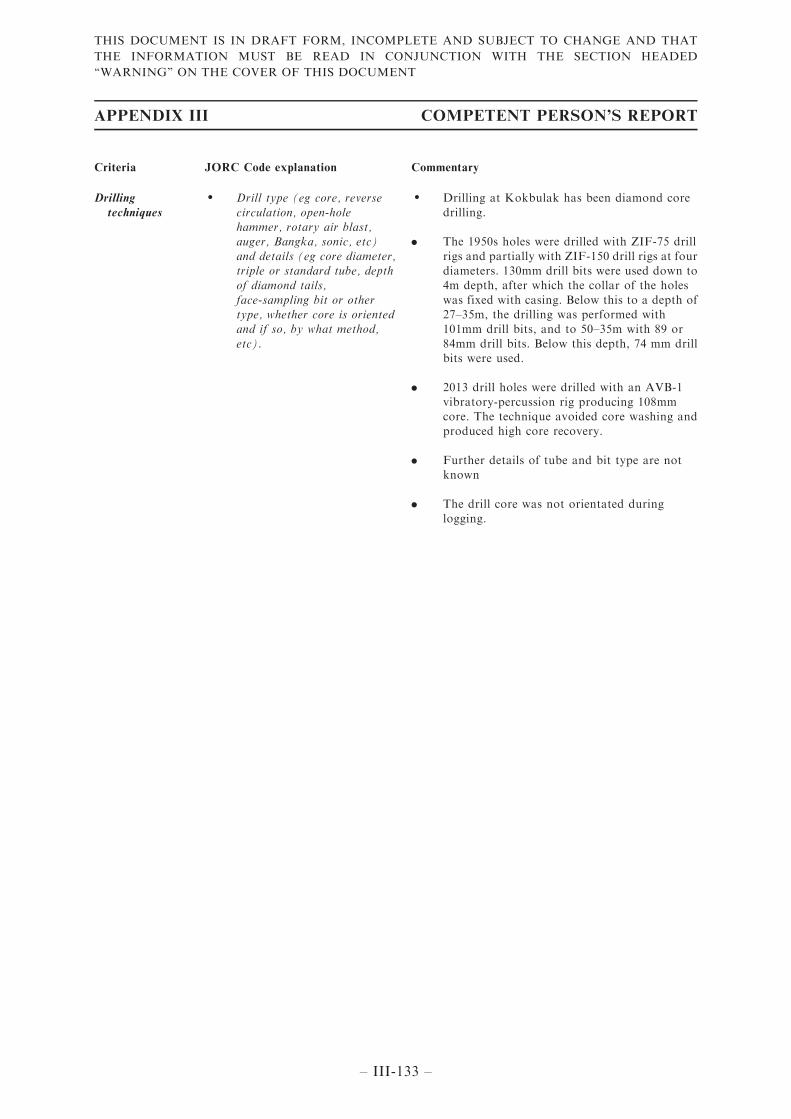
Criteria JORC Code explanation Commentary
Drilling
techniques
‧ Drill type (eg core, reverse
circulation, open-holehammer, rotary air blast,auger, Bangka, sonic, etc)
and details (eg core diameter,triple or standard tube, depthof diamond tails,
face-sampling bit or othertype, whether core is orientedand if so, by what method,
etc).
‧ Drilling at Kokbulak has been diamond core
drilling.
. The 1950s holes were drilled with ZIF-75 drill
rigs and partially with ZIF-150 drill rigs at fourdiameters. 130mm drill bits were used down to4m depth, after which the collar of the holes
was fixed with casing. Below this to a depth of27–35m, the drilling was performed with101mm drill bits, and to 50–35m with 89 or
84mm drill bits. Below this depth, 74 mm drillbits were used.
. 2013 drill holes were drilled with an AVB-1
vibratory-percussion rig producing 108mmcore. The technique avoided core washing andproduced high core recovery.
. Further details of tube and bit type are notknown
. The drill core was not orientated duringlogging.
APPENDIX III COMPETENT PERSON’S REPORT
– III-133 –
THIS DOCUMENT IS IN DRAFT FORM, INCOMPLETE AND SUBJECT TO CHANGE AND THAT
THE INFORMATION MUST BE READ IN CONJUNCTION WITH THE SECTION HEADED
‘‘WARNING’’ ON THE COVER OF THIS DOCUMENT
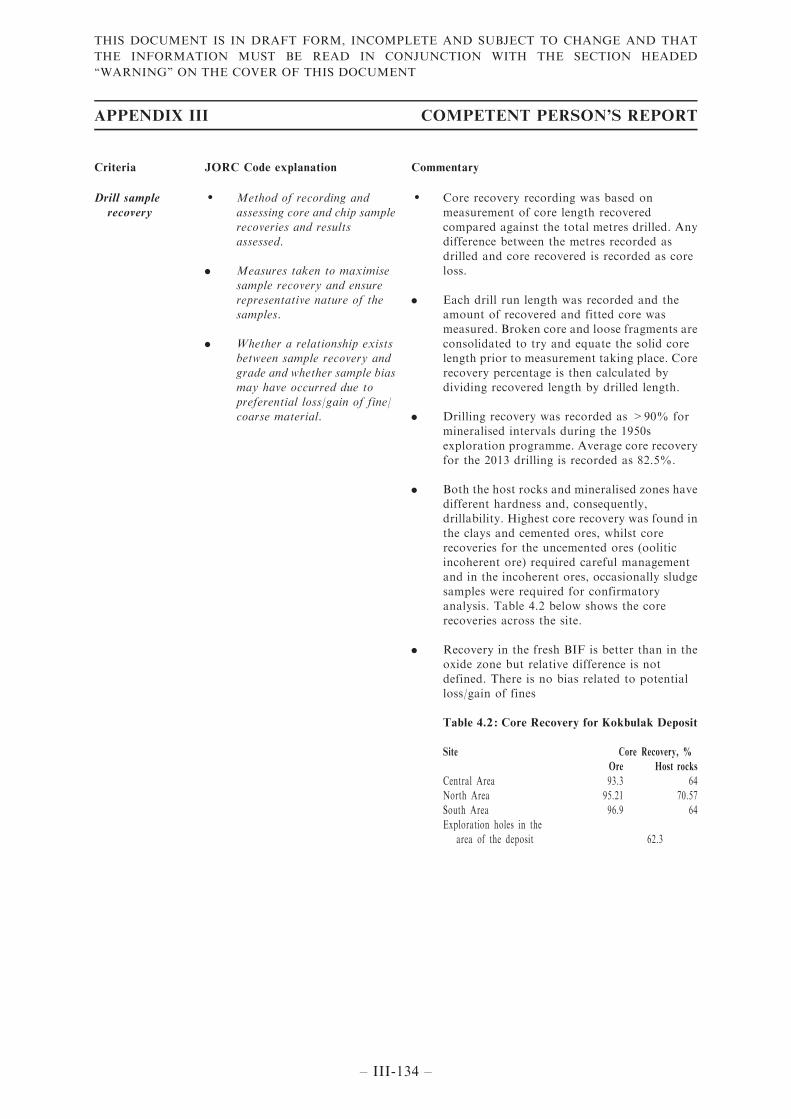
Criteria JORC Code explanation Commentary
Drill sample
recovery
‧ Method of recording and
assessing core and chip samplerecoveries and resultsassessed.
. Measures taken to maximisesample recovery and ensure
representative nature of thesamples.
. Whether a relationship existsbetween sample recovery andgrade and whether sample biasmay have occurred due to
preferential loss/gain of fine/coarse material.
‧ Core recovery recording was based on
measurement of core length recoveredcompared against the total metres drilled. Anydifference between the metres recorded as
drilled and core recovered is recorded as coreloss.
. Each drill run length was recorded and theamount of recovered and fitted core wasmeasured. Broken core and loose fragments are
consolidated to try and equate the solid corelength prior to measurement taking place. Corerecovery percentage is then calculated bydividing recovered length by drilled length.
. Drilling recovery was recorded as >90% formineralised intervals during the 1950s
exploration programme. Average core recoveryfor the 2013 drilling is recorded as 82.5%.
. Both the host rocks and mineralised zones havedifferent hardness and, consequently,drillability. Highest core recovery was found in
the clays and cemented ores, whilst corerecoveries for the uncemented ores (ooliticincoherent ore) required careful managementand in the incoherent ores, occasionally sludge
samples were required for confirmatoryanalysis. Table 4.2 below shows the corerecoveries across the site.
. Recovery in the fresh BIF is better than in theoxide zone but relative difference is not
defined. There is no bias related to potentialloss/gain of fines
Table 4.2 : Core Recovery for Kokbulak Deposit
Site Core Recovery, %
Ore Host rocks
Central Area 93.3 64North Area 95.21 70.57South Area 96.9 64
Exploration holes in thearea of the deposit 62.3
APPENDIX III COMPETENT PERSON’S REPORT
– III-134 –
THIS DOCUMENT IS IN DRAFT FORM, INCOMPLETE AND SUBJECT TO CHANGE AND THAT
THE INFORMATION MUST BE READ IN CONJUNCTION WITH THE SECTION HEADED
‘‘WARNING’’ ON THE COVER OF THIS DOCUMENT
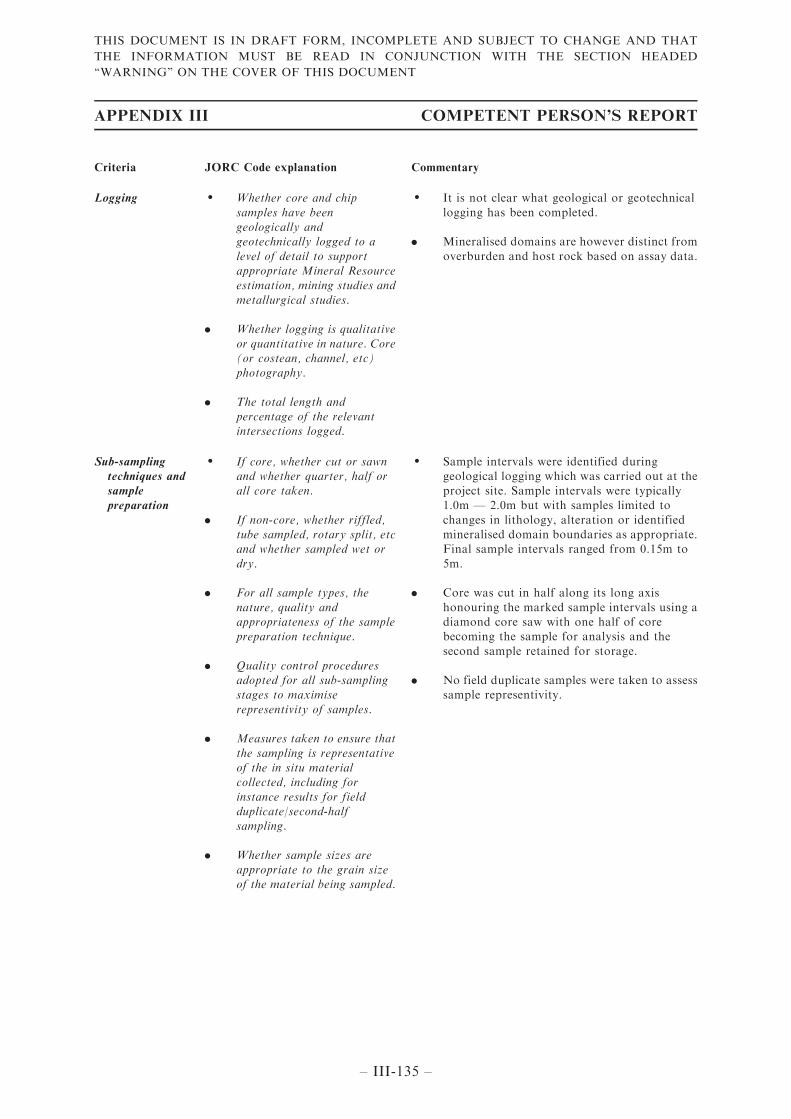
Criteria JORC Code explanation Commentary
Logging ‧ Whether core and chip
samples have beengeologically andgeotechnically logged to a
level of detail to supportappropriate Mineral Resourceestimation, mining studies and
metallurgical studies.
. Whether logging is qualitative
or quantitative in nature. Core(or costean, channel, etc)photography.
. The total length andpercentage of the relevantintersections logged.
‧ It is not clear what geological or geotechnical
logging has been completed.
. Mineralised domains are however distinct from
overburden and host rock based on assay data.
Sub-sampling
techniques and
sample
preparation
‧ If core, whether cut or sawnand whether quarter, half orall core taken.
. If non-core, whether riffled,tube sampled, rotary split, etcand whether sampled wet or
dry.
. For all sample types, the
nature, quality andappropriateness of the samplepreparation technique.
. Quality control proceduresadopted for all sub-samplingstages to maximise
representivity of samples.
. Measures taken to ensure that
the sampling is representativeof the in situ materialcollected, including for
instance results for fieldduplicate/second-halfsampling.
. Whether sample sizes areappropriate to the grain sizeof the material being sampled.
‧ Sample intervals were identified duringgeological logging which was carried out at theproject site. Sample intervals were typically1.0m — 2.0m but with samples limited to
changes in lithology, alteration or identifiedmineralised domain boundaries as appropriate.Final sample intervals ranged from 0.15m to
5m.
. Core was cut in half along its long axis
honouring the marked sample intervals using adiamond core saw with one half of corebecoming the sample for analysis and the
second sample retained for storage.
. No field duplicate samples were taken to assesssample representivity.
APPENDIX III COMPETENT PERSON’S REPORT
– III-135 –
THIS DOCUMENT IS IN DRAFT FORM, INCOMPLETE AND SUBJECT TO CHANGE AND THAT
THE INFORMATION MUST BE READ IN CONJUNCTION WITH THE SECTION HEADED
‘‘WARNING’’ ON THE COVER OF THIS DOCUMENT
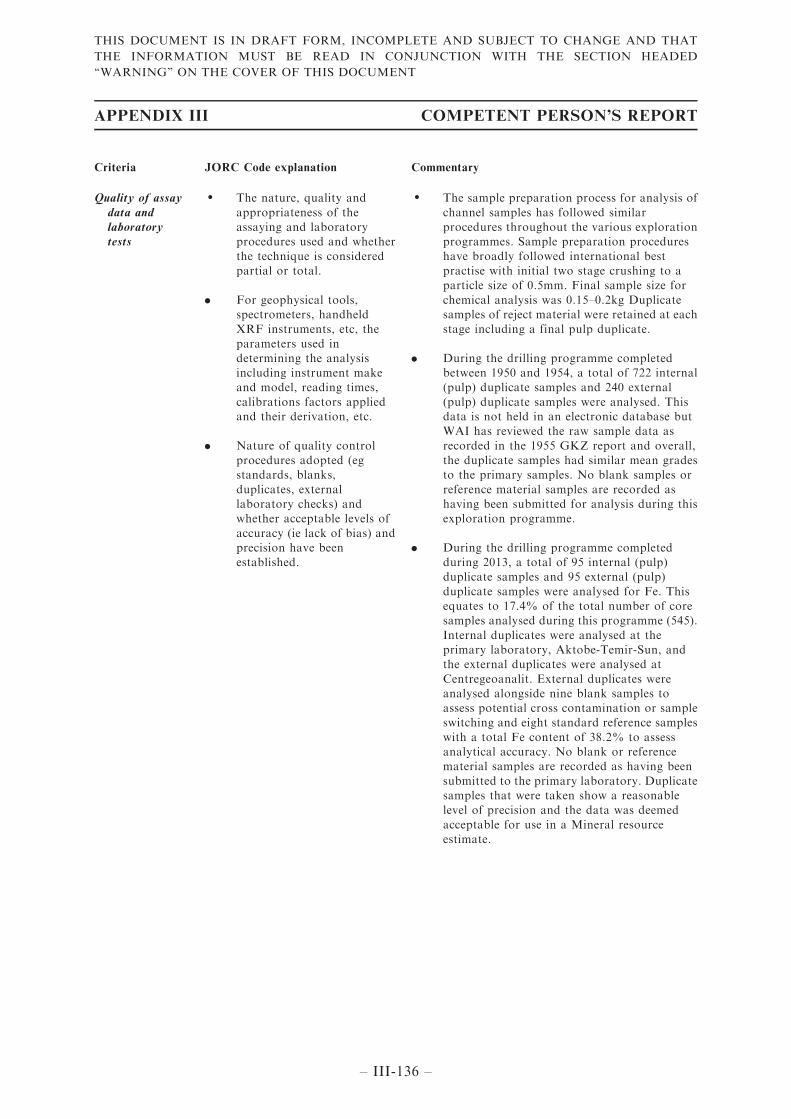
Criteria JORC Code explanation Commentary
Quality of assay
data and
laboratory
tests
‧ The nature, quality and
appropriateness of theassaying and laboratoryprocedures used and whether
the technique is consideredpartial or total.
. For geophysical tools,spectrometers, handheldXRF instruments, etc, the
parameters used indetermining the analysisincluding instrument makeand model, reading times,
calibrations factors appliedand their derivation, etc.
. Nature of quality controlprocedures adopted (egstandards, blanks,
duplicates, externallaboratory checks) andwhether acceptable levels of
accuracy (ie lack of bias) andprecision have beenestablished.
‧ The sample preparation process for analysis of
channel samples has followed similarprocedures throughout the various explorationprogrammes. Sample preparation procedures
have broadly followed international bestpractise with initial two stage crushing to aparticle size of 0.5mm. Final sample size for
chemical analysis was 0.15–0.2kg Duplicatesamples of reject material were retained at eachstage including a final pulp duplicate.
. During the drilling programme completedbetween 1950 and 1954, a total of 722 internal(pulp) duplicate samples and 240 external
(pulp) duplicate samples were analysed. Thisdata is not held in an electronic database butWAI has reviewed the raw sample data as
recorded in the 1955 GKZ report and overall,the duplicate samples had similar mean gradesto the primary samples. No blank samples or
reference material samples are recorded ashaving been submitted for analysis during thisexploration programme.
. During the drilling programme completedduring 2013, a total of 95 internal (pulp)duplicate samples and 95 external (pulp)
duplicate samples were analysed for Fe. Thisequates to 17.4% of the total number of coresamples analysed during this programme (545).
Internal duplicates were analysed at theprimary laboratory, Aktobe-Temir-Sun, andthe external duplicates were analysed at
Centregeoanalit. External duplicates wereanalysed alongside nine blank samples toassess potential cross contamination or sampleswitching and eight standard reference samples
with a total Fe content of 38.2% to assessanalytical accuracy. No blank or referencematerial samples are recorded as having been
submitted to the primary laboratory. Duplicatesamples that were taken show a reasonablelevel of precision and the data was deemed
acceptable for use in a Mineral resourceestimate.
APPENDIX III COMPETENT PERSON’S REPORT
– III-136 –
THIS DOCUMENT IS IN DRAFT FORM, INCOMPLETE AND SUBJECT TO CHANGE AND THAT
THE INFORMATION MUST BE READ IN CONJUNCTION WITH THE SECTION HEADED
‘‘WARNING’’ ON THE COVER OF THIS DOCUMENT
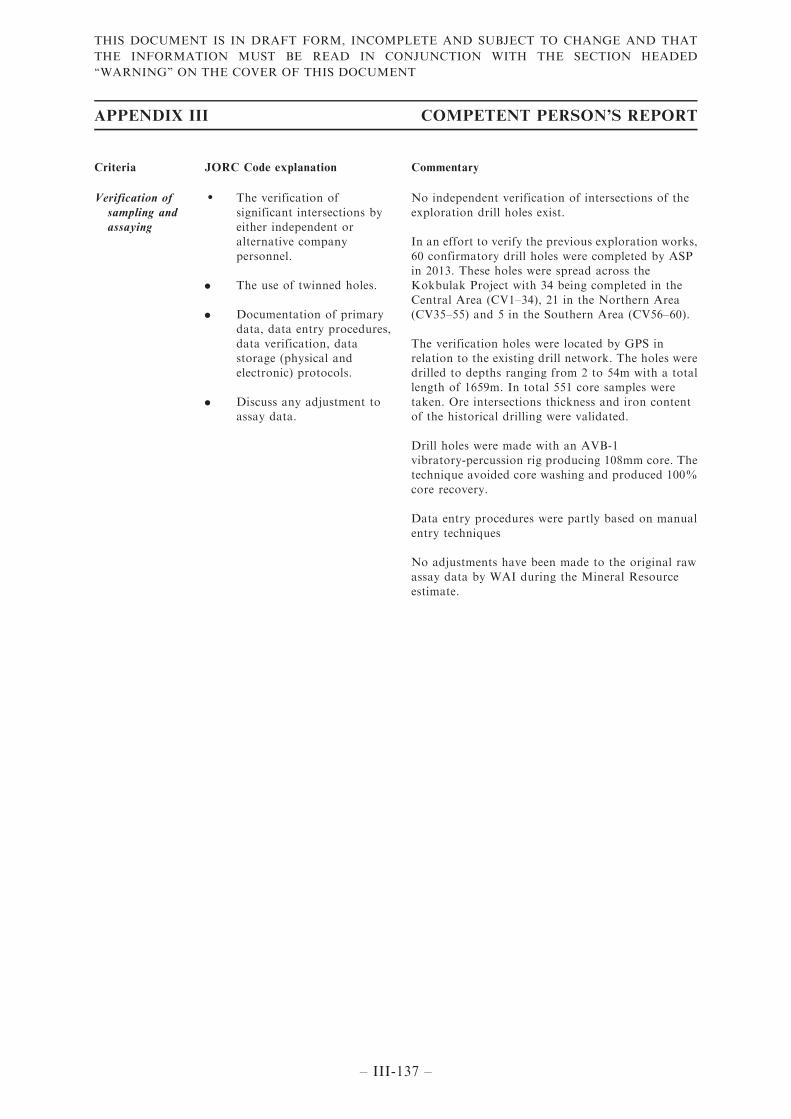
Criteria JORC Code explanation Commentary
Verification of
sampling and
assaying
‧ The verification of
significant intersections byeither independent oralternative company
personnel.
. The use of twinned holes.
. Documentation of primarydata, data entry procedures,
data verification, datastorage (physical andelectronic) protocols.
. Discuss any adjustment toassay data.
No independent verification of intersections of the
exploration drill holes exist.
In an effort to verify the previous exploration works,
60 confirmatory drill holes were completed by ASPin 2013. These holes were spread across theKokbulak Project with 34 being completed in the
Central Area (CV1–34), 21 in the Northern Area(CV35–55) and 5 in the Southern Area (CV56–60).
The verification holes were located by GPS inrelation to the existing drill network. The holes weredrilled to depths ranging from 2 to 54m with a totallength of 1659m. In total 551 core samples were
taken. Ore intersections thickness and iron contentof the historical drilling were validated.
Drill holes were made with an AVB-1vibratory-percussion rig producing 108mm core. Thetechnique avoided core washing and produced 100%
core recovery.
Data entry procedures were partly based on manual
entry techniques
No adjustments have been made to the original rawassay data by WAI during the Mineral Resource
estimate.
APPENDIX III COMPETENT PERSON’S REPORT
– III-137 –
THIS DOCUMENT IS IN DRAFT FORM, INCOMPLETE AND SUBJECT TO CHANGE AND THAT
THE INFORMATION MUST BE READ IN CONJUNCTION WITH THE SECTION HEADED
‘‘WARNING’’ ON THE COVER OF THIS DOCUMENT
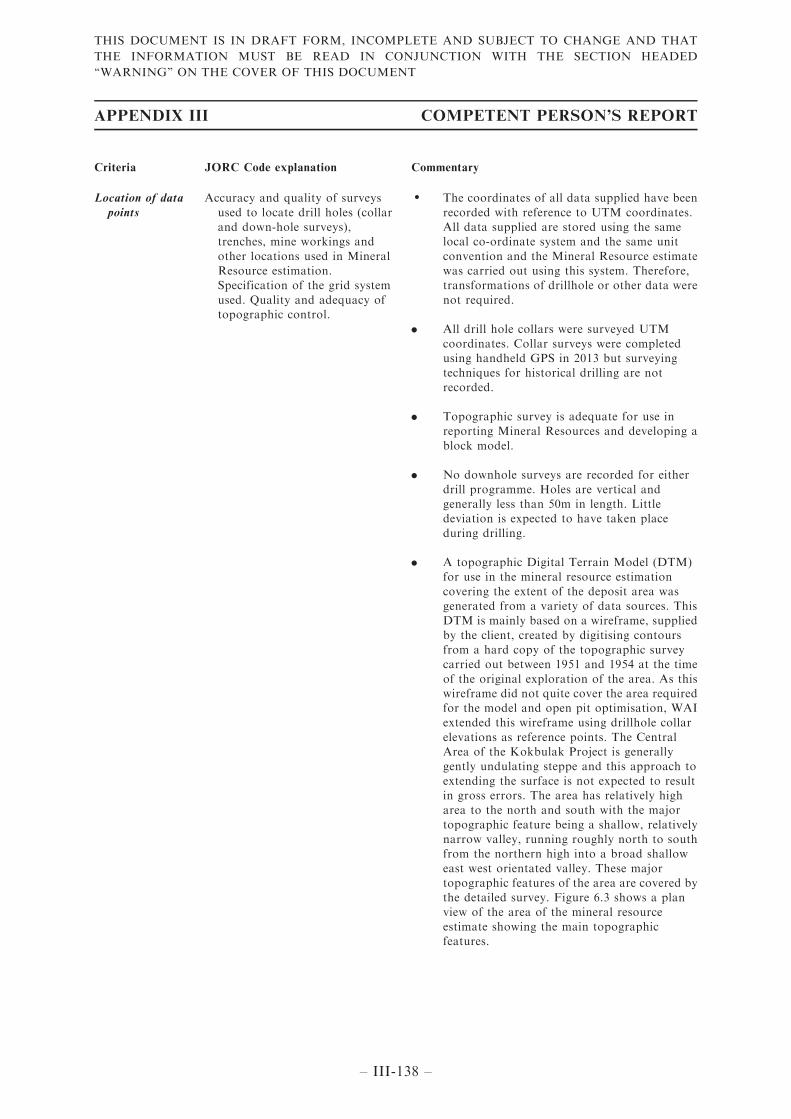
Criteria JORC Code explanation Commentary
Location of data
points
Accuracy and quality of surveys
used to locate drill holes (collarand down-hole surveys),trenches, mine workings and
other locations used in MineralResource estimation.Specification of the grid system
used. Quality and adequacy oftopographic control.
‧ The coordinates of all data supplied have been
recorded with reference to UTM coordinates.All data supplied are stored using the samelocal co-ordinate system and the same unit
convention and the Mineral Resource estimatewas carried out using this system. Therefore,transformations of drillhole or other data were
not required.
. All drill hole collars were surveyed UTM
coordinates. Collar surveys were completedusing handheld GPS in 2013 but surveyingtechniques for historical drilling are notrecorded.
. Topographic survey is adequate for use inreporting Mineral Resources and developing a
block model.
. No downhole surveys are recorded for either
drill programme. Holes are vertical andgenerally less than 50m in length. Littledeviation is expected to have taken place
during drilling.
. A topographic Digital Terrain Model (DTM)for use in the mineral resource estimation
covering the extent of the deposit area wasgenerated from a variety of data sources. ThisDTM is mainly based on a wireframe, supplied
by the client, created by digitising contoursfrom a hard copy of the topographic surveycarried out between 1951 and 1954 at the time
of the original exploration of the area. As thiswireframe did not quite cover the area requiredfor the model and open pit optimisation, WAIextended this wireframe using drillhole collar
elevations as reference points. The CentralArea of the Kokbulak Project is generallygently undulating steppe and this approach to
extending the surface is not expected to resultin gross errors. The area has relatively higharea to the north and south with the major
topographic feature being a shallow, relativelynarrow valley, running roughly north to southfrom the northern high into a broad shallow
east west orientated valley. These majortopographic features of the area are covered bythe detailed survey. Figure 6.3 shows a planview of the area of the mineral resource
estimate showing the main topographicfeatures.
APPENDIX III COMPETENT PERSON’S REPORT
– III-138 –
THIS DOCUMENT IS IN DRAFT FORM, INCOMPLETE AND SUBJECT TO CHANGE AND THAT
THE INFORMATION MUST BE READ IN CONJUNCTION WITH THE SECTION HEADED
‘‘WARNING’’ ON THE COVER OF THIS DOCUMENT
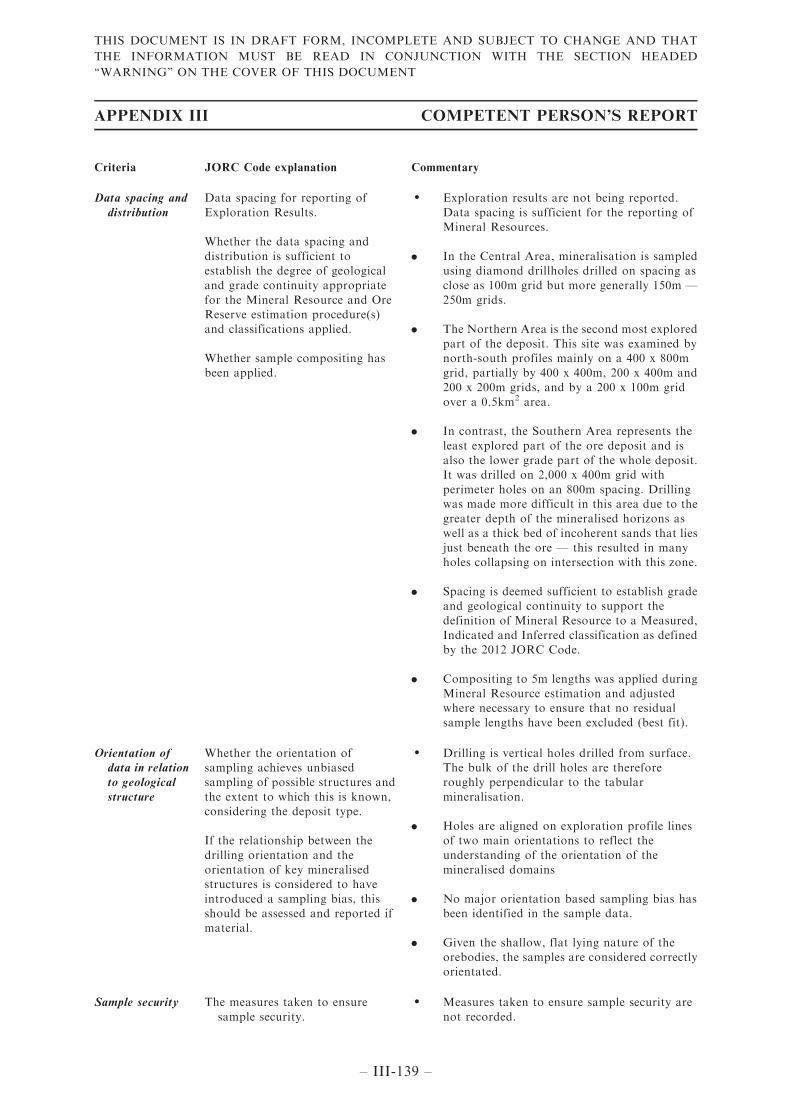
Criteria JORC Code explanation Commentary
Data spacing and
distribution
Data spacing for reporting of
Exploration Results.
Whether the data spacing and
distribution is sufficient toestablish the degree of geologicaland grade continuity appropriate
for the Mineral Resource and OreReserve estimation procedure(s)and classifications applied.
Whether sample compositing hasbeen applied.
‧ Exploration results are not being reported.
Data spacing is sufficient for the reporting ofMineral Resources.
. In the Central Area, mineralisation is sampledusing diamond drillholes drilled on spacing asclose as 100m grid but more generally 150m —
250m grids.
. The Northern Area is the second most explored
part of the deposit. This site was examined bynorth-south profiles mainly on a 400 x 800mgrid, partially by 400 x 400m, 200 x 400m and200 x 200m grids, and by a 200 x 100m grid
over a 0.5km2 area.
. In contrast, the Southern Area represents the
least explored part of the ore deposit and isalso the lower grade part of the whole deposit.It was drilled on 2,000 x 400m grid with
perimeter holes on an 800m spacing. Drillingwas made more difficult in this area due to thegreater depth of the mineralised horizons as
well as a thick bed of incoherent sands that liesjust beneath the ore — this resulted in manyholes collapsing on intersection with this zone.
. Spacing is deemed sufficient to establish gradeand geological continuity to support thedefinition of Mineral Resource to a Measured,
Indicated and Inferred classification as definedby the 2012 JORC Code.
. Compositing to 5m lengths was applied duringMineral Resource estimation and adjustedwhere necessary to ensure that no residualsample lengths have been excluded (best fit).
Orientation of
data in relation
to geological
structure
Whether the orientation ofsampling achieves unbiasedsampling of possible structures and
the extent to which this is known,considering the deposit type.
If the relationship between the
drilling orientation and theorientation of key mineralisedstructures is considered to have
introduced a sampling bias, thisshould be assessed and reported ifmaterial.
‧ Drilling is vertical holes drilled from surface.The bulk of the drill holes are thereforeroughly perpendicular to the tabular
mineralisation.
. Holes are aligned on exploration profile linesof two main orientations to reflect the
understanding of the orientation of themineralised domains
. No major orientation based sampling bias hasbeen identified in the sample data.
. Given the shallow, flat lying nature of theorebodies, the samples are considered correctlyorientated.
Sample security The measures taken to ensure
sample security.
‧ Measures taken to ensure sample security are
not recorded.
APPENDIX III COMPETENT PERSON’S REPORT
– III-139 –
THIS DOCUMENT IS IN DRAFT FORM, INCOMPLETE AND SUBJECT TO CHANGE AND THAT
THE INFORMATION MUST BE READ IN CONJUNCTION WITH THE SECTION HEADED
‘‘WARNING’’ ON THE COVER OF THIS DOCUMENT
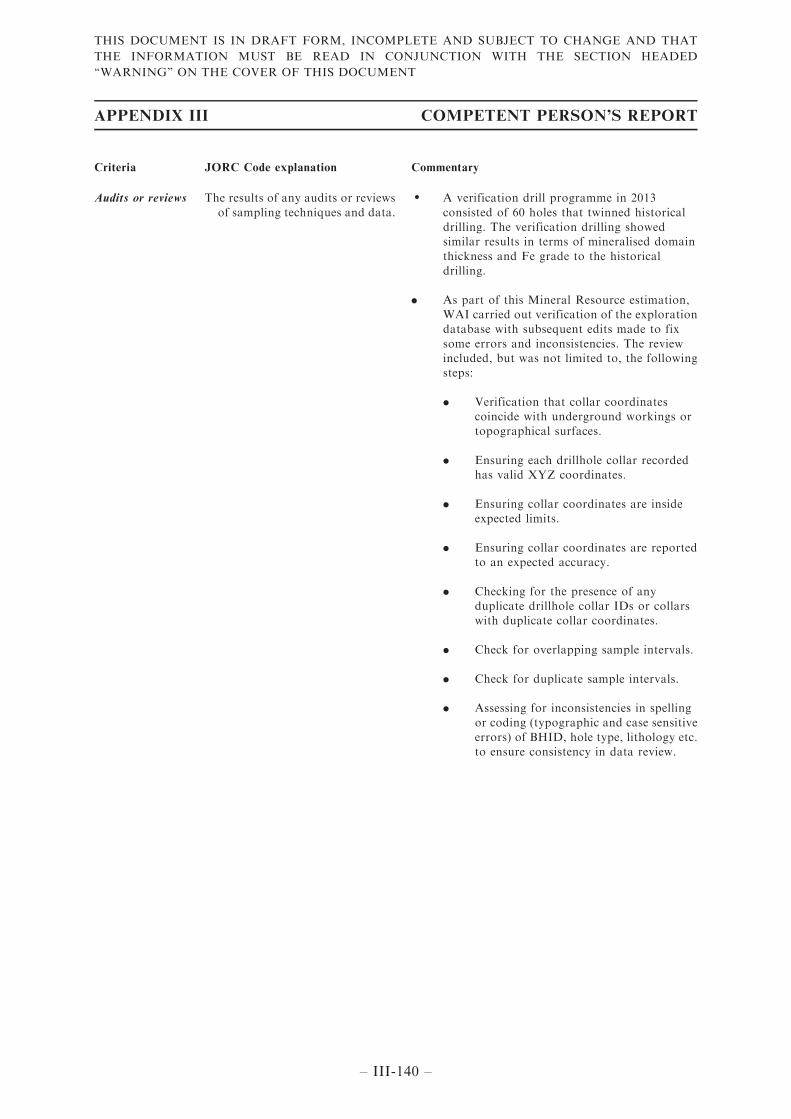
Criteria JORC Code explanation Commentary
Audits or reviews The results of any audits or reviews
of sampling techniques and data.
‧ A verification drill programme in 2013
consisted of 60 holes that twinned historicaldrilling. The verification drilling showedsimilar results in terms of mineralised domain
thickness and Fe grade to the historicaldrilling.
. As part of this Mineral Resource estimation,WAI carried out verification of the explorationdatabase with subsequent edits made to fix
some errors and inconsistencies. The reviewincluded, but was not limited to, the followingsteps:
. Verification that collar coordinatescoincide with underground workings ortopographical surfaces.
. Ensuring each drillhole collar recordedhas valid XYZ coordinates.
. Ensuring collar coordinates are insideexpected limits.
. Ensuring collar coordinates are reportedto an expected accuracy.
. Checking for the presence of anyduplicate drillhole collar IDs or collarswith duplicate collar coordinates.
. Check for overlapping sample intervals.
. Check for duplicate sample intervals.
. Assessing for inconsistencies in spellingor coding (typographic and case sensitive
errors) of BHID, hole type, lithology etc.to ensure consistency in data review.
APPENDIX III COMPETENT PERSON’S REPORT
– III-140 –
THIS DOCUMENT IS IN DRAFT FORM, INCOMPLETE AND SUBJECT TO CHANGE AND THAT
THE INFORMATION MUST BE READ IN CONJUNCTION WITH THE SECTION HEADED
‘‘WARNING’’ ON THE COVER OF THIS DOCUMENT
Criteria JORC Code explanation Commentary
‧ No other audits of sampling techniques or data
are known other than reviews of QA/QC dataduring this Mineral Resource estimate.
An analysis of internal control samples wasundertaken in the laboratories of South-Ural surveyof West-Kazakhstan geological expedition. External
control of the samples was performed by Centralchemical laboratories of Uralsk and West-Siberiangeological surveys.
726 samples were used for internal control, 46samples comprised external control whichcorresponds to 9.9% and 3.4% from the total
number of samples.
A comparison of the results for Quality Control
showed good agreement with the database beingdeemed fit for resource/reserve estimation.
APPENDIX III COMPETENT PERSON’S REPORT
– III-141 –
THIS DOCUMENT IS IN DRAFT FORM, INCOMPLETE AND SUBJECT TO CHANGE AND THAT
THE INFORMATION MUST BE READ IN CONJUNCTION WITH THE SECTION HEADED
‘‘WARNING’’ ON THE COVER OF THIS DOCUMENT
Section 2 Reporting of Exploration Results
(Criteria listed in the preceding section also apply to this section)
Criteria JORC Code explanation Commentary
Mineral tenement
and land tenure
status
. Type, reference name/number,location and ownership includingagreements or material issues with
third parties such as joint ventures,partnerships, overriding royalties,native title interests, historical sites,
wilderness or national park andenvironmental settings.
. The security of the tenure held at
the time of reporting along with anyknown impediments to obtaining alicence to operate in the area.
. Aktobe Steel Production LLP (‘‘ASP’’) holds the subsoiluse contract for the Kokbulak Project under contractnumber 3734-TPI dated October 4, 2010. Six addenda
pertaining to the main contract were subsequentlyentered into. The expiry date of the subsoil use contractis 23 September 2021. Nevertheless, according to the
Client, the subsoil use contract is still legally valid, giventhe Client had successfully submitted an application forProduction Licences on 21 September 2021, which isprior to the expiration date of the subsoil use contract.
The contract area of the subsoil use contract forexploration is currently stated at 307.2km2.
. WAI has been informed that the Licenced Area appliedby the Client for the Production licence is 127.51km2
(which falls within the contract area of the subsoil use
contract for exploration of 307.2km2). The Client willreturn the remaining contract territory of 179.69km2 tothe relevant competent authority. ASP is awaiting theapproval from relevant competent authority for the
Production Licence as at the date of this CPR. For theavoidance of doubt, the Mineral Resource Estimate forthe Kokbulak Project in this CPR covers the contract
area of the subsoil use contract for exploration of307.2km2.
. The mineral licence information was reviewed by WAIbut not to a legal standard
. The licence is considered in good standing
Exploration done by
other parties
. Acknowledgment and appraisal ofexploration by other parties.
. The Kokbulak deposit, upon which the KokbulakProject sits on, has been known about for over 70 yearswith preliminary geological survey work in 1949, then
more detailed investigations over the deposit area(covering some 500km2) in 1950.
. From 1950–54, detailed topographic surveys wereundertaken which tied in all the exploration works beingexecuted at the time, including drilling and limitedunderground exploration.
. This allowed the completion of the first geological mapof the area in 1954 along with a report on the
exploration activities and an initial ‘‘reserve’’ estimation(in accordance with local GKZ standards).
. It was not until 2013 that further exploratory workswere undertaken by ASP at the site of the KokbulakProject leading to the completion of Project XXI 2013
Feasibility Study.
. In 2020, further drilling works were conducted by ASPin the Southern Area of the Kokbulak Project
APPENDIX III COMPETENT PERSON’S REPORT
– III-142 –
THIS DOCUMENT IS IN DRAFT FORM, INCOMPLETE AND SUBJECT TO CHANGE AND THAT
THE INFORMATION MUST BE READ IN CONJUNCTION WITH THE SECTION HEADED
‘‘WARNING’’ ON THE COVER OF THIS DOCUMENT
Criteria JORC Code explanation Commentary
Geology . Deposit type, geological setting and
style of mineralisation.
. The Kokbulak deposit consists of sediment hosted Fe
mineralisation within sands and clays.
. The most widespread ore types identified are:
. Oolitic oxidised brown ores — Type 1, generallyfound above the water table;
. Loose black ores without cement — Type 2,found above and below the water table, and
. Green or dark-grey ores of siderite-chloritecement — Type 3, found below the water table.
In broad terms, ore bodies of the Central and NorthernAreas are similar in that they are characterised by anorth-south strike and are flatly inclined to the
west-southwest, in many cases overlapping each other inthe manner of scales. Ore bodies in the Southern Areahave a different structure. All mineralisation can be
identified visually.
These are three main lenses at the Central Area of the
deposit, with the 1st and 2nd lenses being the largest. Allthree lenses are also traced to the Northern Area.Moreover, two more lenses (4th and 5th) are observed inthe western part of the Northern Area.
At the Southern Area, there is quite a large, embeddedlens observed between exploration lines #1 and #6, in
some places this lens is split into eastern and westernparts.
5.2.2 First Lens
This major mineralised unit has been traced along theeastern part of the deposit from exploration line #13 insouthern part of the Central Area to exploration line
#62 on the Northern Area. Its total length is 17.7kmwith a width 1.6km and occupying an area of about25km2. It appears to be localised in a north-south
depression in the roof of the underlying rocks of theChegan suite.
As with all the lenses seen at the Kokbulak Project,
thickness variations and bifurcations are common,particularly near the edges, although in the main parts,the lens does show a high degree of homogeneity.
Thicknesses can exceed 40m, and reaches 51.7m at hole#655, although equally wedges from the main lens cantail off to around 1m in thickness.
APPENDIX III COMPETENT PERSON’S REPORT
– III-143 –
THIS DOCUMENT IS IN DRAFT FORM, INCOMPLETE AND SUBJECT TO CHANGE AND THAT
THE INFORMATION MUST BE READ IN CONJUNCTION WITH THE SECTION HEADED
‘‘WARNING’’ ON THE COVER OF THIS DOCUMENT
Criteria JORC Code explanation Commentary
5.2.3 Second Lens
The second lens starts from exploration line #7 at theSouthern Area and it is clearly wedged in the northern
part of the Northern Area near exploration line #62. Itstotal length by strike is 23.9km, width is 1.26km
The dimensions of the lens by site is shown in Table 5.1below:
Table 5.1 : Dimensions of Len 2
Site
Length
(m) Width (m)
Area
(km2)
Central Area 4,000 1,450 5.8North Area 5,900 1,100 6.249South Area 14,000 1,240 17.36
Total 23,900 29.63
As with Lens 1, the lens shows good continuity along
strike, but wedging, thickness variations and lithologychange are common on the peripheries of the main body.Thickness again varies considerably from a few metres
to>40m.
5.2.4 Third Lens
The 3rd lens is located to the west of the 2nd lens in the
northern part of the Central Area and in the southernpart of the Northern Area. The lens is not large withstrike length not exceeding 2.8km, width 0.46km with an
area of 1.26km2. The lens is traced from the explorationline #35 to line #38.
The structure is quite simple and does not change either
down dip or along strike. Thickness varies from 2.7 to7.9m in its axial part from where it is symmetricallywedged to the periphery.
5.2.5 Fourth & Fifth Lenses
The Fourth lens is found at the Northern Area fromexploration line #39 to line #56. The lens is extended ina north-south direction for 6.1km and it has asignificant width (average 2.5km) and achieves a
maximum thickness of 36.7m. Area is 19.25km2,therefore making it the third largest behind the first andsecond lenses.
To the west of 4th lens, the small 5th lens is observed inbetween exploration lines #41-#48. The fifth lens is
deposited over the fourth lens.
APPENDIX III COMPETENT PERSON’S REPORT
– III-144 –
THIS DOCUMENT IS IN DRAFT FORM, INCOMPLETE AND SUBJECT TO CHANGE AND THAT
THE INFORMATION MUST BE READ IN CONJUNCTION WITH THE SECTION HEADED
‘‘WARNING’’ ON THE COVER OF THIS DOCUMENT
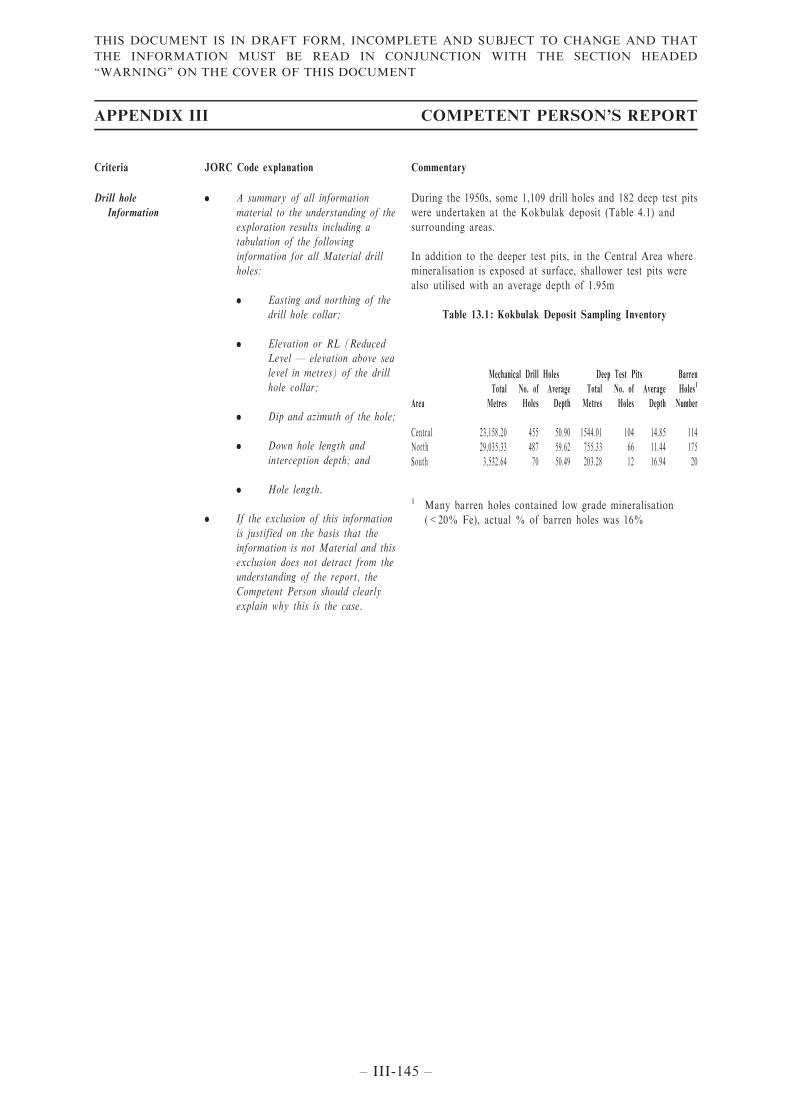
Criteria JORC Code explanation Commentary
Drill hole
Information
. A summary of all information
material to the understanding of theexploration results including atabulation of the following
information for all Material drillholes:
. Easting and northing of thedrill hole collar;
. Elevation or RL (ReducedLevel — elevation above sealevel in metres) of the drillhole collar;
. Dip and azimuth of the hole;
. Down hole length andinterception depth; and
. Hole length.
. If the exclusion of this information
is justified on the basis that theinformation is not Material and thisexclusion does not detract from theunderstanding of the report, the
Competent Person should clearlyexplain why this is the case.
During the 1950s, some 1,109 drill holes and 182 deep test pits
were undertaken at the Kokbulak deposit (Table 4.1) andsurrounding areas.
In addition to the deeper test pits, in the Central Area wheremineralisation is exposed at surface, shallower test pits werealso utilised with an average depth of 1.95m
Table 13.1 : Kokbulak Deposit Sampling Inventory
Area
Mechanical Drill Holes Deep Test Pits Barren
Holes1
Number
Total
Metres
No. of
Holes
Average
Depth
Total
Metres
No. of
Holes
Average
Depth
Central 23,158.20 455 50.90 1544.01 104 14.85 114North 29,035.33 487 59.62 755.33 66 11.44 175
South 3,532.64 70 50.49 203.28 12 16.94 20
1 Many barren holes contained low grade mineralisation
(<20% Fe), actual % of barren holes was 16%
APPENDIX III COMPETENT PERSON’S REPORT
– III-145 –
THIS DOCUMENT IS IN DRAFT FORM, INCOMPLETE AND SUBJECT TO CHANGE AND THAT
THE INFORMATION MUST BE READ IN CONJUNCTION WITH THE SECTION HEADED
‘‘WARNING’’ ON THE COVER OF THIS DOCUMENT
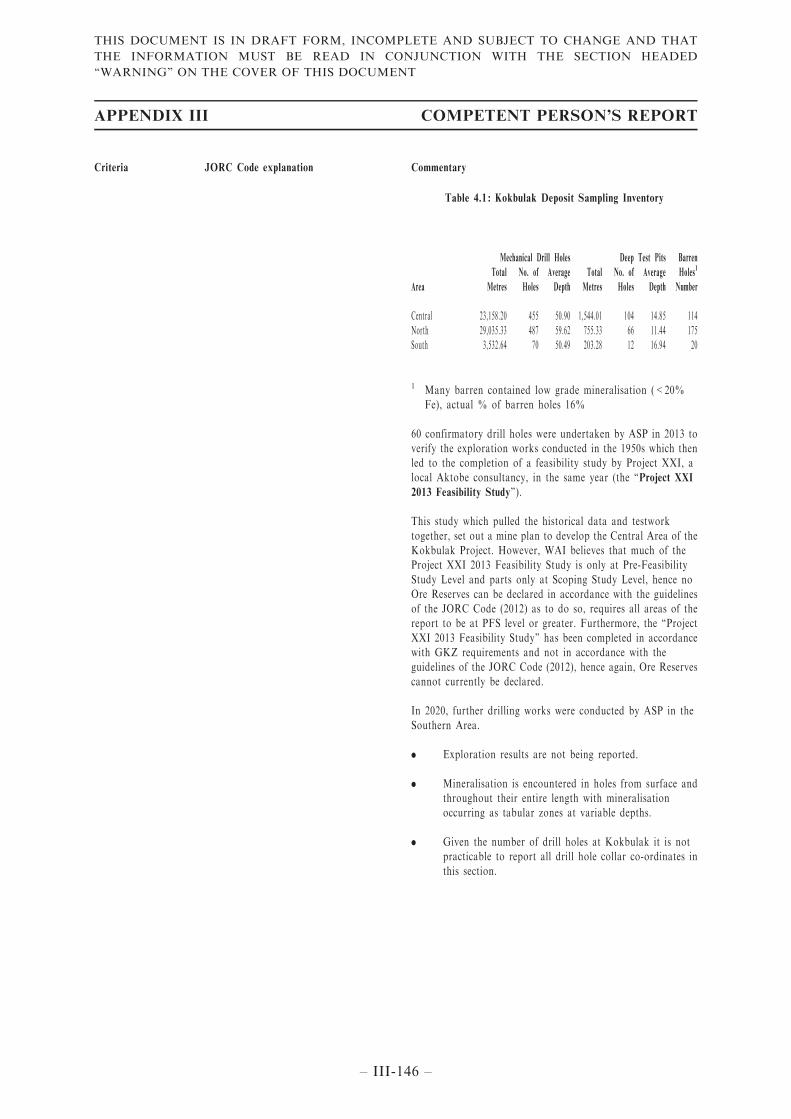
Criteria JORC Code explanation Commentary
Table 4.1 : Kokbulak Deposit Sampling Inventory
Area
Mechanical Drill Holes Deep Test Pits Barren
Holes1
Number
Total
Metres
No. of
Holes
Average
Depth
Total
Metres
No. of
Holes
Average
Depth
Central 23,158.20 455 50.90 1,544.01 104 14.85 114
North 29,035.33 487 59.62 755.33 66 11.44 175South 3,532.64 70 50.49 203.28 12 16.94 20
1 Many barren contained low grade mineralisation (<20%Fe), actual % of barren holes 16%
60 confirmatory drill holes were undertaken by ASP in 2013 toverify the exploration works conducted in the 1950s which thenled to the completion of a feasibility study by Project XXI, alocal Aktobe consultancy, in the same year (the ‘‘Project XXI
2013 Feasibility Study’’).
This study which pulled the historical data and testwork
together, set out a mine plan to develop the Central Area of theKokbulak Project. However, WAI believes that much of theProject XXI 2013 Feasibility Study is only at Pre-Feasibility
Study Level and parts only at Scoping Study Level, hence noOre Reserves can be declared in accordance with the guidelinesof the JORC Code (2012) as to do so, requires all areas of thereport to be at PFS level or greater. Furthermore, the ‘‘Project
XXI 2013 Feasibility Study’’ has been completed in accordancewith GKZ requirements and not in accordance with theguidelines of the JORC Code (2012), hence again, Ore Reserves
cannot currently be declared.
In 2020, further drilling works were conducted by ASP in the
Southern Area.
. Exploration results are not being reported.
. Mineralisation is encountered in holes from surface andthroughout their entire length with mineralisationoccurring as tabular zones at variable depths.
. Given the number of drill holes at Kokbulak it is notpracticable to report all drill hole collar co-ordinates in
this section.
APPENDIX III COMPETENT PERSON’S REPORT
– III-146 –
THIS DOCUMENT IS IN DRAFT FORM, INCOMPLETE AND SUBJECT TO CHANGE AND THAT
THE INFORMATION MUST BE READ IN CONJUNCTION WITH THE SECTION HEADED
‘‘WARNING’’ ON THE COVER OF THIS DOCUMENT
Criteria JORC Code explanation Commentary
Data aggregation
methods
. In reporting Exploration Results,
weighting averaging techniques,maximum and/or minimum gradetruncations (eg cutting of high
grades) and cut-off grades areusually Material and should bestated.
. Where aggregate interceptsincorporate short lengths of high
grade results and longer lengths oflow grade results, the procedureused for such aggregation should bestated and some typical examples of
such aggregations should be shownin detail.
. The assumptions used for anyreporting of metal equivalent valuesshould be clearly stated.
. Exploration results are not being reported.
. No metal equivalents have been used in this MineralResource estimate.
. The raw sample database has not been top-cut. Sampledata has not been top-cut as part of the Mineral
Resource estimation process.
Relationship between
mineralisation
widths and
intercept lengths
. These relationships are particularly
important in the reporting ofExploration Results.
. If the geometry of themineralisation with respect to thedrill hole angle is known, its nature
should be reported.
. If it is not known and only the down
hole lengths are reported, thereshould be a clear statement to thiseffect (eg ‘down hole length, truewidth not known’).
. The data is drilled on profiles perpendicular to the strike
of the two main orientations of mineralised domains.
. Drilling is vertical holes to intersect the tabular zones of
mineralisation.
. No orientation based sampling bias has been identified
in the sample data.
Diagrams . Appropriate maps and sections(with scales) and tabulations ofintercepts should be included for any
significant discovery being reportedThese should include, but not belimited to a plan view of drill holecollar locations and appropriate
sectional views.
. Appropriate data tabulations, plans and sectionsshowing the nature of the mineralisation, explorationand final Mineral Resources are included in the main
body of the report.
Balanced reporting . Where comprehensive reporting ofall Exploration Results is not
practicable, representative reportingof both low and high grades and/orwidths should be practiced to avoidmisleading reporting of Exploration
Results.
. Exploration results are not being reported.
APPENDIX III COMPETENT PERSON’S REPORT
– III-147 –
THIS DOCUMENT IS IN DRAFT FORM, INCOMPLETE AND SUBJECT TO CHANGE AND THAT
THE INFORMATION MUST BE READ IN CONJUNCTION WITH THE SECTION HEADED
‘‘WARNING’’ ON THE COVER OF THIS DOCUMENT
Criteria JORC Code explanation Commentary
Other substantive
exploration data
. Other exploration data, if
meaningful and material, should bereported including (but not limitedto): geological observations;
geophysical survey results;geochemical survey results; bulksamples — size and method of
treatment; metallurgical test results;bulk density, groundwater,geotechnical and rock
characteristics; potential deleteriousor contaminating substances.
. No other information available.
Further work . The nature and scale of plannedfurther work (eg tests for lateral
extensions or depth extensions orlarge-scale step-out drilling).
. Diagrams clearly highlighting theareas of possible extensions,including the main geologicalinterpretations and future drilling
areas, provided this information isnot commercially sensitive.
. WAI know of no further drilling planned at Kokbulak
. WAI recommend infill and definition drilling is plannedto better understand and potentially upgrade areas ofinferred and indicated mineral resources.
APPENDIX III COMPETENT PERSON’S REPORT
– III-148 –
THIS DOCUMENT IS IN DRAFT FORM, INCOMPLETE AND SUBJECT TO CHANGE AND THAT
THE INFORMATION MUST BE READ IN CONJUNCTION WITH THE SECTION HEADED
‘‘WARNING’’ ON THE COVER OF THIS DOCUMENT
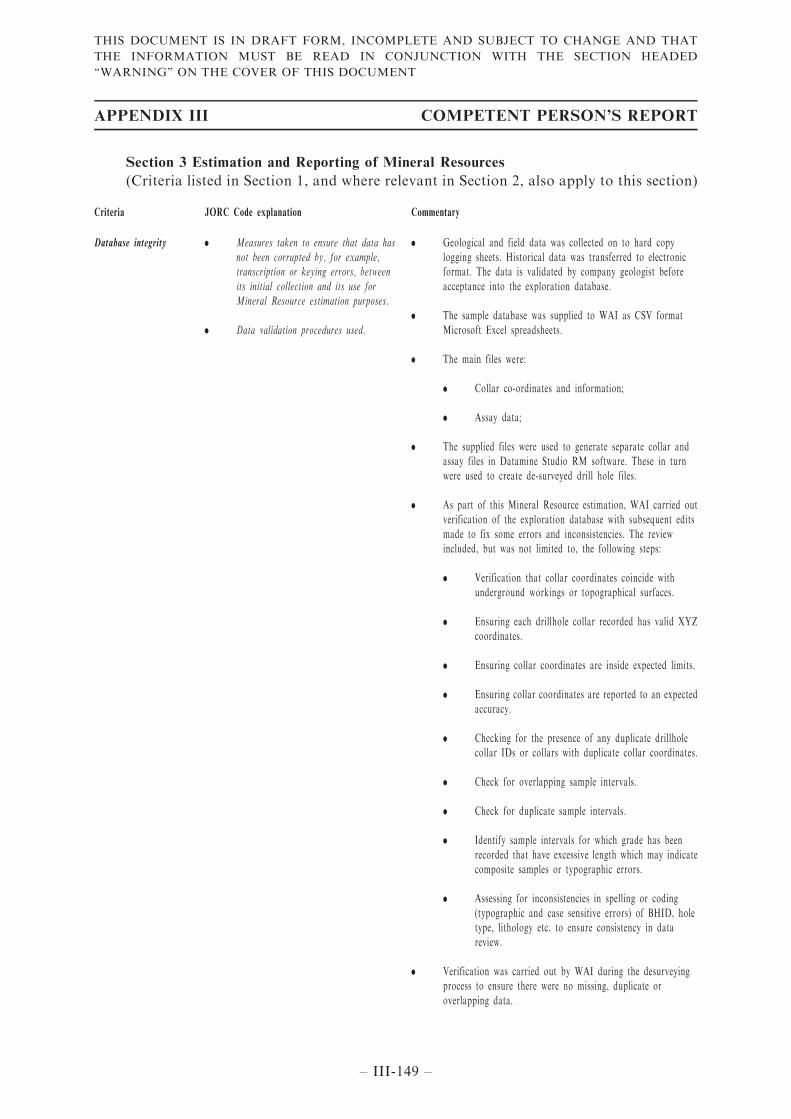
Section 3 Estimation and Reporting of Mineral Resources
(Criteria listed in Section 1, and where relevant in Section 2, also apply to this section)
Criteria JORC Code explanation Commentary
Database integrity . Measures taken to ensure that data hasnot been corrupted by, for example,transcription or keying errors, between
its initial collection and its use forMineral Resource estimation purposes.
. Data validation procedures used.
. Geological and field data was collected on to hard copylogging sheets. Historical data was transferred to electronicformat. The data is validated by company geologist before
acceptance into the exploration database.
. The sample database was supplied to WAI as CSV format
Microsoft Excel spreadsheets.
. The main files were:
. Collar co-ordinates and information;
. Assay data;
. The supplied files were used to generate separate collar andassay files in Datamine Studio RM software. These in turn
were used to create de-surveyed drill hole files.
. As part of this Mineral Resource estimation, WAI carried outverification of the exploration database with subsequent edits
made to fix some errors and inconsistencies. The reviewincluded, but was not limited to, the following steps:
. Verification that collar coordinates coincide withunderground workings or topographical surfaces.
. Ensuring each drillhole collar recorded has valid XYZcoordinates.
. Ensuring collar coordinates are inside expected limits.
. Ensuring collar coordinates are reported to an expectedaccuracy.
. Checking for the presence of any duplicate drillholecollar IDs or collars with duplicate collar coordinates.
. Check for overlapping sample intervals.
. Check for duplicate sample intervals.
. Identify sample intervals for which grade has been
recorded that have excessive length which may indicatecomposite samples or typographic errors.
. Assessing for inconsistencies in spelling or coding
(typographic and case sensitive errors) of BHID, holetype, lithology etc. to ensure consistency in datareview.
. Verification was carried out by WAI during the desurveyingprocess to ensure there were no missing, duplicate or
overlapping data.
APPENDIX III COMPETENT PERSON’S REPORT
– III-149 –
THIS DOCUMENT IS IN DRAFT FORM, INCOMPLETE AND SUBJECT TO CHANGE AND THAT
THE INFORMATION MUST BE READ IN CONJUNCTION WITH THE SECTION HEADED
‘‘WARNING’’ ON THE COVER OF THIS DOCUMENT
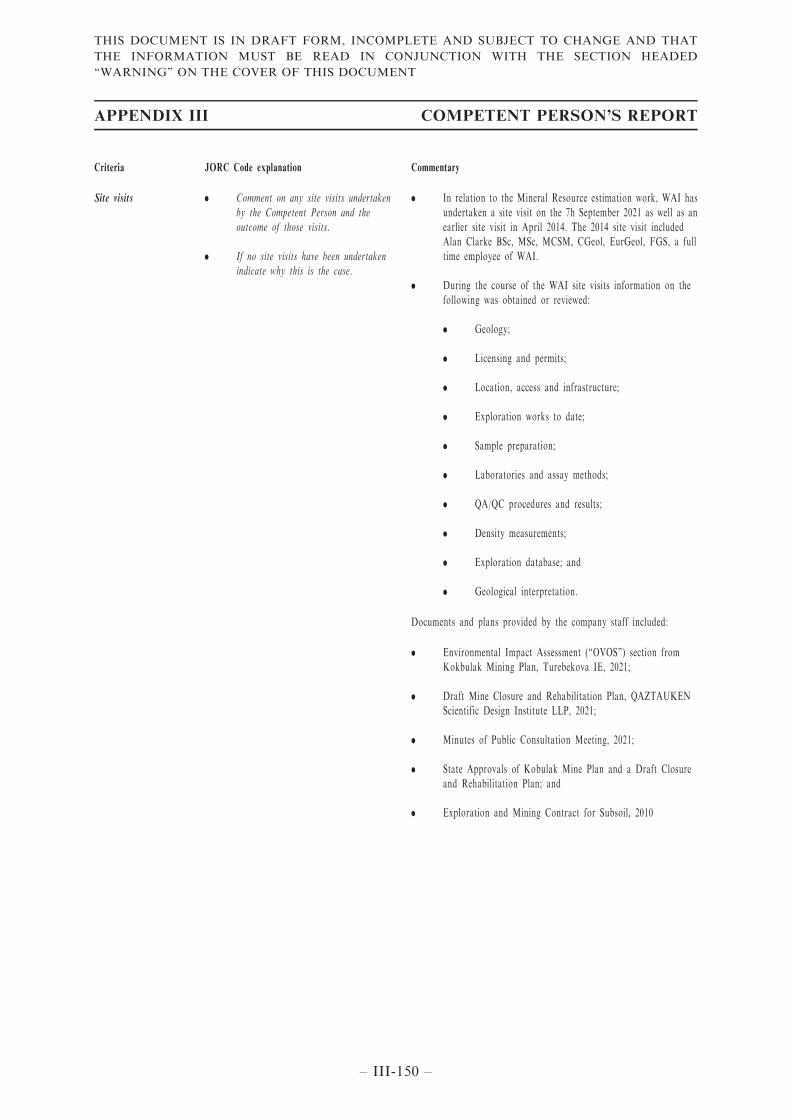
Criteria JORC Code explanation Commentary
Site visits . Comment on any site visits undertaken
by the Competent Person and theoutcome of those visits.
. If no site visits have been undertakenindicate why this is the case.
. In relation to the Mineral Resource estimation work, WAI has
undertaken a site visit on the 7h September 2021 as well as anearlier site visit in April 2014. The 2014 site visit includedAlan Clarke BSc, MSc, MCSM, CGeol, EurGeol, FGS, a full
time employee of WAI.
. During the course of the WAI site visits information on the
following was obtained or reviewed:
. Geology;
. Licensing and permits;
. Location, access and infrastructure;
. Exploration works to date;
. Sample preparation;
. Laboratories and assay methods;
. QA/QC procedures and results;
. Density measurements;
. Exploration database; and
. Geological interpretation.
Documents and plans provided by the company staff included:
. Environmental Impact Assessment (‘‘OVOS’’) section fromKokbulak Mining Plan, Turebekova IE, 2021;
. Draft Mine Closure and Rehabilitation Plan, QAZTAUKENScientific Design Institute LLP, 2021;
. Minutes of Public Consultation Meeting, 2021;
. State Approvals of Kobulak Mine Plan and a Draft Closureand Rehabilitation Plan; and
. Exploration and Mining Contract for Subsoil, 2010
APPENDIX III COMPETENT PERSON’S REPORT
– III-150 –
THIS DOCUMENT IS IN DRAFT FORM, INCOMPLETE AND SUBJECT TO CHANGE AND THAT
THE INFORMATION MUST BE READ IN CONJUNCTION WITH THE SECTION HEADED
‘‘WARNING’’ ON THE COVER OF THIS DOCUMENT
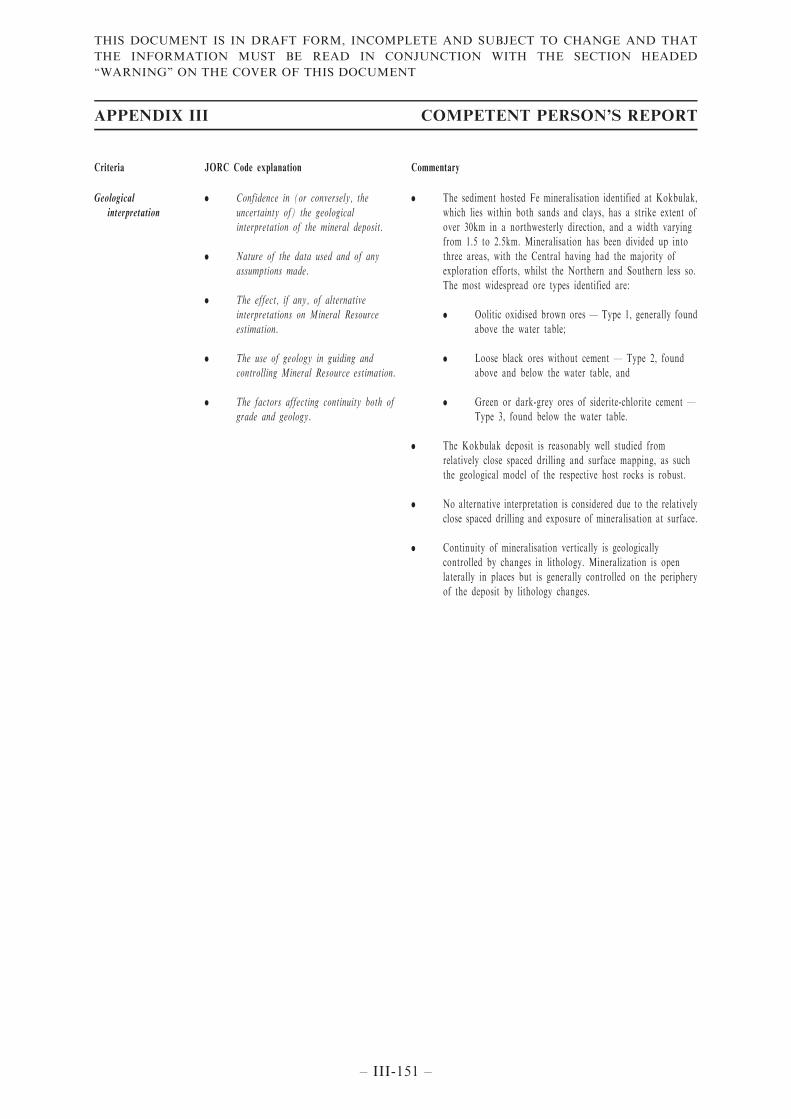
Criteria JORC Code explanation Commentary
Geological
interpretation
. Confidence in (or conversely, the
uncertainty of) the geologicalinterpretation of the mineral deposit.
. Nature of the data used and of anyassumptions made.
. The effect, if any, of alternativeinterpretations on Mineral Resourceestimation.
. The use of geology in guiding andcontrolling Mineral Resource estimation.
. The factors affecting continuity both ofgrade and geology.
. The sediment hosted Fe mineralisation identified at Kokbulak,
which lies within both sands and clays, has a strike extent ofover 30km in a northwesterly direction, and a width varyingfrom 1.5 to 2.5km. Mineralisation has been divided up into
three areas, with the Central having had the majority ofexploration efforts, whilst the Northern and Southern less so.The most widespread ore types identified are:
. Oolitic oxidised brown ores — Type 1, generally foundabove the water table;
. Loose black ores without cement — Type 2, foundabove and below the water table, and
. Green or dark-grey ores of siderite-chlorite cement —Type 3, found below the water table.
. The Kokbulak deposit is reasonably well studied fromrelatively close spaced drilling and surface mapping, as suchthe geological model of the respective host rocks is robust.
. No alternative interpretation is considered due to the relativelyclose spaced drilling and exposure of mineralisation at surface.
. Continuity of mineralisation vertically is geologicallycontrolled by changes in lithology. Mineralization is openlaterally in places but is generally controlled on the periphery
of the deposit by lithology changes.
APPENDIX III COMPETENT PERSON’S REPORT
– III-151 –
THIS DOCUMENT IS IN DRAFT FORM, INCOMPLETE AND SUBJECT TO CHANGE AND THAT
THE INFORMATION MUST BE READ IN CONJUNCTION WITH THE SECTION HEADED
‘‘WARNING’’ ON THE COVER OF THIS DOCUMENT
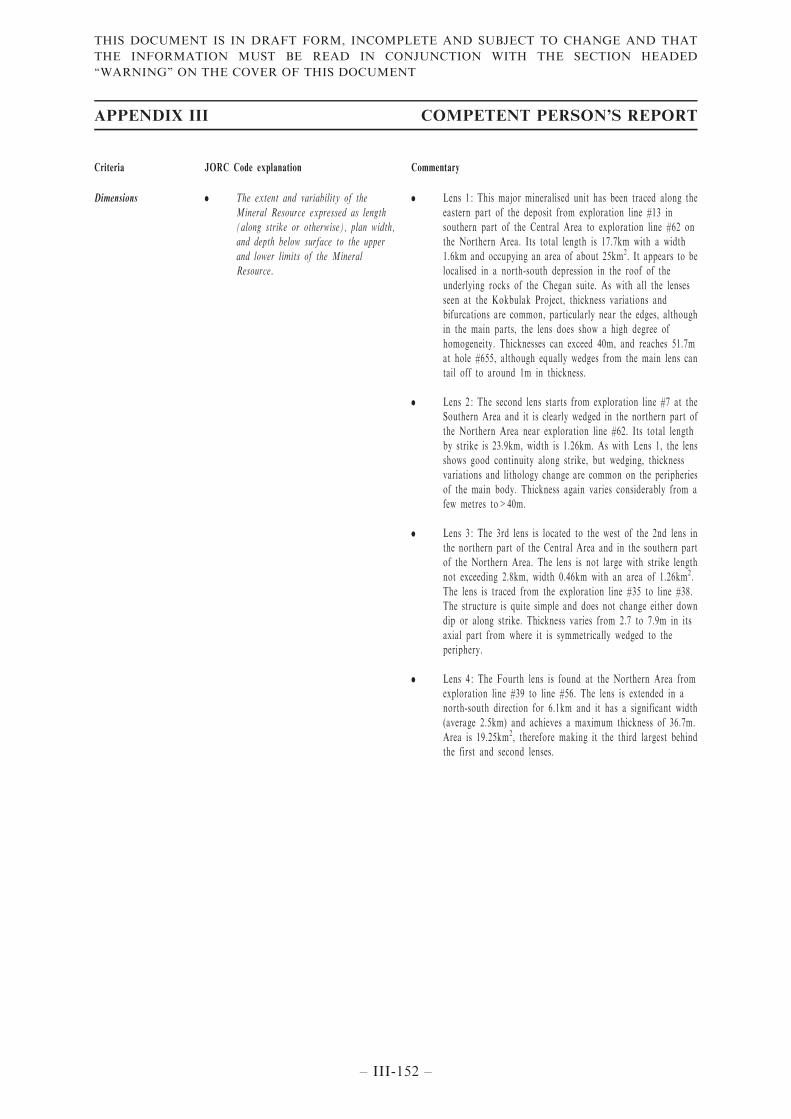
Criteria JORC Code explanation Commentary
Dimensions . The extent and variability of the
Mineral Resource expressed as length(along strike or otherwise), plan width,and depth below surface to the upper
and lower limits of the MineralResource.
. Lens 1 : This major mineralised unit has been traced along the
eastern part of the deposit from exploration line #13 insouthern part of the Central Area to exploration line #62 onthe Northern Area. Its total length is 17.7km with a width
1.6km and occupying an area of about 25km2. It appears to belocalised in a north-south depression in the roof of theunderlying rocks of the Chegan suite. As with all the lenses
seen at the Kokbulak Project, thickness variations andbifurcations are common, particularly near the edges, althoughin the main parts, the lens does show a high degree of
homogeneity. Thicknesses can exceed 40m, and reaches 51.7mat hole #655, although equally wedges from the main lens cantail off to around 1m in thickness.
. Lens 2 : The second lens starts from exploration line #7 at theSouthern Area and it is clearly wedged in the northern part ofthe Northern Area near exploration line #62. Its total length
by strike is 23.9km, width is 1.26km. As with Lens 1, the lensshows good continuity along strike, but wedging, thicknessvariations and lithology change are common on the peripheries
of the main body. Thickness again varies considerably from afew metres to>40m.
. Lens 3 : The 3rd lens is located to the west of the 2nd lens inthe northern part of the Central Area and in the southern partof the Northern Area. The lens is not large with strike lengthnot exceeding 2.8km, width 0.46km with an area of 1.26km2.
The lens is traced from the exploration line #35 to line #38.The structure is quite simple and does not change either downdip or along strike. Thickness varies from 2.7 to 7.9m in its
axial part from where it is symmetrically wedged to theperiphery.
. Lens 4 : The Fourth lens is found at the Northern Area fromexploration line #39 to line #56. The lens is extended in anorth-south direction for 6.1km and it has a significant width(average 2.5km) and achieves a maximum thickness of 36.7m.
Area is 19.25km2, therefore making it the third largest behindthe first and second lenses.
APPENDIX III COMPETENT PERSON’S REPORT
– III-152 –
THIS DOCUMENT IS IN DRAFT FORM, INCOMPLETE AND SUBJECT TO CHANGE AND THAT
THE INFORMATION MUST BE READ IN CONJUNCTION WITH THE SECTION HEADED
‘‘WARNING’’ ON THE COVER OF THIS DOCUMENT
Criteria JORC Code explanation Commentary
Estimation and
modelling techniques
. The nature and appropriateness of the
estimation technique(s) applied and keyassumptions, including treatment ofextreme grade values, domaining,
interpolation parameters and maximumdistance of extrapolation from datapoints. If a computer assisted estimation
method was chosen include a descriptionof computer software and parametersused.
. The availability of check estimates,previous estimates and/or mineproduction records and whether the
Mineral Resource estimate takesappropriate account of such data.
. The assumptions made regardingrecovery of by-products.
. Estimation of deleterious elements orother non-grade variables of economicsignificance (eg sulphur for acid mine
drainage characterisation).
. In the case of block model interpolation,the block size in relation to the average
sample spacing and the search employed.
. Any assumptions behind modelling of
selective mining units.
. Any assumptions about correlation
between variables.
. Description of how the geologicalinterpretation was used to control the
resource estimates.
. Discussion of basis for using or not
using grade cutting or capping.
. The process of validation, the checking
process used, the comparison of modeldata to drill hole data, and use ofreconciliation data if available.
. The Mineral Resource estimation has been carried out using
Datamine Studio RM, Leapfrog and Snowden Supervisorsoftware.
. Domains: The following parameters were used to determinezones of mineralisation:
. Cut-off grade of 30% Fe derived as outlined above;
. Minimum thickness above cut-off grade of 1m; and
. Maximum thickness of internal waste of 1m
The mineralised domains were defined using string outlines
digitised on vertical sections along the exploration profiles thatare spaced 100m to 400m apart. Strings were snapped to thebeginning or end of sample locations. In some areas
discrepancies were found between close spaced drilling. Inthese situations priority was given to the drilling carried out in2013 as these were deemed more reliable. A total of 10
separate mineralised envelopes were defined for Kokbulak.Figure 1.4 is a plan view of the mineralised envelopes andFigure 1.5 is an isometric view of the mineralised envelopes.
Zones 1 and 2 are the largest of the interpreted mineralisedzones. Extrapolation along strike was up to half the distancebetween adjacent exploration profiles where mineralisation wasnot deemed continuous between them with the thickness of
mineralised zones being reduced over this distance.Extrapolation along strike was up to 1/3 of drillhole spacing atthe limits of the mineralised envelopes. In some cases, to
achieve continuity, the wireframes were allowed to passthrough intersections below the cut-off grade if mineralisationabove cut-off grade were found on either side.
. A block model was created using the geological andmineralised zone wireframes as boundaries. A block size of25m (X) x 25m (Y) x 5m (Z) was used in the block model with
key fields established for mineralised domains.
. Grade capping: Assessment was made for anomalous grades
but no grade capping was carried out.
. Composites: A 5m composite length was chosen to ensure
consistent sample support during estimation. Composites werelimited to the boundaries of mineralised domains.
APPENDIX III COMPETENT PERSON’S REPORT
– III-153 –
THIS DOCUMENT IS IN DRAFT FORM, INCOMPLETE AND SUBJECT TO CHANGE AND THAT
THE INFORMATION MUST BE READ IN CONJUNCTION WITH THE SECTION HEADED
‘‘WARNING’’ ON THE COVER OF THIS DOCUMENT
Criteria JORC Code explanation Commentary
. Variography: A variographic study was carried out for Fe,
P2O5, S, CaO, MgO and CO2.
. Estimation: Estimation was carried out using Ordinary kriging
as the primary method. Inverse distance (squared) and NearestNeighbour estimates were carried out for validation purposes.Only composite samples within a domain were used for
estimation of that domain. Estimation parameters were basedon models of grade continuity produced during geostatisticalanalysis. Minimum and maximum sample criteria, restrictions
of number of composite samples from a single drill hole wereemployed during grade estimation to assist with declusteringand to reduce local grade bias. A multiple pass estimation ascarried out with expanding search ellipses and less restrictive
estimation parameters for estimating blocks in more poorlysampled areas.
. Estimation was carried out into parent cells only to reduce riskof conditional bias. Estimation was carried out using adiscretisation of five points in the X and Y dimensions and
two points in the Z dimension.
. The block model was verified first by comparing drill hole
composite sample values with estimated block values on asectional and plan basis. Grade comparison was also carriedout statistically by zone to ensure the global grade estimatewas unbiased. Grade profile (swath) plots were also
constructed to compare modelled grades and input compositegrades in slices or varying width. During this process acomparison was made between declustered and clustered data
to identify any possible local bias introduced by irregulargrade spacing.
. Estimation was carried out for P2O5, S, CaO, MgO and CO2as well as Fe.
Moisture . Whether the tonnages are estimated ona dry basis or with natural moisture,
and the method of determination of themoisture content.
. Mineral Resource tonnages have been reported on a dry basis.
Cut-off parameters . The basis of the adopted cut-offgrade(s) or quality parameters applied.
. WAI has prepared a Mineral Resource Estimate (MRE), inaccordance with the guidelines of the JORC Code (2012),
initially for the Kokbulak Project using a 30% Fe cut-offgrade. The cut-off grade used was the economic cut-off gradeat the time of completion of the MRE for this area.
APPENDIX III COMPETENT PERSON’S REPORT
– III-154 –
THIS DOCUMENT IS IN DRAFT FORM, INCOMPLETE AND SUBJECT TO CHANGE AND THAT
THE INFORMATION MUST BE READ IN CONJUNCTION WITH THE SECTION HEADED
‘‘WARNING’’ ON THE COVER OF THIS DOCUMENT
Criteria JORC Code explanation Commentary
Mining factors or
assumptions
. Assumptions made regarding possible
mining methods, minimum miningdimensions and internal (or, ifapplicable, external) mining dilution. It
is always necessary as part of theprocess of determining reasonableprospects for eventual economic
extraction to consider potential miningmethods, but the assumptions maderegarding mining methods and
parameters when estimating MineralResources may not always be rigorous.Where this is the case, this should bereported with an explanation of the
basis of the mining assumptions made.
. In order to adhere to the guidelines of the JORC Code (2012)
WAI has assumed that all material in the Central Area abovethe reporting cut-off grade has reasonable prospects foreventual economic extraction by open pit mining methods.
. In order to adhere to the guidelines of the JORC Code (2012)that a Mineral Resource should display reasonable prospects
for eventual economic assessment in the Southern andNorthern Areas, WAI has constrained the Mineral Resource tothat portion of the deposit which falls within a conceptual
open pit which is based on reasonably assumed economic andmining parameters. The pit optimisation has been carried outusing NPV Scheduler software with the following parameters:
Pit Optimisation Parameters
Parameter Unit
Target Production Rate Mtpa ore 24Mining cost (Ore & Waste) US$/t rock 0.71Processing cost US$/t ore 15.6
Royalty Cost US$/t ore 2.12Shipping Cost US$/t ore 16.00G & A US$/t ore 0.61
Process Recovery % 96.6Concentrate Grade %Fe 58.4Discount Rate % 10Overall Pit Slope Angle ° 35
Losses % 5Dilution % 1.12Bench Height m 10
Berm Width m 5Fe Price US$/t Metal 161.07Fe Price (58.4% Fe) US$/t conc 94.00
COG % 17.48
APPENDIX III COMPETENT PERSON’S REPORT
– III-155 –
THIS DOCUMENT IS IN DRAFT FORM, INCOMPLETE AND SUBJECT TO CHANGE AND THAT
THE INFORMATION MUST BE READ IN CONJUNCTION WITH THE SECTION HEADED
‘‘WARNING’’ ON THE COVER OF THIS DOCUMENT
Criteria JORC Code explanation Commentary
Mining in the Central Area is to take place via a conventional open pit
operation using conventional hydraulic shovels and trucks formovement of ore and waste. Mineralisation comprises near horizontal(1–2°) bedding located near-surface, with up to 14m of overburden.
An exact equipment requirement is not needed other than to say thatCaterpillar trucks and shovels have been factored into the calculations
to provide an efficient excavation and haulage cycle with oreproduction capacity of 24Mtpa of ore.
Based on the Project XXI 2013 Feasibility Study, it is assumed thatthe haulage distance from the open pit to the processing plant will notexceed 4.8km. At the early stage of the pit life the waste dump will belocated beyond the pit, but later in life of mine the waste will be
backfilled within the pit. Hence, the assumption is that the wastehaulage distance will not exceed 2km.
Since the mining method includes no drilling and blasting, it isrecommended that heavy track- mounted ripper bulldozers such asCaterpillar D9T or Caterpillar D10T be added into the mining fleet to
deal with difficult areas and trim bench floors and for waste dumpmaintenance.
To reduce the movement of the main excavators, it is recommended toadd to the loading fleet heavy wheel-mounted loaders, whose mainpurpose will be to remove the material ripped by bulldozers from thebench floor to support ore stockpiles and backup the main excavators
on production faces.
WAI considers the equipment selected for purchase is well suited to
the intended purpose.
APPENDIX III COMPETENT PERSON’S REPORT
– III-156 –
THIS DOCUMENT IS IN DRAFT FORM, INCOMPLETE AND SUBJECT TO CHANGE AND THAT
THE INFORMATION MUST BE READ IN CONJUNCTION WITH THE SECTION HEADED
‘‘WARNING’’ ON THE COVER OF THIS DOCUMENT
Criteria JORC Code explanation Commentary
Metallurgical factors or
assumptions
. The basis for assumptions or predictions
regarding metallurgical amenability. Itis always necessary as part of theprocess of determining reasonable
prospects for eventual economicextraction to consider potentialmetallurgical methods, but the
assumptions regarding metallurgicaltreatment processes and parametersmade when reporting Mineral Resources
may not always be rigorous. Where thisis the case, this should be reported withan explanation of the basis of themetallurgical assumptions made.
. Processing on the mineralisation of the Kokbulak deposits,
upon which the Kokbulak Project sits on, has been studied ingreat detail in the past. In 1950s, the Moscow Institute ofSteels and Alloys, performed agglomeration and sintering
studies on the unprocessed iron ore samples from theKokbulak deposit and the Thematic Technological PartyCentral Laboratory of the Ural Geological Office conducted
mineral beneficiation tests involving heavy liquid, magnetic,gravity and roasting-magnetic separation technologies. Thetestwork conducted by the Centre of Geosciences, Metallurgy
and Processing in 2011 provides laboratory evidence that thethermo acid dephosphorisation of brown iron samples from theKokbulak Project, in particular from the Central Area, istechnically feasible and low-phosphorus and low-silica brown
iron ore concentrates can be obtained for the further cast ironmelting.
. The first documented processing studies on the Kokbulak ironore deposit were performed in 1952–1953 by the MoscowInstitute of Steel and Alloys (MISA) on samples of the three
main types mineralisation, subsequently identified as Samples1, 2 and 3. These testwork investigated the recoverability,porosity, sintering conditions, agglomerate quality and other
parameters to assess the performance of the ores, prior to anyenrichment by mineral processing, in blast furnace smelting.
. While detailed results from MISA works are not available to
WAI but only a summary of general findings, sintering testsshowed that brown and, in particular, black ore types canproduce agglomerates with low content of FeO (less than
15%), high porosity, good recoverability and high mechanicalproperties.
. These ore types were considered suitable for blast furnacesmelting without processing. The good reducibility of theseores was explained by the low content of limonite and sideriteand the high in- situ porosity.
. For green ore, the lower grade sample No.2, processing byroasting and magnetic separation was initially suggested to
reduce the chlorite content prior to sintering. Subsequentstudies indicated that there is no practical benefit fromprocessing Kokbulak iron ores using the roast-magnetic
separation routes as opposed to direct high intensity magneticseparation.
APPENDIX III COMPETENT PERSON’S REPORT
– III-157 –
THIS DOCUMENT IS IN DRAFT FORM, INCOMPLETE AND SUBJECT TO CHANGE AND THAT
THE INFORMATION MUST BE READ IN CONJUNCTION WITH THE SECTION HEADED
‘‘WARNING’’ ON THE COVER OF THIS DOCUMENT
Criteria JORC Code explanation Commentary
. Sintering tests performed on 0–2mm dry magnetic concentrates
did not reveal any technical issues.
. WAI Comment: Sintering tests showed that hydrogoethite-rich
Kokbulak iron ores have good reducibility, but high levels ofimpurities. Therefore, Kokbulak ores and concentrates willrequire blending with ores and concentrates of different origin
and nature in order to produce a suitable feed for blastfurnaces. Phosphorous, the major impurity, is present withvalues constantly above 1% and roughly one order of
magnitude higher than the desirable level. It will drive therequirement for any treatment and blending of theconcentrates. Kokbulak ores are also characterised by highsilica and alumina contents. The resulting very low Basicity
index (B=(CaO+MgO)/(SiO2+Al2O3)), constantly below 0.12in all samples, will determine the need for the production of aheavily fluxed agglomerate.
Environmental factors
or assumptions
. Assumptions made regarding possiblewaste and process residue disposaloptions. It is always necessary as partof the process of determining reasonable
prospects for eventual economicextraction to consider the potentialenvironmental impacts of the mining and
processing operation. While at this stagethe determination of potentialenvironmental impacts, particularly for a
greenfields project, may not always bewell advanced, the status of earlyconsideration of these potential
environmental impacts should bereported. Where these aspects have notbeen considered this should be reportedwith an explanation of the environmental
assumptions made.
. No environmental factors or assumptions have been appliedduring this Mineral Resource estimate other than theassumption that appropriate permits to operate an open pitmine and associated facilities would be granted.
. No potential environmental impacts have been considered aspart of this Mineral Resource estimate.
To date, the Kokbulak Project is compliant with the terms oftheir exploration licence and are in compliance with Kazakh
legislation. Whilst the Project will affect the environment, dueto the distance from the nearest settlement and any sensitivereceptors, environmental and social conditions are considered
favourable for the Project.
As the project develops, the Company must undertake anEnvironmental and Social scoping study and subsequent impact
assessment to highlight any sensitive receptors and todetermine any impacts requiring mitigation.
The importance of water to the operation cannot beoveremphasised and it is therefore recommended that anupdated hydrogeological investigation covering the
groundwater regime including quantity and quality, isundertaken in the area of abstraction to include an impactstudy to determine the potential impacts of abstractionvolumes required for the project.
APPENDIX III COMPETENT PERSON’S REPORT
– III-158 –
THIS DOCUMENT IS IN DRAFT FORM, INCOMPLETE AND SUBJECT TO CHANGE AND THAT
THE INFORMATION MUST BE READ IN CONJUNCTION WITH THE SECTION HEADED
‘‘WARNING’’ ON THE COVER OF THIS DOCUMENT
Criteria JORC Code explanation Commentary
WAI recommends that the Company adopt, and make public,
procedures and instruments for the management ofenvironmental, social and health and safety issues and applyrelevant national laws and regulations as well as international
best practice guidelines for the necessary management, controland reporting.
Furthermore, WAI recommends instigating an Environmental& Social Action Plan the details of which are provided inTable 9.3 below.
Table 9.3 : Recommendations for Environmental &
Social Action Plan
ActionPriority &
timescale
1. Undertake a hydrogeological investigation coveringwater quality and quantity to ensure the feasibility
and potential impacts of extracting project waterfrom the Begimbet Aquifer
High/ Immediate
2. Prepare an Environmental impact assessment in linewith IFC Performance Standards for inclusion into
BFS
High
3. Prepare a social impact assessment in line with IFCPerformance requirements for inclusion into the
BFS
High
4. Prepare an overarching, company-wideEnvironmental and Soda Management System to
incorporate the following elements:
Medium
‧ policy‧ Identification of risks and impacts;
‧ Management programmes‧ Organizational capacity and competency;‧ Emergency preparedness and response;‧ Stakeholder Engagement; and Monitoring
and Review.
APPENDIX III COMPETENT PERSON’S REPORT
– III-159 –
THIS DOCUMENT IS IN DRAFT FORM, INCOMPLETE AND SUBJECT TO CHANGE AND THAT
THE INFORMATION MUST BE READ IN CONJUNCTION WITH THE SECTION HEADED
‘‘WARNING’’ ON THE COVER OF THIS DOCUMENT

Criteria JORC Code explanation Commentary
Bulk density . Whether assumed or determined. If
assumed, the basis for the assumptions.If determined, the method used, whetherwet or dry, the frequency of the
measurements, the nature, size andrepresentativeness of the samples.
. The bulk density for bulk material musthave been measured by methods thatadequately account for void spaces
(vugs, porosity, etc), moisture anddifferences between rock and alterationzones within the deposit.
. Discuss assumptions for bulk densityestimates used in the evaluation processof the different materials.
. A combination of data is available for density determination.
Values used in the Mineral Resource estimate are determinedfrom various methods and periods of testing.
. Tests of bulk samples in 1950s and of core samples in 2013were carried out. The two eras of testing gave similar meanvalues for bulk density.
. The bulk density of brown and black (incoherent) oreswas determined by direct excavation of the ore mass
from test pits of known dimensions. Ore wasexcavated, weighed, left to dry for 20 or more daysand then re-weighed. From these data, wet and drybulk densities could be estimated.
. For the bulk density of the green ores, this wasestablished in the laboratory as these ores could not be
intersected near surface. Thus, the bulk density wasdetermined from 15–20cm core samples or samplesfrom test pit walls (15x15cm), wrapped in gauze fabric,
waxed and immediately sent to a chemical laboratory,which name is not known to WAI.
. The average bulk density is recorded as 2.36t/m3 fromextensive historical testing, although the position ofsamples used for density measurement is not recorded.Thus, this value was therefore assigned to the whole of
the mineralised zones at the Central Area of theKokbulak Project.
APPENDIX III COMPETENT PERSON’S REPORT
– III-160 –
THIS DOCUMENT IS IN DRAFT FORM, INCOMPLETE AND SUBJECT TO CHANGE AND THAT
THE INFORMATION MUST BE READ IN CONJUNCTION WITH THE SECTION HEADED
‘‘WARNING’’ ON THE COVER OF THIS DOCUMENT
Criteria JORC Code explanation Commentary
Classification . The basis for the classification of the
Mineral Resources into varyingconfidence categories.
. Whether appropriate account has beentaken of all relevant factors (ie relativeconfidence in tonnage/grade estimations,
reliability of input data, confidence incontinuity of geology and metal values,quality, quantity and distribution of the
data).
. Whether the result appropriately reflectsthe Competent Person’s view of the
deposit.
. Classification of Mineral Resources is based upon a review of
geological continuity and complexity, quality of supportingdata, spatial grade continuity and quality of block mode.
. With the current drill hole spacing, geological continuitybetween exploration profiles is seen. The extents of thedomains that act as host for the vast majority of
mineralisation are generally well constrained by the currentdrilling. The current drill hole spacing of areas of 150m x250m (or less) drilling allows for interpretation of continuous
zones of mineralisation for the larger mineralised domains.Little variation is seen in grade or mineralised domainthickness at this grid spacing.
. The data held in the exploration database is deemed acceptablefor use in a Mineral Resource estimate with limitations. QA/QC has generally been of a basic nature throughout the
majority of the exploration used in the estimate with the focusmainly upon analytical precision by reviewing internal andexternal laboratory duplicate assay results. These results show
a reasonable match but a lack of duplicates, other than pulpduplicates, CRM samples and blank data means not all areasof sampling and assay quality have been reviewed. Whilst the
Mineral Resource estimate relies upon a large amount ofhistorical data, a programme of verification drilling has showna good match with the grades and mineralisation domainthickness recorded in these historical holes.
. The data used in geostatistical analysis resulted in robust alongstrike and down dip variogram structures for Fe across main
domains.
. Validation of the block model has shown the estimated grades
to be a good reflection of the input composite grades. Visualand statistical checks reveal no evidence of major under orover estimation.
. Key drill hole spacing for the allocation of resources can besummarised as follows:
Measured resources — Measured resources were outlined wheredrillhole spacing was up to 150m x 250m in areas where 2013drilling has been carried out.
Indicated resources — Indicated resources were outlined wheredrillhole spacing was up to 400m x 200m; and.
Inferred resources — Within defined mineralised zones outsideof the Indicated Resource criteria.
APPENDIX III COMPETENT PERSON’S REPORT
– III-161 –
THIS DOCUMENT IS IN DRAFT FORM, INCOMPLETE AND SUBJECT TO CHANGE AND THAT
THE INFORMATION MUST BE READ IN CONJUNCTION WITH THE SECTION HEADED
‘‘WARNING’’ ON THE COVER OF THIS DOCUMENT
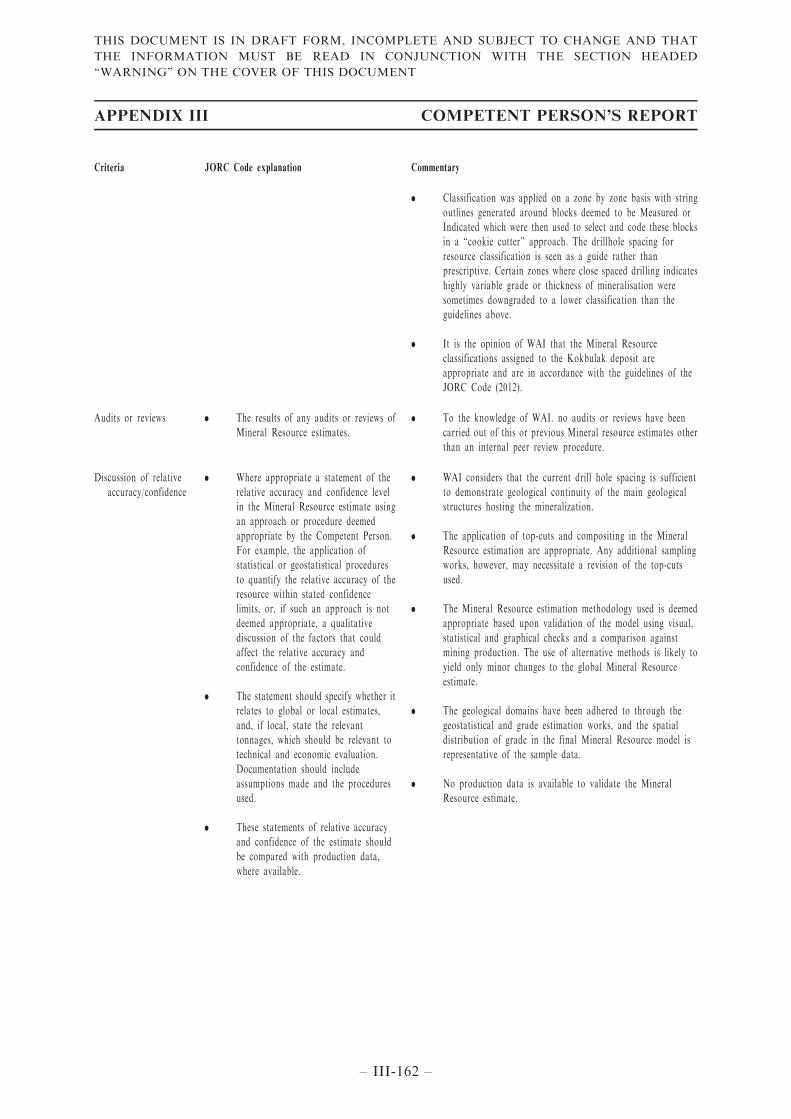
Criteria JORC Code explanation Commentary
. Classification was applied on a zone by zone basis with string
outlines generated around blocks deemed to be Measured orIndicated which were then used to select and code these blocksin a ‘‘cookie cutter’’ approach. The drillhole spacing for
resource classification is seen as a guide rather thanprescriptive. Certain zones where close spaced drilling indicateshighly variable grade or thickness of mineralisation were
sometimes downgraded to a lower classification than theguidelines above.
. It is the opinion of WAI that the Mineral Resourceclassifications assigned to the Kokbulak deposit areappropriate and are in accordance with the guidelines of theJORC Code (2012).
Audits or reviews . The results of any audits or reviews ofMineral Resource estimates.
. To the knowledge of WAI. no audits or reviews have beencarried out of this or previous Mineral resource estimates otherthan an internal peer review procedure.
Discussion of relative
accuracy/confidence
. Where appropriate a statement of the
relative accuracy and confidence levelin the Mineral Resource estimate usingan approach or procedure deemed
appropriate by the Competent Person.For example, the application ofstatistical or geostatistical procedures
to quantify the relative accuracy of theresource within stated confidencelimits, or, if such an approach is notdeemed appropriate, a qualitative
discussion of the factors that couldaffect the relative accuracy andconfidence of the estimate.
. The statement should specify whether itrelates to global or local estimates,
and, if local, state the relevanttonnages, which should be relevant totechnical and economic evaluation.
Documentation should includeassumptions made and the proceduresused.
. These statements of relative accuracyand confidence of the estimate shouldbe compared with production data,
where available.
. WAI considers that the current drill hole spacing is sufficient
to demonstrate geological continuity of the main geologicalstructures hosting the mineralization.
. The application of top-cuts and compositing in the MineralResource estimation are appropriate. Any additional samplingworks, however, may necessitate a revision of the top-cuts
used.
. The Mineral Resource estimation methodology used is deemedappropriate based upon validation of the model using visual,
statistical and graphical checks and a comparison againstmining production. The use of alternative methods is likely toyield only minor changes to the global Mineral Resource
estimate.
. The geological domains have been adhered to through the
geostatistical and grade estimation works, and the spatialdistribution of grade in the final Mineral Resource model isrepresentative of the sample data.
. No production data is available to validate the MineralResource estimate.
APPENDIX III COMPETENT PERSON’S REPORT
– III-162 –
THIS DOCUMENT IS IN DRAFT FORM, INCOMPLETE AND SUBJECT TO CHANGE AND THAT
THE INFORMATION MUST BE READ IN CONJUNCTION WITH THE SECTION HEADED
‘‘WARNING’’ ON THE COVER OF THIS DOCUMENT


