Embed Size (px)
Citation preview
International Journal of Arts and Commerce Vol. 3 No. 8 October, 2014
17
Key Fundamental Factors and Long-run Price Changes in
Emerging Equity Markets, Case of ASE-Jordan
Dr. Abdul Aziz Farid Saymeh
Middle East University,
Amman –Jordan
Email: [email protected]
Dr. Marwan Mohammad Abu Orabi.
Dept. of Finance and Business,
The World Islamic Science University,
Jordan
Abstract
Study purpose: As most emerging equity markets have experienced fluctuating developments in the last two
decades. This study has been developed to assess the two investment strategies at Jordan’s ASE. This study
intends to help clients identify, understand and develop international investment and market
entry/expansion opportunities in the context of their global strategies, opportunities, and to integrate their
investments in the developing stock markets in African and Middle East. Findings : Study has compared the
performance of ASE sector indexes as well as the general index along with their underlying fundamentals.
Study results revealed that there were significant evidences between ASE sectors indexes and their
corresponding fundamental values.However,the short-term correlation and long-term co integration showed
conflicting results.
Contributions: The research made significant contributions to both investors and researchers regarding
the long-term versus short-term investments in the different economical sectors of developing stock market.
The research results might help both academicians and practitioners to be more acquainted by the
components of developing stock markets.
Research Limitations/Recommendations: The data is limited to Jordan ASE; therefore, generalizing results
of a Jordanian setting to other countries may be inconsistent. However, extending the analyses to other
stock markets requires further researches via testing other countries' stock markets. This will help mitigate
the issue of generalizing conclusions on other stock markets.
Key words: Jordan , Stock market , Correlation , Co integration , Fundamentals.
JEL: G11 G12 C33 C32
International Journal of Arts and Commerce ISSN 1929-7106 www.ijac.org.uk
18
I- Introduction :
During the past decade, many stock market indices around the world have gained significant
growth compared to their historical average. Most of the developed markets have been rehabilitated so
swiftly from the technology bubble that occurred a few years earlier, also some emerging markets have
gained large amounts of funds channeled into their stock exchanges, causing their prices to jump into
extraordinary levels. However, some markets have gone through major corrections, partly related to
economic crises. Some of these corrections were temporary, others more pronounced. In the Middle East
and Central Asia, several economies have, partly boosted by oil revenues, established or enhanced their
equity markets recently. In other countries, where stock markets have existed for a long time, (investor)
interest in them has grown drastically in the recent past.
Amman Financial Market (AFM) was established in March 16, 1977 via a ministerial resolution and an
AFM Administration Committee has been established, which immediately went into action; and operation
on January 1 st, 1978. AFM has experienced a series of developments:
In March,11,1999 Amman Stock Exchange was established as a result of the reorganization process of the
Jordan Capital Market. AFM began in 1992 to calculate a Market Capitalization Weighted Price
Index covering 50 stocks which have been increased to 60 stocks in 1994 , to 70 stocks in 2001 , and to 100
in 2007. The base value of 100 points was set up on December 31st, 1991; it was stipulated for the
Weighted Price Index. The 100 points base was changed into 1000 as of January 1st 2004. Recently, ASE
has constructed a new index that is based on free float shares, which provides a better representation of
stocks’ prices movement in the market without any bias to large cap companies, thus limiting their impact
on the index(ASE Files, 2007). ASE is divided into four main sectors: Banking, Services, Insurance and
Industries; later on, ASE has changed the classification into three main sectors: Financials, Services, and
Industries. Mr. Tarif, manager of ASE, elaborated that the new classification is in line with the
classification adopted by the American market, Standard & Poor’s(ASE Files ,2009).
Jordan’s stock market is one of the most regulated and had the most experienced in stock trading among the
emerging Middle East stock markets. ASE has plenty of attracting reasons for international investors, among
which is Jordan’s Unique and Strategic Location, Stable Political Environment, Free Market Oriented
Economy, and its Access to Major International Markets (Koios Associates ,2009). ASE general index in the
2000 was 813.3 points out of 1000 which is the lowest for the study period, 2000-2012, and jumped to
4259.7points in 2005, which is the highest for the study period, dropped to 2373.6 in 2010, to end to1927.7
points in July,2013 (ASEFiles,2009)).Many studies have tackled the factors which impact stock prices and
consequently increases or decreases the market index. ASE stock prices are affected by internal and
external factors in determining the stock prices of the listed companies in Amman Stock Exchange. The
most impact was the inflation rate, while the least one was the nature of firm business (Allahawiah,S. and
Al Amro,S,2012) .
This research concentrates, on ASE long-term and short-term investments strategies. Prior Studies pertaining
investment strategies did not receive much attention. So, no doubt that there are number of studies on this
topic, but still there are enough gaps in the previous studies regarding to test the investment strategies in
ASE sectors at the present period. Therefore Jordan’s ASE market has been selected to test the two
investment strategies of ASE sectors. To achieve research purpose, stock sectors price data of ASE were
collected and investment returns will be calculated. Sample period is from 2000-2012. Empirical findings of
this study would improve our understanding of the long-term and short-term investment strategies and will
enhance our understanding of the pros and cons of each strategy.
International Journal of Arts and Commerce Vol. 3 No. 8 October, 2014
19
II- Literature Review :
Security markets form an important role in economic growth. The growth of international production is
driven by economic and technological forces. It is also driven by the ongoing liberalization of foreign direct
investment and trade policies. In this context, globalization offers an unprecedented opportunity for
developing countries to achieve faster economic growth through trade and investment. In the period 1970s,
international trade grew more rapidly than foreign direct investment (FDI), and thus international trade was
by far than most other important international economic activities. However, This situation has changed
dramatically in the middle of the 1980s, when world FDI started to increase sharply. developing countries as
a group show an FDI increase of 22% at constant prices (world developing report 2010). flows to
developing countries started to pick up in the mid-1990s largely as a result of progressive liberalization of
FDI polices in most of these countries and the adoption of generally more outward-oriented policies(Louzi,B
and Abadi,A., 2011) . The local stock markets have received some attention in the finance and economics of
developing countries. Many studies have contributed to the relationship between risk and return , the
efficiency in pricing securities, evidence on structural breaks in the 1990s, the impact of the inflation rate on
market activity in liquidity (Omran and Pointon, 2001), stock return predictability, and the effect of
developing the securities market on economical growth (Bolbol et al., 2005). Usually, security market
investment is a long-term process. However, many people try to manipulate the market or speculate with the
day trading , it is a risky business and investors really need to understand what they are doing before they try
short-term investments. For most people it is easier, and safer to plan on long-term investments. Investors
usually use financial analysis to figure out what risk and return levels that match their comfort level(Omran,
2002). Long-term investments usually pay off over short periods that may extend into several years.
Investors should determine the rate of return they want and look for an appropriate mutual fund or set of
securities that averages the rate of return over the years period. Investors are required to conduct long term
analysis that focuses on a collection of important investor questions, which help them identify the intuitive
value of a target company (Omran, 2006). These questions focused solely on the variables which seem
important in their investments, so they may not find every undervalued company quite feasible, but they will
guided towards the best companies with the least risk. A major element of this analysis approach is the
SWOT Analysis. When investors invest for the long-terms, they should not panic when securities/stocks
drop and they should not sell when the market looks bad. The market has always recovered from drops in
the past, although it may take time to do so. However ,if investors pull out when prices are low they lose the
money that they initially invested; while if they leave their investments alone then they will recover over
time. It is worth to note that the longer investors have to encounter bigger risks they take. However , short-
term investments need that investors should understand the market they are entering. Short term investing
is considered to be speculative or gambling by some investors . This is because there is a great risk involved.
Many investors often lose their money when they go for short-term investments as they are required to be
sure that they do not put all of their invested money or assets in one basket. Also , short term investors are
required to conduct financial analysis which focuses on three quantitative (mathematical) approaches to
forecast for the fair market value of the targeted companies. The fair price indicates whether you should
buy, sell or hold your target company. If the stock price is significantly below the fair value, then the
investor is able to buy; if the opposite is true, the investor should consider selling . In its more sophisticated
formats, the notion that there are patterns in price movements over short periods of time forms the basis for
much of charting. The serial correlation test indicates that if today is a positive day for a stock, there are
three different opinions pertaining this:
-The first is that there is a momentum from today will be carried into the next day, and that day is more
likely to be an up day than a down day.
International Journal of Arts and Commerce ISSN 1929-7106 www.ijac.org.uk
20
-The second is that there will be a profit taking day as investors are cashing their profits and this is a
moment correction and tomorrow will be a down day.
-The third is that each day is a new day, with new information and new worries, this means that what
happened today has no implications for what will happen tomorrow (Caldwell,M.,2013).
II-1-The Link Between Stock Prices and Fundamental factors:
Stock prices are the prime indicator that is readily available to investors to take decisions to invest in a
particular company. Many theories have proposed that the stock price changes are somehow associated with
the changes in certain relevant fundamental factors such as payout ratio, dividend yield, capital structure,
earnings size of the firm and its growth (Downs ,1991). Linter linked dividend changes to earnings Linter
(1956) , while Shapiro predicts a direct relation between payout ratio and the price-earnings multiple
Shapiro (1962). . Many studies have showed direct relation between stock price changes and both earnings
and dividend changes (Baskin,1989).
In its broadest terms, fundamental analysis involves looking at any data, besides the trading patterns of the
stock itself, which can be expected to impact the price or perceived value of a stock. Fundamental analysis
focuses on creating a portrait of the company, identifying the intrinsic, or fundamental, value of its shares
and buying or selling strength of the stock based on that information. , while technical analysis focuses only
on the trading and price history of a stock. To focus on whether stock prices are commensurate with
fundamentals, a number of standard descriptive indicators are needed to be studied, indicators used to assess
the company’s fundamentals include ( Saadi-Sedik and Petri ,2006).:
II-2--P/E ratio: It is a valuation ratio of a company's current share price compared to its per-share earnings.
It is Calculated as: Market Value per Share/ Earnings per Share (EPS).The P/E ratio measures how
expensive a company’s stock is relative to its most recent earnings. In general, a high P/E suggests that
investors are expecting higher earnings growth in the future compared to companies with a lower P/E.
However, the P/E ratio doesn't tell us the whole story by itself. It's usually more useful to compare the P/E
ratios of one company to other companies in the same industry, to the market in general or against the
company's own historical P/E. It would not be useful for investors using the P/E ratio as a basis for their
investment to compare the P/E of a technology company (high P/E) to a utility company (low P/E) as each
industry has much different growth prospects. After being almost flat for a few years, the P/E ratio of ASE
in 2000 was 14.824, it fluctuated ups and downs to reach 12.968 in 2002 and to reach 44.203 in 2005 and
dropped down to 16.747 in 2006, it has recovered in 2010 to reach 26.345 and dropped to reach 14.14 in
July, 2013.
II-3--Dividend yield: Further evidence is provided by the dividend yield, it is the ratio between the amount
of dividends paid per share over a certain period and the current share price. It shows how much a company
pays out in dividends each year relative to its share price. In the absence of any capital gains, the dividend
yield is the return on investment for a stock. Dividend yield is calculated as follows:
Dividend yield is a way to measure how much cash flow you are getting for each dollar invested in an equity
position. Investors who require a minimum stream of cash flow from their investment portfolio can secure
this cash flow by investing in stocks paying relatively high, stable dividend yields. As expected in, light of
International Journal of Arts and Commerce Vol. 3 No. 8 October, 2014
21
the take-off of actual share prices, the dividend yield of ASE index was 3.637% in 2000 , this percentage
went down to as low as 1.648% in 2005,but it has recovered to reach its highest in 2012 to reach 4.591% .
II-4-Earning volatility: It is A statistical measure of the dispersion of returns for a given security or market
index. Earning Volatility can either be measured by using the standard deviation or variance between returns
from that same security or market index. Commonly, the higher the volatility, the riskier the security. In
other words, volatility refers to the amount of uncertainty or risk about the size of changes in a security's
value. A higher volatility means that a security's value can potentially be spread out over a larger range of
values. This means that the price of the security can change dramatically over a short time period in either
direction. A lower volatility means that a security's value does not fluctuate dramatically, but changes in
value at a steady pace over a period of time. The presence of a bubble in stock markets is usually associated
with a substantial increase in price volatility. Indeed, strong price volatility is often considered by investors
as a signal of an imminent bursting of a bubble, leading to a flight into quality. As the stock price index
displays characteristics of a non-stationary time series, we cannot draw any conclusions from the standard
deviation of the index. Instead, we investigate the standard deviation of the annual returns of ASE index for
the period 2000 to 2012 . After a sudden increase in price volatility at the beginning of 2003 when stock
prices took off, price volatility abated again somewhat. The correction in February 2006 was preceded by a
doubling of the standard deviation. However, an even more pronounced increase occurred in early 2005,
when the market correction was still a year away. Higher volatility of daily returns, therefore, do not
provide conclusive evidence for the existence of a speculative bubble.
II-5- Earning Per Share(EPS) : It is the net profit allocated to each outstanding common share of a public
shareholding company. Or it is the currency value allotted for each outstanding share of a company's
common stock. It serves as an indicator of a company's profitability. It is calculated as:
EPS = (Net Profit – Preferred Dividends) / Weight Average of Common Shares Outstanding.
Earnings per share gives investors the real return on their investment in a particular stock of a publicly
traded company on the par price of the share. Earnings per share is often used as the bottom line of investing
terms, investors usually compare earnings per share to the share’s market price of the stock they own. Based
on the market price , they determine how much they are willing to pay per share of stock.
II-6- Turnover Ratio : It is the percentage of a mutual fund or stock holdings that have been "turned over"
or replaced with other investment holdings in a given year. The type of mutual fund, its investment objective
and/or the portfolio manager's investing style will play an important role in determining its turnover ratio. It
is worth to infer that an aggressive small-cap growth stock portfolio will mostly experience higher turnover
than a large-cap value stock portfolio. Turnover ratios for a stock portfolio will vary from year to year, but
the general range can be assessed by looking at the figure over a few consecutive years. Annual Turnover is
The percentage rate at which a stock portfolio traded fund replaces its investment holdings on an annual
basis. Turnover is meant to adjust for the inflows and outflows of cash and report on the level of trading
activity in the fund. Annual turnover is a good way to assess the average time horizon at which a stock
portfolio employs. Higher turnover levels will generally add to the expense ratio of the portfolio and could
increase capital gains distributions.
III-Amman Stock Exchange (ASE):
Was established in March 1999 as a non-profit organization with administrative and financial autonomy. It
is authorized to function as an exchange for the trading of securities. It is governed by seven-member board
International Journal of Arts and Commerce ISSN 1929-7106 www.ijac.org.uk
22
of directors. The chief executive officer oversees the day-to-day responsibilities and reports to the board.
ASE membership is comprised of Jordan's 62 brokerage firms.
III-1-ASE Vision, Mission and Objectives
III-1-1 : Vision: Advanced financial market distinguished legislatively and technically, regionally and
globally; rising to the latest international standards in the financial markets to provide an attractive
investment environment.
III-1-2 :Mission: Provide an organized, fair, and efficient market for trading securities in the Kingdom, and
secure a transparent, strong, and safe environment for trading securities to deepen trust in the stock market.
III-1-3 : Objectives:
• Creating an attractive and safe environment for investment.
• Developing processes and methods of trading securities in the stock market.
• Meeting the latest international standards
• Disseminating trading information to the largest possible number of dealers and interested parties.
• Enhance the public awareness of all segments of society, while devoting especial attention to dealers
of securities.
• Transparency and credibility in the dealings of the stock market.
III-2: Strengths, Vulnerabilities, and Macroeconomic Linkages of ASE: It is important to analyze
strengths and variations of ASE prices and the macroeconomic effects of the stock market for Jordan
economy. ASE index has increased by about 400 percent since 2003, which incredibly exceeded
corresponding economic growth rates.
III-2-1: Factors Supporting Current ASE Stock Valuations: Recent Econometric studies revealed no
significant effect of macroeconomic factors on ASE. Also, other studies have shown strong
performance of the ASE which is probably due to developments of regional markets. Some researchers
attempted to model the performance of the ASE as a function of real GDP growth, CPI, inflation, interest
rates, and a proxy for the regional stock market for the period 1990-2005 Results were not significant.
Nevertheless, ASE performance was reinforced by Jordan’s strong economic foundations. Main factors
supporting the current valuation of ASE stocks are; (i) strong economic growth and corporate profit abilities;
(ii) low bank rates and high liquidity; (iii) foreign capital inflows; (iv) innovative monitoring and
supervisory regulations; and (v) privatization of public enterprises.
III-2-2 : Factors Threatening Current ASE Stock Valuations: Many researches have been conducted to
assess potential overvaluations in Jordan’s ASE. Indicators analyzed were :(i) the correlation between price
and intrinsic value of stocks; (ii) the money and credit expansions; (iii) price index increasing rate; and (iv)
price volatility.
III-2-3 : Macroeconomic Linkages : The strong performance of the Amman Stock Exchange Securities
during the past few years an overall positive impact on Jordan’s economy. The transmission of financial
resources from the stock market to the real gross national product had positively affected Jordan’ s GDP.
This was due to the influence of wealth and other financial resources such as savings that was used to
generate investments and due to the improvement and development of ASE laws and financial
intermediation and the promising outlook of stocks growth , all have positive impact on the growth and
increase the wealth of investors in the stock market. The rise in stock prices has led to the transformation of
many private companies to public shareholding companies and this has brought more investments by
International Journal of Arts and Commerce Vol. 3 No. 8 October, 2014
23
collecting money from the public. Moreover, and due to the good performance of the Amman Stock
exchange has led to attract foreign capitals to Jordan, which helped to finance the deficit of Jordan’s
balance of payment and to stabilize interest rates to be somewhat lower. Generally, the improvement in
Amman financial market has led to the growth of investment in the Jordanian market, which has also led to
strong economic growth of Jordan’s economy over the past few years in spite of the difficulty of measuring
the impact of that.
III-2-4 :Acceleration in money and credit growth :A rapid expansion of broad money and credit can lead
to a larger amount of savings channeled through stock markets and thus to a level of stock prices that is no
longer in line with its fundamentals.12 Therefore, we check for the existence of a relationship between the
ASE price index movements and the growth of broad money and credit to the private sector . There appears
to be no relationship between the CASE 30 and broad money. Some of the additional private sector credit in
2005–06 could have been channeled to the stock market. The growth rates involved are, however, small
compared to credit booms seen in other countries at a similar stage of development and there appears to be
little relation between the stock market boom and these alternative measures of liquidity. In other words,
most of the stock market acceleration appears to be driven by foreign (as opposed to domestic) liquidity
(Irfan , C, Nishat,M ,2002).
IV-Previous Studies:
In a study of serial correlation , Fama looked at large U.S. stocks and concluded that the serial correlation in
stock prices was small. One of the first tests was conducted in 1965, he found that 8 out of the 30 stocks
listed in the Dow Jones had negative serial correlations and that most of the serial correlations were less
than 0.05(Fama,Y,1965). A study by Jennergren and Korsvold showed that it is unlikely that there is
enough correlation in short-period returns to generate excess returns, after adjusting for transactions
costs(Jennergren and Korsvold ,1974) . A study by Rouwenhorst showed that serial correlation in short
period returns is affected by market liquidity and the presence of a bid-ask spread. Not all stocks in an index
are liquid, and, in some cases, stocks may not trade during a period; although there are some recent studies
showed an evidence of serial correlation in returns over short time periods, but these correlations were
different for high and low volume stocks. With high volume stocks, stock prices were more likely to reverse
themselves over short periods,( i.e., have negative serial correlation); with low volume stocks, prices were
more likely to continue to sustain their direction, i.e., have positive serial correlation , (.Rouwenhorst
,1997) . In their study , Grinblatt, Titman and Wermers showed that once in a while a stock market may
have a series of price increases that may extend for several consecutive days or down prices for several
consecutive days . Although this is almost compatible with the random walk theory, they examined the
stocks history to see if these price changes happen more/or less frequently than they should. Their runs test
was based upon a series of runs, i.e., a list of consecutive price increases or decreases over time. The actual
number of runs in the price series was compared against the number that was expected in a series of such
length, assuming that price changes were random. They found that the actual number of runs were greater
than the expected numbers which was an evidence of negative correlation in price changes(Grinblatt,
Titman and Wermers ,1995). In a study conducted by Irfan , C,et al ,to explain the price changes due to
the six suggested fundamental variables (dividend yield, payout ratio, size of the firm, leverage, earning
volatility and asset growth) in Karachi Stock Exchange during 1981 to 2000 using annual balance sheet data.
Researchers concluded that there are that variables other than the mentioned fundamental variables may be
more important and relevant to explain the share price variation in Pakistan and need further investigation
(Irfan , C,et al ,2002).
International Journal of Arts and Commerce ISSN 1929-7106 www.ijac.org.uk
24
In their research paper, Haque,S &Faruquee,M , aimed to identify the influence of various fundamental
factors in determining the market price of shares in Dhaka Stock Exchange. The study depicts that the
market price is very insensitive toward fundamentals of companies and current market price is highly
overvalued compared to the ideal value of stocks, which reinforces that fact that the impact of unauthorized
information has a greater influence in determining the price of stocks in pharmaceuticals and chemical
industry in Dhaka Stock Exchange(Haque,S &Faruquee,M,2013). Billmeier ,A and Massa,I analyzes the
Egyptian stock market from two angles: it compares the performance of the major stock price index with its
underlying fundamentals, and to explore the relationship between the Egyptian and other stock markets.
Researchers found that: (i) there is some evidence against a stable relationship between the Egyptian index
and its fundamental value; and (ii) short-term correlations and long-term co integrating relations provide
conflicting signals on the value of Egyptian stocks as a means of diversification( Billmeier ,A and Massa,I ,
2009).Sedik,T and Petri,M analyzed the performance of the Amman Stock Exchange (ASE) and its
integration with other markets by using co integration techniques. Researchers found that t ASE and other
Arab stock markets are cointegrated, which implies little long-run risk diversification , but there was no co
integrating relationship between the ASE and other emerging or developed stock
Markets (Sedik,T and Petri,M ,2009). Tajana Barbić ,T and .Jurkić ,I , aimed to analyze the
relationship between stock market indices and macroeconomic variables. Results in general advocated the
long run relationship between stock market indices and macroeconomic variables(Tajana Barbić ,T and
.Jurkić ,I,2010). Soomro,S et al, analyzed the impact of the change in individual retained earnings, debt
ratio, net cash flow, sales, and number of
shares on share price by multiple log linear model through ordinary least square estimation procedure. The
findings showed that all independent variables were positively related with share price except debt
ratio(Soomro,S et al,2010). Al-Zubi ,Kand Salameh H., investigated the relationship between economic
variables and stock returns in the industrial sector in Jordan , using the variables of Industrial production,
expected inflation, unanticipated inflation and term structure. The results showed that there is a long-run
relationship between the two variables but there is no short-run relationship between them(Al-Zubi ,Kand
Salameh H, 2007).
Allahawiah,S and Al Amro ,S, aimed to identify the impact of most basic factors in the market share price
of listed companies in ASE from the respondent's opinions’ perspective. Results of the study showed that
there are impacts of internal and external factors in determining the stock prices of the listed companies in
Amman Stock
Exchange. The most impact was the inflation rate, while the least one was the nature of firm
business(Allahawiah,S and Al Amro ,S , 2012).
V- Methodology:
This paper attempts to shed light on whether stock prices are in line with fundamentals or rather overvalued,
in this sense, a number of standard descriptive indicators, along the lines
of Saadi-Sedik and Petri (2006). Moreover, the literature on asset price bubbles which cause extraordinary
increases in most stock prices are historical price trends associated with the existence of speculative
bubbles. In this paper, researchers will investigate whether there are evidences that stock prices may have
been driven by forces other than market fundamentals. In this sense, researchers will look at several stock
valuation measures via applying statistical techniques to test for speculative bubbles such as variance
bounds test, long-run co integration test between the ASE index and its fundamentals. Researches will test
ASE stock market from a portfolio diversification perspective and analyze whether, in the short or long run,
International Journal of Arts and Comme
ASE stocks moved with other equity m
these relationships have changed over tim
This study is structured as follows : Sect
underlying fundamentals. In Section IV
whether the ASE stock market is inte
markets , and to what extent this relatio
conclusions and implications.
V-1- Data : The Major Annual Financia
Turnover Ratio , Volatility Index , AS
historical files.
V-2-Research Problem:
An investment strategy is a set of ru
an investment portfolio. Usually the stra
investments pertain risk , and thus the in
with minimal commensurate risk. As fo
periods while looking for a fast price rise
gain higher capital gains as well as div
recommend an optimum and fruitful stra
1-Do fundamental factors have significan
2- Does the variance of actual prices is e
V-3-Test Hypotheses : Based on the
hypotheses :
Ho1 :There is no significant effect of fun
Ho2 : The variance of actual prices is no
VI- Analyses Tests :
VI-1- Descriptive Statistics:
Correlation Test : Correlation is the m
giving a value between +1 and −1 inclus
is total negative correlation.. The Pear
the covariance of the two variables divid
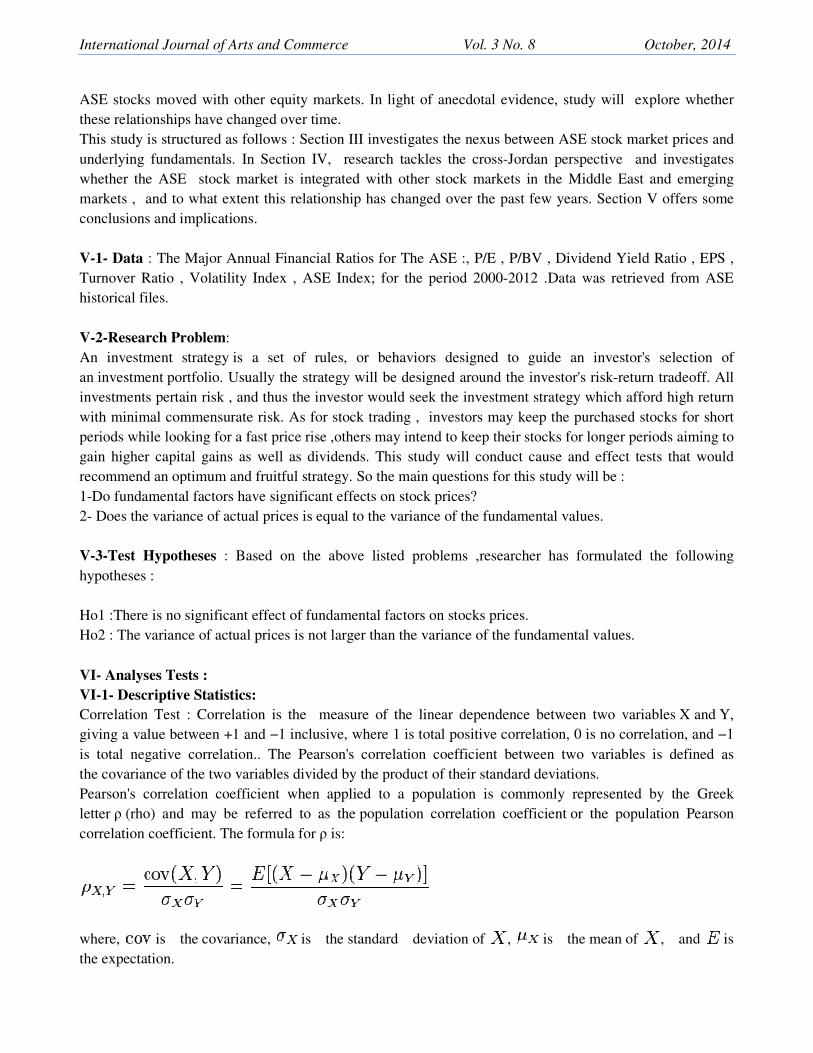
Pearson's correlation coefficient when
letter ρ (rho) and may be referred to a
correlation coefficient. The formula for ρ
where, is the covariance, is
the expectation.
merce Vol. 3 No. 8
markets. In light of anecdotal evidence, study w
time.
ection III investigates the nexus between ASE sto
IV, research tackles the cross-Jordan perspecti
tegrated with other stock markets in the Middle
ationship has changed over the past few years. Se
cial Ratios for The ASE :, P/E , P/BV , Dividend
SE Index; for the period 2000-2012 .Data was
rules, or behaviors designed to guide an inv
trategy will be designed around the investor's risk
investor would seek the investment strategy whic
for stock trading , investors may keep the purch
ise ,others may intend to keep their stocks for long
dividends. This study will conduct cause and eff
trategy. So the main questions for this study will b
cant effects on stock prices?
s equal to the variance of the fundamental values.
he above listed problems ,researcher has formu
undamental factors on stocks prices.
not larger than the variance of the fundamental val
measure of the linear dependence between tw
lusive, where 1 is total positive correlation, 0 is no
earson's correlation coefficient between two var
ided by the product of their standard deviations.
n applied to a population is commonly repres
as the population correlation coefficient or the
ρ is:
the standard deviation of , is the me
October, 2014
will explore whether
tock market prices and
ctive and investigates
dle East and emerging
Section V offers some
nd Yield Ratio , EPS ,
as retrieved from ASE
investor's selection of
isk-return tradeoff. All
hich afford high return
chased stocks for short
nger periods aiming to
effect tests that would
l be :
mulated the following
values.
two variables X and Y,
no correlation, and −1
ariables is defined as
resented by the Greek
he population Pearson
ean of , and is
International Journal of Arts and Commerce ISSN 1929-7106 www.ijac.org.uk
26
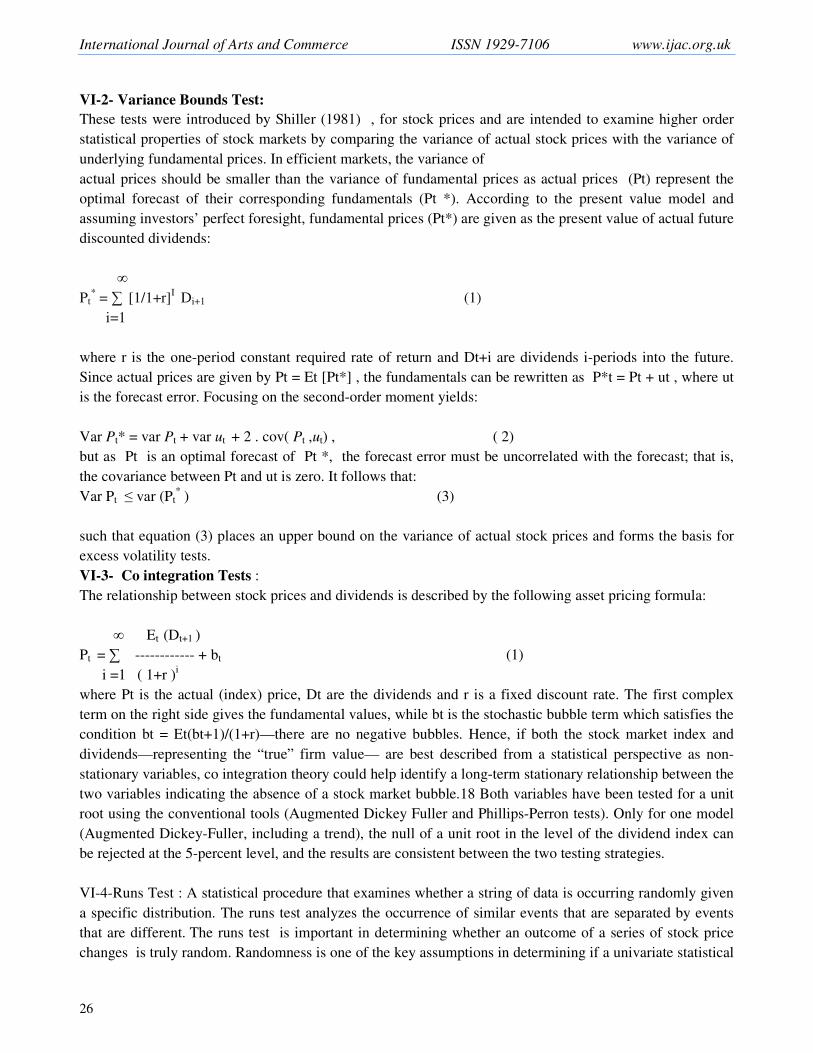
VI-2- Variance Bounds Test:
These tests were introduced by Shiller (1981) , for stock prices and are intended to examine higher order
statistical properties of stock markets by comparing the variance of actual stock prices with the variance of
underlying fundamental prices. In efficient markets, the variance of
actual prices should be smaller than the variance of fundamental prices as actual prices (Pt) represent the
optimal forecast of their corresponding fundamentals (Pt *). According to the present value model and
assuming investors’ perfect foresight, fundamental prices (Pt*) are given as the present value of actual future
discounted dividends:
∞
Pt* = ∑ [1/1+r]
I Di+1 (1)
i=1
where r is the one-period constant required rate of return and Dt+i are dividends i-periods into the future.
Since actual prices are given by Pt = Et [Pt*] , the fundamentals can be rewritten as P*t = Pt + ut , where ut
is the forecast error. Focusing on the second-order moment yields:
Var Pt* = var Pt + var ut + 2 . cov( Pt ,ut) , ( 2)
but as Pt is an optimal forecast of Pt *, the forecast error must be uncorrelated with the forecast; that is,
the covariance between Pt and ut is zero. It follows that:
Var Pt ≤ var (Pt* ) (3)
such that equation (3) places an upper bound on the variance of actual stock prices and forms the basis for
excess volatility tests.
VI-3- Co integration Tests :
The relationship between stock prices and dividends is described by the following asset pricing formula:
∞ Et (Dt+1 )
Pt = ∑ ------------ + bt (1)
i =1 ( 1+r )i
where Pt is the actual (index) price, Dt are the dividends and r is a fixed discount rate. The first complex
term on the right side gives the fundamental values, while bt is the stochastic bubble term which satisfies the
condition bt = Et(bt+1)/(1+r)—there are no negative bubbles. Hence, if both the stock market index and
dividends—representing the “true” firm value— are best described from a statistical perspective as non-
stationary variables, co integration theory could help identify a long-term stationary relationship between the
two variables indicating the absence of a stock market bubble.18 Both variables have been tested for a unit
root using the conventional tools (Augmented Dickey Fuller and Phillips-Perron tests). Only for one model
(Augmented Dickey-Fuller, including a trend), the null of a unit root in the level of the dividend index can
be rejected at the 5-percent level, and the results are consistent between the two testing strategies.
VI-4-Runs Test : A statistical procedure that examines whether a string of data is occurring randomly given
a specific distribution. The runs test analyzes the occurrence of similar events that are separated by events
that are different. The runs test is important in determining whether an outcome of a series of stock price
changes is truly random. Randomness is one of the key assumptions in determining if a univariate statistical
International Journal of Arts and Commerce Vol. 3 No. 8 October, 2014
27
process is in control. If the assumptions of constant location and scale, randomness, and fixed distribution
are reasonable, then the univariate process can be modeled as:
Yi=A0+Ei , where Ei is an error term. If the randomness assumption is not valid, then a different model
needs to be used. This will typically be either a times series model or a non-linear model.
VI-Research Results and Conclusions:
VI-1 - Research Results:
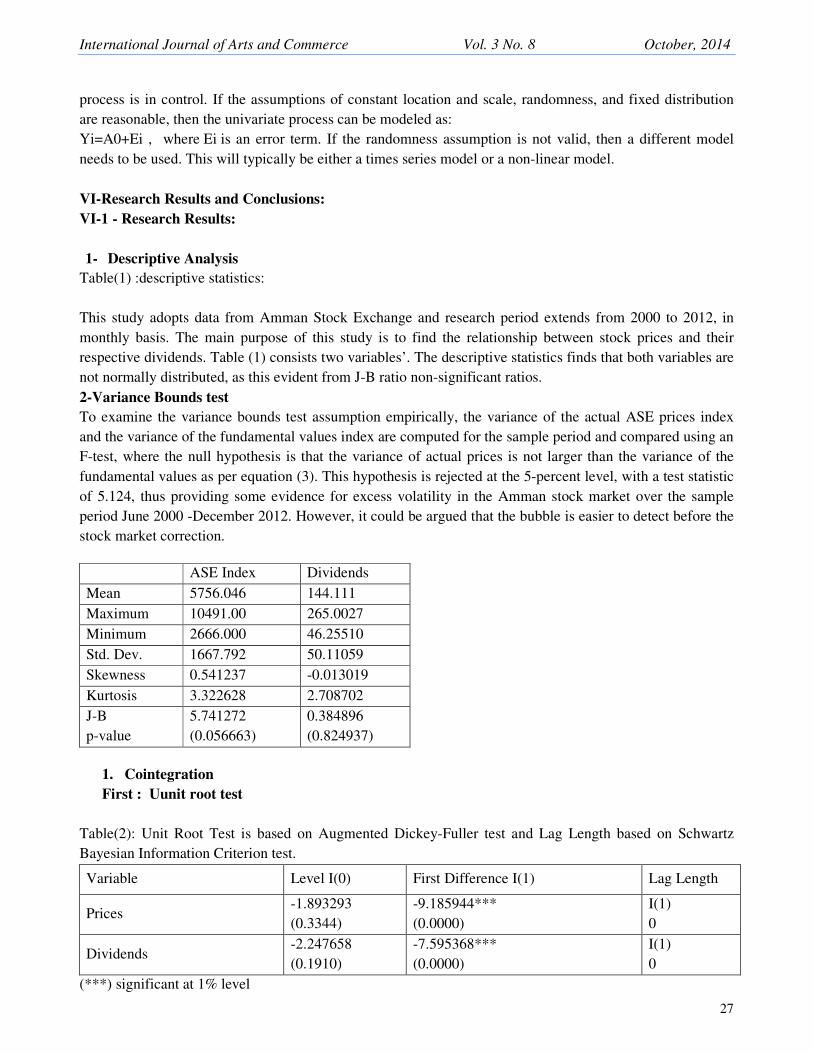
1- Descriptive Analysis
Table(1) :descriptive statistics:
This study adopts data from Amman Stock Exchange and research period extends from 2000 to 2012, in
monthly basis. The main purpose of this study is to find the relationship between stock prices and their
respective dividends. Table (1) consists two variables’. The descriptive statistics finds that both variables are
not normally distributed, as this evident from J-B ratio non-significant ratios.
2-Variance Bounds test
To examine the variance bounds test assumption empirically, the variance of the actual ASE prices index
and the variance of the fundamental values index are computed for the sample period and compared using an
F-test, where the null hypothesis is that the variance of actual prices is not larger than the variance of the
fundamental values as per equation (3). This hypothesis is rejected at the 5-percent level, with a test statistic
of 5.124, thus providing some evidence for excess volatility in the Amman stock market over the sample
period June 2000 -December 2012. However, it could be argued that the bubble is easier to detect before the
stock market correction.
1. Cointegration
First : Uunit root test
Table(2): Unit Root Test is based on Augmented Dickey-Fuller test and Lag Length based on Schwartz
Bayesian Information Criterion test.
Variable Level I(0) First Difference I(1) Lag Length
Prices -1.893293
(0.3344)
-9.185944***
(0.0000)
I(1)
0
Dividends -2.247658
(0.1910)
-7.595368***
(0.0000)
I(1)
0
(***) significant at 1% level
ASE Index Dividends
Mean 5756.046 144.111
Maximum 10491.00 265.0027
Minimum 2666.000 46.25510
Std. Dev. 1667.792 50.11059
Skewness 0.541237 -0.013019
Kurtosis 3.322628 2.708702
J-B
p-value
5.741272
(0.056663)
0.384896
(0.824937)
International Journal of Arts and Commerce ISSN 1929-7106 www.ijac.org.uk
28
Table(2) indicates that variables do not reject unit root null hypothesis. This means that the variables in the
level stage are of non-stationary existence. After running the first difference I(1) , it showed that both
variables have not achieved the 1% significant level. To corroborate the results, we conducted the short co
integration analysis, geared at non stationary data.
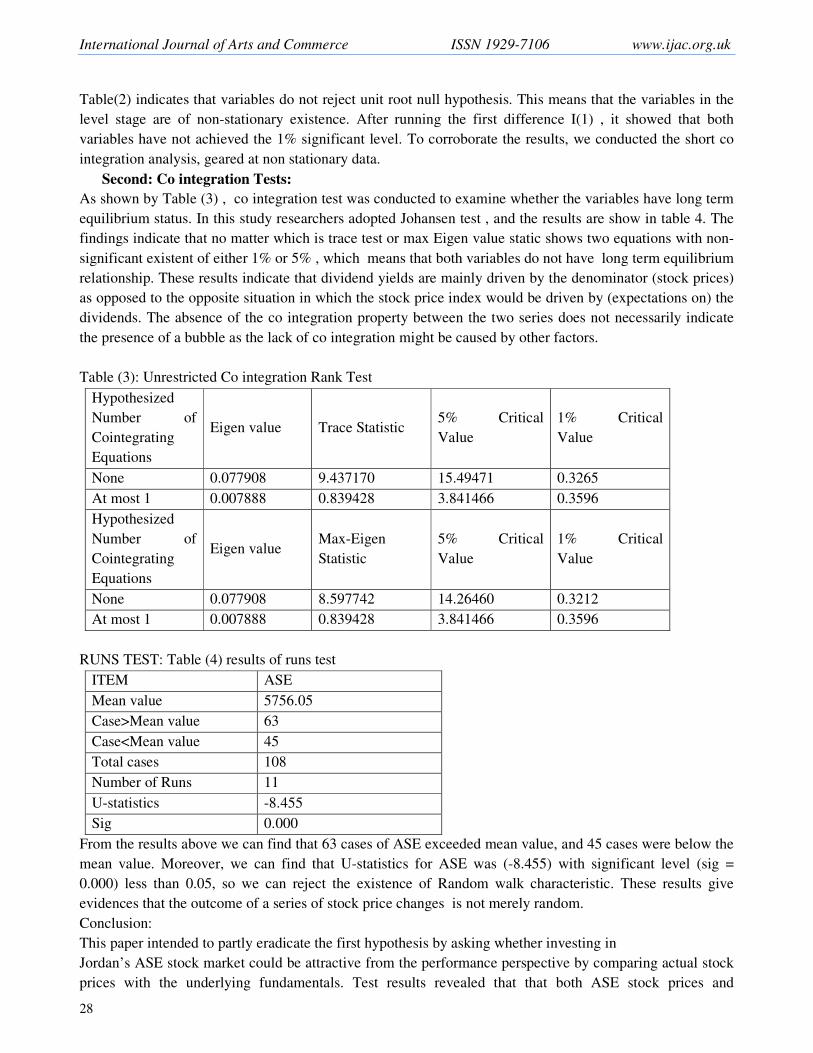
Second: Co integration Tests:
As shown by Table (3) , co integration test was conducted to examine whether the variables have long term
equilibrium status. In this study researchers adopted Johansen test , and the results are show in table 4. The
findings indicate that no matter which is trace test or max Eigen value static shows two equations with non-
significant existent of either 1% or 5% , which means that both variables do not have long term equilibrium
relationship. These results indicate that dividend yields are mainly driven by the denominator (stock prices)
as opposed to the opposite situation in which the stock price index would be driven by (expectations on) the
dividends. The absence of the co integration property between the two series does not necessarily indicate
the presence of a bubble as the lack of co integration might be caused by other factors.
Table (3): Unrestricted Co integration Rank Test
Hypothesized
Number of
Cointegrating
Equations
Eigen value Trace Statistic 5% Critical
Value
1% Critical
Value
None 0.077908 9.437170 15.49471 0.3265
At most 1 0.007888 0.839428 3.841466 0.3596
Hypothesized
Number of
Cointegrating
Equations
Eigen value Max-Eigen
Statistic
5% Critical
Value
1% Critical
Value
None 0.077908 8.597742 14.26460 0.3212
At most 1 0.007888 0.839428 3.841466 0.3596
RUNS TEST: Table (4) results of runs test
ITEM ASE
Mean value 5756.05
Case>Mean value 63
Case<Mean value 45
Total cases 108
Number of Runs 11
U-statistics -8.455
Sig 0.000
From the results above we can find that 63 cases of ASE exceeded mean value, and 45 cases were below the
mean value. Moreover, we can find that U-statistics for ASE was (-8.455) with significant level (sig =
0.000) less than 0.05, so we can reject the existence of Random walk characteristic. These results give
evidences that the outcome of a series of stock price changes is not merely random.
Conclusion:
This paper intended to partly eradicate the first hypothesis by asking whether investing in
Jordan’s ASE stock market could be attractive from the performance perspective by comparing actual stock
prices with the underlying fundamentals. Test results revealed that that both ASE stock prices and
International Journal of Arts and Commerce Vol. 3 No. 8 October, 2014
29
underlying fundamentals do not have long term equilibrium relationship. Also test results provided some
evidence for excess volatility in the Amman stock market over the sample period June 2000 -December
2012.
REFERENCES:
Allahawiah,S. and Al Amro,S,2012, Factors affecting Stock Market Prices in Amman Stock Exchange:A
Survey Study, European Journal of Business and Management ISSN 2222-1905 (Paper) ISSN 2222-2839
(Online) Vol 4, No.8.
Al-Zubi ,Kand Salameh H, 2007, Explaining the Stock Return Via a Macroeconomic
Multifactor Model , Jordan Journal of Business Administration, Volume 3, No. 1.
Billmeier,A and Massa,I., 2008 , Go Long or Short in Pyramids? News from the Egyptian Stock Ma rket.
Billmeier ,A and Massa,I , 2009 , Go Long or Short in Pyramids? News from the Egyptian Stock Market ,
IMF , Middle East and Central Asia Department, room HQ1-6-507, 700 , 19th Street NW, Washington DC
20431, United States
Bolbol, A. A., Fatheldin, A., Omran, M. M., 2005. Financial Development, Structure, and
and Finance 19, 171-194.
Caldwell,M. ,2013, Are Long-Term or Short-Term Investments Better?,About.com.Money in your 20s.
Conrad, Hameed and Niden, 1994 , Volume and Autocovariances in Short-Horizon Individual Security
Returns , Journal of Finance, .
FUNDAMENTALS AND STOCK MARKET INDICES IN SELECTED CEE COUNTRIES ,
EKONOMSKI PREGLED, 62 (3-4) 113-133 (2011)..
Haque,S &Faruquee,M , Impact of Fundamental Factors on Stock Price: A Case Based Approach on
Pharmaceutical Companies Listed with Dhaka Stock Exchange International Journal of Business and
Management Invention ISSN (Online): 2319 – 8028, ISSN (Print): 2319 – 801X www.ijbmi.org Volume 2
Issue 9ǁ September. 2013ǁ PP.34-41 www.ijbmi.org 34.
Irfan , C, Nishat,M ,2002 , Key Fundamental Factors and Long-run Price Changes
in An Emerging Market ---A Case Study of Karachi Stock Exchange , Applied Economics Research Centre
University of Karachi
Koios Associates ,2009 , Competitiveness Assessment , Case of Jordan , www.koiosIIC.com.
Louzi,B and Abadi,A., 2011, The Impact of Foreign Direct Investment on Economic
International Journal of Arts and Commerce ISSN 1929-7106 www.ijac.org.uk
30
Growth in Jordan , www.arpapress.com/Volums/Volum8Issue2/IJRRAS _8_2_16.pdf.
Omran, M., 2002. Random Walks and Stock Return Predictability in Egyptian Stocks
Market: An Application of Variance Ratio Test. Accounting, Management, and
Insurance Review 6, 159-178.
Omran, M 2006. Structural Break in the Egyptian Stock Market: A Logistic Regression Analysis.
International Journal of Business 11, 404-415.
, Omran, M 2007. An Analysis of the Capital Asset Pricing Model in the Egyptian Stock Market.
Quarterly Review of Economics and Finance 46, 801-812.
Omran, M., Pointon, J., 2001. Does the inflation rate affect the performance of the stock
market? The case of Egypt. Emerging Markets Review 2, 263-279.
Mecagni, M., Shawky Sourial, M, 1999. The Egyptian Stock Market: Efficiency Tests and
Volatility Effects. IMF Working Paper No. 99/48. International Monetary Fund,
Washington.
Saadi-Sedik, T., Petri, M., 2006. The Jordanian Stock Market—Should You Invest in It for
Risk Diversification or Performance? IMF Working Paper No. 06/187. International
Monetary Fund, Washington.
Soomro,S, Bhutto,N,A , Abbas,G ,2010, STOCK MARKET CYCLES GENERATION OF NON
FINANCIAL COMPANIES IN PAKISTAN , Asian Journal of Business and Management Sciences
ISSN: 2047-2528 Vol. 1 No. 57 [57- 64].
Tajana Barbić ,T and .Jurkić ,I,2010 , RELATIONSHIP BETWEEN MACROECONOMIC


