Embed Size (px)
Citation preview
Journal of Hazardous Materials B80 (2000) 189–206
Kinetic modelling of aqueous atrazine ozonationprocesses in a continuous flow bubble contactor
Fernando J. Beltrán∗, Manuel González, Benito Acedo,Francisco J. Rivas
Departamento de Ingenierıa Quımica y Energética, Universidad de Extremadura, 06071 Badajoz, Spain
Received 13 March 2000; received in revised form 24 July 2000; accepted 26 July 2000
Abstract
The ozonation of atrazine in different waters (ultrapure and surface waters) has been studiedin continuous bubble contactors with kinetic modelling purposes. Three ozonation processes havebeen considered: ozonation alone and combined with hydrogen peroxide or UV radiation. Thekinetic models are based on a molecular and free radical mechanism of reactions, reaction rateand mass transfer data and non-ideal flow analysis models for gas and water phases through thecontactors (the tanks in series model and the dispersion model). The models predict well the ex-perimental concentrations of atrazine, dissolved ozone and hydrogen peroxide both at non-steadystate and steady state regimes. From both experimental and calculated results, atrazine conversionsare observed to be highly dependent on the nature of water where ozonation is carried out. As far asremoval of atrazine and oxidation intermediates are concerned, ozone combined with UV radiationresulted in the most effective ozonation process among the three studied. © 2000 Elsevier ScienceB.V. All rights reserved.
Keywords:Kinetic modelling; Ozonation processes; Atrazine; Hydrogen peroxide; UV radiation
1. Introduction
Atrazine is one of the most widely used herbicides in agriculture and, as a consequence,its presence in aquatic environments has been extensively reported previously [1,2]. Amongherbicides, atrazine presents a high solubility in water and its concentration in natural watershas very often been found above the maximum permissible level: 0.1mg l−1 according to EC
Abbreviations:A, atrazine; DEA, deethylatrazine; DIA, deisopropylatrazine; DEIA, deethyldeisopropyla-trazine; g, gas phase; L, water phase; 0, conditions at time zero; RTDF, residence time distribution function
∗Corresponding author. Tel.:+34-24-28-9387; fax:+34-24-27-1304.E-mail address:[email protected] (F.J. Beltran).
0304-3894/00/$ – see front matter © 2000 Elsevier Science B.V. All rights reserved.PII: S0304-3894(00)00302-2
190 F.J. Beltran et al. / Journal of Hazardous Materials B80 (2000) 189–206
Directives [3]. Nonetheless, removal of atrazine by chemical treatments has been shownto be a suitable and effective technology to meet all federal, state and local dischargeregulations [4].
Ozonation of atrazine in water has already been studied by different authors and, subse-quently, data on intermediate formation, rate constant calculations and process modellinghave been reported [4–9]. Nevertheless, most studies published on this subject have beencompleted by means of experiments conducted in semibatch reactors with the herbicidedissolved in ultrapure or well-defined laboratory prepared water. In some other cases, thekinetic modelling has been limited to ozonation alone or combined with hydrogen peroxidewithout studying the actual characteristics of the gas flow through the ozonation column[10].
It is known that main disappearance route of atrazine when using ozone, hydrogen per-oxide and/or UV radiation goes through a mechanism of molecular compounds and freeradicals generated in the process [8,11]. Thus, the presence of other substances in this typeof treatment may significantly influence atrazine and intermediates removal rate dependingon the initiating, promoting or inhibiting free radical character of these compounds [12].
In this paper, a kinetic model has been applied to three ozonation processes (ozona-tion alone and combined with hydrogen peroxide or UV radiation) of atrazine carriedout in a continuous regime for both the gas and water phases. The kinetics have beencompleted with information on the non-ideal flow characteristics of gas and water phasesthrough the ozonation contactors by the use of the tanks in series and dispersion models[13].
2. Experimental procedures
Experiments were carried out in two ozonation bubble contactors (see Table 1 for di-mensions). One of them aimed at completing UV radiation experiments (contactor I), wasa photochemical reactor consisting of a bubble column with a quartz well placed along thecentral axis. Both contactors were equipped with a porous plate at their bottom throughwhich the oxidising gas (oxygen–ozone) was fed countercurrently to the water phase con-taining the herbicide. The water flow rate varied depending on the contactor used (seeTable 1), so that the hydraulic residence time was always 10 min, a typical value in realozonation contactors [14]. A 15 W Hanau low pressure mercury vapor lamp was situatedin the quartz well for UV radiation experiments.
Two different surface waters located in the Province of Badajoz (south west of Spain) wereused in this study. Their main characteristics are presented in Table 2. The surface water wasallowed to settle down for 24 h and filtered through a 0.45mm Millipore membrane before
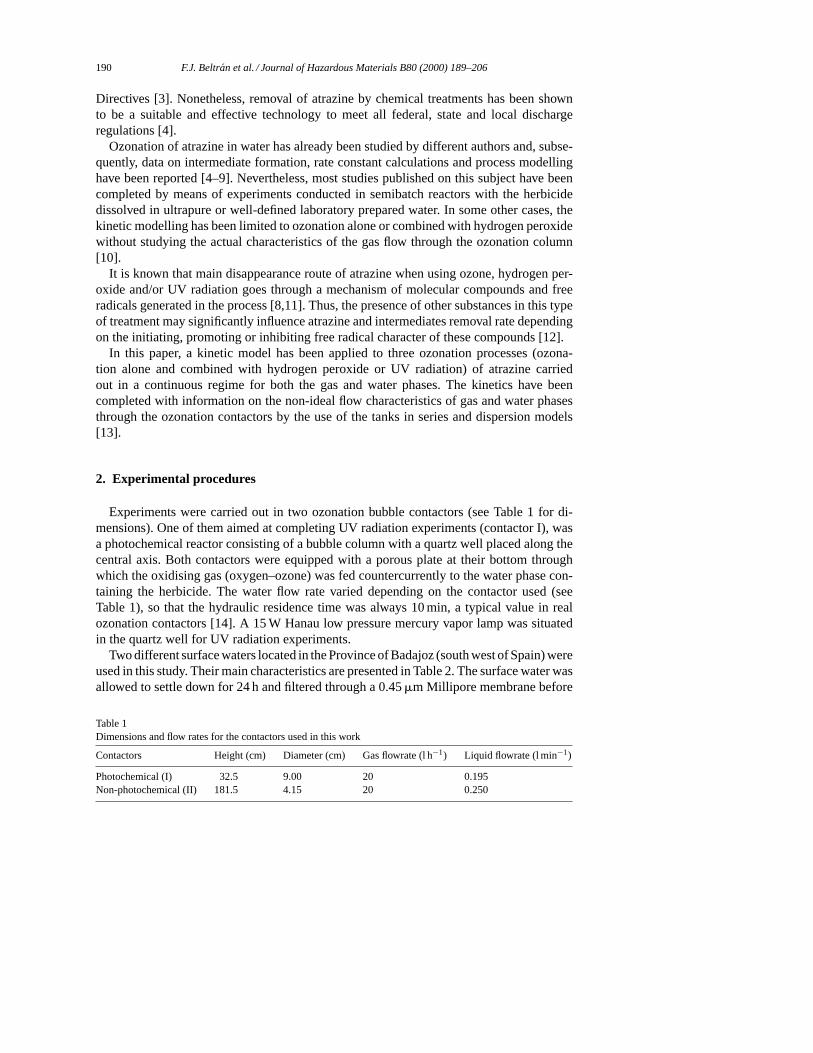
Table 1Dimensions and flow rates for the contactors used in this work
Contactors Height (cm) Diameter (cm) Gas flowrate (l h−1) Liquid flowrate (l min−1)
Photochemical (I) 32.5 9.00 20 0.195Non-photochemical (II) 181.5 4.15 20 0.250
F.J. Beltran et al. / Journal of Hazardous Materials B80 (2000) 189–206 191
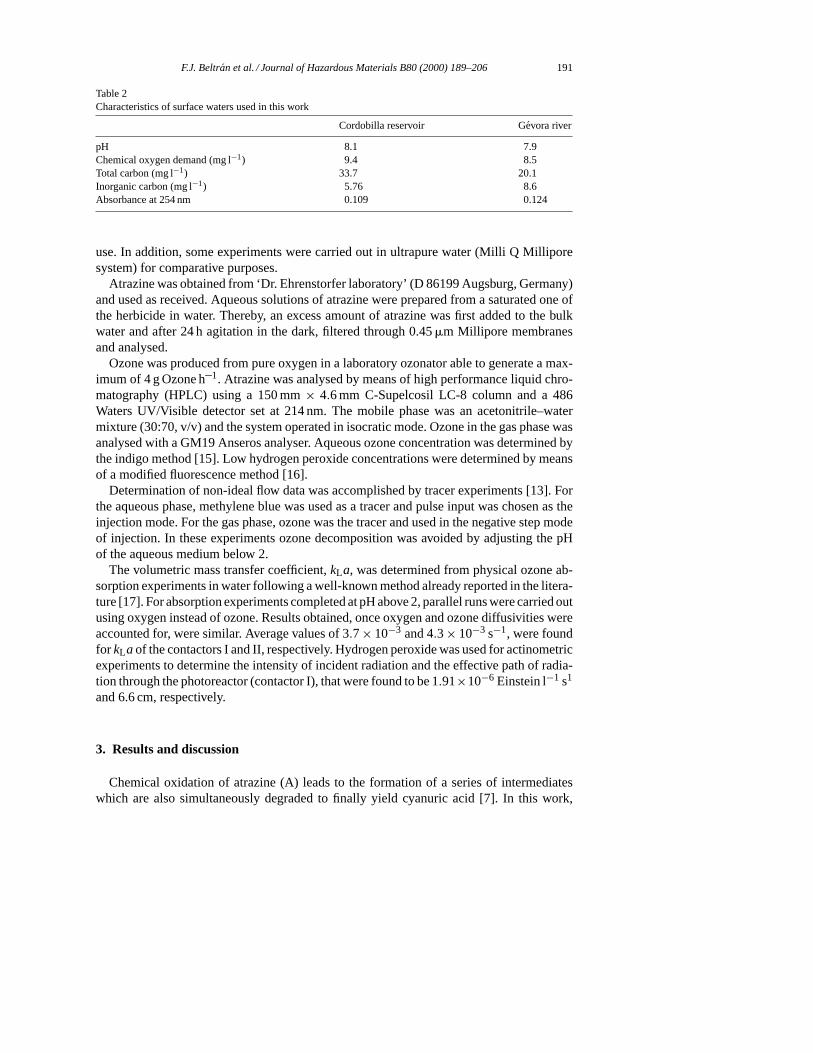
Table 2Characteristics of surface waters used in this work
Cordobilla reservoir Gevora river
pH 8.1 7.9Chemical oxygen demand (mg l−1) 9.4 8.5Total carbon (mg l−1) 33.7 20.1Inorganic carbon (mg l−1) 5.76 8.6Absorbance at 254 nm 0.109 0.124
use. In addition, some experiments were carried out in ultrapure water (Milli Q Milliporesystem) for comparative purposes.
Atrazine was obtained from ‘Dr. Ehrenstorfer laboratory’ (D 86199 Augsburg, Germany)and used as received. Aqueous solutions of atrazine were prepared from a saturated one ofthe herbicide in water. Thereby, an excess amount of atrazine was first added to the bulkwater and after 24 h agitation in the dark, filtered through 0.45mm Millipore membranesand analysed.
Ozone was produced from pure oxygen in a laboratory ozonator able to generate a max-imum of 4 g Ozone h–1. Atrazine was analysed by means of high performance liquid chro-matography (HPLC) using a 150 mm× 4.6 mm C-Supelcosil LC-8 column and a 486Waters UV/Visible detector set at 214 nm. The mobile phase was an acetonitrile–watermixture (30:70, v/v) and the system operated in isocratic mode. Ozone in the gas phase wasanalysed with a GM19 Anseros analyser. Aqueous ozone concentration was determined bythe indigo method [15]. Low hydrogen peroxide concentrations were determined by meansof a modified fluorescence method [16].
Determination of non-ideal flow data was accomplished by tracer experiments [13]. Forthe aqueous phase, methylene blue was used as a tracer and pulse input was chosen as theinjection mode. For the gas phase, ozone was the tracer and used in the negative step modeof injection. In these experiments ozone decomposition was avoided by adjusting the pHof the aqueous medium below 2.
The volumetric mass transfer coefficient,kLa, was determined from physical ozone ab-sorption experiments in water following a well-known method already reported in the litera-ture [17]. For absorption experiments completed at pH above 2, parallel runs were carried outusing oxygen instead of ozone. Results obtained, once oxygen and ozone diffusivities wereaccounted for, were similar. Average values of 3.7× 10⁻³ and 4.3× 10⁻³ s−1, were foundfor kLaof the contactors I and II, respectively. Hydrogen peroxide was used for actinometricexperiments to determine the intensity of incident radiation and the effective path of radia-tion through the photoreactor (contactor I), that were found to be 1.91×10⁻⁶ Einstein l−1 s1
and 6.6 cm, respectively.
3. Results and discussion
Chemical oxidation of atrazine (A) leads to the formation of a series of intermediateswhich are also simultaneously degraded to finally yield cyanuric acid [7]. In this work,
192 F.J. Beltran et al. / Journal of Hazardous Materials B80 (2000) 189–206
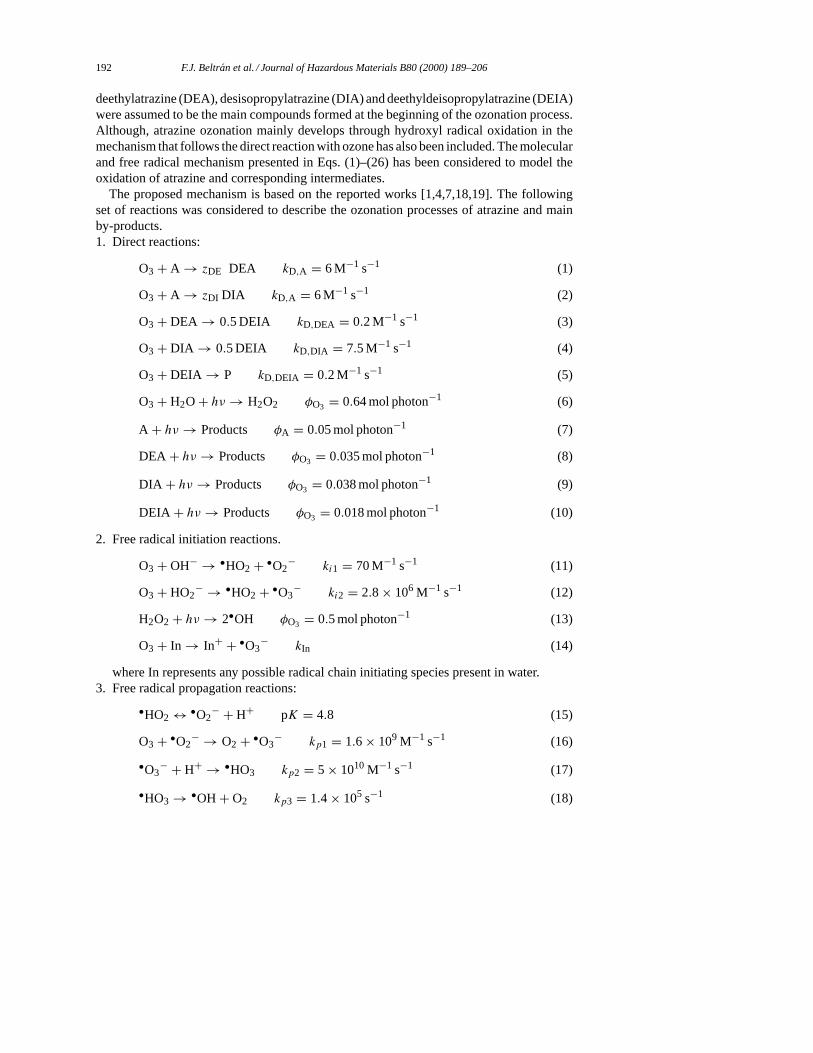
deethylatrazine (DEA), desisopropylatrazine (DIA) and deethyldeisopropylatrazine (DEIA)were assumed to be the main compounds formed at the beginning of the ozonation process.Although, atrazine ozonation mainly develops through hydroxyl radical oxidation in themechanism that follows the direct reaction with ozone has also been included. The molecularand free radical mechanism presented in Eqs. (1)–(26) has been considered to model theoxidation of atrazine and corresponding intermediates.
The proposed mechanism is based on the reported works [1,4,7,18,19]. The followingset of reactions was considered to describe the ozonation processes of atrazine and mainby-products.1. Direct reactions:
O3 + A → zDE DEA kD,A = 6 M−1 s−1 (1)
O3 + A → zDI DIA kD,A = 6 M−1 s−1 (2)
O3 + DEA → 0.5 DEIA kD,DEA = 0.2 M−1 s−1 (3)
O3 + DIA → 0.5 DEIA kD,DIA = 7.5 M−1 s−1 (4)
O3 + DEIA → P kD,DEIA = 0.2 M−1 s−1 (5)
O3 + H2O + hν → H2O2 φO3 = 0.64 mol photon−1 (6)
A + hν → Products φA = 0.05 mol photon−1 (7)
DEA + hν → Products φO3 = 0.035 mol photon−1 (8)
DIA + hν → Products φO3 = 0.038 mol photon−1 (9)
DEIA + hν → Products φO3 = 0.018 mol photon−1 (10)
2. Free radical initiation reactions.
O3 + OH− → •HO2 + •O2− ki1 = 70 M−1 s−1 (11)
O3 + HO2− → •HO2 + •O3
− ki2 = 2.8 × 10⁶ M−1 s−1 (12)
H2O2 + hν → 2•OH φO3 = 0.5 mol photon−1 (13)
O3 + In → In+ + •O3− kIn (14)
where In represents any possible radical chain initiating species present in water.3. Free radical propagation reactions:
•HO2 ↔ •O2− + H+ pK = 4.8 (15)
O3 + •O2− → O2 + •O3
− kp1 = 1.6 × 10⁹ M−1 s−1 (16)
•O3− + H+ → •HO3 kp2 = 5 × 10¹⁰ M−1 s−1 (17)
•HO3 → •OH + O2 kp3 = 1.4 × 10⁵ s−1 (18)
F.J. Beltran et al. / Journal of Hazardous Materials B80 (2000) 189–206 193
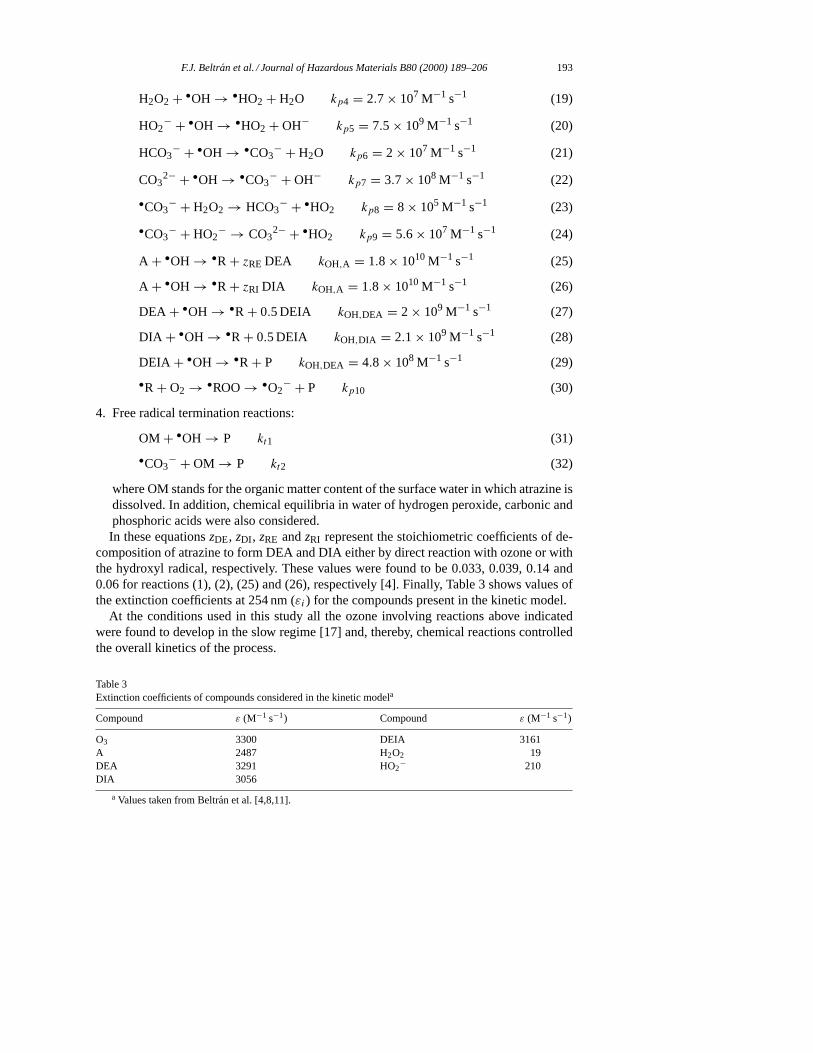
H2O2 + •OH → •HO2 + H2O kp4 = 2.7 × 10⁷ M−1 s−1 (19)
HO2− + •OH → •HO2 + OH− kp5 = 7.5 × 10⁹ M−1 s−1 (20)
HCO3− + •OH → •CO3
− + H2O kp6 = 2 × 10⁷ M−1 s−1 (21)
CO32− + •OH → •CO3
− + OH− kp7 = 3.7 × 10⁸ M−1 s−1 (22)
•CO3− + H2O2 → HCO3
− + •HO2 kp8 = 8 × 10⁵ M−1 s−1 (23)
•CO3− + HO2
− → CO32− + •HO2 kp9 = 5.6 × 10⁷ M−1 s−1 (24)
A + •OH → •R + zRE DEA kOH,A = 1.8 × 10¹⁰ M−1 s−1 (25)
A + •OH → •R + zRI DIA kOH,A = 1.8 × 10¹⁰ M−1 s−1 (26)
DEA + •OH → •R + 0.5 DEIA kOH,DEA = 2 × 10⁹ M−1 s−1 (27)
DIA + •OH → •R + 0.5 DEIA kOH,DIA = 2.1 × 10⁹ M−1 s−1 (28)
DEIA + •OH → •R + P kOH,DEA = 4.8 × 10⁸ M−1 s−1 (29)
•R + O2 → •ROO→ •O2− + P kp10 (30)
4. Free radical termination reactions:
OM + •OH → P kt1 (31)
•CO3− + OM → P kt2 (32)
where OM stands for the organic matter content of the surface water in which atrazine isdissolved. In addition, chemical equilibria in water of hydrogen peroxide, carbonic andphosphoric acids were also considered.In these equationszDE, zDI , zRE andzRI represent the stoichiometric coefficients of de-
composition of atrazine to form DEA and DIA either by direct reaction with ozone or withthe hydroxyl radical, respectively. These values were found to be 0.033, 0.039, 0.14 and0.06 for reactions (1), (2), (25) and (26), respectively [4]. Finally, Table 3 shows values ofthe extinction coefficients at 254 nm (εi) for the compounds present in the kinetic model.
At the conditions used in this study all the ozone involving reactions above indicatedwere found to develop in the slow regime [17] and, thereby, chemical reactions controlledthe overall kinetics of the process.
Table 3Extinction coefficients of compounds considered in the kinetic modela
Compound ε (M−1 s−1) Compound ε (M−1 s−1)
O3 3300 DEIA 3161A 2487 H2O2 19DEA 3291 HO2
− 210DIA 3056
a Values taken from Beltran et al. [4,8,11].
194 F.J. Beltran et al. / Journal of Hazardous Materials B80 (2000) 189–206
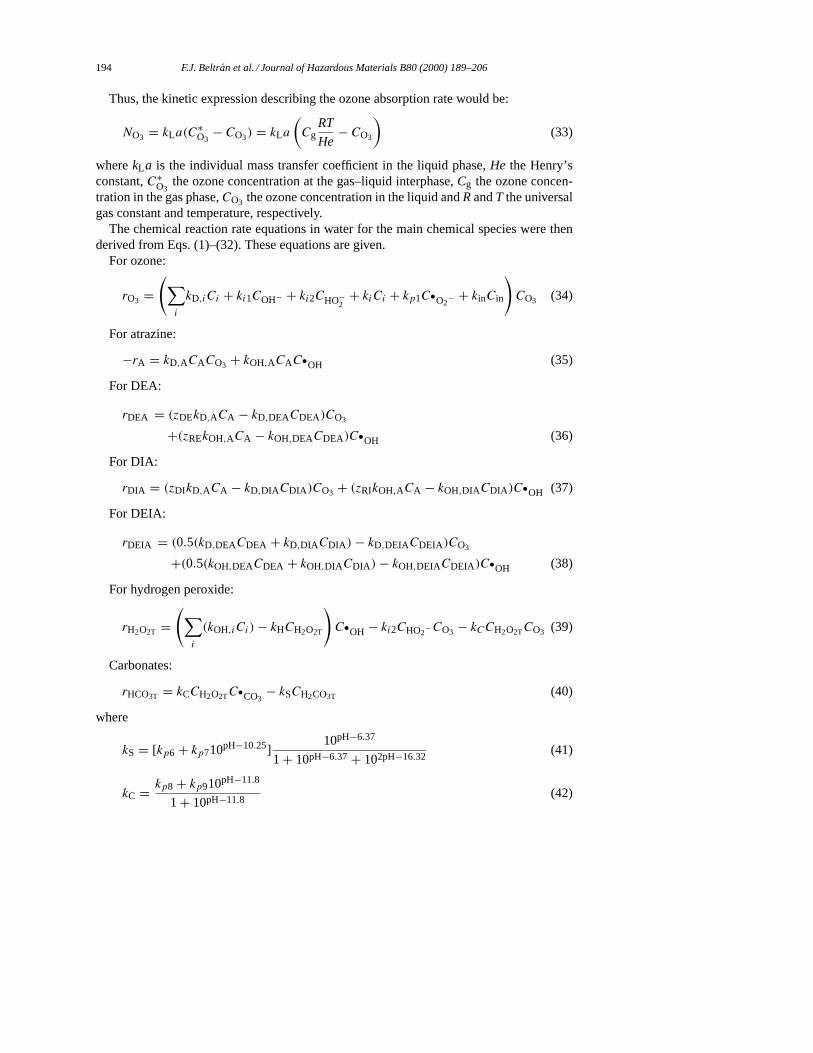
Thus, the kinetic expression describing the ozone absorption rate would be:
NO3 = kLa(C∗O3
− CO3) = kLa
(Cg
RT
He− CO3
)(33)
wherekLa is the individual mass transfer coefficient in the liquid phase,He the Henry’sconstant,C∗
O3the ozone concentration at the gas–liquid interphase,Cg the ozone concen-
tration in the gas phase,CO3 the ozone concentration in the liquid andRandT the universalgas constant and temperature, respectively.
The chemical reaction rate equations in water for the main chemical species were thenderived from Eqs. (1)–(32). These equations are given.
For ozone:
rO3 =(∑
i
kD,iCi + ki1COH− + ki2CHO−2
+ kiCi + kp1C•O2− + kinCin
)CO3 (34)
For atrazine:
−rA = kD,ACACO3 + kOH,ACAC•OH (35)
For DEA:
rDEA = (zDEkD,ACA − kD,DEACDEA)CO3
+(zREkOH,ACA − kOH,DEACDEA)C•OH (36)
For DIA:
rDIA = (zDIkD,ACA − kD,DIACDIA )CO3 + (zRIkOH,ACA − kOH,DIACDIA )C•OH (37)
For DEIA:
rDEIA = (0.5(kD,DEACDEA + kD,DIACDIA )− kD,DEIACDEIA)CO3
+(0.5(kOH,DEACDEA + kOH,DIACDIA )− kOH,DEIACDEIA)C•OH (38)
For hydrogen peroxide:
rH2O2T =(∑
i
(kOH,iCi)− kHCH2O2T
)C•OH − ki2CHO2
−CO3 − kCCH2O2TCO3 (39)
Carbonates:
rHCO3T = kCCH2O2TC•CO3− kSCH2CO3T (40)
where
kS = [kp6 + kp710pH−10.25]10pH−6.37
1 + 10pH−6.37 + 102pH−16.32(41)
kC = kp8 + kp910pH−11.8
1 + 10pH−11.8(42)
F.J. Beltran et al. / Journal of Hazardous Materials B80 (2000) 189–206 195
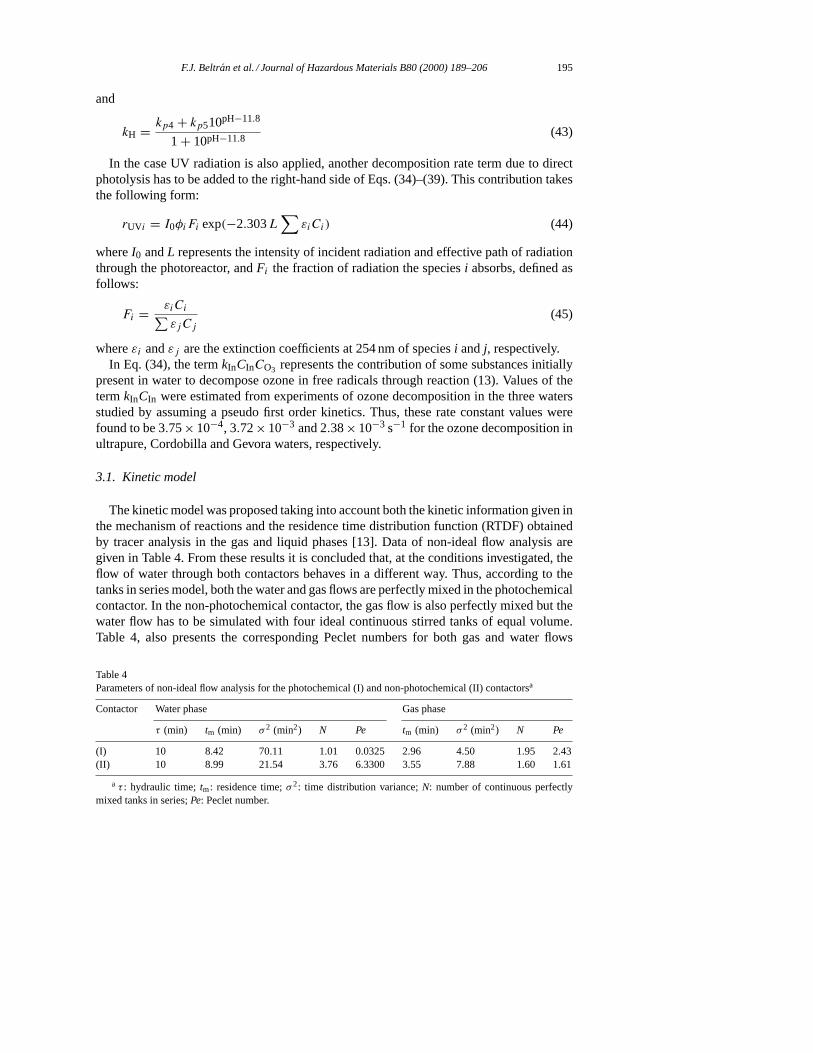
and
kH = kp4 + kp510pH−11.8
1 + 10pH−11.8(43)
In the case UV radiation is also applied, another decomposition rate term due to directphotolysis has to be added to the right-hand side of Eqs. (34)–(39). This contribution takesthe following form:
rUVi = I0φiFi exp(−2.303L∑
εiCi) (44)
whereI0 andL represents the intensity of incident radiation and effective path of radiationthrough the photoreactor, andFi the fraction of radiation the speciesi absorbs, defined asfollows:
Fi = εiCi∑εjCj
(45)
whereεi andεj are the extinction coefficients at 254 nm of speciesi andj, respectively.In Eq. (34), the termkInCInCO3 represents the contribution of some substances initially
present in water to decompose ozone in free radicals through reaction (13). Values of thetermkInCIn were estimated from experiments of ozone decomposition in the three watersstudied by assuming a pseudo first order kinetics. Thus, these rate constant values werefound to be 3.75× 10⁻⁴, 3.72× 10⁻³ and 2.38× 10⁻³ s−1 for the ozone decomposition inultrapure, Cordobilla and Gevora waters, respectively.
3.1. Kinetic model
The kinetic model was proposed taking into account both the kinetic information given inthe mechanism of reactions and the residence time distribution function (RTDF) obtainedby tracer analysis in the gas and liquid phases [13]. Data of non-ideal flow analysis aregiven in Table 4. From these results it is concluded that, at the conditions investigated, theflow of water through both contactors behaves in a different way. Thus, according to thetanks in series model, both the water and gas flows are perfectly mixed in the photochemicalcontactor. In the non-photochemical contactor, the gas flow is also perfectly mixed but thewater flow has to be simulated with four ideal continuous stirred tanks of equal volume.Table 4, also presents the corresponding Peclet numbers for both gas and water flows
Table 4Parameters of non-ideal flow analysis for the photochemical (I) and non-photochemical (II) contactorsa
Contactor Water phase Gas phase
τ (min) tm (min) σ 2 (min2) N Pe tm (min) σ 2 (min2) N Pe
(I) 10 8.42 70.11 1.01 0.0325 2.96 4.50 1.95 2.43(II) 10 8.99 21.54 3.76 6.3300 3.55 7.88 1.60 1.61
a τ : hydraulic time;tm: residence time;σ 2: time distribution variance;N: number of continuous perfectlymixed tanks in series;Pe: Peclet number.
196 F.J. Beltran et al. / Journal of Hazardous Materials B80 (2000) 189–206
through both contactors. These values were later used to apply the dispersion model to theexperimental results of atrazine ozonation processes.
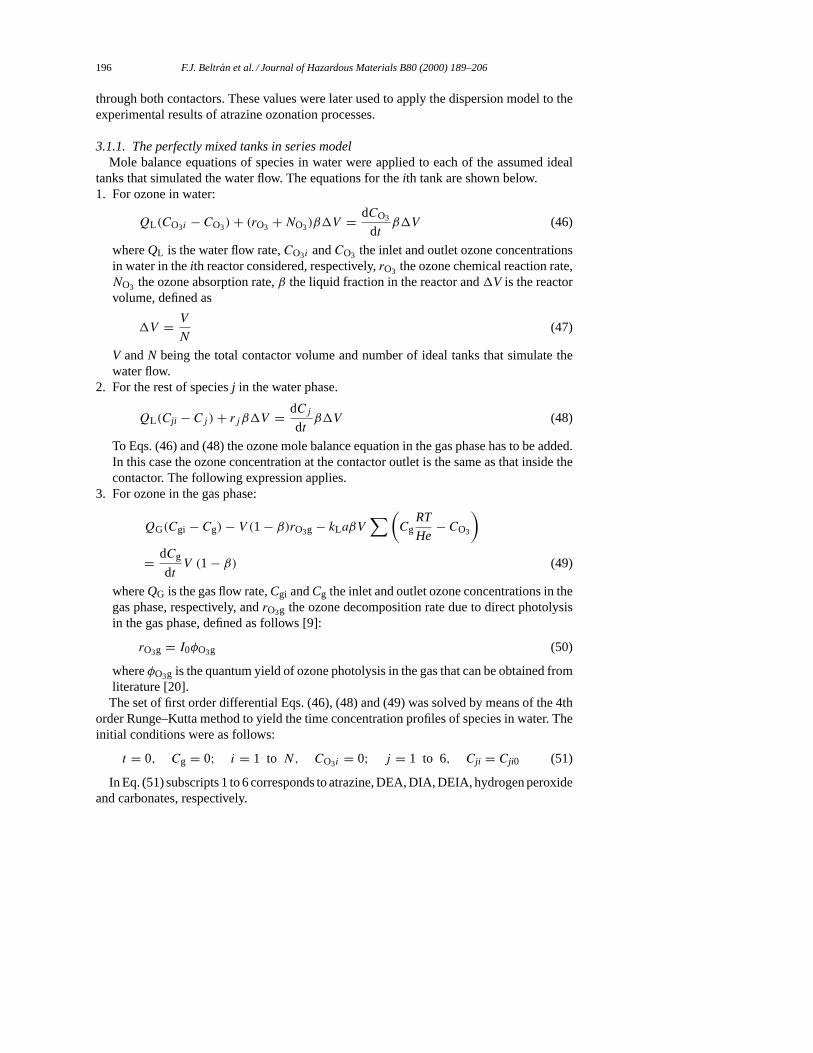
3.1.1. The perfectly mixed tanks in series modelMole balance equations of species in water were applied to each of the assumed ideal
tanks that simulated the water flow. The equations for theith tank are shown below.1. For ozone in water:
QL(CO3i − CO3)+ (rO3 +NO3)β1V = dCO3
dtβ1V (46)
whereQL is the water flow rate,CO3i andCO3 the inlet and outlet ozone concentrationsin water in theith reactor considered, respectively,rO3 the ozone chemical reaction rate,NO3 the ozone absorption rate,β the liquid fraction in the reactor and1V is the reactorvolume, defined as
1V = V
N(47)
V andN being the total contactor volume and number of ideal tanks that simulate thewater flow.
2. For the rest of speciesj in the water phase.
QL(Cji − Cj )+ rjβ1V = dCjdtβ1V (48)
To Eqs. (46) and (48) the ozone mole balance equation in the gas phase has to be added.In this case the ozone concentration at the contactor outlet is the same as that inside thecontactor. The following expression applies.
3. For ozone in the gas phase:
QG(Cgi − Cg)− V (1 − β)rO3g − kLaβV∑(
CgRT
He− CO3
)
= dCg
dtV (1 − β) (49)
whereQG is the gas flow rate,Cgi andCg the inlet and outlet ozone concentrations in thegas phase, respectively, andrO3g the ozone decomposition rate due to direct photolysisin the gas phase, defined as follows [9]:
rO3g = I0φO3g (50)
whereφO3g is the quantum yield of ozone photolysis in the gas that can be obtained fromliterature [20].The set of first order differential Eqs. (46), (48) and (49) was solved by means of the 4th
order Runge–Kutta method to yield the time concentration profiles of species in water. Theinitial conditions were as follows:
t = 0, Cg = 0; i = 1 to N, CO3i = 0; j = 1 to 6, Cji = Cji0 (51)
In Eq. (51) subscripts 1 to 6 corresponds to atrazine, DEA, DIA, DEIA, hydrogen peroxideand carbonates, respectively.
F.J. Beltran et al. / Journal of Hazardous Materials B80 (2000) 189–206 197
3.1.2. The dispersion modelIn this model, convection and diffusion contribute to chemical species transport. Thereby
the following equations describe the ozonation process in the bubble contactor:1. For ozone in the water:
βSH∂CO3
∂t= DO3
∂2CO3
∂h2− uL
∂CO3
∂h+ rO3 +NO3 (52)
whereDO3 represents the ozone diffusivity anduL the superficial velocity of the water.2. For chemical speciesj (atrazine and intermediates, hydrogen peroxide and carbonates)
in water:
βV∂Cj
∂t= Dj
∂2Cj
∂h2− uL
∂Cj
∂h+ rj (53)
Dj being the diffusivity of thej species.3. For ozone in the perfectly mixed gas phase:
(1 − β)VdCg
dt= QG(Cgi − Cg)− βkLa
∫ H
0
(Cg
RT
He− CO3
)S dh
−(1 − β)VrO3g (54)
whereH, S and dh represent the height, transversal area and differential height of thecontactor, respectively.By considering steady-state regime, Eqs. (52)–(54) become in dimensionless form as
follows:• For ozone in water:
1
PeL
d2ψO3
dλ2− dψO3
dλ+ τL
[ωO3
Cgi+ kLa
(ψg
RT
He− ψO3
)]= 0 (55)
• For the chemical speciesj in water:
1
PeL
d2ψj
dλ2− dψj
dλ+ τL
ωj
C1,0= 0 (56)
• For ozone in the gas phase:
ψg + βkLa
τG
∫ 1
0
(ψg
RT
He− ψO3
)dλ = 1 (57)
where
ψg = Cg
Cgi(58)
ψO3 = CO3
Cgi(59)
ψj = Cj
C1,0(60)
198 F.J. Beltran et al. / Journal of Hazardous Materials B80 (2000) 189–206
λ = h
H(61)
PeL = uLH
Dj(62)
ωO3 andωj being the chemical reactions rates expressed as a function ofψO3 andψj ,respectively, and rate constants.
Now, Eqs. (55) and (56) can be transformed into a set of non-linear first order ordinarydifferential equations by defining the following functions:
ξO3 = dψO3
dλ(63)
and
ξj = dψjdλ
(64)
thus, from Eqs. (63) and (64) it is obtained:
1
PeL
dξO3
dλ− ξO3 + τL
[ωO3
Cgi+ kLa
(ψg
RT
He− ψO3
)]= 0 (65)
1
PeL
dξjdλ
− ξj + τLωj
C1,0= 0 (66)
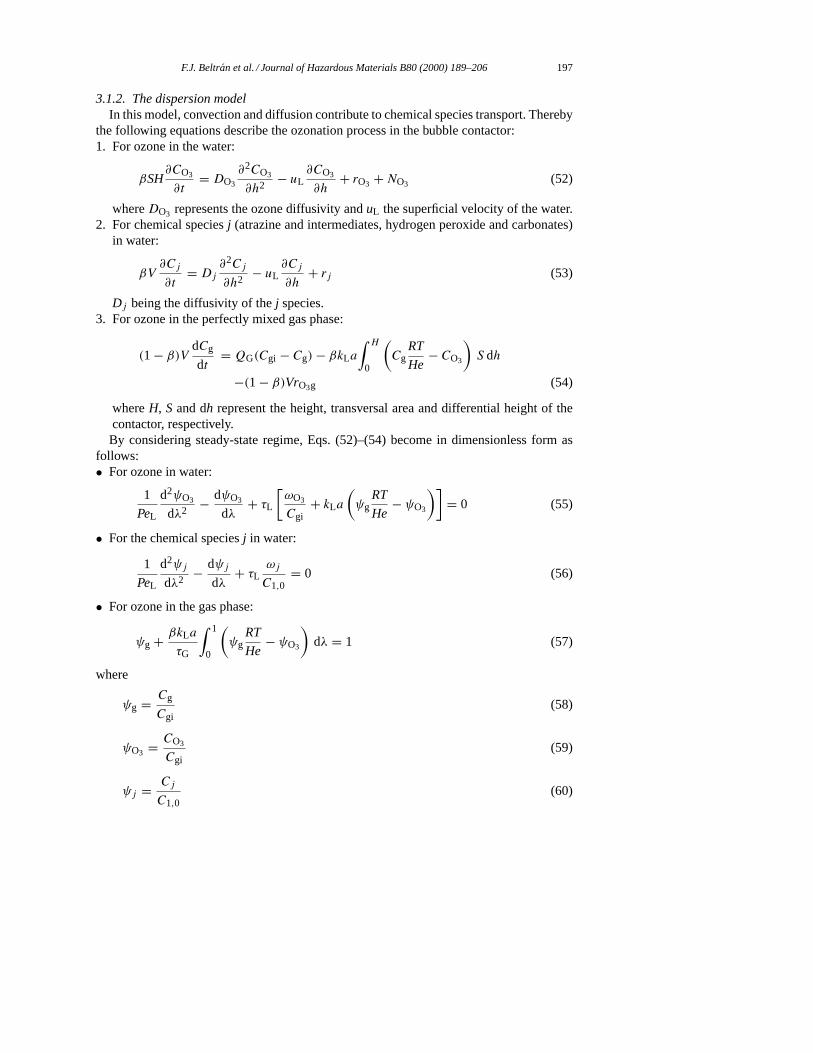
The system of first order differential Eqs. (63)–(66) was solved by following the flowdiagram presented in Fig. 1 using a computer program (Mathematica for Windows, enhancedversion 2.2) with the initial limiting conditions:
λ = 0; ψg = assumed; ψO3 = 0; j = 1 to 6;ξj = 0; ψ1 = 1; j = 2 to 6; ψj = Cj,0
C1,0(67)
Forψg, it was first assumed the value corresponding to the experimental measurementof Cg at the reactor outlet. Once the values ofψO3 andψj in water at the column outletwere obtained, Eq. (57) was used to confirm the assumed value ofψg.
3.2. Simulation results
3.2.1. Ozonation aloneOzonation results of atrazine in ultrapure water and surface water were first simulated
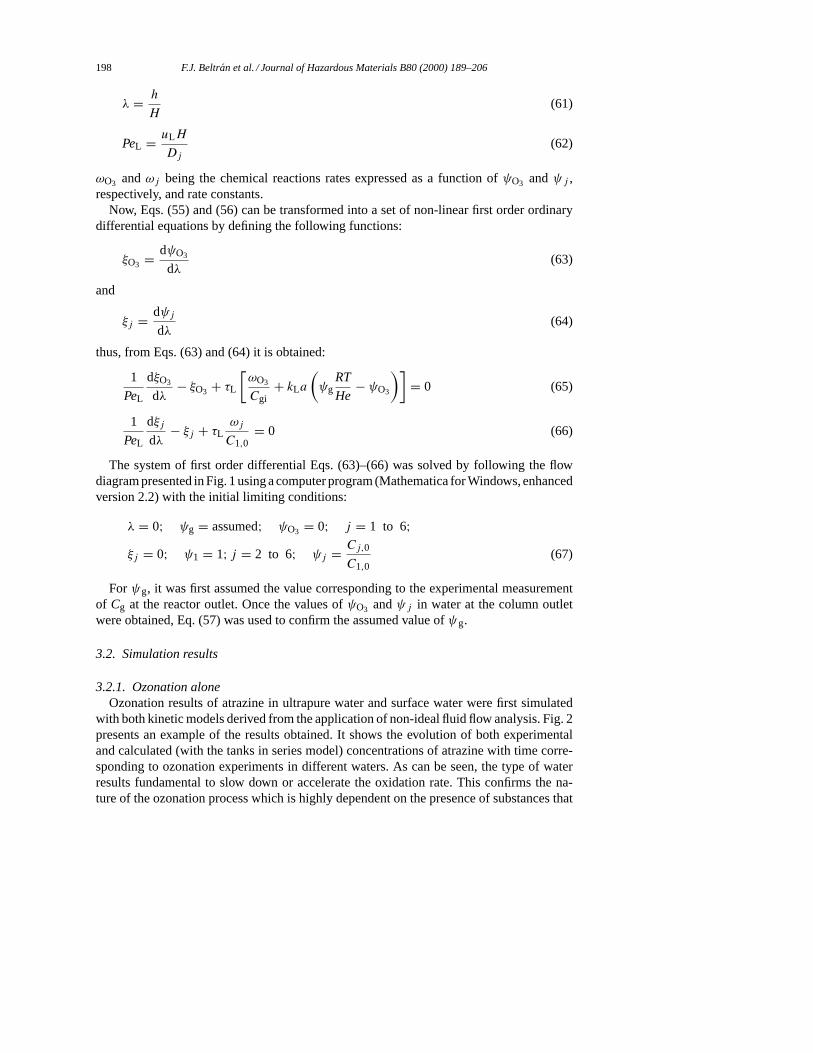
with both kinetic models derived from the application of non-ideal fluid flow analysis. Fig. 2presents an example of the results obtained. It shows the evolution of both experimentaland calculated (with the tanks in series model) concentrations of atrazine with time corre-sponding to ozonation experiments in different waters. As can be seen, the type of waterresults fundamental to slow down or accelerate the oxidation rate. This confirms the na-ture of the ozonation process which is highly dependent on the presence of substances that
F.J. Beltran et al. / Journal of Hazardous Materials B80 (2000) 189–206 199
Fig. 1. Flow diagram used to calculate the steady-state concentrations of different species by means of the dispersionmodel.
inhibit or promote the ozone decomposition in free radicals. Following results shown inFig. 2 it is deduced that water taken from the river Gevora contains substances, carbonatesamong others, that scavenge the action of hydroxyl radicals. This results in a partial inhibi-tion of the oxidation rate. On the contrary, water from Cordobilla reservoir likely containsother substances that promote the ozone decomposition and increase the oxidation rate ofatrazine. As can also be observed from Fig. 2 the kinetic model reproduces reasonably wellthe experimental time concentration profiles although some deviations are noted regardingthe ozonation with Cordobilla water, mainly once the steady state has been reached.
On the other hand, Fig. 2 also shows the simulation results obtained when the dispersionmodel is applied. With this model, however, only results corresponding to the stationary statewere calculated. As can be seen, calculated concentrations are also close to the experimentalones as in the tanks in series model.
200 F.J. Beltran et al. / Journal of Hazardous Materials B80 (2000) 189–206
Fig. 2. Ozonation of atrazine in natural waters. Evolution of atrazine concentration with time. Conditions: pH= 8.5,T = 293 K, contactor (I), ozone dose= 6.65 × 10⁻⁵ M. Water type: (d, s, 1) ultrapure water; (h, j, 2)Cordobilla reservoir water; (m, 4, 3) Gevora river water. Solid symbols: experimental results; solid numberedlines: tanks in series model; dotted lines plus open symbols: steady state concentrations; dispersion model.
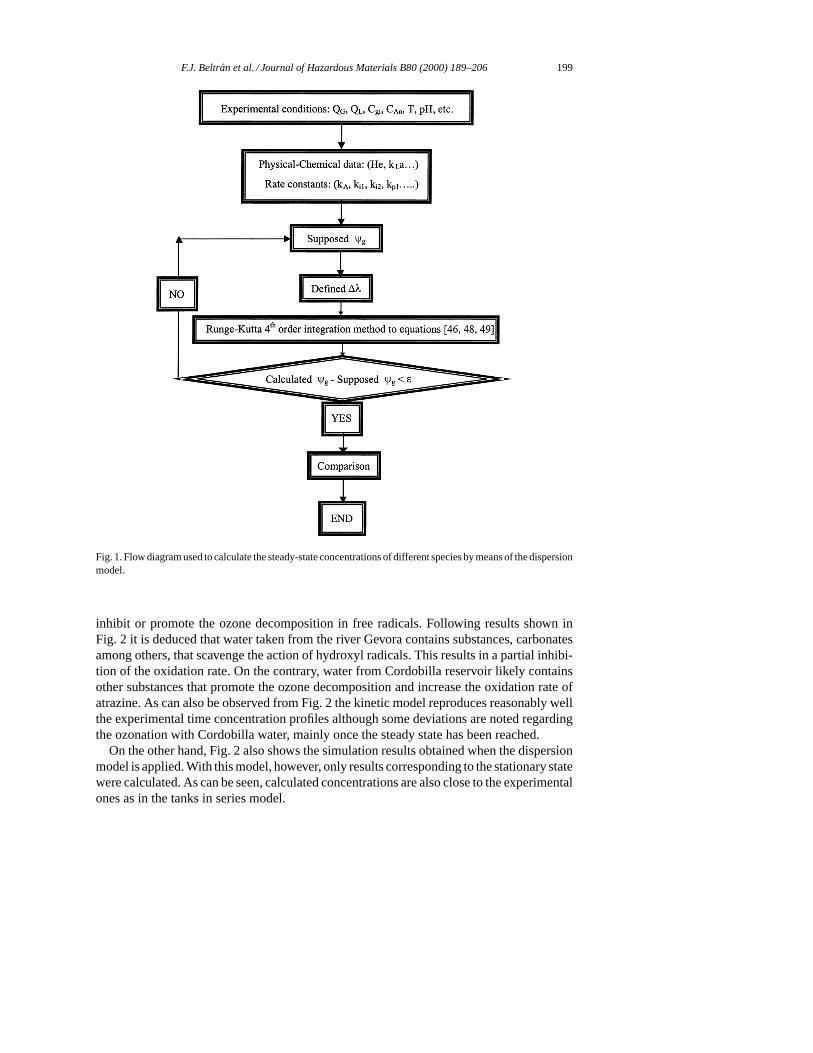
Finally, Fig. 3 presents results of calculated concentrations of the ozonation interme-diates considered in the kinetic model. As can be seen the dispersion model predictsconcentrations of DEA and DIA, first intermediates, higher than those from the tanksin series model. Notice that experimental concentrations of intermediates were not de-termined in this work because of some analytical problems arising when using the HPLC
Fig. 3. Atrazine ozonation in Cordobilla reservoir water. Calculated concentrations of DEA, DIA and DEIA atsteady state regime. Conditions as in Fig. 2.
F.J. Beltran et al. / Journal of Hazardous Materials B80 (2000) 189–206 201
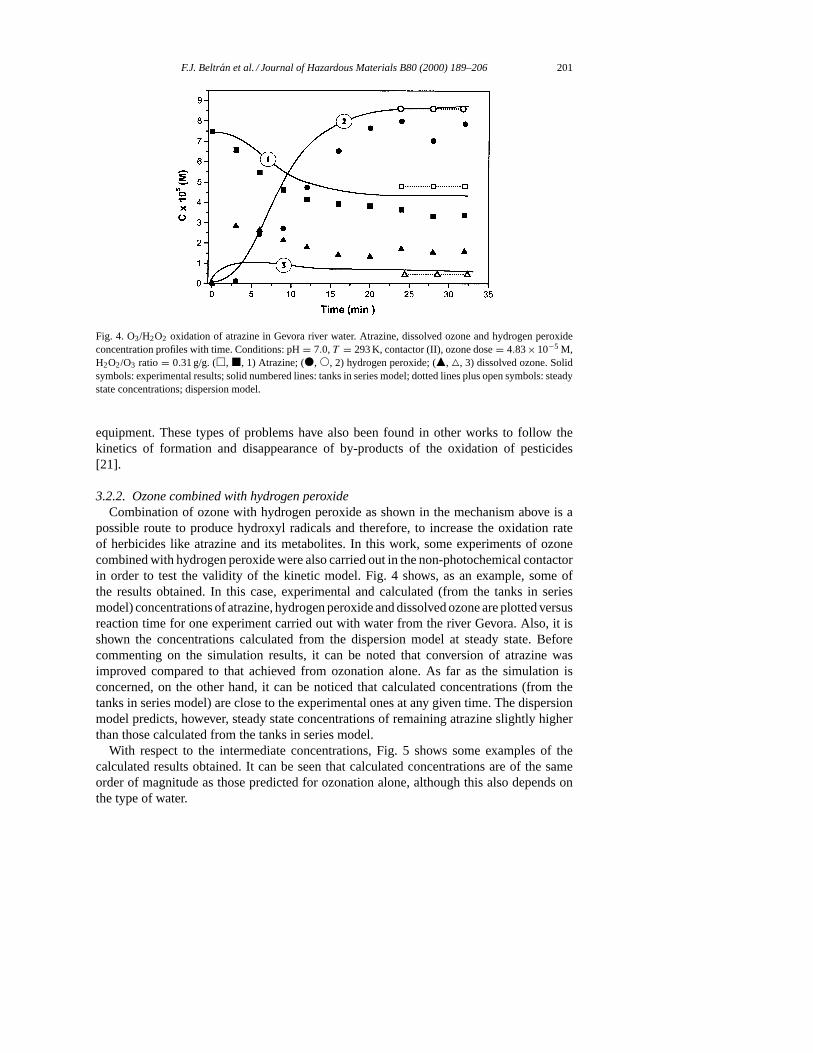
Fig. 4. O3/H2O2 oxidation of atrazine in Gevora river water. Atrazine, dissolved ozone and hydrogen peroxideconcentration profiles with time. Conditions: pH= 7.0,T = 293 K, contactor (II), ozone dose= 4.83× 10⁻⁵ M,H2O2/O3 ratio = 0.31 g/g. (h, j, 1) Atrazine; (d, s, 2) hydrogen peroxide; (m, 4, 3) dissolved ozone. Solidsymbols: experimental results; solid numbered lines: tanks in series model; dotted lines plus open symbols: steadystate concentrations; dispersion model.
equipment. These types of problems have also been found in other works to follow thekinetics of formation and disappearance of by-products of the oxidation of pesticides[21].
3.2.2. Ozone combined with hydrogen peroxideCombination of ozone with hydrogen peroxide as shown in the mechanism above is a
possible route to produce hydroxyl radicals and therefore, to increase the oxidation rateof herbicides like atrazine and its metabolites. In this work, some experiments of ozonecombined with hydrogen peroxide were also carried out in the non-photochemical contactorin order to test the validity of the kinetic model. Fig. 4 shows, as an example, some ofthe results obtained. In this case, experimental and calculated (from the tanks in seriesmodel) concentrations of atrazine, hydrogen peroxide and dissolved ozone are plotted versusreaction time for one experiment carried out with water from the river Gevora. Also, it isshown the concentrations calculated from the dispersion model at steady state. Beforecommenting on the simulation results, it can be noted that conversion of atrazine wasimproved compared to that achieved from ozonation alone. As far as the simulation isconcerned, on the other hand, it can be noticed that calculated concentrations (from thetanks in series model) are close to the experimental ones at any given time. The dispersionmodel predicts, however, steady state concentrations of remaining atrazine slightly higherthan those calculated from the tanks in series model.
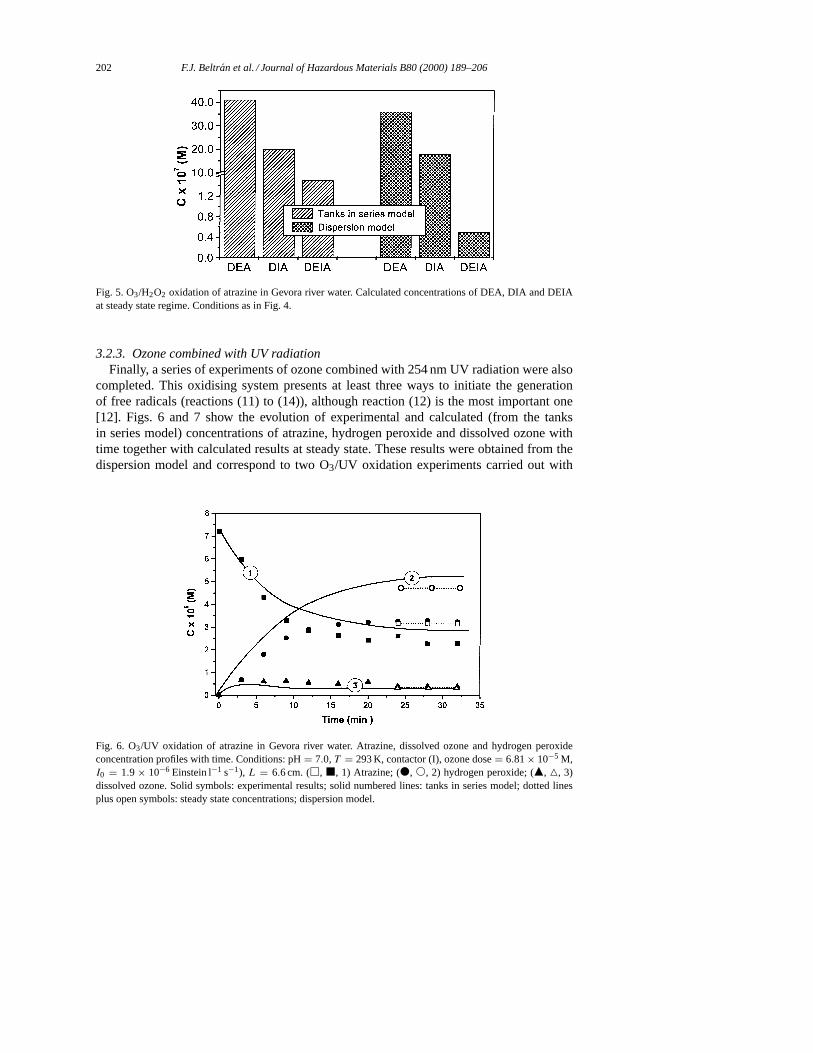
With respect to the intermediate concentrations, Fig. 5 shows some examples of thecalculated results obtained. It can be seen that calculated concentrations are of the sameorder of magnitude as those predicted for ozonation alone, although this also depends onthe type of water.
202 F.J. Beltran et al. / Journal of Hazardous Materials B80 (2000) 189–206
Fig. 5. O3/H2O2 oxidation of atrazine in Gevora river water. Calculated concentrations of DEA, DIA and DEIAat steady state regime. Conditions as in Fig. 4.
3.2.3. Ozone combined with UV radiationFinally, a series of experiments of ozone combined with 254 nm UV radiation were also
completed. This oxidising system presents at least three ways to initiate the generationof free radicals (reactions (11) to (14)), although reaction (12) is the most important one[12]. Figs. 6 and 7 show the evolution of experimental and calculated (from the tanksin series model) concentrations of atrazine, hydrogen peroxide and dissolved ozone withtime together with calculated results at steady state. These results were obtained from thedispersion model and correspond to two O3/UV oxidation experiments carried out with
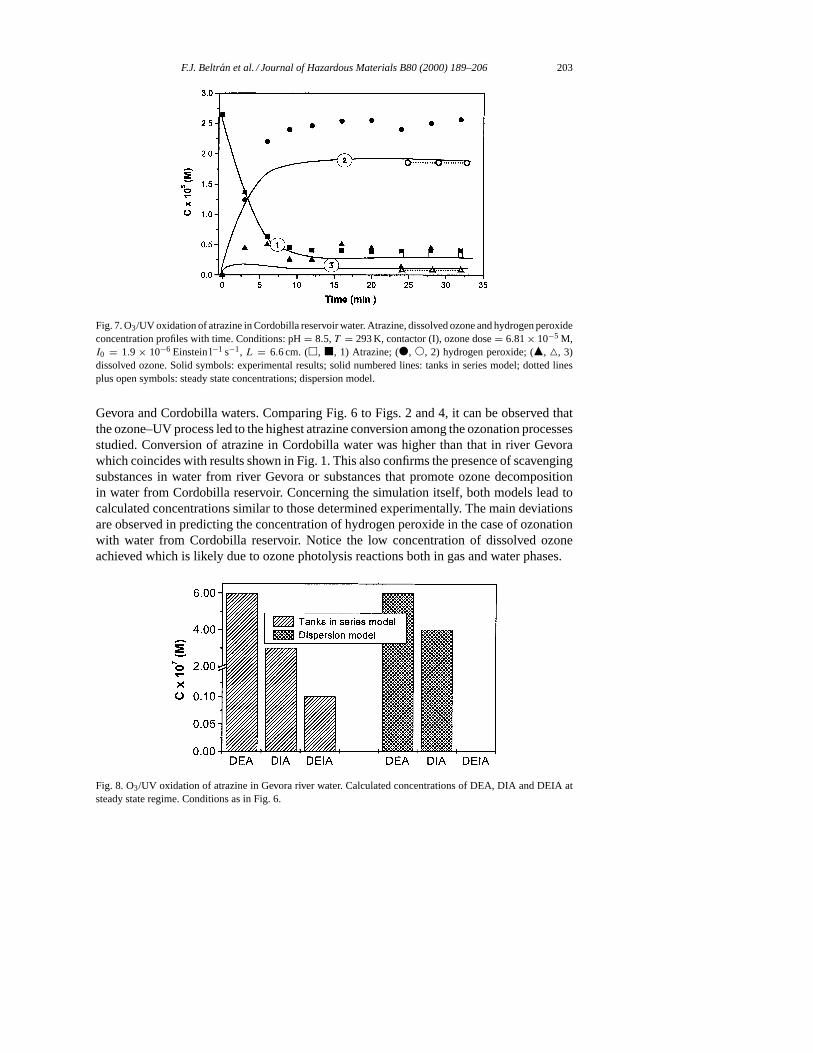
Fig. 6. O3/UV oxidation of atrazine in Gevora river water. Atrazine, dissolved ozone and hydrogen peroxideconcentration profiles with time. Conditions: pH= 7.0,T = 293 K, contactor (I), ozone dose= 6.81× 10⁻⁵ M,I0 = 1.9 × 10⁻⁶ Einstein l−1 s−1), L = 6.6 cm. (h, j, 1) Atrazine; (d, s, 2) hydrogen peroxide; (m, 4, 3)dissolved ozone. Solid symbols: experimental results; solid numbered lines: tanks in series model; dotted linesplus open symbols: steady state concentrations; dispersion model.
F.J. Beltran et al. / Journal of Hazardous Materials B80 (2000) 189–206 203
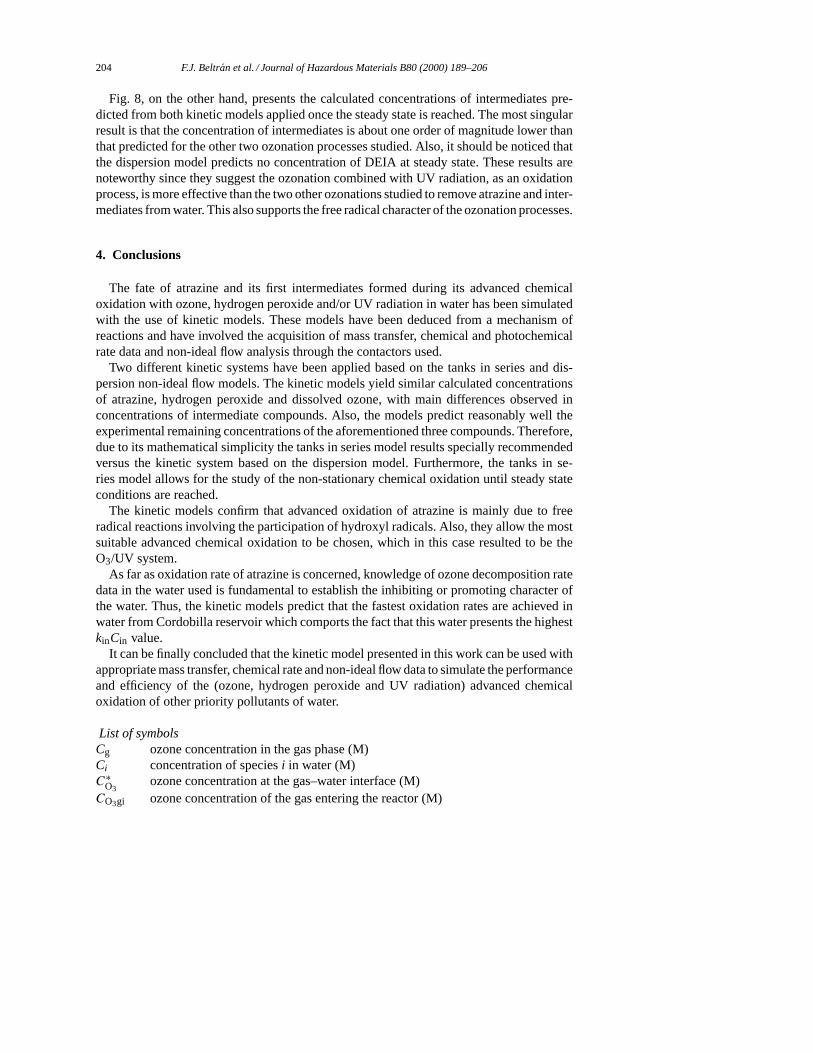
Fig. 7. O3/UV oxidation of atrazine in Cordobilla reservoir water. Atrazine, dissolved ozone and hydrogen peroxideconcentration profiles with time. Conditions: pH= 8.5,T = 293 K, contactor (I), ozone dose= 6.81× 10⁻⁵ M,I0 = 1.9 × 10⁻⁶ Einstein l−1 s−1, L = 6.6 cm. (h, j, 1) Atrazine; (d, s, 2) hydrogen peroxide; (m, 4, 3)dissolved ozone. Solid symbols: experimental results; solid numbered lines: tanks in series model; dotted linesplus open symbols: steady state concentrations; dispersion model.
Gevora and Cordobilla waters. Comparing Fig. 6 to Figs. 2 and 4, it can be observed thatthe ozone–UV process led to the highest atrazine conversion among the ozonation processesstudied. Conversion of atrazine in Cordobilla water was higher than that in river Gevorawhich coincides with results shown in Fig. 1. This also confirms the presence of scavengingsubstances in water from river Gevora or substances that promote ozone decompositionin water from Cordobilla reservoir. Concerning the simulation itself, both models lead tocalculated concentrations similar to those determined experimentally. The main deviationsare observed in predicting the concentration of hydrogen peroxide in the case of ozonationwith water from Cordobilla reservoir. Notice the low concentration of dissolved ozoneachieved which is likely due to ozone photolysis reactions both in gas and water phases.
Fig. 8. O3/UV oxidation of atrazine in Gevora river water. Calculated concentrations of DEA, DIA and DEIA atsteady state regime. Conditions as in Fig. 6.
204 F.J. Beltran et al. / Journal of Hazardous Materials B80 (2000) 189–206
Fig. 8, on the other hand, presents the calculated concentrations of intermediates pre-dicted from both kinetic models applied once the steady state is reached. The most singularresult is that the concentration of intermediates is about one order of magnitude lower thanthat predicted for the other two ozonation processes studied. Also, it should be noticed thatthe dispersion model predicts no concentration of DEIA at steady state. These results arenoteworthy since they suggest the ozonation combined with UV radiation, as an oxidationprocess, is more effective than the two other ozonations studied to remove atrazine and inter-mediates from water. This also supports the free radical character of the ozonation processes.
4. Conclusions
The fate of atrazine and its first intermediates formed during its advanced chemicaloxidation with ozone, hydrogen peroxide and/or UV radiation in water has been simulatedwith the use of kinetic models. These models have been deduced from a mechanism ofreactions and have involved the acquisition of mass transfer, chemical and photochemicalrate data and non-ideal flow analysis through the contactors used.
Two different kinetic systems have been applied based on the tanks in series and dis-persion non-ideal flow models. The kinetic models yield similar calculated concentrationsof atrazine, hydrogen peroxide and dissolved ozone, with main differences observed inconcentrations of intermediate compounds. Also, the models predict reasonably well theexperimental remaining concentrations of the aforementioned three compounds. Therefore,due to its mathematical simplicity the tanks in series model results specially recommendedversus the kinetic system based on the dispersion model. Furthermore, the tanks in se-ries model allows for the study of the non-stationary chemical oxidation until steady stateconditions are reached.
The kinetic models confirm that advanced oxidation of atrazine is mainly due to freeradical reactions involving the participation of hydroxyl radicals. Also, they allow the mostsuitable advanced chemical oxidation to be chosen, which in this case resulted to be theO3/UV system.
As far as oxidation rate of atrazine is concerned, knowledge of ozone decomposition ratedata in the water used is fundamental to establish the inhibiting or promoting character ofthe water. Thus, the kinetic models predict that the fastest oxidation rates are achieved inwater from Cordobilla reservoir which comports the fact that this water presents the highestkinCin value.
It can be finally concluded that the kinetic model presented in this work can be used withappropriate mass transfer, chemical rate and non-ideal flow data to simulate the performanceand efficiency of the (ozone, hydrogen peroxide and UV radiation) advanced chemicaloxidation of other priority pollutants of water.
List of symbolsCg ozone concentration in the gas phase (M)Ci concentration of speciesi in water (M)C∗
O3ozone concentration at the gas–water interface (M)
CO3gi ozone concentration of the gas entering the reactor (M)
F.J. Beltran et al. / Journal of Hazardous Materials B80 (2000) 189–206 205
CO3gs ozone concentration of the gas leaving the reactor (M)dh differential height in the contactor (m)Di diffusivity of speciesi in water (m2 s−1)Fi fraction of absorbed radiation that compoundi absorbs (dimensionless)H total height of liquid in the contactor (m)He constant of Henry for the ozone–water system (Pa l mol−1)I0 intensity of incident radiation (Einstein l−1 s−1)kC constant defined in Eq. (42)kD,i rate constant of the direct reaction between ozone and the speciesi (M−1 s−1)kH constant defined in Eq. (43)kOH,i rate constant of the reaction between hydroxyl
radicals and the speciesi (M−1 s−1)kS constant defined in Eq. (41)kL individual liquid side mass transfer coefficient (m s−1)kLa volumetric mass transfer coefficient (s−1)kti radical termination rate (M−1 s−1)L effective path of incident radiation through the photoreactor (cm)N number of perfectly mixed tank reactorsNO3 ozone absorption rate (M s−1)PeL Peclet number in the water phase, defined by Eq. (62)Q flow rate (m3 s−1)ri reaction rate of any ozone involving reaction (s−1)rUVi rate of the photolysis of speciesi (M s−1)R constant of perfect gases (Pa l mol−1 K−1)S transversal section of the contactors (m2)t time (s)T temperature (K)u superficial velocity of water (m s−1)V contactor volume (m3)zDE stoichiometric coefficient of reaction (1), moles of atrazine consumed per
mole of ozone consumed to form deethylatrazine (dimensionless)zDI stoichiometric coefficient of reaction (2), moles of atrazine consumed per
mole of ozone consumed to form deisopropylatrazine (dimensionless)zRE stoichiometric coefficient of reaction (25), moles of deethylatrazine
formed per mole of atrazine consumed (dimensionless)zRI stoichiometric coefficient of reaction (26), moles of deisopropylatrazine
formed per mole of atrazine consumed (dimensionless)
Greek lettersβ liquid fraction in the contactorεi extinction coefficient of speciesi in water (M−1 cm−1)Φi quantum yield at 254 nm of speciesi (mol photon−1)λ normalised height fraction of contactors, defined in Eq. (61) (dimensionless)σ 2 variance of the residence time distribution function (min2)
206 F.J. Beltran et al. / Journal of Hazardous Materials B80 (2000) 189–206
τ hydraulic time (min)ωj reaction rate of anyj chemical species involving reaction as a
function of parametersψO3, ψi and rate constants (M s−1)ωO3 reaction rate of any ozone involving reaction as a function of
parametersψO3, ψ i and rate constants (M s−1)ξj function defined in Eq. (64)ξO3 function defined in Eq. (63)ψg normalised concentration of ozone in the gas phase,
defined in Eq. (58) (dimensionless)ψi normalised concentration of speciesi, defined in Eq. (60) (dimensionless)ψO3 normalised concentration of ozone in water, defined by Eq. (59) (dimensionless)
Acknowledgements
We thank the CICYT of Spain for its economic support (Research Project AMB97/339).
References
[1] G. Reynolds, N. Graham, R. Perry, R.G. Rice, Ozone Sci. Eng. 11 (1989) 339.[2] C.D. Adams, S.J. Randtke, E.M. Thurman, R.A. Hulsey, in: 109th Annual Conference Proceedings of
American Water Works Association, Cincinnati, OH, 1990, pp 1–24.[3] J.M. Sayre, J. Am. Water Works Assoc. 80 (1988) 53.[4] F.J. Beltrán, J.F. Garcıa-Araya, P. Alvarez, F.J. Rivas, J. Chem. Technol. Biotechnol 71 (1998) 345.[5] B. Legube, S. Guyon, M. Doré, Ozone Sci. Eng. 9 (1987) 233.[6] M. Prados, H. Paillard, P. Roche, Ozone Sci. Eng. 17 (1992) 183.[7] C.D. Adams, S.J. Randtke, Environ. Sci. Technol. 26 (1992) 2218.[8] F.J. Beltrán, J.F. Garcıa-Araya, B. Acedo, Water Res. 28 (1994) 2153.[9] F.J. Beltrán, J.F. Garcıa-Araya, B. Acedo, Water Res. 28 (1994) 2165.
[10] A. Laplanche, R. Bastiment, V. Boisdon, in: Proceedings of the 1st Research Symposium on Les sous-produitsde traitement et d’epuration des eaux, 29-1-29-19, Poitiers, France, 1994.
[11] F.J. Beltrán, G. Ovejero, B. Acedo, Water Res. 27 (1993) 1013.[12] F.J. Beltrán, Ozone Sci. Eng. 21 (1999) 207.[13] H.S. Fogler, Prentice-Hall, Englewood Cliffs, New Jersey, 1989.[14] B. Langlais, D.A. Reckhow, D.R. Brink, (Eds.), Lewis Publishers, Chelsea, MI, USA, 1991.[15] H. Bader, J. Hoigné, Water Res. 15 (1991) 449.[16] R.A. Lazrus, G.L. Kok, S.N. Gitlin, J.A. Lin, S.E. McLaren, Anal. Chem. 87 (1985) 917.[17] P.S.V. Danckwerts, MacGraw-Hill, New York, 1970.[18] S. Staehelin, J. Hoigné, J. Environ. Sci. Technol. 19 (1985) 1206.[19] F.J. Beltrán, M. González, F.J. Rivas, P. Alvarez, Environ. Toxicol. Chem. 15 (1996) 868.[20] S. Morooka, K. Kusakabe, J. Hayasi, K. Isomura, K. Ikemizu, Ind. Eng. Chem. Res. 27 (1988) 2372.[21] S. Chiron, A.R. Fernández-Alba, A. Rodriguez, Trac-Trend. Anal. Chem. 16 (1997) 518.


