Embed Size (px)
Citation preview
Contents :
Thermal, X-ray diffraction, spectral and antimicrobial activity of bivalent 01-08metal (Zn, Cd, Hg, Pb and Sn) chelates of 2-hydroxy-1, 4-naphthoquinone -1, oximeA.B. Pawar, R. G. Sarawadekar, K.D. Jadhav, S.S. Kadam
The Fine Structure of the Adrenal Gland of the Indian SheathTailed Bat, 09-13Taphozous longimanus (Hardwicke)A. A. Nerkar, M. M. Gadegone
Pollen Morphology of Some Members of Nigerian Clusiaceae and Its 14-19Taxonomic SignificanceNnamani, C. V., Nwosu, M. O.
Effect of Supplementation of Embelica Officinalis on Mushroom 20-24Nutraceuticals Poonam Dehariya, Deepak Vyas
Gene Expression of Peroxisome Proliferator-Activated Receptor Is 25-37Upregulated by Nonsteroidal Anti-Inflammatory Drugs and Correlates with Cyclooxygenase-2 Suppression In Inflamed-Rat MuscleAbdelhady S, El Ashmawy N, El Bahrawy H, Fouad H
Kinetic Study of the Acid Hydrolysis of Parthenium hysterophorus L. for 35-41xylose yield in the Production of Lignocellulosic ethanolGhosh Swati, Haldar S, Shubhaneel N, Ganguly A, Chatterjee P. K
Prevalence of Intestinal Parasitic Infections among School Children in 42-44Rural Area of Vizianagaram.Dr.Supriya Panda, Dr.U.Dharma Rao, Dr.K.Rama Sankaram
An Analysis of RF Radiation on Pharmaceutical medicine at Variable 45-50DistanceM. A. Othman, M. Z. A. A. Aziz, M. Sinnappa, M. M. Ismail, H.A. Sulaiman, M. A. Meor Said, M. H. Misran
Volume : 3 Issue : 3ISSN : 2278-3008
IOSR-J
PBS
IOSR-J
PBS
IOSR-J
PBS
IOSR-J
PBS
IOSR-J
PBS
IOSR IOSR JournalsInternational Organizationof Scientific Research
IOSR Journal of Pharmacy and Biological Sciences
Sep-Oct 2012
IOSR Journal of Pharmacy and Biological Sciences (IOSR-JPBS)
ISSN: 2278-3008. Volume 3, Issue 3 (Sep-Oct. 2012), PP 01-08 www.iosrjournals.org
www.iosrjournals.org 1 | Page
Thermal, X-ray diffraction, spectral and antimicrobial activity of
bivalent metal (Zn, Cd, Hg, Pb and Sn) chelates of 2-hydroxy-1, 4-
naphthoquinone -1, oxime
1A.B. Pawar,
2R. G. Sarawadekar,
3K.D. Jadhav,
4S.S. Kadam
1, 2, 3 Bharati Vidyapeeth Deemed University, Pune (India) Yashwantrao Mohite College, Pune 411 038 4Bharati Vidyapeeth Deemed University, L.B.S. Marg, Pune 411030
Abstract: The new complexes M-Lm M= Zn, Cd, Hg, Sn and Pb: Lm = 2-hydroxy -1, 4- naphthoquinone -1,
oxime have been prepared. They were characterized by XRD, IR (FAR and MID), Electronic spectra and
investigated by SEM with EDAX analysis. The antimicrobial activity of these metal complexes was tested
against Escherichia coli, Bacillus subtilis, Klebsiella pneumonie, Staphylococcus aureus and Candida albicans
by disc diffusion method. The results were encouraging and compared with standard Cisplatin complex which
was known as chemotherapy agent for various cancer treatments.
Keywords: Lawsone monoxime, Metal chelates, IR, NMR, SEM, Antimicrobial activity, Electronic spectra
I. Introduction: The effect of monoxime of 2-hydroxy -1, 4- naphthoquinone on muscular work was tested on the
rectus abdominis of Rana temporaria in Ringer solution at pH 7.2 (1). Ligand field stabilization energies were
presented for metallic domplexes of (copper, nickel, cobalt, zinc, lead, cadmium, manganese and magnesium
mono oximates ) by R. K. Sharma et. al. (2). The antimicrobial activity of the Ho (III) complexes of C3
substituted 2-hydroxy -1, 4- naphthoquinone-1, oxime by disc diffusion method against S. aureus, Klebsiella,
pneumonie, Salmonella typhimurium, Proteus morganii, Providencia typhimurium and e. coli. They have
reported a variable the antimicrobial activity against all tested microorganisms and S aureus have showed good
sensitivity against all metal complexes (3). X-ray diffraction, spectral and antimicrobial activity of bivalent metal (Zn, Cd, Hg, Pb and Sn) chelates of 2-hydroxy 1-4 naphthoquinone -1, oxime have been reported and they
carried out antimicrobial activity against Escherichia coli, Bacillus subtilis, Klebsiella pneumonie,
Staphylococcus aureus and Candida albicans . The results were encouraging. (4). Sonawane (5) studied
antifungal screening viz. Candida albicans, Saccharomyeas arevisiae and Aspergillus niger with lawsone
monoxime. P.T. Kulkarni (6) reported antimicrobial activities of lawsone (Lw) and lawsone monoxime (Lm) as
well as zinc lawsonate (Zn-Lw) with dichlone as standard. The spectral data reveal that Lawsone chelate
through the O atoms and lawsone monoximes chelate through N and O with Co( III). An octahedral geometry
is suggested for the chelates. Preliminary antimicrobial activity studies showed that the activity of the ligands
diminishes on chelation (7). This work reports the synthesis of metal chelates, their characterization employing
X-ray diffraction, Far and Mid infra red spectra, Electronic spectra, Thermal analysis TG/DTA curves, SEM,
EDAX and antimicrobial activity against micro organisms.
Computational details
The calculations of the title compound were carried out with Gaussian 09 mechanics program.
Geometry optimization was calculated using RHF / 6-311 G* level of theory. The wave number value
computed by HF method and 6-311 G* level contain known systematic errors due to negligence of electron
correlation (8). We therefore have used the scaling factor as 0.90 for HF/6-311G* (d p) set.
II. Materials and Methods Synthesis of 2-hydoxy-1, 4-napthoquinone-1, oxime was carried as per the reported method (7) which was recrystalized using methanol used as it is, supplied by AR grade Thomas Baker chemicals. A stock solution
of chlorides of Zn (II), Cd (II), Hg (II) Pb (II) and Sn (II) were prepared by using AR grade chemicals.
Deionised water was used during synthesis.
2.1 Preparation of metal chelates.
The chelates were prepared by mixing metal salt solution and ligand in 1:2 for all metals. The mixture
was constantly stirred for one hour with magnetic stirrer. The pH of the mixture was maintained between pH
5.0-6.0 by adding ammonia solution to it. Mixture was warmed on water bath for about 15 minutes. On cooling
it was filtered and found to be colored.
Thermal, X-ray diffraction, spectral and antimicrobial activity of bivalent metal (Zn, Cd, Hg, Pb and
www.iosrjournals.org 2 | Page
2.2 Instrumental Analysis.
The IR spectra were recorded on a JASCO FTIR in the region of 4000 to 350 cm-1 model in a KBr
matrix. Electronic spectra were recorded on JASCO 530 UV-VIS spectrometer, in solid state in KBr matrix and
in methanol solution. DTA/TGA curves were recorded on Shimatzu 60H model using 10 Co / min. heating rate,
800 Co maximum temperature in air. X-ray diffraction patterns were obtained by using Brucker D8 advanced
diffractometer. Elemental analysis was carried out with a Perkin Elmer 2400 series for C, H, O, & N. Scanning electron microscopy was carried out on Vega 2SB model and EDAX on OXFORD INCA PENTA with TECAN
VEGA 2SB.
2.3 Bioassay
Test organisms: The antimicrobial activity ligands, metal salt and synthesized metal chelates were
examined against bacteria and fungi Escherichia coli (NCIM 2065), Bacillus subtilis (NICN 2063), Klebsiella
pneumonie (NCIM 5082), Staphylococcus aureus (NCIM 2079) and Candida albicans (NICM 3471) ] strains
collected from NCL Pune, India.
2.4 Maintenance and Culture:
The culture of bacteria and fungi were maintained on Nutrient agar (Himedia Laboratories Pvt. Ltd.
Ref. M 002-500G 99% Purity and sub cultured accordingly. These plates were incubated at 35oC for 24 hours in incubator.
2.5 Inoculums preparation:
One loopful growth of bacteria and fungi were transferred in to the 100µL of the organism suspension.
Finally 100µL of ligand, metal salt and metal chelates were placed in to each well.
III. Result and discussion The chelates of lawsone monoxime are stable at room temperature, insoluble in water and protic
solvents while soluble in aprotic solvents such as DMF and DMSO.
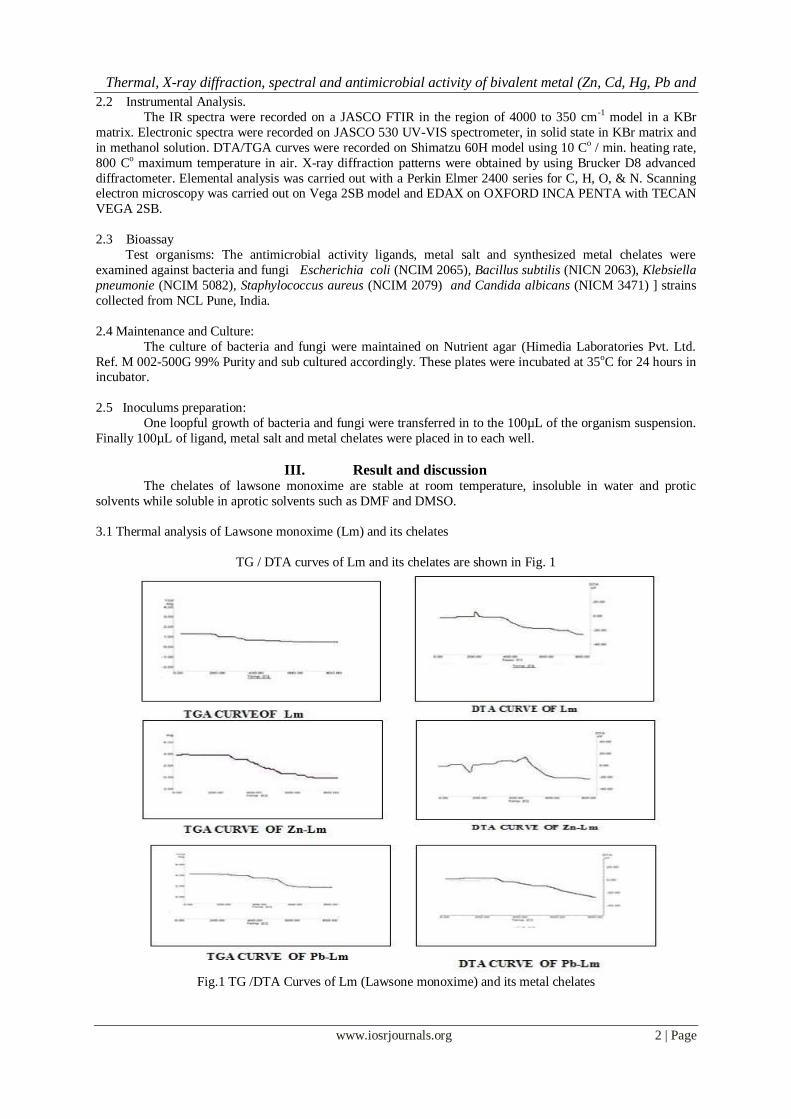
3.1 Thermal analysis of Lawsone monoxime (Lm) and its chelates
TG / DTA curves of Lm and its chelates are shown in Fig. 1
Fig.1 TG /DTA Curves of Lm (Lawsone monoxime) and its metal chelates
Thermal, X-ray diffraction, spectral and antimicrobial activity of bivalent metal (Zn, Cd, Hg, Pb and
www.iosrjournals.org 3 | Page
The TG curve of Lm shows only one step weight loss in the temperature range 127.01 OC to 275 OC up
to 21.53 %. Then the weight loss is continuous up to 800 OC and finally it shows 31.85 % weight loss which
corresponds to loss of NO2 moiety. The probable mechanism can be given as
C10H7NO3 C10H7O2 + NO Step I
C10H7O2 7C Step II
The TG curve of Zn-Lm shows two step weight loss in which first step is starting at 110.71 OC and ends at 304.13 OC with weight loss up to 16.49 % and second step starts at 335.22 OC & ends at 626.75 OC with
weight loss up to 63.33 %. The first step is due to loss of 4 water molecules and the second step for the
decomposition of Lm. Finally it gives ZnO and some carboneous matter.
Zn ( C10H5NO3 ) 2. 4H2O --------- Zn ( C10H5NO3 ) 2 ------------ ZnO + C
The TG curve of Pb-Lm shows two step weight loss in which first step is starting at 37.63 OC and ends at 284.07 OC with weight loss 14.87 % and the second step starts at 473.03 OC which ends at 654.13 OC with weight loss
23.036 %. The first step is due to partial decomposition of Lm and in the second step it decomposes completely
leaving residue as PbO and some carbon ash. The probable mechanism can be given as
Pb (C10H7NO3 )2--------- Pb ( C10O) ---------- PbO + C
DTA of Lm shows only one exotherm in the temperature range of 192.23 OC to 226. 80OC with peak
temperature at 203.89 OC. This can attributed to the partial decomposition of Lm which loses NO moiety only.
DTA of Zn-Lm shows only one Endotherm which starts at 212.41 OC and ends at 160.3 OC. This is due to dehydration process in which it loses 4 molecules of water.
DTA of Pb-Lm shows a broad exothermic peak which starts at 192.44 OC and ends at 290.1 OC. Then it does not
any observable peak.
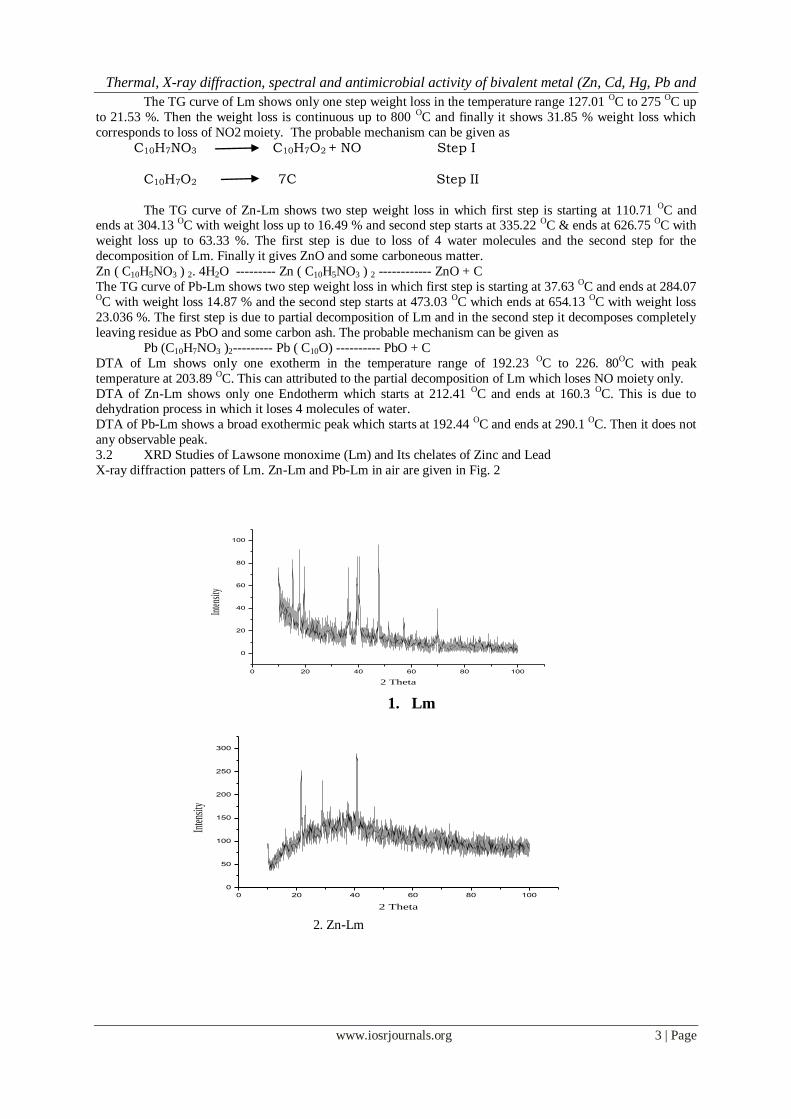
3.2 XRD Studies of Lawsone monoxime (Lm) and Its chelates of Zinc and Lead
X-ray diffraction patters of Lm. Zn-Lm and Pb-Lm in air are given in Fig. 2
0 20 40 60 80 100
0
20
40
60
80
100
Inte
nsity
2 Theta
0 20 40 60 80 100
0
50
100
150
200
250
300
Inte
nsity
2 Theta
2. Zn-Lm
1. Lm
Thermal, X-ray diffraction, spectral and antimicrobial activity of bivalent metal (Zn, Cd, Hg, Pb and
www.iosrjournals.org 4 | Page
0 20 40 60 80 100
0
10
20
30
40
50
60
70
80
Intens
ity
2 Theta 3. Pb-Lm
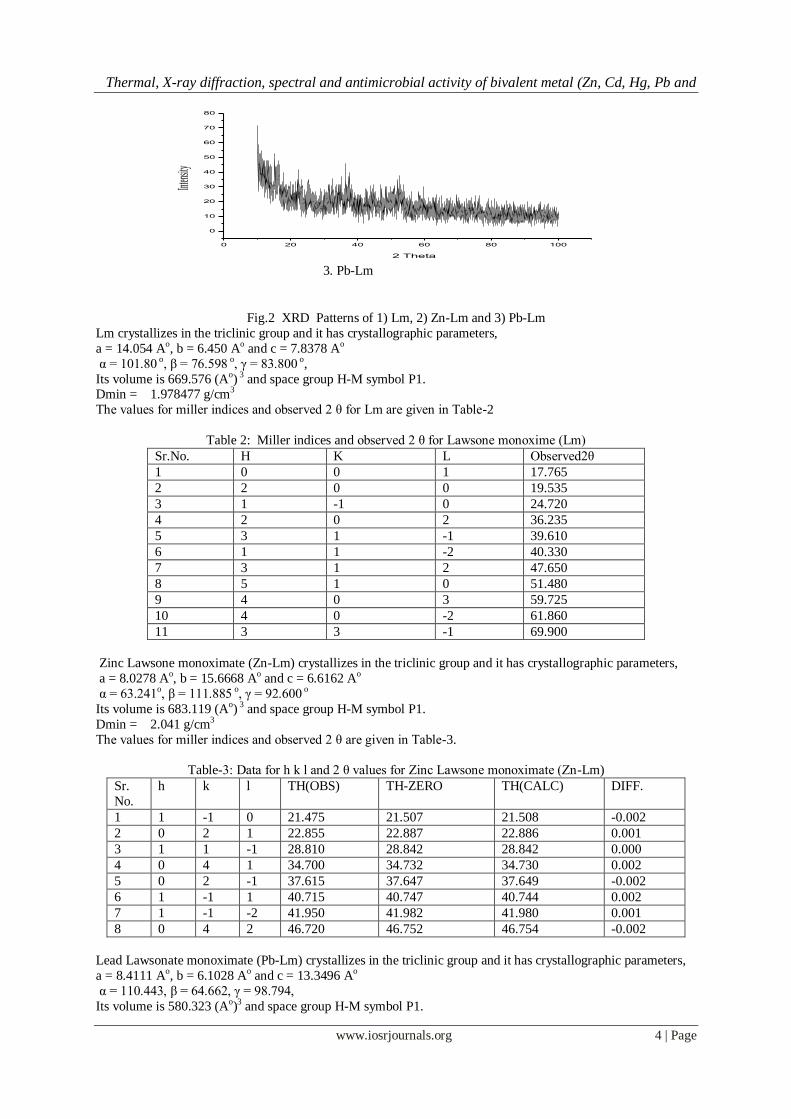
Fig.2 XRD Patterns of 1) Lm, 2) Zn-Lm and 3) Pb-Lm
Lm crystallizes in the triclinic group and it has crystallographic parameters,
a = 14.054 Ao, b = 6.450 Ao and c = 7.8378 Ao
α = 101.80 o, β = 76.598 o, γ = 83.800 o,
Its volume is 669.576 (Ao) 3 and space group H-M symbol P1. Dmin = 1.978477 g/cm3
The values for miller indices and observed 2 θ for Lm are given in Table-2
Table 2: Miller indices and observed 2 θ for Lawsone monoxime (Lm)
Sr.No. H K L Observed2θ
1 0 0 1 17.765
2 2 0 0 19.535
3 1 -1 0 24.720
4 2 0 2 36.235
5 3 1 -1 39.610
6 1 1 -2 40.330
7 3 1 2 47.650
8 5 1 0 51.480
9 4 0 3 59.725
10 4 0 -2 61.860
11 3 3 -1 69.900
Zinc Lawsone monoximate (Zn-Lm) crystallizes in the triclinic group and it has crystallographic parameters,
a = 8.0278 Ao, b = 15.6668 Ao and c = 6.6162 Ao
α = 63.241o, β = 111.885 o, γ = 92.600 o
Its volume is 683.119 (Ao) 3 and space group H-M symbol P1.
Dmin = 2.041 g/cm3
The values for miller indices and observed 2 θ are given in Table-3.
Table-3: Data for h k l and 2 θ values for Zinc Lawsone monoximate (Zn-Lm)
Sr.
No.
h k l TH(OBS) TH-ZERO TH(CALC) DIFF.
1 1 -1 0 21.475 21.507 21.508 -0.002
2 0 2 1 22.855 22.887 22.886 0.001
3 1 1 -1 28.810 28.842 28.842 0.000
4 0 4 1 34.700 34.732 34.730 0.002
5 0 2 -1 37.615 37.647 37.649 -0.002
6 1 -1 1 40.715 40.747 40.744 0.002
7 1 -1 -2 41.950 41.982 41.980 0.001
8 0 4 2 46.720 46.752 46.754 -0.002
Lead Lawsonate monoximate (Pb-Lm) crystallizes in the triclinic group and it has crystallographic parameters,
a = 8.4111 Ao, b = 6.1028 Ao and c = 13.3496 Ao
α = 110.443, β = 64.662, γ = 98.794,
Its volume is 580.323 (Ao)3 and space group H-M symbol P1.
Thermal, X-ray diffraction, spectral and antimicrobial activity of bivalent metal (Zn, Cd, Hg, Pb and
www.iosrjournals.org 5 | Page
Dmin = 1.9686 g/cm3
The values for miller indices and observed 2 θ are given in Table-4.
Table-4: Data for h k l and 2 θ values for Lead Lawsone monoximate (Pb-Lm)
Sr.
No.
h k L TH(OBS) TH-ZERO TH(CALC) DIFF.
1 1 0 1 16.450 16.451 16.465 -0.013
2 0 1 -1 22.285 22.286 22.285 0.001
3 1 -1 1 25.210 25.211 25.201 0.001
4 1 1 1 31.475 31.476 31.465 0.011
5 1 -1 3 32.405 32.406 32.402 0.004
6 0 0 3 34.940 34.941 34.945 -0.004
7 1 -1 -1 36.385 36.386 36.383 0.003
8 2 -1 1 37.480 37.481 37.483 -0.002
9 0 2 -1 44.715 44.716 44.729 -0.003
10 0 1 3 48.450 48.451 48.452 0.000
11 1 2 -2 52.700 52.701 52.698 0.003
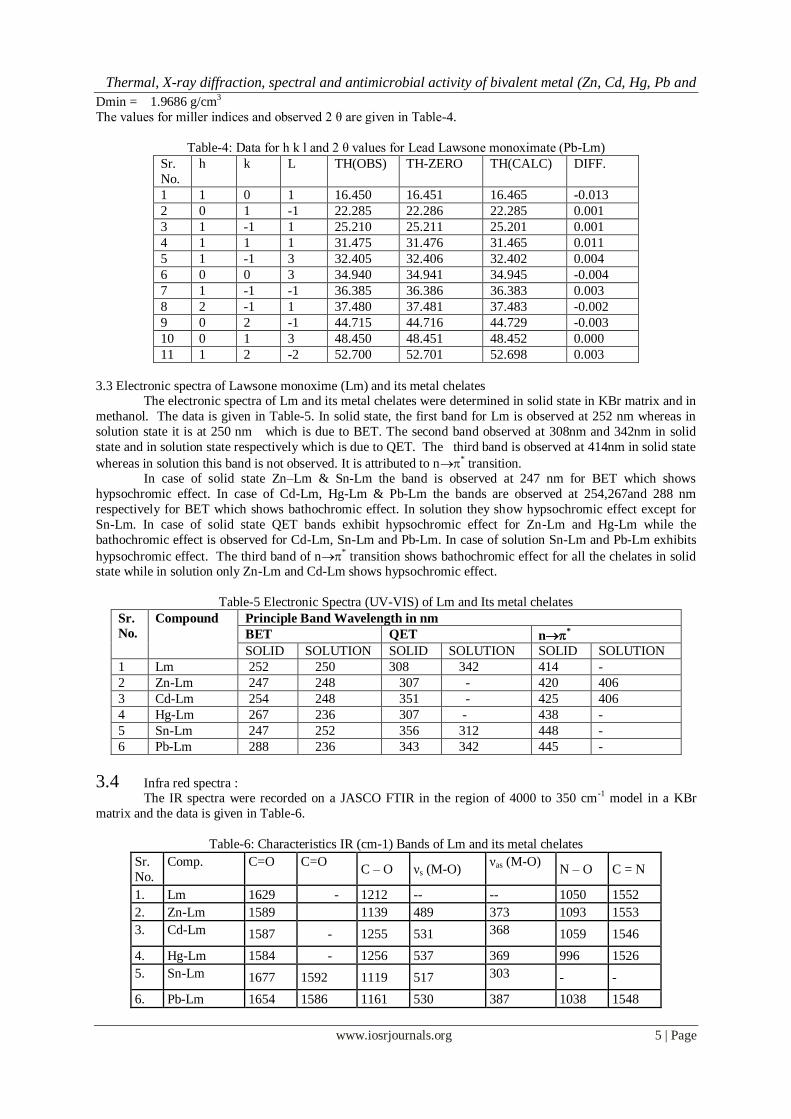
3.3 Electronic spectra of Lawsone monoxime (Lm) and its metal chelates The electronic spectra of Lm and its metal chelates were determined in solid state in KBr matrix and in
methanol. The data is given in Table-5. In solid state, the first band for Lm is observed at 252 nm whereas in
solution state it is at 250 nm which is due to BET. The second band observed at 308nm and 342nm in solid
state and in solution state respectively which is due to QET. The third band is observed at 414nm in solid state
whereas in solution this band is not observed. It is attributed to n* transition. In case of solid state Zn–Lm & Sn-Lm the band is observed at 247 nm for BET which shows
hypsochromic effect. In case of Cd-Lm, Hg-Lm & Pb-Lm the bands are observed at 254,267and 288 nm
respectively for BET which shows bathochromic effect. In solution they show hypsochromic effect except for
Sn-Lm. In case of solid state QET bands exhibit hypsochromic effect for Zn-Lm and Hg-Lm while the
bathochromic effect is observed for Cd-Lm, Sn-Lm and Pb-Lm. In case of solution Sn-Lm and Pb-Lm exhibits
hypsochromic effect. The third band of n* transition shows bathochromic effect for all the chelates in solid state while in solution only Zn-Lm and Cd-Lm shows hypsochromic effect.
Table-5 Electronic Spectra (UV-VIS) of Lm and Its metal chelates
Sr.
No.
Compound Principle Band Wavelength in nm
BET QET n*
SOLID SOLUTION SOLID SOLUTION SOLID SOLUTION
1 Lm 252 250 308 342 414 -
2 Zn-Lm 247 248 307 - 420 406
3 Cd-Lm 254 248 351 - 425 406
4 Hg-Lm 267 236 307 - 438 -
5 Sn-Lm 247 252 356 312 448 -
6 Pb-Lm 288 236 343 342 445 -
3.4 Infra red spectra : The IR spectra were recorded on a JASCO FTIR in the region of 4000 to 350 cm-1 model in a KBr
matrix and the data is given in Table-6.
Table-6: Characteristics IR (cm-1) Bands of Lm and its metal chelates
Sr.
No.
Comp. C=O
C=O
C – O νs (M-O)
νas (M-O) N – O C = N
1. Lm 1629 - 1212 -- -- 1050 1552
2. Zn-Lm 1589 1139 489 373 1093 1553
3. Cd-Lm 1587 - 1255 531 368 1059 1546
4. Hg-Lm 1584 - 1256 537 369 996 1526
5. Sn-Lm 1677 1592 1119 517 303 - -
6. Pb-Lm 1654 1586 1161 530 387 1038 1548
Thermal, X-ray diffraction, spectral and antimicrobial activity of bivalent metal (Zn, Cd, Hg, Pb and
www.iosrjournals.org 6 | Page
In comparison with Lm spectrum, the spectra of the metal chelates displayed bands ranging between
v(C-O) group (9, 10) and confirming the coordination through the phenolic oxygen. The other frequencies of
C=O are shown common in all chelates. The main peak for OH from ligand is not observed in chelates. In the
region 1700-1200 cm-1, all the chelate showed a number of intensive bands, which are due to normal modes of
vibrations of ligand affected by its coordination. The v(C=O) stretching frequency of coordinated carbonyl
group is similar that of ligand. All the chelates exhibits v(C=O) band at lower energy. It can be explained on the basis of mono anionic nature of the ligand which acts as a ring with bidendate ligand. In results form a ring with
metal ion. A considerable delocalization of the π electron density exhibits such a strong ring formation. This can
be explained on the basis of absorption bands by the chelate. The most important region is v 600-300 cm-1
exhibits several absorptions are sensitive to the central metal ion and the structure of the chelate and can be
attributed to the normal mode of vibrations of the MO4 moiety.
Generally the ligand to metal ratio is 1:2 and they have D2h symmetry and band can be assigned in the
region of v 590-420 cm-1 to the νsym (MO) stretching vibration species Blu and the other band in the v390- 320
cm-1 to the vasym (MO) stretching to B2h. These two vibrations are sensitive to the nature to the central metal
ion.
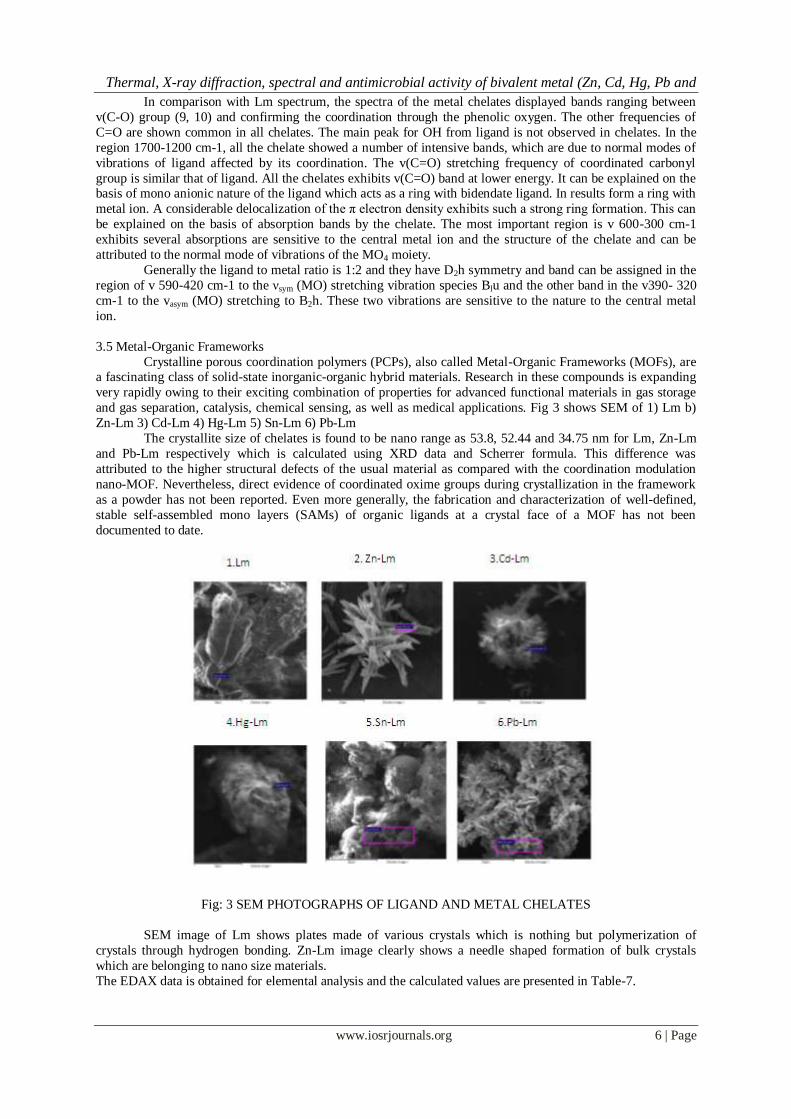
3.5 Metal-Organic Frameworks
Crystalline porous coordination polymers (PCPs), also called Metal-Organic Frameworks (MOFs), are a fascinating class of solid-state inorganic-organic hybrid materials. Research in these compounds is expanding
very rapidly owing to their exciting combination of properties for advanced functional materials in gas storage
and gas separation, catalysis, chemical sensing, as well as medical applications. Fig 3 shows SEM of 1) Lm b)
Zn-Lm 3) Cd-Lm 4) Hg-Lm 5) Sn-Lm 6) Pb-Lm
The crystallite size of chelates is found to be nano range as 53.8, 52.44 and 34.75 nm for Lm, Zn-Lm
and Pb-Lm respectively which is calculated using XRD data and Scherrer formula. This difference was
attributed to the higher structural defects of the usual material as compared with the coordination modulation
nano-MOF. Nevertheless, direct evidence of coordinated oxime groups during crystallization in the framework
as a powder has not been reported. Even more generally, the fabrication and characterization of well-defined,
stable self-assembled mono layers (SAMs) of organic ligands at a crystal face of a MOF has not been
documented to date.
Fig: 3 SEM PHOTOGRAPHS OF LIGAND AND METAL CHELATES
SEM image of Lm shows plates made of various crystals which is nothing but polymerization of
crystals through hydrogen bonding. Zn-Lm image clearly shows a needle shaped formation of bulk crystals
which are belonging to nano size materials.
The EDAX data is obtained for elemental analysis and the calculated values are presented in Table-7.
Thermal, X-ray diffraction, spectral and antimicrobial activity of bivalent metal (Zn, Cd, Hg, Pb and
www.iosrjournals.org 7 | Page
It is observed that this can be a qualitative analysis of the metal chelates.
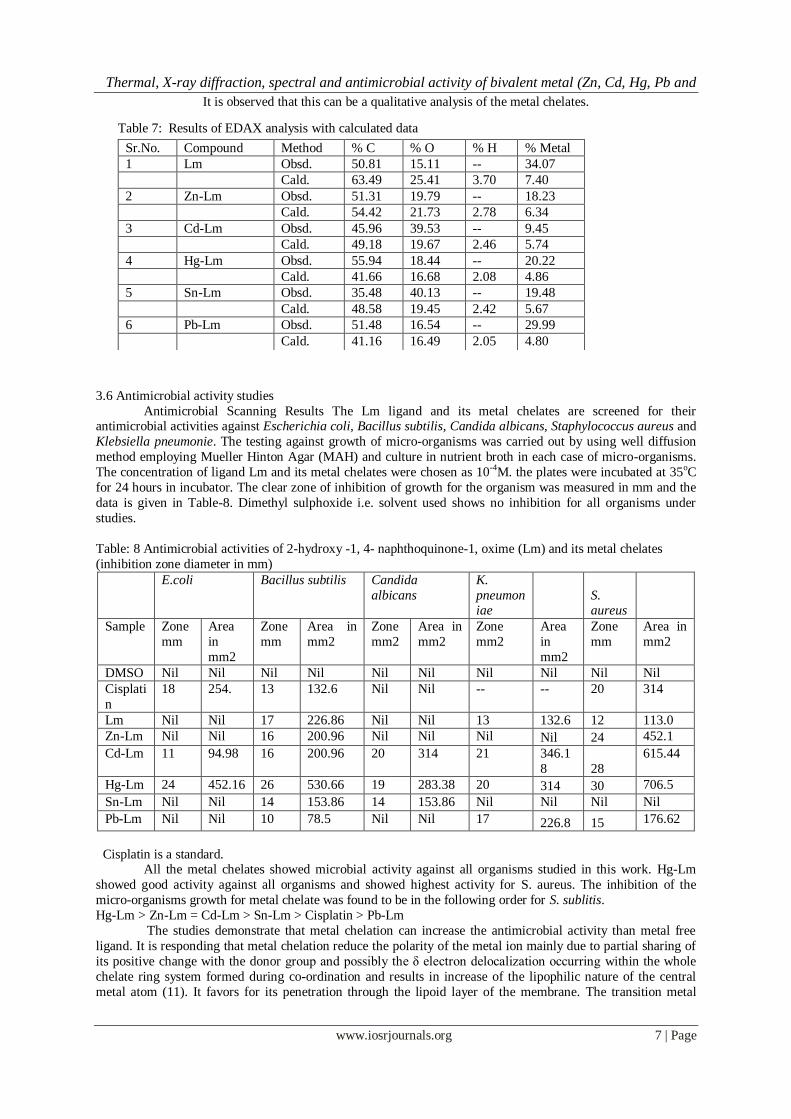
3.6 Antimicrobial activity studies
Antimicrobial Scanning Results The Lm ligand and its metal chelates are screened for their antimicrobial activities against Escherichia coli, Bacillus subtilis, Candida albicans, Staphylococcus aureus and
Klebsiella pneumonie. The testing against growth of micro-organisms was carried out by using well diffusion
method employing Mueller Hinton Agar (MAH) and culture in nutrient broth in each case of micro-organisms.
The concentration of ligand Lm and its metal chelates were chosen as 10-4M. the plates were incubated at 35oC
for 24 hours in incubator. The clear zone of inhibition of growth for the organism was measured in mm and the
data is given in Table-8. Dimethyl sulphoxide i.e. solvent used shows no inhibition for all organisms under
studies.
Table: 8 Antimicrobial activities of 2-hydroxy -1, 4- naphthoquinone-1, oxime (Lm) and its metal chelates
(inhibition zone diameter in mm)
E.coli Bacillus subtilis Candida
albicans
K.
pneumoniae
S. aureus
Sample Zone
mm
Area
in
mm2
Zone
mm
Area in
mm2
Zone
mm2
Area in
mm2
Zone
mm2
Area
in
mm2
Zone
mm
Area in
mm2
DMSO Nil Nil Nil Nil Nil Nil Nil Nil Nil Nil
Cisplati
n
18 254. 13 132.6 Nil Nil -- -- 20 314
Lm Nil Nil 17 226.86 Nil Nil 13 132.6 12 113.0
Zn-Lm Nil Nil 16 200.96 Nil Nil Nil Nil 24 452.1
Cd-Lm 11 94.98 16 200.96 20 314 21 346.1
8 28
615.44
Hg-Lm 24 452.16 26 530.66 19 283.38 20 314 30 706.5
Sn-Lm Nil Nil 14 153.86 14 153.86 Nil Nil Nil Nil
Pb-Lm Nil Nil 10 78.5 Nil Nil 17 226.8 15 176.62
Cisplatin is a standard. All the metal chelates showed microbial activity against all organisms studied in this work. Hg-Lm
showed good activity against all organisms and showed highest activity for S. aureus. The inhibition of the
micro-organisms growth for metal chelate was found to be in the following order for S. sublitis.
Hg-Lm > Zn-Lm = Cd-Lm > Sn-Lm > Cisplatin > Pb-Lm
The studies demonstrate that metal chelation can increase the antimicrobial activity than metal free
ligand. It is responding that metal chelation reduce the polarity of the metal ion mainly due to partial sharing of
its positive change with the donor group and possibly the δ electron delocalization occurring within the whole
chelate ring system formed during co-ordination and results in increase of the lipophilic nature of the central
metal atom (11). It favors for its penetration through the lipoid layer of the membrane. The transition metal
Sr.No. Compound Method % C % O % H % Metal
1 Lm Obsd. 50.81 15.11 -- 34.07
Cald. 63.49 25.41 3.70 7.40
2 Zn-Lm Obsd. 51.31 19.79 -- 18.23
Cald. 54.42 21.73 2.78 6.34
3 Cd-Lm Obsd. 45.96 39.53 -- 9.45
Cald. 49.18 19.67 2.46 5.74
4 Hg-Lm Obsd. 55.94 18.44 -- 20.22
Cald. 41.66 16.68 2.08 4.86
5 Sn-Lm Obsd. 35.48 40.13 -- 19.48
Cald. 48.58 19.45 2.42 5.67
6 Pb-Lm Obsd. 51.48 16.54 -- 29.99
Cald. 41.16 16.49 2.05 4.80
Table 7: Results of EDAX analysis with calculated data
Thermal, X-ray diffraction, spectral and antimicrobial activity of bivalent metal (Zn, Cd, Hg, Pb and
www.iosrjournals.org 8 | Page
chelates possess high degree of inhibition which can be due to the greater number of δ electrons which increase
the electrostatic field around the metal ion.
IV Conclusions: The metal chelates are thermally stable up to 500oC which is a unique characteristic property. All
these chelates are crystalline in nature and generally belong to triclinic. The coordination ability of ligand Lm
towards M (II) chelates were examined by different spectroscopic methods that unequivocally determine the
coordination sites of ligands Lm. It is observed that the ratio of the metal chelates is 1:2 for chelates of Zn, Cd,
Hg, Sn and Pb. Biological activity screening proved the good antimicrobial activity of ligand Lm and its metal
chelates. The antimicrobial activity explored on the basis of overtone concept of cell permeability. The
antimicrobial activity of all metal chelates is compared with standard Cisplatin complex and the results are
encouraging.
Acknowledgement We thank Prin. K.D. Jadhav, Principal, Bharati Vidyapeeth Deemed University, Yashwantrao Mohite
College, Pune for permission to publish this work.
References [1] J. Lecomte and P. Fischer, Physiological properties of quinones and of oxidative derivatives of adrenaline, Archives
Internationales de Physiologie 56, 35 - 44 (1048).
[2] R. K. Sharma, N.S. Jha and S. K. A study of chelation behavior of bivalent metal complexes of biologically active 2- hydroxyl-
1,4-naphthoquinone monoxime ( HNQM ) in dioxane-water mixtures, Sindhwani, Thermochimica Acta., 156(2), 267- 73 (1989).
[3] S.B. Jagtap, S.G. Joshi, G.M. Litake, V.S. Ghole and B. A. Kulkarni, C3 substituted lawsonmonoximates of holmium (III):
Synthesis, characterization and antimicrobial activity, Metal Based Drugs., 7(30, 147-150 (2000).
[4] A. B. Pawar, A. A. Killedar, K. D. Jadhav and R. G. Sarawadekar, X-ray diffraction, spectral and antimicrobial activity of bivalent
metal (Zn, Cd, Hg, Pb and Sn) chelates of 2-hydroxy 1-4 naphthoquinone
[5] International Journal of Chem. Tech. Research, Vol.4, No.3, pp 882-890, July-Sept 2012.
[6] N.J. Sonwane, Ph.D. Thesis, University of Poona (1981).
[7] C.R. Joshi, Ph.D. Thesis, University of Poona (1975).
[8] V. D. Kelkar, R.R. Gokhale, and H. R. Gholap, Synthesis, characterization and antimicrobial studies of cobalt (III) chelates of
some Lawson derivatives. Synthesis and Reactivity in Inorganic and Metal Organic Chemistry, 28(8), 1253-1264 (1998).
[9] J.B. Foreman, E. Frish, in Frish, E. (Ed.), Exploring Chemistry with Electronic Structure Methods, A Guide to using Gaussian,
Gaussian, Pittsburg PA (1996).
[10] Gupta K.C. H.K. Abdulkadir, S. Chand,Metallation of tetra dentate N2O2 Schiff base with Mn (II), Co(II), Cu(II) and
Zn(II):synthesis, characterization and formation constants measurement, J. Molecular catalysis A: Chemical. 202, 253 (2003).
[11] El-Bindary A.A. Spectral studies on metalligand bonding in complexes of 1-acetyl-2-(coumariniminecarboxamide-3-yl)hydrazine
,Spectrochimica Acta., Part A, 57 49 (2001).
[12] Z.H. Chohan, C. T. Supuran and A. Scozzafava, Unsymmetrical 1,1′-disubstituted Ferrocenes: Synthesis of Co(ii), Cu(ii), Ni(ii)
and Zn(ii) Chelates of Ferrocenyl -1-thiadiazolo-1′-tetrazole, -1-thiadiazolo-1′-triazole and -1-tetrazolo-1′-triazole with
Antimicrobial Properties, J. Enzyme Inhihitian and Medicinal chemistry, 20, 303 (2005).
IOSR Journal of Pharmacy and Biological Sciences (IOSR-JPBS)
ISSN: 2278-3008. Volume 3, Issue 3 (Sep-Oct. 2012), PP 09-13 www.iosrjournals.org
www.iosrjournals.org 9 | Page
The Fine Structure of the Adrenal Gland of the Indian Sheath-
Tailed Bat, Taphozous longimanus (Hardwicke)
1A. A. Nerkar,
2M. M. Gadegone
1,2Cell Biology Section, Department of Zoology, Institute of Science, R. T. Road, Civil Lines, Nagpur 440001,
India
Abstract: The Indian sheath-tailed bat, Taphozous longimanus at Nagpur (Maharashtra State) shows
continuous asynchronous breeding, exhibiting aseasonal polyoestry. The adrenal gland of Taphozous is made
up of the steroidogenic and chromaffin cells. The ultrastructural features of the glomerulosa cells during estrus
are inconspicuous Golgi complex mitochondria with vesicular cristae, a few lipid droplets and smooth
endoplasmic reticulum with vesicular cisternae. Numerous mitochondria, smooth endoplasmic reticulum in the
form of interconnected vesicles scattered throughout the cytoplasm and large numbers of lipid droplets are the
characteristics of the cells of zona fasciculata. Adrenal gland of pregnant female shows striking differences in
ultrastrctural features than those observed in the adrenal gland of non-pregnant female. During pregnancy, the
cells of zona glomerulosa are hypertrophied and synthetically very active than that observed during estrus. The
cells of zona fasciculata show mitochondria with tubular and lamellar cristae. There is an increase in Golgi-
SER area during pregnancy as compare to estrus. Lipid droplets are more than those observed in the cells of zona glomerulosa and zona fasciculata of estrus adrenal. The close association of lipid droplets with smooth
endoplasmic reticulum and mitochondria suggests the active biosynthesis of steroid hormones. Adrenal medulla
consists of two types of cells depending on the presence of secretory granules. Nor-epinephrine cells are
predominant in the medulla of pregnant bat while epinephrine cells are predominant in the medulla of estrus
bat.
Keywords- bat, adrenal cortex, medulla, ultrastructure, reproductive cycle.
I. Introduction
Successful reproduction in vertebrates depends on the endocrine system, which must have the capacity
to function within and adapt to a changing physical- and social environment. Although there are many different
neuroendocrine components involved in regulating reproduction and the response to changing environments, the
hypothalamic-pituitary-adrenal (HPA) axis and the hypothalamic-pituitary-gonadal (HPG) axis are particularly
important [1]. The HPA and HPG axes interact with one another in complex way and in part serve to regulate
behavior and fertility [2] and [3].
Chiropterans are the second largest order of mammals but the data of measurement of adrenal functions
in Chiroptera is reported only from a few species. These results indicate that there are both seasonal and stress
related changes in adrenocortical activity [4], [5], [6], [7]. Although the fine structure of adrenal gland is reported in several mammals [8], [9], [10], there is
scanty information available on the fine structure of the adrenal gland of bats [11], [12], [13]. Thus the detailed
study of the ultrastructural and functional characteristics of the adrenal gland of T. longimanus during different
phases of the reproductive cycle has been undertaken to find out the probable role of adrenocortio-medullary
cells in the control of reproductive physiology of this species of bat.
II. Materials And Methods
The emballonurid bat, T. longimanus (Hardwicke) was selected for the present study because of its
unique reproductive habits. This bat shows an aseasonal polyestrus (continuous) breeding pattern [14].The
specimens were collected from Nagpur, India throughout the year representing different reproductive states.
Adult females were trapped alive and were brought alive in the laboratory with minimum stress and constant
supply of food and glucose water. Mature females were separated from immature females after observing
mammary glands and pelvic dugs. Seven sexually mature females in estrus and five females each in mid- and
late pregnancy were killed by cervical dislocation for present investigation.
For the electron-microscopic studies, adrenal glands were immediately removed from non pregnant and pregnant bats after they were killed by decapitation. The tissues were fixed in fresh ice-cold 3% glutaraldehyde
for three hours and then four hours in 0.1 M cacodylate buffer. The tissues were washed in buffer and then post
fixed for one to two hours in 1% 0.067 M cacodylate-buffered osmium tetroxide. After dehydration with graded
series of alcohol, the tissues were cleared in propylene oxide solution and embedded in Araldite resin which
The Fine Structure of the Adrenal Gland of the Indian Sheath-Tailed Bat, Taphozous longimanus
www.iosrjournals.org 10 | Page
would be polymerized at 600C. Then, ultrathin sections from selected blocks were cut with glass knife and
picked up on 400-mesh copper grids. Sections were double stained with 10% alcoholic uranyl acetate for 20 min
and for 10 min in Reynold’s lead citrate. The sections were examined under a JEM Jeol-100s electron
microscope (Japan) at 80KU accelerating voltage and photographed.
III. Results The fine structure of the adrenocortical cells is described, with more emphasis on the organelles
involved in the process of steroidogenesis. Adrenal gland of pregnant female shows striking differences in
ultrastructural features than those observed in the adrenal gland of non-pregnant female.
During estrus, the zona glomerulosa is made up of a group of four to six cells arranged in circular cords
or acini like structures (Fig.1). Each cell is bounded by a plasma membrane of uniform thickness and separated
from adjacent cells by a space of constant width. The nuclei of the cells of zona glomerulosa are round to oval
shape. The lipid droplets are few in number and usually appear as large vacuoles. These droplets are variable in
size, mainly round to ovoid in shape with an irregular boundary containing material of variable electron density.
The Golgi complex is inconspicuous. Mitochondria are many, round in shape with vesicular cristae. The smooth endoplasmic reticulum is in the form of small vesicles scattered throughout the cytoplasm. The zona fasciculata
constitutes the major portion of the adrenal cortex. These cells are large and arranged in radial cords, one or two
cells thick and lie between vascular channels which converge towards the medulla. Mitochondria are
pleomorphic showing vesicular cristae. In some, mitochondrial cristae are collapsed. The cells of zona
fasciculata contain more number of lipid droplets than those observed in the cells of glomerulosa. These droplets
are pleomorphic with irregular boundaries. The cells of zona fasciculata have tubular profiles of smooth
endoplasmic reticulum in the form of vesicles scattered throughout the cytoplasm (Fig.2). In contrast to the zona
glomeruolosa the cells of the zona fasciculata are rich in smooth endoplasmic reticulum. Free ribosomes are
encountered in the cytoplasm. The cells of fasciculata contain large dense bodies (lysosomal bodies). One or
more larger granules form a bulge at the periphery of the dense body. Such dense bodies are not observed in the
cells of glomerulosa.
There are no marked differences in the ultrastructural characteristics of the zona glomerulosa and zona fasciculata during mid- and late pregnancy of this bat. The zona glomerulosa consists of short looped cords of
cells. The nucleus is spherical and somewhat eccentrically placed. A thin rim of chromatin material observed at
the periphery of the nucleus. The nucleolus is large and prominent. Golgi apparatus is indistinct during mid-
pregnancy but it is very well developed during late pregnancy. It is made up of arrays of parallel lamellae. Some
of the lamellae of Golgi are dilated. A large number of small vesicles, some of which have appearance of coated
vesicles are associated with the lamellae of the Golgi apparatus. Mitochondria are large in number and are
scattered throughout the cytoplasm. Mitochondria have lamellar cristae in mid-pregnancy but lamellar as well as
vesicular cristae in late pregnancy. Tubular profiles of smooth endoplasmic reticulum are seen scattered in the
cytoplasm. Lipid droplets show wide variations in size and electron density (Figs. 3, 4).
The cells of the zona fasciculata are large, vacuolated and arranged in groups or cords of polygonal
cells. Mitochondria are randomly distributed in the cytoplasm. Number of mitochondria is more than those observed in the glomerulosa. Mitochondria are larger and more pleomorphic than those of the glomerulosa.
Mitochondrial cristae are mostly tubular but lamellar form of cristae is also observed. The rough endoplasmic
reticulum is rare but large number of free ribosomes is seen. Most striking features of the cytology of this zone
are the elaborate development of the smooth endoplasm reticulum and more number of lipid droplets than those
observed in the zona glomerulosa. Golgi apparatus is inconspicuous. The lipid droplets are observed in close
association with smooth endoplasmic reticulum and mitochondria (Figs. 5, 6).
During estrus, medulla consists of chromaffin cells arranged in small groups or short cords surrounded
by blood capillaries and connective tissue. The chromaffin cells which are irregular in outline has eccentrically
placed nucleus with peripheral chromatin clumps. Golgi zone is well developed. The rough endoplasmic
reticulum is in the form of short and elongated cisternae arranged in parallel profiles. Mitochondria are round or
oval and are scattered throughout the cytoplasm. The distinctive features of medullary cells are the chromaffin
granules which appear as a membrane bound body of variable electron density. Some cells contain predominantly dense black granules called epinephrine cells, while others show scattered empty vesicles with
small amounts of granular material lining to the inner layer or present in the lumen of the vesicles called nor-
epinephrine cells. Thus, both the cell types are observed in medulla of estrus bat as in other mammals (Fig. 7).
During pregnancy, medullary chromaffin cells show similar ultrastructural features exhibited by the
medullary cells during estrus. Two types of cells are identical during pregnancy as observed during estrus.
However, nor-epinephrine cells are predominant during pregnancy (Fig. 8).
The Fine Structure of the Adrenal Gland of the Indian Sheath-Tailed Bat, Taphozous longimanus
www.iosrjournals.org 11 | Page
IV. Discussion The adrenal cortex of bats as in mammals is differentiated into three distinct zones: zona glomerulosa,
zona fasciculata and zona reticularis. However, the zona reticularis is absent in the adrenal gland of T.
longimanus but it is present in the form of islets of cortical cells in the medullary region. Similar observations are reported in T. longimanus [15].
The ultrastructural characteristics of the cells of zona glomerulosa of bat adrenal gland show some
striking differences during estrus and pregnancy. Golgi apparatus is inconspicuous during estrus but well
developed during late pregnancy. Mitochondria show vesicular cristae during estrus and vesicular and lamellar
cristae during pregnancy. Moderate to high amounts of tubular profiles of smooth endoplasmic reticulum is
seen during estrus. However, there is a extensive development of tubular profiles of smooth endoplasmic
reticulum during pregnancy. A few lipid droplets are observed in the cytoplasm during estrus but large numbers
of lipid droplets of various size and electron density are seen in the cytoplasm during pregnancy. Similar
observations are reported in the glomerulosa cells of bat, H. lankadiva during estrus and pregnancy [13] and
during hibernation and arousing of dormouse, Muscardinus avellanarius [8] supporting present observations.
The ultrastructure of the zona fasciculata of non-pregnant adult female and pregnant female of bat, T. longimanus shows striking differences in adreno-cortical region. The zona fasciculata is more developed in the
pregnant animal than the non-pregnant adult female. The zona fasciculata is well developed as compared to
other zones of adrenal cortex during both the phases of the cycle. The cells of zona fasciculata of non-pregnant
bat show presence of vesicular smooth endoplasmic reticulum, numerous spherical mitochondria with vesicular
cristae and lipid droplets indicating that the cells are synthesizing steroid hormones. Zona fasciculata of
pregnant bat shows presence of well developed Golgi network, elaborate network of vesicular or tubular
cisternae of smooth endoplasmic reticulum, mitochondria with vesicular cristae, and numerous lipid droplets.
There is an increase in Golgi-SER area during pregnancy as compared to non-pregnancy. These ultrastructural
features indicate that there is an increase in rate of steroid synthesis in the cells of zona fasciculata during
pregnancy. The present study corroborates the same finding in bat, H. lankadiva during estrus and pregnancy
[13].
Adrenocortical cells of T. longimanus possessed ultrastructural organelles such as abundant mitochondria with tubule-lamellar cristae, lipid droplets and smooth surface endoplasmic reticulum suggest that
they are steroid hormone secreting cells. Our present report corroborates the finding in other mammals [8], [9],
[10] and bat [11], [12], [13], [16].
The zona fasciculata of the cortex of the fruit eating bat, Megaloglossus woermanni has some unusual
features [16]. The mitochondrial cristae are hexagonal and the rough endoplasmic reticulum is prominent.
Smooth endoplasmic reticulum and mitochondria occupied 25% and lipid bodies 8% of cytoplasmic volume.
These features of the adrenal cortex of this animal are probably adaptive for steroidogenesis. However, in T.
longimanus, mitochondrial cristae are lamellar and vesicular. The presence of vesicular and lamellar cristae is
considered as unique feature of steroid producing cells [17], [18]. In T. longimanus, abundant smooth
endoplasmic reticulum is observed in the adrenal cortex of estrus and pregnant bat. The presence of smooth
endoplasmic reticulum is characteristic of actively secreting steroid cells and may well reflect an active synthesis of cortisol. The smooth reticulum contains enzymes involved in the synthesis of cholesterol, the
conversion of pregnenolone to progesterone and of deoxycorticosterone [19].
The enzyme Δ5-3β HDS has been localized in the cells of glomerulosa and fasciculata of T.
longimanus,a continuous breeder [15]. Contrary to this differential enzyme activity is localized and graded in
cortical cells of T. melanopogon, a seasonal breeder [20]. The enzyme Δ5-3β HDS has been demonstrated in
adrenal gland of bat, V. pipistrellus and suggested that adrenal cortex of bat is capable of synthesizing
corticosteroids and also sex steroids [21]. The difference in adrenal gland activity in T. longimanus, a
continuous breeder and T. melanopogon, a seasonal breeder, seems to relate to their breeding habits. In the
present study ultrastructural features typically associated with steroid producing cells, such as large number of
lipid droplets together with mitochondria and agranular endoplasmic reticulum are noted in cortical cells of
adrenal gland of T. longimanus. This suggest that cortical cells are the major site of steroidogenesis as they
contain steroid precursor, lipid containing cholesterol or its esters together with steroidogenic enzymes, supporting the above statement.
In T. longimanus,the medullary cells during estrus and pregnancy are characterized by the presence of
well developed Golgi apparatus, rough endoplasmic reticulum, large number of mitochondria and chromaffin
granules indicating active synthesis of monoamines during estrus and pregnancy. Medulla of T. longimanus
during estrus and pregnancy shows two types of chromaffin cells as described in rat medulla [22]. The nor
epinephrine cells are predominant in the medulla of pregnant bat while epinephrine cells are predominant in the
medulla of estrus bat. Medullary secretion in monkey is predominantly epinephrine in man. The present
observations suggest that two cell types are present in bat species similar to that observed in mammals [23],
[24], [25], [26].
The Fine Structure of the Adrenal Gland of the Indian Sheath-Tailed Bat, Taphozous longimanus
www.iosrjournals.org 12 | Page
V. Conclusion The primary function of the adrenal gland is to protect the organism against acute and chronic stress.
In acute stress catecholamines of the medulla mobilize glucose and fatty acids for energy and prepare the heart,
lungs and muscles for action. The plasma levels of adrenocorticotropic hormone (ACTH) and glucocorticoid levels increase in pteropid bats in response to standard stresses such as handling or restraints despites very high
levels in plasma [7]. Glucocorticoids protect against over reactions of the body’s responses to stress and in more
chronic stress of food and fluid deprivation, stimulate glyconeogensis to maintain the supply of glucose [1].
Stress as well as hyper and hypofunction of adrenal gland is known to suppress reproduction in mammals and
in women is associated with anovulation and amenorrhea, [27].
In the present study, we did not measure the plasma ACTH and glucocorticoid levels in T. longimanus
however, ultrastructural characteristics of ACTH cells, [28], the adrenocortico-medullary cells and enzyme Δ5-
3β HDS in the glomerulosa and fasciculata cells of T. longimanus [15] during estrus and pregnancy suggest that
these cells are equipped with the all infrastructure necessary for synthesis of steroid hormones. The HPA and
HPG are very active during estrus and pregnancy of this species of bat. The adrenal gland of T. longimanus
shows seasonal and stress related changes during estrus and pregnancy. Thus the adrenal gland of bat is not only responsible for synthesis of glucocorticoids, sex steroid hormones but also catecholamine that are required
to protect bat species against acute and chronic stress as well as to support reproductive processes of this species
of bat. We do not have evidence to support either of these possibilities at this time. Further studies are needed to
substantiate the hypothesis.
ACKNOWLEDGEMENTS
The electron microscopy facilities provided by Dr. Arun Chitale, Department of Histopathology, Jaslok
Hospital and Research Centre, Mumbai, are gratefully acknowledged. Our thanks are due to Mr. Dilip Kanaskar
and Shivaji Bhosale for their excellent technical assistance.
References [1] D Reeder and K. Kramer, Stress in free-ranging mammals: Integrating physiology, ecology, and natural history, Journal of
Mammalogy, 86, 2005, 225-235.
[2] A DeVries, Interaction among social environment, the hypothalamic-pituitary-adrenal axis and behavior, Horm. Behav, 41, 2002,
405-413.
[3] V Viau, Functional cross-talk between the hypothalamic-pituitary-gonadal and -adrenal axes, Journal of Neuroendocrinology, 14,
2002, 506-513.
[4] A Gustafson and W. Belt, The adrenal cortex during activity and hibernation in the male little brown bat, Myotis lucifugus
lucifugus: annual rhythm of plasma cortisol levels, Journal of Comparative Endocrinology, 44, 1981, 269-278.
[5] E Widmaier and T. Kunz, Basal, diurnal, and stress-induced levels of glucose and glucocorticoids in captive bats, Journal of
Experimental Zoology, 265, 1993, 533-540.
[6] E Widmaier, T. Harmer, A. Sulak and T. Kunz, Further characterization of the pituitary-adrenocortical responses to stress in
Chiroptera, Journal of Experimental Zoology, 269, 1994, 442-449.
[7] D Reeder, H. Raff, T. Kunz and E. Widmaier, Characterization of pituitary-adrenocortical activity in the Malayan flying fox
(Pteropus vampyrus), Journal of Comparative Physiology (B), 176, 2006, 513-519.
[8] C Zancanaro, M. Malatesta, P. Vogel and S. Fakan, Ultrastructure of the adrenal cortex of hibernating, arousing and euthermic
dormouse, Muscardinus avellanarius, Anatomical Record, 249, 1997, 359-364.
[9] G Vinson, Adrenocortical zonation and ACTH, Microscopy Research and Technique, 61, 2002, 227-239.
[10] S Tokar, E. Koval, E. Yavorskaand and M. Lukyanetz, Ultrastructural characteristics of lipid droplets in rat adrenocortical cells
from zona fasciculata-reticularis, Fiziol Zh, 50, 2004, 107-13.
[11] H Planel, A. Guilhem and J. Soleihavoup, Le cycle annual du cortex surrenal d’un semi-hibernat: Miniopterus schreibersii,
Comptes Rendus de I’ Association des Anatomistes, 47, 1961, 620-633.
[12] G Romita and R. Montesano, Aspetti isotchimici ed ultrastrutturali delle ghiandole surrenali di Chirotteri durante I’ibernazione, il
risveglio ed il periodo estivo, Ateneo Parmense- Sezione i Acta Bio–Medica, 43, 1972 (b), 211–235.
[13] E. Seraphim, Endocrine interaction during different phases of the female reproductive cycle in Hipposideros lankadiva (Kelaart),
doctoral diss., RTM Nagpur University, Nagpur (India), 2004.
[14] A Gopalakrishna, Observations on the breeding habits and ovarian cycle in the Indian sheath tailed bat, Taphozous longimanus
(Hardwicke), Proc. National Institute of Science, India, 1955, 29-41.
[15] M Lowry, J. Bhardwaj and S. Lall, Enzymorphologic demonstration of Δ53β hydroxysteroid dehydrogenase and succinic
dehydrogenase in the cortical and medullary cells of the adrenal gland of Taphozous longimanus Hardwicke (Micorchiroptera:
Mammalia), Current Science, 50, 1980, 730.
[16] K Mensah, W. Kesse and A. Ayettey, Ultrastructural features of the zona fasciculata of the adrenal cortex of the fruit eating bat
Megaloglossus woermann, West African Journal of Anatomy, 2, 1994, 1-8.
[17] M Hanaki, K. Tanaka and Y. kashima, Scanning electron microscopic study on mitochondrial cristae in the rat adrenal cortex,
Journal of Electron Microscopy, 34, 1985, 373-380.
[18] F Prince, Lamellar and tubular associations of the mitochondrial cristae: Unique forms of the cristae present in steroid producing
cells, Mitochondrion, 1, 2002, 381-389.
[19] P Nickerson, Formation of concentric whorls of rough endoplasmic reticulum in the adrenal gland of the Mongolian gerbil,
Journal of Anatomy, 124 (2), 1977, 383-391.
[20] M Lowry and S. Lall, Morphometric and enzymologic changes in the adrenal cortex and medulla of Taphozous melanopogon
melanopogon (Temnick) from nulliparous to the parous state, Myotis,1986, 23-24.
[21] S Saidapur and V. Nadkarni, Histochemical observations on the adrenal gland of bat Vesperugo pipistrellus (Dobson),
Endokrinologie 67, 1976, 244-247.
The Fine Structure of the Adrenal Gland of the Indian Sheath-Tailed Bat, Taphozous longimanus
www.iosrjournals.org 13 | Page
[22] G Brown, L. Grota, D. Penney and S. Reichlin, Pituitary adrenal function in the squirrel monkey. Endocrinology, 86, 1970, 519–
529.
[23] R Coupland, Electron microscopic observations on the structure of the rat adrenal medulla I, The ultrastructure and organization of
chromaffin cells in the normal adrenal medulla, Journal of Anatomy, 99, 1965a, 231-254.
[24] R Brenner, Fine structure of adrenocortical cells in adult male rhesus monkeys, American Journal of Anatomy, 119, 1966, 429-
453.
[25] R Coupland and B.Weakley, Developing chromaffin tissue in the rabbit: an electron microscopic study, Journal of Anatomy, 102,
1968, 425-455.
[26] A Belloni, G. Mazzocchi, F. Mantero, and G. Nussdorfer, The human adrenal cortex: ultrastructure and base-line morphometric
data, Journal of Submicroscopy and Cytology, 19, 1987, 657-668.
[27] P Green, C. Wilkinson and S. Woods, Intraventricular corticosterone increases the rate of body weight gain in underweight
adrenalectomized rats, Endocrinology, 130, 1992, 269–275.
[28] A Nerkar, and M. Gadegone, Ultrastructure of the pars distalis of the Indian female sheath-tailed Bat, Taphozous longimanus
(Hardwicke), International Journal of Morphology, 28, 2010, 787-801.
EXPLANATION OF FIGURES Figure 1. Electron micrograph showing group of cells of zona glomerulosa during estrus. Note round to
oval shaped nuclei (N) and several lipid droplets (LD). X 6000
Figure 2. Electron micrograph of the cell of zona fasciculata during estrus. Note some lysosomal bodies
(Ly), several round shaped lipid droplets (LD) associated with several round to elongated mitochondria (M)
with vesicular cristae. Some mitochondria are hypertrophied with collapsed cristae and tubular profiles of
smooth endoplasmic reticulum (SER) are scattered throughout the cytoplasm. X 12000
Figure 3. Electron micrograph of the cell of glomerulosa during mid-pregnancy showing several round to
elongated mitochondria (M) with vesicular cristae. Few lipid droplets (LD) and vesicular profiles of smooth
endoplasmic reticulum are seen in the cytoplasm. X 8000
Figure 4. Electron micrograph of the cell of zona glomerulosa during late pregnancy showing few spherical
lipid droplets (LD) and several round to oval shaped mitochondria (M) with vesicular cristae. A well developed
Golgi apparatus (G) and network of cisternae of smooth endoplasmic reticulum are seen within cytoplasm. X
10000
Figure 5. Electron micrograph of the cell of the zona fasciculata during mid- pregnancy showing several
spherical to oval shaped mitochondria (M) with lamellar and tubular cristae. Dense bodies (DB) and lipid
droplets (LD) are present in the cytoplasm. Note well developed smooth endoplasmic reticulum (SER) is in
the form of vesicles scattered throughout the cytoplasm. X 12000
Figure 6. Electron micrograph of cell of zona fasciculata during late pregnancy showing several spherical
lipid droplets (LD) which are observed in close association with smooth endoplasmic reticulum (SER) and
mitochondria (M) with tubular cristae. X 10000
Figure 7. Electron micrograph of medullary cell during estrus showing Epinephrine (EP) granules, well
developed Golgi apparatus (G) and large vacuolated mitochondria (M) with collapsed cristae. X 12000
Figure 8. Electron micrograph of medullary cell during pregnancy. Note Golgi apparatus (G), parallel cisternae
of rough endoplasmic reticulum (RER), large hypertrophied mitochondria (M) with collapsed cristae and nor-
epinephrine (NEP) granules in the cytoplasm. X 12000
IOSR Journal of Pharmacy and Biological Sciences (IOSR-JPBS)
ISSN: 2278-3008. Volume 3, Issue 3 (Sep-Oct. 2012), PP 14-19 www.iosrjournals.org
www.iosrjournals.org 14 | Page
Pollen Morphology of Some Members of Nigerian Clusiaceae and
Its Taxonomic Significance
1Nnamani, C. V.,
2Nwosu, M. O.
1United Nations University Institute of Natural Resources in Africa/ Ebonyi State University Abakaliki, Nigeria 2Department of Botany, University of Nigeria, Nsukka, Nigeria
Abstract: The palynological features of three members of Nigerian Clusiaceae were assessed by light
microscopy (LM) after acetolysis in order to determine the observed external and internal peculiarities of these
species, with respect to their taxonomic implications. These species were Harungana madagascariensis (Lam.)
ex Poir., Garcinia kola Heckel. and Pentadesma butyracea Sabine. Results revealed many interesting
palynological features with significant taxonomic values. Pollen grains are radially symmetrical, shed in
monads and isopolar in all the taxa. Apertural types are tetracolporate and zonocolporate for G. kola and P.
butyracea but tricolporate in H. madagascariensis. Pollen form indices vary significantly from 0.55 ± 0.02, 1.59
± 0.12 and 1.18 ± 0.01 to give pollen shapes of oblate spheroidal, spheroidal and subspheroidal for H.
madagascariensis, G. kola and P. butyracea, respectively. Pore orientation is angulaperturate in all while the
exine ornamentations were coarsely psilate in G. kola and P. butyracea but reticulate in H. madagascariensis.
The above features are of high taxonomic value in the classification of these species. Their taxonomic implications were discussed.
Key Words: Taxonomic Values, Pollen Features, Nigerian, Cluusiaceae,
I. Introduction The Clusiaceae include herbs, shrubs and trees with sap resinous and abundant oil glands. Leaves are
opposite or whorled, rarely alternate and exstipulate while flowers are usually unisexual, sometimes bisexual on
the same plant (Keay 1954, Lawrence, 1968) and functionally polygamodioecious, actinomorphic with sepals 2-
10 or more. Petals range from 4-12, usually imbricate, subvalvate or contorted. Stamens are few or numerous,
hypogenous, distinct and variously united. Anther is 2-celled and dehiscing longitudinally. Pistil is 1, ovary
superior, 1 to many loculed; carpels are usually 3 to 5 or as many as the locule (Robson, 1961, Matig et al.,
2007).
This family is very important economically, with some members having very high socio-economic, industrial, ethno medicinal and pharmacological values.
The Igbo and Efik cultures in Southeastern Nigeria use H. madagascariensis medicinally for the
treatment of ulcer and asthma (Inyang, 2003). Leaves are mixed with water, made into a paste and applied
topically to treat ringworm, conjunctivitis, rashes and fevers (Madubunyi, 1995). Fresh leaf juice is applied
topically to treat abscesses, while young leaves are boiled in water and the resulting “tea” is administered orally
three times a day as an analgesic and for whooping cough. In addition, dried leaf infusion is administered orally
in Nigeria to treat stomach problems, leprosy and it equally serves as an oxytocic and abortifacient (Bisby et al.,
2007).
Economically, a mature tree of G. kola can yield about 500 fruits, providing 1700 nuts per year, with
an average of N50- 60,000.00 proceed annually. It serves as a very good source of income for women and men
in Igbo land (Okafor, 2001, Adebisi, 2002, Okeke, personal opinion, 2010,). The seeds are widely eaten in Igbo
land as masticant. G. kola is used in natural dental care to prevent dental caries (Eyogi et al., 2007). The bark is used for tanning
while in the last 3- 4 years, the seeds have also been used as an industrial bittering agent in some Nigerian
breweries (Aniche and Uwakwe, 2010). the fruit pulp is used for the treatment of jaundice or high fever
(Esimone et al., 2002).The nuts are dried, ground and mixed with honey to make a traditional cough mixture
(Adebisi, 2002).
In Southern Nigeria a cold water extract of root-bark with salt is administered to ease off bronchial
asthma or cough and vomiting (Farombi et al., 2005), while the fruits are eaten in Nigeria as a cure for general
aches in the head, back and as well as a vermifuge. Igbo medicine-men prescribe the fruit for arthritic conditions
while the latex from the stem is applied externally to treat parasitic skin diseases and for tropical sores (Liu et
al., 2005).
In line with the above remedies ASICUMPON (2005) opined that the seed is an aphrodisiac and that palm wine tapers use it when tapping to scar away snakes. They concluded that, it also serves as antidote to
poison while the leaves that have bitter taste are used as purgative.
Pollen Morphology of some Members of Nigerian Clusiaceae and its Taxonomic Significance
www.iosrjournals.org 15 | Page
Aduradola (1999) opined that the biflavonoid compound found in G. kola has anti-inflammatory,
antimicrobial, anti- diabetic and antiviral properties. He further stated that the extract from seeds have been
formulated into various dosage forms including tablets, lozenges, creams, vials and toothpaste.
A recent study reported a reduction in subchondral pressure and pain in knee osteoarthritis due to G.
kola intake (Adegbehingbe et al., 2008) it has also proven to be safe in human eyes and its systemic blood
pressure lowering effects has been published in previous studies (Adefule et al., 2004). The fat acid composition from P. butyracea seed has been analyzed for its chemical and physical
constancy and when compared with those of the known cocoa butter and shea butter; it was discovered to
contain 50.0, 52.1, and 53.4% of fat, respectively. Their fats are similar in many of their characteristics,
particularly in their slip point, saponification number and solidification point. Butter tree fat has a much lower
unsaponification matter content of 1.5 - 1.8% than Shea butter that has 7.3- 9.0%. They further stated that the
profile aesthetically gives the butter a distinct texture and their replacement fats in respect to their melting points
are quit unique (Tchobo et al., 2007).
However, the inclusion of H. madagascariensis in the Clusiaceae has been a source of confusion to
both botanist and other researchers, this because it shears many morphological features with members of this
family. It therefore becomes imperative to carry out palynological assessment of some members of these taxa to
aid their proper classification. The main objectives of this work were to 1) assess the palynological feature of
these species, 2) determine external and internal peculiarities of these features and 3) evaluate their taxonomic values.
II. Materials and Methods Sample collection
Specimens were collected from their natural habitats in the various study sites in Southern and
Southeastern parts of Nigeria, Enugu State Forest Reserve, Enugu, Odenigbo in Nsukka Local Government Area
of Enugu State, Adada Forest along Adada River at Nkpologu, Uzo Uwani Local Government Area of Enugu
State. Others were from Staff farm in the Faculty of Biological Sciences, Ebonyi State University, Abakaliki,
Forestry Research Institute of Nigeria (FRIN) at Benin in Edo State and Forestry Research Institute of Nigeria (FRIN) at Ikom in Cross River State.
Specimens were identified with the aid of Keay, 1954; Benson, 1957; Keay, 1989). Voucher specimens
of these plants are deposited in the Herbaria of the Department of Botany, University of Nigeria, Nsukka (UNH)
and Department of Applied Biology, Ebonyi State University, Abakaliki, Nigeria.
Preparation of sample Fresh polleniferous buds from H. madagascariensis, G. kola and P. butyracea were obtained from the
field. Mature buds which had not undergone anthesis were removed from these shoots. Anthers were teased off
from the flower buds into five ml of 70 % alcohol in 25 ml beakers. They were squashed with a glass rod. This
process breaks the anthers to release the pollen grains. The solutions were sieved with fine network mesh of
wire gauze (sterilized under the Bunsen burner to avoid contaminations).This process removes all the plant tissues.
The solutions were then centrifuged at 2000 revaluation per a minute (R P M) for 5 minutes. They were
washed twice with distilled water, centrifuged and then decanted again. Acetolysis
The precipitates were acetolyzed according to a modified version of Erdtman’s (1971) acetolysis
method of 9:1 conc. sulphuric acid and acetic anhydride for ten minutes. They were centrifuged, decanted and
wished twice with distilled water. The recovered precipitates were stored in vials with ten drops of glycerin, for
subsequent light microscopy.
Temporary slides were prepared, pollen grains were mounted in glycerin jelly and examined using light
Olympus CH Trinocular microscope (LM) fitted 650 IS Cannon Digital Camera at x 400 and x 100
magnifications.
The following parameters were assessed qualitatively and quantitatively: polar diameter , equatorial
diameter, pollen form index, exine thickness, shape in polar view , shape in equatorial view, sculpturing type, aperture type, dimension of pore at polar and equatorial views. Terminology for pollen descriptions were
adopted from Erdtman (1971), and Punt et al., (1994). All measurements and photomicrographs were taken
under x 1000 magnification.
Analyses for palynological data were based on 20 measurements for a feature per slide for the four slides per a
sample. These values were tabulated with the species description citing Mean Standard Errors only for some of
the important pollen features.
Pollen Morphology of some Members of Nigerian Clusiaceae and its Taxonomic Significance
www.iosrjournals.org 16 | Page
III. Results Polarity and Symmetry of pollen grains
Pollen grains are radially symmetrical, isopolar, generally shed in monads and rarely in tetrads.
Shapes
Pollen shapes are oblate- spheroidal; amb in polar view is triangular, concave with an oblate outline in
equatorial view for H. madagascariensis while it was spheriodal equatorially, amb in polar view is circular in
outline for G. kola and subspheriodal with circular outline in polar view for P. butyracea.
The pollen form indices were 0.55 ± 0. 02μm, 1.59 ± 0.12 and 1.18 ± 0.01 for H. madagascariensis, G.
kola and P. butyrace, respectively, while polar and equatorial axis 116.65 ± 0.10, 859.04 ± 0.65, 868.8 ± 1.30,
211.19 ± 0.25, 539.94 ± 0.75 and 737.14 ± 0.70, respectively (Table 1).
Aperture Pollen grains are tricolporate, zonocolporate and non lophate while pore orientation was
angulaperturate (Table 2) with pore length and breadth of 121.09± 0.10 and 12.22 ± 0.01, respectively for H. madagascariensis; and apoporium was 34.44 ± 01 μm while mesocolpium is 23.31 ± 0.01 μm. In G. kola pollen
grains are tetracolporate, zonocolporate, and non lophate (Table 2). Pore orientation was angulaperturate with
apertural length and breadth of 424.4 ± 0.30 and14.44 ± 0.25 (Table 2). Apocolpium is 292.19 ± 0.50 μm while
mesocolpium is 199.98 ± 0.1 μm, respectively (Fig. 2). P. butyracea grains are tetracolporate, zonocolporate and
non lophate (Table 2). Apertural length and breadth are 836.58 ± 0.5 and 83.33 ± 0.35, respectively, while pore
orientation is angulaperturate. Pore diameter at equatorial view is 24.18 ± 0.45 while apocolpium is 264.42±
0.83 μm and mesocolpium of 384.41± 0.13 μm, respectively (Fig. 2).
The Exine
Pollen ornamentation is reticulate, tectate, without carvae and a thickness of 22.22 ± 0.05 μm (Table 2
and Fig. 3) while pollen ornamentation is psilate G. kola, tectate with an exine thickness of 43.33 ± 0.10 μm, a
thick margo and a carvae of about 0.42 ± 0.10. Apoporium and mesocolpium are about 292.19 ± 0.50 and 199.98 ± 0.1, respectively (Figure 2).
In P. butyracea pollen ornamentation is psilate, tectate with an exine thickness of 83.32 ± 0.46 μm. (Figures 2,
3, and Table 1). There is the presence of a thick carvae of about 0.22 ± 0.05 μm with apocolpium and
mesocolpium of 264.42 ± 0.83 and 384.41 ± 0.13, respectively (Table 1 and Figure 2).
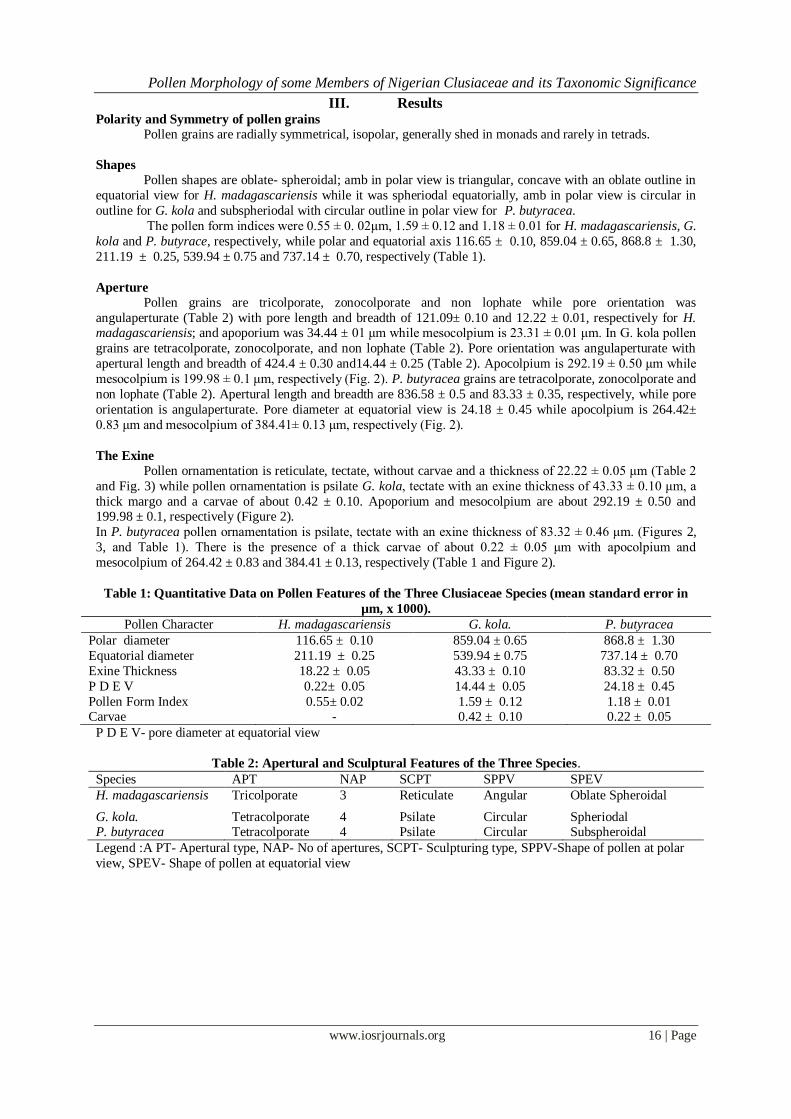
Table 1: Quantitative Data on Pollen Features of the Three Clusiaceae Species (mean standard error in
µm, x 1000).
Pollen Character H. madagascariensis G. kola. P. butyracea
Polar diameter 116.65 ± 0.10 859.04 ± 0.65 868.8 ± 1.30
Equatorial diameter 211.19 ± 0.25 539.94 ± 0.75 737.14 ± 0.70
Exine Thickness 18.22 ± 0.05 43.33 ± 0.10 83.32 ± 0.50
P D E V 0.22± 0.05 14.44 ± 0.05 24.18 ± 0.45
Pollen Form Index 0.55± 0.02 1.59 ± 0.12 1.18 ± 0.01 Carvae - 0.42 ± 0.10 0.22 ± 0.05
P D E V- pore diameter at equatorial view
Table 2: Apertural and Sculptural Features of the Three Species.
Species APT NAP SCPT SPPV SPEV
H. madagascariensis Tricolporate 3 Reticulate Angular Oblate Spheroidal
G. kola. Tetracolporate 4 Psilate Circular Spheriodal P. butyracea Tetracolporate 4 Psilate Circular Subspheroidal
Legend :A PT- Apertural type, NAP- No of apertures, SCPT- Sculpturing type, SPPV-Shape of pollen at polar
view, SPEV- Shape of pollen at equatorial view
Pollen Morphology of some Members of Nigerian Clusiaceae and its Taxonomic Significance
www.iosrjournals.org 17 | Page
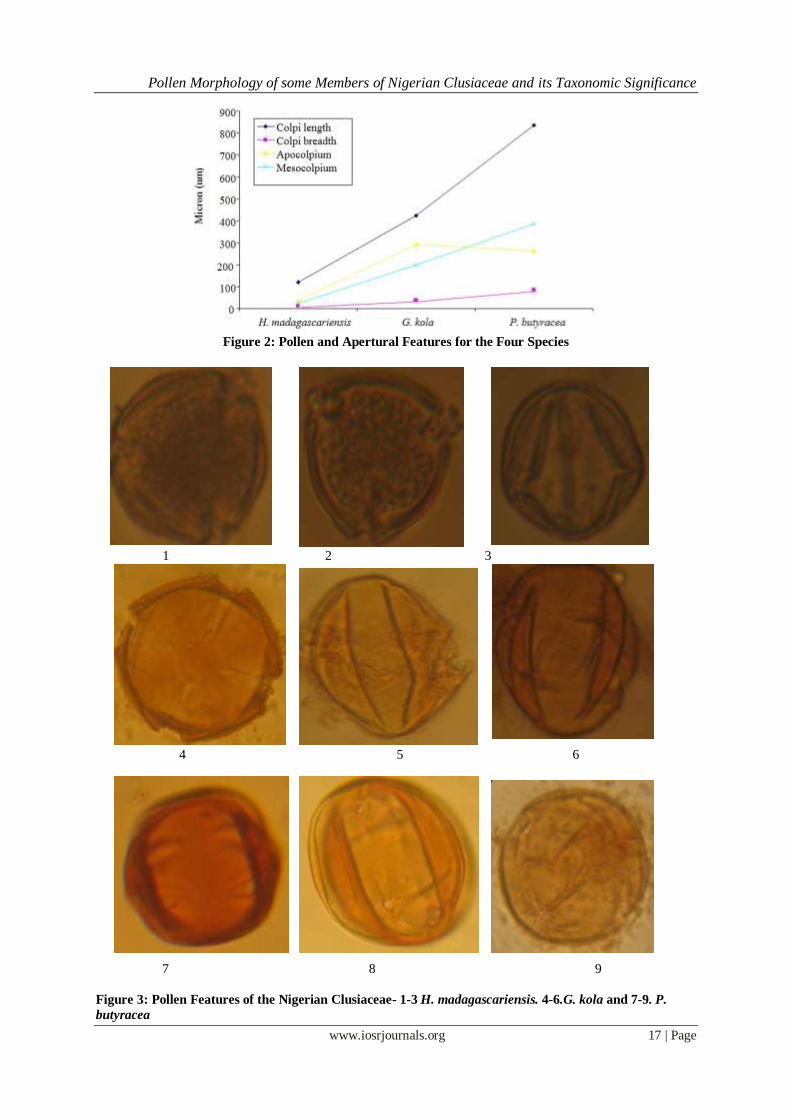
Figure 2: Pollen and Apertural Features for the Four Species
1 2 3
4 5 6
7 8 9
Figure 3: Pollen Features of the Nigerian Clusiaceae- 1-3 H. madagascariensis. 4-6.G. kola and 7-9. P.
butyracea
Pollen Morphology of some Members of Nigerian Clusiaceae and its Taxonomic Significance
www.iosrjournals.org 18 | Page
IV. Discussion This palynological study sought to provide more useful information on the taxonomy of these taxa. The
three species assessed show interesting features with significant taxonomic values. These variations actually
reinforce the morphological and anatomical data obtained from earlier work.
Apertural and Sculpturing type This study recorded two apertural types, the tetracolporate type with psilate sculpturing ornamentation
in both G. kola and P. butyracea with tricolporate and reticulate type found in H. madagascariensis (Figures 3
and Table 2). The above results were in line with the findings of Passarelli et al., (2010) who in their work
reported of psilate ornermentation in Podostemum spp in the family Podostemumaceae, a basal sister group of
the Clusiaceae. This is equally in conformity with the report of Furness et al., (2004) ; Perveen and Qaiser,
(2007) who reported that pollen grains do not differ within most families and as such can be of great value in
establishing affinity or otherwise.
These distinctive pollen apertural and sculpturing types could be used in the taxonomic delimitation of
H. madagascariensis from the rest of the genera. It equally affirms the excluded taxonomic status of H. madagascariensis, as well as the close affinity of G. kola and P. butyracea.
The absence of reticulate ornamentation pattern in G. kola and P. butyracea (except in the H.
madagascariensis) is in accordance with the observations of Punt et al., (1994), who found coarsely psilate
sculpturing pattern with distinctively large pollen in the exotic species of this Clusiaceae. This result is in
agreement with the reports of Bashir and Khan (2003), Mbagwu and Edeoga (2006) and Mbagwu et al., (2009)
who in their various works utilized apertural attributes of pollen grains to establish probable evidence of
relationships among some species in many genera of flowering plants. They suggested that pollen morphology
can be useful in supporting taxonomic evidence and could be used in solving taxonomic controversies in the
classification of problematic taxa.
Dessein et al., (2005) however, noted that the number of apertures are positively correlated with pollen
size, since the larger the pollen grain, the larger the surface area where the colpi may be initiated. They stressed
that more colpi may facilitate higher germination. They further, reported that a possible explanation may be found in the harmomegathy function of the colpi, a process by which the pollen and spores change in shape, to
accommodate variations in the volume of the cytoplasm caused by the changes in dehydration.
However, the present observations conform totally with this report by Dessein et al., (2005), because
all the examined taxa except H. madagascariensis are large with larger number of colpi but on the other hand,
they do not germinate easily from all the available literature.
Shape of pollen
Pollen shapes in polar view are angular in H. madagascariensis, circular in G. kola and P. butyracea
while the equatorial shapes were oblate spheroidal, spheriodal and subspheroidal in H. madagascariensis, G.
kola and P. butyracea, respectively. The above variations could be attributed to their intergeneric differences.
However, Lowe and Soladoye (1990) and Ogwal (1990) suggested that, it is likely that the nature or shape of pollen grains could be an evolutionary modification often inherited to determine the mode of
pollination and thereby perpetuate a particular group of plant in a given environment.
In the same line, Mbagwu and Edeoga (2006), were of the opinion that, where the pollen grain is longer
than wide, it may be explained as a structural adaptation for effective dispersal by wind while the circular nature
of some of the pollen grains were related to structural adaptation for effective pollination by insects. The above
opinions if right may not apply to the above shapes found in all these species. This inference is deduced because
based on the floral morphology of these species, they are all entomophilous plants.
Size, Symmetry and Dispersal Unit Pollen size of these species varied considerably within the taxa. These variations between polar and
equatorial diameter gave an explanation to the oblate spheriodal, spheriodal and subspheroidal shapes found in
H. madagascariensis, G. kola and P. butyracea, respectively. The pollen grains are shed in monads in all the species; they are radially symmetrical and isopolar. The above features are not taxonomically informative, but
rather show evidence of their levels of advancement.
Exine Thickness
The exine of these species varies significantly in H. madagascariensis, G. kola and P. butyracea. H.
madagascariensis had the smallest exine thickness while G. kola had the thickest exine walls. H.
madagascariensis with its thin exine wall is considered more primitive than G. kola and P. butyracea which are
more advanced by possessing pollen grains with thicker exine walls. This is in line with the report of Tomsovie
(1997) and Sahreen et al., (2008) who observed that the presence of thin exine with reduced columellae is a
characteristic feature of primitiveness in Angiosperms.
Pollen Morphology of some Members of Nigerian Clusiaceae and its Taxonomic Significance
www.iosrjournals.org 19 | Page
References [1] Adebisi, A. A. (2002). A Case Study of Garcinia kola Nut Production to Consumption System in J4. Area of Omo Forest Reserve.
In: Sunderland, T. and Ndoye, O. (eds). Forest Products, Livelihood and Conservation. Africa Publishers. 139 p p.
[2] Adebukunola, O., Adefule-Ositelu, B. O., Adegbehingbe, A. K. Adefule, O. O., Adegbehingbe, E. S. and Kehinde O. (2010).
Efficacy of Garcinia kola 0.5% aqueous eye drops in patients with primary open-angle glaucoma or ocular hypertension. East
African Journal of Ophthalmology. 17:1,88-93.
[3] Adefule, A. K., Oosa, B. O. and Onyenafa, P. C. (2004). Antifungal Activities of Garcinia kola Extracts on Purulent Discharges in
Lagos University Teaching Hospital, Lagos, Nigeria. Quarterly Journal Hospital Medicine. 14: 112-114.
[4] Adegbehingbe, O. O, Adesanya, S. A, Idowu, T. O, Okimi, O. C, Oyelami, O. A, Iwalewa, E. O. (2008). Clinical Effects of
Garcinia kola in Knee Osteoarthritis. Journal of Orthop Surgone; 3:34-38.
[5] Aduradola, A. M. (1999). Preliminary Investigation of some Factors Affecting Germination in Seeds of Garcinia kola. Journal
of Tropical Ethnoforestry 2(1): 47-46.
[6] Aniche, G. N. and Uwakwe, G. U.( 2010). Potential Use of G. kola as Hop Substitude in Large Beer Brewing. World Journal of
Microbiology and Biotechnology: 6: 3, 87-82.
[7] ASICUMPON, (2005). Check List of Medicinal Plants of Nigeria and their Uses. Trinity Biz Publishers, Nigeria, 135, pp.
[8] Bashir, S. and Khan, M. A. (2003). Pollen Morphology as an Aid to the Identification of Medicinal Plants: Trianthema
portulacastrum L., Boerhaavia procumbens Banks ex Roxb. and Alternanthera pungens Kunth. J. Hamdard Medicus, XLVI: 7–10.
[9] Bisby, F. A., Roskov, Y. R., Ruggiero, M. A., Orrell, T. M., Paglinawan, L. E.; Brewer, P. W. and Bailly, N. (2007). Species 2000
and ITIS Catalogue of Life: In: Hertum, J. V. (ed) 2007 Annual Checklist. Reading, U.K.
[10] Bonsen, K.. J. M. and Kucera, L. J. (1990). Vessel Occlusion in Plants: Morphological and evolutionary Aspects.
International Association of Wood Anatomists Bulletin II (4): 393-399.
[11] Burkhill, H. M. (1994). The Useful Plants of West Tropical Africa. Vol. 4. Royal Botanic Gardens Kew. 969, pp.
[12] Dessein, S., Harwood, R., Smmets, E. and Robbrecht, E. (2005). Pollen of the Spermacoce (Rubiaceae) Species from the Northern
Territory of Australian: Morphology and Taxonomic Significance. Australia Systematic Botany, 18: 367-382.
[13] Erdtman, G. (1971). Pollen Morphology and Plant Taxonomy (Angiosperm). Hafner Publishing Company, New York.
[14] Esimone, C. O., Nwafor, S. O .V., Okoli, C. O., Chah, K. F., Uzuegbu, D. B., Chibundu, C. and Adikwu, M. U. (2002). In Vivo
Evaluation of Interaction between Aqueous Seed Extract of Garcinia kola and Ciprofloxacin Hydrochloride. American Journal of
Therapeutics. 9 (4): 275-280.
[15] Eyogi, O. M., Aoudji, A. K. and Linsoussi, C. (2007). Garcinia kola Seed Dormancy Breaking. Applied Ecology and
Environmental Research. 5 (1): 63-71.
[16] Farombi, E. O., Akanni, O. O. and Emerole, G. O. (2005). Antioxidant and Scavenging Activities of Flavonoid Extract
(Kolaviron) of Garcinia kola Seeds in Vitro. Pharmacological Biology. 40 (2) l: 107-116.
[17] Furness, C. A. and Rudall, P. J. (2004). Pollen Apertural Evolution: A Crucial Factor for Eudicot Success? Trends in Plant Science
9:1360–1385.
[18] Inyang, E. (2003). Ethnobotany, Conventional and Traditional Uses of Plants. Verdict Press, Nigeria.,191, pp.
[19] Liu, Y., Qiu, Y. P., Hang, L. Z. and Chen, 1. (2005). Dormancy Breaking and Storage Behaviour of Garcinia kola Seeds:
Implications for Ecological Functions and Germplasm Conservation. Journal of Integrated Biology. 471(1): 38-49.
[20] Lowe, J. and Soladoye, M. O. (1990). Some Changes and Corrections to Names of Nigerian Plants and Nigerian Trees since the
Publication of Flora of West Tropical Africa. 2nd Ed. Nigerian Journal of Botany, 3:1-24.
[21] Madubuuyi, I. I. (1995). Antimicrobial Activities of the Constutient of G. kola Seeds Int Journal of Pharmacognocy 33: 232-237.
[22] Matig, A. L., Aoudji, A. K. N. and Linsoussi, A. (2007). G. kola Seed Dormancy- Breaking Applied Ecology and Environmental
Research 5(1): 63-71.
[23] Mbagwu, F. N. and Edeoga, H. O. (2006). Palynological Studies on Some Nigerian Species of Vigna spp. Journal Biological
Science 6 (6): 1122-1125.
[24] Mbagwu, F. N., Chime, E. G. and Unamba, C. I. N. (2009). Palynological Studies on Five Species of Asteraceae. African Journal
of Biotechnology Vol. 8 (7), 1222-1225.
[25] Metcalfe, C. R. and Chalk, L. (1957). Anatomy of the Dicotyledons, Vol 1, Oxford University Clarendon Press, London. 726 pp.
[26] (1965). Anatomy of the Dicotyledons. Vol. 2. Clarendon Press, Oxford, London. pp. 726-1460.
[27] Nasreen, S., Yousa, F. M., Mohmand, A. S. and Ashraf, M. (2002). Study of Seed Dormancy
[28] Nnamani, C. V. and Agwu, C. O. C. (2007). Pollen Analysis of Honey Samples from Ebonyi State Nigeria. Bio-Research: 5 (1)
184-188.
[29] (2008). Index of Phytoecological Indicator Species in Five Honey Samples from Ebonyi State Nigeria. Nigerian Journal of Botany
21 (1) : 129-135.
[30] Nzegbule, E. and Mbakwe, R. (2001). Effect of Pre-Sowing and Incubation Treatment on Germination of Garcinia kola Seed.
Fruits, 56: 437-442.
[31] Okafor, J. C. (2001). Case Study: Role of Conservation and Domestication of Minor Woody Forest Plants for Local Communities
in Nigeria. In: F. T Last (ed) Ecosystesm of the World (19), Tree Crop Ecosystem, Elevier, Amsterdam-London, pp.7-17.
[32] Ogwal, E. N. K. (1990). A Taxonomic Investigation of the Genus Commelina in Uganda. Proceedings AETFAT. Hamburg, 236:
573 -592.
[33] Perveen, A. and M. Qaiser, (2007). Pollen Floral of Pakistan - Malvaceae - Grewioideae - LII. Pakistan Journal of Botany. 39 (1):
1-7
[34] Passarelli, L. M., Tur, N. M. and Girarde, S. B. (2010). Morphology of Pollen of the Species of Neo-Tropical of Pododstemum
(Podostemaceae). International Journal of Tropical Biology and Conservation:58 (1), 82-88.
[35] Punt. W. W.W., Nilsson, S., Blackmore, S. and Thomas, L. A. (1994). Glossary of Pollen and Spore Terminology, -L P P
Foundation, Utrecht, L P P Contribution Series No, 1.
[36] Sahreen, S., Khan, M. A., Meo, A. A. and Jabeen, A. (2008). Pollen Morphology of the Genus Silene (Sileneae-Caryophyllaceae)
from Pakistan. Biological Diversity and Conservation 1 (2): 74-85.
[37] Tchobo, F. P., Natta, A. K, Barea, B., Barouh, N. , Piombo, G. P. M, Villeneuve, P., Soumanou, M. M. and Sohounhloue,D. C. K.
(2007). Characterization of Pentadesma butyracea Sabine Butters of Different Production Regions in Benin. Journal of the
American Oil Chemists' Society 84 (8) 755-780.
[38] Tomsovic, P. (1997). Some Palynological Observations on the Genus Echinops (Asteraceae) and their Taxonomic Implications.
Preslia, Praha, 69: 31-33.
[39] Zafar, M., Khan, M. A., Ahmad, M. and Sultana, S. (2006). Palynological and Taxonomic Studies of Some Weeds from Flora of
Rawalpindi, Pakistan Journal of Weed Science Research. 12 (1-2): 99-109.
IOSR Journal of Pharmacy and Biological Sciences (IOSR-JPBS)
ISSN: 2278-3008. Volume 3, Issue 3 (Sep-Oct. 2012), PP 20-24 www.iosrjournals.org
www.iosrjournals.org 20 | Page
Effect of Supplementation of Embelica Officinalis on Mushroom
Nutraceuticals
1Poonam Dehariya,
2Deepak Vyas
1.2 Lab of Microbial Technology and Plant Pathology, Department of Botany, Dr HS Gour University, Sagar
(MP)
Abstract: In present scenario malnutrition is a biggest problem of India. Increasing population and non
judicial uses of natural resources have great concern. Present study deals with the production of nutraceuticals
from mushroom (Pleurotus sajor-caju (Fr.) Singer) grown on different substrates and enhancement in these
nutraceuticals by supplementation of Embelica officinalis. Results reveals that among all the used substrates
viz. soybean straw, wheat straw, paddy straw, sunflower stalks, sugarcane bagasses and maize stalks, soybean
straw was proved best in terms of nutraceuticals and there was increase in nutritive as well as mineral contents
after supplementation. Thus Embelica officinalis should preferred for the supplementation of Pleurotus sajor-
caju.
Key words: Nutraceutical, Mushroom, Substrates, Supplementation, nutrition.
I. Introduction: The role of dietary active compounds in human nutrition is one of the most important areas of
investigation with the findings having wide‐ranging implications for consumers, healthcare providers, regulators
and industry (Bagchi, 2006). A nutraceutical is any substance that is a food or a part of a food and provides
medical or health benefits, including the prevention and treatment of disease. Such products may range from
isolated nutrients, dietary supplements and specific diets to genetically engineered designer foods, herbal
products, and processed foods such as cereals, soups and beverages (Hardy, 2000).
Oyster mushroom (i.e. Pleurotus spp.) is commonly called as Dhingri in India because of its oyster like
shape. Genus Pleurotus belongs to family Tricholomataceae and has about 40 well-recognized species, out of
which 12 species are cultivated in different parts of country. Pleurotus is an efficient lignin- degrading mushroom and can grow well on different types of lignocellulolosic materials. Mushroom has been recognized
as food contributing to ameliorate the protein malnutrition of the countries which are largely depending upon
cereals (Pandey, 2010; Dehariya et al., 2010). Different substrates affected the nutritional composition of
mushroom. Protein is one of the most important food factor. The sufficiency of protein in a diet is an important
measure of its adequacy and quality (Geda and Joshi, 2006). Minerals in the diet are essential for metabolic
reactions, healthy bone formation, transmission of nerve impulses, regulation of water and salt balance (Kalac
and Svoboda, 2000).
Mushroom normally ranges between 20 and 40% protein which is better than many legume sources
like soybeans and peanuts, and protein-yielding vegetable foods (Chang and Buswell, 1996; Chang and
Mshigeni, 2001). Moreover, mushroom proteins contain all the essential amino acids needed in the human diet
and are especially rich in lysine and leucine which are lacking in most staple cereal foods (Chang and Buswell,
1996; Sadler, 2003). Mushrooms are low in total fat content and have a high proportion of polyunsaturated fatty acids (72 to 85%) relative to total fat content, mainly due to linoleic acid. The high content of linoleic acids is
one of the reasons why mushrooms are considered a health food (Chang and Mshigeni, 2001; Sadler, 2003).
Furthermore, they contain significant amounts of carbohydrates and fibers (Crisan and Sands, 1978; Chang and
Buswell, 1996). The objective of this study was to determine and compare the nutritive value of oyster
mushroom Pleurotus sajor caju cultivated on soybean straw, wheat straw, paddy straw, sunflower stalks,
sugarcane bagasses and maize stalks and supplemented with Embelica officinalis.
II. Materials and Method: In the present study Pleurotus sajor-caju was used for the purpose. Pleurotus sajor-caju was cultivated on
different conventional substrates viz. Soybean straw, wheat straw, paddy straw, sunflower stalks, sugarcane bagasses,
maize straw. For supplementation, powder of Embelica officinalis was used. Supplementation was done at the time of
cultivation. The supplementary was properly treated with 25 ppm bavistin (half gram thoroughly mixed with pre-
treated substrates while spawning).
Preparation of sample: Mushroom samples was prepared by Extraction Technique (Mizuno, 1999). In this
method, the mushroom fruiting bodies were first dried at 45-50OC in oven for at least one hour and after
Effect Of Supplementation Of Embelica Officinalis On Mushroom Nutraceuticals
www.iosrjournals.org 21 | Page
complete dryness were being crushed in a sterile pestle and mortar to form a sharp powder. About 20gm/ 200
gm of powder of these mushrooms were taken into 200ml /400ml of 95% methanol/ethanol for extraction. The
extraction was carried out by a special extraction plant called as Soxhlet extraction Plant. The whole instrument
is operated upon electric current and has special staplers to maintain the temperature. The extraction process is
carried out for about 16-18 hours in Soxhlet unit at 65 OC/79 OC. After complete extraction, the extract is filtered
through whatman number 1 filter paper. The filtered extract was kept in 10-20 ml glass vials and kept in refrigerator or deep freezer at 1-4oC for further use.
III. Analysis of nutrients: Protein estimation: The protein content of crude filtrate homogenate was assayed by the method of Lowry et
al., (1951), using BSA (bovine serum albumin) as standard. The method was based on the principle that
different proteins contain different amount of aromatic residues which react with Folin Cicalteu's Reagent
(Phenol reagent) and values are expressed as mg/ml of culture filtrate.
Carbohydrade analysis: Using the dinitrisalicylic acid as reagent, 25 g of 2,5 dinitrisalicylic acid and 75g sodium potassium tartrate were dissolved in 50 ml sodium suspension of each of the crushed oven dried
mushroom species was added with 1.01 ml of reagent and mixed thoroughly. The mixture boiled in a water bath
for ten minutes. After rapid cooling to room temperature, the absorbance was determined at 570 λmax. The
values of component ingredients of carbohydrate determined from a glucose standard curve (AOAC, 1984).
Fat analysis: Mushroom materials were placed on extraction tube. And 1 ml 0.88% ammonia solution was
added and mixed thoroughly; 10 ml of alcohol was added and mixed to dissolve the protein. The tube was then
immersed in boiling water and liberated component fat rose to the surface. When the tube cooled the fat
extracted by shaking with 1:1 mixtures of diethyl-ether and petroleum spirit (20 ml). The bulked solution was
distilled from the extract and sample dried and weighed to determine weight and fat components (AOAC, 1984).
Minerals analysis: An aliquots of the digest was taken for determination of Ca, Na, K, P and Mg using spectronic at 430 λmax and EDTA complex metric titrations, these minerals were determined by flame emission
after appropriate dilution, using a plan photometer equipped with optical filter (AOAC, 1984).
Crude fiber determination: Crude fiber was determined using a Hennenberg- Stohmann method. A 2 g sample
from mushroom species was boiled in antifoaming solution (1-octanol) for 30 min. Pyrex glasses were used to
filter the solution where the residues were thoroughly washed with boiling water (3 times) to remove
hydrochloric acid. The Pyrex glasses containing the residues were dried at 100°C for five hours, cooled to room
temperature and then weighed. The crucibles were then placed in a muffle furnace at 555°C for 5 hrs. cooled to
room temperature and then reweighed to find the fiber content percentage.
Moisture content determination: A 2 g sample from each of the mushroom sp. used in the study was oven dried at 105°C to constant weights. The difference between the weight of the sample before drying and after
drying was used to calculate the percentage moisture content (Masamba and Kazombo-Mwale, 2010).
Ash determination: A 2 g sample from the finally ground mushroom was placed in a crucible and converted
into ash at 550 - 600°C for 5 hrs. in a carbolite muffle furnace after which it was allowed to cool in a dessicator.
The difference in the weight of the crucible without the sample before and after ashing was used to calculate the
ash content (Masamba and Kazombo-Mwale, 2010).
IV. Result and discussion: The Protein, fat, carbohydrate, crude fiber, moisture and ash contents of mature fruiting bodies of
Pleurotus sajor caju cultivated on different lignocellulosic substrates alone and in supplementation with
Embelica officinalis are shown in Table 1 and 2. Table 1 shows that P. sajor caju fruiting bodies produced on
soybean straw possessed the highest protein content of 29.5 % on a dry weight basis followed by sunflower
stalks (29.0%), wheat straw (28.0%), maize stalks (27.5%) and paddy straw (26.16%). Least protein contents
was found in sugarcane bagasses (25.5%). The fat content of P. sajor caju was 2.69 % grown on sunflower
stalks being the highest followed by paddy straw (2.62%), sugar cane bagasses (2.54), wheat straw (2.53%),
soybean straw (2.48%) and least in maize stalks (1.89%). The % of protein and fat content were similar as
reported in earlier studies (Patil et al., 2008, Patil and Dakore, 2007).
Maximum Carbohydrate content of P. sajor caju was 56.36 % in fruiting bodies cultivated on soybean
straw straw whereas least was 53.87% cultivated on paddy straw. The highest crude fiber was obtained on
soybean straw (7.77%) followed by paddy straw (7.67%), sunflower stalks and wheat straw (7.70%), sugarcane bagasses (7.58%) and least in maize stalks (7.39%). These results were confirmed with findings of Bonatti et
Effect Of Supplementation Of Embelica Officinalis On Mushroom Nutraceuticals
www.iosrjournals.org 22 | Page
al. (2004), Khyadagi et al., (1998), (Sharma & Madan 1993), Singh et. al.(2003). From the present study it is
evident that, Pleurotus sajor caju is the suitable species for nutritional contents. The protein contents of various
lignocellulosic residues were compared and it was reported that the nitrogen content in fruiting bodies was
higher in leguminous plant substrates than non-leguminous ones (Sharma & Madan, 1993). These results were
confirmed with the findings of Kadlag et al., (1998) Mandhare (2000). The protein content usually ranges
between 20–30% on a dry weight basis. The maximum ash content of P. sajor caju was found when grown on sugarcane bagasses (6.52%) followed by mushroom grown soybean straw (6.39%), paddy straw (6.28%), and
least in maize stalks and sunflower stalks (6.18%). Similar results were reported by El –Kattan et al., (1991).
Table 2 shows the nutritive content of P. sajor-caju on different lignocellulosic substrates
supplemented with Emblica officinalis. Maximum protein (29.5%) reported from soybean straw and minimum
(25.5 %) from sugarcane bagasses. Minimum carbohydrate (50.1%) reported from paddy straw and maximum
(56.3%) from soybean straw. Fat content reported 1.90 % to 2.70 %. Moisture content reported 88.3% to 90.2%
and ash from 6.4 % to 7.9%. Maximum fiber content (7.9%) from soy bean straw and sunflower stalks and
minimum (7.4%) from maize stalks.
The Ca, K, Na, Mg, P and Fe contents of mature fruiting bodies of Pleurotus sajor caju cultivated on
different lignocellulosic substrates alone and in supplementation with Embelica officinalis are shown in Table 3
and 4. Table 3 shows that P. sajor caju fruiting bodies produced on soybean straw possessed the highest Ca
(308.4) followed by sunflower stalks (300.0) and minimum (270.0) on wheat straw. Potassium (K) content was higher compared to other minerals in P. sajor-caju. The quantity of K was recorded from 1900 to
2687mg/100g.The highest value was recorded when cultivated on soybean straw (2687mg/100g) followed by
the cultivation on paddy straw (2650mg/100g) and the least was recorded on the maize stalks (1900mg/100g).
Sodium concentration varied significantly with different substrates. The highest sodium concentration was
recorded on soybean straw (308.4 mg/100g) and minimum was obtained on maize stalks (279.0mg/100g). The
highest magnesium concentration was recorded on sunflower stalks (157.4 mg/100g) and minimum was
obtained on maize stalks and paddy straw (151.4 mg/100g). Maximum phosphorus content of 1000 mg/100g
was recorded on soybean straw and minimum was obtained on maize stalks (800.0 mg/100g). Same results were
obtained in case of iron content. Maximum iron content of 130 mg/100g was recorded on soybean straw and
minimum was obtained on maize stalks (100.0 mg/100g). These results coinced with those observed by Kikuchi
et al., (1884), Rathor and Thakore (2004), (Caglarirmak, 2007) (Patil et al., 2010). Table 4 shows the mineral contents of P. sajor-caju on different lignocellulosic substrates
supplemented with Embelica officinalis. Maximum Ca (308.4) reported from sunflower stalks (315.0) and
minimum (274.3) from wheat straw. The highest potassium content was recorded when cultivated on soybean
straw (2689.7 mg/100g) followed by the cultivation on paddy straw (2689.0 mg/100g) and the least was
recorded on the maize stalks (1946.7mg/100g). The highest sodium concentration was recorded on soybean
straw (341.7 mg/100g) and minimum was obtained on maize stalks (284.0 mg/100g). The highest magnesium
concentration was recorded on sunflower stalks (159.7 mg/100g) and minimum was obtained on maize stalks
(154.0 mg/100g). Maximum phosphorus content of 1096.7 mg/100g was recorded on soybean straw and
minimum was obtained on maize stalks (810.0 mg/100g). Maximum iron content of 130 mg/100g was recorded
on soybean straw and minimum was obtained on maize stalks (100.0 mg/100g).
When we compare table 2 with table 1, it is clearly evident from the data that after supplementation all
the substrates shows increase in amount and same results obtained when table 4 compared with table 3.Thus supplementation of Embelica officinalis was proved better for enhancement in the amount of nutraceuticals.
V. Observation: Table: 1 Nutritive content of P. sajor-caju on different substrates.
Substrates Protein
(%) Carbohydrate
(%) Fat
(%) Moisture
(%) Ash
(%) Fiber
(%)
Soybean straw 29.5 56.36 2.48 90.89 6.52 7.77
Wheat straw 28.0 55.46 2.53 86.23 6.39 7.70
Paddy straw 26.16 35.25 2.62 90.13 6.28 7.67
Sun flower stalks 29.0 54.0 2.69 86.26 6.18 7.70
Sugarcane
bagasses 25.5 49.76 2.54 85.13 6.31 7.58
Maize stalks 27.5 50.80 1.89 88.23 6.18 7.39
CD (0.05%) 0.85 0.89 0.52 0.28 0.05 0.07
S Em (±) 0.27 0.29 0.17 0.09 0.01 0.02
Values are given in average of three replicates
Effect Of Supplementation Of Embelica Officinalis On Mushroom Nutraceuticals
www.iosrjournals.org 23 | Page
Table: 2 Nutritive content of P. sajor-caju on different lignocellulosic substrates supplemented with
Emblica officinalis:
Substrates Protein
(%) Carbohydrate
(%) Fat
(%) Moisture
(%) Ash
(%) Fibre
(%)
SS 29.5 56.3 2.48 90.0 6.7 7.9
WS 28.2 55.6 2.53 86.6 6.6 7.8
PS 26.5 50.4 2.63 90.2 6.4 7.8
SB 25.5 50.1 2.54 88.4 7.7 7.7
MS 27.7 51.0 1.90 85.3 7.9 7.4
SFS 29.1 54.7 2.70 88.3 7.8 7.9
CD (0.05%) 0.63 0.50 0.53 0.30 0.34 17.53
S Em (±) 0.20 0.16 1.72 0.1 0.11 5.69
Values are given in average of three replicates
Table: 3 Mineral contents of P. sajor-caju on different lignocellulosic substrates.
Substrates Ca
(mg/100g)
K
(mg/100g)
Na
(mg/100g)
Mg
(mg/100g)
P
(mg/100g)
Fe
(mg/100g)
SS 308.33 2687 308.4 156.4 1000 130.0
WS 270.0 2650 300.0 157.0 800.7 108.4
PS 292.7 2266.7 290.0 151.4 915.0 120.0
SFS 300.0 2320 299.4 157.4 897.4 110.0
SB 275.0 2071.7 282.4 152.7 874.0 120.0
MS 292.4 1900 279.0 151.4 800.0 100.0
CD (0.05%) 13.98 56.23 10.03 4.39 11.72 16.50
S Em (±) 4.53 18.25 3.25 1.42 3.80 5.35
Values are given in average of three replicates
Table: 4: Mineral contents of P. sajor-caju on different lignocellulosic substrates supplemented with
Emblica officinalis.
Substrates Ca
(mg/100g)
K
(mg/100g)
Na
(mg/100g)
Mg
(mg/100g)
P
(mg/100g)
Fe
(mg/100g)
SS 311 2689.7 341.7 157.0 1096.7 130.0
WS 274.3 2663.4 316.7 156.0 908.0 126.7
PS 295.3 2269.0 301.7 156.7 925.0 111.7
SB 281.7 2079.4 200.0 158.4 888.4 111.7
MS 305.4 1946.7 284.0 154.0 810.0 110.0
SFS 315.0 2356.7 323.4 159.7 821.7 128.4
CD
(0.05%) 9.05 40.15 35.59 3.97 70.99 17.53
S Em (±) 2.93 13.03 11.55 1.29 23.04 5.69
Values are given in average of three replicates
References: [1] Bagchi D. Nutraceuticals and functional foods regulations in the United States and around the world. Toxicology 2006;
221(1):1‐3.
[2] Hardy G. Nutraceuticals and functional foods: introduction and meaning. Nutrition 2000; 16(7‐8): 688‐689.
[3] The Health & Wellness Foods Industry in India: An Overview. Tata Strategic Management Group. Osaka International Business
Promotion Center. 2009.
[4] Palthur MP, Palthur SSS, Chitta SK Nutraceutical: Concept and regulatory scenario. International journal of pharmacy and
pharmaceutical sciences. 2010; 2: 14-20.
[5] Mizuno, T. (1999). Bioactive Substances in Hericium erinaceus (Bull; Fr.) Press. (Yamabushitake), and its medicinal Utilization.
Int. J. of Med. Mush. 1: 105-119.
[6] Lowry OH, Rosebrough NJ, Farr AL, Randall, R.J Protein measurement with folin phenol reagents. J. Biol. Chem. 1951; 193: 265-
275.
[7] Association of official Agricultural Chemist (AOAC), 6th
Edition, Washington DC, Longman Group Limited, 1984; 153.
[8] Masamba KG, Kazombo-Mwale R Determination and comparison of nutrient and mineral contents between cultivated and
indigenous edible mushrooms in Central Malawi. African Journal of Food Science 2010; 4: 176-179.
[9] Dehariya, P., Chaubey, A. and Vyas, D. (2010). Mushrooms: A nutritive food for human beings. Microbial biotech. and Ecology
(Eds: D. Vyas, N. Khare, A.K. Pandey) pp.344-352. Daya Publication New Delhi.
[10] Pandey, A. K. (2010). Mushroom Biodiversity: A natural remedy for malnutrition in India (Abst.) National Seminar on Role of
Effect Of Supplementation Of Embelica Officinalis On Mushroom Nutraceuticals
www.iosrjournals.org 24 | Page
Biodiversity in sustainable agriculture (Jhansi). March 4-5 pp 72-73.
[11] Geda, A.K. and Joshi, P. K. (2006). Nutritional qualities of Mushrooms. Compandium of lectures-Emerging Areas in Mushroom
Diversity, Production and post Harvest Developments. pp 53-68.
[12] Sueli, OS, Sandra, MG C, & Edmar, C Chemical composition of Pleurotus pulmonarious (Fr.) Quel., Substrates and Residue after
Cultivation. Brazilian Archives of Biology and Technology. 2002; 45: 531-535.
[13] Wang, D., Sakoda, A., and Suzuki, M. (2001). Biological efficiency and nutritional value of oyster mushroom cultivated on spent
beet grain. Bioresource technology.78: 293-300.
[14] Miles PG, Chang ST Mushroom Biology Concise Basics and Current Developments. World Scientific Publishing Co. Pvt. Ltd.
1997; 105-106.
[15] Chang, S.T., Lau, O.W. and Cho, K.Y. (1981). The cultivation and nutritional value of Pleuorotus sajor-caju. European J. Appl.
Microbiol. Biotechnol. 12: 58–62
[16] Patil SS, Ahmed SA, Telang SM, Baig MMV The nutritional value of Pleurotus ostreatus (Jaco:Fr.) Kumm Cultivation on
different lignocellulosic agro wastes. Innovative Romanian Food Technology 2010; 7: 66-76
[17] Kalac, P.,& Svoboda, L. (2000). A review of trace element concentrations in edible mushrooms. Food Chemistry, 69, 273- 281.
[18] Chang ST, Buswell JA (1996). Mushroom nutriceuticals. World J. Microb. Biotechnol. 12: 473-476.
[19] Chang ST, Mshigeni KE (2001). Mushroom and their human health: their growing significance as potent dietary supplements. The
University of Namibia, Windhoek, 1-79: 1188-1194.
[20] Sadler M (2003). Nutritional properties of edible fungi. Br. Nutr. Found. Nutr. Bull. 28: 305-308.
[21] Crisan EV, Sands A (1978). Nutritional value. In: Chang ST, Hayes WA (Eds). The Biology and Cultivation of Edible
Mushrooms. London, Academic Press Inc, pp. 137-165.
[22] Patil, S. S. and Dakore, H. G. Comparative study on yield performance and Nutritive value of oyster mushroom on soybean straw.
Bioinfolet, 2007; 4(1): 57-59.
[23] Patill S.S., Kadam R.M. Shinde S.L. and Deshmukh S.A. Effect of different substrate on productivity and proximate composition
of P. florida. Int. J. Plant Sci. 2008; 3(1): 151-153.
[24] Bonatti, M., Karnopp, P., Soares, H.M., Furlan, S.A. Evaluation of Pleurotus ostreatus and Pleurotus sajor-caju nutritional
characteristics when cultivated in different lignocellulosic wastes. Food Chem., 2004; 88(3): 425-428.
[25] Khydagi, K.S.; Sharda, G.S. and Meera Rao. Proximate composition of Oyster mushroom. Karnataka J. Agri. Sci. 1998; 11 (2):
548 – 549.
[26] Sharma, S. & Madan, M. Microbial protein from leguminous and non-leguminous substrates. Acta Biotechnologica. 1993; 13:
131–139.
[27] Mandhare, V.K. “Productivity of Pleurotus sp. On different substrates and its effect on Nutritional Indices of spent straw. Ph.D.
Thesis. Marathwada Agricultural Univ., Parbhani. 2000.
[28] El – Kattan, M.H.; Helmy, Z.A.; Abdel, H.; El – Leithy, M. and Abdelkawi, K.A. Studies on cultivation techniques and Chemical
composition of Oyster mushrooms. Mushroom. J. for tropics. 1991; 11 (314): 59 – 66.
[29] Kikuchi, M., Tamakawa, K., Hiroshima, K., Aihara, Y., Mishima, Y., Seki, T., Tsunoda, A. Survey on contents of metals in edible
mushrooms. Journal of the Food Hygienic Society of Japan. 1984; 25(6) 534-542.
[30] Rathore, V. R. S., and Thakore, B. B. L. Effect of different substrates on the production and nutritional value of sporophores of
Pleurotus florida (Eger) Nom. Nud. Journal of Mycology and Plant Pathology, 2004; 34( 1): 66-68.
[31] Çağlarırmak, Necla. The nutrients of exotic mushrooms (Lentinula edodes and Pleurotus species) and an estimated approach to the
volatile compounds. Food Chemistry. 2007; 105(3): 1188-1194.
[32] Patil SS, Ahmed SA, Telang SM, Baig MMV The nutritional value of Pleurotus ostreatus (Jaco:Fr.) Kumm Cultivation on
different lignocellulosic agro wastes. Innovative Romanian Food Technology 2010; 7: 66-76
[33] Ahmed, SA, Kadam1, J.A.,. Mane, V.P. Patil S.S and Baig, M.M.V. Biological Efficiency And Nutritional Contents Of Pleurotus
florida (Mont.) Singer Cultivated On Different Agro-wastes. Nature and Science, 2009;7(1), ISSN 1545-0740
IOSR Journal of Pharmacy and Biological Sciences (IOSR-JPBS)
ISSN: 2278-3008. Volume 3, Issue 3 (Sep-Oct. 2012), PP 25-34 www.iosrjournals.org
www.iosrjournals.org 25 | Page
Gene Expression of Peroxisome Proliferator-Activated Receptor
Is Upregulated by Nonsteroidal Anti-Inflammatory Drugs and
Correlates with Cyclooxygenase-2 Suppression In Inflamed-Rat
Muscle
Abdelhady S1, El Ashmawy N
2, El Bahrawy H
3, Fouad H
4
1,2,3,4 (Biochemistry, Phaculty of Parmacy/Pharos University, Egypt)
Abstract: The peroxisome proliferator-activated receptors (PPARs) have been implicated in the regulation of
endothelial cell inflammatory response. The purpose of the present study was to clarify the molecular
mechanism of NSAIDs in controlling inflammation regarding the gene expression of PPARα and PPARγ1 in a
rat model of chronic inflammation. Wistar rats were classified into 5 experimental groups; 9 rats each. Group (1) normal control; group (2) injected s.c. with 0.3 % carrageenan in muscle on days 1, 4 and 7. Groups (3, 4
and 5) were injected s.c. with carrageenan and at the same time given orally 10 mg/Kg Celecoxib, 12.5 mg/Kg
Nimesulide or 10 mg/Kg sulindac, respectively. On day 7, edema was measured before scarification. Gene
expression PPARγ1 and PPARα was measured in rat muscle by RT-PCR. COX-2 was analyzed in rat muscle by
ELISA. Celecoxib produced the greatest % inhibition of carrageenan-induced edema. PPARγ1 and PPARα
gene expression were significantly increased by NSAIDs treatment compared with carrageenan-untreated
group. The inhibition of COX-2 together with upregulation of PPAR and PPARγ1 nominate NSAIDs to be promising candidates for pharmacologic treatment of tumorgenesis.
Key words: Celecoxib, Nimesulide, Sulindac, PPARα, PPARγ1, carrageenan.
I. Introduction Chronic inflammation is defined as inflammation of prolonged duration in which active inflammation,
tissue destruction and attempts at healing are proceeding simultaneously (1). Chronic inflammation results in
either repair by fibrosis or granuloma formation (2). Nonsteroidal anti-inflammatory drugs (NSAIDs) are
cyclooxygenase (COX) inhibitors frequently used in the treatment of acute and chronic inflammation. Side effects of NSAIDs are often due to their ability to induce apoptosis, gastric and duodenal ulcers and cytotoxicity
in liver cells (3). The inhibition of COX-1 is responsible for the adverse effects of traditional NSAIDs (as
sulindac) on the gastrointestinal mucosa, while their therapeutic benefits depend on the inhibition of COX-2.
Therefore, COX-2 selective inhibitors (as Celecoxib and Nimesulide) were developed to reduce the adverse
effects produced from the inhibition of COX-1 by conventional NSAIDs (4).
The peroxisome proliferator-activated receptors (PPARs) belong to the group of nuclear receptor
superfamily. There are three subtypes of these receptors, PPARα, PPARβ/δ, and PPARγ. PPARs mainly
regulate lipid and carbohydrate metabolism (5). These receptors are also involved in inflammatory process,
reproduction, carcinogenesis and other physiological processes in the body. PPAR activation inhibits
inflammatory response genes and decreases the production of inflammatory mediators like IL-6, IL-2, TNFα,
and COX-2, and also suppresses cells like T cell and macrophages. PPARα and PPARγ have been implicated in
the regulation of endothelial cell inflammatory response and induction of apoptosis (6). A wide variety of natural and synthetic compounds was identified as PPAR ligands. Among the
synthetic ligands, the lipid lowering drugs; fibrates, and the insulin sensitizers; thiazolidinediones are PPARα
and PPARγ agonists, respectively, which underscores the important role of PPARs as therapeutic targets (7).
Interestingly, indomethacin and other NSAIDs that inhibit the production of prostaglandins are also able to
activate PPARα and PPARγ (8).
The purpose of the present study was to clarify the molecular mechanism of NSAIDs in controlling
inflammation regarding the gene expression of PPARα and PPARγ1 in a rat model of chronic inflammation.
The relation between COX-2 inhibition and PPARs expression in rat muscle was also investigated.
II. Materials and Methods Forty five Wistar rats (male and female), weighing 120-160 g, were utilized in the present study. The
rats were obtained from the animal house of Faculty of Pharmacy and Drug Manufacturing, Pharos University,
Alexandria. The animals were maintained in plastic cages at 25°C in animal house for two weeks for
acclimatization and were allowed free access to water and food. The rats were fed bread and milk.
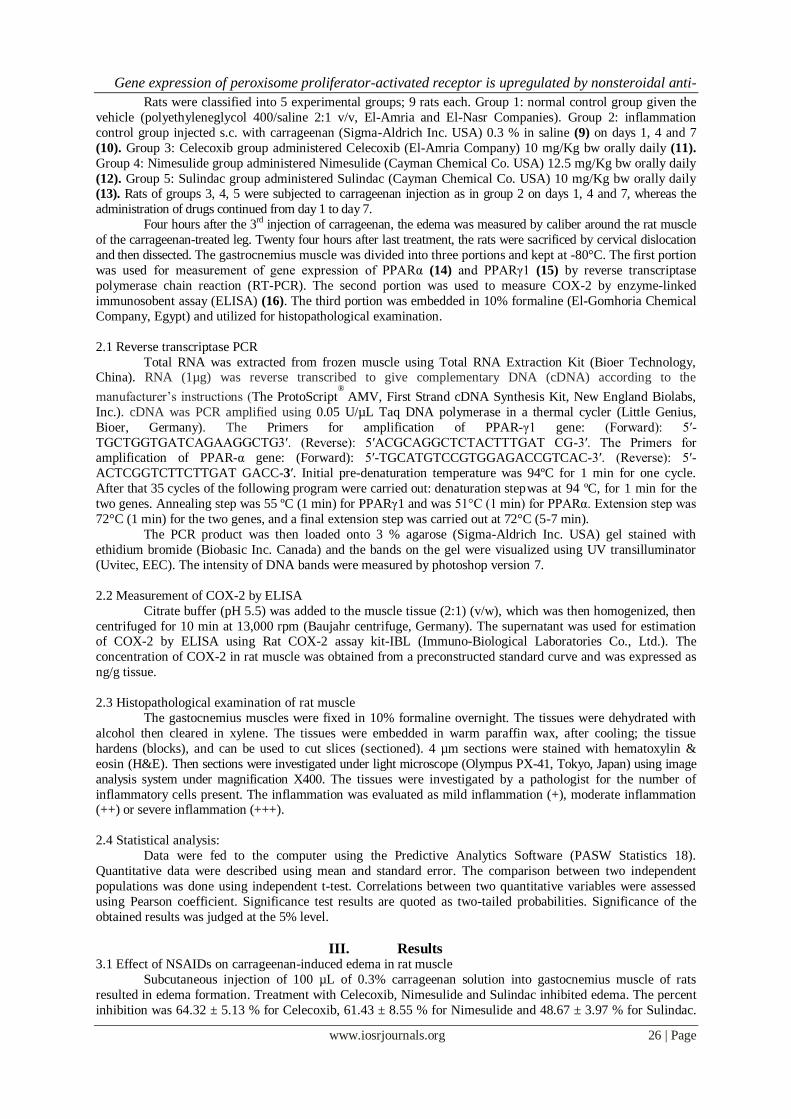
Gene expression of peroxisome proliferator-activated receptor is upregulated by nonsteroidal anti-
www.iosrjournals.org 26 | Page
Rats were classified into 5 experimental groups; 9 rats each. Group 1: normal control group given the
vehicle (polyethyleneglycol 400/saline 2:1 v/v, El-Amria and El-Nasr Companies). Group 2: inflammation
control group injected s.c. with carrageenan (Sigma-Aldrich Inc. USA) 0.3 % in saline (9) on days 1, 4 and 7
(10). Group 3: Celecoxib group administered Celecoxib (El-Amria Company) 10 mg/Kg bw orally daily (11).
Group 4: Nimesulide group administered Nimesulide (Cayman Chemical Co. USA) 12.5 mg/Kg bw orally daily
(12). Group 5: Sulindac group administered Sulindac (Cayman Chemical Co. USA) 10 mg/Kg bw orally daily (13). Rats of groups 3, 4, 5 were subjected to carrageenan injection as in group 2 on days 1, 4 and 7, whereas the
administration of drugs continued from day 1 to day 7.
Four hours after the 3rd injection of carrageenan, the edema was measured by caliber around the rat muscle
of the carrageenan-treated leg. Twenty four hours after last treatment, the rats were sacrificed by cervical dislocation
and then dissected. The gastrocnemius muscle was divided into three portions and kept at -80°C. The first portion
was used for measurement of gene expression of PPARα (14) and PPARγ1 (15) by reverse transcriptase
polymerase chain reaction (RT-PCR). The second portion was used to measure COX-2 by enzyme-linked
immunosobent assay (ELISA) (16). The third portion was embedded in 10% formaline (El-Gomhoria Chemical
Company, Egypt) and utilized for histopathological examination.
2.1 Reverse transcriptase PCR
Total RNA was extracted from frozen muscle using Total RNA Extraction Kit (Bioer Technology, China). RNA (1µg) was reverse transcribed to give complementary DNA (cDNA) according to the
manufacturer’s instructions (The ProtoScript®
AMV, First Strand cDNA Synthesis Kit, New England Biolabs,
Inc.). cDNA was PCR amplified using 0.05 U/µL Taq DNA polymerase in a thermal cycler (Little Genius,
Bioer, Germany). The Primers for amplification of PPAR-γ1 gene: (Forward): 5′-
TGCTGGTGATCAGAAGGCTG3′. (Reverse): 5′ACGCAGGCTCTACTTTGAT CG-3′. The Primers for amplification of PPAR-α gene: (Forward): 5′-TGCATGTCCGTGGAGACCGTCAC-3′. (Reverse): 5′-
ACTCGGTCTTCTTGAT GACC-3′. Initial pre-denaturation temperature was 94ºC for 1 min for one cycle.
After that 35 cycles of the following program were carried out: denaturation step was at 94 ºC, for 1 min for the
two genes. Annealing step was 55 ºC (1 min) for PPARγ1 and was 51°C (1 min) for PPARα. Extension step was
72°C (1 min) for the two genes, and a final extension step was carried out at 72°C (5-7 min).
The PCR product was then loaded onto 3 % agarose (Sigma-Aldrich Inc. USA) gel stained with
ethidium bromide (Biobasic Inc. Canada) and the bands on the gel were visualized using UV transilluminator
(Uvitec, EEC). The intensity of DNA bands were measured by photoshop version 7.
2.2 Measurement of COX-2 by ELISA
Citrate buffer (pH 5.5) was added to the muscle tissue (2:1) (v/w), which was then homogenized, then
centrifuged for 10 min at 13,000 rpm (Baujahr centrifuge, Germany). The supernatant was used for estimation of COX-2 by ELISA using Rat COX-2 assay kit-IBL (Immuno-Biological Laboratories Co., Ltd.). The
concentration of COX-2 in rat muscle was obtained from a preconstructed standard curve and was expressed as
ng/g tissue.
2.3 Histopathological examination of rat muscle
The gastocnemius muscles were fixed in 10% formaline overnight. The tissues were dehydrated with
alcohol then cleared in xylene. The tissues were embedded in warm paraffin wax, after cooling; the tissue
hardens (blocks), and can be used to cut slices (sectioned). 4 µm sections were stained with hematoxylin &
eosin (H&E). Then sections were investigated under light microscope (Olympus PX-41, Tokyo, Japan) using image
analysis system under magnification X400. The tissues were investigated by a pathologist for the number of
inflammatory cells present. The inflammation was evaluated as mild inflammation (+), moderate inflammation (++) or severe inflammation (+++).
2.4 Statistical analysis:
Data were fed to the computer using the Predictive Analytics Software (PASW Statistics 18).
Quantitative data were described using mean and standard error. The comparison between two independent
populations was done using independent t-test. Correlations between two quantitative variables were assessed
using Pearson coefficient. Significance test results are quoted as two-tailed probabilities. Significance of the
obtained results was judged at the 5% level.
III. Results 3.1 Effect of NSAIDs on carrageenan-induced edema in rat muscle
Subcutaneous injection of 100 µL of 0.3% carrageenan solution into gastocnemius muscle of rats
resulted in edema formation. Treatment with Celecoxib, Nimesulide and Sulindac inhibited edema. The percent
inhibition was 64.32 ± 5.13 % for Celecoxib, 61.43 ± 8.55 % for Nimesulide and 48.67 ± 3.97 % for Sulindac.
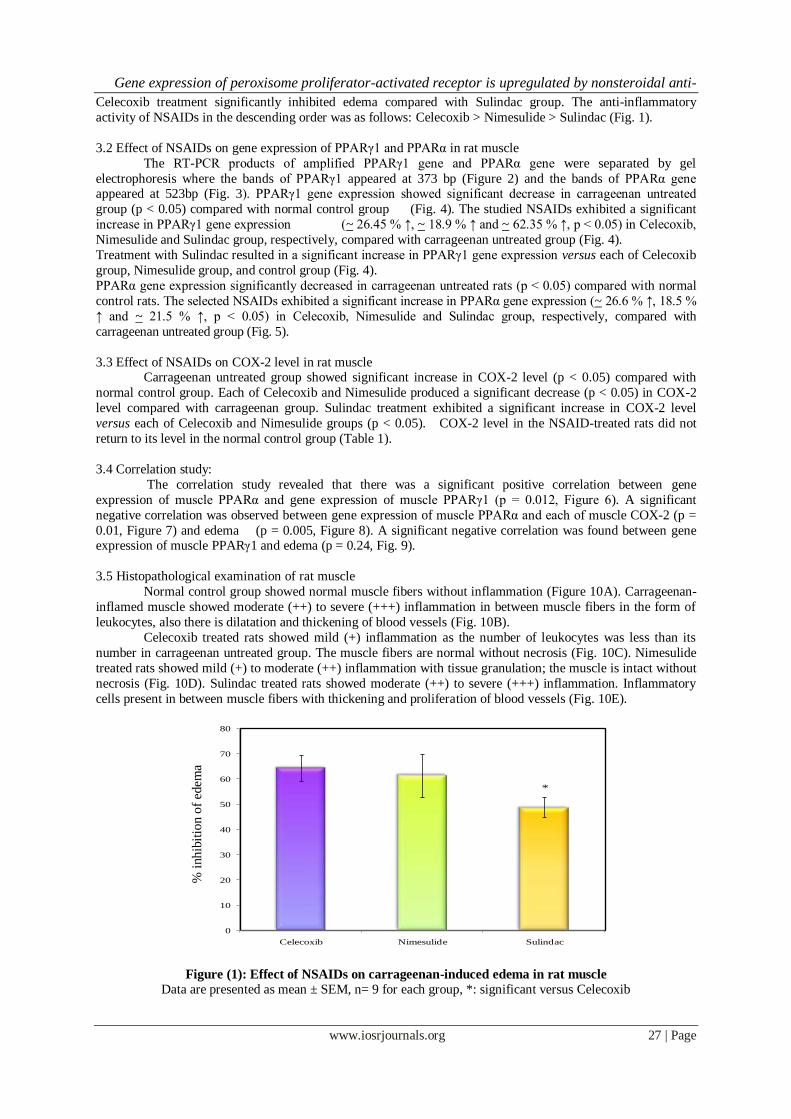
Gene expression of peroxisome proliferator-activated receptor is upregulated by nonsteroidal anti-
www.iosrjournals.org 27 | Page
Celecoxib treatment significantly inhibited edema compared with Sulindac group. The anti-inflammatory
activity of NSAIDs in the descending order was as follows: Celecoxib > Nimesulide > Sulindac (Fig. 1).
3.2 Effect of NSAIDs on gene expression of PPARγ1 and PPARα in rat muscle
The RT-PCR products of amplified PPARγ1 gene and PPARα gene were separated by gel
electrophoresis where the bands of PPARγ1 appeared at 373 bp (Figure 2) and the bands of PPARα gene appeared at 523bp (Fig. 3). PPARγ1 gene expression showed significant decrease in carrageenan untreated
group (p < 0.05) compared with normal control group (Fig. 4). The studied NSAIDs exhibited a significant
increase in PPARγ1 gene expression (~ 26.45 % ↑, ~ 18.9 % ↑ and ~ 62.35 % ↑, p < 0.05) in Celecoxib,
Nimesulide and Sulindac group, respectively, compared with carrageenan untreated group (Fig. 4).
Treatment with Sulindac resulted in a significant increase in PPARγ1 gene expression versus each of Celecoxib
group, Nimesulide group, and control group (Fig. 4).
PPARα gene expression significantly decreased in carrageenan untreated rats (p < 0.05) compared with normal
control rats. The selected NSAIDs exhibited a significant increase in PPARα gene expression (~ 26.6 % ↑, 18.5 %
↑ and ~ 21.5 % ↑, p < 0.05) in Celecoxib, Nimesulide and Sulindac group, respectively, compared with
carrageenan untreated group (Fig. 5).
3.3 Effect of NSAIDs on COX-2 level in rat muscle Carrageenan untreated group showed significant increase in COX-2 level (p < 0.05) compared with
normal control group. Each of Celecoxib and Nimesulide produced a significant decrease (p < 0.05) in COX-2
level compared with carrageenan group. Sulindac treatment exhibited a significant increase in COX-2 level
versus each of Celecoxib and Nimesulide groups (p < 0.05). COX-2 level in the NSAID-treated rats did not
return to its level in the normal control group (Table 1).
3.4 Correlation study:
The correlation study revealed that there was a significant positive correlation between gene
expression of muscle PPARα and gene expression of muscle PPARγ1 (p = 0.012, Figure 6). A significant
negative correlation was observed between gene expression of muscle PPARα and each of muscle COX-2 (p =
0.01, Figure 7) and edema (p = 0.005, Figure 8). A significant negative correlation was found between gene expression of muscle PPARγ1 and edema (p = 0.24, Fig. 9).
3.5 Histopathological examination of rat muscle
Normal control group showed normal muscle fibers without inflammation (Figure 10A). Carrageenan-
inflamed muscle showed moderate (++) to severe (+++) inflammation in between muscle fibers in the form of
leukocytes, also there is dilatation and thickening of blood vessels (Fig. 10B).
Celecoxib treated rats showed mild (+) inflammation as the number of leukocytes was less than its
number in carrageenan untreated group. The muscle fibers are normal without necrosis (Fig. 10C). Nimesulide
treated rats showed mild (+) to moderate (++) inflammation with tissue granulation; the muscle is intact without
necrosis (Fig. 10D). Sulindac treated rats showed moderate (++) to severe (+++) inflammation. Inflammatory
cells present in between muscle fibers with thickening and proliferation of blood vessels (Fig. 10E).
Figure (1): Effect of NSAIDs on carrageenan-induced edema in rat muscle
Data are presented as mean ± SEM, n= 9 for each group, *: significant versus Celecoxib
0
10
20
30
40
50
60
70
80
Celecoxib Nimesulide Sulindac
Mea
n of
size
of e
dem
a
*
% i
nhib
itio
n o
f ed
ema
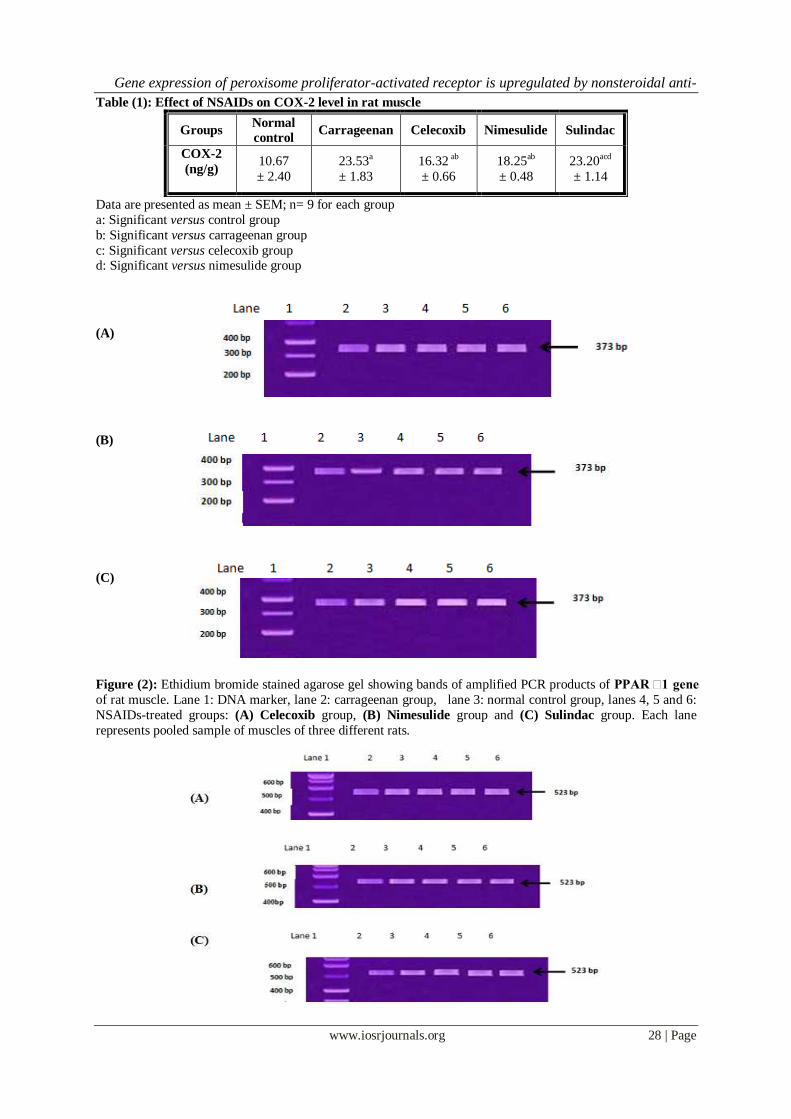
Gene expression of peroxisome proliferator-activated receptor is upregulated by nonsteroidal anti-
www.iosrjournals.org 28 | Page
Table (1): Effect of NSAIDs on COX-2 level in rat muscle
Groups Normal
control Carrageenan Celecoxib Nimesulide Sulindac
COX-2
(ng/g)
10.67
± 2.40
23.53a
± 1.83
16.32 ab
± 0.66
18.25ab
± 0.48
23.20acd
± 1.14
Data are presented as mean ± SEM; n= 9 for each group
a: Significant versus control group
b: Significant versus carrageenan group
c: Significant versus celecoxib group d: Significant versus nimesulide group
(A)
(B)
(C)
Figure (2): Ethidium bromide stained agarose gel showing bands of amplified PCR products of PPAR γ1 gene
of rat muscle. Lane 1: DNA marker, lane 2: carrageenan group, lane 3: normal control group, lanes 4, 5 and 6:
NSAIDs-treated groups: (A) Celecoxib group, (B) Nimesulide group and (C) Sulindac group. Each lane
represents pooled sample of muscles of three different rats.
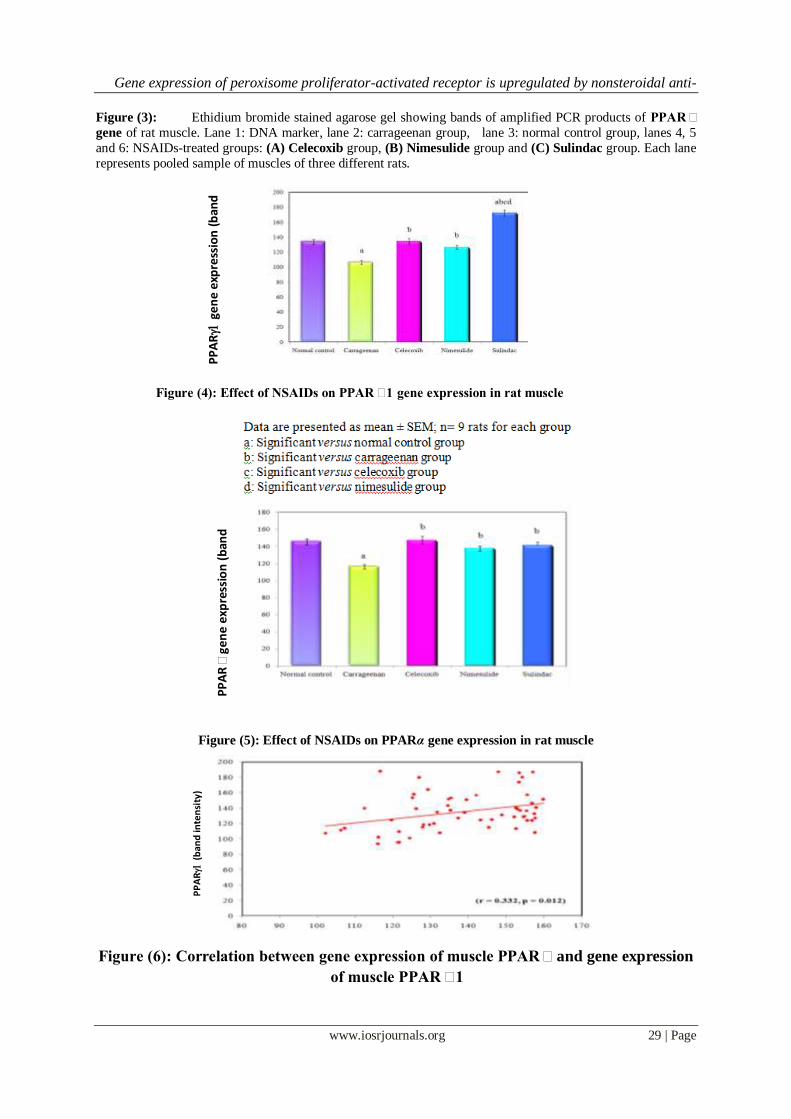
Gene expression of peroxisome proliferator-activated receptor is upregulated by nonsteroidal anti-
www.iosrjournals.org 29 | Page
Figure (3): Ethidium bromide stained agarose gel showing bands of amplified PCR products of PPAR γ
gene of rat muscle. Lane 1: DNA marker, lane 2: carrageenan group, lane 3: normal control group, lanes 4, 5
and 6: NSAIDs-treated groups: (A) Celecoxib group, (B) Nimesulide group and (C) Sulindac group. Each lane
represents pooled sample of muscles of three different rats.
Figure (4): Effect of NSAIDs on PPAR γ1 gene expression in rat muscle
Figure (5): Effect of NSAIDs on PPARα gene expression in rat muscle
Figure (6): Correlation between gene expression of muscle PPARγ and gene expression
of muscle PPAR γ1
PP
AR
ge
ne
exp
ress
ion
(b
and
inte
nsi
ty)
P
PA
Rγ
gen
e ex
pre
ssio
n (
ban
d
inte
nsi
ty)
PP
AR
(b
and
inte
nsi
ty)
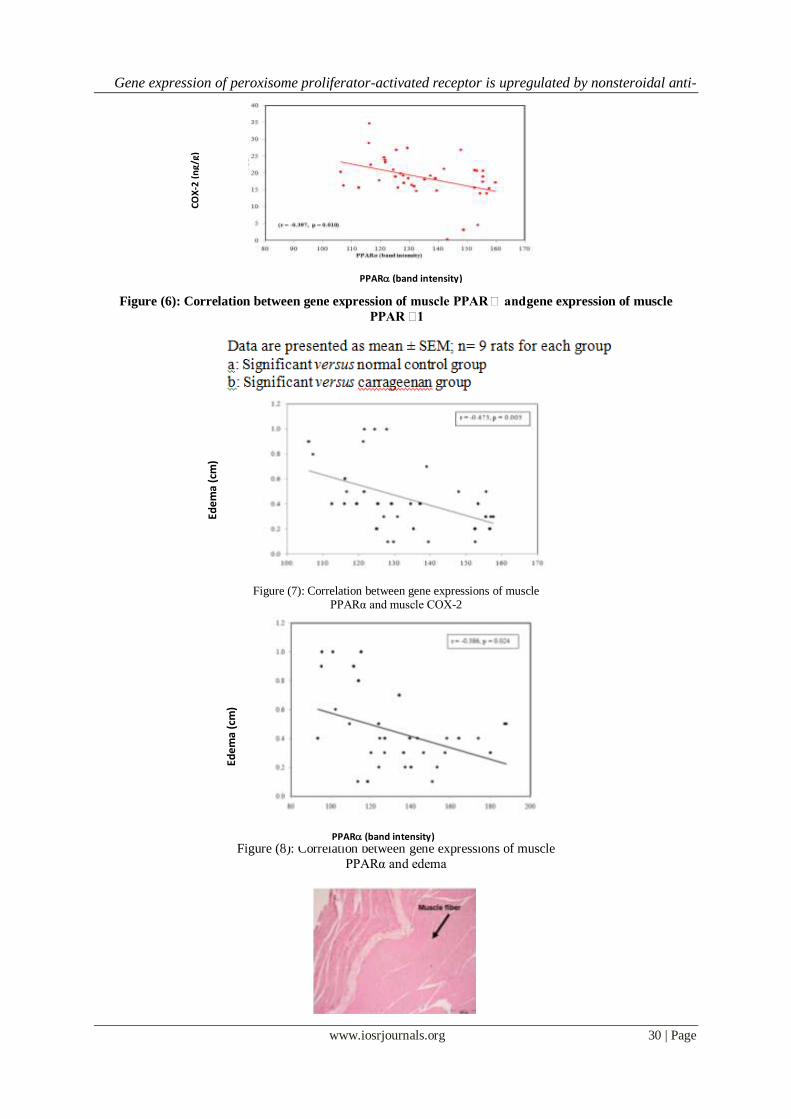
Gene expression of peroxisome proliferator-activated receptor is upregulated by nonsteroidal anti-
www.iosrjournals.org 30 | Page
Figure (6): Correlation between gene expression of muscle PPARγ and gene expression of muscle
PPAR γ1
Figure (7): Correlation between gene expressions of muscle
PPARα and muscle COX-2
Figure (8): Correlation between gene expressions of muscle
PPARα and edema
PPAR (band intensity)
PPAR (band intensity)
Edem
a (c
m)
Edem
a (c
m)
CO
X-2
(n
g/g)
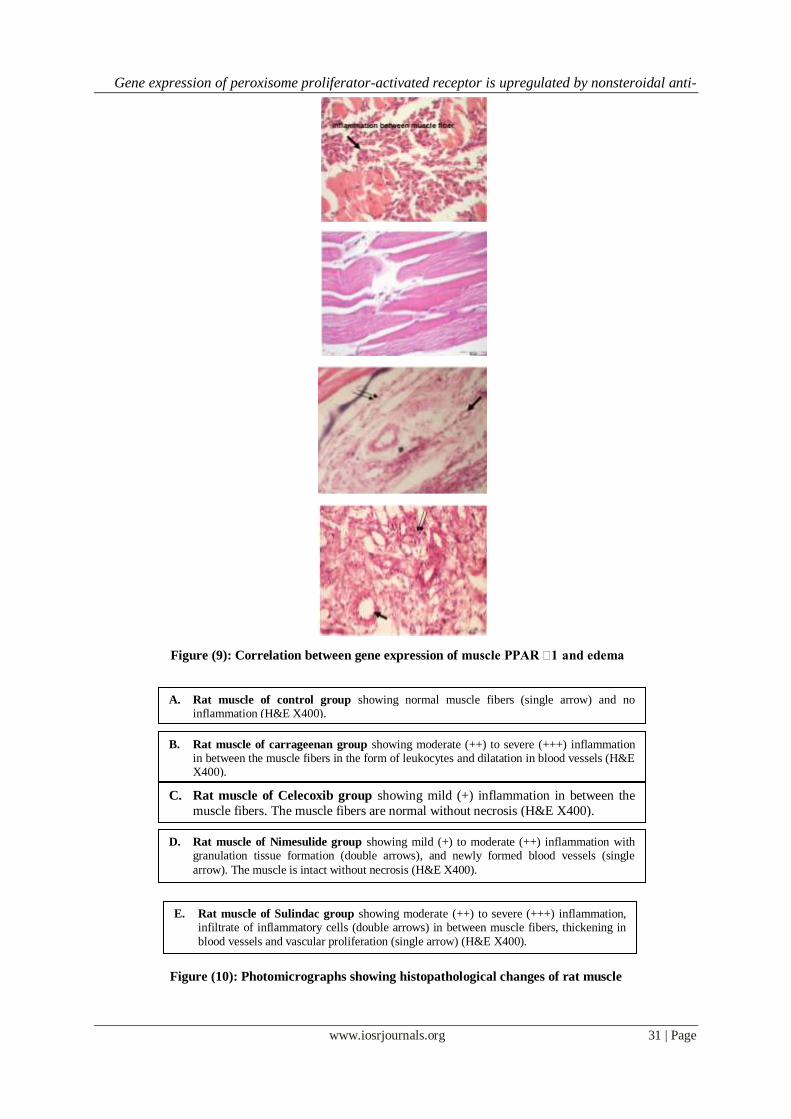
Gene expression of peroxisome proliferator-activated receptor is upregulated by nonsteroidal anti-
www.iosrjournals.org 31 | Page
Figure (9): Correlation between gene expression of muscle PPAR γ1 and edema
Figure (10): Photomicrographs showing histopathological changes of rat muscle
A. Rat muscle of control group showing normal muscle fibers (single arrow) and no inflammation (H&E X400).
B. Rat muscle of carrageenan group showing moderate (++) to severe (+++) inflammation in between the muscle fibers in the form of leukocytes and dilatation in blood vessels (H&E X400).
C. Rat muscle of Celecoxib group showing mild (+) inflammation in between the
muscle fibers. The muscle fibers are normal without necrosis (H&E X400).
D. Rat muscle of Nimesulide group showing mild (+) to moderate (++) inflammation with granulation tissue formation (double arrows), and newly formed blood vessels (single
arrow). The muscle is intact without necrosis (H&E X400).
E. Rat muscle of Sulindac group showing moderate (++) to severe (+++) inflammation, infiltrate of inflammatory cells (double arrows) in between muscle fibers, thickening in
blood vessels and vascular proliferation (single arrow) (H&E X400).
Gene expression of peroxisome proliferator-activated receptor is upregulated by nonsteroidal anti-
www.iosrjournals.org 32 | Page
IV. Discussion PPARα and PPARγ activators have been shown to induce differentiation, inhibit proliferation and
regulate apoptosis in cancer cells (17). PPARα had been proven to have anti-inflammatory and anticarcinogenic
action (18). More recent evidence implied an important role for the nuclear hormone receptor PPARγ in controlling various diseases based on its anti-inflammatory, cell cycle arresting, and proapoptotic properties
(19).
The present study was conducted to elucidate the molecular mechanism of some NSAIDs, as selective
and nonselective COX inhibitors, on gene expression of PPARα and PPARγ1 as well as COX-2 level in a rat
model of chronic inflammation.
The present results showed that injection of carrageenan into the gastrocnemius muscle of rats three
times per week produced edema with severe inflammation and histological changes in muscle fibers. Moderate
to severe inflammation was observed in the form of leukocyte infiltration and dilatation of blood vessels. These
findings were in agreement with (9), who reported that carrageenan can be used as a model of chronic
inflammatory hyperalgesia after 1–2 weeks. The carrageenan-induced inflammatory response has been linked to
neutrophil infiltration and the production of neutrophil-derived free radicals, such as superoxide, hydroxyl radicals and hydrogen peroxide (20).
Administration of NSAIDs to carrageenan-treated rats decreased the severity of inflammation and
reduced edema formation. The anti-inflammatory activity of the selected NSAIDs was arranged in the following
descending order; Celecoxib > Nimesulide > Sulindac. The histological results supported these results. The
NSAIDs exerted an anti-inflammatory effect where the muscles of rats showed mild inflammation in Celecoxib
group, mild to moderate inflammation in Nimesulide group, and moderate to severe inflammation in Sulindac
group.
The present results were in agreement with (21), who reported that Celecoxib, a selective COX-2
inhibitor, in a dose of 10 mg/kg was effective in reducing paw edema. (22) stated that Nimesulide is a multi-
factorial drug in controlling inflammation and pain. The mechanism of anti-inflammatory activity of Nimesulide
is related to the preferential inhibition of the production of COX-2 and other inflammatory mediators whose
production is controlled by stimulation of cyclic-3, 5'-adenosine monophosphate (cAMP). (23) reported that Sulindac decreased rat paw carrageenan-induced edema formation to some extent but it was not the most
effective NSAID tested for this purpose.
Measurement of COX-2 in rat muscle in the present work provided additional support. COX-2 was
greatly increased in carrageenan group compared to normal controls. The percent decrease of COX-2 in
Celecoxib group was greater than in the Nimesulide group than in the Sulindac group. These results may
attribute to that Celecoxib is a selective COX-2 inhibitor, Nimesulide is a preferential selective COX-2 inhibitor
and Sulindac is a nonselective COX inhibitor. Although COX-2 level in NSAIDs treated rats was significantly
lower than in the carrageenan-untreated group, it remained higher than the normal control values.
(24) reported that injection of carrageenan increased both edema and COX-2 mRNA level. COX-2 is
a major contributor to the inflammatory response and cancer progression and is an attractive target for molecular
imaging (25). The higher expression of COX-2 in malignant tissues is also related to nuclear factor-kB (NF-kB), which positively regulates the COX-2 gene. Sulindac and Celecoxib efficiently suppressed the activation
and the transcriptional activity of NF-kB, suggesting an anti-inflammatory role for NSAIDs in colorectal cancer
(26). COX-2 expression has often been associated with the poor response to chemotherapy. The induction of
proliferation arrest, alteration in cell cycle profile, and cell death by Nimesulide could be related to the
downregulating effect of blocking COX-2 on cell survival proteins such as VEGF and IL-10 (27).
In the present work, PPARγ1 gene expression in muscle was significantly decreased in carrageenan
group compared with control group. Treatment with NSAIDs upregulated PPARγ1, which was significantly
increased compared with carrageenan untreated group. Nimesulide and Celecoxib treated rats showed gene
expression of PPARγ1 as in the normal controls, whereas in the Sulindac treated group, PPARγ1 gene
expression was about 1.4 fold as that in the normal control group. A significant negative correlation was found
between PPARγ1 and edema. The expression levels of both PPAR and RXR mRNA have been found to be
decreased in animal model with liver inflammation, indicating that PPARγ and RXR agonists may play an important role in response to inflammation and fibrosis (28).
The present results were in line with the reports that the protein expression of PPARγ was upregulated
but COX-2 protein expression was downregulated in the Lewis lung carcinoma cells exposed to Celecoxib (29).
Another evidence was provided by the findings that Celecoxib and a PPARγ agonist, separately, inhibited COX-
2 and upregulated PPARγ expression. These effects were paralleled by inhibition of PGE2 synthesis (30). Thus
interference of the arachidonic acid pathway and upregulation of PPARγ simultaneously by Celecoxib have
demonstrated great promise in cancer chemoprevention and treatment. In contrast, other studies showed that
Celecoxib had no significant effect on PPARγ expression in hepatic stellate cells (31).
The upregulation of PPARγ1 by Nimesulide in the present work was confirmed by the work of (32), who found
an intense immunohistochemical staining for PPAR-γ in tumor tissue sections from Nimesulide-treated group as
Gene expression of peroxisome proliferator-activated receptor is upregulated by nonsteroidal anti-
www.iosrjournals.org 33 | Page
compared with the negligible expression in control tumor. Our findings also revealed that Sulindac was a potent
inducer of PPARγ1 gene expression in carrageenan-treated rat muscle. These results could be explained by the
work of (33), who demonstrated that Sulindac sulfide as well as its 2′-des-methyl derivatives are potent inducers
of PPARγ, as the carboxylic side chain is required for activity; also it was found that non polar and aromatic
substituents on the benzylidene ring in Sulindac structure lead to potent PPARγ agonists.
It is generally assumed that inflammatory bowel disease-related carcinogenesis occurs as a result of chronic inflammation. Thus immunomodulation by the PPARs ligands might contribute to inhibition of colitis and colon
carcinogenesis. In addition, PPARα could suppress COX-2 induction (34). Several NSAIDs can bind to PPARα
and PPARγ and are identified as PPAR ligands; thus activation of PPARs could contribute to anti-inflammatory
effect of NSAIDs (35).
Our results showed that PPARα gene expression in muscle was significantly decreased in carrageenan-
untreated rats compared with control rat group. Treatment with NSAIDs resulted in significant increase in
PPARα gene expression compared with carrageenan-untreated group. In Celecoxib, Nimesulide and Sulindac
treated rats, the gene expression level of PPARα was returned to near its normal level in the control group. In
addition, PPAR gene expression showed a significant positive correlation with PPARγ1 gene expression and a significant negative correlation with each of edema and COX-2 level in muscle.
These results were in agreement with (36), who stated that expression of PPARα was found to be significantly
higher in cells treated with higher doses of NSAIDs as Celecoxib, Nimesulide, Sulindac and indomethacin.
Thus, PPARα mediates the cell growth modulatory effects and contributes to the mechanisms underlying the chemopreventive effects of NSAIDs.
The research conducted by (37) revealed that the pro-inflammatory cytokines IL-6, TNFα and IL-1 cause a
reduction in the expression of PPARα, and that the decrease in PPARα expression and function may contribute to the
excessive host inflammatory response. It has been documented that treatment with appropriate doses of PPARα
agonists can inhibit inflammatory diseases development (38). The antinociceptive effects of Nimesulide in
carrageenan model of inflammatory hyperalgesia may be mediated by PPARα (39).
V. Conclusion
The anti-inflammatory effect of NSAIDs was mediated by upregulation of PPARγ1 and PPARα genes. Celecoxib showed the highest potency as anti-inflammatory and COX-2 inhibition, whereas Sulindac exhibited
the greatest effect as PPARγ1 inducer. NSAIDs could be considered promising candidates for pharmacologic
treatment of tumorgenesis.
Acknowledgments
The authors would like to thank the Pathologist Ebtehal Ahmed Farrag; MSc in Pathology, Medical Technology
Center, Medical Research Institute for her cooperation and guidance in executing the histopathological work.
References [1] Manabe I (2011): Chronic inflammation links cardiovascular, metabolic and renal diseases. Circ J 75 (12): 2739 – 2748.
[2] Goljan EF (1998): Inflammation and repair. In: Pathology, W.B. Saunders, Philadelphia, pp 38-54.
[3] Franceschelli S, Moltedo O, Amodio G, Tajana G and Remondelli P (2011): In the Huh7 hepatoma cells diclofenac and
indomethacin activate differently the unfolded protein response and induce ER stress apoptosis. Open Biochem J 5: 45-51.
[4] Gene E, Calvet X, Moron A and Iglesias ML (2009): Recommendations for the use of anti-inflammatory drugs and indications for
gastrointestinal protection in emergency departments. Emergencias 21: 295-300.
[5] Chung JH, Seo AY, Chung SW, Kim MK, Leeuwenburgh C, Yu BP and Chung HY (2008): Molecular mechanism of PPAR in the
regulation of age-related inflammation. Ageing Res Rev 7 (2): 126–136.
[6] Huang W and Glass CK (2010): Nuclear receptors and inflammation control: molecular mechanisms and pathophysiological
relevance. Arterioscler Thromb Vasc Biol 30 (8): 1542-1549.
[7] Berger JP, Akiyama TE and Meinke PT (2005): PPARs: therapeutic targets for metabolic disease. Trends Pharmacol Sci 26 (5):
244–251.
[8] Kanayama T, Kobayashi N, Mamiya S, Nakanishi T and Nishikawa J (2005): Organotin compounds promote adipocyte
differentiation as agonists of the peroxisome proliferator-activated receptor gamma/retinoid X receptor pathway. Mol Pharmacol 67
(3): 766-774.
[9] Radhakrishnan R, Moore SA and Sluka KA (2003): Unilateral carrageenan injection into muscle or joint induces. Pain 104 (3):
567–577.
[10] Peter-Szabo M, Kekesi G, Nagy E, Sziver E, Benedek G and Horvath G (2007): Quantitative characterization of a repeated acute
joint inflammation model in rats. Clin Exp Pharmacol Physiol 34 (5-6): 520-526.
[11] Pinheiro RM and Calixto JB (2002): Effect of the selective COX-2 inhibitors, celecoxib and rofecoxib in rat acute models of
inflammation. Inflamm Res. 51 (12): 603-610.
[12] Kopff M, Koppf A and Kowalczyk E (2007): The effect of nonsteroidal anti-inflammatory drugs on oxidative/antioxidative balance.
Pol Merkur Lekarski 23 (135): 184-187.
[13] Giuliano F and Warner TD (1999): Ex vivo assay to determine the cyclooxygenase selective non steroidal anti-inflammatory drugs.
Br J Pharmacol 126 (8): 1824-1830.
[14] Ping YE, Zhao-jun W, Xiu-jin Z and Ya-li Z (2005): Age-related decrease in expression of peroxisome proliferator-activated
receptor α and its effects on development of dyslipidemia. Chin Med J (Eng) 118 (13): 1093-1098.
[15] Liu D, Zeng BX and Shang Y (2006): Decreased expression of peroxisome proliferator-activated receptor γ in endotoxin-induced
acute lung injury. Physiol Res 55 (3): 291-299.
Gene expression of peroxisome proliferator-activated receptor is upregulated by nonsteroidal anti-
www.iosrjournals.org 34 | Page
[16] Zhang HX, Wang Q, Zhou L, Liu LG, Yang X, Yang M, Liu YN and Li X (2009): Effects of scalp acupuncture on acute cerebral
ischemia-reperfusion injury in rats. Zhong Xi Yi Jie He Xue Bao 7 (8): 769-774. [English Abstract]
[17] Sertznig P, Seifert M, Tilgen W and Reichrath J (2008): Peroxisome proliferator-activated receptors (PPARs) and the human skin:
importance of PPARs in skin physiology and dermatologic diseases. Am J Clin Dermatol 9 (1): 15-31.
[18] Meissner M, Berlinski B, Gille J, Doll M and Kaufmann R (2011): Peroxisome proliferator activated receptor-α agonists suppress
transforming growth factor-α-induced matrix metalloproteinase-9 expression in human keratinocytes. Clin Exp Dermatol 36 (8):
911-914.
[19] Schmidt MV, Brüne B, and von Knethen A (2010): The nuclear hormone receptor PPARγ as a therapeutic target in major diseases.
ScientificWorldJournal 10: 2181–2197.
[20] Lai S, Peng WH, Huang SC, Ho YL, Huang TH, Lai ZR and Chang YS (2009): Analgesic and anti-inflammatory activities of
methanol extract from desmodium triflorum DC in mice. Am J Chin Med 37 (3): 573–588.
[21] Khayyal MT, El-Ghazaly MA, El-Hazek RM and Nada AS (2009): The effects of celecoxib, a COX-2 selective inhibitor, on acute
inflammation induced in irradiated rats. Inflammopharmacology 17 (5): 255-266.
[22] Brooks RR, Bonk KR, Decker GE and Miller KE (1985): Anti-inflammatory activity of orpanoxin administered orally and topically
to rodents. Agents Actions 16 (5): 369-376.
[23] Rainsford KD (2006): Current status of the therapeutic uses and actions of the preferential cyclo-oxygenase-2 NSAID, nimesulide.
Inflammopharmacology 14 (3-4): 120-137.
[24] Albertini R, Aimbire F, Villaverde AB, Silva JA Jr and Costa MS (2007): COX-2 mRNA expression decreases in the subplantar
muscle of rat paw subjected to carrageenan-induced inflammation after low level laser therapy. Inflamm Res 56 (6): 228-229.
[25] Uddin MJ, Crews BC, Ghebreselasie K, Huda I, Kingsley PJ, Ansari MS, Tantawy MN, Reese J and Marnett LJ (2011): Fluorinated
COX-2 inhibitors as agents in PET imaging of inflammation and cancer. Cancer Prev Res (Phila) 4 (10): 1536-1545.
[26] Vaish V and Sanyal SN (2011): Chemopreventive effects of NSAIDs on cytokines and transcription factors during the early stages
of colorectal cancer. Pharmacol Rep 63 (5): 1210-1221.
[27] Paul AG, Sharma-Walia N and Chandran B (2011): Targeting KSHV/HHV-8 latency with COX-2 selective inhibitor nimesulide: a
potential chemotherapeutic modality for primary effusion lymphoma. PLoS One 6 (9): 1-19.
[28] Yamamoto A, Kakuta H, Miyachi H and Sugimoto Y (2011): Involvement of the retinoid X receptor ligand in the anti-
Inflammatory effect induced by peroxisome proliferator-activated receptor γ agonist in vivo. PPAR Res 2011: 1-8.
[29] Zhang M, Xu ZG, Shi Z, Shao D, Lio O, Li W, Li ZJ, Wang KZ and Chen L (2011): Inhibitory effect of celecoxib in lung
carcinoma by regulation of cyclooxygenase-2/cytosolic phospholipase A₂ and peroxisome proliferator-activated receptor gamma.
Mol Cell Biochem 355 (1-2): 233-240.
[30] Badawi AF, Eldeen MB, Liu Y, Ross EA and Badr MZ (2004): Inhibition of rat mammary gland carcinogenesis by simultaneous
targeting of cyclooxygenase-2 and peroxisome proliferator-activated receptor γ. Cancer Res 64 (3): 1181–1189.
[31] Paik YH, Kim JK, Lee JI, Kang SH, Kim DY, An SH, Lee SJ, Lee DK, Han KH, Chon CY, Lee SI, Lee KS and Brenner DA
(2009): Celecoxib induces hepatic stellate cell apoptosis through inhibition of Akt activation and suppresses hepatic fibrosis in rats.
Gut 58 (11): 1517-1527.
[32] Shaik MS, Chatterjee A and Singh M (2004): Effect of a selective cyclooxygenase-2 inhibitor, nimesulide, on the growth of lung
tumors and their expression of cyclooxygenase-2 and peroxisome proliferator activated receptor-γ. Clin Cancer Res 10 (4): 1521–
1529.
[33] Felts AS, Siegel BS, Young SM, Moth CW, Lybrand TP, Dannenberg AJ, Marnett LJ and Subbaramaiah K (2008): Sulindac
derivatives that activate the peroxisome proliferator-activated receptor γ but lack cyclooxygenase inhibition. J Med Chem 51: 4911–
4919.
[34] Kohno H, Suzuki R, Sugie S and Tanaka T (2005): Suppression of colitis-related mouse colon carcinogenesis by a COX-2 inhibitor
and PPAR ligands. BMC Cancer 5 (46): 1-12.
[35] Michalik L, Auwerx J, Berger JP, Chatterjee VK, Glass CK, Gonzalez FJ, Grimaldi PA, Kadowaki T, Lazar MA, O’rahilly S,
Palmer C, Plutzky J, Reddy JK, Spiegelman BM, Staels B and Wahli W (2006): International union of pharmacology. LXI.
peroxisome proliferator-activated receptors. Pharmacol Rev 58 (4): 726–741.
[36] Foreman JE, Sorg JM, McGinnis KS,
Rigas B, Williams JL, Clapper ML, Gonzalez FJ and Peters JM (2009): Regulation of
peroxisome proliferator-activated receptor- β/δ by the APC/β-catenin pathway and nonsteroidal anti-inflammatory drugs. Mol
Carcinog 48 (10): 942-952.
[37] Reynders V, Loitsch S, Steinhauer C, Wagner T,
Steinhilber D and Bargon J (2006): Peroxisome Proliferator-Activated Receptor α
(PPARα) down-regulation in cystic fibrosis lymphocytes. Respir Res 7 (104): 1-15.
[38] Crisafulli C, Bruscoli S, Esposito E, Mazzon E, Di Paola R, Genovese T, Bramanti P, Migliorati G and Cuzzocrea S (2009): PPAR-
alpha contributes to the anti-inflammatory activity of 17-beta-estradiol. J Pharmacol Exp Ther 331 (3): 796-807.
[39] Jhaveri MD, Richardson D, Robinson I, Garle MJ, Patel A, Sun Y, Sagar DR, Bennett AJ, Alexander SP, Kendall DA, Barrett DA
and Chapman V (2008): Inhibition of fatty acid amide hydrolase and cyclooxygenase-2 increases levels of endocannabinoid related
molecules and produces analgesia via peroxisome proliferator-activated receptor-alpha in a model of inflammatory pain.
Neuropharmacology 55 (1): 85-93.
IOSR Journal of Pharmacy and Biological Sciences (IOSR-JPBS)
ISSN: 2278-3008. Volume 3, Issue 3 (Sep-Oct. 2012), PP 35-41 www.iosrjournals.org
www.iosrjournals.org 35 | Page
Kinetic Study of the Acid Hydrolysis of Parthenium hysterophorus
L. for xylose yield in the Production of Lignocellulosic ethanol
Ghosh Swati1, Haldar S
2, Shubhaneel N
3, Ganguly A
4, Chatterjee P. K
4*
1 Department of Chemistry , Institute of Engineering and Industrial Technology, Durgapur – 713212, India 2 Department of Chemical Engineering , National Institute of Technology, Durgapur – 713209, India
3Periyar University, Salem, India 4 Thermal Engineering Group, Central Mechanical Engineering Research Institute, Durgapur – 713209, India
Abstract: Parthenium hysterophorus L commonly known as Parthenium weed is one of the seven obnoxious
weed in the world. Being a lignocellulosic biomass, with a composition of Lignin: 13.9%; Hemicellulose:
21.01% and Cellulose: 27.8%, it may be considered as the potential source of fuel ethanol production though
pretreatment, saccharification and fermentation route. In the present work, efforts have been made to increase
the yield of xylose during the hydrolysis process. Hydrolysis of Parthenium hysterophorus was carried out with
1%, 3% & 5% H2SO4 solutions. Each set of biomass was allowed to soak for 1 h & 2 h for each acid
concentration. Finally the substrates were treated for up to 10 min in the temperature range of 190 - 230 oC.
The xylose yield has been studied for every set of parameters. The maximum value of xylose yield obtained is
46.41 mg/g of dry Parthenium, when hydrolysed with 5% H2SO4 at a temperature of 230 oC in 2 h soaking time and 10 min treatment time. The values of kinetic rate constants show the adherence to Arrhenius relationship
with significant changes in the concentration of acid and soaking period.
Keywords: Acid Hydrolysis, Ethanol, Lignocellulose, Parthenium pretreatment, Xylose.
I. Introduction Energy consumption has increased drastically during the last century since more countries have
become industrialized to meet up increasing public demand. Crude oil is one of the major resources to meet the
increased energy demand. Campbell and Laherrere (1998) investigated to estimate the current known crude oil
reserves and the reserves as yet undiscovered and predicted that annual global oil production would decline
from the current 25 billion barrels to approximately 5 billion barrels in 2050. So it is essential to find out the alternative energy sources. Unlike fossil fuels, ethanol is a renewable energy source produced though
fermentation of sugars. Ethanol can be used as a partial gasoline replacement. Fuel ethanol, produced from corn,
has been used in gasohol or oxygenated fuels since the 1980s. These gasoline fuels contain up to 10% ethanol
by volume.
A potential source for low-cost ethanol production is to utilize lignocellulosic materials such as crop
residues, grasses, sawdust, wood chips, and solid animal waste. Extensive research has been done on conversion
of lignocellulosic materials to ethanol in the last two decades. The lignocellulosic conversion involves two
processes: hydrolysis of cellulose in the lignocellulosic materials to fermentable reducing sugars, and
fermentation of the sugars to ethanol. The hydrolysis is usually governed by cellulase enzymes catalyst and the
fermentation is carried out by yeasts or bacteria. The factors on which the hydrolysis depends are porosity
(accessible surface area) of the materials, cellulose fiber crystallinity, and lignin and hemicellulose content of the lignocellulosic biomass. The presence of lignin and hemicelluloses hinder the accessibility of cellulase
enzymes to cellulose, thus reduces the efficiency of the hydrolysis. The effect of pretreatment of lignocellulosic
materials has been recognized for a long time. The purpose of the pretreatment is to remove lignin and
hemicellulose, reduce cellulose crystallinity, and increase the porosity of the materials. Pretreatment must meet
the following requirements: (1) improve the formation of sugars or the ability to subsequently form sugars by
enzymatic hydrolysis; (2) avoid the degradation or loss of carbohydrate; (3) avoid the formation of by products
inhibitory to the subsequent hydrolysis and fermentation processes; and (4) be cost-effective. Physical, physico-
chemical, chemical, and biological processes have been used for pretreatment of lignocellulosic materials [1].
Parthenium hysterophorus L commonly known as Parthenium weed, also known as congress grass,
carrot weed, star weed, feverfew, white top, chatak chandani, bitter weed, ramphool, garghas depending on the
country and area infested. This weed causes allergic respiratory problems, contact dermatitis, mutagenicity in
human being and livestock. Biodiversity and crop production is remarkably reduced owing to its allelopathy and aggressiveness. The pollen is also reported to have allelopathic activity and has inhibited development of fruit
on brinjal, tomato, chilli, when artificially disted on stigatic surface of these plants [2].
Parthenium hysterophorus is able to grow on a wide range of soil types ranging from sandy to heavy
clays but growth is better in later type of soil. It occurs in areas with summer rainfall greater than 500 mm per
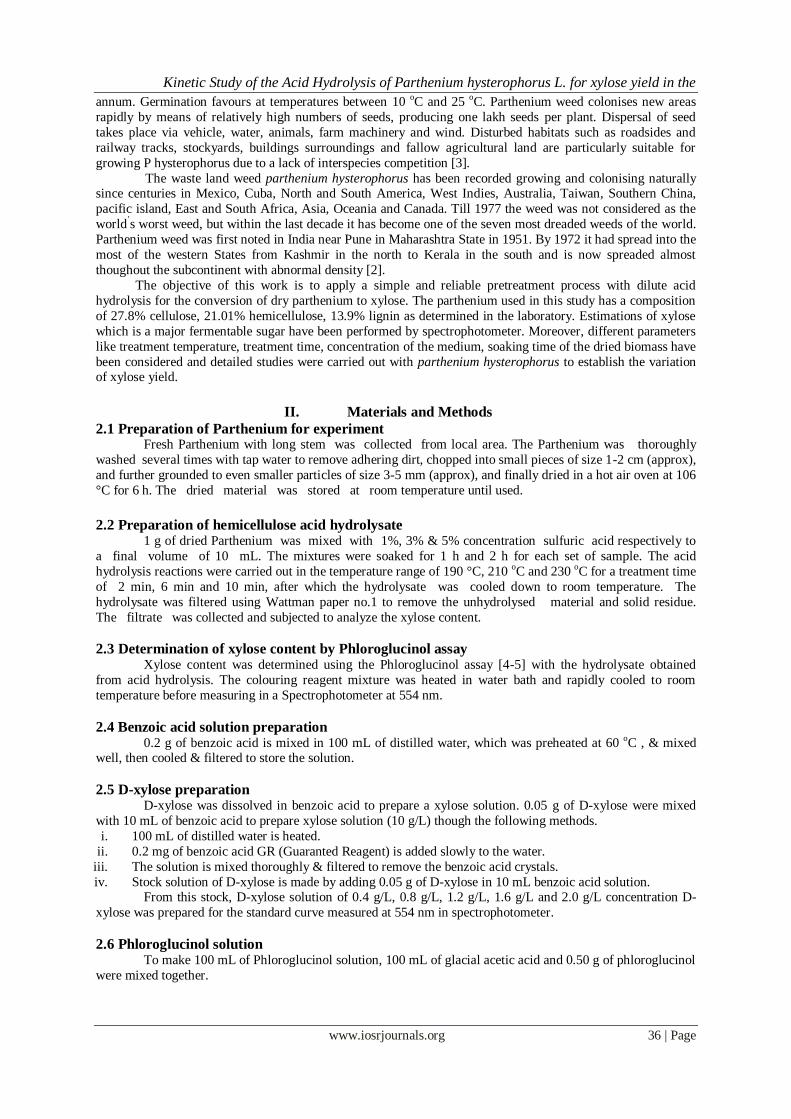
Kinetic Study of the Acid Hydrolysis of Parthenium hysterophorus L. for xylose yield in the
www.iosrjournals.org 36 | Page
annum. Germination favours at temperatures between 10 oC and 25 oC. Parthenium weed colonises new areas
rapidly by means of relatively high numbers of seeds, producing one lakh seeds per plant. Dispersal of seed
takes place via vehicle, water, animals, farm machinery and wind. Disturbed habitats such as roadsides and
railway tracks, stockyards, buildings surroundings and fallow agricultural land are particularly suitable for
growing P hysterophorus due to a lack of interspecies competition [3].
The waste land weed parthenium hysterophorus has been recorded growing and colonising naturally since centuries in Mexico, Cuba, North and South America, West Indies, Australia, Taiwan, Southern China,
pacific island, East and South Africa, Asia, Oceania and Canada. Till 1977 the weed was not considered as the
world’s worst weed, but within the last decade it has become one of the seven most dreaded weeds of the world.
Parthenium weed was first noted in India near Pune in Maharashtra State in 1951. By 1972 it had spread into the
most of the western States from Kashmir in the north to Kerala in the south and is now spreaded almost
thoughout the subcontinent with abnormal density [2].
The objective of this work is to apply a simple and reliable pretreatment process with dilute acid
hydrolysis for the conversion of dry parthenium to xylose. The parthenium used in this study has a composition
of 27.8% cellulose, 21.01% hemicellulose, 13.9% lignin as determined in the laboratory. Estimations of xylose
which is a major fermentable sugar have been performed by spectrophotometer. Moreover, different parameters
like treatment temperature, treatment time, concentration of the medium, soaking time of the dried biomass have
been considered and detailed studies were carried out with parthenium hysterophorus to establish the variation of xylose yield.
II. Materials and Methods
2.1 Preparation of Parthenium for experiment Fresh Parthenium with long stem was collected from local area. The Parthenium was thoroughly
washed several times with tap water to remove adhering dirt, chopped into small pieces of size 1-2 cm (approx),
and further grounded to even smaller particles of size 3-5 mm (approx), and finally dried in a hot air oven at 106
°C for 6 h. The dried material was stored at room temperature until used.
2.2 Preparation of hemicellulose acid hydrolysate
1 g of dried Parthenium was mixed with 1%, 3% & 5% concentration sulfuric acid respectively to
a final volume of 10 mL. The mixtures were soaked for 1 h and 2 h for each set of sample. The acid
hydrolysis reactions were carried out in the temperature range of 190 °C, 210 oC and 230 oC for a treatment time
of 2 min, 6 min and 10 min, after which the hydrolysate was cooled down to room temperature. The
hydrolysate was filtered using Wattman paper no.1 to remove the unhydrolysed material and solid residue.
The filtrate was collected and subjected to analyze the xylose content.
2.3 Determination of xylose content by Phloroglucinol assay Xylose content was determined using the Phloroglucinol assay [4-5] with the hydrolysate obtained
from acid hydrolysis. The colouring reagent mixture was heated in water bath and rapidly cooled to room
temperature before measuring in a Spectrophotometer at 554 nm.
2.4 Benzoic acid solution preparation 0.2 g of benzoic acid is mixed in 100 mL of distilled water, which was preheated at 60 oC , & mixed
well, then cooled & filtered to store the solution.
2.5 D-xylose preparation D-xylose was dissolved in benzoic acid to prepare a xylose solution. 0.05 g of D-xylose were mixed
with 10 mL of benzoic acid to prepare xylose solution (10 g/L) though the following methods.
i. 100 mL of distilled water is heated.
ii. 0.2 mg of benzoic acid GR (Guaranted Reagent) is added slowly to the water.
iii. The solution is mixed thoroughly & filtered to remove the benzoic acid crystals.
iv. Stock solution of D-xylose is made by adding 0.05 g of D-xylose in 10 mL benzoic acid solution. From this stock, D-xylose solution of 0.4 g/L, 0.8 g/L, 1.2 g/L, 1.6 g/L and 2.0 g/L concentration D-
xylose was prepared for the standard curve measured at 554 nm in spectrophotometer.
2.6 Phloroglucinol solution To make 100 mL of Phloroglucinol solution, 100 mL of glacial acetic acid and 0.50 g of phloroglucinol
were mixed together.
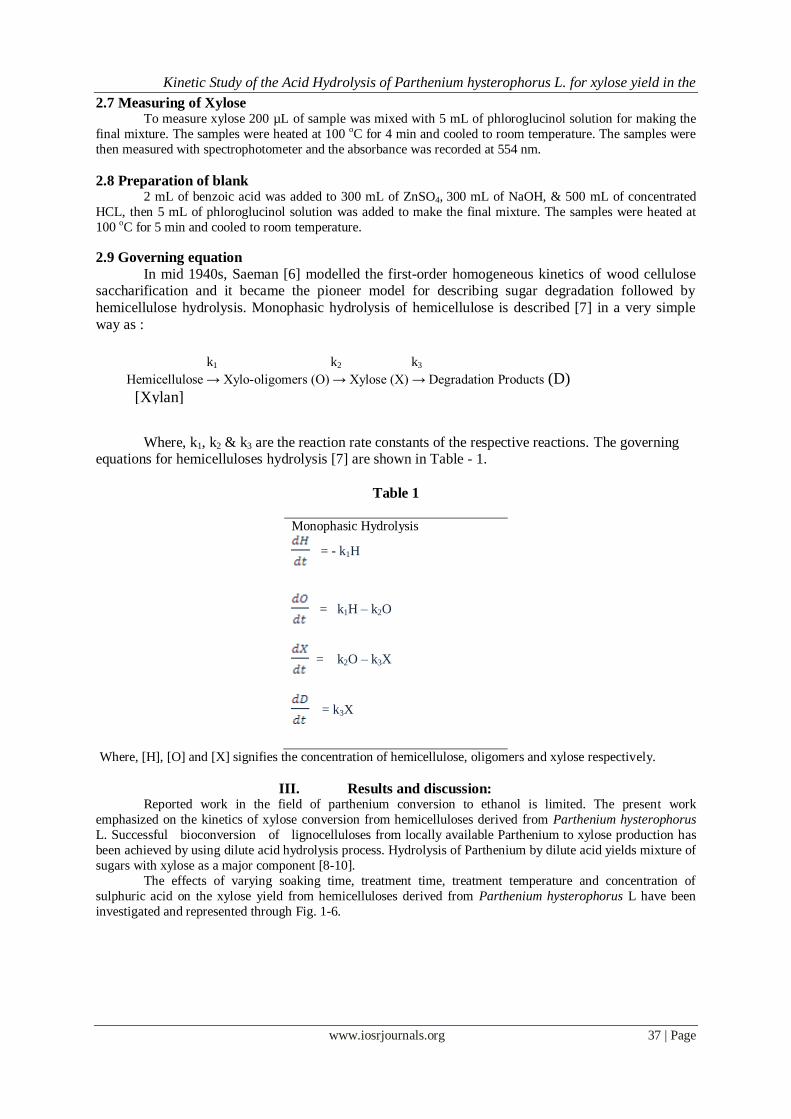
Kinetic Study of the Acid Hydrolysis of Parthenium hysterophorus L. for xylose yield in the
www.iosrjournals.org 37 | Page
2.7 Measuring of Xylose To measure xylose 200 µL of sample was mixed with 5 mL of phloroglucinol solution for making the
final mixture. The samples were heated at 100 oC for 4 min and cooled to room temperature. The samples were
then measured with spectrophotometer and the absorbance was recorded at 554 nm.
2.8 Preparation of blank 2 mL of benzoic acid was added to 300 mL of ZnSO4, 300 mL of NaOH, & 500 mL of concentrated
HCL, then 5 mL of phloroglucinol solution was added to make the final mixture. The samples were heated at
100 oC for 5 min and cooled to room temperature.
2.9 Governing equation
In mid 1940s, Saeman [6] modelled the first-order homogeneous kinetics of wood cellulose saccharification and it became the pioneer model for describing sugar degradation followed by
hemicellulose hydrolysis. Monophasic hydrolysis of hemicellulose is described [7] in a very simple
way as :
Where, k1, k2 & k3 are the reaction rate constants of the respective reactions. The governing equations for hemicelluloses hydrolysis [7] are shown in Table - 1.
Table 1
Monophasic Hydrolysis
= - k1H
= k1H – k2O
= k2O – k3X
= k3X
Where, [H], [O] and [X] signifies the concentration of hemicellulose, oligomers and xylose respectively.
III. Results and discussion: Reported work in the field of parthenium conversion to ethanol is limited. The present work
emphasized on the kinetics of xylose conversion from hemicelluloses derived from Parthenium hysterophorus
L. Successful bioconversion of lignocelluloses from locally available Parthenium to xylose production has
been achieved by using dilute acid hydrolysis process. Hydrolysis of Parthenium by dilute acid yields mixture of
sugars with xylose as a major component [8-10].
The effects of varying soaking time, treatment time, treatment temperature and concentration of
sulphuric acid on the xylose yield from hemicelluloses derived from Parthenium hysterophorus L have been
investigated and represented through Fig. 1-6.
k1 k2 k3
Hemicellulose → Xylo-oligomers (O) → Xylose (X) → Degradation Products (D)
[Xylan]
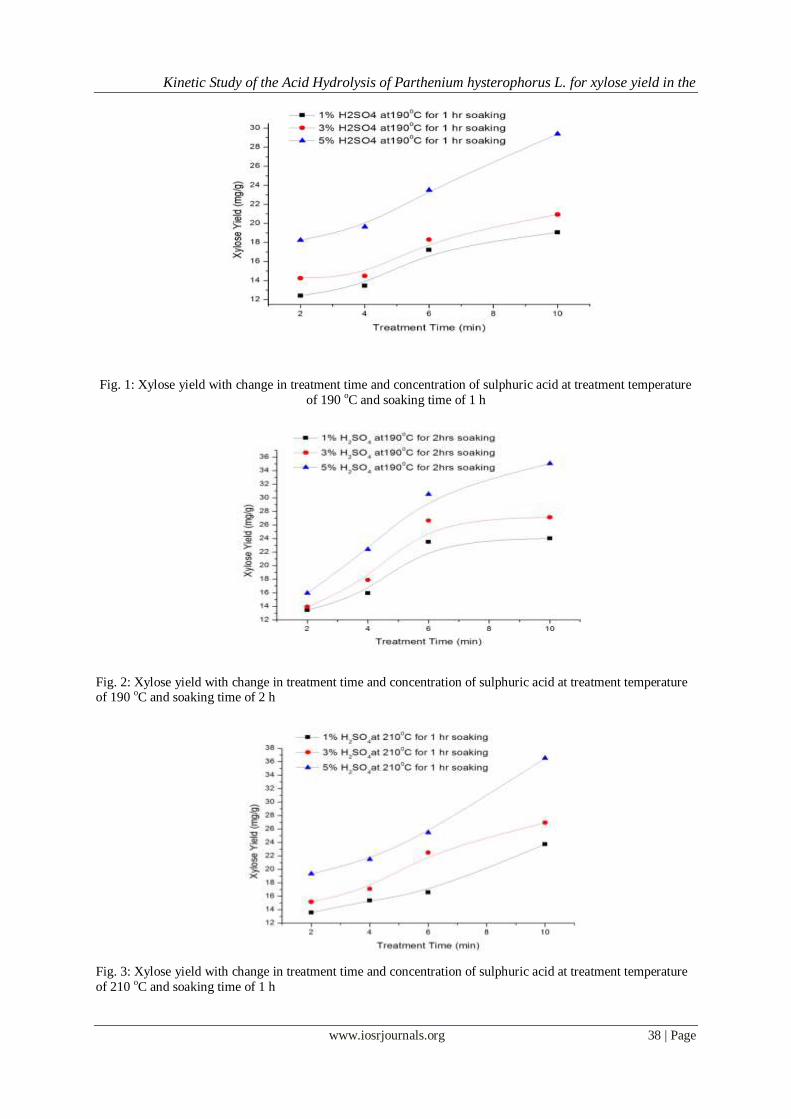
Kinetic Study of the Acid Hydrolysis of Parthenium hysterophorus L. for xylose yield in the
www.iosrjournals.org 38 | Page
Fig. 1: Xylose yield with change in treatment time and concentration of sulphuric acid at treatment temperature
of 190 oC and soaking time of 1 h
Fig. 2: Xylose yield with change in treatment time and concentration of sulphuric acid at treatment temperature of 190 oC and soaking time of 2 h
Fig. 3: Xylose yield with change in treatment time and concentration of sulphuric acid at treatment temperature
of 210 oC and soaking time of 1 h
Kinetic Study of the Acid Hydrolysis of Parthenium hysterophorus L. for xylose yield in the
www.iosrjournals.org 39 | Page
Fig. 4: Xylose yield with change in treatment time and concentration of sulphuric acid at treatment temperature
of 210 oC and soaking time of 2 h
Fig. 5: Xylose yield with change in treatment time and concentration of sulphuric acid at treatment temperature
of 230 oC and soaking time of 1 h
Fig. 6: Xylose yield with change in treatment time and concentration of sulphuric acid at treatment temperature
of 230 oC and soaking time of 2 h
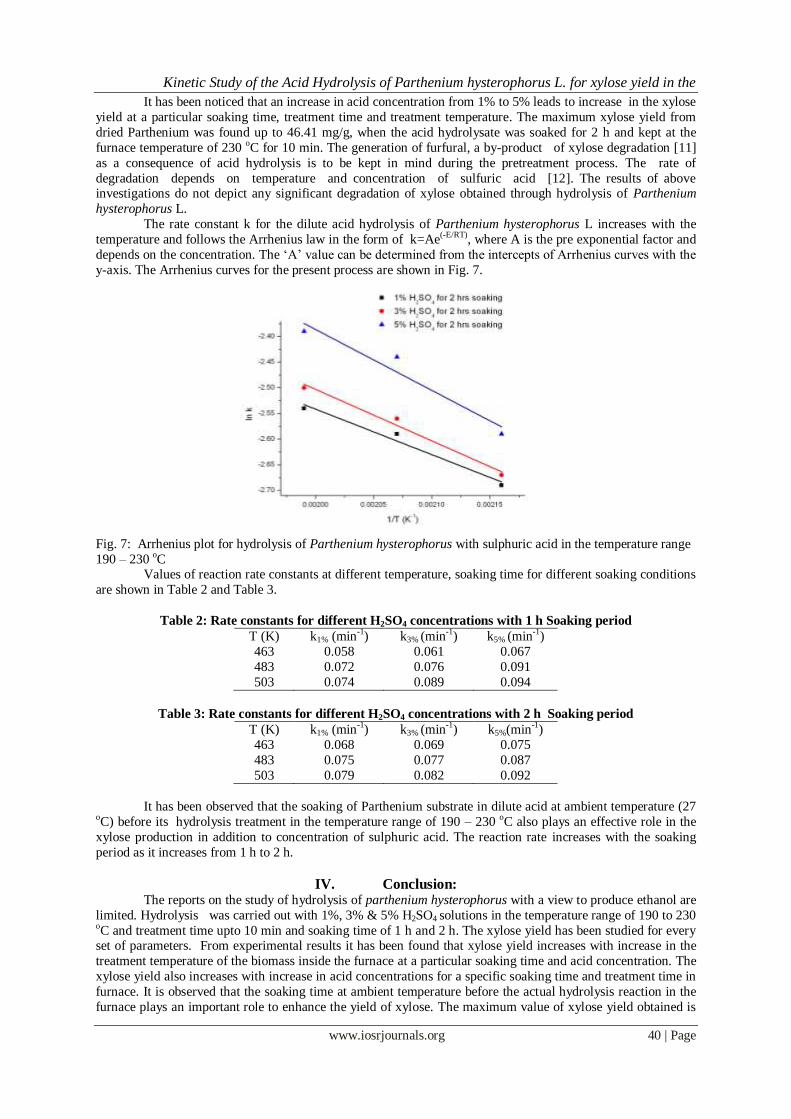
Kinetic Study of the Acid Hydrolysis of Parthenium hysterophorus L. for xylose yield in the
www.iosrjournals.org 40 | Page
It has been noticed that an increase in acid concentration from 1% to 5% leads to increase in the xylose
yield at a particular soaking time, treatment time and treatment temperature. The maximum xylose yield from
dried Parthenium was found up to 46.41 mg/g, when the acid hydrolysate was soaked for 2 h and kept at the
furnace temperature of 230 oC for 10 min. The generation of furfural, a by-product of xylose degradation [11]
as a consequence of acid hydrolysis is to be kept in mind during the pretreatment process. The rate of
degradation depends on temperature and concentration of sulfuric acid [12]. The results of above investigations do not depict any significant degradation of xylose obtained through hydrolysis of Parthenium
hysterophorus L.
The rate constant k for the dilute acid hydrolysis of Parthenium hysterophorus L increases with the
temperature and follows the Arrhenius law in the form of k=Ae(-E/RT), where A is the pre exponential factor and
depends on the concentration. The ‘A’ value can be determined from the intercepts of Arrhenius curves with the
y-axis. The Arrhenius curves for the present process are shown in Fig. 7.
Fig. 7: Arrhenius plot for hydrolysis of Parthenium hysterophorus with sulphuric acid in the temperature range
190 – 230 oC Values of reaction rate constants at different temperature, soaking time for different soaking conditions
are shown in Table 2 and Table 3.
Table 2: Rate constants for different H2SO4 concentrations with 1 h Soaking period
T (K) k1% (min-1) k3% (min-1) k5% (min-1)
463 0.058 0.061 0.067
483 0.072 0.076 0.091
503 0.074 0.089 0.094
Table 3: Rate constants for different H2SO4 concentrations with 2 h Soaking period
T (K) k1% (min-1) k3% (min-1) k5%(min-1)
463 0.068 0.069 0.075
483 0.075 0.077 0.087
503 0.079 0.082 0.092
It has been observed that the soaking of Parthenium substrate in dilute acid at ambient temperature (27
oC) before its hydrolysis treatment in the temperature range of 190 – 230 oC also plays an effective role in the
xylose production in addition to concentration of sulphuric acid. The reaction rate increases with the soaking
period as it increases from 1 h to 2 h.
IV. Conclusion: The reports on the study of hydrolysis of parthenium hysterophorus with a view to produce ethanol are
limited. Hydrolysis was carried out with 1%, 3% & 5% H2SO4 solutions in the temperature range of 190 to 230 oC and treatment time upto 10 min and soaking time of 1 h and 2 h. The xylose yield has been studied for every set of parameters. From experimental results it has been found that xylose yield increases with increase in the
treatment temperature of the biomass inside the furnace at a particular soaking time and acid concentration. The
xylose yield also increases with increase in acid concentrations for a specific soaking time and treatment time in
furnace. It is observed that the soaking time at ambient temperature before the actual hydrolysis reaction in the
furnace plays an important role to enhance the yield of xylose. The maximum value of xylose yield obtained is
Kinetic Study of the Acid Hydrolysis of Parthenium hysterophorus L. for xylose yield in the
www.iosrjournals.org 41 | Page
around 46.41 mg/g of dry Parthenium, when hydrolysed with 5% H2SO4 at a temperature of 230 oC with 2 h
soaking time and 10 min treatment time. The reaction rate for hydrolysis is more for higher soaking period. The
present work will encourage the researchers to explore the potential of one of the most obnoxious weed,
Parthenium Hysterophorus L for the generation of green fuel ethanol. Regression of kinetic data may be taken
up as future work for optimization of parameters affecting the production of xylose from parthenium
hysterophorus L.
Acknowledgements:
Authors wish to thank Director, CSIR Central Mechanical Engineering Research Institute, Durgapur
for his constant support, encouragement and permission to publish this paper.
References: [1] Y. Sun and J. Cheng, Hydrolysis of lignocellulosic materials for ethanol production: a review, Bioresource Technology 83, 2002,
1-11.
[2] M. Mahadevappa, Parthenium hysterophorus. L – A Dreaded Weed, International Parthenium research News, 1(1), 2008.
[3] A. J. Mcconnachie, L. W. Strathie, W. Mersie, L. Gebrehiwot, K. Zewdie, A. Abdurehim, B. Abrha, T. Arrrraya, F. Asaregew,
F. Assefa, R. Gebre-Tsadik, L. Nigatu, B. Tadesse and T. Tana, Current and potential geographical distribution of the invasive
plant Parthenium hysterophorus (Asteraceae) in eastern and southern Africa, Weed Research, 51(1), 2011, 71-84.
[4] T. J. Eberts, R. H. Sample, M. R. Glick and G. H. Ellis, A simplified colorimetric micromethod for xylose in serum or urine,
with phloroglucinol, Clin Chem. 25, 1979, 1440-1443.
[5] S. L. Johnson Bliss M, Mayersohn and K. A. Conrad, Phloroglucinol-based colorimetry of xylose in plasma and urine compared
with a specific gas-chomatographic procedure, Clin Chem. 30, 1984, 1571-1574.
[6] J. F. Saeman, Kinetics of wood saccharificarion hydrolysis of cellulose and decomposition of sugar in dilute acid at high
temperature, Industrial and Engg. Chem. 37(1), 1945, 43-52.
[7] C. Pronyk and G. Mazza, Kinetic Modeling of Hemicellulose Hydrolysis from Triticale Straw in a Pressurized Low Polarity
Water Flow-Though Reactor, Ind Eng Chem. 49, 2010, 6367 – 6375.
[8] I. C. Roberto, I. M. Mancilha, C. A. Souza, M. G. A. Felipe, S. Sato and H. F. Castro, Evaluation of rice straw hemicellulose
hydrolysate in the production of xylitol by Candida guilliermondii, Biotechnol Lett. 16, 1994, 1211-1216.
[9] R. Elander and T. Hsu, Processing and economic impacts of biomass delignification for ethanol production, Appl Microbiol
Biotechnol, 51, 1995, 463-478.
[10] Jr A. Pessoa, I. M. Mancilha and S. Sato, Acid hydrolysis of hemicellulose from sugarcane bagasse, Braz J Chem Eng., 14(3),
1997, doi: 10.1590/S0104-66321997000300-013.
[11] M. Ackerson, M. Ziobro and J. L. Gaddy, Two-stage acid hydrolysis of biomass, Biotechnol Bioeng Symp, 11, 1981, 103-
112.
[12] G. Gonzales, J. Lopes-Santin, G. Caminal and C. Sola, Dilute acid hydrolysis of wheat straw hemicellulose at moderate
temperature: a simplified kinetic model, Biotechnol Bioeng, 28, 1986, 288-293.
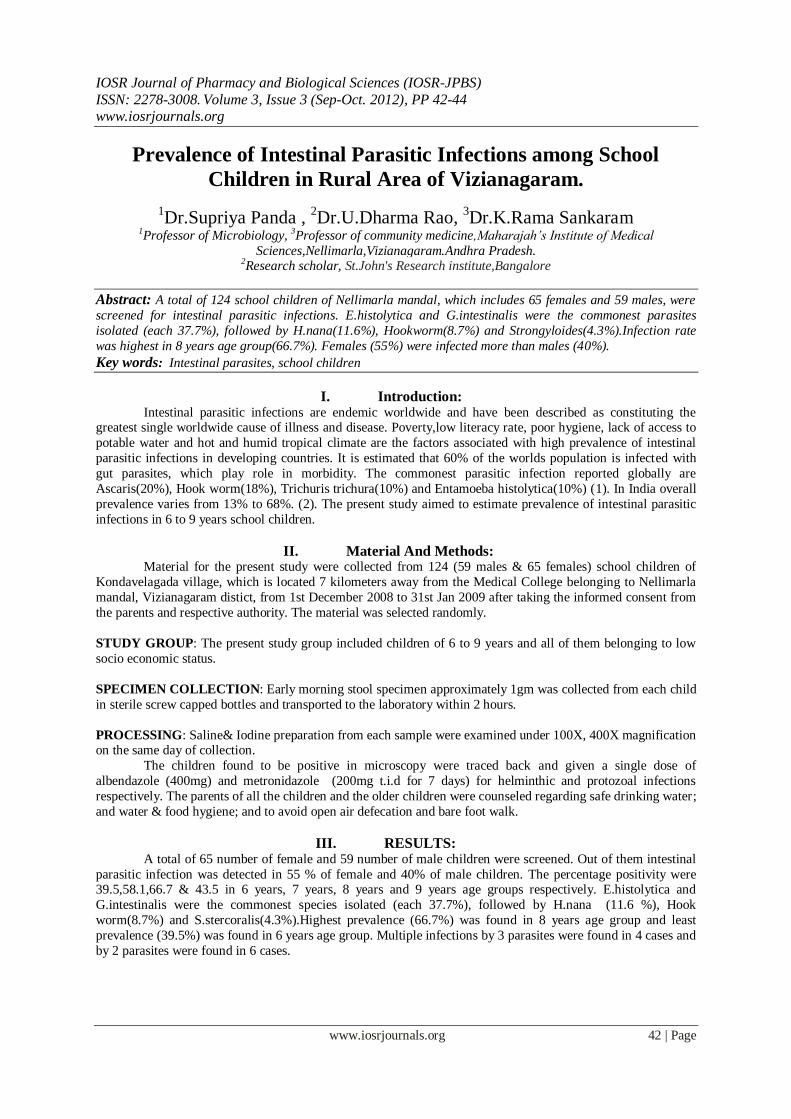
IOSR Journal of Pharmacy and Biological Sciences (IOSR-JPBS)
ISSN: 2278-3008. Volume 3, Issue 3 (Sep-Oct. 2012), PP 42-44 www.iosrjournals.org
www.iosrjournals.org 42 | Page
Prevalence of Intestinal Parasitic Infections among School
Children in Rural Area of Vizianagaram.
1Dr.Supriya Panda ,
2Dr.U.Dharma Rao,
3Dr.K.Rama Sankaram
1Professor of Microbiology, 3Professor of community medicine,Maharajah’s Institute of Medical
Sciences,Nellimarla,Vizianagaram.Andhra Pradesh. 2Research scholar, St.John's Research institute,Bangalore
Abstract: A total of 124 school children of Nellimarla mandal, which includes 65 females and 59 males, were
screened for intestinal parasitic infections. E.histolytica and G.intestinalis were the commonest parasites
isolated (each 37.7%), followed by H.nana(11.6%), Hookworm(8.7%) and Strongyloides(4.3%).Infection rate
was highest in 8 years age group(66.7%). Females (55%) were infected more than males (40%).
Key words: Intestinal parasites, school children
I. Introduction: Intestinal parasitic infections are endemic worldwide and have been described as constituting the
greatest single worldwide cause of illness and disease. Poverty,low literacy rate, poor hygiene, lack of access to
potable water and hot and humid tropical climate are the factors associated with high prevalence of intestinal
parasitic infections in developing countries. It is estimated that 60% of the worlds population is infected with
gut parasites, which play role in morbidity. The commonest parasitic infection reported globally are
Ascaris(20%), Hook worm(18%), Trichuris trichura(10%) and Entamoeba histolytica(10%) (1). In India overall
prevalence varies from 13% to 68%. (2). The present study aimed to estimate prevalence of intestinal parasitic
infections in 6 to 9 years school children.
II. Material And Methods: Material for the present study were collected from 124 (59 males & 65 females) school children of
Kondavelagada village, which is located 7 kilometers away from the Medical College belonging to Nellimarla
mandal, Vizianagaram distict, from 1st December 2008 to 31st Jan 2009 after taking the informed consent from
the parents and respective authority. The material was selected randomly.
STUDY GROUP: The present study group included children of 6 to 9 years and all of them belonging to low
socio economic status.
SPECIMEN COLLECTION: Early morning stool specimen approximately 1gm was collected from each child
in sterile screw capped bottles and transported to the laboratory within 2 hours.
PROCESSING: Saline& Iodine preparation from each sample were examined under 100X, 400X magnification on the same day of collection.
The children found to be positive in microscopy were traced back and given a single dose of
albendazole (400mg) and metronidazole (200mg t.i.d for 7 days) for helminthic and protozoal infections
respectively. The parents of all the children and the older children were counseled regarding safe drinking water;
and water & food hygiene; and to avoid open air defecation and bare foot walk.
III. RESULTS: A total of 65 number of female and 59 number of male children were screened. Out of them intestinal
parasitic infection was detected in 55 % of female and 40% of male children. The percentage positivity were 39.5,58.1,66.7 & 43.5 in 6 years, 7 years, 8 years and 9 years age groups respectively. E.histolytica and
G.intestinalis were the commonest species isolated (each 37.7%), followed by H.nana (11.6 %), Hook
worm(8.7%) and S.stercoralis(4.3%).Highest prevalence (66.7%) was found in 8 years age group and least
prevalence (39.5%) was found in 6 years age group. Multiple infections by 3 parasites were found in 4 cases and
by 2 parasites were found in 6 cases.
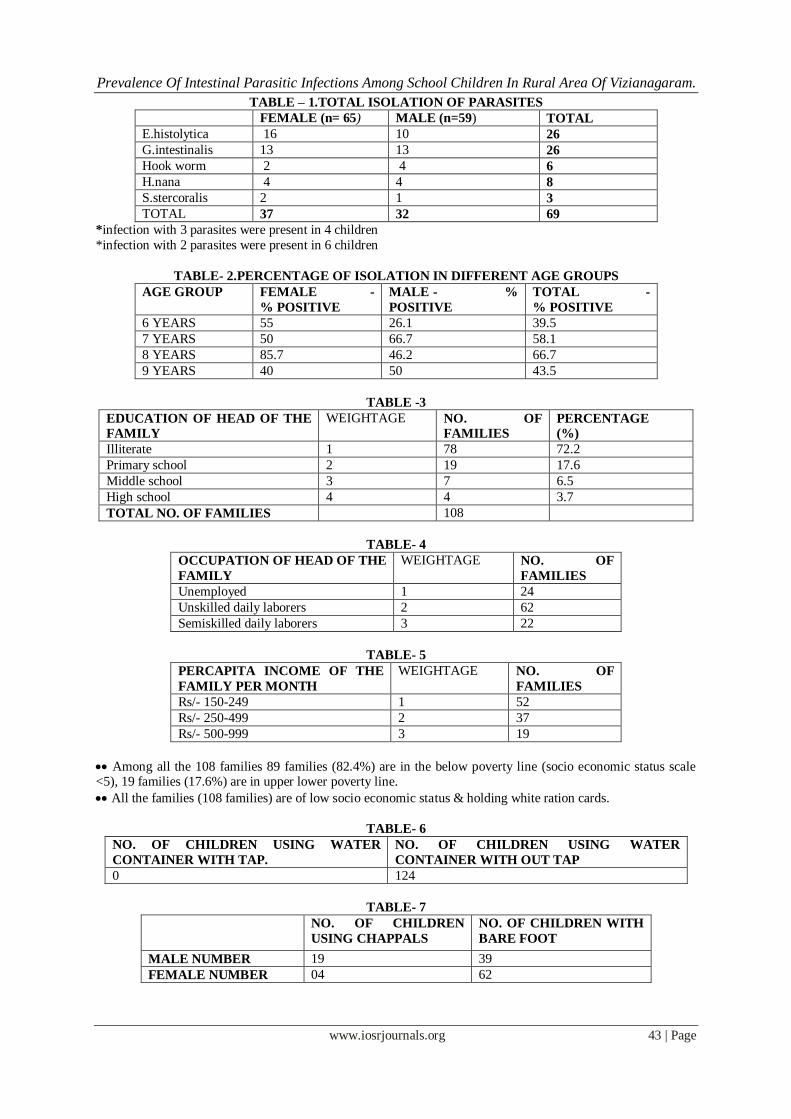
Prevalence Of Intestinal Parasitic Infections Among School Children In Rural Area Of Vizianagaram.
www.iosrjournals.org 43 | Page
TABLE – 1.TOTAL ISOLATION OF PARASITES
FEMALE (n= 65) MALE (n=59) TOTAL
E.histolytica 16 10 26
G.intestinalis 13 13 26
Hook worm 2 4 6
H.nana 4 4 8
S.stercoralis 2 1 3
TOTAL 37 32 69
*infection with 3 parasites were present in 4 children
*infection with 2 parasites were present in 6 children
TABLE- 2.PERCENTAGE OF ISOLATION IN DIFFERENT AGE GROUPS
AGE GROUP FEMALE -
% POSITIVE
MALE - %
POSITIVE
TOTAL -
% POSITIVE
6 YEARS 55 26.1 39.5
7 YEARS 50 66.7 58.1
8 YEARS 85.7 46.2 66.7
9 YEARS 40 50 43.5
TABLE -3
EDUCATION OF HEAD OF THE
FAMILY
WEIGHTAGE NO. OF
FAMILIES
PERCENTAGE
(%)
Illiterate 1 78 72.2
Primary school 2 19 17.6
Middle school 3 7 6.5
High school 4 4 3.7
TOTAL NO. OF FAMILIES 108
TABLE- 4
OCCUPATION OF HEAD OF THE
FAMILY
WEIGHTAGE NO. OF
FAMILIES
Unemployed 1 24
Unskilled daily laborers 2 62
Semiskilled daily laborers 3 22
TABLE- 5
PERCAPITA INCOME OF THE
FAMILY PER MONTH
WEIGHTAGE NO. OF
FAMILIES
Rs/- 150-249 1 52
Rs/- 250-499 2 37
Rs/- 500-999 3 19
Among all the 108 families 89 families (82.4%) are in the below poverty line (socio economic status scale <5), 19 families (17.6%) are in upper lower poverty line.
All the families (108 families) are of low socio economic status & holding white ration cards.
TABLE- 6
NO. OF CHILDREN USING WATER
CONTAINER WITH TAP.
NO. OF CHILDREN USING WATER
CONTAINER WITH OUT TAP
0 124
TABLE- 7
NO. OF CHILDREN
USING CHAPPALS
NO. OF CHILDREN WITH
BARE FOOT
MALE NUMBER 19 39
FEMALE NUMBER 04 62
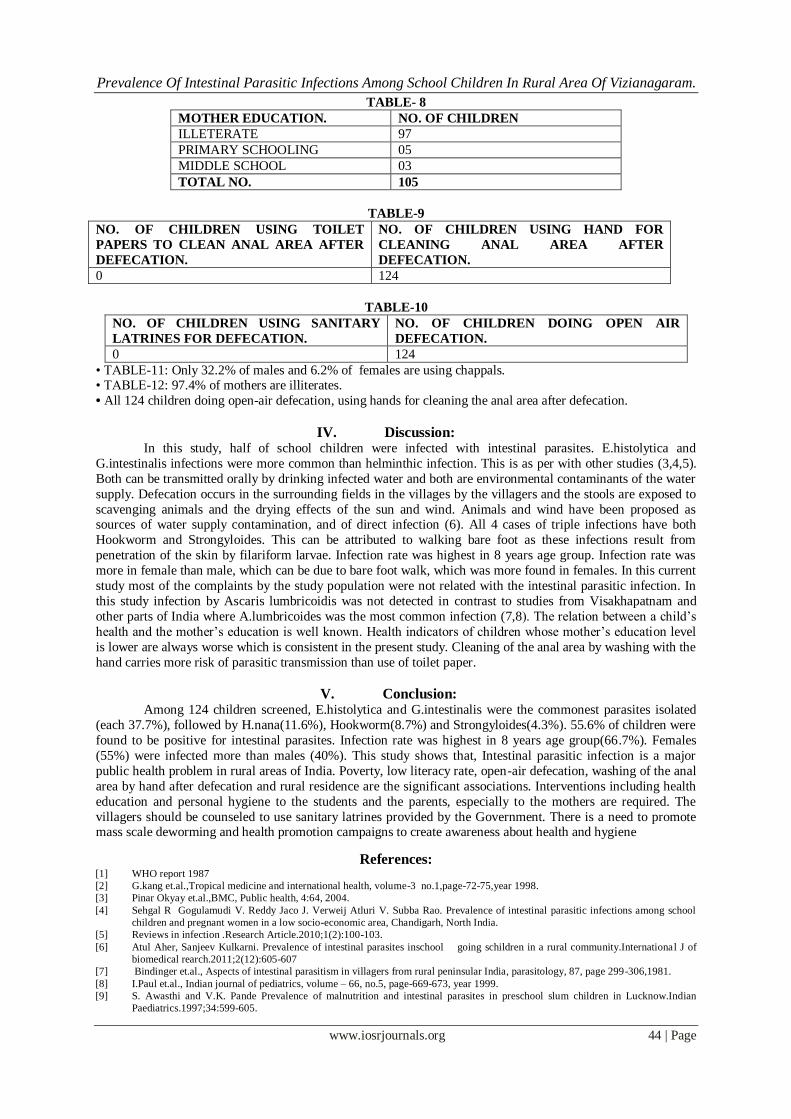
Prevalence Of Intestinal Parasitic Infections Among School Children In Rural Area Of Vizianagaram.
www.iosrjournals.org 44 | Page
TABLE- 8
MOTHER EDUCATION. NO. OF CHILDREN
ILLETERATE 97
PRIMARY SCHOOLING 05
MIDDLE SCHOOL 03
TOTAL NO. 105
TABLE-9
NO. OF CHILDREN USING TOILET
PAPERS TO CLEAN ANAL AREA AFTER
DEFECATION.
NO. OF CHILDREN USING HAND FOR
CLEANING ANAL AREA AFTER
DEFECATION.
0 124
TABLE-10
NO. OF CHILDREN USING SANITARY
LATRINES FOR DEFECATION.
NO. OF CHILDREN DOING OPEN AIR
DEFECATION.
0 124
• TABLE-11: Only 32.2% of males and 6.2% of females are using chappals. • TABLE-12: 97.4% of mothers are illiterates.
• All 124 children doing open-air defecation, using hands for cleaning the anal area after defecation.
IV. Discussion: In this study, half of school children were infected with intestinal parasites. E.histolytica and
G.intestinalis infections were more common than helminthic infection. This is as per with other studies (3,4,5).
Both can be transmitted orally by drinking infected water and both are environmental contaminants of the water
supply. Defecation occurs in the surrounding fields in the villages by the villagers and the stools are exposed to
scavenging animals and the drying effects of the sun and wind. Animals and wind have been proposed as sources of water supply contamination, and of direct infection (6). All 4 cases of triple infections have both
Hookworm and Strongyloides. This can be attributed to walking bare foot as these infections result from
penetration of the skin by filariform larvae. Infection rate was highest in 8 years age group. Infection rate was
more in female than male, which can be due to bare foot walk, which was more found in females. In this current
study most of the complaints by the study population were not related with the intestinal parasitic infection. In
this study infection by Ascaris lumbricoidis was not detected in contrast to studies from Visakhapatnam and
other parts of India where A.lumbricoides was the most common infection (7,8). The relation between a child’s
health and the mother’s education is well known. Health indicators of children whose mother’s education level
is lower are always worse which is consistent in the present study. Cleaning of the anal area by washing with the
hand carries more risk of parasitic transmission than use of toilet paper.
V. Conclusion: Among 124 children screened, E.histolytica and G.intestinalis were the commonest parasites isolated
(each 37.7%), followed by H.nana(11.6%), Hookworm(8.7%) and Strongyloides(4.3%). 55.6% of children were
found to be positive for intestinal parasites. Infection rate was highest in 8 years age group(66.7%). Females
(55%) were infected more than males (40%). This study shows that, Intestinal parasitic infection is a major
public health problem in rural areas of India. Poverty, low literacy rate, open-air defecation, washing of the anal
area by hand after defecation and rural residence are the significant associations. Interventions including health
education and personal hygiene to the students and the parents, especially to the mothers are required. The
villagers should be counseled to use sanitary latrines provided by the Government. There is a need to promote mass scale deworming and health promotion campaigns to create awareness about health and hygiene
References: [1] WHO report 1987
[2] G.kang et.al.,Tropical medicine and international health, volume-3 no.1,page-72-75,year 1998.
[3] Pinar Okyay et.al.,BMC, Public health, 4:64, 2004.
[4] Sehgal R Gogulamudi V. Reddy Jaco J. Verweij Atluri V. Subba Rao. Prevalence of intestinal parasitic infections among school
children and pregnant women in a low socio-economic area, Chandigarh, North India.
[5] Reviews in infection .Research Article.2010;1(2):100-103.
[6] Atul Aher, Sanjeev Kulkarni. Prevalence of intestinal parasites inschool going schildren in a rural community.International J of
biomedical rearch.2011;2(12):605-607
[7] Bindinger et.al., Aspects of intestinal parasitism in villagers from rural peninsular India, parasitology, 87, page 299-306,1981.
[8] I.Paul et.al., Indian journal of pediatrics, volume – 66, no.5, page-669-673, year 1999.
[9] S. Awasthi and V.K. Pande Prevalence of malnutrition and intestinal parasites in preschool slum children in Lucknow.Indian
Paediatrics.1997;34:599-605.
IOSR Journal of Pharmacy and Biological Sciences (IOSR-JPBS)
ISSN: 2278-3008. Volume 3, Issue 3 (Sep-Oct. 2012), PP 45-50 www.iosrjournals.org
www.iosrjournals.org 45 | Page
An Analysis of RF Radiation on Pharmaceutical medicine at
Variable Distance
1M. A. Othman,
2M. Z. A. A. Aziz,
3M. Sinnappa,
4M. M. Ismail,
5H.A. Sulaiman,
6M. A. Meor Said,
7M. H. Misran
1,2,3,4,5,6,7, Centre for Telecommunication Research and Innovation (CeTRi) Fak. Kej. Elektronik dan Kej.
Komputer Universiti Teknikal Malaysia Melaka
Abstract: In this technical paper contains the information of the Radio Frequency (RF) exposure along 10
MHz to 3 GHz frequency on pharmaceutical medicine where in this testing Paracetamol were tested. The
samples were prepared at five different mol (10, 20, 30, 40 & 50 ml) and three different distances (5, 10 & 15
cm) between horn antenna and the samples. The reactions from the medicine due to RF radiation are measured
at S11 by fixed distance versus varied mol. The quasi-static technique and the RF exposure results, with
respective specification was included and discussed.
Keywords: Pharmaceutical medicine, mol, RF radiations, horn antenna, quasi-static
I. INTRODUCTION Radio Frequency (RF) has been applied over past decade in many application and systems, and it’s
emerging technology in this modern world. The RF application was applied in many fields such as military,
hospitality and healthcare, industrial area, transportation and logistics, sports, commercial purpose and so on as
discuss in [1]. By that fact, the RF was applied in science and medical field especially in biological and
pharmaceuticals such as Radio Frequency Identification (RFID), medical diathermy machines and many more.
Currently, RFID tagging and tracking efforts are starting to be combined with sensor networking to provide total
asset visibility [2]. In February 2004 report, the U.S Food and Drug Administration (FDA) listed Radio
Frequency Identification (RFID) technology as an important tool to combat counterfeiting of pharmaceutical
products [3]. The RF is allocate at within the range of 3 kHz to 300GHz spectrum bandwidth. Radio Frequency
(RF) radiation or well know as Electromagnetic radiation (EMR) is a form of energy exists in wave form which travels through free space medium.
Commonly, Biopharmaceuticals define as pharmaceuticals biological in nature and manufactured using
biotechnology. Meanwhile, the drugs comprise other major subset of pharmaceuticals, with their source and
manufacture being chemical in nature. The RFID application used to track and trace on number or code, and
maintain supply chain visibility of products. By history, the RFID system is replacing the bar code technology
system which has been used past years. By using RF in many application systems, the RF radiation is espoused
on many biological pharmaceutical resources. For instance, RFID which used as an identification technology in
many field like in shipping. Specifically, the temperature sensitive products and pharmaceutical drug knows the
environmental profile of a specific shipment is an important. The information is valuable in term of product
shipment and the product in market based on current real time e-pedigree which can prevent missed used or
food and drugs [4]. Rather than that, the Food and Drug Administration (FDA) at United States is responsible
for protect and promoting public health by regulation and supervision on food safety, dietary supplements, medications, vaccines, biopharmaceuticals, electromagnetic radiation devices and many more. FDA not allows
drugs covered under Biologics License Application (BLA) and New Drug Application (NDA) [5]. Meanwhile,
have a lots of encourage future research involve RF application such as Radio Frequency Identification (RFID)
due to insufficient information about potential impact of RF on biologics pharmaceuticals. By doing this
research and detecting every substance S11 reflection signal, the amount of reflection in decibel can estimate.
Every substance and material have different reflection signal level based on combination of substance inside it.
By that, the drug composite inside a pharmaceutical sample can be detected. Based on that reasons, the purpose
of analyzing the RF radiation exposure on biological pharmaceuticals for RF application is to study basic
properties, analyzed the characterized of RF radiation exposure and collect the response data of RF radiation on
a biological pharmaceuticals sample.
II. RADIO FREQUENCIES RADIATION Commonly, in the medical fields there are few common frequency range applied in most of the RF
equipment or system, where these all within the range of radio frequency. In this research paper, the frequency
choose base on that reasons. For instant from the 10 MHz to 3 GHz where is in the range of High Frequency
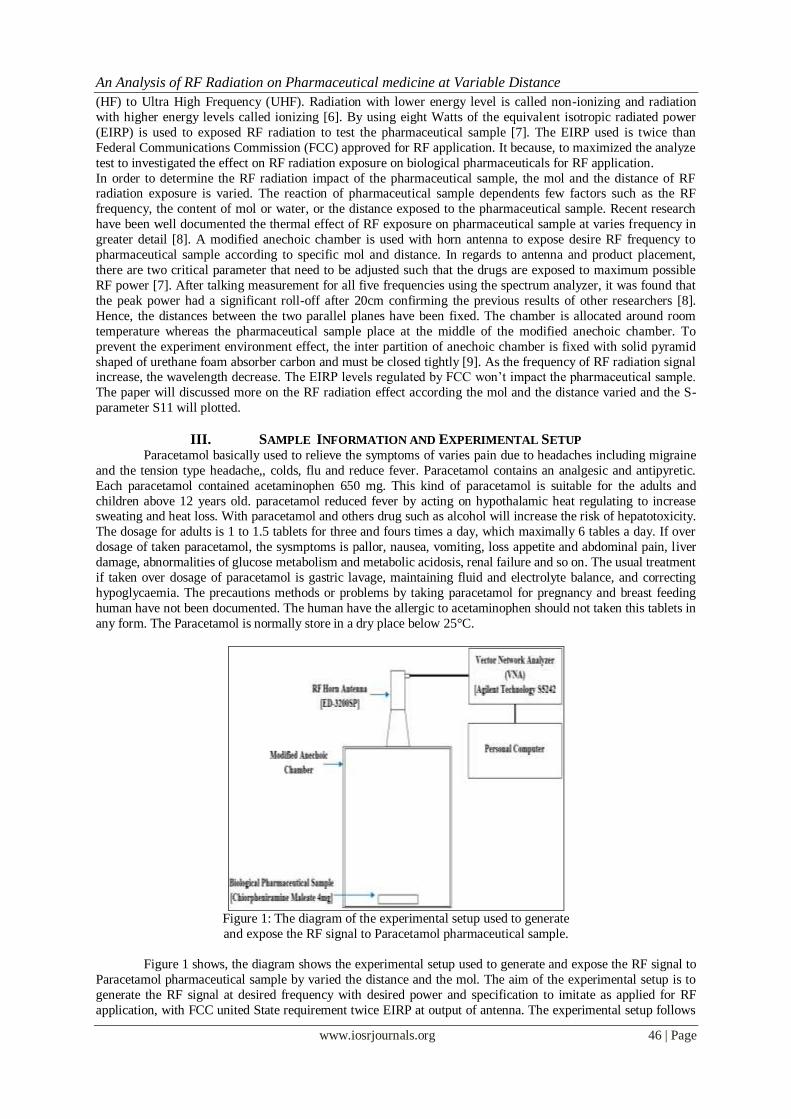
An Analysis of RF Radiation on Pharmaceutical medicine at Variable Distance
www.iosrjournals.org 46 | Page
(HF) to Ultra High Frequency (UHF). Radiation with lower energy level is called non-ionizing and radiation
with higher energy levels called ionizing [6]. By using eight Watts of the equivalent isotropic radiated power
(EIRP) is used to exposed RF radiation to test the pharmaceutical sample [7]. The EIRP used is twice than
Federal Communications Commission (FCC) approved for RF application. It because, to maximized the analyze
test to investigated the effect on RF radiation exposure on biological pharmaceuticals for RF application.
In order to determine the RF radiation impact of the pharmaceutical sample, the mol and the distance of RF radiation exposure is varied. The reaction of pharmaceutical sample dependents few factors such as the RF
frequency, the content of mol or water, or the distance exposed to the pharmaceutical sample. Recent research
have been well documented the thermal effect of RF exposure on pharmaceutical sample at varies frequency in
greater detail [8]. A modified anechoic chamber is used with horn antenna to expose desire RF frequency to
pharmaceutical sample according to specific mol and distance. In regards to antenna and product placement,
there are two critical parameter that need to be adjusted such that the drugs are exposed to maximum possible
RF power [7]. After talking measurement for all five frequencies using the spectrum analyzer, it was found that
the peak power had a significant roll-off after 20cm confirming the previous results of other researchers [8].
Hence, the distances between the two parallel planes have been fixed. The chamber is allocated around room
temperature whereas the pharmaceutical sample place at the middle of the modified anechoic chamber. To
prevent the experiment environment effect, the inter partition of anechoic chamber is fixed with solid pyramid
shaped of urethane foam absorber carbon and must be closed tightly [9]. As the frequency of RF radiation signal increase, the wavelength decrease. The EIRP levels regulated by FCC won’t impact the pharmaceutical sample.
The paper will discussed more on the RF radiation effect according the mol and the distance varied and the S-
parameter S11 will plotted.
III. SAMPLE INFORMATION AND EXPERIMENTAL SETUP Paracetamol basically used to relieve the symptoms of varies pain due to headaches including migraine
and the tension type headache,, colds, flu and reduce fever. Paracetamol contains an analgesic and antipyretic.
Each paracetamol contained acetaminophen 650 mg. This kind of paracetamol is suitable for the adults and
children above 12 years old. paracetamol reduced fever by acting on hypothalamic heat regulating to increase sweating and heat loss. With paracetamol and others drug such as alcohol will increase the risk of hepatotoxicity.
The dosage for adults is 1 to 1.5 tablets for three and fours times a day, which maximally 6 tables a day. If over
dosage of taken paracetamol, the sysmptoms is pallor, nausea, vomiting, loss appetite and abdominal pain, liver
damage, abnormalities of glucose metabolism and metabolic acidosis, renal failure and so on. The usual treatment
if taken over dosage of paracetamol is gastric lavage, maintaining fluid and electrolyte balance, and correcting
hypoglycaemia. The precautions methods or problems by taking paracetamol for pregnancy and breast feeding
human have not been documented. The human have the allergic to acetaminophen should not taken this tablets in
any form. The Paracetamol is normally store in a dry place below 25°C.
Figure 1: The diagram of the experimental setup used to generate
and expose the RF signal to Paracetamol pharmaceutical sample.
Figure 1 shows, the diagram shows the experimental setup used to generate and expose the RF signal to
Paracetamol pharmaceutical sample by varied the distance and the mol. The aim of the experimental setup is to
generate the RF signal at desired frequency with desired power and specification to imitate as applied for RF
application, with FCC united State requirement twice EIRP at output of antenna. The experimental setup follows
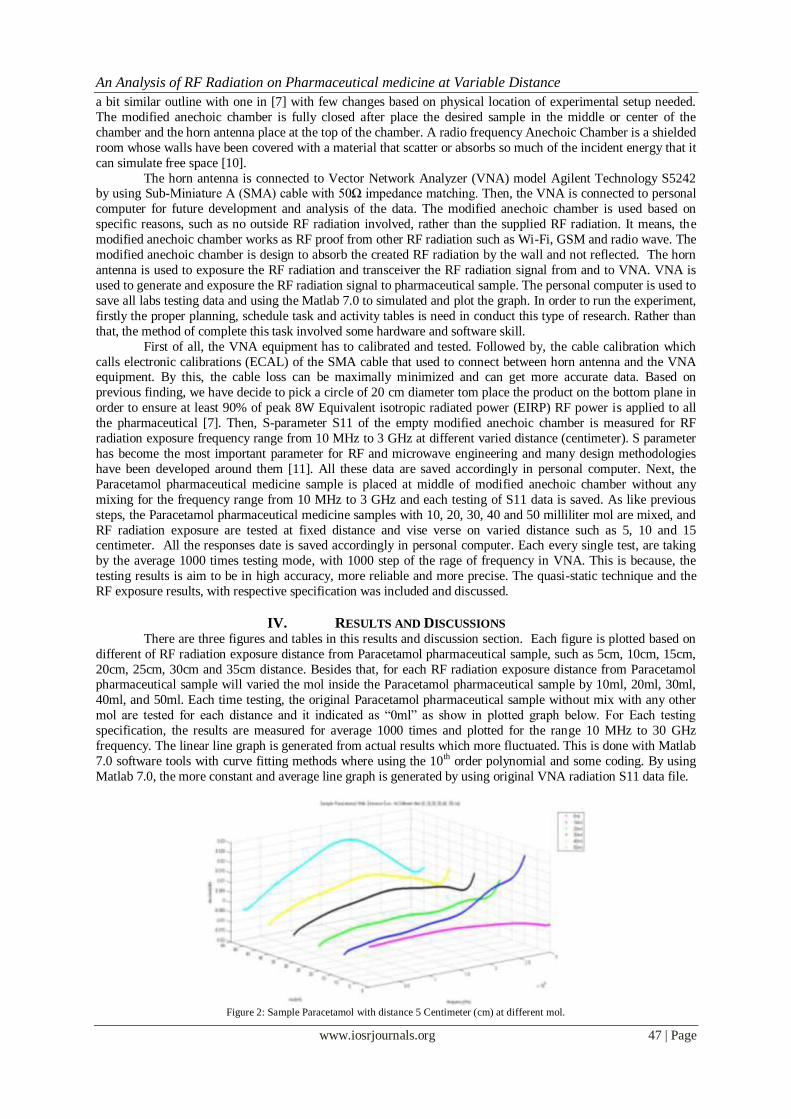
An Analysis of RF Radiation on Pharmaceutical medicine at Variable Distance
www.iosrjournals.org 47 | Page
a bit similar outline with one in [7] with few changes based on physical location of experimental setup needed.
The modified anechoic chamber is fully closed after place the desired sample in the middle or center of the
chamber and the horn antenna place at the top of the chamber. A radio frequency Anechoic Chamber is a shielded
room whose walls have been covered with a material that scatter or absorbs so much of the incident energy that it
can simulate free space [10].
The horn antenna is connected to Vector Network Analyzer (VNA) model Agilent Technology S5242 by using Sub-Miniature A (SMA) cable with 50Ω impedance matching. Then, the VNA is connected to personal
computer for future development and analysis of the data. The modified anechoic chamber is used based on
specific reasons, such as no outside RF radiation involved, rather than the supplied RF radiation. It means, the
modified anechoic chamber works as RF proof from other RF radiation such as Wi-Fi, GSM and radio wave. The
modified anechoic chamber is design to absorb the created RF radiation by the wall and not reflected. The horn
antenna is used to exposure the RF radiation and transceiver the RF radiation signal from and to VNA. VNA is
used to generate and exposure the RF radiation signal to pharmaceutical sample. The personal computer is used to
save all labs testing data and using the Matlab 7.0 to simulated and plot the graph. In order to run the experiment,
firstly the proper planning, schedule task and activity tables is need in conduct this type of research. Rather than
that, the method of complete this task involved some hardware and software skill.
First of all, the VNA equipment has to calibrated and tested. Followed by, the cable calibration which
calls electronic calibrations (ECAL) of the SMA cable that used to connect between horn antenna and the VNA equipment. By this, the cable loss can be maximally minimized and can get more accurate data. Based on
previous finding, we have decide to pick a circle of 20 cm diameter tom place the product on the bottom plane in
order to ensure at least 90% of peak 8W Equivalent isotropic radiated power (EIRP) RF power is applied to all
the pharmaceutical [7]. Then, S-parameter S11 of the empty modified anechoic chamber is measured for RF
radiation exposure frequency range from 10 MHz to 3 GHz at different varied distance (centimeter). S parameter
has become the most important parameter for RF and microwave engineering and many design methodologies
have been developed around them [11]. All these data are saved accordingly in personal computer. Next, the
Paracetamol pharmaceutical medicine sample is placed at middle of modified anechoic chamber without any
mixing for the frequency range from 10 MHz to 3 GHz and each testing of S11 data is saved. As like previous
steps, the Paracetamol pharmaceutical medicine samples with 10, 20, 30, 40 and 50 milliliter mol are mixed, and
RF radiation exposure are tested at fixed distance and vise verse on varied distance such as 5, 10 and 15 centimeter. All the responses date is saved accordingly in personal computer. Each every single test, are taking
by the average 1000 times testing mode, with 1000 step of the rage of frequency in VNA. This is because, the
testing results is aim to be in high accuracy, more reliable and more precise. The quasi-static technique and the
RF exposure results, with respective specification was included and discussed.
IV. RESULTS AND DISCUSSIONS There are three figures and tables in this results and discussion section. Each figure is plotted based on
different of RF radiation exposure distance from Paracetamol pharmaceutical sample, such as 5cm, 10cm, 15cm,
20cm, 25cm, 30cm and 35cm distance. Besides that, for each RF radiation exposure distance from Paracetamol pharmaceutical sample will varied the mol inside the Paracetamol pharmaceutical sample by 10ml, 20ml, 30ml,
40ml, and 50ml. Each time testing, the original Paracetamol pharmaceutical sample without mix with any other
mol are tested for each distance and it indicated as “0ml” as show in plotted graph below. For Each testing
specification, the results are measured for average 1000 times and plotted for the range 10 MHz to 30 GHz
frequency. The linear line graph is generated from actual results which more fluctuated. This is done with Matlab
7.0 software tools with curve fitting methods where using the 10th order polynomial and some coding. By using
Matlab 7.0, the more constant and average line graph is generated by using original VNA radiation S11 data file.
Figure 2: Sample Paracetamol with distance 5 Centimeter (cm) at different mol.
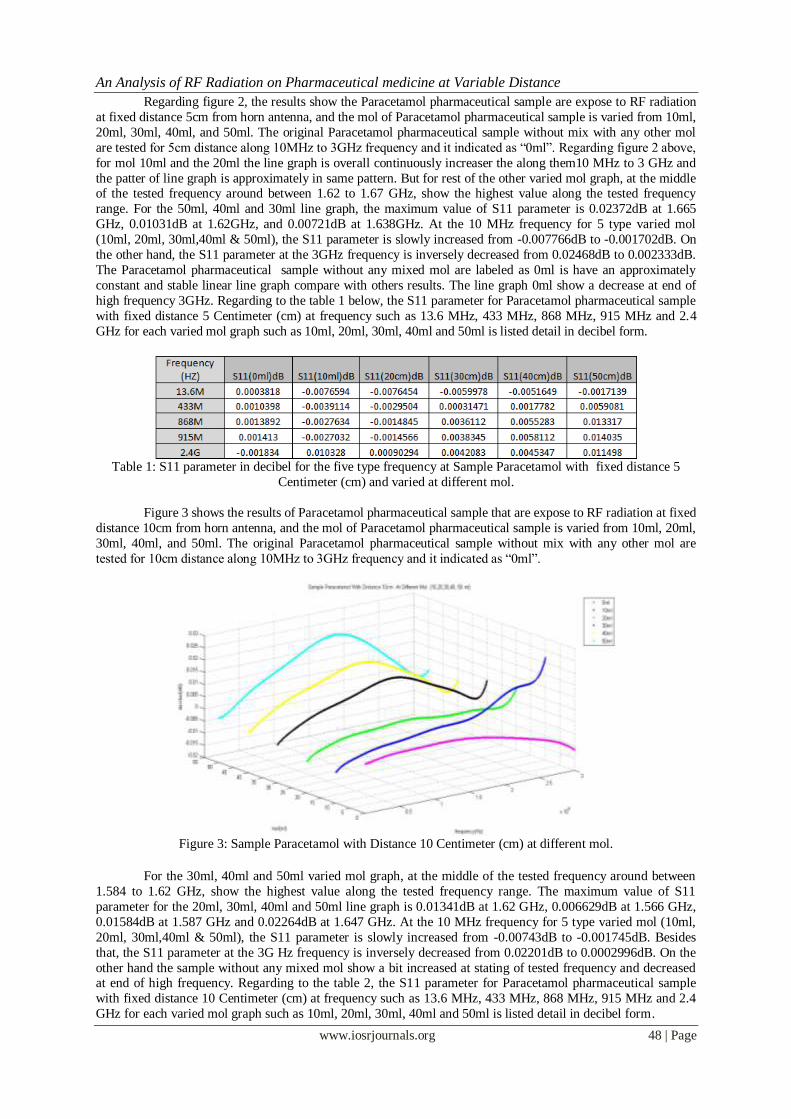
An Analysis of RF Radiation on Pharmaceutical medicine at Variable Distance
www.iosrjournals.org 48 | Page
Regarding figure 2, the results show the Paracetamol pharmaceutical sample are expose to RF radiation
at fixed distance 5cm from horn antenna, and the mol of Paracetamol pharmaceutical sample is varied from 10ml,
20ml, 30ml, 40ml, and 50ml. The original Paracetamol pharmaceutical sample without mix with any other mol
are tested for 5cm distance along 10MHz to 3GHz frequency and it indicated as “0ml”. Regarding figure 2 above,
for mol 10ml and the 20ml the line graph is overall continuously increaser the along them10 MHz to 3 GHz and
the patter of line graph is approximately in same pattern. But for rest of the other varied mol graph, at the middle of the tested frequency around between 1.62 to 1.67 GHz, show the highest value along the tested frequency
range. For the 50ml, 40ml and 30ml line graph, the maximum value of S11 parameter is 0.02372dB at 1.665
GHz, 0.01031dB at 1.62GHz, and 0.00721dB at 1.638GHz. At the 10 MHz frequency for 5 type varied mol
(10ml, 20ml, 30ml,40ml & 50ml), the S11 parameter is slowly increased from -0.007766dB to -0.001702dB. On
the other hand, the S11 parameter at the 3GHz frequency is inversely decreased from 0.02468dB to 0.002333dB.
The Paracetamol pharmaceutical sample without any mixed mol are labeled as 0ml is have an approximately
constant and stable linear line graph compare with others results. The line graph 0ml show a decrease at end of
high frequency 3GHz. Regarding to the table 1 below, the S11 parameter for Paracetamol pharmaceutical sample
with fixed distance 5 Centimeter (cm) at frequency such as 13.6 MHz, 433 MHz, 868 MHz, 915 MHz and 2.4
GHz for each varied mol graph such as 10ml, 20ml, 30ml, 40ml and 50ml is listed detail in decibel form.
Table 1: S11 parameter in decibel for the five type frequency at Sample Paracetamol with fixed distance 5
Centimeter (cm) and varied at different mol.
Figure 3 shows the results of Paracetamol pharmaceutical sample that are expose to RF radiation at fixed
distance 10cm from horn antenna, and the mol of Paracetamol pharmaceutical sample is varied from 10ml, 20ml,
30ml, 40ml, and 50ml. The original Paracetamol pharmaceutical sample without mix with any other mol are
tested for 10cm distance along 10MHz to 3GHz frequency and it indicated as “0ml”.
Figure 3: Sample Paracetamol with Distance 10 Centimeter (cm) at different mol.
For the 30ml, 40ml and 50ml varied mol graph, at the middle of the tested frequency around between
1.584 to 1.62 GHz, show the highest value along the tested frequency range. The maximum value of S11
parameter for the 20ml, 30ml, 40ml and 50ml line graph is 0.01341dB at 1.62 GHz, 0.006629dB at 1.566 GHz,
0.01584dB at 1.587 GHz and 0.02264dB at 1.647 GHz. At the 10 MHz frequency for 5 type varied mol (10ml,
20ml, 30ml,40ml & 50ml), the S11 parameter is slowly increased from -0.00743dB to -0.001745dB. Besides
that, the S11 parameter at the 3G Hz frequency is inversely decreased from 0.02201dB to 0.0002996dB. On the
other hand the sample without any mixed mol show a bit increased at stating of tested frequency and decreased at end of high frequency. Regarding to the table 2, the S11 parameter for Paracetamol pharmaceutical sample
with fixed distance 10 Centimeter (cm) at frequency such as 13.6 MHz, 433 MHz, 868 MHz, 915 MHz and 2.4
GHz for each varied mol graph such as 10ml, 20ml, 30ml, 40ml and 50ml is listed detail in decibel form.
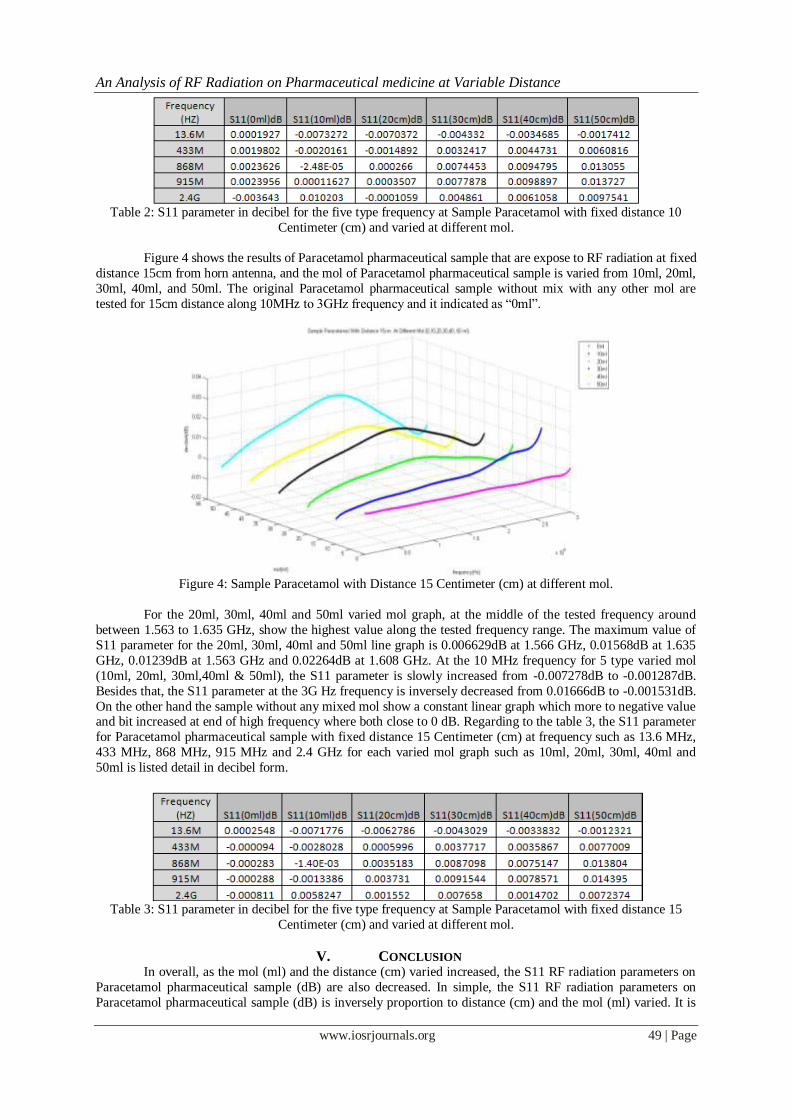
An Analysis of RF Radiation on Pharmaceutical medicine at Variable Distance
www.iosrjournals.org 49 | Page
Table 2: S11 parameter in decibel for the five type frequency at Sample Paracetamol with fixed distance 10
Centimeter (cm) and varied at different mol.
Figure 4 shows the results of Paracetamol pharmaceutical sample that are expose to RF radiation at fixed
distance 15cm from horn antenna, and the mol of Paracetamol pharmaceutical sample is varied from 10ml, 20ml,
30ml, 40ml, and 50ml. The original Paracetamol pharmaceutical sample without mix with any other mol are
tested for 15cm distance along 10MHz to 3GHz frequency and it indicated as “0ml”.
Figure 4: Sample Paracetamol with Distance 15 Centimeter (cm) at different mol.
For the 20ml, 30ml, 40ml and 50ml varied mol graph, at the middle of the tested frequency around
between 1.563 to 1.635 GHz, show the highest value along the tested frequency range. The maximum value of
S11 parameter for the 20ml, 30ml, 40ml and 50ml line graph is 0.006629dB at 1.566 GHz, 0.01568dB at 1.635
GHz, 0.01239dB at 1.563 GHz and 0.02264dB at 1.608 GHz. At the 10 MHz frequency for 5 type varied mol
(10ml, 20ml, 30ml,40ml & 50ml), the S11 parameter is slowly increased from -0.007278dB to -0.001287dB.
Besides that, the S11 parameter at the 3G Hz frequency is inversely decreased from 0.01666dB to -0.001531dB.
On the other hand the sample without any mixed mol show a constant linear graph which more to negative value and bit increased at end of high frequency where both close to 0 dB. Regarding to the table 3, the S11 parameter
for Paracetamol pharmaceutical sample with fixed distance 15 Centimeter (cm) at frequency such as 13.6 MHz,
433 MHz, 868 MHz, 915 MHz and 2.4 GHz for each varied mol graph such as 10ml, 20ml, 30ml, 40ml and
50ml is listed detail in decibel form.
Table 3: S11 parameter in decibel for the five type frequency at Sample Paracetamol with fixed distance 15
Centimeter (cm) and varied at different mol.
V. CONCLUSION In overall, as the mol (ml) and the distance (cm) varied increased, the S11 RF radiation parameters on
Paracetamol pharmaceutical sample (dB) are also decreased. In simple, the S11 RF radiation parameters on
Paracetamol pharmaceutical sample (dB) is inversely proportion to distance (cm) and the mol (ml) varied. It is
An Analysis of RF Radiation on Pharmaceutical medicine at Variable Distance
www.iosrjournals.org 50 | Page
significant to note that the reported biological effect occurring at low levels of RF exposure are variable,
inconsistent and small in number [12]. S11 RF radiation parameters on Paracetamol pharmaceutical sample at
low frequency is increased slowly and reach the maximum and start to reduced at middle of the tested frequency
between 1.288 to 1.665GHz. At beginning of tested frequency which is 10MHz, each line graph value is
increased over varied mol. Where it means, when the quantity of mol increased, the S11 RF radiation
parameters on Paracetamol pharmaceutical sample is increased from the range between (-0.007766 to -0.006912dB), to (-0.003568 to -0.001287dB) at fixed distances at 10MHz. In simple, the varied mol is
proportional to S11 RF radiation parameters at fixed distances at 10MHz. At end of high frequency 3GHz, each
line graph at fixed distance is inversely to mol varied. Where it means, when the quantity of mol increased, the
S11 RF radiation parameters on Paracetamol pharmaceutical sample at fixed distanced, is decreased from the
range between (-0.001684 to 0.02468dB), to (-0.01689 to 0.002333dB). The range of the maximum value at
middle of the tested frequency is from 0.0006168 to 0.02372 dB.
VI. Acknowledgements First and foremost, the author would like to thanks Universiti Teknikal Malaysia Melaka, Malaysia
(UTeM) for their equipment, financial and assistance support. Besides that, the authors also would like to thank
the lecturers, project coordinating supervises and the technicians for their moral supports and contribution. Last
but not list, the author would like to thanks those involved direct and indirect in completing this project success
fully.
REFERENCES [1] Bruce Fette, Aiello, Chandra, Dobkin (et al.), “RF & Wireless Technologies: Know It All”, Elsevier Inc. 2008.
[2] The international committee for information technology standards (INCITS), INCITS T20 (Real Time Locating system),
http://www.autoid.org/INCIT/ncits_t20_2002.htm
[3] U.S Department of Health and Human Service, Food and Drug Administration, “Combating Counterfeit Drugs: A report of food and
drug”, Februrary 18, 2004. http://www.fda.gov/oc/intiatiatives/counterfeit/report02_o4.html
[4] K.RothkAMN, “Evidance for a lack of DNA dauble-stand break repair in human cell exposed to very low x-ray doses”, PROC. Natl.
Acad. Sci. of the USA, vol. 100, pp, 5057-5062, 2003.
[5] “Uderstanding Radiation In Our World” National Safety council” , Washington DC, pp 17.
[6] Ismail Uysal..(et al.), Agriculture and Biological Engineering, Universiti of Florida, “Non-Thermal Effects of Rdio Frequency
Exposure on Biologic Pharmaceuticals for RFID Application”, IEEE RFID 2010.
[7] H. Bassen, S. Seidman, J. Rogul, A. Desta, and S. Wolfgang, “An exposure system for evaluating possible effects of RFID on various
formulations of drug products,” Proc. IEEE Int. Conf. on RFID, pp.191–198, 2007.
[8] Ismail Uysal, Ph.D, Jean-Pierre Emond, Ph.D,University of South Florida College of Technology and Innovation, “RFID in the
Pharmaceutical Supply Chain: Regulations, Physical Limitations and a Real-life Study” RFiD Journal- Ninth Anual Conference and
Exhibition April 12-14 2011.
[9] Glen Dash, Ampyx LLC, “How RF Anechoic Chamber Work” Glen Dash at alum. Mit.edu, 2005 Ampyx LLC 2005.
[10] Michael Steer, “RF MICROWAVE AND RF DESIGN : A Systems Approach”, SciTECH Publishing, inc., 2010, pp 288.
[11] James C. Lin, “Scientific Literature on Biological Effects of Radio Frequency Radiation: Criteria for Evaluation”, IEEE Antenna’s
and Propagation Magazine, vol44. No. 2, April 2002.
IOSR Journal of Pharmacy and Biological Sciences (IOSRJPBS)
Editorial Boardv Dr. Jeremy George, Australia v Dr. Sebastian Johnson, Australia v Dr. Benjamin Robinson, USA v Dr. Zachery Edwards, New Zealand v Dr. Alejandra Plamer, Italy v Dr. Fletcher Ramero, Nigeria v Dr. Barrett Hale, Germany v Dr. Webster, South Africa v Dr. Amjad ali, Iran
Associate Editorial Board
v Dr. Gary Robinso, University of Western Sydney, Australiav Dr. Sharon Rya, The University of Melbournv Dr. Lynn Kem, Universities in Canterbury, Englandv Dr. Kim Mitche, Curtin University of Technologyv Dr. Augustine Ahorght, Boston University, USAv Dr. Gina Salapata, University of Canterburyv Dr. Animol S. Nair, SRM University, Indiav Dr. Linda Mond, Macquarie University, Australiav Dr. Samantha Benjamin, Pathways Health and Rsearch Centrev Dr. John Toumbouro, Deakin Universityv Dr. Mark Dadd, University of Newcastlv Dr. Annette Michau, University of Queenslanv Dr. Raheem Muhmmad, Faculty of Engineering, Alexandria University, Egyptv Dr. Madison Luke, Havard University, USA
IOSR Journals subscriptionInstitute or any person can subscribe the hard copy of IOSR Journals. All subscription are payable in advance. Journals are sent by air to all countries except Indian subcontinent. Subscriptions are on annual basis. For more detail of subscription, log on to www.iosrjournals.org
Contact UsWebsite URL : www.iosrjournals.orgEmail : [email protected]


