Embed Size (px)
Citation preview

Chemical Engineering Journal 102 (2004) 107–117
Kinetic study of the combustion of methyl-ethyl ketoneover�-hematite catalyst
G. Picasso Escobar, A. Quintilla Beroy, M.P. Pina Iritia∗, J. Herguido HuertaDepartment of Chemical and Environmental Engineering, University of Zaragoza, 50009 Zaragoza, Spain
Received 30 June 2003; accepted 19 September 2003
Abstract
The reaction kinetics of the catalytic combustion of methyl-ethyl ketone (MEK) in diluted air streams over Fe2O3 catalyst has beeninvestigated in this work. The kinetic data base has been generated under quasi-differential conditions in a fixed bed reactor with Fe2O3
prepared by thermal decomposition and calcined at 600◦C. A series–parallel reaction network is proposed for the catalytic combustion ofMEK, and several kinetic models have been tested, ranging from the simple power law model to mechanistic approaches. It has been foundthat the Langmuir–Hinshelwood mechanism with one type of active site over which adsorption of oxygen, MEK and carbon monoxidetakes place, fits the experimental results obtained reasonably well. Moreover, the kinetic parameters so obtained are able to predict theperformance of a Fe2O3 based catalytic membrane reactor.© 2003 Elsevier B.V. All rights reserved.
Keywords:Catalytic combustion; Fe2O3; Kinetic modeling; Methyl-ethyl ketone; Catalytic membrane reactor
1. Introduction
Volatile organic compounds (VOC) constitute one impor-tant type of toxic pollutant responsible for photochemicalsmog leading to various environmental hazards. Increasingawareness over the last two decades has prompted the emer-gence of stricter regulations covering industrial activities.Catalytic combustion is one of the most promising alterna-tives for VOC removal from air streams[1–3], in particularwhen total destruction of a highly toxic compound present inlow concentrations has to be ensured. In fact, this technologyis well-developed by engineering companies because the op-erating costs are lower than for thermal combustion, and it ismore flexible compared to other means of VOC elimination.When compared to thermal regenerative oxidation, catalyticoxidation with recuperative heat recovery may be economi-cally advantageous for flow rates under 850 m3 STP/min andVOC concentrations ranging from 50 to 10,000 ppmv[4].
In general, the performance of the catalytic combustionprocess depends on the type of catalyst, the reactor config-uration and the nature of the VOC molecule. There are twomain types of catalyst on the market[5] for the reduction ofVOC emissions: supported noble metal catalysts[6–8] andmetal oxides[9–18]; 75% [19] being precious metal based
∗ Corresponding author.E-mail address:[email protected] (M.P. Pina Iritia).
because these are generally supposed to be more active. TheCatalytica study[5], however, compares the performance ofboth types, and the general conclusion is that metal oxidesare not necessarily less active than noble metal catalysts.Moreover, noble metal catalysts are the most expensive. Inthe last few years, therefore, considerable efforts have beenmade to find more economical catalytic systems based onmetal oxides. In this context, manganese based oxides suchas MnO2 [10], Mn3O4 [11], Mn2O3 [4], copper supported onalumina[12,14] and perovskite-type oxides[15–17] have,among others, been applied to VOC abatement processes.Of the publications found in the literature which address theuse of Fe2O3 for VOC removal, most refer to its use as anoble metal catalyst support[20,21]. Scirè et al[22] com-pare the catalytic activity of the 1B metal (Au, Ag and Cu)supported on Fe2O3 in the oxidation of alcohols, and ob-tain a light-off temperature which, for the most active cat-alyst, is only 40◦C lower than that measured on Fe2O3.Bimetallic systems such as Fe2O3/ZrO2 [23] have been usedfor NO abatement in the presence of hydrocarbons, Fe2O3has been applied as a catalyst for methane combustion[24],and the employment of a catalytic membrane reactor with�-Fe2O3 as the active phase has also been tested[25]. Nev-ertheless, the formation of partially oxidised intermediatesmust be avoided, CO2 and water being the only desiredproducts. In this paper we report a study on the combus-tion of methyl-ethyl ketone (MEK), in excess oxygen over
1385-8947/$ – see front matter © 2003 Elsevier B.V. All rights reserved.doi:10.1016/j.cej.2003.09.006
108 G. Picasso Escobar et al. / Chemical Engineering Journal 102 (2004) 107–117
�-hematite. The catalytic activity of different samples andthe unwanted production of partially oxidised compounds,mainly CO, have been investigated to gain an insight intothe performance of Fe2O3-based catalytic systems for VOCabatement processes. Among the solids prepared, the SI-2,denoted as the reference catalyst, has been used for the ki-netic study. Several authors suggest that VOC oxidation onmetal oxides occurs via the Mars-van Krevelen mechanism[11,22], implying lattice oxide ions as the active oxygenspecies; whereas others suggest that the adsorption of eitherthe O2 molecule or O atom is important[18]. In this paper,therefore, three kinetic models have been used to find whichbest fits the experimental data.
Apart from the above considerations, the catalytic sys-tems used must operate under very demanding conditions:diluted streams, non-steady conditions, and high removal ef-ficiency (usually higher than 95%). Finally, to be feasiblethe catalytic system should be able to handle high feed rateswith a relatively low pressure drop, to ensure total VOCdestruction at low temperatures and also to provide resis-tance to deactivation by fouling, poisoning or sintering. Thecombination of the above requirements represents a signif-icant challenge in the present state of Chemical ReactionEngineering. One possible solution lies in the field of cat-alytic reactors based on porous membranes, currently offer-ing very attractive research opportunities to academic andindustrial scientists working on catalysis[26]. In our previ-ous works, catalytic membrane reactors based on Pt/alumina[27,28], perovskites[29], or �-hematite[30]; operating inthe Knudsen regime under flow-through configuration havedemonstrated interesting performances[27,28] in the com-plete combustion of toluene, hexane or MEK. This typeof gas–solid contactor, in which the permeation of a pre-mixed feedstream takes place, provides an intimate contactbetween the molecules and the wall of the pores, thus min-imising the diffusion resistance present in other systems suchas fixed beds or monolith reactors. In particular,�-hematitebased catalytic membranes[30], show a higher efficiencyin the complete combustion of MEK than their bulk cata-lyst counterparts under equivalent experimental conditions.These results indicate that the membrane could performvery efficiently in the combustion of VOCs at low temper-atures at the expense of a significant pressure drop. Its usewould otherwise be restricted to applications involving reac-tion simultaneous with gas filtration, where a pressure dropis already present[31]. In such applications, the catalyticmembrane reactor is capable of carrying out two operationsat the same time: dust removal and catalytic abatement ofVOCs.
The aims of the present work are: first, to explore the ac-tivity of Fe2O3-based catalysts for the oxidation of MEK,and secondly, to obtain a kinetic model to describe the cat-alytic combustion of the oxygenate, and apply the kineticsobtained to predict the experimental tendencies observed inan integral fixed bed reactor and a Fe2O3-based catalyticmembrane reactor.
2. Experimental
2.1. Catalyst preparation and physicochemicalcharacterisation
The starting materials used were Fe(NO3)3·9H2O (Pan-reac, 98% pure) and NH4OH solution (Panreac, 30% inNH3, 28–30% pure). The catalysts were prepared by twodifferent methods. The first, thesimple method, consists ofthe filtration of a saturated nitrate solution in desionised wa-ter, followed by drying at 60◦C for 24 h and decompositionat 170◦C for 5 h to ensure NOx removal (“SI” samples). Forthe catalysts prepared by theprecipitation method, however,a NH4OH solution is added to the Fe(NO3)3 saturated solu-tion causing the precipitation of Fe(OH)3. The mixing of thesolution is carried out through a rapid addition of the am-monia solution (“RA” samples) or in a controlled way using0.5 cm3/min as NH4OH addition rate (“CA” samples). Asexpected, a positive influence of low precipitation rates overthe specific surface area was detected. The solids obtainedwere filtrated, dried and decomposed under the conditionsdescribed for the SI samples. Two different heating rates upto the calcination temperature were used: 2 and 10◦C/min.The SI samples were calcined at 600◦C for 6 h whereas forthe catalysts prepared by precipitation, the calcination tem-perature was varied from 300 up to 600◦C in order to anal-yse its influence over the BET surface area, XRD spectra andlight-off temperatures. Diffraction patterns were recordedusing Cu K� radiation with a step size of 0.010◦ and a steptime of 2.5 s. The mean crystallite sizes were estimatedusing the Scherrer equation[33] and the selected reflectionpeaks (33◦) were fitted by a Gaussian function. The sampleprepared by the simple method calcined at 600◦C using2◦C/min as heating rate, denoted as SI-2, has been adoptedas the reference catalyst and used for the kinetic study dueto the fact that a well-structured�-hematite phase is formed.
2.2. Reaction system
The catalytic combustion of MEK was performed in a9 mm internal diameter tubular quartz reactor inside an elec-trical furnace operating at atmospheric pressure. The cat-alytic bed was 6 mm total length and 9 mm of diameter. Thetemperature was monitored by a thermocouple inserted inthe centre of the catalyst bed in which 100 mg of catalyst di-luted in 200 mg of glass dust, to avoid hot spots formation,was introduced and fixed over a trap. The experimental setup has been described in previous works[27–30].
The kinetic study was carried out in the tubular fixed bedreactor previously described using the operating conditionspointed out in the followingSection 3.3which ensures thereactor isothermicity due to lower conversions achieved (lessthan 30%).
The catalytic activity study was done from light-offcurves showing the dependence of conversion (measuredas MEK percentage consumed after the reaction) versus
G. Picasso Escobar et al. / Chemical Engineering Journal 102 (2004) 107–117 109
reaction temperature. The typical combustion experimentbegan at 150◦C up to the temperature of total conversion,analyses being carried out every 15–20◦C. TemperaturesT50% and T95% are defined as temperatures at which theconversion of MEK reaches values of 50% (light-off) and95%, respectively.
Integral fixed bed reactor and catalytic membrane reactorexperiments were carried out at two different space veloci-ties, 70 and 170 h−1, to assess the predictive capability of thekinetic model at higher levels of conversion. The catalyticmembrane reactor operation and the membrane preparationprocedure have already been described by Picasso et al.[30].The permeation length of the membrane comprised the cen-tral 45 mm of the 90 mm long tube and the reaction temper-ature for the gas phase at the reactor inlet was measured bya thermocouple located axially in the membrane. The pre-mixed MEK + air stream was fed to the internal side of themembrane and forced to permeate across to the�-Al2O3thin layer (5�m thickness, 5 nm as nominal pore diameter)where the�-Fe2O3 was dispersed.
The exit gases from all reactors were analysed on-lineby gas chromatography (HP 5890 model with FID detector)equipped with a methanation unit for CO and CO2 deter-mination. Carbon mass balance closures were always betterthan±5%.
2.3. Data analysis
The kinetic reaction rate data were analysed with the com-mercial software Scientist, version 2.01 (Micromath Scien-tific Software). The Levenberg–Marquardt method was usedto minimise the sum of squares of the deviations. The sta-tistical parameters considered were the model selection cri-terion (MSC) and the determination coefficient (DC) formodel comparison:
MSC =(∑n
i=1(Cobs,i − Cobs,i)2∑n
i=1(Cobs,i − Ccal,i)2
)− 2p
n(1)
DC =
[∑ni=1(Cobs,iCcal,i)
− (∑ni=1Cobs,i
∑ni=1Ccal,i
)/n]2[∑n
i=1(Cobs,i)2 − (∑n
i=1Cobs,i)/n]
× [∑ni=1(Ccal,i)
2 − (∑ni=1Ccal,i
)/n] (2)
where “p” refers to the number of parameters, “n” refers tothe number of experimental data, and “Cobs” and “Ccal” arethe exit MEK concentration (expressed in ppmv) observedexperimentally and calculated with the model, respectively.
2.4. Reactor simulation
The integral fixed bed reactor and catalytic membrane re-actor were simulated by an engineering model developed inFortran 77. The main assumptions made in order to derivethe model equations are isothermal conditions, and the gasbeing in plug flow and behaving ideally. The flow domain is
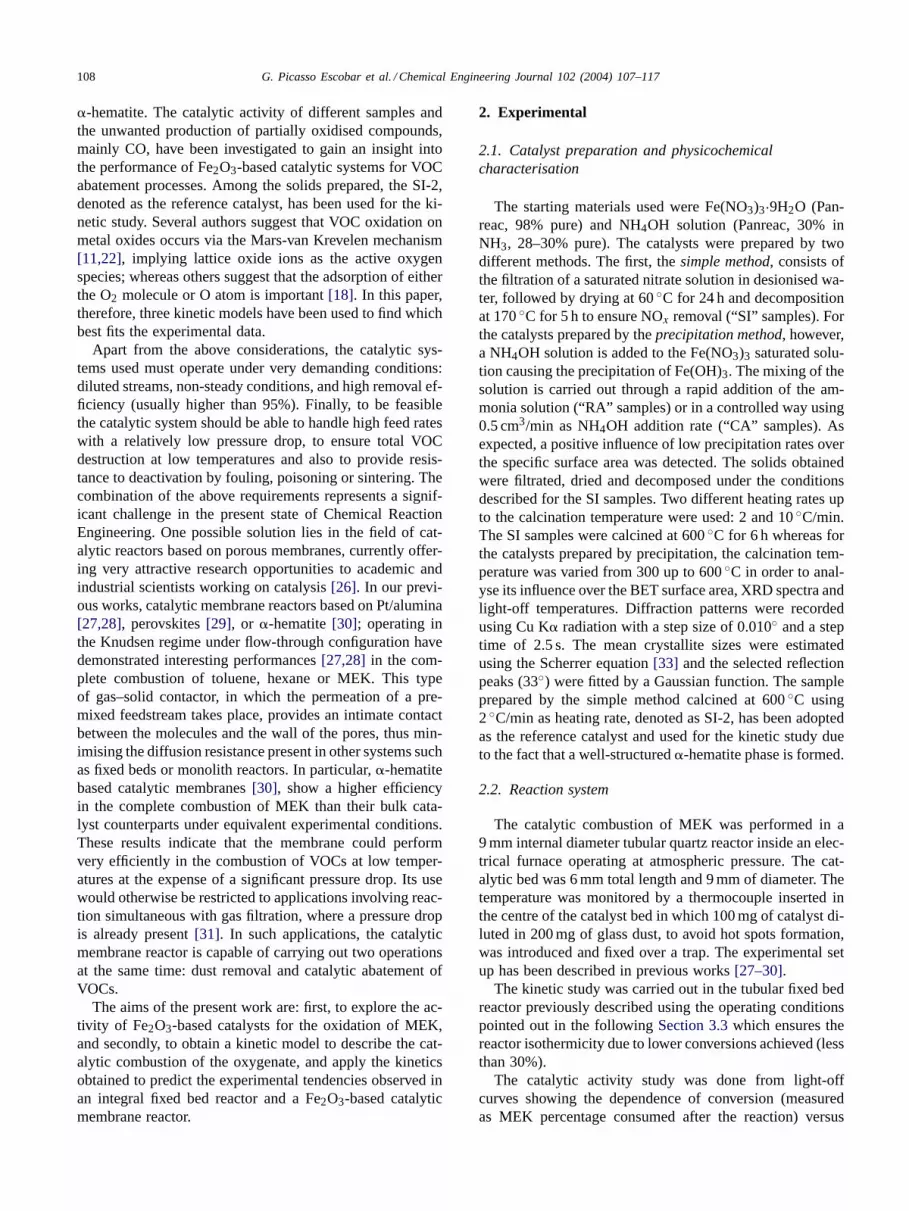
Fig. 1. Comparison of ethylene experimental light-off curve with theprofile calculated from the use of published kinetic parameters[32] and thedeveloped reactor model. Experimental conditions: (C2H4)0 = 2750 ppmv;ug,0 = 0.26 m/s;L = 0.20 m; 0.41 wt.% Pd/Al2O3.
considered as one dimensional. The material balance equa-tions for MEK, CO and CO2 are discretized according to thevolume element formulation and solved using a 4th orderRunge–Kutta based method. The kinetic model and experi-mental data published by van de Beld et al.[33] for catalyticoxidation of 2750 ppmv of ethene in air over Pd/Al2O3 ina packed bed reactor were used to validate the reactor sim-ulation program. The comparison of the experimental dataand that predicted by the model is shown inFig. 1.
3. Results and discussion
3.1. Fe2O3 bulk catalyst characterisation
The main properties of the catalytic samples studied inthis work are summarised inTable 1. The XRD spectraused for crystallite diameter estimations are compiled inFig. 2. All diffractograms correspond to the�-hematitecrystallographic phase of Fe2O3 with the exception of
Table 1Main properties of the bulk catalysts tested in this work
Catalystsample
Heating rate(◦C/min)a
Tcalcination (◦C) BET area(m2/g catalyst)
Dcrystallite
(nm)
SI-1 – Uncalcined 55.7 14SI-2 2 600 5.5 30RA-1 – Uncalcined 26.4 –RA-2 2 300 22.4 19RA-3 2 400 20.2 19RA-4 2 500 12.9 21RA-5 2 600 6.5 26CA-1 – Uncalcined 41.2 –CA-2 2 300 39.9 20CA-3 10 300 57.0 16CA-4 2 600 1.3 30CA-5 10 600 3.1 29
a Heating rate used up to the calcination temperature.

110 G. Picasso Escobar et al. / Chemical Engineering Journal 102 (2004) 107–117
Fig. 2. XRD spectra of the bulk catalysts prepared: (A) SI samples; (B)RA samples; (C) CA samples.
the uncalcined samples RA-1 and CA-1, prepared by theprecipitation method, where the characteristic diffractionpeaks of ammonium nitrate are observed, probably cover-ing the surface of Fe2O3 crystallites. This is due to the factthat the decomposition temperature of NH4NO3 (180◦C)is higher than that corresponding to Fe(NO3)3 (170◦C).Nevertheless, it is important to emphasise that the reactiontemperatures are always higher than these values, thereforethe�-hematite could be expected as active phase.
A BET surface area loss caused by calcination is observed,less pronounced in the case of the RA samples which gavethe lowest values reported for calcination temperatures ofless than 600◦C. The slow addition of the base, used in thepreparation of the “CA” samples, provokes a controlled pre-cipitation of the hydroxide and renders a higher specific area
Fig. 3. Relationship between average crystallite diameter and BET surfacearea for the�-hematite catalysts prepared.
of the calcined solids with respect to their “RA” counterparts(39.9 m2/g for CA-2 versus 22.4 m2/g for RA-2). A similareffect is observed when high heating rates up to the cal-cination temperatures are used (57.0 m2/g for CA-3 versus39.9 m2/g for CA-2); probably due to the solids formed beingunable to accommodate to the temperature profile imposed,and therefore, particle agglomeration is partially avoided.Moreover, a good correlation between BET surface area andaverage crystallite diameter has been found (seeFig. 3).
3.2. Catalytic activity of Fe2O3 bulk catalysts
The Fe2O3 bulk catalysts were tested for total combustionof MEK in order to measure their activity and to evaluate theinfluence of three different factors over the performance ofthe catalytic system: weight hourly space velocity, feed con-centration and preparation method. Previously, some blankexperiments were carried out with fine quartz, demonstratingthe absence of activity up to 400◦C. Table 2compiles the
Table 2Catalytic activity in MEK combustiona of selected samples
Catalystsample
BET area(m2/g catalyst)
T50% (◦C) T95%(◦C) Tmax,CO (◦C)
SI-1 55.7 250 286 250SI-2 5.5 285 326 285RA-1b 26.4 238 266 240RA-2 22.4 266 299 267RA-3 20.2 – – –RA-4 12.9 – – –RA-5b 6.5 282 316 285CA-1 41.2 271 297 270CA-2 39.9 282 322 280CA-3 57.0 259 288 260CA-4 1.3 323 370 315CA-5 3.1 309 350 310
a [MEK] 0 = 1900 ppmv, WHSV= 80 h−1.b [MEK] 0 = 1500 ppmv.

G. Picasso Escobar et al. / Chemical Engineering Journal 102 (2004) 107–117 111
Fig. 4. Effect of preparation method over catalytic performance: SI-1 andCA-1 samples. Experimental conditions: (MEK)0 = 2000 ppmv; WHSV= 170 h−1. Note: Temperatures reported have been measured inside thecatalytic bed.
T50% andT95% values and also the temperatures at which theexit CO concentration is at a maximum, for given reactionconditions (1900 ppmv of MEK and 80 h−1 as WHSV). Ananalysis of the calcination influence over the catalytic per-formance reveals that calcined samples at low heating rates(i.e. 2◦C/min) exhibit higher light-off temperatures due tothe loss of BET surface area by particle sintering. The prepa-ration method has also been analysed in terms of catalyticperformance. When comparing the SI-2, RA-5 and CA-4samples (calcined at 600◦C) with the SI-1, RA-1 and CA-1(uncalcined), differences inT50% values varying from 35 to52◦C are observed. A less pronounced tendency is foundwhen the heating rate factor is studied. The experimentalresults indicate that controlled addition samples are less ac-tive than simple impregnation ones, as is illustrated inFig. 4where the CA-1 and SI-1 light-off curves are compared. Asimilar trend is obtained for the CA-4 and SI-2 samples (seeTable 2) where a total conversion temperature difference of44◦C is detected. When this procedure was applied to cat-alytic membrane preparation[30], a different behaviour wasobserved. For supported�-hematite catalysts, the hydrox-ide precipitation inside the porous structure of the supportmembrane allows the confinement of the catalytic materialwithin an area in which Knudsen diffusion for reactants isensured, and therefore enhanced conversions were achieved.
All the samples tested yield total combustion productswhen total conversion of MEK is reached (seeTable 2).However, the CO concentration presents a maximum at thelight-off temperature according to a series reaction network:CO formation from MEK and CO depletion to CO2. The in-fluence of space velocity on light-off curves and total com-bustion performance is shown inFig. 5A and B. TheT50%increases with the total feed flow rate from 238◦C at 80 h−1
to about 278◦C at 170 h−1; whereas the maximum selec-tivity to CO decreases. Therefore, the yield to CO shifts to
Fig. 5. Effect of weight hourly space velocity over RA-1 sample:(A) light-off curves; (B) yield to CO. Experimental condition: (MEK)0
= 1550 ppmv.Note: Temperatures reported have been measured insidethe catalytic bed.
lower values when the total flow rate increases (from 8.8 to6.3%, respectively).
The experiments carried out over the SI-2 sample atdifferent feed concentrations, shown inFig. 6A (480 and1700 ppmv), are in agreement with a pseudo-reaction totalorder “n” with respect to the oxygenate within the range1 > n ≥ 0, i.e. light-off temperatures increase with MEKconcentration (from 265 to 291◦C). However, the yield toCO at MEK isoconversion slightly increases with the MEKconcentration, probably because it is associated with a re-action order with respect to the oxygenate higher for theCO formation than for the CO2 production.Fig. 6B showsthe evolution of yield to CO versus reaction temperature.As can be observed, this shifts from 4.8 to 5.8% when theMEK concentration increases from 480 to 1700 ppmv.
3.3. Kinetic modelling
The range of operating conditions for the kinetic studywas as follows: catalyst SI-2, constant temperature measured

112 G. Picasso Escobar et al. / Chemical Engineering Journal 102 (2004) 107–117
Fig. 6. Effect of MEK concentration over SI-2 sample: (A) light-offcurves; (B) yield to CO. Experimental condition: WHSV= 75 h−1. Note:Temperatures reported have been measured inside the catalytic bed.
inside the catalytic bed, 250–305◦C; MEK concentrationin the air stream, 500–2000 ppmv and weight hourly spacevelocity defined per total feed flow rate, 70–500 h−1. In allthese experiments, the MEK conversion level was less than30%. The particle size of the catalyst was chosen in orderto minimise internal mass transfer resistance (160–320�m).Previous reaction experiments using different total flow ratesand maintaining the space velocity and MEK concentrationconstant confirmed the absence of external mass transferlimitations at flow rates above 100 cm3 STP/min, the lowestlimit used in the experiments.
The experimental points corresponding to the data plottedin Figs. 8 and 9, generated in the differential reactor underisothermal conditions with the SI-2 catalyst were fitted withboth an empirical power-law model and mechanistic mod-els. As a first approximation to the reaction kinetics, andfor model discrimination purposes, the total MEK deple-tion rate was considered. However, once the best model wasidentified, the kinetics corresponding to the series–parallelreaction network shown inFig. 7 was studied.
Fig. 7. The series–parallel reaction scheme adopted for MEK combustion.
3.4. Power law model
Modelling data with power law expressions help to quan-tify the effect of the principal variables—temperature andreactant partial pressures—on the reaction rates. The MEKconsumption rate was fitted to the following equation:
−rMEK = −dCMEK
dt= kCn
MEKCmO2
(3)
whererMEK is the MEK reaction rate (ppmv/h), andCMEKand CO2 are respectively the MEK and O2 concentrationsat the reactor outlet (ppmv). Because a clear excess of airhas been employed in all the experiments, the oxygen con-centration can be considered nearly constant throughout thereactor, and therefore the reaction rate can be expressed asfollows:
−rMEK = −dCMEK
dt= k′Cn
MEK (4)
The resulting apparent kinetic constantk′ was fitted to theArrhenius equation:
k′ = k′0 exp
(−Ea
R
(1
T− 1
Tm
))(5)
whereTm is a reference temperature (473.15 K) andk′0 the
kinetic constant at that temperature.This empirical model fits the data well with a reasonably
high value of 3.57 for the MSC. The activation energy es-timated, 117 kJ/mol, is similar to the reported value[4] forMEK combustion over Mn2O3, 118 kJ/mol. The reaction or-der with respect to MEK was estimated at 0.36, in agree-ment with the light-off temperature—oxygenate concentra-tion dependency, as was shown inFig. 6. Such reaction or-der clearly was pointing at more detailed mechanisms, suchas those explained in the following section.
The values of the kinetic parameters for the MEK deple-tion rate, the DC and the MSC parameters for all the kineticmodels tested, including the mechanistics ones, are shownin Table 3.
3.5. Mechanistic approaches: Mars-van Krevelen andLangmuir–Hinshelwood models
Mechanistic models are supposed to decouple thechemical reaction into elementary reaction steps, provid-ing an insight into how effectively to optimise the cat-alyst performance and reactor configuration. Two basicmechanistic models were tested: Mars-van Krevelen andLangmuir–Hinshelwood. In the former one, a coupled redox

G. Picasso Escobar et al. / Chemical Engineering Journal 102 (2004) 107–117 113
Table 3Estimated kinetic parametersa for total MEK depletion rate of the differentmodels tested.
Kineticparameters
MEK + �-O2 → reaction products (CO,CO2, H2O)
Power-law Mars-van Krevelen Langmuir–Hinshelwood
n 0.36 1 1MSC 3.5691 3.6064 3.6540DC 0.9733 0.9748 0.9760k′ (ppmv/h) 46.2Ea (kJ/mol) 117 131, 96.2 102,−25.7kMVK (ppmv/h) 524.8ki (ppmv/h) 3.7kLH (ppmv/h) 2.3k′
LH (ppmv/h) 1.3× 10⁻³
a All the kinetic constants tabulated have been evaluated at 473 K.
process between oxygen, active sites and MEK takes place.Oxygen reacts with a reduced catalytic site and the VOCmolecule subsequently reacts with the oxidised centre, andtherefore gas phase oxygen regenerates the catalyst lattice.The elementary steps involved are:
O2 + Zk0i−→ Zo (6)
MEK + Zoki−→products+ Z (7)
The corresponding MEK and O2 reaction rates are definedas
−rMEK = −dCMEK
dt= kiCMEKθ (8)
−rO2 = −dCO2
dt= k0iCO2(1 − θ) (9)
whereθ refers to the fraction of oxidised activated centres“Zo” and (1− θ) to the reduced centres “Z”. Defining “α”as the number of oxygen moles which disappear per moleof MEK, and combiningEqs. (8) and (9), the followingexpression is obtained:
1
−rMEK= α
k0iCO2
+ 1
kiCMEK= 1
kMVK+ 1
kiCMEK(10)
As is observed inTable 3, the apparent activation energies aresimilar to that estimated previously, 131.1 and 96.2 kJ/molfor kMVK andki, respectively. A mechanistic model includ-ing the adsorption of the reactants as elementary steps hasalso been tested. The Langmuir–Hinshelwood approach isessentially a one site model, i.e. both reactants adsorb ontothe surface and the reaction takes place between the adsorbedspecies. This type of mechanism has already been reportedin the literature[18] for MEK oxidation over Mn2O3 cata-lysts. In the present work, dissociative O2 adsorption is pos-tulated; however, several modifications could be developedconsidering specific active adsorption sites for each reactantor product. The set of elementary reaction steps consideredare the following:
MEK + • Ki↔MEK•; Ki = [MEK•]
[MEK][ •](11)
O2 + 2•K0i↔2O•; K0i = [O•]2
[O2] [•]2(12)
MEK• + O• k−→products; −rMEK = k [MEK•] [O•] (13)
where [•] represents the fraction of free active sites over thecatalyst surface. Applying the balance equation to the activecentres, assuming that O2 concentration remains constantdue to the clear excess used and rearranging (11) and (12),the following kinetic equation is obtained:
−rMEK = kKiCMEK√
K0iCO2(1 +√
K0iCO2 + KiCMEK)2 (14)
If (K0iCO2)1/2 is negligible, the MEK depletion rate couldbe expressed as follows:
−rMEK ≈ kLHCMEK
(1 + k′LH · CMEK)2
;
kLH = kKi
√K0iCO2; k′
LH = Ki (15)
Fig. 8 shows the parity MEK concentration plots at thereactor exit for the three models. Although no signifi-cant differences are observed in the model selection cri-teria values when the three models are compared, theLangmuir–Hinshelwood approach renders the highest valueof MSC (3.654). For this reason, and due to the experimen-tally observed relationship between specific surface area ofthe catalytic samples and light-off temperatures, this modelhas been selected to gain an insight into the kinetics of theseries–parallel reaction network shown inFig. 7.
3.6. Langmuir–Hinshelwood model for the series–parallelreaction network
In the reaction scheme adopted to describe the MEK ox-idation process, the reaction rates involved are:
R1 = −dCMEK→CO2
dt; R2 = −dCMEK→CO
dt;
R3 = −dCCO→CO2
dt(16)
Three different LH models have been developed, each ofwhich considers that MEK reacts to give CO and CO2, thatthere is only one type of adsorption site whatever the natureof the species, that product desorption is not controlling thereaction rate, and also that there is a new elementary reac-tion step in which the intermediate molecule CO is impli-cated. In the first model, LH-1, there is no adsorption of CObut the active sites over which atomic oxygen is adsorbedinteract with CO to produce CO2 which can be further de-composed to CO. The second model, LH-2, considers a re-versible homogeneous reaction in gas phase between carbonmonoxide and oxygen. And finally, the LH-3 model assumes

114 G. Picasso Escobar et al. / Chemical Engineering Journal 102 (2004) 107–117
Fig. 8. Parity plots for MEK concentration at the reactor outlet for thedifferent models tested.
that CO and O2 previously adsorbed react to CO2 whichcan also be decomposed to CO. The statistical parametersimprove from model LH1 (MSC= 4.4964, DC= 0.9898)to model LH-2 (MSC= 4.5462, DC= 0.9903) and LH-3(MSC = 4.5796, DC= 0.9908). There is a substantial in-crease in the MSC compared to that calculated previously,indicating that the complex reaction scheme adopted appro-
Table 4Elementary reaction steps and reaction rate expressions for LH-3 model
Adsorption elementary steps: equilibrium assumption
MEK + •K1↔ MEK• K1 = [MEK•]
[MEK][ •]
O2 + 2•K2↔ 2O• K2 = [O•]2
[O2][•]2
CO+ •K3↔ CO• K3 = [CO•]
[CO][•]
Reaction elementary steps: reaction rate expressions
MEK• + O• kA−→ 4CO2 R1 = k1CMEK
(1 + k′CMEK + k′′ · CCO)2
k1 = kAK1√
K2CO2
(1 + √K2O2)2
k′ = K1
(1 + √K2O2)
; k′′ = K3
(1 + √K2O2)
MEK• + O• kB−→ 4CO R2 = k2CMEK
(1 + k′CMEK + k′′CCO)2
k2 = kBK1√
K2CO2
(1 + √K2O2)2
k′ = K1
(1 + √K2O2)
; k′′ = K3
(1 + √K2O2)
CO• + O• kC−→ CO2
+ 2O•R3 = k3CCO
(1 + k′CMEK + k′′CCO)2− k′
3CCO2
CO2k′
C−→ CO+ 12O2 k3 = kCK3
√K2CO2
(1 + √K2O2)2
; k′3 = k′
C
k′ = K1
(1 + √K2O2)
; k′′ = K3
(1 + √K2O2)
priately represents the oxidation process. The elementaryreaction steps and reaction rate expressions for the best fit,mechanism LH-3, have been summarised inTable 4. The es-timated kinetic parameters for this mechanism are collectedin Table 5, while the comparison between the experimentalMEK and CO concentrations at the reactor outlet and thepredicted values is shown inFig. 9A and B, respectively.It should be emphasised thatk′ andk′′ are artificial kineticconstants resulting from an algebraic combination, thereforenegative activation energies can be achieved. Moreover, thekinetic constants for CO2 (k1) and CO (k2) formation fromMEK are quite similar, although the activation energy for theformer is notably higher (114.4 kJ/mol versus 77.2 kJ/mol),in agreement with the CO2 selectivity increase with tem-perature above theT50% value. Under these conditions, thetemperature effect on the reaction rate is more noticeable
Table 5Estimated kinetic parameters for LH-3 model
Kinetic constantsa (ppmv/h) Activation energies (kJ/mol)
k1 1.5 Ea1 114.4k2 1.3 Ea2 77.2k3 187.8 Ea3 32.0k′
3 23.3 E′a3
4.5 × 10⁻¹
k′ 4.7 × 10⁻⁴ E′a 1.7
k′′ 6.1 × 10⁻² E′′a −90.9
a All the kinetic constants tabulated have been evaluated at 473 K.

G. Picasso Escobar et al. / Chemical Engineering Journal 102 (2004) 107–117 115
Fig. 9. Parity plots for: (A) MEK; (B) CO concentration at the reactoroutlet for LH-3 model.
than the concentration dependency. However, the estimatedkinetic parameters are not able to predict the CO concentra-tion with sufficient accuracy, probably due to the relativelylow experimental values detected and the intrinsic error intheir analytical measurement.
3.7. Integral fixed bed reactor simulation with LH-3 model
In order to check the suitability of the LH-3 kineticmodel, we simulated the light-off curves obtained with a cat-alytic fixed bed reactor operating under integral conditions.Fig. 10A–Cillustrate the goodness of the fitting evaluatedfor the reference catalyst and RA-5 catalyst under specificreaction conditions. The Langmuir–Hinshelwood modeloverpredicts the selectivity to CO although it is capable ofreproducing the changes in yield to CO with temperature.
3.8. Catalytic membrane reactor simulation with LH-3model
We have also simulated the light-off curves obtained witha Fe2O3 catalytic membrane reactor in which the MEK con-
Fig. 10. Simulation of an integral fixed bed reactor using the LH-3 kineticmodel: (A) light-off curves; (B) yield to CO for SI-2 catalyst, 75 h−1,480 ppmv and 1700 ppmv MEK, respectively; (C) light-off curve for RA-5catalyst, 170 h−1 and 1700 ppmv MEK.Note: Temperatures reported havebeen measured inside the catalytic bed.

116 G. Picasso Escobar et al. / Chemical Engineering Journal 102 (2004) 107–117
Fig. 11. Simulation of the light-off curves obtained with a Fe2O3 basedcatalytic membrane reactor: (A) 1800 ppmv MEK; (B) 1000 ppmv MEK.Symbols: experimental points; lines: predicted values.Note: Temperaturesreported have been measured in the gas phase at the reactor inlet.
centration varied significantly across the membrane wall. Acomparison of experimental and simulated data is shownin Fig. 11A and Bfor an stainless steel catalytic mem-brane prepared under similar conditions to those employedwith SI-2. As is observed, the experimental tendencies arepredicted reasonably well, assuming the hypothesis for thereactor modelling already quoted. However, the simulatedcurves are always shifted to lower temperatures indicating agas–solid contact efficiency higher than the achieved exper-imentally. This is probably due to part of the active materialdeposited onto the membrane is located in a dead-end poreor inaccessible area, and therefore does not participate in thereaction.
4. Conclusions
Several kinetic models were tested to characterisethe oxidation of MEK over�-hematite catalysts. For aseries–parallel reaction scheme which best describes the
process, a Langmuir–Hinshelwood model appears as themore realistic approach which fits the experimental resultsobtained reasonable well.
This model assumes that the catalyst has only one type ofactive site over which MEK, oxygen and carbon monoxideare adsorbed. The kinetics so obtained was successfully ap-plied to simulate the light-off curves of MEK and the prod-uct distribution obtained in an integral catalytic fixed bedreactor. Moreover, this model, which considers isothermalbehaviour, gas in plug flow and negligible radial concentra-tion gradients, is able to predict reasonably well the perfor-mance of a Fe2O3 catalytic membrane reactor in the MEKoxidation process.
References
[1] J. Spivey, Ind. Eng. Chem. Res. 26 (1987) 2165–2180.[2] E. Moretti, N. Mukhopadhyay, Chem. Eng. Prog. 89 (7) (1993) 20–
26.[3] F.I. Khan, A.Kr. Ghoshal, J. Loss Prev. Proc. Ind. 13 (2000) 527–545.[4] L.M. Gand́ıa, A. Gil, S.A. Korili, Appl. Catal. B: Environ. 33 (2001)
1–8.[5] J.A. Horshley, Catalytica Environmental Report E4, Catalytica
Studies Division, Mountain View, CA, USA, 1993.[6] E.M. Cordi, J.L. Falconer, J. Catal. 162 (1) (1996) 104–117.[7] N. Burgos, M. Paulis, M. Antxustegui, M. Montes, Appl. Catal. B:
Environ. 38 (2002) 251–258.[8] M.A. Centeno, M. Paulis, M. Montes, J.A. Odriozola, Appl. Catal.
A: Gen. 234 (2002) 65–78.[9] J.L. Falconer, E.M. Cordi, P.J. O’Neill, Appl. Catal. B: Environ.
14 (1-2) (1997) 23–36.[10] C. Lahousse, A. Bernier, P. Grange, B. Delmon, P. Papaefthimiou,
T. Ioannides, X. Verkyos, J. Catal. 178 (1998) 214–225.[11] M. Baldi, E. Finocchio, F. Milella, G.A. Busca, Appl. Catal. B:
Environ. 16 (1998) 43–51.[12] N. Ali, C. Lu, R. Masel, Catal. Today 62 (2000) 347–353.[13] H-G. Lintz, K. Wittstock, Appl. Catal. A: Gen. 216 (2001) 217–225.[14] S.C. Kim, J. Haz. Mater. B91 (2002) 285–299.[15] S. Irusta, M.P. Pina, M. Menéndez, J. Santamarı́a, J. Catal. 179 (2)
(1998) 400–412.[16] K. Poplawski, J. Lichtenberger, F.J. Keil, K. Schnitzlein, M.D.
Amiridis, Catal. Today 62 (2000) 329–336.[17] V. Blasin-Aubé, J. Belkouch, L. Moceaux, Appl. Catal. B: Environ.
43 (2) (2003) 175–186.[18] T.K. Tseng, H. Chu, Sci. Tot. Environ. 275 (2001) 83–93.[19] R.K. Sharma, B. Zhou, S. Tong, K.T. Chuang, Ind. Eng. Chem. Res.
34 (1995) 4310–4317.[20] M. Haruta, A. Ueda, S. Tsubota, R.M.T. Sanchez, Catal. Today
29 (1–4) (1996) 443–447.[21] U. Rodemerck, D. Wolf, O.V. Buyevskaya, P. Claus, S. Senkan, M.
Baerns, Chem. Eng. J. 82 (1–3) (2001) 3–11.[22] S. Scirè, S. Minicò, C. Crisafulli, S. Galvagno, Catal. Commun. 2
(2001) 229–232.[23] S. Tuti, F. Pepe, D. Pietrogiacomi, V. Indovina, Catal. Today 75 (1–4)
(2002) 373–378.[24] A. Sanz, A.L. Barbosa, A. Monzón, J. Herguido, J. Santamarı́a, Stud.
Surf. Sci. Catal. 139 (2001) 487–494.[25] M. González-Burillo, A.L. Barbosa, J. Herguido, J. Santamarı́a, J.
Catal. 258 (2003) 457–459.[26] J. Coronas, J. Santamarı́a, Catal. Today 51 (1999) 377–389.[27] M.P. Pina, M. Menéndez, J. Santamarı́a, Appl. Catal. B 11 (1996)
19–27.[28] M.P. Pina, S. Irusta, M. Menéndez, J. Santamarı́a, R. Hughes, N.
Boag, Ind. Eng. Chem. Res. 36 (1997) 4557–4566.

G. Picasso Escobar et al. / Chemical Engineering Journal 102 (2004) 107–117 117
[29] S. Irusta, M.P. Pina, M. Menéndez, J. Santamarı́a, Catal. Lett. 54(1998) 69–78.
[30] G. Picasso, A. Quintilla, M.P. Pina, J. Herguido, Appl. Catal. B:Environ. 46 (2003) 133–143.
[31] G. Saracco, V. Specchia, Chem. Eng. Sci. 55 (2000) 897–908.
[32] L. Van de Beld, M.P.G. Bijl, A. Reinders, B. Van der Werf,K.R. Westerterp, Chem. Eng. Sci. 49 (24A) (1994) 4361–4373.
[33] B.D. Cullity, Elements of X-ray Diffraction, first ed.,Addison-Wesley, Reading, MA, 1959, p. 132.


![2-[2-(2-Pyridyl)ethyl]isoindolinium perchlorate](https://img.pdfslide.net/doc/110x75/6352bf780f35c933db00cfcb/2-2-2-pyridylethylisoindolinium-perchlorate.jpg)


![Hematite (Fe2O3) acts by oxydative stress and potentiates benzo[a]pyrene genotoxicity](https://img.pdfslide.net/doc/110x75/6348330df5483db9d306dabb/hematite-fe2o3-acts-by-oxydative-stress-and-potentiates-benzoapyrene-genotoxicity.jpg)


