Embed Size (px)
Citation preview
Labour market performanceof immigrants in the UKlabour market
Home Office Online Report 05/03
Christian Dustmann, Francesca Fabbri,Ian Preston, Jonathan Wadsworth
The views expressed in this report are those of the authors, not necessarily those of the Home Office (nor do theyreflect Government policy).
Labour market performance of immigrants in the
UK labour market
Christian Dustmann, Francesca Fabbri, Ian Preston, Jonathan Wadsworth 1
1This report has been financed by the UK Home Office. We are grateful to Yasmin Dolatabadi for
excellent research assistance. We thank members of the Home Office Steering Group and the DWP for
comments. We are especially grateful to Carole Willis, Ceri Gott, and Jeremy Kempton for comments
and discussions. We also thank the UK Essex Archive for providing the Labour Force Survey and
the 1971 UK Census data sets and Manchester Information and Associated Services (MIMAS) for
providing the 1981 and 1991 UK Census data sets. We are responsible for any remaining errors.
Contents
1 Introduction . . . . . . . . . . . . . . . . . . . . . . . . . . . . . . . . . . . . . . . . . . . . . . . 10
2 Background . . . . . . . . . . . . . . . . . . . . . . . . . . . . . . . . . . . . . . . . . . . . . . . 13
Theory and methodology . . . . . . . . . . . . . . . . . . . . . . . . . . . . . . . . . . . . . . . 13
Previous literature . . . . . . . . . . . . . . . . . . . . . . . . . . . . . . . . . . . . . . . . . . . 15
The Labour Force Survey . . . . . . . . . . . . . . . . . . . . . . . . . . . . . . . . . . . . . . . 18
3 Immigrants in the UK . . . . . . . . . . . . . . . . . . . . . . . . . . . . . . . . . . . . . . . . . 19
Composition and arrival . . . . . . . . . . . . . . . . . . . . . . . . . . . . . . . . . . . . . . . . 19
Characteristics of immigrants and UK-born individuals . . . . . . . . . . . . . . . . . . . . . . . 20
Participation and employment . . . . . . . . . . . . . . . . . . . . . . . . . . . . . . . . . . . . . 26
Sector allocation and origin . . . . . . . . . . . . . . . . . . . . . . . . . . . . . . . . . . . . . . 29
Summary . . . . . . . . . . . . . . . . . . . . . . . . . . . . . . . . . . . . . . . . . . . . . . . . 33
4 Economic performance of UK-born and foreign-born
individuals . . . . . . . . . . . . . . . . . . . . . . . . . . . . . . . . . . . . . . . . . . . . . . . 34
Employment . . . . . . . . . . . . . . . . . . . . . . . . . . . . . . . . . . . . . . . . . . . . . . 36
Participation . . . . . . . . . . . . . . . . . . . . . . . . . . . . . . . . . . . . . . . . . . . . . . 38
Self-employment . . . . . . . . . . . . . . . . . . . . . . . . . . . . . . . . . . . . . . . . . . . . 40
Wages . . . . . . . . . . . . . . . . . . . . . . . . . . . . . . . . . . . . . . . . . . . . . . . . . . 44
5 Dynamic analysis . . . . . . . . . . . . . . . . . . . . . . . . . . . . . . . . . . . . . . . . . . . . 48
6 Economic outcomes, language, and public-private sector
differentials . . . . . . . . . . . . . . . . . . . . . . . . . . . . . . . . . . . . . . . . . . . . . . . 54
Language and labour market outcomes . . . . . . . . . . . . . . . . . . . . . . . . . . . . . . . . 54
1
Wages in public and private sector . . . . . . . . . . . . . . . . . . . . . . . . . . . . . . . . . . 57
7 White UK-born, ethnic minority immigrants, and ethnic minority UK-born . . . . . . . . . . . 58
Employment . . . . . . . . . . . . . . . . . . . . . . . . . . . . . . . . . . . . . . . . . . . . . . 59
Participation . . . . . . . . . . . . . . . . . . . . . . . . . . . . . . . . . . . . . . . . . . . . . . 62
Wages . . . . . . . . . . . . . . . . . . . . . . . . . . . . . . . . . . . . . . . . . . . . . . . . . . 62
8 Discussion and recommendations . . . . . . . . . . . . . . . . . . . . . . . . . . . . . . . . . . . 68
9 Appendix . . . . . . . . . . . . . . . . . . . . . . . . . . . . . . . . . . . . . . . . . . . . . . . . 71
Technical details . . . . . . . . . . . . . . . . . . . . . . . . . . . . . . . . . . . . . . . . . . . . 71
Glossary . . . . . . . . . . . . . . . . . . . . . . . . . . . . . . . . . . . . . . . . . . . . . . . . . 72
Origin variables and ethnicity . . . . . . . . . . . . . . . . . . . . . . . . . . . . . . . . . 72
Other Variables . . . . . . . . . . . . . . . . . . . . . . . . . . . . . . . . . . . . . . . . . 73
Tables . . . . . . . . . . . . . . . . . . . . . . . . . . . . . . . . . . . . . . . . . . . . . . . . . . 75
2
List of Tables
13. Immigrants and UK-born whites in Britain (population of working age) . . . . . . . . . . . . . 21
23. Employment and participation rates of UK-born whites and immigrants 1979-2000 . . . . . . . 28
33. Employment patterns of immigrants and UK-born whites in Britain - men (population of
working age) . . . . . . . . . . . . . . . . . . . . . . . . . . . . . . . . . . . . . . . . . . . . . . 31
43. Employment patterns of immigrants and UK-born whites in Britain - women (population of
working age) . . . . . . . . . . . . . . . . . . . . . . . . . . . . . . . . . . . . . . . . . . . . . . 32
14. Self-employment sector choice, UK-born white and immigrant men . . . . . . . . . . . . . . . . 43
16. Language proficiency, minority immigrants . . . . . . . . . . . . . . . . . . . . . . . . . . . . . . 55
19. Immigrants vs white UK-born: employment . . . . . . . . . . . . . . . . . . . . . . . . . . . . . 75
29. Immigrants vs white UK-born: participation . . . . . . . . . . . . . . . . . . . . . . . . . . . . 76
39. Immigrants vs white UK-born: self-employment . . . . . . . . . . . . . . . . . . . . . . . . . . . 77
49. Immigrants vs white UK-born: wages . . . . . . . . . . . . . . . . . . . . . . . . . . . . . . . . 78
3
List of Figures
13. Distribution of immigrants by year of entry . . . . . . . . . . . . . . . . . . . . . . . . . . . . . 19
23. Year of arrival by origin status . . . . . . . . . . . . . . . . . . . . . . . . . . . . . . . . . . . . 20
33. Distribution of immigrants by age . . . . . . . . . . . . . . . . . . . . . . . . . . . . . . . . . . 24
43. Employment rates, UK-born whites and immigrants, 1979-2000 . . . . . . . . . . . . . . . . . . 27
53. Participation rates, UK-born whites and immigrants, 1979-2000 . . . . . . . . . . . . . . . . . . 27
14. Employment differentials, 1st Generation immigrants and white UK-born individuals . . . . . . 37
24. Participation differentials, 1st generation immigrants and white UK-born individuals . . . . . . 39
34. Self-employment differentials, 1st generation immigrants and white UK-born individuals . . . . 45
44. Wage differentials, 1st generation immigrants and white UK-born individuals . . . . . . . . . . 47
15. Adaptation profiles, males . . . . . . . . . . . . . . . . . . . . . . . . . . . . . . . . . . . . . . . 50
25. Adaptation profiles, females . . . . . . . . . . . . . . . . . . . . . . . . . . . . . . . . . . . . . . 52
17. Employment differentials, 1st and 2nd generation ethnic minorities and white UK-born individ-
uals, males . . . . . . . . . . . . . . . . . . . . . . . . . . . . . . . . . . . . . . . . . . . . . . . 60
27. Employment differentials, 1st and 2nd generation ethnic minorities and white UK-born individ-
uals, females . . . . . . . . . . . . . . . . . . . . . . . . . . . . . . . . . . . . . . . . . . . . . . 61
37. Participation differentials, 1st and 2nd generation ethnic minorities and white UK-born indi-
viduals, males . . . . . . . . . . . . . . . . . . . . . . . . . . . . . . . . . . . . . . . . . . . . . . 63
47. Participation differentials, 1st and 2nd generation ethnic minorities and white UK-born indi-
viduals, females . . . . . . . . . . . . . . . . . . . . . . . . . . . . . . . . . . . . . . . . . . . . . 64
57. Wage differentials, 1st and 2nd generation ethnic minorities and white UK-born individuals,
males . . . . . . . . . . . . . . . . . . . . . . . . . . . . . . . . . . . . . . . . . . . . . . . . . . 65
67. Wage differentials, 1st and 2nd generation ethnic minorities and white UK-born individuals,
females . . . . . . . . . . . . . . . . . . . . . . . . . . . . . . . . . . . . . . . . . . . . . . . . . 66
4
5
Executive summary
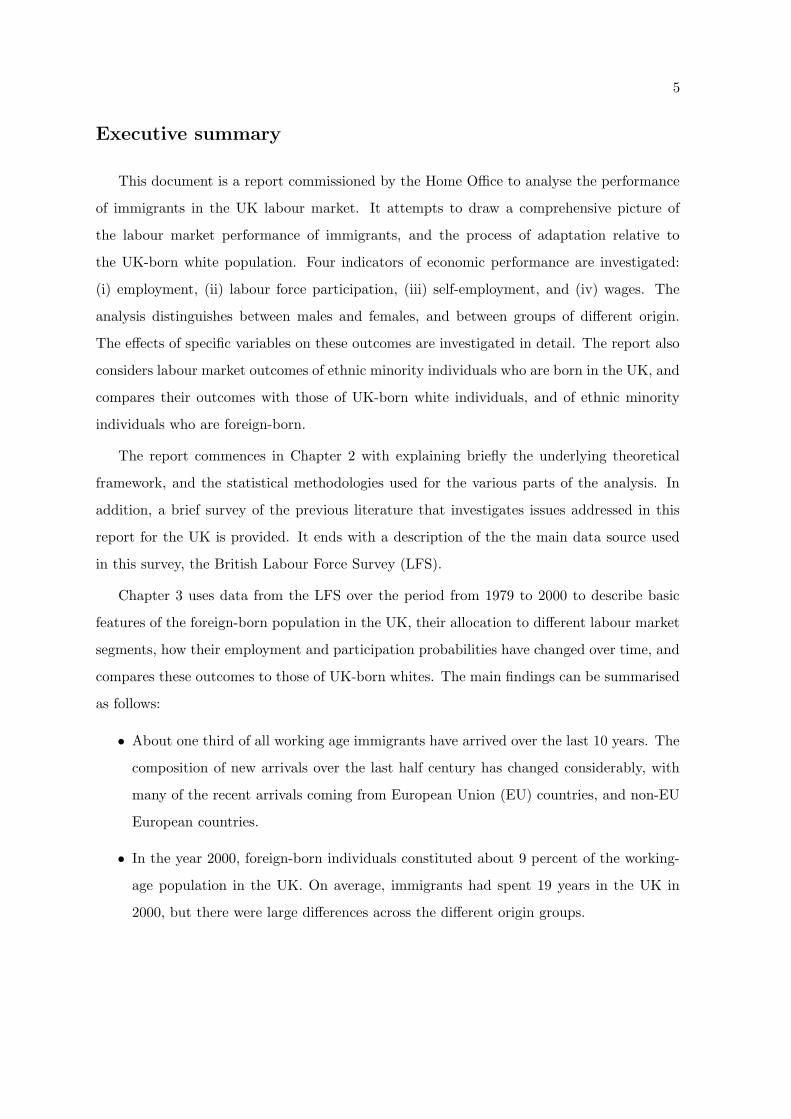
This document is a report commissioned by the Home Office to analyse the performance
of immigrants in the UK labour market. It attempts to draw a comprehensive picture of
the labour market performance of immigrants, and the process of adaptation relative to
the UK-born white population. Four indicators of economic performance are investigated:
(i) employment, (ii) labour force participation, (iii) self-employment, and (iv) wages. The
analysis distinguishes between males and females, and between groups of different origin.
The effects of specific variables on these outcomes are investigated in detail. The report also
considers labour market outcomes of ethnic minority individuals who are born in the UK, and
compares their outcomes with those of UK-born white individuals, and of ethnic minority
individuals who are foreign-born.
The report commences in Chapter 2 with explaining briefly the underlying theoretical
framework, and the statistical methodologies used for the various parts of the analysis. In
addition, a brief survey of the previous literature that investigates issues addressed in this
report for the UK is provided. It ends with a description of the the main data source used
in this survey, the British Labour Force Survey (LFS).
Chapter 3 uses data from the LFS over the period from 1979 to 2000 to describe basic
features of the foreign-born population in the UK, their allocation to different labour market
segments, how their employment and participation probabilities have changed over time, and
compares these outcomes to those of UK-born whites. The main findings can be summarised
as follows:
• About one third of all working age immigrants have arrived over the last 10 years. The
composition of new arrivals over the last half century has changed considerably, with
many of the recent arrivals coming from European Union (EU) countries, and non-EU
European countries.
• In the year 2000, foreign-born individuals constituted about 9 percent of the working-
age population in the UK. On average, immigrants had spent 19 years in the UK in
2000, but there were large differences across the different origin groups.
6
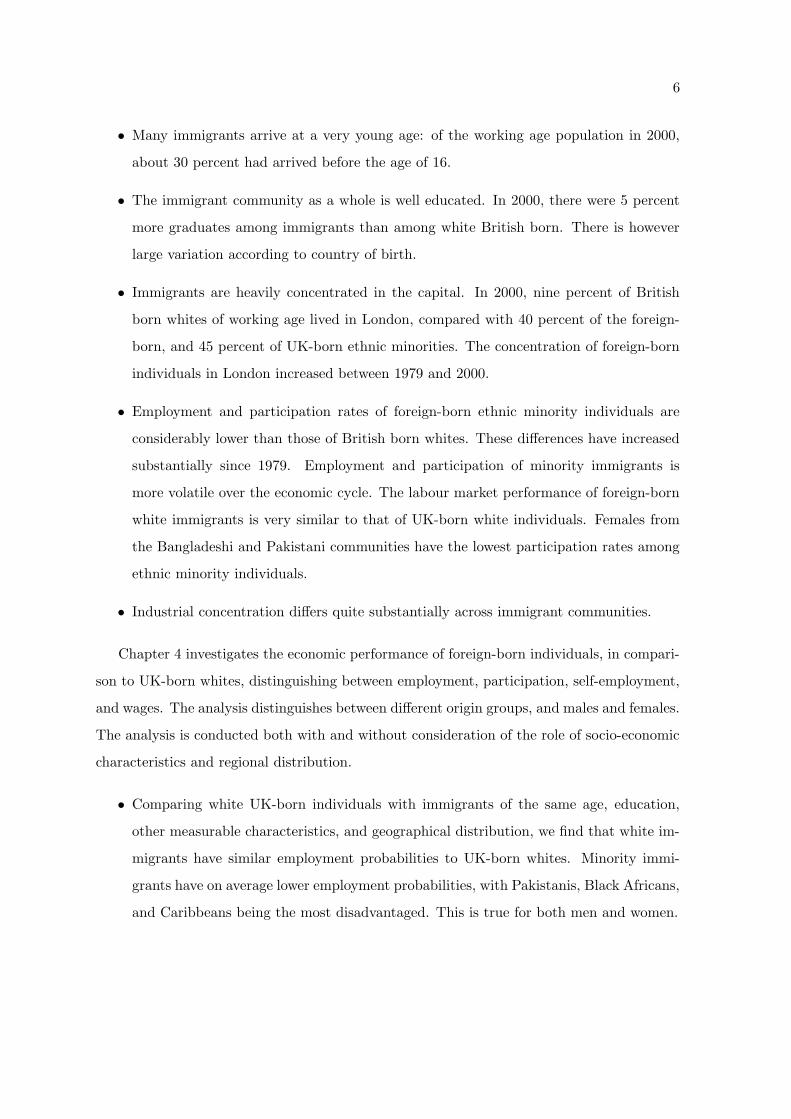
• Many immigrants arrive at a very young age: of the working age population in 2000,
about 30 percent had arrived before the age of 16.
• The immigrant community as a whole is well educated. In 2000, there were 5 percent
more graduates among immigrants than among white British born. There is however
large variation according to country of birth.
• Immigrants are heavily concentrated in the capital. In 2000, nine percent of British
born whites of working age lived in London, compared with 40 percent of the foreign-
born, and 45 percent of UK-born ethnic minorities. The concentration of foreign-born
individuals in London increased between 1979 and 2000.
• Employment and participation rates of foreign-born ethnic minority individuals are
considerably lower than those of British born whites. These differences have increased
substantially since 1979. Employment and participation of minority immigrants is
more volatile over the economic cycle. The labour market performance of foreign-born
white immigrants is very similar to that of UK-born white individuals. Females from
the Bangladeshi and Pakistani communities have the lowest participation rates among
ethnic minority individuals.
• Industrial concentration differs quite substantially across immigrant communities.
Chapter 4 investigates the economic performance of foreign-born individuals, in compari-
son to UK-born whites, distinguishing between employment, participation, self-employment,
and wages. The analysis distinguishes between different origin groups, and males and females.
The analysis is conducted both with and without consideration of the role of socio-economic
characteristics and regional distribution.
• Comparing white UK-born individuals with immigrants of the same age, education,
other measurable characteristics, and geographical distribution, we find that white im-
migrants have similar employment probabilities to UK-born whites. Minority immi-
grants have on average lower employment probabilities, with Pakistanis, Black Africans,
and Caribbeans being the most disadvantaged. This is true for both men and women.
7
• Participation rates differ substantially between immigrant communities, with some (pre-
dominantly the white communities) being similar to UK-born whites, while others (pre-
dominantly some non-white minority communities) have substantially lower participa-
tion probabilities, even if we allow for differences in socio-economic characteristics and
regional distribution. Pakistanis and Bangladeshis are among those with lowest partic-
ipation probabilities.
• Self-employed immigrants are strongly concentrated in some sectors. Concentration
differs according to origin. One out of two self-employed immigrants from the eth-
nic minority communities is active in the Distribution, Hotel and Restaurant sector
(compared to one in six in the UK-born white population). White immigrants are con-
centrated in both the construction sector, and the distribution, hotel and restaurant
sector. Compared to UK-born whites of same characteristics, white male immigrants
have slightly higher probabilities of being self-employed. There is large variation across
minority immigrants: while Pakistanis, Afro-Asians and Chinese are more likely to
be self-employed, Caribbeans and West Africans are less likely to be self-employed,
compared to white UK-born individuals.
• For wages, there is a dividing line between white and non-white immigrants. While
individuals from most white immigrant communities have on average higher wages
than UK-born whites with the same characteristics, immigrants from all ethnic minority
communities have lower wages. This is true for both males and females, with differences
being more accentuated for males. Wage differentials are substantial, reaching about
40 percent for male Bangladeshis.
Chapter 5 investigates the relative change in the economic outcomes of immigrants relative
to UK-born whites over the immigration cycle, considering socio-economic characteristics.
We distinguish between four groups: ethnic minority immigrants, immigrants from Ireland
or the EU, white immigrants from Old Commonwealth countries, and white immigrants from
New Commonwealth countries.
• Employment and participation probabilities for white immigrants remain relatively sta-
8
ble over the migration cycle, compared to British born whites. Employment and partic-
ipation probabilities of minority immigrants are initially substantially lower than those
of UK-born whites, but there is adaptation. We estimate that after about 20 years of
residence, participation and employment probabilities are similar to those of UK-born
whites. Differences for females from ethnic minority communities are much more pro-
nounced. Female immigrants do not appear to reach parity of participation rates with
white UK-born individuals no matter how long they have been resident in Britain.
• Self-employment probabilities increase for all groups after arrival, relative to UK-born
whites. Ethnic minority immigrants and individuals from the Irish community/EU are
more likely to be self-employed than UK-born whites after about five years after arrival.
• Our estimated wage differences relative to UK-born whites conditional on length of
residence are quite unstable, mainly due to the relatively small numbers of observations.
Overall, wages of white immigrants seem to vary little with length of residence relative
to UK-born whites. Wages of minority individuals seem to converge slightly to those
of UK-born whites as length of residence increases.
Drawing on existing literature, Chapter 6 investigates differences in language proficiency
across immigrant groups from ethnic minority communities, the way language relates to
observable characteristics, and the association between language and economic outcomes. It
also investigates wage differences of immigrants between the public and the private sector,
and compares them with those of UK-born white workers.
• There is considerable variation in language proficiency across the various minority im-
migrant groups. Bangladeshis and Pakistanis have the lowest proficiency in the English
language.
• Language proficiency improves with time of residence, is higher for the more educated,
and is higher the lower the age at which the immigrant entered the country.
• Language fluency is strongly and positively associated with the probability to be em-
ployed, and with wages. Language proficiency is likely to reduce the gap between
9
UK-born whites and minority immigrants considerably.
• The wage differential between immigrant men and white UK-born men is smaller in the
public sector than in the private sector.
Chapter 7 compares economic outcomes of ethnic minority individuals born in the UK
with those of UK-born whites, and foreign-born individuals of the same ethnic community.
• For males, there is some improvement of UK-born ethnic minorities in terms of em-
ployment and participation probabilities, relative to minority immigrants. However,
British born ethnic minority individuals from most minority communities are still less
likely to be employed, or to participate in the labour market, relative to their white
peers. For females, UK-born ethnic minority individuals have improved their relative
employment and participation probabilities substantially, compared to immigrants of
the same ethnic origin.
• Wages of UK-born minority individuals are more similar to those of their white peers,
compared to minority immigrants of the same origin. There are still wage penalties for
some ethnic groups. Most disadvantaged seem to be Black African UK-born individuals,
who have, on average, around 20 percent lower wages than their white peers (with
similar numbers for females).
10
1 Introduction
Motivation: According to the Labour Force Survey, some 4.5 million individuals living in
Britain in the year 2000, 9% of the population, were born in another country. Many of these
individuals of foreign origin work, and contribute to economic prosperity and well-being.
Due to differences in education, demographic structure, culture, and skills, foreign-born indi-
viduals may have advantages in some labour market segments, but disadvantages in others.
Over time, they may adjust in many respects to their UK-born peers, due to accumulation
of skills, collection of information, and adoption of new habits. To understand how labour
market performance of immigrants differs from UK-born, and from each other, how these
differences relate to observed characteristics, and how they change over time is an important
pre-requisite for migration policy. While adaptation and labour market performance of immi-
grant populations have been subject of intensive research in the US, Canada, Australia, and
also in some European countries, relatively little is known about the absolute and relative
performance of the immigrant community living in Britain. This report will fill some of these
gaps.
Aims and Objectives: We use the British Labour Force Survey (LFS) for the years 1979-
2000 to provide a comprehensive picture of different aspects of labour market performance
of immigrants in the UK. We define an immigrant as an individual who is born outside the
UK. We investigate four different performance indicators: (i) Labour force participation, (ii)
employment, (iii) wages, and (iv) self-employment. Our comparison group are white UK-born
individuals.
We not only compare immigrants to UK-born individuals, but, where possible and mean-
ingful, we distinguish between immigrants of different origin. We also compare the perfor-
mance of immigrants to that of UK-born workers with the same individual and labour market
characteristics. Thus, we do not only provide answers to questions like “What is the differ-
ence in wages between an average male immigrant and an average male white UK-born”,
but also to questions like “What is the difference in wages between a male immigrant, and a
UK-born white who are identical in their education, age, other demographic characteristics,
11
and choice of residence area?”
Our analysis considers not only males, but also females. Different traditions, religions, and
culture may lead to behaviour of female immigrants which leads to labour market outcomes
that are more distinct from their UK-born peers than those of male immigrants.
Differences between immigrants and UK-born individuals may change while immigrants
reside in the host country. We investigate the way immigrants adapt to or diverge from
UK-born individuals in the host country labour market over their migration history. This
allows us to answer questions like “What is the difference in immigrants’ wages, compared to
UK-born individuals, upon entry to the host country? And how has this difference changed
after 10 years of residence?”
We investigate a number of important additional issues, like the relationship between
language proficiency and economic performance, and whether there is a public sector premium
for immigrants, which is different from that of UK-born individuals.
The process of adaptation may span more than one generation. An important question
is whether and to what extent any disadvantages that the parent generation experiences
are transmitted to the offspring’s generation. In the UK around one million individuals
(according to the LFS) of working-age belong to an ethnic minority, but have been born in
Britain. The economic performance of children of immigrants, relative to their forebears and
their white UK-born peers is an area where little research has been done (see Card, DiNardo
and Estes 2000 for an interesting analysis for the US). We shall attempt an assessment of how
well UK-born minority individuals are doing in the labour market relative to their forebears
and relative to their UK-born white peers.
Methodology: To investigate the relationship between individual characteristics, like ed-
ucation, age, and time of residence, we use regression analysis. Comparisons between im-
migrants and UK-born individuals will likewise be based on underlying regression models.
Our analysis is purely descriptive, in the sense that we do not attempt to address issues
like selective labour force participation. When we compare wages of female immigrants with
those of UK-born individuals, for example, we do not account for the possibility that females
12
who work are selected from the overall population of females on characteristics other than
education, age, years of residence, and other observable demographic indicators. Thus, our
analysis answers questions about differences in wages between UK-born white females, and
female immigrants who are working, but not between UK-born white females, and female
immigrants, who are randomly drawn from the respective populations. To answer the latter
question requires an analysis which is beyond the scope of this report.
Key Limitations of the data analysis: A problem with analysing individuals who constitute
a minority is that representation in surveys is small, so rendering results imprecise. This is
particularly the case when investigating wages, which have not been reported in every wave
of the LFS.
Policy Relevance: The main objective of this report is to inform the debate about the
economic performance of Britain’s immigrant communities, using the latest available data
sources. The results of this study may inform policy makers about which particular immigrant
groups are most disadvantaged, and which groups are more successful. The study identifies
specific areas that should be investigated in more detail in future research.
Structure of the report: We commence our analysis by providing background information,
including the theory and methodology underlying our approaches, brief review of the previous
literature for the UK, and our main data source. We then provide descriptive information on
the composition of immigrants in the UK, and how this has changed over time, their socio-
economic characteristics, and their labour market outcomes. Next we investigate the various
labour market performance indicators for immigrants of different origin, and compare them
to UK-born whites (Chapter 4) of same age, origin, and other background characteristics. In
addition, we study the process of adaptation of immigrants to UK-born whites. In Chapter
6 we look at the determinants of language proficiency, and how language is associated with
economic outcomes, drawing on other recent research. We also analyse wage differentials
between employees in the public and the private sectors. Finally, in Chapter 7 we analyse
ethnic minority individuals who are born in the UK, and compare them to immigrant of the
same ethnic origin, and to white UK-born individuals.
13
2 Background
Theory and methodology
When immigrants arrive in the destination country, their labour market productivity is
likely to be different from that of UK-born individuals. This may be because of different
levels of education, socio-economic characteristics, and different demographic composition.
But even if we compare an immigrant with a UK-born of the same education and age, we
may find that the immigrant differs in labour market outcomes, like wages and participation.
One important reason is that the skills immigrants have acquired in their home country are
often not directly transferable to the host economy. For example, a mechanic in Kosovo may
have acquired skills valuable for performing well in his job in his home country (like building
parts for a car from scratch), but less relevant in the UK; on the other side, he may lack skills
that are important for performing this occupation in the UK (like using electronic equipment
for car maintenance). There are also more general skills immigrants may lack immediately
after arrival in the host country - like fluency in the host country language.
Over time, immigrants may adjust their skills to requirements of the host country labour
market and, in addition, acquire new skills. This may eventually lead to immigrants’ economic
performance becoming more similar to that of their UK-born peers.
Differences in demographics, education, or skills may not be the only reason why im-
migrants differ in their labour market outcomes from UK-born individuals. Upon arrival,
and when given the choice, immigrants may settle in those areas that are economically most
prosperous, and offer the highest wages. As a consequence, when we compare immigrants
with UK-born individuals, this selective settlement may lead, on average, to more favourable
labour market outcomes of immigrants than of UK-born individuals. It may underestimate
the differences in economic outcomes between UK-born individuals and immigrants we would
obtain if immigrants were allocated to areas in the same way as UK-born individuals.
To analyse the differences and the similarities between UK-born individuals and immi-
grants, we analyse micro data, using econometric and statistical techniques. The data is
14
survey based, where individuals are asked about a large array of socio-economic characteris-
tics and labour market outcomes, as well as information about country of birth, and ethnic
affiliation.
From this data, we can compute labour market performance indicators, and compare
them between different groups. To obtain, for instance, the labour force participation rate of
white UK-born individuals, we simply compute the average of individuals participating in a
particular year. We can do the same for immigrants, and compare the two numbers. What
we obtain is an estimate for the difference in participation rates between an average white
UK-born individual, and an average foreign-born individual, for a particular year.
We may also want to compute differences between a UK-born, and a foreign-born indi-
vidual of, for instance, the same age and education. To achieve this, we compute averages, as
before, but conditional on years of education, and age. We do this by using regression analy-
sis. This technique can be used to adjust for differences in other measurable characteristics,
like regional distribution.
To compute changes in the relative economic position of an immigrant over the migration
cycle, we need to make some assumptions about the adjustment process. The standard
assumption is that the time of residence in the host country can be used as a measure for the
acquisition and transformation of skills. Based on information about the time the immigrant
has spent in the host country, we can use the techniques explained above, and compute the
difference in outcomes between a UK-born individual and an immigrant at different stages
of the migration cycle.
The resulting measure for adaptation may be misleading, however. Suppose that the type
of immigrants entering the UK changes over time, and assume that more recent cohorts are
more productive, even conditional on education. Now suppose we compute the process of
adaptation of immigrants, using data for only one year, by comparing immigrants who have
been in the UK for 10 years to immigrants who have just arrived. If the new arrivals are
more productive than immigrants who arrived 10 years earlier, then this comparison leads to
an underestimate of the speed of adjustment. This problem can be dealt with when multiple
years of observations are available, and we will address it in our analysis below.
15
Another problem which may compromise the resulting measure of adaptation is selective
out-migration. Not all immigrants remain in the host country; in fact, there is evidence
that out-migration is very substantial (see Dustmann 1997). Suppose now that it is the
”better” immigrants who out-migrate some years after arrival. Suppose further that we
observe the same cohort of immigrants at arrival, and 10 years later, so that cohort effects can
be successfully eliminated. Still, a comparison of entry outcomes of the immigrant population
with outcomes 10 years later is misleading, as the best individuals have left after 10 years,
and the average outcome of the same cohort after 10 years is lower than it would have been
if the returners had been included. Thus, this leads to an underestimate of the economic
adjustment. This problem is not easily resolved; in fact without information about out-
migration, the problem of selective return migration cannot be solved. As we discuss below,
it is likely to explain some of the patterns we observe in our data.
If we compare now some performance indicators between an immigrant and a UK-born
individual of the same age and education, the interpretation is conditional on the population
to which it refers. For instance, when comparing average wages between immigrants and
UK-born individuals, these wages are computed from data on individuals who are in work.
Accordingly, the wage difference we compute is the difference in wages between immigrants
and UK-born individuals who work. This parameter may be different from the difference in
wages between an average immigrant, and an average UK-born individual of working age.
The reason is that those who are employed may be selected from the overall population,
even given observable characteristics like education and age. The processes of selection may
differ, in addition, between migrants and UK-born individuals. The parameter we report
here always refers to individuals who happen to be in the respective state (say working). To
compute parameters for the overall population is very involved, requires strong assumptions,
and is beyond the scope of this report.
Previous literature
Not much work exists on the economic performance of immigrants in the UK, and most
existing contributions have been written over the last five years only. We briefly survey the
16
recent literature on UK data.
Employment and Participation: The early literature in the UK on employment and partic-
ipation differentials compares outcomes of whites with those of ethnic minorities. Distinctions
between immigrant and UK-born minorities have rarely been drawn, but more recent work
shows that this distinction is crucial.
Based on the 1991 UK Census of population, Blackaby et al. (1997) investigate the
incidence of unemployment. They find that the foreign-born ethnic minorities have a higher
unemployment rate than UK-born minorities. They find no evidence that the latter perform
worse than white UK-born individuals. Blackaby et al. (1997) also find substantial differences
between different ethnic groups. Their results suggest that Pakistanis and Bangladeshis
have particularly low employment probabilities. Wheatley Price (2001) uses Quarterly LFS
data for the years 1993 and 1994. He finds that white and non-white immigrants have
initially a lower probability of being employed, compared to white UK-born individuals.
While this disadvantage decreases over time for white immigrants, it does not disappear for
non-white immigrants. In an analysis of ethnic minority immigrants and ethnic minority UK-
born individuals, and based on data from the Fourth National Survey on Ethnic Minorities
(FNSEM) and the Family and Working Life Survey (FWLS), Dustmann and Fabbri (2002)
find that minority immigrants have lower employment probabilities compared to white UK-
born individuals and minority UK-born individuals. This disadvantage falls slightly over time.
They also find differences between ethnic groups. They confirm the findings by Blackaby et
al. for Pakistani and Bangladeshi immigrants.
Wages: The first study on the earnings adaptation of UK immigrants is by Chiswick
(1980), who analyses the 1972 GHS. He finds that there is no significant earnings gap between
white immigrants and white UK-born individuals, but a 25 percent gap between white UK-
born individuals and non-white immigrants. Chiswick finds no evidence for adaptation of
non-white immigrants. He also finds no wage gap between white and non-white UK-born
individuals.
More recently, Bell (1997) has performed a more exhaustive analysis, pooling 20 consecu-
tive cross-sections of the GHS (1973 to 1992). He distinguishes between West Indian, Indian
17
and white and Old Commonwealth immigrants. He finds different adaptation rates and entry
wage differentials across these groups. While ethnic minority immigrants have an initial wage
disadvantage that slowly decreases, white immigrants have initially higher wages, but adapt
downwards. Bell attributes this negative adaptation to the possibility that white migrants
who remain in the UK are negatively selected. Denny et al. (1997), using also GHS data
(from 1974 to 1993), find similar results. In particular, they find a large wage differential be-
tween non-white immigrants and white UK-born individuals, but no wage gap between white
UK-born individuals and white immigrants. Dustmann and Fabbri (2002) analyse minority
immigrants, based on data from the FNSEM and the FWLS. Their findings confirm results of
earlier studies, indicating that minority immigrants earn substantially lower wages at entry
than white UK-born individuals. This initial gap decreases slightly, but does not close.
Self-Employment: Work on self-employment of immigrants is scarce. For the US, Bor-
jas (1986) analyses self-employment probabilities for immigrants and UK-born individuals.
Borjas and Bronars (1989) extend this analysis, looking at self-employment probability dif-
ferentials among different ethnic groups. For the UK, there are only two papers which study
self-employment probabilities, and only for ethnic minorities. Clark and Drinkwater (1998)
use the General Household Survey (GHS) and the FNSEM (Clark and Drinkwater 2000).
They find that ethnic minority immigrants are more likely to be self-employed than ethnic mi-
nority UK-born individuals. They also find that ethnic concentration affects self-employment
rates negatively - which contrasts with findings by Borjas (1986).
Language: Few studies in the UK analyse the determinants of immigrants’ language
fluency, and the effect of language on economic outcomes. Using the FNSEM, Shields and
Wheatley Price (2002) find that higher education levels are associated with higher degrees of
language proficiency, and that longer migration duration positively affects language fluency.
Analysing the occupational success of non-white immigrants, they find that immigrants who
are fluent in English language have, on average, wages about 20 per cent higher than non-
fluent individuals. Dustmann and Fabbri (2002) find analogous results using both the FNSEM
and the FWLS. The latter survey distinguishes between different language skills (spoken, read
and written English). They find that education is more important for reading and writing
18
proficiency. This reflects the fact that acquisition of reading and writing abilities require a
more systematic way of learning.
Dustmann and Fabbri (2002) find also a positive relationship between language and em-
ployment or earnings. As has been pointed out in work by Dustmann and van Soest (2001),
this relationship does not necessarily indicate a causal effect of language on earnings. One
reason is that unobserved characteristics of the individual that have a positive effect on
labour market performance do at the same time affect language proficiency positively. An-
other reason is that self-reported language measures suffer from large measurement error (see
Dustmann and van Soest 2001). Both these problems lead to bias in the estimate of an effect
of language on outcomes. Dustmann and Fabbri use appropriate econometric techniques to
deal with these problems. Their findings indicate that the effect of language on outcomes
is larger than indicated by simple regression analysis. We report results from this analysis
below.
The Labour Force Survey
The Labour Force Survey (LFS) is a continuous household survey, conducted by the
Office for National Statistics (ONS), which provides a wide range of data on labour market
statistics and related topics such as training, qualifications, income and disability. The data
from the survey are used extensively both within and outside government. The LFS has
been running since Spring 1992 in its present form although a LFS has been carried out in
the UK since 1973. Between 1973 and 1983 a biennial survey was carried out during the
Spring. In 1984 the survey became annual. In Spring 1992, for the first time, the data were
made available quarterly, with a quarterly sample size approximately equivalent to that of
the previous annual data, thus becoming the Quarterly Labour Force Survey. Each quarter
interviews are achieved at about 59,000 addresses with about 138,000 respondents. A core of
questions covering household, family structure, basic housing information and demographic
details of individuals in the households is included in every survey, together with non-core
questions which vary from quarter to quarter.
19
3 Immigrants in the UK
Composition and arrival
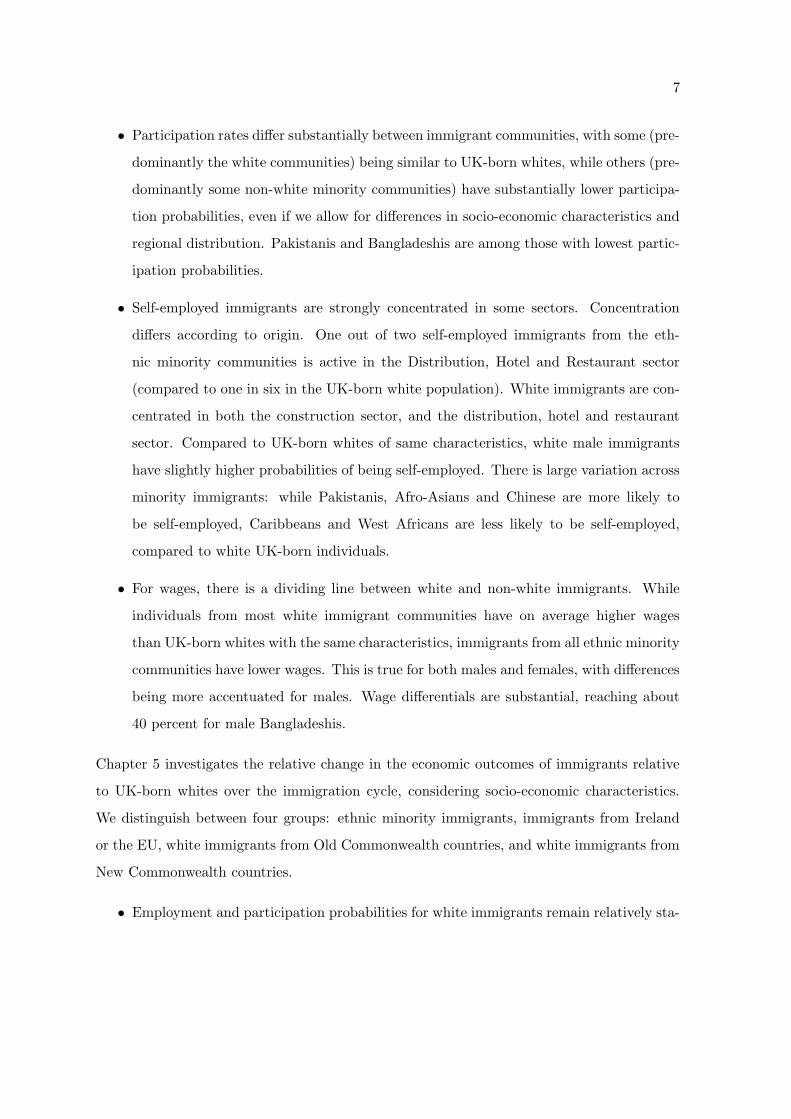
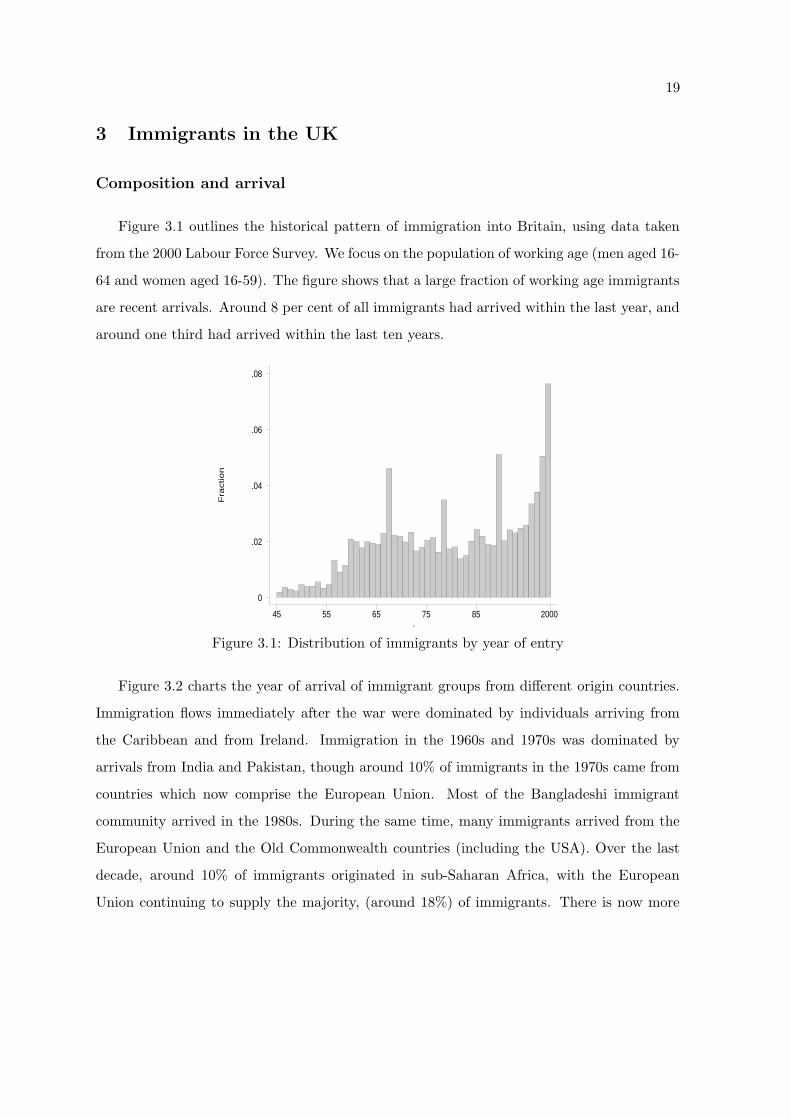
Figure 3.1 outlines the historical pattern of immigration into Britain, using data taken
from the 2000 Labour Force Survey. We focus on the population of working age (men aged 16-
64 and women aged 16-59). The figure shows that a large fraction of working age immigrants
are recent arrivals. Around 8 per cent of all immigrants had arrived within the last year, and
around one third had arrived within the last ten years.
Fra
ctio
n
.45 55 65 75 85 2000
0
.02
.04
.06
.08
Figure 3.1: Distribution of immigrants by year of entry
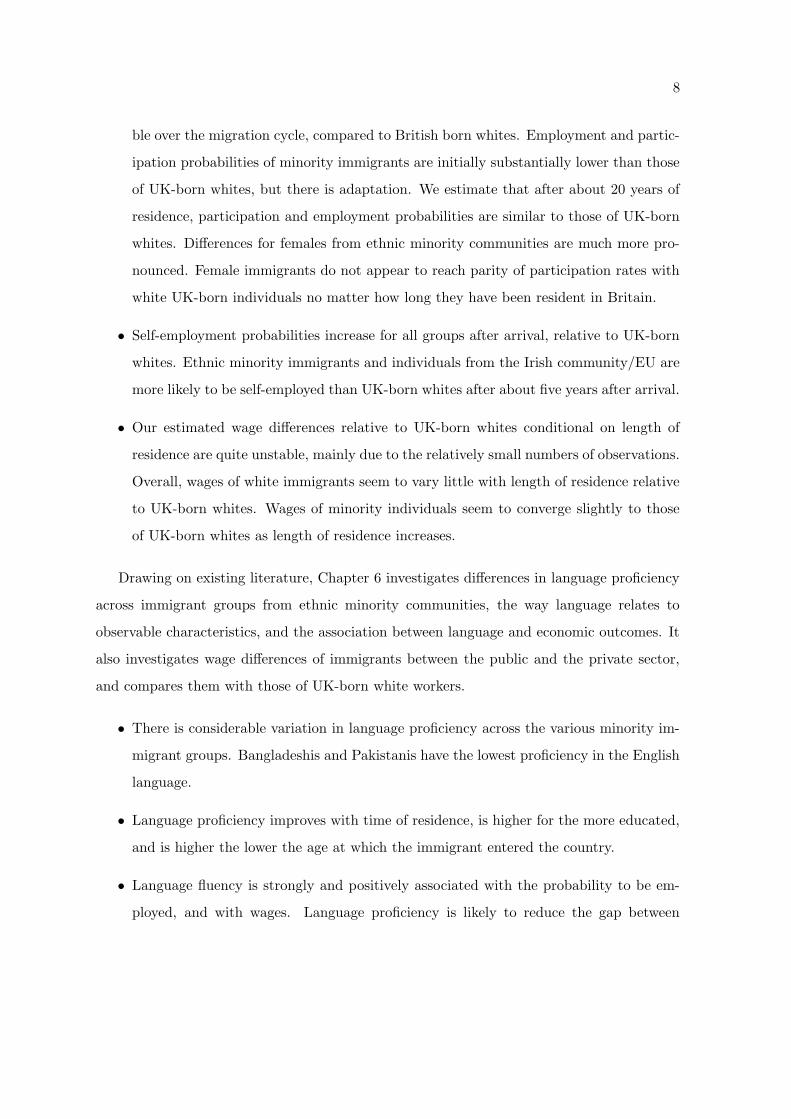
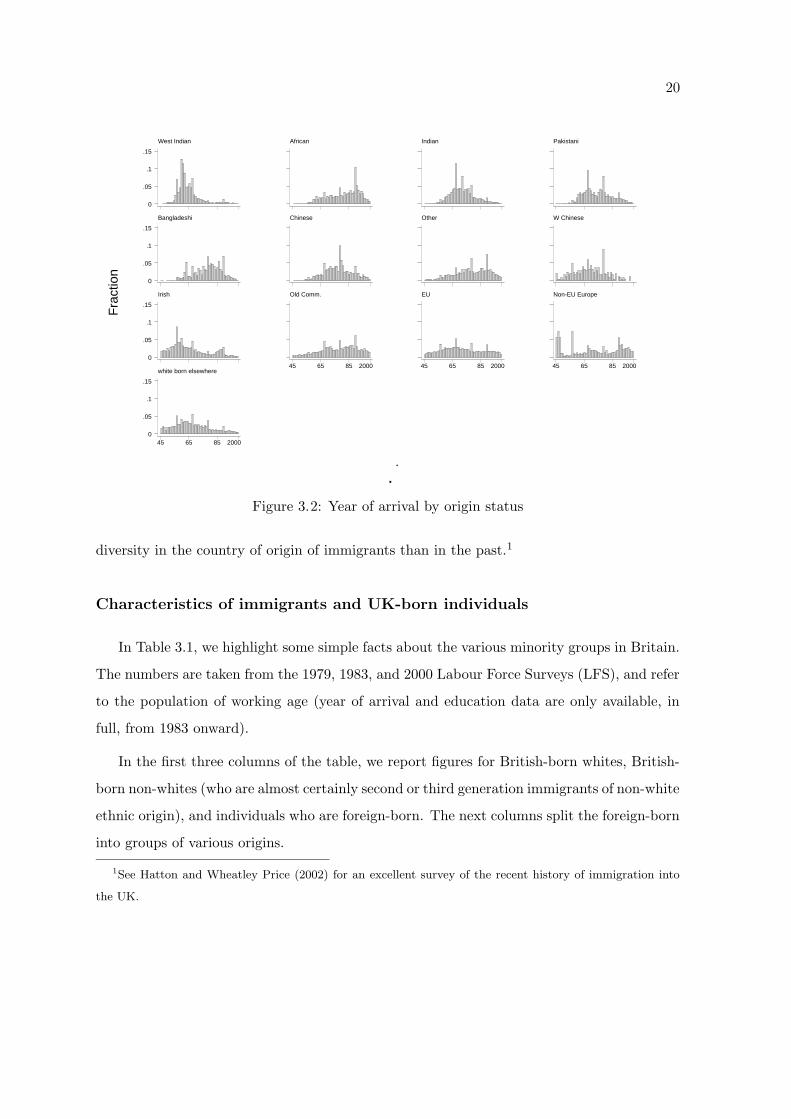
Figure 3.2 charts the year of arrival of immigrant groups from different origin countries.
Immigration flows immediately after the war were dominated by individuals arriving from
the Caribbean and from Ireland. Immigration in the 1960s and 1970s was dominated by
arrivals from India and Pakistan, though around 10% of immigrants in the 1970s came from
countries which now comprise the European Union. Most of the Bangladeshi immigrant
community arrived in the 1980s. During the same time, many immigrants arrived from the
European Union and the Old Commonwealth countries (including the USA). Over the last
decade, around 10% of immigrants originated in sub-Saharan Africa, with the European
Union continuing to supply the majority, (around 18%) of immigrants. There is now more
20
Fra
ctio
n
..
West Indian
0
.05
.1
.15
African Indian Pakistani
Bangladeshi
0
.05
.1
.15
Chinese Other W Chinese
Irish
0
.05
.1
.15
Old Comm.
45 65 85 2000
EU
45 65 85 2000
Non-EU Europe
45 65 85 2000white born elsewhere
45 65 85 20000
.05
.1
.15
Figure 3.2: Year of arrival by origin status
diversity in the country of origin of immigrants than in the past.1
Characteristics of immigrants and UK-born individuals
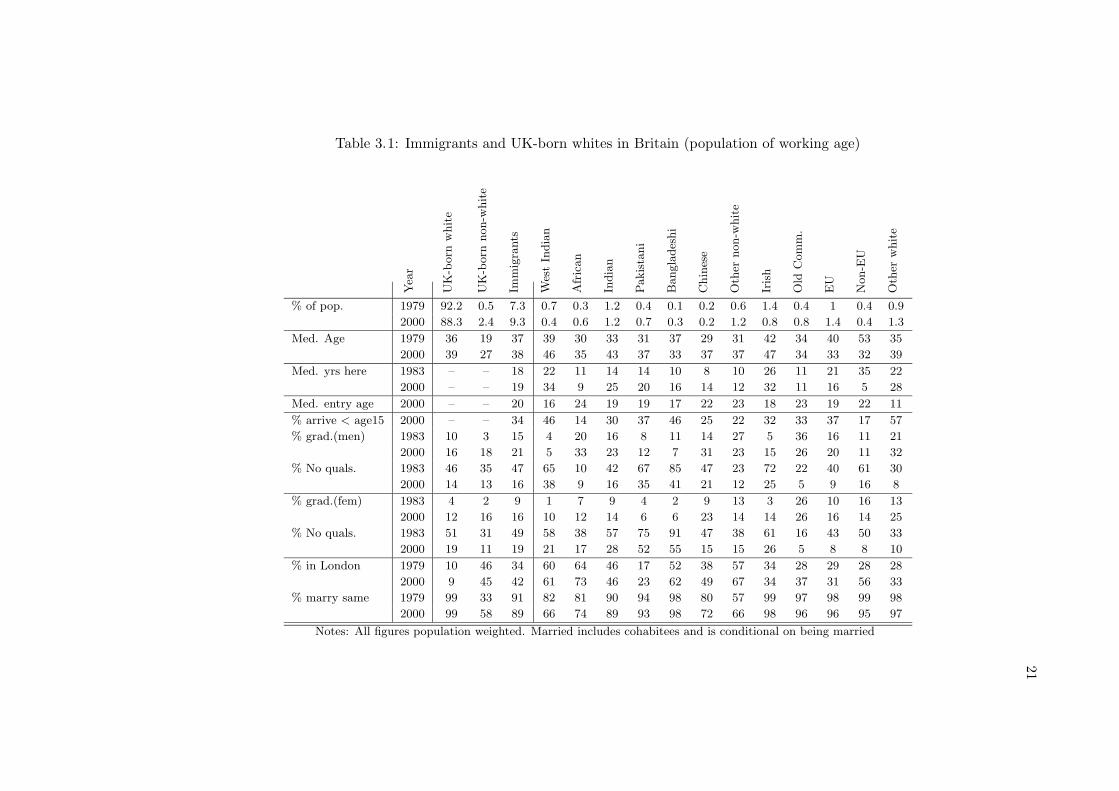
In Table 3.1, we highlight some simple facts about the various minority groups in Britain.
The numbers are taken from the 1979, 1983, and 2000 Labour Force Surveys (LFS), and refer
to the population of working age (year of arrival and education data are only available, in
full, from 1983 onward).
In the first three columns of the table, we report figures for British-born whites, British-
born non-whites (who are almost certainly second or third generation immigrants of non-white
ethnic origin), and individuals who are foreign-born. The next columns split the foreign-born
into groups of various origins.
1See Hatton and Wheatley Price (2002) for an excellent survey of the recent history of immigration into
the UK.
21
Table 3.1: Immigrants and UK-born whites in Britain (population of working age)
Year
UK-born
white
UK-born
non-white
Immigrants
WestIndian
African
Indian
Pakistani
Bangladeshi
Chinese
Other
non-white
Irish
Old
Comm.
EU
Non-EU
Other
white
% of pop. 1979 92.2 0.5 7.3 0.7 0.3 1.2 0.4 0.1 0.2 0.6 1.4 0.4 1 0.4 0.9
2000 88.3 2.4 9.3 0.4 0.6 1.2 0.7 0.3 0.2 1.2 0.8 0.8 1.4 0.4 1.3
Med. Age 1979 36 19 37 39 30 33 31 37 29 31 42 34 40 53 35
2000 39 27 38 46 35 43 37 33 37 37 47 34 33 32 39
Med. yrs here 1983 – – 18 22 11 14 14 10 8 10 26 11 21 35 22
2000 – – 19 34 9 25 20 16 14 12 32 11 16 5 28
Med. entry age 2000 – – 20 16 24 19 19 17 22 23 18 23 19 22 11
% arrive < age15 2000 – – 34 46 14 30 37 46 25 22 32 33 37 17 57
% grad.(men) 1983 10 3 15 4 20 16 8 11 14 27 5 36 16 11 21
2000 16 18 21 5 33 23 12 7 31 23 15 26 20 11 32
% No quals. 1983 46 35 47 65 10 42 67 85 47 23 72 22 40 61 30
2000 14 13 16 38 9 16 35 41 21 12 25 5 9 16 8
% grad.(fem) 1983 4 2 9 1 7 9 4 2 9 13 3 26 10 16 13
2000 12 16 16 10 12 14 6 6 23 14 14 26 16 14 25
% No quals. 1983 51 31 49 58 38 57 75 91 47 38 61 16 43 50 33
2000 19 11 19 21 17 28 52 55 15 15 26 5 8 8 10
% in London 1979 10 46 34 60 64 46 17 52 38 57 34 28 29 28 28
2000 9 45 42 61 73 46 23 62 49 67 34 37 31 56 33
% marry same 1979 99 33 91 82 81 90 94 98 80 57 99 97 98 99 98
2000 99 58 89 66 74 89 93 98 72 66 98 96 96 95 97
Notes: All figures population weighted. Married includes cohabitees and is conditional on being married
22
The immigration flows outlined in Figures 3.1 and 3.2 have shaped the demographic
patterns observed in Table 3.1. In 1979, around 7% of the working-age population were
born outside Britain. The largest immigrant community in Britain in 1979 were those of
Irish origin, some 1.4% of the population, or around 0.6 million individuals. Next came
members of the Indian and European Union communities, each accounting for around 1% of
the working age population, around 400,000 people.
By the year 2000, the total immigrant stock had risen to around 9% of the working
age population. The largest immigrant group were now individuals born elsewhere in the
European Union (outside Ireland), at around 1.4 % of the population, followed by immigrants
from India. The shares of immigrants from sub-Saharan Africa, Pakistan, Bangladesh and
the Old Commonwealth countries of Australia, New Zealand and the USA, all grew over
this period, whilst the shares of immigrants from the Caribbean and Ireland fell. Notice
that the change in the composition of the immigrant population of working age was not only
due to immigration and demographic developments, but may also have been due to return
migration.
The median age of the immigrant population is very similar to that of UK-born whites in
both 1979 and 2000. The median age of UK-born ethnic minorities is much lower, which is
explained by the immigration patterns of the foreign-born ethnic minority individuals. This
population ages considerably between 1979 and 2000.
Information on the year of arrival is not available for the 1979 LFS. The first year for
which this information was recorded is 1983. We report in the table the median years since
migration for the total immigrant population, and distinguish between different origin groups,
for the years 1983 and 2000. The average immigrant had already spent around 18 years in
Britain in 1983 and around 19 years by 2000. This average conceals some large differences
across the various groups, reflecting the history and geographic pattern of immigration into
Britain over the past 50 years. Members of the West Indian community have been in the
UK the longest, around 34 years on average in 2000. They are followed by the Irish and
Indian communities, with 32 and 25 years of residence in 2000 respectively. The most recent
immigrants, on average, now come from European countries currently outside the European
23
Union.
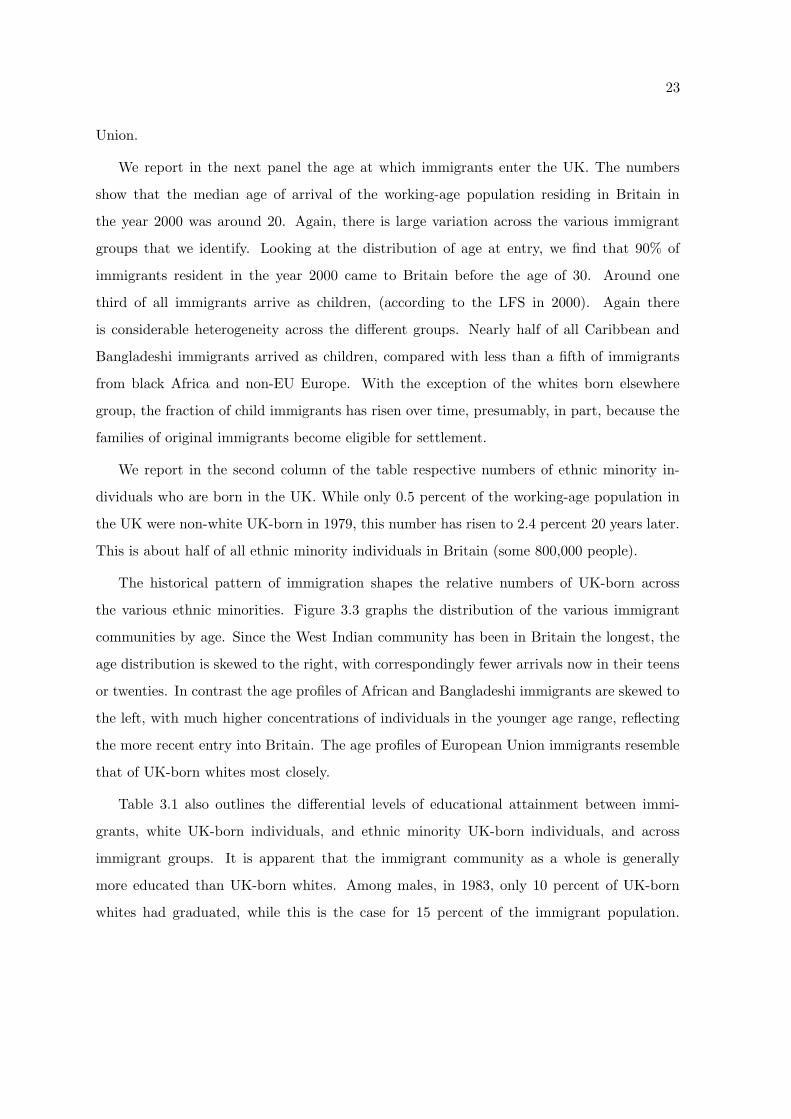
We report in the next panel the age at which immigrants enter the UK. The numbers
show that the median age of arrival of the working-age population residing in Britain in
the year 2000 was around 20. Again, there is large variation across the various immigrant
groups that we identify. Looking at the distribution of age at entry, we find that 90% of
immigrants resident in the year 2000 came to Britain before the age of 30. Around one
third of all immigrants arrive as children, (according to the LFS in 2000). Again there
is considerable heterogeneity across the different groups. Nearly half of all Caribbean and
Bangladeshi immigrants arrived as children, compared with less than a fifth of immigrants
from black Africa and non-EU Europe. With the exception of the whites born elsewhere
group, the fraction of child immigrants has risen over time, presumably, in part, because the
families of original immigrants become eligible for settlement.
We report in the second column of the table respective numbers of ethnic minority in-
dividuals who are born in the UK. While only 0.5 percent of the working-age population in
the UK were non-white UK-born in 1979, this number has risen to 2.4 percent 20 years later.
This is about half of all ethnic minority individuals in Britain (some 800,000 people).
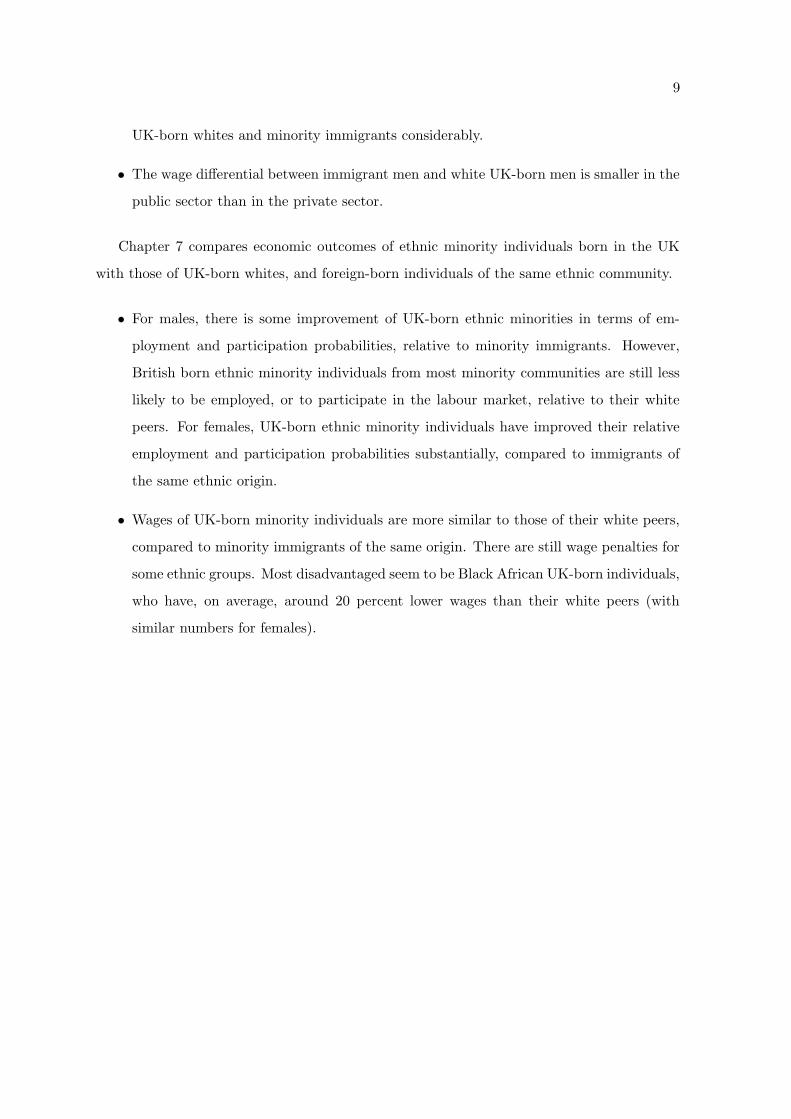
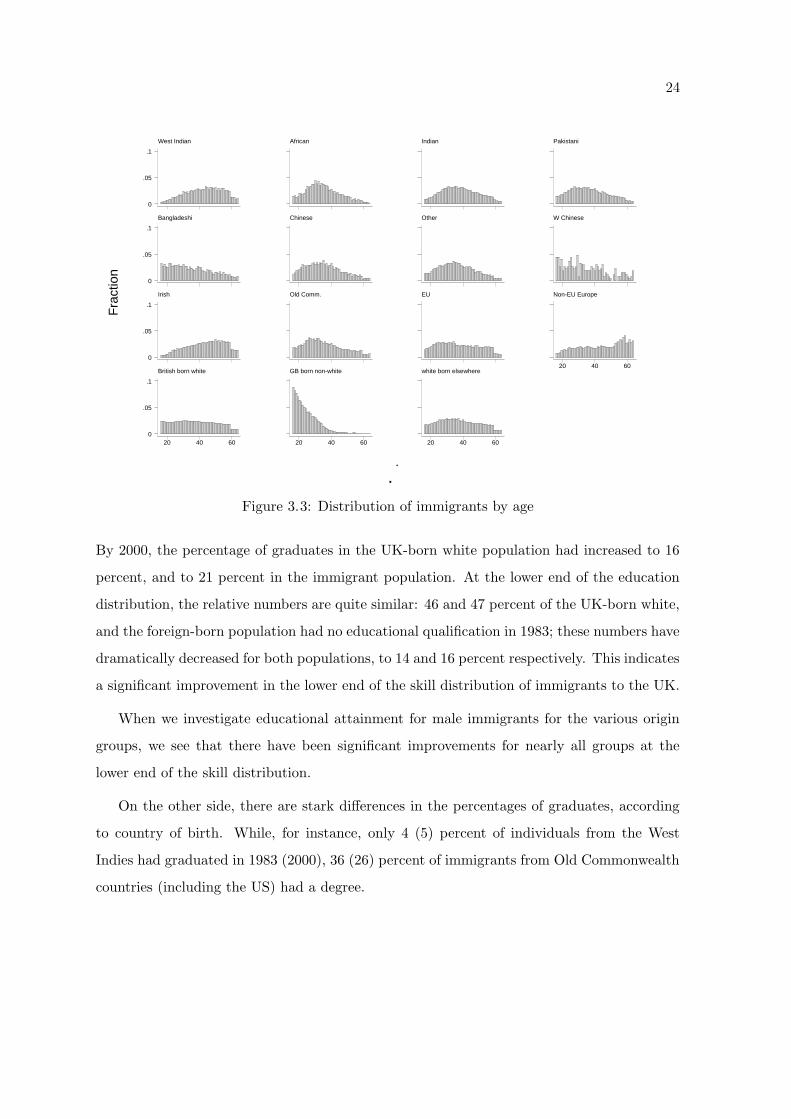
The historical pattern of immigration shapes the relative numbers of UK-born across
the various ethnic minorities. Figure 3.3 graphs the distribution of the various immigrant
communities by age. Since the West Indian community has been in Britain the longest, the
age distribution is skewed to the right, with correspondingly fewer arrivals now in their teens
or twenties. In contrast the age profiles of African and Bangladeshi immigrants are skewed to
the left, with much higher concentrations of individuals in the younger age range, reflecting
the more recent entry into Britain. The age profiles of European Union immigrants resemble
that of UK-born whites most closely.
Table 3.1 also outlines the differential levels of educational attainment between immi-
grants, white UK-born individuals, and ethnic minority UK-born individuals, and across
immigrant groups. It is apparent that the immigrant community as a whole is generally
more educated than UK-born whites. Among males, in 1983, only 10 percent of UK-born
whites had graduated, while this is the case for 15 percent of the immigrant population.
24
Fra
ctio
n
..
West Indian
0
.05
.1
African Indian Pakistani
Bangladeshi
0
.05
.1
Chinese Other W Chinese
Irish
0
.05
.1
Old Comm. EU Non-EU Europe
20 40 60British born white
20 40 600
.05
.1
GB born non-white
20 40 60
white born elsewhere
20 40 60
Figure 3.3: Distribution of immigrants by age
By 2000, the percentage of graduates in the UK-born white population had increased to 16
percent, and to 21 percent in the immigrant population. At the lower end of the education
distribution, the relative numbers are quite similar: 46 and 47 percent of the UK-born white,
and the foreign-born population had no educational qualification in 1983; these numbers have
dramatically decreased for both populations, to 14 and 16 percent respectively. This indicates
a significant improvement in the lower end of the skill distribution of immigrants to the UK.
When we investigate educational attainment for male immigrants for the various origin
groups, we see that there have been significant improvements for nearly all groups at the
lower end of the skill distribution.
On the other side, there are stark differences in the percentages of graduates, according
to country of birth. While, for instance, only 4 (5) percent of individuals from the West
Indies had graduated in 1983 (2000), 36 (26) percent of immigrants from Old Commonwealth
countries (including the US) had a degree.
25
The black African, Indian and Chinese groups contain many more graduates than UK-
born whites and a correspondingly lower share of those with no qualifications. In 2000, around
one third of the African and Chinese immigrant population living in Britain had a degree,
compared to sixteen per cent of UK-born whites. In contrast, the West Indian, Pakistani,
and particularly, the Bangladeshi communities contained fewer graduates than the national
average and many more individuals with no formal qualifications.
In 2000, around 40% of all Bangladeshis had no formal qualifications, compared to 14 per
cent of UK-born whites and 9 per cent of those in the black African group. Whilst the West
Indian immigrant community does relatively badly in terms of educational attainment, it is
the only ethnic group, including UK-born whites, where women do better than men. The
proportion of female West Indian women with a degree is close to the national average and the
share of West Indian women with no qualifications is below the national average. In contrast,
the share of women in the Bangladeshi and Pakistani communities with no qualifications is
more than twice the national average. For females, the differences across years and origin
groups are similar, but the levels are generally lower.
Another interesting feature revealed by Table 3.1 is the stark concentration of immigrants,
as well as the UK-born non-whites, in the capital. In 2000, London contained around 9%
of the total population, but more than 40% of all immigrants, and 45% of UK-born ethnic
minorities!
Comparing 2000 to 1979, the geographic concentration in the capital appears to have
increased. Only the Pakistani, Irish and European groups are less concentrated in the capital,
though members of these groups are still more than twice as likely to live in the capital
compared to UK-born whites.
As employment prospects and particularly wage levels vary between London and else-
where, this regional concentration of immigrants has to be taken into account in the analysis
of wage and employment differentials. We address this issue in later sections.
The bottom two rows of Table 3.1 highlight the proportion of each group who have married
within the same ethnic/immigrant group. Around 10% of immigrants have married outside
26
their ethnic group. It is apparent that marriage across ethnic lines is much more common
amongst UK-born ethnic minority individuals, nearly half of whom, if in a relationship, are
married or cohabiting with someone from a different ethnic group. Amongst immigrants,
marriage or cohabitation with someone from outside the immigrant/ethnic group is quite
common amongst members of the West Indian and Chinese communities and less so in the
Pakistani and Bangladeshi communities.
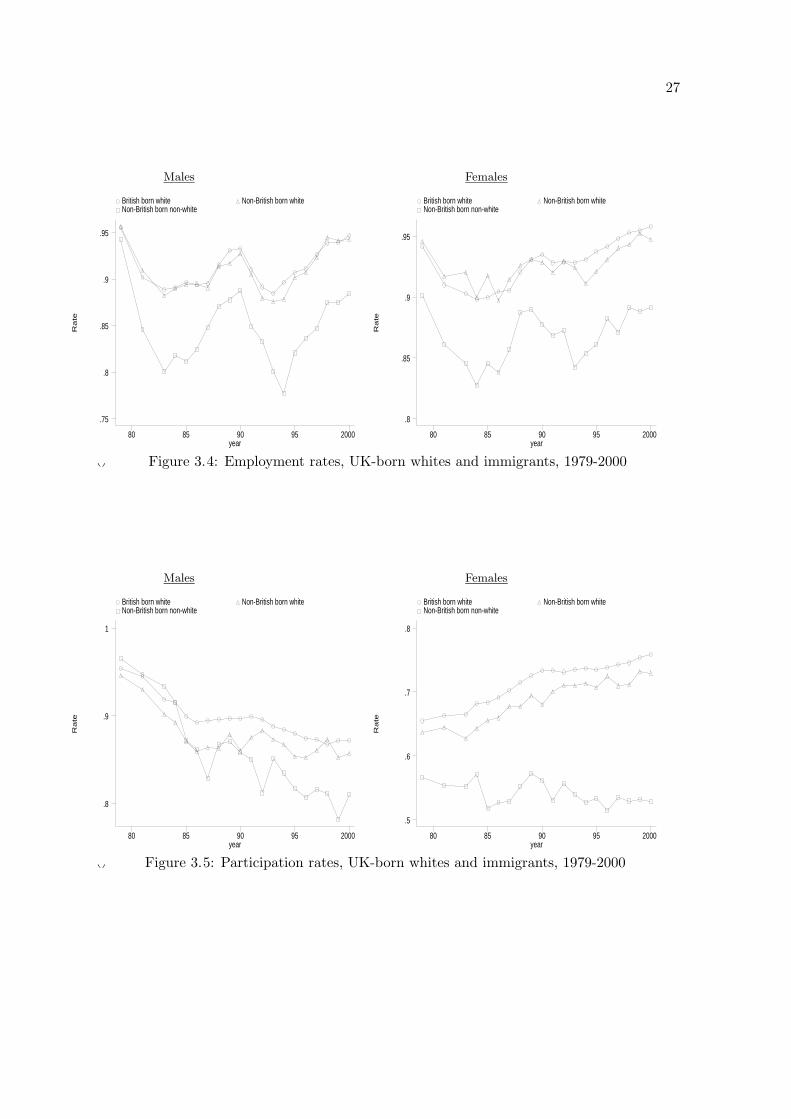
Participation and employment
We next examine differences in labour force participation and employment between UK-
born white British and the foreign-born. We distinguish between non-British-born whites
and non-UK-born non-whites. We exclude students to remove any effects of increased par-
ticipation in tertiary education. We define the participation rate as the ratio of economically
active individuals over the total population. Economically active individuals include individ-
uals currently unemployed, but seeking a job. We define the employment rate as the ratio
of individuals working over individuals participating. Accordingly, the unemployment rate
equals one minus the employment rate. The inactivity rate is one minus the participation
rate. Our results are reported in Figures 3.4 (employment rates) and 3.5 (participation rates).
As Figure 3.4 shows, non-white immigrants have, on average, a dramatically lower em-
ployment rate than UK-born white individuals. Foreign-born whites are very similar to the
UK-born whites. Differences are similar for females and for males. For males, the employ-
ment gap does not appear to be present in the late 1970s, when information on immigrants
in the LFS was first collected.
Over time, through two major economic recessions and subsequent recoveries, employment
rates for non-white immigrants have displayed more volatility than those of UK-born whites
or white immigrants. In bad times employment rates of non-white male immigrants fall
further, but recovery is also faster. This is true for both males and females.
In Figure 3.5, we show participation rates for males and females, using the same grouping
as for employment rates. Male participation rates are falling over the entire period considered,
27
()
Ra
te
year
British born white Non-British born white Non-British born non-white
80 85 90 95 2000
.75
.8
.85
.9
.95
Ra
te
year
British born white Non-British born white Non-British born non-white
80 85 90 95 2000
.8
.85
.9
.95
Males Females
Figure 3.4: Employment rates, UK-born whites and immigrants, 1979-2000
()
Ra
te
year
British born white Non-British born white Non-British born non-white
80 85 90 95 2000
.8
.9
1
Ra
te
year
British born white Non-British born white Non-British born non-white
80 85 90 95 2000
.5
.6
.7
.8
Males Females
Figure 3.5: Participation rates, UK-born whites and immigrants, 1979-2000
28
but have fallen most amongst non-white immigrants. Especially in the 1990’s participation
rates of non-white immigrants fell more sharply than those of white immigrants, and of
UK-born whites. Amongst women, non-white immigrants have much lower participation
rates than whites. Moreover, non-white immigrants do not, on average, appear to have
contributed to the large rise in female participation over the last 20 years. These averages
may be shaped by the changing composition of the immigrant population over time and
conceal large differences across different groups.
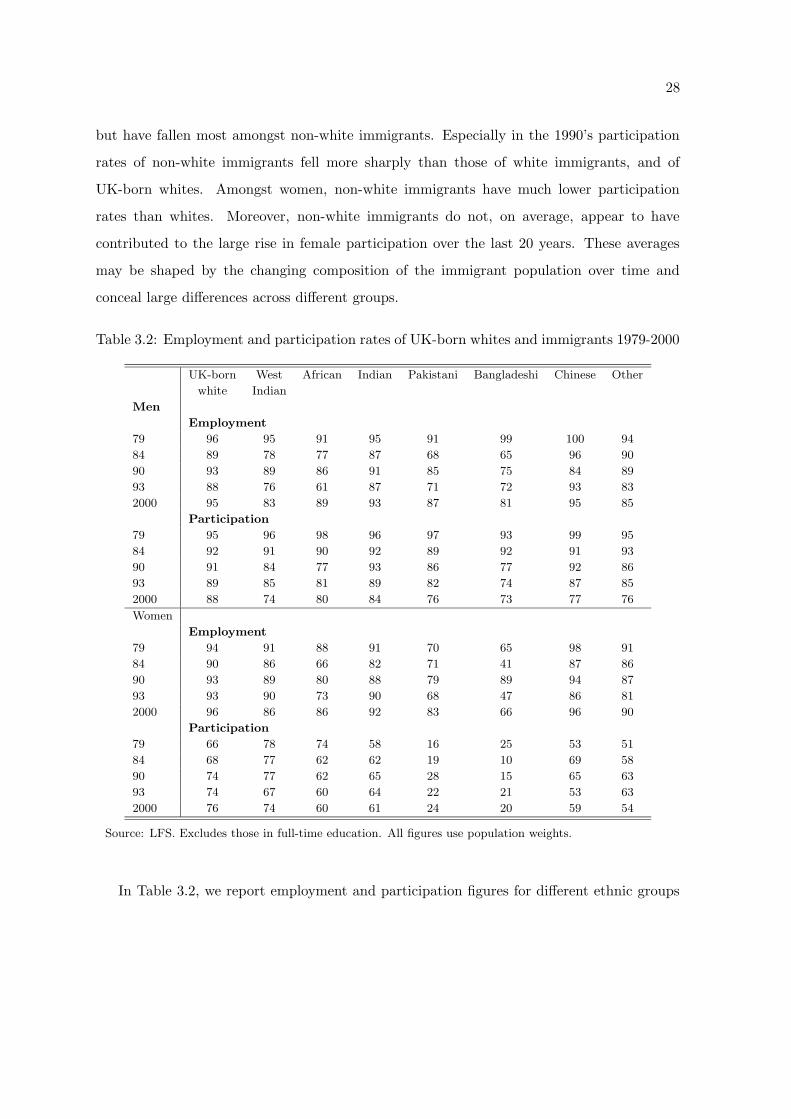
Table 3.2: Employment and participation rates of UK-born whites and immigrants 1979-2000
UK-born West African Indian Pakistani Bangladeshi Chinese Other
white Indian
Men
Employment
79 96 95 91 95 91 99 100 94
84 89 78 77 87 68 65 96 90
90 93 89 86 91 85 75 84 89
93 88 76 61 87 71 72 93 83
2000 95 83 89 93 87 81 95 85
Participation
79 95 96 98 96 97 93 99 95
84 92 91 90 92 89 92 91 93
90 91 84 77 93 86 77 92 86
93 89 85 81 89 82 74 87 85
2000 88 74 80 84 76 73 77 76
Women
Employment
79 94 91 88 91 70 65 98 91
84 90 86 66 82 71 41 87 86
90 93 89 80 88 79 89 94 87
93 93 90 73 90 68 47 86 81
2000 96 86 86 92 83 66 96 90
Participation
79 66 78 74 58 16 25 53 51
84 68 77 62 62 19 10 69 58
90 74 77 62 65 28 15 65 63
93 74 67 60 64 22 21 53 63
2000 76 74 60 61 24 20 59 54
Source: LFS. Excludes those in full-time education. All figures use population weights.
In Table 3.2, we report employment and participation figures for different ethnic groups
29
which constitute the non-white population. Employment and participation rates among some
communities, particularly Bangladeshis and Pakistanis, are lower than among others.
This difference between the Pakistani and Bangladeshi communities on the one side, and
white UK-born individuals and other communities, on the other, is most dramatic for females.
Less than one in four females participates in the labour market in most years. Furthermore,
of those who do participate, Pakistanis and Bangladeshis have the lowest employment rates.
Sector allocation and origin
What can explain the large variation in participation and employment rates, as well as the
greater susceptibility to the economic cycle, amongst the non-white immigrant community?
If certain groups were younger, had fewer qualifications, or were resident in areas where
labour demand was weak, then this could help explain these differences. For example, since
minority groups tend to be younger this means that a higher share of these groups will be in
the age range 16-24, an age group that is historically vulnerable to unemployment. Differential
levels of educational attainment will also affect the chances of being in work. We investigate
these issues in more detail below, where we condition on individual characteristics, thereby
adjusting for differences in socio-economic characteristics between the various immigrant
groups, and white and non-white UK-born individuals.
We first provide some descriptive information on immigrants’ economic activity in the
UK. We consider occupational status of immigrants, and compare it to that of UK-born
whites and ethnic minorities. Again, we look at these features at two points in time: 1979
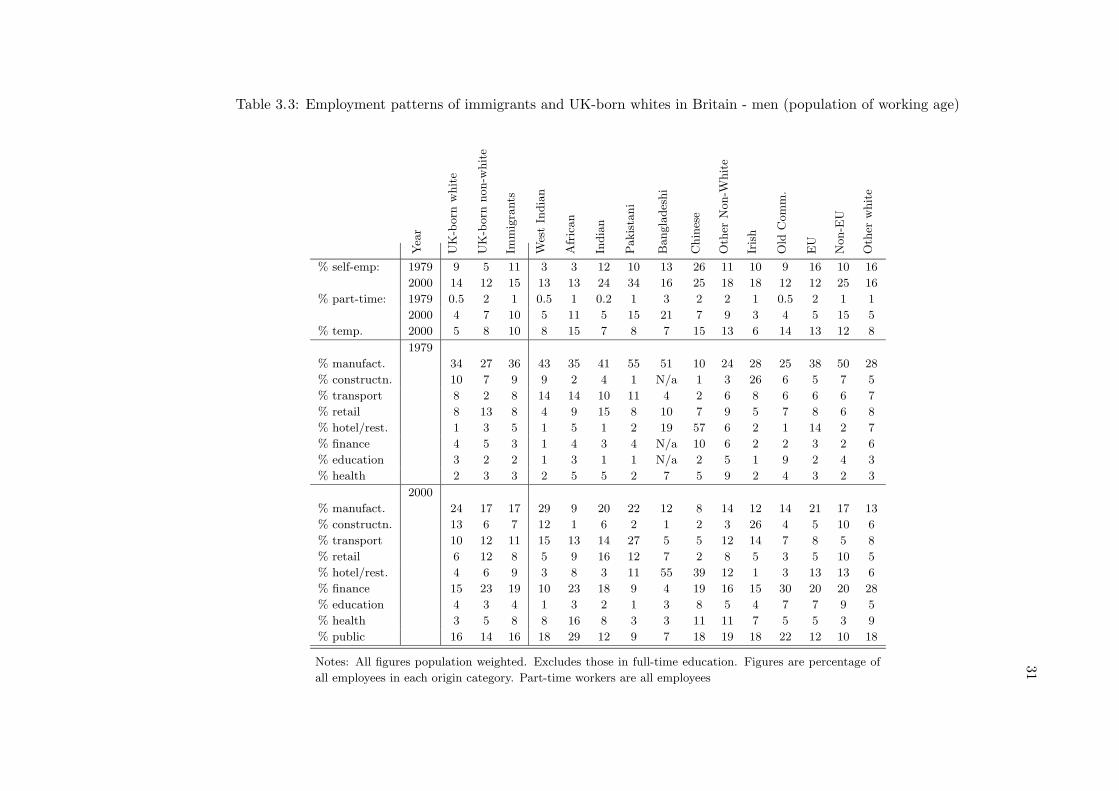
and 2000. We report some summary statistics for males and females in Tables 3.3 and 3.4.
We first discuss results for males.
The first two rows of Table 3.3 outline the share of employed in each group who are
classified as self-employed. There are, on average, more immigrant males working in self-
employment relative to UK-born whites. Again, splitting up these averages across ethnic
groups shows considerable variation in self-employment rates, with larger concentrations of
self-employed among the Indian, Pakistani, Chinese, Irish and other European communities.
30
The self-employment share amongst the Irish may be explained by the concentration of
men working in the construction sector, where sub-contracting is commonplace, whilst the
higher shares of self-employment amongst the former groups may be explained by a high
concentration of workers in the retail and restaurant sectors. We investigate these issues in
some more detail below.
Part-time work seems to be more widespread in the immigrant community, but again the
patterns differ widely according to origin. A very high proportion of male immigrant em-
ployees from the Bangladeshi and Pakistani communities work part-time. Part-time working
amongst women in these groups is also the highest of any other immigrant or UK-born group.
Temporary working amongst employees appears highest among workers from the Old
Commonwealth and Europe outside the European Union, though this, in part, may be ex-
plained by visa restrictions on working for citizens of these countries.
The next two panels investigate sector allocation of the foreign-born and UK-born indi-
viduals. Between 1979 and 2000, there is a remarkable increase of foreign-born individuals in
the finance sector, in the health sector, and in retail and hotel/restaurant sectors. Relative
to UK-born individuals, immigrant shares increased most in the health sector.
The allocation to sectors differs quite substantially across origin groups. In 2000, more
than half of all Bangladeshi men in employment work in the hotel and restaurant sector,
compared with just 4% of UK-born whites. A large percentage of individuals from the old
Commonwealth or Europe work in the finance sector. Eight percent of the Indian or West
Indian population, and 16 percent of male immigrants from Africa work in the health sector,
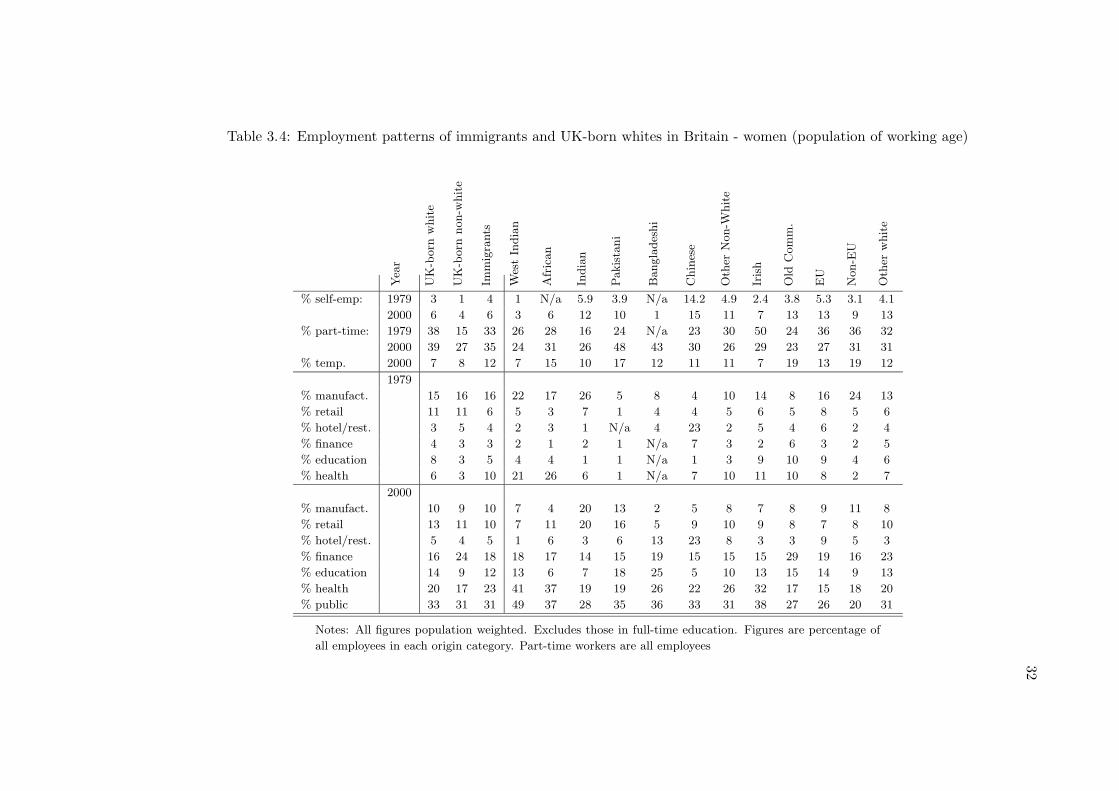
compared to only 3 percent of the UK-born white population. As Table 3.4 illustrates, the
percentage differences are even larger for females.
For 2000, we also report the fraction of individuals working in the public sector. This is
fairly equal between the three groups we consider here.
In Table 3.4 we report results for females. Interesting is the large concentration of some
groups in the health and education sectors. Again, and as for males, there is quite a lot of
variation across origin groups.
31Table 3.3: Employment patterns of immigrants and UK-born whites in Britain - men (population of working age)
Year
UK-born
white
UK-born
non-white
Immigrants
WestIndian
African
Indian
Pakistani
Bangladeshi
Chinese
Other
Non-W
hite
Irish
Old
Comm.
EU
Non-EU
Other
white
% self-emp: 1979 9 5 11 3 3 12 10 13 26 11 10 9 16 10 16
2000 14 12 15 13 13 24 34 16 25 18 18 12 12 25 16
% part-time: 1979 0.5 2 1 0.5 1 0.2 1 3 2 2 1 0.5 2 1 1
2000 4 7 10 5 11 5 15 21 7 9 3 4 5 15 5
% temp. 2000 5 8 10 8 15 7 8 7 15 13 6 14 13 12 8
1979
% manufact. 34 27 36 43 35 41 55 51 10 24 28 25 38 50 28
% constructn. 10 7 9 9 2 4 1 N/a 1 3 26 6 5 7 5
% transport 8 2 8 14 14 10 11 4 2 6 8 6 6 6 7
% retail 8 13 8 4 9 15 8 10 7 9 5 7 8 6 8
% hotel/rest. 1 3 5 1 5 1 2 19 57 6 2 1 14 2 7
% finance 4 5 3 1 4 3 4 N/a 10 6 2 2 3 2 6
% education 3 2 2 1 3 1 1 N/a 2 5 1 9 2 4 3
% health 2 3 3 2 5 5 2 7 5 9 2 4 3 2 3
2000
% manufact. 24 17 17 29 9 20 22 12 8 14 12 14 21 17 13
% constructn. 13 6 7 12 1 6 2 1 2 3 26 4 5 10 6
% transport 10 12 11 15 13 14 27 5 5 12 14 7 8 5 8
% retail 6 12 8 5 9 16 12 7 2 8 5 3 5 10 5
% hotel/rest. 4 6 9 3 8 3 11 55 39 12 1 3 13 13 6
% finance 15 23 19 10 23 18 9 4 19 16 15 30 20 20 28
% education 4 3 4 1 3 2 1 3 8 5 4 7 7 9 5
% health 3 5 8 8 16 8 3 3 11 11 7 5 5 3 9
% public 16 14 16 18 29 12 9 7 18 19 18 22 12 10 18
Notes: All figures population weighted. Excludes those in full-time education. Figures are percentage of
all employees in each origin category. Part-time workers are all employees
32
Table 3.4: Employment patterns of immigrants and UK-born whites in Britain - women (population of working age)
Year
UK-born
white
UK-born
non-white
Immigrants
WestIndian
African
Indian
Pakistani
Bangladeshi
Chinese
Other
Non-W
hite
Irish
Old
Comm.
EU
Non-EU
Other
white
% self-emp: 1979 3 1 4 1 N/a 5.9 3.9 N/a 14.2 4.9 2.4 3.8 5.3 3.1 4.1
2000 6 4 6 3 6 12 10 1 15 11 7 13 13 9 13
% part-time: 1979 38 15 33 26 28 16 24 N/a 23 30 50 24 36 36 32
2000 39 27 35 24 31 26 48 43 30 26 29 23 27 31 31
% temp. 2000 7 8 12 7 15 10 17 12 11 11 7 19 13 19 12
1979
% manufact. 15 16 16 22 17 26 5 8 4 10 14 8 16 24 13
% retail 11 11 6 5 3 7 1 4 4 5 6 5 8 5 6
% hotel/rest. 3 5 4 2 3 1 N/a 4 23 2 5 4 6 2 4
% finance 4 3 3 2 1 2 1 N/a 7 3 2 6 3 2 5
% education 8 3 5 4 4 1 1 N/a 1 3 9 10 9 4 6
% health 6 3 10 21 26 6 1 N/a 7 10 11 10 8 2 7
2000
% manufact. 10 9 10 7 4 20 13 2 5 8 7 8 9 11 8
% retail 13 11 10 7 11 20 16 5 9 10 9 8 7 8 10
% hotel/rest. 5 4 5 1 6 3 6 13 23 8 3 3 9 5 3
% finance 16 24 18 18 17 14 15 19 15 15 15 29 19 16 23
% education 14 9 12 13 6 7 18 25 5 10 13 15 14 9 13
% health 20 17 23 41 37 19 19 26 22 26 32 17 15 18 20
% public 33 31 31 49 37 28 35 36 33 31 38 27 26 20 31
Notes: All figures population weighted. Excludes those in full-time education. Figures are percentage of
all employees in each origin category. Part-time workers are all employees
33
Summary
The immigrant community has a higher overall share of graduates than UK-born whites,
but there is also a higher share of immigrants with no formal qualifications. There is a
diversity in labour market performance among immigrant minority groups. The Bangladeshi
and Pakistani communities do relatively badly. The Chinese and Indian communities do
relatively well. Over the economic cycle, employment and unemployment rates of men in all
immigrant groups appear more volatile than those of UK-born whites, particularly amongst
non-white immigrants.
Our simple descriptive analysis suggests that there are several factors regarding the rela-
tive labour market performance of immigrant minority individuals that are worthy of further
attention. Can differential levels of educational attainment and regional dispersion explain
some of the employment gaps we observe? Are there similar differences with respect to
wages? UK-born ethnic minority individuals seem to have a better overall labour market
performance, relative to those born abroad, but still do relatively worse than their UK-born
peers. Do these effects prevail when we condition on other demographic characteristics? And
how do performance indicators of immigrants change over the migration cycle? We analyse
these issues in the next sections.
34
4 Economic performance of UK-born and foreign-born
individuals
We have illustrated in the previous chapter that rates of employment, unemployment and
economic activity differ substantially between foreign-born and UK-born individuals. We
have also demonstrated large differences with respect to some key characteristics, and even
larger differences in individual characteristics, as well as economic outcomes, across groups
of different origin. Some of the difference in economic performance between UK-born whites
and the foreign-born may be explained by differences in individual characteristics. In this
chapter, we address this issue.
Our prime focus is on two questions. First, how do different immigrant groups differ
from UK-born whites, and how do these differences change when we compare individuals
with the same set of observable characteristics. We use regression analysis to control for
differences in observable variables, like age, education, or region of settlement. Second, how
does the relative economic performance of immigrants change with time spent in the host
country. Again, we use regression analysis, and information on the years of residence of each
individual migrant available in the LFS to answer this question.
The first two performance indicators we analyse are employment and labour force par-
ticipation. We then investigate the differences in self-employment probabilities between the
different immigrant groups, and UK-born individuals. Finally, we look at wages. In most
of our analysis, we shall distinguish between males and females. Furthermore, as mentioned
above, we will focus the discussion on differentials between the various immigrant groups,
all relative to white UK-born individuals, conditional and unconditional on regional and in-
dividual characteristics, as well as the relative patterns of adaptation. We use graphical
presentations to present our results.
The period we consider in our analysis are the last eight years: 1992 to 2000. There
are two reasons for this. First, more recent data may give us more appropriate answers to
current day questions related to immigration. Second, in 1992 the Labour Force Survey was
converted from a yearly cross sectional survey data set into a quarterly rotating panel, where
35
each individual participates for five consecutive quarters. Furthermore, information on wages
- which form the most important indicator for economic success - is only available for this
period. Individuals are asked about their earnings in the last quarterly wave from 1992 to
1996, and in the first and the last wave of the survey from 1997 onwards.
In our analysis, we are not able to distinguish between all possible origin countries, because
numbers of observations would be too small. We therefore group some origin countries into
larger geographical areas, which we consider as being similar with respect to factors affecting
economic performance.
We distinguish between ethnic minority (non-white) and white immigrants. The first
group contains Black Caribbeans, Black Africans, Indians, Pakistanis, Bangladeshis, African
Asians, Chinese and other ethnic minorities. The second group are white individuals who were
born in the Old Commonwealth (including South Africa), the New Commonwealth (including
Pakistan), China, Ireland, European Union, other European countries (i.e. Eastern Europe,
Turkey, Switzerland, Austria and Norway) and other countries.2
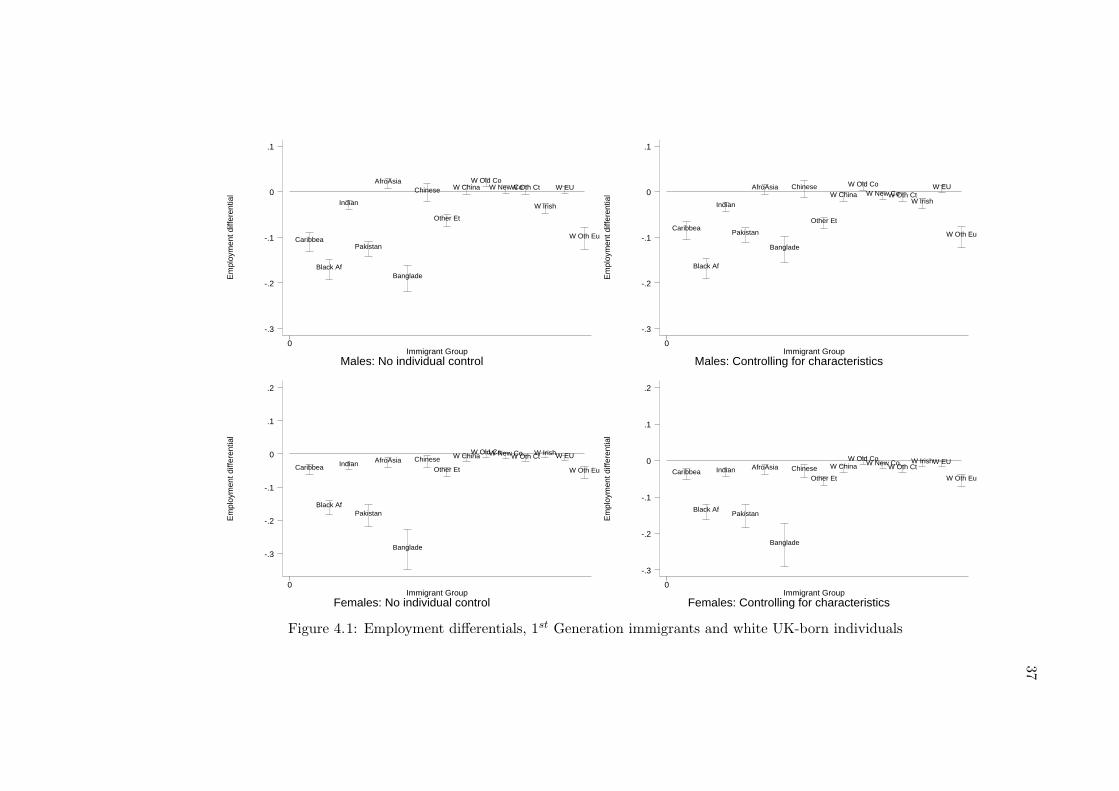
The figures we present report regression-based estimates of the differential effects of the
respective outcome between an immigrant of a respective group (as indicated in the graph),
relative to a white UK-born individual. The white UK-born individuals are represented by
the horizontal line through zero. The entries in the figures represent the point estimate in the
difference between the respective immigrant group and UK-born whites, and the 95 percent
statistical confidence interval, represented by a vertical line. If the vertical line overlaps with
the horizontal line, the difference between the respective immigrant group, and the UK-born
white population is not statistically significant.
All upper panels of the figures report results for males, and the lower panels report results
for females. The left panels report unconditional differences which only correct for changes
over time (the numbers refer to a base year, which we choose to be 1992). Part of these
differences could still be due to differences in the age composition, education, or regional
distribution of immigrants versus UK-born individuals. We therefore also report differences
2See Appendix for details on geographical distribution and list of variables used in the analysis.
36
which compare an immigrant from a respective ethnic group with a white UK-born individual
of the same age, education and regional distribution. These differences are reported in the
right hand panels of the figures.
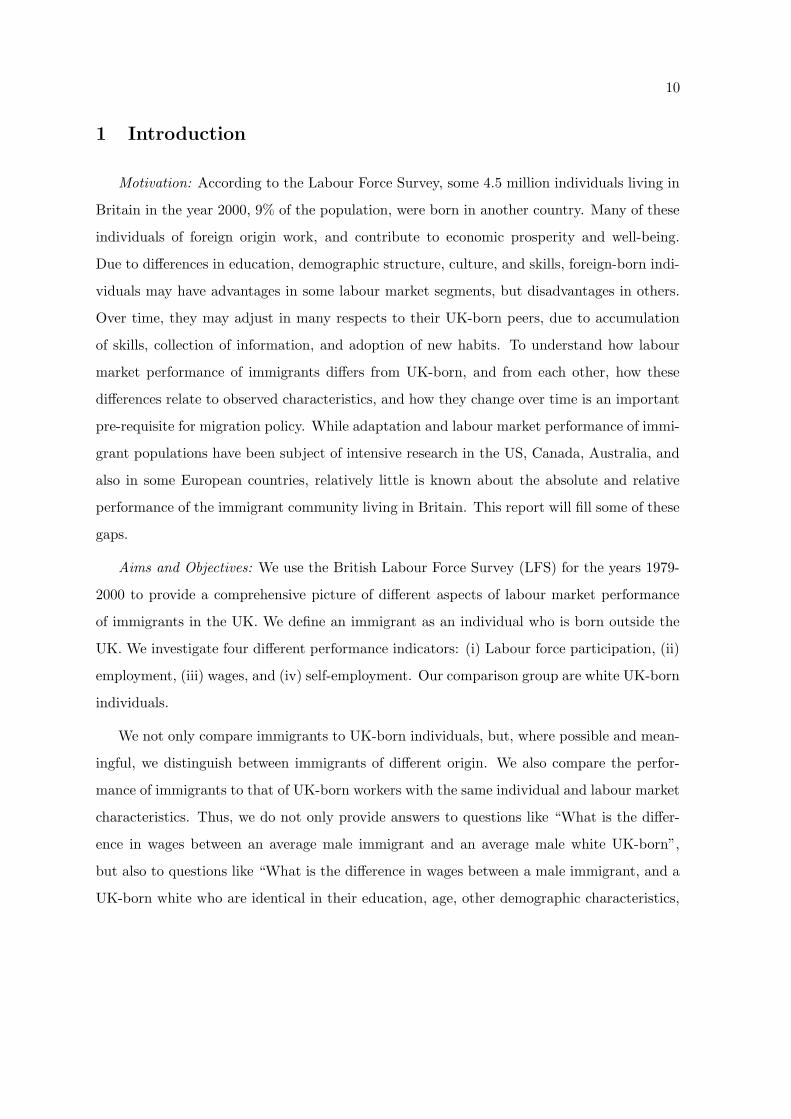
Employment
We commence by discussing employment probabilities (defined as the probability of an
individual being employed rather than unemployed) for males (upper two panels in Figure
4.1). We have ordered the origin countries such that ethnic minority immigrants are in the
left area of the graphs, and white immigrants are in the right area. The upper left graph
reports simple average differences, where we only condition on time effects (which include
the year of the survey, and the quarter of the interview).
The entries indicate that ethnic minority individuals, and in particular individuals from
the Indian, Caribbean, Pakistani, Black African, and Bangladeshi communities, have signifi-
cantly lower employment probabilities than white immigrants, who are similar in this respect
to the UK-born white population. Exceptions are white individuals from other European
countries, who are predominantly from the former Eastern Bloc countries and Turkey.
In the upper right graph, we report results where we keep location choice and individ-
ual characteristics constant. We compare therefore male immigrants and white UK-born
individuals with the same age and education, and who are located in the same region (first
and second pairs of columns of Table 4.1). Coefficient estimates change slightly, and the
differences to the white UK-born population widen for some origin groups.
One reason for the widening of the employment gap is that immigrants are predominantly
located in regions which are economically very successful - as indicated in our descriptive
chapter, 45 percent of the foreign-born are concentrated in London, while this is the case
for only 9 percent of the UK-born population. When we condition on region, we eliminate
the advantage immigrants have because of their regional distribution.3 Another reason for
3The regional dummies indicate that employment probabilities vary across regions. For males, and relative
to Greater London, employment probabilities (conditional on individuals’ characteristics) are highest in East
37
Em
ploy
men
t diff
eren
tial
Males: No individual controlImmigrant Group
0
-.3
-.2
-.1
0
.1
Caribbea
Black Af
Indian
Pakistan
AfroAsia
Banglade
Chinese
Other Et
W ChinaW Old Co
W New CoW Oth Ct
W Irish
W EU
W Oth Eu
Em
ploy
men
t diff
eren
tial
Males: Controlling for characteristicsImmigrant Group
0
-.3
-.2
-.1
0
.1
Caribbea
Black Af
Indian
Pakistan
AfroAsia
Banglade
Chinese
Other Et
W China
W Old CoW New CoW Oth Ct
W Irish
W EU
W Oth EuE
mpl
oym
ent d
iffer
entia
l
Females: No individual controlImmigrant Group
0
-.3
-.2
-.1
0
.1
.2
Caribbea
Black Af
Indian
Pakistan
AfroAsia
Banglade
Chinese
Other Et
W ChinaW Old CoW New CoW Oth CtW IrishW EU
W Oth Eu
Em
ploy
men
t diff
eren
tial
Females: Controlling for characteristicsImmigrant Group
0
-.3
-.2
-.1
0
.1
.2
Caribbea
Black Af
Indian
Pakistan
AfroAsia
Banglade
ChineseOther Et
W ChinaW Old Co
W New CoW Oth CtW IrishW EU
W Oth Eu
Figure 4.1: Employment differentials, 1st Generation immigrants and white UK-born individuals
38
the changes is the difference in the demographic structure between the immigrant and the
UK-born population.
The figure indicates that some immigrant groups have a substantially lower probability to
be employed, compared to white UK-born individuals. The three most disadvantaged groups
are black Africans, Pakistanis, and Bangladeshis. On the other side, white immigrants, and
immigrants from the Chinese and Afro-Asian communities have virtually identical employ-
ment probabilities to the white UK-born.
We report in the lower two panels results for females (results are reported in the third and
fourth pairs of columns in Table 4.1). The picture which emerges is quite similar to that for
males, but the divergence across the different groups is larger. Again, the most disadvantaged
groups are Pakistanis, Bangladeshis, and individuals from the Black African communities;
on the other hand, most white immigrants are very similar to UK-born whites.
Participation
Above, we have investigated the probability of an individual to be in employment, given
that he or she is looking for a job. In this chapter we look at the decision of the individual
whether or not to participate in the labour market. Both employed individuals, and indi-
viduals who are unemployed, but who look for a job fall in the category participation; those
who are not employed, and who are not looking for a job are the reference category - are
economically inactive.
In Figure 4.2 we report participation differentials between UK-born whites and the foreign-
born. The structure of the figure is the same than the one for employment.
For males, the conditional and unconditional participation probabilities are for nearly
all immigrant groups significantly lower than for the UK-born white population. There is a
significant change in differentials once we condition on region and individual characteristics.
Many immigrant groups have participation probabilities which are about 10 percentage points
Anglia and the South East (2.7% higher), and lowest in Merseyside (4.0% lower). For females, differences
across regions are much smaller, and often not significant.
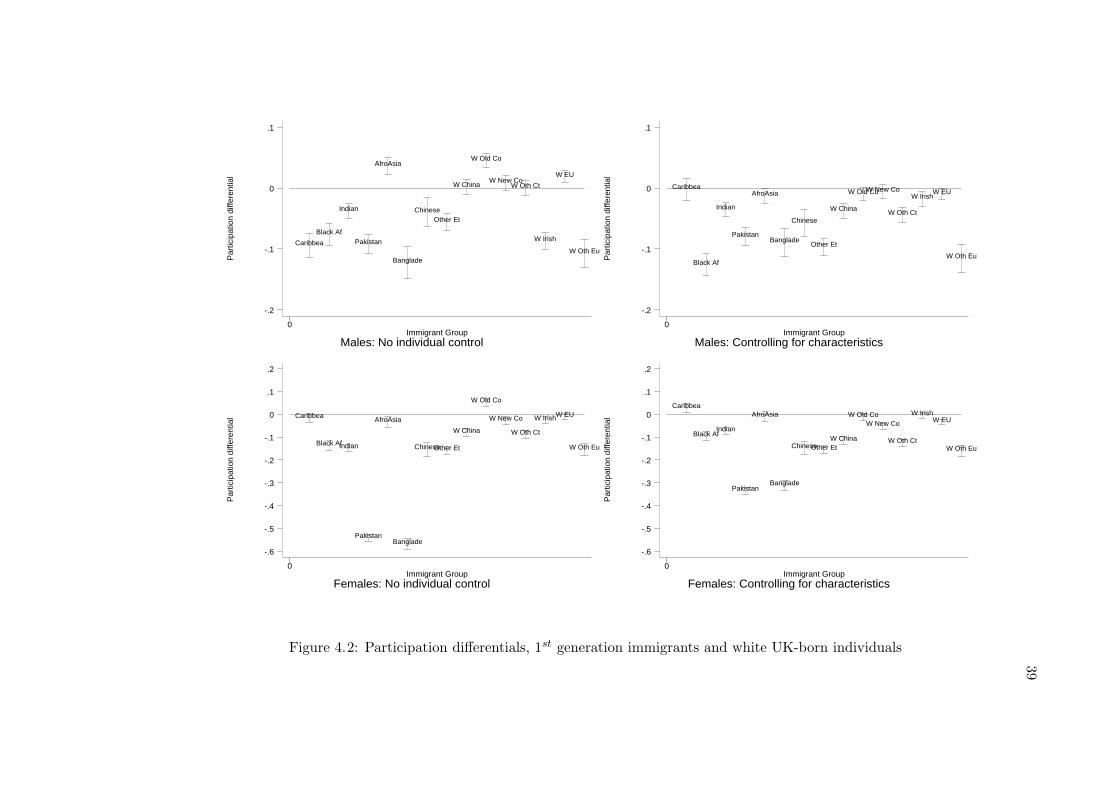
39
Par
ticip
atio
n di
ffere
ntia
l
Males: No individual controlImmigrant Group
0
-.2
-.1
0
.1
Caribbea
Black Af
Indian
Pakistan
AfroAsia
Banglade
ChineseOther Et
W China
W Old Co
W New CoW Oth Ct
W Irish
W EU
W Oth Eu
Par
ticip
atio
n di
ffere
ntia
l
Males: Controlling for characteristicsImmigrant Group
0
-.2
-.1
0
.1
Caribbea
Black Af
Indian
Pakistan
AfroAsia
Banglade
Chinese
Other Et
W China
W Old CoW New Co
W Oth Ct
W IrishW EU
W Oth Eu
Par
ticip
atio
n di
ffere
ntia
l
Females: No individual controlImmigrant Group
0
-.6
-.5
-.4
-.3
-.2
-.1
0
.1
.2
Caribbea
Black AfIndian
Pakistan
AfroAsia
Banglade
ChineseOther Et
W China
W Old Co
W New Co
W Oth Ct
W IrishW EU
W Oth Eu
Par
ticip
atio
n di
ffere
ntia
l
Females: Controlling for characteristicsImmigrant Group
0
-.6
-.5
-.4
-.3
-.2
-.1
0
.1
.2
Caribbea
Black AfIndian
Pakistan
AfroAsia
Banglade
ChineseOther EtW China
W Old CoW New Co
W Oth Ct
W IrishW EU
W Oth Eu
Figure 4.2: Participation differentials, 1st generation immigrants and white UK-born individuals
40
lower than those for white UK-born individuals. There are quite substantial differences
between the different origin groups and Black Africans and white Europeans from outside
the EU have the lowest participation probabilities.
These large differentials reflect the results we have found in the simple mean analysis
in the last chapter. They suggest that characteristics like education and age, and regional
distribution only explain to a small extent participation differentials: for some ethnic com-
munities, a far larger proportion of male immigrants is economically inactive, compared to
UK-born whites with the same demographic characteristics.
Even more dramatic is the comparison with females. Also, for females we find substan-
tial differences between the conditional and unconditional estimates. In other words, when
we compare the average immigrant female from a particular community (for instance Pak-
istani) with the average UK-born white individual, the difference in participation probabilities
seems quite substantial. However, if we compare a Pakistani female with a UK-born white
female with the same demographic characteristics, the difference diminishes substantially.
This means that differences in age and education are largely responsible for the differences
in participation probabilities.
Self-employment
We now turn to self-employment. We investigate whether immigrants have a higher prob-
ability to choose to be self-employed rather than salaried employed, compared to UK-born
whites. Another interesting question is whether immigrants’ activities in self-employment are
concentrated in the same sectors as UK-born individuals’ activities, or whether immigrants
choose other sectors.
It is not unreasonable to hypothesise that some immigrant groups may have a comparative
advantage in engaging in certain self-employment activities - it is well known for instance
that the arrival of Indian restaurants has changed the standards of English cuisine, with
some dishes of clearly Indian origin considered as national dishes today. Expertise and know-
how in this sector is unlikely to be challenged by UK-born white individuals. Furthermore,
41
immigrants may also have an advantage when catering for other immigrants - they may be
more skilled in understanding their preferences and tastes than individuals from the white
UK-born community.
This last point has been put forward by Borjas (1986) in an early comparison of self-
employment probabilities for individuals from distinguishable groups in the same country.
He analyses differences in self-employment propensities between foreign-born and UK-born
workers, using US census data. He finds that immigrants are more likely to be self-employed
than UK-born individuals with similar levels of skills. Borjas explains these results with
what he calls enclave effects: Immigrants create enclaves by concentrating in geographical
areas. Such enclaves then provide self-employment opportunities for other members of the
respective national group. In these enclaves UK-born individuals lack knowledge of language
and preferences of potential customers and have therefore a disadvantage when competing
for the same self-employment opportunities.
Borjas and Bronars (1989) extend this analysis. They do not separate according to
immigration status, but according to race and ethnic affiliation. Across ethnic/racial groups,
they find that minorities have lower rates of self-employment. If self-employed, they have
lower incomes than white self-employed workers. They explain these findings by consumer
discrimination that reduces gains from self-employment for minorities. They conclude that
self-selection into self-employment is negative for minorities, while the selection for individuals
from majorities is positive.
This evidence from the US suggests the following: individuals from minorities have a gen-
eral disadvantage when they compete for self-employment opportunities against individuals
from majorities with the same characteristics, and in the same sector. This disadvantage is
re-enforced if potential customers discriminate against self-employed minority workers. They,
however, may have advantages over majorities in self-employment sectors where customers
discriminate against majorities. This could, for instance, be the case when potential cus-
tomers are mainly from minority groups. The disadvantage for self-employed individuals in
such sectors who are from majority groups may then be prohibitive. As a consequence, for
these self-employment opportunities individuals from minority groups only compete against
42
each other, while for other self-employment opportunities only individuals from majority
groups compete against each other.
We commence our analysis by investigating the choice of sector for UK-born whites and
immigrants; we break the immigrant sample down further into white immigrants and minority
immigrants. We also consider some origin countries in more detail (Table 4.1). White UK-
born individuals are heavily concentrated in construction, which is the largest sector with 33
per cent, followed by distribution, hotels and restaurants (17 per cent) and banking, finance
and insurance (14 per cent). This contrasts sharply with the overall sector allocation of
immigrants who are heavily concentrated in distribution, hotels and restaurants - 36 per cent
of self-employed immigrants are active in this sector. When we further distinguish between
white and ethnic minority immigrants, we see that it is mainly ethnic minority individuals
who are concentrated in this sector - concentration of white individuals is more outspread
and not too dissimilar to that of the white UK-born.
In columns 5-8, we consider four groups of ethnic minority immigrants who are strongly
represented in the self-employment sector: Pakistanis, Chinese, Asians of African origin, and
immigrants from India. The large concentration in distribution, hotels and restaurants is
visible for all groups, but very strong for the Chinese and the African Asians. There are
however also interesting differences. Most notable is the large percentage of Pakistanis who
are active in the transport and communication sector.
In the last column, we present sector allocation for an interesting group of white immi-
grants: the Irish. This group is very heavily concentrated in construction, with 60 per cent
being active in this sector. Overall, these numbers indicate a very unequal distribution of
individuals of different ethnic origin in different self-employment occupations.
We now compare overall self-employment probabilities of immigrants with those of UK-
born whites, where we distinguish, as before, between different origin countries.
The graphs in Figure 4.3 show the probabilities of immigrants of different origin of being
self-employed, relative to UK-born whites. Entries differ quite considerably for immigrants of
different origin. For the male sample, it seems that individuals from the Pakistani, Chinese,
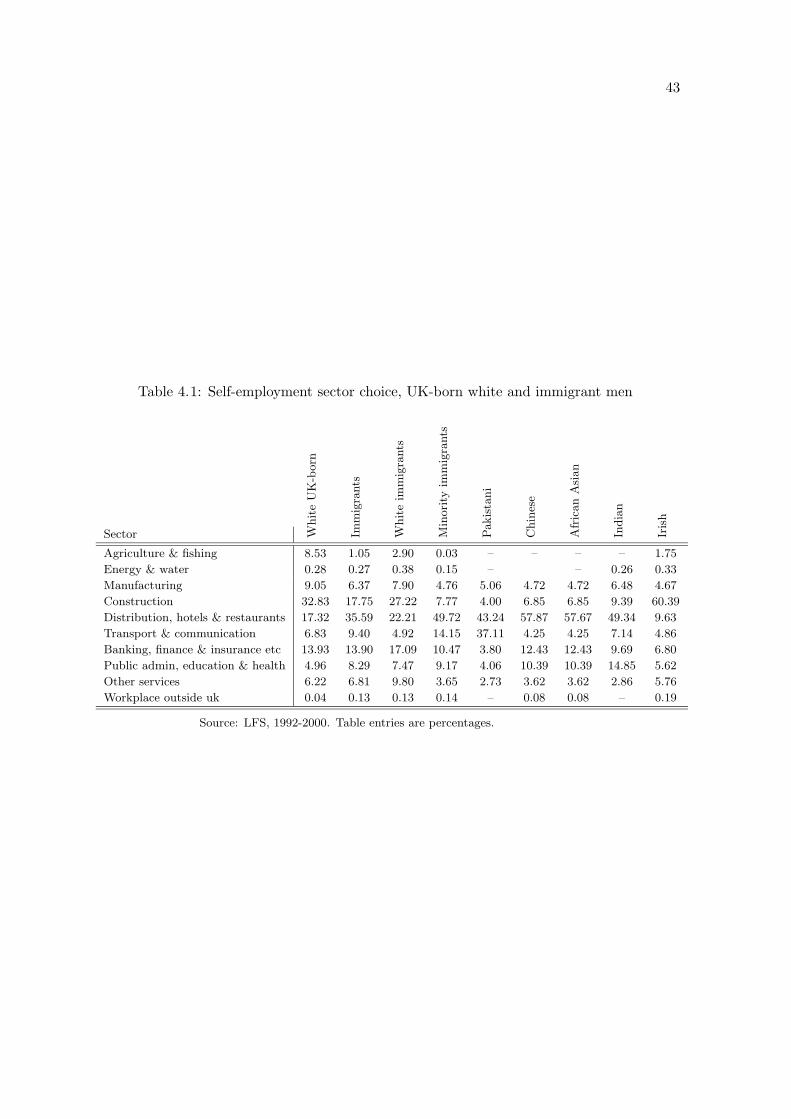
43
Table 4.1: Self-employment sector choice, UK-born white and immigrant men
Sector WhiteUK-born
Immigrants
Whiteimmigrants
Minority
immigrants
Pakistani
Chinese
AfricanAsian
Indian
Irish
Agriculture & fishing 8.53 1.05 2.90 0.03 – – – – 1.75
Energy & water 0.28 0.27 0.38 0.15 – – 0.26 0.33
Manufacturing 9.05 6.37 7.90 4.76 5.06 4.72 4.72 6.48 4.67
Construction 32.83 17.75 27.22 7.77 4.00 6.85 6.85 9.39 60.39
Distribution, hotels & restaurants 17.32 35.59 22.21 49.72 43.24 57.87 57.67 49.34 9.63
Transport & communication 6.83 9.40 4.92 14.15 37.11 4.25 4.25 7.14 4.86
Banking, finance & insurance etc 13.93 13.90 17.09 10.47 3.80 12.43 12.43 9.69 6.80
Public admin, education & health 4.96 8.29 7.47 9.17 4.06 10.39 10.39 14.85 5.62
Other services 6.22 6.81 9.80 3.65 2.73 3.62 3.62 2.86 5.76
Workplace outside uk 0.04 0.13 0.13 0.14 – 0.08 0.08 – 0.19
Source: LFS, 1992-2000. Table entries are percentages.
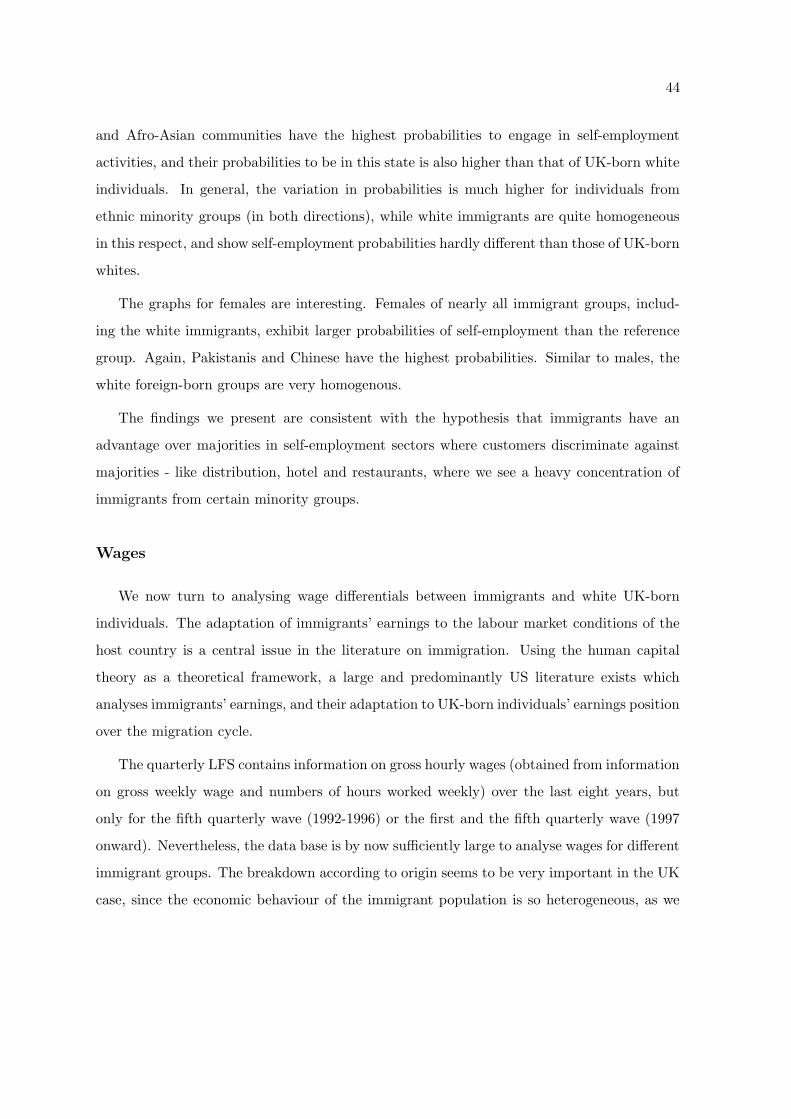
44
and Afro-Asian communities have the highest probabilities to engage in self-employment
activities, and their probabilities to be in this state is also higher than that of UK-born white
individuals. In general, the variation in probabilities is much higher for individuals from
ethnic minority groups (in both directions), while white immigrants are quite homogeneous
in this respect, and show self-employment probabilities hardly different than those of UK-born
whites.
The graphs for females are interesting. Females of nearly all immigrant groups, includ-
ing the white immigrants, exhibit larger probabilities of self-employment than the reference
group. Again, Pakistanis and Chinese have the highest probabilities. Similar to males, the
white foreign-born groups are very homogenous.
The findings we present are consistent with the hypothesis that immigrants have an
advantage over majorities in self-employment sectors where customers discriminate against
majorities - like distribution, hotel and restaurants, where we see a heavy concentration of
immigrants from certain minority groups.
Wages
We now turn to analysing wage differentials between immigrants and white UK-born
individuals. The adaptation of immigrants’ earnings to the labour market conditions of the
host country is a central issue in the literature on immigration. Using the human capital
theory as a theoretical framework, a large and predominantly US literature exists which
analyses immigrants’ earnings, and their adaptation to UK-born individuals’ earnings position
over the migration cycle.
The quarterly LFS contains information on gross hourly wages (obtained from information
on gross weekly wage and numbers of hours worked weekly) over the last eight years, but
only for the fifth quarterly wave (1992-1996) or the first and the fifth quarterly wave (1997
onward). Nevertheless, the data base is by now sufficiently large to analyse wages for different
immigrant groups. The breakdown according to origin seems to be very important in the UK
case, since the economic behaviour of the immigrant population is so heterogeneous, as we
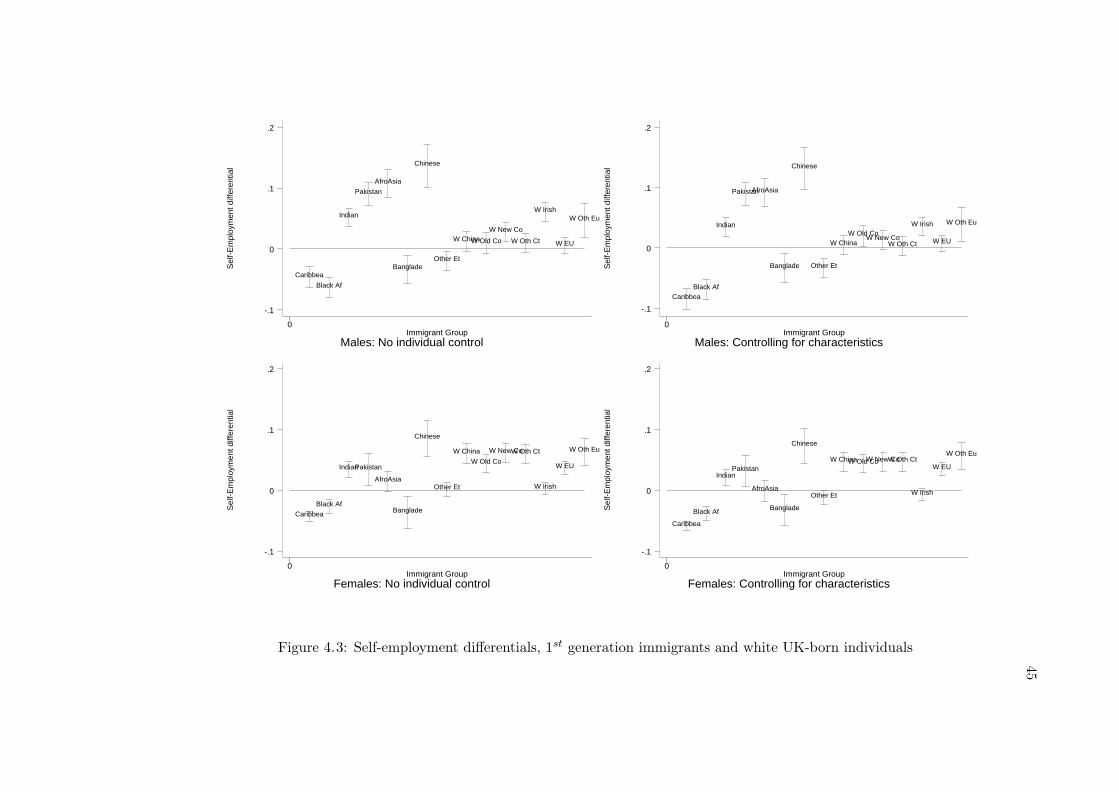
45
Sel
f-E
mpl
oym
ent d
iffer
entia
l
Males: No individual controlImmigrant Group
0
-.1
0
.1
.2
Caribbea
Black Af
Indian
Pakistan
AfroAsia
Banglade
Chinese
Other Et
W ChinaW Old Co
W New Co
W Oth Ct
W Irish
W EU
W Oth Eu
Sel
f-E
mpl
oym
ent d
iffer
entia
l
Males: Controlling for characteristicsImmigrant Group
0
-.1
0
.1
.2
CaribbeaBlack Af
Indian
PakistanAfroAsia
Banglade
Chinese
Other Et
W ChinaW Old Co
W New CoW Oth Ct
W Irish
W EU
W Oth EuS
elf-
Em
ploy
men
t diff
eren
tial
Females: No individual controlImmigrant Group
0
-.1
0
.1
.2
Caribbea
Black Af
IndianPakistan
AfroAsia
Banglade
Chinese
Other Et
W China
W Old Co
W New CoW Oth Ct
W Irish
W EU
W Oth Eu
Sel
f-E
mpl
oym
ent d
iffer
entia
l
Females: Controlling for characteristicsImmigrant Group
0
-.1
0
.1
.2
Caribbea
Black Af
IndianPakistan
AfroAsia
Banglade
Chinese
Other Et
W ChinaW Old CoW New CoW Oth Ct
W Irish
W EU
W Oth Eu
Figure 4.3: Self-employment differentials, 1st generation immigrants and white UK-born individuals
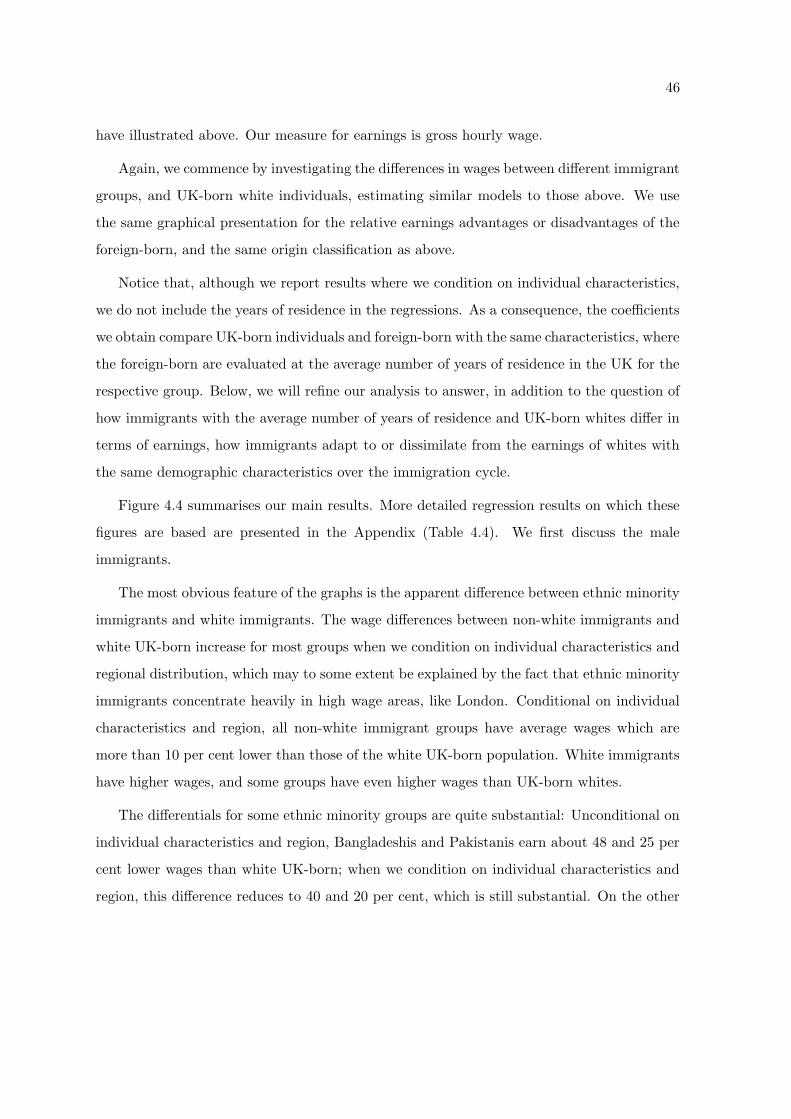
46
have illustrated above. Our measure for earnings is gross hourly wage.
Again, we commence by investigating the differences in wages between different immigrant
groups, and UK-born white individuals, estimating similar models to those above. We use
the same graphical presentation for the relative earnings advantages or disadvantages of the
foreign-born, and the same origin classification as above.
Notice that, although we report results where we condition on individual characteristics,
we do not include the years of residence in the regressions. As a consequence, the coefficients
we obtain compare UK-born individuals and foreign-born with the same characteristics, where
the foreign-born are evaluated at the average number of years of residence in the UK for the
respective group. Below, we will refine our analysis to answer, in addition to the question of
how immigrants with the average number of years of residence and UK-born whites differ in
terms of earnings, how immigrants adapt to or dissimilate from the earnings of whites with
the same demographic characteristics over the immigration cycle.
Figure 4.4 summarises our main results. More detailed regression results on which these
figures are based are presented in the Appendix (Table 4.4). We first discuss the male
immigrants.
The most obvious feature of the graphs is the apparent difference between ethnic minority
immigrants and white immigrants. The wage differences between non-white immigrants and
white UK-born increase for most groups when we condition on individual characteristics and
regional distribution, which may to some extent be explained by the fact that ethnic minority
immigrants concentrate heavily in high wage areas, like London. Conditional on individual
characteristics and region, all non-white immigrant groups have average wages which are
more than 10 per cent lower than those of the white UK-born population. White immigrants
have higher wages, and some groups have even higher wages than UK-born whites.
The differentials for some ethnic minority groups are quite substantial: Unconditional on
individual characteristics and region, Bangladeshis and Pakistanis earn about 48 and 25 per
cent lower wages than white UK-born; when we condition on individual characteristics and
region, this difference reduces to 40 and 20 per cent, which is still substantial. On the other
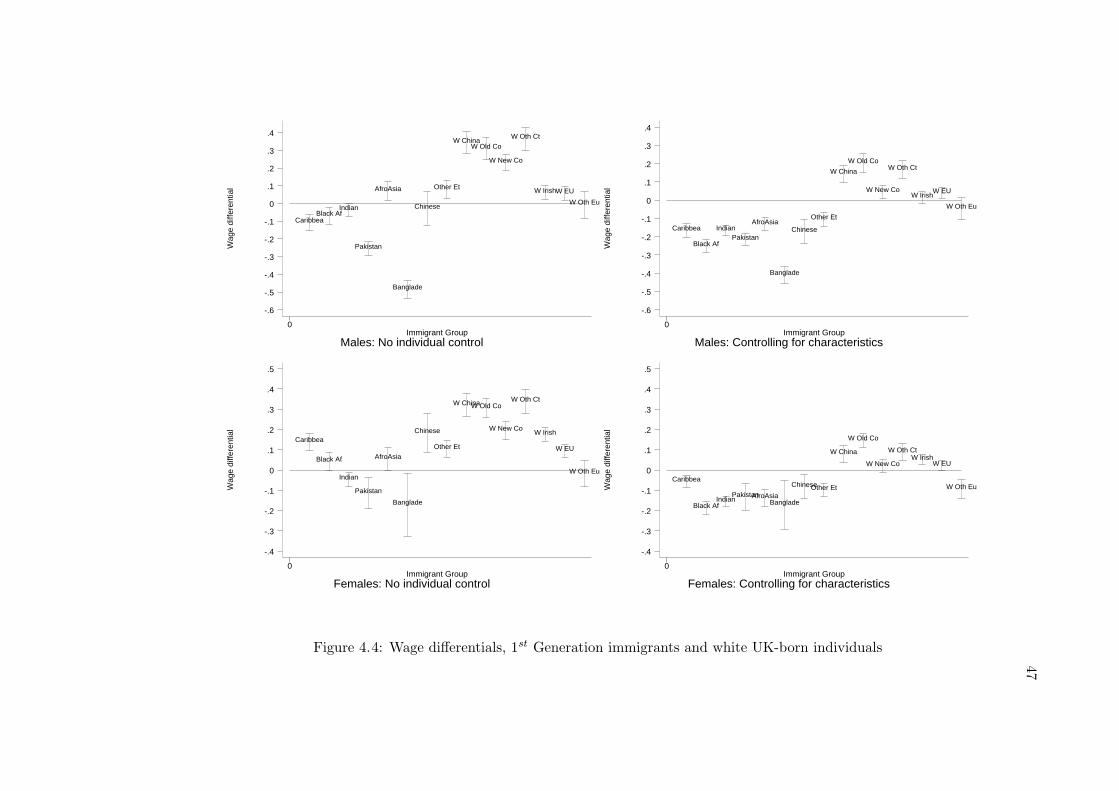
47
Wag
e di
ffere
ntia
l
Males: No individual controlImmigrant Group
0
-.6
-.5
-.4
-.3
-.2
-.1
0
.1
.2
.3
.4
CaribbeaBlack Af
Indian
Pakistan
AfroAsia
Banglade
Chinese
Other Et
W ChinaW Old Co
W New Co
W Oth Ct
W IrishW EU
W Oth Eu
Wag
e di
ffere
ntia
l
Males: Controlling for characteristicsImmigrant Group
0
-.6
-.5
-.4
-.3
-.2
-.1
0
.1
.2
.3
.4
Caribbea
Black Af
IndianPakistan
AfroAsia
Banglade
Chinese
Other Et
W China
W Old Co
W New Co
W Oth Ct
W IrishW EU
W Oth Eu
Wag
e di
ffere
ntia
l
Females: No individual controlImmigrant Group
0
-.4
-.3
-.2
-.1
0
.1
.2
.3
.4
.5
Caribbea
Black Af
Indian
Pakistan
AfroAsia
Banglade
Chinese
Other Et
W ChinaW Old Co
W New Co
W Oth Ct
W Irish
W EU
W Oth Eu
Wag
e di
ffere
ntia
l
Females: Controlling for characteristicsImmigrant Group
0
-.4
-.3
-.2
-.1
0
.1
.2
.3
.4
.5
Caribbea
Black AfIndian
PakistanAfroAsiaBanglade
ChineseOther Et
W China
W Old Co
W New Co
W Oth CtW Irish
W EU
W Oth Eu
Figure 4.4: Wage differentials, 1st Generation immigrants and white UK-born individuals
48
side, white immigrants are mostly more successful than comparable UK-born -for instance,
individuals from the Old Commonwealth countries earn on average 20 per cent higher wages
than comparable UK-born individuals.4
For females, the patterns are very similar. Again, individuals from the Bangladeshi com-
munity have the lowest relative wages. The wage differentials between white female immi-
grants relative to the UK-born are even larger than for males.
5 Dynamic analysis
Our analysis has shown that there are large differences in participation, employment,
wages, and self-employment probabilities between UK-born individuals and foreign-born in-
dividuals, as well as across immigrant groups of different origin, even if we condition on
individual characteristics like age and education, and on geographic distribution.
It is likely that the relative position of immigrants to UK-born individuals changes with
the time of residence. We have discussed in the Background chapter that immigrants may
accumulate additional skills, specific to the host country economy, after arrival, or transfer
skills to the needs of the foreign labour market. Furthermore, they may acquire information
about the labour market after arrival, and learn about particularities of the host country’s
labour market. All this may lead to changes in differences between immigrants and white
UK-born individuals. One variable which is likely to capture this process of adaptation is
the time the immigrant has spent in the host country labour market.
The differences we have discussed in the previous sections are evaluated at the average time
of residence for the particular immigrant group. We now take a more dynamic perspective.
We shall compare an immigrant with a UK-born worker of same characteristics at the time
the immigrant enters the host country, and follow this relative difference for the next four
4We compute per cent differences in wages as (eβ − 1)*100, where β is the estimated parameter of the
respective origin dummy.
49
decades. Thus, we will be able to determine whether, and how fast the immigrant adapts to
to the respective white UK-born worker.
There are a number of issues which need to be considered. First, and as we have discussed
in the Background chapter, this type of analysis is very sensitive to changes in the initial
position of immigrants who arrive at different times (cohort effects). If this initial position
changes, conditional on variables included in the regression, then this may lead to misleading
adaptation profiles. We take account of cohort effects, and we distinguish between three
cohorts: Those who arrived before 1973, those who arrived between 1973 and 1985, and
those who arrived after 1985. Since we only have eight years of data, cohort effects are not
well identified, though.
Second, as discussed above, there may be selective out-migration. If the most successful
individuals leave after some years, then this may lead to a serious underestimate of the
adaptation patterns. There is very little which can be done about this problem without data
on return events. We will discuss the possible impact of this process on our results below.
Other things to consider are additional differences between immigrants we have so far not
taken care of. One astonishing feature emerging from the descriptive analysis above is that
a very large fraction of immigrants arrived at a very young age. It is not unlikely that those
who arrive younger may have different initial opportunities than those who arrive at a later
age. Furthermore, those who arrive young may also be more capable of acquiring additional
knowledge, or have higher incentives for acquisition of additional skills. In our analysis we
account for that by allowing for differences in the initial labour market positions for these
two groups. We do this by conditioning, in addition to age and years since migration, on
a dummy variable that distinguishes between immigrants who were younger than 16 when
they arrived, and immigrants who were older than 16.
One problem we face with this analysis is the relatively small number of observations
for some immigrant groups, which lead to problems in estimating the adaptation profiles in
conjunction with cohort and year effects. We therefore consider four groups of immigrants:
minority immigrants, which include immigrants from Africa (including Afro-Asians), the
Caribbean, India, Pakistan, Bangladesh, and China; white immigrants from the New Com-
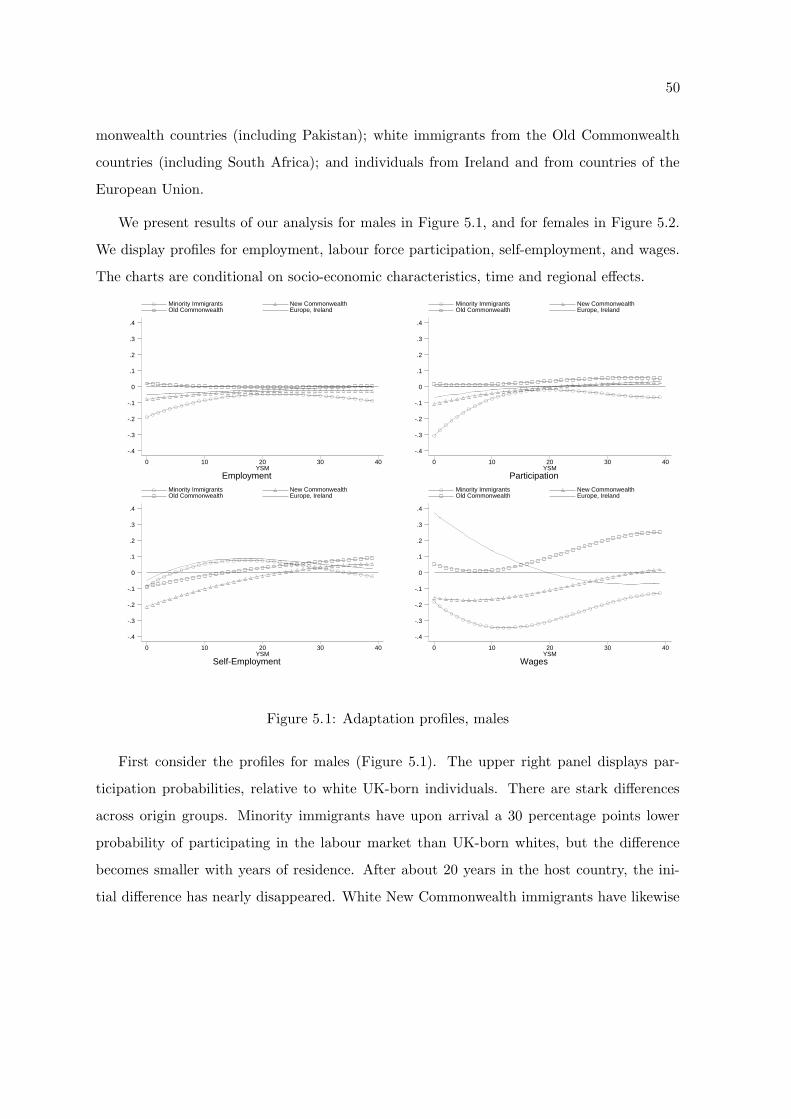
50
monwealth countries (including Pakistan); white immigrants from the Old Commonwealth
countries (including South Africa); and individuals from Ireland and from countries of the
European Union.
We present results of our analysis for males in Figure 5.1, and for females in Figure 5.2.
We display profiles for employment, labour force participation, self-employment, and wages.
The charts are conditional on socio-economic characteristics, time and regional effects.
EmploymentYSM
Minority Immigrants New Commonwealth Old Commonwealth Europe, Ireland
0 10 20 30 40
-.4
-.3
-.2
-.1
0
.1
.2
.3
.4
ParticipationYSM
Minority Immigrants New Commonwealth Old Commonwealth Europe, Ireland
0 10 20 30 40
-.4
-.3
-.2
-.1
0
.1
.2
.3
.4
Self-EmploymentYSM
Minority Immigrants New Commonwealth Old Commonwealth Europe, Ireland
0 10 20 30 40
-.4
-.3
-.2
-.1
0
.1
.2
.3
.4
WagesYSM
Minority Immigrants New Commonwealth Old Commonwealth Europe, Ireland
0 10 20 30 40
-.4
-.3
-.2
-.1
0
.1
.2
.3
.4
Figure 5.1: Adaptation profiles, males
First consider the profiles for males (Figure 5.1). The upper right panel displays par-
ticipation probabilities, relative to white UK-born individuals. There are stark differences
across origin groups. Minority immigrants have upon arrival a 30 percentage points lower
probability of participating in the labour market than UK-born whites, but the difference
becomes smaller with years of residence. After about 20 years in the host country, the ini-
tial difference has nearly disappeared. White New Commonwealth immigrants have likewise
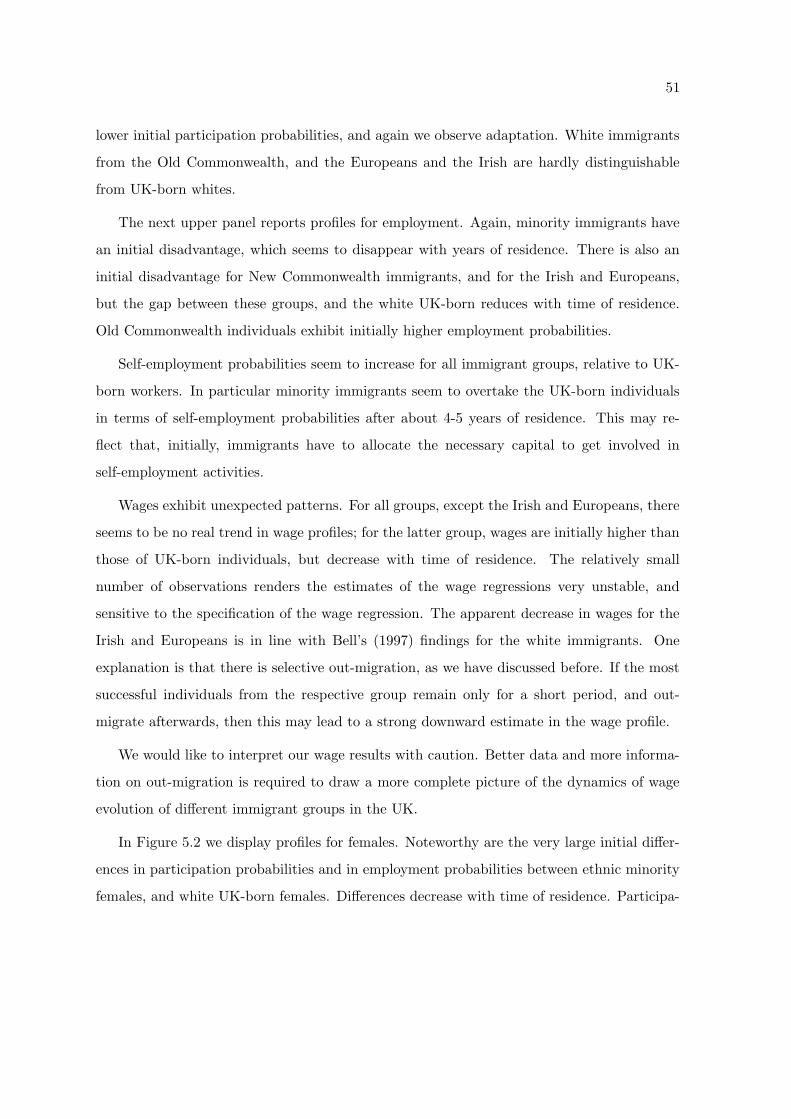
51
lower initial participation probabilities, and again we observe adaptation. White immigrants
from the Old Commonwealth, and the Europeans and the Irish are hardly distinguishable
from UK-born whites.
The next upper panel reports profiles for employment. Again, minority immigrants have
an initial disadvantage, which seems to disappear with years of residence. There is also an
initial disadvantage for New Commonwealth immigrants, and for the Irish and Europeans,
but the gap between these groups, and the white UK-born reduces with time of residence.
Old Commonwealth individuals exhibit initially higher employment probabilities.
Self-employment probabilities seem to increase for all immigrant groups, relative to UK-
born workers. In particular minority immigrants seem to overtake the UK-born individuals
in terms of self-employment probabilities after about 4-5 years of residence. This may re-
flect that, initially, immigrants have to allocate the necessary capital to get involved in
self-employment activities.
Wages exhibit unexpected patterns. For all groups, except the Irish and Europeans, there
seems to be no real trend in wage profiles; for the latter group, wages are initially higher than
those of UK-born individuals, but decrease with time of residence. The relatively small
number of observations renders the estimates of the wage regressions very unstable, and
sensitive to the specification of the wage regression. The apparent decrease in wages for the
Irish and Europeans is in line with Bell’s (1997) findings for the white immigrants. One
explanation is that there is selective out-migration, as we have discussed before. If the most
successful individuals from the respective group remain only for a short period, and out-
migrate afterwards, then this may lead to a strong downward estimate in the wage profile.
We would like to interpret our wage results with caution. Better data and more informa-
tion on out-migration is required to draw a more complete picture of the dynamics of wage
evolution of different immigrant groups in the UK.
In Figure 5.2 we display profiles for females. Noteworthy are the very large initial differ-
ences in participation probabilities and in employment probabilities between ethnic minority
females, and white UK-born females. Differences decrease with time of residence. Participa-
52
EmploymentYSM
Minority Immigrants New Commonwealth Old Commonwealth Europe, Ireland
0 10 20 30 40
-.4
-.3
-.2
-.1
0
.1
.2
.3
.4
ParticipationYSM
Minority Immigrants New Commonwealth Old Commonwealth Europe, Ireland
0 10 20 30 40
-.4
-.3
-.2
-.1
0
.1
.2
.3
.4
Self-EmploymentYSM
Minority Immigrants New Commonwealth Old Commonwealth Europe, Ireland
0 10 20 30 40
-.4
-.3
-.2
-.1
0
.1
.2
.3
.4
WagesYSM
Minority Immigrants New Commonwealth Old Commonwealth Europe, Ireland
0 10 20 30 40
-.4
-.3
-.2
-.1
0
.1
.2
.3
.4
Figure 5.2: Adaptation profiles, females

53
tion probabilities are more than 10 per cent lower than those of white UK-born individuals
even after 40 years of residence. Employment probabilities seem to converge.
Profiles for the other groups are much closer to those of the UK-born whites. There seem
to be initially higher participation probabilities for New and Old Commonwealth individuals.
Employment probabilities for all three latter groups are very similar, and remain slightly
lower then those of UK-born whites. Again, results for wages are very unstable.
54
6 Economic outcomes, language, and public-private sector
differentials
Language and labour market outcomes
We draw in this chapter on Dustmann and Fabbri (2002), who use data from the FWLS
and the FNSEM to analyse language proficiency of minority immigrants, and the effect of
language on employment and wages.
The Family and Working Lives Survey (FWLS) has been collected between 1994 and
1995. It is a retrospective survey on adults aged between 16 and 69, including 9,000 respon-
dents and their partners. It contains a ”boost” sample of about 2,000 individuals belonging
to four ethnic minority groups: Black Caribbeans, Indians, Pakistanis and Bangladeshi. The
data provides information on earnings, education, nationality, language skills and other back-
ground characteristics. Of the 2,388 people forming the minority sample in the main and
”boost” sample, 68 per cent (1,639) are foreign-born.
The Fourth National Survey on Ethnic Minorities (FNSEM) is also a cross-sectional sur-
vey, which was carried out between 1993 and 1994. Individuals included are aged 16 or more,
and of Caribbean, Indian, Pakistani, African-Asian (i.e. individuals born in Africa but with
Asian origin), Bangladeshi or Chinese origin. There are 5,196 observations in the minority
sample and 2,867 observations in the independent comparison sample of white individuals.
Similarly to the FWLS, more than 77 per cent of the individuals in the ethnic minority sample
are foreign-born.
In Table 6.1 we report self-reported language proficiency for different immigrant groups.
The numbers in the table indicate that there are considerable differences in fluency according
to ethnic affiliation, with individuals from the Caribbean community being most fluent, and
individuals from the Pakistani and Bangladeshi communities being most disadvantaged.
As a first step of their analysis, Dustmann and Fabbri (2002) investigate the way language
acquisition is related to individual characteristics, like age at entry, gender, education, and
years of residence. They find that males have a significantly higher probability to be fluent
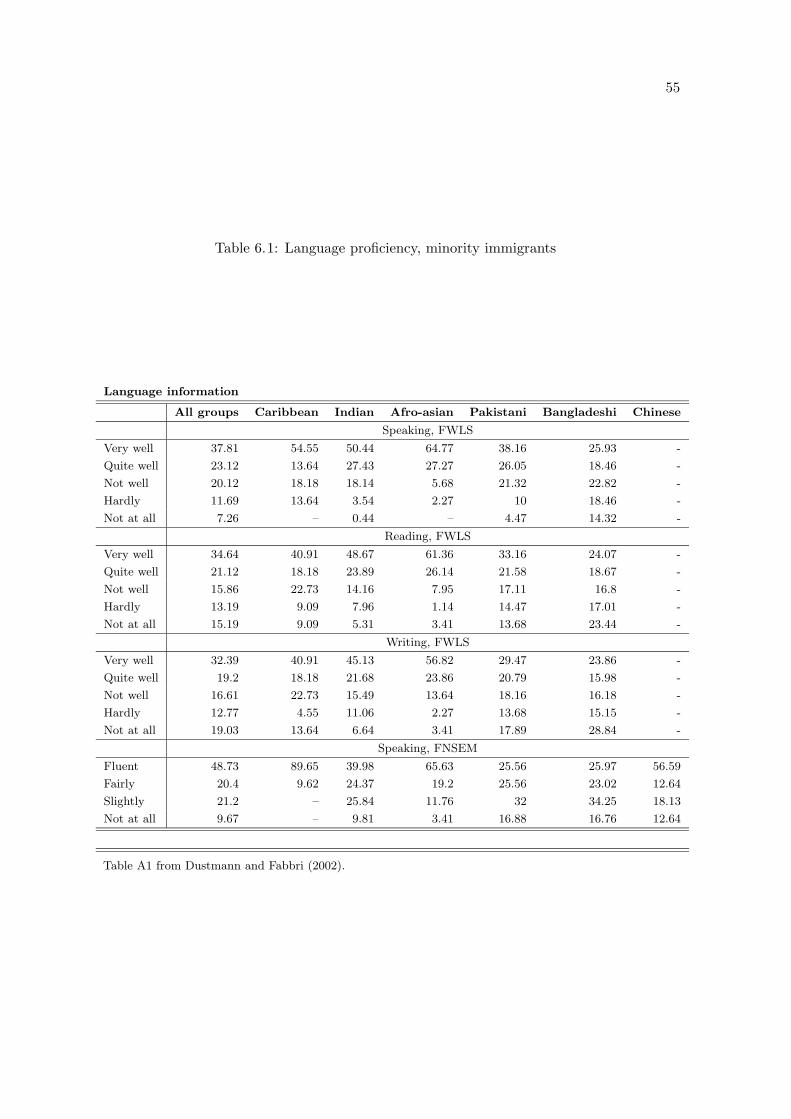
55
Table 6.1: Language proficiency, minority immigrants
Language information
All groups Caribbean Indian Afro-asian Pakistani Bangladeshi Chinese
Speaking, FWLS
Very well 37.81 54.55 50.44 64.77 38.16 25.93 -
Quite well 23.12 13.64 27.43 27.27 26.05 18.46 -
Not well 20.12 18.18 18.14 5.68 21.32 22.82 -
Hardly 11.69 13.64 3.54 2.27 10 18.46 -
Not at all 7.26 – 0.44 – 4.47 14.32 -
Reading, FWLS
Very well 34.64 40.91 48.67 61.36 33.16 24.07 -
Quite well 21.12 18.18 23.89 26.14 21.58 18.67 -
Not well 15.86 22.73 14.16 7.95 17.11 16.8 -
Hardly 13.19 9.09 7.96 1.14 14.47 17.01 -
Not at all 15.19 9.09 5.31 3.41 13.68 23.44 -
Writing, FWLS
Very well 32.39 40.91 45.13 56.82 29.47 23.86 -
Quite well 19.2 18.18 21.68 23.86 20.79 15.98 -
Not well 16.61 22.73 15.49 13.64 18.16 16.18 -
Hardly 12.77 4.55 11.06 2.27 13.68 15.15 -
Not at all 19.03 13.64 6.64 3.41 17.89 28.84 -
Speaking, FNSEM
Fluent 48.73 89.65 39.98 65.63 25.56 25.97 56.59
Fairly 20.4 9.62 24.37 19.2 25.56 23.02 12.64
Slightly 21.2 – 25.84 11.76 32 34.25 18.13
Not at all 9.67 – 9.81 3.41 16.88 16.76 12.64
Table A1 from Dustmann and Fabbri (2002).
56
in the majority language. The effect of age at entry is negative and strongly significant,
indicating that those who arrive younger acquire language proficiency more easily. Years of
residence has a positive effect, which decreases with time in the host country. All these results
are consistent with findings for other countries. Furthermore, the effect of these variables is
similar for all three components of language capital. Education affects fluency positively,
and the positive relationship between educational background and language is stronger for
reading and writing.
There remain large differences in the level of language proficiency among different ethnic
groups, even after conditioning on individual characteristics. Bangladeshis and Pakistanis
are those two groups with the lowest levels of language proficiency.
As regards employment probabilities, findings are that language proficiency is strongly
related to higher employment probabilities, conditional on a large array of background char-
acteristics. English fluency is associated with a 15-17 percentage point higher employment
probability, depending on the data source used. The coefficients are highly significant. For
earnings, there are large and likewise significant coefficients for the English fluency variables.
The point estimates for both data sets are quite similar, and indicate that English language
proficiency is associated with 18 - 20 per cent higher wages.
Simple regressions, on which the reported estimates are based, may not identify the true
causal effect of language on wages. If individuals who are very successful in the labour market
also have higher language proficiency, and if this relationship is due to unobserved character-
istics not included in the regression, then the regression estimates may be overestimates of
the true effect. On the other hand, measurement error in the self-reported language variables
(which is very substantial, as illustrated by Dustmann and van Soest 2001, 2001a) may lead
to an underestimate of language effects. Using an IV approach to address the measurement
error problem, and a matching estimator to address the problem of unobserved heterogeneity,
Dustmann and Fabbri suggest that the true effect of language on employment probabilities
and on wages is larger than what is obtained from simple OLS regressions. Results suggest
that fluency increases the probability that a male individual is employed by around 26 per-
centage points for males. Likewise, results for earnings suggest that the true effect of language
57
is higher than simple regressions indicate.
When computing the effect of language proficiency on the employment and wage gap
between UK-born individuals and ethnic minority immigrants, the study concludes that lan-
guage largely reduces differences in both economic outcomes.
Wages in public and private sector
We have estimated the difference in log wages between immigrants and UK-born workers
in the public sector, and in the private sector, for both males and females. We distinguish
between white immigrants and immigrants from ethnic minority communities. We pool
immigrants and UK-born individuals, and we regress log wages on age, education, year,
region, a dummy variable for public sector, a dummy variable for being in a part-time job,
two dummy variables for being an immigrant from an ethic minority group, or a white
immigrant, and two interaction variables between being in the public sector, and being a
white immigrant, or an ethnic minority immigrant.
We first discuss our results for males. According to our estimations, white immigrants
in the private sector have on average 8 per cent higher wages than UK-born individuals.
This wage advantage reduces by about 4 per cent in the public sector, and this difference is
significant.
On the other hand, immigrants from ethnic minority groups who work in the private
sector have on average a wage disadvantage of 24 per cent; in the public sector however, this
disadvantage reduces by about 15 per cent, and this reduction is again significant.
For females, results are similar. In the private sector, white immigrants earn on aver-
age 6 per cent higher wages than UK-born individuals, while females from ethnic minority
immigrant groups earn about 14 per cent lower wages. This wage differential reduces to 3
per cent for white immigrants in the public sector. For female immigrants from an ethnic
minority group who work in the public sector, there is no significant reduction in the wage
disadvantage, as compared to those who work in the private sector.
58
These results indicate a smaller wage differentials between immigrants and UK-born indi-
viduals in the public sector, as compared to the private sector. Our analysis is very descriptive,
and does not investigate the reasons for this. One possible explanation is that sector choice is
selective on variables which are not observed, and that the selection process differs between
the two immigrant groups we distinguish, and UK-born individuals.5 Future research on
wage differentials of immigrants in public and private sector seems promising.
7 White UK-born, ethnic minority immigrants, and ethnic
minority UK-born
We now turn to an analysis of the relative performance of individuals from ethnic minority
groups who are born in the UK. Given the time patterns of immigration to the UK, these
individuals are predominantly young, and we therefore compare them to UK-born individuals
in the same age range (we only consider UK-born whites below age 45). Our analysis will
again distinguish between different ethnic groups.
We consider the analysis of minorities born in the UK as important for obtaining a full
picture of the well being of immigrants in the UK. The adaptation of immigrants to the
host country economy is an issue which does not only relate to the immigrant population,
but also to the next generation. Our analysis is aimed to provide some understanding as to
whether economic advantages or disadvantages of immigrants relative to UK-born whites, or
to immigrants of different origin, are transmitted to the next generation.
The economic performance indicators we investigate are participation, employment, and
wages.
We commence with investigating employment and participation probabilities. We use
again a graphical representation to report the differences in outcomes, and we compare UK-
born minority individuals to UK-born whites (lower panels). For comparison purposes, we
5See Dustmann and van Soest (1998) for a detailed analysis of public-private sector choice. See Disney and
Gosling (1998) for a detailed analysis of public-private sector wages in the UK.
59
reproduce our results from the sections above for foreign-born individuals of the same eth-
nic origin as the UK-born minority individuals (upper panels). Again, the graphs on the
left report unconditional differences; the graphs on the right report conditional differences,
controlling for demographic characteristics and region.
Employment
In Figures 7.1 and 7.2, we report employment differentials of various ethnic minority
groups born in the UK (lower panel), relative to UK-born white individuals. The figures
refers to males and females respectively. We have seen in chapter 7.3 that, like immigrants,
UK-born ethnic minority individuals are heavily concentrated in London. Controlling for
region is therefore likely to change results of the performance analysis. Comparison of the
graphs on the left and the right of the figure differ slightly, but not dramatically. We see
that, relative to white UK-born, ethnic minority individuals have on average slightly lower
employment probabilities, but not for all groups are these differences significant. While indi-
viduals from the Bangladeshi and Chinese community have employment probabilities which
are not significantly lower than those of whites, differences are quite large, and significant for
Pakistanis, Caribbeans, and Black Africans.
When we compare this with first generation immigrants from the same origin countries
(upper panel), we find some pronounced differences. The differences have reduced for some
ethnic groups in the next generation. Certain patterns are clearly visible - Black Africans,
Caribbeans, and Pakistanis have been the groups with the relatively lowest employment
probabilities among immigrants, and so they are among UK-born minorities. Bangladeshis,
while being the group with the lowest employment probabilities among immigrants, are not
significantly distinguishable any more from UK-born whites if born in the UK. Notice, how-
ever, that standard errors for UK-born minorities are far larger as those of first generation
minorities, which is due to smaller sample sizes on the former groups.
For females, the employment differentials are very similar for immigrants and ethnic
minorities born in the UK.
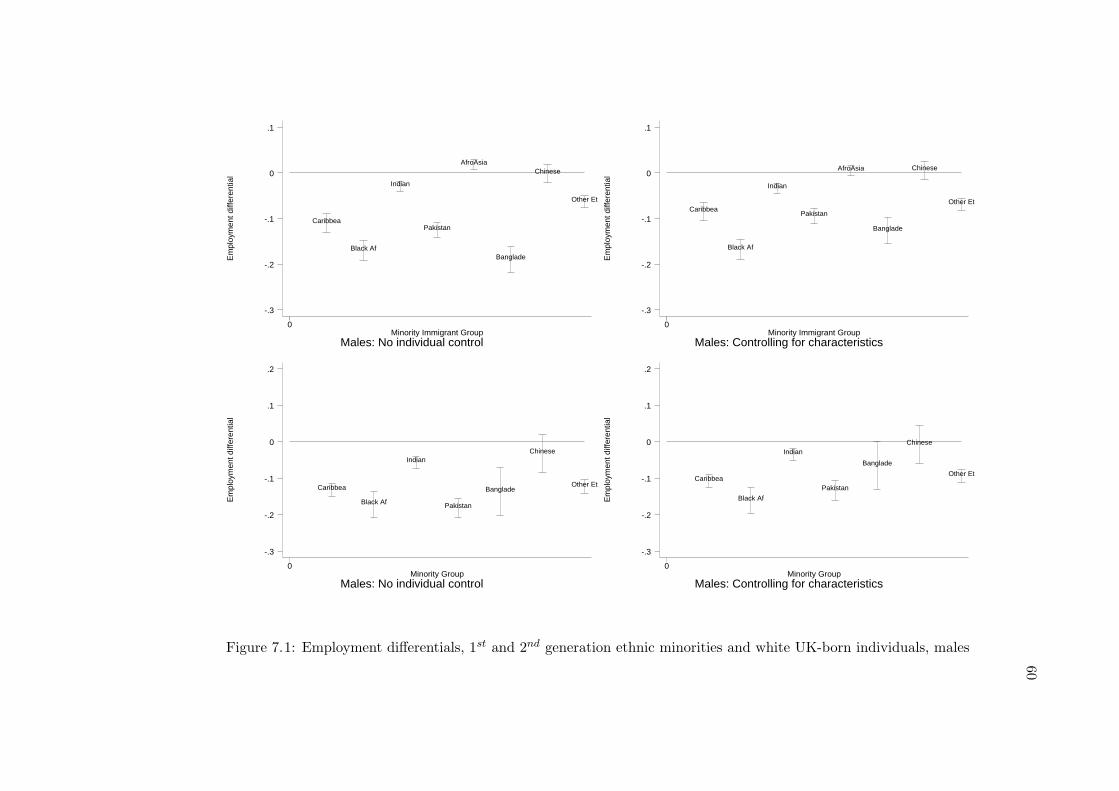
60
Em
ploy
men
t diff
eren
tial
Males: No individual controlMinority Immigrant Group
0
-.3
-.2
-.1
0
.1
Caribbea
Black Af
Indian
Pakistan
AfroAsia
Banglade
Chinese
Other Et
Em
ploy
men
t diff
eren
tial
Males: Controlling for characteristicsMinority Immigrant Group
0
-.3
-.2
-.1
0
.1
Caribbea
Black Af
Indian
Pakistan
AfroAsia
Banglade
Chinese
Other Et
Em
ploy
men
t diff
eren
tial
Males: No individual controlMinority Group
0
-.3
-.2
-.1
0
.1
.2
Caribbea
Black Af
Indian
Pakistan
Banglade
Chinese
Other Et
Em
ploy
men
t diff
eren
tial
Males: Controlling for characteristicsMinority Group
0
-.3
-.2
-.1
0
.1
.2
Caribbea
Black Af
Indian
Pakistan
Banglade
Chinese
Other Et
Figure 7.1: Employment differentials, 1st and 2nd generation ethnic minorities and white UK-born individuals, males
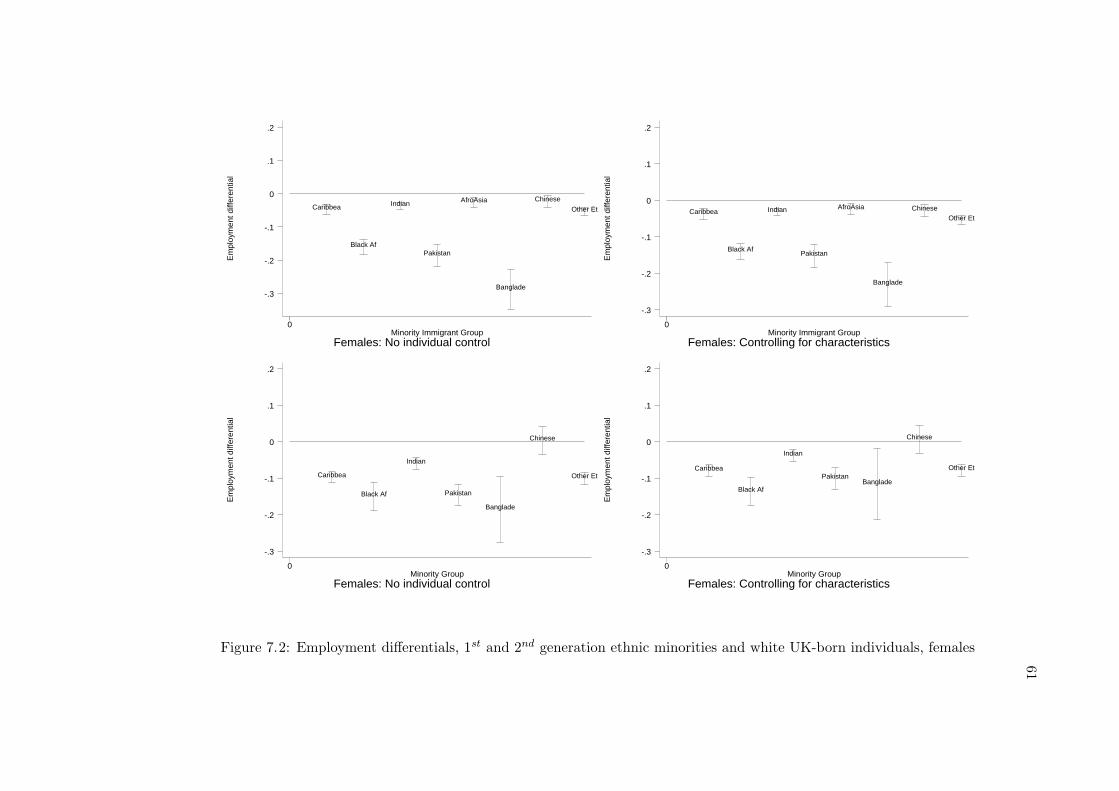
61
Em
ploy
men
t diff
eren
tial
Females: No individual controlMinority Immigrant Group
0
-.3
-.2
-.1
0
.1
.2
Caribbea
Black Af
Indian
Pakistan
AfroAsia
Banglade
Chinese
Other Et
Em
ploy
men
t diff
eren
tial
Females: Controlling for characteristicsMinority Immigrant Group
0
-.3
-.2
-.1
0
.1
.2
Caribbea
Black Af
Indian
Pakistan
AfroAsia
Banglade
ChineseOther Et
Em
ploy
men
t diff
eren
tial
Females: No individual controlMinority Group
0
-.3
-.2
-.1
0
.1
.2
Caribbea
Black Af
Indian
Pakistan
Banglade
Chinese
Other Et
Em
ploy
men
t diff
eren
tial
Females: Controlling for characteristicsMinority Group
0
-.3
-.2
-.1
0
.1
.2
Caribbea
Black Af
Indian
PakistanBanglade
Chinese
Other Et
Figure 7.2: Employment differentials, 1st and 2nd generation ethnic minorities and white UK-born individuals, females
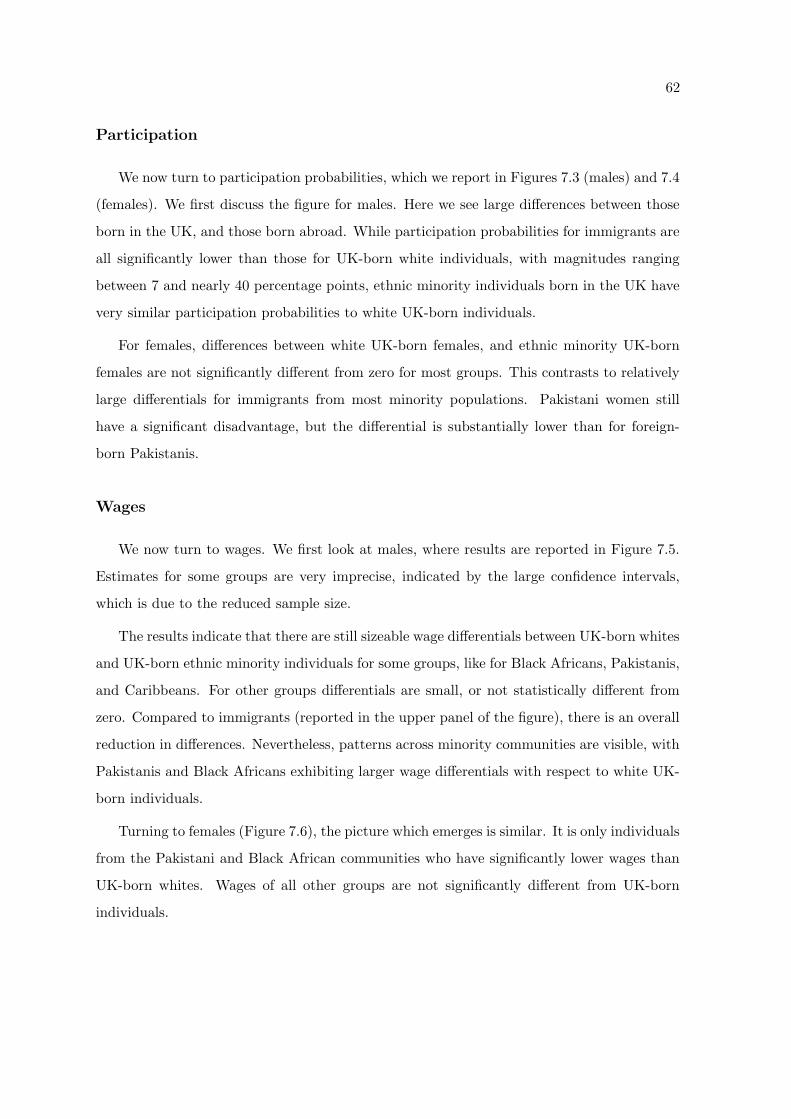
62
Participation
We now turn to participation probabilities, which we report in Figures 7.3 (males) and 7.4
(females). We first discuss the figure for males. Here we see large differences between those
born in the UK, and those born abroad. While participation probabilities for immigrants are
all significantly lower than those for UK-born white individuals, with magnitudes ranging
between 7 and nearly 40 percentage points, ethnic minority individuals born in the UK have
very similar participation probabilities to white UK-born individuals.
For females, differences between white UK-born females, and ethnic minority UK-born
females are not significantly different from zero for most groups. This contrasts to relatively
large differentials for immigrants from most minority populations. Pakistani women still
have a significant disadvantage, but the differential is substantially lower than for foreign-
born Pakistanis.
Wages
We now turn to wages. We first look at males, where results are reported in Figure 7.5.
Estimates for some groups are very imprecise, indicated by the large confidence intervals,
which is due to the reduced sample size.
The results indicate that there are still sizeable wage differentials between UK-born whites
and UK-born ethnic minority individuals for some groups, like for Black Africans, Pakistanis,
and Caribbeans. For other groups differentials are small, or not statistically different from
zero. Compared to immigrants (reported in the upper panel of the figure), there is an overall
reduction in differences. Nevertheless, patterns across minority communities are visible, with
Pakistanis and Black Africans exhibiting larger wage differentials with respect to white UK-
born individuals.
Turning to females (Figure 7.6), the picture which emerges is similar. It is only individuals
from the Pakistani and Black African communities who have significantly lower wages than
UK-born whites. Wages of all other groups are not significantly different from UK-born
individuals.
63
Par
ticip
atio
n di
ffere
ntia
l
Males: No individual controlMinority Immigrant Group
0
-.2
-.1
0
.1
Caribbea
Black Af
Indian
Pakistan
AfroAsia
Banglade
ChineseOther Et
Par
ticip
atio
n di
ffere
ntia
l
Males: Controlling for characteristicsMinority Immigrant Group
0
-.2
-.1
0
.1
Caribbea
Black Af
Indian
Pakistan
AfroAsia
Banglade
Chinese
Other Et
Par
ticip
atio
n di
ffere
ntia
l
Males: No individual controlMinority Group
0
-.2
-.1
0
.1
.2
CaribbeaBlack Af
Indian
Pakistan
Banglade
ChineseOther Et
Par
ticip
atio
n di
ffere
ntia
l
Males: Controlling for characteristicsMinority Group
0
-.2
-.1
0
.1
.2
Caribbea
Black Af
IndianPakistan
BangladeChinese Other Et
Figure 7.3: Participation differentials, 1st and 2nd generation ethnic minorities and white UK-born individuals, males
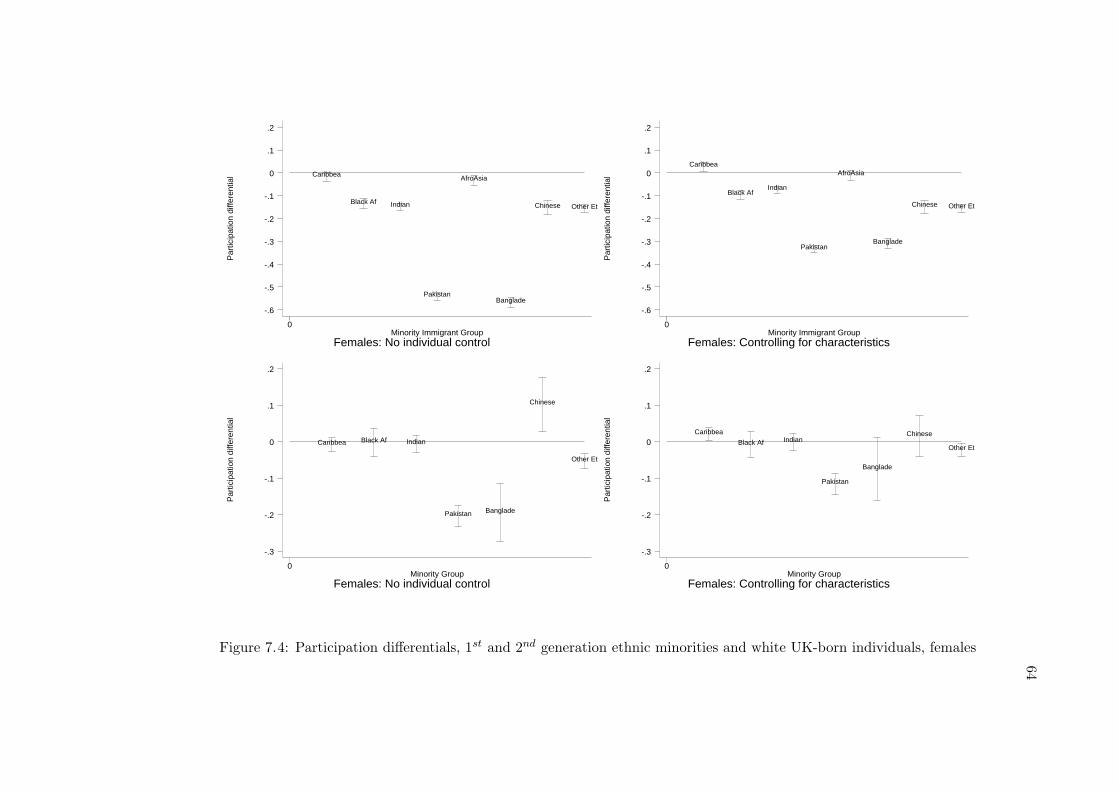
64
Par
ticip
atio
n di
ffere
ntia
l
Females: No individual controlMinority Immigrant Group
0
-.6
-.5
-.4
-.3
-.2
-.1
0
.1
.2
Caribbea
Black Af Indian
Pakistan
AfroAsia
Banglade
Chinese Other Et
Par
ticip
atio
n di
ffere
ntia
l
Females: Controlling for characteristicsMinority Immigrant Group
0
-.6
-.5
-.4
-.3
-.2
-.1
0
.1
.2
Caribbea
Black AfIndian
Pakistan
AfroAsia
Banglade
Chinese Other Et
Par
ticip
atio
n di
ffere
ntia
l
Females: No individual controlMinority Group
0
-.3
-.2
-.1
0
.1
.2
Caribbea Black Af Indian
Pakistan Banglade
Chinese
Other Et
Par
ticip
atio
n di
ffere
ntia
l
Females: Controlling for characteristicsMinority Group
0
-.3
-.2
-.1
0
.1
.2
Caribbea
Black Af Indian
Pakistan
Banglade
Chinese
Other Et
Figure 7.4: Participation differentials, 1st and 2nd generation ethnic minorities and white UK-born individuals, females
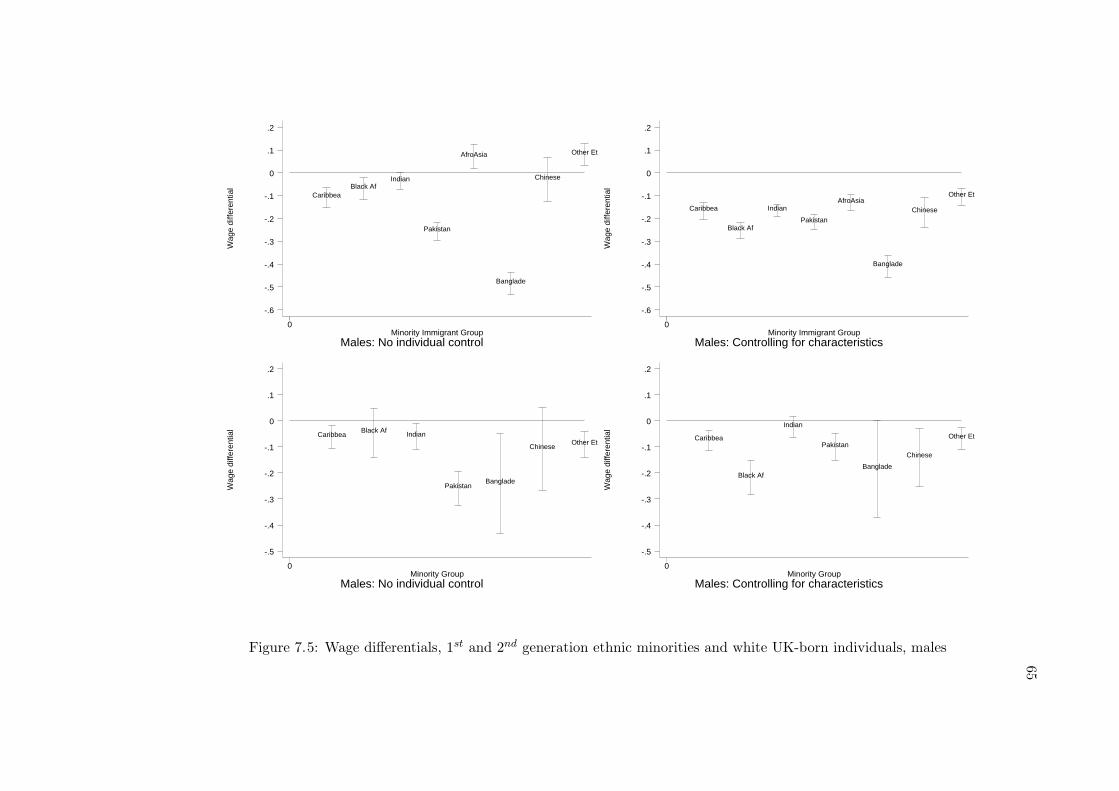
65
Wag
e di
ffere
ntia
l
Males: No individual controlMinority Immigrant Group
0
-.6
-.5
-.4
-.3
-.2
-.1
0
.1
.2
CaribbeaBlack Af
Indian
Pakistan
AfroAsia
Banglade
Chinese
Other Et
Wag
e di
ffere
ntia
l
Males: Controlling for characteristicsMinority Immigrant Group
0
-.6
-.5
-.4
-.3
-.2
-.1
0
.1
.2
Caribbea
Black Af
Indian
Pakistan
AfroAsia
Banglade
Chinese
Other Et
Wag
e di
ffere
ntia
l
Males: No individual controlMinority Group
0
-.5
-.4
-.3
-.2
-.1
0
.1
.2
CaribbeaBlack Af Indian
PakistanBanglade
ChineseOther Et
Wag
e di
ffere
ntia
l
Males: Controlling for characteristicsMinority Group
0
-.5
-.4
-.3
-.2
-.1
0
.1
.2
Caribbea
Black Af
Indian
Pakistan
Banglade
Chinese
Other Et
Figure 7.5: Wage differentials, 1st and 2nd generation ethnic minorities and white UK-born individuals, males
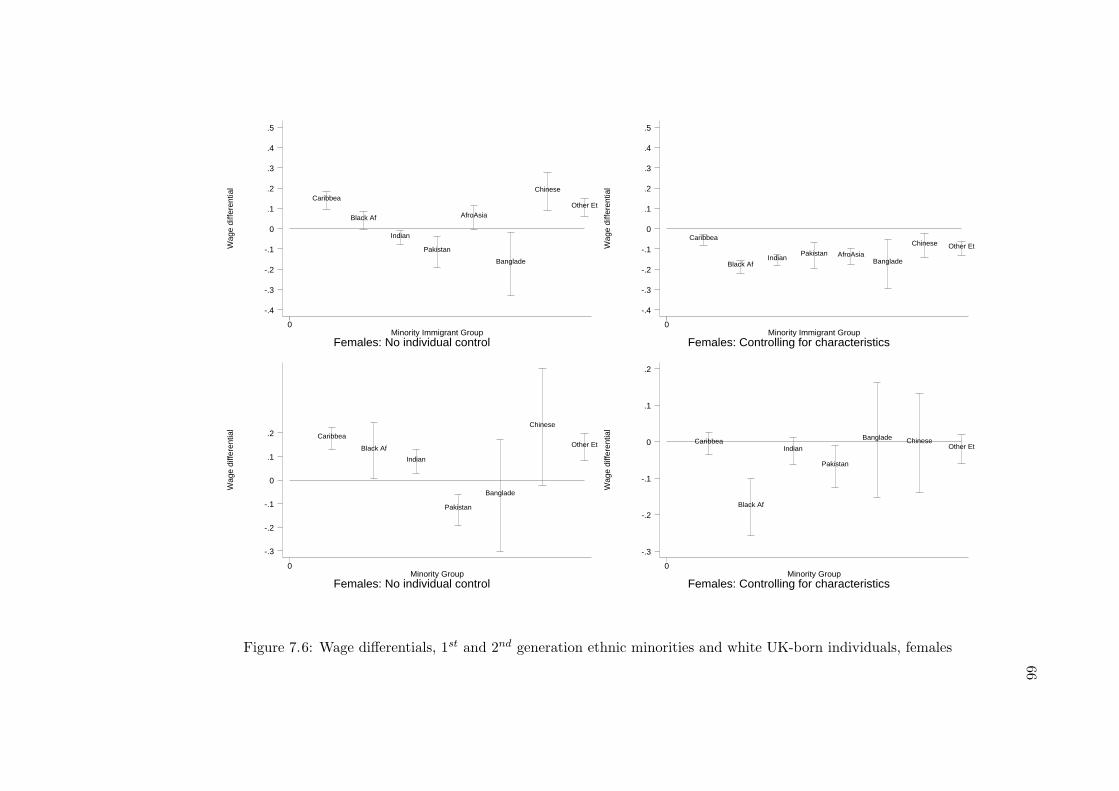
66
Wag
e di
ffere
ntia
l
Females: No individual controlMinority Immigrant Group
0
-.4
-.3
-.2
-.1
0
.1
.2
.3
.4
.5
Caribbea
Black Af
Indian
Pakistan
AfroAsia
Banglade
Chinese
Other Et
Wag
e di
ffere
ntia
l
Females: Controlling for characteristicsMinority Immigrant Group
0
-.4
-.3
-.2
-.1
0
.1
.2
.3
.4
.5
Caribbea
Black AfIndian
Pakistan AfroAsiaBanglade
Chinese Other Et
Wag
e di
ffere
ntia
l
Females: No individual controlMinority Group
0
-.3
-.2
-.1
0
.1
.2 Caribbea
Black Af
Indian
Pakistan
Banglade
Chinese
Other Et
Wag
e di
ffere
ntia
l
Females: Controlling for characteristicsMinority Group
0
-.3
-.2
-.1
0
.1
.2
Caribbea
Black Af
Indian
Pakistan
Banglade ChineseOther Et
Figure 7.6: Wage differentials, 1st and 2nd generation ethnic minorities and white UK-born individuals, females

67
To summarise, our analysis of UK-born ethnic minority individuals reveals that overall,
differences between UK-born minority individuals and UK-born whites are smaller on average
than between minority immigrants and UK-born whites. However, this decrease is not evenly
distributed across ethnic groups. It seems that individuals from the Pakistani, Black African,
and Caribbean communities exhibit stark disadvantages not only among immigrants, but also
among UK-born minorities.
68
8 Discussion and recommendations
Possibly the strongest finding of this report is that immigrants in the UK are far from
homogeneous. Immigrants of different origin differ substantially with respect to their educa-
tion and age structure, their regional distribution, sector choice and time of residence in the
UK. But these observable differences explain only a part of the differences in economic out-
comes. Our analysis illustrates substantial differences in many aspects of economic behaviour
between immigrants and UK-born whites, and even larger differences across immigrants of
different origin, even conditional on education, age, and other individual characteristics. In
general, white immigrants are quite successful in the UK, although there are differences be-
tween groups of different origin. The investigation identifies immigrants from ethnic minority
groups as those who are most disadvantaged. Pakistanis and Bangladeshis are at the lower
end of this scale. Our research also shows that labour market outcomes of non-white immi-
grants are more volatile over the economic cycle than for white immigrants and British-born
whites.
We do not have a simple answer for why there are large differences between immigrants
of different origin, conditional on observable characteristics. One reason may be language
proficiency - the results we report indicate that language proficiency is lowest among those
groups that exhibit the largest disadvantages in the labour market, and that language is
an important determinant for economic success. More and better data, which allows to link
language ability to economic outcomes, would be helpful to quantify more precisely the degree
to which disadvantages of some groups relate to language.
Other reasons for the relative disadvantages of some groups may relate to culture and
religion. The very low participation probabilities of Bangladeshi and Pakistani women may
be explained by these factors. Quantification of the causal links is more difficult, though.
Reasons for the divergence in economic success may also relate to discrimination. Our
analysis is not intended to investigate this issue, and does not provide any hard evidence
for this hypothesis. But the large differences in the probabilities to be employed across
immigrant groups, conditional on being in the labour force, are indicative for demand factors
69
playing some role. Further and deeper analysis in this area could contribute to quantify this
relationship.
We also find that immigrants are very active in self-employment activities, and that they
concentrate in different sectors, according to their origin. This may be related to comparative
advantages in certain sectors. One popular hypothesis is that immigrants choose to become
self-employed because the labour market discriminates against them. Our findings seem not
to be compatible with this hypothesis. While both Pakistanis and Bangladeshis are among
those groups with the lowest employment and participation rates, and the lowest wages, there
is a large difference in the probability to be self-employed, with Pakistanis having on average
a 9 per cent higher probability to be self-employed than UK-born white individuals, while
Bangladeshis have a 3 per cent lower probability. By being self-employed, immigrants may
make major contributions to the UK economy, by providing work opportunities, or producing
goods in their area of expertise. To quantify these effects should be interesting and important.
Another key area for future research is investigation of economic success across immigrant
generations. Adaptation is a dynastic process, with children of immigrants continuing the
process of adaptation, relative to their UK-born white peers, which their forebears have initi-
ated. Our research shows that UK-born minority individuals do better than immigrants (both
relative to UK-born whites), but that many communities are still disadvantaged compared
to UK-born whites. Again, we observe large differences in economic outcomes of UK-born
minority communities. To fully understand the reasons for this is important for policy aimed
at integrating minorities born in the UK. Future research could help to identify the factors
that are the most important contributors to the economic success of UK-born minorities. Re-
sults of more detailed analysis on the intergenerational mobility of immigrants, as compared
to UK-born individuals, would be very relevant, as questions about integration of minority
individuals, different in culture and religion, have become increasingly important.
This report has probably raised more new questions to be investigated in future research
than it has answered. Crucial for more conclusive empirical research on many issues is more
and better data. One of the largest problems is the small sample size of immigrants in survey
data. We suggest the creation of a panel on immigrants, which could supplement existing

70
Panel studies, like the BHPS.
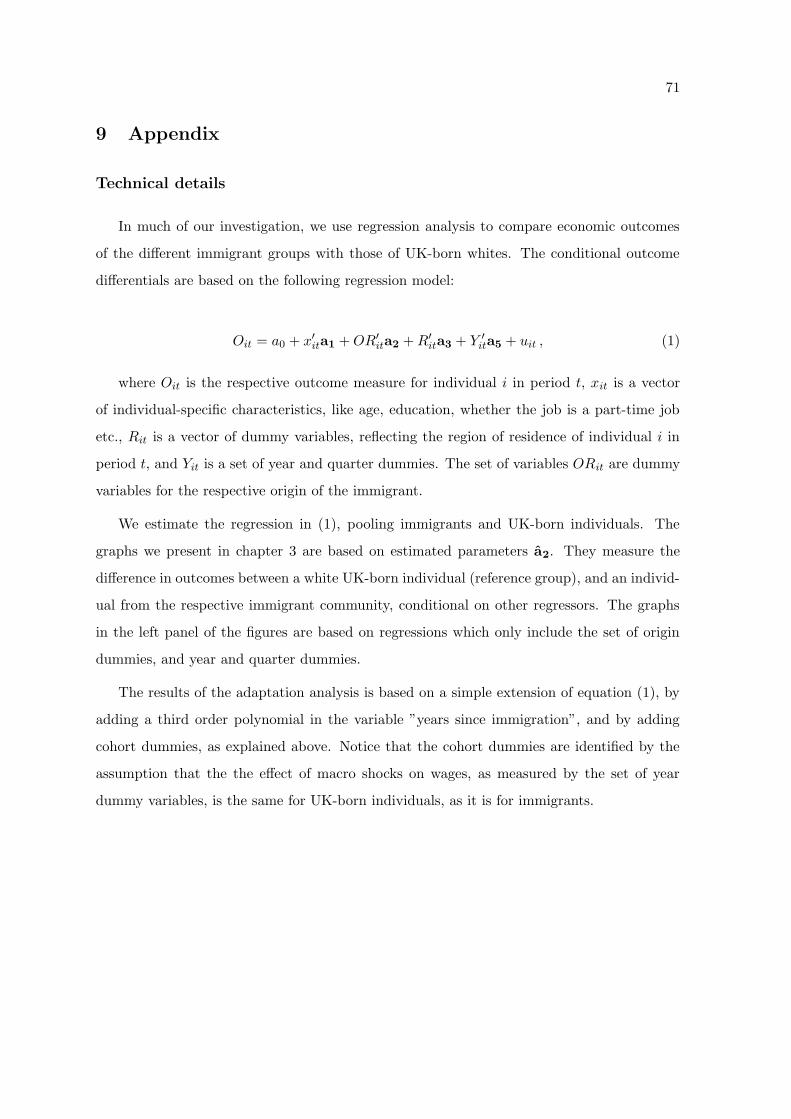
71
9 Appendix
Technical details
In much of our investigation, we use regression analysis to compare economic outcomes
of the different immigrant groups with those of UK-born whites. The conditional outcome
differentials are based on the following regression model:
Oit = a0 + x′
ita1 +OR′
ita2 +R′
ita3 + Y ′
ita5 + uit , (1)
where Oit is the respective outcome measure for individual i in period t, xit is a vector
of individual-specific characteristics, like age, education, whether the job is a part-time job
etc., Rit is a vector of dummy variables, reflecting the region of residence of individual i in
period t, and Yit is a set of year and quarter dummies. The set of variables ORit are dummy
variables for the respective origin of the immigrant.
We estimate the regression in (1), pooling immigrants and UK-born individuals. The
graphs we present in chapter 3 are based on estimated parameters a2. They measure the
difference in outcomes between a white UK-born individual (reference group), and an individ-
ual from the respective immigrant community, conditional on other regressors. The graphs
in the left panel of the figures are based on regressions which only include the set of origin
dummies, and year and quarter dummies.
The results of the adaptation analysis is based on a simple extension of equation (1), by
adding a third order polynomial in the variable ”years since immigration”, and by adding
cohort dummies, as explained above. Notice that the cohort dummies are identified by the
assumption that the the effect of macro shocks on wages, as measured by the set of year
dummy variables, is the same for UK-born individuals, as it is for immigrants.
72
Glossary
This chapter contains definitions of the variables used in the regression analysis.
Origin variables and ethnicity
In much of the analysis, we group immigrants by country of origin category. Sample size
requires us to pool countries of origin. We also distinguish between white and non-white
immigrants (for example, we distinguish between white immigrants born in New Common-
wealth countries from ”ethnic” Indians, ”ethnic” Bangladeshis, etc.) to understand whether
these two groups perform differently.
The immigrants groups we use in the analysis are as follows:
Caribbean: individuals declaring to belong to this ethnic group, and born in the West
Indies and Other Caribbean Commonwealth.
Black African: individuals declaring to belong to this ethnic group, and born on the
African continent.
Indian: individuals declaring to belong to this ethnic group, and born in India.
Pakistani: individuals declaring to belong to this ethnic group, and born in Pakistan.
Afro-Asian: individuals declaring to belong to the Indian or Pakistani ethnic groups,
but born in Africa.
Bangladeshi: individuals declaring to belong to this ethnic group, and born in Bangladesh.
Chinese: individuals declaring to belong to this ethnic group, and born in China (in-
cluding Taiwan and Hong Kong).
w China: white individuals born in China (including Taiwan and Hong Kong).
w Old Comm: white individuals born in the Old Commonwealth.
w New Comm: white individuals born in the New Commonwealth.
w Other: white individuals born in other countries.
w Irish: white individuals born in Ireland.
73
w EU: white individuals born in the European Union.
w Oth Eur: white individuals born in non-EU European countries.
Definitions of geographical areas larger than single countries (following the Labour Force
Survey categories):
Old Commonwealth: Australia, Canada, New Zealand and South Africa.
New Commonwealth: Kenya, Uganda, Tanzania, Malawi, Zambia, Zimbabwe, Botswana,
Lesotho, Swaziland, Gambia, Ghana, Nigeria, Sierra Leone, Barbados, Jamaica, Trinidad and
Tobago, West Indies, Other Caribbean Commonwealth, Belize, Guyana, Bangladesh, India,
Sri Lanka, Hong Kong, Malaysia, Singapore, Cyprus, Gibraltar, Malta and Gozo, Seychelles,
Mauritius, Other New Commonwealth, Pakistan.
European Union: Belgium, Denmark (including Greenland), France (including Monaco),
Italy (including San Marino and Vatican City), Luxembourg, Netherlands, Germany (Federal
Republic and previous Democratic Republic), Austria, Greece, Portugal (including Azores,and
Madeira), Spain (including Balearic and Canary Islands), Finland, Sweden.
Other European countries: Israel, Albania, Bulgaria, (former) Czechoslovakia, Hun-
gary, Poland, Romania, Switzerland, Norway, other Yugoslavia, Turkey, former USSR, other
Europe.
Other Variables
age: Age of individual.
age sq/100: Age of individual squared and divided by 100.
married: Dummy variable equal to 1 if the individual is married or cohabiting.
n children: Number of dependent children under 18 in the household.
degree: Dummy equal to 1 if the individual has a first or higher degree or other degree
level qualification.
A-level: Dummy equal to 1 if the individual has Higher Education qualification below
degree level or A-level or equivalent.

74
O-level: Dummy equal to 1 if the individual has O-level or equivalent or any other
professional-vocational qualifications.
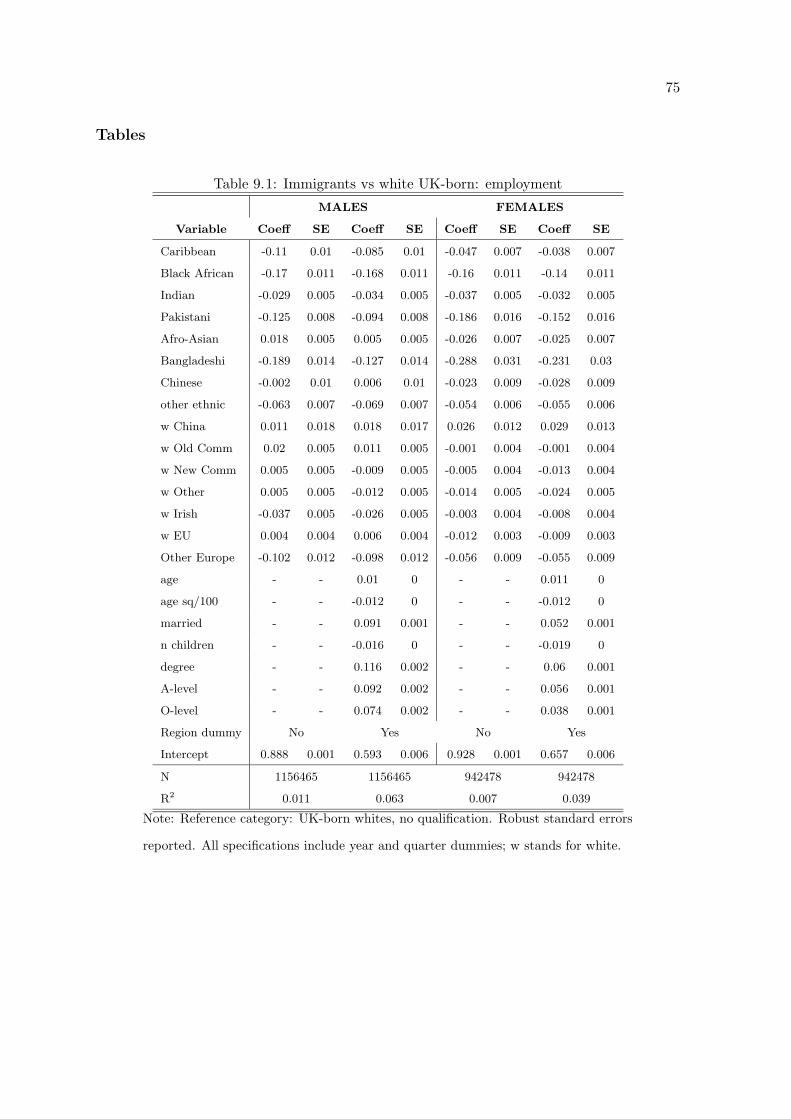
75
Tables
Table 9.1: Immigrants vs white UK-born: employment
MALES FEMALES
Variable Coeff SE Coeff SE Coeff SE Coeff SE
Caribbean -0.11 0.01 -0.085 0.01 -0.047 0.007 -0.038 0.007
Black African -0.17 0.011 -0.168 0.011 -0.16 0.011 -0.14 0.011
Indian -0.029 0.005 -0.034 0.005 -0.037 0.005 -0.032 0.005
Pakistani -0.125 0.008 -0.094 0.008 -0.186 0.016 -0.152 0.016
Afro-Asian 0.018 0.005 0.005 0.005 -0.026 0.007 -0.025 0.007
Bangladeshi -0.189 0.014 -0.127 0.014 -0.288 0.031 -0.231 0.03
Chinese -0.002 0.01 0.006 0.01 -0.023 0.009 -0.028 0.009
other ethnic -0.063 0.007 -0.069 0.007 -0.054 0.006 -0.055 0.006
w China 0.011 0.018 0.018 0.017 0.026 0.012 0.029 0.013
w Old Comm 0.02 0.005 0.011 0.005 -0.001 0.004 -0.001 0.004
w New Comm 0.005 0.005 -0.009 0.005 -0.005 0.004 -0.013 0.004
w Other 0.005 0.005 -0.012 0.005 -0.014 0.005 -0.024 0.005
w Irish -0.037 0.005 -0.026 0.005 -0.003 0.004 -0.008 0.004
w EU 0.004 0.004 0.006 0.004 -0.012 0.003 -0.009 0.003
Other Europe -0.102 0.012 -0.098 0.012 -0.056 0.009 -0.055 0.009
age - - 0.01 0 - - 0.011 0
age sq/100 - - -0.012 0 - - -0.012 0
married - - 0.091 0.001 - - 0.052 0.001
n children - - -0.016 0 - - -0.019 0
degree - - 0.116 0.002 - - 0.06 0.001
A-level - - 0.092 0.002 - - 0.056 0.001
O-level - - 0.074 0.002 - - 0.038 0.001
Region dummy No Yes No Yes
Intercept 0.888 0.001 0.593 0.006 0.928 0.001 0.657 0.006
N 1156465 1156465 942478 942478
R2 0.011 0.063 0.007 0.039
Note: Reference category: UK-born whites, no qualification. Robust standard errors
reported. All specifications include year and quarter dummies; w stands for white.
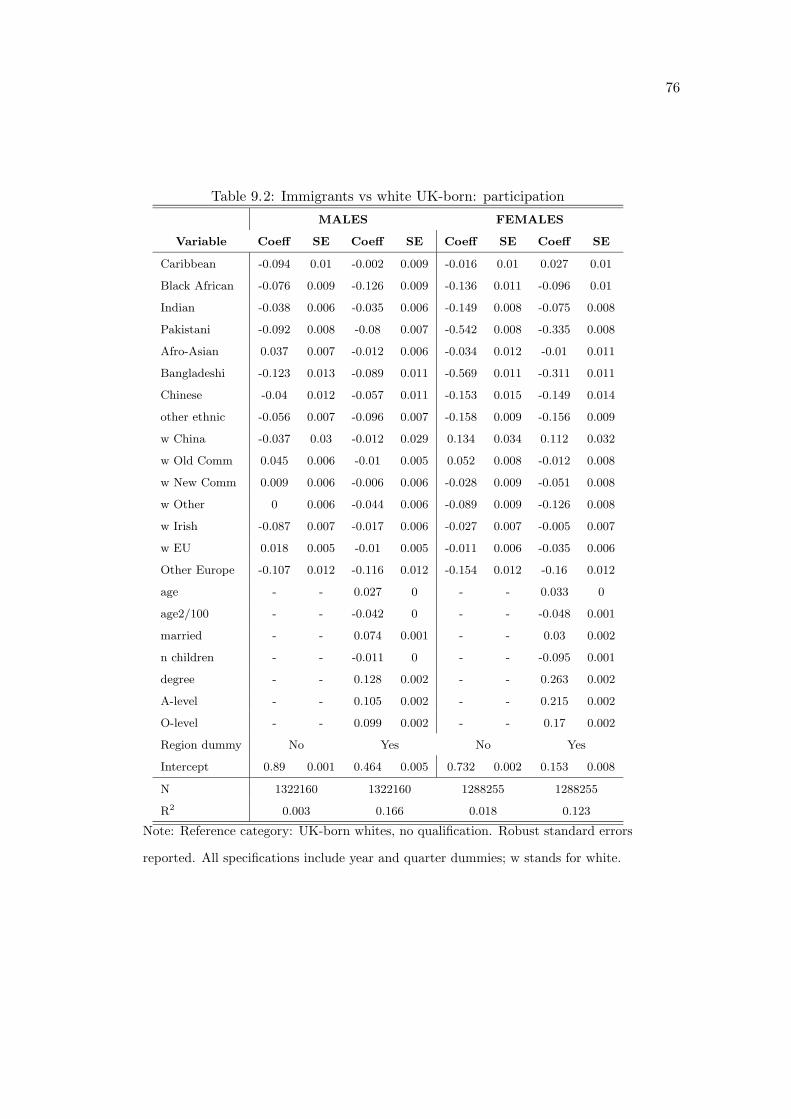
76
Table 9.2: Immigrants vs white UK-born: participation
MALES FEMALES
Variable Coeff SE Coeff SE Coeff SE Coeff SE
Caribbean -0.094 0.01 -0.002 0.009 -0.016 0.01 0.027 0.01
Black African -0.076 0.009 -0.126 0.009 -0.136 0.011 -0.096 0.01
Indian -0.038 0.006 -0.035 0.006 -0.149 0.008 -0.075 0.008
Pakistani -0.092 0.008 -0.08 0.007 -0.542 0.008 -0.335 0.008
Afro-Asian 0.037 0.007 -0.012 0.006 -0.034 0.012 -0.01 0.011
Bangladeshi -0.123 0.013 -0.089 0.011 -0.569 0.011 -0.311 0.011
Chinese -0.04 0.012 -0.057 0.011 -0.153 0.015 -0.149 0.014
other ethnic -0.056 0.007 -0.096 0.007 -0.158 0.009 -0.156 0.009
w China -0.037 0.03 -0.012 0.029 0.134 0.034 0.112 0.032
w Old Comm 0.045 0.006 -0.01 0.005 0.052 0.008 -0.012 0.008
w New Comm 0.009 0.006 -0.006 0.006 -0.028 0.009 -0.051 0.008
w Other 0 0.006 -0.044 0.006 -0.089 0.009 -0.126 0.008
w Irish -0.087 0.007 -0.017 0.006 -0.027 0.007 -0.005 0.007
w EU 0.018 0.005 -0.01 0.005 -0.011 0.006 -0.035 0.006
Other Europe -0.107 0.012 -0.116 0.012 -0.154 0.012 -0.16 0.012
age - - 0.027 0 - - 0.033 0
age2/100 - - -0.042 0 - - -0.048 0.001
married - - 0.074 0.001 - - 0.03 0.002
n children - - -0.011 0 - - -0.095 0.001
degree - - 0.128 0.002 - - 0.263 0.002
A-level - - 0.105 0.002 - - 0.215 0.002
O-level - - 0.099 0.002 - - 0.17 0.002
Region dummy No Yes No Yes
Intercept 0.89 0.001 0.464 0.005 0.732 0.002 0.153 0.008
N 1322160 1322160 1288255 1288255
R2 0.003 0.166 0.018 0.123
Note: Reference category: UK-born whites, no qualification. Robust standard errors
reported. All specifications include year and quarter dummies; w stands for white.
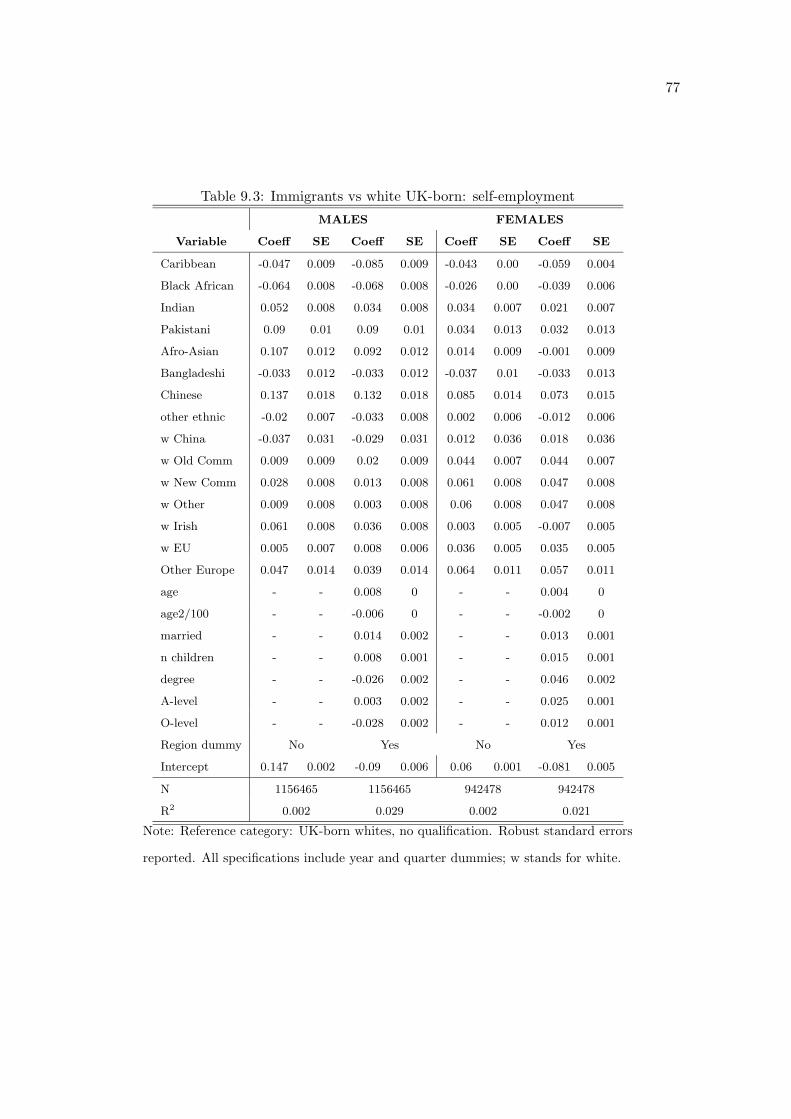
77
Table 9.3: Immigrants vs white UK-born: self-employment
MALES FEMALES
Variable Coeff SE Coeff SE Coeff SE Coeff SE
Caribbean -0.047 0.009 -0.085 0.009 -0.043 0.00 -0.059 0.004
Black African -0.064 0.008 -0.068 0.008 -0.026 0.00 -0.039 0.006
Indian 0.052 0.008 0.034 0.008 0.034 0.007 0.021 0.007
Pakistani 0.09 0.01 0.09 0.01 0.034 0.013 0.032 0.013
Afro-Asian 0.107 0.012 0.092 0.012 0.014 0.009 -0.001 0.009
Bangladeshi -0.033 0.012 -0.033 0.012 -0.037 0.01 -0.033 0.013
Chinese 0.137 0.018 0.132 0.018 0.085 0.014 0.073 0.015
other ethnic -0.02 0.007 -0.033 0.008 0.002 0.006 -0.012 0.006
w China -0.037 0.031 -0.029 0.031 0.012 0.036 0.018 0.036
w Old Comm 0.009 0.009 0.02 0.009 0.044 0.007 0.044 0.007
w New Comm 0.028 0.008 0.013 0.008 0.061 0.008 0.047 0.008
w Other 0.009 0.008 0.003 0.008 0.06 0.008 0.047 0.008
w Irish 0.061 0.008 0.036 0.008 0.003 0.005 -0.007 0.005
w EU 0.005 0.007 0.008 0.006 0.036 0.005 0.035 0.005
Other Europe 0.047 0.014 0.039 0.014 0.064 0.011 0.057 0.011
age - - 0.008 0 - - 0.004 0
age2/100 - - -0.006 0 - - -0.002 0
married - - 0.014 0.002 - - 0.013 0.001
n children - - 0.008 0.001 - - 0.015 0.001
degree - - -0.026 0.002 - - 0.046 0.002
A-level - - 0.003 0.002 - - 0.025 0.001
O-level - - -0.028 0.002 - - 0.012 0.001
Region dummy No Yes No Yes
Intercept 0.147 0.002 -0.09 0.006 0.06 0.001 -0.081 0.005
N 1156465 1156465 942478 942478
R2 0.002 0.029 0.002 0.021
Note: Reference category: UK-born whites, no qualification. Robust standard errors
reported. All specifications include year and quarter dummies; w stands for white.
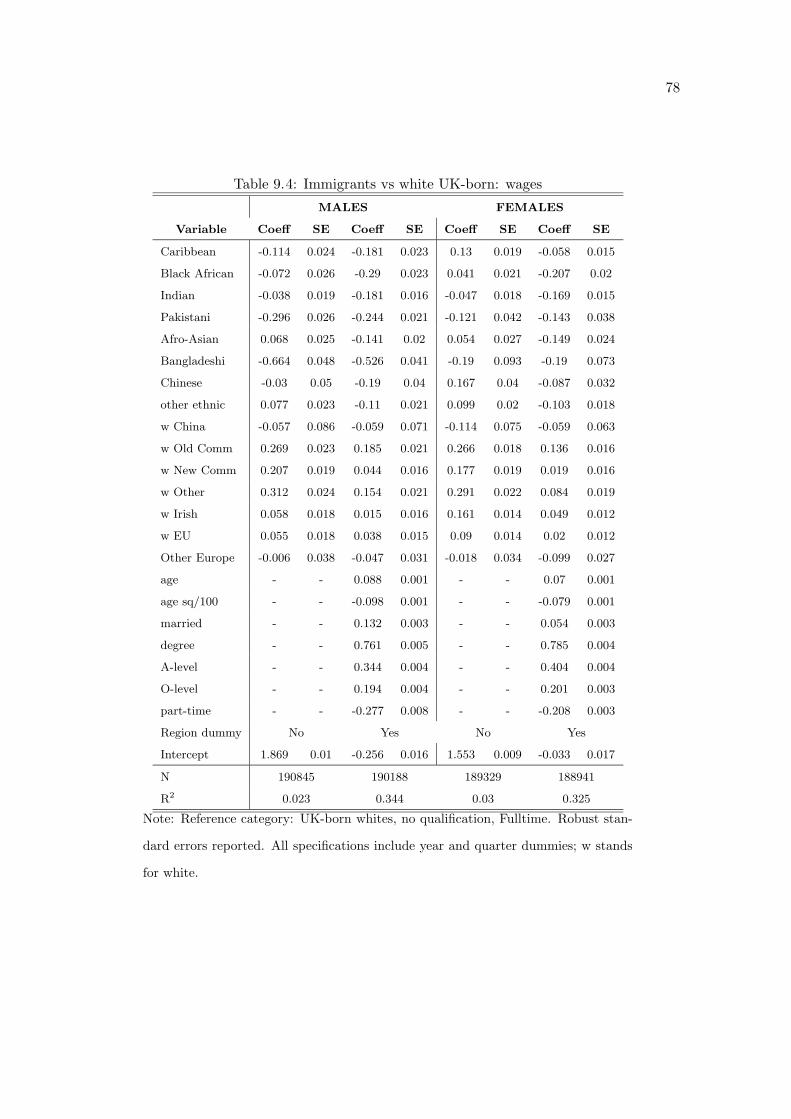
78
Table 9.4: Immigrants vs white UK-born: wages
MALES FEMALES
Variable Coeff SE Coeff SE Coeff SE Coeff SE
Caribbean -0.114 0.024 -0.181 0.023 0.13 0.019 -0.058 0.015
Black African -0.072 0.026 -0.29 0.023 0.041 0.021 -0.207 0.02
Indian -0.038 0.019 -0.181 0.016 -0.047 0.018 -0.169 0.015
Pakistani -0.296 0.026 -0.244 0.021 -0.121 0.042 -0.143 0.038
Afro-Asian 0.068 0.025 -0.141 0.02 0.054 0.027 -0.149 0.024
Bangladeshi -0.664 0.048 -0.526 0.041 -0.19 0.093 -0.19 0.073
Chinese -0.03 0.05 -0.19 0.04 0.167 0.04 -0.087 0.032
other ethnic 0.077 0.023 -0.11 0.021 0.099 0.02 -0.103 0.018
w China -0.057 0.086 -0.059 0.071 -0.114 0.075 -0.059 0.063
w Old Comm 0.269 0.023 0.185 0.021 0.266 0.018 0.136 0.016
w New Comm 0.207 0.019 0.044 0.016 0.177 0.019 0.019 0.016
w Other 0.312 0.024 0.154 0.021 0.291 0.022 0.084 0.019
w Irish 0.058 0.018 0.015 0.016 0.161 0.014 0.049 0.012
w EU 0.055 0.018 0.038 0.015 0.09 0.014 0.02 0.012
Other Europe -0.006 0.038 -0.047 0.031 -0.018 0.034 -0.099 0.027
age - - 0.088 0.001 - - 0.07 0.001
age sq/100 - - -0.098 0.001 - - -0.079 0.001
married - - 0.132 0.003 - - 0.054 0.003
degree - - 0.761 0.005 - - 0.785 0.004
A-level - - 0.344 0.004 - - 0.404 0.004
O-level - - 0.194 0.004 - - 0.201 0.003
part-time - - -0.277 0.008 - - -0.208 0.003
Region dummy No Yes No Yes
Intercept 1.869 0.01 -0.256 0.016 1.553 0.009 -0.033 0.017
N 190845 190188 189329 188941
R2 0.023 0.344 0.03 0.325
Note: Reference category: UK-born whites, no qualification, Fulltime. Robust stan-
dard errors reported. All specifications include year and quarter dummies; w stands
for white.
79
References
• Bell, B.D. (1997): ”The Performance of Immigrants in the United Kingdom: Evidence
from the GHS” The Economic Journal, 107, pp. 333-344.
• Blackaby, D.H, Drinkwater, S., Leslie, D.G, Murphy, P.D. (1997): ”A Picture of Male
and Female Unemployment Among Britain’s Ethnic Minorities” Scottish Journal of
Political Economy, 44(2), pp.182-197.
• Borjas, G.J., Bronars, S.G (1989): ”Consumer Discrimination and Self-Employment”
Journal of Political Economy, 97(3), pp. 581-605
• Borjas, G.J. (1986): ”The Self-employment Experience of Immigrants” Journal of Hu-
man Resources, 21(4), pp. 485-506.
• Card, D., J. DiNardo, and E. Estes (2000): ”The More Things Change: Immigrants
and the Children of Immigrants in the 1940’s, 1950’s, and the 1990’s”, in Issues in the
Economics of Immigration, George J. Borjas (ed), NBER Research Conference Report,
the University of Chicago Press, Chicago.
• Chiswick, B.R. (1980): ”The Earnings of White and Coloured Male Immigrants in
Britain” Economica, 47, pp. 81-87.
• Clark, C., Drinkwater, S. (1998): ”Ethnicity and Self-Employment in Britain” Oxford
Bulletin of Economics and Statistics, 60(3), pp. 383-407.
• Clark, C., Drinkwater, S. (2000): ”Pushed out or pulled in? Self-employment among
ethnic minorities in England and Wales”, Labour Economics (7)5 pp. 603-628.
• Denny, K., Harmon, C., Roche, M. (1997): ”The Distribution of Discrimination in
Immigrant Earnings: Evidence from Britain 1974-93”, IFS Working Paper no. W98/3.
• Disney, R., Gosling, A. (1998): ”Does It Pay to Work in the Public Sector?”, Fiscal
Studies, 19(4), pp. 347-374.
80
• Dustmann, C. (1997): ”Return Migration: The European Experience”, Economic Pol-
icy, 22, pp. 215–250, 1996
• Dustmann, C., Fabbri, F. (2002): ”Language Proficiency and Labour Market Perfor-
mance of Immigrants in the UK”, mimeo, University College London; forthcoming
Economics Journal.
• Dustmann, C., van Soest, A. (1998): ”Wage Structures in the Public and Private
Sectors in West Germany”, European Economic Review, 42, 1417-1441.
• Dustmann, C., van Soest, A. (2001): ”Language Fluency and Earnings Estimation with
Misclassified Language Indicators”, forthcoming Review of Economics and Statistics.
• Dustmann, C., van Soest, A. (2001a): ” Language and the Earnings of Immigrants”,
forthcoming Industrial and Labor Relations Review.
• Hatton, T.J., Wheatley Price, S. (2002): ”Migration, Migrants and Policy in the United
Kingdom”, IZA Discussion Paper no. 81; in Zimmermann, K.F. (ed), ”European Mi-
gration, What do we Know?” CEPR/OUP book forthcoming.
• Shields, M.A., Wheatley Price, S. (2002): ”The English Language Fluency and Oc-
cupational Success of Ethnic Minority Immigrant Men living in English Metropolitan
Areas”, Journal of Population Economics 15, pp. 137-160.
• Wheatley Price, S. (2001): ”The Employment Adjustment of Male Immigrants to the
English Labour Market” Journal of Population Economics, 14, pp. 193-220

Produced by the Research Development and Statistics Directorate, Home Office
This document is available only in Adobe Portable Document Format (PDF)through the RDS website
Home OfficeResearch, Development and Statistics DirectorateCommunication Development UnitRoom 27550 Queen Anne’s GateLondon SW1H 9AT
Tel: 020 7273 2084 (answerphone outside of office hours)Fax: 020 7222 0211Email: [email protected]
ISBN 1 84082 975 3 Crown copyright 2003


