Embed Size (px)
Citation preview
NBER WORKING PAPER SERIES
LANGUAGE BARRIERS IN MULTINATIONALS AND KNOWLEDGE TRANSFERS
Louise GuillouetAmit Khandelwal
Rocco MacchiavelloMatthieu Teachout
Working Paper 28807http://www.nber.org/papers/w28807
NATIONAL BUREAU OF ECONOMIC RESEARCH1050 Massachusetts Avenue
Cambridge, MA 02138May 2021, Revised December 2021
This project would not have been possible without the support and collaboration of U Set Aung, Thilawa SEZ Management Committee, participating factories, and Ian Porter. Our project managers, Paing Thu Htet, Mohak Mangal, Madhav Malhotra, Sangyung Park, have provided exceptional research support, as has the entire Yangon team: Aung Thet Paing, La Min Eain, Myat Mo Phu, Thura Aung, and Zimbo Htike. Pol Antràs, Charles Angelucci, David Atkin, Oriana Bandiera, Wouter Dessein, Ben Faber, Bob Gibbons, Isabela Manelici, Andrea Prat, Andrés Rodríguez-Clare, Raffaella Sadun, Meredith Startz, John Van Reenen, Jose Vasquez provided helpful comments at various stages of the project. We also thank conference and seminar participants at Berkeley, Cambridge, CEU, Census, CEPR, Copenhagen, Dartmouth, 2020 Empirical Management Conference, EBRD, EIIT, HBS EM, Geneva, HBS Strategy, IADB, IPA, IMF, LSE, Maryland, MIT, 2020 NEUDC, Princeton, PSE, PSU, Sussex, Syracuse, Tufts and Yale. The project is registered at the AEA RCT Registry 0004326. We obtained approval from the Columbia University IRB under protocols AAAR2302 and AAAS3817. Financial support from the International Growth Center, Jerome A. Chazen Institute for Global Business, and Columbia’s Center on Japanese Economy and Business is gratefully acknowledged. All errors are our own. The views expressed herein are those of the authors and do not necessarily reflect the views of the National Bureau of Economic Research.
NBER working papers are circulated for discussion and comment purposes. They have not been peer-reviewed or been subject to the review by the NBER Board of Directors that accompanies official NBER publications.
© 2021 by Louise Guillouet, Amit Khandelwal, Rocco Macchiavello, and Matthieu Teachout. All rights reserved. Short sections of text, not to exceed two paragraphs, may be quoted without explicit permission provided that full credit, including © notice, is given to the source.
Language Barriers in Multinationals and Knowledge TransfersLouise Guillouet, Amit Khandelwal, Rocco Macchiavello, and Matthieu Teachout NBER Working Paper No. 28807May 2021, Revised December 2021JEL No. F0,F23,L20
ABSTRACT
A distinct feature of MNCs is a three-tier organizational structure: foreign managers (FMs) supervise domestic managers (DMs) who supervise production workers. Language barriers between FMs and DMs could impede transfers of management knowledge. We develop a model in which DMs learn general management by communicating with FMs, but communication effort is non-contractible. These conditions generate sub-optimal communication within the MNC. If communication is complementary with language skills, the planner could raise welfare by subsidizing foreign language acquisition. We experimentally assess the validity of the general skills and the complementarity assumptions in Myanmar, a setting where FMs and DMs communicate in English. The first experiment examines the general skills assumption by asking prospective employers at domestic firms to rate hypothetical job candidates. They value candidates with both higher English proficiency and MNC experience, a premium driven, in part, by frequent interactions with FMs. The second experiment examines the complementarity assumption by providing English training to a random sample of DMs working at MNCs. At endline, treated DMs have higher English proficiency, communicate more frequently with their FMs, are more involved in firm management, and perform better in simulated management tasks. Organizational barriers within MNCs can thus hinder knowledge transfers.
Louise GuillouetColumbia [email protected]
Amit KhandelwalGraduate School of Business Columbia UniversityUris Hall 606, 3022 Broadway New York, NY 10027and [email protected]
Rocco MacchiavelloManagement DepartmentLondon School of Economics & Political ScienceLondonUnited Kingdomand [email protected]
Matthieu TeachoutInternational Growth [email protected]
1 Introduction
Developing countries routinely offer subsidies to attract multinational companies (MNCs) withthe hope of generating positive spillovers for the rest of the economy. While some studies detectevidence of the latter, others do not (see Harrison and Rodriguez-Clare 2010 for a review). Theuneven empirical support suggests that beneficial spillovers are not automatic, contextual factorsmay matter, and that policymakers might have to consider complementary policies to fully realizepotential spillovers from MNCs. A transfer of knowledge from MNCs to domestic firms and workersis the initial spark for spillovers. This paper documents that language barriers within MNCscan be an important friction limiting this initial knowledge transfer—and thus the potential forspillovers—and examines under which conditions a government intervention is justified.
A distinct feature of MNC organizational structures is that a subsidiary is typically led by expe-rienced foreign managers (FMs) who supervise less-experienced domestic middle managers (DMs),who in turn supervise domestic production workers. In these firms, communication between an FMand a DM often occurs in a language that is not native to at least one layer. In our setting–MNCsoperating in Myanmar–communication occurs in English, a non-native language for both layers.Tailored surveys reveal that DMs’ English proficiency is low on average and that language barriersare an impediment to learning from FMs. Language acquisition and communication, however, arecostly activities, and a certain level of language barriers would be expected within a MNC, evenwhen firms and employees invest in the privately optimal level of language training.
In this paper, we ask under what conditions private incentives to invest in English knowledgediverge from the social optimum and examine whether these conditions arise in our context. Wefirst formulate a model in which a DM learns management–a skill that is tacit and hard-to-codify(Polanyi 1966, Gibbons and Henderson 2012)–by communicating with an FM. Following a standardassumption within organizational economics, we assume that the amount, and content, of commu-nication between the FM and DM is non-contractible (e.g., Crawford and Sobel 1982, Dessein 2002and, for an approach closer to our model, Dewatripont and Tirole 2005). This “within MNCs”contractual friction, which we take to be a realistic feature of the workplace, leads to under-supplyof communication between organizational layers when the knowledge acquired through communi-cation with the FM is a general skill. In those circumstances, the planner would like to interveneto reduce communication frictions between FMs and DMs to boost knowledge transfers. The non-contractibility of communication within organizations, however, prevents the planner from targetingdirectly the market failure. Instead, we consider one practical policy instrument to bring the de-centralized equilibrium closer to the socially efficient level of communication: subsidizing languageacquisition. A necessary condition for the planner to be able to partially correct the inefficiency bysubsidizing English acquisition is that communication is complementary with language ability.1
1We take it for granted that a common language improves efficiency as shown in, for instance, Cremer et al. 2007’smodel of optimal language design (“code”) inside an organization and lab experiments (e.g., Selten and Warglien2007). To focus on how non-contractible communication within an MNC hinders the initial transfer of knowledge, wedeliberately abstract from productivity spillovers to workers and other firms. For the same reason, we also abstractfrom imperfections in the market for language training as a general skill (e.g., Acemoglu and Pischke 1998).
1
We explore the validity of the general skills and complementarity assumptions through twoexperiments. The first protocol examines whether the management knowledge learned throughcommunication at MNCs is a general skill valued by domestic employers.2 We recruit a sample of51 experienced human-resource managers who work at domestic firms to rate hypothetical resumesof job applicants for a general management position. In a first block of questions, HR managersare shown pairs of resumes that vary randomly in applicant characteristics. HR managers place apremium on applicants with English knowledge, MNC experience, and particularly value applicantswith both characteristics. We explore the mechanisms driving this premium through a second ratingexercise. In this second block, HR managers rate applicants with advanced English proficiencyand MNC work experience according to their hypothetical answers to interview questions. Werandomly vary how frequently the applicant reports interacting with their FM, how involved theyare in management, and how frequently they use Microsoft Office (a hard skill). Applicants withfrequent interactions with FMs are offered wages as high as those offered to applicants with thehard skill.3 These findings support the assumption that frequent communication with FMs allowsDMs to learn general management knowledge that is valued by the domestic labor market.
The second experiment explores the complementarity between communication and English pro-ficiency. We contracted with a leading English language training provider in Yangon to offer a free48-hour English training course to a random sample of DMs employed at 27 MNCs operating atMyanmar’s largest Special Economic Zone. At endline, treated DMs’ English skills, as measured bya tailored test, improve relative to control. Several results support the complementarity assump-tion: treated DMs report having more frequent communication and interactions with FMs (but notwith other DMs), having a higher (hypothetical) willingness to pay for additional time interactingwith FMs (but not with other DMs), and being more involved in the management of personnel.
Tracking how the intervention altered on-the-job performance and knowledge transfers is com-plicated for two reasons. First, DMs perform a wide range of tasks at the MNCs, and thus it isdifficult to consistently measure performance across DMs. To overcome this measurement challenge,we design a standardized management exercise that simulates the organizational structure of anMNC. An English-speaking enumerator acting as a “FM” provides instructions to a DM to managea packaging task. The task is a randomly drawn vector of steps that place specific items in a preciseorder and packaged in a certain way. The DM then manages two enumerators (who have no Englishknowledge) acting as production workers (“PWs”) to complete the task. The “PWs” supervised bytreatment DMs complete their assigned task faster with no differences in mistakes—i.e., achievehigher performance—relative to control DMs. Treatment DMs, however, ask more questions and
2An alternative approach to measure generalizable skills is to measure general knowledge transfers through a testbut this is challenging to implement since the DMs perform a wide range of tasks. Below, we discuss a survey thatattempted to record skills to complement this first protocol.
3A potential concern is that HR managers in domestic firms might perceive these candidates to be better selected,rather than having directly benefited from frequent communication with FMs in their previous jobs. A third responseoption regarding frequency of communication, which explains that the applicant was supposed to interact frequentlywith the FM, but did not for exogenous reasons, allows us to test for this possibility. We find no evidence for apotential selection effect.
2
spend more time communicating with the “FM”. This supports the complementary assumption.The second complication is that the actual management knowledge transfers learned from inter-acting with FMs would take time to materialize.4 To overcome this challenge, we conducted afollow-up survey to track skills more than a year after the language intervention. This survey was,unfortunately, initially complicated by the pandemic and then subsequently by the February 2021military coup. Notwithstanding these shocks, the survey provides us with some evidence that theintervention raised certain general soft skills among treatment DMs, thereby complementing theresults from the aforementioned resume rating protocol.
The final section explores additional survey evidence and back-of-envelope calculations thatsupports a key assumption of the model–the non-contractible nature of communication–and theadditional conditions justifying the use of language subsidies as a policy instrument. These addi-tional conditions appear to be relevant in our context, thus justifying an intervention. It is worthemphasizing, however, that the particular language training we offered is unlikely to be the mostcost effective intervention to raise English proficiency since foreign languages are more effectivelylearned at a younger age (Dixon et al. 2012) and there might be additional imperfections in themarket for language training.
Our project explores the conditions for policy intervention in Myanmar, but we believe thatsuch conditions arise in other contexts. The adoption of English as the corporate lingua franca isincreasingly common (Economist 2014), particularly outside Anglophone countries. Additionally,recent decades have seen a sharp rise in South-South FDI flows, e.g., the surge of Chinese invest-ments in Africa (Hanson 2012). Language barriers could be an important impediment to knowledgetransfers in these contexts. In contrast, when middle-managers are bilingual–which is more likelyto be satisfied in high human capital countries or host countries with shared ties with the MNCcountry–language may be a smaller barrier and the rationale for policymakers to intervene dimin-ishes (as predicted by our model). A large literature indeed documents that common language isan important driver of trade and FDI.5 We provide a first attempt to explore how a particularlysalient dimension of culture—language—mediates the impact of FDI in a field setting, and, in doingso, provide a concrete example of how cultural contextual factors can shape the success or failuresof development policies (Nunn 2019).
Our main contribution is to emphasize how language barriers can exacerbate organizationalfrictions within MNCs and impede the initial source of knowledge transfers necessary for spilloversfrom FDI. Besides the aforementioned literature on language and FDI, we thus connect two separatebut related strands of the literature. Multinationals are a key source of technology and knowledgeand drive a large share of world trade (e.g., Keller 2004, Keller and Yeaple 2013, Yeaple 2013). Forthis reason, a large literature seeks to understand the consequences of FDI on developing countries;
4As with the measurement of on-the-job performance, a further complication is that the wide range of DMs’tasks implies that the skills they potentially learn from interacting with FMs are hard to list ex-ante and difficult tomeasure (e.g., through a standardized test) ex-post.
5For empirical evidence of language barriers and trade flows, see, e.g., Rauch and Trindade (2002), Head et al.(2010), Melitz and Toubal (2014), and Morales et al. (2019). For FDI flows, see, e.g., Burchardi et al. (2019).
3
see the comprehensive survey by Harrison and Rodriguez-Clare (2010) and the recent review byKeller (2021). These studies typically focus on spillovers from MNCs to domestic firms and workers,for example through supply-chain linkages (e.g., Aitken and Harrison 1999, Javorcik 2004, Abebeet al. 2018) or through wages (e.g., Poole 2013). Systematic evidence for positive FDI spillovers hasproven elusive. One possibility, overcome by Alfaro-Ureña et al. (2019), is that measurement andidentification challenges make spillovers difficult to detect. A second possibility is that contextualfactors, like those explored in this paper, might influence the likelihood that FDI generate positivespillovers for the host economy.
A separate literature has analyzed the internal organizational structures of MNCs; see the surveyby Antràs and Rossi-Hansberg (2009). Antràs et al. (2006) model the formation of cross-countryhierarchical production teams with less skilled workers specialized in production and more skilledworkers specialized in problem solving (see also Caliendo and Rossi-Hansberg 2012). Antràs et al.(2008) argue that MNCs create a layer of middle managers in host countries to reduce the costsof transmitting knowledge across borders. Unlike this literature, which builds on Garicano (2000)model’s of hierarchies, we focus on the inefficiency arising from the non-contractibility of communi-cation.6 Relatedly, Keller and Yeaple (2013) also argue that because knowledge embedded withinMNCs is difficult to codify, offshore production requires communication between headquarters andforeign affiliates. The efficiency losses from language barriers could also rationalize the cross-borderMNC technological frictions often calibrated in quantitative models (e.g., Arkolakis et al. 2018).7
Our paper also contributes to the literature on management practices (e.g., Bloom and Van Reenen2007, Bloom et al. 2012b). Two findings from this literature motivate our work. First, firm per-formance correlates with the quality of management practices and multinational firms are bettermanaged (Bloom and Van Reenen 2007, Bloom et al. 2016). Second, management practices diffuseslowly because they are hard to codify and transmit (Gibbons and Henderson 2012). Rather thanoffering explicit management consulting or training interventions (e.g., Bloom et al. 2012a, Mac-chiavello et al. 2015, Alfonsi et al. 2020), our paper argues that management can be learned fromdirect interactions within an organization. Recent studies have also studied management knowl-edge transfers between firms. Cai and Szeidl (2017) find large impacts of business networks onfirm performance in China; Giorcelli (2019) find large impacts on Italian firms that sent managersto the U.S. for management training; Bai et al. (2021) examine the role of supplier networks andlabor mobility in fostering knowledge spillovers in the Chinese auto-industry; Bisztray et al. (2018)document knowledge spillovers in importing along managerial networks.
6Contracting problems and informational barriers have been shown to be important constraints to trade (e.g.,Macchiavello and Morjaria 2015, Bai et al. 2020, Chen and Wu 2021, Startz 2021) and arguably could also inhibitknowledge transfers, particularly in low income countries (see Atkin and Khandelwal 2020 for a review). We fo-cus on within-firm interactions and highlight the role of non-contractible communication and language barriers inlimiting transfers of management knowledge. Atkin et al. (2017) show that technology adoption can be slowed bycommunication frictions within the firm (but due to incentive problems, not language barriers).
7The management literature has also examined language barriers within MNCs (see the recent survey by Tenzeret al. 2017). One line of study is the choice of the company’s lingua franca exemplified in the cases of Japanesecompanies adopting English: Rakuten (Neeley, 2017) or more recently, Honda. Our project, instead, takes thelanguage of communication as given and studies the problem from the policymaker’s perspective.
4
The paper is structured as follows. Section 2 describes the setting and facts that motivate themodel and experiments. Section 3 describes the model. Section 4 describes the resume experimentthat tests the “general skills” assumption in the model. Section 5 describes the language experimentthat tests for the “complementarity” assumption in the model. Section 6 discusses other model’sassumptions and the rationale for policy intervention. Section 7 concludes.
2 Setting & Motivating Evidence
This section describes our setting and the evidence that motivates the research design.
2.1 Setting
Following a military coup in 1962, Myanmar spent nearly five decades isolated from global tradeand foreign investment. Beginning in 2010, the military-backed government agreed to transitiontowards democratic rule, and a few years later, the country initiated economic reforms to re-integrate into the global economy by removing trade barriers and implementing new regulations toattract FDI. These reforms have been successful and average annual FDI inflows between 2010 and2019 was $2.5 billion compared to just $0.4 billion in the previous decade. Roughly 90% of flowsoriginate from East and South-East Asia.8
The 2014 Special Economic Zone (SEZ) Law was a key component of the economic reforms and itestablished the regulatory framework that governs the country’s SEZs. Much of our analysis focuseson firms operating in the country’s main zone, Thilawa SEZ, which opened in September 2015.Firms at Thilawa receive the typical benefits associated with SEZs: tax breaks, duty drawbacks onimports used for exports, and high-quality infrastructure (roads, easy access to a wet and dry port,electricity, and water). In 2018, there were 45 MNCs with operations at the SEZ. Japanese MNCsare the largest investors, followed by Singaporean, Thai, Chinese, European/American and KoreanMNCs. The MNCs span a wide range of sectors, including chemicals, distribution, electronics,garments, logistics, machinery, and metals (see Figure A.1).
2.2 Timeline
Our data come from tailored worker and firm surveys conducted between Summer 2018 andSummer 2020.9 In 2018, we conducted a survey of 400 domestic managers (DMs) at 30 MNCs.10
A consistent definition of a “manager” is not straightforward because the firms span many sectorsand managers span many tasks (e.g., production supervisors, human-resource managers, purchasingagents, and so forth). Piloting revealed that individuals earning over $200/month, the income-taxreporting threshold in Myanmar, is a plausible objective metric to identify DMs at each company.
8Calculations from World Development Indicators, WB Open Data and Myanmar’s Directorate of Investmentand Company Administration.
9We supplement these surveys with administrative data collected by the SEZ, when available.10The 30 firms who agreed to participate had on average 141.4 employees. The 15 firms who did not participate
were smaller, with on average 60.1 employees.
5
This survey assessed language proficiency in English and in the original foreign language of thecompany, and asked about DMs’ communication and interactions with FMs. We simultaneouslyconducted a firm-level survey by asking the HR managers questions about FMs’ language skills andlearning frictions at the company.
In January 2019, we designed the language experiment protocol and recruited 27 MNCs toparticipate.11 We surveyed 298 DMs at these firms by phone to collect baseline outcomes andtheir scheduling preferences for the language training. When we refer to the “baseline survey”,we refer to both the 2018 in-person survey and the phone survey from January 2019. We thenperiodically surveyed participants by phone throughout the duration of the treatment and beyond.In January 2020, we started administering the endline survey, testing participants on language andasking about communication within the firm.12 The in-person endline was interrupted in March2020 due to Covid-19 and, given necessary precautions, the survey resumed remotely. The endlinewas completed in June 2020. In June 2020, we recruited human-resource managers at domesticfirms outside the SEZ to conduct remotely the resume rating exercise. Finally, in January 2021,we began a survey to measure potential skills among the DMs. As discussed below, this surveywas implemented remotely due to the ongoing pandemic, subsequently paused in February 2021because of the military coup, and completed remotely in October 2021. We explain more detailsabout the surveys and experiments in Sections 4 and 5.
2.3 Motivating Facts
The data collected in 2018 reveal five facts about MNC organizational structures, languagebarriers, communication and learning that motivate the model and empirical strategy. We describethese facts here.
Fact 1: Three-Layer Organizational Structure
Table 1 reports the organizational structure of the firms. The top layer is comprised of a smallnumber, 4.5 on average, senior expatriate managers (FMs). FMs are responsible for coordinatingwith headquarter operations, setting the strategic direction for the Myanmar factory, and overseeingoperations with the help of a middle-level management layer. These FMs are, on average, 39.3 yearsold and have 8.8 years of work experience at their firm. Their average salary is $2002 per monthwith a standard deviation of $2100. The typical FMs works in Myanmar for 2.2 years.
The second layer is comprised of an average of 13.3 Myanmar middle-managers (DMs). TheDMs are younger than FMs, on average 28.5 years old, and earn an average monthly salary of $363.The third layer is comprised of Myanmar domestic production workers, who earn $99 per month on
11Of the three firms who did not participate, one is a large Chinese MNC who uses Mandarin as their lingua francaand would not have valued the English training, and the other two Japanese firms had an average employee size of94.5.
12Throughout the project, we attempted to survey FMs with limited success. We did conduct interviews andlanguage tests for 23 FMs. Anticipating a low response rate, we use summary statistics from the survey of FMs asmotivating facts, and designed the project to not require their active participation.
6
average. For reference, Myanmar’s GDP per capita is roughly $117 per month and the minimummonthly wage is approximately $70.
Fact 2: DMs Want to Learn Management Skills
The DMs in our sample perform a range of tasks that would be familiar to middle managers in othersettings. For example, interviews reveal that the DMs are responsible for monitoring and evaluatingemployees, handling order logistics for customers or suppliers, preparing sales reports and invoices,and settling financial accounts. Most of them (two thirds) manage several subordinates, while therest of them focus on more technical tasks such as accounting or finance. In any case, interactionsappear to be an important component of their job profiles. On a typical day, a DM reports spending33.3% of the workday in meetings, which is similar to the 27% of time that that employees in NorthAmerica, Europe and the Middle East spend in meetings in a typical day according to DeFilippiset al. (2020).
Pilot surveys elicited why DMs chose to work at MNCs. Panel A of Figure A.2 shows thatnearly 58% of DMs report that learning new skills is the main benefit of working for the MNCsin the SEZ. In contrast, higher wages and better working conditions are reported to be the mainbenefit of working in the SEZ by only 10% and 15%, respectively. Panel B reveals that it isspecifically management skills that most DMs intend to learn at their jobs (more so than hardskills, like production skills or accounting). Pilot interviews suggested that interactions with FMswere important for building management skills.
Fact 3: DMs English Language Proficiency is Low
Communication between FMs and DMs occurs in English, which is the native language of neithergroup.13 Despite being more educated than production workers and probably better selected, inpart, to communicate with FMs relative to DMs in Myanmar firms, English knowledge among DMsin our sample is low.
We assessed language proficiency through two tests. One test was conducted by the firm wehired for the language training and administered to a random sample of DMs (see Section 5 fordetails). Assessing language proficiency being the core business of the provider, we present theseresults first to establish the baseline level of English proficiency in the sample of DMs. PanelA of Figure 1 presents the distribution of scores and their mapping to the Common EuropeanFramework of Reference for Languages (CEFR) scale according to the language provider. The testscores indicate that 85.4% of sampled DMs have, at best, an elementary level of English proficiencywhich includes less than A1, A1 or A2 levels on the CEFR scale. A person with A1 proficiency can“understand and use only a few everyday expressions/phrases aimed at the satisfaction of needsof a concrete type.” A person with A2 proficiency can “understand sentences and frequently used
13English knowledge in Myanmar is low and the country ranks 93rd on the EF English Proficiency–which lies inthe category of “very low” proficiency–alongside neighboring countries Cambodia and Thailand, and just below “low”proficiency countries like Bangladesh and Vietnam (EPI 2020).
7
expressions for areas of immediate relevance but not much beyond.” Only a minority of DMs,14.6%, have achieved the intermediate “B” categories on the scale or above.
With the help of two external consultants, we also created and administered our own languagetests to the full sample of DMs and the sub-sample of FMs. In the listening module, DMs wereasked to answer 16 questions, in an increasing order of difficulty, until they answered two consecutivequestions incorrectly. In the speaking module, DMs answered questions in English about their workroutine and career aspirations and their answers were independently scored by the two consultants.On the subset of DMs who took both the language provider’s test and our test, Figure A.3 indicates apositive correlation between the two suggesting that our tailored test can assess language proficiency.
Panel B of Figure 1 reports the distribution of test scores among the DMs and FMs at baseline.This figure demonstrates that English proficiency among DMs is on average lower than FMs: theaverage FM score is about one sd above the average DM score. As mentioned above, we haddifficulty securing time to administer the English test to all FMs. However, during the Summer2018 survey administered to HR managers to collect firm-level data, the HR managers were askedto report the English proficiency of FMs and DMs. Those responses, denoted by a ‡ in Table 1,confirm that DMs proficiency is low: on average, just 11.1% of DMs are reported to be “proficient”in English compared to 32.3% of FMs.
We also administered tests to assess FMs’ knowledge of Burmese and DMs’ knowledge of thenative language of the FMs (Chinese, Japanese, Korean, depending on the firm). Figure A.4 reportsthese distributions; virtually none of the FMs know Burmese and very few DMs are proficient inthe FMs’ language.14
Fact 4: Learning Challenges
Language barriers between FMs and DMs appear to create challenges to learning. DMs reportthat 33.8% of the time they spend in meetings together with FMs is lost due to language barriers.Additionally, at these meetings, DMs report a low level of comprehension, on average 60.4% ofthe conversation. Average comprehension rises to a modest 62.9% with Google Translate. Thelimited benefit likely stems from Google Translate not translating directly between Burmese andJapanese/Korea/Chinese (a challenge known as indirect translation). Average comprehension risesto 84.0% when a translator is present. Translators, however, are expensive. Half of the firmsin our sample do not hire translators. Those that do typically hire translators on a casual basis.Conditional on hiring a translator, these firms pay for translation services for, on average, 1.5 hoursper day and the translator typically follows the FMs. Part-time translators cost approximately $100a day, well above the average daily DM wage of $15.7. Meetings also last longer when a translatoris present.
Several anecdotes provide texture to the workplace challenges created by language barriers:
14Language barriers could be reduced by providing Burmese language training to FMs. In practice, FMs oppor-tunity cost of time is significantly higher than DMs, and, because they reside in the host country for a limited periodof time, their incentives to learn the local language are muted.
8
• DM, Japanese firm A: “Although the boss can speak English, if the issue is important, weuse translator. The [Myanmar] factory manager cannot speak English at all. So, when thetranslator is not there, we have to talk to him with body language or by drawing pictures. Ittakes more time.”
• DM, Japanese firm B: “He’s [FM] not an English native speaker and we are not native speakereither. So, although we try our best, there are misunderstanding frequently. Sometimes, wedon’t know what he wants.”
• FM, Japanese firm C: “I told the staff to handle products in certain way but they didn’t reallyunderstand it and did it differently. Sometimes, they do things that I ask them not to do anduntil I find out about it, they are doing it wrongly.”
• FM, Korean firm D: “One problem is that it is difficult to teach Myanmar workers the detailsof their job due to language barriers.”
• DM, Korean firm E: “Synonyms had not come out from my mind to clarify the meanings ofthe words while having conversations with FMs.”
• DM, Korean firm F: “I asked FMs to repeat what they said for more than two times, and wasafraid to speak with them.”
• DM, Thai firm G: “I could not understand very well what FM said, and could not give conciseexplanations to FMs. Also, I was afraid of speaking in meetings.”
Fact 5: Lower Communication Frictions Correlate with More DM-FM communication
Lower communication frictions between DMs and FMs are correlated with more frequent com-munication with FMs and higher involvement in the management of the firm. We assess this byestimating the following specification:
yi = α+ βenglishi +X ′iδ + εi (1)
where englishi is the (standardized) English test score at baseline and Xi is a set of controls, includ-ing demographics and DM position.15 We consider four outcomes: frequency of FM communication(scale 1-4), self-reported involvement in plant operations (scale 1-4)16, the score on questions ofmanagement practices adapted from the U.S. Census of Management and Organizational PracticesSurvey (scale 1-15), and wages.
15The set of positions is: assistant, staff, officer, leader, assistant manager, manager, senior manager, accountant,supervisor, general manager, director and executive. The set of departments is: general management, accounting andfinance, human resource, logistics, production, engineering, research and development, marketing.
16The scale for communication frequency is: 1) “never” 2) “seldom” 3) “often” 4) “very often”. The scale forinvolvement is: 1) “not involved at all”, 2) “rarely involved”, 3) “sometimes involved”, and 4) “there is never adiscussion without me, and I take the final call”.
9
Table 2 reports the results. A one sd increase in the English score is correlated with a 0.11higher frequency of communication, 0.13 more involvement, a 0.23 higher management score, anda 0.16 higher wage.
Of course, the coefficient on English in equation (1) may be biased if DMs with better Englishare selected to interact with FMs based on unobservables. An (imperfect) solution to control forunobserved factors correlated with English is to measure DMs’ communication with two superiors:their FM (who is either their direct boss or their closest FM at the firm) and a domestic manager.If the DM did not have a domestic superior, we asked them to report communication with anotherdomestic manager with whom they interact with regularly. This allows us to compare interactionswith each superior while controlling for a DM fixed effect through the following specification:
yib = αi + β1FMb + β2(FMb × englishi) + εib (2)
where αi is a DM fixed effect, FMib is a dummy that takes a value of one if boss b is the foreign expat.We examine two outcomes: frequency of communication and the share of a typical conversationunderstood. For domestic bosses, the share of conversations understood is, naturally 100% since twoindividuals would be speaking in Burmese. The results of the regression are reported in columns5-6 of Table 2. Not surprisingly, DMs report 0.75 less frequent communication (scale 1-4) and27.7% more time lost with FMs relative to domestic bosses. However, these interactions improvewith DM’s English knowledge. Raising DM English test score by 1 sd is correlated with a 0.20more frequent communications with the FM, and a 10.9 percentage points decrease in time lost.Although a correlation, these results suggest a complementarity between DMs’ language ability andthe frequency of communications with FMs.
3 Model
This section presents a model that illustrates how language barriers between DMs and FMs canjustify a policy intervention. In our framework, a DM learns general skills by communicating withFMs. The source of the inefficiency is the non-contractibility of communication between the FMand the DM. In equilibrium, the communication effort supplied by the FM is inefficient because itonly takes into account the returns of communication inside the MNCs and not the (additional)returns that accrue to the DM from learning. DMs therefore learn a suboptimal amount of generalskills from the planner’s perspective. The non-contractibility prevents the planner from directlytargeting the source of knowledge transfers: communication. So, we consider a partial remedy ofsubsidizing the DM’s acquisition of language skills. A necessary, but not sufficient, condition isthat the FM’s communication effort is complementary to the language ability of DM. The modeltherefore justifies why, even if a perfectly functioning language skill market exists, the plannermay want to subsidize the acquisition of the foreign language to (partially) correct for the under-provision of communication inside MNCs.
To focus on the role of non-contractibility and language barriers in stifling the initial spark
10
for knowledge transfers, we deliberately abstract from productivity spillovers to domestic firmsand workers as well as from imperfections in the market for language training (e.g., due to creditconstraints, asymmetric information, social networks, or behavioral biases). While potentiallyrelevant in our setting, the implications of these market failures have been investigated elsewhere(e.g., Acemoglu and Pischke 1998, Munshi and Rosenzweig 2006).
We first provide the model set up and describe the equilibrium. We then discuss the subsidypolicy and conclude with a discussion of the main assumptions.
3.1 Setup
We consider a three-period model with a single domestic manager (DM, he) and a foreignmanager (FM, she). For simplicity, there is no discounting across periods.
The DM and the FM communicate through a language foreign to the DM. We denote λ ≥ 0the foreign language ability of the DM and we assume that the DM can purchase units of λ in aperfectly functioning market. Specifically, we denote c(λ) = cλ + λ2
2 , the cost of acquiring foreignlanguage skills to the DM, where c is the unit price charged by competitive language trainingproviders and λ2
2 represents the DM’s effort cost of acquiring language skills. We assume that whileλ is observable to the FM, she cannot write a contract with the DM on the level of language skills.
To focus on the interaction between DM and FM, we abstract from production workers andalso assume that the DM produces a good sold at price p = 1 in both periods. Output producedby the DM is equal to his productivity level θ. Productivity depends on the DM’s knowledge ofmanagement κ, and on communication with the FM χ. We assume that θ(κ, χ) is increasing, strictlyconcave in both arguments, and jointly concave. For simplicity, we assume that θ(κ, 0) = κ andθ(0, χ) = χ. Unlike for language ability, we assume that there is no market to acquire knowledge ofmanagement; instead, management knowledge is acquired only through communication with FM.
The DM starts period t = 1 with management knowledge normalized to κ1 = 0. We assumethat communication with the FM is given by χ = 2
√λτ , where τ ≥ 0 is the level of communication
effort chosen by the FM. This functional form reflects the complementary assumption: the FM’scommunication effort is more effective as the DM’s language proficiency rises. We denote γ(τ) = γτ
the cost of communication to the FM. This communication effort is non-contractible. The non-contractible nature of communication is a cornerstone of organizational economics, which we modelalong the lines of Dewatripont and Tirole (2005). In this setting, the FM transmits knowledgethrough costly effort and the DM’s ability to absorb the knowledge depends on his level of languageproficiency λ, which is also acquired through costly effort detailed below.
Besides increasing productivity, communication with foreign managers leads to learning. Int = 2, the DM has acquired management knowledge through communication with the FM in theprior period. Since κ1 = 0, we denote κ = κ2, the management knowledge of the DM in periodt = 2. We assume that κ = φχ = 2φ
√λτ1 . The parameter φ captures the amount of skills learned
through communication with the FM. It is thus natural to set φ ≤ 1 and, to avoid corner caseswith no communication and no language acquisition in equilibrium, we also set φ > (cγ)/2. This
11
condition that the profit generated by the knowledgeable DM is sufficiently large for him to wantto acquire a non-zero level of language.
We also assume that as the DM accumulates human capital, returns to communication declinesover time and eventually become lower than the marginal costs of communication. We considerthat this happens already in period 2, i.e., ∂θ(κ2,χ)
∂χ
∣∣∣τ=0
< γ. The assumption, which can be relaxedat the cost of a slightly lengthier taxonomy of cases, makes further communication with the FMin period t = 2 unnecessary. Finally, we assume a perfectly competitive market for experiencedDMs in t = 2 and that the knowledge acquired by the DM is a general skill. The DM thus fullyappropriates the returns from her learning. Since communication at t = 2 is zero, we denote τ = τ1
the level of communication effort in t = 1.The FM has an outside option equal to zero in both periods. The DM has an outside option that
pays w0 in both periods. We assume that w0 is independent of language λ. We discuss in Section3.4 below the role of this assumption and how it can be altered without changing the qualitativeinsights of the model. We also assume that the DM’s wage in the multinational cannot be negative,w ≥ 0, and that w0 < φλγ .
17
To summarize, the timing of events and payoffs are as follows:
• t = 0: DM buys language λ at unit price c and effort cost λ2
2 .
• t = 1: FM offers a wage w to DM:
– If DM accepts the offer, FM chooses communication effort, τ , at private effort cost ofγτ . Output is θ1 = 2
√λτ . FM profit is 2
√λτ − γτ − w. DM payoff is w.
– If DM rejects the offer, there is no output. FM payoff is zero, and DM payoff is w0.
• t = 2: DM produces output, and obtains payoff equal to, θ2 = 2φ√λτ . FM does not get any
share of the output. If DM rejected the offer at t=1 there is no production at t = 2, and FMand DM get 0 and w0, respectively.
3.2 Equilibrium
We describe the private equilibrium and compare it with the allocation that the planner desires.
Private Equilibrium
The model is solved by backward induction, i.e. we solve for the unique subgame perfect equilib-rium. We characterize the equilibrium strategies of the DM {λ, a} and the FM {w, τ}, where a = 1if the DM accepts the wage w offered by the FM and a = 0 otherwise.
17As shown below, this assumption guarantees that the DM has some incentives to invest in language despitehaving no bargaining power in the wage negotiation with the FM. The assumption could be relaxed if the DMhad some bargaining power, and was thus able to capture some of the returns from her investments, at the wagenegotiation stage.
12
In t = 2, the DM’s payoff is given by 2φ√λτ if he has worked for the FM in t = 1, and w0
otherwise. The FM’s payoff is 0.In t = 1, if the DM has accepted to work for her, the FM sets τ to maximize her profits:
2√λτ − γτ − w. Note that the wage paid to the FM, w, does not depend on communication
effort τ . This is where the non-contractibility assumption kicks in. If communication effort wascontractible, DM and FM would negotiate a compensation scheme which induces the FM to alsotake into account DM profits at t = 2. To be precise, our results hinge on the fact that the FMdoes not internalize the entire returns of her communication effort in period t = 1 on the DM’sproductivity in t = 2. Given the non-contractible nature of communication, the FM sets
τ∗ = λ
γ2 .
The complementarity between communication effort and the DM’s language knowledge implies thatτ is increasing in language knowledge λ.
The FM payoff is thus equal to λγ −w and the highest wage that she is willing to offer is w = λ
γ .The DM accepts the wage offer w if the payoff from working for the FM and learning in periodt = 1 and then producing in period t = 2, is higher than the payoff from taking the outside optionin both periods, i.e., if w + 2φ
√λτ > 2w0. The FM would like to offer a wage w = 2w0 − 2φλγ ,
however the assumption w0 < φλγ implies that the resulting wage would be negative and thus, inequilibrium, the FM is constrained to offer a wage w = 0 and the DM accepts (a = 1).18
In t = 0, the DM chooses λ to maximize her payoff over the two periods: maxλ{2φ√λτ −(
cλ+ λ2
2
), 0} Given the assumption φ > (cγ)/2, DM chooses
λ* = 2φγ− c
and
τ∗ = 1γ2 (λ) = 1
γ2
(2φγ− c)
The equilibrium strategies are then {λ∗, a = 1} for the DM and {w = 0, τ∗} for the FM, yielding
payoffs 1γ (2φ
γ − c) and( 2φγ−c)2
2 for the DM and the FM, respectively.
Social Planner
The socially efficient allocation is found by setting both language skills λ and level of communicationτ to maximize the overall surplus in the economy:
18If the DM could be asked to pay the full value of learning, which generates payoff 2φλγin t = 2, the FM would
offer a wage w = 2w0 − 2φλγ. The DM would then have no incentive to invest in language as her payoff would be
equal to 2w0. The assumptions would not be needed if the DM had some bargaining power when negotiating thewage with the FM.
13
maxλ,τ
2φ√λτ︸ ︷︷ ︸
output int=2
+ 2√λτ︸ ︷︷ ︸
output int=1
− γτ︸︷︷︸cost of communication
−(cλ+ λ2
2
)︸ ︷︷ ︸
cost of language aquisition
The FOCs lead to the following level of communication and language skills:
λSP = (1 + φ)2
γ− c > λ∗
τSP = (1 + φ)2
γ2 (λ) = (1 + φ)2
γ2
((1 + φ)2
γ− c)> τ∗
The social planner would thus like to choose a level of communication higher than in the privateequilibrium. Because of the non-contractibility of communication, the FM chooses an inefficientlylow τ for any choice of λ by the DM (τ∗(λ) < τSP(λ) from the comparison of the first terms). If thecommunication effort were contractible, the DM would pay the FM to increase her communicationeffort in t = 1, which would raise communication τ to the efficient level, given λ.
DM’s incentives to invest in language acquisition λ also differs from the social optimum. First,the inefficiently low τ depresses the returns to language skills for the DM. Second the DM doesnot internalize the output of his investment in language in t = 1, which is θ(κ1, χ) − γτ = λ
γ inthe private equilibrium. Since w does not depend on λ, however, the DM underinvests in languageskills, given τ .19
3.3 Language Subsidy
We now consider how the planner could reduce the inefficiency. The planner cannot increasecommunication by directly subsidizing FM’s communication effort because it is non-contractible.In designing the intervention, the planner therefore needs to work with the incentive compatibilityconstraint of the FM given by τ = λ
γ2 (FM IC).We consider a practical policy instrument where the planner subsidizes the acquisition of lan-
guage skills by the DM, which would raise τ by raising λ. We denote this subsidy s so the totalcost of acquiring language skills λ for the DM is now (c− s)λ+ λ2
2 . This implies that the planneralso faces the incentive compatibility constraint for the DM, given by λ = 2φ
γ − (c− s) (DM IC).20
The planner sets the subsidy s solving the following program:
maxs
2φ√λτ + 2
√λτ − γτ −
((c− s)λ+ λ2
2
)− sλ
19This second source of inefficiency would however be removed if the DM had all the bargaining power whennegotiating the wage with the FM.
20We assume throughout that the marginal cost of public funds (Stiglitz and Dasgupta 1971) for the planner, Ψ,is constant and equal to 1. Assuming Ψ > 1 would only distort the language subsidy equilibrium further away fromthe first best. As long as the marginal cost of public funds is not too high,
(Ψ < 1 + 1
2φ−γc
), it remains however
optimal for the planner to subsidize the acquisition of language skills.
14
s.t.
τ = λγ2 (FM IC)
λ = 2φγ − (c− s) (DM IC)
The optimal subsidy is equal to the marginal returns of λ in period t = 1, i.e., the portion of thesocial returns to language not taken into account by DM’s investment choice. That is,
s∗ = ∂(θ(κ1, χ)− γτ)∂λ
∣∣∣∣τ= λ
γ2
= 1γ
The equilibrium level of language skills and communication are given by
λs =(1 + 2φ
γ− c)
τ s = 1γ2
(1 + 2φγ
− c)
The language subsidy only partially corrects for the inefficiency, because it addresses the ex-ternality of the DM’s language investment on FM’s production, but not the non-contractibility.As a result, even though DM’s language investment under the subsidy is efficient for any τ , theFM’s choice of τ is still inefficiently low for any λ. So the interdependent choices of λ and τ arehigher with the subsidy than under private equilibrium, but still lower than the social optimal, i.e.λ∗ < λs < λSP and τ∗ < τ s < τSP .21
3.4 Discussion
Before moving on to the empirical analysis, we discuss further some of the assumptions we havemade along the way. We discuss first our assumptions about communication within the firm. Wethen discuss the assumptions that justify a language subsidy as a partial remedy.
Modeling Approach
Our model is in the spirit of Dewatripont and Tirole (2005) model of communication. We capturethe costly and non-contractible nature of communication, but focus, for simplicity, on the case inwhich only the FM exerts communication effort. Introducing a moral hazard in team frameworkwhere both the DM and the FM exert costly communication effort would not change the maininsights of the model. We also implicitly assume that payoffs are non-contractible. For example, ifthe FM could buy a 100% equity share in the DM’s firm in period t = 2 she would internalize thelearning externality. In practice, such contracts appear implausible in our setting. Theoretically,such contracts would also not restore efficiency in more general models, e.g., if DM’s effort is neededto run the firm at t = 2.22
21If we assumed that the marginal cost of public fund was Ψ > 1, the optimal subsidy is increasing in the cost ofproviding language training, c., i.e. countries with higher language proficiency should subsidize less.
22We also assume that DMs cannot commit to work for two periods for the FM. This assumption can also berelaxed (e.g., along the lines of Acemoglu and Pischke 1998) without altering the main insights of the analysis.We also abstract from other aspects of non-contractible communication like strategic information transmission (e.g.,Crawford and Sobel 1982 and Dessein 2002).
15
We focus on the inefficiency arising from the non-contractibility of communication. For sim-plicity, we abstract from the formalization of communication in hierarchies developed by Garicano(2000) (see also Antràs et al. 2008; Antràs and Rossi-Hansberg 2009; Caliendo and Rossi-Hansberg2012 for applications to trade). In Garicano (2000), the number of layers in the hierarchy and thespan of control are chosen to optimally use scarce communication resources in the organization, i.e.,the organization is efficient. Changes in the cost of communication, for example due to a reductionin language barriers, could lead to changes in both the number of layers and the span of control.Testing these predictions is beyond the scope of our empirical analysis.
Conditions for a Subsidy
We have so far assumed that the wage w earned by the DM does not depend on λ. We makethis assumption for simplicity, but it can be relaxed. Note that if w depends on λ, the DM ICwould be given by λ = 2φ
γ +w′(λ)− (c− s). The planner would like to implement λs = (1+2φ)γ − c.
A subsidy s is thus justified if w′(λ) < 1/γ. This condition states that the marginal return to λinternalized by the DM in t = 1, w′(λ), must be smaller than the marginal returns to λ for theFM, which is given by ∂(θ(κ1,χ)−γτ)
∂λ
∣∣∣τ=λ/γ2
= 1/γ. The condition can be violated if the DM makesa take-it-or-leave it offer to the FM (in which case w captures all the surplus) or if the DM waspaid a wage corresponding to an outside option w0(λ) with w′0(λ) ≥ 1/γ.23 In Section 6, we arguethat the assumptions we impose are likely met in practice.
A related scenario under which a subsidy is no longer effective is the one in which the FM andthe DM can perfectly contract on the amount of language skills λ. When this is the case, theywill maximize the joint surplus subject to the FM IC, thereby replicating the program of the socialplanner. In the equilibrium of our baseline model, if the DM can commit to work in the MNC int = 1, the FM is willing to pay 1/γ for the DM to acquire an extra unit of language knowledge λand the DM would accept the offer. In practice, this scenario is unlikely as language acquisition isa general skill and many employers might be unwilling to pay for it.24
Finally, note that we have imposed the standard assumption that the social planner puts equalweight on all agents. A natural extension would be to consider the case of an industrial-policyplanner who only values the surplus of the FM with weight α < 1. In our model, the FM earns rentsthat are increasing in τ and thus the planner might want to subsidize DM’s language acquisitioneven in the limit case α = 0. In practice, this limit case is not a realistic description of manyindustrial settings in developing countries. First, if the host government taxes (or subsidizes) someof the profits of the MNC, the planner takes into account the tax base and thus α > 0. Second,governments fiercely compete to attract FDI. While, in theory, governments could simply rely onlump-subsidies and tax breaks to attract MNCs, the evidence suggests that policies that improvesthe institutional environment in which the MNCs operate are successful in attracting FDI. An
23In theory, if the marginal returns to language in the outside option are larger than in the MNC, the DM mightend up over-investing in language, thus partially compensating for the under provision of communication.
24In Section 6 we discuss results from an experimental protocol that suggests that FMs and DMs are unlikely tomaximize joint surplus in language training attendance decisions.
16
industrial planner would thus commit to α > 0. Third, if one were to model externalities fromFDI, the planner would want to intervene even if α = 0 and the DM earned no rents.
In sum, the model presented above clarifies how the non-contractible nature of communicationwithin the firm can lead to inefficiently low knowledge transfers of general skills even in the absenceof externalities or distortions in the market for foreign language training. Furthermore, if foreignlanguage skills λ and communication effort τ are complement, the social planner may be able topartially correct the inefficiency by subsidizing foreign language skills. In Section 4, we explorethe general skills assumption through a resume-rating experiment, where HR managers basedin domestic firms evaluate the profiles of candidates with random attributes. In Section 5, weexplore the complementarity assumption through a RCT in which we (exogenously) increase Englishlanguage skills for DMs working inside MNCs. Finally, in Section 6, we discuss additional evidenceon the assumptions discussed above.
4 Protocol 1: Management Knowledge as General Skills
This section investigates the empirical support for whether DMs, through communication withFMs, improve their general management skills. To do so, we measure how potential domesticemployers value this skill through a hypothetical resume rating protocol. We first explain theresearch design and empirical specification and then discuss the results.
4.1 Research design
We assess the value of the skills learned in MNCs by eliciting the demand for such skills on theMyanmar labor market. We recruited HR managers who work at Myanmar-owned firms, operatingoutside the SEZ. The recruitment occurred through a job platform where we explained that we wereseeking HR managers with at least 2 years of work experience to review resumes for managementpositions (and would be paid $20). This recruitment exercise yielded a sample of 51 HR managersworking at domestic firms. These firms are somewhat larger (median size 330) and more service-sector oriented than the firms at the SEZ (at that time). Table A.1 reports the demographics of theHR managers. As their primarily role at their companies is to recruit personnel, the typical managerreports screening 523 resumes (typically resumes submitted through online job platforms) in thepast six months and hiring about 44 new employees. They have experience recruiting employeeswith MNC experience and themselves, on average, have 1.7 years of MNC work experience (and atotal of 7.0 years of work experience).
Our hypothetical resume rating exercise is inspired by Kessler et al. (2019), who incentivize re-cruiters by matching them with real job seekers who have similar characteristics as the hypotheticalones chosen by the recruiters in the rating exercise. The research design yields hedonic valuationson applicant attributes. In our setting, sharing the resumes of the DMs in our sample would havejeopardized our relationship with the MNCs at the SEZ. It would have also been difficult to recruita pool of separate DMs with the characteristics in the second block of the experiment (see be-
17
low). A concern with a non-incentivized resume rating exercise is whether or not the HR managerswould take the exercise seriously. We address this concern when we discuss the results and theirrelationship to existing findings from the literature.
Block 1: Applicant Characteristics
In the first block, we created randomized resumes to analyze the valuations placed on char-acteristics of job applicants. The respondent was told that all potential job applicants graduatedfrom the same university (Yangon University of Economics) with the same degree (Bachelors inBusiness Administration), lived in Yangon, and were married.25 They were applying for a generalmanagement position at the respondent’s company. A candidate’s resume was created by randomlydrawing values from the following characteristics: gender, age, English proficiency, MNC status ofthe previous job, previous company size, and total work experience.26 The donor pool of character-istic values, summarized in Panel A of Table A.2, was chosen to broadly reflect the demographicsof our DMs.
Each respondent was shown 20 pairs of resumes, and for each pair they were asked what wagethey would offer to both candidates, how much they think both candidates would have learned atthe previous job (1-10 scale), and how much involved in management they think both candidateswere at the previous job (1-10 scale).27
We assess the HR manager responses through the following specification:
yrc = αr + αp + β1englishc + β2MNCc + β3englishc ∗MNCc +∑k≥4
βkxkc + εrc (3)
where yrc is the outcome that HR manager r places on applicant c (e.g., the wage offer). Thecoefficients of interest are on the advanced English dummy, the MNC work experience dummyand their interaction. The interaction captures by how much more the HR manager values anapplicant who is proficient in English and has MNC work experience. The xkc capture the additionalcharacteristics that we randomly vary: gender, age, previous company size and total experience.We include respondent fixed effects αr and pair fixed effects αp, and cluster standard errors byrespondent r.
Block 2: Mechanisms
In the second block, we asked respondents to evaluate candidates’ responses to potential inter-view questions. This block was designed to mimic questions that could arise during an interview,
25Piloting revealed that job applicants in Myanmar indicate marital status and residency location on their resumes.26We allowed the age–either 25 or 26–to vary to mitigate the respondents focusing only on the other attributes,
but kept the range narrow to increase power.27This question on involvement separated involvement in the management of personnel and the involvement in
communicating targets to subordinates. We report the average the involvement score over both dimension (the resultson each individual component are similar).
18
and helps analyze directly the importance of communication between the applicant and his previousforeign boss.
All applicants graduated from the same university with the same degree (Bachelors in BusinessAdministration from Yangon University), lived in Yangon, married, male, age 26, and had 3 yearsof experience at a 125-employee Japanese company. Additionally, the HR managers were told thatthe applicants had advanced English proficiency, as did their FM. The reason to note the Englishlevels of both the applicant and the FMs was to ensure that the HR manager would perceive little,if any, communication barriers between the applicant and his FM.
The HR managers were shown profiles with answers to the following questions: a) “How oftendid you interact with your foreign boss (formal/informal meetings, over lunch, etc.)”; b) “Howfrequently did you use Microsoft Office (Word, Excel, PowerPoint); and c) “How often were youinvolved in setting and communicating the company’s targets”. The donor pool of responses tothese questions are summarized in Panel B of Table A.2.
The first question elicits the valuation recruiters place on the mechanism of interest: communi-cation with FMs. The possible values were “frequently”, “infrequently”, and “I was hired to interactfrequently with the foreign boss but interacted infrequently because he had to leave the countryfor a family emergency.” We were concerned that respondents who saw candidates with “frequent”communication may think that the applicant had been selected to interact with FM based on un-observed attributes, thus conflating the treatment effect of communication with a selection effect.The last value indicates the applicant was chosen to communicate frequently with the FM butultimately did not for exogenous reasons.28 The second question assessed the frequency of usingMicrosoft Office, a hard skill that companies value. The third question assessed the frequency ofmanagement involvement in setting and communicating factory-level targets.
HR managers were shown 11 pairs of profiles with answers to these questions, and were askedwhat wage would they offer to both candidates, and how much they think both candidates wouldhave learned at the previous job (1-10 scale). We did not ask to score involvement since the thirdinterview question is about management involvement.
We assess the HR managers’ responses in this block through the following specification:
yrc = αr + αp + γ1freqcommc + γ2hardskillc + γ3involvementc + εrc (4)
where yrc is the outcome that HR manager r places on applicant c (e.g., the wage offer). All threecoefficients are of interest. The categorical variable freqcommc takes on three values, as notedabove. The other variables are binary indicators. We include both respondent fixed effects αr and
28We were concerned that respondents would find this statement unusual. After the resume rating exercise wascompleted, we asked HR managers the following question: “In some interview scripts, you may have seen the response"I was supposed to interact frequently, but interacted infrequently because the foreign boss left the country for afamily emergency." How did you interpret this?” We provided multiple choices for the HR manager to select: a)“The candidate was making an excuse for infrequent communication”; b) “The candidate may have been good ifhe was hired to talk frequently, but was genuinely unable to communicate with the foreign boss due to unexpectedcircumstances”; c) “It did not make sense”; d) “Other (please specify)”. Only 10% HR managers reported (c), while71% chose (b). This suggests that HR managers interpreted the “interview answer” as we meant them to do.
19
pair fixed effects αp and we cluster standard errors by respondent r.
4.2 Results
Block 1 (Applicant Characteristics) Results
Table 3 reports the regression results of the first block. Column 1 reports the primary outcome,the wage that HR managers would offer to candidates. The results suggest that the wage premiumfor an applicant with advanced English proficiency is 15.9% (a $51.3 increase from a mean $323.2).The return to MNC experience is similar: all else equal, having MNC experience would increasethe wage offer by 10.2% (a $33.1 increase). Moreover, a candidate with both advanced English andMNC experience further raises the return by 3.6%, or an additional $11.5. Thus, the results suggestthat potential employers in this setting place particular value on experience acquired in an FDIfirm when the individual speaks English, and is consistent with the model’s assumption that lowercommunication barriers within MNCs should increase the general management skills acquired.
Although the resume rating exercise asked about hypothetical applicants and was not incen-tivized, these coefficients appear plausible. The return to English is remarkably consistent withthe non-experimental Mincerian wage regressions in column 4 of Table 2, where a 1 sd increasein English is associated with a 16.1% higher wage. Since the DMs all work at MNCs, we cannotidentify a MNC wage premium in our sample, but Alfaro-Urena et al. (2019) indicate that theMNC wage premium across several studies is between 5-10%. The estimated size premium is alsoconsistent with the literature. In our hypothetical setting, HR managers would offer a 18.4% pre-mium ($40.0 higher wage) to an applicant from a large 125-employee firm relative to a 25-employeefirm, a magnitude consistent with the 18% large-size premium estimated by Reed and Tran (2019)on a harmonized set of household and labor force surveys across developing countries. As for theexperience premium, our estimates are at the upper end the experience premium estimated byLagakos et al. (2018), who find a premium of 16-30% across developing countries. However, theirstudy compares workers with 5-9 years of potential work experience (years elapsed since finishingschool, rather than actual work experience) relative to 0-4 years and, thus, likely to be a lowerbound on the experience premium.
Column 2 reports the respondent’s perception of how involved the candidate was in managementat the previous job (1-4 scale).29 Applicants with advanced English proficiency have a 0.15 higherperception of involvement off a mean of 2.50. Applicants with MNC experience have a 0.03 higherperception of involvement. We interpret this lower coefficient as the fact that MNCs are perceivedas a challenging environment to be involved in when one does not speak English. By contrast, theHR managers attach a sizable increase in perceived involvement for applicants with both charac-teristics: the coefficient on the interaction is 0.14, which is statistically significant. This suggeststhat improving the English proficiency to advanced for an applicant with MNC experience greatly
29The number of observations in the involvement regression is lower because this question was introduced after afourth of the respondents had already completed the ratings.
20
improves the perceived involvement in management. Not surprisingly, overall work experience isthe largest driver of the perceived involvement of the candidate.
Column 3 reports the results for “how much do you think the candidate has learned in theirprevious job” on a 1-10 scale. We find that perceived learning coefficients are higher for advancedEnglish and MNC experience although we do not find the interaction statistically significant atconventional levels.
Block 2 (Mechanisms) Results
The second block explores the role of frequent communication with FMs as a mechanism forwhy profiles with high English proficiency and MNC experience are valued. Table 4 reports theresults by examining respondent choices among profile pairs that vary in their hypothetical answersto three questions about their previous job: how frequently did the respondent communicate withtheir FM, how frequently did they use Microsoft Office, and how frequently they were involved insetting company targets.
The first column reports the wage offers for candidates. Candidates who interact frequentlywith FMs are highly desired; they would be offered a 9.9% higher wage relative to a candidate whodid not frequently speak with their FM (a $40.8 increase over a mean of $410.2).30 In fact, thisincrease is similar to the coefficient on candidates who frequently report using Microsoft Office (a$33.9 increase). This result supports the key mechanism that for general management positions,potential employers appear to desire candidates who interact with FMs, and they attach a valuationthat is roughly similar to candidates who have a “hard” skill. Naturally, frequent involvement inmanagement is most preferred, and HR managers would offer an even larger wage premium to suchapplicants (a $53.1 increase).
As discussed above, one worry is that profiles that indicate frequent communications with FMsreflect an unobserved attribute of that applicant. To gauge this selection story, we can examinethe coefficient on the response that the candidate had been chosen to interact with the FM, butultimately did not do so. We think that HR managers interpreted this response at face value (seefootnote 28). The wage increase on this response is small ($2.8) and not statistically different fromthe leave-out category (infrequent communication with the FM). This suggests that the respondentsvalue the impact of interactions with FMs as opposed to simply be chosen to interact with the FM.
Column 2 examines perceived learning. The results suggest that HR managers perceive learningto be higher for applicants who interact frequently with the FM. The coefficient implies a 0.52 higherperceived learning for applicants who frequently communicate with the FM relative to infrequentcommunication. As before, this perception is similar to the level of the hard skill (a 0.43 increase inperceived learning). We only observe a modest and statistically insignificant effect on the selectioncoefficient, and applicants who report being frequently involved in setting and communicating
30Notice that the mean wage offer in Block 2 is much higher than in Block 1, which is consistent with the factthat we told recruiters these candidates have an Advanced English level and three years of experience in a largeestablishment owned by an MNC.
21
targets see a 0.84 increase in perceived learning.Taken together, the evidence suggests that domestic employers value experience acquired by
DMs’ working in MNCs. Furthermore, workers that are proficient in English and those given theopportunity to work closely with FMs are particularly valued. The evidence is thus consistent withthe model’s assumption that management knowledge learned in MNCs is a general skill, in thesense of being valued in the labor market for domestic firms, and that this skill is learned, in part,through frequent communication with the FM. If the amount and content of such communicationare non-contractible, the model suggests that the empirical evidence in this section would implyinefficiently low knowledge transfers. The social planner could curb the inefficiency by subsidizingDM’s foreign language acquisition. A necessary condition for that to be the case is that DMs’foreign language proficiency and FMs’ communication are complementary. We now turn to explorewhether this is the case in our context.
5 Protocol 2: Complementarity Between Language Proficiencyand Communication
This section explores the complementarity assumption. To do so, we offer English languagetraining to a random sample of DMs. This allows us to track the effect of an (exogenous) increasein DMs language level λ on communication with FMs τ .
5.1 Research Design and Measurement
We recruited 298 domestic managers at 27 MNCs operating in the SEZ. As noted above, weclassify domestic managers as MNCs employees of Myanmar nationality earning over $200 permonth, the income-tax reporting threshold in Myanmar and a plausible lower bound for holding amanagement position and interacting directly with senior FMs.31
The experiment design was as follows. Within each firm (a stratum), we randomly assigned halfof the domestic managers to attend a free English training course. In total, 154 DMs were assignedto treatment. We contracted with an English-language company to provide the language training,which was entirely conducted by native English-speaking teachers. The course provided 48 hoursof training and was conducted over 3 months, with two 2-hour sessions per week. Only DMs fromthe SEZ would participate in the classes, and the provider taught its standard English for businesscourse.32 The sessions took place after working hours and on weekends, and we offered DMs the
31We excluded Myanmar employees earning above the salary threshold if they held a technical occupation involvingno supervision of subordinates (e.g., engineer or production technician), and brought into the sample frame 64 DMsbelow the salary threshold at the request of 18 firms.
32This course is very similar to a standard language course with daily life scenarios replaced with business sit-uations. For example, the course would teach the correct article ("a" vs. "an") to use for the following positions:accountant, engineer, artist, receptionist, manager, doctor, consultant, pilot, etc. In the provider’s regular course,they would use non-job related words. As another example, students would listen to a conversation and decide whichof the following statements are true or false: "Jim Davis works in the advertising department", "Paula will be anintern in the company for three weeks", "Jonathan Ross is Jenny Bradshaw’s assistant", etc.
22
option to take the course either at a rented space near the SEZ or at the company’s main office indowntown Yangon. The provider’s standard procedure is to conduct an initial English assessmentto determine the student’s knowledge (see Figure 1, Panel A) and place students into a beginnersor intermediate course. We allowed the provider to follow this practice, and treatment DMs wereassigned to one of two sections based on their initial English knowledge. Due to teaching capacityconstraints, we could not train all the DMs simultaneously and staggered the training over ninecohorts through 2019. The typical cohort had around 15 DMs.33 Throughout 2019, treatment andcontrol DMs were asked to answer short phone surveys that asked about interactions with FMs. Sixto eight weeks after completing the course, we administered an endline survey and the managementsimulation exercise.
Bloom and Van Reenen (2007) developed an approach to measure management practices thatwe implemented through closed-end questions. Measuring management performance, however, ischallenging in our setting because DMs perform a range of tasks at firms that span a range ofsectors. We designed a management simulation to assess DMs’ management performance on astandardized task. The simulation exercise was structured as follows. The goal was to mimic thethree-tier organizational structure of MNCs in our setting. An enumerator with advanced Englishproficiency acts as the “FM” by providing instructions in English to DMs to complete a task. TheDM would then manage two “production workers” (“PWs”), performed by enumerators with noknowledge of English. These PWs were shielded from the “FM”-DM interactions so they could nothear the instructions. As is the case at the firms, the DM-“PWs” interactions occurred in Burmese.
The task simulates a common assembly-line task for production workers: precisely placingseveral items into a package. The task was to instruct the “PWs” to select 4 out of 8 objects,arrange them in a pre-specified order and place them in certain position in a box demarcated forshipping. The objects and order were randomized across simulations to mitigate potential learningamong the production workers, and there were a possible 192 combinations of tasks (see Table A.4).Production workers were also randomized from a pool of enumerators. We recorded the length of“FM”-DM and DM-“PWs” interactions, the number of questions, and the total mistakes completingthe task. As we were concerned about experimenter’s effects (e.g., treated DMs might exert moreeffort in the simulation as a result of having being assigned to treatment), we also performed asecond placebo management task (for a different randomly drawn task) where the “FM” deliveredthe instructions in Burmese.
Due to the suspension of in-person surveys in Spring 2020 from Covid-19 lock-downs mandatedby the Institutional Review Board, we switched from in-person to phone surveys to collect themain endline variables for 119 out of 298 DMs in the sample. We were unable to implement themanagement simulation on this sub-sample since the simulation requires a physical presence.
33The first cohort had DMs from one firm and the remaining cohorts had DMs from between 4 and 11 firms.
23
5.2 Baseline Statistics and Empirical Specifications
Table A.3 reports baseline balance between the treatment and control individuals. The averageage is 28.2 years with a tenure of 1.3 years. Across the sample, about 38% of DMs are men. Theaverage monthly salary is $351.8. The table indicates that the randomization achieved balanceacross most observed covariates. Only age is marginally significantly different when comparing thetreatment and control group, with treatment individuals being about 9 months older on average.The final row of Table A.3 reports attrition at endline. Some 9% of DMs refused the endline survey,a low attrition rate which is not significantly different between treatment and control groups.
We estimate intent-to-treat (ITT) using an ANCOVA specification (McKenzie, 2012):
yi = α0 + αf + βtreati + γy0i + φmodei + εi (5)
The specification includes a firm f fixed effect to reflect the stratification, and i indexes the DM.Whenever possible, the outcome value is the average value of the variable measured through surveysthat took place after 75% of the training had been completed and at endline. If an outcome wasonly measured at endline, we use just that value. The baseline value, y0i, is the average value of thevariable measured at baseline and during surveys that took place before 75% of the training hadbeen completed.34 We also include a dummy that turns on if the endline wave was collected overthe phone during the Covid-19 lockdown. Standard errors are clustered by company department;there are 76 company-departments pairs.
We also present treatment-on-the-treated specifications (TOT):
yi = α0 + αf + βtakeupi + γy0i + φmodei + εi (6)
where takeupi is a continuous value between 0 and 1 based on the number of sessions attended outof 24 and is instrumented with treatment. Standard errors are clustered by department.
5.3 Results
We explore how treatment affects interactions with FMs. Before doing so, we first demonstratethat the intervention did, in fact, improve language proficiency for treatment DMs.
34If a baseline value is missing, we set the value to zero and include a missing value dummy. For dropouts andnon-takeup treatment DMs, we assign their survey schedule corresponding to the language course they should haveattended. For control DMs, we assign survey schedules corresponding to the course attended by their treatmentcolleagues of similar English level. (If a firm had treatment DMs attending different courses, we assigned the scheduleaccording to the majority of the treatment DMs). We conducted nine surveys via phone in addition to the (in–person)baseline and (in-person, and then phone due to Covid-19) endline surveys. On average, 2.71 surveys contribute tothe baseline average value (2.82 for treatment DMs and 2.60 for control DMs) and 2.71 surveys contribute to theaverage endline value (same for treatment and control DMs).
24
Takeup and English Proficiency
Table 5 reports the first-stage results that regress takeup on treatment. Columns 1-2 reportthe attendance rates using two different definitions of takeup. Column 1 indicates that 45% ofDMs attended at least three-quarters of the course (18 out of 24 sessions). Alternatively, column2 reports the continuous takeup variable: on average, DMs attend, on average, 56% of the course.We use the continuous takeup measure in the TOT specifications.35
The more direct way to measure the impacts of the language course is to examine DMs’ Englishproficiency at endline using our tailored test (using test questions that differed from the baselinetest). Column 3 reports the impact on English test scores from being assigned to treatment:0.16sd. The TOT specification in column 4 shows an effect that is almost twice as large–0.26sd.The remaining columns separate the effects on speaking (columns 5-6) and listening comprehension(columns 7-8). The point estimates on speaking and listening are both statistically different fromzero at the 10% level. Thus, the English training appears to have successfully improved the Englishproficiency for treatment DMs.36
Communication and Involvement
The model assumes a complementarity between English proficiency and communication withFMs. The top panel of Table 6 explores communication responses at endline.
We first examine the extensive margin of communication: is there an impact of the languagetraining on the frequency of communication in the past 7 days? Columns 1-2 indicate a positiveimpact on communication frequency. Treatment DMs report a 0.20 increase from a baseline averagevalue of 2.31 (on a 1-4 scale), and the TOT coefficient is 0.33. Columns 3-4 regress a dummy thatturns on if the DM participated in a meeting with the FM in the last working day. While noisy,the results suggest a 0.07 increased probability of attending such meetings from a baseline averagevalue of 0.43. On the intensive margin, columns 5-6 report that treatment DMs indicate losingless time due to translations and misunderstandings when they talk to FMs. The coefficients are,however, imprecisely estimated.
One may be worried that improved English leads to greater confidence and so more communi-cation in the firm in general, not just with foreign managers. Moreover, one might worry about aHawthorne effect where the results would be driven by treatment DMs wanting to please the re-searchers by answering more enthusiastically to all questions. To address both concerns, in columns7-10, we turn to DM’s interaction with another DM at a similar or higher level in the firm’s hierar-chy.37 Treated DMs do not report talking more frequently with their domestic bosses/colleagues.
35Figure A.5 shows the attendance distribution. Although an imperfect benchmark, the 76% initial-class atten-dance rate exceeds the average 65% initial-class attendance rate for training programs reviewed by McKenzie andWoodruff (2014).
36Although the training and setting is different from ours, Hoya et al. (2018) conduct an experiment on adults inthe UK that teaches English as a second language through a 66-hour course. They find that improvement in Englishproficiency among treatment doubles relative to control individuals, and we find a similar impact (6.13 vs 3.01 pointson a 100-point scale).
37If a DM’s direct boss was a foreign expat, we would ask the respondent to identify also one Myanmar manager
25
They report attending meetings with a fellow DMs slightly more frequently but this result is in-significant and the effect measured is much smaller than the one observed with respect to FMs(columns 3-4). We conclude that English is complementary with communication between DMs andFMs specifically, and not with communication in general.
Panel B of Table 6 examines management involvement. We asked DMs to self-report theirinvolvement on a scale of 1 to 4 in two broad management tasks: managing employees and settingtargets. For the former, we asked how involved DMs were in setting individual targets for sub-ordinates, promoting good performers, and hiring new employees for their team. For the latter,we asked how involved DMs were in communicating factory and team targets to subordinates. Incolumns 1-2, we find that treatment DMs increase their involvement in managing employees by 0.11,an effect that is both economically and statistically significant. However, we find no differentialinvolvement of treated individuals in communicating targets (columns 3-4).
We then examine DMs’ knowledge of management best practices in columns 5-6. We followedalmost exactly the multiple choice questions in the “management practices” section of the U.S.Census’s Management and Organizational Practices Survey (MOPS) which aims to get at thesame practices as the qualitative questionnaire used in Bloom and Van Reenen (2007). We thenscore each question and obtain a total “management score”.38 When we moved to the phoneendline due to Covid-19, we opted to reduce survey length and retained only the managementquestions about monitoring for this sample. The regression controls for this switch through theendline mode dummy. We do not observe any statistical difference between treatment and controlin these management knowledge questions. Our interpretation is that the management practicesquestionnaires reflect firm policies that may not vary significantly across individuals. Additionally,as revealed below through anecdotal responses, the types of management learned by treatmentDMs via the FMs are more specific than these management questions.
WTP for More Communication
We provide further evidence of the complementarity between language ability and communica-tion. At the endline, we asked DMs how much they would be willing to pay (WTP) for an hour of“one-on-one” conversation with a senior manager, either a FM or another DM (more senior thanthemselves). Referring to our model, this corresponds to the DM’s marginal benefit of learningfrom an additional unit of communication with the FM. Table 7 shows that treated individuals arewilling to pay $32.67 more to spend an hour with the FM, an effect which is significant at the 5%level. The effect is more than twice as large when looking at the TOT: Treated DMs are willing topay $53.62 more than DMs in the control group to spend time with their FMs.
One concern is that difference between WTP for FM and DM across treatment and control can
(either a boss or somewhat at their level in the hierarchy).38For example, we asked participants “What should managers’ promotions primarily based on?” The proposed
answers were “Solely performance and ability; Partly performance and ability, and partly other factors (for example,tenure or connections); Mainly factors other than performance and ability (for example, tenure or connections);Managers are normally not promoted.”
26
be accounted for by “schmoozing” or a desire to influence FMs, rather than opportunities for furtherlearning. In columns 3-4 of Table 7 we ask DMs for their WTP for a one hour conversation witha hypothetical FM working at a different firm. Control DMs are WTP less money to spend timewith an FM outside their company (the control mean is $31.42 as opposed to $39.74), suggestingthat it is considered less valuable, perhaps due to the lack of opportunities to ask for raises orpromotions. However, treated DMs are still WTP to pay $19.09 more than control individuals forthis opportunity. This suggests that English skills increase the DM’s valuation for time spent witha FM and provides further support for the complementarity assumption.
As with our communication results, one may be worried that improved English leads to greaterconfidence in one’s ability to learn in general, not just from foreign managers. Moreover, one mightworry about a Hawthorne effect, especially given that these WTP questions are not incentivized. Toaddress both concerns, we also asked DMs about their WTP for a meeting with another MyanmarDM. The results are shown in columns 5-6 of Table 7. We observe no differential reported WTPbetween treatment and control.
Management Simulation
Participating firms operate across a wide range of sectors and, within those firms, DMs occupya diverse set of roles. This makes it difficult to accurately measure DMs behavior and performanceon the job through metrics that also enable a comparison across such a different range of firms, jobtitles and tasks. To overcome this measurement challenge, we present results from a managementsimulation exercise. The management simulation provides a way to measure performance in acontrolled setting.
Table 8 reports the results. Columns 1-2 report the “PWs” time to complete the task whenmanaged by the treatment DMs relative to control DMs. Production teams managed by treatmentDMs performed the task 0.19 minutes faster relative to the control mean of 1.28, suggesting abouta 15% improvement in productivity. The TOT is 0.37 minutes faster. However, despite this shortertime, mistakes were no different between treatment and control (columns 3-4), so mistake-adjustedproductivity improved.
Why did performance improve for treatment DMs? Columns 5-6 offers a mechanism. We findthat treatment DMs spend more time talking with the “FMs” when receiving the instructions.Column 5 indicates that treatment DMs spend 0.35 more minutes relative to the control meanof 1.89 minutes; and, the TOT estimate is 0.67. The reason for this additional time is becausetreatment DMs ask more questions: on average, treatment DMs ask 1.03 additional questions (andthe TOT estimate is nearly 1.98 additional questions). This suggests that treatment DMs havemore meaningful interactions with the “FM”. They spend more time talking and treatment DMsare more likely to understand the task better by asking more questions.
As a placebo check, we performed the simulation exercise where the “FM” directed the man-agement task in Burmese (for a new randomly drawn task). We would expect no difference inmanagement performance between treatment and control firms in this placebo simulation, and this
27
is confirmed in Panel B of Table 8.
Skills Learned
Did treated DMs learn general skills from the FMs as a result of the language training? Inter-views with treated DMs provide anecdotes that this might indeed have been the case:
• DM, Japanese firm: “I have learned punctuality, discipline, technical and management skillsfrom Japanese Managers.”
• DM, Japanese firm: “From FM, I have learned Microsoft Excel and PDCA (Plan Do CheckAct cycle) which is used in Japan. There is a slight difference in learning process because Iam not afraid of speaking with foreigners and I become to understand what they said.”
• DM, Thai firm: “Problem solving, Customer dealing skills have been learned from FMs. Thelearning process is faster as my confidence allows me to participate in meeting fully and I canunderstand very well what FMs present in the meetings”.
• DM, Japanese firm: “Yes, my involvement with FMs has changed as I get involved in conver-sation with suppliers and customers more.”
Many of the skills listed in these examples (e.g., punctuality, confidence, problem solving, MicrosoftExcel, customer relations) appear to be general.
Of course, it would be ideal to move beyond anecdotes and provide quantitative evidence onwhether indeed treatment DMs learned general skills from FMs. Providing such evidence is chal-lenging for two reasons, and why the resume rating protocol in Section 4 is an appealing way totest whether past interactions with FMs inside MNC is valued by domestic employers. First, thewide range of skills mentioned by the respondents suggests that designing a test to measure knowl-edge transfers is infeasible. For example, one could design a Microsoft Excel test, but such a skillwould only be applicable to a subset of managers. The second challenge is that knowledge transferswould take time to materialize. Although managers can be tracked over time, it turns out thatour ability to survey the sample through long-run followups was complicated by two large shocks.First, as discussed above, the Covid-19 pandemic forced us to complete the endline remotely, andlimited our ability to conduct more detailed interviews about the set of skills learned (and howone could quantify them). Additionally, the pandemic may have slowed the knowledge transfers, asinteractions between FMs and DMs fell substantially due to lockdowns. Nevertheless, we began afollow-up survey to assess knowledge transfers in January 2021, roughly a year after the languageintervention. However, the military coup in February 2021 removed the democratically electedgovernment from office and lead to general strikes, protests and an increasingly violent repressionby the army. The ensuing chaos forced us to temporarily suspend this survey. We resumed inFall 2021, and ultimately completed remote surveys for 219 DMs out of the total 298 DMs. The
28
relatively high attrition due to the two shocks may limit our statistical power to detect effects onoutcomes of interest.39
The survey was designed so that DMs would choose amongst a list of 17 skills those that theyperceived to have learned from their FMs. The skills can be classified into three broad categories:soft skills (e.g., negotiating, business etiquette, customers relations, written communication, pro-fessionalism), hard skills (e.g., software packages, like Excel and SAP), and business skills (e.g.,manpower planning, supply chain management).
We estimate potential differences between treatment and control DMs separately by category,and condition on skill and strata fixed effects for each regression (clustering standard errors bydepartment, as before). Panel A of Table A.6 reports the findings. Columns 1-2 indicate thattreatment DMs report having more soft-skills than control. Unpacking this result, treatment DMsreport higher problem solving/negotiating skills, and also higher confidence, professionalism, andcustomer relations, although individually these latter three are not statistically significant at con-ventional levels. Columns 3-4 and 5-6 indicate no differences in reported hard skills or businessskills. These results suggest that treatment DMs learned more soft skills, which are quite generalin nature, as a result of their interactions with FMs, but not hard or business skills (which maybe slightly easier to codify than soft skills, and hence easier for control DMs to learn). As thesoft skills in the list are general, this suggestive evidence is consistent with, and complements, thefindings from resume rating protocol..
We also attempted to track changes in labor market outcomes. We collected outcomes onsalaries, exits from the MNC, and applications to new job postings at both the endline and thefollowup survey. Panel B of Table A.6 reports the results.40 Treatment DMs do not report highersalaries (columns 1-2) nor are they more likely to have left the company (columns 3-4). However,treatment DMs report applying to 0.22 more jobs than control DMs (columns 5-6). On the onehand, this is suggestive that treatment DMs perceive to have better outside options. On the otherhand, expanded opportunities to learn in the MNC also increases the opportunity cost of acceptingan outside job. This, combined with the two concurrent negative economic shocks, likely limits ourability to detect actual changes in salaries or job switches.
5.4 (No) Spillover to Control DMs
A potential concern with the above results is that the impact of the language training on treatmentDMs may come at the expense of the control group. While this is not a substantial concern foroutcomes such as acquisition of language skills or management skills which are non-rival, the meansthrough which the latter is acquired, communication with FMs, may be a rival good (particularlyso if FMs are constrained in their total communication budget).
Our randomization procedure was not designed to tests for spillovers on control DMs. Such a39The attrition for treatment is 23.38% and for control is 29.86% and the -6.31% difference is not statistically
significant at conventional levels (p-value is 0.25).40The regressions follow the approach in (5) and (6) by averaging outcomes collected at the endline and post-endline
follow-up, control for baseline wage, include strata fixed effects and cluster standard errors by department.
29
design would have varied the intensity of treatment DMs across FMs. Instead, we stratified by firm,and this leads to potentially random variation in the share of treatment DMs across departmentswithin the firm. We choose the department level, described above, as the unit of analysis forspillovers because it represents a relevant unit of management for DMs, with typically at least oneFMs above and subordinates under them. On average, each control DM is in a department with4.8 (sd: 3.2) other sample DMs, 2.7 (sd: 2.1) of whom are treated.
We examine the extent to which control DMs are affected by the intensity of treatment in theirdepartment by running the following specification:
yi = α0 + αf + β#Treatedd + γsized + εi
where #Treatedd is the number of treated DMs working in the same department and sized is thetotal number of sample DMs working in the same department of control DM i. As in the previousspecifications we control for strata (firm) fixed effects αf . Table A.7 shows results for the mainoutcome variables: English knowledge, communication, involvement, WTP for FM meetings, andmanagement simulation. Overall, we are unable to find effects along any of these outcomes, whichis suggestive that control DMs were not crowded out by treatment DMs.
6 Further Evidence
In this section, we provide additional suggestive evidence that supports the presence of aninefficiency in our setting and justifies a language subsidy. First, we discuss evidence that supportsthe assumption of non-contractible communication. Second, we discuss evidence that supports theother conditions that make a language subsidy potentially effective.
6.1 Non-contractible Communication
Our main justification for the non-contractibility assumption is that is a feature of the work-place, and is therefore a cornerstone of workhorse frameworks in organizational economics.41 Thenon-contractible nature of communication in our context is supported by two pieces of empiricalevidence. First, as discussed in Section 5.3, we asked DMs to report their willingness to pay (WTP)for an hour of “one-on-one” conversation with their FM. If communication is non-contractible, weshould expect a sizable wedge between the reported WTP by the DMs and the opportunity cost oftime of the FMs (their hourly wage) in our sample. Panel A of Figure A.6 reports the distributionof the DMs WTP, as well as the average and max hourly wage of FMs in our sample. 67% of DMsreport a higher WTP than the average FM hourly wage and 51% report a higher WTP than the
41An important question is whether relational contracts between the DM and FM can overcome the non-contractibility of communication (Gibbons and Henderson 2012). This is unlikely for several reasons. Relationalcontracts achieve first-best if parties are sufficiently patient. In our setting, the FM and DM have a relatively shorthorizon to develop a collaboration: the DMs will leave the MNC, and the FMs may return home. Second, a well-functioning relational contract requires parties to clearly understand the terms of the relationship (e.g., Chassang2010, Gibbons et al. 2021). The lack of common language–the key friction in our setting–makes this harder. Finally,compared to a benchmark with perfect contractibility, Garicano and Rayo (2017)’s model argues that knowledgetransfers through relational contracts are slow and incomplete.
30
hourly wage of the best paid FM in our sample. This wedge suggest that additional communicationbetween DMs and FMs could increase total surplus.
Second, at the longer-run follow-up survey in 2021, we began to ask DMs to report how manyhours they spent talking with their FM in the past week and how many hours they would have likedto spend talking with their FMs over that same period. Under the non-contractibility assumption,we should also expect seeing a wedge between the ideal and the actual communication time. PanelB of Figure A.6 shows the distribution of values reported by DMs who had responded to the surveybefore it was halted in February.42 On average, in the seven days preceding the survey, DMs wouldhave liked to talk to their FMs 1.4 hours more than they actually did: the actual time is thus lowerthan the ideal one.43
Taken together, this evidence suggests that there is a gap between the level of communicationdesired by the DM and what is provided by the FM.
6.2 Support for the Language Subsidy
The model argues that the general skills and the non-contractibility assumptions are sufficientto create an inefficiency. However, the rationale for the planner to implement a language subsidyand partially correct that inefficiency relies on additional assumptions. In particular, a subsidyis justified if the DM’s choice of English proficiency does not fully internalize the returns of herlanguage investment for the MNC. If either (i) the FM and DM can contract on the DM’s languageskill level or (ii) the English wage premium reflects the marginal value of DM’s English knowledgein the MNC (w′(λ) ≥ 1
γ ), the DM’s privately optimal language investment would be the same orlarger than the one desired by the planner.
With respect to (i), we explored DM’s and FM’s ability to contract on DM’s English proficiencyimplementing a limited experiment during the language training program. For a short period, weoffered an incentive (in the form of mobile phone credit worth $10) conditional on the DM attendinga class. We randomized whether this payment was made to the DM or to the FM. In the spirit ofBubb et al. (2018), the logic of the test is that if the two parties can reach an agreement to split thesurplus created by language training, the identity of the recipient of the payment should not matterfor attendance. If, instead, the identity of the recipient matters, it suggests that parties are unableto maximize and share the joint surplus. We find that the DM’s random assignment to receivingthe incentive increases attendance by 6 percentage points (up from a baseline probability of 57%),but the FM’s random assignment to receive incentive has no effect on the DM’s attendance. Thisprovides suggestive evidence that DMs and FMs are unlikely to be able to contract on the level ofEnglish knowledge.
42To reduce respondent burden, we did not include this question when we resumed the survey in Fall 2021.43Note that if communication was contractible, we would expect the DM to pay for it, in some form. At work,
DM’s wages are positively correlated with communication with the FM, the opposite of what we might expect. Ofcourse the DM might be able to compensate the FM in other ways, e.g., through favors. Although there does notappear to be much evidence of DM and FM in our sample interacting outside of working hours, we cannot completelyrule out such possibility.
31
With respect to (ii), back-of-envelope calculations also suggest that the marginal benefit of lan-guage skills for the MNC are significantly larger than the DM’s English wage premium (w′(λ) < 1
γ ).We calibrate the marginal benefits of the language training to the MNC ( 1
γ ) using the manage-ment simulation results in Section 5.3. On the benefit side, the production workers perform thetask faster if managed by treated DMs (15%, column 1 of Table 8). We multiply the estimatedproductivity gain by the average monthly wage of PWs in the firm and by the average span ofcontrol of DMs in the firm.44 On the cost side, FMs spend more time communicating with DMs(19%, column 5 of Table 8). We multiply this estimate by the average share of FM’s time spenttalking with DMs (6%) and by the monthly wage of FMs at the firm. Our estimate for the average(gross) benefits of the language training for MNCs ( 1
γ ) is thus $19 per month. We compute theDM’s returns from improving English (w′(λ)) using estimates from the resume ratings experiment.When the English level of the DM goes from elementary to advanced (an increase of 2.2 sd in theDMs English skills distribution) the monthly wage offer increases by $51.3 (column 1 of Table 3).The language training increases the English level of DMs by 0.16 sd, so the expected wage increasefrom the language training we offer is $3.6 per month, about 5 times smaller than the MNC’s. Thedata thus suggest that indeed w′(λ) < 1
γ .Applying a conservative 10% annual discount factor, the estimates above imply that DMs
would not pay for the training on their own (See Figure A.7, Panel A). This is consistent with themodel assumption that DM’s investment in English is privately optimal and with DMs self-reportedwillingness to pay for a training program similar to the one we offered. Assuming a conservative3% probability that the DM leaves each month, the NPV of providing the training is also negativefor most MNCs in the sample (see Figure A.7, Panel B).45 Note, however, that the joint returns forDMs and MNCs from the training are positive in 35.9% of cases, but only two MNCs had offered anEnglish language training before our intervention, bringing us back to point (i). As we conclude, itis worth reiterating that the purpose of our intervention was not to evaluate the particular trainingprogram we offered but rather to establish a rationale for some kind of intervention. For example,fostering language acquisition in school might be more effective as foreign languages are betterlearned at a younger age (Dixon et al. 2012).
7 Conclusion
Countries across the developing world open their fiscal coffers to attract MNCs in the hopes thattheir superior operational practices will spillover to domestic companies. We focus on one particularaspect—language barriers—that may impede the initial spark to knowledge transfers, and exploreconditions that would justify policies to complement the typical package of tax incentives, landacquisition, and infrastructure investments that attract MNCs.
44We assume decreasing returns in the span of control (see Figure A.7 for details).45These estimates are consistent with our observation that very few firms had paid language training courses for
their staffs before our intervention. The vast majority of the firms however were very eager that we offer the training,suggesting that the trainings would be beneficial to them.
32
Our setting—MNCs in Myanmar—is a specific one, but we believe that many of its character-istics would be relevant in other settings. The use of English as the lingua franca at the workplaceis common throughout the globe. When DMs in the host country have low proficiency, we wouldexpect communication barriers to be large. Analogously, we would expect similar communicationbarriers to arise when workplace communication occurs in the FMs’ native tongue. For example,Uganda recently added compulsory Mandarin education to selected secondary schools, presum-ably to take advantage of the large inflow of Chinese FDI in recent years. And, of course, manycountries have implemented mandatory English-as-second-language policies starting as early as pri-mary school. There are, of course, many justifications for such policies, the benefits of potentialknowledge transfers from FDI are one specific example. Indeed, Rodrik (2004) argues for languagetraining as an industrial policy because of its potential to raise the process of self-discovery indeveloping countries.
There may be additional inefficiencies that policymakers should correct in order to increase thelikelihood of positive spillovers from MNCs. These could include the provision of infrastructure,removing information frictions to improve matches between MNCs and domestic suppliers, andaddressing credit constraints of existing or potential employees. The approach we take in thispaper—to clarify the conditions under which the planner should intervene and to design a set ofexperimental protocols to explore these conditions—could be adopted to explore frictions that mayimpede spillovers in other settings.
References
Abebe, G., M. S. McMillan, and M. Serafinelli (2018): “Foreign direct investment andknowledge diffusion in poor locations: Evidence from Ethiopia,” Tech. rep., National Bureau ofEconomic Research.
Acemoglu, D. and J.-S. Pischke (1998): “Why do firms train? Theory and evidence,” TheQuarterly journal of economics, 113, 79–119.
Aitken, B. J. and A. E. Harrison (1999): “Do domestic firms benefit from direct foreigninvestment? Evidence from Venezuela,” American economic review, 89, 605–618.
Alfaro-Urena, A., I. Manelici, and J. Vasquez (2019): “The Effects of Multinationals onWorkers: Evidence from Costa Rica,” Tech. rep., London School of Economics.
Alfaro-Ureña, A., I. Manelici, and J. P. Vasquez (2019): “The Effects of Joining Multina-tional Supply Chains: New Evidence from Firm-to-Firm Linkages,” Available at SSRN 3376129.
Alfonsi, L., O. Bandiera, V. Bassi, R. Burgess, I. Rasul, M. Sulaiman, and A. Vitali(2020): “Tackling youth unemployment: Evidence from a labor market experiment in Uganda,”Tech. rep.
33
Antràs, P., L. Garicano, and E. Rossi-Hansberg (2006): “Offshoring in a knowledge econ-omy,” The Quarterly Journal of Economics, 121, 31–77.
Antràs, P. and E. Rossi-Hansberg (2009): “Organizations and Trade,” Annual Review ofEconomics, 1, 43–64.
Antràs, P., E. Rossi-Hansberg, and L. Garicano (2008): Organizing Offshoring: MiddleManagers and Communication Costs, Cambridge, MA: Harvard University Press, 311–39.
Arkolakis, C., N. Ramondo, A. RodrÃguez-Clare, and S. Yeaple (2018): “Innovationand Production in the Global Economy,” American Economic Review, 108, 2128–73.
Atkin, D., A. Chaudhry, S. Chaudry, A. K. Khandelwal, and E. Verhoogen (2017):“Organizational Barriers to Technology Adoption: Evidence from Soccer-Ball Producers in Pak-istan*,” The Quarterly Journal of Economics, 132, 1101–1164.
Atkin, D. and A. K. Khandelwal (2020): “How Distortions Alter the Impacts of InternationalTrade in Developing Countries,” Annual Review of Economics, 12, 213–238.
Bai, J., P. Barwick, S. Cao, and S. Li (2021): “Quid Pro Quo, Knowledge Spillover andIndustrial Quality Upgrading,” .
Bai, J., M. Chen, J. Liu, X. Mu, and D. Y. Xu (2020): “Search and Information Frictionson Global E-Commerce Platforms: Evidence from AliExpress,” Working Paper 28100, NationalBureau of Economic Research.
Bisztray, M., M. Koren, and A. Szeidl (2018): “Learning to import from your peers,” Journalof International Economics, 115, 242–258.
Bloom, N., B. Eifert, A. Mahajan, D. McKenzie, and J. Roberts (2012a): “Does Man-agement Matter? Evidence from India *,” The Quarterly Journal of Economics, 128, 1–51.
Bloom, N., R. Sadun, and J. Van Reenen (2012b): “Americans do IT better: US multina-tionals and the productivity miracle,” American Economic Review, 102, 167–201.
——— (2016): “Management as a Technology?” Working Paper 22327, National Bureau of Eco-nomic Research.
Bloom, N. and J. Van Reenen (2007): “Measuring and explaining management practices acrossfirms and countries,” The quarterly journal of Economics, 122, 1351–1408.
Bubb, R., S. Kaur, and S. Mullainathan (2018): “The limits of neighborly exchange,” Un-published manuscript, Poverty Action Lab.[430].
Burchardi, K. B., T. Chaney, and T. A. Hassan (2019): “Migrants, Ancestors, and ForeignInvestments,” The Review of Economic Studies, 86, 1448–86.
34
Cai, J. and A. Szeidl (2017): “Interfirm Relationships and Business Performance,” The QuarterlyJournal of Economics, 133, 1229–1282.
Caliendo, L. and E. Rossi-Hansberg (2012): “The impact of trade on organization and pro-ductivity,” The quarterly journal of economics, 127, 1393–1467.
Chassang, S. (2010): “Building Routines: Learning, Cooperation, and the Dynamics of Incom-plete Relational Contracts,” American Economic Review, 100, 448–65.
Chen, M. X. and M. Wu (2021): “The Value of Reputation in Trade: Evidence from Alibaba,”The Review of Economics and Statistics, 103, 857–873.
Crawford, V. P. and J. Sobel (1982): “Strategic information transmission,” Econometrica:Journal of the Econometric Society, 1431–1451.
Cremer, J., L. Garicano, and A. Prat (2007): “Language and the Theory of the Firm,” TheQuarterly Journal of Economics, 122, 373–407.
DeFilippis, E., S. M. Impink, M. Singell, J. T. Polzer, and R. Sadun (2020): “Collabo-rating During Coronavirus: The Impact of COVID-19 on the Nature of Work,” Working Paper27612, National Bureau of Economic Research.
Dessein, W. (2002): “Authority and communication in organizations,” The Review of EconomicStudies, 69, 811–838.
Dewatripont, M. and J. Tirole (2005): “Modes of communication,” Journal of political econ-omy, 113, 1217–1238.
Dixon, L. Q., J. Zhao, J.-Y. Shin, S. Wu, J.-H. Su, R. Burgess-Brigham, M. U. Gezer,and C. Snow (2012): “What we know about second language acquisition: A synthesis fromfour perspectives,” Review of Educational Research, 82, 5–60.
Economist (2014): “The English empire,” The Economist.
EPI, E. F. (2020): “EF English proficiency index,” Education First Retrieved from EducationFirst Rankings.
Garicano, L. (2000): “Hierarchies and the Organization of Knowledge in Production,” Journalof political economy, 108, 874–904.
Garicano, L. and L. Rayo (2017): “Relational Knowledge Transfers,” American EconomicReview, 107, 2695–2730.
Gibbons, R. and R. Henderson (2012): “Relational contracts and organizational capabilities,”Organization science, 23, 1350–1364.
35
Gibbons, R., M. LiCalzi, and M. Warglien (2021): “What Situation Is This? Shared Framesand Collective Performance,” Strategy Science.
Giorcelli, M. (2019): “The long-term effects of management and technology transfers,” AmericanEconomic Review, 109, 121–52.
Hanson, G. H. (2012): “The rise of middle kingdoms: Emerging economies in global trade,”Journal of Economic Perspectives, 26, 41–64.
Harrison, A. and A. Rodriguez-Clare (2010): “Trade, foreign investment, and industrialpolicy for developing countries,” in Handbook of development economics, Elsevier, vol. 5, 4039–4214.
Head, K., T. Mayer, and J. Ries (2010): “The erosion of colonial trade linkages after indepen-dence,” Journal of International Economics, 81, 1 – 14.
Hoya, C., A. McCallum, A. Patel, and T. Wilson (2018): “Measuring the impact ofCommunity-Based English Language Provision: Findings from a Randomised Controlled Trial,”.
Javorcik, B. (2004): “Does foreign direct investment increase the productivity of domestic firms?In search of spillovers through backward linkages,” American economic review, 94, 605–627.
Keller, W. (2004): “International Technology Diffusion,” Journal of Economic Literature, 42,752–782.
——— (2021): “Knowledge Spillovers, Trade, and Foreign Direct Investment,” Working Paper28739, National Bureau of Economic Research.
Keller, W. and S. R. Yeaple (2013): “The Gravity of Knowledge,” American Economic Review,103, 1414–44.
Kessler, J. B., C. Low, and C. D. Sullivan (2019): “Incentivized resume rating: Elicitingemployer preferences without deception,” American Economic Review, 109, 3713–44.
Lagakos, D., B. Moll, T. Porzio, N. Qian, and T. Schoellman (2018): “Life cycle wagegrowth across countries,” Journal of Political Economy, 126, 797–849.
Macchiavello, R. and A. Morjaria (2015): “The Value of Relationships: Evidence from aSupply Shock to Kenyan Rose Exports,” American Economic Review, 105, 2911–45.
Macchiavello, R., A. Rabbani, and C. Woodruff (2015): “The market for training services:a demand experiment with Bangladeshi garment factories,” American Economic Review, 105,300–304.
McKenzie, D. (2012): “Beyond baseline and follow-up: The case for more T in experiments,”Journal of development Economics, 99, 210–221.
36
McKenzie, D. and C. Woodruff (2014): “What Are We Learning from Business Training andEntrepreneurship Evaluations around the Developing World?” World Bank Research Observer,29, 48–82.
Melitz, J. and F. Toubal (2014): “Native language, spoken language, translation and trade,”Journal of International Economics, 93, 351–363.
Morales, E., G. Sheu, and A. Zahler (2019): “Extended Gravity,” The Review of EconomicStudies, 86, 2668–2712.
Munshi, K. and M. Rosenzweig (2006): “Traditional Institutions Meet the Modern World:Caste, Gender, and Schooling Choice in a Globalizing Economy,” American Economic Review,96, 1225–1252.
Neeley, T. (2017): The Language of Global Success: How a Common Tongue Transforms Multi-national Organizations, Princeton University Press.
Nunn, N. (2019): “Rethinking economic development,” Canadian Journal of Economics/Revuecanadienne d’Ã c©conomique, 52, 1349–1373.
Polanyi, M. (1966): The Tacit Dimension, Garden City, NY: Doubleday.
Poole, J. P. (2013): “Knowledge transfers from multinational to domestic firms: Evidence fromworker mobility,” Review of Economics and Statistics, 95, 393–406.
Rauch, J. E. and V. Trindade (2002): “Ethnic Chinese Networks In International Trade,” TheReview of Economics and Statistics, 84, 116–130.
Reed, T. and T. T. Tran (2019): The Large-Firm Wage Premium in Developing Economies,The World Bank.
Rodrik, D. (2004): “Industrial Policy for the Twenty-First Century,” Cepr discussion papers,UNIDO.
Selten, R. and M. Warglien (2007): “The emergence of simple languages in an experimentalcoordination game,” Proceedings of the National Academy of Sciences, 104, 7361–7366.
Startz, M. (2021): “The value of face-to-face: Search and contracting problems in Nigerian trade,”Tech. rep., Stanford University.
Stiglitz, J. E. and P. Dasgupta (1971): “Differential taxation, public goods, and economicefficiency,” The Review of Economic Studies, 38, 151–174.
Tenzer, H., S. Terjesen, and A.-W. Harzing (2017): “Language in International Business:A Review and Agenda for Future Research,” Management International Review, 57.
Yeaple, S. R. (2013): “The Multinational Firm,” Annual Review of Economics, 5, 193–217.
37
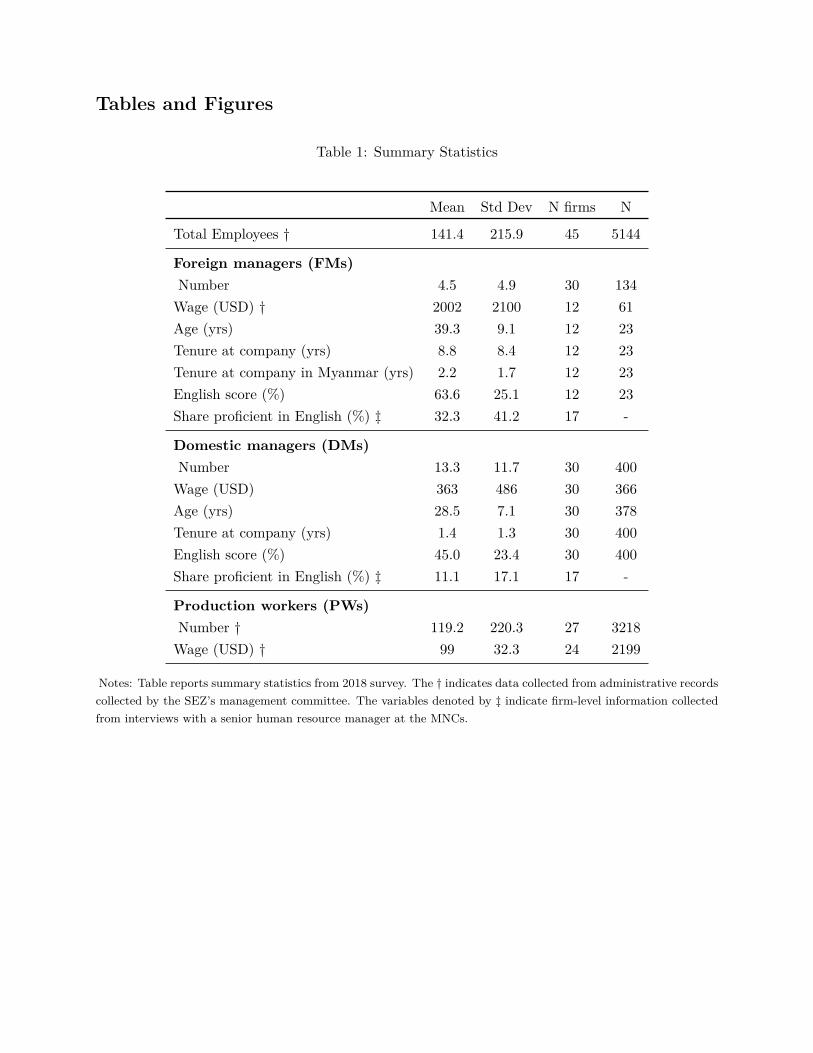
Tables and Figures
Table 1: Summary Statistics
Mean Std Dev N firms N
Total Employees † 141.4 215.9 45 5144
Foreign managers (FMs)Number 4.5 4.9 30 134Wage (USD) † 2002 2100 12 61Age (yrs) 39.3 9.1 12 23Tenure at company (yrs) 8.8 8.4 12 23Tenure at company in Myanmar (yrs) 2.2 1.7 12 23English score (%) 63.6 25.1 12 23Share proficient in English (%) ‡ 32.3 41.2 17 -
Domestic managers (DMs)Number 13.3 11.7 30 400Wage (USD) 363 486 30 366Age (yrs) 28.5 7.1 30 378Tenure at company (yrs) 1.4 1.3 30 400English score (%) 45.0 23.4 30 400Share proficient in English (%) ‡ 11.1 17.1 17 -
Production workers (PWs)Number † 119.2 220.3 27 3218Wage (USD) † 99 32.3 24 2199
Notes: Table reports summary statistics from 2018 survey. The † indicates data collected from administrative recordscollected by the SEZ’s management committee. The variables denoted by ‡ indicate firm-level information collectedfrom interviews with a senior human resource manager at the MNCs.
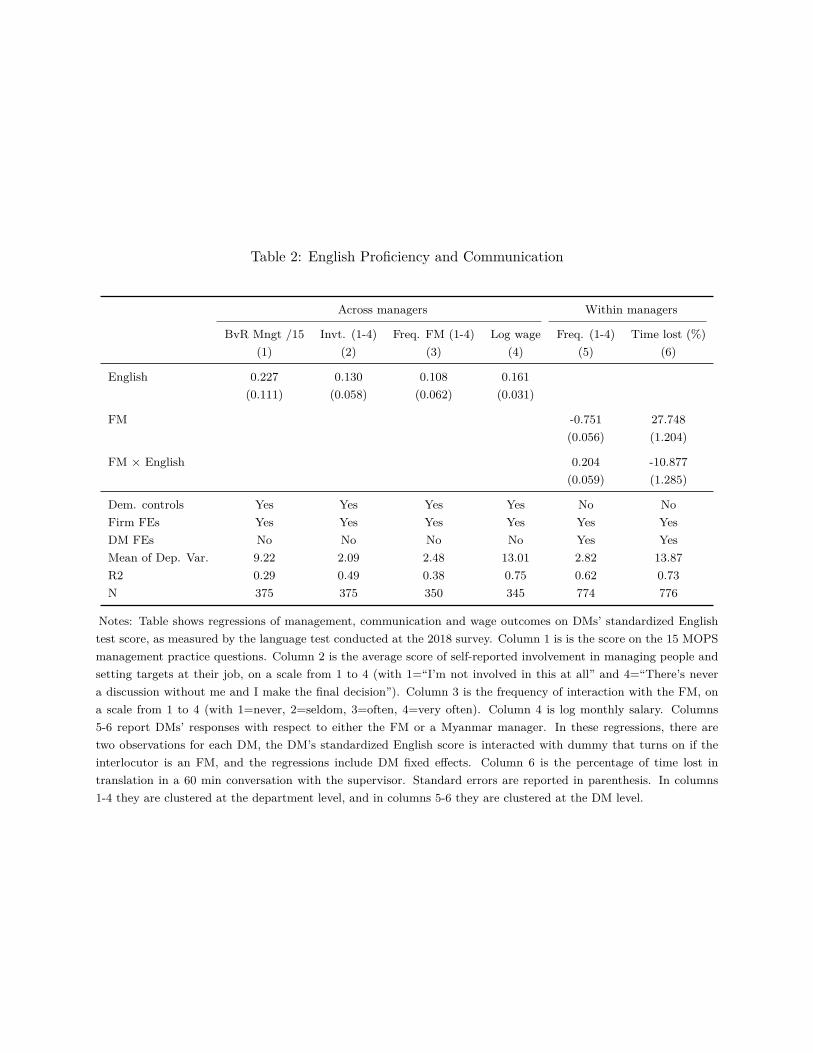
Table 2: English Proficiency and Communication
Across managers Within managers
BvR Mngt /15 Invt. (1-4) Freq. FM (1-4) Log wage Freq. (1-4) Time lost (%)(1) (2) (3) (4) (5) (6)
English 0.227 0.130 0.108 0.161(0.111) (0.058) (0.062) (0.031)
FM -0.751 27.748(0.056) (1.204)
FM × English 0.204 -10.877(0.059) (1.285)
Dem. controls Yes Yes Yes Yes No NoFirm FEs Yes Yes Yes Yes Yes YesDM FEs No No No No Yes YesMean of Dep. Var. 9.22 2.09 2.48 13.01 2.82 13.87R2 0.29 0.49 0.38 0.75 0.62 0.73N 375 375 350 345 774 776
Notes: Table shows regressions of management, communication and wage outcomes on DMs’ standardized Englishtest score, as measured by the language test conducted at the 2018 survey. Column 1 is is the score on the 15 MOPSmanagement practice questions. Column 2 is the average score of self-reported involvement in managing people andsetting targets at their job, on a scale from 1 to 4 (with 1=“I’m not involved in this at all” and 4=“There’s nevera discussion without me and I make the final decision”). Column 3 is the frequency of interaction with the FM, ona scale from 1 to 4 (with 1=never, 2=seldom, 3=often, 4=very often). Column 4 is log monthly salary. Columns5-6 report DMs’ responses with respect to either the FM or a Myanmar manager. In these regressions, there aretwo observations for each DM, the DM’s standardized English score is interacted with dummy that turns on if theinterlocutor is an FM, and the regressions include DM fixed effects. Column 6 is the percentage of time lost intranslation in a 60 min conversation with the supervisor. Standard errors are reported in parenthesis. In columns1-4 they are clustered at the department level, and in columns 5-6 they are clustered at the DM level.
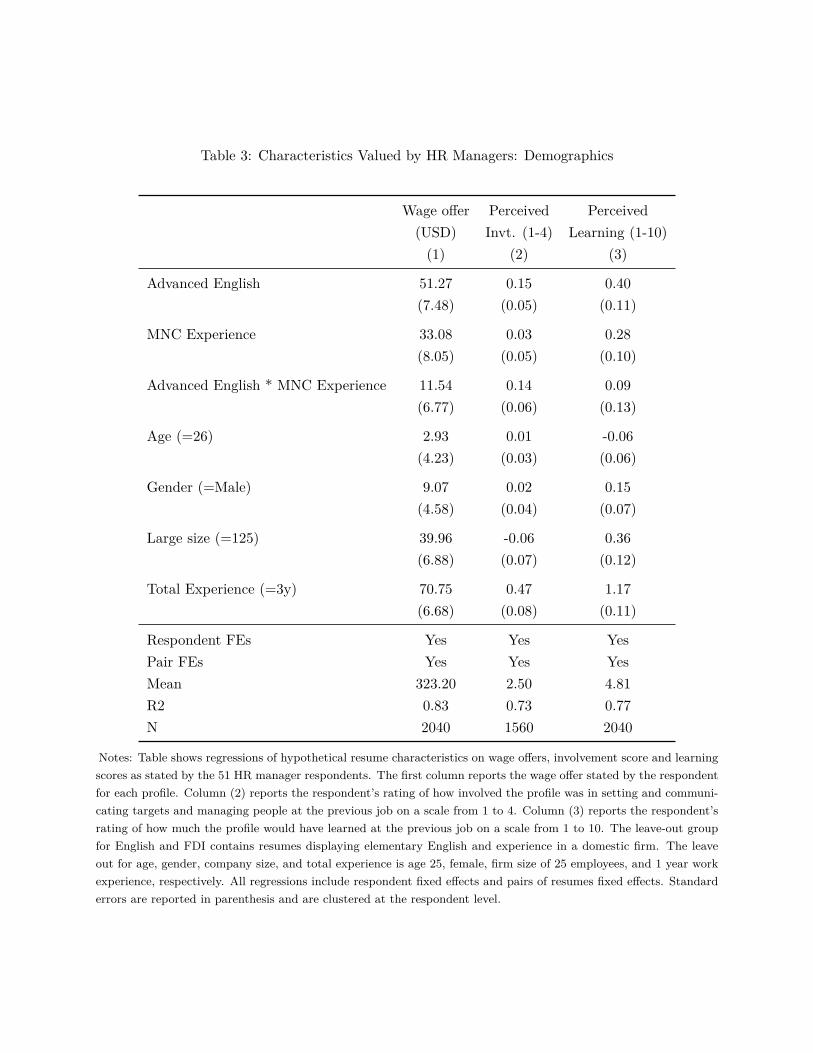
Table 3: Characteristics Valued by HR Managers: Demographics
Wage offer Perceived Perceived(USD) Invt. (1-4) Learning (1-10)(1) (2) (3)
Advanced English 51.27 0.15 0.40(7.48) (0.05) (0.11)
MNC Experience 33.08 0.03 0.28(8.05) (0.05) (0.10)
Advanced English * MNC Experience 11.54 0.14 0.09(6.77) (0.06) (0.13)
Age (=26) 2.93 0.01 -0.06(4.23) (0.03) (0.06)
Gender (=Male) 9.07 0.02 0.15(4.58) (0.04) (0.07)
Large size (=125) 39.96 -0.06 0.36(6.88) (0.07) (0.12)
Total Experience (=3y) 70.75 0.47 1.17(6.68) (0.08) (0.11)
Respondent FEs Yes Yes YesPair FEs Yes Yes YesMean 323.20 2.50 4.81R2 0.83 0.73 0.77N 2040 1560 2040
Notes: Table shows regressions of hypothetical resume characteristics on wage offers, involvement score and learningscores as stated by the 51 HR manager respondents. The first column reports the wage offer stated by the respondentfor each profile. Column (2) reports the respondent’s rating of how involved the profile was in setting and communi-cating targets and managing people at the previous job on a scale from 1 to 4. Column (3) reports the respondent’srating of how much the profile would have learned at the previous job on a scale from 1 to 10. The leave-out groupfor English and FDI contains resumes displaying elementary English and experience in a domestic firm. The leaveout for age, gender, company size, and total experience is age 25, female, firm size of 25 employees, and 1 year workexperience, respectively. All regressions include respondent fixed effects and pairs of resumes fixed effects. Standarderrors are reported in parenthesis and are clustered at the respondent level.
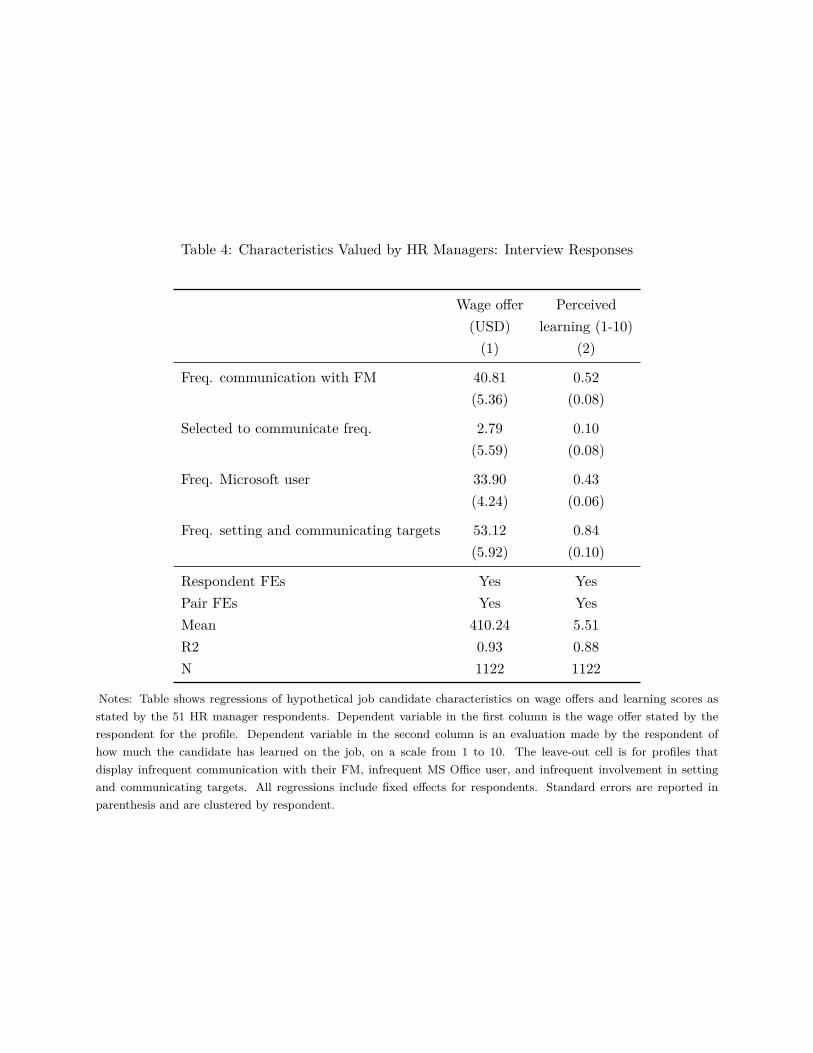
Table 4: Characteristics Valued by HR Managers: Interview Responses
Wage offer Perceived(USD) learning (1-10)(1) (2)
Freq. communication with FM 40.81 0.52(5.36) (0.08)
Selected to communicate freq. 2.79 0.10(5.59) (0.08)
Freq. Microsoft user 33.90 0.43(4.24) (0.06)
Freq. setting and communicating targets 53.12 0.84(5.92) (0.10)
Respondent FEs Yes YesPair FEs Yes YesMean 410.24 5.51R2 0.93 0.88N 1122 1122
Notes: Table shows regressions of hypothetical job candidate characteristics on wage offers and learning scores asstated by the 51 HR manager respondents. Dependent variable in the first column is the wage offer stated by therespondent for the profile. Dependent variable in the second column is an evaluation made by the respondent ofhow much the candidate has learned on the job, on a scale from 1 to 10. The leave-out cell is for profiles thatdisplay infrequent communication with their FM, infrequent MS Office user, and infrequent involvement in settingand communicating targets. All regressions include fixed effects for respondents. Standard errors are reported inparenthesis and are clustered by respondent.
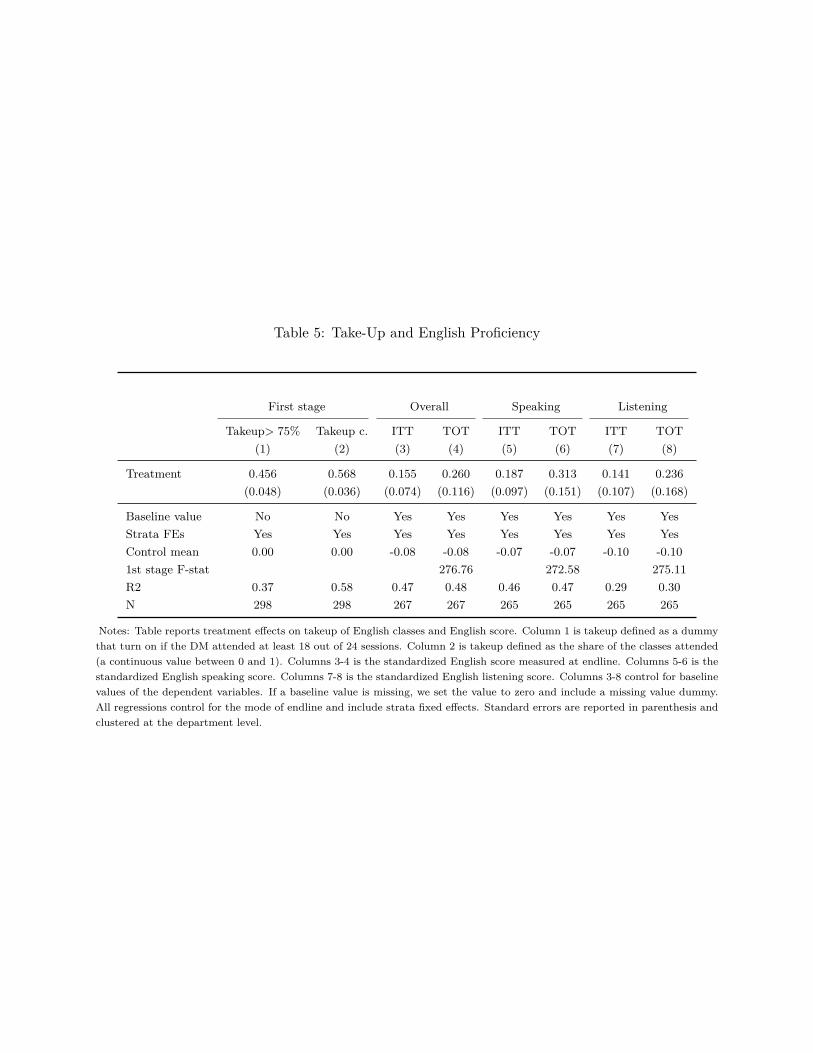
Table 5: Take-Up and English Proficiency
First stage Overall Speaking Listening
Takeup> 75% Takeup c. ITT TOT ITT TOT ITT TOT(1) (2) (3) (4) (5) (6) (7) (8)
Treatment 0.456 0.568 0.155 0.260 0.187 0.313 0.141 0.236(0.048) (0.036) (0.074) (0.116) (0.097) (0.151) (0.107) (0.168)
Baseline value No No Yes Yes Yes Yes Yes YesStrata FEs Yes Yes Yes Yes Yes Yes Yes YesControl mean 0.00 0.00 -0.08 -0.08 -0.07 -0.07 -0.10 -0.101st stage F-stat 276.76 272.58 275.11R2 0.37 0.58 0.47 0.48 0.46 0.47 0.29 0.30N 298 298 267 267 265 265 265 265
Notes: Table reports treatment effects on takeup of English classes and English score. Column 1 is takeup defined as a dummythat turn on if the DM attended at least 18 out of 24 sessions. Column 2 is takeup defined as the share of the classes attended(a continuous value between 0 and 1). Columns 3-4 is the standardized English score measured at endline. Columns 5-6 is thestandardized English speaking score. Columns 7-8 is the standardized English listening score. Columns 3-8 control for baselinevalues of the dependent variables. If a baseline value is missing, we set the value to zero and include a missing value dummy.All regressions control for the mode of endline and include strata fixed effects. Standard errors are reported in parenthesis andclustered at the department level.
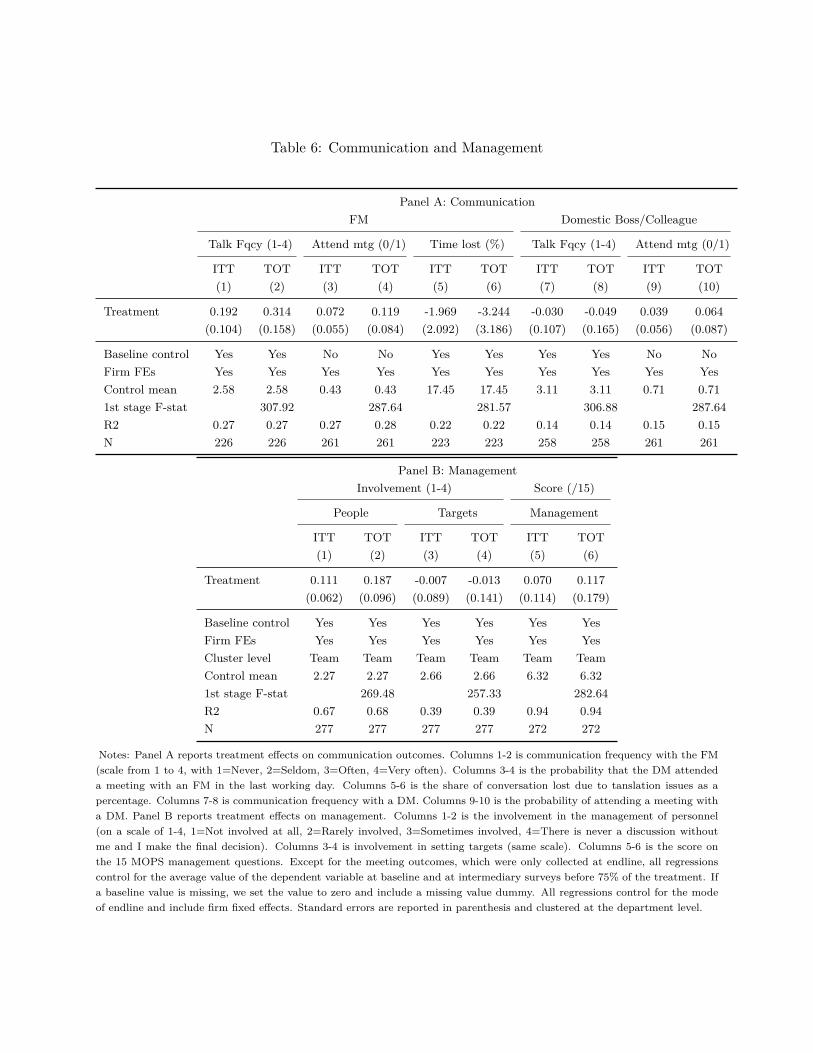
Table 6: Communication and Management
Panel A: CommunicationFM Domestic Boss/Colleague
Talk Fqcy (1-4) Attend mtg (0/1) Time lost (%) Talk Fqcy (1-4) Attend mtg (0/1)
ITT TOT ITT TOT ITT TOT ITT TOT ITT TOT(1) (2) (3) (4) (5) (6) (7) (8) (9) (10)
Treatment 0.192 0.314 0.072 0.119 -1.969 -3.244 -0.030 -0.049 0.039 0.064(0.104) (0.158) (0.055) (0.084) (2.092) (3.186) (0.107) (0.165) (0.056) (0.087)
Baseline control Yes Yes No No Yes Yes Yes Yes No NoFirm FEs Yes Yes Yes Yes Yes Yes Yes Yes Yes YesControl mean 2.58 2.58 0.43 0.43 17.45 17.45 3.11 3.11 0.71 0.711st stage F-stat 307.92 287.64 281.57 306.88 287.64R2 0.27 0.27 0.27 0.28 0.22 0.22 0.14 0.14 0.15 0.15N 226 226 261 261 223 223 258 258 261 261
Panel B: ManagementInvolvement (1-4) Score (/15)
People Targets Management
ITT TOT ITT TOT ITT TOT(1) (2) (3) (4) (5) (6)
Treatment 0.111 0.187 -0.007 -0.013 0.070 0.117(0.062) (0.096) (0.089) (0.141) (0.114) (0.179)
Baseline control Yes Yes Yes Yes Yes YesFirm FEs Yes Yes Yes Yes Yes YesCluster level Team Team Team Team Team TeamControl mean 2.27 2.27 2.66 2.66 6.32 6.321st stage F-stat 269.48 257.33 282.64R2 0.67 0.68 0.39 0.39 0.94 0.94N 277 277 277 277 272 272
Notes: Panel A reports treatment effects on communication outcomes. Columns 1-2 is communication frequency with the FM(scale from 1 to 4, with 1=Never, 2=Seldom, 3=Often, 4=Very often). Columns 3-4 is the probability that the DM attendeda meeting with an FM in the last working day. Columns 5-6 is the share of conversation lost due to tanslation issues as apercentage. Columns 7-8 is communication frequency with a DM. Columns 9-10 is the probability of attending a meeting witha DM. Panel B reports treatment effects on management. Columns 1-2 is the involvement in the management of personnel(on a scale of 1-4, 1=Not involved at all, 2=Rarely involved, 3=Sometimes involved, 4=There is never a discussion withoutme and I make the final decision). Columns 3-4 is involvement in setting targets (same scale). Columns 5-6 is the score onthe 15 MOPS management questions. Except for the meeting outcomes, which were only collected at endline, all regressionscontrol for the average value of the dependent variable at baseline and at intermediary surveys before 75% of the treatment. Ifa baseline value is missing, we set the value to zero and include a missing value dummy. All regressions control for the modeof endline and include firm fixed effects. Standard errors are reported in parenthesis and clustered at the department level.
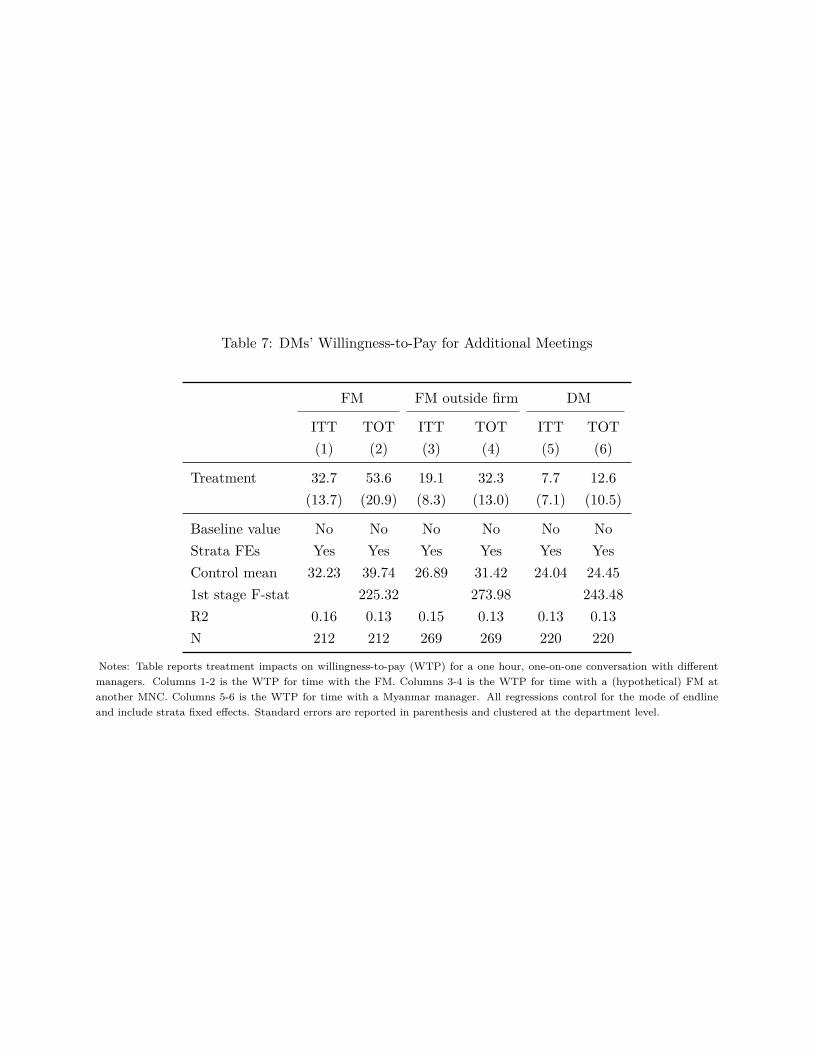
Table 7: DMs’ Willingness-to-Pay for Additional Meetings
FM FM outside firm DM
ITT TOT ITT TOT ITT TOT(1) (2) (3) (4) (5) (6)
Treatment 32.7 53.6 19.1 32.3 7.7 12.6(13.7) (20.9) (8.3) (13.0) (7.1) (10.5)
Baseline value No No No No No NoStrata FEs Yes Yes Yes Yes Yes YesControl mean 32.23 39.74 26.89 31.42 24.04 24.451st stage F-stat 225.32 273.98 243.48R2 0.16 0.13 0.15 0.13 0.13 0.13N 212 212 269 269 220 220
Notes: Table reports treatment impacts on willingness-to-pay (WTP) for a one hour, one-on-one conversation with differentmanagers. Columns 1-2 is the WTP for time with the FM. Columns 3-4 is the WTP for time with a (hypothetical) FM atanother MNC. Columns 5-6 is the WTP for time with a Myanmar manager. All regressions control for the mode of endlineand include strata fixed effects. Standard errors are reported in parenthesis and clustered at the department level.
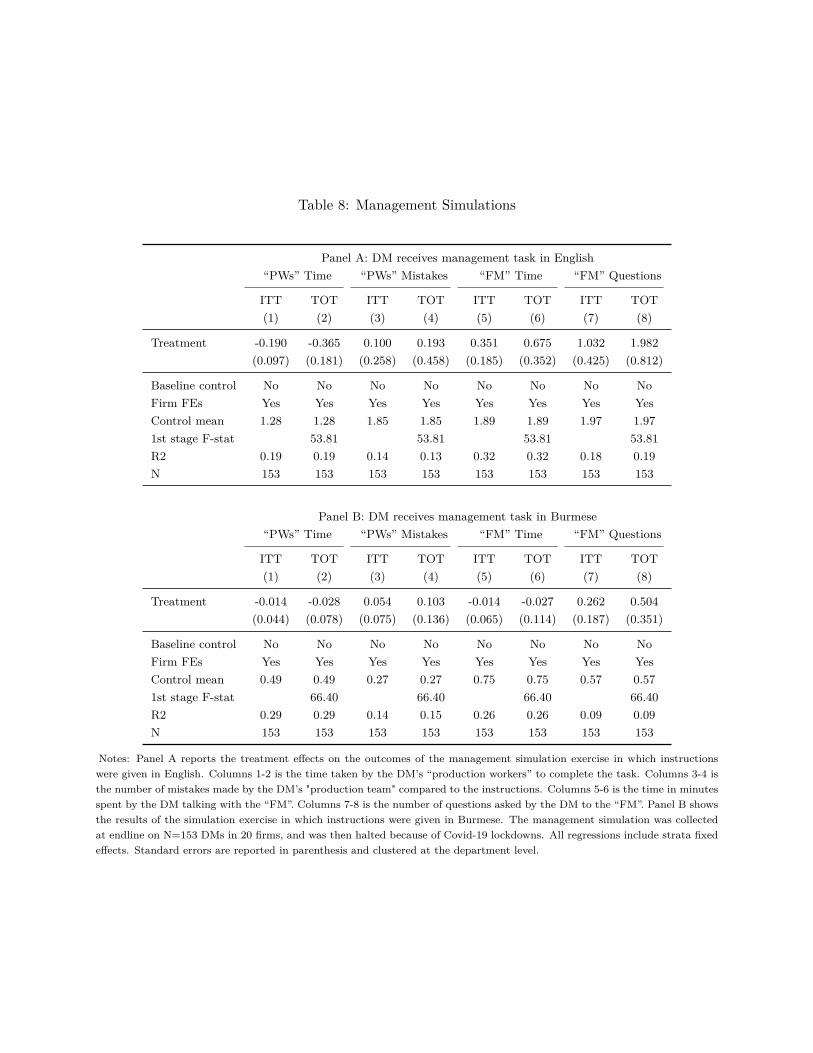
Table 8: Management Simulations
Panel A: DM receives management task in English“PWs” Time “PWs” Mistakes “FM” Time “FM” Questions
ITT TOT ITT TOT ITT TOT ITT TOT(1) (2) (3) (4) (5) (6) (7) (8)
Treatment -0.190 -0.365 0.100 0.193 0.351 0.675 1.032 1.982(0.097) (0.181) (0.258) (0.458) (0.185) (0.352) (0.425) (0.812)
Baseline control No No No No No No No NoFirm FEs Yes Yes Yes Yes Yes Yes Yes YesControl mean 1.28 1.28 1.85 1.85 1.89 1.89 1.97 1.971st stage F-stat 53.81 53.81 53.81 53.81R2 0.19 0.19 0.14 0.13 0.32 0.32 0.18 0.19N 153 153 153 153 153 153 153 153
Panel B: DM receives management task in Burmese“PWs” Time “PWs” Mistakes “FM” Time “FM” Questions
ITT TOT ITT TOT ITT TOT ITT TOT(1) (2) (3) (4) (5) (6) (7) (8)
Treatment -0.014 -0.028 0.054 0.103 -0.014 -0.027 0.262 0.504(0.044) (0.078) (0.075) (0.136) (0.065) (0.114) (0.187) (0.351)
Baseline control No No No No No No No NoFirm FEs Yes Yes Yes Yes Yes Yes Yes YesControl mean 0.49 0.49 0.27 0.27 0.75 0.75 0.57 0.571st stage F-stat 66.40 66.40 66.40 66.40R2 0.29 0.29 0.14 0.15 0.26 0.26 0.09 0.09N 153 153 153 153 153 153 153 153
Notes: Panel A reports the treatment effects on the outcomes of the management simulation exercise in which instructionswere given in English. Columns 1-2 is the time taken by the DM’s “production workers” to complete the task. Columns 3-4 isthe number of mistakes made by the DM’s "production team" compared to the instructions. Columns 5-6 is the time in minutesspent by the DM talking with the “FM”. Columns 7-8 is the number of questions asked by the DM to the “FM”. Panel B showsthe results of the simulation exercise in which instructions were given in Burmese. The management simulation was collectedat endline on N=153 DMs in 20 firms, and was then halted because of Covid-19 lockdowns. All regressions include strata fixedeffects. Standard errors are reported in parenthesis and clustered at the department level.
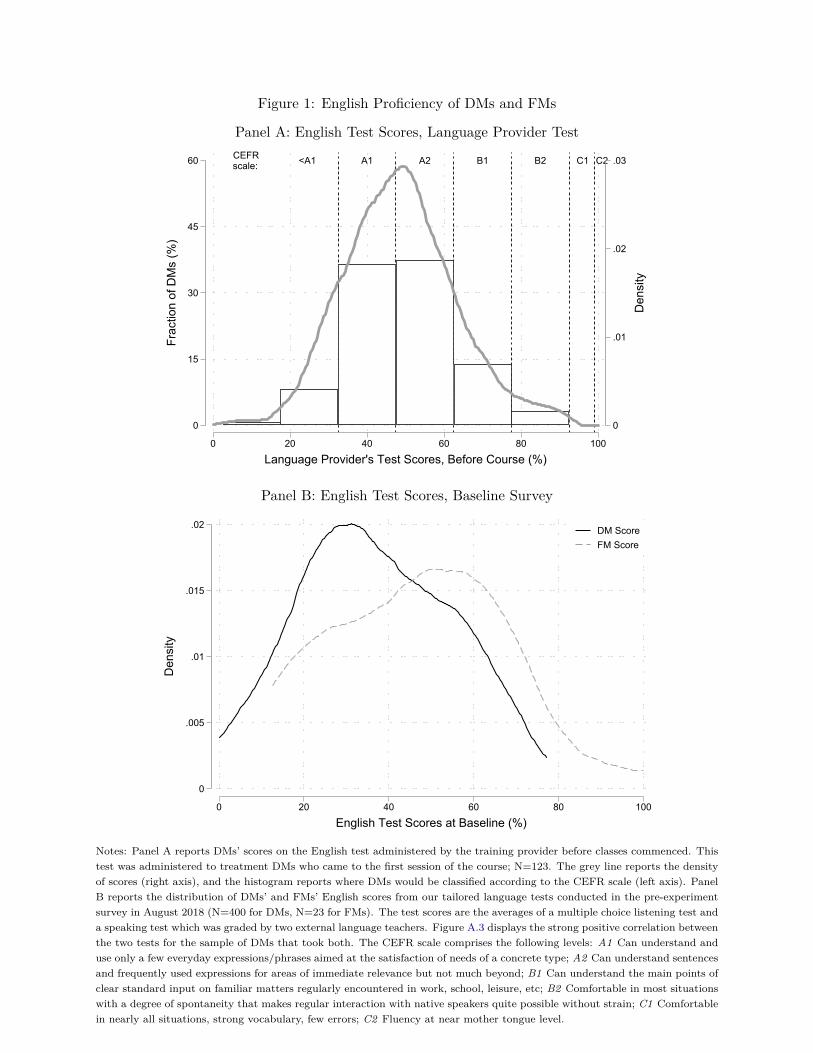
Figure 1: English Proficiency of DMs and FMs
Panel A: English Test Scores, Language Provider TestCEFRscale: <A1 A1 A2 B1 B2 C1 C2
0
.01
.02
.03
Den
sity
0
15
30
45
60Fr
actio
n of
DM
s (%
)
0 20 40 60 80 100
Language Provider's Test Scores, Before Course (%)
Panel B: English Test Scores, Baseline Survey
0
.005
.01
.015
.02
Den
sity
0 20 40 60 80 100
English Test Scores at Baseline (%)
DM ScoreFM Score
Notes: Panel A reports DMs’ scores on the English test administered by the training provider before classes commenced. Thistest was administered to treatment DMs who came to the first session of the course; N=123. The grey line reports the densityof scores (right axis), and the histogram reports where DMs would be classified according to the CEFR scale (left axis). PanelB reports the distribution of DMs’ and FMs’ English scores from our tailored language tests conducted in the pre-experimentsurvey in August 2018 (N=400 for DMs, N=23 for FMs). The test scores are the averages of a multiple choice listening test anda speaking test which was graded by two external language teachers. Figure A.3 displays the strong positive correlation betweenthe two tests for the sample of DMs that took both. The CEFR scale comprises the following levels: A1 Can understand anduse only a few everyday expressions/phrases aimed at the satisfaction of needs of a concrete type; A2 Can understand sentencesand frequently used expressions for areas of immediate relevance but not much beyond; B1 Can understand the main points ofclear standard input on familiar matters regularly encountered in work, school, leisure, etc; B2 Comfortable in most situationswith a degree of spontaneity that makes regular interaction with native speakers quite possible without strain; C1 Comfortablein nearly all situations, strong vocabulary, few errors; C2 Fluency at near mother tongue level.
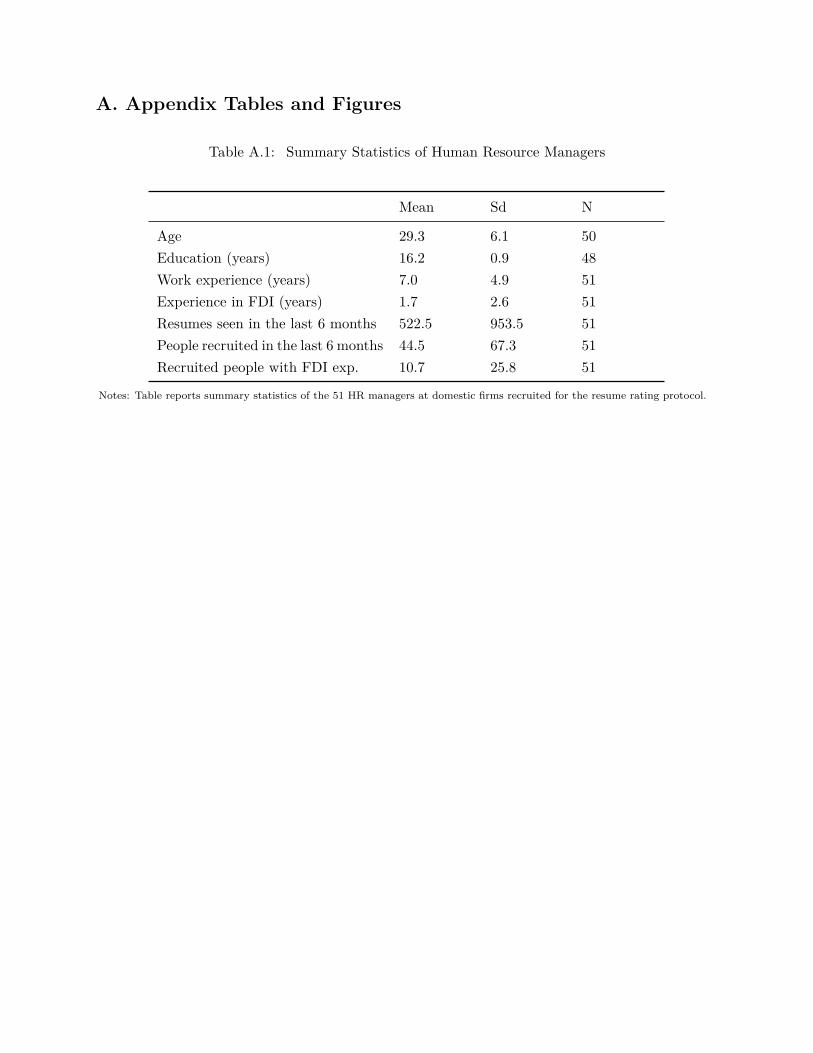
A. Appendix Tables and Figures
Table A.1: Summary Statistics of Human Resource Managers
Mean Sd N
Age 29.3 6.1 50Education (years) 16.2 0.9 48Work experience (years) 7.0 4.9 51Experience in FDI (years) 1.7 2.6 51Resumes seen in the last 6 months 522.5 953.5 51People recruited in the last 6 months 44.5 67.3 51Recruited people with FDI exp. 10.7 25.8 51
Notes: Table reports summary statistics of the 51 HR managers at domestic firms recruited for the resume rating protocol.
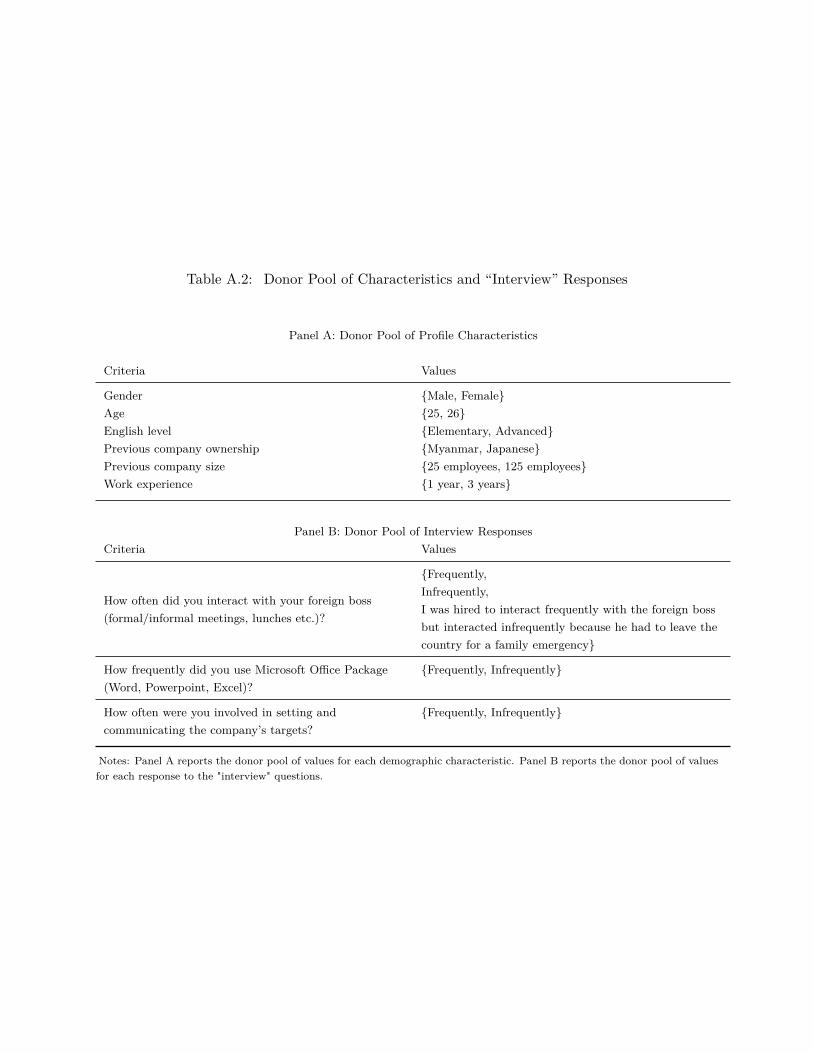
Table A.2: Donor Pool of Characteristics and “Interview” Responses
Panel A: Donor Pool of Profile Characteristics
Criteria Values
Gender {Male, Female}Age {25, 26}English level {Elementary, Advanced}Previous company ownership {Myanmar, Japanese}Previous company size {25 employees, 125 employees}Work experience {1 year, 3 years}
Panel B: Donor Pool of Interview ResponsesCriteria Values
How often did you interact with your foreign boss(formal/informal meetings, lunches etc.)?
{Frequently,Infrequently,I was hired to interact frequently with the foreign bossbut interacted infrequently because he had to leave thecountry for a family emergency}
How frequently did you use Microsoft Office Package(Word, Powerpoint, Excel)?
{Frequently, Infrequently}
How often were you involved in setting andcommunicating the company’s targets?
{Frequently, Infrequently}
Notes: Panel A reports the donor pool of values for each demographic characteristic. Panel B reports the donor pool of valuesfor each response to the "interview" questions.
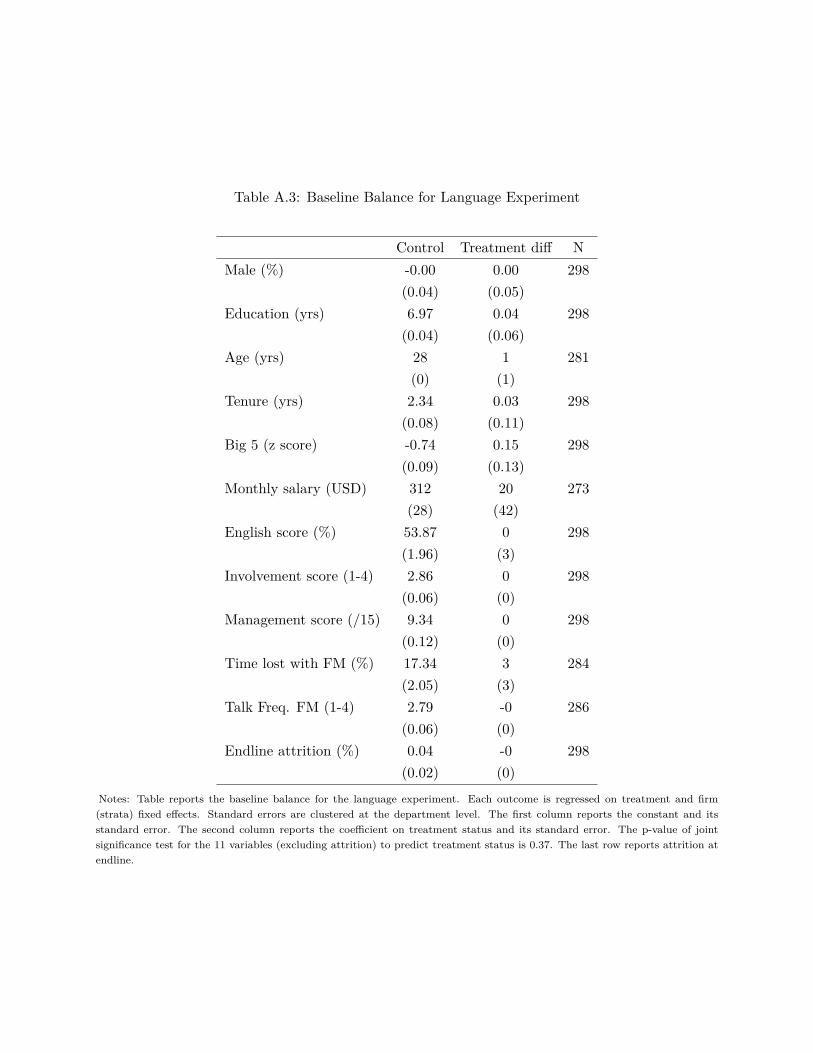
Table A.3: Baseline Balance for Language Experiment
Control Treatment diff NMale (%) -0.00 0.00 298
(0.04) (0.05)Education (yrs) 6.97 0.04 298
(0.04) (0.06)Age (yrs) 28 1 281
(0) (1)Tenure (yrs) 2.34 0.03 298
(0.08) (0.11)Big 5 (z score) -0.74 0.15 298
(0.09) (0.13)Monthly salary (USD) 312 20 273
(28) (42)English score (%) 53.87 0 298
(1.96) (3)Involvement score (1-4) 2.86 0 298
(0.06) (0)Management score (/15) 9.34 0 298
(0.12) (0)Time lost with FM (%) 17.34 3 284
(2.05) (3)Talk Freq. FM (1-4) 2.79 -0 286
(0.06) (0)Endline attrition (%) 0.04 -0 298
(0.02) (0)
Notes: Table reports the baseline balance for the language experiment. Each outcome is regressed on treatment and firm(strata) fixed effects. Standard errors are clustered at the department level. The first column reports the constant and itsstandard error. The second column reports the coefficient on treatment status and its standard error. The p-value of jointsignificance test for the 11 variables (excluding attrition) to predict treatment status is 0.37. The last row reports attrition atendline.
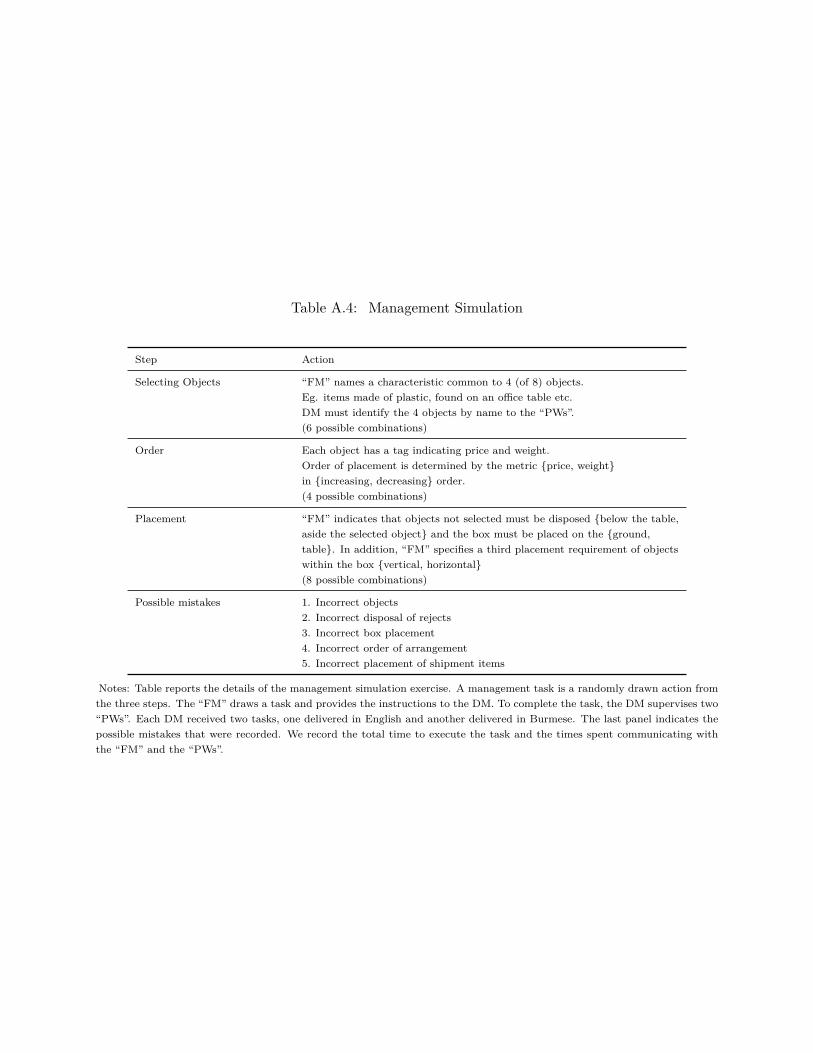
Table A.4: Management Simulation
Step Action
Selecting Objects “FM” names a characteristic common to 4 (of 8) objects.Eg. items made of plastic, found on an office table etc.DM must identify the 4 objects by name to the “PWs”.(6 possible combinations)
Order Each object has a tag indicating price and weight.Order of placement is determined by the metric {price, weight}in {increasing, decreasing} order.(4 possible combinations)
Placement “FM” indicates that objects not selected must be disposed {below the table,aside the selected object} and the box must be placed on the {ground,table}. In addition, “FM” specifies a third placement requirement of objectswithin the box {vertical, horizontal}(8 possible combinations)
Possible mistakes 1. Incorrect objects2. Incorrect disposal of rejects3. Incorrect box placement4. Incorrect order of arrangement5. Incorrect placement of shipment items
Notes: Table reports the details of the management simulation exercise. A management task is a randomly drawn action fromthe three steps. The “FM” draws a task and provides the instructions to the DM. To complete the task, the DM supervises two“PWs”. Each DM received two tasks, one delivered in English and another delivered in Burmese. The last panel indicates thepossible mistakes that were recorded. We record the total time to execute the task and the times spent communicating withthe “FM” and the “PWs”.
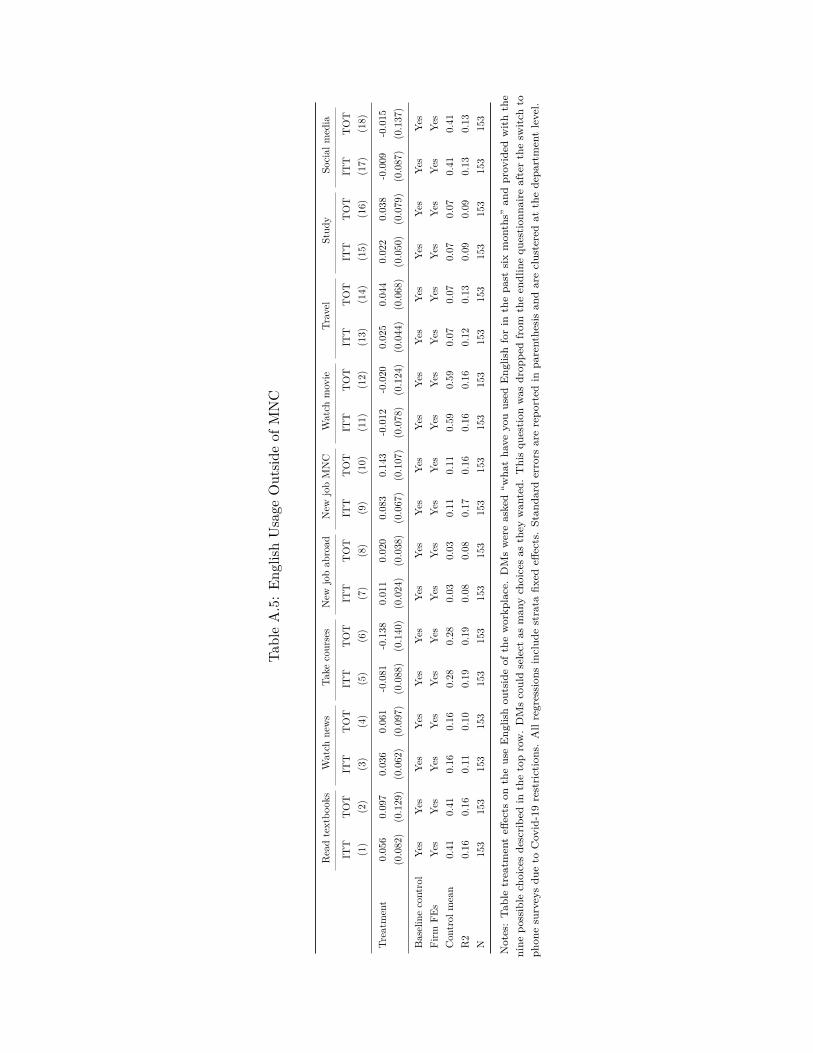
TableA.5:En
glish
Usage
Outsid
eof
MNC
Readtextbo
oks
Watch
news
Take
courses
New
jobab
road
New
jobMNC
Watch
mov
ieTr
avel
Stud
ySo
cial
med
ia
ITT
TOT
ITT
TOT
ITT
TOT
ITT
TOT
ITT
TOT
ITT
TOT
ITT
TOT
ITT
TOT
ITT
TOT
(1)
(2)
(3)
(4)
(5)
(6)
(7)
(8)
(9)
(10)
(11)
(12)
(13)
(14)
(15)
(16)
(17)
(18)
T reatm
ent
0.05
60.09
70.03
60.06
1-0.081
-0.138
0.01
10.02
00.08
30.14
3-0.012
-0.020
0.02
50.04
40.02
20.03
8-0.009
-0.015
(0.082
)(0.129
)(0.062
)(0.097
)(0.088
)(0.140
)(0.024
)(0.038
)(0.067
)(0.107
)(0.078
)(0.124
)(0.044
)(0.068
)(0.050
)(0.079
)(0.087
)(0.137
)
Baselinecontrol
Yes
Yes
Yes
Yes
Yes
Yes
Yes
Yes
Yes
Yes
Yes
Yes
Yes
Yes
Yes
Yes
Yes
Yes
Firm
FEs
Yes
Yes
Yes
Yes
Yes
Yes
Yes
Yes
Yes
Yes
Yes
Yes
Yes
Yes
Yes
Yes
Yes
Yes
Con
trol
mean
0.41
0.41
0.16
0.16
0.28
0.28
0.03
0.03
0.11
0.11
0.59
0.59
0.07
0.07
0.07
0.07
0.41
0.41
R2
0.16
0.16
0.11
0.10
0.19
0.19
0.08
0.08
0.17
0.16
0.16
0.16
0.12
0.13
0.09
0.09
0.13
0.13
N15
315
315
315
315
315
315
315
315
315
315
315
315
315
315
315
315
315
3
Notes:Ta
bletreatm
enteff
ects
ontheuseEng
lishou
tsideof
theworkp
lace.DMswereasked“w
hatha
veyouused
Eng
lishforin
thepa
stsixmon
ths”
andprov
ided
withthe
nine
possible
choicesdescribe
din
thetoprow.DMscouldselect
asman
ychoicesas
they
wan
ted.
Thisqu
estion
was
drop
pedfrom
theendlinequ
estion
naireafterthesw
itch
toph
onesurveysdu
eto
Cov
id-19restrictions.Allregression
sinclud
estrata
fixed
effects.Stan
dard
errors
arerepo
rted
inpa
renthesisan
dareclusteredat
thedepa
rtmentlevel.
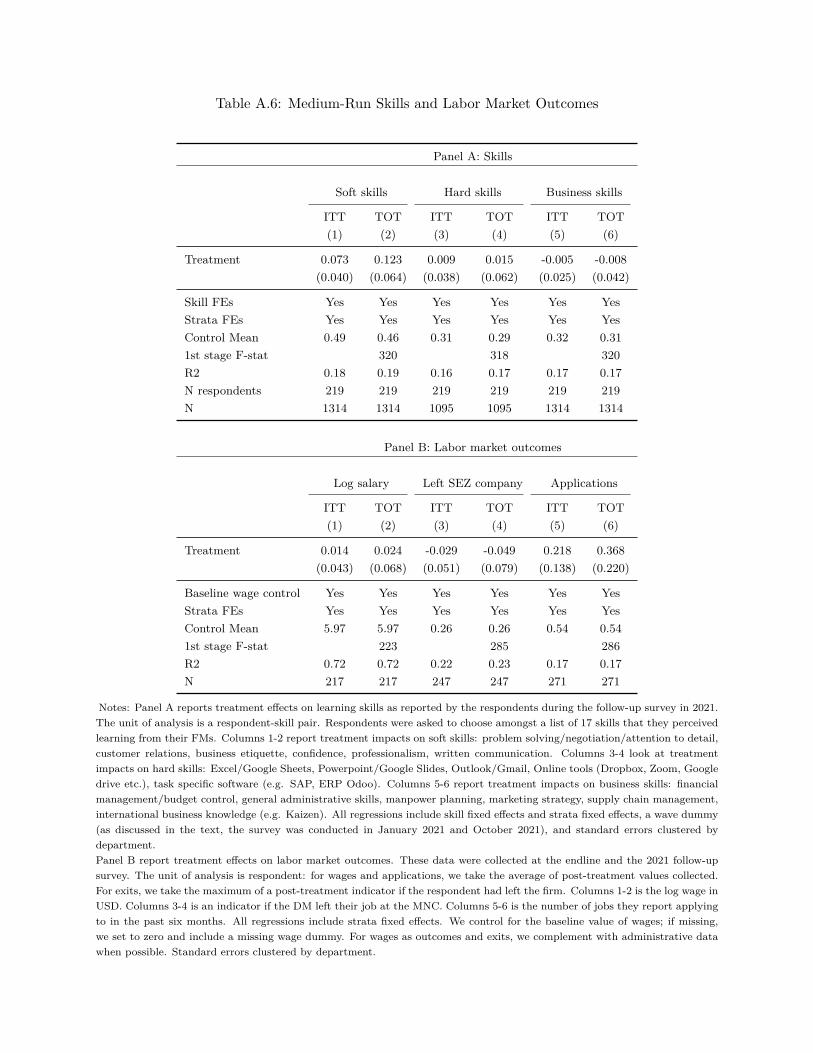
Table A.6: Medium-Run Skills and Labor Market Outcomes
Panel A: Skills
Soft skills Hard skills Business skills
ITT TOT ITT TOT ITT TOT(1) (2) (3) (4) (5) (6)
Treatment 0.073 0.123 0.009 0.015 -0.005 -0.008(0.040) (0.064) (0.038) (0.062) (0.025) (0.042)
Skill FEs Yes Yes Yes Yes Yes YesStrata FEs Yes Yes Yes Yes Yes YesControl Mean 0.49 0.46 0.31 0.29 0.32 0.311st stage F-stat 320 318 320R2 0.18 0.19 0.16 0.17 0.17 0.17N respondents 219 219 219 219 219 219N 1314 1314 1095 1095 1314 1314
Panel B: Labor market outcomes
Log salary Left SEZ company Applications
ITT TOT ITT TOT ITT TOT(1) (2) (3) (4) (5) (6)
Treatment 0.014 0.024 -0.029 -0.049 0.218 0.368(0.043) (0.068) (0.051) (0.079) (0.138) (0.220)
Baseline wage control Yes Yes Yes Yes Yes YesStrata FEs Yes Yes Yes Yes Yes YesControl Mean 5.97 5.97 0.26 0.26 0.54 0.541st stage F-stat 223 285 286R2 0.72 0.72 0.22 0.23 0.17 0.17N 217 217 247 247 271 271
Notes: Panel A reports treatment effects on learning skills as reported by the respondents during the follow-up survey in 2021.The unit of analysis is a respondent-skill pair. Respondents were asked to choose amongst a list of 17 skills that they perceivedlearning from their FMs. Columns 1-2 report treatment impacts on soft skills: problem solving/negotiation/attention to detail,customer relations, business etiquette, confidence, professionalism, written communication. Columns 3-4 look at treatmentimpacts on hard skills: Excel/Google Sheets, Powerpoint/Google Slides, Outlook/Gmail, Online tools (Dropbox, Zoom, Googledrive etc.), task specific software (e.g. SAP, ERP Odoo). Columns 5-6 report treatment impacts on business skills: financialmanagement/budget control, general administrative skills, manpower planning, marketing strategy, supply chain management,international business knowledge (e.g. Kaizen). All regressions include skill fixed effects and strata fixed effects, a wave dummy(as discussed in the text, the survey was conducted in January 2021 and October 2021), and standard errors clustered bydepartment.Panel B report treatment effects on labor market outcomes. These data were collected at the endline and the 2021 follow-upsurvey. The unit of analysis is respondent: for wages and applications, we take the average of post-treatment values collected.For exits, we take the maximum of a post-treatment indicator if the respondent had left the firm. Columns 1-2 is the log wage inUSD. Columns 3-4 is an indicator if the DM left their job at the MNC. Columns 5-6 is the number of jobs they report applyingto in the past six months. All regressions include strata fixed effects. We control for the baseline value of wages; if missing,we set to zero and include a missing wage dummy. For wages as outcomes and exits, we complement with administrative datawhen possible. Standard errors clustered by department.
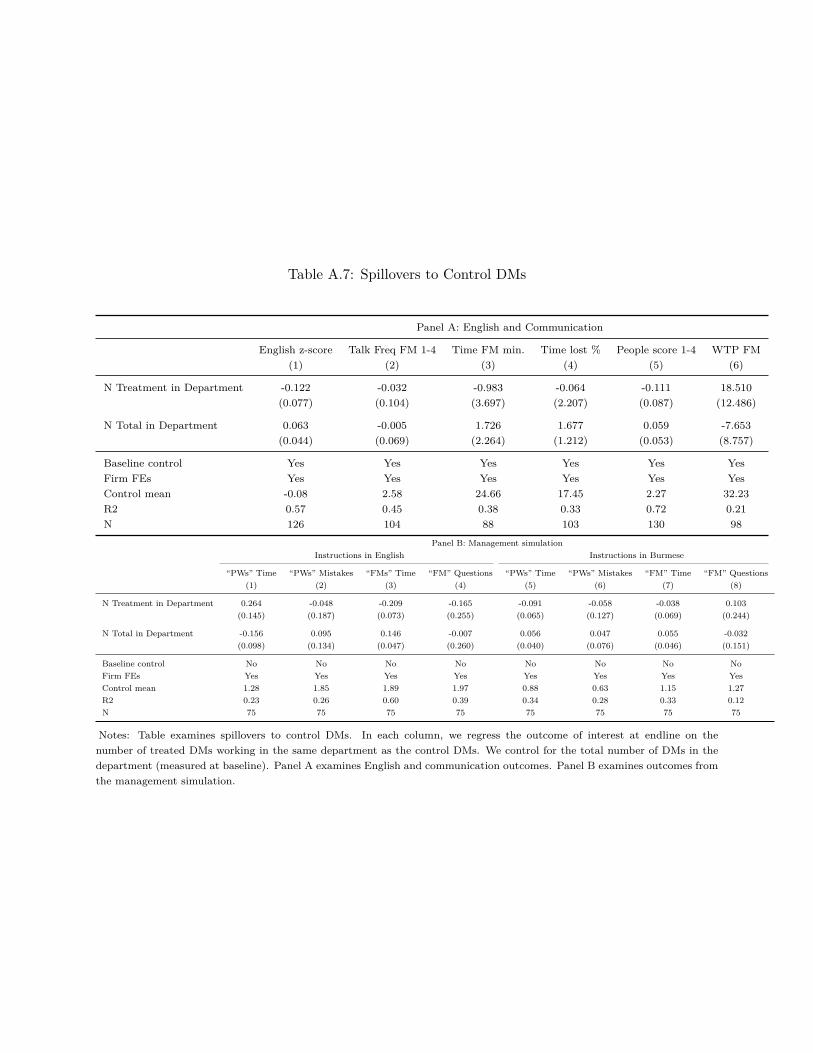
Table A.7: Spillovers to Control DMs
Panel A: English and Communication
English z-score Talk Freq FM 1-4 Time FM min. Time lost % People score 1-4 WTP FM(1) (2) (3) (4) (5) (6)
N Treatment in Department -0.122 -0.032 -0.983 -0.064 -0.111 18.510(0.077) (0.104) (3.697) (2.207) (0.087) (12.486)
N Total in Department 0.063 -0.005 1.726 1.677 0.059 -7.653(0.044) (0.069) (2.264) (1.212) (0.053) (8.757)
Baseline control Yes Yes Yes Yes Yes YesFirm FEs Yes Yes Yes Yes Yes YesControl mean -0.08 2.58 24.66 17.45 2.27 32.23R2 0.57 0.45 0.38 0.33 0.72 0.21N 126 104 88 103 130 98
Panel B: Management simulationInstructions in English Instructions in Burmese
“PWs” Time “PWs” Mistakes “FMs” Time “FM” Questions “PWs” Time “PWs” Mistakes “FM” Time “FM” Questions(1) (2) (3) (4) (5) (6) (7) (8)
N Treatment in Department 0.264 -0.048 -0.209 -0.165 -0.091 -0.058 -0.038 0.103(0.145) (0.187) (0.073) (0.255) (0.065) (0.127) (0.069) (0.244)
N Total in Department -0.156 0.095 0.146 -0.007 0.056 0.047 0.055 -0.032(0.098) (0.134) (0.047) (0.260) (0.040) (0.076) (0.046) (0.151)
Baseline control No No No No No No No NoFirm FEs Yes Yes Yes Yes Yes Yes Yes YesControl mean 1.28 1.85 1.89 1.97 0.88 0.63 1.15 1.27R2 0.23 0.26 0.60 0.39 0.34 0.28 0.33 0.12N 75 75 75 75 75 75 75 75
Notes: Table examines spillovers to control DMs. In each column, we regress the outcome of interest at endline on thenumber of treated DMs working in the same department as the control DMs. We control for the total number of DMs in thedepartment (measured at baseline). Panel A examines English and communication outcomes. Panel B examines outcomes fromthe management simulation.
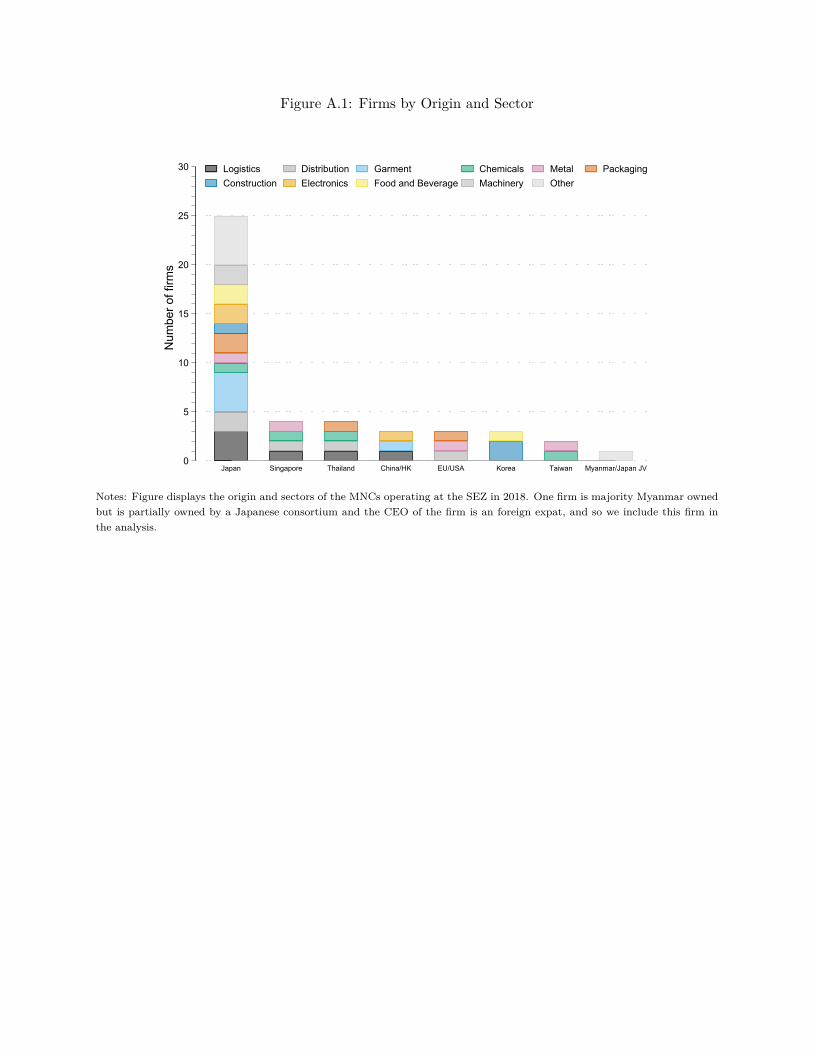
Figure A.1: Firms by Origin and Sector
0
5
10
15
20
25
30N
umbe
r of f
irms
Japan Singapore Thailand China/HK EU/USA Korea Taiwan Myanmar/Japan JV
Logistics Distribution Garment Chemicals Metal PackagingConstruction Electronics Food and Beverage Machinery Other
Notes: Figure displays the origin and sectors of the MNCs operating at the SEZ in 2018. One firm is majority Myanmar ownedbut is partially owned by a Japanese consortium and the CEO of the firm is an foreign expat, and so we include this firm inthe analysis.
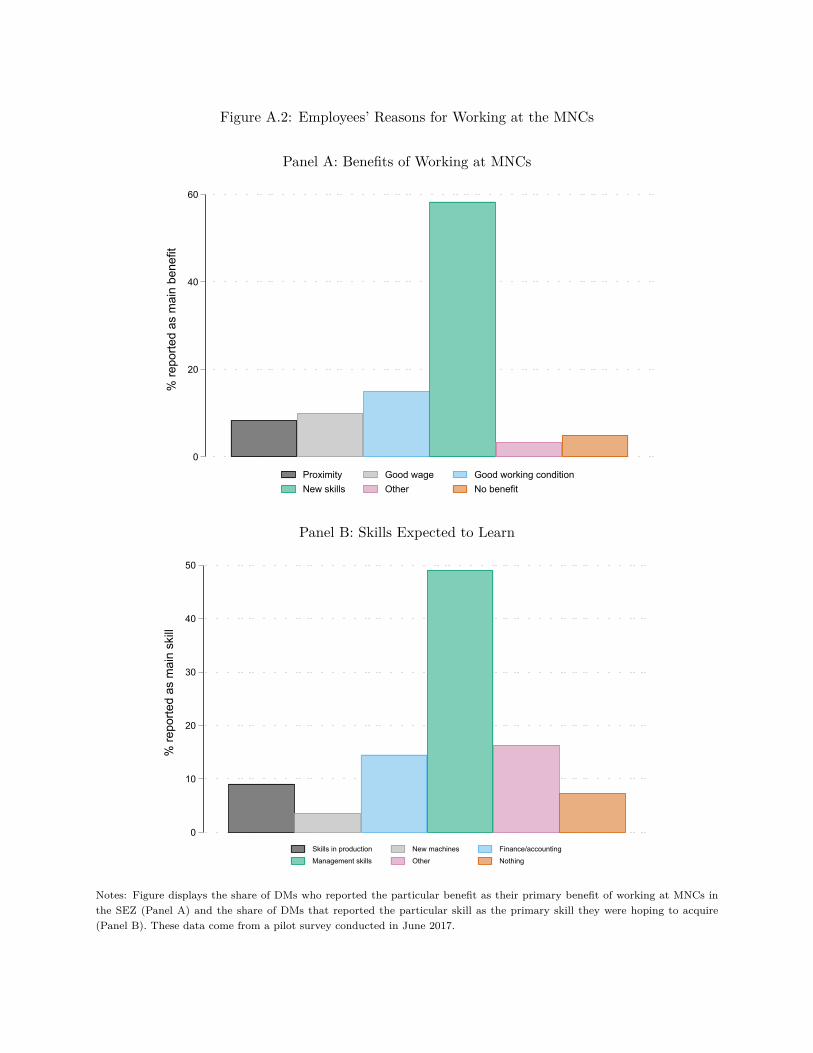
Figure A.2: Employees’ Reasons for Working at the MNCs
Panel A: Benefits of Working at MNCs
0
20
40
60
% re
porte
d as
mai
n be
nefit
Proximity Good wage Good working conditionNew skills Other No benefit
Panel B: Skills Expected to Learn
0
10
20
30
40
50
% re
porte
d as
mai
n sk
ill
Skills in production New machines Finance/accountingManagement skills Other Nothing
Notes: Figure displays the share of DMs who reported the particular benefit as their primary benefit of working at MNCs inthe SEZ (Panel A) and the share of DMs that reported the particular skill as the primary skill they were hoping to acquire(Panel B). These data come from a pilot survey conducted in June 2017.
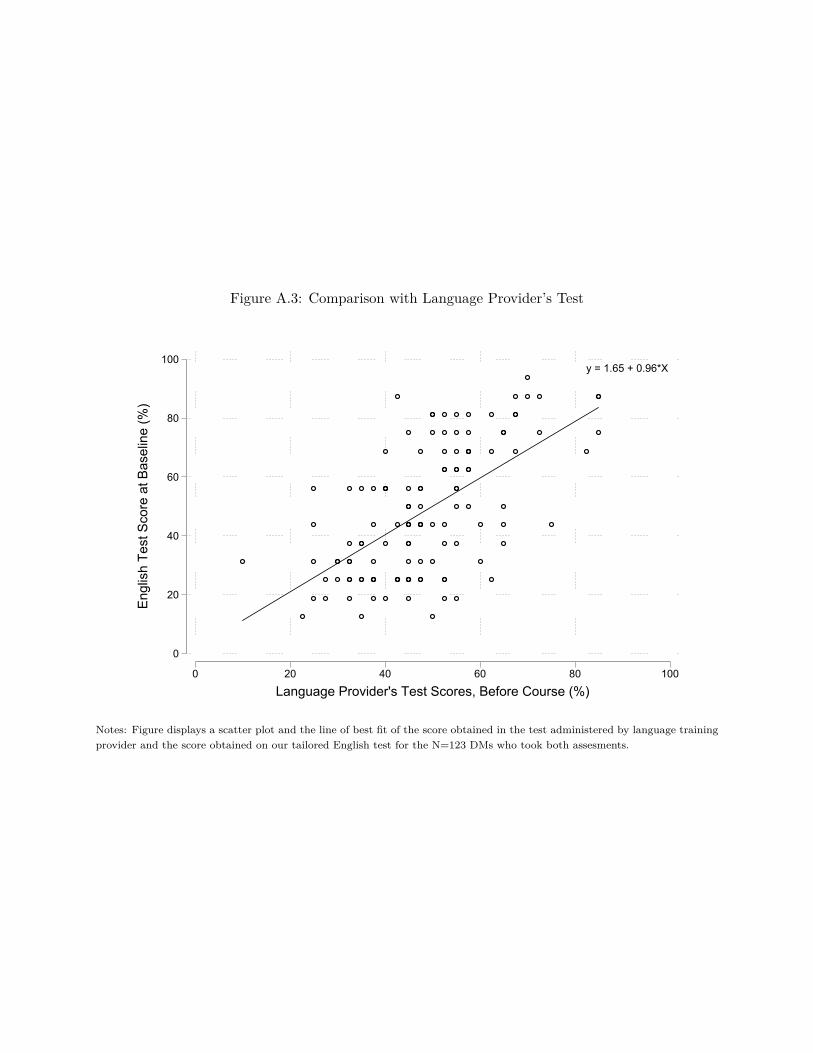
Figure A.3: Comparison with Language Provider’s Test
y = 1.65 + 0.96*X
0
20
40
60
80
100
Engl
ish
Test
Sco
re a
t Bas
elin
e (%
)
0 20 40 60 80 100
Language Provider's Test Scores, Before Course (%)
Notes: Figure displays a scatter plot and the line of best fit of the score obtained in the test administered by language trainingprovider and the score obtained on our tailored English test for the N=123 DMs who took both assesments.
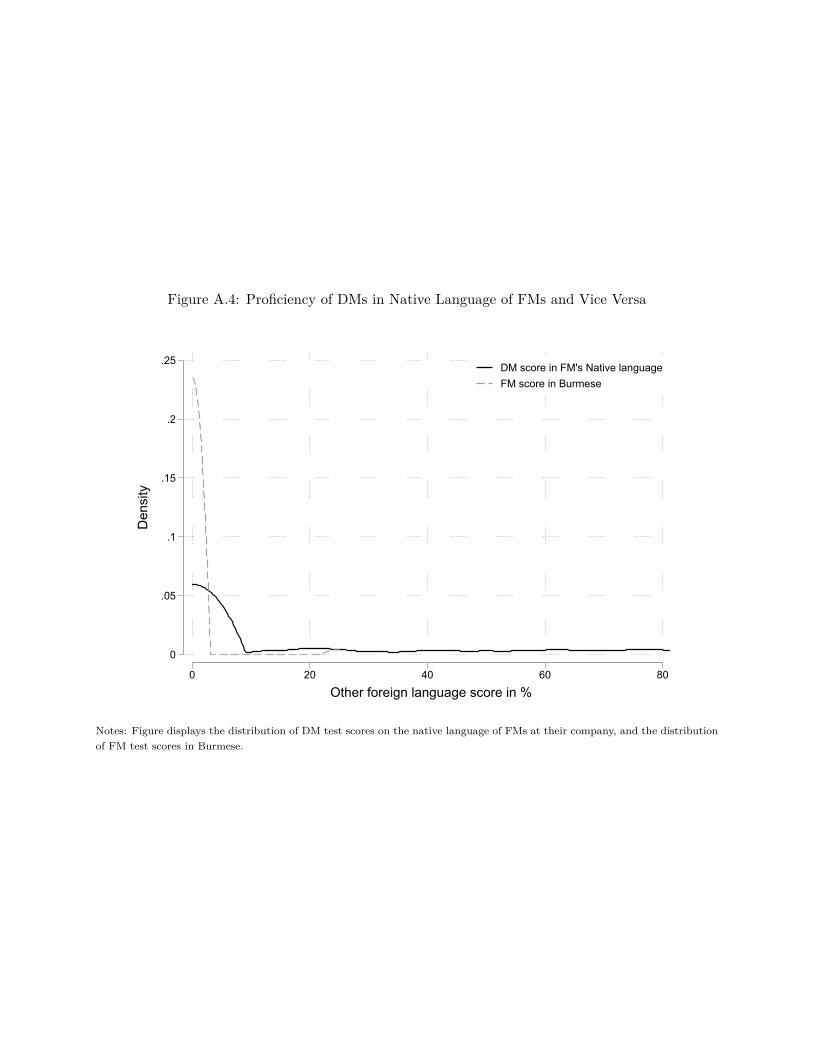
Figure A.4: Proficiency of DMs in Native Language of FMs and Vice Versa
0
.05
.1
.15
.2
.25
Den
sity
0 20 40 60 80
Other foreign language score in %
DM score in FM's Native languageFM score in Burmese
Notes: Figure displays the distribution of DM test scores on the native language of FMs at their company, and the distributionof FM test scores in Burmese.
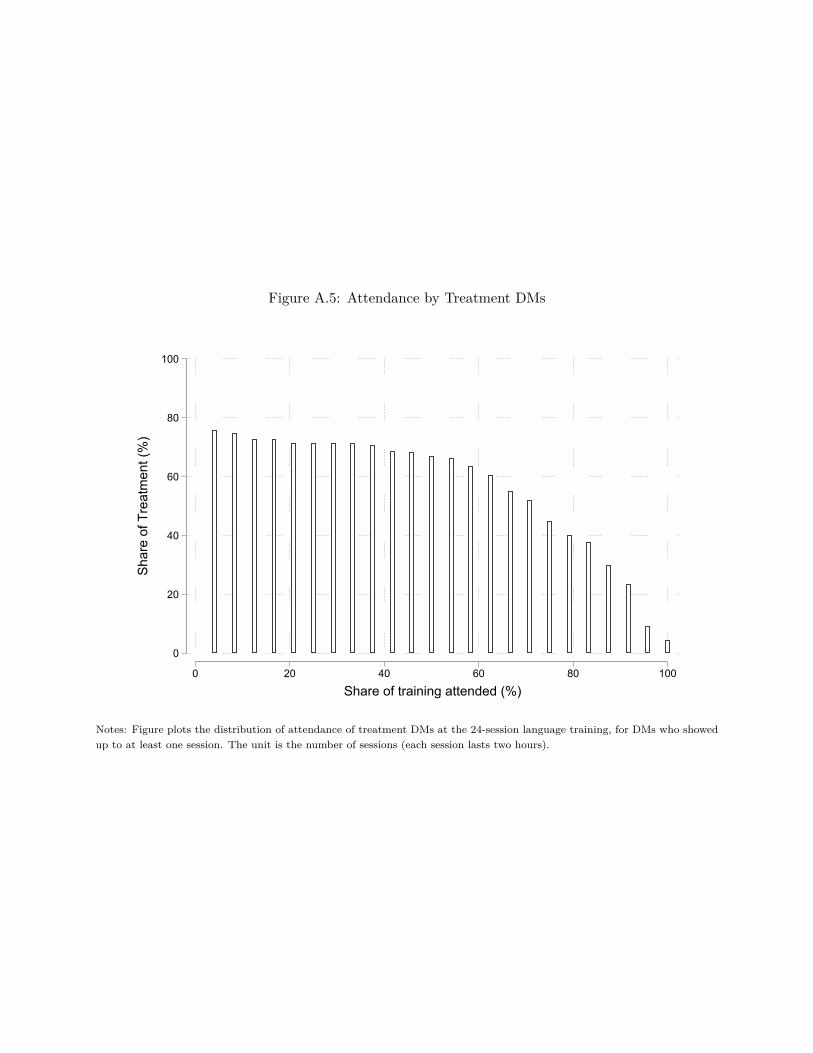
Figure A.5: Attendance by Treatment DMs
0
20
40
60
80
100
Shar
e of
Tre
atm
ent (
%)
0 20 40 60 80 100
Share of training attended (%)
Notes: Figure plots the distribution of attendance of treatment DMs at the 24-session language training, for DMs who showedup to at least one session. The unit is the number of sessions (each session lasts two hours).
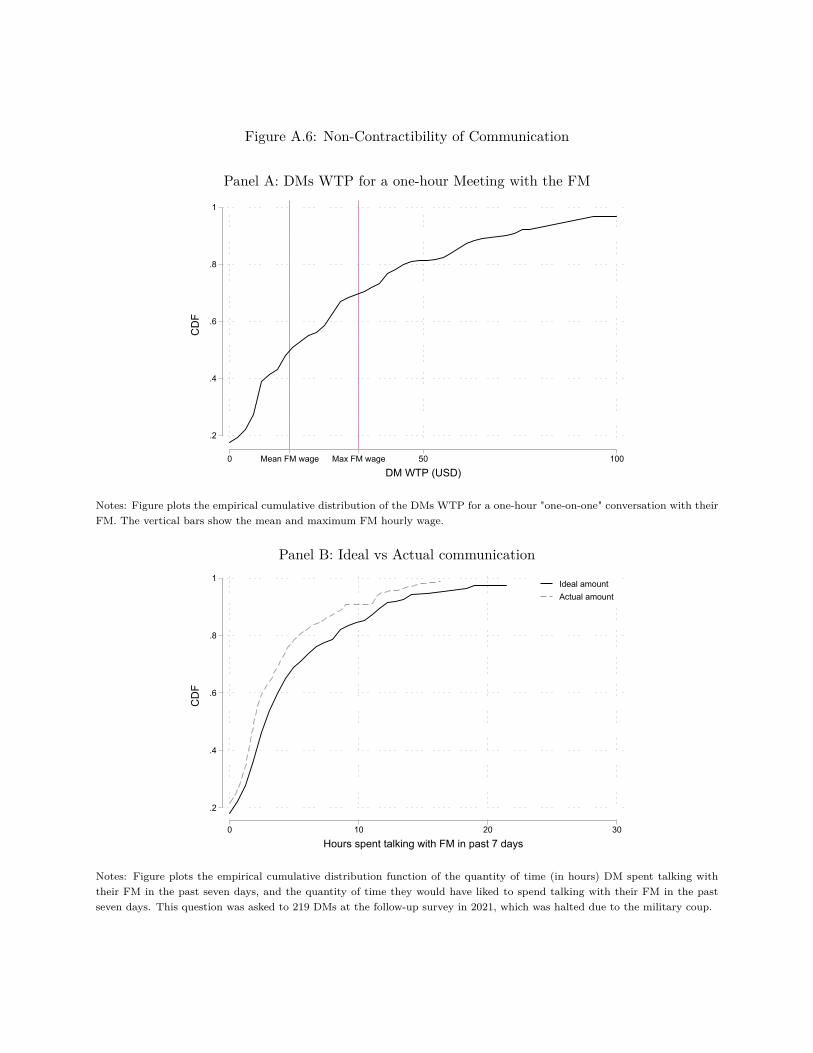
Figure A.6: Non-Contractibility of Communication
Panel A: DMs WTP for a one-hour Meeting with the FM
.2
.4
.6
.8
1C
DF
0 Mean FM wage Max FM wage 50 100
DM WTP (USD)
Notes: Figure plots the empirical cumulative distribution of the DMs WTP for a one-hour "one-on-one" conversation with theirFM. The vertical bars show the mean and maximum FM hourly wage.
Panel B: Ideal vs Actual communication
.2
.4
.6
.8
1
CD
F
0 10 20 30
Hours spent talking with FM in past 7 days
Ideal amountActual amount
Notes: Figure plots the empirical cumulative distribution function of the quantity of time (in hours) DM spent talking withtheir FM in the past seven days, and the quantity of time they would have liked to spend talking with their FM in the pastseven days. This question was asked to 219 DMs at the follow-up survey in 2021, which was halted due to the military coup.
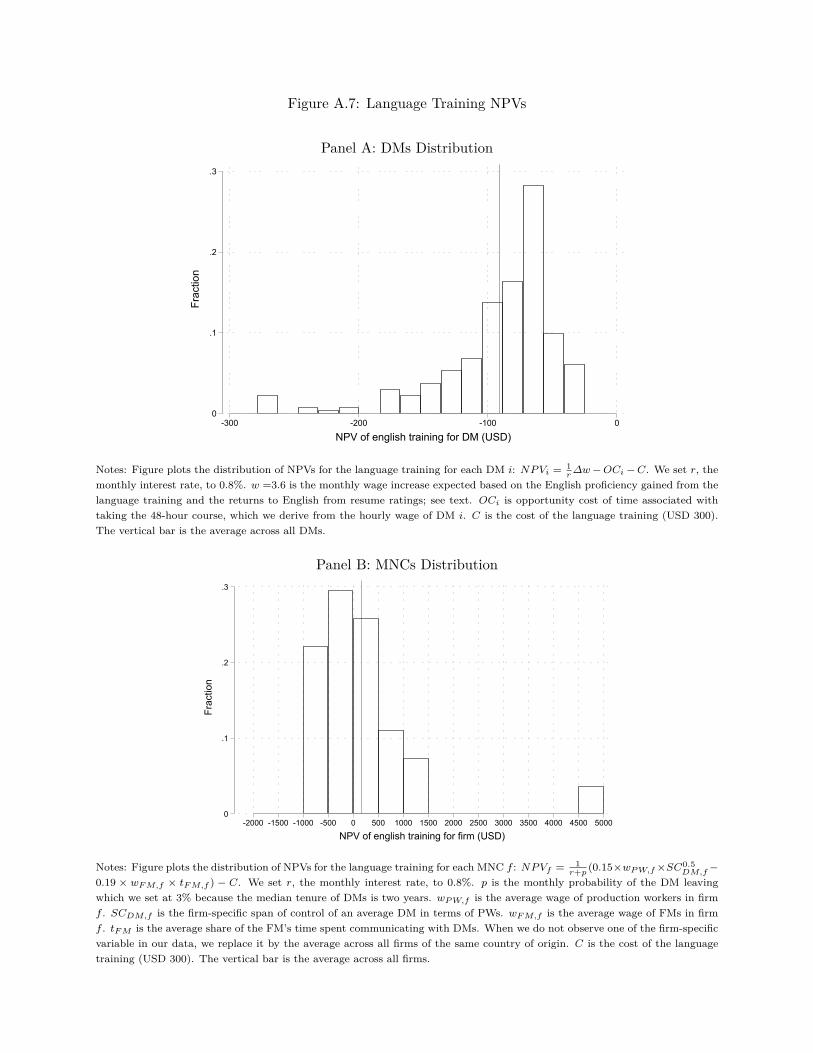
Figure A.7: Language Training NPVs
Panel A: DMs Distribution
0
.1
.2
.3
Frac
tion
-300 -200 -100 0
NPV of english training for DM (USD)
Notes: Figure plots the distribution of NPVs for the language training for each DM i: NPVi = 1r∆w−OCi −C. We set r, the
monthly interest rate, to 0.8%. w =3.6 is the monthly wage increase expected based on the English proficiency gained from thelanguage training and the returns to English from resume ratings; see text. OCi is opportunity cost of time associated withtaking the 48-hour course, which we derive from the hourly wage of DM i. C is the cost of the language training (USD 300).The vertical bar is the average across all DMs.
Panel B: MNCs Distribution
0
.1
.2
.3
Frac
tion
-2000 -1500 -1000 -500 0 500 1000 1500 2000 2500 3000 3500 4000 4500 5000
NPV of english training for firm (USD)
Notes: Figure plots the distribution of NPVs for the language training for each MNC f : NPVf = 1r+p (0.15×wPW,f×SC0.5
DM,f−0.19 × wFM,f × tFM,f ) − C. We set r, the monthly interest rate, to 0.8%. p is the monthly probability of the DM leavingwhich we set at 3% because the median tenure of DMs is two years. wPW,f is the average wage of production workers in firmf . SCDM,f is the firm-specific span of control of an average DM in terms of PWs. wFM,f is the average wage of FMs in firmf . tFM is the average share of the FM’s time spent communicating with DMs. When we do not observe one of the firm-specificvariable in our data, we replace it by the average across all firms of the same country of origin. C is the cost of the languagetraining (USD 300). The vertical bar is the average across all firms.


