Embed Size (px)
Citation preview
Interplay of spin and orbital ordering in the layered colossal
magnetoresistance manganite La2-2xSr1+2xMn2O7 (0.5 ≤ x ≤ 1.0)
C. D. Ling*, J. E. Millburn, J. F. Mitchell, D. N. Argyriou and J. Linton
Materials Science Division, Argonne National Laboratory, Argonne, Illinois 60439
H. N. Bordallo
Intense Pulsed Neutron Source, Argonne National Laboratory, Argonne, Illinois 60439
Ling et al. 2000
2
ABSTRACT
The crystallographic and magnetic phase diagram of the n = 2 layered manganite La2-2xSr1+2xMn2O7 in the
region x ≥ 0.5 has been studied using temperature dependent neutron powder diffraction. The magnetic phase
diagram reveals a progression of ordered magnetic structures generally paralleling that of 3-D perovskites with
similar electronic doping: A (0.5 ≤ x ≤ 0.66) → C (0.75 ≤ x ≤ 0.90) → G (0.90 ≤ x ≤ 1.0). However, the quasi-2-
D structure amplifies this progression to expose features of manganite physics uniquely accessible in the layered
systems: (a) a �frustrated� region between the A and C regimes where no long-range magnetic order is
observed; (b) magnetic polytypism arising from weak inter-bilayer magnetic exchange in the Type-C regime;
and (c) a tetragonal to orthorhombic phase transition whose temperature evolution directly measures ordering of
d3y2-r2 orbitals in the a-b plane. This orbital-ordering transition is precursory to Type-C magnetic ordering,
where ferromagnetic rods lie parallel to the b-axis. These observations support the notion that eg orbital
polarisation is the driving force behind magnetic spin ordering. Finally, in the crossover region between Type-C
and Type-G states, we see some evidence for the development of local Type-C clusters embedded in a Type-G
framework, directly addressing proposals of similar short-range magnetic ordering in highly-doped La1-
xCaxMnO3 perovskites.
Ling et al. 2000
3
I. INTRODUCTION
Colossal magnetoresistive (CMR) manganite perovskites have been intensively studied in recent years.
The transport properties of these itinerant ferromagnets appear to be related to strong interactions among charge,
spin and lattice degrees of freedom. Reducing the dimensionality of these perovskites by studying their
behaviour in layered phases can help elucidate these interactions by constraining the lattice degrees of freedom
and by enhancing the amplitude of charge magnetic fluctuations in the critical region above the insulator-metal
transition. The n = 2 Ruddlesden-Popper (R-P) phase La2-2xSr1+2xMn2O7 (which can be written SrO�(La1-
xSrxMnO3)2 to highlight the analogy to perovskites) has proved to be one of the most interesting such layered
CMR manganites, exhibiting a remarkable range of magnetic behaviour.
Experimentally, the system La2-2xSr1+2xMn2O7 has been thoroughly described in the CMR region
0.3 ≤ x ≤ 0.5, yielding an extraordinarily rich magnetic phase diagram. At low temperatures, a paramagnetic
insulating (PI) state gives way to antiferromagnetic metallic (AFM)1-3, ferromagnetic metallic (FM)4-8, canted
antiferromagnetic (CAF)9 antiferromagnetic insulating (AFI)4 and charge-ordered (CO)5-8, 10 states. An AFI state
was also found at x = 1.011, 12. The intermediate region 0.5 < x < 1.0, however, remained unexplored until very
recently, when we were able to overcome the materials problems associated with this part of the phase diagram
and successfully synthesise samples across its entire range13.
In this paper, we present detailed neutron powder diffraction measurements on samples in the Mn4+-rich
half of the phase diagram. We find a progression of AFI phases [A (0.5 ≤ x ≤ 0.66) → C (0.75 ≤ x ≤ 0.90) → G
(0.90 ≤ x ≤ 1.0)] generally following that of the 3-D perovskites, with notable differences resulting from the
constraints of the quasi-2-D layered structure. In particular, we find: a region between the Type-A and Type-C
stability fields where no long-range magnetic structure is stable; and a tetragonal-orthorhombic orbital ordering
transition as well as magnetic polytypism in the Type-C regime. Furthermore, we present evidence for short-
range Type-C magnetic structure motifs (i.e. ferromagnetic rods) embedded in a Type-G matrix in the crossover
region between the stability fields of Type-G and Type-C. These observations directly address the hypothesis of
similar phenomena in 3-D perovskites14. MnO6 octahedral distortions are interpreted in terms of the occupancy,
polarisation and ordering of eg orbitals and their relationship to magnetic ground state, suggesting that these are
the driving forces behind spin ordering. The layered manganite structure thereby facilitates the observation of
magnetic phenomena critical to understanding the relationship between spin and orbital degrees of freedom in
manganites.
II. EXPERIMENTAL
Synthesis of samples in the range 0.5 ≤ x ≤ 1.0 followed the method described previously13. All samples
were annealed to completely fill oxygen vacancies present in the quenched samples. Oxygen contents were
verified by thermogravimetric analysis.
Preliminary synchrotron x-ray powder diffraction (XRD) data were collected on beamline X7A at
Brookhaven National Laboratory�s National Synchrotron Light Source. Subsequent temperature-dependant
synchrotron XRD data were collected for certain samples (x = 1.00, 0.95, 0.90, 0.80, 0.75, 0.55, 0.50) on
beamline 12-BM-B (BESSRC-CAT) at Argonne National Laboratory�s Advanced Photon Source (APS). Full-
Ling et al. 2000
4
width-half-maxima (FWHM) for the (2 0 0) and (0, 0, 10) reflections at 300 K (λ = 0.688 Å, step size 0.005 û2θ)
are listed in Table 1, and compare favourably with the Al2O3 calibration standard used (FWMH = 0.035(5) û2θ).
These results give us additional confidence in the crystallinity and chemical homogeneity of our samples,
bearing in mind the potential for misleading results obtained with inhomogeneous samples, as discussed by
Battle et al.15. A slight broadening of (2 0 0), but not (0, 0, 10), for 0.75 ≤ x < 0.95 will be discussed in
Section III.C.
Temperature-dependant time-of-flight (TOF) neutron powder diffraction data were collected on the
Special Environment Powder Diffractometer (SEPD), the High Intensity Powder Diffractometer (HIPD) and the
General Purpose Powder Diffractometer (GPPD) at Argonne National Laboratory�s Intense Pulsed Neutron
Source (IPNS). Data were analysed using the program suite GSAS16. The perovskite La1-xSrxMnO3 was included
in a number of refinements as a minor impurity, between 0 ~ 3 wt%. No evidence was found for symmetry
lowering below I4/mmm with the exception of the orthorhombic regime discussed in Section III.C. The
difference between the neutron scattering lengths of La and Sr was insufficient to adequately assess possible
ordering on mixed La/Sr sites, therefore these sites were treated as disordered mixtures of La and Sr in ratios
appropriate to the value of x . Oxygen sites were fixed at 100 % occupancy in accordance with
thermogravimetric analyses. Unit cells, atomic positions, isotropic thermal displacement parameters, absorption
and extinction of the samples were refined in addition to the background and peak profiles of the diffraction
patterns.
III. RESULTS
The magnetic phase diagram of La2-2xSr1+2xMn2O7 across the currently accessible range of the solid
solution, 0.3 ≤ x ≤ 1.0, is presented in Fig. 1. A number of magnetic phases are identified: AFM, FM, A, C, C*,
G. Diagrams of the spin arrangements for each of these phases are presented in Fig. 2; detailed descriptions of
these structures can be found in the text. In this section, we will describe the various stability fields in the phase
diagram and comment on the influence of crystallographic structure on the magnetic ground state.
The region 0.3 ≤ x ≤ 0.5 has been studied in some detail by several groups. At room temperature, the
entire range is PI. At x = 0.3 the material is AFM below the insulator-metal transition temperature3 TIM ≈ 100 K
[Fig. 2(a)]. A tilted FM state is found below the Curie temperature TC in the region 0.32 ≤ x ≤ 0.36, while in-
plane ferromagnetism is found between 0.36 ≤ x ≤ 0.404-8 [Figs. 2(b-c)]. The region 0.42 ≤ x ≤ 0.50 is Type-A
AFI below the Néel temperature TN4 [Fig. 2(d)]. A lower temperature transition in the range 0.42 < x < 0.48
gives rise to a CAF ground state [Figs. 2(c-d)]. At x = 0.50 a CO state appears below TCO5-8, 10, which is slightly
above TN, below which the Type-A AFI state replaces it17. At the far end of the phase diagram, x = 1.00 is Type-
G AFI below TN [Fig. 2(h)]. Magnetic states in the newly elucidated region 0.50 < x < 1.00 are described in the
following subsections.
A. Type-A AFI (0.42 < x < 0.66)
As x is increased beyond the CO composition x = 0.50, we do not observe Bragg peaks due to long-range
CO in synchrotron XRD data. Reflections due to the Type-A AFI state in neutron powder diffraction persist to
Ling et al. 2000
5
x = 0.65. For x close to 0.50, the refined Type-A magnetic moment µA at 20 K is close to the expected spin-only
moment of 3.5 µB/Mn, indicating a highly ordered spin state (Fig. 3). As x increases, µA decreases slowly up to
x = 0.60 before dropping rapidly to zero when x = 0.66. A typical low-temperature magnetic refinement
(x = 0.58 at 20 K, µ = 2.32(5) µB/Mn) is shown in Fig. 4, with corresponding data in Table 2. Perovskite-type
bilayers in the Type-A AFI state [Fig. 2(d)] consist of ferromagnetic sheets perpendicular to c, with
antiferromagnetic intra-bilayer coupling and ferromagnetic inter-bilayer coupling. No diffraction evidence was
found for canting of the Type-A spins when x > 0.50, either within or between ferromagnetic sheets.
B. Frustrated spin state (0.66 ≤ x ≤ 0.74)
In samples of composition x = 0.66, 0.68 and 0.70, no evidence for any kind of long-range magnetic
order was observed in neutron powder diffraction data down to 20 K, despite an available spin-only moment in
the order of 3.3 µB/Mn. Fig. 3 highlights the sharp decrease in the proportion of long-range ordered spins on
either side of this region, indicating the presence of a frustrated spin state. The possible existence of a spin-glass
in this region will be investigated in the near future using frequency-dependent magnetic susceptibility and/or
specific heat measurements.
C. Type-C/C* AFI (0.74 < x < 0.92)
A crystallographic phase transition was observed on cooling samples in the range 0.75 < x ≤ 0.94
(Fig. 1). Single diffraction peaks such as (2 0 0) split cleanly into triplets, indicating a tetragonal →orthorhombic phase transition, i.e. the triplet is (2 0 0)T + (2 0 0)O + (0 2 0)O (Fig. 5). No reflections violating
body-centering extinction conditions in the orthorhombic phase were observed in neutron powder diffraction
data or synchrotron XRD data, leaving Immm as the only appropriate (orthorhombic) maximal non-isomorphic
subgroup of I4/mmm. Rietveld-refinement of thermal displacement parameters provided no justification for
further symmetry lowering (i.e. breaking of mirror symmetries), therefore Immm was retained as the
orthorhombic space group. The magnitude of the orthorhombic splitting (at all temperatures) maximises at
x = 0.80. For x = 0.80, the refined I4/mmm crystal structure at room temperature is compared to the Immm
crystal structure at 10 K in Table 2. As discussed below, this crystallographic phase transition is associated with
an orbital ordering transition that preferentially orients the occupied Mn3+ eg orbital along the y-axis.
Observation of all three ⟨2 0 0⟩ peaks indicates that tetragonal and orthorhombic phases coexist to T = 10 K,
reflecting the first order nature of this orbital ordering transition.
In approximately the same composition range (0.75 ≤ x ≤ 0.90) (Fig. 1), a new set of AF diffraction
peaks appears below TN. These peaks can be divided into two subsets (Fig. 5), the relative intensities of which
vary (apparently unsystematically) with x. The more intense subset can be indexed in terms of the Immm nuclear
subcell to (h+1/2, k, l+1/2) and the weaker subset to (h+1/2, k, l). This indicates the presence of two distinct but
related AF superstructures. The doubling of the short a-axis, but not the long b-axis, in both cases indicates the
presence of ferromagnetic columns along b, antiferromagnetically coupled along a. Comparing calculated to
observed magnetic intensities clearly indicates that these columns are also antiferromagnetically coupled along c
within the perovskite-type bilayers. This is analogous to the Type-C AFI state first seen in La1-xCaxMnO3,
x ≈ 0.818 and more recently in Sm1-xCaxMnO3 and Pr1-xSrxMnO3, x ≈ 0.8519. Magnetic transitions in the latter
Ling et al. 2000
6
compounds were also accompanied by structural transitions. Inter-bilayer coupling is neither ferromagnetic nor
antiferromagnetic, consistent with the degeneracy in the space group symmetry Immm; however, coupling
between one bilayer and the next-nearest bilayer is not degenerate, and the two possibilities available are the
source of the two subsets of AF reflections, i.e. there are two magnetic polytypes. The minority phase is
hereafter referred to as Type-C [Fig. 2(e)], and the majority phase, in which c is doubled, as Type-C* [Fig. 2(f)].
Rietveld-refinement indicates that the spins are aligned parallel to the long basal plane axis, b. Two-phase
magnetic refinements were carried out on the assumption that µC = µC*. Final Rietveld-refined neutron powder
diffraction data (x = 0.84) are presented in Fig. 5, and key results (x = 0.80) in Table 2.
The presence of well-defined magnetic reflections for both Type-C and Type-C* in neutron powder
diffraction data rules out the possibility that the minority Type-C phase represents stacking faults in Type-C*
rather than a separate phase. Although stacking faults could be expected when the interaction differentiating the
two phases takes place across approximately 16 Å, only long-range-ordered Type-C regions can account for the
observed data. Stacking fault intergrowths, such as those seen at x ≈ 0.4 by Osborn et al.20, only lead to a diffuse
scattering streak parallel to the c-axis. Gurewitz et al.21 reported an analogous form of magnetic polytypism in
the n = 2 R-P phase Rb3Mn2Cl7, where individual bilayers have a Type-G AFI arrangement. They found that
different methods of single-crystal growth led to the formation of different magnetic polytypes. We have as yet
been unable to grow a single crystal of La2-2xSr1+2xMn2O7 within the Type-C/C* AFI regime with which to
further investigate this magnetic polytypism.
The tetragonal → orthorhombic phase transition was observed to be incomplete, even at 10 K.
Consequently, in order to obtain meaningful values for the Type-C/C* magnetic moment, it was necessary to
determine whether the Type-C/C* state resides in one or both crystallographic phases. Neutron powder
diffraction data at x = 0.80 were collected on both cooling and warming over the range 10 ≤ T ≤ 300 K. The
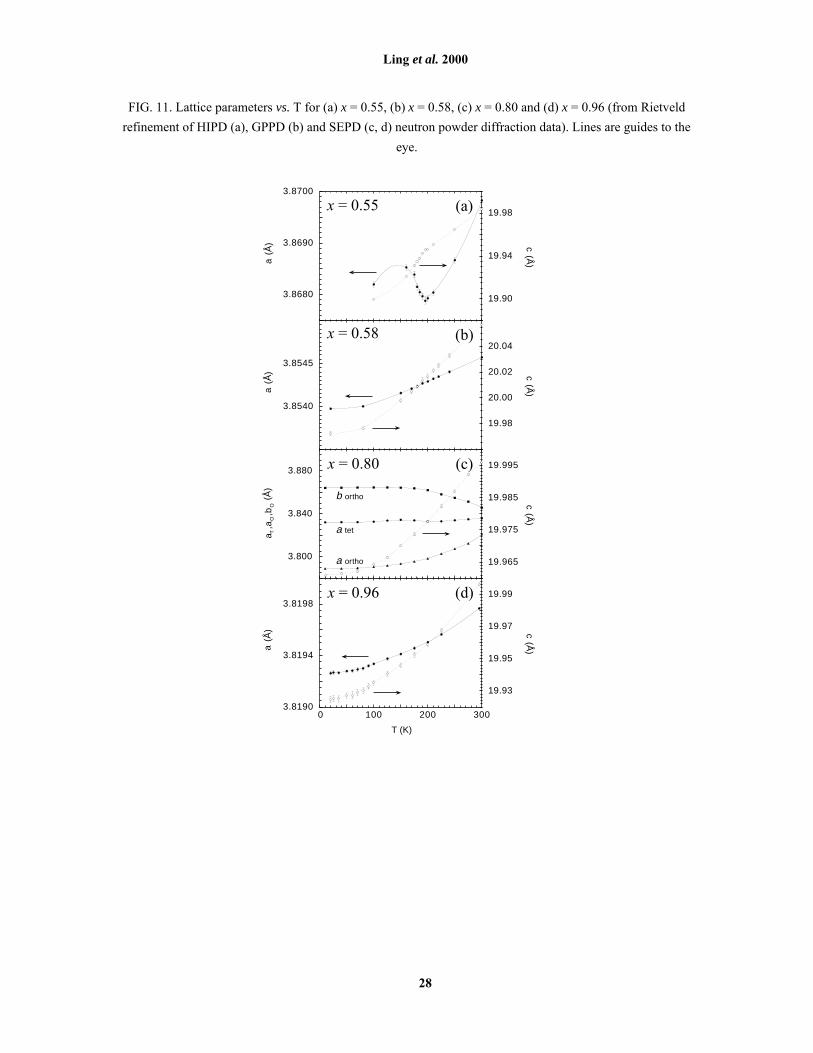
refined tetragonal crystallographic phase fraction is shown on the left-hand axis of Fig. 6(a). At 300 K,
14.0(9) % is already orthorhombic, indicating that the transition temperature TO > 300 K, although the bulk of
the sample remains tetragonal. An approximate value of TO ≈ 340 K can be determined by extrapolating lattice
parameters [Fig. 11(c)] to the mutual intersection of aO, bO and aT. The orthorhombic phase fraction remains
temperature independent down to T ≈ 200 K, below which the transformation rapidly accelerates. At T ≈ 90 K,
only 6.9(2) % remains tetragonal, and this phase fraction persists down to 10 K. The transformation was
reversible on warming, with a hysteresis of approximately 30 K. The experiment was conducted twice, using
two different cooling/warming rates (5 and 0.1 Kmin-1); both the hysteresis and the final low-T tetragonal phase
fraction were found to be rate-independent in this range. Only Type-C* (not Type-C) magnetic reflections were
seen in low-T data for the x = 0.80 sample. The right-hand axis of Fig. 6(a) shows the refined Type-C* magnetic
moment, calculated on the assumption that the tetragonal and orthorhombic phase fractions are equally
responsible for these reflections. The hysteresis in the magnetisation has the form of a magnetisation curve
convoluted with the crystallographic hysteresis, suggesting that Type-C* exists in the orthorhombic phase
fraction only. Recalculating µC* on this basis gives a magnetisation curve with no hysteresis [Fig. 6(b)],
confirming that the Type-C* magnetic superstructure only exists in the presence of an orthorhombic subcell.
Note that for x = 0.80 and x = 0.82 (Table 3), the orthorhombic:tetragonal crystallographic ratios are similar but
the C:C* magnetic phase ratios are very different; this rules out the possibility that Type-C resides in the
tetragonal phase fraction while Type-C* resides in the orthorhombic phase fraction. Note also that for x = 0.80,
Ling et al. 2000
7
the observed moment is only 60 % of the expected spin-only moment (Fig. 3), indicating that a considerable
fraction of the Mn spins do not take part in long-range Type-C* ordering.
This approach to the refinement of SEPD neutron powder diffraction data was used to determine
crystallographic and magnetic phase fractions and magnetic moments for other samples in the Type-C/C*
regime. Final results are presented in Table 3 and Fig. 3. Note in Table 3 that for all samples where the
crystallographic phase fraction could be refined, a small proportion of the sample remains tetragonal at 20 K.
Similarly, a small proportion of these samples is found to be orthorhombic at room temperature. The behaviour
shown for x = 0.80 in Fig. 6(a) cannot, therefore, be attributed to compositional inhomogeneity, although it may
arise from other small inhomogeneities within the samples such as in crystallinity or oxygen stoichimetry. This
behaviour cannot be attributed to compositional inhomogeneity, as evidenced by the FWHM of synchrotron
XRD reflections (Table 1); there is a slight broadening of (2 0 0) in the orthorhombic regime but no broadening
of (0, 0, 10), indicating that a small orthorhombic component rather than compositional inhomogeneity [as in
Fig. 7] causes the broadening.
For samples at the lower and upper limits of the Type-C/C* regime, certain reasonable assumptions were
necessary to obtain the values reported in Table 3. The result of these assumptions is a consistent picture of the
composition dependence of the crystallographic and magnetic phase diagram. At x = 0.75, a Type-C* magnetic
moment (Fig. 3) could be refined, but no orthorhombic splitting [Fig. 7] was observed (even with synchrotron
XRD data) i.e. the subcell appears to remain metrically tetragonal (Fig. 1). Future electron microscopy studies
might reveal some twinning phenomena which help to elucidate this point; for the purposes of the present study,
a single phase tetragonal model was assumed. The refined magnetic moment for x = 0.75 given in Table 3 has
been calculated on the assumption that if Type-C/C* only requires an infinitesimal orthorhombicity at this
composition, then the entire sample will be in the Type-C/C* state below TN.
For x = 0.90 at low temperatures, crystallographic phase fractions for the I4/mmm and Immm components
were refined to give 94 wt% orthorhombic and 6 wt% tetragonal. However, determination of µC/C* was
complicated by the simultaneous presence of Type-G and Type-C* magnetic reflections at low temperatures.
Type-C reflections were not observed; however, considering the typically small ratio of Type-C:Type-C*
reflections throughout the Type-C/C* regime (e.g. at x = 0.84, Fig. 5), and the weakness of Type-C* reflections
for x = 0.90, Type-C reflections may be simply too weak to observe at this composition. The possibility that the
simultaneous presence of Type-G and Type-C* reflections is due to compositional inhomogeneity is remote,
based on analysis of the FWHM of synchrotron XRD peaks (Table 1) in Section II. Initial refinements of the
magnetic reflections assumed that Type-G ordering arose only in the tetragonal and Type-C/C* ordering only in
the orthorhombic phase fractions. These assumptions were based on our observations of neighbouring
compositions. This model produced an unphysically high value for µG = 28 µB/Mn, indicating that the observed
Type-G intensities could not arise from a mere 6 wt% tetragonal phase fraction. Some of the orthorhombic
phase therefore also exhibits Type-G magnetic ordering.
Since the Type-G and Type-C/C* magnetic states both exist in the orthorhombic crystallographic phase,
it is impossible to deconvolute the magnetic from the crystallographic phase fractions i.e. the refinement of µC/C*
and µG is underdetermined. Stable refinements can only be carried out when certain assumptions are made about
the relationship between these magnetic phases. There are two end-case models, which are assessed below
Ling et al. 2000
8
against the plausible criterion that the moments within the Type-C/C* and Type-G domains of the x = 0.90
sample are smoothly continuous with the moments across the whole of the Type-C/C* and Type-G regimes (as a
function of x) (Fig. 3). The relationship between the refined magnetic moments and the intensities of observed
magnetic reflections in these models is fully explained in the Appendix. Analysis of these two models leads to
important conclusions regarding the evolution of magnetic ordering as a function of x.
In the first model, long-range-ordered Type-C/C* regions exist in different crystallites (of a
polycrystalline sample) to those which contain long-range-ordered Type-G regions. This is a chemical phase
segregation model, consistent with phase segregation due to compositional inhomogeneity. This model does not
remove the additional degree of freedom from the refinement (Eqn. 9 in the Appendix), therefore it is necessary
to fix either the crystallographic or the magnetic phase ratio. The most obvious constraint is µC/C* = µG
(Eqn. 10). The refined magnetic moment obtained using this constraint is shown as an open marker in Fig. 3,
where it can be seen that this model results in an unexplainable upturn of the µC/C* vs. x curve. From Eqn. 9, it
can be seen that increasing the C/C* orthorhombic phase fraction CFo causes µC/C* to decrease towards its value
at x = 0.88, but µG to increase towards its value at x = 0.92. There is in fact no value of CFo for which neither the
µC/C* nor µG vs. x curve displays an anomalous upturn at x = 0.90. This model is therefore rejected. Note that the
rejection of this model is further evidence that compositional inhomogeneity is not a significant factor in our
samples, and hence is not impacting our phase diagram.
In the second model, long-range-ordered Type-C/C* regions and long-range-ordered Type-G regions
exist in the same crystallites (of a polycrystalline sample). This is a magnetic phase segregation model that does
not involve chemical phase segregation. In this case, the refinement is no longer underdetermined (Eqns. 12a
and 12b in the Appendix). The results are shown as grey markers in Fig. 3, which fall on the µC/C* and µG vs. x
curves smoothly extrapolated from the rest of the Type-C/C* and Type-G regimes. Clearly, while the true nature
of the phase segregation at x = 0.90 may fall between the two end-case models considered, the second (magnetic
phase segregation) is a far better approximation based on available data. It should still be remembered, however,
that the refined moments for x = 0.90 (Fig. 3, Tables 2 and 3) are necessarily less certain than those for the rest
of the Type-C/C* and Type-G regimes.
In contrasting the two models for x = 0.90, it is important to note the difference between the sets of
magnetic moment terms which do not contribute to observed neutron diffraction intensity, i.e. the terms
subtracted from µTOT on the RHS of Eqn. 8 (chemical phase segregation model) and Eqns. 11a and 11b
(magnetic phase segregation model). The RHS of Eqn. 8 has the same form as the RHS of Eqns. 4 and 5, which
refer to the Type-G and Type-C/C* regimes, where the only terms not contributing to observed intensity are
non-long-range-ordered (subscript D) terms. On the RHS of Eqn. 11a, however, a long-range-ordered term (µoC)
is also subtracted from µTOT. If the composition (x) at the boundary between Type-G and Type-G+C/C* regimes
is X, then at a slightly higher composition X + δ, µoC = 0 and Eqn. 11a ≡ Eqn. 4 (Type-G). As δ → 0 and then
becomes negative, µG must decreases smoothly through the phase boundary in this model (Fig. 3) (a
discontinuity in µG would imply the alternative, chemical phase segregation, model). Therefore, since µC/C*
becomes non-zero discontinuously at the first-order phase transition when δ = 0, it must do so at the expense of
µoD; i.e., regions of Type-C/C* grow out of non-long-range-ordered orthorhombic regions, rather than out of
long-range-ordered Type-G regions, and the total number of long-range-ordered spins increases. This can be
seen in the result that (µG + µC/C*) at x = 0.90 is greater than µG at x = 0.92 (Fig. 3, Tables 3 and 4). Analogous
Ling et al. 2000
9
arguments hold when the Type-G+C/C* regime is entered from the Type-C/C* regime. The magnetic phase
segregation model therefore has important implications for the nature of non-long-range-ordered spins in the
Type-C/C* and Type-G regimes, to be discussed further in Section IV.
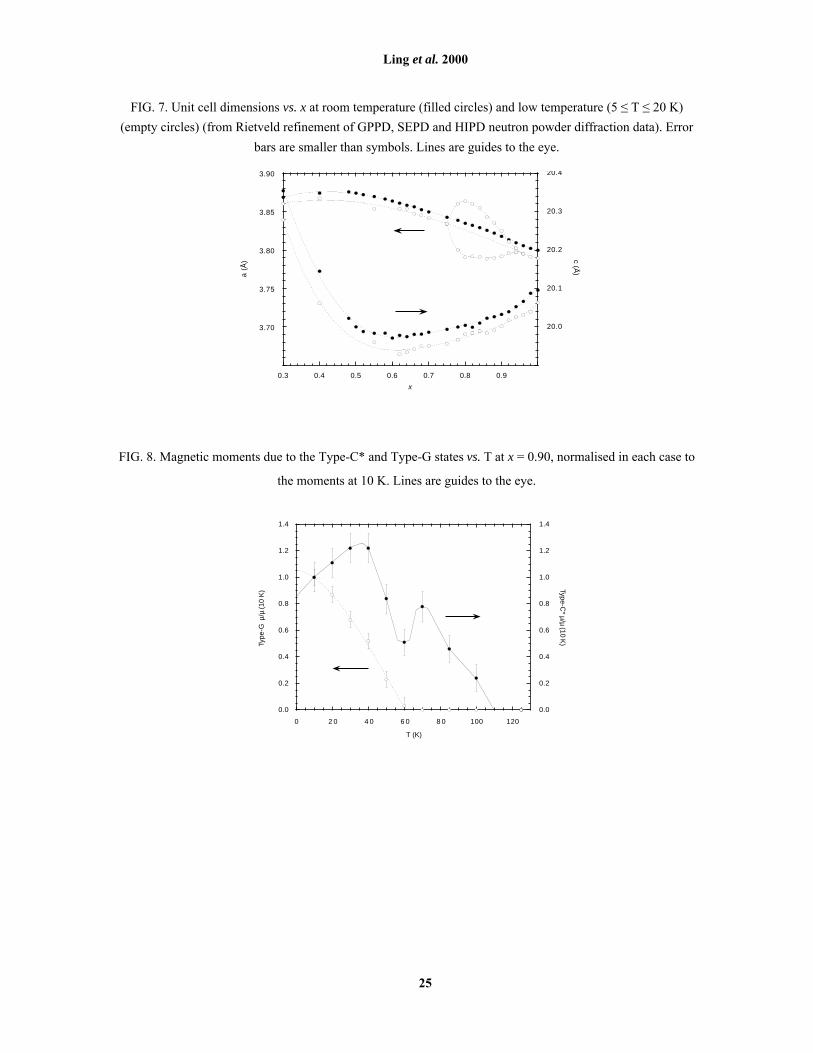
The temperature dependence of µC/C* and of µG at x = 0.90, normalised to their 10 K values i.e.
independent of a model for phase separation, are shown in Fig. 8. Because it is determined by a single point, at
this stage we can attach no significance to the local minimum at T = 60 K in the µC/C* curve. However, that µC/C*
decreases below 35 K while µG is increasing demonstrates that the magnetic phases are in competition within
the same crystallites. This behaviour is consistent with the second model for the phase separation, and further
demonstrates that the observation of both magnetic phases is not a result of compositional inhomogeneity.
D. Type-G AFI (0.89 < x ≤ 1.00)
Low temperature neutron powder diffraction data at x = 0.90 display a number of magnetic peaks in
addition to those of the Type-C/C* AFI. These peaks can be indexed to the I4/mmm and/or Immm subcells as
(h+1/2 k+1/2 l), indicative of the Type-G AFI state found at x = 1.0011, 13. At x = 0.92, only Type-G reflections
remain. Type-G reflections persist to x = 1.00. The relative intensities of Type-G reflections vary as a function
of x over the whole range 0.90 ≤ x ≤ 1.00, however, Type-C/C* reflections are not observed for x > 0.90. The
low-temperature orthorhombic transition seen in the Type-C/C* regime persists as far as x = 0.95 (Fig. 1). For
0.90 ≤ x ≤ 0.94, the magnitude of the splitting was sufficient to refine orthorhombic lattice parameters but
insufficient to refine a tetragonal/orthorhombic phase fraction from SEPD data. At x = 0.96, no splitting of the
(2 0 0) reflection could be observed, even in synchrotron XRD data.
The ideal Type-G state at x = 1.00 involves fully AF coupling between nearest neighbour Mn sites, with
all spins parallel to c. Since no additional magnetic reflections appear, the only available degree of freedom in
the Type-G model with which to fit SEPD data across the entire regime was to apply a uniform, parallel, tilting
of the spins away from c and into the a-b plane. This tilting is defined by θ, the polar angle of µ to c. The
direction of the a-b component of the spin vector (defined by φ, the azimuthal angle of µxy to a) cannot be
determined in the tetragonal space group I4/mmm (x > 0.95), therefore the diagonal between a and b (φ = 45 û) is
chosen arbitrarily. As the orthorhombic splitting increases below x = 0.95, differentiating a from b, refinement
of φ is in principle possible. At x = 0.92, φ refines to a stable value of 65(7) û, i.e. it tends towards the longer b
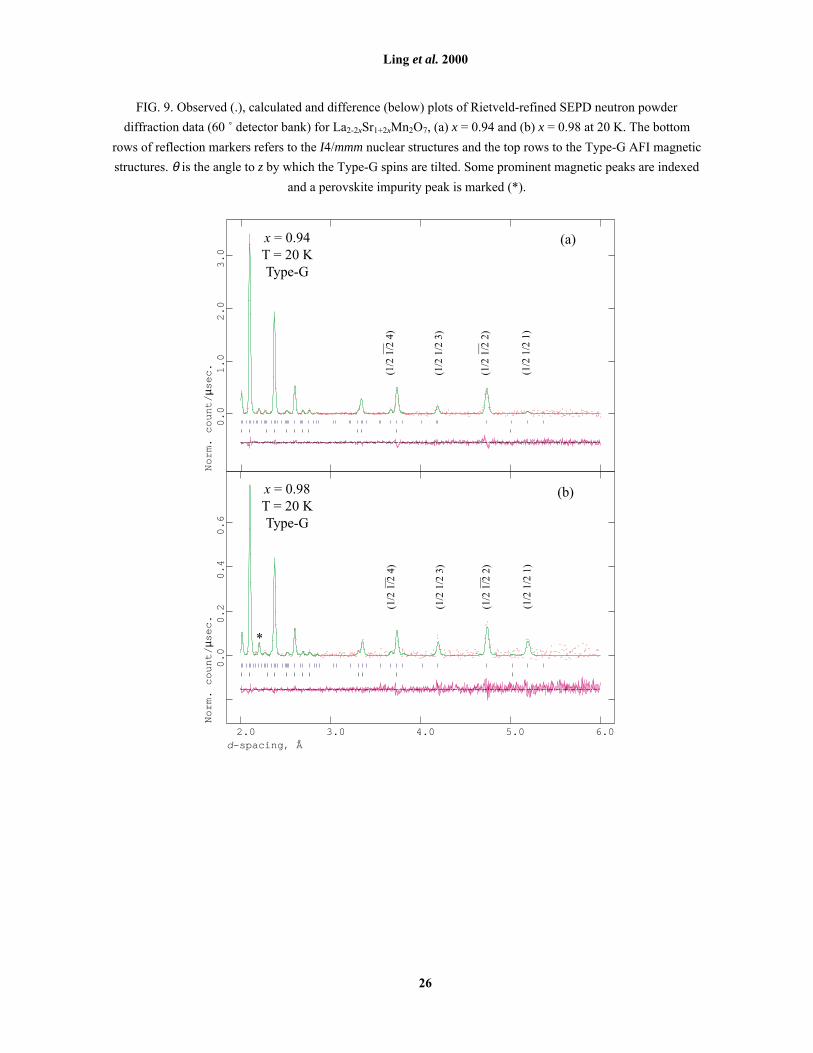
axis as observed in ordered Type-C/C*. Representative 20 K refinements (x = 0.98 and 0.92) are shown in
Fig. 9, with corresponding data in Table 2. Table 4 lists the final refined spin magnitudes and orientations as
they evolve across the Type-G AFI regime, the magnitudes also being plotted in Fig. 3. The treatment of
x = 0.90 data was described in Section III.C. Note that at x = 0.90, Type-G reflections were too weak to refine
the angle azimuthal to a; φ was fixed at 45 û, which was found to give a better refinement than the x = 0.92 value
of 65 û. Trends in spin orientation (θ and φ in Table 4) therefore suggest that the Type-G magnetic state when
x = 0.90 is closer to ideal Type-G (x = 1.00) than when x = 0.92. The interpretation of trends in θ and φ,
including their apparent reversal when x < 0.95, will be discussed further below in terms of the mixed Type-
G+C/C* state described above for x = 0.90.
Ling et al. 2000
10
IV. DISCUSSION
The composition- and temperature-dependence of lattice constants and Mn-O bond lengths can illuminate
details about electronic states of the layered manganites. MnO6 octahedra do not rotate in these layered phases
as they do in the perovskite analogues (hence the mmm symmetry), therefore a and c are directly related to the
equatorial and axial Mn-O bond lengths respectively. Changes in the relationship between equatorial and axial
bond lengths can be interpreted in terms of the distribution of eg electron density associated with Mn3+ ions
(1 � x) into either planar dx2-y2�type or linear d3z2-r2�type orbitals. The relative stability of these orbitals is
thought to play an important role in determining the ground state magnetic structure of both 3-D22 and layered23
manganites. Maezono and Nagaosa24 have produced a theoretical phase diagram for n = 2 manganites based on
orbital polarisation, Coulombic repulsion and coupling with lattice deformation. Extended into the high-x
region, this model predicts a smooth transition from Type-A to Type-G over the range 0.5 ≤ x ≤ 1.0. Having
accessed this region experimentally and found the magnetic phase diagram to be somewhat different, we are
now in a position to comment further on the relationship between orbital polarisation and magnetic structure. In
considering this relationship on the basis of a neutron powder diffraction study, it should be remembered that
while this technique is far more sensitive to spin ordering than to orbital ordering, it is not completely
insensitive to the latter. Consequently, the absence of direct evidence for orbital ordering is not a conclusive
result in itself, and orbital ordering patterns discussed below are inferred from (directly observed) spin ordering
patterns. We will also comment on (limited) evidence for an extension of the CO regime as far as x = 0.6.
Trends in room temperature lattice parameters for x > 0.5 are a reversal of those for x < 0.53, 25 [Fig. 7].
The a-axis reaches a maximum at x ≈ 0.5, and the minimum in c/a is only slightly offset from this point by a
minimum in c at x ≈ 0.6. Lattice parameters at low temperatures (10 - 20 K) track those at room temperature
[Fig. 7], with the obvious exception of the region 0.75 < x < 0.95 where the bulk of the sample is orthorhombic
at low temperatures. MnO6 octahedral bond lengths also vary smoothly with composition (Fig. 10). Close to the
magnetic transition temperatures, however, the behaviour of lattice parameters varies significantly between
compositions (Fig. 11). Coherent lattice effects such as these have been considered in detail elsewhere for
x < 0.53, 25-29; for x ≥ 0.5, they are considered below in terms of qualitative rules of orbital exchange interactions
and Jahn-Teller (J-T) distortions of Mn3+O6 octahedra.
The CO state seen at x = 0.50 has analogues in many perovskite phases Ln1-xCaxMnO3 when x = 0.5030-36.
These phases adopt a Type-CE AFI structure below TN < TCO. The gap between TCO and TN, i.e. the relative
thermodynamic stability of AFI vs. CO states, is very sensitive to both x (nominal hole concentration) and
average cation radius on the perovskite A-site30. In perovskites, Akimoto et al.22 related these sensitivities to the
one-electron bandwidth W: larger A cations lead to straighter Mn�O�Mn angles and thus larger W, delocalising
dx2-y2 orbitals and facilitating ferromagnetic double-exchange in the a-b plane. Smaller A cations lead to smaller
W, localising eg electrons and favouring a CO (Type-CE AFI) state. Increased hole doping (x) further facilitates
double-exchange.
In the layered manganites, however, MnO6 octahedra do not tilt as in perovskites, so the effect of cation
size on W is less obvious or pronounced. Nonetheless, variations in lattice parameters (Fig. 7) and Mn-O bond
lengths (Fig. 10) with x in the Type-A AFI regime are consistent with Akimoto et al.�s model22 and with ideas
from Maezono and Nagaosa24 about planar orbital stabilisation. Note that since x = 1.00 implies that all Mn ions
Ling et al. 2000
11
are in the non-J-T active 4+ oxidation state, the distortion of MnO6 octahedra at x = 1.00 can be taken as the
baseline distortion due solely to the steric influence of surrounding cations. Octahedra in the Type-A regime are
distorted from this baseline by a contraction of the axial bond Mn-O1 (within the perovskite-type layer),
shortening Mn-Mn distances along c. This short Mn-Mn distance is the one over which an antiferromagnetic
superexchange interaction takes place in Akimoto et al.�s model for Type-A. The ferromagnetic double-
exchange interaction within the a-b plane is less distance dependant, hence the Type-A regime is centred around
the minimum in c/a [Fig. 7]. As x increases, eg electron density is lost, weakening the double-exchange
interaction and causing c/a to increase again (back towards the non-J-T distorted value at x = 1.00), both effects
contributing to the disappearance of the Type-A state at x = 0.66.
The presence of antiferromagnetically coupled ferromagnetic planes in Type-A suggests anisotropic
transport properties, and perhaps foreshadows metallic conductivity in the a-b plane given the picture of
Akimoto et al.22 and Maezono and Nagaosa24 of mobile eg electrons in a dx2-y2 band mediating double-exchange.
In the system (La1-zNdz)1-xSrxMnO3, where the additional variable z controls average A-site radius, Akimoto et
al.22 did in fact find (weak) metallic conductivity in the Type-A regime (x = 0.54) when z = 0.0. As z was
increased, resistivity increased, but the general behaviour remained metallic up to z = 0.8 except at low
temperatures (≤ 60 K) where a weak localisation effect was observed. In our ceramic samples, normalised
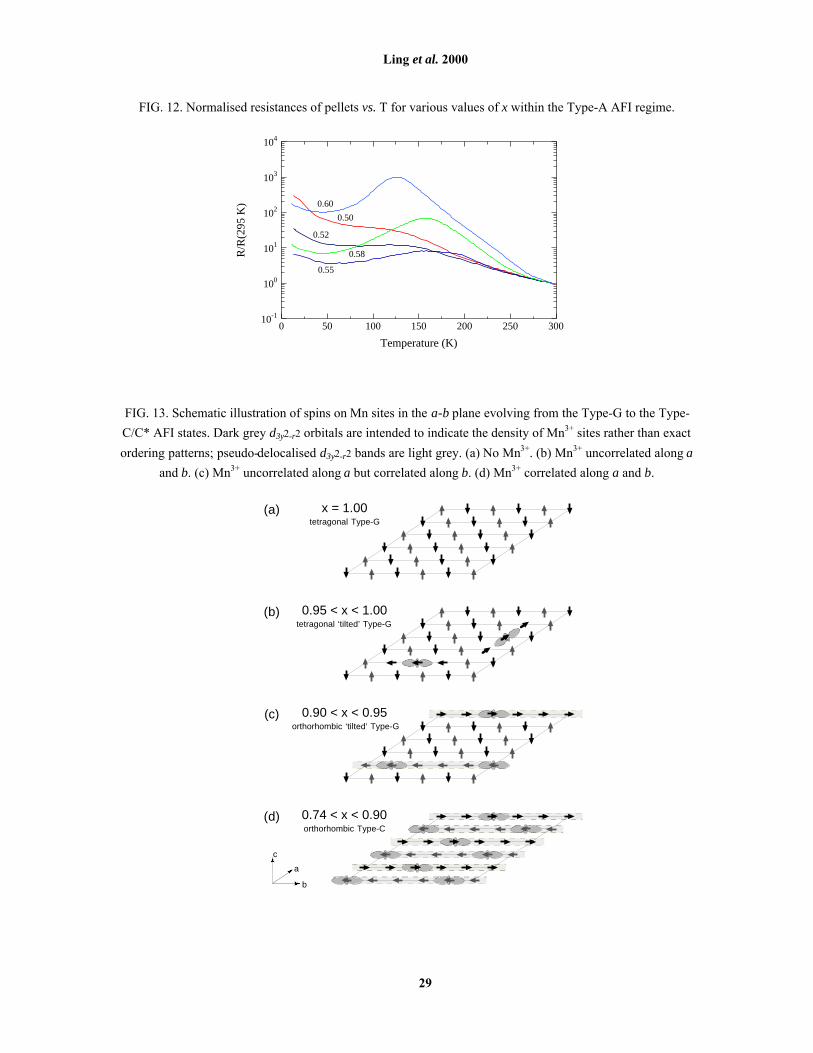
resistance R/R295K vs. T plots for various values of x within the Type-A regime are shown in Fig. 12. Although
the resistivity is much too high to justifiably call these materials metallic (one must, of course, consider grain
boundary effects not present in single crystal samples), for x ≤ 0.60 there is a slight downturn in R/R295K below
TN. We note that for 0.5 < x < 0.6, R/R295K shows a small anomaly around TN. This anomaly is similar to that
observed in in-plane resistivity measurements of single crystals at the CO composition x = 0.506, 10.
Unfortunately, neutron powder diffraction and synchrotron XRD have been unable to detect Bragg peaks
associated with long-range CO in this region, or diffuse scattering in the case that CO is only short-range.
Electron microscopy studies are underway on the polycrystalline samples, and a future single-crystal study
searching for CO diffraction peaks may resolve the issue.
In the region 0.50 ≤ x ≤ 0.55, significant coherent lattice effects are observed as a function of T. For
example, upon cooling the x = 0.55 sample through TN, there are anomalies in the temperature dependence of
the both the c and a axes similar to those observed for x = 0.5017 [Fig. 11(a)]. The change in slope in the
temperature dependence of c close to TN is consistent with transfer of charge into dx2-y2 orbitals below TN17, 37. A
similar trend (much smaller in magnitude) is observed when x = 0.58 [Fig. 11(b)]. The small anomaly observed
in a for x = 0.55 (a small increase) [Fig. 11(a)] has also been reported for layered manganites with lower x and
may be ascribed to magnetostrictive effects29.
The Type-C/C* AFI state is analogous to the Type-C state in La1-xCaxMnO318. Goodenough38 described
this magnetic structure at x = 0.75 using qualitative rules of semi-covalent exchange, with �Case 1� (filled-filled
d-orbital) antiferromagnetic interactions taking place in a plane and �Case 2� (filled-empty d-orbital)
ferromagnetic interactions taking place perpendicular to that plane. Although one in four ferromagnetic
interactions (one in twelve of all interactions) are unfavourable, this is the most cooperative possible
arrangement of localised d3y2-r2 orbitals at this composition. The proposed orbital ordering pattern and spin
orientations in the a-b plane are shown in Fig. 13(d). There is no diffraction evidence for such orbital ordering,
and the range of Mn3+ doping across the Type-C/C* solid-solution (10-25 % of Mn sites) rules it out as an exact
Ling et al. 2000
12
pattern. Nonetheless, lattice effects (i.e. orthorhombic splitting) do clearly indicate that eg electron density from
Mn3+ ions is concentrated along b. This suggests a model in which d3y2-r2 orbitals are delocalised along b to form
bands [dashed lines in Fig. 13(d)]. These d3y2-r2 bands mediate ferromagnetic double exchange while AF
superexchange interactions dominate perpendicular to them. This is analogous to the model proposed by Martin
et al.19 for Type-C ordering in the perovskites Sm0.15Ca0.85MnO3 and Pr0.15Sr0.85MnO3. Note that in the present
case, an orthorhombic lattice distortion could be avoided by placing the ferromagnetic rods along c rather than
b. That the distortion nonetheless takes place supports the notion that ferromagnetic coupling in Type-C/C*
requires long-range delocalisation, which cannot occur along c in the layered phase. Transport measurements on
polycrystalline samples reveal that all compounds in this region of phase space are highly insulating. If suitable
untwinned single crystals could be prepared, they should reveal anisotropic conductivity in the a-b plane if this
picture is correct.
The present model for Type-C/C* implies that orbital ordering along b (and hence symmetry lowering) is
a precondition for spin ordering, i.e. TO > TN. Fig. 1 supports this hypothesis, TO tracking approximately 150 K
above TN as x varies. As discussed in Section III.C, however, between TO and TN the bulk of the sample remains
tetragonal, i.e. the tetragonal phase exists in a metastable, supercooled form. This behaviour is observed across
the whole of the Type-C/C* regime, and therefore cannot be explained by gross phase segregation into Type-
C/C* and neighbouring regimes due to compositional inhomogeneity. The proportions of crystallites which
transform immediately at TO or remain untransformed at 10 K vary unsystematically with x, and may reflect
small inhomogeneities in factors such as crystallinity or oxygen stoichiometry (although small compositional
inhomogeneities may play some role, they cannot account for this behaviour across the whole regime). The
hysteresis was observed to be rate-independent. It is interesting to note the coincidence of the crystallographic
hysteresis loop with TN when x = 0.80 [Fig. 6(a)], suggesting a possible relationship between them. Structural
phase transitions were also noted to coincide with TN in the Type-C perovskites Sm0.15Ca0.85MnO3 and
Pr0.15Sr0.85MnO319. The simplest explanation is that for TN < T < TO, the energy difference between tetragonal
and orthorhombic states is insufficient to drive the transition in the bulk of the crystallites; then for T < TN, the
potential for spin ordering in the orthorhombic state increases the energy difference and drives the
transformation for the bulk of the crystallites. However, the temperature at which the bulk T → O transition
occurs (i.e. the steepest part of the hysteresis curve in Fig. 6(a), as opposed to the actual TO) does not track TN as
x increases from 0.80, but in fact remains almost x invariant. Any relationship between TN and the bulk
transition must therefore be more subtle, possibly involving short-range spin ordering, the onset of which does
not necessarily track TN and is not visible to neutron powder diffraction.
The Type-G AFI regime is also analogous to the magnetic structure of La1-xCaxMnO3 over the same
range of Mn3+ doping x18. As explained by Goodenough38, Type-G at x = 1.00 is a consequence of AF
superexchange interactions between all nearest neighbour Mn4+ sites. Isolated Mn3+ sites, introduced into the
Type-G lattice as x decreases from 1.00, have ferromagnetic double-exchange interactions with their Mn4+
neighbours. This reduces the total AF moment without creating a net ferromagnetic moment, in agreement with
observations of a smoothly decreasing moment as x decreases from 1.00 (Fig. 3).
There are, however, a number of indications that this simple model for Type-G as x decreases from 1.00
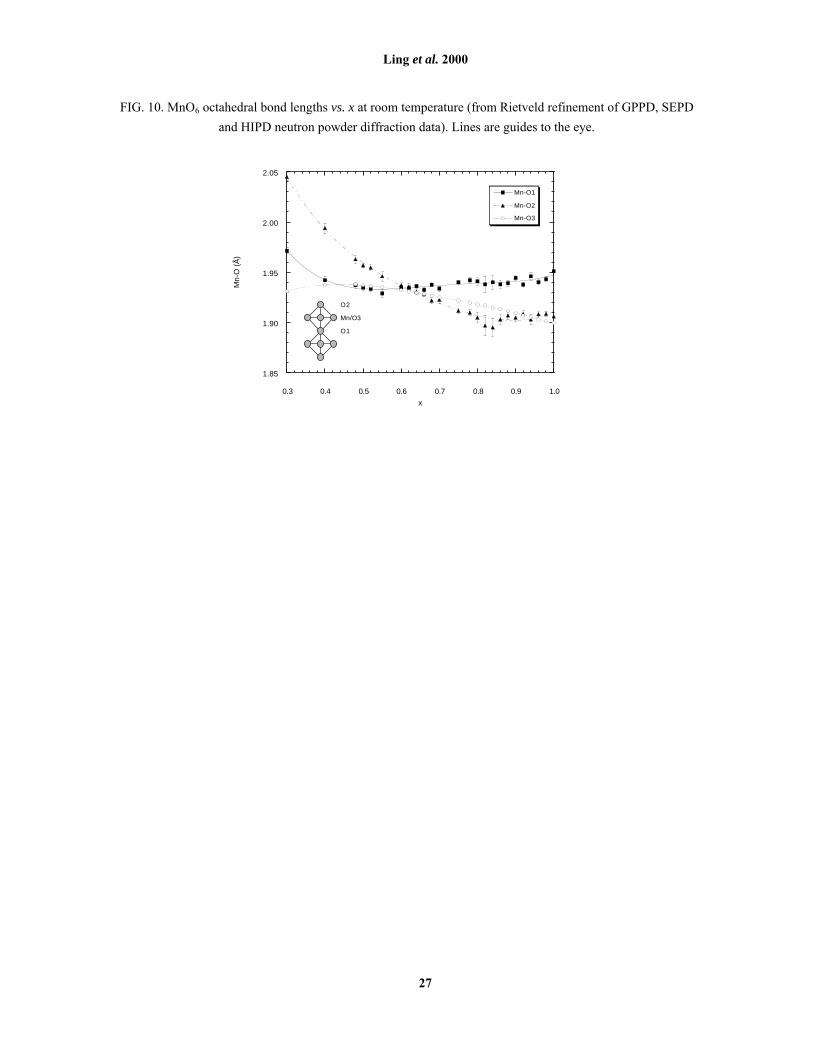
is incomplete. Firstly, Type-G spins appear to �tilt� into the a-b plane (Table 4). Secondly, with decreasing x the
equatorial Mn-O3 bonds lengthen while axial Mn-O1 and Mn-O2 bonds remain essentially constant (Fig. 10),
Ling et al. 2000
13
indicating that eg electron density from doped Mn3+ ions is concentrated in the a-b plane. Thirdly, the tetragonal-
orthorhombic phase transition associated with Type-C/C* extends from x ≈ 0.75 to x ≈ 0.95 (Fig. 2), indicating
that in this region, eg electron density is concentrated along b. All these features suggest a transition towards
Type-C/C* as x decreases from 1.00, however, the absence of Type-C/C* neutron diffraction reflections rules
out a continuous long-range ordered canting of spins from Type-G to Type-C/C*.
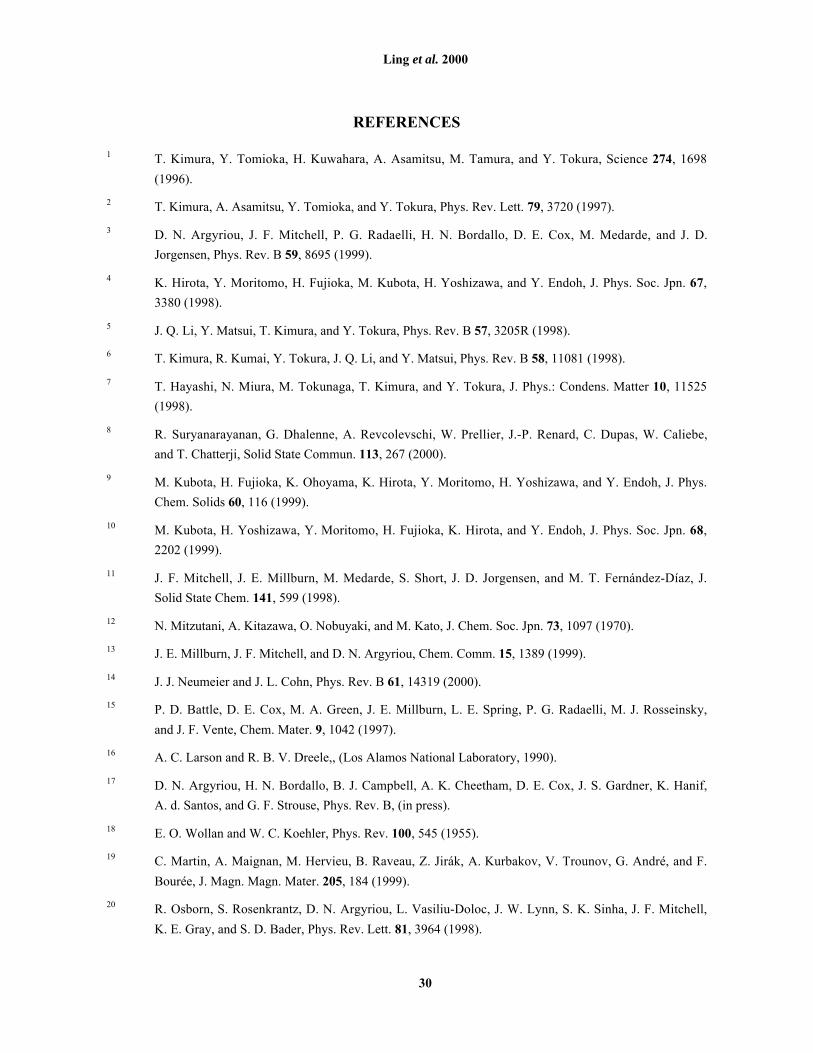
A qualitative picture explaining these observations is illustrated in Fig. 13. Isolated Mn3+ sites are
introduced into the Type-G framework [Fig. 13(a)], but by virtue of the perturbation of the perovskite-type unit
in this layered phase, eg electron density is concentrated randomly in d3x2-r2 and d3y2-r2 orbitals [Fig. 13(b)]. At
low doping (0.95 < x < 1.00), eg orbitals on Mn3+ sites are uncorrelated in x and y, giving isolated ferromagnetic
units but no net ferromagnetic or Type-C/C* moment. At higher doping (0.90 < x < 0.95), eg orbitals correlate in
one dimension to form delocalised bands mediating double exchange along ferromagnetic �rods� [Fig. 13(c)].
The experimental observation of an orthorhombic structure in this region indicates that these �rods� lie parallel
(along y), possibly as a consequence of the constrained 2-D nature of the perovskite layers. Nonetheless, they
remain uncorrelated in x and therefore no net ferromagnetic or Type-C/C* reflections are observed. We note in
Fig. 3 that as x decreases from 1.00, the saturation moment of the Type-G (or tilted Type-G) magnetic ordering
decreases as we approach the Type-C phase boundary from above. In the absence of any additional magnetic
reflections over this composition range, this observation suggests that an increasing number of Mn spins are not
participating in long-range magnetic ordering. We suggest that this is further evidence in support of the
development of uncorrelated Type-C/C* clusters. A similar trend is observed in the Type-C/C* phase field as x
approaches the Type-G phase boundary from below. Clearly, focused studies of diffuse scattering, preferably on
single crystals, will be required to verify these hypotheses. It should be remembered that the observed tilting of
Type-G spins (Table 4) when x < 1.00 is an experimental observation rather than a prediction of this qualitative
scheme. Nonetheless, the tilt angle θ does appear to be a useful parameter tracking the development of short-
range magnetic order in this mixed-phase regime.
Both Type-C/C* and Type-G magnetic phases were observed in neutron powder diffraction data at
x = 0.90. As discussed in Section III.C, two alternative models were considered in order to allow the refinement
of the magnetic moments due to each phase. In the adopted (magnetic phase segregation) model, as this two-
phase regime is approached from the Type-G regime, long-range-ordered Type-C/C* regions grow out of
previously non-long-range-ordered regions, rather than out of long-range-ordered Type-G regions; i.e., the total
number of spins which are long-range-ordered actually increases. We can now interpret this behaviour in terms
of the qualitative scheme for the Type-G regime discussed above (Fig. 13). As x decreases from 1.00, an
increasing number of Mn spins do not participate in long-range Type-G magnetic ordering (Fig. 3). For x < 0.95,
however, these spins appear to be short-range-ordered in the manner of Type-C/C*, as uncorrelated
ferromagnetic �rods� along b [Fig. 13(c)]. The magnetic phase segregation model used at x = 0.90 now implies
that in that two-phase regime, these short-range-ordered �rods� coalesce into long-range-ordered Type-C/C*,
without affecting the magnetic and crystallographic phase fraction occupied by the long-range-ordered Type-G
state. The net Type-G magnetic moment of the sample is unaffected by this magnetic phase segregation (Figs. 1)
and falls on the same µG vs. x curve as the rest of the Type-G regime (Fig. 3). That the same behaviour is
observed for Type-C/C* moments implies that for x < 0.90, short-range-ordered Type-G regions may similarly
exist within a Type-C/C* framework. However, since Type-G does not have lower symmetry than Type-C/C*
there will be no unambiguous evidence in the lattice parameters. Note that the tilting angle θ of Type-G spins to
Ling et al. 2000
14
the c axis, which grows as x decreases from 1.00, shrinks again for x = 0.90 (Table 4). This, too, is consistent
with phase segregation at that composition; the Type-G regions should become more like the ideal Type-G state
(x = 1.00) again when the Type-C/C* regions coalesce.
V. CONCLUSIONS
A key motivation for studying mixed-valent manganite perovskites in the R-P series is the potential they
offer to investigate relationships among charge, spin and lattice degrees of freedom in a reduced-dimensional
setting, and thereby better understand those relationships in 3-D perovskite analogues. The low-temperature
magnetic structures of La2-2xSr1+2xMn2O7 in the range 0.50 ≤ x ≤ 1.00 all have direct analogues in mixed-valent
manganite perovskites. At high x in particular, the Type-G and Type-C/C* regimes occupy approximately the
same Mn3+-doping (i.e. x) regions of the phase diagram as they do in La1-xCaxMnO318, 39 and can be understood
in much the same way38. These layered phases do indeed yield novel information by virtue of their reduced-
dimensional setting, specifically the fact that extended ferromagnetic �rods� in Type-C/C* are constrained to lie
parallel to one another in the a-b plane. This demonstrates that the ferromagnetic �rods� in perovskite Type-C
are mediated by double exchange in long-range, pseudo-delocalised, d3y2-r2 bands. Furthermore, in the layered
system it appears that these �rods� lie parallel even when they are not correlated with one another. They
therefore have a structural signature (symmetry lowering) detectable by neutron powder diffraction even in the
absence of long-range magnetic ordering. This feature of the layered system provides strong evidence for short-
range ordered Type-C units (i.e. ferromagnetic �rods�) within a Type-G framework as x decreases from 1.00,
leading to a phase-segregated (Type-G + Type-C/C*) region before the Type-C/C* regime is entered. Neumeier
and Cohn14 have in fact proposed a very similar phenomenology for the magnetic phase behaviour of La1-
xCaxMnO3 in the same range of x, based on measurements of saturation magnetisation. The findings of the
present study provide support for their model by analogy from the 2-D to the 3-D case. Ultimately, all these
magnetic ground states follow from the polarisation of Mn3 + e g orbitals which places electron density
preferentially along the y-axis, initially on isolated sites (0-D) and subsequently in delocalised rods (1-D).
The analogy between La2-2xSr1+2xMn2O7 and La1-xCaxMnO3 breaks down at lower values of x. In the
perovskite case, a long-range CO Type-CE AFI state at x = 0.50 persists up to a two-phase region with Type-
C18. In the present (n = 2) case, long-range CO associated with Type-CE (but no actual long-range Type-CE
spin ordering) is observed only at x = 0.505-8, 10, in a narrow temperature range between TCO and TN (for a Type-
A AFI ground state). The present study has found evidence that CO may persist in a thin �wedge� of x-T phase
space above TN for 0.50 ≤ x ≤ 0.60. While many perovskite manganites Ln1- xCaxMnO3 exhibit CO when
x = 0.5030-36, the relative stability of CO Type-CE AFI, Type-A AFI and FM states around that composition
varies significantly.
Given the finely balanced competition among states, and the demonstrated influence of perovskite A-site
cation radius on the balance between them22, 23, 30, the only appropriate system with which to compare La2-
2xSr1+2xMn2O7 when considering the effects of reduced dimensionality is La1-xSrxMnO322. In this system the FM
state dominates at low temperature up to x = 0.54. For x ≥ 0.54, the FM state forms below TC but is replaced
below TN (< TC) by the Type-A AFI state. CO is not observed at all. The key change in a reduced-dimensional
setting is that as x decreases, Type-A AFI holds off FM as the ground state configuration down to lower values
Ling et al. 2000
15
of x. This implies that in reduced dimensions, dx2-y2 orbitals continue to delocalise at lower values of x, forming
a pseudo-2-D band mediating double-exchange in the a-b plane. This band (and hence the Type-A AFI state) is
destroyed as x decreases by mounting Mn3+ J-T distortions, which lift the degeneracy of the eg orbitals and
stabilise one-dimensional d3z2-r2 orbitals. [Note that for the perovskite Nd1-xSrxMnO340 substitution of a smaller
A-site cation also stabilises the CO Type-CE state by reducing W, in agreement with Akimoto et al.23.]
Fig. 10 shows why a higher density of J-T active Mn3+ ions (i.e. lower x) is required for this to occur in
the n = 2 compared with the perovskite phase. When x = 1.00, no Mn3+ ions are present and the perovskite phase
is cubic, all Mn-O distances being equivalent. In the n = 2 phase, this structural �baseline� at x = 1.00 is already
distorted by the steric impact of the rock-salt layer on the perovskite layer, elongating the axial bond Mn-O1
compared to the equatorial Mn-O3. (Note that in the layered phase, Mn-O2 is effectively a �spectator� bond
responding to the other Mn-O bond lengths by maintaining an appropriate bond valence sum for the average
oxidation state of Mn26.) As discussed in relation to the Type-G and Type-C/C* states, as x decreases, eg
electron density goes into the a-b plane and elongates the equatorial relative to the axial bonds. In perovskite,
this leads to more distorted MnO6 octahedra as x decreases; in the n = 2 phase (Fig. 10) it leads to less distorted
MnO6 octahedra as x decreases down to ~ 0.6, at which point they are almost regular. This effectively
suppresses the J-T distortion, stabilising the Type-A AFI ground state in the (La,Sr) n = 2 manganite to lower x
(~ 0.48) than in the perovskite analogue (~ 0.54)22. Akimoto et al 23 stabilised Type-A down to even lower x
(0.40) by substituting Ca for Sr at doping levels above 30 %. This result was similarly interpreted as a
consequence of eg orbital polarisation; calculation of Madelung potentials demonstrated that Ca substitution
stabilises dx2-y2 orbitals relative to d3z2-r2 orbitals, with a concomitant switch from FM to Type-A AFI states.
Similar effects of perovskite layering can be seen in (Pr,Sr) and (Nd,Sr) manganites. Pr1-xSrxMnO3 and
Nd1-xSrxMnO3 at x = 0.50 both have FM states below TC and AFI states below TN < TC41, whereas Pr2-
2xSr1+2xMn2O7 and Nd2-2xSr1+2xMn2O7 at x = 0.50 both have AFI states below TN but no FM state42, 43. In contrast,
it is interesting to note that the spin-glass region found below Tg in the (Gd,Sr), (Dy,Sr), (Ho,Sr) and (Eu,Sr)
x = 0.50 perovskite manganites are also found in their n = 2 analogues at x = 0.5043; since there is no 2-D
delocalised dx2-y2 band in the spin-glass state, the location of the spin-glass regime with respect to x is
independent of MnO6 octahedral distortions and therefore unaffected by reduced dimensionality.
The significance of delocalised dx2-y2 orbitals to the Type-A AFI state, and the equally important role
played by delocalised d3y2-r2 orbitals in the Type-C/C* state, allows some insight into the presence of a
magnetically frustrated regime between the two (Fig. 3). The absence of long-range spin order suggests the
absence of such orbital delocalisation, i.e. the transition between long-range 1-D delocalised d3y2-r2 (Type-C/C*)
and 2-D delocalised dx2-y2 (Type-A) bands as x decreases is discontinuous. This differs from the smooth
transition from Type-G to Type-A predicted by Maezono and Nagaosa24, even more than does the presence of a
Type-C/C* state. It appears that spin ordering in this system is very closely coupled to eg orbital polarisation,
and hence highly sensitive to distortions of the perovskite unit as discussed above. The same theoretical models,
applied to accurate structural data (such as reported in the present study), may well predict a magnetic phase
diagram closer to the experimental one described here.
Two distinct effects of reduced dimensionality on the magnetic behaviour of mixed-valent manganite
perovskites have been identified in this study. The first of these is that the occupied axial eg orbitals on Mn3+
Ling et al. 2000
16
sites, the delocalisation of which mediates the Type-C/C* AFI state, are constrained to lie in the basal plane of
the layered compounds. This allows the transition from ideal Type-G (no Mn3+ sites) to Type-C/C* to be more
easily observed and understood. It also leads to a magnetically frustrated region between the Type-C/C* and
Type-A AFI regimes, presumably due to the incompatibility between 1-D d3y2-r2 delocalisation (Type-C/C*) and
2-D dx2-y2 delocalisation (Type-A), both in the a-b plane. Nonetheless, for x ≥ 0.75 the relative stability of Type-
G and Type-C/C* AFI states is largely determined by the extent of Mn3+ doping into the Mn4+ lattice, so the
magnetic phase diagrams of the 3-D and 2-D phases are very similar in this region. For x ≤ 0.66, however,
reduced dimensionality affects the polarisation of eg orbitals, and consequently the relative stability of Type-A
AFI and FM states, which are mediated by delocalised dx2-y2 bands and axial d3z2-r2 orbitals respectively. The
magnetic phase diagrams of the 2-D and 3-D phases are therefore quite different in this region. Studying layered
manganites provides complementary information to the perovskites and can illuminate effects in the latter
compounds that are more difficult to observe due to their pseudo-cubic symmetry, thus contributing to our
understanding of spin and orbital ordering in mixed valent manganite perovskites.
AKNOWLEDGEMENTS
Preliminary synchrotron XRD data was collected by D. E. Cox at Brookhaven National Laboratory. This
work was supported by the U.S. Department of Energy, Basic Energy Sciences - Materials Sciences, under
contract W-31-109-ENG-38.
Ling et al. 2000
17
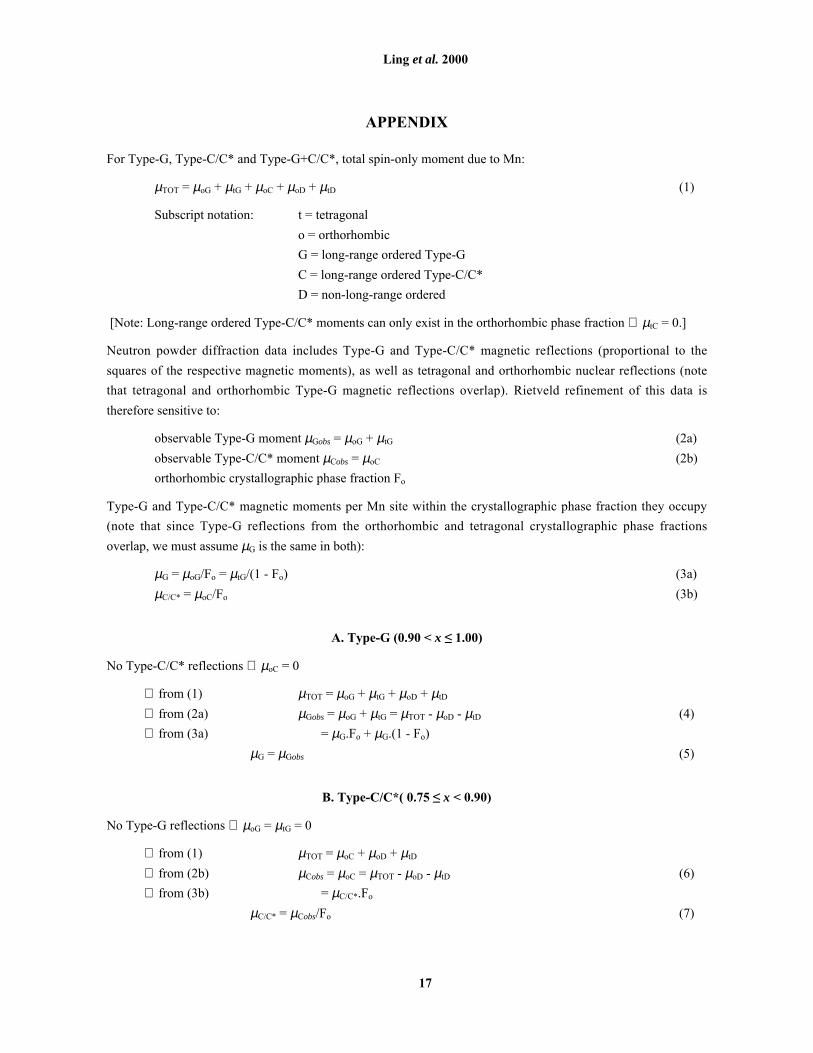
APPENDIX
For Type-G, Type-C/C* and Type-G+C/C*, total spin-only moment due to Mn:
µTOT = µoG + µtG + µoC + µoD + µtD (1)
Subscript notation: t = tetragonal
o = orthorhombic
G = long-range ordered Type-G
C = long-range ordered Type-C/C*
D = non-long-range ordered
[Note: Long-range ordered Type-C/C* moments can only exist in the orthorhombic phase fraction ∴ µtC = 0.]
Neutron powder diffraction data includes Type-G and Type-C/C* magnetic reflections (proportional to the
squares of the respective magnetic moments), as well as tetragonal and orthorhombic nuclear reflections (note
that tetragonal and orthorhombic Type-G magnetic reflections overlap). Rietveld refinement of this data is
therefore sensitive to:
observable Type-G moment µGobs = µoG + µtG (2a)
observable Type-C/C* moment µCobs = µoC (2b)
orthorhombic crystallographic phase fraction Fo
Type-G and Type-C/C* magnetic moments per Mn site within the crystallographic phase fraction they occupy
(note that since Type-G reflections from the orthorhombic and tetragonal crystallographic phase fractions
overlap, we must assume µG is the same in both):
µG = µoG/Fo = µtG/(1 - Fo) (3a)
µC/C* = µoC/Fo (3b)
A. Type-G (0.90 < x ≤ 1.00)
No Type-C/C* reflections ∴ µoC = 0
∴ from (1) µTOT = µoG + µtG + µoD + µtD
∴ from (2a) µGobs = µoG + µtG = µTOT - µoD - µtD (4)
∴ from (3a) = µG.Fo + µG.(1 - Fo)
µG = µGobs (5)
B. Type-C/C*( 0.75 ≤ x < 0.90)
No Type-G reflections ∴ µoG = µtG = 0
∴ from (1) µTOT = µoC + µoD + µtD
∴ from (2b) µCobs = µoC = µTOT - µoD - µtD (6)
∴ from (3b) = µC/C*.Fo
µC/C* = µCobs/Fo (7)
Ling et al. 2000
18
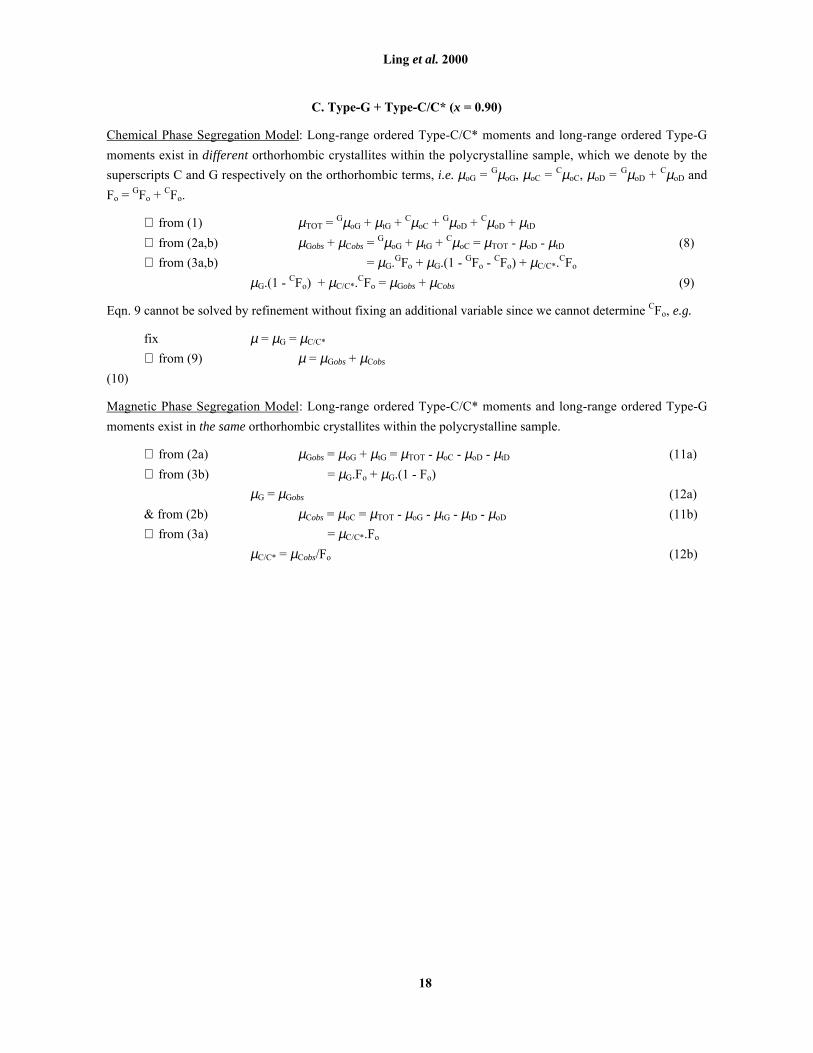
C. Type-G + Type-C/C* (x = 0.90)
Chemical Phase Segregation Model: Long-range ordered Type-C/C* moments and long-range ordered Type-G
moments exist in different orthorhombic crystallites within the polycrystalline sample, which we denote by the
superscripts C and G respectively on the orthorhombic terms, i.e. µoG = GµoG, µoC = CµoC, µoD = GµoD + CµoD and
Fo = GFo + CFo.
∴ from (1) µTOT = GµoG + µtG + CµoC + GµoD + CµoD + µtD
∴ from (2a,b) µGobs + µCobs = GµoG + µtG + CµoC = µTOT - µoD - µtD (8)
∴ from (3a,b) = µG.GFo + µG.(1 - GFo - CFo) + µC/C*.
CFo
µG.(1 - CFo) + µC/C*.CFo = µGobs + µCobs (9)
Eqn. 9 cannot be solved by refinement without fixing an additional variable since we cannot determine CFo, e.g.
fix µ = µG = µC/C*
∴ from (9) µ = µGobs + µCobs
(10)
Magnetic Phase Segregation Model: Long-range ordered Type-C/C* moments and long-range ordered Type-G
moments exist in the same orthorhombic crystallites within the polycrystalline sample.
∴ from (2a) µGobs = µoG + µtG = µTOT - µoC - µoD - µtD (11a)
∴ from (3b) = µG.Fo + µG.(1 - Fo)
µG = µGobs (12a)
& from (2b) µCobs = µoC = µTOT - µoG - µtG - µtD - µoD (11b)
∴ from (3a) = µC/C*.Fo
µC/C* = µCobs/Fo (12b)
Ling et al. 2000
19
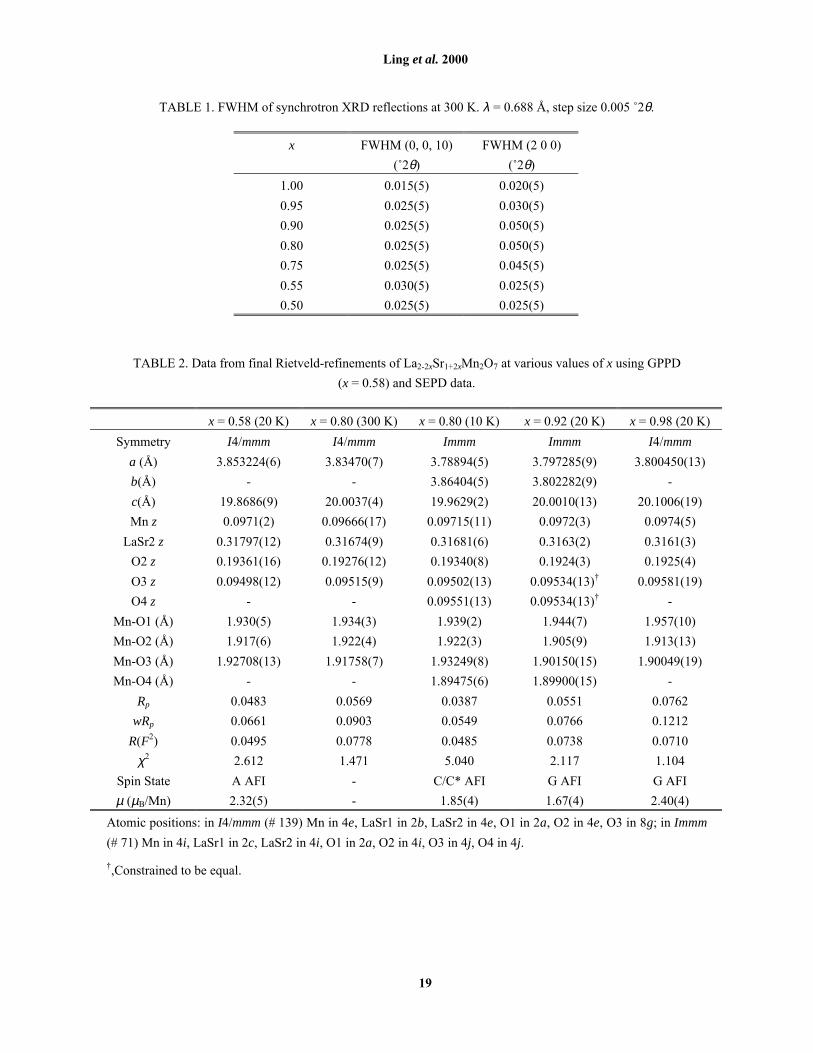
TABLE 1. FWHM of synchrotron XRD reflections at 300 K. λ = 0.688 Å, step size 0.005 û2θ.
x FWHM (0, 0, 10)
(û2θ)
FWHM (2 0 0)
(û2θ)
1.00 0.015(5) 0.020(5)
0.95 0.025(5) 0.030(5)
0.90 0.025(5) 0.050(5)
0.80 0.025(5) 0.050(5)
0.75 0.025(5) 0.045(5)
0.55 0.030(5) 0.025(5)
0.50 0.025(5) 0.025(5)
TABLE 2. Data from final Rietveld-refinements of La2-2xSr1+2xMn2O7 at various values of x using GPPD
(x = 0.58) and SEPD data.
x = 0.58 (20 K) x = 0.80 (300 K) x = 0.80 (10 K) x = 0.92 (20 K) x = 0.98 (20 K)
Symmetry I4/mmm I4/mmm Immm Immm I4/mmm
a (Å) 3.853224(6) 3.83470(7) 3.78894(5) 3.797285(9) 3.800450(13)
b(Å) - - 3.86404(5) 3.802282(9) -
c(Å) 19.8686(9) 20.0037(4) 19.9629(2) 20.0010(13) 20.1006(19)
Mn z 0.0971(2) 0.09666(17) 0.09715(11) 0.0972(3) 0.0974(5)
LaSr2 z 0.31797(12) 0.31674(9) 0.31681(6) 0.3163(2) 0.3161(3)
O2 z 0.19361(16) 0.19276(12) 0.19340(8) 0.1924(3) 0.1925(4)
O3 z 0.09498(12) 0.09515(9) 0.09502(13) 0.09534(13)� 0.09581(19)
O4 z - - 0.09551(13) 0.09534(13)� -
Mn-O1 (Å) 1.930(5) 1.934(3) 1.939(2) 1.944(7) 1.957(10)
Mn-O2 (Å) 1.917(6) 1.922(4) 1.922(3) 1.905(9) 1.913(13)
Mn-O3 (Å) 1.92708(13) 1.91758(7) 1.93249(8) 1.90150(15) 1.90049(19)
Mn-O4 (Å) - - 1.89475(6) 1.89900(15) -
Rp 0.0483 0.0569 0.0387 0.0551 0.0762
wRp 0.0661 0.0903 0.0549 0.0766 0.1212
R(F2) 0.0495 0.0778 0.0485 0.0738 0.0710
χ2 2.612 1.471 5.040 2.117 1.104
Spin State A AFI - C/C* AFI G AFI G AFI
µ (µB/Mn) 2.32(5) - 1.85(4) 1.67(4) 2.40(4)
Atomic positions: in I4/mmm (# 139) Mn in 4e, LaSr1 in 2b, LaSr2 in 4e, O1 in 2a, O2 in 4e, O3 in 8g; in Immm
(# 71) Mn in 4i, LaSr1 in 2c, LaSr2 in 4i, O1 in 2a, O2 in 4i, O3 in 4j, O4 in 4j.
�,Constrained to be equal.
Ling et al. 2000
20
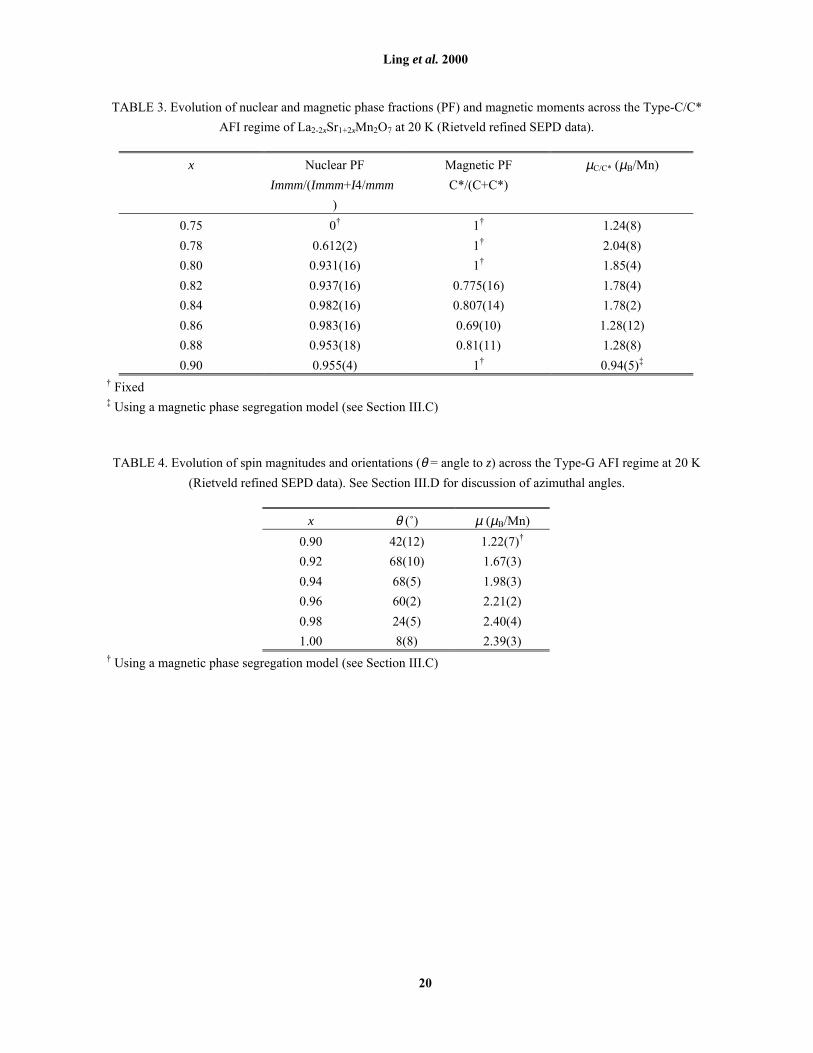
TABLE 3. Evolution of nuclear and magnetic phase fractions (PF) and magnetic moments across the Type-C/C*
AFI regime of La2-2xSr1+2xMn2O7 at 20 K (Rietveld refined SEPD data).
x Nuclear PF
Immm/(Immm+I4/mmm
)
Magnetic PF
C*/(C+C*)
µC/C* (µB/Mn)
0.75 0� 1� 1.24(8)
0.78 0.612(2) 1� 2.04(8)
0.80 0.931(16) 1� 1.85(4)
0.82 0.937(16) 0.775(16) 1.78(4)
0.84 0.982(16) 0.807(14) 1.78(2)
0.86 0.983(16) 0.69(10) 1.28(12)
0.88 0.953(18) 0.81(11) 1.28(8)
0.90 0.955(4) 1� 0.94(5)�
� Fixed� Using a magnetic phase segregation model (see Section III.C)
TABLE 4. Evolution of spin magnitudes and orientations (θ = angle to z) across the Type-G AFI regime at 20 K
(Rietveld refined SEPD data). See Section III.D for discussion of azimuthal angles.
x θ (û) µ (µB/Mn)
0.90 42(12) 1.22(7)�
0.92 68(10) 1.67(3)
0.94 68(5) 1.98(3)
0.96 60(2) 2.21(2)
0.98 24(5) 2.40(4)
1.00 8(8) 2.39(3)� Using a magnetic phase segregation model (see Section III.C)
Ling et al. 2000
21
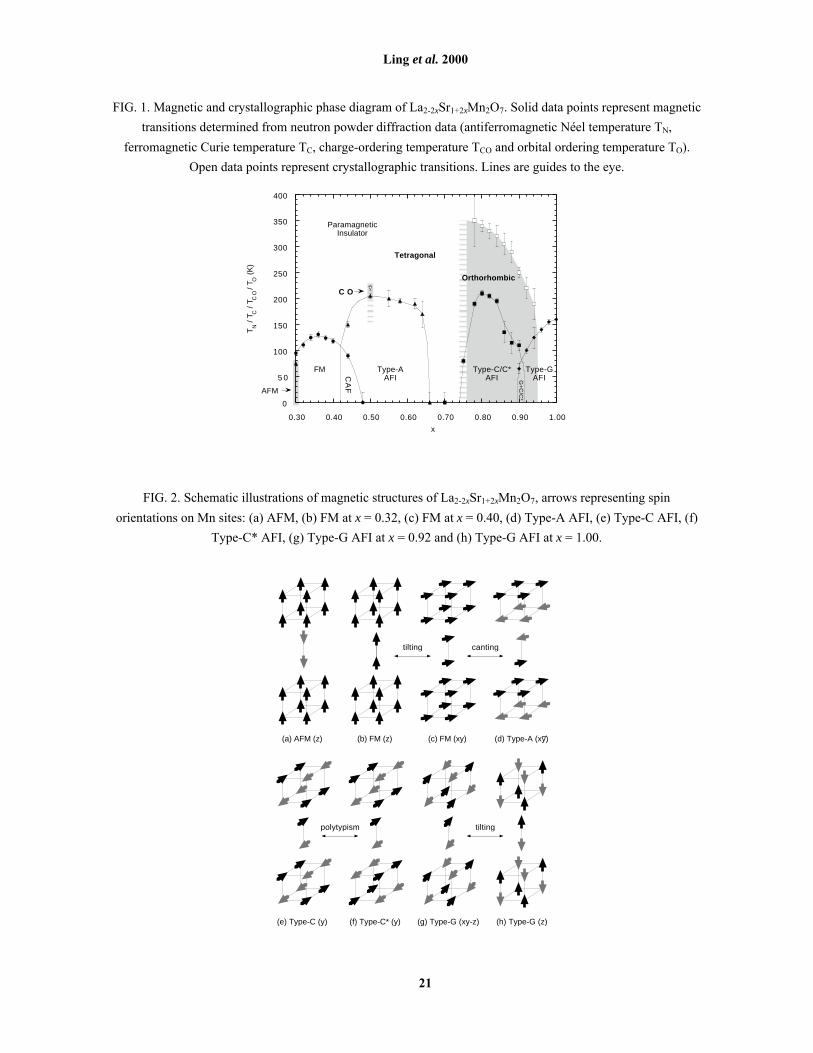
FIG. 1. Magnetic and crystallographic phase diagram of La2-2xSr1+2xMn2O7. Solid data points represent magnetic
transitions determined from neutron powder diffraction data (antiferromagnetic Néel temperature TN,
ferromagnetic Curie temperature TC, charge-ordering temperature TCO and orbital ordering temperature TO).
Open data points represent crystallographic transitions. Lines are guides to the eye.
0
5 0
100
150
200
250
300
350
400
0.30 0.40 0.50 0.60 0.70 0.80 0.90 1.00
T N /
T C /
T CO /
T O (
K)
x
ParamagneticInsulator
Type-C/C*AFI
Type-AAFI
Type-GAFI
FM
C O
AFM
G+
C/C
*
CA
F
Tetragonal
Orthorhombic
FIG. 2. Schematic illustrations of magnetic structures of La2-2xSr1+2xMn2O7, arrows representing spin
orientations on Mn sites: (a) AFM, (b) FM at x = 0.32, (c) FM at x = 0.40, (d) Type-A AFI, (e) Type-C AFI, (f)
Type-C* AFI, (g) Type-G AFI at x = 0.92 and (h) Type-G AFI at x = 1.00.
(a) AFM (z) (b) FM (z)
(e) Type-C (y)
(c) FM (xy) (d) Type-A (xy)
(f) Type-C* (y) (g) Type-G (xy-z) (h) Type-G (z)
tilting canting
tiltingpolytypism
_
Ling et al. 2000
22
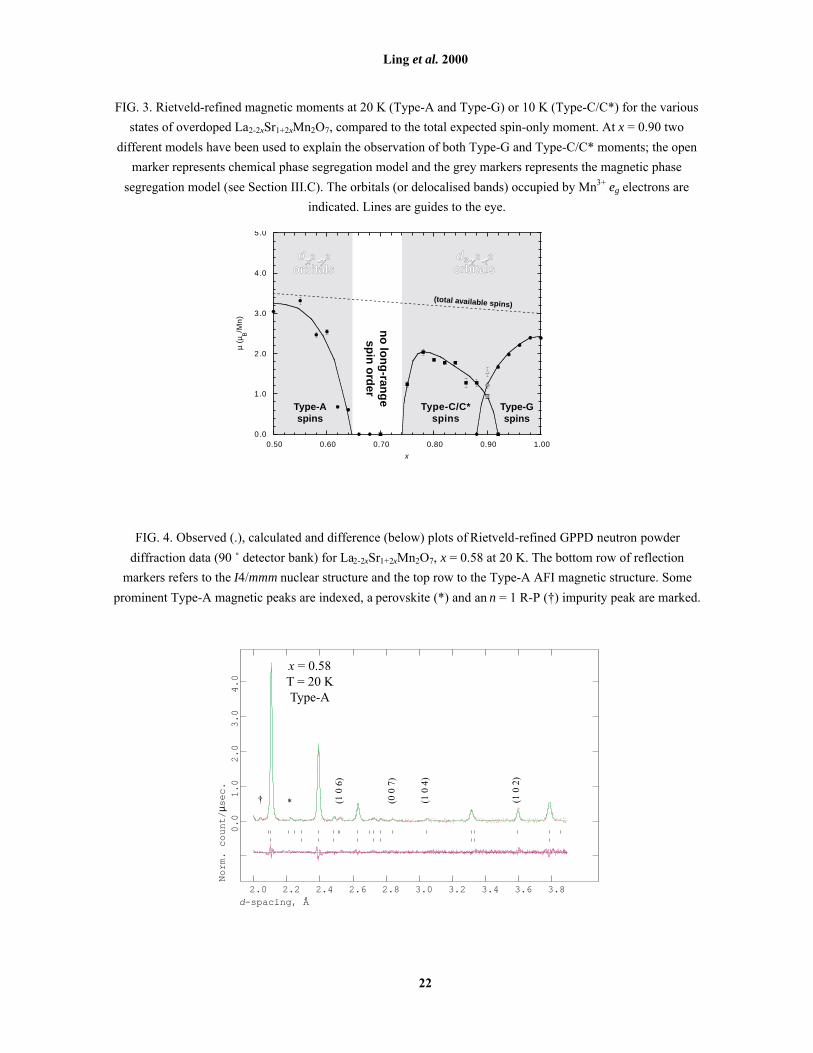
FIG. 3. Rietveld-refined magnetic moments at 20 K (Type-A and Type-G) or 10 K (Type-C/C*) for the various
states of overdoped La2-2xSr1+2xMn2O7, compared to the total expected spin-only moment. At x = 0.90 two
different models have been used to explain the observation of both Type-G and Type-C/C* moments; the open
marker represents chemical phase segregation model and the grey markers represents the magnetic phase
segregation model (see Section III.C). The orbitals (or delocalised bands) occupied by Mn3+ eg electrons are
indicated. Lines are guides to the eye.
µ (µ
B/M
n)
Type-Aspins
Type-C/C*spins
Type-Gspins
d 2 2
orbitals3y -ry -rd 2 2
orbitalsx -yx -y
(total available spins)
no
lon
g-ran
ge
spin
ord
er0.0
1.0
2.0
3.0
4.0
5.0
0.50 0.60 0.70 0.80 0.90 1.00
x
FIG. 4. Observed (.), calculated and difference (below) plots of Rietveld-refined GPPD neutron powder
diffraction data (90 û detector bank) for La2-2xSr1+2xMn2O7, x = 0.58 at 20 K. The bottom row of reflection
markers refers to the I4/mmm nuclear structure and the top row to the Type-A AFI magnetic structure. Some
prominent Type-A magnetic peaks are indexed, a perovskite (*) and an n = 1 R-P (�) impurity peak are marked.
2.0 2.2 2.4 2.6 2.8 3.0 3.2 3.4 3.6 3.8
0.0 1.0
2.0 3.0
4.0
d-spacing, Å
Norm. count/
µsec.
(102)
(106)
(104)
(007)
*
x = 0.58
T = 20 K
Type-A
Ling et al. 2000
23
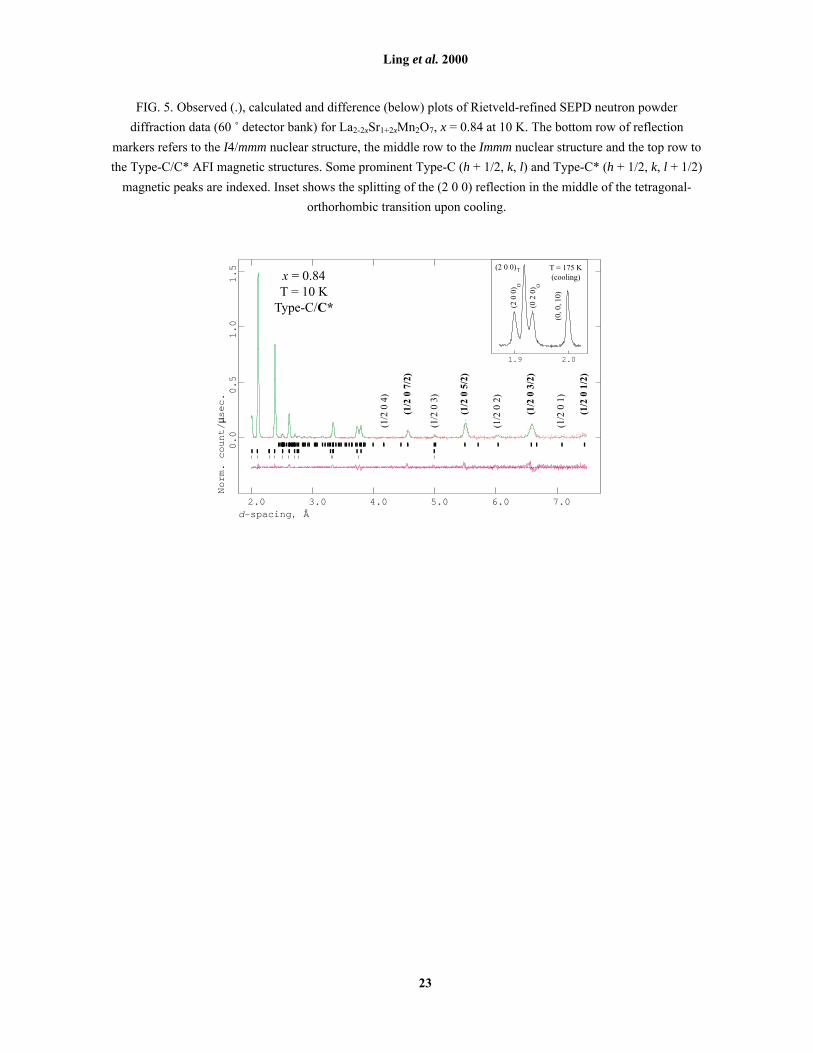
FIG. 5. Observed (.), calculated and difference (below) plots of Rietveld-refined SEPD neutron powder
diffraction data (60 û detector bank) for La2-2xSr1+2xMn2O7, x = 0.84 at 10 K. The bottom row of reflection
markers refers to the I4/mmm nuclear structure, the middle row to the Immm nuclear structure and the top row to
the Type-C/C* AFI magnetic structures. Some prominent Type-C (h + 1/2, k, l) and Type-C* (h + 1/2, k, l + 1/2)
magnetic peaks are indexed. Inset shows the splitting of the (2 0 0) reflection in the middle of the tetragonal-
orthorhombic transition upon cooling.
2.0 3.0 4.0 5.0 6.0 7.0
0.0
0.5
1.0
1.5
d-spacing, Å
Norm. count/
µsec.
(1/2
01/2)
(1/2
02)
(1/2
01)
(1/2
03/2)
(1/2
05/2)
(1/2
04)
(1/2
03)
(1/2
07/2)
1.9 2.0
(0,0,10)
(020) O
(2 0 0)T
(200) O
T = 175 K
(cooling)x = 0.84
T = 10 K
Type-C/C*
Ling et al. 2000
24
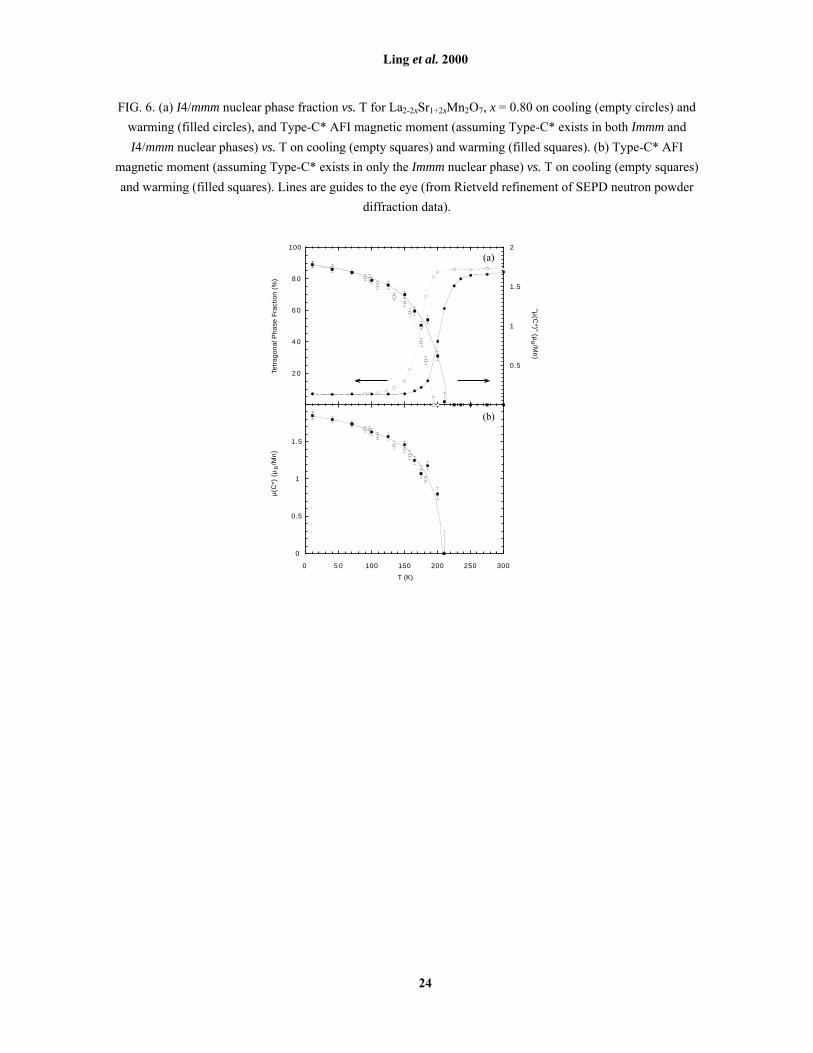
FIG. 6. (a) I4/mmm nuclear phase fraction vs. T for La2-2xSr1+2xMn2O7, x = 0.80 on cooling (empty circles) and
warming (filled circles), and Type-C* AFI magnetic moment (assuming Type-C* exists in both Immm and
I4/mmm nuclear phases) vs. T on cooling (empty squares) and warming (filled squares). (b) Type-C* AFI
magnetic moment (assuming Type-C* exists in only the Immm nuclear phase) vs. T on cooling (empty squares)
and warming (filled squares). Lines are guides to the eye (from Rietveld refinement of SEPD neutron powder
diffraction data).
0
0.5
1
1.5
0 5 0 100 150 200 250 300
T (K)
2 0
4 0
6 0
8 0
100
0.5
1
1.5
2
Tetr
agon
al P
hase
Fra
ctio
n (%
)"µ
(C*)" (µ /M
n)
µ(C
*) (
µ /M
n)
(a)
(b)
BB
Ling et al. 2000
25
FIG. 7. Unit cell dimensions vs. x at room temperature (filled circles) and low temperature (5 ≤ T ≤ 20 K)
(empty circles) (from Rietveld refinement of GPPD, SEPD and HIPD neutron powder diffraction data). Error
bars are smaller than symbols. Lines are guides to the eye.
0.3 0.4 0.5 0.6 0.7 0.8 0.9
x
20.0
20.1
20.2
20.3
20.4
c (Å)
3.70
3.75
3.80
3.85
3.90
a (Å
)
FIG. 8. Magnetic moments due to the Type-C* and Type-G states vs. T at x = 0.90, normalised in each case to
the moments at 10 K. Lines are guides to the eye.
0.0
0.2
0.4
0.6
0.8
1.0
1.2
1.4
0.0
0.2
0.4
0.6
0.8
1.0
1.2
1.4
0 2 0 4 0 6 0 8 0 100 120
Type
-G µ
/µ (1
0 K
) Type-C* µ
/µ(10 K
)
T (K)
Ling et al. 2000
26
FIG. 9. Observed (.), calculated and difference (below) plots of Rietveld-refined SEPD neutron powder
diffraction data (60 û detector bank) for La2-2xSr1+2xMn2O7, (a) x = 0.94 and (b) x = 0.98 at 20 K. The bottom
rows of reflection markers refers to the I4/mmm nuclear structures and the top rows to the Type-G AFI magnetic
structures. θ is the angle to z by which the Type-G spins are tilted. Some prominent magnetic peaks are indexed
and a perovskite impurity peak is marked (*).
0.0 1.0 2.0 3.0
2.0 3.0 4.0 5.0 6.0
0.0 0.2 0.4 0.6
Norm. count/
µsec.
d-spacing, Å
Norm. count/
µsec.
(1/2
1/2
1)
(1/2
1/2
2)
(1/2
1/2
3)
(1/2
1/2
1)
(1/2
1/2
2)
(1/2
1/2
4)
(1/2
1/2
3)
__
__
__
__
(a)
(b)
x = 0.94
T = 20 K
Type-G
x = 0.98
T = 20 K
Type-G
(1/2
1/2
4)
*
Ling et al. 2000
27
FIG. 10. MnO6 octahedral bond lengths vs. x at room temperature (from Rietveld refinement of GPPD, SEPD
and HIPD neutron powder diffraction data). Lines are guides to the eye.
1.85
1.90
1.95
2.00
2.05
0.3 0.4 0.5 0.6 0.7 0.8 0.9 1.0
Mn-O1
Mn-O2
Mn-O3
Mn-
O (
Å)
x
Mn/O3
O1
O2
Ling et al. 2000
28
FIG. 11. Lattice parameters vs. T for (a) x = 0.55, (b) x = 0.58, (c) x = 0.80 and (d) x = 0.96 (from Rietveld
refinement of HIPD (a), GPPD (b) and SEPD (c, d) neutron powder diffraction data). Lines are guides to the
eye.
3.8680
3.8690
3.8700
19.90
19.94
19.98
a (Å
) c (Å)
3.8540
3.8545
19.98
20.00
20.02
20.04
a (Å
) c (Å)
3.800
3.840
3.880
19.965
19.975
19.985
19.995
a tet
a ortho
b ortho
a T, a
O, b
O (Å
)
c (Å)
3.8190
3.8194
3.8198
19.93
19.95
19.97
19.99
0 100 200 300
a (Å
) c (Å)
T (K)
(a)
(b)
(c)
(d)
x = 0.55
x = 0.58
x = 0.80
x = 0.96
Ling et al. 2000
29
FIG. 12. Normalised resistances of pellets vs. T for various values of x within the Type-A AFI regime.
10-1
100
101
102
103
104
R/R
(295
K)
300250200150100500
Temperature (K)
0.60
0.50
0.52
0.58
0.55
FIG. 13. Schematic illustration of spins on Mn sites in the a-b plane evolving from the Type-G to the Type-
C/C* AFI states. Dark grey d3y2-r2 orbitals are intended to indicate the density of Mn3+ sites rather than exact
ordering patterns; pseudo-delocalised d3y2-r2 bands are light grey. (a) No Mn3+. (b) Mn3+ uncorrelated along a
and b. (c) Mn3+ uncorrelated along a but correlated along b. (d) Mn3+ correlated along a and b.
x = 1.00
0.95 < x < 1.00
0.90 < x < 0.95
0.74 < x < 0.90
orthorhombic ‘tilted’ Type-G
orthorhombic Type-C
tetragonal ‘tilted’ Type-G
tetragonal Type-G
a
b
c
(d)
(a)
(b)
(c)
Ling et al. 2000
30
REFERENCES
1 T. Kimura, Y. Tomioka, H. Kuwahara, A. Asamitsu, M. Tamura, and Y. Tokura, Science 274, 1698
(1996).
2 T. Kimura, A. Asamitsu, Y. Tomioka, and Y. Tokura, Phys. Rev. Lett. 79, 3720 (1997).
3 D. N. Argyriou, J. F. Mitchell, P. G. Radaelli, H. N. Bordallo, D. E. Cox, M. Medarde, and J. D.
Jorgensen, Phys. Rev. B 59, 8695 (1999).
4 K. Hirota, Y. Moritomo, H. Fujioka, M. Kubota, H. Yoshizawa, and Y. Endoh, J. Phys. Soc. Jpn. 67,
3380 (1998).
5 J. Q. Li, Y. Matsui, T. Kimura, and Y. Tokura, Phys. Rev. B 57, 3205R (1998).
6 T. Kimura, R. Kumai, Y. Tokura, J. Q. Li, and Y. Matsui, Phys. Rev. B 58, 11081 (1998).
7 T. Hayashi, N. Miura, M. Tokunaga, T. Kimura, and Y. Tokura, J. Phys.: Condens. Matter 10, 11525
(1998).
8 R. Suryanarayanan, G. Dhalenne, A. Revcolevschi, W. Prellier, J.-P. Renard, C. Dupas, W. Caliebe,
and T. Chatterji, Solid State Commun. 113, 267 (2000).
9 M. Kubota, H. Fujioka, K. Ohoyama, K. Hirota, Y. Moritomo, H. Yoshizawa, and Y. Endoh, J. Phys.
Chem. Solids 60, 116 (1999).
10 M. Kubota, H. Yoshizawa, Y. Moritomo, H. Fujioka, K. Hirota, and Y. Endoh, J. Phys. Soc. Jpn. 68,
2202 (1999).
11 J. F. Mitchell, J. E. Millburn, M. Medarde, S. Short, J. D. Jorgensen, and M. T. Fernández-Díaz, J.
Solid State Chem. 141, 599 (1998).
12 N. Mitzutani, A. Kitazawa, O. Nobuyaki, and M. Kato, J. Chem. Soc. Jpn. 73, 1097 (1970).
13 J. E. Millburn, J. F. Mitchell, and D. N. Argyriou, Chem. Comm. 15, 1389 (1999).
14 J. J. Neumeier and J. L. Cohn, Phys. Rev. B 61, 14319 (2000).
15 P. D. Battle, D. E. Cox, M. A. Green, J. E. Millburn, L. E. Spring, P. G. Radaelli, M. J. Rosseinsky,
and J. F. Vente, Chem. Mater. 9, 1042 (1997).
16 A. C. Larson and R. B. V. Dreele,, (Los Alamos National Laboratory, 1990).
17 D. N. Argyriou, H. N. Bordallo, B. J. Campbell, A. K. Cheetham, D. E. Cox, J. S. Gardner, K. Hanif,
A. d. Santos, and G. F. Strouse, Phys. Rev. B, (in press).
18 E. O. Wollan and W. C. Koehler, Phys. Rev. 100, 545 (1955).
19 C. Martin, A. Maignan, M. Hervieu, B. Raveau, Z. Jirák, A. Kurbakov, V. Trounov, G. André, and F.
Bourée, J. Magn. Magn. Mater. 205, 184 (1999).
20 R. Osborn, S. Rosenkrantz, D. N. Argyriou, L. Vasiliu-Doloc, J. W. Lynn, S. K. Sinha, J. F. Mitchell,
K. E. Gray, and S. D. Bader, Phys. Rev. Lett. 81, 3964 (1998).
Ling et al. 2000
31
21 E. Gurewitz, J. Makovsky, and H. Shaked, Phys. Rev. B 14, 2071 (1976).
22 T. Akimoto, Y. Maruyama, Y. Morimoto, A. Nakamura, K. Hirota, K. Ohoyama, and M. Ohashi, Phys.
Rev. B 57, R5594 (1998).
23 T. Akimoto, Y. Moritomo, K. Ohoyama, S. Okamoto, S. Ishihara, S. Maekawa, and A. Nakamura,
Phys. Rev. B 59, 14153R (1999).
24 R. Maezono and N. Nagaosa, Phys. Rev. B 61, 1825 (2000).
25 J. F. Mitchell, D. N. Argyriou, J. D. Jorgensen, D. G. Hinks, C. D. Potter, and S. D. Bader, Phys. Rev.
B 55, 63 (1997).
26 D. N. Argyriou, J. F. Mitchell, J. B. Goodenough, O. Chmaissem, S. Short, and J. D. Jorgensen, Phys.
Rev. Lett. 78, 1568 (1997).
27 D. N. Argyriou, J. F. Mitchell, C. D. Potter, S. D. Bader, R. Kleb, and J. D. Jorgensen, Phys. Rev. B 55,
11965R (1997).
28 D. N. Argyriou, H. N. Bordallo, J. F. Mitchell, J. D. Jorgensen, and G. F. Strouse, Phys. Rev. B 60,
6200 (1999).
29 M. Medarde, J. F. Mitchell, J. E. Millburn, S. Short, and J. D. Jorgensen, Phys. Rev. Lett. 83, 1223
(2000).
30 T. Terai, T. Sasaki, T. Kakeshita, T. Fukuda, and T. Saburi, Phys. Rev. B 61, 3488 (2000).
31 M. Tokunaga, N. Miura, Y. Tomioka, and Y. Tokura, Phys. Rev. B 57, 5259 (1998).
32 Y. Tomioka, A. Asamitsu, Y. Moritomo, H. Kuwahara, and Y. Tokura, Phys. Rev. B 53, 1689 (1996).
33 Y. Tomioka, H. Yoshizama, and N. Miura, Solid State Phys. 32, 326 (1997).
34 P. G. Radaelli, D. E. Cox, M. Marezio, S.-W. Cheong, P. E. Schiffer, and A. P. Ramirez, Phys. Rev.
Lett. 75, 4488 (1995).
35 C. H. Chen and S.-W. Cheong, Phys. Rev. Lett. 76, 4042 (1996).
36 J. Blasco, J. García, J. M. D. Teresa, M. R. Ibarra, J. Pérez, P. A. Algarabel, C. Marquina, and C.
Ritter, J. Phys.: Condens. Matter 9, 10321 (1997).
37 M. Takata, E. Nishibori, K. Kato, M. Sakata, and Y. Moritomo, J. Phys. Soc. Jpn. 68, 2190 (1999).
38 J. B. Goodenough, Phys. Rev. 100, 564 (1955).
39 P. Schiffer, A. P. Ramirez, W. Bao, and S.-W. Cheong, Phys. Rev. B 75, 3336 (1995).
40 R. Kajimoto, H. Yoshizawa, H. Kawano, H. Kuwahara, Y. Tokura, K. Ohoyama, and M. Ohashi, Phys.
Rev. B 60, 9506 (1999).
41 H. Kawano, R. Kajimoto, H. Yoshizawa, Y. Tomioka, H. Kuwahara, and Y. Tokura, Phys. Rev. Lett.
78, 4253 (1997).
42 P. D. Battle, M. A. Green, N. S. Laskey, J. E. Millburn, P. G. Radaelli, M. J. Rosseinsky, S. P.
Sullivan, and J. F. Vente, Phys. Rev. B 54, 15967 (1996).
Ling et al. 2000
32
43 P. D. Battle, M. A. Green, N. S. Laskey, N. Kasmir, J. E. Millburn, L. E. Spring, S. P. Sullivan, M. J.
Rosseinsky, and J. F. Vente, J. Mater. Chem. 7, 977 (1997).


![X-ray study of Nd[sub 0.5]Sr[sub 0.5]MnO[sub 3] manganite structure above and below the ferromagnetic metal–antiferromagnetic insulator spontaneous phase transition](https://img.pdfslide.net/doc/110x75/63518b0489352761b1063940/x-ray-study-of-ndsub-05srsub-05mnosub-3-manganite-structure-above-and-below.jpg)


