Embed Size (px)
Citation preview
Late Cenozoic Glaciations and Environments in Southernmost Patagonia
by
Corinne Y. Griffing
MSc., University of Nevada, Las Vegas, 2011
BSc., University of Nevada, Las Vegas, 2007
Thesis Submitted in Partial Fulfillment of the
Requirements for the Degree of
Doctor of Philosophy
in the
Department of Earth Sciences
Faculty of Science
© Corinne Y. Griffing 2018
SIMON FRASER UNIVERSITY
Spring 2018
Copyright in this work rests with the author. Please ensure that any reproduction or re-use is done in accordance with the relevant national copyright legislation.

ii
Approval
Name: Corinne Griffing
Degree: Doctor of Philosophy (Earth Sciences)
Title: Late Cenozoic Glaciations and Environments in Southernmost Patagonia
Examining Committee: Chair: Derek Thorkelson Professor
Brent Ward Senior Supervisor Professor
John Clague Supervisor Professor Emeritus
Olav Lian Supervisor Adjunct Professor
René Barendregt Supervisor Professor
Gwenn Flowers Internal Examiner Professor Department of Earth Sciences
Hester Jiskoot External Examiner Associate Professor Department of Geography University of Lethbridge
Date Defended/Approved: April 5, 2018
iii
Abstract
This thesis advances understanding of late Cenozoic landscape evolution and glaciation in southernmost South America using continental sedimentary deposits and landforms in the Lago Cardiel region in the foothills of the southern Patagonian Andes and along the Atlantic north and south of the Strait of Magellan. The evolution of the landscape in these two areas was determined through landform mapping and relative chronologic landform correlations. Paleomagnetic characteristics of late Cenozoic sediments and basalt flows and the stratigraphy and sedimentology of Pleistocene glacial sediments in sea cliffs and anthropogenic exposures provide a chronology and evidence of depositional environments during Pleistocene glaciations.
The landscape in the Lago Cardiel area changed significantly following the last major period of tectonic uplift at the end of the Miocene. Large west-trending valleys that incise Miocene-aged basalt were abandoned by their formative rivers about 4.4 Ma. The closed basin that contains Lago Cardiel began to form on the relict plain surface before 4.0 Ma and grew in size throughout the Pliocene and Pleistocene by a combination of erosion by small streams, deflation, colluviation, and possibly tectonic collapse. Drainage reorganizations occurred at about 4.0 Ma and 3.6 Ma, most likely initiated by increased aggradation or isostasy during Pliocene glaciations. Eolian, fluvial, and mass-movement processes continued to alter the landscape throughout the Pleistocene with higher rates during glacial periods.
Evidence of at least three glaciations is recorded in the stratigraphic exposures at the Atlantic Coast and the shores of the Strait of Magellan. At Cabo Vírgenes and Bahía Posesión, two glacial drift units were deposited in a grounding-line environment. These sediments are normally magnetized and date to the Brunhes Chron (<0.78 Ma). The Tres de Enero highway cut exposes three subglacial tills deposited during the Great Patagonian Glaciation (GPG) – two normally magnetized tills that I assign to the early Brunhes Chron and a lower reversely magnetized till deposited during the Matuyama Chron (2.581-0.78 Ma). The reversely magnetized till and other reversely magnetized GPG sediments indicate that the earliest Pleistocene glaciations occurred before 0.78 Ma. In the Río Gallegos Valley, a 0.86 Ma basalt flow caps a thick unit of normally magnetized glaciofluvial gravel, which was probably deposited during the Jaramillo Subchron (1.075-0.991 Ma).
This thesis provides a timeline for the evolution of the landscape of the Lago Cardiel region from the Miocene to the present. It also contributes to our understanding of the age and depositional environments of GPG and post-GPG 1 glacial events in the Strait of Magellan region by documenting the magnetic polarity of glacial sediments throughout the region.

iv
Keywords: Argentina, Andean landscape evolution, paleomagnetism, Quaternary
stratigraphy, depositional environments

v
Dedication
For my father.
vi
Acknowledgements
I am very grateful to my supervisory committee for their support and guidance
throughout my degree. Dr. John Clague has been an exemplary mentor, having taught
me invaluable skills in field geology and science communication. I thank him for his
patience and advice in matters of science and life.
Dr. René Barendregt (University of Lethbridge) provided his expertise in
sampling, measurement, and interpretation of paleomagnetic results. I am very grateful
to René for joining me in the field, and for providing the generous use of his laboratory
equipment. Dr. Olav Lian (University of the Fraser Valley) shared his extensive
knowledge of Quaternary sedimentology and stratigraphy in the field, as well as a
contagious appreciation of South American fauna. Dr. Paul Sanborn (University of
Northern British Columbia) and Mr. Scott Smith (Agricultural and Agri-Food Canada)
contributed their expertise in soil science and periglacial features in soils, paleosols, and
landscapes. Dr. Bettina Ercolano (Universidad Nacional de la Patagonia Austral), Dr.
Hugo Corbella (Museo Argentino de Ciencias Naturales), and Dr. Jorge Rabassa
(CADIC-CONICET) contributed their extensive knowledge of Patagonian Quaternary
geology that was crucial to locating stratigraphic sections and landforms described in
this thesis. This project could not have been completed without their field assistance and
logistical support.
Dr. Nicholas Roberts (SFU) was an invaluable lab and field assistant, officemate,
and friend. I thank him for his assistance with field sampling and interpretation of
paleomagnetic results, and for countless cups of coffee. I am also grateful to Dr. Derek
Turner, Dr. Andrew LaCroix, Ms. Justine Cullen, Dr. Rachel Chapman, and Ms. Leila
Ertolahti for their companionship and assistance in the field. I thank Dr. Brent Ward
(SFU) for teaching me Quaternary geology during my first year, providing advice when
needed, and feeding me a holiday meal here and there.
Finally, I thank my friends and family for their support and encouragement
throughout my long academic career. My parents, Owen and Sharon Griffing, provided
financial support and unconditional faith in my abilities. My sister, Jessica, was a
comforting source of optimism and no-nonsense advice. Nathalie, Kirsten, Mandy,
Alexis, Jolane, and Kirsti supported me with their friendship and inspired me as

vii
successful women in the sciences. Lastly, thank you to my partner, Dave Sacco, for
loving me through the best and worst of times, and helping me keep my eyes on the
prize.
viii
Table of Contents
Approval ............................................................................................................................ ii Abstract ............................................................................................................................. iii Dedication ......................................................................................................................... v Acknowledgements .......................................................................................................... vi Table of Contents ............................................................................................................ viii List of Tables .................................................................................................................... xi List of Figures................................................................................................................... xii
Chapter 1. Introduction ................................................................................................ 1 1.1. Previous studies ...................................................................................................... 2
1.1.1. Miocene-Pliocene glaciations .......................................................................... 2 1.1.2. Pleistocene glaciation ..................................................................................... 4
1.2. My research approach ............................................................................................ 6 1.2.1. Sediment paleomagnetism .............................................................................. 6 1.2.2. Stratigraphy and sedimentology ...................................................................... 8 1.2.3. Geomorphic mapping ...................................................................................... 9
1.3. Research objectives .............................................................................................. 10 1.3.1. Thesis outline ................................................................................................ 10
Chapter 2. Geomorphology and landscape evolution of the Lago Cardiel area .. 12 2.1. Introduction ........................................................................................................... 12 2.2. Study area ............................................................................................................. 14
2.2.1. Physiography ................................................................................................ 14 2.2.2. Bedrock stratigraphy ..................................................................................... 15 2.2.3. Lago Cardiel .................................................................................................. 15
2.3. Methods ................................................................................................................ 17 2.3.1. Paleomagnetic analysis ................................................................................ 17
Sampling .................................................................................................................. 17 Sample analysis ....................................................................................................... 18 Statistical analysis ................................................................................................... 19
2.3.2. Radiometric dating ........................................................................................ 19 2.3.3. Mapping ........................................................................................................ 20
2.4. Results .................................................................................................................. 21 2.4.1. Paleomagnetism ........................................................................................... 21
Paleomagnetic characteristics of sediments ............................................................ 21 Paleomagnetic characteristics of basalts ................................................................. 27
2.4.2. Radiometric age dating ................................................................................. 29 2.4.3. Geomorphic map ........................................................................................... 31
Igneous bedrock surface ......................................................................................... 33 Sedimentary bedrock surface .................................................................................. 34 Main-plateau basalt flows ........................................................................................ 34 Plain 1 ...................................................................................................................... 36
ix
Plain 2 ...................................................................................................................... 38 Paleoshoreline ......................................................................................................... 40 Post-plateau basalt flow ........................................................................................... 42 Colluviated sedimentary rock ................................................................................... 43 Colluviated basalt .................................................................................................... 45 Río Shehuen terraces .............................................................................................. 47 Relict alluvial fans .................................................................................................... 47 Glacial landforms ..................................................................................................... 53 Río Chico terrace 1 .................................................................................................. 54 Río Chico terrace 2 .................................................................................................. 57 Closed depressions ................................................................................................. 58 Río Chico terrace 3 .................................................................................................. 60 Eolian veneer ........................................................................................................... 60 Beaches ................................................................................................................... 61 Modern fans ............................................................................................................. 62 Active plain .............................................................................................................. 63
2.5. Discussion and Conclusion ................................................................................... 65
Chapter 3. Magnetostratigraphy of Early to Middle Pleistocene glaciations in the Strait of Magellan region .................................................................................... 70
3.1. Introduction ........................................................................................................... 70 3.2. Study area ............................................................................................................. 74
3.2.1. Physiography and geology ............................................................................ 74 3.2.2. Glacial record ................................................................................................ 76
3.3. Methods ................................................................................................................ 79 3.3.1. Field methods ................................................................................................ 79 3.3.2. Remanence measurements .......................................................................... 81
3.4. Results and discussion ......................................................................................... 82 3.4.1. GPG drift ....................................................................................................... 89
Tres de Enero .......................................................................................................... 89 Bella Vista ................................................................................................................ 92 Estancia Chimen Aike .............................................................................................. 92 Other GPG sections ................................................................................................. 93
3.4.2. Cabo Vírgenes drift ....................................................................................... 98 3.4.3. Punta Delgada drift ....................................................................................... 98 3.4.4. Primera Angostura drift ............................................................................... 101
3.5. Discussion ........................................................................................................... 101 3.5.1. GPG drift ..................................................................................................... 101 3.5.2. Cabo Vírgenes drift ..................................................................................... 103 3.5.3. Punta Delgada drift ..................................................................................... 104 3.5.4. Primera and Segunda Angostura drifts ....................................................... 104
3.6. Conclusions ......................................................................................................... 104
Chapter 4. Depositional environments of Early to Middle Pleistocene glacial sediments in the Strait of Magellan region ..................................................... 107
x
4.1. Introduction ......................................................................................................... 107 4.2. Regional setting .................................................................................................. 113
4.2.1. Physiography .............................................................................................. 113 4.2.2. Geology ....................................................................................................... 113 4.2.3. Climate and weather ................................................................................... 115
4.3. Methods .............................................................................................................. 115 4.4. Results and interpretations ................................................................................. 118
4.4.1. Geomorphology ........................................................................................... 118 4.4.2. Stratigraphy ................................................................................................. 123
Cabo Vírgenes ....................................................................................................... 123 Bahía Posesión ...................................................................................................... 138 Tres de Enero ........................................................................................................ 142 Cabo del Espíritu Santo ......................................................................................... 146
4.5. Discussion ........................................................................................................... 149 4.6. Conclusions ......................................................................................................... 151
Chapter 5. Conclusions ........................................................................................... 153 5.1. Future research ................................................................................................... 155
5.1.1. Chronology of landscape evolution in the Lago Cardiel region ................... 155 5.1.2. Chronology of Early and Middle Pleistocene glaciations in the Strait of Magellan area ............................................................................................................ 156
References ................................................................................................................... 159
Appendix. Cabo Vírgenes stratigraphic columns ............................................. 171
xi
List of Tables
Table 1. Field work dates, field sites, collaborators, and types of data obtained. .................................................................................................... 8
Table 2. Sample remanence directions by location and polarity. .......................... 22 Table 3. Summary of new and previously published radiometric ages in the
Lago Cardiel study area. ......................................................................... 30 Table 4. Facies types and codes used in this study. ............................................. 81 Table 5. Summary of paleomagnetic data. ............................................................ 83 Table 6. Means of magnetic data for sample groups. ........................................... 89 Table 7. Facies types and codes used in this study ............................................ 118
xii
List of Figures
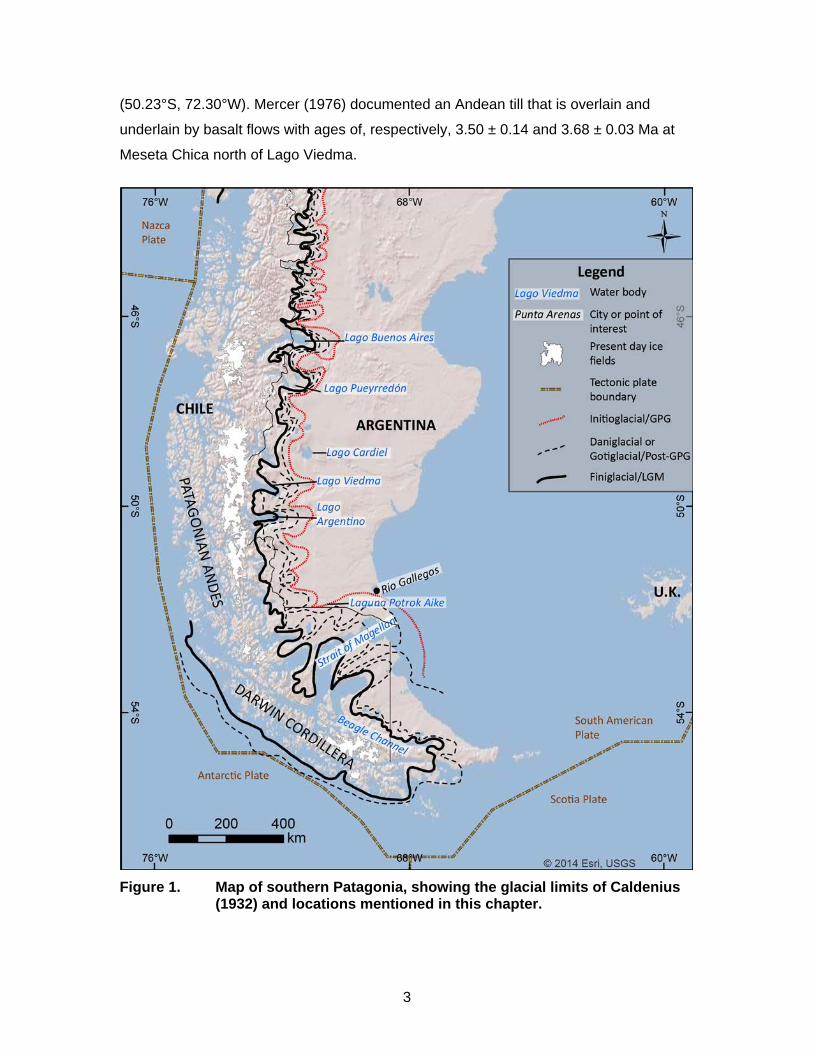
Figure 1. Map of southern Patagonia, showing the glacial limits of Caldenius (1932) and locations mentioned in this chapter. ........................................ 3
Figure 2. The Geomagnetic Polarity Time Scale ...................................................... 7 Figure 3. Colored Shuttle Radar Topography Mission (SRTM), 1 arc second
DEM image of the study area showing localities mentioned in the text. .......................................................................................................... 14
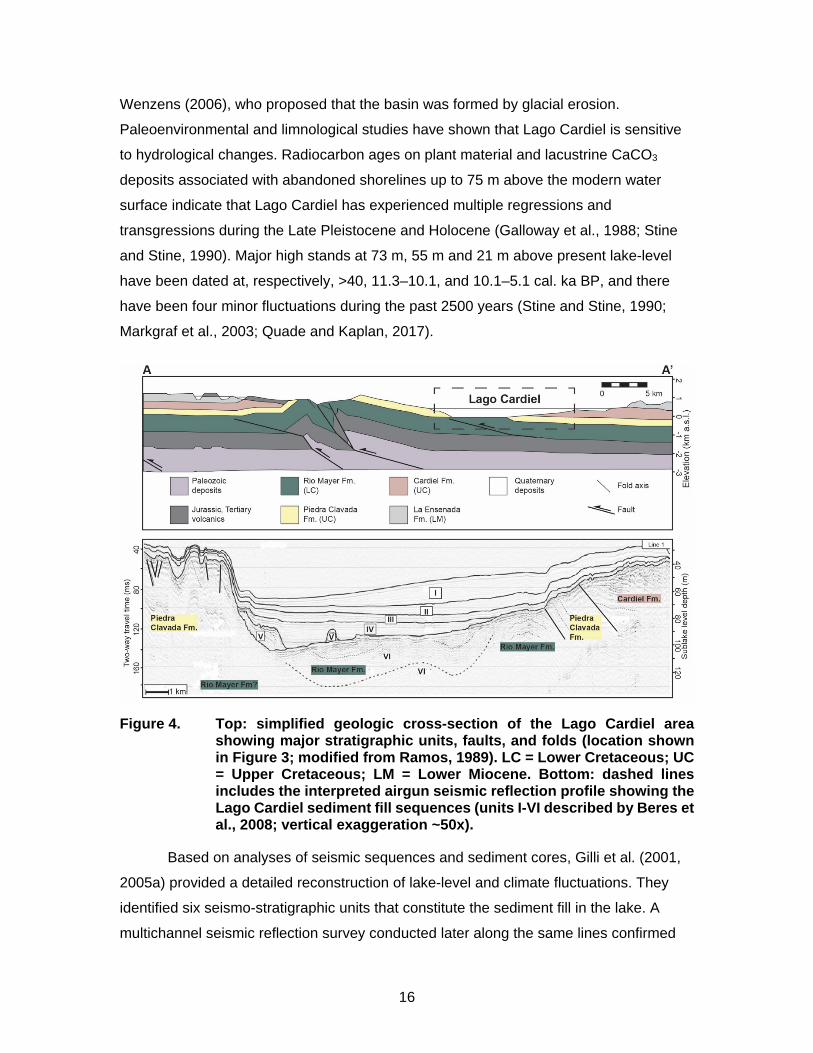
Figure 4. Top: simplified geologic cross-section of the Lago Cardiel area showing major stratigraphic units, faults, and folds. ................................ 16
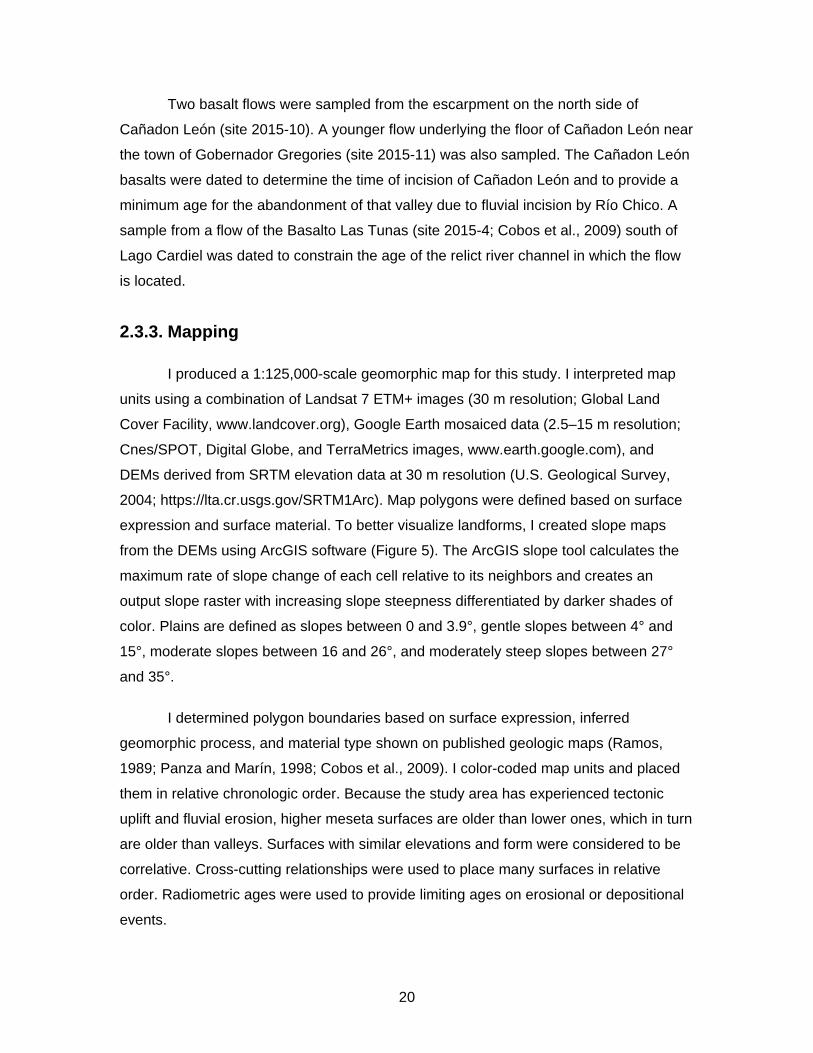
Figure 5. Slope map derived from the 30 m DEM using ArcMap 10.1, with slopes of 1-5° indicated by darker shades of purple. ............................... 21
Figure 6. Equal-area stereographic projections of paleomagnetic directions of sediment samples. ................................................................................... 23
Figure 7. Zijderveld diagrams and equal-area stereographic projections showing demagnetization characteristics of selected samples. .............. 24
Figure 8. Photo, lithostratigraphic log, and magnetostratigraphy of the road-cut exposure at site 2015-2 ..................................................................... 25
Figure 9. Magnetostratigraphy of the road-cut exposure at site 2015-8. ................ 27 Figure 10. Equal-area stereographic projections of paleomagnetic directions of
basalt samples. ........................................................................................ 28 Figure 11. Radiometric ages of basalts in the Lago Cardiel region. ......................... 31 Figure 12. Geomorphic map of the Lago Cardiel and Gobernador Gregores
region. ...................................................................................................... 32 Figure 13. Google Earth images showing (a) Jurassic and Cretaceous igneous
bedrock surfaces in the eastern part of the map area and (b) east-dipping Cretaceous sedimentary rocks west of Lago Cardiel (Landsat/Copernicus 2016 images, accessed October 8, 2017). ............ 33
Figure 14. Main-plateau basalt flows dating to 8.8-8.5 Ma exposed in the north wall of Cañadon León. ............................................................................. 34
Figure 15. Google Earth images (Landsat/Copernicus, accessed March 18, 2017) showing Miocene main-plateau basalt surfaces with lower younger post-plateau basalt surfaces outlined in white. .......................... 35
Figure 16. (a) DEM (SRTM 1 Arc Second scene) and (b) Google Earth image (Landsat/Copernicus image, accessed May 28, 2017) including the location of (c) a cross-section showing the position of fluvial plains at the west end of Meseta de Molinari with respect to dated basalt flows. ....................................................................................................... 38
Figure 17. Photo of plain 2 cobble-boulder gravel exposed in a gravel quarry at site 2015-3 south of Lago Cardiel. ........................................................... 39
Figure 18. (a) Beach/spit complex at about 400 m a.s.l. marking the shore of a shallow lake at the east end of Tres Lagunas valley. (b) Aerial image of the beach complex marking the paleoshoreline. (c) Topographic profile along the center of the Tres Lagunas valley showing flooding to 400 m a.s.l. (SRTM 1 Arc Second scene). .............. 41
xiii
Figure 19. Post-plateau basalt flows (a) covering a Río Chico terrace 3 east of Gobernador Gregores and (b) partially filling the Lago Cardiel basin at Pampa de las Tunas. ........................................................................... 43
Figure 20. Google Earth images (Landsat/Copernicus, accessed October 3, 2017) showing colluviated sedimentary bedrock surfaces. ..................... 44
Figure 21. Google Earth images (Landsat/Copernicus, accessed October 5, 2017) showing examples of (a) arcuate scalloped landslide headscarps along the northwest edge of Meseta el Martillo and (b) sag ponds between slump blocks along the south edge of Meseta del Strobel. .............................................................................................. 46
Figure 22. (a) Colored DEM (SRTM 1 Arc Second scene) showing the Río Shehuen T2 terrace and the Cerro Cordén basalt flow. The red line marked A-A’ corresponds to the cross-section in (b). .............................. 48
Figure 23. Oblique view west down Tres Lagunas valley with its infill of fan sediments. Topographic profile A-A’ shows the undulating surface of the fan apron on the south side of the valley and the beach complex near the east end of the valley. ................................................. 50
Figure 24. Paleosols at site 2015-8. (a) Nodular horizons near the base of the sequence. (b) Vertical filaments and plugged horizons in the upper portion of the sequence. .......................................................................... 51
Figure 25. The geomagnetic polarity timescale showing possible times of formation of the alluvial fan sediments at site 2015-8 (Lisiecki and Raymo, 2005). ......................................................................................... 53
Figure 26. Glacial surface at the southwest corner of Meseta la Siberia, delineated by Early Pleistocene lateral moraines. ................................... 54
Figure 27. Three sets of Río Chico terraces as seen on the 30 m DEM (top) (SRTM 1 Arc Second scene) and a satellite image (middle) (Landsat/Copernicus, accessed October 5, 2017 with Google Earth). Bottom: Topographic cross-section along A-A’ on the DEM. ....... 55
Figure 28. Topographic profile on the 30 m DEM (SRTM 1 Arc Second scene), illustrating the similar elevation and slope gradient of the Río Chico terrace 1 surfaces and Cañadon León. ................................................... 56
Figure 29. Google Earth image (Landsat/Copernicus, accessed October 5, 2017) showing Río Chico terrace 2 surface east of Meseta de Molinari inset into relict alluvial fans, as well as closed deflation basins developed on the terrace surfaces. .............................................. 57
Figure 30. Eroded surfaces of the main-plateau basalt flows. a) Clusters of closed basins along Chorillo Barrancoso and Chorillo el Moro on Meseta de la Muerte; Lago Strobel on the northeast. b) Basins dotting the surface of Meseta de Molinari (Landsat/Copernicus images accessed July 22, 2017, with Google Earth). .............................. 58
Figure 31. A Río Chico terrace 2 east of Meseta de Molinari, showing deflation basins, playa lakes, former shorelines, and eolian sediments. ............... 61
Figure 32. Google Earth image (Landsat/Copernicus, accessed September 26, 2017) showing Holocene and late Pleistocene beaches on the east side of Lago Cardiel. ................................................................................ 62
xiv
Figure 33. Google Earth image (Landsat/Copernicus, accessed October 8, 2017) showing modern alluvial fans at the toes of relict alluvial fans on the north wall of Tres Lagunas valley. ................................................ 63
Figure 34. View to the southeast of the Río Chico valley from the surface of the basalt flow lying on the Río Chico terrace 1 above Gobernador Gregores. ................................................................................................. 64
Figure 35. Google Earth image (Landsat/Copernicus, accessed May 22, 2017) of Cañada de la Casa southeast of Meseta de Molinari. ......................... 64
Figure 36. Global Magnetic Polarity Timescale and δ18O record. ............................. 72 Figure 37. Location map of southern Patagonia. Inset DEM shows field area in
red and Pali Aike volcanic field in black. .................................................. 73 Figure 38. The Pali Aike volcanic field. ..................................................................... 76 Figure 39. Glacial limits of Meglioli (1992) shown on a shaded relief map of
southernmost Patagonia. Also shown are locations of paleomagnetic sediment samples collected and analyzed in this study. ....................................................................................................... 78
Figure 40. Quaternary chronostratigraphy of the Río Gallegos valley and Magellan Strait lobes. .............................................................................. 79
Figure 41. Stereographic plots (left), orthogonal diagrams (center), and intensity diagrams (right) for typical (a) reverse polarity and (b) normal polarity samples. .......................................................................... 86
Figure 42. Stereographic plot of means for each of the sampled units in the study area. ............................................................................................... 87
Figure 43. Stereographic plot of means and 95% circles of confidence for: (a) GPG drift (normal polarity mean in upper hemisphere, reverse polarity in lower hemisphere); (b) Cabo Vírgenes drift; (c) Punta Delgada drift; and (d) Primera Angostura drift. ........................................ 88
Figure 44. Stratigraphy and sampling locations at the Tres de Enero section. (a) Sand wedges and stone lines along unit contacts; (b) deformed sand wedge along contact between units TDE2 and TDE3; (c) photo showing inset photo locations. ....................................................... 92
Figure 45. Log and photo of the Bella Vista section, showing sample locations and a proposed correlation with the GMPT. Stereographs show mean magnetization directions. ............................................................... 94
Figure 46. (a) Log showing sample locations at the Chimen Aike section. (b) Photos show bedding within the glaciolacustrine sequence. (c) Stereographs show mean magnetization directions (see also Table 5). Grain size scale: c = clay; z = silt; s = sand. (d) Photo of borrow pit exposure. ............................................................................................ 95
Figure 47. Reversely magnetized diamicton overlain by silt and sand at TDF125, a short distance north of the Chimen Aike site. ........................ 96
Figure 48. Reversely magnetized diamicton interbedded with gravel at TDF301 at Estancia el Condor. ............................................................................. 96
Figure 49. (a) Log and photos showing sample locations at the Estancia Don Bosco site. (b) Stereographs show mean magnetization directions (see also Table 5). (c) Photo of borrow pit exposure. .............................. 97
xv
Figure 50. (a) Stratigraphy and photo of Cabo Vírgenes drift at the type section. (b) Log and photos showing sample locations. (c) Stereographs show mean magnetization directions. ............................... 99
Figure 51. (a) Log showing stratigraphy at the Bahía Posesión drift. (b) Photo of exposure. (c) Stereograph shows mean magnetization direction. ..... 100
Figure 52. Revised Pleistocene chronostratigraphy of the study area. .................. 106 Figure 53. Glacial limits in Patagonia after Caldenius (1932), as well as
tectonic plate boundaries and major mountain ranges. ......................... 108 Figure 54. Map of Patagonia showing places mentioned in the text. Inset: the
drift units of southern Patagonia, and an outline of the study area. ...... 110 Figure 55. Locations of all stratigraphic sections described for this study. ............. 117 Figure 56. Map of moraine ridges, meltwater scarps, and meltwater channel
central axes in the study area. ............................................................... 120 Figure 57. Arcuate moraine ridges dissected by major and minor meltwater
channels. ............................................................................................... 121 Figure 58. (a) Wavy discontinuous transverse moraine ridges east of Cabo
Vírgenes within post-GPG 1 drift outlined on DEM. The ridges are situated on the proximal side of the post-GPG 1 terminal moraine (dotted white line), where some meltwater channels initiate. (b) Satellite image showing the moraines. .................................................. 122
Figure 59. Quaternary sediments exposed continuously over a distance of 30 km in sea cliffs north of Cabo Vírgenes. ................................................ 124
Figure 60. Field sites and glacial landforms along the Atlantic coast at and north of Cabo Vírgenes. ........................................................................ 124
Figure 61. (a) Type section of Cabo Vírgenes drift. (b) Photograph of the exposure. (c) Contoured stereonet showing orientation of rod-shaped stones at the base of unit CV2. ................................................. 125
Figure 62. Simplified geology of sections along the Cabo Vírgenes transect. ........ 126 Figure 63. Deformation structures in interlensing diamicton, gravel, and sand
of unit CV1 in the Cabo Vírgenes sea cliff. (a) Deformed diamicton, gravel, and sand interbeds at TDF209. (b) Rip-ups of stratified gravel in overlying diamicton at TDF115. (c) Deformed lenses of sand and gravel within diamicton at TDF235. (d) Folded lenses of gravel and diamicton indicating movement toward the north within unit CV1 diamict at TDF214. (e) Loading structures and sand wedges within gravel and diamicton at TDF224. ................................... 127
Figure 64. Unit CV1 and its contact with unit CV2 in the Cabo Vírgenes sea cliff. (a) Erosive lower contact at TDF218. (b) Gradational, conformable lower contact at TDF239. (c) Loaded lower contact at TDF233. Diamicton contains thin lenses of gravel (d) Slump in unit CV1 covering the lower part of the sea cliff. (e) 3-5-m-thick gravel lenses tens of metres long at TDF221, bounded by weakly stratified diamicton. (f) Close-up photo of unit CV1 diamicton. ............................ 128
Figure 65. Cumulative grain-size distribution for unit CV2 diamicton matrix at TDF113. ................................................................................................. 130
xvi
Figure 66. Unit CV2 in the Cabo Vírgenes sea cliff. (a) Weakly stratified gray diamicton at TDF244. (b) Close-up photo of diamicton. (c) Striations on fine-grained clast within diamicton at TDF114. (d) Calcite-cored concretion in diamicton at TDF232. (e) A 5-7-m-thick bed of sandy gravel near the base of unit CV2 at TDF222. (f) Deformed sand lens at the base of unit CV2 at TDF 236 ...................... 131
Figure 67. Unit CV3. (a) At TDF236, where the unit can be traced continuously to the south for ~500 m and is 1.5-2 m thick. (b) Close-up of unit CV3 at TDF236. (c) Laminated silt bed at the contact between units CV2 and CV3 at TDF236. (d) TDF237. (e) TDF245. (f) TDF244. ......... 132
Figure 68. Interpreted post-GPG 1 glacial landforms. ............................................ 134 Figure 69. Sedimentary structures within the ribbed belt of moraines. (a)
Glaciotectonized diamicton, sand, and silt at TDF110. (b) Clastic dikes at TDF111. (c) Lenses of gravel in stratified diamicton at TDF122. ................................................................................................. 135
Figure 70. Schematic diagram showing a glacial grounding-line environment (modified from Bennett et al., 2002). ..................................................... 136
Figure 71. Glacial landforms and field sites at Bahía Posesión. ............................. 139 Figure 72. Stratigraphic column for the section at site TDF109 in eastern Bahía
Posesión. See Table 7 for facies codes used in the diagram. (b) Photo of the exposure. (c) Contoured stereonet of rod-shaped stones at the base of CV2 at site TDF109 (lower hemisphere projection). ............................................................................................. 140
Figure 73. Sedimentary structures and erosive unit BP1-BP2 contact in sea cliffs in eastern Bahía Posesión. (a) Interbedded diamicton, sand, and gravel (unit BP1) unconformably overlying stratified diamicton (unit BP2) at site TDF109. (b) Contact between unit BP1 and BP2 at site TDF187. (c) Interbeds of stratified diamicton, gravel, and sand within unit BP1 at site TDF187. (d) Deformed bedding within unit BP1 at site TDF187. (e) Faulted sand lens within folded diamicton bed at site TDF187. ............................................................................... 141
Figure 74. (a) Stratigraphic section for the Tres de Enero road-cut (site TDF044). (b) Contoured stereonets showing long-axis orientations of rod-shaped stones at the base of TDE1, TDE2, and TDE3. (c) Photo of the section. (d) Deformed sand wedge extending downward from the contact between units TDE2 and TDE3. (e) Channel fill at the south end of the exposure. (f) Photo of the Tres de Enero road-cut showing lateral continuity of units, erratic boulder seen in Figure 75, and locations of photos (c), (d), and (e). .................. 145
Figure 75. Stippled pattern on GPG surface in the vicinity of the Tres de Enero locality, which is a possible thermal-contraction polygon network. ........ 145
Figure 76. a) Stratigraphic column for the section at Cabo del Espíritu Santo (TDF030). b) Contoured stereonet showing long-axis orientation of rod-shaped stones at the base of ES4 (lower hemisphere projection). c) Photo of the exposure. d) Sand wedges cut into unit ES2. e) S-folds at the base of unit ES5. f) Striations along the lower contact of unit ES4 where it lies directly on bedrock. ............................ 148
xvii
Figure 77. Schematic diagram showing the differential glacio-isostasic effect required to create a freshwater moat at the toe of the post-GPG 1 glacier in the Strait of Magellan. ............................................................ 150
Figure 78. Schematic diagram showing the balance between glacio-isostatic depresssion and eustatic sea-level lowering required to create a marine environment at the toe of the post-GPG 1 ice lobe in the Strait of Magellan. .................................................................................. 150
1
Chapter 1. Introduction
The Patagonian Andes and the tablelands and plains to the east contain
outstanding records of glaciation extending back to the late Miocene. Glaciation began
and continued through the late Miocene with uplift of the Andes and Milankovich cycle-
forced changes in climate. Uplift coupled with volcanism, glaciation, and fluvial erosion
has produced a landscape characterized by large valleys inset into higher elevation
“mesetas”, or tablelands. Mesetas are capped by stacked sequences of flat-lying
basaltic lavas of Miocene and Pliocene age. Younger flows and the volcanic cones from
which they issued are present on valley floors and flanks. The positions of basalt flows of
different ages within this landscape and their relations to other dated geologic units
provide opportunities to date geologic events. The region east of the Patagonian Andes
has been arid or semi-arid through most of the late Cenozoic, resulting in remarkably
good preservation of landforms and sediments.
The focus of most previous research on Patagonian glaciations has been on
geomorphic mapping of glacial limits of different ages on the Patagonian plains and on
obtaining radiometric ages on basalt flows that overlie or underlie glacial sediments.
Questions still remain about the evolution of the landscape, particularly the ages of
glaciations older than the Last Glaciation, and the stratigraphic record of these events.
My contribution to a better understanding of the glacial history of southern
Patagonia involved a geologic study of the well-exposed late Cenozoic landforms and
sediments on eastern Tierra del Fuego, the Patagonian plain on the Argentine mainland
south of Río Gallegos, and the region centered on Lago Cardiel to the north. A particular
focus was on the stratigraphic documentation of previously undescribed sea-cliff
exposures of Quaternary glacial sediments along the east shores of the Strait of
Magellan and along the Atlantic coast to the north and south of the mouth of the Strait.
2
1.1. Previous studies
An understanding of the glacial history of southern Patagonia began in the mid-
1800s with Darwin’s (1842) observation of erratic granitic boulders on the Atlantic coast
of Tierra del Fuego. He argued that the boulders had been transported eastward by
glaciers from the Andes at some time in the distant past. Nearly a century later,
Caldenius (1932) significantly advanced understanding of Patagonian glaciation by
mapping the limits of four glaciations over an area between latitudes 39° S and 52°S.
Each limit marked the extension of an ice sheet from the southern Andes onto the
Patagonian plains. Caldenius termed the glacial limits, from oldest (outermost) to
youngest (innermost), Initioglacial, Daniglacial, Gotiglacial, and Finiglacial, based on his
understanding of glaciation in Scandinavia (Figure 1). He also proposed that the nested
moraines that delineated the four glacial limits dated to the Last Glaciation. His
chronology has since been disproven, but his glacial limits, for the most part, are still
accepted.
1.1.1. Miocene-Pliocene glaciations
The next major studies of the glacial deposits in southern Patagonia were
conducted by Feruglio (1949, 1950). He mapped and described glacial landforms and
sediments east of the Southern Patagonian Icefield, including tills interbedded with
basalts, and concluded that the oldest drift units were probably deposited prior to the
Last Glacial Maximum. Flint and Fidalgo (1964, 1969) mapped drift units east of the
Andes between 39° and 43°S. They compared the degree of weathering of granitic
clasts on surfaces of different ages and concluded that the youngest units were probably
deposited during the Last Glaciation, but that older drift units are products of earlier
glaciations. These initial suspicions that older glaciations were responsible for the
outermost drift units were subsequently confirmed with radiometric dating techniques,
particularly K/Ar and Ar/Ar methods.
Mercer et al. (1973) and Mercer (1976) were the first researchers to use the K/Ar
dating technique to determine the ages of basalt flows bounding glacial sediments in the
southern Andes. Their absolute ages provided the first records of Pliocene glaciations on
the east side of the Andes. Mercer et al. (1973) dated basalt flows capping mesetas on
the north side of Lago Viedma (49.63°S, 72.41°W) and south of Lago Argentino
3
(50.23°S, 72.30°W). Mercer (1976) documented an Andean till that is overlain and
underlain by basalt flows with ages of, respectively, 3.50 ± 0.14 and 3.68 ± 0.03 Ma at
Meseta Chica north of Lago Viedma.
Figure 1. Map of southern Patagonia, showing the glacial limits of Caldenius
(1932) and locations mentioned in this chapter.
4
He also described a till at Meseta Desocupada, 9 km to the northeast, lying between
flows about 3.5 Ma old. This work showed that the earliest large-scale glaciation in the
region is middle Pliocene in age. Finally, at Condor Cliff, in the Río Santa Cruz valley 80
km east of Lago Argentino, till overlies a 2.79 ± 0.15 Ma flow (Mercer, 1976). Additional
evidence for Pliocene glaciation includes the presence of glacial landforms on the
surfaces of mesetas surrounding Lago Buenos Aires that have been dated to about 3
Ma (Malagnino, 1995; Lagabrielle et al., 2010).
The record of Patagonian glaciation was extended back to the late Miocene by
Mercer and Sutter (1982) based on dating of basalts at Meseta del Lago Buenos Aires
(46.50°S, 71.49°W), located just south of Lago Buenos Aires. There, a till unit lies
between basalt flows with ages of 7.03 ± 0.11 Ma and 4.63 ± 0.07 Ma. Ton-That et al.
(1999) later confirmed these ages using the 40Ar/39Ar incremental heating method.
Wenzens (2006) presented evidence for what he interpreted to be Miocene (ca. 6.4-10.5
Ma) glaciation near Lago Cardiel (48.92°S, 71.22°W). The origin of the sediments and
landforms that he attributed to glaciation is, however, contested (Rabassa et al., 2011;
Rutter et al., 2012).
Questions remain about the chronology and extent of these early glaciations and
about the cause of the change from a style of Pliocene glaciation in which the
Patagonian ice sheet extended over a low-relief surface to Pleistocene glaciation
characterized by the channeling of a series of coalescent valley glaciers along deeply
incised valleys (e.g. Lagabrielle et al., 2004; Lagabrielle, 2010).
1.1.2. Pleistocene glaciation
Mercer (1976) first described and K/Ar dated old glacial deposits in the north-
facing escarpment of Cerro del Fraile, a meseta just south of Lago Argentino. At that
site, multiple tills are interlayered with basalt flows with ages ranging from 2.00 ± 0.01
Ma to 1.03 ± 0.05 Ma. Singer et al. (2004a) later dated seven tills interbedded with
basalt flows at a nearby section using the 40Ar/39Ar method and the unspiked K/Ar
method, which is different from the conventional K/Ar method in that an atmospheric
argon standard at the same pressure is used to measure argon extracted from the
sample. They obtained Pliocene to Pleistocene ages consistent with those of Mercer
(1976). He also measured the paleomagnetic directions of the basalt flows, using them
5
to constrain the age of known polarity boundaries. The uppermost till yielded an age of
1.073 ± 0.036 Ma, which Singer et al. (2004a) correlated to the earliest Jaramillo normal
polarity subchron, noting that over 1000 m of erosion occurred after this event and prior
to the onset of late Pleistocene glaciations at lower elevations. Mercer (1976) also
described a reversely magnetized 1.17 ± 0.05 Ma basalt flow overlain by drift in the Río
Gallegos valley (51.87°S, 71.68°W), and first proposed that location as the lower
boundary of what he termed the “Greatest (later modified to “Great”) Patagonian
Glaciation” (GPG). He correlated this drift to the uppermost till in the Cerro del Fraile
section, which is capped by a 1.0 Ma flow and which was mapped as the oldest drift unit.
Ton-That et al. (1999) later re-dated Mercer’s Río Gallegos valley basalt using the 40Ar/39Ar incremental heating method to 1.168 ± 0.007, and obtained an age of 1.016 ±
0.005 Ma on a basalt covering what is thought to be GPG drift at Lago Buenos Aires.
These two ages are generally considered to be the lower and upper limiting ages of the
GPG. The GPG glaciation extended farthest from the mountains – over 100 km from the
crest of the Andes in many places, and as far as the Atlantic coast along the Strait of
Magellan. Recent evidence has shown that the GPG comprises two or more separate
glacial events (Bockheim et al., 2009). This emerging evidence, coupled with the large
distance between the sites at which the age of the GPG is constrained, raises questions
about the timing and number of glacial events that constitute the most extensive
glaciation in the region (Rabassa et al., 2011; Rutter et al., 2012).
The next major contribution to our understanding of Pleistocene glaciation in
southern Patagonia is a glacial map of the surficial deposits in the vicinity of the Strait of
Magellan produced by Meglioli (1992). Meglioli’s glacial limits are closely aligned with
those of Caldenius (1932), but were refined using additional topographic maps, field
work, and a chronology supported by radiometric ages. Meglioli (1992) identified four
Middle and Late Pleistocene glacial limits that are younger than the GPG, decreasing in
extent with decreasing age: the Cabo Vírgenes, Punta Delgada, Primera Angostura, and
Segunda Angostura glaciations. These glaciations were re-named Post-GPG 1, 2, 3,
and 4 glaciations by Coronato et al. (2004a) to facilitate correlation of glacial deposits in
the Strait of Magellan area with those in other areas in Patagonia. Meglioli (1992) and
Ton-That et al. (1999) assign an age of between 1.07±0.02 and 0.760±0.001 Ma to the
Post-GPG 1 glaciation. The age of the Post-GPG 2 glaciation is not well constrained,
although a dated basalt flow lying between Post-GPG 1 and Post-GPG 2 drift sheets
6
near Lago Argentino suggests that Post-GPG 2 occurred after 0.128 Ma (Guillou and
Singer, 1997). Moraines of the penultimate glaciation (Post-GPG 3) lie inside Post-GPG
2 moraines. No radiometric ages exist for this glaciation, but it probably dates to marine
isotope stage 4. Post-GPG 4 correlates to the Last Glaciation (marine isotope stage 2)
and is firmly radiocarbon dated to ~12-25 14C ka BP (Lowell et al., 1995; Kaplan et al.,
2005; McCulloch et al., 2005).
Other notable contributions to our understanding of the Pleistocene glacial
geology of southern Patagonia include studies of the Early-Middle Pleistocene
landscape evolution of the Laguna Potrok Aike maar region by Coronato et al. (2013)
and exposure dating studies on outwash plains and moraines by Hein et al. (2011) and
Kaplan et al. (2011). Rabassa et al. (2011) and Coronato and Rabassa (2011) provide
comprehensive reviews summarizing research on late Cenozoic glaciation in Patagonia
and Tierra del Fuego.
1.2. My research approach
I conducted field work for this thesis during the austral summers of 2011, 2012,
and 2013 (Table 1). Data and field observations of Dr. John Clague were also used in
this project. A better understanding of the glacial chronology of southern Patagonia was
achieved by dating volcanic rocks associated with glacial deposits. K/Ar and 40Ar/39Ar
ages in tandem with geologic mapping facilitated correlation of glacial deposits and
landforms over the large area spanned by southern Patagonia (42-56°S). However,
many questions remain about the Plio-Pleistocene glacial record and the chronology of
landscape change in this region. My PhD research addresses these issues with three
techniques outlined below.
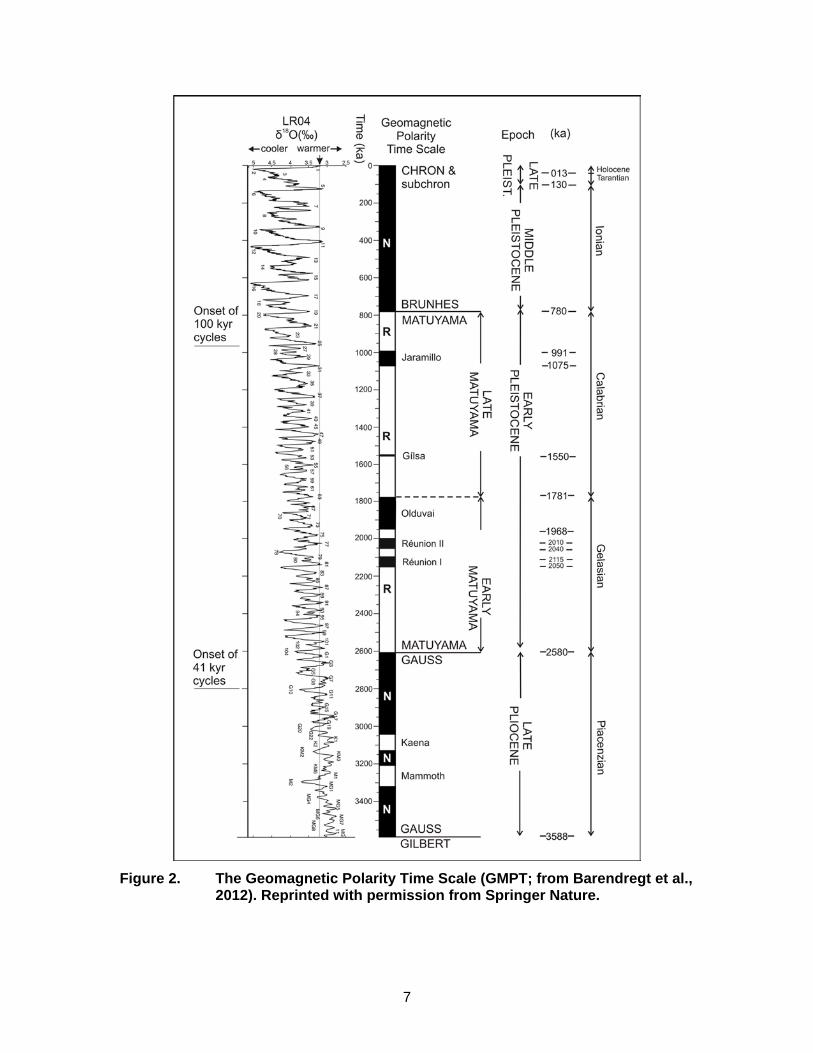
1.2.1. Sediment paleomagnetism
An important dating method that is underutilized in Patagonia is sediment
paleomagnetism. I determined the polarity of glacial sequences to help place them in a
chronological framework. Although this technique does not provide exact absolute ages,
it does allow me to place sequences with some confidence within chrons and even
subchrons of the Geomagnetic Polarity Time Scale (Figure 2; Lisiecki and Raymo,
2005).
7
Figure 2. The Geomagnetic Polarity Time Scale (GMPT; from Barendregt et al.,
2012). Reprinted with permission from Springer Nature.
8
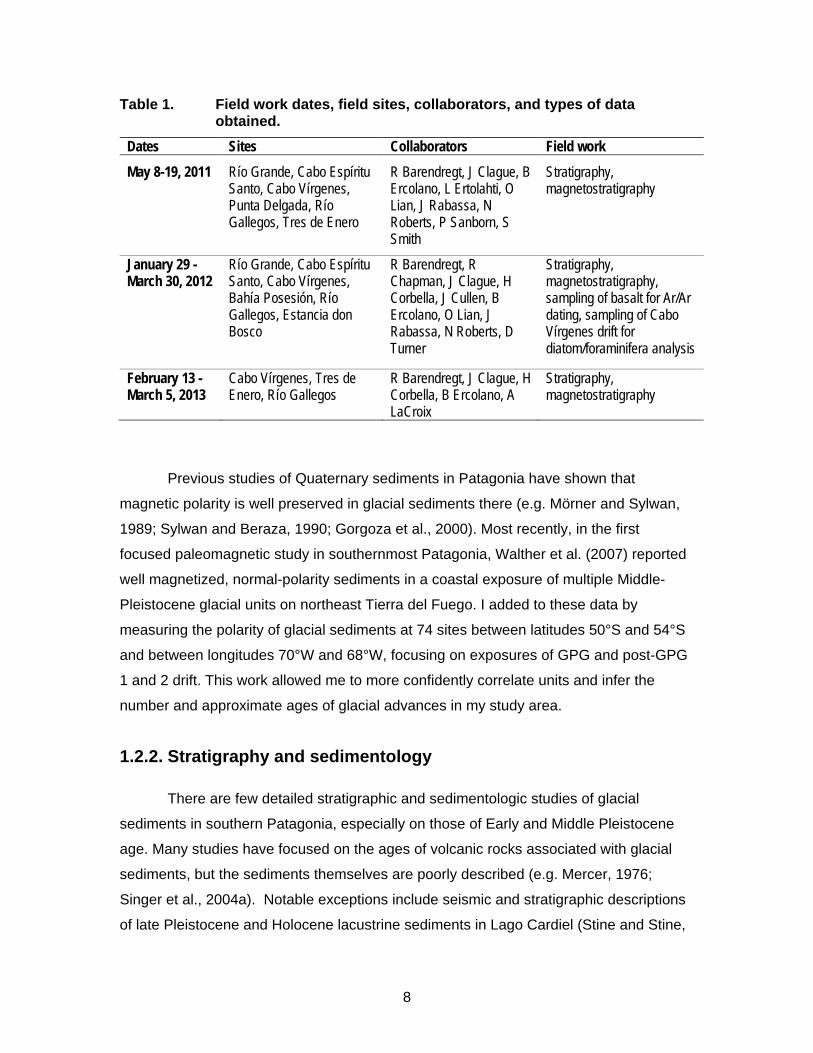
Table 1. Field work dates, field sites, collaborators, and types of data obtained.
Dates Sites Collaborators Field work
May 8-19, 2011 Río Grande, Cabo Espíritu Santo, Cabo Vírgenes, Punta Delgada, Río Gallegos, Tres de Enero
R Barendregt, J Clague, B Ercolano, L Ertolahti, O Lian, J Rabassa, N Roberts, P Sanborn, S Smith
Stratigraphy, magnetostratigraphy
January 29 - March 30, 2012
Río Grande, Cabo Espíritu Santo, Cabo Vírgenes, Bahía Posesión, Río Gallegos, Estancia don Bosco
R Barendregt, R Chapman, J Clague, H Corbella, J Cullen, B Ercolano, O Lian, J Rabassa, N Roberts, D Turner
Stratigraphy, magnetostratigraphy, sampling of basalt for Ar/Ar dating, sampling of Cabo Vírgenes drift for diatom/foraminifera analysis
February 13 - March 5, 2013
Cabo Vírgenes, Tres de Enero, Río Gallegos
R Barendregt, J Clague, H Corbella, B Ercolano, A LaCroix
Stratigraphy, magnetostratigraphy
Previous studies of Quaternary sediments in Patagonia have shown that
magnetic polarity is well preserved in glacial sediments there (e.g. Mörner and Sylwan,
1989; Sylwan and Beraza, 1990; Gorgoza et al., 2000). Most recently, in the first
focused paleomagnetic study in southernmost Patagonia, Walther et al. (2007) reported
well magnetized, normal-polarity sediments in a coastal exposure of multiple Middle-
Pleistocene glacial units on northeast Tierra del Fuego. I added to these data by
measuring the polarity of glacial sediments at 74 sites between latitudes 50°S and 54°S
and between longitudes 70°W and 68°W, focusing on exposures of GPG and post-GPG
1 and 2 drift. This work allowed me to more confidently correlate units and infer the
number and approximate ages of glacial advances in my study area.
1.2.2. Stratigraphy and sedimentology
There are few detailed stratigraphic and sedimentologic studies of glacial
sediments in southern Patagonia, especially on those of Early and Middle Pleistocene
age. Many studies have focused on the ages of volcanic rocks associated with glacial
sediments, but the sediments themselves are poorly described (e.g. Mercer, 1976;
Singer et al., 2004a). Notable exceptions include seismic and stratigraphic descriptions
of late Pleistocene and Holocene lacustrine sediments in Lago Cardiel (Stine and Stine,
9
1990; Gilli et al., 2001; Ariztegui et al., 2010) and Middle and Late Pleistocene lacustrine
deposits at Laguna Potrok Aike north of the Strait of Magellan (Gorgoza et al., 2012;
Kliem et al., 2013). Meglioli (1992) provided brief descriptions of sediment units to
accompany his field mapping of surficial units in the Strait of Magellan area, and
Bockheim et al. (2009) described a multiple till sequence in GPG sediments in a road cut
south of Río Gallegos. I describe the stratigraphy and sedimentology of previously
unstudied GPG and post-GPG 1 and 2 drift units exposed in coastal bluffs, road cuts,
and gravel quarries throughout my study area. This work allowed me to interpret the
depositional environment of the sediments and better understand the glacial history of
the region.
1.2.3. Geomorphic mapping
Regional-scale landform mapping by Caldenius (1932) and Meglioli (1992)
fostered a large number of studies aimed at establishing a glacial chronology for
southern Patagonia (e.g., Coronato et al., 2004a; Coronato and Rabassa, 2011, and
references therein). The earliest mapping by Caldenius (1932) predated the availability
of aerial photographs, satellite imagery, and high-quality topographic maps. Recent
mapping projects, although more localized than those of Caldenius (1932) and Meglioli
(1992), have used satellite remote sensing and field-checking to refine glacial limits in
southern Patagonia (Ercolano et al., 2004; Glasser and Janson, 2008; Rabassa et al.,
2011; Darville et al., 2014). Localized geomorphic mapping done in tandem with
radiometric age dating in the Lago Buenos Aires, Lago Viedma, and Lago Argentino
areas has been instrumental in establishing local glacial chronologies (e.g. Meglioli,
1992; Wenzens, 1999, 2000; Singer et al., 2004b; Lagabrielle et al., 2010).
Using satellite imagery and 30-m-resolution Landsat ETM+ images, I created a
glacial landform map of Early and Middle Pleistocene drift surfaces, which I then used
for associating sediments and landforms and to better correlate paleomagnetic
measurements across the region. I also produced a geomorphic map of the Lago Cardiel
region using the same imagery. This map, together with radiometric ages and
paleomagnetic data, allowed me to reconstruct the evolution of the landscape in the
Lago Cardiel region from the late Miocene to the present.
10
1.3. Research objectives
The primary objective of my PhD research is to better understand the extent,
physical environments, and chronology of glaciation in southern Patagonia. I focus on:
(1) the chronology and sedimentary depositional environments of Early and Middle
Pleistocene glaciations in the Strait of Magellan area; and (2) landscape evolution in the
Lago Cardiel region.
I have three complementary sub-objectives under this general objective:
1. describe the glacial sediments of the GPG and post-GPG 1 and 2 drift units, and interpret their depositional environments in the context of sediment-landform associations;
2. improve the chronology of Early and Middle Pleistocene glaciations in southernmost Patagonia and on Tierra del Fuego; and
3. reconstruct the late Miocene, Pliocene, and Pleistocene landscapes in the foothills of the Patagonian Andes.
1.3.1. Thesis outline
This thesis comprises three chapters on late Cenozoic glaciation and landscape
evolution in southern Patagonia. Each chapter has implications for the others, but
constitutes a separate, independent contribution.
Chapter 2 provides a reconstruction of late Cenozoic landscapes in the Lago
Cardiel area. I utilize new and pre-existing radiometric ages, geomorphic mapping, and
magnetostratigraphy to document major changes in the landscape, such as drainage
reorganization and the development of closed basins in this extra-glaciated region.
Chapter 3 provides an improved chronologic framework for glacial deposits in the
Strait of Magellan area during the Early and Middle Pleistocene. I present the first
regional paleomagnetic results on continental glacial deposits in southern Patagonia and
link the deposits to mapped glacial landforms. The inferred number and ages of
glaciations are discussed in context of those recognized by previous researchers.
11
Chapter 4 describes the oldest glacial drift units in the Strait of Magellan area
and discusses their inferred depositional environments. I correlate sedimentary units
observed at multiple locations.
Chapter 5 summarizes and links Chapter 2, 3, and 4, and identifies
considerations important for improving the glacial chronology of southern Patagonia. It
closes with suggestions for future work that might answer outstanding questions about
the earliest glaciations in the southern Andes.
12
Chapter 2. Geomorphology and landscape evolution of the Lago Cardiel area
2.1. Introduction
The Late Cenozoic is a time of dynamic landscape change in the southern
Andes. Evidence of these changes is well preserved in landforms, sediments, and
volcanic rocks in the Patagonian Cordillera, an area that has experienced repeated late
Miocene, Pliocene, and Pleistocene glaciation (Mercer, 1983; Rabassa and Clapperton,
1990; Rutter et al., 2012). Previous geomorphologic studies in Patagonia have focused
mainly on the glaciated plains and basins east of the Andes, notably along the Strait of
Magellan (Meglioli, 1992; Glasser and Jansson, 2008) and in the deep, glacially carved
basins in the foothills of the Andes (e.g. Feruglio, 1950; Mercer, 1976, 1983; Malagnino,
1995; Ton-That et al., 1999; Singer et al., 2004a, 2004b). The Lago Cardiel region in the
eastern foothills of the Southern Patagonian Andes is the subject of this chapter (Figure
3) and is of particular interest because it preserves evidence of landscape change dating
back to the Miocene and lies outside the limit of Patagonian glaciation.
The Southern Patagonian Andes formed due to the convergence of the Nazca
and South American plates, which began in the earliest Cretaceous (Ramos, 1989;
Ramos and Ghiglione, 2008). The southern Andes reached their highest elevations
during two pulses of uplift, the first during the Paleocene-Eocene (65-40 Ma) and the
second during the early Neogene (22-16 Ma) (Ramos, 1982; Hervé et al., 2004). Uplift
during the later pulse was driven by subduction of the Chile Triple Junction where the
South Chile Ridge collided with the Chile Trench (Cande and Leslie, 1986; Gorring et al.,
1997). Subduction created an aesthenospheric slab window to the east during the early
Miocene (Scalabrino et al., 2009; Lagabrielle et al., 2010). Back-arc extension was
accompanied by eruption of basalt flows on the eastward-dipping piedmont surface east
of the Andes as the triple-junction migrated north from 55°S to its present location at
about 46°S over the past ~15 Ma (Cande and Leslie, 1986; Gorring et al., 1997). The
evolution of the Patagonian landscape during the Pliocene and Quaternary has been
13
strongly affected by fluvial and glacial processes that have operated in tandem with
continuing tectonism (Dietrich et al., 2010) and basaltic volcanism (Gorring et al., 1997).
Research on landscape evolution in the Lago Cardiel area and in extra-Andean
valleys to the south has focused on glacial sediments and absolute age dating of basalt
flows with which they are interlayered (Ramos, 1982; Wenzens, 2000, 2006; Cobos et
al., 2009). A notable feature of interest is the hydrographically closed, 20-km-wide Lago
Cardiel basin, located at the west end of the Tres Lagunas valley (Figure 3). Seismic
reflection surveys of Lago Cardiel and cores of its sediment fill have shown that the
basin is not an impact crater or a volcanic caldera (Gilli et al., 2001, 2005a; Beres et al.,
2008). Wenzens (2006) mapped the basin and surrounding region and concluded that
glaciers sourced in the Southern Patagonian Icefield terminated east and south of the
lake. He interpreted accumulations of large (>1 m diameter) angular basaltic boulders
along the northeast slopes of the Lago Cardiel basin as moraines, and reinterpreted
fluvial deposits as glacial outwash plains. Ramos (1982) and Cobos et al. (2009), on the
other hand, interpreted the angular boulder fields as landslide deposits.
Investigations into the landscape evolution of the Lago Cardiel region allow for
inferences about the origin of the formation of closed depressions along the east side of
the Andes, as well as surrounding landforms. In addition, such inquiries offer an
opportunity to better understand the timing of, and impetus for, the drainage evolution of
the Río Chico watershed.
In this chapter, I identify and map landforms and describe key sediments bearing
on the physiographic evolution of the Lago Cardiel region. My analysis is based on
remotely sensed terrain data including a digital elevation model (DEM) and satellite
imagery, existing and new radiometric ages, and lithostratigraphic and
magnetostratigraphic analysis of two sedimentary sections near the lake. Important
contributions include a new geomorphologic map, new Ar/Ar ages, and paleomagnetic
data. These data allow me to infer regional-scale changes in drainage since the late
Miocene and to speculate on the origin of Lago Cardiel.
14
2.2. Study area
2.2.1. Physiography
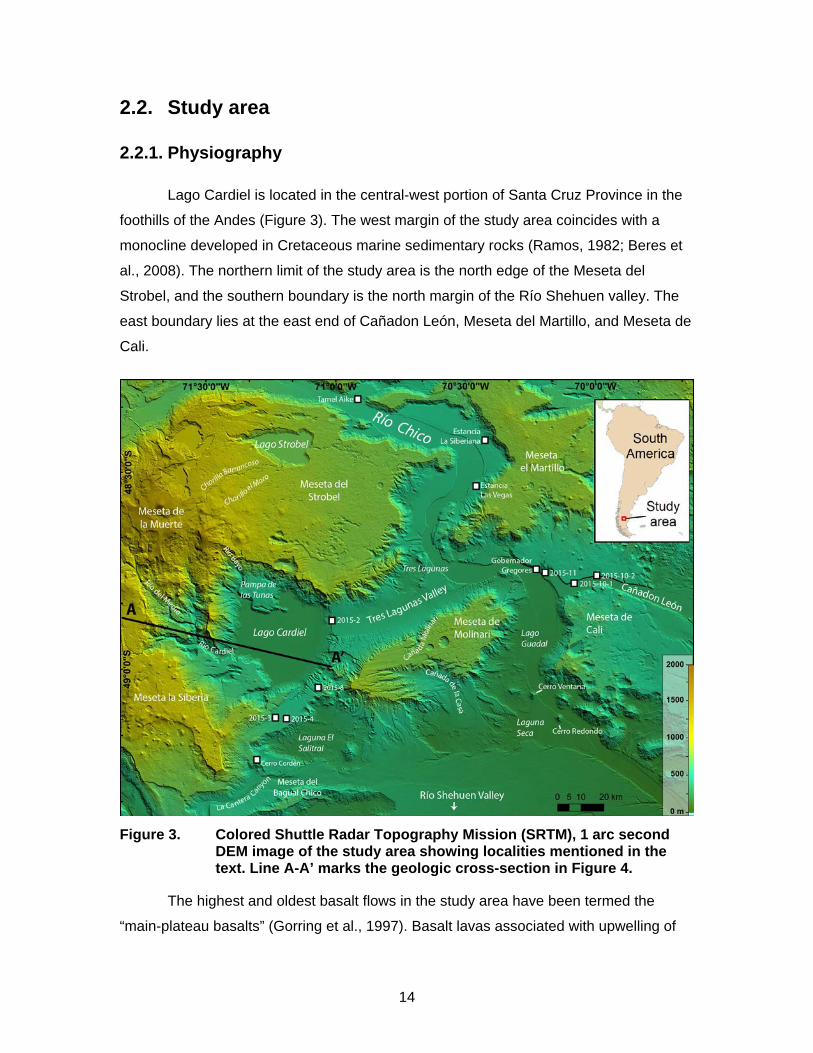
Lago Cardiel is located in the central-west portion of Santa Cruz Province in the
foothills of the Andes (Figure 3). The west margin of the study area coincides with a
monocline developed in Cretaceous marine sedimentary rocks (Ramos, 1982; Beres et
al., 2008). The northern limit of the study area is the north edge of the Meseta del
Strobel, and the southern boundary is the north margin of the Río Shehuen valley. The
east boundary lies at the east end of Cañadon León, Meseta del Martillo, and Meseta de
Cali.
Figure 3. Colored Shuttle Radar Topography Mission (SRTM), 1 arc second
DEM image of the study area showing localities mentioned in the text. Line A-A’ marks the geologic cross-section in Figure 4.
The highest and oldest basalt flows in the study area have been termed the
“main-plateau basalts” (Gorring et al., 1997). Basalt lavas associated with upwelling of
15
mantle material through the slab windows formed a series of volcanic plateaus
(mesetas) with average surface elevations of 1000 m a.s.l. and maximum elevations
between 1500 and 1700 m a.s.l. at the west boundary of the study area. The mesetas
that surround the endorheic basin of Lago Cardiel and have been incised up to 400 m by
ancient rivers that flowed along the now-abandoned, east-trending Tres Lagunas valley
and Cañadon León (320-400 m a.s.l.; Figure 3). Río Chico incises the plateaus and dry
valleys, and flows from northwest to southeast to its confluence with Río Shehuen, which
empties into the Atlantic Ocean to the east.
2.2.2. Bedrock stratigraphy
Geologic mapping and structural studies in the region (Feruglio, 1950; Ramos,
1989; Panza and Marín, 1998; Cobos et al., 2009) have shown that thick marine and
non-marine sediments accumulated in basins east of the rising Andes beginning in the
Cretaceous (Figure 4). Deformation structures such as asymmetric folds and normal
faults are common west of Lago Cardiel but are rare to the east (Figure 4). Marine
fossiliferous shale of the Lower Cretaceous Río Mayer Formation interfingers upward
with shallower water siltstone and sandstone. The Upper Cretaceous Piedra Clavada
Formation, which underlies the Lago Cardiel basin, consists mainly of sandstone that
records a coastal environment that existed prior to the final withdrawal of the sea from
the Patagonia plain (Ramos, 1982). The marine regression was complete by the Late
Cretaceous, which in the study area is recorded by the tuff and conglomerate of the
Cardiel and La Ensenada formations that were deposited in a distal alluvial plain
environment (Ramos, 1982; Cobos et al., 2009). The Cenozoic stratigraphic record is
dominated by continental fluvial deposits and basalt flows. Late Cenozoic glaciers
eroded Cretaceous and Cenozoic rocks west, north, and south of the Cardiel basin, and
covered the eroded surfaces with till and outwash.
2.2.3. Lago Cardiel
Lago Cardiel is a 20-km-diameter closed basin centered at 48°S, 71.2°W. It has
a maximum water depth of 76 m, and a Late Pleistocene and Holocene sediment fill that
is 40 m thick on average (Gilli et al., 2001). With one exception, previous researchers
have concluded that the Lago Cardiel basin and surrounding mesetas were not glaciated
during the Pleistocene (Ramos, 1989; Rabassa and Clapperton 1990). The exception is
16
Wenzens (2006), who proposed that the basin was formed by glacial erosion.
Paleoenvironmental and limnological studies have shown that Lago Cardiel is sensitive
to hydrological changes. Radiocarbon ages on plant material and lacustrine CaCO3
deposits associated with abandoned shorelines up to 75 m above the modern water
surface indicate that Lago Cardiel has experienced multiple regressions and
transgressions during the Late Pleistocene and Holocene (Galloway et al., 1988; Stine
and Stine, 1990). Major high stands at 73 m, 55 m and 21 m above present lake-level
have been dated at, respectively, >40, 11.3–10.1, and 10.1–5.1 cal. ka BP, and there
have been four minor fluctuations during the past 2500 years (Stine and Stine, 1990;
Markgraf et al., 2003; Quade and Kaplan, 2017).
Figure 4. Top: simplified geologic cross-section of the Lago Cardiel area
showing major stratigraphic units, faults, and folds (location shown in Figure 3; modified from Ramos, 1989). LC = Lower Cretaceous; UC = Upper Cretaceous; LM = Lower Miocene. Bottom: dashed lines includes the interpreted airgun seismic reflection profile showing the Lago Cardiel sediment fill sequences (units I-VI described by Beres et al., 2008; vertical exaggeration ~50x).
Based on analyses of seismic sequences and sediment cores, Gilli et al. (2001,
2005a) provided a detailed reconstruction of lake-level and climate fluctuations. They
identified six seismo-stratigraphic units that constitute the sediment fill in the lake. A
multichannel seismic reflection survey conducted later along the same lines confirmed
17
the presence of the six sequences and provided additional detail on the lowest
sediments (Beres et al., 2008) (Figure 4).
The oldest and deepest seismic seismo-stratigraphic unit (Sequence VI in Figure
4) has an eroded surface with an irregular upper contact (Gilli et al., 2001, 2005a).
Internal reflectors within this sequence delineate dipping beds associated with north-
trending fold axes, as well as high-angle faults. Beres et al. (2008) correlated this
sequence with the Upper Cretaceous Piedra Clavada Formation and underlying Lower
Cretaceous Río Mayer Formation (Ramos, 1982). Based on the distribution and inferred
age of Sequence VI, Beres et al. (2008) suggested a tectonic origin for the depression.
Sequence V has a maximum thickness of about 33 m and occurs as isolated bodies of
coarse unconsolidated sediment within a depression on the west side of the lake basin
(Gilli et al. 2005a). This depression was likely created by fluvial erosion at a time when
the lake was dry. Gilli et al. (2005a) and Beres et al. (2008) ascribe Sequence V to an
alluvial fan that built out onto the dry lake floor, most likely during the Pleistocene. The
erosional upper contact of Sequence VI, together with the comparatively low seismic
velocities in Sequence V, support this interpretation (Gilli et al., 2005a). Sequence IV
records the initiation of lacustrine sedimentation in the Lago Cardiel basin. Based on the
transition from highly reflective horizontal internal reflections at the base of the unit to
draped reflections coinciding with a buried beach ridge in the upper part, Gilli et al.
(2005a) concluded that the lake formed and deepened markedly during this stage. The
thick and laterally continuous seismic reflectors within the upper three sequences (III-I)
indicate high rates of sediment accumulation, which persisted until drier modern
conditions were established and the level of the lake fell (Gilli et al., 2005a).
2.3. Methods
2.3.1. Paleomagnetic analysis
Sampling
I constrained the chronostratigraphy based on polarity data at two previously
undescribed sites in the field area: a road cut through a pediment surface at the
southeast margin of Lago Cardiel (site 2015-8, Figure 3) and a road cut through the
upper part of the Tres Lagunas valley fill at the west margin of the valley (site 2015-2).
18
Site 2015-8 was chosen because the 26-m sequence includes a large number of
calcrete horizons that record a long period of time. Site 2015-2 was selected because
the Tres Lagunas valley is cut by the Lago Cardiel basin, and understanding the timing
of its formation is important for constructing a timeline of landscape evolution in the
region. Samples of fine-grained sediment were collected from lenses of silt and sand
within predominantly gravelly sediment. One sample group at site 2015-2 was collected
from a thin buried gypsum layer. I also measured the polarity of cores extracted from
four oriented blocks of basalt collected for radiometric dating.
Sediment samples were collected from cleaned, vertical exposures by inserting
polycarbonate plastic cylinders (2.5 cm wide x 2.5 cm deep) into hand-carved (in situ)
sediment stubs (Barendregt et al., 2010). An arrow inscribed on the bottom of the
cylinder was oriented vertically downward as the cylinder was placed over the sediment
stub. I then measured the insertion azimuth of the cylinder with a Brunton compass
oriented to current magnetic north. Movement of sediment within the cylinder during
insertion and transport is minimized by the internal, slightly raised splines on the cylinder
sides and base and by filling any minor voids at the top of the cylinder with tissue paper
before securing the lid. A minimum of three samples were collected from each measured
horizon to determine statistical variability in the measurements.
Sample analysis
I measured magnetic susceptibility with a Sapphire Instruments (SI-2B)
susceptibility metre housed in the paleomagnetic laboratory of Dr. René Barendregt at
the University of Lethbridge. A pilot sample from each basalt group was exposed to
thermal and step-wise alternating field (AF) demagnetization to ensure that AF
demagnetization was sufficient to demagnetize the remaining samples in the group. The
remaining basalt samples and all sediment samples were then subjected to stepwise AF
demagnetization at 10 to 20 mT steps (up to 180 mT) using an ASC Scientific D-2000
demagnetizer with a three-axis manual tumbler. I measured all sample NRMs (natural
remanent magnetization) before AF and thermal cleaning and after each step of
demagnetization using an AGICO JR6-A spinner magnetometer. I assessed pilot
specimens to determine appropriate demagnetization levels for the remaining samples in
each set. Samples were generally demagnetized at 20, 40, 60, and 80 mT, and in some
19
cases additionally at 100, 120, or up to 180 mT. Median destructive fields for the
magnetite-bearing sediments typically ranged from 20 to 80 mT.
Statistical analysis
Paleomagnetic directions were determined for each sample using a principal
component analysis (Kirschvink, 1980) of the measured directions. At least three points
on the demagnetization curve had to be directed toward the origin when plotted on an
orthogonal projection using AGICO’s Remasoft v. 3.0 program. Fisher means of the
paleomagnetic directions were calculated for each sample group using the Remasoft v.
3.0 program. In a very few cases the intersection of great circles was used to obtain
mean directions. Only mean directions with confidence limits (α95 values) ≤25°were used
(in almost all cases α95 values were ≤15°). In addition to a mean direction, a precision
parameter (k) was calculated, which reflects how tightly the distribution of data points is
concentrated about the mean. The α95 value indicates that there is a 95% probability that
the true mean direction lies within the α95 circle of confidence around the calculated
mean (Butler, 1992). The current inclination of a normal magnetic field in the Southern
Hemisphere is negative, and the declination is ~360°. In the case of a reversed magnetic
field, the inclination is positive and the declination is ~180°. The inclination mean for
each sample group was compared to the geocentric axial dipole (GAD) inclination for the
sampling site. The GAD is the magnetic field at a given geographic latitude defined by a
single magnetic dipole aligned with the rotation axis of the Earth at its center (Butler,
1992). The mean inclination of samples is expected to be similar to the GAD, and the
two directions cannot be discriminated at the 5% significance level if the GAD is within
α95 of the measured mean direction (Butler, 1992). The GAD for the field area
(calculated for latitude 49°S) has an inclination of 66.5° and a declination of 0°.
2.3.2. Radiometric dating
Samples were collected from four basalt flows and radiometrically dated at the
Argon Geochronology for the Earth Sciences laboratory at Lamont-Doherty Earth
Observatory by Dr. Sidney Heming (Columbia University). A Micromass VG5400 mass
spectrometer attached to a CO2 laser extraction system was used to measure the Ar
isotope compositions of mineral grains. The ratio of 40Ar to 39Ar was then used with the
standard radiometric age equation to calculate an age for each sample.
20
Two basalt flows were sampled from the escarpment on the north side of
Cañadon León (site 2015-10). A younger flow underlying the floor of Cañadon León near
the town of Gobernador Gregories (site 2015-11) was also sampled. The Cañadon León
basalts were dated to determine the time of incision of Cañadon León and to provide a
minimum age for the abandonment of that valley due to fluvial incision by Río Chico. A
sample from a flow of the Basalto Las Tunas (site 2015-4; Cobos et al., 2009) south of
Lago Cardiel was dated to constrain the age of the relict river channel in which the flow
is located.
2.3.3. Mapping
I produced a 1:125,000-scale geomorphic map for this study. I interpreted map
units using a combination of Landsat 7 ETM+ images (30 m resolution; Global Land
Cover Facility, www.landcover.org), Google Earth mosaiced data (2.5–15 m resolution;
Cnes/SPOT, Digital Globe, and TerraMetrics images, www.earth.google.com), and
DEMs derived from SRTM elevation data at 30 m resolution (U.S. Geological Survey,
2004; https://lta.cr.usgs.gov/SRTM1Arc). Map polygons were defined based on surface
expression and surface material. To better visualize landforms, I created slope maps
from the DEMs using ArcGIS software (Figure 5). The ArcGIS slope tool calculates the
maximum rate of slope change of each cell relative to its neighbors and creates an
output slope raster with increasing slope steepness differentiated by darker shades of
color. Plains are defined as slopes between 0 and 3.9°, gentle slopes between 4° and
15°, moderate slopes between 16 and 26°, and moderately steep slopes between 27°
and 35°.
I determined polygon boundaries based on surface expression, inferred
geomorphic process, and material type shown on published geologic maps (Ramos,
1989; Panza and Marín, 1998; Cobos et al., 2009). I color-coded map units and placed
them in relative chronologic order. Because the study area has experienced tectonic
uplift and fluvial erosion, higher meseta surfaces are older than lower ones, which in turn
are older than valleys. Surfaces with similar elevations and form were considered to be
correlative. Cross-cutting relationships were used to place many surfaces in relative
order. Radiometric ages were used to provide limiting ages on erosional or depositional
events.
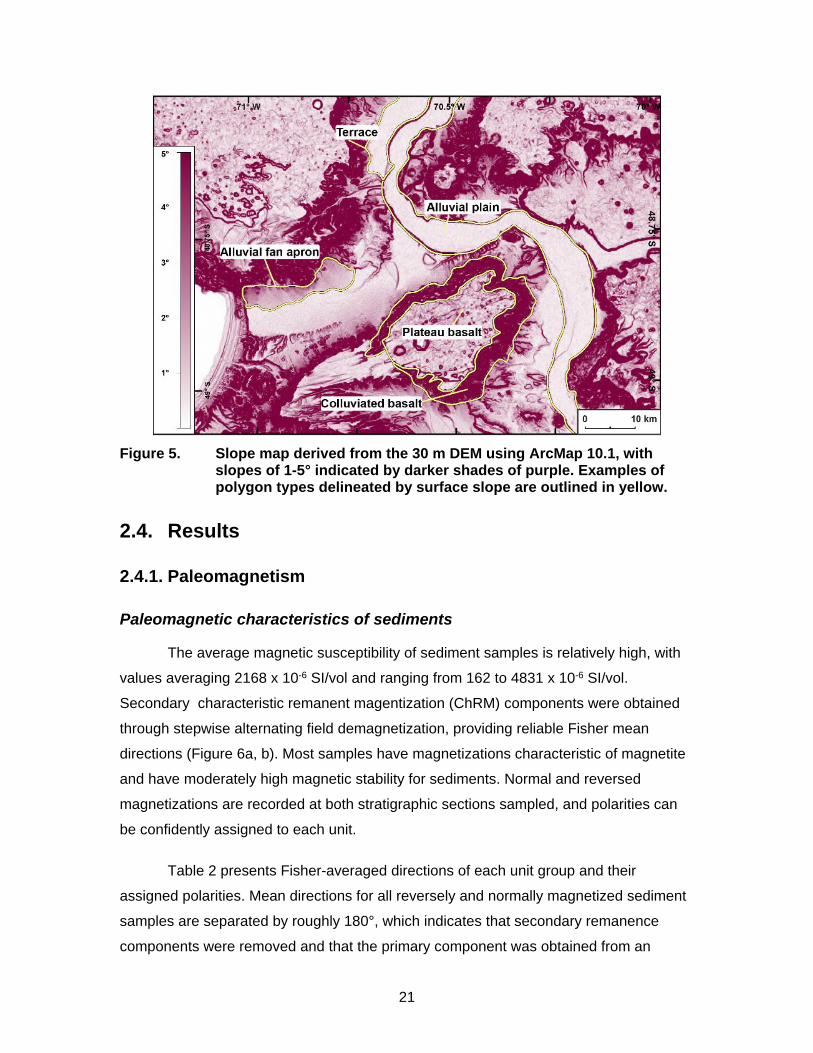
21
Figure 5. Slope map derived from the 30 m DEM using ArcMap 10.1, with
slopes of 1-5° indicated by darker shades of purple. Examples of polygon types delineated by surface slope are outlined in yellow.
2.4. Results
2.4.1. Paleomagnetism
Paleomagnetic characteristics of sediments
The average magnetic susceptibility of sediment samples is relatively high, with
values averaging 2168 x 10-6 SI/vol and ranging from 162 to 4831 x 10-6 SI/vol.
Secondary characteristic remanent magentization (ChRM) components were obtained
through stepwise alternating field demagnetization, providing reliable Fisher mean
directions (Figure 6a, b). Most samples have magnetizations characteristic of magnetite
and have moderately high magnetic stability for sediments. Normal and reversed
magnetizations are recorded at both stratigraphic sections sampled, and polarities can
be confidently assigned to each unit.
Table 2 presents Fisher-averaged directions of each unit group and their
assigned polarities. Mean directions for all reversely and normally magnetized sediment
samples are separated by roughly 180°, which indicates that secondary remanence
components were removed and that the primary component was obtained from an
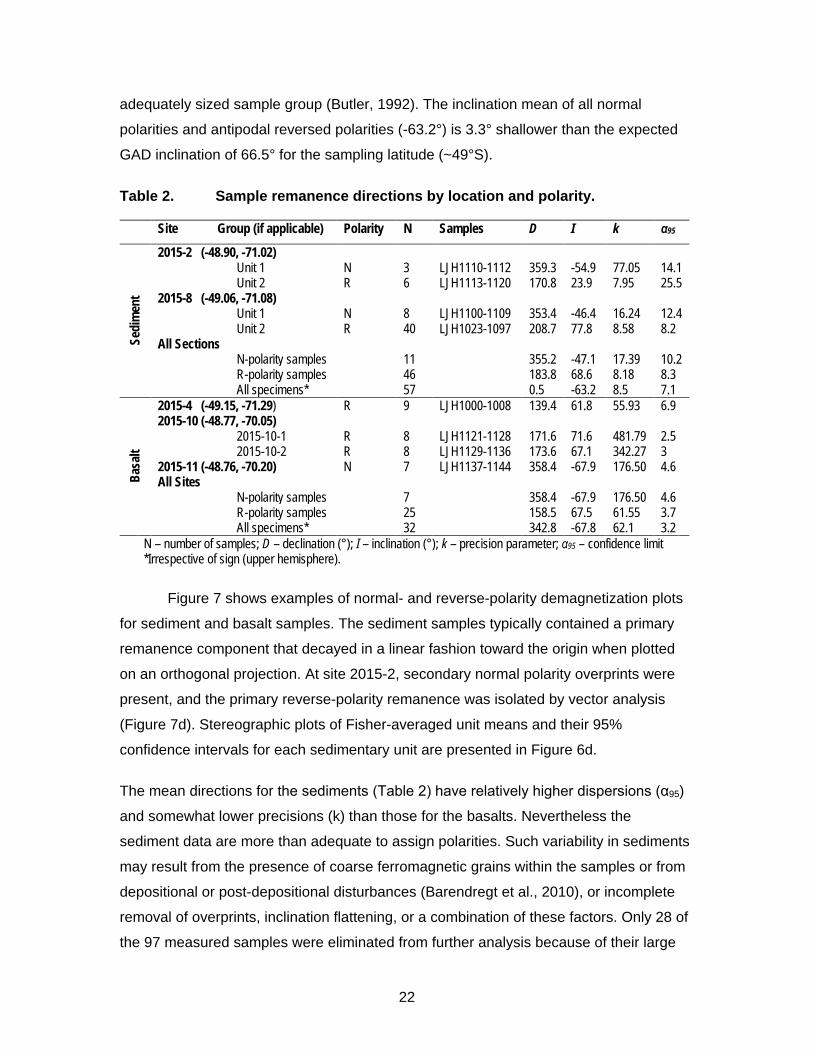
22
adequately sized sample group (Butler, 1992). The inclination mean of all normal
polarities and antipodal reversed polarities (-63.2°) is 3.3° shallower than the expected
GAD inclination of 66.5° for the sampling latitude (~49°S).
Table 2. Sample remanence directions by location and polarity.
Site Group (if applicable) Polarity N Samples D I k α95
Sedi
men
t
2015-2 (-48.90, -71.02) Unit 1 N 3 LJH1110-1112 359.3 -54.9 77.05 14.1 Unit 2 R 6 LJH1113-1120 170.8 23.9 7.95 25.5 2015-8 (-49.06, -71.08) Unit 1 N 8 LJH1100-1109 353.4 -46.4 16.24 12.4 Unit 2 R 40 LJH1023-1097 208.7 77.8 8.58 8.2 All Sections N-polarity samples 11 355.2 -47.1 17.39 10.2 R-polarity samples 46 183.8 68.6 8.18 8.3 All specimens* 57 0.5 -63.2 8.5 7.1
Basa
lt
2015-4 (-49.15, -71.29) R 9 LJH1000-1008 139.4 61.8 55.93 6.9 2015-10 (-48.77, -70.05) 2015-10-1 R 8 LJH1121-1128 171.6 71.6 481.79 2.5 2015-10-2 R 8 LJH1129-1136 173.6 67.1 342.27 3 2015-11 (-48.76, -70.20) N 7 LJH1137-1144 358.4 -67.9 176.50 4.6 All Sites N-polarity samples 7 358.4 -67.9 176.50 4.6 R-polarity samples 25 158.5 67.5 61.55 3.7 All specimens* 32 342.8 -67.8 62.1 3.2
N – number of samples; D – declination (°); I – inclination (°); k – precision parameter; α95 – confidence limit *Irrespective of sign (upper hemisphere).
Figure 7 shows examples of normal- and reverse-polarity demagnetization plots
for sediment and basalt samples. The sediment samples typically contained a primary
remanence component that decayed in a linear fashion toward the origin when plotted
on an orthogonal projection. At site 2015-2, secondary normal polarity overprints were
present, and the primary reverse-polarity remanence was isolated by vector analysis
(Figure 7d). Stereographic plots of Fisher-averaged unit means and their 95%
confidence intervals for each sedimentary unit are presented in Figure 6d.
The mean directions for the sediments (Table 2) have relatively higher dispersions (α95)
and somewhat lower precisions (k) than those for the basalts. Nevertheless the
sediment data are more than adequate to assign polarities. Such variability in sediments
may result from the presence of coarse ferromagnetic grains within the samples or from
depositional or post-depositional disturbances (Barendregt et al., 2010), or incomplete
removal of overprints, inclination flattening, or a combination of these factors. Only 28 of
the 97 measured samples were eliminated from further analysis because of their large
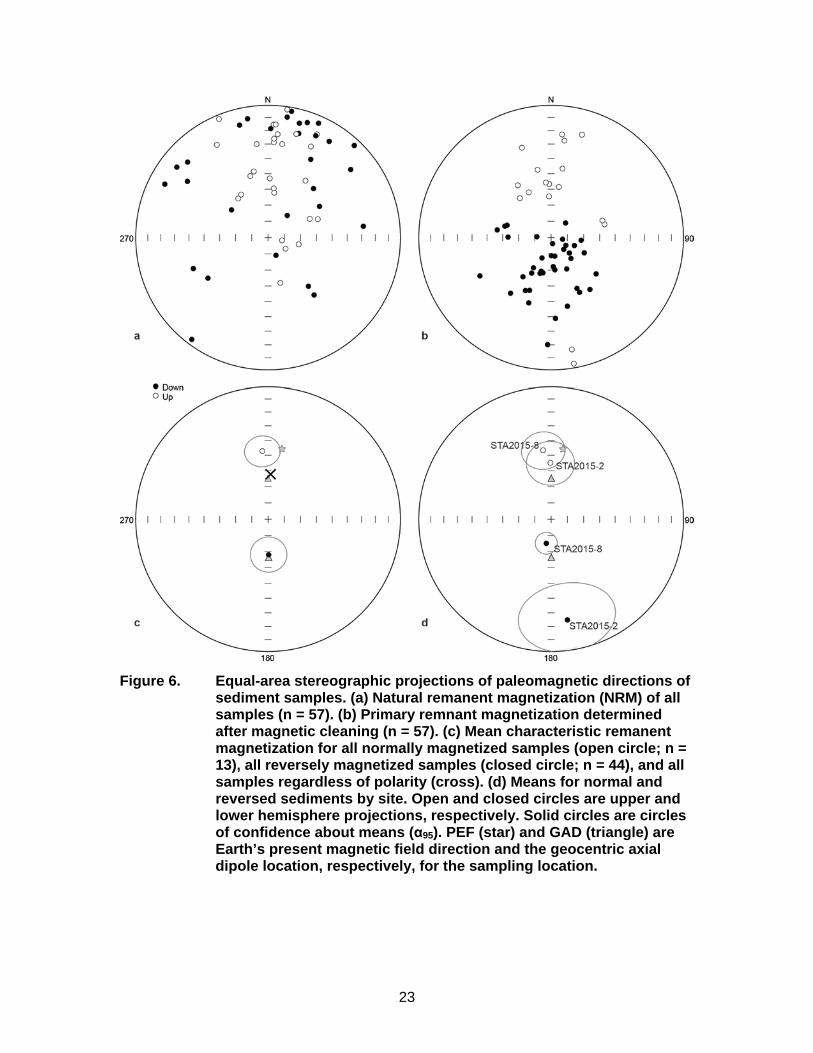
23
Figure 6. Equal-area stereographic projections of paleomagnetic directions of
sediment samples. (a) Natural remanent magnetization (NRM) of all samples (n = 57). (b) Primary remnant magnetization determined after magnetic cleaning (n = 57). (c) Mean characteristic remanent magnetization for all normally magnetized samples (open circle; n = 13), all reversely magnetized samples (closed circle; n = 44), and all samples regardless of polarity (cross). (d) Means for normal and reversed sediments by site. Open and closed circles are upper and lower hemisphere projections, respectively. Solid circles are circles of confidence about means (α95). PEF (star) and GAD (triangle) are Earth’s present magnetic field direction and the geocentric axial dipole location, respectively, for the sampling location.
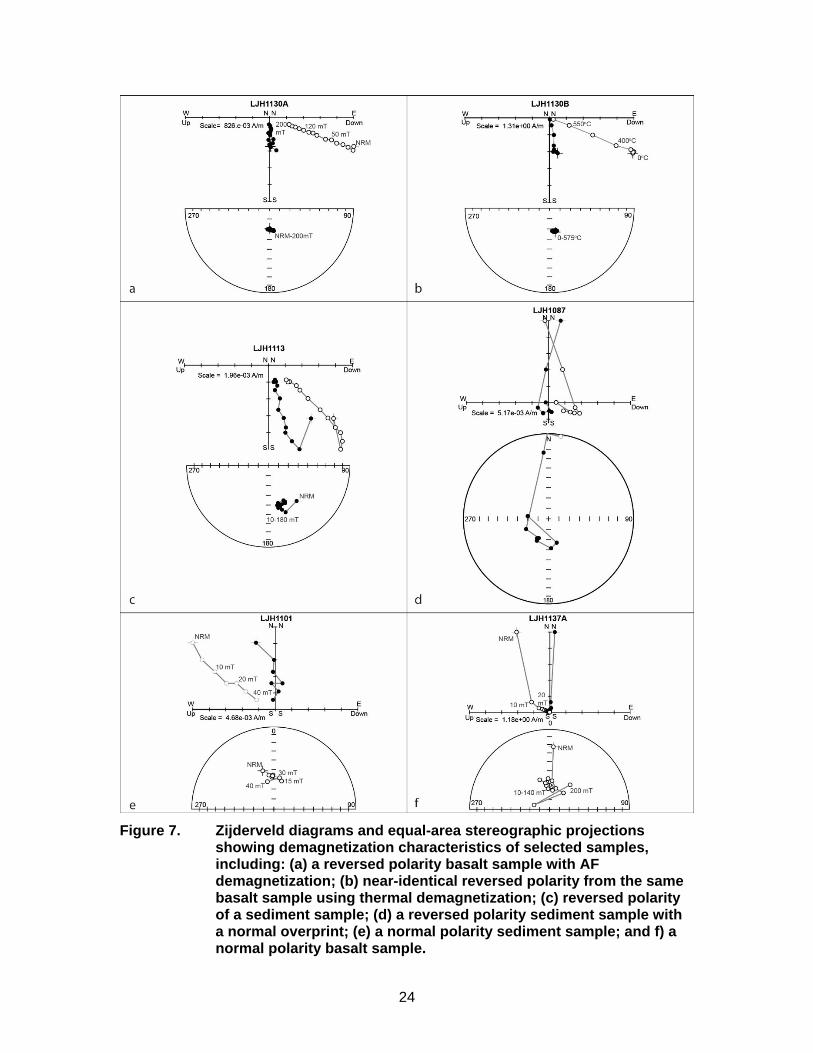
24
Figure 7. Zijderveld diagrams and equal-area stereographic projections
showing demagnetization characteristics of selected samples, including: (a) a reversed polarity basalt sample with AF demagnetization; (b) near-identical reversed polarity from the same basalt sample using thermal demagnetization; (c) reversed polarity of a sediment sample; (d) a reversed polarity sediment sample with a normal overprint; (e) a normal polarity sediment sample; and f) a normal polarity basalt sample.
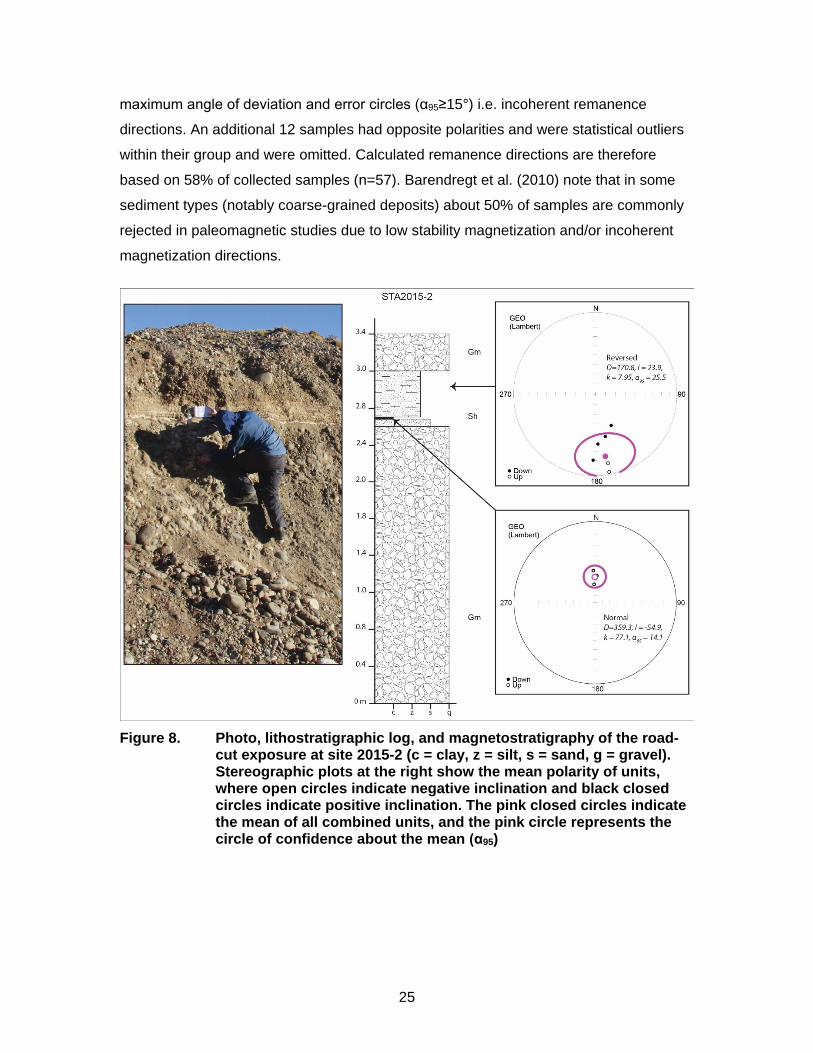
25
maximum angle of deviation and error circles (α95≥15°) i.e. incoherent remanence
directions. An additional 12 samples had opposite polarities and were statistical outliers
within their group and were omitted. Calculated remanence directions are therefore
based on 58% of collected samples (n=57). Barendregt et al. (2010) note that in some
sediment types (notably coarse-grained deposits) about 50% of samples are commonly
rejected in paleomagnetic studies due to low stability magnetization and/or incoherent
magnetization directions.
Figure 8. Photo, lithostratigraphic log, and magnetostratigraphy of the road-
cut exposure at site 2015-2 (c = clay, z = silt, s = sand, g = gravel). Stereographic plots at the right show the mean polarity of units, where open circles indicate negative inclination and black closed circles indicate positive inclination. The pink closed circles indicate the mean of all combined units, and the pink circle represents the circle of confidence about the mean (α95)
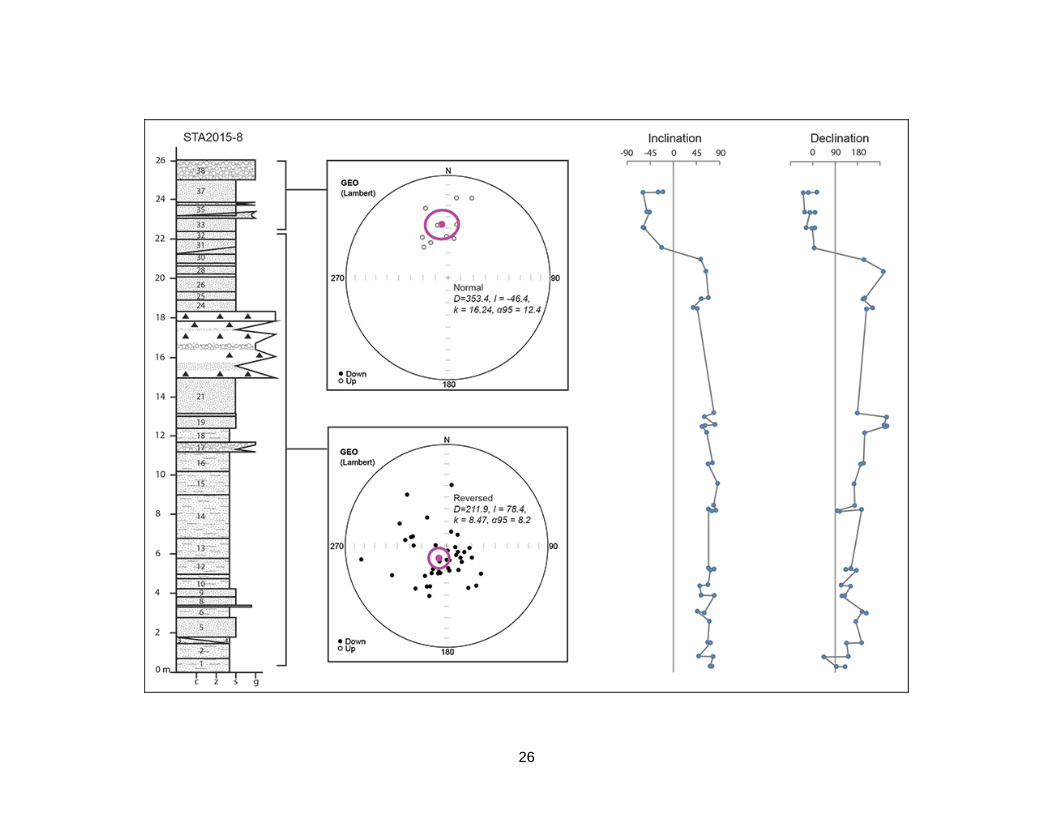
26
27
(Previous page)
Figure 9. Magnetostratigraphy of the road-cut exposure at site 2015-8 (c = clay, z = silt, s = sand, g = gravel, d = diamicton). Each of the numbered units is separated by a carbonate or clay-rich paleosol. Stereographic plots show the mean polarity of units; open circles indicate negative inclination, and black closed circles indicate positive inclination. The pink closed circles are the mean of all combined units, and the pink circle is the circle of confidence about the mean (α95). Depth profiles on the right show changes in inclination and declination within the stratigraphic sequence. Note that declination values (from bottom to top) reveal a number of large swings in declination, likely suggesting considerable passage of time.
The stratigraphic section at site 2015-2 at the west edge of Tres Lagunas valley includes
reversely magnetized fluvial sediments above a normally magnetized gypsum bed
(Figure 8). It is worth noting that, although gypsum is non-magnetic, there appears to
have been sufficient magnetite dust incorporated into the gypsum layer at this site to
impart a stable remanence. Sediments in the road-cut at site 2015-8 south of Lago
Cardiel comprise a normally magnetized sequence overlying a reversely magnetized
one (Figure 9). An unknown, but long period of time is represented by this sequence,
given the large number of calcareous paleosols at the site.
Paleomagnetic characteristics of basalts
Samples from the basalt flows are stably magnetized, and all specimens were
suitable for polarity determination. The primary component was isolated after 10 mT AF
demagnetization, and in many cases (particularly the reversed samples) is reliably
characterized by the NRM directions (Figure 10a, b). The average magnetic
susceptibility of basalt samples is high, with values averaging 2835 x 10-6 SI/vol and
ranging from 1602 to 4720 x 10-6 SI/vol. Secondary remanence components were
removed in a stepwise alternating field, which improved the Fisher mean directions,
most noticeably in the normally magnetized group (Figure 10a, b). Thermal and AF
demagnetization plots from replicate pilot samples revealed identical remanence
directions (Figure 7e, f), so only AF demagnetization was used for the remainder of the
samples.
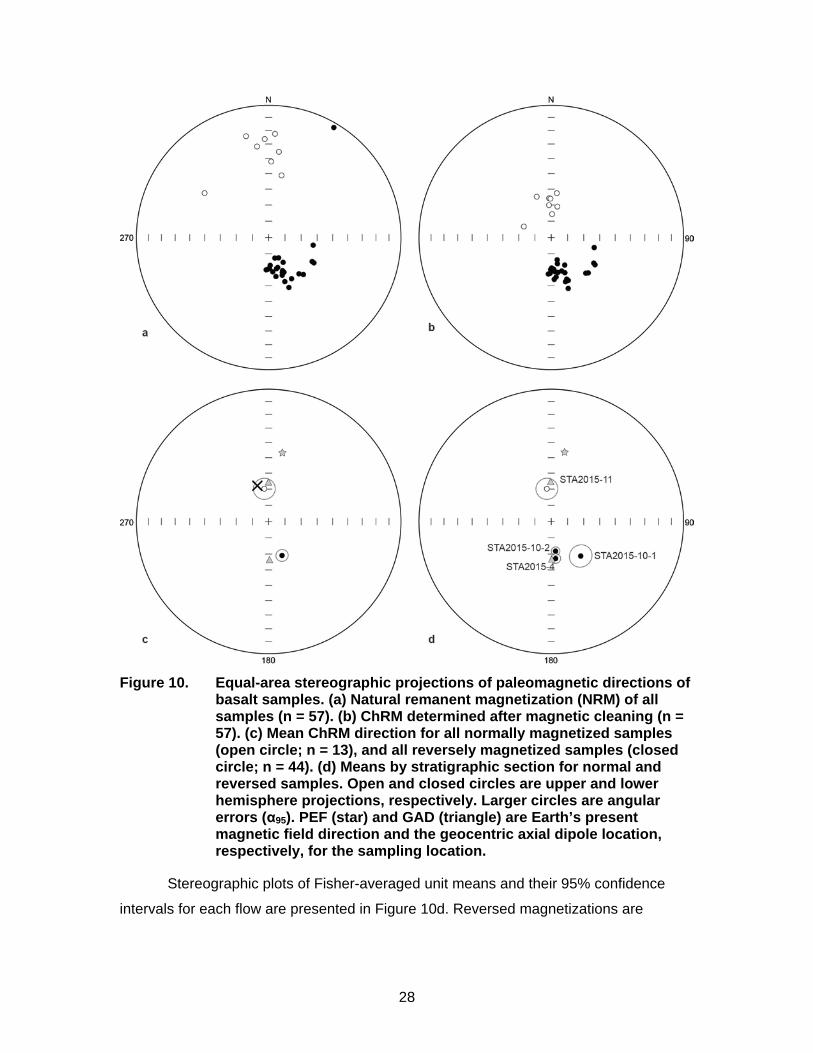
28
Figure 10. Equal-area stereographic projections of paleomagnetic directions of
basalt samples. (a) Natural remanent magnetization (NRM) of all samples (n = 57). (b) ChRM determined after magnetic cleaning (n = 57). (c) Mean ChRM direction for all normally magnetized samples (open circle; n = 13), and all reversely magnetized samples (closed circle; n = 44). (d) Means by stratigraphic section for normal and reversed samples. Open and closed circles are upper and lower hemisphere projections, respectively. Larger circles are angular errors (α95). PEF (star) and GAD (triangle) are Earth’s present magnetic field direction and the geocentric axial dipole location, respectively, for the sampling location.
Stereographic plots of Fisher-averaged unit means and their 95% confidence
intervals for each flow are presented in Figure 10d. Reversed magnetizations are
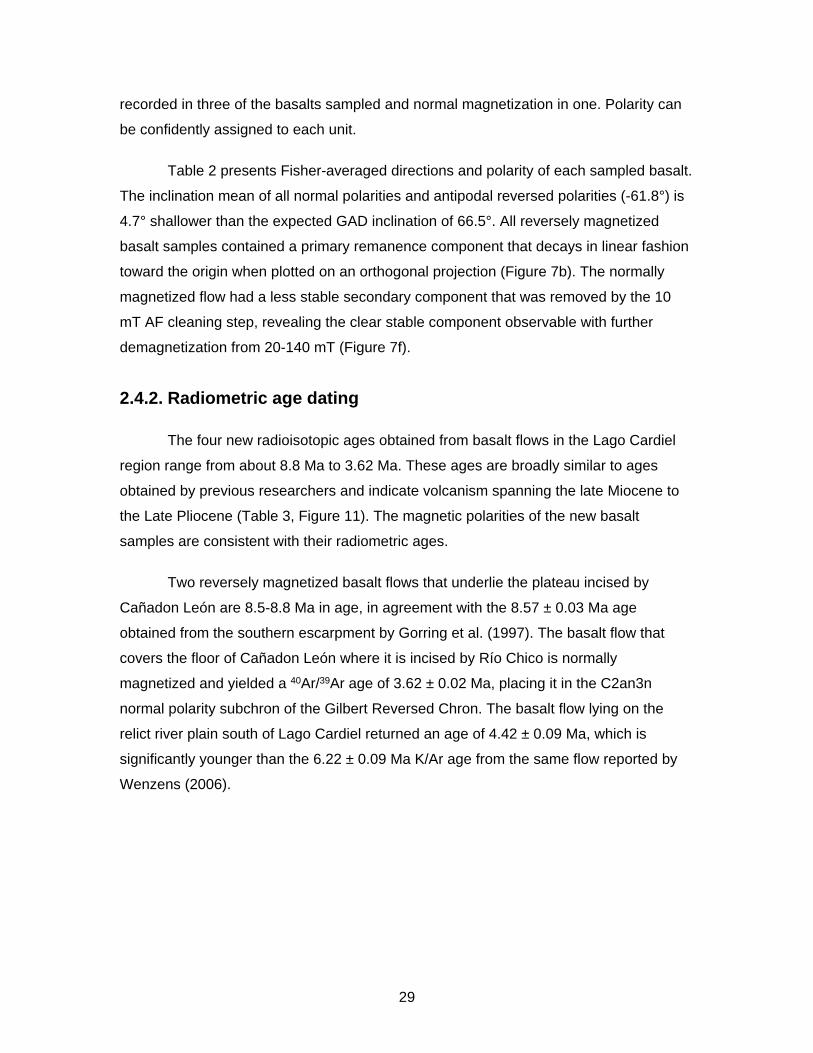
29
recorded in three of the basalts sampled and normal magnetization in one. Polarity can
be confidently assigned to each unit.
Table 2 presents Fisher-averaged directions and polarity of each sampled basalt.
The inclination mean of all normal polarities and antipodal reversed polarities (-61.8°) is
4.7° shallower than the expected GAD inclination of 66.5°. All reversely magnetized
basalt samples contained a primary remanence component that decays in linear fashion
toward the origin when plotted on an orthogonal projection (Figure 7b). The normally
magnetized flow had a less stable secondary component that was removed by the 10
mT AF cleaning step, revealing the clear stable component observable with further
demagnetization from 20-140 mT (Figure 7f).
2.4.2. Radiometric age dating
The four new radioisotopic ages obtained from basalt flows in the Lago Cardiel
region range from about 8.8 Ma to 3.62 Ma. These ages are broadly similar to ages
obtained by previous researchers and indicate volcanism spanning the late Miocene to
the Late Pliocene (Table 3, Figure 11). The magnetic polarities of the new basalt
samples are consistent with their radiometric ages.
Two reversely magnetized basalt flows that underlie the plateau incised by
Cañadon León are 8.5-8.8 Ma in age, in agreement with the 8.57 ± 0.03 Ma age
obtained from the southern escarpment by Gorring et al. (1997). The basalt flow that
covers the floor of Cañadon León where it is incised by Río Chico is normally
magnetized and yielded a 40Ar/39Ar age of 3.62 ± 0.02 Ma, placing it in the C2an3n
normal polarity subchron of the Gilbert Reversed Chron. The basalt flow lying on the
relict river plain south of Lago Cardiel returned an age of 4.42 ± 0.09 Ma, which is
significantly younger than the 6.22 ± 0.09 Ma K/Ar age from the same flow reported by
Wenzens (2006).
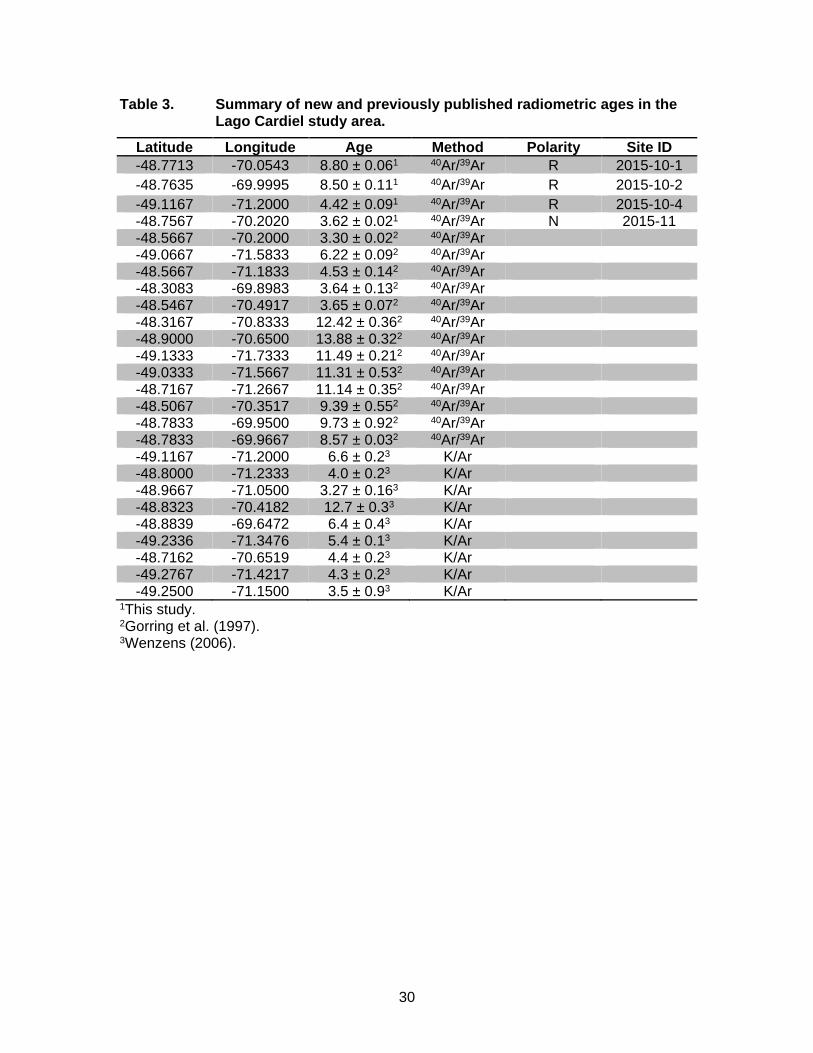
30
Table 3. Summary of new and previously published radiometric ages in the Lago Cardiel study area.
Latitude Longitude Age Method Polarity Site ID -48.7713 -70.0543 8.80 ± 0.061 40Ar/39Ar R 2015-10-1 -48.7635 -69.9995 8.50 ± 0.111 40Ar/39Ar R 2015-10-2 -49.1167 -71.2000 4.42 ± 0.091 40Ar/39Ar R 2015-10-4 -48.7567 -70.2020 3.62 ± 0.021 40Ar/39Ar N 2015-11 -48.5667 -70.2000 3.30 ± 0.022 40Ar/39Ar -49.0667 -71.5833 6.22 ± 0.092 40Ar/39Ar -48.5667 -71.1833 4.53 ± 0.142 40Ar/39Ar -48.3083 -69.8983 3.64 ± 0.132 40Ar/39Ar -48.5467 -70.4917 3.65 ± 0.072 40Ar/39Ar -48.3167 -70.8333 12.42 ± 0.362 40Ar/39Ar -48.9000 -70.6500 13.88 ± 0.322 40Ar/39Ar -49.1333 -71.7333 11.49 ± 0.212 40Ar/39Ar -49.0333 -71.5667 11.31 ± 0.532 40Ar/39Ar -48.7167 -71.2667 11.14 ± 0.352 40Ar/39Ar -48.5067 -70.3517 9.39 ± 0.552 40Ar/39Ar -48.7833 -69.9500 9.73 ± 0.922 40Ar/39Ar -48.7833 -69.9667 8.57 ± 0.032 40Ar/39Ar -49.1167 -71.2000 6.6 ± 0.23 K/Ar -48.8000 -71.2333 4.0 ± 0.23 K/Ar -48.9667 -71.0500 3.27 ± 0.163 K/Ar -48.8323 -70.4182 12.7 ± 0.33 K/Ar -48.8839 -69.6472 6.4 ± 0.43 K/Ar -49.2336 -71.3476 5.4 ± 0.13 K/Ar -48.7162 -70.6519 4.4 ± 0.23 K/Ar -49.2767 -71.4217 4.3 ± 0.23 K/Ar -49.2500 -71.1500 3.5 ± 0.93 K/Ar
1This study. 2Gorring et al. (1997). 3Wenzens (2006).
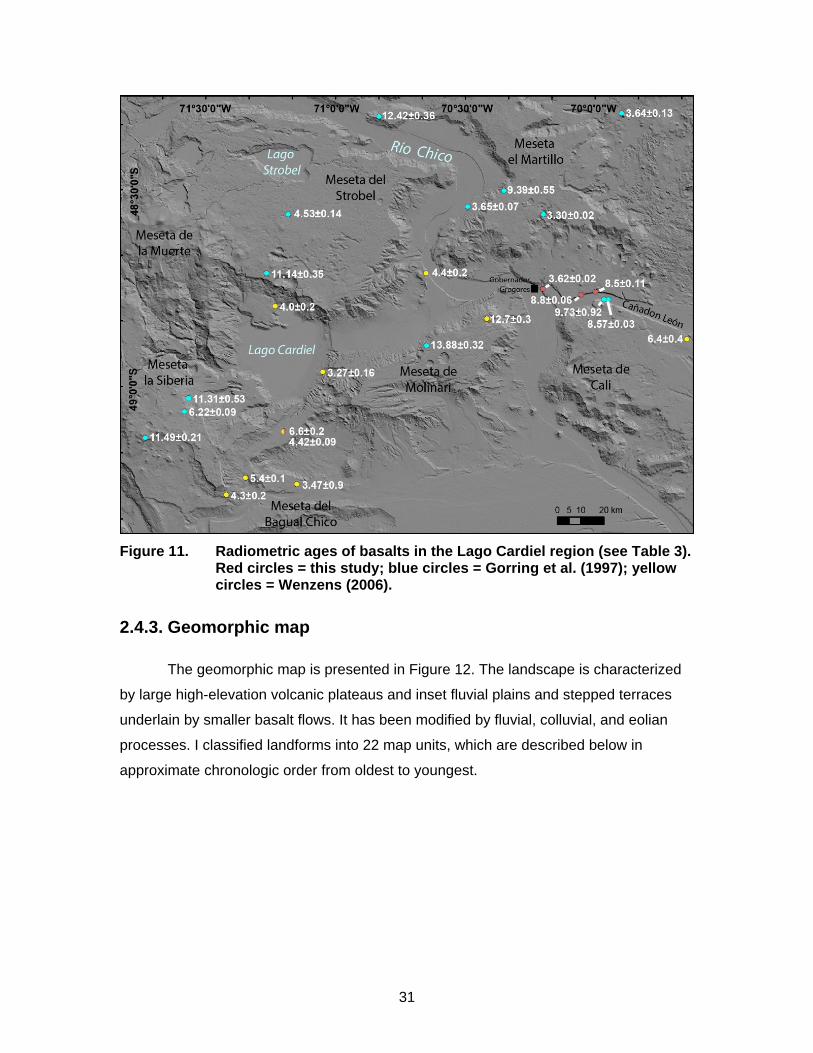
31
Figure 11. Radiometric ages of basalts in the Lago Cardiel region (see Table 3).
Red circles = this study; blue circles = Gorring et al. (1997); yellow circles = Wenzens (2006).
2.4.3. Geomorphic map
The geomorphic map is presented in Figure 12. The landscape is characterized
by large high-elevation volcanic plateaus and inset fluvial plains and stepped terraces
underlain by smaller basalt flows. It has been modified by fluvial, colluvial, and eolian
processes. I classified landforms into 22 map units, which are described below in
approximate chronologic order from oldest to youngest.
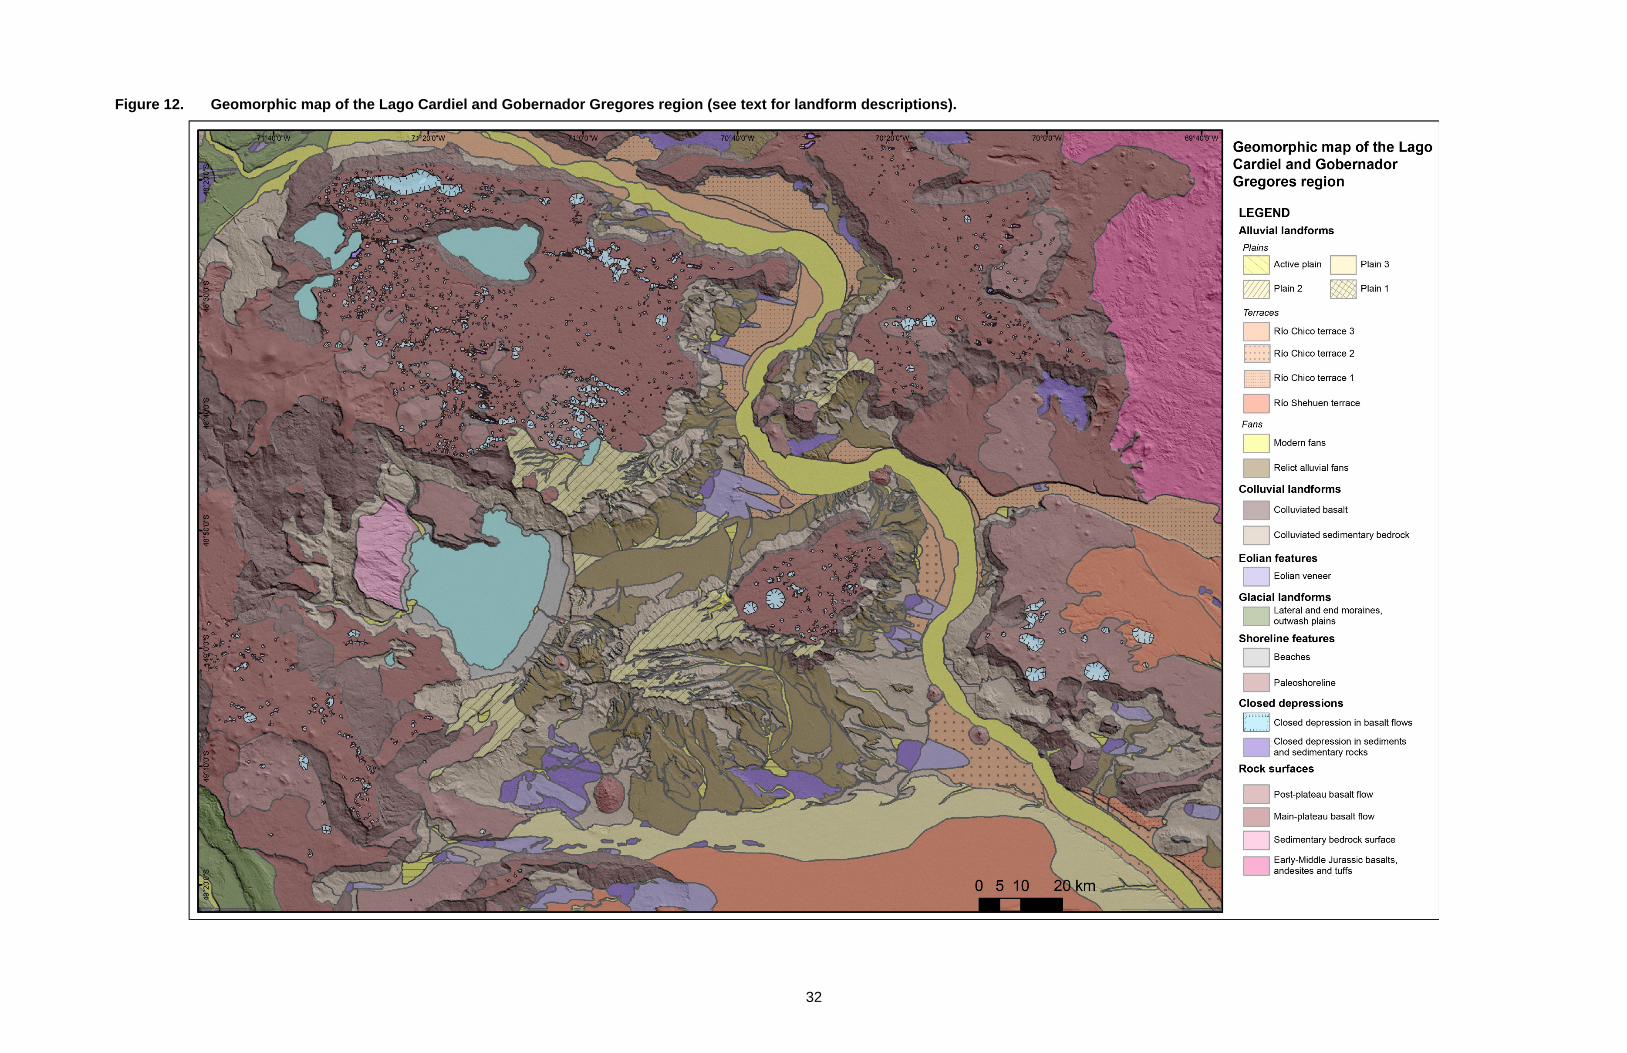
32
Figure 12. Geomorphic map of the Lago Cardiel and Gobernador Gregores region (see text for landform descriptions).
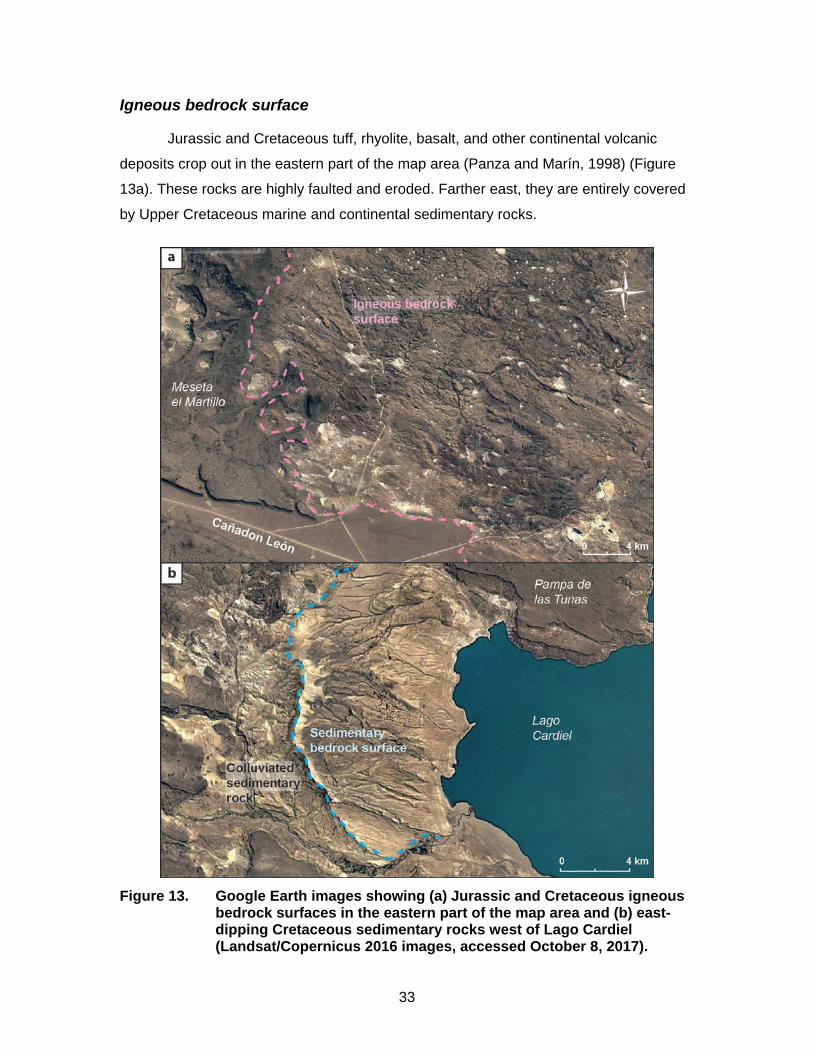
33
Igneous bedrock surface
Jurassic and Cretaceous tuff, rhyolite, basalt, and other continental volcanic
deposits crop out in the eastern part of the map area (Panza and Marín, 1998) (Figure
13a). These rocks are highly faulted and eroded. Farther east, they are entirely covered
by Upper Cretaceous marine and continental sedimentary rocks.
Figure 13. Google Earth images showing (a) Jurassic and Cretaceous igneous
bedrock surfaces in the eastern part of the map area and (b) east-dipping Cretaceous sedimentary rocks west of Lago Cardiel (Landsat/Copernicus 2016 images, accessed October 8, 2017).
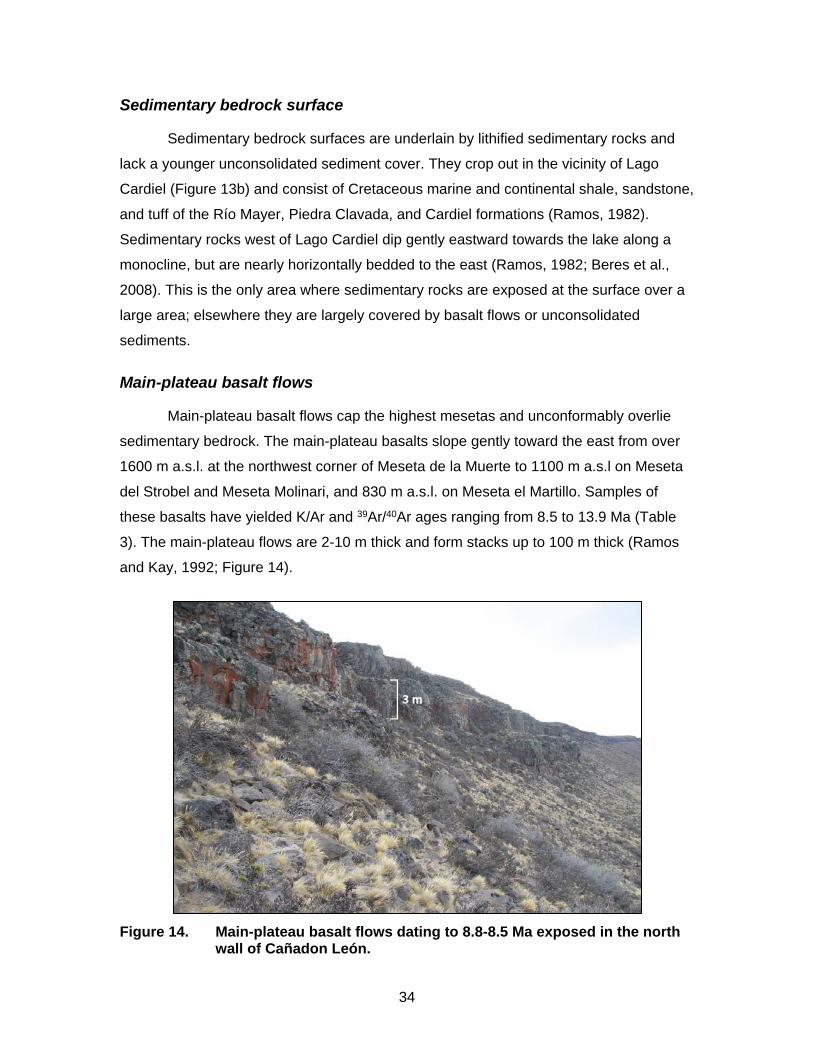
34
Sedimentary bedrock surface
Sedimentary bedrock surfaces are underlain by lithified sedimentary rocks and
lack a younger unconsolidated sediment cover. They crop out in the vicinity of Lago
Cardiel (Figure 13b) and consist of Cretaceous marine and continental shale, sandstone,
and tuff of the Río Mayer, Piedra Clavada, and Cardiel formations (Ramos, 1982).
Sedimentary rocks west of Lago Cardiel dip gently eastward towards the lake along a
monocline, but are nearly horizontally bedded to the east (Ramos, 1982; Beres et al.,
2008). This is the only area where sedimentary rocks are exposed at the surface over a
large area; elsewhere they are largely covered by basalt flows or unconsolidated
sediments.
Main-plateau basalt flows
Main-plateau basalt flows cap the highest mesetas and unconformably overlie
sedimentary bedrock. The main-plateau basalts slope gently toward the east from over
1600 m a.s.l. at the northwest corner of Meseta de la Muerte to 1100 m a.s.l on Meseta
del Strobel and Meseta Molinari, and 830 m a.s.l. on Meseta el Martillo. Samples of
these basalts have yielded K/Ar and 39Ar/40Ar ages ranging from 8.5 to 13.9 Ma (Table
3). The main-plateau flows are 2-10 m thick and form stacks up to 100 m thick (Ramos
and Kay, 1992; Figure 14).
Figure 14. Main-plateau basalt flows dating to 8.8-8.5 Ma exposed in the north
wall of Cañadon León.
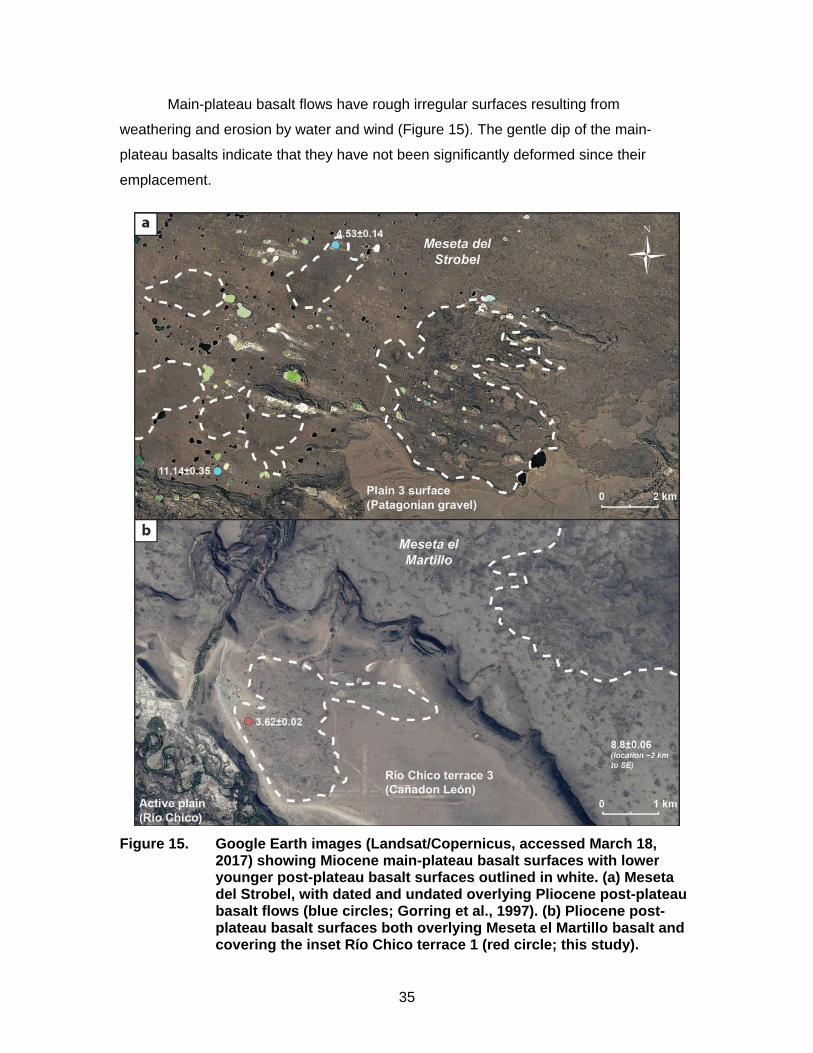
35
Main-plateau basalt flows have rough irregular surfaces resulting from
weathering and erosion by water and wind (Figure 15). The gentle dip of the main-
plateau basalts indicate that they have not been significantly deformed since their
emplacement.
Figure 15. Google Earth images (Landsat/Copernicus, accessed March 18,
2017) showing Miocene main-plateau basalt surfaces with lower younger post-plateau basalt surfaces outlined in white. (a) Meseta del Strobel, with dated and undated overlying Pliocene post-plateau basalt flows (blue circles; Gorring et al., 1997). (b) Pliocene post-plateau basalt surfaces both overlying Meseta el Martillo basalt and covering the inset Río Chico terrace 1 (red circle; this study).
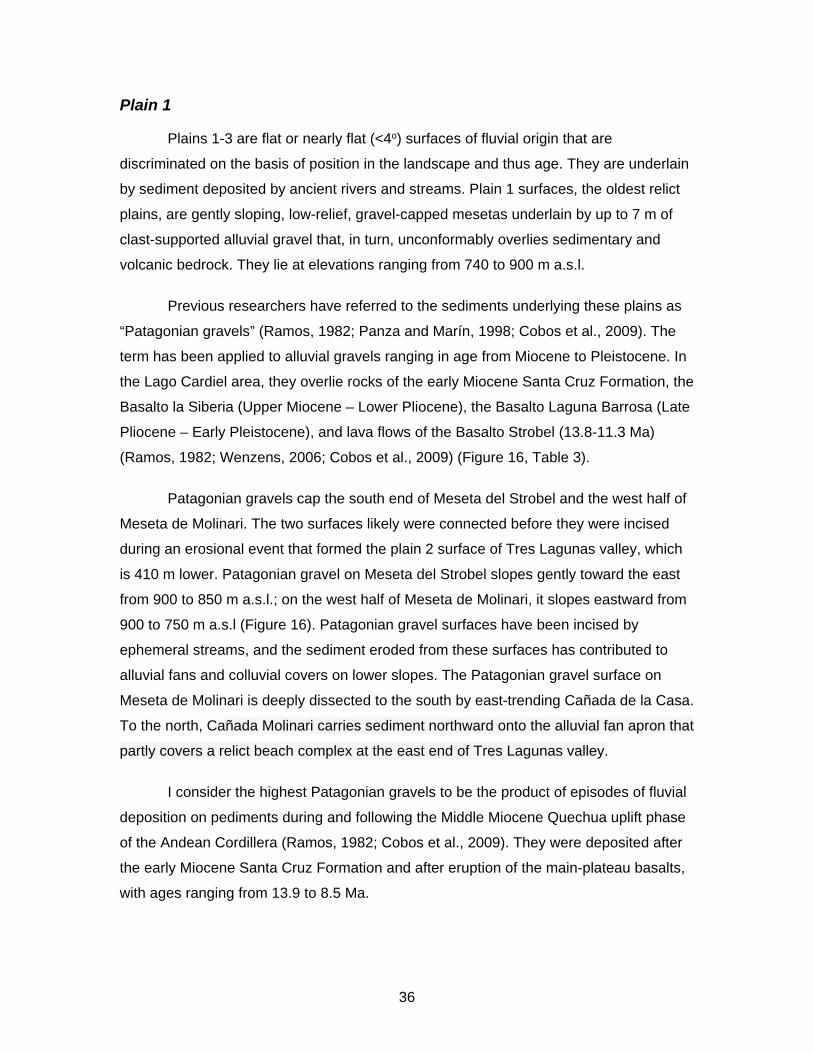
36
Plain 1
Plains 1-3 are flat or nearly flat (<4o) surfaces of fluvial origin that are
discriminated on the basis of position in the landscape and thus age. They are underlain
by sediment deposited by ancient rivers and streams. Plain 1 surfaces, the oldest relict
plains, are gently sloping, low-relief, gravel-capped mesetas underlain by up to 7 m of
clast-supported alluvial gravel that, in turn, unconformably overlies sedimentary and
volcanic bedrock. They lie at elevations ranging from 740 to 900 m a.s.l.
Previous researchers have referred to the sediments underlying these plains as
“Patagonian gravels” (Ramos, 1982; Panza and Marín, 1998; Cobos et al., 2009). The
term has been applied to alluvial gravels ranging in age from Miocene to Pleistocene. In
the Lago Cardiel area, they overlie rocks of the early Miocene Santa Cruz Formation, the
Basalto la Siberia (Upper Miocene – Lower Pliocene), the Basalto Laguna Barrosa (Late
Pliocene – Early Pleistocene), and lava flows of the Basalto Strobel (13.8-11.3 Ma)
(Ramos, 1982; Wenzens, 2006; Cobos et al., 2009) (Figure 16, Table 3).
Patagonian gravels cap the south end of Meseta del Strobel and the west half of
Meseta de Molinari. The two surfaces likely were connected before they were incised
during an erosional event that formed the plain 2 surface of Tres Lagunas valley, which
is 410 m lower. Patagonian gravel on Meseta del Strobel slopes gently toward the east
from 900 to 850 m a.s.l.; on the west half of Meseta de Molinari, it slopes eastward from
900 to 750 m a.s.l (Figure 16). Patagonian gravel surfaces have been incised by
ephemeral streams, and the sediment eroded from these surfaces has contributed to
alluvial fans and colluvial covers on lower slopes. The Patagonian gravel surface on
Meseta de Molinari is deeply dissected to the south by east-trending Cañada de la Casa.
To the north, Cañada Molinari carries sediment northward onto the alluvial fan apron that
partly covers a relict beach complex at the east end of Tres Lagunas valley.
I consider the highest Patagonian gravels to be the product of episodes of fluvial
deposition on pediments during and following the Middle Miocene Quechua uplift phase
of the Andean Cordillera (Ramos, 1982; Cobos et al., 2009). They were deposited after
the early Miocene Santa Cruz Formation and after eruption of the main-plateau basalts,
with ages ranging from 13.9 to 8.5 Ma.
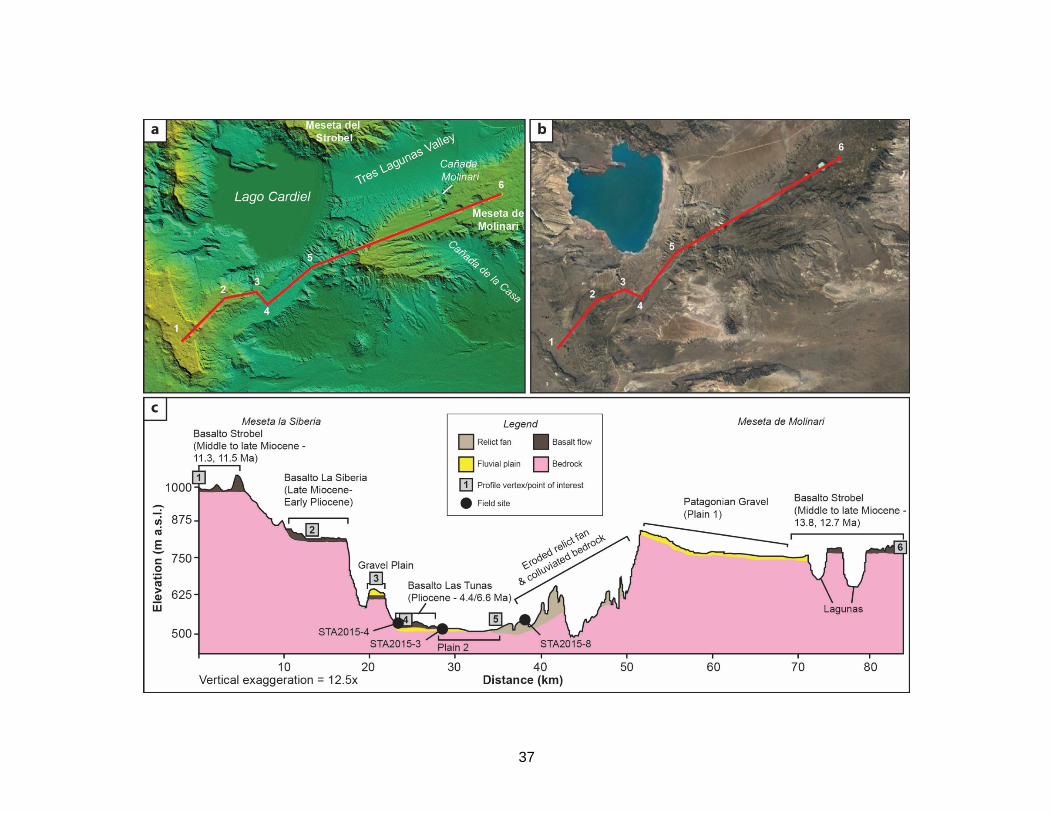
37
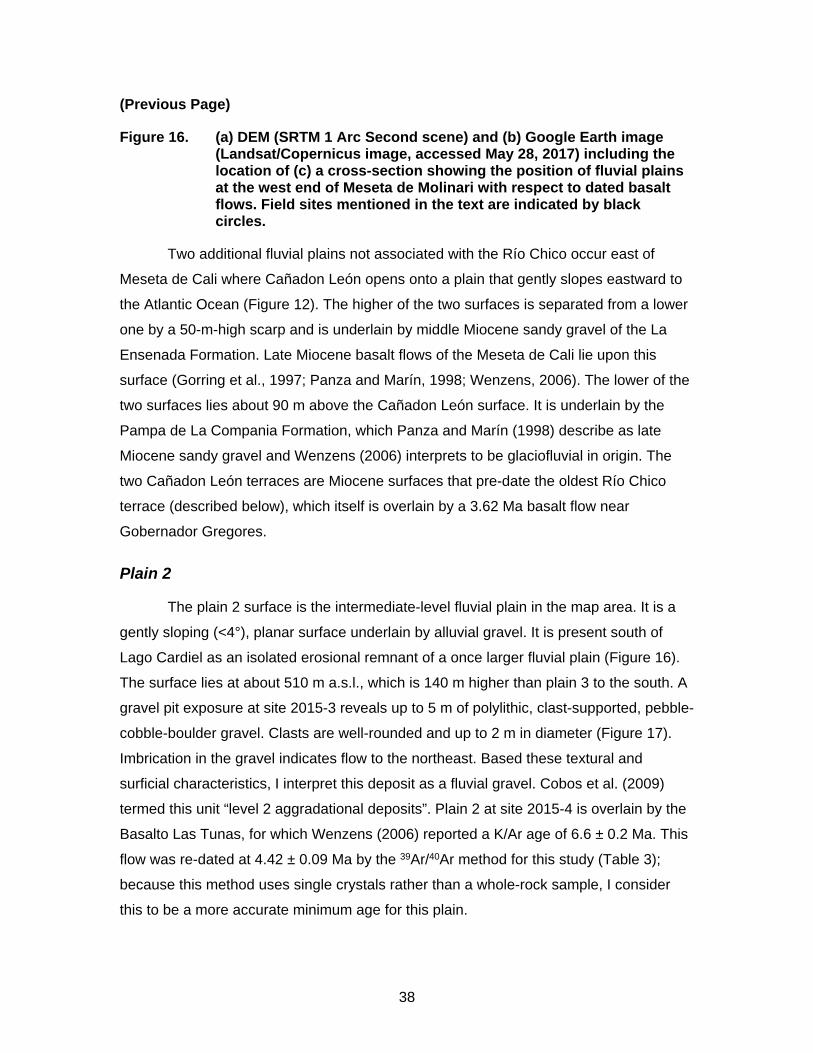
38
(Previous Page)
Figure 16. (a) DEM (SRTM 1 Arc Second scene) and (b) Google Earth image (Landsat/Copernicus image, accessed May 28, 2017) including the location of (c) a cross-section showing the position of fluvial plains at the west end of Meseta de Molinari with respect to dated basalt flows. Field sites mentioned in the text are indicated by black circles.
Two additional fluvial plains not associated with the Río Chico occur east of
Meseta de Cali where Cañadon León opens onto a plain that gently slopes eastward to
the Atlantic Ocean (Figure 12). The higher of the two surfaces is separated from a lower
one by a 50-m-high scarp and is underlain by middle Miocene sandy gravel of the La
Ensenada Formation. Late Miocene basalt flows of the Meseta de Cali lie upon this
surface (Gorring et al., 1997; Panza and Marín, 1998; Wenzens, 2006). The lower of the
two surfaces lies about 90 m above the Cañadon León surface. It is underlain by the
Pampa de La Compania Formation, which Panza and Marín (1998) describe as late
Miocene sandy gravel and Wenzens (2006) interprets to be glaciofluvial in origin. The
two Cañadon León terraces are Miocene surfaces that pre-date the oldest Río Chico
terrace (described below), which itself is overlain by a 3.62 Ma basalt flow near
Gobernador Gregores.
Plain 2
The plain 2 surface is the intermediate-level fluvial plain in the map area. It is a
gently sloping (<4°), planar surface underlain by alluvial gravel. It is present south of
Lago Cardiel as an isolated erosional remnant of a once larger fluvial plain (Figure 16).
The surface lies at about 510 m a.s.l., which is 140 m higher than plain 3 to the south. A
gravel pit exposure at site 2015-3 reveals up to 5 m of polylithic, clast-supported, pebble-
cobble-boulder gravel. Clasts are well-rounded and up to 2 m in diameter (Figure 17).
Imbrication in the gravel indicates flow to the northeast. Based these textural and
surficial characteristics, I interpret this deposit as a fluvial gravel. Cobos et al. (2009)
termed this unit “level 2 aggradational deposits”. Plain 2 at site 2015-4 is overlain by the
Basalto Las Tunas, for which Wenzens (2006) reported a K/Ar age of 6.6 ± 0.2 Ma. This
flow was re-dated at 4.42 ± 0.09 Ma by the 39Ar/40Ar method for this study (Table 3);
because this method uses single crystals rather than a whole-rock sample, I consider
this to be a more accurate minimum age for this plain.
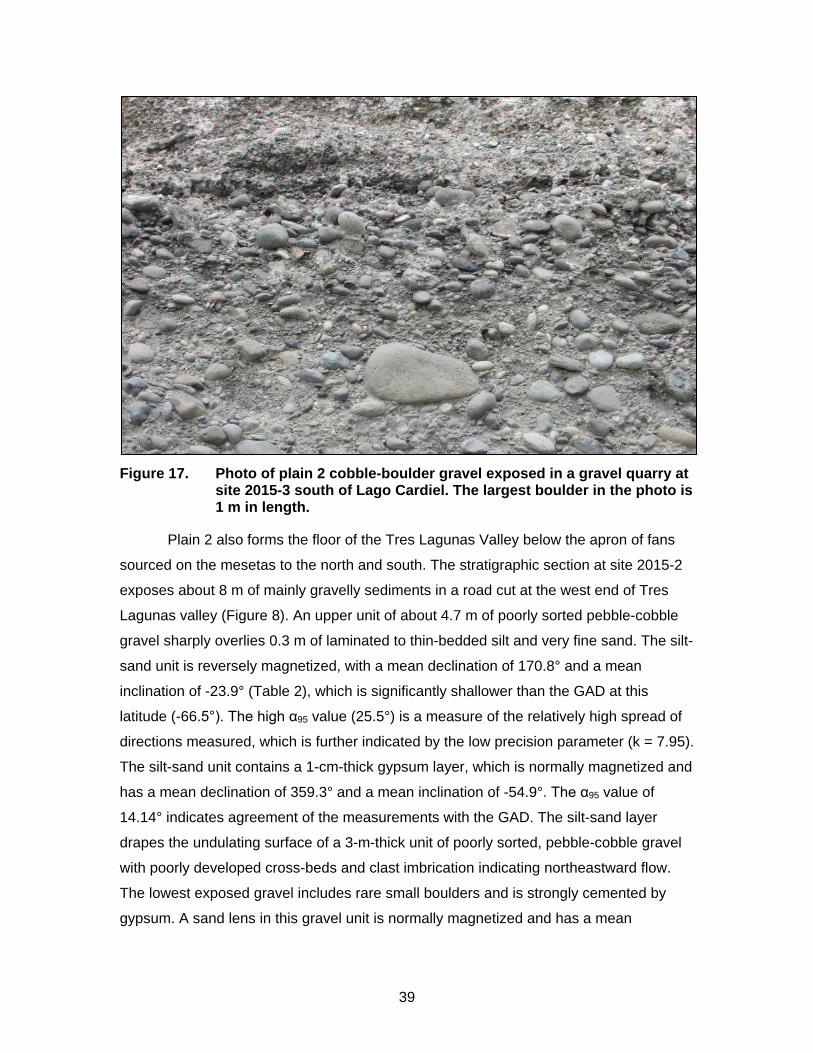
39
Figure 17. Photo of plain 2 cobble-boulder gravel exposed in a gravel quarry at
site 2015-3 south of Lago Cardiel. The largest boulder in the photo is 1 m in length.
Plain 2 also forms the floor of the Tres Lagunas Valley below the apron of fans
sourced on the mesetas to the north and south. The stratigraphic section at site 2015-2
exposes about 8 m of mainly gravelly sediments in a road cut at the west end of Tres
Lagunas valley (Figure 8). An upper unit of about 4.7 m of poorly sorted pebble-cobble
gravel sharply overlies 0.3 m of laminated to thin-bedded silt and very fine sand. The silt-
sand unit is reversely magnetized, with a mean declination of 170.8° and a mean
inclination of -23.9° (Table 2), which is significantly shallower than the GAD at this
latitude (-66.5°). The high α95 value (25.5°) is a measure of the relatively high spread of
directions measured, which is further indicated by the low precision parameter (k = 7.95).
The silt-sand unit contains a 1-cm-thick gypsum layer, which is normally magnetized and
has a mean declination of 359.3° and a mean inclination of -54.9°. The α95 value of
14.14° indicates agreement of the measurements with the GAD. The silt-sand layer
drapes the undulating surface of a 3-m-thick unit of poorly sorted, pebble-cobble gravel
with poorly developed cross-beds and clast imbrication indicating northeastward flow.
The lowest exposed gravel includes rare small boulders and is strongly cemented by
gypsum. A sand lens in this gravel unit is normally magnetized and has a mean
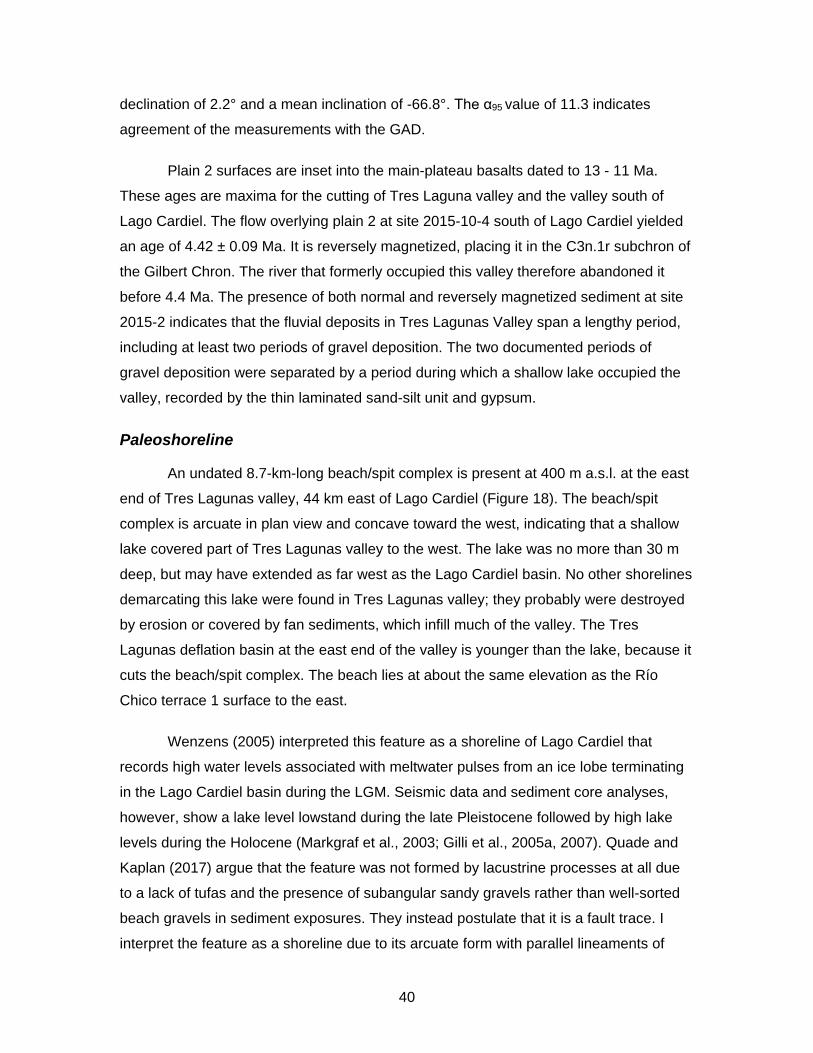
40
declination of 2.2° and a mean inclination of -66.8°. The α95 value of 11.3 indicates
agreement of the measurements with the GAD.
Plain 2 surfaces are inset into the main-plateau basalts dated to 13 - 11 Ma.
These ages are maxima for the cutting of Tres Laguna valley and the valley south of
Lago Cardiel. The flow overlying plain 2 at site 2015-10-4 south of Lago Cardiel yielded
an age of 4.42 ± 0.09 Ma. It is reversely magnetized, placing it in the C3n.1r subchron of
the Gilbert Chron. The river that formerly occupied this valley therefore abandoned it
before 4.4 Ma. The presence of both normal and reversely magnetized sediment at site
2015-2 indicates that the fluvial deposits in Tres Lagunas Valley span a lengthy period,
including at least two periods of gravel deposition. The two documented periods of
gravel deposition were separated by a period during which a shallow lake occupied the
valley, recorded by the thin laminated sand-silt unit and gypsum.
Paleoshoreline
An undated 8.7-km-long beach/spit complex is present at 400 m a.s.l. at the east
end of Tres Lagunas valley, 44 km east of Lago Cardiel (Figure 18). The beach/spit
complex is arcuate in plan view and concave toward the west, indicating that a shallow
lake covered part of Tres Lagunas valley to the west. The lake was no more than 30 m
deep, but may have extended as far west as the Lago Cardiel basin. No other shorelines
demarcating this lake were found in Tres Lagunas valley; they probably were destroyed
by erosion or covered by fan sediments, which infill much of the valley. The Tres
Lagunas deflation basin at the east end of the valley is younger than the lake, because it
cuts the beach/spit complex. The beach lies at about the same elevation as the Río
Chico terrace 1 surface to the east.
Wenzens (2005) interpreted this feature as a shoreline of Lago Cardiel that
records high water levels associated with meltwater pulses from an ice lobe terminating
in the Lago Cardiel basin during the LGM. Seismic data and sediment core analyses,
however, show a lake level lowstand during the late Pleistocene followed by high lake
levels during the Holocene (Markgraf et al., 2003; Gilli et al., 2005a, 2007). Quade and
Kaplan (2017) argue that the feature was not formed by lacustrine processes at all due
to a lack of tufas and the presence of subangular sandy gravels rather than well-sorted
beach gravels in sediment exposures. They instead postulate that it is a fault trace. I
interpret the feature as a shoreline due to its arcuate form with parallel lineaments of
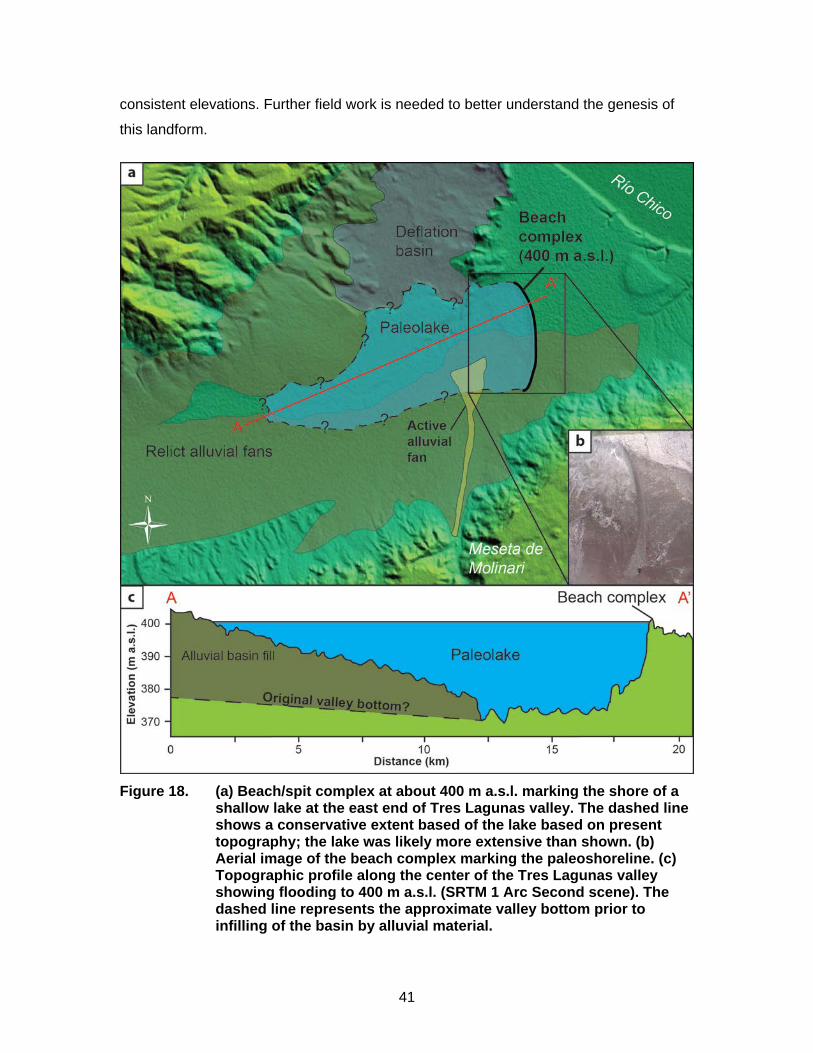
41
consistent elevations. Further field work is needed to better understand the genesis of
this landform.
Figure 18. (a) Beach/spit complex at about 400 m a.s.l. marking the shore of a
shallow lake at the east end of Tres Lagunas valley. The dashed line shows a conservative extent based of the lake based on present topography; the lake was likely more extensive than shown. (b) Aerial image of the beach complex marking the paleoshoreline. (c) Topographic profile along the center of the Tres Lagunas valley showing flooding to 400 m a.s.l. (SRTM 1 Arc Second scene). The dashed line represents the approximate valley bottom prior to infilling of the basin by alluvial material.
42
Post-plateau basalt flow
Post-plateau basalt flows are of Pliocene age in the mapped area (Table 3). Most
are topographically lower than Miocene plateau flows and typically overlie valley floors
and terraces that are 220-550 m above present-day base level. Some small Pliocene
flows, however, ornament the higher Miocene plateau basalts, for example the 4.53 Ma
flow overlying the main-plateau basalt flows of Meseta del Strobel (Figure 15). The post-
plateau basalt flows can be discriminated from Miocene flows on satellite images by their
fresher, less eroded surfaces, which are darker in tone than the main-plateau basalts.
Many are associated with nearby volcanic cones, but others such as the 4.0 ± 0.2 Ma
Pampa de las Tunas flow, which is nested within the Lago Cardiel basin (Wenzens,
2006), do not have a clear source (Figures 11 and 19). The flows are typically several
metres thick, but, in some cases, individual flows are stacked in sequences that are
more than 10 m thick (Cobos et al., 2009). The surfaces of the flows have gradients that
are less than 4°. Most flows terminate in escarpments that are bordered by aprons of
colluviated basalt. Some flows are relatively small, for example the 3.62 Ma flow
covering the floor of Cañadon León east of Gobernador Gregores (6.0 km2; Figures 15
and 19). Others are large, for example the 4.0 Ma Pampa de las Tunas flow (67.9 km2;
Figure 19).
Post-plateau basalt flows in the map area range in age from 5.4 to 3.7 Ma (this
study; Gorring et al., 1997; Wenzens, 2006) (Table 3). The age of the basalt flow at site
2015-11 (3.62 ± 0.02 Ma) is almost identical to the age of a flow that overlies the highest
Río Chico terrace east of Meseta el Martillo (3.65 ± 0.07 Ma; Gorring et al., 1997)
(Figure 11), which covers a high terrace along Río Chico. The 4.42 Ma age of the flow at
site 2015-10-4 south of Lago Cardiel is significantly younger than the K/Ar whole-rock
age of 6.6 ± 0.2 Ma age on the same flow reported by Wenzens (2006). The 39Ar/40Ar
age from this study is a single-grain age, and this method is considered more accurate
than the whole-rock K/Ar method. The younger age is within the range of post-plateau
basalt ages obtained elsewhere in the study area. Post-plateau eruptions began
between 7 and 5 Ma in the area and ceased about 2 Ma (Gorring et al., 1997).
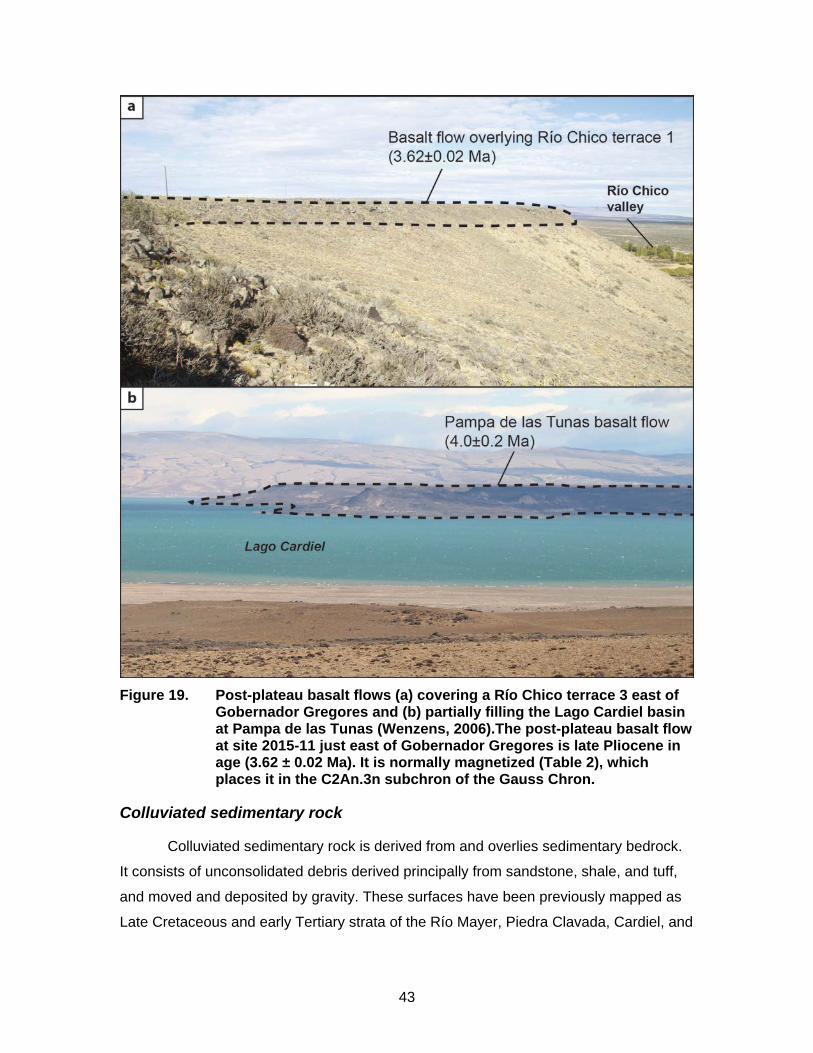
43
Figure 19. Post-plateau basalt flows (a) covering a Río Chico terrace 3 east of
Gobernador Gregores and (b) partially filling the Lago Cardiel basin at Pampa de las Tunas (Wenzens, 2006).The post-plateau basalt flow at site 2015-11 just east of Gobernador Gregores is late Pliocene in age (3.62 ± 0.02 Ma). It is normally magnetized (Table 2), which places it in the C2An.3n subchron of the Gauss Chron.
Colluviated sedimentary rock
Colluviated sedimentary rock is derived from and overlies sedimentary bedrock.
It consists of unconsolidated debris derived principally from sandstone, shale, and tuff,
and moved and deposited by gravity. These surfaces have been previously mapped as
Late Cretaceous and early Tertiary strata of the Río Mayer, Piedra Clavada, Cardiel, and
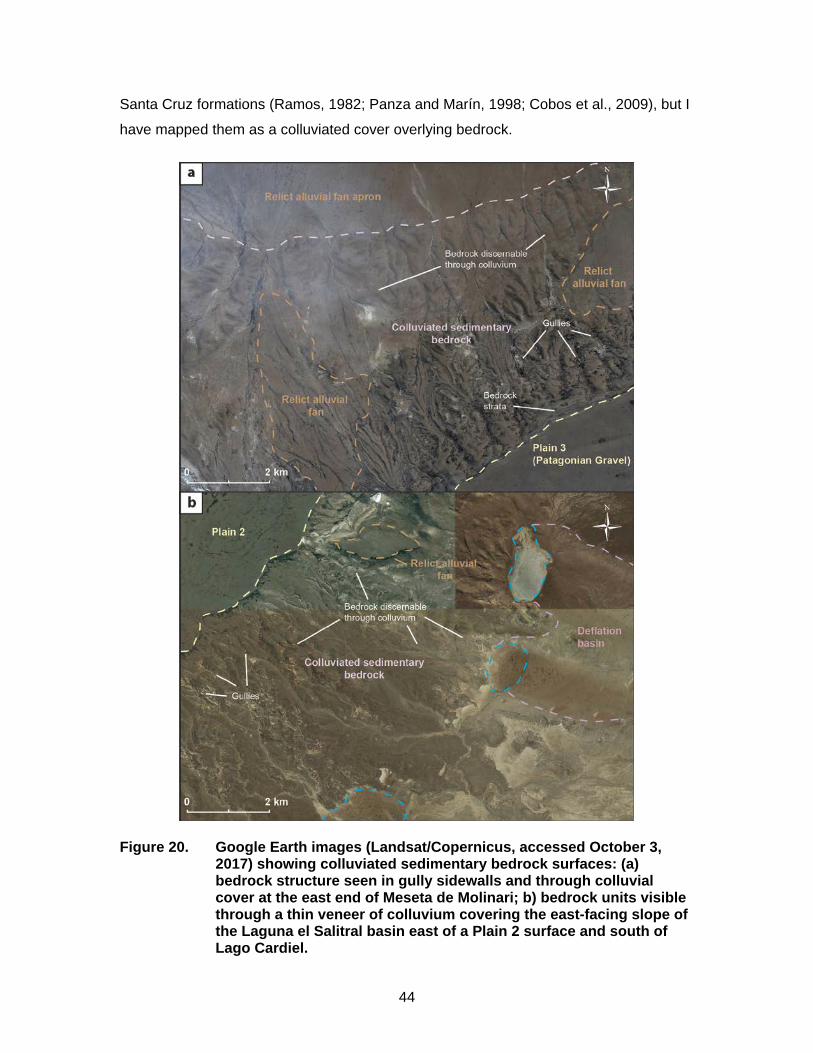
44
Santa Cruz formations (Ramos, 1982; Panza and Marín, 1998; Cobos et al., 2009), but I
have mapped them as a colluviated cover overlying bedrock.
Figure 20. Google Earth images (Landsat/Copernicus, accessed October 3, 2017) showing colluviated sedimentary bedrock surfaces: (a) bedrock structure seen in gully sidewalls and through colluvial cover at the east end of Meseta de Molinari; b) bedrock units visible through a thin veneer of colluvium covering the east-facing slope of the Laguna el Salitral basin east of a Plain 2 surface and south of Lago Cardiel.
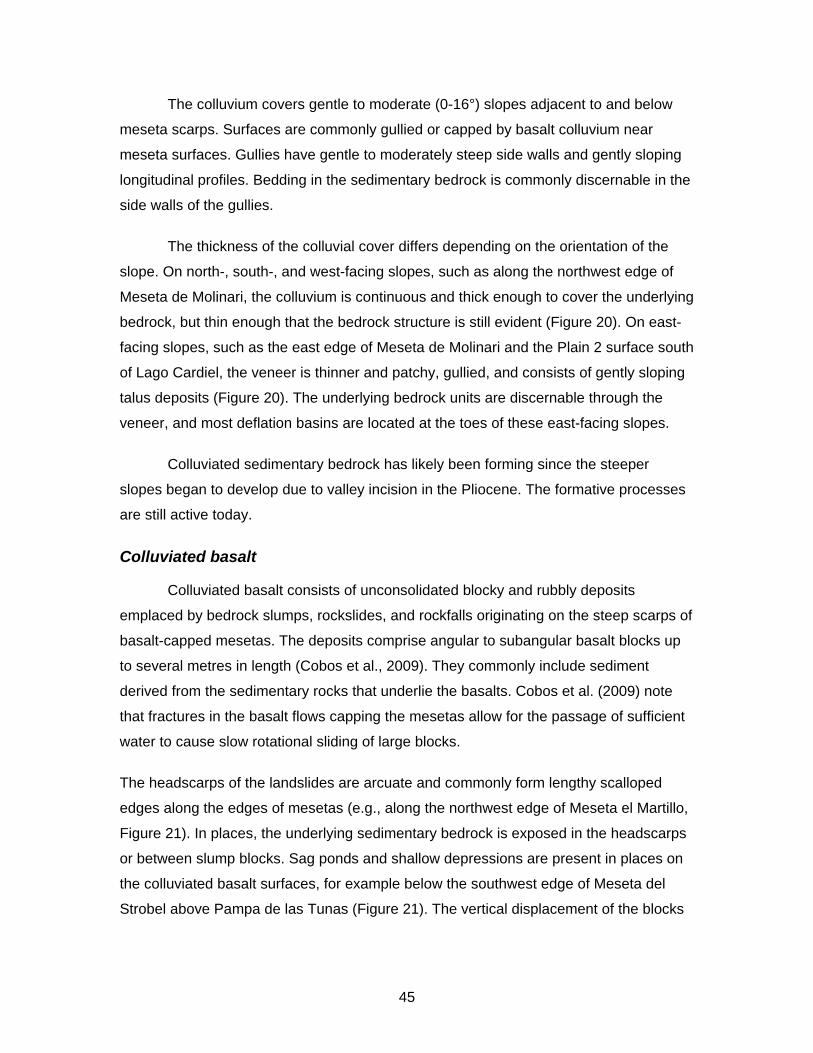
45
The colluvium covers gentle to moderate (0-16°) slopes adjacent to and below
meseta scarps. Surfaces are commonly gullied or capped by basalt colluvium near
meseta surfaces. Gullies have gentle to moderately steep side walls and gently sloping
longitudinal profiles. Bedding in the sedimentary bedrock is commonly discernable in the
side walls of the gullies.
The thickness of the colluvial cover differs depending on the orientation of the
slope. On north-, south-, and west-facing slopes, such as along the northwest edge of
Meseta de Molinari, the colluvium is continuous and thick enough to cover the underlying
bedrock, but thin enough that the bedrock structure is still evident (Figure 20). On east-
facing slopes, such as the east edge of Meseta de Molinari and the Plain 2 surface south
of Lago Cardiel, the veneer is thinner and patchy, gullied, and consists of gently sloping
talus deposits (Figure 20). The underlying bedrock units are discernable through the
veneer, and most deflation basins are located at the toes of these east-facing slopes.
Colluviated sedimentary bedrock has likely been forming since the steeper
slopes began to develop due to valley incision in the Pliocene. The formative processes
are still active today.
Colluviated basalt
Colluviated basalt consists of unconsolidated blocky and rubbly deposits
emplaced by bedrock slumps, rockslides, and rockfalls originating on the steep scarps of
basalt-capped mesetas. The deposits comprise angular to subangular basalt blocks up
to several metres in length (Cobos et al., 2009). They commonly include sediment
derived from the sedimentary rocks that underlie the basalts. Cobos et al. (2009) note
that fractures in the basalt flows capping the mesetas allow for the passage of sufficient
water to cause slow rotational sliding of large blocks.
The headscarps of the landslides are arcuate and commonly form lengthy scalloped
edges along the edges of mesetas (e.g., along the northwest edge of Meseta el Martillo,
Figure 21). In places, the underlying sedimentary bedrock is exposed in the headscarps
or between slump blocks. Sag ponds and shallow depressions are present in places on
the colluviated basalt surfaces, for example below the southwest edge of Meseta del
Strobel above Pampa de las Tunas (Figure 21). The vertical displacement of the blocks
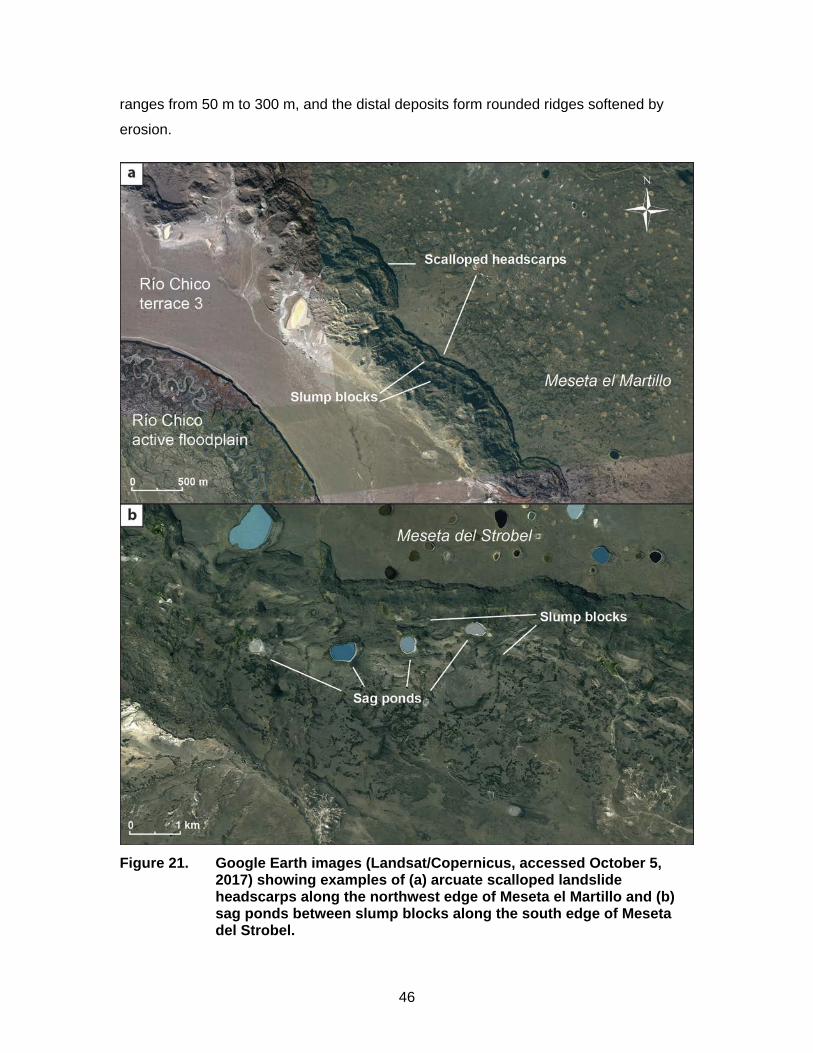
46
ranges from 50 m to 300 m, and the distal deposits form rounded ridges softened by
erosion.
Figure 21. Google Earth images (Landsat/Copernicus, accessed October 5,
2017) showing examples of (a) arcuate scalloped landslide headscarps along the northwest edge of Meseta el Martillo and (b) sag ponds between slump blocks along the south edge of Meseta del Strobel.
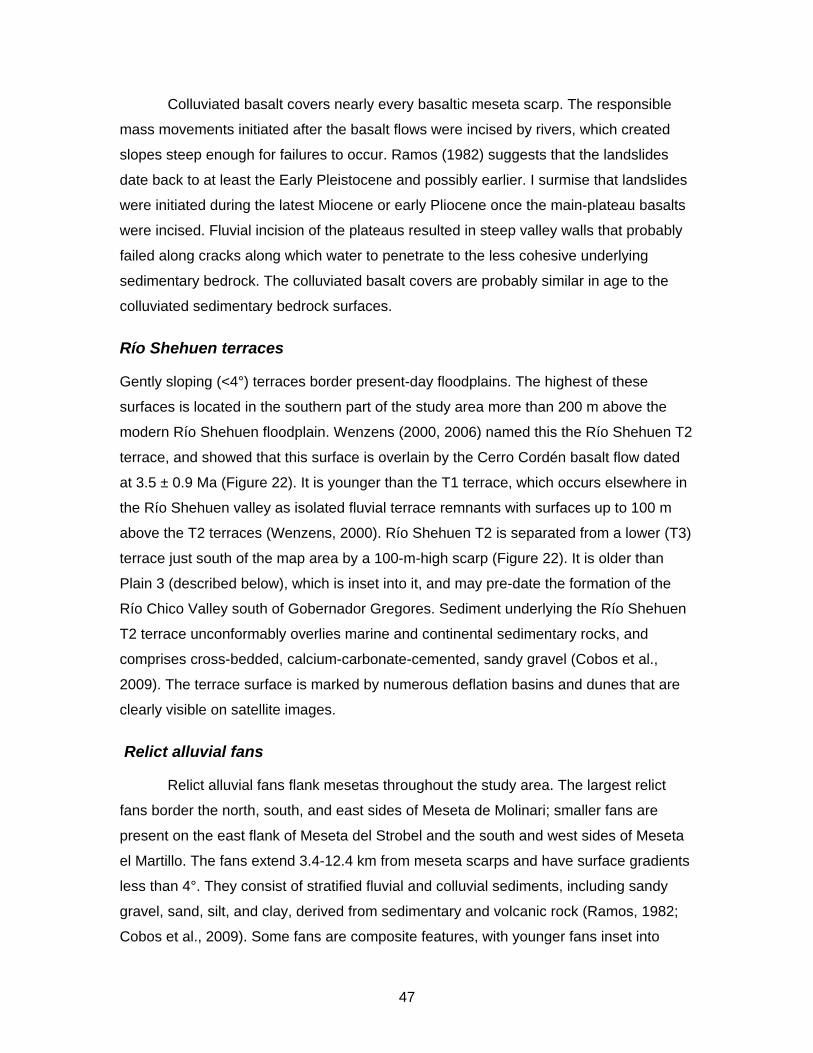
47
Colluviated basalt covers nearly every basaltic meseta scarp. The responsible
mass movements initiated after the basalt flows were incised by rivers, which created
slopes steep enough for failures to occur. Ramos (1982) suggests that the landslides
date back to at least the Early Pleistocene and possibly earlier. I surmise that landslides
were initiated during the latest Miocene or early Pliocene once the main-plateau basalts
were incised. Fluvial incision of the plateaus resulted in steep valley walls that probably
failed along cracks along which water to penetrate to the less cohesive underlying
sedimentary bedrock. The colluviated basalt covers are probably similar in age to the
colluviated sedimentary bedrock surfaces.
Río Shehuen terraces
Gently sloping (<4°) terraces border present-day floodplains. The highest of these
surfaces is located in the southern part of the study area more than 200 m above the
modern Río Shehuen floodplain. Wenzens (2000, 2006) named this the Río Shehuen T2
terrace, and showed that this surface is overlain by the Cerro Cordén basalt flow dated
at 3.5 ± 0.9 Ma (Figure 22). It is younger than the T1 terrace, which occurs elsewhere in
the Río Shehuen valley as isolated fluvial terrace remnants with surfaces up to 100 m
above the T2 terraces (Wenzens, 2000). Río Shehuen T2 is separated from a lower (T3)
terrace just south of the map area by a 100-m-high scarp (Figure 22). It is older than
Plain 3 (described below), which is inset into it, and may pre-date the formation of the
Río Chico Valley south of Gobernador Gregores. Sediment underlying the Río Shehuen
T2 terrace unconformably overlies marine and continental sedimentary rocks, and
comprises cross-bedded, calcium-carbonate-cemented, sandy gravel (Cobos et al.,
2009). The terrace surface is marked by numerous deflation basins and dunes that are
clearly visible on satellite images.
Relict alluvial fans
Relict alluvial fans flank mesetas throughout the study area. The largest relict
fans border the north, south, and east sides of Meseta de Molinari; smaller fans are
present on the east flank of Meseta del Strobel and the south and west sides of Meseta
el Martillo. The fans extend 3.4-12.4 km from meseta scarps and have surface gradients
less than 4°. They consist of stratified fluvial and colluvial sediments, including sandy
gravel, sand, silt, and clay, derived from sedimentary and volcanic rock (Ramos, 1982;
Cobos et al., 2009). Some fans are composite features, with younger fans inset into
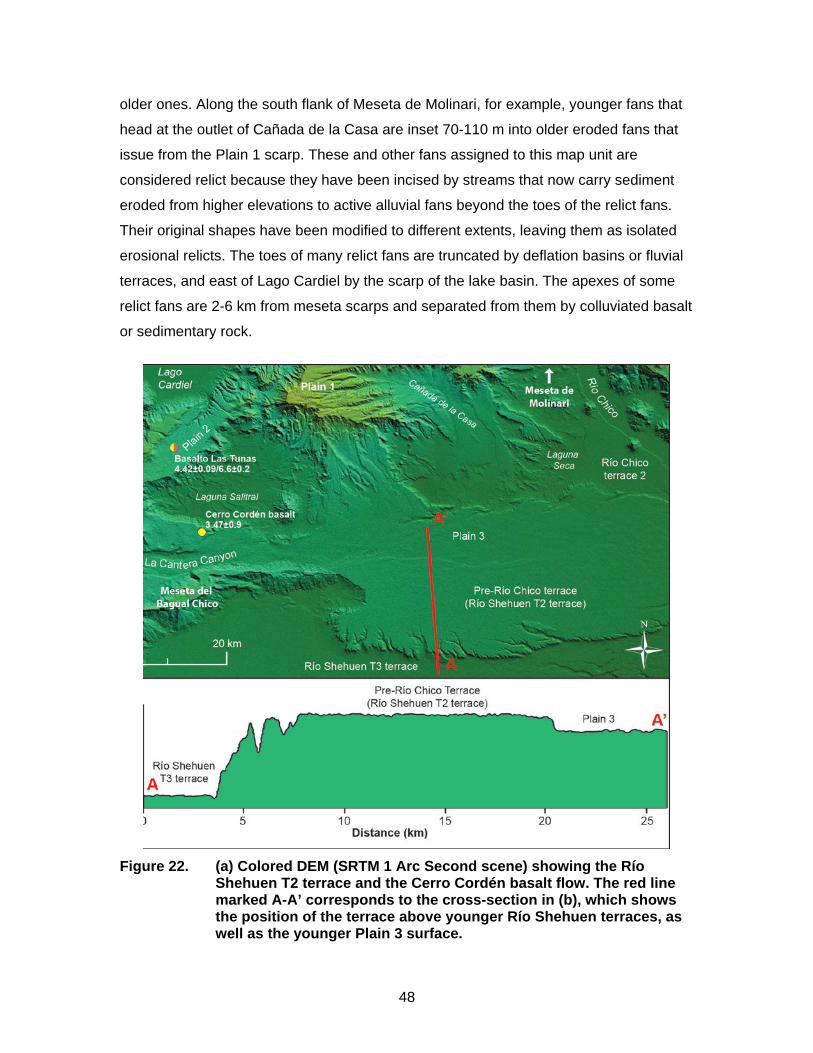
48
older ones. Along the south flank of Meseta de Molinari, for example, younger fans that
head at the outlet of Cañada de la Casa are inset 70-110 m into older eroded fans that
issue from the Plain 1 scarp. These and other fans assigned to this map unit are
considered relict because they have been incised by streams that now carry sediment
eroded from higher elevations to active alluvial fans beyond the toes of the relict fans.
Their original shapes have been modified to different extents, leaving them as isolated
erosional relicts. The toes of many relict fans are truncated by deflation basins or fluvial
terraces, and east of Lago Cardiel by the scarp of the lake basin. The apexes of some
relict fans are 2-6 km from meseta scarps and separated from them by colluviated basalt
or sedimentary rock.
Figure 22. (a) Colored DEM (SRTM 1 Arc Second scene) showing the Río
Shehuen T2 terrace and the Cerro Cordén basalt flow. The red line marked A-A’ corresponds to the cross-section in (b), which shows the position of the terrace above younger Río Shehuen terraces, as well as the younger Plain 3 surface.
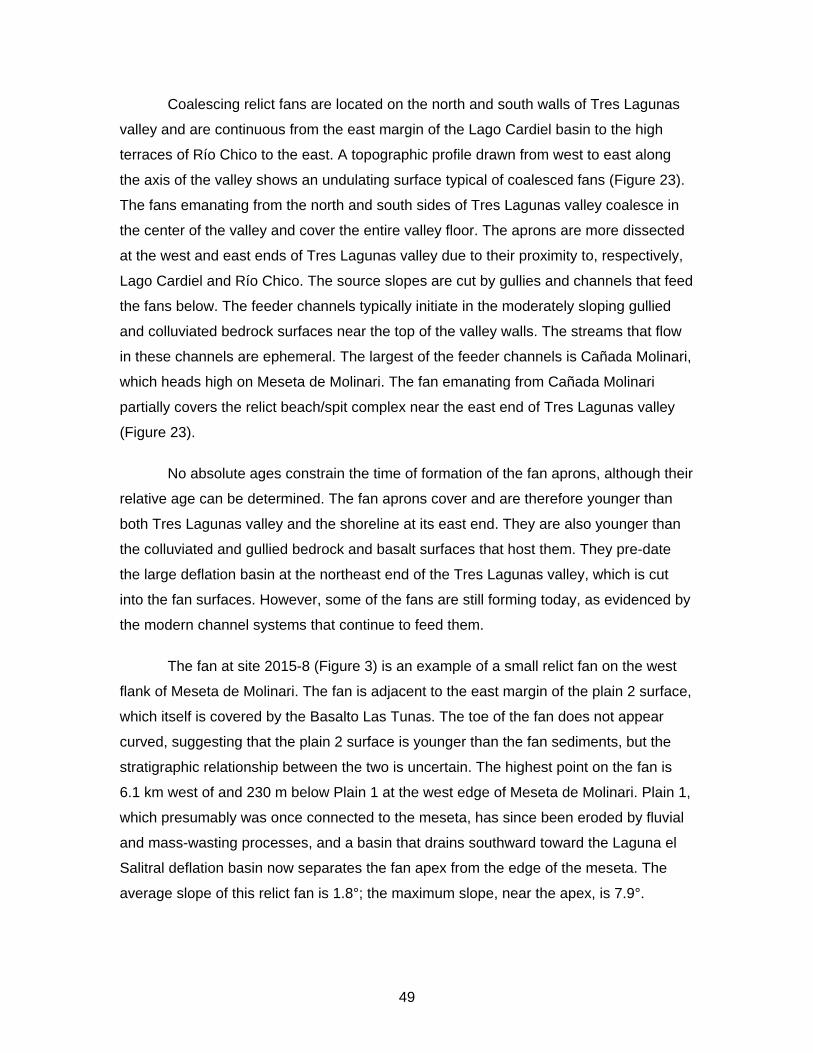
49
Coalescing relict fans are located on the north and south walls of Tres Lagunas
valley and are continuous from the east margin of the Lago Cardiel basin to the high
terraces of Río Chico to the east. A topographic profile drawn from west to east along
the axis of the valley shows an undulating surface typical of coalesced fans (Figure 23).
The fans emanating from the north and south sides of Tres Lagunas valley coalesce in
the center of the valley and cover the entire valley floor. The aprons are more dissected
at the west and east ends of Tres Lagunas valley due to their proximity to, respectively,
Lago Cardiel and Río Chico. The source slopes are cut by gullies and channels that feed
the fans below. The feeder channels typically initiate in the moderately sloping gullied
and colluviated bedrock surfaces near the top of the valley walls. The streams that flow
in these channels are ephemeral. The largest of the feeder channels is Cañada Molinari,
which heads high on Meseta de Molinari. The fan emanating from Cañada Molinari
partially covers the relict beach/spit complex near the east end of Tres Lagunas valley
(Figure 23).
No absolute ages constrain the time of formation of the fan aprons, although their
relative age can be determined. The fan aprons cover and are therefore younger than
both Tres Lagunas valley and the shoreline at its east end. They are also younger than
the colluviated and gullied bedrock and basalt surfaces that host them. They pre-date
the large deflation basin at the northeast end of the Tres Lagunas valley, which is cut
into the fan surfaces. However, some of the fans are still forming today, as evidenced by
the modern channel systems that continue to feed them.
The fan at site 2015-8 (Figure 3) is an example of a small relict fan on the west
flank of Meseta de Molinari. The fan is adjacent to the east margin of the plain 2 surface,
which itself is covered by the Basalto Las Tunas. The toe of the fan does not appear
curved, suggesting that the plain 2 surface is younger than the fan sediments, but the
stratigraphic relationship between the two is uncertain. The highest point on the fan is
6.1 km west of and 230 m below Plain 1 at the west edge of Meseta de Molinari. Plain 1,
which presumably was once connected to the meseta, has since been eroded by fluvial
and mass-wasting processes, and a basin that drains southward toward the Laguna el
Salitral deflation basin now separates the fan apex from the edge of the meseta. The
average slope of this relict fan is 1.8°; the maximum slope, near the apex, is 7.9°.
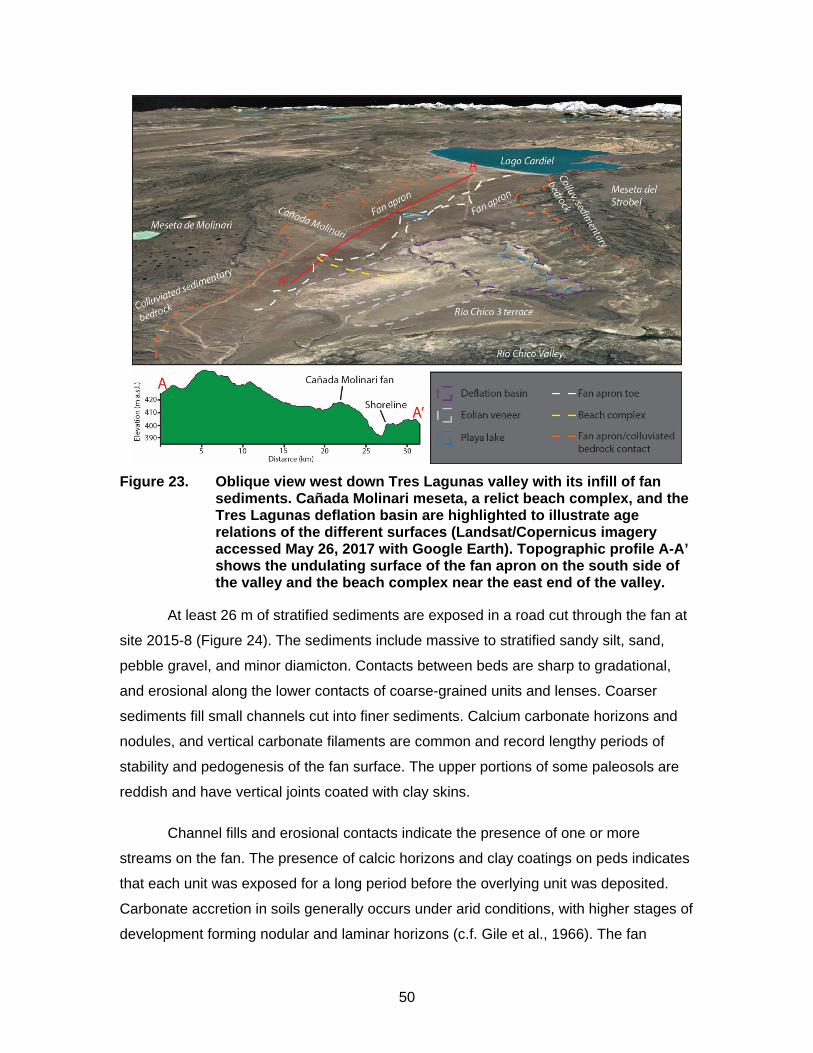
50
Figure 23. Oblique view west down Tres Lagunas valley with its infill of fan
sediments. Cañada Molinari meseta, a relict beach complex, and the Tres Lagunas deflation basin are highlighted to illustrate age relations of the different surfaces (Landsat/Copernicus imagery accessed May 26, 2017 with Google Earth). Topographic profile A-A’ shows the undulating surface of the fan apron on the south side of the valley and the beach complex near the east end of the valley.
At least 26 m of stratified sediments are exposed in a road cut through the fan at
site 2015-8 (Figure 24). The sediments include massive to stratified sandy silt, sand,
pebble gravel, and minor diamicton. Contacts between beds are sharp to gradational,
and erosional along the lower contacts of coarse-grained units and lenses. Coarser
sediments fill small channels cut into finer sediments. Calcium carbonate horizons and
nodules, and vertical carbonate filaments are common and record lengthy periods of
stability and pedogenesis of the fan surface. The upper portions of some paleosols are
reddish and have vertical joints coated with clay skins.
Channel fills and erosional contacts indicate the presence of one or more
streams on the fan. The presence of calcic horizons and clay coatings on peds indicates
that each unit was exposed for a long period before the overlying unit was deposited.
Carbonate accretion in soils generally occurs under arid conditions, with higher stages of
development forming nodular and laminar horizons (c.f. Gile et al., 1966). The fan
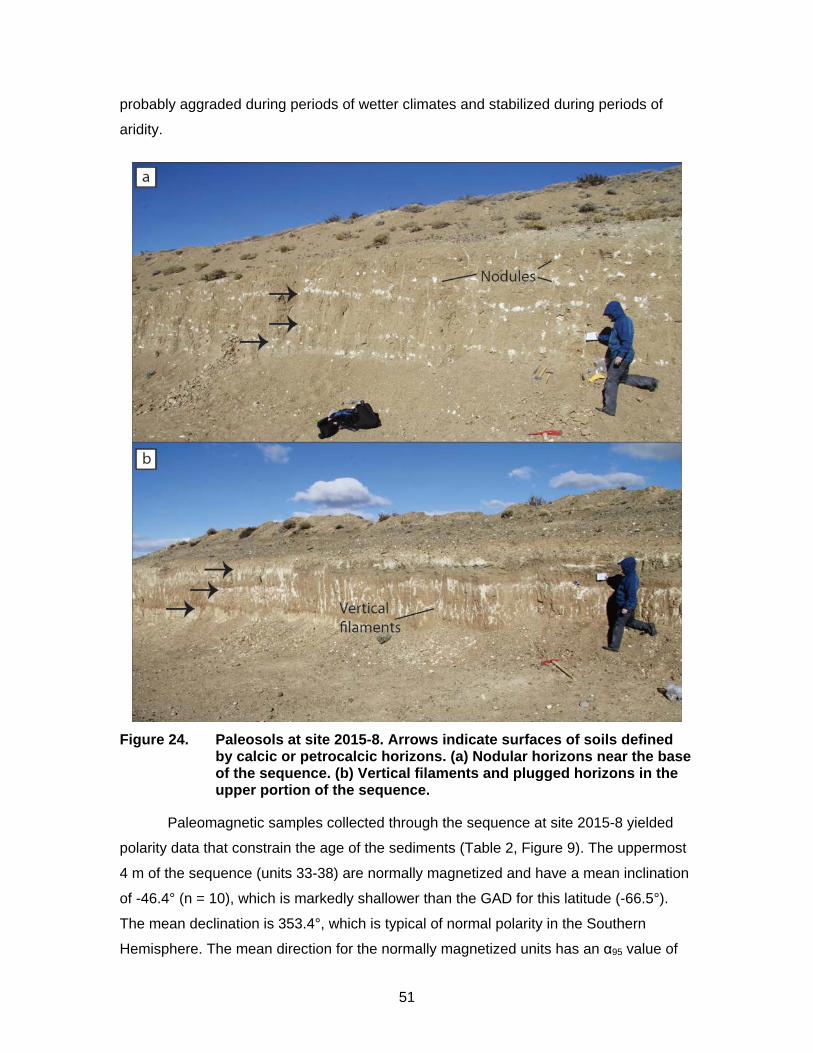
51
probably aggraded during periods of wetter climates and stabilized during periods of
aridity.
Figure 24. Paleosols at site 2015-8. Arrows indicate surfaces of soils defined
by calcic or petrocalcic horizons. (a) Nodular horizons near the base of the sequence. (b) Vertical filaments and plugged horizons in the upper portion of the sequence.
Paleomagnetic samples collected through the sequence at site 2015-8 yielded
polarity data that constrain the age of the sediments (Table 2, Figure 9). The uppermost
4 m of the sequence (units 33-38) are normally magnetized and have a mean inclination
of -46.4° (n = 10), which is markedly shallower than the GAD for this latitude (-66.5°).
The mean declination is 353.4°, which is typical of normal polarity in the Southern
Hemisphere. The mean direction for the normally magnetized units has an α95 value of
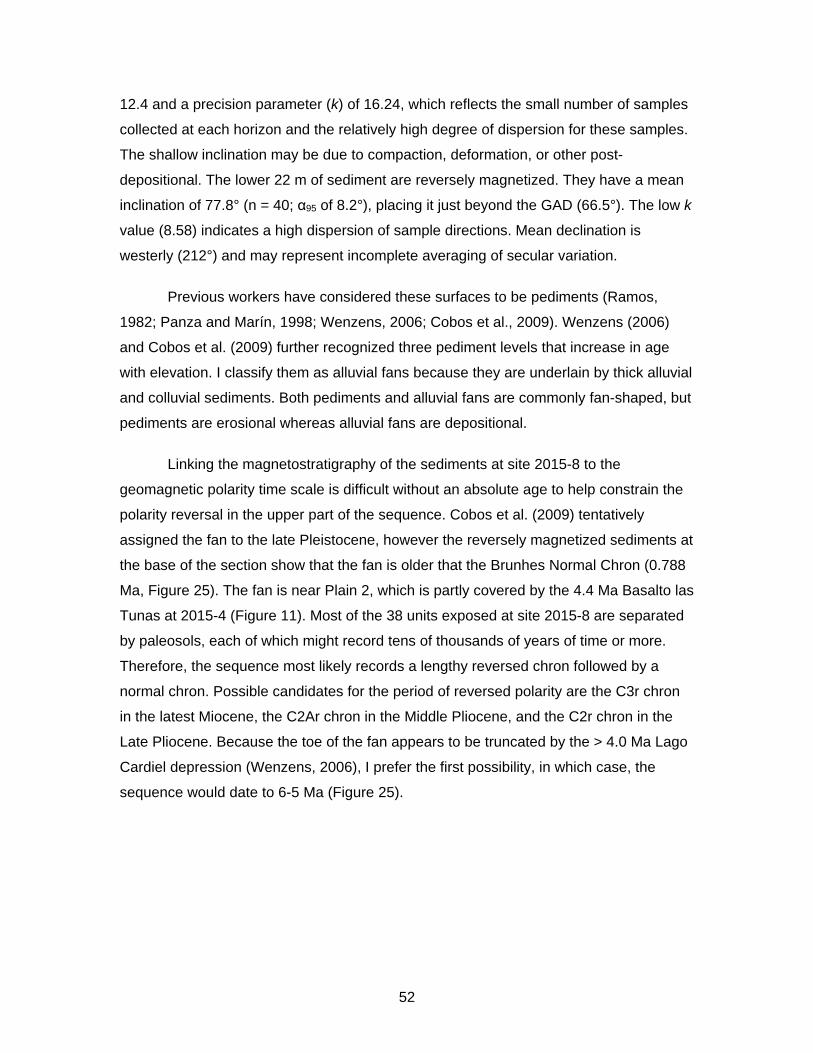
52
12.4 and a precision parameter (k) of 16.24, which reflects the small number of samples
collected at each horizon and the relatively high degree of dispersion for these samples.
The shallow inclination may be due to compaction, deformation, or other post-
depositional. The lower 22 m of sediment are reversely magnetized. They have a mean
inclination of 77.8° (n = 40; α95 of 8.2°), placing it just beyond the GAD (66.5°). The low k
value (8.58) indicates a high dispersion of sample directions. Mean declination is
westerly (212°) and may represent incomplete averaging of secular variation.
Previous workers have considered these surfaces to be pediments (Ramos,
1982; Panza and Marín, 1998; Wenzens, 2006; Cobos et al., 2009). Wenzens (2006)
and Cobos et al. (2009) further recognized three pediment levels that increase in age
with elevation. I classify them as alluvial fans because they are underlain by thick alluvial
and colluvial sediments. Both pediments and alluvial fans are commonly fan-shaped, but
pediments are erosional whereas alluvial fans are depositional.
Linking the magnetostratigraphy of the sediments at site 2015-8 to the
geomagnetic polarity time scale is difficult without an absolute age to help constrain the
polarity reversal in the upper part of the sequence. Cobos et al. (2009) tentatively
assigned the fan to the late Pleistocene, however the reversely magnetized sediments at
the base of the section show that the fan is older that the Brunhes Normal Chron (0.788
Ma, Figure 25). The fan is near Plain 2, which is partly covered by the 4.4 Ma Basalto las
Tunas at 2015-4 (Figure 11). Most of the 38 units exposed at site 2015-8 are separated
by paleosols, each of which might record tens of thousands of years of time or more.
Therefore, the sequence most likely records a lengthy reversed chron followed by a
normal chron. Possible candidates for the period of reversed polarity are the C3r chron
in the latest Miocene, the C2Ar chron in the Middle Pliocene, and the C2r chron in the
Late Pliocene. Because the toe of the fan appears to be truncated by the > 4.0 Ma Lago
Cardiel depression (Wenzens, 2006), I prefer the first possibility, in which case, the
sequence would date to 6-5 Ma (Figure 25).
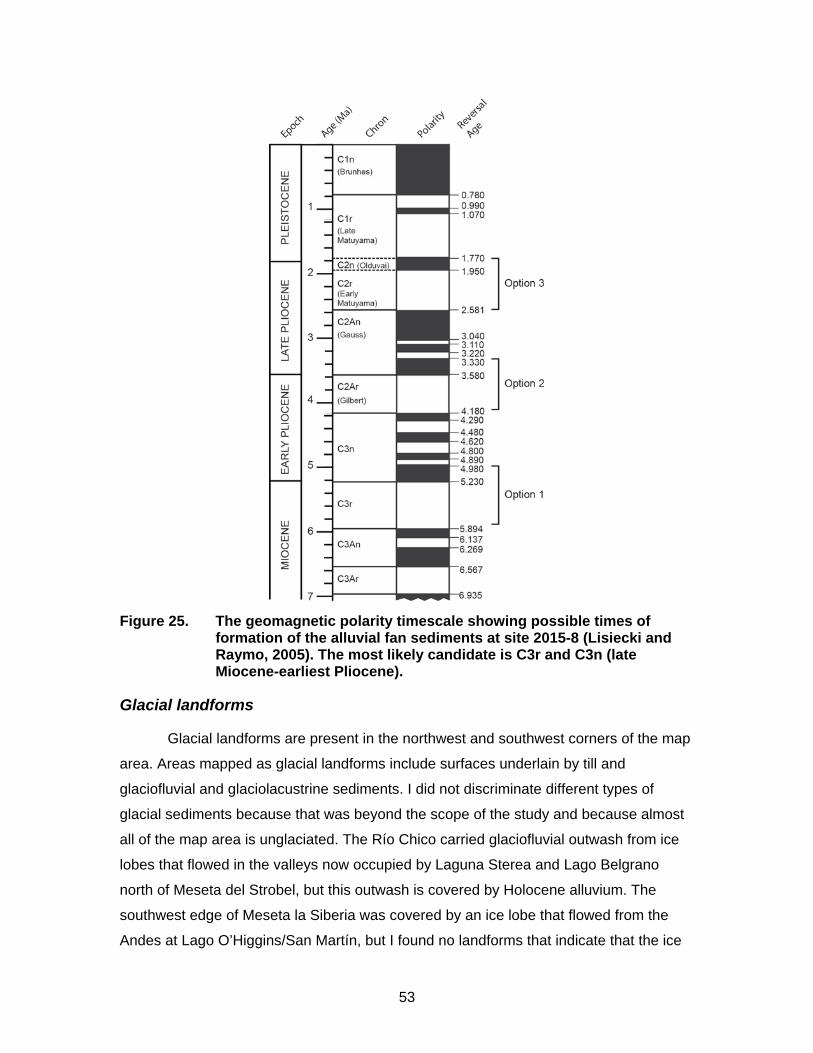
53
Figure 25. The geomagnetic polarity timescale showing possible times of
formation of the alluvial fan sediments at site 2015-8 (Lisiecki and Raymo, 2005). The most likely candidate is C3r and C3n (late Miocene-earliest Pliocene).
Glacial landforms
Glacial landforms are present in the northwest and southwest corners of the map
area. Areas mapped as glacial landforms include surfaces underlain by till and
glaciofluvial and glaciolacustrine sediments. I did not discriminate different types of
glacial sediments because that was beyond the scope of the study and because almost
all of the map area is unglaciated. The Río Chico carried glaciofluvial outwash from ice
lobes that flowed in the valleys now occupied by Laguna Sterea and Lago Belgrano
north of Meseta del Strobel, but this outwash is covered by Holocene alluvium. The
southwest edge of Meseta la Siberia was covered by an ice lobe that flowed from the
Andes at Lago O’Higgins/San Martín, but I found no landforms that indicate that the ice
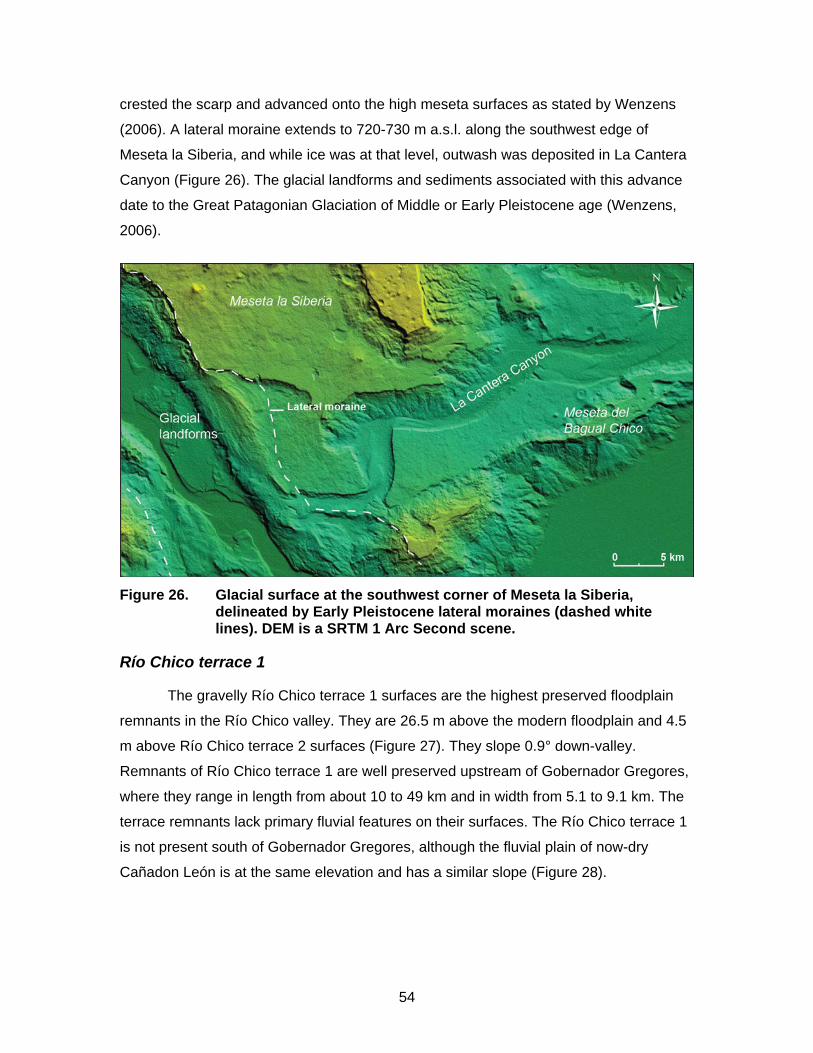
54
crested the scarp and advanced onto the high meseta surfaces as stated by Wenzens
(2006). A lateral moraine extends to 720-730 m a.s.l. along the southwest edge of
Meseta la Siberia, and while ice was at that level, outwash was deposited in La Cantera
Canyon (Figure 26). The glacial landforms and sediments associated with this advance
date to the Great Patagonian Glaciation of Middle or Early Pleistocene age (Wenzens,
2006).
Figure 26. Glacial surface at the southwest corner of Meseta la Siberia,
delineated by Early Pleistocene lateral moraines (dashed white lines). DEM is a SRTM 1 Arc Second scene.
Río Chico terrace 1
The gravelly Río Chico terrace 1 surfaces are the highest preserved floodplain
remnants in the Río Chico valley. They are 26.5 m above the modern floodplain and 4.5
m above Río Chico terrace 2 surfaces (Figure 27). They slope 0.9° down-valley.
Remnants of Río Chico terrace 1 are well preserved upstream of Gobernador Gregores,
where they range in length from about 10 to 49 km and in width from 5.1 to 9.1 km. The
terrace remnants lack primary fluvial features on their surfaces. The Río Chico terrace 1
is not present south of Gobernador Gregores, although the fluvial plain of now-dry
Cañadon León is at the same elevation and has a similar slope (Figure 28).
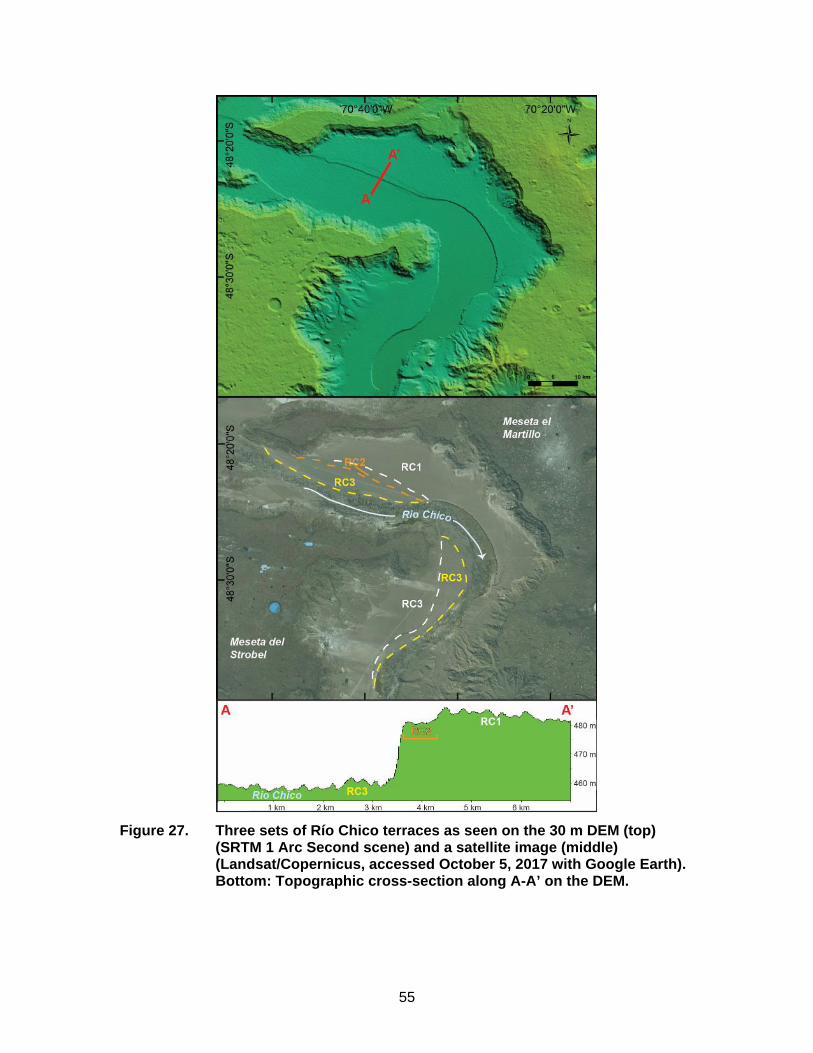
55
Figure 27. Three sets of Río Chico terraces as seen on the 30 m DEM (top)
(SRTM 1 Arc Second scene) and a satellite image (middle) (Landsat/Copernicus, accessed October 5, 2017 with Google Earth). Bottom: Topographic cross-section along A-A’ on the DEM.
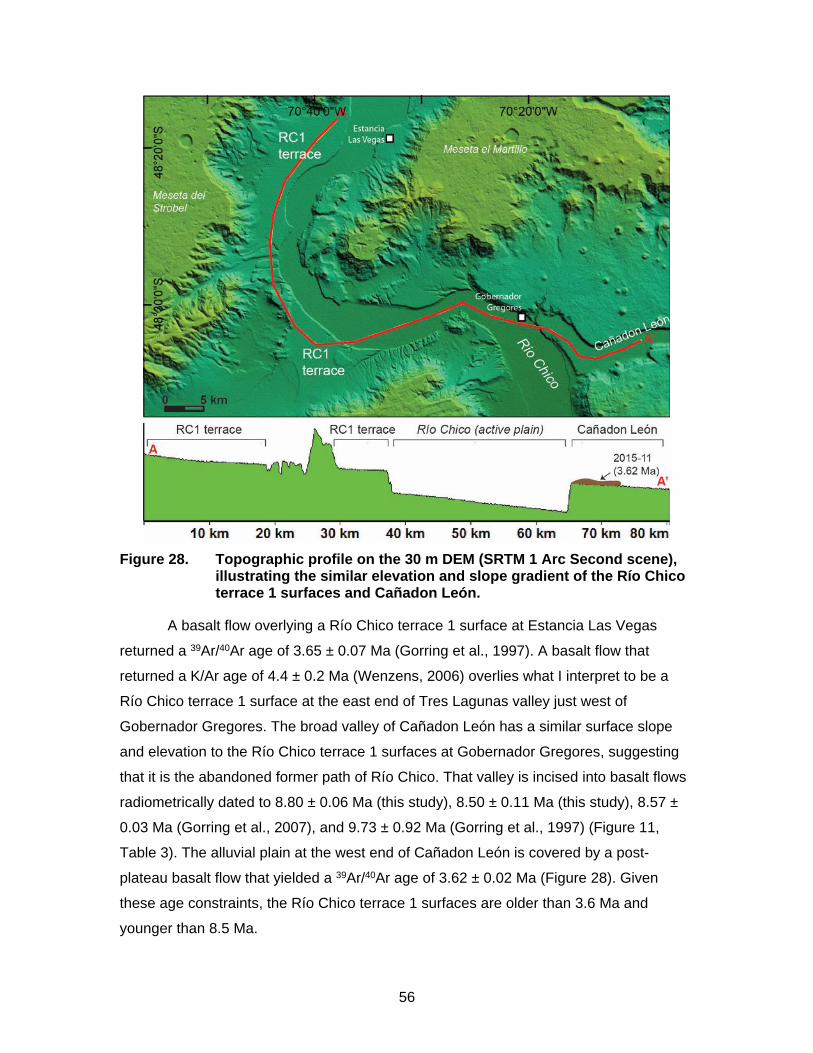
56
Figure 28. Topographic profile on the 30 m DEM (SRTM 1 Arc Second scene),
illustrating the similar elevation and slope gradient of the Río Chico terrace 1 surfaces and Cañadon León.
A basalt flow overlying a Río Chico terrace 1 surface at Estancia Las Vegas
returned a 39Ar/40Ar age of 3.65 ± 0.07 Ma (Gorring et al., 1997). A basalt flow that
returned a K/Ar age of 4.4 ± 0.2 Ma (Wenzens, 2006) overlies what I interpret to be a
Río Chico terrace 1 surface at the east end of Tres Lagunas valley just west of
Gobernador Gregores. The broad valley of Cañadon León has a similar surface slope
and elevation to the Río Chico terrace 1 surfaces at Gobernador Gregores, suggesting
that it is the abandoned former path of Río Chico. That valley is incised into basalt flows
radiometrically dated to 8.80 ± 0.06 Ma (this study), 8.50 ± 0.11 Ma (this study), 8.57 ±
0.03 Ma (Gorring et al., 2007), and 9.73 ± 0.92 Ma (Gorring et al., 1997) (Figure 11,
Table 3). The alluvial plain at the west end of Cañadon León is covered by a post-
plateau basalt flow that yielded a 39Ar/40Ar age of 3.62 ± 0.02 Ma (Figure 28). Given
these age constraints, the Río Chico terrace 1 surfaces are older than 3.6 Ma and
younger than 8.5 Ma.
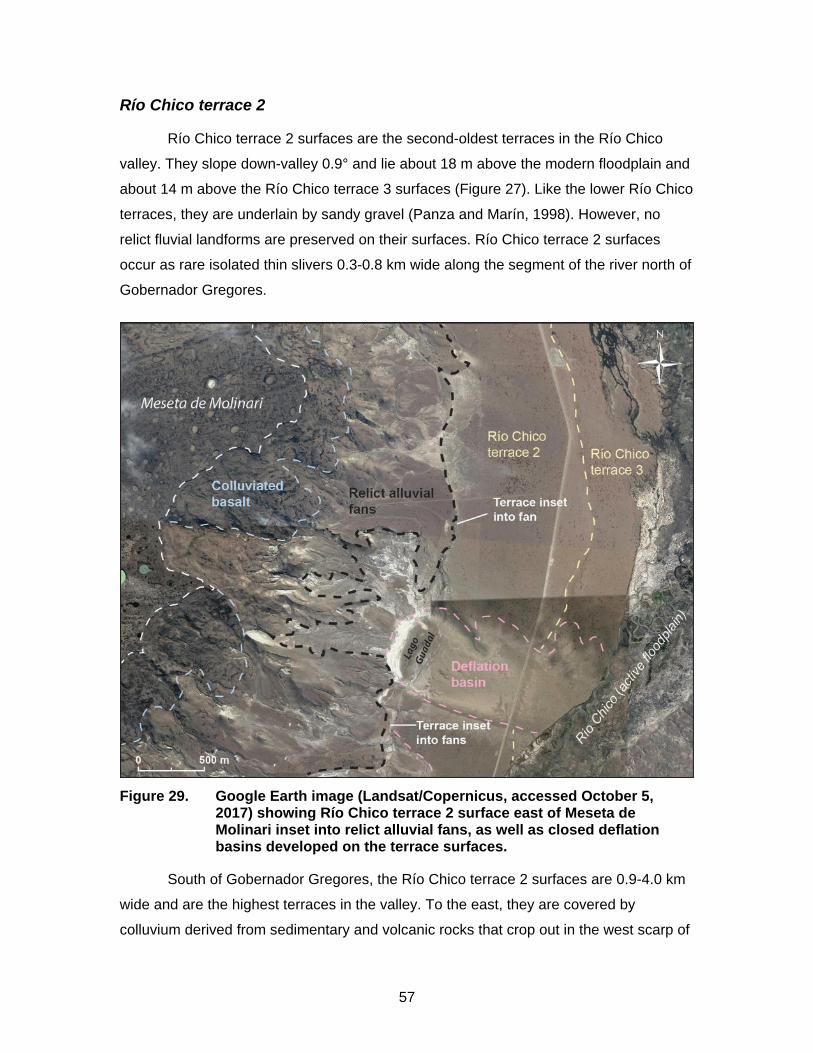
57
Río Chico terrace 2
Río Chico terrace 2 surfaces are the second-oldest terraces in the Río Chico
valley. They slope down-valley 0.9° and lie about 18 m above the modern floodplain and
about 14 m above the Río Chico terrace 3 surfaces (Figure 27). Like the lower Río Chico
terraces, they are underlain by sandy gravel (Panza and Marín, 1998). However, no
relict fluvial landforms are preserved on their surfaces. Río Chico terrace 2 surfaces
occur as rare isolated thin slivers 0.3-0.8 km wide along the segment of the river north of
Gobernador Gregores.
Figure 29. Google Earth image (Landsat/Copernicus, accessed October 5,
2017) showing Río Chico terrace 2 surface east of Meseta de Molinari inset into relict alluvial fans, as well as closed deflation basins developed on the terrace surfaces.
South of Gobernador Gregores, the Río Chico terrace 2 surfaces are 0.9-4.0 km
wide and are the highest terraces in the valley. To the east, they are covered by
colluvium derived from sedimentary and volcanic rocks that crop out in the west scarp of
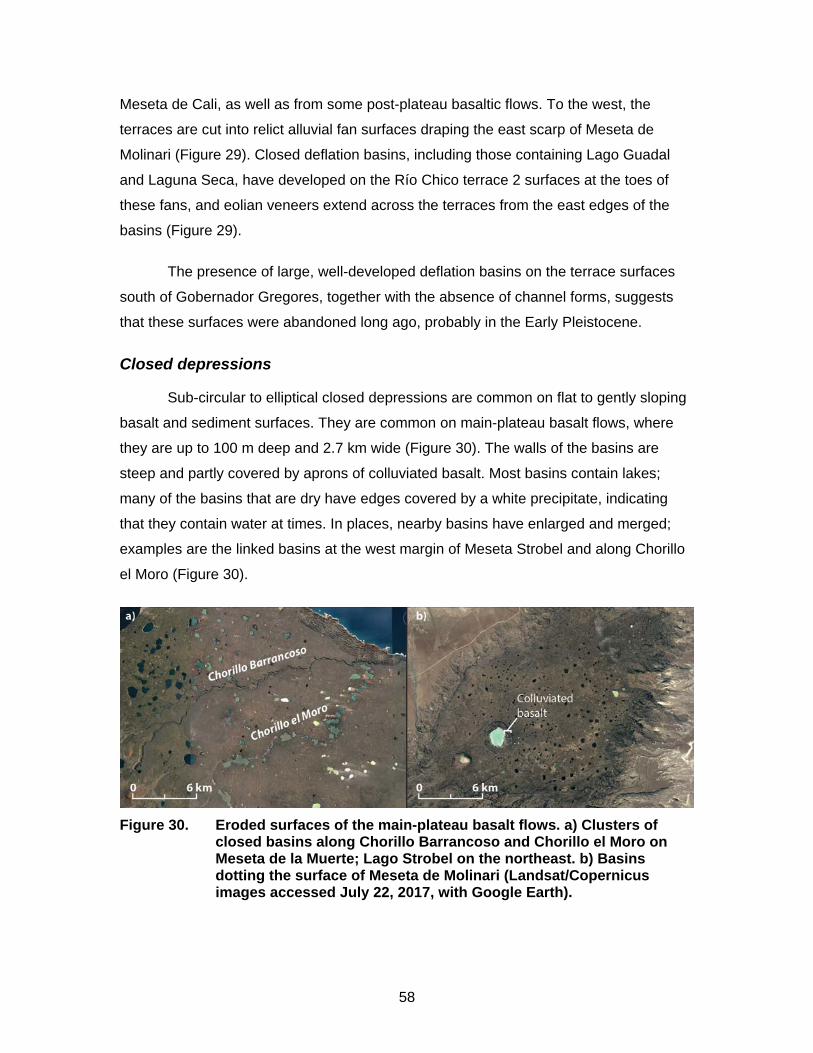
58
Meseta de Cali, as well as from some post-plateau basaltic flows. To the west, the
terraces are cut into relict alluvial fan surfaces draping the east scarp of Meseta de
Molinari (Figure 29). Closed deflation basins, including those containing Lago Guadal
and Laguna Seca, have developed on the Río Chico terrace 2 surfaces at the toes of
these fans, and eolian veneers extend across the terraces from the east edges of the
basins (Figure 29).
The presence of large, well-developed deflation basins on the terrace surfaces
south of Gobernador Gregores, together with the absence of channel forms, suggests
that these surfaces were abandoned long ago, probably in the Early Pleistocene.
Closed depressions
Sub-circular to elliptical closed depressions are common on flat to gently sloping
basalt and sediment surfaces. They are common on main-plateau basalt flows, where
they are up to 100 m deep and 2.7 km wide (Figure 30). The walls of the basins are
steep and partly covered by aprons of colluviated basalt. Most basins contain lakes;
many of the basins that are dry have edges covered by a white precipitate, indicating
that they contain water at times. In places, nearby basins have enlarged and merged;
examples are the linked basins at the west margin of Meseta Strobel and along Chorillo
el Moro (Figure 30).
Figure 30. Eroded surfaces of the main-plateau basalt flows. a) Clusters of
closed basins along Chorillo Barrancoso and Chorillo el Moro on Meseta de la Muerte; Lago Strobel on the northeast. b) Basins dotting the surface of Meseta de Molinari (Landsat/Copernicus images accessed July 22, 2017, with Google Earth).
59
Closed basins on the plateau surface formed by collapse and grew in size
through mass wasting along their margins. Two explanations are possible for the closed
basins on the main-plateau surface. They may have formed during or soon after the
flows were erupted due either to collapse during withdrawal of magma or to phreatic
explosions as lava flowed over a wet substrate (c.f. Walker, 1988; Roche et al., 2001).
The chains of lakes may mark the margins of buried lava flows or collapse into caverns
formed by the widening of fractures in the basalt (e.g. Ferrill et al., 2011). Such
explanations are unlikely because the Miocene basalt sequence comprises many
stacked flows and the basins appear to reach down to the base of the sequence. A
second, preferred explanation is that the basins initiated due to differential weathering of
the basalts, perhaps by eolian and fluvial erosion in low areas on the flow surfaces.
Mechanical weathering by freeze-thaw processes may have accelerated basin formation
during Pliocene and Pleistocene glaciatons. Once initiated, the basins then expanded
through gravitational collapse along their margins.
Closed depressions on sediment surfaces are sub-elliptical to irregular in shape.
They are found on alluvial plains and terraces at the base of pediments flanking
mesetas. There are many examples on alluvial plans in the Tres Lagunas and Cañadon
León valleys and La Cantera Canyon, as well as on high fluvial terraces in the Río Chico
valley. The closed depressions have moderately steep walls and extensive floors. The
long axes of elliptical depressions are perpendicular to the prevailing southeast-directed
winds, and arcuate dunes and veneers of sand and silt extend down-wind from many of
the depressions. Lakes, ponds, and playas occupy the bottoms of many closed
depressions and are depositional sites of fine-grained sediment and evaporites. Most
depressions have well-developed shorelines, indicating that water levels have been
higher during the past (Figure 29). The depressions are developed on, and therefore are
younger than, the pediment surfaces flanking the mesetas and the fluvial plains and
terraces on which they are found. Younger alluvial fans have partially filled some
depressions.
The closed depressions in the map area are similar to “pans” (Goudie and Wells,
1995), which are closed deflation basins in arid regions (Lancaster, 1978). They
probably were deflated during dry periods such as the Holocene. Eolian sediments
downwind of many of the depressions suggest that strong winds remove silt and sand
from the floors and slopes of the depressions, leaving behind coarser sediments. The
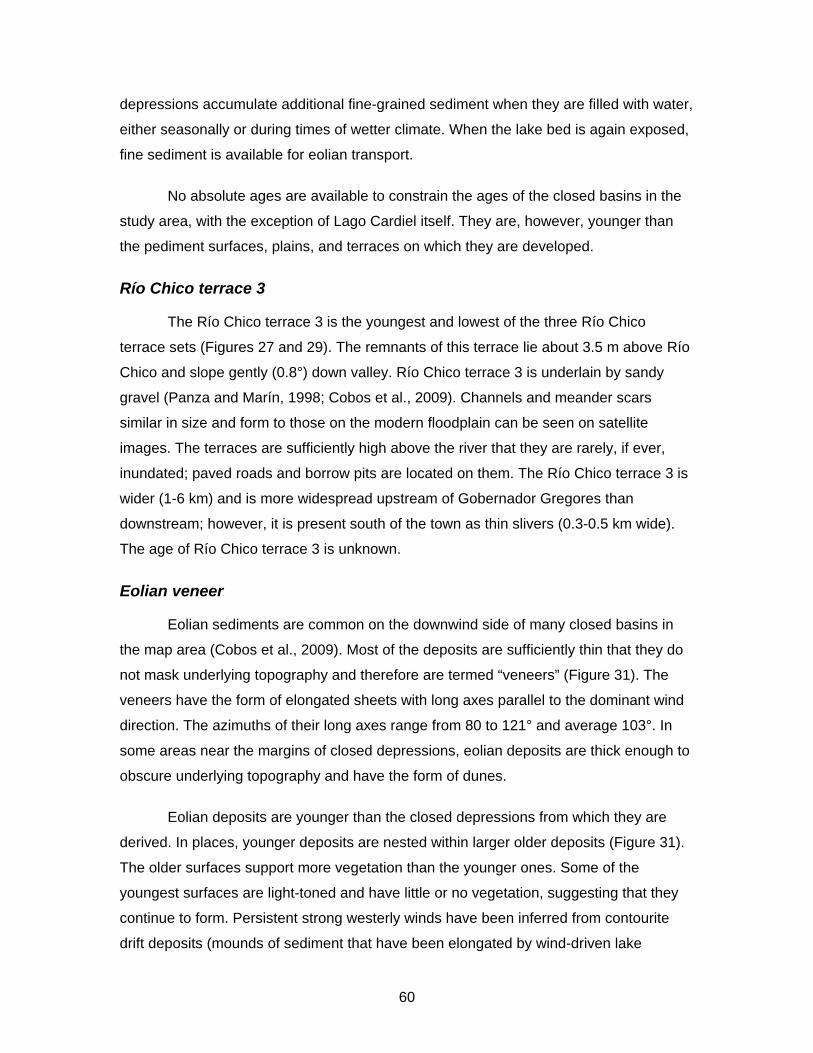
60
depressions accumulate additional fine-grained sediment when they are filled with water,
either seasonally or during times of wetter climate. When the lake bed is again exposed,
fine sediment is available for eolian transport.
No absolute ages are available to constrain the ages of the closed basins in the
study area, with the exception of Lago Cardiel itself. They are, however, younger than
the pediment surfaces, plains, and terraces on which they are developed.
Río Chico terrace 3
The Río Chico terrace 3 is the youngest and lowest of the three Río Chico
terrace sets (Figures 27 and 29). The remnants of this terrace lie about 3.5 m above Río
Chico and slope gently (0.8°) down valley. Río Chico terrace 3 is underlain by sandy
gravel (Panza and Marín, 1998; Cobos et al., 2009). Channels and meander scars
similar in size and form to those on the modern floodplain can be seen on satellite
images. The terraces are sufficiently high above the river that they are rarely, if ever,
inundated; paved roads and borrow pits are located on them. The Río Chico terrace 3 is
wider (1-6 km) and is more widespread upstream of Gobernador Gregores than
downstream; however, it is present south of the town as thin slivers (0.3-0.5 km wide).
The age of Río Chico terrace 3 is unknown.
Eolian veneer
Eolian sediments are common on the downwind side of many closed basins in
the map area (Cobos et al., 2009). Most of the deposits are sufficiently thin that they do
not mask underlying topography and therefore are termed “veneers” (Figure 31). The
veneers have the form of elongated sheets with long axes parallel to the dominant wind
direction. The azimuths of their long axes range from 80 to 121° and average 103°. In
some areas near the margins of closed depressions, eolian deposits are thick enough to
obscure underlying topography and have the form of dunes.
Eolian deposits are younger than the closed depressions from which they are
derived. In places, younger deposits are nested within larger older deposits (Figure 31).
The older surfaces support more vegetation than the younger ones. Some of the
youngest surfaces are light-toned and have little or no vegetation, suggesting that they
continue to form. Persistent strong westerly winds have been inferred from contourite
drift deposits (mounds of sediment that have been elongated by wind-driven lake
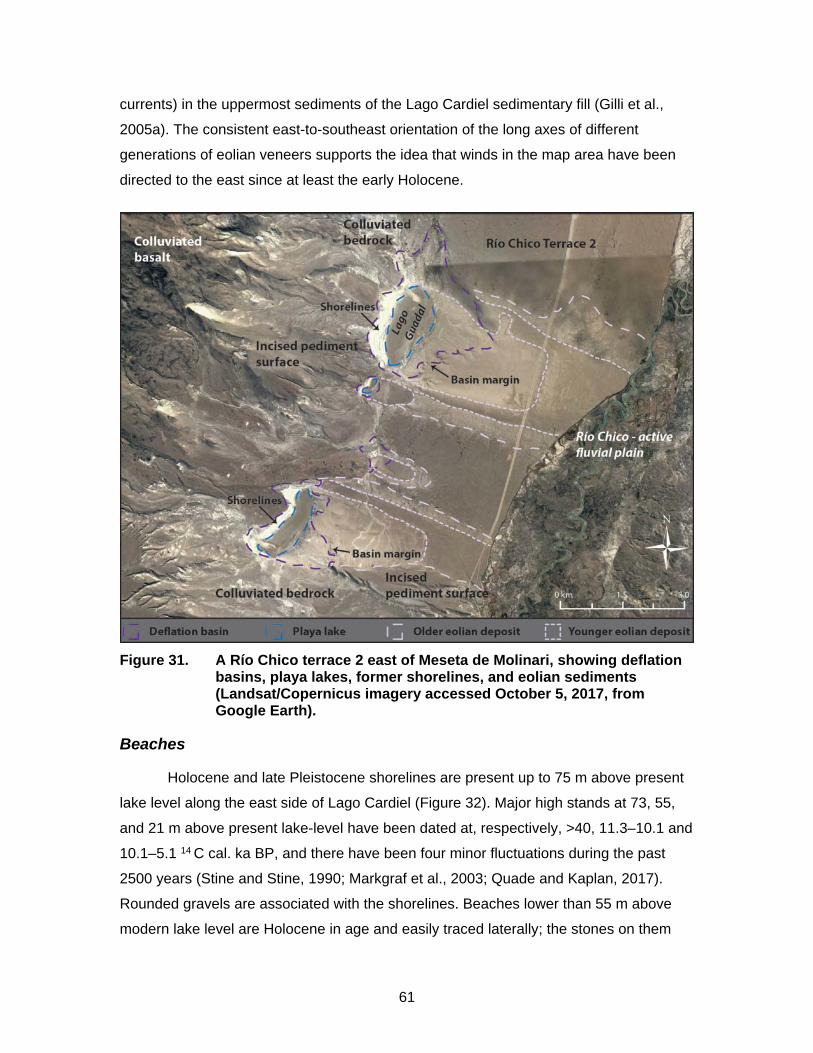
61
currents) in the uppermost sediments of the Lago Cardiel sedimentary fill (Gilli et al.,
2005a). The consistent east-to-southeast orientation of the long axes of different
generations of eolian veneers supports the idea that winds in the map area have been
directed to the east since at least the early Holocene.
Figure 31. A Río Chico terrace 2 east of Meseta de Molinari, showing deflation
basins, playa lakes, former shorelines, and eolian sediments (Landsat/Copernicus imagery accessed October 5, 2017, from Google Earth).
Beaches
Holocene and late Pleistocene shorelines are present up to 75 m above present
lake level along the east side of Lago Cardiel (Figure 32). Major high stands at 73, 55,
and 21 m above present lake-level have been dated at, respectively, >40, 11.3–10.1 and
10.1–5.1 14 C cal. ka BP, and there have been four minor fluctuations during the past
2500 years (Stine and Stine, 1990; Markgraf et al., 2003; Quade and Kaplan, 2017).
Rounded gravels are associated with the shorelines. Beaches lower than 55 m above
modern lake level are Holocene in age and easily traced laterally; the stones on them
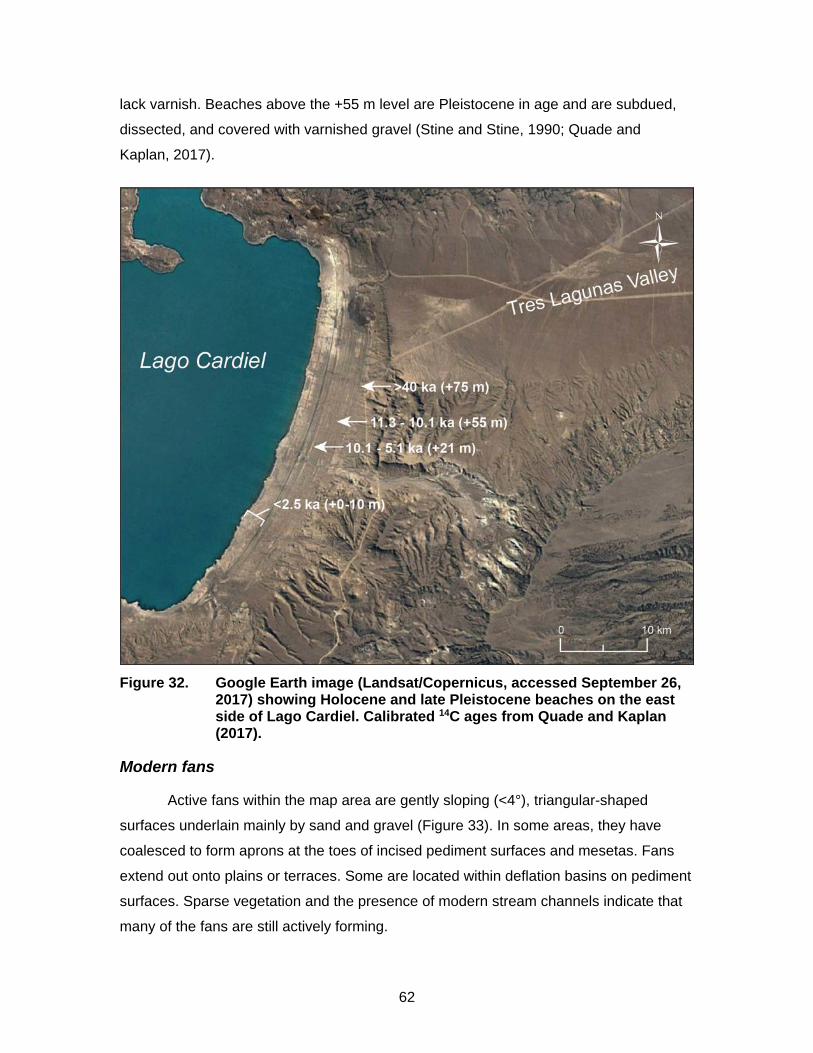
62
lack varnish. Beaches above the +55 m level are Pleistocene in age and are subdued,
dissected, and covered with varnished gravel (Stine and Stine, 1990; Quade and
Kaplan, 2017).
Figure 32. Google Earth image (Landsat/Copernicus, accessed September 26,
2017) showing Holocene and late Pleistocene beaches on the east side of Lago Cardiel. Calibrated 14C ages from Quade and Kaplan (2017).
Modern fans
Active fans within the map area are gently sloping (<4°), triangular-shaped
surfaces underlain mainly by sand and gravel (Figure 33). In some areas, they have
coalesced to form aprons at the toes of incised pediment surfaces and mesetas. Fans
extend out onto plains or terraces. Some are located within deflation basins on pediment
surfaces. Sparse vegetation and the presence of modern stream channels indicate that
many of the fans are still actively forming.
63
Figure 33. Google Earth image (Landsat/Copernicus, accessed October 8,
2017) showing modern alluvial fans (delineated by black dashed lines) at the toes of relict alluvial fans on the north wall of Tres Lagunas valley.
Active plain
Active plains are flat or nearly flat (<1o) surfaces of fluvial origin; they are
occasionally flooded and are underlain by sediment deposited by modern rivers and
streams. They include the wide floodplain of the Río Chico, as well as the beds of
ephemeral streams that channel water and sediment from mesetas to lower valley floors
during periods of rain.
The width of the Río Chico floodplain increases from 0.5 km at the northwest
corner of the map area to an average of 3.2 km to the southeast; its maximum width is
5.6 km near Gobernador Gregores. The active Río Chico channel has an average width
of 0.5 km and features many side channels, meander scrolls, oxbow lakes, and
abandoned channels (Figure 34).
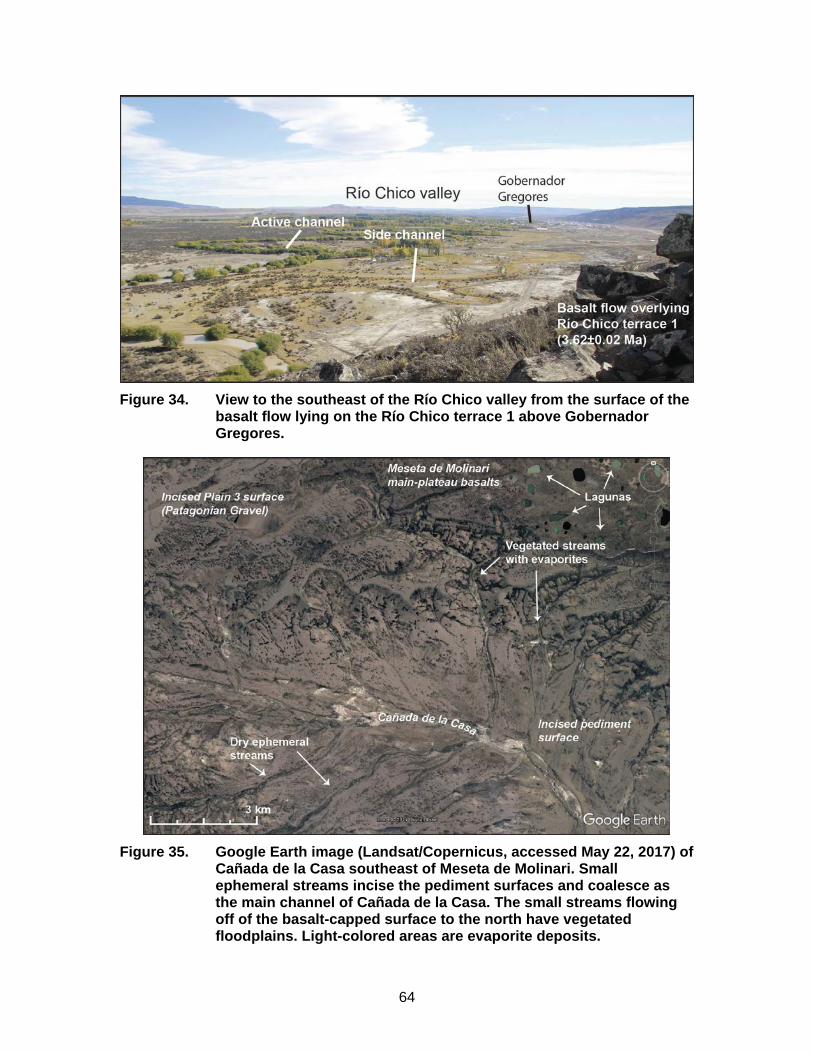
64
Figure 34. View to the southeast of the Río Chico valley from the surface of the
basalt flow lying on the Río Chico terrace 1 above Gobernador Gregores.
Figure 35. Google Earth image (Landsat/Copernicus, accessed May 22, 2017) of
Cañada de la Casa southeast of Meseta de Molinari. Small ephemeral streams incise the pediment surfaces and coalesce as the main channel of Cañada de la Casa. The small streams flowing off of the basalt-capped surface to the north have vegetated floodplains. Light-colored areas are evaporite deposits.
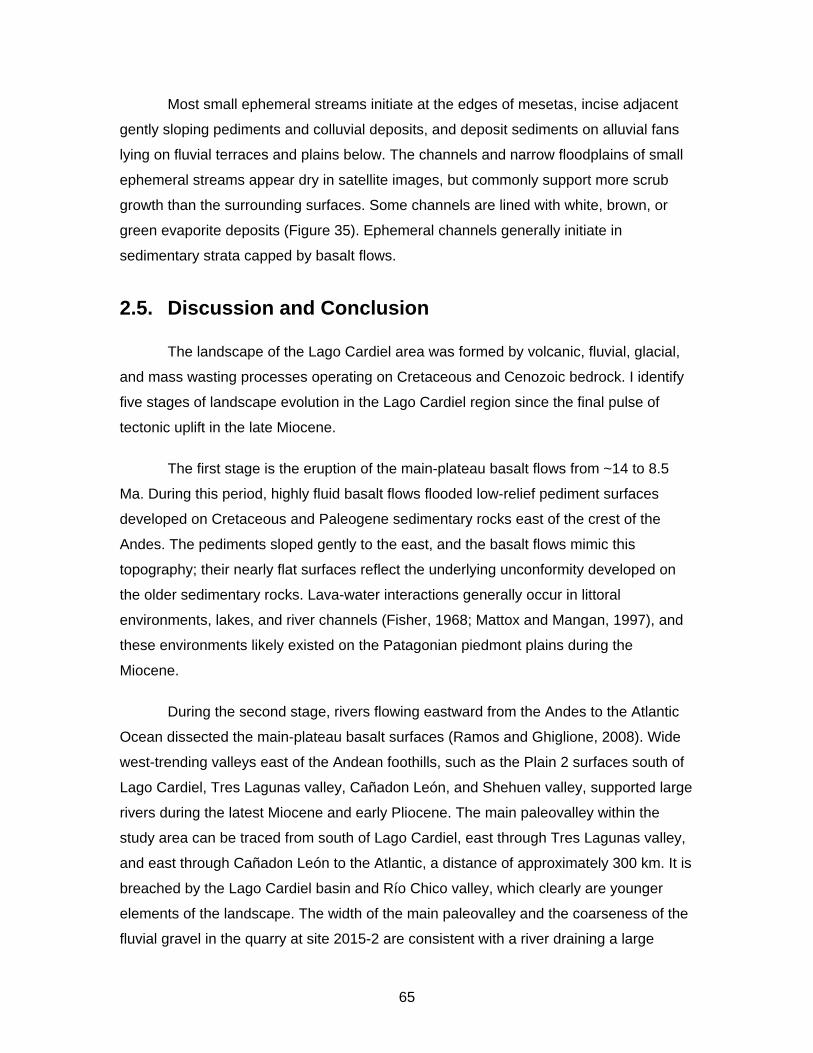
65
Most small ephemeral streams initiate at the edges of mesetas, incise adjacent
gently sloping pediments and colluvial deposits, and deposit sediments on alluvial fans
lying on fluvial terraces and plains below. The channels and narrow floodplains of small
ephemeral streams appear dry in satellite images, but commonly support more scrub
growth than the surrounding surfaces. Some channels are lined with white, brown, or
green evaporite deposits (Figure 35). Ephemeral channels generally initiate in
sedimentary strata capped by basalt flows.
2.5. Discussion and Conclusion
The landscape of the Lago Cardiel area was formed by volcanic, fluvial, glacial,
and mass wasting processes operating on Cretaceous and Cenozoic bedrock. I identify
five stages of landscape evolution in the Lago Cardiel region since the final pulse of
tectonic uplift in the late Miocene.
The first stage is the eruption of the main-plateau basalt flows from ~14 to 8.5
Ma. During this period, highly fluid basalt flows flooded low-relief pediment surfaces
developed on Cretaceous and Paleogene sedimentary rocks east of the crest of the
Andes. The pediments sloped gently to the east, and the basalt flows mimic this
topography; their nearly flat surfaces reflect the underlying unconformity developed on
the older sedimentary rocks. Lava-water interactions generally occur in littoral
environments, lakes, and river channels (Fisher, 1968; Mattox and Mangan, 1997), and
these environments likely existed on the Patagonian piedmont plains during the
Miocene.
During the second stage, rivers flowing eastward from the Andes to the Atlantic
Ocean dissected the main-plateau basalt surfaces (Ramos and Ghiglione, 2008). Wide
west-trending valleys east of the Andean foothills, such as the Plain 2 surfaces south of
Lago Cardiel, Tres Lagunas valley, Cañadon León, and Shehuen valley, supported large
rivers during the latest Miocene and early Pliocene. The main paleovalley within the
study area can be traced from south of Lago Cardiel, east through Tres Lagunas valley,
and east through Cañadon León to the Atlantic, a distance of approximately 300 km. It is
breached by the Lago Cardiel basin and Río Chico valley, which clearly are younger
elements of the landscape. The width of the main paleovalley and the coarseness of the
fluvial gravel in the quarry at site 2015-2 are consistent with a river draining a large
66
watershed in an elevated Andes. The plain 2 valleys are nested within basalt flows dated
from 13.9 to 8.5 Ma, indicating that this stage of incision initiated in the Middle to Late
Miocene. This stage was complete by no later than 4.4 Ma, when the Basalto Las Tunas
flow was emplaced on the floor of the plain south of Lago Cardiel. Towards the end of
this period, the alluvial fan at 2015-8 began to develop on the Plain 2 paleovalley surface
south of Lago Cardiel.
The third stage is characterized by a shift in volcanism to lower volume, post-
plateau basalt flows and a major drainage reorganization, manifest in the abandonment
of the plain 2 fluvial network. A new trunk valley – the paleo-Río Chico valley – became
established, truncating the Plain 2 paleovalley at Gobernador Gregores. The beach
complex at the east end of the Tres Lagunas Valley is contemporaneous with the Río
Chico terrace 1 surface, indicating that the plain 2 surface was abandoned by this time.
A large, shallow lake formed due to aggradation of the Río Chico valley floor where the
paleo-Río Chico turned east and flowed through Cañadon León. Further support for this
conclusion is provided by the absence of Río Chico terrace 1 surfaces south of
Gobernador Gregores. It appears that the river did not occupy the southern part of its
watershed until a later time. Although the cause of the major change in drainage during
the third stage is uncertain, it may have been induced by late Miocene and Pliocene
glaciation in the Andes, volcanism, or both.
Notably, this is the period during which the Lago Cardiel basin began to deepen.
The plain 2 paleovalley could not have supported a large river when there was a closed
depression between the remnant Plain 2 surface south of Lago Cardiel and Tres
Lagunas valley. I infer that the Lago Cardiel basin was initiated before 4.4 Ma, which is
the age of the Basalto Las Tunas flow south of Lago Cardiel, but after about 8 Ma, which
is the age of the youngest main-plateau basalt flows into which the paleovalley is
incised. Gilli et al. (2005a) and Beres et al. (2008) demonstrated that the basin lies in the
low point of a monocline (Figure 4), and that an unconformity marks the boundary
between sedimentary bedrock and what they interpret to be Late Pleistocene sediment
beneath the floor of Lago Cardiel. They infer that Late Pleistocene alluvial fan sediments
were deposited on the dry floor of the basin. A second unconformity exists between the
Late Pleistocene sediments and the oldest Holocene lacustrine unit. These studies
indicate that the basin at times was nearly or completely dry, whereas at other times it
supported a lake many tens of metres deeper than Lago Cardiel today. Lacustrine
67
sediment accumulated in the lake during wet periods, whereas the lake floor became
exposed and subject to deflation during dry periods. Smaller playa lakes in the study
area, such as Lago Guadal east of Meseta de Molinari, are possible analogs. Lago
Guadal is situated on a low-elevation surface on the lee-side of a high meseta. The
strong westerly Patagonian winds flow down the meseta scarp and remove fine
sediment from the lake when it is dry. At Lago Cardiel, a basin might initiate at the site of
a topographic low coinciding with the monocline that exists there. Once formed, the
basin would expand in area by collapse of the high-level, main-plateau basalts rimming
it. The considerable depth of the basin, however, may not be entirely explainable by
episodic eolian stripping of lake-floor sediments. Localized structural collapse might also
be required.
The Pampa de Las Tunas, a flat-lying, post-plateau basalt flow nested within the
Lago Cardiel basin, has been dated by the K/Ar method at 4.0 ± 0.2 Ma (Wenzens,
2006). The flow sits on a bench 115 m above present lake level and approximately 20 m
below the plain 2 level. If this age is correct, the Lago Cardiel basin must have begun to
form well before 4 Ma.
The fourth stage is defined by a second drainage reorganization. Río Chico
abandoned Cañadon León and established its modern path south of Gobernador
Gregores, flowing into the Río Shehuen. Río Chico terrace 2 remnants are the highest
terraces that are continuous along the segment of the Río Chico valley from Tamel Aike
to Shehuen valley. Post-plateau basalt flows capping Río Chico 3 terraces at site 2015-
11 and Estancia Las Vegas are 3.62-3.65 Ma in age and do not appear to have been
eroded by water flowing down Cañadon León, thus this second drainage reorganization
must have occurred before that time. The cause of the abandonment of the Cañadon
León route and establishment of the modern channel is not clear. Although tectonic uplift
or subsidence can change fluvial networks by altering surface slopes (Willett et al.,
2014), tectonic processes operate too slowly to reorganize the drainage system in the
study area at the end of the Pliocene or the beginning of the Pleistocene. A more likely
cause is Andean glaciation, which intensified at the end of the Pliocene (Roberts, 2016).
Enhanced sediment delivery along the paleo-Río Chico might have caused the valley to
aggrade and overtop a bedrock divide that formerly connected Meseta de Molinari and
Meseta de Cali. Alternatively, glacio-isostatic depression during Late Pliocene glacial
advances might have differentially uplifted the area centered on Cañadon León, allowing
68
the river to initiate a path to the south. Finally, headward erosion of a tributary of Río
Shehuen may have captured Río Chico during the Late Pliocene or Early Pleistocene. A
combination of two or more of the above processes may be responsible for the change
in course of Río Chico.
Climate oscillations during the late Pleistocene (Gilli et al., 2005b) triggered
pulses of alluvial fan development and fluvial incision in the valleys flanking the volcanic
mesetas. Colluviation occurred along meseta slopes, and large alluvial fans covered
abandoned Plain 2 and Río Chico terrace 1 surfaces. Although colluviation and the large
fans probably initiated in the Miocene, they may have been most active during wet
periods of the Late Pliocene and Pleistocene. Periods of wetter climate may also be
implicated in the continued expansion of closed basins through mass movements along
their margins. In contrast, during drier periods, ponds and lakes in these basins may
have disappeared, leading to eolian deflation of the basin floors. Abandoned shorelines
up to 75 m above the modern water surface as well as buried beach ridges in the lake
basin fill indicate that Lago Cardiel has experienced multiple regressions and
transgressions during the Late Pleistocene and Holocene due to climate oscillations.
The landscape in the study area has probably changed little during the Late
Pleistocene and Holocene. Río Chico terrace 3 surfaces most likely date to this time,
and Lago Cardiel was much larger at the beginning of the Holocene than today.
Increasing aridity through the Holocene has lowered the level of the lake by about 70 m
(Gilli et al., 2001; Markgraf et al., 2003). Many of the smaller lakes in the area have
disappeared and their floors were deflated during the Holocene. Eolian sediments were
eroded and deposited leeward from these basins by the prevailing Holocene winds.
In conclusion, the landscape of the study area has been shaped by tectonics,
volcanism, glaciation, eolian erosion, and climate fluctuations from the early Miocene to
the present day. Major events in the evolution of the landscape include eruption of flood
basalts on pediment surfaces during the Middle and Late Miocene, incision of these
basalts at the end of the Miocene, and regional and local reorganization of the drainage
system east of the Andes. Large alluvial fans and fan aprons have formed at the edges
of mesetas, and closed basins have formed both on basalt flows and valley floors by
deflation and gravitationally induced collapse. Constraints on the ages of these events
are provided by K/Ar and Ar/Ar ages on basalt flows.
69
My findings align with the conclusions of Gilli et al. (2005a) and Beres et al.
(2008) that the Lago Cardiel basin is beyond the limit of Andean glaciation. The location
of the lake is likely tectonically controlled, but its large size and depth are due to mass
movements along the basin walls and to eolian erosion during dry periods. Past
research provides bedrock and glacial landform mapping, a chronology of Miocene-
Pliocene basalt flows, and details of Late Pleistocene and Holocene climate as recorded
in Lago Cardiel’s basin fill. This study incorporates the findings of past researchers into
an inventory of landforms and provides additional chronological control through new
radiometric ages, magnetostratigraphy, and relative dating of landforms. I provide a
more comprehensive view of landscape evolution from the late Miocene to the present.
Landscape evolution is dominated by tectonic and volcanic processes in the Miocene,
followed by three major Pliocene drainage reorganizations due to isostatic processes
and headward erosion during glaciations. Colluvial, eolian, and alluvial processes have
been the main influences on the landscape during the Late Pleistocene and Holocene;
these processes probably have varied in intensity as climate changed.
70
Chapter 3. Magnetostratigraphy of Early to Middle Pleistocene glaciations in the Strait of Magellan region
3.1. Introduction
Large ice sheets covered much of southernmost South America during the
glacial periods of the Pliocene and Pleistocene. The glacial record is well preserved in
continental sedimentary deposits and landforms on the southernmost mainland of
Argentina and the island of Tierra del Fuego. This record provides a valuable proxy of
past climate change, particularly for the Early and Middle Pleistocene, a period for which
data are sparse in the Southern Hemisphere.
In a general sense, the glacial record of southern Patagonia is similar to that of
North America, with alpine glaciation initiating in the cordillera in the late Miocene and
cyclic ice cap or ice sheet waxing and waning during the Late Pliocene to Late
Pleistocene (Mercer, 1976; Roberts, 2016). However, the Northern Hemisphere record is
far better understood, due in large part to the greater amount of research that has been
done there. The glacial record of Patagonia is largely known from geomorphic studies.
Well-preserved moraines and glaciofluvial landforms record glacier margins, and
radiometric dating of basaltic lava flows that overlie and underlie glacial deposits has
provided a broad chronologic framework for the Pleistocene (e.g. Mercer, 1976; Singer
et al., 2004a, 2004b). Most radiometric ages that constrain the timing of Early and
Middle Pleistocene glaciations have been acquired in the eastern foothills of the Andes,
far from the sediments and landforms on which the chronology is based. The number
and ages of glaciations and their geographic extent, particularly the earliest events, are
still not well understood in this region (Rabassa et al., 2011).
Although Quaternary landforms and lava flows in southern Patagonia have been
well documented (Caldenius, 1932; Mercer, 1976; Meglioli, 1992), there has been limited
study of the glacial sediments with which they are associated. Yet, exposures of Early
and Middle Pleistocene glacial sediment are common along the Atlantic coast and the
shorelines of the Strait of Magellan, as well as in road cuts and gravel pits.
71
Paleomagnetic characterization of stably magnetized fine-grained glacial
sediments can be used to refine glacial histories (e.g. Nelson et al., 2009; Barendregt,
2011) when used in tandem with the Geomagnetic Polarity Time Scale (GMPT; Figure
36). Correlations are strengthened when absolute ages are available to constrain the
ages of the sediment sequences (e.g. Cioppa et al.. 1995; Barendregt et al., 2010; Duk-
Rodkin and Barendegt, 2011).
When a sufficiently strong magnetic field is applied to a ferromagnetic mineral,
the direction of the applied field will be recorded in the path of magnetization of the
mineral even when the field is removed or changes direction (Butler, 1992). Small
magnetite grains (clay size, single domain particles) are excellent recorders of past
magnetic fields and preserve remanent magnetization in the sediment. Detrital remanent
magnetization of sediment is acquired during deposition of magnetite grains in water-
saturated sediments, as grains rotate to align with the magnetic field. The magnetic
moments of the particles will be parallel to the long-axis of the grains at deposition, and
this position is locked-in after dewatering and consolidation of the sediments (Butler,
1992).
In Patagonia, the deposits of the oldest drift units, which are farthest from the
Andes and are termed ‘Great Patagonian Drift’ (GPG) (Mercer, 1976), lie outside of the
lava flows of the Pali Aike Volcanic Field (Figure 37). Their ages are far beyond the limit
of radiocarbon dating, thus precluding reliable absolute age dating using that technique.
However, the basalts over which glaciers flowed contain magnetite, and grains of this
mineral have been incorporated into GPG drift, making them useful carriers of remanent
magnetization. Glacial sediments in southern Patagonia have a high and stable
magnetization, making them ideal for paleomagnetic study.
Polarity reversals have occurred throughout the late Cenozoic. The last polarity
reversal, which is relevant to this study, occurred at the boundary between the Early and
Middle Pleistocene, at 0.78 Ma. At that time, Earth’s magnetic field changed from
reversed (Matuyama Chron, 2.58 – 0.78 Ma) to normal (Brunhes Chron, <0.78 Ma).
Several polarity subchrons occur within the Matuyama Reversed Chron and can be
recorded in Quaternary sediment sequences. The two major subchrons in the
Quaternary are the Jaramillo normal subchron (1.07 – 0.99 Ma) and the Olduvai normal
subchron (1.968-1.781 Ma).
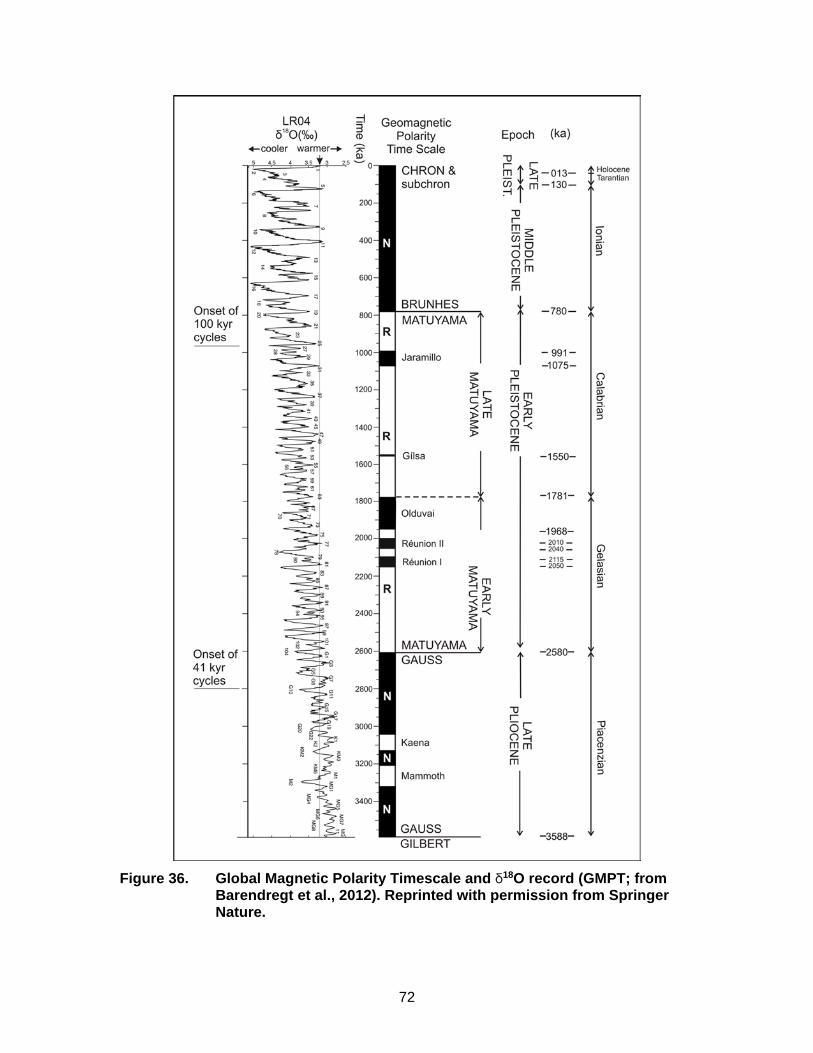
72
Figure 36. Global Magnetic Polarity Timescale and δ18O record (GMPT; from
Barendregt et al., 2012). Reprinted with permission from Springer Nature.
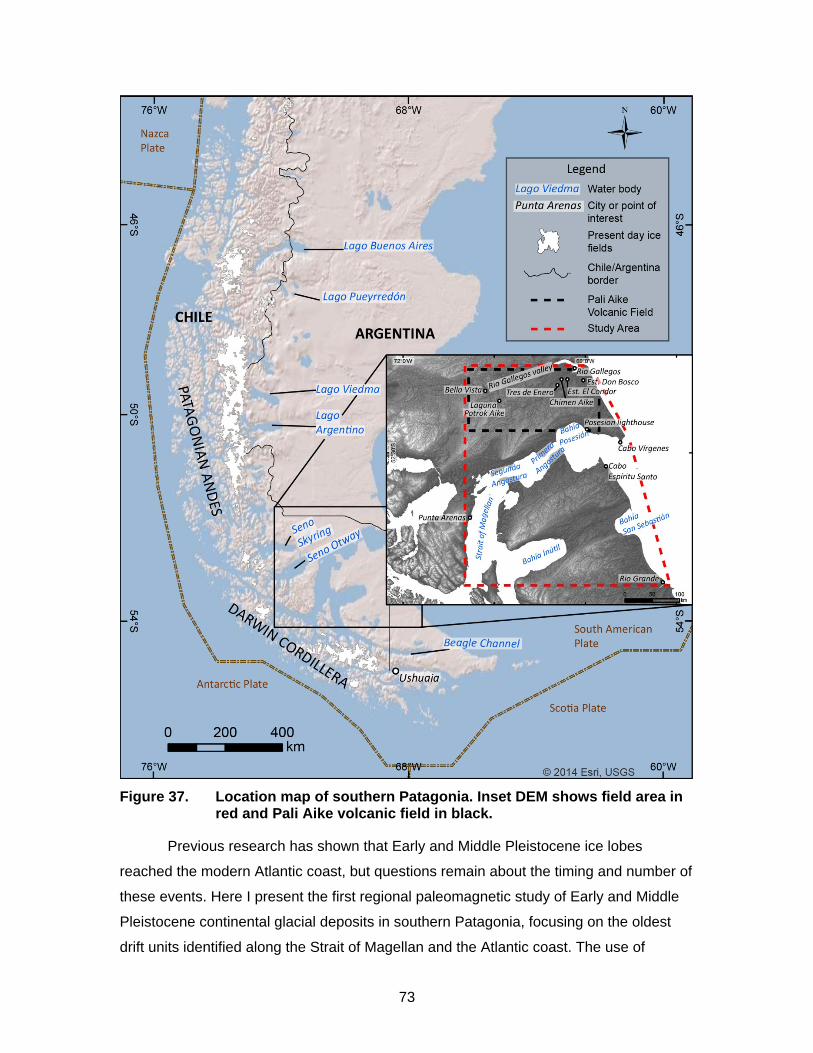
73
Figure 37. Location map of southern Patagonia. Inset DEM shows field area in
red and Pali Aike volcanic field in black.
Previous research has shown that Early and Middle Pleistocene ice lobes
reached the modern Atlantic coast, but questions remain about the timing and number of
these events. Here I present the first regional paleomagnetic study of Early and Middle
Pleistocene continental glacial deposits in southern Patagonia, focusing on the oldest
drift units identified along the Strait of Magellan and the Atlantic coast. The use of
74
paleomagnetic techniques allows me to place sequences with confidence in chrons and
even subchrons of the GMPT, improving the chronology of Early and Middle Pleistocene
glaciations in southernmost Patagonia and on Tierra del Fuego. I correlate the deposits
on which the analyses were performed with mapped glacial landforms and discuss the
inferred number and ages of glaciations with those recognized by previous researchers.
3.2. Study area
3.2.1. Physiography and geology
The study area is located in the Argentine and Chilean Patagonia on the east
side of the Andes. It is bounded by latitudes 51°S and 54°S and longitudes 70°W and
68°W (Figure 37).
The Strait of Magellan separates the mainland of the continent of South America
from Tierra del Fuego and links the Pacific Ocean to the west with the Atlantic Ocean to
the east (Figure 37). To the west are the Patagonian Andes on the mainland and the
Cordillera Darwin on Tierra del Fuego, with peaks up to 2500 m a.s.l. These ranges
host, respectively, the Southern Patagonian Icefields and the Cordillera Darwin Icefield,
which are remnants of the large Andean ice sheet that formed repeatedly over the
southern Andean chain during the Late Pliocene and Pleistocene. East of the cordillera
are the wind-swept Patagonian plains, which slope gradually toward the Atlantic Ocean.
They were uplifted during the Miocene and incised by rivers and glaciers during the
Pliocene and Pleistocene (Rabassa and Clapperton, 1990). The result is in an inverted
topography, where the oldest surfaces are found at the highest elevations and the
youngest surfaces are nested within them at lower elevations.
Landforms on the Patagonian plains are remarkably well-preserved, as the
climate has been dry throughout the Quaternary, limiting weathering and erosion.
Although mean annual precipitation on the Pacific coast in Chile can reach over 2000
mm (Paruelo et al., 1998), mean annual precipitation at Río Gallegos on the Atlantic
coast is only 220 mm (Coronato et al., 2013). Mean annual temperature at Río Gallegos
is 5.9°C, and winds are dominantly from the west, with maximum speeds of over 360 m
s-1 (Coronato et al., 2013). Persistent strong winds have degraded the land surface and
in places eroded large closed basins.
75
The Southern Patagonian Andes lie south of the Chile Triple Junction, where the
spreading center between the Antarctic and Nazca American plates is subducting
beneath the South American plate (Figure 37). Subduction of oceanic crust beneath the
South American plate has continued as the triple junction has migrated northward from
the tip of the continent to its present location at 47°S (Forsythe and Nelson, 1985; Cande
and Leslie, 1986; Herve et al., 2007). The southern Andes consist mainly of Paleozoic
and early Mesozoic metasedimentary and metavolcanic rocks that have been locally
intruded by granitic rocks (Herve et al., 2007). The region has been affected by
tectonism and late Cenozoic volcanism, which has continued to the present. Subduction
and triple junction migration have controlled faulting, which in turn have localized
volcanic fields, major waterways, and sedimentary basins. Crustal faults strike mainly
NW-SE, although some structures strike E-W and WSW-ENE.
Parts of the Patagonia plain are underlain by Paleogene and Neogene
sedimentary rocks. Notably, the Miocene Santa Cruz Formation comprises shallow
marine, lacustrine, deltaic, and fluvial sandstone and mudstone deposited in the
Magallanes foreland basin between 19 and 10 Ma (Dalziel and Palmer, 1974; Wilson,
1991; Fleagle et al., 1995). The Santa Cruz Formation is unconformably overlain by
Neogene basalts and Quaternary sediments, including till, fluvial, glaciofluvial, lacustrine,
glaciolacustrine, aeolian, and beach deposits. Quaternary landforms include end, lateral,
and ground moraines, drumlins, glacial lineations, meltwater channels, outwash
terraces, raised shorelines, and thermal contraction polygons.
The Pali Aike Volcanic Field comprises basaltic lava flows, scoria cones, and
maars ranging in age from about 9.15 Ma to the late Holocene (Mercer, 1976; Meglioli,
1992; Mejia et al., 2004; Singer et al., 2004b) (Figure 38). Volcanism is related to the
opening of a slab window due to subduction of the Antarctic plate beneath the South
American plate (Gorring et al., 1997; D’Orazio et al., 2000; Mazzarini and D’Orazio,
2003). Motion along the triple junction between the South American, Antarctic, and
Scotia plates to the south has also resulted in late Cenozoic volcanism and faulting in
the Strait of Magellan and Beagle Channel areas. Eruptive centres in the Pali Aike
Volcanic Field lie along NE-SW lineaments and generally increase in age toward the SW
(Corbella, 2002).
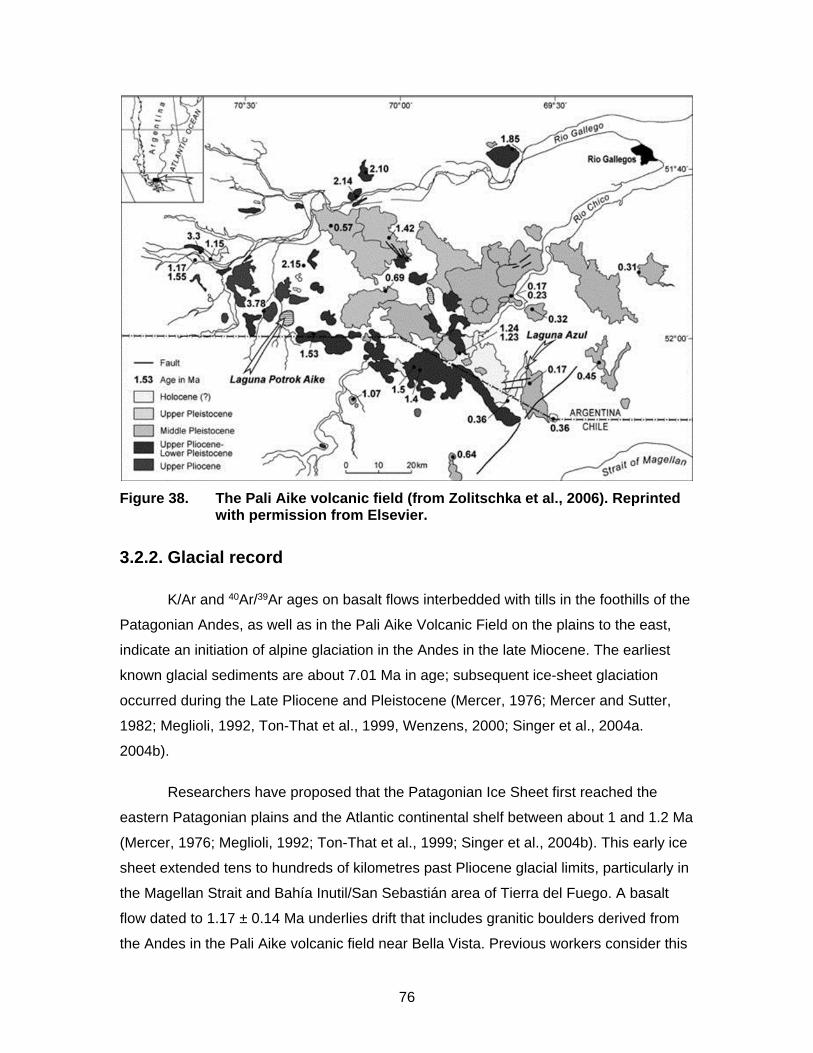
76
Figure 38. The Pali Aike volcanic field (from Zolitschka et al., 2006). Reprinted
with permission from Elsevier.
3.2.2. Glacial record
K/Ar and 40Ar/39Ar ages on basalt flows interbedded with tills in the foothills of the
Patagonian Andes, as well as in the Pali Aike Volcanic Field on the plains to the east,
indicate an initiation of alpine glaciation in the Andes in the late Miocene. The earliest
known glacial sediments are about 7.01 Ma in age; subsequent ice-sheet glaciation
occurred during the Late Pliocene and Pleistocene (Mercer, 1976; Mercer and Sutter,
1982; Meglioli, 1992, Ton-That et al., 1999, Wenzens, 2000; Singer et al., 2004a.
2004b).
Researchers have proposed that the Patagonian Ice Sheet first reached the
eastern Patagonian plains and the Atlantic continental shelf between about 1 and 1.2 Ma
(Mercer, 1976; Meglioli, 1992; Ton-That et al., 1999; Singer et al., 2004b). This early ice
sheet extended tens to hundreds of kilometres past Pliocene glacial limits, particularly in
the Magellan Strait and Bahía Inutil/San Sebastián area of Tierra del Fuego. A basalt
flow dated to 1.17 ± 0.14 Ma underlies drift that includes granitic boulders derived from
the Andes in the Pali Aike volcanic field near Bella Vista. Previous workers consider this
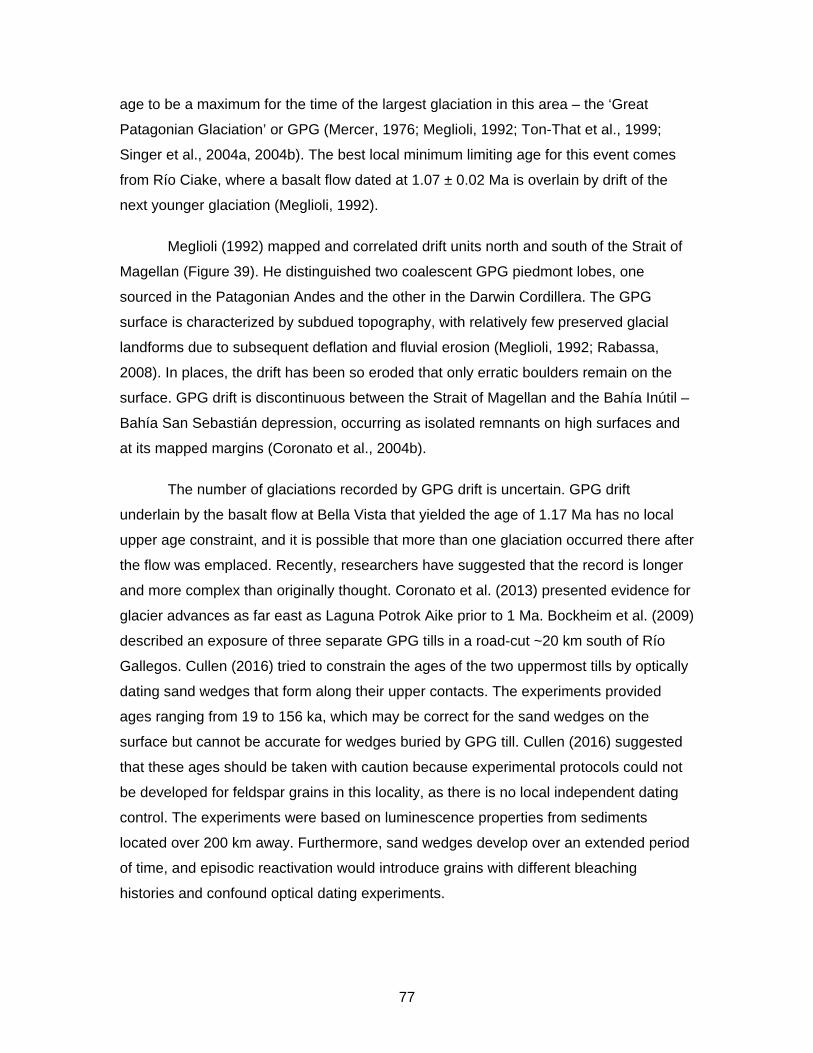
77
age to be a maximum for the time of the largest glaciation in this area – the ‘Great
Patagonian Glaciation’ or GPG (Mercer, 1976; Meglioli, 1992; Ton-That et al., 1999;
Singer et al., 2004a, 2004b). The best local minimum limiting age for this event comes
from Río Ciake, where a basalt flow dated at 1.07 ± 0.02 Ma is overlain by drift of the
next younger glaciation (Meglioli, 1992).
Meglioli (1992) mapped and correlated drift units north and south of the Strait of
Magellan (Figure 39). He distinguished two coalescent GPG piedmont lobes, one
sourced in the Patagonian Andes and the other in the Darwin Cordillera. The GPG
surface is characterized by subdued topography, with relatively few preserved glacial
landforms due to subsequent deflation and fluvial erosion (Meglioli, 1992; Rabassa,
2008). In places, the drift has been so eroded that only erratic boulders remain on the
surface. GPG drift is discontinuous between the Strait of Magellan and the Bahía Inútil –
Bahía San Sebastián depression, occurring as isolated remnants on high surfaces and
at its mapped margins (Coronato et al., 2004b).
The number of glaciations recorded by GPG drift is uncertain. GPG drift
underlain by the basalt flow at Bella Vista that yielded the age of 1.17 Ma has no local
upper age constraint, and it is possible that more than one glaciation occurred there after
the flow was emplaced. Recently, researchers have suggested that the record is longer
and more complex than originally thought. Coronato et al. (2013) presented evidence for
glacier advances as far east as Laguna Potrok Aike prior to 1 Ma. Bockheim et al. (2009)
described an exposure of three separate GPG tills in a road-cut ~20 km south of Río
Gallegos. Cullen (2016) tried to constrain the ages of the two uppermost tills by optically
dating sand wedges that form along their upper contacts. The experiments provided
ages ranging from 19 to 156 ka, which may be correct for the sand wedges on the
surface but cannot be accurate for wedges buried by GPG till. Cullen (2016) suggested
that these ages should be taken with caution because experimental protocols could not
be developed for feldspar grains in this locality, as there is no local independent dating
control. The experiments were based on luminescence properties from sediments
located over 200 km away. Furthermore, sand wedges develop over an extended period
of time, and episodic reactivation would introduce grains with different bleaching
histories and confound optical dating experiments.
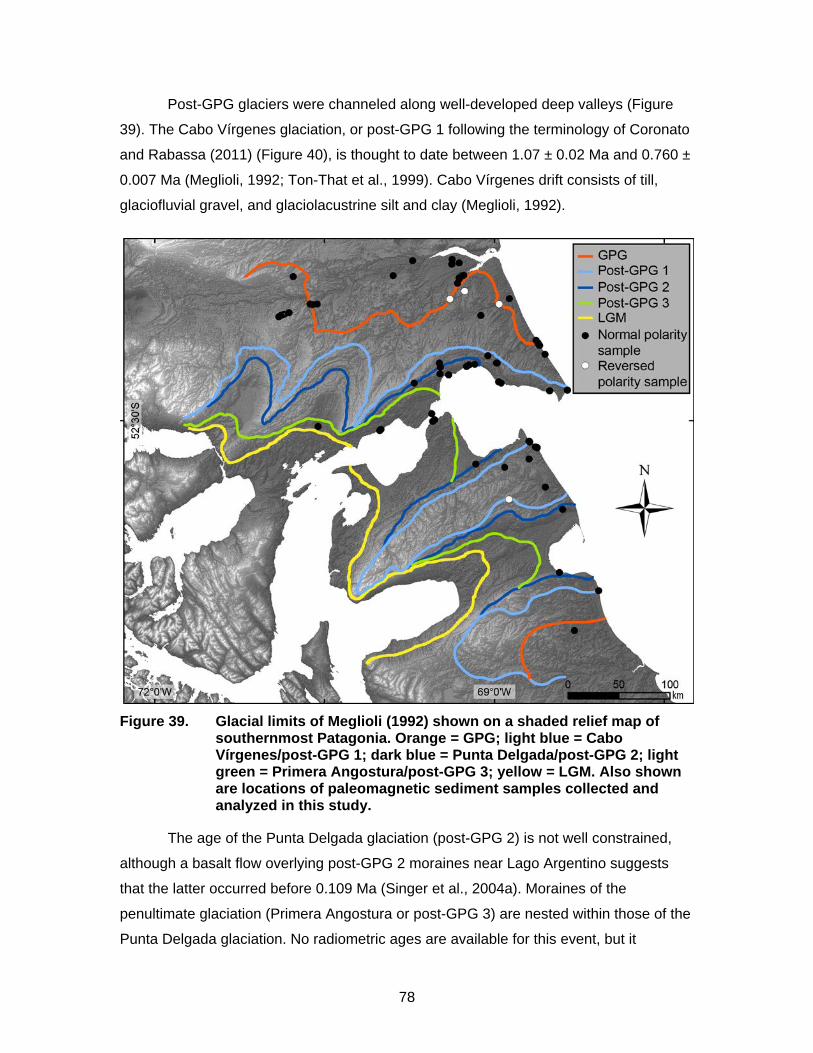
78
Post-GPG glaciers were channeled along well-developed deep valleys (Figure
39). The Cabo Vírgenes glaciation, or post-GPG 1 following the terminology of Coronato
and Rabassa (2011) (Figure 40), is thought to date between 1.07 ± 0.02 Ma and 0.760 ±
0.007 Ma (Meglioli, 1992; Ton-That et al., 1999). Cabo Vírgenes drift consists of till,
glaciofluvial gravel, and glaciolacustrine silt and clay (Meglioli, 1992).
Figure 39. Glacial limits of Meglioli (1992) shown on a shaded relief map of
southernmost Patagonia. Orange = GPG; light blue = Cabo Vírgenes/post-GPG 1; dark blue = Punta Delgada/post-GPG 2; light green = Primera Angostura/post-GPG 3; yellow = LGM. Also shown are locations of paleomagnetic sediment samples collected and analyzed in this study.
The age of the Punta Delgada glaciation (post-GPG 2) is not well constrained,
although a basalt flow overlying post-GPG 2 moraines near Lago Argentino suggests
that the latter occurred before 0.109 Ma (Singer et al., 2004a). Moraines of the
penultimate glaciation (Primera Angostura or post-GPG 3) are nested within those of the
Punta Delgada glaciation. No radiometric ages are available for this event, but it
79
probably dates to either marine isotope stage 4 or 6. The terminal moraine is located at
the westernmost narrows of the Strait of Magellan and has been extensively eroded by
meltwater of the last glaciation.
The last, or Segunda Angostura, glaciation (post-GPG 4) is well dated to ~12-25
ka in the western Strait of Magellan (e.g. McCulloch et al. 2005). Moraines and other
landforms of this glaciation are well preserved, and the deposits support only a poorly
developed soil (Meglioli, 1992).
Figure 40. Quaternary chronostratigraphy of the Río Gallegos valley and
Magellan Strait lobes (after Coronato and Rabassa, 2011).
3.3. Methods
3.3.1. Field methods
I collected 642 sediment samples and 15 basalt samples from 74 units over the
course of three field seasons. Basalt samples were cored from oriented blocks removed
from near-vertical cliff faces. Sediment samples were silt or very fine to fine sand. Fine-
grained sediment was chosen for measurement of remanent magnetism because small
ferromagnetic grains are the strongest recorders of past magnetic fields (Butler, 1992).
80
Alignment of coarser ferromagnetic grains is commonly influenced by depositional
processes, thus sediment coarser than fine sand was not sampled. Weathered
sediments and sediments containing pebbles were avoided. Most samples were
collected from lenses of silt and very fine to fine sand within till and glaciofluvial gravel.
Sediment samples were collected by driving polycarbonate plastic cylinders (2
cm wide x 2 cm deep) horizontally into cleaned, vertical, in-situ sediment exposures. An
arrow on the cylinder face is oriented vertically downward as the cylinder is inserted into
the sediment. The insertion azimuth of the back face (bottom) of the cylinder is then
measured with a Brunton compass. Movement of sediment within the cylinder during
recovery and transport is prevented by internal, slightly raised splines on the cylinder
sides and base, and by filling empty space at the top of the cylinder with tissue paper
before securing the lid. Where possible, a minimum of six samples were collected from
the same level within each unit to determine statistical variability in the measurements.
During the first reconnaissance sampling trip, however, I collected some sets of three
samples.
I described and measured units at each sampling site. Stratigraphic sections
were chosen based on their relationship to landforms of specific glaciations,
accessibility, and the presence of fine-grained sediment. I collected most samples from
areas mapped as GPG and Cabo Vírgenes drift, although I also described and sampled
some exposures of Punta Delgada drift and Primera Angostura drift. Stratigraphic units
exposed in wave-cut cliffs along the coastlines of the Strait of Magellan and the Atlantic
coast are commonly continuous over distances of kilometres, whereas inland road-cut
and gravel pit exposures are typically less than 100 m in length. I used the upper limit of
tides as a baseline for unit elevations in coastal exposures. Most exposures, with the
exception of those in the Río Gallegos valley and along the Atlantic coast of Tierra del
Fuego, had no bedrock at their base.
I described sediments using standard lithofacies codes (Eyles et al., 1983; Evans
and Benn, 2004; Table 4). Observations include unit thicknesses and elevations, particle
size and sorting, color, depositional and deformation structures, presence or absence of
fossils, and the nature of unit contacts.
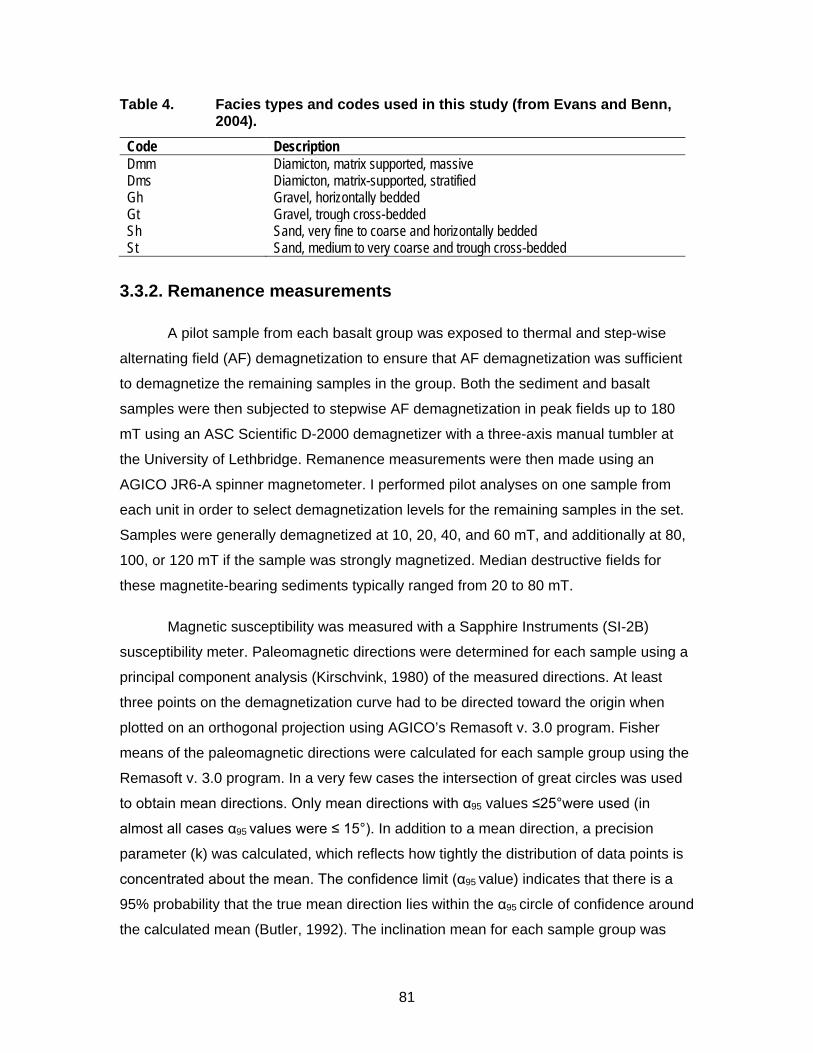
81
Table 4. Facies types and codes used in this study (from Evans and Benn, 2004).
Code Description Dmm Diamicton, matrix supported, massive Dms Diamicton, matrix-supported, stratified Gh Gravel, horizontally bedded Gt Gravel, trough cross-bedded Sh Sand, very fine to coarse and horizontally bedded St Sand, medium to very coarse and trough cross-bedded
3.3.2. Remanence measurements
A pilot sample from each basalt group was exposed to thermal and step-wise
alternating field (AF) demagnetization to ensure that AF demagnetization was sufficient
to demagnetize the remaining samples in the group. Both the sediment and basalt
samples were then subjected to stepwise AF demagnetization in peak fields up to 180
mT using an ASC Scientific D-2000 demagnetizer with a three-axis manual tumbler at
the University of Lethbridge. Remanence measurements were then made using an
AGICO JR6-A spinner magnetometer. I performed pilot analyses on one sample from
each unit in order to select demagnetization levels for the remaining samples in the set.
Samples were generally demagnetized at 10, 20, 40, and 60 mT, and additionally at 80,
100, or 120 mT if the sample was strongly magnetized. Median destructive fields for
these magnetite-bearing sediments typically ranged from 20 to 80 mT.
Magnetic susceptibility was measured with a Sapphire Instruments (SI-2B)
susceptibility meter. Paleomagnetic directions were determined for each sample using a
principal component analysis (Kirschvink, 1980) of the measured directions. At least
three points on the demagnetization curve had to be directed toward the origin when
plotted on an orthogonal projection using AGICO’s Remasoft v. 3.0 program. Fisher
means of the paleomagnetic directions were calculated for each sample group using the
Remasoft v. 3.0 program. In a very few cases the intersection of great circles was used
to obtain mean directions. Only mean directions with α95 values ≤25°were used (in
almost all cases α95 values were ≤ 15°). In addition to a mean direction, a precision
parameter (k) was calculated, which reflects how tightly the distribution of data points is
concentrated about the mean. The confidence limit (α95 value) indicates that there is a
95% probability that the true mean direction lies within the α95 circle of confidence around
the calculated mean (Butler, 1992). The inclination mean for each sample group was
82
compared to the geocentric axial dipole (GAD) inclination for the sampling site. The GAD
is the magnetic field at a given geographic latitude defined by a single magnetic dipole
aligned with the rotation axis of the Earth at its center (Butler, 1992). The mean
inclination of multiple sedimentary units spanning 104-106 years is expected to be similar
to the GAD, and the two directions cannot be discriminated at the 5% significance level if
the GAD is within α95 of the measured mean direction (Butler, 1992). The GAD for the
field area (calculated for latitude 52°S) has a declination of 0° and an inclination of -
68.6°.
During normal polarity conditions in the Southern Hemisphere, the inclination of
the magnetic field is negative and the declination is ~360°. When polarity is reversed,
the inclination is positive and the declination is ~180°. During normal polarity conditions
in the Southern Hemisphere, the inclination of the magnetic field is negative and the
declination is ~360°. When polarity is reversed, the inclination is positive and the
declination is ~180°. Polarity is considered transitional when inclination and declination
values do not correspond to a general N-S dipole configuration, but rather show
mismatches of expected inclination and declination values for normal or reversed fields.
Such mismatched directions recorded in sediments are associated with weakening and
instability of the field associated with a field that is transitioning from one polarity to
another.
3.4. Results and discussion
The average magnetic susceptibility of sediment samples ranges from 120 to
4800 x 10-6 SI/vol. Most samples display magnetizations characteristic of magnetite and
have a relatively high magnetic stability for glacial sediments. Normal and reversed
magnetizations are recorded across the field area, and polarities can be confidently
assigned to most of the sampled units (Figure 39, Table 5). Table 5 presents Fisher-
averaged directions of each unit and their assigned polarities. Figure 41 shows
examples of well-behaved normal- and reverse-polarity demagnetization data.
Stereographic plots of unit means and their 95% confidence intervals for all units
sampled in the field area are presented in Figure 42, and for each individual drift unit in
Figure 43 and Table 6.
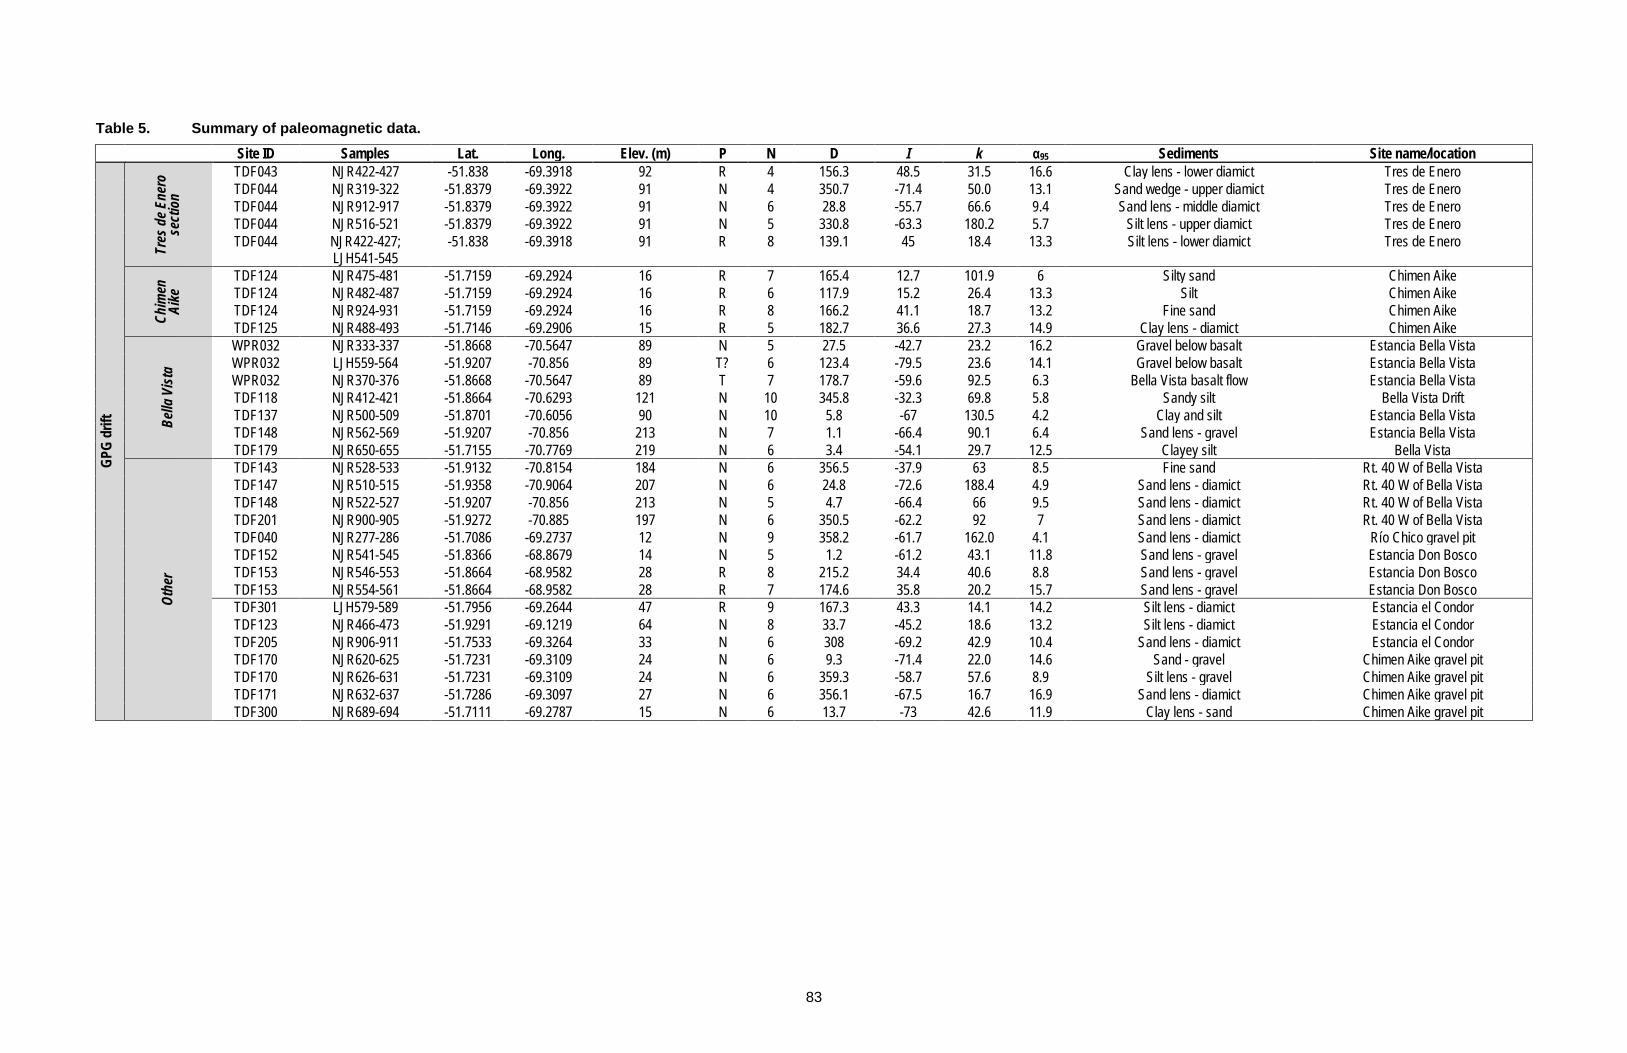
83
Table 5. Summary of paleomagnetic data. Site ID Samples Lat. Long. Elev. (m) P N D I k α95 Sediments Site name/location
GPG
drift
Tres
de E
nero
se
ctio
n TDF043 NJR422-427 -51.838 -69.3918 92 R 4 156.3 48.5 31.5 16.6 Clay lens - lower diamict Tres de Enero TDF044 NJR319-322 -51.8379 -69.3922 91 N 4 350.7 -71.4 50.0 13.1 Sand wedge - upper diamict Tres de Enero TDF044 NJR912-917 -51.8379 -69.3922 91 N 6 28.8 -55.7 66.6 9.4 Sand lens - middle diamict Tres de Enero TDF044 NJR516-521 -51.8379 -69.3922 91 N 5 330.8 -63.3 180.2 5.7 Silt lens - upper diamict Tres de Enero TDF044 NJR422-427;
LJH541-545 -51.838 -69.3918 91 R 8 139.1 45 18.4 13.3 Silt lens - lower diamict Tres de Enero
Chim
en
Aike
TDF124 NJR475-481 -51.7159 -69.2924 16 R 7 165.4 12.7 101.9 6 Silty sand Chimen Aike TDF124 NJR482-487 -51.7159 -69.2924 16 R 6 117.9 15.2 26.4 13.3 Silt Chimen Aike TDF124 NJR924-931 -51.7159 -69.2924 16 R 8 166.2 41.1 18.7 13.2 Fine sand Chimen Aike TDF125 NJR488-493 -51.7146 -69.2906 15 R 5 182.7 36.6 27.3 14.9 Clay lens - diamict Chimen Aike
Bella
Vist
a
WPR032 NJR333-337 -51.8668 -70.5647 89 N 5 27.5 -42.7 23.2 16.2 Gravel below basalt Estancia Bella Vista WPR032 LJH559-564 -51.9207 -70.856 89 T? 6 123.4 -79.5 23.6 14.1 Gravel below basalt Estancia Bella Vista WPR032 NJR370-376 -51.8668 -70.5647 89 T 7 178.7 -59.6 92.5 6.3 Bella Vista basalt flow Estancia Bella Vista TDF118 NJR412-421 -51.8664 -70.6293 121 N 10 345.8 -32.3 69.8 5.8 Sandy silt Bella Vista Drift TDF137 NJR500-509 -51.8701 -70.6056 90 N 10 5.8 -67 130.5 4.2 Clay and silt Estancia Bella Vista TDF148 NJR562-569 -51.9207 -70.856 213 N 7 1.1 -66.4 90.1 6.4 Sand lens - gravel Estancia Bella Vista TDF179 NJR650-655 -51.7155 -70.7769 219 N 6 3.4 -54.1 29.7 12.5 Clayey silt Bella Vista
Othe
r
TDF143 NJR528-533 -51.9132 -70.8154 184 N 6 356.5 -37.9 63 8.5 Fine sand Rt. 40 W of Bella Vista TDF147 NJR510-515 -51.9358 -70.9064 207 N 6 24.8 -72.6 188.4 4.9 Sand lens - diamict Rt. 40 W of Bella Vista TDF148 NJR522-527 -51.9207 -70.856 213 N 5 4.7 -66.4 66 9.5 Sand lens - diamict Rt. 40 W of Bella Vista TDF201 NJR900-905 -51.9272 -70.885 197 N 6 350.5 -62.2 92 7 Sand lens - diamict Rt. 40 W of Bella Vista TDF040 NJR277-286 -51.7086 -69.2737 12 N 9 358.2 -61.7 162.0 4.1 Sand lens - diamict Río Chico gravel pit TDF152 NJR541-545 -51.8366 -68.8679 14 N 5 1.2 -61.2 43.1 11.8 Sand lens - gravel Estancia Don Bosco TDF153 NJR546-553 -51.8664 -68.9582 28 R 8 215.2 34.4 40.6 8.8 Sand lens - gravel Estancia Don Bosco TDF153 NJR554-561 -51.8664 -68.9582 28 R 7 174.6 35.8 20.2 15.7 Sand lens - gravel Estancia Don Bosco TDF301 LJH579-589 -51.7956 -69.2644 47 R 9 167.3 43.3 14.1 14.2 Silt lens - diamict Estancia el Condor TDF123 NJR466-473 -51.9291 -69.1219 64 N 8 33.7 -45.2 18.6 13.2 Silt lens - diamict Estancia el Condor TDF205 NJR906-911 -51.7533 -69.3264 33 N 6 308 -69.2 42.9 10.4 Sand lens - diamict Estancia el Condor TDF170 NJR620-625 -51.7231 -69.3109 24 N 6 9.3 -71.4 22.0 14.6 Sand - gravel Chimen Aike gravel pit TDF170 NJR626-631 -51.7231 -69.3109 24 N 6 359.3 -58.7 57.6 8.9 Silt lens - gravel Chimen Aike gravel pit TDF171 NJR632-637 -51.7286 -69.3097 27 N 6 356.1 -67.5 16.7 16.9 Sand lens - diamict Chimen Aike gravel pit TDF300 NJR689-694 -51.7111 -69.2787 15 N 6 13.7 -73 42.6 11.9 Clay lens - sand Chimen Aike gravel pit
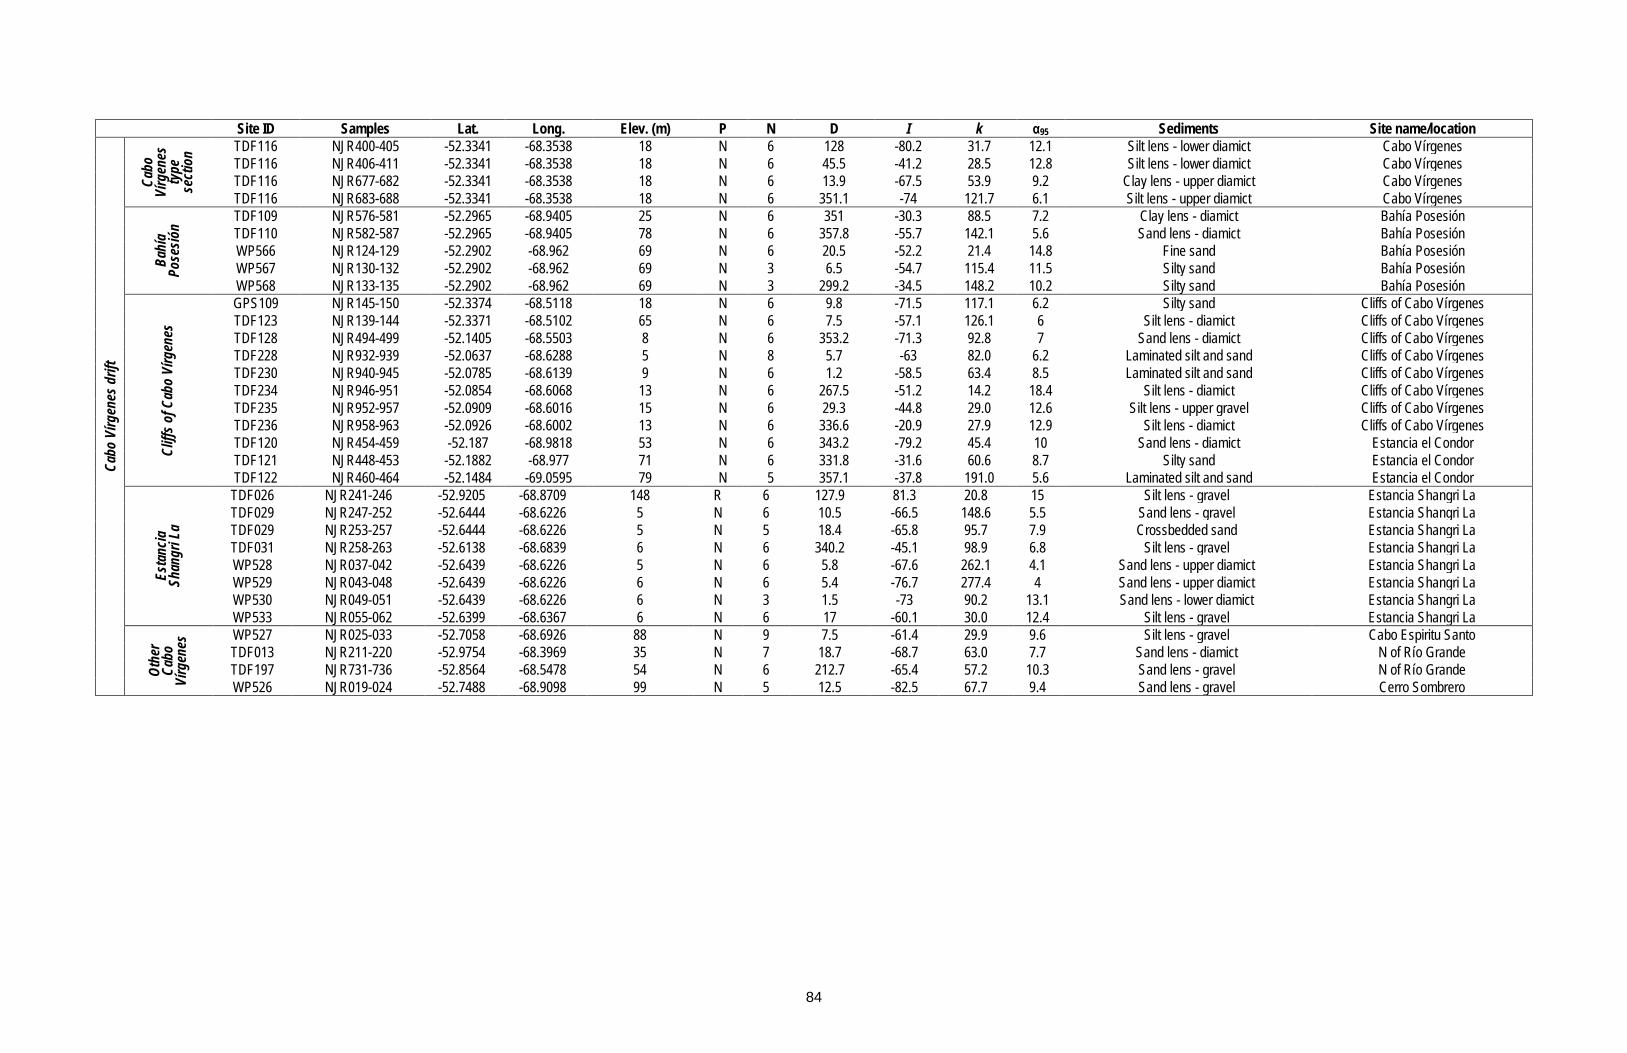
84
Site ID Samples Lat. Long. Elev. (m) P N D I k α95 Sediments Site name/location Ca
bo V
írgen
es d
rift
Cabo
Ví
rgen
es
type
se
ctio
n TDF116 NJR400-405 -52.3341 -68.3538 18 N 6 128 -80.2 31.7 12.1 Silt lens - lower diamict Cabo Vírgenes TDF116 NJR406-411 -52.3341 -68.3538 18 N 6 45.5 -41.2 28.5 12.8 Silt lens - lower diamict Cabo Vírgenes TDF116 NJR677-682 -52.3341 -68.3538 18 N 6 13.9 -67.5 53.9 9.2 Clay lens - upper diamict Cabo Vírgenes TDF116 NJR683-688 -52.3341 -68.3538 18 N 6 351.1 -74 121.7 6.1 Silt lens - upper diamict Cabo Vírgenes
Bahí
a Po
sesió
n
TDF109 NJR576-581 -52.2965 -68.9405 25 N 6 351 -30.3 88.5 7.2 Clay lens - diamict Bahía Posesión TDF110 NJR582-587 -52.2965 -68.9405 78 N 6 357.8 -55.7 142.1 5.6 Sand lens - diamict Bahía Posesión WP566 NJR124-129 -52.2902 -68.962 69 N 6 20.5 -52.2 21.4 14.8 Fine sand Bahía Posesión WP567 NJR130-132 -52.2902 -68.962 69 N 3 6.5 -54.7 115.4 11.5 Silty sand Bahía Posesión WP568 NJR133-135 -52.2902 -68.962 69 N 3 299.2 -34.5 148.2 10.2 Silty sand Bahía Posesión
Cliff
s of C
abo
Vírg
enes
GPS109 NJR145-150 -52.3374 -68.5118 18 N 6 9.8 -71.5 117.1 6.2 Silty sand Cliffs of Cabo Vírgenes TDF123 NJR139-144 -52.3371 -68.5102 65 N 6 7.5 -57.1 126.1 6 Silt lens - diamict Cliffs of Cabo Vírgenes TDF128 NJR494-499 -52.1405 -68.5503 8 N 6 353.2 -71.3 92.8 7 Sand lens - diamict Cliffs of Cabo Vírgenes TDF228 NJR932-939 -52.0637 -68.6288 5 N 8 5.7 -63 82.0 6.2 Laminated silt and sand Cliffs of Cabo Vírgenes TDF230 NJR940-945 -52.0785 -68.6139 9 N 6 1.2 -58.5 63.4 8.5 Laminated silt and sand Cliffs of Cabo Vírgenes TDF234 NJR946-951 -52.0854 -68.6068 13 N 6 267.5 -51.2 14.2 18.4 Silt lens - diamict Cliffs of Cabo Vírgenes TDF235 NJR952-957 -52.0909 -68.6016 15 N 6 29.3 -44.8 29.0 12.6 Silt lens - upper gravel Cliffs of Cabo Vírgenes TDF236 NJR958-963 -52.0926 -68.6002 13 N 6 336.6 -20.9 27.9 12.9 Silt lens - diamict Cliffs of Cabo Vírgenes TDF120 NJR454-459 -52.187 -68.9818 53 N 6 343.2 -79.2 45.4 10 Sand lens - diamict Estancia el Condor TDF121 NJR448-453 -52.1882 -68.977 71 N 6 331.8 -31.6 60.6 8.7 Silty sand Estancia el Condor TDF122 NJR460-464 -52.1484 -69.0595 79 N 5 357.1 -37.8 191.0 5.6 Laminated silt and sand Estancia el Condor
Esta
ncia
Sh
angr
i La
TDF026 NJR241-246 -52.9205 -68.8709 148 R 6 127.9 81.3 20.8 15 Silt lens - gravel Estancia Shangri La TDF029 NJR247-252 -52.6444 -68.6226 5 N 6 10.5 -66.5 148.6 5.5 Sand lens - gravel Estancia Shangri La TDF029 NJR253-257 -52.6444 -68.6226 5 N 5 18.4 -65.8 95.7 7.9 Crossbedded sand Estancia Shangri La TDF031 NJR258-263 -52.6138 -68.6839 6 N 6 340.2 -45.1 98.9 6.8 Silt lens - gravel Estancia Shangri La WP528 NJR037-042 -52.6439 -68.6226 5 N 6 5.8 -67.6 262.1 4.1 Sand lens - upper diamict Estancia Shangri La WP529 NJR043-048 -52.6439 -68.6226 6 N 6 5.4 -76.7 277.4 4 Sand lens - upper diamict Estancia Shangri La WP530 NJR049-051 -52.6439 -68.6226 6 N 3 1.5 -73 90.2 13.1 Sand lens - lower diamict Estancia Shangri La WP533 NJR055-062 -52.6399 -68.6367 6 N 6 17 -60.1 30.0 12.4 Silt lens - gravel Estancia Shangri La
Othe
r Ca
bo
Vírg
enes
WP527 NJR025-033 -52.7058 -68.6926 88 N 9 7.5 -61.4 29.9 9.6 Silt lens - gravel Cabo Espiritu Santo TDF013 NJR211-220 -52.9754 -68.3969 35 N 7 18.7 -68.7 63.0 7.7 Sand lens - diamict N of Río Grande TDF197 NJR731-736 -52.8564 -68.5478 54 N 6 212.7 -65.4 57.2 10.3 Sand lens - gravel N of Río Grande WP526 NJR019-024 -52.7488 -68.9098 99 N 5 12.5 -82.5 67.7 9.4 Sand lens - gravel Cerro Sombrero
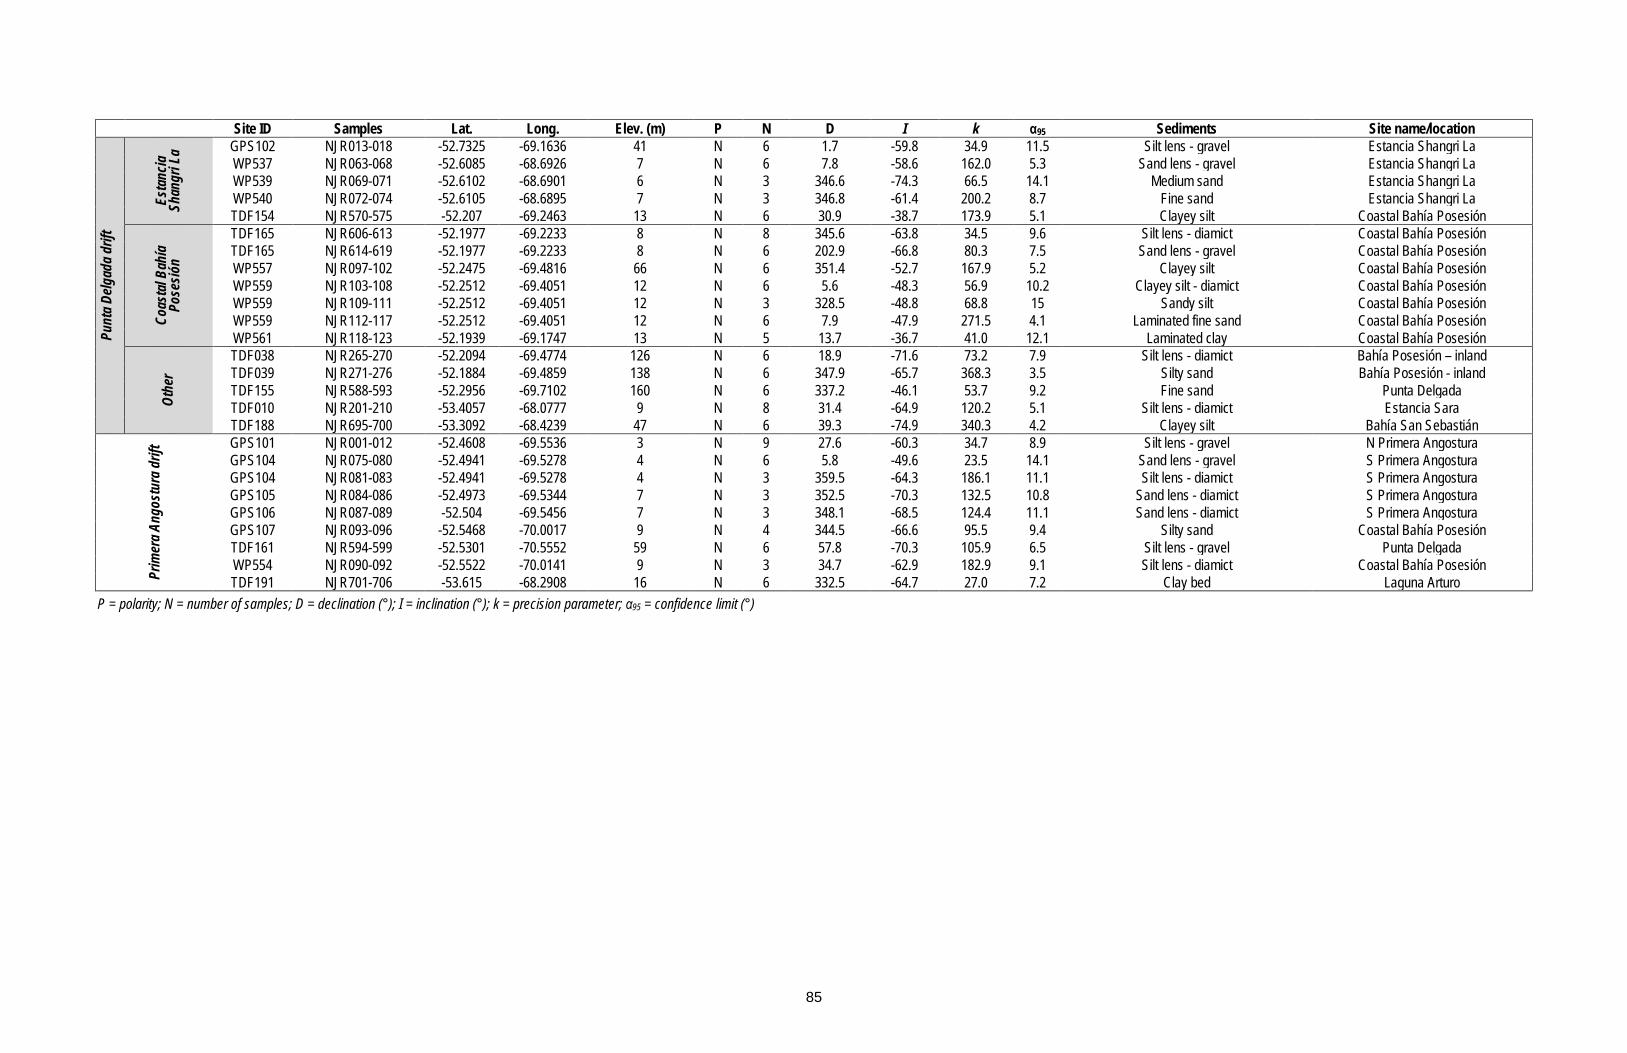
85
Site ID Samples Lat. Long. Elev. (m) P N D I k α95 Sediments Site name/location Pu
nta D
elgad
a drif
t
Esta
ncia
Shan
gri L
a GPS102 NJR013-018 -52.7325 -69.1636 41 N 6 1.7 -59.8 34.9 11.5 Silt lens - gravel Estancia Shangri La WP537 NJR063-068 -52.6085 -68.6926 7 N 6 7.8 -58.6 162.0 5.3 Sand lens - gravel Estancia Shangri La WP539 NJR069-071 -52.6102 -68.6901 6 N 3 346.6 -74.3 66.5 14.1 Medium sand Estancia Shangri La WP540 NJR072-074 -52.6105 -68.6895 7 N 3 346.8 -61.4 200.2 8.7 Fine sand Estancia Shangri La TDF154 NJR570-575 -52.207 -69.2463 13 N 6 30.9 -38.7 173.9 5.1 Clayey silt Coastal Bahía Posesión
Coas
tal B
ahía
Pose
sión
TDF165 NJR606-613 -52.1977 -69.2233 8 N 8 345.6 -63.8 34.5 9.6 Silt lens - diamict Coastal Bahía Posesión TDF165 NJR614-619 -52.1977 -69.2233 8 N 6 202.9 -66.8 80.3 7.5 Sand lens - gravel Coastal Bahía Posesión WP557 NJR097-102 -52.2475 -69.4816 66 N 6 351.4 -52.7 167.9 5.2 Clayey silt Coastal Bahía Posesión WP559 NJR103-108 -52.2512 -69.4051 12 N 6 5.6 -48.3 56.9 10.2 Clayey silt - diamict Coastal Bahía Posesión WP559 NJR109-111 -52.2512 -69.4051 12 N 3 328.5 -48.8 68.8 15 Sandy silt Coastal Bahía Posesión WP559 NJR112-117 -52.2512 -69.4051 12 N 6 7.9 -47.9 271.5 4.1 Laminated fine sand Coastal Bahía Posesión WP561 NJR118-123 -52.1939 -69.1747 13 N 5 13.7 -36.7 41.0 12.1 Laminated clay Coastal Bahía Posesión
Othe
r
TDF038 NJR265-270 -52.2094 -69.4774 126 N 6 18.9 -71.6 73.2 7.9 Silt lens - diamict Bahía Posesión – inland TDF039 NJR271-276 -52.1884 -69.4859 138 N 6 347.9 -65.7 368.3 3.5 Silty sand Bahía Posesión - inland TDF155 NJR588-593 -52.2956 -69.7102 160 N 6 337.2 -46.1 53.7 9.2 Fine sand Punta Delgada TDF010 NJR201-210 -53.4057 -68.0777 9 N 8 31.4 -64.9 120.2 5.1 Silt lens - diamict Estancia Sara TDF188 NJR695-700 -53.3092 -68.4239 47 N 6 39.3 -74.9 340.3 4.2 Clayey silt Bahía San Sebastián
Prim
era A
ngos
tura
drif
t GPS101 NJR001-012 -52.4608 -69.5536 3 N 9 27.6 -60.3 34.7 8.9 Silt lens - gravel N Primera Angostura GPS104 NJR075-080 -52.4941 -69.5278 4 N 6 5.8 -49.6 23.5 14.1 Sand lens - gravel S Primera Angostura GPS104 NJR081-083 -52.4941 -69.5278 4 N 3 359.5 -64.3 186.1 11.1 Silt lens - diamict S Primera Angostura GPS105 NJR084-086 -52.4973 -69.5344 7 N 3 352.5 -70.3 132.5 10.8 Sand lens - diamict S Primera Angostura GPS106 NJR087-089 -52.504 -69.5456 7 N 3 348.1 -68.5 124.4 11.1 Sand lens - diamict S Primera Angostura GPS107 NJR093-096 -52.5468 -70.0017 9 N 4 344.5 -66.6 95.5 9.4 Silty sand Coastal Bahía Posesión TDF161 NJR594-599 -52.5301 -70.5552 59 N 6 57.8 -70.3 105.9 6.5 Silt lens - gravel Punta Delgada WP554 NJR090-092 -52.5522 -70.0141 9 N 3 34.7 -62.9 182.9 9.1 Silt lens - diamict Coastal Bahía Posesión TDF191 NJR701-706 -53.615 -68.2908 16 N 6 332.5 -64.7 27.0 7.2 Clay bed Laguna Arturo
P = polarity; N = number of samples; D = declination (°); I = inclination (°); k = precision parameter; α95 = confidence limit (°)
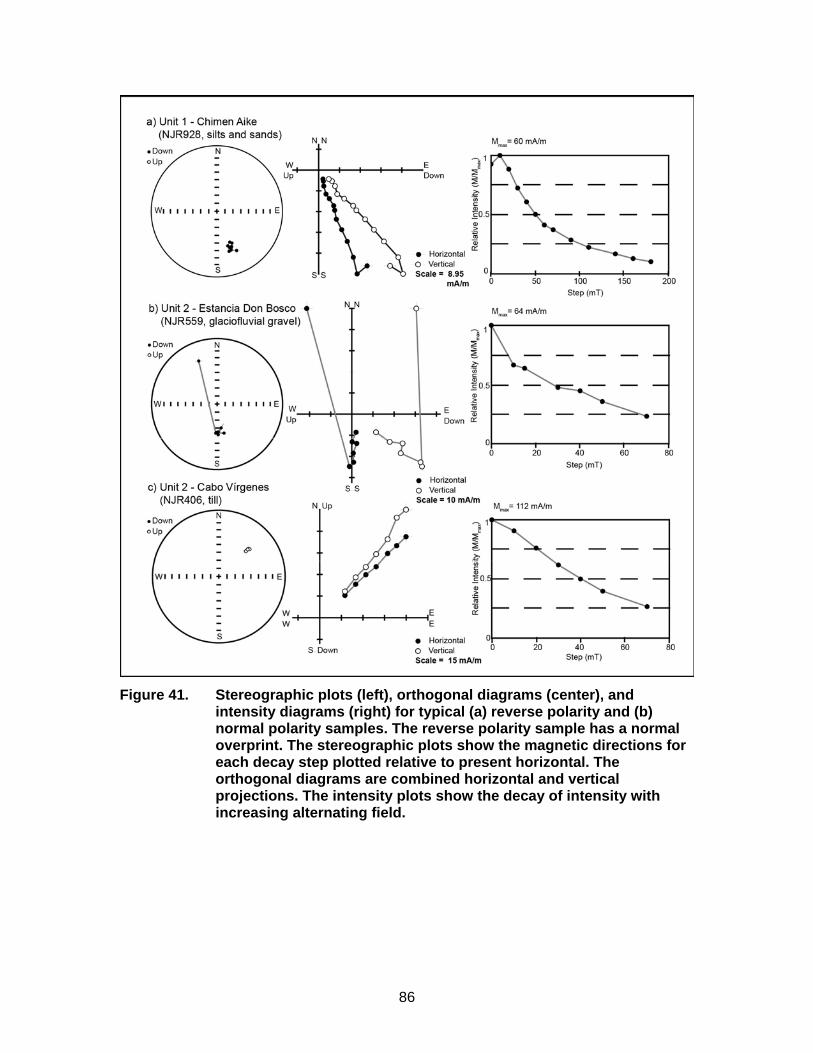
86
Figure 41. Stereographic plots (left), orthogonal diagrams (center), and
intensity diagrams (right) for typical (a) reverse polarity and (b) normal polarity samples. The reverse polarity sample has a normal overprint. The stereographic plots show the magnetic directions for each decay step plotted relative to present horizontal. The orthogonal diagrams are combined horizontal and vertical projections. The intensity plots show the decay of intensity with increasing alternating field.
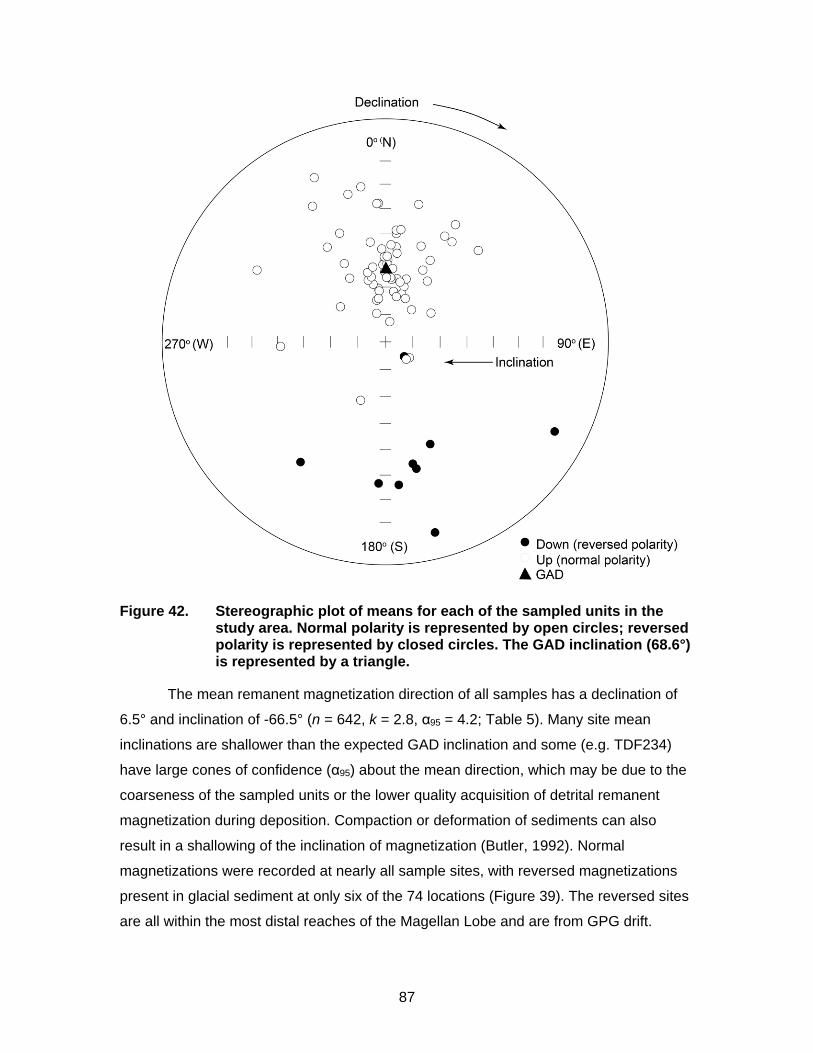
87
Figure 42. Stereographic plot of means for each of the sampled units in the
study area. Normal polarity is represented by open circles; reversed polarity is represented by closed circles. The GAD inclination (68.6°) is represented by a triangle.
The mean remanent magnetization direction of all samples has a declination of
6.5° and inclination of -66.5° (n = 642, k = 2.8, α95 = 4.2; Table 5). Many site mean
inclinations are shallower than the expected GAD inclination and some (e.g. TDF234)
have large cones of confidence (α95) about the mean direction, which may be due to the
coarseness of the sampled units or the lower quality acquisition of detrital remanent
magnetization during deposition. Compaction or deformation of sediments can also
result in a shallowing of the inclination of magnetization (Butler, 1992). Normal
magnetizations were recorded at nearly all sample sites, with reversed magnetizations
present in glacial sediment at only six of the 74 locations (Figure 39). The reversed sites
are all within the most distal reaches of the Magellan Lobe and are from GPG drift.
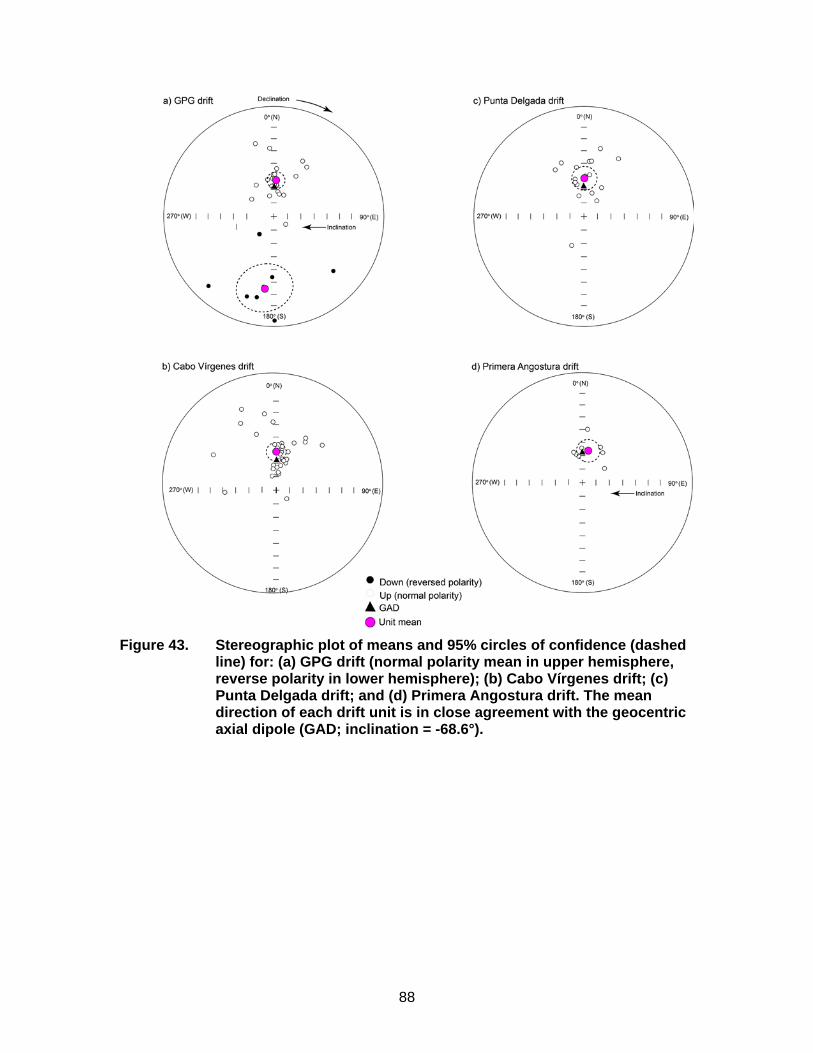
88
Figure 43. Stereographic plot of means and 95% circles of confidence (dashed
line) for: (a) GPG drift (normal polarity mean in upper hemisphere, reverse polarity in lower hemisphere); (b) Cabo Vírgenes drift; (c) Punta Delgada drift; and (d) Primera Angostura drift. The mean direction of each drift unit is in close agreement with the geocentric axial dipole (GAD; inclination = -68.6°).
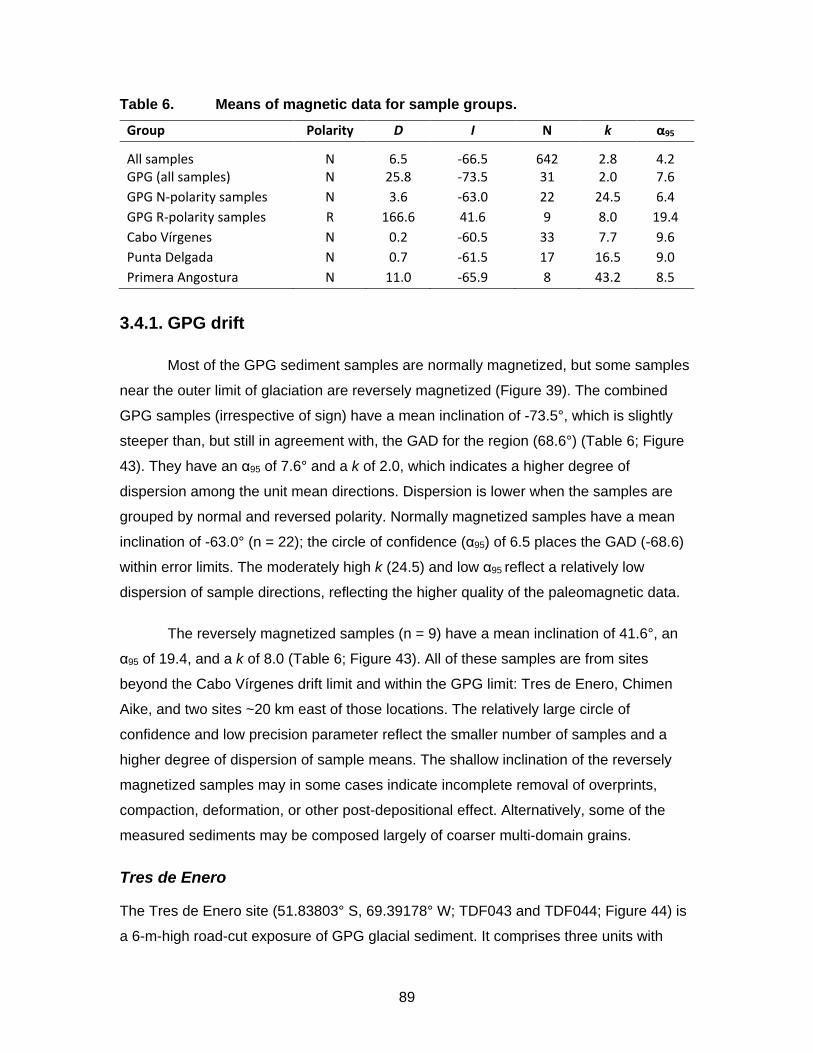
89
Table 6. Means of magnetic data for sample groups.
Group Polarity D I N k α95
All samples N 6.5 -66.5 642 2.8 4.2 GPG (all samples) N 25.8 -73.5 31 2.0 7.6 GPG N-polarity samples N 3.6 -63.0 22 24.5 6.4 GPG R-polarity samples R 166.6 41.6 9 8.0 19.4 Cabo Vírgenes N 0.2 -60.5 33 7.7 9.6 Punta Delgada N 0.7 -61.5 17 16.5 9.0 Primera Angostura N 11.0 -65.9 8 43.2 8.5
3.4.1. GPG drift
Most of the GPG sediment samples are normally magnetized, but some samples
near the outer limit of glaciation are reversely magnetized (Figure 39). The combined
GPG samples (irrespective of sign) have a mean inclination of -73.5°, which is slightly
steeper than, but still in agreement with, the GAD for the region (68.6°) (Table 6; Figure
43). They have an α95 of 7.6° and a k of 2.0, which indicates a higher degree of
dispersion among the unit mean directions. Dispersion is lower when the samples are
grouped by normal and reversed polarity. Normally magnetized samples have a mean
inclination of -63.0° (n = 22); the circle of confidence (α95) of 6.5 places the GAD (-68.6)
within error limits. The moderately high k (24.5) and low α95 reflect a relatively low
dispersion of sample directions, reflecting the higher quality of the paleomagnetic data.
The reversely magnetized samples (n = 9) have a mean inclination of 41.6°, an
α95 of 19.4, and a k of 8.0 (Table 6; Figure 43). All of these samples are from sites
beyond the Cabo Vírgenes drift limit and within the GPG limit: Tres de Enero, Chimen
Aike, and two sites ~20 km east of those locations. The relatively large circle of
confidence and low precision parameter reflect the smaller number of samples and a
higher degree of dispersion of sample means. The shallow inclination of the reversely
magnetized samples may in some cases indicate incomplete removal of overprints,
compaction, deformation, or other post-depositional effect. Alternatively, some of the
measured sediments may be composed largely of coarser multi-domain grains.
Tres de Enero
The Tres de Enero site (51.83803° S, 69.39178° W; TDF043 and TDF044; Figure 44) is
a 6-m-high road-cut exposure of GPG glacial sediment. It comprises three units with
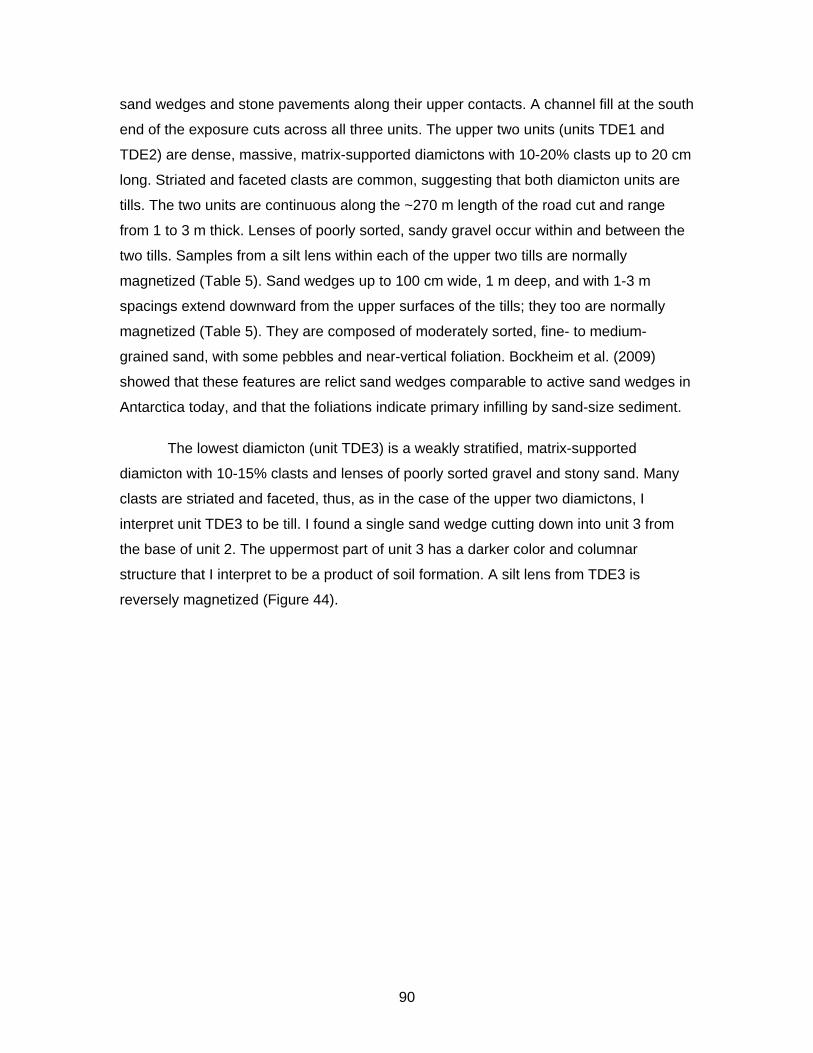
90
sand wedges and stone pavements along their upper contacts. A channel fill at the south
end of the exposure cuts across all three units. The upper two units (units TDE1 and
TDE2) are dense, massive, matrix-supported diamictons with 10-20% clasts up to 20 cm
long. Striated and faceted clasts are common, suggesting that both diamicton units are
tills. The two units are continuous along the ~270 m length of the road cut and range
from 1 to 3 m thick. Lenses of poorly sorted, sandy gravel occur within and between the
two tills. Samples from a silt lens within each of the upper two tills are normally
magnetized (Table 5). Sand wedges up to 100 cm wide, 1 m deep, and with 1-3 m
spacings extend downward from the upper surfaces of the tills; they too are normally
magnetized (Table 5). They are composed of moderately sorted, fine- to medium-
grained sand, with some pebbles and near-vertical foliation. Bockheim et al. (2009)
showed that these features are relict sand wedges comparable to active sand wedges in
Antarctica today, and that the foliations indicate primary infilling by sand-size sediment.
The lowest diamicton (unit TDE3) is a weakly stratified, matrix-supported
diamicton with 10-15% clasts and lenses of poorly sorted gravel and stony sand. Many
clasts are striated and faceted, thus, as in the case of the upper two diamictons, I
interpret unit TDE3 to be till. I found a single sand wedge cutting down into unit 3 from
the base of unit 2. The uppermost part of unit 3 has a darker color and columnar
structure that I interpret to be a product of soil formation. A silt lens from TDE3 is
reversely magnetized (Figure 44).
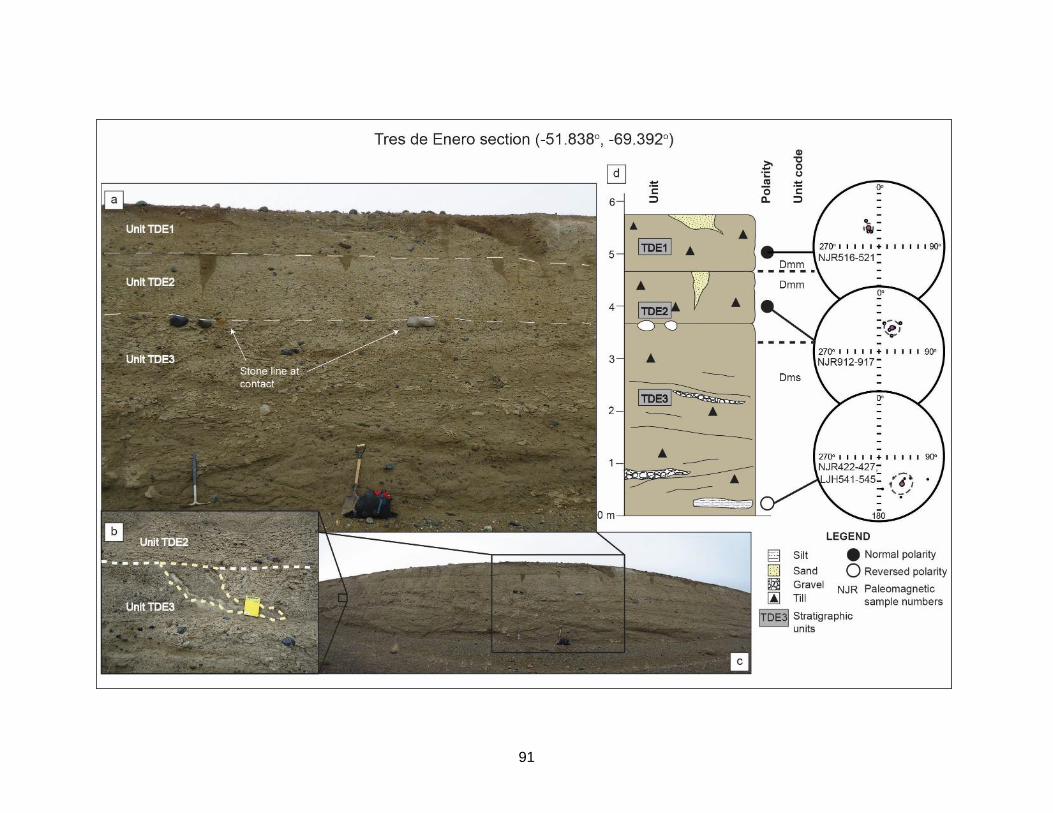
91
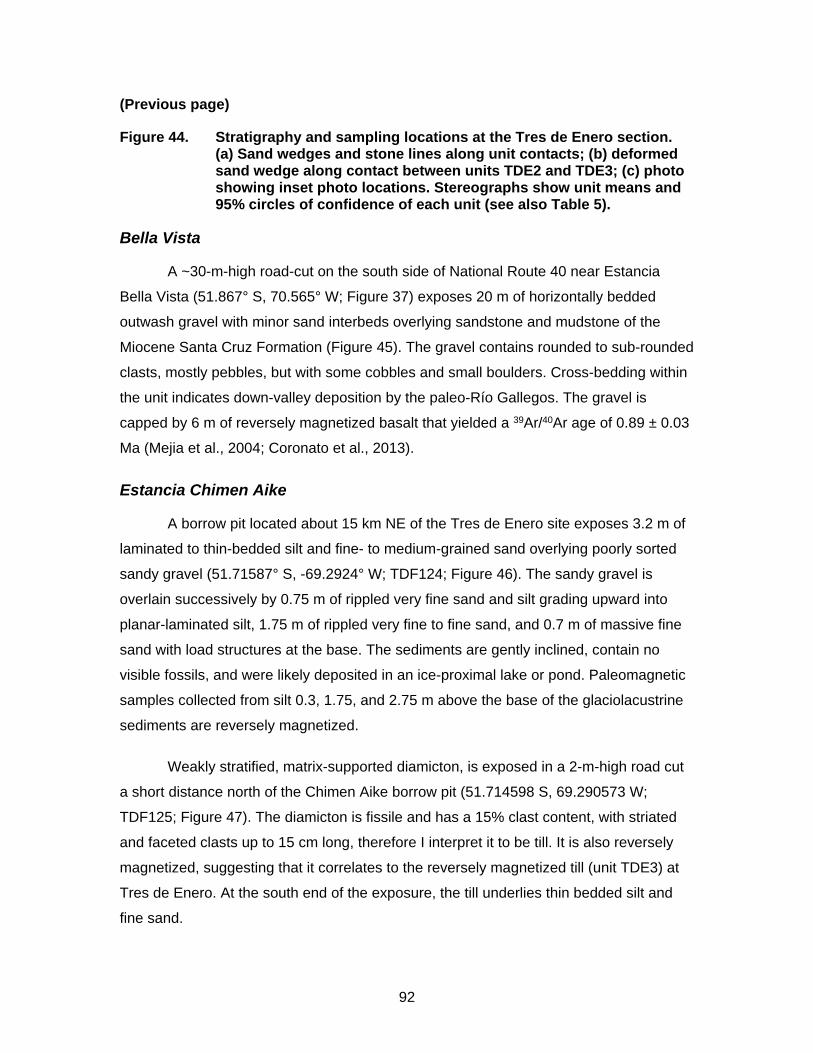
92
(Previous page)
Figure 44. Stratigraphy and sampling locations at the Tres de Enero section. (a) Sand wedges and stone lines along unit contacts; (b) deformed sand wedge along contact between units TDE2 and TDE3; (c) photo showing inset photo locations. Stereographs show unit means and 95% circles of confidence of each unit (see also Table 5).
Bella Vista
A ~30-m-high road-cut on the south side of National Route 40 near Estancia
Bella Vista (51.867° S, 70.565° W; Figure 37) exposes 20 m of horizontally bedded
outwash gravel with minor sand interbeds overlying sandstone and mudstone of the
Miocene Santa Cruz Formation (Figure 45). The gravel contains rounded to sub-rounded
clasts, mostly pebbles, but with some cobbles and small boulders. Cross-bedding within
the unit indicates down-valley deposition by the paleo-Río Gallegos. The gravel is
capped by 6 m of reversely magnetized basalt that yielded a 39Ar/40Ar age of 0.89 ± 0.03
Ma (Mejia et al., 2004; Coronato et al., 2013).
Estancia Chimen Aike
A borrow pit located about 15 km NE of the Tres de Enero site exposes 3.2 m of
laminated to thin-bedded silt and fine- to medium-grained sand overlying poorly sorted
sandy gravel (51.71587° S, -69.2924° W; TDF124; Figure 46). The sandy gravel is
overlain successively by 0.75 m of rippled very fine sand and silt grading upward into
planar-laminated silt, 1.75 m of rippled very fine to fine sand, and 0.7 m of massive fine
sand with load structures at the base. The sediments are gently inclined, contain no
visible fossils, and were likely deposited in an ice-proximal lake or pond. Paleomagnetic
samples collected from silt 0.3, 1.75, and 2.75 m above the base of the glaciolacustrine
sediments are reversely magnetized.
Weakly stratified, matrix-supported diamicton, is exposed in a 2-m-high road cut
a short distance north of the Chimen Aike borrow pit (51.714598 S, 69.290573 W;
TDF125; Figure 47). The diamicton is fissile and has a 15% clast content, with striated
and faceted clasts up to 15 cm long, therefore I interpret it to be till. It is also reversely
magnetized, suggesting that it correlates to the reversely magnetized till (unit TDE3) at
Tres de Enero. At the south end of the exposure, the till underlies thin bedded silt and
fine sand.
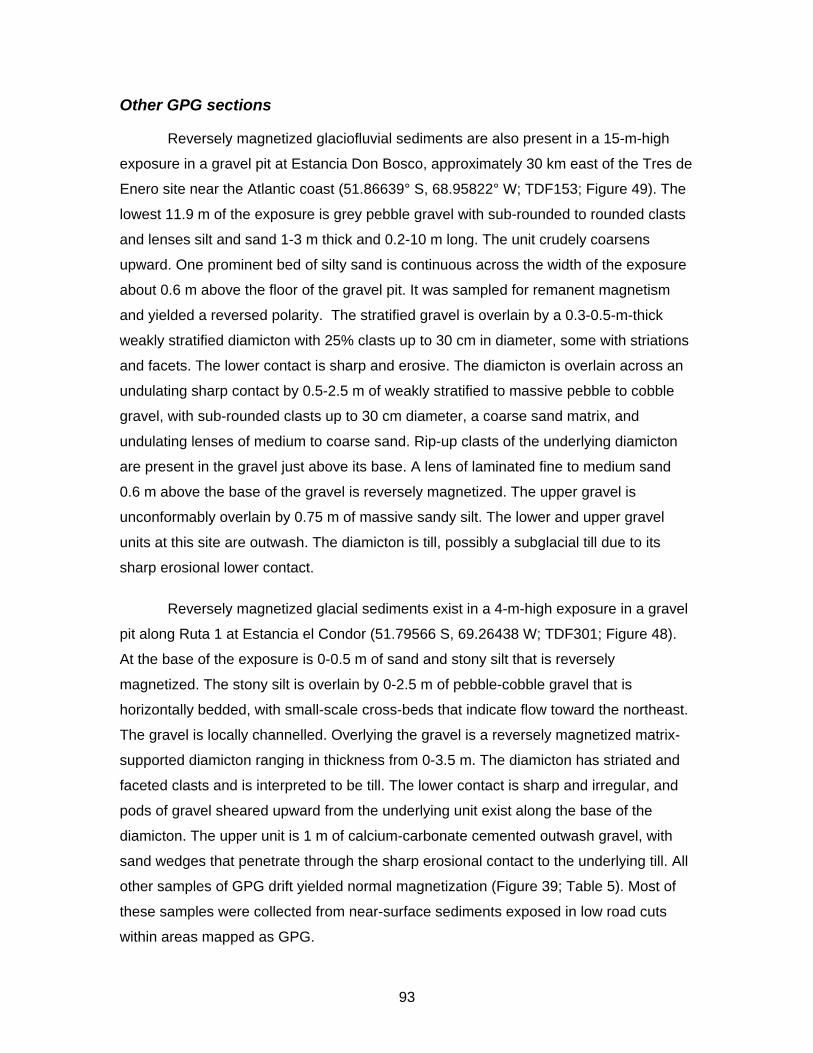
93
Other GPG sections
Reversely magnetized glaciofluvial sediments are also present in a 15-m-high
exposure in a gravel pit at Estancia Don Bosco, approximately 30 km east of the Tres de
Enero site near the Atlantic coast (51.86639° S, 68.95822° W; TDF153; Figure 49). The
lowest 11.9 m of the exposure is grey pebble gravel with sub-rounded to rounded clasts
and lenses silt and sand 1-3 m thick and 0.2-10 m long. The unit crudely coarsens
upward. One prominent bed of silty sand is continuous across the width of the exposure
about 0.6 m above the floor of the gravel pit. It was sampled for remanent magnetism
and yielded a reversed polarity. The stratified gravel is overlain by a 0.3-0.5-m-thick
weakly stratified diamicton with 25% clasts up to 30 cm in diameter, some with striations
and facets. The lower contact is sharp and erosive. The diamicton is overlain across an
undulating sharp contact by 0.5-2.5 m of weakly stratified to massive pebble to cobble
gravel, with sub-rounded clasts up to 30 cm diameter, a coarse sand matrix, and
undulating lenses of medium to coarse sand. Rip-up clasts of the underlying diamicton
are present in the gravel just above its base. A lens of laminated fine to medium sand
0.6 m above the base of the gravel is reversely magnetized. The upper gravel is
unconformably overlain by 0.75 m of massive sandy silt. The lower and upper gravel
units at this site are outwash. The diamicton is till, possibly a subglacial till due to its
sharp erosional lower contact.
Reversely magnetized glacial sediments exist in a 4-m-high exposure in a gravel
pit along Ruta 1 at Estancia el Condor (51.79566 S, 69.26438 W; TDF301; Figure 48).
At the base of the exposure is 0-0.5 m of sand and stony silt that is reversely
magnetized. The stony silt is overlain by 0-2.5 m of pebble-cobble gravel that is
horizontally bedded, with small-scale cross-beds that indicate flow toward the northeast.
The gravel is locally channelled. Overlying the gravel is a reversely magnetized matrix-
supported diamicton ranging in thickness from 0-3.5 m. The diamicton has striated and
faceted clasts and is interpreted to be till. The lower contact is sharp and irregular, and
pods of gravel sheared upward from the underlying unit exist along the base of the
diamicton. The upper unit is 1 m of calcium-carbonate cemented outwash gravel, with
sand wedges that penetrate through the sharp erosional contact to the underlying till. All
other samples of GPG drift yielded normal magnetization (Figure 39; Table 5). Most of
these samples were collected from near-surface sediments exposed in low road cuts
within areas mapped as GPG.
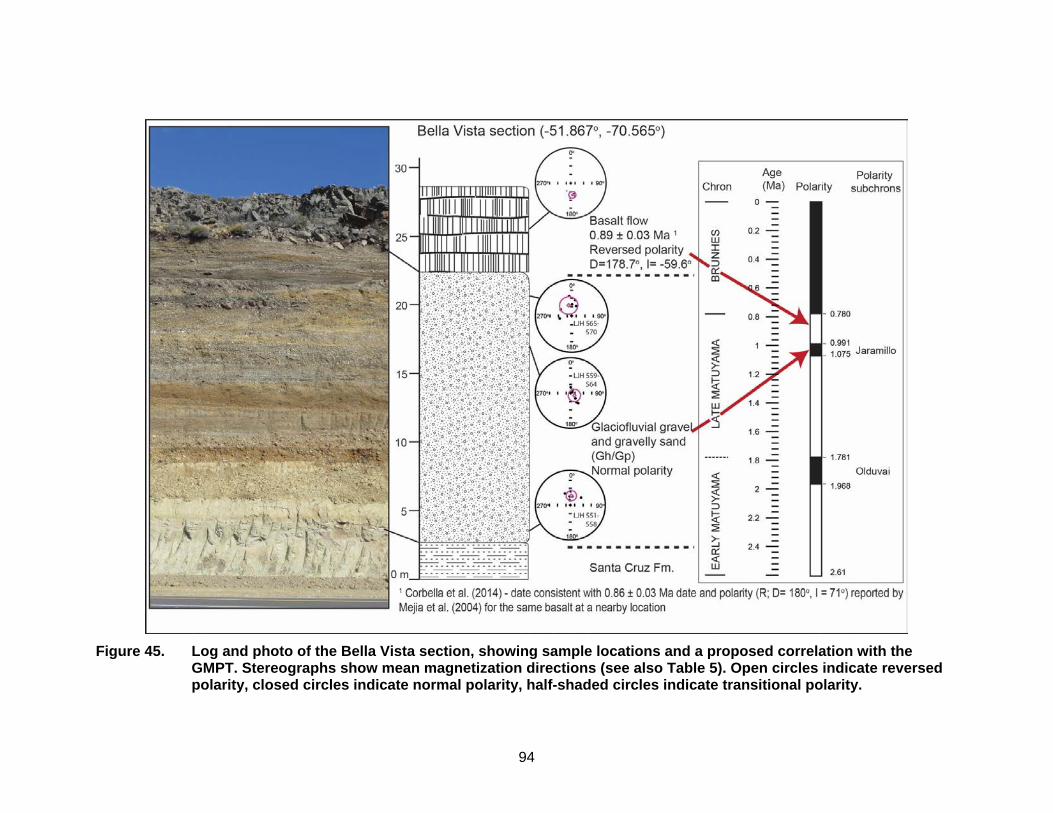
94
Figure 45. Log and photo of the Bella Vista section, showing sample locations and a proposed correlation with the
GMPT. Stereographs show mean magnetization directions (see also Table 5). Open circles indicate reversed polarity, closed circles indicate normal polarity, half-shaded circles indicate transitional polarity.
95
Figure 46. (a) Log showing sample locations at the Chimen Aike section. (b)
Photos show bedding within the glaciolacustrine sequence. (c) Stereographs show mean magnetization directions (see also Table 5). Grain size scale: c = clay; z = silt; s = sand. (d) Photo of borrow pit exposure.
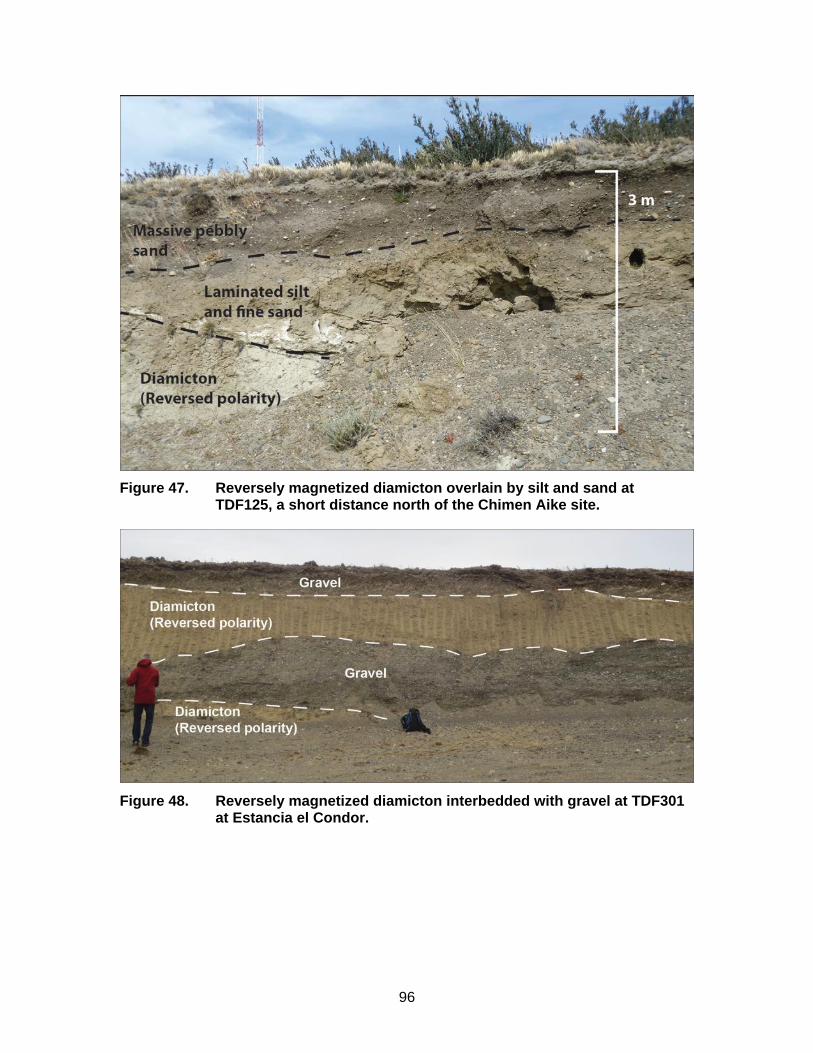
96
Figure 47. Reversely magnetized diamicton overlain by silt and sand at
TDF125, a short distance north of the Chimen Aike site.
Figure 48. Reversely magnetized diamicton interbedded with gravel at TDF301
at Estancia el Condor.
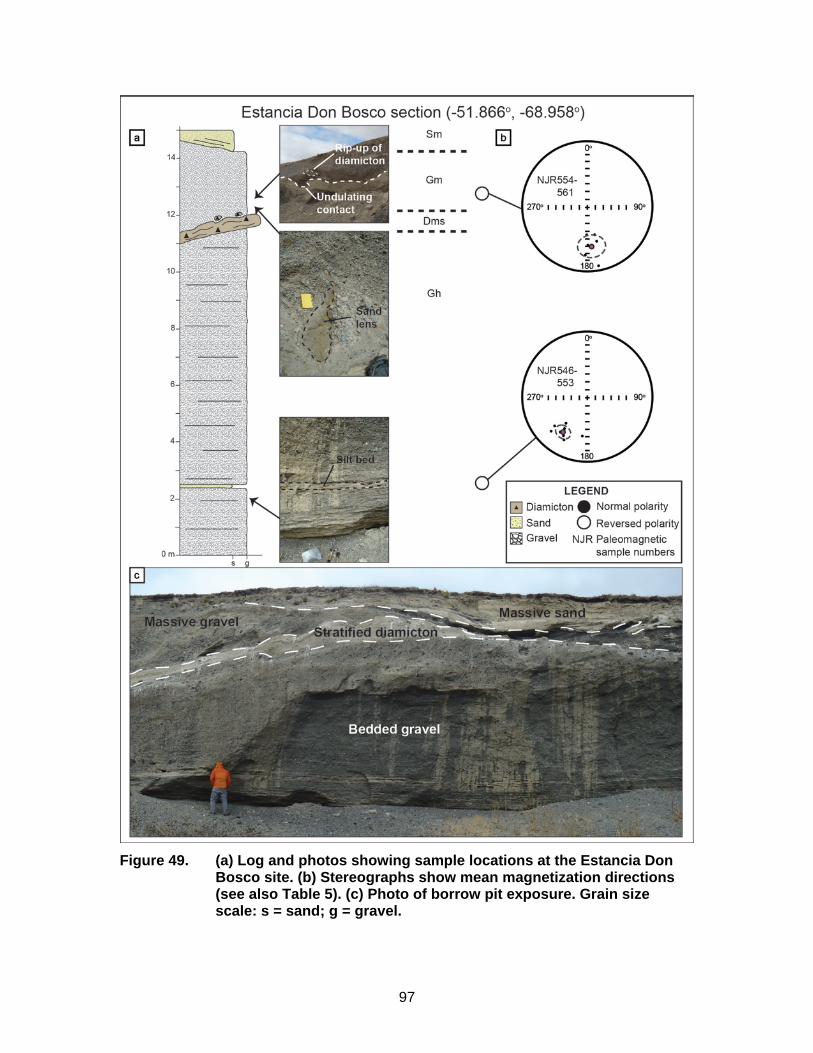
97
Figure 49. (a) Log and photos showing sample locations at the Estancia Don
Bosco site. (b) Stereographs show mean magnetization directions (see also Table 5). (c) Photo of borrow pit exposure. Grain size scale: s = sand; g = gravel.
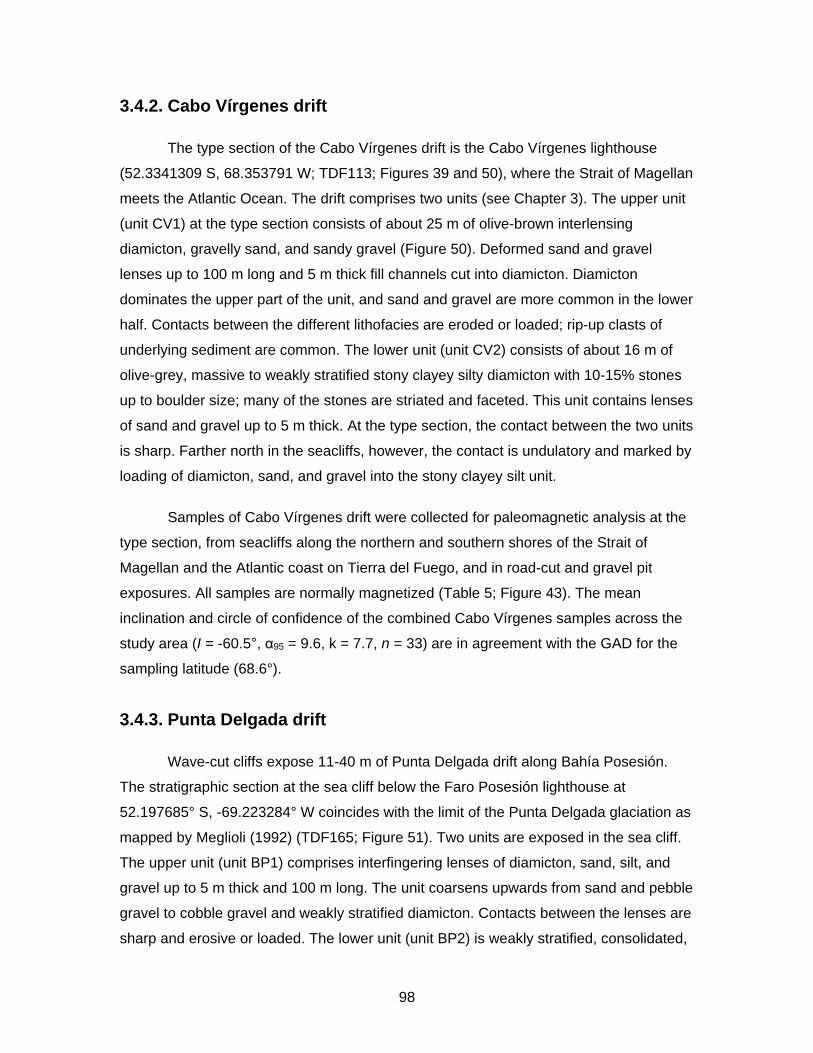
98
3.4.2. Cabo Vírgenes drift
The type section of the Cabo Vírgenes drift is the Cabo Vírgenes lighthouse
(52.3341309 S, 68.353791 W; TDF113; Figures 39 and 50), where the Strait of Magellan
meets the Atlantic Ocean. The drift comprises two units (see Chapter 3). The upper unit
(unit CV1) at the type section consists of about 25 m of olive-brown interlensing
diamicton, gravelly sand, and sandy gravel (Figure 50). Deformed sand and gravel
lenses up to 100 m long and 5 m thick fill channels cut into diamicton. Diamicton
dominates the upper part of the unit, and sand and gravel are more common in the lower
half. Contacts between the different lithofacies are eroded or loaded; rip-up clasts of
underlying sediment are common. The lower unit (unit CV2) consists of about 16 m of
olive-grey, massive to weakly stratified stony clayey silty diamicton with 10-15% stones
up to boulder size; many of the stones are striated and faceted. This unit contains lenses
of sand and gravel up to 5 m thick. At the type section, the contact between the two units
is sharp. Farther north in the seacliffs, however, the contact is undulatory and marked by
loading of diamicton, sand, and gravel into the stony clayey silt unit.
Samples of Cabo Vírgenes drift were collected for paleomagnetic analysis at the
type section, from seacliffs along the northern and southern shores of the Strait of
Magellan and the Atlantic coast on Tierra del Fuego, and in road-cut and gravel pit
exposures. All samples are normally magnetized (Table 5; Figure 43). The mean
inclination and circle of confidence of the combined Cabo Vírgenes samples across the
study area (I = -60.5°, α95 = 9.6, k = 7.7, n = 33) are in agreement with the GAD for the
sampling latitude (68.6°).
3.4.3. Punta Delgada drift
Wave-cut cliffs expose 11-40 m of Punta Delgada drift along Bahía Posesión.
The stratigraphic section at the sea cliff below the Faro Posesión lighthouse at
52.197685° S, -69.223284° W coincides with the limit of the Punta Delgada glaciation as
mapped by Meglioli (1992) (TDF165; Figure 51). Two units are exposed in the sea cliff.
The upper unit (unit BP1) comprises interfingering lenses of diamicton, sand, silt, and
gravel up to 5 m thick and 100 m long. The unit coarsens upwards from sand and pebble
gravel to cobble gravel and weakly stratified diamicton. Contacts between the lenses are
sharp and erosive or loaded. The lower unit (unit BP2) is weakly stratified, consolidated,
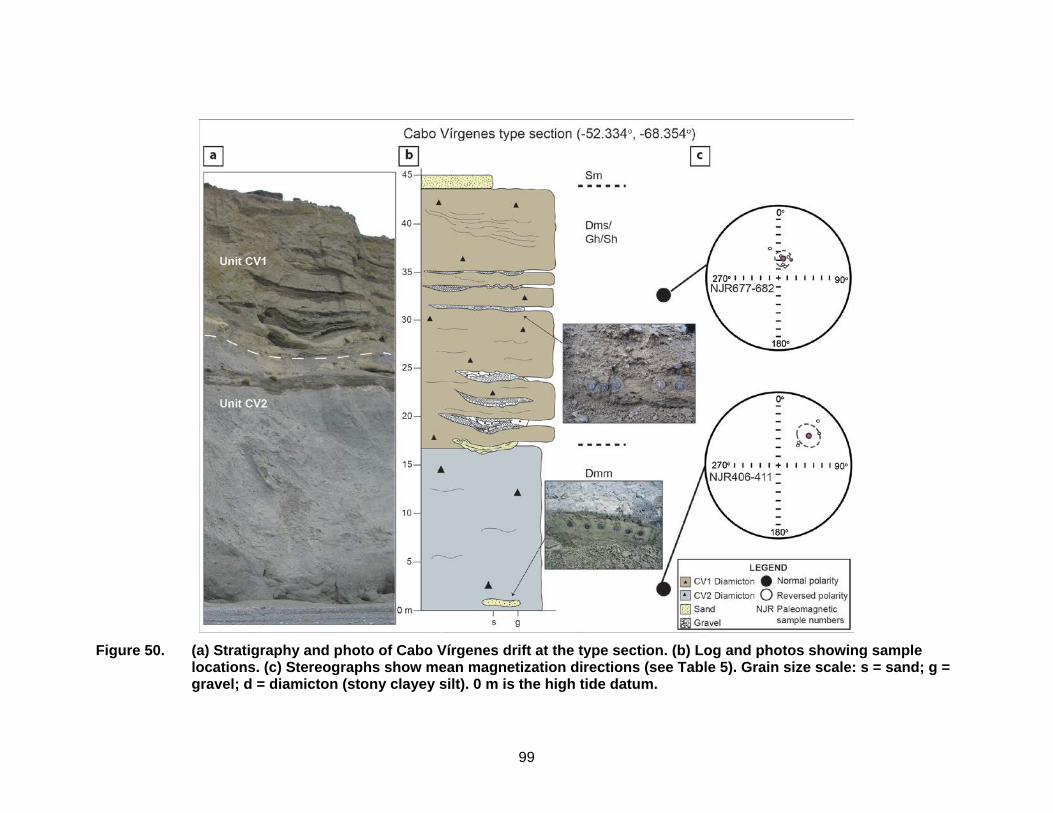
99
Figure 50. (a) Stratigraphy and photo of Cabo Vírgenes drift at the type section. (b) Log and photos showing sample
locations. (c) Stereographs show mean magnetization directions (see Table 5). Grain size scale: s = sand; g = gravel; d = diamicton (stony clayey silt). 0 m is the high tide datum.
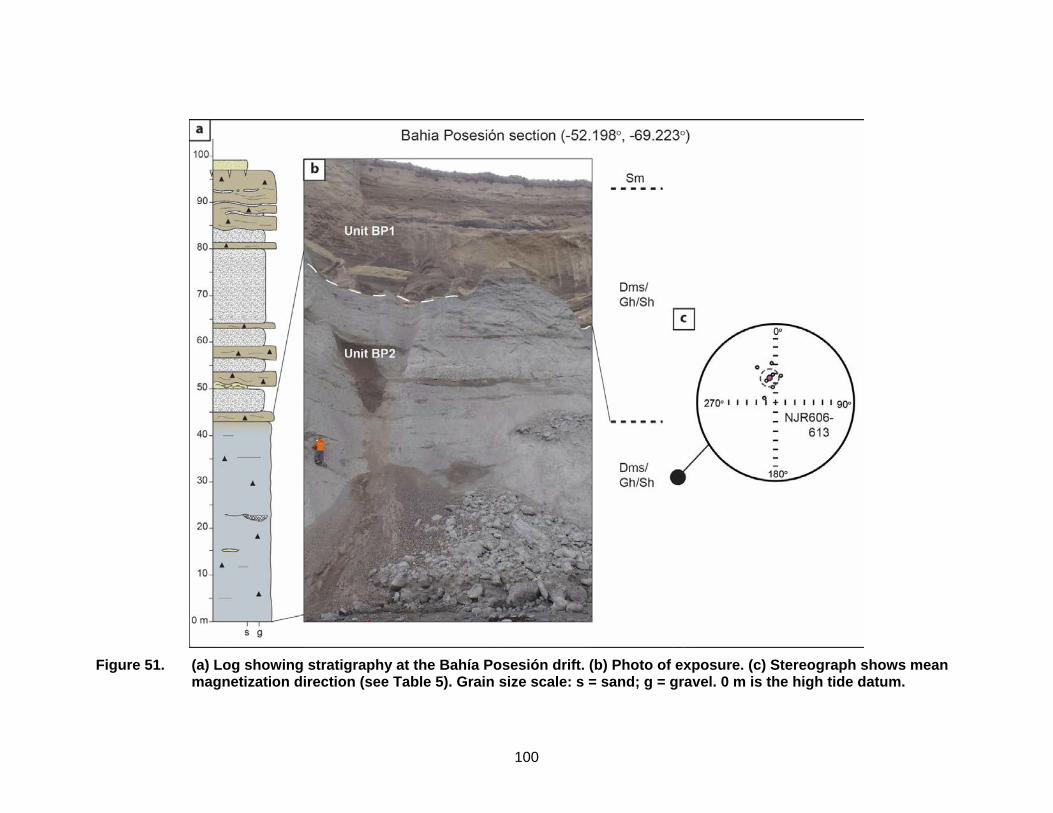
100
Figure 51. (a) Log showing stratigraphy at the Bahía Posesión drift. (b) Photo of exposure. (c) Stereograph shows mean
magnetization direction (see Table 5). Grain size scale: s = sand; g = gravel. 0 m is the high tide datum.
101
stony silt with 10-15% clasts. Lenses of fine to medium-grained sand up to 0.5 m thick
and 20 m long are common throughout the unit.
Samples were collected for paleomagnetic analysis at the type section, other sea
cliff exposures on the north and south shores of the Strait of Magellan, and from road-cut
and gravel pit exposures both north of the strait and along the Bahía Inútil-San
Sebastian depression on Tierra del Fuego. All samples (n = 17) are normally
magnetized. The mean inclination of is -61.5° (α95 = 9.0°, k = 16.5) and within the error
limits lies near the GAD (68.6°).
3.4.4. Primera Angostura drift
All eight samples of Primera Angostura drift are normally magnetized (Table 6;
Figure 43). The mean inclination (I = -65.9°; α95 = 8.5°, k = 43.2, n = 8), lies near the
GAD (68.6°).
3.5. Discussion
3.5.1. GPG drift
The Tres de Enero road cut provides clear evidence for at least three glaciations
involving advances of the Strait of Magellan ice lobe at least as far east as 69° W during
the GPG. The three glaciations were separated by three periods during which climate
was cold enough for ice-wedges to form at the surface. My interpretation that the three
till units were deposited over a long period of time is supported by the change in
magnetic polarity from reversed to normal between deposition of units TDE3 and TDE2
(Figure 44).
Bockheim et al. (2009) identified two till units and two sets of sand wedges at the
Tres de Enero locality. They inferred four periods of cold climate with three proposed
possibilities for their timing. The first possibility is that the lower till (Till 1 of Bockheim et
al., 2009; units TDE2 and TDE3 of this study) represents a pre-GPG advance, and the
capping set of wedges a period of climate deterioration that was cold and dry enough for
periglacial conditions, but not humid enough for ice to reach the site. The upper till (Till 2
of Bockheim et al., 2009, unit TDE1 of this study) would thus record the GPG advance.
102
Their second possibility is that the lower till represents the GPG ice advance, the lower
set of wedges a cold and dry climatic event, and the upper till a post-GPG advance large
enough to reach the site. A final possibility is that the GPG encompassed four advance
stages separated by recessional events. With my discovery of a third till that was not
recognized by Bockheim et al. (2009), the number of advance stages might be increased
to six. This argument, however, requires that the periods of sand-wedge formation be
distinct from the glacier advances that left the overlying till. In addition, the upper set of
sand wedges at the modern ground surface might have formed during any cold period
after the GPG.
There are several possible interpretations of the paleomagnetic data at the Tres
de Enero site. One possibility is that the reversed till (unit TDE3) was deposited late in
the late Matuyama Reversed Chron (0.991-0.780 Ma), and the two normal tills (units
TDE1 and 2) were deposited during the Brunhes Normal Chron (<0.780 Ma). This would
require post-GPG ice lobes to have extended farther east than mapped by Meglioli
(1992) and Coronato et al. (2004a). The second possibility is that the reversely
magnetized till was deposited during the Matuyma Reversed Chron near the purported
onset of the GPG (ca. 1.0-1.2 Ma), but before the Jaramillo Normal subchron (1.075-
0.991 Ma). Given that Cabo Vírgenes drift (post-GPG 1) dates to the Middle Pleistocene
(<0.780 Ma), this interpretation implies that unit TDE 2 might date to the Jaramillo
Normal Subchron (1.075 – 0.991 Ma; MIS 30) and unit TDE 3 to the earliest part of the
Brunhes Normal Chron (e.g., MIS 18). This interpretation is consistent with the
interpretation of Coronato et al. (2013) that Magellan lobe ice reached at least as far
east as Laguna Potrok Aike (51.953085° S, 70.396052° W) near Bella Vista prior to the
onset of the GPG at 1.1 Ma. This earlier ice advance would have occurred after the
eruption of the Piche scoria cone in the Río Gallegos valley at 2.1 Ma (Meglioli, 1992),
possibly during one of the colder stages of the Early Pleistocene (e.g., MIS 58), as
evidenced by glacially scoured lava flows and erratic boulders of Andean provenance
found beyond the moraines of the GPG (Coronato et al., 2013). If the magnetically
reversed till at Tres de Enero is correlative to the earlier ice advance hypothesized at
Laguna Potrok Aike, then I suggest these earlier advances extended at least as far as
69° latitude and possibly beyond the modern Atlantic coastline.
Reversely magnetized glacial sediments are found at Estancia Chimen Aike,
Estancia don Bosco, and Estancia el Condor, also near the Atlantic Coast north of the
103
Strait of Magellan. The simplest interpretation is that they were deposited close to the
glacier margin responsible for deposition of unit TDE3 till at Tres de Enero and prior to
the deposition of normally magnetized till of units TDE1 and TDE2. The samples of GPG
drift that yielded normal magnetization were collected from near-surface sediments, and
were likely deposited during the last GPG glacial event, at the same time as unit TDE1.
The Bella Vista road cut exposes about 20 m of normally magnetized outwash
gravel capped by a reversely magnetized basalt with a 39Ar/40Ar age of 0.89 ± 0.03 Ma.
The basalt flow was erupted late during the late Matuyama Reversed Chron, just before
the beginning of the Brunhes Normal Chron at 0.78 Ma. Samples for paleomagnetic
analysis were collected from three lenses of sandy silt within the gravel 1, 14, and 18 m
above its lower contact with the Santa Cruz Formation. The samples from 1 and 18 m
above the lower contact have normal polarity, and the one collected 14 m above the
base of the unit has transitional polarity (Figure 45). I assign this gravel to the GPG, as it
is normally magnetized but older than 0.89 Ma; it may have been deposited during the
Jaramillo subchron. The transitional polarity of the sample in the upper part of the unit
may indicate that the gravel was deposited close to the change from normal to reversed
polarity at the end of the Jaramillo subchron. I hypothesize that the glaciofluvial gravels
indicate that ice was nearby in the Río Gallegos Valley during the Jaramillo subchron,
most likely during MIS 30. I also suggest that these glaciofluvial gravels might have been
deposited at the same time as one of the normally magnetized tills at the Tres de Enero
locality. Coronato et al. (2013) describe GPG till from the Magellan lobe near Laguna
Potrok Aike that overlies the Bandurrias basalt flow dated 1.19 ± 0.02 Ma (Zolitschka et
al., 2006), as well as an outwash fan overlain by a 0.86 ± 0.03 Ma flow (Mejia et al.,
2004). The Bella Vista road-cut stratigraphy indicates that ice was also present at this
time in the Río Gallegos valley west of 70.565° W.
3.5.2. Cabo Vírgenes drift
All of the samples of Cabo Vírgenes drift are normally magnetized. Previous
researchers have argued that this first post-GPG glaciation happened between 1.07 and
0.760 Ma. My paleomagnetic data indicate that this glaciation is younger than 0.78 Ma,
which is the beginning of the Brunhes Normal Chron. The Cabo Vírgenes glaciation may
coincide with MIS 18 or 16 when the 100 kyr Middle Pleistocene glacial cycles were well
established.
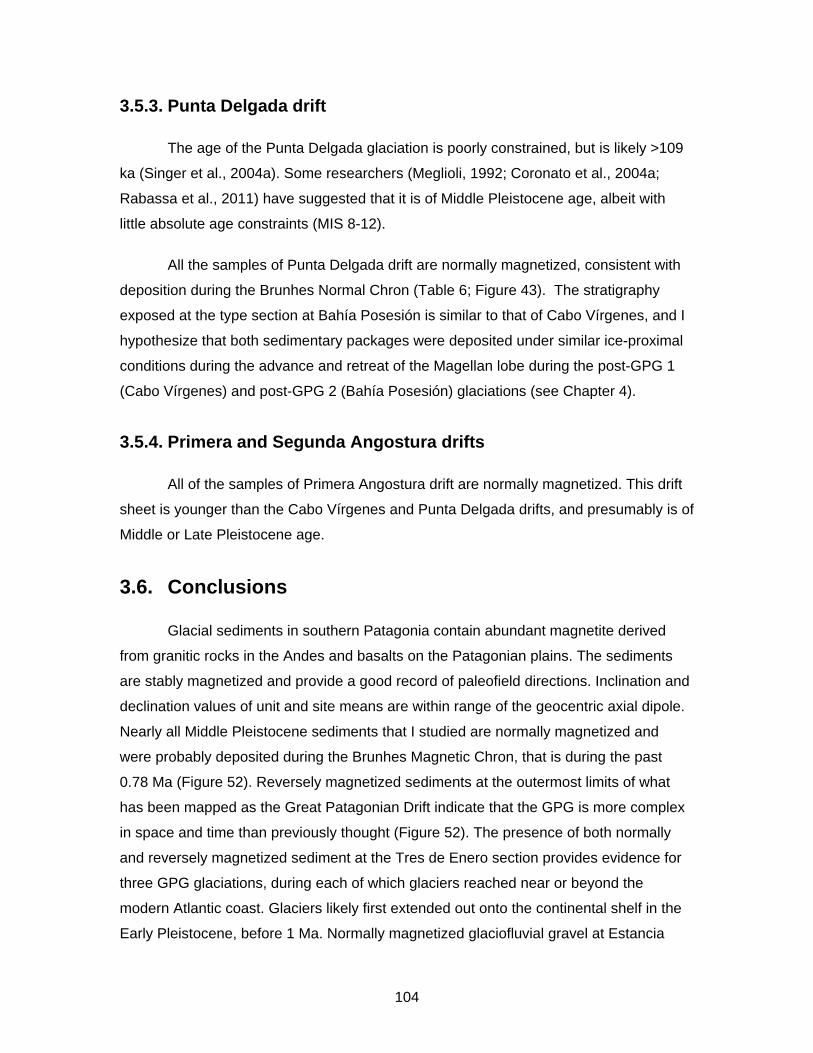
104
3.5.3. Punta Delgada drift
The age of the Punta Delgada glaciation is poorly constrained, but is likely >109
ka (Singer et al., 2004a). Some researchers (Meglioli, 1992; Coronato et al., 2004a;
Rabassa et al., 2011) have suggested that it is of Middle Pleistocene age, albeit with
little absolute age constraints (MIS 8-12).
All the samples of Punta Delgada drift are normally magnetized, consistent with
deposition during the Brunhes Normal Chron (Table 6; Figure 43). The stratigraphy
exposed at the type section at Bahía Posesión is similar to that of Cabo Vírgenes, and I
hypothesize that both sedimentary packages were deposited under similar ice-proximal
conditions during the advance and retreat of the Magellan lobe during the post-GPG 1
(Cabo Vírgenes) and post-GPG 2 (Bahía Posesión) glaciations (see Chapter 4).
3.5.4. Primera and Segunda Angostura drifts
All of the samples of Primera Angostura drift are normally magnetized. This drift
sheet is younger than the Cabo Vírgenes and Punta Delgada drifts, and presumably is of
Middle or Late Pleistocene age.
3.6. Conclusions
Glacial sediments in southern Patagonia contain abundant magnetite derived
from granitic rocks in the Andes and basalts on the Patagonian plains. The sediments
are stably magnetized and provide a good record of paleofield directions. Inclination and
declination values of unit and site means are within range of the geocentric axial dipole.
Nearly all Middle Pleistocene sediments that I studied are normally magnetized and
were probably deposited during the Brunhes Magnetic Chron, that is during the past
0.78 Ma (Figure 52). Reversely magnetized sediments at the outermost limits of what
has been mapped as the Great Patagonian Drift indicate that the GPG is more complex
in space and time than previously thought (Figure 52). The presence of both normally
and reversely magnetized sediment at the Tres de Enero section provides evidence for
three GPG glaciations, during each of which glaciers reached near or beyond the
modern Atlantic coast. Glaciers likely first extended out onto the continental shelf in the
Early Pleistocene, before 1 Ma. Normally magnetized glaciofluvial gravel at Estancia

105
Bella Vista underlies a 0.86 Ma basalt flow, which indicates that at least some normally
magnetized GPG sediment probably was deposited during the Jaramillo Subchron
(1.075-0.991 Ma).
All post-GPG drift units were deposited during the Brunhes Normal Chron, well
inland of the GPG limit. No reversely magnetized sediment was found within the Cabo
Vírgenes drift, indicating that it is younger than 0.78 Ma (Figure 52). Samples of Cabo
Vírgenes and Punta Delgada drifts have nearly identical paleofield directions. More
detailed work on these two drift sequences might help constrain their ages.
106
Figure 52. Revised Pleistocene chronostratigraphy of the study area. The Cabo Vírgenes glaciation is shown as being
within the Brunhes Normal Chron.
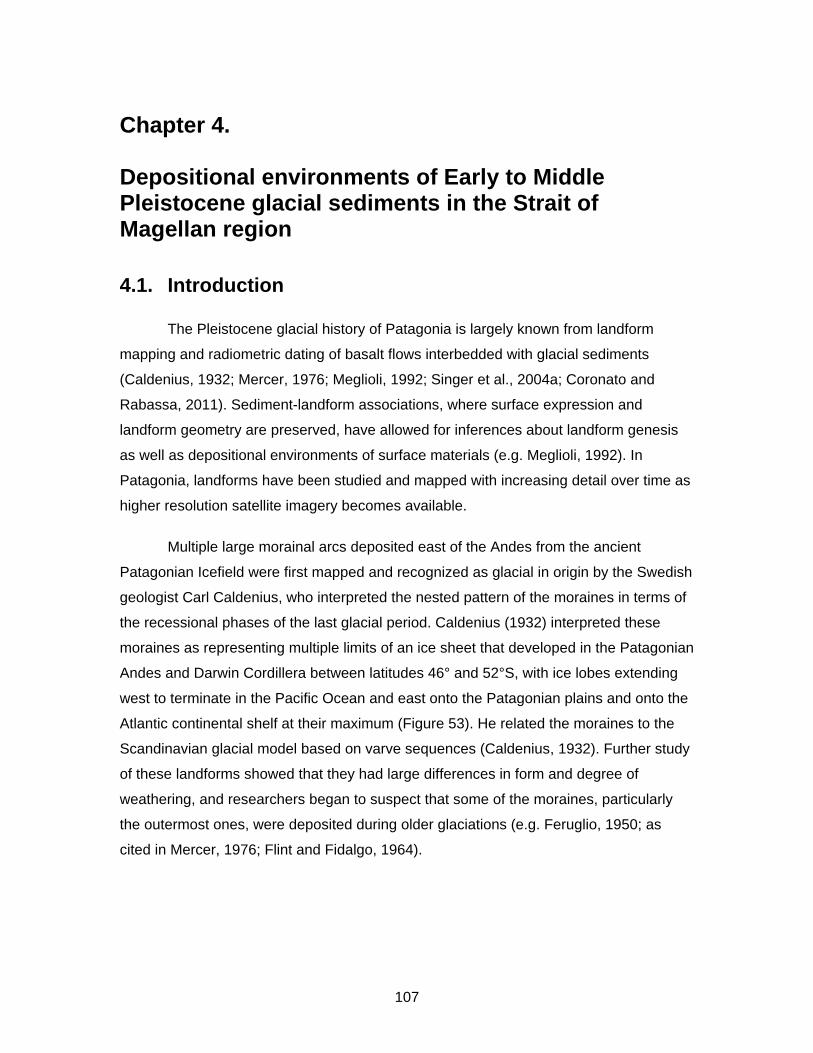
107
Chapter 4. Depositional environments of Early to Middle Pleistocene glacial sediments in the Strait of Magellan region
4.1. Introduction
The Pleistocene glacial history of Patagonia is largely known from landform
mapping and radiometric dating of basalt flows interbedded with glacial sediments
(Caldenius, 1932; Mercer, 1976; Meglioli, 1992; Singer et al., 2004a; Coronato and
Rabassa, 2011). Sediment-landform associations, where surface expression and
landform geometry are preserved, have allowed for inferences about landform genesis
as well as depositional environments of surface materials (e.g. Meglioli, 1992). In
Patagonia, landforms have been studied and mapped with increasing detail over time as
higher resolution satellite imagery becomes available.
Multiple large morainal arcs deposited east of the Andes from the ancient
Patagonian Icefield were first mapped and recognized as glacial in origin by the Swedish
geologist Carl Caldenius, who interpreted the nested pattern of the moraines in terms of
the recessional phases of the last glacial period. Caldenius (1932) interpreted these
moraines as representing multiple limits of an ice sheet that developed in the Patagonian
Andes and Darwin Cordillera between latitudes 46° and 52°S, with ice lobes extending
west to terminate in the Pacific Ocean and east onto the Patagonian plains and onto the
Atlantic continental shelf at their maximum (Figure 53). He related the moraines to the
Scandinavian glacial model based on varve sequences (Caldenius, 1932). Further study
of these landforms showed that they had large differences in form and degree of
weathering, and researchers began to suspect that some of the moraines, particularly
the outermost ones, were deposited during older glaciations (e.g. Feruglio, 1950; as
cited in Mercer, 1976; Flint and Fidalgo, 1964).
108
Figure 53. Glacial limits in Patagonia after Caldenius (1932), as well as tectonic
plate boundaries and major mountain ranges.
The hypothesis that the morainic arcs are products of many glaciations was
confirmed when the age of the outermost glacial surface was found to be correlative with
that of glacial sediments deposited closer to the eastern foothills of the Patagonian
Andes to north, for example at Lago Buenos Aires (46.5°S) (Figure 54). John Mercer
employed radiometric dating and paleomagnetic techniques there to elucidate the glacial
109
chronology in the region. K/Ar ages on basalt flows overlying and underlying glacial
sediments confirmed that glaciations had occurred many times prior to the Last Glacial
Maximum (LGM), even back as far as the late Miocene (Mercer 1976; Mercer and
Sutter, 1982). The oldest drift-bounding basalt flows were later re-dated by Ton-That et
al. (1999), yielding incremental 40Ar/39Ar heating ages of 7.38 ± 0.05 and 5.04 ± 0.04 Ma.
Episodic glaciation marked the Pliocene and Early Pleistocene. At Lago Viedma (49.6°S)
and Lago Argentino (50.2°S), for example, K/Ar ages obtained from basalt flows
interbedded with glacial sediments indicate that glaciers repeatedly advanced onto the
Patagonian plains during the Late Pliocene and Early Pleistocene (Mercer et al., 1975;
Mercer, 1976; Ton-That et al., 1999; Singer et al., 2004b). The first glaciers to reach the
Atlantic coast from this part of the Andes were Early-Middle Pleistocene piedmont
glaciers that extended over relatively flat terrain along valleys formed during a
tectonically-induced “canyon-cutting event” (Rabassa and Clapperton, 1990; Coronato et
al., 2004b). Mercer (1976) named this event the ‘Great Patagonian Glaciation’ (GPG)
and obtained maximum K/Ar ages on it of 1.47 ± 0.01 and 1.17 ± 0.05 Ma from basalt
flows that underlie glacial sediment in the Río Gallegos valley. A glacially scoured,
erratics-strewn basalt flow at Estancia Bella Vista, also in the Río Gallegos valley, was
dated via total fusion, whole-rock 40Ar/39Ar at 1.55 ± 0.03 Ma (Meglioli, 1992) and later by 40Ar/39Ar incremental heating technique at 1.168 ± 0.007 Ma (Ton-That et al.,1999).
Singer et al. (2004a) correlated that event to a glaciation identified at Lago Buenos
Aires, where a basalt flow dated at 1.016 ± 0.005 Ma overlies glacial sediments. They
concluded that this age is a minimum for the GPG.
More recently, researchers have recognized that the GPG is not a single
glaciation, but rather two or more events (Rabassa, 2008; Bockheim et al., 2009; Rutter
et al., 2012). The Bella Vista drift in the Río Gallegos Valley and the Sierra de los Frailes
drift along the Strait of Magellan have been assigned to the GPG. Meglioli (1992)
characterized the Sierra de los Frailes drift surface as till covering a low-relief surface
ranging in elevation from 20 m a.s.l. at the Atlantic coast to 280 m a.s.l farther west. The
surface is highly weathered, with conspicuous oxidized and cryoturbated soil horizons
and well-developed weathering rinds on surface basalt clasts (Meglioli, 1992).
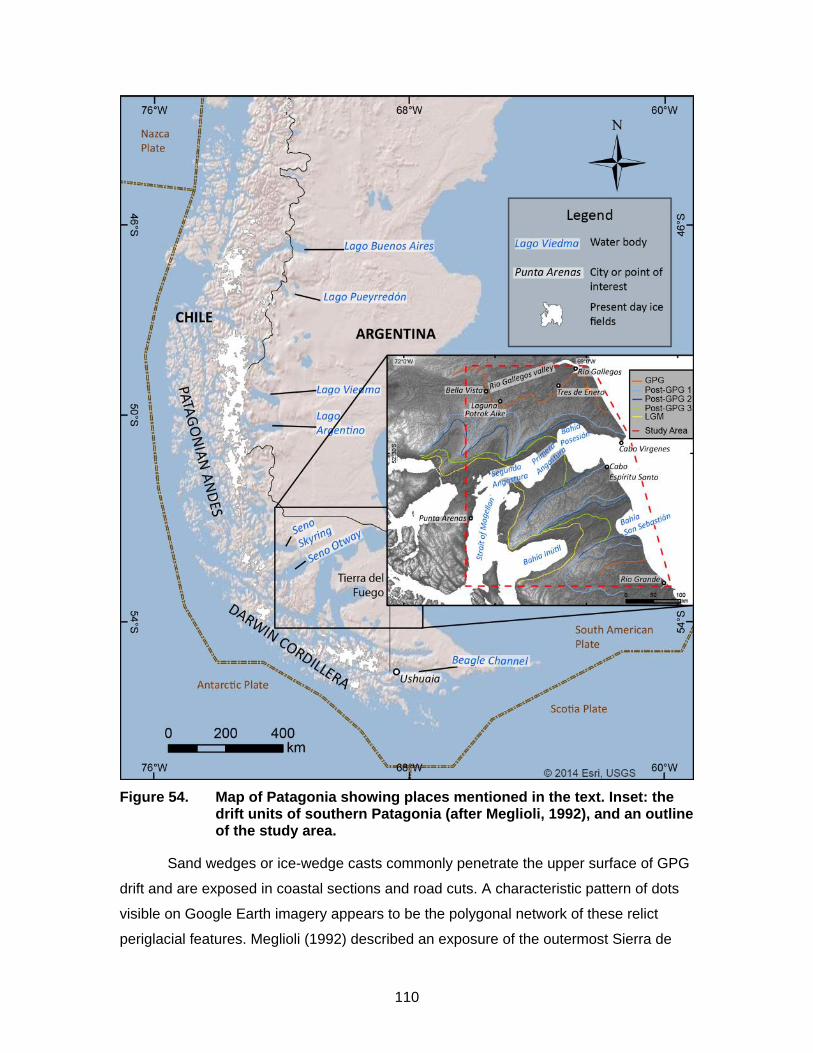
110
Figure 54. Map of Patagonia showing places mentioned in the text. Inset: the
drift units of southern Patagonia (after Meglioli, 1992), and an outline of the study area.
Sand wedges or ice-wedge casts commonly penetrate the upper surface of GPG
drift and are exposed in coastal sections and road cuts. A characteristic pattern of dots
visible on Google Earth imagery appears to be the polygonal network of these relict
periglacial features. Meglioli (1992) described an exposure of the outermost Sierra de
111
los Frailes drift near the police station 8 km south of Río Gallegos where a cryoturbated
till containing striated clasts is overlain by fluvial gravel, with an irregular calcic horizon at
the surface. The Tres de Enero roadcut, 20 km south of Río Gallegos, exposes at least
three GPG tills separated by paleosurfaces marked by truncated sand wedges (Chapter
3). The sand wedges formed over periods of at least hundreds to thousands of years
between periods of glacier cover (Bockheim et al., 2009).
Multiple post-GPG glaciations have since been identified and inferred to be
Middle and Late Pleistocene in age based on both relative and absolute dating
techniques (Mercer, 1976; Mercer and Sutter, 1982; Rabassa and Clapperton, 1990;
Meglioli, 1992; Ton-That et al., 1999, Singer et al., 2004a; Kaplan et al., 2005) (Figure
54). The four drift units that Meglioli (1992) inferred to be younger than GPG have been
referred to by Coronato et al. (2004b) as successively smaller “post-GPG” events.
Coronato et al. (2004a) correlated these events to glaciations documented in the
southern Andes. I use their terminology in this thesis.
The first glacial event to follow the GPG (post-GPG 1) has a maximum Ar/Ar age
of 0.760 ± 0.007 Ma (Ton-That et al., 1999), obtained from a basalt flow near Lago
Buenos Aires that overlies glacial outwash deposits assigned to that glaciation. Coronato
and Rabassa (2011) correlated this event to the Cabo Vírgenes glaciation, which left
thick drift along the Strait of Magellan. Post-GPG 1 glaciers reached the Atlantic
continental shelf along the Strait of Magellan (Meglioli, 1992) (Figure 54), following
drainage networks that were over-deepened by glacial erosion during previous
glaciations. The ice mass split into two ice lobes that left high-elevation surfaces of the
Patagonian plains unglaciated. One lobe flowed over the area that is now Skyring and
Otway sounds and the Strait of Magellan; the second flowed through the Bahía-Inútil /
Bahía San Sebastián depression (Meglioli, 1992; Coronato et al., 2004a) (Figure 54).
The post-GPG 1 moraine arc is located inside that of the GPG at an elevation of 100 m
a.s.l. at the Atlantic coast and 400 m a.s.l. near Punta Arenas to the west (Meglioli,
1992). Ice in the Río Gallegos valley terminated far inland, near Estancia Bella Vista
where it deposited the Glencross drift (Meglioli, 1992).
Two ice lobes also formed during the next glaciation, but they did not reach as far
from the Andes as those of the earlier event, terminating near Bahía Posesión along the
Strait of Magellan and leaving large erratics on the shores of Bahía Inútil and Bahía San
112
Sebastián (Darwin, 1842; Coronato et al., 2004a; Evenson et al., 2009) (Figure 54).
There is no absolute upper limiting age for post-GPG 2 drift, but a basalt flow in the Lago
Buenos Aires area with a 40Ar/39Ar incremental-heating age of 109 ± 3 ka (Singer et al.,
2004a) overlies both post-GPG 3 and post-GPG 2 tills and thus is a minimum age for
both events. Hein et al. (2009) reported a mean 10Be cosmogenic surface exposure age
of 0.260 Ma on a post-GPG 3 outwash terrace at Lago Pueyrredón. This is widely cited
as the age of the post-GPG 3 glaciation (e.g. Coronato and Rabassa, 2011).
Coronato et al. (2004a) assigned the Punta Delgada drift along the Strait of
Magellan and the Río Turbio drift in the Río Gallegos valley to the post-GPG 3
glaciation. Post-GPG 3 ice lobes were even smaller than those of earlier glacial events,
(Figure 54). Two lobes flowed through Seno Skyring and Seno Otway and coalesced
and terminated at the Primera Angostura ferry crossing in the Strait of Magellan (Figure
54). On Tierra del Fuego, a lobe flowed through the Lago Fagnano depression. Post-
GPG 3 drift units are well exposed in wave-cut cliffs along the coast of the Strait of
Magellan and Atlantic Ocean, both on the mainland and Tierra del Fuego. Post-GPG 2
and 3 glacial sediments are normally magnetized (Chapter 3 and Walther et al., 2007),
placing them in the Brunhes Chron and thus younger than 0.78 Ma.
The landforms of the final and least extensive glaciation include the well-
preserved morainal arcs in the western Strait of Magellan, Bahía-Inútil / Bahía San
Sebastián depression, and Beagle Channel (Meglioli, 1992; Clapperton et al., 1995;
Bentley et al., 2005). Post-GPG 4 drift has been radiocarbon-dated to the Last
Glaciation, with a maximum extent between 20 and 25 ka (Clapperton et al., 1995;
McCullogh et al., 2005).
Radiometric ages have greatly improved our understanding of the glacial history
of southern Patagonia, but questions remain about the number and ages of glacial
events and the depositional environments of associated drift sheets. Drift units have
been mapped, and detail has been added with the advent of satellite-derived imagery.
Features such as drumlins, outwash channel systems, and moraines were mapped at a
low resolution by Meglioli (1992), and have been particularly well documented on
surfaces associated with the last and penultimate glaciations (Clapperton et al., 1995;
Bentley et al., 2005; Glasser and Jansson, 2008; Lovell et al., 2011; Darvill et al., 2014).
The sediments associated with glacial landforms, however, have not been described in
113
any detail in spite of the extensive exposures throughout the region. The number of
sedimentary units constituting GPG drift is also unclear. The most distal deposits of the
GPG drift lie outside of the area of Plio-Pleistocene volcanism and are far older than the
limit of radiocarbon dating. In this study, I attempt to address these deficiencies by
describing and interpreting the glacial sediments of the GPG and post-GPG 1 and 2 drift
units.
4.2. Regional setting
4.2.1. Physiography
My study area is within extra-Andean Patagonia in the Southern Patagonian
Tablelands geologic province (Ramos, 1999). It is located on the east side of the Andes
between latitudes 51°S and 54°S and between longitudes 70°W and 68°W (Figure 54).
Within this area, the Strait of Magellan separates the mainland of the South American
continent from Tierra del Fuego and links the Pacific Ocean to the west with the Atlantic
Ocean to the east. The mainland of southern South America comprises two general
areas: the Patagonian Andes on the west and the Patagonian plains to the east. The
island of Tierra del Fuego is also divisible into two areas: the Darwin Cordillera on the
southwest and the plains of Tierra del Fuego on the east. The Patagonian Andes on the
mainland and the Cordillera Darwin on Tierra del Fuego have peaks up to 2500 m a.s.l.
Snowline decreases from 1100 m a.s.l at 51°S to 800 m a.s.l at 54°S. These ranges host
the Southern Patagonian and Cordillera Darwin icefields, which are remnants of the
large Patagonian ice sheet that developed repeatedly during the Pleistocene.
4.2.2. Geology
Southern Patagonia is located near the intersection of three tectonic plates: the
Antarctic, South American, and Scotia plates (Figure 54). The region has been affected
by tectonism and volcanism from the late Mesozoic to the present. Bedrock in the
southern part of the study area is dominated by horizontal to sub-horizontally bedded,
marine and continental Late Cretaceous and Tertiary sedimentary rocks, which have
been dissected by streams and rivers and extensively covered by glacial sediments,
fluvial gravels, and basalt flows. On Tierra del Fuego, fossiliferous silty sandstones were
deposited in a transgressive marine environment during the late Oligocene and early
114
Miocene (Olivero and Malumián, 1999). In the Río Gallegos area, the bedrock is
dominated by continental sedimentary rocks of the Miocene Santa Cruz Formation (19–
10 Ma; Fleagle et al., 1995, Ramos, 2002).
Flat-lying alkaline basalt flows are found on plateau (“meseta”) surfaces and in
some valleys of the study area. They range in age from Miocene to late Holocene and
are localized along northwest-striking faults that coincide with an underlying Jurassic
paleo-rift zone (Corbella et al., 1996) that formed when Africa separated from South
America during the breakup of Gondwana (Uliana and Briddle, 1987). Some basalt flows
occur along west- and west-southwest-striking faults produced by northwesterly oriented
extension, which is related to a younger stress field along the southern flank of the
Magellan Basin (Diraison et al., 1997). Faults also control the paths of rivers such as the
Río Gallegos, as well as of those of glaciers flowing along the Strait of Magellan and
Skyring and Otway sounds.
Many high elevation meseta surfaces and valley floors of the Patagonian Andes
are mantled by Patagonian Gravels (“Rodados Patagonicos”) (Caldenius, 1932; Mercer,
1976; Meglioli, 1992; Clapperton, 1993). The Patagonian Gravels are generally rounded,
pebble- to cobble-size clasts sourced from Andes to the west (Martinez and Coronato.,
2008). Lithologies differ from north to south as a function of the geology of the Andes
(Mercer, 1973). The Patagonian Gravels are generally only a few metres thick, but in the
Santa Cruz valley they reach 100 m in thickness (Darwin, 1842; Mercer, 1973). The
gravels are commonly cemented with calcium carbonate (Mercer, 1976). A glaciofluvial
origin has proposed for the Patagonian Gravels due to the large area they cover
(Feruglio, 1950; as cited in Martinez and Coronato, 2008; Fidalgo and Riggi, 1965).
However, the gravels may be associated with late Cenozic tectonic uplift of the Andes
and not specifically glacial in origin (Fidalgo and Riggi, 1965; Clapperton, 1993).
Martinez and Coronato (2009) note that the Patagonian Gravels range in ages from the
Late Miocene to Holocene, and have been repeatedly reworked from higher alluvial
surfaces to lower ones. In southern Patagonia, they are thought to be associated with
pre-GPG glacial events, such as near Lago Viedma where they lie between two flows
K/Ar dated to 2.79 ± 0.15 and 2.66 ± 0.06 Ma (Mercer, 1973).
115
4.2.3. Climate and weather
The climate of the Patagonian plains is temperate to cold and semiarid. Mean
annual temperature is 5.9°C, and mean annual precipitation is 220 mm. Most
precipitation falls as rain in the summer. Patagonia is located between the subtropical
high pressure belt and the sub-polar low pressure zone, placing it within the southern
westerlies circulation zone (Coronato et al., 2008). Westerly winds have mean speeds of
4.6 m s-1 and maximum speeds of over 36 m s-1 in the Río Gallegos valley (Coronato et
al., 2013). Strong winds scour the Patagonian plains and, over time, have formed large
ellipsoidal-shaped deflation basins with long axes oriented in the direction of the wind.
Sand or silt dunes rim the down-wind margins of many of these basins.
Periglacial conditions existed in southern Patagonia during Pleistocene glacial
periods, and thermal contraction features are preserved on high surfaces throughout the
region. Sand wedges indicate high winds and a dry cold climate; today, they are
restricted to regions where the mean annual air temperature is less than -4°C and mean
annual precipitation is <100 mm (Pewe, 1959; Mackay, 1974; Bockheim et al., 2009).
4.3. Methods
I used a combination of Landsat ETM+ images (30 m resolution; Global Land
Cover Facility, www.landcover.org), Google Earth images (2.5–15 m resolution;
Cnes/SPOT, and Digital Globe and TerraMetrics images (www.earth.google.com) to
map the glacial geomorphology of the study area at a scale of 1:250,000. I used the
surficial mapping protocols suggested by the Geological Survey of Canada to define
landforms (Deblonde et al., 2012), focusing on major moraine ridges, minor transverse
ridges (ribbed/Rogen moraines), and marginal scarps and axes of meltwater channels. I
considered the glacial limits on the surficial geology maps of Meglioli (1992), Coronato et
al. (2004a), and Rabassa and Coronato (2009) in the course of my mapping.
Large amounts of sediment and water were transported by meltwater streams
draining Pliocene and Pleistocene Patagonian ice sheets. I differentiated several
generations of meltwater channel systems by tracing them back to the moraine ridges
where they initiate and also from channel cross-cutting relations. Where meltwater
channels were too narrow to show scarps on the DEM, I mapped only the channel axes.
116
Meltwater channels are of two general types. Proglacial channels extend more-or-less
perpendicularly away from ice margins, typically moraine ridges. Lateral meltwater
channels are located along the margins of, and abut, moraines. They are common within
perched troughs between moraines at the margins of the Strait of Magellan and the
Bahía Inutil / San Sebastián depression valley sides.
There are extensive continuous exposures of Quaternary sediments along the
Atlantic coasts of Tierra del Fuego and the southernmost mainland of Argentina and
along the Strait of Magellan. Smaller exposures are provided in road cuts and gravel pits
throughout the region. I examined most of these sites during the austral summers of
2010, 2011, and 2012, but focused my attention on sites where Early-Middle Pleistocene
glacial sediments are exposed. I recorded detailed sedimentological and stratigraphic
descriptions at 107 sites, and cursory observations at 30 other localities (Figure 55). This
chapter focuses on several key representative sites (Cabo Vírgenes, Bahía Posesión,
Tres de Enero, and Cabo Espíritu Santo). The Cabo Vírgenes site was chosen because
of its continuous 36-km-long sea cliff exposure spanning the boundary between GPG
and post-GPG 1 drift sheets as mapped by Meglioli (1992). The Bahía Posesión site
includes over 40 km of sea cliff on the north shore of the Strait of Magellan, exposing
post-GPG 1 and post-GPG 2 drifts, and was selected in order to compare the two drift
units and to better understand the retreat and advance of Middle Pleistocene ice lobes
through the Strait of Magellan. The Tres de Enero site provides an exposure of multiple
GPG diamictons and cryogenic features, and was chosen because it is representative of
sediments observed at other smaller sections in the area. The Cabo Espíritu Santo site
provides excellent sea-cliff exposures of GPG and post-GPG 1 drift on the northeast
coast of Tierra del Fuego as mapped by Meglioli (1992).
Most of the described sections are continuous wave-cut exposures of
Pleistocene glacial sediments that unconformably overlie Late Cretaceous sedimentary
rocks. Because the cliff faces are very steep and unstable, the sediments are described
with different levels of detail that depend on access. These properties include sediment
texture; clast size, shape, and petrography; sedimentary structures; unit thicknesses and
elevations; nature of unit contacts; and lateral variations in sediment properties. I used
the lithofacies classification protocols of Eyles et al. (1983) and Evans and Benn (2004)
to define and describe units (Table 5). I measured exposure heights with a laser range
finder and recorded sample locations with a handheld GPS. I photographed all sections
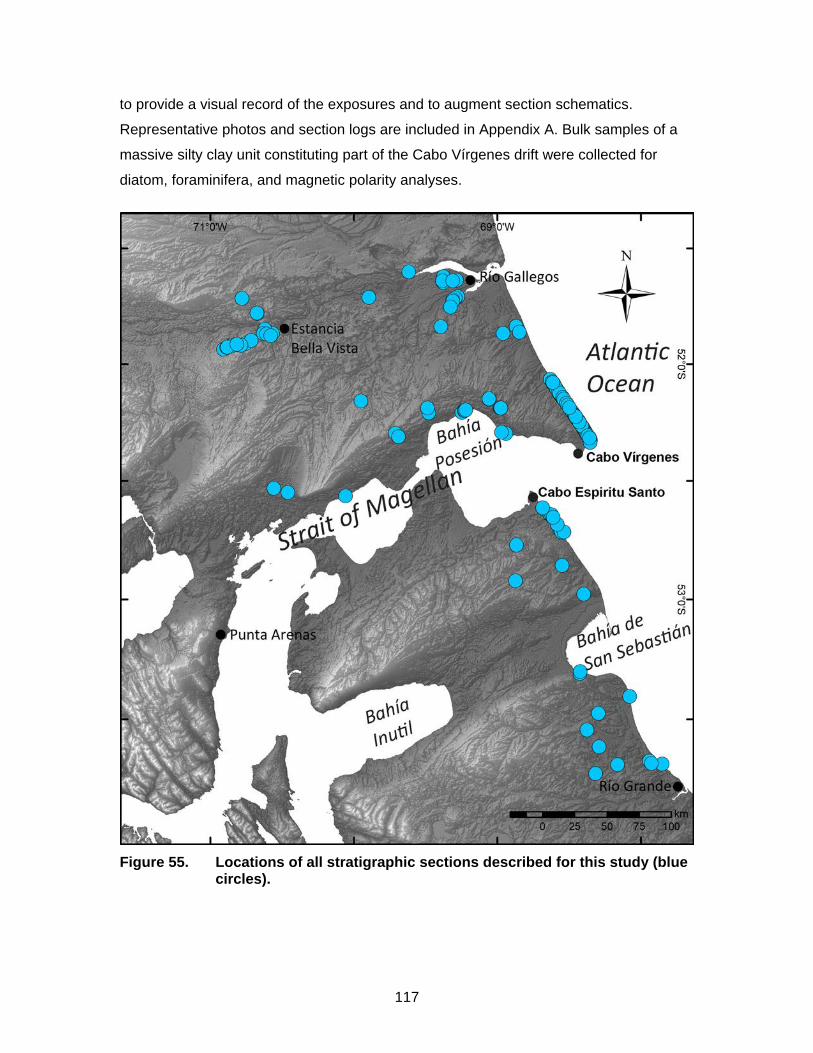
117
to provide a visual record of the exposures and to augment section schematics.
Representative photos and section logs are included in Appendix A. Bulk samples of a
massive silty clay unit constituting part of the Cabo Vírgenes drift were collected for
diatom, foraminifera, and magnetic polarity analyses.
Figure 55. Locations of all stratigraphic sections described for this study (blue
circles).
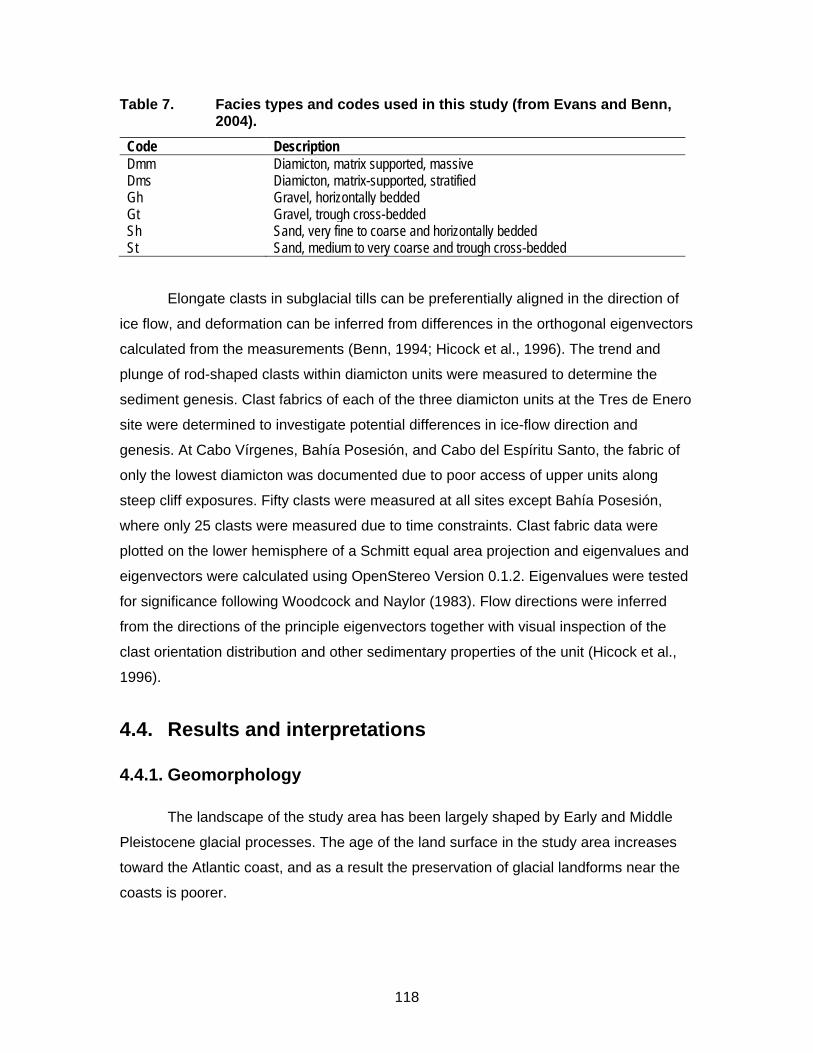
118
Table 7. Facies types and codes used in this study (from Evans and Benn, 2004).
Code Description Dmm Diamicton, matrix supported, massive Dms Diamicton, matrix-supported, stratified Gh Gravel, horizontally bedded Gt Gravel, trough cross-bedded Sh Sand, very fine to coarse and horizontally bedded St Sand, medium to very coarse and trough cross-bedded
Elongate clasts in subglacial tills can be preferentially aligned in the direction of
ice flow, and deformation can be inferred from differences in the orthogonal eigenvectors
calculated from the measurements (Benn, 1994; Hicock et al., 1996). The trend and
plunge of rod-shaped clasts within diamicton units were measured to determine the
sediment genesis. Clast fabrics of each of the three diamicton units at the Tres de Enero
site were determined to investigate potential differences in ice-flow direction and
genesis. At Cabo Vírgenes, Bahía Posesión, and Cabo del Espíritu Santo, the fabric of
only the lowest diamicton was documented due to poor access of upper units along
steep cliff exposures. Fifty clasts were measured at all sites except Bahía Posesión,
where only 25 clasts were measured due to time constraints. Clast fabric data were
plotted on the lower hemisphere of a Schmitt equal area projection and eigenvalues and
eigenvectors were calculated using OpenStereo Version 0.1.2. Eigenvalues were tested
for significance following Woodcock and Naylor (1983). Flow directions were inferred
from the directions of the principle eigenvectors together with visual inspection of the
clast orientation distribution and other sedimentary properties of the unit (Hicock et al.,
1996).
4.4. Results and interpretations
4.4.1. Geomorphology
The landscape of the study area has been largely shaped by Early and Middle
Pleistocene glacial processes. The age of the land surface in the study area increases
toward the Atlantic coast, and as a result the preservation of glacial landforms near the
coasts is poorer.
119
Meltwater channels and moraine ridges dominate the landscape in the study
area (Figure 56). Meltwater channels are interpreted to be proglacial because they
commonly initiate at moraine ridges and have dendritic patterns. No eskers were
identified in the field area. Moraine ridges have linear to arcuate shapes in plan view.
They are morphologically diverse, ranging from wide and flat to relatively narrow with
sharp crests. Heights range from a few metres to tens of metres. To the west, the
moraines of younger glaciations are relatively fresh and continuous in their lateral extent.
Many post-GPG 1 and 2 moraines in the eastern portion of the study area form
discontinuous arcs and broad subdued, but still hummocky, ridges that mark limits of
older glaciations. These moraines have been lowered and subdued by eolian processes
(e.g. at Río Ci Aike, Figure 57). Minor moraine ridges are common on the proximal side
of major moraine ridges, ranging from smaller recessional ridges similar in morphology
to major end moraines to smaller discontinuous transverse ridges resembling ribbed or
de Geer moraines (Figure 58). Longitudinal subglacial bedforms, mainly drumlins and
lineations, are present on LGM surfaces but were not identified on older surfaces in the
field area. They have, however, been described on GPG surfaces in the Río Gallegos
valley (Ercolano et al., 2004). There is also a notable lack of eskers and other subglacial
drainage landforms on GPG and post-GPG 1 and 2 surfaces; these features are present
on surfaces of more recent drift sheets. Valley trains and outwash channels, on the other
hand, are common on all drift surfaces.
Channels and terraces on high surfaces are commonly incised by younger
meltwater channels that are now either abandoned or contain meandering under-fit
streams. I mapped multiple generations of scarps along some major channels such as
the Río Chico. Meltwater channels that initiate at major moraine ridges are wide and flat-
bottomed, particularly in the proximal zone. They are common on higher elevation,
gently sloping GPG and post-GPG 1 surfaces. Some lateral channels are discontinuous
and have an indeterminable flow direction, for example those at Bahía Posesión (Figure
56).
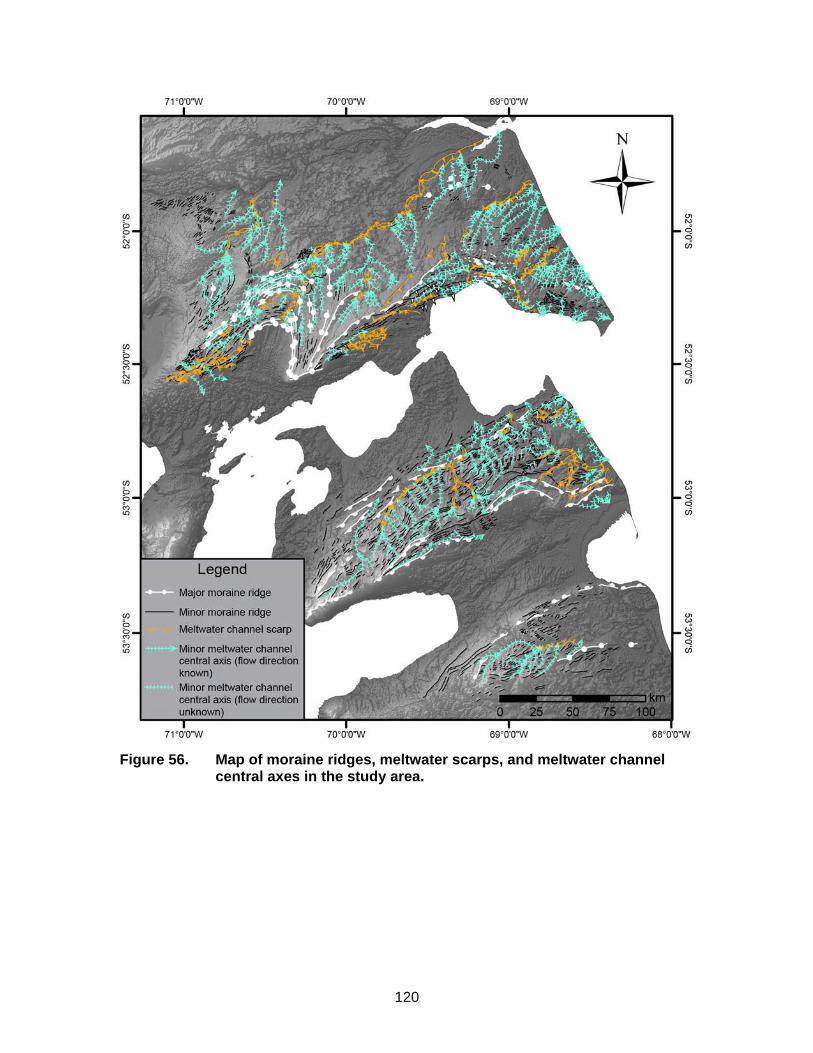
120
Figure 56. Map of moraine ridges, meltwater scarps, and meltwater channel
central axes in the study area.
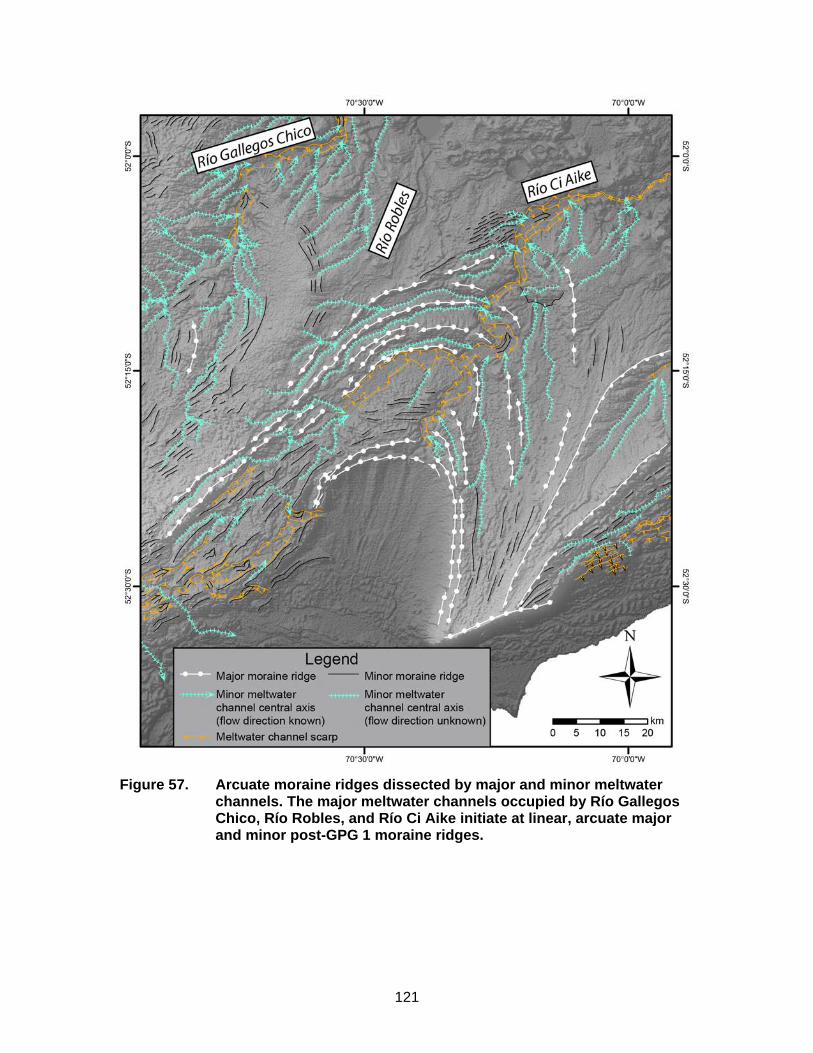
121
Figure 57. Arcuate moraine ridges dissected by major and minor meltwater
channels. The major meltwater channels occupied by Río Gallegos Chico, Río Robles, and Río Ci Aike initiate at linear, arcuate major and minor post-GPG 1 moraine ridges.
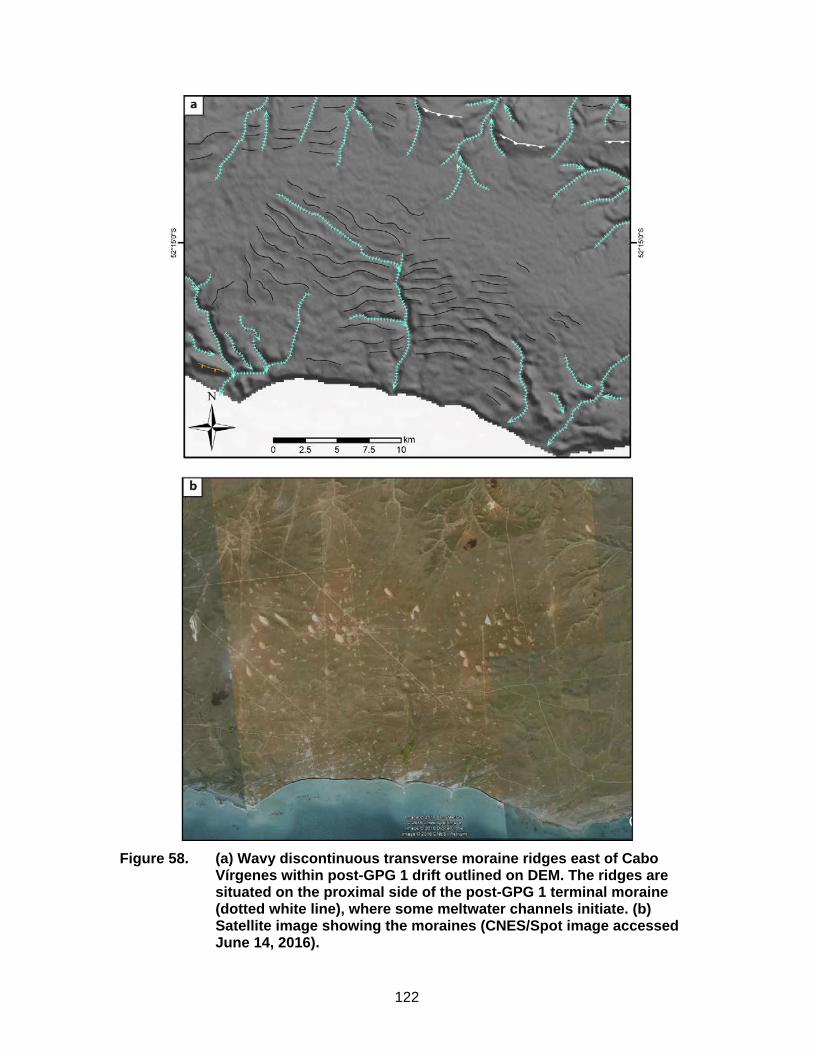
122
Figure 58. (a) Wavy discontinuous transverse moraine ridges east of Cabo
Vírgenes within post-GPG 1 drift outlined on DEM. The ridges are situated on the proximal side of the post-GPG 1 terminal moraine (dotted white line), where some meltwater channels initiate. (b) Satellite image showing the moraines (CNES/Spot image accessed June 14, 2016).
123
4.4.2. Stratigraphy
Cabo Vírgenes
Over 30 km of wave-cut cliffs extend from the lighthouse at Cabo Vírgenes
northward along the Atlantic coast. The cliffs provide continuous exposures of
Pleistocene sediments deposited during two Early-Middle Pleistocene glaciations (Figure
59). Meglioli (1992) mapped the surface as mostly GPG (Sierra de los Frailes drift), with
post-GPG I (Cabo Vírgenes drift) end moraines at the lighthouse (Figure 54). Exposure
heights reach a maximum of 70 m approximately 7 km from the cape, near the end
moraine of the post-GPG I Magellan lobe and decrease in height toward the north with
increasing distance from the ice front. The contact with underlying bedrock is not
exposed and is an undetermined distance below beach level.
I made observations at 45 sites along the 30-km length of the exposure (Figure
60). Stratigraphic columns for each of the 45 sites are presented in Appendix A. Figure
61 shows a stratigraphic section for the type section of the Cabo Vírgenes drift, which is
representative of the exposed sediments along the transect. Based on my observations,
I recognize three distinct sedimentary units (Appendix A). The upper two units (CV1 and
CV2) can be traced over nearly the entire length of the transect, whereas a lower unit
(CV3) is exposed discontinuously at the base of the cliffs only along the northern half of
the transect (Figure 62).
The uppermost unit (CV1) comprises interlensing to interbedded, tan-colored
matrix-supported diamicton, sand, and gravel. Rip-up clasts, ramping, and soft-sediment
deformation structures such as flame and ball-and-pillow structures are present within
CV1 along the length of the exposure (e.g. Figure 63). The lower contact of the unit is
locally erosional, but elsewhere conformable and in a few places loaded (e.g. Figure 64).
The diamicton matrix is silty fine-to-medium sand, and is coarser and less cohesive than
the sediment that dominates unit CV2. The overall coarse nature of unit CV1, including
abundant loose sand and gravel beds and lenses, has resulted in differential erosion of
the cliff face by the sea. The upper part of the cliff face, where unit CV1 crops out, is
slightly recessive relative to the lower part, which is dominated by unit CV2. Slumps and
debris slides from the upper part of the cliff locally cover the lower half of the cliff face
(Figure 64).
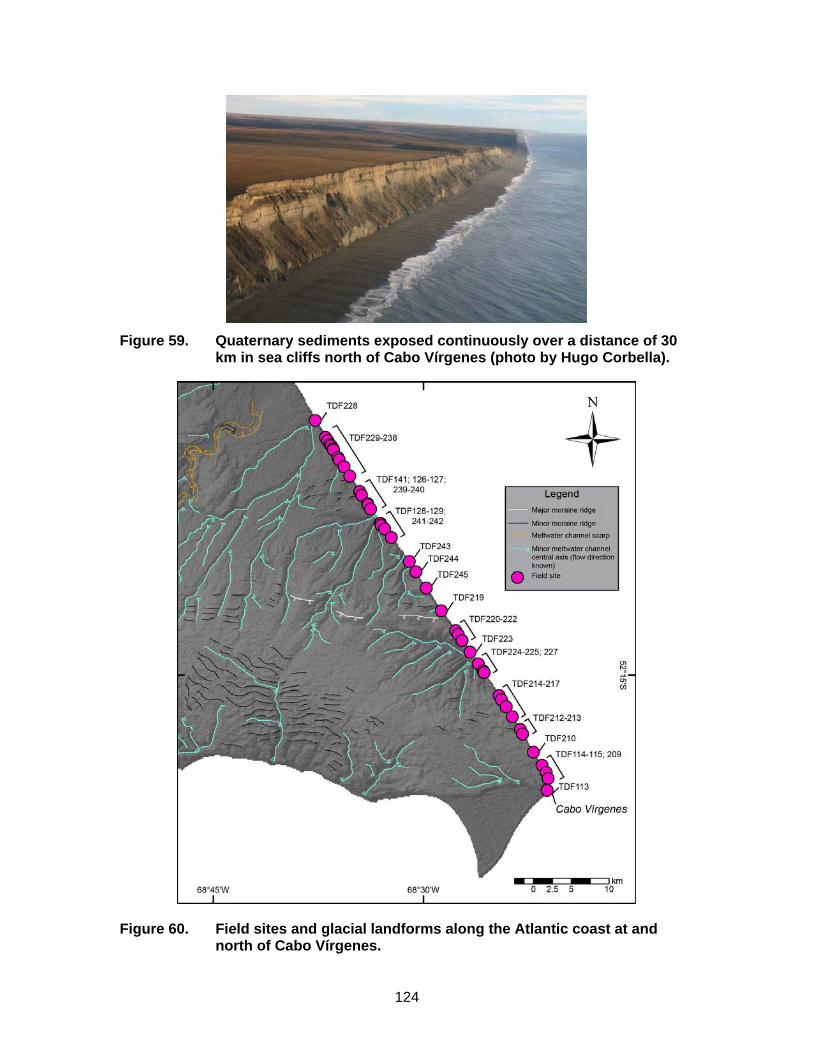
124
Figure 59. Quaternary sediments exposed continuously over a distance of 30
km in sea cliffs north of Cabo Vírgenes (photo by Hugo Corbella).
Figure 60. Field sites and glacial landforms along the Atlantic coast at and north of Cabo Vírgenes.
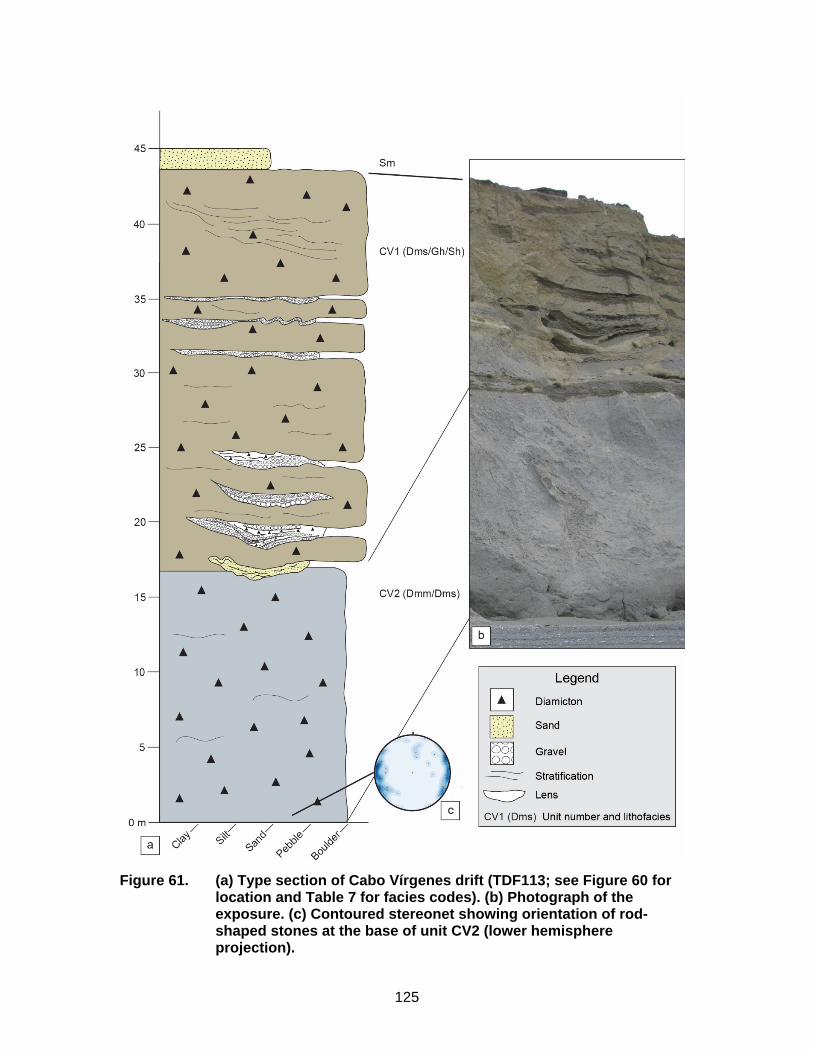
125
Figure 61. (a) Type section of Cabo Vírgenes drift (TDF113; see Figure 60 for
location and Table 7 for facies codes). (b) Photograph of the exposure. (c) Contoured stereonet showing orientation of rod-shaped stones at the base of unit CV2 (lower hemisphere projection).
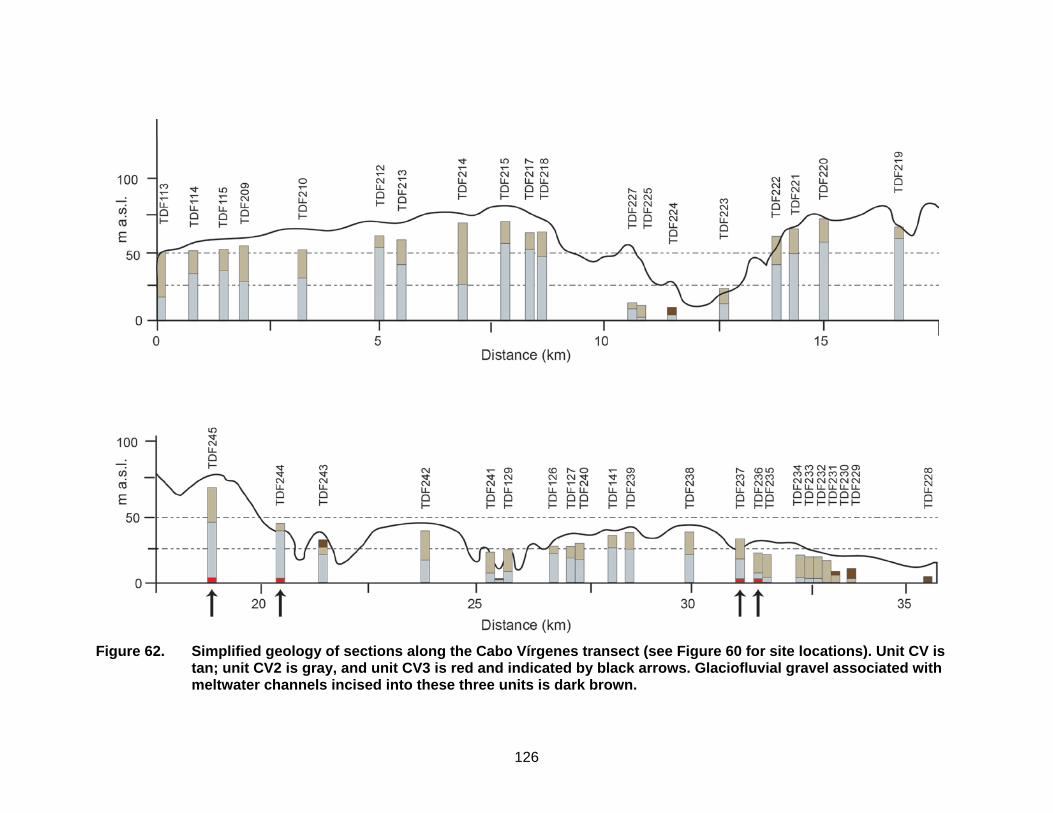
126
Figure 62. Simplified geology of sections along the Cabo Vírgenes transect (see Figure 60 for site locations). Unit CV is
tan; unit CV2 is gray, and unit CV3 is red and indicated by black arrows. Glaciofluvial gravel associated with meltwater channels incised into these three units is dark brown.
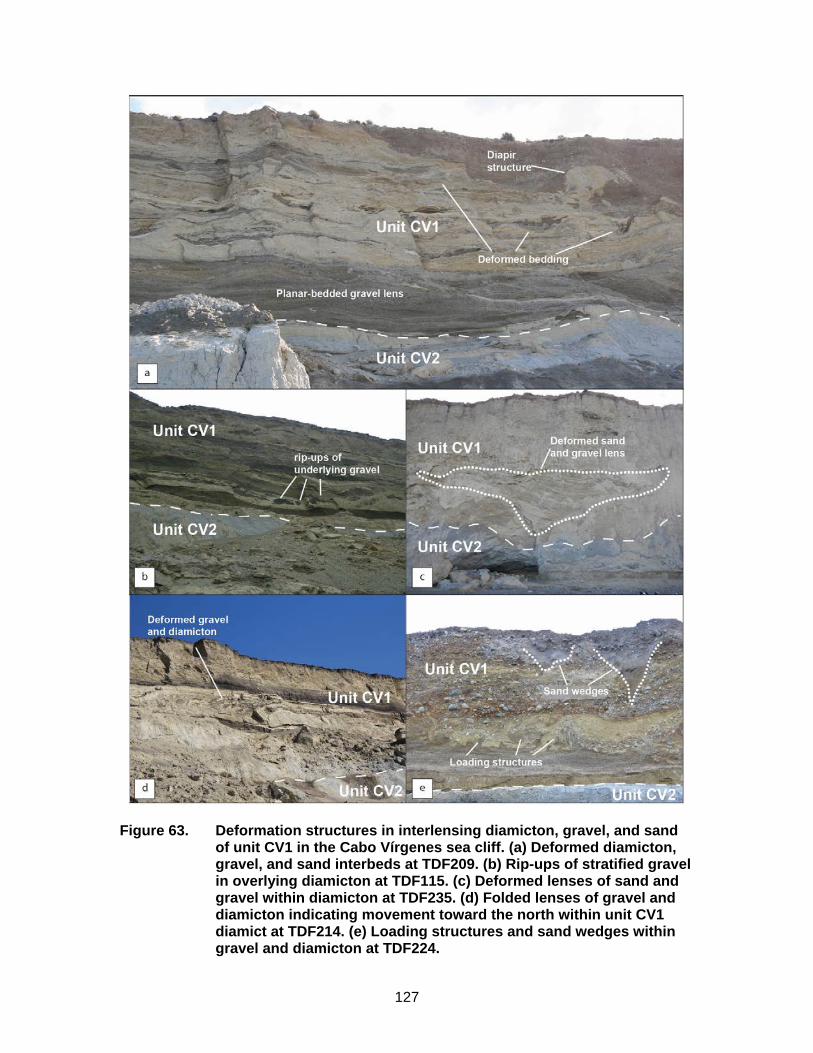
127
Figure 63. Deformation structures in interlensing diamicton, gravel, and sand of unit CV1 in the Cabo Vírgenes sea cliff. (a) Deformed diamicton, gravel, and sand interbeds at TDF209. (b) Rip-ups of stratified gravel in overlying diamicton at TDF115. (c) Deformed lenses of sand and gravel within diamicton at TDF235. (d) Folded lenses of gravel and diamicton indicating movement toward the north within unit CV1 diamict at TDF214. (e) Loading structures and sand wedges within gravel and diamicton at TDF224.
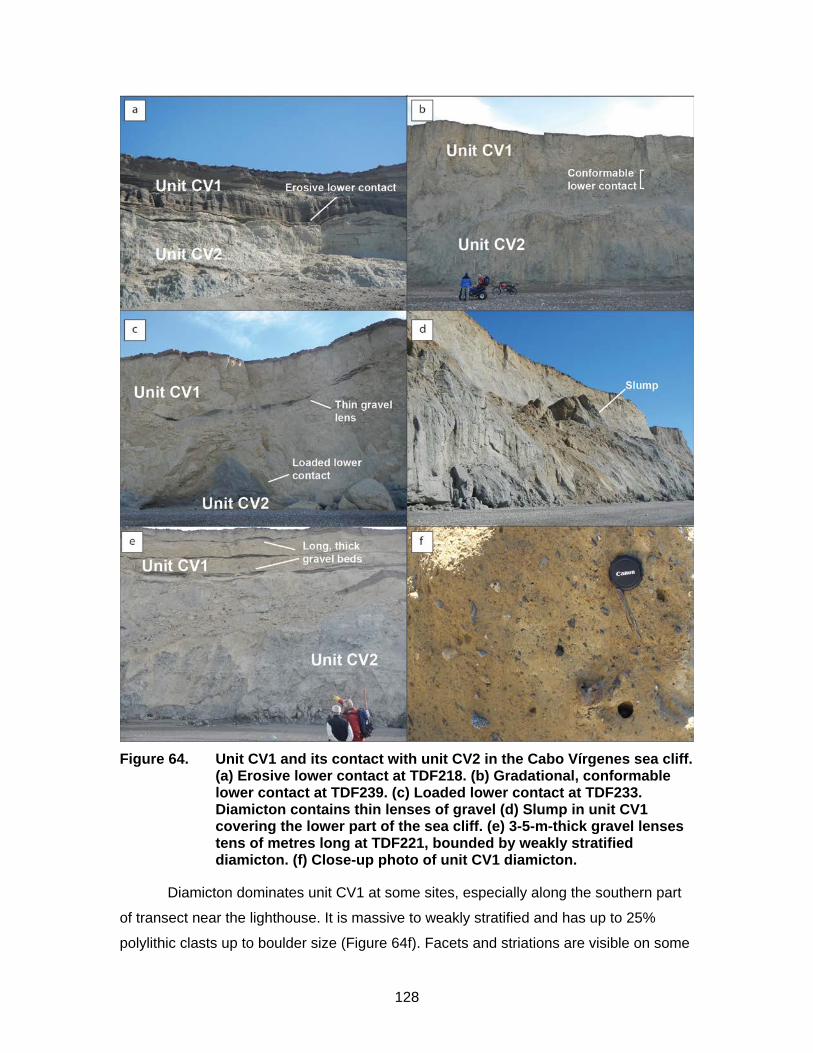
128
Figure 64. Unit CV1 and its contact with unit CV2 in the Cabo Vírgenes sea cliff.
(a) Erosive lower contact at TDF218. (b) Gradational, conformable lower contact at TDF239. (c) Loaded lower contact at TDF233. Diamicton contains thin lenses of gravel (d) Slump in unit CV1 covering the lower part of the sea cliff. (e) 3-5-m-thick gravel lenses tens of metres long at TDF221, bounded by weakly stratified diamicton. (f) Close-up photo of unit CV1 diamicton.
Diamicton dominates unit CV1 at some sites, especially along the southern part
of transect near the lighthouse. It is massive to weakly stratified and has up to 25%
polylithic clasts up to boulder size (Figure 64f). Facets and striations are visible on some
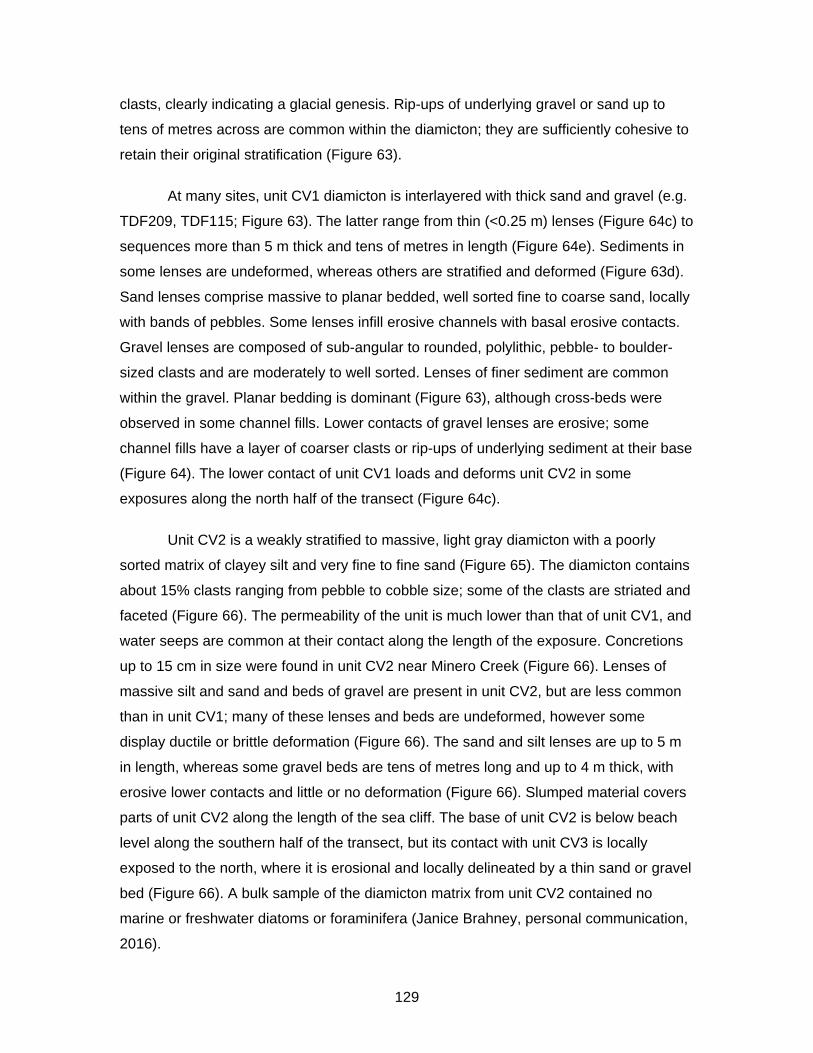
129
clasts, clearly indicating a glacial genesis. Rip-ups of underlying gravel or sand up to
tens of metres across are common within the diamicton; they are sufficiently cohesive to
retain their original stratification (Figure 63).
At many sites, unit CV1 diamicton is interlayered with thick sand and gravel (e.g.
TDF209, TDF115; Figure 63). The latter range from thin (<0.25 m) lenses (Figure 64c) to
sequences more than 5 m thick and tens of metres in length (Figure 64e). Sediments in
some lenses are undeformed, whereas others are stratified and deformed (Figure 63d).
Sand lenses comprise massive to planar bedded, well sorted fine to coarse sand, locally
with bands of pebbles. Some lenses infill erosive channels with basal erosive contacts.
Gravel lenses are composed of sub-angular to rounded, polylithic, pebble- to boulder-
sized clasts and are moderately to well sorted. Lenses of finer sediment are common
within the gravel. Planar bedding is dominant (Figure 63), although cross-beds were
observed in some channel fills. Lower contacts of gravel lenses are erosive; some
channel fills have a layer of coarser clasts or rip-ups of underlying sediment at their base
(Figure 64). The lower contact of unit CV1 loads and deforms unit CV2 in some
exposures along the north half of the transect (Figure 64c).
Unit CV2 is a weakly stratified to massive, light gray diamicton with a poorly
sorted matrix of clayey silt and very fine to fine sand (Figure 65). The diamicton contains
about 15% clasts ranging from pebble to cobble size; some of the clasts are striated and
faceted (Figure 66). The permeability of the unit is much lower than that of unit CV1, and
water seeps are common at their contact along the length of the exposure. Concretions
up to 15 cm in size were found in unit CV2 near Minero Creek (Figure 66). Lenses of
massive silt and sand and beds of gravel are present in unit CV2, but are less common
than in unit CV1; many of these lenses and beds are undeformed, however some
display ductile or brittle deformation (Figure 66). The sand and silt lenses are up to 5 m
in length, whereas some gravel beds are tens of metres long and up to 4 m thick, with
erosive lower contacts and little or no deformation (Figure 66). Slumped material covers
parts of unit CV2 along the length of the sea cliff. The base of unit CV2 is below beach
level along the southern half of the transect, but its contact with unit CV3 is locally
exposed to the north, where it is erosional and locally delineated by a thin sand or gravel
bed (Figure 66). A bulk sample of the diamicton matrix from unit CV2 contained no
marine or freshwater diatoms or foraminifera (Janice Brahney, personal communication,
2016).
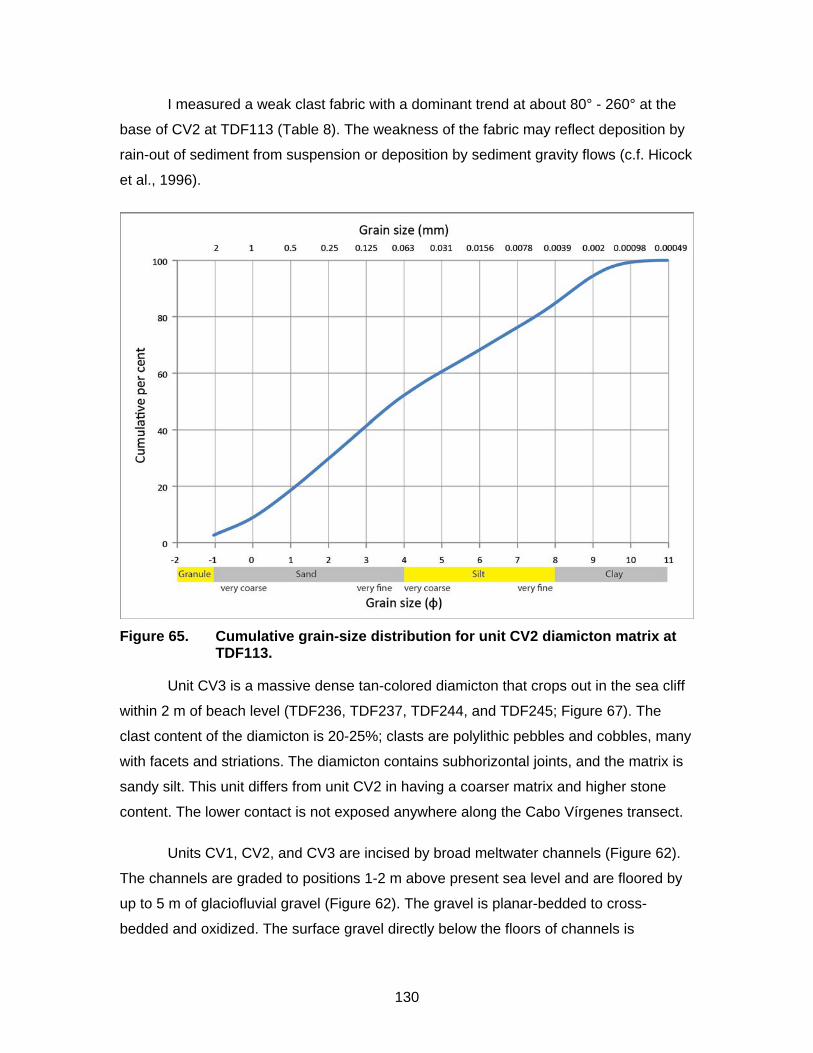
130
I measured a weak clast fabric with a dominant trend at about 80° - 260° at the
base of CV2 at TDF113 (Table 8). The weakness of the fabric may reflect deposition by
rain-out of sediment from suspension or deposition by sediment gravity flows (c.f. Hicock
et al., 1996).
Figure 65. Cumulative grain-size distribution for unit CV2 diamicton matrix at
TDF113.
Unit CV3 is a massive dense tan-colored diamicton that crops out in the sea cliff
within 2 m of beach level (TDF236, TDF237, TDF244, and TDF245; Figure 67). The
clast content of the diamicton is 20-25%; clasts are polylithic pebbles and cobbles, many
with facets and striations. The diamicton contains subhorizontal joints, and the matrix is
sandy silt. This unit differs from unit CV2 in having a coarser matrix and higher stone
content. The lower contact is not exposed anywhere along the Cabo Vírgenes transect.
Units CV1, CV2, and CV3 are incised by broad meltwater channels (Figure 62).
The channels are graded to positions 1-2 m above present sea level and are floored by
up to 5 m of glaciofluvial gravel (Figure 62). The gravel is planar-bedded to cross-
bedded and oxidized. The surface gravel directly below the floors of channels is
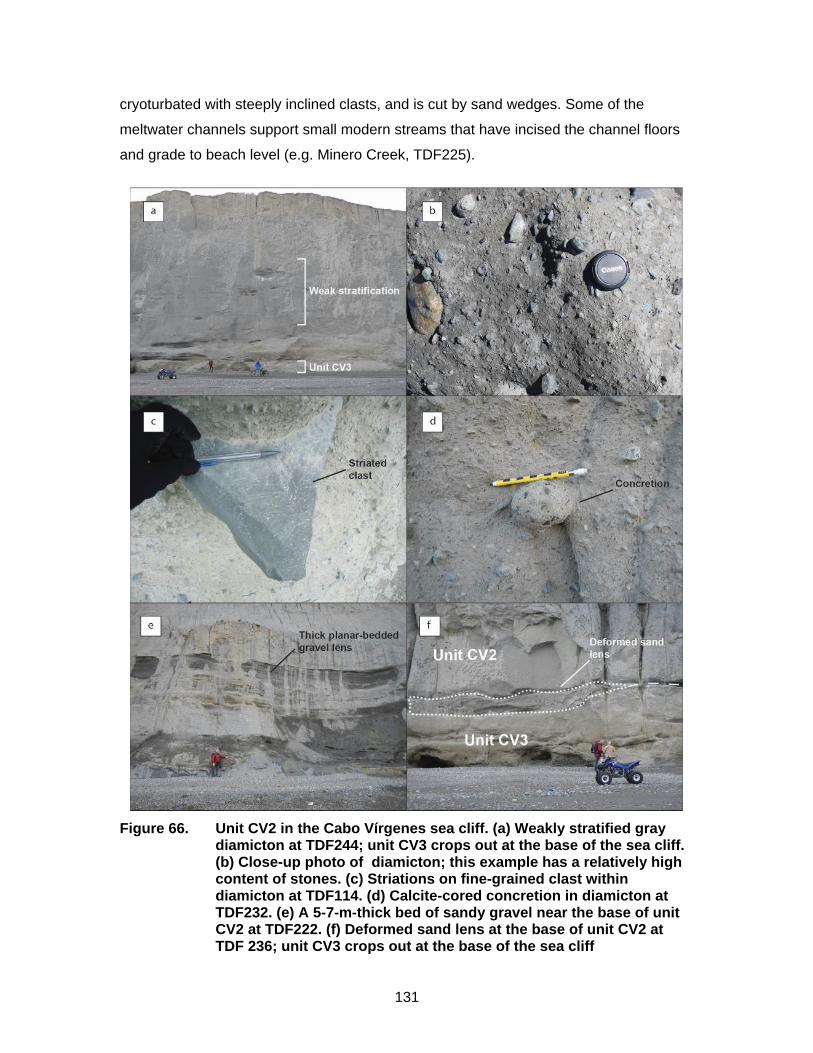
131
cryoturbated with steeply inclined clasts, and is cut by sand wedges. Some of the
meltwater channels support small modern streams that have incised the channel floors
and grade to beach level (e.g. Minero Creek, TDF225).
Figure 66. Unit CV2 in the Cabo Vírgenes sea cliff. (a) Weakly stratified gray
diamicton at TDF244; unit CV3 crops out at the base of the sea cliff. (b) Close-up photo of diamicton; this example has a relatively high content of stones. (c) Striations on fine-grained clast within diamicton at TDF114. (d) Calcite-cored concretion in diamicton at TDF232. (e) A 5-7-m-thick bed of sandy gravel near the base of unit CV2 at TDF222. (f) Deformed sand lens at the base of unit CV2 at TDF 236; unit CV3 crops out at the base of the sea cliff
132
Figure 67. Unit CV3. (a) At TDF236, where the unit can be traced continuously
to the south for ~500 m and is 1.5-2 m thick. (b) Close-up of unit CV3 at TDF236. (c) Laminated silt bed at the contact between units CV2 and CV3 at TDF236. (d) TDF237. (e) TDF245. (f) TDF244.
Interpretation
The sediments exposed along the Cabo Vírgenes transect can be linked to
landforms to the west. A west-trending moraine intersects the Atlantic coast ~ 20 km
north of the cape (Figure 68, location 1). Although subdued, it can be traced as an
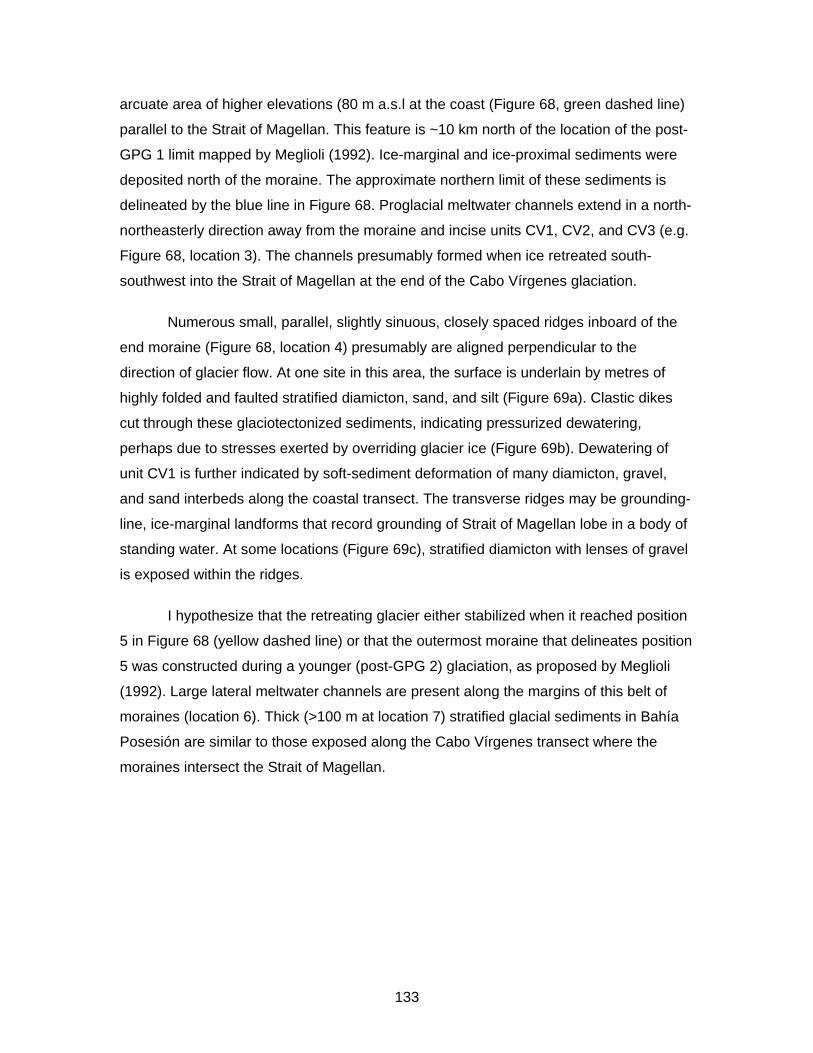
133
arcuate area of higher elevations (80 m a.s.l at the coast (Figure 68, green dashed line)
parallel to the Strait of Magellan. This feature is ~10 km north of the location of the post-
GPG 1 limit mapped by Meglioli (1992). Ice-marginal and ice-proximal sediments were
deposited north of the moraine. The approximate northern limit of these sediments is
delineated by the blue line in Figure 68. Proglacial meltwater channels extend in a north-
northeasterly direction away from the moraine and incise units CV1, CV2, and CV3 (e.g.
Figure 68, location 3). The channels presumably formed when ice retreated south-
southwest into the Strait of Magellan at the end of the Cabo Vírgenes glaciation.
Numerous small, parallel, slightly sinuous, closely spaced ridges inboard of the
end moraine (Figure 68, location 4) presumably are aligned perpendicular to the
direction of glacier flow. At one site in this area, the surface is underlain by metres of
highly folded and faulted stratified diamicton, sand, and silt (Figure 69a). Clastic dikes
cut through these glaciotectonized sediments, indicating pressurized dewatering,
perhaps due to stresses exerted by overriding glacier ice (Figure 69b). Dewatering of
unit CV1 is further indicated by soft-sediment deformation of many diamicton, gravel,
and sand interbeds along the coastal transect. The transverse ridges may be grounding-
line, ice-marginal landforms that record grounding of Strait of Magellan lobe in a body of
standing water. At some locations (Figure 69c), stratified diamicton with lenses of gravel
is exposed within the ridges.
I hypothesize that the retreating glacier either stabilized when it reached position
5 in Figure 68 (yellow dashed line) or that the outermost moraine that delineates position
5 was constructed during a younger (post-GPG 2) glaciation, as proposed by Meglioli
(1992). Large lateral meltwater channels are present along the margins of this belt of
moraines (location 6). Thick (>100 m at location 7) stratified glacial sediments in Bahía
Posesión are similar to those exposed along the Cabo Vírgenes transect where the
moraines intersect the Strait of Magellan.
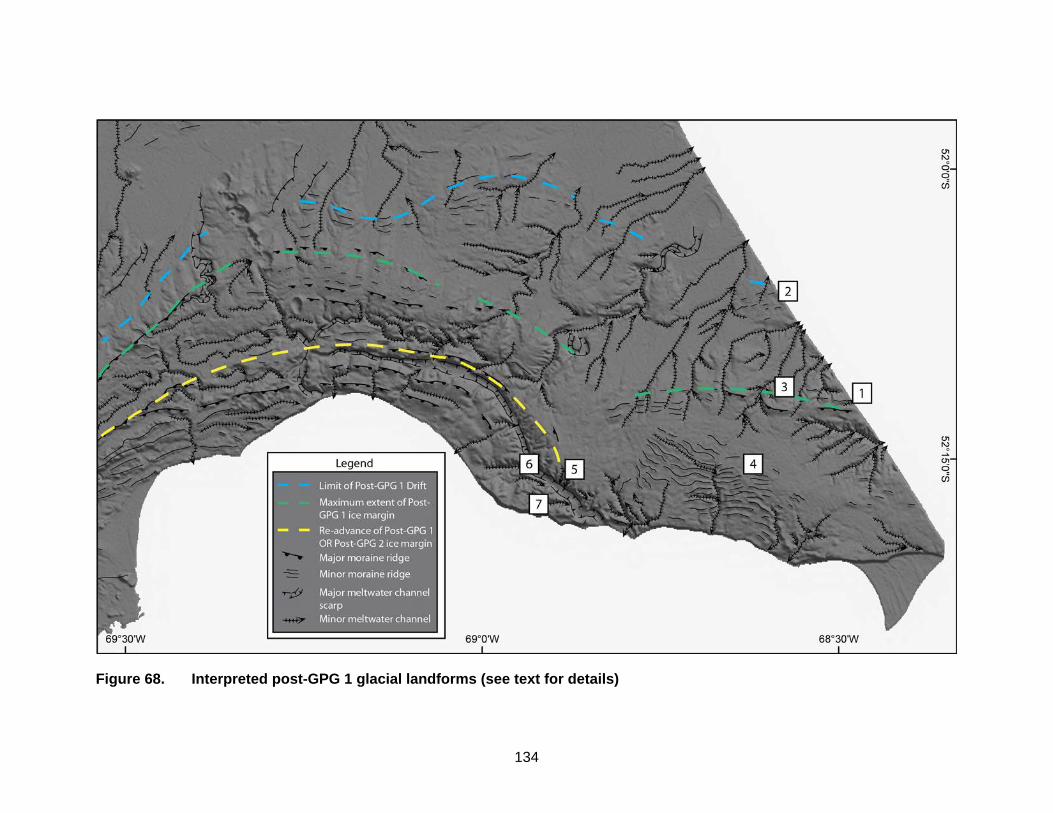
134
Figure 68. Interpreted post-GPG 1 glacial landforms (see text for details)
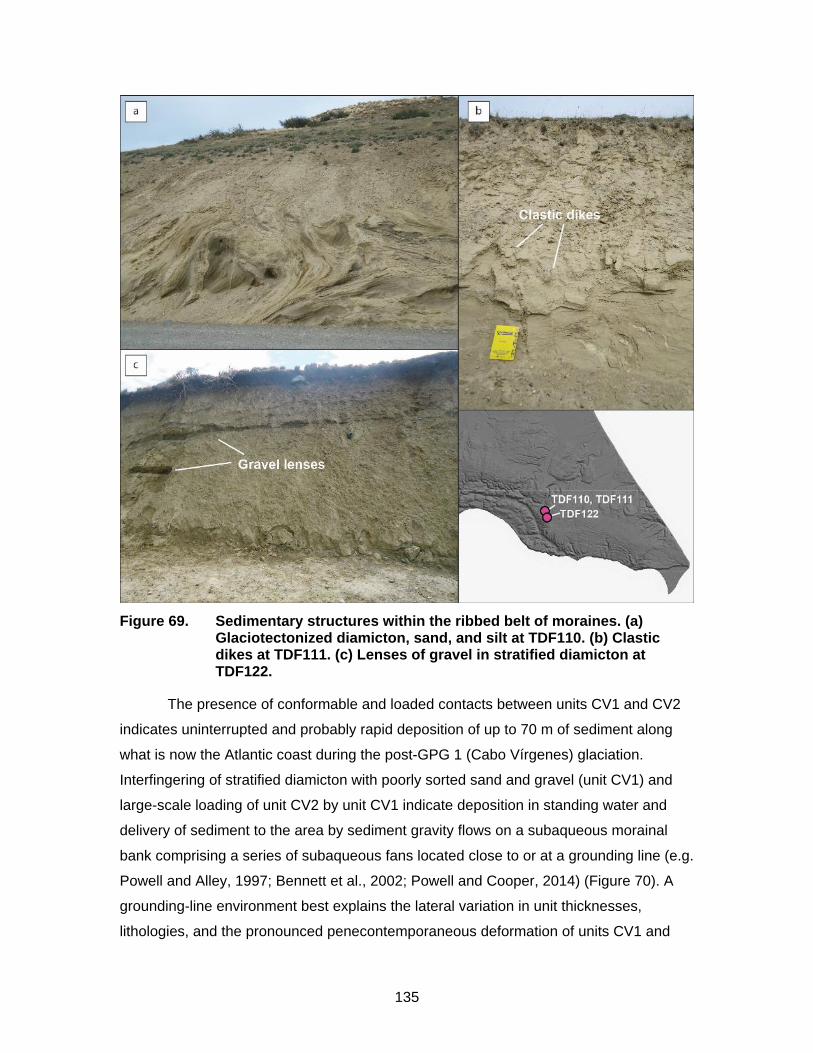
135
Figure 69. Sedimentary structures within the ribbed belt of moraines. (a)
Glaciotectonized diamicton, sand, and silt at TDF110. (b) Clastic dikes at TDF111. (c) Lenses of gravel in stratified diamicton at TDF122.
The presence of conformable and loaded contacts between units CV1 and CV2
indicates uninterrupted and probably rapid deposition of up to 70 m of sediment along
what is now the Atlantic coast during the post-GPG 1 (Cabo Vírgenes) glaciation.
Interfingering of stratified diamicton with poorly sorted sand and gravel (unit CV1) and
large-scale loading of unit CV2 by unit CV1 indicate deposition in standing water and
delivery of sediment to the area by sediment gravity flows on a subaqueous morainal
bank comprising a series of subaqueous fans located close to or at a grounding line (e.g.
Powell and Alley, 1997; Bennett et al., 2002; Powell and Cooper, 2014) (Figure 70). A
grounding-line environment best explains the lateral variation in unit thicknesses,
lithologies, and the pronounced penecontemporaneous deformation of units CV1 and
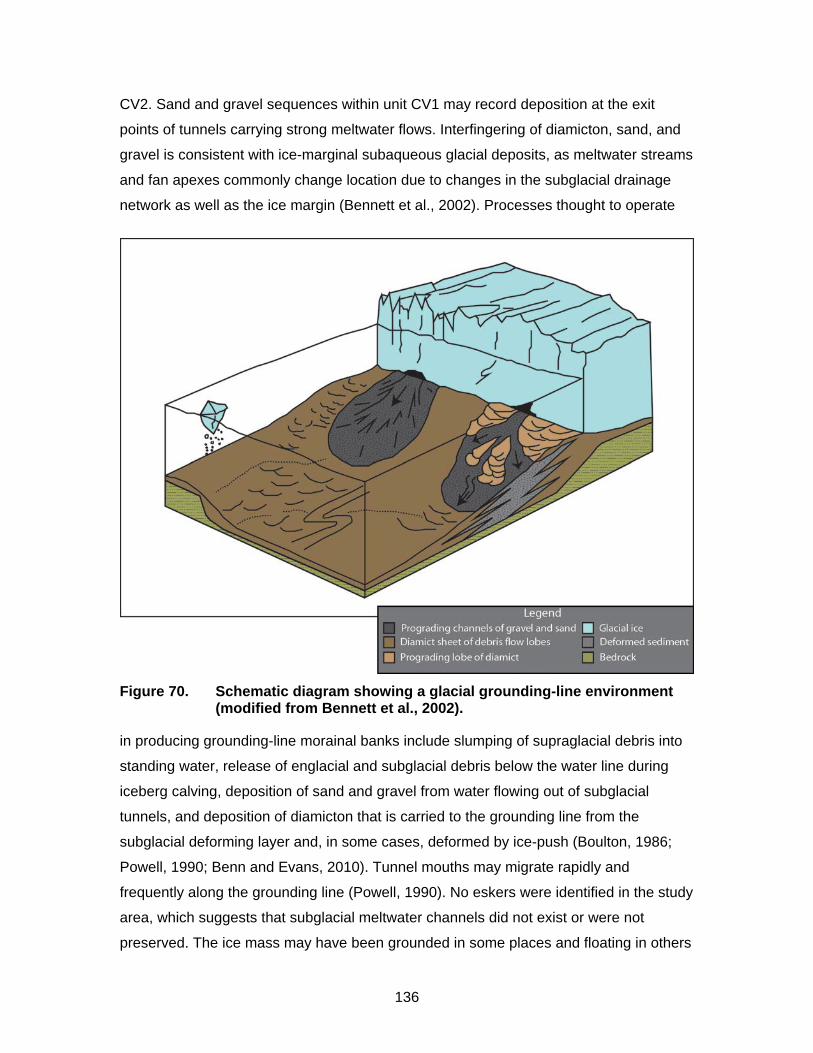
136
CV2. Sand and gravel sequences within unit CV1 may record deposition at the exit
points of tunnels carrying strong meltwater flows. Interfingering of diamicton, sand, and
gravel is consistent with ice-marginal subaqueous glacial deposits, as meltwater streams
and fan apexes commonly change location due to changes in the subglacial drainage
network as well as the ice margin (Bennett et al., 2002). Processes thought to operate
Figure 70. Schematic diagram showing a glacial grounding-line environment
(modified from Bennett et al., 2002).
in producing grounding-line morainal banks include slumping of supraglacial debris into
standing water, release of englacial and subglacial debris below the water line during
iceberg calving, deposition of sand and gravel from water flowing out of subglacial
tunnels, and deposition of diamicton that is carried to the grounding line from the
subglacial deforming layer and, in some cases, deformed by ice-push (Boulton, 1986;
Powell, 1990; Benn and Evans, 2010). Tunnel mouths may migrate rapidly and
frequently along the grounding line (Powell, 1990). No eskers were identified in the study
area, which suggests that subglacial meltwater channels did not exist or were not
preserved. The ice mass may have been grounded in some places and floating in others
137
at the terminus, allowing for sheet flow. Gravel and sand enter standing water at the
base of the water column rather than at the top as in the case of a delta. These coarse
sediments typically display planar bedding, characteristic of the upper flow regime, which
is distinct from the typical bedding of fluvial or glaciofluvial deposits.
Benn (1996) describes subaqueous moraines composed of gravel and sand with
interbeds of diamictic debris flow deposits delivered from the glacier grounding line. A
similar environment is envisioned at Cabo Vírgenes, where stratified deformed beds of
diamicton are interlayered with gravel and sand beds.
Foreset bedding, indicative of delta deposits, is not present in any of the Cabo
Vírgenes sections, thus the sediments were not deposited at the mouths of terrestrial
streams. Some of the gravel and diamicton lenses and beds occupy channels, indicating
that there was sufficient energy to scour and fill underlying eroded channel floors. A
sloping surface can be inferred from the widespread occurrence of subaqueous mass
flow deposits, which in subaqueous grounding-line fans results from the failure and
mobilization of rapidly accumulating sediment. This process produces stratified
diamicton units within eroded channels (Bennett et al., 2002). Channel troughs are
deeper and narrower near the source of subaqueous sediment flows than farther away
(Postma et al., 1983). Mass flow deposits also become better sorted and finer-grained
with distance from tunnel mouths and other sediment sources due to a decrease in flow
velocities. In general, unit CV2 records ice-rafted rain-out debris or deposition by mass
flows on the distal margins of fans or perhaps beyond, whereas unit CV1 clearly is a
product of ice-proximal deposition near the apexes of the fans.
Deformation structures are common in subaqueous grounding-line sediments
(Powell, 1990; Benn, 1996; Bennett et al., 2002). Ball-and-pillow and flame structures
are produced by penecontemporaneous deformation of loose water-saturated sediments
as they compact and dewater. The deformation of some diamicton layers (e.g. TDF115)
suggests sliding or flow of sediment along unstable surfaces. Localized glacier
readvance may have produced faults and folds in unit CV2.
The contact between CV2 and CV3, where exposed, is planar, sharp, and
erosive. There is no evidence of deformation of CV3, which is so characteristic of units
CV1 and CV2; therefore I ascribe CV3 to an older (GPG) glaciation. I interpret the unit to
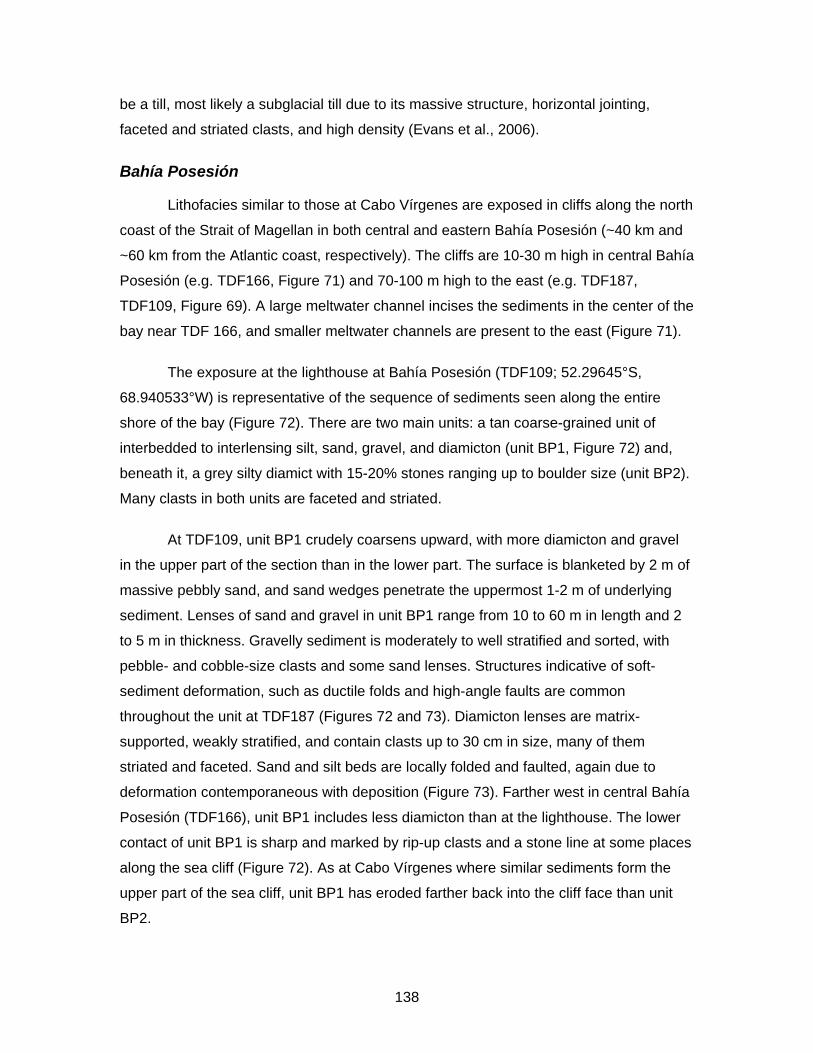
138
be a till, most likely a subglacial till due to its massive structure, horizontal jointing,
faceted and striated clasts, and high density (Evans et al., 2006).
Bahía Posesión
Lithofacies similar to those at Cabo Vírgenes are exposed in cliffs along the north
coast of the Strait of Magellan in both central and eastern Bahía Posesión (~40 km and
~60 km from the Atlantic coast, respectively). The cliffs are 10-30 m high in central Bahía
Posesión (e.g. TDF166, Figure 71) and 70-100 m high to the east (e.g. TDF187,
TDF109, Figure 69). A large meltwater channel incises the sediments in the center of the
bay near TDF 166, and smaller meltwater channels are present to the east (Figure 71).
The exposure at the lighthouse at Bahía Posesión (TDF109; 52.29645°S,
68.940533°W) is representative of the sequence of sediments seen along the entire
shore of the bay (Figure 72). There are two main units: a tan coarse-grained unit of
interbedded to interlensing silt, sand, gravel, and diamicton (unit BP1, Figure 72) and,
beneath it, a grey silty diamict with 15-20% stones ranging up to boulder size (unit BP2).
Many clasts in both units are faceted and striated.
At TDF109, unit BP1 crudely coarsens upward, with more diamicton and gravel
in the upper part of the section than in the lower part. The surface is blanketed by 2 m of
massive pebbly sand, and sand wedges penetrate the uppermost 1-2 m of underlying
sediment. Lenses of sand and gravel in unit BP1 range from 10 to 60 m in length and 2
to 5 m in thickness. Gravelly sediment is moderately to well stratified and sorted, with
pebble- and cobble-size clasts and some sand lenses. Structures indicative of soft-
sediment deformation, such as ductile folds and high-angle faults are common
throughout the unit at TDF187 (Figures 72 and 73). Diamicton lenses are matrix-
supported, weakly stratified, and contain clasts up to 30 cm in size, many of them
striated and faceted. Sand and silt beds are locally folded and faulted, again due to
deformation contemporaneous with deposition (Figure 73). Farther west in central Bahía
Posesión (TDF166), unit BP1 includes less diamicton than at the lighthouse. The lower
contact of unit BP1 is sharp and marked by rip-up clasts and a stone line at some places
along the sea cliff (Figure 72). As at Cabo Vírgenes where similar sediments form the
upper part of the sea cliff, unit BP1 has eroded farther back into the cliff face than unit
BP2.
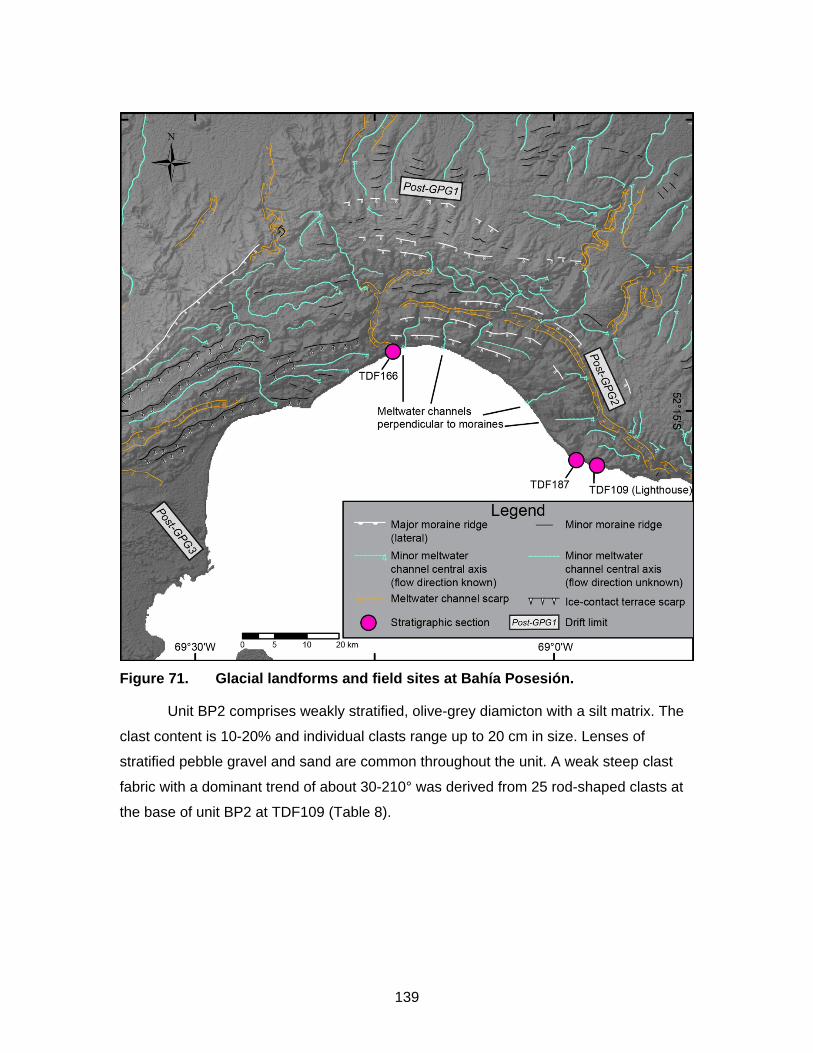
139
Figure 71. Glacial landforms and field sites at Bahía Posesión.
Unit BP2 comprises weakly stratified, olive-grey diamicton with a silt matrix. The
clast content is 10-20% and individual clasts range up to 20 cm in size. Lenses of
stratified pebble gravel and sand are common throughout the unit. A weak steep clast
fabric with a dominant trend of about 30-210° was derived from 25 rod-shaped clasts at
the base of unit BP2 at TDF109 (Table 8).
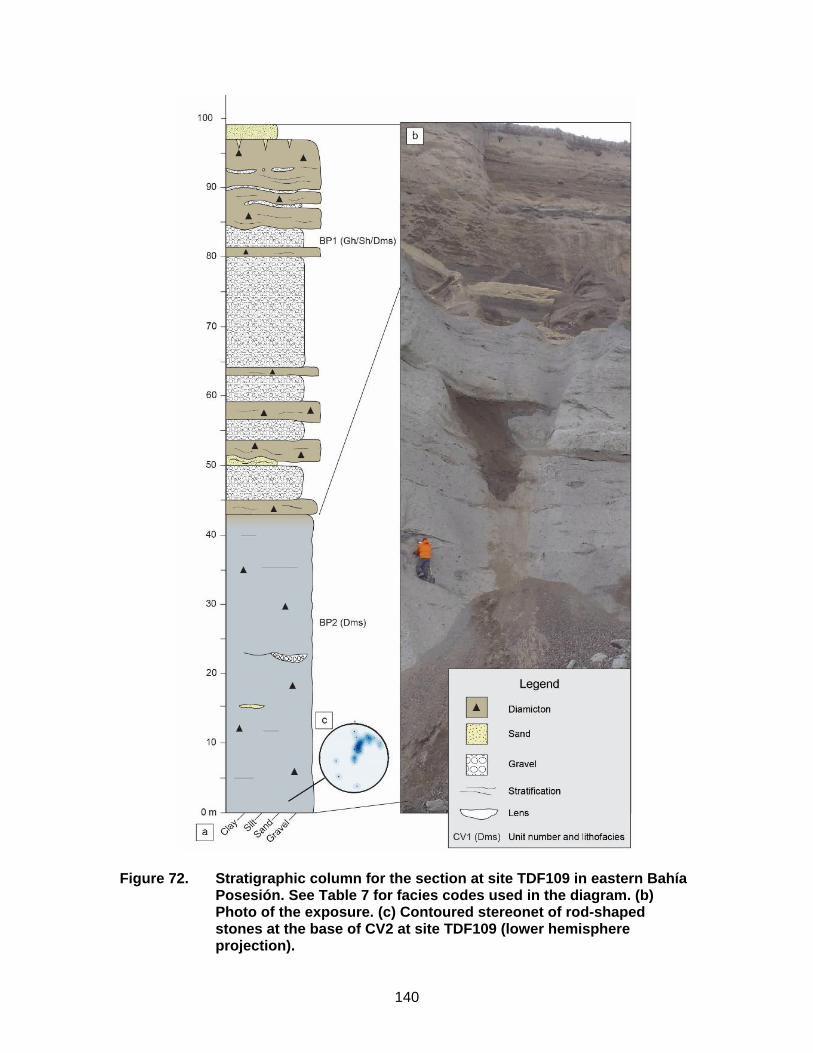
140
Figure 72. Stratigraphic column for the section at site TDF109 in eastern Bahía Posesión. See Table 7 for facies codes used in the diagram. (b) Photo of the exposure. (c) Contoured stereonet of rod-shaped stones at the base of CV2 at site TDF109 (lower hemisphere projection).
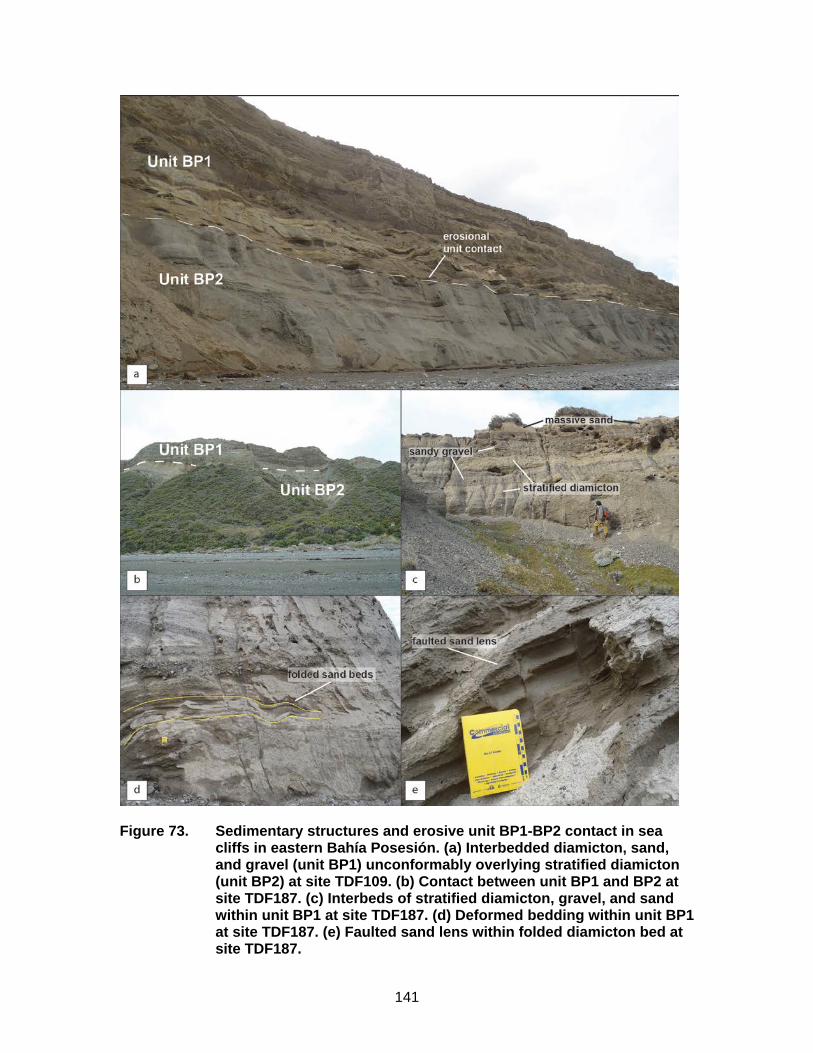
141
Figure 73. Sedimentary structures and erosive unit BP1-BP2 contact in sea cliffs in eastern Bahía Posesión. (a) Interbedded diamicton, sand, and gravel (unit BP1) unconformably overlying stratified diamicton (unit BP2) at site TDF109. (b) Contact between unit BP1 and BP2 at site TDF187. (c) Interbeds of stratified diamicton, gravel, and sand within unit BP1 at site TDF187. (d) Deformed bedding within unit BP1 at site TDF187. (e) Faulted sand lens within folded diamicton bed at site TDF187.
142
In central Bahía Posesión, units BP1 and BP2 have been incised by gravel-
floored, fluvial or glaciofluvial channels. The channels are oriented roughly perpendicular
to the post-GPG 2 moraines and have wide, flat floors (Figure 71).
Interpretation
The sedimentary sequence at Bahía Posesión is remarkably similar to that at
Cabo Vírgenes. It consists of two units, both of which I attribute to deposition in front of a
glacier terminating in a standing body of water, probably freshwater. I envision two
possible hypotheses for the Bahía Posesión sediments. The first hypothesis entails
retreat of the Cabo Vírgenes ice lobe margin westward along the Strait of Magellan,
followed by stabilization in the vicinity of Bahía Posesión. The morainal arc in this area
clearly records a lengthy, relatively stable glacier margin, and ice-marginal sediment
(unit BP1) is the depositional record of that stand. An alternative hypothesis is that the
Bahía Posesión morainal arc is the product of a glaciation that is younger the Cabo
Vírgenes glaciation; that is the two are separated by an interglaciation. The depositional
environment in the case of the second scenario is the same as for the first, but the
morainal arc would represent a terminal, rather than recessional, moraine complex. In
both cases, the grey stony diamicton (unit BP2) is lower-energy sediment deposited in a
glacio-isostatically depressed moat located some distance (perhaps kilometres) from the
ice margin. The average steep plunge of clasts in unit BP2 may reflect deposition from
rafts of ice floating in standing water.
Unit BP2 was deposited either during the advance of post-GPG 2 ice to the Cabo
Posesión area or the advance of post-GPG 1 ice to the Cabo Vírgenes area. In contrast
to their relationship at Cabo Vírgenes, the contact between units BP1 and BP2 at Cabo
Posesión is unconformable, suggesting that the two units at Cabo Posesión are of
different age. This observation favors the second of the two possibilities, that is unit BP2
correlates with unit CV2 and that both were deposited during the post-GPG 1 glaciation.
Tres de Enero
The Tres de Enero site (51.83803°S, 69.39178°W) is a ~270-m-long road-cut
exposure of GPG drift (Figure 74). The height of the exposure ranges from 2 to 6 m.
Three till units with sand wedges and stone lags along their upper contacts are exposed
at the site. The uppermost diamicton (unit TDE1) is matrix-supported, massive to weakly
143
stratified, and contains 15-20% pebble- and cobble-size clasts that are commonly
striated and faceted. The matrix consists mainly of silt and sand. Some lenses of coarse
sand and gravel up to 30 cm long are present within the unit. Sand wedges composed of
massive to vertically laminated, medium to coarse sand extend downward from the top
of unit TDE1 and are spaced about 1-3 m. The wedges narrow downward. Satellite
imagery shows a possible well-developed thermal-contraction network on the GPG
surface at and around the Tres de Enero site (Figure 75). A soil with columnar peds and
a dark brown color is developed on unit TDE1. The lower contact of the unit is sharp,
erosional, and marked by a discontinuous stone line (Figure 74). The clast fabric
measured in unit TDE1 is weak, with a mode at about 80-260° (Table 8), which is similar
to the north-to-northeast ice flow direction expected for the GPG ice lobe.
Unit TDE2 is a massive, tan-colored matrix-supported diamicton with 10-15%
clasts up to boulder size and a silt-sand matrix. Many clasts are striated and faceted.
Sand wedges extend down from the top of the unit; they are more widely spaced than
those in unit TDE1 and are truncated at the contact with that unit. The lower contact is
sharp and marked by a weak stone line and change in color. A weak polymodal to girdle-
shaped clast fabric has a mode at about 150-330°.
Unit TDE3 is a massive to weakly stratified, tan-colored diamicton, similar to unit
TDE2. It is identified as a separate unit because at least one sand wedge within the
upper part of the unit is truncated at its contact with unit TDE2 (Figure 74). In addition,
the darker color and columnar structure of the top of the unit may record a paleosol.
Lenses of gravel and sand are common in this unit. Discontinuous stone lines within unit
TDE3 suggest exposure and reworking of the drift surface and may indicate more than
one glaciation or, alternatively, an oscillating ice front during a single glaciation. A weak
polymodal to girdle-shaped clast fabric measured at the base of the unit has a mode at
150-330° (Table 8).
A channel filled with gravel and sand cuts through all three diamicton units at the
south end of the road-cut (Figure 74). The channel fill is overlain by matrix-supported,
weakly stratified diamicton and is penetrated by sand wedges that appear to be the
same generation as those in unit TDE1.
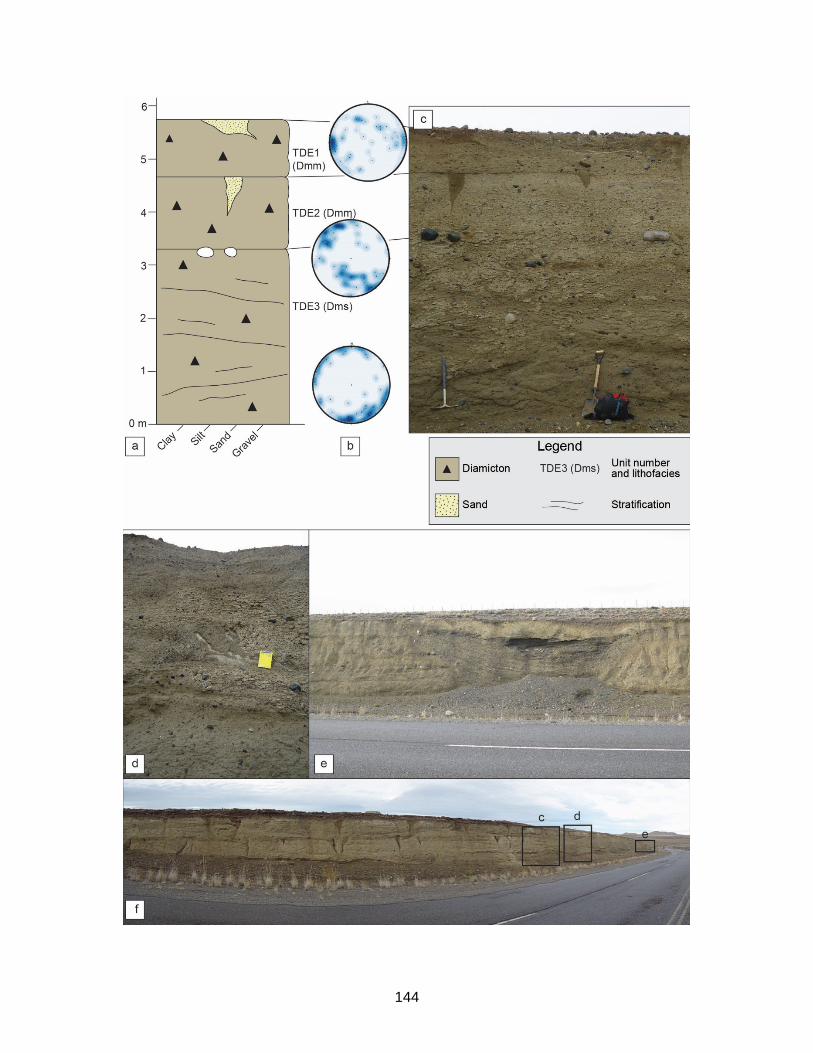
144
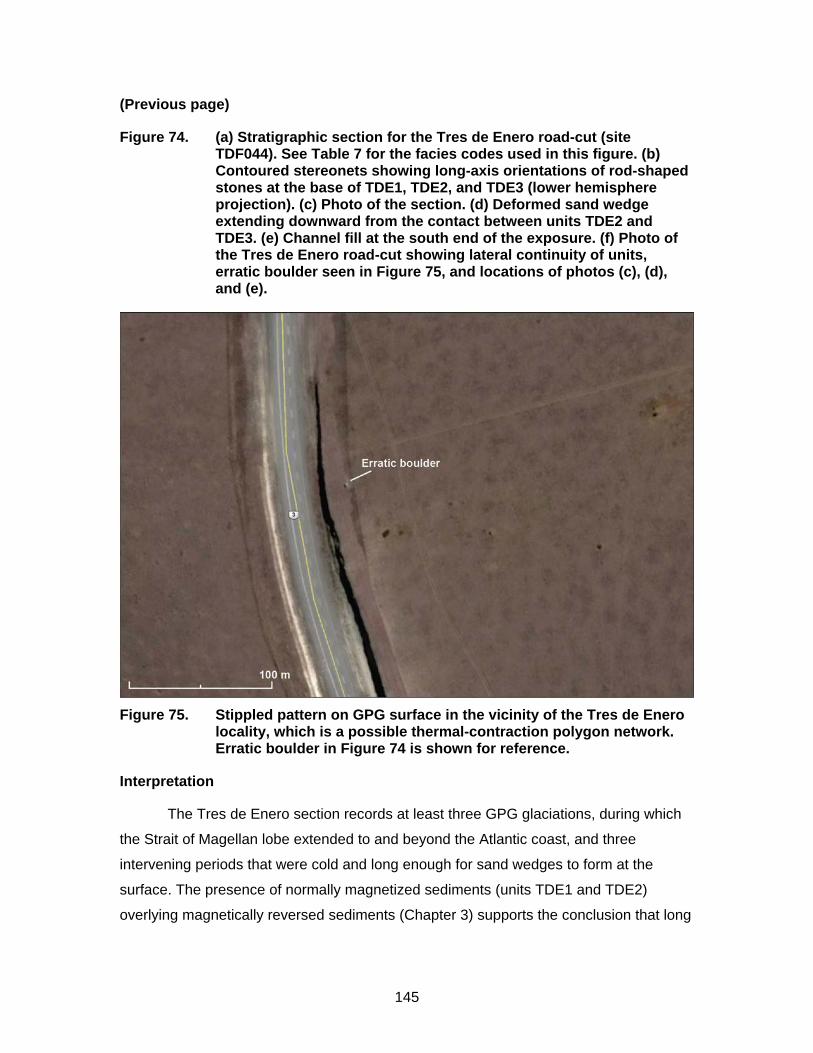
145
(Previous page)
Figure 74. (a) Stratigraphic section for the Tres de Enero road-cut (site TDF044). See Table 7 for the facies codes used in this figure. (b) Contoured stereonets showing long-axis orientations of rod-shaped stones at the base of TDE1, TDE2, and TDE3 (lower hemisphere projection). (c) Photo of the section. (d) Deformed sand wedge extending downward from the contact between units TDE2 and TDE3. (e) Channel fill at the south end of the exposure. (f) Photo of the Tres de Enero road-cut showing lateral continuity of units, erratic boulder seen in Figure 75, and locations of photos (c), (d), and (e).
Figure 75. Stippled pattern on GPG surface in the vicinity of the Tres de Enero
locality, which is a possible thermal-contraction polygon network. Erratic boulder in Figure 74 is shown for reference.
Interpretation
The Tres de Enero section records at least three GPG glaciations, during which
the Strait of Magellan lobe extended to and beyond the Atlantic coast, and three
intervening periods that were cold and long enough for sand wedges to form at the
surface. The presence of normally magnetized sediments (units TDE1 and TDE2)
overlying magnetically reversed sediments (Chapter 3) supports the conclusion that long
146
periods of time passed between deposition of the till units and that the GPG
encompasses multiple glaciations.
The diamictons are basal tills based on their high consolidation, massive
structure, striated and faceted clasts, and the stone lines at the base of units TDF1 and
TDF2. Unit CV3 exposed along the northern part of the Cabo Vírgenes transect is
identical in its sedimentary properties to the tills at the Tres de Enero site and may
correlate with the youngest of the three Tres de Enero tills (TDE1).
In spite of the strong winds and periglacial conditions that existed during multiple
Pleistocene glaciations, the GPG surface has some well-preserved glacial landforms,
including moraine ridges and glaciofluvial channels that have been inactive since they
were cut about one million years ago. Their preservation is a result of the arid climate
that has persisted throughout the Quaternary. Winds have locally degraded the land
surface, as evidenced by blow-out features, sand and silt dunes, and subdued GPG
ground moraine on the Patagonian plain, but not to such an extent that glacial landforms
are unidentifiable.
Cabo del Espíritu Santo
The Cabo del Espíritu Santo sea cliff faces the Atlantic Ocean at the northwest
corner of Tierra del Fuego near the Chile-Argentina boundary. The geology at this
location differs from that north of the Strait of Magellan in that bedrock crops out up to
tens of metres above sea level in most exposures. The section at TDF030 (Figure 76) is
representative of the stratigraphy observed in the 2.5-km-long transect that I
documented. The cliff is capped by 0.8 m of massive dark brown sand with scattered
pebbles and cobbles at the base (unit ES1). This unit overlies 2.2 m of matrix-supported
massive olive-grey diamicton with 5-10% clasts up to cobble size, many of which are
striated and faceted (unit ES2). Sand wedges penetrate the upper 0.8–1 m of this unit
(Figure 76). Unit ES2 unconformably overlies up to 4.7 m of gray-brown well-sorted sand
and gravel with cross-beds that indicate flow to the southeast (unit ES3). The unit is
reversely graded, with fine sand at the base and gravel at the top. It has a sharp
undulating erosional lower contact. In places, the erosional lower contact of unit ES2
extends down to the top of unit ES4; presumably unit ES3 has been removed in these
places by glacial erosion prior to deposition of unit ES2. The sand-gravel unit
unconformably overlies unit ES4, which is 2.5 m of olive-grey matrix-supported
147
diamicton with 25% clasts up to cobble size. The upper part of the diamicton is massive,
whereas the lower part is weakly stratified. Many clasts within the diamicton are striated
and faceted. The lower contact is sharp, undulatory, and erosional. A striated pavement
at the base of the diamicton indicates ice flow toward the southeast (150°) (Figure 76).
This aligns with the ice-flow direction of 150-330° inferred from the clast fabric of ES4,
which though weak is unimodal (Table 8). Unit ES5 comprises up to 3.6 m of trough
cross-bedded pebbly cobbly sand. The cross-beds indicate flow to the southeast, and S-
folds that deform the base of the unit indicate overriding stresses in the same direction
(Figure 76). Upward, the unit coarsens and becomes more poorly sorted and more
weakly stratified. Unit ES5 has an erosional contact with underlying Cretaceous bedrock.
Laterally, this unit is missing, presumably having been eroded by the glacier that
deposited unit ES4.
The sea-cliff exposures at Cabo del Espiritu Santo are incised by large meltwater
channels that are part of a large glaciofluvial drainage system associated with either the
post-GPG 1 or post-GPG 2 glaciation (Meglioli, 1992; Coronato et al., 2004b). The
valleys of this channel system are up to 1 km wide, flat-floored, and partially filled with
sediment after incision. The modern streams in the valleys are underfit and meandering.
Interpretation
The Cabo del Espíritu Santo surface was mapped by Meglioli (1992) as GPG,
but later assigned to the post-GPG 1 glaciation by Coronato et al. (2004a). The Cabo del
Espíritu Santo sequence includes two packages of glacier advance sediments, each
consisting of outwash overlain by subglacial till. I consider the sand/gravel units (ES3
and ES5) to be advance outwash due their cross-bedding, upward coarsening, and poor
sorting. The lower glacial package must be GPG in age. The upper package is either
GPG (if the interpretation of Meglioli, 1992, is correct), or post-GPG 1 (if Coronato et al.,
2004a, are correct). A third cold event is recorded by the sand wedges developed in the
upper till. Samples collected from sand wedges in a gravel unit 10 km to the north of and
stratigraphically younger than the upper till yielded fading-corrected optical ages ranging
from 22-28 ka, suggesting that periglacial conditions existed in the area at least during
the LGM (Cullen, 2016).
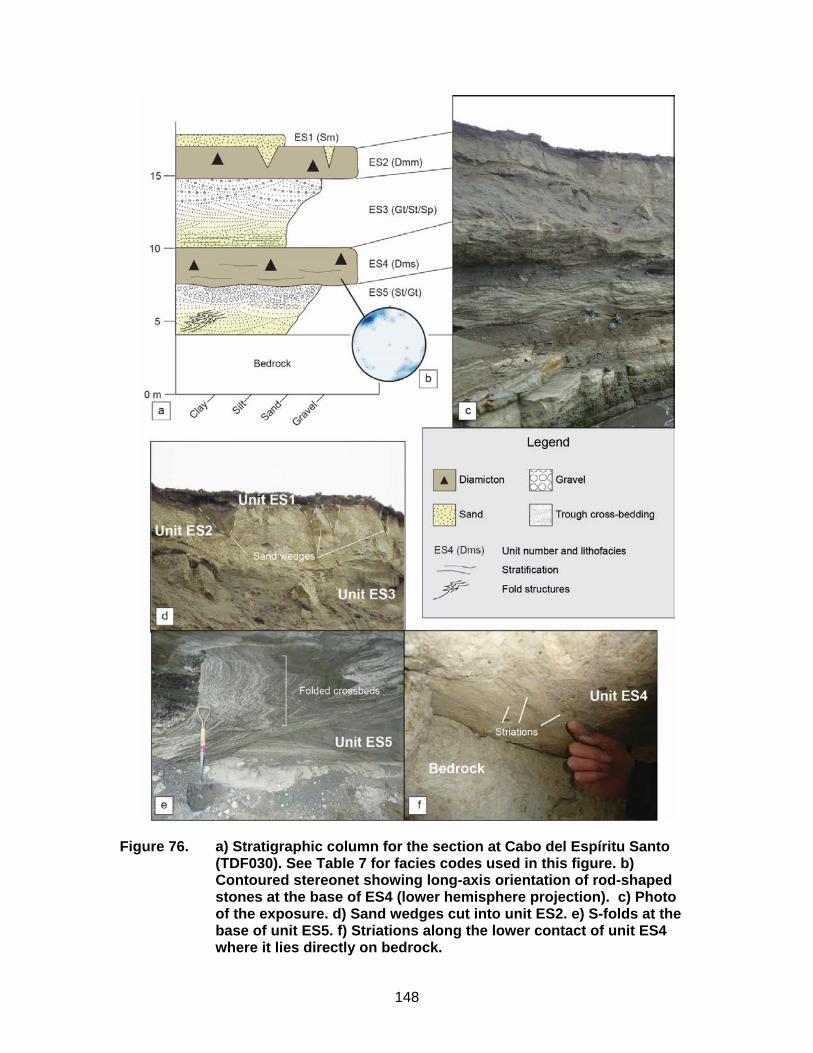
148
Figure 76. a) Stratigraphic column for the section at Cabo del Espíritu Santo (TDF030). See Table 7 for facies codes used in this figure. b) Contoured stereonet showing long-axis orientation of rod-shaped stones at the base of ES4 (lower hemisphere projection). c) Photo of the exposure. d) Sand wedges cut into unit ES2. e) S-folds at the base of unit ES5. f) Striations along the lower contact of unit ES4 where it lies directly on bedrock.
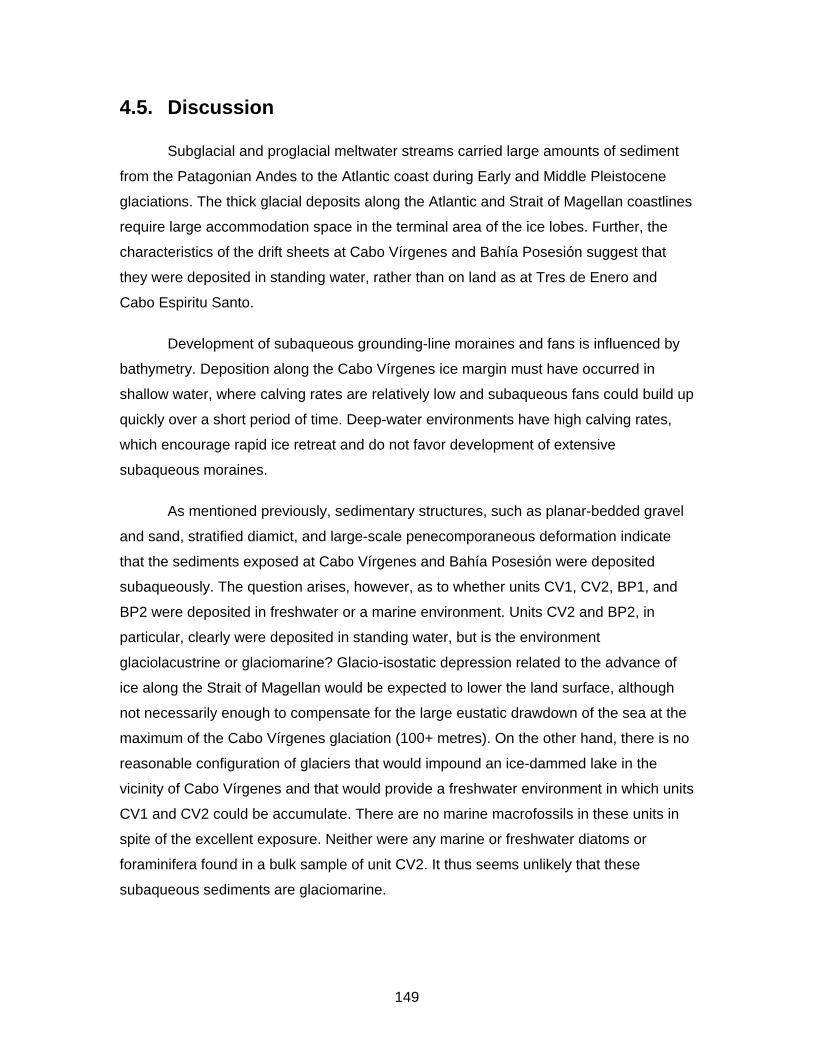
149
4.5. Discussion
Subglacial and proglacial meltwater streams carried large amounts of sediment
from the Patagonian Andes to the Atlantic coast during Early and Middle Pleistocene
glaciations. The thick glacial deposits along the Atlantic and Strait of Magellan coastlines
require large accommodation space in the terminal area of the ice lobes. Further, the
characteristics of the drift sheets at Cabo Vírgenes and Bahía Posesión suggest that
they were deposited in standing water, rather than on land as at Tres de Enero and
Cabo Espiritu Santo.
Development of subaqueous grounding-line moraines and fans is influenced by
bathymetry. Deposition along the Cabo Vírgenes ice margin must have occurred in
shallow water, where calving rates are relatively low and subaqueous fans could build up
quickly over a short period of time. Deep-water environments have high calving rates,
which encourage rapid ice retreat and do not favor development of extensive
subaqueous moraines.
As mentioned previously, sedimentary structures, such as planar-bedded gravel
and sand, stratified diamict, and large-scale penecomporaneous deformation indicate
that the sediments exposed at Cabo Vírgenes and Bahía Posesión were deposited
subaqueously. The question arises, however, as to whether units CV1, CV2, BP1, and
BP2 were deposited in freshwater or a marine environment. Units CV2 and BP2, in
particular, clearly were deposited in standing water, but is the environment
glaciolacustrine or glaciomarine? Glacio-isostatic depression related to the advance of
ice along the Strait of Magellan would be expected to lower the land surface, although
not necessarily enough to compensate for the large eustatic drawdown of the sea at the
maximum of the Cabo Vírgenes glaciation (100+ metres). On the other hand, there is no
reasonable configuration of glaciers that would impound an ice-dammed lake in the
vicinity of Cabo Vírgenes and that would provide a freshwater environment in which units
CV1 and CV2 could be accumulate. There are no marine macrofossils in these units in
spite of the excellent exposure. Neither were any marine or freshwater diatoms or
foraminifera found in a bulk sample of unit CV2. It thus seems unlikely that these
subaqueous sediments are glaciomarine.
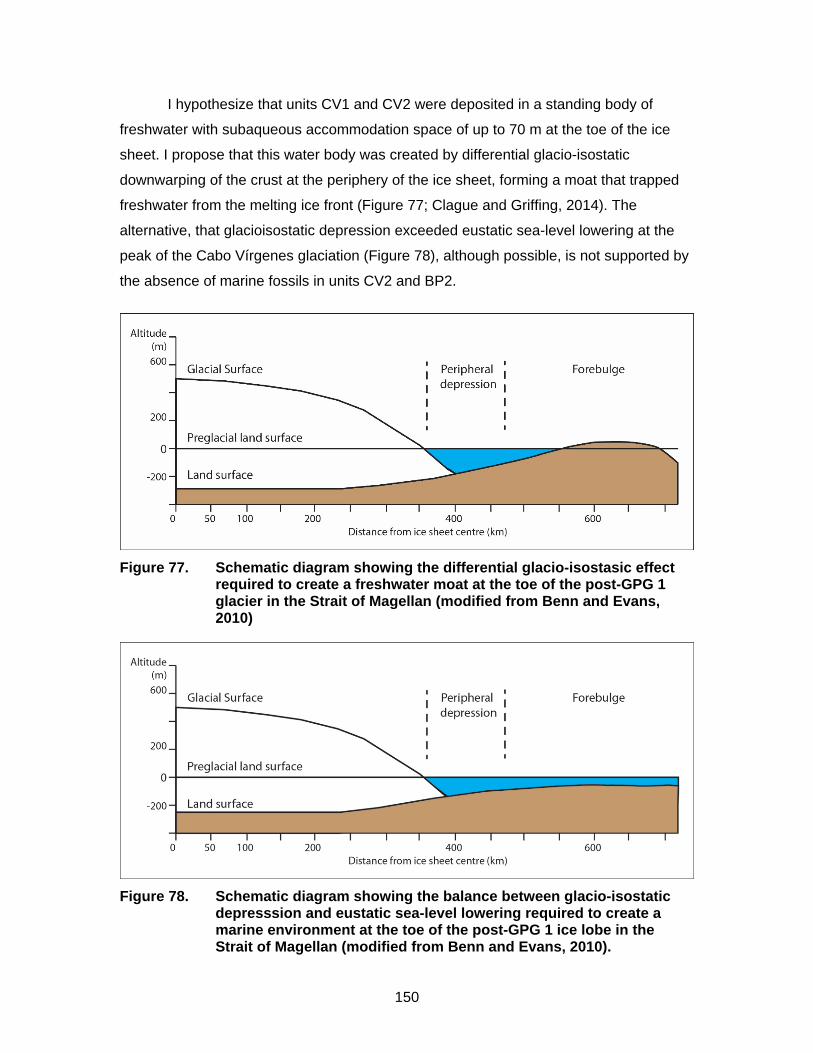
150
I hypothesize that units CV1 and CV2 were deposited in a standing body of
freshwater with subaqueous accommodation space of up to 70 m at the toe of the ice
sheet. I propose that this water body was created by differential glacio-isostatic
downwarping of the crust at the periphery of the ice sheet, forming a moat that trapped
freshwater from the melting ice front (Figure 77; Clague and Griffing, 2014). The
alternative, that glacioisostatic depression exceeded eustatic sea-level lowering at the
peak of the Cabo Vírgenes glaciation (Figure 78), although possible, is not supported by
the absence of marine fossils in units CV2 and BP2.
Figure 77. Schematic diagram showing the differential glacio-isostasic effect
required to create a freshwater moat at the toe of the post-GPG 1 glacier in the Strait of Magellan (modified from Benn and Evans, 2010)
Figure 78. Schematic diagram showing the balance between glacio-isostatic
depresssion and eustatic sea-level lowering required to create a marine environment at the toe of the post-GPG 1 ice lobe in the Strait of Magellan (modified from Benn and Evans, 2010).
151
Exposures of thick deposits of basal till and associated glaciofluvial sand and
gravel on the northeast coast of Tierra del Fuego indicate a subaerial depositional
environment very different from that at Cabo Vírgenes and Bahía Posesión.
Northeastern Tierra del Fuego is 10-20 km west of the Atlantic coast of mainland
Patagonia. This configuration places the terminus of the glacier lobe flowing over Cabo
Espíritu Santo site offshore. Without ocean cores, it is impossible to reconstruct the
depositional environment at the southern margin of the Strait of Magellan lobe during the
Cabo Vírgenes glaciation. It is possible that a grounded ice margin similar to that at
Cabo Vírgenes existed offshore of the modern coastline of Tierra del Fuego and that
subaqueous deposits exist on the continental shelf in that area.
4.6. Conclusions
In this study, I have added to understanding of Early to Middle Pleistocene glacial
events in southern Patagonia. Five drift units had been previously mapped along the
Strait of Magellan (Meglioli, 1992), but the sediments associated with them were not
described in detail. I described the GPG and post-GPG 1 and 2 drift units exposed in
wave-cut cliffs along the shores of the Strait of Magellan and the Atlantic Coast, and in
smaller gravel pit and road-cut exposures. I mapped glacial landforms to determine
sediment-landform associations, which were used along with the sedimentary
descriptions to interpret the depositional environments of the drift sheets.
Three units of subglacial till with sand wedges along their upper contacts occur in
an exposure of GPG drift at the Tres de Enero site. The tills are highly consolidated and
massive. They underlie a flat to gently sloping surface with subdued ground moraines
and thermal-contraction polygonal networks. The lower till is reversely magnetized while
the upper two tills are normally magnetized, indicating the occurrence of at least three
GPG glaciations over a long period of time.
The Cabo Vírgenes sea cliff exposes the contact between GPG and post-GPG 1
drift north of the Strait of Magellan along the Atlantic coast. Massive, dense subglacial till
at the base of the sea cliff has similar physical properties as other GPG diamicton units
in the study area and is unconformably overlain by post-GPG 1 drift. Post-GPG 1 drift
comprises planar-bedded gravel and sand, and stratified diamicton with large-scale
deformation structures. The characteristics of these sediments indicate subaqueous

152
deposition at and near a grounding-line. Exposures of sediment with similar physical
properties are found on the north shore of the Strait of Magellan at Bahía Posesión.
Downwarping of the crust by glacioisostatic depression explains the presence of
freshwater along the periphery of the post-GPG 1 piedmont lobe at a time when the
Atlantic coast was farther to the east due to eustatic sea-level lowering. Further analysis
of post-GPG 1 grounding-line sediments for marine or freshwater microfossils, and
acquisition and study of ocean sediment cores might provide additional information
about the glacial history and environments in the study area.
153
Chapter 5. Conclusions
The landscape of southern Patagonia has been shaped by glaciation beginning
as early as the Miocene and continuing to the present day. Most studies of past
glaciation in this region have focused on mapping the geographic extent of glacial
landforms and drift units. The existing glacial chronology beyond the last glaciation is
based largely on K/Ar and 39Ar/40Ar ages of basalt flows interbedded with glacial
sediments.
This thesis addresses questions that remain about the timing and number of
glacial advances recorded by Early and Middle Pleistocene drift units, as well as
landscape evolution since the onset of glaciation at the end of the Miocene. I have
contributed to an understanding of the evolution of the late Cenozoic southern
Patagonian landscape by studying the paleomagnetic characteristics of Pliocene
sediments and basalt flows in the foothills of the southern Patagonian Andes and Early
and Middle Pleistocene glacial sediments along the Atlantic coast of Patagonia and the
north and south shores of the Strait of Magellan. I use stratigraphic correlations and
landform associations to improve understanding of past environments during these early
glaciations.
The most extensive ice sheets in Southern Patagonia formed in the Early and
Middle Pleistocene. They extended east to the modern Atlantic continental shelf along
the Strait of Magellan and covered much of the Río Gallegos valley. Thick glacial and
proglacial sediments were deposited during the Great Patagonian Glaciation (GPG) and
the progressively less-extensive post-GPG glaciations. The sediments have a high and
stable magnetization with paleofield directions within the range of the geocentric axial
dipole for these sampling latitudes, and are therefore good recorders of the magnetic
field during these events. All post-GPG glacial sediments that I sampled are normally
magnetized. Drift units of the post-GPG 1 and post-GPG 2 have very similar paleofield
directions (post-GPG 1 declination = 0.2°, inclination = -60.5°; post-GPG 2 declination =
0.7°, inclination = 61.5°), and therefore may have been deposited more closely in time
than previously thought. Most GPG sediments that I sampled are normally magnetized
154
and have no signs of magnetic overprinting. Therefore, I assign them to the Brunhes
Chron, which spans the past 0.780 Ma. Reversely magnetized sediments are present
along the margins of GPG drift units associated with the Strait of Magellan lobe,
indicating that the earliest glacial advances most likely occurred during the Matuyama
Chron (2.581-0.78 Ma). In the Río Gallegos Valley, a 0.86 Ma basalt flow caps a thick
unit of normally magnetized glaciofluvial gravel, which was probably deposited during
the Jaramillo Subchron (1.075-0.991 Ma).
Extensive exposures of GPG and post-GPG 1, 2, and 3 drift in wave-cut cliffs
along the shores of the Strait of Magellan and the Atlantic Coast provide details about
glacial depositional environments during the Early to Middle Pleistocene. The drift units
range in thickness from 1 to 80 m and comprise planar-bedded gravel and sand, and
stratified diamicton with large-scale deformation structures. Lithologies and facies
associations, unit contacts, and penecontemporaneous deformation of strata in
exposures of post-GPG 1 and 2 drift at Cabo Vírgenes and Bahía Posesión indicate
deposition in a grounding-line environment. The contact between GPG and post-GPG 1
drift is exposed in sea cliffs at the north end of the Cabo Vírgenes transect. There, GPG
drift comprises up to 2 m of massive dense subglacial till. Other GPG diamicton units
have similar physical properties. At the Tres de Enero study site, a reversely magnetized
subglacial till is overlain by two normally magnetized subglacial tills. Sand wedges
extend down from the top of each till. The Tres de Enero exposure provides evidence for
at least three GPG glaciations, one prior to 0.780 Ma and two younger than 0.780 Ma.
Permafrost formed at the site following each of these three glaciations.
The history of pre-GPG tectonics, volcanism, and landscape evolutions is
recorded in the landforms, sediments, and volcanic rocks in the foothills of the southern
Patagonian Andes. Landforms and sediments in the Lago Cardiel area record the
evolution of the landscape following the last major period of tectonic uplift at the end of
the Miocene, which coincides with extensive volcanism that left widespread basaltic
lavas with ages of 14-8.5 Ma. The Miocene lavas overlie Upper Cretaceous to Miocene
marine and continental sedimentary bedrock. Younger Miocene and Pliocene surfaces
are preserved as mesetas and fluvial plains that formed during incision of the landscape
in the Pliocene and Pleistocene. Large west-trending valleys that incise the Miocene-
aged basalt flows were abandoned by their formative rivers by the early Pliocene, about
4.4 Ma. At about 4.0 Ma, the regional drainage system underwent a major reorganization
155
– Río Chico began to incise the west-trending fluvial valley system, and the plains south
and east of Lago Cardiel were abandoned. The changes in the fluvial networks may
have been initiated by increased aggradation or glacio-isostatic depression caused by
Pliocene glaciation. The closed basin that contains Lago Cardiel began to form on the
relict plain surface before 4.0 Ma, most likely due to its location in a pre-existing
topographic low coincident with the limb of a monocline in Cretaceous rocks. The
depression was enlarged throughout the Pliocene and Pleistocene by a combination of
erosion by small streams and strong deflation, mass movements, and possibly tectonic
collapse. By 3.6 Ma, Río Chico again changed course, abandoning Cañadon León and
flowing south along its modern path to join the Río Shehuen. This final change in
drainage was probably caused by headward erosion of a tributary of the Río Shehuen,
resulting in capture of the river previously flowing through Cañadon León. Thereafter,
eolian, fluvial, and mass movement processes continued to alter the landscape,
generating alluvial and colluvial fans and aprons at the margins of mesetas and fluvial
terraces and the modern floodplains within valleys. These processes differed in intensity
during the Pleistocene due to the marked changes in climate of that period.
5.1. Future research
While my research has contributed to a better understanding of early Patagonian
glaciation and landscape evolution, it has also raised unanswered questions. Future
work should focus on the following themes.
5.1.1. Chronology of landscape evolution in the Lago Cardiel region
Additional radiometric dating of post-plateau basalt flows, chosen for
their relative position to landforms of interest. For example, no ages
exist for basalt flows overlying terraces of the Río Chico north of
Gobernador Gregores. Ar/Ar ages on these flows would help
determine the time of drainage reorganization in the region. Undated
basalt flows also are present around Lago Cardiel; they should be
dated to refine the chronology of formation of the Cardiel basin. Re-
dating of basalt flows that have whole-rock K/Ar ages by the single-
grain 39Ar/40Ar method would aid in improving the chronology of
156
landscape change; an example is the 4.0 Ma age on the Pampa de
las Tunas within the Lago Cardiel depression.
Investigation of eolian erosion. Wind has played an important role in
the evolution of the landscape east of the Andes. The Lago Cardiel
region has many large deflation basins with playa lakes at their
centers and shorelines that suggest higher water levels in the past.
Research into the processes instrumental in forming these basins
might help understand the role that wind played in shaping the Lago
Cardiel depression.
Studies of the formation of closed depressions on the main-plateau
basalt surfaces. Steep-sided circular to sub-elliptical closed basins up
to 16 km long exist on nearly all main-plateau basalt-capped mesetas.
A study of these features might also aid in understanding the
formation of the Lago Cardiel basin.
Geomorphic mapping of Mio-Pliocene surfaces north of Lago Cardiel.
The valleys and mesetas north of Meseta del Strobel in the vicinity of
the Río Chico have similar forms and ages to those in the Lago
Cardiel area. Expanded geomorphic mapping with a focus on
landform associations in this region might identify additional basalt
flows that would aid in constraining the timing and cause of the
Pliocene drainage reorganization.
5.1.2. Chronology of Early and Middle Pleistocene glaciations in the Strait of Magellan area
Chapters 3 and 4 provide information on the times of the GPG and earliest post-
GPG events on the eastern plains of southern Patagonia. Future work in this region
should include:
Additional 39Ar/40Ar ages on basalt flows. The paucity of radiometric
ages that constrain the timing of the oldest Patagonian glaciations is
largely due to an apparent lack of basalt flows and cones that are
closely linked to glaciation. However, undated basalt flows and maars
157
exist in the Bella Vista and Pali Aike volcanic fields, some of which
may offer opportunities for refining the chronology of Pliocene and
Pleistocene events in the region.
Further experiments with optical dating. The study area has
experienced very strong winds throughout the Quaternary, as
indicated by the widespread occurrence of closed deflation basins and
wind-sculpted rock outcrops. Opportunities exist to optically date sand
wedges, eolian silts and silts, and relict beach sediments.
Detailed descriptions of GPG and post-GPG drift along the Strait of
Magellan and on Tierra del Fuego. The correlations that I propose in
this thesis have not utilized all of the stratigraphic exposures in the
region. Sea-cliff exposures similar in quality to those that I studied are
common along the central and western Strait of Magellan and on
Tierra del Fuego, and can be used to corroborate and improve the
stratigraphic framework provided in this thesis. Additional descriptions
of glacial sediments on both sides of the Strait of Magellan would help
resolve the temporal-spatial relationships among the drift units in this
area.
Higher-resolution paleomagnetic analysis of sediment along the
margins of GPG drift and along the northern section of the Cabo
Vírgenes transect. Further paleomagnetic measurements from the
oldest glacial sediments in the region would improve understanding of
the timing and spatial extent of early glacial advances. My work shows
that both normal and reversed polarities are recorded in GPG
sediments, and further paleomagnetic analysis of these drift units
might answer questions about their age. For example, I hypothesize
that the lowest diamicton at Cabo Vírgenes (unit CV3) was deposited
during a GPG glaciation, based on my interpretation that it is a
subglacial till and is unconformably overlain by post-GPG 1 drift.
Paleomagnetic analysis of unit CV3 might show whether or not it is
correlative with the reversely magnetized GPG sediments at Tres de
Enero and Estancia Don Bosco.
158
Detailed mapping of Early and Middle Pleistocene glacial landforms.
As higher-resolution imagery and other remote sensing data become
available, new geomorphic studies of old glacial landforms might aid
in understanding the environments in which they formed.
Analysis of post-GPG 1 grounding-line sediments for marine or
freshwater microfossils. The one bulk sample analyzed from Cabo
Vírgenes did not contain microfossils, leaving some uncertainty in the
environment of deposition of the lowest unit of the Cabo Vírgenes
drift.
Collection and analysis of ocean cores off the coast of Cabo Vírgenes
and Tierra del Fuego. Ocean sediment cores could provide valuable
information about the extent, ages, and character of the most
extensive Patagonian glaciations.
159
References
Ariztegui, D., Gilli, A., Anselmetti, F. S., Goñi, R. A., Belardi, J. B., & Espinosa, S. (2010). Lake-level changes in central Patagonia (Argentina): crossing environmental thresholds for Lateglacial and Holocene human occupation. Journal of Quaternary Science, 25(7), 1092-1099.
Barendregt, R. W. (2011). Magnetostratigraphy of quaternary sections in eastern Alberta, Saskatchewan and Manitoba. In J. Ehlers, P. L. Gibbard & P. D. Hughes (Eds.), Quaternary Glaciations—Extent and Chronology. A Closer Look. Elsevier, Amsterdam, The Netherlands, 591-600.
Barendregt, R. W., Enkin, R. J., Duk-Rodkin, A., & Baker, J. (2010). Paleomagnetic evidence for multiple late Cenozoic glaciations in the Tintina Trench, west-central Yukon, Canada. Canadian Journal of Earth Sciences, 47(7), 987–1002.
Benn, D. I. (1994). Fabric shape and the interpretation of sedimentary fabric data. Journal of Sedimentary Research, 64(4), 910-915.
Benn, D. I. (1996). Subglacial and subaqueous processes near a glacier grounding line: sedimentological evidence from a former ice-dammed lake, Achnasheen, Scotland. Boreas, 25(1), 23–36.
Benn, D. I., & Evans, D. J. (2010). Glaciers & Glaciation (2nd ed.). Hodder Education, London.
Bennett, M. R., Huddart, D., & Thomas, G. S. P. (2002). Facies architecture within a regional glaciolacustrine basin: Copper River, Alaska. Quaternary Science Reviews, 21(20), 2237–2279.
Bentley, M. J., Sugden, D. E., Hulton, N. R. J., & McCulloch, R. D. (2005). The landforms and pattern of deglaciation in the Strait of Magellan and Bahía Inutil, southernmost South America; Late-glacial glacier events in southernmost South America and their global significance. Geografiska Annaler, Series A: Physical Geography, 87(2), 313–333.
Beres, M., Gilli, A., Ariztegui, D., & Anselmetti, F. S. (2008). The Lago Cardiel basin, Argentina (49 S): Origin and evolution revealed by high-resolution multichannel seismic reflection studies. Journal of South American Earth Sciences, 25(1), 74–85.
Bockheim, J., Coronato, A., Rabassa, J., Ercolano, B., & Ponce, J. (2009). Relict sand wedges in southern Patagonia and their stratigraphic and paleo-environmental significance. Quaternary Science Reviews, 28(13–14), 1188–1199.
Boulton, G. S. (1986). Push moraines and glacier-contact fans in marine and terrestrial environments. Sedimentology, 33(5), 677–698.
160
Butler, R. F. (1992). Paleomagnetism; Magnetic Domains to Geologic Terranes. Blackwell Scientific Publishers, Boston, MA.
Caldenius, C. R. C. (1932). Las glaciaciones cuaternarias en la Patagonia y Tierra del Fuego: una investigación regional, estratigráfica y geocronológica, una comparación con la escala geocronológica sueca. Geografiska Annaler, 14(1-2), 1-164.
Cande, S. C., & Leslie, R. B. (1986). Late Cenozoic tectonics of the southern Chile Trench. Journal of Geophysical Research: Solid Earth, 91(B1), 471–496.
Cioppa, M. T., Karlstrom, E. T., Irving, E., & Barendregt, R. W. (1995). Paleomagnetism of tills and associated paleosols in southwestern Alberta and northern Montana: evidence for Late Pliocene–Early Pleistocene glaciations. Canadian Journal of Earth Sciences, 32(5), 555–564.
Clague, J. J., & Griffing, C. Y. (2014). Deposition in glacio-isostatic moats in coastal environments. Geological Society of America, Abstracts with Programs, 46(6), 265.
Clapperton, C. M. (1993). Nature of environmental changes in South America at the Last Glacial Maximum. Palaeogeography, Palaeoclimatology, Palaeoecology, 101(3–4), 189–208.
Clapperton, C. M., Sugden, D. E., Kaufman, D. S., & McCulloch, R. D. (1995). The Last Glaciation in central Magellan Strait, southernmost Chile. Quaternary Research, 44(2), 133–148.
Cobos, J., Anselmi, G., Panza, J. L., Giacosa, R., & Ecosteguy, L. (2009). Hoja Geológica 1:250,000, 4972-IV. Tres Lagos, Provincia de Santa Cruz, Argentina. Boletín del Servicio Geológico Minero Argentino, 340, 94 pp.
Corbella, H. (2002). El campo volcano-tectónico de Pali Aike. In M. J. Haller (ed.), Geologia y Recursos Naturales de Santa Cruz. Asociación Geológica Argentina, 285-301.
Corbella, H., Chelotti, L. Y., Pomposiello, C. (1996). Neotectonica del Rift Jurasico Austral en Pali-Aike, Patagonia extrandina, Santa Cruz, Argentina. XIII Congreso Geologico Argentino, 383–393.
Corbella, H., Ercolano, B., Coronato, A., & Tiberi, P. (2014). Tectónica distensiva, magmatismo y glaciaciones en la Cuenca superior y media del Río Gallegos, Patagonia austral. In Geologia y Recursos Naturales de Santa Cruz. XIX Congreso Geológico, Córdoba, pp. 165-174.
Coronato, A., & Rabassa, J. (2011). Pleistocene glaciations in southern Patagonia and Tierra del Fuego. In J. Ehlers, P. L. Gibbard, & P. D. Hughes (Eds.), Quaternary Glaciations: Extent and Chronology: A Closer Look. Developments in Quaternary Science, Vol. 15. Elsevier, Amsterdam, 715-727.
161
Coronato, A. M. J., Coronato, F., Mazzoni, E., & Vázquez, M. (2008). The physical geography of Patagonia and Tierra del Fuego. In J. Rabassa (ed.), The Late Cenozoic of Patagonia and Tierra del Fuego. Developments in Quaternary Science, Vol. 11. Elsevier, Amsterdam, 13–55.
Coronato, A., Ercolano, B., Corbella, H., & Tiberi, P. (2013). Glacial, fluvial and volcanic landscape evolution in the Laguna Potrok Aike maar area, Southern Patagonia, Argentina. Quaternary Science Reviews, 71, 13–26.
Coronato, A., Martínez, O., & Rabassa, J. (2004a). Glaciations in Argentine Patagonia, southern South America. In J. Ehlers & P. L. Gibbard (Eds.), Quaternary Glaciations: Extent and chronology, part III: South America, Asia, Africa, Australasia, Antarctica. Developments in Quaternary Science, Vol. 2. Elsevier, Amsterdam, 49–67.
Coronato, A., Meglioli, A., & Rabassa, J. (2004b). Glaciations in the Magellan Straits and Tierra del Fuego, southernmost South America. In J. Ehlers, & P. L. Gibbard (Eds.), Quaternary Glaciations: Extent and chronology, part III: South America, Asia, Africa, Australasia, Antarctica. Developments in Quaternary Science, Vol. 2. Elsevier, Amsterdam, 45–48.
Cullen, J.R. (2016). Optical Dating Studies of southeastern Patagonian Sand Wedges in Chile and Argentina. MSc thesis, Simon Fraser University, Burnaby, BC.
Dalziel, I. W., & Palmer, K. F. (1979). Progressive deformation and orogenic uplift at the southern extremity of the Andes. Geological Society of America Bulletin, 90(3), 259-280.
Darvill, C. M., Stokes, C. R., Bentley, M. J., & Lovell, H. (2014). A glacial geomorphological map of the southernmost ice lobes of Patagonia: the Bahía Inútil–San Sebastián, Magellan, Otway, Skyring and Río Gallegos lobes. Journal of Maps, 10(3), 500–520.
Darwin, C. (1842). On the distribution of the erratic boulders and on the contemporaneous unstratified deposits of South America. Transactions of the Geological Society of London, 2(2), 415–431.
Deblonde, C., Plouffe, A., Boisvert, E., Buller, G., Davenport, P., Everett, D., Inglis, E., Kerr, D., Moore, A., & Paradis, S. J. (2012). Science Language for an Integrated Geological Survey of Canada Data Model for Surficial Maps, Version 1.2. Geological Survey of Canada, Open File 7003, 1-224.
Dietrich, R., Ivins, E. R., Casassa, G., Lange, H., Wendt, J., & Fritsche, M. (2010). Rapid crustal uplift in Patagonia due to enhanced ice loss. Earth and Planetary Science Letters, 289(1–2), 22–29.
Diraison, M., Cobbold, P. R., Gapais, D., & Rossello, E. A. (1997). Magellan Strait: part of a Neogene rift system. Geology, 25(8), 703–706.
162
D’Orazio, M., Agostini, S., Mazzarini, Fl., Innocenti, F., Manetti, P., Haller, M. J., & Lahsen, A. (2000). The Pali Aike Volcanic Field, Patagonia: Slab-window magmatism near the tip of South America. Tectonophysics, 321(4), 407-427.
Duk-Rodkin, A., & Barendregt, R. W. (2011). Stratigraphical record of glacials/interglacials in Northwest Canada. In J. Ehlers, P. L., & Gibbard, P. D. Hughes (Eds.), Quaternary Glaciations—Extent and Chronology. A Closer Look. Developments in Quaternary Science, Vol. 15. Elsevier, Amsterdam, 661-698.
Ercolano, B., Mazzoni, E., Vázquez, M., & Rabassa, J. (2004). Drumlins y formas drumlinoides del Pleistoceno Inferior en Patagonia Austral, Provincia de Santa Cruz. Revista de La Asociación Geológica Argentina, 59(4), 771–777.
Evans, D. J. A., & Benn, D. I. (2004). A Practical Guide to the Study of Glacial Sediments. Routledge, New York.
Evans, D. J. A., Phillips, E. R., Hiemstra, J. F., & Auton, C. A. (2006). Subglacial till; formation, sedimentary characteristics and classification. Earth-Science Reviews, 78(1), 115–176.
Evenson, E., Burkhart, P., Gosse, J., Baker, G., Jackofsky, D., Meglioli, A., & Berti, C. (2009). Enigmatic boulder trains, supraglacial rock avalanches, and the origin of “Darwin’s boulders,” Tierra del Fuego. GSA Today, 19(12), 4–10.
Eyles, N., Eyles, C. H., & Miall, A. D. (1983). Lithofacies types and vertical profile models; an alternative approach to the description and environmental interpretation of glacial diamict and diamictite sequences. Sedimentology, 30(3), 393–410.
Ferrill, D. A., Wyrick, D. Y., & Smart, K. J. (2011). Coseismic, dilational-fault and extension-fracture related pit chain formation in Iceland: analog for pit chains on Mars. Lithosphere, 3(2), 133–142.
Feruglio, E. (1949). Descripción Geológica de la Patagonia, Volume 1. Yacimientos Petrolíferos Fiscales, 1-334.
Feruglio, E. (1950). Descripción Geológica de la Patagonia, Volume 3. Yacimientos Petrolíferos Fiscales, 1-432.
Fidalgo, F., & Riggi, J. C. (1965). Los rodados patagonicos en la Meseta del Guenguel y alrededores (Santa Cruz). Revista de La Asociacion Geologica Argentina, 20(3), 273–325.
Fleagle, J. G., Bown, T. M., Swisher, C., & Buckley, G. (1995). Age of the Pinturas and Santa Cruz formations. VI Congreso Argentino de Paleontologia y Bioestratigrafia, Actas, 129–135.
163
Flint, R. F., & Fidalgo, F. (1964). Glacial geology of the east flank of the Argentine Andes between latitude 39 degrees 10’S and latitude 41 degrees 20’S. Geological Society of America Bulletin, 75(4), 335–352.
Flint, R. F., & Fidalgo, F. (1969). Glacial drift in the eastern Argentine Andes between latitude 41 degrees 10’ S and latitude 43 degrees 10’ S. Geological Society of America Bulletin¸ 80(6), 1043–1052.
Fisher, R. V. (1968). Pu’u Hou littoral cones, Hawaii. Geologische Rundschau, 57(3), 837-864.
Forsythe, R., & Nelson, E. (1985). Geological manifestations of ridge collision: evidence from the Golfo de Penas‐Taitao Basin, southern Chile. Tectonics, 4(5), 477–495.
Galloway, R. W., Markgraf, V., & Bradbury, P. (1988). Dating shorelines of lakes in Patagonia, Argentina. Journal of South American Earth Sciences, 1(2), 195-198.
Gile, L. H., Peterson, F. F., & Grossman, R. B. (1966). Morphological and genetic sequences of carbonate accumulation in desert soils. Soil Science, 101(5), 347–360.
Gilli, A., Anselmetti, F. S., Ariztegui, D., Beres, M., McKenzie, J. A., & Markgraf, V. (2005a). Seismic stratigraphy, buried beach ridges and contourite drifts: the Late Quaternary history of the closed Lago Cardiel basin, Argentina (49 S). Sedimentology, 52(1), 1–23.
Gilli, A., Anselmetti, F. S., Ariztegui, D., Bradbury, J. P., Kelts, K. R., Markgraf, V., & McKenzie, J. A. (2001). Tracking abrupt climate change in the Southern Hemisphere: a seismic stratigraphic study of Lago Cardiel, Argentina (49 S). Terra Nova, 13(6), 443–448.
Gilli, A., Ariztegui, D., Anselmetti, F. S., McKenzie, J. A., Markgraf, V., Hajdas, I., & McCulloch, R. D. (2005b). Mid-Holocene strengthening of the southern westerlies in South America—sedimentological evidences from Lago Cardiel, Argentina (49 S). Global and Planetary Change, 49(1), 75–93.
Gilli, A., Markgraf, V., Anselmatti, F. S., & Ariztegui, D., 2007. Comment on: Glacier advances east of the southern Andes between the last glacial maximum and 5000 BP compared with lake terraces of the endorheic Lago Cardiel (49°S, Patagonia, Argentina). Zeitscrhift fϋr Geomorphologie, 51(1), 135-137.
Glasser, N. F., & Jansson, K. N. (2008). The glacial map of southern South America. Journal of Maps, 4(1), 175–196.
Gogorza, C. S., Di Tommaso, I., Sinito, A. M., Jackson, B., Nuñez, H., Creer, K. M., & Vilas, J. M. (1998). Preliminary results from paleomagnetic records on lake sediments from South America. Studia Geophysica et Geodaetica, 42(1), 12-29.
164
Gogorza, C. S., Irurzun, M. A., & Sinito, A. M. (2012). High-resolution paleomagnetic records from Laguna Potrok Aike (Patagonia, Argentina) for the last 16,000 years. Geochemistry, Geophysics, Geosystems, 13(12), 1-18.
Gorring, M. L., Kay, S. M., Zeitler, P. K., Ramos, V. A., Rubiolo, D., Fernandez, M. I., & Panza, J. L. (1997). Neogene Patagonian plateau lavas: continental magmas associated with ridge collision at the Chile Triple Junction. Tectonics, 16(1), 1–17.
Goudie, A. S., & Wells, G. L. (1995). The nature, distribution and formation of pans in arid zones. Earth-Science Reviews, 38(1), 1–69.
Guillou, H., & Singer, B. (1997). Combined unspiked K-Ar and 40Ar/39Ar dating of late Quaternary lavas. EOS, Transactions of the American Geophysical Union, 78(46), 771.
Hein, A. S., Dunai, T. J., Hulton, N. R. J., & Xu, S. (2011). Exposure dating outwash gravels to determine the age of the greatest Patagonian glaciations. Geology, 39(2), 103-106.
Hein, A. S., Hulton, N. R. J., Dunai, T. J., Schnabel, C., Kaplan, M. R., Naylor, M., & Xu, S. (2009). Middle Pleistocene glaciation in Patagonia dated by cosmogenic-nuclide measurements on outwash gravels. Earth and Planetary Science Letters, 286(1-2), 184–197.
Heming, S. R. (n.d.). Argon Geochronology for the Earth Scienes (AGES) Lab. Retrieved from http://www.ldeo.columbia.edu/research/geochemistry/argon-geochronology-earth-sciences-ages-lab.
Hervé, F., Godoy, E., Mpodozis, C., & Fanning, C. (2004). Monitoring magmatism of the Patagonian Batholith through the U-SHRIMP dating of detrital zircons in sedimentary units of the Magallanes Basin. Bolletino dei Geofisica Terica ed Applicata, 45(2), 113–117.
Hervé, F., Pankhurst, R. J., Fanning, C. M., Calderón, M., & Yaxley, G. M. (2007). The South Patagonian batholith: 150 my of granite magmatism on a plate margin. Lithos, 97(3), 373–394.
Hicock, S. R., Goff, J. R., Lian, O. B., & Little, E. C. (1996). On the interpretation of subglacial till fabric. Journal of Sedimentary Research, 66(5), 928–934.
Kaplan, M. R., Douglass, D. C., Singer, B. S., Ackert, R. P., & Caffee, M. W. (2005). Cosmogenic nuclide chronology of pre-Last Glacial Maximum moraines at Lago Buenos Aires, 46 degrees S, Argentina. Quaternary Research, 63(3), 301–315.
165
Kaplan, M. R., Strelin, J. A., Schaefer, J. M., Denton, G. H., Finkel, R. C., Schwartz, R., Putnam, A. E., Vandergoes, M. J., Goehring, B. M., & Travis, S. G. (2011). In-situ cosmogenic 10Be production rate at Lago Argentino, Patagonia: implications for late-glacial climate chronology. Earth and Planetary Science Letters, 309(1-2), 301–315.
Kirschvink, J. L. (1980). The least-squares line and lane and the analysis of palaeomagnetic data. Geophysical Journal of the Royal Astronomical Society, 62(3), 699-718.
Kliem, P., Enters, D., Hahn, A., Ohlendorf, C., Lisé-Pronovost, A., St-Onge, G., Wastegård, S., & Zolitschka, B. (2013). Lithology, radiocarbon chronology and sedimentological interpretation of the lacustrine record from Laguna Potrok Aike, southern Patagonia. Quaternary Science Reviews, 71, 54-69.
Lagabrielle, Y., Scalabrino, B., Suarez, M., & Ritz, J.-F. (2010). Mio-Piiocene glaciations of Central Patagonia: new evidence and tectonic implications. Andean Geology, 37(2), 276–299.
Lagabrielle, Y., Scalabrino, B., Suarez, M., Rossello, E. A., Hérail, G., Martinod, J., Régnier, M., & de la Cruz, R. (2004). Neogene to Quaternary tectonic evolution of the Patagonian Andes at the latitude of the Chile Triple Junction. Tectonophysics, 385(1-4), 211-241.
Lancaster, I. N. (1978). The pans of the southern Kalahari, Botswana. Geographical Journal, 144(1), 81–98.
Lisiecki, L. E., & Raymo, M. E. (2005). A Pliocene-Pleistocene stack of 57 globally disturbed benthic delta 18O records. Paleoceanography, 20(1), 1-17.
Lovell, H., Stokes, C. R., & Bentley, M. J. (2011). A glacial geomorphological map of the Seno Skyring-Seno Otway-Strait of Magellan region, southernmost Patagonia. Journal of Maps, 7(1), 318–339.
Lowell, T., Heusser, C. J., Andersen, B., Moreno, P., Hauser, A., Heusser, L., Schlϋchter, C., Marchant, D., & Denton, G. (1995). Interhemispheric correlation of Late Pleistocene glacial events. Science, 269(5230), 1541-1549.
Mackay, J. R. (1974). Ice-wedge cracks, Garry Island, Northwest Territories. Canadian Journal of Earth Sciences, 11(10), 1366–1383.
Malagnino, E. (1995). The discovery of the oldest extra-Andean glaciation in the Lago Buenos Aires Basin, Argentina. In J. Rabassa, & M. Salemme (Eds.), Quaternary of South America and Antarctic Peninsula, Vol. 9. Balkema Publishers, Rotterdam, 69–83.
166
Markgraf, V., Bradbury, J. P., Schwalb, A., Burns, S. J., Stern, C., Ariztegui, D., & Maidana, N. (2003). Holocene palaeoclimates of southern Patagonia: limnological and environmental history of Lago Cardiel, Argentina. The Holocene, 13(4), 581–591.
Martınez, O. A., & Coronato, A. M. J. (2008). The late Cenozoic fluvial deposits of Argentine Patagonia. In J. Rabassa (ed.), The Late Cenozoic of Patagonia and Tierra Del Fuego, Developments in Quaternary Science, Vol. 11. Elsevier, Amsterdam, 205–226.
Mattox, T. N., & Mangan, M. T. (1977). Littoral hydrovolcanic explosions: a case study of lava-seawater interaction at Kilauea Volcano. Journal of Volcanology and Geothermal Research, 75(1-2), 1-17.
Mazzarini, F., & D’Orazio, M. (2003). Spatial distribution of cones and satellite-detected lineaments in the Pali Aike Volcanic Field (southernmost Patagonia): insights into the tectonic setting of a Neogene rift system. Journal of Volcanology and Geothermal Research, 125(3), 291-305.
McCulloch, R. D., Fogwill, C. J., Sudgen, D. E., Bentley, M. J., & Kubik, P.W. (2005). Chronology of the last glaciation in central Strait of Magellan and Bahía Inutil, southernmost South America. Geografiska Annaler, Series A: Physical Geography, 87(2), 289–312.
Meglioli, A. (1992). Glacial Geology and Chronology of Southernmost Patagonia and Tierra del Fuego, Argentina and Chile. PhD thesis, Lehigh University, Bethlehem, PA.
Mejia, V., Opdyke, N. D., Vilas, J. F., Singer, B. S., & Stoner, J. S. (2004). Plio‐Pleistocene time‐averaged field in southern Patagonia recorded in lava flows. Geochemistry, Geophysics, Geosystems, 5(3), 1-15.
Mercer, J. H. (1976). Glacial history of southernmost South America. Quaternary Research, 6(2), 125–166.
Mercer, J. H. (1983). Cenozoic glaciation in the Southern Hemisphere. Annual Review of Earth and Planetary Sciences, 11(1), 99-132.
Mercer, J. H., & Sutter, J. F. (1982). Late Miocene—earliest Pliocene glaciation in southern Argentina: implications for global ice-sheet history. Palaeogeography, Palaeoclimatology, Palaeoecology, 38(3), 185–206.
Mercer, J. H., Fleck, R. J., Mankinen, E. A., & Sander, W. (1973). Southern Patagonia; glacial events between 4 m.y. and 1 m.y. ago. In R. P. Suggate, & M. M. Cresswell (Eds.), Quaternary Studies. Royal Society New Zealand, Wellington, 223-230.
167
Mörner, N. A., & Sylwan, C. (1989). Magnetostratigraphy of the Patagonian moraine sequence at Lago Buenos Aires. Journal of South American Earth Sciences, 2(4), 385-389.
Nelson, F. E., Barendregt, R. W., & Villeneuve, M. (2009). Stratigraphy of the Fort Selkirk volcanogenic complex in central Yukon and its paleoclimatic significance; Ar/Ar and paleomagnetic data. Canadian Journal of Earth Sciences, 46(5), 381–401.
Olivero, E. B., & Malumián, N. (1999). Eocene stratigraphy of southeastern Tierra del Fuego island, Argentina. American Association of Petroleum Geologists Bulletin, 83(2), 295-313.
Panza, J. L., & Marin, G. (1998). Hoja Geológico 4969-I, Gobernador Gregores (1:250,000), Provincia de Santa Cruz. Servicio Geológico Minero Argentino, 11, map and report, 104 pp.
Paruelo, J. M., Beltran, A., Jobbagy, E., Sala, O. E., & Golluscio, R. A. (1998). The climate of Patagonia: general patterns and controls on biotic processes. Ecología Austral, 8(2), 85–101.
Pewe, T. L. (1959). Sand-wedge polygons (tesselations) in the McMurdo Sound region, Antarctica; a progress report. American Journal of Science, 257(8), 545–552.
Postma, G., Roep, T. B., & Ruegg, G. H. J. (1983). Sandy-gravelly mass-flow deposits in an ice-marginal lake (Saalian, Leuvenumsche Beek Valley, Veluwe, The Netherlands), with emphasis on plug-flow deposits. Sedimentary Geology, 34(1), 59–82.
Powell, R. D. (1990). Glacimarine processes at grounding-line fans and their growth to ice-contact deltas. In J. A. Dowdeswell, & J. D. Scourse (Eds.), Glaciomarine Environments: Processes and Sediments. Geological Society of London Special Publications, 53, 53–73.
Powell, R. D., & Alley, R. B. (1997). Grounding‐line systems: processes, glaciological inferences and the stratigraphic record. In P. F. Barker & A. K. Cooper (Eds.), Geology and Seismic Stratigraphy of the Antarctic Margin, 2. Antarctic Research Series, 71, 169–187.
Powell, R. D., & Cooper, J. M. (2014). A glacial sequence stratigraphic model for temperate, glaciated continental shelves. In J. A. Dowdeswell & O. Cofaigh (Eds.), Glacier-influenced Sedimentation on High-latitude Continental Margins. Geological Society of London Special Publications, 203, 215–244.
Quade, J., & Kaplan, M. R. (2017). Lake-level stratigraphy and geochronology revisited at Lago (Lake) Cardiel, Argentina, and changes in the Southern Hemispheric Westerlies over the last 25 ka. Quaternary Science Reviews, 177, 173-188.
168
Rabassa, J. (2008). Late Cenozoic glaciations in Patagonia and Tierra del Fuego. In J. Rabassa (ed.), The Late Cenozoic of Patagonia and Tierra del Fuego. Developments in Quaternary Science, Vol. 11. Elsevier, Amsterdam, 151-204.
Rabassa, J., & Clapperton, C. M. (1990). Quaternary glaciations of the southern Andes. Quaternary Science Reviews, 9(2–3), 153–174.
Rabassa, J., & Coronato, A. (2009). Glaciations in Patagonia and Tierra del Fuego during the Ensenadan Stage/Age (Early Pleistocene-earliest Middle Pleistocene). Quaternary International, 210(1–2), 18–36.
Rabassa, J., Coronato, A., & Martinez, O. (2011). Late Cenozoic glaciations in Patagonia and Tierra del Fuego: an updated review. Biological Journal of the Linnean Society, 103(2), 316–335.
Ramos, V. A. (1982). Geología de la región del Lago Cardiel, Provincia de Santa Cruz. Revista de La Asociación Geológica Argentina, 37(1), 23–49.
Ramos, V. A. (1989). Andean foothills structures in northern Magallanes Basin, Argentina. American Association of Petroleum Geologists Bulletin, 73, 887-903.
Ramos, V. A. (1999). Plate tectonic setting of the Andean Cordillera. Episodes, 22(3), 183-190.
Ramos, V. A. (2002). El magmatismo paleogeno de la Cordillera Patagonica. In Geologia y Recursos Naturales de Santa Cruz. XV Congreso Geologico Argentino, El Calafate, pp. 165–174.
Ramos, V. A., & Ghiglione, M. C. (2008). Tectonic evolution of the Patagonian Andes. In J. Rabassa (ed.), The Late Cenozoic of Patagonia and Tierra del Fuego. Developments in Quaternary Science, Vol. 11. Elsevier, Amsterdam, 57–71.
Ramos, V. A., & Kay, S. M. (1992). Southern Patagonian plateau basalts and deformation: backarc testimony of ridge collisions. Tectonophysics, 205(1–3), 261–282.
Roberts, N. J. (2016). Late Cenozoic geology of La Paz, Bolivia, and its relation to landslide activity. Phd thesis, Simon Fraser University, Burnaby, BC.
Roche, O., van Wyk de Vries, B., & Druitt, T. H. (2001). Sub-surface structures and collapse mechanisms of summit pit craters. Journal of Volcanology and Geothermal Research, 105(1–2), 1–18.
Rutter, N., Coronato, A., Helmens, K., Rabassa, J., & Zárate, M. (2012). The glacial and loess record of southern South America. In K. Hamilton, G. Lohmann, L. A. Mysak, & J. Rabassa (Eds.), Glaciations in North and South America from the Miocene to the Last Glacial Maximum. Springer, Amsterdam, 1–23.
169
Scalabrino, B., Lagabrielle, Y., Rupelle, A. de la, Malavieille, J., Polvé, M., Espinoza, F., & Suarez, M. (2009). Subduction of an active spreading ridge beneath southern South America. In S. Lallemand, & F. Funiciello (Eds.), A Review of the Cenozoic Geological Records from the Andean Foreland, Central Patagonia (46–47°S). Springer, Berlin, 227–246.
Singer, B. S., Ackert Jr., R. P., & Guillou, H. (2004a). 40Ar/39Ar and K-Ar chronology of Pleistocene glaciations in Patagonia. Geological Society of America Bulletin, 116(3–4), 434–450.
Singer, B. S., Brown, L. L., Rabassa, J. O., & Guillou, H. (2004b). 40Ar/39Ar chronology of late Pliocene and early Pleistocene geomagnetic and glacial events in southern Argentina. In J. E. T. Channell, D. V. Kent, W. Lowrie, & J. G. Meert (Eds.), Timescales of the Internal Geomagnetic Field. American Geophysical Union, Washington, D. C., 175–190.
Stine, S., & Stine, M. (1990). A record from Lake Cardiel of climate change in southern South America. Nature, 345(6277), 705–708.
Sylwan, C. A., & Beraza, L. A. (1990). Paleomagnetic record from glacial varves in Alto Río Mayo, Patagonia, Argentina. Physics of the Earth and Planetary Interiors, 61(3-4), 230-237.
Ton-That, T., Singer, B., Mörner, N.-A., & Rabassa, J. (1999). Datación de lavas basálticas por 40Ar/39Ar y geología glacial de la región del lago Buenos Aires, Provincia de Santa Cruz, Argentina. Revista de La Asociación Geológica Argentina, 54(4), 333–352.
Uliana, M. A., & Biddle, K. T. (1987). Mesozoic-Cenozoic paleogeographic and geodynamic evolution of southern South America. Revista Brasileira de Geociencias, 18(2), 172–190.
USGS, 2004.Shuttle Radar Topography Mission (SRTM) DTED ® 1 Arc-Second Global. NASA EOSDIS Land Processes DAAC, USGS Earth Resources Observation and Science (EROS) Center, Sioux Falls, South Dakota (https://lpdaac.usgs.gov), accessed April 6, 2016, at https://lta.cr.usgs.gov/SRTM1Arc.
Walker, G.P.L. (1988). Three Hawaiian calderas: an origin through loading by shallow intrusions? Journal of Geophysical Research, 93(B12), 14773-14784.
Walther, A., Rabassa, J., Coronato, A., Tassone, A., Lippai, H., & Vilas, J. F. (2007). Paleomagnetic study of glacigenic sediments from northern Tierra del Fuego. In: GEOSUR Meeting 2007, Abstracts, Santiago de Chile, 174.
Wenzens, G. (1999). Fluctuations of outlet and valley glaciers in the Southern Andes (Argentina) during the past 13,000 years. Quaternary Research, 51(3), 238-247.
170
Wenzens, G. (2000). Pliocene piedmont glaciation in the Río Shehuen Valley, southeast Patagonia, Argentina. Arctic, Antarctic, and Alpine Research, 32(1), 46–54.
Wenzens, G. (2005). Glacier advances east of the Southern Andes between the Last Glacial Maximum and 5,000 BP compared with lake terraces of the endorheic Lago Cardiel (49°S, Patagonia, Argentina). Zeitschrift fϋr Geomorphologie, 49(4), 433-454.
Wenzens, G. (2006). Terminal moraines, outwash plains, and lake terraces in the vicinity of Lago Cardiel (49 degree S; Patagonia, Argentina) -- evidence for Miocene Andean foreland glaciations. Arctic, Antarctic, and Alpine Research, 38(2), 276–291.
Willett, S. D., McCoy, S. W., Perron, J. T., Goren, L., & Chen, C.-Y. (2014). Dynamic reorganization of river basins. Science, 343(6175), 1049-1168.
Wilson, T. J., (1991). Transition from back-arc to foreland basin development in the southernmost Andes: stratigraphic record from the Ultima Esperanza District, Chile. Geological Society of America Bulletin, 103(1), 98-111.
Woodcock, N. H. (1977). Specification of fabric shapes using an eigenvalue method. Geological Society of America Bulletin, 88(9), 1231-1236.
Woodcock, N. H., & Naylor, M. (1983). Randomness testing in three-dimensional orientation data. Journal of Structural Geology, 5(5), 539–548.
Zolitschka, B., Schäbitz, F., Lϋcke, A., Corbella, H., Ercolano, B., Fey, M., Haberzettl, T., Janssen, S., Maidana, N., Mayr, C., Ohlendorf, C., Oliva, G., Paez, M. M., Schleser, G. H., Soto, J., Tiberi, P., Wille, M. (2006). Crater lakes of the Pali Aike Volcanic Field as key sites for paleoclimatic and paleoecological reconstructions in southern Patagonia, Argentina. Journal of South American Earth Sciences, 21(3), 234-309.
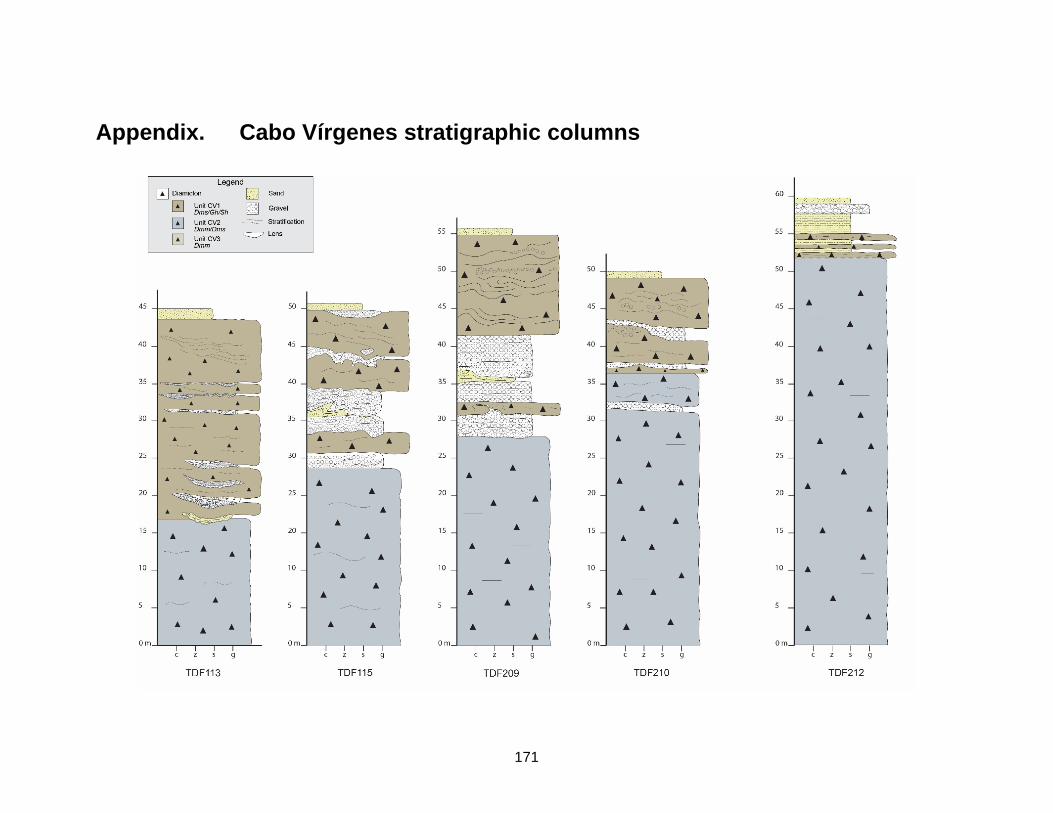
171
Appendix. Cabo Vírgenes stratigraphic columns
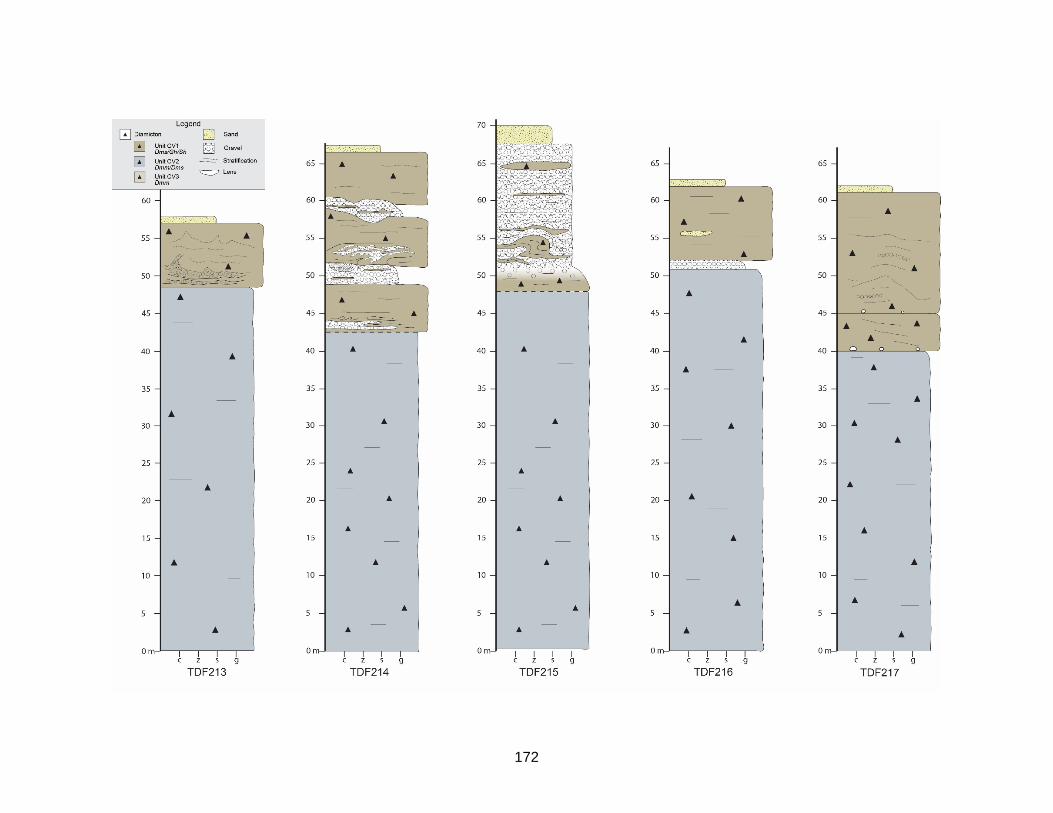
172
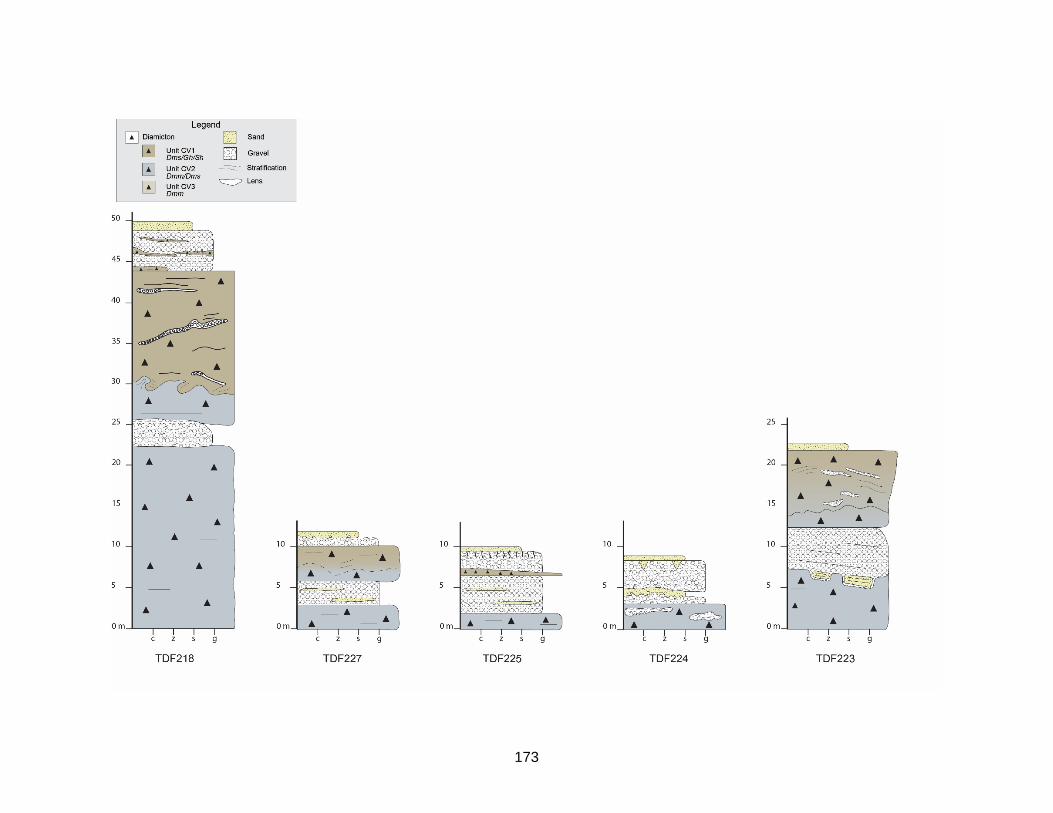
173
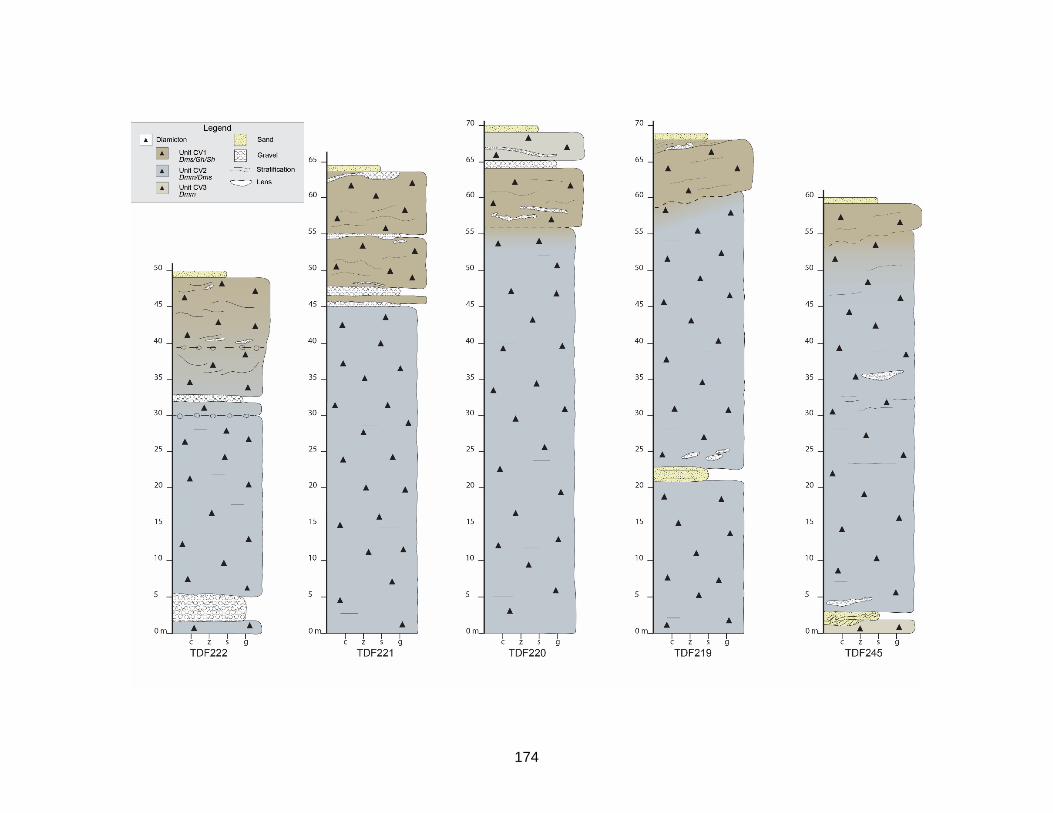
174
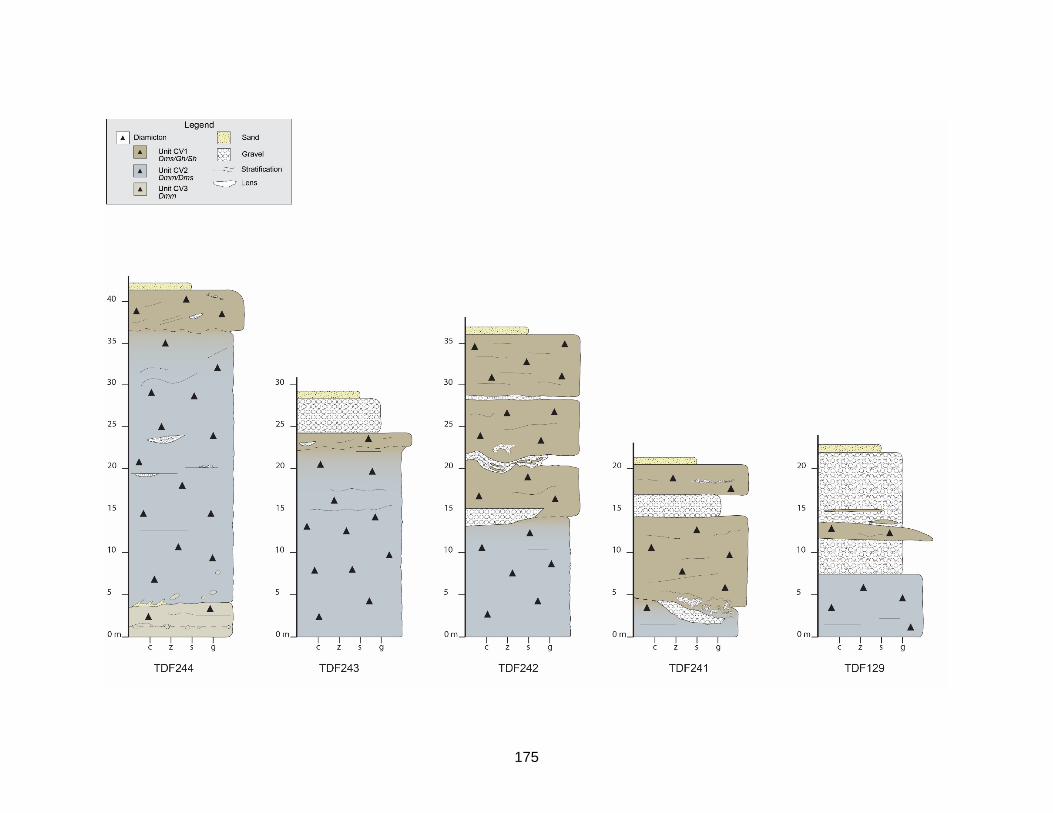
175
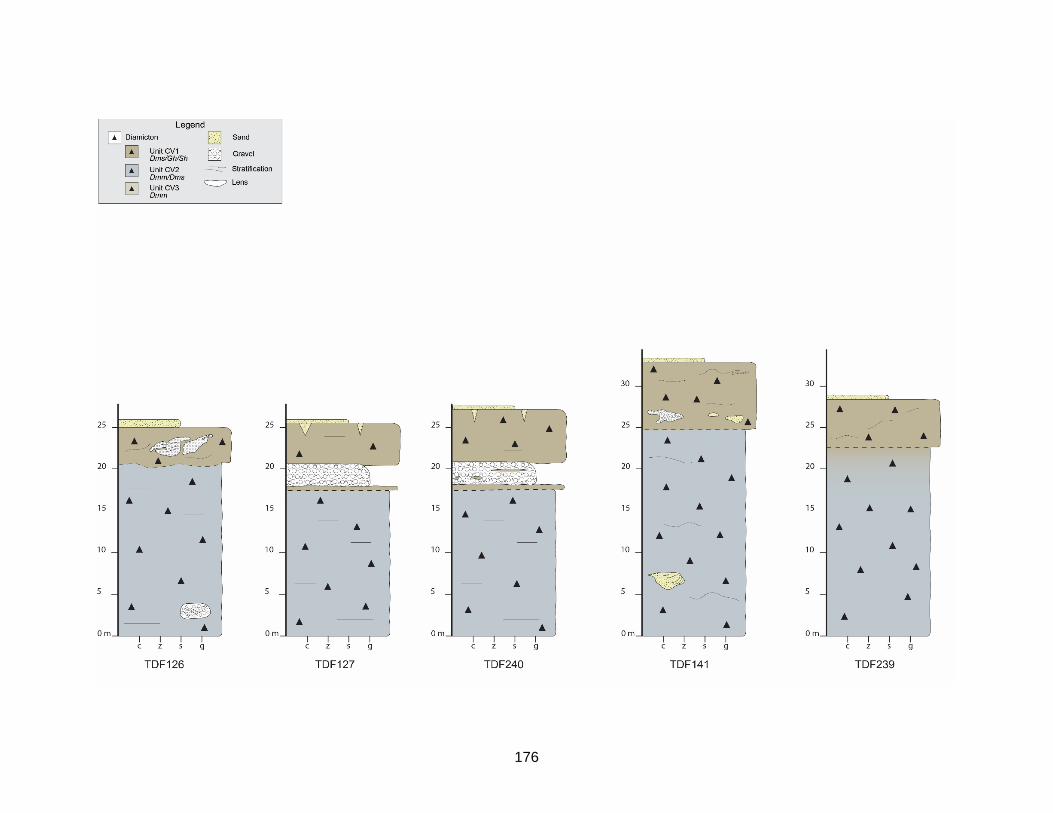
176
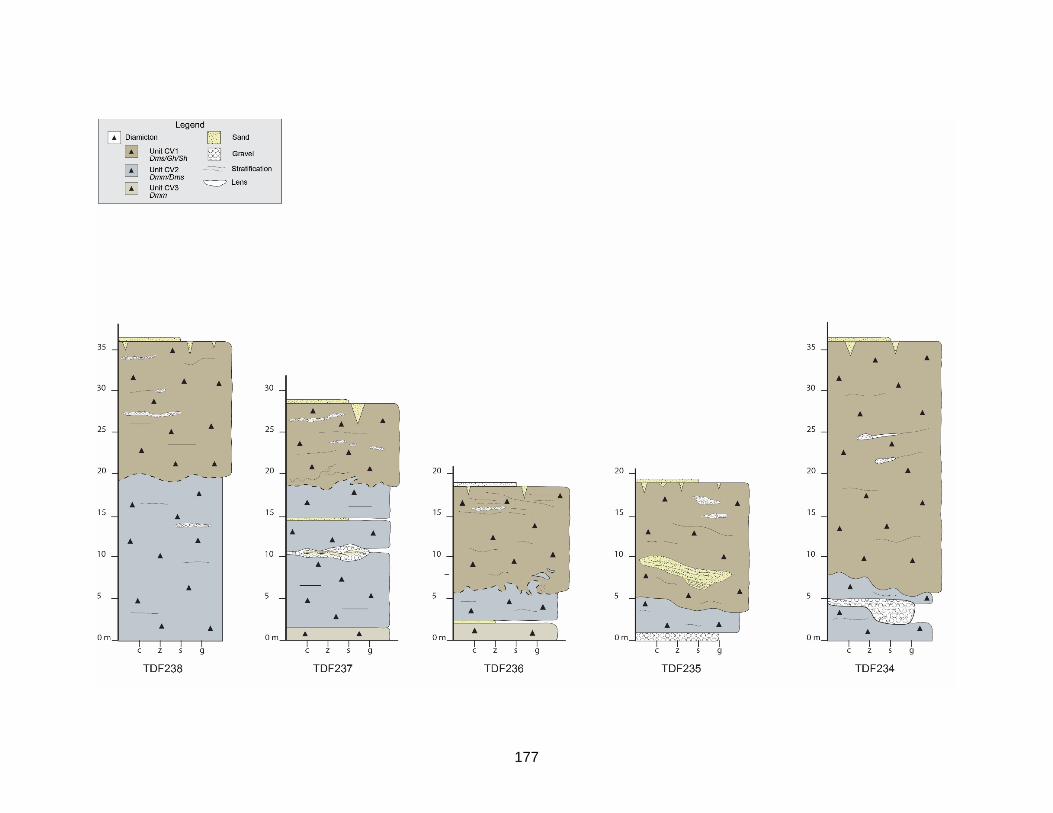
177
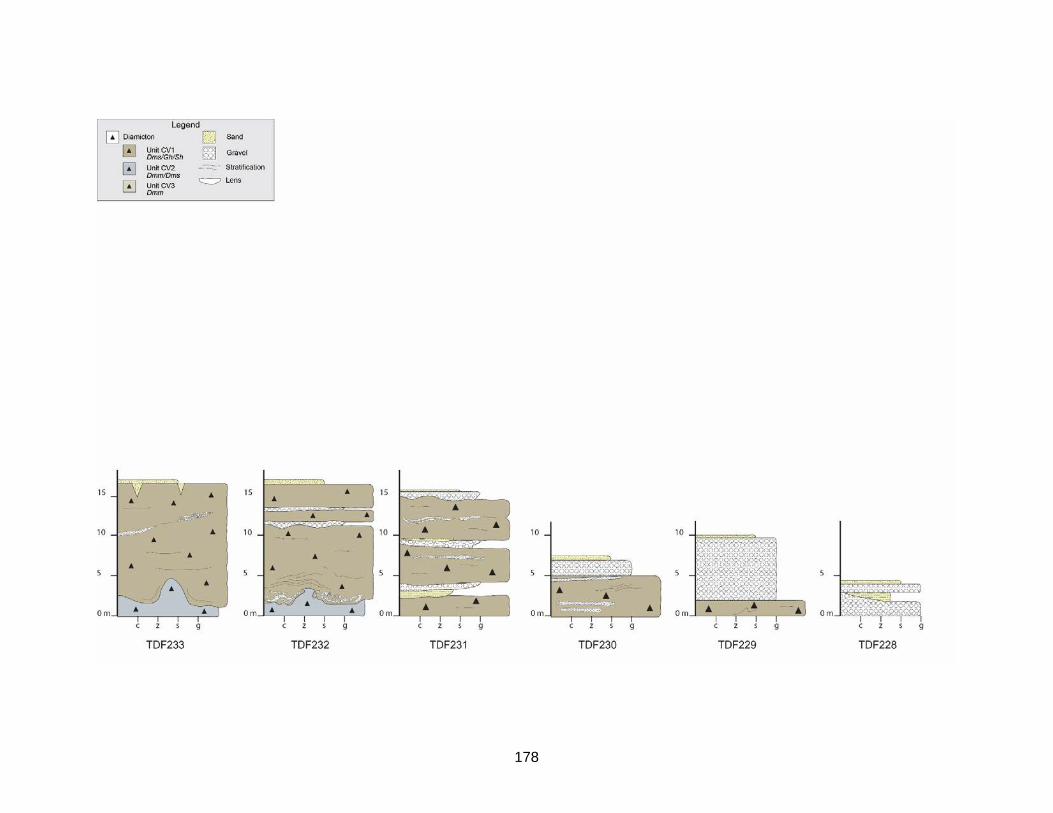
178