Embed Size (px)
Citation preview
LEADING THE TRANSFORMATIONVolvo Group
Annual and Sustainability Report 2021
Content
The Volvo Group drives prosperity through transport and infrastructure solutions, offering trucks, buses, construction equipment, power solutions for marine and industrial applications, financing and services that increase our customers’ uptime and productivity. Founded in 1927, the Volvo Group is committed to shaping the future landscape of sustainable transport and infrastructure solutions. The Volvo Group is headquartered in Gothenburg, Sweden, employs 95,000 people and serves customers in more than 190 markets. In 2021, net sales amounted to about SEK 372 billion (EUR 37 billion). Volvo shares are listed on Nasdaq Stockholm.
Driving prosperity through transport and infra structure solutions
OVERVIEWThis is Volvo Group. . . . . . . . . . . . . . . . . . . . 2
CEO COMMENTSCEO comments and key figures . . . . . . . . 6
STRATEGYThe future of transportation and infrastructure. . . . . . . . . . . . . . . . . . . . . . . Driving prosperity. . . . . . . . . . . . . . . . . . . . 12Strategic priorities . . . . . . . . . . . . . . . . . . . 14Perform . . . . . . . . . . . . . . . . . . . . . . . . . . . . 15 Transform. . . . . . . . . . . . . . . . . . . . . . . . . . . 16Financial targets . . . . . . . . . . . . . . . . . . . . . .17
BUSINESS MODELCustomers . . . . . . . . . . . . . . . . . . . . . . . . . . 19Value chain. . . . . . . . . . . . . . . . . . . . . . . . . . 22Partnerships . . . . . . . . . . . . . . . . . . . . . . . . 24 Our sustainability approach . . . . . . . . . . . 25
CLIMATE AND RESOURCES. . . . . . . . . . . . . . 26
PEOPLE . . . . . . . . . . . . . . . . . . . . . . . . . . . . . . . . . 38
BOARD OF DIRECTORS’ REPORT 2021Financial performance. . . . . . . . . . . . . . . . 45 Financial position . . . . . . . . . . . . . . . . . . . . 48 Cash flow statement . . . . . . . . . . . . . . . . . 52 Financial management . . . . . . . . . . . . . . . 54Changes in consolidated equity . . . . . . . 55Segments. . . . . . . . . . . . . . . . . . . . . . . . . . . 56The share . . . . . . . . . . . . . . . . . . . . . . . . . . . 68 Risks and uncertainties. . . . . . . . . . . . . . . 70
NOTES TO THE FINANCIAL STATEMENTS. . 76
PARENT COMPANY . . . . . . . . . . . . . . . . . . . . . 140
SUSTAINABILITY NOTESImpacts, stakeholders and material topics. . . . . . . . . . . . . . . . . . 153 Climate and environment . . . . . . . . . . . . 154Sustainable finance . . . . . . . . . . . . . . . . . 162 Employees and development. . . . . . . . . 164Safety . . . . . . . . . . . . . . . . . . . . . . . . . . . . . 167Human rights. . . . . . . . . . . . . . . . . . . . . . . 170Responsible sales. . . . . . . . . . . . . . . . . . . 174Suppliers . . . . . . . . . . . . . . . . . . . . . . . . . . 175Business ethics and compliance . . . . . . 177Organizational profile and reporting practices. . . . . . . . . . . . . . . . . . 178
CORPORATE GOVERNANCE REPORTCorporate Governance . . . . . . . . . . . . . . 180Board of Directors . . . . . . . . . . . . . . . . . . 186Group Executive Board . . . . . . . . . . . . . . 192
OTHER INFORMATIONProposed remuneration policy. . . . . . . . 196Proposed disposition of unappropriated earnings. . . . . . . . . . . . . 198Audit report for AB Volvo (publ) . . . . . . 199 Key Ratios . . . . . . . . . . . . . . . . . . . . . . . . .204Eleven-year summary . . . . . . . . . . . . . . . 207Annual General Meeting . . . . . . . . . . . . . 216 Preliminary financial calendar . . . . . . . . 216
The Volvo Group’s formal financial reports are presented on pages 44–151, 196–198 and 204–206 and have been audited by the company’s auditors. For information on which pages constitute the Volvo Group’s Statutory Sustainability Report, please see page 44.
Sustainability information can be found integrated in the Group overview on pages 6–44, in the Sustainability Notes on pages 152–179 and in the Corporate Governance Report on pages 183 and 190.
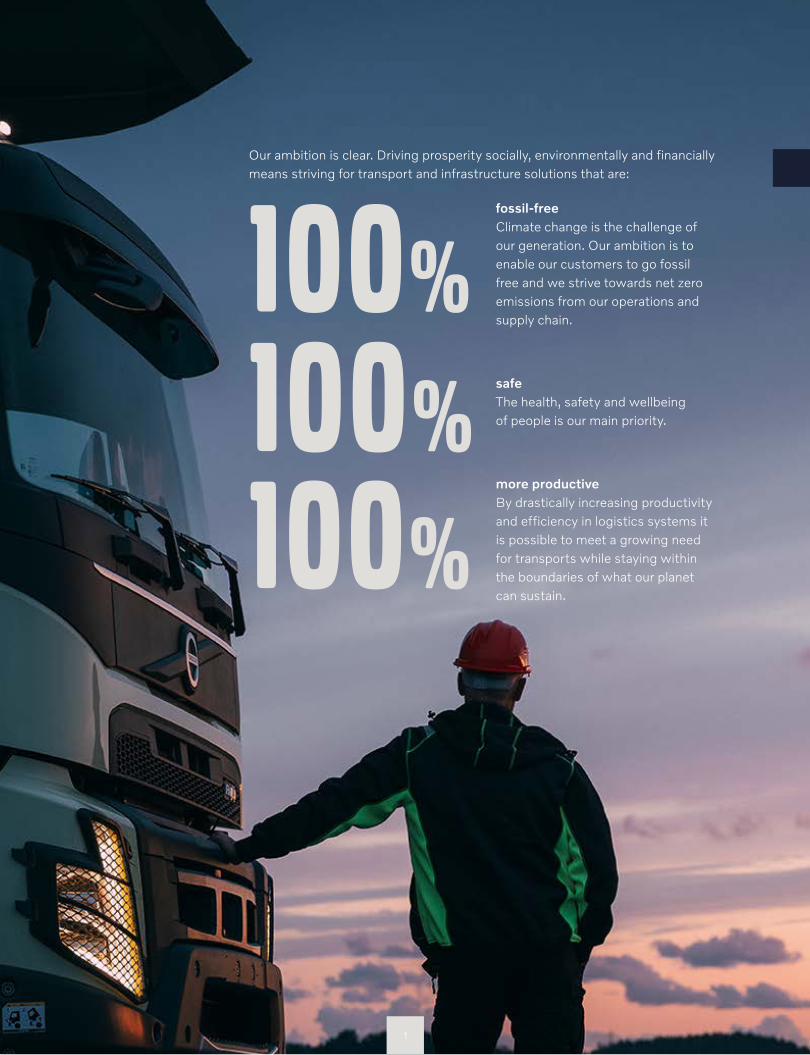
100% safeThe health, safety and wellbeing of people is our main priority.
100% more productiveBy drastically increasing productivity and efficiency in logistics systems it is possible to meet a growing need for transports while staying within the boundaries of what our planet can sustain.
100% fossil-freeClimate change is the challenge of our generation. Our ambition is to enable our customers to go fossil free and we strive towards net zero emissions from our operations and supply chain.
Our ambition is clear. Driving prosperity socially, environmentally and financially means striving for transport and infrastructure solutions that are:
1
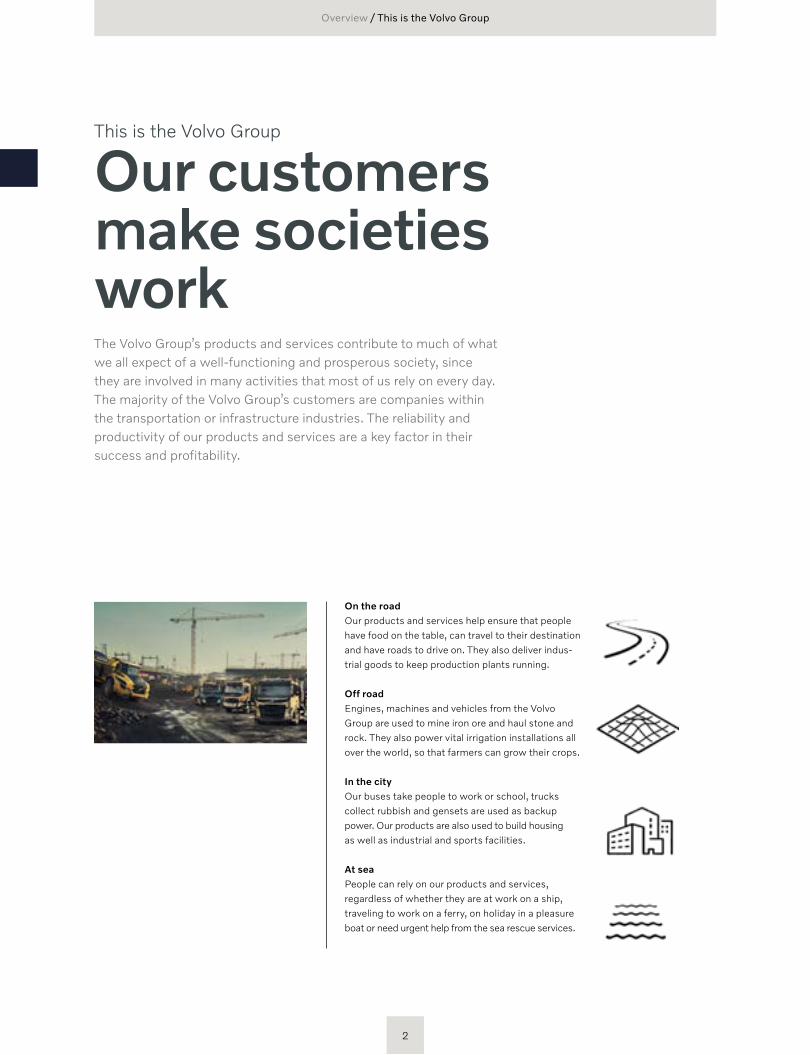
The Volvo Group’s products and services contribute to much of what we all expect of a well-functioning and prosperous society, since they are involved in many activities that most of us rely on every day. The majority of the Volvo Group’s customers are companies within the transportation or infrastructure industries. The reliability and productivity of our products and services are a key factor in their success and profitability.
Our customers make societies work
On the roadOur products and services help ensure that people have food on the table, can travel to their destination and have roads to drive on. They also deliver indus-trial goods to keep production plants running.
Off roadEngines, machines and vehicles from the Volvo Group are used to mine iron ore and haul stone and rock. They also power vital irrigation installations all over the world, so that farmers can grow their crops.
In the cityOur buses take people to work or school, trucks collect rubbish and gensets are used as backup power. Our products are also used to build housing as well as industrial and sports facilities.
At seaPeople can rely on our products and services, regardless of whether they are at work on a ship, travel ing to work on a ferry, on holiday in a pleasure boat or need urgent help from the sea rescue services.
This is the Volvo Group
Overview / This is the Volvo Group
2
The types of products and services the Volvo Group provides contribute to the functioning of the societies in which many of us live.
Overview / This is the Volvo Group
3
The Volvo Group has production in 19 countries and sells its products and services in 190 markets around the world.
Overview / This is the Volvo Group
4
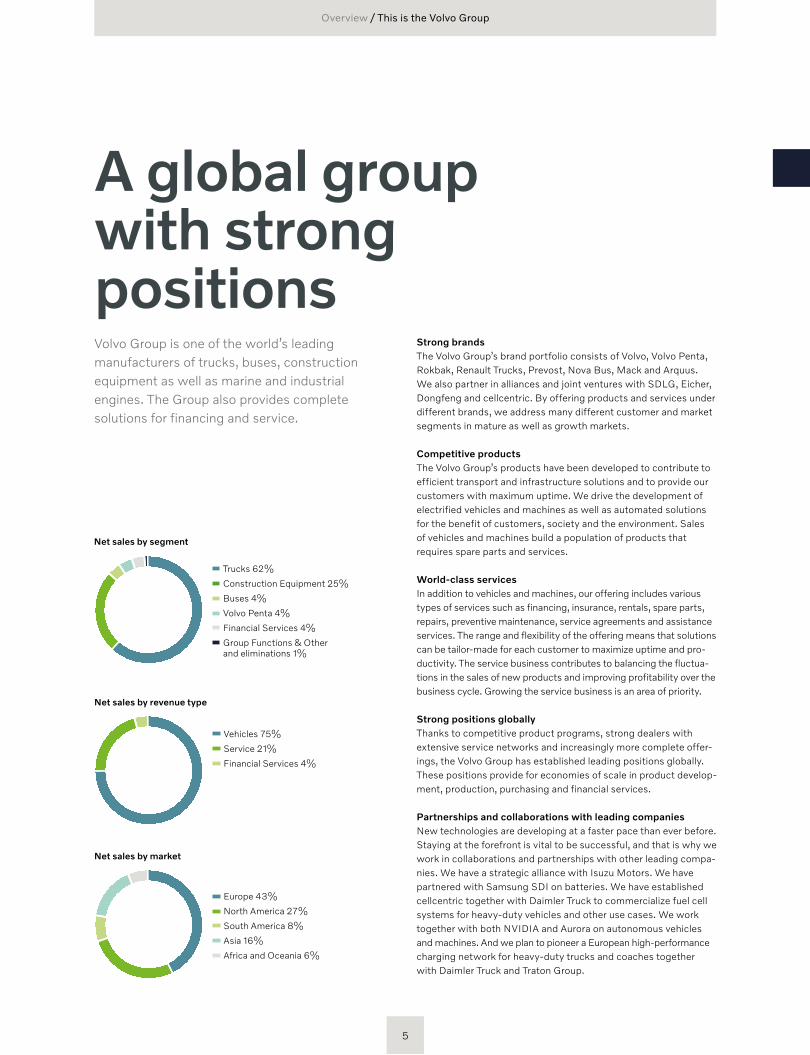
Volvo Group is one of the world’s leading manufacturers of trucks, buses, construction equipment as well as marine and industrial engines. The Group also provides complete solutions for financing and service.
A global group with strong positions
Strong brandsThe Volvo Group’s brand portfolio consists of Volvo, Volvo Penta, Rokbak, Renault Trucks, Prevost, Nova Bus, Mack and Arquus. We also partner in alliances and joint ventures with SDLG, Eicher, Dongfeng and cellcentric. By offering products and services under different brands, we address many different customer and market segments in mature as well as growth markets.
Competitive productsThe Volvo Group’s products have been developed to contribute to efficient transport and infrastructure solutions and to provide our customers with maximum uptime. We drive the development of electrified vehicles and machines as well as automated solutions for the benefit of customers, society and the environment. Sales of vehicles and machines build a population of products that requires spare parts and services.
World-class servicesIn addition to vehicles and machines, our offering includes various types of services such as financing, insurance, rentals, spare parts, repairs, preventive maintenance, service agreements and assistance services. The range and flexibility of the offering means that solutions can be tailor-made for each customer to maximize uptime and pro-ductivity. The service business contributes to balancing the fluctua-tions in the sales of new products and improving profitability over the business cycle. Growing the service business is an area of priority.
Strong positions globallyThanks to competitive product programs, strong dealers with extensive service networks and increasingly more complete offer-ings, the Volvo Group has established leading positions globally. These positions provide for economies of scale in product develop-ment, production, purchasing and financial services.
Partnerships and collaborations with leading companiesNew technologies are developing at a faster pace than ever before. Staying at the forefront is vital to be successful, and that is why we work in collaborations and partnerships with other leading compa-nies. We have a strategic alliance with Isuzu Motors. We have partnered with Samsung SDI on batteries. We have established cellcentric together with Daimler Truck to commercialize fuel cell systems for heavy-duty vehicles and other use cases. We work together with both NVIDIA and Aurora on autonomous vehicles and machines. And we plan to pioneer a European high-performance charging network for heavy-duty trucks and coaches together with Daimler Truck and Traton Group.
Overview / This is the Volvo Group
Net sales by segment
Net sales by revenue type
Net sales by market
Trucks 62%
Construction Equipment 25%
Buses 4%
Volvo Penta 4%
Financial Services 4%
Group Functions & Other and eliminations 1%
Vehicles 75%
Service 21%
Financial Services 4%
Europe 43%
North America 27%
South America 8%
Asia 16%
Africa and Oceania 6%
5
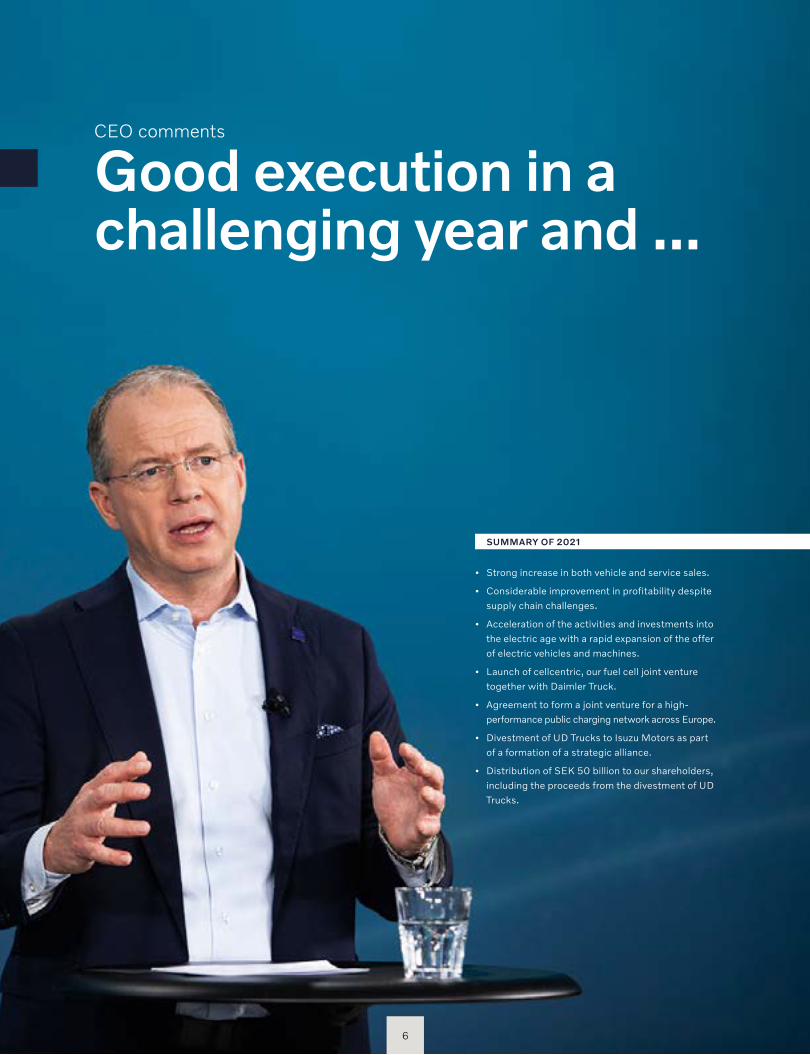
Good execution in a challenging year and ...
CEO comments
• Strong increase in both vehicle and service sales.
• Considerable improvement in profitability despite supply chain challenges.
• Acceleration of the activities and investments into the electric age with a rapid expansion of the offer of electric vehicles and machines.
• Launch of cellcentric, our fuel cell joint venture together with Daimler Truck.
• Agreement to form a joint venture for a high- performance public charging network across Europe.
• Divestment of UD Trucks to Isuzu Motors as part of a formation of a strategic alliance.
• Distribution of SEK 50 billion to our share holders, including the proceeds from the divestment of UD Trucks.
SUMMARY OF 2021
6
CEO comments
KEY RATIOS 2021 2020
Net sales, SEK M 372,216 338,446
Net sales excluding UD Trucks1, SEK M 366,778 315,742
Adjusted operating income2, SEK M 41,015 28,564
Adjusted operating margin, % 11.0 8.4
Operating income, SEK M 43,074 27,484
Operating margin, % 11.6 8.1
Income after financial items, SEK M 43,190 25,917
Income for the period, SEK M 33,243 20,074
Earnings per share, SEK 16.12 9.50
Dividend of the proceeds from the sale of UD Trucks, SEK per share 9.503 –
Dividend, SEK per share 13.004 15.00
Operating cash flow, Industrial Operations, SEK M 29,440 18,545
Net financial position excl. provisions for post-employment benefits and lease liabilities, Industrial Operations, SEK bn 66.2 74.7
Return on capital employed in Industrial Operations, % 25.3 14.7
Return on shareholders’ equity, % 23.4 13.8
Total number of employees 95,850 96,194
Share of women, % 21 19
Share of women, presidents and other senior executives, % 27 26
Energy use per net sales, Industrial Operations, MWh/SEK M 6.7 6.3
Total CO₂ emissions per net sales, Industrial Operations, tons/SEK M (scope 1 & 2) 1.0 1.0
Share of direct material purchasing spend from suppliers having made a CSR self- assessment, % 97 95
1 UD Trucks was divested on April 1, 2021. For more information, please see Note 31.2 For more information on adjusted operating income, please see Key Ratios on page 204.3 Paid out in July, 2021.4 Proposed by the Board of Directors to the Annual General Meeting 2022. SEK 6.50 per share in ordinary
dividend and SEK 6.50 per share in extra dividend.
Unless otherwise stated, all comparisons refer to the same period or the same date of the preceding year.
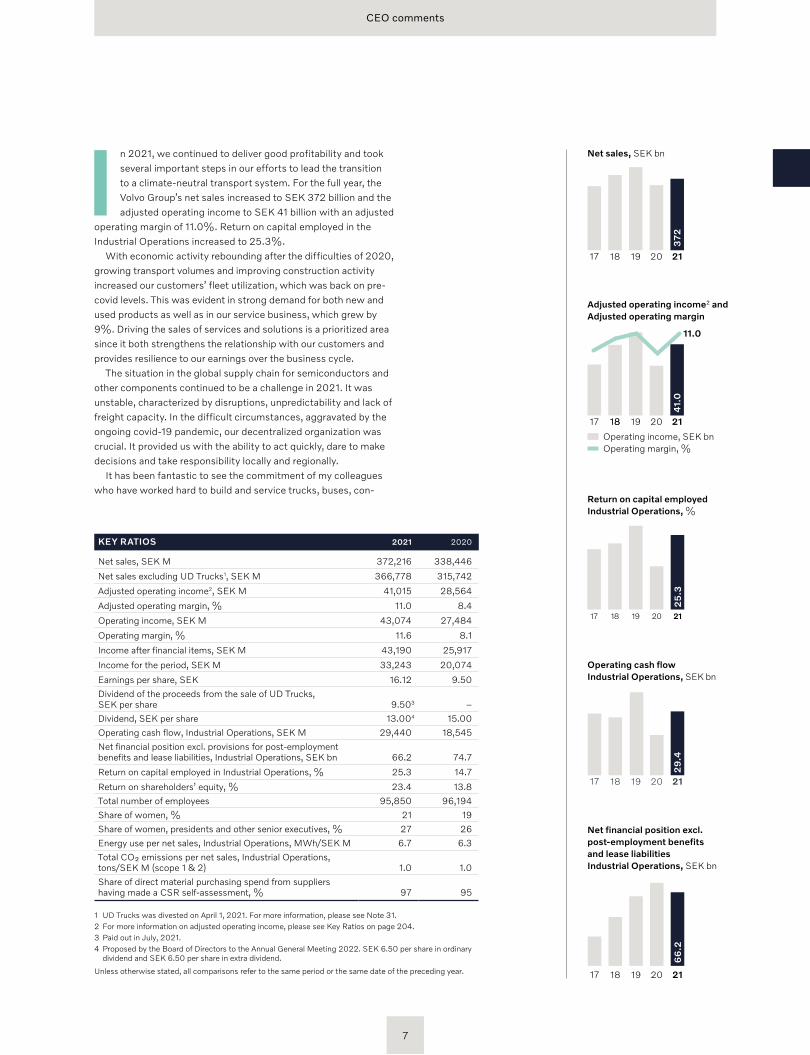
In 2021, we continued to deliver good profitability and took several important steps in our efforts to lead the transition to a climate-neutral transport system. For the full year, the Volvo Group’s net sales increased to SEK 372 billion and the adjusted operating income to SEK 41 billion with an adjusted
operating margin of 11.0%. Return on capital employed in the Industrial Operations increased to 25.3%.
With economic activity rebounding after the difficulties of 2020, growing transport volumes and improving construction activity increased our customers’ fleet utilization, which was back on pre-covid levels. This was evident in strong demand for both new and used products as well as in our service business, which grew by 9%. Driving the sales of services and solutions is a prioritized area since it both strengthens the relationship with our customers and provides resilience to our earnings over the business cycle.
The situation in the global supply chain for semiconductors and other components continued to be a challenge in 2021. It was unstable, characterized by disruptions, unpredictability and lack of freight capacity. In the difficult circumstances, aggravated by the ongoing covid-19 pandemic, our decentralized organization was crucial. It provided us with the ability to act quickly, dare to make decisions and take responsibility locally and regionally.
It has been fantastic to see the commitment of my colleagues who have worked hard to build and service trucks, buses, con-
Net sales, SEK bn
19 201817 21
37
2
Adjusted operating income2 and Adjusted operating margin
Operating income, SEK bn Operating margin, %
18 1917 20 2118
11.0
41.
0
Return on capital employed Industrial Operations, %
17 18 2019 21
25
.3Operating cash flow Industrial Operations, SEK bn
19 201817 21
29
.4
Net financial position excl. post- employment benefits and lease liabilities Industrial Operations, SEK bn
19 201817 21
66
.2
7
13.3% (12.4). Volvo CE continued the rollout of electric compact machines, positioning itself as a manufacturer with a growing range of commercially available electric machines.
Volvo Buses continued to be impacted by the pandemic, which primarily affected the coach business while demand for city buses was less impacted. On the city bus side of the business, there is a distinct acceleration in the transformation to electric buses. Net sales for 2021 amounted to SEK 14 billion (15) and the adjusted operating margin to 0.4% (–3.1).
Volvo Penta’s sales of both engines and services grew strongly, which had a positive effect on profitability. Net sales rose by 21% to SEK 14 billion and the adjusted operating margin to 14.5% (12.2). Electrification projects for both marine and industrial appli-cations are gaining momentum.
The high activity level at many of our customers is reflected in low credit provision expenses in our customer-financing business, Volvo Financial Services. The adjusted operating income increased to SEK 3,279 M (1,606) and return on equity improved to 18.0% (8.3).
In total, the Volvo Group’s net sales amounted to SEK 372 billion (338). Adjusted for the divestment of UD Trucks net sales increased by 16% with both vehicle and service sales contribut-ing. The adjusted operating income improved to SEK 41 billion (29) with an adjusted operating margin of 11.0% (8.4). Operating cash flow in the Industrial Operations increased to SEK 29 billion (19). Even after having distributed SEK 50 billion in 2021, includ-ing the proceeds from the divestment of UD Trucks, we ended the year with a net cash position of SEK 66 billion in the Industrial Operations, pension and leasing liabilities excluded.
Our strong financial position allows us to both increase our investments in the technologies of the future and continue to provide a good return to our shareholders. The Board of Directors proposes an ordinary dividend of SEK 6.50 per share and an extra dividend of SEK 6.50 per share.
Leading the transformation towards sustainable transport solutionsThe increasing demand for transport is a clear, long-term trend driven by population growth, urbanization and increasing e-commerce. It is equally clear that we must meet this demand with transport and infrastructure solutions that are more sustainable than today. Our ambition is to be at the forefront and lead this
Overview / CEO comments
struction equipment and engines for our customers. I would like to thank all my Volvo Group colleagues and our business partners around the world for a job well done during a tough year. It is their efforts that make the Volvo Group and our customers successful.
Strong performance in a year with many challengesDespite the disruptions in the supply chain, our truck business delivered 198,000 vehicles excluding UD Trucks, which was an increase of 31% compared with 2020. The increased transport activity in many countries contributed to good demand for both new and used trucks as well as for spare parts and services. All in all, this meant that net sales in the truck business rose by 21% to SEK 225 billion excluding UD Trucks and the adjusted operating margin improved to 11.1% (8.3).
Construction activity was high in Volvo CE’s key markets in Europe and North America, while demand in China weakened during the course of the year. Volvo CE’s net sales rose by 13% to SEK 92 billion and the adjusted operating margin improved to
... an increased speed in the transformation
“ Together with our customers and partners we are in a strong position to lead the trans -formation of our industry towards a more sustain able future.”
8
transformation. We have further strengthened our work with the principles of the UN Global Compact regarding business ethics, human rights, labor law and the environment. During the pandemic year of 2021, the health and safety of our colleagues, suppliers and customers has of course been our first priority, but we also took major steps in our sustainability ambitions. We set climate targets that are in line with what the latest climate science deems necessary to keep global warming at a maximum 1.5⁰ C. Our path-way to reach the goals of the Paris Climate Agreement was vali-dated by the Science Based Targets initiative in June. Already today, a large part of our R&D activities are related to low and zero-emission technology and it will continue to grow.
We were early out in the electrification journey and have sold electrified city buses for over ten years. We have built a compre-hensive knowledge that we are now capitalizing on. In 2020, we started serial production of medium-duty electric trucks for urban distribution and waste management. In 2021, we took further steps on this journey when we started selling heavy-duty electric trucks in Europe, with planned delivery towards the end of 2022. Today, we have a broad range of electric trucks with a market- leading position in Europe. This has been achieved by building on the great knowledge of our employees, our modular product plat-form and our global industrial system. We assemble trucks with combustion engines and electric trucks on the same assembly lines. We work with competence development of our colleagues – from engineers to assemblers. And we certify our service work-shops to take care of the electric vehicles.
All in all, this means that we are ready to reap the benefits from the transformation. However, we are convinced that it will have different speeds in different parts of the world and take place seg-ment by segment. Fully-electric vehicles and machines currently account for a very small part of our total deliveries, but there is a large and growing interest from our customers and their custom-ers. This applies to cities that want to create a quiet and clean environment, to logistics companies that want to be at the envi-ronmental forefront and not least to transport buyers who come directly to us to assist them in decarbonizing their own operations.
The speed of the transformation will depend on several factors such as costs for fossil fuels, battery prices as well as access to charging infrastructure, green electricity and various incentive pro-grams. However, we cannot wait for all the pieces to fall into place. Instead, we work together with partners and decision-makers to create the right conditions. One example is the planned joint ven-ture with Daimler Truck and Traton Group, where we aim to estab-lish at least 1,700 green charging points for trucks and buses in Europe. Other important collaborations are the alliance with the battery manufacturer Samsung SDI, the joint venture with Daimler Truck on fuel cells, cellcentric, and the technology partnerships with NVIDIA and Aurora to develop autonomous vehicles and machines. We also created a strategic alliance with Isuzu Motors in connection with the sale of UD Trucks to them in April.
Electrification is a crucial part on the road to climate-neutrality since the absolute majority of climate-affecting emissions occur when our customers use the vehicles and machines. But we also work to reduce the climate impact from our own operations and other parts of our value chain. We have an important role to play in stimulating demand for climate-neutral materials and components, and we work closely with our suppliers to drive progress in this area. In the autumn we presented the world’s first vehicle made of green steel, an autonomous load carrier. We have a clear vision and together with our customers we are taking actions here and now to create the world we want to live in.
With 2021 behind us, we can conclude that our strategy and our decentralized organization are working well. Our ability to manage change and act quickly will become even more important when we are increasing the pace in the transformation to a climate- neutral transport system. We have a wide range of electric trucks, buses and machines on the market, high market shares and great interest from our customers. Together with our customers and partners we are in a strong position to lead the transformation of our industry towards a more sustainable future.
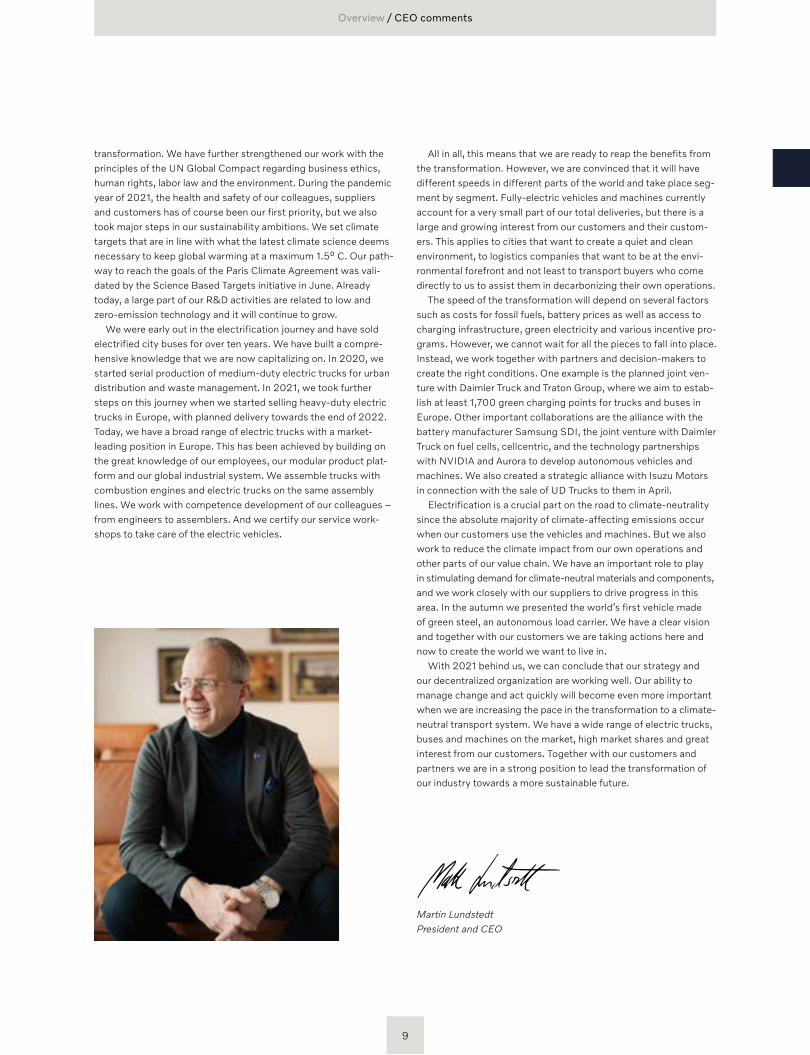
Martin LundstedtPresident and CEO
Overview / CEO comments
9
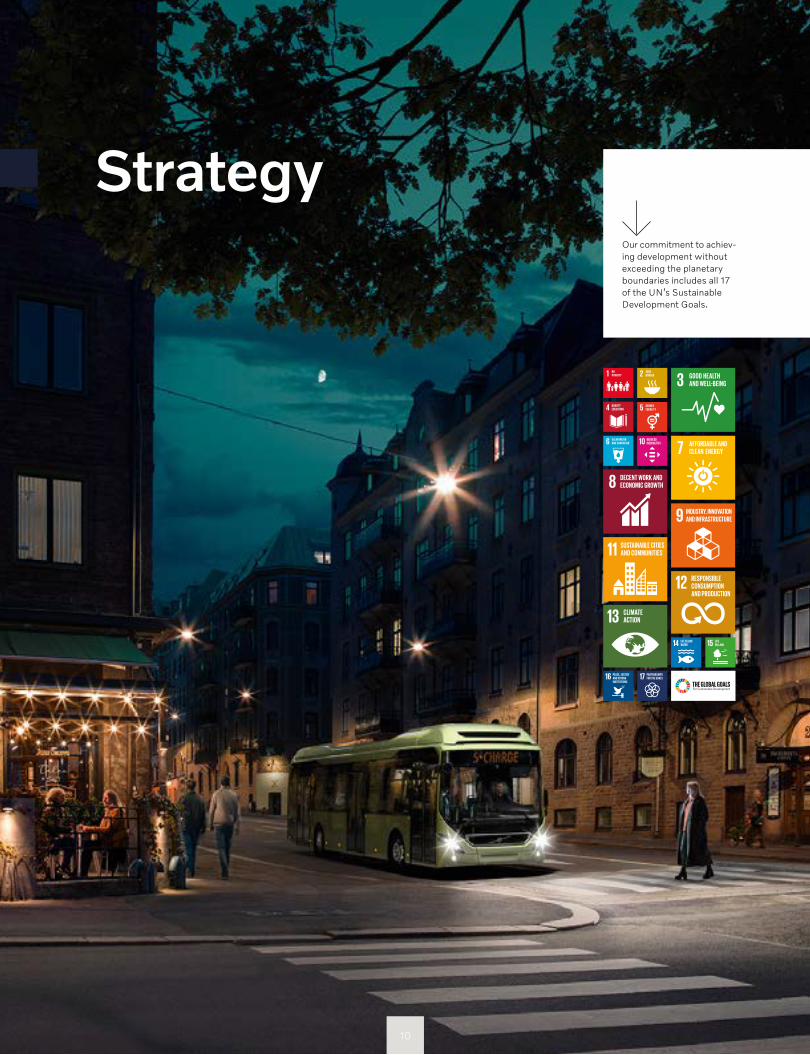
Our commitment to achiev-ing development without exceeding the planetary boundaries includes all 17 of the UN’s Sustainable Development Goals.
Strategy
10
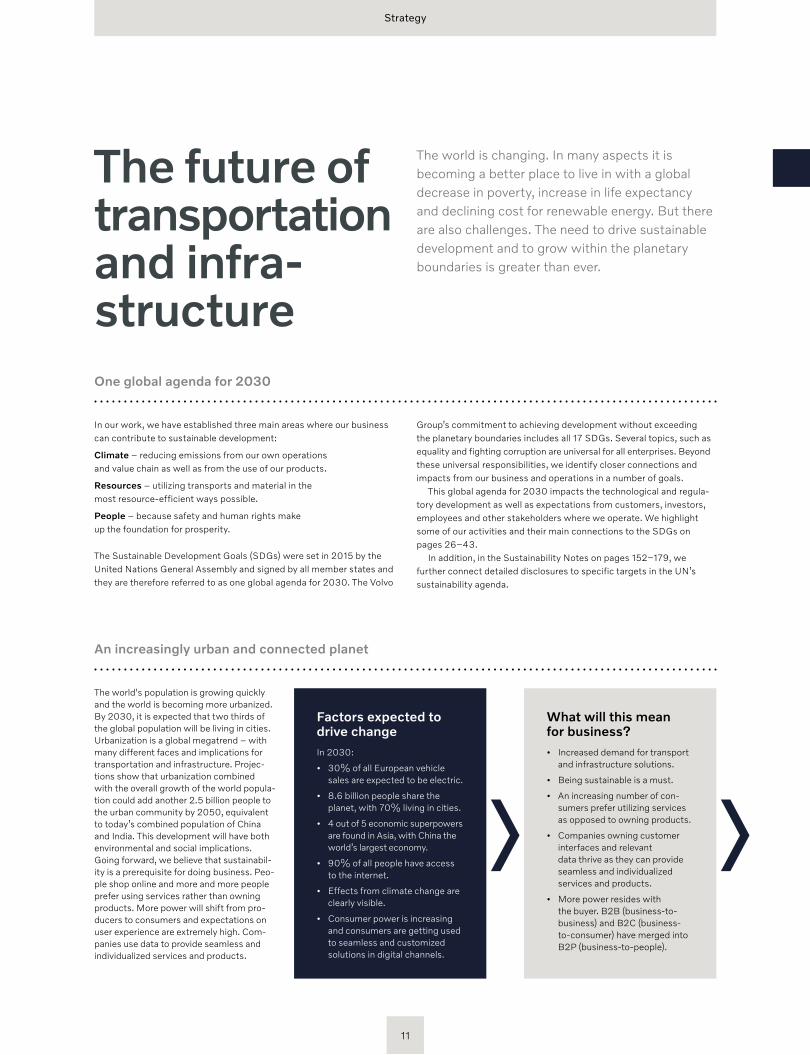
The world is changing. In many aspects it is becoming a better place to live in with a global decrease in poverty, increase in life expectancy and declining cost for renewable energy. But there are also challenges. The need to drive sustainable development and to grow within the planetary boundaries is greater than ever.
The future of trans por tation and infra structureOne global agenda for 2030
An increasingly urban and connected planet
The world's population is growing quickly and the world is becoming more urbanized. By 2030, it is expected that two thirds of the global population will be living in cities. Urbanization is a global megatrend – with many different faces and implications for transportation and infrastructure. Projec-tions show that urbanization combined with the overall growth of the world popula-tion could add another 2.5 billion people to the urban community by 2050, equivalent to today’s combined population of China and India. This development will have both environmental and social implications. Going forward, we believe that sustainabil-ity is a prerequisite for doing business. Peo-ple shop online and more and more people prefer using services rather than owning products. More power will shift from pro-ducers to consumers and expectations on user experience are extremely high. Com-panies use data to provide seamless and individualized services and products.
Factors expected to drive changeIn 2030:
• 30% of all European vehicle sales are expected to be electric.
• 8.6 billion people share the planet, with 70% living in cities.
• 4 out of 5 economic super powers are found in Asia, with China the world’s largest economy.
• 90% of all people have access to the internet.
• Effects from climate change are clearly visible.
• Consumer power is increasing and consumers are getting used to seamless and customized solutions in digital channels.
What will this mean for business?• Increased demand for transport
and infrastructure solutions.
• Being sustainable is a must.
• An increasing number of con-sumers prefer utilizing services as opposed to owning products.
• Companies owning customer interfaces and relevant data thrive as they can provide seamless and individualized services and products.
• More power resides with the buyer. B2B (business-to- business) and B2C (business- to-consumer) have merged into B2P (business-to-people).
Strategy
In our work, we have established three main areas where our business can contribute to sustainable development:
Climate – reducing emissions from our own operations and value chain as well as from the use of our products.
Resources – utilizing transports and material in the most resource- efficient ways possible.
People – because safety and human rights make up the foundation for prosperity.
The Sustainable Development Goals (SDGs) were set in 2015 by the United Nations General Assembly and signed by all member states and they are therefore referred to as one global agenda for 2030. The Volvo
Group’s commitment to achieving development without exceeding the planetary boundaries includes all 17 SDGs. Several topics, such as equality and fighting corruption are universal for all enterprises. Beyond these universal responsibilities, we identify closer connections and impacts from our business and operations in a number of goals.
This global agenda for 2030 impacts the technological and regula-tory development as well as expectations from customers, investors, employees and other stakeholders where we operate. We highlight some of our activities and their main connections to the SDGs on pages 26–43.
In addition, in the Sustainability Notes on pages 152–179, we further connect detailed disclosures to specific targets in the UN’s sustainability agenda.
11
Creating value and building a new society
Driving prosperity
Moving into the golden age of logistics
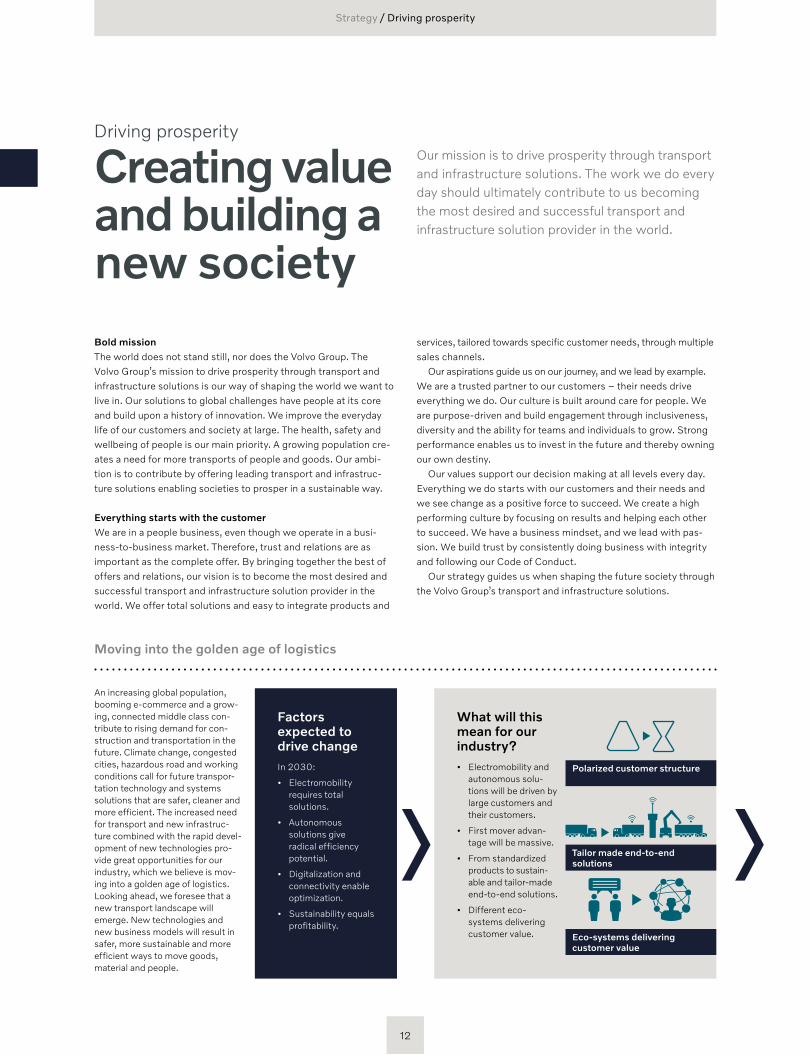
An increasing global population, booming e-commerce and a grow-ing, connected middle class con-tribute to rising demand for con-struction and transportation in the future. Climate change, congested cities, hazardous road and working conditions call for future transpor-tation technology and systems solutions that are safer, cleaner and more efficient. The increased need for transport and new infrastruc-ture combined with the rapid devel-opment of new technologies pro-vide great opportunities for our industry, which we believe is mov-ing into a golden age of logistics. Looking ahead, we foresee that a new transport landscape will emerge. New technologies and new business models will result in safer, more sustainable and more efficient ways to move goods, material and people.
Factors expected to drive changeIn 2030:
• Electromobility requires total solutions.
• Autonomous solutions give radical efficiency potential.
• Digitalization and connectivity enable optimization.
• Sustainability equals profitability.
Ecosystems delivering customer value
Tailor made endtoend solutions
Polarized customer structure
Our mission is to drive prosperity through transport and infrastructure solutions. The work we do every day should ultimately contribute to us becoming the most desired and successful transport and infrastructure solution provider in the world.
Bold mission The world does not stand still, nor does the Volvo Group. The Volvo Group’s mission to drive prosperity through transport and infrastructure solutions is our way of shaping the world we want to live in. Our solutions to global challenges have people at its core and build upon a history of innovation. We improve the everyday life of our customers and society at large. The health, safety and wellbeing of people is our main priority. A growing population cre-ates a need for more transports of people and goods. Our ambi-tion is to contribute by offering leading transport and infrastruc-ture solutions enabling societies to prosper in a sustainable way.
Everything starts with the customerWe are in a people business, even though we operate in a busi-ness-to-business market. Therefore, trust and relations are as important as the complete offer. By bringing together the best of offers and relations, our vision is to become the most desired and successful transport and infrastructure solution provider in the world. We offer total solutions and easy to integrate products and
services, tailored towards specific customer needs, through multiple sales channels.
Our aspirations guide us on our journey, and we lead by example. We are a trusted partner to our customers – their needs drive everything we do. Our culture is built around care for people. We are purpose-driven and build engagement through inclusiveness, diversity and the ability for teams and individuals to grow. Strong performance enables us to invest in the future and thereby owning our own destiny.
Our values support our decision making at all levels every day. Everything we do starts with our customers and their needs and we see change as a positive force to succeed. We create a high performing culture by focusing on results and helping each other to succeed. We have a business mindset, and we lead with pas-sion. We build trust by consistently doing business with integrity and following our Code of Conduct.
Our strategy guides us when shaping the future society through the Volvo Group’s transport and infrastructure solutions.
Strategy / Driving prosperity
What will this mean for our industry?• Electromobility and
autonomous solu-tions will be driven by large customers and their customers.
• First mover advan-tage will be massive.
• From standardized products to sustain-able and tailor-made end-to-end solutions.
• Different eco- systems delivering customer value.
12
The Volvo Group journey continues
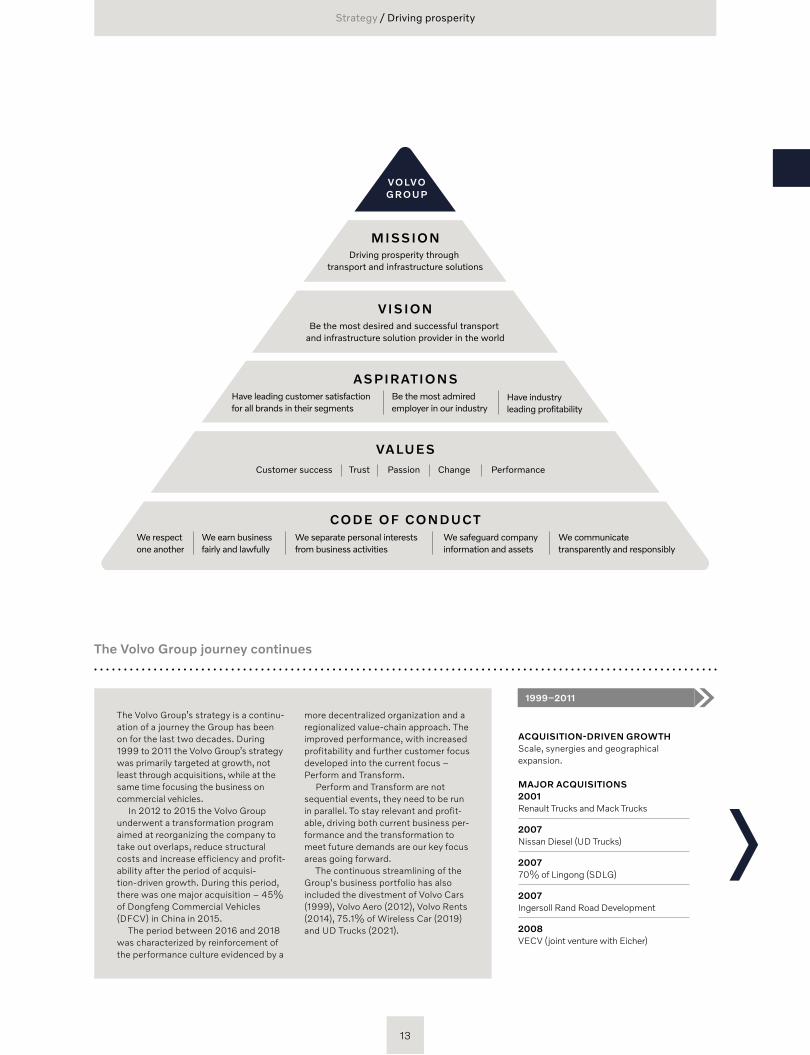
ASPIRATIONS
VALUES
CODE OF CONDUCT
VISION
MISSION
VOLVO GROUP
Driving prosperity through transport and infrastructure solutions
Be the most desired and successful transport and infrastructure solution provider in the world
Customer success Trust Passion Change Performance
We respect one another
We earn business fairly and lawfully
We safeguard company information and assets
We separate personal interests from business activities
We communicate transparently and responsibly
Have leading customer satisfaction for all brands in their segments
Be the most admired employer in our industry
Have industry leading profitability
The Volvo Group’s strategy is a continu-ation of a journey the Group has been on for the last two decades. During 1999 to 2011 the Volvo Group’s strategy was primarily targeted at growth, not least through acquisitions, while at the same time focusing the business on commercial vehicles.
In 2012 to 2015 the Volvo Group underwent a transformation program aimed at reorganizing the company to take out overlaps, reduce structural costs and increase efficiency and profit-ability after the period of acquisi-tion-driven growth. During this period, there was one major acquisition – 45% of Dongfeng Commercial Vehicles (DFCV) in China in 2015.
The period between 2016 and 2018 was characterized by reinforcement of the performance culture evidenced by a
more decentralized organization and a regionalized value-chain approach. The improved performance, with increased profitability and further customer focus developed into the current focus – Perform and Transform.
Perform and Transform are not sequential events, they need to be run in parallel. To stay relevant and profit-able, driving both current business per-formance and the transformation to meet future demands are our key focus areas going forward.
The continuous streamlining of the Group's business portfolio has also inclu ded the divestment of Volvo Cars (1999), Volvo Aero (2012), Volvo Rents (2014), 75.1% of Wireless Car (2019) and UD Trucks (2021).
ACQUISITION-DRIVEN GROWTHScale, synergies and geographical expansion.
MAJOR ACQUISITIONS2001 Renault Trucks and Mack Trucks
2007 Nissan Diesel (UD Trucks)
2007 70% of Lingong (SDLG)
2007 Ingersoll Rand Road Development
2008 VECV (joint venture with Eicher)
1999–2011
Strategy / Driving prosperity
13
Setting the direction
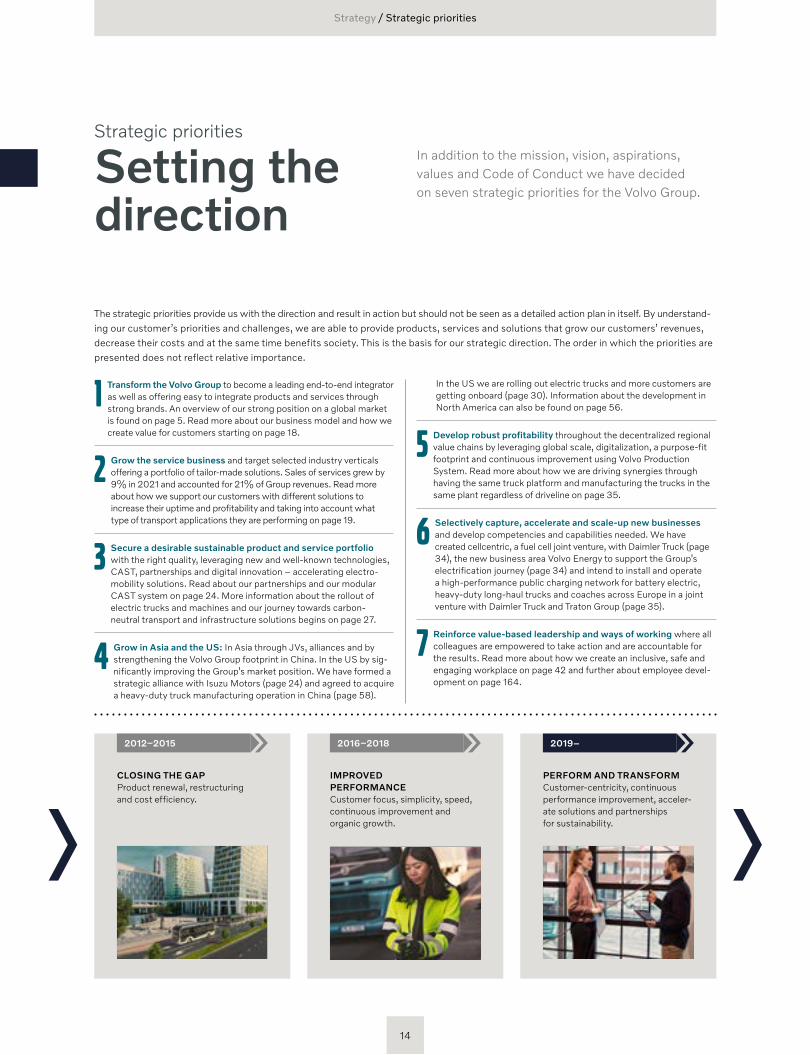
CLOSING THE GAPProduct renewal, restructuring and cost efficiency.
2012–2015
IMPROVED PERFORMANCECustomer focus, simplicity, speed, continuous improvement and organic growth.
2016–2018
PERFORM AND TRANSFORMCustomer-centricity, continuous performance improvement, acceler-ate solutions and partnerships for sustainability.
2019–
Strategic priorities
Strategy / Strategic priorities
The strategic priorities provide us with the direction and result in action but should not be seen as a detailed action plan in itself. By understand-ing our customer’s priorities and challenges, we are able to provide products, services and solutions that grow our customers’ revenues, decrease their costs and at the same time benefits society. This is the basis for our strategic direction. The order in which the priorities are presented does not reflect relative importance.
1 Transform the Volvo Group to become a leading end-to-end integrator as well as offering easy to integrate products and services through strong brands. An overview of our strong position on a global market is found on page 5. Read more about our business model and how we create value for customers starting on page 18.
2 Grow the service business and target selected industry verticals offering a portfolio of tailor-made solutions. Sales of services grew by 9% in 2021 and accounted for 21% of Group revenues. Read more about how we support our customers with different solutions to increase their uptime and profitability and taking into account what type of transport applications they are performing on page 19.
3 Secure a desirable sustainable product and service portfolio with the right quality, leveraging new and well-known technologies, CAST, partnerships and digital innovation – accelerating elec tro -mobility solutions. Read about our partnerships and our modular CAST system on page 24. More information about the rollout of electric trucks and machines and our journey towards carbon- neutral transport and infrastructure solutions begins on page 27.
4 Grow in Asia and the US: In Asia through JVs, alliances and by strengthening the Volvo Group footprint in China. In the US by sig-nificantly improving the Group’s market position. We have formed a strategic alliance with Isuzu Motors (page 24) and agreed to acquire a heavy-duty truck manufacturing operation in China (page 58).
In addition to the mission, vision, aspirations, values and Code of Conduct we have decided on seven strategic priorities for the Volvo Group.
In the US we are rolling out electric trucks and more customers are getting onboard (page 30). Information about the development in North America can also be found on page 56.
5 Develop robust profitability throughout the decentralized regional value chains by leveraging global scale, digitalization, a purpose-fit footprint and continuous improvement using Volvo Production System. Read more about how we are driving synergies through having the same truck platform and manufacturing the trucks in the same plant regardless of driveline on page 35.
6 Selectively capture, accelerate and scaleup new businesses and develop competencies and capabilities needed. We have created cellcentric, a fuel cell joint venture, with Daimler Truck (page 34), the new business area Volvo Energy to support the Group’s electrification journey (page 34) and intend to install and operate a high-performance public charging network for battery electric, heavy-duty long-haul trucks and coaches across Europe in a joint venture with Daimler Truck and Traton Group (page 35).
7 Reinforce valuebased leadership and ways of working where all colleagues are empowered to take action and are accountable for the results. Read more about how we create an inclusive, safe and engaging workplace on page 42 and further about employee devel-opment on page 164.
14
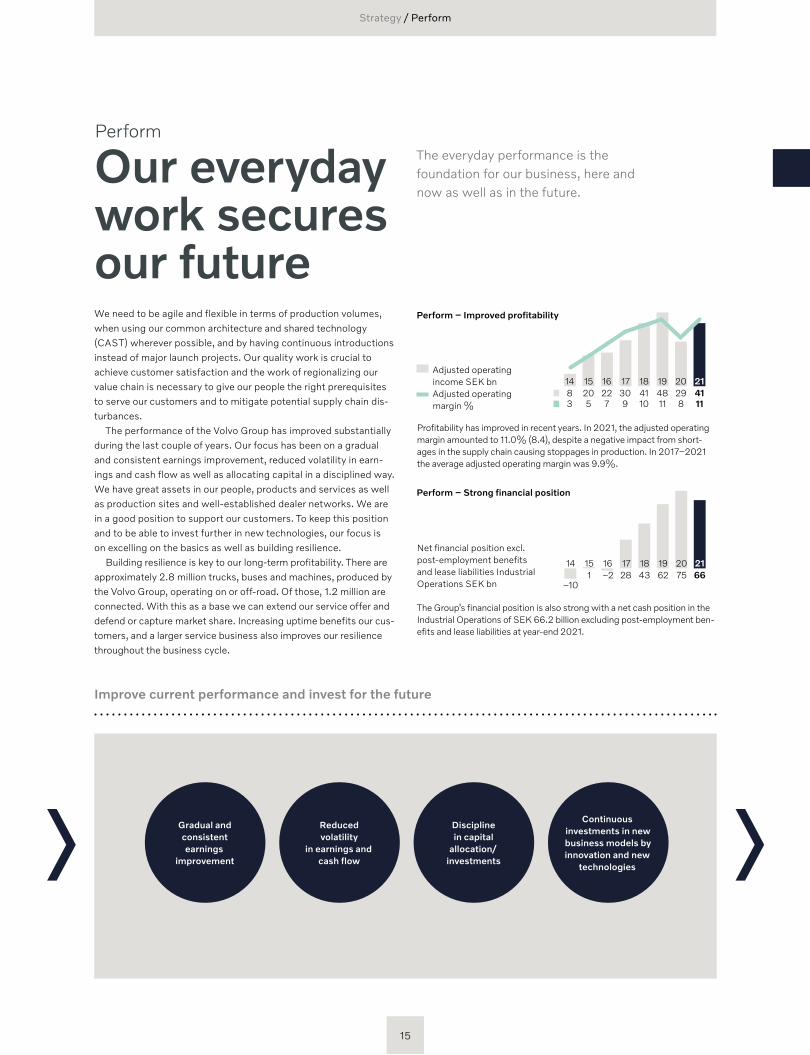
Our everyday work secures our future
The everyday performance is the foundation for our business, here and now as well as in the future.
We need to be agile and flexible in terms of production volumes, when using our common architecture and shared technology (CAST) wherever possible, and by having continuous introductions instead of major launch projects. Our quality work is crucial to achieve customer satisfaction and the work of regionalizing our value chain is necessary to give our people the right pre requisites to serve our customers and to mitigate potential supply chain dis-turbances.
The performance of the Volvo Group has improved substantially during the last couple of years. Our focus has been on a gradual and consistent earnings improvement, reduced volatility in earn-ings and cash flow as well as allocating capital in a disciplined way. We have great assets in our people, products and services as well as production sites and well-established dealer networks. We are in a good position to support our customers. To keep this position and to be able to invest further in new technologies, our focus is on excelling on the basics as well as building resilience.
Building resilience is key to our long-term profitability. There are approximately 2.8 million trucks, buses and machines, produced by the Volvo Group, operating on or off-road. Of those, 1.2 million are connected. With this as a base we can extend our service offer and defend or capture market share. Increasing uptime benefits our cus-tomers, and a larger service business also improves our resilience throughout the business cycle.
Improve current performance and invest for the future
Reducedvolatility
in earnings andcash flow
Continuous investments in new business models by innovation and new
technologies
Gradual and consistentearnings
improvement
Discipline in capital
allocation/investments
Perform
Strategy / Perform
The Group’s financial position is also strong with a net cash position in the Industrial Operations of SEK 66.2 billion excluding post- employment ben-efits and lease liabilities at year-end 2021.
161514 17 18 19 212022208 30 41 48 41753 9 10 11 11
298
Adjusted operating income SEK bn
Adjusted operating margin %
Perform – Improved profitability
211615 17 18 19 2014–21
–1028 43 62 75 66
Net financial position excl. post-employment benefits and lease liabilities Industrial Operations SEK bn
Perform – Strong financial position
Profitability has improved in recent years. In 2021, the adjusted operating margin amounted to 11.0% (8.4), despite a negative impact from short-ages in the supply chain causing stoppages in production. In 2017–2021 the average adjusted operating margin was 9.9%.
15
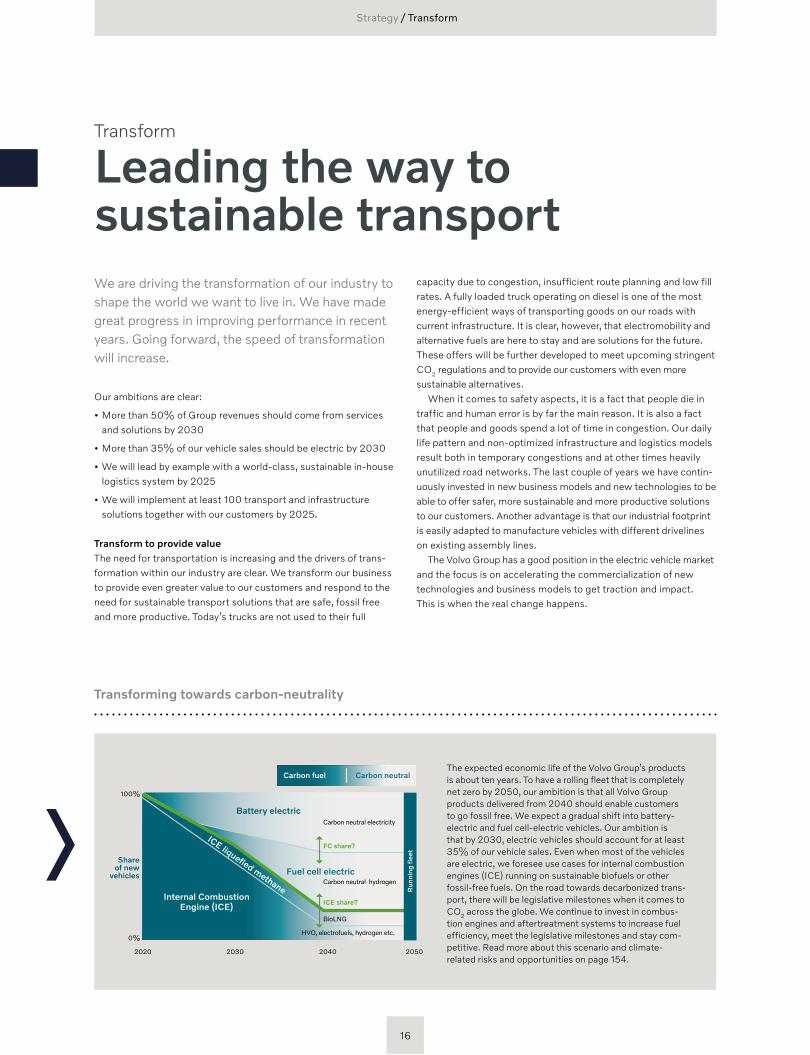
Transforming towards carbonneutrality
The expected economic life of the Volvo Group’s products is about ten years. To have a rolling fleet that is completely net zero by 2050, our ambition is that all Volvo Group products delivered from 2040 should enable customers to go fossil free. We expect a gradual shift into battery -electric and fuel cell-electric vehicles. Our ambition is that by 2030, electric vehicles should account for at least 35% of our vehicle sales. Even when most of the vehicles are electric, we foresee use cases for internal combustion engines (ICE) running on sustainable biofuels or other fossil-free fuels. On the road towards decarbonized trans-port, there will be legislative milestones when it comes to CO2 across the globe. We continue to invest in combus-tion engines and aftertreatment systems to increase fuel efficiency, meet the legislative milestones and stay com-petitive. Read more about this scenario and climate- related risks and opportunities on page 154.
Leading the way to sustainable transport
Carbon fuel Carbon neutral
100%
0%
Share of new
vehicles
2030 2040 20502020
Battery electric
Fuel cell electric
FC share?
ICE share?
Carbon neutral electricity
Carbon neutral hydrogen
BioLNG
HVO, electrofuels, hydrogen etc.
Internal Combustion Engine (ICE)
Run
ning
flee
t
ICE liquefied methane
We are driving the transformation of our industry to shape the world we want to live in. We have made great progress in improving performance in recent years. Going forward, the speed of transformation will increase.
Our ambitions are clear:
• More than 50% of Group revenues should come from services and solutions by 2030
• More than 35% of our vehicle sales should be electric by 2030
• We will lead by example with a world-class, sustainable in-house logistics system by 2025
• We will implement at least 100 transport and infrastructure solutions together with our customers by 2025.
Transform to provide valueThe need for transportation is increasing and the drivers of trans-formation within our industry are clear. We transform our business to provide even greater value to our customers and respond to the need for sustainable transport solutions that are safe, fossil free and more productive. Today’s trucks are not used to their full
capacity due to congestion, insufficient route planning and low fill rates. A fully loaded truck operating on diesel is one of the most energy-efficient ways of transporting goods on our roads with current infrastructure. It is clear, however, that electromobility and alternative fuels are here to stay and are solutions for the future. These offers will be further developed to meet upcoming stringent CO2 regulations and to provide our customers with even more sustainable alternatives.
When it comes to safety aspects, it is a fact that people die in traffic and human error is by far the main reason. It is also a fact that people and goods spend a lot of time in congestion. Our daily life pattern and non-optimized infrastructure and logistics models result both in temporary congestions and at other times heavily unutilized road networks. The last couple of years we have contin-uously invested in new business models and new technologies to be able to offer safer, more sustainable and more productive solutions to our customers. Another advantage is that our industrial footprint is easily adapted to manufacture vehicles with different drivelines on existing assembly lines.
The Volvo Group has a good position in the electric vehicle market and the focus is on accelerating the commercialization of new technologies and business models to get traction and impact. This is when the real change happens.
Transform
Strategy / Transform
16
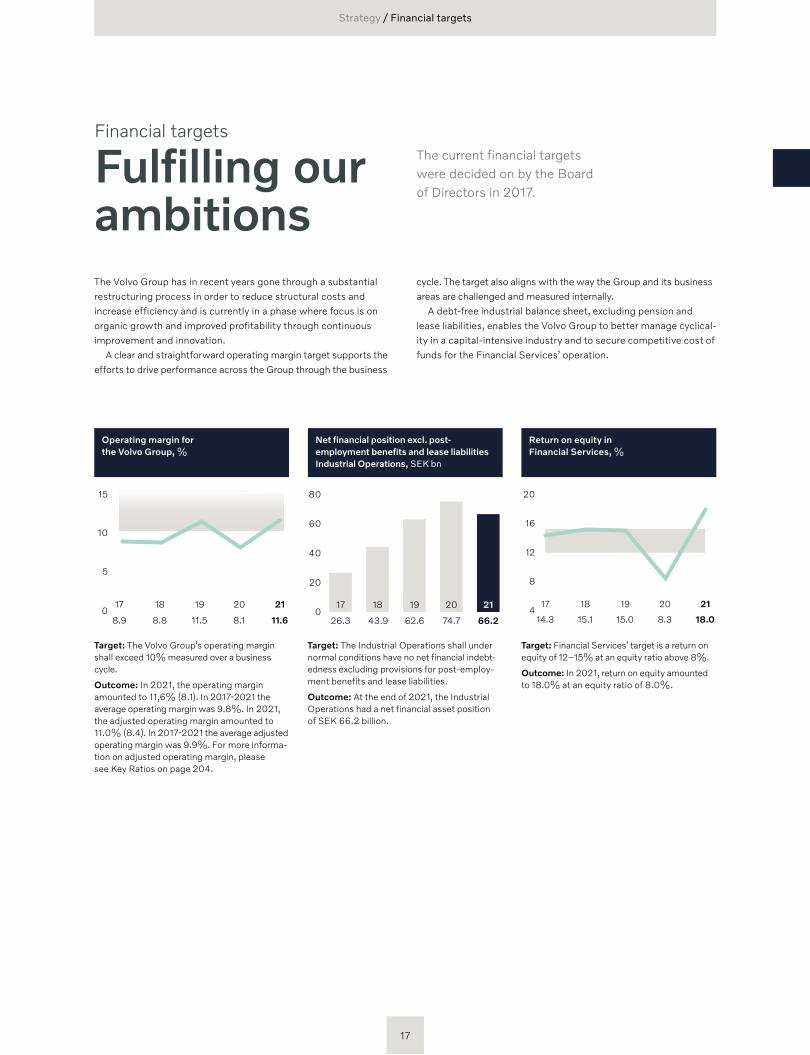
Fulfilling our ambitions
Financial targets
Target: The Volvo Group’s operating margin shall exceed 10% measured over a business cycle.
Outcome: In 2021, the operating margin amounted to 11,6% (8.1). In 2017-2021 the average operating margin was 9.8%. In 2021, the adjusted operating margin amounted to 11.0% (8.4). In 2017-2021 the average adjusted operating margin was 9.9%. For more informa-tion on adjusted operating margin, please see Key Ratios on page 204.
Operating margin for the Volvo Group, %
20 2117 19180
5
15
10
8.1 11.68.9 11.58.8
Target: Financial Services’ target is a return on equity of 12–15% at an equity ratio above 8%.
Outcome: In 2021, return on equity amounted to 18.0% at an equity ratio of 8.0%.
Return on equity in Financial Services, %
4
8
12
20
16
20 2117 1918
8.3 18.014.3 15.015.1
Target: The Industrial Operations shall under normal conditions have no net financial indebt-edness excluding provisions for post- employ-ment benefits and lease liabilities.
Outcome: At the end of 2021, the Industrial Operations had a net financial asset position of SEK 66.2 billion.
Net financial position excl. post employment benefits and lease liabilitiesIndustrial Operations, SEK bn
20 2117 1918
80
20
0
60
40
74.7 66.226.3 62.643.9
The current financial targets were decided on by the Board of Directors in 2017.
The Volvo Group has in recent years gone through a substantial restructuring process in order to reduce structural costs and increase efficiency and is currently in a phase where focus is on organic growth and improved profitability through continuous improvement and innovation.
A clear and straightforward operating margin target supports the efforts to drive performance across the Group through the business
Strategy / Financial targets
cycle. The target also aligns with the way the Group and its business areas are challenged and measured internally.
A debt-free industrial balance sheet, excluding pension and lease liabilities, enables the Volvo Group to better manage cyclical-ity in a capital-intensive industry and to secure competitive cost of funds for the Financial Services’ operation.
17
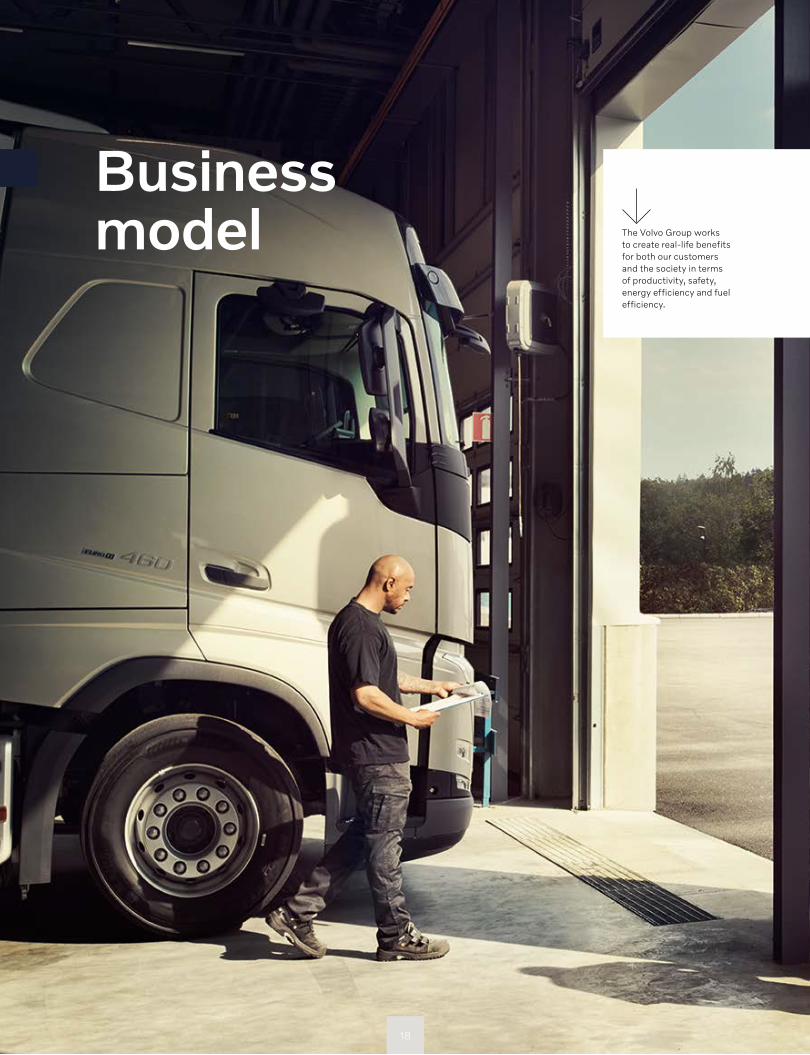
Businessmodel The Volvo Group works
to create real-life benefits for both our customers and the society in terms of productivity, safety, energy efficiency and fuel efficiency.
18
Business model / Customers
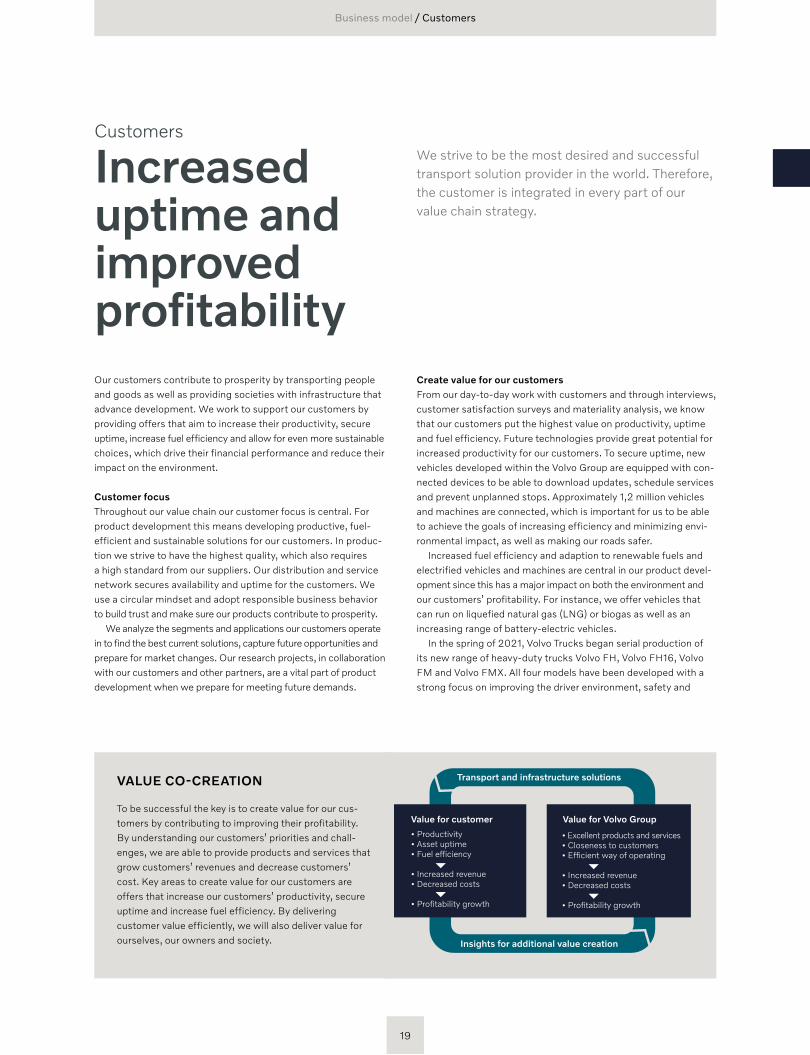
Increased uptime and improved profitabilityOur customers contribute to prosperity by transporting people and goods as well as providing societies with infrastructure that advance development. We work to support our customers by providing offers that aim to increase their productivity, secure uptime, increase fuel efficiency and allow for even more sustainable choices, which drive their financial performance and reduce their impact on the environment.
Customer focus Throughout our value chain our customer focus is central. For product development this means developing productive, fuel- efficient and sustainable solutions for our customers. In produc-tion we strive to have the highest quality, which also requires a high standard from our suppliers. Our distribution and service network secures availability and uptime for the customers. We use a circular mindset and adopt responsible business behavior to build trust and make sure our products contribute to prosperity.
We analyze the segments and applications our customers operate in to find the best current solutions, capture future opportunities and prepare for market changes. Our research projects, in collaboration with our customers and other partners, are a vital part of product development when we prepare for meeting future demands.
Create value for our customersFrom our day-to-day work with customers and through interviews, customer satisfaction surveys and materiality analysis, we know that our customers put the highest value on productivity, uptime and fuel efficiency. Future technologies provide great potential for increased productivity for our customers. To secure uptime, new vehicles developed within the Volvo Group are equipped with con-nected devices to be able to download updates, schedule services and prevent unplanned stops. Approximately 1,2 million vehicles and machines are connected, which is important for us to be able to achieve the goals of increasing efficiency and minimizing envi-ronmental impact, as well as making our roads safer.
Increased fuel efficiency and adaption to renewable fuels and electrified vehicles and machines are central in our product devel-opment since this has a major impact on both the environment and our customers’ profitability. For instance, we offer vehicles that can run on liquefied natural gas (LNG) or biogas as well as an increasing range of battery-electric vehicles.
In the spring of 2021, Volvo Trucks began serial production of its new range of heavy-duty trucks Volvo FH, Volvo FH16, Volvo FM and Volvo FMX. All four models have been developed with a strong focus on improving the driver environment, safety and
We strive to be the most desired and successful transport solution provider in the world. Therefore, the customer is integrated in every part of our value chain strategy.
• Excellent products and services• Closeness to customers• Efficient way of operating
• Increased revenue• Decreased costs
• Profitability growth
Value for Volvo Group
• Productivity• Asset uptime• Fuel efficiency
• Increased revenue• Decreased costs
• Profitability growth
Value for customer
Transport and infrastructure solutions
Insights for additional value creation
VALUE CO-CREATION
To be successful the key is to create value for our cus-tomers by contributing to improving their profitability. By understanding our customers’ priorities and chall-enges, we are able to provide products and services that grow customers’ revenues and decrease customers’ cost. Key areas to create value for our customers are offers that increase our customers’ productivity, secure uptime and increase fuel efficiency. By delivering customer value efficiently, we will also deliver value for ourselves, our owners and society.
Customers
19
Business model / Customers
productivity of the vehicles, making them more efficient than their predecessors. In the autumn of 2021, Volvo Trucks introduced several important new updates to its 11- and 13-liter Euro VI engines that will further improve fuel consumption and drivability.
Reinforcing Volvo Trucks’ commitment to sustainable transport solutions, the new Volvo FH, FM and FMX trucks have also been developed for electrified drivelines with planned production start towards the end of 2022.
During the year, Renault Trucks launched an updated heavy-duty truck range with focus on improved driver comfort as well as vehicle reliability and efficiency. This evolution was extended with the arrival of new 11- and 13-liter engines which, combined with the integration of new technologies and dedicated services, provide fuel savings of up to 10% compared to the previous generation of engines. Renault Trucks also announced its investment ambitions in electromobility. From 2023, an all-electric offer will be available for each segment – distribution, construction and long haul transports.
With the launch of three new electric compact machines – and the introduction of two existing electric compact machines to the North American market – Volvo Construction Equipment continued its electrification journey with five models in total, positioning itself as a manufacturer with a growing range of commercially available electric machines.
To harness the growing global demand for electrified transport solutions, the Volvo BZL Electric, a completely new bus chassis with an electric driveline, was launched. The Volvo BZL Electric is a global platform for clean, silent, and energy-efficient public transport.
The Group already has fully-electric trucks, buses and construc-tion equipment in serial production. Volumes were small in 2021, but customer interest is high and the Group expects the transition to electric vehicles to go segment by segment, market by market and region by region. With the planned rollout of heavy-duty elec-tric trucks from Volvo Trucks and Renault Trucks in 2022 and 2023, the Volvo Group will offer electric trucks with ranges that today are expected to cover almost half of the truck transports carried out in the EU. Read more about our rollout of electric trucks starting on page 28.
Measure successCustomer satisfaction is the true measure of success. Our aspira-tion is to have leading customer satisfaction for all brands in their segments. Through surveys, each business area within the Volvo Group tracks customer satisfaction and brand image perception. The data is an important part of understanding our customers’ needs and in our own work with continuous improvement. Research and studies are performed by leading market research companies and carried out with decision makers among customers and non-customers.
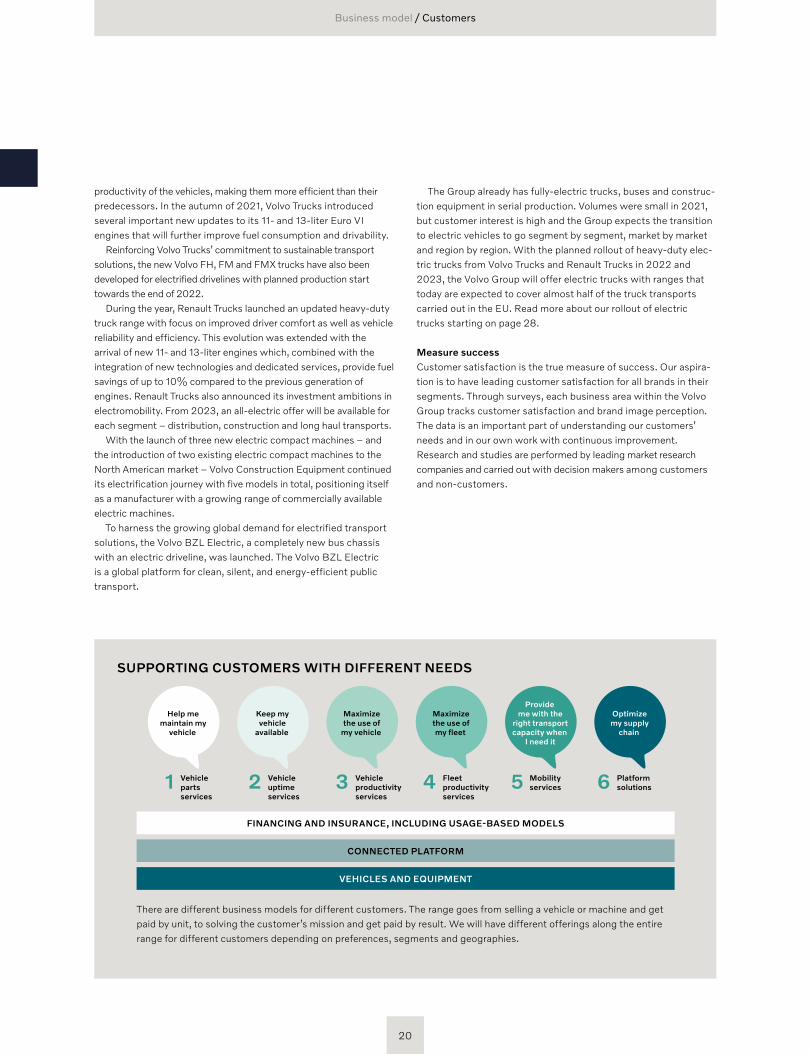
SUPPORTING CUSTOMERS WITH DIFFERENT NEEDS
FINANCING AND INSURANCE, INCLUDING USAGE-BASED MODELS
CONNECTED PLATFORM
VEHICLES AND EQUIPMENT
Vehicle parts services
1 Vehicle uptime services
2 Vehicle productivity services
3 Fleet productivity services
4 Mobility services5 Platform
solutions6
There are different business models for different customers. The range goes from selling a vehicle or machine and get paid by unit, to solving the customer’s mission and get paid by result. We will have different offerings along the entire range for different customers depending on preferences, segments and geographies.
Help me maintain my
vehicle
Keep my vehicle
available
Maximize the use of
my vehicle
Maximize the use of my fleet
Provide me with the
right transport capacity when
I need it
Optimize my supply
chain
20
Business model / Customers
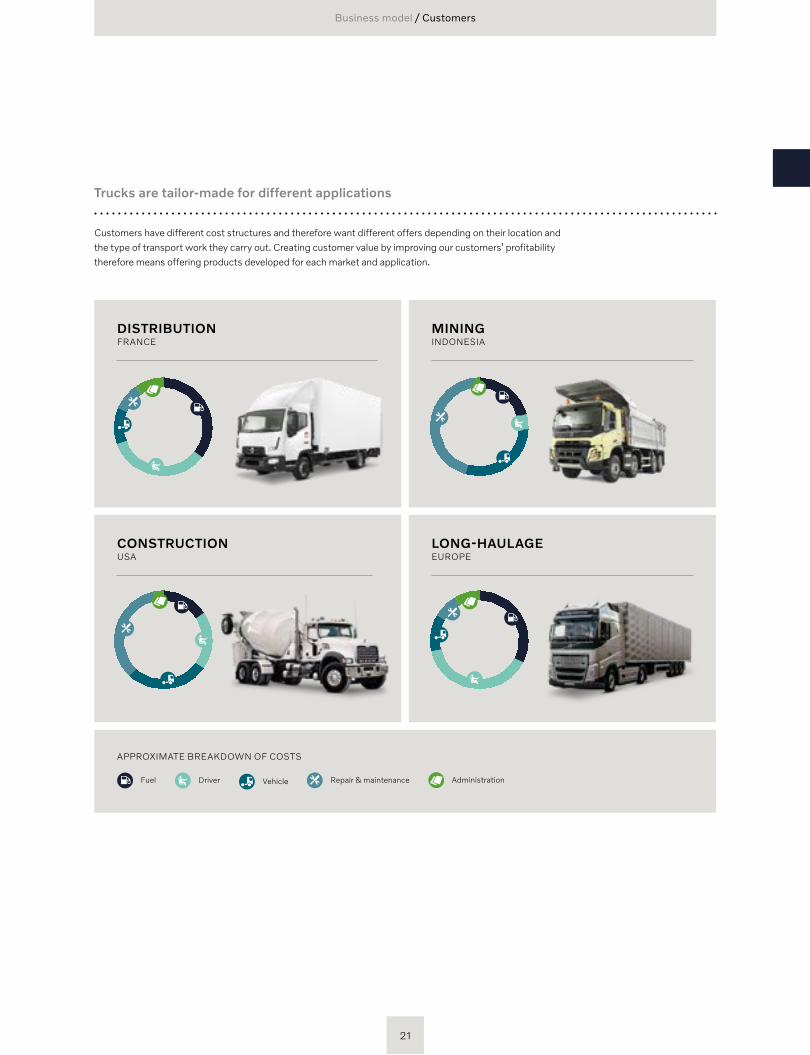
Trucks are tailor-made for different applications
DISTRIBUTION FRANCE
CONSTRUCTION USA
LONG-HAULAGE EUROPE
MINING INDONESIA
Repair & maintenance Administration
APPROXIMATE BREAKDOWN OF COSTS
Fuel Driver Vehicle
Customers have different cost structures and therefore want different offers depending on their location and the type of transport work they carry out. Creating customer value by improving our customers’ profit ability therefore means offering products developed for each market and application.
21
Business model / Value chain
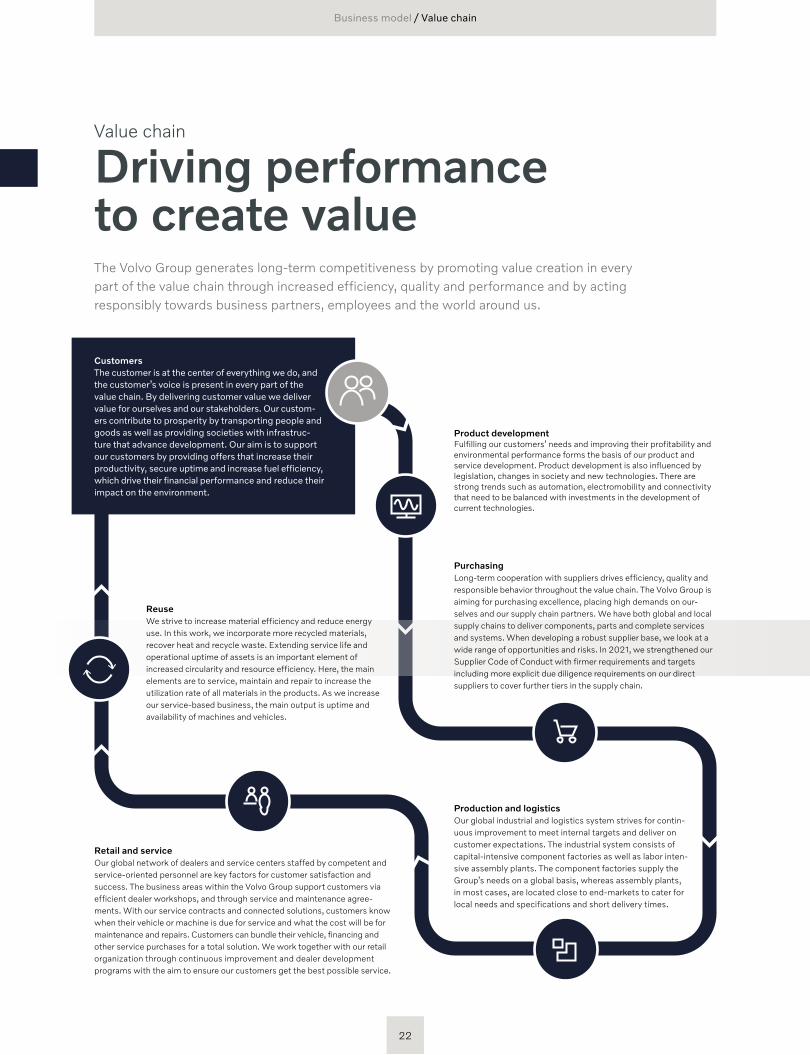
Driving performance to create valueThe Volvo Group generates long-term competitiveness by promoting value creation in every part of the value chain through increased efficiency, quality and performance and by acting responsibly towards business partners, employees and the world around us.
CustomersThe customer is at the center of everything we do, and the customer’s voice is present in every part of the value chain. By delivering customer value we deliver value for ourselves and our stakeholders. Our custom-ers contribute to prosperity by transporting people and goods as well as providing societies with infrastruc-ture that advance development. Our aim is to support our customers by providing offers that increase their productivity, secure uptime and increase fuel efficiency, which drive their financial performance and reduce their impact on the environment.
ReuseWe strive to increase material efficiency and reduce energy use. In this work, we incorporate more recycled materials, recover heat and recycle waste. Extending service life and operational uptime of assets is an important element of increased circularity and resource efficiency. Here, the main elements are to service, maintain and repair to increase the utilization rate of all materials in the products. As we increase our service-based business, the main output is uptime and availability of machines and vehicles.
Retail and serviceOur global network of dealers and service centers staffed by competent and service- oriented personnel are key factors for customer satisfaction and success. The business areas within the Volvo Group support customers via efficient dealer workshops, and through service and maintenance agree-ments. With our service contracts and connected solutions, customers know when their vehicle or machine is due for service and what the cost will be for maintenance and repairs. Customers can bundle their vehicle, financing and other service purchases for a total solution. We work together with our retail organization through continuous improvement and dealer development programs with the aim to ensure our customers get the best possible service.
Production and logisticsOur global industrial and logistics system strives for contin-uous improvement to meet internal targets and deliver on customer expectations. The industrial system consists of capital-intensive component factories as well as labor inten-sive assembly plants. The component factories supply the Group’s needs on a global basis, whereas assembly plants, in most cases, are located close to end-markets to cater for local needs and specifications and short delivery times.
Product developmentFulfilling our customers’ needs and improving their profitability and environmental performance forms the basis of our product and service development. Product development is also influenced by legislation, changes in society and new technologies. There are strong trends such as automation, electromobility and connectivity that need to be balanced with investments in the development of current technologies.
PurchasingLong-term cooperation with suppliers drives efficiency, quality and responsible behavior throughout the value chain. The Volvo Group is aiming for purchasing excellence, placing high demands on our-selves and our supply chain partners. We have both global and local supply chains to deliver components, parts and complete services and systems. When developing a robust supplier base, we look at a wide range of opportunities and risks. In 2021, we strengthened our Supplier Code of Conduct with firmer requirements and targets including more explicit due diligence requirements on our direct suppliers to cover further tiers in the supply chain.
Value chain
22
Business model / Value chain
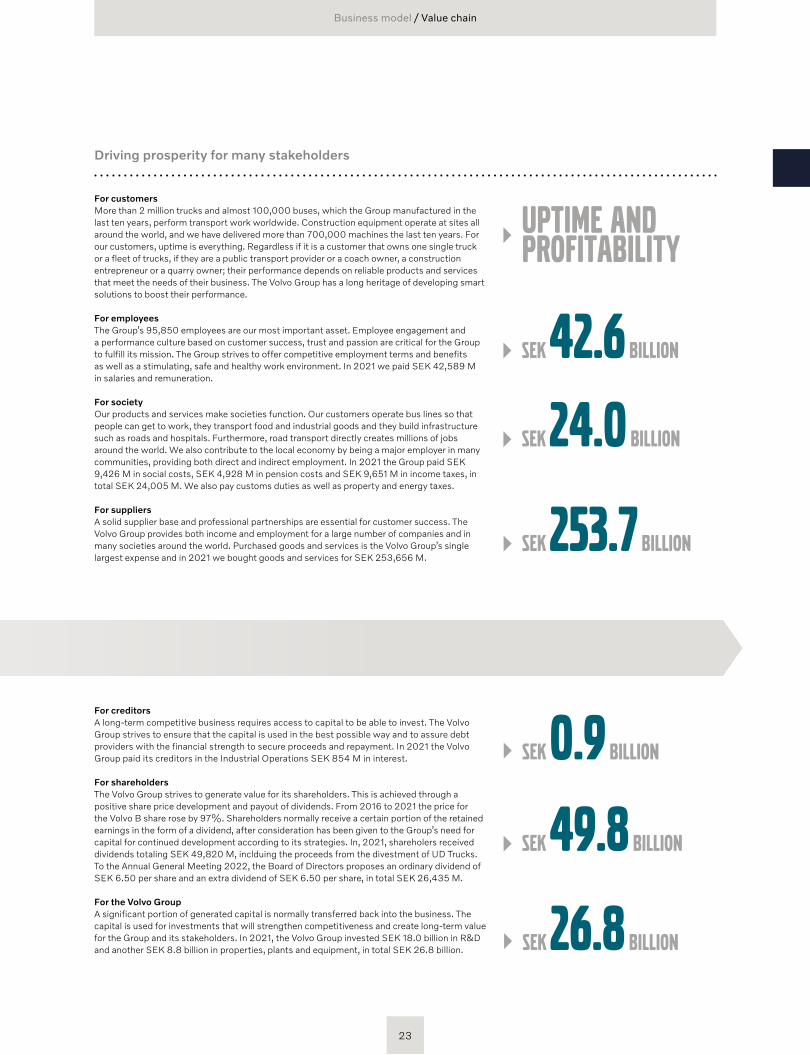
For customersMore than 2 million trucks and almost 100,000 buses, which the Group manufactured in the last ten years, perform transport work worldwide. Construction equipment operate at sites all around the world, and we have delivered more than 700,000 machines the last ten years. For our customers, uptime is everything. Regardless if it is a customer that owns one single truck or a fleet of trucks, if they are a public transport provider or a coach owner, a construction entrepreneur or a quarry owner; their performance depends on reliable products and services that meet the needs of their business. The Volvo Group has a long heritage of developing smart solutions to boost their performance.
For employeesThe Group’s 95,850 employees are our most important asset. Employee engagement and a performance culture based on customer success, trust and passion are critical for the Group to fulfill its mission. The Group strives to offer competitive employment terms and benefits as well as a stimulating, safe and healthy work environment. In 2021 we paid SEK 42,589 M in salaries and remuneration.
For societyOur products and services make societies function. Our customers operate bus lines so that people can get to work, they transport food and industrial goods and they build infrastructure such as roads and hospitals. Furthermore, road transport directly creates millions of jobs around the world. We also contribute to the local economy by being a major employer in many communities, providing both direct and indirect employment. In 2021 the Group paid SEK 9,426 M in social costs, SEK 4,928 M in pension costs and SEK 9,651 M in income taxes, in total SEK 24,005 M. We also pay customs duties as well as property and energy taxes.
For suppliersA solid supplier base and professional partnerships are essential for customer success. The Volvo Group provides both income and employment for a large number of companies and in many societies around the world. Purchased goods and services is the Volvo Group’s single largest expense and in 2021 we bought goods and services for SEK 253,656 M.
SEK 42.6 BILLION
SEK 24.0 BILLION
SEK 253.7 BILLION
For creditorsA long-term competitive business requires access to capital to be able to invest. The Volvo Group strives to ensure that the capital is used in the best possible way and to assure debt providers with the financial strength to secure proceeds and repayment. In 2021 the Volvo Group paid its creditors in the Industrial Operations SEK 854 M in interest.
For share holdersThe Volvo Group strives to generate value for its shareholders. This is achieved through a positive share price development and payout of dividends. From 2016 to 2021 the price for the Volvo B share rose by 97%. Shareholders normally receive a certain portion of the retained earnings in the form of a dividend, after consideration has been given to the Group’s need for capital for continued development according to its strategies. In, 2021, shareholers received dividends totaling SEK 49,820 M, inclduing the proceeds from the divestment of UD Trucks. To the Annual General Meeting 2022, the Board of Directors proposes an ordinary dividend of SEK 6.50 per share and an extra dividend of SEK 6.50 per share, in total SEK 26,435 M.
For the Volvo GroupA significant portion of generated capital is normally transferred back into the business. The capital is used for investments that will strengthen competitiveness and create long-term value for the Group and its stakeholders. In 2021, the Volvo Group invested SEK 18.0 billion in R&D and another SEK 8.8 billion in properties, plants and equipment, in total SEK 26.8 billion.
SEK 0.9 BILLION
SEK 49.8 BILLION
SEK 26.8 BILLION
UPTIME AND PROFITABILITY
Driving prosperity for many stakeholders
23
Keeping up with the latest development is vital to stay successful and is hard to do on one’s own, and that is why the Volvo Group works in collaborations and partnerships.
Based on emerging technologies and the latest findings within connectivity, automation and electrification, we see great opportu-nities to co-create a more sustainable transport system and to make societies prosper. This is the reason why we are forming a new ecosystem in different types of collaborations and partnerships.
Many alliances and partnershipsWe have a strategic alliance with Samsung SDI to develop battery packs for the Volvo Group’s electric trucks.
Sharing the Green Deal vision of sustainable transport and a carbon neutral Europe by 2050, we and Daimler Truck have launched a fuel cell joint venture called cellcentric.
Together with Daimler Truck and the Traton Group we have agreed to install and operate a high-performance public charging network for battery-electric heavy-duty long-haul trucks and coaches across Europe. We work together with both NVIDIA and Aurora to develop autonomous trucks.
We collaborate with SSAB on research, development, serial production and commercialization of the world’s first vehicles made of fossil-free steel. These are some examples which you can read more about in this report. We also have a strategic alliance with Isuzu Motors.
Partnerships to create leadership
Business model / Partnerships
ENGINES
Trucks
Joint venture &Alliancess
CAST
Buses
Volvo Penta
Construction Equipment
Strategic alliance with Isuzu MotorsOn April 1, the Volvo Group and Isuzu Motors completed the trans-action whereby Isuzu Motors acquired UD Trucks from the Volvo Group for an enterprise value of SEK 19 billion on a cash and debt free basis as part of a formation of a strategic alliance. The alliance aims to capture opportunities in the ongoing transformation of the commercial vehicle industry and is set to a build long-term and robust relationship.
Alliance work is focused on deriving potential synergies in areas that will encompass i.e. forming a technology partnership, inten ded to leverage the parties’ complementary areas of expertise within both well-known and new technologies and creating a larger volume base to support investments for world-class technology. Creating the best long-term conditions for a stronger heavy-duty truck busi-ness for UD Trucks and Isuzu Motors in Japan and across interna-tional markets. Exploring further opportunities for even broader and deeper collaboration within the commercial vehicle businesses across geographical areas and product lines for future urban logistics solu-tions. Exploring cooperation in the areas of purchasing and logis-tics, leveraging common technology, as well as the geographical footprint complementarity and volume expansion.
Technologies develop at a faster pace than ever before. Combined in new ways they offer new and innovative solutions in almost all industries.
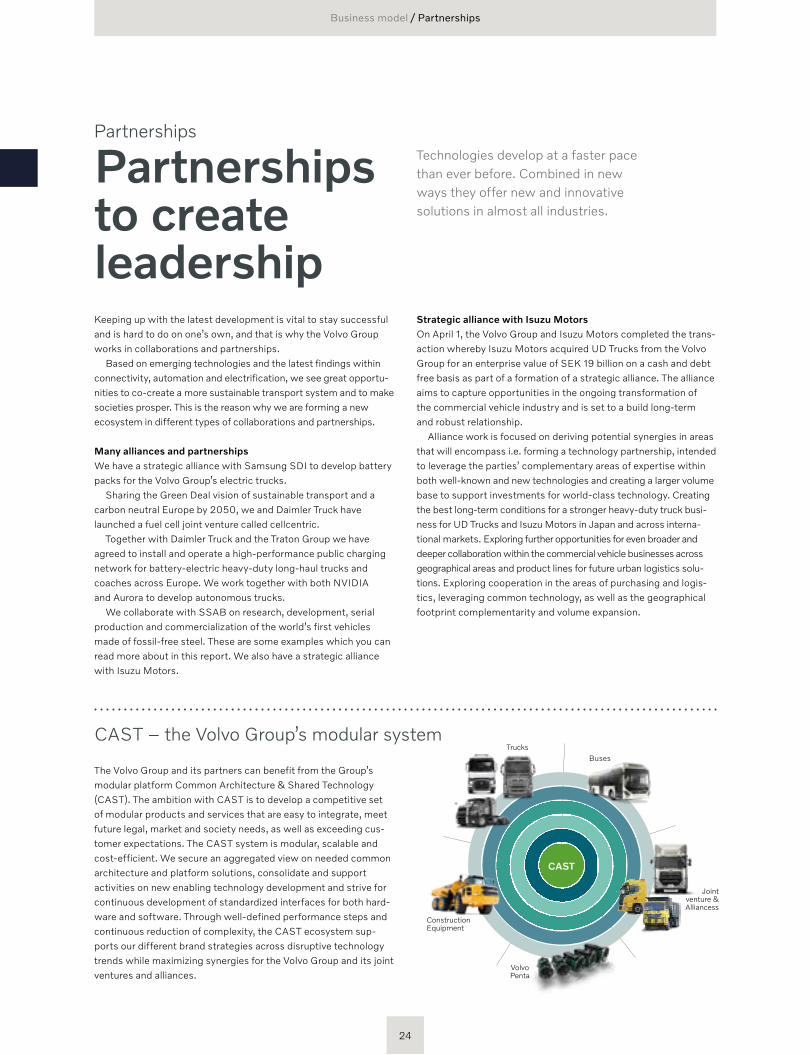
The Volvo Group and its partners can benefit from the Group’s modular platform Common Architecture & Shared Technology (CAST). The ambition with CAST is to develop a competitive set of modular products and services that are easy to integrate, meet future legal, market and society needs, as well as exceeding cus-tomer expectations. The CAST system is modular, scalable and cost-efficient. We secure an aggregated view on needed common architecture and platform solutions, consolidate and support activities on new enabling technology development and strive for continuous development of standardized interfaces for both hard-ware and software. Through well-defined performance steps and continuous reduction of complexity, the CAST ecosystem sup-ports our different brand strategies across disruptive technology trends while maximizing synergies for the Volvo Group and its joint ventures and alliances.
Partnerships
CAST – the Volvo Group’s modular system
24
Business model / Our sustainability approach
Shared value
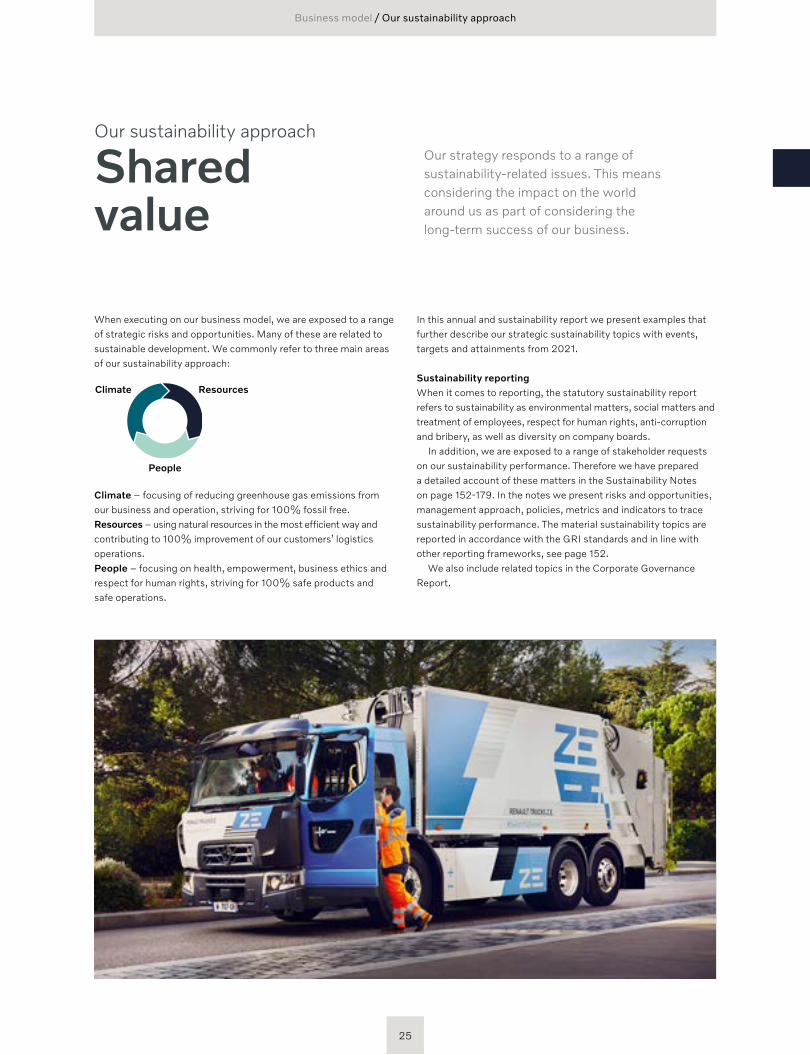
When executing on our business model, we are exposed to a range of strategic risks and opportunities. Many of these are related to sustainable development. We commonly refer to three main areas of our sustainability approach:
Resources
People
Climate
Climate – focusing of reducing greenhouse gas emissions from our business and operation, striving for 100% fossil free.Resources – using natural resources in the most efficient way and contributing to 100% improvement of our customers’ logistics operations.People – focusing on health, empowerment, business ethics and respect for human rights, striving for 100% safe products and safe operations.
Our strategy responds to a range of sustainability-related issues. This means considering the impact on the world around us as part of considering the long-term success of our business.
In this annual and sustainability report we present examples that further describe our strategic sustainability topics with events, targets and attainments from 2021.
Sustainability reportingWhen it comes to reporting, the statutory sustainability report refers to sustainability as environmental matters, social matters and treatment of employees, respect for human rights, anti-corruption and bribery, as well as diversity on company boards.
In addition, we are exposed to a range of stakeholder requests on our sustainability performance. Therefore we have prepared a detailed account of these matters in the Sustainability Notes on page 152-179. In the notes we present risks and opportunities, management approach, policies, metrics and indicators to trace sustainability performance. The material sustainability topics are reported in accordance with the GRI standards and in line with other reporting frameworks, see page 152.
We also include related topics in the Corporate Governance Report.
Our sustainability approach
25
Climate andresources
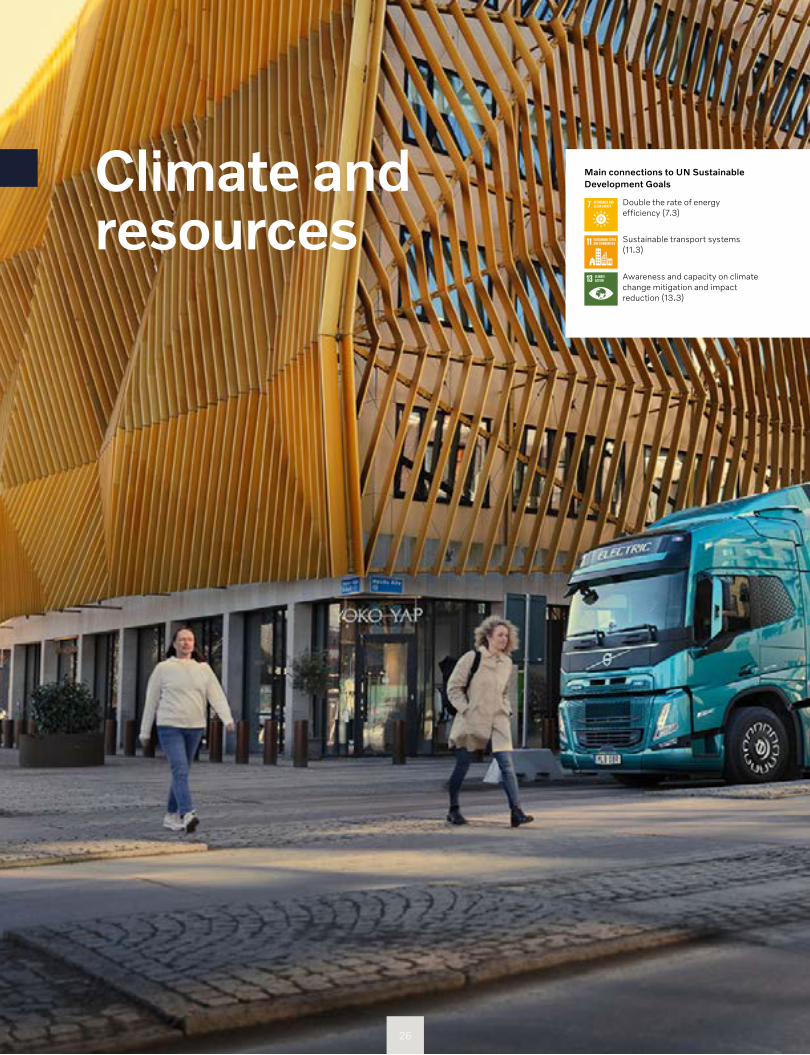
Double the rate of energy efficiency (7.3)
Main connections to UN Sustainable Development Goals
Awareness and capacity on climate change mitigation and impact reduction (13.3)
Sustainable transport systems (11.3)
26
Climate and resources
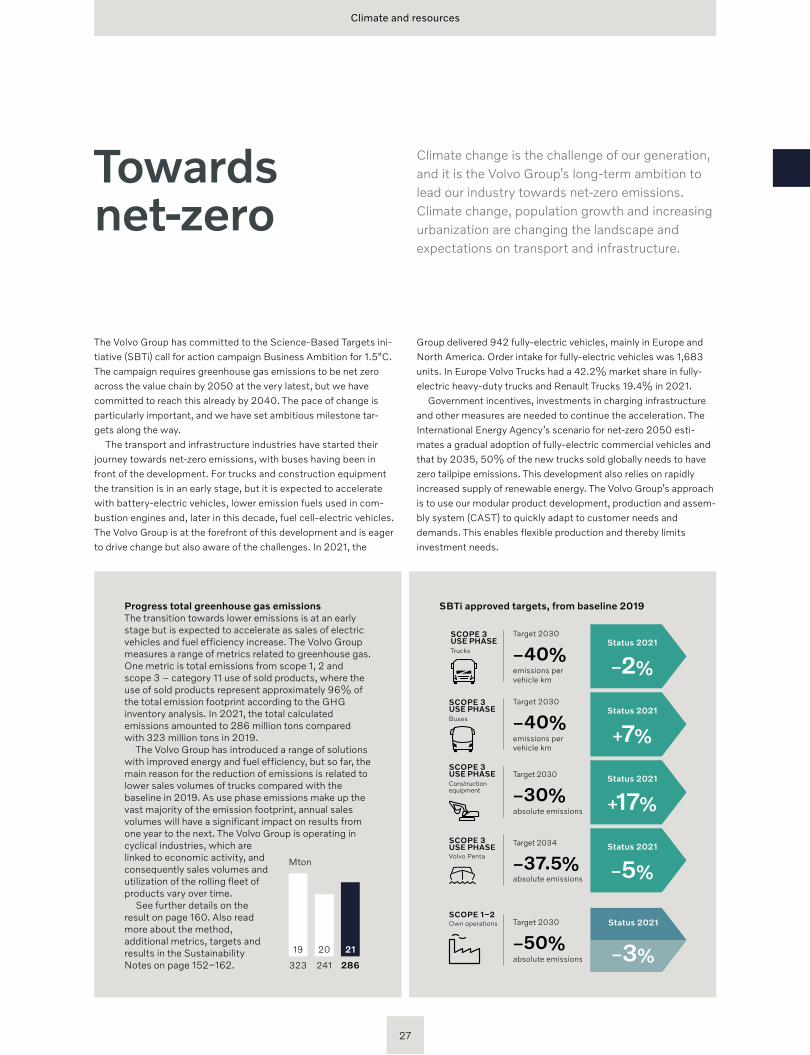
The Volvo Group has committed to the Science-Based Targets ini-tiative (SBTi) call for action campaign Business Ambition for 1.5°C. The campaign requires greenhouse gas emissions to be net zero across the value chain by 2050 at the very latest, but we have committed to reach this already by 2040. The pace of change is particularly important, and we have set ambitious milestone tar-gets along the way.
The transport and infrastructure industries have started their journey towards net-zero emissions, with buses having been in front of the development. For trucks and construction equipment the transition is in an early stage, but it is expected to accelerate with battery-electric vehicles, lower emission fuels used in com-bustion engines and, later in this decade, fuel cell-electric vehicles.The Volvo Group is at the forefront of this development and is eager to drive change but also aware of the challenges. In 2021, the
Group delivered 942 fully-electric vehicles, mainly in Europe and North America. Order intake for fully-electric vehicles was 1,683 units. In Europe Volvo Trucks had a 42.2% market share in fully- electric heavy-duty trucks and Renault Trucks 19.4% in 2021.
Government incentives, investments in charging infrastructure and other measures are needed to continue the acceleration. The International Energy Agency’s scenario for net-zero 2050 esti-mates a gradual adoption of fully-electric commercial vehicles and that by 2035, 50% of the new trucks sold globally needs to have zero tailpipe emissions. This development also relies on rapidly increased supply of renewable energy. The Volvo Group’s approach is to use our modular product development, production and assem-bly system (CAST) to quickly adapt to customer needs and demands. This enables flexible production and thereby limits investment needs.
Towards net-zero
Climate change is the challenge of our generation, and it is the Volvo Group’s long-term ambition to lead our industry towards net-zero emissions. Climate change, population growth and increasing urbanization are changing the landscape and expectations on transport and infrastructure.
Progress total greenhouse gas emissionsThe transition towards lower emissions is at an early stage but is expected to accelerate as sales of electric vehicles and fuel efficiency increase. The Volvo Group measures a range of metrics related to greenhouse gas. One metric is total emissions from scope 1, 2 and scope 3 – category 11 use of sold products, where the use of sold products represent approximately 96% of the total emission footprint according to the GHG inventory analysis. In 2021, the total calculated emissions amounted to 286 million tons compared with 323 million tons in 2019.
The Volvo Group has introduced a range of solutions with improved energy and fuel efficiency, but so far, the main reason for the reduction of emissions is related to lower sales volumes of trucks compared with the baseline in 2019. As use phase emissions make up the vast majority of the emission footprint, annual sales volumes will have a significant impact on results from one year to the next. The Volvo Group is operating in cyclical industries, which are linked to economic activity, and consequently sales volumes and utilization of the rolling fleet of products vary over time.
See further details on the result on page 160. Also read more about the method, additional metrics, targets and results in the Sustainability Notes on page 152–162.
19
Mton
20 21
323 241 286
Status 2021
–3%
Target 2030
–50%absolute emissions
SCOPE 1–2 Own operations
Status 2021
+7%
Target 2030
–40%emissions per vehicle km
Status 2021
+17%
Target 2030
–30%absolute emissions
SCOPE 3 USE PHASE Construction equipment
Status 2021
–5%
Target 2034
–37.5%absolute emissions
SCOPE 3 USE PHASE Volvo Penta
SBTi approved targets, from baseline 2019
Status 2021
–2%
Target 2030
–40%emissions per vehicle km
SCOPE 3 USE PHASE Trucks
SCOPE 3 USE PHASE Buses
27
ROLLOUT OF ELECTRIC TRUCKS
Electromobility plays a key role on the road to fossil-free transports. Our electric trucks, based on Volvo Group tech-nology, are already rolling on the streets in real operations. The electrified transport solutions are helping transport operators to significantly reduce emissions and noise. We are determined to continue leading our industry towards a sustainable future.
We believe that the transformation to electric vehicles will happen segment by segment, market by market and region by region. It has already started in public transport, distribution, waste and recycling and certain construction segments in some markets. And in 2021, Volvo Trucks started selling three new heavy-duty all-electric models, believing that the time is right for a rapid upswing in electri-fication of heavy road transport. Production is planned to begin in the second half of 2022, see next page.
When total cost of ownership is outweighed by the opportunity to provide fossil-free transportation and neces-sary conditions such as charging infrastructure is in place, we believe that the shift to electric vehicles will be quick. The Volvo Group has deep customer knowledge and appli-cation expertise within many segments and this will remain a decisive factor in providing customer value also when it comes to electric vehicles.
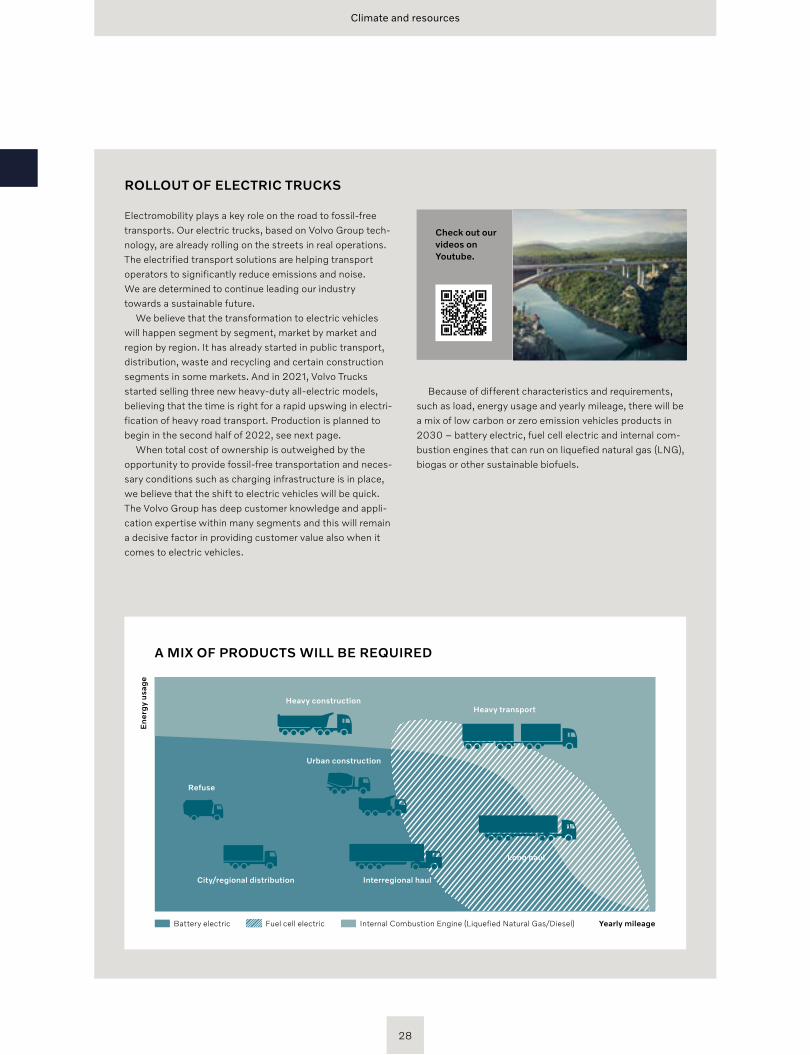
Because of different characteristics and requirements, such as load, energy usage and yearly mileage, there will be a mix of low carbon or zero emission vehicles products in 2030 – battery electric, fuel cell electric and internal com-bustion engines that can run on liquefied natural gas (LNG), biogas or other sustainable biofuels.
A MIX OF PRODUCTS WILL BE REQUIRED
Battery electric Fuel cell electric Internal Combustion Engine (Liquefied Natural Gas/Diesel)
Refuse
City/regional distribution Interregional haul
Yearly mileage
En
erg
y u
sag
e
Long haul
Heavy transportHeavy construction
Urban construction
Climate and resources
Check out our videos on Youtube.
28
RENAULT TRUCKS ENHANCES ITS RANGE OF ELECTRIC TRUCKS
Renault Trucks is developing its range of electric trucks to adapt to the wide variety of urban distribution activities and meet the needs of its customers. A 19-ton D Wide Z.E. has been added to the 16- and 26-ton Renault Trucks D Z.E. and D Wide Z.E. models, which have been in production since 2020. Renault Trucks is also offering a wider range of wheelbases and special connectivity for refrigerated bodies.
Equipped with a two-axle chassis for improved maneuver-ability, the 19-ton Renault Trucks D Wide Z.E. is a great vehicle for temperature-controlled distribution, with an optimized payload. In addition, Renault Trucks has designed a new system to increase the energy efficiency of all-electric trucks equipped with a refrigerated body. Renault Trucks D and D Wide Z.E. 16, 19 and 26 ton trucks are now available with a fridge-connection option, which supplies the energy required for the refrigeration system directly from the vehicle’s 600 V traction batteries.
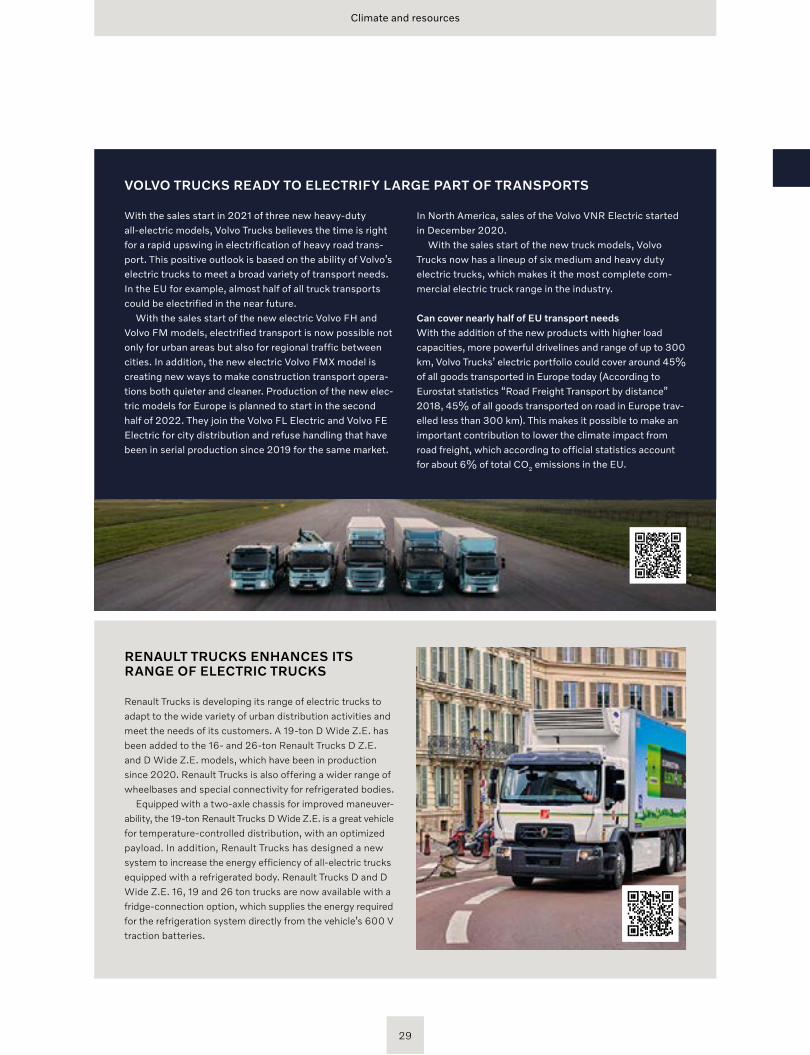
VOLVO TRUCKS READY TO ELECTRIFY LARGE PART OF TRANSPORTS
With the sales start in 2021 of three new heavy-duty all-electric models, Volvo Trucks believes the time is right for a rapid upswing in electrification of heavy road trans-port. This positive outlook is based on the ability of Volvo’s electric trucks to meet a broad variety of transport needs. In the EU for example, almost half of all truck transports could be electrified in the near future.
With the sales start of the new electric Volvo FH and Volvo FM models, electrified transport is now possible not only for urban areas but also for regional traffic between cities. In addition, the new electric Volvo FMX model is creating new ways to make construction transport opera-tions both quieter and cleaner. Production of the new elec-tric models for Europe is planned to start in the second half of 2022. They join the Volvo FL Electric and Volvo FE Electric for city distribution and refuse handling that have been in serial production since 2019 for the same market.
In North America, sales of the Volvo VNR Electric started in December 2020.
With the sales start of the new truck models, Volvo Trucks now has a lineup of six medium and heavy duty electric trucks, which makes it the most complete com-mercial electric truck range in the industry.
Can cover nearly half of EU transport needsWith the addition of the new products with higher load capacities, more powerful drivelines and range of up to 300 km, Volvo Trucks’ electric portfolio could cover around 45% of all goods transported in Europe today (According to Eurostat statistics “Road Freight Transport by distance” 2018, 45% of all goods transported on road in Europe trav-elled less than 300 km). This makes it possible to make an important contribution to lower the climate impact from road freight, which according to official statistics account for about 6% of total CO2 emissions in the EU.
Climate and resources
29
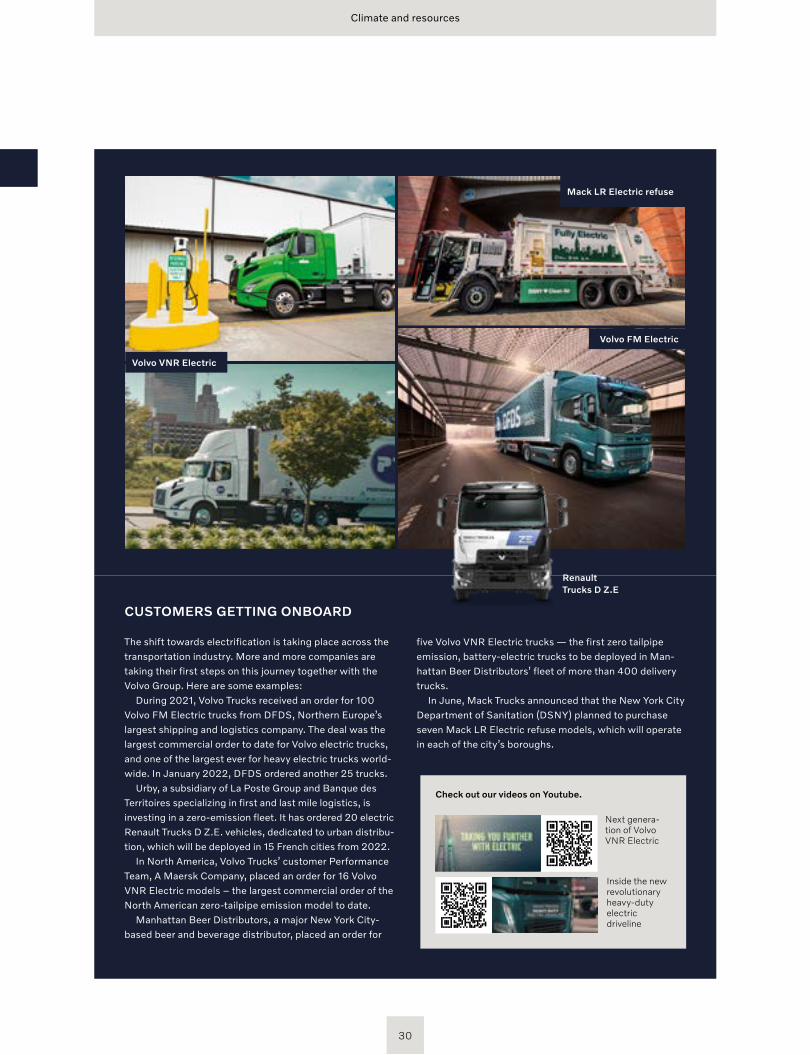
Volvo VNR Electric
Volvo FM Electric
Mack LR Electric refuse
Climate and resources
CUSTOMERS GETTING ONBOARD
The shift towards electrification is taking place across the transportation industry. More and more companies are taking their first steps on this journey together with the Volvo Group. Here are some examples:
During 2021, Volvo Trucks received an order for 100 Volvo FM Electric trucks from DFDS, Northern Europe’s largest shipping and logistics company. The deal was the largest commercial order to date for Volvo electric trucks, and one of the largest ever for heavy electric trucks world-wide. In January 2022, DFDS ordered another 25 trucks.
Urby, a subsidiary of La Poste Group and Banque des Territoires specializing in first and last mile logistics, is investing in a zero-emission fleet. It has ordered 20 electric Renault Trucks D Z.E. vehicles, dedicated to urban distribu-tion, which will be deployed in 15 French cities from 2022.
In North America, Volvo Trucks’ customer Performance Team, A Maersk Company, placed an order for 16 Volvo VNR Electric models – the largest commercial order of the North American zero-tailpipe emission model to date.
Manhattan Beer Distributors, a major New York City-based beer and beverage distributor, placed an order for
five Volvo VNR Electric trucks — the first zero tailpipe emission, battery-electric trucks to be deployed in Man-hattan Beer Distributors’ fleet of more than 400 delivery trucks.
In June, Mack Trucks announced that the New York City Department of Sanitation (DSNY) planned to purchase seven Mack LR Electric refuse models, which will operate in each of the city’s boroughs.
Check out our videos on Youtube.
Next genera-tion of Volvo VNR Electric
Inside the new revolutionary heavy-duty electric driveline
Renault Trucks D Z.E
30
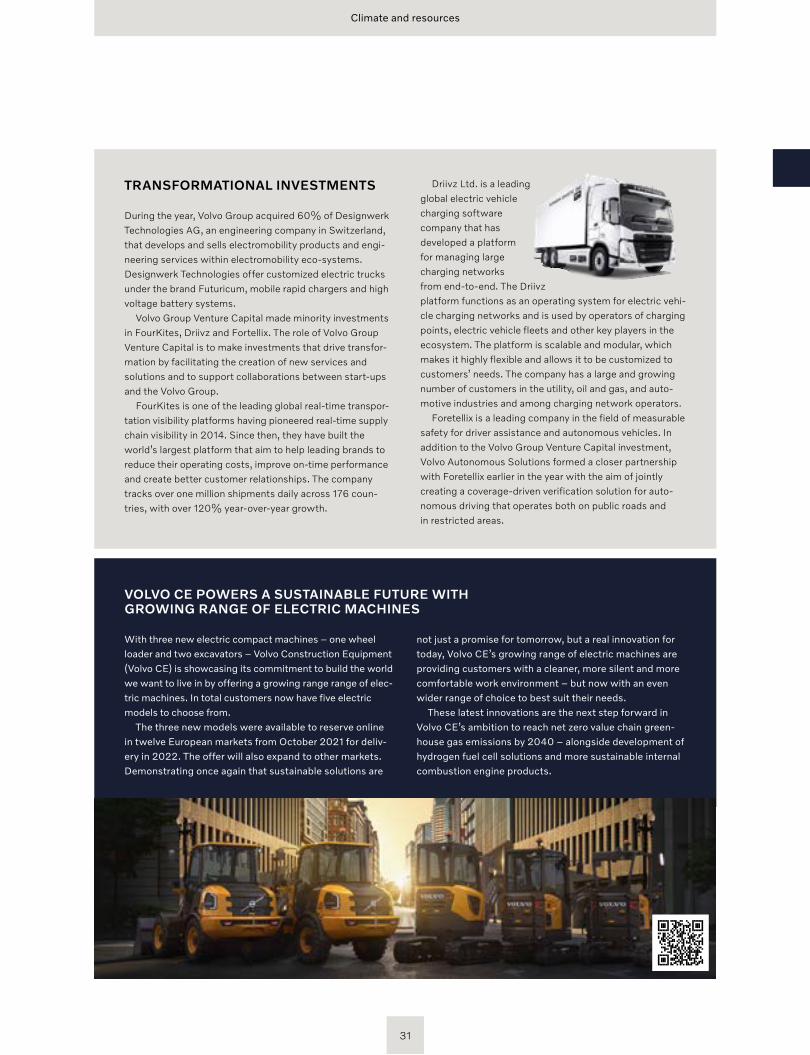
Climate and resources
VOLVO CE POWERS A SUSTAINABLE FUTURE WITH GROWING RANGE OF ELECTRIC MACHINES
With three new electric compact machines – one wheel loader and two excavators – Volvo Construction Equipment (Volvo CE) is showcasing its commitment to build the world we want to live in by offering a growing range range of elec-tric machines. In total customers now have five electric models to choose from.
The three new models were available to reserve online in twelve European markets from October 2021 for deliv-ery in 2022. The offer will also expand to other markets. Demonstrating once again that sustainable solutions are
not just a promise for tomorrow, but a real innovation for today, Volvo CE’s growing range of electric machines are providing customers with a cleaner, more silent and more comfortable work environment – but now with an even wider range of choice to best suit their needs.
These latest innovations are the next step forward in Volvo CE’s ambition to reach net zero value chain green-house gas emissions by 2040 – alongside development of hydrogen fuel cell solutions and more sustainable internal combustion engine products.
TRANSFORMATIONAL INVESTMENTS
During the year, Volvo Group acquired 60% of Designwerk Technologies AG, an engineering company in Switzerland, that develops and sells electromobility products and engi-neering services within electromobility eco-systems. Designwerk Technologies offer customized electric trucks under the brand Futuricum, mobile rapid chargers and high voltage battery systems.
Volvo Group Venture Capital made minority investments in FourKites, Driivz and Fortellix. The role of Volvo Group Venture Capital is to make investments that drive transfor-mation by facilitating the creation of new services and solutions and to support collaborations between start-ups and the Volvo Group.
FourKites is one of the leading global real-time transpor-tation visibility platforms having pioneered real-time supply chain visibility in 2014. Since then, they have built the world’s largest platform that aim to help leading brands to reduce their operating costs, improve on-time performance and create better customer relationships. The company tracks over one million shipments daily across 176 coun-tries, with over 120% year-over-year growth.
Driivz Ltd. is a leading global electric vehicle charging software company that has developed a platform for managing large charging networks from end-to-end. The Driivz platform functions as an operating system for electric vehi-cle charging networks and is used by operators of charging points, electric vehicle fleets and other key players in the ecosystem. The platform is scalable and modular, which makes it highly flexible and allows it to be customized to customers’ needs. The company has a large and growing number of customers in the utility, oil and gas, and auto-motive industries and among charging network operators.
Foretellix is a leading company in the field of measurable safety for driver assistance and autonomous vehicles. In addition to the Volvo Group Venture Capital investment, Volvo Autonomous Solutions formed a closer partnership with Foretellix earlier in the year with the aim of jointly creating a coverage-driven verification solution for auto-nomous driving that operates both on public roads and in restricted areas.
31
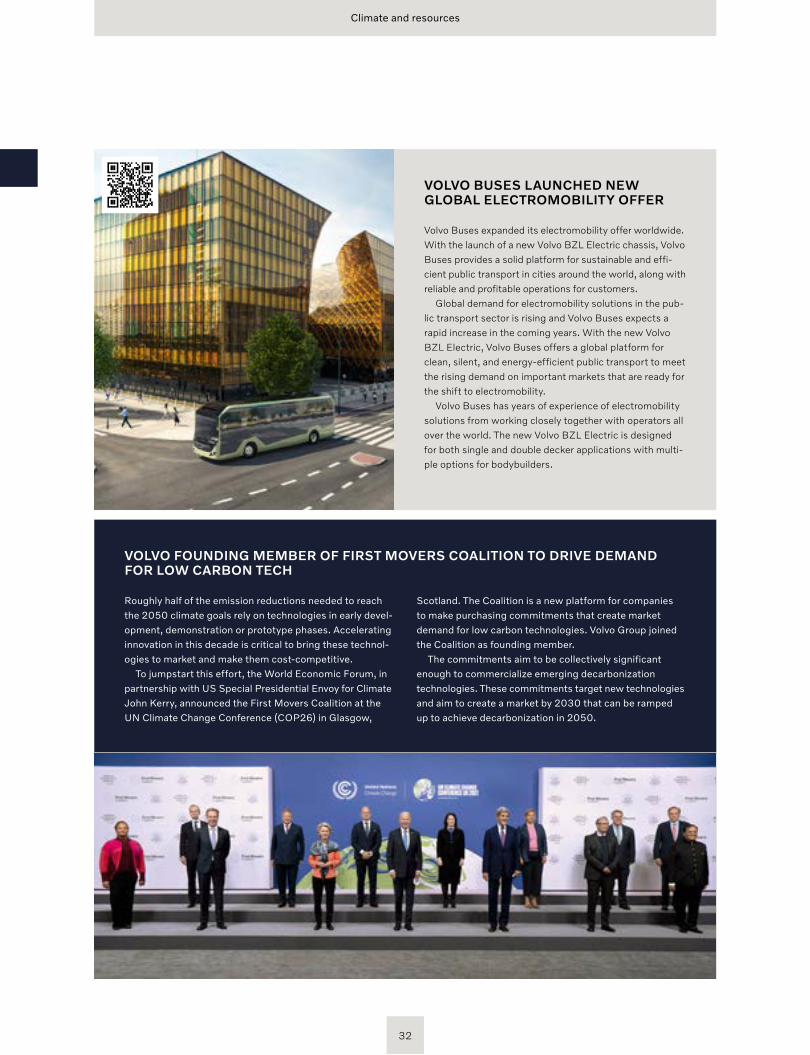
Climate and resources
VOLVO FOUNDING MEMBER OF FIRST MOVERS COALITION TO DRIVE DEMAND FOR LOW CARBON TECH
Roughly half of the emission reductions needed to reach the 2050 climate goals rely on technologies in early devel-opment, demonstration or prototype phases. Accelerating innovation in this decade is critical to bring these technol-ogies to market and make them cost-competitive.
To jumpstart this effort, the World Economic Forum, in partnership with US Special Presidential Envoy for Climate John Kerry, announced the First Movers Coalition at the UN Climate Change Conference (COP26) in Glasgow,
Scotland. The Coalition is a new platform for companies to make purchasing commitments that create market demand for low carbon technologies. Volvo Group joined the Coalition as founding member.
The commitments aim to be collectively significant enough to commercialize emerging decarbonization technologies. These commitments target new technologies and aim to create a market by 2030 that can be ramped up to achieve decarbonization in 2050.
VOLVO BUSES LAUNCHED NEW GLOBAL ELECTROMOBILITY OFFER
Volvo Buses expanded its electromobility offer worldwide. With the launch of a new Volvo BZL Electric chassis, Volvo Buses provides a solid platform for sustainable and effi-cient public transport in cities around the world, along with reliable and profitable operations for customers.
Global demand for electromobility solutions in the pub-lic transport sector is rising and Volvo Buses expects a rapid increase in the coming years. With the new Volvo BZL Electric, Volvo Buses offers a global platform for clean, silent, and energy-efficient public transport to meet the rising demand on important markets that are ready for the shift to electromobility.
Volvo Buses has years of experience of electromobility solutions from working closely together with operators all over the world. The new Volvo BZL Electric is designed for both single and double decker applications with multi-ple options for bodybuilders.
32
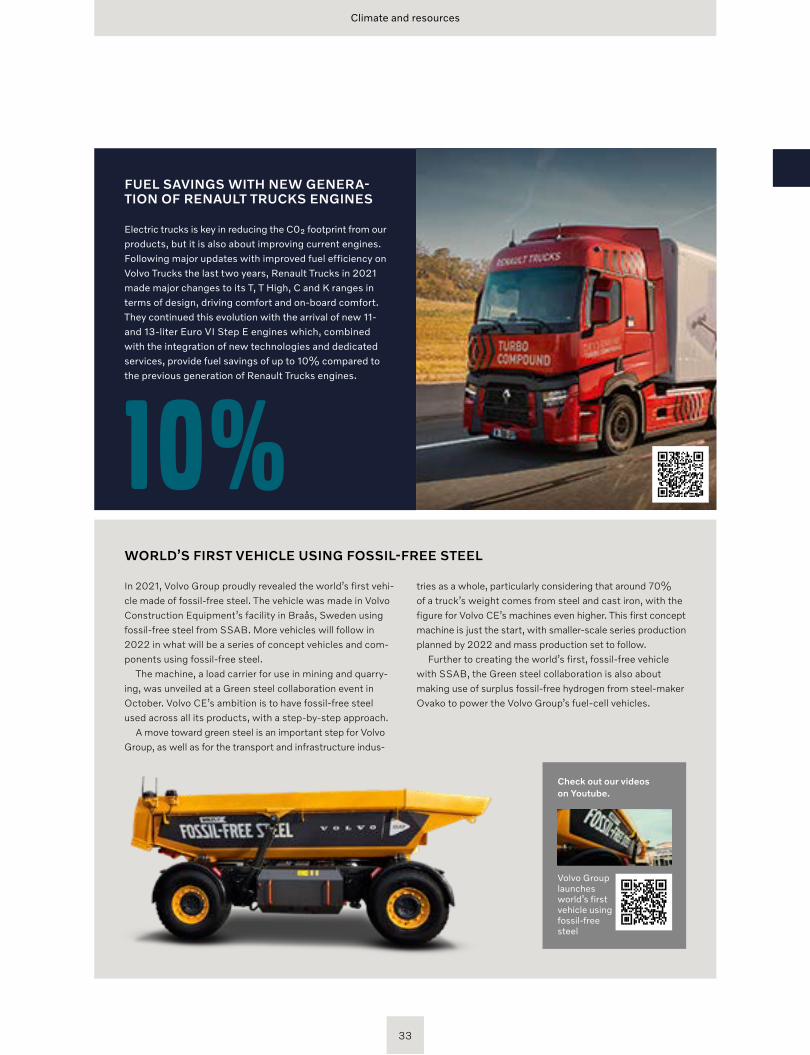
Climate and resources
WORLD’S FIRST VEHICLE USING FOSSIL-FREE STEEL
In 2021, Volvo Group proudly revealed the world’s first vehi-cle made of fossil-free steel. The vehicle was made in Volvo Construction Equipment’s facility in Braås, Sweden using fossil-free steel from SSAB. More vehicles will follow in 2022 in what will be a series of concept vehicles and com-ponents using fossil-free steel.
The machine, a load carrier for use in mining and quarry-ing, was unveiled at a Green steel collaboration event in October. Volvo CE’s ambition is to have fossil-free steel used across all its products, with a step-by-step approach.
A move toward green steel is an important step for Volvo Group, as well as for the transport and infrastructure indus-
tries as a whole, particularly considering that around 70% of a truck’s weight comes from steel and cast iron, with the figure for Volvo CE’s machines even higher. This first concept machine is just the start, with smaller-scale series production planned by 2022 and mass production set to follow.
Further to creating the world’s first, fossil-free vehicle with SSAB, the Green steel collaboration is also about making use of surplus fossil-free hydrogen from steel-maker Ovako to power the Volvo Group’s fuel-cell vehicles.
FUEL SAVINGS WITH NEW GENERA-TION OF RENAULT TRUCKS ENGINES
Electric trucks is key in reducing the C0₂ footprint from our products, but it is also about improving current engines. Following major updates with improved fuel efficiency on Volvo Trucks the last two years, Renault Trucks in 2021 made major changes to its T, T High, C and K ranges in terms of design, driving comfort and on- board comfort. They continued this evolution with the arrival of new 11- and 13-liter Euro VI Step E engines which, combined with the integration of new technologies and dedicated services, provide fuel savings of up to 10% compared to the previous generation of Renault Trucks engines.
10%
Check out our videos on Youtube.
Volvo Group launches world’s first vehicle using fossil-free steel
33
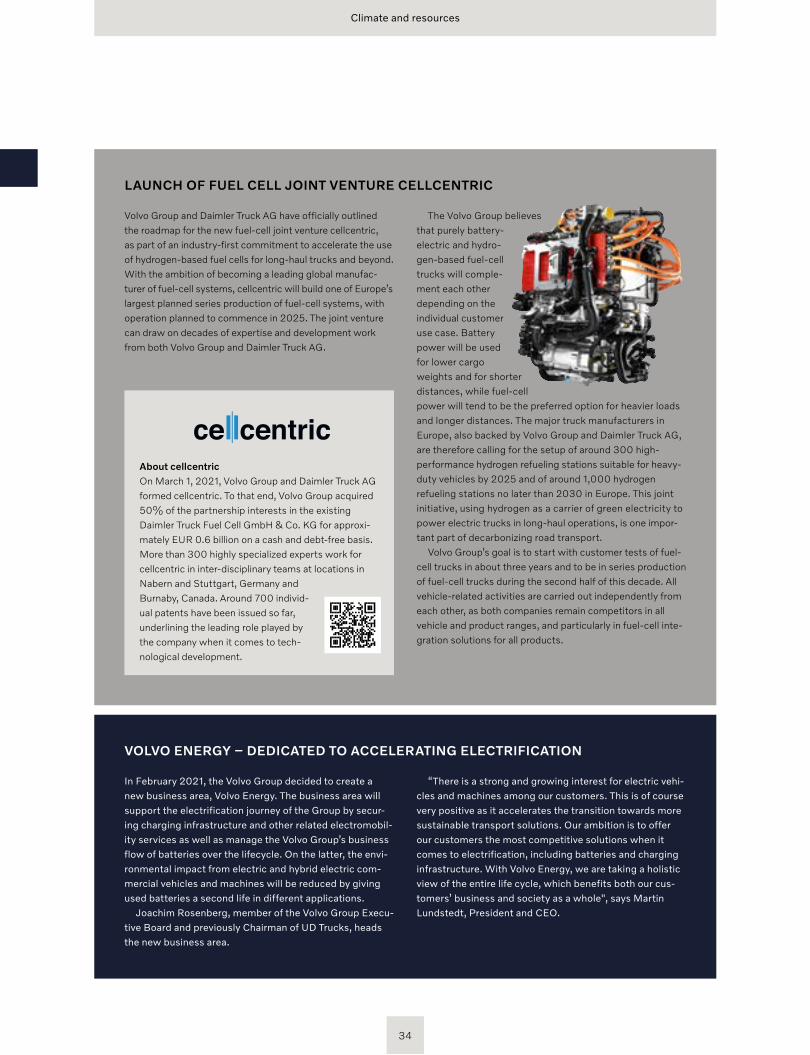
Climate and resources
LAUNCH OF FUEL CELL JOINT VENTURE CELLCENTRIC
Volvo Group and Daimler Truck AG have officially outlined the roadmap for the new fuel-cell joint venture cellcentric, as part of an industry-first commitment to accelerate the use of hydrogen-based fuel cells for long-haul trucks and beyond. With the ambition of becoming a leading global manufac-turer of fuel-cell systems, cellcentric will build one of Europe’s largest planned series production of fuel-cell systems, with operation planned to commence in 2025. The joint venture can draw on decades of expertise and development work from both Volvo Group and Daimler Truck AG.
The Volvo Group believes that purely battery- electric and hydro-gen-based fuel-cell trucks will comple-ment each other depending on the individual customer use case. Battery power will be used for lower cargo weights and for shorter distances, while fuel-cell power will tend to be the preferred option for heavier loads and longer distances. The major truck manufacturers in Europe, also backed by Volvo Group and Daimler Truck AG, are therefore calling for the setup of around 300 high- performance hydrogen refueling stations suitable for heavy-duty vehicles by 2025 and of around 1,000 hydrogen refuel ing stations no later than 2030 in Europe. This joint initiative, using hydrogen as a carrier of green electricity to power electric trucks in long-haul operations, is one impor-tant part of decarbonizing road transport.
Volvo Group’s goal is to start with customer tests of fuel-cell trucks in about three years and to be in series production of fuel-cell trucks during the second half of this decade. All vehicle-related activities are carried out independently from each other, as both companies remain competitors in all vehicle and product ranges, and particularly in fuel-cell inte-gration solutions for all products.
VOLVO ENERGY – DEDICATED TO ACCELERATING ELECTRIFICATION
In February 2021, the Volvo Group decided to create a new business area, Volvo Energy. The business area will support the electrification journey of the Group by secur-ing charging infrastructure and other related electromobil-ity services as well as manage the Volvo Group’s business flow of batteries over the lifecycle. On the latter, the envi-ronmental impact from electric and hybrid electric com-mercial vehicles and machines will be reduced by giving used batteries a second life in different applications.
Joachim Rosenberg, member of the Volvo Group Execu-tive Board and previously Chairman of UD Trucks, heads the new business area.
“There is a strong and growing interest for electric vehi-cles and machines among our customers. This is of course very positive as it accelerates the transition towards more sustainable transport solutions. Our ambition is to offer our customers the most competitive solutions when it comes to electrification, including batteries and charging infrastructure. With Volvo Energy, we are taking a holistic view of the entire life cycle, which benefits both our cus-tomers’ business and society as a whole", says Martin Lundstedt, President and CEO.
About cellcentricOn March 1, 2021, Volvo Group and Daimler Truck AG formed cellcentric. To that end, Volvo Group acquired 50% of the partnership interests in the existing Daimler Truck Fuel Cell GmbH & Co. KG for approxi-mately EUR 0.6 billion on a cash and debt-free basis.More than 300 highly specialized experts work for cellcentric in inter-disciplinary teams at locations in Nabern and Stuttgart, Germany and Burnaby, Canada. Around 700 individ-ual patents have been issued so far, underlining the leading role played by the company when it comes to tech-nological development.
34
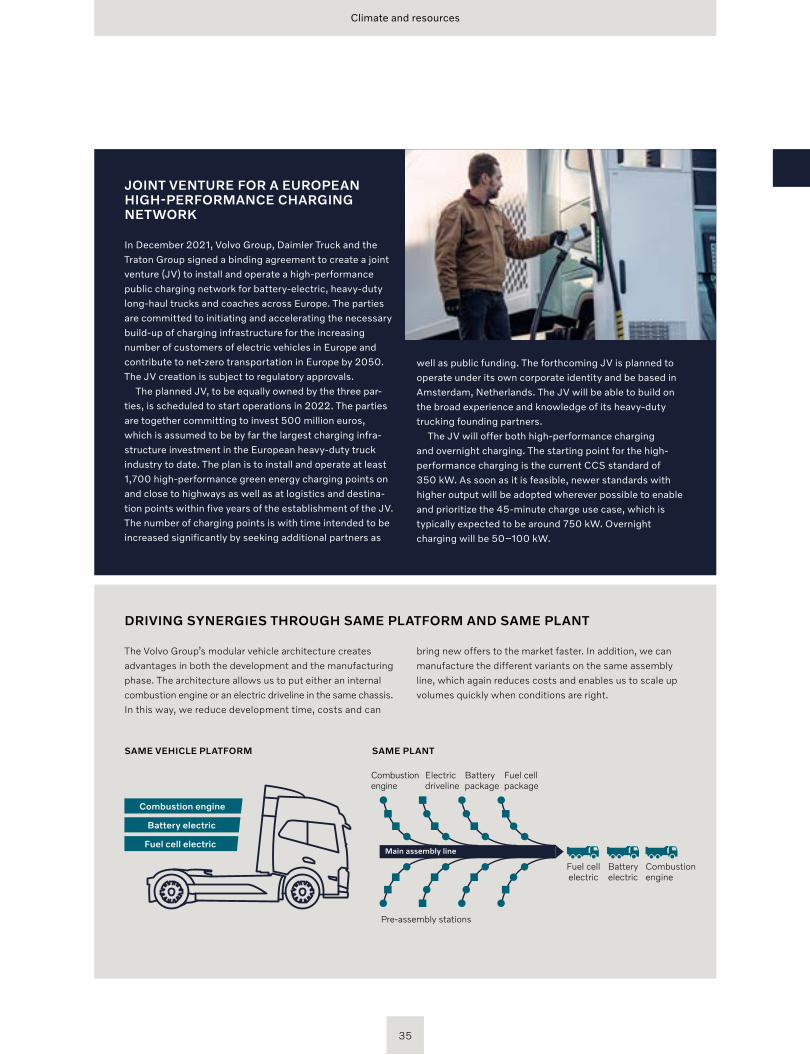
JOINT VENTURE FOR A EUROPEAN HIGH-PERFORMANCE CHARGING NETWORK
In December 2021, Volvo Group, Daimler Truck and the Traton Group signed a binding agreement to create a joint venture (JV) to install and operate a high-performance public charging network for battery-electric, heavy-duty long-haul trucks and coaches across Europe. The parties are committed to initiating and accelerating the necessary build-up of charging infrastructure for the increasing number of customers of electric vehicles in Europe and contribute to net-zero transportation in Europe by 2050. The JV creation is subject to regulatory approvals.
The planned JV, to be equally owned by the three par-ties, is scheduled to start operations in 2022. The parties are together committing to invest 500 million euros, which is assumed to be by far the largest charging infra-structure investment in the European heavy-duty truck industry to date. The plan is to install and operate at least 1,700 high-performance green energy charging points on and close to highways as well as at logistics and destina-tion points within five years of the establishment of the JV. The number of charging points is with time intended to be increased significantly by seeking additional partners as
well as public funding. The forthcoming JV is planned to operate under its own corporate identity and be based in Amsterdam, Netherlands. The JV will be able to build on the broad experience and knowledge of its heavy-duty trucking founding partners.
The JV will offer both high-performance charging and overnight charging. The starting point for the high- performance charging is the current CCS standard of 350 kW. As soon as it is feasible, newer standards with higher output will be adopted wherever possible to enable and prioritize the 45-minute charge use case, which is typically expected to be around 750 kW. Overnight charging will be 50–100 kW.
DRIVING SYNERGIES THROUGH SAME PLATFORM AND SAME PLANT
The Volvo Group’s modular vehicle architecture creates advantages in both the development and the manufacturing phase. The architecture allows us to put either an internal combustion engine or an electric driveline in the same chassis. In this way, we reduce development time, costs and can
bring new offers to the market faster. In addition, we can manufacture the different variants on the same assembly line, which again reduces costs and enables us to scale up volumes quickly when conditions are right.
Climate and resources
Combustion engine
Electricdriveline
Batterypackage
Fuel cellpackage
Fuel cellelectric
Batteryelectric
Combustion engine
Pre-assembly stations
Main assembly line
SAME PLANT SAME VEHICLE PLATFORM
Combustion engine
Battery electric
Fuel cell electric
35
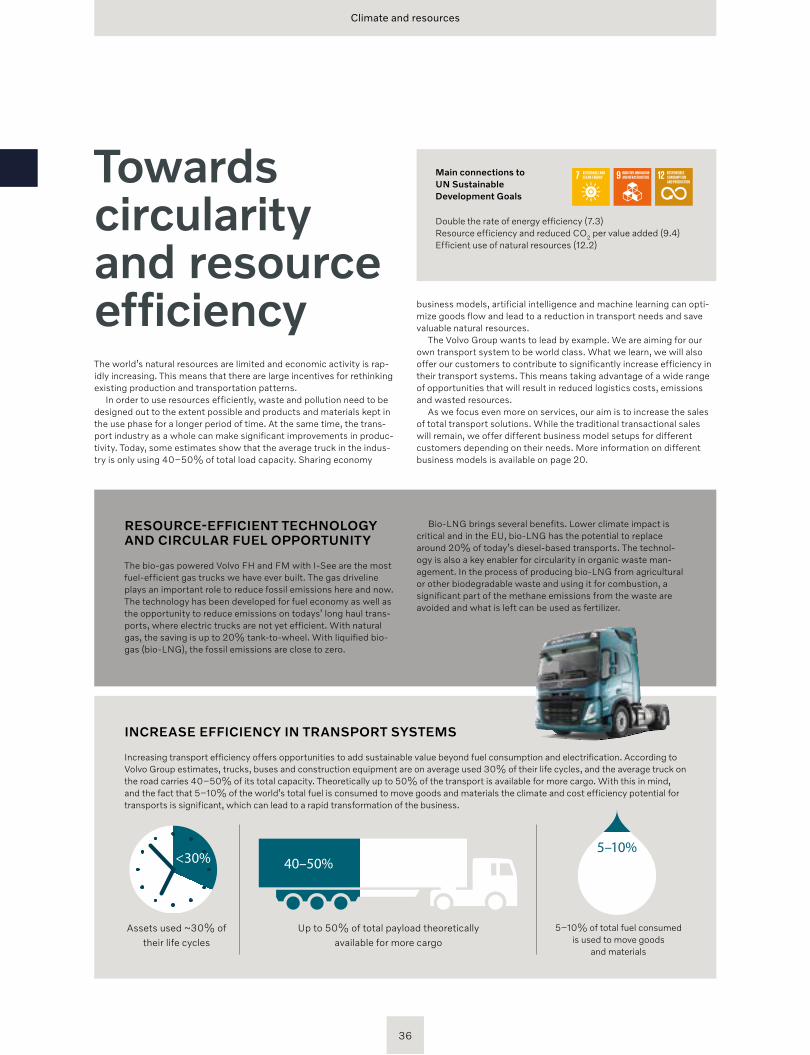
Climate and resources
The world’s natural resources are limited and economic activity is rap-idly increasing. This means that there are large incentives for rethinking existing production and transportation patterns.
In order to use resources efficiently, waste and pollution need to be designed out to the extent possible and products and materials kept in the use phase for a longer period of time. At the same time, the trans-port industry as a whole can make significant improvements in produc-tivity. Today, some estimates show that the average truck in the indus-try is only using 40–50% of total load capacity. Sharing economy
Towards circularity and resource efficiency
INCREASE EFFICIENCY IN TRANSPORT SYSTEMS
Increasing transport efficiency offers opportunities to add sustainable value beyond fuel consumption and electrification. According to Volvo Group estimates, trucks, buses and construction equipment are on average used 30% of their life cycles, and the average truck on the road carries 40–50% of its total capacity. Theoretically up to 50% of the transport is available for more cargo. With this in mind, and the fact that 5–10% of the world’s total fuel is consumed to move goods and materials the climate and cost efficiency potential for transports is significant, which can lead to a rapid transformation of the business.
Assets used ~30% of their life cycles
Up to 50% of total payload theoretically available for more cargo
5–10% of total fuel consumed is used to move goods
and materials
5–10%<30% 40–50%
5–10%<30% 40–50%
5–10%<30% 40–50%
RESOURCE-EFFICIENT TECHNOLOGY AND CIRCULAR FUEL OPPORTUNITY
The bio-gas powered Volvo FH and FM with I-See are the most fuel-efficient gas trucks we have ever built. The gas driveline plays an important role to reduce fossil emissions here and now. The technology has been developed for fuel economy as well as the opportunity to reduce emissions on todays’ long haul trans-ports, where electric trucks are not yet efficient. With natural gas, the saving is up to 20% tank-to-wheel. With liquified bio-gas (bio-LNG), the fossil emissions are close to zero.
Bio-LNG brings several benefits. Lower climate impact is critical and in the EU, bio-LNG has the potential to replace around 20% of today’s diesel-based transports. The technol-ogy is also a key enabler for circularity in organic waste man-agement. In the process of producing bio-LNG from agricultural or other biodegradable waste and using it for combustion, a significant part of the methane emissions from the waste are avoided and what is left can be used as fertilizer.
Double the rate of energy efficiency (7.3) Resource efficiency and reduced CO2 per value added (9.4) Efficient use of natural resources (12.2)
Main connections to UN Sustainable Development Goals
business models, artificial intelligence and machine learning can opti-mize goods flow and lead to a reduction in transport needs and save valuable natural resources.
The Volvo Group wants to lead by example. We are aiming for our own transport system to be world class. What we learn, we will also offer our customers to contribute to significantly increase efficiency in their transport systems. This means taking advantage of a wide range of opportunities that will result in reduced logistics costs, emissions and wasted resources.
As we focus even more on services, our aim is to increase the sales of total transport solutions. While the traditional transactional sales will remain, we offer different business model setups for different customers depending on their needs. More information on different business models is available on page 20.
36

Climate and resources
REMANUFACTURING RENAULT TRUCKS
The business case for circularity is developing rapidly to handle resource scarcity. Volvo Group has a strong position within refurbishment and remanufacturing of both components and vehicles. Renault Trucks has during the year scaled up its facility for remanu factured and refurbished trucks. In 2021, around 500 used trucks were converted in Renault Trucks’ used truck centers.
The centers focus on a range of business solutions to increase circularity by extending operating life. Vehicles used up to four years are regenerated and upgraded with hardware and soft-ware and returned to their owners for full capacity and operating beyond the one-million-kilometer mark.
Trucks used for a specific application or route are taken back and transformed for a new purpose. For example a long-haulage tractor is turned into a rigid, or a retrofitting of a traditional drive-line to a biofuel driveline.
Parts and components are remanufactured to the same or higher quality as a new. Renault Trucks mainly remanufactures engines, gearboxes, injectors and particle filters.
Read more on renault-trucks.com
VOLVO AND HOLCIM IN A PROJECT TO USE AUTONOMOUS ELECTRIC HAULERS
Volvo Autonomous Solutions and Holcim Switzerland have entered a collaboration to jointly test and further develop the use of autonomous electric haulers in a limestone quarry. The two companies are dedicated to seeking infrastructure and transport solutions that are safe, efficient, innovative and sustainable.
Holcim’s quarry Gabenchopf in Siggenthal has been chosen as the site for this project. The battery-electric haulers currently being tested mark a groundbreaking step in the industry: not only are they quieter and more sustainable than conventional haulers, they are also safer while being a part of a CE-certified electric, autonomous transport solution for the quarry and cement industries.
“This project showcases a sustainable transport solution that is commercially viable and combines the technology shifts of connectivity, automation and electrification,” says Nils Jaeger, President of Volvo Autonomous Solutions.
The testing and likely deployment of electric haulers in the quarry is part of Holcim’s digitization initiative “Plants of Tomor-row”. As part of the initiative, Holcim is testing automation tech-nologies, robotics and artificial intelligence throughout the entire production process in order to develop innovative solutions for a safer, more efficient and more sustainable cement production.
PROTOTYPE OF LONG-HAUL AUTONO-MOUS TRUCK FOR NORTH AMERICA
Volvo Autonomous Solutions and Aurora achieved the next mile-stone in their partnership to jointly develop on-highway autono-mous trucks in the U.S. In September, a prototype of Volvo Trucks’ flagship, long-haul VNL model, integrated with the Aurora Driver technology, was revealed, representing an important step towards launching fully autonomous heavy-duty trucks commer-cially in North America.
While the transformation to autonomous trucking will not happen overnight, Volvo Autonomous Solutions will continue to further increase the speed of development to support cus-tomers’ changing needs across many segments and markets and ultimately bring the benefits of autonomous transport solutions to the public with safer, more efficient and more sustainable commercial transport of goods across the U.S.
37
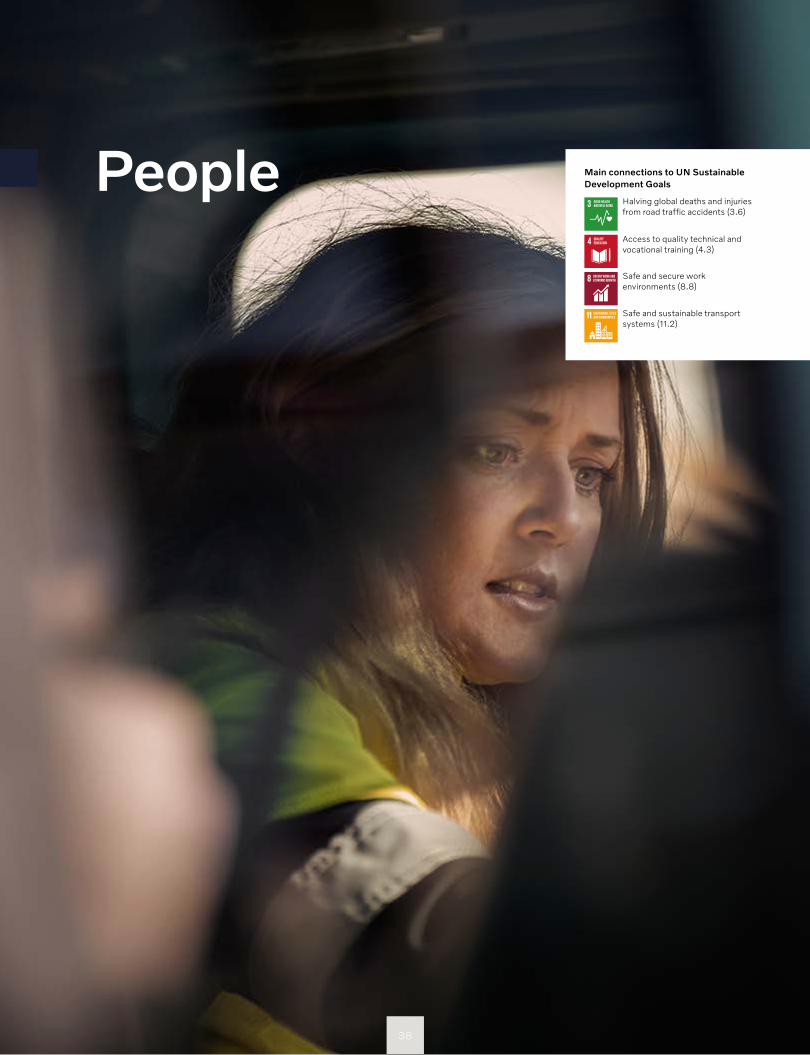
PeopleAccess to quality tech ni cal and vocational training (4.3)
Main connections to UN Sustainable Development Goals
Safe and sustainable transport systems (11.2)
Safe and secure work environments (8.8)
Halving global deaths and injuries from road traffic accidents (3.6)
38
People
Safety is a priority in every thing we do. We have a vision for zero accidents with Volvo Group products and in our workplaces.
Striving for safe roads and workplaces
Every year there are more than 1.3 million lives lost and 50 million people injured in road traffic accidents around the world. We work proactively to develop intelligent solutions that not only mitigate the consequences of accidents but strive to avoid them altogether. Our vision is zero fatalities, zero injuries and ultimately zero accidents.
According to the World Health Organization, the cost of road traffic accidents can be up to 3% of global GDP. Therefore, there is a strong focus on safety in the transport and infrastructure industry, as well as from governments around the world. Safety features for vehicles and machine are key, but our work also includes a range of engagements with customers and regulatory bodies, as well as road traffic safety and driver training. Visit volvogroup.com/safety for more information.
With safety, as well as with the environment, we believe in taking a full value chain approach. We work to improve health and safety in our own operations, and we set high standards for our partners in the supply chain. Collaboration, being innovative, life-long learning, challenging the status quo and being curious drive engagement and improvement work. We strive to increase safety in our operations and have targeted to reduce the accident rate on an aggregated level by at least 50% by 2030, compared to 2019.
Safety mindset is also the foundation for health, non-discrimi-nation and other human rights aspects. For more information, see the Sustainability Notes on page 152–179.
SAFETY IN OPERATIONS
We work to improve health and safety in our own operations, and we set high standards for our partners in the supply chain.
SAFETY FOR OUR CUSTOMERS
Our vision is zero accidents with Volvo Group prod-ucts, and the offering of world-leading products and solutions for sustainable transports is an im-portant part of getting closer to this vision. The approach is to look at the traffic system and see where we can contribute. In this work, we consider the views of drivers and operators, commuters, as well as other traffic system users like cyclists and pedestrians.
39
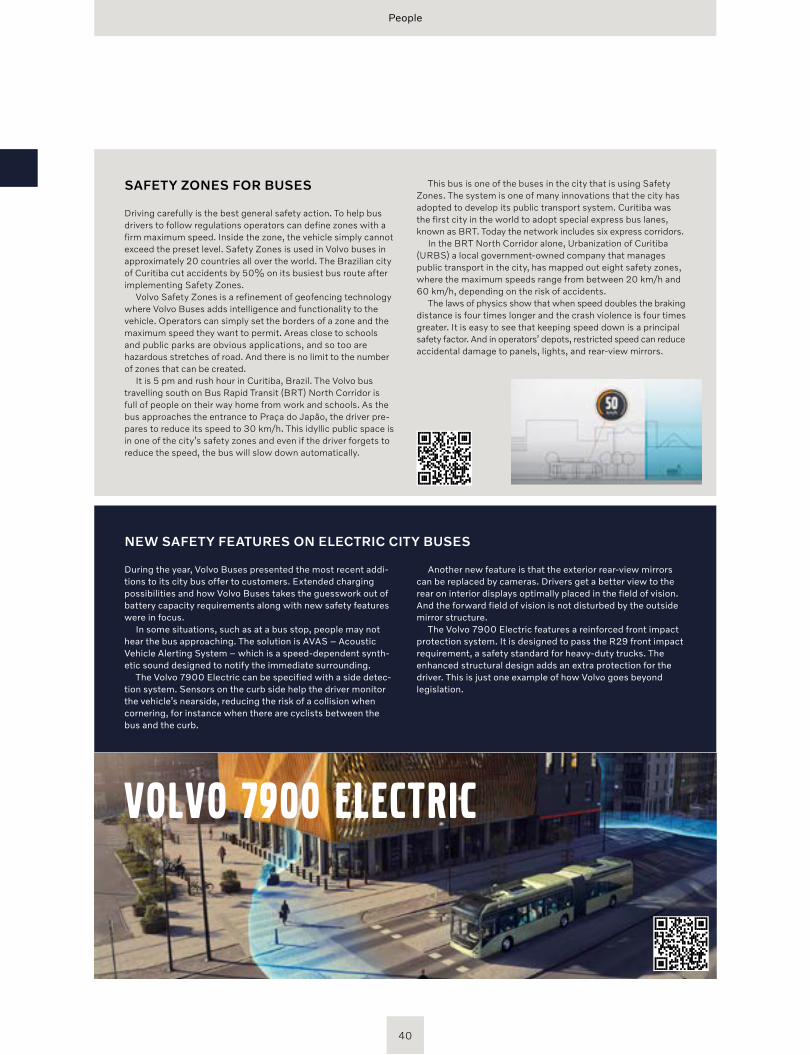
People
SAFETY ZONES FOR BUSES
Driving carefully is the best general safety action. To help bus drivers to follow regulations operators can define zones with a firm maximum speed. Inside the zone, the vehicle simply cannot exceed the preset level. Safety Zones is used in Volvo buses in approximately 20 countries all over the world. The Brazilian city of Curitiba cut accidents by 50% on its busiest bus route after implementing Safety Zones.
Volvo Safety Zones is a refinement of geofencing technology where Volvo Buses adds intelligence and functionality to the vehicle. Operators can simply set the borders of a zone and the maximum speed they want to permit. Areas close to schools and public parks are obvious applications, and so too are hazard ous stretches of road. And there is no limit to the number of zones that can be created.
It is 5 pm and rush hour in Curitiba, Brazil. The Volvo bus travelling south on Bus Rapid Transit (BRT) North Corridor is full of people on their way home from work and schools. As the bus approaches the entrance to Praça do Japão, the driver pre-pares to reduce its speed to 30 km/h. This idyllic public space is in one of the city’s safety zones and even if the driver forgets to reduce the speed, the bus will slow down automatically.
This bus is one of the buses in the city that is using Safety Zones. The system is one of many innovations that the city has adopted to develop its public transport system. Curitiba was the first city in the world to adopt special express bus lanes, known as BRT. Today the network includes six express corridors.
In the BRT North Corridor alone, Urbanization of Curitiba (URBS) a local government-owned company that manages public transport in the city, has mapped out eight safety zones, where the maximum speeds range from between 20 km/h and 60 km/h, depending on the risk of accidents.
The laws of physics show that when speed doubles the braking distance is four times longer and the crash violence is four times greater. It is easy to see that keeping speed down is a principal safety factor. And in operators’ depots, restricted speed can reduce accidental damage to panels, lights, and rear- view mirrors.
NEW SAFETY FEATURES ON ELECTRIC CITY BUSES
During the year, Volvo Buses presented the most recent addi-tions to its city bus offer to customers. Extended charging possibilities and how Volvo Buses takes the guesswork out of battery capacity requirements along with new safety features were in focus.
In some situations, such as at a bus stop, people may not hear the bus approaching. The solution is AVAS – Acoustic Vehicle Alerting System – which is a speed-dependent synth-etic sound designed to notify the immediate surrounding.
The Volvo 7900 Electric can be specified with a side detec-tion system. Sensors on the curb side help the driver monitor the vehicle’s nearside, reducing the risk of a collision when cornering, for instance when there are cyclists between the bus and the curb.
Another new feature is that the exterior rear-view mirrors can be replaced by cameras. Drivers get a better view to the rear on interior displays optimally placed in the field of vision. And the forward field of vision is not disturbed by the outside mirror structure.
The Volvo 7900 Electric features a reinforced front impact protection system. It is designed to pass the R29 front impact requirement, a safety standard for heavy-duty trucks. The enhanced structural design adds an extra protection for the driver. This is just one example of how Volvo goes beyond legislation.
VOLVO 7900 ELECTRIC
40
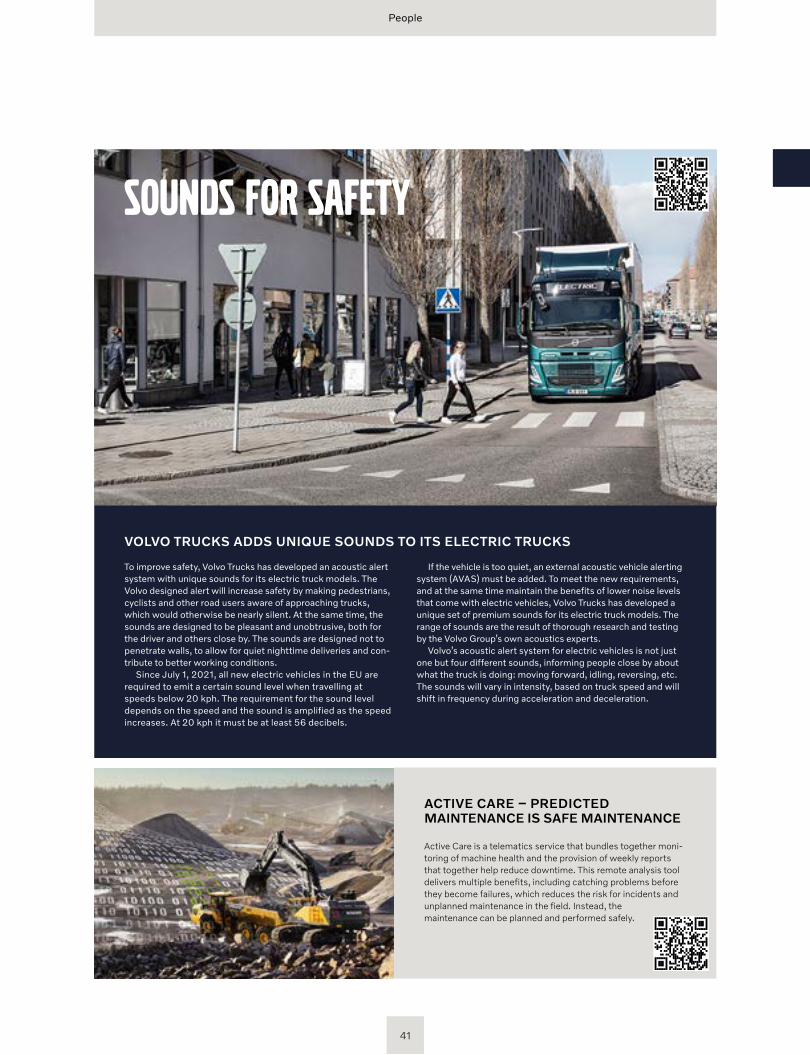
People
ACTIVE CARE – PREDICTED MAINTENANCE IS SAFE MAINTENANCE
Active Care is a telematics service that bundles together moni-toring of machine health and the provision of weekly reports that together help reduce downtime. This remote analysis tool delivers multiple benefits, including catching problems before they become failures, which reduces the risk for incidents and unplanned maintenance in the field. Instead, the maintenance can be planned and performed safely.
VOLVO TRUCKS ADDS UNIQUE SOUNDS TO ITS ELECTRIC TRUCKS
To improve safety, Volvo Trucks has developed an acoustic alert system with unique sounds for its electric truck models. The Volvo designed alert will increase safety by making pedestrians, cyclists and other road users aware of approaching trucks, which would otherwise be nearly silent. At the same time, the sounds are designed to be pleasant and unobtrusive, both for the driver and others close by. The sounds are designed not to penetrate walls, to allow for quiet nighttime deliveries and con-tribute to better working conditions.
Since July 1, 2021, all new electric vehicles in the EU are required to emit a certain sound level when travelling at speeds below 20 kph. The requirement for the sound level depends on the speed and the sound is amplified as the speed increases. At 20 kph it must be at least 56 decibels.
If the vehicle is too quiet, an external acoustic vehicle alerting system (AVAS) must be added. To meet the new requirements, and at the same time maintain the benefits of lower noise levels that come with electric vehicles, Volvo Trucks has developed a unique set of premium sounds for its electric truck models. The range of sounds are the result of thorough research and testing by the Volvo Group’s own acoustics experts.
Volvo’s acoustic alert system for electric vehicles is not just one but four different sounds, informing people close by about what the truck is doing: moving forward, idling, reversing, etc. The sounds will vary in intensity, based on truck speed and will shift in frequency during acceleration and deceleration.
SOUNDS FOR SAFETY
41
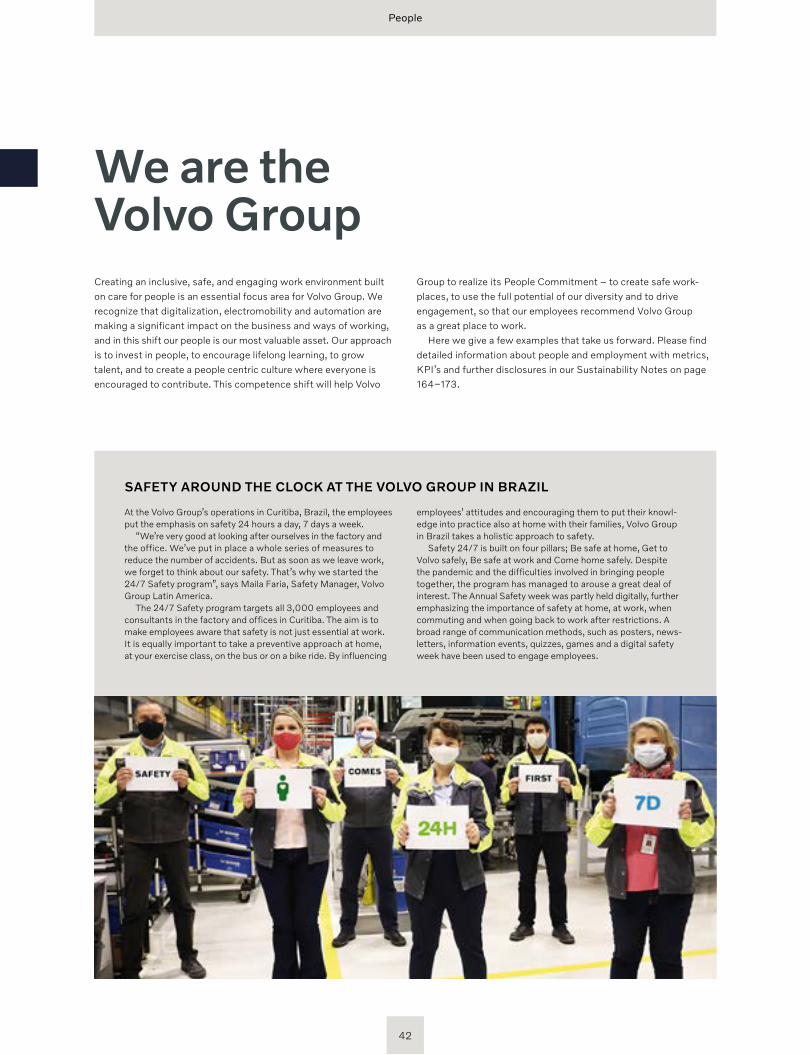
People
We are the Volvo GroupCreating an inclusive, safe, and engaging work environment built on care for people is an essential focus area for Volvo Group. We recognize that digitalization, electromobility and automation are making a significant impact on the business and ways of working, and in this shift our people is our most valuable asset. Our approach is to invest in people, to encourage lifelong learning, to grow talent, and to create a people centric culture where everyone is encouraged to contribute. This competence shift will help Volvo
SAFETY AROUND THE CLOCK AT THE VOLVO GROUP IN BRAZIL
At the Volvo Group’s operations in Curitiba, Brazil, the employees put the emphasis on safety 24 hours a day, 7 days a week.
“We’re very good at looking after ourselves in the factory and the office. We’ve put in place a whole series of measures to reduce the number of accidents. But as soon as we leave work, we forget to think about our safety. That’s why we started the 24/7 Safety program” , says Maila Faria, Safety Manager, Volvo Group Latin America.
The 24/7 Safety program targets all 3,000 employees and consultants in the factory and offices in Curitiba. The aim is to make employees aware that safety is not just essential at work. It is equally important to take a preventive approach at home, at your exercise class, on the bus or on a bike ride. By influencing
employees’ attitudes and encouraging them to put their knowl-edge into practice also at home with their families, Volvo Group in Brazil takes a holistic approach to safety.
Safety 24/7 is built on four pillars; Be safe at home, Get to Volvo safely, Be safe at work and Come home safely. Despite the pandemic and the difficulties involved in bringing people together, the program has managed to arouse a great deal of interest. The Annual Safety week was partly held digitally, further emphasizing the importance of safety at home, at work, when commuting and when going back to work after restrictions. A broad range of communication methods, such as posters, news-letters, information events, quizzes, games and a digital safety week have been used to engage employees.
Group to realize its People Commitment – to create safe work-places, to use the full potential of our diversity and to drive engagement, so that our employees recommend Volvo Group as a great place to work.
Here we give a few examples that take us forward. Please find detailed information about people and employment with metrics, KPI’s and further disclosures in our Sustainability Notes on page 164–173.
42
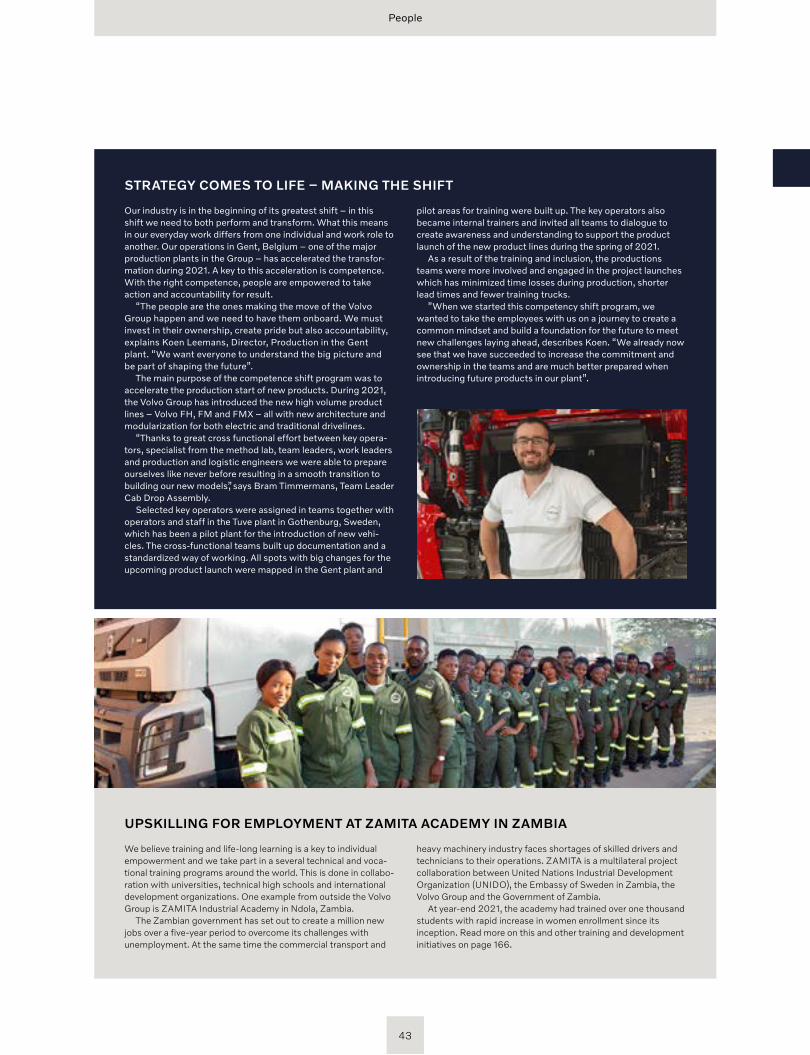
People
UPSKILLING FOR EMPLOYMENT AT ZAMITA ACADEMY IN ZAMBIA
We believe training and life-long learning is a key to individual empowerment and we take part in a several technical and voca-tional training programs around the world. This is done in collabo-ration with universities, technical high schools and international development organizations. One example from outside the Volvo Group is ZAMITA Industrial Academy in Ndola, Zambia.
The Zambian government has set out to create a million new jobs over a five-year period to overcome its challenges with unemployment. At the same time the commercial transport and
heavy machinery industry faces shortages of skilled drivers and technicians to their operations. ZAMITA is a multilateral project collaboration between United Nations Industrial Development Organization (UNIDO), the Embassy of Sweden in Zambia, the Volvo Group and the Government of Zambia.
At year-end 2021, the academy had trained over one thousand students with rapid increase in women enrollment since its inception. Read more on this and other training and development initiatives on page 166.
STRATEGY COMES TO LIFE – MAKING THE SHIFT
Our industry is in the beginning of its greatest shift – in this shift we need to both perform and transform. What this means in our everyday work differs from one individual and work role to another. Our operations in Gent, Belgium – one of the major production plants in the Group – has accelerated the transfor-mation during 2021. A key to this acceleration is competence. With the right competence, people are empowered to take action and accountability for result.
“The people are the ones making the move of the Volvo Group happen and we need to have them onboard. We must invest in their ownership, create pride but also accountability, explains Koen Leemans, Director, Production in the Gent plant. “We want everyone to understand the big picture and be part of shaping the future”.
The main purpose of the competence shift program was to accelerate the production start of new products. During 2021, the Volvo Group has introduced the new high volume product lines – Volvo FH, FM and FMX – all with new architecture and modularization for both electric and traditional drivelines.
“Thanks to great cross functional effort between key opera-tors, specialist from the method lab, team leaders, work leaders and production and logistic engineers we were able to prepare ourselves like never before resulting in a smooth transition to building our new models”, says Bram Timmermans, Team Leader Cab Drop Assembly.
Selected key operators were assigned in teams together with operators and staff in the Tuve plant in Gothenburg, Sweden, which has been a pilot plant for the introduction of new vehi-cles. The cross-functional teams built up documentation and a standardized way of working. All spots with big changes for the upcoming product launch were mapped in the Gent plant and
pilot areas for training were built up. The key operators also became internal trainers and invited all teams to dialogue to create awareness and understanding to support the product launch of the new product lines during the spring of 2021.
As a result of the training and inclusion, the productions teams were more involved and engaged in the project launches which has minimized time losses during production, shorter lead times and fewer training trucks.
”When we started this competency shift program, we wanted to take the employees with us on a journey to create a common mindset and build a foundation for the future to meet new challenges laying ahead, describes Koen. “We already now see that we have succeeded to increase the commitment and ownership in the teams and are much better prepared when introducing future products in our plant”.
43
Board of Directors’ Report 2021
Ownership and legal form
AB Volvo (publ) with corporate identity no 556012-5790 is a limited company and its shares are listed on Nasdaq Stockholm, Sweden. AB Volvo is the parent company of the Volvo Group and is headquartered in Goth-enburg, Sweden. The ultimate parent of the Group is AB Volvo with registered office at SE-405 08 Gothenburg, Sweden.
Business activities
The Volvo Group drives pros-perity through transport and infrastructure solutions, offer-ing trucks, buses, construction equipment, power solutions for marine and industrial applica-tions, financing and services that increase our customers’ uptime and productivity. Founded in 1927, the Volvo Group is committed to shaping the future landscape of sustain-able transport and infrastructure solutions. The Volvo Group has production facilities in 19 coun-tries and sell its products in more than 190 markets. A sig-nificant part of the Group’s operations is in Sweden. Other significant operations are found in the US, Brazil, India, France and China.
Statutory sustainability report
The Volvo Group has prepared a sustain ability report in accord-ance with the Global Reporting Initiative’s guidelines (GRI Standards) and the non-financial disclosure requirements in the Swedish Annual Accounts Act. The Volvo Group’s sustain ability report consists of the Sustain-ability Notes on pages 152–179 together with all other relevant sustainability disclosures in this Annual and Sustainability Report, see:
Strategy and business model, pages 10–43
Policies, assessments and results, pages 154–179
Material risks and mitiga-tion, pages 70–75 and 154–179
Key performance indicators, pages 154–179. Taxonomy regulation disclosures, page 162.
Events after the balance sheet date
The Russia/Ukraine conflict might negatively impact the development of the Volvo Group’s financial results and financial position. It is however currently not possible to assess its consequences for the Volvo Group.
44
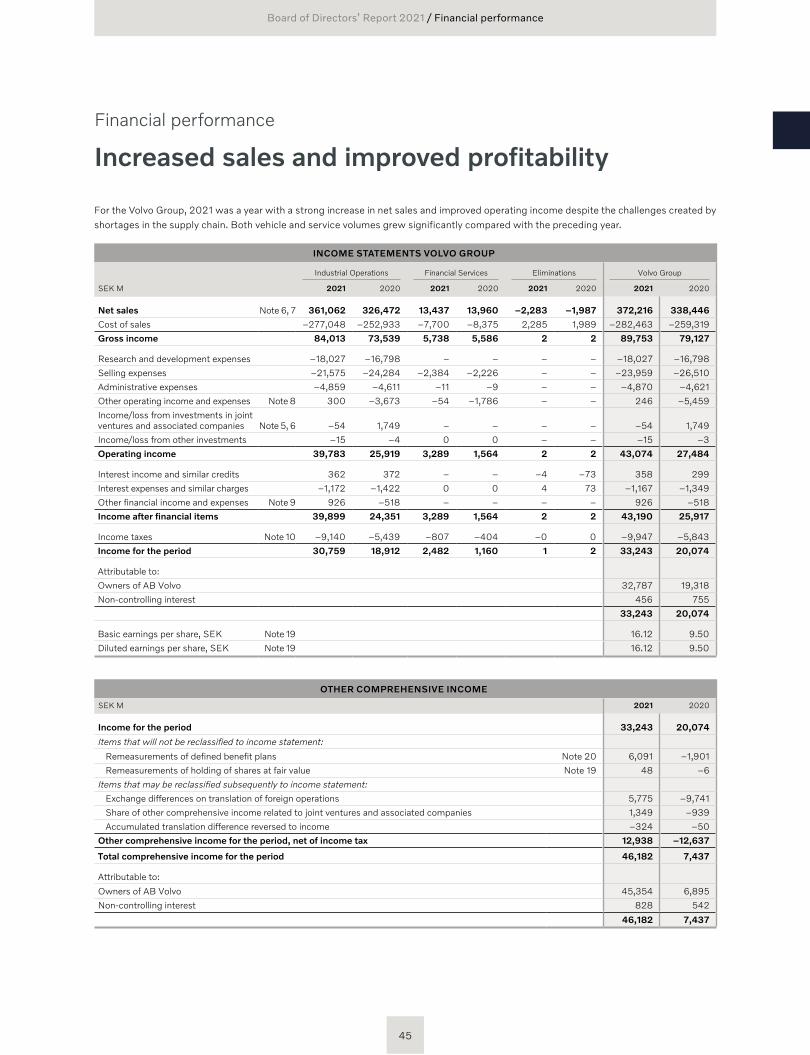
INCOME STATEMENTS VOLVO GROUP
Industrial Operations Financial Services Eliminations Volvo Group
SEK M 2021 2020 2021 2020 2021 2020 2021 2020
Net sales Note 6, 7 361,062 326,472 13,437 13,960 –2,283 –1,987 372,216 338,446
Cost of sales –277,048 –252,933 –7,700 –8,375 2,285 1,989 –282,463 –259,319
Gross income 84,013 73,539 5,738 5,586 2 2 89,753 79,127
Research and development expenses –18,027 –16,798 – – – – –18,027 –16,798
Selling expenses –21,575 –24,284 –2,384 –2,226 – – –23,959 –26,510
Administrative expenses –4,859 –4,611 –11 –9 – – –4,870 –4,621
Other operating income and expenses Note 8 300 –3,673 –54 –1,786 – – 246 –5,459
Income/loss from investments in joint ventures and associated companies Note 5, 6 –54 1,749 – – – – –54 1,749
Income/loss from other investments –15 –4 0 0 – – –15 –3
Operating income 39,783 25,919 3,289 1,564 2 2 43,074 27,484
Interest income and similar credits 362 372 – – –4 –73 358 299
Interest expenses and similar charges –1,172 –1,422 0 0 4 73 –1,167 –1,349
Other financial income and expenses Note 9 926 –518 – – – – 926 –518
Income after financial items 39,899 24,351 3,289 1,564 2 2 43,190 25,917
Income taxes Note 10 –9,140 –5,439 –807 –404 –0 0 –9,947 –5,843
Income for the period 30,759 18,912 2,482 1,160 1 2 33,243 20,074
Attributable to:
Owners of AB Volvo 32,787 19,318
Non-controlling interest 456 755
33,243 20,074
Basic earnings per share, SEK Note 19 16.12 9.50
Diluted earnings per share, SEK Note 19 16.12 9.50
OTHER COMPREHENSIVE INCOME
SEK M 2021 2020
Income for the period 33,243 20,074
Items that will not be reclassified to income statement:
Remeasurements of defined benefit plans Note 20 6,091 –1,901
Remeasurements of holding of shares at fair value Note 19 48 –6
Items that may be reclassified subsequently to income statement:
Exchange differences on translation of foreign operations 5,775 –9,741
Share of other comprehensive income related to joint ventures and associated companies 1,349 –939
Accumulated translation difference reversed to income –324 –50
Other comprehensive income for the period, net of income tax 12,938 –12,637
Total comprehensive income for the period 46,182 7,437
Attributable to:
Owners of AB Volvo 45,354 6,895
Non-controlling interest 828 542
46,182 7,437
For the Volvo Group, 2021 was a year with a strong increase in net sales and improved operating income despite the challenges created by shortages in the supply chain. Both vehicle and service volumes grew significantly compared with the preceding year.
Increased sales and improved profitability
Financial performance
Board of Directors’ Report 2021 / Financial performance
45
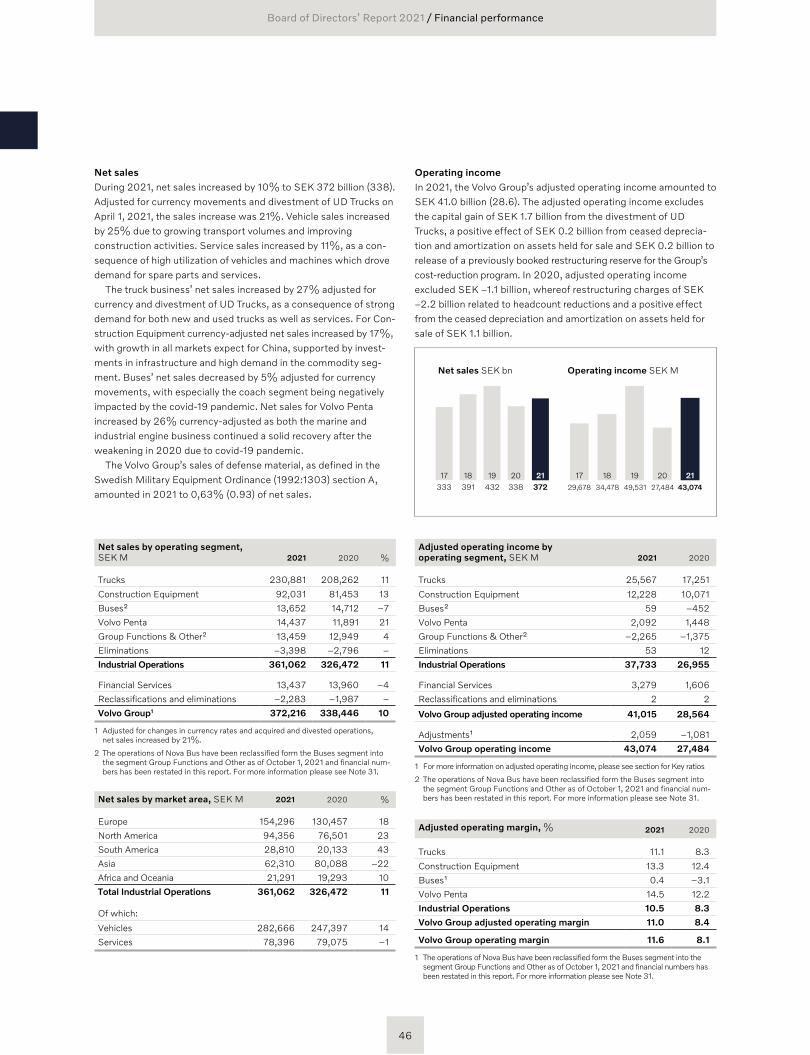
Net sales During 2021, net sales increased by 10% to SEK 372 billion (338). Adjusted for currency movements and divestment of UD Trucks on April 1, 2021, the sales increase was 21%. Vehicle sales increased by 25% due to growing transport volumes and improving construction activities. Service sales increased by 11%, as a con-sequence of high utilization of vehicles and machines which drove demand for spare parts and services.
The truck business’ net sales increased by 27% adjusted for currency and divestment of UD Trucks, as a consequence of strong demand for both new and used trucks as well as services. For Con-struction Equipment currency-adjusted net sales increased by 17%, with growth in all markets expect for China, supported by invest-ments in infrastructure and high demand in the commodity seg-ment. Buses’ net sales decreased by 5% adjusted for currency movements, with especially the coach segment being negatively impacted by the covid-19 pandemic. Net sales for Volvo Penta increased by 26% currency-adjusted as both the marine and industrial engine business continued a solid recovery after the weakening in 2020 due to covid-19 pandemic.
The Volvo Group’s sales of defense material, as defined in the Swedish Military Equipment Ordinance (1992:1303) section A, amounted in 2021 to 0,63% (0.93) of net sales.
Operating income In 2021, the Volvo Group’s adjusted operating income amounted to SEK 41.0 billion (28.6). The adjusted operating income excludes the capital gain of SEK 1.7 billion from the divestment of UD Trucks, a positive effect of SEK 0.2 billion from ceased deprecia-tion and amortization on assets held for sale and SEK 0.2 billion to release of a previously booked restructuring reserve for the Group’s cost-reduction program. In 2020, adjusted operating income excluded SEK –1.1 billion, whereof restructuring charges of SEK –2.2 billion related to headcount reductions and a positive effect from the ceased depreciation and amortization on assets held for sale of SEK 1.1 billion.
Net sales by operating segment, SEK M 2021 2020 %
Trucks 230,881 208,262 11
Construction Equipment 92,031 81,453 13
Buses² 13,652 14,712 –7
Volvo Penta 14,437 11,891 21
Group Functions & Other² 13,459 12,949 4
Eliminations –3,398 –2,796 –
Industrial Operations 361,062 326,472 11
Financial Services 13,437 13,960 –4
Reclassifications and eliminations –2,283 –1,987 –
Volvo Group1 372,216 338,446 10
1 Adjusted for changes in currency rates and acquired and divested operations, net sales increased by 21%.
2 The operations of Nova Bus have been reclassified form the Buses segment into the segment Group Functions and Other as of October 1, 2021 and financial num-bers has been restated in this report. For more information please see Note 31.
Net sales by market area, SEK M 2021 2020 %
Europe 154,296 130,457 18
North America 94,356 76,501 23
South America 28,810 20,133 43
Asia 62,310 80,088 –22
Africa and Oceania 21,291 19,293 10
Total Industrial Operations 361,062 326,472 11
Of which:
Vehicles 282,666 247,397 14
Services 78,396 79,075 –1
Adjusted operating income by operating segment, SEK M 2021 2020
Trucks 25,567 17,251
Construction Equipment 12,228 10,071
Buses² 59 –452
Volvo Penta 2,092 1,448
Group Functions & Other² –2,265 –1,375
Eliminations 53 12
Industrial Operations 37,733 26,955
Financial Services 3,279 1,606
Reclassifications and eliminations 2 2
Volvo Group adjusted operating income 41,015 28,564
Adjustments¹ 2,059 –1,081
Volvo Group operating income 43,074 27,484
1 For more information on adjusted operating income, please see section for Key ratios
2 The operations of Nova Bus have been reclassified form the Buses segment into the segment Group Functions and Other as of October 1, 2021 and financial num-bers has been restated in this report. For more information please see Note 31.
Adjusted operating margin, % 2021 2020
Trucks 11.1 8.3
Construction Equipment 13.3 12.4
Buses¹ 0.4 –3.1
Volvo Penta 14.5 12.2
Industrial Operations 10.5 8.3
Volvo Group adjusted operating margin 11.0 8.4
Volvo Group operating margin 11.6 8.1
1 The operations of Nova Bus have been reclassified form the Buses segment into the segment Group Functions and Other as of October 1, 2021 and financial numbers has been restated in this report. For more information please see Note 31.
17 18 19 2120333 391 432 372338
Net sales SEK bn
17 18 19 20 2129,678 34,478 49,531 27,484 43,074
Operating income SEK M
46
Board of Directors’ Report 2021 / Financial performance
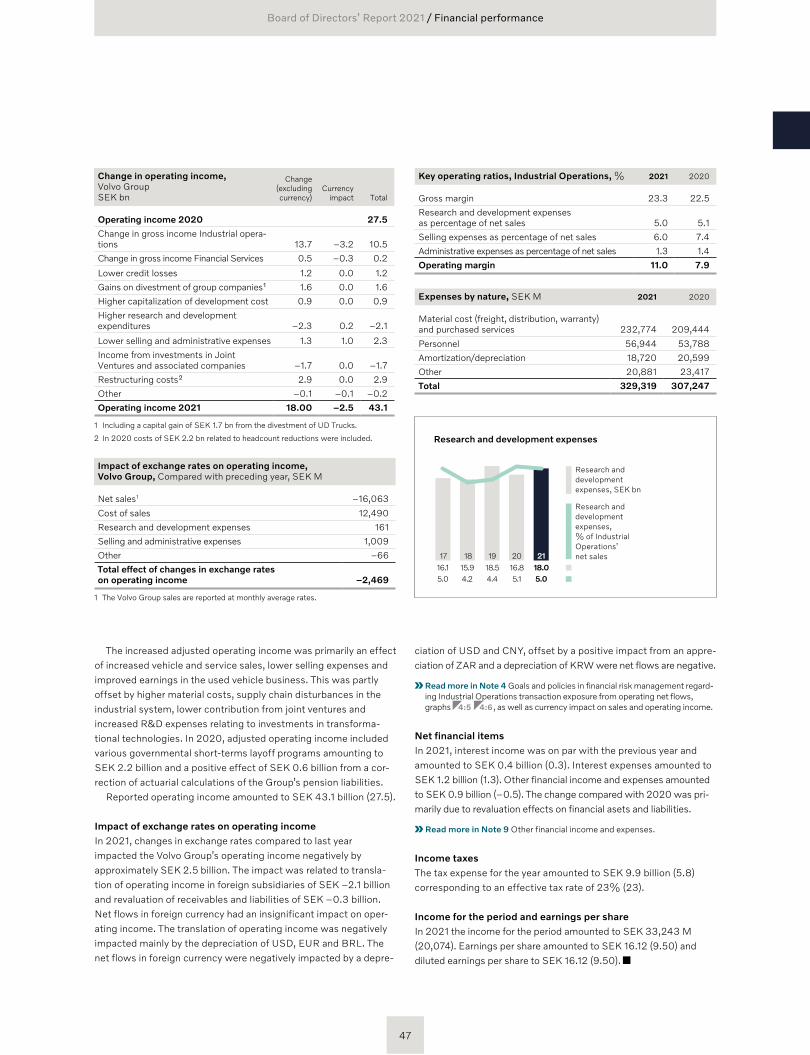
The increased adjusted operating income was primarily an effect of increased vehicle and service sales, lower selling expenses and improved earnings in the used vehicle business. This was partly offset by higher material costs, supply chain disturbances in the industrial system, lower contribution from joint ventures and increased R&D expenses relating to investments in transforma-tional technologies. In 2020, adjusted operating income included various governmental short-terms layoff programs amounting to SEK 2.2 billion and a positive effect of SEK 0.6 billion from a cor-rection of actuarial calculations of the Group’s pension liabilities.
Reported operating income amounted to SEK 43.1 billion (27.5).
Impact of exchange rates on operating incomeIn 2021, changes in exchange rates compared to last year impacted the Volvo Group’s operating income negatively by approximately SEK 2.5 billion. The impact was related to transla-tion of operating income in foreign subsidiaries of SEK –2.1 billion and revaluation of receivables and liabilities of SEK –0.3 billion. Net flows in foreign currency had an insignificant impact on oper-ating income. The translation of operating income was negatively impacted mainly by the depreciation of USD, EUR and BRL. The net flows in foreign currency were negatively impacted by a depre-
ciation of USD and CNY, offset by a positive impact from an appre-ciation of ZAR and a depreciation of KRW were net flows are negative.
Read more in Note 4 Goals and policies in financial risk management regard-ing Industrial Operations transaction exposure from operating net flows, graphs 4:5 4:6 , as well as currency impact on sales and operating income.
Net financial items In 2021, interest income was on par with the previous year and amounted to SEK 0.4 billion (0.3). Interest expenses amounted to SEK 1.2 billion (1.3). Other financial income and expenses amounted to SEK 0.9 billion (–0.5). The change compared with 2020 was pri-marily due to revaluation effects on financial asets and liabilities.
Read more in Note 9 Other financial income and expenses.
Income taxes The tax expense for the year amounted to SEK 9.9 billion (5.8) corresponding to an effective tax rate of 23% (23).
Income for the period and earnings per share In 2021 the income for the period amounted to SEK 33,243 M (20,074). Earnings per share amounted to SEK 16.12 (9.50) and diluted earnings per share to SEK 16.12 (9.50).
Key operating ratios, Industrial Operations, % 2021 2020
Gross margin 23.3 22.5
Research and development expenses as percentage of net sales 5.0 5.1
Selling expenses as percentage of net sales 6.0 7.4
Administrative expenses as percentage of net sales 1.3 1.4
Operating margin 11.0 7.9
Expenses by nature, SEK M 2021 2020
Material cost (freight, distribution, warranty) and purchased services 232,774 209,444
Personnel 56,944 53,788
Amortization/depreciation 18,720 20,599
Other 20,881 23,417
Total 329,319 307,247
Change in operating income, Volvo GroupSEK bn
Change (excluding currency)
Currency impact Total
Operating income 2020 27.5
Change in gross income Industrial opera-tions 13.7 –3.2 10.5
Change in gross income Financial Services 0.5 –0.3 0.2
Lower credit losses 1.2 0.0 1.2
Gains on divestment of group companies¹ 1.6 0.0 1.6
Higher capitalization of development cost 0.9 0.0 0.9
Higher research and development expenditures –2.3 0.2 –2.1
Lower selling and administrative expenses 1.3 1.0 2.3
Income from investments in Joint Ventures and associated companies –1.7 0.0 –1.7
Restructuring costs² 2.9 0.0 2.9
Other –0.1 –0.1 –0.2
Operating income 2021 18.00 –2.5 43.1
1 Including a capital gain of SEK 1.7 bn from the divestment of UD Trucks.
2 In 2020 costs of SEK 2.2 bn related to headcount reductions were included.
Impact of exchange rates on operating income, Volvo Group, Compared with preceding year, SEK M
Net sales1 –16,063
Cost of sales 12,490
Research and development expenses 161
Selling and administrative expenses 1,009
Other –66
Total effect of changes in exchange rates on operating income –2,469
1 The Volvo Group sales are reported at monthly average rates.
Research and development expenses
191817 20 2115.94.2
18.54.4
16.15.0
Research and development expenses, SEK bn
Research and development expenses, % of Industrial Operations’ net sales
16.85.1
18.05.0
47
Board of Directors’ Report 2021 / Financial performance
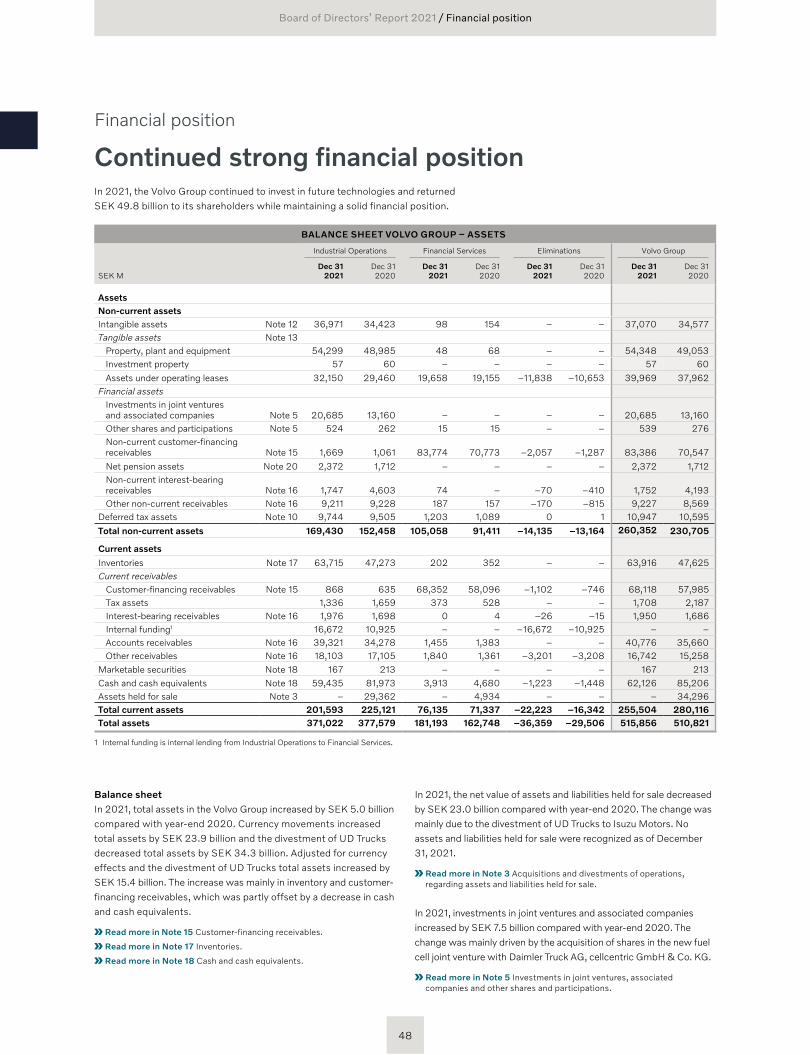
Balance sheetIn 2021, total assets in the Volvo Group increased by SEK 5.0 billion compared with year-end 2020. Currency movements increased total assets by SEK 23.9 billion and the divestment of UD Trucks decreased total assets by SEK 34.3 billion. Adjusted for currency effects and the divestment of UD Trucks total assets increased by SEK 15.4 billion. The increase was mainly in inventory and customer- financing receivables, which was partly offset by a decrease in cash and cash equivalents.
Read more in Note 15 Customer-financing receivables.
Read more in Note 17 Inventories.
Read more in Note 18 Cash and cash equivalents.
Financial position
Continued strong financial position
BALANCE SHEET VOLVO GROUP – ASSETS
Industrial Operations Financial Services Eliminations Volvo Group
SEK MDec 31
2021Dec 312020
Dec 312021
Dec 312020
Dec 312021
Dec 312020
Dec 312021
Dec 312020
AssetsNon-current assetsIntangible assets Note 12 36,971 34,423 98 154 – – 37,070 34,577Tangible assets Note 13
Property, plant and equipment 54,299 48,985 48 68 – – 54,348 49,053Investment property 57 60 – – – – 57 60Assets under operating leases 32,150 29,460 19,658 19,155 –11,838 –10,653 39,969 37,962
Financial assetsInvestments in joint ventures and associated companies Note 5 20,685 13,160 – – – – 20,685 13,160Other shares and participations Note 5 524 262 15 15 – – 539 276Non-current customer-financing receivables Note 15 1,669 1,061 83,774 70,773 –2,057 –1,287 83,386 70,547Net pension assets Note 20 2,372 1,712 – – – – 2,372 1,712Non-current interest-bearing receivables Note 16 1,747 4,603 74 – –70 –410 1,752 4,193Other non-current receivables Note 16 9,211 9,228 187 157 –170 –815 9,227 8,569
Deferred tax assets Note 10 9,744 9,505 1,203 1,089 0 1 10,947 10,595
Total non-current assets 169,430 152,458 105,058 91,411 –14,135 –13,164 260,352 230,705
Current assets
Inventories Note 17 63,715 47,273 202 352 – – 63,916 47,625Current receivables
Customer-financing receivables Note 15 868 635 68,352 58,096 –1,102 –746 68,118 57,985Tax assets 1,336 1,659 373 528 – – 1,708 2,187Interest-bearing receivables Note 16 1,976 1,698 0 4 –26 –15 1,950 1,686Internal funding1 16,672 10,925 – – –16,672 –10,925 – –Accounts receivables Note 16 39,321 34,278 1,455 1,383 – – 40,776 35,660Other receivables Note 16 18,103 17,105 1,840 1,361 –3,201 –3,208 16,742 15,258
Marketable securities Note 18 167 213 – – – – 167 213Cash and cash equivalents Note 18 59,435 81,973 3,913 4,680 –1,223 –1,448 62,126 85,206Assets held for sale Note 3 – 29,362 – 4,934 – – – 34,296Total current assets 201,593 225,121 76,135 71,337 –22,223 –16,342 255,504 280,116Total assets 371,022 377,579 181,193 162,748 –36,359 –29,506 515,856 510,821
1 Internal funding is internal lending from Industrial Operations to Financial Services.
In 2021, the net value of assets and liabilities held for sale decreased by SEK 23.0 billion compared with year-end 2020. The change was mainly due to the divestment of UD Trucks to Isuzu Motors. No assets and liabilities held for sale were recognized as of December 31, 2021.
Read more in Note 3 Acquisitions and divestments of operations, regarding assets and liabilities held for sale.
In 2021, investments in joint ventures and associated companies increased by SEK 7.5 billion compared with year-end 2020. The change was mainly driven by the acquisition of shares in the new fuel cell joint venture with Daimler Truck AG, cellcentric GmbH & Co. KG.
Read more in Note 5 Investments in joint ventures, associated companies and other shares and participations.
In 2021, the Volvo Group continued to invest in future technologies and returned SEK 49.8 billion to its shareholders while maintaining a solid financial position.
48
Board of Directors’ Report 2021 / Financial position
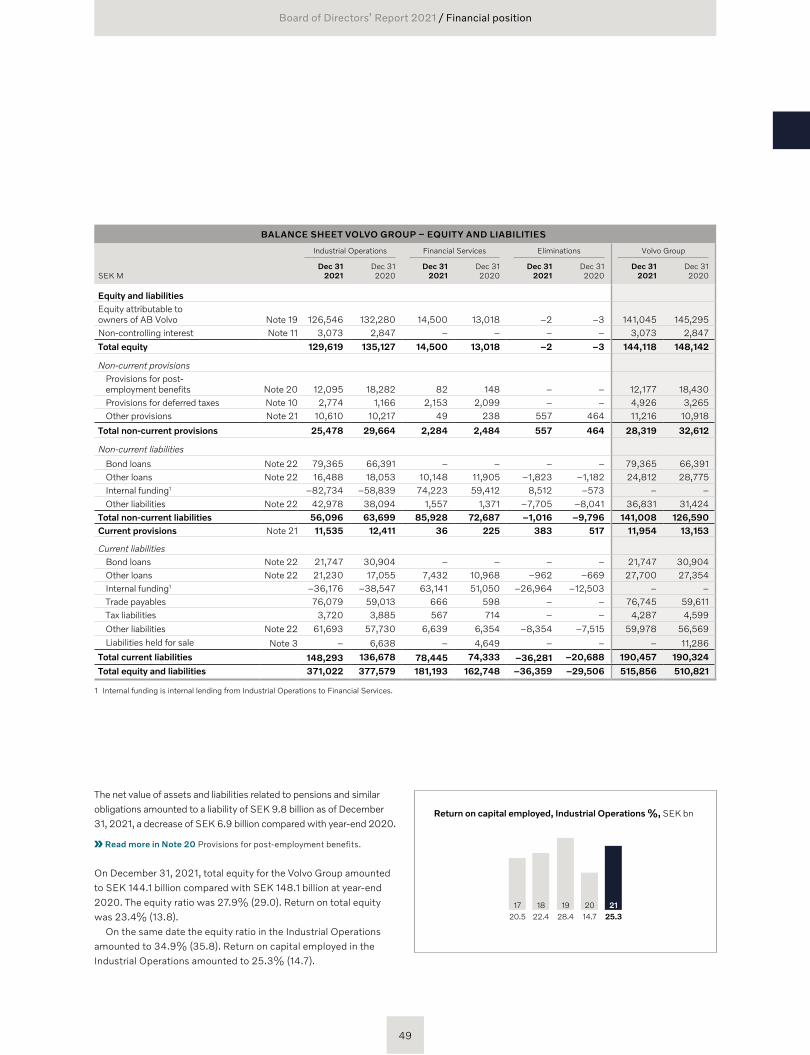
BALANCE SHEET VOLVO GROUP – EQUITY AND LIABILITIES
Industrial Operations Financial Services Eliminations Volvo Group
SEK MDec 31
2021Dec 312020
Dec 312021
Dec 312020
Dec 312021
Dec 312020
Dec 312021
Dec 312020
Equity and liabilitiesEquity attributable to owners of AB Volvo Note 19 126,546 132,280 14,500 13,018 –2 –3 141,045 145,295Non-controlling interest Note 11 3,073 2,847 – – – – 3,073 2,847Total equity 129,619 135,127 14,500 13,018 –2 –3 144,118 148,142
Non-current provisionsProvisions for post- employment benefits Note 20 12,095 18,282 82 148 – – 12,177 18,430Provisions for deferred taxes Note 10 2,774 1,166 2,153 2,099 – – 4,926 3,265Other provisions Note 21 10,610 10,217 49 238 557 464 11,216 10,918
Total non-current provisions 25,478 29,664 2,284 2,484 557 464 28,319 32,612
Non-current liabilities
Bond loans Note 22 79,365 66,391 – – – – 79,365 66,391Other loans Note 22 16,488 18,053 10,148 11,905 –1,823 –1,182 24,812 28,775Internal funding1 –82,734 –58,839 74,223 59,412 8,512 –573 – –Other liabilities Note 22 42,978 38,094 1,557 1,371 –7,705 –8,041 36,831 31,424
Total non-current liabilities 56,096 63,699 85,928 72,687 –1,016 –9,796 141,008 126,590Current provisions Note 21 11,535 12,411 36 225 383 517 11,954 13,153
Current liabilitiesBond loans Note 22 21,747 30,904 – – – – 21,747 30,904Other loans Note 22 21,230 17,055 7,432 10,968 –962 –669 27,700 27,354Internal funding1 –36,176 –38,547 63,141 51,050 –26,964 –12,503 – –Trade payables 76,079 59,013 666 598 – – 76,745 59,611Tax liabilities 3,720 3,885 567 714 – – 4,287 4,599Other liabilities Note 22 61,693 57,730 6,639 6,354 –8,354 –7,515 59,978 56,569Liabilities held for sale Note 3 – 6,638 – 4,649 – – – 11,286
Total current liabilities 148,293 136,678 78,445 74,333 –36,281 –20,688 190,457 190,324
Total equity and liabilities 371,022 377,579 181,193 162,748 –36,359 –29,506 515,856 510,821
1 Internal funding is internal lending from Industrial Operations to Financial Services.
The net value of assets and liabilities related to pensions and similar obligations amounted to a liability of SEK 9.8 billion as of December 31, 2021, a decrease of SEK 6.9 billion compared with year-end 2020.
Read more in Note 20 Provisions for post- employment benefits.
On December 31, 2021, total equity for the Volvo Group amounted to SEK 144.1 billion compared with SEK 148.1 billion at year-end 2020. The equity ratio was 27.9% (29.0). Return on total equity was 23.4% (13.8).
On the same date the equity ratio in the Industrial Operations amounted to 34.9% (35.8). Return on capital employed in the Industrial Operations amounted to 25.3% (14.7).
Return on capital employed, Industrial Operations %, SEK bn
17 18 20 211922.4 14.7 25.328.420.5
Board of Directors’ Report 2021 / Financial position
49
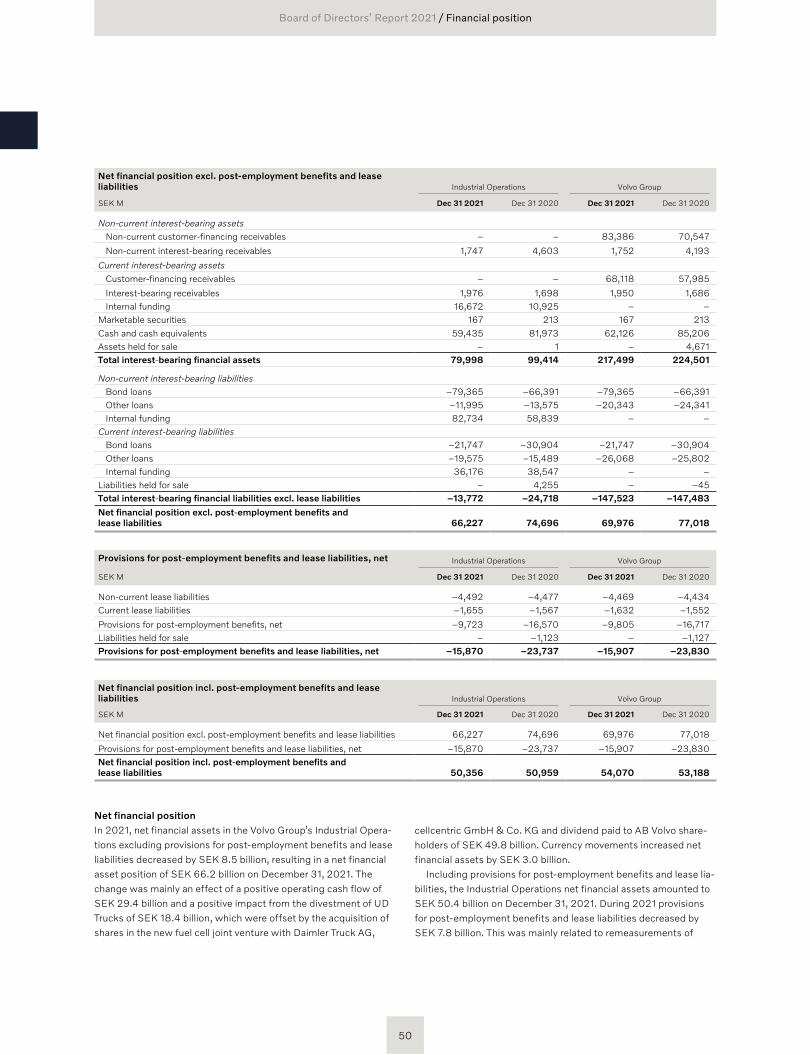
Net financial position excl. post-employment benefits and lease liabilities Industrial Operations Volvo Group
SEK M Dec 31 2021 Dec 31 2020 Dec 31 2021 Dec 31 2020
Non-current interest-bearing assetsNon-current customer-financing receivables – – 83,386 70,547
Non-current interest-bearing receivables 1,747 4,603 1,752 4,193
Current interest-bearing assetsCustomer-financing receivables – – 68,118 57,985
Interest-bearing receivables 1,976 1,698 1,950 1,686Internal funding 16,672 10,925 – –
Marketable securities 167 213 167 213Cash and cash equivalents 59,435 81,973 62,126 85,206Assets held for sale – 1 – 4,671Total interest-bearing financial assets 79,998 99,414 217,499 224,501
Non-current interest-bearing liabilitiesBond loans –79,365 –66,391 –79,365 –66,391Other loans –11,995 –13,575 –20,343 –24,341Internal funding 82,734 58,839 – –
Current interest-bearing liabilitiesBond loans –21,747 –30,904 –21,747 –30,904Other loans –19,575 –15,489 –26,068 –25,802Internal funding 36,176 38,547 – –
Liabilities held for sale – 4,255 – –45Total interest-bearing financial liabilities excl. lease liabilities –13,772 –24,718 –147,523 –147,483
Net financial position excl. post-employment benefits and lease liabilities 66,227 74,696 69,976 77,018
Provisions for post-employment benefits and lease liabilities, net Industrial Operations Volvo Group
SEK M Dec 31 2021 Dec 31 2020 Dec 31 2021 Dec 31 2020
Non-current lease liabilities –4,492 –4,477 –4,469 –4,434Current lease liabilities –1,655 –1,567 –1,632 –1,552
Provisions for post-employment benefits, net –9,723 –16,570 –9,805 –16,717Liabilities held for sale – –1,123 – –1,127Provisions for post-employment benefits and lease liabilities, net –15,870 –23,737 –15,907 –23,830
Net financial positionIn 2021, net financial assets in the Volvo Group’s Industrial Opera-tions excluding provisions for post-employment benefits and lease liabilities decreased by SEK 8.5 billion, resulting in a net financial asset position of SEK 66.2 billion on December 31, 2021. The change was mainly an effect of a positive operating cash flow of SEK 29.4 billion and a positive impact from the divestment of UD Trucks of SEK 18.4 billion, which were offset by the acquisition of shares in the new fuel cell joint venture with Daimler Truck AG,
cellcentric GmbH & Co. KG and dividend paid to AB Volvo share-holders of SEK 49.8 billion. Currency movements increased net financial assets by SEK 3.0 billion.
Including provisions for post-employment benefits and lease lia-bilities, the Industrial Operations net financial assets amounted to SEK 50.4 billion on December 31, 2021. During 2021 provisions for post-employment benefits and lease liabilities decreased by SEK 7.8 billion. This was mainly related to remeasurements of
Net financial position incl. post-employment benefits and lease liabilities Industrial Operations Volvo Group
SEK M Dec 31 2021 Dec 31 2020 Dec 31 2021 Dec 31 2020
Net financial position excl. post-employment benefits and lease liabilities 66,227 74,696 69,976 77,018
Provisions for post-employment benefits and lease liabilities, net –15,870 –23,737 –15,907 –23,830Net financial position incl. post-employment benefits and lease liabilities 50,356 50,959 54,070 53,188
Board of Directors’ Report 2021 / Financial position
50
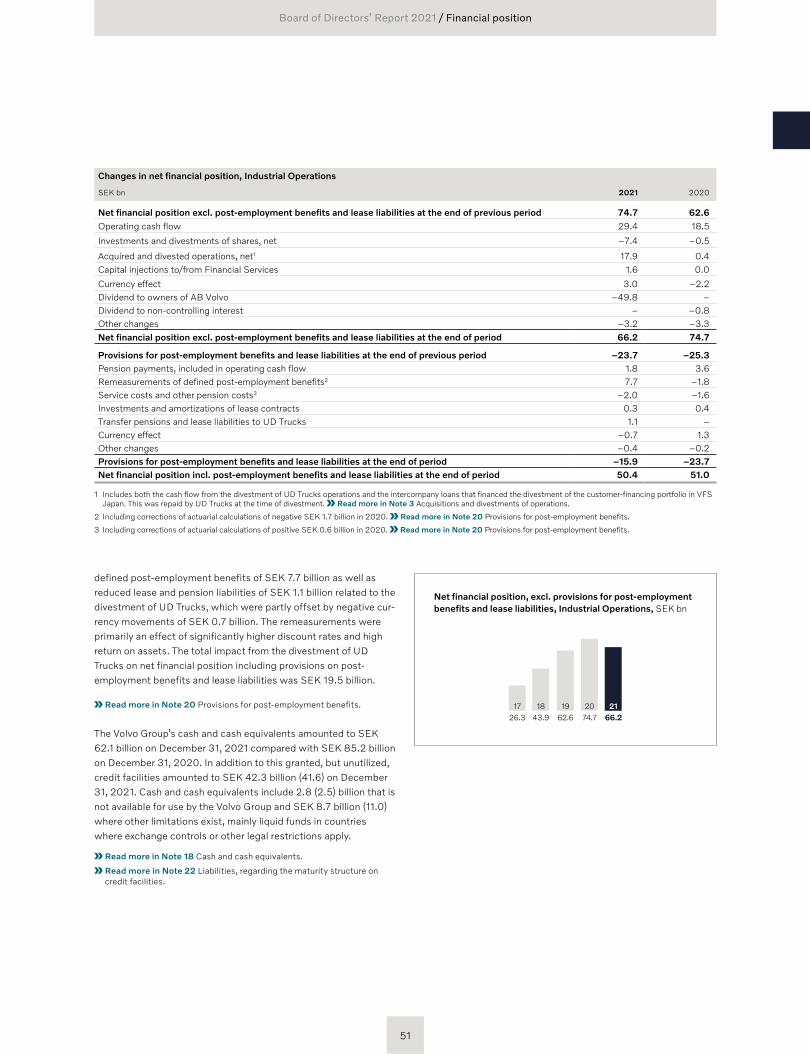
defined post-employment benefits of SEK 7.7 billion as well as reduced lease and pension liabilities of SEK 1.1 billion related to the divestment of UD Trucks, which were partly offset by negative cur-rency movements of SEK 0.7 billion. The remeasurements were primarily an effect of significantly higher discount rates and high return on assets. The total impact from the divestment of UD Trucks on net financial position including provisions on post- employment benefits and lease liabilities was SEK 19.5 billion.
Read more in Note 20 Provisions for post- employment benefits.
The Volvo Group’s cash and cash equivalents amounted to SEK 62.1 billion on December 31, 2021 compared with SEK 85.2 billion on December 31, 2020. In addition to this granted, but unutilized, credit facilities amounted to SEK 42.3 billion (41.6) on December 31, 2021. Cash and cash equivalents include 2.8 (2.5) billion that is not available for use by the Volvo Group and SEK 8.7 billion (11.0)where other limitations exist, mainly liquid funds in countries where exchange controls or other legal restrictions apply.
Read more in Note 18 Cash and cash equivalents.
Read more in Note 22 Liabilities, regarding the maturity structure on credit facilities.
Changes in net financial position, Industrial Operations
SEK bn 2021 2020
Net financial position excl. post-employment benefits and lease liabilities at the end of previous period 74.7 62.6Operating cash flow 29.4 18.5
Investments and divestments of shares, net –7.4 –0.5
Acquired and divested operations, net1 17.9 0.4Capital injections to/from Financial Services 1.6 0.0
Currency effect 3.0 –2.2Dividend to owners of AB Volvo –49.8 –Dividend to non-controlling interest – –0.8Other changes –3.2 –3.3Net financial position excl. post-employment benefits and lease liabilities at the end of period 66.2 74.7
Provisions for post-employment benefits and lease liabilities at the end of previous period –23.7 –25.3Pension payments, included in operating cash flow 1.8 3.6Remeasurements of defined post-employment benefits2 7.7 –1.8 Service costs and other pension costs3 –2.0 –1.6Investments and amortizations of lease contracts 0.3 0.4Transfer pensions and lease liabilities to UD Trucks 1.1 –Currency effect –0.7 1.3Other changes –0.4 –0.2Provisions for post-employment benefits and lease liabilities at the end of period –15.9 –23.7Net financial position incl. post-employment benefits and lease liabilities at the end of period 50.4 51.0
1 Includes both the cash flow from the divestment of UD Trucks operations and the intercompany loans that financed the divestment of the customer-financing portfolio in VFS Japan. This was repaid by UD Trucks at the time of divestment. Read more in Note 3 Acquisitions and divestments of operations.
2 Including corrections of actuarial calculations of negative SEK 1.7 billion in 2020. Read more in Note 20 Provisions for post-employment benefits.
3 Including corrections of actuarial calculations of positive SEK 0.6 billion in 2020. Read more in Note 20 Provisions for post-employment benefits.
Net financial position, excl. provisions for post-employment benefits and lease liabilities, Industrial Operations, SEK bn
17 18 20 211943.9 74.7 66.262.626.3
Board of Directors’ Report 2021 / Financial position
51
In 2021, operating cash flow in the Industrial Operations amounted to SEK 29.4 billion (18.5). The higher operating cash flow compared with 2020 is primarily an effect of a higher operating income of SEK 13.9 billion and a lower increase in working capital of SEK 2.3 billion (11.0). This was partly offset by an increase in income taxes paid of SEK 4.5 billion and higher investments of SEK 3.9 billion compared with 2020.
Operating cash flow in Financial Services was negative in an amount of SEK –12.7 billion (0.8). The change compared to 2020 was mainly due to significantly higher increase of new business volume in the credit portfolio.
Read more in Note 10 Income taxes. Read more in Note 21 Other provisions.
Investments and disposalsIn 2021, the Industrial Operations’ investments in tangible and intangible assets amounted to SEK 12.5 billion (8.7).
Trucks investments in tangible and intangible assets amounted to SEK 9.8 billion (6.8). The major investments were related to industrial efficiency measures and replacements such as the ongoing replacement of casting process equipment in Skövde, Sweden, and upgrades in the plants in the U.S. Investments were also related to product renewals such as the development of battery- electric and fuel-cell electric trucks with both product develop-ment activities and required adaptations in the plants. Investments in dealer networks and workshops were mainly made in Europe, primarily for upgrades and replacements.
Investments in Construction Equipment amounted to SEK 1.2 billion (0.9). The major investments in the plants were related to renewals but also to industrial efficiency measures, primarily in Asia. Product-related investments were mainly related to upgrades with both continued investments in adaptations in the plants for electric machines and product development activities.
Investments in Buses were SEK 0.4 billion (0.2) and in Volvo Penta SEK 0.7 billion (0.5).
The investment level for property, plant and equipment increased during 2021 compared to prior year, which was considerably impac-ted by the covid-19 pandemic. Investments in property, plant and equipment are expected to increase further during 2022. Invest-ments in optimization of the industrial footprint, product- related tooling, replacements as well as dealer investments will continue to be the main areas.
Investments and divestments of sharesIn 2021, investments and divestments of shares had a negative impact on cash flow of SEK 7.4 billion (0.5). The negative impact was mainly due to the acquisition of shares in the new fuel cell joint venture with Daimler Truck AG, cellcentric Gmbh & Co KG.
Read more in Note 5 Investments in joint ventures, associated companies and other shares and participations.
Acquired and divested operationsIn 2021, acquired and divested operations had a positive impact on cash flow of SEK 22.0 billion (0.4). The positive impact was mainly due to the divestment of UD Trucks by SEK 22.8 billion.
Read more in Note 3 Acquisitions and divestments of operations.
Financing and dividendIn 2021, net borrowings decreased by SEK 7.0 billion, mainly due to an improved operating cash flow. In 2020, net borrowings increased by SEK 7.3 billion to safeguard liquidity in the Volvo Group. During 2021 dividends of in total SEK 49.8 billion (0) were paid. These con-sisted of an ordinary dividend of SEK 6.00 per share and two extra dividends totaling 18.50 per share, whereof an extra dividend of 9.50 refers to the distribution of the proceeds from the sale of UD Trucks.
Read more in Note 29 Cash flow regarding change in loans during 2021.
Change in cash and cash equivalentsIn 2021, Cash and cash equivalents decreased by SEK 23.1 billion and amounted to SEK 62.1 billion on December 31, 2021.
Read more in Note 18 Cash and cash equivalents regarding the accounting policy.
Read more in Note 29 Cash flow regarding principles for preparing the cash flow statement.
Cash flow statement
Improved operating cash flow
Board of Directors’ Report 2021 / Cash flow statement
52
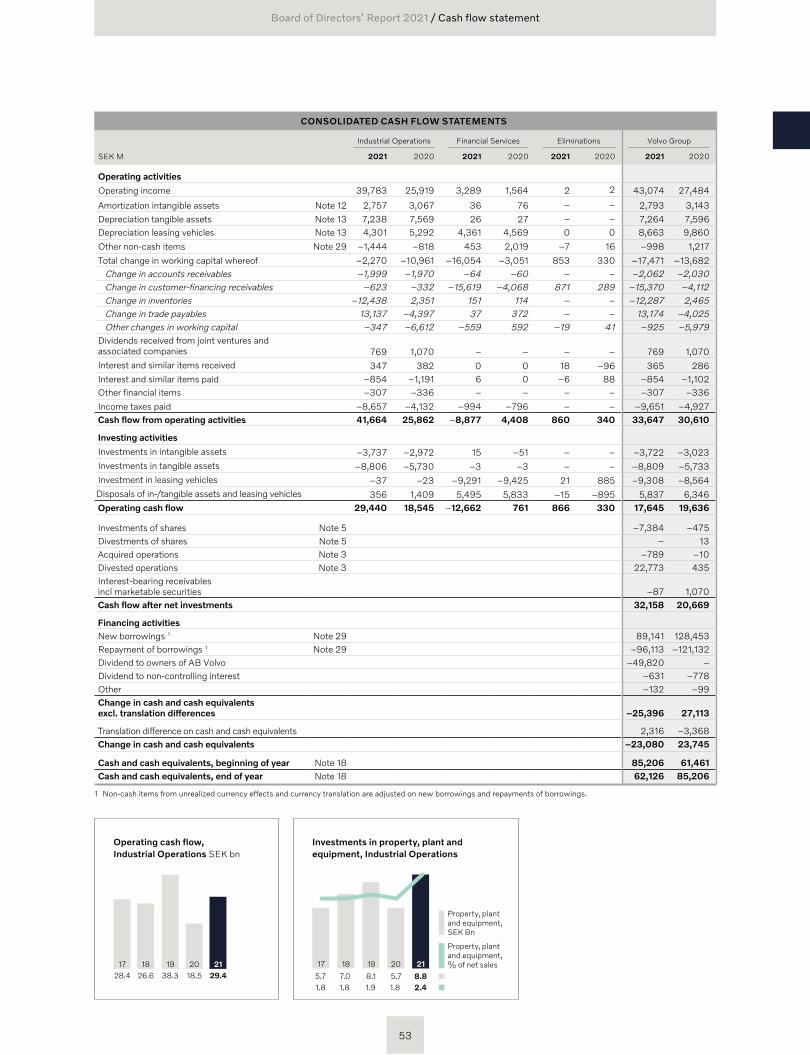
CONSOLIDATED CASH FLOW STATEMENTS
Industrial Operations Financial Services Eliminations Volvo Group
SEK M 2021 2020 2021 2020 2021 2020 2021 2020
Operating activities
Operating income 39,783 25,919 3,289 1,564 2 2 43,074 27,484
Amortization intangible assets Note 12 2,757 3,067 36 76 – – 2,793 3,143Depreciation tangible assets Note 13 7,238 7,569 26 27 – – 7,264 7,596Depreciation leasing vehicles Note 13 4,301 5,292 4,361 4,569 0 0 8,663 9,860
Other non-cash items Note 29 –1,444 –818 453 2,019 –7 16 –998 1,217
Total change in working capital whereof –2,270 –10,961 –16,054 –3,051 853 330 –17,471 –13,682Change in accounts receivables –1,999 –1,970 –64 –60 – – –2,062 –2,030Change in customer-financing receivables –623 –332 –15,619 –4,068 871 289 –15,370 –4,112Change in inventories –12,438 2,351 151 114 – – –12,287 2,465Change in trade payables 13,137 –4,397 37 372 – – 13,174 –4,025Other changes in working capital –347 –6,612 –559 592 –19 41 –925 –5,979
Dividends received from joint ventures and associated companies 769 1,070 – – – – 769 1,070Interest and similar items received 347 382 0 0 18 –96 365 286Interest and similar items paid –854 –1,191 6 0 –6 88 –854 –1,102Other financial items –307 –336 – – – – –307 –336
Income taxes paid –8,657 –4,132 –994 –796 – – –9,651 –4,927Cash flow from operating activities 41,664 25,862 –8,877 4,408 860 340 33,647 30,610
Investing activities
Investments in intangible assets –3,737 –2,972 15 –51 – – –3,722 –3,023Investments in tangible assets –8,806 –5,730 –3 –3 – – –8,809 –5,733Investment in leasing vehicles –37 –23 –9,291 –9,425 21 885 –9,308 –8,564
Disposals of in-/tangible assets and leasing vehicles 356 1,409 5,495 5,833 –15 –895 5,837 6,346Operating cash flow 29,440 18,545 –12,662 761 866 330 17,645 19,636
Investments of shares Note 5 –7,384 –475Divestments of shares Note 5 – 13Acquired operations Note 3 –789 –10Divested operations Note 3 22,773 435Interest-bearing receivables incl marketable securities –87 1,070Cash flow after net investments 32,158 20,669
Financing activities New borrowings 1 Note 29 89,141 128,453Repayment of borrowings 1 Note 29 –96,113 –121,132Dividend to owners of AB Volvo –49,820 –Dividend to non-controlling interest –631 –778Other –132 –99Change in cash and cash equivalents excl. translation differences –25,396 27,113
Translation difference on cash and cash equivalents 2,316 –3,368Change in cash and cash equivalents –23,080 23,745
Cash and cash equivalents, beginning of year Note 18 85,206 61,461Cash and cash equivalents, end of year Note 18 62,126 85,206
1 Non-cash items from unrealized currency effects and currency translation are adjusted on new borrowings and repayments of borrowings.
Investments in property, plant and equipment, Industrial Operations
17 18 19 20 21
Property, plant and equipment, % of net sales
Property, plant and equipment, SEK Bn
1.8 5.7
2.48.8
1.87.0
1.98.1
1.85.7
Operating cash flow, Industrial Operations SEK bn
17 18 20 211926.6 18.5 29.438.328.4
Board of Directors’ Report 2021 / Cash flow statement
53
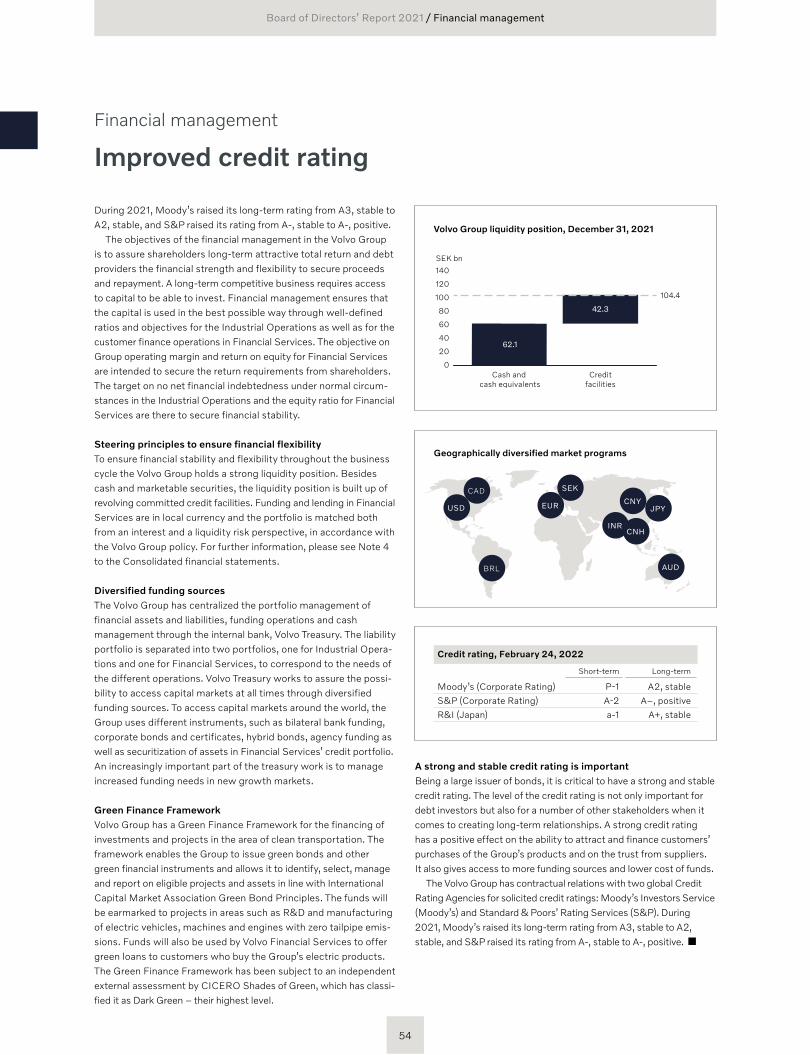
Financial management
Improved credit rating
During 2021, Moody’s raised its long-term rating from A3, stable to A2, stable, and S&P raised its rating from A-, stable to A-, positive.
The objectives of the financial management in the Volvo Group is to assure shareholders long-term attractive total return and debt providers the financial strength and flexibility to secure proceeds and repayment. A long-term competitive business requires access to capital to be able to invest. Financial management ensures that the capital is used in the best possible way through well-defined ratios and objectives for the Industrial Operations as well as for the customer finance operations in Financial Services. The objective on Group operating margin and return on equity for Financial Services are intended to secure the return requirements from shareholders. The target on no net financial indebtedness under normal circum-stances in the Industrial Operations and the equity ratio for Financial Services are there to secure fi nancial stability.
Steering principles to ensure financial flexibility To ensure financial stability and flexibility throughout the business cycle the Volvo Group holds a strong liquidity position. Besides cash and marketable securities, the liquidity position is built up of revolving committed credit facilities. Funding and lending in Financial Services are in local currency and the portfolio is matched both from an interest and a liquidity risk perspective, in accordance with the Volvo Group policy. For further information, please see Note 4 to the Consolidated financial statements.
Diversified funding sourcesThe Volvo Group has centralized the portfolio man agement of financial assets and liabilities, funding operations and cash manage ment through the internal bank, Volvo Treasury. The liability port folio is separated into two portfolios, one for Industrial Opera-tions and one for Financial Services, to correspond to the needs of the different operations. Volvo Treasury works to assure the possi-bility to access capital markets at all times through diversified funding sources. To access capital markets around the world, the Group uses different instruments, such as bilateral bank funding, corpor ate bonds and certificates, hybrid bonds, agency funding as well as securitization of assets in Financial Services’ credit portfolio. An increasingly import ant part of the treasury work is to manage increased funding needs in new growth markets.
Green Finance FrameworkVolvo Group has a Green Finance Framework for the financing of investments and projects in the area of clean transportation. The framework enables the Group to issue green bonds and other green financial instruments and allows it to identify, select, manage and report on eligible projects and assets in line with International Capital Market Association Green Bond Principles. The funds will be earmarked to projects in areas such as R&D and manufacturing of electric vehicles, machines and engines with zero tailpipe emis-sions. Funds will also be used by Volvo Financial Services to offer green loans to customers who buy the Group’s electric products. The Green Finance Framework has been subject to an independent external assessment by CICERO Shades of Green, which has classi-fied it as Dark Green – their highest level.
A strong and stable credit rating is importantBeing a large issuer of bonds, it is critical to have a strong and stable credit rating. The level of the credit rating is not only important for debt investors but also for a number of other stakeholders when it comes to creating long-term relationships. A strong credit rating has a positive effect on the ability to attract and finance customers’ purchases of the Group’s products and on the trust from suppliers. It also gives access to more funding sources and lower cost of funds.
The Volvo Group has contractual relations with two global Credit Rating Agencies for solicited credit ratings: Moody’s Investors Service (Moody’s) and Standard & Poors’ Rating Services (S&P). During 2021, Moody’s raised its long-term rating from A3, stable to A2, stable, and S&P raised its rating from A-, stable to A-, positive.
Credit rating, February 24, 2022
Short-term Long-term
Moody’s (Corporate Rating) P-1 A2, stable
S&P (Corporate Rating) A-2 A–, positive
R&I (Japan) a-1 A+, stable
Geographically diversified market programs
CNY
SEK
JPY
AUD
EUR
CAD
USD
BRL
INRCNH
Volvo Group liquidity position, December 31, 2021
Cash and cash equivalents
Creditfacilities
0
20
80
40
140
120
100
60
104.4
SEK bn
42.3
62.1
Board of Directors’ Report 2021 / Financial management
54
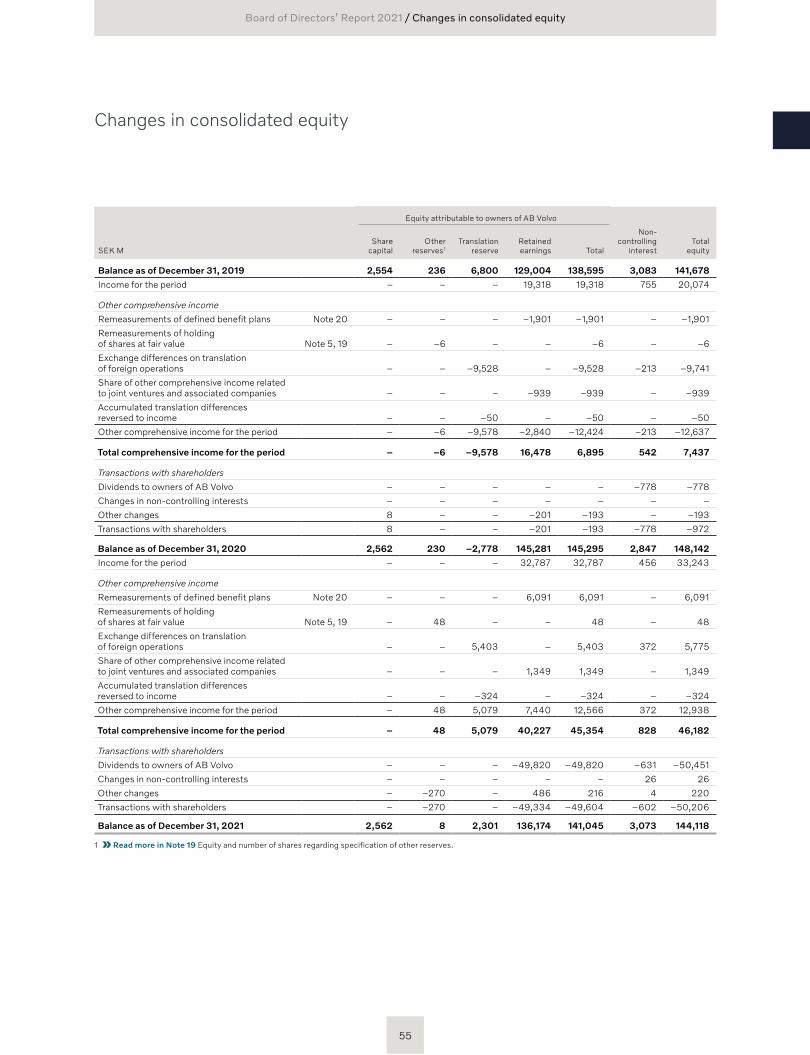
Changes in consolidated equity
Equity attributable to owners of AB Volvo
SEK MShare
capitalOther
reserves 1Translation
reserveRetainedearnings Total
Non-controlling
interestTotal
equity
Balance as of December 31, 2019 2,554 236 6,800 129,004 138,595 3,083 141,678
Income for the period – – – 19,318 19,318 755 20,074
Other comprehensive income
Remeasurements of defined benefit plans Note 20 – – – –1,901 –1,901 – –1,901
Remeasurements of holding of shares at fair value Note 5, 19 – –6 – – –6 – –6
Exchange differences on translation of foreign operations – – –9,528 – –9,528 –213 –9,741
Share of other comprehensive income related to joint ventures and associated companies – – – –939 –939 – –939
Accumulated translation differences reversed to income – – –50 – –50 – –50
Other comprehensive income for the period – –6 –9,578 –2,840 –12,424 –213 –12,637
Total comprehensive income for the period – –6 –9,578 16,478 6,895 542 7,437
Transactions with shareholders
Dividends to owners of AB Volvo – – – – – –778 –778
Changes in non-controlling interests – – – – – – –
Other changes 8 – – –201 –193 – –193
Transactions with shareholders 8 – – –201 –193 –778 –972
Balance as of December 31, 2020 2,562 230 –2,778 145,281 145,295 2,847 148,142
Income for the period – – – 32,787 32,787 456 33,243
Other comprehensive income
Remeasurements of defined benefit plans Note 20 – – – 6,091 6,091 – 6,091
Remeasurements of holding of shares at fair value Note 5, 19 – 48 – – 48 – 48
Exchange differences on translation of foreign operations – – 5,403 – 5,403 372 5,775
Share of other comprehensive income related to joint ventures and associated companies – – – 1,349 1,349 – 1,349
Accumulated translation differences reversed to income – – –324 – –324 – –324
Other comprehensive income for the period – 48 5,079 7,440 12,566 372 12,938
Total comprehensive income for the period – 48 5,079 40,227 45,354 828 46,182
Transactions with shareholders
Dividends to owners of AB Volvo – – – –49,820 –49,820 –631 –50,451
Changes in non-controlling interests – – – – – 26 26
Other changes – –270 – 486 216 4 220
Transactions with shareholders – –270 – –49,334 –49,604 –602 –50,206
Balance as of December 31, 2021 2,562 8 2,301 136,174 141,045 3,073 144,118 1 Read more in Note 19 Equity and number of shares regarding specification of other reserves.
Board of Directors’ Report 2021 / Changes in consolidated equity
55
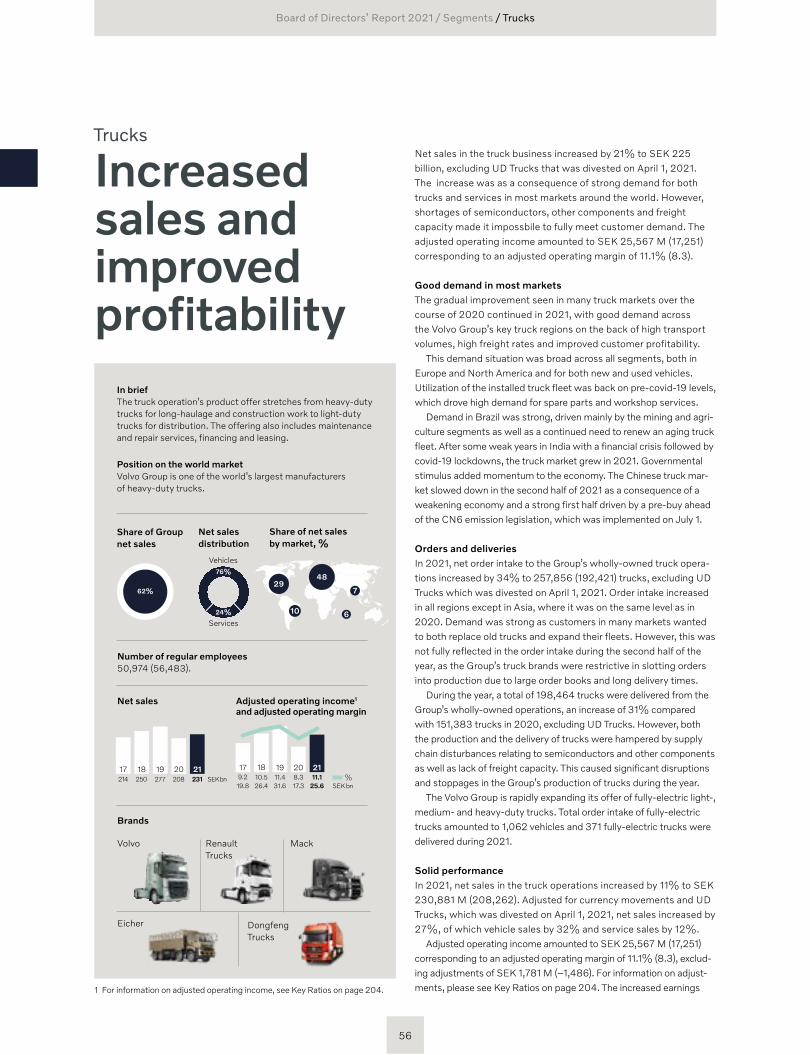
191817 20 21214 250 277 208 SEK bn231
Net sales
191817 20 219.2 10.5 11.4 8.3
SEK bn%11.1
19.8 26.4 31.6 17.3 25.6
Adjusted operating income1 and adjusted operating margin
Number of regular employees 50,974 (56,483).
Trucks
Increased sales and improved profitability
Net sales in the truck business increased by 21% to SEK 225 billion, excluding UD Trucks that was divested on April 1, 2021. The increase was as a consequence of strong demand for both trucks and services in most markets around the world. However, shortages of semiconductors, other components and freight capacity made it impossbile to fully meet customer demand. The adjusted operating income amounted to SEK 25,567 M (17,251) corresponding to an adjusted operating margin of 11.1% (8.3).
Good demand in most marketsThe gradual improvement seen in many truck markets over the course of 2020 continued in 2021, with good demand across the Volvo Group’s key truck regions on the back of high transport volumes, high freight rates and improved customer profitability.
This demand situation was broad across all segments, both in Europe and North America and for both new and used vehicles. Utilization of the installed truck fleet was back on pre-covid-19 levels, which drove high demand for spare parts and workshop services.
Demand in Brazil was strong, driven mainly by the mining and agri-culture segments as well as a continued need to renew an aging truck fleet. After some weak years in India with a financial crisis followed by covid-19 lockdowns, the truck market grew in 2021. Governmental stimulus added momentum to the economy. The Chinese truck mar-ket slowed down in the second half of 2021 as a consequence of a weakening economy and a strong first half driven by a pre-buy ahead of the CN6 emission legislation, which was implemented on July 1.
Orders and deliveriesIn 2021, net order intake to the Group’s wholly-owned truck opera-tions increased by 34% to 257,856 (192,421) trucks, excluding UD Trucks which was divested on April 1, 2021. Order intake increased in all regions except in Asia, where it was on the same level as in 2020. Demand was strong as customers in many markets wanted to both replace old trucks and expand their fleets. However, this was not fully reflected in the order intake during the second half of the year, as the Group’s truck brands were restrictive in slotting orders into production due to large order books and long delivery times.
During the year, a total of 198,464 trucks were delivered from the Group’s wholly-owned operations, an increase of 31% compared with 151,383 trucks in 2020, excluding UD Trucks. However, both the production and the delivery of trucks were hampered by supply chain disturbances relating to semiconductors and other components as well as lack of freight capacity. This caused significant disruptions and stoppages in the Group’s production of trucks during the year.
The Volvo Group is rapidly expanding its offer of fully-electric light-, medium- and heavy-duty trucks. Total order intake of fully-electric trucks amounted to 1,062 vehicles and 371 fully-electric trucks were delivered during 2021.
Solid performanceIn 2021, net sales in the truck operations increased by 11% to SEK 230,881 M (208,262). Adjusted for currency movements and UD Trucks, which was divested on April 1, 2021, net sales increased by 27%, of which vehicle sales by 32% and service sales by 12%.
Adjusted operating income amounted to SEK 25,567 M (17,251) corresponding to an adjusted operating margin of 11.1% (8.3), ex clud-ing adjustments of SEK 1,781 M (–1,486). For information on adjust-ments, please see Key Ratios on page 204. The increased earnings
In briefThe truck operation’s product offer stretches from heavy-duty trucks for long-haulage and construc tion work to light-duty trucks for distri bution. The offering also includes maintenance and repair services, financing and leasing.
Position on the world market Volvo Group is one of the world’s largest manufac turers of heavy-duty trucks.
Share of net sales by market, %
Share of Group net sales
Net sales distribution
62%
Vehicles76%
24%
Services
1 For information on adjusted operating income, see Key Ratios on page 204.
4829
10 6
7
Brands
Volvo MackRenault Trucks
Eicher Dongfeng Trucks
56
Board of Directors’ Report 2021 / Segments / Trucks
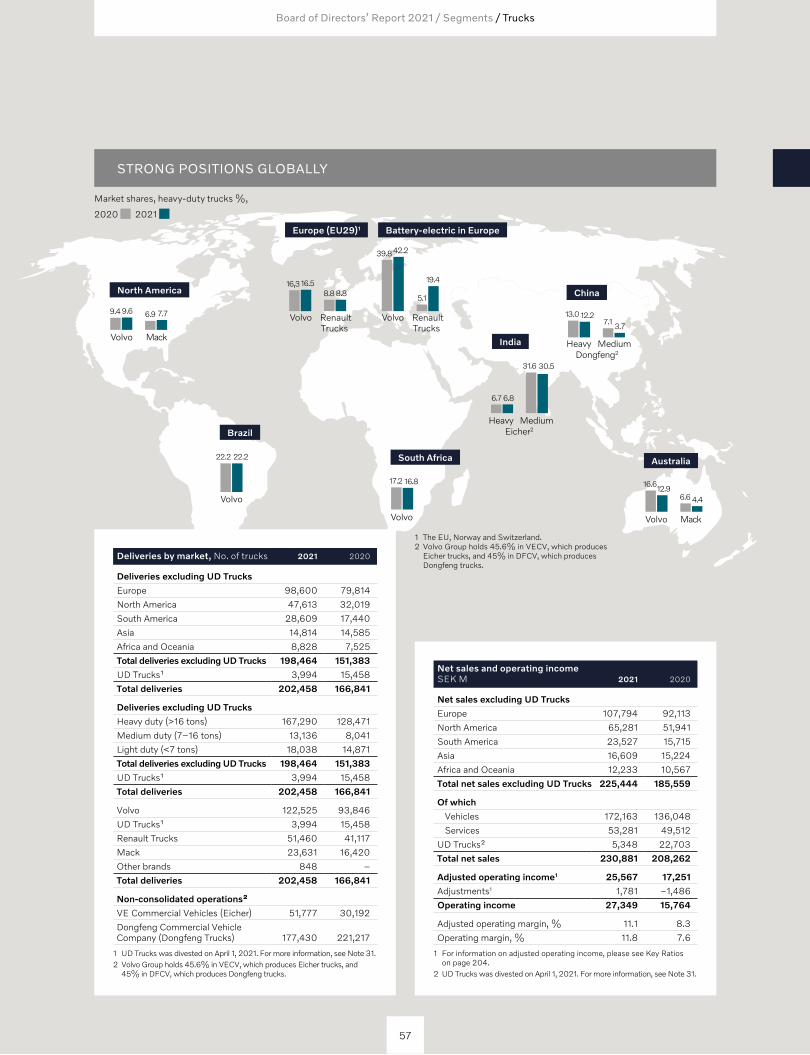
Volvo
Volvo Mack
Volvo Volvo Mack
Volvo RenaultTrucks
Volvo RenaultTrucks
Dongfeng2Heavy Medium
Eicher2Heavy Medium
9.49.6 6.9 7.7
22.2 22.2
17.2 16.8
16,316.58.88.8
6.7 6.8
31.6 30.5
13.0 12.27.1 3.7
5.1
19.4
39.842.2
6.6 4.412.916.6
North America China
India
Australia
Europe (EU29)1 Battery-electric in Europe
Brazil
South Africa
Net sales and operating income SEK M 2021 2020
Net sales excluding UD Trucks
Europe 107,794 92,113
North America 65,281 51,941
South America 23,527 15,715
Asia 16,609 15,224
Africa and Oceania 12,233 10,567
Total net sales excluding UD Trucks 225,444 185,559
Of which
Vehicles 172,163 136,048
Services 53,281 49,512
UD Trucks² 5,348 22,703
Total net sales 230,881 208,262
Adjusted operating income1 25,567 17,251
Adjustments1 1,781 –1,486
Operating income 27,349 15,764
Adjusted operating margin, % 11.1 8.3
Operating margin, % 11.8 7.6
1 For information on adjusted operating income, please see Key Ratios on page 204.
2 UD Trucks was divested on April 1, 2021. For more information, see Note 31.
Deliveries by market, No. of trucks 2021 2020
Deliveries excluding UD Trucks
Europe 98,600 79,814
North America 47,613 32,019
South America 28,609 17,440
Asia 14,814 14,585
Africa and Oceania 8,828 7,525
Total deliveries excluding UD Trucks 198,464 151,383
UD Trucks¹ 3,994 15,458
Total deliveries 202,458 166,841
Deliveries excluding UD Trucks
Heavy duty (>16 tons) 167,290 128,471
Medium duty (7–16 tons) 13,136 8,041
Light duty (<7 tons) 18,038 14,871
Total deliveries excluding UD Trucks 198,464 151,383
UD Trucks¹ 3,994 15,458
Total deliveries 202,458 166,841
Volvo 122,525 93,846
UD Trucks¹ 3,994 15,458
Renault Trucks 51,460 41,117
Mack 23,631 16,420
Other brands 848 –
Total deliveries 202,458 166,841
Non-consolidated operations²
VE Commercial Vehicles (Eicher) 51,777 30,192
Dongfeng Commercial Vehicle Company (Dongfeng Trucks) 177,430 221,217
1 UD Trucks was divested on April 1, 2021. For more information, see Note 31.2 Volvo Group holds 45.6% in VECV, which produces Eicher trucks, and
45% in DFCV, which produces Dongfeng trucks.
STRONG POSITIONS GLOBALLY
Market shares, heavy-duty trucks %,
2020 2021
1 The EU, Norway and Switzerland.2 Volvo Group holds 45.6% in VECV, which produces
Eicher trucks, and 45% in DFCV, which produces Dongfeng trucks.
57
Board of Directors’ Report 2021 / Segments / Trucks
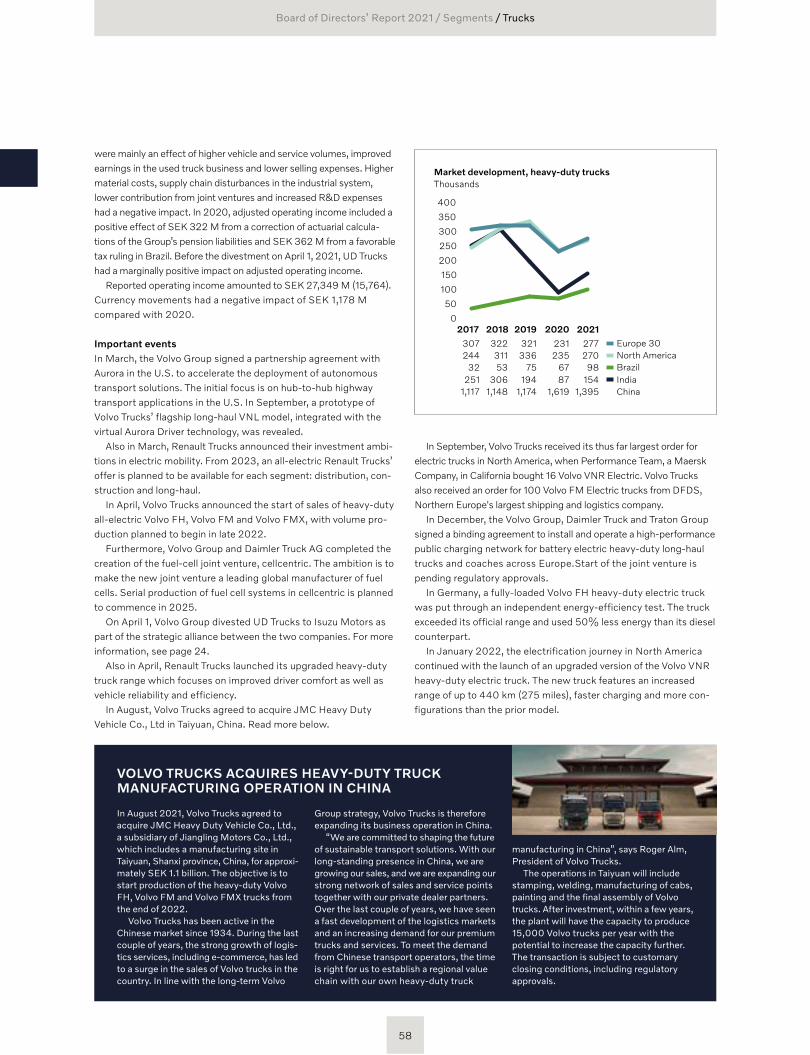
were mainly an effect of higher vehicle and service volumes, improved earnings in the used truck business and lower selling expenses. Higher material costs, supply chain disturbances in the industrial system, lower contribution from joint ventures and increased R&D expenses had a negative impact. In 2020, adjusted operating income included a positive effect of SEK 322 M from a correction of actuarial calcula-tions of the Group’s pension liabilities and SEK 362 M from a favorable tax ruling in Brazil. Before the divestment on April 1, 2021, UD Trucks had a marginally positive impact on adjusted operating income.
Reported operating income amounted to SEK 27,349 M (15,764). Currency movements had a negative impact of SEK 1,178 M compared with 2020.
Important eventsIn March, the Volvo Group signed a partnership agreement with Aurora in the U.S. to accelerate the deployment of autonomous transport solutions. The initial focus is on hub-to-hub highway transport applications in the U.S. In September, a prototype of Volvo Trucks’ flagship long-haul VNL model, integrated with the virtual Aurora Driver technology, was revealed.
Also in March, Renault Trucks announced their investment ambi-tions in electric mobility. From 2023, an all-electric Renault Trucks’ offer is planned to be available for each segment: distribution, con-struction and long-haul.
In April, Volvo Trucks announced the start of sales of heavy-duty all-electric Volvo FH, Volvo FM and Volvo FMX, with volume pro-duction planned to begin in late 2022.
Furthermore, Volvo Group and Daimler Truck AG completed the creation of the fuel-cell joint venture, cellcentric. The ambition is to make the new joint venture a leading global manufacturer of fuel cells. Serial production of fuel cell systems in cellcentric is planned to commence in 2025.
On April 1, Volvo Group divested UD Trucks to Isuzu Motors as part of the strategic alliance between the two companies. For more information, see page 24.
Also in April, Renault Trucks launched its upgraded heavy-duty truck range which focuses on improved driver comfort as well as vehicle reliability and efficiency.
In August, Volvo Trucks agreed to acquire JMC Heavy Duty Vehicle Co., Ltd in Taiyuan, China. Read more below.
50
0
100
150
200
250
300
350
400
Europe 30North AmericaBrazilIndiaChina
2017 2018 2019 2020
307244
32251
1,117
32231153
3061,148
321336
75194
1,174
231235
6787
1,619
2021
277270
98154
1,395
Market development, heavy-duty trucks Thousands
In September, Volvo Trucks received its thus far largest order for electric trucks in North America, when Performance Team, a Maersk Company, in California bought 16 Volvo VNR Electric. Volvo Trucks also received an order for 100 Volvo FM Electric trucks from DFDS, Northern Europe's largest shipping and logistics company.
In December, the Volvo Group, Daimler Truck and Traton Group signed a binding agreement to install and operate a high-performance public charging network for battery electric heavy-duty long-haul trucks and coaches across Europe.Start of the joint venture is pending regulatory approvals.
In Germany, a fully-loaded Volvo FH heavy-duty electric truck was put through an independent energy-efficiency test. The truck exceeded its official range and used 50% less energy than its diesel counterpart.
In January 2022, the electrification journey in North America continued with the launch of an upgraded version of the Volvo VNR heavy-duty electric truck. The new truck features an increased range of up to 440 km (275 miles), faster charging and more con-figurations than the prior model.
VOLVO TRUCKS ACQUIRES HEAVY-DUTY TRUCK MANUFACTURING OPERATION IN CHINA
In August 2021, Volvo Trucks agreed to acquire JMC Heavy Duty Vehicle Co., Ltd., a subsidiary of Jiangling Motors Co., Ltd., which includes a manufacturing site in Taiyuan, Shanxi province, China, for approximately SEK 1.1 billion. The objective is to start production of the heavyduty Volvo FH, Volvo FM and Volvo FMX trucks from the end of 2022.
Volvo Trucks has been active in the Chinese market since 1934. During the last couple of years, the strong growth of logistics services, including ecommerce, has led to a surge in the sales of Volvo trucks in the country. In line with the longterm Volvo
Group strategy, Volvo Trucks is therefore expanding its business operation in China.
“We are committed to shaping the future of sustainable transport solutions. With our longstanding presence in China, we are growing our sales, and we are expand ing our strong network of sales and service points together with our private dealer partners. Over the last couple of years, we have seen a fast development of the logistics markets and an increasing demand for our premium trucks and services. To meet the demand from Chinese transport operators, the time is right for us to establish a regional value chain with our own heavyduty truck
manufacturing in China” , says Roger Alm, President of Volvo Trucks.
The operations in Taiyuan will include stamping, welding, manufacturing of cabs, painting and the final assembly of Volvo trucks. After investment, within a few years, the plant will have the capacity to produce 15,000 Volvo trucks per year with the poten tial to increase the capacity further. The transaction is subject to customary closing conditions, including regulatory approvals.
58
Board of Directors’ Report 2021 / Segments / Trucks
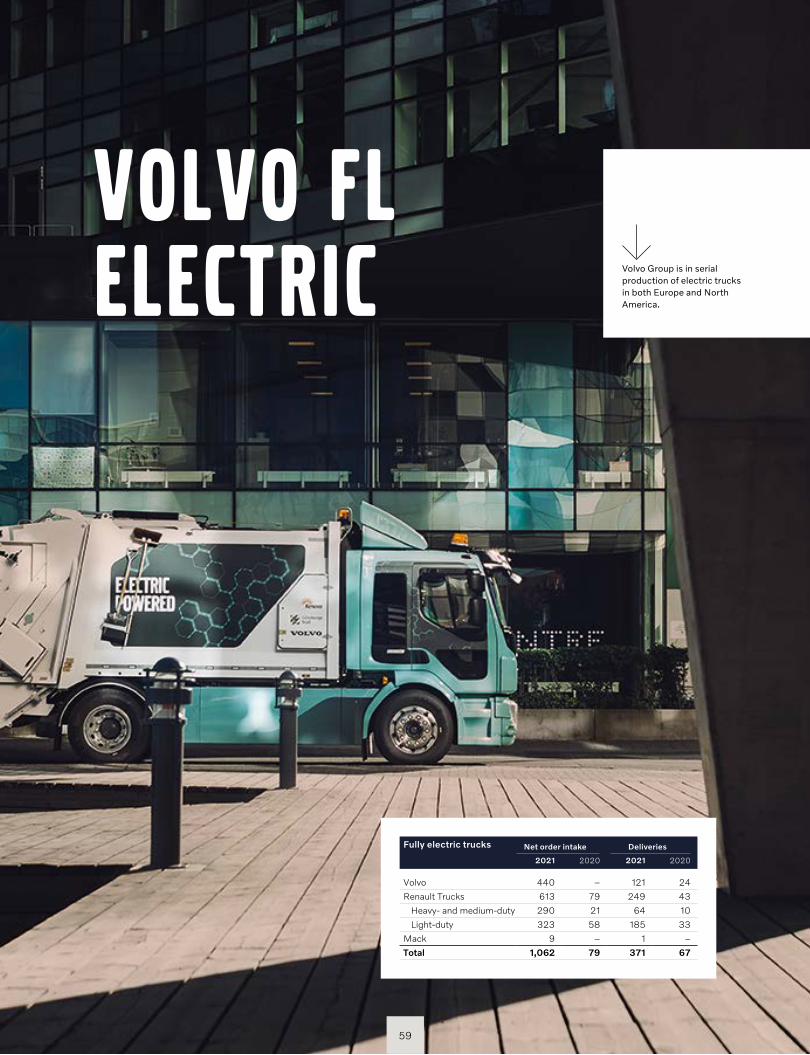
VOLVO FL ELECTRIC Volvo Group is in serial
production of electric trucks in both Europe and North America.
Fully electric trucks Net order intake Deliveries
2021 2020 2021 2020
Volvo 440 – 121 24
Renault Trucks 613 79 249 43
Heavy- and medium-duty 290 21 64 10
Light-duty 323 58 185 33
Mack 9 – 1 –
Total 1,062 79 371 67
59
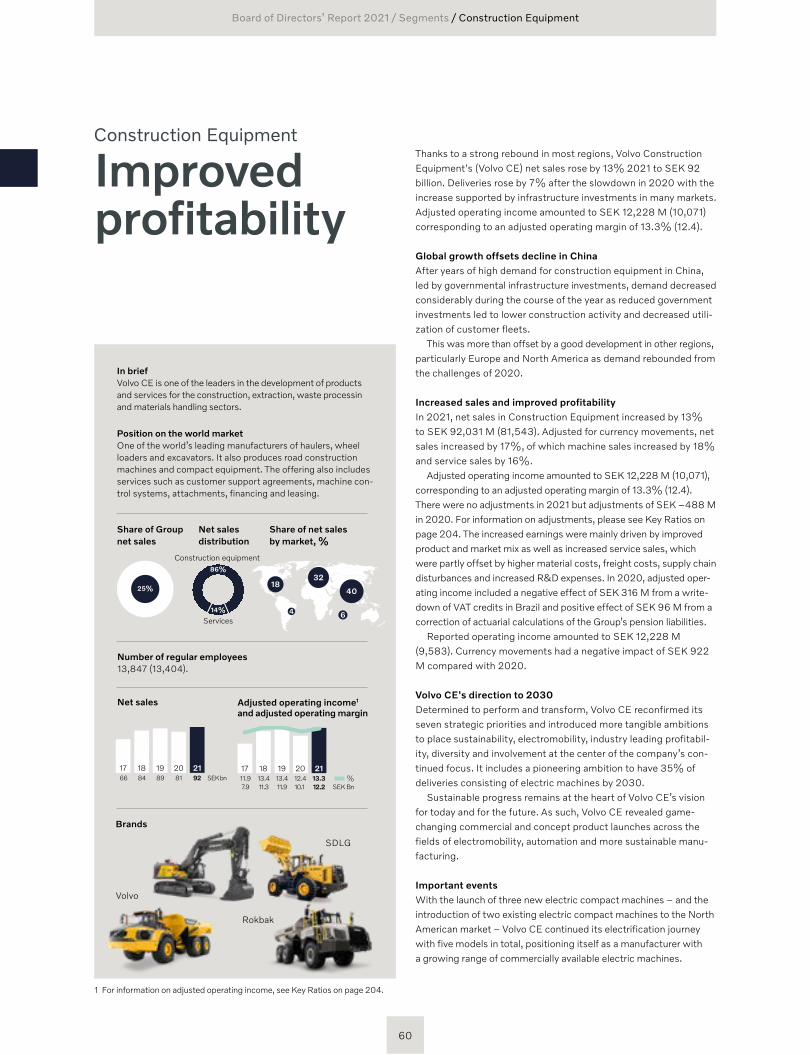
Thanks to a strong rebound in most regions, Volvo Construction Equipment's (Volvo CE) net sales rose by 13% 2021 to SEK 92 billion. Deliveries rose by 7% after the slowdown in 2020 with the increase supported by infrastructure investments in many markets. Adjusted operating income amounted to SEK 12,228 M (10,071) corresponding to an adjusted operating margin of 13.3% (12.4).
Global growth offsets decline in ChinaAfter years of high demand for construction equipment in China, led by governmental infrastructure investments, demand decreased considerably during the course of the year as reduced government investments led to lower construction activity and decreased utili-zation of customer fleets.
This was more than offset by a good development in other regions, particularly Europe and North America as demand rebounded from the challenges of 2020.
Increased sales and improved profitabilityIn 2021, net sales in Construction Equipment increased by 13% to SEK 92,031 M (81,543). Adjusted for currency movements, net sales increased by 17%, of which machine sales increased by 18% and service sales by 16%.
Adjusted operating income amounted to SEK 12,228 M (10,071), corresponding to an adjusted operating margin of 13.3% (12.4). There were no adjustments in 2021 but adjustments of SEK –488 M in 2020. For information on adjustments, please see Key Ratios on page 204. The increased earnings were mainly driven by improved product and market mix as well as increased service sales, which were partly offset by higher material costs, freight costs, supply chain disturbances and increased R&D expenses. In 2020, adjusted oper-ating income included a negative effect of SEK 316 M from a write-down of VAT credits in Brazil and positive effect of SEK 96 M from a correction of actuarial calculations of the Group’s pension liabilities.
Reported operating income amounted to SEK 12,228 M (9,583). Currency movements had a negative impact of SEK 922 M compared with 2020.
Volvo CE's direction to 2030Determined to perform and transform, Volvo CE reconfirmed its seven strategic priorities and introduced more tangible ambitions to place sustainability, electromobility, industry leading profitabil-ity, diversity and involvement at the center of the company’s con-tinued focus. It includes a pioneering ambition to have 35% of deliveries consisting of electric machines by 2030.
Sustainable progress remains at the heart of Volvo CE’s vision for today and for the future. As such, Volvo CE revealed game-changing commercial and concept product launches across the fields of electromobility, automation and more sustainable manu-facturing.
Important eventsWith the launch of three new electric compact machines – and the introduction of two existing electric compact machines to the North American market – Volvo CE continued its electrification journey with five models in total, positioning itself as a manufacturer with a growing range of commercially available electric machines.
Construction Equipment
Improved profitability
Number of regular employees 13,847 (13,404).
191817 20 2166 84 89 81 92 SEK bn
Net sales
191817 20 21
SEK Bn%11.9 13.4 13.4 12.4 13.3
7.9 11.3 11.9 10.1 12.2
Adjusted operating income1 and adjusted operating margin
In briefVolvo CE is one of the leaders in the development of products and services for the construction, extraction, waste processin and materials handling sectors.
Position on the world market One of the world’s leading manufacturers of haulers, wheel loaders and excavators. It also produces road construction machines and compact equipment. The offering also includes services such as customer support agreements, machine con-trol systems, attachments, financing and leasing.
Share of net sales by market, %
Share of Group net sales
Net sales distribution
25%
Construction equipment 86%
14%
Services
1 For information on adjusted operating income, see Key Ratios on page 204.
3218
4 6
40
Brands
Volvo
Rokbak
SDLG
60
Board of Directors’ Report 2021 / Segments / Construction Equipment
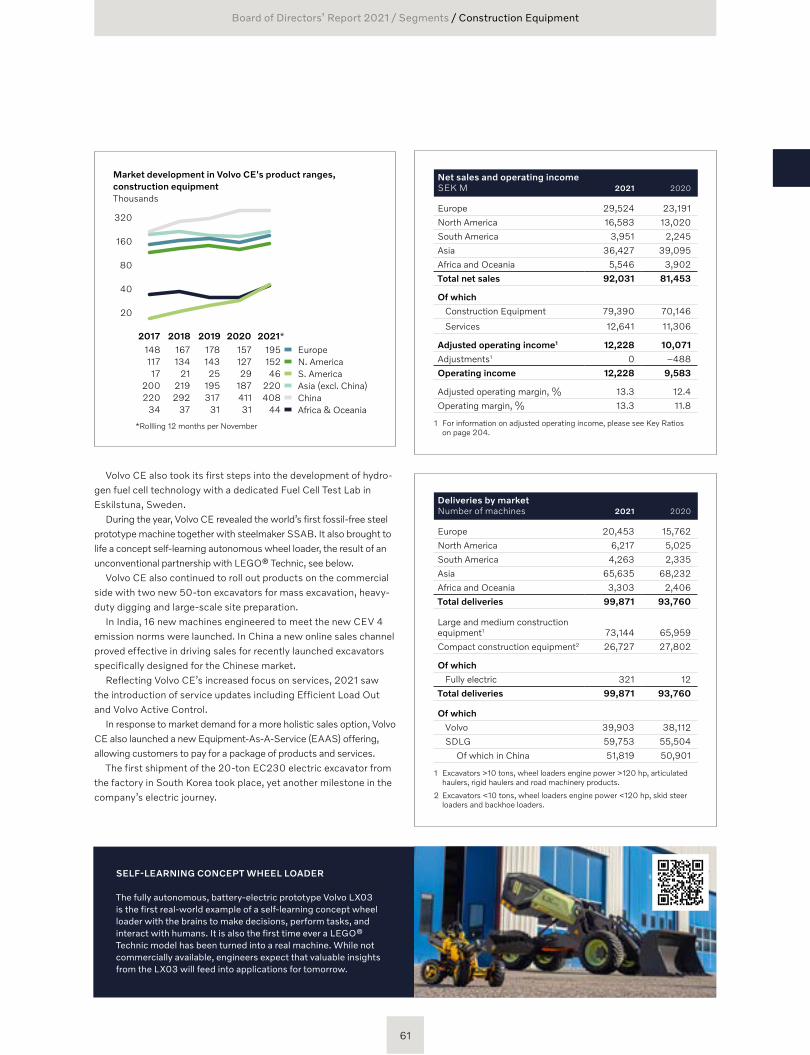
Volvo CE also took its first steps into the development of hydro-gen fuel cell technology with a dedicated Fuel Cell Test Lab in Eskilstuna, Sweden.
During the year, Volvo CE revealed the world’s first fossil-free steel prototype machine together with steelmaker SSAB. It also brought to life a concept self-learning autonomous wheel loader, the result of an unconventional partnership with LEGO® Technic, see below.
Volvo CE also continued to roll out products on the commercial side with two new 50-ton excavators for mass excavation, heavy-duty digging and large-scale site preparation.
In India, 16 new machines engineered to meet the new CEV 4 emission norms were launched. In China a new online sales channel proved effective in driving sales for recently launched excavators specifically designed for the Chinese market.
Reflecting Volvo CE’s increased focus on services, 2021 saw the introduction of service updates including Efficient Load Out and Volvo Active Control.
In response to market demand for a more holistic sales option, Volvo CE also launched a new Equipment-As-A-Service (EAAS) offering, allowing customers to pay for a package of products and services.
The first shipment of the 20-ton EC230 electric excavator from the factory in South Korea took place, yet another milestone in the company’s electric journey.
Deliveries by market Number of machines 2021 2020
Europe 20,453 15,762
North America 6,217 5,025
South America 4,263 2,335
Asia 65,635 68,232
Africa and Oceania 3,303 2,406
Total deliveries 99,871 93,760
Large and medium construction equipment1 73,144 65,959
Compact construction equipment2 26,727 27,802
Of which
Fully electric 321 12
Total deliveries 99,871 93,760
Of which
Volvo 39,903 38,112
SDLG 59,753 55,504
Of which in China 51,819 50,901
1 Excavators >10 tons, wheel loaders engine power >120 hp, articulated haulers, rigid haulers and road machinery products.
2 Excavators <10 tons, wheel loaders engine power <120 hp, skid steer loaders and backhoe loaders.
Net sales and operating income SEK M 2021 2020
Europe 29,524 23,191
North America 16,583 13,020
South America 3,951 2,245
Asia 36,427 39,095
Africa and Oceania 5,546 3,902
Total net sales 92,031 81,453
Of which
Construction Equipment 79,390 70,146
Services 12,641 11,306
Adjusted operating income1 12,228 10,071
Adjustments1 0 –488
Operating income 12,228 9,583
Adjusted operating margin, % 13.3 12.4
Operating margin, % 13.3 11.8
1 For information on adjusted operating income, please see Key Ratios on page 204.
40
20
80
160
320
Europe
*Rollling 12 months per November
N. AmericaS. AmericaAsia (excl. China)ChinaAfrica & Oceania
2017 2019 2020201814811717
200220
34
167134
21219292
37
17814325
195317
31
15712729
18741131
2021*19515246
220408
44
Market development in Volvo CE's product ranges, construction equipment Thousands
SELF-LEARNING CONCEPT WHEEL LOADER
The fully autonomous, batteryelectric prototype Volvo LX03 is the first realworld example of a selflearning concept wheel loader with the brains to make decisions, perform tasks, and interact with humans. It is also the first time ever a LEGO® Technic model has been turned into a real machine. While not commercially available, engineers expect that valuable insights from the LX03 will feed into applications for tomorrow.
61
Board of Directors’ Report 2021 / Segments / Construction Equipment
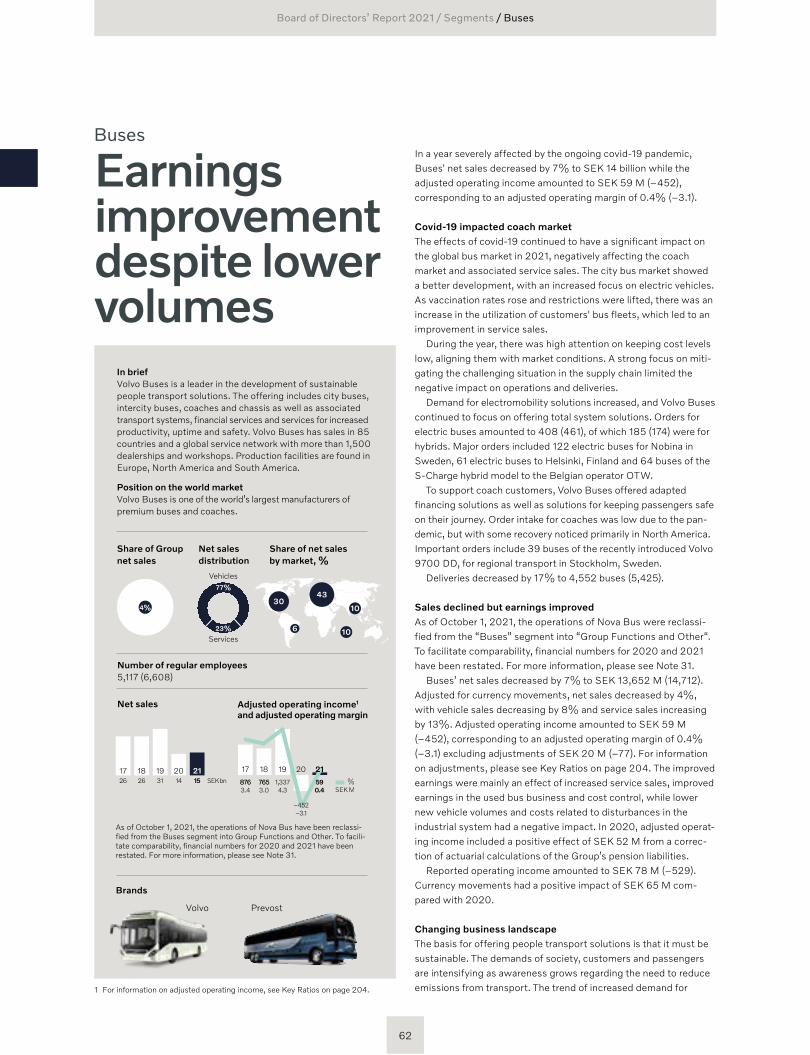
In a year severely affected by the ongoing covid-19 pandemic, Buses' net sales decreased by 7% to SEK 14 billion while the adjusted operating income amounted to SEK 59 M (–452), corresponding to an adjusted operating margin of 0.4% (–3.1).
Covid-19 impacted coach marketThe effects of covid-19 continued to have a significant impact on the global bus market in 2021, negatively affecting the coach market and associated service sales. The city bus market showed a better development, with an increased focus on electric vehicles. As vaccination rates rose and restrictions were lifted, there was an increase in the utilization of customers' bus fleets, which led to an improvement in service sales.
During the year, there was high attention on keeping cost levels low, aligning them with market conditions. A strong focus on miti-gating the challenging situation in the supply chain limited the negative impact on operations and deliveries.
Demand for electromobility solutions increased, and Volvo Buses continued to focus on offering total system solutions. Orders for electric buses amounted to 408 (461), of which 185 (174) were for hybrids. Major orders included 122 electric buses for Nobina in Sweden, 61 electric buses to Helsinki, Finland and 64 buses of the S-Charge hybrid model to the Belgian operator OTW.
To support coach customers, Volvo Buses offered adapted financing solutions as well as solutions for keeping passengers safe on their journey. Order intake for coaches was low due to the pan-demic, but with some recovery noticed primarily in North America. Important orders include 39 buses of the recently introduced Volvo 9700 DD, for regional transport in Stockholm, Sweden.
Deliveries decreased by 17% to 4,552 buses (5,425).
Sales declined but earnings improvedAs of October 1, 2021, the operations of Nova Bus were reclassi-fied from the “Buses” segment into “Group Functions and Other“. To facilitate comparability, financial numbers for 2020 and 2021 have been restated. For more information, please see Note 31.
Buses’ net sales decreased by 7% to SEK 13,652 M (14,712). Adjusted for currency movements, net sales decreased by 4%, with vehicle sales decreasing by 8% and service sales increasing by 13%. Adjusted operating income amounted to SEK 59 M (–452), corresponding to an adjusted operating margin of 0.4% (–3.1) excluding adjustments of SEK 20 M (–77). For information on adjustments, please see Key Ratios on page 204. The improved earnings were mainly an effect of increased service sales, improved earnings in the used bus business and cost control, while lower new vehicle volumes and costs related to disturbances in the industrial system had a negative impact. In 2020, adjusted operat-ing income included a positive effect of SEK 52 M from a correc-tion of actuarial calculations of the Group’s pension liabilities.
Reported operating income amounted to SEK 78 M (–529). Currency movements had a positive impact of SEK 65 M com-pared with 2020.
Changing business landscapeThe basis for offering people transport solutions is that it must be sustainable. The demands of society, customers and passengers are intensifying as awareness grows regarding the need to reduce emissions from transport. The trend of increased demand for
Buses
Earnings improvement despite lower volumes
Number of regular employees 5,117 (6,608)
191817 20 2126 26 31 14 SEK bn15
Net sales
20191817 21
SEK M%
3.4 3.0 4.3
–3.1
0.4876 765876 765 1,337
–452
59
Adjusted operating income1 and adjusted operating margin
As of October 1, 2021, the operations of Nova Bus have been reclassi-fied from the Buses segment into Group Functions and Other. To facili-tate comparability, financial numbers for 2020 and 2021 have been restated. For more information, please see Note 31.
Share of net sales by market, %
4330
6 10
10
In briefVolvo Buses is a leader in the development of sustainable people transport solutions. The offering includes city buses, intercity buses, coaches and chassis as well as associated transport systems, financial services and services for increased productivity, uptime and safety. Volvo Buses has sales in 85 countries and a global service network with more than 1,500 dealerships and workshops. Production facilities are found in Europe, North America and South America.
Position on the world market Volvo Buses is one of the world’s largest manufacturers of premium buses and coaches.
1 For information on adjusted operating income, see Key Ratios on page 204.
Share of Group net sales
Net sales distribution
4%
Vehicles77%
23%
Services
Brands
Volvo Prevost
62
Board of Directors’ Report 2021 / Segments / Buses
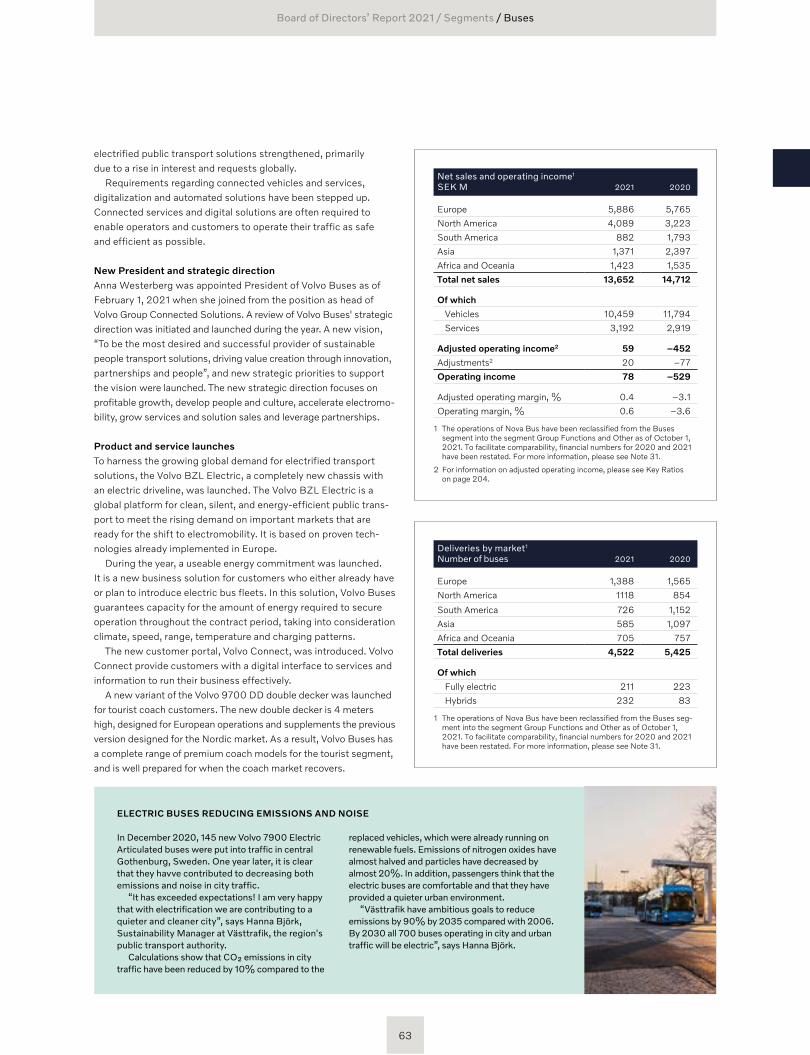
Deliveries by market1 Number of buses 2021 2020
Europe 1,388 1,565
North America 1118 854
South America 726 1,152
Asia 585 1,097
Africa and Oceania 705 757
Total deliveries 4,522 5,425
Of which
Fully electric 211 223
Hybrids 232 83
1 The operations of Nova Bus have been reclassified from the Buses seg-ment into the segment Group Functions and Other as of October 1, 2021. To facilitate comparability, financial numbers for 2020 and 2021 have been restated. For more information, please see Note 31.
Net sales and operating income1 SEK M 2021 2020
Europe 5,886 5,765
North America 4,089 3,223
South America 882 1,793
Asia 1,371 2,397
Africa and Oceania 1,423 1,535
Total net sales 13,652 14,712
Of which
Vehicles 10,459 11,794
Services 3,192 2,919
Adjusted operating income2 59 –452
Adjustments2 20 –77
Operating income 78 –529
Adjusted operating margin, % 0.4 –3.1
Operating margin, % 0.6 –3.6
1 The operations of Nova Bus have been reclassified from the Buses segment into the segment Group Functions and Other as of October 1, 2021. To facilitate comparability, financial numbers for 2020 and 2021 have been restated. For more information, please see Note 31.
2 For information on adjusted operating income, please see Key Ratios on page 204.
ELECTRIC BUSES REDUCING EMISSIONS AND NOISE
In December 2020, 145 new Volvo 7900 Electric Articulated buses were put into traffic in central Gothenburg, Sweden. One year later, it is clear that they havve contributed to decreasing both emissions and noise in city traffic.
“It has exceeded expectations! I am very happy that with electrification we are contributing to a quieter and cleaner city” , says Hanna Björk, Sustainability Manager at Västtrafik, the region's public transport authority.
Calculations show that CO₂ emissions in city traffic have been reduced by 10% compared to the
replaced vehicles, which were already running on renewable fuels. Emissions of nitrogen oxides have almost halved and particles have decreased by almost 20%. In addition, passengers think that the electric buses are comfortable and that they have provided a quieter urban environment.
“Västtrafik have ambitious goals to reduce emissions by 90% by 2035 compared with 2006. By 2030 all 700 buses operating in city and urban traffic will be electric” , says Hanna Björk.
electrified public transport solutions strengthened, primarily due to a rise in interest and requests globally.
Requirements regarding connected vehicles and services, digitalization and automated solutions have been stepped up. Connected services and digital solutions are often required to enable operators and customers to operate their traffic as safe and efficient as possible.
New President and strategic directionAnna Westerberg was appointed President of Volvo Buses as of February 1, 2021 when she joined from the position as head of Volvo Group Connected Solutions. A review of Volvo Buses' strategic direction was initiated and launched during the year. A new vision, “To be the most desired and successful provider of sustainable people transport solutions, driving value creation through innovation, partnerships and people” , and new strategic priorities to support the vision were launched. The new strategic direction focuses on profitable growth, develop people and culture, accelerate electromo-bility, grow services and solution sales and leverage partnerships.
Product and service launchesTo harness the growing global demand for electrified transport solutions, the Volvo BZL Electric, a completely new chassis with an electric driveline, was launched. The Volvo BZL Electric is a global platform for clean, silent, and energy-efficient public trans-port to meet the rising demand on important markets that are ready for the shift to electromobility. It is based on proven tech-nologies already implemented in Europe.
During the year, a useable energy commitment was launched. It is a new business solution for customers who either already have or plan to introduce electric bus fleets. In this solution, Volvo Buses guarantees capacity for the amount of energy required to secure operation throughout the contract period, taking into consideration climate, speed, range, temperature and charging patterns.
The new customer portal, Volvo Connect, was introduced. Volvo Connect provide customers with a digital interface to services and information to run their business effectively.
A new variant of the Volvo 9700 DD double decker was launched for tourist coach customers. The new double decker is 4 meters high, designed for European operations and supplements the previous version designed for the Nordic market. As a result, Volvo Buses has a complete range of premium coach models for the tourist segment, and is well prepared for when the coach market recovers.
63
Board of Directors’ Report 2021 / Segments / Buses
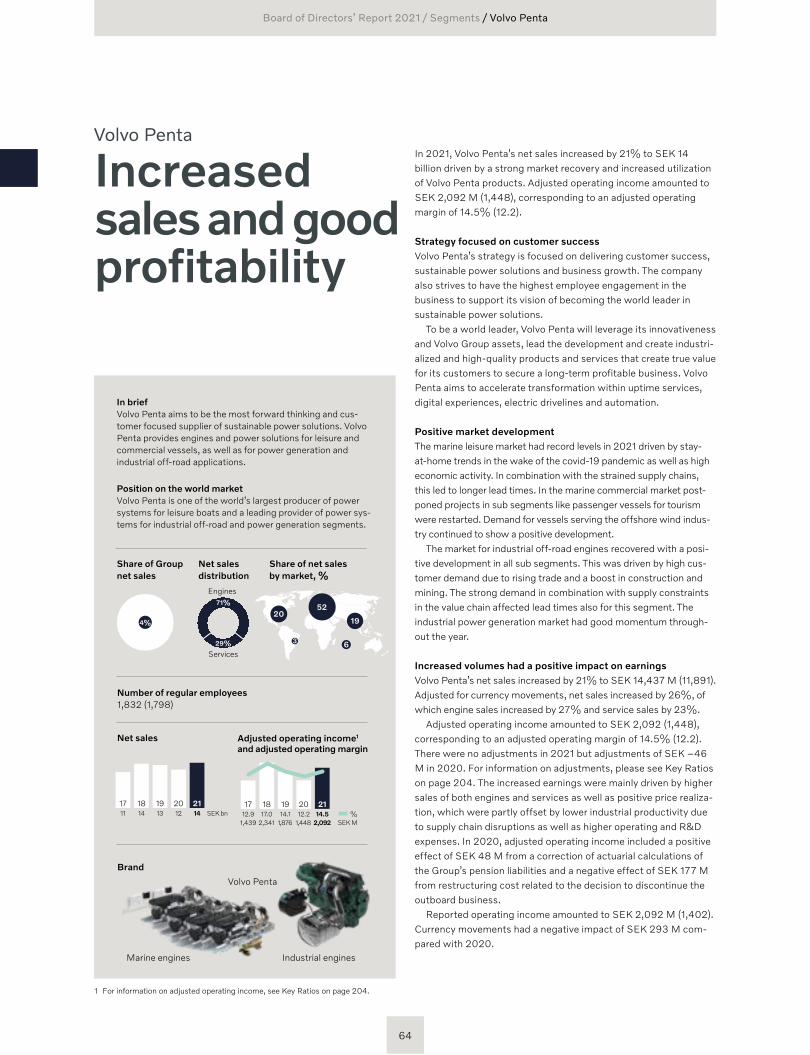
In 2021, Volvo Penta’s net sales increased by 21% to SEK 14 billion driven by a strong market recovery and increased utilization of Volvo Penta products. Adjusted operating income amounted to SEK 2,092 M (1,448), corresponding to an adjusted operating margin of 14.5% (12.2).
Strategy focused on customer successVolvo Penta’s strategy is focused on delivering customer success, sustainable power solutions and business growth. The company also strives to have the highest employee engagement in the business to support its vision of becoming the world leader in sustainable power solutions.
To be a world leader, Volvo Penta will leverage its innovativeness and Volvo Group assets, lead the development and create industri-alized and high-quality products and services that create true value for its customers to secure a long-term profitable business. Volvo Penta aims to accelerate transformation within uptime services, digital experiences, electric drivelines and automation.
Positive market developmentThe marine leisure market had record levels in 2021 driven by stay- at-home trends in the wake of the covid-19 pandemic as well as high economic activity. In combination with the strained supply chains, this led to longer lead times. In the marine commercial market post-poned projects in sub segments like passenger vessels for tourism were restarted. Demand for vessels serving the offshore wind indus-try continued to show a positive development.
The market for industrial off-road engines recovered with a posi-tive development in all sub segments. This was driven by high cus-tomer demand due to rising trade and a boost in construction and mining. The strong demand in combination with supply constraints in the value chain affected lead times also for this segment. The industrial power generation market had good momentum through-out the year.
Increased volumes had a positive impact on earningsVolvo Penta’s net sales increased by 21% to SEK 14,437 M (11,891). Adjusted for currency movements, net sales increased by 26%, of which engine sales increased by 27% and service sales by 23%.
Adjusted operating income amounted to SEK 2,092 (1,448), corresponding to an adjusted operating margin of 14.5% (12.2). There were no adjustments in 2021 but adjustments of SEK –46 M in 2020. For information on adjustments, please see Key Ratios on page 204. The increased earnings were mainly driven by higher sales of both engines and services as well as positive price realiza-tion, which were partly offset by lower industrial productivity due to supply chain disruptions as well as higher operating and R&D expenses. In 2020, adjusted operating income included a positive effect of SEK 48 M from a correction of actuarial calculations of the Group’s pension liabilities and a negative effect of SEK 177 M from restructuring cost related to the decision to discontinue the outboard business.
Reported operating income amounted to SEK 2,092 M (1,402). Currency movements had a negative impact of SEK 293 M com-pared with 2020.
Volvo Penta
Increased sales and good profitability
1 For information on adjusted operating income, see Key Ratios on page 204.
In briefVolvo Penta aims to be the most forward thinking and cus-tomer focused supplier of sustainable power solutions. Volvo Penta provides engines and power solutions for leisure and commercial vessels, as well as for power generation and industrial off-road applications.
Position on the world market Volvo Penta is one of the world’s largest producer of power systems for leisure boats and a leading provider of power sys-tems for industrial off-road and power generation segments.
Number of regular employees 1,832 (1,798)
20191817 2111 14 13 12 SEK bn14
Net sales
20191817 21
SEK M%
1,439 2,341 1,876 1,448 2,09214.512.9 17.0 14.1 12.2
Adjusted operating income1 and adjusted operating margin
Share of net sales by market, %
Share of Group net sales
Net sales distribution
Engines 71%
29%
Services
4%
5220
3 6
19
Brand
Industrial enginesMarine engines
Volvo Penta
64
Board of Directors’ Report 2021 / Segments / Volvo Penta
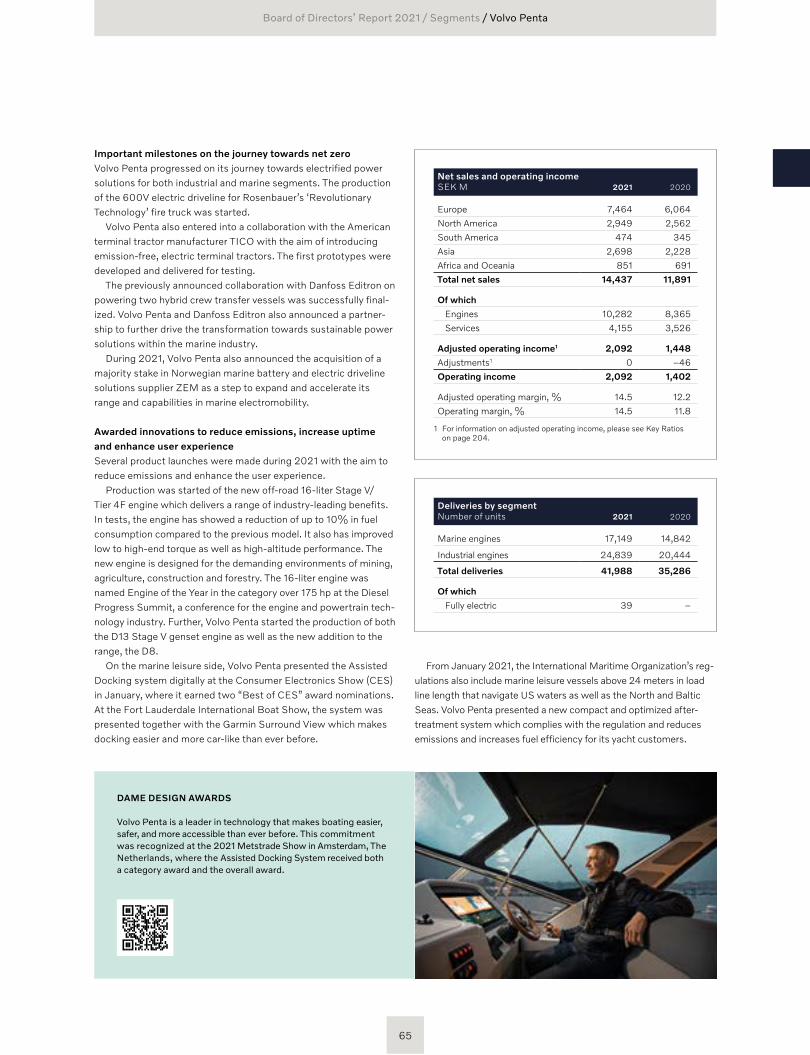
Important milestones on the journey towards net zeroVolvo Penta progressed on its journey towards electrified power solutions for both industrial and marine segments. The production of the 600V electric driveline for Rosenbauer’s ‘Revolutionary Technology’ fire truck was started.
Volvo Penta also entered into a collaboration with the American terminal tractor manufacturer TICO with the aim of introducing emission-free, electric terminal tractors. The first prototypes were developed and delivered for testing.
The previously announced collaboration with Danfoss Editron on powering two hybrid crew transfer vessels was successfully final-ized. Volvo Penta and Danfoss Editron also announced a partner-ship to further drive the transformation towards sustainable power solutions within the marine industry.
During 2021, Volvo Penta also announced the acquisition of a majority stake in Norwegian marine battery and electric driveline solutions supplier ZEM as a step to expand and accelerate its range and capabilities in marine electromobility.
Awarded innovations to reduce emissions, increase uptime and enhance user experienceSeveral product launches were made during 2021 with the aim to reduce emissions and enhance the user experience.
Production was started of the new off-road 16-liter Stage V/Tier 4F engine which delivers a range of industry-leading benefits. In tests, the engine has showed a reduction of up to 10% in fuel consumption compared to the previous model. It also has improved low to high-end torque as well as high-altitude performance. The new engine is designed for the demanding environments of mining, agriculture, construction and forestry. The 16-liter engine was named Engine of the Year in the category over 175 hp at the Diesel Progress Summit, a conference for the engine and powertrain tech-nology industry. Further, Volvo Penta started the production of both the D13 Stage V genset engine as well as the new addition to the range, the D8.
On the marine leisure side, Volvo Penta presented the Assisted Docking system digitally at the Consumer Electronics Show (CES) in January, where it earned two “Best of CES” award nominations. At the Fort Lauderdale International Boat Show, the system was presented together with the Garmin Surround View which makes docking easier and more car-like than ever before.
Net sales and operating income SEK M 2021 2020
Europe 7,464 6,064
North America 2,949 2,562
South America 474 345
Asia 2,698 2,228
Africa and Oceania 851 691
Total net sales 14,437 11,891
Of which
Engines 10,282 8,365
Services 4,155 3,526
Adjusted operating income1 2,092 1,448
Adjustments1 0 –46
Operating income 2,092 1,402
Adjusted operating margin, % 14.5 12.2
Operating margin, % 14.5 11.8
1 For information on adjusted operating income, please see Key Ratios on page 204.
Deliveries by segment Number of units 2021 2020
Marine engines 17,149 14,842
Industrial engines 24,839 20,444
Total deliveries 41,988 35,286
Of which
Fully electric 39 –
From January 2021, the International Maritime Organization’s reg-ulations also include marine leisure vessels above 24 meters in load line length that navigate US waters as well as the North and Baltic Seas. Volvo Penta presented a new compact and optimized after-treatment system which complies with the regulation and reduces emissions and increases fuel efficiency for its yacht customers.
DAME DESIGN AWARDS
Volvo Penta is a leader in technology that makes boating easier, safer, and more accessible than ever before. This commitment was recognized at the 2021 Metstrade Show in Amsterdam, The Netherlands, where the Assisted Docking System received both a category award and the overall award.
65
Board of Directors’ Report 2021 / Segments / Volvo Penta
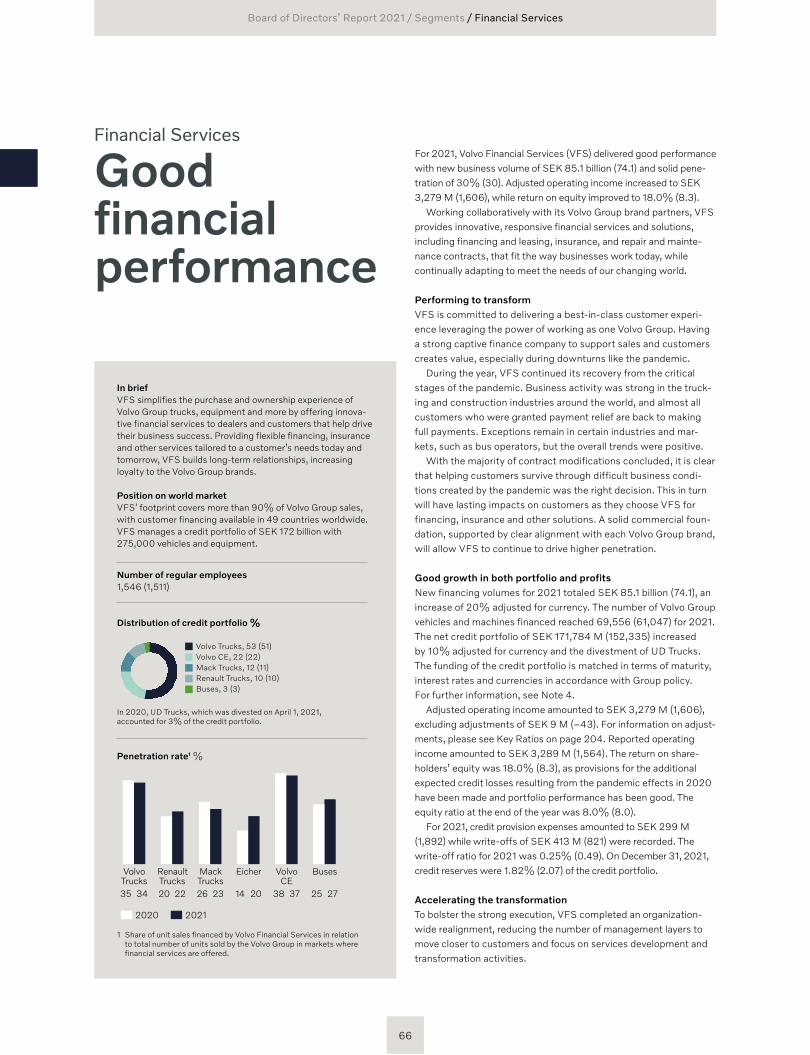
Financial Services
Good financial performance
For 2021, Volvo Financial Services (VFS) delivered good performance with new business volume of SEK 85.1 billion (74.1) and solid pene-tration of 30% (30). Adjusted operating income increased to SEK 3,279 M (1,606), while return on equity improved to 18.0% (8.3).
Working collaboratively with its Volvo Group brand partners, VFS provides innovative, responsive financial services and solutions, including financing and leasing, insurance, and repair and mainte-nance contracts, that fit the way businesses work today, while continually adapting to meet the needs of our changing world.
Performing to transformVFS is committed to delivering a best-in-class customer experi-ence leveraging the power of working as one Volvo Group. Having a strong captive finance company to support sales and customers creates value, especially during downturns like the pandemic.
During the year, VFS continued its recovery from the critical stages of the pandemic. Business activity was strong in the truck-ing and construction industries around the world, and almost all customers who were granted payment relief are back to making full payments. Exceptions remain in certain industries and mar-kets, such as bus operators, but the overall trends were positive.
With the majority of contract modifications concluded, it is clear that helping customers survive through difficult business condi-tions created by the pandemic was the right decision. This in turn will have lasting impacts on customers as they choose VFS for financing, insurance and other solutions. A solid commercial foun-dation, supported by clear alignment with each Volvo Group brand, will allow VFS to continue to drive higher penetration.
Good growth in both portfolio and profitsNew financing volumes for 2021 totaled SEK 85.1 billion (74.1), an increase of 20% adjusted for currency. The number of Volvo Group vehicles and machines financed reached 69,556 (61,047) for 2021. The net credit portfolio of SEK 171,784 M (152,335) increased by 10% adjusted for currency and the divestment of UD Trucks. The funding of the credit portfolio is matched in terms of maturity, interest rates and currencies in accordance with Group policy. For further information, see Note 4.
Adjusted operating income amounted to SEK 3,279 M (1,606), excluding adjustments of SEK 9 M (–43). For information on adjust-ments, please see Key Ratios on page 204. Reported operating income amounted to SEK 3,289 M (1,564). The return on share-holders’ equity was 18.0% (8.3), as provisions for the additional expected credit losses resulting from the pandemic effects in 2020 have been made and portfolio performance has been good. The equity ratio at the end of the year was 8.0% (8.0).
For 2021, credit provision expenses amounted to SEK 299 M (1,892) while write-offs of SEK 413 M (821) were recorded. The write-off ratio for 2021 was 0.25% (0.49). On December 31, 2021, credit reserves were 1.82% (2.07) of the credit portfolio.
Accelerating the transformationTo bolster the strong execution, VFS completed an organization- wide realignment, reducing the number of management layers to move closer to customers and focus on services development and transformation activities.
In briefVFS simplifies the purchase and ownership experience of Volvo Group trucks, equipment and more by offering innova-tive financial services to dealers and customers that help drive their business success. Providing flexible financing, insurance and other services tailored to a customer’s needs today and tomorrow, VFS builds long-term relationships, increasing loyalty to the Volvo Group brands.
Position on world market VFS’ footprint covers more than 90% of Volvo Group sales, with customer financing available in 49 countries worldwide. VFS manages a credit portfolio of SEK 172 billion with 275,000 vehicles and equipment.
Number of regular employees 1,546 (1,511)
Distribution of credit portfolio %
Volvo Trucks, 53 (51)Volvo CE, 22 (22)Mack Trucks, 12 (11)Renault Trucks, 10 (10)Buses, 3 (3)
In 2020, UD Trucks, which was divested on April 1, 2021, accounted for 3% of the credit portfolio.
Penetration rate1 %
2020 2021
Eicher VolvoCE
BusesRenaultTrucks
VolvoTrucks
MackTrucks
2014 272537383435 2220 2326
1 Share of unit sales financed by Volvo Financial Services in relation to total number of units sold by the Volvo Group in markets where financial services are offered.
66
Board of Directors’ Report 2021 / Segments / Financial Services
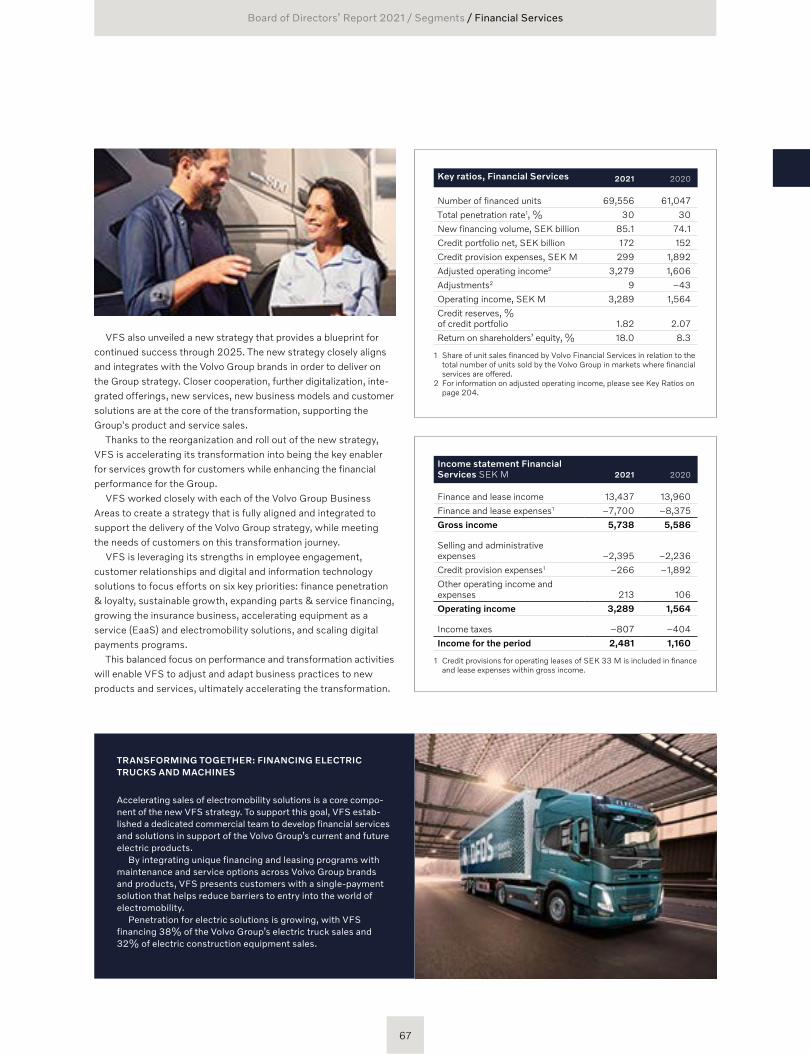
VFS also unveiled a new strategy that provides a blueprint for continued success through 2025. The new strategy closely aligns and integrates with the Volvo Group brands in order to deliver on the Group strategy. Closer cooperation, further digitalization, inte-grated offerings, new services, new business models and customer solutions are at the core of the transformation, supporting the Group's product and service sales.
Thanks to the reorganization and roll out of the new strategy, VFS is accelerating its transformation into being the key enabler for services growth for customers while enhancing the financial performance for the Group.
VFS worked closely with each of the Volvo Group Business Areas to create a strategy that is fully aligned and integrated to support the delivery of the Volvo Group strategy, while meeting the needs of customers on this transformation journey.
VFS is leveraging its strengths in employee engagement, customer relationships and digital and information technology solutions to focus efforts on six key priorities: finance penetration & loyalty, sustainable growth, expanding parts & service financing, growing the insurance business, accelerating equipment as a service (EaaS) and electromobility solutions, and scaling digital payments programs.
This balanced focus on performance and transformation activities will enable VFS to adjust and adapt business practices to new products and services, ultimately accelerating the transformation.
Key ratios, Financial Services 2021 2020
Number of financed units 69,556 61,047
Total penetration rate1, % 30 30
New financing volume, SEK billion 85.1 74.1
Credit portfolio net, SEK billion 172 152
Credit provision expenses, SEK M 299 1,892
Adjusted operating income2 3,279 1,606
Adjustments2 9 –43
Operating income, SEK M 3,289 1,564
Credit reserves, % of credit portfolio 1.82 2.07
Return on shareholders’ equity, % 18.0 8.3
1 Share of unit sales financed by Volvo Financial Services in relation to the total number of units sold by the Volvo Group in markets where financial services are offered.
2 For information on adjusted operating income, please see Key Ratios on page 204.
Income statement Financial Services SEK M 2021 2020
Finance and lease income 13,437 13,960
Finance and lease expenses1 –7,700 –8,375
Gross income 5,738 5,586
Selling and administrative expenses –2,395 –2,236
Credit provision expenses1 –266 –1,892
Other operating income and expenses 213 106
Operating income 3,289 1,564
Income taxes –807 –404
Income for the period 2,481 1,160
1 Credit provisions for operating leases of SEK 33 M is included in finance and lease expenses within gross income.
TRANSFORMING TOGETHER: FINANCING ELECTRIC TRUCKS AND MACHINES
Accelerating sales of electromobility solutions is a core compo-nent of the new VFS strategy. To support this goal, VFS estab-lished a dedicated commercial team to develop financial services and solutions in support of the Volvo Group’s current and future electric products.
By integrating unique financing and leasing programs with maintenance and service options across Volvo Group brands and products, VFS presents customers with a single-payment solution that helps reduce barriers to entry into the world of electromobility.
Penetration for electric solutions is growing, with VFS financing 38% of the Volvo Group’s electric truck sales and 32% of electric construction equipment sales.
67
Board of Directors’ Report 2021 / Segments / Financial Services
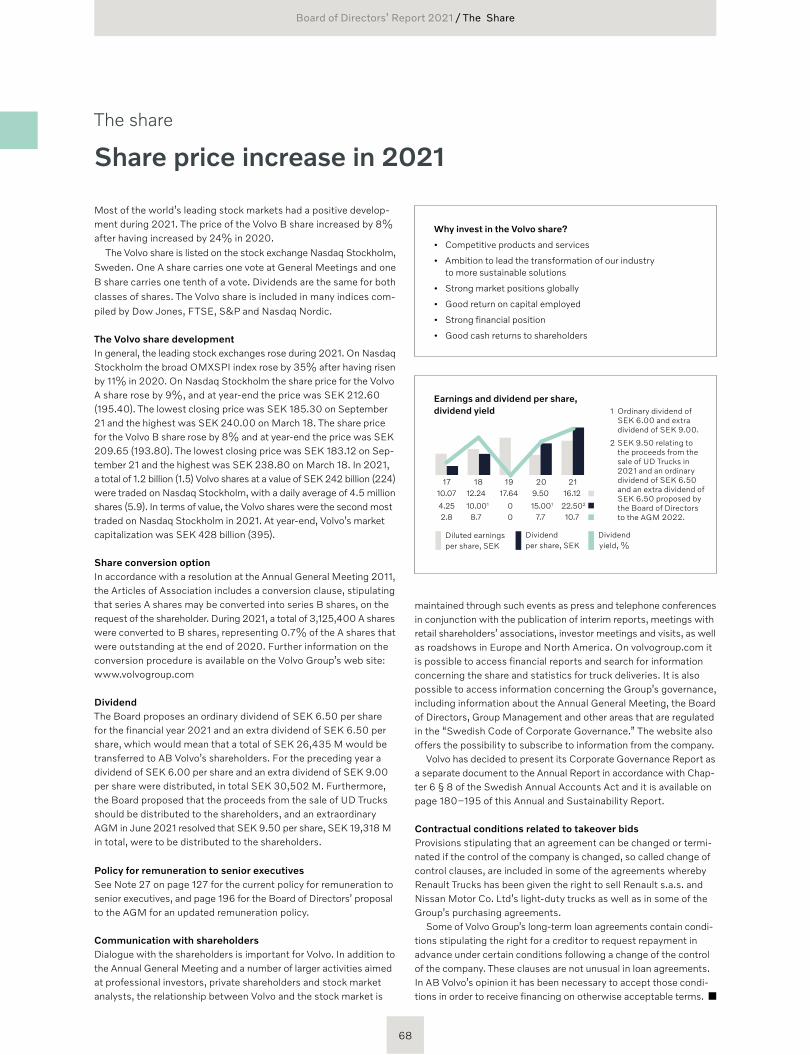
The share
Most of the world’s leading stock markets had a positive develop-ment during 2021. The price of the Volvo B share increased by 8% after having increased by 24% in 2020.
The Volvo share is listed on the stock exchange Nasdaq Stockholm, Sweden. One A share carries one vote at General Meetings and one B share carries one tenth of a vote. Dividends are the same for both classes of shares. The Volvo share is included in many indices com-piled by Dow Jones, FTSE, S&P and Nasdaq Nordic.
The Volvo share developmentIn general, the leading stock exchanges rose during 2021. On Nasdaq Stockholm the broad OMXSPI index rose by 35% after having risen by 11% in 2020. On Nasdaq Stockholm the share price for the Volvo A share rose by 9%, and at year-end the price was SEK 212.60 (195.40). The lowest closing price was SEK 185.30 on September 21 and the highest was SEK 240.00 on March 18. The share price for the Volvo B share rose by 8% and at year-end the price was SEK 209.65 (193.80). The lowest closing price was SEK 183.12 on Sep-tember 21 and the highest was SEK 238.80 on March 18. In 2021, a total of 1.2 billion (1.5) Volvo shares at a value of SEK 242 billion (224) were traded on Nasdaq Stockholm, with a daily average of 4.5 million shares (5.9). In terms of value, the Volvo shares were the second most traded on Nasdaq Stockholm in 2021. At year-end, Volvo’s market capitalization was SEK 428 billion (395).
Share conversion optionIn accordance with a resolution at the Annual General Meeting 2011, the Articles of Association includes a conversion clause, stipulating that series A shares may be converted into series B shares, on the request of the shareholder. During 2021, a total of 3,125,400 A shares were converted to B shares, representing 0.7% of the A shares that were outstanding at the end of 2020. Further information on the conversion procedure is available on the Volvo Group’s web site: www. volvogroup.com
DividendThe Board proposes an ordinary dividend of SEK 6.50 per share for the financial year 2021 and an extra dividend of SEK 6.50 per share, which would mean that a total of SEK 26,435 M would be transferred to AB Volvo’s shareholders. For the preceding year a dividend of SEK 6.00 per share and an extra dividend of SEK 9.00 per share were distributed, in total SEK 30,502 M. Furthermore, the Board proposed that the proceeds from the sale of UD Trucks should be distributed to the shareholders, and an extraordinary AGM in June 2021 resolved that SEK 9.50 per share, SEK 19,318 M in total, were to be distributed to the shareholders.
Policy for remuneration to senior executivesSee Note 27 on page 127 for the current policy for remuneration to senior executives, and page 196 for the Board of Directors’ proposal to the AGM for an updated remuneration policy.
Communication with shareholdersDialogue with the shareholders is important for Volvo. In addition to the Annual General Meeting and a number of larger activities aimed at professional investors, private shareholders and stock market analysts, the relationship between Volvo and the stock market is
maintained through such events as press and telephone conferences in conjunction with the publication of interim reports, meetings with retail shareholders’ associations, investor meetings and visits, as well as roadshows in Europe and North America. On volvogroup.com it is possible to access financial reports and search for information concerning the share and statistics for truck deliveries. It is also possible to access information concerning the Group’s governance, including information about the Annual General Meeting, the Board of Directors, Group Management and other areas that are regulated in the “Swedish Code of Corporate Governance.” The website also offers the possibility to subscribe to information from the company.
Volvo has decided to present its Corporate Governance Report as a separate document to the Annual Report in accordance with Chap-ter 6 § 8 of the Swedish Annual Accounts Act and it is available on page 180–195 of this Annual and Sustainability Report.
Contractual conditions related to takeover bidsProvisions stipulating that an agreement can be changed or termi-nated if the control of the company is changed, so called change of control clauses, are included in some of the agreements whereby Renault Trucks has been given the right to sell Renault s.a.s. and Nissan Motor Co. Ltd’s light-duty trucks as well as in some of the Group’s purchasing agreements.
Some of Volvo Group’s long-term loan agreements contain condi-tions stipulating the right for a creditor to request repayment in advance under certain conditions following a change of the control of the company. These clauses are not unusual in loan agreements. In AB Volvo’s opinion it has been necessary to accept those condi-tions in order to receive financing on otherwise acceptable terms.
Why invest in the Volvo share?
• Competitive products and services
• Ambition to lead the transformation of our industry to more sustainable solutions
• Strong market positions globally
• Good return on capital employed
• Strong financial position
• Good cash returns to shareholders
Share price increase in 2021
Earnings and dividend per share, dividend yield
17 18 19 20 21
Diluted earnings per share, SEK
Dividend per share, SEK
Dividend yield, %
10.001
8.7
12.24
0
17.64
4.252.8
10.07
015.001
7.7
9.50
22.502
10.7
16.12
1 Ordinary dividend of SEK 6.00 and extra dividend of SEK 9.00.
2 SEK 9.50 relating to the proceeds from the sale of UD Trucks in 2021 and an ordinary dividend of SEK 6.50 and an extra dividend of SEK 6.50 proposed by the Board of Directors to the AGM 2022.
Board of Directors’ Report 2021 / The Share
68
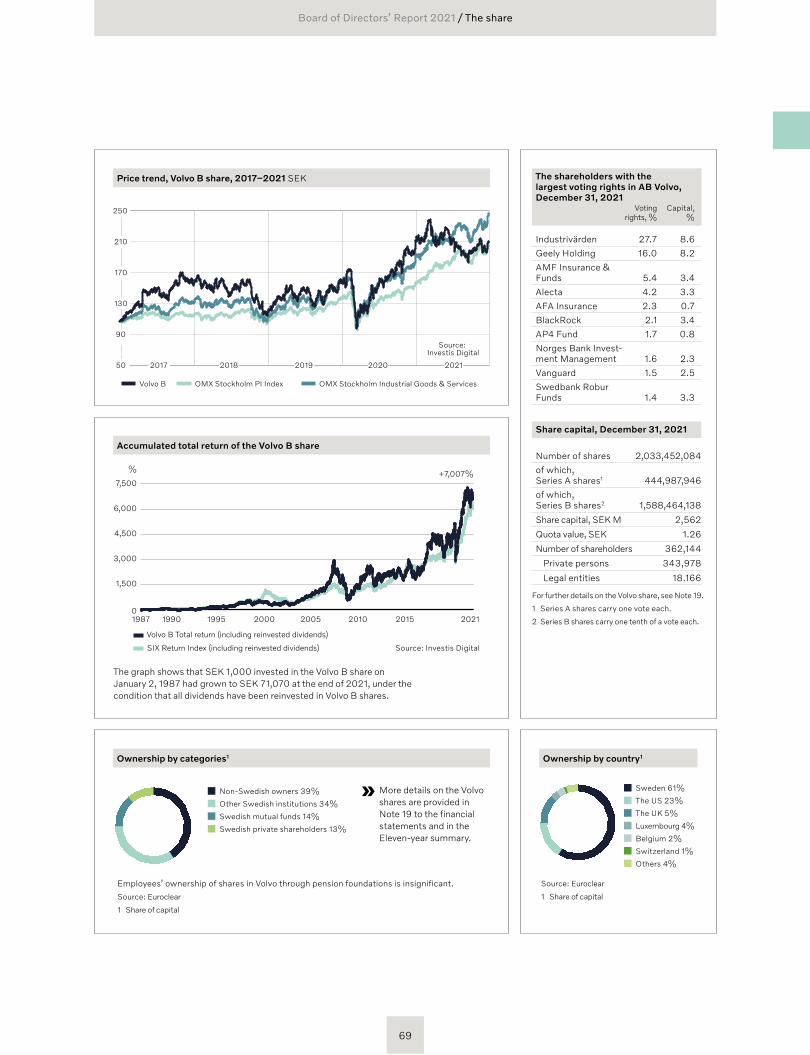
The shareholders with the largest voting rights in AB Volvo, December 31, 2021
Voting rights, %
Capital, %
Industrivärden 27.7 8.6
Geely Holding 16.0 8.2
AMF Insurance & Funds 5.4 3.4
Alecta 4.2 3.3
AFA Insurance 2.3 0.7
BlackRock 2.1 3.4
AP4 Fund 1.7 0.8
Norges Bank Invest-ment Management 1.6 2.3
Vanguard 1.5 2.5
Swedbank Robur Funds 1.4 3.3
Share capital, December 31, 2021
Number of shares 2,033,452,084
of which, Series A shares1 444,987,946
of which, Series B shares2 1,588,464,138
Share capital, SEK M 2,562
Quota value, SEK 1.26
Number of shareholders 362,144
Private persons 343,978
Legal entities 18.166
For further details on the Volvo share, see Note 19.
1 Series A shares carry one vote each.
2 Series B shares carry one tenth of a vote each.
Non-Swedish owners 39%
Other Swedish institutions 34%
Swedish mutual funds 14%
Swedish private shareholders 13%
More details on the Volvo shares are provided in Note 19 to the financial statements and in the Eleven-year summary.
Employees’ ownership of shares in Volvo through pension foundations is insignificant.
Source: Euroclear
1 Share of capital
Accumulated total return of the Volvo B share
Volvo B Total return (including reinvested dividends)
SIX Return Index (including reinvested dividends)
1990 1995 2000 2005 2010 20212015
Source: Investis Digital
1987
7,500
%
6,000
4,500
3,000
1,500
0
+7,007%
The graph shows that SEK 1,000 invested in the Volvo B share on January 2, 1987 had grown to SEK 71,070 at the end of 2021, under the condition that all dividends have been reinvested in Volvo B shares.
Source: Euroclear
1 Share of capital
Sweden 61%
The US 23%
The UK 5%
Luxembourg 4%
Belgium 2%
Switzerland 1%
Others 4%
50
90
130
250
210
170
2017 2018 2019 2020 2021
OMX Stockholm PI Index Volvo B OMX Stockholm Industrial Goods & Services
Source: Investis Digital
Price trend, Volvo B share, 2017–2021 SEK
Ownership by categories1 Ownership by country1
69
Board of Directors’ Report 2021 / The share
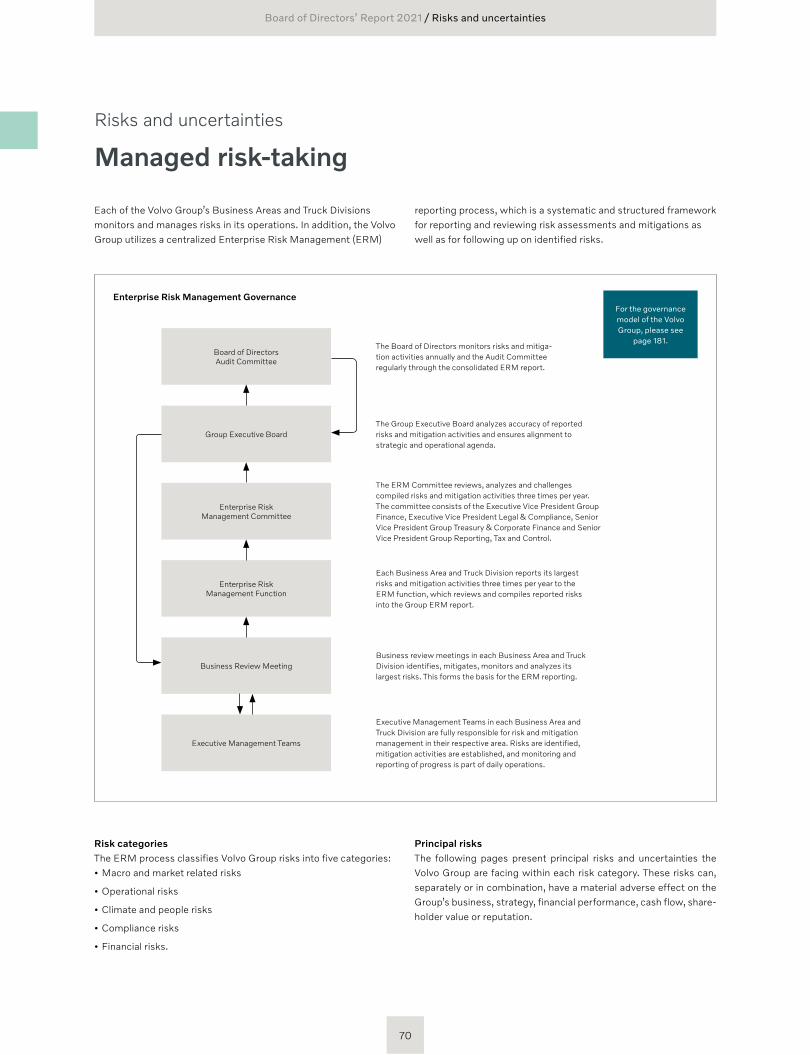
Risks and uncertainties
Managed risk-taking
Each of the Volvo Group’s Business Areas and Truck Divisions moni tors and manages risks in its operations. In addition, the Volvo Group utilizes a centralized Enterprise Risk Management (ERM)
Enterprise Risk Management GovernanceFor the governance model of the Volvo Group, please see
page 181.
The Group Executive Board analyzes accuracy of reported risks and mitigation activities and ensures alignment to strategic and operational agenda.
The Board of Directors monitors risks and mitiga-tion activities annually and the Audit Committee regularly through the consolidated ERM report.
The ERM Committee reviews, analyzes and challenges compiled risks and mitigation activities three times per year. The committee consists of the Executive Vice President Group Finance, Executive Vice President Legal & Compliance, Senior Vice President Group Treasury & Corporate Finance and Senior Vice President Group Reporting, Tax and Control.
Each Business Area and Truck Division reports its largest risks and mitigation activities three times per year to the ERM function, which reviews and compiles reported risks into the Group ERM report.
Business review meetings in each Business Area and Truck Division identifies, mitigates, monitors and analyzes its largest risks. This forms the basis for the ERM reporting.
Executive Management Teams in each Business Area and Truck Division are fully responsible for risk and miti gation management in their respective area. Risks are identified, mitigation activities are established, and monitoring and reporting of progress is part of daily operations.
Board of Directors Audit Committee
Group Executive Board
Enterprise Risk Management Committee
Enterprise Risk Management Function
Business Review Meeting
Executive Management Teams
reporting process, which is a systematic and structured framework for reporting and reviewing risk assessments and mitigations as well as for following up on identified risks.
Principal risksThe following pages present principal risks and uncertainties the Volvo Group are facing within each risk category. These risks can, separately or in combination, have a material adverse effect on the Group’s business, strategy, financial performance, cash flow, share-holder value or reputation.
Risk categoriesThe ERM process classifies Volvo Group risks into five categories: • Macro and market related risks
• Operational risks
• Climate and people risks
• Compliance risks
• Financial risks.
70
Board of Directors’ Report 2021 / Risks and uncertainties
MACRO AND MARKET RELATED RISKS
extensive and evolving. These laws and regulations result in an often complex, uncertain and changing legal and regulatory environment for Volvo Group’s global businesses and operations.
The Volvo Group works actively to ensure compliance with appli-cable laws and regulations and endeavors to collaborate and be transparent with all governing bodies in certification and compliance processes, during development and throughout the lifecycle of Group products as well as in investments in production plants, but can provide no assurance that it will at all times be fully compliant. If the Volvo Group has failed or fails to comply with these laws, regulations and requirements it could be subject to costs of recalls and other remediation, significant penalties and other sanctions and liability as well as reputational damage. A failure to meet applicable laws and regulations in this area could also imply a failure to assure an updated and compliant product and service range in time to meet regulations which could have a material adverse effect on the Volvo Group’s business, operating results, financial conditions and brand.
In addition, safety regulations are also becoming increasingly important with autonomous vehicles in commercial applications. If regulations are not set, or not clear enough, there is a risk of not being able to scale up the autonomous offer, or not complying with regulations. A safety incident could have a detrimental effect on the Group’s brand image and possible earnings. An incident in the industry could also lead to quickly adjusted or additional regulations.
Political instability and security The Volvo Group is active in more than 190 countries across the world. Political instability, armed conflicts or civil unrest can impact the Group’s ability to trade in affected areas. Acts of terrorism, sab-otage, and other criminal or malicious activities directed towards the Volvo Group’s people, information systems, products, production systems, or facilities, or those of its business partners, suppliers or customers, could cause harm to people and severely damage the Group’s operations and brand reputation.
The changing geopolitical situation and potential trade sanctions may also give rise to further tariffs and other trade restrictions and barriers being imposed, which can negatively impact the Group’s production system and ability to conduct its operations.
Cyclical commercial vehicles industry The Volvo Group’s customers operate all over the world, some within a single country and others across borders. A multitude of global and regional economic, regulatory, digital, technological, climate and energy resource efficiency factors contribute to a considerable volatility in demand and risks in different markets.
Like many capital goods industries, the commercial vehicle indus-try generally has been cyclical, impacted by e.g. developments of GDP and corresponding changes in transport demand, the need to replace aging vehicles and machines and changing laws and regu-lations. Although there is a continued shift in focus in the commercial vehicle industry from product to service, the cyclicality in the indus-try remains. Fluctuating demand for the Group’s products and ser-vices makes the financial result of the operations dependent on the Group’s ability to react quickly to market changes.
Inability to adapt to changes in demand could lead to capacity constraints or underutilization of resources, which could have a negative effect on earnings and financial position.
CompetitionThe Volvo Group operates in markets which are highly competitive, and thus faces intense competition from global and local industry peers. The Volvo Group also encounters competition from new market entrants, seeking to offer e.g. sustainable transportation, increased logistics efficiency, new technologies and/or new business models. In this market environment, there can be no assurance that current or new competitors cannot be more successful than the Group in bringing new products and service solutions to the market, in implementing new technologies or collaboration models or in offering more attractively priced products, services or solutions.
RegulationsThe Volvo Group is subject to environmental, occupational health and safety laws and regulations that affect the operations, facilities, products and services in each of the jurisdictions in which the Volvo Group operates. In particular, regulations regarding exhaust emissions, noise, safety and pollutants from production plants and products are
OPERATIONAL RISKS
The driving factors of the transformation come from different sources that may not always correlate. Extensive and continuously evolving regulations and government actions set the legal framework. Social attitudes and customer preferences relating to climate change and the transition to a lower carbon economy are additional factors that the Volvo Group is impacted by. In addition, investor preferences and sentiment are more and more influenced by environmental, social and corporate governance (ESG) considerations. Changes in these factors, including the pace of change to any of these factors, as well as the pace of the transition itself, could have an adverse impact on
Transformation and technology riskThe ongoing and accelerating transformation of the transport and vehicle industry towards climate-neutral and sustainable transporta-tion and infrastructure solutions entails various transitional risks for the Volvo Group. The Volvo Group’s future business success depends on its ability to develop new, attractive, competitive and energy-effi-cient products as well as to successfully position itself in this industry shift. Failure to develop products in line with demand and regulations, especially in view of digitalization, electromobility and autonomous solutions could adversely impact the Group’s operations.
Board of Directors’ Report 2021 / Risks and uncertainties
71
the result of strategic business decisions and, in the end, on the overall business of the Volvo Group. Changes in investor prefer-ences and sentiment could significantly affect the Volvo Group’s business plans and financial performance.
Compliance with CO₂, fuel efficiency and emission control require-ments might lead to a need to accelerate introduction of significant volumes of electric vehicles as well as implementing additional new technologies for conventional diesel engines. There can be no assur-ance that such new technologies and solutions can be produced and sold profitably or that customers will purchase those in the quanti-ties needed to meet the regulatory requirements. Even if challenges in these areas are resolved and handled, they could have a negative impact on the Group’s reputation, usage of resources, cost of pro-duction or cost of product recalls, and may result in adverse effects on earnings and financial position.
Many of the new products and technologies are still in early stages of development which – together with the lack of broadly accepted standards – poses significant risks for the Volvo Group as it is required to choose relevant technologies, quality of products and time their introduction wisely, while respecting the wide spread in readiness level among markets and segments across the globe. If the Volvo Group miscalculates, delays recognition of, or fails to adapt its prod-ucts and services to trends, legal and customer requirements in indi-vidual markets or other changes in demand, it could have a material adverse impact on the Group’s results of operations, financial condition and cash flows.
New business modelsThe transport and vehicle industry is facing new technologies, busi-ness models, competitors and global trends such as digitalization which combined create a highly disruptive environment. These factors are shifting the Volvo Group from a heavy commercial vehicle manu-facturer to more of a provider of transport and logistics solutions. The Volvo Group has, during the last couple of years, continuously invested in new business models and new technologies to be able to offer safer, more sustainable and more productive solutions to its customers. Going forward, a new transport landscape will continue to emerge and will impact large parts of the Volvo Group’s operations and way of working, entailing risks related to the ability to respond to specific customer needs with tailored services and the availability of technological innovations that respond to the major trends of the industry (i.e. digitalization, electromobility and autonomous solu-tions). If the Volvo Group miscalculates, delays recognition of, or fails to adapt its services to trends, legal and customer requirements or other changes in demand, it could have a material adverse impact on the Group’s results of operations, financial condition and cash flows.
An additional level of risk relates to the need to evolve from a vehicle/product focus towards an ecosystem-driven approach, where vehicles and infrastructures are to be developed and implemented simultaneously. The transition to electrification also depends upon external factors such as the existence of a functioning charging infrastructure and access to renewable energy sources to power battery electric and fuel cell electric products. If the Volvo Group positions itself unsuccessfully in this technology shift, earnings capacity and financial standing could be severely affected.
Industrial operations Our ability to deliver in accordance with market demand and product quality expectations depends significantly on obtaining a timely and adequate supply of materials, components and other vital services, as well as on our ability to properly utilize the capacity in the Group’s different production and service facilities. In 2021, our supply chain and industrial systems were strained in many areas due to e.g. short-ages of semiconductors and other materials and components, shortages of transport services and developments of the covid-19 pandemic and response measures taken. Further disturbances in the supply chain and industrial system can arise from a variety of factors, including continued or additional shortages of material, labor and components, strikes, pandemics or extreme weather, which each or in combination could result in stoppages and other interferences in production and deliveries, which may impair our ability to meet our customers’ orders, and thus negatively affect the Volvo Group’s business, reputation and results from operations.
Reliance on suppliers and scarce materialsThe ongoing technology shift into electrification and other new cus-tomer offerings, combined with required investments in traditional technologies, may move the industry and the Volvo Group towards reliance on new suppliers, new materials and on materials being used in new applications and in different quantities compared to traditional technologies. Some of these materials may pose a risk of supply due to scarcity or geopolitical, conflict or human rights concerns. At the same time the suppliers providing more traditional products might lose business and risk closing, which could leave the Volvo Group with a shortage of suppliers in a particular area and thereby a need to make investments.
Cost inflation and price increasesInflationary trends could occur for commodities and other materi-als which the Group purchase on the world market as well as on salaries and services. The ability to pass on such higher costs into price increases for products and services may be limited by com-petitive pressure or already committed prices to customers in order books and other agreements. Rising prices on commodities and other costs may therefore have a negative impact on the profit margin and negatively affect Group earnings.
Cybersecurity and IT infrastructureThe operation of many of the Volvo Group’s business processes depends on reliable information technology (IT) systems and infra-structure. This applies to e.g. production, logistics and sales, as well as products using connectivity and automation features. Disruptions, cyberattacks and other security threats against our products or busi-ness could harm the Volvo Group’s operations, reputation and have a significant adverse effect on earnings and financial position. Timely detection of cybersecurity and other security incidents is becoming increasingly complex, and the Volvo Group seeks to investigate and manage incidents with a view to prevent their recurrence.
72
Board of Directors’ Report 2021 / Risks and uncertainties
The Volvo Group relies on third parties where significant parts of maintenance and operations of the IT systems has been outsourced. The Volvo Group has taken precautions in the selection and ongoing management of these third parties, but events or incidents caused by vulnerabilities in their operations or products could cause disruption of operations, loss or leakage of data, reputational risk and financial losses.
Mergers and acquisitions, partnerships and divestmentsIn addition to the Volvo Group’s in-house work and focus on organic growth, the Volvo Group engages in acquisitions and divestments, as well as in JVs, partnerships and other forms of cooperation. These are essential parts in executing on our strategy. However, there can be no assurance that these transactions and cooperations become or remain successful, nor that they will deliver expected benefits. Acquisitions could e.g. result in incurrence of contingent liabilities and an increase in amortization expenses and impairments related to goodwill and other intangible assets, as well as unantici-pated difficulties in integration of an acquired entity. Divestments could present risks in e.g. the operational separation or through contractual undertakings or legal liabilities with respect to the business divested.
JVs and partnerships may fail to perform as expected for various reasons, including our or our partner’s incorrect assessment of needs and potential synergies, a failure to invest sufficient resources in the cooperation or a change of strategic direction that the cooperation fails to accommodate. Further, JVs and partnerships may restrict e.g. our ability to run independent operations within the scope of cooperation, and limitations in our or our partner’s operational and financial resources may restrain the capabilities of the cooperation.
Residual value commitments The Volvo Group sometimes offers customers to acquire Group products with a residual value commitment, meaning that the customer can return the asset at an agreed date and to an agreed price. The committed prices are established within each Business Area, which assumes the responsibility for maintaining a residual value matrix aiming to reflect fair future market values. Volvo Group will have a residual value risk if vehicles subject to residual value com-mitments and/or rebought vehicles can be sold only for a price below the vehicle’s committed residual value. A residual value commitment can also become a future used vehicle inventory risk if vehicles are not sold, affecting the cash flow negatively. For further information on residual value commitments, see Note 13 Tangible assets.
CLIMATE AND PEOPLE RISKS
Volvo Group Enterprise Risk Management process. These risks, including their potential financial impact, are described in more detail in under the risk categories “Regulations” , “Transformation and technology risk” , “New business models” and “Reliance on suppliers and scarce materials”.
People and cultureThe Volvo Group strongly believes that there is a high correlation between the Group’s future success and its capability to recruit, retain and develop qualified personnel. The Volvo Group counts on leveraging the full diversity of its workforce to fulfil customer demands. Managing the needed competence shift in the transfor-mation in specialized areas is key to succeed. To meet expectations from employees and other stakeholders, a strong focus is required on areas such as leadership, empowerment, employee engagement, human rights, Group culture and values, sharing of knowledge, and building diverse teams. Failure to do the right things in these areas can cause a negative impact on the Volvo Group’s reputation, as well as on the image as an employer and on the ability to recruit, retain and develop the knowledge and skills of the employees necessary to ensure customer success and the transition to new technologies.
PandemicsThe outbreak of pandemics throughout the world, such as the ongo-ing covid-19 pandemic, may lead to major disruptions in the econo-mies of many countries, including the Group’s key markets, and may impact global economic activity as well as Group performance negatively going forward. The duration and expected development of the covid-19 pandemic is unknown, and no predictions can be made in relation to future impacts. Any prolongation or worsening of the virus outbreak would, however, be expected to negatively affect the Group’s financial performance, and could have a material adverse effect on the Group’s business and financial development.
Climate riskThe scientific consensus indicates that emissions of greenhouse gases continue to alter the composition of the earth’s atmosphere in ways that are affecting, and are expected to continue to affect, the global climate. The potential impacts of climate change on the Volvo Group’s customers, product offerings, operations, facilities and suppliers are accelerating and uncertain, as they will be particular to local and customer-specific circumstances. As stated on page 154 in the Sustainability Notes, the Volvo Group has identified a number of climate-related transitional risks, which are incorporated into the
Board of Directors’ Report 2021 / Risks and uncertainties
73
COMPLIANCE RISKS
to use the Renault brand and trademarks are related to the truck operations only and are regulated by a license from Renault s.a.s., which owns the Renault brand and trademarks. In addition, the Volvo Group owns several other trademarks relating to its business.
Use in possible conflict with third-party intellectual property rights, or third-parties’ unauthorized use of the Volvo Group’s pro-prietary rights, may have significant business impact on the Group.
Legal proceedings In the normal course of business, the Volvo Group is involved in legal proceedings. These proceedings may relate to a number of topics, including vehicle safety and other product related claims, warranty claims, commercial disputes, intellectual property claims, allegations concerning health, environmental or safety issues, antitrust, tax or labor disputes and regulatory inquiries and investigations. Further, AB Volvo and other companies in the Group, as well as their officers, may be subject to claims alleging failures to comply with stock market regulations, securities law and other applicable rules and regulations. Legal proceedings can be expensive, lengthy, take up resources that could be used for other purposes and are often diffi-cult to predict. There can be no assurance that provisions, where recognized, for a particular legal proceeding will cover the costs of an adverse outcome, nor that unprovisioned proceedings will not give rise to any significant additional expenditure. Information about certain legal proceedings involving entities within the Volvo Group, see Note 21 Other Provisions and in Note 24 Contingent Liabilities.
Corruption and non-compliance with competition lawCorruption risks are primarily linked to the Volvo Group’s sales and supply chain activities but may also relate to administrative proce-dures, such as licensing and permitting. This includes activities of Volvo Group employees but may further extend to the activities of the Volvo Group’s business partners and intermediaries. The overall risk level therefore is affected by sales volumes, the way of distribution
Non-compliance with data protection laws Focus on Data Protection is increasing from authorities around the globe resulting in Data Protection laws entering into force. The EU General Data Protection Regulation (“GDPR”) introduced increased monetary penalties for breaches of the regulation and sets a standard applied in several other data protection laws throughout the juris-dictions in which Volvo Group operates. Non-compliance with data protection laws could expose the Group to fines and penalties and severe infringements may potentially cause authorities to issue instructions to stop processing of personal data, which could dis-rupt operations. The Group could also face litigations with persons allegedly affected by data protection violations. Data protection law infringements may hence involve severe negative impact for the busi-ness operations, including reputational damage and adverse effect on the Group’s earnings and financial standing.
Intangible assets The Volvo Group owns or otherwise has rights to patents, trademarks, designs and copyrights that relate to the products and services that the Group manufactures and markets. These rights have been developed or acquired over a number of years and are valuable to the operations of the Volvo Group. Further, in order to safeguard investments in R&D, the Volvo Group has an intellectual property plan defining the creation and use of its intellectual property rights.
The share of trade in counterfeit goods as a proportion of global trade has grown significantly. Products infringing on Volvo Group’s intellectual property rights are often of substandard quality and poses risks to the Group regarding safety of customers, vehicle perfor-mance, quality and emission levels that will affect public health and the climate, as well as the brand reputation.
AB Volvo and Volvo Car Corporation jointly own the Volvo brand and trademarks through Volvo Trademark Holding AB. AB Volvo has the exclusive right to use the Volvo name and trademark for its prod-ucts and services and according to a license agreement. Similarly, Volvo Car Corporation has the exclusive right to use the Volvo name and trademark for its products and services. The Volvo Group’s rights
Human rightsThe Volvo Group is committed to respecting internationally recog-nized human rights and avoiding causing or contributing to adverse human rights impacts in line with applicable legislation throughout the world, relevant global frameworks such as the UN Guiding Prin-ciples on Business and Human Rights (UNGP) and the UN Global Compact as well as its own standards.
Adverse human rights impacts may potentially materialize not only within the Group’s own organization, but also through the Group’s business relationships and in the value chain. The Group seeks to address adverse human rights impacts with which it may be involved. The consequences of human rights risks for the Volvo Group could range from liability to reputational and brand damage, depending
also on the severity of the nature of harm done. This depends on whether the Group is seen in breach of applicable laws or is seen as causing, contributing to or being directly linked to the harm done, as defined in the United Nations Guiding Principles on Business and Human Rights.
The Group is aware that conducting business in certain parts of the world constitutes higher risks for potential human rights viola-tions and therefore has identified certain countries where the Volvo Group has a substantial number of employees and/or close business partners that are considered to have elevated risk in this respect. The Group is also aware that certain purchasing and customer seg-ments constitutes higher risks for negative human rights impacts.
74
Board of Directors’ Report 2021 / Risks and uncertainties
and the fact that Volvo Group pursues business operations also in markets that are considered high risk from a corruption perspective.
Potential risks for non-compliance with competition law (e.g. price fixing, market sharing, unlawful information exchange, abuse of market power) are primarily linked to behavior of employees when interacting with competitors and other external stakeholders in various situations.
Corruption as well as competition law infringements may involve severe negative impacts for the business operations, including reputational damage, legal proceedings, fines and imprisonment of employees. The Group could also be affected by claims raised by persons or entities affected by allegedly non-compliant practices.
FINANCIAL RISKS
Interest rate risk Volvo Group’s net financial debt structure is exposed to fluctuations in market interest rates. Movements in interest-rate levels may impact the Group’s net income and cash flow or the value of financial assets and liabilities.
Currency riskThe Volvo Group’s global presence means that business is conducted in several different currency regions. More than 95% of the Group’s net sales are generated in countries other than Sweden. The Volvo Group’s cash flow, profitability, and balance sheet are impacted by fluctuations in foreign exchange rates.
Liquidity riskIt is of critical importance for the Volvo Group to assure a sufficient payment capability over time, to continuously manage demands and expectations from external stakeholders.
Sudden changes in the business cycle, unforeseen events within the financial markets, changes in the Volvo Group’s access to finan-cial markets, and changes in customers’ appetite for financing from the Group, may stress the Group’s liquidity preparedness.
Failure to properly manage the Group’s liquidity risks, may cause material adverse impact on earnings capability and financial standing.
ImpairmentThe Volvo Group has substantial values in goodwill and other in tan-gible assets on its balance sheet. Goodwill and other intangible assets not yet in use are not depreciated, hence there is a risk for impairment if the calculated recoverable amount is lower than the carrying amount. The calculated recoverable amounts differ between the operating segments and they are, to a varying degree, sensitive to changes in the business environment. Instability in the business performance and volatility in interest and currency rates may indi-cate a need for impairment. Please see Note 12 Intangible assets.
InsuranceThe Volvo Group generally takes out insurance coverage where it is legally or contractually obligated to do so and otherwise against such risks, in such amounts and on terms that it considers com-mercially motivated from time to time. Where insurance coverage cannot be procured on such terms, the Group can be exposed to material uninsured losses, which could have a materially adverse effect on Group operations and financial standing. For example, the Group is not fully insured against effects from flooding, earth-quakes and other natural disasters.
Credit riskThe Volvo Group is exposed to credit risk mainly through its sales to customers in the Industrial Operations, and its long-term credit receivables in its Financial Services operations. Total exposure as of December 31, 2021 can be found in Note 15 Customer-financing receivables and Note 16 Receivables. The Group is also exposed to financial credit risk due to short-term deposits with the Group’s core banks and unrealized results from derivatives used for hedging purposes. For further information, please see Note 4 Goals and pol-icies in financial risk management and Note 15 Customer- financing receivables. If several larger customers, dealers, or a core bank, fails to meet its undertakings the Group could suffer significant losses.
Pension commitmentsThe Volvo Group has substantial pension commitments, some of which are owed under defined benefit plans. Changes in assump-tions of interest and inflation rates, mortality, retirement age and pensionable remunerations could result in significant changes to the present value of already accrued benefit obligations as well as the cost of new benefit accruals, affecting funding level of such plans. The investment performance of pension assets may also substantially affect funding levels. Defined benefit plan assets are managed independently from the Group, with a significant portion of plan assets held in shares and other similar instruments that are exposed to market risks. Please see Note 20 Provisions for post-employment benefits for further information.
If there is a shortfall in benefit plans, the Volvo Group could be required to make substantial unexpected cash contributions, which would adversely affect cash flow and the Group’s financial position.
Board of Directors’ Report 2021 / Risks and uncertainties
75
Notes to the financial statementsNOTE PAGE
1 Accounting policies 772 Key sources of estimation uncertainty and
critical judgments79
3 Acquisitions and divestments of operations
80
4 Goals and policies in financial risk management
82
5 Investments in joint ventures, associated companies and other shares and participations
88
6 Segment reporting 927 Revenue 948 Other operating income and expenses 969 Other financial income and expenses 97
10 Income taxes 9711 Non-controlling interest 9912 Intangible assets 10013 Tangible assets 10214 Leasing 105
NOTE PAGE15 Customer-financing receivables 10816 Receivables 11017 Inventories 11218 Cash and cash equivalents 11319 Equity and number of shares 11420 Provisions for post-employment benefits 11521 Other provisions 12122 Liabilities 123
23 Assets pledged 12424 Contingent liabilities and contingent
assets125
25 Transactions with related parties 12626 Government grants 12627 Personnel 12728 Fees to the auditors 13229 Cash flow 13230 Financial instruments 13331 Changes in Volvo Group financial reporting 137
Financial Statements
Financial performance Page 45
Financial position Page 48
Changes in consolidated equity
Page 55
Cash flow statement Page 52
76
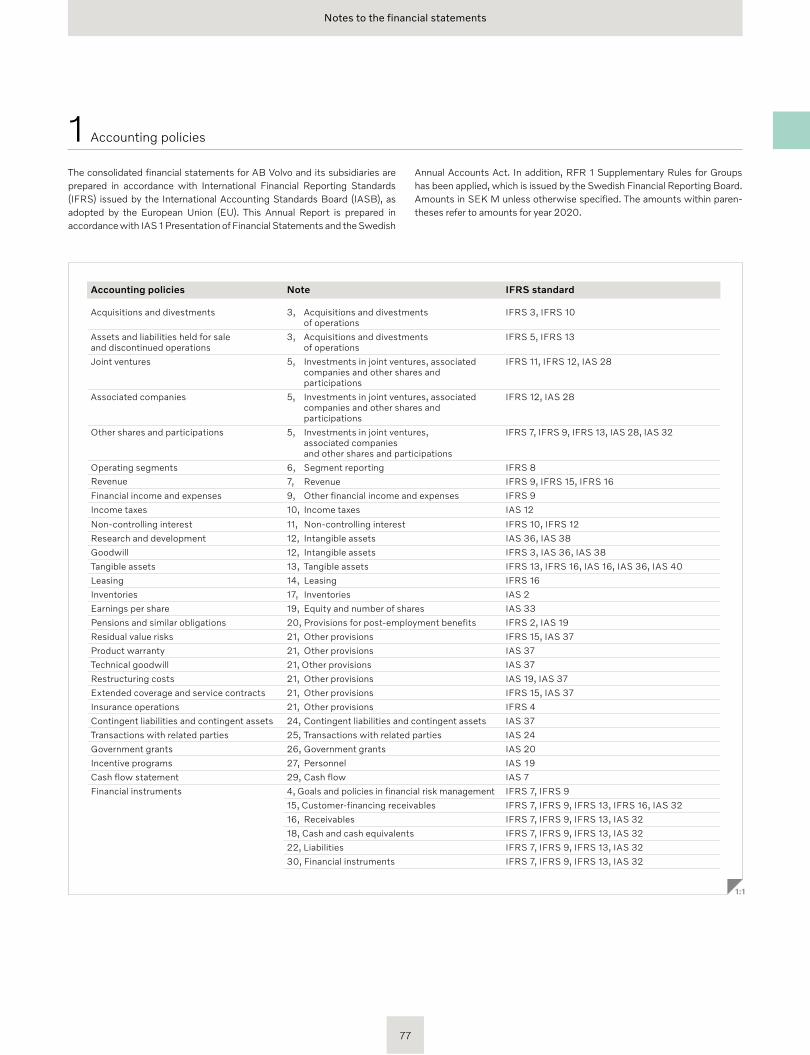
Notes to the financial statements
The consolidated financial statements for AB Volvo and its subsidiaries are prepared in accordance with International Financial Reporting Standards (IFRS) issued by the International Accounting Standards Board (IASB), as adopted by the European Union (EU). This Annual Report is prepared in accordance with IAS 1 Presentation of Financial Statements and the Swedish
Annual Accounts Act. In addition, RFR 1 Supplementary Rules for Groups has been applied, which is issued by the Swe dish Financial Reporting Board. Amounts in SEK M unless otherwise specified. The amounts within paren-theses refer to amounts for year 2020.
1 Accounting policies
Accounting policies Note IFRS standard
Acquisitions and divestments 3, Acquisitions and divestments of operations
IFRS 3, IFRS 10
Assets and liabilities held for sale and discontinued operations
3, Acquisitions and divestments of operations
IFRS 5, IFRS 13
Joint ventures 5, Investments in joint ventures, associated companies and other shares and participations
IFRS 11, IFRS 12, IAS 28
Associated companies 5, Investments in joint ventures, associated companies and other shares and participations
IFRS 12, IAS 28
Other shares and participations 5, Investments in joint ventures, associated companies and other shares and participations
IFRS 7, IFRS 9, IFRS 13, IAS 28, IAS 32
Operating segments 6, Segment reporting IFRS 8Revenue 7, Revenue IFRS 9, IFRS 15, IFRS 16
Financial income and expenses 9, Other financial income and expenses IFRS 9
Income taxes 10, Income taxes IAS 12
Non-controlling interest 11, Non-controlling interest IFRS 10, IFRS 12
Research and development 12, Intangible assets IAS 36, IAS 38
Goodwill 12, Intangible assets IFRS 3, IAS 36, IAS 38
Tangible assets 13, Tangible assets IFRS 13, IFRS 16, IAS 16, IAS 36, IAS 40
Leasing 14, Leasing IFRS 16
Inventories 17, Inventories IAS 2
Earnings per share 19, Equity and number of shares IAS 33
Pensions and similar obligations 20, Provisions for post-employment benefits IFRS 2, IAS 19
Residual value risks 21, Other provisions IFRS 15, IAS 37
Product warranty 21, Other provisions IAS 37
Technical goodwill 21, Other provisions IAS 37
Restructuring costs 21, Other provisions IAS 19, IAS 37
Extended coverage and service contracts 21, Other provisions IFRS 15, IAS 37
Insurance operations 21, Other provisions IFRS 4
Contingent liabilities and contingent assets 24, Contingent liabilities and contingent assets IAS 37
Transactions with related parties 25, Transactions with related parties IAS 24
Government grants 26, Government grants IAS 20
Incentive programs 27, Personnel IAS 19
Cash flow statement 29, Cash flow IAS 7
Financial instruments 4, Goals and policies in financial risk management IFRS 7, IFRS 9
15, Customer-financing receivables IFRS 7, IFRS 9, IFRS 13, IFRS 16, IAS 32
16, Receivables IFRS 7, IFRS 9, IFRS 13, IAS 32
18, Cash and cash equivalents IFRS 7, IFRS 9, IFRS 13, IAS 32
22, Liabilities IFRS 7, IFRS 9, IFRS 13, IAS 32
30, Financial instruments IFRS 7, IFRS 9, IFRS 13, IAS 32
1:1
77
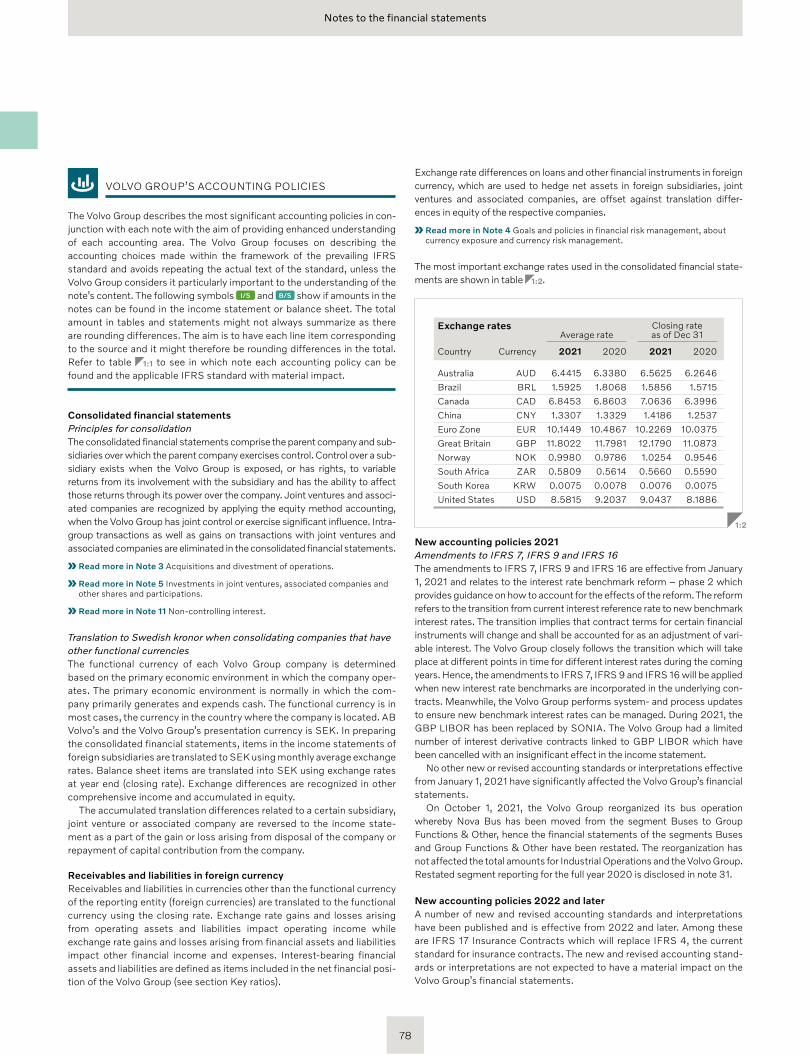
Notes to the financial statements
VOLVO GROUP’S ACCOUNTING POLICIES
The Volvo Group describes the most significant accounting policies in con-junction with each note with the aim of providing enhanced understanding of each accounting area. The Volvo Group focuses on describing the accounting choices made within the framework of the prevailing IFRS standard and avoids repeating the actual text of the standard, unless the Volvo Group considers it particularly important to the understanding of the note’s content. The following symbols I/S and B/S show if amounts in the notes can be found in the income statement or balance sheet. The total amount in tables and statements might not always summarize as there are rounding differences. The aim is to have each line item corresponding to the source and it might therefore be rounding differences in the total. Refer to table 1:1 to see in which note each accounting policy can be found and the applicable IFRS standard with material impact.
Consolidated financial statementsPrinciples for consolidationThe consolidated financial statements comprise the parent company and sub-sidiaries over which the parent company exercises control. Control over a sub-sidiary exists when the Volvo Group is exposed, or has rights, to variable returns from its involvement with the subsidiary and has the ability to affect those returns through its power over the company. Joint ventures and associ-ated companies are recognized by applying the equity method accounting, when the Volvo Group has joint control or exercise significant influence. Intra-group trans actions as well as gains on transactions with joint ventures and associated companies are eliminated in the consolidated financial statements.
Read more in Note 3 Acquisitions and divestment of operations.
Read more in Note 5 Investments in joint ventures, associated companies and other shares and participations.
Read more in Note 11 Non-controlling interest.
Translation to Swedish kronor when consolidating companies that have other functional currenciesThe functional currency of each Volvo Group company is determined based on the primary economic environment in which the company oper-ates. The primary economic environment is normally in which the com-pany primarily generates and expends cash. The functional currency is in most cases, the currency in the country where the company is located. AB Volvo’s and the Volvo Group’s presentation currency is SEK. In preparing the consolidated financial statements, items in the income statements of foreign subsidiaries are translated to SEK using monthly average exchange rates. Balance sheet items are translated into SEK using exchange rates at year end (closing rate). Exchange differences are recognized in other comprehensive income and accumulated in equity.
The accumulated translation differences related to a certain subsidiary, joint venture or associated company are reversed to the income state-ment as a part of the gain or loss arising from disposal of the company or repayment of capital contribution from the company.
Receivables and liabilities in foreign currencyReceivables and liabilities in currencies other than the functional currency of the reporting entity (foreign currencies) are translated to the functional currency using the closing rate. Exchange rate gains and losses arising from operating assets and liabilities impact operating income while exchange rate gains and losses arising from financial assets and liabilities impact other financial income and expenses. Interest-bearing financial assets and liabilities are defined as items included in the net financial posi-tion of the Volvo Group (see section Key ratios).
Exchange rate differences on loans and other financial instruments in foreign currency, which are used to hedge net assets in foreign subsidiaries, joint ventures and associated companies, are offset against translation differ-ences in equity of the respective companies.
Read more in Note 4 Goals and policies in financial risk management, about currency exposure and currency risk management.
The most important exchange rates used in the consolidated financial state-ments are shown in table 1:2.
Exchange ratesAverage rate
Closing rate as of Dec 31
Country Currency 2021 2020 2021 2020
Australia AUD 6.4415 6.3380 6.5625 6.2646
Brazil BRL 1.5925 1.8068 1.5856 1.5715
Canada CAD 6.8453 6.8603 7.0636 6.3996
China CNY 1.3307 1.3329 1.4186 1.2537
Euro Zone EUR 10.1449 10.4867 10.2269 10.0375
Great Britain GBP 11.8022 11.7981 12.1790 11.0873
Norway NOK 0.9980 0.9786 1.0254 0.9546
South Africa ZAR 0.5809 0.5614 0.5660 0.5590
South Korea KRW 0.0075 0.0078 0.0076 0.0075
United States USD 8.5815 9.2037 9.0437 8.1886
1:2
New accounting policies 2021Amendments to IFRS 7, IFRS 9 and IFRS 16 The amendments to IFRS 7, IFRS 9 and IFRS 16 are effective from January 1, 2021 and relates to the interest rate benchmark reform – phase 2 which provides guidance on how to account for the effects of the reform. The reform refers to the transition from current interest reference rate to new benchmark interest rates. The transition implies that contract terms for certain financial instruments will change and shall be accounted for as an adjustment of vari-able interest. The Volvo Group closely follows the transition which will take place at different points in time for different interest rates during the coming years. Hence, the amendments to IFRS 7, IFRS 9 and IFRS 16 will be applied when new interest rate benchmarks are incorporated in the underlying con-tracts. Meanwhile, the Volvo Group performs system- and process updates to ensure new benchmark interest rates can be managed. During 2021, the GBP LIBOR has been replaced by SONIA. The Volvo Group had a limited number of interest derivative contracts linked to GBP LIBOR which have been cancelled with an insignificant effect in the income statement.
No other new or revised accounting standards or interpretations effective from January 1, 2021 have significantly affected the Volvo Group’s financial statements.
On October 1, 2021, the Volvo Group reorganized its bus operation whereby Nova Bus has been moved from the segment Buses to Group Functions & Other, hence the financial statements of the segments Buses and Group Functions & Other have been restated. The reorganization has not affected the total amounts for Industrial Operations and the Volvo Group. Restated segment reporting for the full year 2020 is disclosed in note 31.
New accounting policies 2022 and later A number of new and revised accounting standards and interpretations have been published and is effective from 2022 and later. Among these are IFRS 17 Insurance Contracts which will replace IFRS 4, the current standard for insurance contracts. The new and revised accounting stand-ards or interpretations are not expected to have a material impact on the Volvo Group’s financial statements.
78
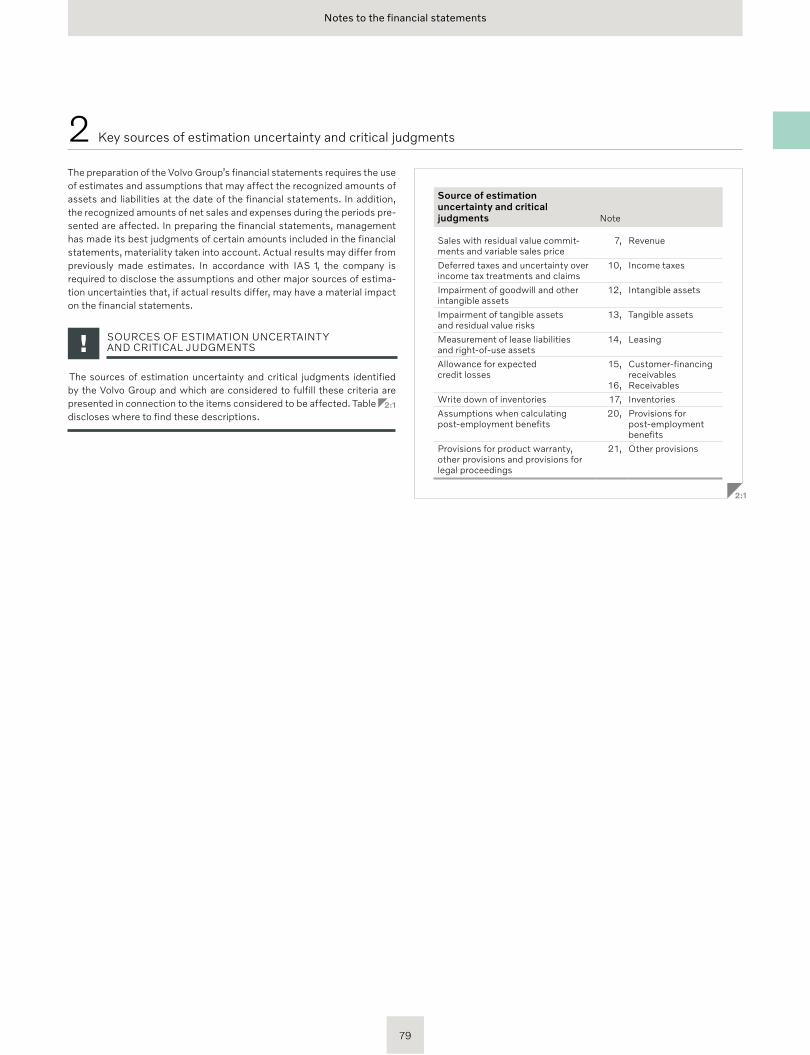
Notes to the financial statements
The preparation of the Volvo Group’s financial statements requires the use of estimates and assumptions that may affect the recognized amounts of assets and liabilities at the date of the financial statements. In addition, the recognized amounts of net sales and expenses during the periods pre-sented are affected. In preparing the financial statements, management has made its best judgments of certain amounts included in the financial statements, materiality taken into account. Actual results may differ from previously made estimates. In accordance with IAS 1, the company is required to disclose the assumptions and other major sources of estima-tion uncertainties that, if actual results differ, may have a material impact on the financial statements.
SOURCES OF ESTIMATION UNCERTAINTY AND CRITICAL JUDGMENTS
The sources of estimation uncertainty and critical judgments identified by the Volvo Group and which are considered to fulfill these criteria are presented in connection to the items considered to be affected. Table 2:1 discloses where to find these descriptions.
Source of estimation uncertainty and critical judgments Note
Sales with residual value commit-ments and variable sales price
7, Revenue
Deferred taxes and uncertainty over income tax treatments and claims
10, Income taxes
Impairment of goodwill and other intangible assets
12, Intangible assets
Impairment of tangible assets and residual value risks
13, Tangible assets
Measurement of lease liabilities and right-of-use assets
14, Leasing
Allowance for expected credit losses
15,
16,
Customer-financing receivablesReceivables
Write down of inventories 17, Inventories
Assumptions when calculating post-employment benefits
20, Provisions for post- employment benefits
Provisions for product warranty, other provisions and provisions for legal proceedings
21, Other provisions
2:1
2 Key sources of estimation uncertainty and critical judgments
79
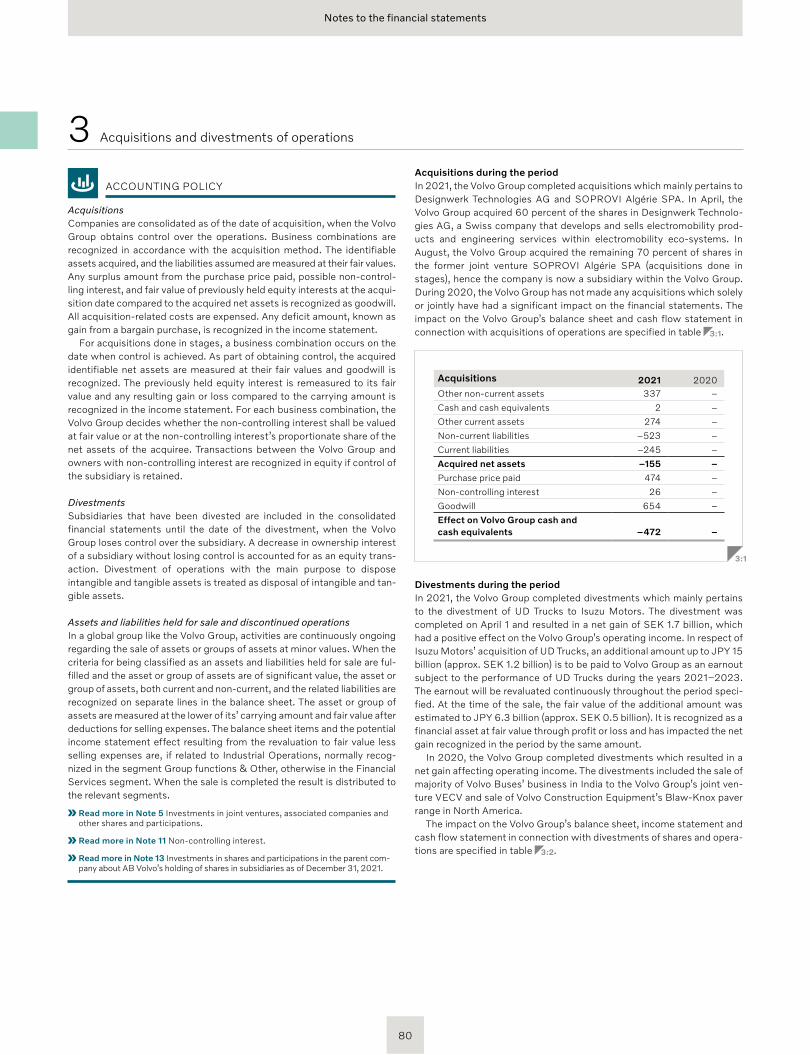
Notes to the financial statements
ACCOUNTING POLICY
AcquisitionsCompanies are consolidated as of the date of acquisition, when the Volvo Group obtains control over the operations. Business combinations are recognized in accordance with the acquisition method. The identifiable assets acquired, and the liabilities assumed are measured at their fair values. Any surplus amount from the purchase price paid, possible non-control-ling interest, and fair value of previously held equity interests at the acqui-sition date compared to the acquired net assets is recognized as goodwill. All acquisition-related costs are expensed. Any deficit amount, known as gain from a bargain purchase, is recognized in the income statement.
For acquisitions done in stages, a business combination occurs on the date when control is achieved. As part of obtaining control, the acquired identifiable net assets are measured at their fair values and goodwill is recognized. The previously held equity interest is remeasured to its fair value and any resulting gain or loss compared to the carrying amount is recognized in the income statement. For each business combination, the Volvo Group decides whether the non-controlling interest shall be valued at fair value or at the non-controlling interest’s proportionate share of the net assets of the acquiree. Transactions between the Volvo Group and owners with non-controlling interest are recognized in equity if control of the subsidiary is retained.
DivestmentsSubsidiaries that have been divested are included in the consolidated financial statements until the date of the divestment, when the Volvo Group loses control over the subsidiary. A decrease in ownership interest of a subsidiary without losing control is accounted for as an equity trans-action. Divestment of operations with the main purpose to dispose intang ible and tangible assets is treated as disposal of intangible and tan-gible assets.
Assets and liabilities held for sale and discontinued operationsIn a global group like the Volvo Group, activities are continuously ongoing regarding the sale of assets or groups of assets at minor values. When the criteria for being classified as an assets and liabilities held for sale are ful-filled and the asset or group of assets are of significant value, the asset or group of assets, both current and non-current, and the related liabilities are recognized on separate lines in the balance sheet. The asset or group of assets are measured at the lower of its’ carrying amount and fair value after deductions for selling expenses. The balance sheet items and the potential income statement effect resulting from the revaluation to fair value less selling expenses are, if related to Industrial Operations, normally recog-nized in the segment Group functions & Other, otherwise in the Financial Services segment. When the sale is completed the result is distributed to the relevant segments.
Read more in Note 5 Investments in joint ventures, associated companies and other shares and participations.
Read more in Note 11 Non-controlling interest.
Read more in Note 13 Investments in shares and participations in the parent com-pany about AB Volvo’s holding of shares in subsidiaries as of December 31, 2021.
Acquisitions during the periodIn 2021, the Volvo Group completed acquisitions which mainly pertains to Designwerk Technologies AG and SOPROVI Algérie SPA. In April, the Volvo Group acquired 60 percent of the shares in Designwerk Technolo-gies AG, a Swiss company that develops and sells electromobility prod-ucts and engineering services within electromobility eco- systems. In August, the Volvo Group acquired the remaining 70 percent of shares in the former joint venture SOPROVI Algérie SPA (acquisitions done in stages), hence the company is now a subsidiary within the Volvo Group. During 2020, the Volvo Group has not made any acquisitions which solely or jointly have had a significant impact on the financial statements. The impact on the Volvo Group’s balance sheet and cash flow statement in connection with acquisitions of operations are specified in table 3:1.
Acquisitions 2021 2020Other non-current assets 337 –
Cash and cash equivalents 2 –
Other current assets 274 –
Non-current liabilities –523 –
Current liabilities –245 –
Acquired net assets –155 –
Purchase price paid 474 –
Non-controlling interest 26 –
Goodwill 654 –
Effect on Volvo Group cash and cash equivalents –472 –
3:1
Divestments during the periodIn 2021, the Volvo Group completed divestments which mainly pertains to the divestment of UD Trucks to Isuzu Motors. The divestment was completed on April 1 and resulted in a net gain of SEK 1.7 billion, which had a positive effect on the Volvo Group’s operating income. In respect of Isuzu Motors’ acquisition of UD Trucks, an additional amount up to JPY 15 billion (approx. SEK 1.2 billion) is to be paid to Volvo Group as an earnout subject to the performance of UD Trucks during the years 2021–2023. The earnout will be revaluated continuously throughout the period speci-fied. At the time of the sale, the fair value of the additional amount was estimated to JPY 6.3 billion (approx. SEK 0.5 billion). It is recognized as a financial asset at fair value through profit or loss and has impacted the net gain recognized in the period by the same amount.
In 2020, the Volvo Group completed divestments which resulted in a net gain affecting operating income. The divestments included the sale of majority of Volvo Buses’ business in India to the Volvo Group’s joint ven-ture VECV and sale of Volvo Construction Equipment’s Blaw-Knox paver range in North America.
The impact on the Volvo Group’s balance sheet, income statement and cash flow statement in connection with divestments of shares and opera-tions are specified in table 3:2.
3 Acquisitions and divestments of operations
80
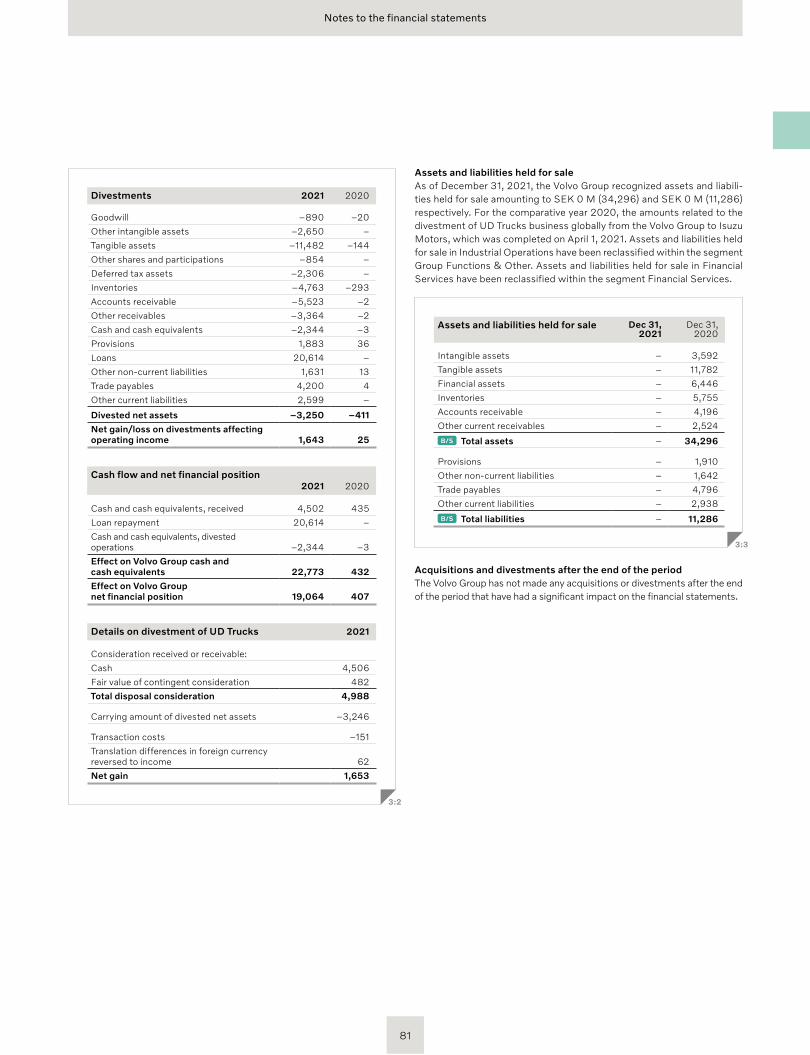
Notes to the financial statements
Divestments 2021 2020
Goodwill –890 –20
Other intangible assets –2,650 –
Tangible assets –11,482 –144
Other shares and participations –854 –
Deferred tax assets –2,306 –
Inventories –4,763 –293
Accounts receivable –5,523 –2
Other receivables –3,364 –2
Cash and cash equivalents –2,344 –3
Provisions 1,883 36
Loans 20,614 –
Other non-current liabilities 1,631 13
Trade payables 4,200 4
Other current liabilities 2,599 –
Divested net assets –3,250 –411
Net gain/loss on divestments affectingoperating income 1,643 25
Cash flow and net financial position 2021 2020
Cash and cash equivalents, received 4,502 435
Loan repayment 20,614 –
Cash and cash equivalents, divested operations –2,344 –3
Effect on Volvo Group cash and cash equivalents 22,773 432
Effect on Volvo Group net financial position 19,064 407
Details on divestment of UD Trucks 2021
Consideration received or receivable:
Cash 4,506
Fair value of contingent consideration 482
Total disposal consideration 4,988
Carrying amount of divested net assets –3,246
Transaction costs –151
Translation differences in foreign currency reversed to income 62
Net gain 1,653
3:2
Assets and liabilities held for saleAs of December 31, 2021, the Volvo Group recognized assets and liabili-ties held for sale amounting to SEK 0 M (34,296) and SEK 0 M (11,286) respectively. For the comparative year 2020, the amounts related to the divestment of UD Trucks business globally from the Volvo Group to Isuzu Motors, which was completed on April 1, 2021. Assets and liabilities held for sale in Industrial Operations have been reclassified within the segment Group Functions & Other. Assets and liabilities held for sale in Financial Services have been reclassified within the segment Financial Services.
Assets and liabilities held for sale Dec 31,2021
Dec 31,2020
Intangible assets – 3,592
Tangible assets – 11,782
Financial assets – 6,446
Inventories – 5,755
Accounts receivable – 4,196
Other current receivables – 2,524
B/S Total assets – 34,296
Provisions – 1,910
Other non-current liabilities – 1,642
Trade payables – 4,796
Other current liabilities – 2,938
B/S Total liabilities – 11,286
3:3
Acquisitions and divestments after the end of the periodThe Volvo Group has not made any acquisitions or divestments after the end of the period that have had a significant impact on the financial statements.
81
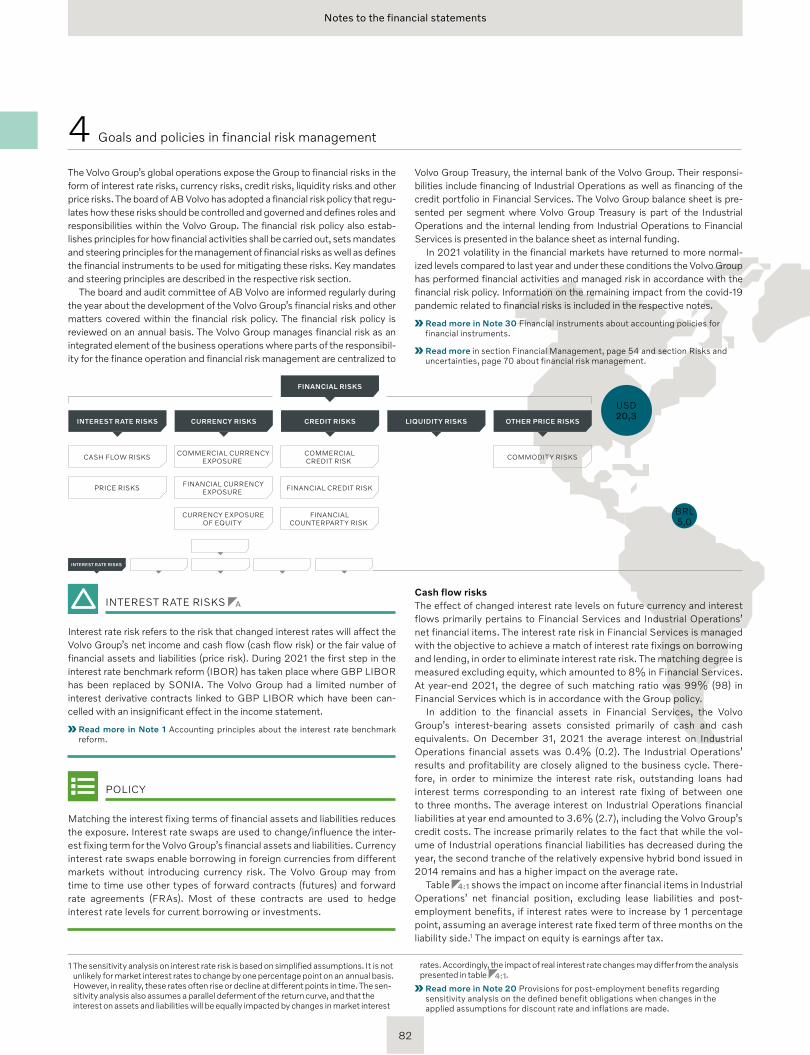
Notes to the financial statements
The Volvo Group’s global operations expose the Group to financial risks in the form of interest rate risks, currency risks, credit risks, liquidity risks and other price risks. The board of AB Volvo has adopted a financial risk policy that regu-lates how these risks should be controlled and governed and defines roles and responsibilities within the Volvo Group. The financial risk policy also estab-lishes principles for how financial activities shall be carried out, sets mandates and steering principles for the management of financial risks as well as defines the financial instruments to be used for mitigating these risks. Key mandates and steering principles are described in the respective risk section.
The board and audit committee of AB Volvo are informed regularly during the year about the development of the Volvo Group’s financial risks and other matters covered within the financial risk policy. The financial risk policy is reviewed on an annual basis. The Volvo Group manages financial risk as an integrated element of the business operations where parts of the responsibil-ity for the finance operation and financial risk management are centralized to
1 The sensitivity analysis on interest rate risk is based on simplified assumptions. It is not unlikely for market interest rates to change by one percentage point on an annual basis. However, in reality, these rates often rise or decline at different points in time. The sen-sitivity analysis also assumes a parallel deferment of the return curve, and that the interest on assets and liabilities will be equally impacted by changes in market interest
rates. Accordingly, the impact of real interest rate changes may differ from the analysis presented in table 4:1.
Read more in Note 20 Provisions for post-employment benefits regarding sensitivity analysis on the defined benefit obligations when changes in the applied assumptions for discount rate and inflations are made.
INTEREST RATE RISKS
CASH FLOW RISKS
PRICE RISKS FINANCIAL CURRENCY EXPOSURE
CURRENCY EXPOSURE OF EQUITY
COMMERCIAL CURRENCY EXPOSURE
COMMERCIAL CREDIT RISK COMMODITY RISKS
FINANCIAL CREDIT RISK
FINANCIAL COUNTERPARTY RISK
INTEREST RATE RISKS CURRENCY RISKS CREDIT RISKS
FINANCIAL RISKS
OTHER PRICE RISKSLIQUIDITY RISKS
INTEREST RATE RISKS A
Interest rate risk refers to the risk that changed interest rates will affect the Volvo Group’s net income and cash flow (cash flow risk) or the fair value of financial assets and liabilities (price risk). During 2021 the first step in the interest rate benchmark reform (IBOR) has taken place where GBP LIBOR has been replaced by SONIA. The Volvo Group had a limited number of interest derivative contracts linked to GBP LIBOR which have been can-celled with an insignificant effect in the income statement.
Read more in Note 1 Accounting principles about the interest rate benchmark reform.
POLICY
Matching the interest fixing terms of financial assets and liabilities reduces the exposure. Interest rate swaps are used to change/influence the inter-est fixing term for the Volvo Group’s financial assets and liabilities. Currency interest rate swaps enable borrowing in foreign currencies from different markets without introducing currency risk. The Volvo Group may from time to time use other types of forward contracts (futures) and forward rate agreements (FRAs). Most of these contracts are used to hedge interest rate levels for current borrowing or investments.
Cash flow risksThe effect of changed interest rate levels on future currency and interest flows primarily pertains to Financial Services and Industrial Operations’ net financial items. The interest rate risk in Financial Services is managed with the objective to achieve a match of interest rate fixings on borrowing and lending, in order to eliminate interest rate risk. The matching degree is measured excluding equity, which amounted to 8% in Financial Services.At year-end 2021, the degree of such matching ratio was 99% (98) in Financial Services which is in accordance with the Group policy.
In addition to the financial assets in Financial Services, the Volvo Group’s interest-bearing assets consisted primarily of cash and cash equivalents. On December 31, 2021 the average interest on Industrial Operations financial assets was 0.4% (0.2). The Industrial Operations’ results and profitability are closely aligned to the business cycle. There-fore, in order to minimize the interest rate risk, outstanding loans had interest terms corresponding to an interest rate fixing of between one to three months. The average interest on Industrial Operations financial liabilities at year end amounted to 3.6% (2.7), including the Volvo Group’s credit costs. The increase primarily relates to the fact that while the vol-ume of Industrial operations financial liabilities has decreased during the year, the second tranche of the relatively expensive hybrid bond issued in 2014 remains and has a higher impact on the average rate.
Table 4:1 shows the impact on income after financial items in Industrial Operations’ net financial position, excluding lease liabilities and post-employment benefits, if interest rates were to increase by 1 percentage point, assuming an average interest rate fixed term of three months on the liability side.1 The impact on equity is earnings after tax.
4 Goals and policies in financial risk management
Volvo Group Treasury, the internal bank of the Volvo Group. Their responsi-bilities include financing of Industrial Operations as well as financing of the credit portfolio in Financial Services. The Volvo Group balance sheet is pre-sented per segment where Volvo Group Treasury is part of the Industrial Operations and the internal lending from Industrial Operations to Financial Services is presented in the balance sheet as internal funding.
In 2021 volatility in the financial markets have returned to more normal-ized levels compared to last year and under these conditions the Volvo Group has performed financial activities and managed risk in accordance with the financial risk policy. Information on the remaining impact from the covid-19 pandemic related to financial risks is included in the respective notes.
Read more in Note 30 Financial instruments about accounting policies for financial instruments.
Read more in section Financial Management, page 54 and section Risks and uncertainties, page 70 about financial risk management.
USD 20,3
BRL 5,0
82
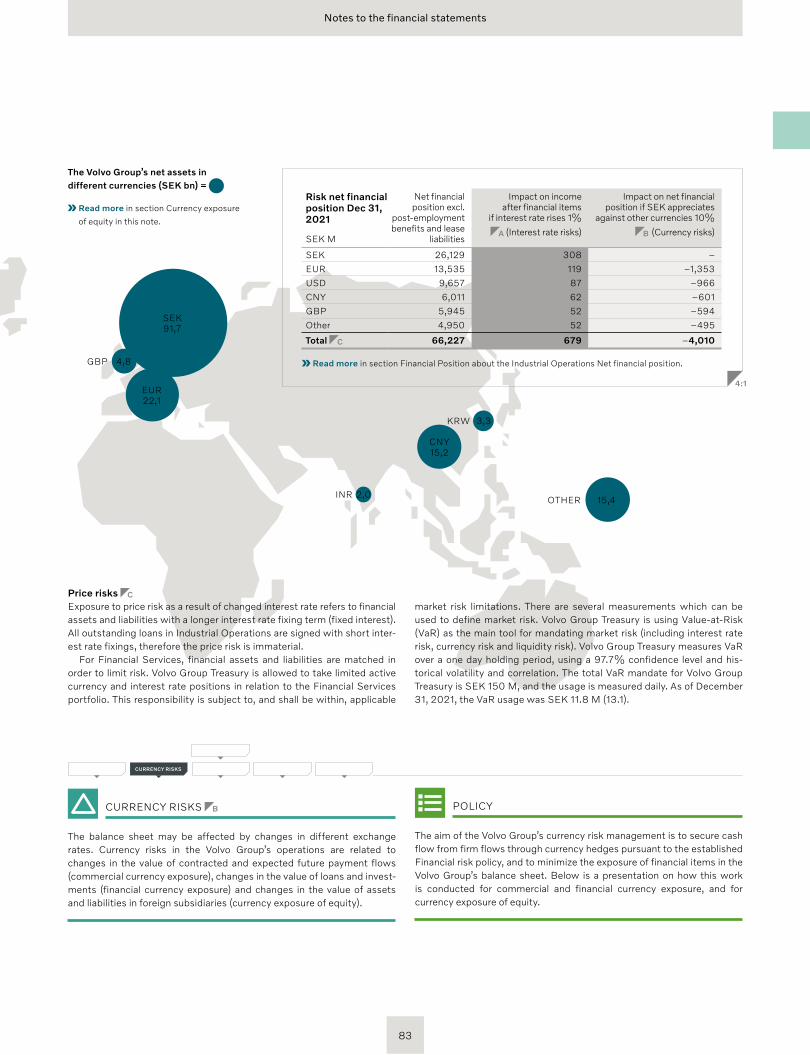
Notes to the financial statements
The Volvo Group’s net assets in different currencies (SEK bn) =
Read more in section Currency exposure
of equity in this note.
CURRENCY RISKS B
The balance sheet may be affected by changes in different exchange rates. Currency risks in the Volvo Group’s operations are related to changes in the value of contracted and expected future payment flows (commercial currency exposure), changes in the value of loans and invest-ments (financial currency exposure) and changes in the value of assets and liabilities in foreign subsidiaries (currency exposure of equity).
CURRENCY RISKS
Risk net financial position Dec 31, 2021
Net financial position excl.
post-employment benefits and lease
liabilities
Impact on income after financial items
if interest rate rises 1%
A (Interest rate risks)
Impact on net financial position if SEK appreciates
against other currencies 10%
B (Currency risks) SEK M
SEK 26,129 308 –
EUR 13,535 119 –1,353
USD 9,657 87 –966
CNY 6,011 62 –601
GBP 5,945 52 –594
Other 4,950 52 –495
Total C 66,227 679 –4,010
Read more in section Financial Position about the Industrial Operations Net financial position.
4:1
CNY15,2
INR 2,0
KRW 3,3
OTHER 15,4
SEK 91,7
EUR 22,1
GBP 4,8
POLICY
The aim of the Volvo Group’s currency risk management is to secure cash flow from firm flows through currency hedges pursuant to the established Financial risk policy, and to minimize the exposure of financial items in the Volvo Group’s balance sheet. Below is a presentation on how this work is conducted for commercial and financial currency exposure, and for currency exposure of equity.
Price risks C
Exposure to price risk as a result of changed interest rate refers to financial assets and liabilities with a longer interest rate fixing term (fixed interest). All outstanding loans in Industrial Operations are signed with short inter-est rate fixings, therefore the price risk is immaterial.
For Financial Services, financial assets and liabilities are matched in order to limit risk. Volvo Group Treasury is allowed to take limited active currency and interest rate positions in relation to the Financial Services portfolio. This responsibility is subject to, and shall be within, applicable
market risk limitations. There are several measurements which can be used to define market risk. Volvo Group Treasury is using Value-at-Risk (VaR) as the main tool for mandating market risk (including interest rate risk, currency risk and liquidity risk). Volvo Group Treasury measures VaR over a one day holding period, using a 97.7% confidence level and his-torical volatility and correlation. The total VaR mandate for Volvo Group Treasury is SEK 150 M, and the usage is measured daily. As of December 31, 2021, the VaR usage was SEK 11.8 M (13.1).
83
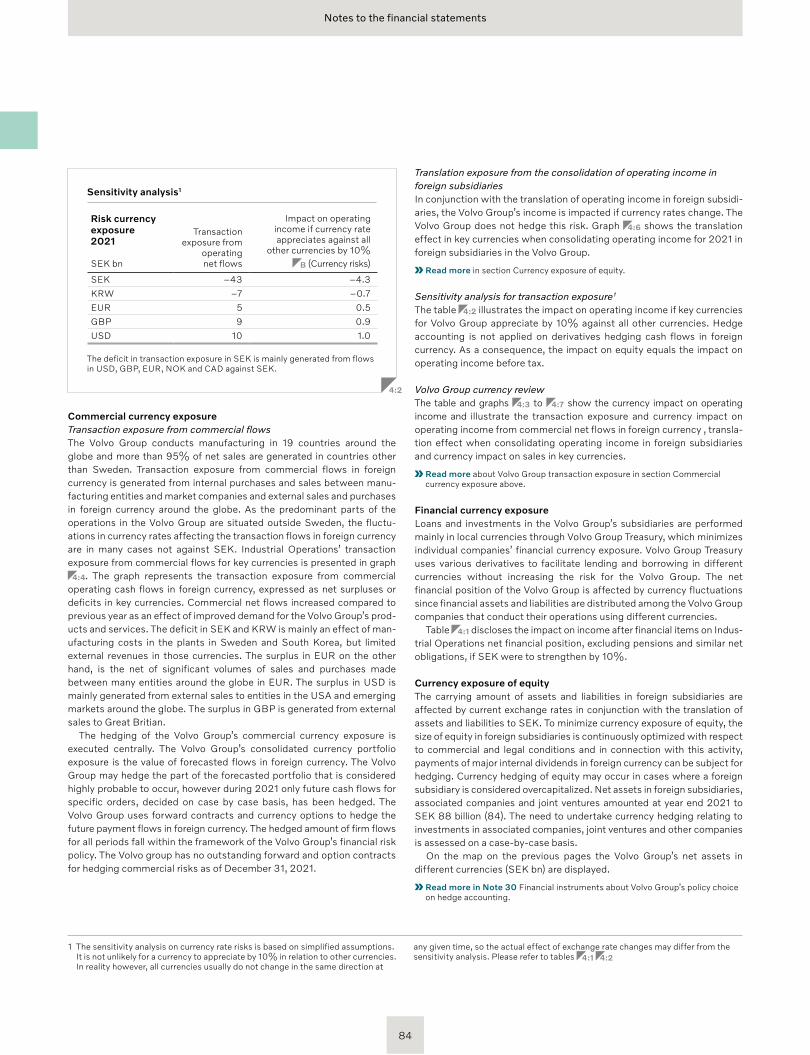
Notes to the financial statements
Sensitivity analysis1
Risk currency exposure 2021
Transaction exposure from
operating net flows
Impact on operating income if currency rate appreciates against all
other currencies by 10% B (Currency risks)SEK bn
SEK –43 –4.3
KRW –7 –0.7
EUR 5 0.5
GBP 9 0.9
USD 10 1.0
The deficit in transaction exposure in SEK is mainly generated from flows in USD, GBP, EUR, NOK and CAD against SEK.
4:2
Commercial currency exposureTransaction exposure from commercial flowsThe Volvo Group conducts manufacturing in 19 countries around the globe and more than 95% of net sales are generated in countries other than Sweden. Transaction exposure from commercial flows in foreign currency is generated from internal purchases and sales between manu-facturing entities and market companies and external sales and purchases in foreign currency around the globe. As the predominant parts of the operations in the Volvo Group are situated outside Sweden, the fluctu-ations in currency rates affecting the transaction flows in foreign currency are in many cases not against SEK. Industrial Operations’ transaction exposure from commercial flows for key currencies is presented in graph
4:4. The graph represents the transaction exposure from commercial operating cash flows in foreign currency, expressed as net surpluses or deficits in key currencies. Commercial net flows increased compared to previous year as an effect of improved demand for the Volvo Group’s prod-ucts and services. The deficit in SEK and KRW is mainly an effect of man-ufacturing costs in the plants in Sweden and South Korea, but limited external revenues in those currencies. The surplus in EUR on the other hand, is the net of significant volumes of sales and purchases made between many entities around the globe in EUR. The surplus in USD is mainly generated from external sales to entities in the USA and emerging markets around the globe. The surplus in GBP is generated from external sales to Great Britian.
The hedging of the Volvo Group’s commercial currency exposure is executed centrally. The Volvo Group’s consolidated currency portfolio exposure is the value of forecasted flows in foreign currency. The Volvo Group may hedge the part of the forecasted portfolio that is considered highly probable to occur, however during 2021 only future cash flows for specific orders, decided on case by case basis, has been hedged. The Volvo Group uses forward contracts and currency options to hedge the future payment flows in foreign currency. The hedged amount of firm flows for all periods fall within the framework of the Volvo Group’s financial risk policy. The Volvo group has no outstanding forward and option contracts for hedging commercial risks as of December 31, 2021.
Translation exposure from the consolidation of operating income in foreign subsidiariesIn conjunction with the translation of operating income in foreign subsidi-aries, the Volvo Group’s income is impacted if currency rates change. The Volvo Group does not hedge this risk. Graph 4:6 shows the translation effect in key currencies when consolidating operating income for 2021 in foreign subsidiaries in the Volvo Group.
Read more in section Currency exposure of equity.
Sensitivity analysis for transaction exposure 1 The table 4:2 illustrates the impact on operating income if key currencies for Volvo Group appreciate by 10% against all other currencies. Hedge accounting is not applied on derivatives hedging cash flows in foreign currency. As a consequence, the impact on equity equals the impact on operating income before tax.
Volvo Group currency review The table and graphs 4:3 to 4:7 show the currency impact on operating income and illustrate the transaction exposure and currency impact on operating income from commercial net flows in foreign currency , transla-tion effect when consolidating operating income in foreign subsidiaries and currency impact on sales in key currencies.
Read more about Volvo Group transaction exposure in section Commercial currency exposure above.
Financial currency exposureLoans and investments in the Volvo Group’s subsidiaries are performed mainly in local currencies through Volvo Group Treasury, which minimizes individual companies’ financial currency exposure. Volvo Group Treasury uses various derivatives to facilitate lending and borrowing in different currencies without increasing the risk for the Volvo Group. The net financial position of the Volvo Group is affected by currency fluctuations since financial assets and liabilities are distributed among the Volvo Group companies that conduct their operations using different currencies.
Table 4:1 discloses the impact on income after financial items on Indus-trial Operations net financial position, excluding pensions and similar net obligations, if SEK were to strengthen by 10%.
Currency exposure of equityThe carrying amount of assets and liabilities in foreign subsidiaries are affected by current exchange rates in conjunction with the translation of assets and liabilities to SEK. To minimize currency exposure of equity, the size of equity in foreign subsidiaries is continuously optimized with respect to commercial and legal conditions and in connection with this activity, payments of major internal dividends in foreign currency can be subject for hedging. Currency hedging of equity may occur in cases where a foreign subsidiary is considered overcapitalized. Net assets in foreign subsidiaries, associated companies and joint ventures amounted at year end 2021 to SEK 88 billion (84). The need to undertake currency hedging relating to investments in associated companies, joint ventures and other companies is assessed on a case-by-case basis.
On the map on the previous pages the Volvo Group’s net assets in different currencies (SEK bn) are displayed.
Read more in Note 30 Financial instruments about Volvo Group’s policy choice on hedge accounting.
1 The sensitivity analysis on currency rate risks is based on simplified assumptions. It is not unlikely for a currency to appreciate by 10% in relation to other currencies. In reality however, all currencies usually do not change in the same direction at
any given time, so the actual effect of exchange rate changes may differ from the sensitivity analysis. Please refer to tables 4:1 4:2
84
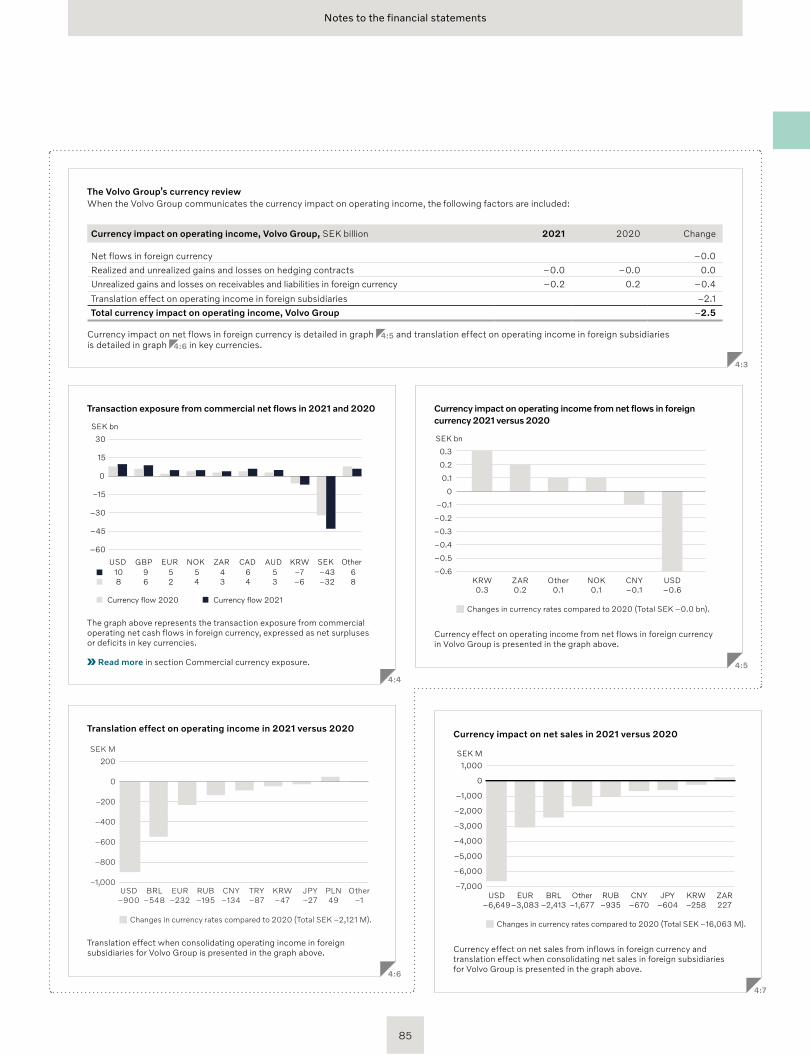
Notes to the financial statements
The Volvo Group’s currency review When the Volvo Group communicates the currency impact on operating income, the following factors are included:
Currency impact on operating income, Volvo Group, SEK billion 2021 2020 Change
Net flows in foreign currency –0.0
Realized and unrealized gains and losses on hedging contracts –0.0 –0.0 0.0
Unrealized gains and losses on receivables and liabilities in foreign currency –0.2 0.2 –0.4
Translation effect on operating income in foreign subsidiaries –2.1
Total currency impact on operating income, Volvo Group –2.5
Currency impact on net flows in foreign currency is detailed in graph 4:5 and translation effect on operating income in foreign subsidiaries is detailed in graph 4:6 in key currencies.
4:3
Transaction exposure from commercial net flows in 2021 and 2020
–60
–45
–30
–15
0
15
30
SEK bn
Currency flow 2020 Currency flow 2021
SEKKRWAUDCADNOKEURGBP ZARUSD Other 10 9 5 5 4 6 5 –7 –43 6 8 6 2 4 3 4 3 –6 –32 8
The graph above represents the transaction exposure from commercial operating net cash flows in foreign currency, expressed as net surpluses or deficits in key currencies.
Read more in section Commercial currency exposure.
4:4
Translation effect on operating income in 2021 versus 2020
Changes in currency rates compared to 2020 (Total SEK –2,121 M).
SEK M
–1,000
200
0
–200
–400
–600
–800
USD–900
BRL–548
EUR–232
RUB–195
CNY–134
TRY–87
KRW–47
JPY–27
PLN49
Other–1
Translation effect when consolidating operating income in foreign subsidiaries for Volvo Group is presented in the graph above.
4:6
Currency impact on operating income from net flows in foreign currency 2021 versus 2020
Changes in currency rates compared to 2020 (Total SEK –0.0 bn).
SEK bn
–0.6
–0.5
–0.4
–0.3
–0.2
–0.1
0
0.1
0.3
0.2
USD–0.6
KRW0.3
ZAR0.2
Other0.1
NOK0.1
CNY–0.1
Currency effect on operating income from net flows in foreign currency in Volvo Group is presented in the graph above.
4:5
Currency impact on net sales in 2021 versus 2020
Changes in currency rates compared to 2020 (Total SEK –16,063 M).
–5,000
EUR–3,083
BRL–2,413
Other–1,677
RUB–935
CNY–670
JPY–604
KRW–258
ZAR227
USD–6,649
SEK M
–6,000
–7,000
–4,000
–3,000
–2,000
–1,000
0
1,000
Currency effect on net sales from inflows in foreign currency and translation effect when consolidating net sales in foreign subsidiaries for Volvo Group is presented in the graph above.
4:7
85
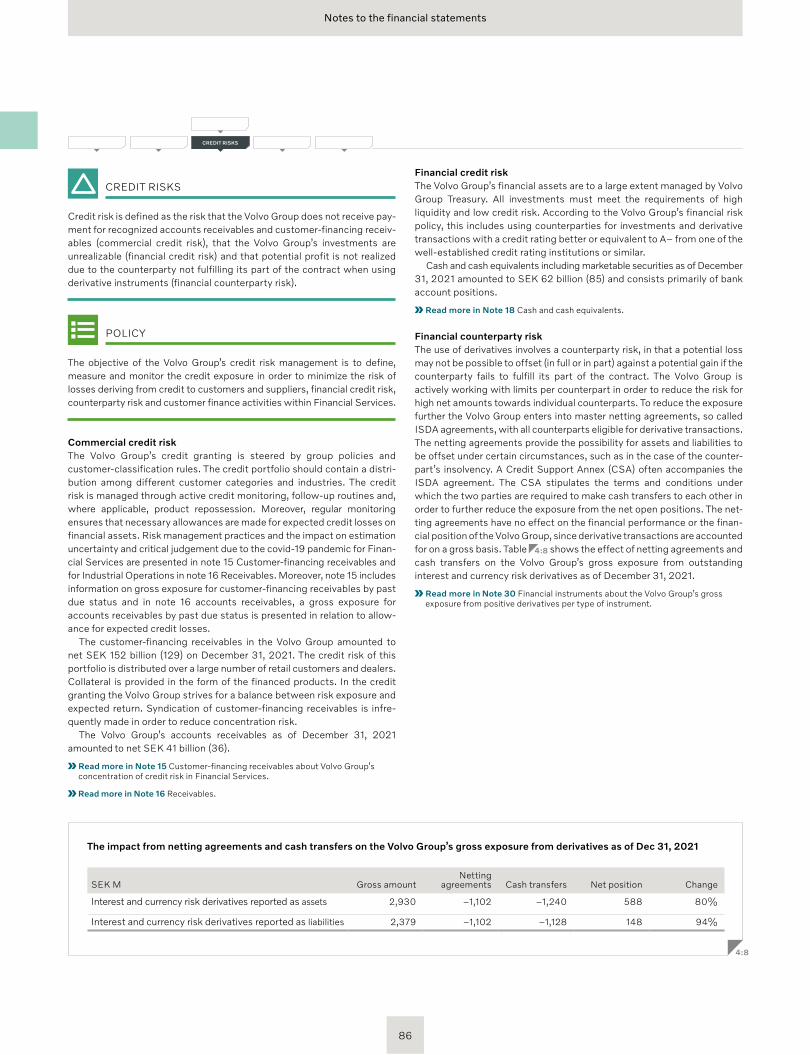
Notes to the financial statements
CREDIT RISKS
Credit risk is defined as the risk that the Volvo Group does not receive pay-ment for recognized accounts receivables and customer-financing receiv-ables (commercial credit risk), that the Volvo Group’s investments are unrealizable (financial credit risk) and that potential profit is not realized due to the counterparty not fulfilling its part of the contract when using derivative instruments (financial counterparty risk).
POLICY
The objective of the Volvo Group’s credit risk management is to define, measure and monitor the credit exposure in order to minimize the risk of losses deriving from credit to customers and suppliers, financial credit risk, counterparty risk and customer finance activities within Financial Services.
Commercial credit riskThe Volvo Group’s credit granting is steered by group policies and customer-classification rules. The credit portfolio should contain a distri-bution among different customer categories and industries. The credit risk is managed through active credit monitoring, follow-up routines and, where applicable, product repossession. Moreover, regular monitoring ensures that necessary allowances are made for expected credit losses on financial assets. Risk management practices and the impact on estimation uncertainty and critical judgement due to the covid-19 pandemic for Finan-cial Services are presented in note 15 Customer-financing receivables and for Industrial Operations in note 16 Receivables. Moreover, note 15 includes information on gross exposure for customer-financing receivables by past due status and in note 16 accounts receivables, a gross exposure for accounts receivables by past due status is presented in relation to allow-ance for expected credit losses.
The customer-financing receivables in the Volvo Group amounted to net SEK 152 billion (129) on December 31, 2021. The credit risk of this portfolio is distributed over a large number of retail customers and dealers. Collateral is provided in the form of the financed products. In the credit granting the Volvo Group strives for a balance between risk exposure and expected return. Syndication of customer-financing receivables is infre-quently made in order to reduce concentration risk.
The Volvo Group’s accounts receivables as of December 31, 2021 amounted to net SEK 41 billion (36).
Read more in Note 15 Customer-financing receivables about Volvo Group’s concentration of credit risk in Financial Services.
Read more in Note 16 Receivables.
Financial credit riskThe Volvo Group’s financial assets are to a large extent managed by Volvo Group Treasury. All investments must meet the requirements of high liquid ity and low credit risk. According to the Volvo Group’s financial risk policy, this includes using counterparties for investments and derivative transactions with a credit rating better or equivalent to A– from one of the well-established credit rating institutions or similar.
Cash and cash equivalents including marketable securities as of December 31, 2021 amounted to SEK 62 billion (85) and consists primarily of bank account positions.
Read more in Note 18 Cash and cash equivalents.
Financial counterparty riskThe use of derivatives involves a counterparty risk, in that a potential loss may not be possible to offset (in full or in part) against a potential gain if the counterparty fails to fulfill its part of the contract. The Volvo Group is actively working with limits per counterpart in order to reduce the risk for high net amounts towards individual counterparts. To reduce the expos ure further the Volvo Group enters into master netting agreements, so called ISDA agreements, with all counterparts eligible for derivative transactions. The netting agreements provide the possibility for assets and lia bilities to be offset under certain circumstances, such as in the case of the counter-part’s insolvency. A Credit Support Annex (CSA) often accompanies the ISDA agreement. The CSA stipulates the terms and conditions under which the two parties are required to make cash transfers to each other in order to further reduce the exposure from the net open positions. The net-ting agreements have no effect on the financial performance or the finan-cial position of the Volvo Group, since derivative transactions are accounted for on a gross basis. Table 4 :8 shows the effect of netting agreements and cash transfers on the Volvo Group’s gross exposure from outstanding interest and currency risk derivatives as of December 31, 2021.
Read more in Note 30 Financial instruments about the Volvo Group’s gross exposure from positive derivatives per type of instrument.
CREDIT RISKS
The impact from netting agreements and cash transfers on the Volvo Group’s gross exposure from derivatives as of Dec 31, 2021
SEK M Gross amountNetting
agreements Cash transfers Net position Change
Interest and currency risk derivatives reported as assets 2,930 –1,102 –1,240 588 80%
Interest and currency risk derivatives reported as liabilities 2,379 –1,102 –1,128 148 94%
4:8
86
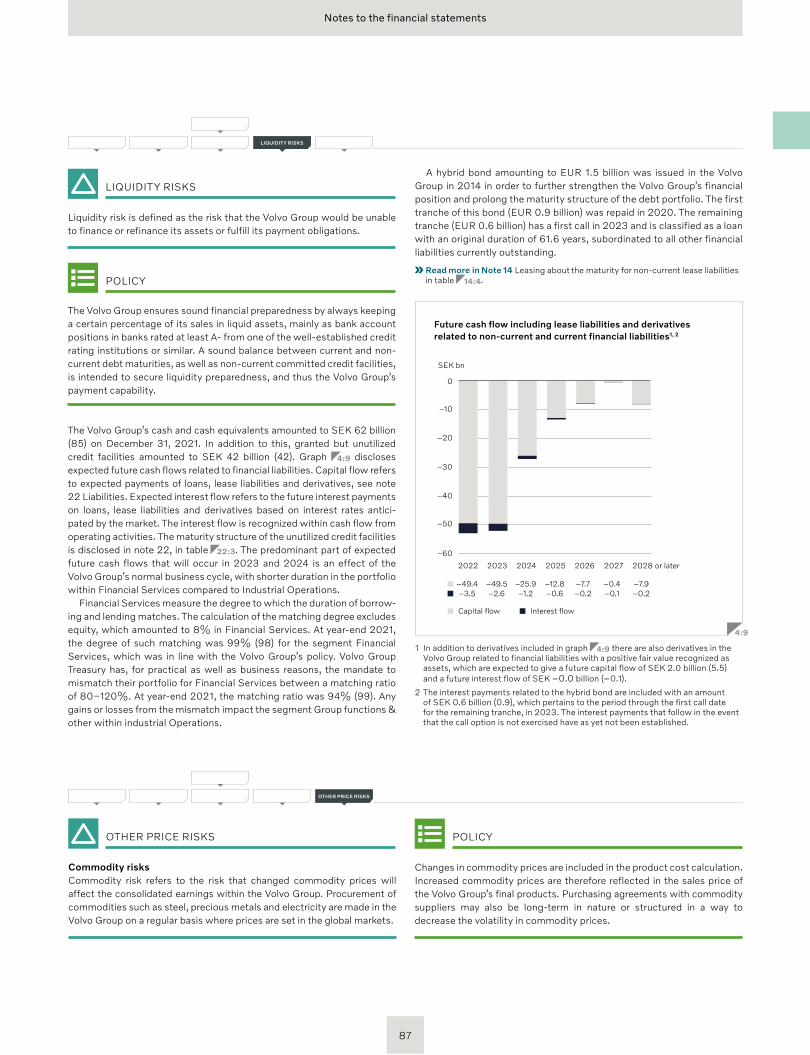
Notes to the financial statements
LIQUIDITY RISKS
Liquidity risk is defined as the risk that the Volvo Group would be unable to finance or refinance its assets or fulfill its payment obligations.
POLICY
The Volvo Group ensures sound financial preparedness by always keeping a certain percentage of its sales in liquid assets, mainly as bank account positions in banks rated at least A- from one of the well-established credit rating institutions or similar. A sound balance between current and non-current debt maturities, as well as non-current committed credit facilities, is intended to secure liquidity preparedness, and thus the Volvo Group’s payment capability.
The Volvo Group’s cash and cash equivalents amounted to SEK 62 billion (85) on December 31, 2021. In addition to this, granted but unutilized credit facilities amounted to SEK 42 billion (42). Graph 4:9 discloses expected future cash flows related to financial liabilities. Capital flow refers to expected payments of loans, lease liabilities and derivatives, see note 22 Liabilities. Expected interest flow refers to the future interest payments on loans, lease liabilities and derivatives based on interest rates antici-pated by the market. The interest flow is recognized within cash flow from operating activities. The maturity structure of the unutilized credit facilities is disclosed in note 22, in table 22:3. The predominant part of expected future cash flows that will occur in 2023 and 2024 is an effect of the Volvo Group’s normal business cycle, with shorter duration in the portfolio within Financial Services compared to Industrial Operations.
Financial Services measure the degree to which the duration of borrow-ing and lending matches. The calculation of the matching degree excludes equity, which amounted to 8% in Financial Services. At year-end 2021, the degree of such matching was 99% (98) for the segment Financial Services, which was in line with the Volvo Group’s policy. Volvo Group Treasury has, for practical as well as business reasons, the mandate to mismatch their portfolio for Financial Services between a matching ratio of 80–120%. At year-end 2021, the matching ratio was 94% (99). Any gains or losses from the mismatch impact the segment Group functions & other within industrial Operations.
POLICY
Changes in commodity prices are included in the product cost calculation. Increased commodity prices are therefore reflected in the sales price of the Volvo Group’s final products. Purchasing agreements with commodity suppliers may also be long-term in nature or structured in a way to de crease the volatility in commodity prices.
OTHER PRICE RISKS
Commodity risksCommodity risk refers to the risk that changed commodity prices will affect the consolidated earnings within the Volvo Group. Procurement of commodities such as steel, precious metals and electricity are made in the Volvo Group on a regular basis where prices are set in the global markets.
A hybrid bond amounting to EUR 1.5 billion was issued in the Volvo Group in 2014 in order to further strengthen the Volvo Group’s financial position and prolong the maturity structure of the debt portfolio. The first tranche of this bond (EUR 0.9 billion) was repaid in 2020. The remaining tranche (EUR 0.6 billion) has a first call in 2023 and is classified as a loan with an original duration of 61.6 years, subordinated to all other financial liabilities currently outstanding.
Read more in Note 14 Leasing about the maturity for non-current lease liabilities in table 14:4.
Future cash flow including lease liabilities and derivatives related to non-current and current financial liabilities1, 2
–60
0
–40
–50
–30
–20
–10
SEK bn
2028 or later
Capital flow Interest flow
2023 2024 20252022 2026 2027
–49.4 –49.5 –25.9 –12.8 –7.7 –0.4–3.5 –2.6 –1.2 –0.6 –0.2 –0.1
–7.9–0.2
4:9
1 In addition to derivatives included in graph 4:9 there are also derivatives in the Volvo Group related to financial liabilities with a positive fair value recognized as assets, which are expected to give a future capital flow of SEK 2.0 billion (5.5) and a future interest flow of SEK –0.0 billion (–0.1).
2 The interest payments related to the hybrid bond are included with an amount of SEK 0.6 billion (0.9), which pertains to the period through the first call date for the remaining tranche, in 2023. The interest payments that follow in the event that the call option is not exercised have as yet not been established.
LIQUIDITY RISKS
OTHER PRICE RISKS
87
Notes to the financial statements
ACCOUNTING POLICY
Joint venturesJoint ventures are companies in which the Volvo Group has joint control together with one or more external parties. Investments in joint ventures are recognized by applying equity method accounting. The Volvo Group's most significant holdings in joint ventures are VE Commercial Vehicles, Ltd., (VECV) and cellcentric GmbH & Co. KG (cellcentric). Both invest-ments are joint ventures since common agreement is needed for impor-tant matters related to the governance in the joint ventures. The invest-ment in VECV aims at strengthening the Volvo Group’s position in the market in India. As of March 1, 2021, the Volvo Group acquired 50 percent of the shares in the existing Daimler Truck Fuel Cell GmbH & Co. KG and formed a joint venture with Daimler Truck AG. The parties agreed to rename the company to cellcentric GmbH & Co. KG (cellcentric). The joint venture will develop, produce, and commercialize fuel-cell systems for use in heavy-duty trucks as the primary focus. Both VECV and cellcentric are included in the Trucks segment.
Associated companies Associated companies are companies in which the Volvo Group has a sig-nificant influence. A strong indication of such influence is when the Group’s holding is more than 20% but less than 50% of the voting rights. Investments in associated companies are recognized by applying equity method accounting. The ownership in the Chinese automotive manufac-turer Dongfeng Commercial Vehicles Co., Ltd (DFCV) is classified as an associated company and is included in the Trucks segment.
Equity methodThe Volvo Group’s share of the companies’ income/loss recognized according to the equity method is included in the Volvo Group’s income statement as income/loss from investments in joint ventures and associ-ated companies. Where appropriate, the income has been reduced by depreciation of surplus values and the effect of applying different account-ing policies has been considered. Income from companies recognized in accordance with the equity method is included in operating income since
the Volvo Group’s investments are business related in nature. For practical reasons, some of the associated companies are included in the consoli-dated financial statements with a certain time lag, normally up to one quarter. Dividends from joint ventures and associated companies are not included in the consolidated income. The carrying amount of investments in joint ventures and associated companies are affected by the Volvo Group’s share of the companies' net income, less depreciation of surplus values and dividends received. Investments in joint ventures and associated com-panies are also affected by the Volvo Group’s share of the companies' other comprehensive income and by the translation difference from translating the companies' equity in the consolidation of the Volvo Group.
When applying the equity method, losses recognized by joint ventures or associates could indicate impairment and additional impairment losses might be recognized. For instance, a significant or prolonged decline in the fair value of the shares is an indication of impairment. However, invest-ments accounted for in accordance with the equity method cannot amount to a negative carrying value and losses are therefore not adjusted for if the holding is of a negative amount. Additional losses are provided for to the extent that the Volvo Group has incurred legal or constructive obligations to make payments on behalf of the joint venture or the associ-ated company.
Other shares and participationsOther shares and participations recognizes holding of shares in which the Volvo Group does not hold a significant influence. This generally means the Volvo Group’s holding of shares corresponds to less than 20% of the voting rights. Listed shares are recognized at fair value through other comprehensive income since the shares are not held for trading. For unlisted shares and participations, a fair value cannot be reasonably measured, hence these are measured at amortized cost. Earned or paid interest attributable to these assets is recognized in the income state-ment as part of net financial items, in accordance with the effective inter-est method. Dividends received attributable to these assets are recog-nized as income from other investments within operating income.
Read more in Note 30 Financial instruments, regarding classification and valuation of financial instruments.
5 Investments in joint ventures, associated companies and other shares and participations
88
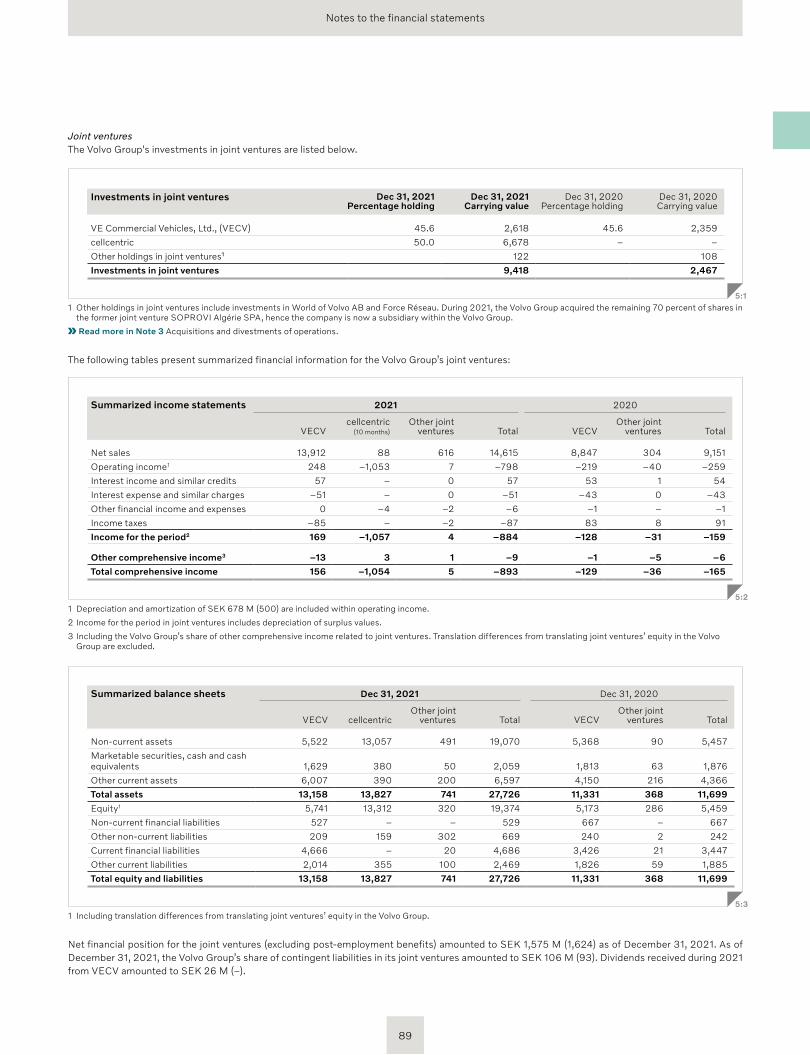
Notes to the financial statements
Summarized income statements 2021 2020
VECVcellcentric
(10 months)Other joint
ventures Total VECVOther joint
ventures Total
Net sales 13,912 88 616 14,615 8,847 304 9,151
Operating income 1 248 –1,053 7 –798 –219 –40 –259
Interest income and similar credits 57 – 0 57 53 1 54
Interest expense and similar charges –51 – 0 –51 –43 0 –43
Other financial income and expenses 0 –4 –2 –6 –1 – –1
Income taxes –85 – –2 –87 83 8 91
Income for the period2 169 –1,057 4 –884 –128 –31 –159
Other comprehensive income3 –13 3 1 –9 –1 –5 –6
Total comprehensive income 156 –1,054 5 –893 –129 –36 –165
5:2
1 Depreciation and amortization of SEK 678 M (500) are included within operating income.
2 Income for the period in joint ventures includes depreciation of surplus values.
3 Including the Volvo Group’s share of other comprehensive income related to joint ventures. Translation differences from translating joint ventures’ equity in the Volvo Group are excluded.
Summarized balance sheets Dec 31, 2021 Dec 31, 2020
VECV cellcentricOther joint
ventures Total VECV Other joint
ventures Total
Non-current assets 5,522 13,057 491 19,070 5,368 90 5,457
Marketable securities, cash and cash equivalents 1,629 380 50 2,059 1,813 63 1,876
Other current assets 6,007 390 200 6,597 4,150 216 4,366
Total assets 13,158 13,827 741 27,726 11,331 368 11,699
Equity1 5,741 13,312 320 19,374 5,173 286 5,459
Non-current financial liabilities 527 – – 529 667 – 667
Other non-current liabilities 209 159 302 669 240 2 242
Current financial liabilities 4,666 – 20 4,686 3,426 21 3,447
Other current liabilities 2,014 355 100 2,469 1,826 59 1,885
Total equity and liabilities 13,158 13,827 741 27,726 11,331 368 11,699
5:3
1 Including translation differences from translating joint ventures’ equity in the Volvo Group.
Net financial position for the joint ventures (excluding post-employment benefits) amounted to SEK 1,575 M (1,624) as of December 31, 2021. As of December 31, 2021, the Volvo Group’s share of contingent liabilities in its joint ventures amounted to SEK 106 M (93). Dividends received during 2021 from VECV amounted to SEK 26 M (–).
Joint ventures The Volvo Group's investments in joint ventures are listed below.
Investments in joint ventures Dec 31, 2021 Percentage holding
Dec 31, 2021Carrying value
Dec 31, 2020 Percentage holding
Dec 31, 2020Carrying value
VE Commercial Vehicles, Ltd., (VECV) 45.6 2,618 45.6 2,359
cellcentric 50.0 6,678 – –
Other holdings in joint ventures¹ 122 108
Investments in joint ventures 9,418 2,467
5:1
1 Other holdings in joint ventures include investments in World of Volvo AB and Force Réseau. During 2021, the Volvo Group acquired the remaining 70 percent of shares in the former joint venture SOPROVI Algérie SPA, hence the company is now a subsidiary within the Volvo Group.
Read more in Note 3 Acquisitions and divestments of operations.
The following tables present summarized financial information for the Volvo Group’s joint ventures:
89
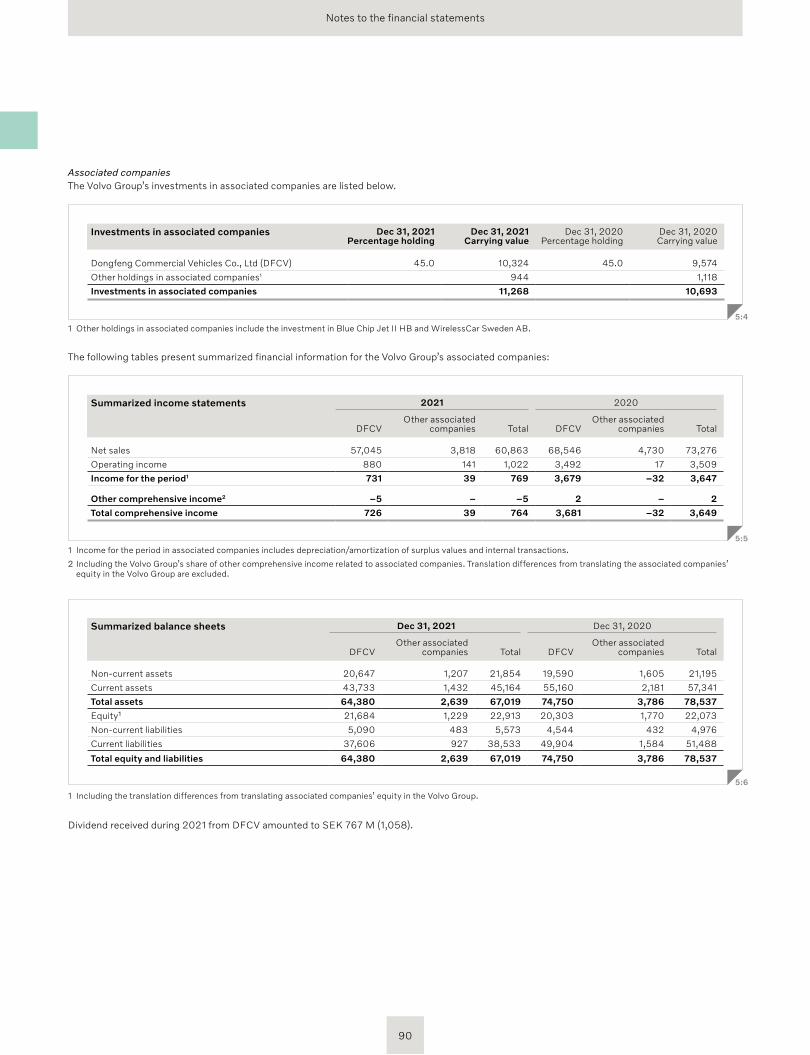
Notes to the financial statements
Associated companiesThe Volvo Group’s investments in associated companies are listed below.
Investments in associated companies Dec 31, 2021 Percentage holding
Dec 31, 2021Carrying value
Dec 31, 2020 Percentage holding
Dec 31, 2020Carrying value
Dongfeng Commercial Vehicles Co., Ltd (DFCV) 45.0 10,324 45.0 9,574
Other holdings in associated companies1 944 1,118
Investments in associated companies 11,268 10,693
5:4
1 Other holdings in associated companies include the investment in Blue Chip Jet II HB and WirelessCar Sweden AB.
The following tables present summarized financial information for the Volvo Group’s associated companies:
Summarized income statements 2021 2020
DFCVOther associated
companies Total DFCVOther associated
companies Total
Net sales 57,045 3,818 60,863 68,546 4,730 73,276
Operating income 880 141 1,022 3,492 17 3,509
Income for the period1 731 39 769 3,679 –32 3,647
Other comprehensive income2 –5 – –5 2 – 2
Total comprehensive income 726 39 764 3,681 –32 3,649
5:5
1 Income for the period in associated companies includes depreciation/amortization of surplus values and internal transactions.
2 Including the Volvo Group’s share of other comprehensive income related to associated companies. Translation differences from translating the associated companies’ equity in the Volvo Group are excluded.
Summarized balance sheets Dec 31, 2021 Dec 31, 2020
DFCVOther associated
companies Total DFCVOther associated
companies Total
Non-current assets 20,647 1,207 21,854 19,590 1,605 21,195
Current assets 43,733 1,432 45,164 55,160 2,181 57,341
Total assets 64,380 2,639 67,019 74,750 3,786 78,537
Equity¹ 21,684 1,229 22,913 20,303 1,770 22,073
Non-current liabilities 5,090 483 5,573 4,544 432 4,976
Current liabilities 37,606 927 38,533 49,904 1,584 51,488
Total equity and liabilities 64,380 2,639 67,019 74,750 3,786 78,537
5:6
1 Including the translation differences from translating associated companies’ equity in the Volvo Group.
Dividend received during 2021 from DFCV amounted to SEK 767 M (1,058).
90
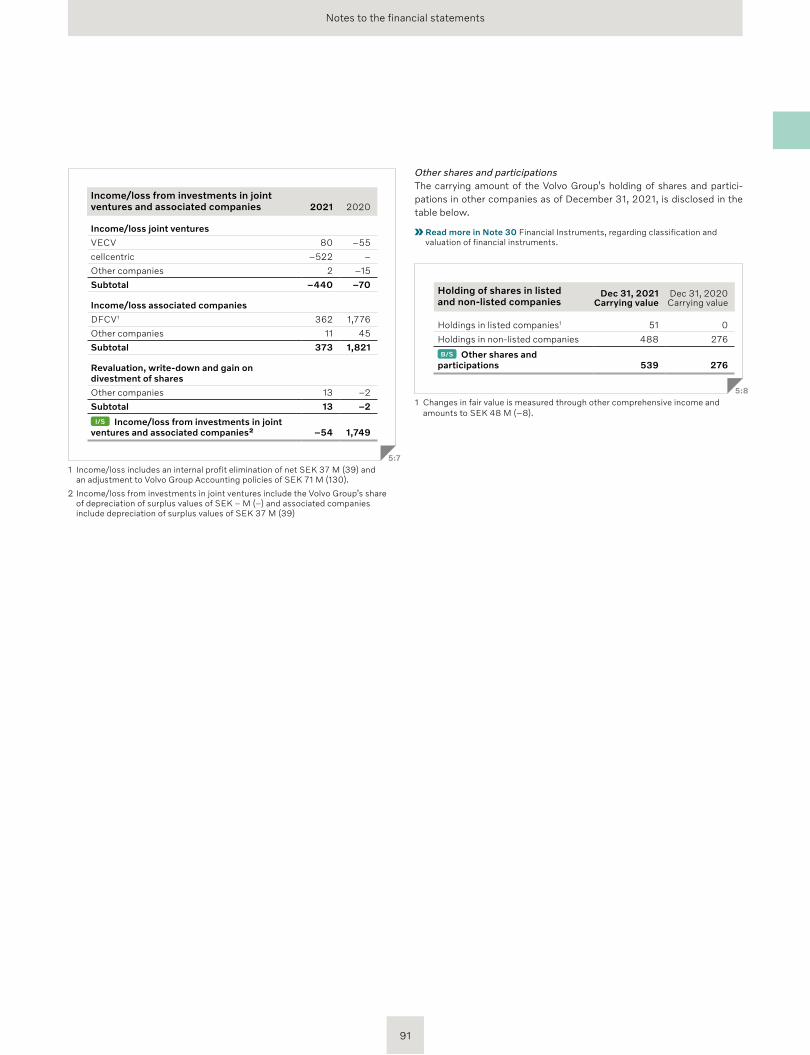
Notes to the financial statements
Other shares and participationsThe carrying amount of the Volvo Group’s holding of shares and partici-pations in other companies as of December 31, 2021, is disclosed in the table below.
Read more in Note 30 Financial Instruments, regarding classification and valuation of financial instruments.
Holding of shares in listed and non-listed companies
Dec 31, 2021Carrying value
Dec 31, 2020Carrying value
Holdings in listed companies1 51 0
Holdings in non-listed companies 488 276
B/S Other shares and participations 539 276
5:8
1 Changes in fair value is measured through other comprehensive income and amounts to SEK 48 M (–8).
Income/loss from investments in joint ventures and associated companies 2021 2020
Income/loss joint ventures
VECV 80 –55
cellcentric –522 –
Other companies 2 –15
Subtotal –440 –70
Income/loss associated companies
DFCV1 362 1,776
Other companies 11 45
Subtotal 373 1,821
Revaluation, write-down and gain on divestment of shares
Other companies 13 –2
Subtotal 13 –2
I/S Income/loss from investments in joint ventures and associated companies² –54 1,749
5:7
1 Income/loss includes an internal profit elimination of net SEK 37 M (39) and an adjustment to Volvo Group Accounting policies of SEK 71 M (130).
2 Income/loss from investments in joint ventures include the Volvo Group’s share of depreciation of surplus values of SEK – M (–) and associated companies include depreciation of surplus values of SEK 37 M (39)
91
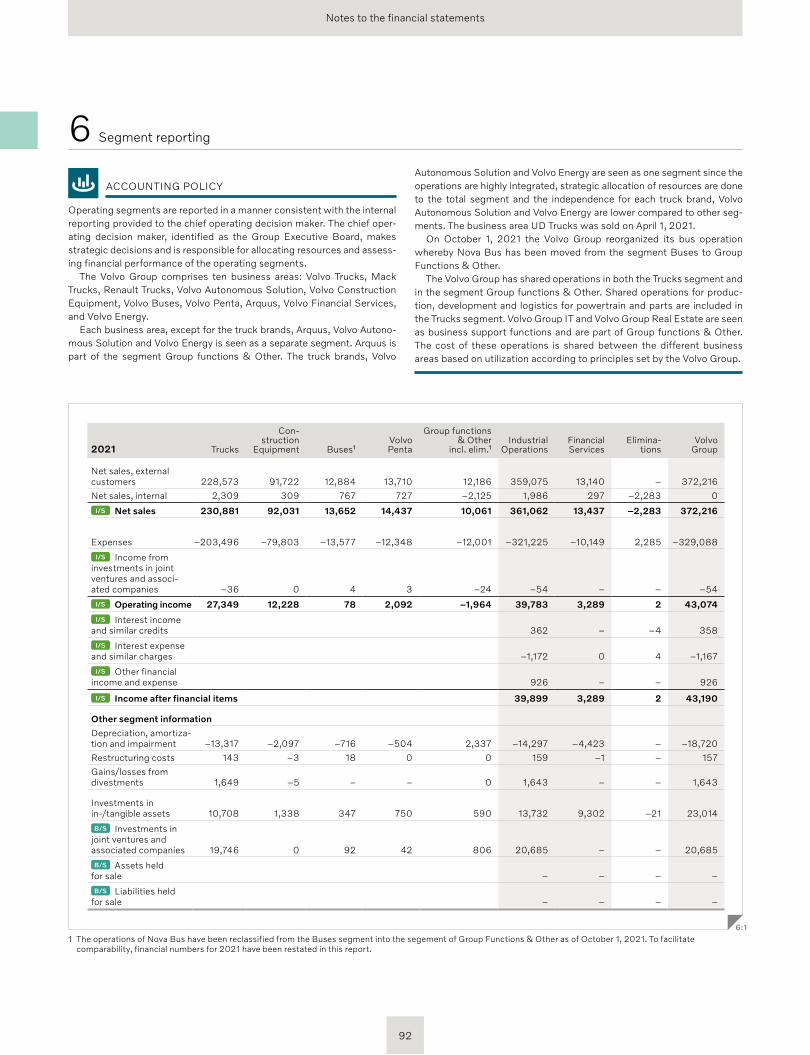
Notes to the financial statements
ACCOUNTING POLICY
Operating segments are reported in a manner consistent with the internal reporting provided to the chief operating decision maker. The chief oper-ating decision maker, identified as the Group Executive Board, makes strategic decisions and is responsible for allocating resources and assess-ing financial performance of the operating segments.
The Volvo Group comprises ten business areas: Volvo Trucks, Mack Trucks, Renault Trucks, Volvo Autonomous Solution, Volvo Construction Equipment, Volvo Buses, Volvo Penta, Arquus, Volvo Financial Services, and Volvo Energy.
Each business area, except for the truck brands, Arquus, Volvo Autono-mous Solution and Volvo Energy is seen as a separate segment. Arquus is part of the segment Group functions & Other. The truck brands, Volvo
Autonomous Solution and Volvo Energy are seen as one segment since the operations are highly integrated, strategic allocation of resources are done to the total segment and the independence for each truck brand, Volvo Autonomous Solution and Volvo Energy are lower compared to other seg-ments. The business area UD Trucks was sold on April 1, 2021.
On October 1, 2021 the Volvo Group reorganized its bus operation whereby Nova Bus has been moved from the segment Buses to Group Functions & Other.
The Volvo Group has shared operations in both the Trucks segment and in the segment Group functions & Other. Shared operations for produc-tion, development and logistics for powertrain and parts are included in the Trucks segment. Volvo Group IT and Volvo Group Real Estate are seen as business support functions and are part of Group functions & Other. The cost of these operations is shared between the different business areas based on utilization according to principles set by the Volvo Group.
6 Segment reporting
2021 Trucks
Con-struction
Equipment Buses¹Volvo Penta
Group functions & Other
incl. elim.¹Industrial
OperationsFinancial Services
Elimina-tions
Volvo Group
Net sales, external customers 228,573 91,722 12,884 13,710 12,186 359,075 13,140 – 372,216
Net sales, internal 2,309 309 767 727 –2,125 1,986 297 –2,283 0
I/S Net sales 230,881 92,031 13,652 14,437 10,061 361,062 13,437 –2,283 372,216
Expenses
–203,496 –79,803 –13,577 –12,348 –12,001 –321,225 –10,149 2,285 –329,088
I/S Income from investments in joint ventures and associ-ated companies –36 0 4 3 –24 –54 – – –54
I/S Operating income 27,349 12,228 78 2,092 –1,964 39,783 3,289 2 43,074
I/S Interest income and similar credits 362 – –4 358
I/S Interest expense and similar charges –1,172 0 4 –1,167
I/S Other financial income and expense 926 – – 926
I/S Income after financial items 39,899 3,289 2 43,190
Other segment information
Depreciation, amortiza-tion and impairment –13,317 –2,097 –716 –504 2,337 –14,297 –4,423 – –18,720
Restructuring costs 143 –3 18 0 0 159 –1 – 157
Gains/losses from divestments 1,649 –5 – – 0 1,643 – – 1,643
Investments in in-/tangible assets 10,708 1,338 347 750 590 13,732 9,302 –21 23,014
B/S Investments in joint ventures and associated companies 19,746 0 92 42 806 20,685 – – 20,685
B/S Assets held for sale – – – –
B/S Liabilities held for sale – – – –
6:1
1 The operations of Nova Bus have been reclassified from the Buses segment into the segement of Group Functions & Other as of October 1, 2021. To facilitate compara bility, financial numbers for 2021 have been restated in this report.
92
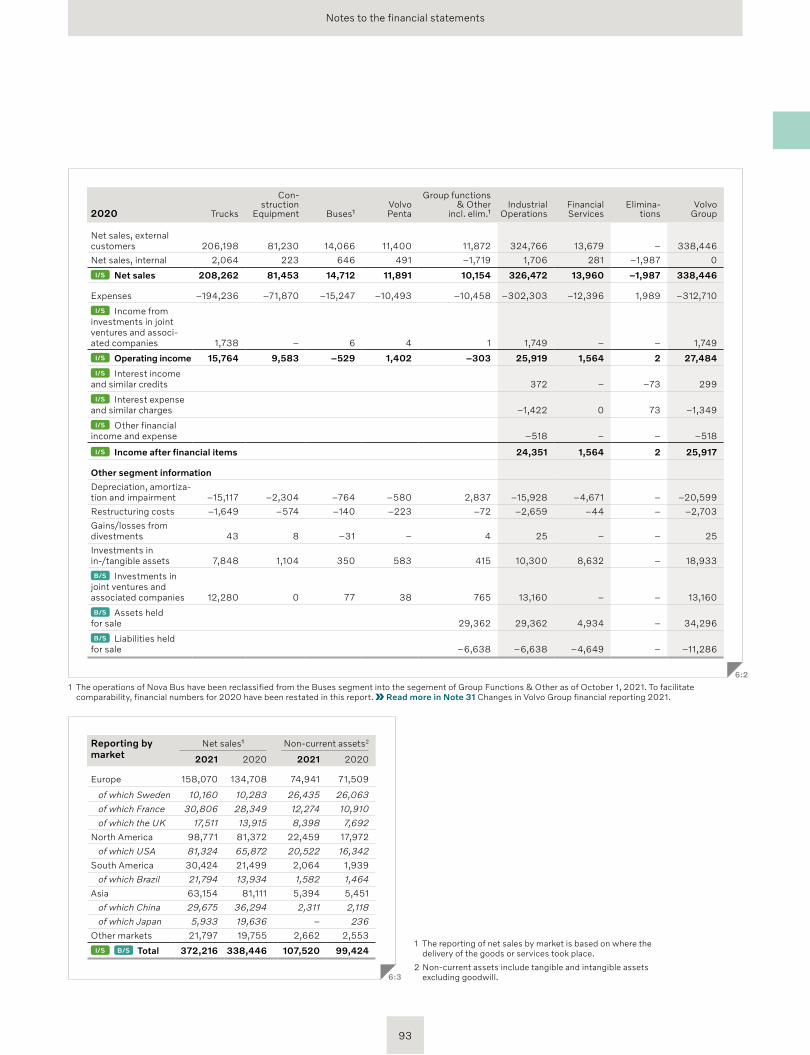
Notes to the financial statements
2020 Trucks
Con-struction
Equipment Buses¹Volvo Penta
Group functions & Other
incl. elim.¹Industrial
OperationsFinancial Services
Elimina-tions
Volvo Group
Net sales, external customers 206,198 81,230 14,066 11,400 11,872 324,766 13,679 – 338,446
Net sales, internal 2,064 223 646 491 –1,719 1,706 281 –1,987 0
I/S Net sales 208,262 81,453 14,712 11,891 10,154 326,472 13,960 –1,987 338,446
Expenses –194,236 –71,870 –15,247 –10,493 –10,458 –302,303 –12,396 1,989 –312,710
I/S Income from investments in joint ventures and associ-ated companies 1,738 – 6 4 1 1,749 – – 1,749
I/S Operating income 15,764 9,583 –529 1,402 –303 25,919 1,564 2 27,484
I/S Interest income and similar credits 372 – –73 299
I/S Interest expense and similar charges –1,422 0 73 –1,349
I/S Other financial income and expense –518 – – –518
I/S Income after financial items 24,351 1,564 2 25,917
Other segment information
Depreciation, amortiza-tion and impairment –15,117 –2,304 –764 –580 2,837 –15,928 –4,671 – –20,599
Restructuring costs –1,649 –574 –140 –223 –72 –2,659 –44 – –2,703
Gains/losses from divestments 43 8 –31 – 4 25 – – 25
Investments in in-/tangible assets 7,848 1,104 350 583 415 10,300 8,632 – 18,933
B/S Investments in joint ventures and associated companies 12,280 0 77 38 765 13,160 – – 13,160
B/S Assets held for sale 29,362 29,362 4,934 – 34,296
B/S Liabilities held for sale –6,638 –6,638 –4,649 – –11,286
6:2
1 The operations of Nova Bus have been reclassified from the Buses segment into the segement of Group Functions & Other as of October 1, 2021. To facilitate comparability, financial numbers for 2020 have been restated in this report. Read more in Note 31 Changes in Volvo Group financial reporting 2021.
Reporting by market
Net sales¹ Non-current assets2
2021 2020 2021 2020
Europe 158,070 134,708 74,941 71,509
of which Sweden 10,160 10,283 26,435 26,063
of which France 30,806 28,349 12,274 10,910
of which the UK 17,511 13,915 8,398 7,692
North America 98,771 81,372 22,459 17,972
of which USA 81,324 65,872 20,522 16,342
South America 30,424 21,499 2,064 1,939
of which Brazil 21,794 13,934 1,582 1,464
Asia 63,154 81,111 5,394 5,451
of which China 29,675 36,294 2,311 2,118
of which Japan 5,933 19,636 – 236
Other markets 21,797 19,755 2,662 2,553
I/S B/S Total 372,216 338,446 107,520 99,424
6:3
1 The reporting of net sales by market is based on where the delivery of the goods or services took place.
2 Non-current assets include tangible and intangible assets excluding goodwill.
93
Notes to the financial statements
7 Revenue
ACCOUNTING POLICY
The recognized net sales in Industrial Operations pertain to revenues from sales of vehicles and services. Revenue from vehicles and services are recognized when control has been transferred from Volvo Group to the customer. Control refers to the customers’ ability to use vehicles or ser-vices in its operations and to obtain the associated cash flow related to the use. Vehicles and services are sold separately or as a combined offer. In combined offers where the vehicle and services are separable from each other and the customer can benefit from the vehicle and the service independently, the transaction price is allocated between vehicles and services based on stand-alone selling price according to price lists.
The recognized net sales in Financial Services pertain to interest income related to finance leases and installment credits as well as income from operating lease contracts. Interest income is recognized during the underlying contract period and income from operating leasing is recog-nized over the leasing period.
VehiclesVehicles include sales of new vehicles, machines and engines as well as sales of used vehicles, machines, trailers, superstructures and special vehicles. A standard contractual warranty is included as part of the sales, read more in note 21 Other provisions about product warranty. The customer can pay for the vehicle at the point of sale or defer the payment by entering into agreements such as installment credits and finance lease.
Revenue is recognized at a specific point in time, when control of the vehicle has been transferred to the customer, normally when the vehicle has been delivered to the customer. The value of rebates, returns and var-iable sales price have been considered as part of the revenue recognition.
If the sale of the vehicle is combined with a residual value commitment (buybacks and tradebacks) the criterion of transferring control is based on if the customer has a significant economic incentive to exercise the option to return the vehicle or not. A significant economic incentive exists if the repurchase price is higher than the assessed fair market value i.e. net real-izable value at the end of the residual value commitment period, or if the historical returns indicate that it is probable that the customer will return the vehicle at the end of the commitment period. Thus, the control has not been transferred and the sales transaction is recognized as an operating lease transaction. The revenue and expense are recognized over the resid-ual value commitment period in the income statement. Assets under operating leases, a residual value liability, and a deferred lease income are recognized in the balance sheet. The asset is depreciated over the com-mitment period and the deferred lease income is recognized as revenue over the same period. The residual value liability amount remains unchanged until the end of the commitment period. If the vehicle is returned at the end of the commitment period, the residual value liability is paid to the customer and the vehicle is reclassified from assets under operating lease to inventory.
Read more in Note 14 Leasing about lease income on assets under operating lease.
Read more in Sustainability notes and section EU Taxonomy regulation disclosures about taxonomy eligible turnover.
If the customer is not considered to have a significant economic incentive to return the vehicle, the sales transaction is recognized in accordance with the right of return model. Revenue corresponding to the sales amount less the buyback amount is recognized at the initial sale, as well as a pro-portionate share of cost of goods sold. The remaining revenue is recog-
nized as a refund liability and the remaining cost of goods sold as a right of return asset during the commitment period. If the vehicle is not returned the refund liability is recognized as revenue and the right of return asset is recognized as cost of goods sold at the end of the commitment period.
ServicesServices include sale of spare parts, maintenance services, repairs, extended coverage, connectivity solutions and other aftermarket products. The con-trol of the service has been transferred to the customer when the Volvo Group incurs the associated cost to deliver the service and the customer can benefit from the use of the delivered services. For spare parts, revenue is normally recognized at one point time, which is when it is delivered to the customer. For maintenance services, connectivity solutions and other aftermarket products, revenue is recognized over time, i.e. normally during the contract period. When payment for maintenance contracts is received in advance, the payment is recognized as a contract liability.
Services also includes sales in Financial Services related to finance lease, installment credits and operating leases. During 2021, revenue from Financial Services operations amounted to SEK 13,437 M (13,960).
Read more in Note 6 Segment reporting regarding net sales by segment and market.
Read more in Note 14 Leasing about lease income on assets under operating lease and finance income om customer-financing receivables.
SOURCE OF ESTIMATION UNCERTAINTY AND CRITICAL JUDGMENTS
Sales with residual value commitmentsWhen the Volvo Group enters into sales transactions of vehicles with resid-ual value commitments (buybacks and tradebacks) the judgment whether control has been transferred from Volvo Group to the customer and at what point in time revenue shall be recognized is critical. The judgment made is when a significant economic incentive exists or not for the cus-tomer to return the vehicle at the end of the commitment period. The assessment of significant economic incentive is performed at the incep-tion of the contract and the outcome at the end of the commitment period can differ from the initial assessment. Factors that are considered and requires judgment is the assessed fair market value i.e. net realizable value at the end of the residual value commitment period and historical returns. The future mix of vehicles and services is driven by customer demand for products and solutions with lower environmental impact. Supply chain and production disturbances due to covid-19 and the gradual introduction of battery electric and fuel cell electric products imply to some extent uncer-tainties in the assessment of fair market value.
Read more in Note 13 Tangible assets for a description of residual value risks and the assessment of fair market value.
Variable sales priceIn some sales transactions, the sales price is variable such as residual value guarantees. In assessing the variable sales price, the expected value method is used and revenue is recognized when it is highly probable that a reversal will not occur. Both the expected value method and the assess-ment of highly probable requires judgments to be able to make estimates. The estimates are made at the contract start with continuous assessment at each reporting period.
94
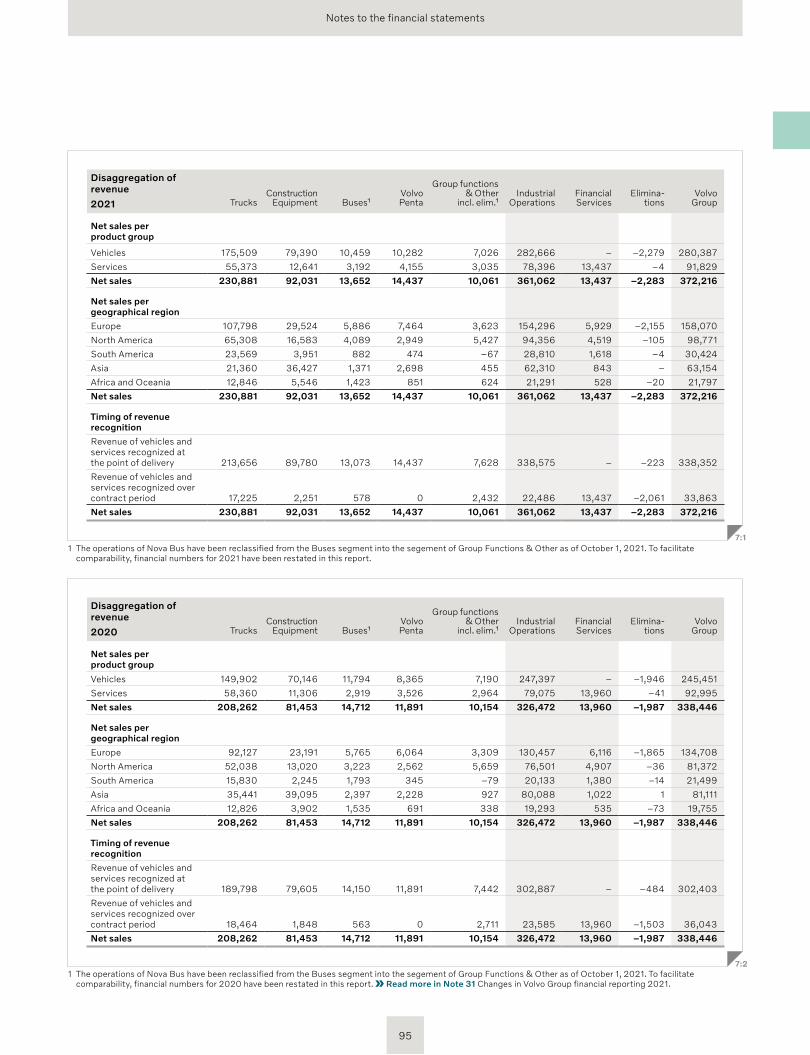
Notes to the financial statements
Disaggregation of revenue
TrucksConstruction
Equipment Buses¹Volvo Penta
Group func tions & Other
incl. elim.¹Industrial
OperationsFinancial Services
Elimina-tions
Volvo Group2021
Net sales per product group
Vehicles 175,509 79,390 10,459 10,282 7,026 282,666 – –2,279 280,387
Services 55,373 12,641 3,192 4,155 3,035 78,396 13,437 –4 91,829
Net sales 230,881 92,031 13,652 14,437 10,061 361,062 13,437 –2,283 372,216
Net sales per geographical region
Europe 107,798 29,524 5,886 7,464 3,623 154,296 5,929 –2,155 158,070
North America 65,308 16,583 4,089 2,949 5,427 94,356 4,519 –105 98,771
South America 23,569 3,951 882 474 –67 28,810 1,618 –4 30,424
Asia 21,360 36,427 1,371 2,698 455 62,310 843 – 63,154
Africa and Oceania 12,846 5,546 1,423 851 624 21,291 528 –20 21,797
Net sales 230,881 92,031 13,652 14,437 10,061 361,062 13,437 –2,283 372,216
Timing of revenue recognition
Revenue of vehicles and services recognized at the point of delivery 213,656 89,780 13,073 14,437 7,628 338,575 – –223 338,352
Revenue of vehicles and services recognized over contract period 17,225 2,251 578 0 2,432 22,486 13,437 –2,061 33,863
Net sales 230,881 92,031 13,652 14,437 10,061 361,062 13,437 –2,283 372,216
7:11 The operations of Nova Bus have been reclassified from the Buses segment into the segement of Group Functions & Other as of October 1, 2021. To facilitate
compara bility, financial numbers for 2021 have been restated in this report.
Disaggregation of revenue
TrucksConstruction
Equipment Buses¹Volvo Penta
Group func tions & Other
incl. elim.¹Industrial
OperationsFinancial Services
Elimina-tions
Volvo Group2020
Net sales per product group
Vehicles 149,902 70,146 11,794 8,365 7,190 247,397 – –1,946 245,451
Services 58,360 11,306 2,919 3,526 2,964 79,075 13,960 –41 92,995
Net sales 208,262 81,453 14,712 11,891 10,154 326,472 13,960 –1,987 338,446
Net sales per geographical region
Europe 92,127 23,191 5,765 6,064 3,309 130,457 6,116 –1,865 134,708
North America 52,038 13,020 3,223 2,562 5,659 76,501 4,907 –36 81,372
South America 15,830 2,245 1,793 345 –79 20,133 1,380 –14 21,499
Asia 35,441 39,095 2,397 2,228 927 80,088 1,022 1 81,111
Africa and Oceania 12,826 3,902 1,535 691 338 19,293 535 –73 19,755
Net sales 208,262 81,453 14,712 11,891 10,154 326,472 13,960 –1,987 338,446
Timing of revenue recognition
Revenue of vehicles and services recognized at the point of delivery 189,798 79,605 14,150 11,891 7,442 302,887 – –484 302,403
Revenue of vehicles and services recognized over contract period 18,464 1,848 563 0 2,711 23,585 13,960 –1,503 36,043
Net sales 208,262 81,453 14,712 11,891 10,154 326,472 13,960 –1,987 338,446
7:21 The operations of Nova Bus have been reclassified from the Buses segment into the segement of Group Functions & Other as of October 1, 2021. To facilitate
comparability, financial numbers for 2020 have been restated in this report. Read more in Note 31 Changes in Volvo Group financial reporting 2021.
95
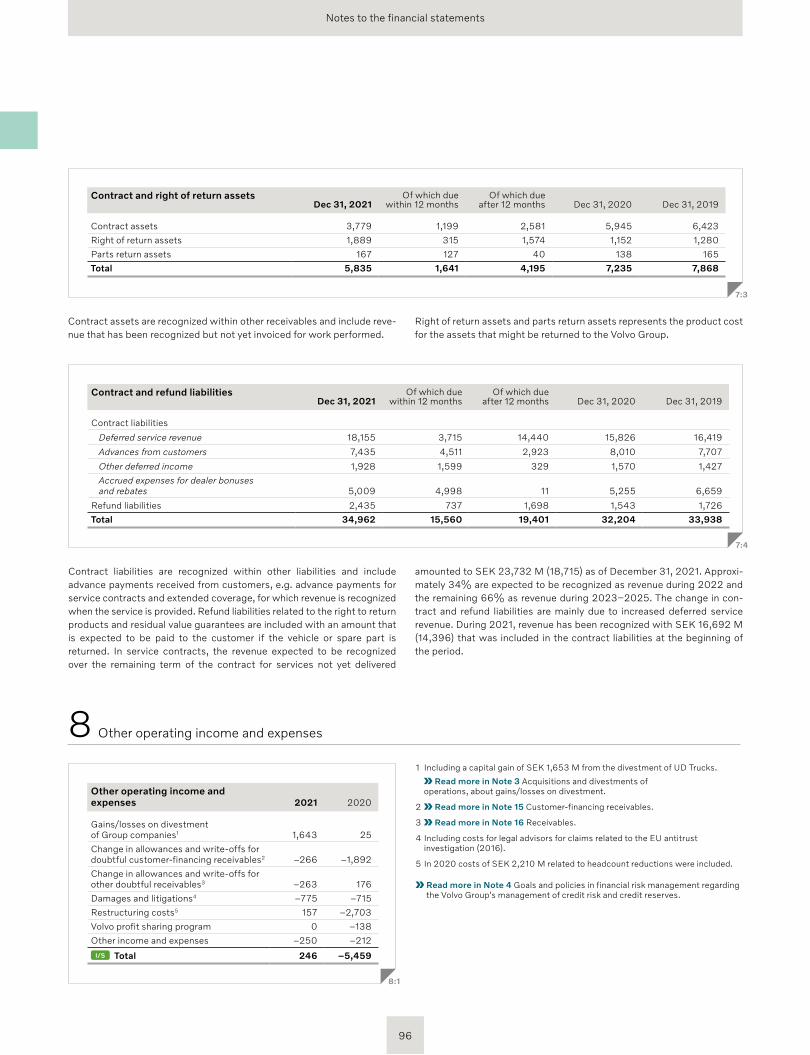
Notes to the financial statements
Contract and right of return assetsDec 31, 2021
Of which due within 12 months
Of which due after 12 months Dec 31, 2020 Dec 31, 2019
Contract assets 3,779 1,199 2,581 5,945 6,423
Right of return assets 1,889 315 1,574 1,152 1,280
Parts return assets 167 127 40 138 165
Total 5,835 1,641 4,195 7,235 7,868
7:3
Contract assets are recognized within other receivables and include reve-nue that has been recognized but not yet invoiced for work performed.
Right of return assets and parts return assets represents the product cost for the assets that might be returned to the Volvo Group.
Contract liabilities are recognized within other liabilities and include advance payments received from customers, e.g. advance payments for service contracts and extended coverage, for which revenue is recognized when the service is provided. Refund liabilities related to the right to return products and residual value guarantees are included with an amount that is expected to be paid to the customer if the vehicle or spare part is returned. In service contracts, the revenue expected to be recognized over the remaining term of the contract for services not yet delivered
amounted to SEK 23,732 M (18,715) as of December 31, 2021. Approxi-mately 34% are expected to be recognized as revenue during 2022 and the remaining 66% as revenue during 2023–2025. The change in con-tract and refund liabilities are mainly due to increased deferred service revenue. During 2021, revenue has been recognized with SEK 16,692 M (14,396) that was included in the contract liabilities at the beginning of the period.
Contract and refund liabilitiesDec 31, 2021
Of which due within 12 months
Of which due after 12 months Dec 31, 2020 Dec 31, 2019
Contract liabilities
Deferred service revenue 18,155 3,715 14,440 15,826 16,419
Advances from customers 7,435 4,511 2,923 8,010 7,707
Other deferred income 1,928 1,599 329 1,570 1,427
Accrued expenses for dealer bonuses and rebates 5,009 4,998 11 5,255 6,659
Refund liabilities 2,435 737 1,698 1,543 1,726
Total 34,962 15,560 19,401 32,204 33,938
7:4
Other operating income and expenses 2021 2020
Gains/losses on divestment of Group companies1 1,643 25
Change in allowances and write-offs for doubtful customer-financing receivables2 –266 –1,892
Change in allowances and write-offs for other doubtful receivables3 –263 176
Damages and litigations4 –775 –715
Restructuring costs5 157 –2,703
Volvo profit sharing program 0 –138
Other income and expenses –250 –212
I/S Total 246 –5,459
8:1
1 Including a capital gain of SEK 1,653 M from the divestment of UD Trucks.
Read more in Note 3 Acquisitions and divestments of operations, about gains/losses on divestment.
2 Read more in Note 15 Customer-financing receivables.
3 Read more in Note 16 Receivables.
4 Including costs for legal advisors for claims related to the EU antitrust investigation (2016).
5 In 2020 costs of SEK 2,210 M related to headcount reductions were included.
Read more in Note 4 Goals and policies in financial risk management regarding the Volvo Group's management of credit risk and credit reserves.
8 Other operating income and expenses
96
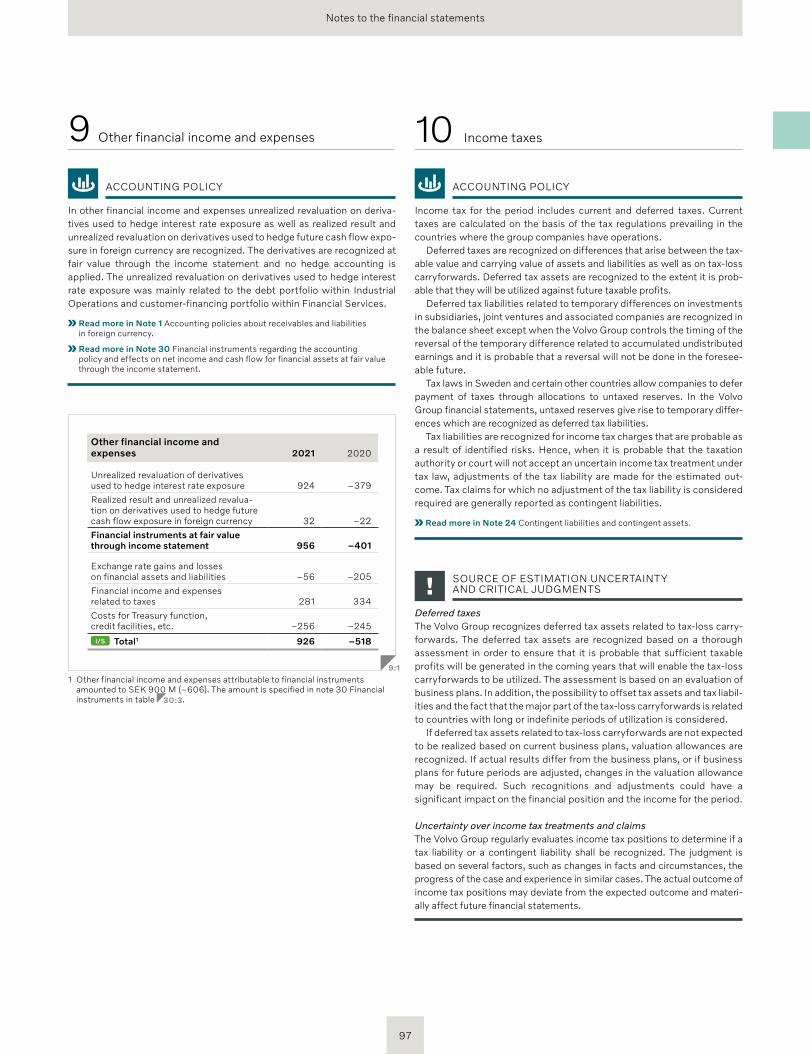
Notes to the financial statements
ACCOUNTING POLICY
Income tax for the period includes current and deferred taxes. Current taxes are calculated on the basis of the tax regulations prevailing in the countries where the group companies have operations.
Deferred taxes are recognized on differences that arise between the tax-able value and carrying value of assets and liabilities as well as on tax-loss carryforwards. Deferred tax assets are recognized to the extent it is prob-able that they will be utilized against future taxable profits.
Deferred tax liabilities related to temporary differences on investments in subsidiaries, joint ventures and associated companies are recognized in the balance sheet except when the Volvo Group controls the timing of the reversal of the temporary difference related to accumulated undistributed earnings and it is probable that a reversal will not be done in the foresee-able future.
Tax laws in Sweden and certain other countries allow companies to defer payment of taxes through allocations to untaxed reserves. In the Volvo Group financial statements, untaxed reserves give rise to temporary differ-ences which are recognized as deferred tax liabilities.
Tax liabilities are recognized for income tax charges that are probable as a result of identified risks. Hence, when it is probable that the taxation authority or court will not accept an uncertain income tax treatment under tax law, adjustments of the tax liability are made for the estimated out-come. Tax claims for which no adjustment of the tax liability is considered required are generally reported as contingent liabilities.
Read more in Note 24 Contingent liabilities and contingent assets.
SOURCE OF ESTIMATION UNCERTAINTY AND CRITICAL JUDGMENTS
Deferred taxes The Volvo Group recognizes deferred tax assets related to tax-loss carry-forwards. The deferred tax assets are recognized based on a thorough assessment in order to ensure that it is probable that sufficient taxable profits will be generated in the coming years that will enable the tax-loss carryforwards to be utilized. The assessment is based on an evaluation of business plans. In addition, the possibility to offset tax assets and tax lia bil-ities and the fact that the major part of the tax-loss carryforwards is related to countries with long or indefinite periods of utilization is considered.
If deferred tax assets related to tax-loss carryforwards are not expected to be realized based on current business plans, valuation allowances are recognized. If actual results differ from the business plans, or if business plans for future periods are adjusted, changes in the valuation allowance may be required. Such recognitions and adjustments could have a significant impact on the financial position and the income for the period.
Uncertainty over income tax treatments and claimsThe Volvo Group regularly evaluates income tax positions to determine if a tax liability or a contingent liability shall be recognized. The judgment is based on several factors, such as changes in facts and circumstances, the progress of the case and experience in similar cases. The actual outcome of income tax positions may deviate from the expected outcome and materi-ally affect future financial statements.
ACCOUNTING POLICY
In other financial income and expenses unrealized revaluation on deriva-tives used to hedge interest rate exposure as well as realized result and unrealized revaluation on derivatives used to hedge future cash flow expo-sure in foreign currency are recognized. The derivatives are recognized at fair value through the income statement and no hedge accounting is applied. The unrealized revaluation on derivatives used to hedge interest rate exposure was mainly related to the debt portfolio within Industrial Operations and customer-financing portfolio within Financial Services.
Read more in Note 1 Accounting policies about receivables and liabilities in foreign currency.
Read more in Note 30 Financial instruments regarding the accounting policy and effects on net income and cash flow for financial assets at fair value through the income statement.
Other financial income and expenses 2021 2020
Unrealized revaluation of derivatives used to hedge interest rate exposure 924 –379
Realized result and unrealized revalua-tion on derivatives used to hedge future cash flow exposure in foreign currency 32 –22
Financial instruments at fair value through income statement 956 –401
Exchange rate gains and losses on financial assets and liabilities –56 –205
Financial income and expenses related to taxes 281 334
Costs for Treasury function, credit facilities, etc. –256 –245
I/S Total1 926 –518
9:1
1 Other financial income and expenses attributable to financial instruments amounted to SEK 900 M (–606). The amount is specified in note 30 Financial instruments in table 30:3.
9 Other financial income and expenses 10 Income taxes
97
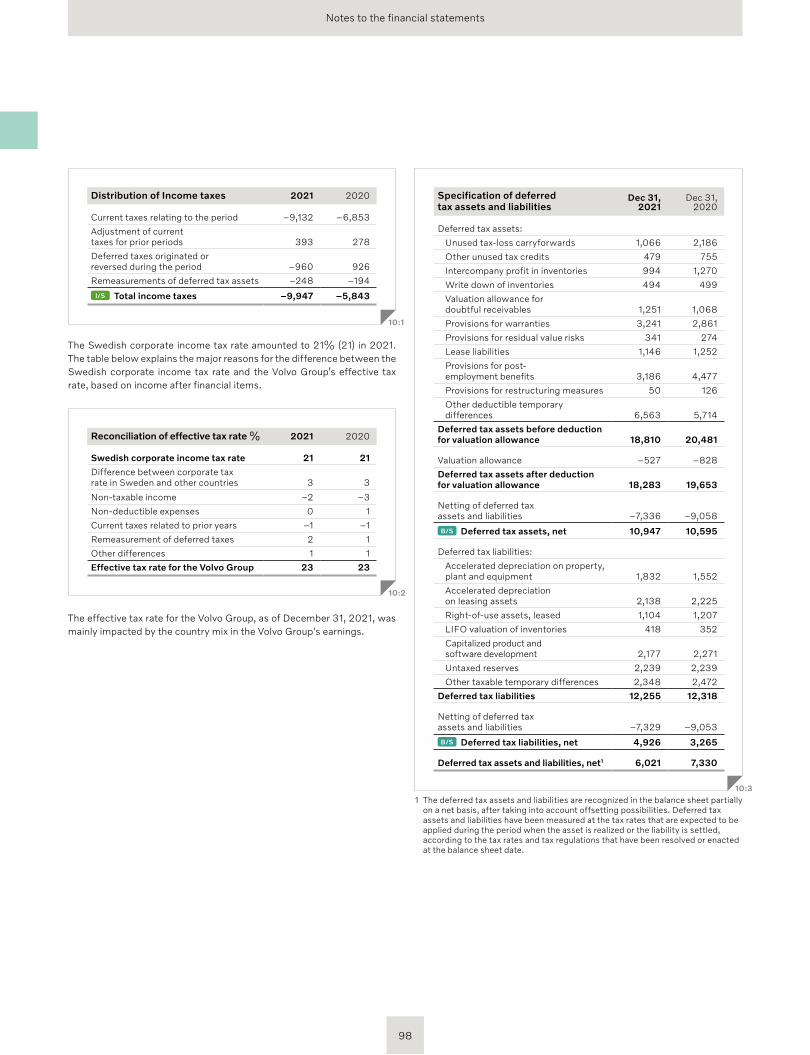
Notes to the financial statements
Distribution of Income taxes 2021 2020
Current taxes relating to the period –9,132 –6,853
Adjustment of current taxes for prior periods 393 278
Deferred taxes originated or reversed during the period –960 926
Remeasurements of deferred tax assets –248 –194
I/S Total income taxes –9,947 –5,843
10:1
The Swedish corporate income tax rate amounted to 21% (21) in 2021. The table below explains the major reasons for the difference between the Swedish corporate income tax rate and the Volvo Group’s effective tax rate, based on income after financial items.
Reconciliation of effective tax rate % 2021 2020
Swedish corporate income tax rate 21 21
Difference between corporate tax rate in Sweden and other countries 3 3
Non-taxable income –2 –3
Non-deductible expenses 0 1
Current taxes related to prior years –1 –1
Remeasurement of deferred taxes 2 1
Other differences 1 1
Effective tax rate for the Volvo Group 23 23
10:2
The effective tax rate for the Volvo Group, as of December 31, 2021, was mainly impacted by the country mix in the Volvo Group's earnings.
Specification of deferred tax assets and liabilities
Dec 31,2021
Dec 31,2020
Deferred tax assets:
Unused tax-loss carryforwards 1,066 2,186
Other unused tax credits 479 755
Intercompany profit in inventories 994 1,270
Write down of inventories 494 499
Valuation allowance for doubtful receivables 1,251 1,068
Provisions for warranties 3,241 2,861
Provisions for residual value risks 341 274
Lease liabilities 1,146 1,252
Provisions for post- employment benefits 3,186 4,477
Provisions for restructuring measures 50 126
Other deductible temporary differences 6,563 5,714
Deferred tax assets before deduction for valuation allowance 18,810 20,481
Valuation allowance –527 –828
Deferred tax assets after deduction for valuation allowance 18,283 19,653
Netting of deferred tax assets and liabilities –7,336 –9,058
B/S Deferred tax assets, net 10,947 10,595
Deferred tax liabilities:
Accelerated depreciation on property, plant and equipment 1,832 1,552
Accelerated depreciation on leasing assets 2,138 2,225
Right-of-use assets, leased 1,104 1,207
LIFO valuation of inventories 418 352
Capitalized product and software development 2,177 2,271
Untaxed reserves 2,239 2,239
Other taxable temporary differences 2,348 2,472
Deferred tax liabilities 12,255 12,318
Netting of deferred tax assets and liabilities –7,329 –9,053
B/S Deferred tax liabilities, net 4,926 3,265
Deferred tax assets and liabilities, net1 6,021 7,330
10:3
1 The deferred tax assets and liabilities are recognized in the balance sheet partially on a net basis, after taking into account offsetting possibilities. Deferred tax assets and liabilities have been measured at the tax rates that are expected to be applied during the period when the asset is realized or the liability is settled, according to the tax rates and tax regulations that have been resolved or enacted at the balance sheet date.
98
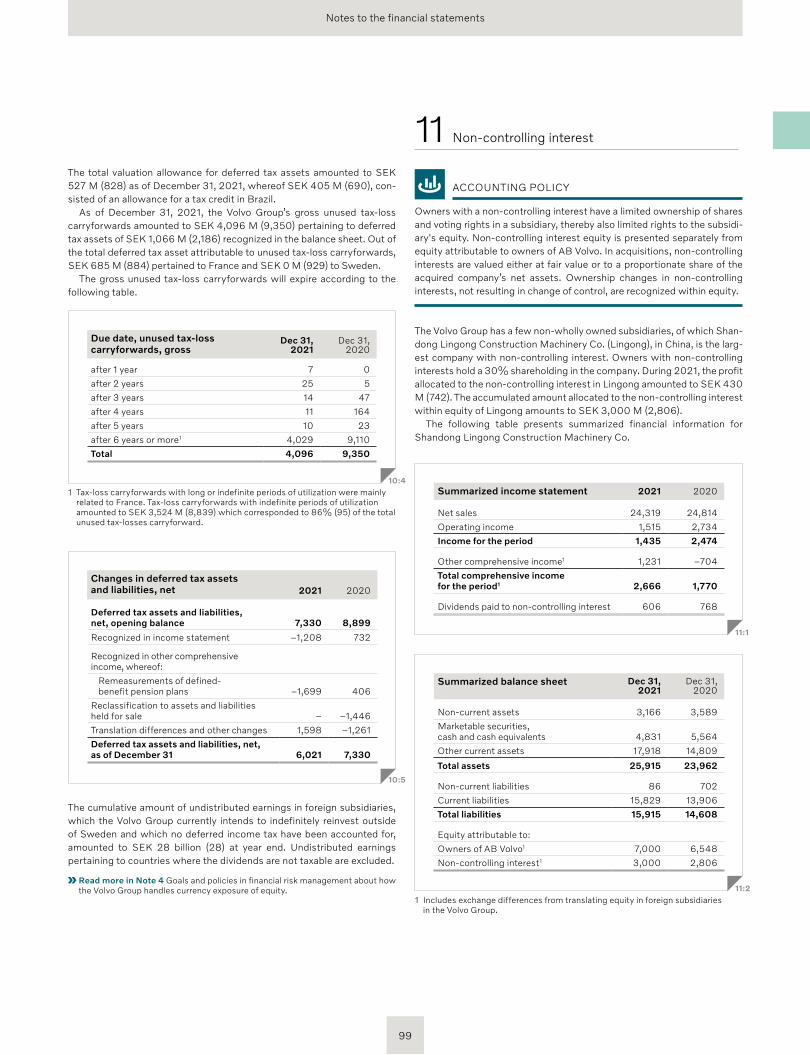
Notes to the financial statements
The total valuation allowance for deferred tax assets amounted to SEK 527 M (828) as of December 31, 2021, whereof SEK 405 M (690), con-sisted of an allowance for a tax credit in Brazil.
As of December 31, 2021, the Volvo Group’s gross unused tax-loss carry forwards amounted to SEK 4,096 M (9,350) pertaining to deferred tax assets of SEK 1,066 M (2,186) recognized in the balance sheet. Out of the total deferred tax asset attributable to unused tax-loss carryforwards, SEK 685 M (884) pertained to France and SEK 0 M (929) to Sweden.
The gross unused tax-loss carryforwards will expire according to the following table.
Due date, unused tax-loss carryforwards, gross
Dec 31,2021
Dec 31,2020
after 1 year 7 0
after 2 years 25 5
after 3 years 14 47
after 4 years 11 164
after 5 years 10 23
after 6 years or more 1 4,029 9,110
Total 4,096 9,350
10:4
1 Tax-loss carryforwards with long or indefinite periods of utilization were mainly related to France. Tax-loss carryforwards with indefinite periods of utilization amounted to SEK 3,524 M (8,839) which corresponded to 86% (95) of the total unused tax-losses carryforward.
Changes in deferred tax assets and liabilities, net 2021 2020
Deferred tax assets and liabilities, net, opening balance 7,330 8,899
Recognized in income statement –1,208 732
Recognized in other comprehensive income, whereof:
Remeasurements of defined- benefit pension plans –1,699 406
Reclassification to assets and liabilities held for sale – –1,446
Translation differences and other changes 1,598 –1,261
Deferred tax assets and liabilities, net, as of December 31 6,021 7,330
10:5
The cumulative amount of undistributed earnings in foreign subsidiaries, which the Volvo Group currently intends to indefinitely reinvest outside of Sweden and which no deferred income tax have been accounted for, amounted to SEK 28 billion (28) at year end. Undistributed earnings pertaining to countries where the dividends are not taxable are excluded.
Read more in Note 4 Goals and policies in financial risk management about how the Volvo Group handles currency exposure of equity.
11 Non-controlling interest
ACCOUNTING POLICY
Owners with a non-controlling interest have a limited ownership of shares and voting rights in a subsidiary, thereby also limited rights to the subsidi-ary's equity. Non-controlling interest equity is presented separately from equity attributable to owners of AB Volvo. In acquisitions, non-controlling interests are valued either at fair value or to a proportionate share of the acquired company’s net assets. Ownership changes in non-controlling interests, not resulting in change of control, are recognized within equity.
The Volvo Group has a few non-wholly owned subsidiaries, of which Shan-dong Lingong Construction Machinery Co. (Lingong), in China, is the larg-est company with non-controlling interest. Owners with non- controlling interests hold a 30% shareholding in the company. During 2021, the profit allocated to the non-controlling interest in Lingong amounted to SEK 430 M (742). The accumulated amount allocated to the non- controlling interest within equity of Lingong amounts to SEK 3,000 M (2,806).
The following table presents summarized financial information for Shandong Lingong Construction Machinery Co.
Summarized income statement 2021 2020
Net sales 24,319 24,814
Operating income 1,515 2,734
Income for the period 1,435 2,474
Other comprehensive income1 1,231 –704
Total comprehensive income for the period1 2,666 1,770
Dividends paid to non-controlling interest 606 768
11:1
Summarized balance sheet Dec 31, 2021
Dec 31, 2020
Non-current assets 3,166 3,589
Marketable securities, cash and cash equivalents 4,831 5,564
Other current assets 17,918 14,809
Total assets 25,915 23,962
Non-current liabilities 86 702
Current liabilities 15,829 13,906
Total liabilities 15,915 14,608
Equity attributable to:
Owners of AB Volvo1 7,000 6,548
Non-controlling interest1 3,000 2,806
11:2
1 Includes exchange differences from translating equity in foreign subsidiaries in the Volvo Group.
99
Notes to the financial statements
ACCOUNTING POLICY
Volvo Group applies the cost method for recognition of intangible assets, consisting of goodwill, capitalized product and software development and other intangible assets.
Read more in Sustainability notes and section EU Taxonomy regulation disclosures about taxonomy eligible capital expenditure.
GoodwillGoodwill is recognized as an intangible asset with indefinite useful life. For non-depreciable assets such as goodwill, impairment tests are performed annually, as well as if there are indications of impairments during the year. Goodwill is allocated and tested at the level of cash-generating units which are identified as the Volvo Group’s operating segments. However, in the seg-ment Group Functions & Other two new cash-generating units, Nova Bus and Designwerk are included. If the carrying amount of the tested cash-generating unit exceeds the calculated recoverable amount, an impairment loss is recog-nized for the difference. The recoverable amount for a cash-generating unit is determined by the value in use, which is based on a discounted cash flow model with a forecast period of five years. The valuation is based on a business plan which is an integral part of the Volvo Group’s financial planning process and represents management’s best estimate of the development of the oper-ations. Assumption of 2% (2) long-term market growth beyond the forecast period and the expected development of the operations in relation to this envi-ronment is a basis for the valuation. In the model, the Volvo Group is expected to maintain stable capital efficiency over time. Other parameters considered in the calculation are operating income, mix of products and services, expenses and level of capital expenditures. The Volvo Group uses a discount rate at 10% (10) before tax for 2021.
In 2021, the recoverable amount of Volvo Group’s operations exceeded the carrying amount for all cash-generating units, thus no impairment was recognized. The Volvo Group has also analyzed whether a negative adjust-ment of several percentage points on the used assumptions for discount rate and operating income would result in impairment for goodwill, how-ever none of the cash-generating units would be impaired as a result of this analysis. The operating parameters applied in the valuation are based on management’s strategy and could indicate higher value than historical performance for each cash-generating unit. Furthermore, the Volvo Group is operating in a cyclical industry why performance could vary over time.
Headroom differs between the cash-generating units and they are sen-sitive to changes in the assumptions described above to a varying degree. Therefore, the Volvo Group continuously follows the performance of the cash-generating units whose headroom is dependent on the fulfillment of the Volvo Group’s assessments. Instability in the recovery of the market and volatility in interest and currency rates may lead to indications of a need for impairment. The most important factors for the future operations of the Volvo Group are described in the Volvo Group’s operating seg-ments, as well as in the Risk management section.
Research and developmentExpenditures for the development of new products and software are recog-nized as intangible assets if such expenditures, with a high degree of cer-tainty, will result in future financial benefits for the company. Intangible assets are amortized over its estimated useful life.
The rules require stringent criteria to be met for these development expenditures to be recognized as assets. For example, it must be possible to prove the technical functionality of a new product or software prior to its development expenditure being recognized as an asset. In normal cases, this means that expenditures are capitalized only during the industrialization phase of a product development project. Other research and development costs are recognized in the income statement as incurred.
The Volvo Group has developed a process for conducting product develop-ment projects, which has six phases focused on separate parts of the project. Every phase starts and ends with a reconciliation point, known as a gate, for which the criteria must be met for the project’s decision making committee to allow the project to progress to the next phase. During the industrialization phase, the industrial system is prepared for serial production and the product is launched. A corresponding process is developed for software development.
Other intangible assetsOther intangible assets include trademarks, distribution networks, licenses and other rights. When participating in industrial projects in partnership with other companies the Volvo Group in certain cases pays an entrance fee to participate, which is capitalized as an intangible asset.
Amortization and impairment with finite useful lifeIntangible assets with finite useful life are amortized on a straight line basis over their estimated useful life. Amortization is based on the cost of the assets, adjusted by impairments when applicable and estimated useful lives. Amortization is recognized in the respective function to which it belongs, meaning that amortization of product development is part of the research and development expenses in the income statement. Impair-ment tests for amortizable assets are performed if there are indications of impairment. In addition, impairment tests are performed annually for cap-italized development cost for products and software not yet in use by cal-culating the recoverable amount. The recoverable amount is the higher of the fair value less costs of disposal and the value in use. The value in use is measured as the discounted future cash flows, which the asset is expected to generate either by itself or from the lowest cash-generating unit to which the asset belongs. If the recoverable amount is less than the carry-ing amount, an impairment is recognized and the carrying amount of the asset is reduced to the recoverable amount.
Estimated useful life
Trademarks Max 5 years
Distribution networks 10 years
Product and software development 3–8 years
Other intangible assets 3–5 years
12:1
SOURCE OF ESTIMATION UNCERTAINTY AND CRITICAL JUDGMENTS
Impairment of goodwill and other intangible assetsWhen conducting impairment tests of goodwill and other intangible assets, estimates have to be made to determine the recoverable amounts of cash-generating units. The recoverable amount is based upon manage-ment’s projections of future cash flows. Headroom differs between the cash-generating units and are to a varying degree sensitive to changes in assumptions and the business environment. The broadening of the customer offer with focus to switch to more sustainable solutions accelerates invest-ments in research and development. The magnitude of investments and the assessment of future useful life is uncertain due to technology and infra-structure development, emission regulations, government incentives and customer demand. While management believes that estimates of future cash flows and other assumptions made are reasonable, there are uncer-tainties which could materially affect the valuations.
12 Intangible assets
100
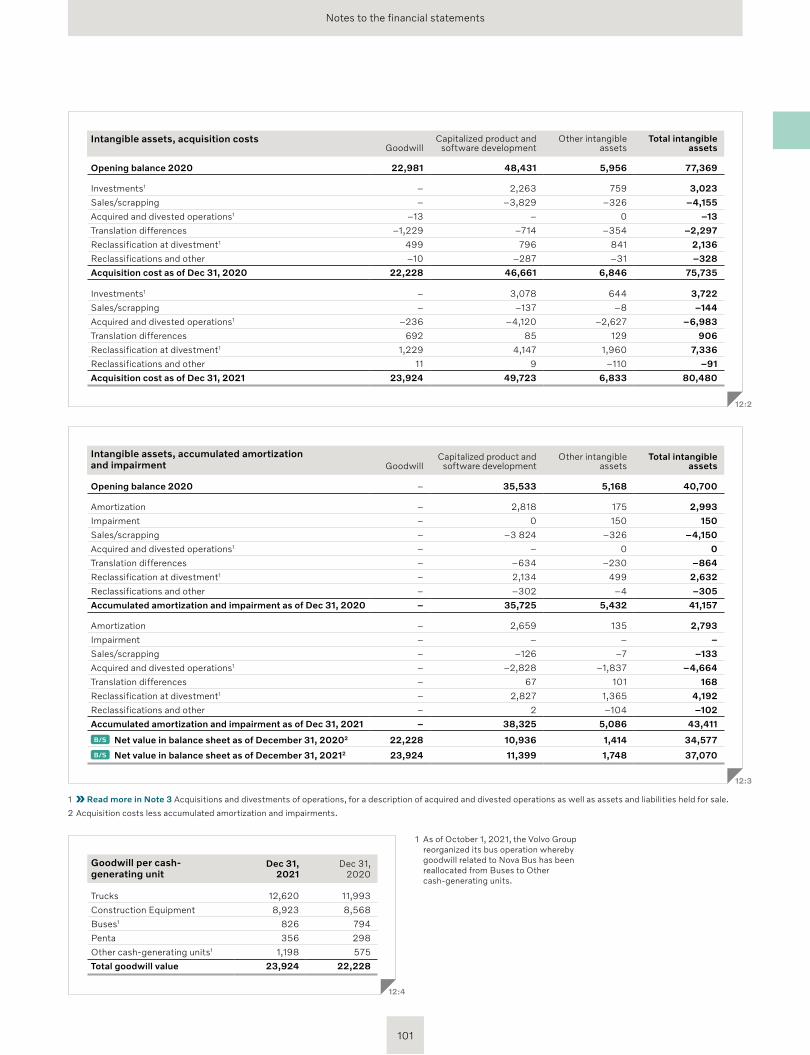
Notes to the financial statements
Intangible assets, acquisition costsGoodwill
Capitalized product and software development
Other intangible assets
Total intangible assets
Opening balance 2020 22,981 48,431 5,956 77,369
Investments1 – 2,263 759 3,023
Sales/scrapping – –3,829 –326 –4,155
Acquired and divested operations1 –13 – 0 –13
Translation differences –1,229 –714 –354 –2,297
Reclassification at divestment1 499 796 841 2,136
Reclassifications and other –10 –287 –31 –328
Acquisition cost as of Dec 31, 2020 22,228 46,661 6,846 75,735
Investments1 – 3,078 644 3,722
Sales/scrapping – –137 –8 –144
Acquired and divested operations1 –236 –4,120 –2,627 –6,983
Translation differences 692 85 129 906
Reclassification at divestment1 1,229 4,147 1,960 7,336
Reclassifications and other 11 9 –110 –91
Acquisition cost as of Dec 31, 2021 23,924 49,723 6,833 80,480
12:2
Intangible assets, accumulated amortization and impairment Goodwill
Capitalized product and software development
Other intangible assets
Total intangible assets
Opening balance 2020 – 35,533 5,168 40,700
Amortization – 2,818 175 2,993
Impairment – 0 150 150
Sales/scrapping – –3 824 –326 –4,150
Acquired and divested operations1 – – 0 0
Translation differences – –634 –230 –864
Reclassification at divestment1 – 2,134 499 2,632
Reclassifications and other – –302 –4 –305
Accumulated amortization and impairment as of Dec 31, 2020 – 35,725 5,432 41,157
Amortization – 2,659 135 2,793
Impairment – – – –
Sales/scrapping – –126 –7 –133
Acquired and divested operations1 – –2,828 –1,837 –4,664
Translation differences – 67 101 168
Reclassification at divestment1 – 2,827 1,365 4,192
Reclassifications and other – 2 –104 –102
Accumulated amortization and impairment as of Dec 31, 2021 – 38,325 5,086 43,411
B/S Net value in balance sheet as of December 31, 20202 22,228 10,936 1,414 34,577
B/S Net value in balance sheet as of December 31, 20212 23,924 11,399 1,748 37,070
12:3
1 Read more in Note 3 Acquisitions and divestments of operations, for a description of acquired and divested operations as well as assets and liabilities held for sale.
2 Acquisition costs less accumulated amortization and impairments.
1 As of October 1, 2021, the Volvo Group reorganized its bus operation whereby goodwill related to Nova Bus has been reallocated from Buses to Other cash-generating units.
Goodwill per cash- generating unit
Dec 31,2021
Dec 31,2020
Trucks 12,620 11,993
Construction Equipment 8,923 8,568
Buses1 826 794
Penta 356 298
Other cash-generating units1 1,198 575
Total goodwill value 23,924 22,228
12:4
101

Notes to the financial statements
ACCOUNTING POLICY
The Volvo Group applies the cost method for measurement of tangible assets, consisting of property, plant, equipment and investment property as well as assets under operating leases.
Buildings include owner-occupied properties and investment proper-ties. Investment properties are properties owned for the purpose of obtaining rental income and appreciation in value. Investment properties are recognized at cost. For disclosure purposes, information regarding the estimated fair value of investment properties is based on an internal dis-counted cash flow projection as relevant observable market inputs for the assets are not available. The required return is based on current property market conditions for comparable properties in comparable locations. Hence, the applied valuation method to measure fair value is classified as level 3 of the fair value hierarchy and there have not been any changes in valuation method during the year. Land contains land and land improve-ments. Machinery and equipment consists of production related assets such as machinery, type-bound tools and other equipment. Construction in progress are assets under construction and advanced payments. Right-of-use assets relates to lease contracts with the Volvo Group as a lessee.
Assets under operating leases are mainly owned by the Volvo Group. These transactions are accounted for as operating lease transactions and consists of contractual operating lease agreements with customers within Financial Services and rental fleet which are assets used in a fleet for rental business within Industrial Operations. Some rental fleet assets are leased by the Volvo Group and later sub-leased to customers as oper-ating leases. Sales with residual value commitments within Industrial Operations are also recognized within assets under operating leases.
Read more in Note 7 Revenue about sales with residual value commitments.
Read more in Note 14 Leasing about right-of-use assets and assets under operating leases.
Read more in Sustainability notes and section EU Taxonomy regulation disclosures about taxonomy eligible capital expenditure.
Depreciation and impairmentProperty, plant, equipment and investment property are depreciated over their estimated useful lives. Land is not depreciated. Depreciation is rec-ognized on a straight-line basis based on the cost of the assets, adjusted by residual value when applicable, and estimated useful lives. Right-of-use assets are generally depreciated over the lease term on a straight-line basis. Assets under operating leases are depreciated on a straight-line basis over the contract period. During the contract period, the depreciable amount is adjusted by accelerated depreciation and/or write-downs. The adjustment is recognized through the income statement to correspond to estimated future net realizable value to continuously reflect potential residual value risks at the end of the contract period. Depreciation is recog nized in the respective function to which it belongs. Impairment tests are performed if there are indications of impairment by calculating a recoverable amount which is the higher of the asset’s fair value less cost of disposal and its value in use.
Estimated useful life
Type-bound tools 3 to 8 years
Operating leases, rental fleet 3 to 5 years
Sales with residual value commitments 3 to 5 years
Machinery and equipment 5 to 20 years
Buildings and investment properties 20 to 50 years
Land improvements 20 years
13:1
SOURCE OF ESTIMATION UNCERTAINTY AND CRITICAL JUDGMENTS
Impairment of tangible assets Impairment tests are performed if there is any indication that a tangible asset has been impaired. The impairment tests are based on estimation of the recoverable amount of the asset, or the cash-generating unit to which the asset belongs. To determine the recoverable amount, projections of future cash flows are used, which are based upon internal business plans and forecasts. The ongoing transition of the transport sector towards new technologies with battery electric and fuel cell vehicles bring uncertainties regarding current and future investments in production facilities as well as estimated useful life. However, many assembly lines can produce both electric trucks and trucks with combustion engines which limits invest-ment needs and risk for impairment. While management believes that esti-mates of future cash flows and other assumptions made are reasonable, there are uncertainties which could materially affect the valuations.
Residual value risksVolvo Group is exposed to residual value risks related to assets under operating leases which are the risks that the Volvo Group in the future would have to dispose used vehicles at a loss if the price development of these products is worse than what was expected when the contracts were entered. The assessment of residual value risks is based upon an estimation of the used vehicle’s future net realizable value (fair market value). The estimated future net realizable value of the vehicles at the end of the contract period is monitored individually on a continuing basis. Thus, a decline in prices for used vehicles may negatively affect the Volvo Group’s operating income. High inventories in the truck industry and the construction equipment industry and low demand may have a negative impact on the prices of new and used vehicles. In monitoring estimated net realizable value of each vehicle included as assets under operating leases, management considers current price level of the used product model. The price level is impacted by value of optional equipment, mile-age, current condition, expected future price development, change of market conditions including the shift towards battery electric and fuel cells vehicles, alternative distribution channels, inventory lead-time, repair and reconditioning costs, handling costs, indirect costs associated with the sale of used vehicles and legislative demands.
13 Tangible assets
102
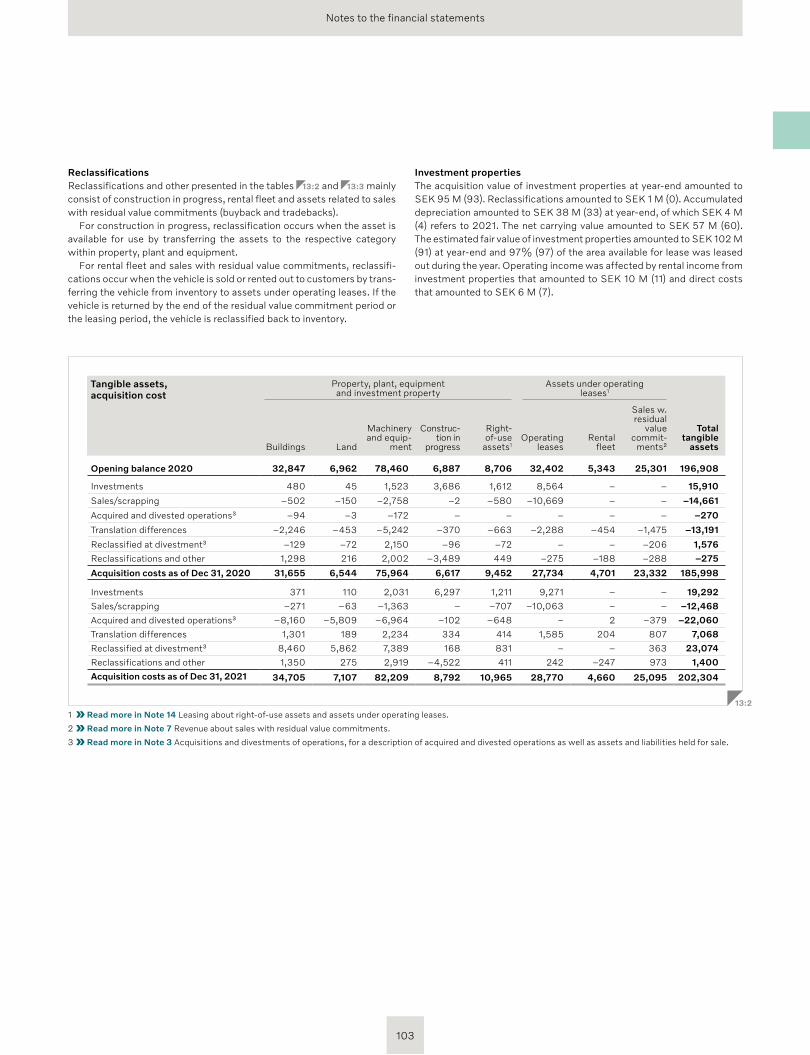
Notes to the financial statements
ReclassificationsReclassifications and other presented in the tables 13:2 and 13:3 mainly consist of construction in progress, rental fleet and assets related to sales with residual value commitments (buyback and tradebacks).
For construction in progress, reclassification occurs when the asset is available for use by transferring the assets to the respective category within property, plant and equipment.
For rental fleet and sales with residual value commitments, reclassifi-cations occur when the vehicle is sold or rented out to customers by trans-ferring the vehicle from inventory to assets under operating leases. If the vehicle is returned by the end of the residual value commitment period or the leasing period, the vehicle is reclassified back to inventory.
Investment propertiesThe acquisition value of investment properties at year-end amounted to SEK 95 M (93). Reclassifications amounted to SEK 1 M (0). Accumulated depreciation amounted to SEK 38 M (33) at year-end, of which SEK 4 M (4) refers to 2021. The net carrying value amounted to SEK 57 M (60). The estimated fair value of investment properties amounted to SEK 102 M (91) at year-end and 97% (97) of the area available for lease was leased out during the year. Operating income was affected by rental income from investment properties that amounted to SEK 10 M (11) and direct costs that amounted to SEK 6 M (7).
Tangible assets, acquisition cost
Property, plant, equipment and investment property
Assets under operating leases1
Buildings Land
Machinery and equip-
ment
Construc-tion in
progress
Right-of-use
assets1Operating
leasesRental
fleet
Sales w. residual
value commit-
ments2
Total tangible
assets
Opening balance 2020 32,847 6,962 78,460 6,887 8,706 32,402 5,343 25,301 196,908
Investments 480 45 1,523 3,686 1,612 8,564 – – 15,910
Sales/scrapping –502 –150 –2,758 –2 –580 –10,669 – – –14,661
Acquired and divested operations3 –94 –3 –172 – – – – – –270
Translation differences –2,246 –453 –5,242 –370 –663 –2,288 –454 –1,475 –13,191
Reclassified at divestment3 –129 –72 2,150 –96 –72 – – –206 1,576
Reclassifications and other 1,298 216 2,002 –3,489 449 –275 –188 –288 –275
Acquisition costs as of Dec 31, 2020 31,655 6,544 75,964 6,617 9,452 27,734 4,701 23,332 185,998
Investments 371 110 2,031 6,297 1,211 9,271 – – 19,292
Sales/scrapping –271 –63 –1,363 – –707 –10,063 – – –12,468
Acquired and divested operations3 –8,160 –5,809 –6,964 –102 –648 – 2 –379 –22,060
Translation differences 1,301 189 2,234 334 414 1,585 204 807 7,068
Reclassified at divestment3 8,460 5,862 7,389 168 831 – – 363 23,074
Reclassifications and other 1,350 275 2,919 –4,522 411 242 –247 973 1,400
Acquisition costs as of Dec 31, 2021 34,705 7,107 82,209 8,792 10,965 28,770 4,660 25,095 202,304
13:2
1 Read more in Note 14 Leasing about right-of-use assets and assets under operating leases.
2 Read more in Note 7 Revenue about sales with residual value commitments.
3 Read more in Note 3 Acquisitions and divestments of operations, for a description of acquired and divested operations as well as assets and liabilities held for sale.
103
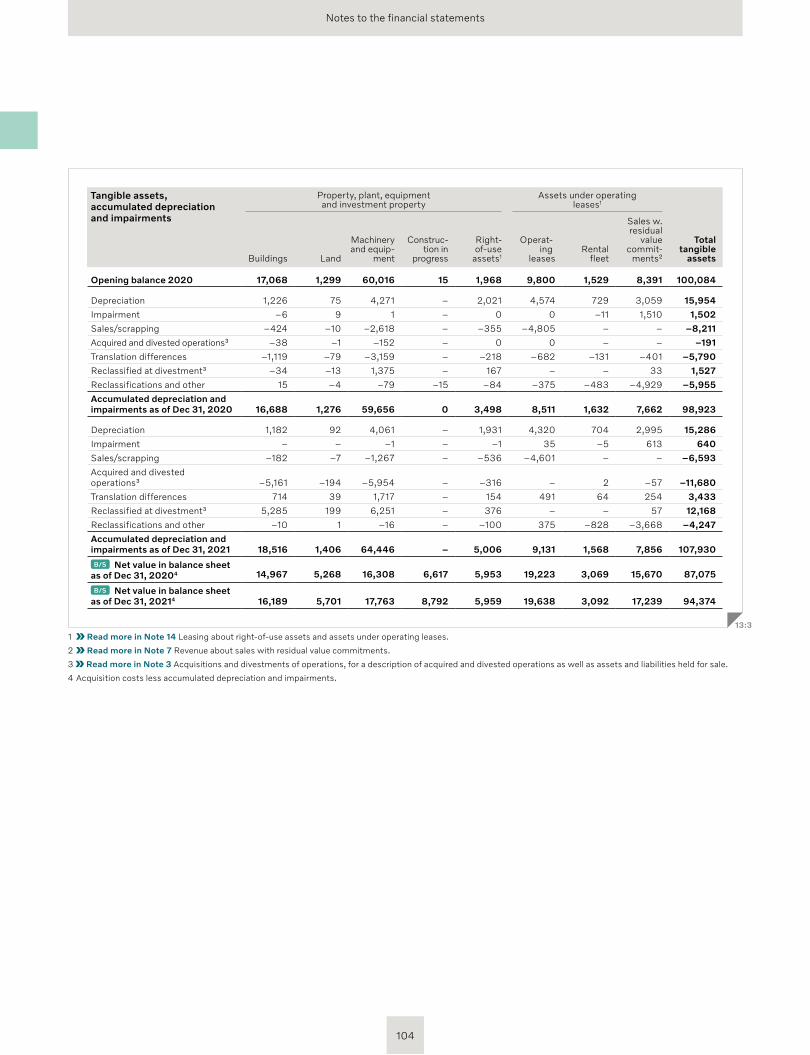
Notes to the financial statements
Tangible assets, accumulated depreciation and impairments
Property, plant, equipment and investment property
Assets under operating leases1
Buildings Land
Machinery and equip-
ment
Construc-tion in
progress
Right-of-use
assets1
Operat-ing
leasesRental
fleet
Sales w. residual
value commit-
ments2
Total tangible
assets
Opening balance 2020 17,068 1,299 60,016 15 1,968 9,800 1,529 8,391 100,084
Depreciation 1,226 75 4,271 – 2,021 4,574 729 3,059 15,954
Impairment –6 9 1 – 0 0 –11 1,510 1,502
Sales/scrapping –424 –10 –2,618 – –355 –4,805 – – –8,211
Acquired and divested operations3 –38 –1 –152 – 0 0 – – –191
Translation differences –1,119 –79 –3,159 – –218 –682 –131 –401 –5,790
Reclassified at divestment3 –34 –13 1,375 – 167 – – 33 1,527
Reclassifications and other 15 –4 –79 –15 –84 –375 –483 –4,929 –5,955
Accumulated depreciation and impairments as of Dec 31, 2020 16,688 1,276 59,656 0 3,498 8,511 1,632 7,662 98,923
Depreciation 1,182 92 4,061 – 1,931 4,320 704 2,995 15,286
Impairment – – –1 – –1 35 –5 613 640
Sales/scrapping –182 –7 –1,267 – –536 –4,601 – – –6,593
Acquired and divested operations3 –5,161 –194 –5,954 – –316 – 2 –57 –11,680
Translation differences 714 39 1,717 – 154 491 64 254 3,433
Reclassified at divestment3 5,285 199 6,251 – 376 – – 57 12,168
Reclassifications and other –10 1 –16 – –100 375 –828 –3,668 –4,247
Accumulated depreciation and impairments as of Dec 31, 2021 18,516 1,406 64,446 – 5,006 9,131 1,568 7,856 107,930
B/S Net value in balance sheet as of Dec 31, 20204 14,967 5,268 16,308 6,617 5,953 19,223 3,069 15,670 87,075
B/S Net value in balance sheet as of Dec 31, 20214 16,189 5,701 17,763 8,792 5,959 19,638 3,092 17,239 94,374
13:3
1 Read more in Note 14 Leasing about right-of-use assets and assets under operating leases.
2 Read more in Note 7 Revenue about sales with residual value commitments.
3 Read more in Note 3 Acquisitions and divestments of operations, for a description of acquired and divested operations as well as assets and liabilities held for sale.
4 Acquisition costs less accumulated depreciation and impairments.
104
Notes to the financial statements
ACCOUNTING POLICY
Volvo Group as the lessorLeasing contracts are defined in two categories, operating and finance leases, depending on the contracts’ financial implications.
Operating leases are offered from Financial Services (contractual oper-ating leases) and from Industrial Operations (rental fleet agreements). Sales with residual value commitments (buybacks and tradebacks) are also accounted for as operating lease transactions when the customer has a significant economic incentive to exercise the option to return the vehicle and the control therefore has not been transferred to the customer. Oper-ating lease agreements are recognized as tangible assets in assets under operating leases and are valued at cost less accumulated depreciation and impairment, if needed. The cost of an asset comprises the acquisition value and any initial direct costs related to the contract. Depreciation of the asset is recognized on a straight-line basis over the contract period. During the period the depreciable amount is adjusted through the income statement by depreciations or write-downs to correspond to the estimated future realizable value to reflect residual value risks at the end of the contract period. Lease income is equally distributed over the contract period and recognized within net sales.
Read more in Note 7 Revenue, about sales with residual value commitments.
Read more in Note 13 Tangible assets, about residual value risks related to assets under operating lease.
Finance leases are offered from Financial Services. As Industrial Opera-tions manufacture the vehicles which are leased from Financial Services to the customers, the Volvo Group is acting as a manufacturer lessor. Hence, a finance lease asset gives rise to a selling profit which is recognized within Industrial Operations. Finance lease contracts are rec-ognized as non-current and current customer-financing receivables within Financial Services. The asset is measured at an amount equal to the net investment in the finance lease contract corresponding to the gross investment (future minimum lease payments and unguaranteed residual value) discounted with the rate in the finance lease contract and reduced by unearned finance income and allowance for expected credit losses. Assessment of allowance for expected credit losses is reflected in the valuation of customer-financing receivables and recorded at initial recognition and reassessed during the contract period. Lease income is recognized as interest income within net sales in Financial Services. Vari-able lease payments not dependent on an index or rate are recognized as income as they occur. Payments received from finance lease contracts are distributed between interest income and amortization of the receivable.
Read more in Note 15 Customer-financing receivables, about finance leases.
Volvo Group as the lesseeLease contracts are recognized as right-of-use (RoU) assets as well as interest-bearing lease liabilities in the balance sheet. Lease liabilities are recognized within other loans and are measured by the present value of future lease payments. The lease payments are discounted by using a rate reflecting what the Volvo Group would have to pay to borrow funds to acquire a similar asset, with similar collateral and similar term. RoU assets are presented as tangible assets and are valued at cost less accumulated
depreciation and impairment, if needed. The cost of an RoU asset contains the initial amount of the lease liability adjusted for any lease payments made before the commencement date, less any lease incentives received. Moreover, any initial direct costs are included, as well as an estimate of costs to be incurred in dismantling, removing or restoring the underlying asset. The leased asset is depreciated on a straight-line basis over the lease term, or over the useful life of the underlying asset if the ownership is transferred to the Volvo Group at the end of the lease term. The lease expense is recognized as depreciation of the asset within operating income and interest expense within the finance net. Payments made are distributed between interest paid and amortization of the lease liability.
Lease contracts with the Volvo Group as the lessee are primarily con-tracts for real estate (such as office buildings, warehouses and dealer premises), company cars and production related assets. For real estate and company car leases, service components are normally a considerable portion of the contracts and are therefore separated. The service compo-nents are recognized as operating expenses and not included in the RoU asset and the lease liability. For other lease contracts, both the leased asset and services are included in the RoU asset and the lease liability.
If a lease contract includes variable lease payments not dependent on an index or rate, or include a low value asset or has a lease term that is twelve months or less, the lease payments are recognized as operating expenses as they occur.
SOURCE OF ESTIMATION UNCERTAINTY AND CRITICAL JUDGMENTS
Measurement of lease liabilities and right-of-use assetsWhen entering a lease contract, judgments related to contract scope, lease term and interest rate to be used when discounting future lease pay-ments are made which affect the measurement of the lease liability and the RoU asset.
Assessment of contract scope includes judgments whether a leased asset and/or a service component is identified in the contract. In com-bined contracts, the total contract amount is allocated between the leased asset and the service by using a market stand-alone price.
When determining the lease term of a contract, judgments are also required. The lease term includes the non-cancellable period. If the Volvo Group is reasonably certain to use an option to extend the lease, or not to use an option to terminate the lease in advance, this is also considered. The contracts contain a range of different conditions. Extension and ter-mination options are mainly related to real estate leases. Thus, all relevant facts and circumstances that create an economic incentive to include optional periods are evaluated. The importance of the underlying asset in the operations and its location, availability of suitable alternatives, signifi-cant leasehold improvements, level of rentals in optional periods com-pared to market rates as well as past practice are examples of factors included in the assessment. Lease terms are negotiated on an individual basis and are reassessed if an option is exercised.
Judgments are also required to determine the interest rate when dis-counting future lease payments and whether the interest rate implicit in the lease can be readily determined and thereby used, or if the Volvo Group’s incremental borrowing rate should be used.
14 Leasing
105
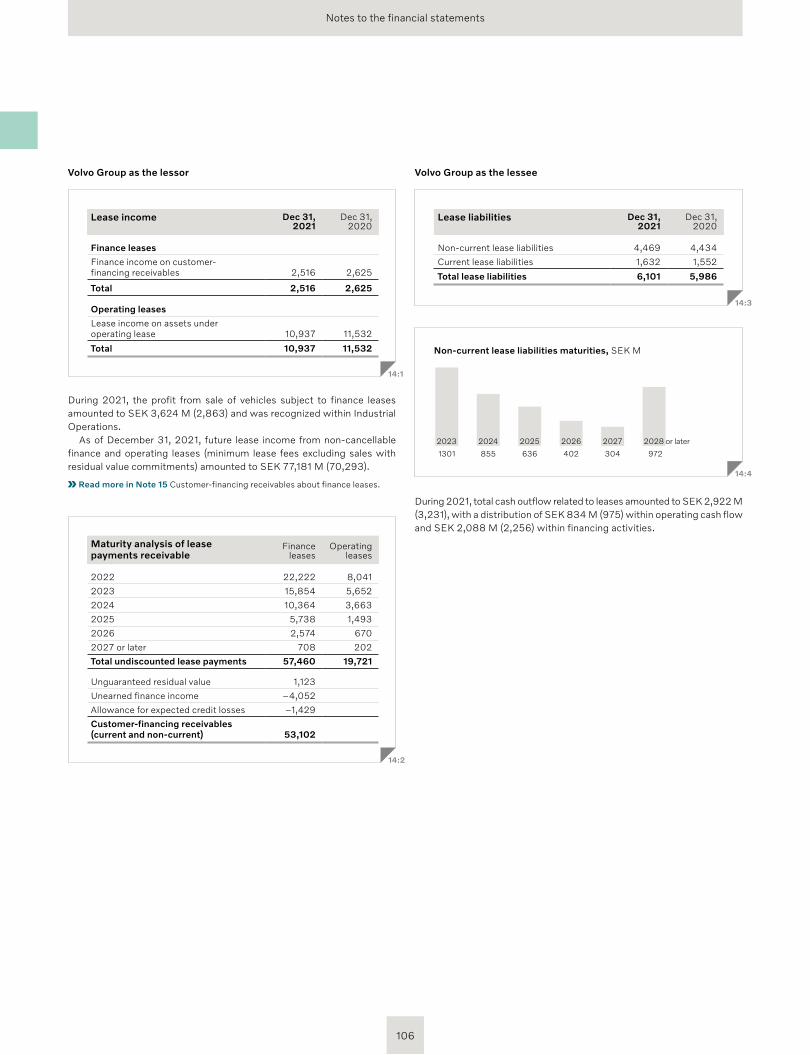
Notes to the financial statements
Volvo Group as the lessor
Lease income Dec 31, 2021
Dec 31, 2020
Finance leases
Finance income on customer- financing receivables 2,516 2,625
Total 2,516 2,625
Operating leases
Lease income on assets under operating lease 10,937 11,532
Total 10,937 11,532
14:1
During 2021, the profit from sale of vehicles subject to finance leases amounted to SEK 3,624 M (2,863) and was recognized within Industrial Operations.
As of December 31, 2021, future lease income from non-cancellable finance and operating leases (minimum lease fees excluding sales with residual value commitments) amounted to SEK 77,181 M (70,293).
Read more in Note 15 Customer-financing receivables about finance leases.
Maturity analysis of lease payments receivable
Finance leases
Operating leases
2022 22,222 8,041
2023 15,854 5,652
2024 10,364 3,663
2025 5,738 1,493
2026 2,574 670
2027 or later 708 202
Total undiscounted lease payments 57,460 19,721
Unguaranteed residual value 1,123
Unearned finance income –4,052
Allowance for expected credit losses –1,429
Customer-financing receivables (current and non-current) 53,102
14:2
Volvo Group as the lessee
Lease liabilities Dec 31, 2021
Dec 31, 2020
Non-current lease liabilities 4,469 4,434
Current lease liabilities 1,632 1,552
Total lease liabilities 6,101 5,986
14:3
Non-current lease liabilities maturities, SEK M
1301 855 636 402 304 972
2023 2024 2025 2026 2027 2028 or later
14:4
During 2021, total cash outflow related to leases amounted to SEK 2,922 M (3,231), with a distribution of SEK 834 M (975) within operating cash flow and SEK 2,088 M (2,256) within financing activities.
106
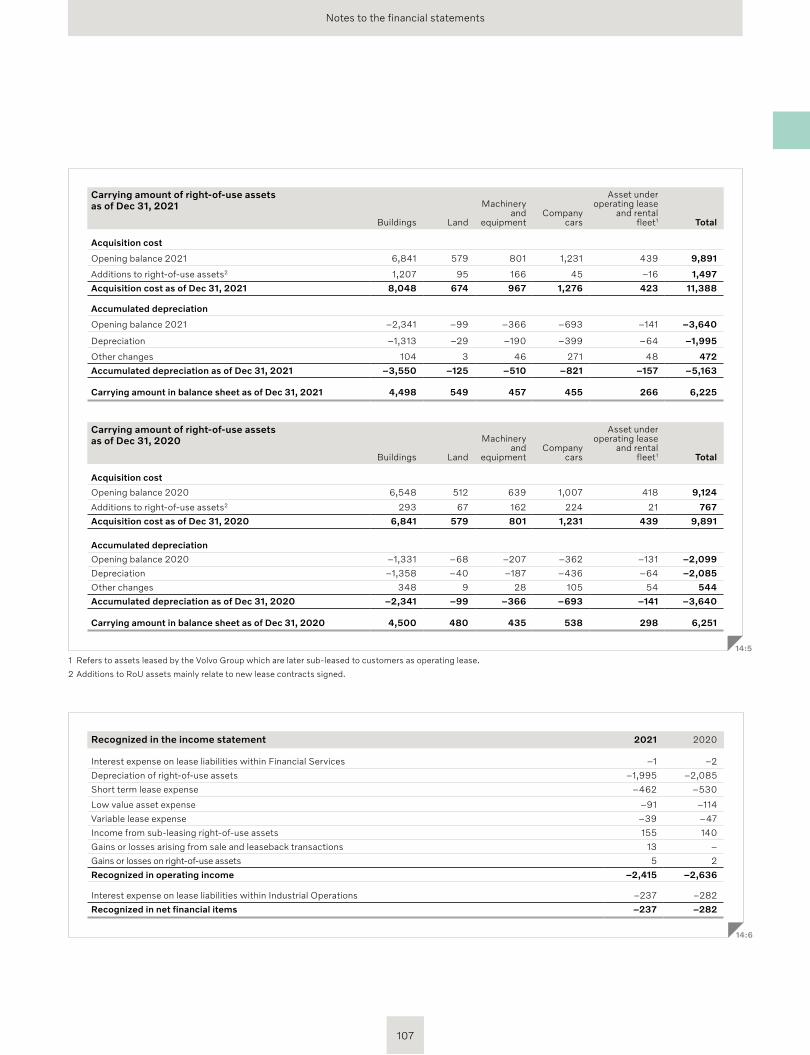
Notes to the financial statements
Carrying amount of right-of-use assetsas of Dec 31, 2021
Buildings Land
Machinery and
equipmentCompany
cars
Asset under operating lease
and rental fleet1 Total
Acquisition cost
Opening balance 2021 6,841 579 801 1,231 439 9,891
Additions to right-of-use assets2 1,207 95 166 45 –16 1,497
Acquisition cost as of Dec 31, 2021 8,048 674 967 1,276 423 11,388
Accumulated depreciation
Opening balance 2021 –2,341 –99 –366 –693 –141 –3,640
Depreciation –1,313 –29 –190 –399 –64 –1,995
Other changes 104 3 46 271 48 472
Accumulated depreciation as of Dec 31, 2021 –3,550 –125 –510 –821 –157 –5,163
Carrying amount in balance sheet as of Dec 31, 2021 4,498 549 457 455 266 6,225
Carrying amount of right-of-use assetsas of Dec 31, 2020
Buildings Land
Machinery and
equipmentCompany
cars
Asset under operating lease
and rental fleet1 Total
Acquisition cost
Opening balance 2020 6,548 512 639 1,007 418 9,124
Additions to right-of-use assets2 293 67 162 224 21 767
Acquisition cost as of Dec 31, 2020 6,841 579 801 1,231 439 9,891
Accumulated depreciation
Opening balance 2020 –1,331 –68 –207 –362 –131 –2,099
Depreciation –1,358 –40 –187 –436 –64 –2,085
Other changes 348 9 28 105 54 544
Accumulated depreciation as of Dec 31, 2020 –2,341 –99 –366 –693 –141 –3,640
Carrying amount in balance sheet as of Dec 31, 2020 4,500 480 435 538 298 6,251
14:5
1 Refers to assets leased by the Volvo Group which are later sub-leased to customers as operating lease.
2 Additions to RoU assets mainly relate to new lease contracts signed.
Recognized in the income statement 2021 2020
Interest expense on lease liabilities within Financial Services –1 –2
Depreciation of right-of-use assets –1,995 –2,085
Short term lease expense –462 –530
Low value asset expense –91 –114
Variable lease expense –39 –47
Income from sub-leasing right-of-use assets 155 140
Gains or losses arising from sale and leaseback transactions 13 –
Gains or losses on right-of-use assets 5 2
Recognized in operating income –2,415 –2,636
Interest expense on lease liabilities within Industrial Operations –237 –282
Recognized in net financial items –237 –282
14:6
107
Notes to the financial statements
ACCOUNTING POLICY
Installment credits, dealer financing and other receivables within customer- financing receivables are held as part of a business model whose objective is of collecting contractual cash flows. The contractual cash flows are solely payments of principal and interest and are measured at amortized cost in accordance with the effective interest method. Finance lease con-tracts are valued at amortized cost, for further information on recognition and classification see note 14 Leasing.
The Volvo Group is applying the simplified expected credit loss model for customer-financing receivables, under which the loss allowance is measured at an amount equal to lifetime expected credit losses. The allowance is recorded at initial recognition and is reassessed during the contract period.
Interest income on customer-financing receivables is recognized within net sales, mainly within Financial Services. Changes to the allowance for expected credit losses are recognized in other operating income and expense.
SOURCE OF ESTIMATION UNCERTAINTY AND CRITICAL JUDGMENTS
Allowance for expected credit losses The assessment of allowances for expected credit losses on customer- financing receivables is dependent on estimates including assumptions regarding past dues, repossession rates and quality level of repossessed collateral.
A collective assessment is made for customer-financing receivables that are not credit impaired. The assets are grouped based on shared risk characteristics such as type of customer, geographical area, initial credit risk rating, collateral type and date of initial recognition to evaluate the credit losses collectively. Historical information regarding credit loss experience is used to forecast future losses, adjusted for current and fore-casted conditions in the different regions based on management’s evalu-ation of macro-level and portfolio-level factors, such as GDP, oil prices, unemployment rates etc.
Since the covid-19 pandemic started, the assessment process has been intensified. The collective assessment for customer-financing receivables that are not credit impaired is reviewed and adjusted on a more detailed level, in order to identify individual segments in each market that are signif-icantly impacted by the pandemic, to forecast future losses on those spe-cific markets. As a critical part in the collective assessment, the largest customers in each market are reviewed individually based on the financial condition of each customer and the value of the underlying collateral. The impact from government support programs linked to the pandemic and modifications through extended payment terms and their discontinuance is taken into consideration, and is monitored closely for on-going payment performance and signs of impairment. The recent impacts from rising interest rates and supply shortages is also taken into consideration. Worst case scenarios from historical information regarding credit loss experience is also used in order to estimate the potential impact of the pandemic.
Overall, in the collective assessment the historical information regard-ing credit loss experience is still used as a base and is adjusted based on information from the detailed assessment from the largest customers. This provides a basic understanding of how the assessment process has evolved since the pandemic, and how it impacts customers in various seg-ments in each market to estimate expected credit losses on the rest of the customer-financing receivables portfolio.
15 Customer-financing receivables
An individual assessment is made for credit impaired customer-financing receivables based on the financial condition of the customers and the value of the underlying collateral and guarantees. The Volvo Group considers a financial asset credit impaired if it meets one or more of the following criteria; when there are indications that the customer is unlikely to pay, such as bankruptcy filing, unauthorized transfer of collateral, at surrender of collateral etc. or, at the latest, when the customer fails to make contractual payment within 90 days of when the receivable falls due.
Risk management practicesOther than the dealer financing, customer-financing receivables extend over several years, but normally the customers make monthly payments throughout the term to reduce the outstanding exposure. The customer- financing receivables are secured by the financed commercial vehicles and equipment. However, in the case of customer default, the value of the repossessed commercial vehicles and equipment may not necessarily cover the outstanding financed amount. In order to mitigate this risk, Financial Services has strong portfolio management processes based on prudent credit approval, active monitoring of individual loan performance, utilization of in-house and external collections, portfolio segmentation analysis, and on-going monitoring of the economic, political and industry conditions in each market. In addition, other credit enhancements such as down payments, personal guarantees, credit insurance, liens on other property owned by the borrower etc. may be required at the time of origi-nation or when there are signs of impairment. When customer- financing receivables exceed 90 days of overdue collateral repossession is initiated, although there may be circumstances where repossession is initiated earlier. When the collateral is repossessed, the net realizable value is established and the vehicle is transferred to inventory and becomes part of the Volvo Group’s normal business activity of selling used vehicles and equipment and the expected loss on the customer-financing receivable is written off. If repossession has not occurred on customer-financing receivables exceeding 180 days of overdue the expected loss on the receivable is written off. Financial Services continues to engage in enforcement activity on all customer financing- receivables written off during the year to attempt to recover the contractual amount not previously received from the customer.
Read more in Note 4 Goals and policies in financial risk management, for a description of credit risks, interest risks and currency risks.
As of December 31, 2021, the total allowances for impairment in Financial Services amounted to 1.82% (2.07) of the total credit portfolio in the seg-ment. This reserve ratio is used as an important measure for Financial Services and includes operating leases and inventory. Allowances for expected credit losses for customer-financing receivables has increased since the beginning of the year from SEK 2,900 M to SEK 3,308 M pri-marily due to fluctuations in exchange rates. The increase in expected credit losses due to a higher volume in the credit portfolio were partly offset by a decrease in expected credit losses, due to improved financial performance of the customers within Financial Services, leading to a lower reserve ratio. Part of the increase in allowance for expected credit losses due to the pandemic recognized last year, is still recognized in cus-tomer-financing receivables not credit impaired as not all specific cus-tomers have been identified as credit impaired. Once a customer is iden-tified as impaired a reclassification is made from the not credit impaired towards the credit impaired.
108
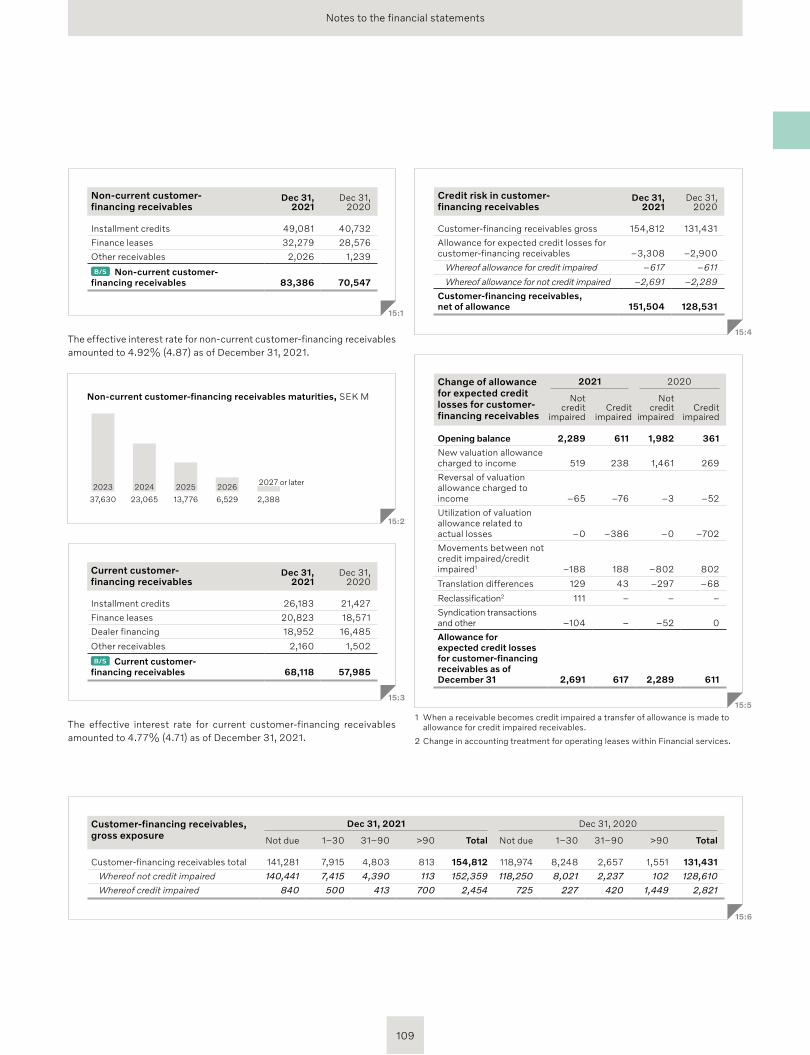
Notes to the financial statements
The effective interest rate for non-current customer-financing receivables amounted to 4.92% (4.87) as of December 31, 2021.
The effective interest rate for current customer-financing receivables amounted to 4.77% (4.71) as of December 31, 2021.
Non-current customer- financing receivables
Dec 31, 2021
Dec 31, 2020
Installment credits 49,081 40,732
Finance leases 32,279 28,576
Other receivables 2,026 1,239
B/S Non-current customer- financing receivables 83,386 70,547
15:1
Non-current customer- financing receivables maturities, SEK M
2023 2024 2025 2026 2027 or later
2,38837,630 23,065 13,776 6,529
15:2
Current customer- financing receivables
Dec 31, 2021
Dec 31, 2020
Installment credits 26,183 21,427
Finance leases 20,823 18,571
Dealer financing 18,952 16,485
Other receivables 2,160 1,502
B/S Current customer- financing receivables 68,118 57,985
15:3
Credit risk in customer- financing receivables
Dec 31, 2021
Dec 31, 2020
Customer-financing receivables gross 154,812 131,431
Allowance for expected credit losses for customer-financing receivables –3,308 –2,900
Whereof allowance for credit impaired –617 –611
Whereof allowance for not credit impaired –2,691 –2,289
Customer-financing receivables, net of allowance 151,504 128,531
15:4
1 When a receivable becomes credit impaired a transfer of allowance is made to allowance for credit impaired receivables.
2 Change in accounting treatment for operating leases within Financial services.
Change of allowance for expected credit losses for customer- financing receivables
2021 2020
Not credit
impairedCredit
impaired
Not credit
impairedCredit
impaired
Opening balance 2,289 611 1,982 361
New valuation allowance charged to income 519 238 1,461 269
Reversal of valuation allowance charged to income –65 –76 –3 –52
Utilization of valuation allowance related to actual losses –0 –386 –0 –702
Movements between not credit impaired/credit impaired1 –188 188 –802 802
Translation differences 129 43 –297 –68
Reclassification2 111 – – –
Syndication transactions and other –104 – –52 0
Allowance for expected credit losses for customer- financing receivables as of December 31 2,691 617 2,289 611
15:5
Customer-financing receivables, gross exposure
Dec 31, 2021 Dec 31, 2020
Not due 1–30 31–90 >90 Total Not due 1–30 31–90 >90 Total
Customer-financing receivables total 141,281 7,915 4,803 813 154,812 118,974 8,248 2,657 1,551 131,431
Whereof not credit impaired 140,441 7,415 4,390 113 152,359 118,250 8,021 2,237 102 128,610
Whereof credit impaired 840 500 413 700 2,454 725 227 420 1,449 2,821
15:6
109
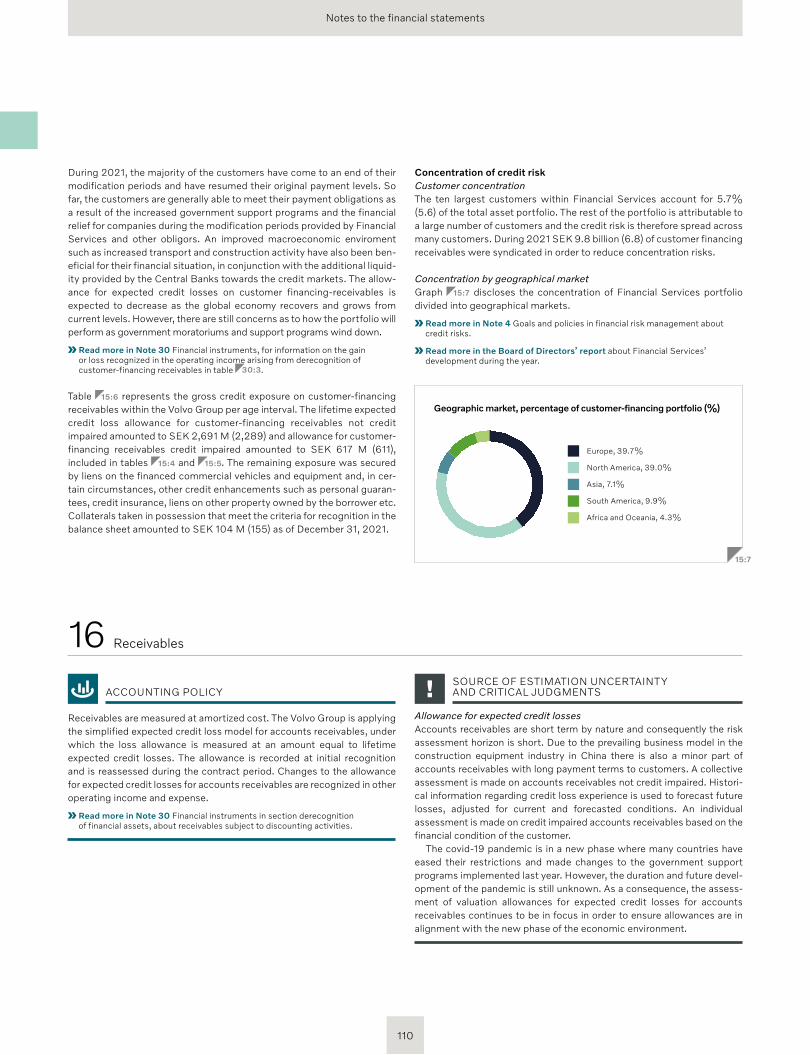
Notes to the financial statements
ACCOUNTING POLICY
Receivables are measured at amortized cost. The Volvo Group is applying the simplified expected credit loss model for accounts receivables, under which the loss allowance is measured at an amount equal to lifetime expected credit losses. The allowance is recorded at initial recognition and is reassessed during the contract period. Changes to the allowance for expected credit losses for accounts receivables are recognized in other operating income and expense.
Read more in Note 30 Financial instruments in section derecognition of financial assets, about receivables subject to discounting activities.
16 Receivables
During 2021, the majority of the customers have come to an end of their modification periods and have resumed their original payment levels. So far, the customers are generally able to meet their payment obligations as a result of the increased government support programs and the financial relief for companies during the modification periods provided by Financial Services and other obligors. An improved macroeconomic enviroment such as increased transport and construction activity have also been ben-eficial for their financial situation, in conjunction with the additional liquid-ity provided by the Central Banks towards the credit markets. The allow-ance for expected credit losses on customer financing-receivables is expected to decrease as the global economy recovers and grows from current levels. However, there are still concerns as to how the portfolio will perform as government moratoriums and support programs wind down.
Read more in Note 30 Financial instruments, for information on the gain or loss recognized in the operating income arising from derecognition of customer-financing receivables in table 30:3.
Table 15:6 represents the gross credit exposure on customer-financing receivables within the Volvo Group per age interval. The lifetime expected credit loss allowance for customer-financing receivables not credit impaired amounted to SEK 2,691 M (2,289) and allowance for customer- financing receivables credit impaired amounted to SEK 617 M (611), included in tables 15:4 and 15:5. The remaining exposure was secured by liens on the financed commercial vehicles and equipment and, in cer-tain circumstances, other credit enhancements such as personal guaran-tees, credit insurance, liens on other property owned by the borrower etc. Collaterals taken in possession that meet the criteria for recognition in the balance sheet amounted to SEK 104 M (155) as of December 31, 2021.
SOURCE OF ESTIMATION UNCERTAINTY AND CRITICAL JUDGMENTS
Allowance for expected credit lossesAccounts receivables are short term by nature and consequently the risk assessment horizon is short. Due to the prevailing business model in the construction equipment industry in China there is also a minor part of accounts receivables with long payment terms to customers. A collective assessment is made on accounts receivables not credit impaired. Histori-cal information regarding credit loss experience is used to forecast future losses, adjusted for current and forecasted conditions. An individual assessment is made on credit impaired accounts receivables based on the financial condition of the customer.
The covid-19 pandemic is in a new phase where many countries have eased their restrictions and made changes to the government support programs implemented last year. However, the duration and future devel-opment of the pandemic is still unknown. As a consequence, the assess-ment of valuation allowances for expected credit losses for accounts receivables continues to be in focus in order to ensure allowances are in alignment with the new phase of the economic environment.
Concentration of credit riskCustomer concentrationThe ten largest customers within Financial Services account for 5.7% (5.6) of the total asset portfolio. The rest of the portfolio is attributable to a large number of customers and the credit risk is therefore spread across many customers. During 2021 SEK 9.8 billion (6.8) of customer financing receivables were syndicated in order to reduce concentration risks.
Concentration by geographical marketGraph 15:7 discloses the concentration of Financial Services portfolio divided into geographical markets.
Read more in Note 4 Goals and policies in financial risk management about credit risks.
Read more in the Board of Directors’ report about Financial Services’ development during the year.
Geographic market, percentage of customer-financing portfolio (%)
Europe, 39.7%
North America, 39.0%
Asia, 7.1%
South America, 9.9%
Africa and Oceania, 4.3%
15:7
110
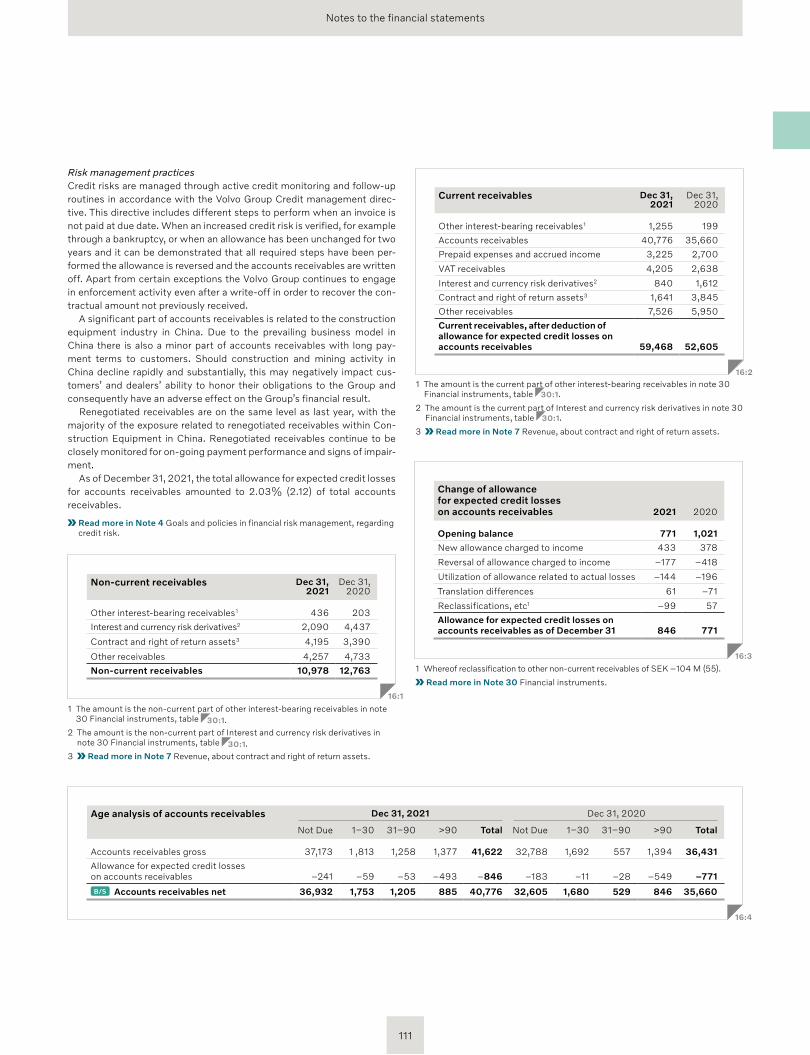
Notes to the financial statements
1 The amount is the current part of other interest-bearing receivables in note 30 Financial instruments, table 30:1.
2 The amount is the current part of Interest and currency risk derivatives in note 30 Financial instruments, table 30:1.
3 Read more in Note 7 Revenue, about contract and right of return assets.
Current receivables Dec 31, 2021
Dec 31, 2020
Other interest-bearing receivables 1 1,255 199
Accounts receivables 40,776 35,660
Prepaid expenses and accrued income 3,225 2,700
VAT receivables 4,205 2,638
Interest and currency risk derivatives2 840 1,612
Contract and right of return assets3 1,641 3,845
Other receivables 7,526 5,950
Current receivables, after deduction of allowance for expected credit losses on accounts receivable s 59,468 52,605
16:2
1 Whereof reclassification to other non-current receivables of SEK –104 M (55).
Read more in Note 30 Financial instruments.
Change of allowance for expected credit losses on accounts receivables 2021 2020
Opening balance 771 1,021
New allowance charged to income 433 378
Reversal of allowance charged to income –177 –418
Utilization of allowance related to actual losses –144 –196
Translation differences 61 –71
Reclassifications, etc1 –99 57
Allowance for expected credit losses on accounts receivables as of December 31 846 771
16:3
Age analysis of accounts receivables Dec 31, 2021 Dec 31, 2020
Not Due 1–30 31–90 >90 Total Not Due 1–30 31–90 >90 Total
Accounts receivables gross 37,173 1 ,813 1,258 1,377 41,622 32,788 1,692 557 1,394 36,431
Allowance for expected credit losses on accounts receivables –241 –59 –53 –493 –846 –183 –11 –28 –549 –771
B/S Accounts receivables net 36,932 1,753 1,205 885 40,776 32,605 1,680 529 846 35,660
16:4
Risk management practices Credit risks are managed through active credit monitoring and follow-up routines in accordance with the Volvo Group Credit management direc-tive. This directive includes different steps to perform when an invoice is not paid at due date. When an increased credit risk is verified, for example through a bankruptcy, or when an allowance has been unchanged for two years and it can be demonstrated that all required steps have been per-formed the allowance is reversed and the accounts receivables are written off. Apart from certain exceptions the Volvo Group continues to engage in enforcement activity even after a write-off in order to recover the con-tractual amount not previously received.
A significant part of accounts receivables is related to the construction equipment industry in China. Due to the prevailing business model in China there is also a minor part of accounts receivables with long pay-ment terms to customers. Should construction and mining activity in China decline rapidly and substantially, this may negatively impact cus-tomers’ and dealers’ ability to honor their obligations to the Group and consequently have an adverse effect on the Group’s financial result.
Renegotiated receivables are on the same level as last year, with the majority of the exposure related to renegotiated receivables within Con-struction Equipment in China. Renegotiated receivables continue to be closely monitored for on-going payment performance and signs of impair-ment.
As of December 31, 2021, the total allowance for expected credit losses for accounts receivables amounted to 2.03% (2.12) of total accounts receivables.
Read more in Note 4 Goals and policies in financial risk management, regarding credit risk.
Non-current receivables Dec 31, 2021
Dec 31, 2020
Other interest-bearing receivables 1 436 203
Interest and currency risk derivatives 2 2,090 4,437
Contract and right of return assets3 4,195 3,390
Other receivables 4,257 4,733
Non-current receivables 10,978 12,763
16:1
1 The amount is the non-current part of other interest-bearing receivables in note 30 Financial instruments, table 30:1.
2 The amount is the non-current part of Interest and currency risk derivatives in note 30 Financial instruments, table 30:1.
3 Read more in Note 7 Revenue, about contract and right of return assets.
111
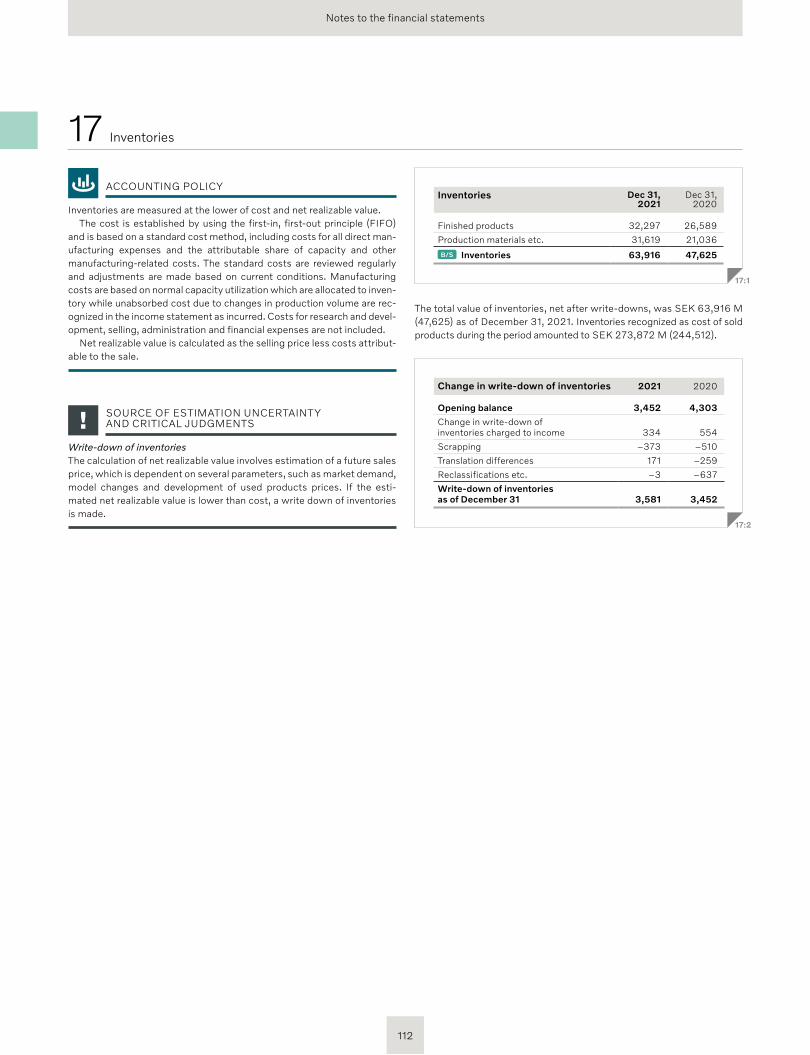
Notes to the financial statements
17 Inventories
ACCOUNTING POLICY
Inventories are measured at the lower of cost and net realizable value.The cost is established by using the first-in, first-out principle (FIFO)
and is based on a standard cost method, including costs for all direct man-ufacturing expenses and the attributable share of capacity and other manu facturing-related costs. The standard costs are reviewed regularly and adjustments are made based on current conditions. Manufacturing costs are based on normal capacity utilization which are allocated to inven-tory while unabsorbed cost due to changes in production volume are rec-ognized in the income statement as incurred. Costs for research and devel-opment, selling, administration and financial expenses are not in cluded.
Net realizable value is calculated as the selling price less costs attribut-able to the sale.
SOURCE OF ESTIMATION UNCERTAINTY AND CRITICAL JUDGMENTS
Write-down of inventoriesThe calculation of net realizable value involves estimation of a future sales price, which is dependent on several parameters, such as market demand, model changes and development of used products prices. If the esti-mated net realizable value is lower than cost, a write down of invent ories is made.
Inventories Dec 31, 2021
Dec 31, 2020
Finished products 32,297 26,589
Production materials etc. 31,619 21,036
B/S Inventories 63,916 47,625
17:1
The total value of inventories, net after write-downs, was SEK 63,916 M (47,625) as of December 31, 2021. Inventories recognized as cost of sold products during the period amounted to SEK 273,872 M (244,512).
Change in write-down of inventories 2021 2020
Opening balance 3,452 4,303
Change in write-down of inventories charged to income 334 554
Scrapping –373 –510
Translation differences 171 –259
Reclassifications etc. –3 –637
Write-down of inventories as of December 31 3,581 3,452
17:2
112
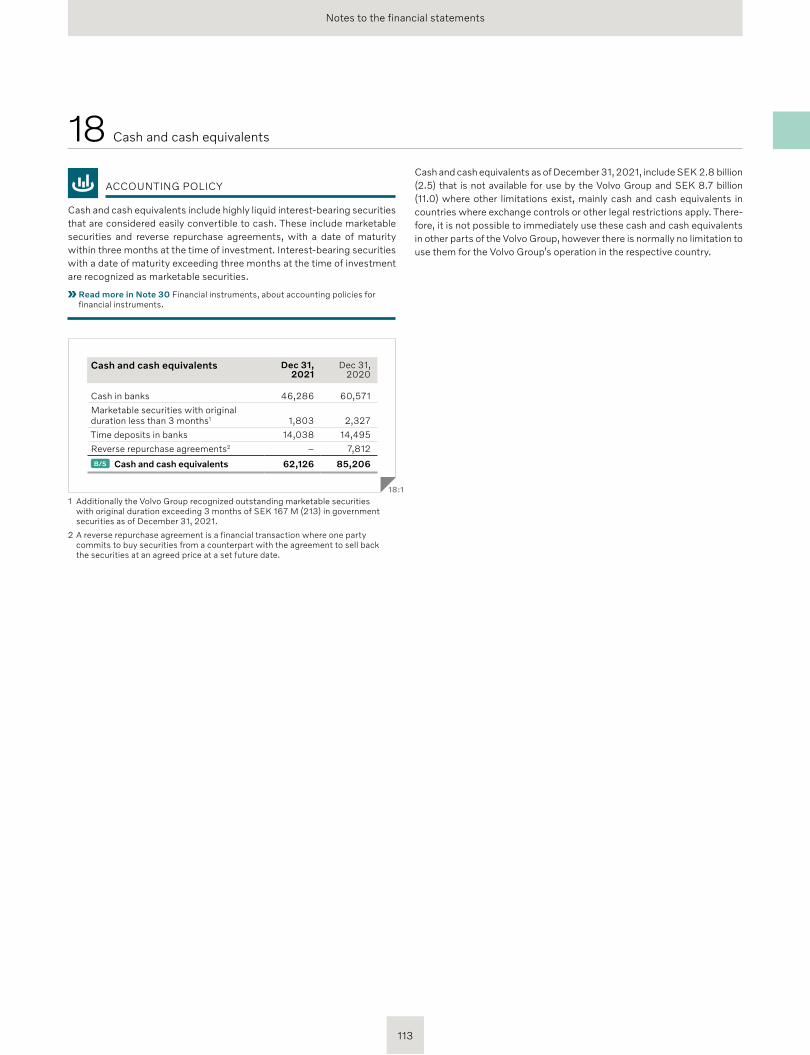
Notes to the financial statements
ACCOUNTING POLICY
Cash and cash equivalents include highly liquid interest-bearing securities that are considered easily convertible to cash. These include market able securities and reverse repurchase agreements, with a date of maturity within three months at the time of investment. Interest-bearing securities with a date of maturity exceeding three months at the time of investment are recognized as marketable securities.
Read more in Note 30 Financial instruments, about accounting policies for financial instruments.
Cash and cash equivalents Dec 31,2021
Dec 31,2020
Cash in banks 46,286 60,571
Marketable securities with original duration less than 3 months1 1,803 2,327
Time deposits in banks 14,038 14,495
Reverse repurchase agreements2 – 7,812
B/S Cash and cash equivalents 62,126 85,206
18:1
1 Additionally the Volvo Group recognized outstanding marketable securities with original duration exceeding 3 months of SEK 167 M (213) in government securities as of December 31, 2021.
2 A reverse repurchase agreement is a financial transaction where one party commits to buy securities from a counterpart with the agreement to sell back the securities at an agreed price at a set future date.
18 Cash and cash equivalents
Cash and cash equivalents as of December 31, 2021, include SEK 2.8 billion (2.5) that is not available for use by the Volvo Group and SEK 8.7 billion (11.0) where other limitations exist, mainly cash and cash equivalents in countries where exchange controls or other legal restrictions apply. There-fore, it is not possible to immediately use these cash and cash equivalents in other parts of the Volvo Group, however there is normally no limitation to use them for the Volvo Group’s operation in the respective country.
113
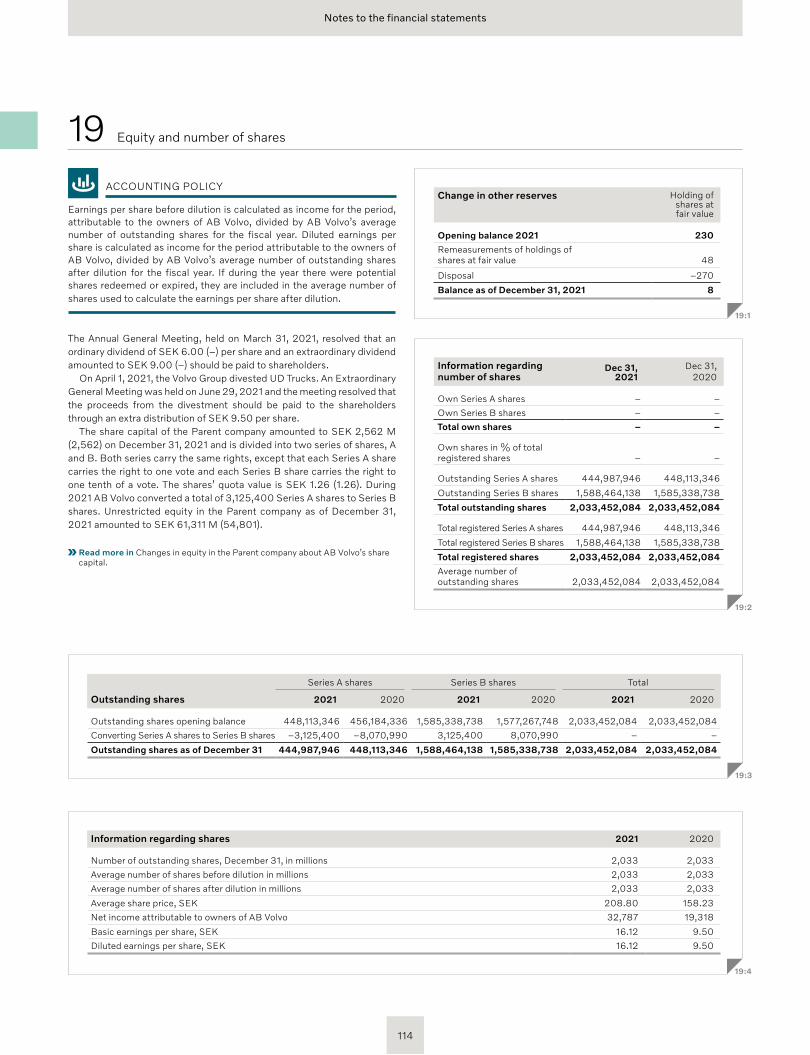
Notes to the financial statements
Information regarding shares 2021 2020
Number of outstanding shares, December 31, in millions 2,033 2,033
Average number of shares before dilution in millions 2,033 2,033
Average number of shares after dilution in millions 2,033 2,033
Average share price, SEK 208.80 158.23
Net income attributable to owners of AB Volvo 32,787 19,318
Basic earnings per share, SEK 16.12 9.50
Diluted earnings per share, SEK 16.12 9.50
19:4
Series A shares Series B shares Total
Outstanding shares 2021 2020 2021 2020 2021 2020
Outstanding shares opening balance 448,113,346 456,184,336 1,585,338,738 1,577,267,748 2,033,452,084 2,033,452,084
Converting Series A shares to Series B shares –3,125,400 –8,070,990 3,125,400 8,070,990 – –
Outstanding shares as of December 31 444,987,946 448,113,346 1,588,464,138 1,585,338,738 2,033,452,084 2,033,452,084
19:3
Change in other reserves Holding of shares at fair value
Opening balance 2021 230
Remeasurements of holdings of shares at fair value 48
Disposal –270
Balance as of December 31, 2021 8
19:1
Information regarding number of shares
Dec 31,2021
Dec 31,2020
Own Series A shares – –
Own Series B shares – –
Total own shares – –
Own shares in % of total registered shares – –
Outstanding Series A shares 444,987,946 448,113,346
Outstanding Series B shares 1,588,464,138 1,585,338,738
Total outstanding shares 2,033,452,084 2,033,452,084
Total registered Series A shares 444,987,946 448,113,346
Total registered Series B shares 1,588,464,138 1,585,338,738
Total registered shares 2,033,452,084 2,033,452,084
Average number of outstanding shares 2,033,452,084 2,033,452,084
19:2
ACCOUNTING POLICY
Earnings per share before dilution is calculated as income for the period, attributable to the owners of AB Volvo, divided by AB Volvo’s average number of outstanding shares for the fiscal year. Diluted earnings per share is calculated as income for the period attributable to the owners of AB Volvo, divided by AB Volvo’s average number of outstanding shares after dilution for the fiscal year. If during the year there were potential shares redeemed or expired, they are included in the average number of shares used to calculate the earnings per share after dilution.
The Annual General Meeting, held on March 31, 2021, resolved that an ordinary dividend of SEK 6.00 (–) per share and an extraordinary dividend amounted to SEK 9.00 (–) should be paid to shareholders.
On April 1, 2021, the Volvo Group divested UD Trucks. An Extraordinary General Meeting was held on June 29, 2021 and the meeting resolved that the proceeds from the divestment should be paid to the shareholders through an extra distribution of SEK 9.50 per share.
The share capital of the Parent company amounted to SEK 2,562 M (2,562) on December 31, 2021 and is divided into two series of shares, A and B. Both series carry the same rights, except that each Series A share carries the right to one vote and each Series B share carries the right to one tenth of a vote. The shares’ quota value is SEK 1.26 (1.26). During 2021 AB Volvo converted a total of 3,125,400 Series A shares to Series B shares. Unrestricted equity in the Parent company as of December 31, 2021 amounted to SEK 61,311 M (54,801).
Read more in Changes in equity in the Parent company about AB Volvo’s share capital.
19 Equity and number of shares
114
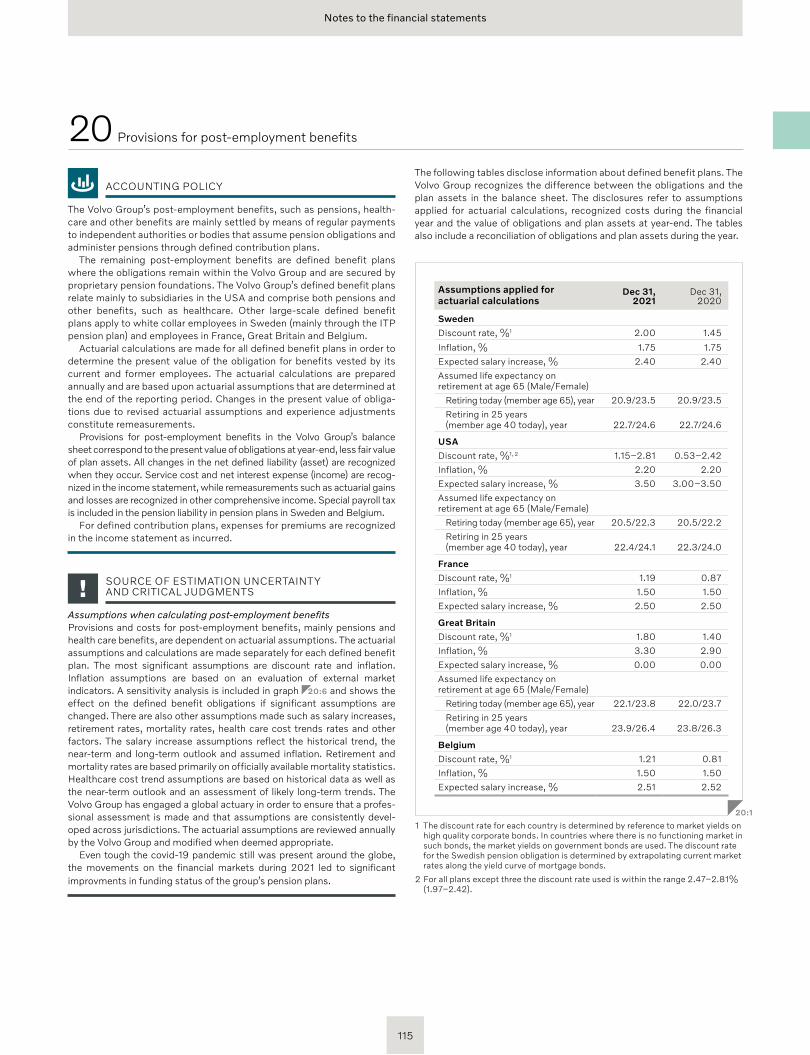
Notes to the financial statements
ACCOUNTING POLICY
The Volvo Group’s post-employment benefits, such as pensions, health-care and other benefits are mainly settled by means of regular payments to independent authorities or bodies that assume pension obligations and administer pensions through defined contribution plans.
The remaining post-employment benefits are defined benefit plans where the obligations remain within the Volvo Group and are secured by proprietary pension foundations. The Volvo Group’s defined benefit plans relate mainly to subsidiaries in the USA and comprise both pensions and other benefits, such as healthcare. Other large-scale defined benefit plans apply to white collar employees in Sweden (mainly through the ITP pension plan) and employees in France, Great Britain and Belgium.
Actuarial calculations are made for all defined benefit plans in order to determine the present value of the obligation for benefits vested by its current and former employees. The actuarial calculations are prepared annually and are based upon actuarial assumptions that are determined at the end of the reporting period. Changes in the present value of obliga-tions due to revised actuarial assumptions and experience adjustments constitute remeasurements.
Provisions for post-employment benefits in the Volvo Group’s balance sheet correspond to the present value of obligations at year-end, less fair value of plan assets. All changes in the net defined liability (asset) are recognized when they occur. Service cost and net interest expense (income) are recog-nized in the income statement, while remeasurements such as actuarial gains and losses are recognized in other comprehensive income. Special payroll tax is included in the pension liability in pension plans in Sweden and Belgium.
For defined contribution plans, expenses for premiums are recognized in the income statement as incurred.
SOURCE OF ESTIMATION UNCERTAINTY AND CRITICAL JUDGMENTS
Assumptions when calculating post-employment benefits Provisions and costs for post-employment benefits, mainly pensions and health care benefits, are dependent on actuarial assumptions. The actuarial assumptions and calculations are made separately for each defined benefit plan. The most significant assumptions are discount rate and inflation. Inflation assumptions are based on an evaluation of external market indicators. A sensitivity analysis is included in graph 20:6 and shows the effect on the defined benefit obligations if significant assumptions are changed. There are also other assumptions made such as salary increases, retirement rates, mortality rates, health care cost trends rates and other factors. The salary increase assumptions reflect the historical trend, the near-term and long-term outlook and assumed inflation. Retirement and mortality rates are based primarily on officially available mortality statistics. Healthcare cost trend assumptions are based on historical data as well as the near-term outlook and an assessment of likely long-term trends. The Volvo Group has engaged a global actuary in order to ensure that a profes-sional assessment is made and that assumptions are consistently devel-oped across jurisdictions. The actuarial assumptions are reviewed annually by the Volvo Group and modified when deemed appropriate.
Even tough the covid-19 pandemic still was present around the globe, the movements on the financial markets during 2021 led to significant improvments in funding status of the group’s pension plans.
20Provisions for post-employment benefits
Assumptions applied for actuarial calculations
Dec 31,2021
Dec 31,2020
Sweden
Discount rate, %1 2.00 1.45
Inflation, % 1.75 1.75
Expected salary increase, % 2.40 2.40
Assumed life expectancy on retirement at age 65 (Male/Female)
Retiring today (member age 65), year 20.9/23.5 20.9/23.5
Retiring in 25 years (member age 40 today), year 22.7/24.6 22.7/24.6
USA
Discount rate, %1, 2 1.15–2.81 0.53–2.42
Inflation, % 2.20 2.20
Expected salary increase, % 3.50 3.00–3.50
Assumed life expectancy on retirement at age 65 (Male/Female)
Retiring today (member age 65), year 20.5/22.3 20.5/22.2
Retiring in 25 years (member age 40 today), year 22.4/24.1 22.3/24.0
France
Discount rate, %1 1.19 0.87
Inflation, % 1.50 1.50
Expected salary increase, % 2.50 2.50
Great Britain
Discount rate, %1 1.80 1.40
Inflation, % 3.30 2.90
Expected salary increase, % 0.00 0.00
Assumed life expectancy on retirement at age 65 (Male/Female)
Retiring today (member age 65), year 22.1/23.8 22.0/23.7
Retiring in 25 years (member age 40 today), year 23.9/26.4 23.8/26.3
Belgium
Discount rate, %1 1.21 0.81
Inflation, % 1.50 1.50
Expected salary increase, % 2.51 2.52
20:1
1 The discount rate for each country is determined by reference to market yields on high quality corporate bonds. In countries where there is no functioning market in such bonds, the market yields on government bonds are used. The discount rate for the Swedish pension obligation is determined by extra polating current market rates along the yield curve of mortgage bonds.
2 For all plans except three the discount rate used is within the range 2.47–2.81% (1.97–2.42).
The following tables disclose information about defined benefit plans. The Volvo Group recognizes the difference between the obligations and the plan assets in the balance sheet. The disclosures refer to assumptions applied for actuarial calculations, recognized costs during the financial year and the value of obligations and plan assets at year-end. The tables also include a reconciliation of obligations and plan assets during the year.
115
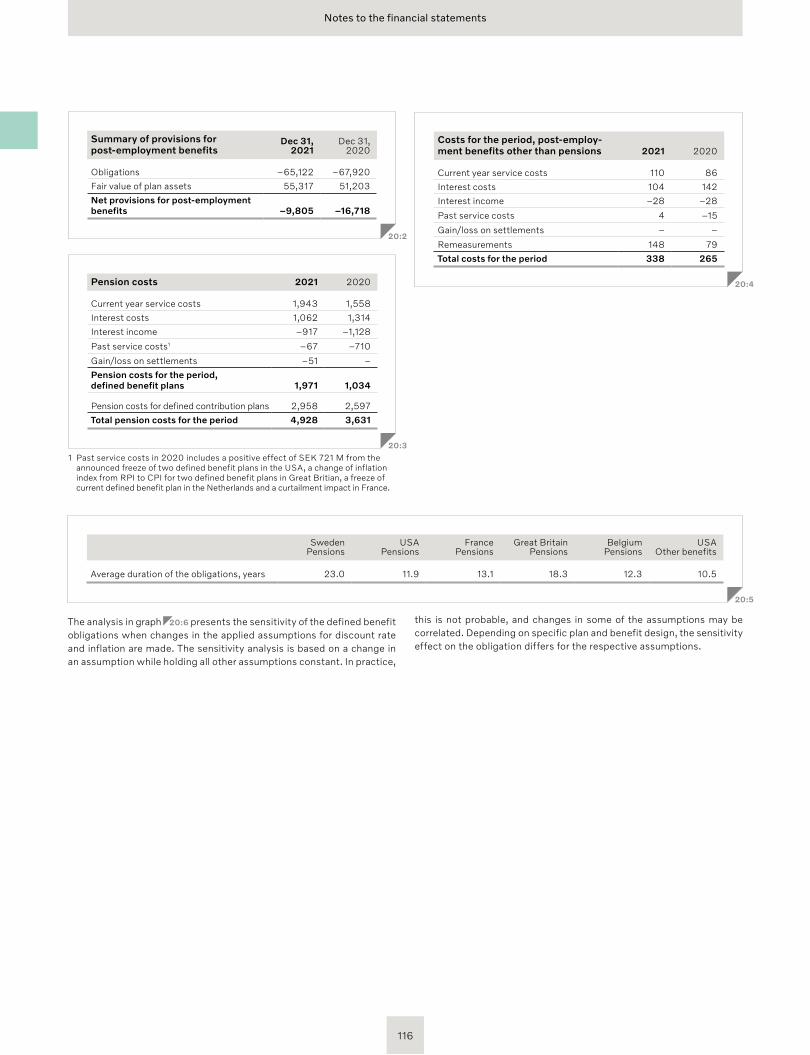
Notes to the financial statements
Pension costs 2021 2020
Current year service costs 1,943 1,558
Interest costs 1,062 1,314
Interest income –917 –1,128
Past service costs1 –67 –710
Gain/loss on settlements –51 –
Pension costs for the period, defined benefit plans 1,971 1,034
Pension costs for defined contribution plans 2,958 2,597
Total pension costs for the period 4,928 3,631
20:3
1 Past service costs in 2020 includes a positive effect of SEK 721 M from the announced freeze of two defined benefit plans in the USA, a change of inflation index from RPI to CPI for two defined benefit plans in Great Britian, a freeze of current defined benefit plan in the Netherlands and a curtailment impact in France.
The analysis in graph 20:6 presents the sensitivity of the defined benefit obligations when changes in the applied assumptions for discount rate and inflation are made. The sensitivity analysis is based on a change in an assump tion while holding all other assumptions constant. In practice,
this is not probable, and changes in some of the assumptions may be correlated. Depending on specific plan and benefit design, the sensitivity effect on the obligation differs for the respective assumptions.
SwedenPensions
USAPensions
FrancePensions
Great BritainPensions
BelgiumPensions
USA Other benefits
Average duration of the obligations, years 23.0 11.9 13.1 18.3 12.3 10.5
20:5
Costs for the period, post-employ-ment benefits other than pensions 2021 2020
Current year service costs 110 86
Interest costs 104 142
Interest income –28 –28
Past service costs 4 –15
Gain/loss on settlements – –
Remeasurements 148 79
Total costs for the period 338 265
20:4
Summary of provisions for post-employment benefits
Dec 31, 2021
Dec 31, 2020
Obligations –65,122 –67,920
Fair value of plan assets 55,317 51,203
Net provisions for post-employment benefits –9,805 –16,718
20:2
116
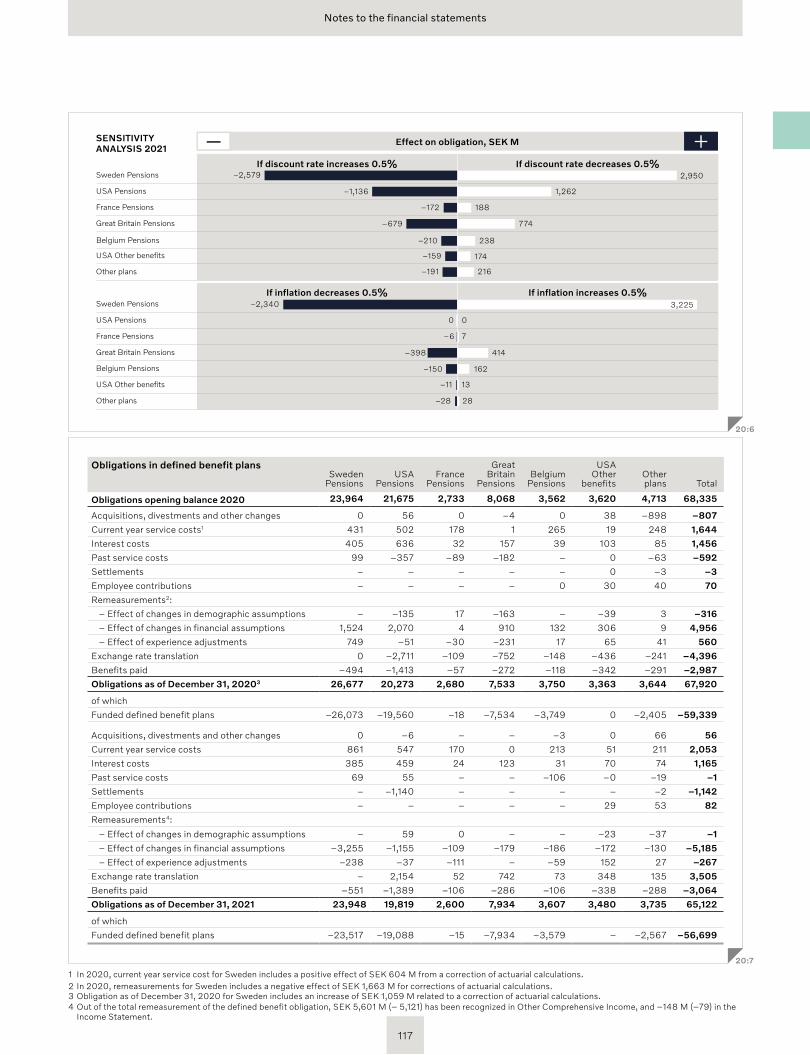
Notes to the financial statements
Obligations in defined benefit plansSweden
PensionsUSA
PensionsFrance
Pensions
GreatBritain
PensionsBelgium
Pensions
USA Other
benefitsOtherplans Total
Obligations opening balance 2020 23,964 21,675 2,733 8,068 3,562 3,620 4,713 68,335
Acquisitions, divestments and other changes 0 56 0 –4 0 38 –898 –807
Current year service costs1 431 502 178 1 265 19 248 1,644
Interest costs 405 636 32 157 39 103 85 1,456
Past service costs 99 –357 –89 –182 – 0 –63 –592
Settlements – – – – – 0 –3 –3
Employee contributions – – – – 0 30 40 70
Remeasurements2:
– Effect of changes in demographic assumptions – –135 17 –163 – –39 3 –316
– Effect of changes in financial assumptions 1,524 2,070 4 910 132 306 9 4,956
– Effect of experience adjustments 749 –51 –30 –231 17 65 41 560
Exchange rate translation 0 –2,711 –109 –752 –148 –436 –241 –4,396
Benefits paid –494 –1,413 –57 –272 –118 –342 –291 –2,987
Obligations as of December 31, 20203 26,677 20,273 2,680 7,533 3,750 3,363 3,644 67,920
of which
Funded defined benefit plans –26,073 –19,560 –18 –7,534 –3,749 0 –2,405 –59,339
Acquisitions, divestments and other changes 0 –6 – – –3 0 66 56
Current year service costs 861 547 170 0 213 51 211 2,053
Interest costs 385 459 24 123 31 70 74 1,165
Past service costs 69 55 – – –106 –0 –19 –1
Settlements – –1,140 – – – – –2 –1,142
Employee contributions – – – – – 29 53 82
Remeasurements4:
– Effect of changes in demographic assumptions – 59 0 – – –23 –37 –1
– Effect of changes in financial assumptions –3,255 –1,155 –109 –179 –186 –172 –130 –5,185
– Effect of experience adjustments –238 –37 –111 – –59 152 27 –267
Exchange rate translation – 2,154 52 742 73 348 135 3,505
Benefits paid –551 –1,389 –106 –286 –106 –338 –288 –3,064
Obligations as of December 31, 2021 23,948 19,819 2,600 7,934 3,607 3,480 3,735 65,122
of which
Funded defined benefit plans –23,517 –19,088 –15 –7,934 –3,579 – –2,567 –56,699
20:7
1 In 2020, current year service cost for Sweden includes a positive effect of SEK 604 M from a correction of actuarial calculations.2 In 2020, remeasurements for Sweden includes a negative effect of SEK 1,663 M for corrections of actuarial calculations.3 Obligation as of December 31, 2020 for Sweden includes an increase of SEK 1,059 M related to a correction of actuarial calculations.4 Out of the total remeasurement of the defined benefit obligation, SEK 5,601 M (– 5,121) has been recognized in Other Comprehensive Income, and –148 M (–79) in the
Income Statement.
− +2,950
1,262
188
774
174
216
0
7
13
28
414
162
238
3,225
–2,579
–1,136
–172
–679
–159
–191
–210
Effect on obligation, SEK M
Sweden Pensions
USA Pensions
USA Other benefits
Other plans
France Pensions
Great Britain Pensions
If inflation decreases 0.5% If inflation increases 0.5%Sweden Pensions
USA Pensions
USA Other benefits
Other plans
France Pensions
Great Britain Pensions
Belgium Pensions
SENSITIVITY ANALYSIS 2021
If discount rate increases 0.5% If discount rate decreases 0.5%
Belgium Pensions
–2,340
0
–6
–398
–11
–28
–150
20:6
117
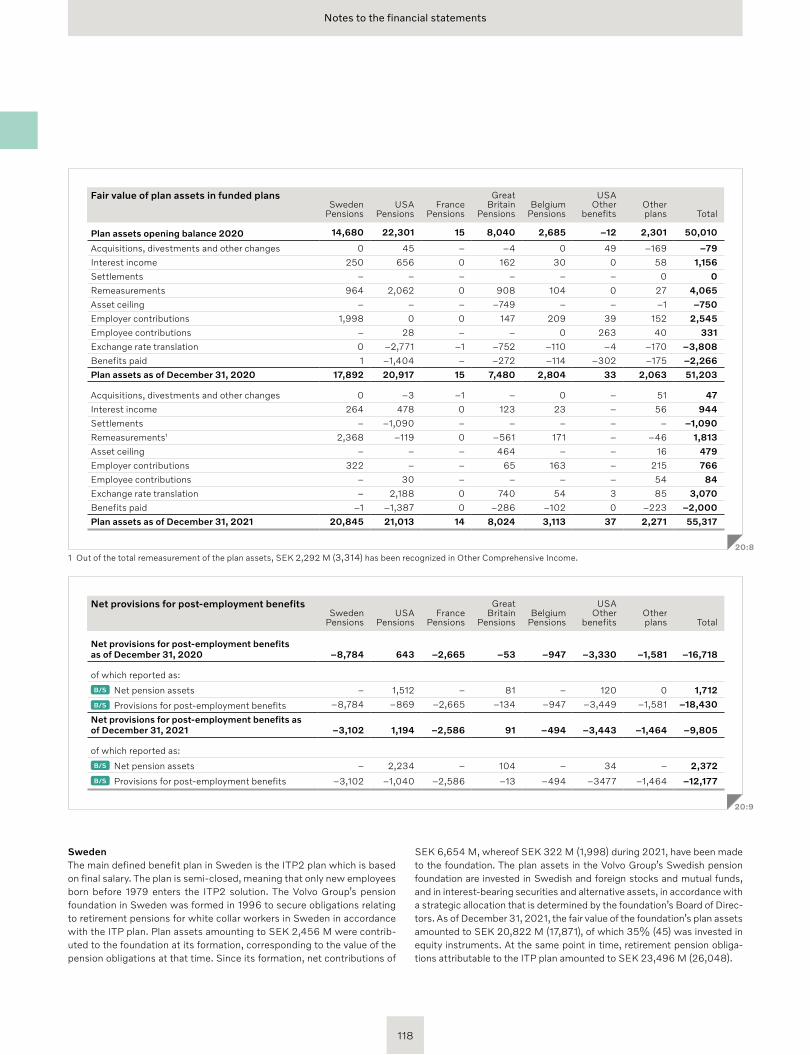
Notes to the financial statements
Fair value of plan assets in funded plansSweden
PensionsUSA
PensionsFrance
Pensions
GreatBritain
PensionsBelgium
Pensions
USA Other
benefitsOtherplans Total
Plan assets opening balance 2020 14,680 22,301 15 8,040 2,685 –12 2,301 50,010
Acquisitions, divestments and other changes 0 45 – –4 0 49 –169 –79
Interest income 250 656 0 162 30 0 58 1,156
Settlements – – – – – – 0 0
Remeasurements 964 2,062 0 908 104 0 27 4,065
Asset ceiling – – – –749 – – –1 –750
Employer contributions 1,998 0 0 147 209 39 152 2,545
Employee contributions – 28 – – 0 263 40 331
Exchange rate translation 0 –2,771 –1 –752 –110 –4 –170 –3,808
Benefits paid 1 –1,404 – –272 –114 –302 –175 –2,266
Plan assets as of December 31, 2020 17,892 20,917 15 7,480 2,804 33 2,063 51,203
Acquisitions, divestments and other changes 0 –3 –1 – 0 – 51 47
Interest income 264 478 0 123 23 – 56 944
Settlements – –1,090 – – – – – –1,090
Remeasurements1 2,368 –119 0 –561 171 – –46 1,813
Asset ceiling – – – 464 – – 16 479
Employer contributions 322 – – 65 163 – 215 766
Employee contributions – 30 – – – – 54 84
Exchange rate translation – 2,188 0 740 54 3 85 3,070
Benefits paid –1 –1,387 0 –286 –102 0 –223 –2,000
Plan assets as of December 31, 2021 20,845 21,013 14 8,024 3,113 37 2,271 55,317
20:81 Out of the total remeasurement of the plan assets, SEK 2,292 M (3,314) has been recognized in Other Comprehensive Income.
Net provisions for post-employment benefitsSweden
PensionsUSA
PensionsFrance
Pensions
GreatBritain
PensionsBelgium
Pensions
USA Other
benefitsOtherplans Total
Net provisions for post-employment benefits as of December 31, 2020 –8,784 643 –2,665 –53 –947 –3,330 –1,581 –16,718
of which reported as:
B/S Net pension assets – 1,512 – 81 – 120 0 1,712
B/S Provisions for post-employment benefits –8,784 –869 –2,665 –134 –947 –3,449 –1,581 –18,430
Net provisions for post-employment benefits as of December 31, 2021 –3,102 1,194 –2,586 91 –494 –3,443 –1,464 –9,805
of which reported as:
B/S Net pension assets – 2,234 – 104 – 34 – 2,372
B/S Provisions for post-employment benefits –3,102 –1,040 –2,586 –13 –494 –3477 –1,464 –12,177
20:9
SEK 6,654 M, whereof SEK 322 M (1,998) during 2021, have been made to the foundation. The plan assets in the Volvo Group’s Swedish pension foundation are invested in Swedish and foreign stocks and mutual funds, and in interest-bearing securities and alternative assets, in accordance with a strategic allocation that is determined by the foundation’s Board of Direc-tors. As of December 31, 2021, the fair value of the foundation’s plan assets amounted to SEK 20,822 M (17,871), of which 35% (45) was invested in equity instruments. At the same point in time, retirement pension obliga-tions attributable to the ITP plan amounted to SEK 23,496 M (26,048).
SwedenThe main defined benefit plan in Sweden is the ITP2 plan which is based on final salary. The plan is semi-closed, meaning that only new employees born before 1979 enters the ITP2 solution. The Volvo Group’s pension foundation in Sweden was formed in 1996 to secure obligations relating to retirement pensions for white collar workers in Sweden in accordance with the ITP plan. Plan assets amounting to SEK 2,456 M were contrib-uted to the foundation at its formation, corresponding to the value of the pension obligations at that time. Since its formation, net contributions of
118
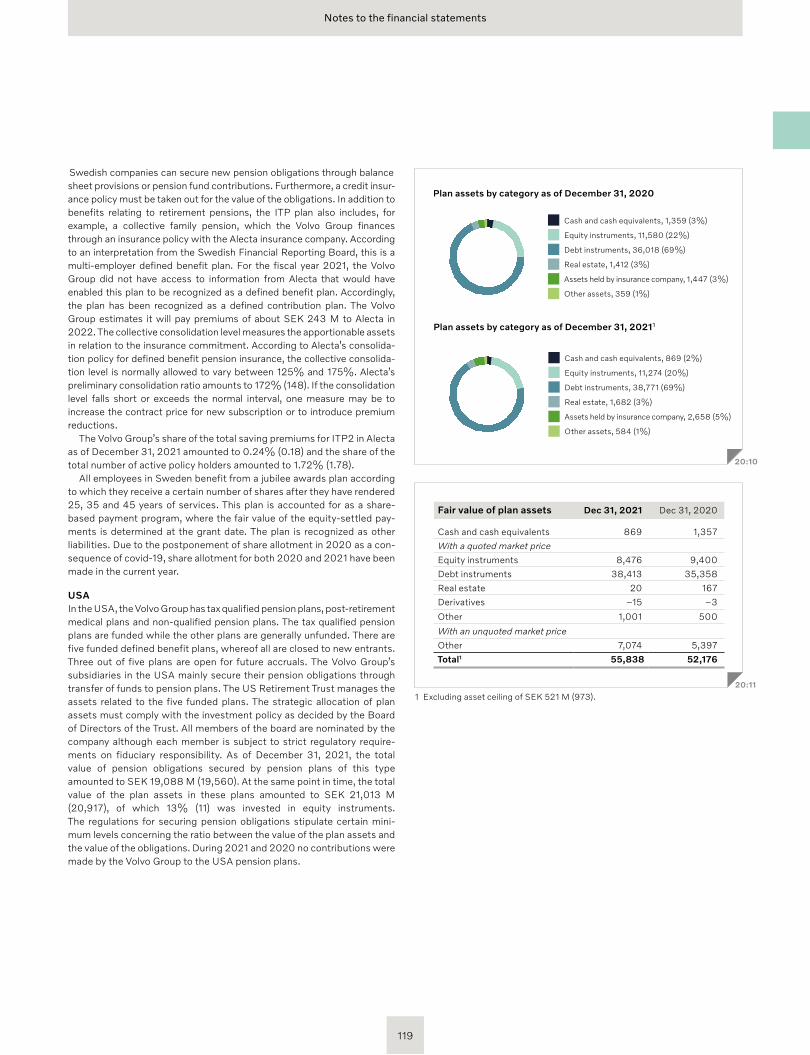
Notes to the financial statements
Swedish companies can secure new pension obligations through balance sheet provisions or pension fund contributions. Furthermore, a credit insur-ance policy must be taken out for the value of the obligations. In addition to benefits relating to retirement pensions, the ITP plan also includes, for example, a collective family pension, which the Volvo Group finances through an insurance policy with the Alecta insurance company. According to an interpretation from the Swedish Financial Reporting Board, this is a multi-employer defined benefit plan. For the fiscal year 2021, the Volvo Group did not have access to information from Alecta that would have enabled this plan to be recognized as a defined benefit plan. Accordingly, the plan has been recognized as a defined contribution plan. The Volvo Group estimates it will pay premiums of about SEK 243 M to Alecta in 2022. The collective consolidation level measures the apportionable assets in relation to the insurance commitment. According to Alecta’s consolida-tion policy for defined benefit pension insurance, the collective consolida-tion level is normally allowed to vary between 125% and 175%. Alecta’s preliminary consolidation ratio amounts to 172% (148). If the consolidation level falls short or exceeds the normal interval, one measure may be to increase the contract price for new subscription or to introduce premium reductions.
The Volvo Group’s share of the total saving premiums for ITP2 in Alecta as of December 31, 2021 amounted to 0.24% (0.18) and the share of the total number of active policy holders amounted to 1.72% (1.78).
All employees in Sweden benefit from a jubilee awards plan according to which they receive a certain number of shares after they have rendered 25, 35 and 45 years of services. This plan is accounted for as a share-based payment program, where the fair value of the equity-settled pay-ments is determined at the grant date. The plan is recognized as other liabilities. Due to the postponement of share allotment in 2020 as a con-sequence of covid-19, share allotment for both 2020 and 2021 have been made in the current year.
USA In the USA, the Volvo Group has tax qualified pension plans, post- retirement medical plans and non-qualified pension plans. The tax qualified pension plans are funded while the other plans are generally unfunded. There are five funded defined benefit plans, whereof all are closed to new entrants. Three out of five plans are open for future accruals. The Volvo Group’s subsidiaries in the USA mainly secure their pension obligations through transfer of funds to pension plans. The US Retirement Trust manages the assets related to the five funded plans. The strategic allocation of plan assets must comply with the investment policy as decided by the Board of Directors of the Trust. All members of the board are nominated by the company although each member is subject to strict regulatory require-ments on fiduciary responsibility. As of December 31, 2021, the total value of pension obligations secured by pension plans of this type amounted to SEK 19,088 M (19,560). At the same point in time, the total value of the plan assets in these plans amounted to SEK 21,013 M (20,917), of which 13% (11) was invested in equity instruments. The regulations for securing pension obligations stipulate certain mini-mum levels concerning the ratio between the value of the plan assets and the value of the obligations. During 2021 and 2020 no contributions were made by the Volvo Group to the USA pension plans.
Cash and cash equivalents, 869 (2%)
Equity instruments, 11,274 (20%)
Debt instruments, 38,771 (69%)
Real estate, 1,682 (3%)
Assets held by insurance company, 2,658 (5%)
Other assets, 584 (1%)
Plan assets by category as of December 31, 2021¹
Cash and cash equivalents, 1,359 (3%)
Equity instruments, 11,580 (22%)
Debt instruments, 36,018 (69%)
Real estate, 1,412 (3%)
Assets held by insurance company, 1,447 (3%)
Other assets, 359 (1%)
Plan assets by category as of December 31, 2020
20:10
Fair value of plan assets Dec 31, 2021 Dec 31, 2020
Cash and cash equivalents 869 1,357
With a quoted market price
Equity instruments 8,476 9,400
Debt instruments 38,413 35,358
Real estate 20 167
Derivatives –15 –3
Other 1,001 500
With an unquoted market price
Other 7,074 5,397
Total1 55,838 52,176
20:11
1 Excluding asset ceiling of SEK 521 M (973).
119
Notes to the financial statements
France In France, the Volvo Group has two types of defined benefit plans, Indemnité de Fin de Carrière (IFC) and jubilee awards plan. The plans are unfunded. The IFC is compulsory in France. The benefits are based on the Collective Bargaining Agreement applicable in the company, on the employee’s seniority at retirement date and on the final pay. The benefit payment is due only if employees are working for the company when they retire. The jubilee award plan is an internal agreement and the benefit is based on the employee’s seniority career at 20, 30, 35 and 40 years. As of December 31, 2021, the total value of pension obligations amounted to SEK 2,600 M (2,680).
Great Britain In Great Britain, the Volvo Group has five defined benefit pension plans, which are all funded. The pension funds are set up as separate legal enti-ties, which are governed by a professional trustee. All plans are closed to new entrants and closed for future accruals to existing members. The allo-cation of plan assets must comply with the investment strategy agreed between the company and the professional trustee. For three of the plans, if a net surplus is recognized in the balance sheet when the pension scheme runs-off, the Volvo Group has an unconditional right to the sur-plus of that plan or plans. For two plans this is not strictly legally the case and therefore an asset ceiling is applied. As of December 31, 2021, the total value of pension obligations amounted to SEK 7,934 M (7,533). At the same point in time, the total value of the plan assets in these plans amounted to SEK 8,024 M (7,480), of which 5% (6) was invested in equity instruments. During 2021, the Volvo Group contributed SEK 65 M (147) to the Great Britain pension plans.
BelgiumIn Belgium, the Volvo Group has four traditional defined benefit pension plans based on final salary, whereof all are closed to new entrants. All plans are open for future accruals. Two are funded via an external pension fund with a legally ringfenced Volvo section and two are funded via the group insurance product referred to in Belgium as Branch 21. Benefits are paid as a lump sum at retirement. There is also an open defined contribution pen-sion plan as well as a local profit sharing program whereby any pay-outs are contributed to a defined contribution pension plan managed by the own pension fund or through a group insurance. All defined contribution pension plans in Belgium have a statutory minimum return guarantee and are there-fore accounted for as defined benefit plans. The strategic asset allocation of plan assets must comply with the investment policy as proposed by the Volvo Group and formally adopted by the Board of Directors of the pension fund. As of December 31, 2021, the total value of pension obligations amounted to SEK 3,607 M (3,750). At the same point in time, the plan assets of these plans amounted to SEK 3,113 M (2,804), of which 27% (27) was invested in equity instruments. During 2021, the Volvo Group contributed SEK 163 M (209) to the Belgium pension plans.
Investment strategy and risk managementThe Volvo Group manages the allocation and investment of pension plan assets with the purpose of meeting the long term objectives. The main objectives are to meet present and future benefit obligations, provide sufficient liquidity to meet such payment requirements and to provide a total return that maximizes the ratio of the plan assets in relation to the plan liabilities by maximizing return on the assets at an appropriate level of risk. The final investment decision often resides with the local trustee, but the investment policy for all plans ensures that the risks in the investment portfolios are well diversified. The primary risk mitigating activity in the long run is to close defined benefit plans to new entrants or to future accru-als for existing members and replace these plans with defined contribution plans when and where possible. The risks related to already accrued pension obligations, e.g. longevity and inflation, as well as buy out premiums and matching strategies are monitored on an ongoing basis in order to further limit the Volvo Group’s exposure where and when possible.
In the last couple of years, some of the defined benefit plans have been closed to new entrants and replaced by defined contribution plans in order to reduce risk for the Volvo Group.
In Sweden, the minimum funding target is decided by PRI Pensions-garanti. This is mandatory in order to stay in the system and get insurance for the pension liability. The contributions usually represent one year’s new accrued benefits plus any shortfall towards the minimum funding target unless there is a surplus according to local scheme valuation principles.
In the USA, the minimum funding target is decided by the company in order to avoid penalties, keep flexibility and avoid extensive filing with the Internal Revenue Service and participants in the pension plan. The mini-mum contributions usually represent one year’s accrued benefits plus a seventh of any deficit unless a scheme is showing a surplus according to local scheme valuation principles.
In Great Britain, there is no minimum funding ratio. There is a regulatory requirement for each scheme to perform triennial valuations whereby any scheme showing a deficit must develop a recovery plan that returns the scheme to a fully funded basis within a reasonable timeframe. The recovery plan shall be agreed with the company and submitted to the regulator for approval.
In Belgium, the minimum funding level is regulated by law and monitored by the financial supervisory authority, FSMA. The framework for the mini-mum funding requirement is based on a discount rate, which is based on the expected return of the plan assets. The pension fund must be fully funded on this basis at all times. The contribution policy of the pension fund is designed to provide stability in contributions over the duration of the plan.
In 2022, the Volvo Group estimates to transfer an amount of SEK 0.5–1.0 billion to pension plans.
120
Notes to the financial statements
ACCOUNTING POLICY
Provisions are recognized in the balance sheet when a legal or constructive obligation exists as a result from a past event, it is probable that an outflow of resources will be required to settle the obligation and the amount can be reliably estimated. When these criteria are not met, a contingent liability may be recognized.
Provisions for product warranty Provisions for product warranty are recognized as cost of sales and include contractual warranty and campaign warranty. Provisions for contractual warranty are recognized when the products are sold. Provision for campaigns in connection with specific quality problems are recognized when the campaign is decided.
Provisions for technical goodwillTechnical goodwill is coverage in excess of contractual warranty or campaigns in order to maintain a good business relation with the customer. The provisions for technical goodwill are determined based on historical statistics for customers where an element of constructive obligation exists.
Provisions for extended coverageAn extended coverage is a product insurance sold to a customer to cover a product according to specific conditions for an agreed period as an additional insurance to the factory contractual warranty. The provision is intended to cover the risk that the expected cost of providing services under the extended coverage contract exceed the expected revenue.
Provisions in insurance operationsVolvo Group has a captive insurance company and the provisions in insurance operations are related to third party claims addressed to companies within the Volvo Group. The claims reserve also includes a provision for unreported losses based on past experience. The unearned premium reserve is reported as an accrued expense within other current liabilities.
Provisions for restructuring costs A provision for decided restructuring measures is recognized when a detailed plan for the implementation of the measures is complete and when this plan is communicated to those who are affected. A provision and costs for termination benefits as a result of a voluntary termination program is recognized when the employee accepts the offer. Normally restructuring costs are included in other operating income and expenses.
Provisions for residual value risks Residual value risks are the risks that the Volvo Group in the future would have to dispose used vehicles at a loss if the price development of these products is worse than expected when the contracts were entered. The residual value risks pertain to operating lease contracts and sales transactions with residual value commitments (buybacks and tradebacks) where the Volvo Group has a residual value commitment. The majority of these contracts are recognized as assets under operating leases or as right of return asset in the balance sheet. During the period, the depreciable amount is adjusted through the income statement to correspond to estimated future net realizable value to continuously reflect potential residual value risks at the end of the contract period.
Read more in Note 13 Tangible assets about residual value risks.
Residual value commitments that are independent from the sales transaction are not recognized as assets under operating leases or as right of return in the balance sheet, hence the potential residual value risks related to these contracts are recognized as provisions. To the extent the residual
value exposure does not meet the definition of a provision, the gross exposure is reported as a contingent liability.
Read more in Note 24 Contingent liabilities and contingent assets.
Provisions for service contractsService contracts offer the customer preventive maintenance according to an agreed service plan. The provision is intended to cover the risk that the expected cost of providing services and repairs under the service contract exceeds the expected revenue.
Other provisionsOther provisions mainly includes provisions for legal disputes, provisions for externally issued credit guarantees and other provisions, unless separately specified.
Longterm provisions as above are expected to be settled within 2 to 3 years.
SOURCE OF ESTIMATION UNCERTAINTY AND CRITICAL JUDGMENTS
The uncertainties about the amount or timing of outflows vary for different kind of provisions. Regarding provisions for product warranty, technical goodwill, extended coverage, residual value risks and service contracts, the provisions are based on historical statistics and estimated future costs, which is why the provided amount has a high correlation with the outflow of resources. Regarding provisions for disputes, like tax and legal disputes, the uncertainty is higher.
Provisions for product warrantyWarranty provisions are estimated with consideration of historical statistics with regard to known changes in warranty claims, warranty periods, the average timelag between faults occurring until claims are received by the company and anticipated changes in quality indexes. The actual outcome of product warranties may deviate from the expected outcome and materially affect the warranty costs and provisions in future periods. Re funds from suppliers, that decrease the Volvo Group’s warranty costs, are recognized to the extent these are considered to be certain.
Other provisionsThe Volvo Group works actively to ensure compliance with applicable environmental laws and regulations, which are often complex and uncertain. If the Volvo Group fails to meet climate related targets or regulatory requirements it could be subject to significant penalties and other sanctions which could materially affect the financial statements.
Provisions for legal proceedingsThe Volvo Group regularly reviews the development of significant outstanding legal disputes in which the Volvo Group companies are parties, both regarding civil law and tax disputes, in order to assess the need for provisions and contingent liabilities in the financial statements. Among the factors that the Volvo Group considers in making decisions on provisions and contingent liabilities are the nature of the dispute, the amount claimed, the progress of the case, the opinions of legal and other advisers, experience in similar cases, and any decision of the Volvo Group’s management as to how the Volvo Group intends to handle the dispute. The actual outcome of a legal dispute may deviate from the expected outcome of the dispute. The difference between actual and expected outcome of a dispute might materially affect future financial statements, with an adverse impact upon the Volvo Group’s operating income, financial position and liquidity.
Provisions for legal disputes are included within other provisions in table 21:1 .
Read more in Note 24 Contingent liabilities and contingent assets.
21 Other provisions
121
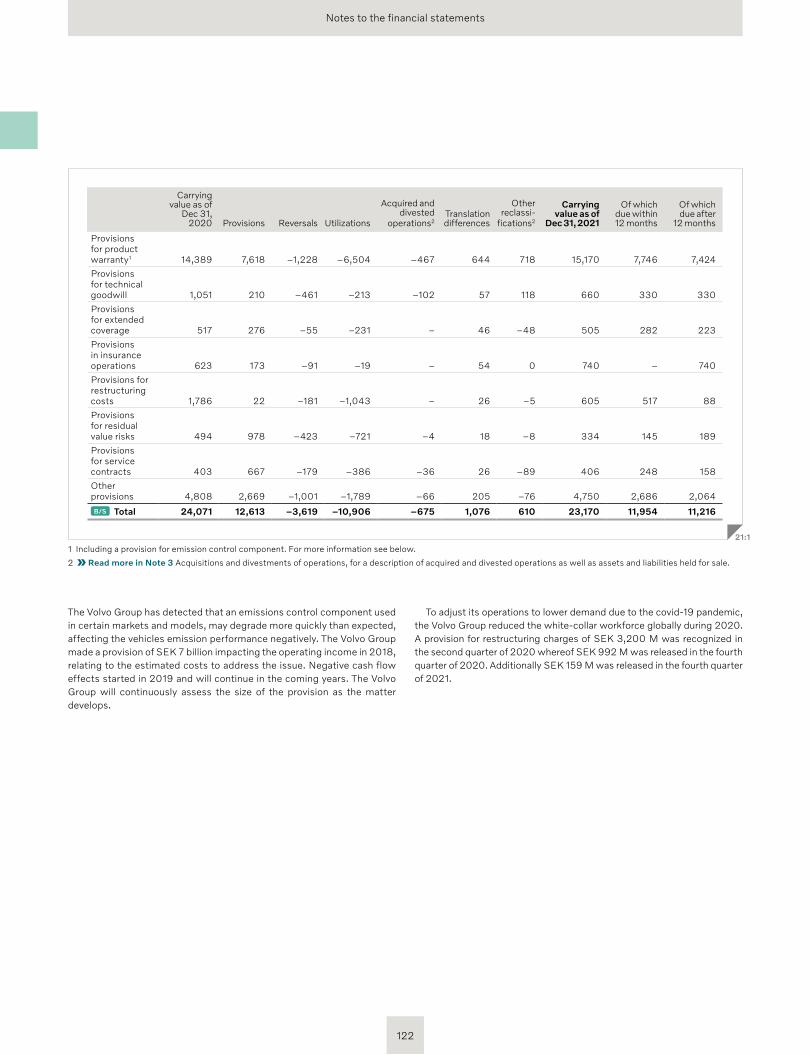
Notes to the financial statements
Carryingvalue as of
Dec 31, 2020 Provisions Reversals Utilizations
Acquired and divested
operations2Trans lation differences
Other reclassi
fications2
Carryingvalue as of
Dec 31, 2021
Of which due within 12 months
Of which due after
12 months
Provisions for product warranty1 14,389 7,618 –1,228 –6,504 –467 644 718 15,170 7,746 7,424
Provisions for technical goodwill 1,051 210 –461 –213 –102 57 118 660 330 330
Provisions for extended coverage 517 276 –55 –231 – 46 –48 505 282 223
Provisions in insurance operations 623 173 –91 –19 – 54 0 740 – 740
Provisions for restructuring costs 1,786 22 –181 –1,043 – 26 –5 605 517 88
Provisions for residual value risks 494 978 –423 –721 –4 18 –8 334 145 189
Provisions for service contracts 403 667 –179 –386 –36 26 –89 406 248 158
Other provisions 4,808 2,669 –1,001 –1,789 –66 205 –76 4,750 2,686 2,064
B/S Total 24,071 12,613 –3,619 –10,906 –675 1,076 610 23,170 11,954 11,216
21:1
1 Including a provision for emission control component. For more information see below.
2 Read more in Note 3 Acquisitions and divestments of operations, for a description of acquired and divested operations as well as assets and liabilities held for sale.
The Volvo Group has detected that an emissions control component used in certain markets and models, may degrade more quickly than expected, affecting the vehicles emission performance negatively. The Volvo Group made a provision of SEK 7 billion impacting the operating income in 2018, relating to the estimated costs to address the issue. Negative cash flow effects started in 2019 and will continue in the coming years. The Volvo Group will continuously assess the size of the provision as the matter develops.
To adjust its operations to lower demand due to the covid19 pandemic, the Volvo Group reduced the whitecollar workforce globally during 2020. A provision for restructuring charges of SEK 3,200 M was recognized in the second quarter of 2020 whereof SEK 992 M was released in the fourth quarter of 2020. Additionally SEK 159 M was released in the fourth quarter of 2021.
122
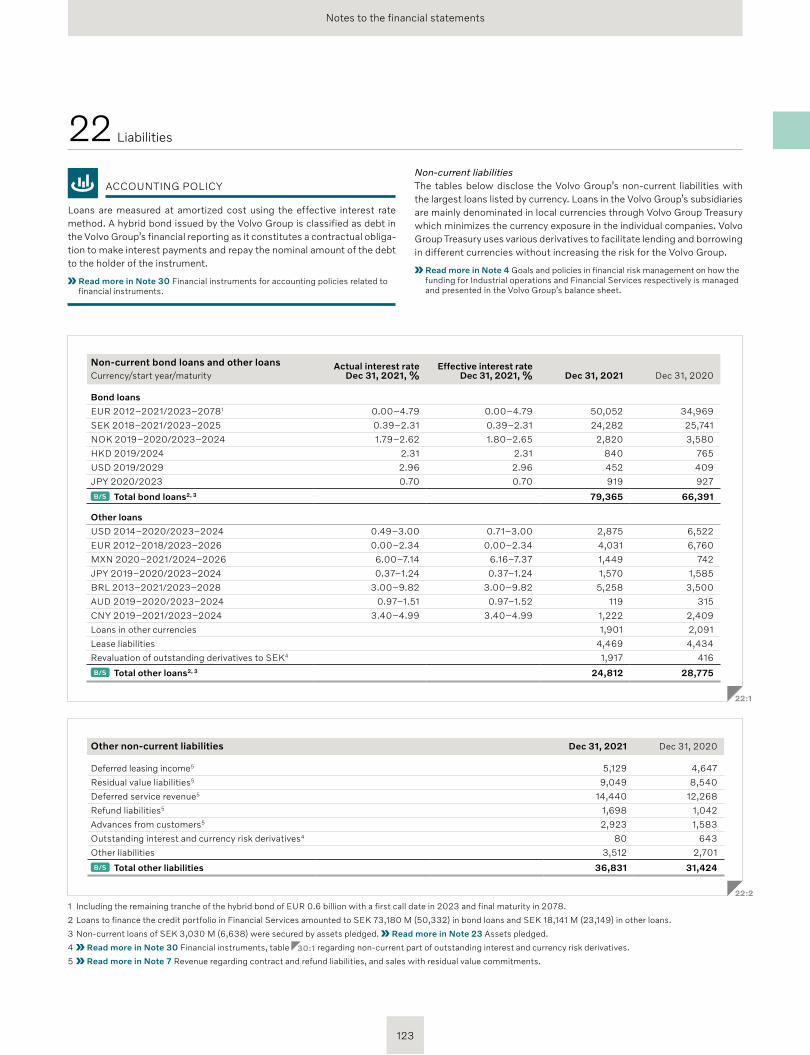
Notes to the financial statements
ACCOUNTING POLICY
Loans are measured at amortized cost using the effective interest rate method. A hybrid bond issued by the Volvo Group is classified as debt in the Volvo Group’s financial reporting as it constitutes a contractual obligation to make interest payments and repay the nominal amount of the debt to the holder of the instrument.
Read more in Note 30 Financial instruments for accounting policies related to financial instruments.
Non-current liabilitiesThe tables below disclose the Volvo Group’s noncurrent liabilities with the largest loans listed by currency. Loans in the Volvo Group’s subsidiaries are mainly denominated in local currencies through Volvo Group Treasury which minimizes the currency exposure in the individual companies. Volvo Group Treasury uses various derivatives to facilitate lending and borrowing in different currencies without increasing the risk for the Volvo Group.
Read more in Note 4 Goals and policies in financial risk management on how the funding for Industrial operations and Financial Services respectively is managed and presented in the Volvo Group’s balance sheet.
22 Liabilities
Non-current bond loans and other loansCurrency/start year/maturity
Actual interest rate Dec 31, 2021, %
Effective interest rate Dec 31, 2021, % Dec 31, 2021 Dec 31, 2020
Bond loans
EUR 2012–2021/2023–20781 0.00–4.79 0.00–4.79 50,052 34,969
SEK 2018–2021/2023–2025 0.39–2.31 0.39–2.31 24,282 25,741
NOK 2019–2020/2023–2024 1.79–2.62 1.80–2.65 2,820 3,580
HKD 2019/2024 2.31 2.31 840 765
USD 2019/2029 2.96 2.96 452 409
JPY 2020/2023 0.70 0.70 919 927
B/S Total bond loans2, 3 79,365 66,391
Other loans
USD 2014–2020/2023–2024 0.49–3.00 0.71–3.00 2,875 6,522
EUR 2012–2018/2023–2026 0.00–2.34 0.00–2.34 4,031 6,760
MXN 2020–2021/2024–2026 6.00–7.14 6.16–7.37 1,449 742
JPY 2019–2020/2023–2024 0.37–1.24 0.37–1.24 1,570 1,585
BRL 2013–2021/2023–2028 3.00–9.82 3.00–9.82 5,258 3,500
AUD 2019–2020/2023–2024 0.97–1.51 0.97–1.52 119 315
CNY 2019–2021/2023–2024 3.40–4.99 3.40–4.99 1,222 2,409
Loans in other currencies 1,901 2,091
Lease liabilities 4,469 4,434
Revaluation of outstanding derivatives to SEK4 1,917 416
B/S Total other loans2, 3 24,812 28,775
22:1
1 Including the remaining tranche of the hybrid bond of EUR 0.6 billion with a first call date in 2023 and final maturity in 2078.
2 Loans to finance the credit portfolio in Financial Services amounted to SEK 73,180 M (50,332) in bond loans and SEK 18,141 M (23,149) in other loans.
3 Noncurrent loans of SEK 3,030 M (6,638) were secured by assets pledged. Read more in Note 23 Assets pledged.
4 Read more in Note 30 Financial instruments, table 30:1 regarding noncurrent part of outstanding interest and currency risk derivatives.
5 Read more in Note 7 Revenue regarding contract and refund liabilities, and sales with residual value commitments.
Other non-current liabilities Dec 31, 2021 Dec 31, 2020
Deferred leasing income5 5,129 4,647
Residual value liabilities5 9,049 8,540
Deferred service revenue5 14,440 12,268
Refund liabilities5 1,698 1,042
Advances from customers5 2,923 1,583
Outstanding interest and currency risk derivatives4 80 643
Other liabilities 3,512 2,701
B/S Total other liabilities 36,831 31,424
22:2
123
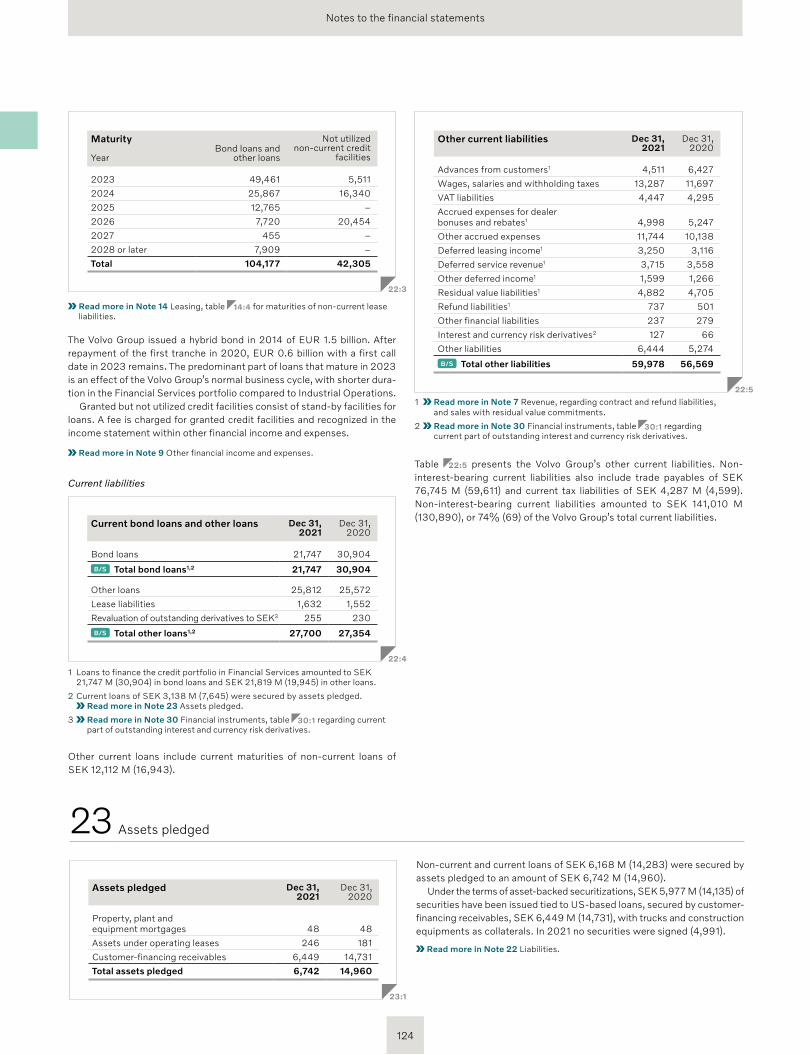
Notes to the financial statements
Maturity
YearBond loans and
other loans
Not utilized noncurrent credit
facilities
2023 49,461 5,511
2024 25,867 16,340
2025 12,765 –
2026 7,720 20,454
2027 455 –
2028 or later 7,909 –
Total 104,177 42,305
22:3
Read more in Note 14 Leasing, table 14:4 for maturities of noncurrent lease liabilities.
The Volvo Group issued a hybrid bond in 2014 of EUR 1.5 billion. After repayment of the first tranche in 2020, EUR 0.6 billion with a first call date in 2023 remains. The predominant part of loans that mature in 2023 is an effect of the Volvo Group’s normal business cycle, with shorter duration in the Financial Services portfolio compared to Industrial Operations.
Granted but not utilized credit facilities consist of standby facilities for loans. A fee is charged for granted credit facilities and recognized in the income statement within other financial income and expenses.
Read more in Note 9 Other financial income and expenses.
Current liabilities
Current bond loans and other loans Dec 31,2021
Dec 31,2020
Bond loans 21,747 30,904
B/S Total bond loans1,2 21,747 30,904
Other loans 25,812 25,572
Lease liabilities 1,632 1,552
Revaluation of outstanding derivatives to SEK3 255 230
B/S Total other loans1,2 27,700 27,354
22:4
1 Loans to finance the credit portfolio in Financial Services amounted to SEK 21,747 M (30,904) in bond loans and SEK 21,819 M (19,945) in other loans.
2 Current loans of SEK 3,138 M (7,645) were secured by assets pledged. Read more in Note 23 Assets pledged.
3 Read more in Note 30 Financial instruments, table 30:1 regarding current part of outstanding interest and currency risk derivatives.
Other current loans include current maturities of noncurrent loans of SEK 12,112 M (16,943).
Other current liabilities Dec 31,2021
Dec 31,2020
Advances from customers1 4,511 6,427
Wages, salaries and withholding taxes 13,287 11,697
VAT liabilities 4,447 4,295
Accrued expenses for dealer bonuses and rebates1 4,998 5,247
Other accrued expenses 11,744 10,138
Deferred leasing income1 3,250 3,116
Deferred service revenue1 3,715 3,558
Other deferred income1 1,599 1,266
Residual value liabilities1 4,882 4,705
Refund liabilities1 737 501
Other financial liabilities 237 279
Interest and currency risk derivatives 2 127 66
Other liabilities 6,444 5,274
B/S Total other liabilities 59,978 56,569
22:5
1 Read more in Note 7 Revenue, regarding contract and refund liabilities, and sales with residual value commitments.
2 Read more in Note 30 Financial instruments, table 30:1 regarding current part of outstanding interest and currency risk derivatives.
Table 22:5 presents the Volvo Group’s other current liabilities. Non interestbearing current liabilities also include trade payables of SEK 76,745 M (59,611) and current tax liabilities of SEK 4,287 M (4,599). Noninterestbearing current liabilities amounted to SEK 141,010 M (130,890), or 74% (69) of the Volvo Group’s total current liabilities.
Assets pledged Dec 31,2021
Dec 31,2020
Property, plant and equipment mortgages 48 48
Assets under operating leases 246 181
Customerfinancing receivables 6,449 14,731
Total assets pledged 6,742 14,960
23:1
Noncurrent and current loans of SEK 6,168 M (14,283) were secured by assets pledged to an amount of SEK 6,742 M (14,960).
Under the terms of assetbacked securitizations, SEK 5,977 M (14,135) of securities have been issued tied to USbased loans, secured by customer financing receivables, SEK 6,449 M (14,731), with trucks and construction equipments as collaterals. In 2021 no securities were signed (4,991).
Read more in Note 22 Liabilities.
23 Assets pledged
124
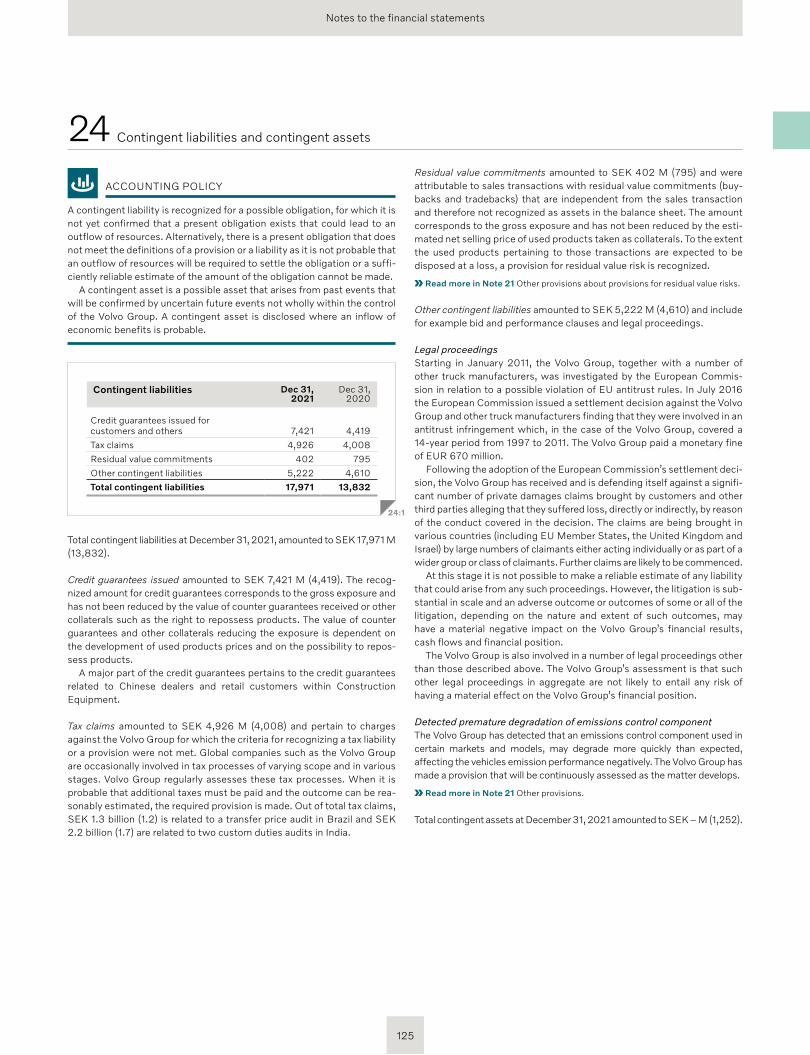
Notes to the financial statements
ACCOUNTING POLICY
A contingent liability is recognized for a possible obligation, for which it is not yet confirmed that a present obligation exists that could lead to an outflow of resources. Alternatively, there is a present obligation that does not meet the definitions of a provision or a liability as it is not probable that an outflow of resources will be required to settle the obligation or a sufficiently reliable estimate of the amount of the obligation cannot be made.
A contingent asset is a possible asset that arises from past events that will be confirmed by uncertain future events not wholly within the control of the Volvo Group. A contingent asset is disclosed where an inflow of economic benefits is probable.
Contingent liabilities Dec 31,2021
Dec 31,2020
Credit guarantees issued for customers and others 7,421 4,419
Tax claims 4,926 4,008
Residual value commitments 402 795
Other contingent liabilities 5,222 4,610
Total contingent liabilities 17,971 13,832
24:1
Total contingent liabilities at December 31, 2021, amounted to SEK 17,971 M (13,832).
Credit guarantees issued amounted to SEK 7,421 M (4,419). The recognized amount for credit guarantees corresponds to the gross exposure and has not been reduced by the value of counter guarantees received or other collaterals such as the right to repossess products. The value of counter guarantees and other collaterals reducing the exposure is dependent on the development of used products prices and on the possibility to repossess products.
A major part of the credit guarantees pertains to the credit guarantees related to Chinese dealers and retail customers within Construction Equipment.
Tax claims amounted to SEK 4,926 M (4,008) and pertain to charges against the Volvo Group for which the criteria for recognizing a tax liability or a provision were not met. Global companies such as the Volvo Group are occasionally involved in tax processes of varying scope and in various stages. Volvo Group regularly assesses these tax processes. When it is probable that additional taxes must be paid and the outcome can be reasonably estimated, the required provision is made. Out of total tax claims, SEK 1.3 billion (1.2) is related to a transfer price audit in Brazil and SEK 2.2 billion (1.7) are related to two custom duties audits in India.
Residual value commitments amounted to SEK 402 M (795) and were attributable to sales transactions with residual value commitments (buybacks and tradebacks) that are independent from the sales transaction and therefore not recognized as assets in the balance sheet. The amount corresponds to the gross exposure and has not been reduced by the estimated net selling price of used products taken as collaterals. To the extent the used products pertaining to those transactions are expected to be disposed at a loss, a provision for residual value risk is recognized.
Read more in Note 21 Other provisions about provisions for residual value risks.
Other contingent liabilities amounted to SEK 5,222 M (4,610) and include for example bid and performance clauses and legal proceedings.
Legal proceedings Starting in January 2011, the Volvo Group, together with a number of other truck manufacturers, was investigated by the European Commission in relation to a possible violation of EU antitrust rules. In July 2016 the European Commission issued a settlement decision against the Volvo Group and other truck manufacturers finding that they were involved in an antitrust infringement which, in the case of the Volvo Group, covered a 14year period from 1997 to 2011. The Volvo Group paid a monetary fine of EUR 670 million.
Following the adoption of the European Commission’s settlement decision, the Volvo Group has received and is defending itself against a significant number of private damages claims brought by customers and other third parties alleging that they suffered loss, directly or indirectly, by reason of the conduct covered in the decision. The claims are being brought in various countries (including EU Member States, the United Kingdom and Israel) by large numbers of claimants either acting individually or as part of a wider group or class of claimants. Further claims are likely to be commenced.
At this stage it is not possible to make a reliable estimate of any liability that could arise from any such proceedings. However, the litigation is substantial in scale and an adverse outcome or outcomes of some or all of the litigation, depending on the nature and extent of such outcomes, may have a material negative impact on the Volvo Group’s financial results, cash flows and financial position.
The Volvo Group is also involved in a number of legal proceedings other than those described above. The Volvo Group’s assessment is that such other legal proceedings in aggregate are not likely to entail any risk of having a material effect on the Volvo Group’s financial position.
Detected premature degradation of emissions control componentThe Volvo Group has detected that an emissions control component used in certain markets and models, may degrade more quickly than expected, affecting the vehicles emission performance negatively. The Volvo Group has made a provision that will be continuously assessed as the matter develops.
Read more in Note 21 Other provisions.
Total contingent assets at December 31, 2021 amounted to SEK – M (1,252).
24 Contingent liabilities and contingent assets
125
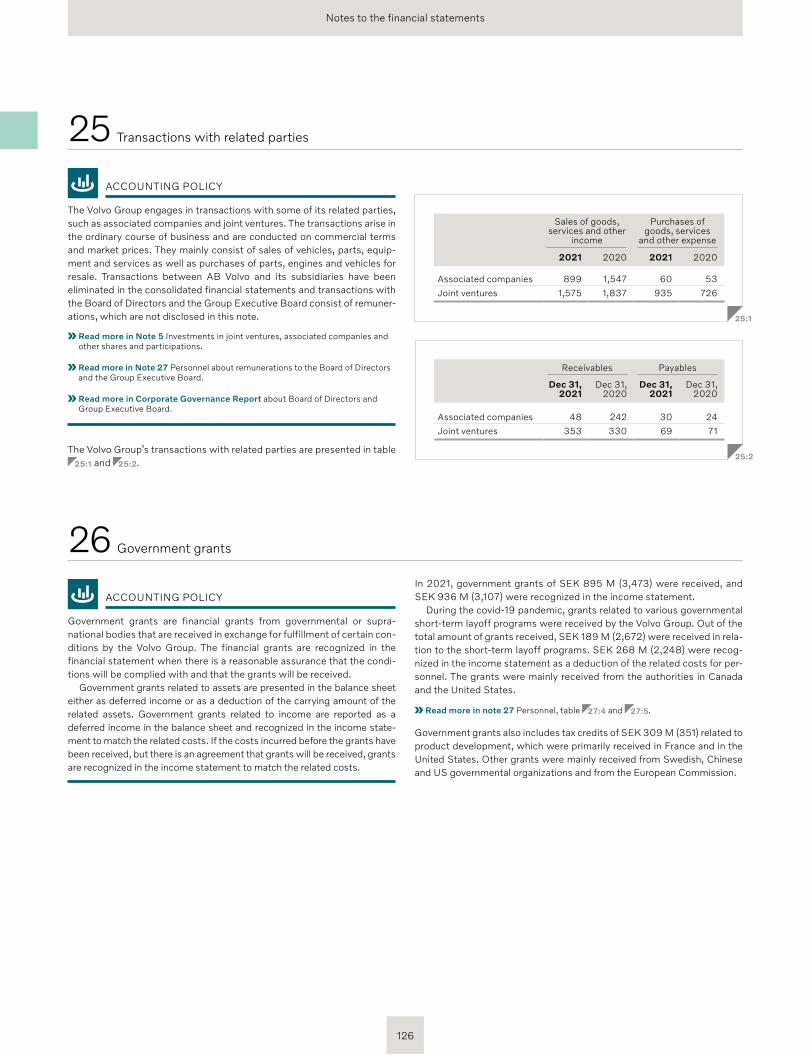
Notes to the financial statements
ACCOUNTING POLICY
Government grants are financial grants from governmental or supranational bodies that are received in exchange for fulfillment of certain conditions by the Volvo Group. The financial grants are recognized in the financial statement when there is a reasonable assurance that the conditions will be complied with and that the grants will be received.
Government grants related to assets are presented in the balance sheet either as deferred income or as a deduction of the carrying amount of the related assets. Government grants related to income are reported as a deferred income in the balance sheet and recognized in the income statement to match the related costs. If the costs incurred before the grants have been received, but there is an agreement that grants will be received, grants are recognized in the income statement to match the related costs.
In 2021, government grants of SEK 895 M (3,473) were received, and SEK 936 M (3,107) were recognized in the income statement.
During the covid19 pandemic, grants related to various governmental shortterm layoff programs were received by the Volvo Group. Out of the total amount of grants received, SEK 189 M (2,672) were received in relation to the shortterm layoff programs. SEK 268 M (2,248) were recognized in the income statement as a deduction of the related costs for personnel. The grants were mainly received from the authorities in Canada and the United States.
Read more in note 27 Personnel, table 27:4 and 27:5.
Government grants also includes tax credits of SEK 309 M (351) related to product development, which were primarily received in France and in the United States. Other grants were mainly received from Swedish, Chinese and US governmental organizations and from the European Commission.
25 Transactions with related parties
26 Government grants
ACCOUNTING POLICY
The Volvo Group engages in transactions with some of its related parties, such as associated companies and joint ventures. The transactions arise in the ordinary course of business and are conducted on commercial terms and market prices. They mainly consist of sales of vehicles, parts, equipment and services as well as purchases of parts, engines and vehicles for resale. Transactions between AB Volvo and its subsidiaries have been eliminated in the consolidated financial statements and transactions with the Board of Directors and the Group Executive Board consist of remunerations, which are not disclosed in this note.
Read more in Note 5 Investments in joint ventures, associated companies and other shares and participations.
Read more in Note 27 Personnel about remunerations to the Board of Directors and the Group Executive Board.
Read more in Corporate Governance Report about Board of Directors and Group Executive Board.
The Volvo Group’s transactions with related parties are presented in table 25:1 and 25:2.
Sales of goods, services and other
income
Purchases of goods, services
and other expense
2021 2020 2021 2020
Associated companies 899 1,547 60 53
Joint ventures 1,575 1,837 935 726
25:1
Receivables Payables
Dec 31, 2021
Dec 31, 2020
Dec 31, 2021
Dec 31, 2020
Associated companies 48 242 30 24
Joint ventures 353 330 69 71
25:2
126
Notes to the financial statements
other Executives. The holding requirements for the Executives shall cease upon termination of an Executive’s employment, and the Board of Directors may grant such other exceptions to the requirements as the Board deems appropriate.
Further cash remuneration may be awarded in extraordinary circumstances, provided that such extraordinary arrangements are limited in time and only made on an individual basis, either for the purpose of recruiting or retaining Executives, or as remuneration for extraordinary performance beyond the individual’s ordinary tasks. Such remuneration may not exceed an amount corresponding to 100 per cent of the annual base salary. Any resolution on such remuneration shall be made by the Board of Directors based on a proposal from the Remuneration Committee.
For the President and CEO, pension benefits shall be granted on the basis of a defined contribution plan. The pensionable salary shall include base salary only. The pension contributions for the President and CEO attributable to the annual base salary shall amount to not more than 35 per cent of the base salary.
Other benefits may include, for example, life insurance, medical and health insurance, and company cars. Premiums and other costs relating to such benefits may amount to not more than 3 per cent of the annual base salary for the President and CEO.
For other Executives, pension benefits shall be granted on the basis of a defined contribution plan except where law or collective agreement require a defined benefit pension. The pensionable salary shall include base salary and, where required by law or collective agreement, shortterm incentives. The total pension contributions for other Executives shall amount to not more than 35 per cent of base salary, unless a higher percentage results from the application of law or collective agreement.
Other benefits may include, for example, life insurance, medical and health insurance, and company cars. Premiums and other costs relating to such benefits may amount to not more than 10 per cent of the annual base salary for other Executives.
Remuneration for Executives that reside outside Sweden or reside in Sweden but having a material connection to or having been residing in a country other than Sweden may be duly adjusted to comply with mandatory rules or local practice, taking into account, to the extent possible, the overall purpose of these guidelines.
In addition to remuneration set out above, Executives who relocate for the purposes of the position or who work in other multiple countries may also receive such remuneration and benefits as are reasonable to reflect the special circumstances associated with such arrangements, taking into account the overall purpose of these guidelines and alignment with the general policies and practices within the Volvo Group applicable to cross border work.
Termination of employmentUpon termination of an Executive’s employment, the notice period may not exceed twelve months. Base salary during the notice period and severance pay may not together exceed an amount corresponding to the base salary for two years.
Executives that reside outside Sweden or reside in Sweden but having a material connection to or having been residing in a country other than Sweden may be offered notice periods for termination and severance payment as are reasonable to reflect the special circumstances, taking into account the overall purpose of these guidelines and alignment with the general policies and practices within the Volvo Group.
Criteria for awarding variable cash remuneration, etc.Shortterm and longterm incentives shall be linked to predetermined and measurable criteria. The criteria – which for example may relate to EBIT, cash flow, return on capital employed or similar ratios, or sustainability targets
ACCOUNTING POLICY
Incentive programsThe Volvo Group has a longterm and a shortterm incentive program that is accounted for in accordance with IAS 19 Employee benefits. During the vesting period, the incentive program is recognized as an expense and as a shortterm liability.
Policy for remuneration to seni or executives, approved by the Annual General Meeting on 31 March 2021The Annual General Meeting 2021 decided upon the following policy on remuneration and other terms of employment for the members of the Volvo Group Executive Board.
These guidelines are forwardlooking, i.e. they are applicable to remuneration agreed, and amendments to remuneration already agreed, after the proposed adoption of these guidelines by the 2021 annual general meeting. These guidelines do not apply to any remuneration decided or approved by the general meeting. Any new sharebased incentive plans will, where applicable, be resolved by the general meeting, but no such plan is currently proposed.
The guidelines’ promotion of the Volvo Group’s business strategy, long-term interests and sustainability It is a prerequisite for the successful implementation of the Volvo Group’s business strategy and safeguarding of its longterm interests, including its sustainability, that the Group can recruit, retain and develop top executives. These guidelines enable AB Volvo to offer Executives a competitive total remuneration. More information regarding the Volvo Group’s business strategy is available in the Volvo Group Annual and Sustainability Report.
Types of remunerationVolvo Group remuneration to Executives shall consist of the following components: base salary, shortterm and longterm variable incentives, pension benefits and other benefits.
Shortterm incentives may, for the President and CEO, amount to a maximum of 100 per cent of the base salary and, for other Executives, a maximum of 80 per cent of the base salary.
Longterm incentives may, for the President and CEO, amount to a maximum of 100 per cent of the base salary and, for other Executives, a maximum of 80 per cent of the base salary. The current longterm incentive plan for the Group’s senior management, including the Executives, was introduced in connection with the 2016 annual general meeting. The objective of the program is to align the interests of the senior management with those of the shareholders. To achieve this, the program operates on a fouryear cycle; with a performance based annual award, which is invested in Volvo shares with a mandatory lockin period of three years. There will be no payout under the longterm incentive program if the Annual General Meeting that is held in the year following the performance year, decides not to distribute any dividends to the shareholders. The program is funded on an annual basis by an award, measured against performance criteria established by the Board of Directors. The after tax portion of this payment must be immediately invested in AB Volvo shares which must be held for a minimum of three years. In this way, the Executives will build up a shareholding in the company and have a vested interest over the longer term development in the value of the shares. At the end of the three year period, the Executives may sell their shares, if they meet the requirement for owning shares valued at two years of the pretax base salary for the President and CEO and one year of the pretax base salary for the
27 Personnel
127
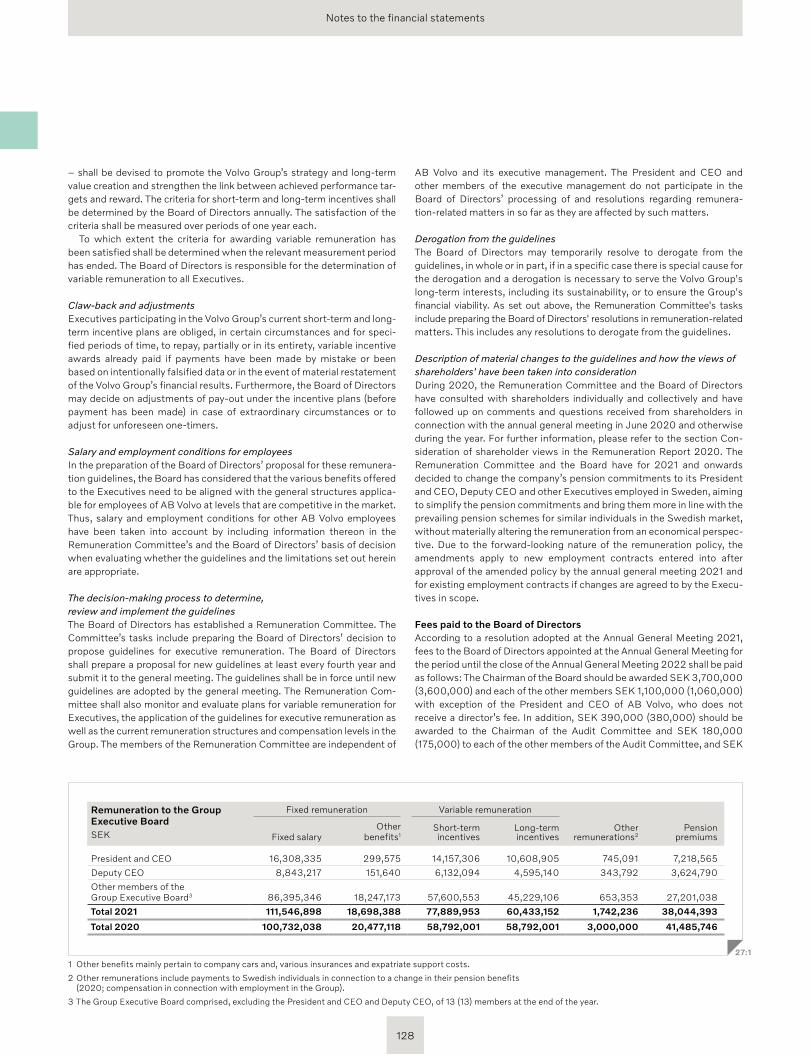
Notes to the financial statements
– shall be devised to promote the Volvo Group’s strategy and longterm value creation and strengthen the link between achieved performance targets and reward. The criteria for shortterm and longterm incentives shall be determined by the Board of Directors annually. The satisfaction of the criteria shall be measured over periods of one year each.
To which extent the criteria for awarding variable remuneration has been satisfied shall be determined when the relevant measurement period has ended. The Board of Directors is responsible for the determination of variable remuneration to all Executives.
Claw-back and adjustmentsExecutives participating in the Volvo Group’s current shortterm and longterm incentive plans are obliged, in certain circumstances and for specified periods of time, to repay, partially or in its entirety, variable incentive awards already paid if payments have been made by mistake or been based on intentionally falsified data or in the event of material restatement of the Volvo Group’s financial results. Furthermore, the Board of Directors may decide on adjustments of payout under the incentive plans (before payment has been made) in case of extraordinary circumstances or to adjust for unforeseen onetimers.
Salary and employment conditions for employeesIn the preparation of the Board of Directors’ proposal for these remuneration guidelines, the Board has considered that the various benefits offered to the Executives need to be aligned with the general structures applicable for employees of AB Volvo at levels that are competitive in the market. Thus, salary and employment conditions for other AB Volvo employees have been taken into account by including information thereon in the Remuneration Committee’s and the Board of Directors’ basis of decision when evaluating whether the guidelines and the limitations set out herein are appropriate.
The decision-making process to determine, review and implement the guidelinesThe Board of Directors has established a Remuneration Committee. The Committee’s tasks include preparing the Board of Directors’ decision to propose guidelines for executive remuneration. The Board of Directors shall prepare a proposal for new guidelines at least every fourth year and submit it to the general meeting. The guidelines shall be in force until new guidelines are adopted by the general meeting. The Remuneration Committee shall also monitor and evaluate plans for variable remuneration for Executives, the application of the guidelines for executive remuneration as well as the current remuneration structures and compensation levels in the Group. The members of the Remuneration Committee are independent of
AB Volvo and its executive management. The President and CEO and other members of the executive management do not participate in the Board of Directors’ processing of and resolutions regarding remunerationrelated matters in so far as they are affected by such matters.
Derogation from the guidelinesThe Board of Directors may temporarily resolve to derogate from the guidelines, in whole or in part, if in a specific case there is special cause for the derogation and a derogation is necessary to serve the Volvo Group's longterm interests, including its sustainability, or to ensure the Group's financial viability. As set out above, the Remuneration Committee's tasks include preparing the Board of Directors' resolutions in remunerationrelated matters. This includes any resolutions to derogate from the guidelines.
Description of material changes to the guidelines and how the views of shareholders' have been taken into considerationDuring 2020, the Remuneration Committee and the Board of Directors have consulted with shareholders individually and collectively and have followed up on comments and questions received from shareholders in connection with the annual general meeting in June 2020 and otherwise during the year. For further information, please refer to the section Consideration of shareholder views in the Remuneration Report 2020. The Remuneration Committee and the Board have for 2021 and onwards decided to change the company’s pension commitments to its President and CEO, Deputy CEO and other Executives employed in Sweden, aiming to simplify the pension commitments and bring them more in line with the prevailing pension schemes for similar individuals in the Swedish market, without materially altering the remuneration from an economical perspective. Due to the forwardlooking nature of the remuneration policy, the amendments apply to new employment contracts entered into after approval of the amended policy by the annual general meeting 2021 and for existing employment contracts if changes are agreed to by the Executives in scope.
Fees paid to the Board of DirectorsAccording to a resolution adopted at the Annual General Meeting 2021, fees to the Board of Directors appointed at the Annual General Meeting for the period until the close of the Annual General Meeting 2022 shall be paid as follows: The Chairman of the Board should be awarded SEK 3,700,000 (3,600,000) and each of the other members SEK 1,100,000 (1,060,000) with exception of the President and CEO of AB Volvo, who does not receive a director’s fee. In addition, SEK 390,000 (380,000) should be awarded to the Chairman of the Audit Committee and SEK 180,000 (175,000) to each of the other members of the Audit Committee, and SEK
Remuneration to the Group Executive BoardSEK
Fixed remuneration Variable remuneration
Fixed salaryOther
benefits1Shortterm incentives
Longterm incentives
Other remunerations2
Pension premiums
President and CEO 16,308,335 299,575 14,157,306 10,608,905 745,091 7,218,565
Deputy CEO 8,843,217 151,640 6,132,094 4,595,140 343,792 3,624,790
Other members of the Group Executive Board3 86,395,346 18,247,173 57,600,553 45,229,106 653,353 27,201,038
Total 2021 111,546,898 18,698,388 77,889,953 60,433,152 1,742,236 38,044,393
Total 2020 100,732,038 20,477,118 58,792,001 58,792,001 3,000,000 41,485,746
27:1
1 Other benefits mainly pertain to company cars and, various insurances and expatriate support costs.
2 Other remunerations include payments to Swedish individuals in connection to a change in their pension benefits (2020; compensation in connection with employment in the Group).
3 The Group Executive Board comprised, excluding the President and CEO and Deputy CEO, of 13 (13) members at the end of the year.
128
Notes to the financial statements
165,000 (160,000) to the Chairman of the Remuneration Committee and SEK 118,000 (115,000) to each of the other members of the Remuneration Committee. During 2020 the Board members decided to voluntarily abstain from 20 per cent of their Board and Committee remuneration during the period from the Annual General Meeting 2020 to the Annual General Meeting 2021. For more information, please refer to the Corporate Governance Report.
Terms of employment and remuneration to the President and CEOFixed salary, short-term and long-term incentivesThe President and CEO is entitled to a remuneration consisting of a fixed annual salary and shortterm and longterm incentives. During the financial year 2021, the shortterm incentives are based on operating income and cash flow for the Volvo Group; the longterm incentives are based on operating income and return on capital employed. The shortterm and longterm incentives, each, amounts to a maximum of 100% of the annual base salary.
For the financial year 2021, the President and CEO received a fixed salary including vacation payment of SEK 16,308,335 (14,517,854) and a shortterm incentive of SEK 14,157,306 (10,720,811). The salary in 2020 was lower than the President and CEO’s contractual salary due to a reduction in connection with the extraordinary situation caused by the covid19 pandemic. The shortterm incentive was 88.1% (70.3) of the annual base salary.
As part of the agreement to change the pension setup as per July 1, 2021, (as further described below under Pensions to the President and CEO) a base salary increase of 4.46% was granted as per the same date and a lump sum cash payment of SEK 745,091 was paid out later during the year. Other benefits, mainly pertaining to a company car, amounted to SEK 299,575 (251,546).
The President and CEO was also participating in the longterm incentive program decided by the Board of Directors in 2021. During the financial year the outcome of the longterm incentive program amounted to SEK 10,608,905 (10,720,811), which was 66.1% (70.3) of the base salary. The full net amount shall be invested in Volvo B shares. There is to be no payout of the amount if the Annual Meeting held in 2022 decides not to distribute any dividends to the shareholders for 2021.
PensionsDuring the period from January 1 to June 30, 2021, the President and CEO was covered both by pension benefits provided under collective bargain agreements and by the Volvo Management Pension (VMP) and Volvo Executive Pension (VEP) plans. Both VMP and VEP were defined contribution plans. The pensionable salary consisted of the annual salary, vacation pay and a calculated shortterm variable pay. The premium for the VMP plan was SEK 30,000 per year plus 20% of pensionable salary over 30 income base amounts and the premium for the VEP plan was 10% of pensionable salary. There were no commitments other than the payment of the premiums.
During this period, the President and CEO was also covered by Volvo Företagspension, a defined contribution plan for additional retirement benefits. For 2021, the cost amounts to SEK 4,764 (8,568).
As of July 1, 2021, all previous pension commitments were replaced. Hence, during the period from July 1 to December 31, 2021, the President and CEO was covered by a pension benefit in the form of a defined contribution (DC) plan with a contribution amounting to 35% of the annual base salary. There were no commitments other than the payment of the contributions.
Total pension premiums for the President and CEO amounted to SEK 7,218,565 (7,714,902) in 2021.
Severance paymentsThe President and CEO has a 12 months' notice period upon termination by AB Volvo and a 6 months' notice period upon termination on his own initiative. If terminated by the company, the President and CEO is entitled to a severance payment equivalent to 12 months’ salary. In the event of new employment during the severance period, the severance pay is reduced with an amount equal to 100% of the income from the new employment.
Terms of employment and remuneration to the Deputy CEOFixed salary, short-term and long-term incentivesThe Deputy CEO receives shortterm and longterm incentives in addition to a fixed salary. During the financial year 2021, the shortterm incentives are based on operating income and cash flow for the Volvo Group; the longterm incentives are based on operating income and return on capital employed. In 2021, shortterm and longterm incentives, for the Deputy CEO, could each amount to a maximum of 80% of the annual base salary.
For the financial year 2021, the Deputy CEO received a fixed salary including vacation payment of SEK 8,843,217 (7,871,465) and a shortterm incentive of SEK 6,132,094 (4,647,870). The salary in 2020 was lower than the Deputy CEO’s contractual salary due to a reduction in connection with the extraordinary situation caused by the covid19 pandemic. The shortterm incentive was 70.5% (56.3) of the annual base salary.
As part of the agreement to change the pension setup as per July 1, 2021, (as further described below under Pensions to the Deputy CEO) a base salary increase of 5.39% was granted as per the same date and a lump sum cash payment of SEK 343,792 was paid out later during the year. Other benefits, mainly pertaining to car and insured benefits, amounted to SEK 151,640 (91,810).
The Deputy CEO also participated in the longterm incentive program decided by the Board of Directors in 2021. The longterm incentive amounted to SEK 4,595,140 (4,647,870), which was 52.8% (56.3) of the annual base salary and the full net amount shall be invested in Volvo B shares. There is to be no payout of the amount if the Annual Meeting held in 2022 decides not to distribute any dividends to the shareholders for 2021.
PensionsDuring the period from January 1 to June 30, 2021, the Deputy CEO was covered both by pension benefits provided under collective bargain agreements and by the Volvo Management Pension (VMP) and Volvo Executive Pension (VEP) plans. Both VMP and VEP were defined contribution plans. The pensionable salary consisted of the annual salary, vacation pay and a calculated shortterm variable pay. The premium for the VMP plan was SEK 30,000 per year plus 20% of pensionable salary over 30 income base amounts and the premium for the VEP plan was 10% of pensionable salary. There were no commitments other than the payment of the premiums.
During this period, the Deputy CEO was also covered by Volvo Företagspension, a defined contribution plan for additional retirement benefits. For 2021, the cost amounts to SEK 4,764 (8,568).
During the period from July 1 to December 31, 2021, the Deputy CEO continued to participate in the collective bargain agreement (ITP). However, all other pension plans were replaced by a new Volvo Executive Pension (VEP) plan. This is a defined contribution (DC) plan with a contribution amounting to 35% of the annual base salary exceeding 30 income base amounts (SEK 2,046,000 in 2021). There were no commitments other than the payment of the contributions.
Total pension premiums for the Deputy CEO amounted to SEK 3,624,790 (4,049,242) in 2021.
129
Notes to the financial statements
Severance payments The employment contract for the Deputy CEO contains rules governing severance payments when AB Volvo terminates the employment. The notice period upon termination by the company shall not exceed 12 months and the notice period upon termination by the Deputy CEO shall not exceed 6 months. In addition, in the event of termination by the company, the Deputy CEO is entitled to a maximum of 12 months’ severance pay.
Remuneration to the Group Executive BoardFixed salary, short-term and long-term incentivesMembers of the Group Executive Board receive shortterm and longterm incentives in addition to fixed salaries. During the financial year 2021, the shortterm incentives are based on operating income and cash flow for the Volvo Group; the longterm incentives are based on operating income and return on capital employed. In 2021, shortterm and longterm incentives, for Group Executive Board members excluding the President and CEO, could each amount to a maximum of 80% of the annual base salary.
For the financial year 2021, fixed salaries amounted to SEK 86,395,346 (78,342,719) for the Group Executive Board members excluding the President and CEO and the Deputy CEO, and a compensation in connection with a change in pension plans for Swedish Executive Board members to an amount of SEK 653,353 (3,000,000; compensation in connection with employment in the Group). The salaries in 2020 were lower than the contractual salaries due to a reduction in connection with the extraordinary situation caused by the covid19 pandemic. The shortterm incentive amounted to SEK 57,600,553 (43,423,320) for the Group Executive Board members excluding the President and CEO and the Deputy CEO. Shortterm incentive was in average 68.3% (56.3) of the annual base salary. As part of the agreement to change the pension setup as per July 1, 2021, (as further described below under Pensions to the Group Executive Board) for the Group Executive Board members in the Swedish pension plan, base salary increases between 5.50% – 8.13% were granted as per the same date and lump sum cash payments between SEK 0 – 246,135 were paid out later during the year. Other benefits, including company cars, housing and expatriate support costs, amounted to SEK 18,247,173 (20,133,762).
The Group Executive Board also participated in the longterm incentive program decided by the Board of Directors in 2021. During the financial year the outcome of the longterm incentive amounted to SEK 45,229,106 (43,423,320) for the Group Executive Board members, excluding the President and CEO and the Deputy CEO, which was 52.8% (56.3) of the annual base salaries and the full net amount shall be invested in Volvo B shares. There is to be no payout of the amount if the Annual Meeting held in 2022 decides not to distribute any dividends to the shareholders for 2021.
PensionsDuring the period from January 1 to June 30, 2021, the Group Executive Board members enrolled in the Swedish pension plan were covered both by pension benefits provided under collective bargain agreements (ITP) and by the Volvo Management Pension (VMP) and the Volvo Executive Pension (VEP) plans. Both VMP and VEP were defined contribution plans.
The pensionable salary consisted of the annual salary, vacation pay and a calculated shortterm variable pay. The premium for the VMP plan was SEK 30,000 per year plus 20% of pensionable salary over 30 income base amounts and the premium for the VEP plan was 10% of pensionable salary. There were no commitments other than the payment of the premiums.
The Group Executive Board members enrolled in the Swedish pension plan were also covered by Volvo Företagspension, a defined contribution plan for additional retirement benefits. For 2021, the cost amounts to SEK 4,764 (8,568) per member.
During the period from July 1 to December 31, 2021, the Group Executive Board members enrolled in the Swedish pension plan continued to participate in the collective bargain agreement (ITP). However, all other pension plans were replaced by a new Volvo Executive Pension (VEP) plan. This is a defined contribution (DC) plan with a contribution amounting to 35% of the annual base salary exceeding 30 income base amounts (SEK 2,046,000 in 2021). There were no commitments other than the payment of the contributions.
Pension premiums for the Group Executive Board, excluding the President and CEO and the Deputy CEO, amounted to SEK 27,201,038 (29,721,602) in 2021.
Severance paymentsThe employment contracts for Group Executive Board members contain rules governing severance payments when AB Volvo terminates the employment. For Executives resident in Sweden, the notice period upon termination by the company shall not exceed 12 months and the notice period upon termination by the Executive shall not exceed 6 months. In addition, in the event of termination by the company, the Executive is entitled to a maximum of 12 months’ severance pay.
Executives resident outside Sweden or resident in Sweden but having a material connection to or having been resident in a country other than Sweden may be offered notice periods for termination and severance payment that are competitive in the country where the Executives are or have been resident or to which the Executives have a material connection, preferably solutions comparable to the solutions applied to Executives resident in Sweden.
Volvo Group's total cost for remuneration and benefits to the Group Executive BoardThe total cost for remuneration and benefits to the Group Executive Board amounted to SEK 380 M (345) and pertained to fixed salaries, shortterm and longterm incentives, other benefits and pensions. It also included social fees on salaries and benefits, special payroll tax and additional costs for other benefits.
Long-term incentive programs Long-term incentive program valid from 2016The Board of Directors have in 2016 approved a longterm cashbased incentive program comprising the top 300 persons from senior management, including Executives, in the Volvo Group. For more information, please refer to Types of remuneration on page 127.
130
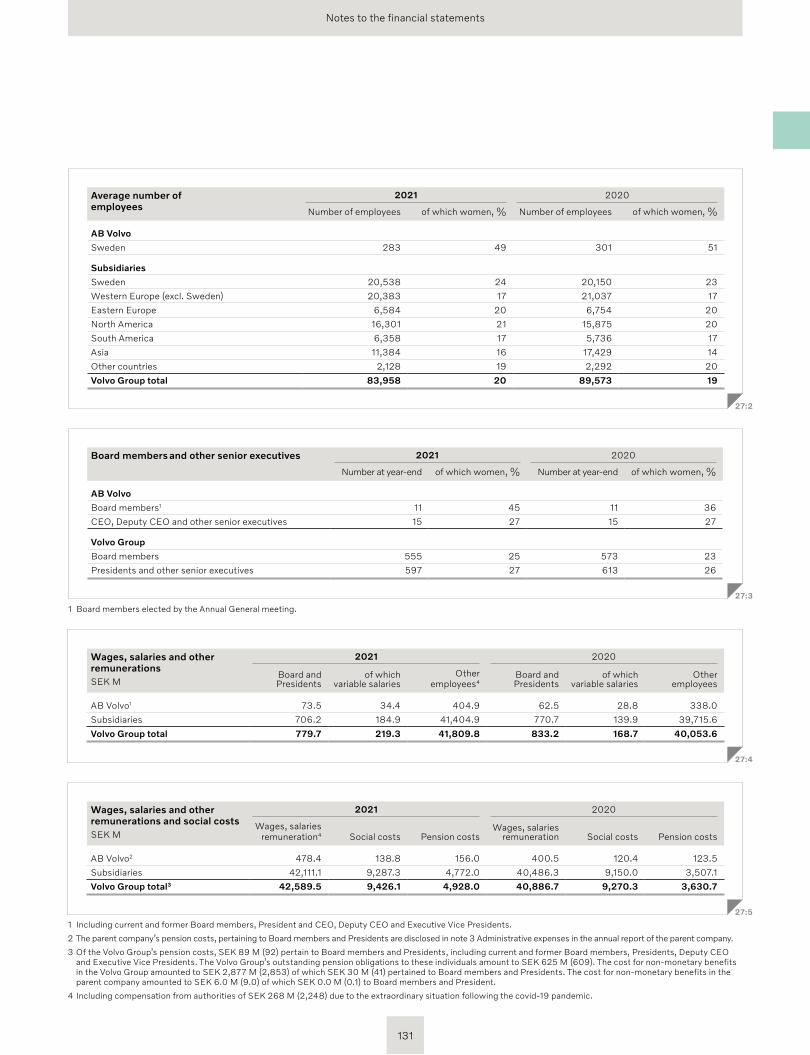
Notes to the financial statements
Wages, salaries and other remunerationsSEK M
2021 2020
Board and Presidents
of which variable salaries
Otheremployees4
Board and Presidents
of which variable salaries
Otheremployees
AB Volvo1 73.5 34.4 404.9 62.5 28.8 338.0
Subsidiaries 706.2 184.9 41,404.9 770.7 139.9 39,715.6
Volvo Group total 779.7 219.3 41,809.8 833.2 168.7 40,053.6
27:4
Wages, salaries and other remunerations and social costsSEK M
2021 2020
Wages, salaries remuneration4 Social costs Pension costs
Wages, salaries remuneration Social costs Pension costs
AB Volvo2 478.4 138.8 156.0 400.5 120.4 123.5
Subsidiaries 42,111.1 9,287.3 4,772.0 40,486.3 9,150.0 3,507.1
Volvo Group total3 42,589.5 9,426.1 4,928.0 40,886.7 9,270.3 3,630.7
27:5
1 Including current and former Board members, President and CEO, Deputy CEO and Executive Vice Presidents.
2 The parent company’s pension costs, pertaining to Board members and Presidents are disclosed in note 3 Administrative expenses in the annual report of the parent company.
3 Of the Volvo Group’s pension costs, SEK 89 M (92) pertain to Board members and Presidents, including current and former Board members, Presidents, Deputy CEO and Executive Vice Presidents. The Volvo Group’s outstanding pension obligations to these individuals amount to SEK 625 M (609). The cost for nonmonetary benefits in the Volvo Group amounted to SEK 2,877 M (2,853) of which SEK 30 M (41) pertained to Board members and Presidents. The cost for nonmonetary benefits in the parent company amounted to SEK 6.0 M (9.0) of which SEK 0.0 M (0.1) to Board members and President.
4 Including compensation from authorities of SEK 268 M (2,248) due to the extraordinary situation following the covid19 pandemic.
Average number of employees
2021 2020
Number of employees of which women, % Number of employees of which women, %
AB Volvo
Sweden 283 49 301 51
Subsidiaries
Sweden 20,538 24 20,150 23
Western Europe (excl. Sweden) 20,383 17 21,037 17
Eastern Europe 6,584 20 6,754 20
North America 16,301 21 15,875 20
South America 6,358 17 5,736 17
Asia 11,384 16 17,429 14
Other countries 2,128 19 2,292 20
Volvo Group total 83,958 20 89,573 19
27:2
Board members and other senior executives 2021 2020
Number at yearend of which women, % Number at yearend of which women, %
AB Volvo
Board members1 11 45 11 36
CEO, Deputy CEO and other senior executives 15 27 15 27
Volvo Group
Board members 555 25 573 23
Presidents and other senior executives 597 27 613 26
27:3
1 Board members elected by the Annual General meeting.
131
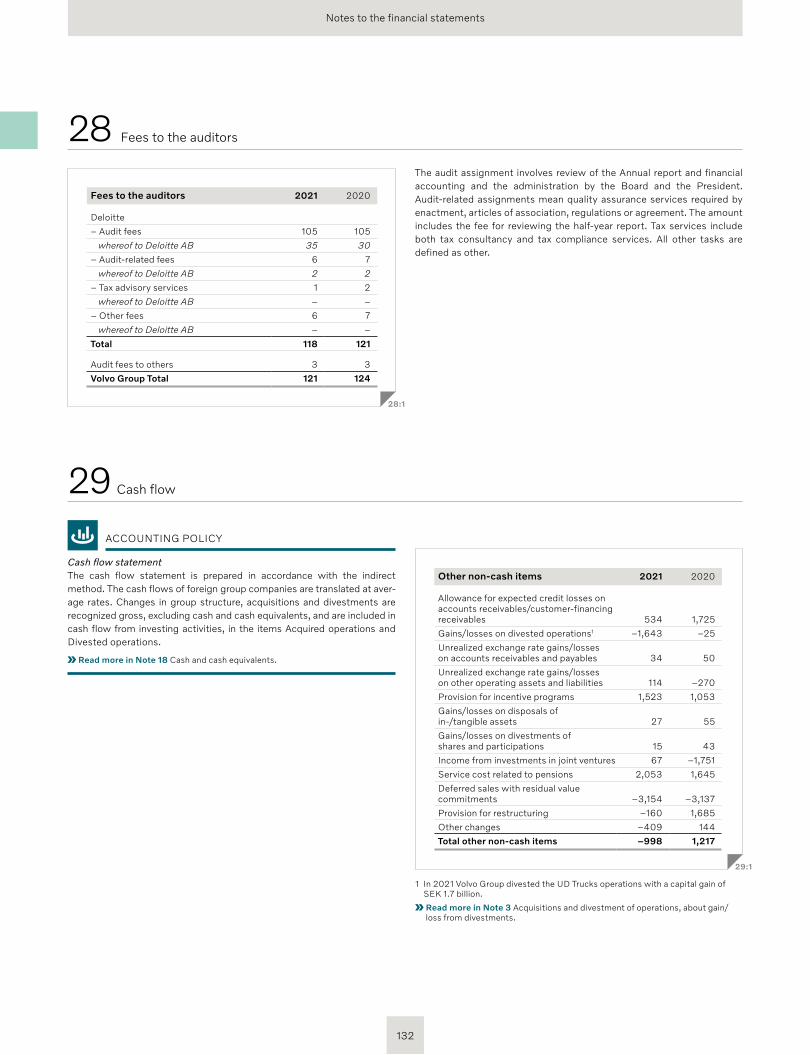
Notes to the financial statements
Other non-cash items 2021 2020
Allowance for expected credit losses on accounts receivables/customerfinancing receivables 534 1,725
Gains/losses on divested operations1 –1,643 –25
Unrealized exchange rate gains/losses on accounts receivables and payables 34 50
Unrealized exchange rate gains/losses on other operating assets and liabilities 114 –270
Provision for incentive programs 1,523 1,053
Gains/losses on disposals of in/tangible assets 27 55
Gains/losses on divestments of shares and participations 15 43
Income from investments in joint ventures 67 –1,751
Service cost related to pensions 2,053 1,645
Deferred sales with residual value commitments –3,154 –3,137
Provision for restructuring –160 1,685
Other changes –409 144
Total other non-cash items –998 1,217
29:1
1 In 2021 Volvo Group divested the UD Trucks operations with a capital gain of SEK 1.7 billion.
Read more in Note 3 Acquisitions and divestment of operations, about gain/loss from divestments.
Fees to the auditors 2021 2020
Deloitte
– Audit fees 105 105
whereof to Deloitte AB 35 30
– Auditrelated fees 6 7
whereof to Deloitte AB 2 2
– Tax advisory services 1 2
whereof to Deloitte AB – –
– Other fees 6 7
whereof to Deloitte AB – –
Total 118 121
Audit fees to others 3 3
Volvo Group Total 121 124
28:1
28 Fees to the auditors
ACCOUNTING POLICY
Cash flow statement The cash flow statement is prepared in accordance with the indirect method. The cash flows of foreign group companies are translated at average rates. Changes in group structure, acquisitions and divestments are recognized gross, excluding cash and cash equivalents, and are included in cash flow from investing activities, in the items Acquired operations and Divested operations.
Read more in Note 18 Cash and cash equivalents.
29 Cash flow
The audit assignment involves review of the Annual report and financial accounting and the administration by the Board and the President. Auditrelated assignments mean quality assurance services required by enactment, articles of association, regulations or agreement. The amount includes the fee for reviewing the halfyear report. Tax services include both tax consultancy and tax compliance services. All other tasks are defined as other.
132
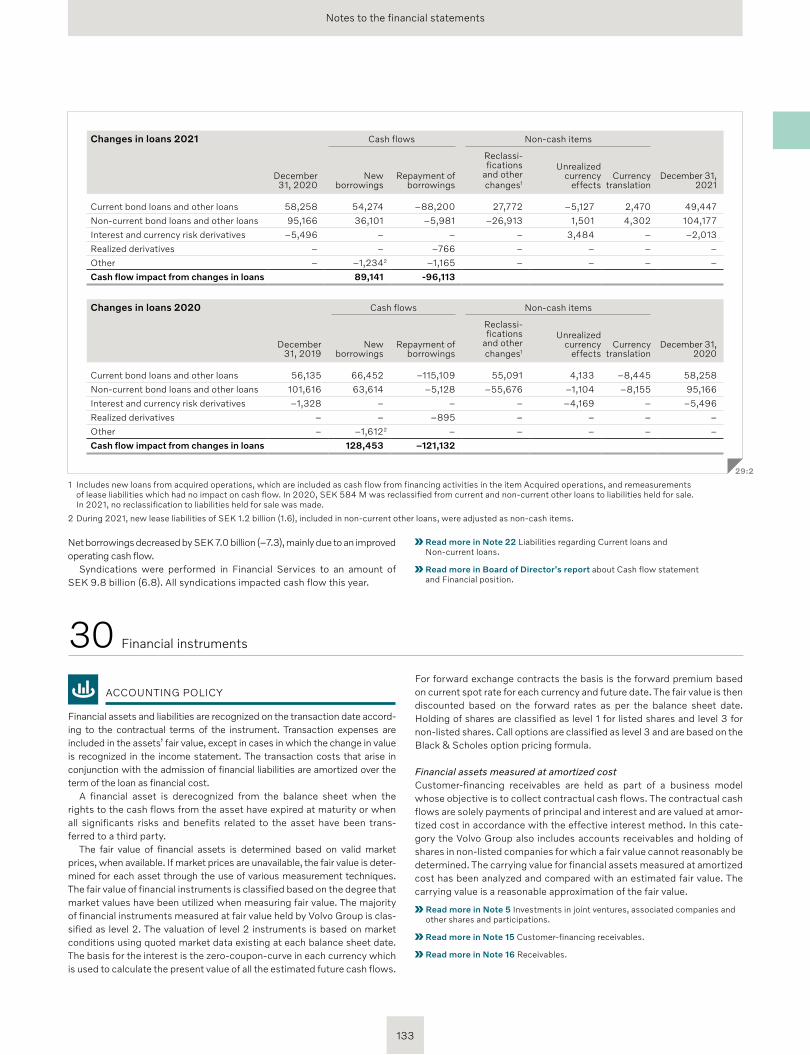
Notes to the financial statements
ACCOUNTING POLICY
Financial assets and liabilities are recognized on the transaction date according to the contractual terms of the instrument. Transaction expenses are included in the assets’ fair value, except in cases in which the change in value is recognized in the income statement. The transaction costs that arise in conjunction with the admission of financial liabilities are amortized over the term of the loan as financial cost.
A financial asset is derecognized from the balance sheet when the rights to the cash flows from the asset have expired at maturity or when all significants risks and benefits related to the asset have been transferred to a third party.
The fair value of financial assets is determined based on valid market prices, when available. If market prices are unavailable, the fair value is determined for each asset through the use of various measurement techniques. The fair value of financial instruments is classified based on the degree that market values have been utilized when measuring fair value. The majority of financial instruments measured at fair value held by Volvo Group is classified as level 2. The valuation of level 2 instruments is based on market conditions using quoted market data existing at each balance sheet date. The basis for the interest is the zerocouponcurve in each currency which is used to calculate the present value of all the estimated future cash flows.
For forward exchange contracts the basis is the forward premium based on current spot rate for each currency and future date. The fair value is then discounted based on the forward rates as per the balance sheet date. Holding of shares are classified as level 1 for listed shares and level 3 for nonlisted shares. Call options are classified as level 3 and are based on the Black & Scholes option pricing formula.
Financial assets measured at amortized costCustomerfinancing receivables are held as part of a business model whose objective is to collect contractual cash flows. The contractual cash flows are solely payments of principal and interest and are valued at amortized cost in accordance with the effective interest method. In this category the Volvo Group also includes accounts receivables and holding of shares in nonlisted companies for which a fair value cannot reasonably be determined. The carrying value for financial assets measured at amortized cost has been analyzed and compared with an estimated fair value. The carrying value is a reasonable approximation of the fair value.
Read more in Note 5 Investments in joint ventures, associated companies and other shares and participations.
Read more in Note 15 Customerfinancing receivables.
Read more in Note 16 Receivables.
30 Financial instruments
Changes in loans 2021 Cash flows Noncash items
December 31, 2020
New borrowings
Repayment of borrowings
Reclass ifications
and other changes1
Unrealized currency
effectsCurrency
translation December 31,
2021
Current bond loans and other loans 58,258 54,274 –88,200 27,772 –5,127 2,470 49,447
Noncurrent bond loans and other loans 95,166 36,101 –5,981 –26,913 1,501 4,302 104,177
Interest and currency risk derivatives –5,496 – – – 3,484 – –2,013
Realized derivatives – – –766 – – – –
Other – –1,2342 –1,165 – – – –
Cash flow impact from changes in loans 89,141 -96,113
Changes in loans 2020 Cash flows Noncash items
December 31, 2019
New borrowings
Repayment of borrowings
Reclass ifications
and other changes1
Unrealized currency
effectsCurrency
translation December 31,
2020
Current bond loans and other loans 56,135 66,452 –115,109 55,091 4,133 –8,445 58,258
Noncurrent bond loans and other loans 101,616 63,614 –5,128 –55,676 –1,104 –8,155 95,166
Interest and currency risk derivatives –1,328 – – – –4,169 – –5,496
Realized derivatives – – –895 – – – –
Other – –1,6122 – – – – –
Cash flow impact from changes in loans 128,453 –121,132
29:2
1 Includes new loans from acquired operations, which are included as cash flow from financing activities in the item Acquired operations, and remeasurements of lease liabilities which had no impact on cash flow. In 2020, SEK 584 M was reclassified from current and noncurrent other loans to liabilities held for sale. In 2021, no reclassification to liabilities held for sale was made.
2 During 2021, new lease liabilities of SEK 1.2 billion (1.6), included in noncurrent other loans, were adjusted as noncash items.
Net borrowings decreased by SEK 7.0 billion (–7.3), mainly due to an improved operating cash flow.
Syndications were performed in Financial Services to an amount of SEK 9.8 billion (6.8). All syndications impacted cash flow this year.
Read more in Note 22 Liabilities regarding Current loans and Noncurrent loans.
Read more in Board of Director's report about Cash flow statement and Financial position.
133
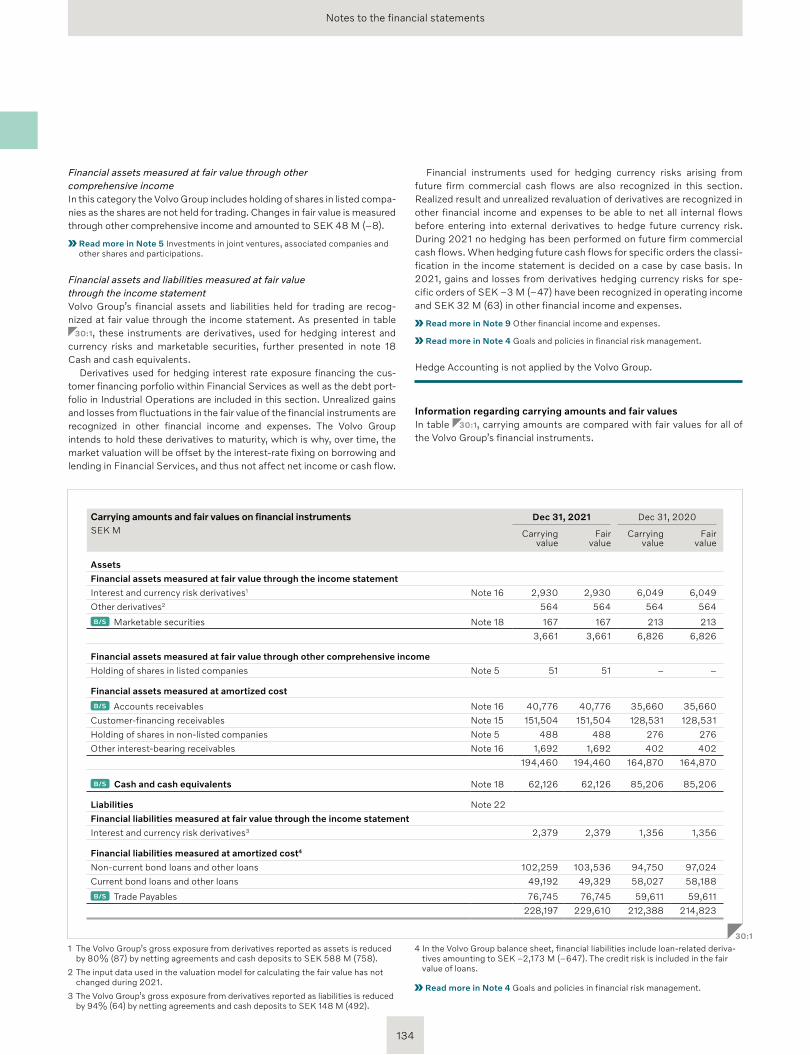
Notes to the financial statements
1 The Volvo Group’s gross exposure from derivatives reported as assets is reduced by 80% (87) by netting agreements and cash deposits to SEK 588 M (758).
2 The input data used in the valuation model for calculating the fair value has not changed during 2021.
3 The Volvo Group’s gross exposure from derivatives reported as liabilities is reduced by 94% (64) by netting agreements and cash deposits to SEK 148 M (492).
4 In the Volvo Group balance sheet, financial liabilities include loanrelated derivatives amounting to SEK –2,173 M (–647). The credit risk is included in the fair value of loans.
Read more in Note 4 Goals and policies in financial risk management.
Carrying amounts and fair values on financial instrumentsSEK M
Dec 31, 2021 Dec 31, 2020
Carrying value
Fairvalue
Carrying value
Fairvalue
Assets
Financial assets measured at fair value through the income statement
Interest and currency risk derivatives1 Note 16 2,930 2,930 6,049 6,049
Other derivatives2 564 564 564 564
B/S Marketable securities Note 18 167 167 213 213
3,661 3,661 6,826 6,826
Financial assets measured at fair value through other comprehensive income
Holding of shares in listed companies Note 5 51 51 – –
Financial assets measured at amortized cost
B/S Accounts receivables Note 16 40,776 40,776 35,660 35,660
Customerfinancing receivables Note 15 151,504 151,504 128,531 128,531
Holding of shares in nonlisted companies Note 5 488 488 276 276
Other interestbearing receivables Note 16 1,692 1,692 402 402
194,460 194,460 164,870 164,870
B/S Cash and cash equivalents Note 18 62,126 62,126 85,206 85,206
Liabilities Note 22
Financial liabilities measured at fair value through the income statement
Interest and currency risk derivatives3 2,379 2,379 1,356 1,356
Financial liabilities measured at amortized cost4
Noncurrent bond loans and other loans 102,259 103,536 94,750 97,024
Current bond loans and other loans 49,192 49,329 58,027 58,188
B/S Trade Payables 76,745 76,745 59,611 59,611
228,197 229,610 212,388 214,823
30:1
Financial assets measured at fair value through other comprehensive income In this category the Volvo Group includes holding of shares in listed companies as the shares are not held for trading. Changes in fair value is measured through other comprehensive income and amounted to SEK 48 M (–8).
Read more in Note 5 Investments in joint ventures, associated companies and other shares and participations.
Financial assets and liabilities measured at fair value through the income statement Volvo Group’s financial assets and liabilities held for trading are recognized at fair value through the income statement. As presented in table
30:1, these instruments are derivatives, used for hedging interest and currency risks and marketable securities, further presented in note 18 Cash and cash equivalents.
Derivatives used for hedging interest rate exposure financing the customer financing porfolio within Financial Services as well as the debt portfolio in Industrial Operations are included in this section. Unrealized gains and losses from fluctuations in the fair value of the financial instruments are recognized in other financial income and expenses. The Volvo Group intends to hold these derivatives to maturity, which is why, over time, the market valuation will be offset by the interestrate fixing on borrowing and lending in Financial Services, and thus not affect net income or cash flow.
Financial instruments used for hedging currency risks arising from future firm commercial cash flows are also recognized in this section. Realized result and unrealized revaluation of derivatives are recognized in other financial income and expenses to be able to net all internal flows before entering into external derivatives to hedge future currency risk. During 2021 no hedging has been performed on future firm commercial cash flows. When hedging future cash flows for specific orders the classification in the income statement is decided on a case by case basis. In 2021, gains and losses from derivatives hedging currency risks for specific orders of SEK –3 M (–47) have been recognized in operating income and SEK 32 M (63) in other financial income and expenses.
Read more in Note 9 Other financial income and expenses.
Read more in Note 4 Goals and policies in financial risk management.
Hedge Accounting is not applied by the Volvo Group.
Information regarding carrying amounts and fair valuesIn table 30:1, carrying amounts are compared with fair values for all of the Volvo Group’s financial instruments.
134
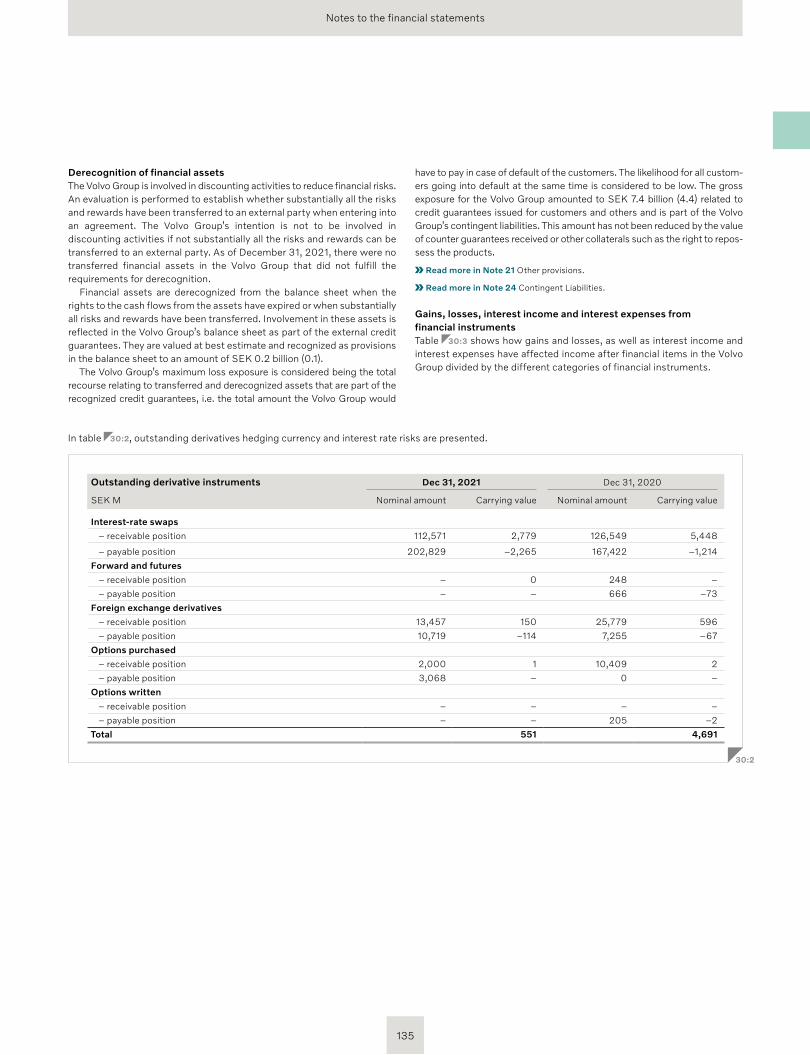
Notes to the financial statements
Derecognition of financial assetsThe Volvo Group is involved in discounting activities to reduce financial risks. An evaluation is performed to establish whether substantially all the risks and rewards have been transferred to an external party when entering into an agreement. The Volvo Group’s intention is not to be involved in discounting activities if not substantially all the risks and rewards can be transferred to an external party. As of December 31, 2021, there were no transferred financial assets in the Volvo Group that did not fulfill the requirements for derecognition.
Financial assets are derecognized from the balance sheet when the rights to the cash flows from the assets have expired or when substantially all risks and rewards have been transferred. Involvement in these assets is reflected in the Volvo Group’s balance sheet as part of the external credit guarantees. They are valued at best estimate and recognized as provisions in the balance sheet to an amount of SEK 0.2 billion (0.1).
The Volvo Group’s maximum loss exposure is considered being the total recourse relating to transferred and derecognized assets that are part of the recognized credit guarantees, i.e. the total amount the Volvo Group would
have to pay in case of default of the customers. The likelihood for all customers going into default at the same time is considered to be low. The gross exposure for the Volvo Group amounted to SEK 7.4 billion (4.4) related to credit guarantees issued for customers and others and is part of the Volvo Group’s contingent liabilities. This amount has not been reduced by the value of counter guarantees received or other collaterals such as the right to repossess the products.
Read more in Note 21 Other provisions.
Read more in Note 24 Contingent Liabilities.
Gains, losses, interest income and interest expenses from financial instrumentsTable 30:3 shows how gains and losses, as well as interest income and interest expenses have affected income after financial items in the Volvo Group divided by the different categories of financial instruments.
In table 30:2, outstanding derivatives hedging currency and interest rate risks are presented.
Outstanding derivative instruments Dec 31, 2021 Dec 31, 2020
SEK M Nominal amount Carrying value Nominal amount Carrying value
Interest-rate swaps
– receivable position 112,571 2,779 126,549 5,448
– payable position 202,829 –2,265 167,422 –1,214
Forward and futures
– receivable position – 0 248 –
– payable position – – 666 –73
Foreign exchange derivatives
– receivable position 13,457 150 25,779 596
– payable position 10,719 –114 7,255 –67
Options purchased
– receivable position 2,000 1 10,409 2
– payable position 3,068 – 0 –
Options written
– receivable position – – – –
– payable position – – 205 –2
Total 551 4,691
30:2
135
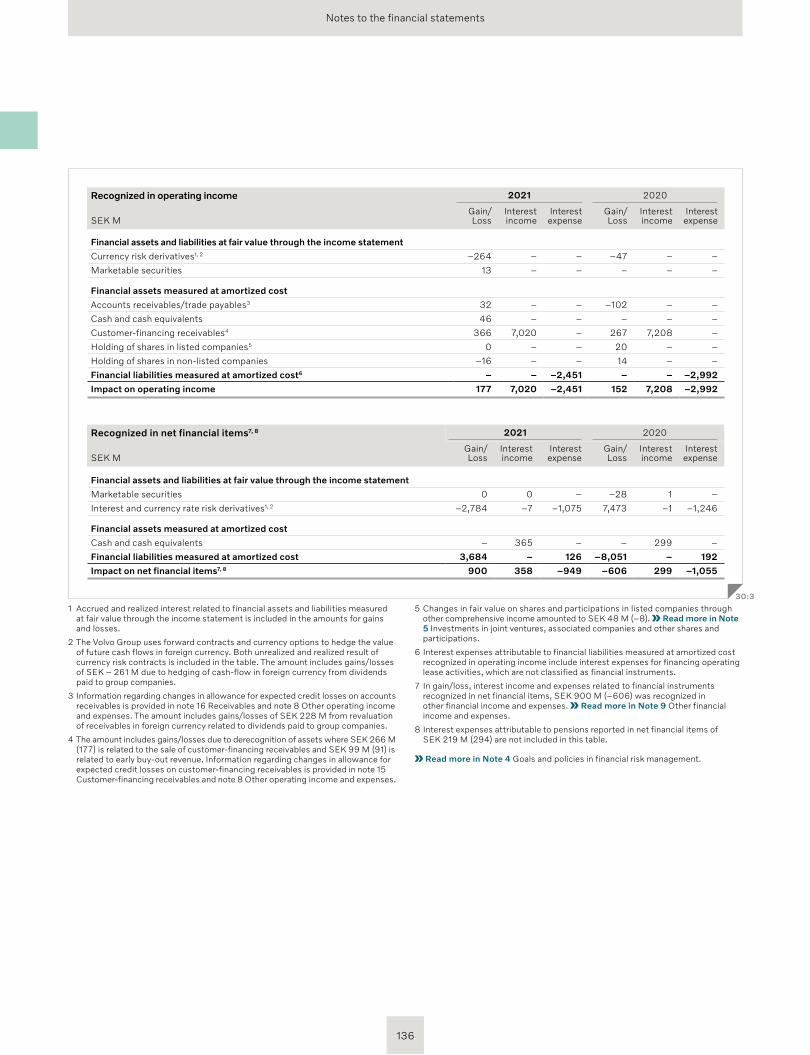
Notes to the financial statements
1 Accrued and realized interest related to financial assets and liabilities measured at fair value through the income statement is included in the amounts for gains and losses.
2 The Volvo Group uses forward contracts and currency options to hedge the value of future cash flows in foreign currency. Both unrealized and realized result of currency risk contracts is included in the table. The amount includes gains/losses of SEK – 261 M due to hedging of cashflow in foreign currency from dividends paid to group companies.
3 Information regarding changes in allowance for expected credit losses on accounts receivables is provided in note 16 Receivables and note 8 Other operating income and expenses. The amount includes gains/losses of SEK 228 M from revaluation of receivables in foreign currency related to dividends paid to group companies.
4 The amount includes gains/losses due to derecognition of assets where SEK 266 M (177) is related to the sale of customerfinancing receivables and SEK 99 M (91) is related to early buyout revenue. Information regarding changes in allowance for expected credit losses on customerfinancing receivables is provided in note 15 Customerfinancing receivables and note 8 Other operating income and expenses.
5 Changes in fair value on shares and participations in listed companies through other comprehensive income amounted to SEK 48 M (–8). Read more in Note 5 Investments in joint ventures, associated companies and other shares and partici pations.
6 Interest expenses attributable to financial liabilities measured at amortized cost recognized in operating income include interest expenses for financing operating lease activities, which are not classified as financial instruments.
7 In gain/loss, interest income and expenses related to financial instruments recognized in net financial items, SEK 900 M (–606) was recognized in other financial income and expenses. Read more in Note 9 Other financial income and expenses.
8 Interest expenses attributable to pensions reported in net financial items of SEK 219 M (294) are not included in this table.
Read more in Note 4 Goals and policies in financial risk management.
Recognized in operating income 2021 2020
SEK MGain/Loss
Interest income
Interest expense
Gain/Loss
Interest income
Interest expense
Financial assets and liabilities at fair value through the income statement
Currency risk derivatives1, 2 –264 – – –47 – –
Marketable securities 13 – – – – –
Financial assets measured at amortized cost
Accounts receivables/trade payables3 32 – – –102 – –
Cash and cash equivalents 46 – – – – –
Customerfinancing receivables4 366 7,020 – 267 7,208 –
Holding of shares in listed companies5 0 – – 20 – –
Holding of shares in nonlisted companies –16 – – 14 – –
Financial liabilities measured at amortized cost6 – – –2,451 – – –2,992
Impact on operating income 177 7,020 –2,451 152 7,208 –2,992
Recognized in net financial items7, 8 2021 2020
SEK MGain/Loss
Interest income
Interest expense
Gain/Loss
Interest income
Interest expense
Financial assets and liabilities at fair value through the income statement
Marketable securities 0 0 – –28 1 –
Interest and currency rate risk derivatives1, 2 –2,784 –7 –1,075 7,473 –1 –1,246
Financial assets measured at amortized cost
Cash and cash equivalents – 365 – – 299 –
Financial liabilities measured at amortized cost 3,684 – 126 –8,051 – 192
Impact on net financial items7, 8 900 358 –949 –606 299 –1,055
30:3
136
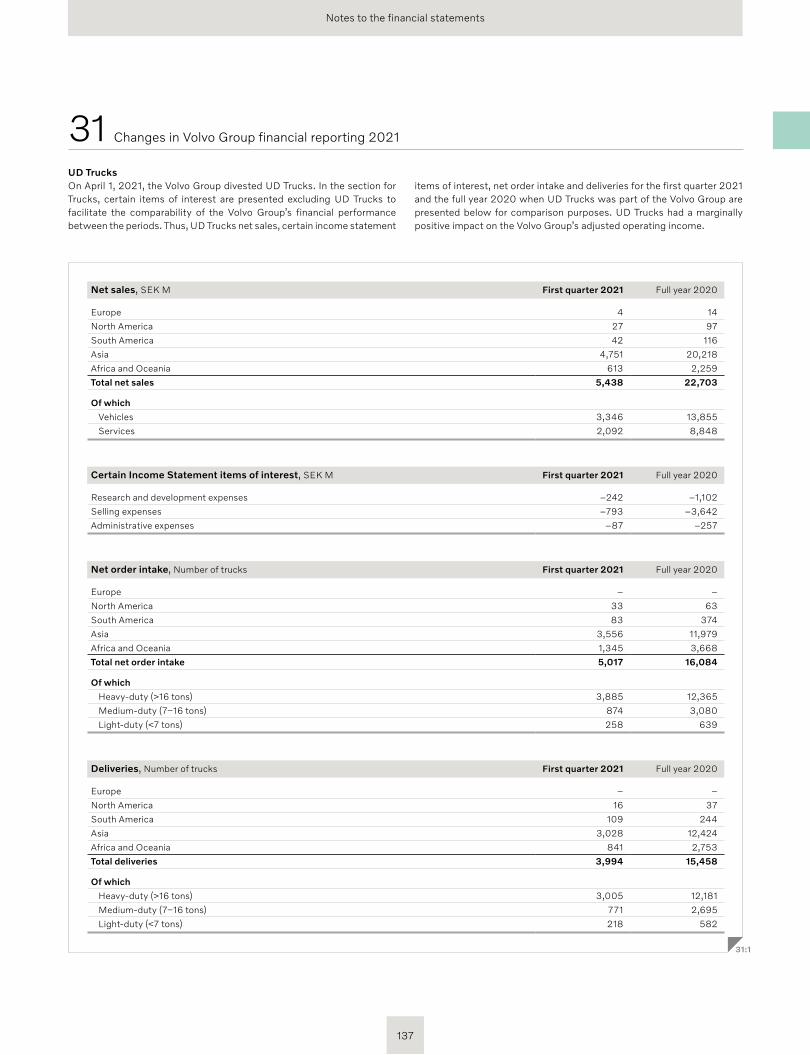
Notes to the financial statements
UD TrucksOn April 1, 2021, the Volvo Group divested UD Trucks. In the section for Trucks, certain items of interest are presented excluding UD Trucks to facilitate the comparability of the Volvo Group’s financial performance between the periods. Thus, UD Trucks net sales, certain income statement
31 Changes in Volvo Group financial reporting 2021
items of interest, net order intake and deliveries for the first quarter 2021 and the full year 2020 when UD Trucks was part of the Volvo Group are presented below for comparison purposes. UD Trucks had a marginally positive impact on the Volvo Group’s adjusted operating income.
Net sales, SEK M First quarter 2021 Full year 2020
Europe 4 14
North America 27 97
South America 42 116
Asia 4,751 20,218
Africa and Oceania 613 2,259
Total net sales 5,438 22,703
Of which
Vehicles 3,346 13,855
Services 2,092 8,848
Certain Income Statement items of interest, SEK M First quarter 2021 Full year 2020
Research and development expenses –242 –1,102
Selling expenses –793 –3,642
Administrative expenses –87 –257
Net order intake, Number of trucks First quarter 2021 Full year 2020
Europe – –
North America 33 63
South America 83 374
Asia 3,556 11,979
Africa and Oceania 1,345 3,668
Total net order intake 5,017 16,084
Of which
Heavyduty (>16 tons) 3,885 12,365
Mediumduty (7–16 tons) 874 3,080
Lightduty (<7 tons) 258 639
Deliveries, Number of trucks First quarter 2021 Full year 2020
Europe – –
North America 16 37
South America 109 244
Asia 3,028 12,424
Africa and Oceania 841 2,753
Total deliveries 3,994 15,458
Of which
Heavyduty (>16 tons) 3,005 12,181
Mediumduty (7–16 tons) 771 2,695
Lightduty (<7 tons) 218 582
31:1
137
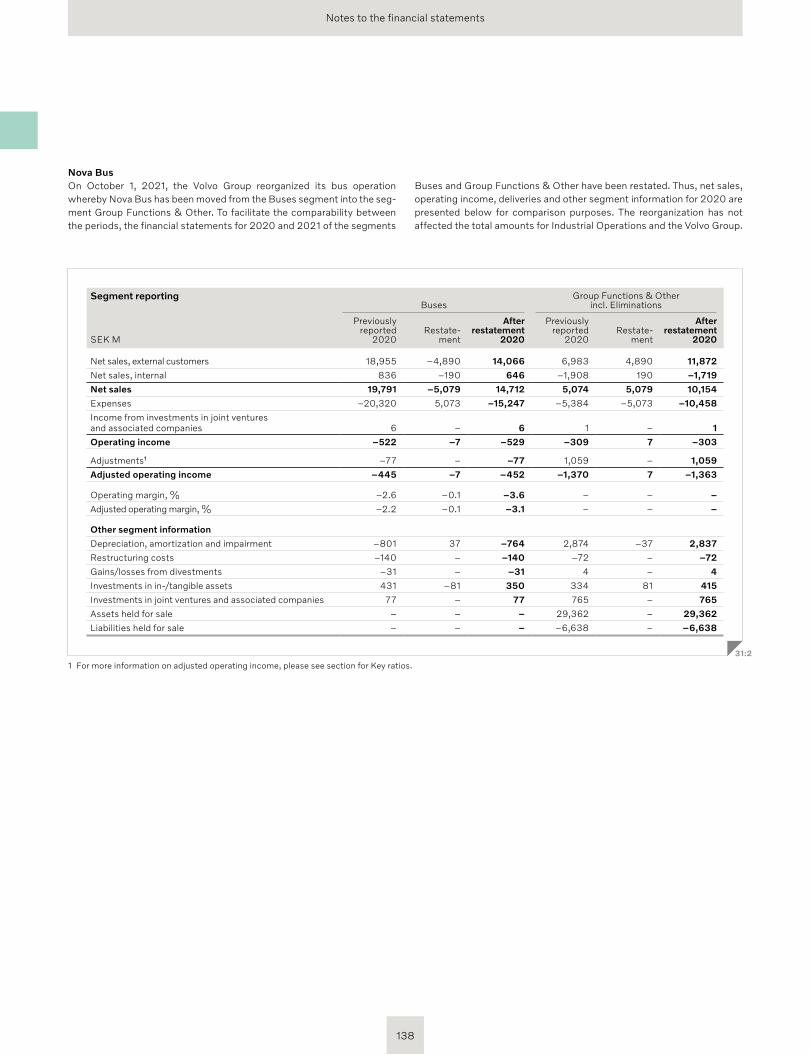
Notes to the financial statements
Nova BusOn October 1, 2021, the Volvo Group reorganized its bus operation whereby Nova Bus has been moved from the Buses segment into the segment Group Functions & Other. To facilitate the comparability between the periods, the financial statements for 2020 and 2021 of the segments
Buses and Group Functions & Other have been restated. Thus, net sales, operating income, deliveries and other segment information for 2020 are presented below for comparison purposes. The reorganization has not affected the total amounts for Industrial Operations and the Volvo Group.
Segment reportingBuses
Group Functions & Other incl. Eliminations
SEK M
Previously reported
2020Restate
ment
After restatement
2020
Previously reported
2020Restate
ment
After restatement
2020
Net sales, external customers 18,955 –4,890 14,066 6,983 4,890 11,872
Net sales, internal 836 –190 646 –1,908 190 –1,719
Net sales 19,791 –5,079 14,712 5,074 5,079 10,154
Expenses –20,320 5,073 –15,247 –5,384 –5,073 –10,458
Income from investments in joint ventures and associated companies 6 – 6 1 – 1
Operating income –522 –7 –529 –309 7 –303
Adjustments¹ –77 – –77 1,059 – 1,059
Adjusted operating income –445 –7 –452 –1,370 7 –1,363
Operating margin, % –2.6 –0.1 –3.6 – – –
Adjusted operating margin, % –2.2 –0.1 –3.1 – – –
Other segment information
Depreciation, amortization and impairment –801 37 –764 2,874 –37 2,837
Restructuring costs –140 – –140 –72 – –72
Gains/losses from divestments –31 – –31 4 – 4
Investments in in/tangible assets 431 –81 350 334 81 415
Investments in joint ventures and associated companies 77 – 77 765 – 765
Assets held for sale – – – 29,362 – 29,362
Liabilities held for sale – – – –6,638 – –6,638
31:2
1 For more information on adjusted operating income, please see section for Key ratios.
138
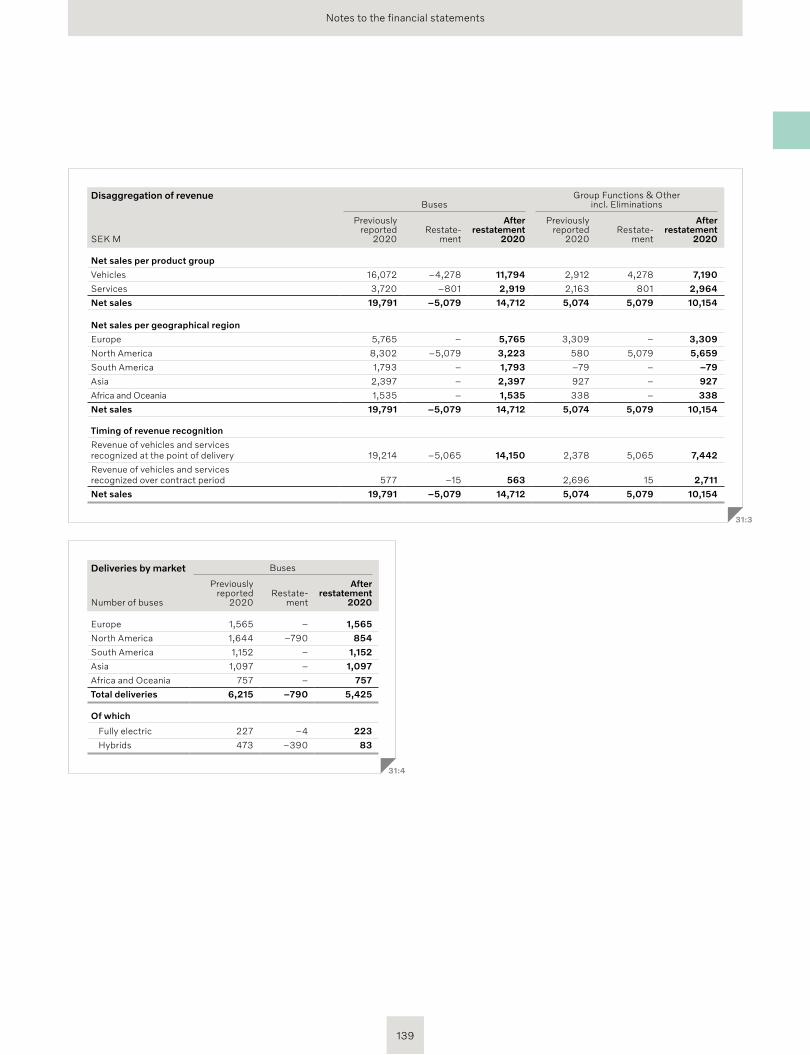
Notes to the financial statements
Disaggregation of revenueBuses
Group Functions & Other incl. Eliminations
SEK M
Previously reported
2020Restate
ment
After restatement
2020
Previously reported
2020Restate
ment
After restatement
2020
Net sales per product group
Vehicles 16,072 –4,278 11,794 2,912 4,278 7,190
Services 3,720 –801 2,919 2,163 801 2,964
Net sales 19,791 –5,079 14,712 5,074 5,079 10,154
Net sales per geographical region
Europe 5,765 – 5,765 3,309 – 3,309
North America 8,302 –5,079 3,223 580 5,079 5,659
South America 1,793 – 1,793 –79 – –79
Asia 2,397 – 2,397 927 – 927
Africa and Oceania 1,535 – 1,535 338 – 338
Net sales 19,791 –5,079 14,712 5,074 5,079 10,154
Timing of revenue recognition
Revenue of vehicles and services recognized at the point of delivery 19,214 –5,065 14,150 2,378 5,065 7,442
Revenue of vehicles and services recognized over contract period 577 –15 563 2,696 15 2,711
Net sales 19,791 –5,079 14,712 5,074 5,079 10,154
31:3
Deliveries by market Buses
Number of buses
Previously reported
2020Restate
ment
After restatement
2020
Europe 1,565 – 1,565
North America 1,644 –790 854
South America 1,152 – 1,152
Asia 1,097 – 1,097
Africa and Oceania 757 – 757
Total deliveries 6,215 –790 5,425
Of which
Fully electric 227 –4 223
Hybrids 473 –390 83
31:4
139
Parent company
Parent companyNOTE PAGE
1 Accounting policies 1452 Revenue and intra-group transactions 1453 Administrative expenses 1454 Other operating income and expenses 1465 Income from investments
in group companies146
6 Income from investments in joint ventures and associated companies
146
7 Income from other investments 1468 Interest expenses and similar charges 1469 Other financial income and expenses 146
10 Appropriations 14611 Income taxes 14712 Intangible and tangible assets 14713 Investments in shares and participations 14814 Other non-current receivables 15015 Other receivables 15016 Untaxed reserves 15017 Provisions for post- employment benefits 15018 Other provisions 15119 Non-current liabilities 15120 Other liabilities 15121 Contingent liabilities 15122 Cash flow 151
140
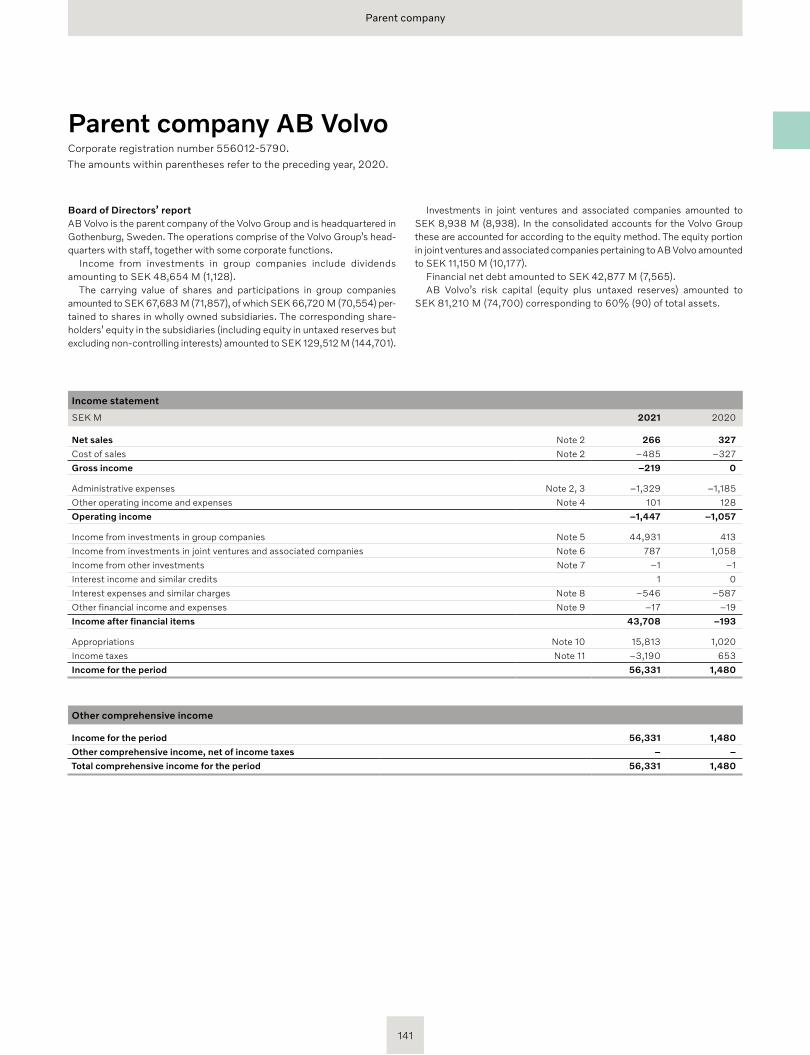
Parent company
Parent company AB Volvo Corporate registration number 556012-5790.The amounts within parentheses refer to the preceding year, 2020.
Board of Directors’ reportAB Volvo is the parent company of the Volvo Group and is headquartered in Gothenburg, Sweden. The operations comprise of the Volvo Group’s head-quarters with staff, together with some cor porate functions.
Income from investments in group companies include dividends amounting to SEK 48,654 M (1,128).
The carrying value of shares and participations in group companies amounted to SEK 67,683 M (71,857), of which SEK 66,720 M (70,554) per-tained to shares in wholly owned subsidiaries. The corresponding share-holders’ equity in the subsidiaries (including equity in untaxed reserves but excluding non-controlling interests) amounted to SEK 129,512 M (144,701).
Investments in joint ventures and associated companies amounted to SEK 8,938 M (8,938). In the consolidated accounts for the Volvo Group these are accounted for according to the equity method. The equity portion in joint ventures and associated companies pertaining to AB Volvo amounted to SEK 11,150 M (10,177).
Financial net debt amounted to SEK 42,877 M (7,565). AB Volvo’s risk capital (equity plus untaxed reserves) amounted to
SEK 81,210 M (74,700) corresponding to 60% (90) of total assets.
Income statement
SEK M 2021 2020
Net sales Note 2 266 327
Cost of sales Note 2 –485 –327
Gross income –219 0
Administrative expenses Note 2, 3 –1,329 –1,185
Other operating income and expenses Note 4 101 128
Operating income –1,447 –1,057
Income from investments in group companies Note 5 44,931 413
Income from investments in joint ventures and associated companies Note 6 787 1,058
Income from other investments Note 7 –1 –1
Interest income and similar credits 1 0
Interest expenses and similar charges Note 8 –546 –587
Other financial income and expenses Note 9 –17 –19
Income after financial items 43,708 –193
Appropriations Note 10 15,813 1,020
Income taxes Note 11 –3,190 653
Income for the period 56,331 1,480
Other comprehensive income
Income for the period 56,331 1,480
Other comprehensive income, net of income taxes – –
Total comprehensive income for the period 56,331 1,480
141
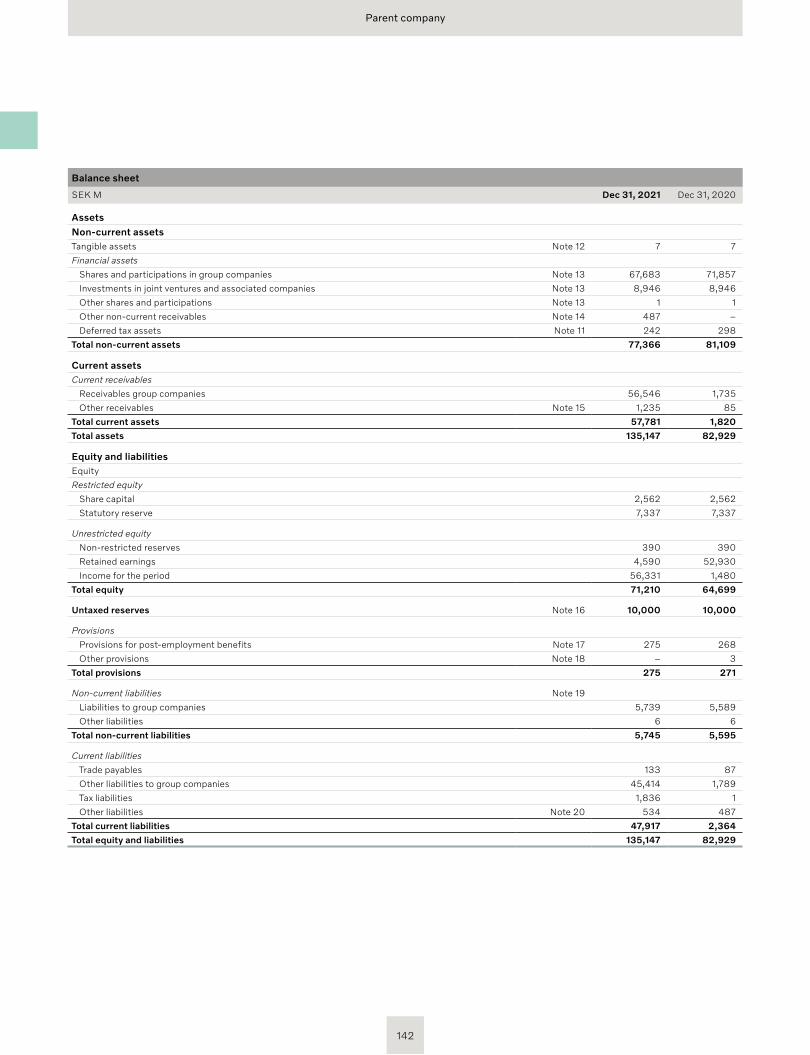
Parent company
Balance sheet
SEK M Dec 31, 2021 Dec 31, 2020
AssetsNon-current assetsTangible assets Note 12 7 7
Financial assets
Shares and participations in group companies Note 13 67,683 71,857
Investments in joint ventures and associated companies Note 13 8,946 8,946
Other shares and participations Note 13 1 1
Other non-current receivables Note 14 487 –
Deferred tax assets Note 11 242 298
Total non-current assets 77,366 81,109
Current assetsCurrent receivables
Receivables group companies 56,546 1,735
Other receivables Note 15 1,235 85
Total current assets 57,781 1,820
Total assets 135,147 82,929
Equity and liabilitiesEquity
Restricted equity
Share capital 2,562 2,562
Statutory reserve 7,337 7,337
Unrestricted equity
Non-restricted reserves 390 390
Retained earnings 4,590 52,930
Income for the period 56,331 1,480
Total equity 71,210 64,699
Untaxed reserves Note 16 10,000 10,000
Provisions
Provisions for post-employment benefits Note 17 275 268
Other provisions Note 18 – 3
Total provisions 275 271
Non-current liabilities Note 19
Liabilities to group companies 5,739 5,589
Other liabilities 6 6
Total non-current liabilities 5,745 5,595
Current liabilities
Trade payables 133 87
Other liabilities to group companies 45,414 1,789
Tax liabilities 1,836 1
Other liabilities Note 20 534 487
Total current liabilities 47,917 2,364
Total equity and liabilities 135,147 82,929
142
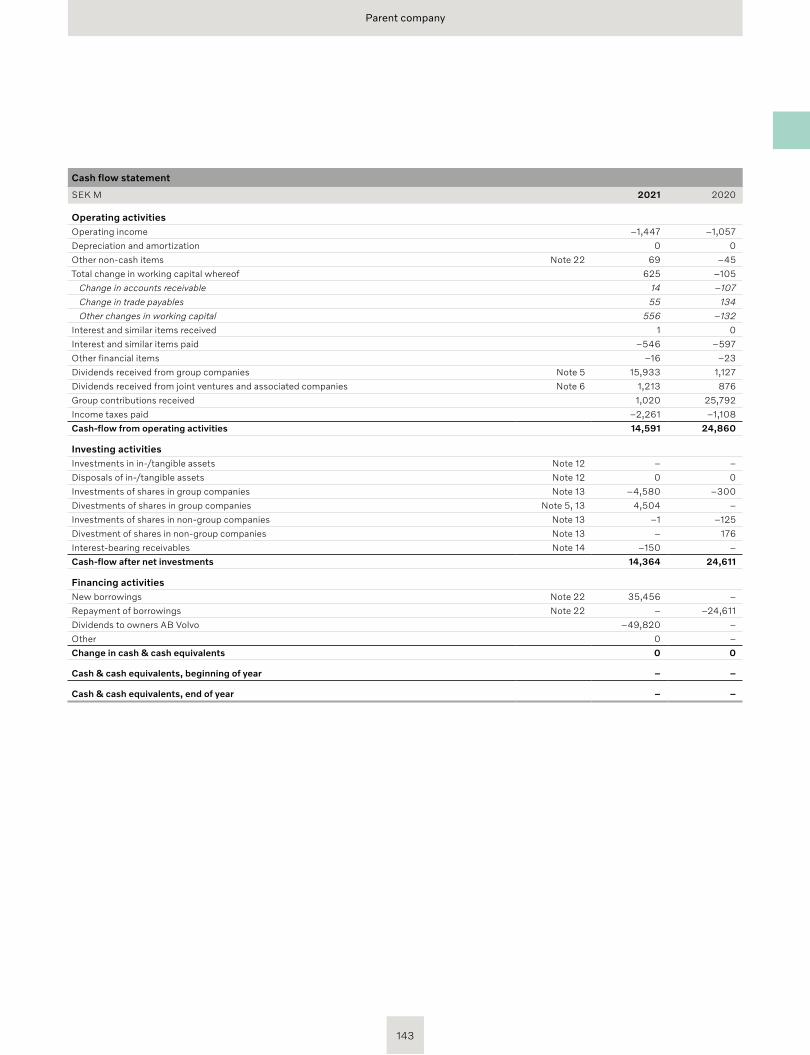
Parent company
Cash flow statement
SEK M 2021 2020
Operating activitiesOperating income –1,447 –1,057
Depreciation and amortization 0 0
Other non-cash items Note 22 69 –45
Total change in working capital whereof 625 –105
Change in accounts receivable 14 –107
Change in trade payables 55 134
Other changes in working capital 556 –132
Interest and similar items received 1 0
Interest and similar items paid –546 –597
Other financial items –16 –23
Dividends received from group companies Note 5 15,933 1,127
Dividends received from joint ventures and associated companies Note 6 1,213 876
Group contributions received 1,020 25,792
Income taxes paid –2,261 –1,108
Cash-flow from operating activities 14,591 24,860
Investing activitiesInvestments in in-/tangible assets Note 12 – –
Disposals of in-/tangible assets Note 12 0 0
Investments of shares in group companies Note 13 –4,580 –300
Divestments of shares in group companies Note 5, 13 4,504 –
Investments of shares in non-group companies Note 13 –1 –125
Divestment of shares in non-group companies Note 13 – 176
Interest-bearing receivables Note 14 –150 –
Cash-flow after net investments 14,364 24,611
Financing activitiesNew borrowings Note 22 35,456 –
Repayment of borrowings Note 22 – –24,611
Dividends to owners AB Volvo –49,820 –
Other 0 –
Change in cash & cash equivalents 0 0
Cash & cash equivalents, beginning of year – –
Cash & cash equivalents, end of year – –
143
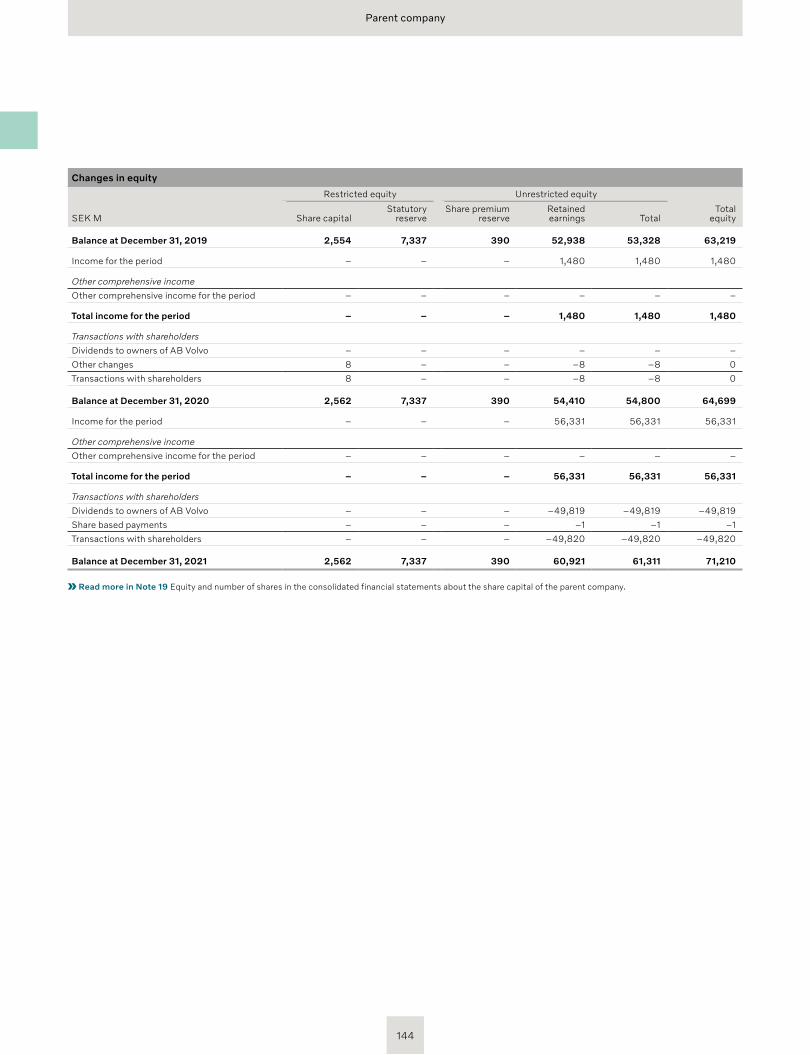
Parent company
Changes in equity
Restricted equity Unrestricted equity
SEK M Share capitalStatutory
reserveShare premium
reserveRetained earnings Total
Total equity
Balance at December 31, 2019 2,554 7,337 390 52,938 53,328 63,219
Income for the period – – – 1,480 1,480 1,480
Other comprehensive income
Other comprehensive income for the period – – – – – –
Total income for the period – – – 1,480 1,480 1,480
Transactions with shareholders
Dividends to owners of AB Volvo – – – – – –
Other changes 8 – – –8 –8 0
Transactions with shareholders 8 – – –8 –8 0
Balance at December 31, 2020 2,562 7,337 390 54,410 54,800 64,699
Income for the period – – – 56,331 56,331 56,331
Other comprehensive income
Other comprehensive income for the period – – – – – –
Total income for the period – – – 56,331 56,331 56,331
Transactions with shareholders
Dividends to owners of AB Volvo – – – –49,819 –49,819 –49,819
Share based payments – – – –1 –1 –1
Transactions with shareholders – – – –49,820 –49,820 –49,820
Balance at December 31, 2021 2,562 7,337 390 60,921 61,311 71,210
Read more in Note 19 Equity and number of shares in the consolidated financial statements about the share capital of the parent company.
144
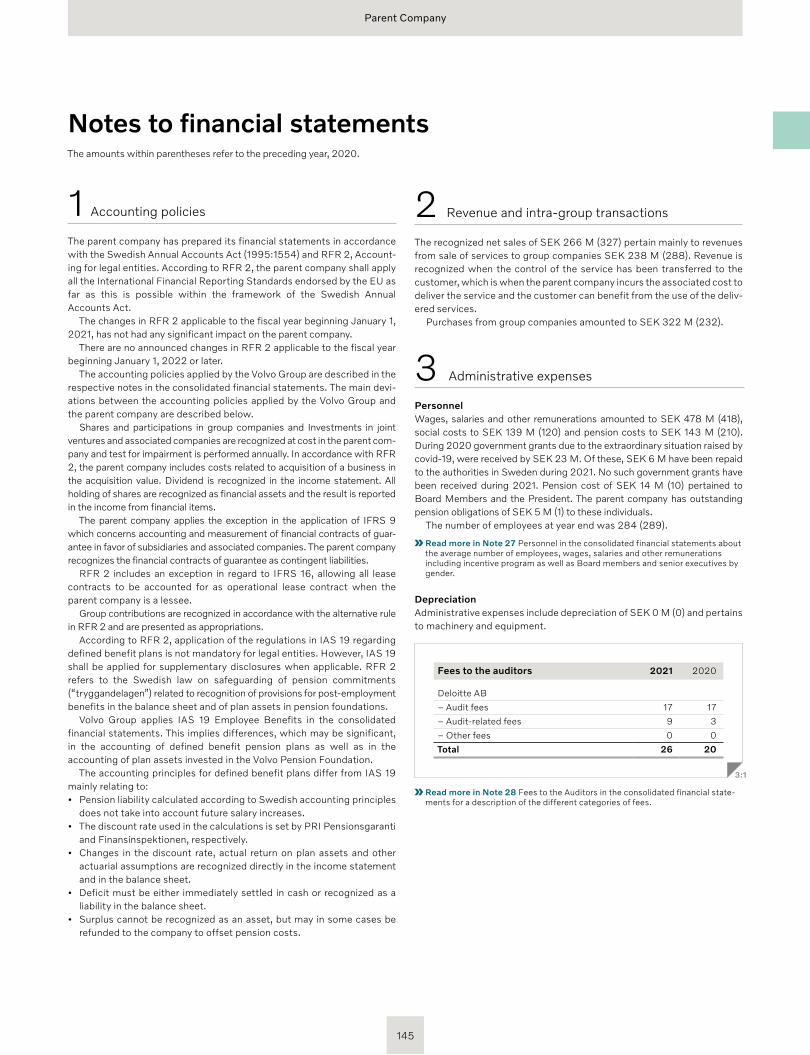
Parent Company
145
The amounts within parentheses refer to the preceding year, 2020.
1 Accounting policies
The parent company has prepared its financial statements in accordance with the Swedish Annual Accounts Act (1995:1554) and RFR 2, Account-ing for legal entities. According to RFR 2, the parent company shall apply all the International Financial Reporting Standards endorsed by the EU as far as this is possible within the framework of the Swedish Annual Accounts Act.
The changes in RFR 2 applicable to the fiscal year beginning January 1, 2021, has not had any significant impact on the parent company.
There are no announced changes in RFR 2 applicable to the fiscal year beginning January 1, 2022 or later.
The accounting policies applied by the Volvo Group are described in the respective notes in the consolidated financial statements. The main devi-ations between the accounting policies applied by the Volvo Group and the parent company are described below.
Shares and participations in group companies and Investments in joint ventures and associated companies are recognized at cost in the parent com-pany and test for impairment is performed annually. In accordance with RFR 2, the parent company includes costs related to acquisition of a business in the acquisition value. Dividend is recognized in the income statement. All holding of shares are recognized as financial assets and the result is reported in the income from financial items.
The parent company applies the exception in the application of IFRS 9 which concerns accounting and measurement of financial contracts of guar-antee in favor of subsidiaries and associated companies. The parent company recognizes the financial contracts of guarantee as contingent liabilities.
RFR 2 includes an exception in regard to IFRS 16, allowing all lease contracts to be accounted for as operational lease contract when the parent company is a lessee.
Group contributions are recognized in accordance with the alternative rule in RFR 2 and are presented as appropriations.
According to RFR 2, application of the regulations in IAS 19 regarding defined benefit plans is not mandatory for legal entities. However, IAS 19 shall be applied for supplementary disclosures when applicable. RFR 2 refers to the Swedish law on safeguarding of pension commitments (“tryggandelagen”) related to recognition of provisions for post-employment benefits in the balance sheet and of plan assets in pension foundations.
Volvo Group applies IAS 19 Employee Benefits in the consolidated financial statements. This implies differences, which may be significant, in the accounting of defined benefit pension plans as well as in the accounting of plan assets invested in the Volvo Pension Foundation.
The accounting principles for defined benefit plans differ from IAS 19 mainly relating to:• Pension liability calculated according to Swedish accounting principles
does not take into account future salary increases. • The discount rate used in the calculations is set by PRI Pensions garanti
and Finansinspektionen, respectively. • Changes in the discount rate, actual return on plan assets and other
actuarial assumptions are recognized directly in the income statement and in the balance sheet.
• Deficit must be either immediately settled in cash or recognized as a liability in the balance sheet.
• Surplus cannot be recognized as an asset, but may in some cases be refunded to the company to offset pension costs.
Notes to financial statements
2 Revenue and intra-group transactions
The recognized net sales of SEK 266 M (327) pertain mainly to revenues from sale of services to group companies SEK 238 M (288). Revenue is recognized when the control of the service has been transferred to the customer, which is when the parent company incurs the associated cost to deliver the service and the customer can benefit from the use of the deliv-ered services.
Purchases from group companies amounted to SEK 322 M (232).
3 Administrative expenses
PersonnelWages, salaries and other remunerations amounted to SEK 478 M (418), social costs to SEK 139 M (120) and pension costs to SEK 143 M (210). During 2020 government grants due to the extraordinary situation raised by covid-19, were received by SEK 23 M. Of these, SEK 6 M have been repaid to the authorities in Sweden during 2021. No such government grants have been received during 2021. Pension cost of SEK 14 M (10) pertained to Board Members and the President. The parent company has outstanding pension obligations of SEK 5 M (1) to these individuals.
The number of employees at year end was 284 (289).
Read more in Note 27 Personnel in the consolidated financial statements about the average number of employees, wages, salaries and other remunerations including incentive program as well as Board members and senior executives by gender.
DepreciationAdministrative expenses include depreciation of SEK 0 M (0) and pertains to machinery and equipment.
Fees to the auditors 2021 2020
Deloitte AB
– Audit fees 17 17
– Audit-related fees 9 3
– Other fees 0 0
Total 26 20
3:1
Read more in Note 28 Fees to the Auditors in the consolidated financial state-ments for a description of the different categories of fees.
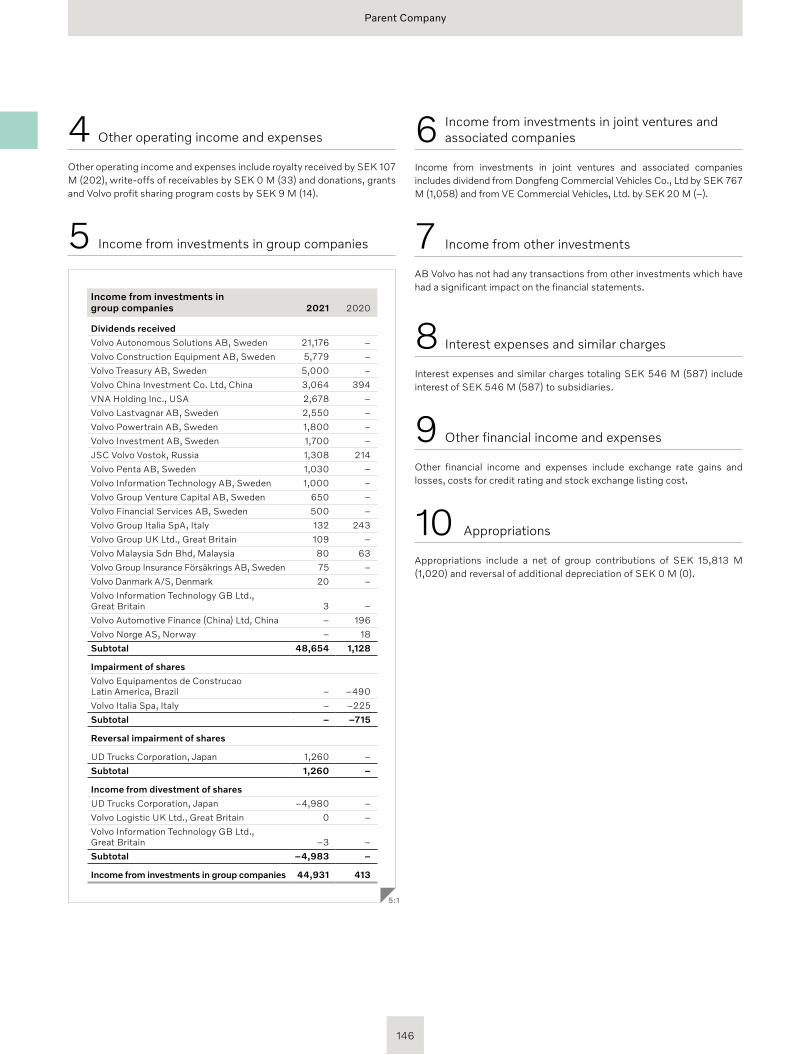
Parent Company
146
4 Other operating income and expenses
Other operating income and expenses include royalty received by SEK 107 M (202), write-offs of receivables by SEK 0 M (33) and donations, grants and Volvo profit sharing program costs by SEK 9 M (14).
5 Income from investments in group companies
Income from investments in group companies 2021 2020
Dividends received
Volvo Autonomous Solutions AB, Sweden 21,176 –
Volvo Construction Equipment AB, Sweden 5,779 –
Volvo Treasury AB, Sweden 5,000 –
Volvo China Investment Co. Ltd, China 3,064 394
VNA Holding Inc., USA 2,678 –
Volvo Lastvagnar AB, Sweden 2,550 –
Volvo Powertrain AB, Sweden 1,800 –
Volvo Investment AB, Sweden 1,700 –
JSC Volvo Vostok, Russia 1,308 214
Volvo Penta AB, Sweden 1,030 –
Volvo Information Technology AB, Sweden 1,000 –
Volvo Group Venture Capital AB, Sweden 650 –
Volvo Financial Services AB, Sweden 500 –
Volvo Group Italia SpA, Italy 132 243
Volvo Group UK Ltd., Great Britain 109 –
Volvo Malaysia Sdn Bhd, Malaysia 80 63
Volvo Group Insurance Försäkrings AB, Sweden 75 –
Volvo Danmark A/S, Denmark 20 –
Volvo Information Technology GB Ltd., Great Britain 3 –
Volvo Automotive Finance (China) Ltd, China – 196
Volvo Norge AS, Norway – 18
Subtotal 48,654 1,128
Impairment of shares
Volvo Equipamentos de Construcao Latin America, Brazil – –490
Volvo Italia Spa, Italy – –225
Subtotal – –715
Reversal impairment of shares
UD Trucks Corporation, Japan 1,260 –
Subtotal 1,260 –
Income from divestment of shares
UD Trucks Corporation, Japan –4,980 –
Volvo Logistic UK Ltd., Great Britain 0 –
Volvo Information Technology GB Ltd., Great Britain –3 –
Subtotal –4,983 –
Income from investments in group companies 44,931 413
5:1
6 Income from investments in joint ventures and associated companies
Income from investments in joint ventures and associated companies includes dividend from Dongfeng Commercial Vehicles Co., Ltd by SEK 767 M (1,058) and from VE Commercial Vehicles, Ltd. by SEK 20 M (–).
7 Income from other investments
AB Volvo has not had any transactions from other investments which have had a significant impact on the financial statements.
8 Interest expenses and similar charges
Interest expenses and similar charges totaling SEK 546 M (587) include interest of SEK 546 M (587) to subsidiaries.
9 Other financial income and expenses
Other financial income and expenses include exchange rate gains and losses, costs for credit rating and stock exchange listing cost.
10 Appropriations
Appropriations include a net of group contributions of SEK 15,813 M (1,020) and reversal of additional depreciation of SEK 0 M (0).
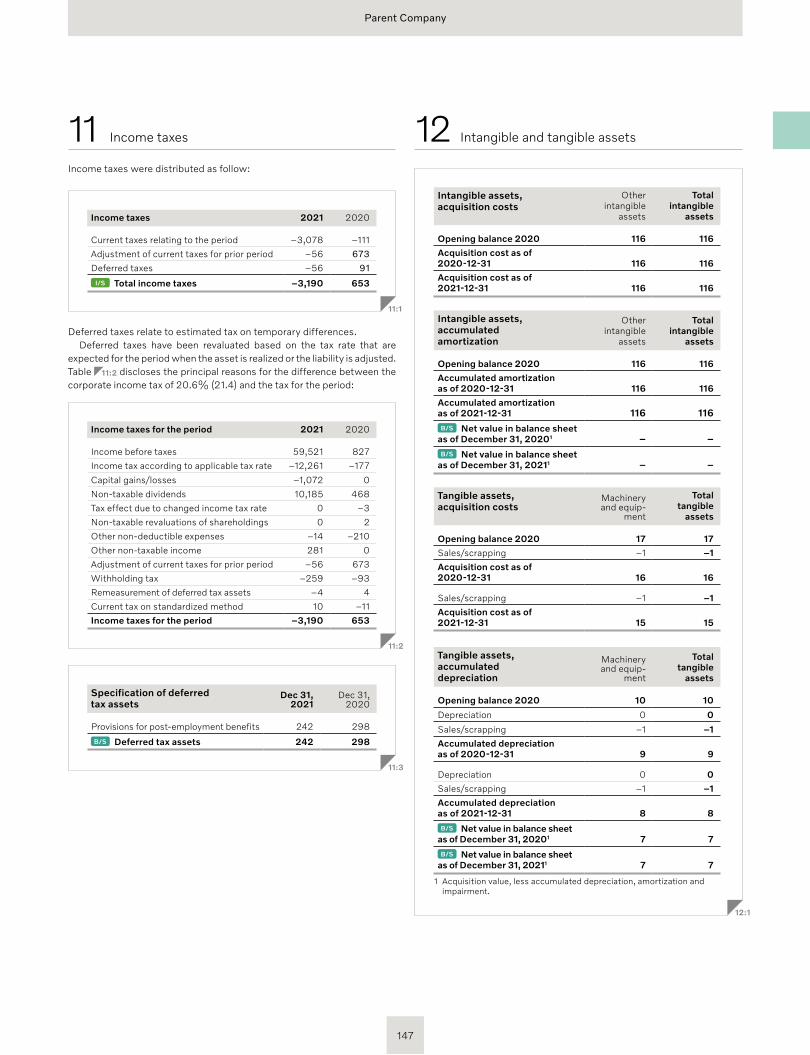
Parent Company
Income taxes were distributed as follow:
Income taxes 2021 2020
Current taxes relating to the period –3,078 –111
Adjustment of current taxes for prior period –56 673
Deferred taxes –56 91
I/S Total income taxes –3,190 653
11:1
Deferred taxes relate to estimated tax on temporary differences. Deferred taxes have been revaluated based on the tax rate that are
expected for the period when the asset is realized or the liability is adjusted. Table 11:2 discloses the principal reasons for the difference between the corporate income tax of 20.6% (21.4) and the tax for the period:
Income taxes for the period 2021 2020
Income before taxes 59,521 827
Income tax according to applicable tax rate –12,261 –177
Capital gains/losses –1,072 0
Non-taxable dividends 10,185 468
Tax effect due to changed income tax rate 0 –3
Non-taxable revaluations of shareholdings 0 2
Other non-deductible expenses –14 –210
Other non-taxable income 281 0
Adjustment of current taxes for prior period –56 673
Withholding tax –259 –93
Remeasurement of deferred tax assets –4 4
Current tax on standardized method 10 –11
Income taxes for the period –3,190 653
11:2
Specification of deferred tax assets
Dec 31, 2021
Dec 31, 2020
Provisions for post-employment benefits 242 298
B/S Deferred tax assets 242 298
11:3
Intangible assets, acquisition costs
Other intangible
assets
Total intangible
assets
Opening balance 2020 116 116
Acquisition cost as of 2020-12-31 116 116
Acquisition cost as of 2021-12-31 116 116
Intangible assets, accumulated amortization
Other intangible
assets
Total intangible
assets
Opening balance 2020 116 116
Accumulated amortization as of 2020-12-31 116 116
Accumulated amortization as of 2021-12-31 116 116B/S Net value in balance sheet
as of December 31, 20201 – –B/S Net value in balance sheet
as of December 31, 20211 – –
Tangible assets, acquisition costs
Machinery and equip-
ment
Total tangible
assets
Opening balance 2020 17 17
Sales/scrapping –1 –1
Acquisition cost as of 2020-12-31 16 16
Sales/scrapping –1 –1
Acquisition cost as of 2021-12-31 15 15
Tangible assets, accumulated depreciation
Machinery and equip-
ment
Total tangible
assets
Opening balance 2020 10 10
Depreciation 0 0
Sales/scrapping –1 –1
Accumulated depreciation as of 2020-12-31 9 9
Depreciation 0 0
Sales/scrapping –1 –1
Accumulated depreciation as of 2021-12-31 8 8
B/S Net value in balance sheet as of December 31, 20201 7 7
B/S Net value in balance sheet as of December 31, 20211 7 7
1 Acquisition value, less accumulated depreciation, amortization and impairment.
12:1
12 Intangible and tangible assets 11 Income taxes
147
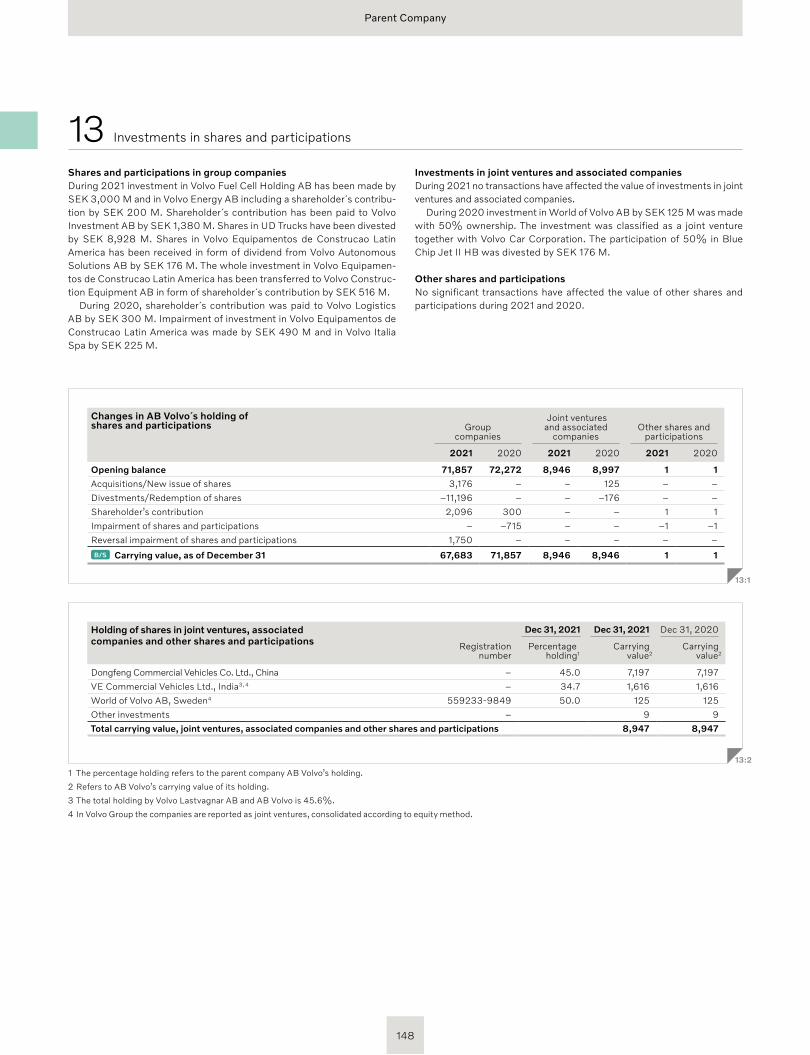
Parent Company
13 Investments in shares and participations
Shares and participations in group companies During 2021 investment in Volvo Fuel Cell Holding AB has been made by SEK 3,000 M and in Volvo Energy AB including a shareholder´s contribu-tion by SEK 200 M. Shareholder´s contribution has been paid to Volvo Investment AB by SEK 1,380 M. Shares in UD Trucks have been divested by SEK 8,928 M. Shares in Volvo Equipamentos de Construcao Latin America has been received in form of dividend from Volvo Autonomous Solutions AB by SEK 176 M. The whole investment in Volvo Equipamen-tos de Construcao Latin America has been transferred to Volvo Construc-tion Equipment AB in form of shareholder´s contribution by SEK 516 M.
During 2020, shareholder´s contribution was paid to Volvo Logistics AB by SEK 300 M. Impairment of investment in Volvo Equipamentos de Construcao Latin America was made by SEK 490 M and in Volvo Italia Spa by SEK 225 M.
Investments in joint ventures and associated companiesDuring 2021 no transactions have affected the value of investments in joint ventures and associated companies.
During 2020 investment in World of Volvo AB by SEK 125 M was made with 50% ownership. The investment was classified as a joint venture together with Volvo Car Corporation. The participation of 50% in Blue Chip Jet II HB was divested by SEK 176 M.
Other shares and participationsNo significant transactions have affected the value of other shares and participations during 2021 and 2020.
Holding of shares in joint ventures, associated companies and other shares and participations
Dec 31, 2021 Dec 31, 2021 Dec 31, 2020
Registration number
Percentageholding1
Carrying value2
Carrying value2
Dongfeng Commercial Vehicles Co. Ltd., China – 45.0 7,197 7,197
VE Commercial Vehicles Ltd., India3, 4 – 34.7 1,616 1,616
World of Volvo AB, Sweden4 559233-9849 50.0 125 125
Other investments – 9 9
Total carrying value, joint ventures, associated companies and other shares and participations 8,947 8,947
13:2
Changes in AB Volvo´s holding of shares and participations Group
companies
Joint ventures and associated
companiesOther shares and
participations
2021 2020 2021 2020 2021 2020
Opening balance 71,857 72,272 8,946 8,997 1 1
Acquisitions/New issue of shares 3,176 – – 125 – –
Divestments/Redemption of shares –11,196 – – –176 – –
Shareholder’s contribution 2,096 300 – – 1 1
Impairment of shares and participations – –715 – – –1 –1
Reversal impairment of shares and participations 1,750 – – – – –
B/S Carrying value, as of December 31 67,683 71,857 8,946 8,946 1 1 13:1
1 The percentage holding refers to the parent company AB Volvo’s holding.
2 Refers to AB Volvo’s carrying value of its holding.
3 The total holding by Volvo Lastvagnar AB and AB Volvo is 45.6%.
4 In Volvo Group the companies are reported as joint ventures, consolidated according to equity method.
148
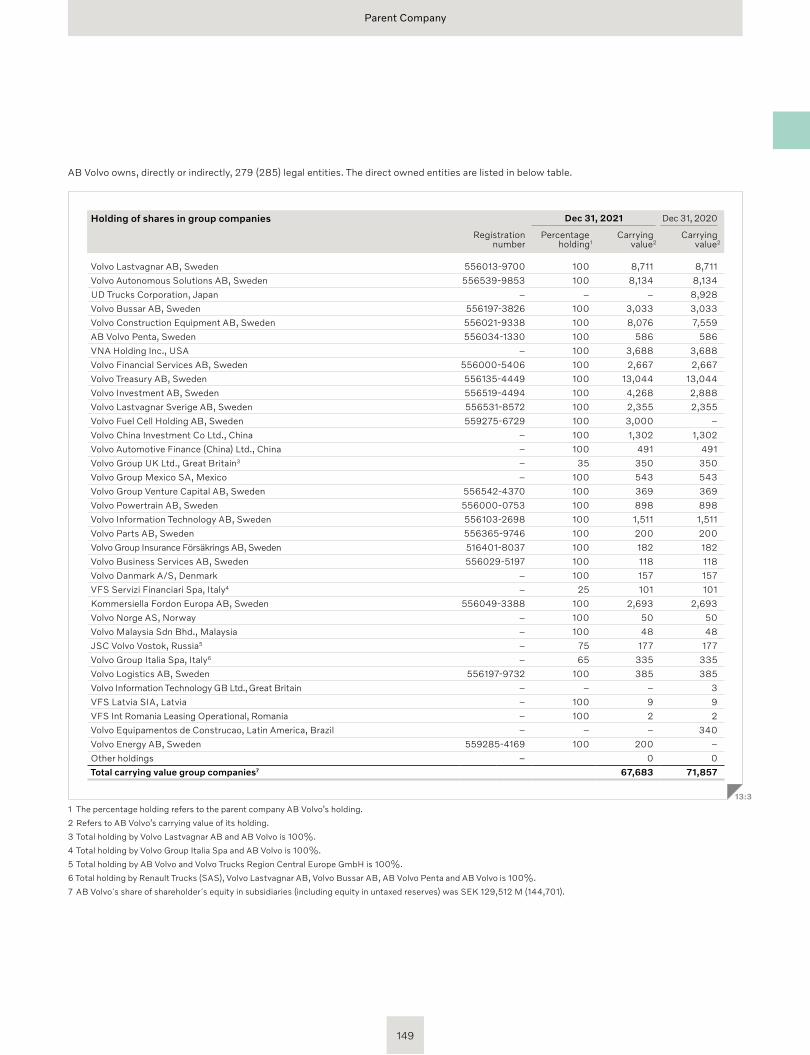
Parent Company
AB Volvo owns, directly or indirectly, 279 (285) legal entities. The direct owned entities are listed in below table.
Holding of shares in group companies Dec 31, 2021 Dec 31, 2020
Registration number
Percentageholding1
Carryingvalue2
Carryingvalue2
Volvo Lastvagnar AB, Sweden 556013-9700 100 8,711 8,711
Volvo Autonomous Solutions AB, Sweden 556539-9853 100 8,134 8,134
UD Trucks Corporation, Japan – – – 8,928
Volvo Bussar AB, Sweden 556197-3826 100 3,033 3,033
Volvo Construction Equipment AB, Sweden 556021-9338 100 8,076 7,559
AB Volvo Penta, Sweden 556034-1330 100 586 586
VNA Holding Inc., USA – 100 3,688 3,688
Volvo Financial Services AB, Sweden 556000-5406 100 2,667 2,667
Volvo Treasury AB, Sweden 556135-4449 100 13,044 13,044
Volvo Investment AB, Sweden 556519-4494 100 4,268 2,888
Volvo Lastvagnar Sverige AB, Sweden 556531-8572 100 2,355 2,355
Volvo Fuel Cell Holding AB, Sweden 559275-6729 100 3,000 –
Volvo China Investment Co Ltd., China – 100 1,302 1,302
Volvo Automotive Finance (China) Ltd., China – 100 491 491
Volvo Group UK Ltd., Great Britain3 – 35 350 350
Volvo Group Mexico SA, Mexico – 100 543 543
Volvo Group Venture Capital AB, Sweden 556542-4370 100 369 369
Volvo Powertrain AB, Sweden 556000-0753 100 898 898
Volvo Information Technology AB, Sweden 556103-2698 100 1,511 1,511
Volvo Parts AB, Sweden 556365-9746 100 200 200
Volvo Group Insurance Försäkrings AB, Sweden 516401-8037 100 182 182
Volvo Business Services AB, Sweden 556029-5197 100 118 118
Volvo Danmark A/S, Denmark – 100 157 157
VFS Servizi Financiari Spa, Italy4 – 25 101 101
Kommersiella Fordon Europa AB, Sweden 556049-3388 100 2,693 2,693
Volvo Norge AS, Norway – 100 50 50
Volvo Malaysia Sdn Bhd., Malaysia – 100 48 48
JSC Volvo Vostok, Russia5 – 75 177 177
Volvo Group Italia Spa, Italy6 – 65 335 335
Volvo Logistics AB, Sweden 556197-9732 100 385 385
Volvo Information Technology GB Ltd., Great Britain – – – 3
VFS Latvia SIA, Latvia – 100 9 9
VFS Int Romania Leasing Operational, Romania – 100 2 2
Volvo Equipamentos de Construcao, Latin America, Brazil – – – 340
Volvo Energy AB, Sweden 559285-4169 100 200 –
Other holdings – 0 0
Total carrying value group companies7 67,683 71,857
13:3
1 The percentage holding refers to the parent company AB Volvo’s holding.
2 Refers to AB Volvo’s carrying value of its holding.
3 Total holding by Volvo Lastvagnar AB and AB Volvo is 100%.
4 Total holding by Volvo Group Italia Spa and AB Volvo is 100%.
5 Total holding by AB Volvo and Volvo Trucks Region Central Europe GmbH is 100%.
6 Total holding by Renault Trucks (SAS), Volvo Lastvagnar AB, Volvo Bussar AB, AB Volvo Penta and AB Volvo is 100%.
7 AB Volvo´s share of shareholder´s equity in subsidiaries (including equity in untaxed reserves) was SEK 129,512 M (144,701).
149
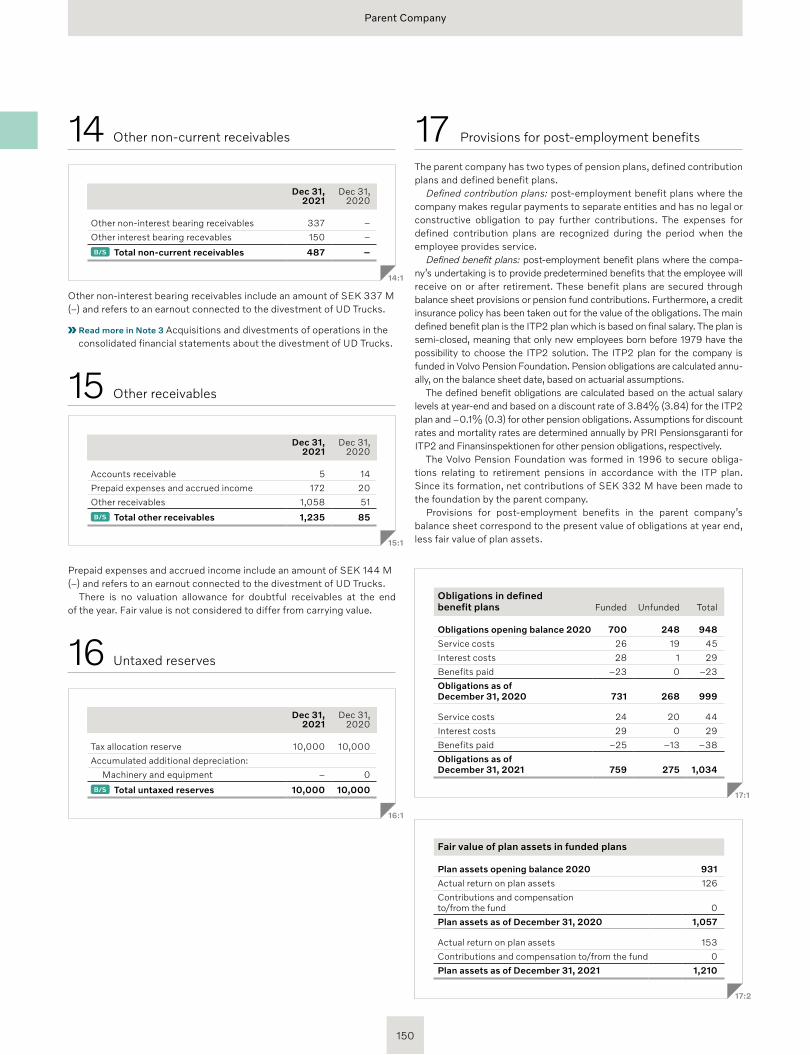
Parent Company
17 Provisions for post-employment benefits
The parent company has two types of pension plans, defined contribution plans and defined benefit plans.
Defined contribution plans: post-employment benefit plans where the company makes regular payments to separate entities and has no legal or constructive obligation to pay further contributions. The expenses for defined contribution plans are recognized during the period when the employee provides service.
Defined benefit plans: post-employment benefit plans where the compa-ny’s undertaking is to provide predetermined benefits that the employee will receive on or after retirement. These benefit plans are secured through balance sheet provisions or pension fund contributions. Furthermore, a credit insurance policy has been taken out for the value of the obligations. The main defined benefit plan is the ITP2 plan which is based on final salary. The plan is semi-closed, meaning that only new employees born before 1979 have the possibility to choose the ITP2 solution. The ITP2 plan for the company is funded in Volvo Pension Foundation. Pension obligations are calculated annu-ally, on the balance sheet date, based on actuarial assumptions.
The defined benefit obligations are calculated based on the actual salary levels at year-end and based on a discount rate of 3.84% (3.84) for the ITP2 plan and –0.1% (0.3) for other pension obligations. Assumptions for discount rates and mortality rates are determined annually by PRI Pensionsgaranti for ITP2 and Finansinspektionen for other pension obligations, respectively.
The Volvo Pension Foundation was formed in 1996 to secure obliga-tions relating to retirement pensions in accordance with the ITP plan. Since its formation, net contributions of SEK 332 M have been made to the foundation by the parent company.
Provisions for post-employment benefits in the parent company’s balance sheet correspond to the present value of obligations at year end, less fair value of plan assets.
Obligations in defined benefit plans Funded Unfunded Total
Obligations opening balance 2020 700 248 948
Service costs 26 19 45
Interest costs 28 1 29
Benefits paid –23 0 –23
Obligations as of December 31, 2020 731 268 999
Service costs 24 20 44
Interest costs 29 0 29
Benefits paid –25 –13 –38
Obligations as of December 31, 2021 759 275 1,034
17:1
Fair value of plan assets in funded plans
Plan assets opening balance 2020 931
Actual return on plan assets 126
Contributions and compensation to/from the fund 0
Plan assets as of December 31, 2020 1,057
Actual return on plan assets 153
Contributions and compensation to/from the fund 0
Plan assets as of December 31, 2021 1,210
17:2
14 Other non-current receivables
Dec 31, 2021
Dec 31, 2020
Other non-interest bearing receivables 337 –
Other interest bearing recevables 150 –
B/S Total non-current receivables 487 –
14:1
Other non-interest bearing receivables include an amount of SEK 337 M (–) and refers to an earnout connected to the divestment of UD Trucks.
Read more in Note 3 Acquisitions and divestments of operations in the consolidated financial statements about the divestment of UD Trucks.
15 Other receivables
Dec 31, 2021
Dec 31, 2020
Accounts receivable 5 14
Prepaid expenses and accrued income 172 20
Other receivables 1,058 51
B/S Total other receivables 1,235 85
15:1
Prepaid expenses and accrued income include an amount of SEK 144 M (–) and refers to an earnout connected to the divestment of UD Trucks.
There is no valuation allowance for doubtful receivables at the end of the year. Fair value is not considered to differ from carrying value.
16 Untaxed reserves
Dec 31, 2021
Dec 31, 2020
Tax allocation reserve 10,000 10,000
Accumulated additional depreciation:
Machinery and equipment – 0
B/S Total untaxed reserves 10,000 10,000
16:1
150
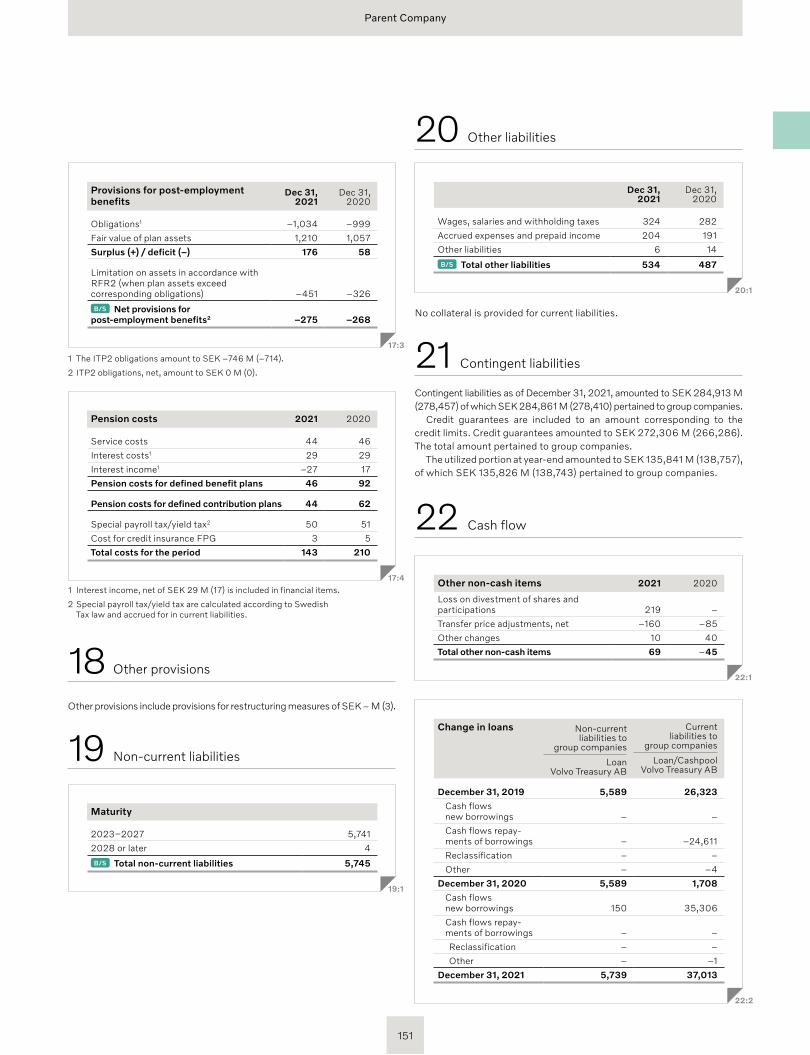
Parent Company
Provisions for post-employment benefits
Dec 31, 2021
Dec 31, 2020
Obligations1 –1,034 –999
Fair value of plan assets 1,210 1,057
Surplus (+) / deficit (–) 176 58
Limitation on assets in accordance with RFR2 (when plan assets exceed corresponding obligations) –451 –326
B/S Net provisions for post-employment benefits2 –275 –268
17:3
1 The ITP2 obligations amount to SEK –746 M (–714).
2 ITP2 obligations, net, amount to SEK 0 M (0).
Pension costs 2021 2020
Service costs 44 46
Interest costs1 29 29
Interest income1 –27 17
Pension costs for defined benefit plans 46 92
Pension costs for defined contribution plans 44 62
Special payroll tax/yield tax2 50 51
Cost for credit insurance FPG 3 5
Total costs for the period 143 210
17:4
1 Interest income, net of SEK 29 M (17) is included in financial items.
2 Special payroll tax/yield tax are calculated according to Swedish Tax law and accrued for in current liabilities.
18 Other provisions
Other provisions include provisions for restructuring measures of SEK – M (3).
19 Non-current liabilities
Maturity
2023–2027 5,741
2028 or later 4
B/S Total non-current liabilities 5,745
19:1
20 Other liabilities
Dec 31, 2021
Dec 31, 2020
Wages, salaries and withholding taxes 324 282
Accrued expenses and prepaid income 204 191
Other liabilities 6 14
B/S Total other liabilities 534 487
20:1
No collateral is provided for current liabilities.
21 Contingent liabilities
Contingent liabilities as of December 31, 2021, amounted to SEK 284,913 M (278,457) of which SEK 284,861 M (278,410) pertained to group companies.
Credit guarantees are included to an amount corresponding to the credit limits. Credit guarantees amounted to SEK 272,306 M (266,286). The total amount pertained to group companies.
The utilized portion at year-end amounted to SEK 135,841 M (138,757), of which SEK 135,826 M (138,743) pertained to group companies.
22 Cash flow
Other non-cash items 2021 2020
Loss on divestment of shares and participations 219 –
Transfer price adjustments, net –160 –85
Other changes 10 40
Total other non-cash items 69 –45
22:1
Change in loans Non-current liabilities to
group companies
Loan Volvo Treasury AB
Current liabilities to
group companies
Loan/Cashpool Volvo Treasury AB
December 31, 2019 5,589 26,323
Cash flows new borrowings – –
Cash flows repay-ments of borrowings – –24,611
Reclassification – –
Other – –4
December 31, 2020 5,589 1,708
Cash flows new borrowings 150 35,306
Cash flows repay-ments of borrowings – –
Reclassification – –
Other – –1
December 31, 2021 5,739 37,013
22:2
151
PAGE
About the report 152
Impacts, stakeholders and material topics 153
Climate and environment 154
Governance, strategy, opportunities & risks 154
Risk management, metrics & targets 156
TCFD-index 157
Energy and emissions 158
Water, Waste 161
Materials of concern, Compliance 161
Biodiversity 162
Sustainable Finance 162
EU Taxonomy regulation disclosures 162
Research and development investments 163
Employees and development 164
Employment 164
Labor and management relations 165
Diversity and equal opportunities 165
Training and education 166
PAGE
Safety 167
Customer health and safety 167
Occupational health and safety 168
Human rights 170
Human rights governance 170
Policy commitment and salient risks 170
Value chain approach 170
Awareness and grievance mechanism 171
Specific reports 172
Responsible sales 174
Suppliers 175
Supplier social assessment 176
Supplier environmental assessment 176
Sustainable minerals program 176
Business ethics and compliance 177
Compliance, Anti-corruption, Whistle-blower reporting 177
Tax, Public policy 178
Organizational profile and reporting practices 178
About the reportThese Sustainability notes include the Volvo Group’s col-lected sustainability disclosures. As sustainability topics are top strategic issues and well integrated in the busi-ness and operating model of the Volvo Group, additional sustainability disclosures can be found in other parts of the report, see below.
GovernanceThe overall governance of sustainability is described in the Corporate Governance report on page 183 and 190.
Strategy and Business modelThe Volvo Group´s strategy includes sustainability priori-ties and is presented on pages 10–43. Our business model is outlined on pages 18–25. With business operations in more than 190 countries whereof many are classified as high-risk countries from an environmental, human rights or corruption perspective we need to ensure that we pursue our business operations in a responsible manner. Environ-mental, social and financial sustainability aspects as well as ethical business conduct are integrated into the Volvo Group overall strategy and business model and also incor-porated into our processes and policies.
Policies The Volvo Group Code of Conduct is a Group-wide policy that sets the standards on how we conduct business; eth-ically and in compliance with applicable laws and regula-
tions. It applies everywhere we operate, for our employees and everyone else who works on our behalf. In addition to the Code of Conduct, the Volvo Group’s policies on com-petition, human rights, data privacy, anti-corruption and export control, tax and environment are complemented with compliance programs and management systems for effective policy deployment. In line with our decentral-ized model each business area is responsible to ensure compliance with the Volvo Group’s minimum require-ments and standards for sustainable and responsible business conduct. Business areas are also free to comple-ment existing policies and compliance programs with more stringent requirements.
Risks and mitigationThe Volvo Group’s enterprise risk management process includes sustainability-related risks. Principal risks, includ-ing several sustainability-related risks, are reported in the overall Risks and uncertainties section, see pages 70–75. These Sustainability Notes include a more detailed over-view on risks and mitigation activities and complements information where sustainability topics has not yet been qualified as a principal Group wide risk.
Key Performance IndicatorsKPI’s in relation to the environment, employees, social factors, human rights and business ethics are reported for each material topic in these Sustain ability notes.
Reporting standards usedThis report has been prepared in accordance with the Global Reporting Initiative’s (GRI) Standards “Core” option. GRI is complemented by other relevant frameworks where stated, including the Task Force on Climate-related Financial Disclosures initiative (TCFD). GRI and UN Global Compact’s guide Business Reporting in the Sustainable Development Goals (SDGs) have been used to translate the disclosures herein to a number of the 169 SDG targets.
Topics related to this reportComplementary information is available on volvogroup.com/asr2021. This includes:• GRI index, also available on volvogroup.com/gri2021• SASB index, Industrial Goods and Machinery• Locations of major operations• Membership in associations• Code of Conduct and related policies
Sustainability Notes
152
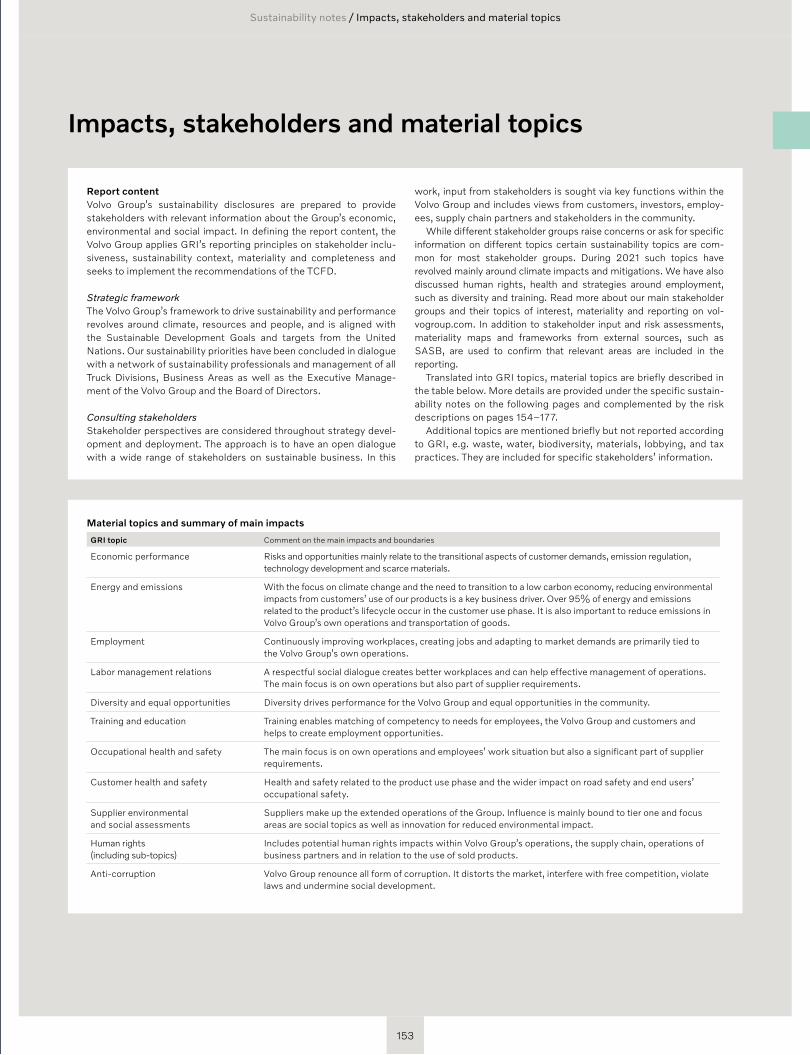
Impacts, stakeholders and material topics
Report content Volvo Group’s sustainability disclosures are prepared to provide stakeholders with relevant information about the Group’s economic, environmental and social impact. In defining the report content, the Volvo Group applies GRI’s reporting principles on stakeholder inclu-siveness, sustainability context, materiality and completeness and seeks to implement the recommendations of the TCFD.
Strategic framework The Volvo Group’s framework to drive sustainability and performance revolves around climate, resources and people, and is aligned with the Sustainable Development Goals and targets from the United Nations. Our sustainability priorities have been concluded in dialogue with a network of sustainability professionals and management of all Truck Divisions, Business Areas as well as the Executive Manage-ment of the Volvo Group and the Board of Directors.
Consulting stakeholders Stakeholder perspectives are considered throughout strategy devel-opment and deployment. The approach is to have an open dialogue with a wide range of stakeholders on sustainable business. In this
work, input from stakeholders is sought via key functions within the Volvo Group and includes views from customers, investors, employ-ees, supply chain partners and stakeholders in the community.
While different stakeholder groups raise concerns or ask for specific information on different topics certain sustainability topics are com-mon for most stakeholder groups. During 2021 such topics have revolved mainly around climate impacts and mitigations. We have also discussed human rights, health and strategies around employment, such as diversity and training. Read more about our main stakeholder groups and their topics of interest, materiality and reporting on vol-vogroup.com. In addition to stakeholder input and risk assessments, materiality maps and frameworks from external sources, such as SASB, are used to confirm that relevant areas are included in the reporting.
Translated into GRI topics, material topics are briefly described in the table below. More details are provided under the specific sustain-ability notes on the following pages and complemented by the risk descriptions on pages 154–177.
Additional topics are mentioned briefly but not reported according to GRI, e.g. waste, water, biodiversity, materials, lobbying, and tax practices. They are included for specific stakeholders’ information.
Material topics and summary of main impacts
GRI topic Comment on the main impacts and boundaries
Economic performance Risks and opportunities mainly relate to the transitional aspects of customer demands, emission regulation, technology development and scarce materials.
Energy and emissions With the focus on climate change and the need to transition to a low carbon economy, reducing environmental impacts from customers’ use of our products is a key business driver. Over 95% of energy and emissions related to the product’s lifecycle occur in the customer use phase. It is also important to reduce emissions in Volvo Group’s own operations and transportation of goods.
Employment Continuously improving workplaces, creating jobs and adapting to market demands are primarily tied to the Volvo Group’s own operations.
Labor management relations A respectful social dialogue creates better workplaces and can help effective management of operations. The main focus is on own operations but also part of supplier requirements.
Diversity and equal opportunities Diversity drives performance for the Volvo Group and equal opportunities in the community.
Training and education Training enables matching of competency to needs for employees, the Volvo Group and customers and helps to create employment opportunities.
Occupational health and safety The main focus is on own operations and employees’ work situation but also a significant part of supplier requirements.
Customer health and safety Health and safety related to the product use phase and the wider impact on road safety and end users’ occupational safety.
Supplier environmental and social assessments
Suppliers make up the extended operations of the Group. Influence is mainly bound to tier one and focus areas are social topics as well as innovation for reduced environmental impact.
Human rights (including sub-topics)
Includes potential human rights impacts within Volvo Group’s operations, the supply chain, operations of business partners and in relation to the use of sold products.
Anti-corruption Volvo Group renounce all form of corruption. It distorts the market, interfere with free competition, violate laws and undermine social development.
Sustainability notes / Impacts, stakeholders and material topics
153
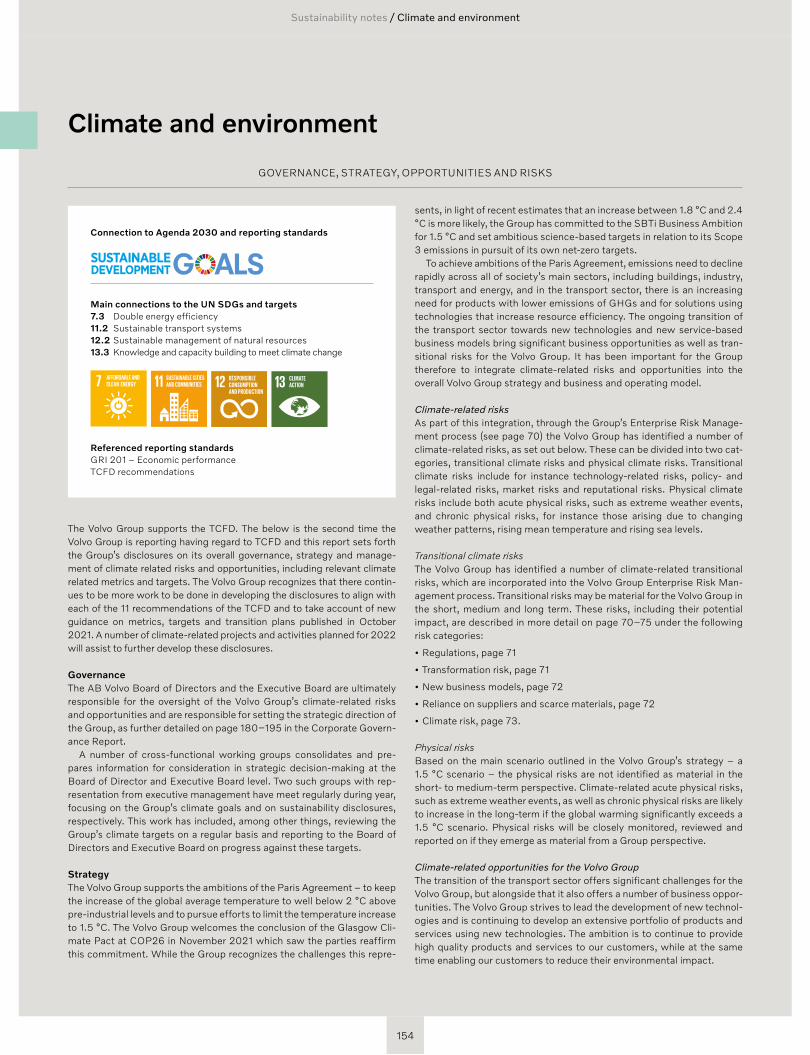
Sustainability notes / Climate and environment
Climate and environment
GOVERNANCE, STRATEGY, OPPORTUNITIES AND RISKS
Connection to Agenda 2030 and reporting standards
Main connections to the UN SDGs and targets7.3 Double energy efficiency11.2 Sustainable transport systems12.2 Sustainable management of natural resources13.3 Knowledge and capacity building to meet climate change
Referenced reporting standards GRI 201 – Economic performanceTCFD recommendations
The Volvo Group supports the TCFD. The below is the second time the Volvo Group is reporting having regard to TCFD and this report sets forth the Group’s disclosures on its overall governance, strategy and manage-ment of climate related risks and opportunities, including relevant climate related metrics and targets. The Volvo Group recognizes that there contin-ues to be more work to be done in developing the disclosures to align with each of the 11 recommendations of the TCFD and to take account of new guidance on metrics, targets and transition plans published in October 2021. A number of climate-related projects and activities planned for 2022 will assist to further develop these disclosures.
GovernanceThe AB Volvo Board of Directors and the Executive Board are ultimately responsible for the oversight of the Volvo Group’s climate-related risks and opportunities and are responsible for setting the strategic direction of the Group, as further detailed on page 180–195 in the Corporate Govern-ance Report.
A number of cross-functional working groups consolidates and pre-pares information for consideration in strategic decision-making at the Board of Director and Executive Board level. Two such groups with rep-resentation from executive management have meet regularly during year, focusing on the Group’s climate goals and on sustainability disclosures, respectively. This work has included, among other things, reviewing the Group’s climate targets on a regular basis and reporting to the Board of Directors and Executive Board on progress against these targets.
StrategyThe Volvo Group supports the ambitions of the Paris Agreement – to keep the increase of the global average temperature to well below 2 °C above pre-industrial levels and to pursue efforts to limit the temperature increase to 1.5 °C. The Volvo Group welcomes the conclusion of the Glasgow Cli-mate Pact at COP26 in November 2021 which saw the parties reaffirm this commitment. While the Group recognizes the challenges this repre-
sents, in light of recent estimates that an increase between 1.8 °C and 2.4 °C is more likely, the Group has committed to the SBTi Business Ambition for 1.5 °C and set ambitious science-based targets in relation to its Scope 3 emissions in pursuit of its own net-zero targets.
To achieve ambitions of the Paris Agreement, emissions need to decline rapidly across all of society’s main sectors, including buildings, industry, transport and energy, and in the transport sector, there is an increasing need for products with lower emissions of GHGs and for solutions using technologies that increase resource efficiency. The ongoing transition of the transport sector towards new technologies and new service-based business models bring significant business opportunities as well as tran-sitional risks for the Volvo Group. It has been important for the Group therefore to integrate climate-related risks and opportunities into the overall Volvo Group strategy and business and operating model.
Climate-related risksAs part of this integration, through the Group’s Enterprise Risk Manage-ment process (see page 70) the Volvo Group has identified a number of climate-related risks, as set out below. These can be divided into two cat-egories, transitional climate risks and physical climate risks. Transitional climate risks include for instance technology-related risks, policy- and legal-related risks, market risks and reputational risks. Physical climate risks include both acute physical risks, such as extreme weather events, and chronic physical risks, for instance those arising due to changing weather patterns, rising mean temperature and rising sea levels.
Transitional climate risks The Volvo Group has identified a number of climate-related transitional risks, which are incorporated into the Volvo Group Enterprise Risk Man-agement process. Transitional risks may be material for the Volvo Group in the short, medium and long term. These risks, including their potential impact, are described in more detail on page 70–75 under the following risk categories:
• Regulations, page 71
• Transformation risk, page 71
• New business models, page 72
• Reliance on suppliers and scarce materials, page 72
• Climate risk, page 73.
Physical risksBased on the main scenario outlined in the Volvo Group’s strategy – a 1.5 °C scenario – the physical risks are not identified as material in the short- to medium-term perspective. Climate-related acute physical risks, such as extreme weather events, as well as chronic physical risks are likely to increase in the long-term if the global warming significantly exceeds a 1.5 °C scenario. Physical risks will be closely monitored, reviewed and reported on if they emerge as material from a Group perspective.
Climate-related opportunities for the Volvo Group The transition of the transport sector offers significant challenges for the Volvo Group, but alongside that it also offers a number of business oppor-tunities. The Volvo Group strives to lead the development of new technol-ogies and is continuing to develop an extensive portfolio of products and services using new technologies. The ambition is to continue to provide high quality products and services to our customers, while at the same time enabling our customers to reduce their environmental impact.
154
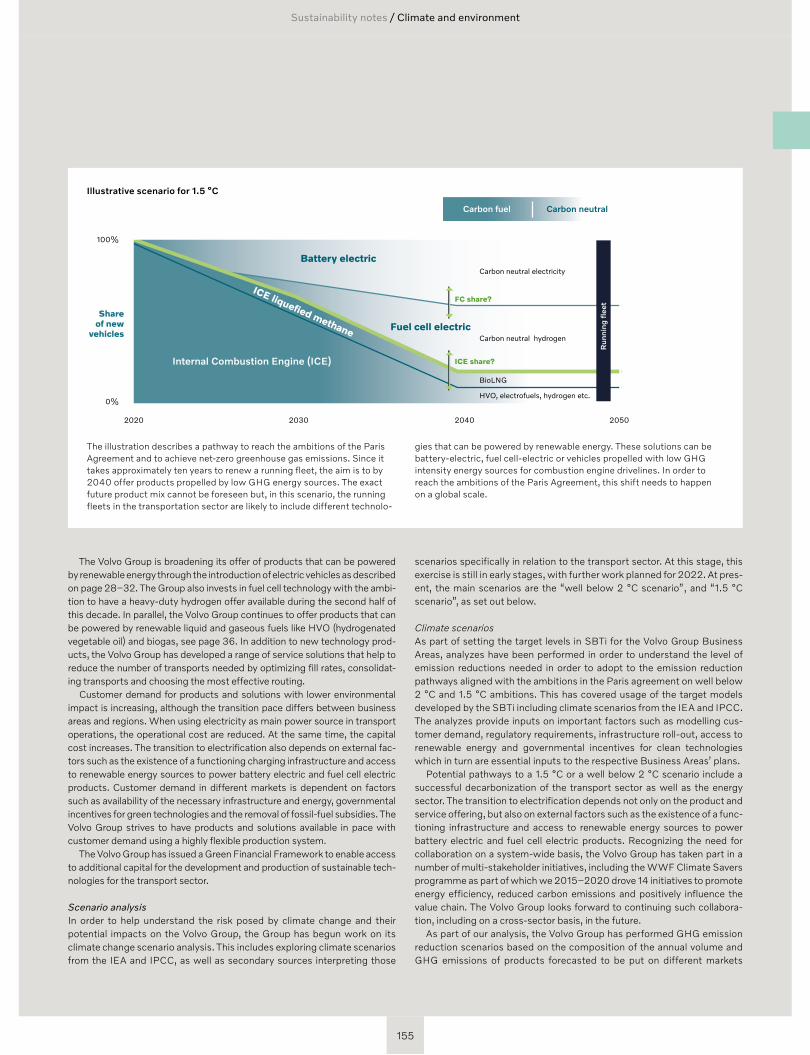
Sustainability notes / Climate and environment
Carbon fuel Carbon neutral
100%
0%
Share of new
vehicles
2030 2040 20502020
Battery electric
Fuel cell electric
FC share?
ICE share?
Carbon neutral electricity
Carbon neutral hydrogen
BioLNG
HVO, electrofuels, hydrogen etc.
Internal Combustion Engine (ICE)
ICE liquefied methane
Run
ning
flee
t
Illustrative scenario for 1.5 °C
The Volvo Group is broadening its offer of products that can be powered by renewable energy through the introduction of electric vehicles as described on page 28–32. The Group also invests in fuel cell technology with the ambi-tion to have a heavy-duty hydrogen offer available during the second half of this decade. In parallel, the Volvo Group continues to offer products that can be powered by renewable liquid and gaseous fuels like HVO (hydrogenated vegetable oil) and biogas, see page 36. In addition to new technology prod-ucts, the Volvo Group has developed a range of service solutions that help to reduce the number of transports needed by optimizing fill rates, consolidat-ing transports and choosing the most effective routing.
Customer demand for products and solutions with lower environmental impact is increasing, although the transition pace differs between business areas and regions. When using electricity as main power source in transport operations, the operational cost are reduced. At the same time, the capital cost increases. The transition to electrification also depends on external fac-tors such as the existence of a functioning charging infrastructure and access to renewable energy sources to power battery electric and fuel cell electric products. Customer demand in different markets is dependent on factors such as availability of the necessary infrastructure and energy, governmental incentives for green technologies and the removal of fossil-fuel subsidies. The Volvo Group strives to have products and solutions available in pace with customer demand using a highly flexible production system.
The Volvo Group has issued a Green Financial Framework to enable access to additional capital for the development and production of sustainable tech-nologies for the transport sector.
Scenario analysisIn order to help understand the risk posed by climate change and their potential impacts on the Volvo Group, the Group has begun work on its climate change scenario analysis. This includes exploring climate scenarios from the IEA and IPCC, as well as secondary sources interpreting those
scenarios specifically in relation to the transport sector. At this stage, this exercise is still in early stages, with further work planned for 2022. At pres-ent, the main scenarios are the “well below 2 °C scenario” , and “1.5 °C scenario” , as set out below.
Climate scenariosAs part of setting the target levels in SBTi for the Volvo Group Business Areas, analyzes have been performed in order to understand the level of emission reductions needed in order to adopt to the emission reduction pathways aligned with the ambitions in the Paris agreement on well below 2 °C and 1.5 °C ambitions. This has covered usage of the target models developed by the SBTi including climate scenarios from the IEA and IPCC. The analyzes provide inputs on important factors such as modelling cus-tomer demand, regulatory requirements, infrastructure roll-out, access to renewable energy and governmental incentives for clean technologies which in turn are essential inputs to the respective Business Areas’ plans.
Potential pathways to a 1.5 °C or a well below 2 °C scenario include a successful decarbonization of the transport sector as well as the energy sector. The transition to electrification depends not only on the product and service offering, but also on external factors such as the existence of a func-tioning infrastructure and access to renewable energy sources to power battery electric and fuel cell electric products. Recognizing the need for collaboration on a system-wide basis, the Volvo Group has taken part in a number of multi-stakeholder initiatives, including the WWF Climate Savers programme as part of which we 2015–2020 drove 14 initiatives to promote energy efficiency, reduced carbon emissions and positively influence the value chain. The Volvo Group looks forward to continuing such collabora-tion, including on a cross-sector basis, in the future.
As part of our analysis, the Volvo Group has performed GHG emission reduction scenarios based on the composition of the annual volume and GHG emissions of products forecasted to be put on different markets
The illustration describes a pathway to reach the ambitions of the Paris Agreement and to achieve net-zero greenhouse gas emissions. Since it takes approximately ten years to renew a running fleet, the aim is to by 2040 offer products propelled by low GHG energy sources. The exact future product mix cannot be foreseen but, in this scenario, the running fleets in the transportation sector are likely to include different technolo-
gies that can be powered by renewable energy. These solutions can be battery-electric, fuel cell-electric or vehicles propelled with low GHG intensity energy sources for combustion engine drivelines. In order to reach the ambitions of the Paris Agreement, this shift needs to happen on a global scale.
155
over time. The Business Areas and Truck Divisions have undertaken sce-nario analyses, including modelling customer demand, regulatory require-ments, infrastructure roll-out, access to renewable energy, governmental incentives for clean technologies, etc. The analysis showed that, without action, the scenario presented risks to us. However, while these would need to be managed, some of these changes also present material opportunities. The results of the analysis have since been fed into the relevant Business Area and Truck Division business strategies to support development and offering of the right mix of products for each respective market over time. This may include electrified products as well as conventional combustion engine products powered by renewable liquid and gaseous fuels.
Financial planningThe Volvo Group’s investment plan includes a technology roadmap to increase zero-emission vehicles or low-emission vehicles that can enable net-zero transport solutions. These include solutions based on electric and hydrogen drivelines as well as sustainable biofuels.
Investments in property, plant and equipment will increase in connec-tion with the Group building up capacity for battery-electric and fuel cell-electric vehicles. However, thanks to the Group’s modular product architecture both electric trucks and trucks with combustion engines can be produced on the same assembly lines, thus limiting the investments needed for this transition in the industrial system.
Many plants that are currently producing components for combustion engines will gradually introduce production of components for electric vehicles. Investments in research and development are accelerated to help customers switch to more sustainable solutions. A substantial part of the investments is already today directed towards products and services based on zero-exhaust emission technology, and we expect this share to increase gradually. However, the actual outcome will depend on several factors, such as technology and infrastructure development, emission regulations, government incentives and customer demand. Read more about sustainable finance on pages 162–163.
Risk managementThe Volvo Group works with a Group-wide Enterprise Risk Management (ERM) process, which is a systematic and structured process to consoli-date and analyze risks and mitigations as well as to follow up on the risks that might impact the Group’s business.
In accordance with the decentralized Volvo Group governance model, each Business Area and Truck Division is accountable for its own risk management. For more information on risk identification and manage-ment, see page 70. Once risks have been identified, Truck Divisions, Busi-ness Areas and Group functions report them in the ERM process using an integrated multi-disciplinary approach. The ERM process includes all types of risks for the Volvo Group, so the processes for identifying, assessing and managing climate and other sustainability related risks are fully integrated into the Volvo Group’s wider risk management.
The risks identified in the ERM process undergo a materiality analysis. The Group recognizes that some externalities impact the business in sev-eral ways and climate change is a good example of this as it poses both long-term strategic risks, for instance as a result of technology shifts and increasing government regulations, and short to medium term risks, for example in relation to customer satisfaction, physical disruptions of the production system and requirements of environmental regulation. The materiality analysis is conducted with internal and external stakeholders, and the risks that are classified as material are risks which can, separately or in combination, have a material adverse effect on the Group’s business, strategy, financial performance, cash flow, shareholder value or reputa-tion. These risks are considered to be the most prominent risk factors for the Volvo Group, see page 70.
Metrics and targetsRecognizing that climate change is one of the biggest challenges of our time, the Volvo Group has set ambitious science-based targets. The cor-nerstone of these targets is the Group’s ambition to achieve net-zero green-house gas emissions by 2040, a key element of which will require the Group to develop ranges that help reduce our customers’ emissions. Devel-oping products and solutions that reduce the GHG footprint of our custom-ers is thus the priority in the Volvo Group climate strategy. In this transition work, the Volvo Group has established several metrics and targets to assess and manage climate related and environmental risks and opportuni-ties in relation to its products and operations.
Focus on scope 3 – use of sold productsThe most significant part of product life-cycle emissions – over 95% – occurs during the use of sold products, when the end-users drive or operate vehicles and machines. Electric vehicle sales and research and development metrics are directly linked to reducing use phase GHG-emissions.
Focus on scope 1 and 2 emissions from own production and operationsEmissions from our own operations and from purchased energy. Targets and ambitions are set to increase energy efficiency for operations and to reduce the carbon intensity of the energy used.
Focus on other scope 3 emissions, risks or opportunitiesEmissions from own transportation and distribution make up a smaller part of the life-cycle impact but is strategically important due to the sector served by the Volvo Group. The Volvo Group works with third party logistics providers to increase the use of efficient transport modes and to reduce unnecessary transports by e.g., increasing fill rates and more efficient routing.
Related information on public policy advocacy is also found on page 178.
Sustainability notes / Climate and environment
156
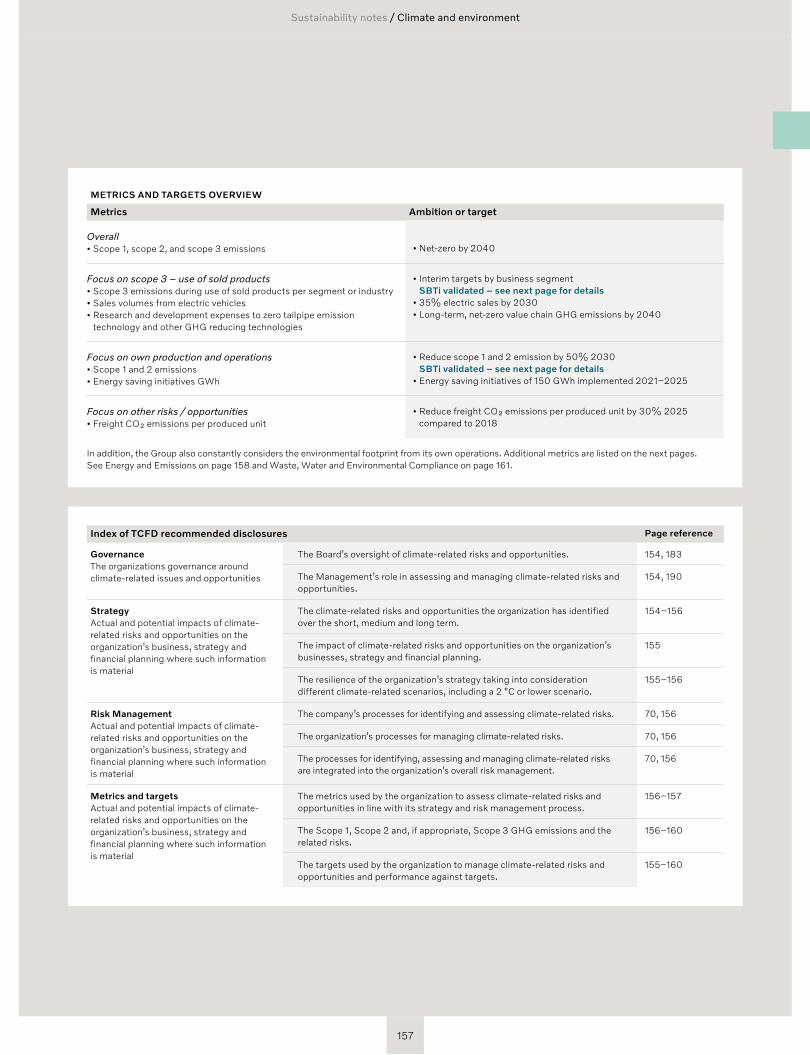
METRICS AND TARGETS OVERVIEW
Metrics Ambition or target
Overall• Scope 1, scope 2, and scope 3 emissions
• Net-zero by 2040
Focus on scope 3 – use of sold products• Scope 3 emissions during use of sold products per segment or industry• Sales volumes from electric vehicles • Research and development expenses to zero tailpipe emission
technology and other GHG reducing technologies
• Interim targets by business segment SBTi validated – see next page for details
• 35% electric sales by 2030• Long-term, net-zero value chain GHG emissions by 2040
Focus on own production and operations• Scope 1 and 2 emissions• Energy saving initiatives GWh
• Reduce scope 1 and 2 emission by 50% 2030 SBTi validated – see next page for details
• Energy saving initiatives of 150 GWh implemented 2021–2025
Focus on other risks / opportunities • Freight CO₂ emissions per produced unit
• Reduce freight CO₂ emissions per produced unit by 30% 2025 compared to 2018
In addition, the Group also constantly considers the environmental footprint from its own operations. Additional metrics are listed on the next pages. See Energy and Emissions on page 158 and Waste, Water and Environmental Compliance on page 161.
Index of TCFD recommended disclosures Page reference
GovernanceThe organizations governance around climate-related issues and opportunities
The Board’s oversight of climate-related risks and opportunities. 154, 183
The Management’s role in assessing and managing climate-related risks and opportunities.
154, 190
Strategy Actual and potential impacts of climate- related risks and opportunities on the organization’s business, strategy and financial planning where such information is material
The climate-related risks and opportunities the organization has identified over the short, medium and long term.
154–156
The impact of climate-related risks and opportunities on the organization’s businesses, strategy and financial planning.
155
The resilience of the organization’s strategy taking into consideration different climate-related scenarios, including a 2 °C or lower scenario.
155–156
Risk Management Actual and potential impacts of climate- related risks and opportunities on the organization’s business, strategy and financial planning where such information is material
The company’s processes for identifying and assessing climate- related risks. 70, 156
The organization’s processes for managing climate-related risks. 70, 156
The processes for identifying, assessing and managing climate-related risks are integrated into the organization’s overall risk management.
70, 156
Metrics and targetsActual and potential impacts of climate- related risks and opportunities on the organization’s business, strategy and financial planning where such information is material
The metrics used by the organization to assess climate-related risks and opportunities in line with its strategy and risk management process.
156–157
The Scope 1, Scope 2 and, if appropriate, Scope 3 GHG emissions and the related risks.
156–160
The targets used by the organization to manage climate-related risks and opportunities and performance against targets.
155–160
Sustainability notes / Climate and environment
157
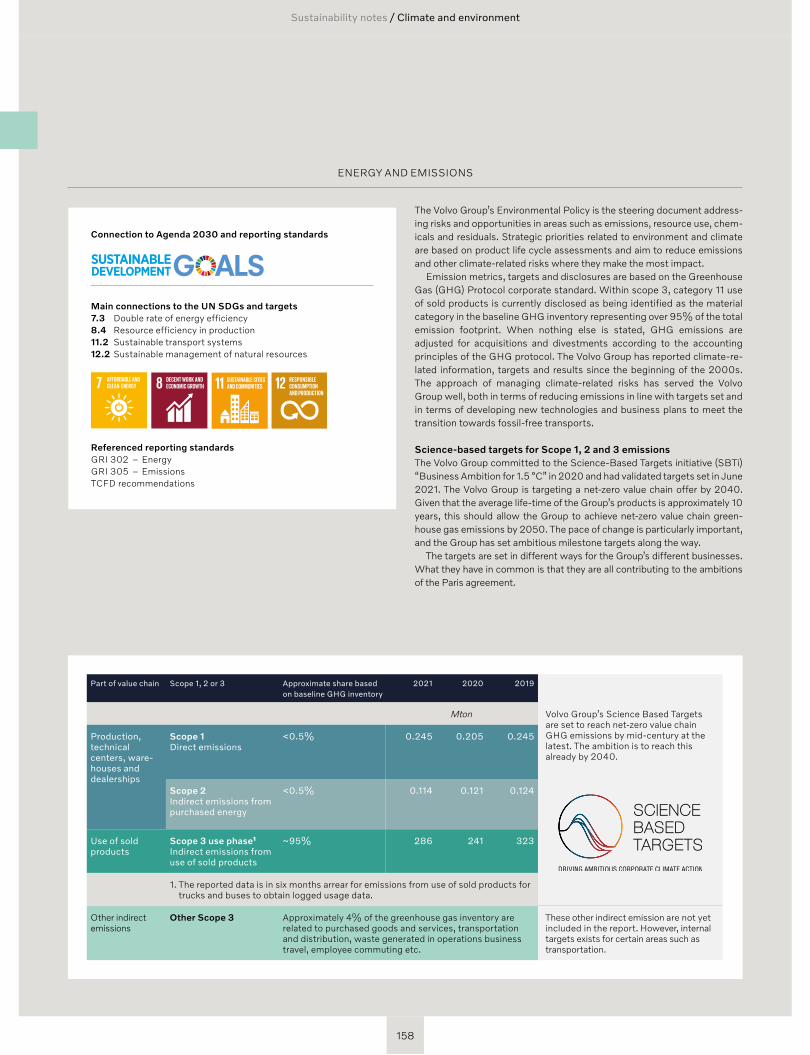
ENERGY AND EMISSIONS
Connection to Agenda 2030 and reporting standards
Main connections to the UN SDGs and targets7.3 Double rate of energy efficiency8.4 Resource efficiency in production11.2 Sustainable transport systems12.2 Sustainable management of natural resources
Referenced reporting standards GRI 302 – EnergyGRI 305 – EmissionsTCFD recommendations
The Volvo Group’s Environmental Policy is the steering document address-ing risks and opportunities in areas such as emissions, resource use, chem-icals and residuals. Strategic priorities related to environment and climate are based on product life cycle assessments and aim to reduce emissions and other climate-related risks where they make the most impact.
Emission metrics, targets and disclosures are based on the Greenhouse Gas (GHG) Protocol corporate standard. Within scope 3, category 11 use of sold products is currently disclosed as being identified as the material category in the baseline GHG inventory representing over 95% of the total emission footprint. When nothing else is stated, GHG emissions are adjusted for acquisitions and divestments according to the accounting principles of the GHG protocol. The Volvo Group has reported climate-re-lated information, targets and results since the beginning of the 2000s. The approach of managing climate-related risks has served the Volvo Group well, both in terms of reducing emissions in line with targets set and in terms of developing new technologies and business plans to meet the transition towards fossil-free transports.
Science-based targets for Scope 1, 2 and 3 emissionsThe Volvo Group committed to the Science-Based Targets initiative (SBTi) “Business Ambition for 1.5 °C” in 2020 and had validated targets set in June 2021. The Volvo Group is targeting a net-zero value chain offer by 2040. Given that the average life-time of the Group’s products is approximately 10 years, this should allow the Group to achieve net-zero value chain green-house gas emissions by 2050. The pace of change is particularly important, and the Group has set ambitious milestone targets along the way.
The targets are set in different ways for the Group’s different businesses. What they have in common is that they are all contributing to the ambitions of the Paris agreement.
Part of value chain Scope 1, 2 or 3 Approximate share based on baseline GHG inventory
2021 2020 2019
Mton Volvo Group’s Science Based Targets are set to reach net-zero value chain GHG emissions by mid-century at the latest. The ambition is to reach this already by 2040.
Production, technical centers, ware-houses and dealerships
Scope 1Direct emissions
<0.5% 0.245 0.205 0.245
Scope 2Indirect emissions from purchased energy
<0.5% 0.114 0.121 0.124
Use of sold products
Scope 3 use phase¹Indirect emissions from use of sold products
~95% 286 241 323
1. The reported data is in six months arrear for emissions from use of sold products for trucks and buses to obtain logged usage data.
Other indirect emissions
Other Scope 3 Approximately 4% of the greenhouse gas inventory are related to purchased goods and services, transportation and distribution, waste generated in operations business travel, employee commuting etc.
These other indirect emission are not yet included in the report. However, internal targets exists for certain areas such as transportation.
Sustainability notes / Climate and environment
158
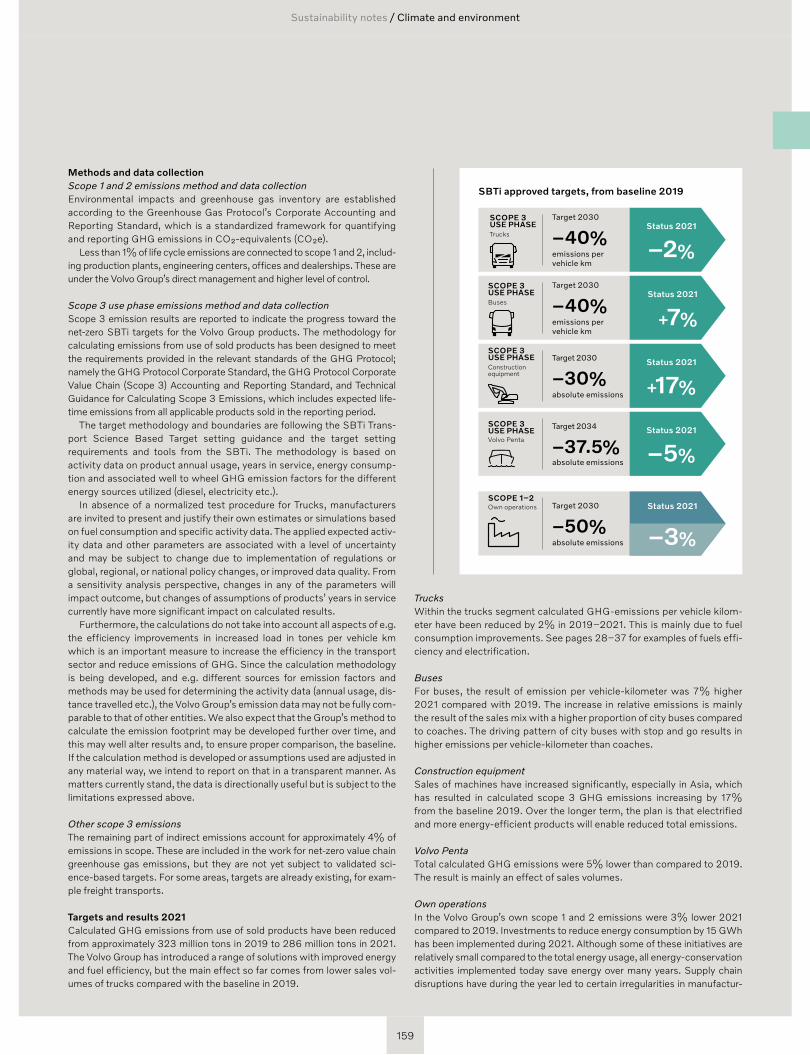
Methods and data collectionScope 1 and 2 emissions method and data collectionEnvironmental impacts and greenhouse gas inventory are established according to the Greenhouse Gas Protocol’s Corporate Accounting and Reporting Standard, which is a standardized framework for quantifying and reporting GHG emissions in CO₂-equivalents (CO₂e).
Less than 1% of life cycle emissions are connected to scope 1 and 2, includ-ing production plants, engineering centers, offices and dealerships. These are under the Volvo Group’s direct management and higher level of control.
Scope 3 use phase emissions method and data collectionScope 3 emission results are reported to indicate the progress toward the net-zero SBTi targets for the Volvo Group products. The methodology for calculating emissions from use of sold products has been designed to meet the requirements provided in the relevant standards of the GHG Protocol; namely the GHG Protocol Corporate Standard, the GHG Protocol Corporate Value Chain (Scope 3) Accounting and Reporting Standard, and Technical Guidance for Calculating Scope 3 Emissions, which includes expected life-time emissions from all applicable products sold in the reporting period.
The target methodology and boundaries are following the SBTi Trans-port Science Based Target setting guidance and the target setting requirements and tools from the SBTi. The methodology is based on activity data on product annual usage, years in service, energy consump-tion and associated well to wheel GHG emission factors for the different energy sources utilized (diesel, electricity etc.).
In absence of a normalized test procedure for Trucks, manufacturers are invited to present and justify their own estimates or simulations based on fuel consumption and specific activity data. The applied expected activ-ity data and other parameters are associated with a level of uncertainty and may be subject to change due to implementation of regulations or global, regional, or national policy changes, or improved data quality. From a sensitivity analysis perspective, changes in any of the parameters will impact outcome, but changes of assumptions of products’ years in service currently have more significant impact on calculated results.
Furthermore, the calculations do not take into account all aspects of e.g. the efficiency improvements in increased load in tones per vehicle km which is an important measure to increase the efficiency in the transport sector and reduce emissions of GHG. Since the calculation methodology is being developed, and e.g. different sources for emission factors and methods may be used for determining the activity data (annual usage, dis-tance travelled etc.), the Volvo Group’s emission data may not be fully com-parable to that of other entities. We also expect that the Group’s method to calculate the emission footprint may be developed further over time, and this may well alter results and, to ensure proper comparison, the baseline. If the calculation method is developed or assumptions used are adjusted in any material way, we intend to report on that in a transparent manner. As matters currently stand, the data is directionally useful but is subject to the limitations expressed above.
Other scope 3 emissionsThe remaining part of indirect emissions account for approximately 4% of emissions in scope. These are included in the work for net-zero value chain greenhouse gas emissions, but they are not yet subject to validated sci-ence-based targets. For some areas, targets are already existing, for exam-ple freight transports.
Targets and results 2021Calculated GHG emissions from use of sold products have been reduced from approximately 323 million tons in 2019 to 286 million tons in 2021. The Volvo Group has introduced a range of solutions with improved energy and fuel efficiency, but the main effect so far comes from lower sales vol-umes of trucks compared with the baseline in 2019.
SBTi approved targets, from baseline 2019
Status 2021
–3%
Target 2030
–50%absolute emissions
SCOPE 1–2 Own operations
Status 2021
+7%
Target 2030
–40%emissions per vehicle km
Status 2021
+17%
Target 2030
–30%absolute emissions
SCOPE 3 USE PHASE Construction equipment
Status 2021
–5%
Target 2034
–37.5%absolute emissions
SCOPE 3 USE PHASE Volvo Penta
Status 2021
–2%
Target 2030
–40%emissions per vehicle km
SCOPE 3 USE PHASE Trucks
SCOPE 3 USE PHASE Buses
TrucksWithin the trucks segment calculated GHG-emissions per vehicle kilom-eter have been reduced by 2% in 2019–2021. This is mainly due to fuel consumption improvements. See pages 28–37 for examples of fuels effi-ciency and electrification.
BusesFor buses, the result of emission per vehicle-kilometer was 7% higher 2021 compared with 2019. The increase in relative emissions is mainly the result of the sales mix with a higher proportion of city buses compared to coaches. The driving pattern of city buses with stop and go results in higher emissions per vehicle-kilometer than coaches.
Construction equipment Sales of machines have increased significantly, especially in Asia, which has resulted in calculated scope 3 GHG emissions increasing by 17% from the baseline 2019. Over the longer term, the plan is that electrified and more energy-efficient products will enable reduced total emissions.
Volvo Penta Total calculated GHG emissions were 5% lower than compared to 2019. The result is mainly an effect of sales volumes.
Own operations In the Volvo Group’s own scope 1 and 2 emissions were 3% lower 2021 compared to 2019. Investments to reduce energy consumption by 15 GWh has been implemented during 2021. Although some of these initiatives are relatively small compared to the total energy usage, all energy-conservation activities implemented today save energy over many years. Supply chain disruptions have during the year led to certain irregularities in manufactur-
Sustainability notes / Climate and environment
159
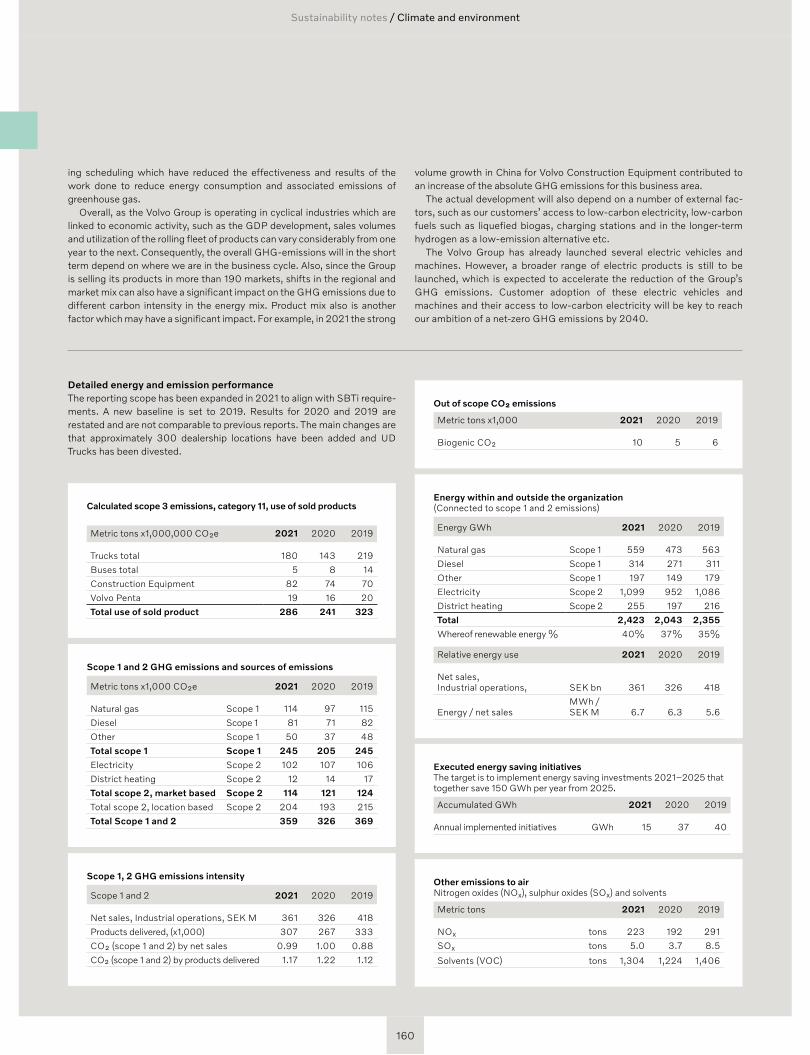
Detailed energy and emission performanceThe reporting scope has been expanded in 2021 to align with SBTi require-ments. A new baseline is set to 2019. Results for 2020 and 2019 are restated and are not comparable to previous reports. The main changes are that approximately 300 dealership locations have been added and UD Trucks has been divested.
Calculated scope 3 emissions, category 11, use of sold products
Metric tons x1,000,000 CO₂e 2021 2020 2019
Trucks total 180 143 219
Buses total 5 8 14
Construction Equipment 82 74 70
Volvo Penta 19 16 20
Total use of sold product 286 241 323
Scope 1 and 2 GHG emissions and sources of emissions
Metric tons x1,000 CO₂e 2021 2020 2019
Natural gas Scope 1 114 97 115
Diesel Scope 1 81 71 82
Other Scope 1 50 37 48
Total scope 1 Scope 1 245 205 245
Electricity Scope 2 102 107 106
District heating Scope 2 12 14 17
Total scope 2, market based Scope 2 114 121 124
Total scope 2, location based Scope 2 204 193 215
Total Scope 1 and 2 359 326 369
Scope 1, 2 GHG emissions intensity
Scope 1 and 2 2021 2020 2019
Net sales, Industrial operations, SEK M 361 326 418
Products delivered, (x1,000) 307 267 333
CO₂ (scope 1 and 2) by net sales 0.99 1.00 0.88
CO₂ (scope 1 and 2) by products delivered 1.17 1.22 1.12
ing scheduling which have reduced the effectiveness and results of the work done to reduce energy consumption and associated emissions of greenhouse gas.
Overall, as the Volvo Group is operating in cyclical industries which are linked to economic activity, such as the GDP development, sales volumes and utilization of the rolling fleet of products can vary considerably from one year to the next. Consequently, the overall GHG-emissions will in the short term depend on where we are in the business cycle. Also, since the Group is selling its products in more than 190 markets, shifts in the regional and market mix can also have a significant impact on the GHG emissions due to different carbon intensity in the energy mix. Product mix also is another factor which may have a significant impact. For example, in 2021 the strong
volume growth in China for Volvo Construction Equipment contributed to an increase of the absolute GHG emissions for this business area.
The actual development will also depend on a number of external fac-tors, such as our customers’ access to low-carbon electricity, low-carbon fuels such as liquefied biogas, charging stations and in the longer-term hydrogen as a low-emission alternative etc.
The Volvo Group has already launched several electric vehicles and machines. However, a broader range of electric products is still to be launched, which is expected to accelerate the reduction of the Group’s GHG emissions. Customer adoption of these electric vehicles and machines and their access to low-carbon electricity will be key to reach our ambition of a net-zero GHG emissions by 2040.
Out of scope CO₂ emissions
Metric tons x1,000 2021 2020 2019
Biogenic CO₂ 10 5 6
Energy within and outside the organization (Connected to scope 1 and 2 emissions)
Energy GWh 2021 2020 2019
Natural gas Scope 1 559 473 563
Diesel Scope 1 314 271 311
Other Scope 1 197 149 179
Electricity Scope 2 1,099 952 1,086
District heating Scope 2 255 197 216
Total 2,423 2,043 2,355
Whereof renewable energy % 40% 37% 35%
Relative energy use 2021 2020 2019
Net sales, Industrial operations, SEK bn 361 326 418
Energy / net salesMWh /SEK M 6.7 6.3 5.6
Executed energy saving initiatives The target is to implement energy saving investments 2021–2025 that together save 150 GWh per year from 2025.
Accumulated GWh 2021 2020 2019
Annual implemented initiatives GWh 15 37 40
Other emissions to airNitrogen oxides (NOX), sulphur oxides (SOX) and solvents
Metric tons 2021 2020 2019
NOX tons 223 192 291
SOX tons 5.0 3.7 8.5
Solvents (VOC) tons 1,304 1,224 1,406
Sustainability notes / Climate and environment
160
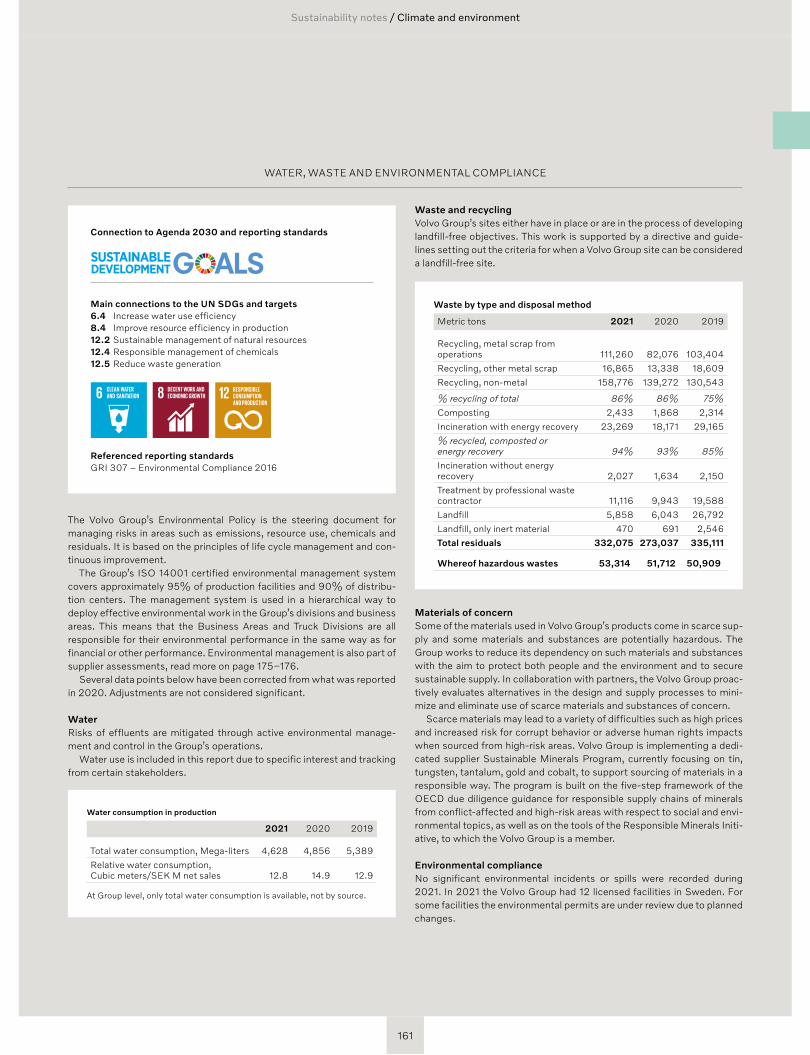
WATER, WASTE AND ENVIRONMENTAL COMPLIANCE
Connection to Agenda 2030 and reporting standards
Main connections to the UN SDGs and targets6.4 Increase water use efficiency8.4 Improve resource efficiency in production 12.2 Sustainable management of natural resources12.4 Responsible management of chemicals12.5 Reduce waste generation
Referenced reporting standards GRI 307 – Environmental Compliance 2016
The Volvo Group’s Environmental Policy is the steering document for managing risks in areas such as emissions, resource use, chemicals and residuals. It is based on the principles of life cycle management and con-tinuous improvement.
The Group’s ISO 14001 certified environmental management system covers approximately 95% of production facilities and 90% of distribu-tion centers. The management system is used in a hierarchical way to deploy effective environmental work in the Group’s divisions and business areas. This means that the Business Areas and Truck Divisions are all responsible for their environmental performance in the same way as for financial or other performance. Environmental management is also part of supplier assessments, read more on page 175–176.
Several data points below have been corrected from what was reported in 2020. Adjustments are not considered significant.
WaterRisks of effluents are mitigated through active environmental manage-ment and control in the Group’s operations.
Water use is included in this report due to specific interest and tracking from certain stakeholders.
Water consumption in production
2021 2020 2019
Total water consumption, Mega-liters 4,628 4,856 5,389
Relative water consumption,Cubic meters/SEK M net sales 12.8 14.9 12.9
At Group level, only total water consumption is available, not by source.
Waste and recycling Volvo Group’s sites either have in place or are in the process of developing landfill-free objectives. This work is supported by a directive and guide-lines setting out the criteria for when a Volvo Group site can be considered a landfill-free site.
Waste by type and disposal method
Metric tons 2021 2020 2019
Recycling, metal scrap from operations 111,260 82,076 103,404
Recycling, other metal scrap 16,865 13,338 18,609
Recycling, non-metal 158,776 139,272 130,543
% recycling of total 86% 86% 75%
Composting 2,433 1,868 2,314
Incineration with energy recovery 23,269 18,171 29,165
% recycled, composted or energy recovery 94% 93% 85%
Incineration without energy recovery 2,027 1,634 2,150
Treatment by professional waste contractor 11,116 9,943 19,588
Landfill 5,858 6,043 26,792
Landfill, only inert material 470 691 2,546
Total residuals 332,075 273,037 335,111
Whereof hazardous wastes 53,314 51,712 50,909
Materials of concern Some of the materials used in Volvo Group’s products come in scarce sup-ply and some materials and substances are potentially hazardous. The Group works to reduce its dependency on such materials and substances with the aim to protect both people and the environment and to secure sustainable supply. In collaboration with partners, the Volvo Group proac-tively evaluates alternatives in the design and supply processes to mini-mize and eliminate use of scarce materials and substances of concern.
Scarce materials may lead to a variety of difficulties such as high prices and increased risk for corrupt behavior or adverse human rights impacts when sourced from high-risk areas. Volvo Group is implementing a dedi-cated supplier Sustainable Minerals Program, currently focusing on tin, tungsten, tantalum, gold and cobalt, to support sourcing of materials in a responsible way. The program is built on the five-step framework of the OECD due diligence guidance for responsible supply chains of minerals from conflict- affected and high-risk areas with respect to social and envi-ronmental topics, as well as on the tools of the Responsible Minerals Initi-ative, to which the Volvo Group is a member.
Environmental complianceNo significant environmental incidents or spills were recorded during 2021. In 2021 the Volvo Group had 12 licensed facilities in Sweden. For some facilities the environmental permits are under review due to planned changes.
Sustainability notes / Climate and environment
161
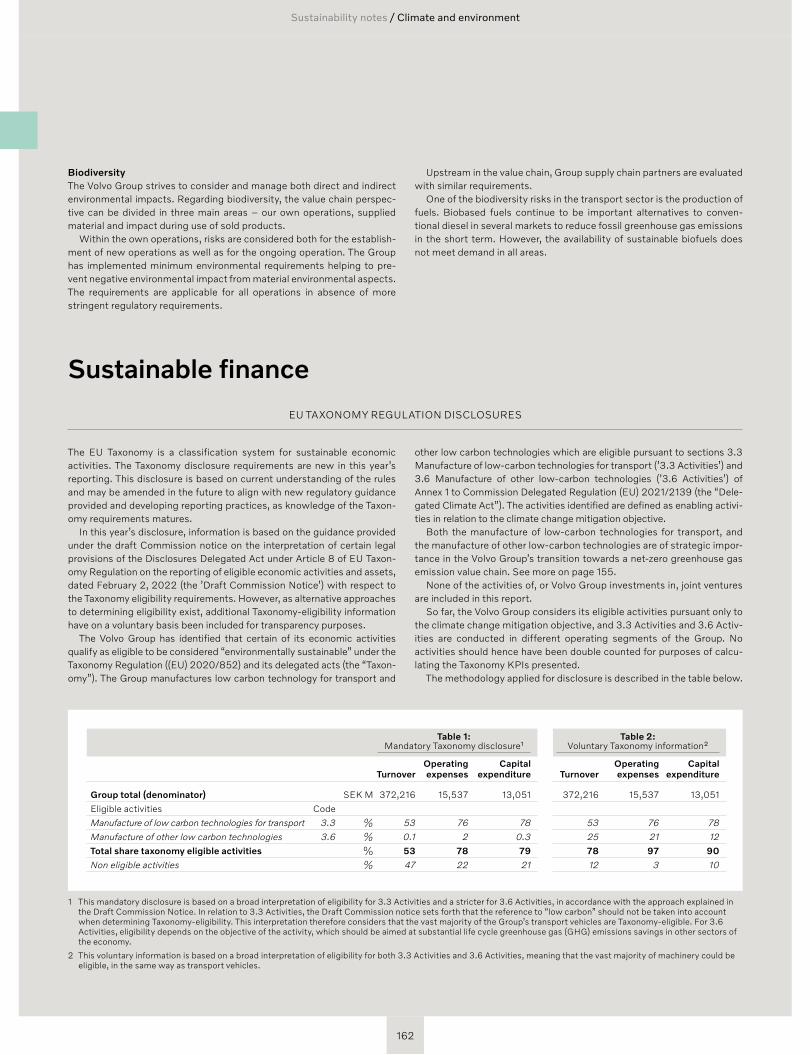
Sustainability notes / Climate and environment
The EU Taxonomy is a classification system for sustainable economic activities. The Taxonomy disclosure requirements are new in this year’s reporting. This disclosure is based on current understanding of the rules and may be amended in the future to align with new regulatory guidance provided and developing reporting practices, as knowledge of the Taxon-omy requirements matures.
In this year’s disclosure, information is based on the guidance provided under the draft Commission notice on the interpretation of certain legal provisions of the Disclosures Delegated Act under Article 8 of EU Taxon-omy Regulation on the reporting of eligible economic activities and assets, dated February 2, 2022 (the ’Draft Commission Notice’) with respect to the Taxonomy eligibility requirements. However, as alternative approaches to determining eligibility exist, additional Taxonomy-eligibility information have on a voluntary basis been included for transparency purposes.
The Volvo Group has identified that certain of its economic activities qualify as eligible to be considered “environmentally sustainable” under the Taxonomy Regulation ((EU) 2020/852) and its delegated acts (the “Taxon-omy”). The Group manufactures low carbon technology for transport and
other low carbon technologies which are eligible pursuant to sections 3.3 Manufacture of low-carbon technologies for transport (’3.3 Activities’) and 3.6 Manufacture of other low-carbon technologies (’3.6 Activities’) of Annex 1 to Commission Delegated Regulation (EU) 2021/2139 (the “Dele-gated Climate Act”). The activities identified are defined as enabling activi-ties in relation to the climate change mitigation objective.
Both the manufacture of low-carbon technologies for transport, and the manufacture of other low-carbon technologies are of strategic impor-tance in the Volvo Group’s transition towards a net-zero greenhouse gas emission value chain. See more on page 155.
None of the activities of, or Volvo Group investments in, joint ventures are included in this report.
So far, the Volvo Group considers its eligible activities pursuant only to the climate change mitigation objective, and 3.3 Activities and 3.6 Activ-ities are conducted in different operating segments of the Group. No activities should hence have been double counted for purposes of calcu-lating the Taxonomy KPIs presented.
The methodology applied for disclosure is described in the table below.
Sustainable finance
EU TAXONOMY REGULATION DISCLOSURES
BiodiversityThe Volvo Group strives to consider and manage both direct and indirect environmental impacts. Regarding biodiversity, the value chain perspec-tive can be divided in three main areas – our own operations, supplied material and impact during use of sold products.
Within the own operations, risks are considered both for the establish-ment of new operations as well as for the ongoing operation. The Group has implemented minimum environmental requirements helping to pre-vent negative environmental impact from material environmental aspects. The requirements are applicable for all operations in absence of more stringent regulatory requirements.
Upstream in the value chain, Group supply chain partners are evaluated with similar requirements.
One of the biodiversity risks in the transport sector is the production of fuels. Biobased fuels continue to be important alternatives to conven-tional diesel in several markets to reduce fossil greenhouse gas emissions in the short term. However, the availability of sustainable biofuels does not meet demand in all areas.
Table 1: Mandatory Taxonomy disclosure¹
Table 2: Voluntary Taxonomy information²
TurnoverOperating expenses
Capital expenditure Turnover
Operating expenses
Capital expenditure
Group total (denominator) SEK M 372,216 15,537 13,051 372,216 15,537 13,051
Eligible activities Code
Manufacture of low carbon technologies for transport 3.3 % 53 76 78 53 76 78
Manufacture of other low carbon technologies 3.6 % 0.1 2 0.3 25 21 12
Total share taxonomy eligible activities % 53 78 79 78 97 90
Non eligible activities % 47 22 21 12 3 10
1 This mandatory disclosure is based on a broad interpretation of eligibility for 3.3 Activities and a stricter for 3.6 Activities, in accordance with the approach explained in the Draft Commission Notice. In relation to 3.3 Activities, the Draft Commission notice sets forth that the reference to “low carbon” should not be taken into account when determining Taxonomy-eligibility. This interpretation therefore considers that the vast majority of the Group’s transport vehicles are Taxonomy-eligible. For 3.6 Activities, eligibility depends on the objective of the activity, which should be aimed at substantial life cycle greenhouse gas (GHG) emissions savings in other sectors of the economy.
2 This voluntary information is based on a broad interpretation of eligibility for both 3.3 Activities and 3.6 Activities, meaning that the vast majority of machinery could be eligible, in the same way as transport vehicles.
162
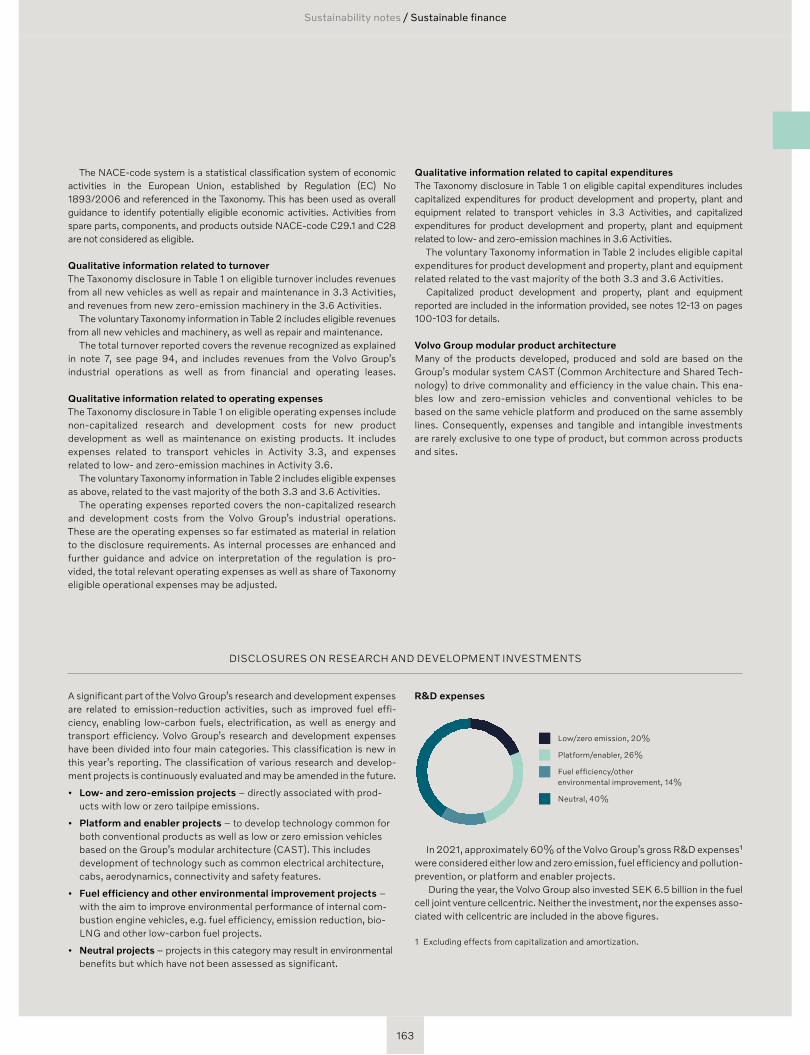
Sustainability notes / Sustainable finance
DISCLOSURES ON RESEARCH AND DEVELOPMENT INVESTMENTS
A significant part of the Volvo Group’s research and development expenses are related to emission-reduction activities, such as improved fuel effi-ciency, enabling low-carbon fuels, electrification, as well as energy and transport efficiency. Volvo Group’s research and development expenses have been divided into four main categories. This classification is new in this year’s reporting. The classification of various research and develop-ment projects is continuously evaluated and may be amended in the future.
• Low- and zero-emission projects – directly associated with prod-ucts with low or zero tailpipe emissions.
• Platform and enabler projects – to develop technology common for both conventional products as well as low or zero emission vehicles based on the Group’s modular architecture (CAST). This includes development of technology such as common electrical architecture, cabs, aerodynamics, connectivity and safety features.
• Fuel efficiency and other environmental improvement projects – with the aim to improve environmental performance of internal com-bustion engine vehicles, e.g. fuel efficiency, emission reduction, bio-LNG and other low-carbon fuel projects.
• Neutral projects – projects in this category may result in environmental benefits but which have not been assessed as significant.
In 2021, approximately 60% of the Volvo Group’s gross R&D expenses¹ were considered either low and zero emission, fuel efficiency and pollution- prevention, or platform and enabler projects.
During the year, the Volvo Group also invested SEK 6.5 billion in the fuel cell joint venture cellcentric. Neither the investment, nor the expenses asso-ciated with cellcentric are included in the above figures.
1 Excluding effects from capitalization and amortization.
Low/zero emission, 20%
Platform/enabler, 26%
Fuel efficiency/other environmental improvement, 14%
Neutral, 40%
R&D expenses
The NACE-code system is a statistical classification system of economic activities in the European Union, established by Regulation (EC) No 1893/2006 and referenced in the Taxonomy. This has been used as overall guidance to identify potentially eligible economic activities. Activities from spare parts, components, and products outside NACE-code C29.1 and C28 are not considered as eligible.
Qualitative information related to turnoverThe Taxonomy disclosure in Table 1 on eligible turnover includes revenues from all new vehicles as well as repair and maintenance in 3.3 Activities, and revenues from new zero-emission machinery in the 3.6 Activities.
The voluntary Taxonomy information in Table 2 includes eligible revenues from all new vehicles and machinery, as well as repair and maintenance.
The total turnover reported covers the revenue recognized as explained in note 7, see page 94, and includes revenues from the Volvo Group’s industrial operations as well as from financial and operating leases.
Qualitative information related to operating expenses The Taxonomy disclosure in Table 1 on eligible operating expenses include non-capitalized research and development costs for new product development as well as maintenance on existing products. It includes expenses related to transport vehicles in Activity 3.3, and expenses related to low- and zero-emission machines in Activity 3.6.
The voluntary Taxonomy information in Table 2 includes eligible expenses as above, related to the vast majority of the both 3.3 and 3.6 Activities.
The operating expenses reported covers the non-capitalized research and development costs from the Volvo Group’s industrial operations. These are the operating expenses so far estimated as material in relation to the disclosure requirements. As internal processes are enhanced and further guidance and advice on interpretation of the regulation is pro-vided, the total relevant operating expenses as well as share of Taxonomy eligible operational expenses may be adjusted.
Qualitative information related to capital expendituresThe Taxonomy disclosure in Table 1 on eligible capital expenditures includes capitalized expenditures for product development and property, plant and equipment related to transport vehicles in 3.3 Activities, and capitalized expenditures for product development and property, plant and equipment related to low- and zero-emission machines in 3.6 Activities.
The voluntary Taxonomy information in Table 2 includes eligible capital expenditures for product development and property, plant and equipment related related to the vast majority of the both 3.3 and 3.6 Activities.
Capitalized product development and property, plant and equipment reported are included in the information provided, see notes 12-13 on pages 100-103 for details.
Volvo Group modular product architecture Many of the products developed, produced and sold are based on the Group’s modular system CAST (Common Architecture and Shared Tech-nology) to drive commonality and efficiency in the value chain. This ena-bles low and zero-emission vehicles and conventional vehicles to be based on the same vehicle platform and produced on the same assembly lines. Consequently, expenses and tangible and intangible investments are rarely exclusive to one type of product, but common across products and sites.
163
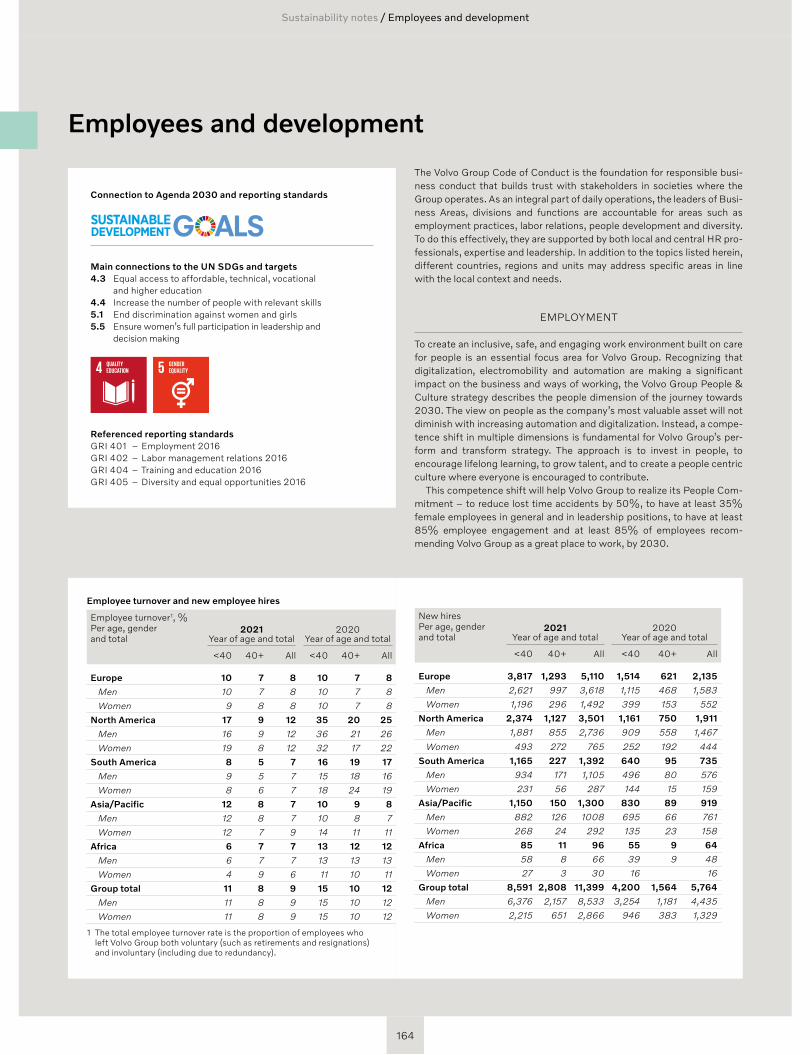
Employees and development
Connection to Agenda 2030 and reporting standards
Main connections to the UN SDGs and targets4.3 Equal access to affordable, technical, vocational
and higher education4.4 Increase the number of people with relevant skills5.1 End discrimination against women and girls5.5 Ensure women’s full participation in leadership and decision making
Referenced reporting standards GRI 401 – Employment 2016GRI 402 – Labor management relations 2016GRI 404 – Training and education 2016GRI 405 – Diversity and equal opportunities 2016
The Volvo Group Code of Conduct is the foundation for responsible busi-ness conduct that builds trust with stakeholders in societies where the Group operates. As an integral part of daily operations, the leaders of Busi-ness Areas, divisions and functions are accountable for areas such as employment practices, labor relations, people development and diversity. To do this effectively, they are supported by both local and central HR pro-fessionals, expertise and leadership. In addition to the topics listed herein, different countries, regions and units may address specific areas in line with the local context and needs.
EMPLOYMENT
To create an inclusive, safe, and engaging work environment built on care for people is an essential focus area for Volvo Group. Recognizing that digitalization, electromobility and automation are making a significant impact on the business and ways of working, the Volvo Group People & Culture strategy describes the people dimension of the journey towards 2030. The view on people as the company’s most valuable asset will not diminish with increasing automation and digitalization. Instead, a compe-tence shift in multiple dimensions is fundamental for Volvo Group’s per-form and transform strategy. The approach is to invest in people, to encourage lifelong learning, to grow talent, and to create a people centric culture where everyone is encouraged to contribute.
This competence shift will help Volvo Group to realize its People Com-mitment – to reduce lost time accidents by 50%, to have at least 35% female employees in general and in leadership positions, to have at least 85% employee engagement and at least 85% of employees recom-mending Volvo Group as a great place to work, by 2030.
Employee turnover and new employee hires
Employee turnover1, % Per age, gender and total
2021 Year of age and total
2020 Year of age and total
<40 40+ All <40 40+ All
Europe 10 7 8 10 7 8
Men 10 7 8 10 7 8
Women 9 8 8 10 7 8
North America 17 9 12 35 20 25
Men 16 9 12 36 21 26
Women 19 8 12 32 17 22
South America 8 5 7 16 19 17
Men 9 5 7 15 18 16
Women 8 6 7 18 24 19
Asia/Pacific 12 8 7 10 9 8
Men 12 8 7 10 8 7
Women 12 7 9 14 11 11
Africa 6 7 7 13 12 12
Men 6 7 7 13 13 13
Women 4 9 6 11 10 11
Group total 11 8 9 15 10 12
Men 11 8 9 15 10 12
Women 11 8 9 15 10 12
1 The total employee turnover rate is the proportion of employees who left Volvo Group both voluntary (such as retirements and resignations) and involuntary (including due to redundancy).
New hires Per age, gender and total
2021 Year of age and total
2020 Year of age and total
<40 40+ All <40 40+ All
Europe 3,817 1,293 5,110 1,514 621 2,135
Men 2,621 997 3,618 1,115 468 1,583
Women 1,196 296 1,492 399 153 552
North America 2,374 1,127 3,501 1,161 750 1,911
Men 1,881 855 2,736 909 558 1,467
Women 493 272 765 252 192 444
South America 1,165 227 1,392 640 95 735
Men 934 171 1,105 496 80 576
Women 231 56 287 144 15 159
Asia/Pacific 1,150 150 1,300 830 89 919
Men 882 126 1008 695 66 761
Women 268 24 292 135 23 158
Africa 85 11 96 55 9 64
Men 58 8 66 39 9 48
Women 27 3 30 16 16
Group total 8,591 2,808 11,399 4,200 1,564 5,764
Men 6,376 2,157 8,533 3,254 1,181 4,435
Women 2,215 651 2,866 946 383 1,329
Sustainability notes / Employees and development
164
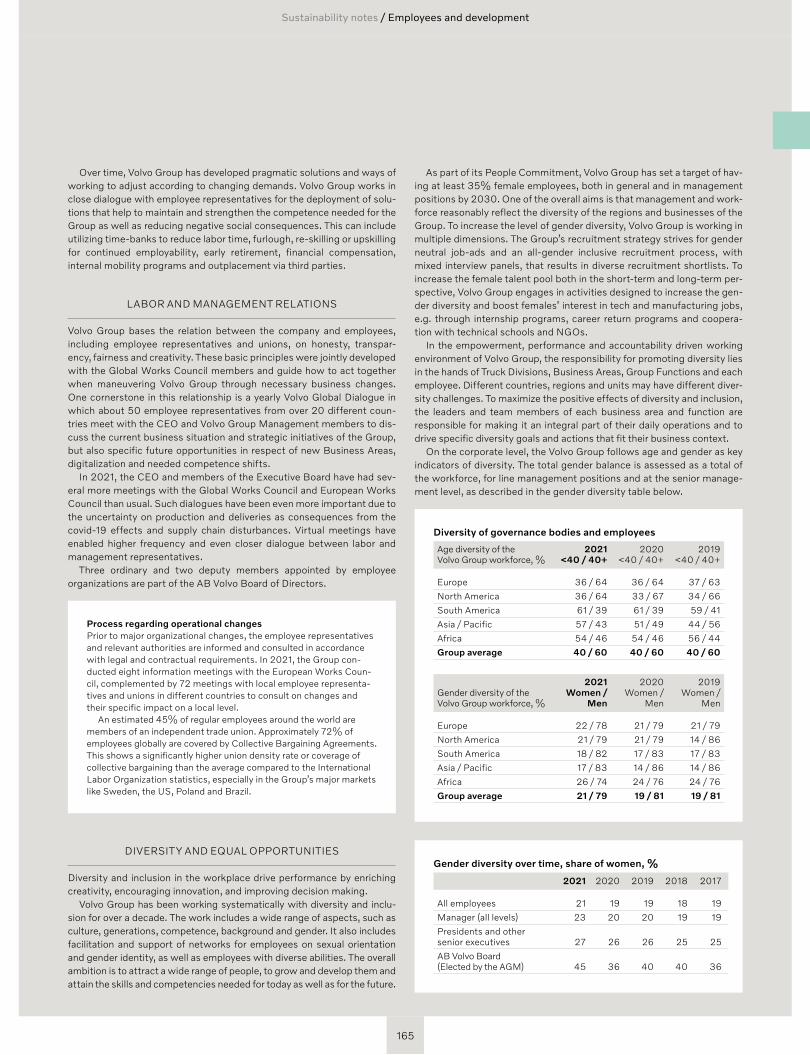
Over time, Volvo Group has developed pragmatic solutions and ways of working to adjust according to changing demands. Volvo Group works in close dialogue with employee representatives for the deployment of solu-tions that help to maintain and strengthen the competence needed for the Group as well as reducing negative social consequences. This can include utilizing time-banks to reduce labor time, furlough, re-skilling or upskilling for continued employability, early retirement, financial compensation, internal mobility programs and outplacement via third parties.
LABOR AND MANAGEMENT RELATIONS
Volvo Group bases the relation between the company and employees, including employee representatives and unions, on honesty, transpar-ency, fairness and creativity. These basic principles were jointly developed with the Global Works Council members and guide how to act together when maneuvering Volvo Group through necessary business changes. One cornerstone in this relationship is a yearly Volvo Global Dialogue in which about 50 employee representatives from over 20 different coun-tries meet with the CEO and Volvo Group Management members to dis-cuss the current business situation and strategic initiatives of the Group, but also specific future opportunities in respect of new Business Areas, digitalization and needed competence shifts.
In 2021, the CEO and members of the Executive Board have had sev-eral more meetings with the Global Works Council and European Works Council than usual. Such dialogues have been even more important due to the uncertainty on production and deliveries as consequences from the covid-19 effects and supply chain disturbances. Virtual meetings have enabled higher frequency and even closer dialogue between labor and management representatives.
Three ordinary and two deputy members appointed by employee organizations are part of the AB Volvo Board of Directors.
Process regarding operational changesPrior to major organizational changes, the employee representatives and relevant authorities are informed and consulted in accordance with legal and contractual requirements. In 2021, the Group con-ducted eight information meetings with the European Works Coun-cil, complemented by 72 meetings with local employee representa-tives and unions in different countries to consult on changes and their specific impact on a local level.
An estimated 45% of regular employees around the world are members of an independent trade union. Approximately 72% of employees globally are covered by Collective Bargaining Agreements. This shows a significantly higher union density rate or coverage of collective bargaining than the average compared to the International Labor Organization statistics, especially in the Group’s major markets like Sweden, the US, Poland and Brazil.
DIVERSITY AND EQUAL OPPORTUNITIES
Diversity and inclusion in the workplace drive performance by enriching creativity, encouraging innovation, and improving decision making.
Volvo Group has been working systematically with diversity and inclu-sion for over a decade. The work includes a wide range of aspects, such as culture, generations, competence, background and gender. It also includes facilitation and support of networks for employees on sexual orientation and gender identity, as well as employees with diverse abilities. The overall ambition is to attract a wide range of people, to grow and develop them and attain the skills and competencies needed for today as well as for the future.
As part of its People Commitment, Volvo Group has set a target of hav-ing at least 35% female employees, both in general and in management positions by 2030. One of the overall aims is that management and work-force reasonably reflect the diversity of the regions and businesses of the Group. To increase the level of gender diversity, Volvo Group is working in multiple dimensions. The Group’s recruitment strategy strives for gender neutral job-ads and an all-gender inclusive recruitment process, with mixed interview panels, that results in diverse recruitment shortlists. To increase the female talent pool both in the short-term and long-term per-spective, Volvo Group engages in activities designed to increase the gen-der diversity and boost females’ interest in tech and manufacturing jobs, e.g. through internship programs, career return programs and coopera-tion with technical schools and NGOs.
In the empowerment, performance and accountability driven working environment of Volvo Group, the responsibility for promoting diversity lies in the hands of Truck Divisions, Business Areas, Group Functions and each employee. Different countries, regions and units may have different diver-sity challenges. To maximize the positive effects of diversity and inclusion, the leaders and team members of each business area and function are responsible for making it an integral part of their daily operations and to drive specific diversity goals and actions that fit their business context.
On the corporate level, the Volvo Group follows age and gender as key indicators of diversity. The total gender balance is assessed as a total of the workforce, for line management positions and at the senior manage-ment level, as described in the gender diversity table below.
Diversity of governance bodies and employees
Age diversity of the Volvo Group workforce, %
2021<40 / 40+
2020<40 / 40+
2019<40 / 40+
Europe 36 / 64 36 / 64 37 / 63
North America 36 / 64 33 / 67 34 / 66
South America 61 / 39 61 / 39 59 / 41
Asia / Pacific 57 / 43 51 / 49 44 / 56
Africa 54 / 46 54 / 46 56 / 44
Group average 40 / 60 40 / 60 40 / 60
Gender diversity of the Volvo Group workforce, %
2021Women /
Men
2020Women /
Men
2019Women /
Men
Europe 22 / 78 21 / 79 21 / 79
North America 21 / 79 21 / 79 14 / 86
South America 18 / 82 17 / 83 17 / 83
Asia / Pacific 17 / 83 14 / 86 14 / 86
Africa 26 / 74 24 / 76 24 / 76
Group average 21 / 79 19 / 81 19 / 81
Gender diversity over time, share of women, %
2021 2020 2019 2018 2017
All employees 21 19 19 18 19
Manager (all levels) 23 20 20 19 19
Presidents and other senior executives 27 26 26 25 25
AB Volvo Board (Elected by the AGM) 45 36 40 40 36
Sustainability notes / Employees and development
165
ExcelHer supports female talents to return to the workplace To fulfill the aspirations to create an inclusive workplace and increase access to hire more female talent, Volvo Group India has conceptual-ized an initiative focused on empowering women in re-launching their professional journey. ExcelHer, a unique career restart program created exclusively for women, is just one of many efforts to create an inclusive workplace. The nine-month long career returnship pro-gram aims to help women on a career break for more than a year, by supporting them in getting up-to-date with the technical or func-tional skills, building their leadership competencies, and helping society benefit from this talent pool.
During the assignment the participants gain access to personal development and mentorship from business leaders. At the end of the internship, the returnees have the opportunity to explore full-time roles with Volvo Group in India based on the individual’s perfor-mance and business requirements. Since its inception, the program has received great response and the first class of around 25 women professionals are already on-board.
TRAINING AND EDUCATION
Leadership, learning and development is a vital contributor to the trans-formation of the Group and to employees’ employability. Volvo Group Uni-versity is focused on providing high quality training in competence areas that are common across business areas, divisions or functions. This spans from leadership development, across sales and price management, agile methodologies and compliance training, to technology related topics such as electromobility and automation. Learning comes in many shapes, and most of people’s development takes place during the course of a working day, in the teams. It is facilitated by the company throughout the employment cycle. To ensure access to training, despite the limitations due to the pandemic, a large part of instructor lead programs is adapted for a virtual delivery. The quality of the experience is maintained, or even enhanced, and the diversity of participants has improved. It has further opened up possibilities for employees outside the major sites to join train-ing activities and to build networks across the Group.
Business operations drive development of the competences specific to their needs. During times of production stops trainer-led sessions and online training are made available to the teams, organized as “learning camps”. It allows a large number of employees to expand their knowledge in critical areas. A multitude of digital learning solutions on different sub-jects, and in a variety of formats, is available to all employees via mobile and computer. These provide a base for individual development, as well as learning and reflecting together in teams.
Programs for upgrading employee skills and transition assistance programsThe Group offers programs specifically designed for leadership development and for job roles that require upgraded skills or that will be transitioned over time.
The E-mobility journey in Blainville Transforming the technology competence base is fundamental to Volvo Group’s future success. To succeed, Volvo Group is re- shaping the approach to technology, intro-ducing new ways of working and shifting the competencies.
The Blainville plant was the first facility in the Group producing fully electric trucks. A complete competence shift program was established based on experiences from Volvo Bus, Volvo Group Uni-versity together with the Business Unit, Group Trucks Operations and Group Trucks Technology experts. Together they adjusted the existing learning portfolio and developed additional programs to make the learning offer fit the local needs.
By 2021, 2,500 participants, operators and managers of the elec-tromobility ecosystem have acquired the needed competences in electromobility business understanding and urban fully electric truck technologies. The electrical safety program, compliant with French regulation for high voltage handling were also part of the compe-tence shift program. Thanks to the training, a safe production start was secured with maintained efficiency, good business understand-ing and a gradual shift towards new skills in the Blainville plant.
Vocational training is an important factor in driving prosperity. In addition to training for employees and distributors, the Group initiates, supports or runs vocational training programs across the world focusing on practical skills for mechanics, bus or truck drivers and machine operators. Volvo Group special-ists can be directly involved as teachers or trainers and in some countries the Group cooperates with technical colleges and universities.
In several markets, the Volvo Group and its customers have experi-enced a mismatch between skills and business needs. In many of these markets the Volvo Group therefore works together with national and inter-national aid agencies to provide the education needed for increasing employment and opportunities for people to be self-sufficient.
Such projects aim at creating employment opportunities in the heavy-duty machinery and commercial vehicles industry. The projects are designed to improve the relevance and quality of technical and vocational training and education in our sector and to ensure that experienced and new professionals are equipped with marketable skills that enhance their employability. See example from Zambia on the next page.
Sustainability notes / Employees and development
166
Connection to Agenda 2030 and reporting standards
Main connections to the UN SDGs and targets3.6 Halve road traffic accidents8.8 Promote safe working environments11.2 Provide access to safe, affordable and sustainable
transport systems for all, improving road safety.
Referenced reporting standards GRI 416 – Customer health and safety 2016
Volvo Group has a value chain approach to customer health and safety that considers the effects on customers, end users and indirect stake-holders. The Group’s business and the products it offers target a wide range of application areas and impact many categories of people, such as drivers and operators, commuters, as well as other traffic system users like cyclists and pedestrians.
The vision is zero accidents with Volvo Group products, and the offer-ing of world-leading products and solutions for sustainable transports is an important part of getting closer to our vision.
Volvo Group’s products are used in complex and challenging environ-ments. Every year, 1.3 million people lose their lives in road traffic accidents worldwide, and many million are seriously injured. In addition, there are occupational health and safety risks in and around vehicles and machines, both on the road and in construction and work sites. Issues such as noise and air pollution are also considered in customer health and safety.
A holistic approach means addressing all these concerns in a proactive and systematic way. Volvo Group works systematically with in-depth accident research to understand the context and challenges facing cus-tomers in their operations. This knowledge is then used in product devel-opment to achieve continuous improvements. Volvo Group also works with partners in academia and policy makers to promote progress in road traffic safety and enable safer solutions to be brought to the market. Designing the best solutions to address these global health and safety challenges is delivering both on the Volvo Group’s commitment to the Sustainable Development Goals and to offer the most competitive solu-tions to customers and business partners. The knowledge gained on safety is shared via communication and training programs in many mar-kets where the Group operates to raise awareness and promote a safe driving behavior.
Assessment of the health and safety impactsAll product lines are assessed for health and safety impacts. Such assess-ment can include product assessments, audits of different processes in the design, development, production and use phases, as well as research inves-tigations from real accidents. Please read more on volvogroup.com/safety.
CUSTOMER HEALTH AND SAFETY
Safety
Strengthening the employability of Zambian youthVocational training helps to match jobs and improves safety in vehicle operations. The Zambian Industrial Training Academy (ZAMITA academy) established a center of excellence in 2016, to upskill the workforce on operations and maintenance of modern heavy equipment used in the
mining, construction and transport industries. This is part of an overall National Development plan to systematically improve vocational training and increasing the supply of skilled workers and create one million new Zambian jobs over a five-year period. The managing partners of the academy, United Nations Industrial Development Organization (UNIDO), the Embassy of Sweden in Zambia, the Volvo Group and the Government of Zambia has pledged to continue supporting the academy for the coming years.
In recent years, the academy was expanded to serve the commercial transport sector workforce development in Ndola, Zambia. The second phase of the project aims to increase the capacity of ZAMITA through a multi-lateral public-private partnership program to overcome the skills shortage in the commercial transport sector. Volvo Trucks Southern Africa is involved for technology transfer, updating the curriculum, sup-plying the necessary infrastructure and staff development training.
The ZAMITA academy has boosted its efforts in generating productive employment for young Zambian men and women. This and similar initia-tives help to close the skills gap, facilitate safe operations and empower the next generation workforce in finding meaningful employment. At year-end 2021, the academy had trained over one thousand students since its inception.
Sustainability notes / Safety
167
Connection to Agenda 2030 and reporting standards
Main connections to the UN SDGs and targets3.3 End epidemics of communicable diseases 8.8 Promote safe working environments
Referenced reporting standardsGRI 403 – Occupational health and safety 2018
The health, safety and wellbeing of employees and business partners is always the first priority of the Volvo Group. Health and safety are material issues in several aspects of Volvo Group’s direct operations as well as in activities that occur along the value chain. The Volvo Group Health and Safety Policy gives direction on how workplace safety, health and well-being shall be handled within the Group. The policy covers both direct employees and consultants.
In 2021, the Group continued to deal with the effects of the covid-19 pandemic. Significant efforts were put in place to hinder and slow down the spread of the pandemic and protect employees. New workplace rou-tines with preventive hygiene and safety measures for production units, offices and meeting areas were implemented. Remote work has been widely enabled, including ergonomics guidance and an expanded IT infra-structure to secure technical functionality of digital meetings and collab-oration tools. Internal and external communication channels have been used to keep the workforce informed about the pandemic situation, busi-ness updates and of specific behavioral protocols. In many countries, Volvo Group has arranged on-site vaccination via third party health ser-vice providers. Only business critical business travel was conducted.
In addition, the Group has sought to balance remote work with proactive approaches towards mental health and wellbeing, to avoid isolation, e.g. through raising awareness and ensuring adequate support is available. As an example, mental health webinars and sessions on how to boost resil-ience were organized.
Volvo Group has further continued its focus on a safe return to the work-place with high activity levels across the Group. Prevention of serious and fatal incidents, with targeted approaches towards high-risk activities, has been another focus area during this year.
Safety is the first item on the agenda in Business Review Meetings with all business areas and their units. Throughout 2021, the Group has empha-sized how health, safety and wellbeing is its first priority and communi-cated this commitment widely by senior leaders across the Group. Within the Group, a global network of over 200 expert practitioners on occupa-tional health and safety – including doctors, nurses, safety engineers, psy-chologists, and ergonomists collaborate to find and share best practices.
Occupational health and safety management systemEach business area, division and function is accountable and responsible for managing health, safety and wellbeing. Volvo Buses and Volvo Con-struction Equipment have continued to certify their parts of the manage-ment systems according to ISO 45001. Others have been developing internal safety management systems with regular assessments and
coaching as an integral part the Volvo Group Management System (VGMS) and Volvo Production System (VPS). This helps to ensure that there are written procedures, internal controls, clear ownership and man-agement review, and that deviations are acted upon. The scope of preven-tion work includes both physical and psychological health, and workplace safety. It covers all employees working for Volvo Group on- or off-site, as well as the period of time spent commuting to and from work.
Hazard identification, risk assessment and incident investigationVolvo Group and its subsidiaries apply tools and processes to manage risk and create productive working environments. Risk assessments are carried out on a regular basis at all levels from shop floor to office. Health and safety professionals ensure the quality of risk assessments and involve line man-agement and union representatives in this work. Potential risks are in focus during internal assessments and external audits, where typically a sample of risk assessments and corrective and preventative actions are reviewed. Managers and employees are reviewed in their knowledge of their own major risks. Measures to mitigate or eliminate the identified risks are defined and implemented, and risk assessments are reviewed and updated periodically or after any incident has occurred.
Recordable accidents are reported and followed up at the unit level and further up in the organization, continuing up to the Group level. Investiga-tions resulting in corrective and preventative actions must be deployed after each recordable accident. In cases where the issue is linked to risks that may be relevant for other units – the causes of the accident and the correc-tive and preventative measure to avoid a repeat are shared with other rele-vant units within the global health and safety network. In certain cases, directives are built to be deployed throughout the company as part of a preventative measure.
Based on the risk assessment carried out for a specific machine, process or work area, employees receive training so they understand the risks and how to manage them – through following defined procedures or wearing personal protective equipment, for example. When defining corrective or preventative actions in response to identified risk, the Volvo Group Health and Safety Policy requires that the hierarchy of control measures principles be applied. The first option is hazard elimination. If hazard elimination is not possible, substitution, engineering controls, administrative controls and personal protective equipment are applied. The policy is distributed and made visible on the walls of factories and offices within the company.
Employees are asked to report accidents, incidents and unsafe acts and conditions – as they are a vital source of improvements and highlight opportunities to better control the associated risk. The Volvo Group’s Code of Conduct and related processes make it clear that any management reprisals against individuals making such reports in good faith are not tol-erated. If a manager or colleague acts against the Code of Conduct – a whistle blower process can be used to escalate this.
Health and safety coordinators are employed to support team leaders and managers in the organization. Periodic training is also organized on health and safety procedures, roles and responsibilities for managers and health and safety coordinators.
Ergonomics in focusErgonomics is a prioritized area across the Volvo Group and individual workstations are regularly assessed for improvements. Operators, employees and consultants also receive training on occupational ergo-nomics tailored to specific areas, whether manufacturing, administration or when working from home. Training centers on many of the Group’s sites also offer and promote training courses opportunities on focused themes within ergonomics.
Ergonomics guidelines exist for specific roles. In manufacturing for example, guidelines summarize the main ergonomics specifications and provide general principles for an ergonomic-based approach to worksta-tions design and layout.
OCCUPATIONAL HEALTH AND SAFETY
Sustainability notes / Safety
168
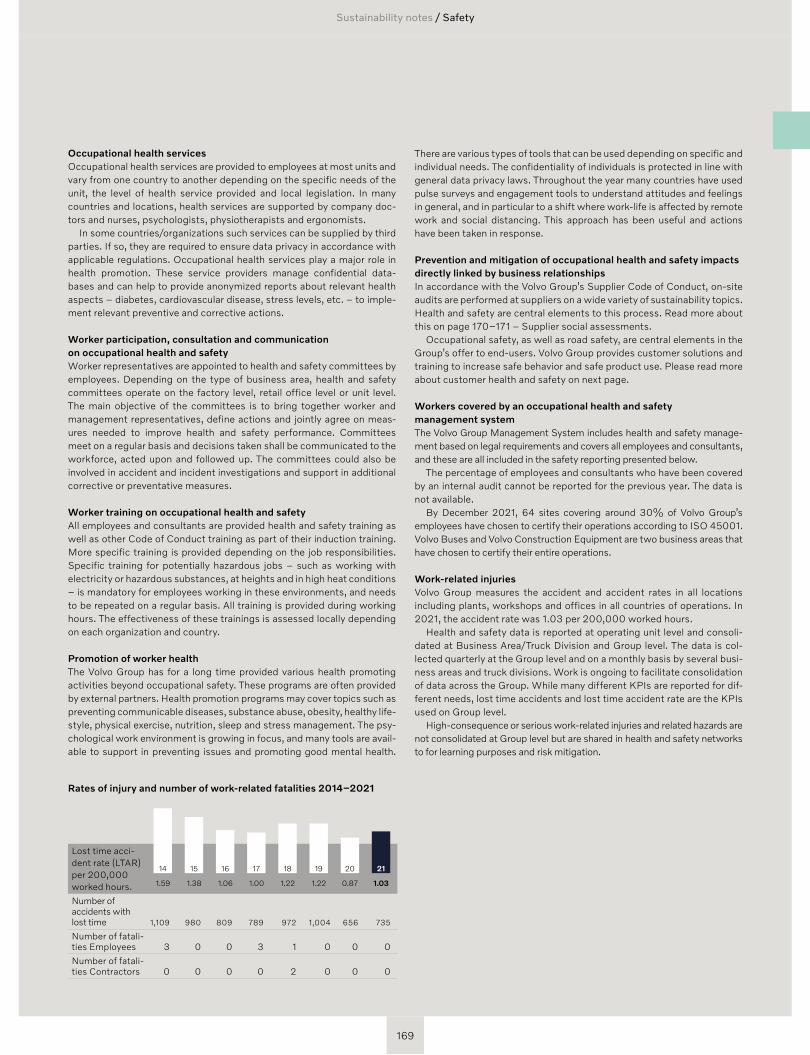
Occupational health servicesOccupational health services are provided to employees at most units and vary from one country to another depending on the specific needs of the unit, the level of health service provided and local legislation. In many countries and locations, health services are supported by company doc-tors and nurses, psychologists, physiotherapists and ergonomists.
In some countries/organizations such services can be supplied by third parties. If so, they are required to ensure data privacy in accordance with applicable regulations. Occupational health services play a major role in health promotion. These service providers manage confidential data-bases and can help to provide anonymized reports about relevant health aspects – diabetes, cardiovascular disease, stress levels, etc. – to imple-ment relevant preventive and corrective actions.
Worker participation, consultation and communication on occupational health and safetyWorker representatives are appointed to health and safety committees by employees. Depending on the type of business area, health and safety committees operate on the factory level, retail office level or unit level. The main objective of the committees is to bring together worker and management representatives, define actions and jointly agree on meas-ures needed to improve health and safety performance. Committees meet on a regular basis and decisions taken shall be communicated to the workforce, acted upon and followed up. The committees could also be involved in accident and incident investigations and support in additional corrective or preventative measures.
Worker training on occupational health and safetyAll employees and consultants are provided health and safety training as well as other Code of Conduct training as part of their induction training. More specific training is provided depending on the job responsibilities. Specific training for potentially hazardous jobs – such as working with electricity or hazardous substances, at heights and in high heat conditions – is mandatory for employees working in these environments, and needs to be repeated on a regular basis. All training is provided during working hours. The effectiveness of these trainings is assessed locally depending on each organization and country.
Promotion of worker healthThe Volvo Group has for a long time provided various health promoting activities beyond occupational safety. These programs are often provided by external partners. Health promotion programs may cover topics such as preventing communicable diseases, substance abuse, obesity, healthy life-style, physical exercise, nutrition, sleep and stress management. The psy-chological work environment is growing in focus, and many tools are avail-able to support in preventing issues and promoting good mental health.
There are various types of tools that can be used depending on specific and individual needs. The confidentiality of individuals is protected in line with general data privacy laws. Throughout the year many countries have used pulse surveys and engagement tools to understand attitudes and feelings in general, and in particular to a shift where work-life is affected by remote work and social distancing. This approach has been useful and actions have been taken in response.
Prevention and mitigation of occupational health and safety impacts directly linked by business relationshipsIn accordance with the Volvo Group’s Supplier Code of Conduct, on-site audits are performed at suppliers on a wide variety of sustainability topics. Health and safety are central elements to this process. Read more about this on page 170–171 – Supplier social assessments.
Occupational safety, as well as road safety, are central elements in the Group’s offer to end-users. Volvo Group provides customer solutions and training to increase safe behavior and safe product use. Please read more about customer health and safety on next page.
Workers covered by an occupational health and safety management systemThe Volvo Group Management System includes health and safety manage-ment based on legal requirements and covers all employees and consultants, and these are all included in the safety reporting presented below.
The percentage of employees and consultants who have been covered by an internal audit cannot be reported for the previous year. The data is not available.
By December 2021, 64 sites covering around 30% of Volvo Group’s employees have chosen to certify their operations according to ISO 45001. Volvo Buses and Volvo Construction Equipment are two business areas that have chosen to certify their entire operations.
Work-related injuriesVolvo Group measures the accident and accident rates in all locations including plants, workshops and offices in all countries of operations. In 2021, the accident rate was 1.03 per 200,000 worked hours.
Health and safety data is reported at operating unit level and consoli-dated at Business Area/Truck Division and Group level. The data is col-lected quarterly at the Group level and on a monthly basis by several busi-ness areas and truck divisions. Work is ongoing to facilitate consolidation of data across the Group. While many different KPIs are reported for dif-ferent needs, lost time accidents and lost time accident rate are the KPIs used on Group level.
High-consequence or serious work-related injuries and related hazards are not consolidated at Group level but are shared in health and safety networks to for learning purposes and risk mitigation.
Rates of injury and number of work-related fatalities 2014–2021
Lost time acci-dent rate (LTAR) per 200,000 worked hours.
Number of accidents with lost time 1,109 980 809 789 972 1,004 656 735
Number of fatali-ties Employees 3 0 0 3 1 0 0 0
Number of fatali-ties Contractors 0 0 0 0 2 0 0 0
161514 17 18 19 20 21
1.061.381.59 1.00 1.22 1.22 0.87 1.03
Sustainability notes / Safety
169
Connection to Agenda 2030 and reporting standards
Main connections to the UN SDGs and targets5.1 End discrimination against women and girls8.7 Take immediate and effective measures to eradicate forced
labour, end modern slavery and human trafficking8.8 Protect labor rights and promote safe and secure working
environments for all workers
Referenced reporting standards GRI 406 – Non-discrimination 2016 GRI 407 – Freedom of association and collective bargaining 2016GRI 408 – Child labor 2016GRI 409 – Forced or compulsory labor 2016GRI 412 – Human rights assessments 2016UN Guiding Principles Reporting framework
The Volvo Group is committed to respecting internationally recognized human rights. Negative human rights impacts may potentially materialize not only within our own organization, but also through our business rela-tionships and in the value chain. We also seek to address adverse human rights impacts with which the Volvo Group is involved. We are continuing to strengthen and align our human rights work with the following international frameworks:
• UN International Bill of Human Rights.
• ILO’s eight fundamental conventions.
• UN Global Compact.
• UN Guiding Principles on Business and Human Rights.
• OECD Guidelines for Multinational Enterprises.
• Children’s Rights and Business Principles.
These frameworks provide guidance in contexts with elevated human rights risks and where local regulations are sometimes insufficient or inadequately enforced. The Volvo Group reports on its human rights- related work under applicable laws and regulations, including national laws under the EU’s non-financial reporting directive, and the Modern Slavery legislation in Australia and the United Kingdom. In 2021, we pub-lished Modern Slavery Statements for relevant companies within the Volvo Group in line with these legal disclosure requirements.
Human rights governance and oversightThe Volvo Group’s human rights governance follows our allocation of busi-ness accountability and includes several cross-functional governance fora across the company. At the Group level, the strategic direction on human rights is steered by the Volvo Group Human Rights Board with relevant members from the Executive Board.
Group functions such as Corporate Responsibility, Legal and Compli-ance, and People and Culture, together with the Truck Divisions and Busi-ness Areas identify, assess, and monitor human rights-related risks within our operating environment. The human rights due diligence and mitigation efforts adopt a risk-based approach considering country-specific risk lev-els and our operational context in the country, inherent risks in certain pur-chasing categories and sales segments, and potential concerns brought to our attention by internal and external stakeholders.
Human Rights Policy commitmentThe Volvo Group launched a standalone Human Rights Policy in 2021. This policy sets the common threshold for our commitment to respect human rights and applies to all Volvo Group entities, employees and others working at our sites.
The human rights policy is complemented by the Volvo Group’s Code of Conduct and specific policies, directives, and guidelines developed by our Truck Divisions and Business Areas on several human rights-related areas. These include health and safety, responsible purchasing through our Sup-plier Code of Conduct (updated in 2021), human resources, responsible sales, and whistleblowing.
Salient human rights risksThe Volvo Group’s sustainability ambitions are divided into the three areas of climate, resources and people. Human rights risks may be associated with our activities and business relationships in all three of these areas. The Human Rights Policy describes the Volvo Group’s ten salient human rights risks across these three areas.
CLIMATE RESOURCES PEOPLE
Climate & environmental impacts
Hazardous materi-als & substances
Minerals & metals from conflict- affected and high-risk areas
Health, safety & facilities
Fair employment & work-ing conditions
Freedom of association & collective bargaining
Non-discrimination & fair treatment
Forced labor & modern slavery
Child labor & children’s rights
Sales to conflict-affected & high-risk areas
These risks have been identified through the implementation of human rights due diligence across the value chain, the enterprise risk manage-ment process, ongoing dialogues with unions, inputs from grievance chan-nels including the Volvo Group Whistle mechanism, and collaboration with peers and others. While these risks are the current areas of focus, we will remain alert to the potential for other human rights risks that may arise. Many of these topics are also part of the mandatory training for all employ-ees on the Volvo Group Code of Conduct and other human rights-related training and awareness initiatives.
Human Rights
Sustainability notes / Human Rights
170
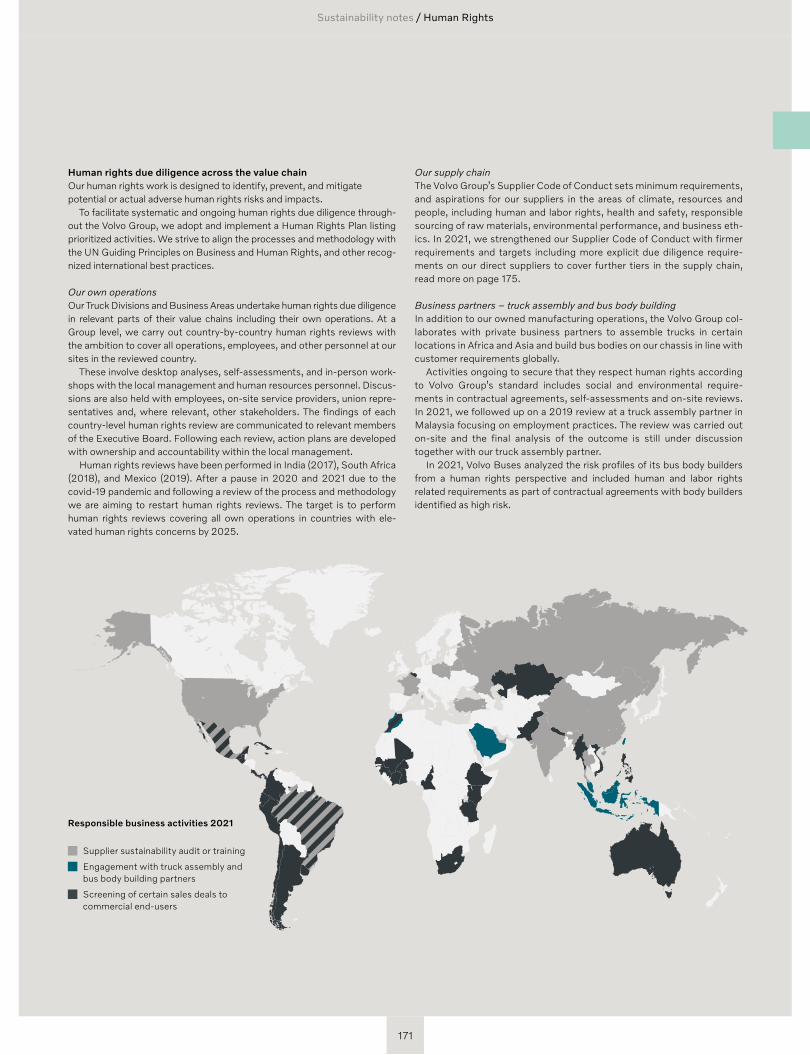
Human rights due diligence across the value chainOur human rights work is designed to identify, prevent, and mitigate potential or actual adverse human rights risks and impacts.
To facilitate systematic and ongoing human rights due diligence through-out the Volvo Group, we adopt and implement a Human Rights Plan listing prioritized activities. We strive to align the processes and methodology with the UN Guiding Principles on Business and Human Rights, and other recog-nized international best practices.
Our own operationsOur Truck Divisions and Business Areas undertake human rights due diligence in relevant parts of their value chains including their own operations. At a Group level, we carry out country-by-country human rights reviews with the ambition to cover all operations, employees, and other personnel at our sites in the reviewed country.
These involve desktop analyses, self-assessments, and in-person work-shops with the local management and human resources personnel. Discus-sions are also held with employees, on-site service providers, union repre-sentatives and, where relevant, other stakeholders. The findings of each country-level human rights review are communicated to relevant members of the Executive Board. Following each review, action plans are developed with ownership and accountability within the local management.
Human rights reviews have been performed in India (2017), South Africa (2018), and Mexico (2019). After a pause in 2020 and 2021 due to the covid-19 pandemic and following a review of the process and methodology we are aiming to restart human rights reviews. The target is to perform human rights reviews covering all own operations in countries with ele-vated human rights concerns by 2025.
Our supply chain The Volvo Group’s Supplier Code of Conduct sets minimum requirements, and aspirations for our suppliers in the areas of climate, resources and people, including human and labor rights, health and safety, responsible sourcing of raw materials, environmental performance, and business eth-ics. In 2021, we strengthened our Supplier Code of Conduct with firmer requirements and targets including more explicit due diligence require-ments on our direct suppliers to cover further tiers in the supply chain, read more on page 175.
Business partners – truck assembly and bus body buildingIn addition to our owned manufacturing operations, the Volvo Group col-laborates with private business partners to assemble trucks in certain locations in Africa and Asia and build bus bodies on our chassis in line with customer requirements globally.
Activities ongoing to secure that they respect human rights according to Volvo Group’s standard includes social and environmental require-ments in contractual agreements, self-assessments and on-site reviews. In 2021, we followed up on a 2019 review at a truck assembly partner in Malaysia focusing on employment practices. The review was carried out on-site and the final analysis of the outcome is still under discussion together with our truck assembly partner.
In 2021, Volvo Buses analyzed the risk profiles of its bus body builders from a human rights perspective and included human and labor rights related requirements as part of contractual agreements with body builders identified as high risk.
Responsible business activities 2021
Supplier sustainability audit or training
Engagement with truck assembly and bus body building partners
Screening of certain sales deals to commercial end-users
Sustainability notes / Human Rights
171
In addition, the Volvo Group is involved in CSR Europe’s Responsible Trucking Initiative. The initiative aims to improve employment and working conditions for truck drivers in the road transport sector across Europe. In 2021, the initiative released new social guidelines for common expecta-tions towards suppliers and sub-contractors on human rights, working con-ditions and business ethics, read more at www.csreurope.org/.
Our sales channels and the use of productsCertain sales deals are assessed for risks related to human rights, primarily in connection with direct sales deals involving customer financing and support from export credit guarantees, sales to certain high-risk end users such as the military and law enforcement. Certain sales deals are also assessed in specific customer segments such as the fossil fuels sector, mining, and sales to conflict-affected areas.
During 2021, Volvo Construction Equipment developed a new dealer operating standard on responsible sales that includes certain mandatory requirements as well as two aspirational levels thus providing an opportu-nity to engage with our dealers on responsible sales. Volvo Trucks initiated the strengthening of their standards and agreements with our sales busi-ness partners such as distributors and dealers to include human rights- related requirements. See page 174 for more details on our Responsible sales approach, and specific activities undertaken in 2021.
Human rights awarenessTraining and raising awareness for our colleagues and relevant business partners is a key element of our human rights work. In 2021, the Executive Management Teams of Volvo Trucks, Volvo Buses, Group Truck Opera-tions, and Group People and Culture participated in human rights-related awareness sessions.
In addition, several awareness sessions were organized by our Group Functions, Truck Divisions and Business Areas in which more than 1,000
colleagues working in areas such as human resources, legal and compli-ance, communication, purchasing, and sales participated. These overall human rights awareness initiatives complement other specific training on related topics such as diversity and inclusion, health and safety, non-dis-crimination and anti-harassment, equal pay and living wage, responsible purchasing, and responsible sales.
Stakeholder engagement related to human rights We engage with our colleagues and external stakeholders including cus-tomers, investors, NGOs, and other societal actors on our human rights approach and performance. In 2021, our engagement with external stake-holders primarily related to our overall human rights governance and policy, sourcing from conflict-affected areas, and sales to military end-users and to customers in certain markets. See pages 174 for more details on respon-sible sales including our response and actions on stakeholder concerns.
Grievance channels and access to remedyOur employees, representatives of the Volvo Group, and external stake-holders can report any instances of breach of our Code of Conduct and other policies, including human rights violations, where the Volvo Group or any of its representatives are believed to be involved. Grievances can be reported through internal and publicly available grievance channels described in our Code of Conduct, including the Volvo Group Whistle. Reports can be made anonymously wherever permitted by local law.
The Volvo Group aims to provide for or cooperate in the remediation of negative human rights impacts if our activities have caused or contributed to them and seek to play a role in the remediation of negative human rights impacts that we may be directly linked to in our operations, products, ser-vices, or business relationships.
See page 177 for more information on our grievance channels and the types of concerns reported in 2021.
Specific disclosures on salient human rights risks
Climate and environmental impacts We recognize the importance of the transition to a low carbon economy envisaged by the Paris Agreement, and that a safe and clean environment is essential for the full enjoyment of human rights. We have set Science-Based Targets and are actively working to reduce climate and environmental impacts in our operations and our value chain. > Read more on page 158–159
Hazardous materials and substances We have a target to phase out potentially hazardous materials and substances, where possible, and to secure their safe and responsible handling throughout the value-chain.
Minerals and metals from conflict-affected and high-risk areas A dedicated Sustainable Minerals Program supports our efforts to pursue due diligence for supply chain transparency and to promote responsible sourcing, extraction, and handling of such materials. > Read more on page 176
Health and safetyAs a human centric company, safety is a priority in everything we do. We have a vision for zero accidents with Volvo Group products and in our workplaces. > Read more on page 168–169
Sustainability notes / Human Rights
172
Fair employment and working conditionsThe Volvo Group assesses potential gaps in employment and working conditions in our due diligence activities in own operations and in the supply chain. Our policies such as the Code of Conduct, Human Rights Policy, Supplier Code of Conduct, and global and local human resources guidelines spell out our expectations.
In 2021, we took the initiative to develop a framework on fair living wages covering our own operations globally to increase awareness and iden-tify any potential gaps. We will continue to develop and implement this framework in 2022 and beyond to address any identified gaps. To support this work, the Volvo Group partnered with the Fair Wage Network in order to further strengthen our competence in this area, and to align our princi-ples with international best practices.
Freedom of association and collective bargainingLegal compliance is the foundation for Volvo Group’s activities. Varying country legislation on union independence means the approach to managing freedom of association and collective bargaining may differ from one country to another. The Volvo Group respects the right of all employees to form and join an association to represent their interests as employees, to organize, and to bargain collectively or individually, as well as the right to refrain from joining a union.
We assess risks related to freedom of association and collective bargaining as part of our overall human rights due diligence in our own opera-tions and in the supply chain. Human and labor rights issues, as well as other relevant topics, can also be raised during the Volvo Global Dialogue – a global forum where employee representatives engage in discussions with the Volvo Group’s executive management.
Our Supplier Code of Conduct requires suppliers to respect their employees’ right to freedom of association and their right to collective bargaining. It also provides that where local law sets restrictions on the right to freedom of association and collective bargaining, the supplier shall allow alternative forms of worker representation, association, and bargaining.
> Read more on labor management relations on page 165 and responsible purchasing on page 175.
Non-discrimination and fair treatmentAt the Volvo Group, we do not tolerate harassment and discrimination and aim to mitigate unconscious bias.
In 2021, 38 allegations perceived as related to discrimination or harassment were reported via the Volvo Group Whistle, included in the category ”Fair Workplace Management” on page 177. All reports were investigated, with six being in progress at year-end. Over half of the closed reports were unsubstantiated. Most cases resulted in some corrective actions, such as training, coaching or changes to processes or routines. Relevant dis-ciplinary measures were taken in the substantiated cases.
The Volvo Group provides awareness trainings to prevent harassment and discrimination. This is done with the Volvo Group Code of Conduct as the core foundation. In addition, special courses on prevention of harassment and discrimination are offered for managers in some jurisdictions, for example the training Civil Treatment for Leaders in the US and the workshop Active Measures, held in Sweden to enable a workplace environment with zero tolerance for harassment and discrimination.
> Read more about our approach on diversity, equity, and Inclusion on page 165.
Forced labor and modern slaveryThe Volvo Group assesses risks related to forced and compulsory labor as part of our overall human rights due diligence in our own operations and rele-vant parts of the value chain. In 2021, no cases of forced or compulsory labor were identified at own operations or during supplier sustainability audits. During the year, we published Modern Slavery Statements for relevant companies within the Volvo Group in line with legal disclosure requirements.
The covid-19 pandemic has resulted in increased forced labor and modern slavery risks and we continue to monitor for these elevated risks in our supply chain. In 2021, our Code of Conduct training for all employees also had a focused module on Modern Slavery.
> Read more about Code of Conduct training on page 177.
Child labor and children’s rightsThe Volvo Group assesses risks related to child labor and children’s rights as part of our overall human rights due diligence in our own operations and relevant parts of the value chain. In 2021, no cases of child labor were identified at own operations or in supplier sustainability audits.
When considering human rights, we look at a range of aspect where we can have an impact. On road traffic safety, One area close to our business is road traffic safety and in this context, children’s rights as road users are emphasized. Our global campaign Stop. Look. Wave. is designed to teach children all around the world about traffic safety and to spread the awareness of the rights of all road users.
In connection with our Sustainable Minerals Program in the supply chain, we are also considering how the Volvo Group can be more involved on the ground to prevent child and forced labor in the conflict minerals supply chains through collaboration with local civil society organizations.
> See pages 167 for more information on road and traffic safety, and responsible purchasing on pages 175–176.
Sales to conflict-affected and high-risk areasThe sale and use of our products in conflict and other high-risk contexts could result in potential adverse human rights impacts. Therefore, we review certain sales deals – involving customer financing and support from export credit guarantees, sales to certain high-risk end users such as military and law enforcement end-users, and sales to conflict-affected areas.
> In addition to this chapter, see pages 174 for an overview of activities related to responsible sales.
Sustainability notes / Human Rights
173
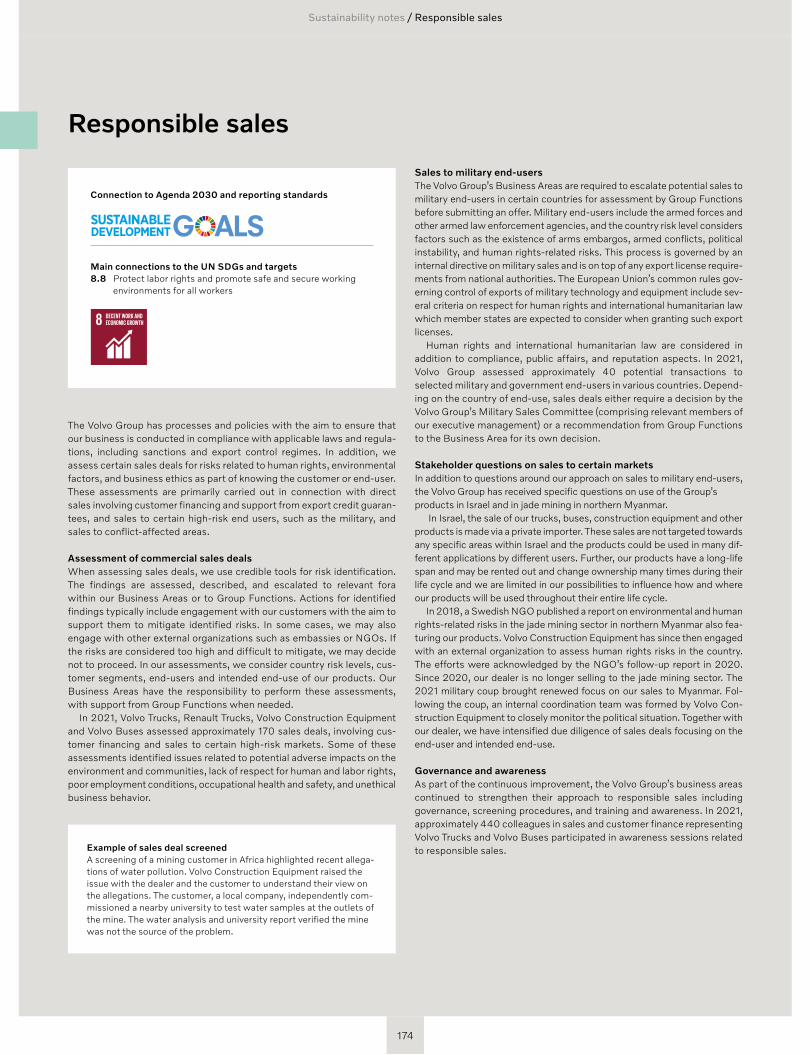
The Volvo Group has processes and policies with the aim to ensure that our business is conducted in compliance with applicable laws and regula-tions, including sanctions and export control regimes. In addition, we assess certain sales deals for risks related to human rights, environmental factors, and business ethics as part of knowing the customer or end-user. These assessments are primarily carried out in connection with direct sales involving customer financing and support from export credit guaran-tees, and sales to certain high-risk end users, such as the military, and sales to conflict-affected areas.
Assessment of commercial sales dealsWhen assessing sales deals, we use credible tools for risk identification. The findings are assessed, described, and escalated to relevant fora within our Business Areas or to Group Functions. Actions for identified findings typically include engagement with our customers with the aim to support them to mitigate identified risks. In some cases, we may also engage with other external organizations such as embassies or NGOs. If the risks are considered too high and difficult to mitigate, we may decide not to proceed. In our assessments, we consider country risk levels, cus-tomer segments, end-users and intended end-use of our products. Our Business Areas have the responsibility to perform these assessments, with support from Group Functions when needed.
In 2021, Volvo Trucks, Renault Trucks, Volvo Construction Equipment and Volvo Buses assessed approximately 170 sales deals, involving cus-tomer financing and sales to certain high-risk markets. Some of these assessments identified issues related to potential adverse impacts on the environment and communities, lack of respect for human and labor rights, poor employment conditions, occupational health and safety, and unethical business behavior.
Sales to military end-usersThe Volvo Group’s Business Areas are required to escalate potential sales to military end-users in certain countries for assessment by Group Functions before submitting an offer. Military end-users include the armed forces and other armed law enforcement agencies, and the country risk level considers factors such as the existence of arms embargos, armed conflicts, political instability, and human rights-related risks. This process is governed by an internal directive on military sales and is on top of any export license require-ments from national authorities. The European Union’s common rules gov-erning control of exports of military technology and equipment include sev-eral criteria on respect for human rights and international humanitarian law which member states are expected to consider when granting such export licenses.
Human rights and international humanitarian law are considered in addition to compliance, public affairs, and reputation aspects. In 2021, Volvo Group assessed approximately 40 potential transactions to selected military and government end-users in various countries. Depend-ing on the country of end-use, sales deals either require a decision by the Volvo Group’s Military Sales Committee (comprising relevant members of our executive management) or a recommendation from Group Functions to the Business Area for its own decision.
Stakeholder questions on sales to certain marketsIn addition to questions around our approach on sales to military end-users, the Volvo Group has received specific questions on use of the Group’s products in Israel and in jade mining in northern Myanmar.
In Israel, the sale of our trucks, buses, construction equipment and other products is made via a private importer. These sales are not targeted towards any specific areas within Israel and the products could be used in many dif-ferent applications by different users. Further, our products have a long-life span and may be rented out and change ownership many times during their life cycle and we are limited in our possibilities to influence how and where our products will be used throughout their entire life cycle.
In 2018, a Swedish NGO published a report on environmental and human rights-related risks in the jade mining sector in northern Myanmar also fea-turing our products. Volvo Construction Equipment has since then engaged with an external organization to assess human rights risks in the country. The efforts were acknowledged by the NGO’s follow-up report in 2020. Since 2020, our dealer is no longer selling to the jade mining sector. The 2021 military coup brought renewed focus on our sales to Myanmar. Fol-lowing the coup, an internal coordination team was formed by Volvo Con-struction Equipment to closely monitor the political situation. Together with our dealer, we have intensified due diligence of sales deals focusing on the end-user and intended end-use.
Governance and awareness As part of the continuous improvement, the Volvo Group’s business areas continued to strengthen their approach to responsible sales including governance, screening procedures, and training and awareness. In 2021, approximately 440 colleagues in sales and customer finance representing Volvo Trucks and Volvo Buses participated in awareness sessions related to responsible sales.
Connection to Agenda 2030 and reporting standards
Main connections to the UN SDGs and targets8.8 Protect labor rights and promote safe and secure working
environments for all workers
Responsible sales
Example of sales deal screenedA screening of a mining customer in Africa highlighted recent allega-tions of water pollution. Volvo Construction Equipment raised the issue with the dealer and the customer to understand their view on the allegations. The customer, a local company, independently com-missioned a nearby university to test water samples at the outlets of the mine. The water analysis and university report verified the mine was not the source of the problem.
Sustainability notes / Responsible sales
174
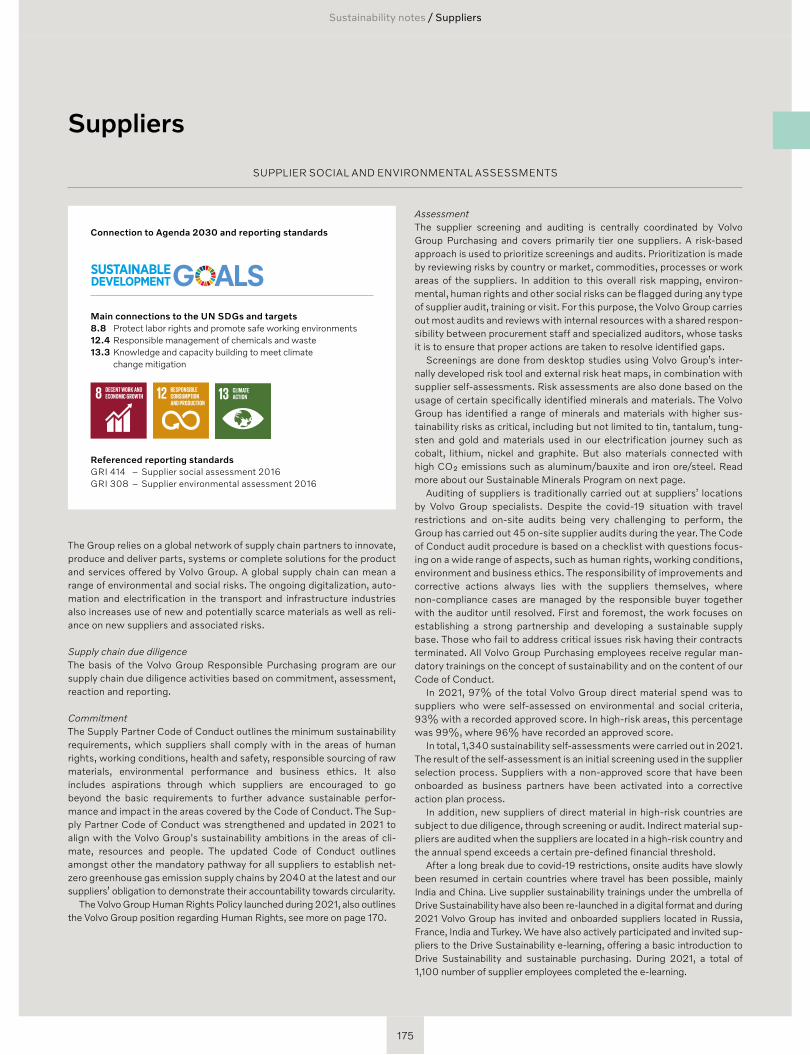
Connection to Agenda 2030 and reporting standards
Main connections to the UN SDGs and targets8.8 Protect labor rights and promote safe working environments 12.4 Responsible management of chemicals and waste13.3 Knowledge and capacity building to meet climate
change mitigation
Referenced reporting standards GRI 414 – Supplier social assessment 2016GRI 308 – Supplier environmental assessment 2016
The Group relies on a global network of supply chain partners to innovate, produce and deliver parts, systems or complete solutions for the product and services offered by Volvo Group. A global supply chain can mean a range of environmental and social risks. The ongoing digitalization, auto-mation and electrification in the transport and infrastructure industries also increases use of new and potentially scarce materials as well as reli-ance on new suppliers and associated risks.
Supply chain due diligence The basis of the Volvo Group Responsible Purchasing program are our supply chain due diligence activities based on commitment, assessment, reaction and reporting.
CommitmentThe Supply Partner Code of Conduct outlines the minimum sustainability requirements, which suppliers shall comply with in the areas of human rights, working conditions, health and safety, responsible sourcing of raw materials, environmental performance and business ethics. It also includes aspirations through which suppliers are encouraged to go beyond the basic requirements to further advance sustainable perfor-mance and impact in the areas covered by the Code of Conduct. The Sup-ply Partner Code of Conduct was strengthened and updated in 2021 to align with the Volvo Group's sustainability ambitions in the areas of cli-mate, resources and people. The updated Code of Conduct outlines amongst other the mandatory pathway for all suppliers to establish net-zero greenhouse gas emission supply chains by 2040 at the latest and our suppliers’ obligation to demonstrate their accountability towards circularity.
The Volvo Group Human Rights Policy launched during 2021, also outlines the Volvo Group position regarding Human Rights, see more on page 170.
AssessmentThe supplier screening and auditing is centrally coordinated by Volvo Group Purchasing and covers primarily tier one suppliers. A risk-based approach is used to prioritize screenings and audits. Prioritization is made by reviewing risks by country or market, commodities, processes or work areas of the suppliers. In addition to this overall risk mapping, environ-mental, human rights and other social risks can be flagged during any type of supplier audit, training or visit. For this purpose, the Volvo Group carries out most audits and reviews with internal resources with a shared respon-sibility between procurement staff and specialized auditors, whose tasks it is to ensure that proper actions are taken to resolve identified gaps.
Screenings are done from desktop studies using Volvo Group’s inter-nally developed risk tool and external risk heat maps, in combination with supplier self-assessments. Risk assessments are also done based on the usage of certain specifically identified minerals and materials. The Volvo Group has identified a range of minerals and materials with higher sus-tainability risks as critical, including but not limited to tin, tantalum, tung-sten and gold and materials used in our electrification journey such as cobalt, lithium, nickel and graphite. But also materials connected with high CO₂ emissions such as aluminum/bauxite and iron ore/steel. Read more about our Sustainable Minerals Program on next page.
Auditing of suppliers is traditionally carried out at suppliers’ locations by Volvo Group specialists. Despite the covid-19 situation with travel restrictions and on-site audits being very challenging to perform, the Group has carried out 45 on-site supplier audits during the year. The Code of Conduct audit procedure is based on a checklist with questions focus-ing on a wide range of aspects, such as human rights, working conditions, environment and business ethics. The responsibility of improvements and corrective actions always lies with the suppliers themselves, where non-compliance cases are managed by the responsible buyer together with the auditor until resolved. First and foremost, the work focuses on establishing a strong partnership and developing a sustainable supply base. Those who fail to address critical issues risk having their contracts terminated. All Volvo Group Purchasing employees receive regular man-datory trainings on the concept of sustainability and on the content of our Code of Conduct.
In 2021, 97% of the total Volvo Group direct material spend was to suppliers who were self-assessed on environmental and social criteria, 93% with a recorded approved score. In high-risk areas, this percentage was 99%, where 96% have recorded an approved score.
In total, 1,340 sustainability self-assessments were carried out in 2021. The result of the self-assessment is an initial screening used in the supplier selection process. Suppliers with a non-approved score that have been onboarded as business partners have been activated into a corrective action plan process.
In addition, new suppliers of direct material in high-risk countries are subject to due diligence, through screening or audit. Indirect material sup-pliers are audited when the suppliers are located in a high-risk country and the annual spend exceeds a certain pre-defined financial threshold.
After a long break due to covid-19 restrictions, onsite audits have slowly been resumed in certain countries where travel has been possible, mainly India and China. Live supplier sustainability trainings under the umbrella of Drive Sustainability have also been re-launched in a digital format and during 2021 Volvo Group has invited and onboarded suppliers located in Russia, France, India and Turkey. We have also actively participated and invited sup-pliers to the Drive Sustainability e-learning, offering a basic introduction to Drive Sustainability and sustainable purchasing. During 2021, a total of 1,100 number of supplier employees completed the e-learning.
Suppliers
SUPPLIER SOCIAL AND ENVIRONMENTAL ASSESSMENTS
Sustainability notes / Suppliers
175
Social impacts in the supply chain and actions takenIn 2021, deviations were found within the areas of health and safety, working hours and sustainability communication towards sub-suppliers. In the area of health and safety, the deviations related mainly to hazardous waste disposal. In the area of working hours, the findings were related to excessive working hours and in the area of supplier communication, the deviations were found around inconsistent sub-supplier Codes of Con-duct, lack of cascading requirements and information and training to sub-contractors about social, environmental or business ethics require-ments. The findings from the audits are communicated back to the suppli-ers. The suppliers are expected to set up and implement a corrective action plan in a timely manner. Such corrective actions are then monitored by the responsible buyer in cooperation with the auditor and the Respon-sible Purchasing Team. All have confirmed corrective actions to be taken.
Environmental impacts in the supply chain and actions takenIn 2021, minor deviations related to hazardous waste management were found, these were connected to the deviations above. From an environ-mental perspective these were seen as minor, but from a health and safety perspective they were considered more significant. All have con-firmed corrective actions to be taken.
An important environmental focus in the supply chain focuses on the transition to net-zero greenhouse gas emissions. This includes both com-ponents and solutions used in Volvo Group’s products but will increas-ingly also include emission performance at suppliers. During 2021, emis-sion hot spots in the supply chain have been identified based on updated life cycle assessments. We have also identified prioritized suppliers based on greenhouse gas intensity, based on both current as well as expected future technology. This analysis will be used to set up individual and spe-cific decarbonization plans with selected suppliers. These supply chain ambition follows the Volvo Group’s overall ambition to enable customers to go fossil free by 2040.
Sustainable Minerals Program As part of our Supply Chain Due Diligence program, the Volvo Group has a specific focus on a range of selected minerals and materials. The Volvo Group’s ambition is to support its suppliers to secure sustainable supply chains of these minerals and the ultimate aim is to secure an environmen-tally and socially sound supply chain of components and minerals. Con-flict minerals and cobalt are part of our Sustainable Minerals Program where we accelerate the supply chain activities even more and go deeper and wider to make risk assessments and drive sustainable corrective actions. Tin, tantalum, tungsten, gold and cobalt are part of our global supply chains and are used in a variety of materials and components. As part of this work, Volvo Group is a member of RMI (Responsible Minerals
Examples of industry collaborations for sustainable supply chains
The Responsible Minerals Initiative (RMI) is a collaborative platform addressing responsible mineral sourcing issues in global supply chains. Volvo Group is working with RMI with the aim to ensure responsible and sustainable sourcing of tin, tantalum, tungsten and gold (sometimes referred to as conflict minerals), as well as cobalt. Through RMI, participants develop and gain access to tools and resources to ensure regulatory compliance and support responsible sourcing of minerals from conflict- affected and high-risk areas.
DRIVE Sustainability is a network of eleven leading automotive com-panies working towards enhancing sustainability throughout the automotive industry by leveraging a common voice and by engaging with our supply chain partners, stakeholders and related sectors on impactful activities. Volvo Group is active in several working groups within the initiative to leverage a circular and sustainable automotive value chain. During 2021, the Drive Sustainability network was extended to Drive+ where tier 1 suppliers are invited to become mem-bers in order to strengthen the dialogue, collaboration and under-standing in order to achieve common sustainable supply chains. Drive Sustainability also during 2021 launched the Raw Material Outlook Platform, an open platform helping the automotive industry to man-age and remediate sustainability risks of raw materials through value chain mapping and Sustainability/ESG risk identification.
The Global Battery Alliance a public-private collaboration platform under the umbrella of the World Economic Forum. The vision is to create a circular and sustainable battery value chain set on ten guid-ing principles covering issues from the circular recovery of battery materials, ensuring transparency of greenhouse gas emissions and their progressive reduction, to eliminating child and forced labor.
Initiative, see information to the right). In 2021, 821 tier one companies are selected in the Volvo Group’s sustainable minerals program with the aim to create transparency and visibility in the supply chains of conflict minerals and cobalt by using the Conflict Minerals and Cobalt Reporting template of the RMI.
Several of the invited companies already collaborate and all invited will be assessed on the parameters of (a) strength of Human Rights Due Dili-gence program and (b) association to smelters or refiners of concern in their supply chain. The long-term ambition of the Sustainable Minerals program is to drive full transparency by 2025 where all supply chain part-ners in scope are to be compliant with our Responsible Purchasing stand-ards and requirements.
Sustainability notes / Suppliers
176
Connection to Agenda 2030 and reporting standards
Main connections to the UN SDGs and targets16.5 Substantially reduce corruption and bribery
Referenced reporting standardsGRI 205 – Anti-corruption 2016
COMPLIANCE PROGRAMS
Legal compliance forms the basis for everything we do in the Volvo Group. It covers many different areas and is guided by people of expertise and knowledge across the Group, and spans across topics such as emissions regulations, competition and anti-corruption laws, anti-money launder-ing, export control regulations and data privacy.
Our Code of Conduct states that we compete in a fair manner on the merits of our products and services and not participate in or endorse any corrupt practices. These principles of compliance are implemented through dedicated resources and compliance programs, including policies and guidelines, a comprehensive range of e-learning and tailored face-to-face training, counselling and support, as well as auditing and reviews. In addition, the Volvo Group has implemented Whistleblowing channels that can be used by internal and external parties for all compliance areas.
ANTI-CORRUPTION
The Volvo Group strictly prohibits and condemns all forms of corruption, including bribery. This is not only because it is illegal, but also because of a strong conviction that corruption distorts the market, interferes with free competition, violates laws and undermines social development. Volvo Group employees at all levels are prohibited from participating, or otherwise becoming involved, in any form of corruption, including offering or accepting, directly or indirectly, bribes, excessive gifts or hospitality or facilitation payments. The Volvo Group expects all its business partners to maintain the comparable anti-corruption principles and does not tolerate that they get involved in corruption in any form.
The exposure of the Volvo Group and its employees to corruption risks stems from various risk factors. For instance, the company has a global footprint with business operations in many countries, including countries that are considered to be high-risk from a corruption perspective. The Volvo Group business involves high-value contracts and direct and indirect participation in private and public tender procedures. Further, the com-pany is exposed to third-party compliance risks due to its interactions with a broad range of business partners and other third parties, such as officials or representatives of government bodies or institutions.
The Volvo Group has established a dedicated anti-corruption policy and detailed instructions and guidelines to complement the Volvo Group Code of Conduct. Among other things, these include books and records require-ments, a mandatory risk-based anti-corruption due diligence process for new and existing business partners, rules and procedures for facilitation payments, gift and hospitality, third party remuneration, sponsorships and
charitable donations. Where deemed necessary we have further docu-ments in adjacent areas such as anti-money laundering and fraud report-ing. Group Compliance is responsible for designing and developing the Volvo Group anti-corruption compliance program and monitors the imple-mentation across the Group. A network of compliance officers in the busi-ness areas and divisions work closely with Group Compliance to ensure the implementation in their respective areas.
Volvo Group uses a combination of audits, management control sys-tems and internal controls to ensure adherence to the Code of Conduct. Further, the Code of Conduct encourages all employees to speak up and report suspected violations to their managers or other management repre-sentatives. Another way to raise a concern is through the Volvo Group Whistle, available on volvogroup.com.
Communication and training about anti-corruptionVolvo Group’s top management, Group Compliance and other internal stake-holders regularly communicate the importance of anti-corruption compli-ance in various forms. Training is a central element of the Volvo Group’s com-pliance programs. Following a risk-based approach, the Volvo Group provided instructor led anti-corruption training to more than 4,300 employ-ees in 2021. Anti-corruption is also addressed in Volvo Group’s annual Code of Conduct e-learning completed by more than 37,000 employees.
WHISTLEBLOWER REPORTING
In Volvo Group, we believe that a vivid speak-up culture is a crucial ele-ment for the company’s success, can help uncover misconduct, and pre-vent violations of the law. The Volvo Group Whistle, is hosted by a third party and open to anyone within or outside the company to ask a question or report a concern related to the Volvo Group Code of Conduct. In 2021, an updated Whistleblowing and Investigations Policy was published to emphasize Volvo Group’s commitment of non-retaliation and whistle-blower protection, including confidentiality, right to anonymity, and other key aspects of proper handling of the reported concerns. The policy builds on legal requirements from different jurisdictions, including the European Union Directive 2019/1937 on the protection of persons who report breaches of Union law.
The Whistleblowing and Global Investigations function is an independ-ent unit within Group Compliance. In 2021, Group Compliance received 121 concerns through several available reporting channels. All reports were investigated. We observed an increased activity compared to the previous year. Nine of the reported cases were categorized as suspected corruption or conflict of interest of which one was closed substantiated, with appropriate disciplinary and remediation actions taken.
Whistleblower concerns escalated to Group Compliance
2021 2020
Type of concerns reported No. % No. %
Fair workplace violations 48 40% 39 40%
Offences against company assets 24 20% 27 28%
Business conduct offences 25 21% 10 10%
Offenses endangering the environ-ment or health and safety 13 11% 3 3%
Violations of privacy or private sphere 4 3% 1 1%
Offenses against financial integrity 0 0% 2 2%
Inquiries 7 6% 15 15%
121 100% 97 100%
Business ethics and compliance
Sustainability notes / Business ethics and compliance
177
Organizational profile and reporting practices
Reporting cycleThe reporting cycle is annual. No significant restatements have been made. The reporting period is January 1, 2021 to December 31, 2021. The date of the most recent report was February 26, 2021.
Name of the organizationThe name of the company issuing this report is AB Volvo (publ). The com-pany is the parent company of the Volvo Group.
Activities, brands, products and servicesThe Volvo Group is one of the world’s leading manufacturers of trucks, buses, construction equipment and marine and industrial engines. The Group also provides complete solutions for financing and service. The Volvo Group’s brand portfolio consists of Volvo, Volvo Penta, Rokbak, Renault Trucks, Prevost, Nova Bus, Mack and Arquus. We partner in alliances and joint ventures with the SDLG, Eicher, Dongfeng and cellcentric brands.
Location of headquarters and operationsThe Volvo Group is headquartered in Gothenburg, Sweden, and has pro-duction facilities in 19 countries and sells its products in more than 190 markets. The company was founded in Sweden in 1927 where the Volvo Group still operates a significant part of its operations. Other significant operations are found in the US, Brazil, India, France and China. For more information about major production facilities, please refer to volvogroup.com/asr2021.
Ownership and legal formAB Volvo (publ) is a publicly held company, and its shares are listed on the stock exchange Nasdaq Stockholm, Sweden.
Scale of the organizationNet sales amounted to SEK 372 billion in 2021. See page 92 for segment reporting. Refer to page 213 for a summary of products delivered.
TAX POLICY – KEY PRINCIPLES
The Volvo Group has a clear policy on how to manage tax across the organ-ization. The policy is adopted by the Volvo Board of Directors and estab-lishes the following key principles:
The Volvo Group shall comply with the tax laws and regulations in all countries where we operate. Tax compliance is a matter of legal adher-ence and responsible business behavior. Tax compliance therefore requires consideration of both the wording and the spirit of the law. Where tax laws and regulations are unclear, prudence shall be observed by apply-ing a high standard of professional integrity to maintain the Volvo Group’s reputation as a compliant taxpayer contributing to society wherever oper-ations take place.
The Volvo Group strives to comply with domestic and international tax reporting requirements and shall act transparently towards Tax Authori-ties, by providing them with all relevant information requested to assess the Group’s compliance with tax laws and regulations.
The Volvo Group seeks to ensure that taxes are paid where value is cre-ated by adhering to applicable transfer pricing rules and guidelines as developed by the OECD and other standard setting and regulatory bodies.
The Volvo Group shall manage its operations in a tax conscious manner, notably by avoiding double taxation, safeguarding its deferred tax assets and applying tax consolidation according to local legislations. The Volvo Group does not engage in aggressive tax planning activities through structures in tax havens or otherwise.
The average corporate tax rate of the Volvo Group for the last five years is 23% (24).
PUBLIC POLICY
The Volvo Group has a continuous dialogue with authorities, regulators and policymakers on issues relevant for us and our customers’ business and operations. The dialogue is guided by yearly priorities approved by the Executive Board. The Group is engaged in direct and indirect advocacy related to public policy, mainly in the EU and the US. Associated costs are reported to lobby registers for transparency. In 2021, the total staff cost for lobbying in the EU and the US was approximately SEK 14 M.
The Volvo Group observes neutrality with regard to political parties and their representatives. The Volvo Group Code of Conduct and related poli-cies serve as the foundation for our position on public policy.
The Volvo Group’s advocacy efforts, direct or indirect via its member-ships in associations are based on the following guiding principles, set by the Executive Board:
1. In line with the Paris Climate Agreement
2. Fair and free trade
3. Level playing field
4. Technology neutrality
5. Global standards
6. Long-term prerequisites
7. Clarity and predictability
Volvo Group is member of several trade associations, providing a possibility to monitor and comment on proposed regulations and policies. During the year, the Group has reviewed its material memberships and their positions on climate change. This is an important element in the work towards net-zero value chain greenhouse gas emissions.
In 2021, 14 organizations were reviewed based on their importance for Volvo Group’s business and industry, that they operate in regions or coun-tries where Volvo Group has significant business, and the possibility for Volvo Group to influence the position of the association. Seven of the assessed organizations were considered as aligned with Volvo Group’s posi-tion and strategy supporting the ambition of the Paris Climate Agreement, seven were found to be partly aligned. Volvo Group will continue to follow up the partly aligned positions striving towards harmonized climate ambitions.
A list of memberships is available on volvogroup.com/lobbying.
Sustainability notes / Business ethics and compliance
178
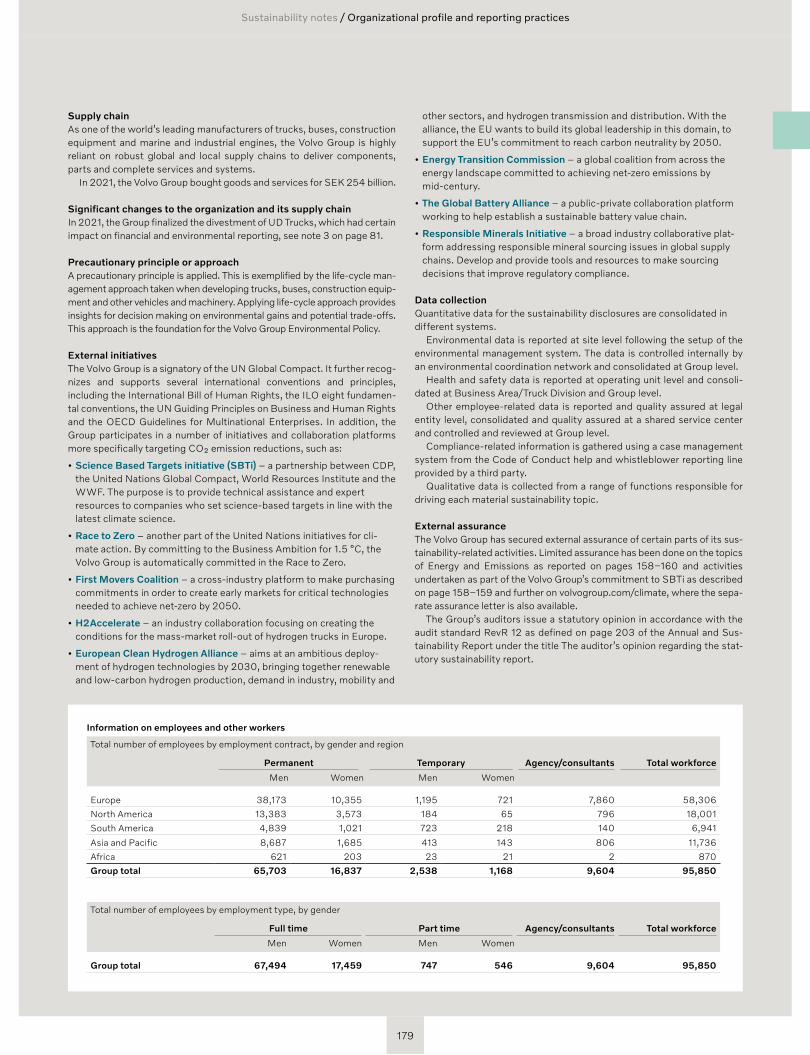
Supply chainAs one of the world’s leading manufacturers of trucks, buses, construction equipment and marine and industrial engines, the Volvo Group is highly reliant on robust global and local supply chains to deliver components, parts and complete services and systems.
In 2021, the Volvo Group bought goods and services for SEK 254 billion.
Significant changes to the organization and its supply chainIn 2021, the Group finalized the divestment of UD Trucks, which had certain impact on financial and environmental reporting, see note 3 on page 81.
Precautionary principle or approachA precautionary principle is applied. This is exemplified by the life-cycle man-agement approach taken when developing trucks, buses, construction equip-ment and other vehicles and machinery. Applying life- cycle approach provides insights for decision making on environmental gains and potential trade-offs. This approach is the foundation for the Volvo Group Environmental Policy.
External initiativesThe Volvo Group is a signatory of the UN Global Compact. It further recog-nizes and supports several international conventions and principles, including the International Bill of Human Rights, the ILO eight fundamen-tal conventions, the UN Guiding Principles on Business and Human Rights and the OECD Guidelines for Multinational Enterprises. In addition, the Group participates in a number of initiatives and collaboration platforms more specifically targeting CO₂ emission reductions, such as:
• Science Based Targets initiative (SBTi) – a partnership between CDP, the United Nations Global Compact, World Resources Institute and the WWF. The purpose is to provide technical assistance and expert resources to companies who set science-based targets in line with the latest climate science.
• Race to Zero – another part of the United Nations initiatives for cli-mate action. By committing to the Business Ambition for 1.5 °C, the Volvo Group is automatically committed in the Race to Zero.
• First Movers Coalition – a cross-industry platform to make purchasing commitments in order to create early markets for critical technologies needed to achieve net-zero by 2050.
• H2Accelerate – an industry collaboration focusing on creating the conditions for the mass-market roll-out of hydrogen trucks in Europe.
• European Clean Hydrogen Alliance – aims at an ambitious deploy-ment of hydrogen technologies by 2030, bringing together renewable and low-carbon hydrogen production, demand in industry, mobility and
other sectors, and hydrogen transmission and distribution. With the alliance, the EU wants to build its global leadership in this domain, to support the EU’s commitment to reach carbon neutrality by 2050.
• Energy Transition Commission – a global coalition from across the energy landscape committed to achieving net-zero emissions by mid-century.
• The Global Battery Alliance – a public-private collaboration platform working to help establish a sustainable battery value chain.
• Responsible Minerals Initiative – a broad industry collaborative plat-form addressing responsible mineral sourcing issues in global supply chains. Develop and provide tools and resources to make sourcing decisions that improve regulatory compliance.
Data collectionQuantitative data for the sustainability disclosures are consolidated in different systems.
Environmental data is reported at site level following the setup of the environmental management system. The data is controlled internally by an environmental coordination network and consolidated at Group level.
Health and safety data is reported at operating unit level and consoli-dated at Business Area/Truck Division and Group level.
Other employee-related data is reported and quality assured at legal entity level, consolidated and quality assured at a shared service center and controlled and reviewed at Group level.
Compliance-related information is gathered using a case management system from the Code of Conduct help and whistleblower reporting line provided by a third party.
Qualitative data is collected from a range of functions responsible for driving each material sustainability topic.
External assuranceThe Volvo Group has secured external assurance of certain parts of its sus-tainability-related activities. Limited assurance has been done on the topics of Energy and Emissions as reported on pages 158–160 and activities undertaken as part of the Volvo Group’s commitment to SBTi as described on page 158–159 and further on volvogroup.com/climate, where the sepa-rate assurance letter is also available.
The Group’s auditors issue a statutory opinion in accordance with the audit standard RevR 12 as defined on page 203 of the Annual and Sus-tainability Report under the title The auditor’s opinion regarding the stat-utory sustainability report.
Information on employees and other workers
Total number of employees by employment contract, by gender and region
Permanent Temporary Agency/consultants Total workforce
Men Women Men Women
Europe 38,173 10,355 1,195 721 7,860 58,306
North America 13,383 3,573 184 65 796 18,001
South America 4,839 1,021 723 218 140 6,941
Asia and Pacific 8,687 1,685 413 143 806 11,736
Africa 621 203 23 21 2 870
Group total 65,703 16,837 2,538 1,168 9,604 95,850
Total number of employees by employment type, by gender
Full time Part time Agency/consultants Total workforce
Men Women Men Women
Group total 67,494 17,459 747 546 9,604 95,850
Sustainability notes / Organizational profile and reporting practices
179
Corporate Governance Report 2021
Corporate Governance Report 2021
The Swedish Corporate Governance Code
AB Volvo’s shares are admitted to trading on the stock exchange Nasdaq Stockholm’s main market. As a listed company, Volvo applies the Swedish Corporate Governance Code (the Code), which is available at www.corporategovernanceboard.se.
This Corporate Governance Report has been prepared in accordance with the Swedish Annual Accounts Act and the Code, and is separate from the Annual and Sustainability Report. The report has been reviewed by, and includes a report from, Volvo's auditors.
Corporate Governance Model
At the General Meetings of AB Volvo, which is the parent company of the Volvo Group, the shareholders exercise their voting rights with regard to for example the composition of the Board of Directors of AB Volvo and the election of auditors.
An Election Committee, appointed by the Annual General Meeting, submits proposals to the General Meeting concerning the election of Board members and Board Chairman as well as proposals for resolutions concerning remuneration of the Board. When applicable, the Election Committee also submits proposals to the General Meeting for the election of external auditors and for resolutions concerning fees to the auditors.
The Board is ultimately responsible for Volvo’s organization and the management of its operations.
In addition, the Board appoints the President and CEO of AB Volvo. The CEO is in charge of the daily management of the Group in accordance with the guidelines provided by the Board.
The Volvo Group appreciates sound corporate governance as a fundamental base in promoting its long-term strategic objectives and in achieving a trusting relation with shareholders and other key stakeholders. High standards when it comes to transparency, reliability and ethical values are guiding principles within the Volvo Group’s operations.
180
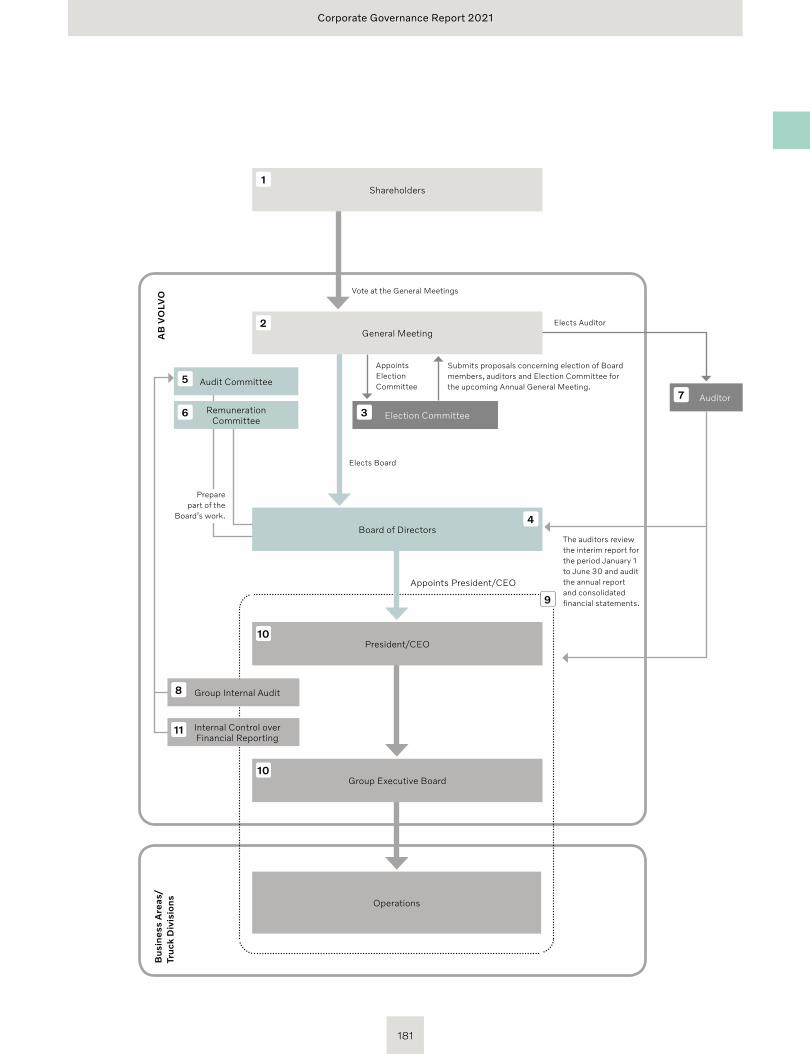
Corporate Governance Report 2021
Audit Committee
Election Committee
Auditor
AB
VO
LVO
Bu
sin
ess
Are
as/
Tru
ck D
ivis
ion
s
Vote at the General Meetings
Elects Board
Prepare part of the
Board’s work.
Elects Auditor
Appoints Election Committee
The auditors review the interim report for the period January 1 to June 30 and audit the annual report and consolidated financial statements.
Appoints President/CEO
Shareholders
General Meeting
1
2
5
Remuneration Committee
6 3
7
President/CEO
Operations
Board of Directors
Submits proposals concerning election of Board members, auditors and Election Committee for the upcoming Annual General Meeting.
4
9
10
Group Executive Board10
Group Internal Audit
Internal Control over Financial Reporting
8
11
181
Corporate Governance Report 2021
Volvo has issued two classes of shares: series A and series B. At a General Meeting, series A shares carry one vote and series B shares one-tenth of a vote. The two share classes carry equal rights in the assets and earnings of the company. According to a special share conversion clause in the Arti-cles of Association, holders of series A shares are entitled to request that their series A shares be converted to series B shares. Implementation of such conversions, which occurs on a regular basis, entail that the total number of votes in the company decreases.
The share register of AB Volvo is maintained by Euroclear Sweden AB. On December 31, 2021, Volvo had 358,253 shareholders according to the share register. The largest shareholder, in terms of votes on that date was AB Industrivärden, with 27.7 percent of the votes. As per the same date, Geely Holding held 16.0 percent of the votes, AMF Insurance & Funds held 5.4 percent of the votes, Alecta held 4.2 percent of the votes and AFA Insurance held 2.3 percent of the votes.
For more information about the Volvo share and its shareholders, please refer to the Board of Director’s Report on pages 68–69 of the Annual and Sustainability Report.
SHARES AND SHAREHOLDERS1
GeneralThe General Meeting is Volvo’s highest decision-making body. The Annual General Meeting is held within six months of the end of the financial year, normally in Gothenburg, Sweden.
In addition to what follows from applicable law regarding shareholders’ right to participate at General Meetings, under Volvo’s Articles of Associa-tion shareholders must give notice of their attendance (within the time stated in the convening notice) and, when applicable, notify the company of any intention to bring assistants.
A shareholder who wants the General Meeting to consider a particular mat-ter must submit a request to the Board in sufficient time prior to the General Meeting to the address provided on Volvo’s website, www.volvogroup.com.
The Annual General Meeting 2021 was held on March 31, 2021 and an Extraordinary General Meeting was held on June 29, 2021 to resolve on an extraordinary dividend. To reduce the risk of spreading the covid-19 virus and considering the authorities’ regulations and advice on avoiding public gatherings, both the Annual General Meeting 2021 and the Extraor-dinary General Meeting were carried out through postal voting, without any physical attendance, pursuant to temporary legislation. As communi-cated by the Swedish Corporate Governance Board in March 2020, this is not to be considered a deviation from the Code.
Annual General Meeting 2022Volvo’s Annual General Meeting 2022 will be held on Wednesday, April 6, 2022. For further information about the Annual General Meeting 2022, please refer to the end of the Annual and Sustainability Report and Volvo’s website, www.volvogroup.com.
GENERAL MEETING2
DutiesThe Election Committee is elected by the General Meeting. The Election Committee shall perform the tasks that are incumbent upon the Election Committee according to its instructions from the General Meeting and the rules of the Code. The main task is to prepare and present proposals to the Annual General Meeting on behalf of the shareholders for the election of Board members, Chairman of the Board and Board remuneration and, when applicable, proposals for auditors and fees to the auditors.
In addition, the Election Committee presents proposals for members of the Election Committee for the following year, in accordance with prevail-ing instructions for Volvo’s Election Committee.
CompositionIn accordance with the current instructions for Volvo’s Election Commit-tee (adopted by the Annual General Meeting 2019), the Annual General Meeting shall elect five members to serve on the Election Committee, of
ELECTION COMMITTEE
whom four shall represent the largest shareholders in the company in terms of votes, who have expressed their willingness to participate in the Election Committee. In addition, one of the members shall be the Chair-man of the AB Volvo Board. Volvo’s Annual General Meeting 2021 resolved to appoint the following individuals as members of the Election Committee:
• Bengt Kjell (AB Industrivärden)
• Anders Oscarsson (AMF and AMF Funds)
• Ramsay Brufer (Alecta)
• Carine Smith Ihenacho (Norges Bank Investment Management)
• Carl-Henric Svanberg, Chairman of the Board
The Election Committee appointed Bengt Kjell as Chairman of the Election Committee.
3
182
Corporate Governance Report 2021
BOARD OF DIRECTORS4
DutiesThe Board is ultimately responsible for Volvo’s organization and manage-ment of the company’s operations. The Board is responsible for the Group’s long-term development and strategy, for regularly controlling and evaluating the Group’s operations and for the other duties set forth in the Swedish Companies Act.
Composition In 2021, AB Volvo’s Board consisted of eleven members elected by the Annual General Meeting and three members and two deputy members appointed by employee organizations.
The Annual General Meeting 2021 re-elected Matti Alahuhta, Eckhard Cordes, Hanne de Mora, Eric Elzvik, Kurt Jofs, Martin Lundstedt, Kathryn V. Marinello, Martina Merz, Helena Stjernholm and Carl-Henric Svanberg as Board members and Martha Finn Brooks was elected as new Board member. The previous Board member James W. Griffith did not stand for re-election. The Annual General Meeting re-elected Carl-Henric Svanberg as Chairman of the Board. A more detailed presentation of each Board member is set out in the “Board of Directors” section on pages 186–187.
Prior to the Annual General Meeting 2021, the Election Committee announced that it had applied the provisions of rule 4.1 of the Code as board diversity policy. The aim is that the Board as a collective should possess the required mix in terms of background and knowledge, whereby an even gen-der distribution is taken into particular account. The result of the Election Committee’s application of the diversity policy is a Board that represents a mix of both professional experience and knowledge as well as geographical and cultural backgrounds. 45 percent (five out of eleven) of the Board mem-bers elected by the Annual General Meeting are women.
Independence requirements The Board of Directors of AB Volvo is subject to the independence require-ments prescribed in the Code.
Prior to the Annual General Meeting 2021, the Election Committee presented the following assessment of the independence of Board mem-bers elected at the Annual General Meeting 2021.
Carl-Henric Svanberg, Matti Alahuhta, Eckhard Cordes, Hanne de Mora, Eric Elzvik, Martha Finn Brooks, Kurt Jofs, Kathryn V. Marinello and Martina Merz were all considered independent of the company and company management, as well as the company’s major shareholders.
Martin Lundstedt, as President of AB Volvo and CEO of the Volvo Group, was considered independent of the company’s major shareholders but not of the company and company management.
Helena Stjernholm was considered independent of the company and company management but not in relation to one of the major sharehold-ers, due to her capacity as President and CEO of AB Industrivärden.
Work procedures Every year, the Board adopts work procedures for the Board’s work.
The work procedures outline how the Board’s duties should be distributed, including the specific role and duties of the Chairman, instructions for the divi-sion of duties between the Board and the President and for the reporting of financial information to the Board. The Board has also adopted specific instruc-tions for the Board’s committees, which are linked to the work procedures.
The Board’s work in 2021The Board’s work is mainly performed within the framework of formal Board meetings and through meetings in the committees of the Board. In addition, regular contact is maintained between the Chairman of the
Board and the CEO in order to discuss ongoing business and to ensure that the Board’s decisions are executed.
In 2021, there were ten regular Board meetings, two extraordinary Board meetings and one statutory Board meeting. Due to the covid-19 pandemic, several of the Board meetings during 2021 were held as video conferences. In light thereof, the Board has decided that, from both a sus-tainability and efficiency perspective, some of the ordinary Board meet-ings should continue to be held as video conferences also after the pan-demic. The attendance of the Board members at the Board meetings in 2021 is presented in the table on page 185. The company’s auditor attended one Board meeting during the year.
During 2021, the Board has continued to monitor the measures taken to address the challenges and consequences of the covid-19 pandemic, with continuous focus on the health and safety of Volvo Group colleagues, customers and business partners as well as to maintain a tight cost con-trol and focus on cash flow. The global shortage of semiconductors and other components has been a challenge throughout the year as well as the ramp-up of production to meet the strong demand, both of which have been closely monitored by the Board.
The focus on sustainability has increased further during 2021 and the Volvo Group’s sustainability work and objectives are an integrated part of the Volvo Group’s business and are regularly reported to the Board by the Volvo Group management. In addition, work is on-going to strengthen the reporting and enable consolidated follow-ups within the area of sustainability. In 2021 the Volvo Group’s climate targets were validated by the Science Based Targets initiative (for further information, see pages 158-160) and the Board adopted the Volvo Group Human Rights Policy as well as the Volvo Group Tax Policy.
The speed of transformation of the industry is accelerating and, in light thereof, the Board has devoted most of its time to strategic topics, with particular focus on disruptive technologies related to digitalization, con-nectivity, automation and electromobility. These technologies play an essential part in the Group’s positioning in the transformation of the industry towards climate-neutral and sustainable transportation and infrastructure solutions. During 2021, the Volvo Group has entered into several partnerships with focus on autonomous solutions, electrification and charging infrastructure. These include, among others, partnering with Aurora to jointly develop autonomous transport solutions, the completion of the transaction to form a fuel-cell joint venture with Daimler Truck AG and the signing of a binding agreement with Daimler Truck and the Traton Group to create a joint venture to install and operate a high-performance public charging network for battery electric, heavy-duty long-haul trucks and coaches across Europe. In addition, the strategic alliance with Isuzu became operational in 2021. Furthermore, the Board has taken the deci-sion to invest in a truck plant in China in order to strengthen Volvo Trucks’ position in the Chinese market in this period of transformation.
By allocating time to business reviews of the Group’s various Truck Divi-sions and Business Areas the Board remains continuously up to date on the status and development of the Group’s transformation work and strategies in relation thereto. Furthermore, the Board has devoted time to talent review and succession planning and on the review and follow-up of the company’s quality work. Related to this work, the Board usually makes a yearly visit to the com-pany’s operations throughout the world. In October 2021, the Board travelled in Sweden and visited the Volvo Group’s truck plant in Tuve (Göteborg) and the Volvo Group’s construction equipment operations in Eskilstuna and Braås.
During 2021, the Board decided on an overall financial plan and invest-ment framework for the Group’s operations. In addition, the Board regu-larly monitors the Group’s earnings and financial position and maintains continuous focus on risk related issues such as overall risk management
183
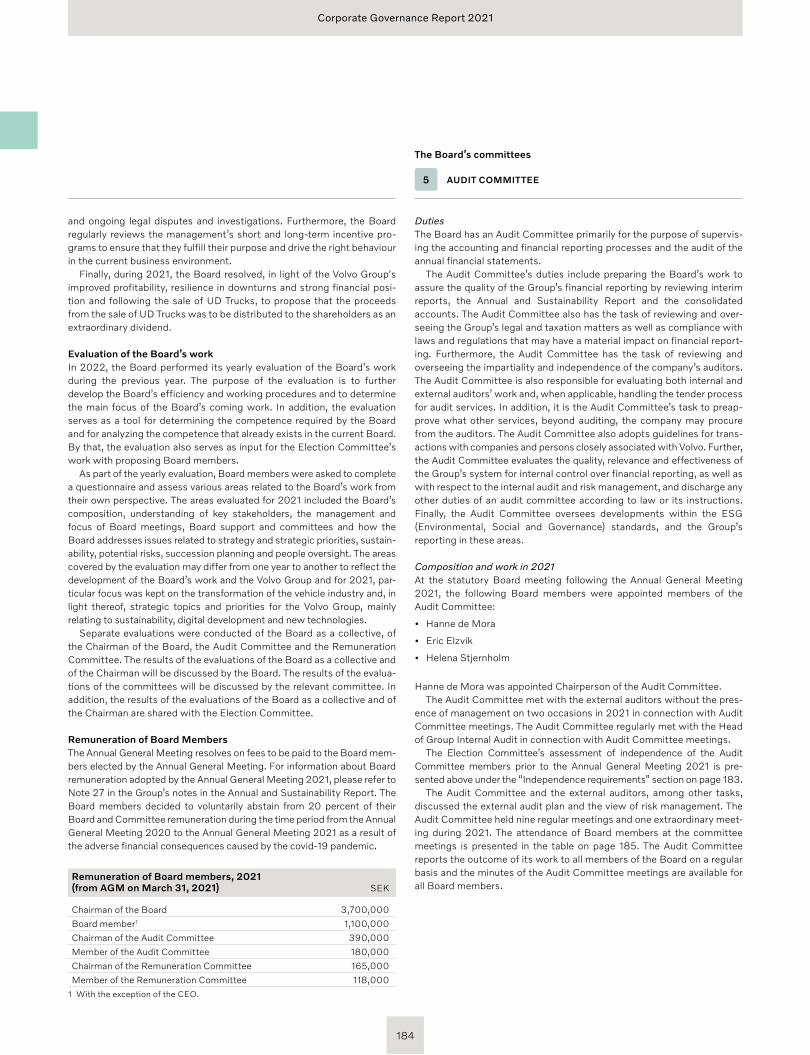
Corporate Governance Report 2021
and ongoing legal disputes and investigations. Furthermore, the Board regularly reviews the management’s short and long-term incentive pro-grams to ensure that they fulfill their purpose and drive the right behaviour in the current business environment.
Finally, during 2021, the Board resolved, in light of the Volvo Group's improved profitability, resilience in downturns and strong financial posi-tion and following the sale of UD Trucks, to propose that the proceeds from the sale of UD Trucks was to be distributed to the shareholders as an extraordinary dividend.
Evaluation of the Board’s workIn 2022, the Board performed its yearly evaluation of the Board’s work during the previous year. The purpose of the evaluation is to further develop the Board’s efficiency and working procedures and to determine the main focus of the Board’s coming work. In addition, the evaluation serves as a tool for determining the competence required by the Board and for analyzing the competence that already exists in the current Board. By that, the evaluation also serves as input for the Election Committee’s work with proposing Board members.
As part of the yearly evaluation, Board members were asked to complete a questionnaire and assess various areas related to the Board’s work from their own perspective. The areas evaluated for 2021 included the Board’s composition, understanding of key stakeholders, the management and focus of Board meetings, Board support and committees and how the Board addresses issues related to strategy and strategic priorities, sustain-ability, potential risks, succession planning and people oversight. The areas covered by the evaluation may differ from one year to another to reflect the development of the Board’s work and the Volvo Group and for 2021, par-ticular focus was kept on the transformation of the vehicle industry and, in light thereof, strategic topics and priorities for the Volvo Group, mainly relating to sustainability, digital development and new technologies.
Separate evaluations were conducted of the Board as a collective, of the Chairman of the Board, the Audit Committee and the Remuneration Committee. The results of the evaluations of the Board as a collective and of the Chairman will be discussed by the Board. The results of the evalua-tions of the committees will be discussed by the relevant committee. In addition, the results of the evaluations of the Board as a collective and of the Chairman are shared with the Election Committee.
Remuneration of Board Members The Annual General Meeting resolves on fees to be paid to the Board mem-bers elected by the Annual General Meeting. For information about Board remuneration adopted by the Annual General Meeting 2021, please refer to Note 27 in the Group’s notes in the Annual and Sustainability Report. The Board members decided to voluntarily abstain from 20 percent of their Board and Committee remuneration during the time period from the Annual General Meeting 2020 to the Annual General Meeting 2021 as a result of the adverse financial consequences caused by the covid-19 pandemic.
Remuneration of Board members, 2021 (from AGM on March 31, 2021) SEK
Chairman of the Board 3,700,000
Board member1 1,100,000
Chairman of the Audit Committee 390,000
Member of the Audit Committee 180,000
Chairman of the Remuneration Committee 165,000
Member of the Remuneration Committee 118,0001 With the exception of the CEO.
DutiesThe Board has an Audit Committee primarily for the purpose of supervis-ing the accounting and financial reporting processes and the audit of the annual financial statements.
The Audit Committee’s duties include preparing the Board’s work to assure the quality of the Group’s financial reporting by reviewing interim reports, the Annual and Sustainability Report and the consolidated accounts. The Audit Committee also has the task of reviewing and over-seeing the Group’s legal and taxation matters as well as compliance with laws and regulations that may have a material impact on financial report-ing. Furthermore, the Audit Committee has the task of reviewing and overseeing the impartiality and independence of the company’s auditors. The Audit Committee is also responsible for evaluating both internal and external auditors’ work and, when applicable, handling the tender process for audit services. In addition, it is the Audit Committee’s task to preap-prove what other services, beyond auditing, the company may procure from the auditors. The Audit Committee also adopts guidelines for trans-actions with companies and persons closely associated with Volvo. Further, the Audit Committee evaluates the quality, relevance and effectiveness of the Group’s system for internal control over financial reporting, as well as with respect to the internal audit and risk management, and discharge any other duties of an audit committee according to law or its instructions. Finally, the Audit Committee oversees developments within the ESG (Environmental, Social and Governance) standards, and the Group’s reporting in these areas.
Composition and work in 2021At the statutory Board meeting following the Annual General Meeting 2021, the following Board members were appointed members of the Audit Committee:
• Hanne de Mora
• Eric Elzvik
• Helena Stjernholm
Hanne de Mora was appointed Chairperson of the Audit Committee. The Audit Committee met with the external auditors without the pres-
ence of management on two occasions in 2021 in connection with Audit Committee meetings. The Audit Committee regularly met with the Head of Group Internal Audit in connection with Audit Committee meetings.
The Election Committee’s assessment of independence of the Audit Committee members prior to the Annual General Meeting 2021 is pre-sented above under the “Independence requirements” section on page 183.
The Audit Committee and the external auditors, among other tasks, discussed the external audit plan and the view of risk management. The Audit Committee held nine regular meetings and one extraordinary meet-ing during 2021. The attendance of Board members at the committee meetings is presented in the table on page 185. The Audit Committee reports the outcome of its work to all members of the Board on a regular basis and the minutes of the Audit Committee meetings are available for all Board members.
The Board’s committees
5 AUDIT COMMITTEE
184
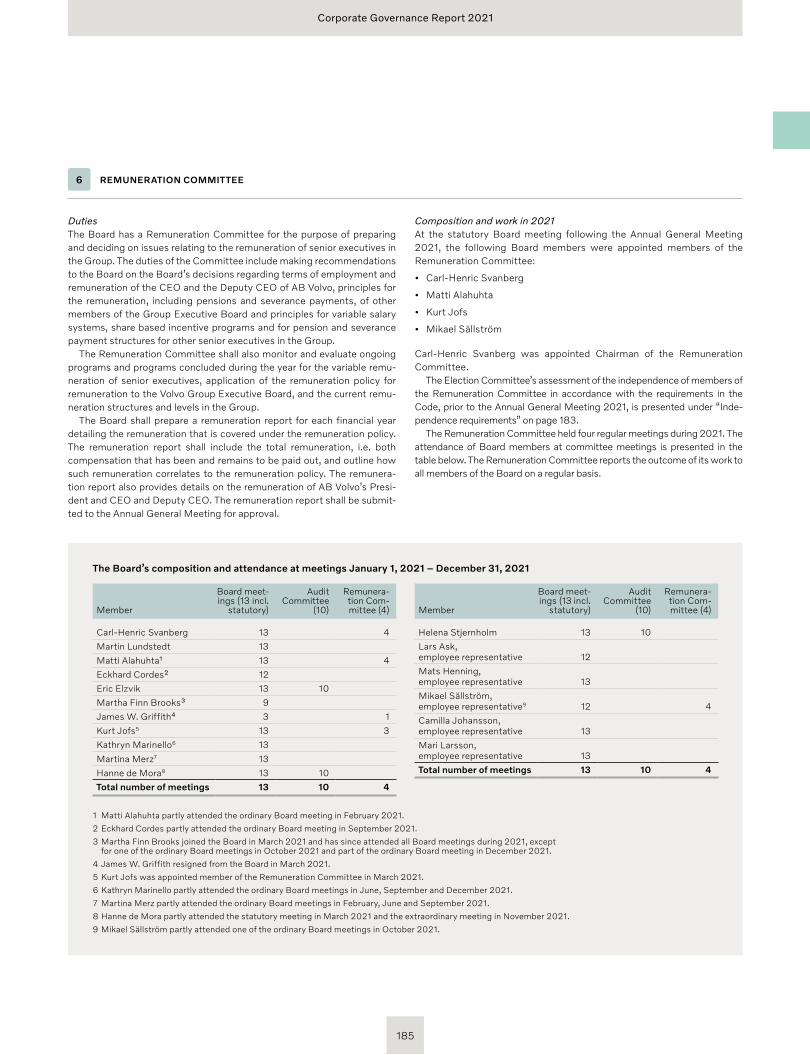
Corporate Governance Report 2021
6 REMUNERATION COMMITTEE
DutiesThe Board has a Remuneration Committee for the purpose of preparing and deciding on issues relating to the remuneration of senior executives in the Group. The duties of the Committee include making recommendations to the Board on the Board’s decisions regarding terms of employment and remuneration of the CEO and the Deputy CEO of AB Volvo, principles for the remuneration, including pensions and severance payments, of other members of the Group Executive Board and principles for variable salary systems, share based incentive programs and for pension and severance payment structures for other senior executives in the Group.
The Remuneration Committee shall also monitor and evaluate ongoing programs and programs concluded during the year for the variable remu-neration of senior executives, application of the remuneration policy for remuneration to the Volvo Group Executive Board, and the current remu-neration structures and levels in the Group.
The Board shall prepare a remuneration report for each financial year detailing the remuneration that is covered under the remuneration policy. The remuneration report shall include the total remuneration, i.e. both compensation that has been and remains to be paid out, and outline how such remuneration correlates to the remuneration policy. The remunera-tion report also provides details on the remuneration of AB Volvo’s Presi-dent and CEO and Deputy CEO. The remuneration report shall be submit-ted to the Annual General Meeting for approval.
Composition and work in 2021At the statutory Board meeting following the Annual General Meeting 2021, the following Board members were appointed members of the Remuneration Committee:
• Carl-Henric Svanberg
• Matti Alahuhta
• Kurt Jofs
• Mikael Sällström
Carl-Henric Svanberg was appointed Chairman of the Remuneration Committee.
The Election Committee’s assessment of the independence of members of the Remuneration Committee in accordance with the requirements in the Code, prior to the Annual General Meeting 2021, is presented under “Inde-pendence requirements” on page 183.
The Remuneration Committee held four regular meetings during 2021. The attendance of Board members at committee meetings is presented in the table below. The Remuneration Committee reports the outcome of its work to all members of the Board on a regular basis.
1 Matti Alahuhta partly attended the ordinary Board meeting in February 2021.
2 Eckhard Cordes partly attended the ordinary Board meeting in September 2021.
3 Martha Finn Brooks joined the Board in March 2021 and has since attended all Board meetings during 2021, except for one of the ordinary Board meetings in October 2021 and part of the ordinary Board meeting in December 2021.
4 James W. Griffith resigned from the Board in March 2021.
5 Kurt Jofs was appointed member of the Remuneration Committee in March 2021.
6 Kathryn Marinello partly attended the ordinary Board meetings in June, September and December 2021.
7 Martina Merz partly attended the ordinary Board meetings in February, June and September 2021.
8 Hanne de Mora partly attended the statutory meeting in March 2021 and the extraordinary meeting in November 2021.
9 Mikael Sällström partly attended one of the ordinary Board meetings in October 2021.
Member
Board meet-ings (13 incl.
statutory)
Audit Committee
(10)
Remunera-tion Com-mittee (4)
Carl-Henric Svanberg 13 4
Martin Lundstedt 13
Matti Alahuhta¹ 13 4
Eckhard Cordes² 12
Eric Elzvik 13 10
Martha Finn Brooks³ 9
James W. Griffith⁴ 3 1
Kurt Jofs5 13 3
Kathryn Marinello6 13
Martina Merz7 13
Hanne de Mora8 13 10
Total number of meetings 13 10 4
Member
Board meet-ings (13 incl.
statutory)
Audit Committee
(10)
Remunera-tion Com-mittee (4)
Helena Stjernholm 13 10
Lars Ask, employee representative 12
Mats Henning, employee representative 13
Mikael Sällström, employee representative9 12 4
Camilla Johansson, employee representative 13
Mari Larsson, employee representative 13
Total number of meetings 13 10 4
The Board’s composition and attendance at meetings January 1, 2021 – December 31, 2021
185
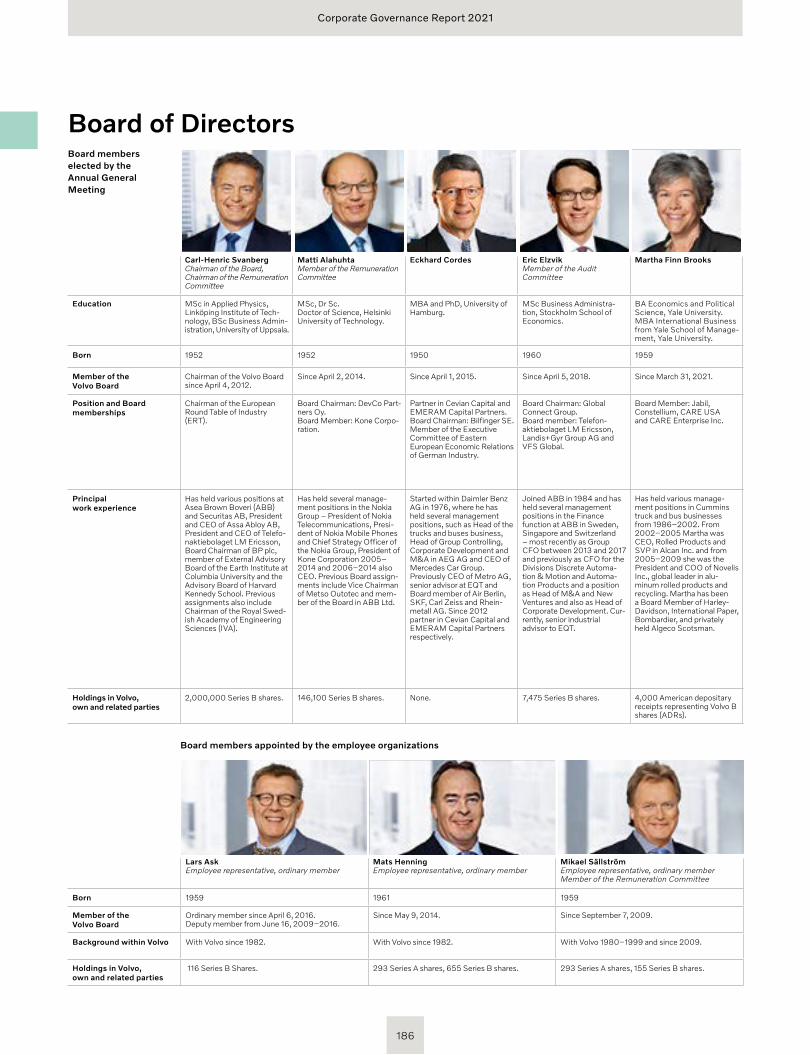
Corporate Governance Report 2021
Board members appointed by the employee organizations
Lars AskEmployee representative, ordinary member
Mats HenningEmployee representative, ordinary member
Mikael SällströmEmployee representative, ordinary member Member of the Remuneration Committee
Camilla JohanssonEmployee representative, deputy member
Mari LarssonEmployee representative, deputy member
Sofia FrändbergSecretary to the Board Master of Laws
Born 1959 1961 1959 1966 1978 1964
Member of the Volvo Board
Ordinary member since April 6, 2016. Deputy member from June 16, 2009–2016.
Since May 9, 2014. Since September 7, 2009. Deputy member since April 6, 2016. Deputy member since May 22, 2015. Secretary to the Board since April 1, 2013.
Background within Volvo With Volvo since 1982. With Volvo since 1982. With Volvo 1980–1999 and since 2009. With Volvo since 1997. With Volvo since 2004. Executive Vice President Group Legal & Compliance and General Counsel.
Holdings in Volvo, own and related parties
116 Series B Shares. 293 Series A shares, 655 Series B shares. 293 Series A shares, 155 Series B shares. 643 Series A shares, 155 Series B shares. 605 Series A shares, 155 Series B shares. 1,738 Series A shares, 59,007 Series B shares.
Board of DirectorsBoard members elected by the Annual General Meeting
Carl-Henric SvanbergChairman of the Board, Chairman of the Remuneration Committee
Matti AlahuhtaMember of the Remuneration Committee
Eckhard Cordes Eric Elzvik Member of the Audit Committee
Martha Finn Brooks Kurt Jofs Member of the Remuneration Committee
Martin Lundstedt President and CEO
Kathryn V. Marinello Martina Merz Hanne de Mora Chairperson of the Audit Committee
Helena StjernholmMember of the Audit Committee
Education MSc in Applied Physics, Linköping Institute of Tech-nology, BSc Business Admin-istration, University of Uppsala.
MSc, Dr Sc. Doctor of Science, Helsinki University of Technology.
MBA and PhD, University of Hamburg.
MSc Business Administra-tion, Stockholm School of Economics.
BA Economics and Political Science, Yale University. MBA International Business from Yale School of Manage-ment, Yale University.
MSc, KTH Royal Institute of Technology, Stockholm.
MSc, Chalmers University of Technology.
BA from State University of New York at Albany, MBA & Doctorate from Hofstra University.
BS from University of Coopera-tive Education, Stuttgart.
BA in Economics from HEC in Lausanne, MBA from IESE in Barcelona.
MSc Business Administra-tion, Stockholm School of Economics.
Born 1952 1952 1950 1960 1959 1958 1967 1956 1963 1960 1970
Member of the Volvo Board
Chairman of the Volvo Board since April 4, 2012.
Since April 2, 2014. Since April 1, 2015. Since April 5, 2018. Since March 31, 2021. Since June 18, 2020. Since April 6, 2016. Since April 2, 2014. Since April 1, 2015. Since April 14, 2010. Since April 6, 2016.
Position and Board memberships
Chairman of the European Round Table of Industry (ERT).
Board Chairman: DevCo Part-ners Oy.Board Member: Kone Corpo-ration.
Partner in Cevian Capital and EMERAM Capital Partners.Board Chairman: Bilfinger SE. Member of the Executive Committee of Eastern European Economic Relations of German Industry.
Board Chairman: Global Connect Group.Board member: Telefon-aktiebolaget LM Ericsson, Landis+Gyr Group AG and VFS Global.
Board Member: Jabil, Constellium, CARE USA and CARE Enterprise Inc.
Board Member: Telefonaktie-bolaget LM Ericsson, Feal AB and Arjeplog Hotel Silverhat-ten AB.
President and CEO of AB Volvo. Board Chairman: Per-mobil AB. Board Member: The European Automobile Manu-facturers’ Association (ACEA) and Autoliv Inc. Member of the Royal Swedish Academy of Engineering Sciences (IVA) and the European Round Table of Industry (ERT).
President and CEO of PODS.Board Chairperson: Concen-trix. Board Member: Ares Acquisition Corporation.
President and CEO of Thyssen krupp AG.Board Member: SAF Holland SA.
Board Chairperson: Micro-caps AGBoard Member: IMD Super-visory Board and Nestlé S.A.
President and CEO of AB Industri värden.Board Member: AB Industri värden, Sandvik AB and Telefon aktie bolaget LM Ericsson.
Principal work experience
Has held various positions at Asea Brown Boveri (ABB) and Securitas AB, President and CEO of Assa Abloy AB, President and CEO of Telefo-naktiebolaget LM Ericsson, Board Chairman of BP plc, member of External Advisory Board of the Earth Institute at Columbia University and the Advisory Board of Harvard Kennedy School. Previous assignments also include Chairman of the Royal Swed-ish Academy of Engineering Sciences (IVA).
Has held several manage-ment positions in the Nokia Group – President of Nokia Telecommunications, Presi-dent of Nokia Mobile Phones and Chief Strategy Officer of the Nokia Group, President of Kone Corporation 2005–2014 and 2006–2014 also CEO. Previous Board assign-ments include Vice Chairman of Metso Outotec and mem-ber of the Board in ABB Ltd.
Started within Daimler Benz AG in 1976, where he has held several manage ment positions, such as Head of the trucks and buses business, Head of Group Controlling, Corporate Development and M&A in AEG AG and CEO of Mercedes Car Group. Previously CEO of Metro AG, senior advisor at EQT and Board member of Air Berlin, SKF, Carl Zeiss and Rhein-metall AG. Since 2012 partner in Cevian Capital and EMERAM Capital Partners respectively.
Joined ABB in 1984 and has held several management positions in the Finance function at ABB in Sweden, Singa pore and Switzerland – most recently as Group CFO between 2013 and 2017 and previously as CFO for the Divisions Discrete Automa-tion & Motion and Automa-tion Products and a position as Head of M&A and New Ventures and also as Head of Corporate Development. Cur-rently, senior industrial advisor to EQT.
Has held various manage-ment positions in Cummins truck and bus businesses from 1986–2002. From 2002–2005 Martha was CEO, Rolled Products and SVP in Alcan Inc. and from 2005–2009 she was the President and COO of Novelis Inc., global leader in alu-minum rolled products and recycling. Martha has been a Board Member of Harley-Davidson, International Paper, Bombardier, and privately held Algeco Scotsman.
Previous positions include Executive Vice President and responsible for Telefonaktie-bolaget LM Ericsson’s Net-works business 2003–2008, CEO of Segerström & Sven-sson 1999–2001, CEO of Linjebuss 1996–1999 and various positions within ABB and Telefonaktiebolaget LM Ericsson. Previous Board assignments include Board Chairman of Vesper Holding AB and of Höganäs AB.
President and CEO of Scania 2012–2015. Prior to that, var-ious managerial positions at Scania since 1992. Co-chair-man of the UN Secretary - General’s High-Level Advisory Group on Sustainable Trans-port 2015–2016. Previous Board assignments include Board member of Concentric AB.
Several management posi-tions at Citibank, Chemical Bank New York (now JP Mor-gan Chase), First Bank Sys-tems and First Data Corpora-tion, Division President General Electric Financial Assurance Partnership Mar-keting and Division President General Electric Fleet Ser-vices, President and CEO of Ceridian Corporation and sub-sequently also Chairman, Board Chairman, President and CEO of Stream Global Services, Inc. Senior Advisor, Ares Management, LLC. Board Member of Nielsen, RealPage, General Motors Co. and MasterCard US. Until 2020 President and CEO of Hertz Global Holdings.
Until January 2015, CEO for Chassis Brakes International. Has, during almost 25 years held various management posi-tions in Robert Bosch GmbH, most recently as Executive Vice President Sales and Marketing in the Chassis System Brakes division combined with respon-sibility for regions China and Brazil and previously CEO of the subsidiary Bosch Closure Sys-tems, also member of the Board of Management of Brose Fahrzeugteile GmbH & Co.
Credit Analyst Den Norske Creditbank in Luxemburg 1984. Various positions within brand management and controlling within Procter & Gamble 1986-1989, Partner McKinsey & Company, Inc. 1989-2002, one of the founders and owners, also Board Chairper-son of the global consulting firm and talent pool a-con-nect (group) AG from 2002 until May 2021. Previous Board assignments also include Board member of Metso Outotec Oyj.
Between 1998 and 2015, employed by the private equity firm IK Investment Partners (former Industri Kapital) where she held various positions. She was a Partner with responsibility for the Stockholm office. She was also a member of IK’s Executive Committee. Prior to that she worked as a consultant for Bain & Company.
Holdings in Volvo, own and related parties
2,000,000 Series B shares. 146,100 Series B shares. None. 7,475 Series B shares. 4,000 American depositary receipts representing Volvo B shares (ADRs).
41,215 Series B shares. 223,755 Series B shares. None. 4,500 Series B shares. 18,230 Series B shares. 8,000 Series B shares.
186
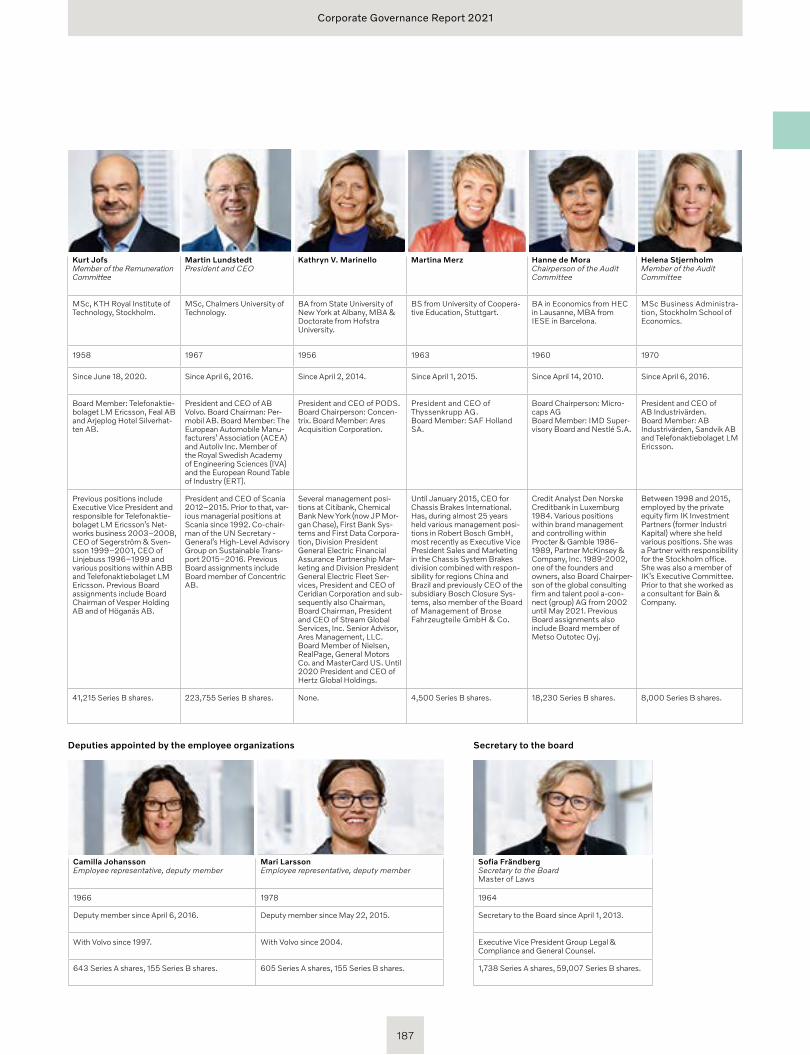
Corporate Governance Report 2021
Deputies appointed by the employee organizations Secretary to the board
Lars AskEmployee representative, ordinary member
Mats HenningEmployee representative, ordinary member
Mikael SällströmEmployee representative, ordinary member Member of the Remuneration Committee
Camilla JohanssonEmployee representative, deputy member
Mari LarssonEmployee representative, deputy member
Sofia FrändbergSecretary to the Board Master of Laws
Born 1959 1961 1959 1966 1978 1964
Member of the Volvo Board
Ordinary member since April 6, 2016. Deputy member from June 16, 2009–2016.
Since May 9, 2014. Since September 7, 2009. Deputy member since April 6, 2016. Deputy member since May 22, 2015. Secretary to the Board since April 1, 2013.
Background within Volvo With Volvo since 1982. With Volvo since 1982. With Volvo 1980–1999 and since 2009. With Volvo since 1997. With Volvo since 2004. Executive Vice President Group Legal & Compliance and General Counsel.
Holdings in Volvo, own and related parties
116 Series B Shares. 293 Series A shares, 655 Series B shares. 293 Series A shares, 155 Series B shares. 643 Series A shares, 155 Series B shares. 605 Series A shares, 155 Series B shares. 1,738 Series A shares, 59,007 Series B shares.
Board of DirectorsBoard members elected by the Annual General Meeting
Carl-Henric SvanbergChairman of the Board, Chairman of the Remuneration Committee
Matti AlahuhtaMember of the Remuneration Committee
Eckhard Cordes Eric Elzvik Member of the Audit Committee
Martha Finn Brooks Kurt Jofs Member of the Remuneration Committee
Martin Lundstedt President and CEO
Kathryn V. Marinello Martina Merz Hanne de Mora Chairperson of the Audit Committee
Helena StjernholmMember of the Audit Committee
Education MSc in Applied Physics, Linköping Institute of Tech-nology, BSc Business Admin-istration, University of Uppsala.
MSc, Dr Sc. Doctor of Science, Helsinki University of Technology.
MBA and PhD, University of Hamburg.
MSc Business Administra-tion, Stockholm School of Economics.
BA Economics and Political Science, Yale University. MBA International Business from Yale School of Manage-ment, Yale University.
MSc, KTH Royal Institute of Technology, Stockholm.
MSc, Chalmers University of Technology.
BA from State University of New York at Albany, MBA & Doctorate from Hofstra University.
BS from University of Coopera-tive Education, Stuttgart.
BA in Economics from HEC in Lausanne, MBA from IESE in Barcelona.
MSc Business Administra-tion, Stockholm School of Economics.
Born 1952 1952 1950 1960 1959 1958 1967 1956 1963 1960 1970
Member of the Volvo Board
Chairman of the Volvo Board since April 4, 2012.
Since April 2, 2014. Since April 1, 2015. Since April 5, 2018. Since March 31, 2021. Since June 18, 2020. Since April 6, 2016. Since April 2, 2014. Since April 1, 2015. Since April 14, 2010. Since April 6, 2016.
Position and Board memberships
Chairman of the European Round Table of Industry (ERT).
Board Chairman: DevCo Part-ners Oy.Board Member: Kone Corpo-ration.
Partner in Cevian Capital and EMERAM Capital Partners.Board Chairman: Bilfinger SE. Member of the Executive Committee of Eastern European Economic Relations of German Industry.
Board Chairman: Global Connect Group.Board member: Telefon-aktiebolaget LM Ericsson, Landis+Gyr Group AG and VFS Global.
Board Member: Jabil, Constellium, CARE USA and CARE Enterprise Inc.
Board Member: Telefonaktie-bolaget LM Ericsson, Feal AB and Arjeplog Hotel Silverhat-ten AB.
President and CEO of AB Volvo. Board Chairman: Per-mobil AB. Board Member: The European Automobile Manu-facturers’ Association (ACEA) and Autoliv Inc. Member of the Royal Swedish Academy of Engineering Sciences (IVA) and the European Round Table of Industry (ERT).
President and CEO of PODS.Board Chairperson: Concen-trix. Board Member: Ares Acquisition Corporation.
President and CEO of Thyssen krupp AG.Board Member: SAF Holland SA.
Board Chairperson: Micro-caps AGBoard Member: IMD Super-visory Board and Nestlé S.A.
President and CEO of AB Industri värden.Board Member: AB Industri värden, Sandvik AB and Telefon aktie bolaget LM Ericsson.
Principal work experience
Has held various positions at Asea Brown Boveri (ABB) and Securitas AB, President and CEO of Assa Abloy AB, President and CEO of Telefo-naktiebolaget LM Ericsson, Board Chairman of BP plc, member of External Advisory Board of the Earth Institute at Columbia University and the Advisory Board of Harvard Kennedy School. Previous assignments also include Chairman of the Royal Swed-ish Academy of Engineering Sciences (IVA).
Has held several manage-ment positions in the Nokia Group – President of Nokia Telecommunications, Presi-dent of Nokia Mobile Phones and Chief Strategy Officer of the Nokia Group, President of Kone Corporation 2005–2014 and 2006–2014 also CEO. Previous Board assign-ments include Vice Chairman of Metso Outotec and mem-ber of the Board in ABB Ltd.
Started within Daimler Benz AG in 1976, where he has held several manage ment positions, such as Head of the trucks and buses business, Head of Group Controlling, Corporate Development and M&A in AEG AG and CEO of Mercedes Car Group. Previously CEO of Metro AG, senior advisor at EQT and Board member of Air Berlin, SKF, Carl Zeiss and Rhein-metall AG. Since 2012 partner in Cevian Capital and EMERAM Capital Partners respectively.
Joined ABB in 1984 and has held several management positions in the Finance function at ABB in Sweden, Singa pore and Switzerland – most recently as Group CFO between 2013 and 2017 and previously as CFO for the Divisions Discrete Automa-tion & Motion and Automa-tion Products and a position as Head of M&A and New Ventures and also as Head of Corporate Development. Cur-rently, senior industrial advisor to EQT.
Has held various manage-ment positions in Cummins truck and bus businesses from 1986–2002. From 2002–2005 Martha was CEO, Rolled Products and SVP in Alcan Inc. and from 2005–2009 she was the President and COO of Novelis Inc., global leader in alu-minum rolled products and recycling. Martha has been a Board Member of Harley-Davidson, International Paper, Bombardier, and privately held Algeco Scotsman.
Previous positions include Executive Vice President and responsible for Telefonaktie-bolaget LM Ericsson’s Net-works business 2003–2008, CEO of Segerström & Sven-sson 1999–2001, CEO of Linjebuss 1996–1999 and various positions within ABB and Telefonaktiebolaget LM Ericsson. Previous Board assignments include Board Chairman of Vesper Holding AB and of Höganäs AB.
President and CEO of Scania 2012–2015. Prior to that, var-ious managerial positions at Scania since 1992. Co-chair-man of the UN Secretary - General’s High-Level Advisory Group on Sustainable Trans-port 2015–2016. Previous Board assignments include Board member of Concentric AB.
Several management posi-tions at Citibank, Chemical Bank New York (now JP Mor-gan Chase), First Bank Sys-tems and First Data Corpora-tion, Division President General Electric Financial Assurance Partnership Mar-keting and Division President General Electric Fleet Ser-vices, President and CEO of Ceridian Corporation and sub-sequently also Chairman, Board Chairman, President and CEO of Stream Global Services, Inc. Senior Advisor, Ares Management, LLC. Board Member of Nielsen, RealPage, General Motors Co. and MasterCard US. Until 2020 President and CEO of Hertz Global Holdings.
Until January 2015, CEO for Chassis Brakes International. Has, during almost 25 years held various management posi-tions in Robert Bosch GmbH, most recently as Executive Vice President Sales and Marketing in the Chassis System Brakes division combined with respon-sibility for regions China and Brazil and previously CEO of the subsidiary Bosch Closure Sys-tems, also member of the Board of Management of Brose Fahrzeugteile GmbH & Co.
Credit Analyst Den Norske Creditbank in Luxemburg 1984. Various positions within brand management and controlling within Procter & Gamble 1986-1989, Partner McKinsey & Company, Inc. 1989-2002, one of the founders and owners, also Board Chairper-son of the global consulting firm and talent pool a-con-nect (group) AG from 2002 until May 2021. Previous Board assignments also include Board member of Metso Outotec Oyj.
Between 1998 and 2015, employed by the private equity firm IK Investment Partners (former Industri Kapital) where she held various positions. She was a Partner with responsibility for the Stockholm office. She was also a member of IK’s Executive Committee. Prior to that she worked as a consultant for Bain & Company.
Holdings in Volvo, own and related parties
2,000,000 Series B shares. 146,100 Series B shares. None. 7,475 Series B shares. 4,000 American depositary receipts representing Volvo B shares (ADRs).
41,215 Series B shares. 223,755 Series B shares. None. 4,500 Series B shares. 18,230 Series B shares. 8,000 Series B shares.
187
Corporate Governance Report 2021
Volvo’s auditors are elected by the Annual General Meeting. The auditors review the interim report for the period January 1 to June 30 and audit the annual financial statements and consolidated accounts. The auditors also review the Corporate Governance Report and confirms whether the Group has presented a Sustainability Report. The auditors report the results of their audit in the Audit Report and in an opinion on the Corpo-rate Governance Report, and provides an opinion on whether the guide-lines for remuneration to senior executives have been complied with, which they present to the Annual General Meeting.
The current auditor, Deloitte AB, was elected at the Annual General Meeting 2018 for a period of four years. Jan Nilsson is responsible for the audit of Volvo and is the Auditor-in-Charge.
For information about Volvo’s remuneration of the auditors, please refer to Note 28 “Fees to the auditors” in the Group’s notes in the Annual and Sustainability Report.
EXTERNAL AUDITING7
Volvo’s internal audit function, Group Internal Audit, provides the Board and the Group Executive Board with an independent, risk based and objective assurance on the effectiveness and the efficiency of the govern-ance, risk management and control systems of the Volvo Group. Group Internal Audit runs from time to time advisory work as well. Group Internal Audit helps the organization to accomplish its objectives by bringing a systematic, disciplined approach to evaluate and to improve the effective-ness of risk management, control and governance processes.
Group Internal Audit performs internal audits in selected focus areas, identified through an independent risk assessment process involving key stakeholders, input from past audits and from the other assurance func-tions including the external auditors. This audit plan is approved by the Audit Committee. In addition, special assignments requested by manage-ment and the Audit Committee are performed. The audits cover, among other things, assessments on the adequacy and effectiveness of the Volvo Group’s processes for controlling its activities and managing its risks and evaluation of compliance with policies and directives.
The head of Group Internal Audit reports directly to the CEO, the Group’s General Counsel and the Board’s Audit Committee.
For additional information on internal control over financial reporting, see pages 194–195.
GROUP INTERNAL AUDIT8
188
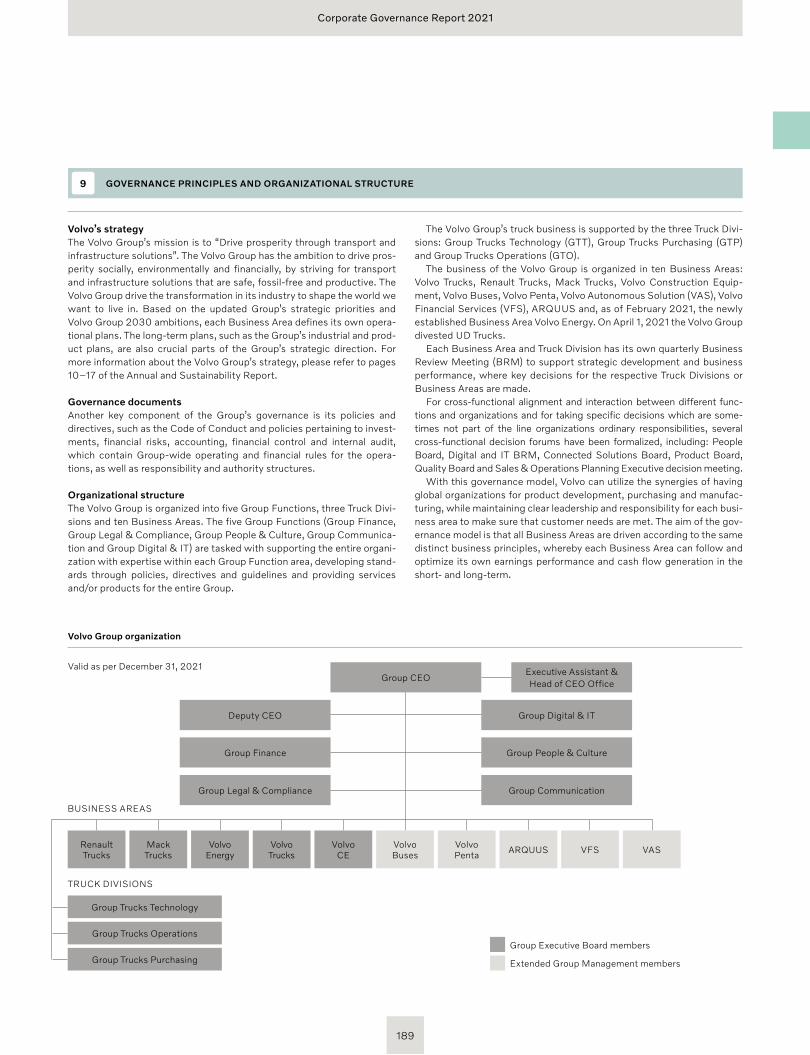
Corporate Governance Report 2021
GOVERNANCE PRINCIPLES AND ORGANIZATIONAL STRUCTURE9
Volvo’s strategyThe Volvo Group’s mission is to “Drive prosperity through transport and infrastructure solutions”. The Volvo Group has the ambition to drive pros-perity socially, environmentally and financially, by striving for transport and infrastructure solutions that are safe, fossil-free and productive. The Volvo Group drive the transformation in its industry to shape the world we want to live in. Based on the updated Group’s strategic priorities and Volvo Group 2030 ambitions, each Business Area defines its own opera-tional plans. The long-term plans, such as the Group’s industrial and prod-uct plans, are also crucial parts of the Group’s strategic direction. For more information about the Volvo Group’s strategy, please refer to pages 10–17 of the Annual and Sustainability Report.
Governance documents Another key component of the Group’s governance is its policies and directives, such as the Code of Conduct and policies pertaining to invest-ments, financial risks, accounting, financial control and internal audit, which contain Group-wide operating and financial rules for the opera-tions, as well as responsibility and authority structures.
Organizational structureThe Volvo Group is organized into five Group Functions, three Truck Divi-sions and ten Business Areas. The five Group Functions (Group Finance, Group Legal & Compliance, Group People & Culture, Group Communica-tion and Group Digital & IT) are tasked with supporting the entire organi-zation with expertise within each Group Function area, developing stand-ards through policies, directives and guidelines and providing services and/or products for the entire Group.
The Volvo Group’s truck business is supported by the three Truck Divi-sions: Group Trucks Technology (GTT), Group Trucks Purchasing (GTP) and Group Trucks Operations (GTO).
The business of the Volvo Group is organized in ten Business Areas: Volvo Trucks, Renault Trucks, Mack Trucks, Volvo Construction Equip-ment, Volvo Buses, Volvo Penta, Volvo Autonomous Solution (VAS), Volvo Financial Services (VFS), ARQUUS and, as of February 2021, the newly established Business Area Volvo Energy. On April 1, 2021 the Volvo Group divested UD Trucks.
Each Business Area and Truck Division has its own quarterly Business Review Meeting (BRM) to support strategic development and business performance, where key decisions for the respective Truck Divisions or Business Areas are made.
For cross-functional alignment and interaction between different func-tions and organizations and for taking specific decisions which are some-times not part of the line organizations ordinary responsibilities, several cross-functional decision forums have been formalized, including: People Board, Digital and IT BRM, Connected Solutions Board, Product Board, Quality Board and Sales & Operations Planning Executive decision meeting.
With this governance model, Volvo can utilize the synergies of having global organizations for product development, purchasing and manufac-turing, while maintaining clear leadership and responsibility for each busi-ness area to make sure that customer needs are met. The aim of the gov-ernance model is that all Business Areas are driven according to the same distinct business principles, whereby each Business Area can follow and optimize its own earnings performance and cash flow generation in the short- and long-term.
Volvo Group organization
Group People & Culture
Group Digital & IT
Group Communication
Group Finance
Deputy CEO
Group Legal & Compliance
Group CEO
BUSINESS AREAS
TRUCK DIVISIONS
MackTrucks
RenaultTrucks
Volvo Trucks
VolvoCE
VolvoBuses
VolvoPenta ARQUUS VFSVolvo
Energy VAS
Group Trucks Technology
Group Trucks Operations
Group Trucks Purchasing Extended Group Management members
Group Executive Board members
Valid as per December 31, 2021 Executive Assistant & Head of CEO Office
189
Corporate Governance Report 2021
The CEO is responsible for managing the day-to-day operations of the Volvo Group and is authorized to make decisions on matters that do not require AB Volvo Board approval. The CEO leads the operations of the Volvo Group, e.g. through the Group Executive Board, the extended Group Management and the cross-functional forums.
The Group Executive Board is the highest operational decision forum and is chaired by the President and CEO of the Volvo Group, Martin Lund-stedt. Furthermore, the members of the Group Executive Board are the Deputy CEO, Executive Vice Presidents of the Group Functions, Execu-tive Vice Presidents and Presidents of Volvo Trucks, Renault Trucks, Mack Trucks, Volvo Construction Equipment and Volvo Energy as well as the Executive Vice Presidents of the Truck Divisions.
The members of Group Management report directly to the CEO and include the Presidents of Volvo Buses, Volvo Penta, Volvo Autonomous Solutions (VAS), Volvo Financial Services (VFS) and ARQUUS respec-tively. The Group Executive Board and Group Management meet to align on Group matters on a quarterly basis.
Remuneration of the Group Executive BoardAB Volvo’s Annual General Meeting shall, at least every fourth year, resolve on a remuneration policy for remuneration to the members of the Group Executive Board, based on a proposal from the Board. For informa-tion about the remuneration policy adopted by the Annual General Meet-ing 2021, please refer to Note 27 “Personnel” in the Group’s notes in the Annual and Sustainability Report.
Changes to the Group Executive Board and Group Management As of February 1, 2021 Anna Westerberg replaced Håkan Agnevall as President of Volvo Buses and joined Group Management. In February 2021 Joachim Rosenberg, member of the Volvo Group Executive Board, was appointed President of the new business area Volvo Energy.
In February 2022 it was announced that Tina Hultkvist has been appointed Chief Financial Officer and new member of the Volvo Group Executive Board as of 15 March 2022. She will hence succeed Jan Ytter-berg, who will continue as Volvo Group senior advisor.
Sustainability and climate related mattersSustainability is of strategic importance to the Group and the accountabil-ity to drive sustainability performance primarily lies with the Truck Divi-sions and Business Areas. The organizational structure described in this Corporate Governance Report applies to all strategic topics within the Volvo Group, including climate and sustainability matters. For sustainabil-ity related matters, the Volvo Group relies on an integrated approach to ensure that environmental, social and economic topics are considered in all relevant decision-making. Opportunities and risks related to sustaina-bility are identified in all Truck Divisions and Business Areas, and may relate to e.g. government regulation, technology development, customer satisfaction and physical risks. The principal risks are consolidated in the Volvo Group’s enterprise risk management process and managed by the Group Executive Board and the Truck Divisions, Business Areas and Group Functions.
On Group level, the work is coordinated by cross-functional forums and working groups assigned by one or several Group Executive Board mem-bers with representatives from the relevant Truck Divisions and Business Areas. These forums and working groups prepare the material for deci-sion-making at Group Executive Board level, to be executed in the respec-tive Truck Divisions, Business Areas and/or Group Functions.
The most relevant cross-functional forums and working groups for sus-tainability related matters are:
• The Product Board, headed by the Chief Technology Officer, where climate related opportunities and risks are managed primarily as part of the transition towards fossil-free transportation.
• The People Board, headed by the Executive Vice President and Head of People & Culture, which focuses on all significant employee related matters such as training, health and safety, diversity, inclusion and talent management.
• The Environmental Committee, a delegated committee from Group Legal & Compliance where Group Functions, Truck Divisions and Business Areas representatives coordinate environmental manage-ment with the mission to secure the effective work of the Volvo Group’s Environmental Policy and management system.
• The Human Rights Board, chaired by the Executive Vice President Group Communication and the Senior Vice President, Corporate Responsibility with Group Executive Board members who coordinate the implementation of the Group’s Human Rights policy and work.
GROUP EXECUTIVE BOARD AND GROUP MANAGEMENT10
190
Corporate Governance Report 2021
191
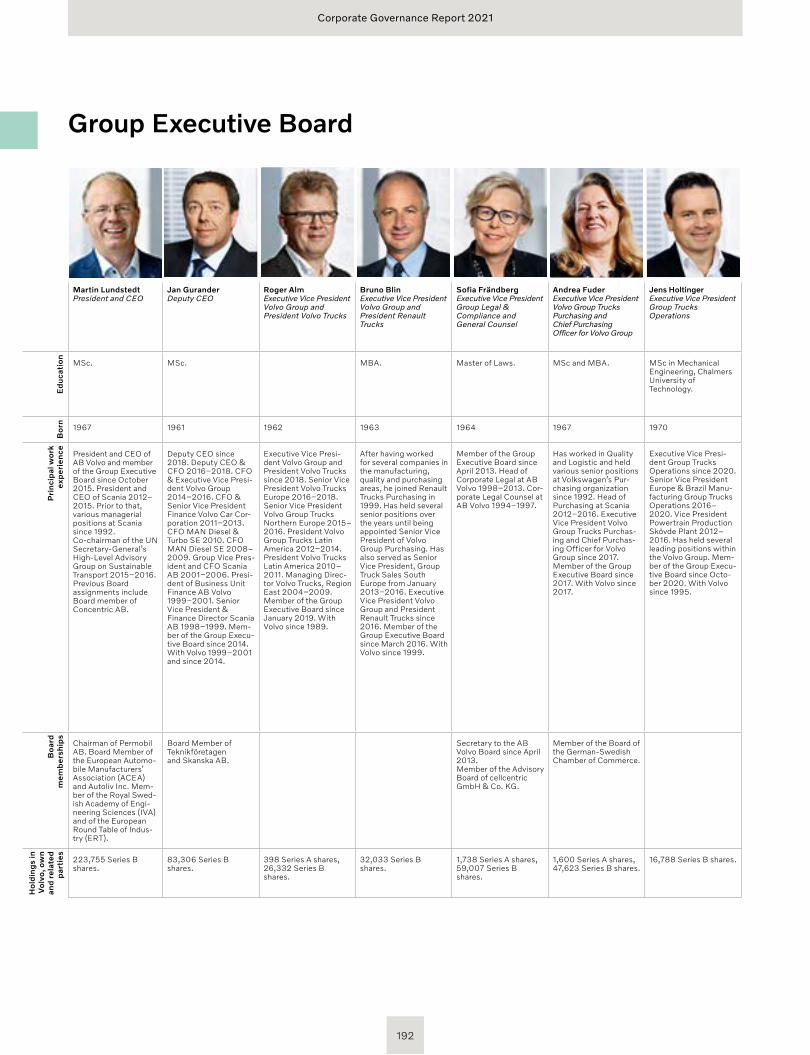
Corporate Governance Report 2021
Martin LundstedtPresident and CEO
Jan GuranderDeputy CEO
Roger AlmExecutive Vice President Volvo Group and President Volvo Trucks
Bruno BlinExecutive Vice President Volvo Group and President Renault Trucks
Sofia FrändbergExecutive Vice President Group Legal & Compliance and General Counsel
Andrea Fuder Executive Vice President Volvo Group Trucks Purchasing andChief PurchasingOfficer for Volvo Group
Jens HoltingerExecutive Vice President Group Trucks Operations
Melker JernbergExecutive Vice President Volvo Group and President Volvo Construction Equipment
Diana NiuExecutive Vice President Group People & Culture
Scott RafkinExecutive Vice President and Chief Digital Officer for Volvo Group
Joachim RosenbergExecutive Vice President Volvo Group and President Volvo Energy
Lars StenqvistExecutive Vice President Group Trucks Technology and Volvo Group Chief Technology Officer
Martin WeissburgExecutive Vice President Volvo Group and President Mack Trucks
Kina Wileke Executive Vice President Group Communication
Jan YtterbergExecutive Vice President Group Finance and CFO
MSc. MSc. MBA. Master of Laws. MSc and MBA. MSc in Mechanical Engineering, Chalmers University of Technology.
MSc in Mechanical Engineering.
MBA and BA in Economics.
BBA (Bachelors in Business Adminis-tration), University of Massachusetts at Amherst.
MSc Industrial Engineering and Management, MSc Financial Econom-ics, MSc Business and Economics.
MSc Industrial Engineering.
Master of Business Management, BSc Industrial Manage-ment.
MA in journalism. MSc in Business Administration and Economics.
1967 1961 1962 1963 1964 1967 1970 1968 1966 1969 1970 1967 1962 1974 1961
President and CEO of AB Volvo and member of the Group Execu tive Board since Octo ber 2015. Presi dent and CEO of Scania 2012–2015. Prior to that, various managerial positions at Scania since 1992. Co-chairman of the UN Secretary-General’s High-Level Advisory Group on Sustainable Transport 2015–2016. Previous Board assignments include Board member of Concentric AB.
Deputy CEO since 2018. Deputy CEO & CFO 2016–2018. CFO & Executive Vice Presi-dent Volvo Group 2014–2016. CFO & Senior Vice President Finance Volvo Car Cor-poration 2011–2013. CFO MAN Diesel & Turbo SE 2010. CFO MAN Diesel SE 2008–2009. Group Vice Pres-ident and CFO Scania AB 2001–2006. Presi-dent of Business Unit Finance AB Volvo 1999–2001. Senior Vice President & Finance Director Scania AB 1998–1999. Mem-ber of the Group Execu-tive Board since 2014. With Volvo 1999–2001 and since 2014.
Executive Vice Presi-dent Volvo Group and President Volvo Trucks since 2018. Senior Vice President Volvo Trucks Europe 2016–2018. Senior Vice President Volvo Group Trucks Northern Europe 2015–2016. President Volvo Group Trucks Latin America 2012–2014. President Volvo Trucks Latin America 2010–2011. Managing Direc-tor Volvo Trucks, Region East 2004–2009. Member of the Group Executive Board since January 2019. With Volvo since 1989.
After having worked for several companies in the manufacturing, quality and purchasing areas, he joined Renault Trucks Purchasing in 1999. Has held several senior positions over the years until being appointed Senior Vice President of Volvo Group Purchasing. Has also served as Senior Vice President, Group Truck Sales South Europe from January 2013–2016. Executive Vice President Volvo Group and President Renault Trucks since 2016. Member of the Group Executive Board since March 2016. With Volvo since 1999.
Member of the Group Executive Board since April 2013. Head of Corporate Legal at AB Volvo 1998–2013. Cor-porate Legal Counsel at AB Volvo 1994–1997.
Has worked in Quality and Logistic and held various senior positions at Volkswagen’s Pur-chasing organization since 1992. Head of Purchasing at Scania 2012–2016. Executive Vice President Volvo Group Trucks Purchas-ing and Chief Purchas-ing Officer for Volvo Group since 2017. Member of the Group Executive Board since 2017. With Volvo since 2017.
Executive Vice Presi-dent Group Trucks Operations since 2020. Senior Vice President Europe & Brazil Manu-facturing Group Trucks Operations 2016–2020. Vice President Powertrain Production Skövde Plant 2012–2016. Has held several leading positions within the Volvo Group. Mem-ber of the Group Execu-tive Board since Octo-ber 2020. With Volvo since 1995.
Executive Vice Pres-ident Volvo Group and President Volvo Construction Equip-ment since 2018. CEO and President at Höganäs AB 2014–2017. Execu-tive Vice President, Business Area EMEA at SSAB 2011–2014. Has held various posi-tions at Scania AB since 1989, most recently as Senior Vice President Buses and Coaches at Scania AB 2007-2011. Member of the Group Executive Board since January 2018. With Volvo since 2018.
Executive Vice Pres-ident Group People & Culture since 2019. Joined Volvo Group in February 2005, with SVP HR jobs in two Business Areas, Trucks Asia Pacific and Volvo Construction Equip-ment. Worked for Telefonaktiebolaget LM Ericsson from July 1993 to January 2005 in a number of leadership positions. Member of the Group Executive Board since January 2019.
Executive Vice Pres-ident and Chief Digi-tal Officer Volvo Group since 2020. President Volvo Financial Services 2014–2019. Chief Financial Officer Volvo Financial Ser-vices 2010–2014. Senior Vice Presi-dent Global Opera-tions Volvo Financial Services 2003–2009. Senior Vice President Risk Volvo Financial Services 2001–2002. Prior to 2001, held several senior posi-tions with Volvo Car Finance North America. Prior to Volvo, Business Assurance and Capi-tal Markets Manager Coopers & Lybrand LLC. Member of the Group Executive Board since January 2020. With Volvo since 2001.
Executive Vice Pres-ident Volvo Group and President Volvo Energy since 2021. Executive Vice Pres-ident Volvo Group and Chairman UD Trucks 2016–2021. Executive Vice Pres-ident Group Trucks Sales 2015–2016. Executive Vice Pres-ident Group Trucks Sales & Marketing APAC 2012–2014. President Volvo Group Asia Truck Operations 2007-2011. Vice President Volvo Group Alliance Office 2007. Vice President Volvo Powertrain 2005-2007. Consultant with McKinsey & Company 1996–2004. Member of the Group Executive Board since 2012. With Volvo since 2005.
Executive Vice Pres-ident Group Trucks Technology and Volvo Group Chief Technology Officer since October 2016. Head of R&D and CTO at Volkswagen Truck & Bus 2015–2016. Senior Vice President Vehicle Definition R&D at Scania 2007–2015. Prior to that various senior positions at Scania since 1992. Member of the Group Executive Board since October 2016. With Volvo since October 2016. Fellow of the Royal Swedish Academy of Engineering Sci-ences (IVA).
President Mack Trucks since 2018. President Volvo Construction Equip-ment 2014–2017. President & CEO Volvo Financial Ser-vices 2010–2014. President Volvo Financial Services Americas 2005–2010. Prior to Volvo, President Woodard LLC, President Great Dane Financial Services and Senior Vice President ORIX. Member of the Group Executive Board since March 2016. With Volvo since 2005.
Responsible for Group Communica-tions since 2018. With the Volvo Group since 2008, most recently as Senior Vice Presi-dent Brand, Com-munication & Marketing Volvo Penta 2016–2017, Senior Vice Presi-dent External Corpo-rate Communi cation Volvo Group 2012–2016 and CEO Com-munication Volvo Group 2008–2012. Has held a number of positions in TV4 Group 1998–2008. Member of the Group Executive Board since 2018.
Executive Vice Pres-ident Group Finance and CFO since 2018. CFO of Husq-varna Group 2015–2018. Executive Vice President and CFO of Scania Group 2006–2015. Various positions in accounting and finance, Scania Group 1987–2006. Member of the Group Executive Board since November 2018. With Volvo since 2018.
Chairman of Permobil AB. Board Member of the European Automo-bile Manufacturers’ Association (ACEA) and Autoliv Inc. Mem-ber of the Royal Swed-ish Academy of Engi-neering Sciences (IVA) and of the European Round Table of Indus-try (ERT).
Board Member of Teknikföretagen and Skanska AB.
Secretary to the AB Volvo Board since April 2013.Member of the Advisory Board of cellcentric GmbH & Co. KG.
Member of the Board of the German-Swedish Chamber of Commerce.
Member of the Board of Concentric AB since April 2021.
Board Member of International Cham-ber of Commerce (ICC), Sweden.
223,755 Series B shares.
83,306 Series B shares.
398 Series A shares, 26,332 Series B shares.
32,033 Series B shares.
1,738 Series A shares, 59,007 Series B shares.
1,600 Series A shares, 47,623 Series B shares.
16,788 Series B shares. 31,120 Series B shares.
54,169 Series B shares.
37,342 Series B shares.
87 Series A shares, 228,536 Series B shares.
32,062 Series B shares.
124,163 Series B shares.
344 Series A shares, 18,761 Series B shares.
18,925 Series B shares.
Ed
uca
tio
nB
orn
Pri
nci
pal
wo
rk
exp
erie
nce
Bo
ard
m
emb
ersh
ips
Ho
ldin
gs
in
Vo
lvo
, ow
n an
d r
elat
ed
par
ties
Group Executive Board
192
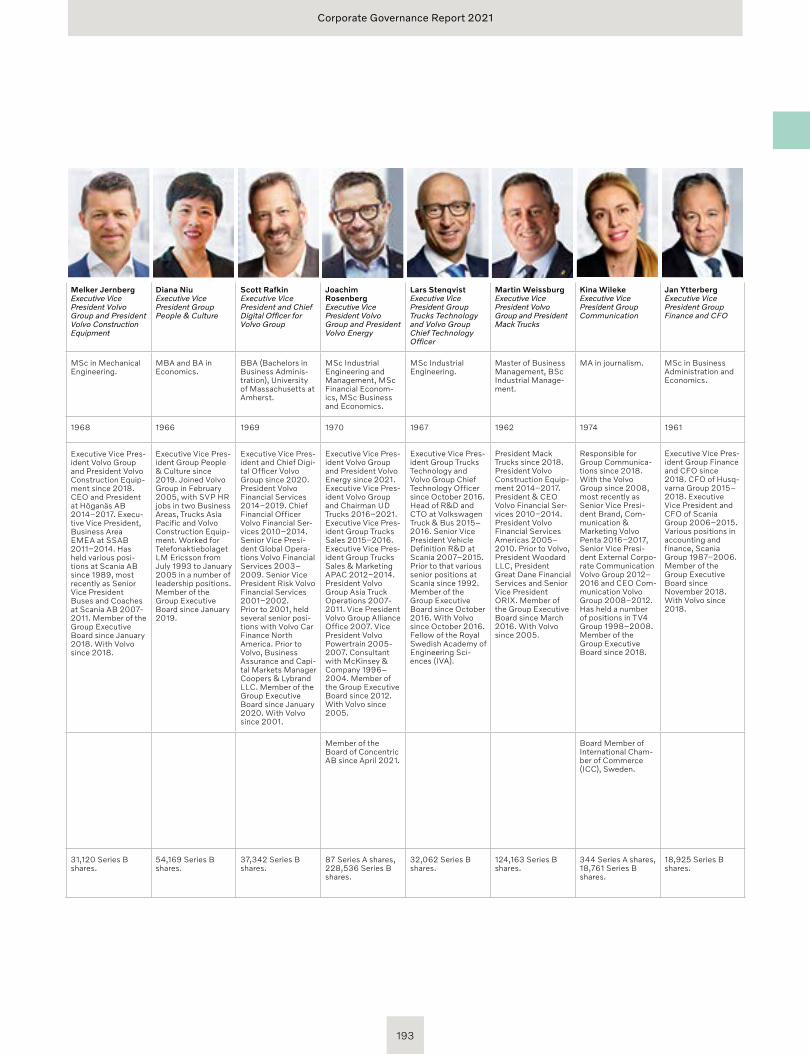
Corporate Governance Report 2021
Martin LundstedtPresident and CEO
Jan GuranderDeputy CEO
Roger AlmExecutive Vice President Volvo Group and President Volvo Trucks
Bruno BlinExecutive Vice President Volvo Group and President Renault Trucks
Sofia FrändbergExecutive Vice President Group Legal & Compliance and General Counsel
Andrea Fuder Executive Vice President Volvo Group Trucks Purchasing andChief PurchasingOfficer for Volvo Group
Jens HoltingerExecutive Vice President Group Trucks Operations
Melker JernbergExecutive Vice President Volvo Group and President Volvo Construction Equipment
Diana NiuExecutive Vice President Group People & Culture
Scott RafkinExecutive Vice President and Chief Digital Officer for Volvo Group
Joachim RosenbergExecutive Vice President Volvo Group and President Volvo Energy
Lars StenqvistExecutive Vice President Group Trucks Technology and Volvo Group Chief Technology Officer
Martin WeissburgExecutive Vice President Volvo Group and President Mack Trucks
Kina Wileke Executive Vice President Group Communication
Jan YtterbergExecutive Vice President Group Finance and CFO
MSc. MSc. MBA. Master of Laws. MSc and MBA. MSc in Mechanical Engineering, Chalmers University of Technology.
MSc in Mechanical Engineering.
MBA and BA in Economics.
BBA (Bachelors in Business Adminis-tration), University of Massachusetts at Amherst.
MSc Industrial Engineering and Management, MSc Financial Econom-ics, MSc Business and Economics.
MSc Industrial Engineering.
Master of Business Management, BSc Industrial Manage-ment.
MA in journalism. MSc in Business Administration and Economics.
1967 1961 1962 1963 1964 1967 1970 1968 1966 1969 1970 1967 1962 1974 1961
President and CEO of AB Volvo and member of the Group Execu tive Board since Octo ber 2015. Presi dent and CEO of Scania 2012–2015. Prior to that, various managerial positions at Scania since 1992. Co-chairman of the UN Secretary-General’s High-Level Advisory Group on Sustainable Transport 2015–2016. Previous Board assignments include Board member of Concentric AB.
Deputy CEO since 2018. Deputy CEO & CFO 2016–2018. CFO & Executive Vice Presi-dent Volvo Group 2014–2016. CFO & Senior Vice President Finance Volvo Car Cor-poration 2011–2013. CFO MAN Diesel & Turbo SE 2010. CFO MAN Diesel SE 2008–2009. Group Vice Pres-ident and CFO Scania AB 2001–2006. Presi-dent of Business Unit Finance AB Volvo 1999–2001. Senior Vice President & Finance Director Scania AB 1998–1999. Mem-ber of the Group Execu-tive Board since 2014. With Volvo 1999–2001 and since 2014.
Executive Vice Presi-dent Volvo Group and President Volvo Trucks since 2018. Senior Vice President Volvo Trucks Europe 2016–2018. Senior Vice President Volvo Group Trucks Northern Europe 2015–2016. President Volvo Group Trucks Latin America 2012–2014. President Volvo Trucks Latin America 2010–2011. Managing Direc-tor Volvo Trucks, Region East 2004–2009. Member of the Group Executive Board since January 2019. With Volvo since 1989.
After having worked for several companies in the manufacturing, quality and purchasing areas, he joined Renault Trucks Purchasing in 1999. Has held several senior positions over the years until being appointed Senior Vice President of Volvo Group Purchasing. Has also served as Senior Vice President, Group Truck Sales South Europe from January 2013–2016. Executive Vice President Volvo Group and President Renault Trucks since 2016. Member of the Group Executive Board since March 2016. With Volvo since 1999.
Member of the Group Executive Board since April 2013. Head of Corporate Legal at AB Volvo 1998–2013. Cor-porate Legal Counsel at AB Volvo 1994–1997.
Has worked in Quality and Logistic and held various senior positions at Volkswagen’s Pur-chasing organization since 1992. Head of Purchasing at Scania 2012–2016. Executive Vice President Volvo Group Trucks Purchas-ing and Chief Purchas-ing Officer for Volvo Group since 2017. Member of the Group Executive Board since 2017. With Volvo since 2017.
Executive Vice Presi-dent Group Trucks Operations since 2020. Senior Vice President Europe & Brazil Manu-facturing Group Trucks Operations 2016–2020. Vice President Powertrain Production Skövde Plant 2012–2016. Has held several leading positions within the Volvo Group. Mem-ber of the Group Execu-tive Board since Octo-ber 2020. With Volvo since 1995.
Executive Vice Pres-ident Volvo Group and President Volvo Construction Equip-ment since 2018. CEO and President at Höganäs AB 2014–2017. Execu-tive Vice President, Business Area EMEA at SSAB 2011–2014. Has held various posi-tions at Scania AB since 1989, most recently as Senior Vice President Buses and Coaches at Scania AB 2007-2011. Member of the Group Executive Board since January 2018. With Volvo since 2018.
Executive Vice Pres-ident Group People & Culture since 2019. Joined Volvo Group in February 2005, with SVP HR jobs in two Business Areas, Trucks Asia Pacific and Volvo Construction Equip-ment. Worked for Telefonaktiebolaget LM Ericsson from July 1993 to January 2005 in a number of leadership positions. Member of the Group Executive Board since January 2019.
Executive Vice Pres-ident and Chief Digi-tal Officer Volvo Group since 2020. President Volvo Financial Services 2014–2019. Chief Financial Officer Volvo Financial Ser-vices 2010–2014. Senior Vice Presi-dent Global Opera-tions Volvo Financial Services 2003–2009. Senior Vice President Risk Volvo Financial Services 2001–2002. Prior to 2001, held several senior posi-tions with Volvo Car Finance North America. Prior to Volvo, Business Assurance and Capi-tal Markets Manager Coopers & Lybrand LLC. Member of the Group Executive Board since January 2020. With Volvo since 2001.
Executive Vice Pres-ident Volvo Group and President Volvo Energy since 2021. Executive Vice Pres-ident Volvo Group and Chairman UD Trucks 2016–2021. Executive Vice Pres-ident Group Trucks Sales 2015–2016. Executive Vice Pres-ident Group Trucks Sales & Marketing APAC 2012–2014. President Volvo Group Asia Truck Operations 2007-2011. Vice President Volvo Group Alliance Office 2007. Vice President Volvo Powertrain 2005-2007. Consultant with McKinsey & Company 1996–2004. Member of the Group Executive Board since 2012. With Volvo since 2005.
Executive Vice Pres-ident Group Trucks Technology and Volvo Group Chief Technology Officer since October 2016. Head of R&D and CTO at Volkswagen Truck & Bus 2015–2016. Senior Vice President Vehicle Definition R&D at Scania 2007–2015. Prior to that various senior positions at Scania since 1992. Member of the Group Executive Board since October 2016. With Volvo since October 2016. Fellow of the Royal Swedish Academy of Engineering Sci-ences (IVA).
President Mack Trucks since 2018. President Volvo Construction Equip-ment 2014–2017. President & CEO Volvo Financial Ser-vices 2010–2014. President Volvo Financial Services Americas 2005–2010. Prior to Volvo, President Woodard LLC, President Great Dane Financial Services and Senior Vice President ORIX. Member of the Group Executive Board since March 2016. With Volvo since 2005.
Responsible for Group Communica-tions since 2018. With the Volvo Group since 2008, most recently as Senior Vice Presi-dent Brand, Com-munication & Marketing Volvo Penta 2016–2017, Senior Vice Presi-dent External Corpo-rate Communi cation Volvo Group 2012–2016 and CEO Com-munication Volvo Group 2008–2012. Has held a number of positions in TV4 Group 1998–2008. Member of the Group Executive Board since 2018.
Executive Vice Pres-ident Group Finance and CFO since 2018. CFO of Husq-varna Group 2015–2018. Executive Vice President and CFO of Scania Group 2006–2015. Various positions in accounting and finance, Scania Group 1987–2006. Member of the Group Executive Board since November 2018. With Volvo since 2018.
Chairman of Permobil AB. Board Member of the European Automo-bile Manufacturers’ Association (ACEA) and Autoliv Inc. Mem-ber of the Royal Swed-ish Academy of Engi-neering Sciences (IVA) and of the European Round Table of Indus-try (ERT).
Board Member of Teknikföretagen and Skanska AB.
Secretary to the AB Volvo Board since April 2013.Member of the Advisory Board of cellcentric GmbH & Co. KG.
Member of the Board of the German-Swedish Chamber of Commerce.
Member of the Board of Concentric AB since April 2021.
Board Member of International Cham-ber of Commerce (ICC), Sweden.
223,755 Series B shares.
83,306 Series B shares.
398 Series A shares, 26,332 Series B shares.
32,033 Series B shares.
1,738 Series A shares, 59,007 Series B shares.
1,600 Series A shares, 47,623 Series B shares.
16,788 Series B shares. 31,120 Series B shares.
54,169 Series B shares.
37,342 Series B shares.
87 Series A shares, 228,536 Series B shares.
32,062 Series B shares.
124,163 Series B shares.
344 Series A shares, 18,761 Series B shares.
18,925 Series B shares.
Ed
uca
tio
nB
orn
Pri
nci
pal
wo
rk
exp
erie
nce
Bo
ard
m
emb
ersh
ips
Ho
ldin
gs
in
Vo
lvo
, ow
n an
d r
elat
ed
par
ties
Group Executive Board
193
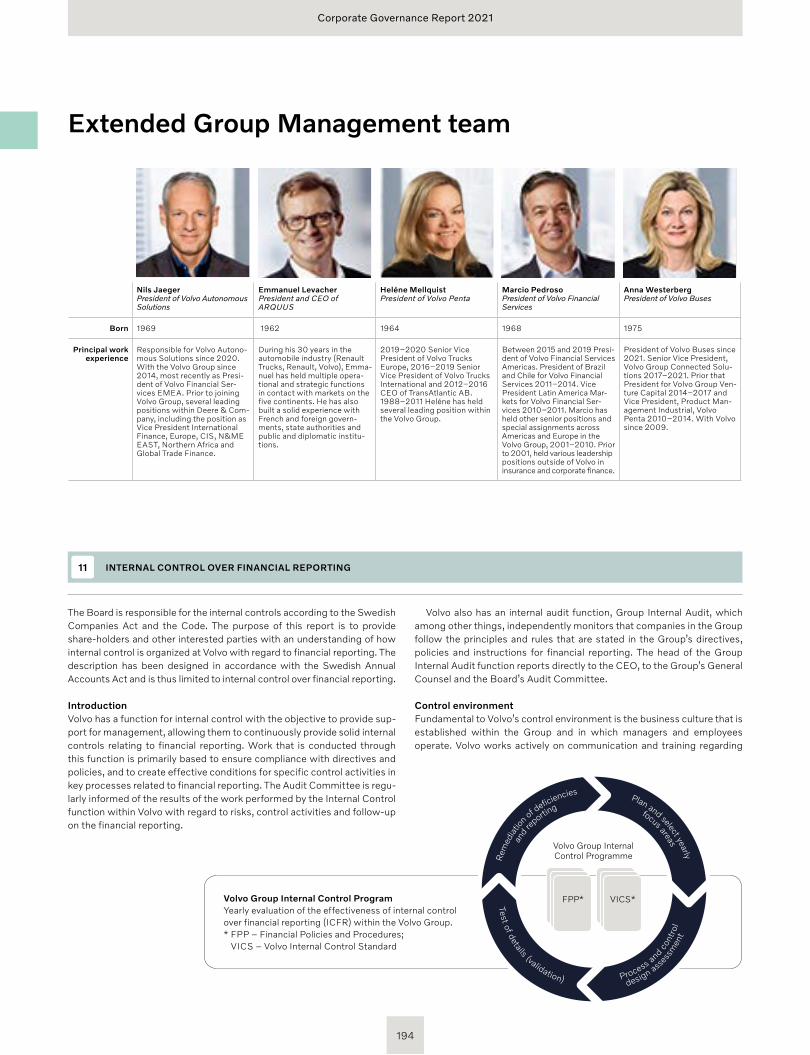
Corporate Governance Report 2021
The Board is responsible for the internal controls according to the Swedish Companies Act and the Code. The purpose of this report is to provide share-holders and other interested parties with an understanding of how internal control is organized at Volvo with regard to financial reporting. The description has been designed in accordance with the Swedish Annual Accounts Act and is thus limited to internal control over financial reporting.
IntroductionVolvo has a function for internal control with the objective to provide sup-port for management, allowing them to continuously provide solid internal controls relating to financial reporting. Work that is conducted through this function is primarily based to ensure compliance with directives and policies, and to create effective conditions for specific control activities in key processes related to financial reporting. The Audit Committee is regu-larly informed of the results of the work performed by the Internal Control function within Volvo with regard to risks, control activities and follow-up on the financial reporting.
Volvo also has an internal audit function, Group Internal Audit, which among other things, independently monitors that companies in the Group follow the principles and rules that are stated in the Group’s directives, policies and instructions for financial reporting. The head of the Group Internal Audit function reports directly to the CEO, to the Group’s General Counsel and the Board’s Audit Committee.
Control environmentFundamental to Volvo’s control environment is the business culture that is established within the Group and in which managers and employees operate. Volvo works actively on communication and training regarding
INTERNAL CONTROL OVER FINANCIAL REPORTING11
Volvo Group Internal Control ProgramYearly evaluation of the effectiveness of internal control over financial reporting (ICFR) within the Volvo Group.* FPP – Financial Policies and Procedures;
VICS – Volvo Internal Control Standard
Rem
ediat
ion
of deficiencies
and
reportin
gPlan and select yearly
focus areas
Test of details (validation)
FPP* VICS*
Volvo Group Internal Control Programme
Process and con
trol
design ass
essm
ent
Nils JaegerPresident of Volvo Autonomous Solutions
Emmanuel LevacherPresident and CEO of ARQUUS
Heléne MellquistPresident of Volvo Penta
Marcio PedrosoPresident of Volvo Financial Services
Anna WesterbergPresident of Volvo Buses
Born 1969 1962 1964 1968 1975
Principal work experience
Responsible for Volvo Autono-mous Solutions since 2020. With the Volvo Group since 2014, most recently as Presi-dent of Volvo Financial Ser-vices EMEA. Prior to joining Volvo Group, several leading positions within Deere & Com-pany, including the position as Vice President International Finance, Europe, CIS, N&ME EAST, Northern Africa and Global Trade Finance.
During his 30 years in the automobile industry (Renault Trucks, Renault, Volvo), Emma-nuel has held multiple opera-tional and strategic functions in contact with markets on the five continents. He has also built a solid experience with French and foreign govern-ments, state authorities and public and diplomatic institu-tions.
2019–2020 Senior Vice President of Volvo Trucks Europe, 2016–2019 Senior Vice President of Volvo Trucks International and 2012–2016 CEO of TransAtlantic AB. 1988–2011 Heléne has held several leading position within the Volvo Group.
Between 2015 and 2019 Presi-dent of Volvo Financial Services Americas. President of Brazil and Chile for Volvo Financial Services 2011–2014. Vice President Latin America Mar-kets for Volvo Financial Ser-vices 2010–2011. Marcio has held other senior positions and special assignments across Americas and Europe in the Volvo Group, 2001–2010. Prior to 2001, held various leadership positions outside of Volvo in insurance and corporate finance.
President of Volvo Buses since 2021. Senior Vice President, Volvo Group Connected Solu-tions 2017–2021. Prior that President for Volvo Group Ven-ture Capital 2014–2017 and Vice President, Product Man-agement Industrial, Volvo Penta 2010–2014. With Volvo since 2009.
Extended Group Management team
194
Corporate Governance Report 2021
To the general meeting of the shareholders of AB Volvo (publ)corporate identity number 556012-5790
Engagement and responsibilityIt is the board of directors who is responsible for the corporate govern-ance statement for the financial year 2021-01-01–2021-12-31 on pages 180–195 and that it has been prepared in accordance with the Annual Accounts Act.
The scope of the auditOur examination has been conducted in accordance with FAR’s standard RevU 16 The auditor’s examination of the corporate governance statement. This means that our examination of the corporate governance statement is different and substantially less in scope than an audit conducted in accordance with International Standards on Auditing and generally accepted auditing standards in Sweden. We believe that the examination has provided us with sufficient basis for our opinions.
OpinionsA corporate governance statement has been prepared. Disclosures in accordance with chapter 6 section 6 the second paragraph points 2–6 the Annual Accounts Act and chapter 7 section 31 the second paragraph the same law are consistent with the annual accounts and the consoli-dated accounts and are in accordance with the Annual Accounts Act.
Göteborg, February 24, 2022
Deloitte AB
Signature on Swedish original
Jan NilssonAuthorized Public Accountant
This is a translation of the Swedish language original. In the event of any differences between this translation and the Swedish language original, the latter shall prevail.
AUDITOR’S REPORT ON THE CORPORATE GOVERNANCE STATEMENT
the company’s basic values included in the Group’s Code of Conduct, to ensure that the business conducted by the organization is characterized by good ethics, integrity and is in compliance with the law.
The foundation of the internal control process relating to the financial reporting is based on the Group’s directives, policies and instructions, as well as the organization’s responsibility and authority structure. The prin-ciples for Volvo’s internal controls and directives and policies for the finan-cial reporting are contained in the Volvo Group Management System, a group wide management system comprising, among other things, instructions, rules and principles.
Risk assessmentRisks relating to financial reporting are evaluated and monitored by the Board through the Audit Committee inter alia through identifying risks that could be considered as material, and through the mitigating generic controls. The risk assessment is based on a number of criteria, such as the complexity of the accounting principles, revaluation principles of assets or liabilities, complex and/or changing business circumstances, etc. The risks together with mitigating generic controls are collected in a frame-work for internal control over financial reporting, Volvo Internal Control Standard (VICS).
Control activitiesIn addition to the Board and its Audit Committee, the management groups and other decision-making bodies in the Group constitute overall supervisory bodies. Business processes are designed to ensure that potential errors or deviations in the financial reporting are prevented, dis-covered and corrected by implementing control activities that correspond to the generic controls defined in the VICS framework. Control activities range from review of outcome results against earlier periods and forecasts in management group meetings to specific reconciliation of accounts and analyses of the ongoing processes for financial reporting.
Information and communicationPolicies and instructions relating to the financial reporting are updated and communicated on a regular basis from management to all affected employees. The Group’s financial reporting function has direct operating responsibility for the daily financial reporting and works to ensure a uniform
application of the Group’s policies, principles and instructions for the financial reporting and to identify and communicate shortcomings and areas of improvement in the processes for financial reporting.
Follow-upOngoing responsibility for follow-up rests with the Group’s financial reporting function. In addition, the Group Internal Audit and the Internal Control function conduct review and follow-up activities in accordance with what is described in the introduction of this report. More specifically, the Internal Control function runs and coordinates evaluation activities through the “Volvo Group Internal Control Programme”, with the purpose of systematically evaluating the quality of the internal control over finan-cial reporting on an annual basis. An annual evaluation plan is established and presented to the Audit Committee. This evaluation program com-prises three main areas:
1. Group-wide controls: Self-assessment procedure carried out by man-agement teams at business area, Group Function and company levels. The main areas evaluated are compliance with the Group’s financial directives and policies and the Group’s Code of Conduct.
2. Process controls at transaction level: Processes related to the financial reporting are evaluated by testing procedures/controls based on the framework for internal control over financial reporting, Volvo Internal Control Standards (VICS).
3. General IT controls: Processes for maintenance, development and access management of financial applications are evaluated by testing procedures and controls.
The results of the evaluation activities are reported to Group management and the Audit Committee. During 2021, the Internal Control function
reported two times to the Audit Committee regarding the annual evalua-tion plan, status on outstanding issues and final assessment of the control environment.
Göteborg, February 24, 2022
AB Volvo (publ)
195
Other information 2021
The Board of Directors proposes that the Annual General Meeting adopts the following policy for remuneration to senior executives. As compared to the current remuneration policy, adopted at the Annual General Meet-ing 2021, two changes are proposed. First, in order to bring the total remuneration towards a more market competitive level, it is proposed to increase the maximum long-term incentive opportunity level for the Pres-ident and CEO, from maximum 100 per cent of base salary as of today to maximum 150 per cent of the base salary. To increase the long-term incentive, where the pay-out is 100 per cent invested into Volvo shares subject to a three-year holding period, will also further strengthen the alignment with long-term shareholder interests. Secondly it is proposed to clarify that, in addition to short-term incentives, long-term incentives will be regarded as pensionable salary, if required by law or collective agreement.
The Board of Directors’ of AB Volvo (publ) proposal for guidelines for remuneration to the Volvo Group Executive Board (remuneration policy)These guidelines (AB Volvo’s remuneration policy) concern the remunera-tion and other terms of employment for the members of the Volvo Group Executive Board (“Executives”).
The guidelines are forward-looking, i.e. they are applicable to remuner-ation agreed, and amendments to remuneration already agreed, after the proposed adoption of these guidelines by the 2022 annual general meeting. These guidelines do not apply to any remuneration decided or approved by the general meeting. Any new share-based incentive plans will, where applicable, be resolved by the general meeting, but no such plan is cur-rently proposed.
The guidelines’ promotion of the Volvo Group’s business strategy, long-term interests and sustainabilityIt is a prerequisite for the successful implementation of the Volvo Group’s business strategy and safeguarding of its long-term interests, including its sustainability, that the Group can recruit, retain and develop senior man-agement. These guidelines enable AB Volvo to offer Executives a compe-titive total remuneration. More information regarding the Volvo Group’s business strategy is available in the Volvo Group Annual and Sustainability Report.
Types of remunerationVolvo Group remuneration to Executives shall consist of the following components: base salary, short-term and long-term variable incentives, pension benefits and other benefits.
Short-term incentives may, for the President and CEO, amount to a maximum of 100 per cent of the base salary and, for other Executives, a maximum of 80 per cent of the base salary.Long-term incentives may, for the President and CEO, amount to a maxi-mum of 150 per cent of the base salary and, for other Executives, a maxi-mum of 80 per cent of the base salary. The current long-term incentive plan for the Group’s senior management, including the Executives, was introduced in connection with the 2016 annual general meeting. The objective of the program is to drive long-term value creation and align the interests of the senior management with those of shareholders. To achieve
this, the program operates on a four-year cycle: with a performance based annual award, which is invested in Volvo shares with a mandatory lock-in period of three years. There will be no payout under the long-term incen-tive program if the Annual General Meeting that is held in the year follow-ing the performance year, decides not to distribute any dividends to the shareholders. The program is funded on an annual basis by an award, measured against performance criteria established by the Board of Direc-tors. The after-tax portion of this payment must be immediately invested in AB Volvo shares which must be held for a minimum of three years. In this way, the Executives will build up a shareholding in the company and have a vested interest over the longer-term development in the value of the shares. At the end of the three-year period, the Executives may sell their shares, if they meet the requirement for owning shares valued at two years of the pre-tax base salary for the President and CEO and one year of the pre-tax base salary for the other Executives. The holding requirements for the Executives shall cease upon termination of an Executive’s employ-ment, and the Board of Directors may grant such other exceptions to the requirements as the Board deems appropriate.
Further cash remuneration may be awarded in extraordinary circum-stances, provided that such extraordinary arrangements are limited in time and only made on an individual basis, either for the purpose of recruiting or retaining Executives, or as remuneration for extraordinary performance beyond the individual’s ordinary tasks. Such remuneration may not exceed an amount corresponding to 100 per cent of the annual base salary. Any resolution on such remuneration shall be made by the Board of Directors based on a proposal from the Remuneration Committee.
For the President and CEO, pension benefits shall be granted on the basis of a defined contribution plan. The pensionable salary shall include base salary only. The pension contributions for the President and CEO attributable to the annual base salary shall amount to not more than 35 per cent of the base salary.
Other benefits may include, for example, life insurance, medical and health insurance, and company cars. Premiums and other costs relating to such benefits may amount to not more than 3 per cent of the annual base salary for the President and CEO.
For other Executives, pension benefits shall be granted on the basis of a defined contribution plan except where law or collective agreement require a defined benefit pension. The pensionable salary shall include base salary and, where required by law or collective agreement, incen-tives. The total pension contributions for other Executives shall amount to not more than 35 per cent of base salary, unless a higher percentage results from the application of law or collective agreement.
Other benefits may include, for example, life insurance, medical and health insurance, and company cars. Premiums and other costs relating to such benefits may amount to not more than 10 per cent of the annual base salary for other Executives.
Remuneration for Executives that reside outside Sweden or reside in Sweden but having a material connection to or having been residing in a country other than Sweden may be duly adjusted to comply with manda-tory rules or local practice, taking into account, to the extent possible, the overall purpose of these guidelines.
Proposed policy for remuneration to senior executives
196
Other information 2021
In addition to remuneration set out above, Executives who relocate for the purposes of the position or who work in other multiple countries may also receive such remuneration and benefits as are reasonable to reflect the special circumstances associated with such arrangements, taking into account the overall purpose of these guidelines and alignment with the general policies and practices within the Volvo Group applicable to cross border work.
Termination of employmentUpon termination of an Executive’s employment, the notice period may not exceed twelve months. Base salary during the notice period and sev-erance pay may not together exceed an amount corresponding to the base salary for two years.
Executives that reside outside Sweden or reside in Sweden but having a material connection to or having been residing in a country other than Sweden may be offered notice periods for termination and severance pay-ment as are reasonable to reflect the special circumstances, taking into account the overall purpose of these guidelines and alignment with the general policies and practices within the Volvo Group.
Criteria for awarding variable cash remuneration, etc.Short-term and long-term incentives shall be linked to predetermined and measurable criteria. The criteria – which for example may relate to EBIT, cash flow, return on capital employed or similar ratios, or sustainability targets – shall be devised to promote the Volvo Group’s strategy and long-term value creation and strengthen the link between achieved per-formance targets and reward. The criteria for short-term and long-term incentives shall be determined by the Board of Directors annually. The satisfaction of the criteria shall be measured over periods of one year each.
To which extent the criteria for awarding variable remuneration has been satisfied shall be determined when the relevant measurement period has ended. The Board of Directors is responsible for the determination of vari-able remuneration to all Executives.
Claw-back and adjustmentsExecutives participating in the Volvo Group’s current short-term and long-term incentive plans are obligated, in certain circumstances and for spec-ified periods of time, to repay, partially or in its entirety, variable incentive awards already paid if payments have been made by mistake or been based on intentionally falsified data or in the event of material restatement of the Volvo Group’s financial results. Furthermore, the Board of Directors may decide on adjustments of pay-out under the incentive plans (before payment has been made) in case of extraordinary circumstances or to adjust for unforeseen one-timers.
Salary and employment conditions for employeesIn the preparation of the Board of Directors’ proposal for these remunera-tion guidelines, the Board has considered that the various benefits offered to the Executives need to be aligned with the general structures applica-ble for employees of AB Volvo at levels that are competitive in the market.
Thus, salary and employment conditions for other AB Volvo employees have been taken into account by including information thereon in the Remuneration Committee’s and the Board of Directors’ basis of decision when evaluating whether the guidelines and the limitations set out herein are appropriate.
The decision-making process to determine, review and implement the guidelinesThe Board of Directors has established a Remuneration Committee. The Committee’s tasks include preparing the Board of Directors’ decision to propose guidelines for executive remuneration. The Board of Directors shall prepare a proposal for new guidelines at least every fourth year and submit it to the general meeting. The guidelines shall be in force until new guidelines are adopted by the general meeting. The Remuneration Com-mittee shall also monitor and evaluate plans for variable remuneration for Executives, the application of the guidelines for executive remuneration as well as the current remuneration structures and compensation levels in the Group. The members of the Remuneration Committee are independ-ent of AB Volvo and its executive management. The President and CEO and other members of the executive management do not participate in the Board of Directors’ processing of and resolutions regarding remunera-tion-related matters in so far as they are affected by such matters.
Derogation from the guidelinesThe Board of Directors may temporarily resolve to derogate from the guide-lines, in whole or in part, if in a specific case there is special cause for the derogation and a derogation is necessary to serve the Volvo Group’s long-term interests, including its sustainability, or to ensure the Group’s financial viability. As set out above, the Remuneration Committee’s tasks include preparing the Board of Directors’ resolutions in remuneration-related mat-ters. This includes any resolutions to derogate from the guidelines.
Description of changes to the guidelines, etcIn order to bring the total remuneration towards more market competitive level, it is proposed to increase the maximum long-term incentive oppor-tunity level for the President and CEO, from maximum 100% of base sal-ary as of today to maximum 150% of the base salary. In addition, increas-ing the long-term incentive where the pay-out is 100% invested into Volvo shares subject to a three-year holding period will further strengthen the alignment with long-term shareholder interests.
The only further changes proposed to the Remuneration Policy are edi-torial changes as well as a clarification on pensionable salary in relation to incentives.
During 2021, the company has carefully considered feedback received from shareholders and proxy advisors in connection with the Annual Gen-eral Meeting 2021 and otherwise during the year. For further information, please refer to the section Looking ahead to 2022 in the Remuneration Report 2021.
Additional information regarding executive remuneration in the Volvo Group is available in the Volvo Group Annual and Sustainability Report.
197
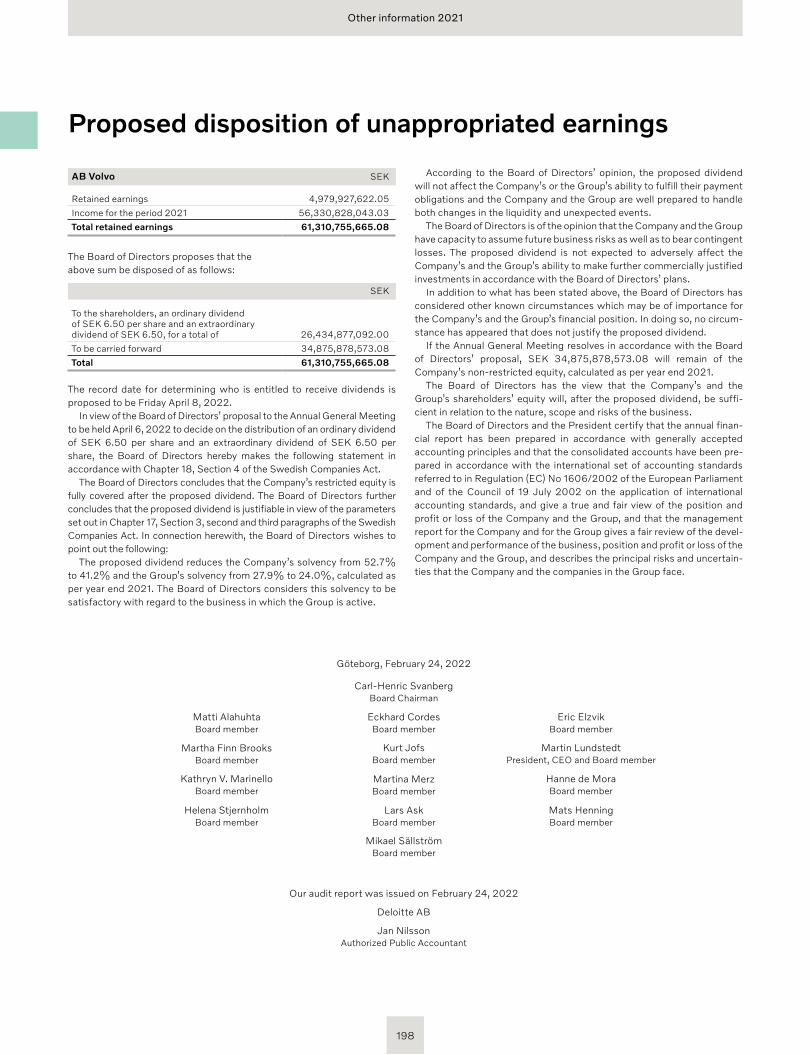
Other information 2021
Proposed disposition of unappropriated earnings
According to the Board of Directors’ opinion, the proposed dividend will not affect the Company’s or the Group’s ability to fulfill their payment obligations and the Company and the Group are well prepared to handle both changes in the liquidity and unexpected events.
The Board of Directors is of the opinion that the Company and the Group have capacity to assume future business risks as well as to bear contingent losses. The proposed dividend is not expected to adversely affect the Company’s and the Group’s ability to make further commercially justified investments in accordance with the Board of Directors’ plans.
In addition to what has been stated above, the Board of Directors has considered other known circumstances which may be of importance for the Company’s and the Group’s financial position. In doing so, no circum-stance has appeared that does not justify the proposed dividend.
If the Annual General Meeting resolves in accordance with the Board of Directors’ proposal, SEK 34,875,878,573.08 will remain of the Company’s non-restricted equity, calculated as per year end 2021.
The Board of Directors has the view that the Company’s and the Group’s shareholders’ equity will, after the proposed dividend, be suffi-cient in relation to the nature, scope and risks of the business.
The Board of Directors and the President certify that the annual finan-cial report has been prepared in accordance with generally accepted accounting principles and that the consolidated accounts have been pre-pared in accordance with the international set of accounting standards referred to in Regulation (EC) No 1606/2002 of the European Parliament and of the Council of 19 July 2002 on the application of international accounting standards, and give a true and fair view of the position and profit or loss of the Company and the Group, and that the management report for the Company and for the Group gives a fair review of the devel-opment and performance of the business, position and profit or loss of the Company and the Group, and describes the principal risks and uncertain-ties that the Company and the companies in the Group face.
AB Volvo SEK
Retained earnings 4,979,927,622.05
Income for the period 2021 56,330,828,043.03
Total retained earnings 61,310,755,665.08
The Board of Directors proposes that the above sum be disposed of as follows:
SEK
To the shareholders, an ordinary dividend of SEK 6.50 per share and an extraordinary dividend of SEK 6.50, for a total of 26,434,877,092.00
To be carried forward 34,875,878,573.08
Total 61,310,755,665.08
The record date for determining who is entitled to receive dividends is proposed to be Friday April 8, 2022.
In view of the Board of Directors’ proposal to the Annual General Meeting to be held April 6, 2022 to decide on the distribution of an ordinary dividend of SEK 6.50 per share and an extraordinary dividend of SEK 6.50 per share, the Board of Directors hereby makes the following statement in accordance with Chapter 18, Section 4 of the Swedish Companies Act.
The Board of Directors concludes that the Company’s restricted equity is fully covered after the proposed dividend. The Board of Directors further concludes that the proposed dividend is justifiable in view of the parameters set out in Chapter 17, Section 3, second and third paragraphs of the Swedish Companies Act. In connection herewith, the Board of Directors wishes to point out the following:
The proposed dividend reduces the Company’s solvency from 52.7% to 41.2% and the Group’s solvency from 27.9% to 24.0%, calculated as per year end 2021. The Board of Directors considers this solvency to be satisfactory with regard to the business in which the Group is active.
Göteborg, February 24, 2022
Carl-Henric SvanbergBoard Chairman
Matti Alahuhta Board member
Eckhard CordesBoard member
Eric ElzvikBoard member
Martha Finn BrooksBoard member
Kurt JofsBoard member
Martin LundstedtPresident, CEO and Board member
Kathryn V. MarinelloBoard member
Martina MerzBoard member
Hanne de MoraBoard member
Helena StjernholmBoard member
Lars AskBoard member
Mats HenningBoard member
Mikael SällströmBoard member
Our audit report was issued on February 24, 2022
Deloitte AB
Jan NilssonAuthorized Public Accountant
198
Other information 2021
Audit report for AB Volvo (publ)
To the general meeting of the shareholders of AB Volvo (publ) corporate identity number 556012-5790
REPORT ON THE ANNUAL ACCOUNTS AND CONSOLIDATED ACCOUNTS
OpinionsWe have audited the annual accounts and consolidated accounts of AB Volvo (publ) for the financial year 2021-01-01–2021-12-31. The annual accounts and consolidated accounts of the company are included on pages 44–151, 196–198 and 204–206 in this document.
In our opinion, the annual accounts have been prepared in accordance with the Annual Accounts Act and present fairly, in all material respects, the financial position of the parent company as of 31 December 2021 and its financial performance and cash flow for the year then ended in accord-ance with the Annual Accounts Act. The consolidated accounts have been prepared in accordance with the Annual Accounts Act and present fairly, in all material respects, the financial position of the group as of 31 Decem-ber 2021 and their financial performance and cash flow for the year then ended in accordance with International Financial Reporting Standards (IFRS), as adopted by the EU, and the Annual Accounts Act. The statutory administration report is consistent with the other parts of the annual accounts and consolidated accounts.
We therefore recommend that the general meeting of shareholders adopts the income statement and balance sheet for the parent company and the group.
Our opinions in this report on the annual accounts and consolidated accounts are consistent with the content of the additional report that has been submitted to the parent company’s audit committee in accordance with the Audit Regulation (537/2014) Article 11.
Basis for OpinionsWe conducted our audit in accordance with International Standards on Auditing (ISA) and generally accepted auditing standards in Sweden. Our responsibilities under those standards are further described in the Audi-tor’s Responsibilities section. We are independent of the parent company and the group in accordance with professional ethics for accountants in Sweden and have otherwise fulfilled our ethical responsibilities in accord-ance with these requirements. This includes that, based on the best of our knowledge and belief, no prohibited services referred to in the Audit Reg-ulation (537/2014) Article 5.1 have been provided to the audited company or, where applicable, its parent company or its controlled companies within the EU.
We believe that the audit evidence we have obtained is sufficient and appropriate to provide a basis for our opinions.
Key Audit MattersKey audit matters of the audit are those matters that, in our professional judgment, were of most significance in our audit of the annual accounts and consolidated accounts of the current period. These matters were addressed in the context of our audit of, and in forming our opinion thereon, the annual accounts and consolidated accounts as a whole, but we do not provide a separate opinion on these matters.
Allowance for Expected Credit Losses for Customer-Financing and Accounts ReceivablesRisk descriptionVolvo Group applies a simplified expected credit loss model for customer- financing, as well as accounts receivables, under which the loss allowance is measured at an amount equal to lifetime expected credit losses. The allowance is recorded at initial recognition and is reassessed during the contract period. The accounting principles for expected credit losses and management’s significant judgments applied in relation thereto are fur-ther described in Note 15 “Customer-Financing Receivables” and Note 16 “Receivables” to the annual report.
The determination of the allowance for expected credit losses for receivables require management to make significant qualitative judg-ments, including assumptions regarding current and forecasted market conditions and individual assessment of the largest customers and busi-ness segments. The ongoing covid-19 pandemic, in combination with macroeconomic factors, has resulted in increased market volatility and increased uncertainties in certain geographies. Further, there is a high degree of uncertainty and subjectivity in determining the severity and duration of the pandemic and its impact on the Volvo Group’s customers and business segments. Changing market conditions in certain geograph-ical markets increases the complexities in managements qualitative judg-ments and estimates. As such, historical credit loss information used within the expected credit loss model to forecast future credit losses may not adequately reflect the current and future economic environment.
Our Audit ApproachOur audit procedures included, but were not limited to:• Evaluating the design and implementation of relevant internal controls
implemented within the allowance for expected credit loss process.
• Assessing the reasonableness of the expected credit loss model and methodology used including reviewing management’s written poli-cies, procedures, and accounting position papers around the model.
• Performing audit procedures to test the completeness and accuracy of the underlying data and information used in management’s expected credit loss model and management overlays.
• Independently reperforming the calculations within the model to ensure the output is accurate and carried out retrospective review to assess the reliability of model’s historical ability to estimate future credit losses.
• Assessing and challenging the reasonableness of management’s sig-nificant assumptions in relation to severity of default at portfolio level as well as at customer-by-customer level by evaluating the financial position of the customer in certain cases, frequency of default and management overlays, including inspection of documentation sup-porting key assumptions and considerations taken by management.
• For customer financing receivables, our procedures included involving our financial service industry valuation experts, where relevant, with specific knowledge and expertise who assisted in evaluating the rea-sonableness of the methodology and models used.
199
Other information 2021
Provisions for losses from claims from customers and other third parties – EC Antitrust Settlement Risk descriptionIn July 2016, the European Commission and Volvo Group reached a settlement with regards to antitrust allegations made by the European Commission against Volvo Group and other companies in the truck manufacturing industry. Following the adoption of the European Commission’s settlement decision, the Company has received and may continue to receive a significant number of thirdparty damage claims from customers and other third parties alleging that they suffered loss, directly or indirectly, by reason of the conduct covered in the decision.
The accounting principles for legal disputes is further described in Note 21 “Other Provisions” and Note 24 “Contingent Liabilities” to the annual report. The recognition and measurement of any provisions recorded or quantification of contingent liabilities to be disclosed for such legal disputes is complicated, requires expert legal input, and involves consideration of potential future outcomes of the claims which at this stage are uncertain. Due to these complexities, the valuation of any such provisions or contingent liabilities is significantly impacted by management’s ultimate judgments and best estimates. On December 31, 2021, the Company has not been able to make a reliable estimate of the amount of any provision or contingent liability that could arise from these claims.
Our Audit ApproachOur audit procedures included, but were not limited to:• Holding discussions with management and audit the relevant docu
mentation and conclude how management and the board assessed the claims.
• Holding discussions with internal legal department and with Volvo Group’s external legal advisors in order to obtain an understanding of matters relevant to the claims.
• Reviewing internal minutes and relevant assessments prepared for management and Board to corroborate the consistency of information received.
• Assessing the appropriateness of the Company’s final accounting conclusions.
• Assessing the adequacy of the disclosures around the legal proceedings.
Impairment risk for vehicles sold with residual value commitmentRisk descriptionWhen the sale of the vehicle is combined with a residual value commitment and it is concluded that control with respect to the vehicle sold has not been transferred, the sales transaction is recognized as an operating lease transaction and an asset is recognised in the balance sheet. These assets carry a risk that the ultimate disposal of the used vehicles could lead to a loss if the price development of these vehicles is worse than what was expected when the contracts were entered. The assessment of the risk is based on the estimation of the used vehicle’s future fair market value. The accounting principles for vehicles sold with residual value commitment and management’s significant judgments applied in relation thereto are further described in Note 13 “Tangible Assets” to the annual report.
Fair market values are dependent on the situation in the used vehicle markets prevailing when the vehicles are expected to be returned. The futureoriented valuation is based on several assumptions and involves high degree of estimation for example on conditions of the vehicles
returned and expected repair costs, future price developments due to change of market conditions and distribution channels used for ultimate disposal of the vehicles. Due to the ongoing covid19 pandemic and other market developments, for example shortage of new trucks in the market, during 2021 the prices of used trucks are volatile. Consequently, there is a high degree of uncertainty and subjectivity in determining the Fair Market Value of the trucks sold under residual value commitments.
Our Audit ApproachOur audit procedures included, but were not limited to:• Evaluating the design and implementation of relevant internal controls
implemented within the determination of fair market value process.
• Assessing the reasonableness of the methodology used in determination of fair market value including reviewing management’s written policies, procedures, and accounting position papers.
• Performing audit procedures to test the completeness and accuracy of the underlying data and information used by management in determining the fair market value.
• Assessing and challenging the reasonableness of management’s significant assumptions in relation to fair market values of used vehicles based on current market trends and future market developments, expected repair costs and distribution channels. Management’s assessment was evaluated based on enquiries and inspection of documentation supporting key assumptions and considerations taken by management.
Other information than the annual accounts and consolidated accountsThe Board of Directors and the President are responsible for other information. The other information includes the Remuneration report, and the pages 1–43, 152–195, 199–203 and 207–215 in this document which does not include the annual accounts and consolidated accounts or our Auditors report.
Our opinion on the annual accounts and consolidated accounts does not cover this other information and we do not express any form of assurance conclusion regarding this other information.
In connection with our audit of the annual accounts and consolidated accounts, our responsibility is to read the information identified above and consider whether the information is materially inconsistent with the annual accounts and consolidated accounts. In this procedure we also take into account our knowledge otherwise obtained in the audit and assess whether the information otherwise appears to be materially misstated.
If we, based on the work performed concerning this information, conclude that there is a material misstatement of this other information, we are required to report that fact. We have nothing to report in this regard.
Responsibilities of the Board of Directors and the PresidentThe Board of Directors and the President are responsible for the preparation of the annual accounts and consolidated accounts and that they give a fair presentation in accordance with the Annual Accounts Act and, concerning the consolidated accounts, in accordance with IFRS as adopted by the EU. The Board of Directors and the President are also responsible for such internal control as they determine is necessary to enable the preparation of annual accounts and consolidated accounts that are free from material misstatement, whether due to fraud or error.
200200
Other information 2021
In preparing the annual accounts and consolidated accounts, The Board of Directors and the President are responsible for the assessment of the company’s and the group’s ability to continue as a going concern. They disclose, as applicable, matters related to going concern and using the going concern basis of accounting. The going concern basis of accounting is however not applied if the Board of Directors and the President intends to liquidate the company, to cease operations, or has no realistic alternative but to do so.
The Audit Committee shall, without prejudice to the Board of Director’s responsibilities and tasks in general, among other things oversee the company’s financial reporting process.
Auditor’s responsibilityOur objectives are to obtain reasonable assurance about whether the annual accounts and consolidated accounts as a whole are free from material misstatement, whether due to fraud or error, and to issue an auditor’s report that includes our opinions. Reasonable assurance is a high level of assurance, but is not a guarantee that an audit conducted in accordance with ISAs and generally accepted auditing standards in Sweden will always detect a material misstatement when it exists. Misstatements can arise from fraud or error and are considered material if, individually or in the aggregate, they could reasonably be expected to influence the economic decisions of users taken on the basis of these annual accounts and consolidated accounts.
A further description of our responsibilities for the audit of the annual accounts and consolidated accounts is located at the Swedish Inspectorate of Auditors website: www.revisorsinspektionen.se/revisornsansvar. This description forms part of the auditor’s report.
REPORT ON OTHER LEGAL AND REGULATORY REQUIREMENTS
OpinionsIn addition to our audit of the annual accounts and consolidated accounts, we have also audited the administration of the Board of Directors and the President of AB Volvo (publ) for the financial year 2021-01-01–2021-12-31 and the proposed appropriations of the company’s profit or loss.
We recommend to the general meeting of shareholders that the profit to be appropriated in accordance with the proposal in the statutory administration report and that the members of the Board of Directors and the President be discharged from liability for the financial year.
Basis for OpinionsWe conducted the audit in accordance with generally accepted auditing standards in Sweden. Our responsibilities under those standards are further described in the Auditor’s Responsibilities section. We are independent of the parent company and the group in accordance with professional ethics for accountants in Sweden and have otherwise fulfilled our ethical responsibilities in accordance with these requirements.
We believe that the audit evidence we have obtained is sufficient and appropriate to provide a basis for our opinions.
Responsibilities of the Board of Directors and the PresidentThe Board of Directors and President are responsible for the proposal for appropriations of the company’s profit or loss. At the proposal of a dividend, this includes an assessment of whether the dividend is justifiable considering the requirements which the company’s and the group’s type of operations, size and risks place on the size of the parent company’s and the group’s equity, consolidation requirements, liquidity and position in general.
The Board of Directors is responsible for the company’s organization and the administration of the company’s affairs. This includes among other things continuous assessment of the company’s and the group’s financial situation and ensuring that the company’s organization is designed so that the accounting, management of assets and the company’s financial affairs otherwise are controlled in a reassuring manner. The President shall manage the ongoing administration according to the Board of Directors’ guidelines and instructions and among other matters take measures that are necessary to fulfill the company’s accounting in accordance with law and handle the management of assets in a reassuring manner.
Auditor’s responsibilityOur objective concerning the audit of the administration, and thereby our opinion about discharge from liability, is to obtain audit evidence to assess with a reasonable degree of assurance whether any member of the Board of Directors or the President in any material respect:• has undertaken any action or been guilty of any omission which can
give rise to liability to the company, or
• in any other way has acted in contravention of the Companies Act, the Annual Accounts Act or the Articles of Association.
Our objective concerning the audit of the proposed appropriations of the company’s profit or loss, and thereby our opinion about this, is to assess with reasonable degree of assurance whether the proposal is in accordance with the Companies Act.
Reasonable assurance is a high level of assurance, but is not a guarantee that an audit conducted in accordance with generally accepted auditing standards in Sweden will always detect actions or omissions that can give rise to liability to the company, or that the proposed appropriations of the company’s profit or loss are not in accordance with the Companies Act.
A further description of our responsibilities for the audit of the management’s administration is located at the Swedish Inspectorate of Auditors website: www.revisorsinspektionen.se/revisornsansvar. This description forms part of the auditor’s report.
THE AUDITOR’S EXAMINATION OF THE ESEF REPORT
OpinionIn addition to our audit of the annual accounts and consolidated accounts, we have also examined that the Board of Directors and the President have prepared the annual accounts and consolidated accounts in a format that enables uniform electronic reporting (the Esef report) pursuant to Chapter 16, Section 4 a of the Swedish Securities Market Act (2007:528) for AB Volvo (publ) for the financial year 2021-01-01–2021-12-31.
Our examination and our opinion relate only to the statutory requirements. In our opinion, the Esef report #[0deced797c812367a9b1322b 78f3304c656a4d9ec1e2f8ed51a4501d9941c118] has been prepared in a format that, in all material respects, enables uniform electronic reporting.
Basis for opinionWe have performed the examination in accordance with FAR’s recommendation RevR 18 Examination of the Esef report. Our responsibility under this recommendation is described in more detail in the Auditors’ responsibility section. We are independent of AB Volvo (publ) in accordance with professional ethics for accountants in Sweden and have otherwise fulfilled our ethical responsibilities in accordance with these requirements.
We believe that the evidence we have obtained is sufficient and appropriate to provide a basis for our opinion.
201201
Other information 2021
Responsibilities of the Board of Directors and the PresidentThe Board of Directors and the President are responsible for the prepara-tion of the Esef report in accordance with the Chapter 16, Section 4 a of the Swedish Securities Market Act (2007:528), and for such internal con-trol that the Board of Directors and the President determine is necessary to prepare the Esef report without material misstatements, whether due to fraud or error.
Auditor’s responsibilityOur responsibility is to obtain reasonable assurance whether the Esef report is in all material respects prepared in a format that meets the requirements of Chapter 16, Section 4(a) of the Swedish Securities Market Act (2007:528), based on the procedures performed.
RevR 18 requires us to plan and execute procedures to achieve reason-able assurance that the Esef report is prepared in a format that meets these requirements.
Reasonable assurance is a high level of assurance, but it is not a guar-antee that an engagement carried out according to RevR 18 and generally accepted auditing standards in Sweden will always detect a material mis-statement when it exists. Misstatements can arise from fraud or error and are considered material if, individually or in aggregate, they could reason-ably be expected to influence the economic decisions of users taken on the basis of the Esef report.
The audit firm applies ISQC 1 Quality Control for Firms that Perform Audits and Reviews of Financial Statements, and other Assurance and Related Services Engagements and accordingly maintains a comprehen-sive system of quality control, including documented policies and proce-dures regarding compliance with professional ethical requirements, pro-fessional standards and legal and regulatory requirements.
The examination involves obtaining evidence, through various proce-dures, that the Esef report has been prepared in a format that enables uniform electronic reporting of the annual accounts and consolidated accounts. The procedures selected depend on the auditor’s judgment, including the assessment of the risks of material misstatement in the report, whether due to fraud or error. In carrying out this risk assessment, and in order to design audit procedures that are appropriate in the circum-stances, the auditor considers those elements of internal control that are relevant to the preparation of the Esef report by the Board of Directors and the President, but not for the purpose of expressing an opinion on the effectiveness of those internal controls. The examination also includes an evaluation of the appropriateness and reasonableness of assumptions made by the Board of Directors and the President.
The procedures mainly include a technical validation of the Esef report, i.e., if the file containing the Esef report meets the technical specification set out in the Commission’s Delegated Regulation (EU) 2019/815 and a reconciliation of the Esef report with the audited annual accounts and consolidated accounts.
Furthermore, the procedures also includes an assessment of whether the Esef report has been marked with iXBRL which enables a fair and complete machine-readable version of the consolidated statement of financial performance, financial position, changes in equity and cash flow.
Deloitte AB, was appointed auditor of AB Volvo by the general meeting of the shareholders on April 5, 2018 and has been the company’s auditor since April 5, 2018.
Göteborg, February 24, 2022
Deloitte AB
Signature on Swedish original
Jan NilssonAuthorized Public Accountant
This is a translation of the Swedish language original. In the event of any differences between this translation and the Swedish language original, the latter shall prevail.
202
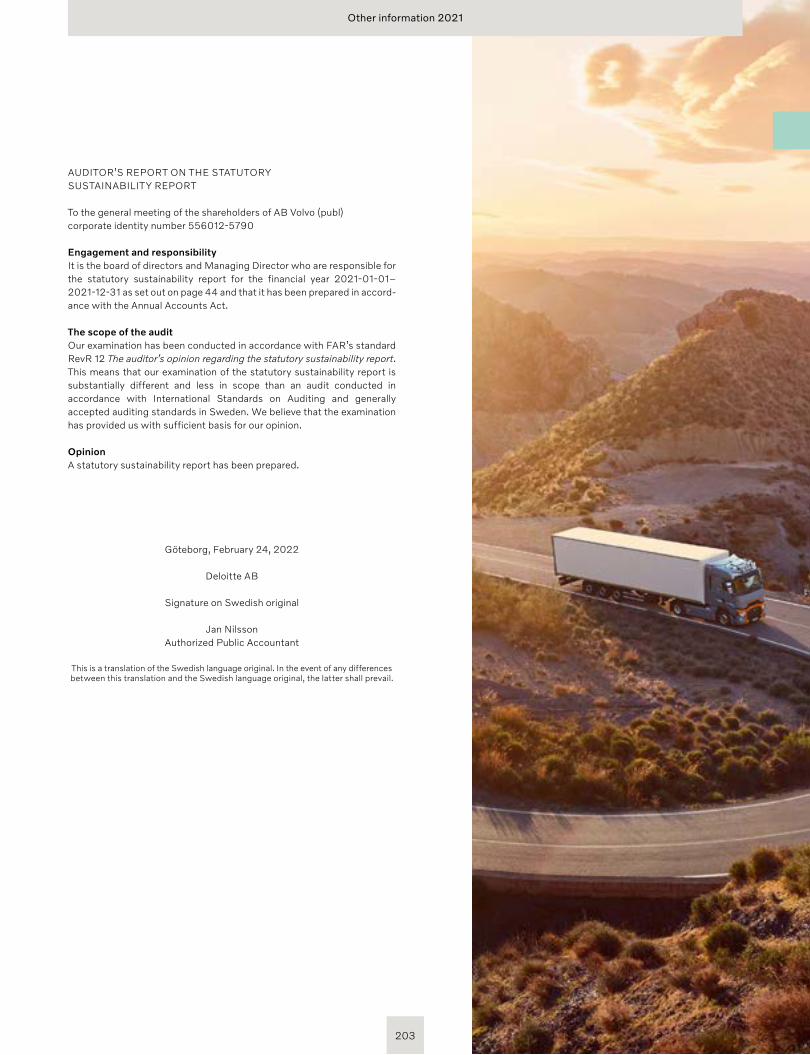
AUDITOR’S REPORT ON THE STATUTORY SUSTAINABILITY REPORT
To the general meeting of the shareholders of AB Volvo (publ)corporate identity number 556012-5790
Engagement and responsibilityIt is the board of directors and Managing Director who are responsible for the statutory sustainability report for the financial year 2021-01-01–2021-12-31 as set out on page 44 and that it has been prepared in accord-ance with the Annual Accounts Act.
The scope of the auditOur examination has been conducted in accordance with FAR’s standard RevR 12 The auditor’s opinion regarding the statutory sustainability report. This means that our examination of the statutory sustainability report is substantially different and less in scope than an audit conducted in accordance with International Standards on Auditing and generally accepted auditing standards in Sweden. We believe that the examination has provided us with sufficient basis for our opinion.
OpinionA statutory sustainability report has been prepared.
Göteborg, February 24, 2022
Deloitte AB
Signature on Swedish original
Jan NilssonAuthorized Public Accountant
This is a translation of the Swedish language original. In the event of any differences between this translation and the Swedish language original, the latter shall prevail.
203
Other information 2021
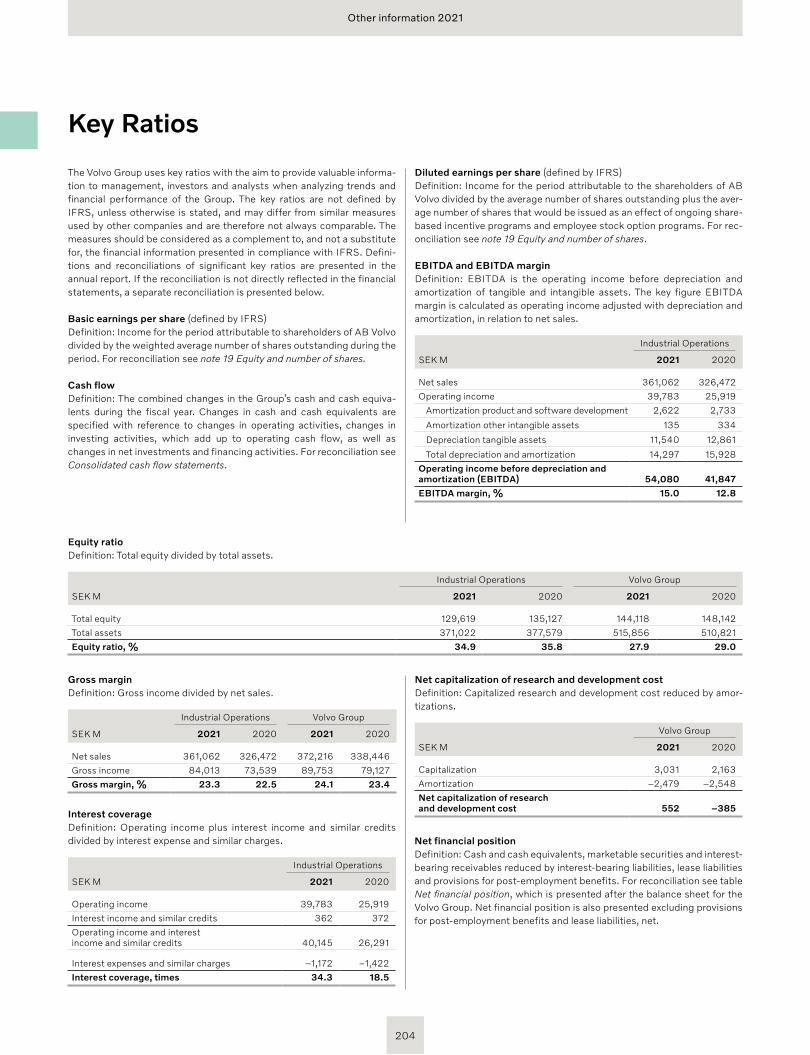
Other information 2021
Key Ratios
The Volvo Group uses key ratios with the aim to provide valuable informa-tion to management, investors and analysts when analyzing trends and financial performance of the Group. The key ratios are not defined by IFRS, unless otherwise is stated, and may differ from similar measures used by other companies and are therefore not always comparable. The measures should be considered as a complement to, and not a substitute for, the financial information presented in compliance with IFRS. Defini-tions and reconciliations of significant key ratios are presented in the annual report. If the reconciliation is not directly reflected in the financial statements, a separate reconciliation is presented below.
Basic earnings per share (defined by IFRS)Definition: Income for the period attributable to shareholders of AB Volvo divided by the weighted average number of shares outstanding during the period. For reconciliation see note 19 Equity and number of shares.
Cash flowDefinition: The combined changes in the Group’s cash and cash equiva-lents during the fiscal year. Changes in cash and cash equivalents are specified with reference to changes in operating activities, changes in investing activities, which add up to operating cash flow, as well as changes in net investments and financing activities. For reconciliation see Consolidated cash flow statements.
Diluted earnings per share (defined by IFRS)Definition: Income for the period attributable to the shareholders of AB Volvo divided by the average number of shares outstanding plus the aver-age number of shares that would be issued as an effect of ongoing share-based incentive programs and employee stock option programs. For rec-onciliation see note 19 Equity and number of shares.
EBITDA and EBITDA margin Definition: EBITDA is the operating income before depreciation and amortization of tangible and intangible assets. The key figure EBITDA margin is calculated as operating income adjusted with depreciation and amortization, in relation to net sales.
Industrial Operations
SEK M 2021 2020
Net sales 361,062 326,472
Operating income 39,783 25,919
Amortization product and software development 2,622 2,733
Amortization other intangible assets 135 334
Depreciation tangible assets 11,540 12,861
Total depreciation and amortization 14,297 15,928
Operating income before depreciation and amortization (EBITDA) 54,080 41,847
EBITDA margin, % 15.0 12.8
Equity ratio Definition: Total equity divided by total assets.
Industrial Operations Volvo Group
SEK M 2021 2020 2021 2020
Total equity 129,619 135,127 144,118 148,142
Total assets 371,022 377,579 515,856 510,821
Equity ratio, % 34.9 35.8 27.9 29.0
Gross margin Definition: Gross income divided by net sales.
Industrial Operations Volvo Group
SEK M 2021 2020 2021 2020
Net sales 361,062 326,472 372,216 338,446
Gross income 84,013 73,539 89,753 79,127
Gross margin, % 23.3 22.5 24.1 23.4
Interest coverageDefinition: Operating income plus interest income and similar credits divided by interest expense and similar charges.
Industrial Operations
SEK M 2021 2020
Operating income 39,783 25,919
Interest income and similar credits 362 372
Operating income and interest income and similar credits 40,145 26,291
Interest expenses and similar charges –1,172 –1,422
Interest coverage, times 34.3 18.5
Net capitalization of research and development costDefinition: Capitalized research and development cost reduced by amor-tizations.
Volvo Group
SEK M 2021 2020
Capitalization 3,031 2,163
Amortization –2,479 –2,548
Net capitalization of research and development cost 552 –385
Net financial positionDefinition: Cash and cash equivalents, marketable securities and interest-bearing receivables reduced by interest-bearing liabili ties, lease liabilities and provisions for post-employment benefits. For reconciliation see table Net financial position, which is presented after the balance sheet for the Volvo Group. Net financial position is also presented excluding provisions for post-employment benefits and lease liabilities, net.
204
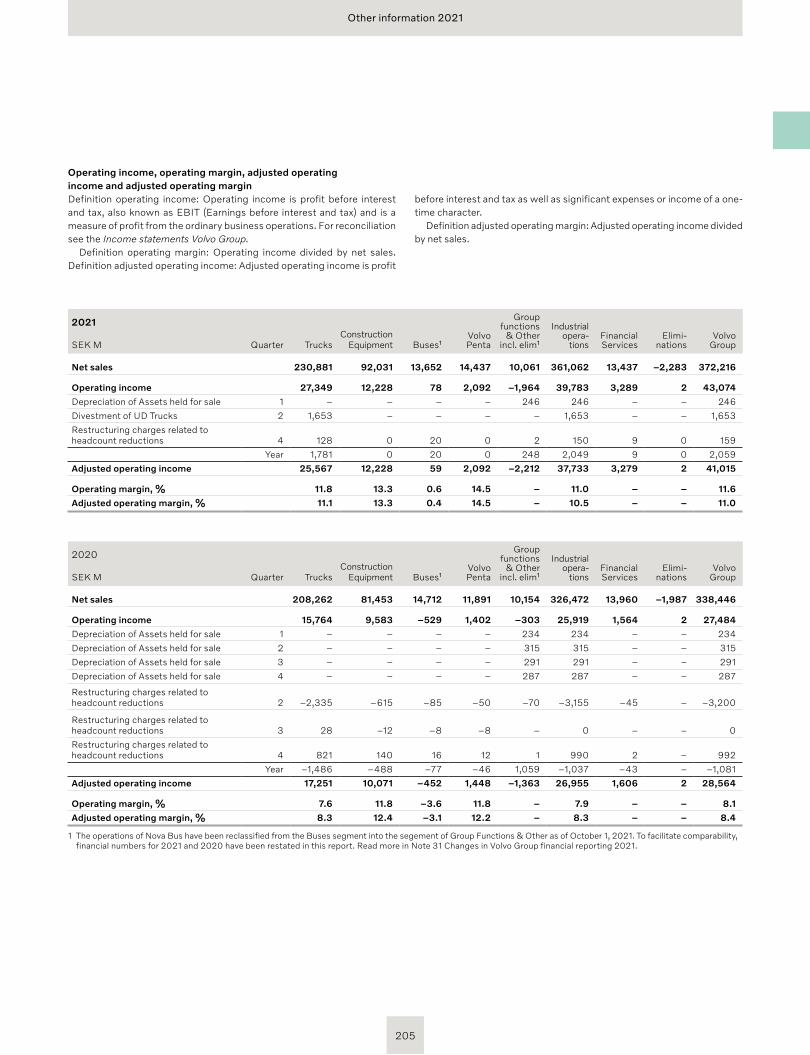
Other information 2021
Operating income, operating margin, adjusted operating income and adjusted operating marginDefinition operating income: Operating income is profit before interest and tax, also known as EBIT (Earnings before interest and tax) and is a measure of profit from the ordinary business operations. For reconciliation see the Income statements Volvo Group.
Definition operating margin: Operating income divided by net sales. Definition adjusted operating income: Adjusted operating income is profit
2021
Quarter TrucksConstruction
Equipment Buses¹Volvo Penta
Group functions
& Other incl. elim¹
Industrial opera-
tionsFinancial Services
Elimi-nations
Volvo GroupSEK M
Net sales 230,881 92,031 13,652 14,437 10,061 361,062 13,437 –2,283 372,216
Operating income 27,349 12,228 78 2,092 –1,964 39,783 3,289 2 43,074
Depreciation of Assets held for sale 1 – – – – 246 246 – – 246
Divestment of UD Trucks 2 1,653 – – – – 1,653 – – 1,653
Restructuring charges related to headcount reductions 4 128 0 20 0 2 150 9 0 159
Year 1,781 0 20 0 248 2,049 9 0 2,059
Adjusted operating income 25,567 12,228 59 2,092 –2,212 37,733 3,279 2 41,015
Operating margin, % 11.8 13.3 0.6 14.5 – 11.0 – – 11.6
Adjusted operating margin, % 11.1 13.3 0.4 14.5 – 10.5 – – 11.0
2020
Quarter TrucksConstruction
Equipment Buses¹Volvo Penta
Group functions
& Other incl. elim¹
Industrial opera-
tionsFinancial Services
Elimi-nations
Volvo GroupSEK M
Net sales 208,262 81,453 14,712 11,891 10,154 326,472 13,960 –1,987 338,446
Operating income 15,764 9,583 –529 1,402 –303 25,919 1,564 2 27,484
Depreciation of Assets held for sale 1 – – – – 234 234 – – 234
Depreciation of Assets held for sale 2 – – – – 315 315 – – 315
Depreciation of Assets held for sale 3 – – – – 291 291 – – 291
Depreciation of Assets held for sale 4 – – – – 287 287 – – 287
Restructuring charges related to headcount reductions 2 –2,335 –615 –85 –50 –70 –3,155 –45 – –3,200
Restructuring charges related to headcount reductions 3 28 –12 –8 –8 – 0 – – 0
Restructuring charges related to headcount reductions 4 821 140 16 12 1 990 2 – 992
Year –1,486 –488 –77 –46 1,059 –1,037 –43 – –1,081
Adjusted operating income 17,251 10,071 –452 1,448 –1,363 26,955 1,606 2 28,564
Operating margin, % 7.6 11.8 –3.6 11.8 – 7.9 – – 8.1
Adjusted operating margin, % 8.3 12.4 –3.1 12.2 – 8.3 – – 8.4
1 The operations of Nova Bus have been reclassified from the Buses segment into the segement of Group Functions & Other as of October 1, 2021. To facilitate comparability, financial numbers for 2021 and 2020 have been restated in this report. Read more in Note 31 Changes in Volvo Group financial reporting 2021.
before interest and tax as well as significant expenses or income of a one-time character.
Definition adjusted operating margin: Adjusted operating income divided by net sales.
205
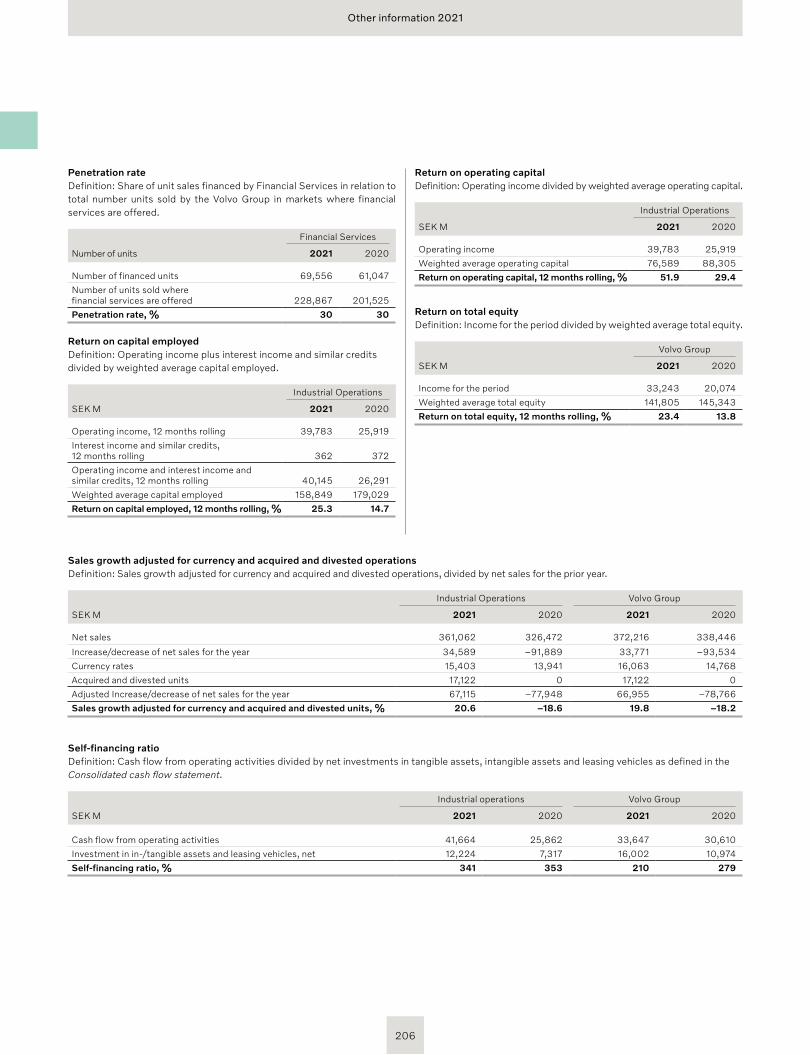
Other information 2021
Penetration rateDefinition: Share of unit sales financed by Financial Services in relation to total number units sold by the Volvo Group in markets where financial services are offered.
Financial Services
Number of units 2021 2020
Number of financed units 69,556 61,047
Number of units sold where financial services are offered 228,867 201,525
Penetration rate, % 30 30
Return on capital employedDefinition: Operating income plus interest income and similar credits divided by weighted average capital employed.
Industrial Operations
SEK M 2021 2020
Operating income, 12 months rolling 39,783 25,919
Interest income and similar credits, 12 months rolling 362 372
Operating income and interest income and similar credits, 12 months rolling 40,145 26,291
Weighted average capital employed 158,849 179,029
Return on capital employed, 12 months rolling, % 25.3 14.7
Return on operating capital Definition: Operating income divided by weighted average operating capital.
Industrial Operations
SEK M 2021 2020
Operating income 39,783 25,919
Weighted average operating capital 76,589 88,305
Return on operating capital, 12 months rolling, % 51.9 29.4
Return on total equity Definition: Income for the period divided by weighted average total equity.
Volvo Group
SEK M 2021 2020
Income for the period 33,243 20,074
Weighted average total equity 141,805 145,343
Return on total equity, 12 months rolling, % 23.4 13.8
Sales growth adjusted for currency and acquired and divested operationsDefinition: Sales growth adjusted for currency and acquired and divested operations, divided by net sales for the prior year.
Industrial Operations Volvo Group
SEK M 2021 2020 2021 2020
Net sales 361,062 326,472 372,216 338,446
Increase/decrease of net sales for the year 34,589 –91,889 33,771 –93,534
Currency rates 15,403 13,941 16,063 14,768
Acquired and divested units 17,122 0 17,122 0
Adjusted Increase/decrease of net sales for the year 67,115 –77,948 66,955 –78,766
Sales growth adjusted for currency and acquired and divested units, % 20.6 –18.6 19.8 –18.2
Self-financing ratioDefinition: Cash flow from operating activities divided by net investments in tangible assets, intangible assets and leasing vehicles as defined in the Consolidated cash flow statement.
Industrial operations Volvo Group
SEK M 2021 2020 2021 2020
Cash flow from operating activities 41,664 25,862 33,647 30,610
Investment in in-/tangible assets and leasing vehicles, net 12,224 7,317 16,002 10,974
Self-financing ratio, % 341 353 210 279
206
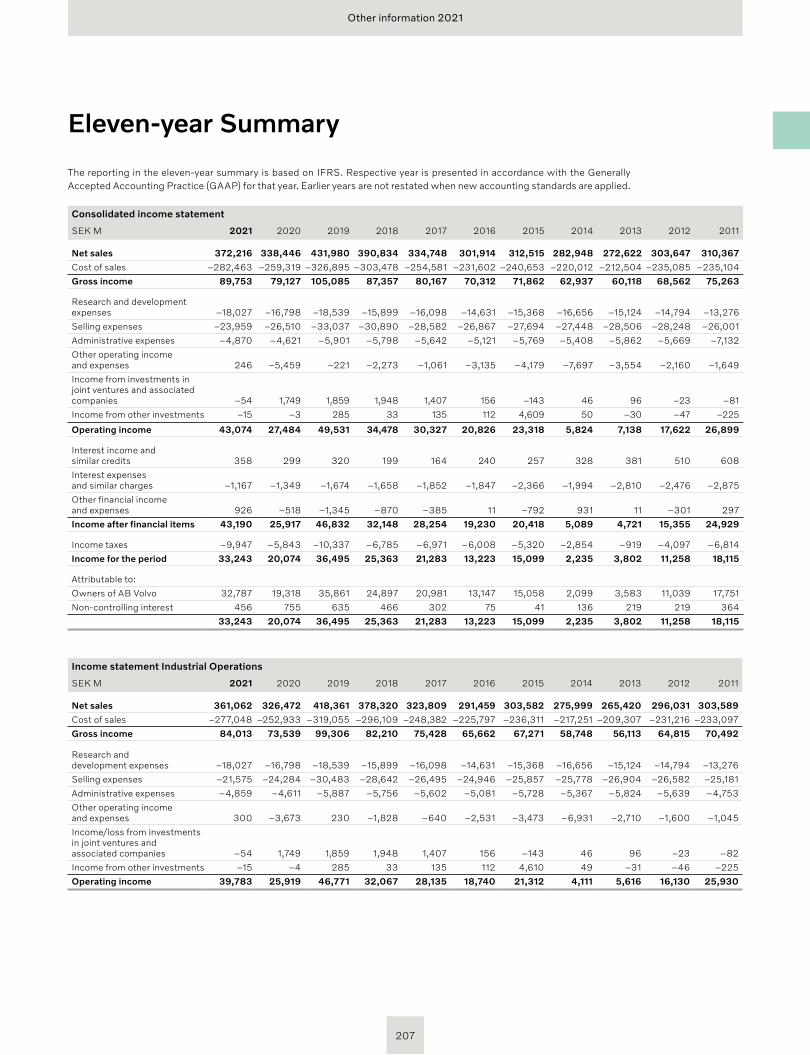
Other information 2021
Eleven-year Summary
The reporting in the eleven-year summary is based on IFRS. Respective year is presented in accordance with the Generally Accepted Accounting Practice (GAAP) for that year. Earlier years are not restated when new accounting standards are applied.
Consolidated income statement
SEK M 2021 2020 2019 2018 2017 2016 2015 2014 2013 2012 2011
Net sales 372,216 338,446 431,980 390,834 334,748 301,914 312,515 282,948 272,622 303,647 310,367
Cost of sales –282,463 –259,319 –326,895 –303,478 –254,581 –231,602 –240,653 –220,012 –212,504 –235,085 –235,104
Gross income 89,753 79,127 105,085 87,357 80,167 70,312 71,862 62,937 60,118 68,562 75,263
Research and development expenses –18,027 –16,798 –18,539 –15,899 –16,098 –14,631 –15,368 –16,656 –15,124 –14,794 –13,276
Selling expenses –23,959 –26,510 –33,037 –30,890 –28,582 –26,867 –27,694 –27,448 –28,506 –28,248 –26,001
Administrative expenses –4,870 –4,621 –5,901 –5,798 –5,642 –5,121 –5,769 –5,408 –5,862 –5,669 –7,132
Other operating income and expenses 246 –5,459 –221 –2,273 –1,061 –3,135 –4,179 –7,697 –3,554 –2,160 –1,649
Income from investments in joint ventures and associated companies –54 1,749 1,859 1,948 1,407 156 –143 46 96 –23 –81
Income from other investments –15 –3 285 33 135 112 4,609 50 –30 –47 –225
Operating income 43,074 27,484 49,531 34,478 30,327 20,826 23,318 5,824 7,138 17,622 26,899
Interest income and similar credits 358 299 320 199 164 240 257 328 381 510 608
Interest expenses and similar charges –1,167 –1,349 –1,674 –1,658 –1,852 –1,847 –2,366 –1,994 –2,810 –2,476 –2,875
Other financial income and expenses 926 –518 –1,345 –870 –385 11 –792 931 11 –301 297
Income after financial items 43,190 25,917 46,832 32,148 28,254 19,230 20,418 5,089 4,721 15,355 24,929
Income taxes –9,947 –5,843 –10,337 –6,785 –6,971 –6,008 –5,320 –2,854 –919 –4,097 –6,814
Income for the period 33,243 20,074 36,495 25,363 21,283 13,223 15,099 2,235 3,802 11,258 18,115
Attributable to:
Owners of AB Volvo 32,787 19,318 35,861 24,897 20,981 13,147 15,058 2,099 3,583 11,039 17,751
Non-controlling interest 456 755 635 466 302 75 41 136 219 219 364
33,243 20,074 36,495 25,363 21,283 13,223 15,099 2,235 3,802 11,258 18,115
Income statement Industrial Operations
SEK M 2021 2020 2019 2018 2017 2016 2015 2014 2013 2012 2011
Net sales 361,062 326,472 418,361 378,320 323,809 291,459 303,582 275,999 265,420 296,031 303,589
Cost of sales –277,048 –252,933 –319,055 –296,109 –248,382 –225,797 –236,311 –217,251 –209,307 –231,216 –233,097
Gross income 84,013 73,539 99,306 82,210 75,428 65,662 67,271 58,748 56,113 64,815 70,492
Research and development expenses –18,027 –16,798 –18,539 –15,899 –16,098 –14,631 –15,368 –16,656 –15,124 –14,794 –13,276
Selling expenses –21,575 –24,284 –30,483 –28,642 –26,495 –24,946 –25,857 –25,778 –26,904 –26,582 –25,181
Administrative expenses –4,859 –4,611 –5,887 –5,756 –5,602 –5,081 –5,728 –5,367 –5,824 –5,639 –4,753
Other operating income and expenses 300 –3,673 230 –1,828 –640 –2,531 –3,473 –6,931 –2,710 –1,600 –1,045
Income/loss from investments in joint ventures and associated companies –54 1,749 1,859 1,948 1,407 156 –143 46 96 –23 –82
Income from other investments –15 –4 285 33 135 112 4,610 49 –31 –46 –225
Operating income 39,783 25,919 46,771 32,067 28,135 18,740 21,312 4,111 5,616 16,130 25,930
207
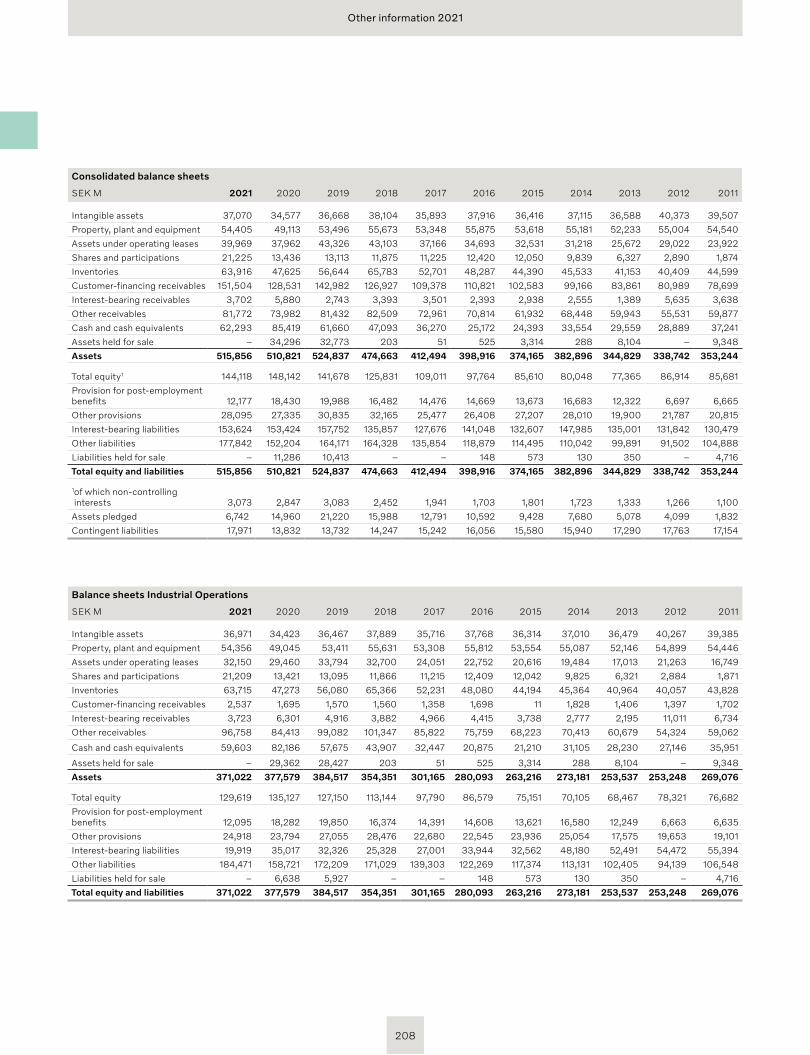
Other information 2021
Consolidated balance sheets
SEK M 2021 2020 2019 2018 2017 2016 2015 2014 2013 2012 2011
Intangible assets 37,070 34,577 36,668 38,104 35,893 37,916 36,416 37,115 36,588 40,373 39,507
Property, plant and equipment 54,405 49,113 53,496 55,673 53,348 55,875 53,618 55,181 52,233 55,004 54,540
Assets under operating leases 39,969 37,962 43,326 43,103 37,166 34,693 32,531 31,218 25,672 29,022 23,922
Shares and participations 21,225 13,436 13,113 11,875 11,225 12,420 12,050 9,839 6,327 2,890 1,874
Inventories 63,916 47,625 56,644 65,783 52,701 48,287 44,390 45,533 41,153 40,409 44,599
Customer-financing receivables 151,504 128,531 142,982 126,927 109,378 110,821 102,583 99,166 83,861 80,989 78,699
Interest-bearing receivables 3,702 5,880 2,743 3,393 3,501 2,393 2,938 2,555 1,389 5,635 3,638
Other receivables 81,772 73,982 81,432 82,509 72,961 70,814 61,932 68,448 59,943 55,531 59,877
Cash and cash equivalents 62,293 85,419 61,660 47,093 36,270 25,172 24,393 33,554 29,559 28,889 37,241
Assets held for sale – 34,296 32,773 203 51 525 3,314 288 8,104 – 9,348
Assets 515,856 510,821 524,837 474,663 412,494 398,916 374,165 382,896 344,829 338,742 353,244
Total equity1 144,118 148,142 141,678 125,831 109,011 97,764 85,610 80,048 77,365 86,914 85,681
Provision for post-employment benefits 12,177 18,430 19,988 16,482 14,476 14,669 13,673 16,683 12,322 6,697 6,665
Other provisions 28,095 27,335 30,835 32,165 25,477 26,408 27,207 28,010 19,900 21,787 20,815
Interest-bearing liabilities 153,624 153,424 157,752 135,857 127,676 141,048 132,607 147,985 135,001 131,842 130,479
Other liabilities 177,842 152,204 164,171 164,328 135,854 118,879 114,495 110,042 99,891 91,502 104,888
Liabilities held for sale – 11,286 10,413 – – 148 573 130 350 – 4,716
Total equity and liabilities 515,856 510,821 524,837 474,663 412,494 398,916 374,165 382,896 344,829 338,742 353,244
1 of which non-controlling interests 3,073 2,847 3,083 2,452 1,941 1,703 1,801 1,723 1,333 1,266 1,100
Assets pledged 6,742 14,960 21,220 15,988 12,791 10,592 9,428 7,680 5,078 4,099 1,832
Contingent liabilities 17,971 13,832 13,732 14,247 15,242 16,056 15,580 15,940 17,290 17,763 17,154
Balance sheets Industrial Operations
SEK M 2021 2020 2019 2018 2017 2016 2015 2014 2013 2012 2011
Intangible assets 36,971 34,423 36,467 37,889 35,716 37,768 36,314 37,010 36,479 40,267 39,385
Property, plant and equipment 54,356 49,045 53,411 55,631 53,308 55,812 53,554 55,087 52,146 54,899 54,446
Assets under operating leases 32,150 29,460 33,794 32,700 24,051 22,752 20,616 19,484 17,013 21,263 16,749
Shares and participations 21,209 13,421 13,095 11,866 11,215 12,409 12,042 9,825 6,321 2,884 1,871
Inventories 63,715 47,273 56,080 65,366 52,231 48,080 44,194 45,364 40,964 40,057 43,828
Customer-financing receivables 2,537 1,695 1,570 1,560 1,358 1,698 11 1,828 1,406 1,397 1,702
Interest-bearing receivables 3,723 6,301 4,916 3,882 4,966 4,415 3,738 2,777 2,195 11,011 6,734
Other receivables 96,758 84,413 99,082 101,347 85,822 75,759 68,223 70,413 60,679 54,324 59,062
Cash and cash equivalents 59,603 82,186 57,675 43,907 32,447 20,875 21,210 31,105 28,230 27,146 35,951
Assets held for sale – 29,362 28,427 203 51 525 3,314 288 8,104 – 9,348
Assets 371,022 377,579 384,517 354,351 301,165 280,093 263,216 273,181 253,537 253,248 269,076
Total equity 129,619 135,127 127,150 113,144 97,790 86,579 75,151 70,105 68,467 78,321 76,682
Provision for post-employment benefits 12,095 18,282 19,850 16,374 14,391 14,608 13,621 16,580 12,249 6,663 6,635
Other provisions 24,918 23,794 27,055 28,476 22,680 22,545 23,936 25,054 17,575 19,653 19,101
Interest-bearing liabilities 19,919 35,017 32,326 25,328 27,001 33,944 32,562 48,180 52,491 54,472 55,394
Other liabilities 184,471 158,721 172,209 171,029 139,303 122,269 117,374 113,131 102,405 94,139 106,548
Liabilities held for sale – 6,638 5,927 – – 148 573 130 350 – 4,716
Total equity and liabilities 371,022 377,579 384,517 354,351 301,165 280,093 263,216 273,181 253,537 253,248 269,076
208
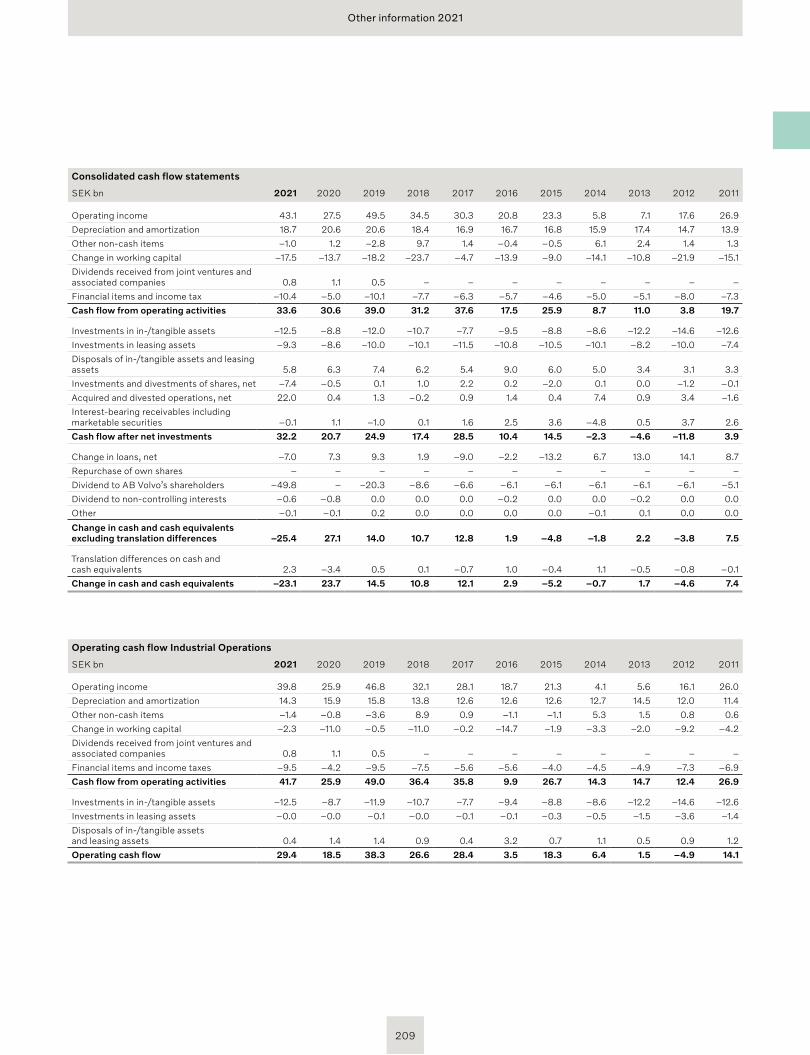
Other information 2021
Consolidated cash flow statements
SEK bn 2021 2020 2019 2018 2017 2016 2015 2014 2013 2012 2011
Operating income 43.1 27.5 49.5 34.5 30.3 20.8 23.3 5.8 7.1 17.6 26.9
Depreciation and amortization 18.7 20.6 20.6 18.4 16.9 16.7 16.8 15.9 17.4 14.7 13.9
Other non-cash items –1.0 1.2 –2.8 9.7 1.4 –0.4 –0.5 6.1 2.4 1.4 1.3
Change in working capital –17.5 –13.7 –18.2 –23.7 –4.7 –13.9 –9.0 –14.1 –10.8 –21.9 –15.1
Dividends received from joint ventures and associated companies 0.8 1.1 0.5 – – – – – – – –
Financial items and income tax –10.4 –5.0 –10.1 –7.7 –6.3 –5.7 –4.6 –5.0 –5.1 –8.0 –7.3
Cash flow from operating activities 33.6 30.6 39.0 31.2 37.6 17.5 25.9 8.7 11.0 3.8 19.7
Investments in in-/tangible assets –12.5 –8.8 –12.0 –10.7 –7.7 –9.5 –8.8 –8.6 –12.2 –14.6 –12.6
Investments in leasing assets –9.3 –8.6 –10.0 –10.1 –11.5 –10.8 –10.5 –10.1 –8.2 –10.0 –7.4
Disposals of in-/tangible assets and leasing assets 5.8 6.3 7.4 6.2 5.4 9.0 6.0 5.0 3.4 3.1 3.3
Investments and divestments of shares, net –7.4 –0.5 0.1 1.0 2.2 0.2 –2.0 0.1 0.0 –1.2 –0.1
Acquired and divested operations, net 22.0 0.4 1.3 –0.2 0.9 1.4 0.4 7.4 0.9 3.4 –1.6
Interest-bearing receivables including marketable securities –0.1 1.1 –1.0 0.1 1.6 2.5 3.6 –4.8 0.5 3.7 2.6
Cash flow after net investments 32.2 20.7 24.9 17.4 28.5 10.4 14.5 –2.3 –4.6 –11.8 3.9
Change in loans, net –7.0 7.3 9.3 1.9 –9.0 –2.2 –13.2 6.7 13.0 14.1 8.7
Repurchase of own shares – – – – – – – – – – –
Dividend to AB Volvo’s shareholders –49.8 – –20.3 –8.6 –6.6 –6.1 –6.1 –6.1 –6.1 –6.1 –5.1
Dividend to non-controlling interests –0.6 –0.8 0.0 0.0 0.0 –0.2 0.0 0.0 –0.2 0.0 0.0
Other –0.1 –0.1 0.2 0.0 0.0 0.0 0.0 –0.1 0.1 0.0 0.0
Change in cash and cash equivalents excluding translation differences –25.4 27.1 14.0 10.7 12.8 1.9 –4.8 –1.8 2.2 –3.8 7.5
Translation differences on cash and cash equivalents 2.3 –3.4 0.5 0.1 –0.7 1.0 –0.4 1.1 –0.5 –0.8 –0.1
Change in cash and cash equivalents –23.1 23.7 14.5 10.8 12.1 2.9 –5.2 –0.7 1.7 –4.6 7.4
Operating cash flow Industrial Operations
SEK bn 2021 2020 2019 2018 2017 2016 2015 2014 2013 2012 2011
Operating income 39.8 25.9 46.8 32.1 28.1 18.7 21.3 4.1 5.6 16.1 26.0
Depreciation and amortization 14.3 15.9 15.8 13.8 12.6 12.6 12.6 12.7 14.5 12.0 11.4
Other non-cash items –1.4 –0.8 –3.6 8.9 0.9 –1.1 –1.1 5.3 1.5 0.8 0.6
Change in working capital –2.3 –11.0 –0.5 –11.0 –0.2 –14.7 –1.9 –3.3 –2.0 –9.2 –4.2
Dividends received from joint ventures and associated companies 0.8 1.1 0.5 – – – – – – – –
Financial items and income taxes –9.5 –4.2 –9.5 –7.5 –5.6 –5.6 –4.0 –4.5 –4.9 –7.3 –6.9
Cash flow from operating activities 41.7 25.9 49.0 36.4 35.8 9.9 26.7 14.3 14.7 12.4 26.9
Investments in in-/tangible assets –12.5 –8.7 –11.9 –10.7 –7.7 –9.4 –8.8 –8.6 –12.2 –14.6 –12.6
Investments in leasing assets –0.0 –0.0 –0.1 –0.0 –0.1 –0.1 –0.3 –0.5 –1.5 –3.6 –1.4
Disposals of in-/tangible assets and leasing assets 0.4 1.4 1.4 0.9 0.4 3.2 0.7 1.1 0.5 0.9 1.2
Operating cash flow 29.4 18.5 38.3 26.6 28.4 3.5 18.3 6.4 1.5 –4.9 14.1
209
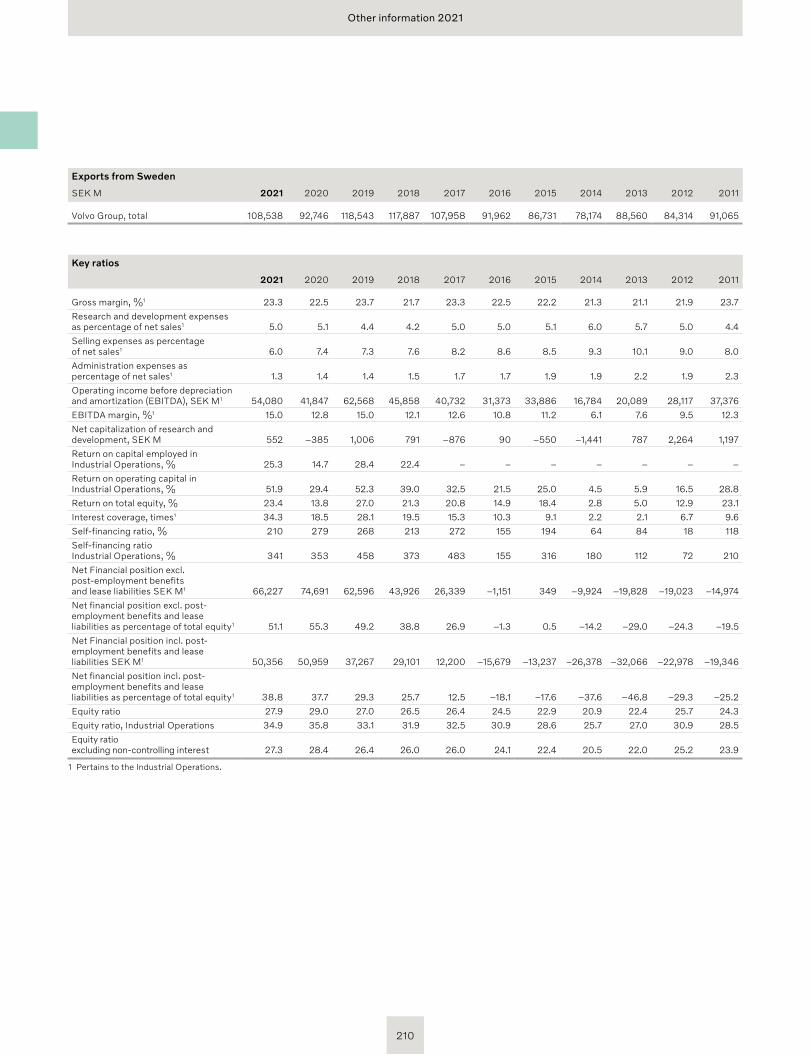
Other information 2021
Key ratios
2021 2020 2019 2018 2017 2016 2015 2014 2013 2012 2011
Gross margin, %1 23.3 22.5 23.7 21.7 23.3 22.5 22.2 21.3 21.1 21.9 23.7
Research and development expenses as percentage of net sales1 5.0 5.1 4.4 4.2 5.0 5.0 5.1 6.0 5.7 5.0 4.4
Selling expenses as percentage of net sales1 6.0 7.4 7.3 7.6 8.2 8.6 8.5 9.3 10.1 9.0 8.0
Administration expenses as percentage of net sales1 1.3 1.4 1.4 1.5 1.7 1.7 1.9 1.9 2.2 1.9 2.3
Operating income before depreciation and amortization (EBITDA), SEK M1 54,080 41,847 62,568 45,858 40,732 31,373 33,886 16,784 20,089 28,117 37,376
EBITDA margin, %1 15.0 12.8 15.0 12.1 12.6 10.8 11.2 6.1 7.6 9.5 12.3
Net capitalization of research and development, SEK M 552 –385 1,006 791 –876 90 –550 –1,441 787 2,264 1,197
Return on capital employed in Industrial Operations, % 25.3 14.7 28.4 22.4 – – – – – – –
Return on operating capital in Industrial Operations, % 51.9 29.4 52.3 39.0 32.5 21.5 25.0 4.5 5.9 16.5 28.8
Return on total equity, % 23.4 13.8 27.0 21.3 20.8 14.9 18.4 2.8 5.0 12.9 23.1
Interest coverage, times1 34.3 18.5 28.1 19.5 15.3 10.3 9.1 2.2 2.1 6.7 9.6
Self-financing ratio, % 210 279 268 213 272 155 194 64 84 18 118
Self-financing ratio Industrial Operations, % 341 353 458 373 483 155 316 180 112 72 210
Net Financial position excl. post -employment benefits and lease liabilities SEK M1 66,227 74,691 62,596 43,926 26,339 –1,151 349 –9,924 –19,828 –19,023 –14,974
Net financial position excl. post- employment benefits and lease liabilities as percentage of total equity1 51.1 55.3 49.2 38.8 26.9 –1.3 0.5 –14.2 –29.0 –24.3 –19.5
Net Financial position incl. post -employment benefits and lease liabilities SEK M1 50,356 50,959 37,267 29,101 12,200 –15,679 –13,237 –26,378 –32,066 –22,978 –19,346
Net financial position incl. post- employment benefits and lease liabilities as percentage of total equity1 38.8 37.7 29.3 25.7 12.5 –18.1 –17.6 –37.6 –46.8 –29.3 –25.2
Equity ratio 27.9 29.0 27.0 26.5 26.4 24.5 22.9 20.9 22.4 25.7 24.3
Equity ratio, Industrial Operations 34.9 35.8 33.1 31.9 32.5 30.9 28.6 25.7 27.0 30.9 28.5
Equity ratio excluding non-controlling interest 27.3 28.4 26.4 26.0 26.0 24.1 22.4 20.5 22.0 25.2 23.9
1 Pertains to the Industrial Operations.
Exports from Sweden
SEK M 2021 2020 2019 2018 2017 2016 2015 2014 2013 2012 2011
Volvo Group, total 108,538 92,746 118,543 117,887 107,958 91,962 86,731 78,174 88,560 84,314 91,065
210
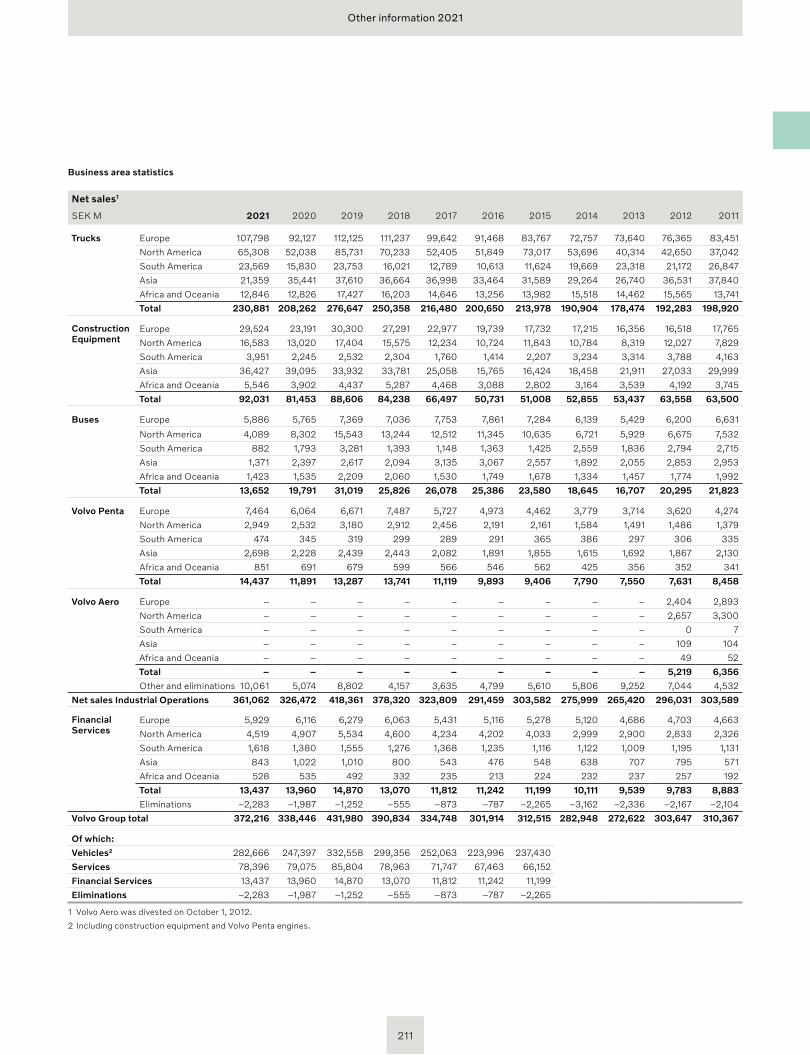
Other information 2021
Business area statistics
Net sales1
SEK M 2021 2020 2019 2018 2017 2016 2015 2014 2013 2012 2011
Trucks Europe 107,798 92,127 112,125 111,237 99,642 91,468 83,767 72,757 73,640 76,365 83,451
North America 65,308 52,038 85,731 70,233 52,405 51,849 73,017 53,696 40,314 42,650 37,042
South America 23,569 15,830 23,753 16,021 12,789 10,613 11,624 19,669 23,318 21,172 26,847
Asia 21,359 35,441 37,610 36,664 36,998 33,464 31,589 29,264 26,740 36,531 37,840
Africa and Oceania 12,846 12,826 17,427 16,203 14,646 13,256 13,982 15,518 14,462 15,565 13,741
Total 230,881 208,262 276,647 250,358 216,480 200,650 213,978 190,904 178,474 192,283 198,920
ConstructionEquipment
Europe 29,524 23,191 30,300 27,291 22,977 19,739 17,732 17,215 16,356 16,518 17,765
North America 16,583 13,020 17,404 15,575 12,234 10,724 11,843 10,784 8,319 12,027 7,829
South America 3,951 2,245 2,532 2,304 1,760 1,414 2,207 3,234 3,314 3,788 4,163
Asia 36,427 39,095 33,932 33,781 25,058 15,765 16,424 18,458 21,911 27,033 29,999
Africa and Oceania 5,546 3,902 4,437 5,287 4,468 3,088 2,802 3,164 3,539 4,192 3,745
Total 92,031 81,453 88,606 84,238 66,497 50,731 51,008 52,855 53,437 63,558 63,500
Buses Europe 5,886 5,765 7,369 7,036 7,753 7,861 7,284 6,139 5,429 6,200 6,631 North America 4,089 8,302 15,543 13,244 12,512 11,345 10,635 6,721 5,929 6,675 7,532
South America 882 1,793 3,281 1,393 1,148 1,363 1,425 2,559 1,836 2,794 2,715
Asia 1,371 2,397 2,617 2,094 3,135 3,067 2,557 1,892 2,055 2,853 2,953
Africa and Oceania 1,423 1,535 2,209 2,060 1,530 1,749 1,678 1,334 1,457 1,774 1,992
Total 13,652 19,791 31,019 25,826 26,078 25,386 23,580 18,645 16,707 20,295 21,823
Volvo Penta Europe 7,464 6,064 6,671 7,487 5,727 4,973 4,462 3,779 3,714 3,620 4,274
North America 2,949 2,532 3,180 2,912 2,456 2,191 2,161 1,584 1,491 1,486 1,379
South America 474 345 319 299 289 291 365 386 297 306 335
Asia 2,698 2,228 2,439 2,443 2,082 1,891 1,855 1,615 1,692 1,867 2,130
Africa and Oceania 851 691 679 599 566 546 562 425 356 352 341
Total 14,437 11,891 13,287 13,741 11,119 9,893 9,406 7,790 7,550 7,631 8,458
Volvo Aero Europe – – – – – – – – – 2,404 2,893
North America – – – – – – – – – 2,657 3,300
South America – – – – – – – – – 0 7
Asia – – – – – – – – – 109 104
Africa and Oceania – – – – – – – – – 49 52
Total – – – – – – – – – 5,219 6,356
Other and eliminations 10,061 5,074 8,802 4,157 3,635 4,799 5,610 5,806 9,252 7,044 4,532
Net sales Industrial Operations 361,062 326,472 418,361 378,320 323,809 291,459 303,582 275,999 265,420 296,031 303,589
FinancialServices
Europe 5,929 6,116 6,279 6,063 5,431 5,116 5,278 5,120 4,686 4,703 4,663
North America 4,519 4,907 5,534 4,600 4,234 4,202 4,033 2,999 2,900 2,833 2,326
South America 1,618 1,380 1,555 1,276 1,368 1,235 1,116 1,122 1,009 1,195 1,131
Asia 843 1,022 1,010 800 543 476 548 638 707 795 571
Africa and Oceania 528 535 492 332 235 213 224 232 237 257 192
Total 13,437 13,960 14,870 13,070 11,812 11,242 11,199 10,111 9,539 9,783 8,883
Eliminations –2,283 –1,987 –1,252 –555 –873 –787 –2,265 –3,162 –2,336 –2,167 –2,104
Volvo Group total 372,216 338,446 431,980 390,834 334,748 301,914 312,515 282,948 272,622 303,647 310,367
Of which:
Vehicles2 282,666 247,397 332,558 299,356 252,063 223,996 237,430
Services 78,396 79,075 85,804 78,963 71,747 67,463 66,152
Financial Services 13,437 13,960 14,870 13,070 11,812 11,242 11,199
Eliminations –2,283 –1,987 –1,252 –555 –873 –787 –2,265
1 Volvo Aero was divested on October 1, 2012.
2 Including construction equipment and Volvo Penta engines.
211
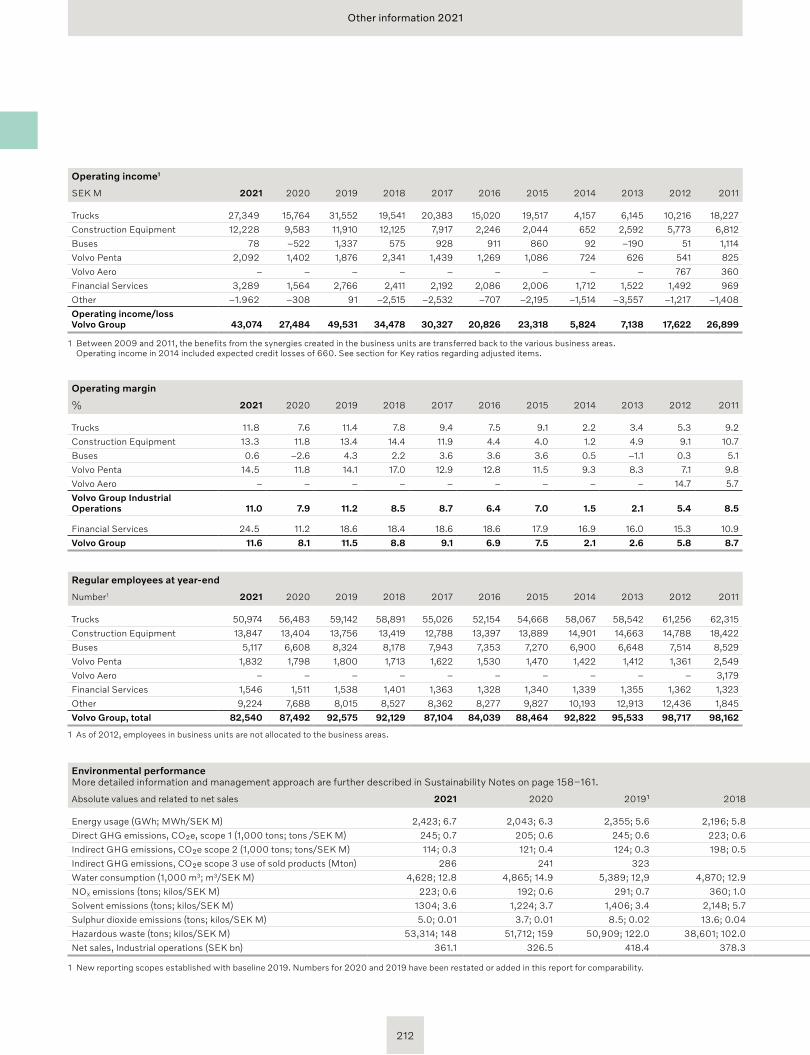
Other information 2021
Operating margin
% 2021 2020 2019 2018 2017 2016 2015 2014 2013 2012 2011
Trucks 11.8 7.6 11.4 7.8 9.4 7.5 9.1 2.2 3.4 5.3 9.2
Construction Equipment 13.3 11.8 13.4 14.4 11.9 4.4 4.0 1.2 4.9 9.1 10.7
Buses 0.6 –2.6 4.3 2.2 3.6 3.6 3.6 0.5 –1.1 0.3 5.1
Volvo Penta 14.5 11.8 14.1 17.0 12.9 12.8 11.5 9.3 8.3 7.1 9.8
Volvo Aero – – – – – – – – – 14.7 5.7
Volvo Group Industrial Operations 11.0 7.9 11.2 8.5 8.7 6.4 7.0 1.5 2.1 5.4 8.5
Financial Services 24.5 11.2 18.6 18.4 18.6 18.6 17.9 16.9 16.0 15.3 10.9
Volvo Group 11.6 8.1 11.5 8.8 9.1 6.9 7.5 2.1 2.6 5.8 8.7
Operating income1
SEK M 2021 2020 2019 2018 2017 2016 2015 2014 2013 2012 2011
Trucks 27,349 15,764 31,552 19,541 20,383 15,020 19,517 4,157 6,145 10,216 18,227
Construction Equipment 12,228 9,583 11,910 12,125 7,917 2,246 2,044 652 2,592 5,773 6,812
Buses 78 –522 1,337 575 928 911 860 92 –190 51 1,114
Volvo Penta 2,092 1,402 1,876 2,341 1,439 1,269 1,086 724 626 541 825
Volvo Aero – – – – – – – – – 767 360
Financial Services 3,289 1,564 2,766 2,411 2,192 2,086 2,006 1,712 1,522 1,492 969
Other –1.962 –308 91 –2,515 –2,532 –707 –2,195 –1,514 –3,557 –1,217 –1,408
Operating income/loss Volvo Group 43,074 27,484 49,531 34,478 30,327 20,826 23,318 5,824 7,138 17,622 26,899
Regular employees at year-end
Number1 2021 2020 2019 2018 2017 2016 2015 2014 2013 2012 2011
Trucks 50,974 56,483 59,142 58,891 55,026 52,154 54,668 58,067 58,542 61,256 62,315
Construction Equipment 13,847 13,404 13,756 13,419 12,788 13,397 13,889 14,901 14,663 14,788 18,422
Buses 5,117 6,608 8,324 8,178 7,943 7,353 7,270 6,900 6,648 7,514 8,529
Volvo Penta 1,832 1,798 1,800 1,713 1,622 1,530 1,470 1,422 1,412 1,361 2,549
Volvo Aero – – – – – – – – – – 3,179
Financial Services 1,546 1,511 1,538 1,401 1,363 1,328 1,340 1,339 1,355 1,362 1,323
Other 9,224 7,688 8,015 8,527 8,362 8,277 9,827 10,193 12,913 12,436 1,845
Volvo Group, total 82,540 87,492 92,575 92,129 87,104 84,039 88,464 92,822 95,533 98,717 98,162
1 As of 2012, employees in business units are not allocated to the business areas.
Environmental performanceMore detailed information and management approach are further described in Sustainability Notes on page 158–161.
Absolute values and related to net sales 2021 2020 2019¹ 2018 2017 2016 2015 2014 2013 2012 2011
Energy usage (GWh; MWh/SEK M) 2,423; 6.7 2,043; 6.3 2,355; 5.6 2,196; 5.8 2,068; 6.4 2,076; 7.1 2,077; 6.8 2,168; 7.9 2,320; 8.7 2,483; 8.5 2,471; 8.1
Direct GHG emissions, CO₂e, scope 1 (1,000 tons; tons /SEK M) 245; 0.7 205; 0.6 245; 0.6 223; 0.6 207; 0.6 211; 0.7 220; 0.7 231; 0.8 255; 1.0 273; 0.9 255; 0.8
Indirect GHG emissions, CO₂e scope 2 (1,000 tons; tons/SEK M) 114; 0.3 121; 0.4 124; 0.3 198; 0.5 192; 0.6 196; 0.7 192; 0.6 218; 0.8 243; 0.9 260; 0.9
Indirect GHG emissions, CO₂e scope 3 use of sold products (Mton) 286 241 323
Water consumption (1,000 m3; m3/SEK M) 4,628; 12.8 4,865; 14.9 5,389; 12,9 4,870; 12.9 4,817; 14.9 4,430; 15.2 4,919; 16.2 4,982; 18.1 5,815; 21.9 7,372; 25.2 7,970; 26.2
NOX emissions (tons; kilos/SEK M) 223; 0.6 192; 0.6 291; 0.7 360; 1.0 301; 0.9 333; 1.1 344; 1.3 332; 1.2 347; 1.3 413; 1.4 474; 1.6
Solvent emissions (tons; kilos/SEK M) 1304; 3.6 1,224; 3.7 1,406; 3.4 2,148; 5.7 1,681; 5.2 1,792; 6.1 1,885; 6.2 2,472; 9.0 2,221; 8.4 2,358; 8.1 2,554; 8.4
Sulphur dioxide emissions (tons; kilos/SEK M) 5.0; 0.01 3.7; 0.01 8.5; 0.02 13.6; 0.04 13.3; 0.04 12.9; 0.04 32.1; 0.1 37.9; 0.1 23.4; 0.1 26; 0.1 34; 0.1
Hazardous waste (tons; kilos/SEK M) 53,314; 148 51,712; 159 50,909; 122.0 38,601; 102.0 31,941; 98.6 27,649; 94.9 27,824; 91.6 24,944; 90.4 28,395; 107.0 32,547; 111.4 25,943; 85.5
Net sales, Industrial operations (SEK bn) 361.1 326.5 418.4 378.3 323.8 291.5 303.6 276.0 265.4 292.2 303.6
1 New reporting scopes established with baseline 2019. Numbers for 2020 and 2019 have been restated or added in this report for comparability.
1 Between 2009 and 2011, the benefits from the synergies created in the business units are transferred back to the various business areas. Operating income in 2014 included expected credit losses of 660. See section for Key ratios regarding adjusted items.
212
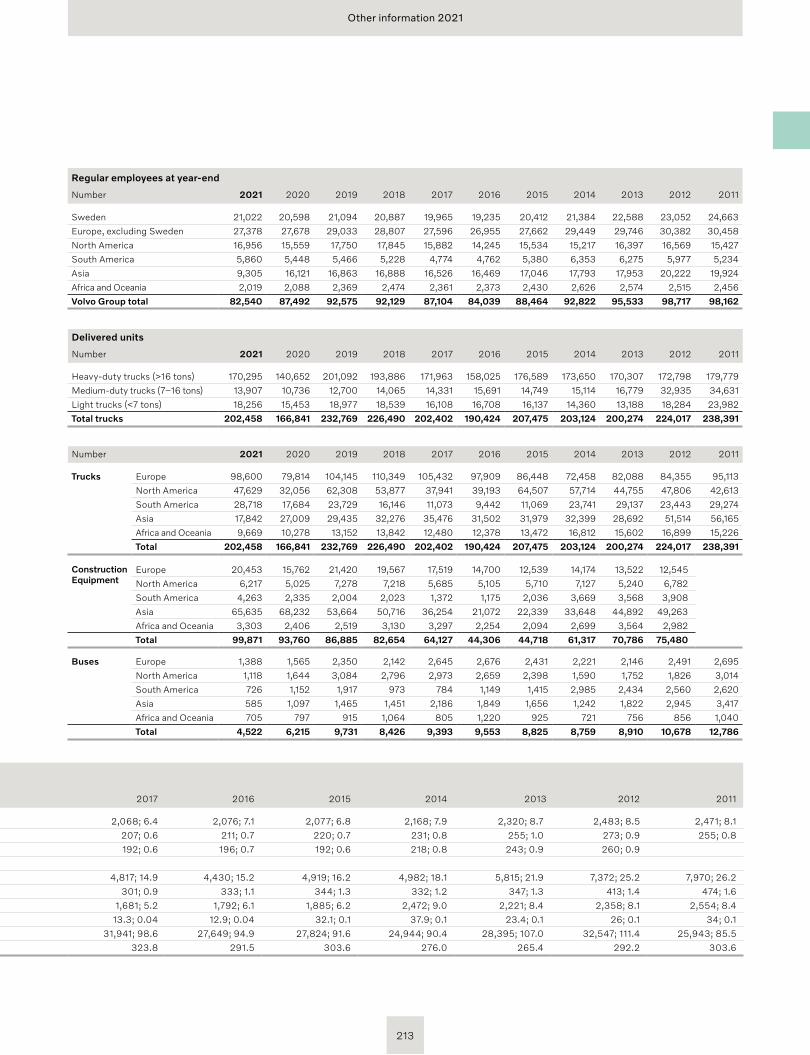
Other information 2021
Environmental performanceMore detailed information and management approach are further described in Sustainability Notes on page 158–161.
Absolute values and related to net sales 2021 2020 2019¹ 2018 2017 2016 2015 2014 2013 2012 2011
Energy usage (GWh; MWh/SEK M) 2,423; 6.7 2,043; 6.3 2,355; 5.6 2,196; 5.8 2,068; 6.4 2,076; 7.1 2,077; 6.8 2,168; 7.9 2,320; 8.7 2,483; 8.5 2,471; 8.1
Direct GHG emissions, CO₂e, scope 1 (1,000 tons; tons /SEK M) 245; 0.7 205; 0.6 245; 0.6 223; 0.6 207; 0.6 211; 0.7 220; 0.7 231; 0.8 255; 1.0 273; 0.9 255; 0.8
Indirect GHG emissions, CO₂e scope 2 (1,000 tons; tons/SEK M) 114; 0.3 121; 0.4 124; 0.3 198; 0.5 192; 0.6 196; 0.7 192; 0.6 218; 0.8 243; 0.9 260; 0.9
Indirect GHG emissions, CO₂e scope 3 use of sold products (Mton) 286 241 323
Water consumption (1,000 m3; m3/SEK M) 4,628; 12.8 4,865; 14.9 5,389; 12,9 4,870; 12.9 4,817; 14.9 4,430; 15.2 4,919; 16.2 4,982; 18.1 5,815; 21.9 7,372; 25.2 7,970; 26.2
NOX emissions (tons; kilos/SEK M) 223; 0.6 192; 0.6 291; 0.7 360; 1.0 301; 0.9 333; 1.1 344; 1.3 332; 1.2 347; 1.3 413; 1.4 474; 1.6
Solvent emissions (tons; kilos/SEK M) 1304; 3.6 1,224; 3.7 1,406; 3.4 2,148; 5.7 1,681; 5.2 1,792; 6.1 1,885; 6.2 2,472; 9.0 2,221; 8.4 2,358; 8.1 2,554; 8.4
Sulphur dioxide emissions (tons; kilos/SEK M) 5.0; 0.01 3.7; 0.01 8.5; 0.02 13.6; 0.04 13.3; 0.04 12.9; 0.04 32.1; 0.1 37.9; 0.1 23.4; 0.1 26; 0.1 34; 0.1
Hazardous waste (tons; kilos/SEK M) 53,314; 148 51,712; 159 50,909; 122.0 38,601; 102.0 31,941; 98.6 27,649; 94.9 27,824; 91.6 24,944; 90.4 28,395; 107.0 32,547; 111.4 25,943; 85.5
Net sales, Industrial operations (SEK bn) 361.1 326.5 418.4 378.3 323.8 291.5 303.6 276.0 265.4 292.2 303.6
1 New reporting scopes established with baseline 2019. Numbers for 2020 and 2019 have been restated or added in this report for comparability.
Regular employees at year-end
Number 2021 2020 2019 2018 2017 2016 2015 2014 2013 2012 2011
Sweden 21,022 20,598 21,094 20,887 19,965 19,235 20,412 21,384 22,588 23,052 24,663
Europe, excluding Sweden 27,378 27,678 29,033 28,807 27,596 26,955 27,662 29,449 29,746 30,382 30,458
North America 16,956 15,559 17,750 17,845 15,882 14,245 15,534 15,217 16,397 16,569 15,427
South America 5,860 5,448 5,466 5,228 4,774 4,762 5,380 6,353 6,275 5,977 5,234
Asia 9,305 16,121 16,863 16,888 16,526 16,469 17,046 17,793 17,953 20,222 19,924
Africa and Oceania 2,019 2,088 2,369 2,474 2,361 2,373 2,430 2,626 2,574 2,515 2,456
Volvo Group total 82,540 87,492 92,575 92,129 87,104 84,039 88,464 92,822 95,533 98,717 98,162
Delivered units
Number 2021 2020 2019 2018 2017 2016 2015 2014 2013 2012 2011
Heavy-duty trucks (>16 tons) 170,295 140,652 201,092 193,886 171,963 158,025 176,589 173,650 170,307 172,798 179,779
Medium-duty trucks (7–16 tons) 13,907 10,736 12,700 14,065 14,331 15,691 14,749 15,114 16,779 32,935 34,631
Light trucks (<7 tons) 18,256 15,453 18,977 18,539 16,108 16,708 16,137 14,360 13,188 18,284 23,982
Total trucks 202,458 166,841 232,769 226,490 202,402 190,424 207,475 203,124 200,274 224,017 238,391
Number 2021 2020 2019 2018 2017 2016 2015 2014 2013 2012 2011
Trucks Europe 98,600 79,814 104,145 110,349 105,432 97,909 86,448 72,458 82,088 84,355 95,113
North America 47,629 32,056 62,308 53,877 37,941 39,193 64,507 57,714 44,755 47,806 42,613
South America 28,718 17,684 23,729 16,146 11,073 9,442 11,069 23,741 29,137 23,443 29,274
Asia 17,842 27,009 29,435 32,276 35,476 31,502 31,979 32,399 28,692 51,514 56,165
Africa and Oceania 9,669 10,278 13,152 13,842 12,480 12,378 13,472 16,812 15,602 16,899 15,226
Total 202,458 166,841 232,769 226,490 202,402 190,424 207,475 203,124 200,274 224,017 238,391
ConstructionEquipment
Europe 20,453 15,762 21,420 19,567 17,519 14,700 12,539 14,174 13,522 12,545
North America 6,217 5,025 7,278 7,218 5,685 5,105 5,710 7,127 5,240 6,782
South America 4,263 2,335 2,004 2,023 1,372 1,175 2,036 3,669 3,568 3,908
Asia 65,635 68,232 53,664 50,716 36,254 21,072 22,339 33,648 44,892 49,263
Africa and Oceania 3,303 2,406 2,519 3,130 3,297 2,254 2,094 2,699 3,564 2,982
Total 99,871 93,760 86,885 82,654 64,127 44,306 44,718 61,317 70,786 75,480
Buses Europe 1,388 1,565 2,350 2,142 2,645 2,676 2,431 2,221 2,146 2,491 2,695
North America 1,118 1,644 3,084 2,796 2,973 2,659 2,398 1,590 1,752 1,826 3,014
South America 726 1,152 1,917 973 784 1,149 1,415 2,985 2,434 2,560 2,620
Asia 585 1,097 1,465 1,451 2,186 1,849 1,656 1,242 1,822 2,945 3,417
Africa and Oceania 705 797 915 1,064 805 1,220 925 721 756 856 1,040
Total 4,522 6,215 9,731 8,426 9,393 9,553 8,825 8,759 8,910 10,678 12,786
213
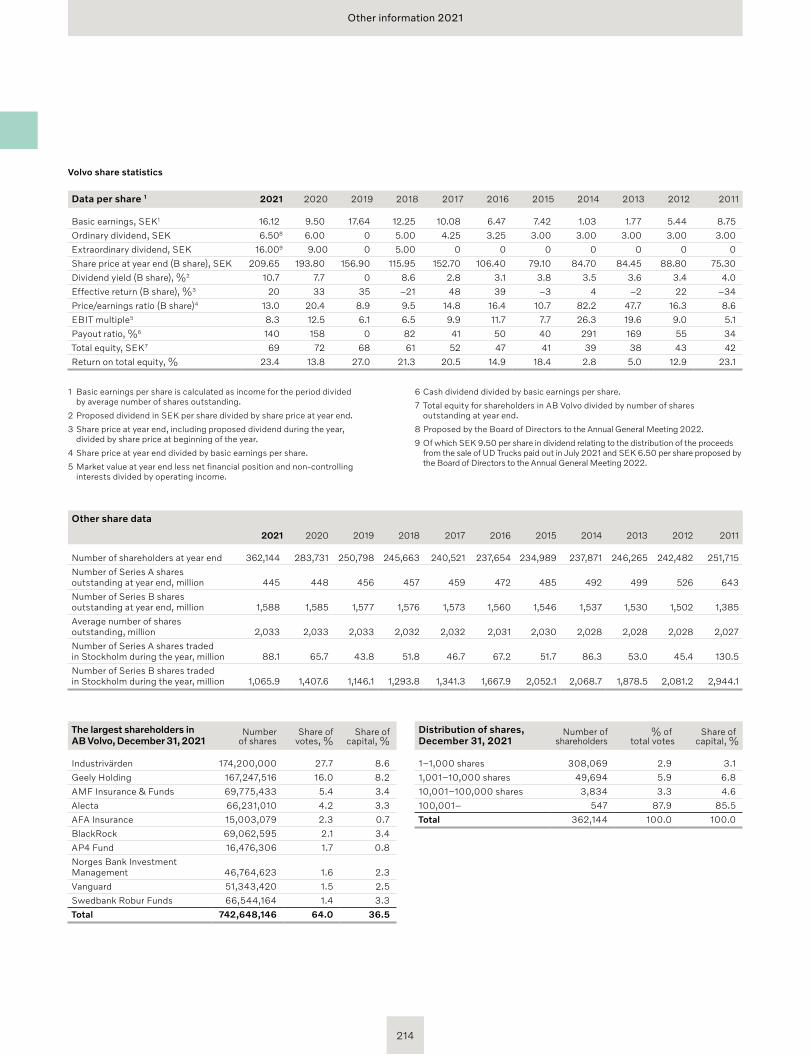
Other information 2021
Volvo share statistics
Data per share 1 2021 2020 2019 2018 2017 2016 2015 2014 2013 2012 2011
Basic earnings, SEK1 16.12 9.50 17.64 12.25 10.08 6.47 7.42 1.03 1.77 5.44 8.75
Ordinary dividend, SEK 6.508 6.00 0 5.00 4.25 3.25 3.00 3.00 3.00 3.00 3.00
Extraordinary dividend, SEK 16.009 9.00 0 5.00 0 0 0 0 0 0 0
Share price at year end (B share), SEK 209.65 193.80 156.90 115.95 152.70 106.40 79.10 84.70 84.45 88.80 75.30
Dividend yield (B share), %2 10.7 7.7 0 8.6 2.8 3.1 3.8 3.5 3.6 3.4 4.0
Effective return (B share), %3 20 33 35 –21 48 39 –3 4 –2 22 –34
Price/earnings ratio (B share)4 13.0 20.4 8.9 9.5 14.8 16.4 10.7 82.2 47.7 16.3 8.6
EBIT multiple5 8.3 12.5 6.1 6.5 9.9 11.7 7.7 26.3 19.6 9.0 5.1
Payout ratio, %6 140 158 0 82 41 50 40 291 169 55 34
Total equity, SEK7 69 72 68 61 52 47 41 39 38 43 42
Return on total equity, % 23.4 13.8 27.0 21.3 20.5 14.9 18.4 2.8 5.0 12.9 23.1
Other share data
2021 2020 2019 2018 2017 2016 2015 2014 2013 2012 2011
Number of shareholders at year end 362,144 283,731 250,798 245,663 240,521 237,654 234,989 237,871 246,265 242,482 251,715
Number of Series A shares outstanding at year end, million 445 448 456 457 459 472 485 492 499 526 643
Number of Series B shares outstanding at year end, million 1,588 1,585 1,577 1,576 1,573 1,560 1,546 1,537 1,530 1,502 1,385
Average number of shares outstanding, million 2,033 2,033 2,033 2,032 2,032 2,031 2,030 2,028 2,028 2,028 2,027
Number of Series A shares traded in Stockholm during the year, million 88.1 65.7 43.8 51.8 46.7 67.2 51.7 86.3 53.0 45.4 130.5
Number of Series B shares traded in Stockholm during the year, million 1,065.9 1,407.6 1,146.1 1,293.8 1,341.3 1,667.9 2,052.1 2,068.7 1,878.5 2,081.2 2,944.1
1 Basic earnings per share is calculated as income for the period divided by average number of shares outstanding.
2 Proposed dividend in SEK per share divided by share price at year end.
3 Share price at year end, including proposed dividend during the year, divided by share price at beginning of the year.
4 Share price at year end divided by basic earnings per share.
5 Market value at year end less net financial position and non-controlling interests divided by operating income.
6 Cash dividend divided by basic earnings per share.
7 Total equity for shareholders in AB Volvo divided by number of shares out stand ing at year end.
8 Proposed by the Board of Directors to the Annual General Meeting 2022.
9 Of which SEK 9.50 per share in dividend relating to the distribution of the proceeds from the sale of UD Trucks paid out in July 2021 and SEK 6.50 per share proposed by the Board of Directors to the Annual General Meeting 2022.
The largest shareholders in AB Volvo, December 31, 2021
Number of shares
Share of votes, %
Share of capital, %
Industrivärden 174,200,000 27.7 8.6
Geely Holding 167,247,516 16.0 8.2
AMF Insurance & Funds 69,775,433 5.4 3.4
Alecta 66,231,010 4.2 3.3
AFA Insurance 15,003,079 2.3 0.7
BlackRock 69,062,595 2.1 3.4
AP4 Fund 16,476,306 1.7 0.8
Norges Bank Investment Management 46,764,623 1.6 2.3
Vanguard 51,343,420 1.5 2.5
Swedbank Robur Funds 66,544,164 1.4 3.3
Total 742,648,146 64.0 36.5
Distribution of shares, December 31, 2021
Number of shareholders
% oftotal votes
Share ofcapital, %
1–1,000 shares 308,069 2.9 3.1
1,001–10,000 shares 49,694 5.9 6.8
10,001–100,000 shares 3,834 3.3 4.6
100,001– 547 87.9 85.5
Total 362,144 100.0 100.0
214
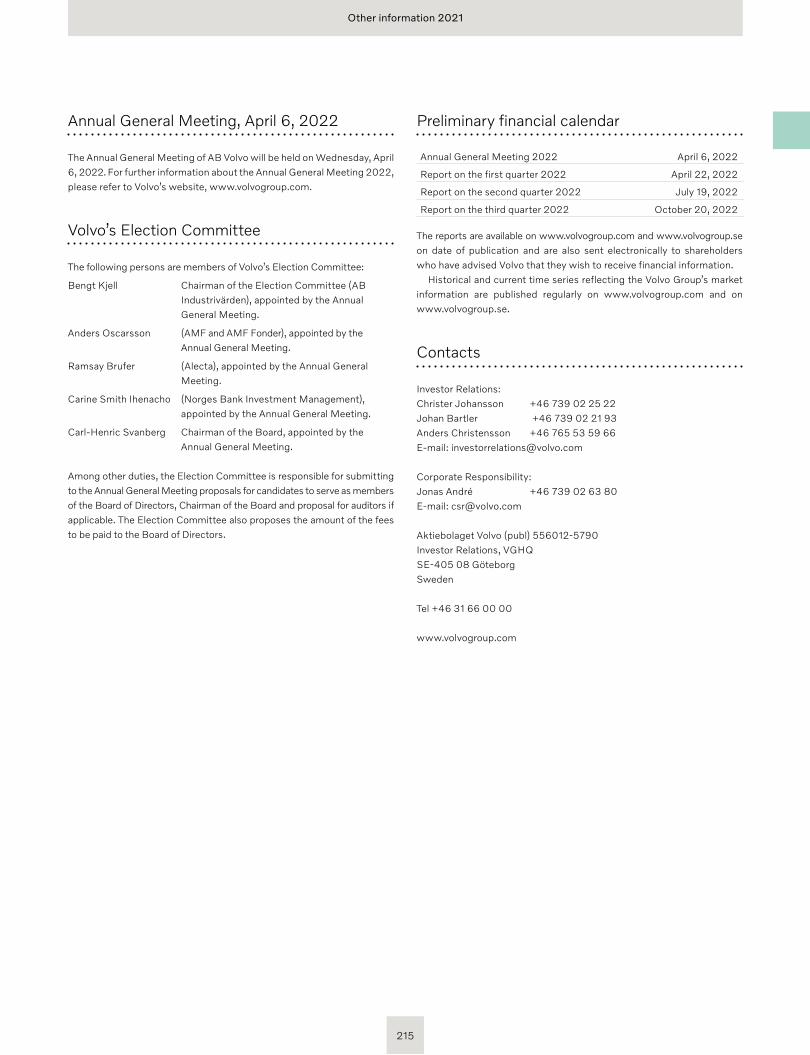
Other information 2021
Annual General Meeting, April 6, 2022
The Annual General Meeting of AB Volvo will be held on Wednesday, April 6, 2022. For further information about the Annual General Meeting 2022, please refer to Volvo’s website, www.volvogroup.com.
Volvo’s Election Committee
The following persons are members of Volvo’s Election Committee:
Bengt Kjell Chairman of the Election Committee (AB Industrivärden), appointed by the Annual General Meeting.
Anders Oscarsson (AMF and AMF Fonder), appointed by the Annual General Meeting.
Ramsay Brufer (Alecta), appointed by the Annual General Meeting.
Carine Smith Ihenacho (Norges Bank Investment Management), appointed by the Annual General Meeting.
Carl-Henric Svanberg Chairman of the Board, appointed by the Annual General Meeting.
Among other duties, the Election Committee is responsible for submitting to the Annual General Meeting proposals for candidates to serve as members of the Board of Directors, Chairman of the Board and proposal for auditors if applicable. The Election Committee also proposes the amount of the fees to be paid to the Board of Directors.
Preliminary financial calendar
Annual General Meeting 2022 April 6, 2022
Report on the first quarter 2022 April 22, 2022
Report on the second quarter 2022 July 19, 2022
Report on the third quarter 2022 October 20, 2022
The reports are available on www.volvogroup.com and www.volvogroup.se on date of publication and are also sent electronically to shareholders who have advised Volvo that they wish to receive financial information.
Historical and current time series reflecting the Volvo Group’s market information are published regularly on www.volvogroup.com and on www.volvogroup.se.
Contacts
Investor Relations: Christer Johansson +46 739 02 25 22Johan Bartler +46 739 02 21 93 Anders Christensson +46 765 53 59 66 E-mail: [email protected]
Corporate Responsibility:Jonas André +46 739 02 63 80E-mail: [email protected]
Aktiebolaget Volvo (publ) 556012-5790Investor Relations, VGHQ SE-405 08 Göteborg Sweden
Tel +46 31 66 00 00
www.volvogroup.com
215
AB Volvo (publ)SE-40508 Göteborg, SwedenTelephone +46 31 66 00 00www.volvogroup.com
AB
Vol
vo, I
nves
tor
Rel
atio
ns a
nd G
roup
Acc
ount
ing
The Volvo Group drives prosperity through transport and infrastructure solutions, offering trucks, buses, construction equipment, power solutions for marine and industrial applications, financing and services that increase our customers’ uptime and productivity. Founded in 1927, the Volvo Group is committed to shaping the future landscape of sustainable transport and infrastructure solutions. The Volvo Group is headquartered in Gothenburg, Sweden, employs 95,000 people and serves customers in more than 190 markets. In 2021, net sales amounted to SEK 372 billion (EUR 37 billion). Volvo shares are listed on Nasdaq Stockholm.


