Embed Size (px)
Citation preview

Journal of Experimental Botany, Vol. 63, No. 2, pp. 895–911, 2012doi:10.1093/jxb/err321 Advance Access publication 21 October, 2011This paper is available online free of all access charges (see http://jxb.oxfordjournals.org/open_access.html for further details)
RESEARCH PAPER
Leaf photosynthesis and respiration of three bioenergy cropsin relation to temperature and leaf nitrogen: how conservedare biochemical model parameters among crop species?
S. V. Archontoulis1,2, X. Yin1, J. Vos1, N. G. Danalatos2 and P. C. Struik1,*
1 Centre for Crop Systems Analysis, Plant Sciences Group, Wageningen University, Wageningen, The Netherlands2 Laboratory of Agronomy and Applied Crop Physiology, Department of Agriculture, University of Thessaly, Volos, Greece
* To whom correspondence should be addressed. E-mail: [email protected]
Received 20 June 2011; Revised 31 August 2011; Accepted 7 September 2011
Abstract
Given the need for parallel increases in food and energy production from crops in the context of global change, crop
simulation models and data sets to feed these models with photosynthesis and respiration parameters are increasingly
important. This study provides information on photosynthesis and respiration for three energy crops (sunflower, kenaf,
and cynara), reviews relevant information for five other crops (wheat, barley, cotton, tobacco, and grape), and assesses
how conserved photosynthesis parameters are among crops. Using large data sets and optimization techniques, the C3
leaf photosynthesis model of Farquhar, von Caemmerer, and Berry (FvCB) and an empirical night respiration model for
tested energy crops accounting for effects of temperature and leaf nitrogen were parameterized. Instead of the commonapproach of using information on net photosynthesis response to CO2 at the stomatal cavity (An–Ci), the model was
parameterized by analysing the photosynthesis response to incident light intensity (An–Iinc). Convincing evidence is
provided that the maximum Rubisco carboxylation rate or the maximum electron transport rate was very similar whether
derived from An–Ci or from An–Iinc data sets. Parameters characterizing Rubisco limitation, electron transport limitation,
the degree to which light inhibits leaf respiration, night respiration, and the minimum leaf nitrogen required for
photosynthesis were then determined. Model predictions were validated against independent sets. Only a few FvCB
parameters were conserved among crop species, thus species-specific FvCB model parameters are needed for crop
modelling. Therefore, information from readily available but underexplored An–Iinc data should be re-analysed, therebyexpanding the potential of combining classical photosynthetic data and the biochemical model.
Key words: A–Iinc curves, acclimation, bioenergy crops, crop modelling, day and night respiration, electron transport rate, leafnitrogen, photosynthesis, Rubisco carboxylation, temperature.
Introduction
In conventional crop modelling leaf photosynthesis is
calculated from net photosynthesis light response curves
(An–Iinc; see symbols explanation in Table 1) at ambient
atmospheric CO2 level using empirical functions (e.g.
SUCROS; Goudriaan and van Laar, 1994). In the contextof better understanding biological processes and exploring
the impact of climate change, recent crop models (e.g.
GECROS; Yin and van Laar, 2005), 3D models (e.g.
Evers et al., 2010), or terrestrial ecosystem models (e.g.
LPJmL; Beringer et al., 2011) calculate photosynth-
esis based on the mechanistic model of Farquhar, von
Caemmerer, and Berry (Farquhar et al., 1980; the FvCB
model hereafter).
The FvCB model describes photosynthesis as the mini-
mum of the Rubisco-limited rate and the electron transport-
limited rate. The key parameters of the model are themaximum Rubisco carboxylation rate (Vcmax), the maxi-
mum electron transport rate (Jmax), and the mitochondrial
day respiration (Rd). These biochemical parameters are
influenced both by the physiological status of a leaf such as
the amount of leaf nitrogen per unit area (Na) (e.g. Harley
et al., 1992) and by short- and long-term changes of
ª 2011 The Author(s).
This is an Open Access article distributed under the terms of the Creative Commons Attribution Non-Commercial License (http://creativecommons.org/licenses/by-nc/3.0), which permits unrestricted non-commercial use, distribution, and reproduction in any medium, provided the original work is properly cited.

environmental variables such as temperature, light (e.g.
Hikosaka, 2005), CO2 (e.g. Makino et al., 1994), and
drought (e.g. Galmes et al., 2007).
Usually, the FvCB parameters are obtained by analysis of
net photosynthesis response to CO2 at the stomatal cavity
(An–Ci) (e.g. Sharkey et al., 2007) or by combining An–Ci
and An–Iinc curves (e.g. Braune et al., 2009) or by combining
these curves with chlorophyll fluorescence measurements
(Yin et al., 2009). Obviously, to parameterize the FvCB
model, information on An–Ci is predominantly considered to
be essential, and an ongoing discussion is mainly focused onimproving the methods of analysing these An–Ci curves
(Ethier et al., 2004; Sharkey et al., 2007; Gu et al., 2010).
In the context of forward crop modelling typically for
predictions at the ambient CO2 level, the FvCB model is used
to project leaf photosynthetic rates in response to both
temporal (diurnal and seasonal) and spatial (within a crop
canopy) variation in light intensity. This implies that in the
context of inverse modelling, important FvCB model param-eters Jmax and Vcmax should and can be estimated from An
responses to Iinc. This would reflect better the tradition
whereby crop modellers describe leaf photosynthesis from its
response to light intensity (e.g. Goudriaan, 1979), in contrast
to the tradition that photosynthesis physiologists study gas
exchange measurements mainly across various levels of CO2
(e.g. von Caemmerer and Farquhar, 1981). In fact, the FvCB
model can be parameterized from analysis of An–Iinc dataalone (Niinemets and Tenhunen, 1997; Kosugi et al., 2003),
but so far there is no information about the accuracy of Jmax
and Vcmax parameters derived from such an analysis. If Jmax
and Vcmax estimates derived from analysis of An–Iinc are
similar to those obtained from the common An–Ci analysis or
combined analysis of An–Ci and An–Iinc curves, it may
generate an opportunity to reduce empiricism in crop models
by using readily available An–Iinc data. Therefore, the firstobjective of this study is to explore this opportunity by
parameterizing the FvCB model using An–Iinc data.
In the light of current trends for a parallel increase in food
and energy production from crop species in the context of
climate change, the use of the FvCB-based simulation models
together with an urgent need to feed these models with
photosynthetic and respiration parameters has been increased
(e.g. Beringer et al., 2011). Compared with the rich in-formation found for trees in the literature, there are only
a few reports on Jmax, Vcmax, Rd, and night respiration (Rn)
parameters in relation to environmental and management
factors for economically important crop species (e.g. Muller
et al., 2005; Braune et al., 2009; Yin et al., 2009) and these
are virtually lacking for new bioenergy species. Therefore, the
second objective of this study is 3-fold: (i) to provide new
information on photosynthesis and respiration for threeMediterranean energy crops (Helianthus annuus, sunflower;
Hibiscus cannabinus, kenaf; and Cynara cardunculus, cynara);
(ii) to summarize existing information for five major cash
crops (wheat, barley, cotton, tobacco, and grape); and (iii) to
assess how conserved FvCB parameters are among crop
species to better assist modellers in this exploitation.
Sunflower, kenaf, and cynara crops were chosen because
these crops have great potential to increase bioenergyproduction in the Mediterranean region (Archontoulis et al.,
2010a, b; Danalatos and Archontoulis, 2010). In addition,
Table 1. List of main symbols used in this study with their
definitions and units
Symbol Definition Unit
Ac Rubisco-limited net
photosynthetic rate
lmol CO2 m�2 s�1
An Net assimilation rate lmol CO2 m�2 s�1
Aj Electron transport-limited
net photosynthetic rate
lmol CO2 m�2 s�1
An,max Light-saturated An lmol CO2 m�2 s�1
aR x-axis intercept in Equation 12 lmol CO2 m�2 s�1
bR Slope parameter in Equation 12 –
Cc CO2 chloroplast partial pressure lbar
Ci Intercellular CO2 partial pressure lbar
Dj, Dv Deactivation energy of Jmax and
Vcmax (Equation 6)
J mol�1
EKmc, EKmo
Activation energy for Kmc and for Kmo J mol�1
Ej, ERn, Ev Activation energy of Jmax, Rn, and
Vcmax (Equations 5–6)
J mol�1
ERn(a)Constant parameter (Equation 11) J mol�1
ERn(b)Slope parameter in Equation 11 J m�2 mol�1 g�1 N
gm Mesophyll conductance for
CO2 diffusion
mol m�2 s�1
gs Stomatal conductance for H2O mol m�2 s�1
Iinc Incident light on leaf surface lmol photons m�2 s�1
J Photosystem II electron transport rate lmol e� m�2 s�1
Jmax Maximum electron transport rate lmol e� m�2 s�1
Jmax25 Value of Jmax at 25 �C lmol e� m�2 s�1
Kmc Michaelis–Menten constant for CO2 lbar
Kmo Michaelis–Menten constant for O2 mbar
Na Leaf nitrogen per unit area g N m�2 leaf
Nb Minimum Na required for
photosynthesis
g N m�2 leaf
O Oxygen partial pressure
of the air (¼210)
mbar
R Universal gas constant (¼8.314) J K�1 mol�1
Rd Day respiration rate lmol CO2 m�2 s�1
Rn Night respiration rate lmol CO2 m�2 s�1
Rn25 Value of Rn at 25 �C lmol CO2 m�2 s�1
Sj, Sv Entropy term for Jmax and Vcmax
(Equation 6)
J K�1 mol�1
Vcmax Maximum carboxylation rate lmol CO2 m�2 s�1
Vcmax25 Value of Vcmax at 25 �C lmol CO2 m�2 s�1
C* Ci-based CO2 compensation
point in the absence of Rd
lbar
h Convexity factor for the
response of J to Iinc
–
j2LL Conversion efficiency of Iinc
into J at low light
mol e� mol�1 photons
UCO2LL Apparent quantum yield
of An at low Iinc
mol CO2 mol�1 photons
vj Slope of the Jmax25 and Na
relationship (Equation 10)
lmol e� g�1 N s�1
vR Slope of the Rn25 and Na
relationship (Equation 8)
lmol CO2 g�1 N s�1
vv Slope of the Vcmax25 and Na
relationship (Equation 9)
lmol CO2 g�1 N s�1
896 | Archontoulis et al.

the chosen crops cover a wide range of bioindustrial
applications (biodiesel, bioethanol, heat, and electricity) and
fit into different cropping strategies (short or long growing
period, cultivation with or without irrigation, etc.). Sunflower
is widely grown in the Mediterranean region, but kenaf and
cynara cultivation is still in the experimental phase; relevant
information for crop modelling is currently being accumu-
lated for these crops, including vertical distribution of lightand nitrogen within crop canopies (Archontoulis et al.,
2011). Photosynthetic gas exchange studies for sunflower
have been reported (e.g. Connor et al., 1993), but there are
only a few for kenaf (Muchow, 1990; Cosentino et al., 2004)
and none for cynara.
The present analysis focuses on the FvCB parameters in
response to temperature and Na for these bioenergy crops.
This is because earlier studies on Vcmax and Jmax temperaturedependencies showed great species-to-species variability
(Leuning, 2002; Medlyn et al., 2002a), and because Na is
linearly related to Rubisco content that drives CO2 fixation
(Makino et al., 1994), reflects leaf dynamics well (leaf age,
rank; Archontoulis et al., 2011), and comprises a reference
index for scaling photosynthetic CO2 assimilation from leaf
to canopy levels (de Pury and Farquhar, 1997). Among
bioenergy crops, the perennial cynara has long annualgrowth cycles (;10 months each; Archontoulis et al.,
2010a). Given the numerous reports together with their
diverse findings on photosynthetic and respiratory acclima-
tion to growth environment (Atkin et al., 2005; Ow et al.,
2008; Yamori et al., 2005, 2010; Silim et al., 2010), seasonal
acclimation effects on photosynthesis and respiration for the
cynara crop are also investigated.
Materials and methods
Literature data for An–Ci versus An–Iinc curves
The first objective of this study was to compare Vcmax and Jmax
estimates derived either from An–Ci or from An–Iinc curves. Forthis, published data from Yin et al. (2009) for Triticum aestivum(cv. Minaret) were used. All relevant parameter values required tofit the FvCB model to the An–Ci or An–Iinc data set were available,therefore avoiding any statistical artefact in Vcmax and Jmax
estimation. Wheat measurements (four replicates; all at 25 �C)were conducted on leaves with different Na status (15 sets of An–Ci
and 15 of An–Iinc curves), allowing the comparison of Jmax andVcmax estimates to be made over a wide range of their values. Formore information about the measurements, see Yin et al. (2009).
Energy crop species and study site
Sunflower (cv. Panter), kenaf (cv. Everglades 41), and cynara (cv.Biango avorio) crops were grown in different sections of the samefield (for details, see Archontoulis et al., 2011) in central Greece(39�25’43.4’’ N, 22�05’09.7’’ E, 105 m asl) for 3 years (2007–2009).The site has a Mediterranean climate with cold/wet winters andwarm/dry summers (Supplementary Fig. S1 available at JXBonline). The soil was loamy, classified as Aquic Xerofluvent, witha shallow groundwater table (1.8–2.8 m below the surface duringMay). In general, crops grown at that site produce much higherbiomass yields than crops grown on dry soils (e.g. Archontouliset al., 2010b). During summer, sunflower and kenaf crops werefrequently irrigated at intervals of 4–6 d according to potentialevapotranspiration (for site-specific calculations, see Danalatos and
Archontoulis, 2010) while cynara was irrigated only a few times,when necessary during May–June but not during November–April(see precipitation in Supplementary Fig. S1).
Gas exchange measurements and experimental protocol
Leaf gas exchange (GE) measurements were implemented in situ infully expanded leaves using a portable open gas exchange systemwith a 6.25 cm2 clamp-on leaf chamber (ADC, LCi/LCpro+,Bioscientific Ltd, Hoddesdon, UK). CO2/H2O exchanged by theleaf was measured using an infrared gas analyser in a differentialmode. The system allowed for an automated microclimate control inthe leaf chamber. Before each measurement, attached leaves wereadapted for 10–45 min to chamber conditions, depending on leaf age,time of the day, and season. Daytime GE measurements were takenwithin 1–2 d after irrigation and during morning hours to ensure nowater stress and to avoid midday depression of photosynthesis.Night-time GE measurements were initiated 30–45 min after sunsetand lasted for 4–5 h each time.
To parameterize the model, a common experimental protocolwas applied per species, including four different sets of GEmeasurements. In all sets, CO2 concentration was kept at 38065lmol mol�1. The first set aimed to determine the response of netphotosynthesis (An) to incident light (Iinc). Accordingly, at fixedleaf temperature and measured Na, An was determined in 11 Iinc
steps (2000, 1500, 1000, 500, 250, 200, 150, 100, 50, 20, and 0 lmolphotons m�2 s�1); in total, 76 curves were constructed. Adaptationtime to each Iinc level was ;5 min, except for Iinc¼0 where it was>10 min; 3–5 replicated An measurements were taken at each Iinc
step to ensure stability and precision of measurements. Given thatthe examination of steady-state photosynthesis takes considerabletime and that GE measurements should be done within a limitedtime frame in order to avoid stress conditions (see above), theresponse of An to leaf temperature (set II) was determined at threeIinc levels: 450, 900, and 1800 lmol photons m�2 s�1. Na was alsodetermined. At each Iinc, leaf temperature was increased ordecreased up to 10 �C from the ambient temperature in steps of2–4 �C and replicated An measurements were recorded every 5 min.To establish the relationship between net photosynthesis and Na
(set III), it was necessary to evaluate leaves with as wide an Na
range as possible. So, in addition to earlier sets, An measurementswere done at saturated Iinc (1600–1800 lmol photons m�2 s�1) onleaves from different insertion heights in the canopy, from differentgrowth stages, and from plots with different N status. Per leaf(;180 leaves assessed), 5–10 measurements were taken at leaftemperature close to the ambient temperature.
To obtain direct measurements of the mitochondrial respirationoccurring in the night (Rn), the response of Rn to temperature wasinvestigated (set IV). Leaf temperature increased or decreased up to10 �C from the ambient temperature in small steps of 1–2 �C, andreplicated Rn measurements were recorded every 4 min. Measure-ments were done on leaves with (as much as possible) variable Na.
To validate the models, GE measurements obtained from thesame genotypes growing in the same site during summer 2005 and2006 (set V) were used. Sunflower and kenaf GE measurementswere collected using similar techniques and time frames to thosedescribed for sets I–IV. In cynara, a different protocol wasfollowed. The external unit that controls chamber microclimatewas removed to obtain measurements under real ambient con-ditions. Measurements were recorded every 4–8 min, while climaticvariables were continuously changing following 24 diurnal trends,thereby providing a data set to assess whether the FvCB model canpredict An under real fluctuating field conditions.
The wide range of measuring temperature used (15–40 �C)unavoidably resulted in variation in vapour pressure difference(VPD). An effort was made to reduce that variation by keepinghumidity high at high temperature. In most cases, VPD wasmaintained below 3 kPa to prevent stomatal closure (Bernacchiet al., 2001). Although VPD was sometimes above 3 kPa at the
Temperature and nitrogen effects on leaf photosynthesis and respiration of biomass crops | 897

highest temperatures, the stomatal conductance for H2O vapourwas not less than 0.30 mol m�2 s�1 (as in Yamori et al., 2005).
All measured An data were corrected for the CO2 respired underthe gasket surface (total 4 mm width; R. Newman, personalcommunication) following the common approach of Pons andWelschen (2002). All GE characteristics were re-calculated accordingto von Caemmerer and Farquhar (1981), for example to provide theCi values that are required as input to the FvCB model (see below).In addition, the number of replications and observations were in-creased to reduce the measurement noise, especially when low CO2
exchange rates were measured (e.g. respiration).The portion of the leaf used for measurements was cut and its
area was measured with a Li-Cor area meter. The leaf material wasthen weighed after drying at 70 �C to constant weight and its totalnitrogen concentration was measured using the Kjeldahl method.From these measurements, the leaf nitrogen content Na (g N m�2)was calculated.
Model and its parameterization
The FvCB model predicts An (lmol CO2 m�2 s�1) as the minimumof two processes (see Fig. 1), the Rubisco carboxylation-limitedrate (Ac) and the RuBP regeneration- or electron transport-limitedrate (Aj):
An ¼ min�Ac;Aj
�ð1Þ
Rubisco-limited photosynthesis is calculated as a function ofmaximum carboxylation capacity (Vcmax, lmol CO2 m�2 s�1):
Ac ¼VcmaxðCi � C�Þ
Ci þ Kmcð1 þO=KmoÞ� Rd ð2Þ
where Ci (lbar) and O (mbar) are the intercellular partial pressuresof CO2 and O2, respectively, Kmc (lbar) and Kmo (mbar) are theMichaelis–Menten coefficients of Rubisco for CO2 and O2, re-
spectively, and C* (lbar) is the CO2 compensation point in theabsence of Rd (day respiration in lmol CO2 m�2 s�1, whichcomprises mitochondrial CO2 release occurring in the light otherthan photorespiration; von Caemmerer et al., 2009).
There are various equations to describe the rate of photosynthesiswhen RuBP regeneration is limiting (Farquhar and von Caemmerer,1982; Yin et al., 2004). The most widely used form is given by:
Aj ¼JðCi � C�Þ4Ci þ 8C�
� Rd ð3Þ
where J (lmol e� m�2 s�1) is the photosystem II electron transportrate that is used for CO2 fixation and photorespiration. J is relatedto the amount of incident photosynthetically active irradiance (Iinc;lmol photons m�2 s�1) by:
J ¼
�j2LLIinc þ Jmax �
ffiffiffiffiffiffiffiffiffiffiffiffiffiffiffiffiffiffiffiffiffiffiffiffiffiffiffiffiffiffiffiffiffiffiffiffiffiffiffiffiffiffiffiffiffiffiffiffiffiffiffiffiffiffiffiffiffiffiffiffiffiffiffiffiffiffiffiffiffiðj2LLIinc þ JmaxÞ2 � 4hJmaxj2LLIinc
q �2h
ð4Þ
where Jmax (lmol e� m�2 s�1) is the maximum electron transportrate at saturating light levels, h is a dimensionless convexityfactor for the response of J to Iinc, and j2LL (mol e� mol�1
photons) is the conversion efficiency of Iinc into J at limiting lightlevels (Yin and Struik, 2009a; Yin et al., 2009). The formulationof Equations 2 and 3 assumes infinitive mesophyll conductance(gm) for CO2 transfer to chloroplasts, so that Ci is used as theproxy for the chloroplast CO2 level (Cc). There is increasingevidence that gm might be low enough to allow a significantdrawdown of Cc from Ci in most species (Warren, 2004; Flexaset al., 2008). However based on the available GE data, it wasrisky to evaluate gm (Pons et al., 2009; von Caemmerer et al.,2009; Yin and Struik, 2009b), hence the forms of Equations 2 and3 had to be used, as in most earlier studies (e.g. Medlyn et al.,2002a; Kosugi et al., 2003). Omitting gm in the analysis means
Fig. 1. Main panel: typical net photosynthesis light response curve (An–Iinc) at ambient CO2 concentration. Curve regions for the Rubisco
carboxylation-limited rate (Ac-limited, Equation 2; solid line) and the electron transport-limited rate (Aj-limited, Equation 3; dotted line) are
indicated. Usually, Ac-limitation occurs above 1500 lmol photons m�2 s�1; however, it is also possible that the entire An–Iinc curve is
described as Aj-limited. Inset panel: representative portion of the An–Iinc curve used in calculations of the day respiration (Rd), night
respiration (Rn), and apparent quantum yield (UCO2LL). Rd and UCO2LL were calculated from linear regression analysis to open circles
while the filled circle represents the value of the Rn. For details, see the Materials and methods.
898 | Archontoulis et al.

that an appropriate consideration is needed in choosing values ofthe Rubisco kinetic constants (see below).
The temperature responses of respiration and of Rubisco kineticproperties (Kmc and Kmo) are described using an Arrheniusfunction (Equation 5) while the temperature responses of Vcmax
and Jmax were explored using a peaked Arrhenius function(Equation 6); both functions were normalized with respect to theirvalues at 25 �C:
X ¼ X25exp
�ExðT � 25Þ
298RðT þ 273Þ
�ð5Þ
X ¼ X25exp
�ExðT � 25Þ
298RðT þ 273Þ
�_
24 1 þ exp
�298Sx�Dx
298R
�1 þ exp
�ðTþ273ÞSx�Dx
RðTþ273Þ
35 ð6Þ
where T is the leaf temperature (�C); X25 is the value of eachparameter at 25 �C (Rn25, Kmc25, Kmo25, Vcmax25, and Jmax25); Ex isthe activation energy of each parameter (ERn
, EKmc, EKmo
, Ev, andEj; in J mol�1); Dx is the deactivation energy for Jmax and Vcmax
(Dj and Dv in J mol�1); Sx is the entropy term for Jmax and Vcmax
(Sj, Sv in J K�1 mol�1), and R is the universal gas constant(¼8.314 J K�1 mol�1). Given that Equation 5 is a special case ofEquation 6, F-tests were performed to determine whether Equation6 described temperature responses of Vcmax and Jmax significantlybetter than did Equation 5. When Equation 6 was overparame-terized, as often observed in the literature (Dreyer et al., 2001;Medlyn et al., 2002a), then Sx was fixed at 650 J K�1 mol�1
(Harley et al., 1992).Rubisco kinetic properties are generally assumed constant
among C3 species (von Caemmerer et al., 2009). However, valuesof these constants and their temperature dependency reported inthe literature vary appreciably, so the choice of Rubisco parame-ters is a matter of considerable uncertainty (Dreyer et al., 2001). Inthis work, similar to many other reports (e.g. Medlyn et al., 2002a;Muller et al., 2005), Rubisco parameters reported by Bernacchiet al. (2001) were selected because these values (i) were estimatedfrom in vivo measurements without disturbance of the leaf; and (ii)were derived using the Ci-based FvCB model and hence arecompatible with the present analysis assuming an infinite gm (seeabove). The parameter values are: Kmc25¼404.9 lbar; Kmo25¼278.4mbar; EKmc¼79 430 J mol�1; and EKmo¼36 380 J mol�1 (Table 1).Furthermore, using these values. the temperature dependence ofC* was calculated as (Yin et al., 2004):
C� ¼ 0:5OKmc
Kmo
�exp
��3:3801 þ 5220
298RðT þ 273Þ
��ð7Þ
where the factor 0.5 is mol CO2 released when Rubisco catalysesthe reaction with 1 mol O2 in photorespiration. The term in thebrackets was derived using Bernacchi et al. (2001) parameters fortemperature dependence of maximum carboxylation and oxgenationrates of Rubisco.
The basal capacity of Rn25, Vcmax25, and Jmax25 is linearly relatedto Na (Harley et al., 1992; Hirose et al., 1997; Muller et al., 2005;Braune et al., 2009):
Rn25 ¼ �RðNa �NbÞ ð8Þ
Vcmax25 ¼ �vðNa �NbÞ ð9Þ
Jmax25 ¼ �JðNa �NbÞ ð10Þ
where vR (lmol CO2 g�1 N s�1), vv (lmol CO2 g�1 N s�1), and vj
(lmol e� g�1 N s�1) are the slopes for Rn25, Vcmax25, and Jmax25,respectively, and Nb (g N m�2) is the minimum value of Na at orbelow which An is zero. In principle, this Nb is practically impossibleto measure and its estimation depends on the statistical methodsused and on the available data sets. For instance, different Nb
estimates were found when different data sets were examined (An or
Vcmax, or Jmax; e.g. Harley et al., 1992; Muller et al., 2005;Supplementary Table S1 at JXB online) or when Nb was estimatedsimultaneously with other parameters in optimization procedures orwhen different equations (linear or non-linear) were applied to thesame data set (Niinemets and Tenhunen, 1997). Given the simplicityrequired in modelling and the lack of biological interpretation ofdifferent Nb values for the same species, a unique Nb value (perspecies) was determined beforehand from direct assessments of An–Na plots. Then this estimate was used as input parameter.
There is some evidence that the activation energy for respiration(ERn
) depends on the position of the leaf in the canopy (Bolstadet al., 1999; Griffin et al., 2002) and perhaps ERn
is also associatedwith Na since a close relationship between leaf canopy position andNa usually exists (Archontoulis et al., 2011). This was tested byassuming a linear relationship between ERn
and Na:
ERn¼ ERnðaÞ þ ERnðbÞNa ð11Þ
and it was checked whether the slope parameter ERn(b)differed
significantly from zero.So far, temperature and nitrogen relationships for Rn have been
described, as extensive GE measurements during the night periodwere available. However, the FvCB requires estimates for Rd,which is much more difficult to measure. To estimate Rd,regression analysis was applied to the linear sections of the An–Iinc
curves for each species (Fig. 1, inset; Kok method; Sharp et al.,1984). From this analysis, Rd was calculated as the y-axis interceptof the linear regression and the corresponding Rn was estimated asthe mean of the An values at 0 lmol photons m�2 s�1. Addition-ally, the apparent quantum efficiency at limiting light (UCO2LL,mol CO2 mol�1 photons) on the incident light basis was calculatedfrom the slope of the regression. The Iinc range for this regressionanalysis was typically 20–150 lmol m�2 s�1 (Fig. 1, inset), while ina few cases the Iinc range was slightly different, especially for datasets obtained at high temperatures. The estimated Rd was thenrelated to Rn as:
Rd ¼ bR 3 ðRn � aRÞ ð12Þ
where bR and aR are the slope and the x-axis intercept of the linearmodel, respectively. By assuming that activation energies for Rd
and Rn are similar and taking into account the precise quantifica-tion of Rn based on a large data set, the temperature and nitrogendependencies of Rd can be calculated from combining Equations 5,8, 11, and 12. This approach allows Rd values to be estimated forsets II and III (see above) where Iinc exceeds 350 lmol m�2 s�1, forwhich it was not possible to use the Kok method for estimating Rd.
Summary of parameters and statistics
The basic equations of the FvCB model, Equations 1–4, capture theresponse of An to Ci and to Iinc. Coupled with auxiliary temperature(Equations 5–7) and nitrogen (Equations 8–12) equations, the modelalso quantifies leaf photosynthesis and respiration (Rd and Rn) inresponse to these environmental variables. Data from sets I–IV wereanalysed using step-wise optimization procedures. Per crop, 16parameters were estimated following the order: step 1, Nb; step 2,vR, ERn(a)
, ERn(b); step 3, bR, aR; step 4, vv, Ev, Dv, Sv; step 5, j2LL;
step 6, vj, Ej, Dj, Sj, and h (see the Results). Inputs to the model are:Ci, Iinc, leaf temperature, and Na. So, just like usingAn–Ci curves, using An–Iinc data to calculate FvCB model parame-ters (e.g. Vcmax) also requires Ci as an input to the model, meaningthat any (short-term) change in stomatal aperture during the An–Iinc
measurements will have been reflected in the values of Ci and thushave little effect on the calculation of the FvCB parameters. Fora similar reason, the direction of changing Iinc levels for measuringA–Iinc curves will also have little impact on parameter estimation(see Yin et al., 2011).
For each step, regression fitting was carried out using theGAUSS method in PROC NLIN of SAS (SAS Institute Inc.). Toinvestigate seasonal effects of acclimation on photosynthesis and
Temperature and nitrogen effects on leaf photosynthesis and respiration of biomass crops | 899

respiration rates of cynara, data sets were split into two periods:a cold period with low light from November to April and a warmperiod with high light from May to June (Supplementary Fig. S1at JXB online). Then, dummy variables (Z1¼1 and Z2¼0 forwarm and Z1¼0 and Z2¼1 for cold periods, respectively) wereintroduced into the regression analysis to separate for the effects.A dummy variable was also used to best estimate the Nb parameter(see the Results).
The goodness of model fit was assessed by calculating r2 and therelative mean root square error (rRMSE). A sensitivity analysiswas also performed. Model predictions were validated againstindependent data sets (set V).
Results
Vcmax and Jmax estimates from An–Ci and/or An–Iinc
curves
Vcmax and Jmax were estimated for wheat, from either An–Iinc
or An–Ci curves alone or from the combined data of the two
curves. The following parameters were set as inputs to the
model (see Equations 1–4 and 7): Kmc25 and Kmo25 fromBernacchi et al. (2001); and Rd25, Rn25, j2LL, and h per set of
data from Yin et al. (2009). Vcmax and Jmax were successfully
estimated simultaneously in 40 out of the 45 cases (15 sets33
methodologies). In five cases, it was not possible to estimate
Vcmax from An–Iinc curves because in these cases the entire
curve was Aj limited (Fig. 1). Then we first calculated Vcmax
directly from Equation 2 with observed Ci as input for simple
substitution using data points where Iinc >1500 lmol pho-tons m�2 s�1, and secondly by setting Vcmax as an input to
the model, the Jmax parameter was estimated again. To be
consistent, results for all An–Iinc curves were presented
following the two-step approach, because estimates from
both approaches were very close.
Figure 2 illustrates Vcmax and Jmax estimates from An–Ci
and from An–Iinc curves versus the combination of those
curves. As expected, Vcmax and Jmax estimates obtained fromAn–Ci curves were almost identical to the estimates based on
the combined data (r2¼0.97–0.99). However, it was found
that An–Iinc curves alone also provided sufficient estimates
(r2¼0.91–0.93) and thus can be considered as an alternative
to predominant An–Ci curves to parameterize the FvCB
model. In fact, regression lines in Fig. 2 were matching across
a very wide range of Vcmax and Jmax values. Even in cases
where photosynthetic responses to light were entirely Aj
limited (Fig. 1), Vcmax estimates obtained from either An–Iinc
or An–Ci data were close (Fig. 2). The slight discrepancy of
the estimates at high Vcmax and Jmax values (Fig. 2) caused
a lower r2 for the An–Iinc compared with the An–Ci estimates.
Step-wise estimation of model parameters forbioenergy crops
Step 1: Nb estimation
Measured light-saturated An (An,max) responded non-linearly to
increasing Na in all tested crops (Fig. 3; r2 > 0.81; P < 0.001).
An effect of temperature was detected in this relationship only
at high Na (Fig. 3). To estimate the Nb value properly fromthese plots a dummy variables approach was used, in order to
obtain a unique Nb estimate per crop, while allowing the
equation to vary with different temperatures (optimum versus
non-optimum temperature ranges; Fig. 3). Derived parameters
are listed in Table 2. Nb values for all crops were close to 0.4 g
N m�2, while the lack of Na data below 0.7 g m�2 caused
a high standard error of the Nb estimate (Table 2).
Step 2: Rn in relation to temperature and Na
By combining Equations 5, 8, and 11, Rn parameters were
estimated (Table 3). In cynara, an additional seasonal
effect was found, with significantly higher Rn rates for the
winter/cold- compared with the summer/warm-growing
leaves (Fig. 4). Incorporation of this effect into the modelimproved r2 from 0.68 to 0.72. Of the two Rn parameters,
temperature sensitivity (ERn) was significantly (P < 0.01)
affected by season, but the slope of the Rn–Na relationship
(vR) was not (P¼0.263); thus, a common vR value was
calculated (Table 3). The Rn models’ goodness of fit was
satisfactory (r2 > 0.72; rRMSE < 0.28 across species).
Step 3: relationship between Rd and Rn
Plotting Rd versus Rn gave a good linear relationship with
no significant differences among species (P¼0.225; Fig. 5;
Fig. 2. Relationships between Vcmax (lmol CO2 m�2 s�1) and Jmax (lmol e� m�2 s�1) estimated from photosynthetic light response
curves at ambient CO2 concentration (open circles; An–Iinc) or from photosynthetic CO2 response curves at saturated light (filled circles;
An–Ci) versus estimates obtained from an analysis of combined An–Iinc and An–Ci curves. Data for An–Ci and An–Iinc measurements are
from Yin et al. (2009) for Triticum aestivum (n¼15).
900 | Archontoulis et al.

Table 3). Analysis showed that mitochondrial respiration
was inhibited by ;28% in the light. The observed x-axis
intercept (aR¼0.39) differed significantly from zero
(P¼0.0039), indicating that Rn and Rd were not entirely
proportional (Fig. 5). Additionally, no effect of Na
(r2¼0.01; P¼0.67) but a significant effect of temperature
(r2¼0.18; P¼0.008) was found on the Rd/Rn ratio, showing
that the ratio approached unity at high temperatures. Simil-
arly, the Rn/An,max ratio—ranging from 7% to 11% across
bioenergy species—was insensitive to changes in Na (P >
0.05), but increased significantly with increasing temperature
(r2¼0.62; P < 0.01; data not shown).
Step 4: Vcmax in relation to temperature and Na
The relationships of Vcmax to temperature and Na were
quantified by fitting Equations 2 and 5–12 to data obtained
at high light levels (Iinc >1500 lmol m�2 s�1) to ensure that
An is limited only by Rubisco. All required parameters
(vv, Ev, Dv, and Sv) were well estimated. Across species,there were small differences in vv (<12%; Table 3), and large
differences in temperature sensitivities >30 �C (Fig. 6a;
including other crops). Sunflower temperature sensitivity
was best described by the peaked Arrhenius equation
(r2¼0.736; P < 0.001; Table 3), showing an optimum
Fig. 3. Relationships between light-saturated net photosynthesis, An (Iinc >1500 lmol m�2s�1; CO2¼380 lmol mol�1), and leaf nitrogen
content, Na. Filled symbols refer to data obtained at temperatures near the optimum temperature for photosynthesis per species (sunflower,
26–34 �C; kenaf, 27–35 �C; cynara, 23–31 �C) and open symbols refer to data obtained at sub- (open squares) or supra- (open triangles)
optimum temperature ranges. Each point is an average of 4–10 measurements. Lines are fits from a three-parameter non-linear equation:
An¼An,max {2/[1+exp(–c(Na–Nb))]–1}, (see Sinclair and Horie 1989), where An,max is the asymptote (maximum value) of the dependent variable;
c is the parameter determining the steepness of the curve; and Nb is the intercept of the x-axis denoting a threshold leaf nitrogen value at or
below An equals zero. Estimates of parameters are given in Table 2. Cynara’s data points were mostly collected during May–June.
Table 2. Estimates (SE in parentheses) of the non-linear equation
used to describe data illustrated in Fig. 3
An,max is the maximum net assimilation rate (lmol CO2 m�2 s�1) atsaturated light, maximal leaf nitrogen content, ambient CO2 concen-tration, and at optimum (filled symbols) and non-optimum (opensymbols) temperature ranges; c is a dimensionless factor determin-ing the steepness of the non-linear model; and Nb is the minimumleaf nitrogen content (g N m�2) required for photosynthesis.
Species Symbola An,max c Nbb
Sunflower Filled (26–34 �C) 36.6 (2.48) 1.19 (0.195) 0.387 (0.078)
Open 26.4 (1.45) 1.65 (0.313)
Kenaf Filled (27–35 �C) 35.8 (2.18) 1.29 (0.269) 0.390 (0.126)
Open 29.2 (2.12) 1.45 (0.334)
Cynara Filled (22–31 �C) 36.4 (2.41) 1.08 (0.191) 0.416 (0.097)
Open 23.9 (2.16) 1.22 (0.725)
a Symbols in Fig. 3.b The confidence limits for Nb are: 0.231–0.541, 0.139–0.640, and
0.225–0.608 for sunflower, kenaf, and cynara, respectively (P¼0.05).
Temperature and nitrogen effects on leaf photosynthesis and respiration of biomass crops | 901

temperature for Vcmax at 38.7 �C (calculated from Equation
A1 in the Appendix). For kenaf and cynara no optimum
temperature was observed within the measurement range tested
(18–41 �C; Fig. 6a). To explore any acclimation of Vcmax togrowth environments in cynara, the model was allowed to
estimate different parameters for two contrasting seasons. No
significant effect of the growing season on vv (65.8 versus 64.3;
P¼0.094) or on Ev, Dv, and Sv parameters (P¼0.247) was
found, meaning little seasonal Vcmax acclimation.
Step 5: j2LL in relation to temperature and Na
j2LL was estimated indirectly from UCO2LL information (see
Equation A2). Correlations of j2LL with temperature, light,and nitrogen were investigated afterwards. The results
indicated poor correlations with Na (r2¼0.26, P¼0.025), leaf
temperature (r2¼0.19, P¼0.104), and the combination of
the above (r2¼0.44, P < 0.01; data not shown). However,
better relationships were obtained when j2LL was regressed
against seasonal temperature (r2¼0.40, P¼0.004) and radi-
ation data (r2¼0.34, P¼0.003), showing a long-term j2LL
acclimation. This became clearer when average j2LL valuesper crop and per growth environments were considered
(Fig. 7). These findings were supported fairly well by
literature data (Fig. 7). Based on this analysis, average j2LL
values per species were considered in further analyses
(including acclimation effect for cynara, Table 3).
Step 6: Jmax in relation to temperature and Na
All Jmax temperature sensitivities (except kenaf; Table 3) were
best described using Equation 6. Across species, Jmax
temperature sensitivity was highly variable (Fig. 6b including
other crops), while the maximum Jmax was obtained at lower
temperature than the maximum Vcmax (temperature optimum
of 32, 42, and 33 �C for sunflower, kenaf, and cynara,
respectively; Fig. 6). As a result, there was a decreasing trend
of the Jmax/Vcmax ratio with increasing temperature (Fig. 8).
For cynara, a significant (P < 0.05) temporal change was
found for the vj parameter (Table 3). vj showed a largervariability (36% change) than vv (12% change) among species
and growth environments studied (Table 3). The parameter hwas lower for sunflower (0.60) and higher for cynara (0.84),
but close to the commonly used value of 0.75 in all cases. All
these differences (including temperature and nitrogen sensi-
tivities) among species and growth environments became
smaller when the Jmax/Vcmax ratio was plotted against leaf
temperature (Fig. 8).
Sensitivity and validation analysis
To investigate the uncertainty introduced into the estimates
by the chosen Rubisco kinetic parameters, the initial values
of Bernacchi et al. (2001) were increased or decreased by
20% and optimization procedures were repeated. Not
Table 3. Estimates (SE in parentheses) of parameters used to describe temperature and nitrogen sensitivities of photosynthesis and
respiration rates in three bioenergy crops
For cynara, when significant differences between warm and cold seasons were found, two estimates are given. For units see Table 1.
Parameter Sunflower Kenaf Cynara-warma Cynara-colda
Rn vR 0.609 (0.006) 0.954 (0.015) 0.775 (0.009)
ERn(a)117 912 (1814) 100 740 (3250) –10 900 (5617) 146 956 (4281)
ERn(b)–23 346 (770) –15 743 (1455) 33 040 (2490) –26 640 (1858)
n (night)b 2492 1403 3212
r2 0.799 0.793 0.724
Rd/Rn bR 0.843 (0.040)
aR 0.390 (0.107)
Vcmax vv 73.8 (0.94) 66.7 (0.92) 65.2 (0.62)
Ev 53 688 (1631) 61 812 (1402) 190 831 (33 853)
Dv 205 638 (355) 0 158 486 (30 907)
Sv 650c 0 550 (108.2)
J vj 144.2 (3.4) 122.1 (1.88) 100 (0.91) 92.2 (0.88)
Ej 43 295 (5122) 28 584d (1131) 23 111 (971)
Dj 125 324 (12 653) 0d 204 489 (218)
Sj 405 (38.47) 0d 650c
j2LL 0.255 (0.018) 0.278 (0.013) 0.314 (0.014) 0.419 (0.011)
h 0.607 (0.027) 0.627 (0.023) 0.847 (0.011)
n (day)b 1366 2042 2334
r2 0.928 0.909 0.916
Ratio Jmax/Vcmaxe 1.95 1.83 1.53 1.41
Rd/Vcmaxe 0.0057 0.0103 0.0085
a Warm period¼from early May to end of June; cold period¼from November to mid-April; see supplementary Fig. S1 at JXB online.b Number of data used in the analysis.c Fixed value (see the Materials and methods).d Alternatively the following parameters: Ej¼28 149, Dj¼474 614, and Sj¼1482 (with a temperature optimum of 41.7 �C) gave equal
temperature sensitivities but values were rejected due to a high standard error of the estimate.e Normalized to 25 �C.
902 | Archontoulis et al.

surprisingly, a maximum change was obtained in the
estimated Vcmax25, whereas the remaining parameters were
less affected (<5%; data not shown). Given that even the
maximum change in Vcmax was ;11% in response to a 20%change, the parameter estimates were quite stable despite
the uncertainties in values of Rubisco kinetic constants.
A further analysis showed that the predicted An was sensitive
to a 20% decrease in vv and vj, whereas its sensitivity to other
changes was weak (Fig. 9).
Lastly the models were validated against independent data
sets (Fig. 10). Predictions versus observations for sunflower
and kenaf were satisfactory (rRMSE < 0.15; Fig. 10a, b). For
cynara the FvCB model was tested using measurements
from a series of 24 h diurnal cycles (Fig. 10c), where stress
conditions were unavoidably present (data sets outside thecalibration range). In general, predictions were close to actual
measurements, except for those data obtained from 14:00 h
to 18:00 h, where a systematic overestimation was detected
(Fig. 10c). The FvCB model responded to lowering temper-
ature in late afternoon by increasing An; however, actual
measurements indicated that the photosynthetic apparatus
could not recover so quickly from the ‘photosynthesis
midday depression’. The failure in predicting the depressionand its after-effect during the recovery hours (Fig. 10c) might
be attributed to the ‘steady-state’ character of the FvCB
model. These results suggest that prediction of diurnal
photosynthesis for species grown in the Mediterranean region
requires more detailed approaches in which gm, recovery
functions for An (midday depression), and the effects of leaf
water potential should be included (see Tuzet et al., 2003;
Vico and Porporato, 2008; Yin and Struik, 2009a).
Discussion
Use of An–Iinc curves to parameterize the FvCB model
The FvCB model parameters, Jmax and Vcmax in particular,
have been predominantly estimated from An–Ci data sets
(Harley et al., 1992; Medlyn et al., 2002a). The value of An–Ci
curves for parameterizing the FvCB model is confirmed (Fig. 2).
It was also shown that Vcmax and Jmax can be estimated
sufficiently well by an appropriate analysis of An–Iinc data
alone (r2¼0.91–0.93; Fig. 2). Unlike Jmax, Vcmax cannotalways be estimated from An–Iinc curves; that is when the
entire curve is Aj limited (Fig. 1). This is often observed in
field crops (e.g. cotton; Wise et al., 2004). Actually, Boote
and Pickering (1994) used only the Aj equation of the FvCB
model to calculate leaf photosynthesis in their canopy
photosynthesis model. For the purpose of using the
complete FvCB model, the two-step approach is proposed
to estimate both Vcmax and Jmax from An–Iinc data. This isin line with the approach of Niinemets and Tenhunen
(1997), but in contrast to that of Kosugi et al. (2003) and
Muller et al. (2005) who assumed a fixed Jmax/Vcmax ratio of
2.1 at 25 �C (based on Wullschleger, 1993) in their analyses.
This assumption does not allow for the flexibility of the
ratio as observed for different species or for the same
species when grown under different environments, thereby
introducing many uncertainties in parameter values (seeFig. 8 and discussion below).
The present results indicated that information from An–Iinc
curves has been underexplored. Use of An–Iinc curves has an
additional advantage in that data of An–Ci curves may be
uncertain due to CO2 leakage during gas exchange
Fig. 4. Cynara’s night respiration rates (Rn) in relation to leaf
temperature. Data are presented per growth season and include
leaves with various Na. (a) The predicted Rn from a simple tempera-
ture-sensitive model (Equation 5; parameter values used are shown).
(b) The predicted Rn from a combined nitrogen-, temperature-, and
acclimation-sensitive model (see parameter values in Table 3).
Fig. 5. Relationship between day (Rd) and night (Rn) respiration
rates (see also Table 3 and Equation 12).
Temperature and nitrogen effects on leaf photosynthesis and respiration of biomass crops | 903
measurements when CO2 set point values are either below or
above the ambient air CO2 level (Flexas et al., 2007). Crop
modellers used to measure An–Iinc curves under an ambient
CO2 condition, upon which an empirical model for light–
response curves is parameterized. Provided that values of Ci
across Iinc levels are properly monitored, re-analysing readily
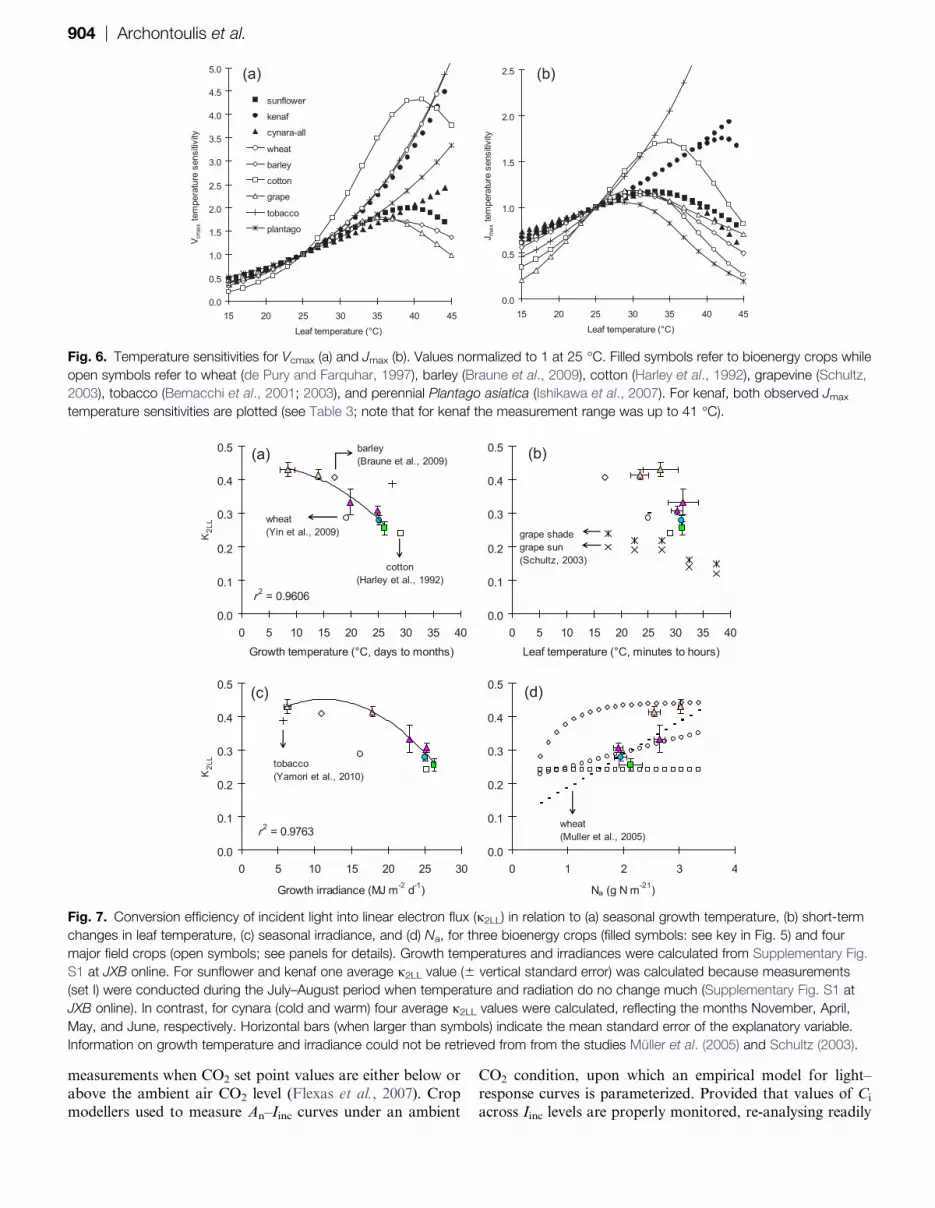
Fig. 7. Conversion efficiency of incident light into linear electron flux (j2LL) in relation to (a) seasonal growth temperature, (b) short-term
changes in leaf temperature, (c) seasonal irradiance, and (d) Na, for three bioenergy crops (filled symbols: see key in Fig. 5) and four
major field crops (open symbols; see panels for details). Growth temperatures and irradiances were calculated from Supplementary Fig.
S1 at JXB online. For sunflower and kenaf one average j2LL value (6 vertical standard error) was calculated because measurements
(set I) were conducted during the July–August period when temperature and radiation do no change much (Supplementary Fig. S1 at
JXB online). In contrast, for cynara (cold and warm) four average j2LL values were calculated, reflecting the months November, April,
May, and June, respectively. Horizontal bars (when larger than symbols) indicate the mean standard error of the explanatory variable.
Information on growth temperature and irradiance could not be retrieved from from the studies Muller et al. (2005) and Schultz (2003).
Fig. 6. Temperature sensitivities for Vcmax (a) and Jmax (b). Values normalized to 1 at 25 �C. Filled symbols refer to bioenergy crops while
open symbols refer to wheat (de Pury and Farquhar, 1997), barley (Braune et al., 2009), cotton (Harley et al., 1992), grapevine (Schultz,
2003), tobacco (Bernacchi et al., 2001; 2003), and perennial Plantago asiatica (Ishikawa et al., 2007). For kenaf, both observed Jmax
temperature sensitivities are plotted (see Table 3; note that for kenaf the measurement range was up to 41 �C).
904 | Archontoulis et al.

available An–Iinc data to parameterize the FvCB model will
strengthen photosynthesis calculations in crop models. This
would expand the potential of combining classical photosyn-
thetic data and the biochemical FvCB model to assess the
impact of climate change on crop production and to examine
options of bioenergy production under a changing climate.
On the other hand, caution should be exercised that use of
An–Iinc data sets does not allow the model to account for theTPU (triose phosphate utilization)-limited rate, the third
limitation added by Sharkey (1985) to the FvCB model. TPU
limitation sets an upper limit to the maximum photosynthetic
capacity and is usually observed at high CO2 or/and low O2
levels (e.g. Wise et al., 2004), although many studies still
ignore this limitation (e.g. Wohlfahrt et al., 1999). The
limitation, if it occurs, can be easily identified, at the high
end of An–Ci curves, versus the Rubisco limitation that canbe identified at the low end of An–Ci curves. In the present
study, where essentially An–Iinc curves were used, it was not
possible to detect this limitation, because both Rubisco and
TPU limitations, if any, will occur at the high end of An–Iinc
curves. This is certainly the disadvantage of using An–Iinc
curves to parameterize the FvCB model. Fortunately, the
present light response curves were obtained under ambient
CO2 conditions, so any TPU limitation, if it exists, can beassumed to be negligible under these measurement condi-
tions. In the future climate where the ambient CO2 level is
expected to increase, the TPU limitation will be more likely
to occur. Therefore, use of An–Iinc curves to estimate FvCB
model parameters needs to be tested across high CO2 levels
and a broad range of other environmental variables in order
to decide how conserved these parameters are.
Below the effects of temperature, Na, and season onphotosynthesis and respiration parameters, all derived from
the current An–Iinc data for three bioenergy crops, are
discussed. The present findings will be compared with those
reported for the crops wheat, barley, cotton, tobacco, and
grapevine based on An–Ci or combined An–Ci and An–Iinc
data sets, with attention to any conserved nature in these
parameters among species.
Night and day respiration parameters: vR, ERn(a), ERn(b)
,bR, and aR
This study is among few in the literature providing direct Rn
measurements, underlining the great importance of respiration
in carbon budgets (Valentini et al., 2000). The present estimates
for vR (range: 0.61–0.95 lmol CO2 g�1 N s�1; Table 3) agreewell with previous reports for crops (Hirose et al., 1997; Reich
et al., 1998; Muller et al., 2005; Braune et al., 2009), but
current values are almost double compared with those for trees
(Bolstad et al., 1999; Griffin et al., 2002). The temperature
sensitivity for respiration (ERn) was significantly correlated
with Na in all species (Equation 11; Table 3), indicating that
respiration in leaves with high Na values (young/sun leaves)
was less sensitive to changes in temperature, while leaves withlower Na values were more sensitive (senescence/shade leaves).
Griffin et al. (2002) and Bolstad et al. (1999) working with tree
leaves that were positioned in different canopy layers—also
having different Na values—found temperature sensitivities
similar to those in the present study, while Turnbull et al.
Fig. 9. Sensitivity analysis of the predicted An in response to
a 620% change in input parameter values for the photosynthesis
model. The relative change in predicted value was calculated as:
1003(An, predicted–An, predicted, original)/An, predicted, original.
When input parameters were part of a linear or polynomial
equation (e.g. Ej, Dj, Sj; Equation 6) and strongly intercorrelated,
a combined change was implemented.
Fig. 8. Jmax/Vcmax ratio versus leaf temperature. Closed symbols
refer to bioenergy crops, open symbols to major field crops. Note
that for cynara two lines were plotted because the parameter
Jmax25 differs between seasons (see Equation 10 and Table 3).
Temperature and nitrogen effects on leaf photosynthesis and respiration of biomass crops | 905

(2003) reported the opposite. However, in none of these studies
was ERn significantly correlated with Na.
For cotton, Harley et al. (1992) reported a simpletemperature-sensitive Rn model for leaves with variable Na.
The present analysis indicated that it is useful to calculate
both Rn components as a function of Na (e.g. Fig. 4; across
all species, r2 scaled from 0.53 to 0.77). The component Rn25
accounted for 27% and ERn for the other 5% of this
improvement in r2. However, the remaining unexplained
variability in night data sets (see r2 in Table 3; Fig. 4) means
that apart from Na, other factors should be explored.Unlike for Rn, it is difficult to measure Rd directly as
such measurements require sophisticated methodologies (e.g.
Haupt-Herting et al., 2001; Pinelli and Loreto, 2003; Parnik
and Keerberg, 2007). Its value is empirically estimated indir-
ectly using various methods (for a comparison see Yin et al.,
2011), or is commonly fixed as 1% of Vcmax or as 50% of Rn
(de Purry and Farquhar, 1997; Wohlfahrt et al., 1998; Medlyn
et al., 2002a; Kosugi et al., 2003; Braune et al., 2009). Here,application of the Kok method (Sharp et al., 1984) indicated
a 28% reduction in Rd compared with Rn, an estimate which is
positioned at the lowest reported range (light inhibition range:
24–90%; Buckley and Adams, 2011, and references therein).
Rubisco and electron transport parameters: Nb, vv, vj,j2LL, h, Ev, Ej, Dv, and Dj
The present findings for Nb (Fig. 3) along with published
data support the idea that this threshold value for photosyn-
thesis is not affected by temperature (Sage and Pearcy, 1987;
Makino et al., 1994; Niinemets and Tenhunen, 1997), CO2
(Harley et al., 1992; Hirose et al., 1997), or irradiance levels
(Makino et al., 1997). Excluding the statistical bias that
usually exists in Nb estimations (see the Materials and
methods) it is believed that a common Nb is 0.3–0.4 g N m�2
for C3 crop species (excluding legume crops; Supplementary
Table S1 at JXB online). For use in modelling, it was shown
that a 620% change in the Nb value resulted in a <5%
change in the predicted An (Fig. 9).
The relationships between An,max and Na at near-optimum
temperature ranges for sunflower, kenaf, and cynara (Fig. 3)
agreed well with several non-legume C3 species (Supplementary
Fig. S2 at JXB online). The observed decline in An,max at high
temperature (Fig. 3; Na >2 g N m�2) is associated with gm
(Bernacchi et al., 2002) and/or Vcmax and Jmax limitations of
photosynthesis (Fig. 6). Na and leaf temperature explained
>81% of the temporal (seasonal) and spatial (within a crop
canopy) variation in An,max values (Fig. 3). The remaining
unexplained variability might be due to leaf adaptation to
different microenvironments created by CO2 and light gra-
dients within crop stands (Buchmann and Ehlinger, 1998;
Archontoulis et al., 2011). This may have an additional impact
on Jmax and Vcmax estimates and their ratio.
Nevertheless, the observed consistency among An,max–Na
plots (Supplementary Fig. S2 at JXB online) along with the
similar vv estimates for sunflower, kenaf, cynara, cotton,
wheat, and barley (range: 60–82 lmol CO2 g�1 N s�1; Table 3;
y = 0.8761x + 1.9382r 2 = 0.9396rRMSE = 0.129rRMSE = 0.145n = 492
0
5
10
15
20
25
30
35
40
0 5 10 15 20 25 30 35 40
Measured An (µmol CO2 m-2 s-1)
Pred
icte
d (µ
mol
CO
2m
-2s-1
)
(b) Kenaf
Na= 1.7 - 2.4 g N m-2
Temperature = 17 - 39 °CIinc = 100 - 2000 µmol m-2 s-1
CO2 = 380 µmol mol-1
y = 0.9316x + 2.0039r 2 = 0.9192***
n = 454
0
5
10
15
20
25
30
35
40
0 5 10 15 20 25 30 35 40
Measured An
An
(µmol CO2 m-2 s-1)
Pred
icte
d A
n (µm
ol C
O2
m-2
s-1)
Na= 2.1 - 2.3 g N m-2
Temperature = 16 - 41 °CIinc = 100 - 2000 µmol m-2 s-1
CO2 = 380 µmol mol-1
(a) Sunflower
-10
0
10
20
30
40
50
0:00 6:00 12:00 18:00 0:00
Day 1(c) Cynara
temperature
light
0:00 6:00 12:00 18:00 0:00
Day 2
predicted
measured
0:00 6:00 12:00 18:00 0:000
200
400
600
800
1000
1200
1400
1600
1800
2000
Day 3
An,
Rn (
µmol
CO
2m
-2s-1
), te
mpe
ratu
re (°
C)
Inci
dent
light
(µm
ol p
hoto
nsm
-2s-1
)
Time (h)
Fig. 10. Measured versus predicted photosynthesis (all panels) and measured versus predicted night respiration (only in the lower
panel c). In c, canopy CO2 varied from 350–380 lmol mol�1 during day time to 450–600 lmol mol�1 during night-time; VPD followed
temperature variations, and stomatal conductance ranged from 0.05 mol m�2 s�1 during the night up to 0.48 mol m�2 s�1 during the
day time. The model predicted diurnal trends moderately (r2¼0.814, rRMSE¼0.553, n¼720). When midday measurements were
excluded (14:00–16:00 h), the model fit was improved (r2¼0.930, rRMSE¼0.335, n¼543).
906 | Archontoulis et al.

Harley et al., 1992; de Pury and Farquhar, 1997; Muller
et al., 2005, 2008; Braune et al., 2009) suggests that vv is
very conserved for this plant group (An,max¼30–35 lmol
CO2 m�2 s�1; Supplementary Fig. S2).
Unlike vv, vj for the same group was highly variable (90–
165 lmol e� g�1 N s�1). However, the parameter vj (which
determines Jmax25; Equation 10) is not independent of, but
interrelated to, the values of j2LL and h (see Equation 4).This means that use of constant j2LL and h values across
species and environments will bias Jmax estimates and
therefore the Jmax/Vcmax ratio. Among sunflower, kenaf,
and cynara, vj varied by 36%, j2LL by 39%, and h by 28%,
but in different directions (Table 3). When j2LL was fixed to
0.3 and h to 0.7 (commonly assumed values; de Pury and
Farquhar, 1997; Medlyn et al., 2002a), the vj variation
among crops and growing environments became smaller(15%), and the Jmax/Vcmax ratio less variable.
The present analysis showed that variation in the electron
transport rate among bioenergy crops followed changes in
environmental conditions during growth (Supplementary
Fig. S1 at JXB online), with higher J rates for cynara in low
light (<700 lmol m�2 s�1; winter period) and higher J rates
for sunflower and kenaf in high light conditions (>700 lmol
m�2 s�1; summer period; Table 3, Equation 4). This isconsistent with recent findings for tobacco (Yamori et al.,
2010) where plants grown under low light enhanced the
efficiency of light acquisition while those grown under high
light enhanced the capacity of light utilization, through
changes in chlorophyll contents, the chlorophyll a/b ratio,
and cytochrome f and Rubisco contents.
In studies of Wullschleger (1993), Dreyer et al. (2001),
and Medlyn et al. (2002a) the j2LL was fixed as a constantat 0.18, 0.24, and 0.30, respectively, across species, crop
stages, and environments. However, Yin et al. (2009)
directly demonstrated a positive relationship between j2LL
and Na, which was confirmed by the results of a model
curve-fitting procedure (Muller et al., 2005; Braune et al.,
2009; Yamori et al., 2010).
In Fig. 7, j2LL information for eight crops is summarized
and this large variation is interpreted in the light of long- orshort-term response to temperature or irradiance. Across
species, the highest j2LL values were found in crops grown
under long-term low irradiance and temperature conditions
(Fig. 7a, c). To understand this, it is necessary to underline
the components of the j2LL parameter (see Equation A3
derived by Yin et al., 2004, 2009; Yin and Struik, 2009a;
also see equation 6 in Niinemets and Tenhunen, 1997). The
fraction of Iinc absorbed by the leaf photosynthetic pig-ments (parameter b in Equation A3) is affected by long-
term changes in light and temperature through its changes
in leaf morphology. Leaves grown at high temperature are
generally thinner, with a lower ability to absorb light
(Poorter and Evans, 1998; Yamori et al., 2005), therefore
providing a reasonable explanation for the observed j2LL
reduction with increasing temperature. On the other hand,
leaves grown at high irradiance are thicker (Niinemets andTenhunen, 1997), indicating that j2LL variation is much
more complex and still not fully understood. Nonetheless,
caution should be exercised when modelling canopy photo-
synthesis based on the sun/shade approach (de Pury and
Farquhar, 1997; Yin and van Laar, 2005) because j2LL
increases with increasing Na (Fig. 7d), while j2LL also
increases with decreasing light (Schultz, 2003; shade leaves
which generally have low Na values; Fig. 7b).
The normalized temperature functions of Vcmax and Jmax
were variable across crops (Fig. 6), particularly above30 �C, in line with Leuning (2002). This mean that the
assumption used in crop modelling, a unique An response to
temperature across crop species, is inappropriate when
photosynthesis is calculated by the FvCB model. In the case
of no available data, it is suggested that researchers as a first
approximation use Vcmax and Jmax temperature parameters
from species that belong to the same family (see Fig. 6;
cotton and kenaf belong to Malvaceae; sunflower andcynara to Asteraceae).
The Jmax/Vcmax ratio provides an estimate of the relative
activities of RuBP regeneration and Rubisco carboxylation,
and incorporates both temperature and Na effects. This
study confirms (Table 3) the generally reported Jmax/Vcmax
value of 2.060.5 (Wullschleger, 1993; Poorter and Evans,
1998; Bunce, 2000; Leuning, 2002; Medlyn et al., 2002a).
However, this ratio should not be considered constant inabsolute terms. Vcmax is dependent on the Rubisco para-
meters used (up to 11% change; see also Medlyn et al.,
2002a) and Jmax is affected by the assumed j2LL and h values
used (see earlier discussion). For instance, grape showed
a much higher Jmax/Vcmax ratio compared with other crops
(Fig. 8). Apart from the effect of species, there are two
possible artefacts causing this: the different Rubisco para-
meters used in that study (Schultz, 2003) and the lower grapej2LL values compared with the other crops (Fig. 7b). Also
use of Ci instead of Cc affects this ratio. Thus approaches
(e.g. Kosugi et al., 2003; Muller et al., 2005) that fix the Jmax/
Vcmax ratio at a constant value to parameterize the FvCB
model should receive critical reservation.
Seasonal effects on photosynthesis and respiration incynara
Direct interpretation of the seasonal effects on An and Rn for
cynara is difficult because both the climate (Supplementary
Fig. S1 at JXB online) and the plant stage are different, with
new and old leaves being present (Archontoulis et al., 2010a;Searle et al., 2011). Rn acclimated to cold and warm
environments to a larger extent than did An (Table 3; Fig. 4).
This is consistent with previous studies (Yamori et al., 2005;
Ow et al., 2008; Silim et al., 2010).
The nature of Rn acclimation is variable within and
among plant species, and it is usually related to changes in
ERn and/or to changes in Rn25 (Atkin et al., 2005; Searle
et al., 2011). Given that vR did not change between seasons(P¼0.269; Table 3) and that the measured winter leaves had
higher Na values than the summer leaves (on average 2.48
versus 1.53 g N m�2; see also Fig. 7d), this indicates that
basal capacity, Rn25, plays an important role in this
acclimation. Secondly, ERn was also higher during winter
Temperature and nitrogen effects on leaf photosynthesis and respiration of biomass crops | 907
periods. Apparently, cynara follows an ‘acclimation type II’
(Atkin et al., 2005) where the overall elevation of the Rn–
temperature response was affected by season and growth
stage (Fig. 4).
Among FvCB parameters analysed, seasonal effects were
found on two electron transport parameters, vj and j2LL
(Table 3 and earlier discussion), and none related to Vcmax.
Literature information on An acclimation is diverse amongstudies (Wilson et al., 2000; Medlyn et al., 2002a; Bernacchi
et al., 2003; Hikosaka, 2005; Yamori et al., 2005; Braune
et al., 2009; Silim et al., 2010). As far as is known, only
Wilson et al. (2000) reported both vj and vv seasonal
changes in trees, while Braune et al. (2009) found only vj
variation for barley as in the present study. For cynara, the
normalized Vcmax and Jmax temperature functions were
slightly changed between seasons, in line with other fieldstudies (Medlyn et al., 2002b; Schultz, 2003), but in contrast
to growth chamber studies (Bernacchi et al., 2003; Yamori
et al., 2005; Ishikawa et al., 2007; Braune et al., 2009) where
plants were grown only at different temperatures. The fact
that this study assessed leaves with different Na status may
be a reason, but an inconsistency between actual field and
controlled chamber studies is obvious.
The Jmax/Vcmax ratio has been reported to be eithersensitive or insensitive to growth temperature (see discus-
sion by Hikosaka et al., 2005), growth irradiance (Poorter
and Evans, 1998; Yamori et al., 2010), and seasonal changes
(Bunce, 2000; Medlyn et al., 2002b). The present results
suggest that cynara regulates the balance between RuBP
regeneration and Rubisco carboxylation to maintain the
Jmax/Vcmax ratio almost constant (change <8%; Table 3)
across seasons and growth stages.
Conclusions
This study provides new information on photosynthesis andrespiration rates for three bioenergy crops, sunflower,
kenaf, and cynara. It provides an alternative way to
parameterize the FvCB model from An–Iinc data, instead of
using An–Ci data that are more expensive to obtain. It was
shown that major FvCB model parameters, Vcmax and Jmax,
derived from either An–Ci or An–Iinc analysis, are very close
(r2¼0.92). Present models can predict photosynthesis under
varying levels of Ci, Iinc, temperature, and leaf nitrogen, andcan estimate night respiration under varying levels of
temperature and leaf nitrogen, for the three bioenergy
crops. Comparisons of FvCB model parameters among
sunflower, kenaf, cynara, cotton, wheat, barley, tobacco,
and grapevine indicated that only a few parameters were
conserved. This means that in order to feed crop models
properly, species-specific FvCB model parameters are
needed. In this context, readily available An–Iinc data—thathave been underexplored—can assist in that respect. By
combining classical photosynthetic data and the biochemi-
cal model, the potential of crop growth models to assess the
impact of climate change on crop production and to
examine options of bioenergy production under a changing
climate is enlarged. Further research is needed to quantify
reliably the effects of photosynthetic acclimation and di-
urnal midday depression identified in this study.
Supplementary data
Supplementary data are available at JXB online.
Figure S1. Average monthly temperatures, radiation, and
precipitation at the experimental site (period: 2007–2009).
Sunflower measurements were taken from July to August;
kenaf measurements from July to September, and cynara
measurements from November to June.
Figure S2. Reported relationships between light-saturatednet assimilation rate at ambient CO2 concentration and at
near-optimum temperature (An,max in lmol CO2 m�2 s�1)
and leaf nitrogen content (g N m�2) for C3 crops (a), C3
legume crops and trees (b), and C4 crops (c). (d) An average
relationship for C3 and C4 crops.
Table S1. Reported Nb values (minimum leaf nitrogen for
photosynthesis, in g N m�2) for various species.
Acknowledgements
SVA acknowledges financial support received from the
Crop Physiology group (Wageningen University) and the
Laboratory of Agronomy and Applied Crop Physiology
(University of Thessaly) to accomplish this research, which
is part of his PhD study. XY and PCS partly contributed to
this research through their participation in the Dutch
photosynthesis research programme BioSolar Cells, fundedby the Ministry of Economic Affairs, Agriculture and
Innovation.
Appendix
1. Estimating the optimum temperature from the peakedArrhenius equation
The optimum temperature for Vcmax or Jmax in Equation 6 is givenby the following equation (Medlyn et al., 2002a):
Topt ¼Dx
Sx � R � ln�
Ex
Dx�Ex
ðA1Þ
2. The relationship between j2LL and UCO2LL
By dividing both parts of Equation 3 by Iinc and re-arranging, theefficiency of incident light conversion into e�, j2LL, can becalculated mathematically from UCO2LL:
UCO2LL¼An þ Rd
Iinc
Iinc/0
¼ j2LLCi � C�
4Ci þ 8C�
5j2LL ¼ UCO2LL
4Ci þ 8C�Ci � C�
ðA2Þ
This approach was also used by Niinemets et al. (2001), but
lacks any further interpretation.
908 | Archontoulis et al.

3. Components of parameter j2LL
Yin et al. (2004) described a generalized stoichiometric equationfor Aj, where the linear photosystem II (PSII) electron transportrate (J) was replaced by the total electron transport rate passingPSII (J2) and fractions of the total e� flux passing PSI that followcyclic (fcyc) and pseudocyclic (fpseudo) pathways. Again, under lowlight conditions, dividing J by Iinc yields j2LL as follows (Yin andStruik, 2009a; Yin et al., 2009):
j2LL ¼ J
IincjIinc/0
¼ J2
Iinc
1 � fpseudo
1 � fcyc
!¼ q2bU2LL
1 � fpseudo
1 � fcyc
!
ðA3Þ
By definition, the variable J2 can be replaced by the term
q23b3U2LL3Iinc, where q2 is the fraction of absorbed
irradiance partitioned to PSII (usually assumed to be 0.5),b is the fraction of Iinc absorbed by the leaf photosynthetic
pigments, and U2LL is the PSII e� transport efficiency under
limiting light.
References
Atkin OK, Bruhn D, Hurry VM, Tjoelker MG. 2005. The hot and the
cold: unravelling the variable response of plant respiration to
temperature. Functional Plant Biology 32, 87–105.
Archontoulis SV, Struik PC, Vos J, Danalatos NG. 2010a.
Phenological growth stages of Cynara cardunculus: codification and
description according to the BBCH scale. Annals of Applied Biology
156, 253–270.
Archontoulis SV, Struik PC, Yin X, Bastiaans L, Vos J,
Danalatos NG. 2010b. Inflorescence characteristics, seed
composition, and allometric relationships predicting seed yields in the
biomass crop Cynara cardunculus. Global Change Biology–Bioenergy
2, 113–129.
Archontoulis SV, Vos J, Yin X, Bastiaans L, Danalatos NG,
Struik PC. 2011. Temporal dynamics of light and nitrogen vertical
distributions in canopies of sunflower, kenaf and cynara. Field Crops
Research 122, 186–198.
Beringer T, Lucht W, Schaphoff S. 2011. Bioenergy production
potential of global biomass plantations under environmental and
agricultural constraints. GCB Bioenergy 3, 299–312.
Bernacchi CJ, Pimentel C, Long SP. 2003. In vivo temperature
response functions of parameters required to model RuBP-limited
photosynthesis. Plant, Cell and Environment 26, 1419–1430.
Bernacchi CJ, Portis AR, Nakano H, von Caemmerer S,
Long SP. 2002. Temperature response of mesophyll conductance.
Implications for the determination of Rubisco enzyme kinetics and for
limitations to photosynthesis in vivo. Plant Physiology 130, 1992–1998.
Bernacchi CJ, Singsaas EL, Pimentel C, Portis AR, Long SP.
2001. Improved temperature response functions for models of
Rubisco-limited photosynthesis. Plant, Cell and Environment 24,
253–259.
Bolstad PV, Mitchell K, Vose JM. 1999. Foliar temperature–
respiration response functions for broad-leaved tree species in
southern Appalachians. Tree Physiology 19, 871–878.
Boote KJ, Pickering NB. 1994. Modelling photosynthesis of row
crop canopies. HortScience 29, 1423–1434.
Braune H, Muller J, Diepenbrock W. 2009. Integrating effects of
leaf nitrogen, age, and growth temperature into the photosynthesis–
stomatal conductance model LEAFC3-N parameterized for barley
(Hordeum vulgare L.). Ecological Modelling 220, 1599–1612.
Buchmann N, Ehlinger JR. 1998. CO2 concentration profiles, and
carbon and oxygen isotopes in C3 and C4 crop canopies. Agricultural
and Forest Meteorology 89, 45–58.
Buckley TN, Adams MA. 2011. An analytical model of non-
photorespiration CO2 release in the light and dark in leaves of C3
species based on stoichiometric flux balance. Plant, Cell and
Environment 34, 89–112.
Bunce JA. 2000. Acclimation of photosynthesis to temperature in
eight cool and warm climate herbaceous C3 species: temperature
dependence of parameters of a biochemical photosynthesis model.
Photosynthesis Research 63, 59–67.
Connor DJ, Hall AJ, Sadras VO. 1993. Effects of nitrogen content
on the photosynthetic characteristics of sunflower leaves. Australian
Journal of Plant Physiology 20, 251–263.
Cosentino SL, Riggi E, D’Agosta G. 2004. Leaf photosynthesis in
kenaf (Hibiscus cannabinus L.) in response to water stress. In:
Proceedings of the 2nd World Biomass Conference, Rome, Italy,
374–376.
Danalatos NG, Archontoulis SV. 2010. Growth and biomass
productivity of kenaf (Hibiscus cannabinus L.) under different
agricultural inputs and management practices in central Greece.
Industrial Crops and Products 32, 231–240.
De Pury DGG, Farquhar GD. 1997. Simple scaling of photosynthesis
from leaves to canopies without the errors of the big-leaf models.
Plant, Cell and Environment 20, 537–557.
Dreyer E, Le Roux X, Montpied P, Daudet AF, Masson F. 2001.
Temperature response of leaf photosynthetic capacity in seedlings
from seven temperate tree species. Tree Physiology 21, 223–232.
Either GJ, Livington NJ. 2004. On the need to incorporate sensitivity
to CO2 transfer conductance into the Farquhar–von Caemmerer–Berry
leaf photosynthesis model. Plant, Cell and Environment 27, 137–153.
Evers JB, Vos J, Yin X, Romero P, van der Putten PEL,
Struik PC. 2010. Simulation of wheat growth and development based
on organ-level photosynthesis and assimilate allocation. Journal of
Experimental Botany 61, 2203–2216.
Farquhar GD, von Caemmerer S. 1982. Modelling of photosynthetic
response to environmental conditions. In: Lange OL, Nobel PS,
Osmond CB, Ziegler H, eds. Physiological plant ecology II. Water
relations and carbon assimilation. Encyclopaedia of plant physiology,
New Series, Vol. 12 B. Berlin: Springer Verlag, 549–588.
Farquhar GD, von Caemmerer S, Berry JA. 1980. A biochemical
model of photosynthetic CO2 assimilation in leaves of C3 species.
Planta 149, 78–90.
Flexas J, Diaz-Espejo A, Berry JA, Cifre J, Galmes J,
Kaldenhoff R, Medrano H, Ribas-Carbo M. 2007. Analysis of
leakage in IRGA’s leaf chambers of open gas exchange systems:
quantification and its effects in photosynthesis parameterization.
Journal of Experimental Botany 58, 1533–1543.
Temperature and nitrogen effects on leaf photosynthesis and respiration of biomass crops | 909

Flexas J, Ribas-Carbo M, Diaz-Espejo A, Galmes J, Medrano H.
2008. Mesophyll conductance to CO2: current knowledge and future
prospects. Plant, Cell and Environment 31, 602–621.
Galmes J, Medrano H, Flexas J. 2007. Photosynthetic limitation in
response to water stress and recovery in Mediterranean plants with
different growth forms. New Phytologist 175, 81–93.
Goudriaan J. 1979. A family of saturation type curves, especially in
relation to photosynthesis. Annals of Botany 43, 783–785.
Goudriaan J, van Laar HH. 1994. Modelling potential crop growth
processes. Dordrecht, The Netherlands: Kluwer Academic Publishers.
Griffin KL, Turnbull M, Murthy R. 2002. Canopy position affects the
temperature response of leaf respiration in Populus deltoides. New
Phytologist 154, 609–619.
Gu L, Pallardy SG, Tu K, Law BE, Wullschleger SD. 2010. Reliable
estimation of biochemical parameters from C3 leaf photosynthesis–
intercellular carbon dioxide response curves. Plant, Cell and
Environment 33, 1852–1874.
Harley PC, Thomas RB, Reynolds JF, Strain BR. 1992. Modelling
photosynthesis of cotton grown in elevated CO2. Plant, Cell and
Environment 15, 271–282.
Haupt-Herting S, Klug K, Fock HP. 2001. A new approach to
measure gross CO2 fluxes in leaves. Gross CO2 assimilation,
photorespiration, and mitochondrial respiration in the light in tomato
under drought stress. Plant Physiology 126, 388–396.
Hikosaka K. 2005. Nitrogen partitioning in the photosynthetic
apparatus of Plantago asiatica leaves grown under different
temperature and light conditions: similarities and differences between
temperature and light acclimation. Plant and Cell Physiology 46,
1283–1290.
Hirose T, Ackerly DD, Traw MB, Ramseirer D, Bazz FA. 1997.
CO2 elevation, canopy photosynthesis and optimal leaf area index.
Ecology 78, 2339–2350.
Ishikawa K, Onoda Y, Hikosaka K. 2007. Intraspecific variation in
temperature dependence of gas exchange characteristics among
Plantago asiatica ecotypes from different temperature regimes. New
Phytologist 176, 356–364.
Kosugi Y, Shibata S, Kobashi S. 2003. Parameterization of the CO2
and H2O gas exchange of several temperate deciduous broadleaved
trees at the leaf scale considering seasonal changes. Plant, Cell and
Environment 26, 285–301.
Leuning R. 2002. Temperature dependence of two parameters in
a photosynthetic model. Plant, Cell and Environment 25, 1205–1210.
Makino A, Nakano H, Mae T. 1994. Effects of growth temperature
on the responses of ribulose-1.5-bisphosphate carboxylase, electron
transport components, and sucrose synthesis enzymes to leaf
nitrogen in rice, and their relationships to photosynthesis. Plant
Physiology 105, 1231–1238.
Makino A, Sato T, Nakano H, Mae T. 1997. Leaf photosynthesis,
plant growth and nitrogen allocation in rice under different irradiances.
Planta 203, 390–398.
Medlyn BE, Dreyer E, Ellsworth D, et al. 2002a. Temperature
response of parameters of a biochemically based model of
photosynthesis. II. A review of experimental data. Plant, Cell and
Environment 25, 1167–1179.
Medlyn BE, Loustau D, Delzon S. 2002b. Temperature response of
parameters of a biochemically based model of photosynthesis. I.
Seasonal changes in mature maritime pine (Pinus pinaster Alt.). Plant,
Cell and Environment 25, 1155–1165.
Muchow RC. 1990. Effects of leaf nitrogen and water regime on the
photosynthetic capacity of kenaf (Hibiscus cannabinus) under field
conditions. Australian Journal of Agricultural Research 41, 845–852.
Muller J, Wernecke P, Diepenbrock W. 2005. LEAFC3-N:
a nitrogen sensitive extension of the CO2 and H2O gas exchange
model LEAFC3 parameterized and tested for winter wheat (Triticum
aestivum L.). Ecological Modelling 183, 183–210.
Muller J, Braune H, Diepenbrock W. 2008. Photosynthesis–
stomatal conductance model LEAFC3-N: specification for barley,
generalised nitrogen relations and aspects of model application.
Functional Plant Biology 35, 797–810.
Niinemets U, Ellsworth D, Lukjanova A, Tobias M. 2001. Site
fertility and the morphological and photosynthetic acclimation of Pinus
sylvestris needles to light. Tree Physiology 21, 1231–1244.
Niinemets U, Tenhunen JD. 1997. A model separating leaf structural
and physiological effects on carbon gain along light gradients for the
shade-tolerant species Acer saccharum. Plant, Cell and Environment
20, 845–865.
Ow FL, Griffin KL, Whitehead D, Walcroft AS, Turnbull M. 2008.
Thermal acclimation of leaf respiration but not photosynthesis in
Populus deltoides 3 nigra. New Phytologist 178, 123–134.
Parnik T, Keerberg O. 2007. Advanced radiogasometric method for
the determination of the rates of photorespiratory and respiratory
decarboxylations of primary and stored photosynthates under steady
state photosynthesis. Physiologia Plantarum 129, 33–44.
Pinelli P, Loreto F. 2003. 12CO2 emission from different metabolic
pathways measured in illustrated and darkened C3 and C4 leaves at
low, atmospheric and elevated CO2 concentration. Journal of
Experimental Botany 54, 1761–1769.
Pons TL, Flexas J, von Caemmerer S, Evans JR, Genty B,
Ribas-Carbo M, Brugnoli E. 2009. Estimating mesophyll
conductance to CO2: methodology, potential errors, and
recommendations. Journal of Experimental Botany 60, 2217–2234.
Pons TL, Welschen RAM. 2002. Overestimation of respiration rates
in commercially available clamp-on leaf chambers. Complications with
measurement of net photosynthesis. Plant, Cell and Environment 25,
1367–1372.
Poorter H, Evans JR. 1998. Photosynthetic nitrogen-use efficiency of
species that differ inherently in specific leaf area. Oecologia 116,
26–37.
Reich PB, Walters MB, Ellsworth DS, Vose JM, Volin JC,
Gresham C, Bowman WD. 1998. Relationships of leaf dark
respiration to leaf nitrogen, specific leaf area and leaf life-span: a test
across biomes and functional groups. Oecologia 114, 471–482.
Sage RF, Rearcy RW. 1987. The nitrogen use efficiency of C3 and
C4 plants. II. Leaf nitrogen effects on the gas exchange characteristics
of Chenopodium album L. and Amaranthus retroflexus L. Plant
Physiology 84, 959–963.
Searle SY, Thomas S, Griffin KL, Horron T, Kornfeld, Yakir D,
Hurry V, Turnbull MH. 2011. Leaf respiration and alternative oxidase
910 | Archontoulis et al.

in field-grown alpine grasses respond to natural changes in
temperature and light. New Phytologist 189, 1027–1039.
Schultz HR. 2003. Extension of a Farquhar model for limitation of leaf
photosynthesis induced by light environment, phenology and leaf age
in grapevines (Vitis vinifera cv. White Riesling and Zinfabdel). Functional
Plant Biology 30, 673–687.
Sharkey TD. 1985. Photosynthesis in intact leaves of C3 plants:
physics, physiology and rate limitations. Botanical Review 51, 53–105.
Sharkey TD, Bernacchi CJ, Farquhar GD, Singass EL. 2007.
Fitting photosynthetic carbon dioxide response curves for C3 leaves.
Plant, Cell and Environment 30, 1035–1040.
Sharp RE, Matthews MA, Boyer JS. 1984. Kok effect and the
quantum yield of photosynthesis. Light partially inhibits dark
respiration. Plant Physiology 75, 95–101.
Silim SN, Ryan N, Kubien DS. 2010. Temperature of photosynthesis
and respiration in Populus balsamifera L.: acclimation versus
adaptation. Photosynthesis Research 104, 19–30.
Sinclair TR, Horie T. 1989. Leaf nitrogen, photosynthesis, and crop
radiation use efficiency: a review. Crop Science 29, 90–98.
Tuzet A, Perrier A, Leuning R. 2003. A coupled model of stomatal
conductance, photosynthesis and transpiration. Plant, Cell and
Environment 26, 1097–1116.
Turnbull MH, Whitehead D, Tissue DT, Schuster WSF,
Brown KL, Griffin KL. 2003. Scaling foliar respiration in two
contrasting forest canopies. Functional Ecology 17, 101–114.
Valentini R, Matteucci G, Dolman AJ, et al. 2000. Respiration as
the main determinant of carbon balance in European forests. Nature
404, 861–865.
Vico G, Porporato A. 2008. Modelling C3 and C4 photosynthesis
under water-stressed conditions. Plant and Soil 313, 187–203.
von Caemmerer S, Farquhar GD. 1981. Some relationships
between the biochemistry of photosynthesis and the gas exchange of
leaves. Planta 153, 376–387.
von Caemmerer S, Farquhar G, Berry J. 2009. Biochemical model
of C3 photosynthesis. In: Laisk A, Nebal L, Govindjee, eds.
Photosynthesis in silico: understanding complexity from molecules to
ecosystems. Dordrecht: Springer Science+Business Media B.V.,
209–230.
Warren CR. 2004. The photosynthetic limitation posed by internal
conductance to CO2 movement is increased by nutrient supply.
Journal of Experimental Botany 55, 2313–2321.
Wilson KB, Baldocchi DD, Hanson PJ. 2000. Spatial and seasonal
variability of photosynthetic parameters and their relationship to leaf
nitrogen in a deciduous forest. Tree Physiology 20, 565–578.
Wise RR, Olson AJ, Schrader SM, Sharkey TD. 2004. Electron
transport is the functional limitation of photosynthesis in field-grown
Pima cotton plants at high temperature. Plant, Cell and Environment
27, 717–724.
Wohlfahrt G, Bahn M, Horak I, Tappeiner U, Cerbusca A. 1998.
A nitrogen sensitive model of leaf carbon dioxide and water vapour
gas exchange: application to 13 key species from differently managed
mountain grassland ecosystems. Ecological Modelling 113, 179–199.
Wohlfahrt G, Bahn M, Haufner E, Horak I, Michaeler W,
Rottmar K, Tappeiner U, Cerbusca A. 1999. Inter-specific variation
of the biochemical limitation to photosynthesis and related leaf traits of
30 species from mountain grassland ecosystems under different land
use. Plant, Cell and Environment 22, 1281–1296.
Wullschleger SD. 1993. Biochemical limitations to carbon
assimilation in C3 plants—a retrospective analysis of the A/Ci curves
from 109 species. Journal of Experimental Botany 44, 907–920.
Yamori W, Evans JR, von Caemmerer S. 2010. Effects of growth
and measurement light intensities on temperature dependence of CO2
assimilation rate in tobacco leaves. Plant, Cell and Environment 33,
332–343.
Yamori W, Nogughi K, Terashima I. 2005. Temperature acclimation
of photosynthesis in spinach leaves: analyses of photosynthetic
components and temperature dependencies of photosynthetic partial
reactions. Plant, Cell and Environment 28, 536–547.
Yin X, van Oijen M, Schapendonk AHCM. 2004. Extension of
a biochemical model for the generalized stoichiometry of electron
transport limited C3 photosynthesis. Plant, Cell and Environment 27,
1211–1222.
Yin X, Struik PC. 2009a. C3 and C4 photosynthesis models: an
overview from the perspective of crop modelling. NJAS–Wageningen
Journal of Life Sciences 57, 27–38.
Yin X, Struik PC. 2009b. Theoretical reconsiderations when estimating
the mesophyll conductance to CO2 diffusion in leaves of C3 plants by
analysis of combined gas exchange and chlorophyll fluorescence
measurements. Plant, Cell and Environment 32, 1513–1524.
Yin X, Struik PC, Romero P, Harbinson J, Evers JB, van den
Putten PEL, Vos J. 2009. Using combined measurements of gas
exchange and chlorophyll fluorescence to estimate parameters of
a biochemical C3 photosynthesis model: a critical appraisal and a new
integrated approach applied to leaves in a wheat (Triticum aestivum)
canopy. Plant, Cell and Environment 32, 448–464.
Yin X, Sun Z, Struik PC, Gu J. 2011. Evaluating a new method to
estimate the rate of leaf respiration in the light by analysis of combined
gas exchange and chlorophyll fluorescence measurements. Journal of
Experimental Botany 62, 3489–3499.
Yin X, van Laar HH. 2005. Crop systems dynamics: an
ecophysiological simulation model for genotype-by-environment
interactions. Wageningen, The Netherlands: Wageningen Academic
Publishers.
Temperature and nitrogen effects on leaf photosynthesis and respiration of biomass crops | 911


