Embed Size (px)
Citation preview

J Sign Process SystDOI 10.1007/s11265-008-0176-8
Leakage-Aware Multiprocessor Scheduling
Pepijn de Langen · Ben Juurlink
Received: 12 October 2007 / Revised: 4 January 2008 / Accepted: 13 March 2008© The Author(s) 2008
Abstract When peak performance is unnecessary, Dy-namic Voltage Scaling (DVS) can be used to reducethe dynamic power consumption of embedded mul-tiprocessors. In future technologies, however, staticpower consumption due to leakage current is expectedto increase significantly. Then it will be more effectiveto limit the number of processors employed (i.e., turnsome of them off), or to use a combination of DVSand processor shutdown. In this paper, leakage-awarescheduling heuristics are presented that determine thebest trade-off between these three techniques: DVS,processor shutdown, and finding the optimal numberof processors. Experimental results obtained using apublic benchmark set of task graphs and real parallelapplications show that our approach reduces the totalenergy consumption by up to 46% for tight deadlines(1.5× the critical path length) and by up to 73% forloose deadlines (8× the critical path length) comparedto an approach that only employs DVS. We also com-pare the energy consumed by our scheduling algorithmsto two absolute lower bounds, one for the case whereall processors continuously run at the same frequency,
This research was supported in part by the NetherlandsOrganisation for Scientific Research (NWO).
This paper is a revised and extended version of the work thatappeared in [2, 3].
P. de Langen (B) · B. JuurlinkFaculty of Electrical Engineering, Mathematicsand Computer Science, Computer Engineering Lab.,Delft University of Technology, Mekelweg 4,2628 CD Delft, The Netherlandse-mail: [email protected]
B. Juurlinke-mail: [email protected]
and one for the case where the processors can run atdifferent frequencies and these frequencies may changeover time. The results show that the energy reductionachieved by our best approach is close to these theoret-ical limits.
Keywords Multiprocessor · Scheduling ·Leakage power · Voltage scaling
1 Introduction
Recently, (single-chip) multiprocessors such as theARM11 MPCore [4] and the IBM/Sony/Toshiba Cellarchitecture [5] have been introduced on the high-performance embedded market. The power consump-tion of such systems is a prime design consideration.It consists of a dynamic part (due to switching ac-tivity) and a static part (due to leakage current). Inpast technologies, the dynamic power was much largerthan the static power. With each technology genera-tion, however, the leakage current is predicted to in-crease by a factor of five [6] and the static powerconsumption is predicted to surpass the dynamic powerconsumption [7].
To reduce power consumption, many techniqueshave been proposed such as shutting down unusedparts [8] or to support multiple supply voltages [9]. Inthis paper we consider the problem of scheduling taskson a real-time multiprocessor system that supportsthese hardware techniques. The goal of the proposedscheduling algorithms is to minimize the total energyconsumption.
To guarantee real-time performance, embeddedmultiprocessors and Systems-on-Chip in general are

P. de Langen, B. Juurlink
usually overbudgeted, e.g., they generally contain moreprocessing cores than needed. When the dynamicpower is much larger than the static power, an effec-tive technique to reduce the energy is to schedule thetasks on as many processors as possible to reduce themakespan of the schedule. Thereafter, the remainingtime before the deadline (the slack) is used to scaledown the supply voltages and operating frequencies.We refer to this technique as Schedule-and-Stretch(S&S). When the static and dynamic power are com-parable, however, S&S is no longer effective because itincreases the leakage current by using more processorsthan necessary and by lengthening the time it takes tocomplete the computation.
Scheduling heuristics are presented that improveupon S&S by determining the optimal trade-off be-tween Dynamic Voltage Scaling (DVS) and processorshutdown (PS). The first algorithm, called Leakage-Aware MultiProcessor Scheduling (LAMPS), does notemploy as many processors as possible to maximizethe amount of slack that can be used to lower thesupply voltage. Instead, it determines an optimal bal-ance between the number of processors that shouldbe used and the level of voltage/frequency scaling. Wethen extend both S&S and LAMPS with the optionto put processors temporarily in a deep sleep or shut-down mode. This technique is referred to as PS, andhence, these strategies are referred to as S&S+PS andLAMPS+PS, respectively.
Furthermore, we formulate two absolute lowerbounds that produce schedules that consume theleast amount of energy possible. The first is for thecase where all processors run at the same frequencythroughout the entire schedule. The schedules pro-duced by S&S(+PS) and LAMPS(+PS) have this prop-erty. The second is for the case where the processorscan run at different frequencies and these frequenciesmay change over time.
Experimental results are obtained using a publicbenchmark set of task graphs with precedence con-straints and real parallel applications. The results showthat our best approach (LAMPS+PS) reduces the totalenergy consumption by up to 46% for tight deadlines(1.5× the critical path length) and by up to 73% forloose deadlines (8× the critical path length (CPL))compared to S&S. Compared to LAMPS, LAMPS+PSdecreases the total energy consumption by up to 12%respectively 18%. We also analyze how the results areaffected by the average amount of parallelism, whichis defined as the total amount of work divided by theCPL. Comparing the results to the theoretical lowerbounds indicates there is little room left for improve-ment. For example, for fairly coarse-grain task graphs
LAMPS+PS attains over 94% of the possible energysaving, provided the frequency is the same for all activeprocessors and constant throughout the schedule.
This paper is organized as follows. Section 2 containsan overview of related work. The system and appli-cation model, the power model, and the DVS and PStechniques are explained in detail in Section 3. Section 4reviews S&S and presents LAMPS and extends bothof them with the option to shut down processors tem-porarily. Experimental results for randomly generatedas well as task graphs derived from real applicationsare provided in Section 5. Finally, in Section 6, conclu-sions are drawn and some directions for future researchare given.
2 Related Work
Reducing power consumption has been an importantresearch topic in recent years and many techniquesat the process, circuit design, and micro-architecturallevel have been proposed. One of the most promisingtechniques is DVS, where both the clock frequencyand the supply voltage are scaled down when peakperformance is not needed. DVS is also referred toas dynamic voltage/frequency scaling. Several existingprocessors such as the Intel XScale [10] support DVS.
Applying DVS to multiprocessor scheduling hasbeen investigated by a significant number of re-searchers. An overview is provided by Jha [11]. Asdescribed in Section 1, one approach is to use anexisting scheduling algorithm, such as list schedulingwith earliest deadline first (EDF), to finish the tasksas early as possible and to use the remaining slackbefore the deadline to lower the supply voltage. Thistechnique has been proposed by several authors [1, 12]using different names and, therefore, we refer to it as(S&S). Leakage current was not included in their powermodels, however.
Jejurikar et al. [13] presented a detailed power modelthat includes static as well as dynamic power. We usethe same power model. They further showed that thereis an optimal operating point, called the critical speed,at which the total energy consumption is minimized.Lowering the supply voltage below this point increasesthe energy consumption. They computed processorslowdown factors based on the critical speed. A similarapproach was followed by [14], who employed a fixedpriority instead of EDF. In contrast to our work, boththese works focussed on single-processor schedulingand assumed that tasks are independent and arriveperiodically with deadlines. The same real-time modelwas assumed in [15], but DVS was not considered. Irani

Leakage-aware multiprocessor scheduling
et al. [16] also used this model but assumed a continu-ous voltage range and presented a theoretical analysisof systems which can use DVS and PS. Specifically,they presented an offline algorithm with a competitiveratio of 3 and an online algorithm with a constantcompetitive ratio.
Zhang et al. [17] used the same real-time modelas we do (weighted directed acyclic graphs (DAGs)with deadlines). They did not use EDF schedulingbut scheduled in such a way to have more slowdownopportunities. In this paper we analyze the effect ofemploying a different scheduling algorithm. Further-more, they did not attempt to determine the numberof processors that yields the least energy consump-tion. Kianzad et al. [18] presented an integrated ap-proach, combining scheduling and DVS in a geneticalgorithm. However, they did not consider PS. Varatkaret al. [19] proposed to execute part of the code on alower supply voltage while minimizing communication.Some researchers proposed to improve DVS by alsoadjusting the threshold voltage when scaling the supplyvoltage [20, 21]. Others extended this to scheduling forreal-time multiprocessor systems [22, 23]. None of theseworks, however, attempted to determine the optimalnumber of processors.
Xu et al. [24] proposed to minimize energy consump-tion by both DVS and choosing the correct numberof employed processors. Their work, however, targetsembedded clusters in which the nodes provide the sametype of service in a client-server model. Furthermore,these authors do not consider static scheduling butinstead propose an online algorithm similar to [1].
Our work differs in the following ways. First, weassume that applications are represented as weightedDAGs whereas many others assumed independent pe-riodic tasks with deadlines. Second, we focus on multi-processor scheduling while others focussed mainly onsingle-processor scheduling. Third, we use a detailedpower model and limit the voltage scaling to discretesteps. Fourth, we exploit DVS and PS as well as findingthe optimal number of processors. Finally, we use apublicly available set of task graphs and a task graph
derived from a real application (MPEG-1), whereasmost others used randomly generated graphs.
3 Preliminaries
In this section we describe the system and applicationmodels, the power model, as well as two primary waysto reduce power dissipation: DVS and PS.
3.1 System and Application Model
We assume a shared memory multiprocessor systemrunning parallel applications, for which the schedulingand mapping are statically determined. The applica-tions are represented as weighted DAGs, where nodescorrespond to tasks, edges to task dependences, andnode weights to task processing times. We furthermoreassume that this system is CPU bound. As explained byLiberato et al. [25], real-time applications with periodictasks can be translated to DAGs using the frame-basedscheduling paradigm.
Another common application model based on func-tional or pipelining parallelism is Kahn Process Net-works [26], where a group of processes are connectedby communication channels to form a network ofprocesses. Each process is in principle infinite and re-ceives data over its input channels, processes it, andsends the results over the output channels. Here thereis not a single deadline but a certain throughput mustbe guaranteed. This model can be converted to DAGsby making several copies of the KPN, by translatingedges in the KPN to edges between successive copiesin the DAG and adding an edge from each node inthe ith copy to the corresponding node in the (i + 1)stcopy. The output nodes of the first copy are assignedan arbitrary but reasonable deadline. The deadline ofthe output nodes of each successive copy is set to thedeadline of the corresponding node in the previouscopy plus the reciprocal of the throughput. A simpleexample is depicted in Fig. 1. In the KPN in Fig. 1a,task T1 successively receives inputs I1, I2, . . . , processes
Figure 1 Simple example fortranslating KPNs into DAGs(a, b).
3 2 1..., I , I , I
3 2..., J , J , J 1
I1
J1
I2
J2
I3
J3
(a) (b)

P. de Langen, B. Juurlink
them, and sends the results to T2. Task T3 receivesinputs J1, J2, . . . but also receives data from T2. Itcombines input Ji+1 with the ith data received fromT2. In the DAG in Fig. 1b, each node is replicated anumber of times. Let T j
i denote the jth copy of taskTi. Then T j
1 receives input I j and T j3 receives input J j.
There are edges from T j1 and T j
3 to T j+12 . Because T3
combines input Ji+1 with the ith data received from T2,there are also edges from T j
2 to T j+13 . To indicate that
not all inputs are available at time zero, there are alsoedges from T j
i to T j+1i . This could also be modeled by
adding dummy input nodes whose weights are equal tothe time the input becomes available.
Mainly due to unpredictable behavior in the memorysystem, the execution time of a task does not solely de-pend on the clock frequency. However, since reducingthe frequency will make memory accesses relatively lesscostly, it is safe to assume that executing a task on 1/Nth
of the frequency will take at most N times as much time.
3.2 Power Model
We use the power model described in [13], which inturn is based on the model and parameters given in [21],where it has been verified with SPICE simulations. Inthis model, the power consumption of a processor isgiven by:
P = PAC + PDC + Pon,
where PAC is the dynamic power consumption (due toswitching activity), PDC is the static power consump-tion (due to leakage current), and Pon is the intrinsicpower consumption needed to keep the processor on.Like [13], we assume Pon is 0.1W. The dynamic poweris given by:
PAC = aCeff V2dd f,
where a is the activity factor, Ceff is the effective switch-ing capacitance, Vdd is the supply voltage, and f is theoperating frequency. The static power is given by:
PDC = Vdd Isubn + |Vbs| I j,
where Isubn is the sub-threshold leakage current, Vbs isthe voltage applied between body and source, and I j
is the reverse bias junction current. The sub-thresholdleakage current is given by:
Isubn = K3eK4Vdd eK5Vbs,
Table 1 Constants for 70 nmtechnology ([13, 21]). Constant Value
K1 0.063K2 0.153K3 5.38 · 10−7
K4 1.83K5 4.19K6 5.26 · 10−12
K7 −0.144Vdd0 1.0Vbs −0.7α 1.5Vth1 0.244I j 4.8 · 10−10
Ceff 0.43 · 10−9
Ld 37.0Lg 4.0 · 106
where K3, K4, and K5 are constants. The relation be-tween operating frequency, supply voltage, and thresh-old voltage is:
f = (Vdd − Vth)α/Ld K6,
where Ld represents the logic depth and K6 and α areconstants for a certain technology. Finally, the thresh-old voltage is given by:
Vth = Vth1 − K1Vdd − K2Vbs,
where Vth1, K1, and K2 are constants. We use the same70nm technology constants as [13, 21]. These constantsare listed in Table 1. The maximum frequency of thisprocessor is 3.1GHz, which requires a supply voltageof 1V. Figure 2a and b depict the resulting powerconsumption and energy per cycle as a function of thenormalized operating frequency.
3.3 Dynamic Voltage Scaling
DVS mainly reduces the dynamic power consumption,which increases quadratically with the supply voltage.The static component, although having a exponentialrelation with supply voltage, does not decrease as muchwith decreasing supply voltage as the dynamic compo-nent, as is depicted in Fig. 2.
Since energy equals power times time, the energyconsumption will actually start to increase if the fre-quency is decreased below a certain point. Figure 2depicts the energy per cycle as a function of the nor-malized frequency. It can be seen that the optimal orcritical frequency ( fcrit) is 0.38 times the maximum.Because of the discrete voltage levels, however, thecritical frequency is reached at a supply voltage of0.7V, corresponding to a normalized frequency of 0.41.

Leakage-aware multiprocessor scheduling
0
0.5
1
1.5
2
2.5
0 0.2 0.4 0.6 0.8 1
pow
er [W
]
normalized frequency
PtotalPacPdcPon
(a)
0
0.2
0.4
0.6
0.8
1
1.2
0 0.2 0.4 0.6 0.8 1
ener
gy p
er c
ycle
[µJ]
normalized frequency
f crit
EtotalEacEdcEon
(b)Figure 2 Power and energy consumption as a function ofthe normalized frequency. (a) Power consumption. (b) Energyconsumption.
Scaling below this frequency will reduce the powerconsumption but not the total energy consumption,provided that the processors can be shut down forthe remaining time. When there is no sleep/shutdownmode, scaling below fcrit will, in fact, reduce the totalenergy consumption, since the processors also consumeenergy for the remaining time.
3.4 Processor Shutdown
The second technique to reduce the energy consump-tion of a multiprocessor system is to put idle processorstemporarily in a deep sleep or shutdown mode. Theadvantage of this technique over DVS is that it reducesall terms of the total power consumption, not only thedynamic part. When shutting down a processor, how-ever, the contents of, e.g., caches and branch predictors
are lost. When a processor is switched back on, theyhave to be warmed up again, which causes additionaldelay and consumes extra energy. We use the estimatesof Jejurikar et al. [13], who estimated that a processorin sleep state consumes about 50μW of power andthat shutting down and resuming a processor incurs anenergy overhead of 483μJ. This overhead includes thesupply voltage switching as well as the energy spent towarm up caches and predictors. The additional delayincurred by powering down can be hidden by wakingup the processor a short time before the end of theidle period.
PS is only beneficial if a processor is idle for asufficiently long period. Figure 3 depicts this minimumnumber of idle cycles as a function of the normalizedfrequency. From this figure it can be seen that, in orderto save energy consumption by putting a processortemporarily in shutdown mode, a significant numberof idle cycles is required. When clocked at half themaximum frequency, for example, an idle period ofat least 1.7 million cycles is required. Since in mostcases applications with rather fine-grain tasks will haverelatively short idle periods (unless the task graph isvery unbalanced), such applications will in general notbenefit from to shutting down processors temporarilybetween the execution of two tasks. However, it mightstill be energy efficient to shut down at the end of theschedule, provided the deadline is relatively long.
4 Scheduling for Energy Minimization
In this section we review S&S and LAMPS and en-hance both scheduling approaches with the option toshut down processors temporarily. In the schedulesproduced by these approaches, all processors run atthe same operating frequency and this frequency isconstant throughout the whole schedule. Both S&S
2e+06
1.5e+06
1e+06
0.5e+06
0 1 0.9 0.8 0.7 0.6 0.5 0.4 0.3 0.2 0.1 0
cycl
es
normalized frequencyFigure 3 Minimum number of idle cycles required for PS to bebeneficial, as a function of the normalized processor frequency.

P. de Langen, B. Juurlink
and LAMPS employ list scheduling with earliest dead-line first (LS-EDF) to perform the actual scheduling.EDF does not necessarily produce the best schedule,however. To investigate if other scheduling algorithmscould result in additional energy gains, we also presentan ideal model in which idle processors are assumedto consume no energy. Furthermore, we also show theimprovements that could be attained if the frequencycould vary among processors and over time.
4.1 Schedule & Stretch
Figure 4 illustrates the concept behind S&S. The taskgraph in Fig. 4a is first scheduled using LS-EDF tominimize the makespan of the schedule, or in otherwords, maximize the amount of slack before the dead-line. This is depicted in Fig. 4b, which shows that afterthe scheduling process, there are certain periods inwhich a processor is idle. Thereafter, the slack thatremains at the end of the schedule is used to lower theclock frequency and supply voltage of all processors,as depicted in Fig. 4c. S&S already reduces the energyconsumption by 30% for tight deadlines and by morethan 70% for loose ones [2].
4.2 Leakage Aware Multiprocessor Scheduling
In LAMPS, a trade-off is made between the numberof processors that should be employed and the amountof voltage scaling. The remaining processors are turned
off. The number of processors that minimizes the en-ergy is found as follows. Let the task graph be rep-resented by an acyclic graph G = (V, E, w), where Vcorresponds to the tasks, E to task dependences, andw(v) denotes the execution time of task v.
First we determine the minimal number of proces-sors required to finish the tasks before the deadline.This step is performed as follows. First, we establish alower bound on the number of processors Nlwb neededto complete the tasks before the deadline D and anupper bound on the number of processors Nupb that canbe employed efficiently:
Nlwb = ⌈ ∑
v∈V
w(v)/D⌉, Nupb = |V|.
Thereafter, a binary search is performed on the inter-val [Nlwb, Nupb] to determine the minimal number ofprocessors required to finish the task graph on time.First, it is determined if N = (Nlwb + Nupb)/2 are suf-ficient to finish before the deadline. This is done usingLS-EDF. If the makespan of the schedule producedby the list scheduler is less than or equal to the deadline,the search continues on the interval [Nlwb, N]. If not,the search continues on the interval [N + 1, Nupb].
After having found the minimal number of proces-sors Nmin required, the number of processors thatdissipates the least amount of power is determined.This step is performed as follows. First, we determinethe total power consumption for Nmin processors. Thisis done by lowering the clock frequency and supply
Figure 4 Illustration of S&S.(a) Task graph. (b) Scheduleproduced by EDF.(c) Schedule produced byS&S. 4
2
6 4
2
T1
T2T3 T4
T5
(a)
f
1
f
1
f
1
dead
line
Processor 1 t
Processor 2 t
Processor 3 t
5TT
3
T
T
T
1 2
4 f0.67
f0.67
f0.67
dead
line
Processor 1 t
Processor 2 t
Processor 3 t
T1 T2
T4
T5
T3
(b) (c)

Leakage-aware multiprocessor scheduling
Figure 5 Pseudocode for theLAMPS heuristic.
1
voltage so that the task graph is completed as close apossible to the deadline, as in the S&S algorithm. Inother words, we stretch the schedule so that it finishesexactly on time. This is also done for Nmin+1, Nmin+2,etc. processors, until increasing the number of proces-sors no longer decreases the makespan of the schedule.At this point, increasing the number of processors willalways increase the total power consumption. The algo-rithm returns the configuration (number of processors)that dissipates the least amount of energy. Figure 5depicts the pseudocode for the LAMPS heuristic.
The reason for performing a linear search instead ofa binary search in the second phase of the algorithmis that the energy consumption as a function of thenumber of processors can have local minima. Conse-quently, a binary search will not always find the optimalsolution. Figure 6 depicts the normalized total energyconsumption as a function of the number of processorsemployed for the case that the deadline is 1.5× thelength of the critical path. (The benchmarks will bedescribed in Section 5.1.) It can be seen that there areminima that are not global minima. This happens, for
example, for the sparse benchmark at 14 processors.Therefore, a full search must be performed on thenumber of processors, in order to find the optimum fora certain graph and deadline.
The time complexity of the algorithm depends onthe structure of the task graph and the time it takesto perform list scheduling. Let Tls denote the timerequired to perform list scheduling. The time TLAMPS
taken by the LAMPS algorithm is given by:
TLAMPS = log2(Nupb − Nlwb) · Tls + M · Tls,
where M is the number of iterations of the secondphase (number of iterations required until the make-span of the generated schedule no longer decreases). Inpractice, for all benchmarks finding the optimal config-uration never took more than 20 seconds on a 3GHzPentium 4.
Figure 7a illustrates the schedule generated byLAMPS. Instead of 3 processors, the task graph shown
Figure 6 Normalized energyconsumption for differentbenchmarks with the deadlineat 2 times the CPL.
0 1 2 3 4 5 6 7 8 9 10 11 12 13 14 15 16 17 18 19 20
# of processors
0
2
4
6
8
10
12
14
16
18
rela
tive
ener
gy c
onsu
mpt
ion
fpppprobotsparse

P. de Langen, B. Juurlink
Figure 7 Illustration ofLAMPS and S&S+PS.(a) Schedule produced byLAMPS. (b) Scheduleproduced by S&S+PS.
f0.8
f0.8
dead
line
Processor 1 t
Processor 2 t
T1 T2
T4
T5
3T
f0.8
f0.8
f0.8
Processor 1 t
Processor 2 t
Processor 3
dead
line
T1 T2
T4
T5
T3
(a) (b)
in Fig. 4b is scheduled on only 2 processors but witha higher frequency. Nevertheless, because the thirdprocessor is turned off, the schedule produced byLAMPS consumes less energy than the schedule gen-erated by S&S.
4.3 S&S+PS and LAMPS+PS
We extend S&S with the option to shut down proces-sors temporarily. We refer to this heuristic as S&Swith PS (S&S+PS). In S&S+PS, the task graph is againfirst scheduled using the EDF policy. Thereafter, theoptimal balance between processor slowdown (throughDVS) and shutdown is determined by gradually scaling
the operating frequency from the maximum frequencyto the minimum frequency required to meet the dead-line using discrete voltage level steps of 0.05 V. For eachfrequency, the remaining slack both inside as well as atthe end of the schedule is used to shut down processors,provided the idle period is longer than the minimumidle period to result in energy savings (cf. Fig. 3). Inother words, the slack is only used to shut down a pro-cessor if it is large enough to make up for the additionalenergy consumption due to loss of state.
Figure 7b illustrates the schedule produced byS&S+PS. In this example, only part of the slack at theend of the schedule is exploited to lower the frequency.The remaining slack is used to shutdown processors
Figure 8 Pseudocode for theLAMPS+PS heuristic.
1

Leakage-aware multiprocessor scheduling
I0 P3
B1 B2
P6
B4 B5
P9
B7 B8
P12
B10 B11 B13 B14
Figure 9 Dependence graph for processing 15 MPEG-1 frames, assuming execution times of 36700900, 178259300, and 73401800 cyclesfor I, B, and P frames respectively.
temporarily. We note that this example is merely meantfor illustration. In reality, for the given task graph it isnot advantageous to employ PS.
We remark that the time taken by the scheduling al-gorithm can be improved by scaling down the frequencyto the critical frequency (or the minimum frequencyrequired to meet the deadline if this minimum fre-quency is larger than the critical frequency), and to usethe remaining slack to shut down processors. However,because the effectiveness of PS depends on both thetime a processor is idle and on the intrinsic powerneeded to keep the processor on, such an approachwould not find the schedule that minimizes the totalenergy consumption.
We also enhance the LAMPS heuristic with the op-tion to shut down processors and refer to the resultingheuristic as LAMPS+PS. As in LAMPS, the number ofprocessors that minimizes the total energy consumptionis determined by calculating the energy consumptionfor Nmin, Nmin + 1, . . . , Nmax processors, where Nmin isthe minimal number of processors needed to meet thedeadline and Nmax is the number of processors that canbe employed efficiently. For each number of proces-sors, we then determine the balance between DVS andPS by scaling the frequency from the maximum to theminimum frequency required to meet the deadline. Foreach frequency, we then use the available slack to shutdown processors, similar to the S&S+PS heuristic. The
pseudocode for the LAMPS+PS heuristic is depictedin Fig. 8.
4.4 LIMIT-SF & LIMIT-MF
In the approaches described above, the schedule isalways produced by EDF. It is known, however, thatEDF is not always optimal for multiprocessor schedul-ing. Furthermore, in our approaches the frequency isalways constant throughout the entire schedule. Toinvestigate if additional energy can be saved by em-ploying a different scheduling algorithm or by allowingdifferent frequencies, we also define two lower bounds,one for the case with a single frequency (LIMIT-SF)and one for the case where multiple frequencies areallowed (LIMIT-MF).
LIMIT-SF has the following characteristics. First,idle processors are assumed to consume no energy atall. In other words, only active cycles are consideredwhen calculating the energy consumption and, conse-quently, there is no benefit from or penalty for shuttingdown processors. Second, the number of processors isequal to the number of tasks. Since idle processorsconsume no energy, using fewer processors will notreduce the energy. Third, the frequency is scaled downto the optimal frequency if possible to meet the dead-line, or otherwise as much as possible. No schedule can
Table 2 Employedbenchmarks from STG [27]and their main characteristics.
Name Number of nodes Number of edges Critical path Total work
fpppp 334 1196 1062 7113robot 88 130 545 2459sparse 96 128 122 192050 50 66–926 24–447 204–644100 100 138–1898 29–569 458–1347300 300 412–8991 45–1164 1517–3568500 500 698–24497 67–1941 2563–55301000 1000 1378–99164 50–3298 5179–111382000 2000 2797–396760 48–6770 10563–216155000 5000 7132–2491411 62–17386 27009–54010

P. de Langen, B. Juurlink
consume less energy than this ideal model, providedthat the frequency is the same for all active processorsand is constant throughout the schedule.
The difference between LIMIT-MF and LIMIT-SFis that in LIMIT-MF all tasks are scheduled at thecritical frequency. Because of this and since idle proces-sors are assumed to consume no energy, LIMIT-MFis an absolute lower bound, even for the case whereprocessors can run at different speeds and where thefrequency may change over time. We note, however,that it may happen that the schedule produced byLIMIT-MF does not meet the deadline.
Since both LIMIT-SF and LIMIT-MF do not dependon any particular scheduling algorithm, this impliesthat these results cannot be improved by employing adifferent scheduling algorithm than EDF.
5 Experimental Evaluation
In this section, we present and compare the results ofthe different scheduling approaches. We use the samepower model as used by [21] and [13], as explainedin Section 3. We again emphasize that a processor insleep state consumes 50 μW and that shutting down andwaking up a processor dissipates 483 μJ of energy.
5.1 Experimental Setup
For the experiments we use task graphs from the Stan-dard Task Graph Set [27], as well as a task graph forMPEG-1 encoding presented by Zhu et al. [1]. TheMPEG-1 encoding task graph consists of an encodingsequence of 15 I, B, and P frames, and is depicted inFig. 9. We have used the maximum execution timesfor the Tennis sequence as presented in [1], scaled tomatch the maximum clock frequency of 3.1GHz. Thedeadline was set at 0.5 seconds for a GOP of 15 frames,to match a real-time encoding requirement of 30 framesper second.
The Standard Task Graph Set provides 3 graphsthat were generated from actual applications: ‘fpppp’,‘robot’, and ‘sparse’. This set also contains 2700 ran-domly generated graphs, grouped by the number ofnodes. Each group in this set consists of 180 differentgraphs. Since the results for differently sized graphs arecomparable, we only present the results for 50, 100,500, 1000, 2000, and 5000 nodes in this work. For boththe real application graphs and the groups of randomgraphs, the number of nodes and edges, the CPL, andthe sum of all node weights (total work) are listed inTable 2.
Since the Standard Task Graph Set does not providedeadlines, we use deadlines of 1.5, 2, 4, and 8 timesthe CPL when running at the maximum frequency of3.1 GHz. It also does not define the unit of the taskweights. Instead, the weights are given as integers in therange from 1 to 300. Therefore, two different scenariosare considered. In the first scenario, corresponding torather coarse-grain tasks, a weight of 1 in a task graphimplies an execution time of 3.1 · 106 cycles, which is 1millisecond when running at the maximum frequencyof 3.1GHz. In the second scenario, corresponding torelatively fine-grain tasks, the same weight implies anexecution time of 3.1 · 104 cycles, which at maximumfrequency takes 10 microseconds.
5.2 Results for the Standard Task Graph Set
Figures 10 and 11 depict the relative energy consump-tion for coarse grain and fine grain tasks, respectively.For each scenario, we show the energy consumptionfor deadlines of 1.5, 2, 4, and 8 times the CPL. Eachfigure shows the results of the four different approachesexplained in Section 4, as well as the theoretical limits.Throughout this section, S&S is used as the baselineagainst which we compare the other heuristics.
First we compare the energy consumption of theschedules produced by LAMPS to the energy consump-tion of the schedules generated by S&S. Figures 10and 11 show that LAMPS improves upon S&S mainlyfor less strict deadlines. This can be expected becausefor tight deadlines (1.5× the CPL), LAMPS requiresthe same or nearly the same number of processors asS&S to meet the deadline, and therefore consumes thesame or nearly the same amount of energy as S&S.In other words, if the deadline is tight, there is lessopportunity to turn off processors. For loose deadlines(8× the CPL), on the other hand, LAMPS consumessignificantly less energy than S&S, simply because itcan employ fewer processors. In this case LAMPS re-duces the total energy consumption by 45% on averagecompared to S&S with a maximum of 67%. For fine-grain tasks, depicted in Fig. 11, the relative differencesbetween S&S and LAMPS are the same as with coarse-grain tasks, since both heuristics do not shut downprocessors.
We now compare S&S+PS to S&S. Because S&Semploys a large number of processors, it consumes asignificant amount of static power. Therefore, S&S+PSimproves upon S&S significantly, by shutting down idleprocessors temporarily. The gains, in this case, are con-siderably larger for coarse-grain tasks (23% on averagewith a deadline of 2× the CPL) than for fine-graintasks (4% on average with a deadline of 2× the CPL),

Leakage-aware multiprocessor scheduling
Figure 10 Energyconsumption forcoarse-grain tasks.(a) Deadline = 1.5 × CPL.(b) Deadline = 2 × CPL.(c) Deadline = 4 × CPL.(d) Deadline = 8 × CPL.
LAMPS S&S+PS LAMPS+PS LIMIT-SF LIMIT-MF
50 100 500 1000 2000 2500 5000 fpppp robot sparse0%
20%
40%
60%
80%
100%
Rel
ativ
e en
ergy
con
sum
ptio
n
(a)
50 100 500 1000 2000 2500 5000 fpppp robot sparse0%
20%
40%
60%
80%
100%
Rel
ativ
e en
ergy
con
sum
ptio
n
(b)
50 100 500 1000 2000 2500 5000 fpppp robot sparse0%
20%
40%
60%
80%
100%
Rel
ativ
e en
ergy
con
sum
ptio
n
(c)
50 100 500 1000 2000 2500 5000 fpppp robot sparse0%
20%
40%
60%
80%
100%
Rel
ativ
e en
ergy
con
sum
ptio
n
(d)
because in the latter case the slack is often not largeenough to make shutdown beneficial.
LAMPS+PS improves upon LAMPS mostly forcoarse-grain tasks. Again, the main reason for this isthat for fine-grain tasks, the slack is often not largeenough to make shutting down worthwhile. Withcoarse grain tasks, however, a significant amount of
energy can be saved by shutting processors downtemporarily. The improvement of LAMPS+PS overLAMPS is typically less than the improvement ofS&S+PS over S&S. This is because in LAMPSthe static dissipation is already reduced by using asmaller number of processors compared to S&S. Forcoarse-grain tasks, the maximum improvements by
P. de Langen, B. Juurlink
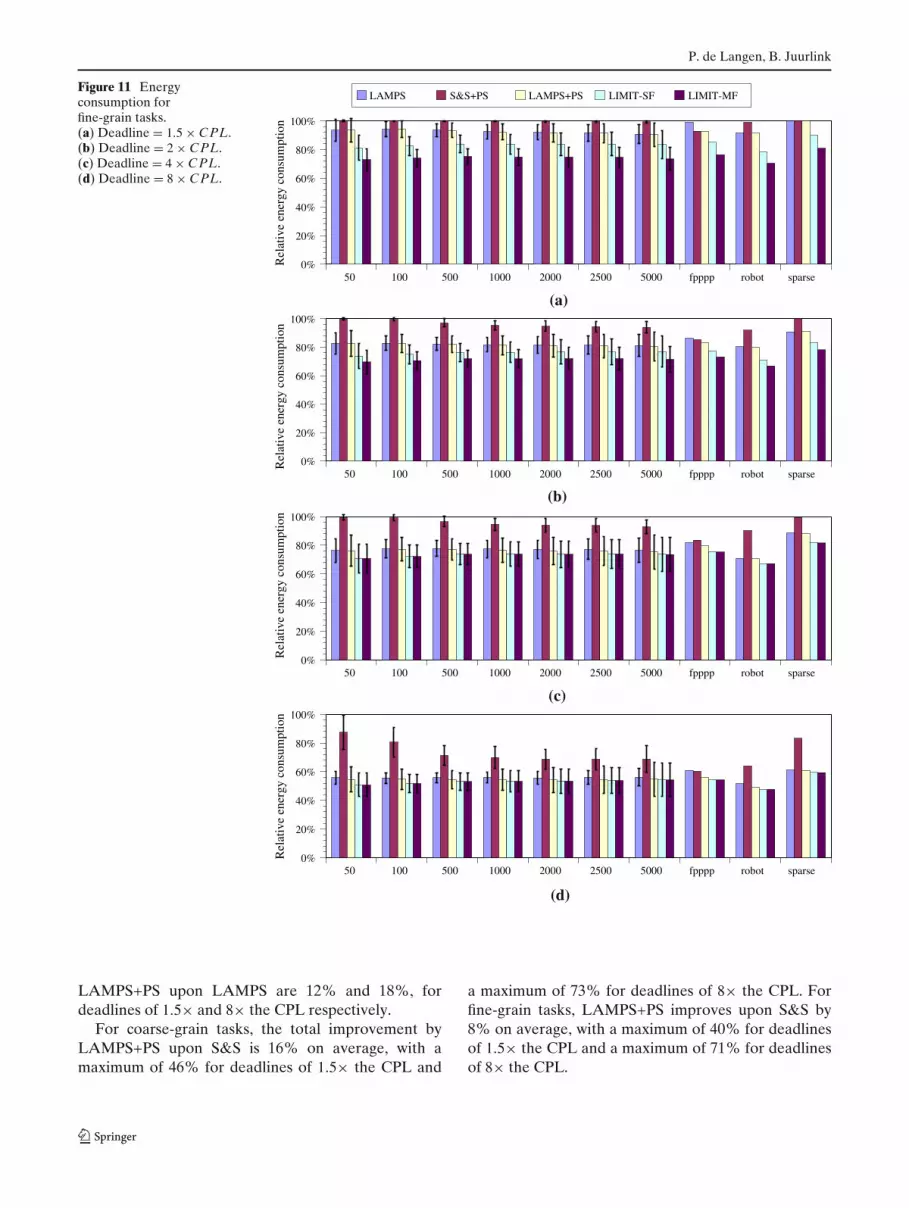
Figure 11 Energyconsumption forfine-grain tasks.(a) Deadline = 1.5 × CPL.(b) Deadline = 2 × CPL.(c) Deadline = 4 × CPL.(d) Deadline = 8 × CPL.
LAMPS S&S+PS LAMPS+PS LIMIT-SF LIMIT-MF
50 100 500 1000 2000 2500 5000 fpppp robot sparse0%
20%
40%
60%
80%
100%
Rel
ativ
e en
ergy
con
sum
ptio
n
(a)
50 100 500 1000 2000 2500 5000 fpppp robot sparse0%
20%
40%
60%
80%
100%
Rel
ativ
e en
ergy
con
sum
ptio
n
(b)
50 100 500 1000 2000 2500 5000 fpppp robot sparse0%
20%
40%
60%
80%
100%
Rel
ativ
e en
ergy
con
sum
ptio
n
(c)
50 100 500 1000 2000 2500 5000 fpppp robot sparse0%
20%
40%
60%
80%
100%
Rel
ativ
e en
ergy
con
sum
ptio
n
(d)
LAMPS+PS upon LAMPS are 12% and 18%, fordeadlines of 1.5× and 8× the CPL respectively.
For coarse-grain tasks, the total improvement byLAMPS+PS upon S&S is 16% on average, with amaximum of 46% for deadlines of 1.5× the CPL and
a maximum of 73% for deadlines of 8× the CPL. Forfine-grain tasks, LAMPS+PS improves upon S&S by8% on average, with a maximum of 40% for deadlinesof 1.5× the CPL and a maximum of 71% for deadlinesof 8× the CPL.
Leakage-aware multiprocessor scheduling
Figure 12 Energy/total workas a function of the averageamount of parallelism forcoarse-grain tasks. Each dotrepresents one task graph.
0 10 20 30 40 50parallelism
0.0015
0.002
0.0025
0.003
0.0035
ener
gy /
tota
l wor
k
S&S LAMPS S&S+PS LAMPS+PS LIMIT-MF
LIMIT-SF in Figs. 10 and 11 gives an upper limit onthe energy savings using our current single-frequencymodel. Using S&S as the baseline and LIMIT-SF as themaximum, it shows that LAMPS+PS attains more than94% of the possible energy reduction with coarse-graintasks, for all combinations of benchmarks and dead-lines. For fine-grain tasks and strict deadlines (1.5×the CPL), LAMPS+PS achieves more than 50% of thepotential savings on 54% of the benchmarks. With lessstrict deadlines, LAMPS+PS attains more than 88% ofthe possible savings on all benchmarks.
In Figs. 10 and 11, Limit-MF is an indication forthe possible improvements that could be attained byallowing the processors to run at a different frequency,and by allowing these frequencies to change over time.The results indicate that there is very little room forimprovements when the deadline is relatively loose.For stricter deadlines, some savings may be attained,but mostly for fine-grain tasks. In the case of fine-graintasks with strict deadlines, the periods of inactivity areoften too small to make shutting down worthwhile. Inthis case, allowing varying frequencies might result insome additional savings. However, when the deadline is
less strict and/or the task graph is fairly coarse-grained,shutting down processors becomes worthwhile. In thiscase, scheduling tasks at different frequencies will notprovide a significant improvement.
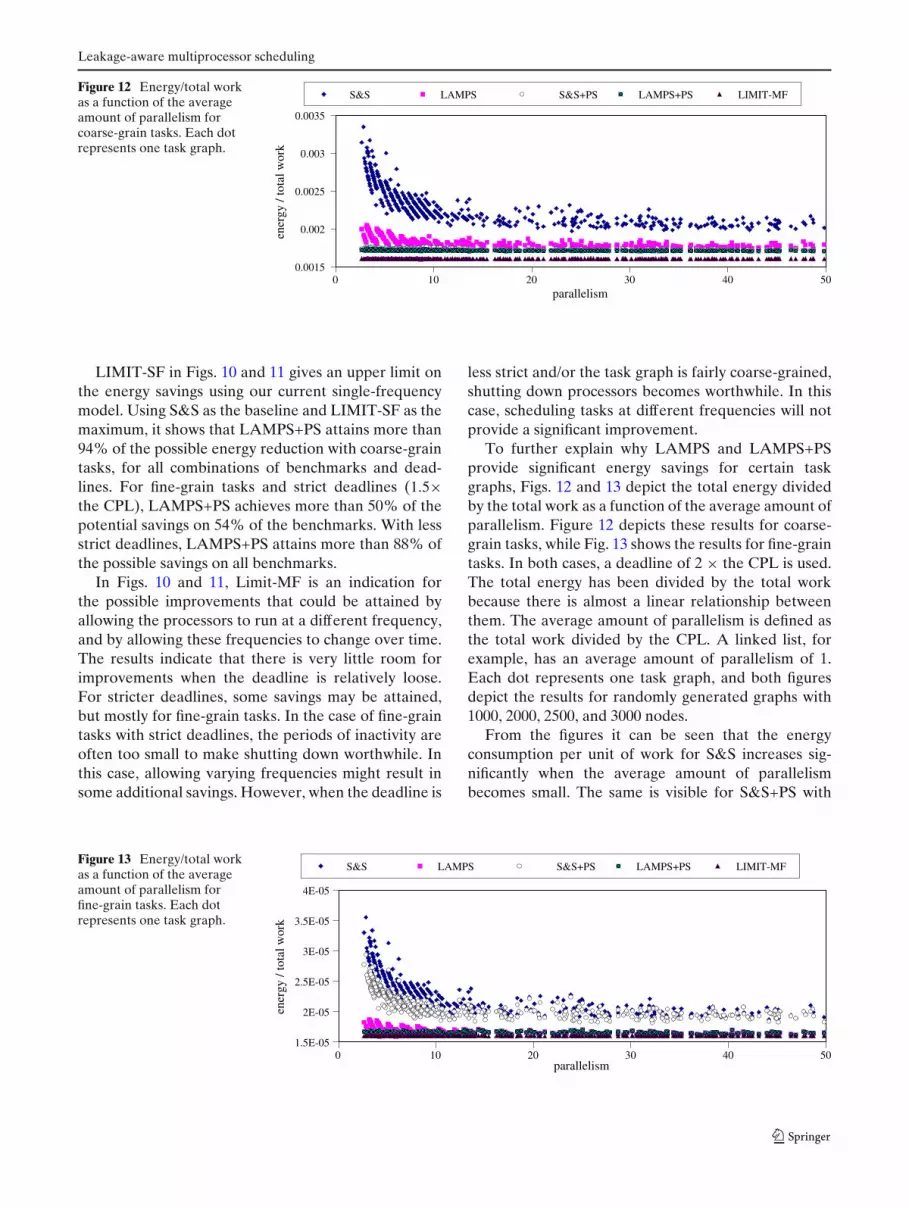
To further explain why LAMPS and LAMPS+PSprovide significant energy savings for certain taskgraphs, Figs. 12 and 13 depict the total energy dividedby the total work as a function of the average amount ofparallelism. Figure 12 depicts these results for coarse-grain tasks, while Fig. 13 shows the results for fine-graintasks. In both cases, a deadline of 2 × the CPL is used.The total energy has been divided by the total workbecause there is almost a linear relationship betweenthem. The average amount of parallelism is defined asthe total work divided by the CPL. A linked list, forexample, has an average amount of parallelism of 1.Each dot represents one task graph, and both figuresdepict the results for randomly generated graphs with1000, 2000, 2500, and 3000 nodes.
From the figures it can be seen that the energyconsumption per unit of work for S&S increases sig-nificantly when the average amount of parallelismbecomes small. The same is visible for S&S+PS with
Figure 13 Energy/total workas a function of the averageamount of parallelism forfine-grain tasks. Each dotrepresents one task graph.
0 10 20 30 40 50parallelism
1.5E-05
2E-05
2.5E-05
3E-05
3.5E-05
4E-05
ener
gy /
tota
l wor
k
S&S LAMPS S&S+PS LAMPS+PS LIMIT-MF

P. de Langen, B. Juurlink
Table 3 Energy consumptionfor the MPEG-1 benchmarkusing various approaches.
S&S LAMPS S&S+PS LAMPS+PS LIMIT-SF LIMIT-MF
Energy 18.116 13.290 10.949 10.947 10.940 10.940# of processors 7 3 7 6 N/A N/A
fine-grain tasks. This shows that especially when theaverage amount of parallelism is small, the energy con-sumption will increase when the option to shut downprocessors is not available or cannot be used effectively.The reason for this is that S&S will try to use as manyprocessors as possible, but when the parallelism is low,they will be idle but continue to consume energy. Forfine-grain tasks, the idle periods are often not longenough to save energy by shutting processors downtemporarily, which is why S&S+PS with fine-grain tasksconsumes significantly more energy than LAMPS andLAMPS+PS. For both LAMPS and LAMPS+PS, asmall amount of parallelism has no significant effecton the energy consumption per unit of work, as bothapproaches can decide to use fewer processors.
The clustered results in these figures, especially visi-ble when parallelism is low, are schedules that employthe same number of processors. For solutions with thesame number of processors, the energy consumptiondecreases as the average parallelism more closely ap-proaches the number of employed processors. Again,this effect is most clearly visible for S&S and S&S+PS,which employ as many processors as can effectively beused to exploit parallelism.
5.3 Results for MPEG-1
Figure 9 depicts the task graph for the MPEG-1 bench-mark. The results from experiments with this bench-mark are presented in Table 3. Similar to the previousexperiments, these numbers were obtained by schedul-ing the task graph using the heuristics described inSection 4 and by measuring the energy consumptionusing the models described in Section 3.
When S&S is used to schedule this graph, it em-ploys as many processors as can be used to reduce themakespan of the graph, which in this case is 7 proces-sors. LAMPS, on the other hand, determines that using3 processors is more efficient, and is hence able toreduce the energy consumption by more than 26%compared to S&S. S&S+PS also uses the maximumnumber of processors, but being able to shut processorsdown temporarily, it reduces the energy consumptionby almost 40% compared to S&S. LAMPS+PS reducesthe energy consumption by nearly the same amount asS&S+PS, albeit using 1 processor less. From this we
can conclude that the periods of slack in the sched-ule are long enough to offset the cost of using oneprocessor more. Furthermore, the results for S&S+PSand LAMPS+PS are extremely close to the lower limitsLIMIT-SF and LIMIT-MF. From this we can concludethat it will not be possible to further reduce the energyconsumption by using a different scheduling algorithmor by allowing processors to run at different and/orchanging frequencies.
6 Conclusions and Future Work
As feature sizes keep decreasing, the contribution ofleakage current to the total energy consumption isexpected to increase. Depending on the amount ofslack that remains before the deadline, the amountof parallelism, and the granularity of the application,voltage scaling as well as shutting down processors canbe used to reduce the energy significantly. At the sametime, it is important not to employ too many processors.
We have shown that our best approach, LAMPS+PS,reduces the energy consumption of a parallel MPEG-1implementation by almost 40% compared to S&S. Fora set of randomly generated task graphs, LAMPS+PSreduces the total energy consumption by up to 46% fortight deadlines and up to 73% for loose ones comparedto the S&S algorithm. For coarse-grain tasks and asingle frequency, LAMPS+PS attains more than 94%of the possible energy reduction, i.e., the energy reduc-tion achieved by LIMIT-SF compared to S&S. SinceLIMIT-SF is independent of the scheduling algorithm,this implies that there is almost no room left for im-provement by using other scheduling algorithms thanEDF.
Employing too many processors can significantly in-crease the total energy consumption, especially if theaverage amount of parallelism is low. When the amountof parallelism and the number of employed processorsare higher, using additional processors is relatively lesscostly.
Even when multiple frequencies are allowed,LAMPS+PS reduces the energy consumption close tothe theoretical limit (LIMIT-MF). For loose deadlines(4× or 8× the CPL), LIMIT-MF consumes the sameamount of energy as LIMIT-SF, and so LAMPS+PS

Leakage-aware multiprocessor scheduling
again attains over 94% of the potential savings withcoarse-grain tasks. As a result, it will be nearly im-possible to reduce the overall energy consumption fur-ther by using other scheduling algorithms that pro-duce schedules in which different processors can runat different frequencies and in which the frequencycan change over time. Applications consisting of rela-tively fine-grain tasks, on the other hand, might bene-fit from using other scheduling approaches. However,since LIMIT-MF does not take the deadline into ac-count, real scheduling approaches will probably notreach this limit. Consequently, the actual benefit fromhaving multiple frequencies will probably be much less.We have shown that having processors run at theirown frequency, as well as having this frequency changeover time, does not provide a significant improvement,especially with coarse-grain task graphs and a relaxeddeadline. For more fine-grain tasks and stricter dead-lines, some improvements might be attained by usingmultiple frequencies or by using other scheduling algo-rithms such as the algorithm that maximizes the slackproposed in [1] or the integrated approach describedin [18]. We intend to investigate the impact of thesetechniques on fine-grain task graphs in more detail infuture research.
Open Access This article is distributed under the terms of theCreative Commons Attribution Noncommercial License whichpermits any noncommercial use, distribution, and reproductionin any medium, provided the original author(s) and source arecredited.
References
1. Zhu, D., Melhem, R., & Childers, B. (2003). Scheduling withdynamic voltage/speed adjustment using slack reclamationin multiprocessor real-time systems. IEEE Transactions onParallel and Distributed Systems, 14(7), 686–700.
2. de Langen, P. J., & Juurlink, B. (2006). Leakage-aware multi-processor scheduling for low power. In Proc. Int. Parallel andDistributed Processing Symp.
3. de Langen, P. J., & Juurlink, B. (2007). Trade-offs be-tween voltage scaling and processor shutdown for low-energyembedded multiprocessors. In Proc. Int. Workshop onComputer Systems: Architectures, Modelling, and Simulation(pp. 75–85).
4. ARM Ltd (2008). ARM11 MPCore. http://www.arm.com/products/CPUs/ARM11MPCoreMultiprocessor.html.
5. Hofstee, H. (2005). Power efficient processor architectureand the cell processor. In Proc. Int. Symp. on High-Performance Computer Architecture (pp. 258–262).
6. Borkar, S. (1999). Design challenges of technology scaling.IEEE Micro, 19(4), 23–29.
7. Duarte, D., Vijaykrishnan, N., Irwin, M., & Tsai, Y. (2002).Impact of technology scaling and packaging on dynamicvoltage scaling techniques. In Proc. IEEE Int. ASIC/SOCConf.
8. Burd, T. D., & Brodersen, R. W. (1995). Energy efficientCMOS microprocessor design. In Proc. Hawaii Int. Conf. onSystem Sciences (pp. 288–297).
9. Pering, T., & Broderson, R. (1998). Dynamic voltage scalingand the design of a low-power microprocessor system. InProceedings of the Power Driven Microarchitecture Work-shop, attached to ISCA98.
10. Intel Corp. Intel XScale Technology. http://www.intel.com/design/intelxscale/.
11. Jha, N. (2005). Low-power system scheduling, synthesis anddisplays. IEE Proceedings on Computers and Digital Tech-niques, 152(3), 344–352.
12. Gruian, F., & Kuchcinski, K. (2001). LEneS: Task schedulingfor low-energy systems using variable supply voltage proces-sors. In Proc. Conf. on Asia South Pacific Design Automation(pp. 449–455).
13. Jejurikar, R., Pereira, C., & Gupta, R. (2004). Leakage awaredynamic voltage scaling for real-time embedded systems.In Proc. Conf. on Design Automation (pp. 275–280).
14. Quan, G., Niu, L., Hu, X. S., & Mochocki, B. (2004). Fixedpriority scheduling for reducing overall energy on variablevoltage processors. In Proc. Int. Real-Time System Sympo-sium (pp. 309–318).
15. Lee, Y., Reddy, K., & Krishna, C. (2003). Scheduling tech-niques for reducing leakage power in hard real-time sys-tems. In Proc. Euromicro Conf. on Real-Time Systems(pp. 105–112).
16. Irani, S., Shukla, S., & Gupta, R. (2003). Algorithms forpower savings. In Proc. ACM-SIAM Symp. on Discrete Al-gorithms (pp. 37–46).
17. Zhang, Y., Hu, X. S., & Chen, D. Z. (2002). Task schedulingand voltage selection for energy minimization. In Proc. Conf.on Design Automation (pp. 183–188).
18. Kianzad, V., Bhattacharyya, S. S., & Qu, G. (2005).CASPER: An integrated energy-driven approach for taskgraph scheduling on distributed embedded systems. In Proc.IEEE Int. Conf. on Application-Specific Systems, ArchitectureProcessors (pp. 191–197).
19. Varatkar, G., & Marculescu, R. (2003). Communication-aware task scheduling and voltage selection for total systemsenergy minimization. In Proc. Int. Conf. on Computer-AidedDesign (pp.510–517).
20. Gonzalez, R., Gordon, B., & Horowitz, M. (1997). Supplyand threshold voltage scaling for low power CMOS. IEEEJournal of Solid-State Circuits, 32(8), 1210–1216.
21. Martin, S., Flautner, K., Mudge, T., & Blaauw, D. (2002).Combined dynamic voltage scaling and adaptive body biasingfor lower power microprocessors under dynamic workloads.In Proc. Int. Conf. on Computer-Aided Design (pp. 721–725).
22. Andrei, A., Schmitz, M., Eles, P., Peng, Z., & Al-Hashimi,B. M. (2004). Overhead-conscious voltage selection fordynamic and leakage energy reduction of time-constrainedsystems. In Proc. Conf. on Design, Automation and Test inEurope (pp. 518–525).
23. Yan, L., Luo, J., & Jha, N. K. (2003). Combined dynamicvoltage scaling and adaptive body biasing for heterogeneousdistributed real-time embedded systems. In Proc. Int. Conf.on Computer-Aided Design (pp. 30–37).
24. Xu, R., Zhu, D., Rusu, C., Melhem, R., & Mossé, D. (2005).Energy-efficient policies for embedded clusters. In Proc.ACM SIGPLAN/SIGBED Conf. on Languages, Compilers,and Tools for Embedded Systems (pp. 1–10).

P. de Langen, B. Juurlink
25. Liberato, F., Lauzac, S., Melhem, R., & Mossé, D. (1999).Fault tolerant real-time global scheduling on multipro-cessors. In Proc. Euromicro Conf. on Real-Time Systems(pp. 252–259).
26. Kahn, G. (1974). The semantics of a simple language forparallel programming. Information Processing, 74, 471–475.
27. Kasahara, H., Tobita, T., Matsuzawa, T., & Sakaida, S.(2008). Standard task graph set. http://www.kasahara.elec.waseda.ac.jp/schedule/.
Pepijn de Langen was born in Groningen, the Netherlands,in 1976. He received the M.Sc. degree in electrical engineeringfrom Delft University of Technology in 2003. He is currentlyat the final stage of his Ph.D. in the Computer EngineeringLaboratory at Delft University of Technology. His research in-
terests include advanced computer architectures, memory sys-tems, hardware/software co-design, and techniques for reducingpower consumption.
Ben Juurlink is an associate professor in the ComputerEngineering Laboratory of the Faculty of Electrical Engineer-ing, Mathematics, and Computer Science at Delft Universityof Technology, the Netherlands. He received the MSc degreein computer science, from Utrecht University, Utrecht, theNetherlands, in 1992, and the Ph.D. degree also in computerscience from Leiden University, Leiden, the Netherlands, in 1997.His research interests include instruction-level parallel proces-sors, application-specific ISA extensions, low power techniques,and hierarchical memory systems. He has (co-)authored morethan 50 papers in international conferences and journals andis a senior member of the IEEE, a member of the ACM, and amember of the HiPEAC Network of Excellence.


