Embed Size (px)
Citation preview
1SLVAEB5–May 2019Submit Documentation Feedback
Copyright © 2019, Texas Instruments Incorporated
LED Temperature Protection by Vf Monitoring
Application ReportSLVAEB5–May 2019
LED Temperature Protection by Vf Monitoring
Florent Muret, Olivier Mellin
ABSTRACTLEDs are often driven in current. As temperature increases, LEDs are gradually driven with less current tosave them from premature aging and protect them from thermal damage. This regulation often requiresexternal sensors while the forward voltage of LEDs (Vf) varies with temperature monotonically. Moreover,similarly to PN junctions in processors, Vf is a better image of the LED temperature as there is no thermalinertia or thermal resistance that comes into play. Modern LED drivers like the TPS929120-Q1 monitorLED Vf to diagnose faults like open/short. This application report shows that it is possible to use thisforward voltage to monitor the temperature with accuracy and perform thermal foldback without anexternal sensor or a conditioning circuit. This application report also provides an application example ofhow to use this solution with a next generation LED driver, the TPS929120-Q1, and explains how it ispossible.
Contents1 Introduction ................................................................................................................... 22 Challenges in Today's Design ............................................................................................. 23 Using LED Forward Voltage as a Sensor ................................................................................ 34 Vf vs Temperature .......................................................................................................... 55 Global Process ............................................................................................................... 86 LED Aging Effect on the Forward Voltage................................................................................ 87 Using Vf as a Temperature Sensor with TPS929120-Q1 ............................................................. 98 How to Program MCU to Perform Thermal Foldback Using Vf ...................................................... 129 Conclusion .................................................................................................................. 16
List of Figures
1 Basic Process in Automotive Lighting for LED Temperature Protection ............................................. 22 Derating Curve Current in LED vs Temperature ........................................................................ 33 Monitoring the Full LED String ............................................................................................ 34 Monitoring One LED......................................................................................................... 35 Relative Forward Voltage vs Junction Temperature .................................................................... 56 Forward Current vs Forward Voltage (Red)2 ............................................................................. 57 Relative Forward Voltage vs Junction Temperature at Different Currents ........................................... 68 Coefficient a Slope .......................................................................................................... 69 Coefficient b Slope .......................................................................................................... 610 Coefficient c Slope........................................................................................................... 611 Relative Forward Voltage vs Temperature .............................................................................. 712 Relative Forward Voltage vs Temperature with Different Duty Cycle - 200 mA Peak Current .................... 813 Vf vs Temperature-aged LED ............................................................................................. 914 Aged LED ΔVf Error Compared to a Reference ......................................................................... 915 TPS929120-Q1 One Channel, Amplifier, and Resistor Saving While Using LED Vf.............................. 1016 Temperature Calculated with Vf Compared to an Accurate Sensor Reference ................................... 1117 Simulation NTC Slope with 5 V Regulated Voltage and Resistor Divider Bridge.................................. 1218 Slope 1 kΩ Resistor........................................................................................................ 12
Introduction www.ti.com
2 SLVAEB5–May 2019Submit Documentation Feedback
Copyright © 2019, Texas Instruments Incorporated
LED Temperature Protection by Vf Monitoring
19 Slope 10 kΩ Resistor ...................................................................................................... 1220 Basic Process: Proof of Concept with a Microcontroller ............................................................. 1321 MSP430 Code Routine Steps for Thermal Derating................................................................... 1322 Error Evolution Compared to the TMP107 Over Time ................................................................ 1523 Error Evolution Compared to the TMP107 Over Time ................................................................ 15
List of Tables
1 Precision Table Depending on the ADC on a Range of 25°C–100°C for a Typical Red LED .................... 42 Result for 75 mA Drive with a 10 LED String on TPS929120........................................................ 113 Components Used for Simulation ....................................................................................... 11
TrademarksAll trademarks are the property of their respective owners.
1 IntroductionAs the LED forward voltage decreases monotonically while temperature increases, instead of using anexternal sensor, this application report proposes a way of using this forward voltage in order to sense thetemperature and protect those LEDs from being damaged at high temperatures. The main advantage ofthis method is that it permits removing the temperature sensor on the LED board as well as itsconditioning circuit, which can be significant in terms of cost and size. Moreover, the forward voltage givesan exact image of the temperature inside the LED unlike an NTC, which senses the board temperature.
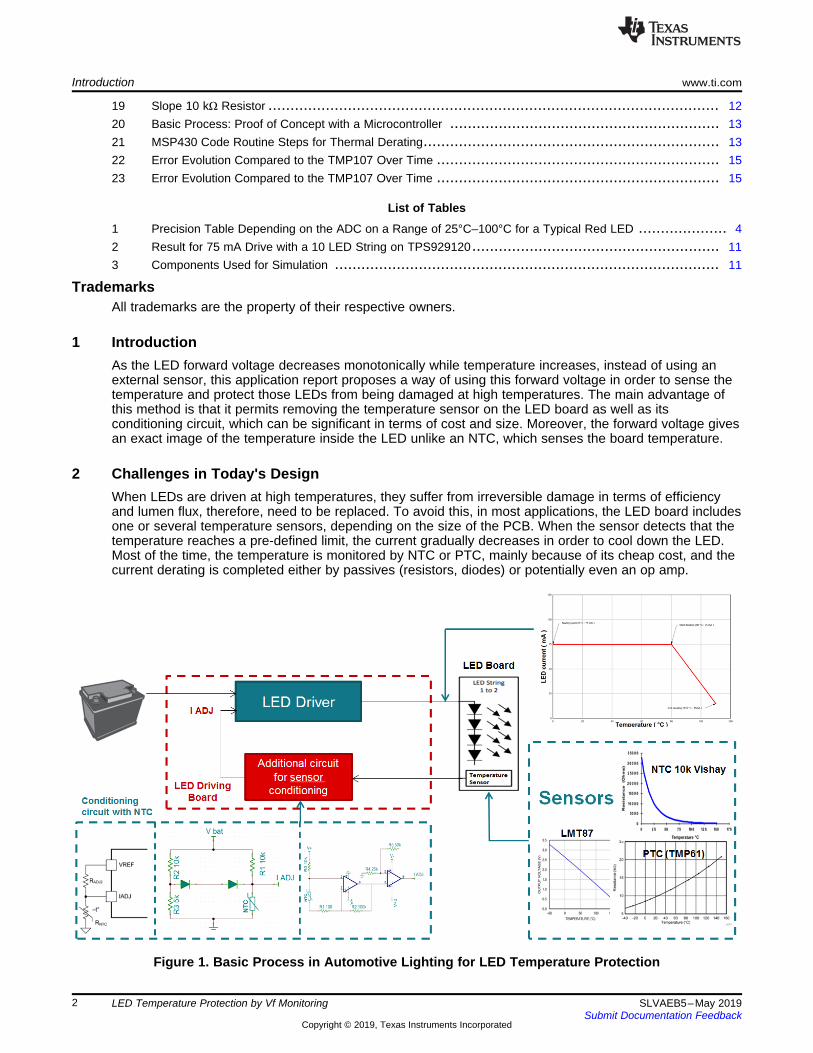
2 Challenges in Today's DesignWhen LEDs are driven at high temperatures, they suffer from irreversible damage in terms of efficiencyand lumen flux, therefore, need to be replaced. To avoid this, in most applications, the LED board includesone or several temperature sensors, depending on the size of the PCB. When the sensor detects that thetemperature reaches a pre-defined limit, the current gradually decreases in order to cool down the LED.Most of the time, the temperature is monitored by NTC or PTC, mainly because of its cheap cost, and thecurrent derating is completed either by passives (resistors, diodes) or potentially even an op amp.
Figure 1. Basic Process in Automotive Lighting for LED Temperature Protection
www.ti.com Challenges in Today's Design
3SLVAEB5–May 2019Submit Documentation Feedback
Copyright © 2019, Texas Instruments Incorporated
LED Temperature Protection by Vf Monitoring
The thermal foldback (reduction of the LED current from a certain temperature) can be designed withdiscrete components biasing the Iset PIN voltage of a LED driver (the Iset pin regulates the outputcurrent), but it requires at least an operational amplifier and some resistors in order to linearize the slope.Moreover, sometimes the manufacturer requires a second operational amplifier to increase the deratingslope. The thermal foldback can be performed using an ADC combined with the PWM dimming todecrease the LED current.
2.1 The Main Characteristics of the Thermal Foldback CurveThe typical foldback curve is characterized by three points which are each described by a current and atemperature per Figure 2:• Starting point: The nominal current flowing into the LED before the trigger of the thermal foldback. At
this temperature, the LED protection starts.• Start derating: The current value before it starts to decrease. At this temperature, the thermal foldback
starts.• End derating: This is the final current value. At this temperature, the current reduction is stopped.
Figure 2 provides a quick overview about the regulation slope which sums up those parameters.
Figure 2. Derating Curve Current in LED vs Temperature
Today's temperature sensing is mostly done using NTC or PTC. They both have their own accuracy whichare typically ±2.5°C for PTC and between ±0.5% and ±5% for NTC. In addition, they measure the ambientor PCB temperature rather than the internal LED temperature, which the Vf does naturally.
In any case, there is a need for a temperature sensor and all the extra components needed to fulfill thecircuit requirements: resistor, diode, and amplifier. Moreover, it adds extra engineering time. The designchallenge is to reduce the cost and the size of the board as much as possible. This application reportprovides a guide about how to use the LED Vf as a temperature sensor and its drawback.
3 Using LED Forward Voltage as a SensorThe LED forward voltage can be used in analog using a threshold with an amplifier and resistor. Due tothe non-linearity of the slope, it may be easier for the processing to use an ADC to sample the Vf value.There are two ways to connect the ADC:
Using LED Forward Voltage as a Sensor www.ti.com
4 SLVAEB5–May 2019Submit Documentation Feedback
Copyright © 2019, Texas Instruments Incorporated
LED Temperature Protection by Vf Monitoring
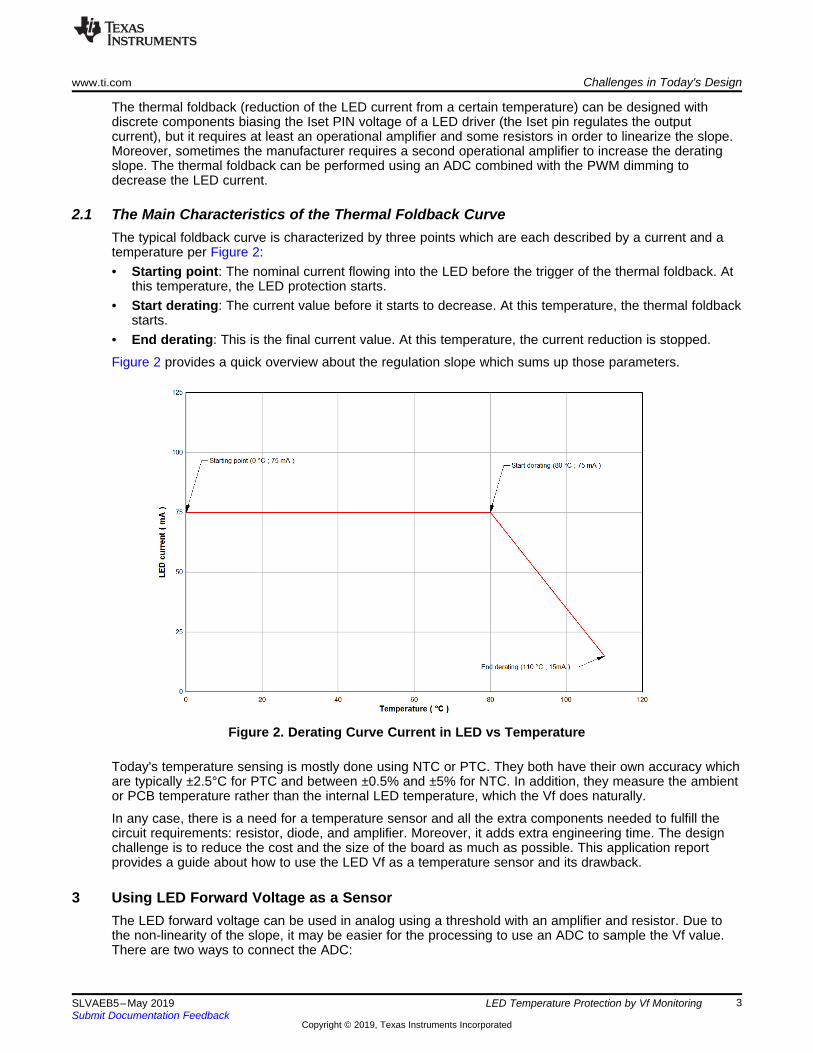
Figure 3. Monitoring the Full LED String Figure 4. Monitoring One LED
• Monitoring the full LED string: It allows an image of the temperature in the LED string by creating anaverage of all the LEDs forward voltage. The additional benefits are that the ADC input range isoptimized (for high Vref ADC) and faults diagnostic can be completed similar to the TPS929120-Q1(single LED short, short to the ground, short to bat, and so forth). Nevertheless, if one LED gets hotterthan the others on the string, it cannot be detected.
• Monitoring one LED per string: It permits to have a perfect image of the temperature on one LED,but if there is one part of the string that is damaged, it cannot be detected, but the averaging and theLED string diagnostic are lost.
The critical parameters of the ADC are then the input range and the effective resolution. While monitoringa string of LED, the ADC range has to be as close as possible to the maximum voltage of the LED strings(at the lowest temperature).
Depending on the LED drive, the Vf can change with temperature from a few mV to hundreds of mV onthe range of 25°C–100°C for a red LED. This voltage variation is even bigger for green and blue LEDs,which makes the measurement more accurate.
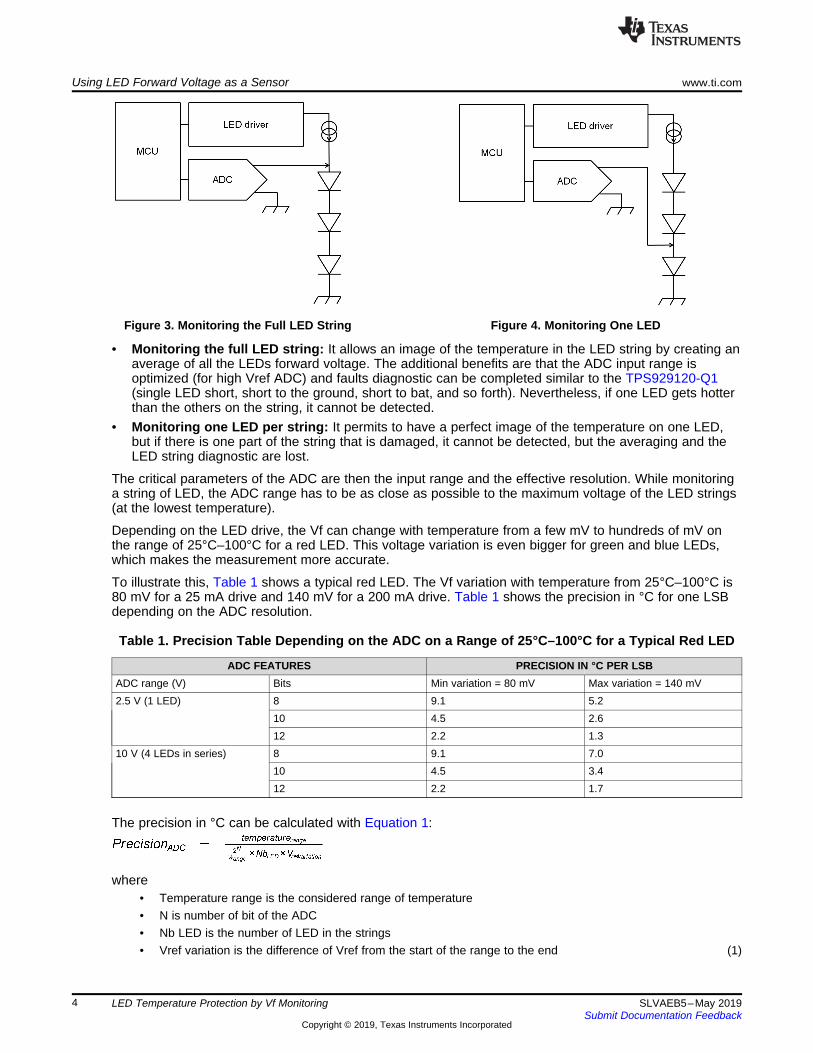
To illustrate this, Table 1 shows a typical red LED. The Vf variation with temperature from 25°C–100°C is80 mV for a 25 mA drive and 140 mV for a 200 mA drive. Table 1 shows the precision in °C for one LSBdepending on the ADC resolution.
Table 1. Precision Table Depending on the ADC on a Range of 25°C–100°C for a Typical Red LED
ADC FEATURES PRECISION IN °C PER LSBADC range (V) Bits Min variation = 80 mV Max variation = 140 mV2.5 V (1 LED) 8 9.1 5.2
10 4.5 2.612 2.2 1.3
10 V (4 LEDs in series) 8 9.1 7.010 4.5 3.412 2.2 1.7
The precision in °C can be calculated with Equation 1:
where• Temperature range is the considered range of temperature• N is number of bit of the ADC• Nb LED is the number of LED in the strings• Vref variation is the difference of Vref from the start of the range to the end (1)
www.ti.com Vf vs Temperature
5SLVAEB5–May 2019Submit Documentation Feedback
Copyright © 2019, Texas Instruments Incorporated
LED Temperature Protection by Vf Monitoring
Later, this application report uses a 12-bit ADC with a 2.5-V Vref and an 8-bit ADC with a 20.5 V Vref tocompare the results.
4 Vf vs TemperatureBeyond temperature, LED forward voltage mainly depends on three parameters:• Aging: If aging affects the Vf, the delta Vf vs. temperature slope remains the same. See Section 6 for
more details.• Input current: The higher the current flowing into the LED is, the higher the forward voltage across the
junction is.• PWM: When using PWM current instead of linear current, the Vf variation is higher and the linearity is
affected.
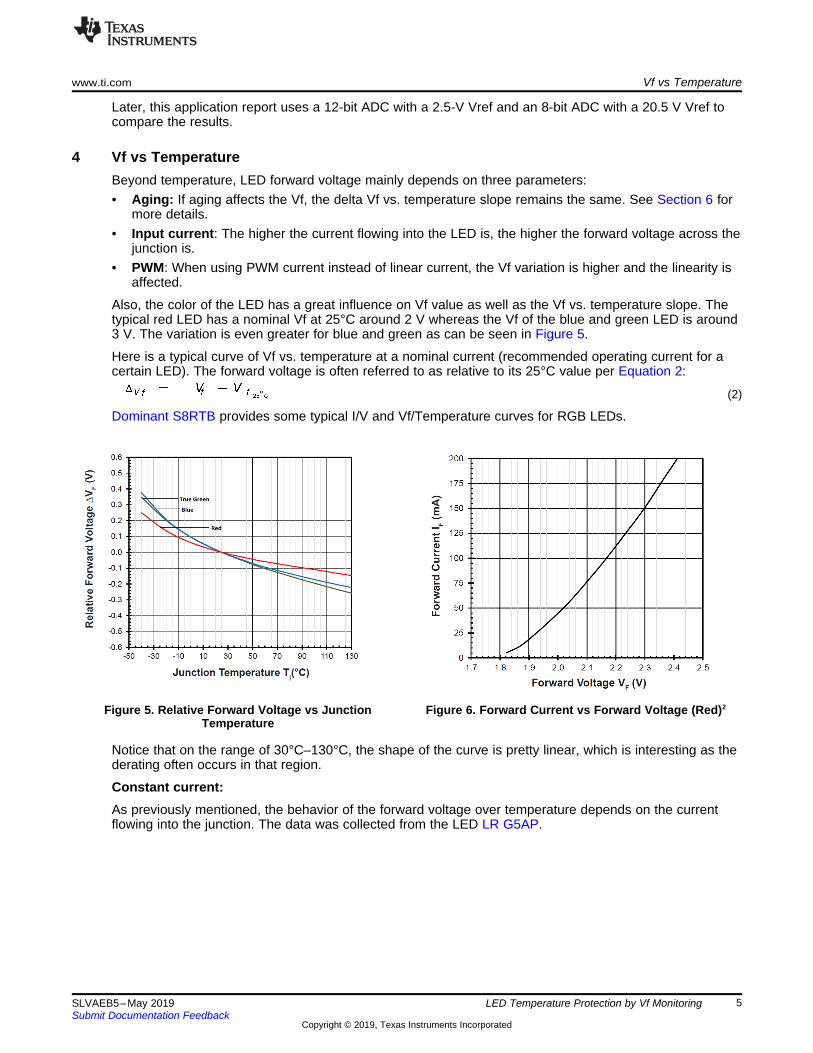
Also, the color of the LED has a great influence on Vf value as well as the Vf vs. temperature slope. Thetypical red LED has a nominal Vf at 25°C around 2 V whereas the Vf of the blue and green LED is around3 V. The variation is even greater for blue and green as can be seen in Figure 5.
Here is a typical curve of Vf vs. temperature at a nominal current (recommended operating current for acertain LED). The forward voltage is often referred to as relative to its 25°C value per Equation 2:
(2)
Dominant S8RTB provides some typical I/V and Vf/Temperature curves for RGB LEDs.
Figure 5. Relative Forward Voltage vs JunctionTemperature
Figure 6. Forward Current vs Forward Voltage (Red)2
Notice that on the range of 30°C–130°C, the shape of the curve is pretty linear, which is interesting as thederating often occurs in that region.
Constant current:As previously mentioned, the behavior of the forward voltage over temperature depends on the currentflowing into the junction. The data was collected from the LED LR G5AP.
Vf vs Temperature www.ti.com
6 SLVAEB5–May 2019Submit Documentation Feedback
Copyright © 2019, Texas Instruments Incorporated
LED Temperature Protection by Vf Monitoring
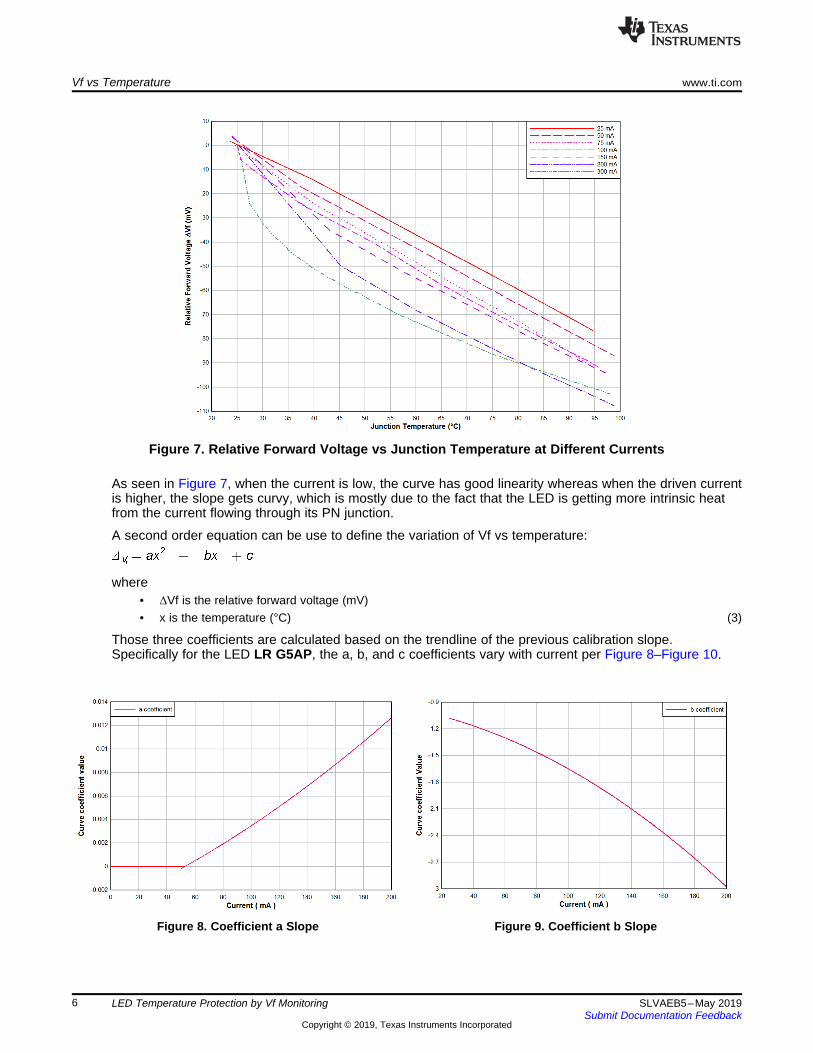
Figure 7. Relative Forward Voltage vs Junction Temperature at Different Currents
As seen in Figure 7, when the current is low, the curve has good linearity whereas when the driven currentis higher, the slope gets curvy, which is mostly due to the fact that the LED is getting more intrinsic heatfrom the current flowing through its PN junction.
A second order equation can be use to define the variation of Vf vs temperature:
where• ΔVf is the relative forward voltage (mV)• x is the temperature (°C) (3)
Those three coefficients are calculated based on the trendline of the previous calibration slope.Specifically for the LED LR G5AP, the a, b, and c coefficients vary with current per Figure 8–Figure 10.
Figure 8. Coefficient a Slope Figure 9. Coefficient b Slope
www.ti.com Vf vs Temperature
7SLVAEB5–May 2019Submit Documentation Feedback
Copyright © 2019, Texas Instruments Incorporated
LED Temperature Protection by Vf Monitoring
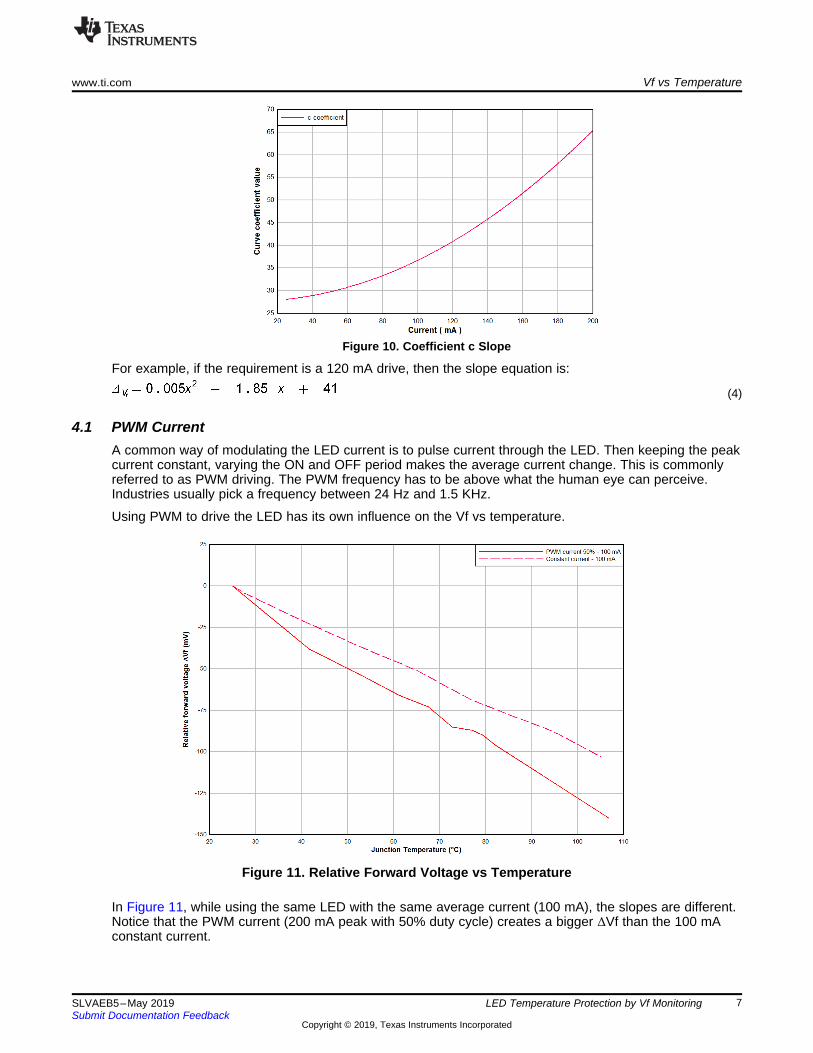
Figure 10. Coefficient c Slope
For example, if the requirement is a 120 mA drive, then the slope equation is:
(4)
4.1 PWM CurrentA common way of modulating the LED current is to pulse current through the LED. Then keeping the peakcurrent constant, varying the ON and OFF period makes the average current change. This is commonlyreferred to as PWM driving. The PWM frequency has to be above what the human eye can perceive.Industries usually pick a frequency between 24 Hz and 1.5 KHz.
Using PWM to drive the LED has its own influence on the Vf vs temperature.
Figure 11. Relative Forward Voltage vs Temperature
In Figure 11, while using the same LED with the same average current (100 mA), the slopes are different.Notice that the PWM current (200 mA peak with 50% duty cycle) creates a bigger ΔVf than the 100 mAconstant current.
Global Process www.ti.com
8 SLVAEB5–May 2019Submit Documentation Feedback
Copyright © 2019, Texas Instruments Incorporated
LED Temperature Protection by Vf Monitoring
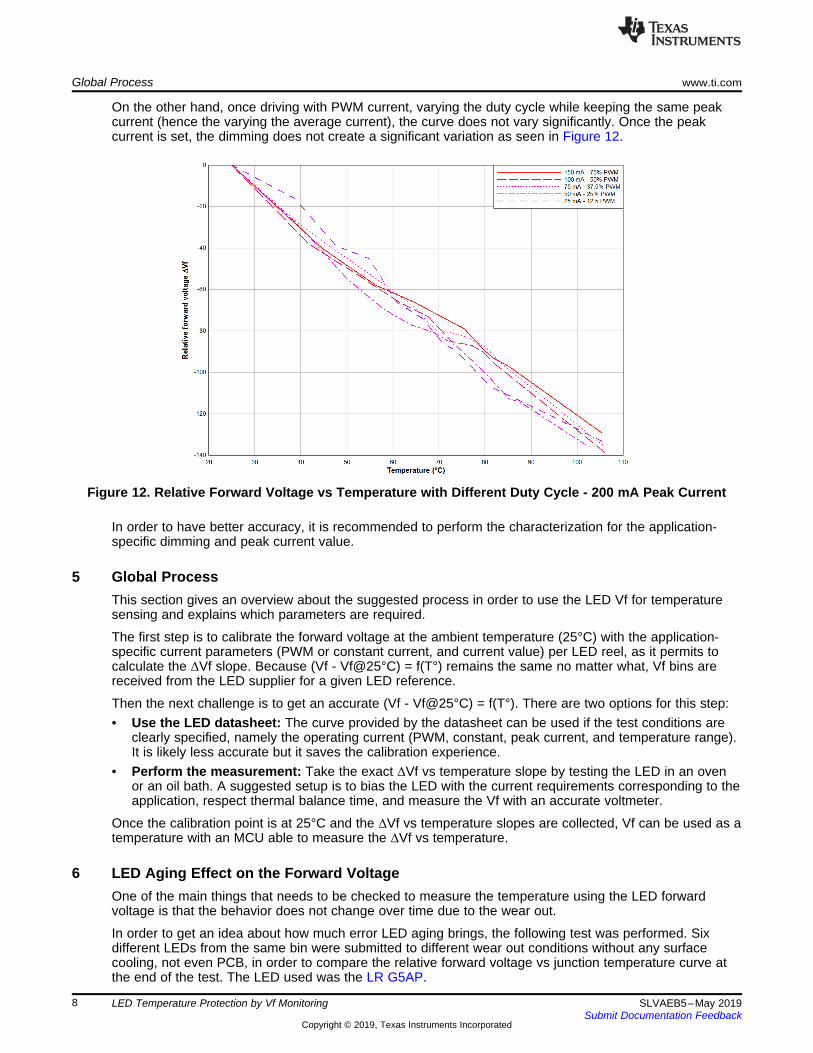
On the other hand, once driving with PWM current, varying the duty cycle while keeping the same peakcurrent (hence the varying the average current), the curve does not vary significantly. Once the peakcurrent is set, the dimming does not create a significant variation as seen in Figure 12.
Figure 12. Relative Forward Voltage vs Temperature with Different Duty Cycle - 200 mA Peak Current
In order to have better accuracy, it is recommended to perform the characterization for the application-specific dimming and peak current value.
5 Global ProcessThis section gives an overview about the suggested process in order to use the LED Vf for temperaturesensing and explains which parameters are required.
The first step is to calibrate the forward voltage at the ambient temperature (25°C) with the application-specific current parameters (PWM or constant current, and current value) per LED reel, as it permits tocalculate the ΔVf slope. Because (Vf - Vf@25°C) = f(T°) remains the same no matter what, Vf bins arereceived from the LED supplier for a given LED reference.
Then the next challenge is to get an accurate (Vf - Vf@25°C) = f(T°). There are two options for this step:• Use the LED datasheet: The curve provided by the datasheet can be used if the test conditions are
clearly specified, namely the operating current (PWM, constant, peak current, and temperature range).It is likely less accurate but it saves the calibration experience.
• Perform the measurement: Take the exact ΔVf vs temperature slope by testing the LED in an ovenor an oil bath. A suggested setup is to bias the LED with the current requirements corresponding to theapplication, respect thermal balance time, and measure the Vf with an accurate voltmeter.
Once the calibration point is at 25°C and the ΔVf vs temperature slopes are collected, Vf can be used as atemperature with an MCU able to measure the ΔVf vs temperature.
6 LED Aging Effect on the Forward VoltageOne of the main things that needs to be checked to measure the temperature using the LED forwardvoltage is that the behavior does not change over time due to the wear out.
In order to get an idea about how much error LED aging brings, the following test was performed. Sixdifferent LEDs from the same bin were submitted to different wear out conditions without any surfacecooling, not even PCB, in order to compare the relative forward voltage vs junction temperature curve atthe end of the test. The LED used was the LR G5AP.
www.ti.com Using Vf as a Temperature Sensor with TPS929120-Q1
9SLVAEB5–May 2019Submit Documentation Feedback
Copyright © 2019, Texas Instruments Incorporated
LED Temperature Protection by Vf Monitoring
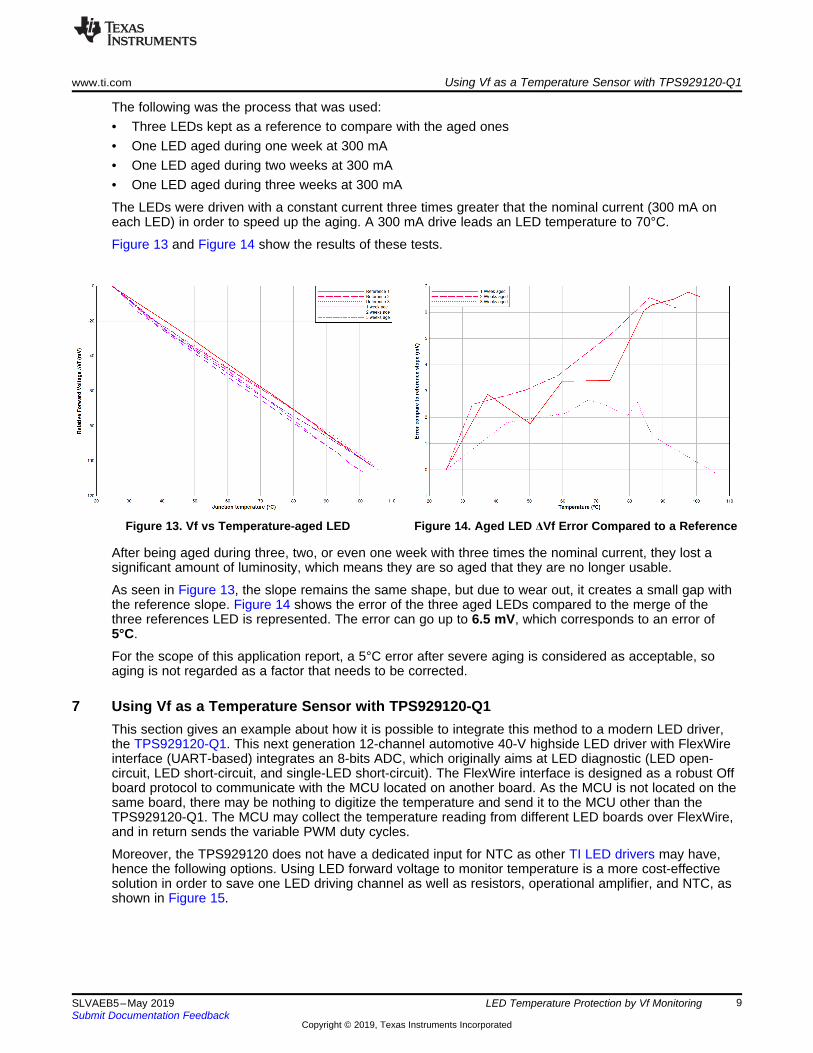
The following was the process that was used:• Three LEDs kept as a reference to compare with the aged ones• One LED aged during one week at 300 mA• One LED aged during two weeks at 300 mA• One LED aged during three weeks at 300 mA
The LEDs were driven with a constant current three times greater that the nominal current (300 mA oneach LED) in order to speed up the aging. A 300 mA drive leads an LED temperature to 70°C.
Figure 13 and Figure 14 show the results of these tests.
Figure 13. Vf vs Temperature-aged LED Figure 14. Aged LED ΔVf Error Compared to a Reference
After being aged during three, two, or even one week with three times the nominal current, they lost asignificant amount of luminosity, which means they are so aged that they are no longer usable.
As seen in Figure 13, the slope remains the same shape, but due to wear out, it creates a small gap withthe reference slope. Figure 14 shows the error of the three aged LEDs compared to the merge of thethree references LED is represented. The error can go up to 6.5 mV, which corresponds to an error of5°C.
For the scope of this application report, a 5°C error after severe aging is considered as acceptable, soaging is not regarded as a factor that needs to be corrected.
7 Using Vf as a Temperature Sensor with TPS929120-Q1This section gives an example about how it is possible to integrate this method to a modern LED driver,the TPS929120-Q1. This next generation 12-channel automotive 40-V highside LED driver with FlexWireinterface (UART-based) integrates an 8-bits ADC, which originally aims at LED diagnostic (LED open-circuit, LED short-circuit, and single-LED short-circuit). The FlexWire interface is designed as a robust Offboard protocol to communicate with the MCU located on another board. As the MCU is not located on thesame board, there may be nothing to digitize the temperature and send it to the MCU other than theTPS929120-Q1. The MCU may collect the temperature reading from different LED boards over FlexWire,and in return sends the variable PWM duty cycles.
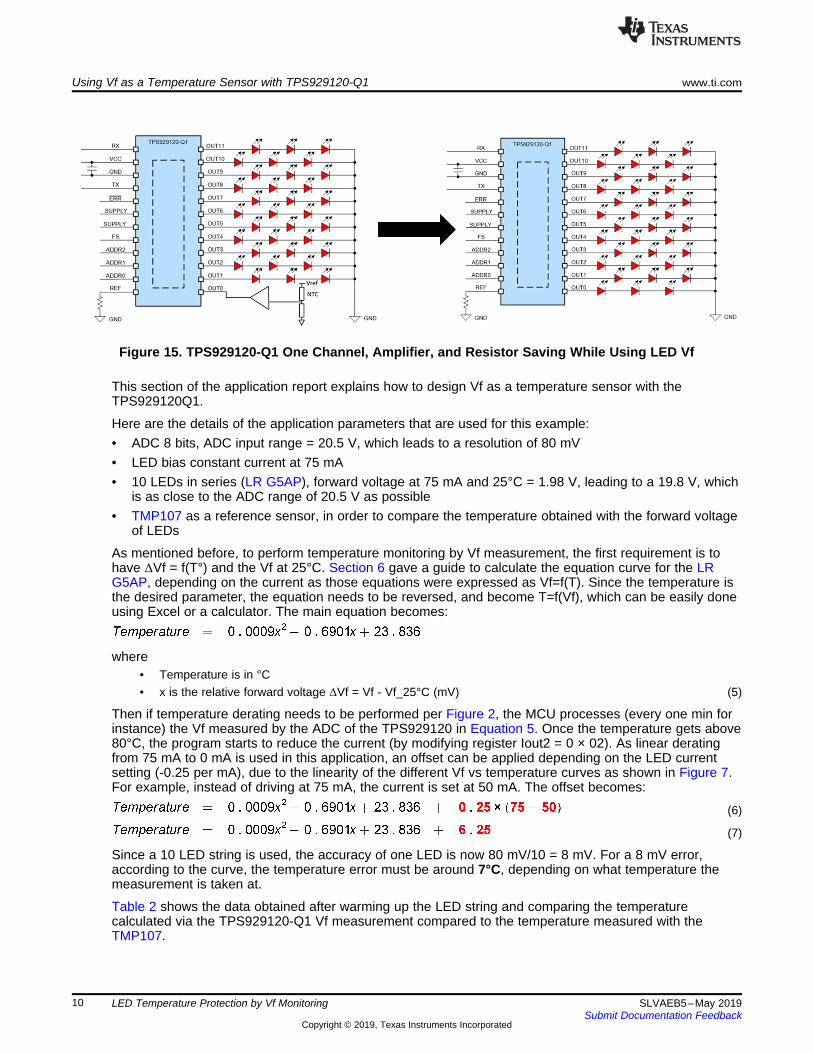
Moreover, the TPS929120 does not have a dedicated input for NTC as other TI LED drivers may have,hence the following options. Using LED forward voltage to monitor temperature is a more cost-effectivesolution in order to save one LED driving channel as well as resistors, operational amplifier, and NTC, asshown in Figure 15.
Using Vf as a Temperature Sensor with TPS929120-Q1 www.ti.com
10 SLVAEB5–May 2019Submit Documentation Feedback
Copyright © 2019, Texas Instruments Incorporated
LED Temperature Protection by Vf Monitoring
Figure 15. TPS929120-Q1 One Channel, Amplifier, and Resistor Saving While Using LED Vf
This section of the application report explains how to design Vf as a temperature sensor with theTPS929120Q1.
Here are the details of the application parameters that are used for this example:• ADC 8 bits, ADC input range = 20.5 V, which leads to a resolution of 80 mV• LED bias constant current at 75 mA• 10 LEDs in series (LR G5AP), forward voltage at 75 mA and 25°C = 1.98 V, leading to a 19.8 V, which
is as close to the ADC range of 20.5 V as possible• TMP107 as a reference sensor, in order to compare the temperature obtained with the forward voltage
of LEDs
As mentioned before, to perform temperature monitoring by Vf measurement, the first requirement is tohave ΔVf = f(T°) and the Vf at 25°C. Section 6 gave a guide to calculate the equation curve for the LRG5AP, depending on the current as those equations were expressed as Vf=f(T). Since the temperature isthe desired parameter, the equation needs to be reversed, and become T=f(Vf), which can be easily doneusing Excel or a calculator. The main equation becomes:
where• Temperature is in °C• x is the relative forward voltage ΔVf = Vf - Vf_25°C (mV) (5)
Then if temperature derating needs to be performed per Figure 2, the MCU processes (every one min forinstance) the Vf measured by the ADC of the TPS929120 in Equation 5. Once the temperature gets above80°C, the program starts to reduce the current (by modifying register Iout2 = 0 × 02). As linear deratingfrom 75 mA to 0 mA is used in this application, an offset can be applied depending on the LED currentsetting (-0.25 per mA), due to the linearity of the different Vf vs temperature curves as shown in Figure 7.For example, instead of driving at 75 mA, the current is set at 50 mA. The offset becomes:
(6)
(7)
Since a 10 LED string is used, the accuracy of one LED is now 80 mV/10 = 8 mV. For a 8 mV error,according to the curve, the temperature error must be around 7°C, depending on what temperature themeasurement is taken at.
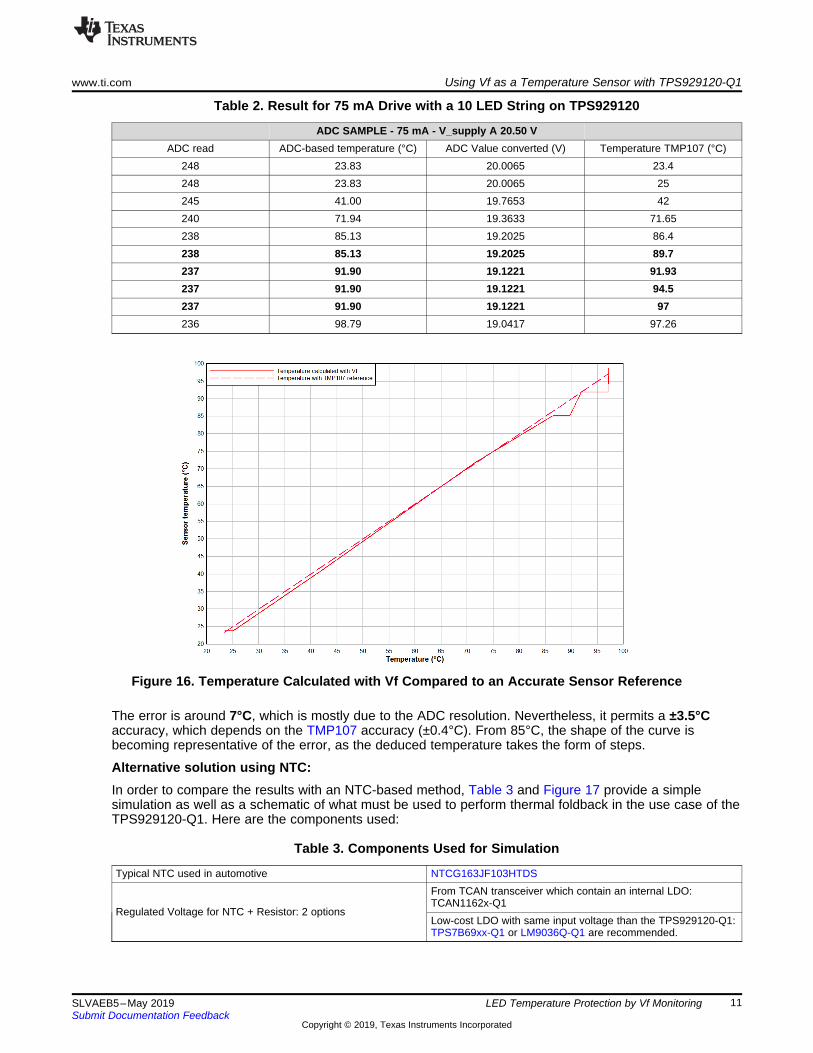
Table 2 shows the data obtained after warming up the LED string and comparing the temperaturecalculated via the TPS929120-Q1 Vf measurement compared to the temperature measured with theTMP107.
www.ti.com Using Vf as a Temperature Sensor with TPS929120-Q1
11SLVAEB5–May 2019Submit Documentation Feedback
Copyright © 2019, Texas Instruments Incorporated
LED Temperature Protection by Vf Monitoring
Table 2. Result for 75 mA Drive with a 10 LED String on TPS929120
ADC SAMPLE - 75 mA - V_supply A 20.50 VADC read ADC-based temperature (°C) ADC Value converted (V) Temperature TMP107 (°C)
248 23.83 20.0065 23.4248 23.83 20.0065 25245 41.00 19.7653 42240 71.94 19.3633 71.65238 85.13 19.2025 86.4238 85.13 19.2025 89.7237 91.90 19.1221 91.93237 91.90 19.1221 94.5237 91.90 19.1221 97236 98.79 19.0417 97.26
Figure 16. Temperature Calculated with Vf Compared to an Accurate Sensor Reference
The error is around 7°C, which is mostly due to the ADC resolution. Nevertheless, it permits a ±3.5°Caccuracy, which depends on the TMP107 accuracy (±0.4°C). From 85°C, the shape of the curve isbecoming representative of the error, as the deduced temperature takes the form of steps.
Alternative solution using NTC:In order to compare the results with an NTC-based method, Table 3 and Figure 17 provide a simplesimulation as well as a schematic of what must be used to perform thermal foldback in the use case of theTPS929120-Q1. Here are the components used:
Table 3. Components Used for Simulation
Typical NTC used in automotive NTCG163JF103HTDS
Regulated Voltage for NTC + Resistor: 2 options
From TCAN transceiver which contain an internal LDO:TCAN1162x-Q1Low-cost LDO with same input voltage than the TPS929120-Q1:TPS7B69xx-Q1 or LM9036Q-Q1 are recommended.
How to Program MCU to Perform Thermal Foldback Using Vf www.ti.com
12 SLVAEB5–May 2019Submit Documentation Feedback
Copyright © 2019, Texas Instruments Incorporated
LED Temperature Protection by Vf Monitoring
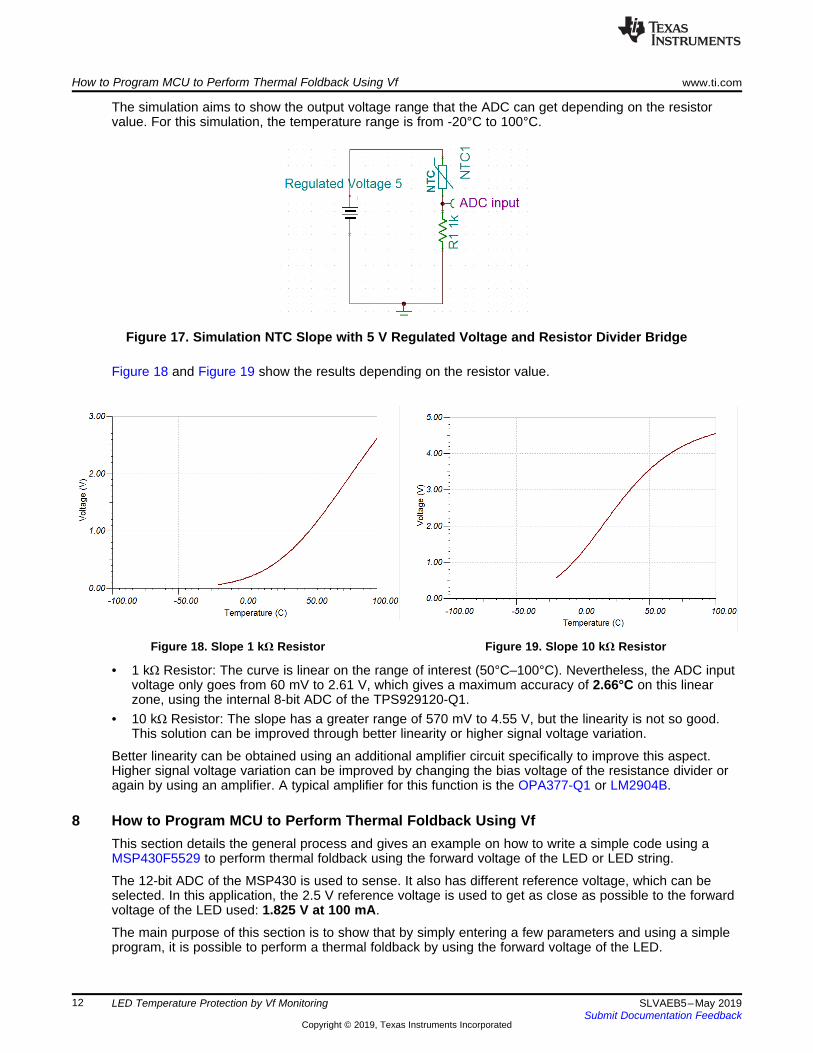
The simulation aims to show the output voltage range that the ADC can get depending on the resistorvalue. For this simulation, the temperature range is from -20°C to 100°C.
Figure 17. Simulation NTC Slope with 5 V Regulated Voltage and Resistor Divider Bridge
Figure 18 and Figure 19 show the results depending on the resistor value.
Figure 18. Slope 1 kΩ Resistor Figure 19. Slope 10 kΩ Resistor
• 1 kΩ Resistor: The curve is linear on the range of interest (50°C–100°C). Nevertheless, the ADC inputvoltage only goes from 60 mV to 2.61 V, which gives a maximum accuracy of 2.66°C on this linearzone, using the internal 8-bit ADC of the TPS929120-Q1.
• 10 kΩ Resistor: The slope has a greater range of 570 mV to 4.55 V, but the linearity is not so good.This solution can be improved through better linearity or higher signal voltage variation.
Better linearity can be obtained using an additional amplifier circuit specifically to improve this aspect.Higher signal voltage variation can be improved by changing the bias voltage of the resistance divider oragain by using an amplifier. A typical amplifier for this function is the OPA377-Q1 or LM2904B.
8 How to Program MCU to Perform Thermal Foldback Using VfThis section details the general process and gives an example on how to write a simple code using aMSP430F5529 to perform thermal foldback using the forward voltage of the LED or LED string.
The 12-bit ADC of the MSP430 is used to sense. It also has different reference voltage, which can beselected. In this application, the 2.5 V reference voltage is used to get as close as possible to the forwardvoltage of the LED used: 1.825 V at 100 mA.
The main purpose of this section is to show that by simply entering a few parameters and using a simpleprogram, it is possible to perform a thermal foldback by using the forward voltage of the LED.
www.ti.com How to Program MCU to Perform Thermal Foldback Using Vf
13SLVAEB5–May 2019Submit Documentation Feedback
Copyright © 2019, Texas Instruments Incorporated
LED Temperature Protection by Vf Monitoring
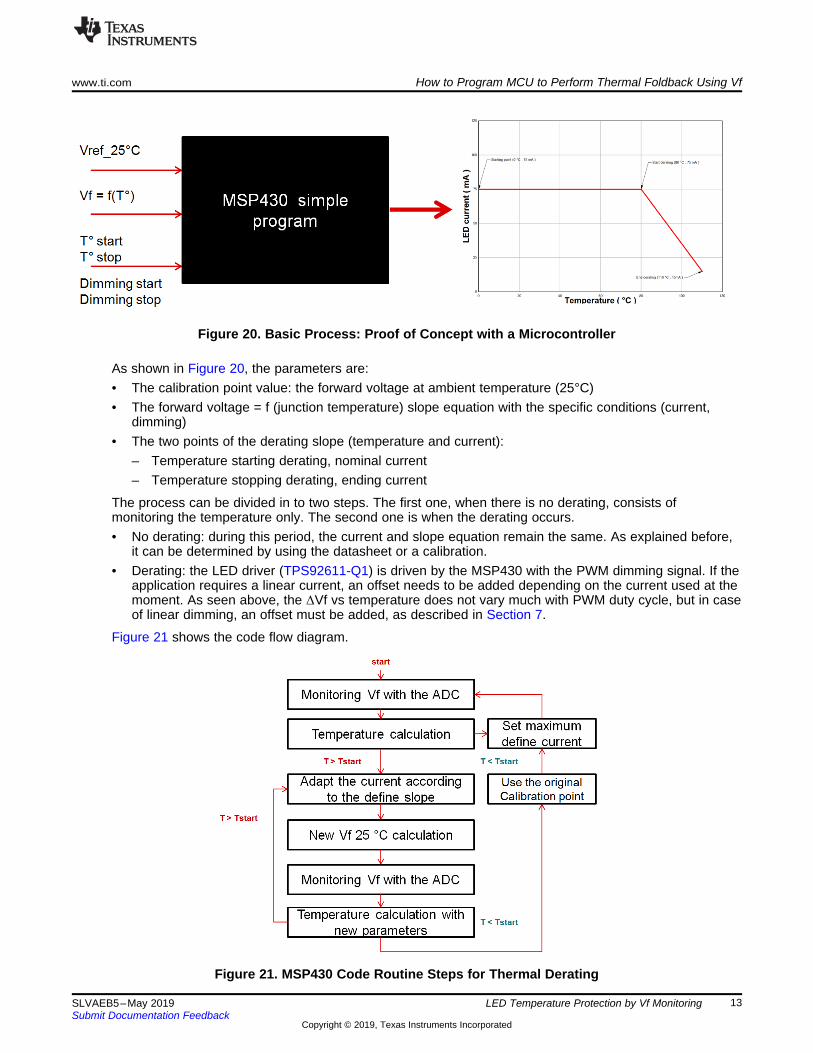
Figure 20. Basic Process: Proof of Concept with a Microcontroller
As shown in Figure 20, the parameters are:• The calibration point value: the forward voltage at ambient temperature (25°C)• The forward voltage = f (junction temperature) slope equation with the specific conditions (current,
dimming)• The two points of the derating slope (temperature and current):
– Temperature starting derating, nominal current– Temperature stopping derating, ending current
The process can be divided in to two steps. The first one, when there is no derating, consists ofmonitoring the temperature only. The second one is when the derating occurs.• No derating: during this period, the current and slope equation remain the same. As explained before,
it can be determined by using the datasheet or a calibration.• Derating: the LED driver (TPS92611-Q1) is driven by the MSP430 with the PWM dimming signal. If the
application requires a linear current, an offset needs to be added depending on the current used at themoment. As seen above, the ΔVf vs temperature does not vary much with PWM duty cycle, but in caseof linear dimming, an offset must be added, as described in Section 7.
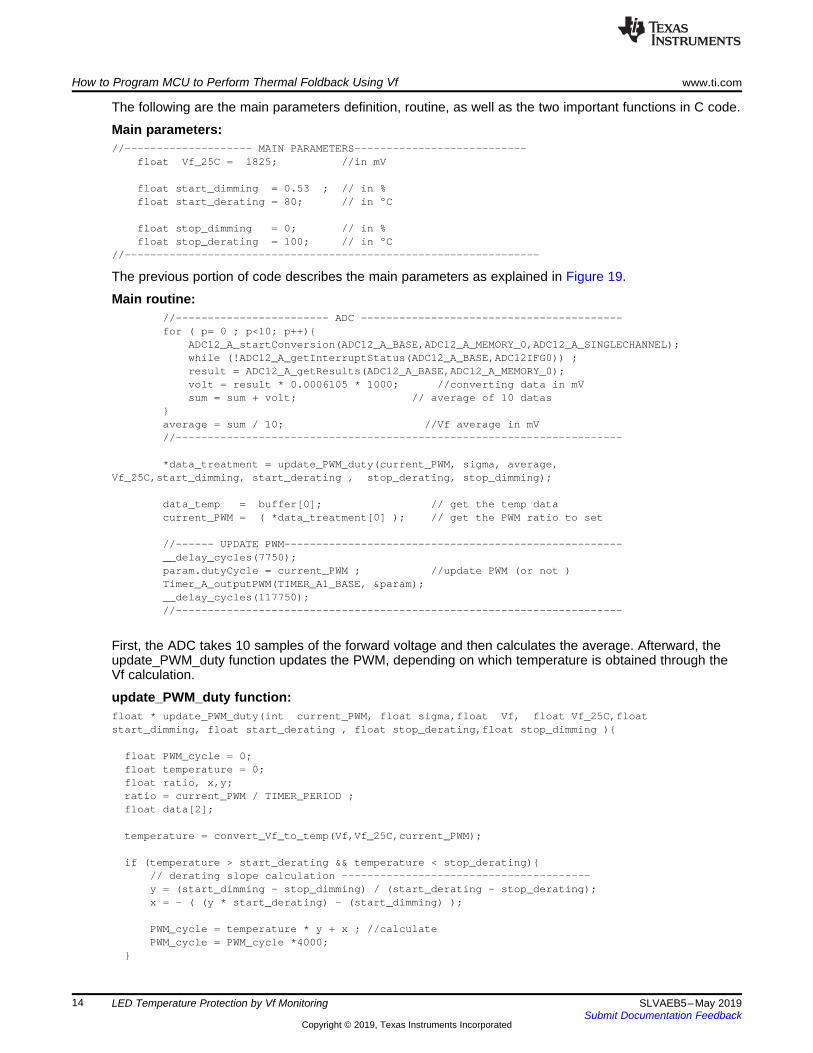
Figure 21 shows the code flow diagram.
Figure 21. MSP430 Code Routine Steps for Thermal Derating
How to Program MCU to Perform Thermal Foldback Using Vf www.ti.com
14 SLVAEB5–May 2019Submit Documentation Feedback
Copyright © 2019, Texas Instruments Incorporated
LED Temperature Protection by Vf Monitoring
The following are the main parameters definition, routine, as well as the two important functions in C code.
Main parameters://-------------------- MAIN PARAMETERS---------------------------
float Vf_25C = 1825; //in mV
float start_dimming = 0.53 ; // in %float start_derating = 80; // in °C
float stop_dimming = 0; // in %float stop_derating = 100; // in °C
//-----------------------------------------------------------------
The previous portion of code describes the main parameters as explained in Figure 19.
Main routine://------------------------ ADC -----------------------------------------for ( p= 0 ; p<10; p++){
ADC12_A_startConversion(ADC12_A_BASE,ADC12_A_MEMORY_0,ADC12_A_SINGLECHANNEL);while (!ADC12_A_getInterruptStatus(ADC12_A_BASE,ADC12IFG0)) ;result = ADC12_A_getResults(ADC12_A_BASE,ADC12_A_MEMORY_0);volt = result * 0.0006105 * 1000; //converting data in mVsum = sum + volt; // average of 10 datas
}average = sum / 10; //Vf average in mV//----------------------------------------------------------------------
*data_treatment = update_PWM_duty(current_PWM, sigma, average,Vf_25C,start_dimming, start_derating , stop_derating, stop_dimming);
data_temp = buffer[0]; // get the temp datacurrent_PWM = ( *data_treatment[0] ); // get the PWM ratio to set
//------ UPDATE PWM-----------------------------------------------------__delay_cycles(7750);param.dutyCycle = current_PWM ; //update PWM (or not )Timer_A_outputPWM(TIMER_A1_BASE, ¶m);__delay_cycles(117750);//----------------------------------------------------------------------
First, the ADC takes 10 samples of the forward voltage and then calculates the average. Afterward, theupdate_PWM_duty function updates the PWM, depending on which temperature is obtained through theVf calculation.
update_PWM_duty function:float * update_PWM_duty(int current_PWM, float sigma,float Vf, float Vf_25C,floatstart_dimming, float start_derating , float stop_derating,float stop_dimming ){
float PWM_cycle = 0;float temperature = 0;float ratio, x,y;ratio = current_PWM / TIMER_PERIOD ;float data[2];
temperature = convert_Vf_to_temp(Vf,Vf_25C,current_PWM);
if (temperature > start_derating && temperature < stop_derating){// derating slope calculation ---------------------------------------y = (start_dimming - stop_dimming) / (start_derating - stop_derating);x = - ( (y * start_derating) - (start_dimming) );
PWM_cycle = temperature * y + x ; //calculatePWM_cycle = PWM_cycle *4000;
}
www.ti.com How to Program MCU to Perform Thermal Foldback Using Vf
15SLVAEB5–May 2019Submit Documentation Feedback
Copyright © 2019, Texas Instruments Incorporated
LED Temperature Protection by Vf Monitoring
if (temperature < start_derating){ //start derating conditionPWM_cycle = start_dimming * 4000 ;
}
data[0] = PWM_cycle ; // send through functionbuffer[0] = temperature ; // send through pointer
return data;
}
The update_PWM_duty changes the PWM output (or not) if the temperature calculated through the Vf ishigher than the limit. Then, it calculates the equation of the derating slope with the two points from thebasic parameters (starting point and ending point), and adapts the PWM duty cycle. On the other hand, ifthe temperature is lower than the limit, the PWM duty cycle stays the same.
convert_Vf_to_temp function:float convert_Vf_to_temp(float Vf, float Vf_25C , int PWM) {
float temp = 0 ;float facteur=0, dimming_factor =0, Vf_normalised=0, ratio=0, Vf_at_25=0, delta = 0;float former_temp = 0 ;
former_temp = buffer[0]; //take the former_temp
dimming_factor = (PWM * 0.00025) ; // dimming factorVf_at_25 = 1266.2 * dimming_factor +1097; //Vf 25°C calculation
according to the datasheetVf_normalised = Vf - Vf_at_25 ; //relative Vf
if (former_temp > 80 ){ // if deratingtemp =(-0.0025 * Vf_normalised * Vf_normalised -
0.995*Vf_normalised + 24.45 ) ;}
else {temp =(-0.5130 * Vf_normalised + 29 ) ; //define slope
}return temp;
}
This function calculates the temperature depending on the PWM parameters. It first starts by calculatingthe Vf_25°C if the PWM was modified before. It also stores the former temperature calculated. If theformer temperature is above the derating threshold, the program uses another slope, more accurate to fitwith the data.
Results:In order to know the accuracy of the system, the temperature that was measured using the MSP430 codeand the LED forward voltage with an accurate sensor are compared with the TMP107 (±0.4°C), whileperforming derating.
Conclusion www.ti.com
16 SLVAEB5–May 2019Submit Documentation Feedback
Copyright © 2019, Texas Instruments Incorporated
LED Temperature Protection by Vf Monitoring
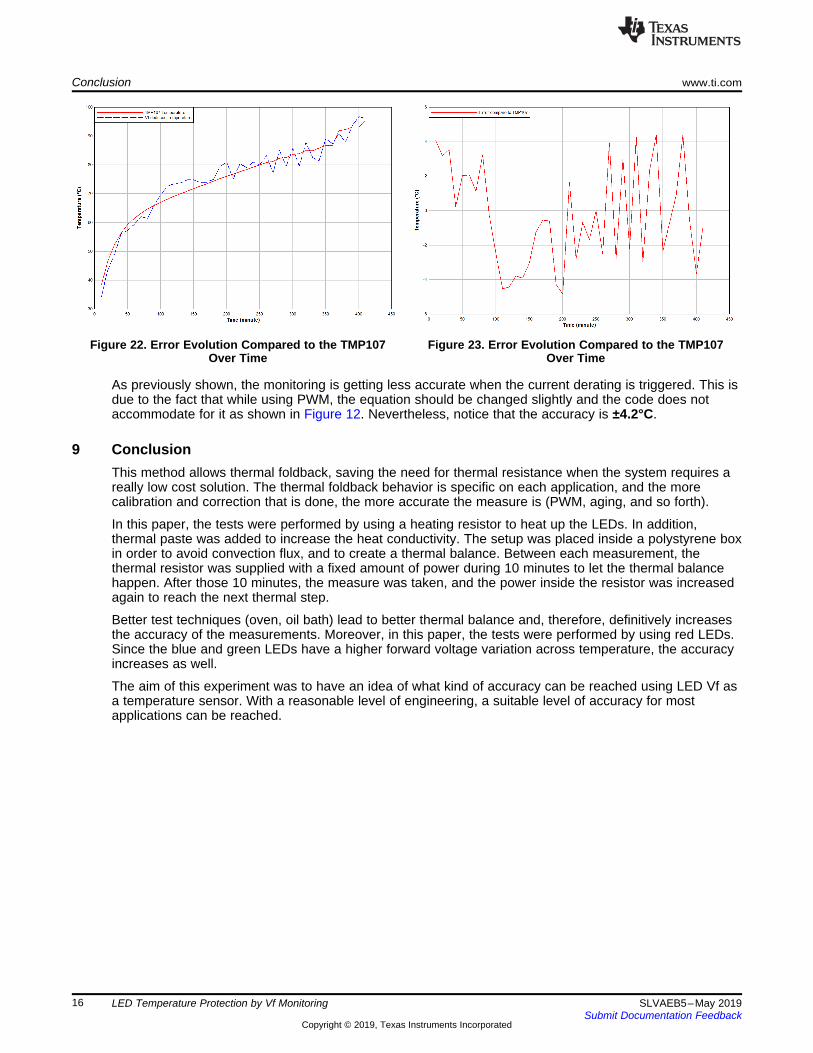
Figure 22. Error Evolution Compared to the TMP107Over Time
Figure 23. Error Evolution Compared to the TMP107Over Time
As previously shown, the monitoring is getting less accurate when the current derating is triggered. This isdue to the fact that while using PWM, the equation should be changed slightly and the code does notaccommodate for it as shown in Figure 12. Nevertheless, notice that the accuracy is ±4.2°C.
9 ConclusionThis method allows thermal foldback, saving the need for thermal resistance when the system requires areally low cost solution. The thermal foldback behavior is specific on each application, and the morecalibration and correction that is done, the more accurate the measure is (PWM, aging, and so forth).
In this paper, the tests were performed by using a heating resistor to heat up the LEDs. In addition,thermal paste was added to increase the heat conductivity. The setup was placed inside a polystyrene boxin order to avoid convection flux, and to create a thermal balance. Between each measurement, thethermal resistor was supplied with a fixed amount of power during 10 minutes to let the thermal balancehappen. After those 10 minutes, the measure was taken, and the power inside the resistor was increasedagain to reach the next thermal step.
Better test techniques (oven, oil bath) lead to better thermal balance and, therefore, definitively increasesthe accuracy of the measurements. Moreover, in this paper, the tests were performed by using red LEDs.Since the blue and green LEDs have a higher forward voltage variation across temperature, the accuracyincreases as well.
The aim of this experiment was to have an idea of what kind of accuracy can be reached using LED Vf asa temperature sensor. With a reasonable level of engineering, a suitable level of accuracy for mostapplications can be reached.

IMPORTANT NOTICE AND DISCLAIMER
TI PROVIDES TECHNICAL AND RELIABILITY DATA (INCLUDING DATASHEETS), DESIGN RESOURCES (INCLUDING REFERENCEDESIGNS), APPLICATION OR OTHER DESIGN ADVICE, WEB TOOLS, SAFETY INFORMATION, AND OTHER RESOURCES “AS IS”AND WITH ALL FAULTS, AND DISCLAIMS ALL WARRANTIES, EXPRESS AND IMPLIED, INCLUDING WITHOUT LIMITATION ANYIMPLIED WARRANTIES OF MERCHANTABILITY, FITNESS FOR A PARTICULAR PURPOSE OR NON-INFRINGEMENT OF THIRDPARTY INTELLECTUAL PROPERTY RIGHTS.These resources are intended for skilled developers designing with TI products. You are solely responsible for (1) selecting the appropriateTI products for your application, (2) designing, validating and testing your application, and (3) ensuring your application meets applicablestandards, and any other safety, security, or other requirements. These resources are subject to change without notice. TI grants youpermission to use these resources only for development of an application that uses the TI products described in the resource. Otherreproduction and display of these resources is prohibited. No license is granted to any other TI intellectual property right or to any thirdparty intellectual property right. TI disclaims responsibility for, and you will fully indemnify TI and its representatives against, any claims,damages, costs, losses, and liabilities arising out of your use of these resources.TI’s products are provided subject to TI’s Terms of Sale (www.ti.com/legal/termsofsale.html) or other applicable terms available either onti.com or provided in conjunction with such TI products. TI’s provision of these resources does not expand or otherwise alter TI’s applicablewarranties or warranty disclaimers for TI products.
Mailing Address: Texas Instruments, Post Office Box 655303, Dallas, Texas 75265Copyright © 2019, Texas Instruments Incorporated
![Urk] dk;kZy; vf/k”kklh vfHk](https://img.pdfslide.net/doc/110x75/63338108a6138719eb0aa42c/urk-dkkzy-vfkkklh-vfhk.jpg)


![vf]h cEof; $ - CIJ Nepal](https://img.pdfslide.net/doc/110x75/633600e829fb49e5aa0b0857/vfh-ceof-cij-nepal.jpg)


![Informe de Gestión 2018-2021 - VF[63]](https://img.pdfslide.net/doc/110x75/632908b2cedd78c2b50e5a4c/informe-de-gestion-2018-2021-vf63.jpg)