Embed Size (px)
Citation preview
© BIOPAC Systems, Inc. 2005
Physiology Lessons
for use with the Biopac Science Lab MP40
PC running Windows® XP or Mac® OS X 10.3-10.4
Lesson 5 EEG 1 Electroencephalography: Brain Rhythms
Lesson Revision 2.23.2006
BIOPAC Systems, Inc. 42 Aero Camino, Goleta, CA 93117 (805) 685-0066, Fax (805) 685-0067
Page 2 Biopac Science Lab
Lesson 5 ELECTROENCEPHALOGPAHY 1 Brain Rhythms
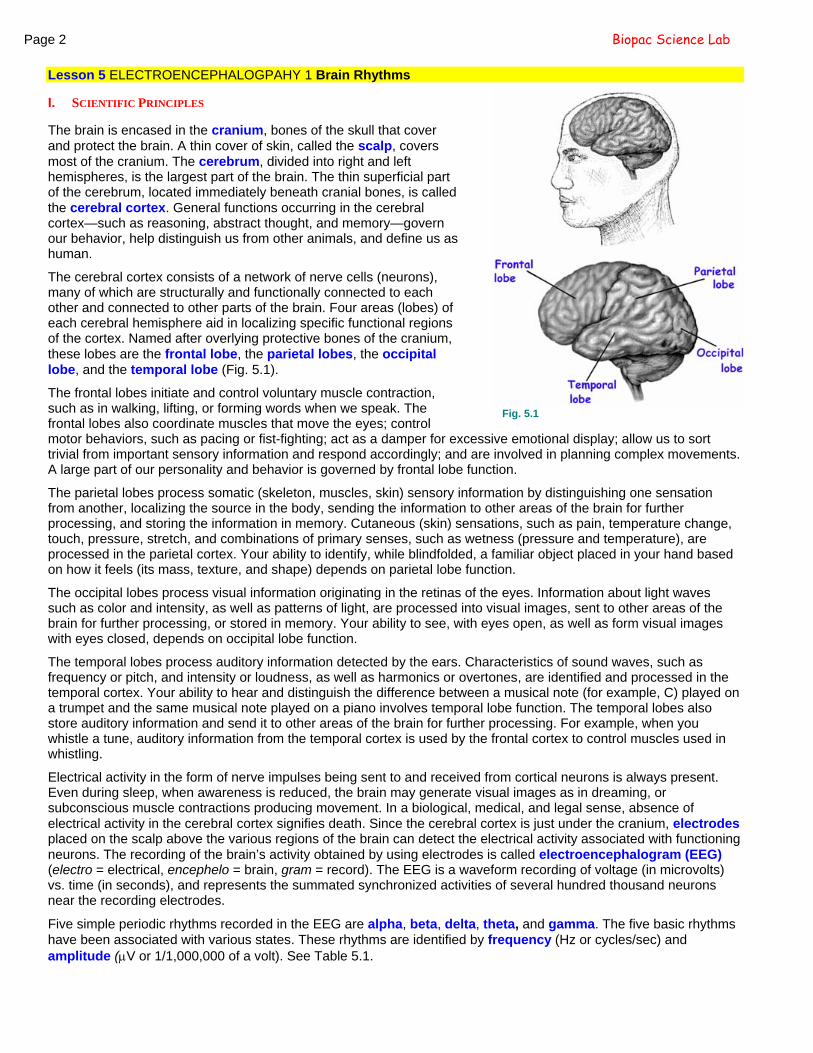
Fig. 5.1
I.
The cerebral cortex consists of a network of nerve cells (neurons), many of which are structurally and functionally connected to each other and connected to other parts of the brain. Four areas (lobes) of each cerebral hemisphere aid in localizing specific functional regions of the cortex. Named after overlying protective bones of the cranium, these lobes are the frontal lobe, the parietal lobes, the occipital lobe, and the temporal lobe (Fig. 5.1).
SCIENTIFIC PRINCIPLES
The brain is encased in the cranium, bones of the skull that cover and protect the brain. A thin cover of skin, called the scalp, covers most of the cranium. The cerebrum, divided into right and left hemispheres, is the largest part of the brain. The thin superficial part of the cerebrum, located immediately beneath cranial bones, is called the cerebral cortex. General functions occurring in the cerebral cortex—such as reasoning, abstract thought, and memory—govern our behavior, help distinguish us from other animals, and define us as human.
The frontal lobes initiate and control voluntary muscle contraction, such as in walking, lifting, or forming words when we speak. The frontal lobes also coordinate muscles that move the eyes; control motor behaviors, such as pacing or fist-fighting; act as a damper for excessive emotional display; allow us to sort trivial from important sensory information and respond accordingly; and are involved in planning complex movements. A large part of our personality and behavior is governed by frontal lobe function.
The parietal lobes process somatic (skeleton, muscles, skin) sensory information by distinguishing one sensation from another, localizing the source in the body, sending the information to other areas of the brain for further processing, and storing the information in memory. Cutaneous (skin) sensations, such as pain, temperature change, touch, pressure, stretch, and combinations of primary senses, such as wetness (pressure and temperature), are processed in the parietal cortex. Your ability to identify, while blindfolded, a familiar object placed in your hand based on how it feels (its mass, texture, and shape) depends on parietal lobe function.
The occipital lobes process visual information originating in the retinas of the eyes. Information about light waves such as color and intensity, as well as patterns of light, are processed into visual images, sent to other areas of the brain for further processing, or stored in memory. Your ability to see, with eyes open, as well as form visual images with eyes closed, depends on occipital lobe function.
The temporal lobes process auditory information detected by the ears. Characteristics of sound waves, such as frequency or pitch, and intensity or loudness, as well as harmonics or overtones, are identified and processed in the temporal cortex. Your ability to hear and distinguish the difference between a musical note (for example, C) played on a trumpet and the same musical note played on a piano involves temporal lobe function. The temporal lobes also store auditory information and send it to other areas of the brain for further processing. For example, when you whistle a tune, auditory information from the temporal cortex is used by the frontal cortex to control muscles used in whistling.
Electrical activity in the form of nerve impulses being sent to and received from cortical neurons is always present. Even during sleep, when awareness is reduced, the brain may generate visual images as in dreaming, or subconscious muscle contractions producing movement. In a biological, medical, and legal sense, absence of electrical activity in the cerebral cortex signifies death. Since the cerebral cortex is just under the cranium, electrodes placed on the scalp above the various regions of the brain can detect the electrical activity associated with functioning neurons. The recording of the brain’s activity obtained by using electrodes is called electroencephalogram (EEG) (electro = electrical, encephelo = brain, gram = record). The EEG is a waveform recording of voltage (in microvolts) vs. time (in seconds), and represents the summated synchronized activities of several hundred thousand neurons near the recording electrodes.
Five simple periodic rhythms recorded in the EEG are alpha, beta, delta, theta, and gamma. The five basic rhythms have been associated with various states. These rhythms are identified by frequency (Hz or cycles/sec) and amplitude (μV or 1/1,000,000 of a volt). See Table 5.1.
Lesson 5: EEG 1 Page 3
© BIOPAC Systems, Inc. 2005
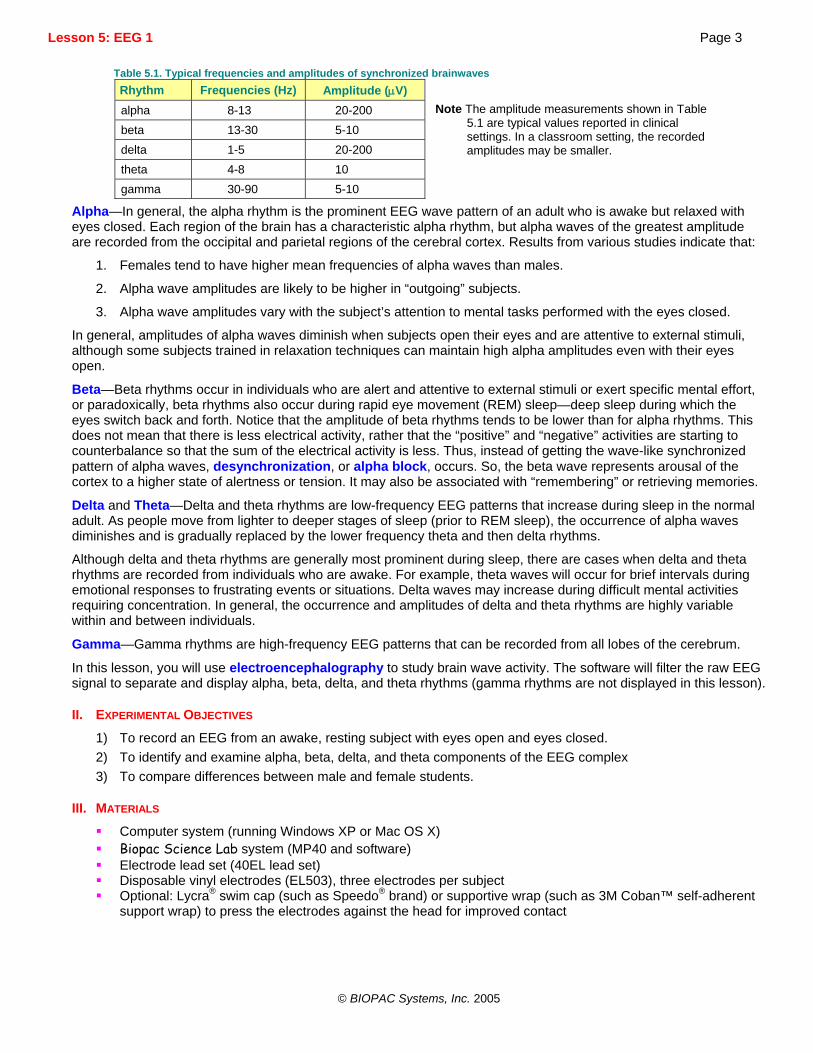
Table 5.1. Typical frequencies and amplitudes of synchronized brainwaves Rhythm Frequencies (Hz) Amplitude (μV) alpha 8-13 20-200 beta 13-30 5-10 delta 1-5 20-200 theta 4-8 10 gamma 30-90 5-10
Note The amplitude measurements shown in Table
5.1 are typical values reported in clinical settings. In a classroom setting, the recorded amplitudes may be smaller.
Alpha—In general, the alpha rhythm is the prominent EEG wave pattern of an adult who is awake but relaxed with eyes closed. Each region of the brain has a characteristic alpha rhythm, but alpha waves of the greatest amplitude are recorded from the occipital and parietal regions of the cerebral cortex. Results from various studies indicate that:
1. Females tend to have higher mean frequencies of alpha waves than males.
2. Alpha wave amplitudes are likely to be higher in “outgoing” subjects.
3. Alpha wave amplitudes vary with the subject’s attention to mental tasks performed with the eyes closed.
In general, amplitudes of alpha waves diminish when subjects open their eyes and are attentive to external stimuli, although some subjects trained in relaxation techniques can maintain high alpha amplitudes even with their eyes open.
Beta—Beta rhythms occur in individuals who are alert and attentive to external stimuli or exert specific mental effort, or paradoxically, beta rhythms also occur during rapid eye movement (REM) sleep—deep sleep during which the eyes switch back and forth. Notice that the amplitude of beta rhythms tends to be lower than for alpha rhythms. This does not mean that there is less electrical activity, rather that the “positive” and “negative” activities are starting to counterbalance so that the sum of the electrical activity is less. Thus, instead of getting the wave-like synchronized pattern of alpha waves, desynchronization, or alpha block, occurs. So, the beta wave represents arousal of the cortex to a higher state of alertness or tension. It may also be associated with “remembering” or retrieving memories.
Delta and Theta—Delta and theta rhythms are low-frequency EEG patterns that increase during sleep in the normal adult. As people move from lighter to deeper stages of sleep (prior to REM sleep), the occurrence of alpha waves diminishes and is gradually replaced by the lower frequency theta and then delta rhythms.
Although delta and theta rhythms are generally most prominent during sleep, there are cases when delta and theta rhythms are recorded from individuals who are awake. For example, theta waves will occur for brief intervals during emotional responses to frustrating events or situations. Delta waves may increase during difficult mental activities requiring concentration. In general, the occurrence and amplitudes of delta and theta rhythms are highly variable within and between individuals.
Gamma—Gamma rhythms are high-frequency EEG patterns that can be recorded from all lobes of the cerebrum.
In this lesson, you will use electroencephalography to study brain wave activity. The software will filter the raw EEG signal to separate and display alpha, beta, delta, and theta rhythms (gamma rhythms are not displayed in this lesson).
II.
III.
EXPERIMENTAL OBJECTIVES
1) To record an EEG from an awake, resting subject with eyes open and eyes closed. 2) To identify and examine alpha, beta, delta, and theta components of the EEG complex 3) To compare differences between male and female students.
MATERIALS
Computer system (running Windows XP or Mac OS X) Biopac Science Lab system (MP40 and software) Electrode lead set (40EL lead set) Disposable vinyl electrodes (EL503), three electrodes per subject Optional: Lycra® swim cap (such as Speedo® brand) or supportive wrap (such as 3M Coban™ self-adherent
support wrap) to press the electrodes against the head for improved contact
Page 4 Biopac Science Lab
IV. EXPERIMENTAL METHODS
A. Set Up
EQUIPMENT
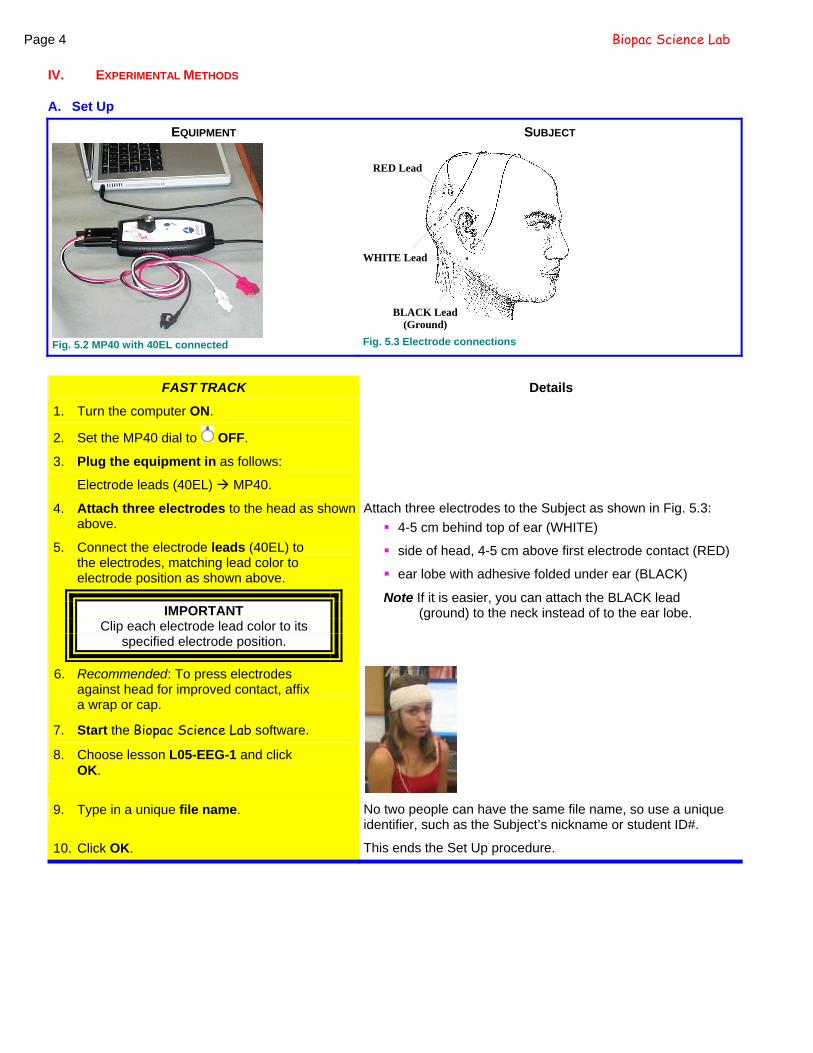
Fig. 5.2 MP40 with 40EL connected
SUBJECT
RED Lead
BLACK Lead(Ground)
WHITE Lead
Fig. 5.3 Electrode connections
FAST TRACK Details
1. Turn the computer ON.
2. Set the MP40 dial to OFF.
3. Plug the equipment in as follows:
Electrode leads (40EL) MP40.
4. Attach three electrodes to the head as shown above.
5. Connect the electrode leads (40EL) to the electrodes, matching lead color to electrode position as shown above.
IMPORTANT Clip each electrode lead color to its
specified electrode position.
Attach three electrodes to the Subject as shown in Fig. 5.3: 4-5 cm behind top of ear (WHITE)
side of head, 4-5 cm above first electrode contact (RED)
ear lobe with adhesive folded under ear (BLACK)
Note If it is easier, you can attach the BLACK lead (ground) to the neck instead of to the ear lobe.
6. Recommended: To press electrodes against head for improved contact, affix a wrap or cap.
7. Start the Biopac Science Lab software.
8. Choose lesson L05-EEG-1 and click OK.
9. Type in a unique file name. No two people can have the same file name, so use a unique
identifier, such as the Subject’s nickname or student ID#.
10. Click OK. This ends the Set Up procedure.
Lesson 5: EEG 1 Page 5
B. Check
FAST TRACK Details
MP40 Check
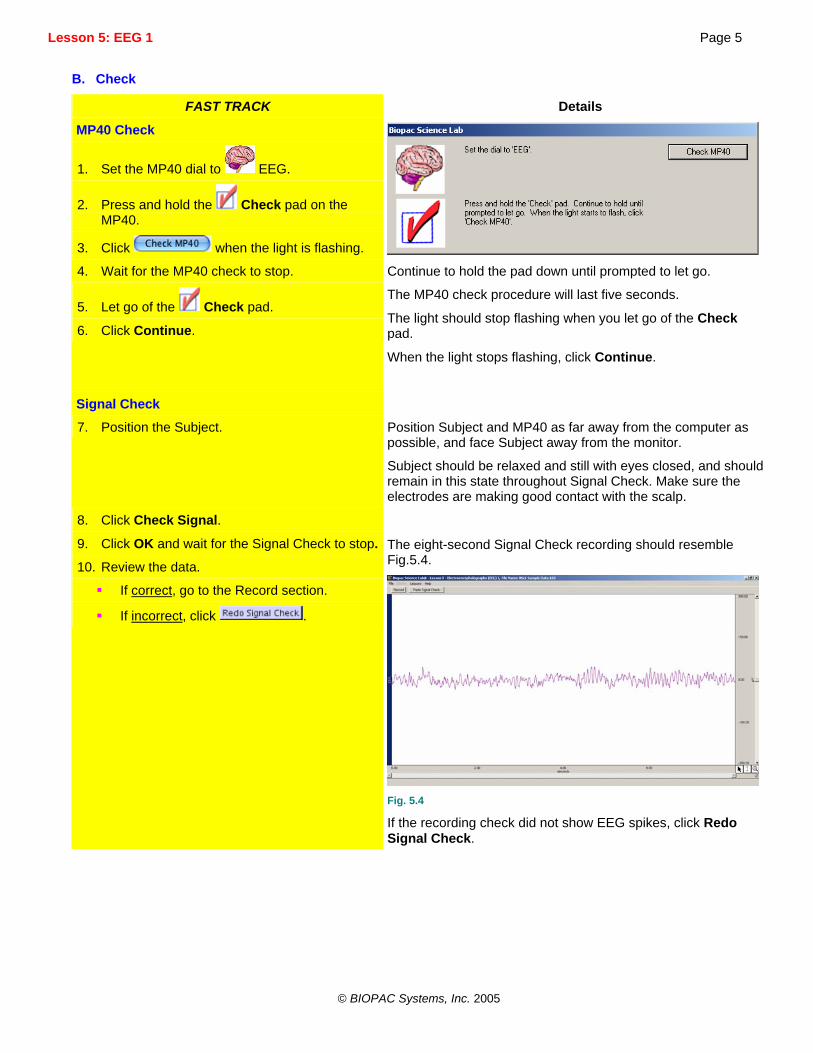
1. Set the MP40 dial to EEG.
2. Press and hold the Check pad on the MP40.
3. Click when the light is flashing.
4. Wait for the MP40 check to stop. Continue to hold the pad down until prompted to let go.
5. Let go of the Check pad.
6. Click Continue.
The MP40 check procedure will last five seconds.
The light should stop flashing when you let go of the Check pad.
When the light stops flashing, click Continue.
Signal Check
7. Position the Subject. Position Subject and MP40 as far away from the computer as possible, and face Subject away from the monitor.
Subject should be relaxed and still with eyes closed, and should remain in this state throughout Signal Check. Make sure the electrodes are making good contact with the scalp.
8. Click Check Signal.
9. Click OK and wait for the Signal Check to stop.
10. Review the data.
© BIOPAC Systems, Inc. 2005
If correct, go to the Record section.
If incorrect, click .
The eight-second Signal Check recording should resemble Fig.5.4.
Fig. 5.4
If the recording check did not show EEG spikes, click Redo Signal Check.
Page 6 Biopac Science Lab
C. Record
FAST TRACK Details
1. Prepare for the recording. Watch the Help menu videos to prepare for the recording. You will record the “raw EEG” while the Subject is relaxed with eyes closed, eyes opened, and eyes closed again. For EEG recording with the MP40 System, it is especially important to position the Subject away from the computer monitor and to place the MP40 away from the computer (set aside or clip to Subject).
In order to work efficiently, read this entire section so you will know what to do before recording.
SEGMENT 1
2. Click . When you click Record, the recording will begin and you can visually review the EEG signal.
3. The Director should tell the Subject to change the eye condition for 20-second intervals, and the Recorder should insert an event marker (F9 or Esc) at each change.
Time Eye Condition 0-20 seconds eyes closed 20-40 seconds eyes open 40-60 seconds eyes re-closed
The Director should tell the Subject to change the eye condition for 20-second intervals, and the Recorder should insert an event marker at each change. To insert a marker, press F9 (Windows) or Esc (Mac).
Subject should try not to blink during the “eyes open” state.
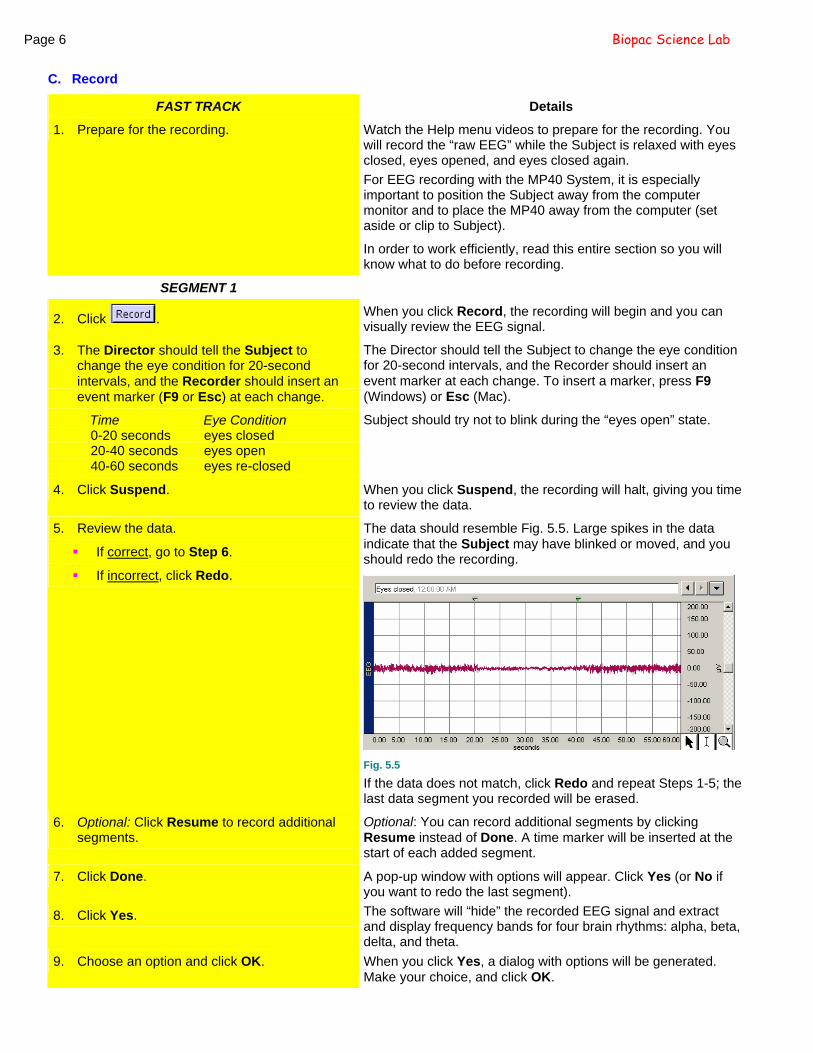
4. Click Suspend. When you click Suspend, the recording will halt, giving you time to review the data.
5. Review the data.
If correct, go to Step 6.
If incorrect, click Redo.
The data should resemble Fig. 5.5. Large spikes in the data indicate that the Subject may have blinked or moved, and you should redo the recording.
Fig. 5.5
If the data does not match, click Redo and repeat Steps 1-5; the last data segment you recorded will be erased.
6. Optional: Click Resume to record additional segments.
Optional: You can record additional segments by clicking Resume instead of Done. A time marker will be inserted at the start of each added segment.
7. Click Done. A pop-up window with options will appear. Click Yes (or No if you want to redo the last segment).
8. Click Yes. The software will “hide” the recorded EEG signal and extract and display frequency bands for four brain rhythms: alpha, beta, delta, and theta.
9. Choose an option and click OK. When you click Yes, a dialog with options will be generated. Make your choice, and click OK.

Lesson 5: EEG 1 Page 7
© BIOPAC Systems, Inc. 2005
If you choose Analyze current data file, go to the Analyze section for directions.
10. Remove the electrodes.
END OF RECORDING
Unclip the electrode lead connectors and peel off the electrodes. Throw out the electrodes.
Page 8 Biopac Science Lab
V. ANALYZE
FAST TRACK Details
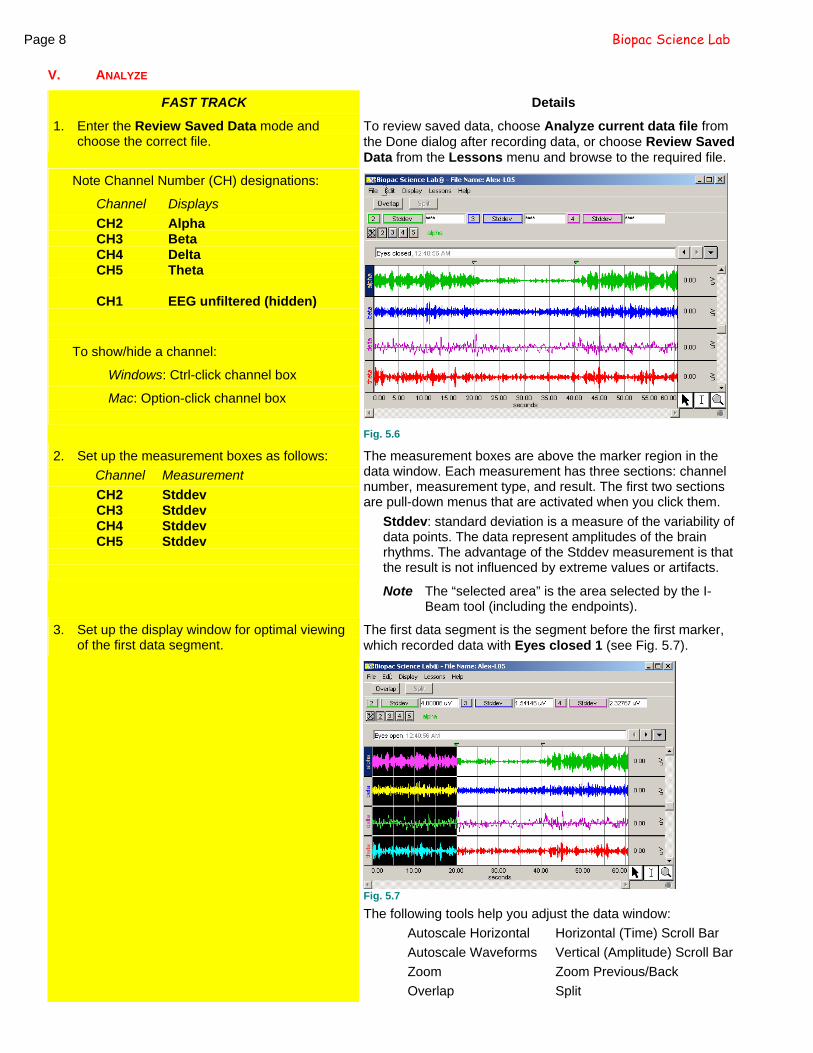
1. Enter the Review Saved Data mode and choose the correct file.
To review saved data, choose Analyze current data file from the Done dialog after recording data, or choose Review Saved Data from the Lessons menu and browse to the required file.
Note Channel Number (CH) designations:
Channel Displays CH2 Alpha CH3 Beta CH4 Delta CH5 Theta CH1 EEG unfiltered (hidden)
To show/hide a channel:
Windows: Ctrl-click channel box
Mac: Option-click channel box
Fig. 5.6
2. Set up the measurement boxes as follows: Channel Measurement CH2 Stddev CH3 Stddev CH4 Stddev CH5 Stddev
The measurement boxes are above the marker region in the data window. Each measurement has three sections: channel number, measurement type, and result. The first two sections are pull-down menus that are activated when you click them.
Stddev: standard deviation is a measure of the variability of data points. The data represent amplitudes of the brain rhythms. The advantage of the Stddev measurement is that the result is not influenced by extreme values or artifacts.
Note The “selected area” is the area selected by the I-Beam tool (including the endpoints).
3. Set up the display window for optimal viewing of the first data segment.
The first data segment is the segment before the first marker, which recorded data with Eyes closed 1 (see Fig. 5.7).
Fig. 5.7 The following tools help you adjust the data window:
Autoscale Horizontal Horizontal (Time) Scroll Bar Autoscale Waveforms Vertical (Amplitude) Scroll Bar Zoom Zoom Previous/Back Overlap Split
Lesson 5: EEG 1 Page 9
4. Using the I-Beam tool, select the area of “eyes closed” data from Time 0 to the first event marker.
A
5. Repeat Step 4 for the “eyes open” data.
A
6. Repeat Step 4 for the “eyes re-closed” data.
This is the data from the append marker at Time 0 to the first event marker when the Subject’s eyes were first opened.
7. Set the measurements for Frequency (Freq): Channel Measurement CH2 Freq CH3 Freq CH4 Freq CH5 Freq
8. Zoom in on a 1-2 second section of the “eyes closed” data from Time 0 to the first event marker.
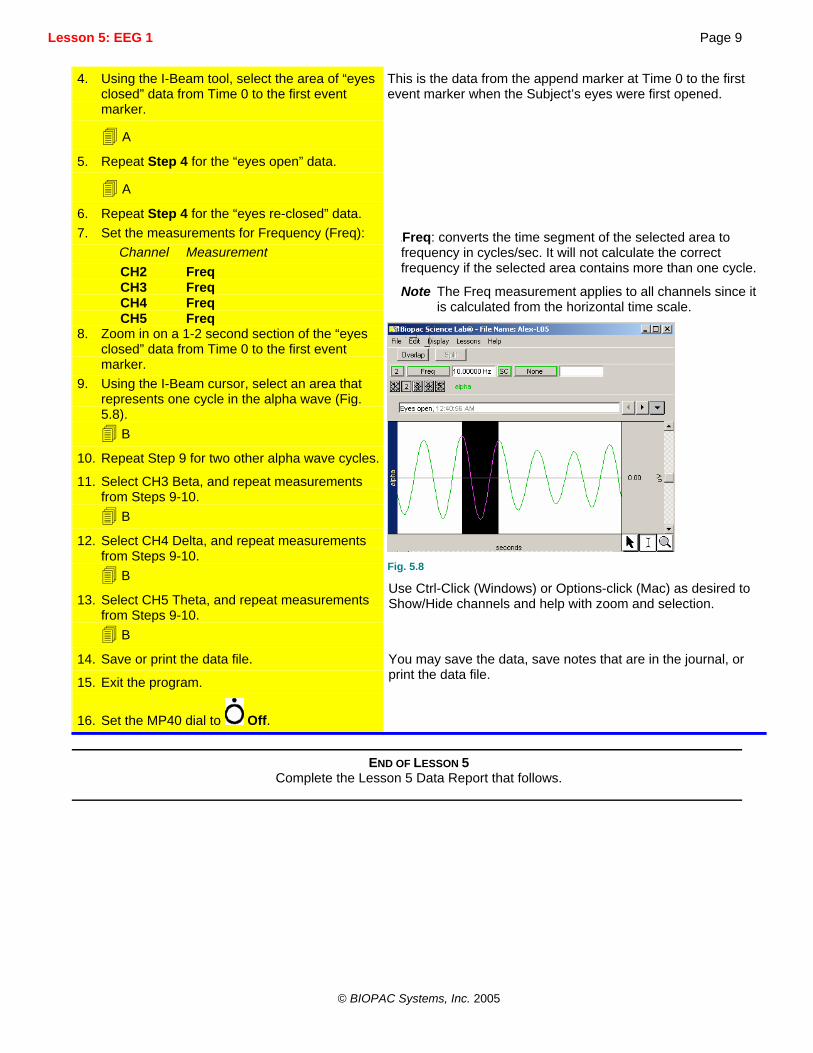
9. Using the I-Beam cursor, select an area that represents one cycle in the alpha wave (Fig. 5.8).
B
10. Repeat Step 9 for two other alpha wave cycles.
11. Select CH3 Beta, and repeat measurements from Steps 9-10.
B
12. Select CH4 Delta, and repeat measurements from Steps 9-10.
B
13. Select CH5 Theta, and repeat measurements from Steps 9-10.
B
Freq: converts the time segment of the selected area to frequency in cycles/sec. It will not calculate the correct frequency if the selected area contains more than one cycle.
Note The Freq measurement applies to all channels since it is calculated from the horizontal time scale.
Fig. 5.8
Use Ctrl-Click (Windows) or Options-click (Mac) as desired to Show/Hide channels and help with zoom and selection.
14. Save or print the data file.
15. Exit the program.
16. Set the MP40 dial to Off.
You may save the data, save notes that are in the journal, or print the data file.
END OF LESSON 5
Complete the Lesson 5 Data Report that follows.
© BIOPAC Systems, Inc. 2005

Page 10 Biopac Science Lab
The Data Report starts on the next page.

Biopac Science Lab Page 11
These are sample questions. You should amend, add, or delete questions to support your curriculum objectives.
Lesson 5 ELECTROENCEPHALOGRAPHY 1 EEG and Brain Rhythms
DATA REPORT
Student’s Name:
Lab Section:
Date: I. Data and Calculations Subject Profile
Name Age Gender: Male / Female Height Weight
EEG Amplitudes A. Complete Table 5.2 with standard deviation (Stddev) measurement results.
Table 5.2 Standard deviation results
Rhythm CH Eyes Open Eyes Closed Eyes Re-Opened Alpha 2
Beta 3
Delta 4
Theta 5
EEG Frequencies B. Complete Table 5.3 with three frequency (Freq) results for each rhythm and compute the mean.
Note It is not necessary to change channels for Frequency measurements because the software recognizes the beginning and end of the selected area regardless of channel.
Table 5.3 Frequency results for Eyes Closed Rhythm CH Cycle 1 Cycle 2 Cycle 3 Mean (computed) Alpha 2 Hz Hz Hz Hz
Beta 3 Hz Hz Hz Hz
Delta 4 Hz Hz Hz Hz
Theta 5 Hz Hz Hz Hz
II. Data Summary and Questions C. List and define two characteristics of regular, periodic waveforms.
D. Compare and contrast synchrony and alpha block.
© BIOPAC Systems, Inc. 2005

Page 12 Biopac Science Lab
E. Examine the alpha and beta waveforms for change between the “eyes closed” state and the “eyes open” state.
a. Does desynchronization of the alpha rhythm occur when the eyes are open?
b. Does the beta rhythm become more pronounced in the “eyes open” state?
F. The amplitude measurements (Stddev) are indicative of how much alpha activity is occurring in the Subject. But, the amplitude values for beta do not truly reflect the amount of mental activity occurring with the eyes open. Explain.
G. Examine the delta and theta rhythm. Is there an increase in delta and theta activity when the eyes are open? Explain your observation.
H. Define the following terms:
Alpha rhythm
Beta rhythm
Theta rhythm
Delta rhythm
End of Biopac Science Lab Lesson 5 Data Report
Biopac Science Lab Page 13
VI. ACTIVE LEARNING LAB
Design a new experiment to test or verify the scientific principle(s) you learned in the Biopac Science Lab recording and analysis segments.
For this lesson, you might examine how different activities influence lobe activity and brain rhythms.
Design Your Experiment
Use a separate sheet to detail your experiment design, and be sure to address these main points:
A. Hypothesis
Describe the scientific principle to be tested or verified.
B. Materials
List the materials will you use to complete your investigation.
C. Method
Describe the experimental procedure—be sure to number each step to make it easy to follow during recording.
See the Set Up section or Help > About Electrodes for electrode placement guidelines.
Run Your Experiment
D. Set Up
Set up the equipment and prepare the subject for your experiment.
E. Record
Use the Record, Resume, and Suspend buttons in the Biopac Science Lab program to record as many segments as necessary for your experiment.
Click Done when you have completed all of the segments required for your experiment.
Analyze Your Experiment
F. Set measurements relevant to your experiment and record the results in a Data Report.
© BIOPAC Systems, Inc. 2005


