Embed Size (px)
Citation preview

LIDL GREAT BRITAIN LIMITED
PROPOSED FOOD STORE
MUMBLES ROAD, SWANSEA
TRANSPORT ASSESSMENT
20-00668/TA/01
September 2021
Mumbles Road, Swansea
Lidl Great Britain Limited Transport Assessment
20-00668/TA/01 Corun Associates Ltd
September 2021 Page 1
DOCUMENT SIGNATURE AND MODIFICATION SHEET
Project Details
Project Title: Proposed Lidl Food Store, Mumbles Road, Swansea
Project No: 20-00668 Document No: TA/01
Client: Lidl Great Britain Limited
- Name Signature Date
Prepared by Mark Murawski
September 2021
Checked and
Approved for Issue
by
Matthew Anderson
September 2021
Modification Details
Rev Date Description Checked By
Issued By:
Corun Associates Limited
Swansea
T 01792 229155
Mumbles Road, Swansea
Lidl Great Britain Limited Transport Assessment
20-00668/TA/01 Corun Associates Ltd
September 2021 Page 2
CONTENTS Page
1 INTRODUCTION 4
1.1 Background 4
1.2 Scope 4
1.3 Covid Note 4
2 EXISTING CONDITIONS 5
2.1 Site Description and Location 5
2.2 Local Highway Network 5
2.3 Pedestrian Facilities 6
2.4 Cycle Facilities 8
2.5 Public Transport Facilities 11
2.6 Local Highway Safety 13
3 LOCAL AND NATIONAL PLANNING GUIDANCE 15
3.1 Overview 15
3.2 Overall Policy Objective 15
3.3 Conclusion 15
4 DEVELOPMENT PROPOSAL 16
4.1 Proposed Re-Development 16
4.2 Vehicular Access 16
4.3 Parking Provision 16
4.4 Sustainable Transport Enhancements 19
5 DEVELOPMENT TRAFFIC GENERATION AND IMPACT 20
5.1 Introduction 20
5.2 Proposed Lidl development trip generation 20
5.3 Development Modal Split 21
5.4 Permitted Site Use Trip Generation 22
5.5 Proposed Change of Use Trip Generation Difference 23
5.6 Proposed Development Highway Impact 25
6 CAPACITY ASSESSMENT 28
6.1 Junction Modelling Methodology 28
6.2 Proposed Site Access Junction Capacity Assessment Summary 29
6.3 A4067 / Derwen Fawr Road Junction Capacity Assessment Summary 29
6.4 Capacity Assessment Summary 30
7 SUMMARY AND CONCLUSION 31
7.1 Summary 31
7.2 Conclusion 32
Mumbles Road, Swansea
Lidl Great Britain Limited Transport Assessment
20-00668/TA/01 Corun Associates Ltd
September 2021 Page 3
FIGURES
Figure 2.1: Site in Local Context
Figure 2.2: Site in Strategic Context
Figure 2.3: 1.2km and 2km indicative walking catchments from the site
Figure 2.4: Swansea Bay Cycle Network ‘Tube Map’
Figure 2.5: 4km and 12km indicative cycle catchments from the site
Figure 2.6: Bus services in the vicinity of the site
Figure 2.7: PIA plot extract and location of DfT count site
APPENDICES
Appendix A – Proposed Site Layout Plans
Appendix B – Swansea Council Pre-Application Discussion Response
Appendix C – TRICS Outputs
Appendix D – A4067 ATC Survey Summary
Appendix E – A4067 / Derwen Fawr Road Turning Count Summary
Appendix F – PICADY Modelling Outputs
Mumbles Road, Swansea
Lidl Great Britain Limited Transport Assessment
20-00668/TA/01 Corun Associates Ltd
September 2021 Page 4
1 INTRODUCTION
1.1 Background
1.1.1 This Transport Assessment (TA) has been produced by Corun Associates Ltd (Corun) on
behalf of Lidl Great Britain Limited, the applicants, to examine the highway and
transportation issues associated with the proposed development of a new Lidl food store
(Class A1) along Mumbles Road, Swansea.
1.1.2 The proposal involves the construction of a new 2,029m2 (GFA) Lidl food store unit together
with associated parking (50 spaces in total) at a vacant site formerly occupied by a Shell
filling station (now demolished). A layout plan of the proposed development is contained at
Appendix A.
1.1.3 A pre-application discussion has been had with Swansea Council for the proposed
development. A copy of the Swansea Council response letter for this pre-application
discussion (received on 28th August 2021) is contained at Appendix B.
1.1.4 The aim of this report is to demonstrate that there are no reasons, in highway and
transportation terms, why the proposed re-development site should not be allocated
planning permission.
1.2 Scope
1.2.1 This report will discuss the following key transportation issues arising from the proposals:
(i) the existing site location and transport infrastructure;
(ii) analysis of personal injury traffic accident data;
(iii) the site’s compliance with applicable transport policy;
(iv) the development proposal in detail;
(v) development-generated vehicular traffic; and
(vi) development impact on the surrounding highway network.
1.3 Covid Note
1.3.1 It is important to note that this report has been produced during the Covid-19 pandemic
period which has imposed restrictions on the collection of traffic survey data. However,
surveys were undertaken when schools were operational and there were no local lockdowns
in place.
1.3.2 Data released by the DfT, as well as the survey data obtained by Corun, indicate that traffic
during the survey period was near enough in line with pre-Covid levels, which enabled a
robust assessment.
1.3.3 On this basis, no Covid-19 adjustment factor was deemed necessary, and the data obtained
from the surveys undertaken is considered representative and robust for assessment
purposes.
1.3.4 All traffic survey data can be provided on request.
Mumbles Road, Swansea
Lidl Great Britain Limited Transport Assessment
20-00668/TA/01 Corun Associates Ltd
September 2021 Page 5
2 EXISTING CONDITIONS
2.1 Site Description and Location
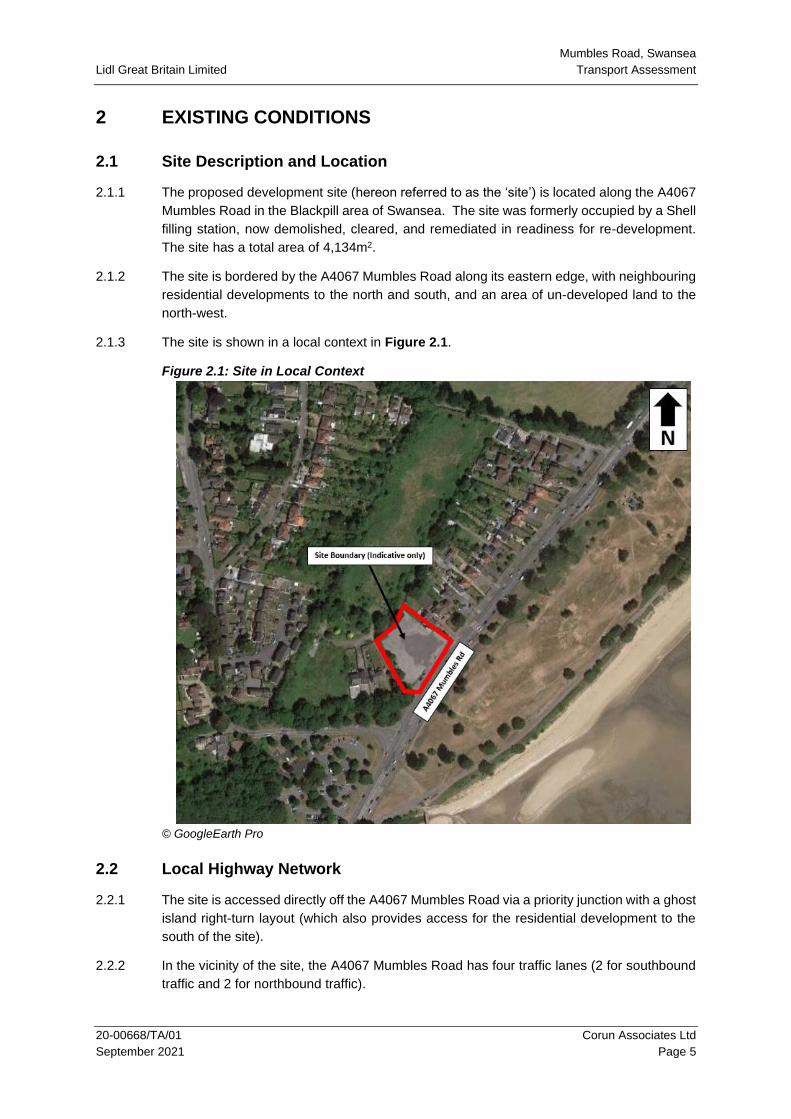
2.1.1 The proposed development site (hereon referred to as the ‘site’) is located along the A4067
Mumbles Road in the Blackpill area of Swansea. The site was formerly occupied by a Shell
filling station, now demolished, cleared, and remediated in readiness for re-development.
The site has a total area of 4,134m2.
2.1.2 The site is bordered by the A4067 Mumbles Road along its eastern edge, with neighbouring
residential developments to the north and south, and an area of un-developed land to the
north-west.
2.1.3 The site is shown in a local context in Figure 2.1.
Figure 2.1: Site in Local Context
© GoogleEarth Pro
2.2 Local Highway Network
2.2.1 The site is accessed directly off the A4067 Mumbles Road via a priority junction with a ghost
island right-turn layout (which also provides access for the residential development to the
south of the site).
2.2.2 In the vicinity of the site, the A4067 Mumbles Road has four traffic lanes (2 for southbound
traffic and 2 for northbound traffic).
Mumbles Road, Swansea
Lidl Great Britain Limited Transport Assessment
20-00668/TA/01 Corun Associates Ltd
September 2021 Page 6
2.2.3 The site is located approximately 20m south of a speed limit change along the A4067
Mumbles Road. South from this point the road is subject to a 30mph speed limit, and north
from this point the road is subject to a 40mph speed limit.
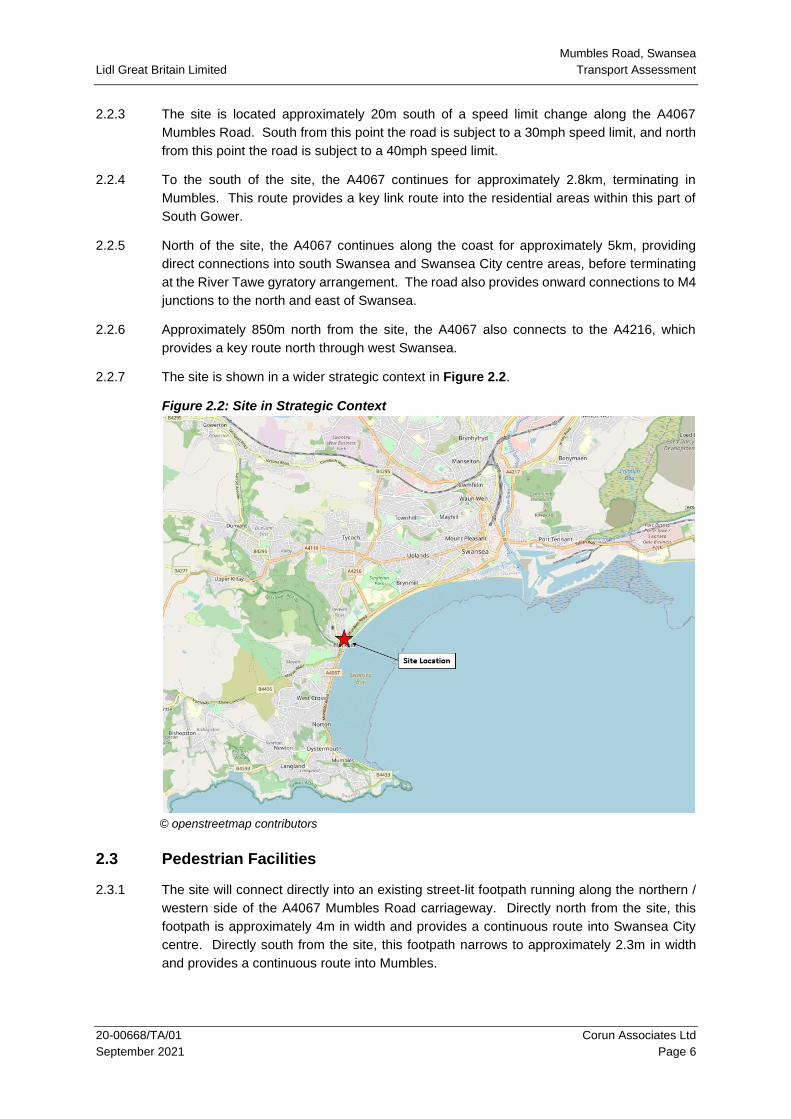
2.2.4 To the south of the site, the A4067 continues for approximately 2.8km, terminating in
Mumbles. This route provides a key link route into the residential areas within this part of
South Gower.
2.2.5 North of the site, the A4067 continues along the coast for approximately 5km, providing
direct connections into south Swansea and Swansea City centre areas, before terminating
at the River Tawe gyratory arrangement. The road also provides onward connections to M4
junctions to the north and east of Swansea.
2.2.6 Approximately 850m north from the site, the A4067 also connects to the A4216, which
provides a key route north through west Swansea.
2.2.7 The site is shown in a wider strategic context in Figure 2.2.
Figure 2.2: Site in Strategic Context
© openstreetmap contributors
2.3 Pedestrian Facilities
2.3.1 The site will connect directly into an existing street-lit footpath running along the northern /
western side of the A4067 Mumbles Road carriageway. Directly north from the site, this
footpath is approximately 4m in width and provides a continuous route into Swansea City
centre. Directly south from the site, this footpath narrows to approximately 2.3m in width
and provides a continuous route into Mumbles.
Mumbles Road, Swansea
Lidl Great Britain Limited Transport Assessment
20-00668/TA/01 Corun Associates Ltd
September 2021 Page 7
2.3.2 A Toucan crossing is located approximately 200m to the south of the site, providing a safe
crossing point across the A4067 Mumbles Road, which provides a direct connection into the
Swansea Bay shared-use pedestrian and cycle path. This route follows the coast along the
old Mumbles tramway, providing a traffic-free pedestrian/cycle route between Swansea
Marina and Mumbles.
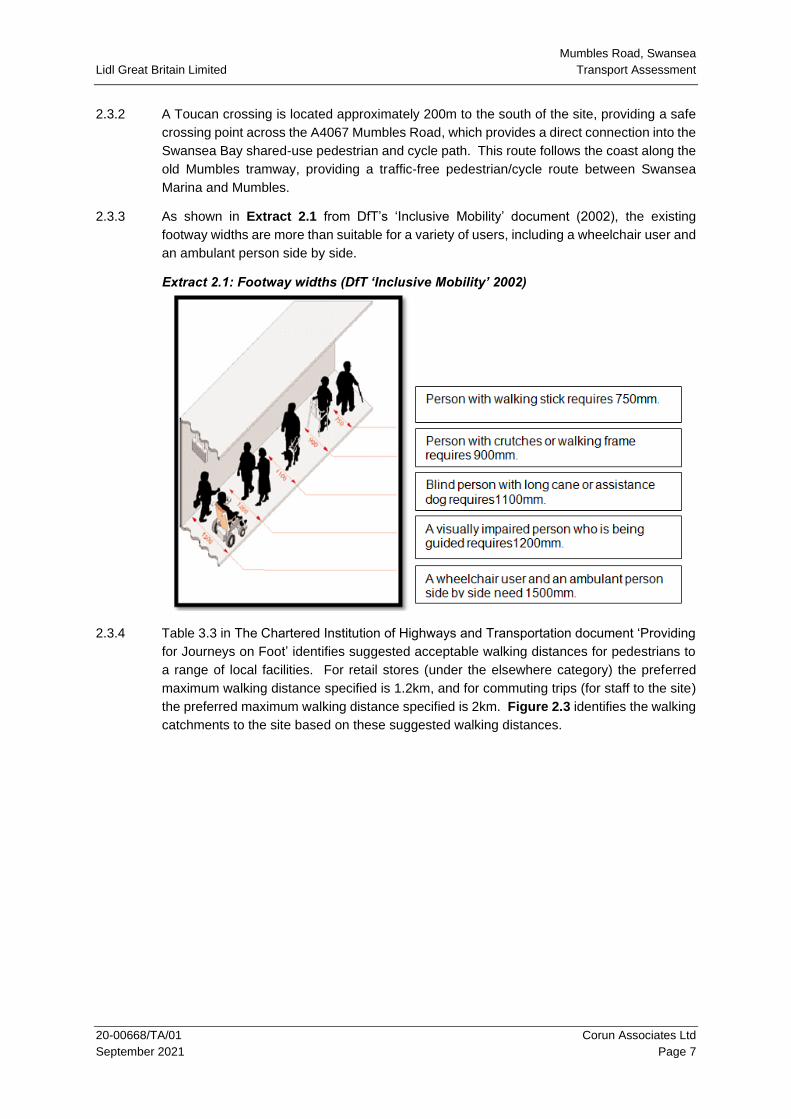
2.3.3 As shown in Extract 2.1 from DfT’s ‘Inclusive Mobility’ document (2002), the existing
footway widths are more than suitable for a variety of users, including a wheelchair user and
an ambulant person side by side.
Extract 2.1: Footway widths (DfT ‘Inclusive Mobility’ 2002)
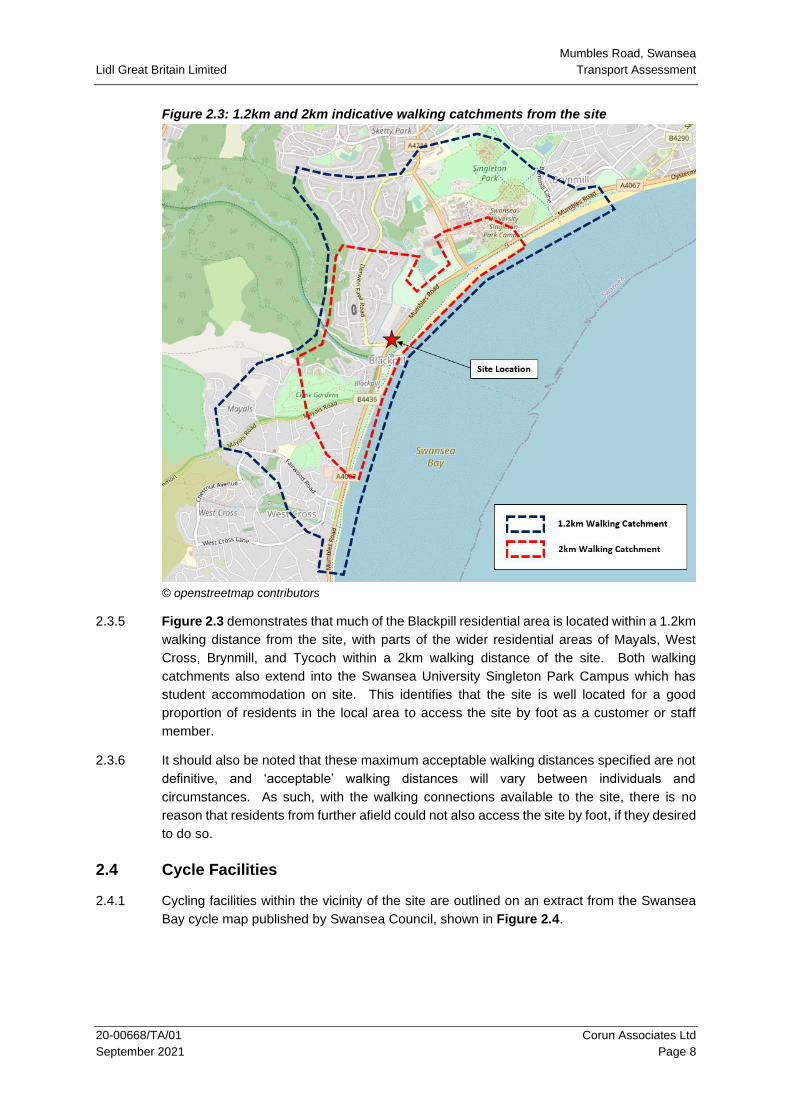
2.3.4 Table 3.3 in The Chartered Institution of Highways and Transportation document ‘Providing
for Journeys on Foot’ identifies suggested acceptable walking distances for pedestrians to
a range of local facilities. For retail stores (under the elsewhere category) the preferred
maximum walking distance specified is 1.2km, and for commuting trips (for staff to the site)
the preferred maximum walking distance specified is 2km. Figure 2.3 identifies the walking
catchments to the site based on these suggested walking distances.
Mumbles Road, Swansea
Lidl Great Britain Limited Transport Assessment
20-00668/TA/01 Corun Associates Ltd
September 2021 Page 8
Figure 2.3: 1.2km and 2km indicative walking catchments from the site
© openstreetmap contributors
2.3.5 Figure 2.3 demonstrates that much of the Blackpill residential area is located within a 1.2km
walking distance from the site, with parts of the wider residential areas of Mayals, West
Cross, Brynmill, and Tycoch within a 2km walking distance of the site. Both walking
catchments also extend into the Swansea University Singleton Park Campus which has
student accommodation on site. This identifies that the site is well located for a good
proportion of residents in the local area to access the site by foot as a customer or staff
member.
2.3.6 It should also be noted that these maximum acceptable walking distances specified are not
definitive, and ‘acceptable’ walking distances will vary between individuals and
circumstances. As such, with the walking connections available to the site, there is no
reason that residents from further afield could not also access the site by foot, if they desired
to do so.
2.4 Cycle Facilities
2.4.1 Cycling facilities within the vicinity of the site are outlined on an extract from the Swansea
Bay cycle map published by Swansea Council, shown in Figure 2.4.
Mumbles Road, Swansea
Lidl Great Britain Limited Transport Assessment
20-00668/TA/01 Corun Associates Ltd
September 2021 Page 9
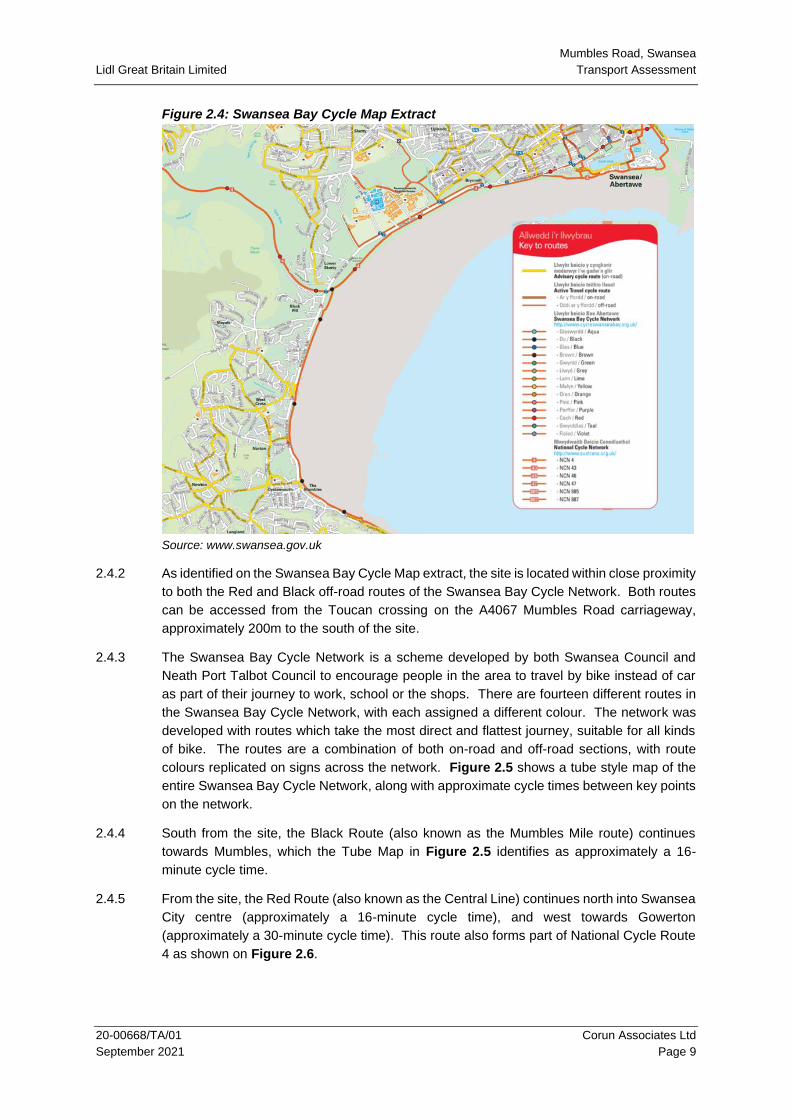
Figure 2.4: Swansea Bay Cycle Map Extract
Source: www.swansea.gov.uk
2.4.2 As identified on the Swansea Bay Cycle Map extract, the site is located within close proximity
to both the Red and Black off-road routes of the Swansea Bay Cycle Network. Both routes
can be accessed from the Toucan crossing on the A4067 Mumbles Road carriageway,
approximately 200m to the south of the site.
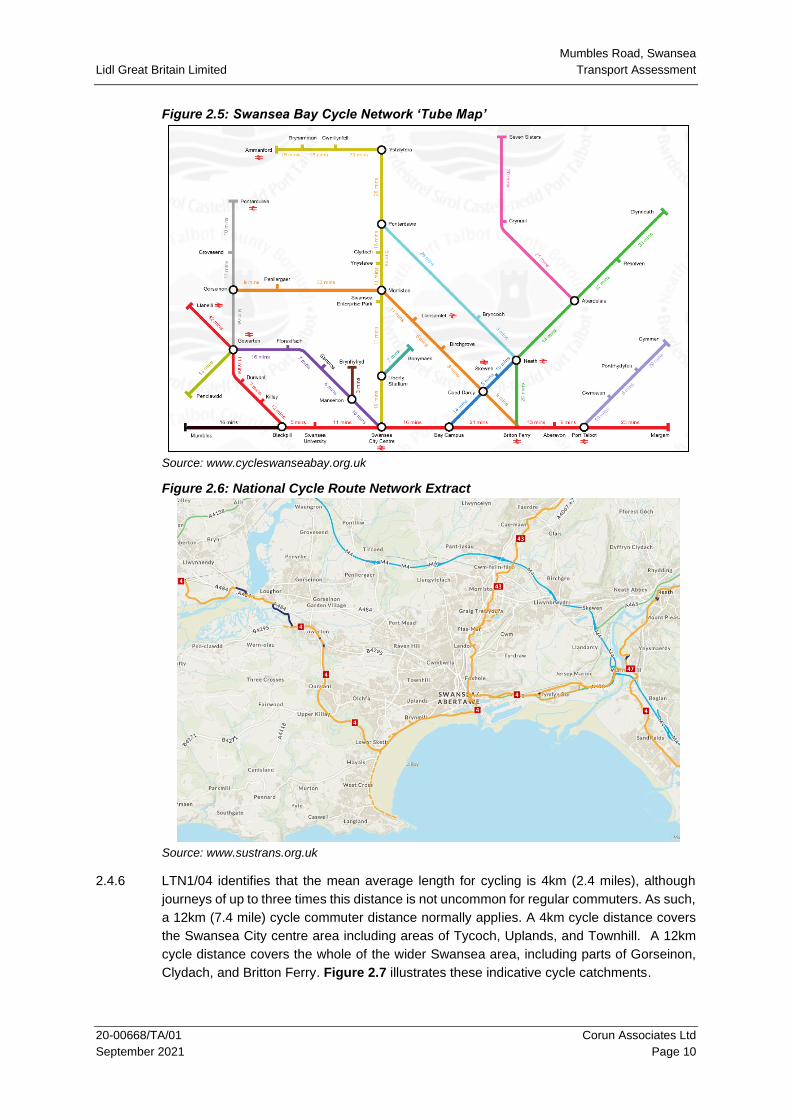
2.4.3 The Swansea Bay Cycle Network is a scheme developed by both Swansea Council and
Neath Port Talbot Council to encourage people in the area to travel by bike instead of car
as part of their journey to work, school or the shops. There are fourteen different routes in
the Swansea Bay Cycle Network, with each assigned a different colour. The network was
developed with routes which take the most direct and flattest journey, suitable for all kinds
of bike. The routes are a combination of both on-road and off-road sections, with route
colours replicated on signs across the network. Figure 2.5 shows a tube style map of the
entire Swansea Bay Cycle Network, along with approximate cycle times between key points
on the network.
2.4.4 South from the site, the Black Route (also known as the Mumbles Mile route) continues
towards Mumbles, which the Tube Map in Figure 2.5 identifies as approximately a 16-
minute cycle time.
2.4.5 From the site, the Red Route (also known as the Central Line) continues north into Swansea
City centre (approximately a 16-minute cycle time), and west towards Gowerton
(approximately a 30-minute cycle time). This route also forms part of National Cycle Route
4 as shown on Figure 2.6.
Mumbles Road, Swansea
Lidl Great Britain Limited Transport Assessment
20-00668/TA/01 Corun Associates Ltd
September 2021 Page 10
Figure 2.5: Swansea Bay Cycle Network ‘Tube Map’
Source: www.cycleswanseabay.org.uk
Figure 2.6: National Cycle Route Network Extract
Source: www.sustrans.org.uk
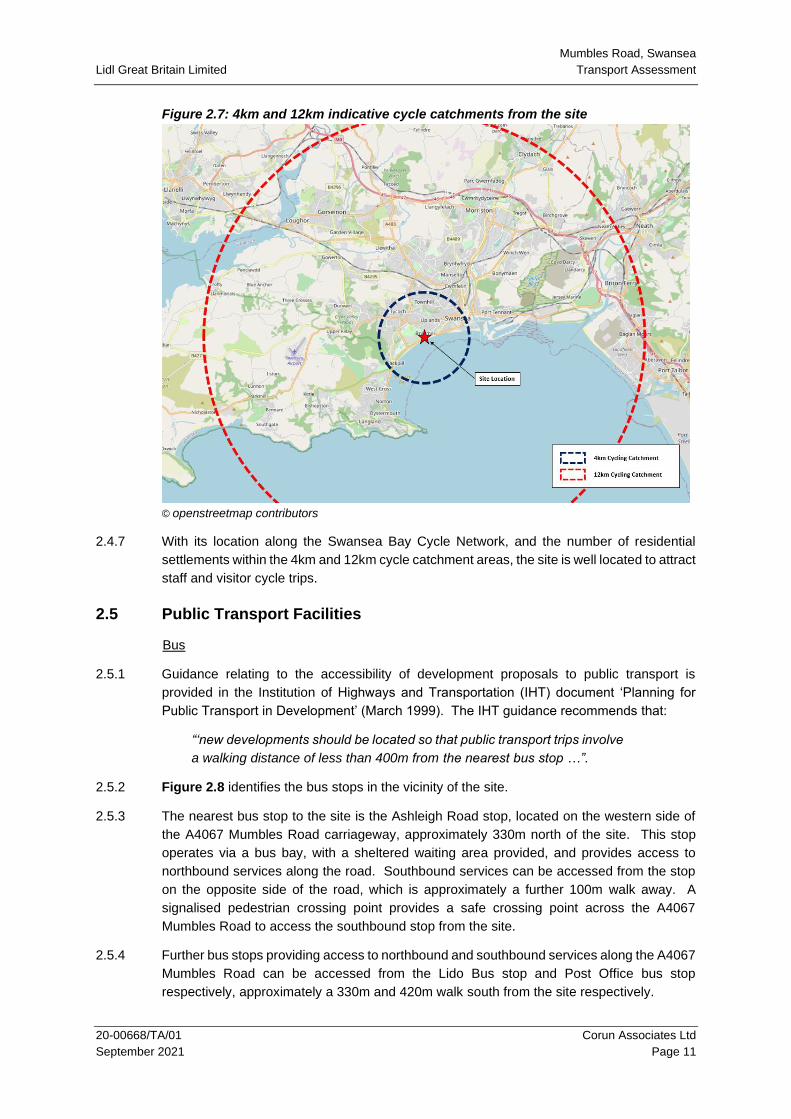
2.4.6 LTN1/04 identifies that the mean average length for cycling is 4km (2.4 miles), although
journeys of up to three times this distance is not uncommon for regular commuters. As such,
a 12km (7.4 mile) cycle commuter distance normally applies. A 4km cycle distance covers
the Swansea City centre area including areas of Tycoch, Uplands, and Townhill. A 12km
cycle distance covers the whole of the wider Swansea area, including parts of Gorseinon,
Clydach, and Britton Ferry. Figure 2.7 illustrates these indicative cycle catchments.
Mumbles Road, Swansea
Lidl Great Britain Limited Transport Assessment
20-00668/TA/01 Corun Associates Ltd
September 2021 Page 11
Figure 2.7: 4km and 12km indicative cycle catchments from the site
© openstreetmap contributors
2.4.7 With its location along the Swansea Bay Cycle Network, and the number of residential
settlements within the 4km and 12km cycle catchment areas, the site is well located to attract
staff and visitor cycle trips.
2.5 Public Transport Facilities
Bus
2.5.1 Guidance relating to the accessibility of development proposals to public transport is
provided in the Institution of Highways and Transportation (IHT) document ‘Planning for
Public Transport in Development’ (March 1999). The IHT guidance recommends that:
“‘new developments should be located so that public transport trips involve
a walking distance of less than 400m from the nearest bus stop …”.
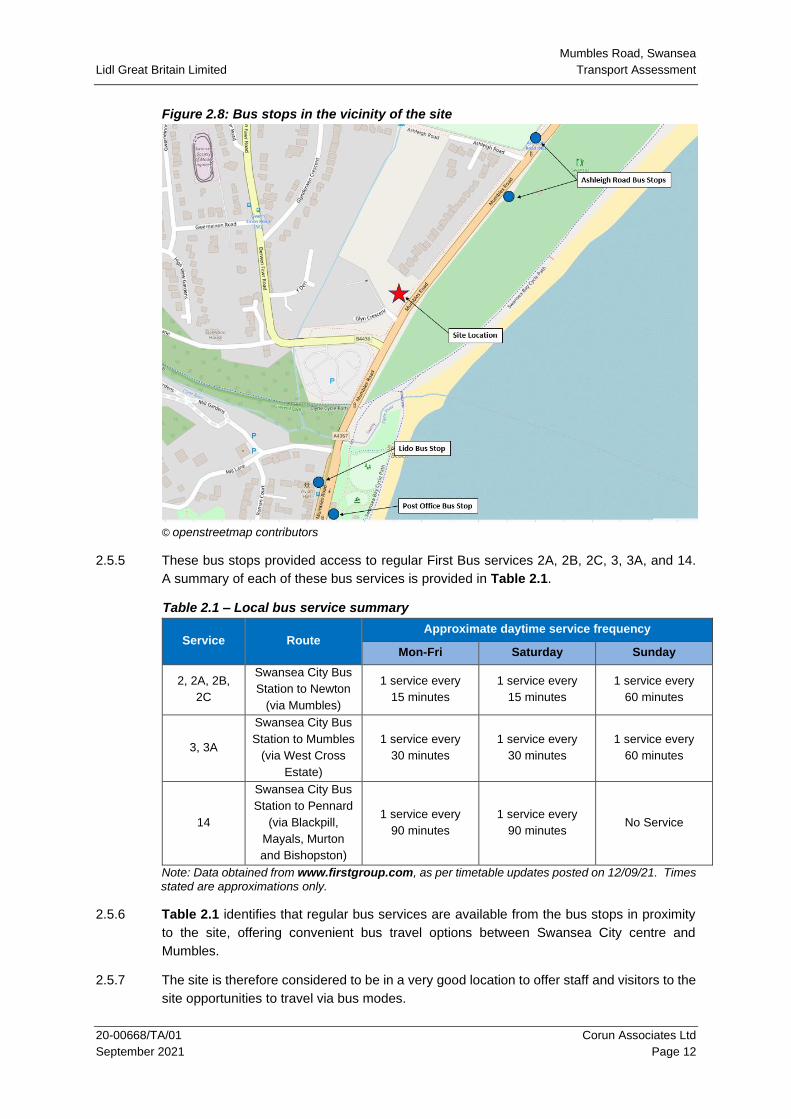
2.5.2 Figure 2.8 identifies the bus stops in the vicinity of the site.
2.5.3 The nearest bus stop to the site is the Ashleigh Road stop, located on the western side of
the A4067 Mumbles Road carriageway, approximately 330m north of the site. This stop
operates via a bus bay, with a sheltered waiting area provided, and provides access to
northbound services along the road. Southbound services can be accessed from the stop
on the opposite side of the road, which is approximately a further 100m walk away. A
signalised pedestrian crossing point provides a safe crossing point across the A4067
Mumbles Road to access the southbound stop from the site.
2.5.4 Further bus stops providing access to northbound and southbound services along the A4067
Mumbles Road can be accessed from the Lido Bus stop and Post Office bus stop
respectively, approximately a 330m and 420m walk south from the site respectively.
Mumbles Road, Swansea
Lidl Great Britain Limited Transport Assessment
20-00668/TA/01 Corun Associates Ltd
September 2021 Page 12
Figure 2.8: Bus stops in the vicinity of the site
© openstreetmap contributors
2.5.5 These bus stops provided access to regular First Bus services 2A, 2B, 2C, 3, 3A, and 14.
A summary of each of these bus services is provided in Table 2.1.
Table 2.1 – Local bus service summary
Service Route Approximate daytime service frequency
Mon-Fri Saturday Sunday
2, 2A, 2B,
2C
Swansea City Bus
Station to Newton
(via Mumbles)
1 service every
15 minutes
1 service every
15 minutes
1 service every
60 minutes
3, 3A
Swansea City Bus
Station to Mumbles
(via West Cross
Estate)
1 service every
30 minutes
1 service every
30 minutes
1 service every
60 minutes
14
Swansea City Bus
Station to Pennard
(via Blackpill,
Mayals, Murton
and Bishopston)
1 service every
90 minutes
1 service every
90 minutes No Service
Note: Data obtained from www.firstgroup.com, as per timetable updates posted on 12/09/21. Times stated are approximations only.
2.5.6 Table 2.1 identifies that regular bus services are available from the bus stops in proximity
to the site, offering convenient bus travel options between Swansea City centre and
Mumbles.
2.5.7 The site is therefore considered to be in a very good location to offer staff and visitors to the
site opportunities to travel via bus modes.
Mumbles Road, Swansea
Lidl Great Britain Limited Transport Assessment
20-00668/TA/01 Corun Associates Ltd
September 2021 Page 13
Rail
2.5.8 The nearest train station to the site is Swansea station, approximately 5km away. Although
outside a reasonable walking distance to the site, the station can be accessed via a multi-
modal cycle or bus journey.
2.5.9 Swansea is a key station in Wales, providing access to Transport for Wales services running
across South Wales, and onward to Manchester Piccadilly and Shrewsbury. The station
also provides access to First Great Western services operating between Carmarthen and
London Paddington.
2.5.10 Potential commuter stations within a short rail journey time to Swansea include Gowerton
(11-minutes) and Llanelli (18-minutes) to the west, and Neath (11-minutes), Port Talbot (18-
minutes) and Bridgend (31-minutes) to the east.
2.5.11 With the opportunity for a multi-modal cycle trip (and possibly bus trip), access to Swansea
train station is an option from the site if required, especially for staff commuting trips.
2.6 Local Highway Safety
2.6.1 A review has been carried out on local highway network safety in order to establish whether
there are any current accident clusters or blackspots in the vicinity of the site that may be
exacerbated by the development proposal. In this instance, a cluster is identified as a closely
defined area of five or more accidents.
2.6.2 The website www.crashmap.co.uk has been interrogated to provide a review of accidents in
the surrounding area.
2.6.3 CrashMap uses data collected by the police about road traffic crashes occurring on British
roads where someone has been injured. This data is approved by the National Statistics
Authority and reported on by the Department for Transport each year. The website uses
data obtained directly from official sources and compiled in an easy-to-use format showing
each incident on a map. Incidents are plotted to within 10 metres of their location and the
data includes all incidents up to the end of 2019.
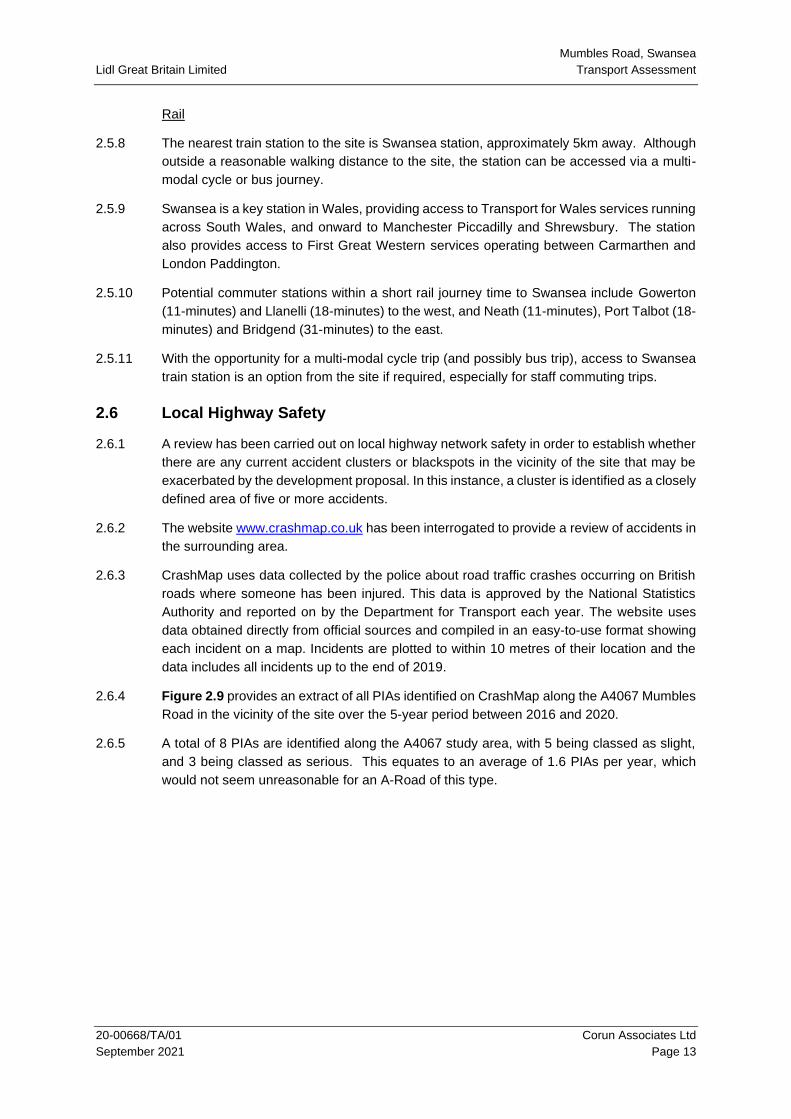
2.6.4 Figure 2.9 provides an extract of all PIAs identified on CrashMap along the A4067 Mumbles
Road in the vicinity of the site over the 5-year period between 2016 and 2020.
2.6.5 A total of 8 PIAs are identified along the A4067 study area, with 5 being classed as slight,
and 3 being classed as serious. This equates to an average of 1.6 PIAs per year, which
would not seem unreasonable for an A-Road of this type.
Mumbles Road, Swansea
Lidl Great Britain Limited Transport Assessment
20-00668/TA/01 Corun Associates Ltd
September 2021 Page 14
Figure 2.9: PIA plot extract and location of DfT count site
Source: www.crashmap.co.uk - data extracted April 2021
2.6.6 The accident data does not therefore appear to identify any significant highway safety issue
within the immediate area of the development site, and the minor increase in traffic
generated by the proposed development (as discussed later on in this report) is highly
unlikely to exacerbate the existing safety record to a significant enough level to warrant
concern.
Mumbles Road, Swansea
Lidl Great Britain Limited Transport Assessment
20-00668/TA/01 Corun Associates Ltd
September 2021 Page 15
3 LOCAL AND NATIONAL PLANNING GUIDANCE
3.1 Overview
3.1.1 In transport terms the relevant policy guidance that applies to this site are contained in the
following documents:
• Planning Policy Wales (Edition 11, February 2021);
• Technical Advice Note (Wales) (2007) 18 - Transport;
• Wales Transport Strategy (2008);
• Joint Transport Plan for South West Wales (2015 – 2020); and
• Swansea Local Development Plan 2010 - 2025, adopted February 2019
3.1.2 Consideration is also given to the following legislation, which has an emphasis on
sustainable transport provision:
• Active Travel Wales Act 2013;
• Well-being of Future Generations (Wales) Act 2015.
3.2 Overall Policy Objective
3.2.1 The overarching desire at all tiers of planning policy guidance is to influence a modal shift
from single occupancy car travel towards more sustainable modes such as walking, cycling,
and public transport.
3.2.2 In order to achieve this, it is recognised that development should be located such that the
need to travel by private car is reduced, by locating development where there is good access
to high quality public transport, walking and cycling provision.
3.3 Conclusion
3.3.1 As identified in Section 2 of this report, the site is well located to encourage travel by
sustainable modes for both staff and visitors of the proposed development.
3.3.2 The site is therefore concluded to comply with transport planning policy at local and national
level.
Mumbles Road, Swansea
Lidl Great Britain Limited Transport Assessment
20-00668/TA/01 Corun Associates Ltd
September 2021 Page 16
4 DEVELOPMENT PROPOSAL
4.1 Proposed Re-Development
4.1.1 The proposed development involves the construction of a new 2,029m2 (GFA) Lidl food store
(Class A1), and associated parking.
4.1.2 Indicative site layout plans of these proposals are contained at Appendix A.
4.2 Vehicular Access
4.2.1 Vehicular access to the site is proposed to be upgraded to a new T-junction arrangement
along the A4067 Mumbles Road, with a DMRB compliant extended right turn lane (providing
stacking distance for at least 6 vehicles). The existing traffic island along the site frontage
on the A4067 Mumbles Road is to be removed as part of this new access arrangement, with
carriageway widening into the adopted highway / verge proposed to facilitate this extension.
The layout plan at Appendix A shows the location and preliminary design of this proposed
new access junction.
4.2.2 The new access will be designed to allow sufficient space for a max legal 16.5m articulated
vehicle to safely manoeuvre in and out of the site as shown on the layout plans at Appendix
A. The internal layout will also allow a vehicle of this size to safely manoeuvre within the
site, to both enter and exit within a forward gear.
4.2.3 Visibility splays well in excess of 200m would be achievable in both directions from the
proposed new access junction. These distances are comfortably above the minimum
required distances for a road of this type, as set out in DMRB guidance.
4.2.4 The existing access junction to Glyn Crescent will be unaffected by these works. The
removal of the existing traffic island along the A4067 Mumbles Road however, will extend
the right turn lane of this junction, allowing vehicles easier and safer entry into this lane.
4.3 Parking Provision
4.3.1 The development proposal includes 50 parking spaces, made up of 37 (74%) standard
parking spaces, 4 (8%) for disabled customers, 7 (14%) parent and child spaces, and 2 (4%)
electric vehicle charging spaces.
4.3.2 The supplementary planning document ‘City and County of Swansea Parking Standards’
adopted in March 2012 sets out detailed parking requirements according to land use and
type of development across the county. These parking standards differ across six distinct
zones identified within the document. These zone descriptions are slightly vague within the
SPG, with the proposed development potentially falling within either ‘Zone 3’ or ‘Zone 4’.
4.3.3 The proposed development has a GEA of 2,194m2. The Zone 3 parking standards for the
‘Shops (including shops, supermarkets, and superstores)’ category state significantly
different parking requirements for developments of this type with a GFA above and below a
threshold of 2,000m2. As the proposed development is only slightly over this threshold (by
194m2), it would not seem unreasonable to apply the parking standards for developments
in the 1,000m2 to 2,000m2 category. Based on this, the parking standards state that a
maximum of 1 space per 40m2 (GFA) should be provided. For the proposed development
this equates to a maximum of 55 car parking spaces.
Mumbles Road, Swansea
Lidl Great Britain Limited Transport Assessment
20-00668/TA/01 Corun Associates Ltd
September 2021 Page 17
4.3.4 The Zone 4 parking standards for the ‘Shops (including shops, supermarkets, and
superstores)’ with a GFA between 1,000m2 to 2,000m2 category however state that a
maximum of 1 space per 20m2 (GFA) should be provided. For the proposed development
this equates to a maximum of 110 car parking spaces. This is a significant difference from
the Zone 3 standards, and identifies how a site-specific approach is required in applying
these standards.
4.3.5 Section 6.1 of the SPG also outlines the following:
“The scale of parking provision varies throughout Wales and local priorities
will dictate the manner in which the standards are used. Interpretation and
application of the standards will rest with the Local Authority, but flexibility
in the standards allows local circumstances to be taken into account.
(a) In assessing the parking requirements for a particular development, the
planning authority will need to take into account a number of factors in
relation to the development and its location. These are listed below:
• Access requirements of disabled people
• Accessibility to and the service provided by the public transport system,
• The availability of private buses or the extent of car pooling,
• The relative proportions of full time / part time / local catchment of labour,
• Accessibility by walking and cycling,
• The existing and possible future congestion in streets adjacent to the
development,
• Accessibility to and the availability of public and / or private car parking
space in the vicinity.”
4.3.6 As identified in Section 2 of this report, the development is well located to encourage non-
car modes of travel, and as such the lower Zone 3 standards would seem more appropriate
to apply at the site.
4.3.7 As outlined in Section 4.3 of the SPG, the parking standards also aim to set a maximum
level of parking to be provided at developments, in line with national and regional policies to
encourage a move to more sustainable modes of transport. The SPG was also published
before the more recent ‘Future Wales – The National Plan 2040 (February 2021)’ and
‘Planning Policy Wales (Edition 11, February 2021)’ documents which identify the following
with regards parking provision at non-residential developments:
Planning Policy Wales - Edition 11
“Car parking provision is a major influence on how people choose to travel
and the pattern of development. Where and how cars are parked can in
turn be a major factor in the quality of a place.”
“A design-led approach to the provision of car parking should be taken,
which ensures an appropriate level of car parking is integrated in a way
which does not dominate the development. Parking provision should be
informed by the local context, including public transport accessibility, urban
design principles and the objective of reducing reliance on the private car
and supporting a modal shift to walking, cycling and public transport.
Mumbles Road, Swansea
Lidl Great Britain Limited Transport Assessment
20-00668/TA/01 Corun Associates Ltd
September 2021 Page 18
Planning authorities must support schemes which keep parking levels
down, especially off-street parking, when well designed.”
“Parking standards should be applied flexibly and allow for the provision of
lower levels of parking and the creation of high quality places”
4.3.8 The proposed provision of 50 parking spaces is within the SPG maximum provision
suggested, and In line with national policy to reduce reliance on car provision at
developments, the good accessibility of the site to non-car modes of travel, and the
operator’s extensive experience of demand at stores throughout the UK, this parking level
is considered appropriate for the intended food store use.
4.3.9 The Swansea parking standards provide recommended dimensions of car park space of
4.8m x 2.6m, with 6.0m provided between opposing bays. The proposed layout includes
car parking spaces of dimensions 4.7m x 2.5m, with a minimum of 6.5m provided between
each opposing bay. Although slightly below the recommended space sizes identified in the
parking standards, these are similar to spaces provided in the operator’s other stores
throughout the country, which provide adequate space for vehicles to safely enter and exit
spaces and manoeuvre through the car park.
4.3.10 The Swansea parking standards identify that 3 parking spaces should be provided for
commercial vehicles. The proposals include 1 loading bay space for vehicles at the south
west corner of the store. Based on the operator’s extensive experience throughout the UK,
this is deemed sufficient for the site’s needs, and this loading bay will be managed to ensure
that no more than one articulated vehicle is scheduled to arrive and park within the site at
any one time.
4.3.11 As shown on the swept path analysis contained at Appendix A, there is sufficient room
within the site for a max legal 16.5m articulated vehicle to manoeuvre in and out of the
loading bay safely.
Enhanced Access Parking Bays
4.3.12 Swansea parking standards require retail sites to provide a minimum of 6% of the total car
park capacity for disabled motorists, plus an additional space for each disabled employee.
These spaces are preferably to be located within 50m of the facility served by the car park,
and designed to recommendations set out in the DfT document ‘Inclusive Mobility, A Guide
to Best Practice on Access to Pedestrian and Transport Infrastructure (2002)’.
4.3.13 In addition to the disabled parking allocation, a further 5% of spaces need to be of the larger
dimensions in order to cater for users who would benefit from more room to access and
egress vehicles.
4.3.14 A total of 4 (8%) disabled and 7 (14%) parent and child spaces are proposed at the
development, which together represent 22% of the total provision, and meet both enhanced
bay parking requirements.
4.3.15 The disabled bays will be marked and reserved for vulnerable and impaired users and will
include an additional buffer strip at the side and rear of each space to assist with access
especially for wheelchair users.
4.3.16 All enhanced bays are conveniently located near the proposed entrance and within the
Swansea parking guidelines recommended 50m distance.
Mumbles Road, Swansea
Lidl Great Britain Limited Transport Assessment
20-00668/TA/01 Corun Associates Ltd
September 2021 Page 19
Bicycle Parking
4.3.17 Swansea parking standards require 1 short stay and 1 long stay cycle spaces per 500m2
(GFA) at supermarket developments. This equates to a total of 8 cycle parking spaces at
the proposed site.
4.3.18 A minimum of 4 Sheffield cycle stands will be provided at the development, which will allow
parking for a minimum of 8 bicycles. This provision will help encourage this mode of travel.
4.4 Sustainable Transport Enhancements
4.4.1 As identified in Section 2 of this report, it is considered that the site well located to
encourage pedestrian travel from the nearby residential areas of the Blackpill area, and even
students at the Swansea University Singleton Campus.
4.4.2 To further promote this mode of travel, the existing vehicular access junction will be
improved to include tactile paving and dropped kerb crossings to assist mobility impaired
users. Direct access from the internal pedestrian footway onto the existing pedestrian
footway along the western edge of the A4067 Mumbles Road will also be included at the
vehicular access point.
4.4.3 To promote the use of electric vehicles to the site, 2 electric vehicles charging parking
spaces are also included within the proposals.
4.4.4 A Travel Plan will also be created as part of the proposals. This is a document that will be
produced with the intention of promoting and increasing sustainable modes of travel to the
site. This Travel Plan will be primarily targeted at trips made by staff of the proposed
development.
Mumbles Road, Swansea
Lidl Great Britain Limited Transport Assessment
20-00668/TA/01 Corun Associates Ltd
September 2021 Page 20
5 DEVELOPMENT TRAFFIC GENERATION AND IMPACT
5.1 Introduction
5.1.1 Predicted site traffic flows have been forecast using the TRICS database. TRICS is a
nationally accepted database providing information relating to the total number of trips
generated by various land uses, based on existing trips observed at similar sites throughout
the United Kingdom.
5.1.2 From the TRICS database, a Trip Rate is derived which provides the number of expected
trips per unit of measurement (e.g. unit, bay or area). The TRICS good practice guide
promotes an ‘inclusive’ rather than ‘exclusive’ approach to site selection.
5.2 Proposed Lidl development trip generation
5.2.1 The category ’01-Retail/C – Discount Food Store’ was used in TRICS to represent the
proposed Lidl store. An initial filtering step was applied to remove all sites in Greater London
Scotland and Ireland, before a further filter was applied to remove both ‘town centre’ and
‘edge of town centre’ located sites from the selection.
5.2.2 Sites were extracted from TRICS to develop both a weekday and Saturday trip rate
separately.
5.2.3 A copy of the TRICS selection criteria used, and trip rates calculated are included at
Appendix C.
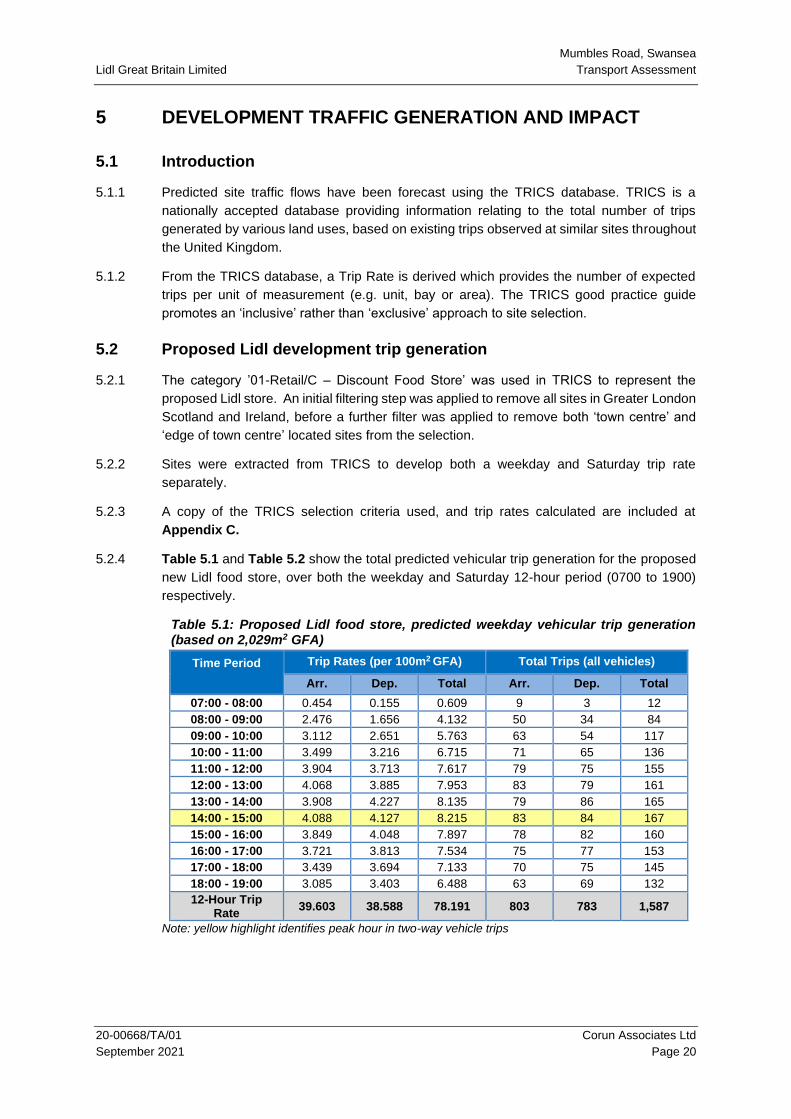
5.2.4 Table 5.1 and Table 5.2 show the total predicted vehicular trip generation for the proposed
new Lidl food store, over both the weekday and Saturday 12-hour period (0700 to 1900)
respectively.
Table 5.1: Proposed Lidl food store, predicted weekday vehicular trip generation (based on 2,029m2 GFA)
Time Period
Trip Rates (per 100m2 GFA) Total Trips (all vehicles)
Arr. Dep. Total Arr. Dep. Total
07:00 - 08:00 0.454 0.155 0.609 9 3 12
08:00 - 09:00 2.476 1.656 4.132 50 34 84
09:00 - 10:00 3.112 2.651 5.763 63 54 117
10:00 - 11:00 3.499 3.216 6.715 71 65 136
11:00 - 12:00 3.904 3.713 7.617 79 75 155
12:00 - 13:00 4.068 3.885 7.953 83 79 161
13:00 - 14:00 3.908 4.227 8.135 79 86 165
14:00 - 15:00 4.088 4.127 8.215 83 84 167
15:00 - 16:00 3.849 4.048 7.897 78 82 160
16:00 - 17:00 3.721 3.813 7.534 75 77 153
17:00 - 18:00 3.439 3.694 7.133 70 75 145
18:00 - 19:00 3.085 3.403 6.488 63 69 132
12-Hour Trip Rate
39.603 38.588 78.191 803 783 1,587
Note: yellow highlight identifies peak hour in two-way vehicle trips
Mumbles Road, Swansea
Lidl Great Britain Limited Transport Assessment
20-00668/TA/01 Corun Associates Ltd
September 2021 Page 21
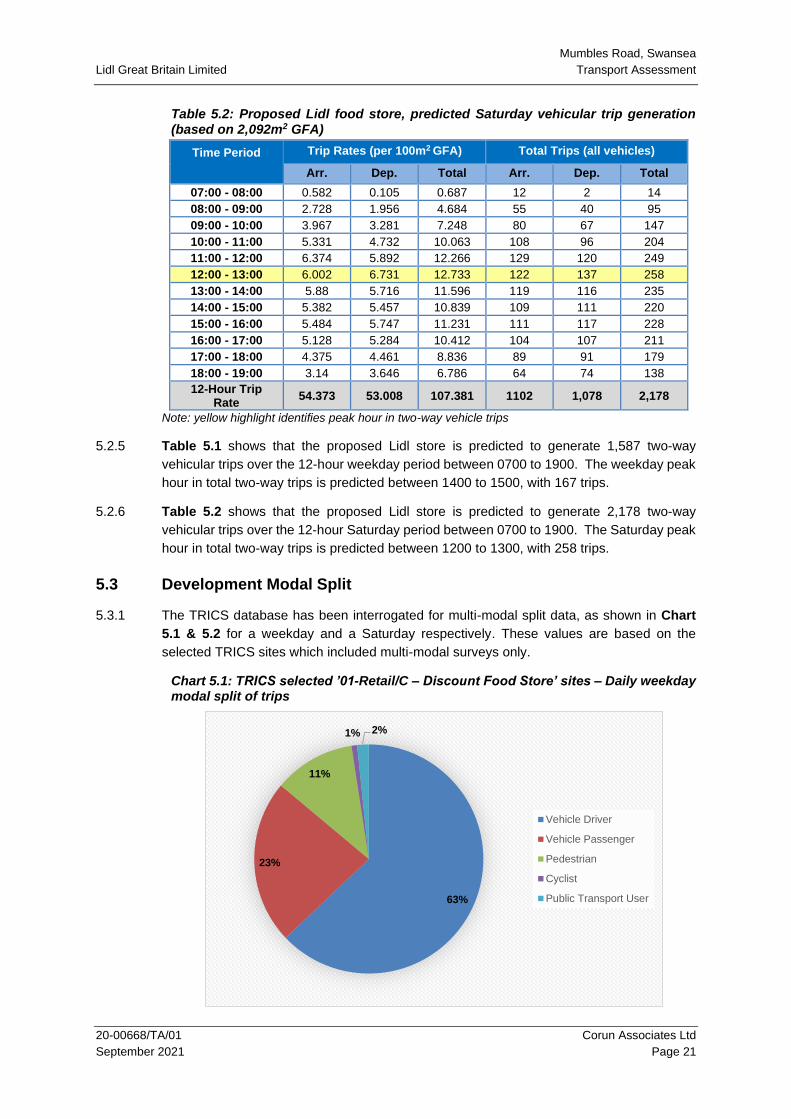
Table 5.2: Proposed Lidl food store, predicted Saturday vehicular trip generation (based on 2,092m2 GFA)
Time Period
Trip Rates (per 100m2 GFA) Total Trips (all vehicles)
Arr. Dep. Total Arr. Dep. Total
07:00 - 08:00 0.582 0.105 0.687 12 2 14
08:00 - 09:00 2.728 1.956 4.684 55 40 95
09:00 - 10:00 3.967 3.281 7.248 80 67 147
10:00 - 11:00 5.331 4.732 10.063 108 96 204
11:00 - 12:00 6.374 5.892 12.266 129 120 249
12:00 - 13:00 6.002 6.731 12.733 122 137 258
13:00 - 14:00 5.88 5.716 11.596 119 116 235
14:00 - 15:00 5.382 5.457 10.839 109 111 220
15:00 - 16:00 5.484 5.747 11.231 111 117 228
16:00 - 17:00 5.128 5.284 10.412 104 107 211
17:00 - 18:00 4.375 4.461 8.836 89 91 179
18:00 - 19:00 3.14 3.646 6.786 64 74 138
12-Hour Trip Rate
54.373 53.008 107.381 1102 1,078 2,178
Note: yellow highlight identifies peak hour in two-way vehicle trips
5.2.5 Table 5.1 shows that the proposed Lidl store is predicted to generate 1,587 two-way
vehicular trips over the 12-hour weekday period between 0700 to 1900. The weekday peak
hour in total two-way trips is predicted between 1400 to 1500, with 167 trips.
5.2.6 Table 5.2 shows that the proposed Lidl store is predicted to generate 2,178 two-way
vehicular trips over the 12-hour Saturday period between 0700 to 1900. The Saturday peak
hour in total two-way trips is predicted between 1200 to 1300, with 258 trips.
5.3 Development Modal Split
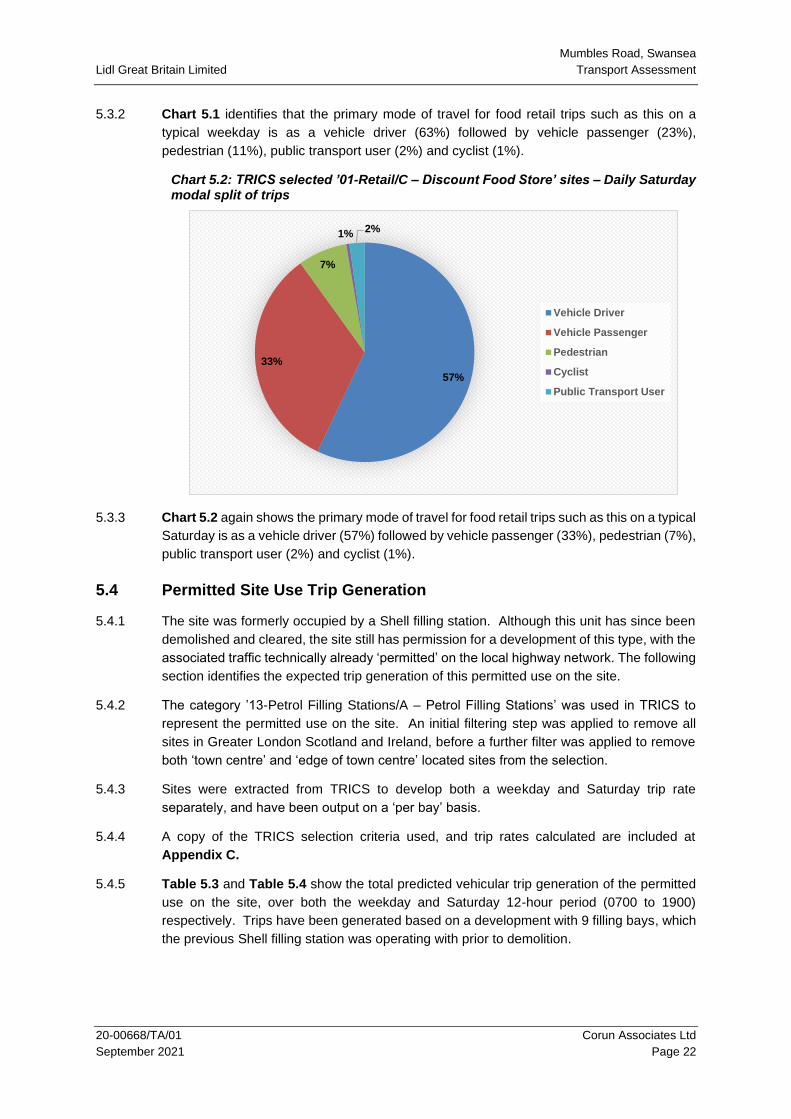
5.3.1 The TRICS database has been interrogated for multi-modal split data, as shown in Chart
5.1 & 5.2 for a weekday and a Saturday respectively. These values are based on the
selected TRICS sites which included multi-modal surveys only.
Chart 5.1: TRICS selected ’01-Retail/C – Discount Food Store’ sites – Daily weekday modal split of trips
63%
23%
11%
1% 2%
Vehicle Driver
Vehicle Passenger
Pedestrian
Cyclist
Public Transport User
Mumbles Road, Swansea
Lidl Great Britain Limited Transport Assessment
20-00668/TA/01 Corun Associates Ltd
September 2021 Page 22
5.3.2 Chart 5.1 identifies that the primary mode of travel for food retail trips such as this on a
typical weekday is as a vehicle driver (63%) followed by vehicle passenger (23%),
pedestrian (11%), public transport user (2%) and cyclist (1%).
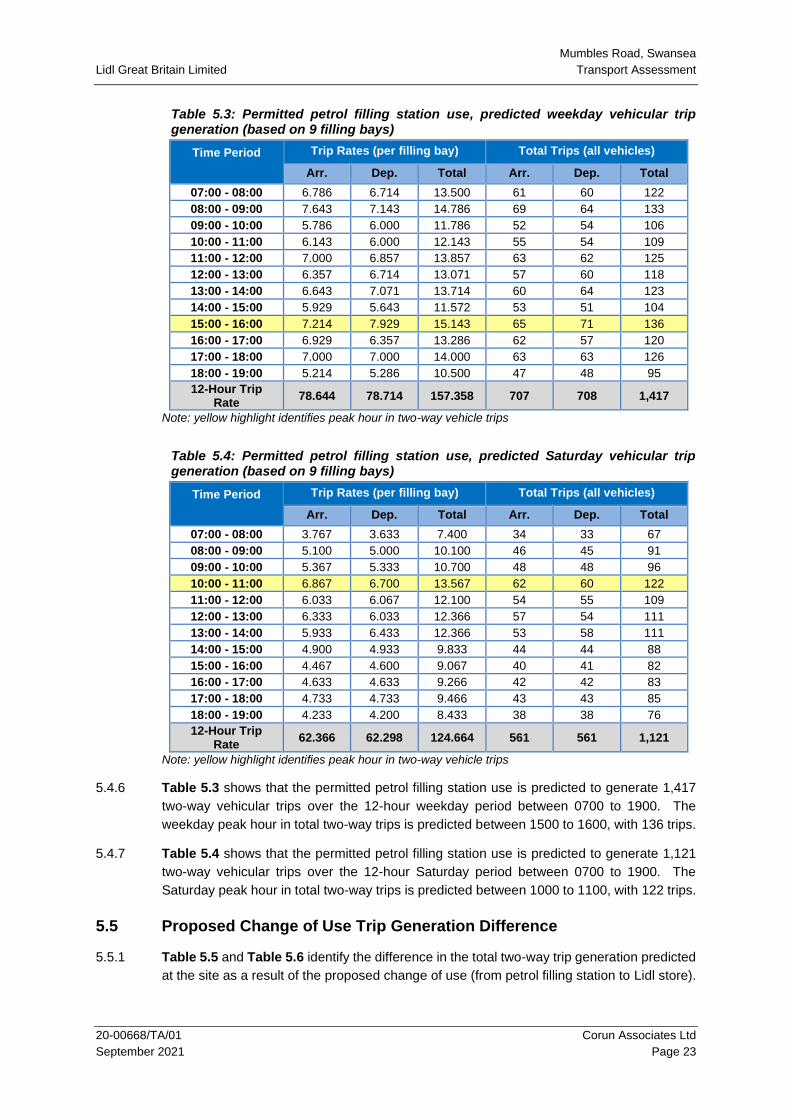
Chart 5.2: TRICS selected ’01-Retail/C – Discount Food Store’ sites – Daily Saturday modal split of trips
5.3.3 Chart 5.2 again shows the primary mode of travel for food retail trips such as this on a typical
Saturday is as a vehicle driver (57%) followed by vehicle passenger (33%), pedestrian (7%),
public transport user (2%) and cyclist (1%).
5.4 Permitted Site Use Trip Generation
5.4.1 The site was formerly occupied by a Shell filling station. Although this unit has since been
demolished and cleared, the site still has permission for a development of this type, with the
associated traffic technically already ‘permitted’ on the local highway network. The following
section identifies the expected trip generation of this permitted use on the site.
5.4.2 The category ’13-Petrol Filling Stations/A – Petrol Filling Stations’ was used in TRICS to
represent the permitted use on the site. An initial filtering step was applied to remove all
sites in Greater London Scotland and Ireland, before a further filter was applied to remove
both ‘town centre’ and ‘edge of town centre’ located sites from the selection.
5.4.3 Sites were extracted from TRICS to develop both a weekday and Saturday trip rate
separately, and have been output on a ‘per bay’ basis.
5.4.4 A copy of the TRICS selection criteria used, and trip rates calculated are included at
Appendix C.
5.4.5 Table 5.3 and Table 5.4 show the total predicted vehicular trip generation of the permitted
use on the site, over both the weekday and Saturday 12-hour period (0700 to 1900)
respectively. Trips have been generated based on a development with 9 filling bays, which
the previous Shell filling station was operating with prior to demolition.
57%
33%
7%
1% 2%
Vehicle Driver
Vehicle Passenger
Pedestrian
Cyclist
Public Transport User
Mumbles Road, Swansea
Lidl Great Britain Limited Transport Assessment
20-00668/TA/01 Corun Associates Ltd
September 2021 Page 23
Table 5.3: Permitted petrol filling station use, predicted weekday vehicular trip generation (based on 9 filling bays)
Time Period
Trip Rates (per filling bay) Total Trips (all vehicles)
Arr. Dep. Total Arr. Dep. Total
07:00 - 08:00 6.786 6.714 13.500 61 60 122
08:00 - 09:00 7.643 7.143 14.786 69 64 133
09:00 - 10:00 5.786 6.000 11.786 52 54 106
10:00 - 11:00 6.143 6.000 12.143 55 54 109
11:00 - 12:00 7.000 6.857 13.857 63 62 125
12:00 - 13:00 6.357 6.714 13.071 57 60 118
13:00 - 14:00 6.643 7.071 13.714 60 64 123
14:00 - 15:00 5.929 5.643 11.572 53 51 104
15:00 - 16:00 7.214 7.929 15.143 65 71 136
16:00 - 17:00 6.929 6.357 13.286 62 57 120
17:00 - 18:00 7.000 7.000 14.000 63 63 126
18:00 - 19:00 5.214 5.286 10.500 47 48 95
12-Hour Trip Rate
78.644 78.714 157.358 707 708 1,417
Note: yellow highlight identifies peak hour in two-way vehicle trips
Table 5.4: Permitted petrol filling station use, predicted Saturday vehicular trip generation (based on 9 filling bays)
Time Period
Trip Rates (per filling bay) Total Trips (all vehicles)
Arr. Dep. Total Arr. Dep. Total
07:00 - 08:00 3.767 3.633 7.400 34 33 67
08:00 - 09:00 5.100 5.000 10.100 46 45 91
09:00 - 10:00 5.367 5.333 10.700 48 48 96
10:00 - 11:00 6.867 6.700 13.567 62 60 122
11:00 - 12:00 6.033 6.067 12.100 54 55 109
12:00 - 13:00 6.333 6.033 12.366 57 54 111
13:00 - 14:00 5.933 6.433 12.366 53 58 111
14:00 - 15:00 4.900 4.933 9.833 44 44 88
15:00 - 16:00 4.467 4.600 9.067 40 41 82
16:00 - 17:00 4.633 4.633 9.266 42 42 83
17:00 - 18:00 4.733 4.733 9.466 43 43 85
18:00 - 19:00 4.233 4.200 8.433 38 38 76
12-Hour Trip Rate
62.366 62.298 124.664 561 561 1,121
Note: yellow highlight identifies peak hour in two-way vehicle trips
5.4.6 Table 5.3 shows that the permitted petrol filling station use is predicted to generate 1,417
two-way vehicular trips over the 12-hour weekday period between 0700 to 1900. The
weekday peak hour in total two-way trips is predicted between 1500 to 1600, with 136 trips.
5.4.7 Table 5.4 shows that the permitted petrol filling station use is predicted to generate 1,121
two-way vehicular trips over the 12-hour Saturday period between 0700 to 1900. The
Saturday peak hour in total two-way trips is predicted between 1000 to 1100, with 122 trips.
5.5 Proposed Change of Use Trip Generation Difference
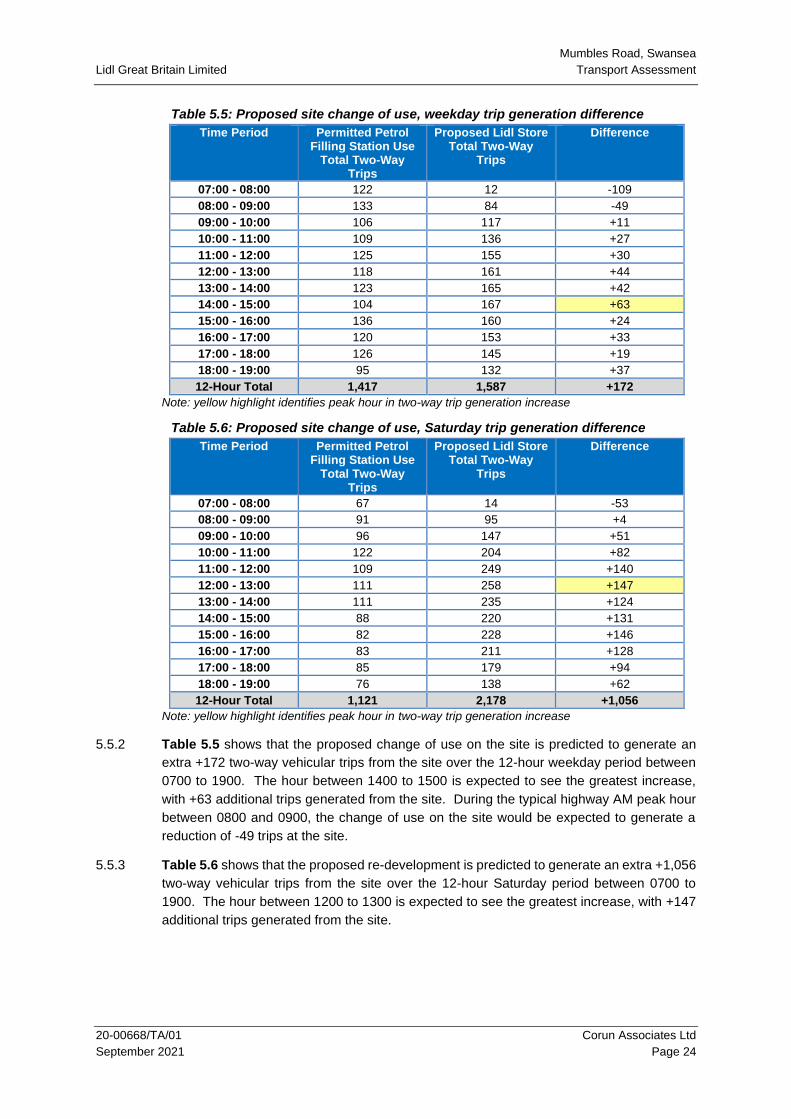
5.5.1 Table 5.5 and Table 5.6 identify the difference in the total two-way trip generation predicted
at the site as a result of the proposed change of use (from petrol filling station to Lidl store).
Mumbles Road, Swansea
Lidl Great Britain Limited Transport Assessment
20-00668/TA/01 Corun Associates Ltd
September 2021 Page 24
Table 5.5: Proposed site change of use, weekday trip generation difference
Time Period Permitted Petrol Filling Station Use
Total Two-Way Trips
Proposed Lidl Store Total Two-Way
Trips
Difference
07:00 - 08:00 122 12 -109
08:00 - 09:00 133 84 -49
09:00 - 10:00 106 117 +11
10:00 - 11:00 109 136 +27
11:00 - 12:00 125 155 +30
12:00 - 13:00 118 161 +44
13:00 - 14:00 123 165 +42
14:00 - 15:00 104 167 +63
15:00 - 16:00 136 160 +24
16:00 - 17:00 120 153 +33
17:00 - 18:00 126 145 +19
18:00 - 19:00 95 132 +37
12-Hour Total 1,417 1,587 +172
Note: yellow highlight identifies peak hour in two-way trip generation increase
Table 5.6: Proposed site change of use, Saturday trip generation difference
Time Period Permitted Petrol Filling Station Use
Total Two-Way Trips
Proposed Lidl Store Total Two-Way
Trips
Difference
07:00 - 08:00 67 14 -53
08:00 - 09:00 91 95 +4
09:00 - 10:00 96 147 +51
10:00 - 11:00 122 204 +82
11:00 - 12:00 109 249 +140
12:00 - 13:00 111 258 +147
13:00 - 14:00 111 235 +124
14:00 - 15:00 88 220 +131
15:00 - 16:00 82 228 +146
16:00 - 17:00 83 211 +128
17:00 - 18:00 85 179 +94
18:00 - 19:00 76 138 +62
12-Hour Total 1,121 2,178 +1,056
Note: yellow highlight identifies peak hour in two-way trip generation increase
5.5.2 Table 5.5 shows that the proposed change of use on the site is predicted to generate an
extra +172 two-way vehicular trips from the site over the 12-hour weekday period between
0700 to 1900. The hour between 1400 to 1500 is expected to see the greatest increase,
with +63 additional trips generated from the site. During the typical highway AM peak hour
between 0800 and 0900, the change of use on the site would be expected to generate a
reduction of -49 trips at the site.
5.5.3 Table 5.6 shows that the proposed re-development is predicted to generate an extra +1,056
two-way vehicular trips from the site over the 12-hour Saturday period between 0700 to
1900. The hour between 1200 to 1300 is expected to see the greatest increase, with +147
additional trips generated from the site.
Mumbles Road, Swansea
Lidl Great Britain Limited Transport Assessment
20-00668/TA/01 Corun Associates Ltd
September 2021 Page 25
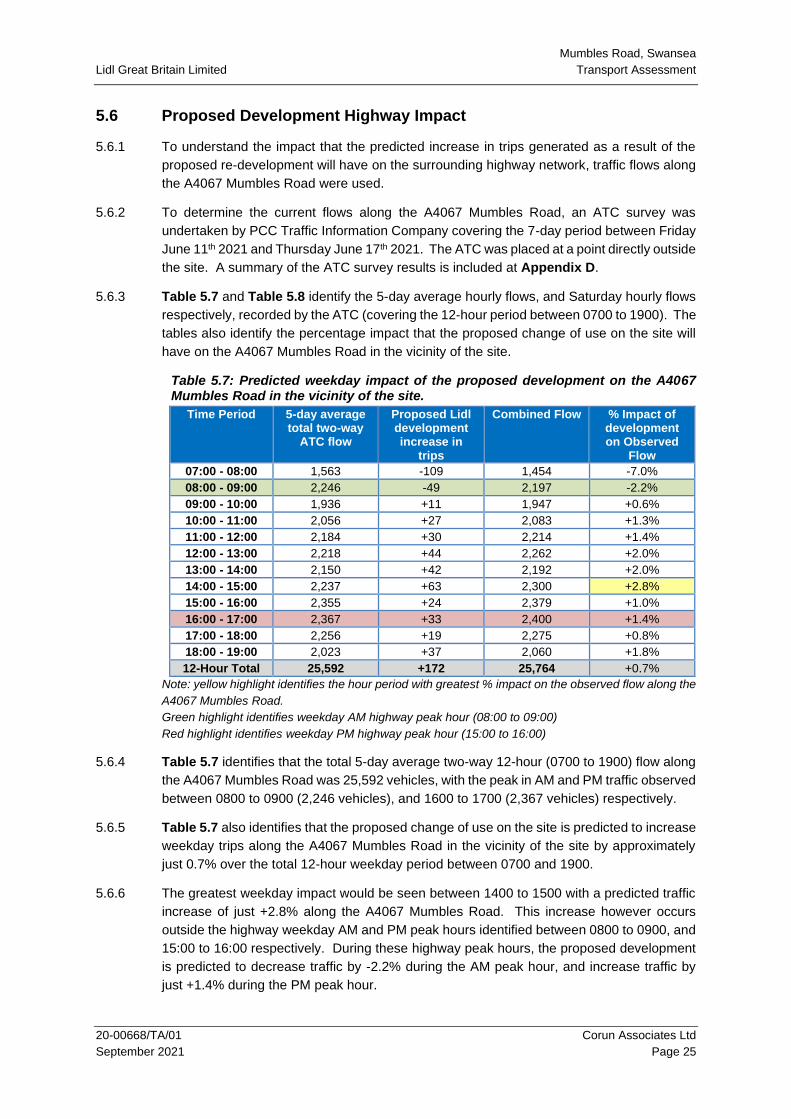
5.6 Proposed Development Highway Impact
5.6.1 To understand the impact that the predicted increase in trips generated as a result of the
proposed re-development will have on the surrounding highway network, traffic flows along
the A4067 Mumbles Road were used.
5.6.2 To determine the current flows along the A4067 Mumbles Road, an ATC survey was
undertaken by PCC Traffic Information Company covering the 7-day period between Friday
June 11th 2021 and Thursday June 17th 2021. The ATC was placed at a point directly outside
the site. A summary of the ATC survey results is included at Appendix D.
5.6.3 Table 5.7 and Table 5.8 identify the 5-day average hourly flows, and Saturday hourly flows
respectively, recorded by the ATC (covering the 12-hour period between 0700 to 1900). The
tables also identify the percentage impact that the proposed change of use on the site will
have on the A4067 Mumbles Road in the vicinity of the site.
Table 5.7: Predicted weekday impact of the proposed development on the A4067 Mumbles Road in the vicinity of the site.
Time Period 5-day average total two-way
ATC flow
Proposed Lidl development increase in
trips
Combined Flow % Impact of development on Observed
Flow
07:00 - 08:00 1,563 -109 1,454 -7.0%
08:00 - 09:00 2,246 -49 2,197 -2.2%
09:00 - 10:00 1,936 +11 1,947 +0.6%
10:00 - 11:00 2,056 +27 2,083 +1.3%
11:00 - 12:00 2,184 +30 2,214 +1.4%
12:00 - 13:00 2,218 +44 2,262 +2.0%
13:00 - 14:00 2,150 +42 2,192 +2.0%
14:00 - 15:00 2,237 +63 2,300 +2.8%
15:00 - 16:00 2,355 +24 2,379 +1.0%
16:00 - 17:00 2,367 +33 2,400 +1.4%
17:00 - 18:00 2,256 +19 2,275 +0.8%
18:00 - 19:00 2,023 +37 2,060 +1.8%
12-Hour Total 25,592 +172 25,764 +0.7%
Note: yellow highlight identifies the hour period with greatest % impact on the observed flow along the
A4067 Mumbles Road.
Green highlight identifies weekday AM highway peak hour (08:00 to 09:00)
Red highlight identifies weekday PM highway peak hour (15:00 to 16:00)
5.6.4 Table 5.7 identifies that the total 5-day average two-way 12-hour (0700 to 1900) flow along
the A4067 Mumbles Road was 25,592 vehicles, with the peak in AM and PM traffic observed
between 0800 to 0900 (2,246 vehicles), and 1600 to 1700 (2,367 vehicles) respectively.
5.6.5 Table 5.7 also identifies that the proposed change of use on the site is predicted to increase
weekday trips along the A4067 Mumbles Road in the vicinity of the site by approximately
just 0.7% over the total 12-hour weekday period between 0700 and 1900.
5.6.6 The greatest weekday impact would be seen between 1400 to 1500 with a predicted traffic
increase of just +2.8% along the A4067 Mumbles Road. This increase however occurs
outside the highway weekday AM and PM peak hours identified between 0800 to 0900, and
15:00 to 16:00 respectively. During these highway peak hours, the proposed development
is predicted to decrease traffic by -2.2% during the AM peak hour, and increase traffic by
just +1.4% during the PM peak hour.
Mumbles Road, Swansea
Lidl Great Britain Limited Transport Assessment
20-00668/TA/01 Corun Associates Ltd
September 2021 Page 26
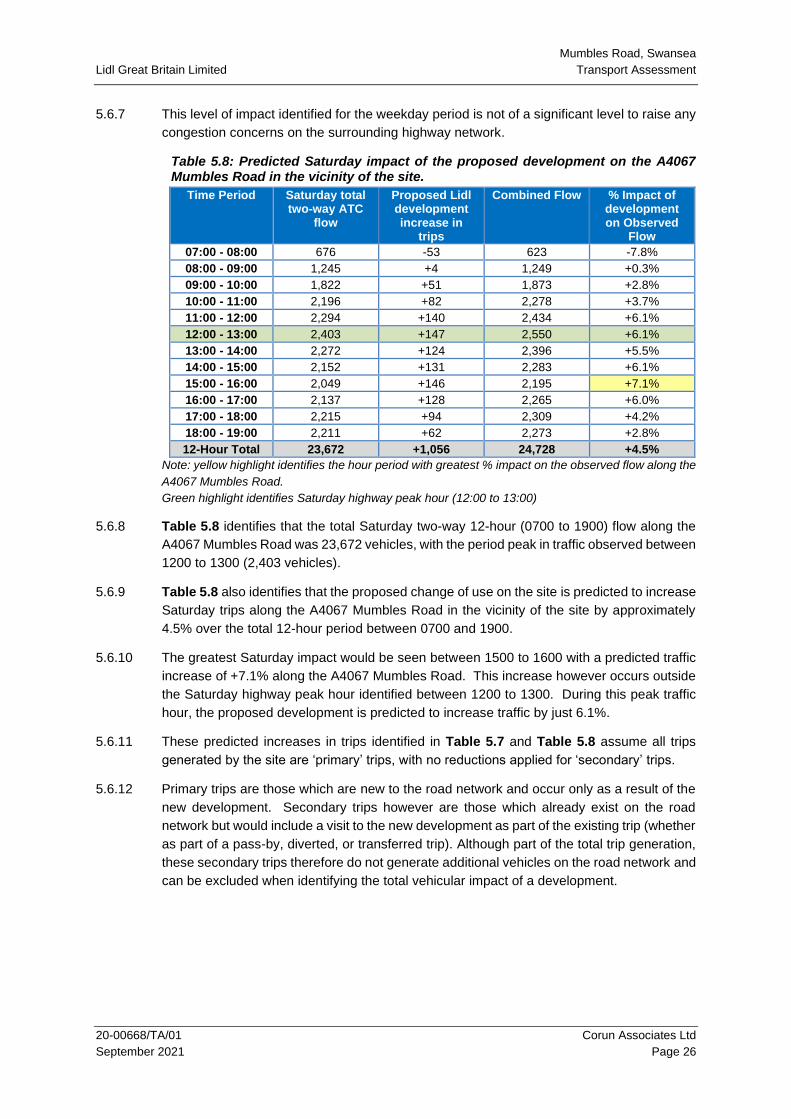
5.6.7 This level of impact identified for the weekday period is not of a significant level to raise any
congestion concerns on the surrounding highway network.
Table 5.8: Predicted Saturday impact of the proposed development on the A4067 Mumbles Road in the vicinity of the site.
Time Period Saturday total two-way ATC
flow
Proposed Lidl development increase in
trips
Combined Flow % Impact of development on Observed
Flow
07:00 - 08:00 676 -53 623 -7.8%
08:00 - 09:00 1,245 +4 1,249 +0.3%
09:00 - 10:00 1,822 +51 1,873 +2.8%
10:00 - 11:00 2,196 +82 2,278 +3.7%
11:00 - 12:00 2,294 +140 2,434 +6.1%
12:00 - 13:00 2,403 +147 2,550 +6.1%
13:00 - 14:00 2,272 +124 2,396 +5.5%
14:00 - 15:00 2,152 +131 2,283 +6.1%
15:00 - 16:00 2,049 +146 2,195 +7.1%
16:00 - 17:00 2,137 +128 2,265 +6.0%
17:00 - 18:00 2,215 +94 2,309 +4.2%
18:00 - 19:00 2,211 +62 2,273 +2.8%
12-Hour Total 23,672 +1,056 24,728 +4.5%
Note: yellow highlight identifies the hour period with greatest % impact on the observed flow along the
A4067 Mumbles Road.
Green highlight identifies Saturday highway peak hour (12:00 to 13:00)
5.6.8 Table 5.8 identifies that the total Saturday two-way 12-hour (0700 to 1900) flow along the
A4067 Mumbles Road was 23,672 vehicles, with the period peak in traffic observed between
1200 to 1300 (2,403 vehicles).
5.6.9 Table 5.8 also identifies that the proposed change of use on the site is predicted to increase
Saturday trips along the A4067 Mumbles Road in the vicinity of the site by approximately
4.5% over the total 12-hour period between 0700 and 1900.
5.6.10 The greatest Saturday impact would be seen between 1500 to 1600 with a predicted traffic
increase of +7.1% along the A4067 Mumbles Road. This increase however occurs outside
the Saturday highway peak hour identified between 1200 to 1300. During this peak traffic
hour, the proposed development is predicted to increase traffic by just 6.1%.
5.6.11 These predicted increases in trips identified in Table 5.7 and Table 5.8 assume all trips
generated by the site are ‘primary’ trips, with no reductions applied for ‘secondary’ trips.
5.6.12 Primary trips are those which are new to the road network and occur only as a result of the
new development. Secondary trips however are those which already exist on the road
network but would include a visit to the new development as part of the existing trip (whether
as part of a pass-by, diverted, or transferred trip). Although part of the total trip generation,
these secondary trips therefore do not generate additional vehicles on the road network and
can be excluded when identifying the total vehicular impact of a development.

Mumbles Road, Swansea
Lidl Great Britain Limited Transport Assessment
20-00668/TA/01 Corun Associates Ltd
September 2021 Page 27
5.6.13 Although there is not currently any definitive guidance available providing levels of
secondary trip reductions to be applied at certain developments, the ‘TRICS Research
Report 14/1 (2014)’ provides a review on the subject. The report identifies that levels of
secondary trips at any development will be dependent on variables such as its location,
range of services offered, and size, and that a site-by-site approach should be taken in
calculating these trip levels. The report also includes summaries of previous commercial
and academic research on the subject, with one study identifying convenience stores
experiencing secondary trip proportions up to 85%, with rates showing a positive relationship
to adjacent street volumes.
5.6.14 As a retail store situated along an A-Road carrying a significant volume of traffic, it is not
considered unreasonable to expect a large proportion (at least 50%) of trips from the
proposed development to be secondary trips, and already exist on the road network.
5.6.15 As such, if only considering primary trip attractions to the development (i.e. completely new
trips on the network) the actual impact on the local highway network would likely be
significantly lower than identified in Table 5.7 and Table 5.8, and these increases represent
a very robust ‘worst case’ scenario highway impact for the proposed re-development of the
site.
5.6.16 On this basis, it is concluded that the proposed development will have a minor impact on
traffic flows on the local highway network, and raises no major congestion or highway safety
concerns. The change of use on the site from a petrol filling station to a Lidl store would
also be anticipated to result in a decrease in trips generated during the critical weekday
highway AM peak hour period.
Mumbles Road, Swansea
Lidl Great Britain Limited Transport Assessment
20-00668/TA/01 Corun Associates Ltd
September 2021 Page 28
6 CAPACITY ASSESSMENT
6.1 Junction Modelling Methodology
6.1.1 To further assess the impact of the proposed development on the surrounding highway
network, capacity analysis of both the proposed site access junction, and the neighbouring
A4067 / Derwen Fawr Road priority junction have been undertaken using the PICADY
computer modelling tool within Junctions 9. These assessments have been undertaken to
identify the operation of the junctions under current traffic conditions.
6.1.2 The output from the PICADY programs provides a number of measurements to provide
information of a junction’s operation. These relate to the ‘Ratio of Flow to Capacity’ (RFC),
maximum queue length in PCUs, and delay in minutes per vehicle. The main indication of
the performance of a junction is given by the RFC for each arm of the junction. The peak
capacity is realised when the demand flow at the entry is great enough to cause a continuous
queue of vehicles to wait in the approach. This is reached when the RFC attains a value of
1. An RFC value of 0.85 is normally accepted as being within capacity as this reduces the
risk of delays due to traffic count inaccuracies and analytical and modelling assumptions.
6.1.3 Traffic flow data for the junction assessments has been taken from a 12-hour (0700 to 1900)
turning count survey undertaken at the A4067 / Derwen Fawr Road junction by PCCTIC
over both Friday 11th June 2021, and Saturday 12th June 2021. A summary of the traffic
survey results is included at Appendix E.
6.1.4 Based on the traffic survey data, the weekday AM and PM peak hour periods in total traffic
through the junction were identified from 0800 to 0900, and 1530 to 1630 respectively, with
the Saturday peak hour period in total traffic through the junction identified from 1200 to
1300. Each of these peak hour periods have been modlled at each assessment junction.
6.1.5 Traffic flows for the A4067 / Derwen Fawr Road junction were taken directly from the traffic
surveys. For the proposed site access junction, the A4067 flows were calculated from the
traffic survey, with the site entry and exit flows identified from the TRICS analysis data (as
previously identified in Section 5).
6.1.6 For the A4067 / Derwen Fawr Road junction assessment, scenarios were modelled to
represent both a ‘Without Development’ and a ‘With Development’ scenario. The ‘Without
Development’ scenario included site trips for the extant permission (as per Table 5.3 and
Table 5.4), whereas the ‘With Development’ scenario included site trips for the proposed
use (as per Table 5.1 and Table 5.2).
6.1.7 For the ‘With Development’ scenarios, development trips have been distributed based on
the observed turning movement proportions identified in the 2021 MCC surveys.
6.1.8 As identified in Section 4 of this report, the proposed new site access is currently only in
outline design stage. For calculating the proposed access model geometry, measurements
of the existing site access arrangements (which include a ghost island right turn lane
arrangement) have been taken.
6.1.9 A summary of the capacity assessments at each assessment junction is summarised in the
following sections.
Mumbles Road, Swansea
Lidl Great Britain Limited Transport Assessment
20-00668/TA/01 Corun Associates Ltd
September 2021 Page 29
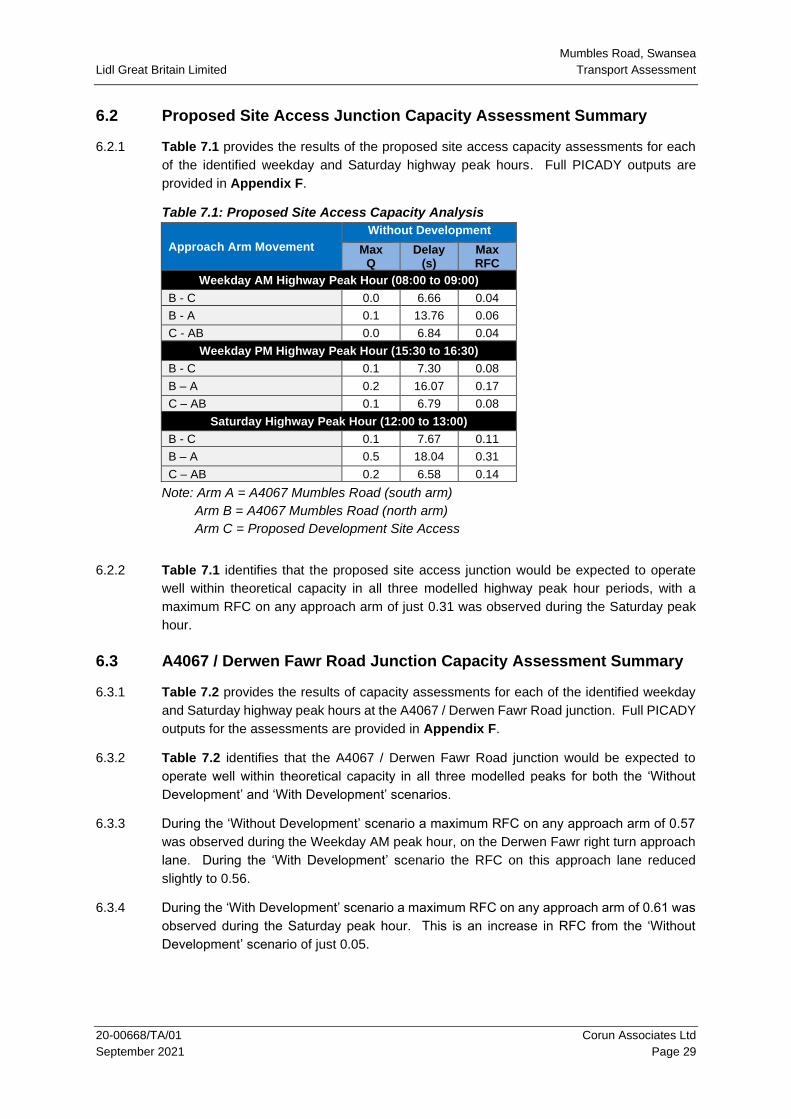
6.2 Proposed Site Access Junction Capacity Assessment Summary
6.2.1 Table 7.1 provides the results of the proposed site access capacity assessments for each
of the identified weekday and Saturday highway peak hours. Full PICADY outputs are
provided in Appendix F.
Table 7.1: Proposed Site Access Capacity Analysis
Approach Arm Movement
Without Development
Max Q
Delay (s)
Max RFC
Weekday AM Highway Peak Hour (08:00 to 09:00)
B - C 0.0 6.66 0.04
B - A 0.1 13.76 0.06
C - AB 0.0 6.84 0.04
Weekday PM Highway Peak Hour (15:30 to 16:30)
B - C 0.1 7.30 0.08
B – A 0.2 16.07 0.17
C – AB 0.1 6.79 0.08
Saturday Highway Peak Hour (12:00 to 13:00)
B - C 0.1 7.67 0.11
B – A 0.5 18.04 0.31
C – AB 0.2 6.58 0.14
Note: Arm A = A4067 Mumbles Road (south arm)
Arm B = A4067 Mumbles Road (north arm)
Arm C = Proposed Development Site Access
6.2.2 Table 7.1 identifies that the proposed site access junction would be expected to operate
well within theoretical capacity in all three modelled highway peak hour periods, with a
maximum RFC on any approach arm of just 0.31 was observed during the Saturday peak
hour.
6.3 A4067 / Derwen Fawr Road Junction Capacity Assessment Summary
6.3.1 Table 7.2 provides the results of capacity assessments for each of the identified weekday
and Saturday highway peak hours at the A4067 / Derwen Fawr Road junction. Full PICADY
outputs for the assessments are provided in Appendix F.
6.3.2 Table 7.2 identifies that the A4067 / Derwen Fawr Road junction would be expected to
operate well within theoretical capacity in all three modelled peaks for both the ‘Without
Development’ and ‘With Development’ scenarios.
6.3.3 During the ‘Without Development’ scenario a maximum RFC on any approach arm of 0.57
was observed during the Weekday AM peak hour, on the Derwen Fawr right turn approach
lane. During the ‘With Development’ scenario the RFC on this approach lane reduced
slightly to 0.56.
6.3.4 During the ‘With Development’ scenario a maximum RFC on any approach arm of 0.61 was
observed during the Saturday peak hour. This is an increase in RFC from the ‘Without
Development’ scenario of just 0.05.
Mumbles Road, Swansea
Lidl Great Britain Limited Transport Assessment
20-00668/TA/01 Corun Associates Ltd
September 2021 Page 30
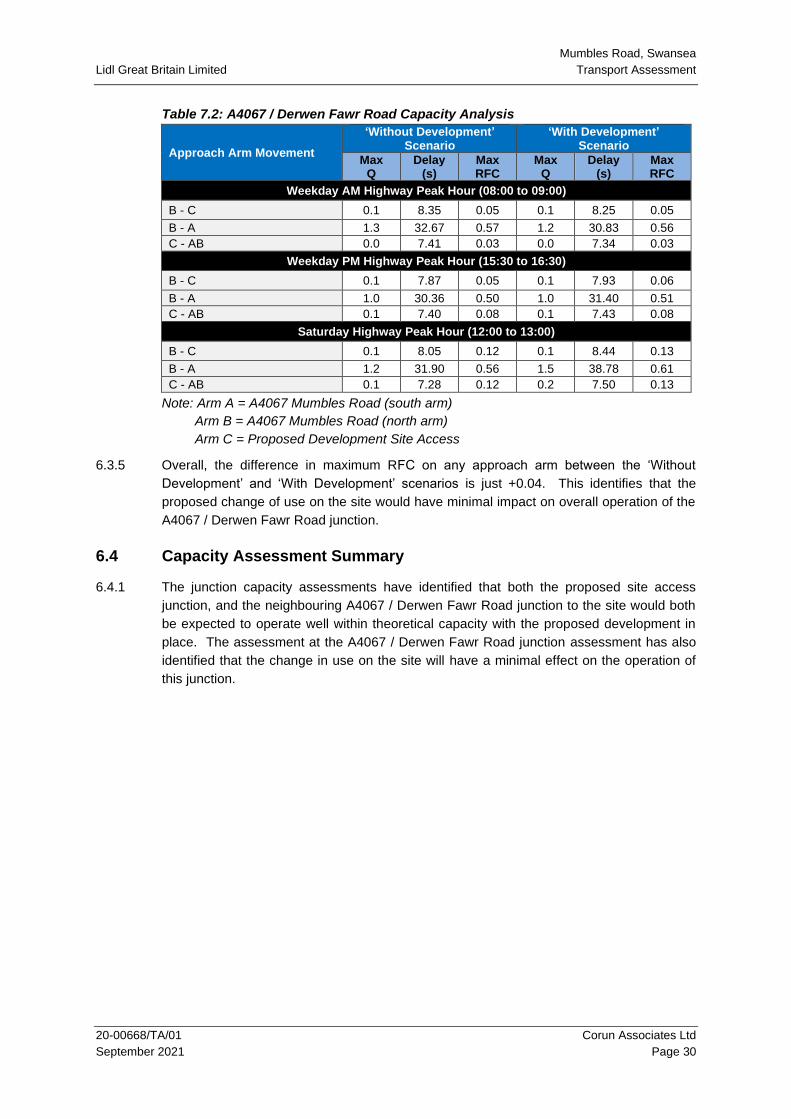
Table 7.2: A4067 / Derwen Fawr Road Capacity Analysis
Approach Arm Movement
‘Without Development’ Scenario
‘With Development’ Scenario
Max Q
Delay (s)
Max RFC
Max Q
Delay (s)
Max RFC
Weekday AM Highway Peak Hour (08:00 to 09:00)
B - C 0.1 8.35 0.05 0.1 8.25 0.05
B - A 1.3 32.67 0.57 1.2 30.83 0.56
C - AB 0.0 7.41 0.03 0.0 7.34 0.03
Weekday PM Highway Peak Hour (15:30 to 16:30)
B - C 0.1 7.87 0.05 0.1 7.93 0.06
B - A 1.0 30.36 0.50 1.0 31.40 0.51
C - AB 0.1 7.40 0.08 0.1 7.43 0.08
Saturday Highway Peak Hour (12:00 to 13:00)
B - C 0.1 8.05 0.12 0.1 8.44 0.13
B - A 1.2 31.90 0.56 1.5 38.78 0.61
C - AB 0.1 7.28 0.12 0.2 7.50 0.13
Note: Arm A = A4067 Mumbles Road (south arm)
Arm B = A4067 Mumbles Road (north arm)
Arm C = Proposed Development Site Access
6.3.5 Overall, the difference in maximum RFC on any approach arm between the ‘Without
Development’ and ‘With Development’ scenarios is just +0.04. This identifies that the
proposed change of use on the site would have minimal impact on overall operation of the
A4067 / Derwen Fawr Road junction.
6.4 Capacity Assessment Summary
6.4.1 The junction capacity assessments have identified that both the proposed site access
junction, and the neighbouring A4067 / Derwen Fawr Road junction to the site would both
be expected to operate well within theoretical capacity with the proposed development in
place. The assessment at the A4067 / Derwen Fawr Road junction assessment has also
identified that the change in use on the site will have a minimal effect on the operation of
this junction.
Mumbles Road, Swansea
Lidl Great Britain Limited Transport Assessment
20-00668/TA/01 Corun Associates Ltd
September 2021 Page 31
7 SUMMARY AND CONCLUSION
7.1 Summary
7.1.1 This Transport Assessment (TA) has been produced by Corun Associates Ltd (Corun) on
behalf of Lidl Great Britain Limited, the applicants, to examine the highway and
transportation issues associated with the proposed development of a new Lidl food store
(Class A1) along Mumbles Road, Swansea.
7.1.2 The proposal involves the construction of a new 2,029m2 (GFA) Lidl food store unit together
with associated parking (50 spaces in total) at a vacant site formerly occupied by a Shell
filling station. Although the petrol filling station has since been demolished, the site still has
permission for a development of this type.
7.1.3 The site is well located to encourage sustainable modes of travel for staff and visitors living
in the surrounding residential areas of Blackpill, and on the Swansea University Singleton
Campus. The extended cycling and bus networks through the wider Swansea area will also
allow opportunities for sustainable travel for longer, or multi-modal trips.
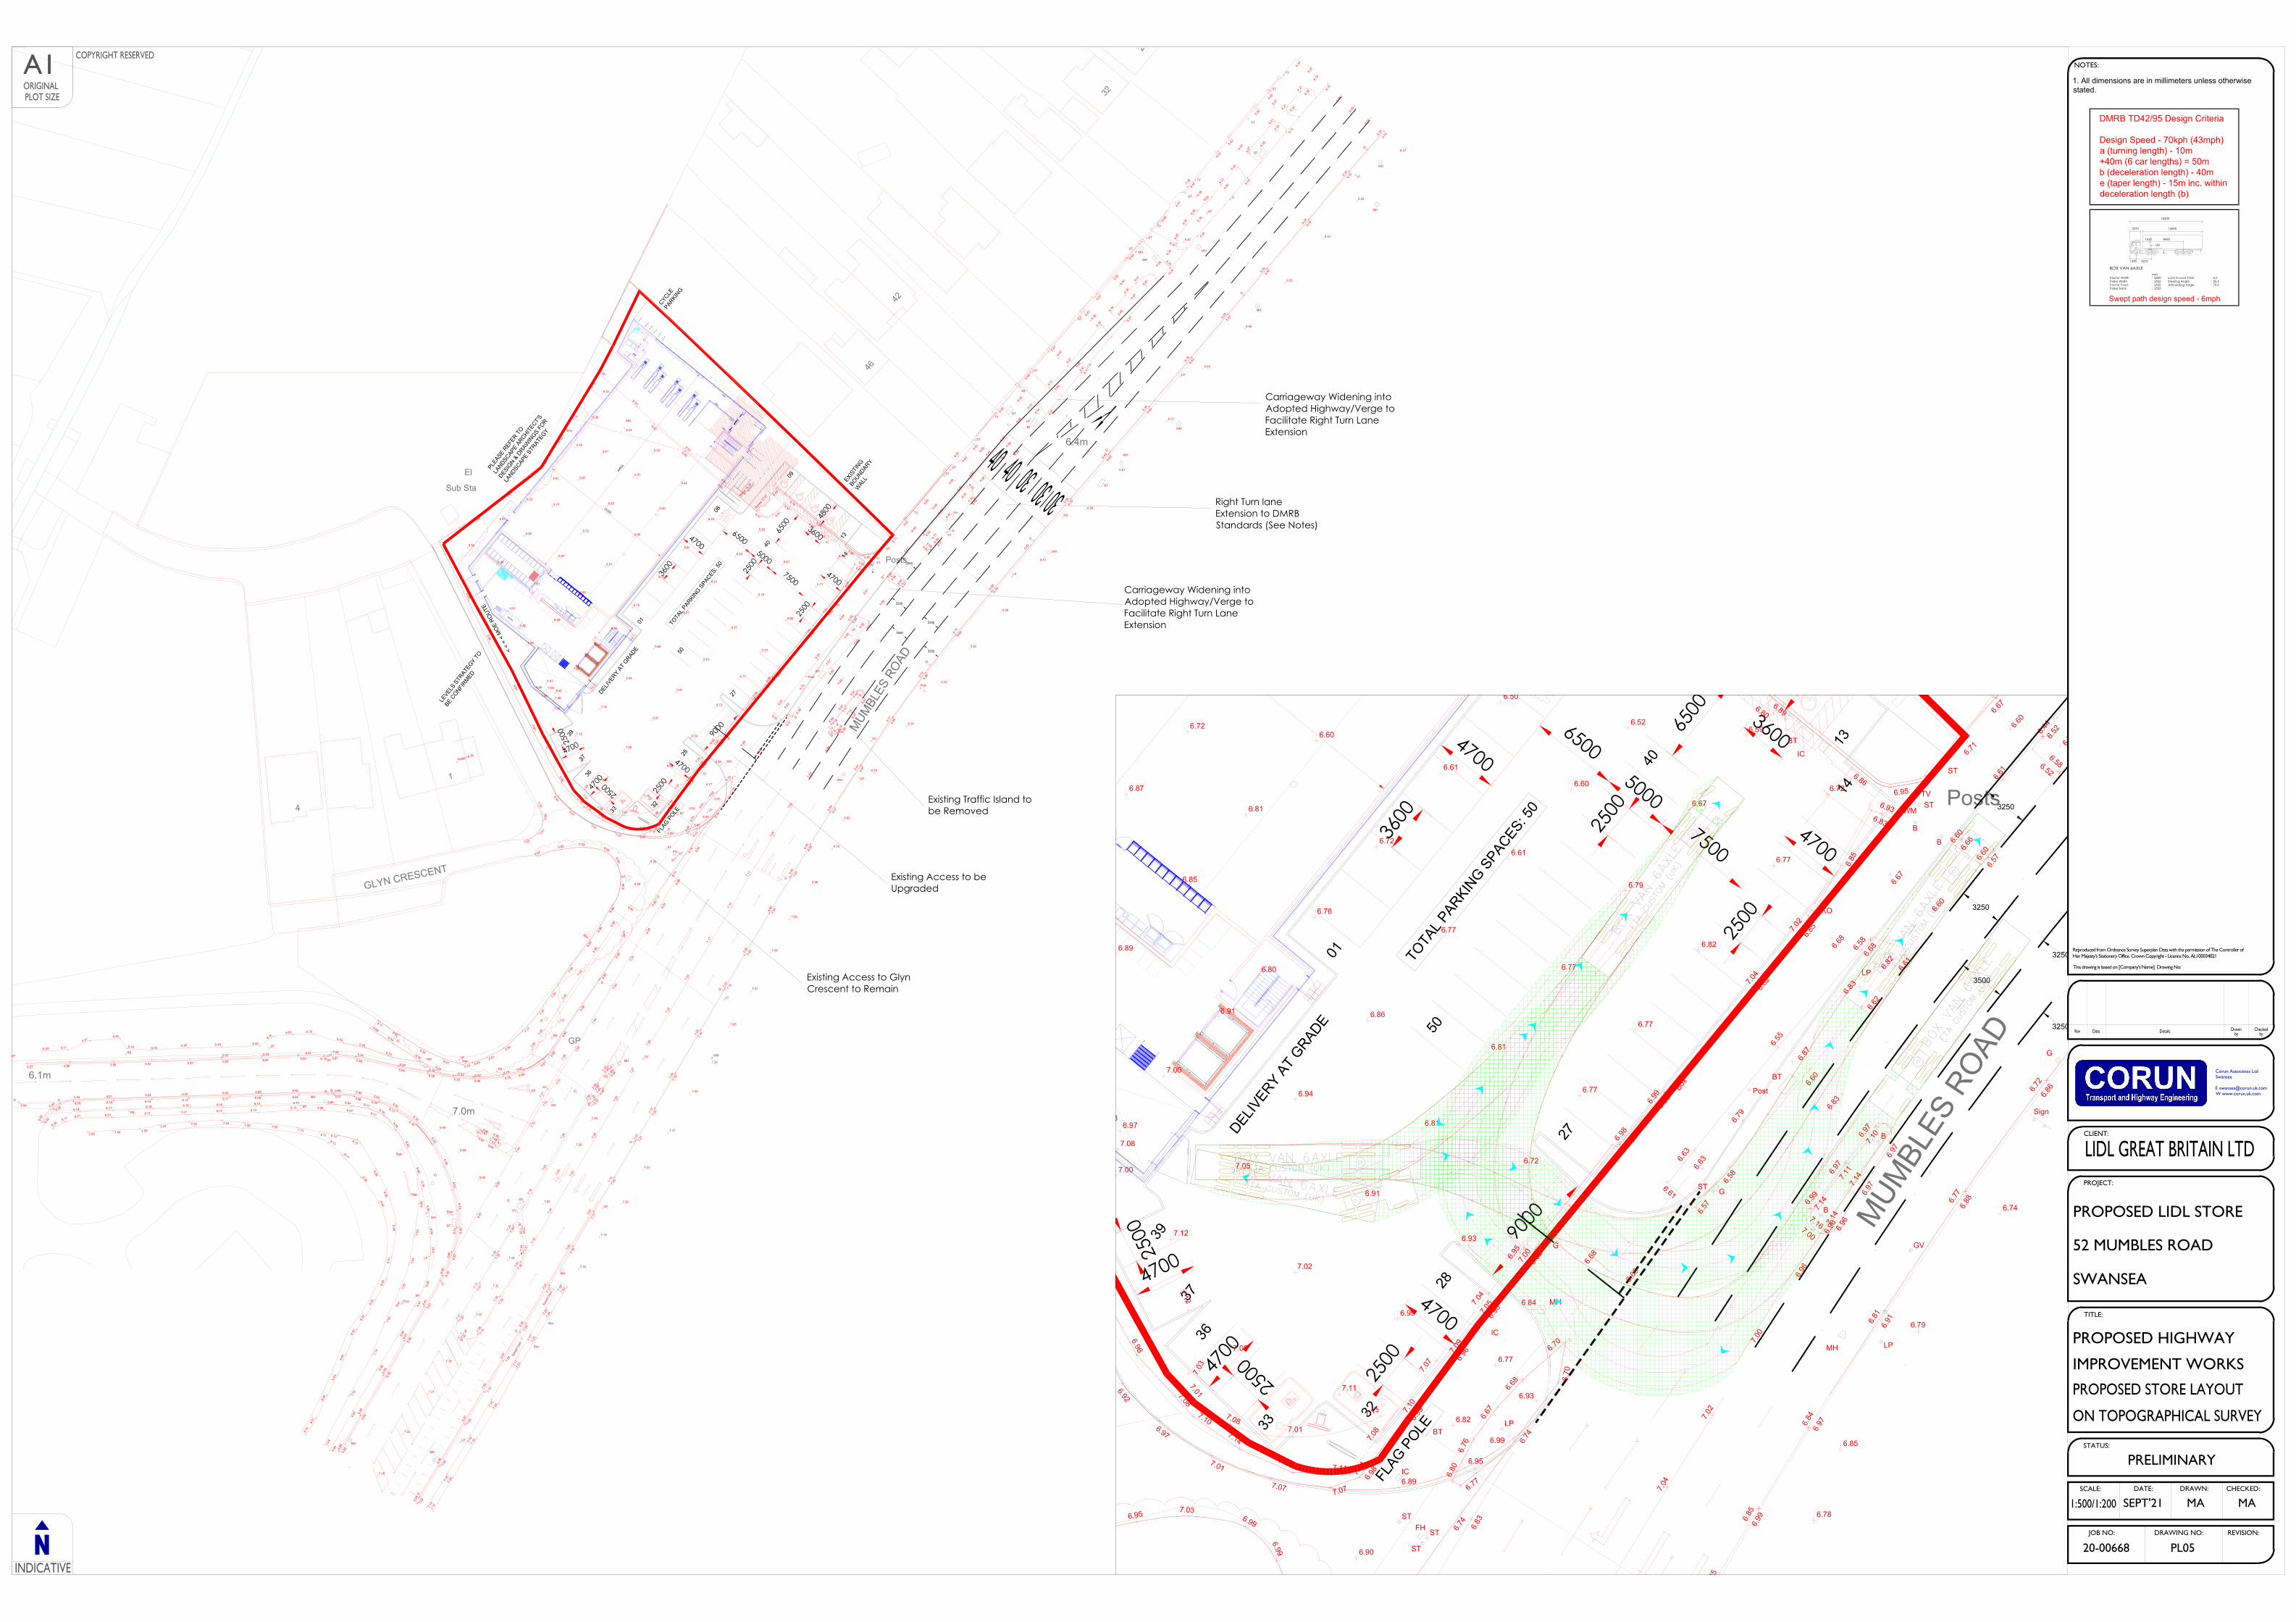
7.1.4 Vehicular access to the site is proposed to be upgraded to a new T-junction arrangement
along the A4067 Mumbles Road, with a DMRB compliant extended right turn lane (providing
stacking distance for at least 6 vehicles). The existing traffic island along the site frontage
on the A4067 Mumbles Road is to be removed as part of this new access arrangement, with
carriageway widening into the adopted highway / verge proposed to facilitate this extension.
The new access will be designed to allow sufficient space for a max legal 16.5m articulated
vehicle to safely manoeuvre in and out of the site. Visibility splays well in excess of 200m
would also be achievable in both directions.
7.1.5 Pedestrian access to the proposed development will also be provided at this existing access
point. The proposals include improvements to the existing layout, with inclusion of tactile
paving and a dropped kerb crossing, and provision of direct access into the existing footway
network along the A4067 Mumbles Road.
7.1.6 The development proposal includes 50 parking spaces on the site, made up of 37 (74%)
standard parking spaces, 4 (8%) for disabled customers, 7 (14%) parent and child spaces,
and 2 (4%) electric vehicle charging spaces. This level of provision is within the Swansea
Council maximum parking requirement for a development of this type, and conforms with
national policy aims to target a reduction in car occupancy levels at new developments.
7.1.7 A minimum of 4 Sheffield cycle stands will be provided at the development, which will allow
parking for a minimum of 8 bicycles. This provision will help encourage this mode of travel.
7.1.8 The proposed development (and change of use from petrol filling station to Lidl store) is
predicted to generate an additional +172 and +1,056 two-way vehicular trips to the site over
the 12-hour period (0700 to 1900) on a weekday and Saturday respectively. The greatest
increase in trips on a weekday is seen between 1400 to 1500 (+63 trips), and between 1200
to 1300 on a Saturday (+147 trips).
7.1.9 A robust highway impact assessment has been undertaken identifying that over the 12-hour
weekday period between 0700 to 1900, the proposed development would lead to an
increase in traffic of just +0.7% along the A4067 Mumbles Road (in the vicinity of the site),
with a -2.2% decrease in trips generated during the AM highway peak hour (0800 to 0900),
and a just a +1.4% increase in trips during the PM highway peak hour (1500 to 1600).
Mumbles Road, Swansea
Lidl Great Britain Limited Transport Assessment
20-00668/TA/01 Corun Associates Ltd
September 2021 Page 32
7.1.10 Over the 12-hour Saturday period, the proposed development would lead to an increase in
traffic of +4.5% along the A4067 Mumbles Road, with a +6.1% increase in trips during the
Saturday highway peak hour (1200 to 1300). These values represent a ‘worst case’
scenario, and do not include any reductions expected as a result of pass-by trip
considerations. It is therefore concluded that the re-development of the site will have a minor
impact on weekday traffic flows on the local highway network, and raises no major
congestion concerns.
7.1.11 A review of the accident record along the A4067 Mumbles Road in the vicinity of the site
does not identify any significant highway safety issue within the immediate area of the
development site, and the minor increase in traffic generated by the proposed development
is highly unlikely to exacerbate the existing safety record to a significant enough level to
warrant concern.
7.1.12 The junction capacity assessments have identified that both the proposed site access
junction, and the neighbouring A4067 / Derwen Fawr Road junction to the site would both
be expected to operate well within theoretical capacity with the proposed development in
place. The assessment at the A4067 / Derwen Fawr Road junction assessment has also
identified that the change in use on the site will have a minimal effect on the operation of
this junction.
7.1.13 A Travel Plan will also be developed as part of the proposals, which aims to maximise active
modes of travel and public transport use associated with the site.
7.2 Conclusion
7.2.1 This Transport Assessment has demonstrated that the development should be considered
acceptable in terms of highways and transportation.
7.2.2 There are no reasons in highway and transportation terms why the proposed development
should not be granted consent.

Mumbles Road, Swansea
Lidl Great Britain Limited Transport Assessment
20-00668/TA/01 Corun Associates Ltd
September 2021 Appendix A
APPENDIX A
Proposed Site Layout Plans
PostsPosts
MUM
BLES
ROAD
MUM
BLES
ROAD
FLAG P
OLE
FLAG P
OLETO
TAL P
ARKING S
PACES:
TOTA
L PARKIN
G SPACES: 5
050
0101
47004700
DELIVERY A
T GRADE
DELIVERY A
T GRADE
11331144
2277
3322
3333
336647
0047
00
2500
2500
47004700
47004700
36003600
2500
2500
47004700
3377
3939
4400
5050
75007500
65006500
50005000
9000
9000
2288
2500
2500
2500
2500
2500
2500
6500
3600
3600
4800
6.776.77
6.80
6.80
6.76
6.76
6.67
6.67
6.68
6.68
6.70
6.70
6.70
6.70
6.74
6.74
6.74
6.74
6.83
6.83
6.956.95 7.037.036.996.99
6.996.99 6.906.90
6.896.89
STST
STST
STSTFHFH
6.826.82
6.776.77
6.846.84
7.05
7.05
ICIC
7.09
7.09
6.82
6.82
6.90
6.90
6.96
6.96
6.99
6.99
6.98
6.98
7.10
7.10
ICIC7.11
7.11
LPLP
6.956.95
6.996.99
6.936.93
7.04
7.04
7.02
7.02
7.00
7.00
6.96
6.96
6.96
6.96
6.99
6.99
6.85
6.85
6.85
6.84
6.84
6.81
6.81
6.77
6.77
6.72
6.72
6.786.78
6.726.72
6.776.77
6.826.82
6.776.77
6.776.77
6.726.72
6.936.93
6.996.99
7.117.11
7.087.08
7.027.02
6.916.91
6.816.81
6.816.81
6.776.77
6.796.79
6.676.67
6.596.596.526.52
6.606.60
6.616.61
6.776.77
6.866.86
6.946.94
7.057.05
7.127.12
7.087.08
7.007.00
6.976.977.08
7.007.00
6.916.91
6.806.80
6.766.76
6.726.72
6.616.61
6.50
6.606.60
6.816.81
6.856.85
6.896.89
6.876.87
6.726.72
7.087.08
7.107.10
7.147.14
7.147.14 7.117.11
7.08
7.08
7.07
7.07
7.04
7.04
6.95
6.95
ICIC
BTBT
BTBT
6.99
6.99
6.85
6.85
6.82
6.82
6.83
6.83
6.83
6.836.9
86.9
8
6.80
6.80
GG
7.00
7.00
MHMH
6.68
6.68
6.65
6.65
Box
Box
7.077.077.077.07
7.017.01
6.976.97
6.926.92
6.966.96
7.017.01
7.087.087.017.01
7.137.13
7.127.12
7.03
7.03
6.806.80
6.896.89
6.866.86
6.58
6.86
6.86
GG
SignSign
6.88
6.88
GVGV
6.91
6.91
LPLPMHMH
6.97
6.97
6.856.85
6.796.79
6.746.74
6.57
6.57
6.60
6.60
6.66
6.66
6.60
6.60
BB
BB6.836.83
6.936.93
6.85
6.85
KOKO
7.04
7.04
7.02
7.02
6.60
6.60
6.61
6.61
6.62
6.62
6.60
6.60
6.58
6.58
6.57
6.57
6.616.61
6.63
6.63
6.55
6.55
6.58
6.58
LPLP
PostPost
STST GG
6.63
6.63
6.79
6.79
6.87
6.87
6.83
6.83
6.82
6.826.6
86.6
86.68
6.68
6.67
6.67
WMWMSTST
BTBT
6.96
6.967.00
7.00
6.99
6.99
6.97
6.97
6.97
6.97
6.97
6.97
6.97
6.977.1
47.1
47.1
07.1
0
7.11
7.11
7.14
7.14
7.167.16 7.
147.
14
BB
BB
6.44
6.44
6.526.52
6.586.58
6.52
6.52
6.77
6.67
6.67
6.956.95
STST
6.71
6.71
6.61
6.61
6.60
6.60
TVTV
6.83
6.83
32503250
3250
35003500
32503250
32503250
B
O
X
V
A
N
6
A
X
L
E
B
O
X
V
A
N
6
A
X
L
E
F
T
A
C
U
S
T
O
M
(
U
K
)
F
T
A
C
U
S
T
O
M
(
U
K
)
(
c
)
2
0
2
1
T
r
a
n
s
o
f
t
S
o
l
u
t
i
o
n
s
,
I
n
c
.
A
l
l
r
i
g
h
t
s
r
e
s
e
r
v
e
d
.
(
c
)
2
0
2
1
T
r
a
n
s
o
f
t
S
o
l
u
t
i
o
n
s
,
I
n
c
.
A
l
l
r
i
g
h
t
s
r
e
s
e
r
v
e
d
.
B
O
X
V
A
N
6
A
X
L
E
B
O
X
V
A
N
6
A
X
L
E
F
T
A
C
U
S
T
O
M
(
U
K
)
F
T
A
C
U
S
T
O
M
(
U
K
)
(c) 2021 Transoft Solutions, Inc. All rights reserved.
(c) 2021 Transoft Solutions, Inc. All rights reserved.
B
O
X
V
A
N
6
A
X
L
E
B
O
X
V
A
N
6
A
X
L
E
F
T
A
C
U
S
T
O
M
(
U
K
)
F
T
A
C
U
S
T
O
M
(
U
K
)
BOX VAN 6AXLEBOX VAN 6AXLE
FTA CUSTOM (UK)FTA CUSTOM (UK)
(c) 2021 Transoft Solutions, Inc. All rights reserved.(c) 2021 Transoft Solutions, Inc. All rights reserved.
B
O
X
V
A
N
6
A
X
L
E
B
O
X
V
A
N
6
A
X
L
E
F
T
A
C
U
S
T
O
M
(
U
K
)
F
T
A
C
U
S
T
O
M
(
U
K
)
(
c
)
2
0
2
1
T
r
a
n
s
o
f
t
S
o
l
u
t
i
o
n
s
,
I
n
c
.
A
l
l
r
i
g
h
t
s
r
e
s
e
r
v
e
d
.
(
c
)
2
0
2
1
T
r
a
n
s
o
f
t
S
o
l
u
t
i
o
n
s
,
I
n
c
.
A
l
l
r
i
g
h
t
s
r
e
s
e
r
v
e
d
.
6.1m6.1m
Sub StaSub Sta
3232
6.4m6.4m
28
4242
PostsPosts
4646
ElEl
MUM
BLES
ROAD
MUM
BLES
ROAD
GLYN CRESCENTGLYN CRESCENT
11
GPGP
7.0m7.0m
44
FLAG P
OLE
FLAG P
OLETO
TAL P
ARKING S
PACES:
TOTA
L PARKIN
G SPACES: 5
050
< <
< <
< <
< <
MOE
ROU
TE
MOE
ROU
TE
0101
0088
47004700
DELIVERY A
T GRADE
DELIVERY A
T GRADE
11331144
2277
3322
3333
336647
0047
00
2500
2500
47004700
47004700
36003600
2500
2500
47004700
3377
3939
0909
4400
5050
75007500
65006500
50005000
9000
9000
2288
2500
2500
2500
2500
2500
2500
6500
6500
3600
3600
4800
4800
EXISTI
NG
EXISTI
NGBOUNDARY
BOUNDARY
WALL
WALL
PLEASE R
EFER T
O
PLEASE R
EFER T
O
LANDSCAPE A
RCHITECT'S
LANDSCAPE A
RCHITECT'S
DESIGN &
DRAW
INGS F
OR
DESIGN &
DRAW
INGS F
OR
LANDSCAPE S
TRATE
GY
LANDSCAPE S
TRATE
GY
CYCLECYCLE
PARKING
PARKING
LEVELS
STR
ATEGY T
O
LEVELS
STR
ATEGY T
O
BE CONFI
RMED
BE CONFI
RMED
4482
644
826
2550025500
BALERBALER
GG
6.776.77
6.80
6.80
6.76
6.76
6.67
6.67
6.68
6.68
6.70
6.70
6.70
6.70
6.74
6.74
6.74
6.74
6.73
6.73
6.80
6.80
6.896.89
GG
6.876.876.786.78
6.526.526.336.336.196.19
6.096.09
5.945.945.945.94
STSTGGGG
6.016.01
6.846.846.756.75
6.486.486.306.306.086.08
6.046.04
5.895.895.875.875.925.925.945.945.955.95
6.036.036.026.02
5.975.976.026.025.995.995.985.985.975.97
GG
5.945.94
GG
6.22
6.22
6.086.08
6.056.05 6.126.12 6.146.14 6.156.15 6.116.11 6.086.08
6.09
6.09
5.955.95
5.945.94 6.016.01 6.046.04 6.056.05 6.026.02 5.995.99 5.945.94 5.895.89 5.895.895.945.94
6.026.02
6.166.16
6.066.06 5.975.97
GGGG
5.985.986.046.04
6.136.13
6.186.18
6.326.32
6.486.48
6.636.63
6.736.73
6.79
6.79
6.86
6.86
6.90
6.90
GG
6.91
6.91
6.91
6.91
6.89
6.89
6.76
6.76
6.82
6.82
6.78
6.78
6.81
6.81
6.84
6.84
6.83
6.83
6.82
6.82
6.82
6.82
6.89
6.89
6.88
6.88
MHMH
6.966.96
6.97
6.97
6.98
6.98
6.97
6.97
6.96
6.96
6.96
6.96
6.95
6.95
6.90
6.90
SPSP
LPLP
MHMH
SignSign
BTBT
6.196.19 6.176.17 6.186.18 6.186.18 6.186.18 6.146.14 6.106.10 6.066.06 6.046.04 6.116.116.166.16
6.266.26
6.436.43
6.686.68
6.786.78
6.956.95
ICIC
SignSign
MHMH
SPSP
RSRS
6.306.30
6.176.17 6.216.21 6.216.21 6.176.17 6.216.21 6.176.17 6.136.136.126.12 6.086.08
6.076.076.176.17
SignSign
6.90
6.90
7.05
7.05
7.04
7.04
7.05
7.05
7.04
7.04
7.14
7.14
7.03
7.03
7.04
7.04
8.75
8.75
8.51
8.51
8.46
8.46
8.63
8.63
8.65
8.65
8.93
8.93
8.76
8.76
8.56
8.56
8.44
8.44
8.51
8.51
8.488.48
8.488.48
8.268.26
8.128.12
8.148.148.118.11
7.737.737.557.557.327.32
7.247.247.327.327.477.47
7.507.507.487.487.567.56 BB 6.936.93 6.966.96
6.946.94
6.826.82
6.856.85
7.057.057.037.03 BB
7.11
7.11
7.05
7.05
MHMH
6.83
6.83
6.89
6.89
6.93
6.93
6.99
6.99
7.03
7.03
7.03
7.03
7.04
7.04
7.06
7.06
7.10
7.10
7.12
7.12
7.10
7.10
7.03
7.03
6.98
6.98
6.91
6.91
6.906.90
6.696.69
6.456.45
STST
RSRS
SignSignLPLPMHMH
6.686.68
6.546.54
6.446.44
6.246.24
ICIC
BoxBox
6.976.97
6.956.95 7.037.036.996.99
6.996.99
6.99
6.99
6.98
6.98
6.96
6.96
6.99
6.99
7.06
7.06
7.09
7.09
7.16
7.16
7.17
7.17
6.996.99
6.836.83
6.636.636.536.53
6.476.47
6.566.56
6.626.62
6.716.71
6.896.89
BTBT
6.906.90
6.896.89
STST
STST
STSTFHFH
6.826.82
6.776.77
6.846.84
7.05
7.05
ICIC
7.09
7.09
6.82
6.82
6.90
6.90
6.96
6.96
6.99
6.99
6.98
6.98
7.10
7.10
ICIC7.11
7.11
LPLP
6.956.95
6.996.99
6.936.93
LPLPICIC
7.00
7.00
7.05
7.05
7.05
7.05
7.02
7.02
6.95
6.95
6.89
6.89
6.886.88
6.89
6.89
6.83
6.83
6.88
6.88
6.85
6.85
6.89
6.89
6.876.87
FHFH
6.246.24 6.316.31
6.416.416.496.49
6.346.34 6.506.506.456.45 6.436.43 6.486.48
6.756.75
6.826.82 6.756.75
6.506.506.286.28
6.236.23
LPLP
RSRSLPLP
GVGV
GVGVICIC
7.397.397.
337.
33
7.32
7.32
7.31
7.31
7.257.25
7.21
7.21
7.18
7.18
7.19
7.19
7.15
7.15
7.187.18
7.17
7.17
7.17
7.17
7.19
7.19
7.20
7.20
7.30
7.30
7.297.29
7.28
7.28
7.30
7.30
7.31
7.31
7.34
7.34
BB
BB7.357.35
7.327.32
7.327.32
BB
7.187.18
7.217.21
7.227.22
7.187.18
7.19
7.19
7.20
7.20
7.24
7.24
ICICICIC
BB
BB
RSRS
MHMH
7.46
7.467.
467.
46
7.37
7.37
7.40
7.40
7.36
7.36
7.32
7.32
7.35
7.35
7.35
7.35
7.48
7.48
7.51
7.51
7.49
7.49
7.307.30
7.267.26
7.23
7.23
7.227.22
7.19
7.19
7.20
7.20
7.23
7.23
7.26
7.26
7.25
7.25
7.27
7.27
GVGV
7.26
7.26
7.25
7.25
7.22
7.22
7.17
7.17
7.15
7.15
7.11
7.11
7.04
7.04
7.02
7.02
7.00
7.00
6.96
6.96
6.96
6.96
6.99
6.99
7.01
7.01
GG
7.04
7.04
7.09
7.09
7.12
7.12
GG
LPLP
7.16
7.16
7.19
7.19
7.20
7.20
7.21
7.21
GG
7.20
7.20
7.17
7.17
LPLP
7.15
7.15
MHMH
7.11
7.11
6.89
6.89
6.95
6.95
6.97
6.97
7.00
7.00
6.97
6.97
6.95
6.95
7.01
7.01
7.05
7.05
7.07
7.07
7.10
7.10
7.07
7.07
7.10
7.10
7.09
7.09
7.05
7.05
7.01
7.01
7.00
7.00
6.92
6.92
6.85
6.85
6.85
6.85
6.84
6.84
6.81
6.81
6.77
6.77
6.72
6.72
6.70
6.70
6.68
6.68
6.62
6.62
6.58
6.58
6.48
6.48
6.49
6.49
6.39
6.39
6.29
6.29
6.29
6.29
6.28
6.28
6.20
6.20
6.20
6.20
7.09
7.09
GG
7.09
7.09
7.10
7.10
7.08
7.08
7.06
7.06
MHMH
GG
7.04
7.04
LPLP
7.17
7.17
7.20
7.20
7.19
7.19
7.24
7.24
7.22
7.22
7.25
7.25
7.29
7.29
7.22
7.227.
187.
18
7.20
7.20
7.17
7.17
7.17
7.17
7.16
7.16
7.13
7.13
7.15
7.15
7.12
7.12
Spee
d Ca
m
Spee
d Ca
m
BoxBox
BoxBox
Spee
d Ca
m
Spee
d Ca
m
7.187.18
7.167.16
7.267.26
7.317.31
7.317.31
7.257.25
7.227.22
WMWM
7.057.05
7.077.07
7.067.06
7.067.06
6.966.96
6.786.78
GVGV
6.726.72
6.776.77
6.826.82
6.776.77
6.776.77
6.726.72
6.936.93
6.996.99
7.117.11
7.087.08
7.027.02
6.916.91
6.816.81
6.816.81
6.776.77
6.796.79
6.676.67
6.596.596.526.52
6.606.60
6.616.61
6.776.77
6.866.86
6.946.94
7.057.05
7.127.12
7.087.08
7.007.00
6.976.97
6.916.91
6.856.85
7.097.09
7.087.08
7.007.00
6.916.91
6.806.80
6.766.76
6.726.72
6.616.61
6.506.50
6.446.44
6.506.50
6.606.60
6.816.81
6.856.85
6.896.89
6.996.99
6.826.82
6.916.91
7.017.01
6.876.87
6.726.72
6.636.63
6.516.51
6.326.32
6.346.34
6.416.41
6.576.57
6.706.70
6.906.90
6.966.96
6.926.92
6.936.93
6.726.72
6.616.61
6.406.40
6.366.36
6.326.32
7.087.08
7.107.10
7.147.14
7.147.14 7.117.11
7.08
7.08
7.07
7.07
7.04
7.04
6.95
6.95
ICIC
BTBT
Box
Box
8.468.46
8.288.28
8.178.17
8.138.13
PostPost
BTBT
6.99
6.99
6.85
6.85
6.82
6.82
6.83
6.83
6.83
6.836.9
86.9
8
6.80
6.80
GG
7.00
7.00
MHMH
6.68
6.68
6.65
6.65
Box
Box
7.077.077.077.07
7.017.01
6.976.97
6.926.92
7.037.03
6.96
6.96
7.01
7.01
7.027.02
6.616.616.47
6.47
MHMH6.426.42
6.406.40
6.456.45
TPTP
StayStay
6.906.90
6.886.88
6.866.86
6.816.81
6.826.82
6.966.96
7.017.01
7.087.087.017.01
7.137.13
7.057.05
7.127.12
7.03
7.03
6.60
6.60
6.576.57
6.806.80
6.896.89
6.866.86
6.10
6.10
6.41
6.41
6.37
6.37
6.50
6.50
6.58
6.58
Ridge 1
5.36
Ridge 1
5.36
Eaves
12.47
Eaves
12.47
Ridge 15.76Ridge 15.76
6.33
6.33
GG
LPLP
6.39
6.39
6.42
6.42
GG
6.47
6.47
6.53
6.53
6.60
6.60
6.63
6.63
GG
6.70
6.70
RSRS
GG
LPLP
6.79
6.79
6.82
6.82
6.86
6.86
GG
SignSign
6.88
6.88
GVGV
6.91
6.91
LPLPMHMH
6.97
6.97
6.856.85
6.796.79
6.746.74
6.726.72
6.626.62
6.696.69
6.616.61
MHMH
6.596.59
BTBT
MHMH
6.616.61
6.576.57
MHMH
6.556.55
6.566.56
MHMH
6.556.55
6.526.52
6.526.52
6.476.47
MHMH
MHMH
6.15
6.15
6.18
6.18
6.25
6.25
6.24
6.24
6.27
6.27
6.31
6.31
6.46
6.46
6.50
6.50
6.51
6.51
6.57
6.57
6.60
6.60
6.66
6.66
6.60
6.60
BB
BB6.836.83
6.936.93
6.85
6.85
KOKO
7.04
7.04
7.02
7.02
6.60
6.60
6.61
6.61
6.62
6.62
6.60
6.60
6.58
6.58
6.57
6.57
6.616.61
6.63
6.63
6.55
6.55
6.58
6.58
LPLP
PostPost
STST GG
6.63
6.63
6.79
6.79
6.87
6.87
6.83
6.83
6.82
6.826.6
86.6
86.68
6.68
6.67
6.67
WMWMSTST
BTBT
6.96
6.967.00
7.00
6.99
6.99
6.97
6.97
6.97
6.97
6.97
6.97
6.97
6.977.1
47.1
47.1
07.1
0
7.11
7.11
7.14
7.14
7.167.16 7.
147.
14
BB
BB
6.21
6.21
6.21
6.21
6.21
6.21
6.27
6.27
6.26
6.26
6.27
6.27
6.20
6.20
6.28
6.28
6.30
6.30
6.29
6.29
MHMH
6.326.32
6.256.25
6.27
6.27
6.30
6.30
6.30
6.30
6.30
6.30
6.27
6.27
6.41
6.41
6.33
6.33
6.40
6.40
6.40
6.40
6.45
6.45
6.51
6.51
6.536.53
6.50
6.50
6.47
6.47
6.44
6.44
6.526.52
6.586.58
6.52
6.52
6.77
6.77
6.65
6.65
6.70
6.70
FHFH
GGSTST
6.68
6.68
RSRS
6.68
6.68
BTBT
LPLP
6.54
6.54
6.60
6.60
6.49
6.49 GG
6.49
6.49
6.47
6.47
6.40
6.40
6.476.47
6.39
6.39
LPLP
6.40
6.40
GG
BTBT
6.36
6.36
6.33
6.33
6.33
6.33
6.30
6.30
6.42
6.42
6.43
6.43
6.47
6.47
6.52
6.52
6.47
6.47
6.61
6.61
6.60
6.60
6.67
6.67
6.956.95
6.706.70
STST
STST
STST
STST
BTBT
STST
STST
STST
STST
STST
MHMH
MHMH
STST
STST
STST
6.34
6.34
6.14
6.14
6.40
6.40
6.42
6.42
6.47
6.47
6.49
6.49
6.38
6.38
6.35
6.35
6.52
6.52
6.43
6.43
6.56
6.56
6.60
6.60
6.62
6.62
6.62
6.62
6.71
6.71
6.61
6.61
6.28
6.28
6.40
6.40
6.36
6.36
7.36
7.36
6.27
6.27
6.31
6.31
6.32
6.32
6.38
6.38
6.40
6.40
6.35
6.35
6.42
6.42
6.44
6.44
6.55
6.55
6.60
6.60
6.58
6.58
6.60
6.60
LPLP
6.35
6.35
TVTV
TVTV
TVTV
TVTV
TVTV
TVTV
7.127.12
6.19
6.19
6.32
6.32
6.56
6.56
6.816.81
7.067.06
6.296.29
6.336.33
6.536.53
6.616.61
6.47
6.47
6.83
6.83
32503250
32503250
35003500
32503250
32503250
4040 3030 3030
4040 3030LIDL GREAT BRITAIN LTDLIDL GREAT BRITAIN LTD
PROPOSED LIDL STOREPROPOSED LIDL STORE
52 MUMBLES ROAD52 MUMBLES ROAD
SWANSEASWANSEA
PROPOSED HIGHWAYPROPOSED HIGHWAY
IMPROVEMENT WORKSIMPROVEMENT WORKS
PROPOSED STORE LAYOUTPROPOSED STORE LAYOUT
ON TOPOGRAPHICAL SURVEYON TOPOGRAPHICAL SURVEY
PRELIMINARYPRELIMINARY
1:500/1:2001:500/1:200 SEPT'21SEPT'21 MAMA MAMA
20-0066820-00668 PL05PL05
PROJECT:PROJECT:
TITLE:TITLE:
STATUS:STATUS:
CLIENT:CLIENT:
SCALE:SCALE: DATE:DATE: DRAWN:DRAWN: CHECKED:CHECKED:
REVISION:REVISION:DRAWING NO:DRAWING NO:JOB NO:JOB NO:
DateDateRevRev DetailsDetails CheckedCheckedDrawnDrawnbybybyby
A1A1ORIGINALORIGINALPLOT SIZEPLOT SIZE
COPYRIGHT RESERVEDCOPYRIGHT RESERVED
INDICATIVEINDICATIVE
Reproduced from Ordnance Survey Superplan Data with the permission of The Controller ofReproduced from Ordnance Survey Superplan Data with the permission of The Controller ofHer Majesty's Stationery Office. Crown Copyright - Licence No. AL100034021Her Majesty's Stationery Office. Crown Copyright - Licence No. AL100034021
NOTES:NOTES:
This drawing is based on [Company's Name] Drawing No:This drawing is based on [Company's Name] Drawing No:
1. All dimensions are in millimeters unless otherwise1. All dimensions are in millimeters unless otherwisestated.stated.
Corun Associates LtdCorun Associates LtdSwanseaSwansea
E [email protected] [email protected] www.corun.uk.comW www.corun.uk.com
DMRB TD42/95 Design CriteriaDMRB TD42/95 Design Criteria
Design Speed - 70kph (43mph)Design Speed - 70kph (43mph)a (turning length) - 10ma (turning length) - 10m+40m (6 car lengths) = 50m+40m (6 car lengths) = 50mb (deceleration length) - 40mb (deceleration length) - 40me (taper length) - 15m inc. withine (taper length) - 15m inc. withindeceleration length (b)deceleration length (b)
Steering AngleSteering AngleLock to Lock TimeLock to Lock Time
Articulating AngleArticulating Angle
BOX VAN 6AXLEBOX VAN 6AXLE
Trailer TrackTrailer TrackTractor TrackTractor TrackTrailer WidthTrailer WidthTractor WidthTractor Width
12901290
mmmm
25502550
:: 2550255025502550
::::::
25502550
130130
32703270
16201620 84608460
22702270 1369013690
:::::: 6.06.0
25.525.570.070.0
1650016500
Swept path design speed - 6mphSwept path design speed - 6mph
Right Turn laneRight Turn laneExtension to DMRBExtension to DMRBStandards (See Notes)Standards (See Notes)
Carriageway Widening intoCarriageway Widening intoAdopted Highway/Verge toAdopted Highway/Verge toFacilitate Right Turn LaneFacilitate Right Turn LaneExtensionExtension
Existing Traffic Island toExisting Traffic Island tobe Removedbe Removed
Existing Access to beExisting Access to beUpgradedUpgraded
Existing Access to GlynExisting Access to GlynCrescent to RemainCrescent to Remain
Carriageway Widening intoCarriageway Widening intoAdopted Highway/Verge toAdopted Highway/Verge toFacilitate Right Turn LaneFacilitate Right Turn LaneExtensionExtension
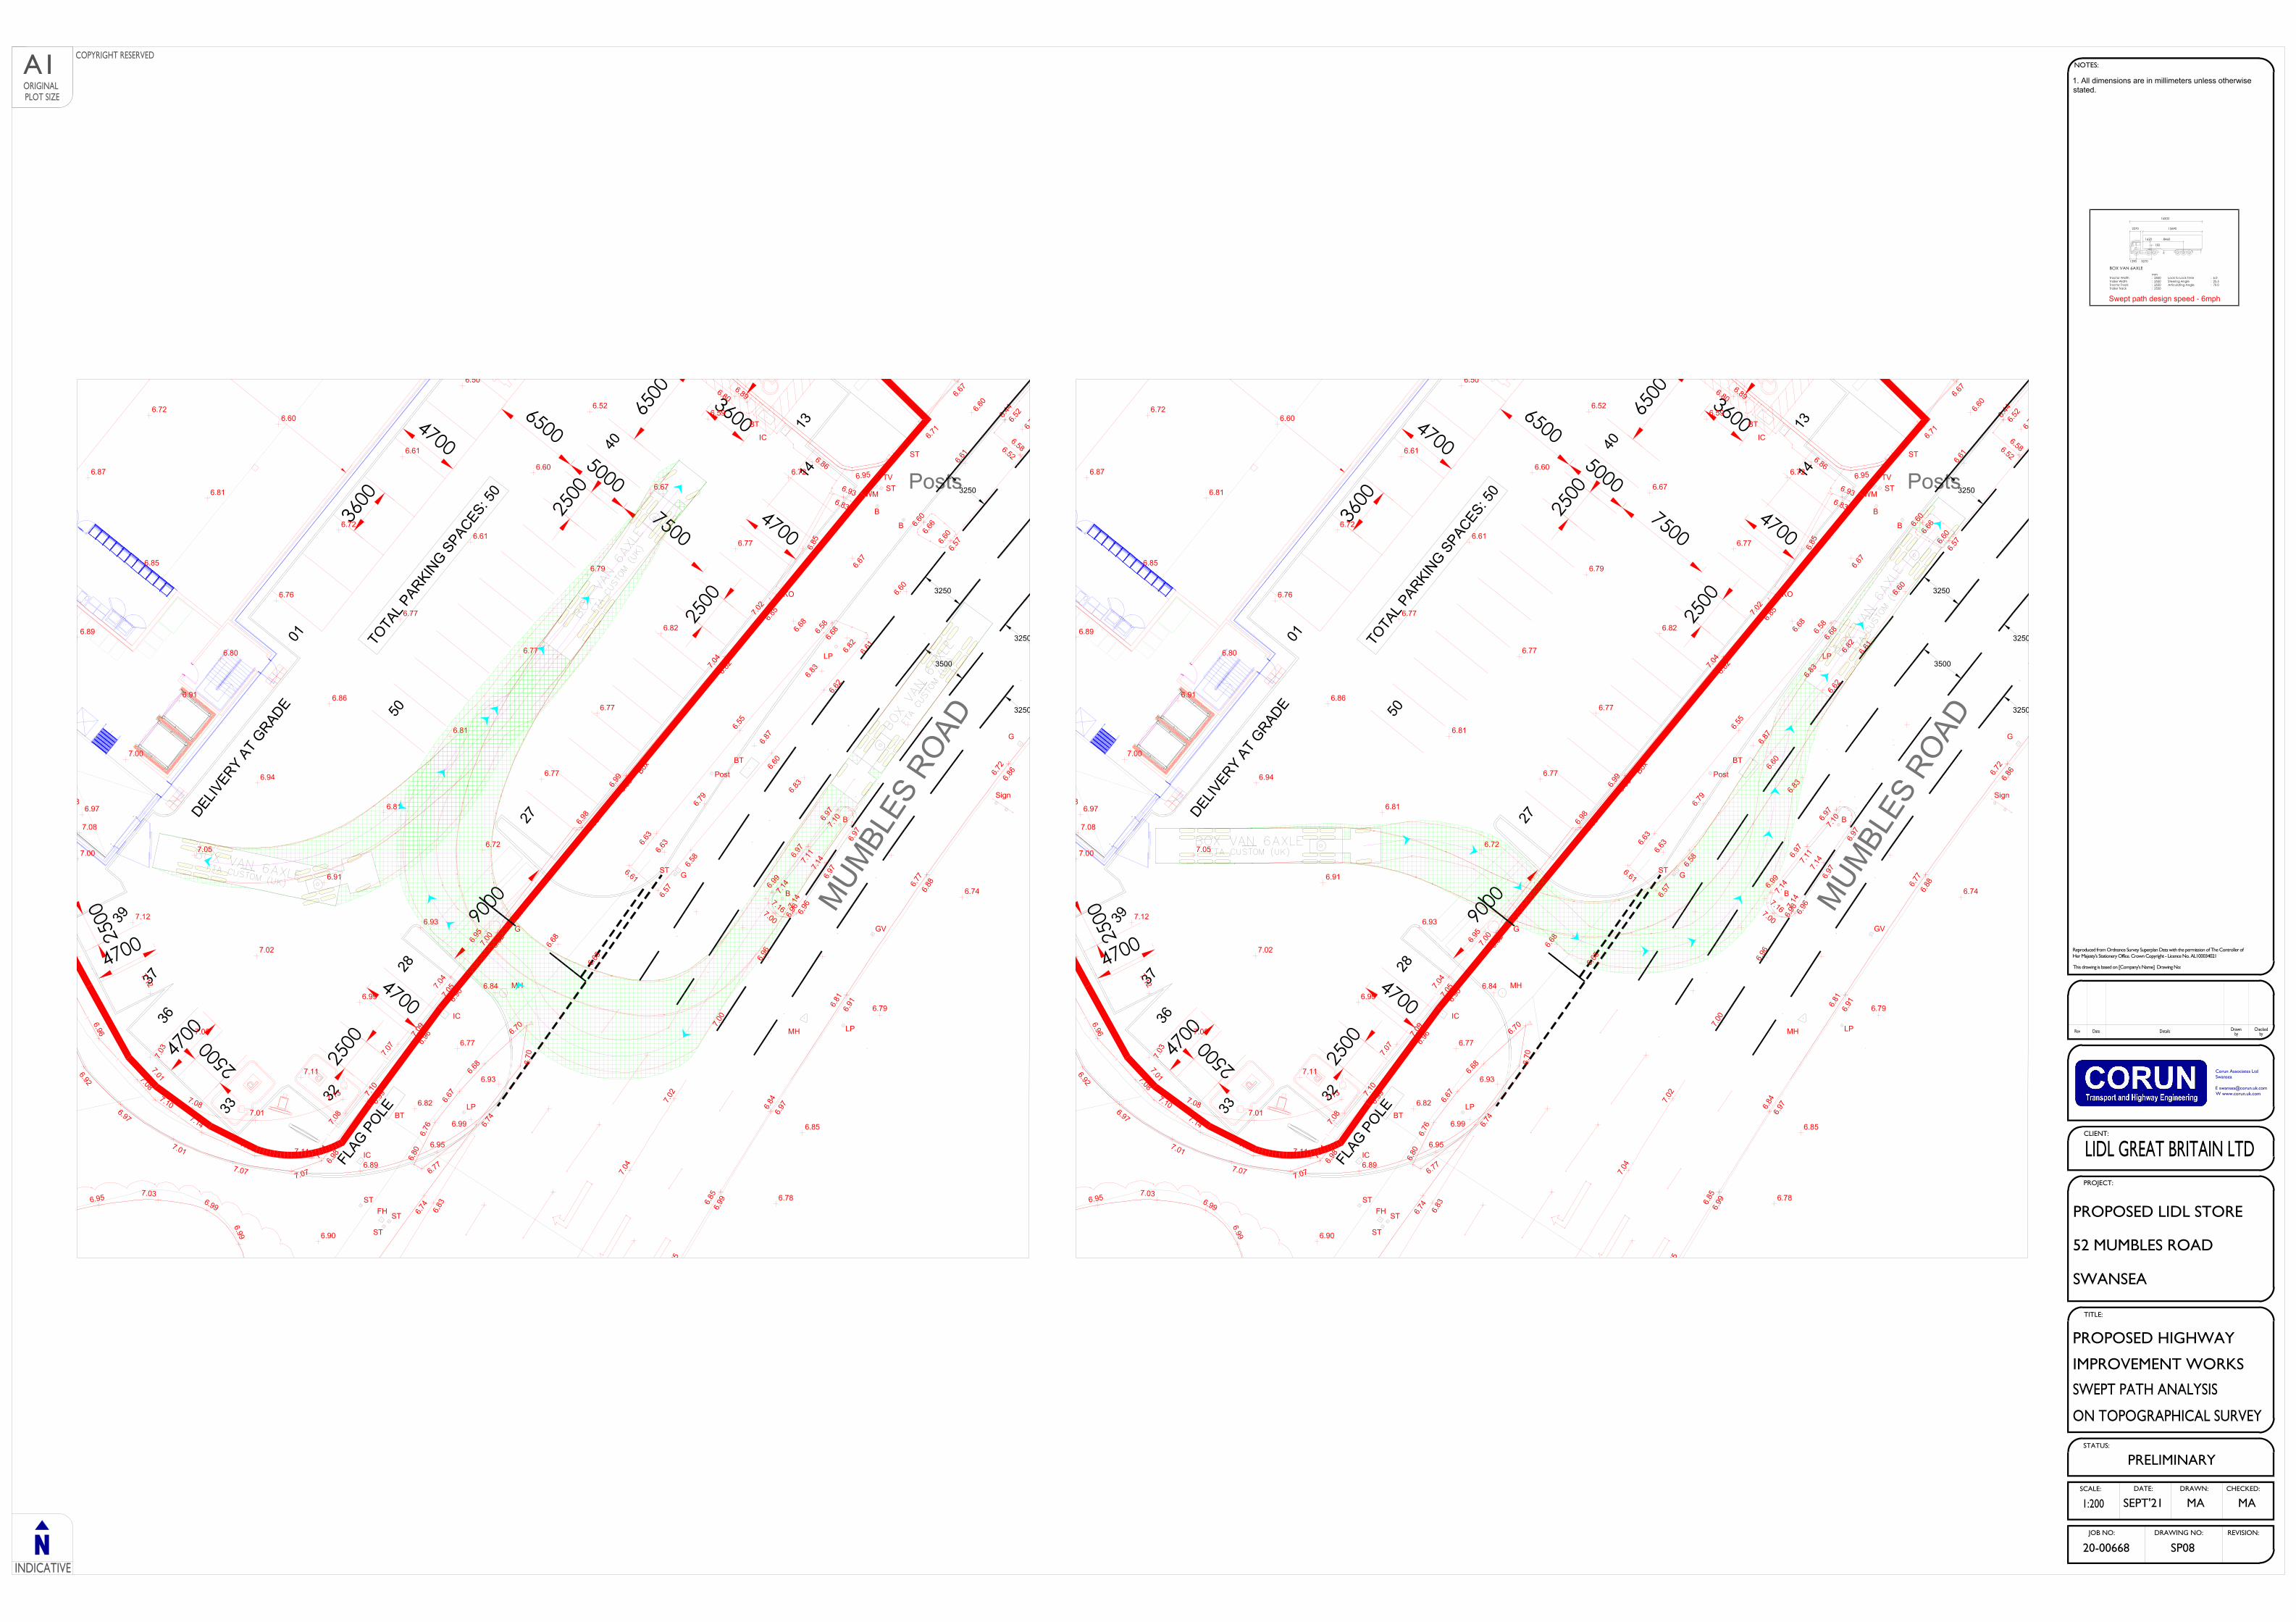
PostsPosts
MUM
BLES
ROAD
MUM
BLES
ROAD
FLAG P
OLE
FLAG P
OLETO
TAL P
ARKING S
PACES:
TOTA
L PARKIN
G SPACES: 5
050
0101
47004700
DELIVERY A
T GRADE
DELIVERY A
T GRADE
11331144
2277
3322
3333
336647
0047
00
2500
2500
47004700
47004700
36003600
2500
2500
47004700
3377
3939
4400
5050
75007500
65006500
50005000
9000
9000
2288
2500
2500
2500
2500
2500
2500
6500
3600
3600
4800
6.776.77
6.80
6.80
6.76
6.76
6.67
6.67
6.68
6.68
6.70
6.70
6.70
6.70
6.74
6.74
6.74
6.74
6.83
6.83
6.956.95 7.037.036.996.99
6.996.99 6.906.90
6.896.89
STST
STST
STSTFHFH
6.826.82
6.776.77
6.846.84
7.05
7.05
ICIC
7.09
7.09
6.82
6.82
6.90
6.90
6.96
6.96
6.99
6.99
6.98
6.98
7.10
7.10
ICIC7.11
7.11
LPLP
6.956.95
6.996.99
6.936.93
7.04
7.04
7.02
7.02
7.00
7.00
6.96
6.96
6.96
6.96
6.99
6.99
6.85
6.85
6.85
6.84
6.84
6.81
6.81
6.77
6.77
6.72
6.72
6.786.78
6.726.72
6.776.77
6.826.82
6.776.77
6.776.77
6.726.72
6.936.93
6.996.99
7.117.11
7.087.08
7.027.02
6.916.91
6.816.81
6.816.81
6.776.77
6.796.79
6.676.67
6.596.596.526.52
6.606.60
6.616.61
6.776.77
6.866.86
6.946.94
7.057.05
7.127.12
7.087.08
7.007.00
6.976.977.08
7.007.00
6.916.91
6.806.80
6.766.76
6.726.72
6.616.61
6.50
6.606.60
6.816.81
6.856.85
6.896.89
6.876.87
6.726.72
7.087.08
7.107.10
7.147.14
7.147.14 7.117.11
7.08
7.08
7.07
7.07
7.04
7.04
6.95
6.95
ICIC
BTBT
BTBT
6.99
6.99
6.85
6.85
6.82
6.82
6.83
6.83
6.83
6.836.9
86.9
8
6.80
6.80
GG
7.00
7.00
MHMH
6.68
6.68
6.65
6.65
Box
Box
7.077.077.077.07
7.017.01
6.976.97
6.926.92
6.966.96
7.017.01
7.087.087.017.01
7.137.13
7.127.12
7.03
7.03
6.806.80
6.896.89
6.866.86
6.58
6.86
6.86
GG
SignSign
6.88
6.88
GVGV
6.91
6.91
LPLPMHMH
6.97
6.97
6.856.85
6.796.79
6.746.74
6.57
6.57
6.60
6.60
6.66
6.66
6.60
6.60
BB
BB6.836.83
6.936.93
6.85
6.85
KOKO
7.04
7.04
7.02
7.02
6.60
6.60
6.61
6.61
6.62
6.62
6.60
6.60
6.58
6.58
6.57
6.57
6.616.61
6.63
6.63
6.55
6.55
6.58
6.58
LPLP
PostPost
STST GG
6.63
6.63
6.79
6.79
6.87
6.87
6.83
6.83
6.82
6.826.6
86.6
86.68
6.68
6.67
6.67
WMWMSTST
BTBT
6.96
6.967.00
7.00
6.99
6.99
6.97
6.97
6.97
6.97
6.97
6.97
6.97
6.977.1
47.1
47.1
07.1
0
7.11
7.11
7.14
7.14
7.167.16 7.
147.
14
BB
BB
6.44
6.44
6.526.52
6.586.58
6.52
6.52
6.77
6.67
6.67
6.956.95
STST
6.71
6.71
6.61
6.61
6.60
6.60
TVTV
6.83
6.83
3250
3250
35003500
32503250
32503250
BOX VAN 6AXLEBOX VAN 6AXLE
FTA CUSTOM (UK)FTA CUSTOM (UK)
(c) 2021 Transoft Solutions, Inc. All rights reserved.(c) 2021 Transoft Solutions, Inc. All rights reserved.
B
O
X
V
A
N
6
A
X
L
E
B
O
X
V
A
N
6
A
X
L
E
F
T
A
C
U
S
T
O
M
(
U
K
)
F
T
A
C
U
S
T
O
M
(
U
K
)
(
c
)
2
0
2
1
T
r
a
n
s
o
f
t
S
o
l
u
t
i
o
n
s
,
I
n
c
.
A
l
l
r
i
g
h
t
s
r
e
s
e
r
v
e
d
.
(
c
)
2
0
2
1
T
r
a
n
s
o
f
t
S
o
l
u
t
i
o
n
s
,
I
n
c
.
A
l
l
r
i
g
h
t
s
r
e
s
e
r
v
e
d
.
PostsPosts
MUM
BLES
ROAD
MUM
BLES
ROAD
FLAG P
OLE
FLAG P
OLETO
TAL P
ARKING S
PACES:
TOTA
L PARKIN
G SPACES: 5
050
0101
47004700
DELIVERY A
T GRADE
DELIVERY A
T GRADE
11331144
2277
3322
3333
336647
0047
00
2500
2500
47004700
47004700
36003600
2500
2500
47004700
3377
3939
4400
5050
75007500
65006500
50005000
9000
9000
2288
2500
2500
2500
2500
2500
2500
6500
3600
3600
4800
6.776.77
6.80
6.80
6.76
6.76
6.67
6.67
6.68
6.68
6.70
6.70
6.70
6.70
6.74
6.74
6.74
6.74
6.83
6.83
6.956.95 7.037.036.996.99
6.996.99 6.906.90
6.896.89
STST
STST
STSTFHFH
6.826.82
6.776.77
6.846.84
7.05
7.05
ICIC
7.09
7.09
6.82
6.82
6.90
6.90
6.96
6.96
6.99
6.99
6.98
6.98
7.10
7.10
ICIC7.11
7.11
LPLP
6.956.95
6.996.99
6.936.93
7.04
7.04
7.02
7.02
7.00
7.00
6.96
6.96
6.96
6.96
6.99
6.99
6.85
6.85
6.85
6.84
6.84
6.81
6.81
6.77
6.77
6.72
6.72
6.786.78
6.726.72
6.776.77
6.826.82
6.776.77
6.776.77
6.726.72
6.936.93
6.996.99
7.117.11
7.087.08
7.027.02
6.916.91
6.816.81
6.816.81
6.776.77
6.796.79
6.676.67
6.596.596.526.52
6.606.60
6.616.61
6.776.77
6.866.86
6.946.94
7.057.05
7.127.12
7.087.08
7.007.00
6.976.977.08
7.007.00
6.916.91
6.806.80
6.766.76
6.726.72
6.616.61
6.50
6.606.60
6.816.81
6.856.85
6.896.89
6.876.87
6.726.72
7.087.08
7.107.10
7.147.14
7.147.14 7.117.11
7.08
7.08
7.07
7.07
7.04
7.04
6.95
6.95
ICIC
BTBT
BTBT
6.99
6.99
6.85
6.85
6.82
6.82
6.83
6.83
6.83
6.836.9
86.9
8
6.80
6.80
GG
7.00
7.00
MHMH
6.68
6.68
6.65
6.65
Box
Box
7.077.077.077.07
7.017.01
6.976.97
6.926.92
6.966.96
7.017.01
7.087.087.017.01
7.137.13
7.127.12
7.03
7.03
6.806.80
6.896.89
6.866.86
6.58
6.86
6.86
GG
SignSign
6.88
6.88
GVGV
6.91
6.91
LPLPMHMH
6.97
6.97
6.856.85
6.796.79
6.746.74
6.57
6.57
6.60
6.60
6.66
6.66
6.60
6.60
BB
BB6.836.83
6.936.93
6.85
6.85
KOKO
7.04
7.04
7.02
7.02
6.60
6.60
6.61
6.61
6.62
6.62
6.60
6.60
6.58
6.58
6.57
6.57
6.616.61
6.63
6.63
6.55
6.55
6.58
6.58
LPLP
PostPost
STST GG
6.63
6.63
6.79
6.79
6.87
6.87
6.83
6.83
6.82
6.826.6
86.6
86.68
6.68
6.67
6.67
WMWMSTST
BTBT
6.96
6.967.00
7.00
6.99
6.99
6.97
6.97
6.97
6.97
6.97
6.97
6.97
6.977.1
47.1
47.1
07.1
0
7.11
7.11
7.14
7.14
7.167.16 7.
147.
14
BB
BB
6.44
6.44
6.526.52
6.586.58
6.52
6.52
6.77
6.67
6.67
6.956.95
STST
6.71
6.71
6.61
6.61
6.60
6.60
TVTV
6.83
6.83
3250
3250
35003500
32503250
32503250
B
O
X
V
A
N
6
A
X
L
E
B
O
X
V
A
N
6
A
X
L
E
F
T
A
C
U
S
T
O
M
(
U
K
)
F
T
A
C
U
S
T
O
M
(
U
K
)
(
c
)
2
0
2
1
T
r
a
n
s
o
f
t
S
o
l
u
t
i
o
n
s
,
I
n
c
.
A
l
l
r
i
g
h
t
s
r
e
s
e
r
v
e
d
.
(
c
)
2
0
2
1
T
r
a
n
s
o
f
t
S
o
l
u
t
i
o
n
s
,
I
n
c
.
A
l
l
r
i
g
h
t
s
r
e
s
e
r
v
e
d
.
B
O
X
V
A
N
6
A
X
L
E
B
O
X
V
A
N
6
A
X
L
E
F
T
A
C
U
S
T
O
M
(
U
K
)
F
T
A
C
U
S
T
O
M
(
U
K
)
(c) 2021 Transoft Solutions, Inc. All rights reserved.
(c) 2021 Transoft Solutions, Inc. All rights reserved.
B
O
X
V
A
N
6
A
X
L
E
B
O
X
V
A
N
6
A
X
L
E
F
T
A
C
U
S
T
O
M
(
U
K
)
F
T
A
C
U
S
T
O
M
(
U
K
)
LIDL GREAT BRITAIN LTDLIDL GREAT BRITAIN LTD
PROPOSED LIDL STOREPROPOSED LIDL STORE
52 MUMBLES ROAD52 MUMBLES ROAD
SWANSEASWANSEA
PROPOSED HIGHWAYPROPOSED HIGHWAY
IMPROVEMENT WORKSIMPROVEMENT WORKS
SWEPT PATH ANALYSISSWEPT PATH ANALYSIS
ON TOPOGRAPHICAL SURVEYON TOPOGRAPHICAL SURVEY
PRELIMINARYPRELIMINARY
1:2001:200 SEPT'21SEPT'21 MAMA MAMA
20-0066820-00668 SP08SP08
PROJECT:PROJECT:
TITLE:TITLE:
STATUS:STATUS:
CLIENT:CLIENT:
SCALE:SCALE: DATE:DATE: DRAWN:DRAWN: CHECKED:CHECKED:
REVISION:REVISION:DRAWING NO:DRAWING NO:JOB NO:JOB NO:
DateDateRevRev DetailsDetails CheckedCheckedDrawnDrawnbybybyby
A1A1ORIGINALORIGINALPLOT SIZEPLOT SIZE
COPYRIGHT RESERVEDCOPYRIGHT RESERVED
INDICATIVEINDICATIVE
Reproduced from Ordnance Survey Superplan Data with the permission of The Controller ofReproduced from Ordnance Survey Superplan Data with the permission of The Controller ofHer Majesty's Stationery Office. Crown Copyright - Licence No. AL100034021Her Majesty's Stationery Office. Crown Copyright - Licence No. AL100034021
NOTES:NOTES:
This drawing is based on [Company's Name] Drawing No:This drawing is based on [Company's Name] Drawing No:
1. All dimensions are in millimeters unless otherwise1. All dimensions are in millimeters unless otherwisestated.stated.
Corun Associates LtdCorun Associates LtdSwanseaSwansea
E [email protected] [email protected] www.corun.uk.comW www.corun.uk.com
Steering AngleSteering AngleLock to Lock TimeLock to Lock Time
Articulating AngleArticulating Angle
BOX VAN 6AXLEBOX VAN 6AXLE
Trailer TrackTrailer TrackTractor TrackTractor TrackTrailer WidthTrailer WidthTractor WidthTractor Width
12901290
mmmm
25502550
:: 2550255025502550
::::::
25502550
130130
32703270
16201620 84608460
22702270 1369013690
:::::: 6.06.0
25.525.570.070.0
1650016500
Swept path design speed - 6mphSwept path design speed - 6mph
Mumbles Road, Swansea
Lidl Great Britain Limited Transport Assessment
20-00668/TA/01 Corun Associates Ltd
September 2021 Appendix B
APPENDIX B
Swansea Council Pre-Application Discussion Response
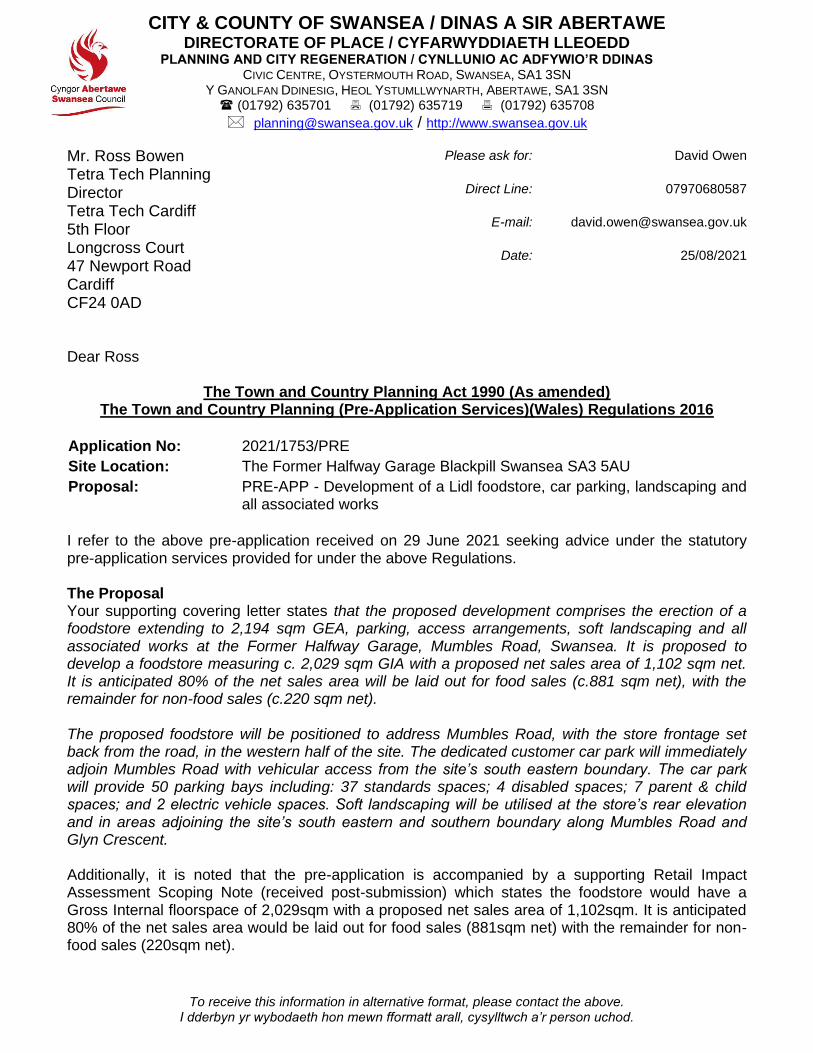
CITY & COUNTY OF SWANSEA / DINAS A SIR ABERTAWE DIRECTORATE OF PLACE / CYFARWYDDIAETH LLEOEDD
PLANNING AND CITY REGENERATION / CYNLLUNIO AC ADFYWIO’R DDINAS CIVIC CENTRE, OYSTERMOUTH ROAD, SWANSEA, SA1 3SN
Y GANOLFAN DDINESIG, HEOL YSTUMLLWYNARTH, ABERTAWE, SA1 3SN (01792) 635701 (01792) 635719 (01792) 635708
[email protected] / http://www.swansea.gov.uk
To receive this information in alternative format, please contact the above. I dderbyn yr wybodaeth hon mewn fformatt arall, cysylltwch a’r person uchod.
Mr. Ross Bowen Tetra Tech Planning Director Tetra Tech Cardiff 5th Floor Longcross Court 47 Newport Road Cardiff CF24 0AD
Please ask for:
Direct Line:
E-mail:
Date:
David Owen
07970680587
25/08/2021
Dear Ross
The Town and Country Planning Act 1990 (As amended) The Town and Country Planning (Pre-Application Services)(Wales) Regulations 2016
Application No: 2021/1753/PRE
Site Location: The Former Halfway Garage Blackpill Swansea SA3 5AU
Proposal: PRE-APP - Development of a Lidl foodstore, car parking, landscaping and all associated works
I refer to the above pre-application received on 29 June 2021 seeking advice under the statutory pre-application services provided for under the above Regulations.
The Proposal Your supporting covering letter states that the proposed development comprises the erection of a foodstore extending to 2,194 sqm GEA, parking, access arrangements, soft landscaping and all associated works at the Former Halfway Garage, Mumbles Road, Swansea. It is proposed to develop a foodstore measuring c. 2,029 sqm GIA with a proposed net sales area of 1,102 sqm net. It is anticipated 80% of the net sales area will be laid out for food sales (c.881 sqm net), with the remainder for non-food sales (c.220 sqm net). The proposed foodstore will be positioned to address Mumbles Road, with the store frontage set back from the road, in the western half of the site. The dedicated customer car park will immediately adjoin Mumbles Road with vehicular access from the site’s south eastern boundary. The car park will provide 50 parking bays including: 37 standards spaces; 4 disabled spaces; 7 parent & child spaces; and 2 electric vehicle spaces. Soft landscaping will be utilised at the store’s rear elevation and in areas adjoining the site’s south eastern and southern boundary along Mumbles Road and Glyn Crescent. Additionally, it is noted that the pre-application is accompanied by a supporting Retail Impact Assessment Scoping Note (received post-submission) which states the foodstore would have a Gross Internal floorspace of 2,029sqm with a proposed net sales area of 1,102sqm. It is anticipated 80% of the net sales area would be laid out for food sales (881sqm net) with the remainder for non-food sales (220sqm net).

CITY & COUNTY OF SWANSEA / DINAS A SIR ABERTAWE DIRECTORATE OF PLACE / CYFARWYDDIAETH LLEOEDD
PLANNING AND CITY REGENERATION / CYNLLUNIO AC ADFYWIO’R DDINAS CIVIC CENTRE, OYSTERMOUTH ROAD, SWANSEA, SA1 3SN
Y GANOLFAN DDINESIG, HEOL YSTUMLLWYNARTH, ABERTAWE, SA1 3SN (01792) 635701 (01792) 635719 (01792) 635708
[email protected] / http://www.swansea.gov.uk
To receive this information in alternative format, please contact the above. I dderbyn yr wybodaeth hon mewn fformatt arall, cysylltwch a’r person uchod.
Site Description & Surroundings The covering letter also provides a site context as follows: The application site is located within the settlement of Blackpill, a suburban area of west Swansea, which sits beside Swansea Bay and is situated approximately 3.7km southwest of the city centre. The application site is a broadly square parcel of land which extends to approximately 0.4 Ha and occupies a prominent position, fronting Mumbles Road (A4067). The site currently comprises vacated, cleared land following the demolition of a Shell petrol filling station and associated buildings in 2017, which historically occupied the site. The site was remediated of its former use and now lies clear and unused. Vehicular access to the site is currently achieved via two points on the site’s south eastern border, from Mumbles Road. In respect of surroundings, Mumbles Road runs parallel to the sites south eastern border. A ‘pitch & putt’ golf course is found immediately beyond Mumbles Road to the east. Residential dwellings adjoin the site to the north east and west, whilst an area of greenspace adjoins the site to the north west. In terms of floodrisk the Development Advice Map indicates the site comprises areas of both Flood Zone A – Considered to be at little or no risk of fluvial or coastal/tidal flooding and Flood Zone C2 – Without significant flood defence infrastructure. In terms of heritage, the Cadw Designated Historic Assets map indicates there are no heritage assets, including listed buildings and scheduled ancient monuments within or in the immediate vicinity of the application site. Relevant planning history The covering letter also outlines a planning history of the site, notably:
• 2017/0105/PND Demolition and removal of all associated fuel infrastructure, including tanks and pipework (application for the Prior Notification of Proposed Demolition). Below Ground:
Removal of all associated fuel infrastructure, including tanks and pipework. Prior approval not required February 2017 You will also be aware of a previous proposal on the adjacent land to the rear for the construction of a Asda retail superstore with 433-space car park provision, service area, internal access layout, stream diversion, bat roost and associated improvements to Derwen Fawr Road, new/improved footpaths on Derwen Fawr Road and Mumbles Road, new traffic light junction to Derwen Fawr Road, new store traffic light access off Mumbles Road plus 9 detached dwelling houses and associated access arrangements. (Outline) – 2002/1267 – which was subsequently withdrawn. Reference is also made to previous pre-application enquiries on or partly on the site for a retail food store under refs: 2018/2017/PRE & 2019/0695/PRE. Development Plan and Relevant Policies The Development Plan for the area is the Swansea Local Development Plan (Adopted February 2019) and within which the following policies are considered to be relevant to your proposal: PS1; PS2; PS4, IO1, SI8, RC2, RC5; RC6; ER1, ER2, ER8, ER9, ER11; T1, T2, T5, T6, T7, EU4; RP1, RP2, RP3, RP4, RP5; RP6; RP9, RP10 Supplementary Planning Guidance (SPG):

CITY & COUNTY OF SWANSEA / DINAS A SIR ABERTAWE DIRECTORATE OF PLACE / CYFARWYDDIAETH LLEOEDD
PLANNING AND CITY REGENERATION / CYNLLUNIO AC ADFYWIO’R DDINAS CIVIC CENTRE, OYSTERMOUTH ROAD, SWANSEA, SA1 3SN
Y GANOLFAN DDINESIG, HEOL YSTUMLLWYNARTH, ABERTAWE, SA1 3SN (01792) 635701 (01792) 635719 (01792) 635708
[email protected] / http://www.swansea.gov.uk
To receive this information in alternative format, please contact the above. I dderbyn yr wybodaeth hon mewn fformatt arall, cysylltwch a’r person uchod.
SPG relevant to the proposed development, which are available to download in full from our website at www.swansea.gov.uk are as follows:[INSERT SPG ].
• Parking Standards (Adopted March 2012)
• Planning Obligations (Adopted March 2010)
• Planning for Community Safety (Adopted December 2012)
• Development and Biodiversity (Feb. 2021). Consultation Responses Natural Resources Wales - As the above proposal will involve the provision of a building or buildings where the floor space to be created by the development is 1,000 square metres or more’ - this constitutes ‘major development’ as specified in the Town and Country Planning (Development Management Procedure) (Wales) Order 2012. Therefore, we would advise that you notify the applicant to inform them that Natural Resources Wales are a specialist consultee as part of the process as defined in article 2(1) of the Order and are required to be notified and provided with an opportunity to review the draft planning application. We will therefore comment on the proposed development when consulted by the applicant. Dwr Cymru Welsh Water – I refer to your request for our comments in response to the Applicant’s submission of a Pre-Application enquiry. Whilst I appreciate the engagement with us and the opportunity to comment, there is no statutory obligation on ‘Specialist Consultees’ to respond formally and contribute to your Pre-Application response to the Applicant. I trust you will appreciate our position however we do very much recognise our duty to engage with the planning process and contribute positively to the pre-application process and discussions. To assist Applicants I recommend that you include reference to our own pre-app procedures within any written response and I can offer the following paragraph which you may want to include within your standard responses. Welsh Water has a key role to play in the development and planning process as the services provided are at the forefront of public health and protection of the environment. Welsh Water encourages all developers to engage with them as early as possible in order to address any issues that may arise during the planning/construction process. Upon receipt of a pre-application enquiry, Welsh Water will provide a written response advising whether the local network(s) can support the proposal, whether off-site water mains and/or sewers will need to be provided, and whether there are any apparatus located within the land you wish to develop and the requirements for these apparatus. CCS Drainage Engineer - We have reviewed the submitted information and based on the details comment as follows. As correctly identified the site is mostly covered by Flood Zone C2 and any application will need to accompanied by a Flood Consequences Assessment appropriate to the scale and nature of the development, it is likely that floodplain compensation on a level for level, volume for volume basis

CITY & COUNTY OF SWANSEA / DINAS A SIR ABERTAWE DIRECTORATE OF PLACE / CYFARWYDDIAETH LLEOEDD
PLANNING AND CITY REGENERATION / CYNLLUNIO AC ADFYWIO’R DDINAS CIVIC CENTRE, OYSTERMOUTH ROAD, SWANSEA, SA1 3SN
Y GANOLFAN DDINESIG, HEOL YSTUMLLWYNARTH, ABERTAWE, SA1 3SN (01792) 635701 (01792) 635719 (01792) 635708
[email protected] / http://www.swansea.gov.uk
To receive this information in alternative format, please contact the above. I dderbyn yr wybodaeth hon mewn fformatt arall, cysylltwch a’r person uchod.
within the red line will be necessary to pursue any development proposals on this site. Natural Resources Wales will be able to advise further on the scope and information available to undertake such an assessment. On the drainage strategy proposed we would highlight very strongly that the site has no right to connect to DCWW assets in Mumbles Road as indicated by dwg SK-500 Rev P01, Standard 1 of the WG SuDS Standards must be followed. Given that the Cwm Stream is not far from the rear of the site it would be expected that the site connect to that directly or use infiltration in accordance with the hierarchy this may require a radical rethink of the SuDS Strategy. We note the use of a green/blue roof however in our experience these are rarely achieved on such developments as the steel frame of building will require upgrading beyond the standard used to take the weight of the roof. However biodiversity and amenity standards would still need to be met which may require a reduction in the size of the development to achieve this that has knock on effects on site viability. Schedule 3, Flood and Water Management Act 2010. Your development proposal has been identified as requiring SuDS Approval Body consent irrespective of any other permissions given. CCS Planning Ecologist - Preliminary Ecological Assessment (PEA) The site is adjacent to semi-natural habitats and there are records of protected species, including bats, badger, otter, hedgehog and birds of conservation concern close to the site. Any submission must be accompanied by a Preliminary Ecological Appraisal (PEA). This should include an assessment of the potential of the site to support protected species and habitats and determine the need for any further surveys. The PEA should also contain an assessment of the presence of Invasive Non-Native plant Species (INNS). The PEA must be carried out by a suitably qualified and experienced ecologist. The submission must be accompanied by the results of any further surveys that are identified as necessary within the PEA. It should also include recommendations for mitigation and enhancements. Lighting Strategy A sensitive lighting strategy should be adopted to protect bats, badgers and other nocturnal species, and to protect nearby habitats. A plan showing location, light spill and specification for any proposed lights on the site must be submitted for approval. The lighting plan should reflect the Bat Conservation Trust’s Bats and Artificial Lighting in the U.K. (2018) guidance. Construction Environmental Management Plan (CEMP) A Construction Environmental Management Plan (CEMP) will be required to inform the development. The document will need to include sufficient detail to demonstrate how construction will be managed to ensure pollution prevention and protection of habitats and species on and adjacent to the site. Green Infrastructure LDP Policy ER 2 requires that in order to be acceptable, development must not compromise the integrity of the green infrastructure system. This means that where a development proposal will

CITY & COUNTY OF SWANSEA / DINAS A SIR ABERTAWE DIRECTORATE OF PLACE / CYFARWYDDIAETH LLEOEDD
PLANNING AND CITY REGENERATION / CYNLLUNIO AC ADFYWIO’R DDINAS CIVIC CENTRE, OYSTERMOUTH ROAD, SWANSEA, SA1 3SN
Y GANOLFAN DDINESIG, HEOL YSTUMLLWYNARTH, ABERTAWE, SA1 3SN (01792) 635701 (01792) 635719 (01792) 635708
[email protected] / http://www.swansea.gov.uk
To receive this information in alternative format, please contact the above. I dderbyn yr wybodaeth hon mewn fformatt arall, cysylltwch a’r person uchod.
result in loss in green infrastructure and consequently a loss in ecosystem service provision, mitigation and compensation measures will be required. The LDP policy now requires that compensatory measures should maintain and enhance the green infrastructure network. The policy criteria set out the type of measures that could be incorporated into a development scheme to achieve this. Sustainable Drainage (SuDS) From 7th January 2019, all new developments of more than 1 house or where the construction area is of 100m2 or more require sustainable drainage to manage on-site surface water. It is advised that reference is made to the Swansea Council LDP. SuDS work by making use of landscape and natural vegetation to control the flow of surface water and reduce the risk of flooding. Designs can include ponds, permeable paving and swales, which slow down the discharge of surface water more than conventional piped drainage. Standard S5 addresses the design of SuDS to ensure, where possible, they create ecologically rich green and blue corridors in developments and enrich biodiversity value by linking networks of habitats and ecosystems together. Biodiversity should be considered at the early design stage of a development to ensure the potential benefits are maximised Ecological Enhancements: A scheme to demonstrate that the development will conserve and enhance biodiversity and resilient ecosystems will need to be approved by the LPA. This is in line with the Section 6 Duty of the Environment (Wales) Act 2016, the Resilient Wales Goal of the Well-being of Future Generations Act 2015, Planning Policy Wales Edition 11 and Technical Advice Note 5. The Biodiversity Supplementary Planning Guidance (SPG) should be referred to for further information: https://www.swansea.gov.uk/biodiversityspg CCS Pollution Control Team - Whilst I am not in a position to object to the application I will want the following conditions to be either attached to any application or addressed as part of an application:
• Land Contamination;
• Imported Soils;
• Unforeseen Contamination;
• Building Services Plant Noise:
• Ventilation and fume extraction;
• Condensing units relating to refrigeration and freezing of products;
• Control hours use of the car park and requiring a delivery management plan to ensure that the process does not have a detrimental effect upon local residential land uses;
• Lighting scheme for the proposed site. CCS Highways - The supporting documents which have been submitted with this pre-application enquiry have been reviewed and our observations are set out below. The site has been the subject of a previous pre-application enquiries, for background the advice which was given in the past has been reviewed to ensure consistency.

CITY & COUNTY OF SWANSEA / DINAS A SIR ABERTAWE DIRECTORATE OF PLACE / CYFARWYDDIAETH LLEOEDD
PLANNING AND CITY REGENERATION / CYNLLUNIO AC ADFYWIO’R DDINAS CIVIC CENTRE, OYSTERMOUTH ROAD, SWANSEA, SA1 3SN
Y GANOLFAN DDINESIG, HEOL YSTUMLLWYNARTH, ABERTAWE, SA1 3SN (01792) 635701 (01792) 635719 (01792) 635708
[email protected] / http://www.swansea.gov.uk
To receive this information in alternative format, please contact the above. I dderbyn yr wybodaeth hon mewn fformatt arall, cysylltwch a’r person uchod.
The proposals seek to redevelop a site which was previously used by Shell for a petrol station serving Mumbles Road and includes two neighbouring residential properties, one within and one without the site. The layout it is noted as indicatively shown for access, although the Highway Authority has provided comments which it considers would be useful to the prospective applicant. The enquiry details suggest that the supermarket will be of a Lidl format and have an area of 2,194 sqm Gross External area shown on the plan The net retail sales area has been presented as 1,102 sqm. This size of food retail would trigger the thresholds for a Transport Assessment (TA) and we would strongly advise the applicant that the content of the TA should be fully scoped and agreed with the Highway Authority. The purpose of the scoping discussions would be to ensure that the form of access, internal layout and extent of assessment area are appropriate. A TA submitted without prior formal scoping may incur delays and additional assessment work and redesign. The existing land uses would have previously had a traffic generating capability, this is still the case for the residential dwellings although the petrol station has been demolished for some time and all permitted uses have now been extinguished. The proposed site location is within a predominantly residential area but adjacent a principal route in Swansea, the A4067 Mumbles Road. To the north the residential site is bound by open area that has seen previous development interest and then Ashleigh Road. To the south and west of the proposed access Glyn Crescent connects with Mumbles Road and serves a small number of properties. Midway along the length of Glyn Crescent a lane, which bounds the application side, provides access to the larger site behind. Access The form of access into the Lidl car park and access to the store is shown via a new priority junction on Mumbles Road. There is no further detail on how this will integrate with the existing highway network or how it may impact upon Glyn Crescent or the existing arrangements for Derwen Fawr Road. For information purposes, we would not support any additional traffic movements utilising Glyn Crescent with its existing substandard priority junction and would be concerned over any proposals which detriment the current level of access provision. General advice can be provided for consideration, in the interests of informing the progression of a more detailed masterplan. Glyn Crescent must be retained and provision made within any wider junction design to ensure it is safe and adequate for use. The access to the development site must be set out in sufficient detail to understand how the access will work and appropriate capacity assessments undertaken. Where necessary the design, assessment and mitigation process should be undertaken in an iterative way until the proposed access is appropriate. It would be expected that any junction designs are supported by capacity analysis and a traffic assessment which considers the effect of the proposals on local routes including Derwen Fawr Road. The capacity analysis would need to take into account the effects of introducing a development of this scale at this location and the interaction with all other junctions.

CITY & COUNTY OF SWANSEA / DINAS A SIR ABERTAWE DIRECTORATE OF PLACE / CYFARWYDDIAETH LLEOEDD
PLANNING AND CITY REGENERATION / CYNLLUNIO AC ADFYWIO’R DDINAS CIVIC CENTRE, OYSTERMOUTH ROAD, SWANSEA, SA1 3SN
Y GANOLFAN DDINESIG, HEOL YSTUMLLWYNARTH, ABERTAWE, SA1 3SN (01792) 635701 (01792) 635719 (01792) 635708
[email protected] / http://www.swansea.gov.uk
To receive this information in alternative format, please contact the above. I dderbyn yr wybodaeth hon mewn fformatt arall, cysylltwch a’r person uchod.
As advised, this assessment and analysis work should be presented within a Transport Assessment, the scope of which should be agreed with the Highway Authority prior to completing the assessment. Internal Access The internal car park access route appears to be a logical layout and the proposed separation of service area to the car park is welcomed. This will of course require swept path analysis to ensure that the any proposed access and internal layout can accommodate the operational vehicle requirements, being easily accessed and egressed without encroaching into lanes for travelling in the opposite direction. The access road into the Lidl car park is short in length and widens considerably upon arrival to the car park, care should be taken to ensure that indecision and delay does not happen to drivers on entry. Signage and road markings should be used to set out the main access route, distinguishing it from the minor arms of parking aisles. There would be a requirement for a clear and safe access route for pedestrians from Mumbles Road to the store entrance, the indicative layout is useful. Internally within the car park, currently none are indicated â this should also be addressed with crossings provided where needed. The layout plan does include swept path assessment of a HGV, this is a useful addition for our views. The note on the plan confirms that tracking will be attended to in the future and we would offer advice on this matter. The swept paths should include the vehicle specification date and vehicle travelling speed used. The manoeuvres should be set out separately and include other vehicle types as appropriate. It is difficult to determine the appropriateness of the swept paths overlaid as shown all in black markings. We would advise the layout appears constrained and HGV vehicle manoeuvres requiring such an extent of car park use at the immediate entry at junction mouth would not be supported as a matter of highway safety. The manoeuvres could lead to a HGV not able to fully enter the site and / or cars blocking the highway or internal layout. Further thought and new strategy for servicing will be required, one that is safe and efficient and fully accommodated on site. A Stage 1 Road Safety Audit should be provided as part of the planning submission package, covering access for all modes within the access and layout this should include changes to the highway and any impact on the operation of nearby junctions. Parking Parking will be required to be set out and implanted in accordance with the City and County of Swansea Parking Standards March 2012 Supplementary Parking Guidance. For this location, the standards could be considered as potentially zone 3 to 4. The parking standards of floor area per parking space relates to Gross Floor Area, as set out above this will be required for consideration, not least to review proposed parking provision which appears very low. Food Retail The requirement for operational vehicles would be 3 commercial vehicle spaces, whilst this is not explicitly shown within the layout submitted, there does appear to be sufficient room in the service area.
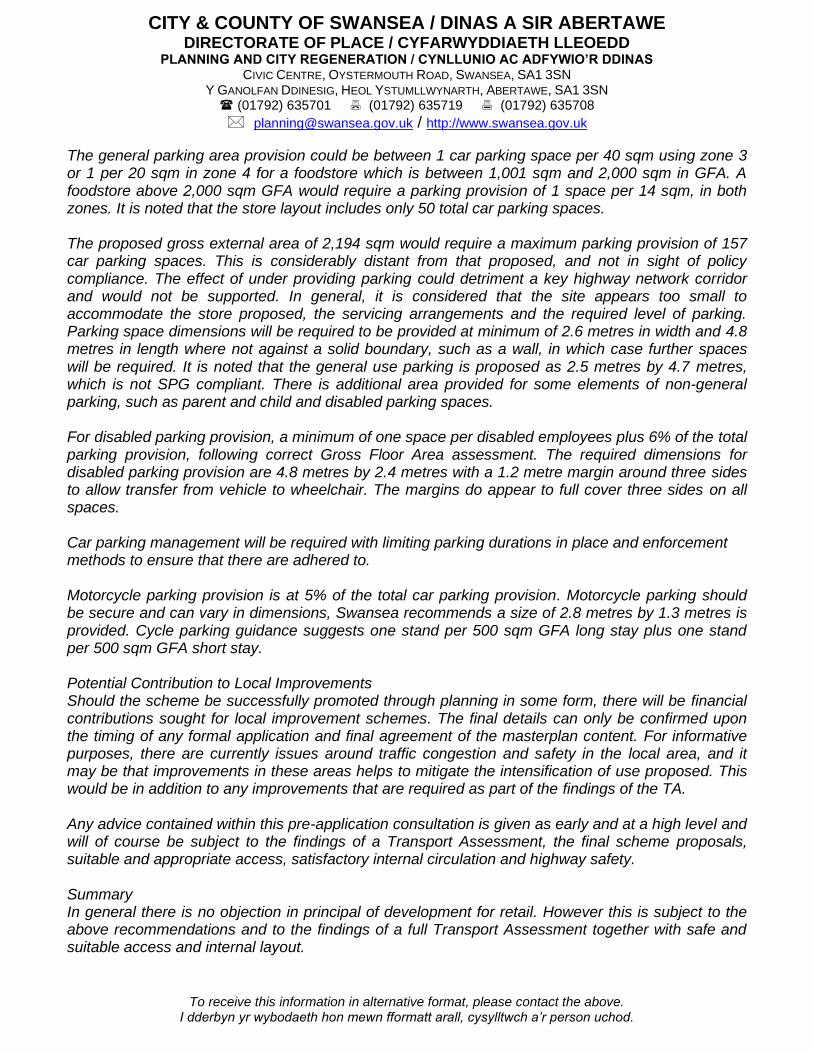
CITY & COUNTY OF SWANSEA / DINAS A SIR ABERTAWE DIRECTORATE OF PLACE / CYFARWYDDIAETH LLEOEDD
PLANNING AND CITY REGENERATION / CYNLLUNIO AC ADFYWIO’R DDINAS CIVIC CENTRE, OYSTERMOUTH ROAD, SWANSEA, SA1 3SN
Y GANOLFAN DDINESIG, HEOL YSTUMLLWYNARTH, ABERTAWE, SA1 3SN (01792) 635701 (01792) 635719 (01792) 635708
[email protected] / http://www.swansea.gov.uk
To receive this information in alternative format, please contact the above. I dderbyn yr wybodaeth hon mewn fformatt arall, cysylltwch a’r person uchod.
The general parking area provision could be between 1 car parking space per 40 sqm using zone 3 or 1 per 20 sqm in zone 4 for a foodstore which is between 1,001 sqm and 2,000 sqm in GFA. A foodstore above 2,000 sqm GFA would require a parking provision of 1 space per 14 sqm, in both zones. It is noted that the store layout includes only 50 total car parking spaces. The proposed gross external area of 2,194 sqm would require a maximum parking provision of 157 car parking spaces. This is considerably distant from that proposed, and not in sight of policy compliance. The effect of under providing parking could detriment a key highway network corridor and would not be supported. In general, it is considered that the site appears too small to accommodate the store proposed, the servicing arrangements and the required level of parking. Parking space dimensions will be required to be provided at minimum of 2.6 metres in width and 4.8 metres in length where not against a solid boundary, such as a wall, in which case further spaces will be required. It is noted that the general use parking is proposed as 2.5 metres by 4.7 metres, which is not SPG compliant. There is additional area provided for some elements of non-general parking, such as parent and child and disabled parking spaces. For disabled parking provision, a minimum of one space per disabled employees plus 6% of the total parking provision, following correct Gross Floor Area assessment. The required dimensions for disabled parking provision are 4.8 metres by 2.4 metres with a 1.2 metre margin around three sides to allow transfer from vehicle to wheelchair. The margins do appear to full cover three sides on all spaces. Car parking management will be required with limiting parking durations in place and enforcement methods to ensure that there are adhered to. Motorcycle parking provision is at 5% of the total car parking provision. Motorcycle parking should be secure and can vary in dimensions, Swansea recommends a size of 2.8 metres by 1.3 metres is provided. Cycle parking guidance suggests one stand per 500 sqm GFA long stay plus one stand per 500 sqm GFA short stay. Potential Contribution to Local Improvements Should the scheme be successfully promoted through planning in some form, there will be financial contributions sought for local improvement schemes. The final details can only be confirmed upon the timing of any formal application and final agreement of the masterplan content. For informative purposes, there are currently issues around traffic congestion and safety in the local area, and it may be that improvements in these areas helps to mitigate the intensification of use proposed. This would be in addition to any improvements that are required as part of the findings of the TA. Any advice contained within this pre-application consultation is given as early and at a high level and will of course be subject to the findings of a Transport Assessment, the final scheme proposals, suitable and appropriate access, satisfactory internal circulation and highway safety. Summary In general there is no objection in principal of development for retail. However this is subject to the above recommendations and to the findings of a full Transport Assessment together with safe and suitable access and internal layout.
CITY & COUNTY OF SWANSEA / DINAS A SIR ABERTAWE DIRECTORATE OF PLACE / CYFARWYDDIAETH LLEOEDD
PLANNING AND CITY REGENERATION / CYNLLUNIO AC ADFYWIO’R DDINAS CIVIC CENTRE, OYSTERMOUTH ROAD, SWANSEA, SA1 3SN
Y GANOLFAN DDINESIG, HEOL YSTUMLLWYNARTH, ABERTAWE, SA1 3SN (01792) 635701 (01792) 635719 (01792) 635708
[email protected] / http://www.swansea.gov.uk
To receive this information in alternative format, please contact the above. I dderbyn yr wybodaeth hon mewn fformatt arall, cysylltwch a’r person uchod.
The level of development proposed is such that a Pre-application Consultation (PAC) will be required, advice will be provided by Highways as a consultee. Comments made only relate to the area within the red line shown in the enclosed plan, no comments are provided on wider areas seen as part of other applications. This would have to be the subject of a separate consultation, it is considered that access of the remaining area is likely to prove extremely difficult should these proposals come forward. Initial assessment of the proposed development and consideration of planning merits As set out in the meeting the key considerations in a future application are likely to relate to the principle of development in terms of an assessment of retail need in the area, placemaking principles, impacts upon residential amenity, highway safety and flooding / drainage. Principle of Development / Retail Need CCS Placemaking and Strategic Planning have assessed the proposal and have provided detailed comments. The national and local policy framework in regard to retail planning is key to determining the acceptability or otherwise of the principle of a foodstore at the proposed location. Future Wales Policy 6 and Planning Policy Wales (PPW) set out the ‘town centres first’ national planning policy requirement which the Welsh Government operates in relation to retail developments. This approach is also central to the Swansea LDP policies on retail planning. Fundamentally the site is located a significant distance outside any defined retail centre as set out in the LDP and accordingly it is clear the site is an out of centre location in line with national and local planning policy. Strategic Policy PS 1 sets out the LDP’s approach to sustainable development. In order to deliver sustainable places and strategically manage the spatial growth of the County, the delivery of new homes, jobs, infrastructure and community facilities must comply with the Plan’s sustainable settlement strategy that requires development to be directed to the most sustainable locations within the defined settlement boundaries of the urban area. Key to this consideration in respect of this proposal is whether the proposals comply with the retail policy RC2. LDP Policy RC2 promotes the Plan’s defined Centres as the most appropriate and sustainable locations for locating new retail, leisure and supporting commercial development in-line with National Guidance. The term ‘Centre’ as used in this policy and throughout the Plan, refers specifically to only the Swansea Central Area Retail Centre and the defined network of District and Local Centres. The policy states that Retail proposals must in the first instance assess the suitability of sites and premises within appropriate Centres that would serve the population concerned. Where proposals demonstrate there are no suitable available sites or premises then edge of centre sites can be considered in preference to out of centre sites. Appropriate assessments of need and retail impact must be submitted by the developer in support of proposals in out of centre sites. Policy RC2 also states that where evidence clearly demonstrates that no sites within centres or at edge of centre sites can be made available for the proposed development, out of centre sites will be considered. In such circumstances developers should consider available sites and premises within defined Retail Park boundaries which are the preferred location for out of centre retail developments. Policy RC 2 further states that retail proposals will only be permitted at out of centre locations outside Retail Parks in exceptional circumstances, and where a specific need is identified for: small scale development intended to serve an identified local need (in accordance with Policy RC6),

CITY & COUNTY OF SWANSEA / DINAS A SIR ABERTAWE DIRECTORATE OF PLACE / CYFARWYDDIAETH LLEOEDD
PLANNING AND CITY REGENERATION / CYNLLUNIO AC ADFYWIO’R DDINAS CIVIC CENTRE, OYSTERMOUTH ROAD, SWANSEA, SA1 3SN
Y GANOLFAN DDINESIG, HEOL YSTUMLLWYNARTH, ABERTAWE, SA1 3SN (01792) 635701 (01792) 635719 (01792) 635708
[email protected] / http://www.swansea.gov.uk
To receive this information in alternative format, please contact the above. I dderbyn yr wybodaeth hon mewn fformatt arall, cysylltwch a’r person uchod.
development that is part of a planned new Centre or to serve a substantial new neighbourhood or development that requires a particular type of unit that is not normally available within centres or retail parks in order to accommodate the proposed range of goods sold. Paragraph 2.8.7 of the Policy Justification states that in line with national planning policy and guidance, developers should exhaust all appropriate options within town centres in the first instance, before edge of centre and out of centre sites are considered. This exercise must involve a comprehensive review of all potentially suitable sites, including possible buildings for conversion and/or reasonable opportunities to remodel existing units to accommodate a proposed development. Proposals must demonstrate flexibility in this regard and consider how the business could reasonably trade within those sites and units that are available, or likely to become available within centres. This flexible approach may require a modification to the proposed operator’s typical trading approach. Paragraph 2.8.8 states that the onus of proof that sites within Centres have been thoroughly assessed rests with the developer. For the avoidance of doubt the sequential order of priority requires developers to consider edge of centre (if no suitable ‘in centre’ sites can be found) before any out of centre site is considered. The sequential assessment should include evidence relating to the likely distribution of demand and the size of the catchment area that the development would serve. Paragraph 2.8.9 states that for proposals outside centres, the policy emphasises that as a starting point, the developer must demonstrate by means of suitable evidence whether there is a need for the proposed scheme. Establishing quantitative need is the first requirement and takes precedence over qualitative factors such as the impact on travel patterns. Paragraph 2.8.10 indicates that the Swansea Retail and Leisure Study (2015) concludes that there is not any quantitative need for additional convenience goods floorspace during the plan period, which is a conclusion based on the overall scale of existing provision across the County. The study recognises however that this represents a global capacity figure, and it is feasible that, during the course of the Plan period a developer may be able to demonstrate a degree of quantitative need for new convenience provision having regard to changing circumstances such as commitments for housing growth within a given catchment. Developers will need to use appropriate methodologies and up to date evidence and survey data in order to identify any such need. As highlighted above, fundamentally the application site is out of centre - located approximately 1.6km away from the nearest defined local centre at West Cross (Alderwood Road) – and it is significant that LDP policy RC2 makes clear retail and leisure proposals will only be permitted at such locations in exceptional circumstances. One of these circumstances is where a specific need is identified for small scale development intended only to serve an identified local need (Policy RC2 refers). ‘Small scale’ is defined in policy RC6 as less than 1000sqm GFA. The proposals are clearly outside the scope of this exception and as such the developer is required to submit a convincing case to the LPA that there are particular material circumstances in this case, related to addressing an unmet need, to justify the Council departing from that policy position. This evidence will need to justify that the store to be provided should reasonably be permitted to contain retail floorspace that is over and above the ‘allowance’ highlighted in the policy for small scale local provision outside centres.

CITY & COUNTY OF SWANSEA / DINAS A SIR ABERTAWE DIRECTORATE OF PLACE / CYFARWYDDIAETH LLEOEDD
PLANNING AND CITY REGENERATION / CYNLLUNIO AC ADFYWIO’R DDINAS CIVIC CENTRE, OYSTERMOUTH ROAD, SWANSEA, SA1 3SN
Y GANOLFAN DDINESIG, HEOL YSTUMLLWYNARTH, ABERTAWE, SA1 3SN (01792) 635701 (01792) 635719 (01792) 635708
[email protected] / http://www.swansea.gov.uk
To receive this information in alternative format, please contact the above. I dderbyn yr wybodaeth hon mewn fformatt arall, cysylltwch a’r person uchod.
As outlined in para 2.8.10 of Policy RC2, the results of the County wide retail capacity assessment (2015) that underpins the policies of the LDP concluded there is no quantitative need for additional convenience goods floorspace over the LDP period. However, that assessment did also recognise that this represents a global capacity figure, and that a developer may be able to demonstrate a degree of quantitative need for new convenience provision having regard to changing circumstances within a given catchment. The LPA is required to consider specific proposals intended to address a local deficiency within certain areas of Swansea, based on the circumstances that apply at the time of any application. It is incumbent on the applicant therefore to ensure that the Retail Assessment in support of the application takes account of any changes in retail provision relevant to the site since the 2015 study was conducted. Retail Impact Assessment Scoping Note Following a review of the submitted Retail Impact Assessment Scoping Note the following observations are made:
• Para 1.4.5 – it is emphasised that in line with RC2 para 2.8.7 that in the sequential review of sites the developer must demonstrate flexibility in terms of a review of potentially suitable opportunities, including possible buildings for conversion and or reasonable opportunities to remodel existing units to accommodate a proposed development. In addition, in line with para 2.8.8 the onus of proof that sites have been assessed rests with the developer.
• Para 1.5.1/1.5.2 (Proposed Retail methodology) - An assessment of both need (quantitative and qualitative) and impact is required for the proposal. Establishing quantitative need is the first requirement and takes precedence over qualitative factors. The proposals must demonstrate why this proposal meets a particular local need, notwithstanding the global figure of a lack of quantitative need for additional convenience goods floorspace across the county. Qualitative need is an important matter however and it is recognised that a discount food retailer within the West of Swansea would add to the range/ type of foodstores to serve surrounding residents. Whilst this area is served by a number of convenience retailers (for example, Cooperative Sketty/West Cross/Mumbles/Bishopston, Marks and Spencer's Mumbles, Nisa Sketty Park) the concentration of larger format stores are toward the other side of the city which generates trips along Mumbles Road.
• The developer will need to be satisfied that the data to inform the quantitative analysis as suggested is robust and based upon the most up to date evidence.
• Paras 1.5.4-1.58 - Since the Retail Study was published planning permission has been granted for other new convenience retail floorspace – including for example a new Marks and Spencer's foodstore within Mumbles District Centre in January 2020 (2016/1472) (as amended) and also a coop store in West Cross. These will likely impact on the level of outflow of shoppers to Zone 1. In addition, whilst currently there is a low market penetration of Zone 4 based stores/centres for Zone 1 based residents, a discount food operator may likely draw trade from the west of Zone 1 and the centres there. These, and any other relevant planning approvals and developments for new retail provision, will need to be considered as part of any submitted Retail Assessment.
• Para 1.5.9-1.5.11 - The developer will need to be satisfied the data used is robust and up to date to enable the assessment.
• Para 1.5.13 - 14 Request – The applicant has requested the LPA confirms the relevant Centres for the healthcheck assessment. Given the proximity to the site the healthcheck
CITY & COUNTY OF SWANSEA / DINAS A SIR ABERTAWE DIRECTORATE OF PLACE / CYFARWYDDIAETH LLEOEDD
PLANNING AND CITY REGENERATION / CYNLLUNIO AC ADFYWIO’R DDINAS CIVIC CENTRE, OYSTERMOUTH ROAD, SWANSEA, SA1 3SN
Y GANOLFAN DDINESIG, HEOL YSTUMLLWYNARTH, ABERTAWE, SA1 3SN (01792) 635701 (01792) 635719 (01792) 635708
[email protected] / http://www.swansea.gov.uk
To receive this information in alternative format, please contact the above. I dderbyn yr wybodaeth hon mewn fformatt arall, cysylltwch a’r person uchod.
assessments should be extended to include the local centre at Brynymor (Brynymor Road), together with the identified District Centres of Killay, Mumbles, Sketty and Uplands and the Local Centres of Kittle, Murton, Sketty Park Drive, Tycoch (Tycoch Cross), West Cross (Alderwood Road) and West Cross (West Cross Lane).
• Para 1.5.16 - Consideration of sites ‘on the edge of centres’ should reasonably encompass sites that are a very short and easy walking route from existing retail units.
• Para 1.5.18 Request – The applicant has requested the LPA to confirm agreement of the centres to be assessed for sequential purposes. Additional local centres of West Cross Alderwood Road, Brynymor Road, Sketty Park should be included in the sequential test for completeness alongside the identified District Centres of Killay, Mumbles, Sketty and Uplands and the Local Centres of Tycoch (Tycoch Cross) and West Cross (West Cross Lane).
• The applicant has requested that the LPA point to any sites that could potentially be available in sequential preferable locations within, or adjacent to, Centres. The responsibility lies with developer, there are no allocated sites or stipulations within the adopted plan. However, it is known that the former Army Reserve training facility (4.7acre site) off Mumbles Road was marketed in February 2021 by Avison Young. This site also accessed off Mumbles Road would be considered a more sequentially favourable site in an edge of centre location given the distance (approximately 240m) from West Cross (Alderwood Road) Local Centre.
• Para 1.5.19-21, 1.5.22-23, 1.5.32, 1.5.33-34 Request – The applicant has requested the LPA advise of any particular retail commitments which it requires to be included in the RIA quantitative analysis. It is incumbent on the applicant to undertake a complete review of retail applications permitted via the Council’s online planning application search software since the 2015 base date of the retail study and any schemes pending. However, aside from this the applicant will need to consider the COU of the former Linden Tree Public House to a Cooperative on Linden Ave/Fairwood Road in West Cross. (No planning application for this scheme).
• Para 1.5.30 - A trade diversion assessment will be undertaken informed by Shopping patterns identified in the Retail and Leisure Study 2015 based on up to date population and expenditure data. The applicant will need to consider whether there are foodstores that have been permitted/implemented since this study together with any potential change to shopping patterns as a result of the COVID pandemic that would alter these patterns. The applicant will need to consider if it would be reasonable to repeat shopping patterns for the purposes of this assessment or whether the trade diversion assessment should be based on up to date convenience shopping patterns.
• We are not convinced with the argument set out in the retail impact section (para.1.5.33) to exclude the non-food (comparison) floor space from the assessment. The turnover of stock and the WIGIG model does not provide reasonable justification to exclude an RIA on the comparison element as this would generate trips to Lidl for specific products on offer. Accordingly I don’t think that the model attracts solely impulse buys. Thus the non-food offer, whilst a smaller element of the floorspace could draw comparison trade away from existing stores. Accordingly the assessment should cover the whole of the proposal (both food and non food) for completeness.
Other Retail Matters Beyond the designated boundaries of the district centres, and the local centres identified, the LDP does not have any specific in-centre allocations/investment proposals other than the city centre

CITY & COUNTY OF SWANSEA / DINAS A SIR ABERTAWE DIRECTORATE OF PLACE / CYFARWYDDIAETH LLEOEDD
PLANNING AND CITY REGENERATION / CYNLLUNIO AC ADFYWIO’R DDINAS CIVIC CENTRE, OYSTERMOUTH ROAD, SWANSEA, SA1 3SN
Y GANOLFAN DDINESIG, HEOL YSTUMLLWYNARTH, ABERTAWE, SA1 3SN (01792) 635701 (01792) 635719 (01792) 635708
[email protected] / http://www.swansea.gov.uk
To receive this information in alternative format, please contact the above. I dderbyn yr wybodaeth hon mewn fformatt arall, cysylltwch a’r person uchod.
proposals. Furthermore, there are no non-central retail allocations identified in the LDP that are of relevance to the proposal. Any retail assessment to be submitted in support of an application should include consideration of schemes consented planning permission but that may not yet have been built out. Test of Retail Need (Quantitative and Qualitative) should follow guidance within TAN 4 (Section 6). Sequential test should follow the guidance in TAN 4 (Section 7). The proposal should also be assessed against the impact criteria in para 8.3 of TAN4. Placemaking Principles The Development Plan places significant emphasis on the importance of placemaking, and defines key principles in this regard for all proposals to seek to incorporate: Future Wales Policy 2 sets out that:
• development should adhere to key placemaking principles in order that it positively contributes towards building sustainable places that support well-being objectives,
• opportunities should be taken to ensure that multifunctional GI is fully integrated into development schemes wherever possible.
Swansea LDP Policies PS 2 and ER 2 highlight that:
• all proposals should adhere to key placemaking principles and development criteria, to ensure that proposals make a positive contribution to the experience and enjoyment of places.
• development should enhance the quality of places and spaces and respond positively to aspects of local context and character.
• the design, layout and orientation of proposed buildings, and the spaces between them, should provide for an attractive, legible, healthy, accessible and safe environment, and must not cause unacceptable impacts on people’s amenity.
• development must take opportunities to maintain and enhance the County’s GI network, having regard to the extent, quality, and connectivity of the GI resource.
Having regard to the importance of proposals addressing key placemaking and GI principles, the following highlights specific comments from the Placemaking and Heritage Team: The application site is located on the western side of Mumbles Road and is currently vacant having been cleared following the demolition of a petrol station. The surrounding area is predominately characterised by residential use, with existing residential use fronting onto Mumbles Road to the immediate north of the site and further residential use abutting the site to the southwest (Glyn Terrace). To the rear (northwest) of the site is an area of open space and on the opposite side of Mumbles Road is further open space currently used for ‘footgolf’ and is covered by a SINC and SSSI. Clyne Castle historic park and garden is located approx. 180m to the southwest of the site on the opposite side of Derwen Fawr Road. It is acknowledged that recent changes along Derwen Fawr

CITY & COUNTY OF SWANSEA / DINAS A SIR ABERTAWE DIRECTORATE OF PLACE / CYFARWYDDIAETH LLEOEDD
PLANNING AND CITY REGENERATION / CYNLLUNIO AC ADFYWIO’R DDINAS CIVIC CENTRE, OYSTERMOUTH ROAD, SWANSEA, SA1 3SN
Y GANOLFAN DDINESIG, HEOL YSTUMLLWYNARTH, ABERTAWE, SA1 3SN (01792) 635701 (01792) 635719 (01792) 635708
[email protected] / http://www.swansea.gov.uk
To receive this information in alternative format, please contact the above. I dderbyn yr wybodaeth hon mewn fformatt arall, cysylltwch a’r person uchod.
Road have already altered views from this boundary of the historic park and the proposed development is therefore unlikely to have any significant impact on the setting of the registered Clyne Castle historic park and garden. CADW should however be consulted. The proposal seeks to redevelop the site and includes two neighbouring residential properties (no’s 50 & 52 Mumbles Road), one located within and one outside the site, to comprise a new Lidl foodstore with associated car parking and landscaping works. Vehicular access is achieved from the site’s southeast boundary from Mumbles Road, as was the case with the previous petrol station use. Pedestrian access is shown to run along the northern boundary, adjacent to no. 48 Mumbles Road. This narrow and rather contrived pedestrian link is not acceptable as an active travel route and further consideration is required to ensure this is integral to the design to encourage walking and cycling to the site. To further assist improved connectivity, the site would benefit from an additional pedestrian link into the site from the southern corner however given the car park and servicing arrangements this would not appear safe or legible. The new supermarket will be sited to the western (rear) section of the site with the servicing area located to the southern side of the building and car parking to the site frontage (east). The proposed arrangement therefore offers limited active frontage with Mumbles Road due to the set back and separation by car parking although given the nature of the development and adjoining uses/established building lines this would appear most logical. In terms of scale, the building footprint encroaches within close proximity of neighbouring residential uses resulting in limited separation distances, with only approx. 1m between the store entrance (NE corner) and the boundary of no. 48 Mumbles Road. In this regard the site appears cramped, and concern is raised insofar as to how the development will impact upon adjoining residential use. It is likely that any redevelopment of the site will need to be scaled down to fully consider and integrate its surrounding context. Two concept elevation options have been submitted for the proposed single storey retail store; the first comprises a curved roof edge and the second with a slight ‘V’ shaped roof profile. Both include full height glazing to the entrance to provide a legible entrance lobby to the store. However, the main expanse of glazing forms the north facing (side elevation) which appears illogical as this should form the east facing frontage to the Mumbles Road. In addition, the large expanse of glazing would be in close proximity to the boundary with adjoining residential use and will undoubtedly result in significant lightspill which will be unacceptable from a residential amenity perspective. The front elevation facing Mumbles Road comprises an element of timber cladding and local stone, which is acceptable, however as addressed above, this elevation should provide the expansive glazing to provide active frontage and can be combined with timber cladding/stone detailing. The inclusion of a green/blue roof is welcomed on the basis that this it is an extensive green has sufficient depth to achieve the relevant scoring for substrate of 60-80mm. Fundamentally, placemaking considers the context, function and relationships between a development site and its wider surroundings. In terms of making most efficient use of the site and considering the surrounding context and inherently sustainable location, question is raised as to

CITY & COUNTY OF SWANSEA / DINAS A SIR ABERTAWE DIRECTORATE OF PLACE / CYFARWYDDIAETH LLEOEDD
PLANNING AND CITY REGENERATION / CYNLLUNIO AC ADFYWIO’R DDINAS CIVIC CENTRE, OYSTERMOUTH ROAD, SWANSEA, SA1 3SN
Y GANOLFAN DDINESIG, HEOL YSTUMLLWYNARTH, ABERTAWE, SA1 3SN (01792) 635701 (01792) 635719 (01792) 635708
[email protected] / http://www.swansea.gov.uk
To receive this information in alternative format, please contact the above. I dderbyn yr wybodaeth hon mewn fformatt arall, cysylltwch a’r person uchod.
whether the proposal should be for a mixed-use development, comprising ground floor retail unit and residential above, as per the recent British Legion conversion on Newton Road, Mumbles. Has this option been explored? The flood risk designation will of course impact on the potential for any vulnerable use such as residential. Residential Amenity In regard to residential amenity the key considerations will be the impact of the nature of the use on neighbouring residential properties in regard to increased noise and disturbance. It is noted that the proposed access would be in close proximity to No.1 Glyn Crescent. The overall use of the site will generate a level of noise for deliveries in addition to general customer use by car. It is noted that the proximity of the dual carriageway already generates a significant noise disturbance in the area. However it is recommended that both the opening and delivery operations are set at a reasonable time to reduce the noise and disturbance at unsociable hours. It is noted however, that the scale of the proposed development does result in both the store entrance, extensive glazed north elevation and service area being in very close proximity to adjoining residential dwellings, which would create significant residential amenity issues and as noted above, the site layout should be reconsidered and possibly scaled down to fully consider and integrate its surrounding context. Flood Risk The site lies in a Flood Risk area partly within a C2 floodplain (without significant flood defence infrastructure as defined by TAN15) as shown on the Development Advice Maps. However, the applicant should be aware that the whole of the site is shown to be within floodzone 3 on the new draft flood maps part of the proposed revised TAN15. Decision making will be made on the basis of the floodmaps/TAN15 guidance that is in force at the time of determination of any future planning application. Policy RP1 states that development will not be permitted that would result in significant risk to life particularly in respect of flood risk. Policy RP5 further advises that in order to avoid the risk of flooding, development will not be permitted in areas of coastal flooding, unless it can be demonstrated that the development can be justified in-line with national guidance and is supported by a technical assessment that verifies that the new development is designed to alleviate the threat and consequences of flooding. TAN 15 provides technical guidance to supplement the policy set out in PPW. The TAN outlines a precautionary methodology for the assessment of development proposals and flood risk. Where development is proposed in a flood zone, the TAN sets out guidance on the assessment of justification and flooding consequences required by PPW. The circumstances in which development in a flood zone can be justified is outlined in section 6 and relate to economic regeneration and achieving economic objectives to serve existing settlements whilst concurring with PPW and falling within PPW’s definition of previously developed land (PDL). Guidance on undertaking a flood consequence assessment (FCA) is provided in section 7 and appendix 1. In essence a comprehensive study of the consequences of flooding that examines the likely mechanisms that cause the flooding, the consequence on and off site of those floods and appropriate mitigation measures to manage those consequences must be provided. As the proposed retail store would fall within the ‘Less Vulnerable’ category by TAN 15, in line with paragraph 6.2 of the TAN15 any future proposal would only be acceptable in terms of flood risk if it meets the justification tests set out in Paragraph 6.2.
CITY & COUNTY OF SWANSEA / DINAS A SIR ABERTAWE DIRECTORATE OF PLACE / CYFARWYDDIAETH LLEOEDD
PLANNING AND CITY REGENERATION / CYNLLUNIO AC ADFYWIO’R DDINAS CIVIC CENTRE, OYSTERMOUTH ROAD, SWANSEA, SA1 3SN
Y GANOLFAN DDINESIG, HEOL YSTUMLLWYNARTH, ABERTAWE, SA1 3SN (01792) 635701 (01792) 635719 (01792) 635708
[email protected] / http://www.swansea.gov.uk
To receive this information in alternative format, please contact the above. I dderbyn yr wybodaeth hon mewn fformatt arall, cysylltwch a’r person uchod.
In order to fully assess this proposal, within a high risk flood zone, the policy framework requires the developer to provide justification for its location and a detailed flood consequence assessment (as outlined above). To satisfy the specific requirements of the LDP policies RP1, RP4, RP5, the FCA must not only address the flooding consequences for the new development but also on existing flood defences, including access for maintenance; demonstrate that the development would not lead to increased flooding either on the site or elsewhere and provide environmentally sympathetic mitigation measures, such as SuDS. In addition, a satisfactory drainage strategy must be provided to deal with flood risk from the local sources such as Cwm stream that runs adjacent to the site and surface water run-off. The Council’s drainage engineers can provide specific guidance on FCA and local drainage strategy requirements. None of the required technical flood risk assessments have been submitted with this pre-application query and therefore no further policy comments relating to flood risk can be provided at this stage. Surface Water Drainage / SuDs In terms of SuDS, the site is covered by flood zone C2 and as highlighted by the Council’s Drainage officer, the proposal to connect the DCWW assets in Mumbles Road would not be permitted. On the basis that the Cwm stream runs in close proximity to the rear of the site, it would be expected that the site connects to that directly or use infiltration methods. The SuDS Strategy therefore requires further consideration. Any requirement to use above ground SuDS elements may change the layout of the site due to potential reductions in the size of the developable area. The SuDS approach must be positively integrated and designed in parallel with the planning layout and should link to the multi-functional GI approach. A SAB application should be pursued to address all design issues. The submission fails to include a Landscape Plan and the site is devoid of any meaningful new landscaping/greening to the site's periphery, i.e. grassed banks and new planting to provide an element of visual softening. The current arrangement is unacceptable and requires further consideration. In addition, no GI Strategy has been prepared for the site. The purpose of the GI Strategy is to review the extent to which any existing GI assets are functioning well (in this instance the site is lacking although it is noted that there are existing trees to the southwest boundaries which have not been included on the proposed layout plans), to identify where there are existing and anticipated future gaps and to set out what actions and interventions could enhance the current provision. The GI Strategy should fit around the SuDS at the site. For example, the proposal fails to incorporate any planting within the car parking area, including necessary root pits. In terms of wider GI connectivity opportunities, there is a SINC on the opposite side of Mumbles Road and there is an area of green space to the rear of the site. Is there scope to link into any existing green corridors? Biodiversity Enhancement Complementary to the need to align with placemaking requirements, the Development Plan also places significant emphasis on the importance of development integrating nature-based solutions to the design of the built environment wherever possible, which reflects the Council’s duty under Section 6 of the Environment (Wales) Act 2016 (“the S6 duty’). FW Policy 9 and PPW require that:

CITY & COUNTY OF SWANSEA / DINAS A SIR ABERTAWE DIRECTORATE OF PLACE / CYFARWYDDIAETH LLEOEDD
PLANNING AND CITY REGENERATION / CYNLLUNIO AC ADFYWIO’R DDINAS CIVIC CENTRE, OYSTERMOUTH ROAD, SWANSEA, SA1 3SN
Y GANOLFAN DDINESIG, HEOL YSTUMLLWYNARTH, ABERTAWE, SA1 3SN (01792) 635701 (01792) 635719 (01792) 635708
[email protected] / http://www.swansea.gov.uk
To receive this information in alternative format, please contact the above. I dderbyn yr wybodaeth hon mewn fformatt arall, cysylltwch a’r person uchod.
• all applications demonstrate the actions that have been taken where possible to maintain and enhance and biodiversity and ecosystem resilience, as well as relevant GI assets.
• a clear and proportionate approach is taken to considering biodiversity and securing overall enhancement.
The Council’s Adopted SPG - Biodiversity and Development provides:
• guidance on how the requirement for biodiversity can be addressed and assessed.
• details of specific measures that could be provided to enhance biodiversity and ecosystem resilience depending on the nature of the proposals
Transportation The traffic / parking / highway safety implications of the development are considered in detail in the comments from CCS Comments from Transportation and Highways officers above. As indicated, given the size of the proposed retail store any potential future proposal would require a Transport Impact Assessment to accompany any potential future planning application. Accordingly, the issues relating to the impact on the network, provision of parking, measures to improve walking and cycling and public transport access and measures to reduce levels of air and noise pollution would need to be assessed. Ultimately, the scheme would need to satisfy the requirements set out in Policies T1, T2, T5 and T6 of the LDP. Site Contamination Due to the previous use of the site as a petrol filling station, there is potential for the site to be contaminated notwithstanding the removal of all associated fuel infrastructure, including tanks and pipework. CCS Environmental Heath Officers have highlighted the need to investigate this issue, together with several other issues. Consequently, any scheme would need to satisfy the requirements of Policies RP1 and RP6 in respect of land contamination. RP6 states that development proposals on land where there is a risk from actual or potential contamination or landfill gas will not be permitted unless it can be demonstrated that measures can be taken to satisfactorily overcome any significant risk to life, human health, property, controlled waters, or the natural and historic environment. Infrastructure In-line with Policy EU 4, the proposal will need to demonstrate that the utility infrastructure is adequate to meet the needs of the development, and if it requires new or improved utility infrastructure, it can be satisfactorily demonstrated that the developer will make an appropriate contribution to secure the provision of the infrastructure. Policy RP 4 requires that sustainable drainage systems (SuDS) must be implemented wherever they would be effective and practicable. Additionally, RP10 requires development will be required to incorporate, as appropriate, adequate and effective provision for the storage, recycling and other sustainable management of waste, and allow for appropriate access arrangements for recycling and refuse collection vehicles and personnel. Details of any documents required for a subsequent application
• Design and Access Statement;
• Planning Statement
CITY & COUNTY OF SWANSEA / DINAS A SIR ABERTAWE DIRECTORATE OF PLACE / CYFARWYDDIAETH LLEOEDD
PLANNING AND CITY REGENERATION / CYNLLUNIO AC ADFYWIO’R DDINAS CIVIC CENTRE, OYSTERMOUTH ROAD, SWANSEA, SA1 3SN
Y GANOLFAN DDINESIG, HEOL YSTUMLLWYNARTH, ABERTAWE, SA1 3SN (01792) 635701 (01792) 635719 (01792) 635708
[email protected] / http://www.swansea.gov.uk
To receive this information in alternative format, please contact the above. I dderbyn yr wybodaeth hon mewn fformatt arall, cysylltwch a’r person uchod.
• PAC Report;
• Retail Need and Impact Assessment;
• Transport Assessment;
• Flood Consequences Assessment;
• Drainage Strategy (SuDs requirements);
• Preliminary Ecological Assessment (PEA);
• Tree Survey;
• Green Infrastructure Assessment;
• Noise Assessment;
• Air Quality Assessment;
• Site Investigation / Geo Environmental Study – contaminated land; Pre-application Consultation (PAC) You will be aware, the Wales Planning Act 2015 introduced the requirement for pre-application consultation in respect of applications for major developments which came into force in March, 2016 and the requirement for applicants to submit the pre-application consultation report (PAC) as a validation requirement for applications made after 1 August 2016. The guidance on Pre-application Consultation is set out in Article 1 of the Town and Country Planning (Development Management Procedure) (Wales) Amendment Order 2016. Equally, in response to Coronavirus, you will be aware of the guidance issued by the Welsh Government on 15 May, 2020 (subsequently updated) – Amendments to Pre-Application Consultation relating to Applications for Major Development and Developments of National Significance which outlines the changes to the Town and Country Planning (Development Management Procedure) (Wales) Order 2012 (“DMPWO”) in response to the challenges presented by COVID-19. Conclusion The proposal constitutes a significant retail development on a site well outside any designated district or local centre. Future Wales, PPW and the adopted LDP are all consistent in emphasising the town centres first policy for retail development. Policy is clear that such development in an out of centre location such as the proposed site should only be permitted if clear evidence is submitted to satisfy the ‘tests’ set out in PPW and LDP Policy RC2 relating to need, impact and sequential analysis, in order to potentially justify the proposal as an acceptable exception. This proposal will require a detailed need and impact assessment. Also, a sufficiently comprehensive sequential analysis is required to demonstrate that there are no preferable alternative sites to serve the relevant population (taking a flexible approach to development opportunities) and that the location is compatible with the plan’s sustainable settlement strategy. In terms of placemaking requirements, concerns are highlighted that the site appears cramped, and that the development could adversely impact upon adjoining residential uses, including noise/disturbance and lightspill. Notwithstanding it is a brownfield site and its previous use as a PFS, it is likely that any redevelopment of the site will need to be scaled down to fully consider and integrate its surrounding context. Two concept elevation options have been submitted. Both include full height glazing to the entrance to provide a legible entrance lobby to the store. However, the main expanse of glazing forms the north facing (side elevation) which appears illogical as this should form the east facing frontage to Mumbles Road. The submission fails to include a Landscape Plan which is unacceptable, and landscaping requires further consideration.

CITY & COUNTY OF SWANSEA / DINAS A SIR ABERTAWE DIRECTORATE OF PLACE / CYFARWYDDIAETH LLEOEDD
PLANNING AND CITY REGENERATION / CYNLLUNIO AC ADFYWIO’R DDINAS CIVIC CENTRE, OYSTERMOUTH ROAD, SWANSEA, SA1 3SN
Y GANOLFAN DDINESIG, HEOL YSTUMLLWYNARTH, ABERTAWE, SA1 3SN (01792) 635701 (01792) 635719 (01792) 635708
[email protected] / http://www.swansea.gov.uk
To receive this information in alternative format, please contact the above. I dderbyn yr wybodaeth hon mewn fformatt arall, cysylltwch a’r person uchod.
A proposed pedestrian access is shown to run along the northern boundary, adjacent to no. 48 Mumbles Road, however this is narrow and rather contrived and not acceptable as an active travel route. Further consideration is required to ensure Active Travel requirements are integral to the design to encourage walking and cycling to the site. The SuDS Strategy requires further consideration and must be positively integrated and designed in parallel with the planning layout and link to a multi-functional GI approach. A key constraint is the location of the site within a C2 floodplain and the consequential flood risk to the proposed development. At this stage insufficient evidence has been presented that floodrisk constraints can be overcome and that the development can be justified in accordance with the exception tests within TAN15. Further information is required in the form of a Flood Consequence Assessment. Any future proposal would also need to overcome any transport, parking, and contamination issues. So in conclusion on the basis of the information submitted it is not possible to give a positive recommendation on the likelihood of approval of the proposed retail food store development on this site. Please note that this guidance is given on the basis of the information submitted, and that full consultation with Statutory Undertakers or interested parties, such as neighbours has not been undertaken, and that it is only through the submission of a planning application that full consideration can be given to a proposal. Additionally, the views expressed are those of an officer of the Authority, which cannot prejudice any final decision the Council may make if an application for planning permission is submitted.
I trust that the above advice is satisfactory for your current purposes. However should you require clarification of any of the above matters, please do not hesitate to contact David Owen on the above number.
Should you wish to obtain further discussion and advice in relation to this pre-application, as part of our pre-application services the Council offers follow-up meetings to pre-application letters. In accordance with our Fee Schedule a meeting on this particular scheme would amount to a total of £600.00.
Yours sincerely
Liam Jones
LIAM JONES TEAM LEADER – BAY AREA

Mumbles Road, Swansea
Lidl Great Britain Limited Transport Assessment
20-00668/TA/01 Corun Associates Ltd
September 2021 Appendix C
APPENDIX C
TRICS Outputs
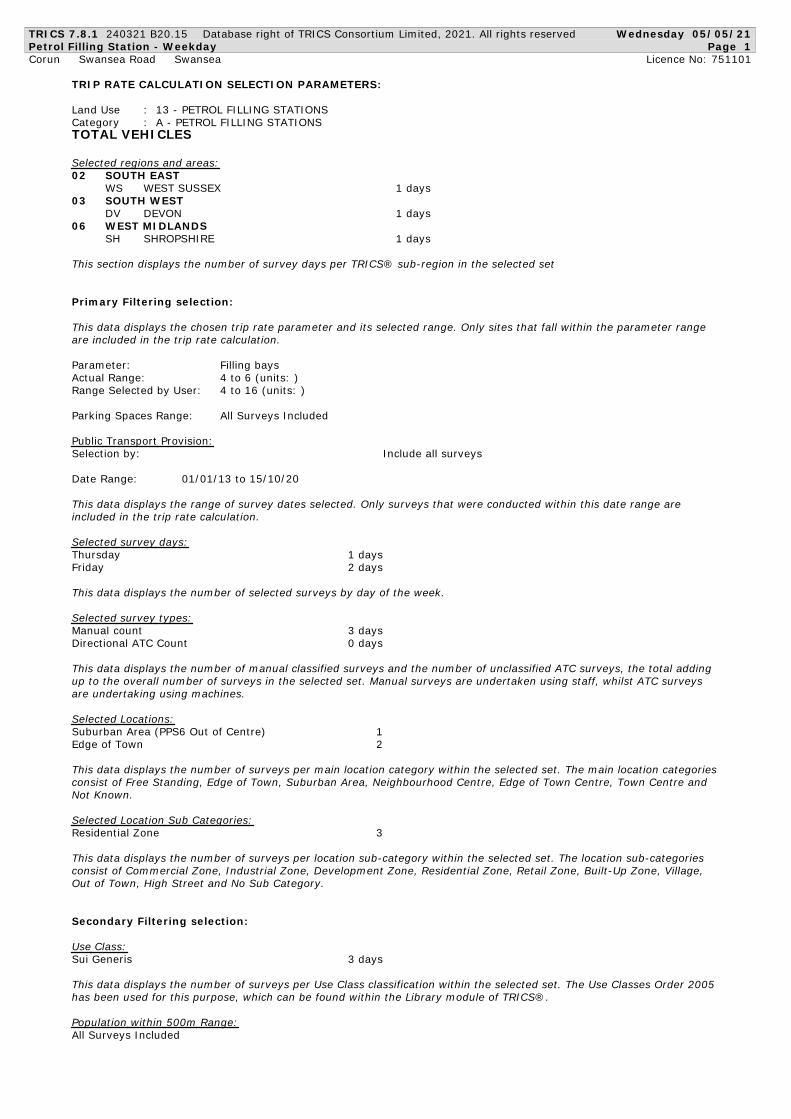
TRICS 7.8.1 240321 B20.15 Database right of TRICS Consortium Limited, 2021. All rights reserved Wednesday 05/05/21
Petrol Filling Station - Weekday Page 1
Corun Swansea Road Swansea Licence No: 751101
TRIP RATE CALCULATION SELECTION PARAMETERS:
Land Use : 13 - PETROL FILLING STATIONS
Category : A - PETROL FILLING STATIONS
TOTAL VEHICLES
Selected regions and areas:
02 SOUTH EAST
WS WEST SUSSEX 1 days
03 SOUTH WEST
DV DEVON 1 days
06 WEST MIDLANDS
SH SHROPSHIRE 1 days
This section displays the number of survey days per TRICS® sub-region in the selected set
Primary Filtering selection:
This data displays the chosen trip rate parameter and its selected range. Only sites that fall within the parameter range
are included in the trip rate calculation.
Parameter: Filling bays
Actual Range: 4 to 6 (units: )
Range Selected by User: 4 to 16 (units: )
Parking Spaces Range: All Surveys Included
Public Transport Provision:
Selection by: Include all surveys
Date Range: 01/01/13 to 15/10/20
This data displays the range of survey dates selected. Only surveys that were conducted within this date range are
included in the trip rate calculation.
Selected survey days:
Thursday 1 days
Friday 2 days
This data displays the number of selected surveys by day of the week.
Selected survey types:
Manual count 3 days
Directional ATC Count 0 days
This data displays the number of manual classified surveys and the number of unclassified ATC surveys, the total adding
up to the overall number of surveys in the selected set. Manual surveys are undertaken using staff, whilst ATC surveys
are undertaking using machines.
Selected Locations:
Suburban Area (PPS6 Out of Centre) 1
Edge of Town 2
This data displays the number of surveys per main location category within the selected set. The main location categories
consist of Free Standing, Edge of Town, Suburban Area, Neighbourhood Centre, Edge of Town Centre, Town Centre and
Not Known.
Selected Location Sub Categories:
Residential Zone 3
This data displays the number of surveys per location sub-category within the selected set. The location sub-categories
consist of Commercial Zone, Industrial Zone, Development Zone, Residential Zone, Retail Zone, Built-Up Zone, Village,
Out of Town, High Street and No Sub Category.
Secondary Filtering selection:
Use Class:
Sui Generis 3 days
This data displays the number of surveys per Use Class classification within the selected set. The Use Classes Order 2005
has been used for this purpose, which can be found within the Library module of TRICS®.
Population within 500m Range:
All Surveys Included
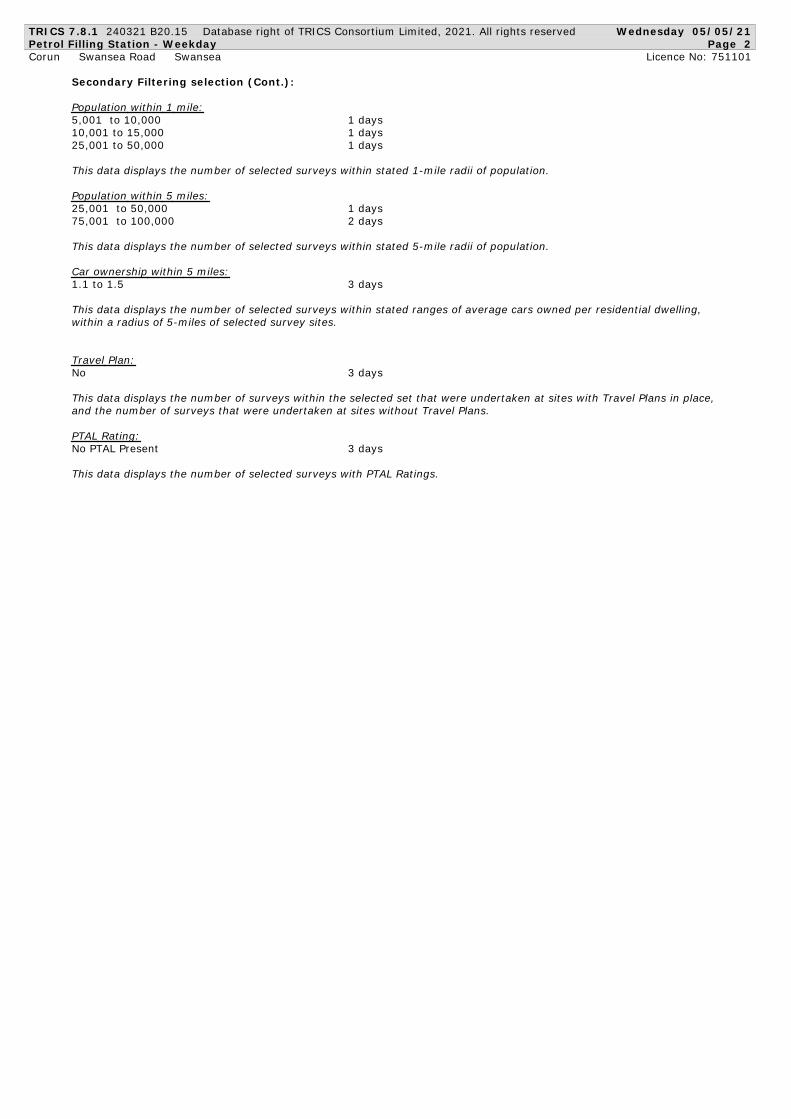
TRICS 7.8.1 240321 B20.15 Database right of TRICS Consortium Limited, 2021. All rights reserved Wednesday 05/05/21
Petrol Filling Station - Weekday Page 2
Corun Swansea Road Swansea Licence No: 751101
Secondary Filtering selection (Cont.):
Population within 1 mile:
5,001 to 10,000 1 days
10,001 to 15,000 1 days
25,001 to 50,000 1 days
This data displays the number of selected surveys within stated 1-mile radii of population.
Population within 5 miles:
25,001 to 50,000 1 days
75,001 to 100,000 2 days
This data displays the number of selected surveys within stated 5-mile radii of population.
Car ownership within 5 miles:
1.1 to 1.5 3 days
This data displays the number of selected surveys within stated ranges of average cars owned per residential dwelling,
within a radius of 5-miles of selected survey sites.
Travel Plan:
No 3 days
This data displays the number of surveys within the selected set that were undertaken at sites with Travel Plans in place,
and the number of surveys that were undertaken at sites without Travel Plans.
PTAL Rating:
No PTAL Present 3 days
This data displays the number of selected surveys with PTAL Ratings.
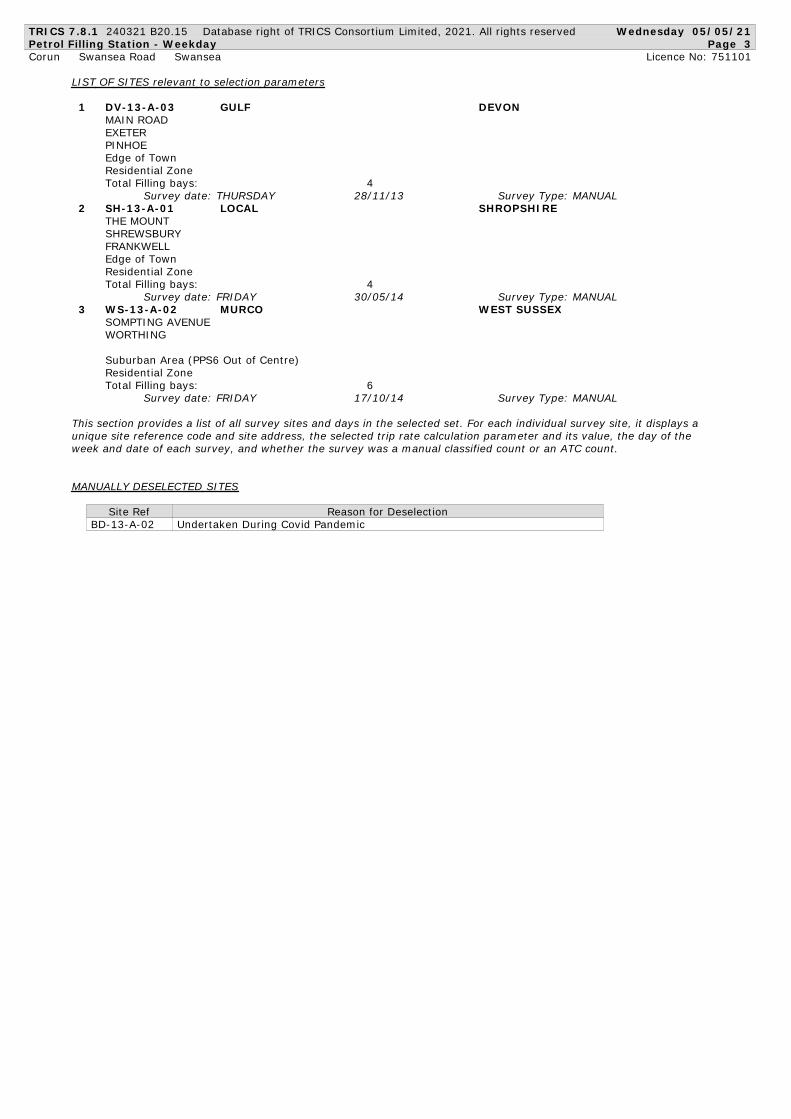
TRICS 7.8.1 240321 B20.15 Database right of TRICS Consortium Limited, 2021. All rights reserved Wednesday 05/05/21
Petrol Filling Station - Weekday Page 3
Corun Swansea Road Swansea Licence No: 751101
LIST OF SITES relevant to selection parameters
1 DV-13-A-03 GULF DEVON
MAIN ROAD
EXETER
PINHOE
Edge of Town
Residential Zone
Total Filling bays: 4
Survey date: THURSDAY 28/11/13 Survey Type: MANUAL
2 SH-13-A-01 LOCAL SHROPSHIRE
THE MOUNT
SHREWSBURY
FRANKWELL
Edge of Town
Residential Zone
Total Filling bays: 4
Survey date: FRIDAY 30/05/14 Survey Type: MANUAL
3 WS-13-A-02 MURCO WEST SUSSEX
SOMPTING AVENUE
WORTHING
Suburban Area (PPS6 Out of Centre)
Residential Zone
Total Filling bays: 6
Survey date: FRIDAY 17/10/14 Survey Type: MANUAL
This section provides a list of all survey sites and days in the selected set. For each individual survey site, it displays a
unique site reference code and site address, the selected trip rate calculation parameter and its value, the day of the
week and date of each survey, and whether the survey was a manual classified count or an ATC count.
MANUALLY DESELECTED SITES
Site Ref Reason for Deselection
BD-13-A-02 Undertaken During Covid Pandemic
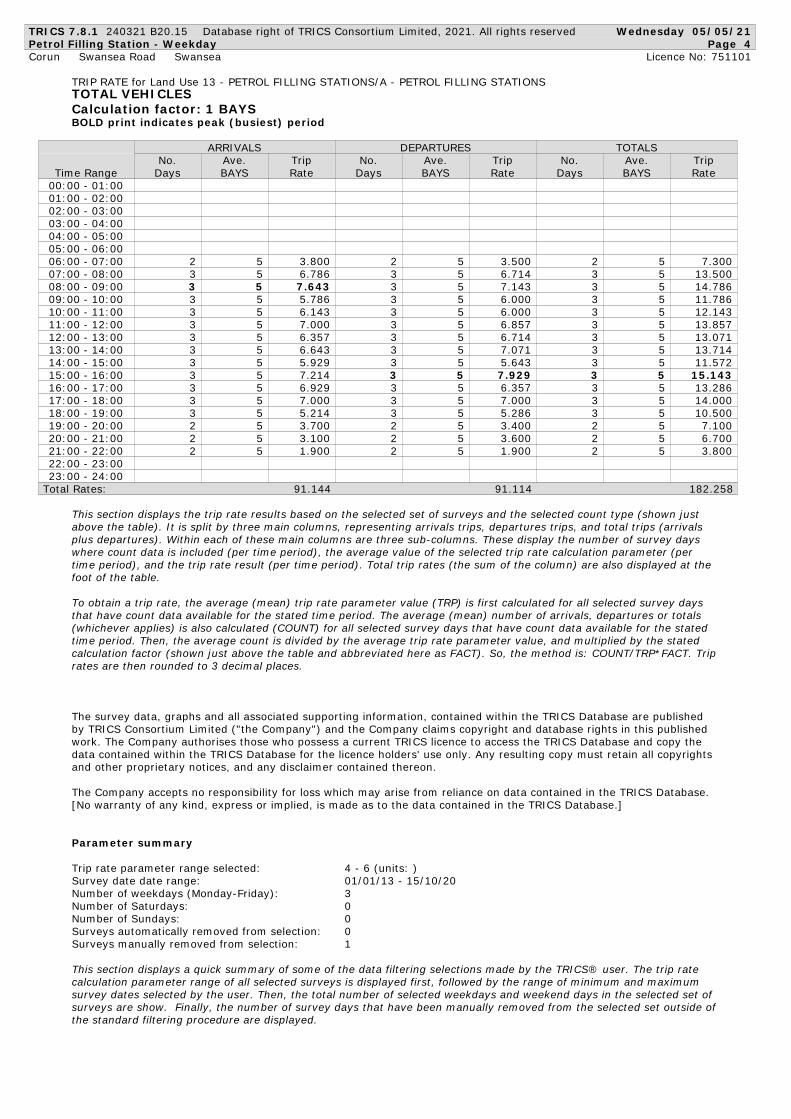
TRICS 7.8.1 240321 B20.15 Database right of TRICS Consortium Limited, 2021. All rights reserved Wednesday 05/05/21
Petrol Filling Station - Weekday Page 4
Corun Swansea Road Swansea Licence No: 751101
TRIP RATE for Land Use 13 - PETROL FILLING STATIONS/A - PETROL FILLING STATIONS
TOTAL VEHICLES
Calculation factor: 1 BAYS
BOLD print indicates peak (busiest) period
ARRIVALS DEPARTURES TOTALS
No. Ave. Trip No. Ave. Trip No. Ave. Trip
Time Range Days BAYS Rate Days BAYS Rate Days BAYS Rate
00:00 - 01:00
01:00 - 02:00
02:00 - 03:00
03:00 - 04:00
04:00 - 05:00
05:00 - 06:00
2 5 3.800 2 5 3.500 2 5 7.30006:00 - 07:00
3 5 6.786 3 5 6.714 3 5 13.50007:00 - 08:00
3 5 7.643 3 5 7.143 3 5 14.78608:00 - 09:00
3 5 5.786 3 5 6.000 3 5 11.78609:00 - 10:00
3 5 6.143 3 5 6.000 3 5 12.14310:00 - 11:00
3 5 7.000 3 5 6.857 3 5 13.85711:00 - 12:00
3 5 6.357 3 5 6.714 3 5 13.07112:00 - 13:00
3 5 6.643 3 5 7.071 3 5 13.71413:00 - 14:00
3 5 5.929 3 5 5.643 3 5 11.57214:00 - 15:00
3 5 7.214 3 5 7.929 3 5 15.14315:00 - 16:00
3 5 6.929 3 5 6.357 3 5 13.28616:00 - 17:00
3 5 7.000 3 5 7.000 3 5 14.00017:00 - 18:00
3 5 5.214 3 5 5.286 3 5 10.50018:00 - 19:00
2 5 3.700 2 5 3.400 2 5 7.10019:00 - 20:00
2 5 3.100 2 5 3.600 2 5 6.70020:00 - 21:00
2 5 1.900 2 5 1.900 2 5 3.80021:00 - 22:00
22:00 - 23:00
23:00 - 24:00
Total Rates: 9 1.144 9 1.114 182.258
This section displays the trip rate results based on the selected set of surveys and the selected count type (shown just
above the table). It is split by three main columns, representing arrivals trips, departures trips, and total trips (arrivals
plus departures). Within each of these main columns are three sub-columns. These display the number of survey days
where count data is included (per time period), the average value of the selected trip rate calculation parameter (per
time period), and the trip rate result (per time period). Total trip rates (the sum of the column) are also displayed at the
foot of the table.
To obtain a trip rate, the average (mean) trip rate parameter value (TRP) is first calculated for all selected survey days
that have count data available for the stated time period. The average (mean) number of arrivals, departures or totals
(whichever applies) is also calculated (COUNT) for all selected survey days that have count data available for the stated
time period. Then, the average count is divided by the average trip rate parameter value, and multiplied by the stated
calculation factor (shown just above the table and abbreviated here as FACT). So, the method is: COUNT/TRP*FACT. Trip
rates are then rounded to 3 decimal places.
The survey data, graphs and all associated supporting information, contained within the TRICS Database are published
by TRICS Consortium Limited ("the Company") and the Company claims copyright and database rights in this published
work. The Company authorises those who possess a current TRICS licence to access the TRICS Database and copy the
data contained within the TRICS Database for the licence holders' use only. Any resulting copy must retain all copyrights
and other proprietary notices, and any disclaimer contained thereon.
The Company accepts no responsibility for loss which may arise from reliance on data contained in the TRICS Database.
[No warranty of any kind, express or implied, is made as to the data contained in the TRICS Database.]
Parameter summary
Trip rate parameter range selected: 4 - 6 (units: )
Survey date date range: 01/01/13 - 15/10/20
Number of weekdays (Monday-Friday): 3
Number of Saturdays: 0
Number of Sundays: 0
Surveys automatically removed from selection: 0
Surveys manually removed from selection: 1
This section displays a quick summary of some of the data filtering selections made by the TRICS® user. The trip rate
calculation parameter range of all selected surveys is displayed first, followed by the range of minimum and maximum
survey dates selected by the user. Then, the total number of selected weekdays and weekend days in the selected set of
surveys are show. Finally, the number of survey days that have been manually removed from the selected set outside of
the standard filtering procedure are displayed.

TRICS 7.8.1 240321 B20.15 Database right of TRICS Consortium Limited, 2021. All rights reserved Wednesday 05/05/21
Petrol Filling Station - Weekday Page 5
Corun Swansea Road Swansea Licence No: 751101
TRIP RATE for Land Use 13 - PETROL FILLING STATIONS/A - PETROL FILLING STATIONS
TAXIS
Calculation factor: 1 BAYS
BOLD print indicates peak (busiest) period
ARRIVALS DEPARTURES TOTALS
No. Ave. Trip No. Ave. Trip No. Ave. Trip
Time Range Days BAYS Rate Days BAYS Rate Days BAYS Rate
00:00 - 01:00
01:00 - 02:00
02:00 - 03:00
03:00 - 04:00
04:00 - 05:00
05:00 - 06:00
2 5 0.200 2 5 0.100 2 5 0.30006:00 - 07:00
3 5 0.000 3 5 0.071 3 5 0.07107:00 - 08:00
3 5 0.071 3 5 0.071 3 5 0.14208:00 - 09:00
3 5 0.071 3 5 0.071 3 5 0.14209:00 - 10:00
3 5 0.214 3 5 0.143 3 5 0.35710:00 - 11:00
3 5 0.000 3 5 0.071 3 5 0.07111:00 - 12:00
3 5 0.000 3 5 0.000 3 5 0.00012:00 - 13:00
3 5 0.143 3 5 0.143 3 5 0.28613:00 - 14:00
3 5 0.071 3 5 0.071 3 5 0.14214:00 - 15:00
3 5 0.071 3 5 0.071 3 5 0.14215:00 - 16:00
3 5 0.143 3 5 0.143 3 5 0.28616:00 - 17:00
3 5 0.000 3 5 0.000 3 5 0.00017:00 - 18:00
3 5 0.000 3 5 0.000 3 5 0.00018:00 - 19:00
2 5 0.000 2 5 0.000 2 5 0.00019:00 - 20:00
2 5 0.200 2 5 0.200 2 5 0.40020:00 - 21:00
2 5 0.000 2 5 0.000 2 5 0.00021:00 - 22:00
22:00 - 23:00
23:00 - 24:00
Total Rates: 1.184 1.155 2.339
This section displays the trip rate results based on the selected set of surveys and the selected count type (shown just
above the table). It is split by three main columns, representing arrivals trips, departures trips, and total trips (arrivals
plus departures). Within each of these main columns are three sub-columns. These display the number of survey days
where count data is included (per time period), the average value of the selected trip rate calculation parameter (per
time period), and the trip rate result (per time period). Total trip rates (the sum of the column) are also displayed at the
foot of the table.
To obtain a trip rate, the average (mean) trip rate parameter value (TRP) is first calculated for all selected survey days
that have count data available for the stated time period. The average (mean) number of arrivals, departures or totals
(whichever applies) is also calculated (COUNT) for all selected survey days that have count data available for the stated
time period. Then, the average count is divided by the average trip rate parameter value, and multiplied by the stated
calculation factor (shown just above the table and abbreviated here as FACT). So, the method is: COUNT/TRP*FACT. Trip
rates are then rounded to 3 decimal places.

TRICS 7.8.1 240321 B20.15 Database right of TRICS Consortium Limited, 2021. All rights reserved Wednesday 05/05/21
Petrol Filling Station - Weekday Page 6
Corun Swansea Road Swansea Licence No: 751101
TRIP RATE for Land Use 13 - PETROL FILLING STATIONS/A - PETROL FILLING STATIONS
OGVS
Calculation factor: 1 BAYS
BOLD print indicates peak (busiest) period
ARRIVALS DEPARTURES TOTALS
No. Ave. Trip No. Ave. Trip No. Ave. Trip
Time Range Days BAYS Rate Days BAYS Rate Days BAYS Rate
00:00 - 01:00
01:00 - 02:00
02:00 - 03:00
03:00 - 04:00
04:00 - 05:00
05:00 - 06:00
2 5 0.100 2 5 0.100 2 5 0.20006:00 - 07:00
3 5 0.143 3 5 0.143 3 5 0.28607:00 - 08:00
3 5 0.071 3 5 0.071 3 5 0.14208:00 - 09:00
3 5 0.000 3 5 0.000 3 5 0.00009:00 - 10:00
3 5 0.000 3 5 0.000 3 5 0.00010:00 - 11:00
3 5 0.071 3 5 0.071 3 5 0.14211:00 - 12:00
3 5 0.071 3 5 0.071 3 5 0.14212:00 - 13:00
3 5 0.071 3 5 0.000 3 5 0.07113:00 - 14:00
3 5 0.000 3 5 0.071 3 5 0.07114:00 - 15:00
3 5 0.071 3 5 0.000 3 5 0.07115:00 - 16:00
3 5 0.000 3 5 0.071 3 5 0.07116:00 - 17:00
3 5 0.000 3 5 0.000 3 5 0.00017:00 - 18:00
3 5 0.000 3 5 0.000 3 5 0.00018:00 - 19:00
2 5 0.000 2 5 0.000 2 5 0.00019:00 - 20:00
2 5 0.000 2 5 0.000 2 5 0.00020:00 - 21:00
2 5 0.000 2 5 0.000 2 5 0.00021:00 - 22:00
22:00 - 23:00
23:00 - 24:00
Total Rates: 0.598 0.598 1.196
This section displays the trip rate results based on the selected set of surveys and the selected count type (shown just
above the table). It is split by three main columns, representing arrivals trips, departures trips, and total trips (arrivals
plus departures). Within each of these main columns are three sub-columns. These display the number of survey days
where count data is included (per time period), the average value of the selected trip rate calculation parameter (per
time period), and the trip rate result (per time period). Total trip rates (the sum of the column) are also displayed at the
foot of the table.
To obtain a trip rate, the average (mean) trip rate parameter value (TRP) is first calculated for all selected survey days
that have count data available for the stated time period. The average (mean) number of arrivals, departures or totals
(whichever applies) is also calculated (COUNT) for all selected survey days that have count data available for the stated
time period. Then, the average count is divided by the average trip rate parameter value, and multiplied by the stated
calculation factor (shown just above the table and abbreviated here as FACT). So, the method is: COUNT/TRP*FACT. Trip
rates are then rounded to 3 decimal places.
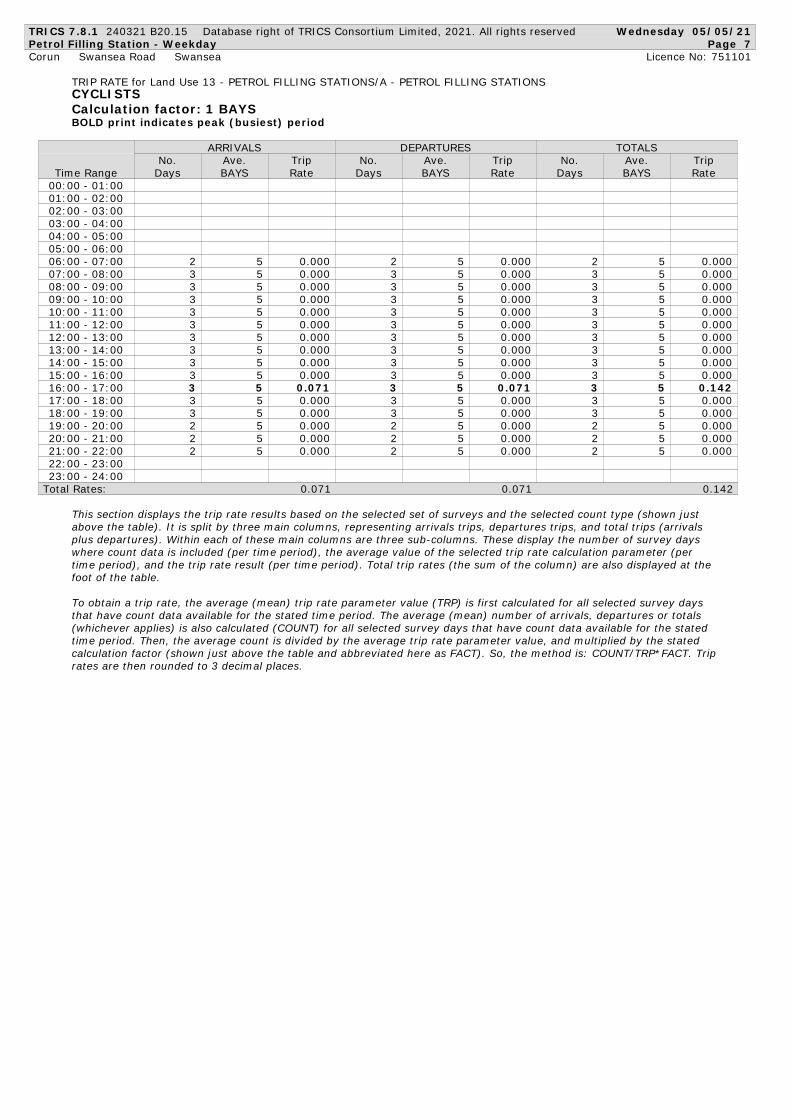
TRICS 7.8.1 240321 B20.15 Database right of TRICS Consortium Limited, 2021. All rights reserved Wednesday 05/05/21
Petrol Filling Station - Weekday Page 7
Corun Swansea Road Swansea Licence No: 751101
TRIP RATE for Land Use 13 - PETROL FILLING STATIONS/A - PETROL FILLING STATIONS
CYCLISTS
Calculation factor: 1 BAYS
BOLD print indicates peak (busiest) period
ARRIVALS DEPARTURES TOTALS
No. Ave. Trip No. Ave. Trip No. Ave. Trip
Time Range Days BAYS Rate Days BAYS Rate Days BAYS Rate
00:00 - 01:00
01:00 - 02:00
02:00 - 03:00
03:00 - 04:00
04:00 - 05:00
05:00 - 06:00
2 5 0.000 2 5 0.000 2 5 0.00006:00 - 07:00
3 5 0.000 3 5 0.000 3 5 0.00007:00 - 08:00
3 5 0.000 3 5 0.000 3 5 0.00008:00 - 09:00
3 5 0.000 3 5 0.000 3 5 0.00009:00 - 10:00
3 5 0.000 3 5 0.000 3 5 0.00010:00 - 11:00
3 5 0.000 3 5 0.000 3 5 0.00011:00 - 12:00
3 5 0.000 3 5 0.000 3 5 0.00012:00 - 13:00
3 5 0.000 3 5 0.000 3 5 0.00013:00 - 14:00
3 5 0.000 3 5 0.000 3 5 0.00014:00 - 15:00
3 5 0.000 3 5 0.000 3 5 0.00015:00 - 16:00
3 5 0.071 3 5 0.071 3 5 0.14216:00 - 17:00
3 5 0.000 3 5 0.000 3 5 0.00017:00 - 18:00
3 5 0.000 3 5 0.000 3 5 0.00018:00 - 19:00
2 5 0.000 2 5 0.000 2 5 0.00019:00 - 20:00
2 5 0.000 2 5 0.000 2 5 0.00020:00 - 21:00
2 5 0.000 2 5 0.000 2 5 0.00021:00 - 22:00
22:00 - 23:00
23:00 - 24:00
Total Rates: 0.071 0.071 0.142
This section displays the trip rate results based on the selected set of surveys and the selected count type (shown just
above the table). It is split by three main columns, representing arrivals trips, departures trips, and total trips (arrivals
plus departures). Within each of these main columns are three sub-columns. These display the number of survey days
where count data is included (per time period), the average value of the selected trip rate calculation parameter (per
time period), and the trip rate result (per time period). Total trip rates (the sum of the column) are also displayed at the
foot of the table.
To obtain a trip rate, the average (mean) trip rate parameter value (TRP) is first calculated for all selected survey days
that have count data available for the stated time period. The average (mean) number of arrivals, departures or totals
(whichever applies) is also calculated (COUNT) for all selected survey days that have count data available for the stated
time period. Then, the average count is divided by the average trip rate parameter value, and multiplied by the stated
calculation factor (shown just above the table and abbreviated here as FACT). So, the method is: COUNT/TRP*FACT. Trip
rates are then rounded to 3 decimal places.
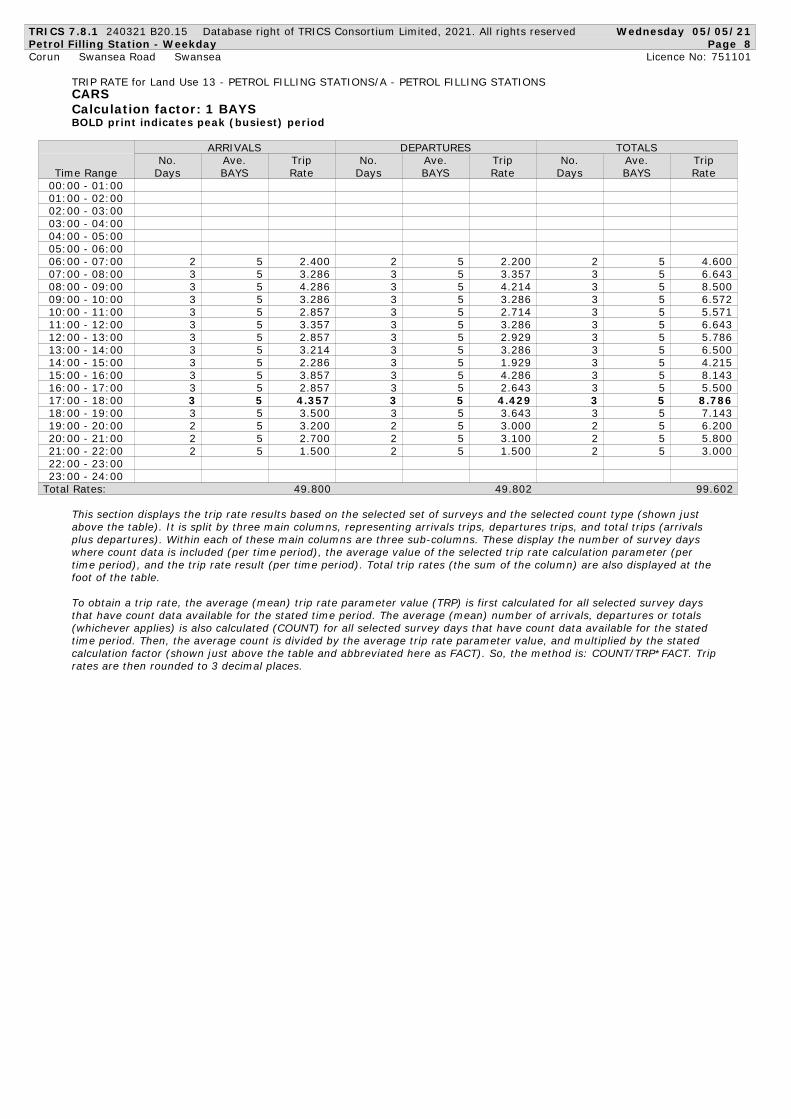
TRICS 7.8.1 240321 B20.15 Database right of TRICS Consortium Limited, 2021. All rights reserved Wednesday 05/05/21
Petrol Filling Station - Weekday Page 8
Corun Swansea Road Swansea Licence No: 751101
TRIP RATE for Land Use 13 - PETROL FILLING STATIONS/A - PETROL FILLING STATIONS
CARS
Calculation factor: 1 BAYS
BOLD print indicates peak (busiest) period
ARRIVALS DEPARTURES TOTALS
No. Ave. Trip No. Ave. Trip No. Ave. Trip
Time Range Days BAYS Rate Days BAYS Rate Days BAYS Rate
00:00 - 01:00
01:00 - 02:00
02:00 - 03:00
03:00 - 04:00
04:00 - 05:00
05:00 - 06:00
2 5 2.400 2 5 2.200 2 5 4.60006:00 - 07:00
3 5 3.286 3 5 3.357 3 5 6.64307:00 - 08:00
3 5 4.286 3 5 4.214 3 5 8.50008:00 - 09:00
3 5 3.286 3 5 3.286 3 5 6.57209:00 - 10:00
3 5 2.857 3 5 2.714 3 5 5.57110:00 - 11:00
3 5 3.357 3 5 3.286 3 5 6.64311:00 - 12:00
3 5 2.857 3 5 2.929 3 5 5.78612:00 - 13:00
3 5 3.214 3 5 3.286 3 5 6.50013:00 - 14:00
3 5 2.286 3 5 1.929 3 5 4.21514:00 - 15:00
3 5 3.857 3 5 4.286 3 5 8.14315:00 - 16:00
3 5 2.857 3 5 2.643 3 5 5.50016:00 - 17:00
3 5 4.357 3 5 4.429 3 5 8.78617:00 - 18:00
3 5 3.500 3 5 3.643 3 5 7.14318:00 - 19:00
2 5 3.200 2 5 3.000 2 5 6.20019:00 - 20:00
2 5 2.700 2 5 3.100 2 5 5.80020:00 - 21:00
2 5 1.500 2 5 1.500 2 5 3.00021:00 - 22:00
22:00 - 23:00
23:00 - 24:00
Total Rates: 4 9.800 4 9.802 9 9.602
This section displays the trip rate results based on the selected set of surveys and the selected count type (shown just
above the table). It is split by three main columns, representing arrivals trips, departures trips, and total trips (arrivals
plus departures). Within each of these main columns are three sub-columns. These display the number of survey days
where count data is included (per time period), the average value of the selected trip rate calculation parameter (per
time period), and the trip rate result (per time period). Total trip rates (the sum of the column) are also displayed at the
foot of the table.
To obtain a trip rate, the average (mean) trip rate parameter value (TRP) is first calculated for all selected survey days
that have count data available for the stated time period. The average (mean) number of arrivals, departures or totals
(whichever applies) is also calculated (COUNT) for all selected survey days that have count data available for the stated
time period. Then, the average count is divided by the average trip rate parameter value, and multiplied by the stated
calculation factor (shown just above the table and abbreviated here as FACT). So, the method is: COUNT/TRP*FACT. Trip
rates are then rounded to 3 decimal places.

TRICS 7.8.1 240321 B20.15 Database right of TRICS Consortium Limited, 2021. All rights reserved Wednesday 05/05/21
Petrol Filling Station - Weekday Page 9
Corun Swansea Road Swansea Licence No: 751101
TRIP RATE for Land Use 13 - PETROL FILLING STATIONS/A - PETROL FILLING STATIONS
LGVS
Calculation factor: 1 BAYS
BOLD print indicates peak (busiest) period
ARRIVALS DEPARTURES TOTALS
No. Ave. Trip No. Ave. Trip No. Ave. Trip
Time Range Days BAYS Rate Days BAYS Rate Days BAYS Rate
00:00 - 01:00
01:00 - 02:00
02:00 - 03:00
03:00 - 04:00
04:00 - 05:00
05:00 - 06:00
2 5 0.800 2 5 0.800 2 5 1.60006:00 - 07:00
3 5 1.857 3 5 1.714 3 5 3.57107:00 - 08:00
3 5 1.286 3 5 1.143 3 5 2.42908:00 - 09:00
3 5 1.000 3 5 1.071 3 5 2.07109:00 - 10:00
3 5 0.571 3 5 0.643 3 5 1.21410:00 - 11:00
3 5 0.786 3 5 0.786 3 5 1.57211:00 - 12:00
3 5 1.071 3 5 1.214 3 5 2.28512:00 - 13:00
3 5 1.143 3 5 1.143 3 5 2.28613:00 - 14:00
3 5 0.929 3 5 0.857 3 5 1.78614:00 - 15:00
3 5 1.286 3 5 1.357 3 5 2.64315:00 - 16:00
3 5 0.929 3 5 1.000 3 5 1.92916:00 - 17:00
3 5 0.429 3 5 0.429 3 5 0.85817:00 - 18:00
3 5 0.357 3 5 0.357 3 5 0.71418:00 - 19:00
2 5 0.400 2 5 0.300 2 5 0.70019:00 - 20:00
2 5 0.200 2 5 0.300 2 5 0.50020:00 - 21:00
2 5 0.400 2 5 0.400 2 5 0.80021:00 - 22:00
22:00 - 23:00
23:00 - 24:00
Total Rates: 1 3.444 1 3.514 2 6.958
This section displays the trip rate results based on the selected set of surveys and the selected count type (shown just
above the table). It is split by three main columns, representing arrivals trips, departures trips, and total trips (arrivals
plus departures). Within each of these main columns are three sub-columns. These display the number of survey days
where count data is included (per time period), the average value of the selected trip rate calculation parameter (per
time period), and the trip rate result (per time period). Total trip rates (the sum of the column) are also displayed at the
foot of the table.
To obtain a trip rate, the average (mean) trip rate parameter value (TRP) is first calculated for all selected survey days
that have count data available for the stated time period. The average (mean) number of arrivals, departures or totals
(whichever applies) is also calculated (COUNT) for all selected survey days that have count data available for the stated
time period. Then, the average count is divided by the average trip rate parameter value, and multiplied by the stated
calculation factor (shown just above the table and abbreviated here as FACT). So, the method is: COUNT/TRP*FACT. Trip
rates are then rounded to 3 decimal places.
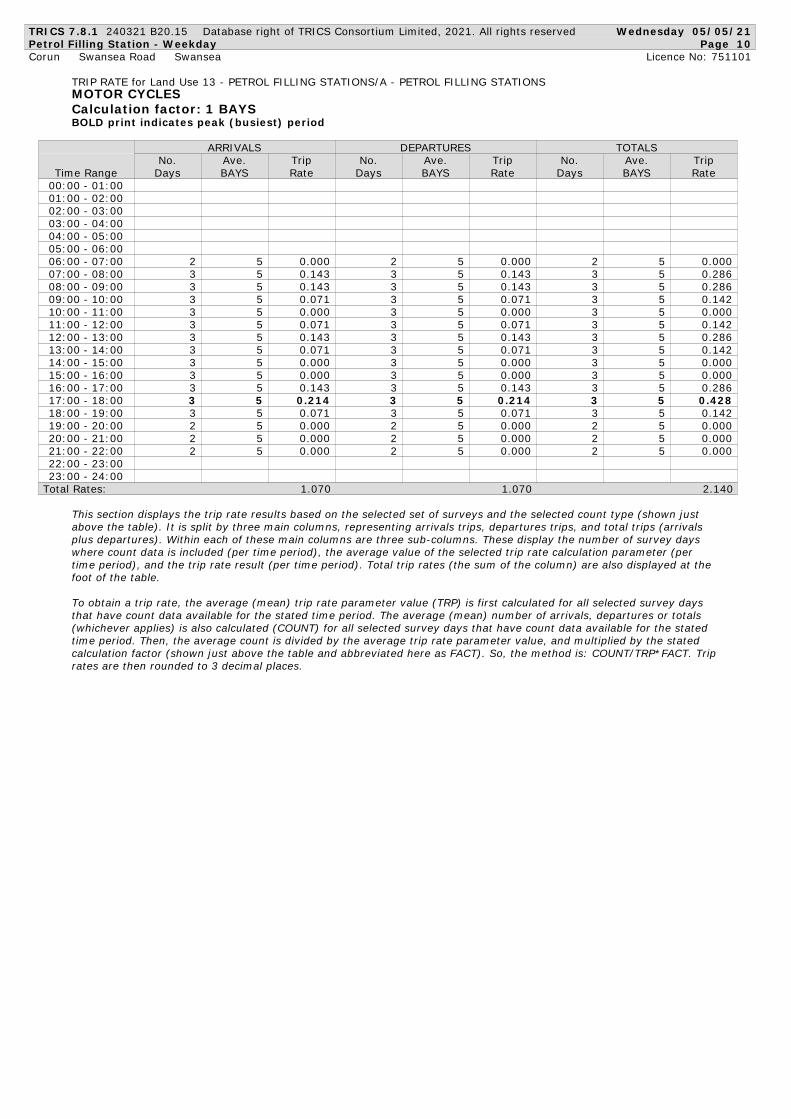
TRICS 7.8.1 240321 B20.15 Database right of TRICS Consortium Limited, 2021. All rights reserved Wednesday 05/05/21
Petrol Filling Station - Weekday Page 10
Corun Swansea Road Swansea Licence No: 751101
TRIP RATE for Land Use 13 - PETROL FILLING STATIONS/A - PETROL FILLING STATIONS
MOTOR CYCLES
Calculation factor: 1 BAYS
BOLD print indicates peak (busiest) period
ARRIVALS DEPARTURES TOTALS
No. Ave. Trip No. Ave. Trip No. Ave. Trip
Time Range Days BAYS Rate Days BAYS Rate Days BAYS Rate
00:00 - 01:00
01:00 - 02:00
02:00 - 03:00
03:00 - 04:00
04:00 - 05:00
05:00 - 06:00
2 5 0.000 2 5 0.000 2 5 0.00006:00 - 07:00
3 5 0.143 3 5 0.143 3 5 0.28607:00 - 08:00
3 5 0.143 3 5 0.143 3 5 0.28608:00 - 09:00
3 5 0.071 3 5 0.071 3 5 0.14209:00 - 10:00
3 5 0.000 3 5 0.000 3 5 0.00010:00 - 11:00
3 5 0.071 3 5 0.071 3 5 0.14211:00 - 12:00
3 5 0.143 3 5 0.143 3 5 0.28612:00 - 13:00
3 5 0.071 3 5 0.071 3 5 0.14213:00 - 14:00
3 5 0.000 3 5 0.000 3 5 0.00014:00 - 15:00
3 5 0.000 3 5 0.000 3 5 0.00015:00 - 16:00
3 5 0.143 3 5 0.143 3 5 0.28616:00 - 17:00
3 5 0.214 3 5 0.214 3 5 0.42817:00 - 18:00
3 5 0.071 3 5 0.071 3 5 0.14218:00 - 19:00
2 5 0.000 2 5 0.000 2 5 0.00019:00 - 20:00
2 5 0.000 2 5 0.000 2 5 0.00020:00 - 21:00
2 5 0.000 2 5 0.000 2 5 0.00021:00 - 22:00
22:00 - 23:00
23:00 - 24:00
Total Rates: 1.070 1.070 2.140
This section displays the trip rate results based on the selected set of surveys and the selected count type (shown just
above the table). It is split by three main columns, representing arrivals trips, departures trips, and total trips (arrivals
plus departures). Within each of these main columns are three sub-columns. These display the number of survey days
where count data is included (per time period), the average value of the selected trip rate calculation parameter (per
time period), and the trip rate result (per time period). Total trip rates (the sum of the column) are also displayed at the
foot of the table.
To obtain a trip rate, the average (mean) trip rate parameter value (TRP) is first calculated for all selected survey days
that have count data available for the stated time period. The average (mean) number of arrivals, departures or totals
(whichever applies) is also calculated (COUNT) for all selected survey days that have count data available for the stated
time period. Then, the average count is divided by the average trip rate parameter value, and multiplied by the stated
calculation factor (shown just above the table and abbreviated here as FACT). So, the method is: COUNT/TRP*FACT. Trip
rates are then rounded to 3 decimal places.
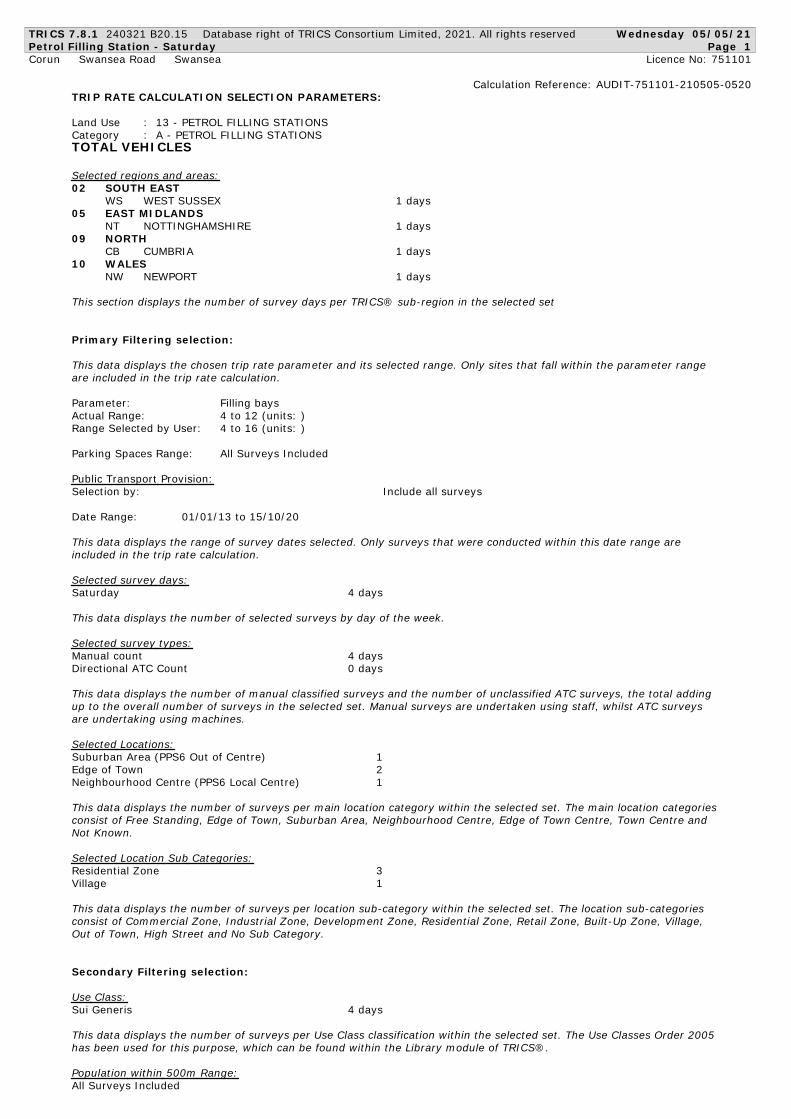
TRICS 7.8.1 240321 B20.15 Database right of TRICS Consortium Limited, 2021. All rights reserved Wednesday 05/05/21
Petrol Filling Station - Saturday Page 1
Corun Swansea Road Swansea Licence No: 751101
Calculation Reference: AUDIT-751101-210505-0520
TRIP RATE CALCULATION SELECTION PARAMETERS:
Land Use : 13 - PETROL FILLING STATIONS
Category : A - PETROL FILLING STATIONS
TOTAL VEHICLES
Selected regions and areas:
02 SOUTH EAST
WS WEST SUSSEX 1 days
05 EAST MIDLANDS
NT NOTTINGHAMSHIRE 1 days
09 NORTH
CB CUMBRIA 1 days
10 WALES
NW NEWPORT 1 days
This section displays the number of survey days per TRICS® sub-region in the selected set
Primary Filtering selection:
This data displays the chosen trip rate parameter and its selected range. Only sites that fall within the parameter range
are included in the trip rate calculation.
Parameter: Filling bays
Actual Range: 4 to 12 (units: )
Range Selected by User: 4 to 16 (units: )
Parking Spaces Range: All Surveys Included
Public Transport Provision:
Selection by: Include all surveys
Date Range: 01/01/13 to 15/10/20
This data displays the range of survey dates selected. Only surveys that were conducted within this date range are
included in the trip rate calculation.
Selected survey days:
Saturday 4 days
This data displays the number of selected surveys by day of the week.
Selected survey types:
Manual count 4 days
Directional ATC Count 0 days
This data displays the number of manual classified surveys and the number of unclassified ATC surveys, the total adding
up to the overall number of surveys in the selected set. Manual surveys are undertaken using staff, whilst ATC surveys
are undertaking using machines.
Selected Locations:
Suburban Area (PPS6 Out of Centre) 1
Edge of Town 2
Neighbourhood Centre (PPS6 Local Centre) 1
This data displays the number of surveys per main location category within the selected set. The main location categories
consist of Free Standing, Edge of Town, Suburban Area, Neighbourhood Centre, Edge of Town Centre, Town Centre and
Not Known.
Selected Location Sub Categories:
Residential Zone 3
Village 1
This data displays the number of surveys per location sub-category within the selected set. The location sub-categories
consist of Commercial Zone, Industrial Zone, Development Zone, Residential Zone, Retail Zone, Built-Up Zone, Village,
Out of Town, High Street and No Sub Category.
Secondary Filtering selection:
Use Class:
Sui Generis 4 days
This data displays the number of surveys per Use Class classification within the selected set. The Use Classes Order 2005
has been used for this purpose, which can be found within the Library module of TRICS®.
Population within 500m Range:
All Surveys Included
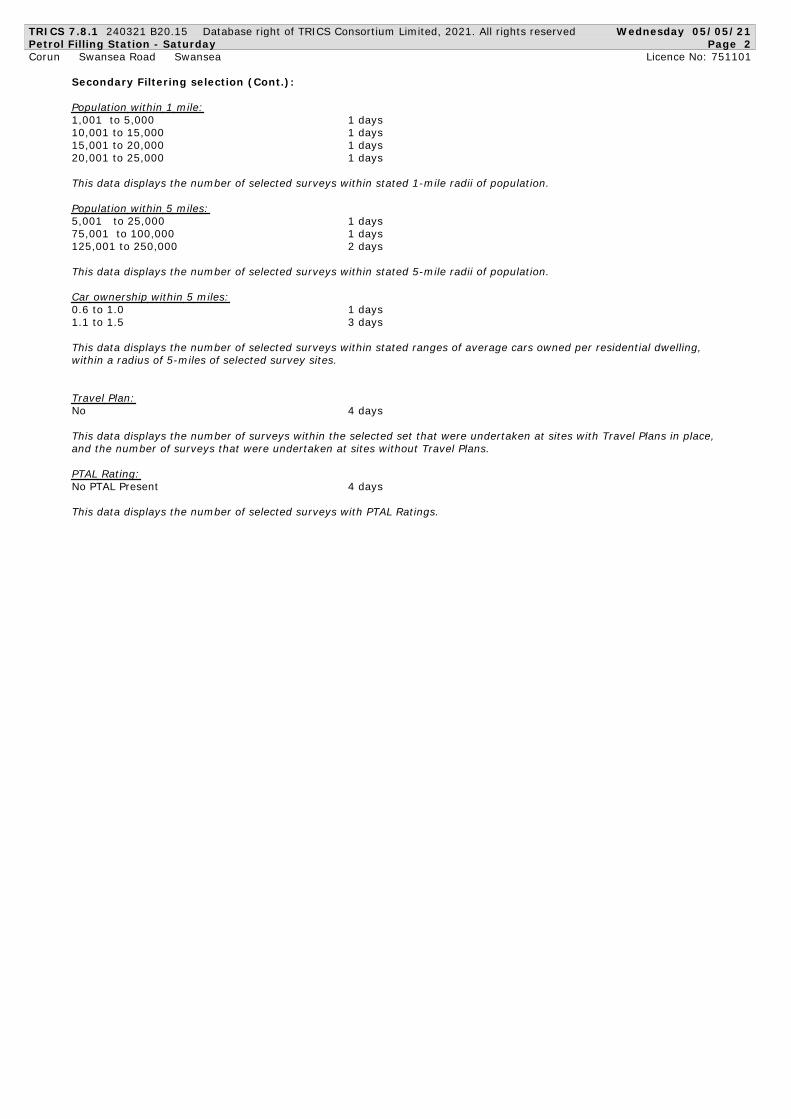
TRICS 7.8.1 240321 B20.15 Database right of TRICS Consortium Limited, 2021. All rights reserved Wednesday 05/05/21
Petrol Filling Station - Saturday Page 2
Corun Swansea Road Swansea Licence No: 751101
Secondary Filtering selection (Cont.):
Population within 1 mile:
1,001 to 5,000 1 days
10,001 to 15,000 1 days
15,001 to 20,000 1 days
20,001 to 25,000 1 days
This data displays the number of selected surveys within stated 1-mile radii of population.
Population within 5 miles:
5,001 to 25,000 1 days
75,001 to 100,000 1 days
125,001 to 250,000 2 days
This data displays the number of selected surveys within stated 5-mile radii of population.
Car ownership within 5 miles:
0.6 to 1.0 1 days
1.1 to 1.5 3 days
This data displays the number of selected surveys within stated ranges of average cars owned per residential dwelling,
within a radius of 5-miles of selected survey sites.
Travel Plan:
No 4 days
This data displays the number of surveys within the selected set that were undertaken at sites with Travel Plans in place,
and the number of surveys that were undertaken at sites without Travel Plans.
PTAL Rating:
No PTAL Present 4 days
This data displays the number of selected surveys with PTAL Ratings.
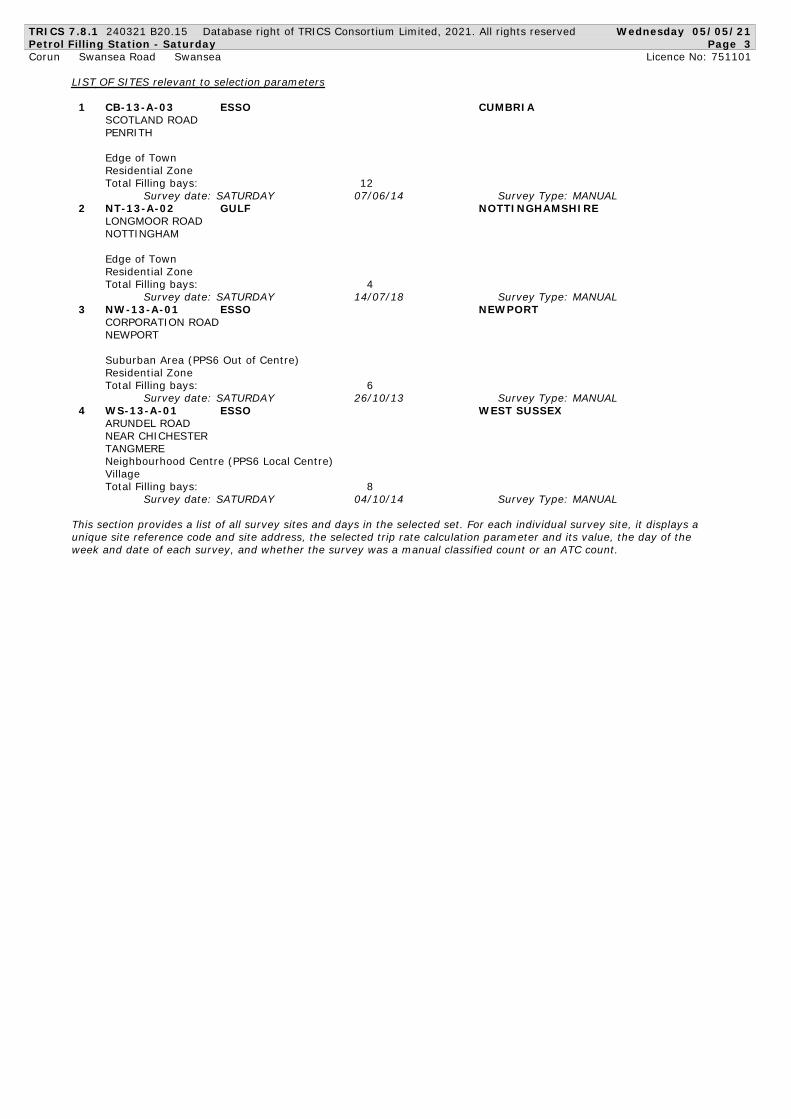
TRICS 7.8.1 240321 B20.15 Database right of TRICS Consortium Limited, 2021. All rights reserved Wednesday 05/05/21
Petrol Filling Station - Saturday Page 3
Corun Swansea Road Swansea Licence No: 751101
LIST OF SITES relevant to selection parameters
1 CB-13-A-03 ESSO CUMBRIA
SCOTLAND ROAD
P E N R I T H
Edge of Town
Residential Zone
Total Filling bays: 1 2
Survey date: SATURDAY 07/06/14 Survey Type: MANUAL
2 NT-13-A-02 GULF NOTTINGHAMSHIRE
LONGMOOR ROAD
NOTTINGHAM
Edge of Town
Residential Zone
Total Filling bays: 4
Survey date: SATURDAY 14/07/18 Survey Type: MANUAL
3 NW-13-A-01 ESSO NEWPORT
CORPORATION ROAD
NEWPORT
Suburban Area (PPS6 Out of Centre)
Residential Zone
Total Filling bays: 6
Survey date: SATURDAY 26/10/13 Survey Type: MANUAL
4 WS-13-A-01 ESSO WEST SUSSEX
ARUNDEL ROAD
NEAR CHICHESTER
TANGMERE
Neighbourhood Centre (PPS6 Local Centre)
Village
Total Filling bays: 8
Survey date: SATURDAY 04/10/14 Survey Type: MANUAL
This section provides a list of all survey sites and days in the selected set. For each individual survey site, it displays a
unique site reference code and site address, the selected trip rate calculation parameter and its value, the day of the
week and date of each survey, and whether the survey was a manual classified count or an ATC count.
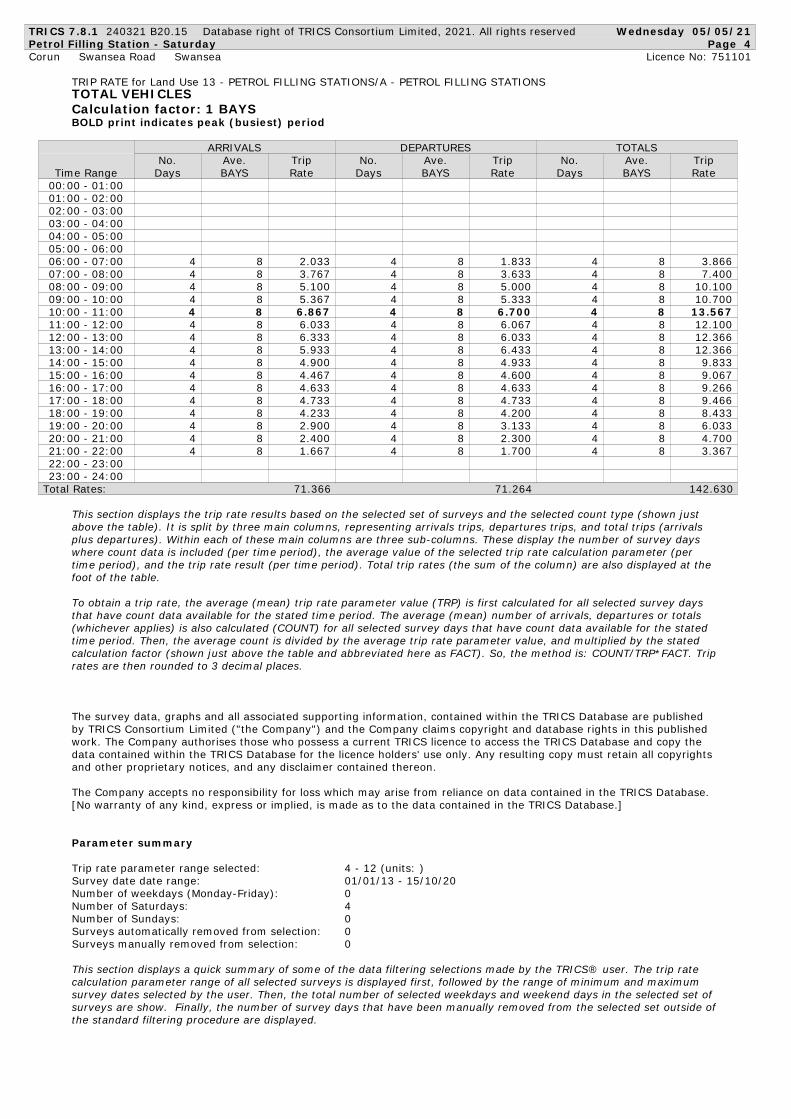
TRICS 7.8.1 240321 B20.15 Database right of TRICS Consortium Limited, 2021. All rights reserved Wednesday 05/05/21
Petrol Filling Station - Saturday Page 4
Corun Swansea Road Swansea Licence No: 751101
TRIP RATE for Land Use 13 - PETROL FILLING STATIONS/A - PETROL FILLING STATIONS
TOTAL VEHICLES
Calculation factor: 1 BAYS
BOLD print indicates peak (busiest) period
ARRIVALS DEPARTURES TOTALS
No. Ave. Trip No. Ave. Trip No. Ave. Trip
Time Range Days BAYS Rate Days BAYS Rate Days BAYS Rate
00:00 - 01:00
01:00 - 02:00
02:00 - 03:00
03:00 - 04:00
04:00 - 05:00
05:00 - 06:00
4 8 2.033 4 8 1.833 4 8 3.86606:00 - 07:00
4 8 3.767 4 8 3.633 4 8 7.40007:00 - 08:00
4 8 5.100 4 8 5.000 4 8 10.10008:00 - 09:00
4 8 5.367 4 8 5.333 4 8 10.70009:00 - 10:00
4 8 6.867 4 8 6.700 4 8 13.56710:00 - 11:00
4 8 6.033 4 8 6.067 4 8 12.10011:00 - 12:00
4 8 6.333 4 8 6.033 4 8 12.36612:00 - 13:00
4 8 5.933 4 8 6.433 4 8 12.36613:00 - 14:00
4 8 4.900 4 8 4.933 4 8 9.83314:00 - 15:00
4 8 4.467 4 8 4.600 4 8 9.06715:00 - 16:00
4 8 4.633 4 8 4.633 4 8 9.26616:00 - 17:00
4 8 4.733 4 8 4.733 4 8 9.46617:00 - 18:00
4 8 4.233 4 8 4.200 4 8 8.43318:00 - 19:00
4 8 2.900 4 8 3.133 4 8 6.03319:00 - 20:00
4 8 2.400 4 8 2.300 4 8 4.70020:00 - 21:00
4 8 1.667 4 8 1.700 4 8 3.36721:00 - 22:00
22:00 - 23:00
23:00 - 24:00
Total Rates: 7 1.366 7 1.264 142.630
This section displays the trip rate results based on the selected set of surveys and the selected count type (shown just
above the table). It is split by three main columns, representing arrivals trips, departures trips, and total trips (arrivals
plus departures). Within each of these main columns are three sub-columns. These display the number of survey days
where count data is included (per time period), the average value of the selected trip rate calculation parameter (per
time period), and the trip rate result (per time period). Total trip rates (the sum of the column) are also displayed at the
foot of the table.
To obtain a trip rate, the average (mean) trip rate parameter value (TRP) is first calculated for all selected survey days
that have count data available for the stated time period. The average (mean) number of arrivals, departures or totals
(whichever applies) is also calculated (COUNT) for all selected survey days that have count data available for the stated
time period. Then, the average count is divided by the average trip rate parameter value, and multiplied by the stated
calculation factor (shown just above the table and abbreviated here as FACT). So, the method is: COUNT/TRP*FACT. Trip
rates are then rounded to 3 decimal places.
The survey data, graphs and all associated supporting information, contained within the TRICS Database are published
by TRICS Consortium Limited ("the Company") and the Company claims copyright and database rights in this published
work. The Company authorises those who possess a current TRICS licence to access the TRICS Database and copy the
data contained within the TRICS Database for the licence holders' use only. Any resulting copy must retain all copyrights
and other proprietary notices, and any disclaimer contained thereon.
The Company accepts no responsibility for loss which may arise from reliance on data contained in the TRICS Database.
[No warranty of any kind, express or implied, is made as to the data contained in the TRICS Database.]
Parameter summary
Trip rate parameter range selected: 4 - 12 (units: )
Survey date date range: 01/01/13 - 15/10/20
Number of weekdays (Monday-Friday): 0
Number of Saturdays: 4
Number of Sundays: 0
Surveys automatically removed from selection: 0
Surveys manually removed from selection: 0
This section displays a quick summary of some of the data filtering selections made by the TRICS® user. The trip rate
calculation parameter range of all selected surveys is displayed first, followed by the range of minimum and maximum
survey dates selected by the user. Then, the total number of selected weekdays and weekend days in the selected set of
surveys are show. Finally, the number of survey days that have been manually removed from the selected set outside of
the standard filtering procedure are displayed.

TRICS 7.8.1 240321 B20.15 Database right of TRICS Consortium Limited, 2021. All rights reserved Wednesday 05/05/21
Petrol Filling Station - Saturday Page 5
Corun Swansea Road Swansea Licence No: 751101
TRIP RATE for Land Use 13 - PETROL FILLING STATIONS/A - PETROL FILLING STATIONS
TAXIS
Calculation factor: 1 BAYS
BOLD print indicates peak (busiest) period
ARRIVALS DEPARTURES TOTALS
No. Ave. Trip No. Ave. Trip No. Ave. Trip
Time Range Days BAYS Rate Days BAYS Rate Days BAYS Rate
00:00 - 01:00
01:00 - 02:00
02:00 - 03:00
03:00 - 04:00
04:00 - 05:00
05:00 - 06:00
4 8 0.033 4 8 0.033 4 8 0.06606:00 - 07:00
4 8 0.000 4 8 0.000 4 8 0.00007:00 - 08:00
4 8 0.033 4 8 0.033 4 8 0.06608:00 - 09:00
4 8 0.033 4 8 0.033 4 8 0.06609:00 - 10:00
4 8 0.100 4 8 0.100 4 8 0.20010:00 - 11:00
4 8 0.033 4 8 0.033 4 8 0.06611:00 - 12:00
4 8 0.033 4 8 0.033 4 8 0.06612:00 - 13:00
4 8 0.000 4 8 0.000 4 8 0.00013:00 - 14:00
4 8 0.000 4 8 0.000 4 8 0.00014:00 - 15:00
4 8 0.100 4 8 0.100 4 8 0.20015:00 - 16:00
4 8 0.100 4 8 0.100 4 8 0.20016:00 - 17:00
4 8 0.033 4 8 0.033 4 8 0.06617:00 - 18:00
4 8 0.100 4 8 0.100 4 8 0.20018:00 - 19:00
4 8 0.033 4 8 0.033 4 8 0.06619:00 - 20:00
4 8 0.000 4 8 0.000 4 8 0.00020:00 - 21:00
4 8 0.033 4 8 0.033 4 8 0.06621:00 - 22:00
22:00 - 23:00
23:00 - 24:00
Total Rates: 0.664 0.664 1.328
This section displays the trip rate results based on the selected set of surveys and the selected count type (shown just
above the table). It is split by three main columns, representing arrivals trips, departures trips, and total trips (arrivals
plus departures). Within each of these main columns are three sub-columns. These display the number of survey days
where count data is included (per time period), the average value of the selected trip rate calculation parameter (per
time period), and the trip rate result (per time period). Total trip rates (the sum of the column) are also displayed at the
foot of the table.
To obtain a trip rate, the average (mean) trip rate parameter value (TRP) is first calculated for all selected survey days
that have count data available for the stated time period. The average (mean) number of arrivals, departures or totals
(whichever applies) is also calculated (COUNT) for all selected survey days that have count data available for the stated
time period. Then, the average count is divided by the average trip rate parameter value, and multiplied by the stated
calculation factor (shown just above the table and abbreviated here as FACT). So, the method is: COUNT/TRP*FACT. Trip
rates are then rounded to 3 decimal places.
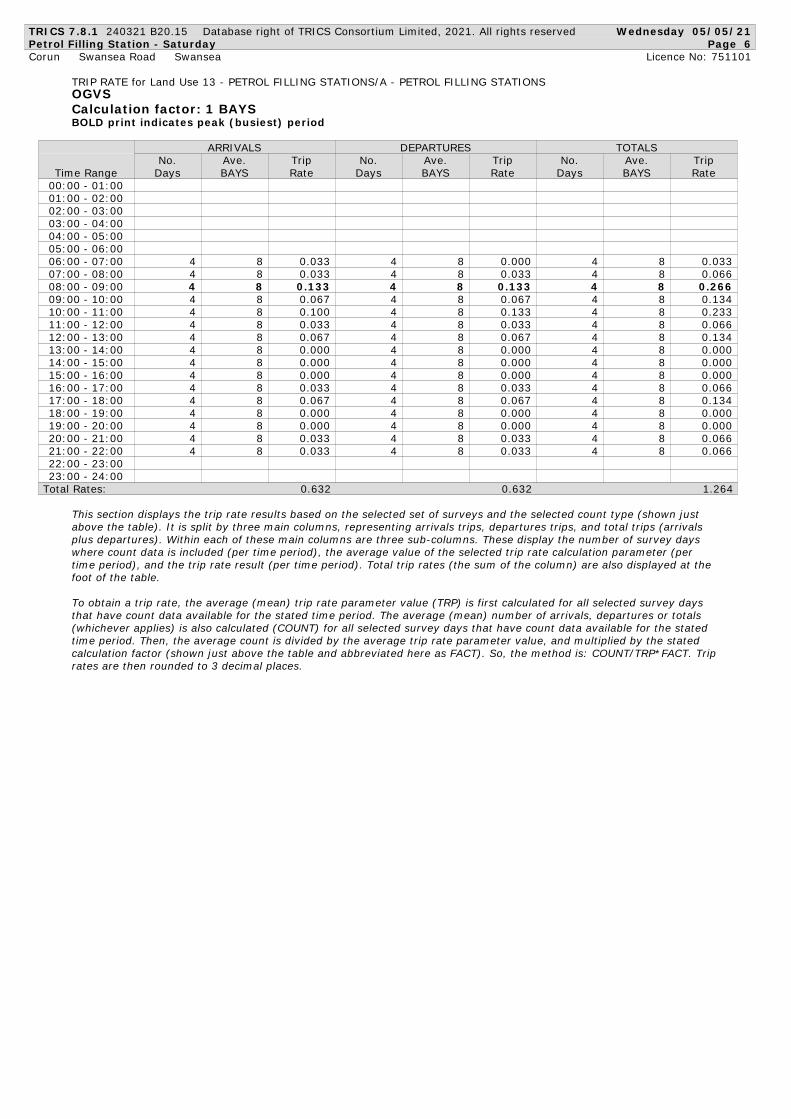
TRICS 7.8.1 240321 B20.15 Database right of TRICS Consortium Limited, 2021. All rights reserved Wednesday 05/05/21
Petrol Filling Station - Saturday Page 6
Corun Swansea Road Swansea Licence No: 751101
TRIP RATE for Land Use 13 - PETROL FILLING STATIONS/A - PETROL FILLING STATIONS
OGVS
Calculation factor: 1 BAYS
BOLD print indicates peak (busiest) period
ARRIVALS DEPARTURES TOTALS
No. Ave. Trip No. Ave. Trip No. Ave. Trip
Time Range Days BAYS Rate Days BAYS Rate Days BAYS Rate
00:00 - 01:00
01:00 - 02:00
02:00 - 03:00
03:00 - 04:00
04:00 - 05:00
05:00 - 06:00
4 8 0.033 4 8 0.000 4 8 0.03306:00 - 07:00
4 8 0.033 4 8 0.033 4 8 0.06607:00 - 08:00
4 8 0.133 4 8 0.133 4 8 0.26608:00 - 09:00
4 8 0.067 4 8 0.067 4 8 0.13409:00 - 10:00
4 8 0.100 4 8 0.133 4 8 0.23310:00 - 11:00
4 8 0.033 4 8 0.033 4 8 0.06611:00 - 12:00
4 8 0.067 4 8 0.067 4 8 0.13412:00 - 13:00
4 8 0.000 4 8 0.000 4 8 0.00013:00 - 14:00
4 8 0.000 4 8 0.000 4 8 0.00014:00 - 15:00
4 8 0.000 4 8 0.000 4 8 0.00015:00 - 16:00
4 8 0.033 4 8 0.033 4 8 0.06616:00 - 17:00
4 8 0.067 4 8 0.067 4 8 0.13417:00 - 18:00
4 8 0.000 4 8 0.000 4 8 0.00018:00 - 19:00
4 8 0.000 4 8 0.000 4 8 0.00019:00 - 20:00
4 8 0.033 4 8 0.033 4 8 0.06620:00 - 21:00
4 8 0.033 4 8 0.033 4 8 0.06621:00 - 22:00
22:00 - 23:00
23:00 - 24:00
Total Rates: 0.632 0.632 1.264
This section displays the trip rate results based on the selected set of surveys and the selected count type (shown just
above the table). It is split by three main columns, representing arrivals trips, departures trips, and total trips (arrivals
plus departures). Within each of these main columns are three sub-columns. These display the number of survey days
where count data is included (per time period), the average value of the selected trip rate calculation parameter (per
time period), and the trip rate result (per time period). Total trip rates (the sum of the column) are also displayed at the
foot of the table.
To obtain a trip rate, the average (mean) trip rate parameter value (TRP) is first calculated for all selected survey days
that have count data available for the stated time period. The average (mean) number of arrivals, departures or totals
(whichever applies) is also calculated (COUNT) for all selected survey days that have count data available for the stated
time period. Then, the average count is divided by the average trip rate parameter value, and multiplied by the stated
calculation factor (shown just above the table and abbreviated here as FACT). So, the method is: COUNT/TRP*FACT. Trip
rates are then rounded to 3 decimal places.

TRICS 7.8.1 240321 B20.15 Database right of TRICS Consortium Limited, 2021. All rights reserved Wednesday 05/05/21
Petrol Filling Station - Saturday Page 7
Corun Swansea Road Swansea Licence No: 751101
TRIP RATE for Land Use 13 - PETROL FILLING STATIONS/A - PETROL FILLING STATIONS
PSVS
Calculation factor: 1 BAYS
BOLD print indicates peak (busiest) period
ARRIVALS DEPARTURES TOTALS
No. Ave. Trip No. Ave. Trip No. Ave. Trip
Time Range Days BAYS Rate Days BAYS Rate Days BAYS Rate
00:00 - 01:00
01:00 - 02:00
02:00 - 03:00
03:00 - 04:00
04:00 - 05:00
05:00 - 06:00
4 8 0.000 4 8 0.000 4 8 0.00006:00 - 07:00
4 8 0.000 4 8 0.000 4 8 0.00007:00 - 08:00
4 8 0.000 4 8 0.000 4 8 0.00008:00 - 09:00
4 8 0.000 4 8 0.000 4 8 0.00009:00 - 10:00
4 8 0.000 4 8 0.000 4 8 0.00010:00 - 11:00
4 8 0.000 4 8 0.000 4 8 0.00011:00 - 12:00
4 8 0.000 4 8 0.000 4 8 0.00012:00 - 13:00
4 8 0.033 4 8 0.033 4 8 0.06613:00 - 14:00
4 8 0.000 4 8 0.000 4 8 0.00014:00 - 15:00
4 8 0.000 4 8 0.000 4 8 0.00015:00 - 16:00
4 8 0.000 4 8 0.000 4 8 0.00016:00 - 17:00
4 8 0.000 4 8 0.000 4 8 0.00017:00 - 18:00
4 8 0.000 4 8 0.000 4 8 0.00018:00 - 19:00
4 8 0.000 4 8 0.000 4 8 0.00019:00 - 20:00
4 8 0.000 4 8 0.000 4 8 0.00020:00 - 21:00
4 8 0.000 4 8 0.000 4 8 0.00021:00 - 22:00
22:00 - 23:00
23:00 - 24:00
Total Rates: 0.033 0.033 0.066
This section displays the trip rate results based on the selected set of surveys and the selected count type (shown just
above the table). It is split by three main columns, representing arrivals trips, departures trips, and total trips (arrivals
plus departures). Within each of these main columns are three sub-columns. These display the number of survey days
where count data is included (per time period), the average value of the selected trip rate calculation parameter (per
time period), and the trip rate result (per time period). Total trip rates (the sum of the column) are also displayed at the
foot of the table.
To obtain a trip rate, the average (mean) trip rate parameter value (TRP) is first calculated for all selected survey days
that have count data available for the stated time period. The average (mean) number of arrivals, departures or totals
(whichever applies) is also calculated (COUNT) for all selected survey days that have count data available for the stated
time period. Then, the average count is divided by the average trip rate parameter value, and multiplied by the stated
calculation factor (shown just above the table and abbreviated here as FACT). So, the method is: COUNT/TRP*FACT. Trip
rates are then rounded to 3 decimal places.

TRICS 7.8.1 240321 B20.15 Database right of TRICS Consortium Limited, 2021. All rights reserved Wednesday 05/05/21
Petrol Filling Station - Saturday Page 8
Corun Swansea Road Swansea Licence No: 751101
TRIP RATE for Land Use 13 - PETROL FILLING STATIONS/A - PETROL FILLING STATIONS
CYCLISTS
Calculation factor: 1 BAYS
BOLD print indicates peak (busiest) period
ARRIVALS DEPARTURES TOTALS
No. Ave. Trip No. Ave. Trip No. Ave. Trip
Time Range Days BAYS Rate Days BAYS Rate Days BAYS Rate
00:00 - 01:00
01:00 - 02:00
02:00 - 03:00
03:00 - 04:00
04:00 - 05:00
05:00 - 06:00
4 8 0.000 4 8 0.000 4 8 0.00006:00 - 07:00
4 8 0.033 4 8 0.033 4 8 0.06607:00 - 08:00
4 8 0.000 4 8 0.000 4 8 0.00008:00 - 09:00
4 8 0.067 4 8 0.067 4 8 0.13409:00 - 10:00
4 8 0.033 4 8 0.033 4 8 0.06610:00 - 11:00
4 8 0.033 4 8 0.033 4 8 0.06611:00 - 12:00
4 8 0.033 4 8 0.033 4 8 0.06612:00 - 13:00
4 8 0.100 4 8 0.067 4 8 0.16713:00 - 14:00
4 8 0.067 4 8 0.100 4 8 0.16714:00 - 15:00
4 8 0.200 4 8 0.200 4 8 0.40015:00 - 16:00
4 8 0.067 4 8 0.067 4 8 0.13416:00 - 17:00
4 8 0.033 4 8 0.033 4 8 0.06617:00 - 18:00
4 8 0.067 4 8 0.033 4 8 0.10018:00 - 19:00
4 8 0.033 4 8 0.067 4 8 0.10019:00 - 20:00
4 8 0.000 4 8 0.000 4 8 0.00020:00 - 21:00
4 8 0.033 4 8 0.033 4 8 0.06621:00 - 22:00
22:00 - 23:00
23:00 - 24:00
Total Rates: 0.799 0.799 1.598
This section displays the trip rate results based on the selected set of surveys and the selected count type (shown just
above the table). It is split by three main columns, representing arrivals trips, departures trips, and total trips (arrivals
plus departures). Within each of these main columns are three sub-columns. These display the number of survey days
where count data is included (per time period), the average value of the selected trip rate calculation parameter (per
time period), and the trip rate result (per time period). Total trip rates (the sum of the column) are also displayed at the
foot of the table.
To obtain a trip rate, the average (mean) trip rate parameter value (TRP) is first calculated for all selected survey days
that have count data available for the stated time period. The average (mean) number of arrivals, departures or totals
(whichever applies) is also calculated (COUNT) for all selected survey days that have count data available for the stated
time period. Then, the average count is divided by the average trip rate parameter value, and multiplied by the stated
calculation factor (shown just above the table and abbreviated here as FACT). So, the method is: COUNT/TRP*FACT. Trip
rates are then rounded to 3 decimal places.

TRICS 7.8.1 240321 B20.15 Database right of TRICS Consortium Limited, 2021. All rights reserved Wednesday 05/05/21
Petrol Filling Station - Saturday Page 9
Corun Swansea Road Swansea Licence No: 751101
TRIP RATE for Land Use 13 - PETROL FILLING STATIONS/A - PETROL FILLING STATIONS
CARS
Calculation factor: 1 BAYS
BOLD print indicates peak (busiest) period
ARRIVALS DEPARTURES TOTALS
No. Ave. Trip No. Ave. Trip No. Ave. Trip
Time Range Days BAYS Rate Days BAYS Rate Days BAYS Rate
00:00 - 01:00
01:00 - 02:00
02:00 - 03:00
03:00 - 04:00
04:00 - 05:00
05:00 - 06:00
4 8 0.933 4 8 0.833 4 8 1.76606:00 - 07:00
4 8 1.400 4 8 1.233 4 8 2.63307:00 - 08:00
4 8 2.167 4 8 2.133 4 8 4.30008:00 - 09:00
4 8 2.400 4 8 2.467 4 8 4.86709:00 - 10:00
4 8 3.133 4 8 3.100 4 8 6.23310:00 - 11:00
4 8 3.067 4 8 3.000 4 8 6.06711:00 - 12:00
4 8 3.033 4 8 2.933 4 8 5.96612:00 - 13:00
4 8 3.233 4 8 3.367 4 8 6.60013:00 - 14:00
4 8 2.533 4 8 2.600 4 8 5.13314:00 - 15:00
4 8 2.133 4 8 2.133 4 8 4.26615:00 - 16:00
4 8 2.067 4 8 2.100 4 8 4.16716:00 - 17:00
4 8 2.833 4 8 2.767 4 8 5.60017:00 - 18:00
4 8 2.167 4 8 2.267 4 8 4.43418:00 - 19:00
4 8 1.367 4 8 1.467 4 8 2.83419:00 - 20:00
4 8 0.967 4 8 0.933 4 8 1.90020:00 - 21:00
4 8 0.600 4 8 0.600 4 8 1.20021:00 - 22:00
22:00 - 23:00
23:00 - 24:00
Total Rates: 3 4.033 3 3.933 6 7.966
This section displays the trip rate results based on the selected set of surveys and the selected count type (shown just
above the table). It is split by three main columns, representing arrivals trips, departures trips, and total trips (arrivals
plus departures). Within each of these main columns are three sub-columns. These display the number of survey days
where count data is included (per time period), the average value of the selected trip rate calculation parameter (per
time period), and the trip rate result (per time period). Total trip rates (the sum of the column) are also displayed at the
foot of the table.
To obtain a trip rate, the average (mean) trip rate parameter value (TRP) is first calculated for all selected survey days
that have count data available for the stated time period. The average (mean) number of arrivals, departures or totals
(whichever applies) is also calculated (COUNT) for all selected survey days that have count data available for the stated
time period. Then, the average count is divided by the average trip rate parameter value, and multiplied by the stated
calculation factor (shown just above the table and abbreviated here as FACT). So, the method is: COUNT/TRP*FACT. Trip
rates are then rounded to 3 decimal places.

TRICS 7.8.1 240321 B20.15 Database right of TRICS Consortium Limited, 2021. All rights reserved Wednesday 05/05/21
Petrol Filling Station - Saturday Page 10
Corun Swansea Road Swansea Licence No: 751101
TRIP RATE for Land Use 13 - PETROL FILLING STATIONS/A - PETROL FILLING STATIONS
LGVS
Calculation factor: 1 BAYS
BOLD print indicates peak (busiest) period
ARRIVALS DEPARTURES TOTALS
No. Ave. Trip No. Ave. Trip No. Ave. Trip
Time Range Days BAYS Rate Days BAYS Rate Days BAYS Rate
00:00 - 01:00
01:00 - 02:00
02:00 - 03:00
03:00 - 04:00
04:00 - 05:00
05:00 - 06:00
4 8 0.467 4 8 0.467 4 8 0.93406:00 - 07:00
4 8 1.100 4 8 1.067 4 8 2.16707:00 - 08:00
4 8 1.133 4 8 1.100 4 8 2.23308:00 - 09:00
4 8 0.633 4 8 0.600 4 8 1.23309:00 - 10:00
4 8 1.267 4 8 1.133 4 8 2.40010:00 - 11:00
4 8 0.400 4 8 0.500 4 8 0.90011:00 - 12:00
4 8 0.500 4 8 0.500 4 8 1.00012:00 - 13:00
4 8 0.267 4 8 0.300 4 8 0.56713:00 - 14:00
4 8 0.767 4 8 0.767 4 8 1.53414:00 - 15:00
4 8 0.533 4 8 0.633 4 8 1.16615:00 - 16:00
4 8 0.167 4 8 0.167 4 8 0.33416:00 - 17:00
4 8 0.200 4 8 0.267 4 8 0.46717:00 - 18:00
4 8 0.333 4 8 0.333 4 8 0.66618:00 - 19:00
4 8 0.267 4 8 0.267 4 8 0.53419:00 - 20:00
4 8 0.333 4 8 0.300 4 8 0.63320:00 - 21:00
4 8 0.067 4 8 0.067 4 8 0.13421:00 - 22:00
22:00 - 23:00
23:00 - 24:00
Total Rates: 8.434 8.468 1 6.902
This section displays the trip rate results based on the selected set of surveys and the selected count type (shown just
above the table). It is split by three main columns, representing arrivals trips, departures trips, and total trips (arrivals
plus departures). Within each of these main columns are three sub-columns. These display the number of survey days
where count data is included (per time period), the average value of the selected trip rate calculation parameter (per
time period), and the trip rate result (per time period). Total trip rates (the sum of the column) are also displayed at the
foot of the table.
To obtain a trip rate, the average (mean) trip rate parameter value (TRP) is first calculated for all selected survey days
that have count data available for the stated time period. The average (mean) number of arrivals, departures or totals
(whichever applies) is also calculated (COUNT) for all selected survey days that have count data available for the stated
time period. Then, the average count is divided by the average trip rate parameter value, and multiplied by the stated
calculation factor (shown just above the table and abbreviated here as FACT). So, the method is: COUNT/TRP*FACT. Trip
rates are then rounded to 3 decimal places.

TRICS 7.8.1 240321 B20.15 Database right of TRICS Consortium Limited, 2021. All rights reserved Wednesday 05/05/21
Petrol Filling Station - Saturday Page 11
Corun Swansea Road Swansea Licence No: 751101
TRIP RATE for Land Use 13 - PETROL FILLING STATIONS/A - PETROL FILLING STATIONS
MOTOR CYCLES
Calculation factor: 1 BAYS
BOLD print indicates peak (busiest) period
ARRIVALS DEPARTURES TOTALS
No. Ave. Trip No. Ave. Trip No. Ave. Trip
Time Range Days BAYS Rate Days BAYS Rate Days BAYS Rate
00:00 - 01:00
01:00 - 02:00
02:00 - 03:00
03:00 - 04:00
04:00 - 05:00
05:00 - 06:00
4 8 0.000 4 8 0.000 4 8 0.00006:00 - 07:00
4 8 0.000 4 8 0.000 4 8 0.00007:00 - 08:00
4 8 0.000 4 8 0.000 4 8 0.00008:00 - 09:00
4 8 0.067 4 8 0.067 4 8 0.13409:00 - 10:00
4 8 0.200 4 8 0.200 4 8 0.40010:00 - 11:00
4 8 0.000 4 8 0.000 4 8 0.00011:00 - 12:00
4 8 0.167 4 8 0.167 4 8 0.33412:00 - 13:00
4 8 0.200 4 8 0.200 4 8 0.40013:00 - 14:00
4 8 0.033 4 8 0.033 4 8 0.06614:00 - 15:00
4 8 0.033 4 8 0.033 4 8 0.06615:00 - 16:00
4 8 0.033 4 8 0.033 4 8 0.06616:00 - 17:00
4 8 0.033 4 8 0.033 4 8 0.06617:00 - 18:00
4 8 0.000 4 8 0.000 4 8 0.00018:00 - 19:00
4 8 0.133 4 8 0.133 4 8 0.26619:00 - 20:00
4 8 0.000 4 8 0.000 4 8 0.00020:00 - 21:00
4 8 0.000 4 8 0.000 4 8 0.00021:00 - 22:00
22:00 - 23:00
23:00 - 24:00
Total Rates: 0.899 0.899 1.798
This section displays the trip rate results based on the selected set of surveys and the selected count type (shown just
above the table). It is split by three main columns, representing arrivals trips, departures trips, and total trips (arrivals
plus departures). Within each of these main columns are three sub-columns. These display the number of survey days
where count data is included (per time period), the average value of the selected trip rate calculation parameter (per
time period), and the trip rate result (per time period). Total trip rates (the sum of the column) are also displayed at the
foot of the table.
To obtain a trip rate, the average (mean) trip rate parameter value (TRP) is first calculated for all selected survey days
that have count data available for the stated time period. The average (mean) number of arrivals, departures or totals
(whichever applies) is also calculated (COUNT) for all selected survey days that have count data available for the stated
time period. Then, the average count is divided by the average trip rate parameter value, and multiplied by the stated
calculation factor (shown just above the table and abbreviated here as FACT). So, the method is: COUNT/TRP*FACT. Trip
rates are then rounded to 3 decimal places.
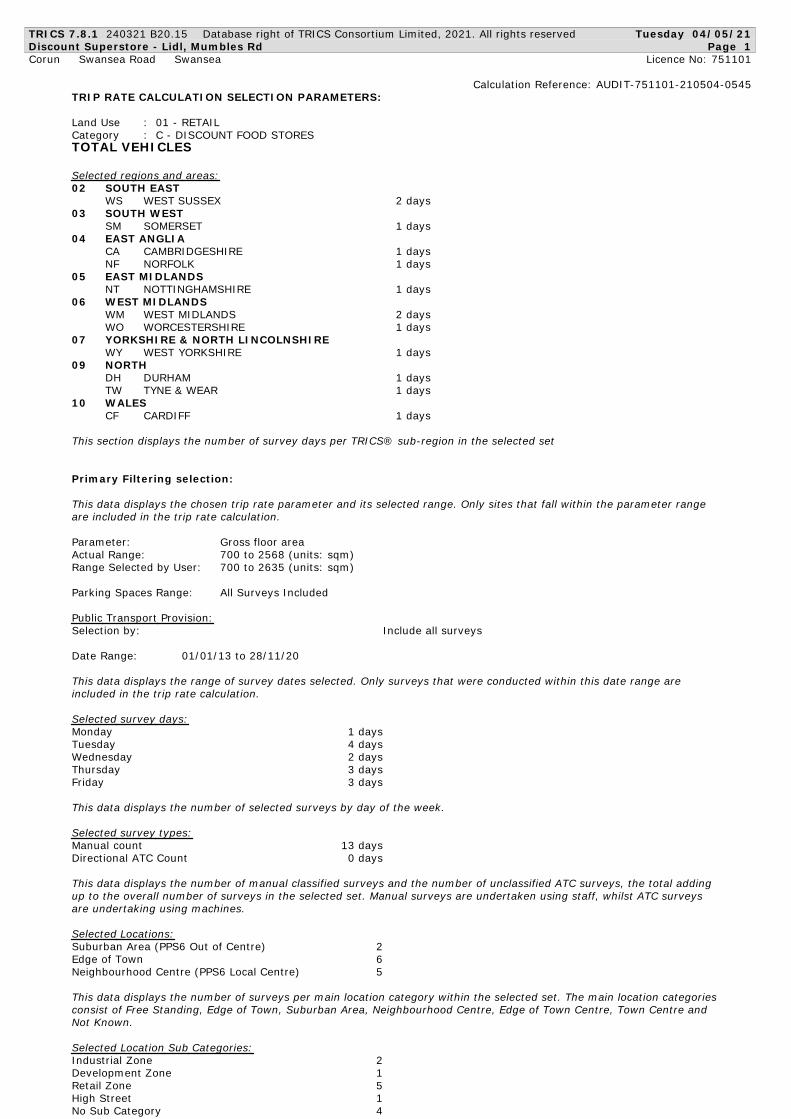
TRICS 7.8.1 240321 B20.15 Database right of TRICS Consortium Limited, 2021. All rights reserved Tuesday 04/05/21
Discount Superstore - Lidl, Mumbles Rd Page 1
Corun Swansea Road Swansea Licence No: 751101
Calculation Reference: AUDIT-751101-210504-0545
TRIP RATE CALCULATION SELECTION PARAMETERS:
Land Use : 01 - RETAIL
Category : C - DISCOUNT FOOD STORES
TOTAL VEHICLES
Selected regions and areas:
02 SOUTH EAST
WS WEST SUSSEX 2 days
03 SOUTH WEST
SM SOMERSET 1 days
04 EAST ANGLIA
CA CAMBRIDGESHIRE 1 days
NF NORFOLK 1 days
05 EAST MIDLANDS
NT NOTTINGHAMSHIRE 1 days
06 WEST MIDLANDS
WM WEST MIDLANDS 2 days
WO WORCESTERSHIRE 1 days
07 YORKSHIRE & NORTH LINCOLNSHIRE
WY WEST YORKSHIRE 1 days
09 NORTH
DH DURHAM 1 days
TW TYNE & WEAR 1 days
10 WALES
CF CARDIFF 1 days
This section displays the number of survey days per TRICS® sub-region in the selected set
Primary Filtering selection:
This data displays the chosen trip rate parameter and its selected range. Only sites that fall within the parameter range
are included in the trip rate calculation.
Parameter: Gross floor area
Actual Range: 700 to 2568 (units: sqm)
Range Selected by User: 700 to 2635 (units: sqm)
Parking Spaces Range: All Surveys Included
Public Transport Provision:
Selection by: Include all surveys
Date Range: 01/01/13 to 28/11/20
This data displays the range of survey dates selected. Only surveys that were conducted within this date range are
included in the trip rate calculation.
Selected survey days:
Monday 1 days
Tuesday 4 days
Wednesday 2 days
Thursday 3 days
Friday 3 days
This data displays the number of selected surveys by day of the week.
Selected survey types:
Manual count 13 days
Directional ATC Count 0 days
This data displays the number of manual classified surveys and the number of unclassified ATC surveys, the total adding
up to the overall number of surveys in the selected set. Manual surveys are undertaken using staff, whilst ATC surveys
are undertaking using machines.
Selected Locations:
Suburban Area (PPS6 Out of Centre) 2
Edge of Town 6
Neighbourhood Centre (PPS6 Local Centre) 5
This data displays the number of surveys per main location category within the selected set. The main location categories
consist of Free Standing, Edge of Town, Suburban Area, Neighbourhood Centre, Edge of Town Centre, Town Centre and
Not Known.
Selected Location Sub Categories:
Industrial Zone 2
Development Zone 1
Retail Zone 5
High Street 1
No Sub Category 4
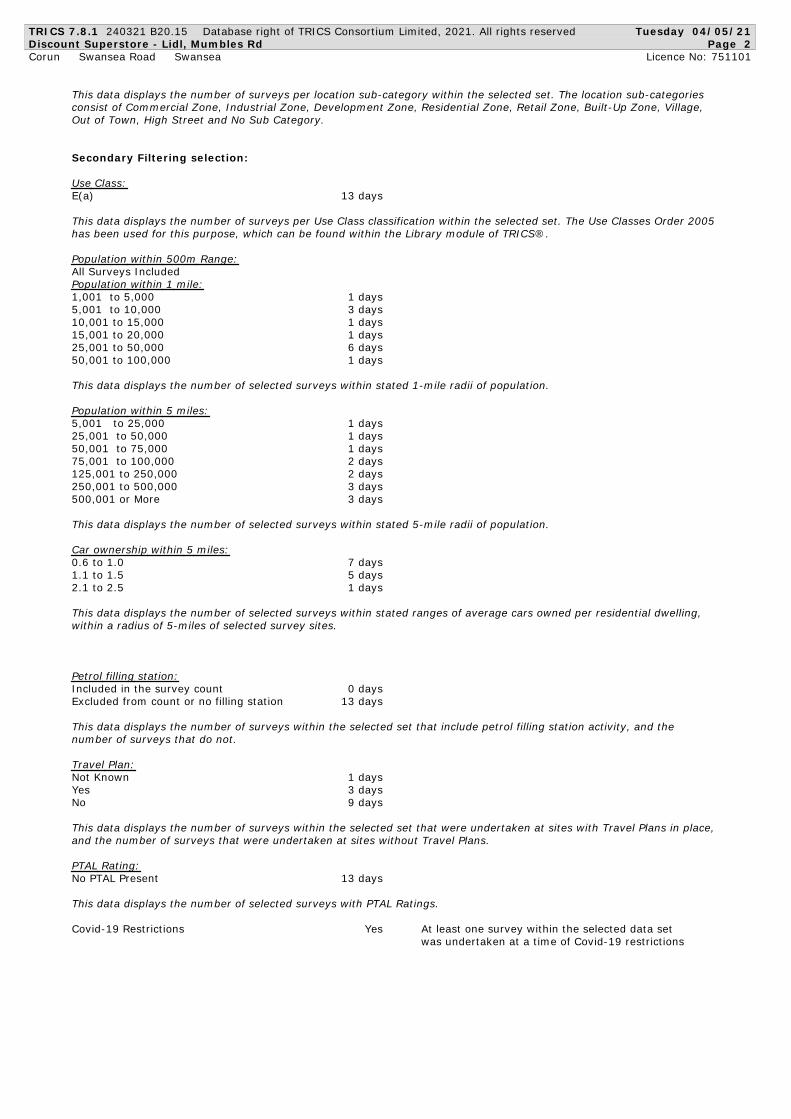
TRICS 7.8.1 240321 B20.15 Database right of TRICS Consortium Limited, 2021. All rights reserved Tuesday 04/05/21
Discount Superstore - Lidl, Mumbles Rd Page 2
Corun Swansea Road Swansea Licence No: 751101
This data displays the number of surveys per location sub-category within the selected set. The location sub-categories
consist of Commercial Zone, Industrial Zone, Development Zone, Residential Zone, Retail Zone, Built-Up Zone, Village,
Out of Town, High Street and No Sub Category.
Secondary Filtering selection:
Use Class:
E ( a ) 13 days
This data displays the number of surveys per Use Class classification within the selected set. The Use Classes Order 2005
has been used for this purpose, which can be found within the Library module of TRICS®.
Population within 500m Range:
All Surveys Included
Population within 1 mile:
1,001 to 5,000 1 days
5,001 to 10,000 3 days
10,001 to 15,000 1 days
15,001 to 20,000 1 days
25,001 to 50,000 6 days
50,001 to 100,000 1 days
This data displays the number of selected surveys within stated 1-mile radii of population.
Population within 5 miles:
5,001 to 25,000 1 days
25,001 to 50,000 1 days
50,001 to 75,000 1 days
75,001 to 100,000 2 days
125,001 to 250,000 2 days
250,001 to 500,000 3 days
500,001 or More 3 days
This data displays the number of selected surveys within stated 5-mile radii of population.
Car ownership within 5 miles:
0.6 to 1.0 7 days
1.1 to 1.5 5 days
2.1 to 2.5 1 days
This data displays the number of selected surveys within stated ranges of average cars owned per residential dwelling,
within a radius of 5-miles of selected survey sites.
Petrol filling station:
Included in the survey count 0 days
Excluded from count or no filling station 13 days
This data displays the number of surveys within the selected set that include petrol filling station activity, and the
number of surveys that do not.
Travel Plan:
Not Known 1 days
Yes 3 days
No 9 days
This data displays the number of surveys within the selected set that were undertaken at sites with Travel Plans in place,
and the number of surveys that were undertaken at sites without Travel Plans.
PTAL Rating:
No PTAL Present 13 days
This data displays the number of selected surveys with PTAL Ratings.
Covid-19 Restrictions Yes At least one survey within the selected data set
was undertaken at a time of Covid-19 restrictions
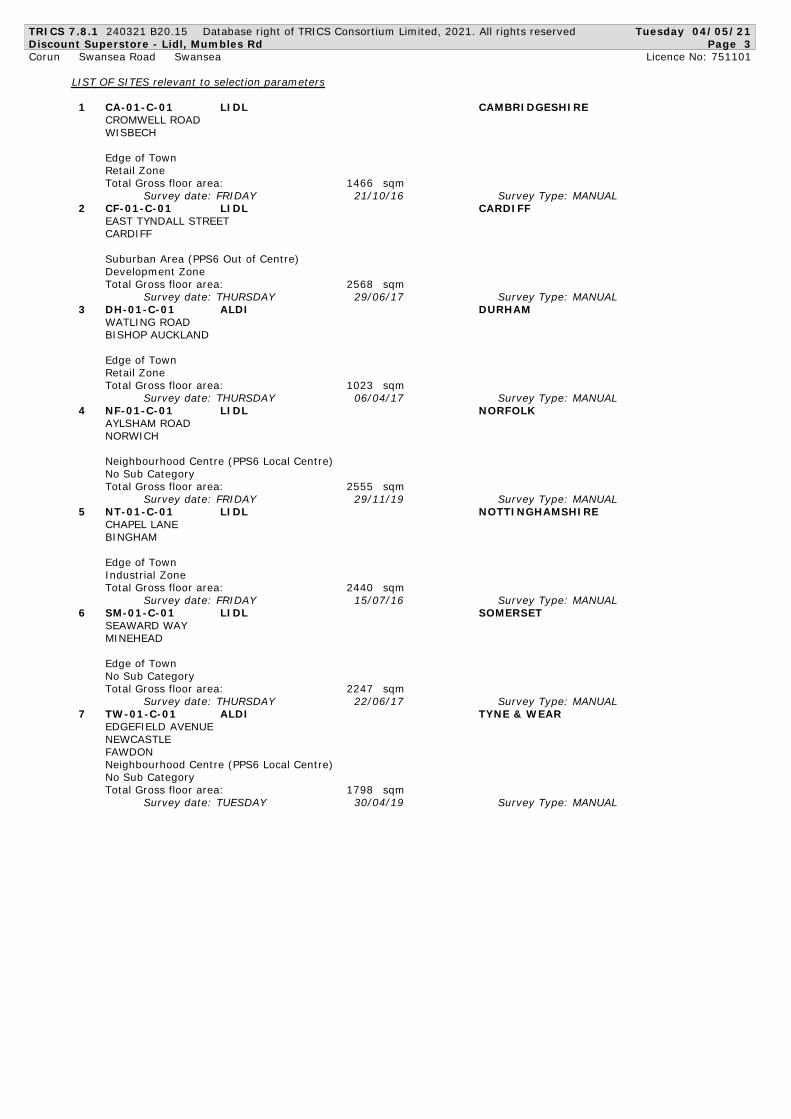
TRICS 7.8.1 240321 B20.15 Database right of TRICS Consortium Limited, 2021. All rights reserved Tuesday 04/05/21
Discount Superstore - Lidl, Mumbles Rd Page 3
Corun Swansea Road Swansea Licence No: 751101
LIST OF SITES relevant to selection parameters
1 CA-01-C-01 LIDL CAMBRIDGESHIRE
CROMWELL ROAD
WISBECH
Edge of Town
Retail Zone
Total Gross floor area: 1 4 6 6 sqm
Survey date: FRIDAY 21/10/16 Survey Type: MANUAL
2 CF-01-C-01 LIDL CARDIFF
EAST TYNDALL STREET
CARDIFF
Suburban Area (PPS6 Out of Centre)
Development Zone
Total Gross floor area: 2 5 6 8 sqm
Survey date: THURSDAY 29/06/17 Survey Type: MANUAL
3 DH-01-C-01 ALDI DURHAM
WATLING ROAD
BISHOP AUCKLAND
Edge of Town
Retail Zone
Total Gross floor area: 1 0 2 3 sqm
Survey date: THURSDAY 06/04/17 Survey Type: MANUAL
4 NF-01-C-01 LIDL NORFOLK
AYLSHAM ROAD
NORWICH
Neighbourhood Centre (PPS6 Local Centre)
No Sub Category
Total Gross floor area: 2 5 5 5 sqm
Survey date: FRIDAY 29/11/19 Survey Type: MANUAL
5 NT-01-C-01 LIDL NOTTINGHAMSHIRE
CHAPEL LANE
BINGHAM
Edge of Town
Industrial Zone
Total Gross floor area: 2 4 4 0 sqm
Survey date: FRIDAY 15/07/16 Survey Type: MANUAL
6 SM-01-C-01 LIDL SOMERSET
SEAWARD WAY
MINEHEAD
Edge of Town
No Sub Category
Total Gross floor area: 2 2 4 7 sqm
Survey date: THURSDAY 22/06/17 Survey Type: MANUAL
7 TW-01-C-01 ALDI TYNE & WEAR
EDGEFIELD AVENUE
NEWCASTLE
FAWDON
Neighbourhood Centre (PPS6 Local Centre)
No Sub Category
Total Gross floor area: 1 7 9 8 sqm
Survey date: TUESDAY 30/04/19 Survey Type: MANUAL
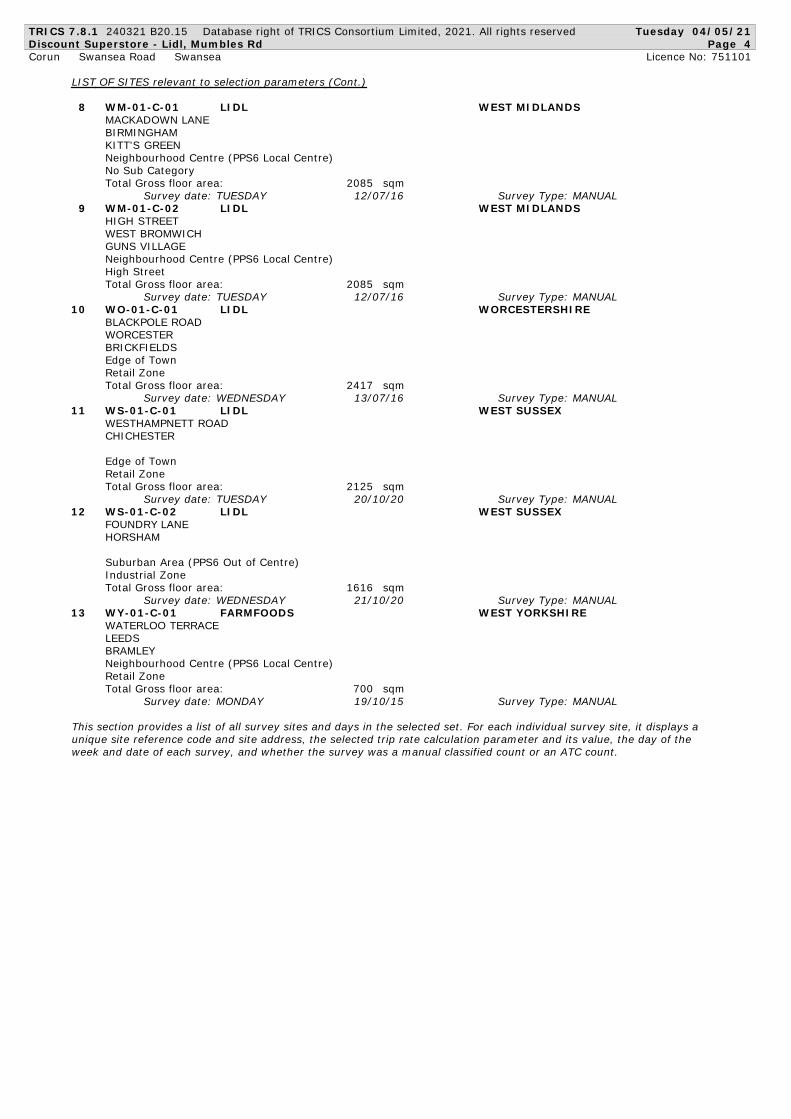
TRICS 7.8.1 240321 B20.15 Database right of TRICS Consortium Limited, 2021. All rights reserved Tuesday 04/05/21
Discount Superstore - Lidl, Mumbles Rd Page 4
Corun Swansea Road Swansea Licence No: 751101
LIST OF SITES relevant to selection parameters (Cont.)
8 WM-01-C-01 LIDL WEST MIDLANDS
MACKADOWN LANE
BIRMINGHAM
KITT'S GREEN
Neighbourhood Centre (PPS6 Local Centre)
No Sub Category
Total Gross floor area: 2 0 8 5 sqm
Survey date: TUESDAY 12/07/16 Survey Type: MANUAL
9 WM-01-C-02 LIDL WEST MIDLANDS
HIGH STREET
WEST BROMWICH
GUNS VILLAGE
Neighbourhood Centre (PPS6 Local Centre)
High Street
Total Gross floor area: 2 0 8 5 sqm
Survey date: TUESDAY 12/07/16 Survey Type: MANUAL
10 WO-01-C-01 LIDL WORCESTERSHIRE
BLACKPOLE ROAD
WORCESTER
BRICKFIELDS
Edge of Town
Retail Zone
Total Gross floor area: 2 4 1 7 sqm
Survey date: WEDNESDAY 13/07/16 Survey Type: MANUAL
11 WS-01-C-01 LIDL WEST SUSSEX
WESTHAMPNETT ROAD
CHICHESTER
Edge of Town
Retail Zone
Total Gross floor area: 2 1 2 5 sqm
Survey date: TUESDAY 20/10/20 Survey Type: MANUAL
12 WS-01-C-02 LIDL WEST SUSSEX
FOUNDRY LANE
HORSHAM
Suburban Area (PPS6 Out of Centre)
Industrial Zone
Total Gross floor area: 1 6 1 6 sqm
Survey date: WEDNESDAY 21/10/20 Survey Type: MANUAL
13 WY-01-C-01 FARMFOODS WEST YORKSHIRE
WATERLOO TERRACE
LEEDS
BRAMLEY
Neighbourhood Centre (PPS6 Local Centre)
Retail Zone
Total Gross floor area: 7 0 0 sqm
Survey date: MONDAY 19/10/15 Survey Type: MANUAL
This section provides a list of all survey sites and days in the selected set. For each individual survey site, it displays a
unique site reference code and site address, the selected trip rate calculation parameter and its value, the day of the
week and date of each survey, and whether the survey was a manual classified count or an ATC count.
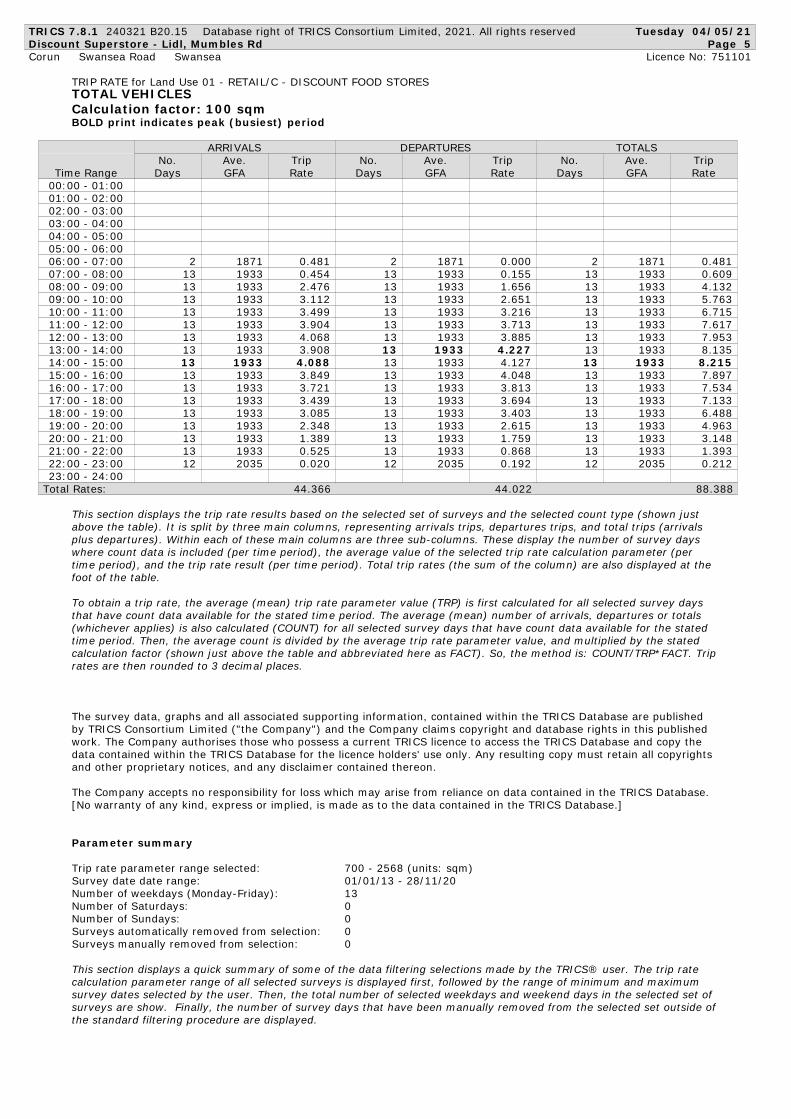
TRICS 7.8.1 240321 B20.15 Database right of TRICS Consortium Limited, 2021. All rights reserved Tuesday 04/05/21
Discount Superstore - Lidl, Mumbles Rd Page 5
Corun Swansea Road Swansea Licence No: 751101
TRIP RATE for Land Use 01 - RETAIL/C - DISCOUNT FOOD STORES
TOTAL VEHICLES
Calculation factor: 100 sqm
BOLD print indicates peak (busiest) period
ARRIVALS DEPARTURES TOTALS
No. Ave. Trip No. Ave. Trip No. Ave. Trip
Time Range Days GFA Rate Days GFA Rate Days GFA Rate
00:00 - 01:00
01:00 - 02:00
02:00 - 03:00
03:00 - 04:00
04:00 - 05:00
05:00 - 06:00
2 1871 0.481 2 1871 0.000 2 1871 0.48106:00 - 07:00
13 1933 0.454 13 1933 0.155 13 1933 0.60907:00 - 08:00
13 1933 2.476 13 1933 1.656 13 1933 4.13208:00 - 09:00
13 1933 3.112 13 1933 2.651 13 1933 5.76309:00 - 10:00
13 1933 3.499 13 1933 3.216 13 1933 6.71510:00 - 11:00
13 1933 3.904 13 1933 3.713 13 1933 7.61711:00 - 12:00
13 1933 4.068 13 1933 3.885 13 1933 7.95312:00 - 13:00
13 1933 3.908 13 1933 4.227 13 1933 8.13513:00 - 14:00
13 1933 4.088 13 1933 4.127 13 1933 8.21514:00 - 15:00
13 1933 3.849 13 1933 4.048 13 1933 7.89715:00 - 16:00
13 1933 3.721 13 1933 3.813 13 1933 7.53416:00 - 17:00
13 1933 3.439 13 1933 3.694 13 1933 7.13317:00 - 18:00
13 1933 3.085 13 1933 3.403 13 1933 6.48818:00 - 19:00
13 1933 2.348 13 1933 2.615 13 1933 4.96319:00 - 20:00
13 1933 1.389 13 1933 1.759 13 1933 3.14820:00 - 21:00
13 1933 0.525 13 1933 0.868 13 1933 1.39321:00 - 22:00
12 2035 0.020 12 2035 0.192 12 2035 0.21222:00 - 23:00
23:00 - 24:00
Total Rates: 4 4.366 4 4.022 8 8.388
This section displays the trip rate results based on the selected set of surveys and the selected count type (shown just
above the table). It is split by three main columns, representing arrivals trips, departures trips, and total trips (arrivals
plus departures). Within each of these main columns are three sub-columns. These display the number of survey days
where count data is included (per time period), the average value of the selected trip rate calculation parameter (per
time period), and the trip rate result (per time period). Total trip rates (the sum of the column) are also displayed at the
foot of the table.
To obtain a trip rate, the average (mean) trip rate parameter value (TRP) is first calculated for all selected survey days
that have count data available for the stated time period. The average (mean) number of arrivals, departures or totals
(whichever applies) is also calculated (COUNT) for all selected survey days that have count data available for the stated
time period. Then, the average count is divided by the average trip rate parameter value, and multiplied by the stated
calculation factor (shown just above the table and abbreviated here as FACT). So, the method is: COUNT/TRP*FACT. Trip
rates are then rounded to 3 decimal places.
The survey data, graphs and all associated supporting information, contained within the TRICS Database are published
by TRICS Consortium Limited ("the Company") and the Company claims copyright and database rights in this published
work. The Company authorises those who possess a current TRICS licence to access the TRICS Database and copy the
data contained within the TRICS Database for the licence holders' use only. Any resulting copy must retain all copyrights
and other proprietary notices, and any disclaimer contained thereon.
The Company accepts no responsibility for loss which may arise from reliance on data contained in the TRICS Database.
[No warranty of any kind, express or implied, is made as to the data contained in the TRICS Database.]
Parameter summary
Trip rate parameter range selected: 700 - 2568 (units: sqm)
Survey date date range: 01/01/13 - 28/11/20
Number of weekdays (Monday-Friday): 13
Number of Saturdays: 0
Number of Sundays: 0
Surveys automatically removed from selection: 0
Surveys manually removed from selection: 0
This section displays a quick summary of some of the data filtering selections made by the TRICS® user. The trip rate
calculation parameter range of all selected surveys is displayed first, followed by the range of minimum and maximum
survey dates selected by the user. Then, the total number of selected weekdays and weekend days in the selected set of
surveys are show. Finally, the number of survey days that have been manually removed from the selected set outside of
the standard filtering procedure are displayed.

TRICS 7.8.1 240321 B20.15 Database right of TRICS Consortium Limited, 2021. All rights reserved Tuesday 04/05/21
Discount Superstore - Lidl, Mumbles Rd Page 6
Corun Swansea Road Swansea Licence No: 751101
TRIP RATE for Land Use 01 - RETAIL/C - DISCOUNT FOOD STORES
TAXIS
Calculation factor: 100 sqm
BOLD print indicates peak (busiest) period
ARRIVALS DEPARTURES TOTALS
No. Ave. Trip No. Ave. Trip No. Ave. Trip
Time Range Days GFA Rate Days GFA Rate Days GFA Rate
00:00 - 01:00
01:00 - 02:00
02:00 - 03:00
03:00 - 04:00
04:00 - 05:00
05:00 - 06:00
2 1871 0.000 2 1871 0.000 2 1871 0.00006:00 - 07:00
13 1933 0.000 13 1933 0.000 13 1933 0.00007:00 - 08:00
13 1933 0.016 13 1933 0.008 13 1933 0.02408:00 - 09:00
13 1933 0.048 13 1933 0.048 13 1933 0.09609:00 - 10:00
13 1933 0.044 13 1933 0.040 13 1933 0.08410:00 - 11:00
13 1933 0.020 13 1933 0.028 13 1933 0.04811:00 - 12:00
13 1933 0.028 13 1933 0.032 13 1933 0.06012:00 - 13:00
13 1933 0.048 13 1933 0.044 13 1933 0.09213:00 - 14:00
13 1933 0.040 13 1933 0.036 13 1933 0.07614:00 - 15:00
13 1933 0.032 13 1933 0.032 13 1933 0.06415:00 - 16:00
13 1933 0.032 13 1933 0.024 13 1933 0.05616:00 - 17:00
13 1933 0.040 13 1933 0.040 13 1933 0.08017:00 - 18:00
13 1933 0.040 13 1933 0.052 13 1933 0.09218:00 - 19:00
13 1933 0.012 13 1933 0.016 13 1933 0.02819:00 - 20:00
13 1933 0.028 13 1933 0.020 13 1933 0.04820:00 - 21:00
13 1933 0.016 13 1933 0.024 13 1933 0.04021:00 - 22:00
12 2035 0.000 12 2035 0.000 12 2035 0.00022:00 - 23:00
23:00 - 24:00
Total Rates: 0.444 0.444 0.888
This section displays the trip rate results based on the selected set of surveys and the selected count type (shown just
above the table). It is split by three main columns, representing arrivals trips, departures trips, and total trips (arrivals
plus departures). Within each of these main columns are three sub-columns. These display the number of survey days
where count data is included (per time period), the average value of the selected trip rate calculation parameter (per
time period), and the trip rate result (per time period). Total trip rates (the sum of the column) are also displayed at the
foot of the table.
To obtain a trip rate, the average (mean) trip rate parameter value (TRP) is first calculated for all selected survey days
that have count data available for the stated time period. The average (mean) number of arrivals, departures or totals
(whichever applies) is also calculated (COUNT) for all selected survey days that have count data available for the stated
time period. Then, the average count is divided by the average trip rate parameter value, and multiplied by the stated
calculation factor (shown just above the table and abbreviated here as FACT). So, the method is: COUNT/TRP*FACT. Trip
rates are then rounded to 3 decimal places.

TRICS 7.8.1 240321 B20.15 Database right of TRICS Consortium Limited, 2021. All rights reserved Tuesday 04/05/21
Discount Superstore - Lidl, Mumbles Rd Page 7
Corun Swansea Road Swansea Licence No: 751101
TRIP RATE for Land Use 01 - RETAIL/C - DISCOUNT FOOD STORES
OGVS
Calculation factor: 100 sqm
BOLD print indicates peak (busiest) period
ARRIVALS DEPARTURES TOTALS
No. Ave. Trip No. Ave. Trip No. Ave. Trip
Time Range Days GFA Rate Days GFA Rate Days GFA Rate
00:00 - 01:00
01:00 - 02:00
02:00 - 03:00
03:00 - 04:00
04:00 - 05:00
05:00 - 06:00
2 1871 0.000 2 1871 0.000 2 1871 0.00006:00 - 07:00
13 1933 0.016 13 1933 0.008 13 1933 0.02407:00 - 08:00
13 1933 0.012 13 1933 0.012 13 1933 0.02408:00 - 09:00
13 1933 0.016 13 1933 0.024 13 1933 0.04009:00 - 10:00
13 1933 0.012 13 1933 0.012 13 1933 0.02410:00 - 11:00
13 1933 0.016 13 1933 0.012 13 1933 0.02811:00 - 12:00
13 1933 0.012 13 1933 0.008 13 1933 0.02012:00 - 13:00
13 1933 0.020 13 1933 0.028 13 1933 0.04813:00 - 14:00
13 1933 0.000 13 1933 0.008 13 1933 0.00814:00 - 15:00
13 1933 0.004 13 1933 0.004 13 1933 0.00815:00 - 16:00
13 1933 0.008 13 1933 0.004 13 1933 0.01216:00 - 17:00
13 1933 0.004 13 1933 0.004 13 1933 0.00817:00 - 18:00
13 1933 0.020 13 1933 0.016 13 1933 0.03618:00 - 19:00
13 1933 0.020 13 1933 0.020 13 1933 0.04019:00 - 20:00
13 1933 0.004 13 1933 0.012 13 1933 0.01620:00 - 21:00
13 1933 0.000 13 1933 0.000 13 1933 0.00021:00 - 22:00
12 2035 0.000 12 2035 0.000 12 2035 0.00022:00 - 23:00
23:00 - 24:00
Total Rates: 0.164 0.172 0.336
This section displays the trip rate results based on the selected set of surveys and the selected count type (shown just
above the table). It is split by three main columns, representing arrivals trips, departures trips, and total trips (arrivals
plus departures). Within each of these main columns are three sub-columns. These display the number of survey days
where count data is included (per time period), the average value of the selected trip rate calculation parameter (per
time period), and the trip rate result (per time period). Total trip rates (the sum of the column) are also displayed at the
foot of the table.
To obtain a trip rate, the average (mean) trip rate parameter value (TRP) is first calculated for all selected survey days
that have count data available for the stated time period. The average (mean) number of arrivals, departures or totals
(whichever applies) is also calculated (COUNT) for all selected survey days that have count data available for the stated
time period. Then, the average count is divided by the average trip rate parameter value, and multiplied by the stated
calculation factor (shown just above the table and abbreviated here as FACT). So, the method is: COUNT/TRP*FACT. Trip
rates are then rounded to 3 decimal places.

TRICS 7.8.1 240321 B20.15 Database right of TRICS Consortium Limited, 2021. All rights reserved Tuesday 04/05/21
Discount Superstore - Lidl, Mumbles Rd Page 8
Corun Swansea Road Swansea Licence No: 751101
TRIP RATE for Land Use 01 - RETAIL/C - DISCOUNT FOOD STORES
CYCLISTS
Calculation factor: 100 sqm
BOLD print indicates peak (busiest) period
ARRIVALS DEPARTURES TOTALS
No. Ave. Trip No. Ave. Trip No. Ave. Trip
Time Range Days GFA Rate Days GFA Rate Days GFA Rate
00:00 - 01:00
01:00 - 02:00
02:00 - 03:00
03:00 - 04:00
04:00 - 05:00
05:00 - 06:00
2 1871 0.027 2 1871 0.000 2 1871 0.02706:00 - 07:00
13 1933 0.028 13 1933 0.000 13 1933 0.02807:00 - 08:00
13 1933 0.072 13 1933 0.068 13 1933 0.14008:00 - 09:00
13 1933 0.084 13 1933 0.052 13 1933 0.13609:00 - 10:00
13 1933 0.100 13 1933 0.084 13 1933 0.18410:00 - 11:00
13 1933 0.072 13 1933 0.084 13 1933 0.15611:00 - 12:00
13 1933 0.068 13 1933 0.092 13 1933 0.16012:00 - 13:00
13 1933 0.088 13 1933 0.084 13 1933 0.17213:00 - 14:00
13 1933 0.072 13 1933 0.076 13 1933 0.14814:00 - 15:00
13 1933 0.084 13 1933 0.076 13 1933 0.16015:00 - 16:00
13 1933 0.084 13 1933 0.064 13 1933 0.14816:00 - 17:00
13 1933 0.119 13 1933 0.139 13 1933 0.25817:00 - 18:00
13 1933 0.100 13 1933 0.092 13 1933 0.19218:00 - 19:00
13 1933 0.040 13 1933 0.052 13 1933 0.09219:00 - 20:00
13 1933 0.056 13 1933 0.068 13 1933 0.12420:00 - 21:00
13 1933 0.004 13 1933 0.032 13 1933 0.03621:00 - 22:00
12 2035 0.004 12 2035 0.016 12 2035 0.02022:00 - 23:00
23:00 - 24:00
Total Rates: 1.102 1.079 2.181
This section displays the trip rate results based on the selected set of surveys and the selected count type (shown just
above the table). It is split by three main columns, representing arrivals trips, departures trips, and total trips (arrivals
plus departures). Within each of these main columns are three sub-columns. These display the number of survey days
where count data is included (per time period), the average value of the selected trip rate calculation parameter (per
time period), and the trip rate result (per time period). Total trip rates (the sum of the column) are also displayed at the
foot of the table.
To obtain a trip rate, the average (mean) trip rate parameter value (TRP) is first calculated for all selected survey days
that have count data available for the stated time period. The average (mean) number of arrivals, departures or totals
(whichever applies) is also calculated (COUNT) for all selected survey days that have count data available for the stated
time period. Then, the average count is divided by the average trip rate parameter value, and multiplied by the stated
calculation factor (shown just above the table and abbreviated here as FACT). So, the method is: COUNT/TRP*FACT. Trip
rates are then rounded to 3 decimal places.

TRICS 7.8.1 240321 B20.15 Database right of TRICS Consortium Limited, 2021. All rights reserved Tuesday 04/05/21
Discount Superstore - Lidl, Mumbles Rd Page 9
Corun Swansea Road Swansea Licence No: 751101
TRIP RATE for Land Use 01 - RETAIL/C - DISCOUNT FOOD STORES
CARS
Calculation factor: 100 sqm
BOLD print indicates peak (busiest) period
ARRIVALS DEPARTURES TOTALS
No. Ave. Trip No. Ave. Trip No. Ave. Trip
Time Range Days GFA Rate Days GFA Rate Days GFA Rate
00:00 - 01:00
01:00 - 02:00
02:00 - 03:00
03:00 - 04:00
04:00 - 05:00
05:00 - 06:00
2 1871 0.401 2 1871 0.000 2 1871 0.40106:00 - 07:00
13 1933 0.398 13 1933 0.123 13 1933 0.52107:00 - 08:00
13 1933 2.297 13 1933 1.520 13 1933 3.81708:00 - 09:00
13 1933 2.838 13 1933 2.408 13 1933 5.24609:00 - 10:00
13 1933 3.272 13 1933 2.997 13 1933 6.26910:00 - 11:00
13 1933 3.705 13 1933 3.495 13 1933 7.20011:00 - 12:00
13 1933 3.849 13 1933 3.698 13 1933 7.54712:00 - 13:00
13 1933 3.674 13 1933 3.980 13 1933 7.65413:00 - 14:00
13 1933 3.904 13 1933 3.912 13 1933 7.81614:00 - 15:00
13 1933 3.630 13 1933 3.813 13 1933 7.44315:00 - 16:00
13 1933 3.487 13 1933 3.606 13 1933 7.09316:00 - 17:00
13 1933 3.248 13 1933 3.487 13 1933 6.73517:00 - 18:00
13 1933 2.882 13 1933 3.164 13 1933 6.04618:00 - 19:00
13 1933 2.189 13 1933 2.460 13 1933 4.64919:00 - 20:00
13 1933 1.313 13 1933 1.644 13 1933 2.95720:00 - 21:00
13 1933 0.482 13 1933 0.808 13 1933 1.29021:00 - 22:00
12 2035 0.020 12 2035 0.188 12 2035 0.20822:00 - 23:00
23:00 - 24:00
Total Rates: 4 1.589 4 1.303 8 2.892
This section displays the trip rate results based on the selected set of surveys and the selected count type (shown just
above the table). It is split by three main columns, representing arrivals trips, departures trips, and total trips (arrivals
plus departures). Within each of these main columns are three sub-columns. These display the number of survey days
where count data is included (per time period), the average value of the selected trip rate calculation parameter (per
time period), and the trip rate result (per time period). Total trip rates (the sum of the column) are also displayed at the
foot of the table.
To obtain a trip rate, the average (mean) trip rate parameter value (TRP) is first calculated for all selected survey days
that have count data available for the stated time period. The average (mean) number of arrivals, departures or totals
(whichever applies) is also calculated (COUNT) for all selected survey days that have count data available for the stated
time period. Then, the average count is divided by the average trip rate parameter value, and multiplied by the stated
calculation factor (shown just above the table and abbreviated here as FACT). So, the method is: COUNT/TRP*FACT. Trip
rates are then rounded to 3 decimal places.
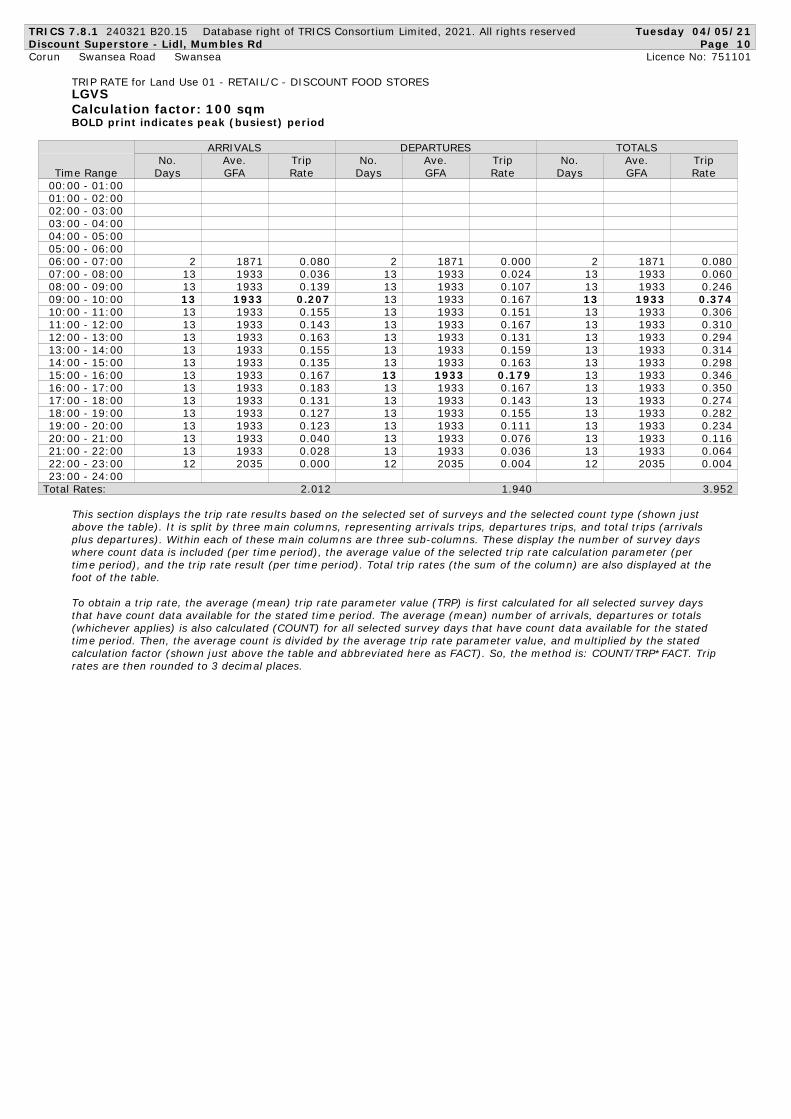
TRICS 7.8.1 240321 B20.15 Database right of TRICS Consortium Limited, 2021. All rights reserved Tuesday 04/05/21
Discount Superstore - Lidl, Mumbles Rd Page 10
Corun Swansea Road Swansea Licence No: 751101
TRIP RATE for Land Use 01 - RETAIL/C - DISCOUNT FOOD STORES
LGVS
Calculation factor: 100 sqm
BOLD print indicates peak (busiest) period
ARRIVALS DEPARTURES TOTALS
No. Ave. Trip No. Ave. Trip No. Ave. Trip
Time Range Days GFA Rate Days GFA Rate Days GFA Rate
00:00 - 01:00
01:00 - 02:00
02:00 - 03:00
03:00 - 04:00
04:00 - 05:00
05:00 - 06:00
2 1871 0.080 2 1871 0.000 2 1871 0.08006:00 - 07:00
13 1933 0.036 13 1933 0.024 13 1933 0.06007:00 - 08:00
13 1933 0.139 13 1933 0.107 13 1933 0.24608:00 - 09:00
13 1933 0.207 13 1933 0.167 13 1933 0.37409:00 - 10:00
13 1933 0.155 13 1933 0.151 13 1933 0.30610:00 - 11:00
13 1933 0.143 13 1933 0.167 13 1933 0.31011:00 - 12:00
13 1933 0.163 13 1933 0.131 13 1933 0.29412:00 - 13:00
13 1933 0.155 13 1933 0.159 13 1933 0.31413:00 - 14:00
13 1933 0.135 13 1933 0.163 13 1933 0.29814:00 - 15:00
13 1933 0.167 13 1933 0.179 13 1933 0.34615:00 - 16:00
13 1933 0.183 13 1933 0.167 13 1933 0.35016:00 - 17:00
13 1933 0.131 13 1933 0.143 13 1933 0.27417:00 - 18:00
13 1933 0.127 13 1933 0.155 13 1933 0.28218:00 - 19:00
13 1933 0.123 13 1933 0.111 13 1933 0.23419:00 - 20:00
13 1933 0.040 13 1933 0.076 13 1933 0.11620:00 - 21:00
13 1933 0.028 13 1933 0.036 13 1933 0.06421:00 - 22:00
12 2035 0.000 12 2035 0.004 12 2035 0.00422:00 - 23:00
23:00 - 24:00
Total Rates: 2.012 1.940 3.952
This section displays the trip rate results based on the selected set of surveys and the selected count type (shown just
above the table). It is split by three main columns, representing arrivals trips, departures trips, and total trips (arrivals
plus departures). Within each of these main columns are three sub-columns. These display the number of survey days
where count data is included (per time period), the average value of the selected trip rate calculation parameter (per
time period), and the trip rate result (per time period). Total trip rates (the sum of the column) are also displayed at the
foot of the table.
To obtain a trip rate, the average (mean) trip rate parameter value (TRP) is first calculated for all selected survey days
that have count data available for the stated time period. The average (mean) number of arrivals, departures or totals
(whichever applies) is also calculated (COUNT) for all selected survey days that have count data available for the stated
time period. Then, the average count is divided by the average trip rate parameter value, and multiplied by the stated
calculation factor (shown just above the table and abbreviated here as FACT). So, the method is: COUNT/TRP*FACT. Trip
rates are then rounded to 3 decimal places.
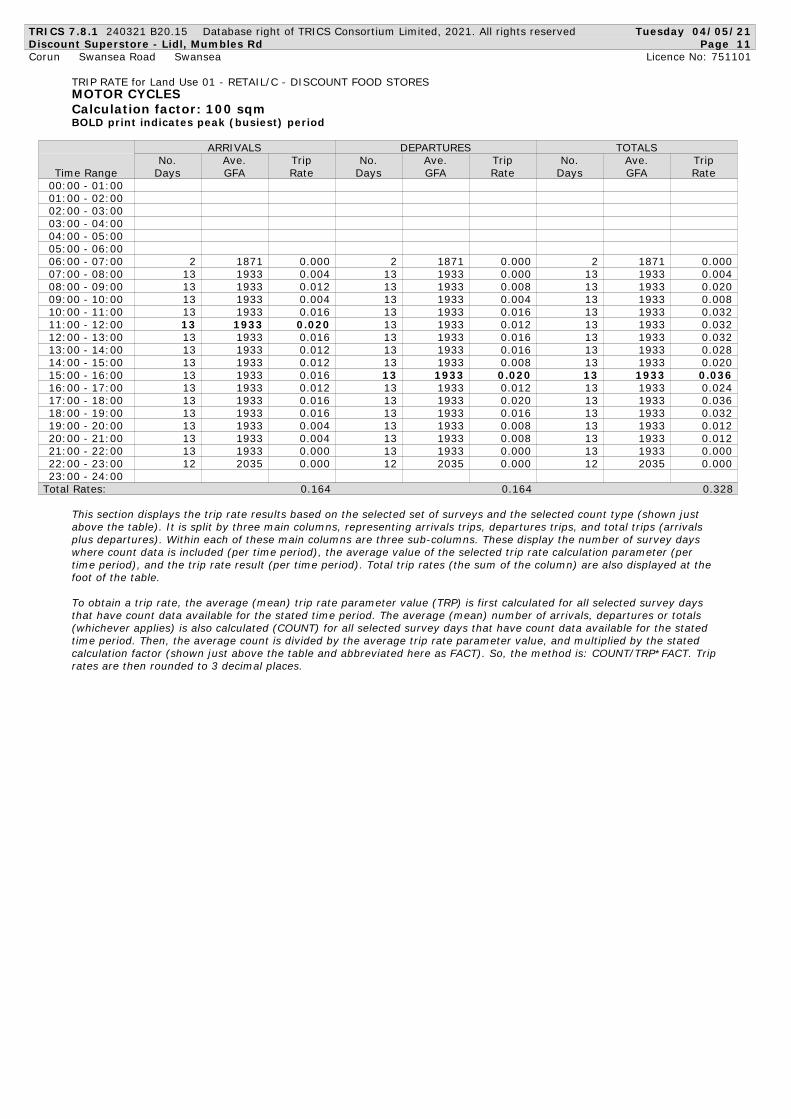
TRICS 7.8.1 240321 B20.15 Database right of TRICS Consortium Limited, 2021. All rights reserved Tuesday 04/05/21
Discount Superstore - Lidl, Mumbles Rd Page 11
Corun Swansea Road Swansea Licence No: 751101
TRIP RATE for Land Use 01 - RETAIL/C - DISCOUNT FOOD STORES
MOTOR CYCLES
Calculation factor: 100 sqm
BOLD print indicates peak (busiest) period
ARRIVALS DEPARTURES TOTALS
No. Ave. Trip No. Ave. Trip No. Ave. Trip
Time Range Days GFA Rate Days GFA Rate Days GFA Rate
00:00 - 01:00
01:00 - 02:00
02:00 - 03:00
03:00 - 04:00
04:00 - 05:00
05:00 - 06:00
2 1871 0.000 2 1871 0.000 2 1871 0.00006:00 - 07:00
13 1933 0.004 13 1933 0.000 13 1933 0.00407:00 - 08:00
13 1933 0.012 13 1933 0.008 13 1933 0.02008:00 - 09:00
13 1933 0.004 13 1933 0.004 13 1933 0.00809:00 - 10:00
13 1933 0.016 13 1933 0.016 13 1933 0.03210:00 - 11:00
13 1933 0.020 13 1933 0.012 13 1933 0.03211:00 - 12:00
13 1933 0.016 13 1933 0.016 13 1933 0.03212:00 - 13:00
13 1933 0.012 13 1933 0.016 13 1933 0.02813:00 - 14:00
13 1933 0.012 13 1933 0.008 13 1933 0.02014:00 - 15:00
13 1933 0.016 13 1933 0.020 13 1933 0.03615:00 - 16:00
13 1933 0.012 13 1933 0.012 13 1933 0.02416:00 - 17:00
13 1933 0.016 13 1933 0.020 13 1933 0.03617:00 - 18:00
13 1933 0.016 13 1933 0.016 13 1933 0.03218:00 - 19:00
13 1933 0.004 13 1933 0.008 13 1933 0.01219:00 - 20:00
13 1933 0.004 13 1933 0.008 13 1933 0.01220:00 - 21:00
13 1933 0.000 13 1933 0.000 13 1933 0.00021:00 - 22:00
12 2035 0.000 12 2035 0.000 12 2035 0.00022:00 - 23:00
23:00 - 24:00
Total Rates: 0.164 0.164 0.328
This section displays the trip rate results based on the selected set of surveys and the selected count type (shown just
above the table). It is split by three main columns, representing arrivals trips, departures trips, and total trips (arrivals
plus departures). Within each of these main columns are three sub-columns. These display the number of survey days
where count data is included (per time period), the average value of the selected trip rate calculation parameter (per
time period), and the trip rate result (per time period). Total trip rates (the sum of the column) are also displayed at the
foot of the table.
To obtain a trip rate, the average (mean) trip rate parameter value (TRP) is first calculated for all selected survey days
that have count data available for the stated time period. The average (mean) number of arrivals, departures or totals
(whichever applies) is also calculated (COUNT) for all selected survey days that have count data available for the stated
time period. Then, the average count is divided by the average trip rate parameter value, and multiplied by the stated
calculation factor (shown just above the table and abbreviated here as FACT). So, the method is: COUNT/TRP*FACT. Trip
rates are then rounded to 3 decimal places.
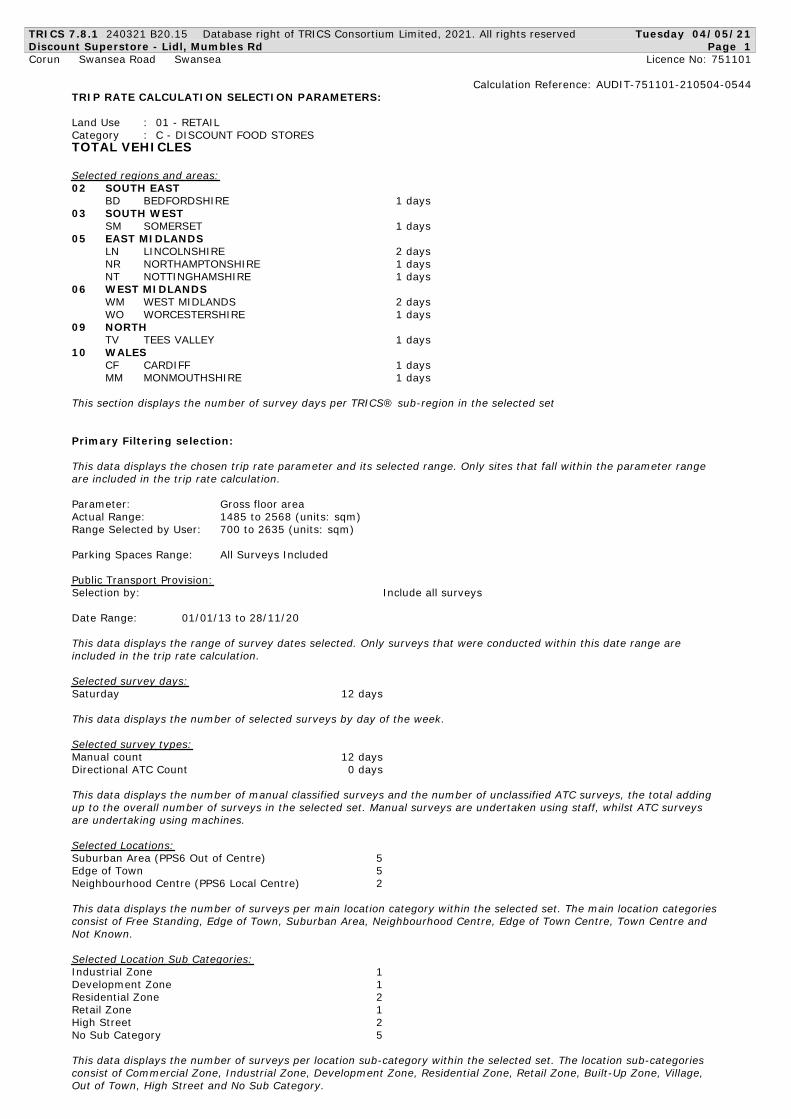
TRICS 7.8.1 240321 B20.15 Database right of TRICS Consortium Limited, 2021. All rights reserved Tuesday 04/05/21
Discount Superstore - Lidl, Mumbles Rd Page 1
Corun Swansea Road Swansea Licence No: 751101
Calculation Reference: AUDIT-751101-210504-0544
TRIP RATE CALCULATION SELECTION PARAMETERS:
Land Use : 01 - RETAIL
Category : C - DISCOUNT FOOD STORES
TOTAL VEHICLES
Selected regions and areas:
02 SOUTH EAST
BD BEDFORDSHIRE 1 days
03 SOUTH WEST
SM SOMERSET 1 days
05 EAST MIDLANDS
LN LINCOLNSHIRE 2 days
NR NORTHAMPTONSHIRE 1 days
NT NOTTINGHAMSHIRE 1 days
06 WEST MIDLANDS
WM WEST MIDLANDS 2 days
WO WORCESTERSHIRE 1 days
09 NORTH
TV TEES VALLEY 1 days
10 WALES
CF CARDIFF 1 days
MM MONMOUTHSHIRE 1 days
This section displays the number of survey days per TRICS® sub-region in the selected set
Primary Filtering selection:
This data displays the chosen trip rate parameter and its selected range. Only sites that fall within the parameter range
are included in the trip rate calculation.
Parameter: Gross floor area
Actual Range: 1485 to 2568 (units: sqm)
Range Selected by User: 700 to 2635 (units: sqm)
Parking Spaces Range: All Surveys Included
Public Transport Provision:
Selection by: Include all surveys
Date Range: 01/01/13 to 28/11/20
This data displays the range of survey dates selected. Only surveys that were conducted within this date range are
included in the trip rate calculation.
Selected survey days:
Saturday 12 days
This data displays the number of selected surveys by day of the week.
Selected survey types:
Manual count 12 days
Directional ATC Count 0 days
This data displays the number of manual classified surveys and the number of unclassified ATC surveys, the total adding
up to the overall number of surveys in the selected set. Manual surveys are undertaken using staff, whilst ATC surveys
are undertaking using machines.
Selected Locations:
Suburban Area (PPS6 Out of Centre) 5
Edge of Town 5
Neighbourhood Centre (PPS6 Local Centre) 2
This data displays the number of surveys per main location category within the selected set. The main location categories
consist of Free Standing, Edge of Town, Suburban Area, Neighbourhood Centre, Edge of Town Centre, Town Centre and
Not Known.
Selected Location Sub Categories:
Industrial Zone 1
Development Zone 1
Residential Zone 2
Retail Zone 1
High Street 2
No Sub Category 5
This data displays the number of surveys per location sub-category within the selected set. The location sub-categories
consist of Commercial Zone, Industrial Zone, Development Zone, Residential Zone, Retail Zone, Built-Up Zone, Village,
Out of Town, High Street and No Sub Category.
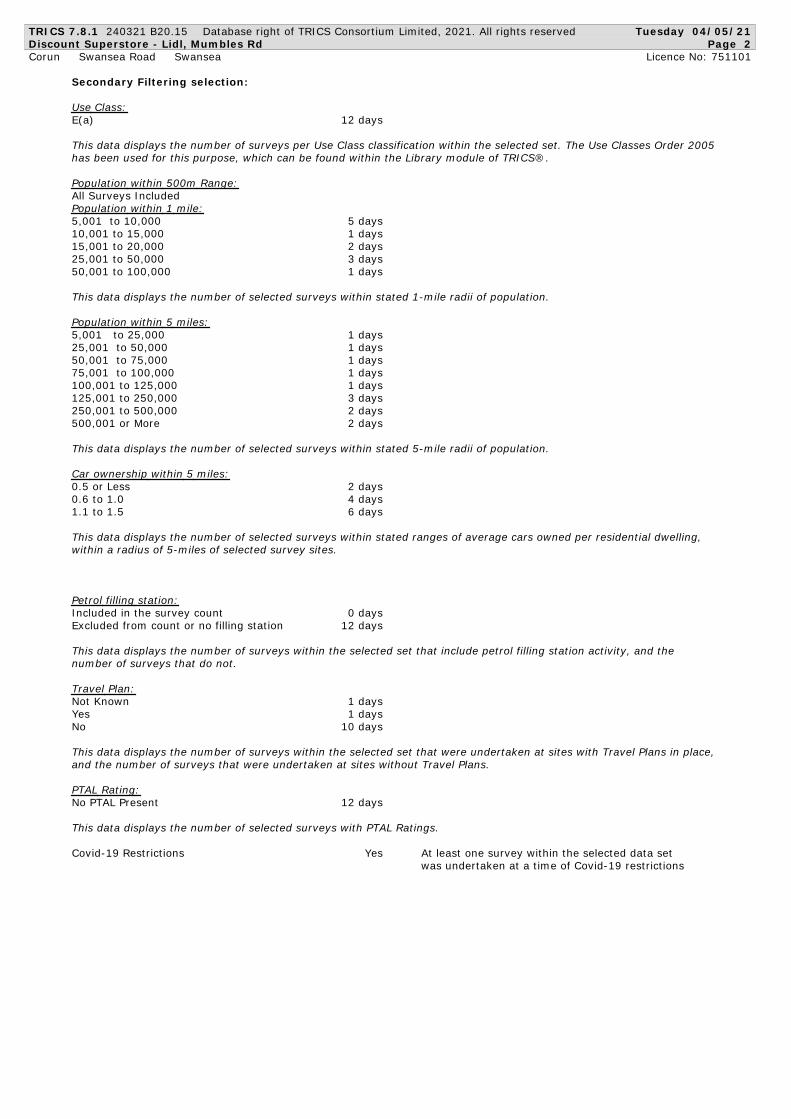
TRICS 7.8.1 240321 B20.15 Database right of TRICS Consortium Limited, 2021. All rights reserved Tuesday 04/05/21
Discount Superstore - Lidl, Mumbles Rd Page 2
Corun Swansea Road Swansea Licence No: 751101
Secondary Filtering selection:
Use Class:
E ( a ) 12 days
This data displays the number of surveys per Use Class classification within the selected set. The Use Classes Order 2005
has been used for this purpose, which can be found within the Library module of TRICS®.
Population within 500m Range:
All Surveys Included
Population within 1 mile:
5,001 to 10,000 5 days
10,001 to 15,000 1 days
15,001 to 20,000 2 days
25,001 to 50,000 3 days
50,001 to 100,000 1 days
This data displays the number of selected surveys within stated 1-mile radii of population.
Population within 5 miles:
5,001 to 25,000 1 days
25,001 to 50,000 1 days
50,001 to 75,000 1 days
75,001 to 100,000 1 days
100,001 to 125,000 1 days
125,001 to 250,000 3 days
250,001 to 500,000 2 days
500,001 or More 2 days
This data displays the number of selected surveys within stated 5-mile radii of population.
Car ownership within 5 miles:
0.5 or Less 2 days
0.6 to 1.0 4 days
1.1 to 1.5 6 days
This data displays the number of selected surveys within stated ranges of average cars owned per residential dwelling,
within a radius of 5-miles of selected survey sites.
Petrol filling station:
Included in the survey count 0 days
Excluded from count or no filling station 12 days
This data displays the number of surveys within the selected set that include petrol filling station activity, and the
number of surveys that do not.
Travel Plan:
Not Known 1 days
Yes 1 days
No 10 days
This data displays the number of surveys within the selected set that were undertaken at sites with Travel Plans in place,
and the number of surveys that were undertaken at sites without Travel Plans.
PTAL Rating:
No PTAL Present 12 days
This data displays the number of selected surveys with PTAL Ratings.
Covid-19 Restrictions Yes At least one survey within the selected data set
was undertaken at a time of Covid-19 restrictions
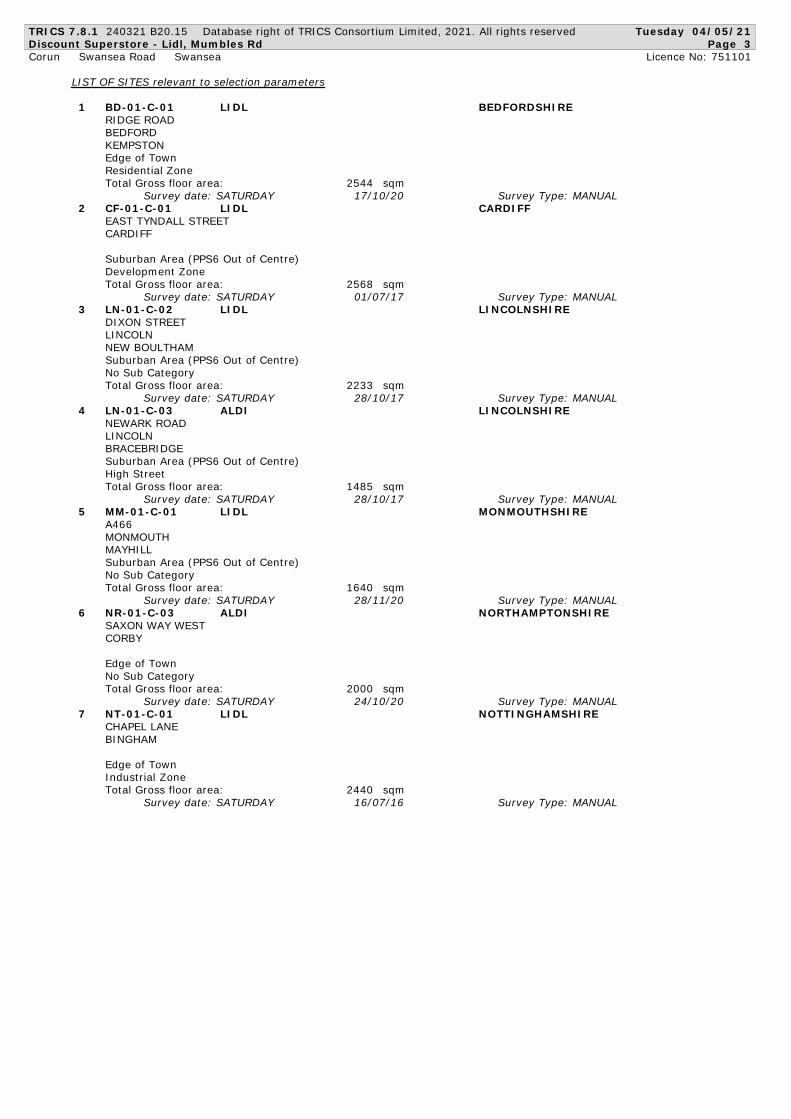
TRICS 7.8.1 240321 B20.15 Database right of TRICS Consortium Limited, 2021. All rights reserved Tuesday 04/05/21
Discount Superstore - Lidl, Mumbles Rd Page 3
Corun Swansea Road Swansea Licence No: 751101
LIST OF SITES relevant to selection parameters
1 BD-01-C-01 LIDL BEDFORDSHIRE
RIDGE ROAD
BEDFORD
KEMPSTON
Edge of Town
Residential Zone
Total Gross floor area: 2 5 4 4 sqm
Survey date: SATURDAY 17/10/20 Survey Type: MANUAL
2 CF-01-C-01 LIDL CARDIFF
EAST TYNDALL STREET
CARDIFF
Suburban Area (PPS6 Out of Centre)
Development Zone
Total Gross floor area: 2 5 6 8 sqm
Survey date: SATURDAY 01/07/17 Survey Type: MANUAL
3 LN-01-C-02 LIDL LINCOLNSHIRE
DIXON STREET
LINCOLN
NEW BOULTHAM
Suburban Area (PPS6 Out of Centre)
No Sub Category
Total Gross floor area: 2 2 3 3 sqm
Survey date: SATURDAY 28/10/17 Survey Type: MANUAL
4 LN-01-C-03 ALDI LINCOLNSHIRE
NEWARK ROAD
LINCOLN
BRACEBRIDGE
Suburban Area (PPS6 Out of Centre)
High Street
Total Gross floor area: 1 4 8 5 sqm
Survey date: SATURDAY 28/10/17 Survey Type: MANUAL
5 MM-01-C-01 LIDL MONMOUTHSHIRE
A466
MONMOUTH
MAYHILL
Suburban Area (PPS6 Out of Centre)
No Sub Category
Total Gross floor area: 1 6 4 0 sqm
Survey date: SATURDAY 28/11/20 Survey Type: MANUAL
6 NR-01-C-03 ALDI NORTHAMPTONSHIRE
SAXON WAY WEST
CORBY
Edge of Town
No Sub Category
Total Gross floor area: 2 0 0 0 sqm
Survey date: SATURDAY 24/10/20 Survey Type: MANUAL
7 NT-01-C-01 LIDL NOTTINGHAMSHIRE
CHAPEL LANE
BINGHAM
Edge of Town
Industrial Zone
Total Gross floor area: 2 4 4 0 sqm
Survey date: SATURDAY 16/07/16 Survey Type: MANUAL
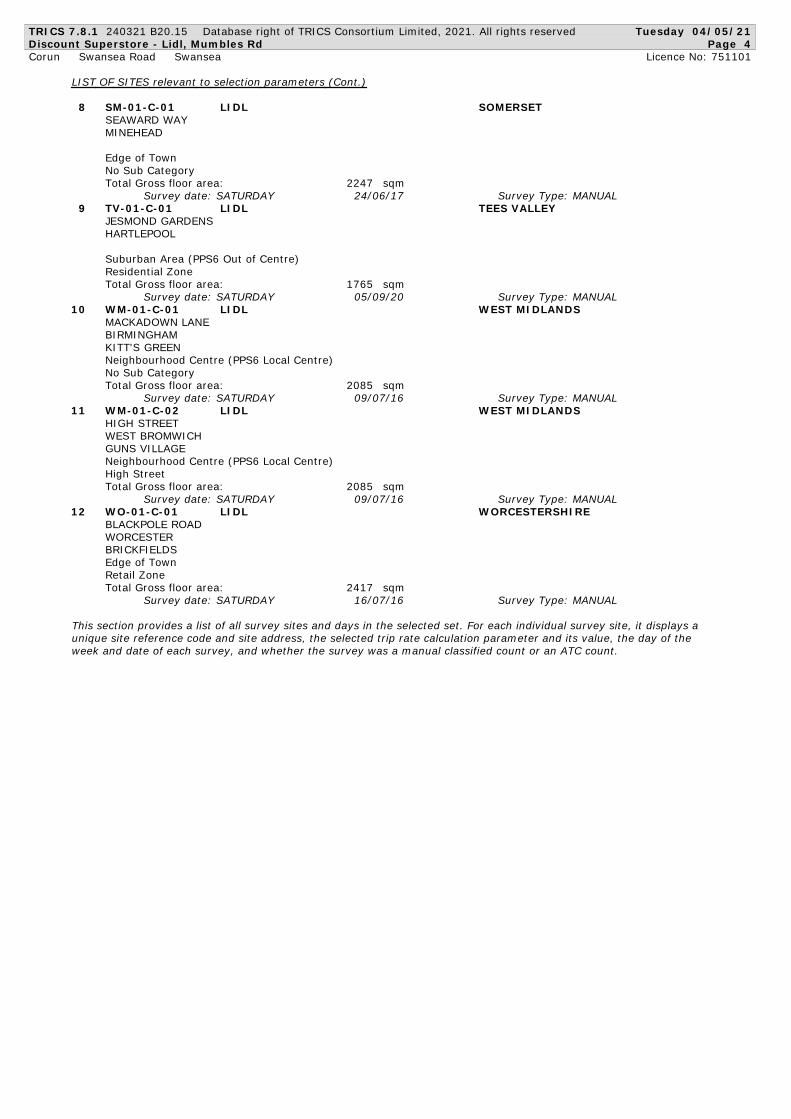
TRICS 7.8.1 240321 B20.15 Database right of TRICS Consortium Limited, 2021. All rights reserved Tuesday 04/05/21
Discount Superstore - Lidl, Mumbles Rd Page 4
Corun Swansea Road Swansea Licence No: 751101
LIST OF SITES relevant to selection parameters (Cont.)
8 SM-01-C-01 LIDL SOMERSET
SEAWARD WAY
MINEHEAD
Edge of Town
No Sub Category
Total Gross floor area: 2 2 4 7 sqm
Survey date: SATURDAY 24/06/17 Survey Type: MANUAL
9 TV-01-C-01 LIDL TEES VALLEY
JESMOND GARDENS
HARTLEPOOL
Suburban Area (PPS6 Out of Centre)
Residential Zone
Total Gross floor area: 1 7 6 5 sqm
Survey date: SATURDAY 05/09/20 Survey Type: MANUAL
10 WM-01-C-01 LIDL WEST MIDLANDS
MACKADOWN LANE
BIRMINGHAM
KITT'S GREEN
Neighbourhood Centre (PPS6 Local Centre)
No Sub Category
Total Gross floor area: 2 0 8 5 sqm
Survey date: SATURDAY 09/07/16 Survey Type: MANUAL
11 WM-01-C-02 LIDL WEST MIDLANDS
HIGH STREET
WEST BROMWICH
GUNS VILLAGE
Neighbourhood Centre (PPS6 Local Centre)
High Street
Total Gross floor area: 2 0 8 5 sqm
Survey date: SATURDAY 09/07/16 Survey Type: MANUAL
12 WO-01-C-01 LIDL WORCESTERSHIRE
BLACKPOLE ROAD
WORCESTER
BRICKFIELDS
Edge of Town
Retail Zone
Total Gross floor area: 2 4 1 7 sqm
Survey date: SATURDAY 16/07/16 Survey Type: MANUAL
This section provides a list of all survey sites and days in the selected set. For each individual survey site, it displays a
unique site reference code and site address, the selected trip rate calculation parameter and its value, the day of the
week and date of each survey, and whether the survey was a manual classified count or an ATC count.
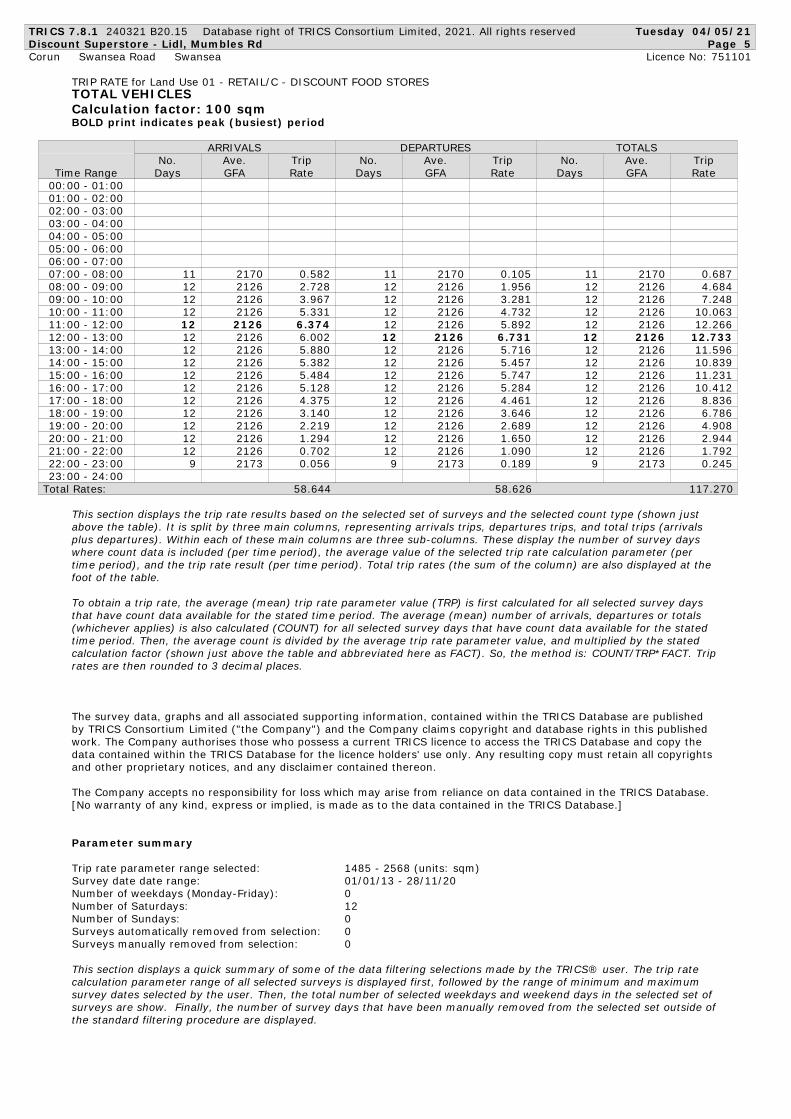
TRICS 7.8.1 240321 B20.15 Database right of TRICS Consortium Limited, 2021. All rights reserved Tuesday 04/05/21
Discount Superstore - Lidl, Mumbles Rd Page 5
Corun Swansea Road Swansea Licence No: 751101
TRIP RATE for Land Use 01 - RETAIL/C - DISCOUNT FOOD STORES
TOTAL VEHICLES
Calculation factor: 100 sqm
BOLD print indicates peak (busiest) period
ARRIVALS DEPARTURES TOTALS
No. Ave. Trip No. Ave. Trip No. Ave. Trip
Time Range Days GFA Rate Days GFA Rate Days GFA Rate
00:00 - 01:00
01:00 - 02:00
02:00 - 03:00
03:00 - 04:00
04:00 - 05:00
05:00 - 06:00
06:00 - 07:00
11 2170 0.582 11 2170 0.105 11 2170 0.68707:00 - 08:00
12 2126 2.728 12 2126 1.956 12 2126 4.68408:00 - 09:00
12 2126 3.967 12 2126 3.281 12 2126 7.24809:00 - 10:00
12 2126 5.331 12 2126 4.732 12 2126 10.06310:00 - 11:00
12 2126 6.374 12 2126 5.892 12 2126 12.26611:00 - 12:00
12 2126 6.002 12 2126 6.731 12 2126 12.73312:00 - 13:00
12 2126 5.880 12 2126 5.716 12 2126 11.59613:00 - 14:00
12 2126 5.382 12 2126 5.457 12 2126 10.83914:00 - 15:00
12 2126 5.484 12 2126 5.747 12 2126 11.23115:00 - 16:00
12 2126 5.128 12 2126 5.284 12 2126 10.41216:00 - 17:00
12 2126 4.375 12 2126 4.461 12 2126 8.83617:00 - 18:00
12 2126 3.140 12 2126 3.646 12 2126 6.78618:00 - 19:00
12 2126 2.219 12 2126 2.689 12 2126 4.90819:00 - 20:00
12 2126 1.294 12 2126 1.650 12 2126 2.94420:00 - 21:00
12 2126 0.702 12 2126 1.090 12 2126 1.79221:00 - 22:00
9 2173 0.056 9 2173 0.189 9 2173 0.24522:00 - 23:00
23:00 - 24:00
Total Rates: 5 8.644 5 8.626 117.270
This section displays the trip rate results based on the selected set of surveys and the selected count type (shown just
above the table). It is split by three main columns, representing arrivals trips, departures trips, and total trips (arrivals
plus departures). Within each of these main columns are three sub-columns. These display the number of survey days
where count data is included (per time period), the average value of the selected trip rate calculation parameter (per
time period), and the trip rate result (per time period). Total trip rates (the sum of the column) are also displayed at the
foot of the table.
To obtain a trip rate, the average (mean) trip rate parameter value (TRP) is first calculated for all selected survey days
that have count data available for the stated time period. The average (mean) number of arrivals, departures or totals
(whichever applies) is also calculated (COUNT) for all selected survey days that have count data available for the stated
time period. Then, the average count is divided by the average trip rate parameter value, and multiplied by the stated
calculation factor (shown just above the table and abbreviated here as FACT). So, the method is: COUNT/TRP*FACT. Trip
rates are then rounded to 3 decimal places.
The survey data, graphs and all associated supporting information, contained within the TRICS Database are published
by TRICS Consortium Limited ("the Company") and the Company claims copyright and database rights in this published
work. The Company authorises those who possess a current TRICS licence to access the TRICS Database and copy the
data contained within the TRICS Database for the licence holders' use only. Any resulting copy must retain all copyrights
and other proprietary notices, and any disclaimer contained thereon.
The Company accepts no responsibility for loss which may arise from reliance on data contained in the TRICS Database.
[No warranty of any kind, express or implied, is made as to the data contained in the TRICS Database.]
Parameter summary
Trip rate parameter range selected: 1485 - 2568 (units: sqm)
Survey date date range: 01/01/13 - 28/11/20
Number of weekdays (Monday-Friday): 0
Number of Saturdays: 12
Number of Sundays: 0
Surveys automatically removed from selection: 0
Surveys manually removed from selection: 0
This section displays a quick summary of some of the data filtering selections made by the TRICS® user. The trip rate
calculation parameter range of all selected surveys is displayed first, followed by the range of minimum and maximum
survey dates selected by the user. Then, the total number of selected weekdays and weekend days in the selected set of
surveys are show. Finally, the number of survey days that have been manually removed from the selected set outside of
the standard filtering procedure are displayed.

TRICS 7.8.1 240321 B20.15 Database right of TRICS Consortium Limited, 2021. All rights reserved Tuesday 04/05/21
Discount Superstore - Lidl, Mumbles Rd Page 6
Corun Swansea Road Swansea Licence No: 751101
TRIP RATE for Land Use 01 - RETAIL/C - DISCOUNT FOOD STORES
TAXIS
Calculation factor: 100 sqm
BOLD print indicates peak (busiest) period
ARRIVALS DEPARTURES TOTALS
No. Ave. Trip No. Ave. Trip No. Ave. Trip
Time Range Days GFA Rate Days GFA Rate Days GFA Rate
00:00 - 01:00
01:00 - 02:00
02:00 - 03:00
03:00 - 04:00
04:00 - 05:00
05:00 - 06:00
06:00 - 07:00
11 2170 0.000 11 2170 0.000 11 2170 0.00007:00 - 08:00
12 2126 0.004 12 2126 0.004 12 2126 0.00808:00 - 09:00
12 2126 0.008 12 2126 0.004 12 2126 0.01209:00 - 10:00
12 2126 0.043 12 2126 0.031 12 2126 0.07410:00 - 11:00
12 2126 0.078 12 2126 0.067 12 2126 0.14511:00 - 12:00
12 2126 0.078 12 2126 0.090 12 2126 0.16812:00 - 13:00
12 2126 0.067 12 2126 0.055 12 2126 0.12213:00 - 14:00
12 2126 0.071 12 2126 0.063 12 2126 0.13414:00 - 15:00
12 2126 0.078 12 2126 0.086 12 2126 0.16415:00 - 16:00
12 2126 0.059 12 2126 0.063 12 2126 0.12216:00 - 17:00
12 2126 0.055 12 2126 0.063 12 2126 0.11817:00 - 18:00
12 2126 0.043 12 2126 0.043 12 2126 0.08618:00 - 19:00
12 2126 0.035 12 2126 0.047 12 2126 0.08219:00 - 20:00
12 2126 0.035 12 2126 0.035 12 2126 0.07020:00 - 21:00
12 2126 0.020 12 2126 0.024 12 2126 0.04421:00 - 22:00
9 2173 0.000 9 2173 0.000 9 2173 0.00022:00 - 23:00
23:00 - 24:00
Total Rates: 0.674 0.675 1.349
This section displays the trip rate results based on the selected set of surveys and the selected count type (shown just
above the table). It is split by three main columns, representing arrivals trips, departures trips, and total trips (arrivals
plus departures). Within each of these main columns are three sub-columns. These display the number of survey days
where count data is included (per time period), the average value of the selected trip rate calculation parameter (per
time period), and the trip rate result (per time period). Total trip rates (the sum of the column) are also displayed at the
foot of the table.
To obtain a trip rate, the average (mean) trip rate parameter value (TRP) is first calculated for all selected survey days
that have count data available for the stated time period. The average (mean) number of arrivals, departures or totals
(whichever applies) is also calculated (COUNT) for all selected survey days that have count data available for the stated
time period. Then, the average count is divided by the average trip rate parameter value, and multiplied by the stated
calculation factor (shown just above the table and abbreviated here as FACT). So, the method is: COUNT/TRP*FACT. Trip
rates are then rounded to 3 decimal places.

TRICS 7.8.1 240321 B20.15 Database right of TRICS Consortium Limited, 2021. All rights reserved Tuesday 04/05/21
Discount Superstore - Lidl, Mumbles Rd Page 7
Corun Swansea Road Swansea Licence No: 751101
TRIP RATE for Land Use 01 - RETAIL/C - DISCOUNT FOOD STORES
OGVS
Calculation factor: 100 sqm
BOLD print indicates peak (busiest) period
ARRIVALS DEPARTURES TOTALS
No. Ave. Trip No. Ave. Trip No. Ave. Trip
Time Range Days GFA Rate Days GFA Rate Days GFA Rate
00:00 - 01:00
01:00 - 02:00
02:00 - 03:00
03:00 - 04:00
04:00 - 05:00
05:00 - 06:00
06:00 - 07:00
11 2170 0.021 11 2170 0.008 11 2170 0.02907:00 - 08:00
12 2126 0.012 12 2126 0.024 12 2126 0.03608:00 - 09:00
12 2126 0.012 12 2126 0.008 12 2126 0.02009:00 - 10:00
12 2126 0.008 12 2126 0.008 12 2126 0.01610:00 - 11:00
12 2126 0.000 12 2126 0.004 12 2126 0.00411:00 - 12:00
12 2126 0.004 12 2126 0.008 12 2126 0.01212:00 - 13:00
12 2126 0.012 12 2126 0.000 12 2126 0.01213:00 - 14:00
12 2126 0.004 12 2126 0.008 12 2126 0.01214:00 - 15:00
12 2126 0.016 12 2126 0.020 12 2126 0.03615:00 - 16:00
12 2126 0.004 12 2126 0.004 12 2126 0.00816:00 - 17:00
12 2126 0.000 12 2126 0.004 12 2126 0.00417:00 - 18:00
12 2126 0.004 12 2126 0.000 12 2126 0.00418:00 - 19:00
12 2126 0.016 12 2126 0.012 12 2126 0.02819:00 - 20:00
12 2126 0.016 12 2126 0.012 12 2126 0.02820:00 - 21:00
12 2126 0.000 12 2126 0.012 12 2126 0.01221:00 - 22:00
9 2173 0.000 9 2173 0.000 9 2173 0.00022:00 - 23:00
23:00 - 24:00
Total Rates: 0.129 0.132 0.261
This section displays the trip rate results based on the selected set of surveys and the selected count type (shown just
above the table). It is split by three main columns, representing arrivals trips, departures trips, and total trips (arrivals
plus departures). Within each of these main columns are three sub-columns. These display the number of survey days
where count data is included (per time period), the average value of the selected trip rate calculation parameter (per
time period), and the trip rate result (per time period). Total trip rates (the sum of the column) are also displayed at the
foot of the table.
To obtain a trip rate, the average (mean) trip rate parameter value (TRP) is first calculated for all selected survey days
that have count data available for the stated time period. The average (mean) number of arrivals, departures or totals
(whichever applies) is also calculated (COUNT) for all selected survey days that have count data available for the stated
time period. Then, the average count is divided by the average trip rate parameter value, and multiplied by the stated
calculation factor (shown just above the table and abbreviated here as FACT). So, the method is: COUNT/TRP*FACT. Trip
rates are then rounded to 3 decimal places.

TRICS 7.8.1 240321 B20.15 Database right of TRICS Consortium Limited, 2021. All rights reserved Tuesday 04/05/21
Discount Superstore - Lidl, Mumbles Rd Page 8
Corun Swansea Road Swansea Licence No: 751101
TRIP RATE for Land Use 01 - RETAIL/C - DISCOUNT FOOD STORES
PSVS
Calculation factor: 100 sqm
BOLD print indicates peak (busiest) period
ARRIVALS DEPARTURES TOTALS
No. Ave. Trip No. Ave. Trip No. Ave. Trip
Time Range Days GFA Rate Days GFA Rate Days GFA Rate
00:00 - 01:00
01:00 - 02:00
02:00 - 03:00
03:00 - 04:00
04:00 - 05:00
05:00 - 06:00
06:00 - 07:00
11 2170 0.000 11 2170 0.000 11 2170 0.00007:00 - 08:00
12 2126 0.000 12 2126 0.000 12 2126 0.00008:00 - 09:00
12 2126 0.000 12 2126 0.000 12 2126 0.00009:00 - 10:00
12 2126 0.004 12 2126 0.000 12 2126 0.00410:00 - 11:00
12 2126 0.000 12 2126 0.004 12 2126 0.00411:00 - 12:00
12 2126 0.004 12 2126 0.000 12 2126 0.00412:00 - 13:00
12 2126 0.000 12 2126 0.004 12 2126 0.00413:00 - 14:00
12 2126 0.000 12 2126 0.000 12 2126 0.00014:00 - 15:00
12 2126 0.004 12 2126 0.000 12 2126 0.00415:00 - 16:00
12 2126 0.000 12 2126 0.004 12 2126 0.00416:00 - 17:00
12 2126 0.000 12 2126 0.000 12 2126 0.00017:00 - 18:00
12 2126 0.004 12 2126 0.004 12 2126 0.00818:00 - 19:00
12 2126 0.000 12 2126 0.000 12 2126 0.00019:00 - 20:00
12 2126 0.000 12 2126 0.000 12 2126 0.00020:00 - 21:00
12 2126 0.000 12 2126 0.000 12 2126 0.00021:00 - 22:00
9 2173 0.000 9 2173 0.000 9 2173 0.00022:00 - 23:00
23:00 - 24:00
Total Rates: 0.016 0.016 0.032
This section displays the trip rate results based on the selected set of surveys and the selected count type (shown just
above the table). It is split by three main columns, representing arrivals trips, departures trips, and total trips (arrivals
plus departures). Within each of these main columns are three sub-columns. These display the number of survey days
where count data is included (per time period), the average value of the selected trip rate calculation parameter (per
time period), and the trip rate result (per time period). Total trip rates (the sum of the column) are also displayed at the
foot of the table.
To obtain a trip rate, the average (mean) trip rate parameter value (TRP) is first calculated for all selected survey days
that have count data available for the stated time period. The average (mean) number of arrivals, departures or totals
(whichever applies) is also calculated (COUNT) for all selected survey days that have count data available for the stated
time period. Then, the average count is divided by the average trip rate parameter value, and multiplied by the stated
calculation factor (shown just above the table and abbreviated here as FACT). So, the method is: COUNT/TRP*FACT. Trip
rates are then rounded to 3 decimal places.
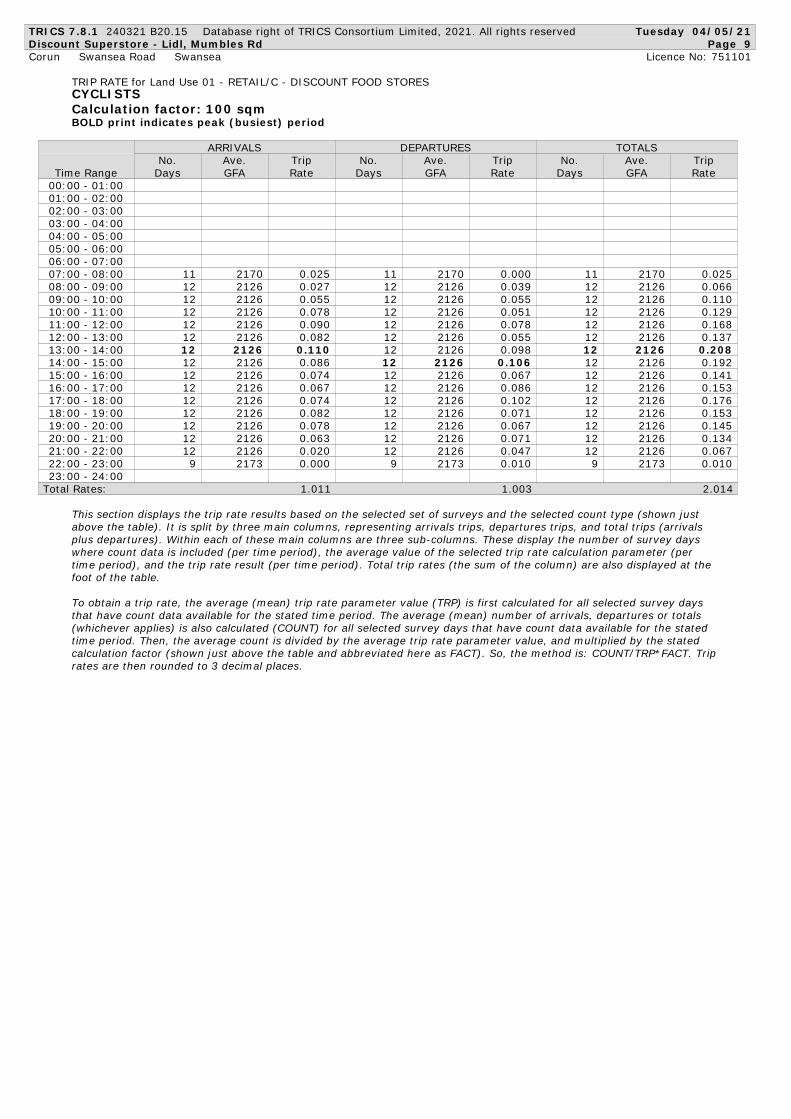
TRICS 7.8.1 240321 B20.15 Database right of TRICS Consortium Limited, 2021. All rights reserved Tuesday 04/05/21
Discount Superstore - Lidl, Mumbles Rd Page 9
Corun Swansea Road Swansea Licence No: 751101
TRIP RATE for Land Use 01 - RETAIL/C - DISCOUNT FOOD STORES
CYCLISTS
Calculation factor: 100 sqm
BOLD print indicates peak (busiest) period
ARRIVALS DEPARTURES TOTALS
No. Ave. Trip No. Ave. Trip No. Ave. Trip
Time Range Days GFA Rate Days GFA Rate Days GFA Rate
00:00 - 01:00
01:00 - 02:00
02:00 - 03:00
03:00 - 04:00
04:00 - 05:00
05:00 - 06:00
06:00 - 07:00
11 2170 0.025 11 2170 0.000 11 2170 0.02507:00 - 08:00
12 2126 0.027 12 2126 0.039 12 2126 0.06608:00 - 09:00
12 2126 0.055 12 2126 0.055 12 2126 0.11009:00 - 10:00
12 2126 0.078 12 2126 0.051 12 2126 0.12910:00 - 11:00
12 2126 0.090 12 2126 0.078 12 2126 0.16811:00 - 12:00
12 2126 0.082 12 2126 0.055 12 2126 0.13712:00 - 13:00
12 2126 0.110 12 2126 0.098 12 2126 0.20813:00 - 14:00
12 2126 0.086 12 2126 0.106 12 2126 0.19214:00 - 15:00
12 2126 0.074 12 2126 0.067 12 2126 0.14115:00 - 16:00
12 2126 0.067 12 2126 0.086 12 2126 0.15316:00 - 17:00
12 2126 0.074 12 2126 0.102 12 2126 0.17617:00 - 18:00
12 2126 0.082 12 2126 0.071 12 2126 0.15318:00 - 19:00
12 2126 0.078 12 2126 0.067 12 2126 0.14519:00 - 20:00
12 2126 0.063 12 2126 0.071 12 2126 0.13420:00 - 21:00
12 2126 0.020 12 2126 0.047 12 2126 0.06721:00 - 22:00
9 2173 0.000 9 2173 0.010 9 2173 0.01022:00 - 23:00
23:00 - 24:00
Total Rates: 1.011 1.003 2.014
This section displays the trip rate results based on the selected set of surveys and the selected count type (shown just
above the table). It is split by three main columns, representing arrivals trips, departures trips, and total trips (arrivals
plus departures). Within each of these main columns are three sub-columns. These display the number of survey days
where count data is included (per time period), the average value of the selected trip rate calculation parameter (per
time period), and the trip rate result (per time period). Total trip rates (the sum of the column) are also displayed at the
foot of the table.
To obtain a trip rate, the average (mean) trip rate parameter value (TRP) is first calculated for all selected survey days
that have count data available for the stated time period. The average (mean) number of arrivals, departures or totals
(whichever applies) is also calculated (COUNT) for all selected survey days that have count data available for the stated
time period. Then, the average count is divided by the average trip rate parameter value, and multiplied by the stated
calculation factor (shown just above the table and abbreviated here as FACT). So, the method is: COUNT/TRP*FACT. Trip
rates are then rounded to 3 decimal places.

TRICS 7.8.1 240321 B20.15 Database right of TRICS Consortium Limited, 2021. All rights reserved Tuesday 04/05/21
Discount Superstore - Lidl, Mumbles Rd Page 10
Corun Swansea Road Swansea Licence No: 751101
TRIP RATE for Land Use 01 - RETAIL/C - DISCOUNT FOOD STORES
CARS
Calculation factor: 100 sqm
BOLD print indicates peak (busiest) period
ARRIVALS DEPARTURES TOTALS
No. Ave. Trip No. Ave. Trip No. Ave. Trip
Time Range Days GFA Rate Days GFA Rate Days GFA Rate
00:00 - 01:00
01:00 - 02:00
02:00 - 03:00
03:00 - 04:00
04:00 - 05:00
05:00 - 06:00
06:00 - 07:00
11 2170 0.499 11 2170 0.071 11 2170 0.57007:00 - 08:00
12 2126 2.548 12 2126 1.815 12 2126 4.36308:00 - 09:00
12 2126 3.787 12 2126 3.144 12 2126 6.93109:00 - 10:00
12 2126 5.100 12 2126 4.524 12 2126 9.62410:00 - 11:00
12 2126 6.088 12 2126 5.582 12 2126 11.67011:00 - 12:00
12 2126 5.771 12 2126 6.468 12 2126 12.23912:00 - 13:00
12 2126 5.586 12 2126 5.480 12 2126 11.06613:00 - 14:00
12 2126 5.088 12 2126 5.186 12 2126 10.27414:00 - 15:00
12 2126 5.202 12 2126 5.429 12 2126 10.63115:00 - 16:00
12 2126 4.936 12 2126 5.088 12 2126 10.02416:00 - 17:00
12 2126 4.132 12 2126 4.222 12 2126 8.35417:00 - 18:00
12 2126 2.972 12 2126 3.462 12 2126 6.43418:00 - 19:00
12 2126 2.097 12 2126 2.517 12 2126 4.61419:00 - 20:00
12 2126 1.196 12 2126 1.521 12 2126 2.71720:00 - 21:00
12 2126 0.635 12 2126 1.000 12 2126 1.63521:00 - 22:00
9 2173 0.056 9 2173 0.184 9 2173 0.24022:00 - 23:00
23:00 - 24:00
Total Rates: 5 5.693 5 5.693 111.386
This section displays the trip rate results based on the selected set of surveys and the selected count type (shown just
above the table). It is split by three main columns, representing arrivals trips, departures trips, and total trips (arrivals
plus departures). Within each of these main columns are three sub-columns. These display the number of survey days
where count data is included (per time period), the average value of the selected trip rate calculation parameter (per
time period), and the trip rate result (per time period). Total trip rates (the sum of the column) are also displayed at the
foot of the table.
To obtain a trip rate, the average (mean) trip rate parameter value (TRP) is first calculated for all selected survey days
that have count data available for the stated time period. The average (mean) number of arrivals, departures or totals
(whichever applies) is also calculated (COUNT) for all selected survey days that have count data available for the stated
time period. Then, the average count is divided by the average trip rate parameter value, and multiplied by the stated
calculation factor (shown just above the table and abbreviated here as FACT). So, the method is: COUNT/TRP*FACT. Trip
rates are then rounded to 3 decimal places.

TRICS 7.8.1 240321 B20.15 Database right of TRICS Consortium Limited, 2021. All rights reserved Tuesday 04/05/21
Discount Superstore - Lidl, Mumbles Rd Page 11
Corun Swansea Road Swansea Licence No: 751101
TRIP RATE for Land Use 01 - RETAIL/C - DISCOUNT FOOD STORES
LGVS
Calculation factor: 100 sqm
BOLD print indicates peak (busiest) period
ARRIVALS DEPARTURES TOTALS
No. Ave. Trip No. Ave. Trip No. Ave. Trip
Time Range Days GFA Rate Days GFA Rate Days GFA Rate
00:00 - 01:00
01:00 - 02:00
02:00 - 03:00
03:00 - 04:00
04:00 - 05:00
05:00 - 06:00
06:00 - 07:00
11 2170 0.059 11 2170 0.025 11 2170 0.08407:00 - 08:00
12 2126 0.157 12 2126 0.110 12 2126 0.26708:00 - 09:00
12 2126 0.157 12 2126 0.122 12 2126 0.27909:00 - 10:00
12 2126 0.172 12 2126 0.161 12 2126 0.33310:00 - 11:00
12 2126 0.184 12 2126 0.216 12 2126 0.40011:00 - 12:00
12 2126 0.129 12 2126 0.153 12 2126 0.28212:00 - 13:00
12 2126 0.204 12 2126 0.161 12 2126 0.36513:00 - 14:00
12 2126 0.204 12 2126 0.192 12 2126 0.39614:00 - 15:00
12 2126 0.169 12 2126 0.188 12 2126 0.35715:00 - 16:00
12 2126 0.125 12 2126 0.122 12 2126 0.24716:00 - 17:00
12 2126 0.180 12 2126 0.157 12 2126 0.33717:00 - 18:00
12 2126 0.114 12 2126 0.133 12 2126 0.24718:00 - 19:00
12 2126 0.071 12 2126 0.114 12 2126 0.18519:00 - 20:00
12 2126 0.039 12 2126 0.078 12 2126 0.11720:00 - 21:00
12 2126 0.043 12 2126 0.047 12 2126 0.09021:00 - 22:00
9 2173 0.000 9 2173 0.005 9 2173 0.00522:00 - 23:00
23:00 - 24:00
Total Rates: 2.007 1.984 3.991
This section displays the trip rate results based on the selected set of surveys and the selected count type (shown just
above the table). It is split by three main columns, representing arrivals trips, departures trips, and total trips (arrivals
plus departures). Within each of these main columns are three sub-columns. These display the number of survey days
where count data is included (per time period), the average value of the selected trip rate calculation parameter (per
time period), and the trip rate result (per time period). Total trip rates (the sum of the column) are also displayed at the
foot of the table.
To obtain a trip rate, the average (mean) trip rate parameter value (TRP) is first calculated for all selected survey days
that have count data available for the stated time period. The average (mean) number of arrivals, departures or totals
(whichever applies) is also calculated (COUNT) for all selected survey days that have count data available for the stated
time period. Then, the average count is divided by the average trip rate parameter value, and multiplied by the stated
calculation factor (shown just above the table and abbreviated here as FACT). So, the method is: COUNT/TRP*FACT. Trip
rates are then rounded to 3 decimal places.

TRICS 7.8.1 240321 B20.15 Database right of TRICS Consortium Limited, 2021. All rights reserved Tuesday 04/05/21
Discount Superstore - Lidl, Mumbles Rd Page 12
Corun Swansea Road Swansea Licence No: 751101
TRIP RATE for Land Use 01 - RETAIL/C - DISCOUNT FOOD STORES
MOTOR CYCLES
Calculation factor: 100 sqm
BOLD print indicates peak (busiest) period
ARRIVALS DEPARTURES TOTALS
No. Ave. Trip No. Ave. Trip No. Ave. Trip
Time Range Days GFA Rate Days GFA Rate Days GFA Rate
00:00 - 01:00
01:00 - 02:00
02:00 - 03:00
03:00 - 04:00
04:00 - 05:00
05:00 - 06:00
06:00 - 07:00
11 2170 0.004 11 2170 0.000 11 2170 0.00407:00 - 08:00
12 2126 0.008 12 2126 0.004 12 2126 0.01208:00 - 09:00
12 2126 0.004 12 2126 0.004 12 2126 0.00809:00 - 10:00
12 2126 0.004 12 2126 0.008 12 2126 0.01210:00 - 11:00
12 2126 0.024 12 2126 0.020 12 2126 0.04411:00 - 12:00
12 2126 0.016 12 2126 0.012 12 2126 0.02812:00 - 13:00
12 2126 0.012 12 2126 0.016 12 2126 0.02813:00 - 14:00
12 2126 0.016 12 2126 0.008 12 2126 0.02414:00 - 15:00
12 2126 0.016 12 2126 0.024 12 2126 0.04015:00 - 16:00
12 2126 0.004 12 2126 0.004 12 2126 0.00816:00 - 17:00
12 2126 0.008 12 2126 0.016 12 2126 0.02417:00 - 18:00
12 2126 0.004 12 2126 0.004 12 2126 0.00818:00 - 19:00
12 2126 0.000 12 2126 0.000 12 2126 0.00019:00 - 20:00
12 2126 0.008 12 2126 0.004 12 2126 0.01220:00 - 21:00
12 2126 0.004 12 2126 0.008 12 2126 0.01221:00 - 22:00
9 2173 0.000 9 2173 0.000 9 2173 0.00022:00 - 23:00
23:00 - 24:00
Total Rates: 0.132 0.132 0.264
This section displays the trip rate results based on the selected set of surveys and the selected count type (shown just
above the table). It is split by three main columns, representing arrivals trips, departures trips, and total trips (arrivals
plus departures). Within each of these main columns are three sub-columns. These display the number of survey days
where count data is included (per time period), the average value of the selected trip rate calculation parameter (per
time period), and the trip rate result (per time period). Total trip rates (the sum of the column) are also displayed at the
foot of the table.
To obtain a trip rate, the average (mean) trip rate parameter value (TRP) is first calculated for all selected survey days
that have count data available for the stated time period. The average (mean) number of arrivals, departures or totals
(whichever applies) is also calculated (COUNT) for all selected survey days that have count data available for the stated
time period. Then, the average count is divided by the average trip rate parameter value, and multiplied by the stated
calculation factor (shown just above the table and abbreviated here as FACT). So, the method is: COUNT/TRP*FACT. Trip
rates are then rounded to 3 decimal places.
Mumbles Road, Swansea
Lidl Great Britain Limited Transport Assessment
20-00668/TA/01 Corun Associates Ltd
September 2021 Appendix D
APPENDIX D
A4067 ATC Survey Summary
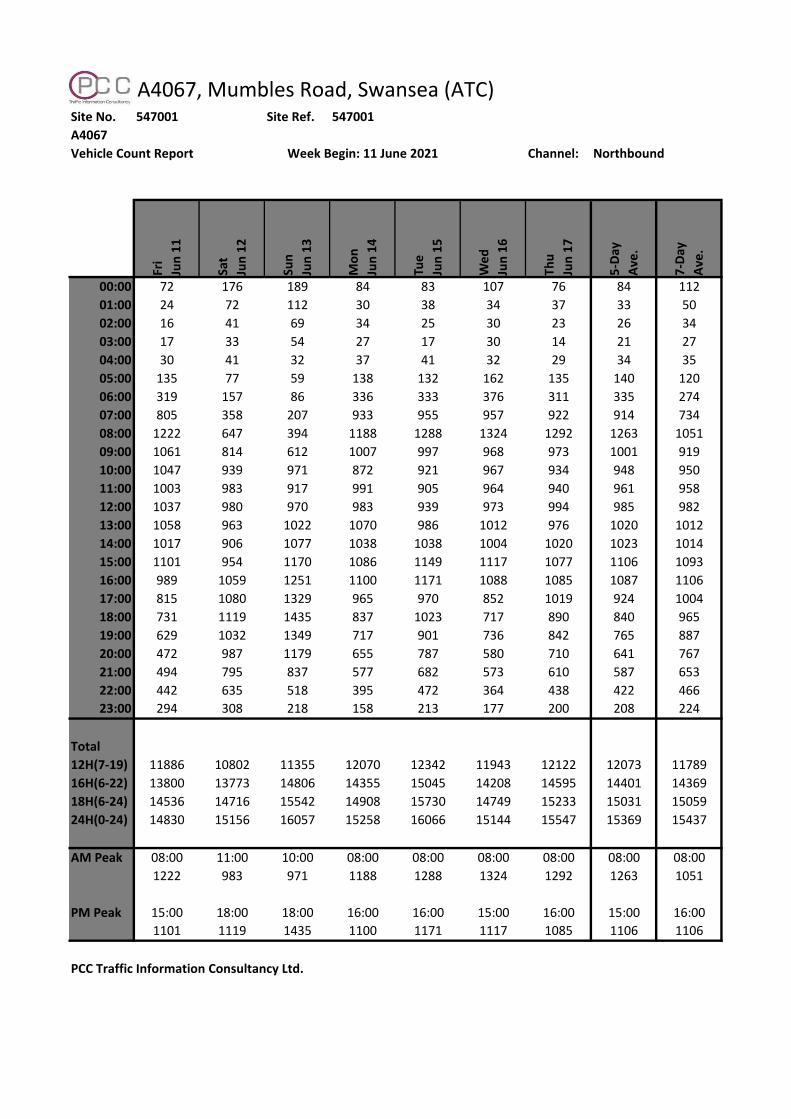
A4067, Mumbles Road, Swansea (ATC)Site No. 547001 Site Ref. 547001
A4067
Vehicle Count Report Week Begin: 11 June 2021 Channel: NorthboundFr
i
Jun
11
Sat
Jun
12
Sun
Jun
13
Mo
n
Jun
14
Tue
Jun
15
We
d
Jun
16
Thu
Jun
17
5-D
ay
Ave
.
7-D
ay
Ave
.
00:00 72 176 189 84 83 107 76 84 112
01:00 24 72 112 30 38 34 37 33 50
02:00 16 41 69 34 25 30 23 26 34
03:00 17 33 54 27 17 30 14 21 27
04:00 30 41 32 37 41 32 29 34 35
05:00 135 77 59 138 132 162 135 140 120
06:00 319 157 86 336 333 376 311 335 274
07:00 805 358 207 933 955 957 922 914 734
08:00 1222 647 394 1188 1288 1324 1292 1263 1051
09:00 1061 814 612 1007 997 968 973 1001 919
10:00 1047 939 971 872 921 967 934 948 950
11:00 1003 983 917 991 905 964 940 961 958
12:00 1037 980 970 983 939 973 994 985 982
13:00 1058 963 1022 1070 986 1012 976 1020 1012
14:00 1017 906 1077 1038 1038 1004 1020 1023 1014
15:00 1101 954 1170 1086 1149 1117 1077 1106 1093
16:00 989 1059 1251 1100 1171 1088 1085 1087 1106
17:00 815 1080 1329 965 970 852 1019 924 1004
18:00 731 1119 1435 837 1023 717 890 840 965
19:00 629 1032 1349 717 901 736 842 765 887
20:00 472 987 1179 655 787 580 710 641 767
21:00 494 795 837 577 682 573 610 587 653
22:00 442 635 518 395 472 364 438 422 466
23:00 294 308 218 158 213 177 200 208 224
Total
12H(7-19) 11886 10802 11355 12070 12342 11943 12122 12073 11789
16H(6-22) 13800 13773 14806 14355 15045 14208 14595 14401 14369
18H(6-24) 14536 14716 15542 14908 15730 14749 15233 15031 15059
24H(0-24) 14830 15156 16057 15258 16066 15144 15547 15369 15437
AM Peak 08:00 11:00 10:00 08:00 08:00 08:00 08:00 08:00 08:00
1222 983 971 1188 1288 1324 1292 1263 1051
PM Peak 15:00 18:00 18:00 16:00 16:00 15:00 16:00 15:00 16:00
1101 1119 1435 1100 1171 1117 1085 1106 1106
PCC Traffic Information Consultancy Ltd.

Site No. 547001 Site Ref. 547001
A4067
Vehicle Count Report Week Begin: 11 June 2021 Channel: Southbound
Fri
Jun
11
Sat
Jun
12
Sun
Jun
13
Mo
n
Jun
14
Tue
Jun
15
We
d
Jun
16
Thu
Jun
17
5-D
ay
Ave
.
7-D
ay
Ave
.
00:00 55 131 151 67 64 77 68 66 88
01:00 30 76 86 30 40 30 34 33 47
02:00 9 41 56 25 18 22 25 20 28
03:00 13 22 26 10 13 18 11 13 16
04:00 25 41 39 30 30 34 31 30 33
05:00 70 73 54 53 65 66 72 65 65
06:00 162 169 109 180 181 190 203 183 171
07:00 614 318 235 643 657 687 642 649 542
08:00 993 598 639 925 1003 1000 997 984 879
09:00 898 1008 1210 942 955 903 975 935 984
10:00 1078 1257 1377 1164 1193 1112 994 1108 1168
11:00 1142 1311 1311 1253 1362 1183 1177 1223 1248
12:00 1207 1423 1111 1297 1312 1258 1091 1233 1243
13:00 1141 1309 1099 1124 1167 1081 1136 1130 1151
14:00 1257 1246 1101 1200 1242 1213 1157 1214 1202
15:00 1256 1095 1109 1228 1298 1213 1248 1249 1207
16:00 1221 1078 1057 1293 1292 1249 1348 1281 1220
17:00 1274 1135 966 1356 1304 1304 1421 1332 1251
18:00 1163 1092 975 1175 1243 996 1342 1184 1141
19:00 1072 951 847 816 939 896 1010 947 933
20:00 690 658 621 622 740 662 690 681 669
21:00 479 464 438 419 463 401 469 446 448
22:00 368 357 263 253 292 257 276 289 295
23:00 277 253 146 123 152 149 160 172 180
Total
12H(7-19) 13244 12870 12190 13600 14028 13199 13528 13520 13237
16H(6-22) 15647 15112 14205 15637 16351 15348 15900 15777 15457
18H(6-24) 16292 15722 14614 16013 16795 15754 16336 16238 15932
24H(0-24) 16494 16106 15026 16228 17025 16001 16577 16465 16208
AM Peak 11:00 11:00 10:00 11:00 11:00 11:00 11:00 11:00 11:00
1142 1311 1377 1253 1362 1183 1177 1223 1248
PM Peak 17:00 12:00 12:00 17:00 12:00 17:00 17:00 17:00 17:00
1274 1423 1111 1356 1312 1304 1421 1332 1251
PCC Traffic Information Consultancy Ltd.
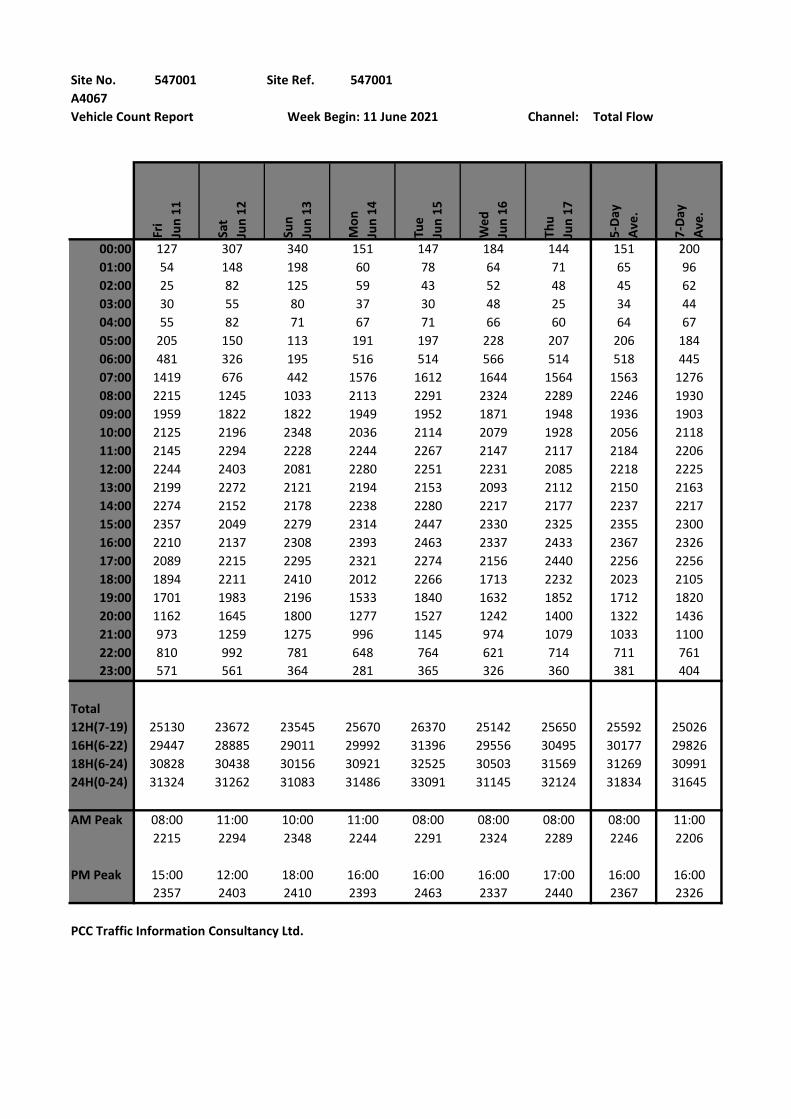
Site No. 547001 Site Ref. 547001
A4067
Vehicle Count Report Week Begin: 11 June 2021 Channel: Total Flow
Fri
Jun
11
Sat
Jun
12
Sun
Jun
13
Mo
n
Jun
14
Tue
Jun
15
We
d
Jun
16
Thu
Jun
17
5-D
ay
Ave
.
7-D
ay
Ave
.
00:00 127 307 340 151 147 184 144 151 200
01:00 54 148 198 60 78 64 71 65 96
02:00 25 82 125 59 43 52 48 45 62
03:00 30 55 80 37 30 48 25 34 44
04:00 55 82 71 67 71 66 60 64 67
05:00 205 150 113 191 197 228 207 206 184
06:00 481 326 195 516 514 566 514 518 445
07:00 1419 676 442 1576 1612 1644 1564 1563 1276
08:00 2215 1245 1033 2113 2291 2324 2289 2246 1930
09:00 1959 1822 1822 1949 1952 1871 1948 1936 1903
10:00 2125 2196 2348 2036 2114 2079 1928 2056 2118
11:00 2145 2294 2228 2244 2267 2147 2117 2184 2206
12:00 2244 2403 2081 2280 2251 2231 2085 2218 2225
13:00 2199 2272 2121 2194 2153 2093 2112 2150 2163
14:00 2274 2152 2178 2238 2280 2217 2177 2237 2217
15:00 2357 2049 2279 2314 2447 2330 2325 2355 2300
16:00 2210 2137 2308 2393 2463 2337 2433 2367 2326
17:00 2089 2215 2295 2321 2274 2156 2440 2256 2256
18:00 1894 2211 2410 2012 2266 1713 2232 2023 2105
19:00 1701 1983 2196 1533 1840 1632 1852 1712 1820
20:00 1162 1645 1800 1277 1527 1242 1400 1322 1436
21:00 973 1259 1275 996 1145 974 1079 1033 1100
22:00 810 992 781 648 764 621 714 711 761
23:00 571 561 364 281 365 326 360 381 404
Total
12H(7-19) 25130 23672 23545 25670 26370 25142 25650 25592 25026
16H(6-22) 29447 28885 29011 29992 31396 29556 30495 30177 29826
18H(6-24) 30828 30438 30156 30921 32525 30503 31569 31269 30991
24H(0-24) 31324 31262 31083 31486 33091 31145 32124 31834 31645
AM Peak 08:00 11:00 10:00 11:00 08:00 08:00 08:00 08:00 11:00
2215 2294 2348 2244 2291 2324 2289 2246 2206
PM Peak 15:00 12:00 18:00 16:00 16:00 16:00 17:00 16:00 16:00
2357 2403 2410 2393 2463 2337 2440 2367 2326
PCC Traffic Information Consultancy Ltd.
Mumbles Road, Swansea
Lidl Great Britain Limited Transport Assessment
20-00668/TA/01 Corun Associates Ltd
September 2021 Appendix E
APPENDIX E
A4067 / Derwen Fawr Road Turning Count Summary
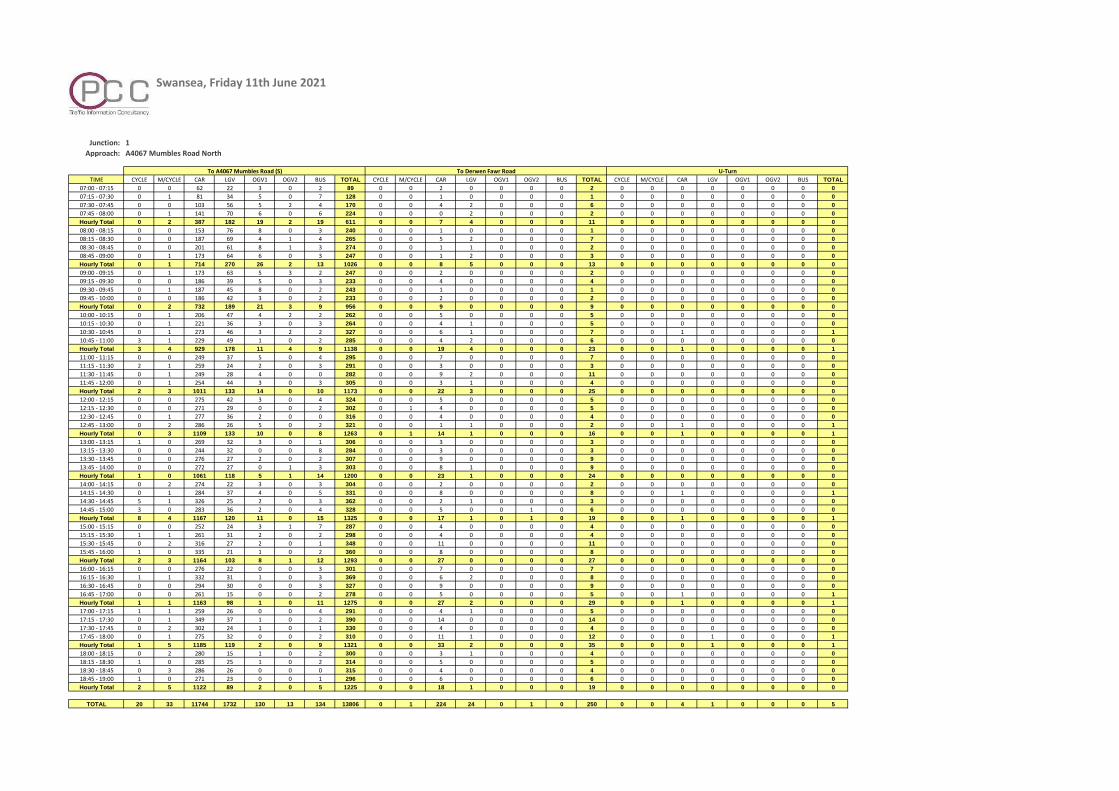
Swansea, Friday 11th June 2021
Junction: 1
Approach: A4067 Mumbles Road North
TIME CYCLE M/CYCLE CAR LGV OGV1 OGV2 BUS TOTAL CYCLE M/CYCLE CAR LGV OGV1 OGV2 BUS TOTAL CYCLE M/CYCLE CAR LGV OGV1 OGV2 BUS TOTAL
07:00 - 07:15 0 0 62 22 3 0 2 89 0 0 2 0 0 0 0 2 0 0 0 0 0 0 0 0
07:15 - 07:30 0 1 81 34 5 0 7 128 0 0 1 0 0 0 0 1 0 0 0 0 0 0 0 0
07:30 - 07:45 0 0 103 56 5 2 4 170 0 0 4 2 0 0 0 6 0 0 0 0 0 0 0 0
07:45 - 08:00 0 1 141 70 6 0 6 224 0 0 0 2 0 0 0 2 0 0 0 0 0 0 0 0
Hourly Total 0 2 387 182 19 2 19 611 0 0 7 4 0 0 0 11 0 0 0 0 0 0 0 0
08:00 - 08:15 0 0 153 76 8 0 3 240 0 0 1 0 0 0 0 1 0 0 0 0 0 0 0 0
08:15 - 08:30 0 0 187 69 4 1 4 265 0 0 5 2 0 0 0 7 0 0 0 0 0 0 0 0
08:30 - 08:45 0 0 201 61 8 1 3 274 0 0 1 1 0 0 0 2 0 0 0 0 0 0 0 0
08:45 - 09:00 0 1 173 64 6 0 3 247 0 0 1 2 0 0 0 3 0 0 0 0 0 0 0 0
Hourly Total 0 1 714 270 26 2 13 1026 0 0 8 5 0 0 0 13 0 0 0 0 0 0 0 0
09:00 - 09:15 0 1 173 63 5 3 2 247 0 0 2 0 0 0 0 2 0 0 0 0 0 0 0 0
09:15 - 09:30 0 0 186 39 5 0 3 233 0 0 4 0 0 0 0 4 0 0 0 0 0 0 0 0
09:30 - 09:45 0 1 187 45 8 0 2 243 0 0 1 0 0 0 0 1 0 0 0 0 0 0 0 0
09:45 - 10:00 0 0 186 42 3 0 2 233 0 0 2 0 0 0 0 2 0 0 0 0 0 0 0 0
Hourly Total 0 2 732 189 21 3 9 956 0 0 9 0 0 0 0 9 0 0 0 0 0 0 0 0
10:00 - 10:15 0 1 206 47 4 2 2 262 0 0 5 0 0 0 0 5 0 0 0 0 0 0 0 0
10:15 - 10:30 0 1 221 36 3 0 3 264 0 0 4 1 0 0 0 5 0 0 0 0 0 0 0 0
10:30 - 10:45 0 1 273 46 3 2 2 327 0 0 6 1 0 0 0 7 0 0 1 0 0 0 0 1
10:45 - 11:00 3 1 229 49 1 0 2 285 0 0 4 2 0 0 0 6 0 0 0 0 0 0 0 0
Hourly Total 3 4 929 178 11 4 9 1138 0 0 19 4 0 0 0 23 0 0 1 0 0 0 0 1
11:00 - 11:15 0 0 249 37 5 0 4 295 0 0 7 0 0 0 0 7 0 0 0 0 0 0 0 0
11:15 - 11:30 2 1 259 24 2 0 3 291 0 0 3 0 0 0 0 3 0 0 0 0 0 0 0 0
11:30 - 11:45 0 1 249 28 4 0 0 282 0 0 9 2 0 0 0 11 0 0 0 0 0 0 0 0
11:45 - 12:00 0 1 254 44 3 0 3 305 0 0 3 1 0 0 0 4 0 0 0 0 0 0 0 0
Hourly Total 2 3 1011 133 14 0 10 1173 0 0 22 3 0 0 0 25 0 0 0 0 0 0 0 0
12:00 - 12:15 0 0 275 42 3 0 4 324 0 0 5 0 0 0 0 5 0 0 0 0 0 0 0 0
12:15 - 12:30 0 0 271 29 0 0 2 302 0 1 4 0 0 0 0 5 0 0 0 0 0 0 0 0
12:30 - 12:45 0 1 277 36 2 0 0 316 0 0 4 0 0 0 0 4 0 0 0 0 0 0 0 0
12:45 - 13:00 0 2 286 26 5 0 2 321 0 0 1 1 0 0 0 2 0 0 1 0 0 0 0 1
Hourly Total 0 3 1109 133 10 0 8 1263 0 1 14 1 0 0 0 16 0 0 1 0 0 0 0 1
13:00 - 13:15 1 0 269 32 3 0 1 306 0 0 3 0 0 0 0 3 0 0 0 0 0 0 0 0
13:15 - 13:30 0 0 244 32 0 0 8 284 0 0 3 0 0 0 0 3 0 0 0 0 0 0 0 0
13:30 - 13:45 0 0 276 27 2 0 2 307 0 0 9 0 0 0 0 9 0 0 0 0 0 0 0 0
13:45 - 14:00 0 0 272 27 0 1 3 303 0 0 8 1 0 0 0 9 0 0 0 0 0 0 0 0
Hourly Total 1 0 1061 118 5 1 14 1200 0 0 23 1 0 0 0 24 0 0 0 0 0 0 0 0
14:00 - 14:15 0 2 274 22 3 0 3 304 0 0 2 0 0 0 0 2 0 0 0 0 0 0 0 0
14:15 - 14:30 0 1 284 37 4 0 5 331 0 0 8 0 0 0 0 8 0 0 1 0 0 0 0 1
14:30 - 14:45 5 1 326 25 2 0 3 362 0 0 2 1 0 0 0 3 0 0 0 0 0 0 0 0
14:45 - 15:00 3 0 283 36 2 0 4 328 0 0 5 0 0 1 0 6 0 0 0 0 0 0 0 0
Hourly Total 8 4 1167 120 11 0 15 1325 0 0 17 1 0 1 0 19 0 0 1 0 0 0 0 1
15:00 - 15:15 0 0 252 24 3 1 7 287 0 0 4 0 0 0 0 4 0 0 0 0 0 0 0 0
15:15 - 15:30 1 1 261 31 2 0 2 298 0 0 4 0 0 0 0 4 0 0 0 0 0 0 0 0
15:30 - 15:45 0 2 316 27 2 0 1 348 0 0 11 0 0 0 0 11 0 0 0 0 0 0 0 0
15:45 - 16:00 1 0 335 21 1 0 2 360 0 0 8 0 0 0 0 8 0 0 0 0 0 0 0 0
Hourly Total 2 3 1164 103 8 1 12 1293 0 0 27 0 0 0 0 27 0 0 0 0 0 0 0 0
16:00 - 16:15 0 0 276 22 0 0 3 301 0 0 7 0 0 0 0 7 0 0 0 0 0 0 0 0
16:15 - 16:30 1 1 332 31 1 0 3 369 0 0 6 2 0 0 0 8 0 0 0 0 0 0 0 0
16:30 - 16:45 0 0 294 30 0 0 3 327 0 0 9 0 0 0 0 9 0 0 0 0 0 0 0 0
16:45 - 17:00 0 0 261 15 0 0 2 278 0 0 5 0 0 0 0 5 0 0 1 0 0 0 0 1
Hourly Total 1 1 1163 98 1 0 11 1275 0 0 27 2 0 0 0 29 0 0 1 0 0 0 0 1
17:00 - 17:15 1 1 259 26 0 0 4 291 0 0 4 1 0 0 0 5 0 0 0 0 0 0 0 0
17:15 - 17:30 0 1 349 37 1 0 2 390 0 0 14 0 0 0 0 14 0 0 0 0 0 0 0 0
17:30 - 17:45 0 2 302 24 1 0 1 330 0 0 4 0 0 0 0 4 0 0 0 0 0 0 0 0
17:45 - 18:00 0 1 275 32 0 0 2 310 0 0 11 1 0 0 0 12 0 0 0 1 0 0 0 1
Hourly Total 1 5 1185 119 2 0 9 1321 0 0 33 2 0 0 0 35 0 0 0 1 0 0 0 1
18:00 - 18:15 0 2 280 15 1 0 2 300 0 0 3 1 0 0 0 4 0 0 0 0 0 0 0 0
18:15 - 18:30 1 0 285 25 1 0 2 314 0 0 5 0 0 0 0 5 0 0 0 0 0 0 0 0
18:30 - 18:45 0 3 286 26 0 0 0 315 0 0 4 0 0 0 0 4 0 0 0 0 0 0 0 0
18:45 - 19:00 1 0 271 23 0 0 1 296 0 0 6 0 0 0 0 6 0 0 0 0 0 0 0 0
Hourly Total 2 5 1122 89 2 0 5 1225 0 0 18 1 0 0 0 19 0 0 0 0 0 0 0 0
TOTAL 20 33 11744 1732 130 13 134 13806 0 1 224 24 0 1 0 250 0 0 4 1 0 0 0 5
U-TurnTo Derwen Fawr RoadTo A4067 Mumbles Road (S)
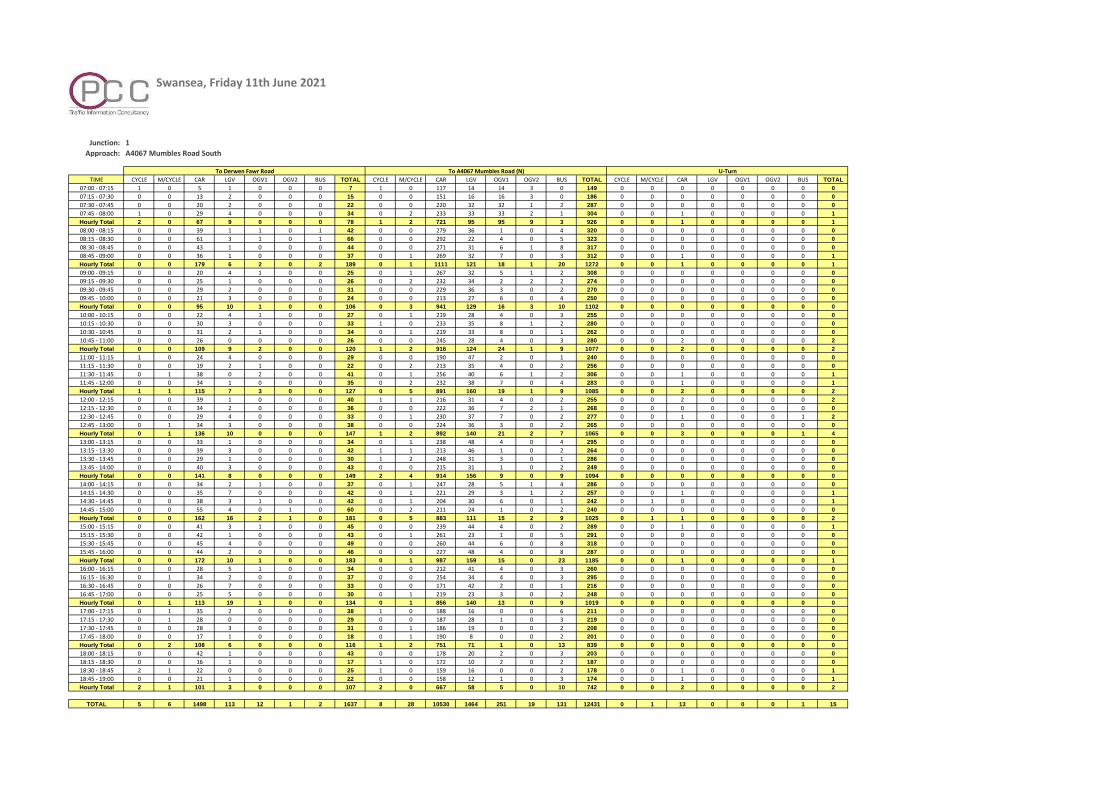
Swansea, Friday 11th June 2021
Junction: 1
Approach: A4067 Mumbles Road South
TIME CYCLE M/CYCLE CAR LGV OGV1 OGV2 BUS TOTAL CYCLE M/CYCLE CAR LGV OGV1 OGV2 BUS TOTAL CYCLE M/CYCLE CAR LGV OGV1 OGV2 BUS TOTAL
07:00 - 07:15 1 0 5 1 0 0 0 7 1 0 117 14 14 3 0 149 0 0 0 0 0 0 0 0
07:15 - 07:30 0 0 13 2 0 0 0 15 0 0 151 16 16 3 0 186 0 0 0 0 0 0 0 0
07:30 - 07:45 0 0 20 2 0 0 0 22 0 0 220 32 32 1 2 287 0 0 0 0 0 0 0 0
07:45 - 08:00 1 0 29 4 0 0 0 34 0 2 233 33 33 2 1 304 0 0 1 0 0 0 0 1
Hourly Total 2 0 67 9 0 0 0 78 1 2 721 95 95 9 3 926 0 0 1 0 0 0 0 1
08:00 - 08:15 0 0 39 1 1 0 1 42 0 0 279 36 1 0 4 320 0 0 0 0 0 0 0 0
08:15 - 08:30 0 0 61 3 1 0 1 66 0 0 292 22 4 0 5 323 0 0 0 0 0 0 0 0
08:30 - 08:45 0 0 43 1 0 0 0 44 0 0 271 31 6 1 8 317 0 0 0 0 0 0 0 0
08:45 - 09:00 0 0 36 1 0 0 0 37 0 1 269 32 7 0 3 312 0 0 1 0 0 0 0 1
Hourly Total 0 0 179 6 2 0 2 189 0 1 1111 121 18 1 20 1272 0 0 1 0 0 0 0 1
09:00 - 09:15 0 0 20 4 1 0 0 25 0 1 267 32 5 1 2 308 0 0 0 0 0 0 0 0
09:15 - 09:30 0 0 25 1 0 0 0 26 0 2 232 34 2 2 2 274 0 0 0 0 0 0 0 0
09:30 - 09:45 0 0 29 2 0 0 0 31 0 0 229 36 3 0 2 270 0 0 0 0 0 0 0 0
09:45 - 10:00 0 0 21 3 0 0 0 24 0 0 213 27 6 0 4 250 0 0 0 0 0 0 0 0
Hourly Total 0 0 95 10 1 0 0 106 0 3 941 129 16 3 10 1102 0 0 0 0 0 0 0 0
10:00 - 10:15 0 0 22 4 1 0 0 27 0 1 219 28 4 0 3 255 0 0 0 0 0 0 0 0
10:15 - 10:30 0 0 30 3 0 0 0 33 1 0 233 35 8 1 2 280 0 0 0 0 0 0 0 0
10:30 - 10:45 0 0 31 2 1 0 0 34 0 1 219 33 8 0 1 262 0 0 0 0 0 0 0 0
10:45 - 11:00 0 0 26 0 0 0 0 26 0 0 245 28 4 0 3 280 0 0 2 0 0 0 0 2
Hourly Total 0 0 109 9 2 0 0 120 1 2 916 124 24 1 9 1077 0 0 2 0 0 0 0 2
11:00 - 11:15 1 0 24 4 0 0 0 29 0 0 190 47 2 0 1 240 0 0 0 0 0 0 0 0
11:15 - 11:30 0 0 19 2 1 0 0 22 0 2 213 35 4 0 2 256 0 0 0 0 0 0 0 0
11:30 - 11:45 0 1 38 0 2 0 0 41 0 1 256 40 6 1 2 306 0 0 1 0 0 0 0 1
11:45 - 12:00 0 0 34 1 0 0 0 35 0 2 232 38 7 0 4 283 0 0 1 0 0 0 0 1
Hourly Total 1 1 115 7 3 0 0 127 0 5 891 160 19 1 9 1085 0 0 2 0 0 0 0 2
12:00 - 12:15 0 0 39 1 0 0 0 40 1 1 216 31 4 0 2 255 0 0 2 0 0 0 0 2
12:15 - 12:30 0 0 34 2 0 0 0 36 0 0 222 36 7 2 1 268 0 0 0 0 0 0 0 0
12:30 - 12:45 0 0 29 4 0 0 0 33 0 1 230 37 7 0 2 277 0 0 1 0 0 0 1 2
12:45 - 13:00 0 1 34 3 0 0 0 38 0 0 224 36 3 0 2 265 0 0 0 0 0 0 0 0
Hourly Total 0 1 136 10 0 0 0 147 1 2 892 140 21 2 7 1065 0 0 3 0 0 0 1 4
13:00 - 13:15 0 0 33 1 0 0 0 34 0 1 238 48 4 0 4 295 0 0 0 0 0 0 0 0
13:15 - 13:30 0 0 39 3 0 0 0 42 1 1 213 46 1 0 2 264 0 0 0 0 0 0 0 0
13:30 - 13:45 0 0 29 1 0 0 0 30 1 2 248 31 3 0 1 286 0 0 0 0 0 0 0 0
13:45 - 14:00 0 0 40 3 0 0 0 43 0 0 215 31 1 0 2 249 0 0 0 0 0 0 0 0
Hourly Total 0 0 141 8 0 0 0 149 2 4 914 156 9 0 9 1094 0 0 0 0 0 0 0 0
14:00 - 14:15 0 0 34 2 1 0 0 37 0 1 247 28 5 1 4 286 0 0 0 0 0 0 0 0
14:15 - 14:30 0 0 35 7 0 0 0 42 0 1 221 29 3 1 2 257 0 0 1 0 0 0 0 1
14:30 - 14:45 0 0 38 3 1 0 0 42 0 1 204 30 6 0 1 242 0 1 0 0 0 0 0 1
14:45 - 15:00 0 0 55 4 0 1 0 60 0 2 211 24 1 0 2 240 0 0 0 0 0 0 0 0
Hourly Total 0 0 162 16 2 1 0 181 0 5 883 111 15 2 9 1025 0 1 1 0 0 0 0 2
15:00 - 15:15 0 0 41 3 1 0 0 45 0 0 239 44 4 0 2 289 0 0 1 0 0 0 0 1
15:15 - 15:30 0 0 42 1 0 0 0 43 0 1 261 23 1 0 5 291 0 0 0 0 0 0 0 0
15:30 - 15:45 0 0 45 4 0 0 0 49 0 0 260 44 6 0 8 318 0 0 0 0 0 0 0 0
15:45 - 16:00 0 0 44 2 0 0 0 46 0 0 227 48 4 0 8 287 0 0 0 0 0 0 0 0
Hourly Total 0 0 172 10 1 0 0 183 0 1 987 159 15 0 23 1185 0 0 1 0 0 0 0 1
16:00 - 16:15 0 0 28 5 1 0 0 34 0 0 212 41 4 0 3 260 0 0 0 0 0 0 0 0
16:15 - 16:30 0 1 34 2 0 0 0 37 0 0 254 34 4 0 3 295 0 0 0 0 0 0 0 0
16:30 - 16:45 0 0 26 7 0 0 0 33 0 0 171 42 2 0 1 216 0 0 0 0 0 0 0 0
16:45 - 17:00 0 0 25 5 0 0 0 30 0 1 219 23 3 0 2 248 0 0 0 0 0 0 0 0
Hourly Total 0 1 113 19 1 0 0 134 0 1 856 140 13 0 9 1019 0 0 0 0 0 0 0 0
17:00 - 17:15 0 1 35 2 0 0 0 38 1 0 188 16 0 0 6 211 0 0 0 0 0 0 0 0
17:15 - 17:30 0 1 28 0 0 0 0 29 0 0 187 28 1 0 3 219 0 0 0 0 0 0 0 0
17:30 - 17:45 0 0 28 3 0 0 0 31 0 1 186 19 0 0 2 208 0 0 0 0 0 0 0 0
17:45 - 18:00 0 0 17 1 0 0 0 18 0 1 190 8 0 0 2 201 0 0 0 0 0 0 0 0
Hourly Total 0 2 108 6 0 0 0 116 1 2 751 71 1 0 13 839 0 0 0 0 0 0 0 0
18:00 - 18:15 0 0 42 1 0 0 0 43 0 0 178 20 2 0 3 203 0 0 0 0 0 0 0 0
18:15 - 18:30 0 0 16 1 0 0 0 17 1 0 172 10 2 0 2 187 0 0 0 0 0 0 0 0
18:30 - 18:45 2 1 22 0 0 0 0 25 1 0 159 16 0 0 2 178 0 0 1 0 0 0 0 1
18:45 - 19:00 0 0 21 1 0 0 0 22 0 0 158 12 1 0 3 174 0 0 1 0 0 0 0 1
Hourly Total 2 1 101 3 0 0 0 107 2 0 667 58 5 0 10 742 0 0 2 0 0 0 0 2
TOTAL 5 6 1498 113 12 1 2 1637 8 28 10530 1464 251 19 131 12431 0 1 13 0 0 0 1 15
To A4067 Mumbles Road (N) U-TurnTo Derwen Fawr Road

Swansea, Friday 11th June 2021
Junction: 1
Approach: Derwen Fawr Road
TIME CYCLE M/CYCLE CAR LGV OGV1 OGV2 BUS TOTAL CYCLE M/CYCLE CAR LGV OGV1 OGV2 BUS TOTAL
07:00 - 07:15 0 0 2 1 0 0 0 3 0 0 5 0 0 0 0 5
07:15 - 07:30 0 0 3 0 0 0 0 3 0 0 2 2 0 0 0 4
07:30 - 07:45 0 0 5 1 0 0 0 6 0 0 15 1 0 0 0 16
07:45 - 08:00 0 0 7 0 0 0 0 7 0 0 15 6 0 0 0 21
Hourly Total 0 0 17 2 0 0 0 19 0 0 37 9 0 0 0 46
08:00 - 08:15 0 0 9 0 0 0 0 9 0 1 23 7 0 0 0 31
08:15 - 08:30 0 0 5 0 0 0 0 5 0 0 29 4 2 0 0 35
08:30 - 08:45 0 0 2 0 0 0 0 2 0 0 29 8 0 0 0 37
08:45 - 09:00 0 0 3 0 0 0 0 3 0 0 26 5 0 0 0 31
Hourly Total 0 0 19 0 0 0 0 19 0 1 107 24 2 0 0 134
09:00 - 09:15 0 0 4 1 0 0 0 5 0 0 27 3 1 0 0 31
09:15 - 09:30 0 0 5 1 0 0 0 6 0 0 18 8 0 0 0 26
09:30 - 09:45 0 0 4 0 0 0 0 4 0 0 15 0 0 0 0 15
09:45 - 10:00 0 0 4 1 0 0 0 5 0 0 24 2 0 0 0 26
Hourly Total 0 0 17 3 0 0 0 20 0 0 84 13 1 0 0 98
10:00 - 10:15 0 0 6 1 0 0 0 7 0 0 14 2 0 0 0 16
10:15 - 10:30 0 0 3 0 0 0 0 3 0 0 20 2 0 0 0 22
10:30 - 10:45 0 0 9 0 0 0 0 9 0 0 19 0 0 0 0 19
10:45 - 11:00 0 0 10 1 0 0 0 11 0 0 12 7 0 0 0 19
Hourly Total 0 0 28 2 0 0 0 30 0 0 65 11 0 0 0 76
11:00 - 11:15 0 0 10 0 0 0 0 10 0 1 18 4 1 0 0 24
11:15 - 11:30 0 0 8 0 0 0 0 8 0 0 23 4 1 0 0 28
11:30 - 11:45 0 0 4 2 0 0 0 6 0 1 21 2 0 0 0 24
11:45 - 12:00 0 0 7 0 0 0 0 7 0 0 26 3 1 0 0 30
Hourly Total 0 0 29 2 0 0 0 31 0 2 88 13 3 0 0 106
12:00 - 12:15 0 0 6 0 0 0 0 6 0 0 25 4 0 0 0 29
12:15 - 12:30 0 0 8 3 0 0 0 11 0 0 27 2 0 0 0 29
12:30 - 12:45 0 0 5 1 0 0 0 6 0 0 25 0 0 0 1 26
12:45 - 13:00 0 0 3 0 0 0 0 3 0 0 18 7 0 0 0 25
Hourly Total 0 0 22 4 0 0 0 26 0 0 95 13 0 0 1 109
13:00 - 13:15 0 0 8 2 0 0 0 10 0 0 19 5 0 0 0 24
13:15 - 13:30 0 0 3 0 0 0 0 3 1 0 17 2 0 0 0 20
13:30 - 13:45 0 0 6 0 0 0 0 6 0 0 13 2 0 0 0 15
13:45 - 14:00 0 0 6 0 0 0 0 6 0 0 23 4 0 0 0 27
Hourly Total 0 0 23 2 0 0 0 25 1 0 72 13 0 0 0 86
14:00 - 14:15 0 0 6 1 0 0 0 7 0 0 18 3 0 0 0 21
14:15 - 14:30 0 0 6 2 0 0 0 8 0 0 22 4 1 0 0 27
14:30 - 14:45 0 0 6 1 1 0 0 8 2 1 23 7 0 0 0 33
14:45 - 15:00 0 0 5 0 0 1 0 6 0 1 34 3 1 0 0 39
Hourly Total 0 0 23 4 1 1 0 29 2 2 97 17 2 0 0 120
15:00 - 15:15 0 0 8 1 0 0 0 9 0 0 19 5 2 0 0 26
15:15 - 15:30 0 0 4 3 0 0 0 7 0 0 19 3 0 0 0 22
15:30 - 15:45 0 0 4 1 0 0 0 5 1 1 27 1 0 0 1 31
15:45 - 16:00 0 0 4 1 0 0 0 5 0 0 20 6 1 0 0 27
Hourly Total 0 0 20 6 0 0 0 26 1 1 85 15 3 0 1 106
16:00 - 16:15 0 0 6 0 0 0 0 6 0 0 25 2 0 0 0 27
16:15 - 16:30 0 0 6 1 0 0 0 7 0 0 22 1 0 0 0 23
16:30 - 16:45 0 0 6 1 0 0 0 7 0 0 23 5 0 0 1 29
16:45 - 17:00 0 0 4 0 0 0 0 4 0 0 27 0 0 0 0 27
Hourly Total 0 0 22 2 0 0 0 24 0 0 97 8 0 0 1 106
17:00 - 17:15 0 0 3 0 0 0 0 3 0 0 29 5 0 0 0 34
17:15 - 17:30 0 0 10 2 0 0 0 12 0 0 21 0 0 0 0 21
17:30 - 17:45 0 0 3 1 0 0 0 4 0 0 23 4 0 0 0 27
17:45 - 18:00 0 0 1 0 0 0 0 1 0 0 31 1 0 0 0 32
Hourly Total 0 0 17 3 0 0 0 20 0 0 104 10 0 0 0 114
18:00 - 18:15 2 0 5 0 0 0 0 7 0 0 21 2 0 0 0 23
18:15 - 18:30 0 0 4 0 0 0 0 4 0 1 23 1 0 0 0 25
18:30 - 18:45 0 0 1 1 0 0 0 2 0 0 19 1 0 0 0 20
18:45 - 19:00 0 0 3 0 0 0 0 3 0 0 19 2 0 0 0 21
Hourly Total 2 0 13 1 0 0 0 16 0 1 82 6 0 0 0 89
TOTAL 2 0 250 31 1 1 0 285 4 7 1013 152 11 0 3 1190
To A4067 Mumbles Road (N) To A4067 Mumbles Road (S)
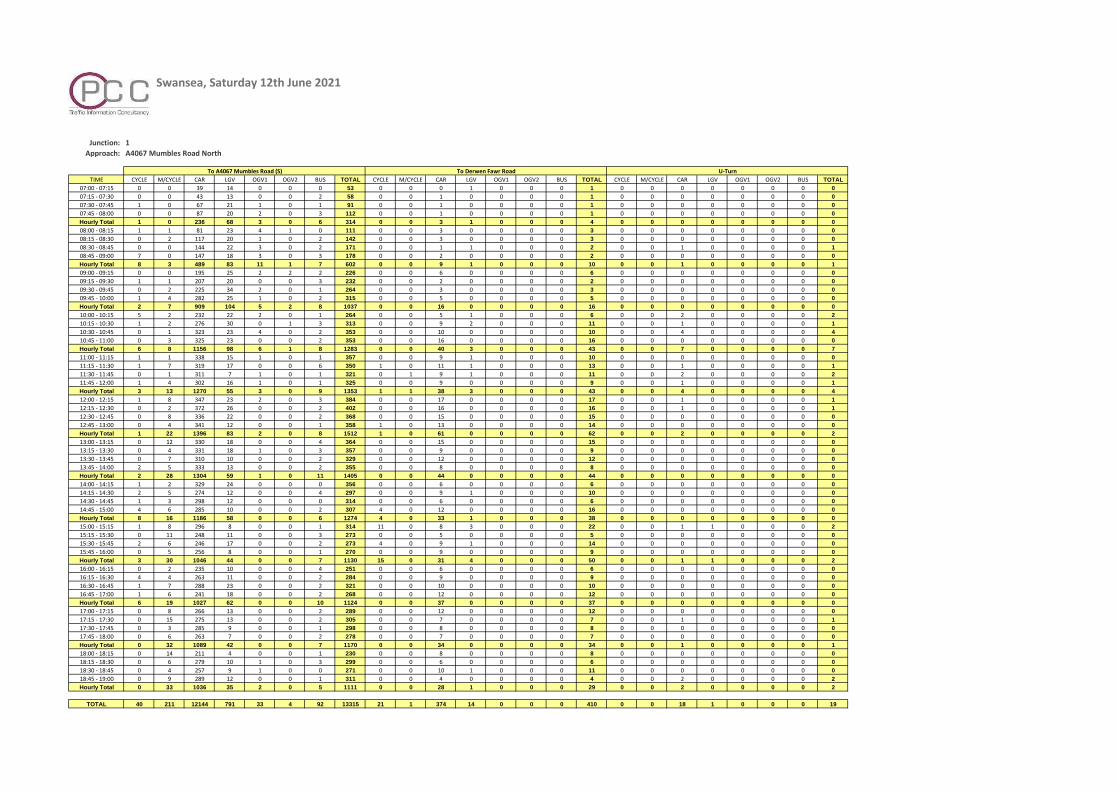
Swansea, Saturday 12th June 2021
Junction: 1
Approach: A4067 Mumbles Road North
TIME CYCLE M/CYCLE CAR LGV OGV1 OGV2 BUS TOTAL CYCLE M/CYCLE CAR LGV OGV1 OGV2 BUS TOTAL CYCLE M/CYCLE CAR LGV OGV1 OGV2 BUS TOTAL
07:00 - 07:15 0 0 39 14 0 0 0 53 0 0 0 1 0 0 0 1 0 0 0 0 0 0 0 0
07:15 - 07:30 0 0 43 13 0 0 2 58 0 0 1 0 0 0 0 1 0 0 0 0 0 0 0 0
07:30 - 07:45 1 0 67 21 1 0 1 91 0 0 1 0 0 0 0 1 0 0 0 0 0 0 0 0
07:45 - 08:00 0 0 87 20 2 0 3 112 0 0 1 0 0 0 0 1 0 0 0 0 0 0 0 0
Hourly Total 1 0 236 68 3 0 6 314 0 0 3 1 0 0 0 4 0 0 0 0 0 0 0 0
08:00 - 08:15 1 1 81 23 4 1 0 111 0 0 3 0 0 0 0 3 0 0 0 0 0 0 0 0
08:15 - 08:30 0 2 117 20 1 0 2 142 0 0 3 0 0 0 0 3 0 0 0 0 0 0 0 0
08:30 - 08:45 0 0 144 22 3 0 2 171 0 0 1 1 0 0 0 2 0 0 1 0 0 0 0 1
08:45 - 09:00 7 0 147 18 3 0 3 178 0 0 2 0 0 0 0 2 0 0 0 0 0 0 0 0
Hourly Total 8 3 489 83 11 1 7 602 0 0 9 1 0 0 0 10 0 0 1 0 0 0 0 1
09:00 - 09:15 0 0 195 25 2 2 2 226 0 0 6 0 0 0 0 6 0 0 0 0 0 0 0 0
09:15 - 09:30 1 1 207 20 0 0 3 232 0 0 2 0 0 0 0 2 0 0 0 0 0 0 0 0
09:30 - 09:45 0 2 225 34 2 0 1 264 0 0 3 0 0 0 0 3 0 0 0 0 0 0 0 0
09:45 - 10:00 1 4 282 25 1 0 2 315 0 0 5 0 0 0 0 5 0 0 0 0 0 0 0 0
Hourly Total 2 7 909 104 5 2 8 1037 0 0 16 0 0 0 0 16 0 0 0 0 0 0 0 0
10:00 - 10:15 5 2 232 22 2 0 1 264 0 0 5 1 0 0 0 6 0 0 2 0 0 0 0 2
10:15 - 10:30 1 2 276 30 0 1 3 313 0 0 9 2 0 0 0 11 0 0 1 0 0 0 0 1
10:30 - 10:45 0 1 323 23 4 0 2 353 0 0 10 0 0 0 0 10 0 0 4 0 0 0 0 4
10:45 - 11:00 0 3 325 23 0 0 2 353 0 0 16 0 0 0 0 16 0 0 0 0 0 0 0 0
Hourly Total 6 8 1156 98 6 1 8 1283 0 0 40 3 0 0 0 43 0 0 7 0 0 0 0 7
11:00 - 11:15 1 1 338 15 1 0 1 357 0 0 9 1 0 0 0 10 0 0 0 0 0 0 0 0
11:15 - 11:30 1 7 319 17 0 0 6 350 1 0 11 1 0 0 0 13 0 0 1 0 0 0 0 1
11:30 - 11:45 0 1 311 7 1 0 1 321 0 1 9 1 0 0 0 11 0 0 2 0 0 0 0 2
11:45 - 12:00 1 4 302 16 1 0 1 325 0 0 9 0 0 0 0 9 0 0 1 0 0 0 0 1
Hourly Total 3 13 1270 55 3 0 9 1353 1 1 38 3 0 0 0 43 0 0 4 0 0 0 0 4
12:00 - 12:15 1 8 347 23 2 0 3 384 0 0 17 0 0 0 0 17 0 0 1 0 0 0 0 1
12:15 - 12:30 0 2 372 26 0 0 2 402 0 0 16 0 0 0 0 16 0 0 1 0 0 0 0 1
12:30 - 12:45 0 8 336 22 0 0 2 368 0 0 15 0 0 0 0 15 0 0 0 0 0 0 0 0
12:45 - 13:00 0 4 341 12 0 0 1 358 1 0 13 0 0 0 0 14 0 0 0 0 0 0 0 0
Hourly Total 1 22 1396 83 2 0 8 1512 1 0 61 0 0 0 0 62 0 0 2 0 0 0 0 2
13:00 - 13:15 0 12 330 18 0 0 4 364 0 0 15 0 0 0 0 15 0 0 0 0 0 0 0 0
13:15 - 13:30 0 4 331 18 1 0 3 357 0 0 9 0 0 0 0 9 0 0 0 0 0 0 0 0
13:30 - 13:45 0 7 310 10 0 0 2 329 0 0 12 0 0 0 0 12 0 0 0 0 0 0 0 0
13:45 - 14:00 2 5 333 13 0 0 2 355 0 0 8 0 0 0 0 8 0 0 0 0 0 0 0 0
Hourly Total 2 28 1304 59 1 0 11 1405 0 0 44 0 0 0 0 44 0 0 0 0 0 0 0 0
14:00 - 14:15 1 2 329 24 0 0 0 356 0 0 6 0 0 0 0 6 0 0 0 0 0 0 0 0
14:15 - 14:30 2 5 274 12 0 0 4 297 0 0 9 1 0 0 0 10 0 0 0 0 0 0 0 0
14:30 - 14:45 1 3 298 12 0 0 0 314 0 0 6 0 0 0 0 6 0 0 0 0 0 0 0 0
14:45 - 15:00 4 6 285 10 0 0 2 307 4 0 12 0 0 0 0 16 0 0 0 0 0 0 0 0
Hourly Total 8 16 1186 58 0 0 6 1274 4 0 33 1 0 0 0 38 0 0 0 0 0 0 0 0
15:00 - 15:15 1 8 296 8 0 0 1 314 11 0 8 3 0 0 0 22 0 0 1 1 0 0 0 2
15:15 - 15:30 0 11 248 11 0 0 3 273 0 0 5 0 0 0 0 5 0 0 0 0 0 0 0 0
15:30 - 15:45 2 6 246 17 0 0 2 273 4 0 9 1 0 0 0 14 0 0 0 0 0 0 0 0
15:45 - 16:00 0 5 256 8 0 0 1 270 0 0 9 0 0 0 0 9 0 0 0 0 0 0 0 0
Hourly Total 3 30 1046 44 0 0 7 1130 15 0 31 4 0 0 0 50 0 0 1 1 0 0 0 2
16:00 - 16:15 0 2 235 10 0 0 4 251 0 0 6 0 0 0 0 6 0 0 0 0 0 0 0 0
16:15 - 16:30 4 4 263 11 0 0 2 284 0 0 9 0 0 0 0 9 0 0 0 0 0 0 0 0
16:30 - 16:45 1 7 288 23 0 0 2 321 0 0 10 0 0 0 0 10 0 0 0 0 0 0 0 0
16:45 - 17:00 1 6 241 18 0 0 2 268 0 0 12 0 0 0 0 12 0 0 0 0 0 0 0 0
Hourly Total 6 19 1027 62 0 0 10 1124 0 0 37 0 0 0 0 37 0 0 0 0 0 0 0 0
17:00 - 17:15 0 8 266 13 0 0 2 289 0 0 12 0 0 0 0 12 0 0 0 0 0 0 0 0
17:15 - 17:30 0 15 275 13 0 0 2 305 0 0 7 0 0 0 0 7 0 0 1 0 0 0 0 1
17:30 - 17:45 0 3 285 9 0 0 1 298 0 0 8 0 0 0 0 8 0 0 0 0 0 0 0 0
17:45 - 18:00 0 6 263 7 0 0 2 278 0 0 7 0 0 0 0 7 0 0 0 0 0 0 0 0
Hourly Total 0 32 1089 42 0 0 7 1170 0 0 34 0 0 0 0 34 0 0 1 0 0 0 0 1
18:00 - 18:15 0 14 211 4 0 0 1 230 0 0 8 0 0 0 0 8 0 0 0 0 0 0 0 0
18:15 - 18:30 0 6 279 10 1 0 3 299 0 0 6 0 0 0 0 6 0 0 0 0 0 0 0 0
18:30 - 18:45 0 4 257 9 1 0 0 271 0 0 10 1 0 0 0 11 0 0 0 0 0 0 0 0
18:45 - 19:00 0 9 289 12 0 0 1 311 0 0 4 0 0 0 0 4 0 0 2 0 0 0 0 2
Hourly Total 0 33 1036 35 2 0 5 1111 0 0 28 1 0 0 0 29 0 0 2 0 0 0 0 2
TOTAL 40 211 12144 791 33 4 92 13315 21 1 374 14 0 0 0 410 0 0 18 1 0 0 0 19
U-TurnTo Derwen Fawr RoadTo A4067 Mumbles Road (S)
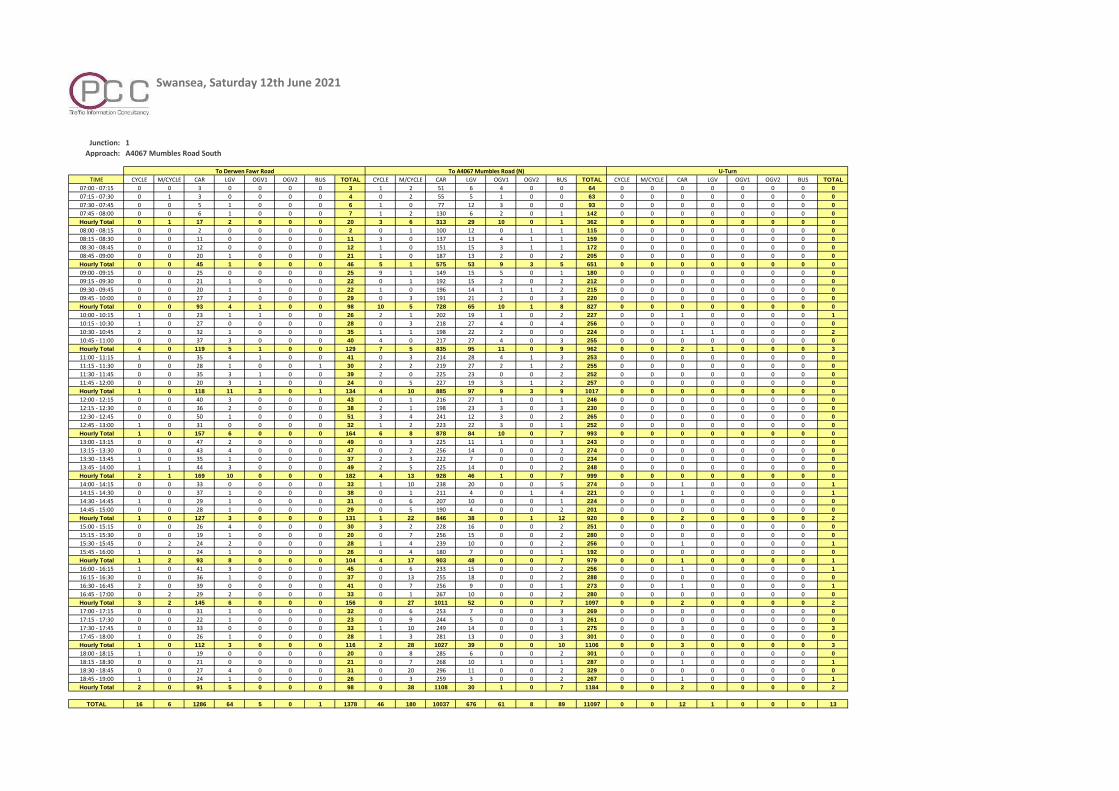
Swansea, Saturday 12th June 2021
Junction: 1
Approach: A4067 Mumbles Road South
TIME CYCLE M/CYCLE CAR LGV OGV1 OGV2 BUS TOTAL CYCLE M/CYCLE CAR LGV OGV1 OGV2 BUS TOTAL CYCLE M/CYCLE CAR LGV OGV1 OGV2 BUS TOTAL
07:00 - 07:15 0 0 3 0 0 0 0 3 1 2 51 6 4 0 0 64 0 0 0 0 0 0 0 0
07:15 - 07:30 0 1 3 0 0 0 0 4 0 2 55 5 1 0 0 63 0 0 0 0 0 0 0 0
07:30 - 07:45 0 0 5 1 0 0 0 6 1 0 77 12 3 0 0 93 0 0 0 0 0 0 0 0
07:45 - 08:00 0 0 6 1 0 0 0 7 1 2 130 6 2 0 1 142 0 0 0 0 0 0 0 0
Hourly Total 0 1 17 2 0 0 0 20 3 6 313 29 10 0 1 362 0 0 0 0 0 0 0 0
08:00 - 08:15 0 0 2 0 0 0 0 2 0 1 100 12 0 1 1 115 0 0 0 0 0 0 0 0
08:15 - 08:30 0 0 11 0 0 0 0 11 3 0 137 13 4 1 1 159 0 0 0 0 0 0 0 0
08:30 - 08:45 0 0 12 0 0 0 0 12 1 0 151 15 3 1 1 172 0 0 0 0 0 0 0 0
08:45 - 09:00 0 0 20 1 0 0 0 21 1 0 187 13 2 0 2 205 0 0 0 0 0 0 0 0
Hourly Total 0 0 45 1 0 0 0 46 5 1 575 53 9 3 5 651 0 0 0 0 0 0 0 0
09:00 - 09:15 0 0 25 0 0 0 0 25 9 1 149 15 5 0 1 180 0 0 0 0 0 0 0 0
09:15 - 09:30 0 0 21 1 0 0 0 22 0 1 192 15 2 0 2 212 0 0 0 0 0 0 0 0
09:30 - 09:45 0 0 20 1 1 0 0 22 1 0 196 14 1 1 2 215 0 0 0 0 0 0 0 0
09:45 - 10:00 0 0 27 2 0 0 0 29 0 3 191 21 2 0 3 220 0 0 0 0 0 0 0 0
Hourly Total 0 0 93 4 1 0 0 98 10 5 728 65 10 1 8 827 0 0 0 0 0 0 0 0
10:00 - 10:15 1 0 23 1 1 0 0 26 2 1 202 19 1 0 2 227 0 0 1 0 0 0 0 1
10:15 - 10:30 1 0 27 0 0 0 0 28 0 3 218 27 4 0 4 256 0 0 0 0 0 0 0 0
10:30 - 10:45 2 0 32 1 0 0 0 35 1 1 198 22 2 0 0 224 0 0 1 1 0 0 0 2
10:45 - 11:00 0 0 37 3 0 0 0 40 4 0 217 27 4 0 3 255 0 0 0 0 0 0 0 0
Hourly Total 4 0 119 5 1 0 0 129 7 5 835 95 11 0 9 962 0 0 2 1 0 0 0 3
11:00 - 11:15 1 0 35 4 1 0 0 41 0 3 214 28 4 1 3 253 0 0 0 0 0 0 0 0
11:15 - 11:30 0 0 28 1 0 0 1 30 2 2 219 27 2 1 2 255 0 0 0 0 0 0 0 0
11:30 - 11:45 0 0 35 3 1 0 0 39 2 0 225 23 0 0 2 252 0 0 0 0 0 0 0 0
11:45 - 12:00 0 0 20 3 1 0 0 24 0 5 227 19 3 1 2 257 0 0 0 0 0 0 0 0
Hourly Total 1 0 118 11 3 0 1 134 4 10 885 97 9 3 9 1017 0 0 0 0 0 0 0 0
12:00 - 12:15 0 0 40 3 0 0 0 43 0 1 216 27 1 0 1 246 0 0 0 0 0 0 0 0
12:15 - 12:30 0 0 36 2 0 0 0 38 2 1 198 23 3 0 3 230 0 0 0 0 0 0 0 0
12:30 - 12:45 0 0 50 1 0 0 0 51 3 4 241 12 3 0 2 265 0 0 0 0 0 0 0 0
12:45 - 13:00 1 0 31 0 0 0 0 32 1 2 223 22 3 0 1 252 0 0 0 0 0 0 0 0
Hourly Total 1 0 157 6 0 0 0 164 6 8 878 84 10 0 7 993 0 0 0 0 0 0 0 0
13:00 - 13:15 0 0 47 2 0 0 0 49 0 3 225 11 1 0 3 243 0 0 0 0 0 0 0 0
13:15 - 13:30 0 0 43 4 0 0 0 47 0 2 256 14 0 0 2 274 0 0 0 0 0 0 0 0
13:30 - 13:45 1 0 35 1 0 0 0 37 2 3 222 7 0 0 0 234 0 0 0 0 0 0 0 0
13:45 - 14:00 1 1 44 3 0 0 0 49 2 5 225 14 0 0 2 248 0 0 0 0 0 0 0 0
Hourly Total 2 1 169 10 0 0 0 182 4 13 928 46 1 0 7 999 0 0 0 0 0 0 0 0
14:00 - 14:15 0 0 33 0 0 0 0 33 1 10 238 20 0 0 5 274 0 0 1 0 0 0 0 1
14:15 - 14:30 0 0 37 1 0 0 0 38 0 1 211 4 0 1 4 221 0 0 1 0 0 0 0 1
14:30 - 14:45 1 0 29 1 0 0 0 31 0 6 207 10 0 0 1 224 0 0 0 0 0 0 0 0
14:45 - 15:00 0 0 28 1 0 0 0 29 0 5 190 4 0 0 2 201 0 0 0 0 0 0 0 0
Hourly Total 1 0 127 3 0 0 0 131 1 22 846 38 0 1 12 920 0 0 2 0 0 0 0 2
15:00 - 15:15 0 0 26 4 0 0 0 30 3 2 228 16 0 0 2 251 0 0 0 0 0 0 0 0
15:15 - 15:30 0 0 19 1 0 0 0 20 0 7 256 15 0 0 2 280 0 0 0 0 0 0 0 0
15:30 - 15:45 0 2 24 2 0 0 0 28 1 4 239 10 0 0 2 256 0 0 1 0 0 0 0 1
15:45 - 16:00 1 0 24 1 0 0 0 26 0 4 180 7 0 0 1 192 0 0 0 0 0 0 0 0
Hourly Total 1 2 93 8 0 0 0 104 4 17 903 48 0 0 7 979 0 0 1 0 0 0 0 1
16:00 - 16:15 1 0 41 3 0 0 0 45 0 6 233 15 0 0 2 256 0 0 1 0 0 0 0 1
16:15 - 16:30 0 0 36 1 0 0 0 37 0 13 255 18 0 0 2 288 0 0 0 0 0 0 0 0
16:30 - 16:45 2 0 39 0 0 0 0 41 0 7 256 9 0 0 1 273 0 0 1 0 0 0 0 1
16:45 - 17:00 0 2 29 2 0 0 0 33 0 1 267 10 0 0 2 280 0 0 0 0 0 0 0 0
Hourly Total 3 2 145 6 0 0 0 156 0 27 1011 52 0 0 7 1097 0 0 2 0 0 0 0 2
17:00 - 17:15 0 0 31 1 0 0 0 32 0 6 253 7 0 0 3 269 0 0 0 0 0 0 0 0
17:15 - 17:30 0 0 22 1 0 0 0 23 0 9 244 5 0 0 3 261 0 0 0 0 0 0 0 0
17:30 - 17:45 0 0 33 0 0 0 0 33 1 10 249 14 0 0 1 275 0 0 3 0 0 0 0 3
17:45 - 18:00 1 0 26 1 0 0 0 28 1 3 281 13 0 0 3 301 0 0 0 0 0 0 0 0
Hourly Total 1 0 112 3 0 0 0 116 2 28 1027 39 0 0 10 1106 0 0 3 0 0 0 0 3
18:00 - 18:15 1 0 19 0 0 0 0 20 0 8 285 6 0 0 2 301 0 0 0 0 0 0 0 0
18:15 - 18:30 0 0 21 0 0 0 0 21 0 7 268 10 1 0 1 287 0 0 1 0 0 0 0 1
18:30 - 18:45 0 0 27 4 0 0 0 31 0 20 296 11 0 0 2 329 0 0 0 0 0 0 0 0
18:45 - 19:00 1 0 24 1 0 0 0 26 0 3 259 3 0 0 2 267 0 0 1 0 0 0 0 1
Hourly Total 2 0 91 5 0 0 0 98 0 38 1108 30 1 0 7 1184 0 0 2 0 0 0 0 2
TOTAL 16 6 1286 64 5 0 1 1378 46 180 10037 676 61 8 89 11097 0 0 12 1 0 0 0 13
To A4067 Mumbles Road (N) U-TurnTo Derwen Fawr Road
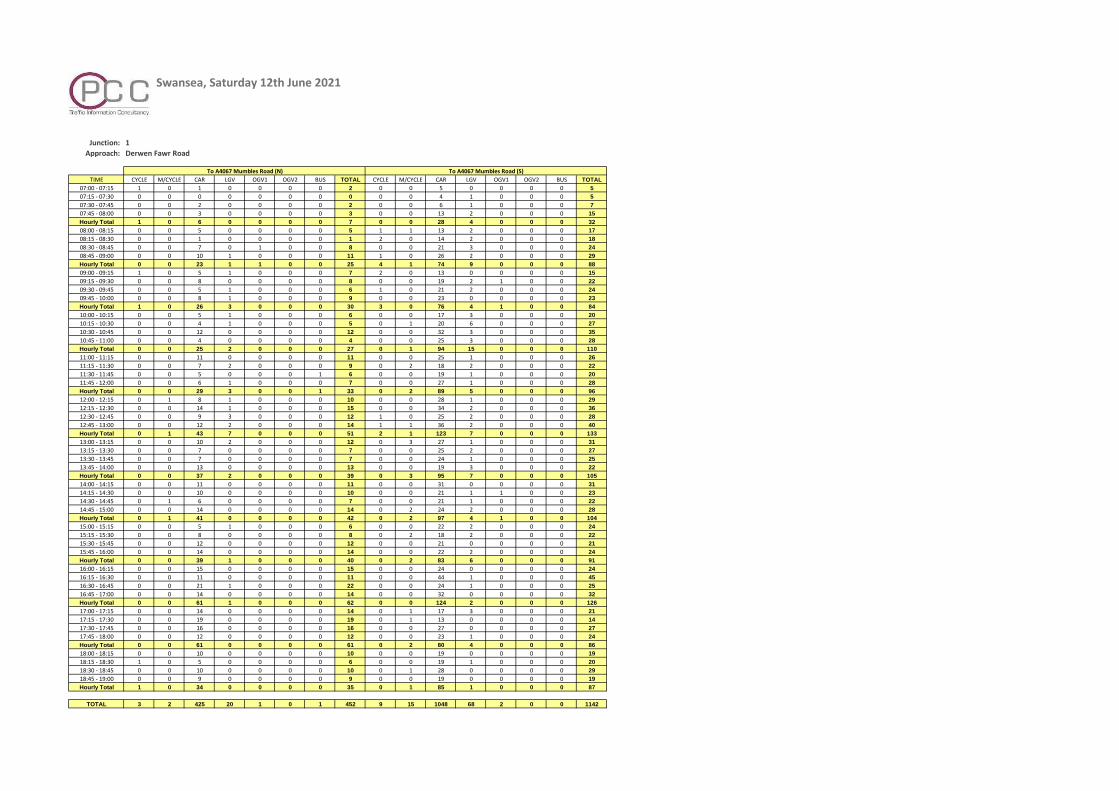
Swansea, Saturday 12th June 2021
Junction: 1
Approach: Derwen Fawr Road
TIME CYCLE M/CYCLE CAR LGV OGV1 OGV2 BUS TOTAL CYCLE M/CYCLE CAR LGV OGV1 OGV2 BUS TOTAL
07:00 - 07:15 1 0 1 0 0 0 0 2 0 0 5 0 0 0 0 5
07:15 - 07:30 0 0 0 0 0 0 0 0 0 0 4 1 0 0 0 5
07:30 - 07:45 0 0 2 0 0 0 0 2 0 0 6 1 0 0 0 7
07:45 - 08:00 0 0 3 0 0 0 0 3 0 0 13 2 0 0 0 15
Hourly Total 1 0 6 0 0 0 0 7 0 0 28 4 0 0 0 32
08:00 - 08:15 0 0 5 0 0 0 0 5 1 1 13 2 0 0 0 17
08:15 - 08:30 0 0 1 0 0 0 0 1 2 0 14 2 0 0 0 18
08:30 - 08:45 0 0 7 0 1 0 0 8 0 0 21 3 0 0 0 24
08:45 - 09:00 0 0 10 1 0 0 0 11 1 0 26 2 0 0 0 29
Hourly Total 0 0 23 1 1 0 0 25 4 1 74 9 0 0 0 88
09:00 - 09:15 1 0 5 1 0 0 0 7 2 0 13 0 0 0 0 15
09:15 - 09:30 0 0 8 0 0 0 0 8 0 0 19 2 1 0 0 22
09:30 - 09:45 0 0 5 1 0 0 0 6 1 0 21 2 0 0 0 24
09:45 - 10:00 0 0 8 1 0 0 0 9 0 0 23 0 0 0 0 23
Hourly Total 1 0 26 3 0 0 0 30 3 0 76 4 1 0 0 84
10:00 - 10:15 0 0 5 1 0 0 0 6 0 0 17 3 0 0 0 20
10:15 - 10:30 0 0 4 1 0 0 0 5 0 1 20 6 0 0 0 27
10:30 - 10:45 0 0 12 0 0 0 0 12 0 0 32 3 0 0 0 35
10:45 - 11:00 0 0 4 0 0 0 0 4 0 0 25 3 0 0 0 28
Hourly Total 0 0 25 2 0 0 0 27 0 1 94 15 0 0 0 110
11:00 - 11:15 0 0 11 0 0 0 0 11 0 0 25 1 0 0 0 26
11:15 - 11:30 0 0 7 2 0 0 0 9 0 2 18 2 0 0 0 22
11:30 - 11:45 0 0 5 0 0 0 1 6 0 0 19 1 0 0 0 20
11:45 - 12:00 0 0 6 1 0 0 0 7 0 0 27 1 0 0 0 28
Hourly Total 0 0 29 3 0 0 1 33 0 2 89 5 0 0 0 96
12:00 - 12:15 0 1 8 1 0 0 0 10 0 0 28 1 0 0 0 29
12:15 - 12:30 0 0 14 1 0 0 0 15 0 0 34 2 0 0 0 36
12:30 - 12:45 0 0 9 3 0 0 0 12 1 0 25 2 0 0 0 28
12:45 - 13:00 0 0 12 2 0 0 0 14 1 1 36 2 0 0 0 40
Hourly Total 0 1 43 7 0 0 0 51 2 1 123 7 0 0 0 133
13:00 - 13:15 0 0 10 2 0 0 0 12 0 3 27 1 0 0 0 31
13:15 - 13:30 0 0 7 0 0 0 0 7 0 0 25 2 0 0 0 27
13:30 - 13:45 0 0 7 0 0 0 0 7 0 0 24 1 0 0 0 25
13:45 - 14:00 0 0 13 0 0 0 0 13 0 0 19 3 0 0 0 22
Hourly Total 0 0 37 2 0 0 0 39 0 3 95 7 0 0 0 105
14:00 - 14:15 0 0 11 0 0 0 0 11 0 0 31 0 0 0 0 31
14:15 - 14:30 0 0 10 0 0 0 0 10 0 0 21 1 1 0 0 23
14:30 - 14:45 0 1 6 0 0 0 0 7 0 0 21 1 0 0 0 22
14:45 - 15:00 0 0 14 0 0 0 0 14 0 2 24 2 0 0 0 28
Hourly Total 0 1 41 0 0 0 0 42 0 2 97 4 1 0 0 104
15:00 - 15:15 0 0 5 1 0 0 0 6 0 0 22 2 0 0 0 24
15:15 - 15:30 0 0 8 0 0 0 0 8 0 2 18 2 0 0 0 22
15:30 - 15:45 0 0 12 0 0 0 0 12 0 0 21 0 0 0 0 21
15:45 - 16:00 0 0 14 0 0 0 0 14 0 0 22 2 0 0 0 24
Hourly Total 0 0 39 1 0 0 0 40 0 2 83 6 0 0 0 91
16:00 - 16:15 0 0 15 0 0 0 0 15 0 0 24 0 0 0 0 24
16:15 - 16:30 0 0 11 0 0 0 0 11 0 0 44 1 0 0 0 45
16:30 - 16:45 0 0 21 1 0 0 0 22 0 0 24 1 0 0 0 25
16:45 - 17:00 0 0 14 0 0 0 0 14 0 0 32 0 0 0 0 32
Hourly Total 0 0 61 1 0 0 0 62 0 0 124 2 0 0 0 126
17:00 - 17:15 0 0 14 0 0 0 0 14 0 1 17 3 0 0 0 21
17:15 - 17:30 0 0 19 0 0 0 0 19 0 1 13 0 0 0 0 14
17:30 - 17:45 0 0 16 0 0 0 0 16 0 0 27 0 0 0 0 27
17:45 - 18:00 0 0 12 0 0 0 0 12 0 0 23 1 0 0 0 24
Hourly Total 0 0 61 0 0 0 0 61 0 2 80 4 0 0 0 86
18:00 - 18:15 0 0 10 0 0 0 0 10 0 0 19 0 0 0 0 19
18:15 - 18:30 1 0 5 0 0 0 0 6 0 0 19 1 0 0 0 20
18:30 - 18:45 0 0 10 0 0 0 0 10 0 1 28 0 0 0 0 29
18:45 - 19:00 0 0 9 0 0 0 0 9 0 0 19 0 0 0 0 19
Hourly Total 1 0 34 0 0 0 0 35 0 1 85 1 0 0 0 87
TOTAL 3 2 425 20 1 0 1 452 9 15 1048 68 2 0 0 1142
To A4067 Mumbles Road (N) To A4067 Mumbles Road (S)
Mumbles Road, Swansea
Lidl Great Britain Limited Transport Assessment
20-00668/TA/01 Corun Associates Ltd
September 2021 Appendix F
APPENDIX F
PICADY Modelling Outputs
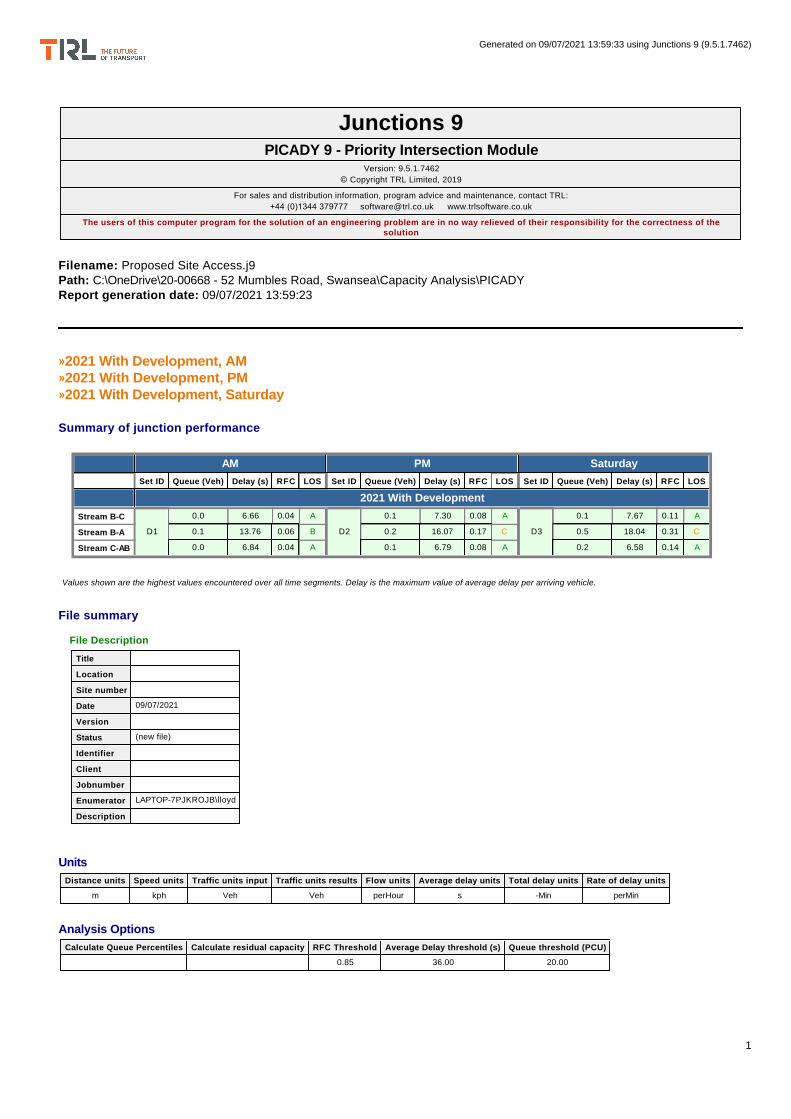
Filename: Proposed Site Access.j9 Path: C:\OneDrive\20-00668 - 52 Mumbles Road, Swansea\Capacity Analysis\PICADY Report generation date: 09/07/2021 13:59:23
»2021 With Development, AM »2021 With Development, PM »2021 With Development, Saturday
Summary of junction performance
Junctions 9PICADY 9 - Priority Intersection Module
Version: 9.5.1.7462
© Copyright TRL Limited, 2019
For sales and distribution information, program advice and maintenance, contact TRL:
+44 (0)1344 379777 [email protected] www.trlsoftware.co.uk
The users of this computer program for the solution of an engineering problem are in no way relieved of their responsibility for the correctness of the solution
AM PM Saturday
Set ID Queue (Veh) Delay (s) RFC LOS Set ID Queue (Veh) Delay (s) RFC LOS Set ID Queue (Veh) Delay (s) RFC LOS
2021 With Development
Stream B-C
D1
0.0 6.66 0.04 A
D2
0.1 7.30 0.08 A
D3
0.1 7.67 0.11 A
Stream B-A 0.1 13.76 0.06 B 0.2 16.07 0.17 C 0.5 18.04 0.31 C
Stream C-AB 0.0 6.84 0.04 A 0.1 6.79 0.08 A 0.2 6.58 0.14 A
Values shown are the highest values encountered over all time segments. Delay is the maximum value of average delay per arriving vehicle.
File summary
Units
Analysis Options
File Description
Title
Location
Site number
Date 09/07/2021
Version
Status (new file)
Identifier
Client
Jobnumber
Enumerator LAPTOP-7PJKROJB\lloyd
Description
Distance units Speed units Traffic units input Traffic units results Flow units Average delay units Total delay units Rate of delay units
m kph Veh Veh perHour s -Min perMin
Calculate Queue Percentiles Calculate residual capacity RFC Threshold Average Delay threshold (s) Queue threshold (PCU)
0.85 36.00 20.00
Generated on 09/07/2021 13:59:33 using Junctions 9 (9.5.1.7462)
1

Demand Set Summary
Analysis Set Details
ID Scenario name Time Period name Traffic profile type Start time (HH:mm) Finish time (HH:mm) Time segment length (min)
D1 2021 With Development AM ONE HOUR 07:45 09:15 15
D2 2021 With Development PM ONE HOUR 15:15 16:45 15
D3 2021 With Development Saturday ONE HOUR 11:45 13:15 15
ID Network flow scaling factor (%)
A1 100.000
Generated on 09/07/2021 13:59:33 using Junctions 9 (9.5.1.7462)
2
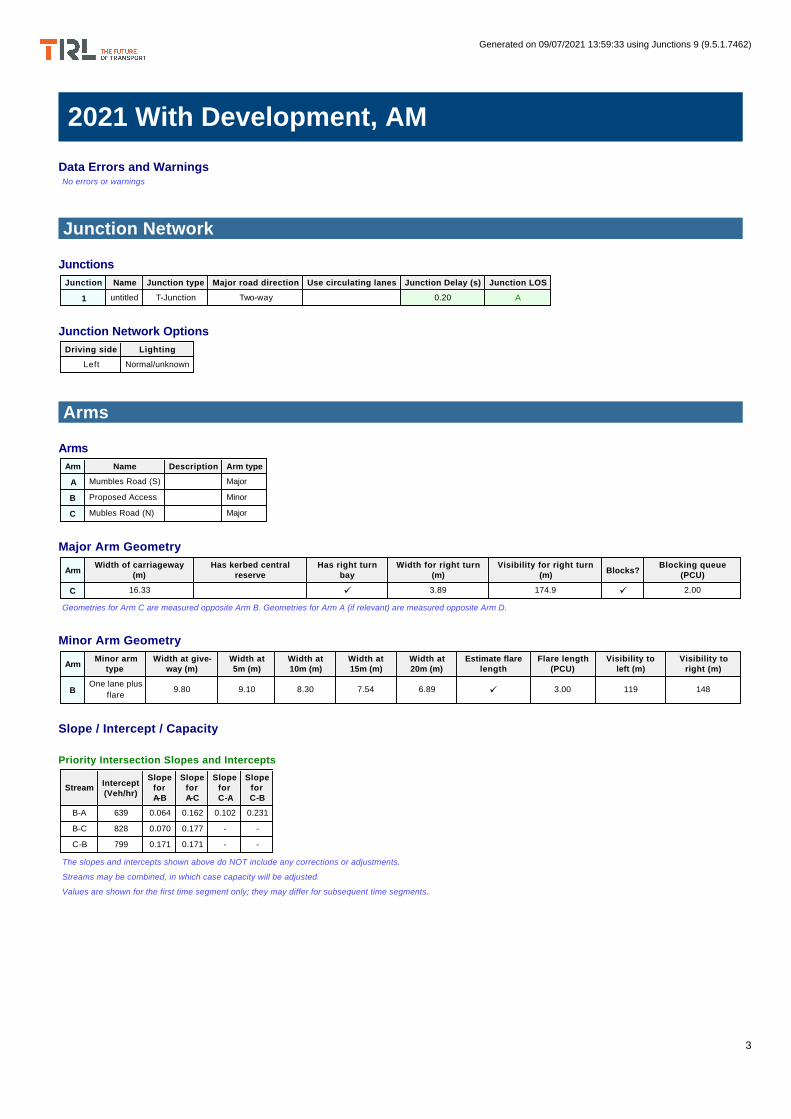
2021 With Development, AM
Data Errors and Warnings No errors or warnings
Junction Network
Junctions
Junction Network Options
Arms
Arms
Major Arm Geometry
Geometries for Arm C are measured opposite Arm B. Geometries for Arm A (if relevant) are measured opposite Arm D.
Minor Arm Geometry
Slope / Intercept / Capacity
Priority Intersection Slopes and Intercepts
The slopes and intercepts shown above do NOT include any corrections or adjustments.
Streams may be combined, in which case capacity will be adjusted.
Values are shown for the first time segment only; they may differ for subsequent time segments.
Junction Name Junction type Major road direction Use circulating lanes Junction Delay (s) Junction LOS
1 untitled T-Junction Two-way 0.20 A
Driving side Lighting
Left Normal/unknown
Arm Name Description Arm type
A Mumbles Road (S) Major
B Proposed Access Minor
C Mubles Road (N) Major
ArmWidth of carriageway
(m)Has kerbed central
reserveHas right turn
bayWidth for right turn
(m)Visibility for right turn
(m)Blocks?
Blocking queue (PCU)
C 16.33 ü 3.89 174.9 ü 2.00
ArmMinor arm
typeWidth at give-
way (m)Width at 5m (m)
Width at 10m (m)
Width at 15m (m)
Width at 20m (m)
Estimate flare length
Flare length (PCU)
Visibility to left (m)
Visibility to right (m)
BOne lane plus
flare9.80 9.10 8.30 7.54 6.89 ü 3.00 119 148
StreamIntercept(Veh/hr)
Slopefor A-B
Slopefor A-C
Slopefor C-A
Slopefor C-B
B-A 639 0.064 0.162 0.102 0.231
B-C 828 0.070 0.177 - -
C-B 799 0.171 0.171 - -
Generated on 09/07/2021 13:59:33 using Junctions 9 (9.5.1.7462)
3
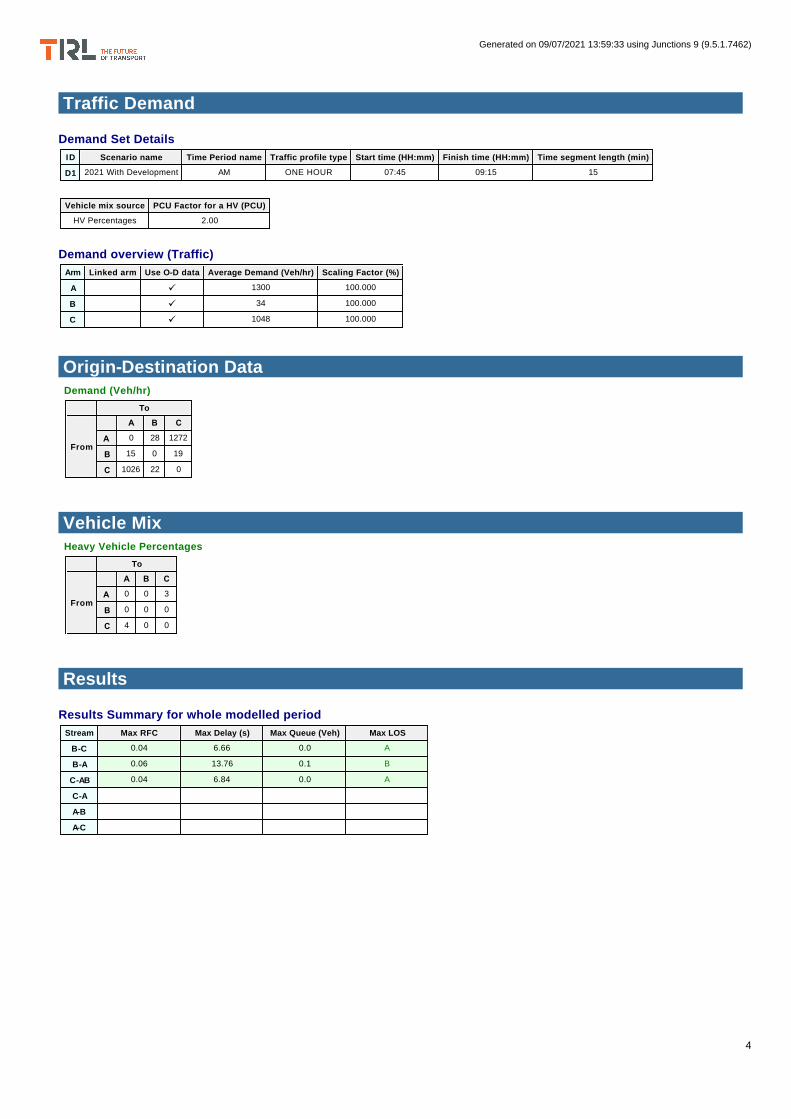
Traffic Demand
Demand Set Details
Demand overview (Traffic)
Origin-Destination Data
Vehicle Mix
Results
Results Summary for whole modelled period
ID Scenario name Time Period name Traffic profile type Start time (HH:mm) Finish time (HH:mm) Time segment length (min)
D1 2021 With Development AM ONE HOUR 07:45 09:15 15
Vehicle mix source PCU Factor for a HV (PCU)
HV Percentages 2.00
Arm Linked arm Use O-D data Average Demand (Veh/hr) Scaling Factor (%)
A ü 1300 100.000
B ü 34 100.000
C ü 1048 100.000
Demand (Veh/hr)
To
From
A B C
A 0 28 1272
B 15 0 19
C 1026 22 0
Heavy Vehicle Percentages
To
From
A B C
A 0 0 3
B 0 0 0
C 4 0 0
Stream Max RFC Max Delay (s) Max Queue (Veh) Max LOS
B-C 0.04 6.66 0.0 A
B-A 0.06 13.76 0.1 B
C-AB 0.04 6.84 0.0 A
C-A
A-B
A-C
Generated on 09/07/2021 13:59:33 using Junctions 9 (9.5.1.7462)
4
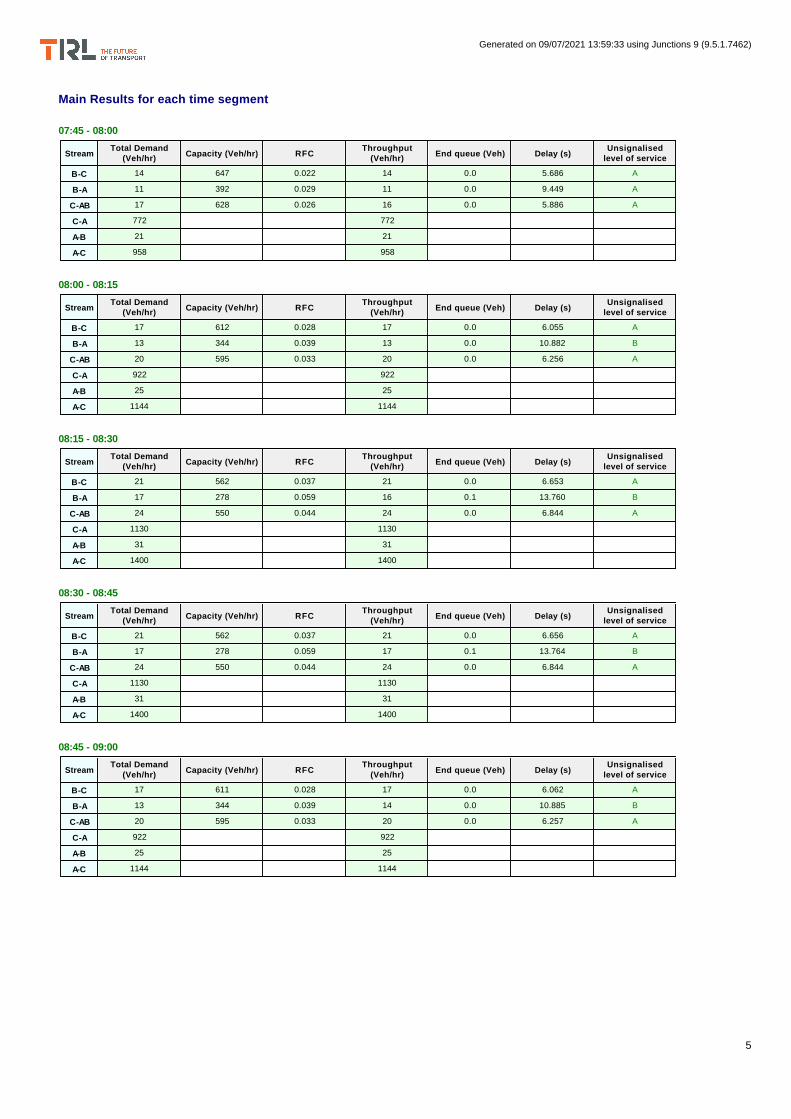
Main Results for each time segment
07:45 - 08:00
08:00 - 08:15
08:15 - 08:30
08:30 - 08:45
08:45 - 09:00
StreamTotal Demand
(Veh/hr)Capacity (Veh/hr) RFC
Throughput (Veh/hr)
End queue (Veh) Delay (s)Unsignalised
level of service
B-C 14 647 0.022 14 0.0 5.686 A
B-A 11 392 0.029 11 0.0 9.449 A
C-AB 17 628 0.026 16 0.0 5.886 A
C-A 772 772
A-B 21 21
A-C 958 958
StreamTotal Demand
(Veh/hr)Capacity (Veh/hr) RFC
Throughput (Veh/hr)
End queue (Veh) Delay (s)Unsignalised
level of service
B-C 17 612 0.028 17 0.0 6.055 A
B-A 13 344 0.039 13 0.0 10.882 B
C-AB 20 595 0.033 20 0.0 6.256 A
C-A 922 922
A-B 25 25
A-C 1144 1144
StreamTotal Demand
(Veh/hr)Capacity (Veh/hr) RFC
Throughput (Veh/hr)
End queue (Veh) Delay (s)Unsignalised
level of service
B-C 21 562 0.037 21 0.0 6.653 A
B-A 17 278 0.059 16 0.1 13.760 B
C-AB 24 550 0.044 24 0.0 6.844 A
C-A 1130 1130
A-B 31 31
A-C 1400 1400
StreamTotal Demand
(Veh/hr)Capacity (Veh/hr) RFC
Throughput (Veh/hr)
End queue (Veh) Delay (s)Unsignalised
level of service
B-C 21 562 0.037 21 0.0 6.656 A
B-A 17 278 0.059 17 0.1 13.764 B
C-AB 24 550 0.044 24 0.0 6.844 A
C-A 1130 1130
A-B 31 31
A-C 1400 1400
StreamTotal Demand
(Veh/hr)Capacity (Veh/hr) RFC
Throughput (Veh/hr)
End queue (Veh) Delay (s)Unsignalised
level of service
B-C 17 611 0.028 17 0.0 6.062 A
B-A 13 344 0.039 14 0.0 10.885 B
C-AB 20 595 0.033 20 0.0 6.257 A
C-A 922 922
A-B 25 25
A-C 1144 1144
Generated on 09/07/2021 13:59:33 using Junctions 9 (9.5.1.7462)
5

09:00 - 09:15
StreamTotal Demand
(Veh/hr)Capacity (Veh/hr) RFC
Throughput (Veh/hr)
End queue (Veh) Delay (s)Unsignalised
level of service
B-C 14 647 0.022 14 0.0 5.693 A
B-A 11 392 0.029 11 0.0 9.453 A
C-AB 17 628 0.026 17 0.0 5.889 A
C-A 772 772
A-B 21 21
A-C 958 958
Generated on 09/07/2021 13:59:33 using Junctions 9 (9.5.1.7462)
6
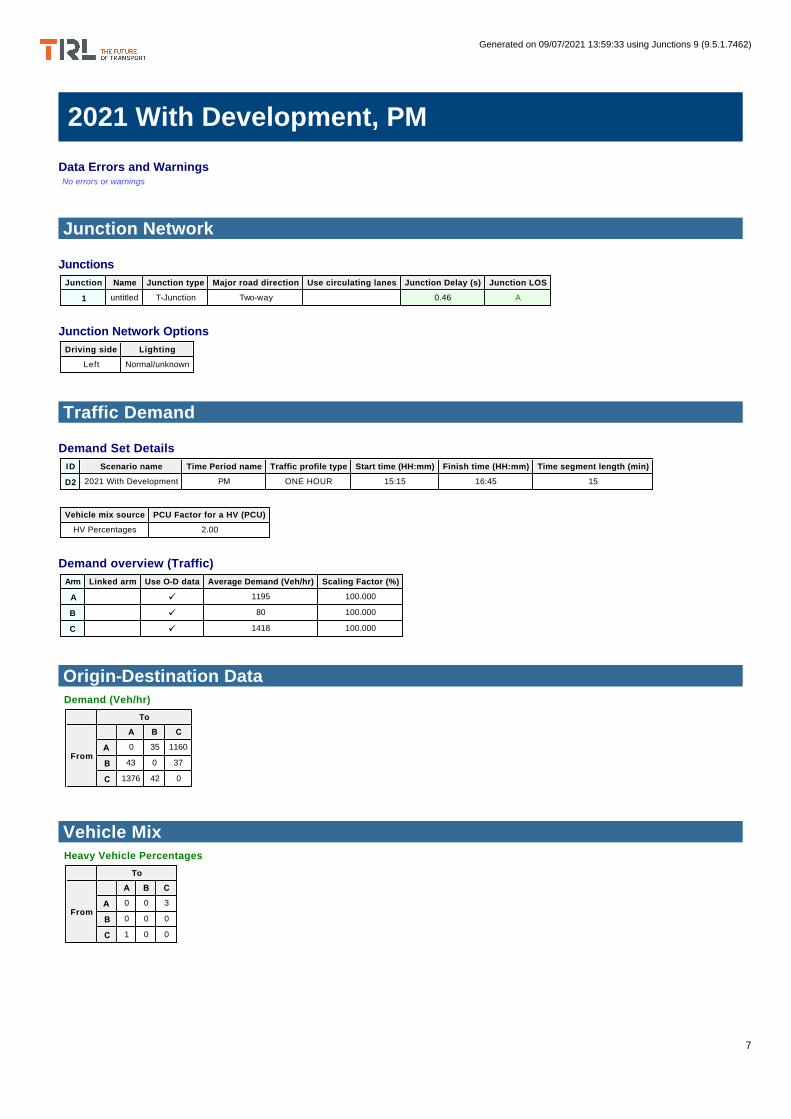
2021 With Development, PM
Data Errors and Warnings No errors or warnings
Junction Network
Junctions
Junction Network Options
Traffic Demand
Demand Set Details
Demand overview (Traffic)
Origin-Destination Data
Vehicle Mix
Junction Name Junction type Major road direction Use circulating lanes Junction Delay (s) Junction LOS
1 untitled T-Junction Two-way 0.46 A
Driving side Lighting
Left Normal/unknown
ID Scenario name Time Period name Traffic profile type Start time (HH:mm) Finish time (HH:mm) Time segment length (min)
D2 2021 With Development PM ONE HOUR 15:15 16:45 15
Vehicle mix source PCU Factor for a HV (PCU)
HV Percentages 2.00
Arm Linked arm Use O-D data Average Demand (Veh/hr) Scaling Factor (%)
A ü 1195 100.000
B ü 80 100.000
C ü 1418 100.000
Demand (Veh/hr)
To
From
A B C
A 0 35 1160
B 43 0 37
C 1376 42 0
Heavy Vehicle Percentages
To
From
A B C
A 0 0 3
B 0 0 0
C 1 0 0
Generated on 09/07/2021 13:59:33 using Junctions 9 (9.5.1.7462)
7

Results
Results Summary for whole modelled period
Main Results for each time segment
15:15 - 15:30
15:30 - 15:45
15:45 - 16:00
16:00 - 16:15
Stream Max RFC Max Delay (s) Max Queue (Veh) Max LOS
B-C 0.08 7.30 0.1 A
B-A 0.17 16.07 0.2 C
C-AB 0.08 6.79 0.1 A
C-A
A-B
A-C
StreamTotal Demand
(Veh/hr)Capacity (Veh/hr) RFC
Throughput (Veh/hr)
End queue (Veh) Delay (s)Unsignalised
level of service
B-C 28 617 0.045 28 0.0 6.109 A
B-A 32 399 0.081 32 0.1 9.793 A
C-AB 32 643 0.049 32 0.1 5.882 A
C-A 1036 1036
A-B 26 26
A-C 873 873
StreamTotal Demand
(Veh/hr)Capacity (Veh/hr) RFC
Throughput (Veh/hr)
End queue (Veh) Delay (s)Unsignalised
level of service
B-C 33 583 0.057 33 0.1 6.550 A
B-A 39 346 0.112 39 0.1 11.716 B
C-AB 38 615 0.062 38 0.1 6.240 A
C-A 1237 1237
A-B 31 31
A-C 1043 1043
StreamTotal Demand
(Veh/hr)Capacity (Veh/hr) RFC
Throughput (Veh/hr)
End queue (Veh) Delay (s)Unsignalised
level of service
B-C 41 534 0.076 41 0.1 7.297 A
B-A 47 271 0.175 47 0.2 16.036 C
C-AB 47 578 0.081 47 0.1 6.784 A
C-A 1514 1514
A-B 39 39
A-C 1277 1277
StreamTotal Demand
(Veh/hr)Capacity (Veh/hr) RFC
Throughput (Veh/hr)
End queue (Veh) Delay (s)Unsignalised
level of service
B-C 41 533 0.076 41 0.1 7.305 A
B-A 47 271 0.174 47 0.2 16.070 C
C-AB 47 578 0.081 47 0.1 6.787 A
C-A 1514 1514
A-B 39 39
A-C 1277 1277
Generated on 09/07/2021 13:59:33 using Junctions 9 (9.5.1.7462)
8

16:15 - 16:30
16:30 - 16:45
StreamTotal Demand
(Veh/hr)Capacity (Veh/hr) RFC
Throughput (Veh/hr)
End queue (Veh) Delay (s)Unsignalised
level of service
B-C 33 582 0.057 33 0.1 6.565 A
B-A 39 346 0.112 39 0.1 11.741 B
C-AB 38 615 0.062 38 0.1 6.245 A
C-A 1237 1237
A-B 31 31
A-C 1043 1043
StreamTotal Demand
(Veh/hr)Capacity (Veh/hr) RFC
Throughput (Veh/hr)
End queue (Veh) Delay (s)Unsignalised
level of service
B-C 28 616 0.045 28 0.0 6.123 A
B-A 32 400 0.081 33 0.1 9.810 A
C-AB 32 643 0.049 32 0.1 5.888 A
C-A 1036 1036
A-B 26 26
A-C 873 873
Generated on 09/07/2021 13:59:33 using Junctions 9 (9.5.1.7462)
9

2021 With Development, Saturday
Data Errors and Warnings No errors or warnings
Junction Network
Junctions
Junction Network Options
Traffic Demand
Demand Set Details
Demand overview (Traffic)
Origin-Destination Data
Vehicle Mix
Junction Name Junction type Major road direction Use circulating lanes Junction Delay (s) Junction LOS
1 untitled T-Junction Two-way 0.87 A
Driving side Lighting
Left Normal/unknown
ID Scenario name Time Period name Traffic profile type Start time (HH:mm) Finish time (HH:mm) Time segment length (min)
D3 2021 With Development Saturday ONE HOUR 11:45 13:15 15
Vehicle mix source PCU Factor for a HV (PCU)
HV Percentages 2.00
Arm Linked arm Use O-D data Average Demand (Veh/hr) Scaling Factor (%)
A ü 1035 100.000
B ü 137 100.000
C ü 1585 100.000
Demand (Veh/hr)
To
From
A B C
A 0 48 987
B 83 0 54
C 1511 74 0
Heavy Vehicle Percentages
To
From
A B C
A 0 0 2
B 0 0 0
C 1 0 0
Generated on 09/07/2021 13:59:33 using Junctions 9 (9.5.1.7462)
10

Results
Results Summary for whole modelled period
Main Results for each time segment
11:45 - 12:00
12:00 - 12:15
12:15 - 12:30
12:30 - 12:45
Stream Max RFC Max Delay (s) Max Queue (Veh) Max LOS
B-C 0.11 7.67 0.1 A
B-A 0.31 18.04 0.5 C
C-AB 0.14 6.58 0.2 A
C-A
A-B
A-C
StreamTotal Demand
(Veh/hr)Capacity (Veh/hr) RFC
Throughput (Veh/hr)
End queue (Veh) Delay (s)Unsignalised
level of service
B-C 41 610 0.067 40 0.1 6.314 A
B-A 62 419 0.149 62 0.2 10.060 B
C-AB 56 672 0.084 56 0.1 5.839 A
C-A 1137 1137
A-B 36 36
A-C 743 743
StreamTotal Demand
(Veh/hr)Capacity (Veh/hr) RFC
Throughput (Veh/hr)
End queue (Veh) Delay (s)Unsignalised
level of service
B-C 49 578 0.084 48 0.1 6.797 A
B-A 75 365 0.204 74 0.3 12.361 B
C-AB 68 653 0.104 68 0.1 6.154 A
C-A 1357 1357
A-B 43 43
A-C 887 887
StreamTotal Demand
(Veh/hr)Capacity (Veh/hr) RFC
Throughput (Veh/hr)
End queue (Veh) Delay (s)Unsignalised
level of service
B-C 59 529 0.112 59 0.1 7.659 A
B-A 91 291 0.314 91 0.4 17.909 C
C-AB 86 632 0.135 85 0.2 6.580 A
C-A 1660 1660
A-B 53 53
A-C 1087 1087
StreamTotal Demand
(Veh/hr)Capacity (Veh/hr) RFC
Throughput (Veh/hr)
End queue (Veh) Delay (s)Unsignalised
level of service
B-C 59 529 0.112 59 0.1 7.673 A
B-A 91 291 0.314 91 0.5 18.035 C
C-AB 86 632 0.135 86 0.2 6.583 A
C-A 1660 1660
A-B 53 53
A-C 1087 1087
Generated on 09/07/2021 13:59:33 using Junctions 9 (9.5.1.7462)
11

12:45 - 13:00
13:00 - 13:15
StreamTotal Demand
(Veh/hr)Capacity (Veh/hr) RFC
Throughput (Veh/hr)
End queue (Veh) Delay (s)Unsignalised
level of service
B-C 49 577 0.084 49 0.1 6.814 A
B-A 75 365 0.204 75 0.3 12.448 B
C-AB 68 653 0.104 68 0.1 6.161 A
C-A 1357 1357
A-B 43 43
A-C 887 887
StreamTotal Demand
(Veh/hr)Capacity (Veh/hr) RFC
Throughput (Veh/hr)
End queue (Veh) Delay (s)Unsignalised
level of service
B-C 41 610 0.067 41 0.1 6.331 A
B-A 62 419 0.149 63 0.2 10.116 B
C-AB 56 672 0.084 56 0.1 5.845 A
C-A 1137 1137
A-B 36 36
A-C 743 743
Generated on 09/07/2021 13:59:33 using Junctions 9 (9.5.1.7462)
12
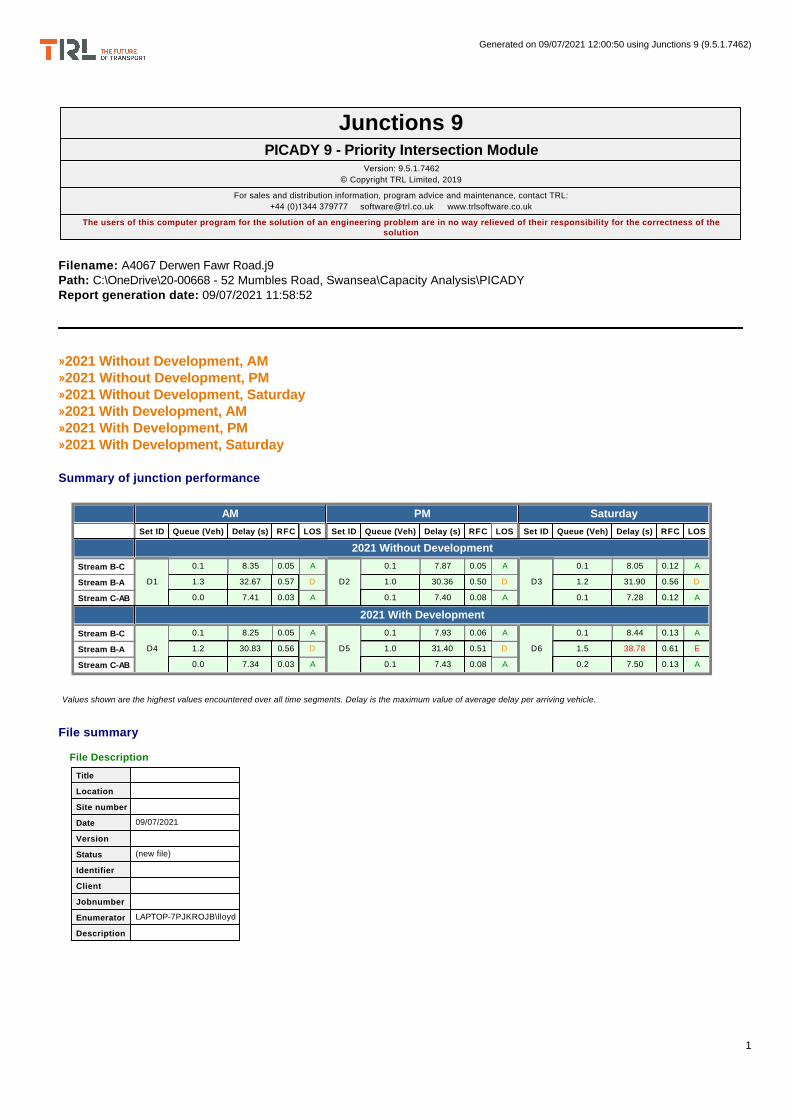
Filename: A4067 Derwen Fawr Road.j9 Path: C:\OneDrive\20-00668 - 52 Mumbles Road, Swansea\Capacity Analysis\PICADY Report generation date: 09/07/2021 11:58:52
»2021 Without Development, AM »2021 Without Development, PM »2021 Without Development, Saturday »2021 With Development, AM »2021 With Development, PM »2021 With Development, Saturday
Summary of junction performance
Junctions 9PICADY 9 - Priority Intersection Module
Version: 9.5.1.7462
© Copyright TRL Limited, 2019
For sales and distribution information, program advice and maintenance, contact TRL:
+44 (0)1344 379777 [email protected] www.trlsoftware.co.uk
The users of this computer program for the solution of an engineering problem are in no way relieved of their responsibility for the correctness of the solution
AM PM Saturday
Set ID Queue (Veh) Delay (s) RFC LOS Set ID Queue (Veh) Delay (s) RFC LOS Set ID Queue (Veh) Delay (s) RFC LOS
2021 Without Development
Stream B-C
D1
0.1 8.35 0.05 A
D2
0.1 7.87 0.05 A
D3
0.1 8.05 0.12 A
Stream B-A 1.3 32.67 0.57 D 1.0 30.36 0.50 D 1.2 31.90 0.56 D
Stream C-AB 0.0 7.41 0.03 A 0.1 7.40 0.08 A 0.1 7.28 0.12 A
2021 With Development
Stream B-C
D4
0.1 8.25 0.05 A
D5
0.1 7.93 0.06 A
D6
0.1 8.44 0.13 A
Stream B-A 1.2 30.83 0.56 D 1.0 31.40 0.51 D 1.5 38.78 0.61 E
Stream C-AB 0.0 7.34 0.03 A 0.1 7.43 0.08 A 0.2 7.50 0.13 A
Values shown are the highest values encountered over all time segments. Delay is the maximum value of average delay per arriving vehicle.
File summary
File Description
Title
Location
Site number
Date 09/07/2021
Version
Status (new file)
Identifier
Client
Jobnumber
Enumerator LAPTOP-7PJKROJB\lloyd
Description
Generated on 09/07/2021 12:00:50 using Junctions 9 (9.5.1.7462)
1
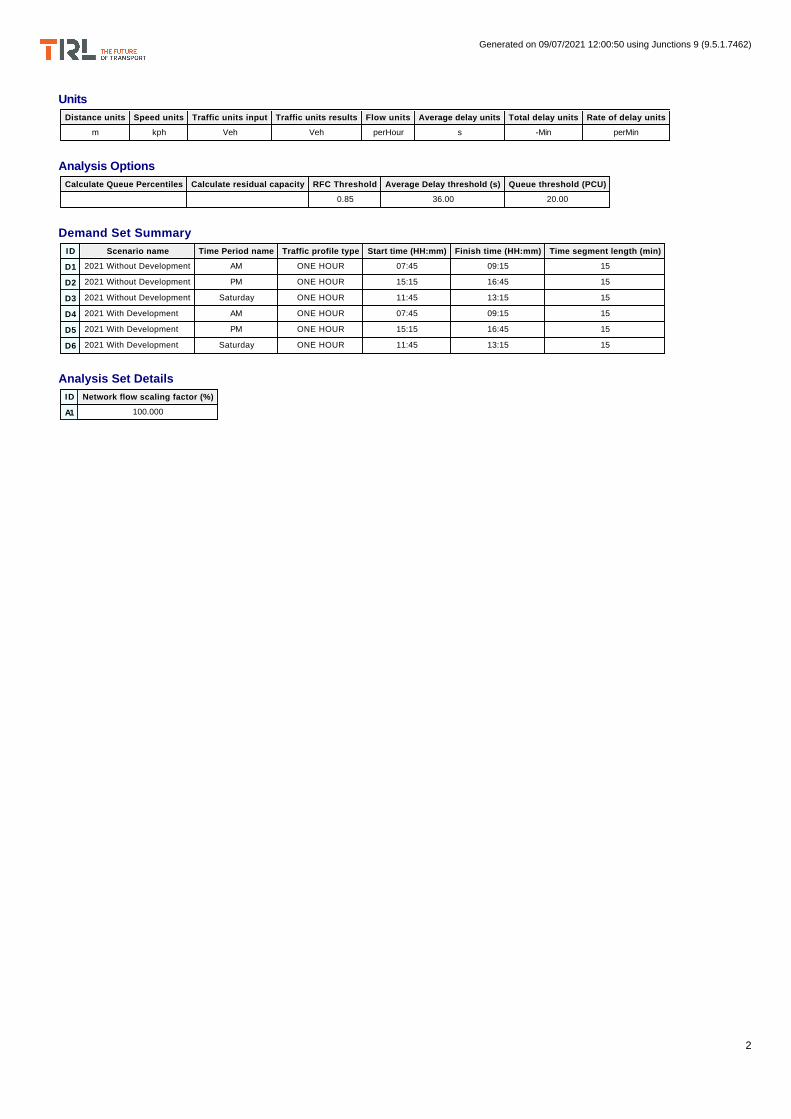
Units
Analysis Options
Demand Set Summary
Analysis Set Details
Distance units Speed units Traffic units input Traffic units results Flow units Average delay units Total delay units Rate of delay units
m kph Veh Veh perHour s -Min perMin
Calculate Queue Percentiles Calculate residual capacity RFC Threshold Average Delay threshold (s) Queue threshold (PCU)
0.85 36.00 20.00
ID Scenario name Time Period name Traffic profile type Start time (HH:mm) Finish time (HH:mm) Time segment length (min)
D1 2021 Without Development AM ONE HOUR 07:45 09:15 15
D2 2021 Without Development PM ONE HOUR 15:15 16:45 15
D3 2021 Without Development Saturday ONE HOUR 11:45 13:15 15
D4 2021 With Development AM ONE HOUR 07:45 09:15 15
D5 2021 With Development PM ONE HOUR 15:15 16:45 15
D6 2021 With Development Saturday ONE HOUR 11:45 13:15 15
ID Network flow scaling factor (%)
A1 100.000
Generated on 09/07/2021 12:00:50 using Junctions 9 (9.5.1.7462)
2
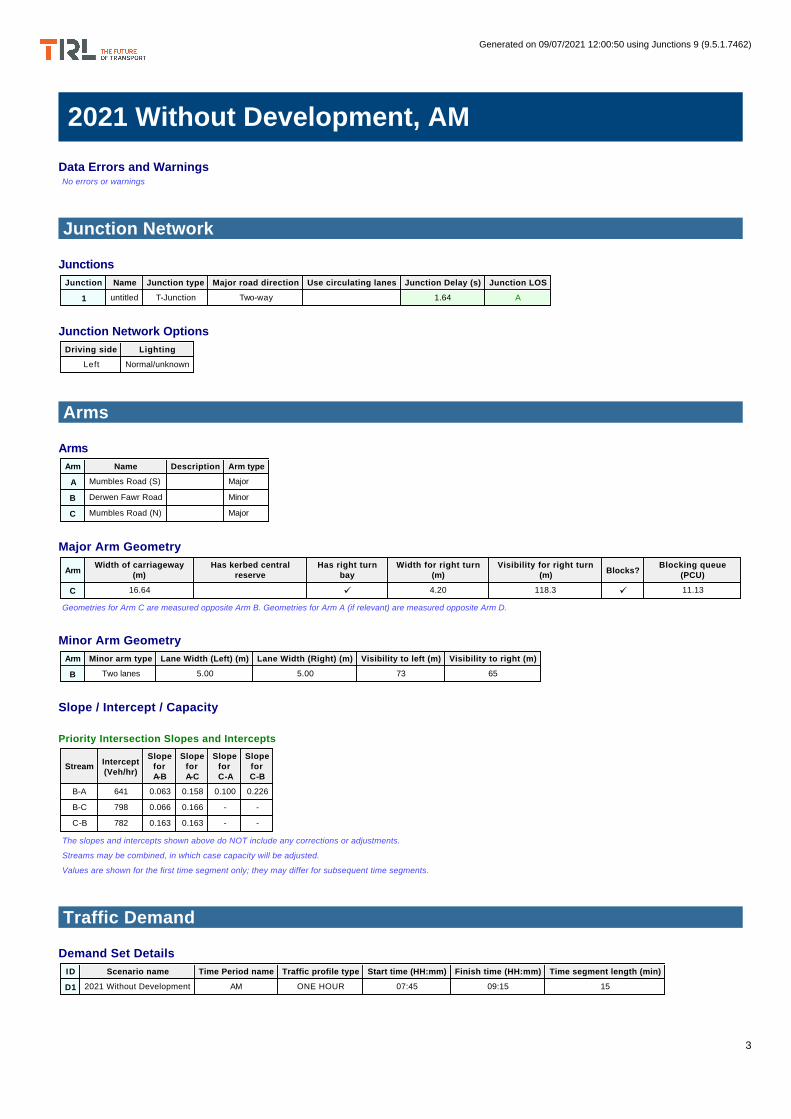
2021 Without Development, AM
Data Errors and Warnings No errors or warnings
Junction Network
Junctions
Junction Network Options
Arms
Arms
Major Arm Geometry
Geometries for Arm C are measured opposite Arm B. Geometries for Arm A (if relevant) are measured opposite Arm D.
Minor Arm Geometry
Slope / Intercept / Capacity
Priority Intersection Slopes and Intercepts
The slopes and intercepts shown above do NOT include any corrections or adjustments.
Streams may be combined, in which case capacity will be adjusted.
Values are shown for the first time segment only; they may differ for subsequent time segments.
Traffic Demand
Demand Set Details
Junction Name Junction type Major road direction Use circulating lanes Junction Delay (s) Junction LOS
1 untitled T-Junction Two-way 1.64 A
Driving side Lighting
Left Normal/unknown
Arm Name Description Arm type
A Mumbles Road (S) Major
B Derwen Fawr Road Minor
C Mumbles Road (N) Major
ArmWidth of carriageway
(m)Has kerbed central
reserveHas right turn
bayWidth for right turn
(m)Visibility for right turn
(m)Blocks?
Blocking queue (PCU)
C 16.64 ü 4.20 118.3 ü 11.13
Arm Minor arm type Lane Width (Left) (m) Lane Width (Right) (m) Visibility to left (m) Visibility to right (m)
B Two lanes 5.00 5.00 73 65
StreamIntercept(Veh/hr)
Slopefor A-B
Slopefor A-C
Slopefor C-A
Slopefor C-B
B-A 641 0.063 0.158 0.100 0.226
B-C 798 0.066 0.166 - -
C-B 782 0.163 0.163 - -
ID Scenario name Time Period name Traffic profile type Start time (HH:mm) Finish time (HH:mm) Time segment length (min)
D1 2021 Without Development AM ONE HOUR 07:45 09:15 15
Generated on 09/07/2021 12:00:50 using Junctions 9 (9.5.1.7462)
3
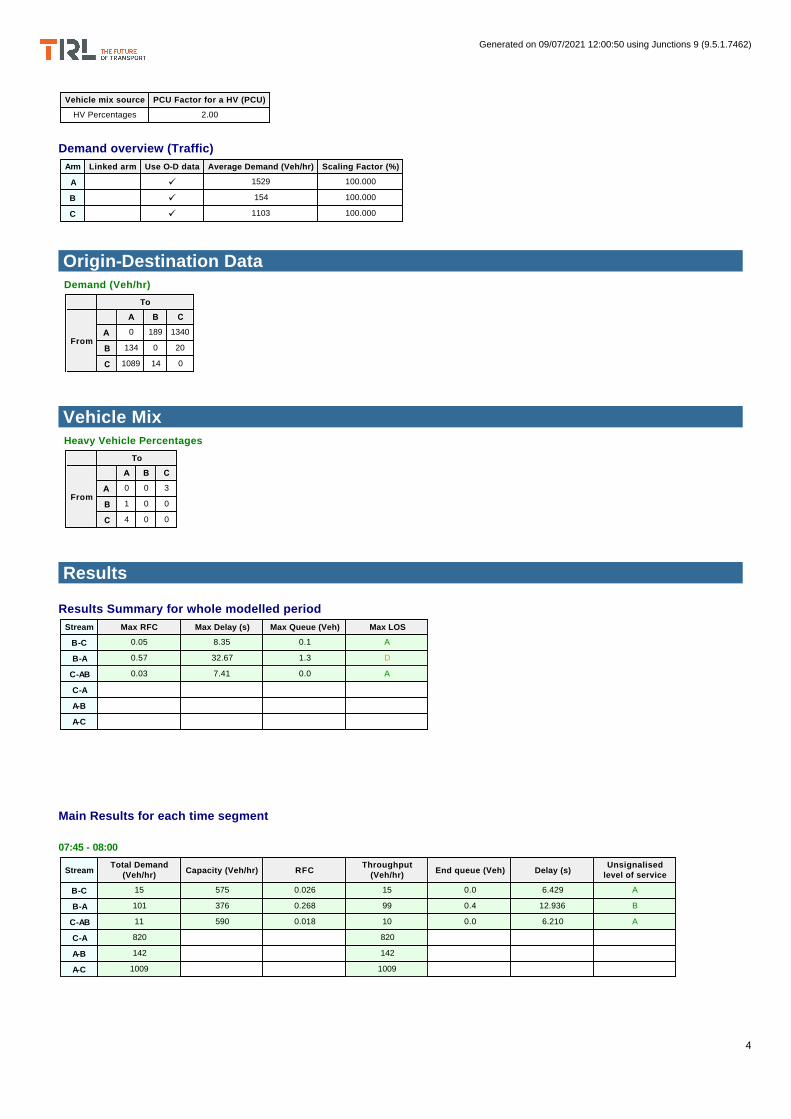
Demand overview (Traffic)
Origin-Destination Data
Vehicle Mix
Results
Results Summary for whole modelled period
Main Results for each time segment
07:45 - 08:00
Vehicle mix source PCU Factor for a HV (PCU)
HV Percentages 2.00
Arm Linked arm Use O-D data Average Demand (Veh/hr) Scaling Factor (%)
A ü 1529 100.000
B ü 154 100.000
C ü 1103 100.000
Demand (Veh/hr)
To
From
A B C
A 0 189 1340
B 134 0 20
C 1089 14 0
Heavy Vehicle Percentages
To
From
A B C
A 0 0 3
B 1 0 0
C 4 0 0
Stream Max RFC Max Delay (s) Max Queue (Veh) Max LOS
B-C 0.05 8.35 0.1 A
B-A 0.57 32.67 1.3 D
C-AB 0.03 7.41 0.0 A
C-A
A-B
A-C
StreamTotal Demand
(Veh/hr)Capacity (Veh/hr) RFC
Throughput (Veh/hr)
End queue (Veh) Delay (s)Unsignalised
level of service
B-C 15 575 0.026 15 0.0 6.429 A
B-A 101 376 0.268 99 0.4 12.936 B
C-AB 11 590 0.018 10 0.0 6.210 A
C-A 820 820
A-B 142 142
A-C 1009 1009
Generated on 09/07/2021 12:00:50 using Junctions 9 (9.5.1.7462)
4
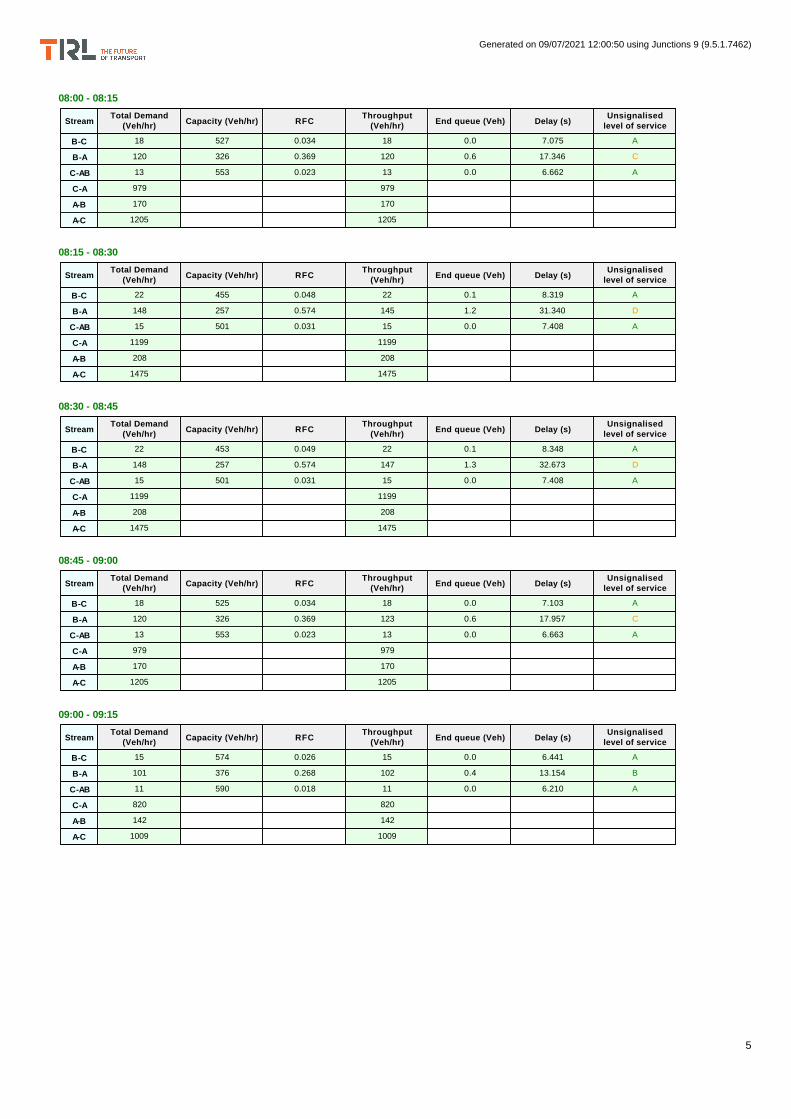
08:00 - 08:15
08:15 - 08:30
08:30 - 08:45
08:45 - 09:00
09:00 - 09:15
StreamTotal Demand
(Veh/hr)Capacity (Veh/hr) RFC
Throughput (Veh/hr)
End queue (Veh) Delay (s)Unsignalised
level of service
B-C 18 527 0.034 18 0.0 7.075 A
B-A 120 326 0.369 120 0.6 17.346 C
C-AB 13 553 0.023 13 0.0 6.662 A
C-A 979 979
A-B 170 170
A-C 1205 1205
StreamTotal Demand
(Veh/hr)Capacity (Veh/hr) RFC
Throughput (Veh/hr)
End queue (Veh) Delay (s)Unsignalised
level of service
B-C 22 455 0.048 22 0.1 8.319 A
B-A 148 257 0.574 145 1.2 31.340 D
C-AB 15 501 0.031 15 0.0 7.408 A
C-A 1199 1199
A-B 208 208
A-C 1475 1475
StreamTotal Demand
(Veh/hr)Capacity (Veh/hr) RFC
Throughput (Veh/hr)
End queue (Veh) Delay (s)Unsignalised
level of service
B-C 22 453 0.049 22 0.1 8.348 A
B-A 148 257 0.574 147 1.3 32.673 D
C-AB 15 501 0.031 15 0.0 7.408 A
C-A 1199 1199
A-B 208 208
A-C 1475 1475
StreamTotal Demand
(Veh/hr)Capacity (Veh/hr) RFC
Throughput (Veh/hr)
End queue (Veh) Delay (s)Unsignalised
level of service
B-C 18 525 0.034 18 0.0 7.103 A
B-A 120 326 0.369 123 0.6 17.957 C
C-AB 13 553 0.023 13 0.0 6.663 A
C-A 979 979
A-B 170 170
A-C 1205 1205
StreamTotal Demand
(Veh/hr)Capacity (Veh/hr) RFC
Throughput (Veh/hr)
End queue (Veh) Delay (s)Unsignalised
level of service
B-C 15 574 0.026 15 0.0 6.441 A
B-A 101 376 0.268 102 0.4 13.154 B
C-AB 11 590 0.018 11 0.0 6.210 A
C-A 820 820
A-B 142 142
A-C 1009 1009
Generated on 09/07/2021 12:00:50 using Junctions 9 (9.5.1.7462)
5
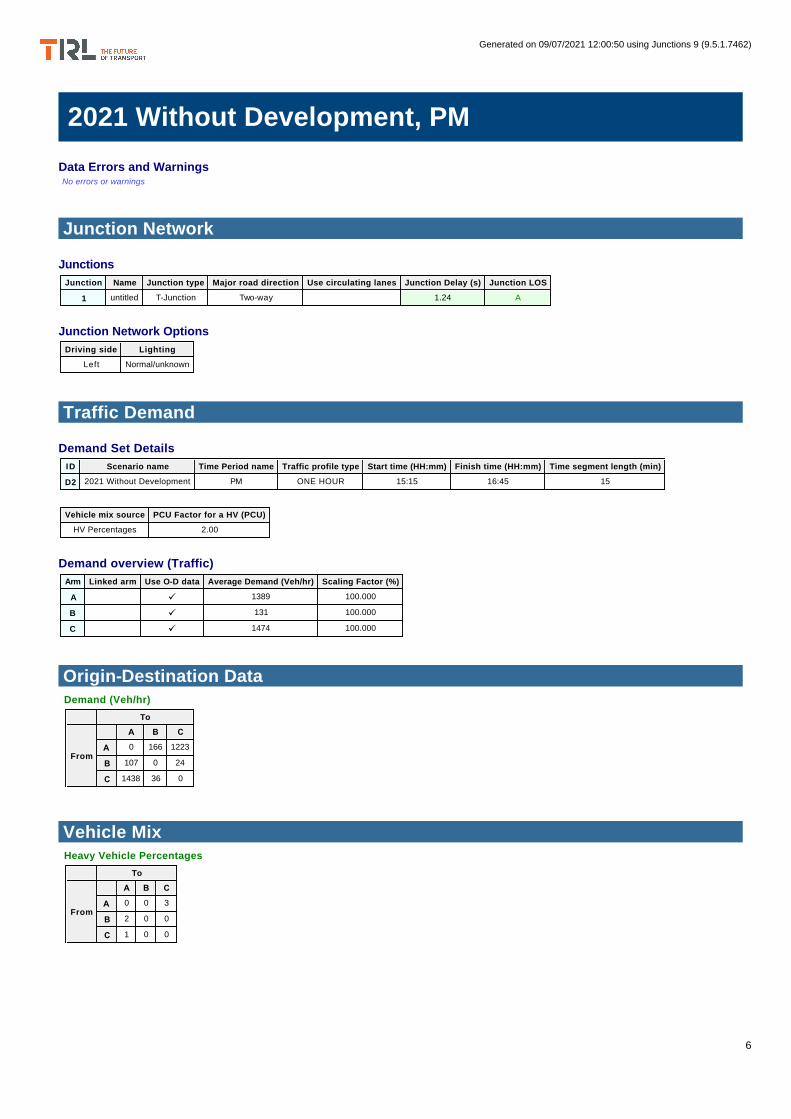
2021 Without Development, PM
Data Errors and Warnings No errors or warnings
Junction Network
Junctions
Junction Network Options
Traffic Demand
Demand Set Details
Demand overview (Traffic)
Origin-Destination Data
Vehicle Mix
Junction Name Junction type Major road direction Use circulating lanes Junction Delay (s) Junction LOS
1 untitled T-Junction Two-way 1.24 A
Driving side Lighting
Left Normal/unknown
ID Scenario name Time Period name Traffic profile type Start time (HH:mm) Finish time (HH:mm) Time segment length (min)
D2 2021 Without Development PM ONE HOUR 15:15 16:45 15
Vehicle mix source PCU Factor for a HV (PCU)
HV Percentages 2.00
Arm Linked arm Use O-D data Average Demand (Veh/hr) Scaling Factor (%)
A ü 1389 100.000
B ü 131 100.000
C ü 1474 100.000
Demand (Veh/hr)
To
From
A B C
A 0 166 1223
B 107 0 24
C 1438 36 0
Heavy Vehicle Percentages
To
From
A B C
A 0 0 3
B 2 0 0
C 1 0 0
Generated on 09/07/2021 12:00:50 using Junctions 9 (9.5.1.7462)
6

Results
Results Summary for whole modelled period
Main Results for each time segment
15:15 - 15:30
15:30 - 15:45
15:45 - 16:00
16:00 - 16:15
Stream Max RFC Max Delay (s) Max Queue (Veh) Max LOS
B-C 0.05 7.87 0.1 A
B-A 0.50 30.36 1.0 D
C-AB 0.08 7.40 0.1 A
C-A
A-B
A-C
StreamTotal Demand
(Veh/hr)Capacity (Veh/hr) RFC
Throughput (Veh/hr)
End queue (Veh) Delay (s)Unsignalised
level of service
B-C 18 597 0.030 18 0.0 6.220 A
B-A 81 360 0.224 79 0.3 12.779 B
C-AB 27 607 0.045 27 0.0 6.203 A
C-A 1083 1083
A-B 125 125
A-C 921 921
StreamTotal Demand
(Veh/hr)Capacity (Veh/hr) RFC
Throughput (Veh/hr)
End queue (Veh) Delay (s)Unsignalised
level of service
B-C 22 552 0.039 22 0.0 6.782 A
B-A 96 308 0.312 96 0.4 16.897 C
C-AB 32 573 0.056 32 0.1 6.655 A
C-A 1293 1293
A-B 149 149
A-C 1099 1099
StreamTotal Demand
(Veh/hr)Capacity (Veh/hr) RFC
Throughput (Veh/hr)
End queue (Veh) Delay (s)Unsignalised
level of service
B-C 26 485 0.055 26 0.1 7.853 A
B-A 118 236 0.499 116 0.9 29.487 D
C-AB 40 526 0.075 40 0.1 7.398 A
C-A 1583 1583
A-B 183 183
A-C 1347 1347
StreamTotal Demand
(Veh/hr)Capacity (Veh/hr) RFC
Throughput (Veh/hr)
End queue (Veh) Delay (s)Unsignalised
level of service
B-C 26 484 0.055 26 0.1 7.874 A
B-A 118 236 0.499 118 1.0 30.361 D
C-AB 40 526 0.075 40 0.1 7.398 A
C-A 1583 1583
A-B 183 183
A-C 1347 1347
Generated on 09/07/2021 12:00:50 using Junctions 9 (9.5.1.7462)
7

16:15 - 16:30
16:30 - 16:45
StreamTotal Demand
(Veh/hr)Capacity (Veh/hr) RFC
Throughput (Veh/hr)
End queue (Veh) Delay (s)Unsignalised
level of service
B-C 22 551 0.039 22 0.0 6.801 A
B-A 96 308 0.312 98 0.5 17.321 C
C-AB 32 573 0.056 32 0.1 6.657 A
C-A 1293 1293
A-B 149 149
A-C 1099 1099
StreamTotal Demand
(Veh/hr)Capacity (Veh/hr) RFC
Throughput (Veh/hr)
End queue (Veh) Delay (s)Unsignalised
level of service
B-C 18 596 0.030 18 0.0 6.234 A
B-A 81 360 0.224 81 0.3 12.949 B
C-AB 27 607 0.045 27 0.0 6.209 A
C-A 1083 1083
A-B 125 125
A-C 921 921
Generated on 09/07/2021 12:00:50 using Junctions 9 (9.5.1.7462)
8

2021 Without Development, Saturday
Data Errors and Warnings No errors or warnings
Junction Network
Junctions
Junction Network Options
Traffic Demand
Demand Set Details
Demand overview (Traffic)
Origin-Destination Data
Vehicle Mix
Junction Name Junction type Major road direction Use circulating lanes Junction Delay (s) Junction LOS
1 untitled T-Junction Two-way 1.67 A
Driving side Lighting
Left Normal/unknown
ID Scenario name Time Period name Traffic profile type Start time (HH:mm) Finish time (HH:mm) Time segment length (min)
D3 2021 Without Development Saturday ONE HOUR 11:45 13:15 15
Vehicle mix source PCU Factor for a HV (PCU)
HV Percentages 2.00
Arm Linked arm Use O-D data Average Demand (Veh/hr) Scaling Factor (%)
A ü 1204 100.000
B ü 185 100.000
C ü 1626 100.000
Demand (Veh/hr)
To
From
A B C
A 0 163 1041
B 131 0 54
C 1563 63 0
Heavy Vehicle Percentages
To
From
A B C
A 0 0 2
B 0 0 0
C 1 0 0
Generated on 09/07/2021 12:00:50 using Junctions 9 (9.5.1.7462)
9

Results
Results Summary for whole modelled period
Main Results for each time segment
11:45 - 12:00
12:00 - 12:15
12:15 - 12:30
12:30 - 12:45
Stream Max RFC Max Delay (s) Max Queue (Veh) Max LOS
B-C 0.12 8.05 0.1 A
B-A 0.56 31.90 1.2 D
C-AB 0.12 7.28 0.1 A
C-A
A-B
A-C
StreamTotal Demand
(Veh/hr)Capacity (Veh/hr) RFC
Throughput (Veh/hr)
End queue (Veh) Delay (s)Unsignalised
level of service
B-C 41 615 0.066 40 0.1 6.264 A
B-A 99 378 0.261 97 0.3 12.758 B
C-AB 47 633 0.075 47 0.1 6.145 A
C-A 1177 1177
A-B 123 123
A-C 784 784
StreamTotal Demand
(Veh/hr)Capacity (Veh/hr) RFC
Throughput (Veh/hr)
End queue (Veh) Delay (s)Unsignalised
level of service
B-C 49 573 0.085 48 0.1 6.863 A
B-A 118 327 0.360 117 0.5 17.071 C
C-AB 57 604 0.094 57 0.1 6.580 A
C-A 1405 1405
A-B 147 147
A-C 936 936
StreamTotal Demand
(Veh/hr)Capacity (Veh/hr) RFC
Throughput (Veh/hr)
End queue (Veh) Delay (s)Unsignalised
level of service
B-C 59 508 0.117 59 0.1 8.018 A
B-A 144 257 0.562 142 1.2 30.669 D
C-AB 69 563 0.123 69 0.1 7.282 A
C-A 1721 1721
A-B 179 179
A-C 1146 1146
StreamTotal Demand
(Veh/hr)Capacity (Veh/hr) RFC
Throughput (Veh/hr)
End queue (Veh) Delay (s)Unsignalised
level of service
B-C 59 507 0.117 59 0.1 8.049 A
B-A 144 256 0.562 144 1.2 31.897 D
C-AB 69 563 0.123 69 0.1 7.285 A
C-A 1721 1721
A-B 179 179
A-C 1146 1146
Generated on 09/07/2021 12:00:50 using Junctions 9 (9.5.1.7462)
10
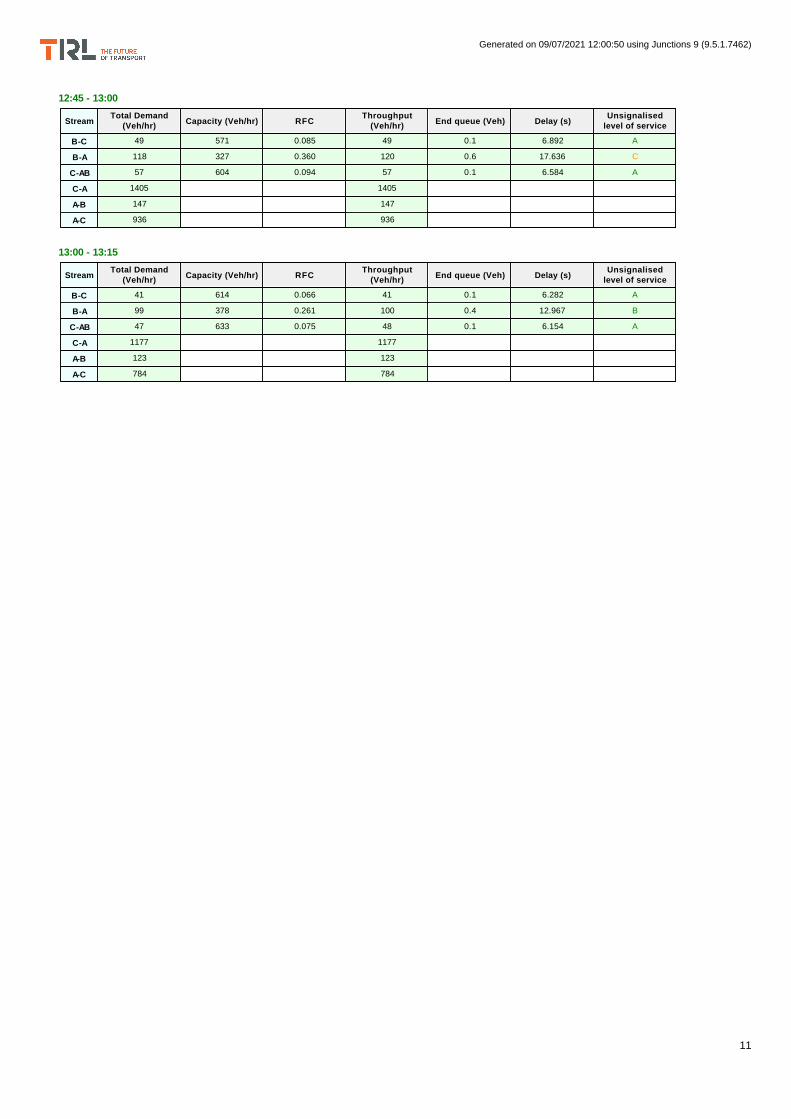
12:45 - 13:00
13:00 - 13:15
StreamTotal Demand
(Veh/hr)Capacity (Veh/hr) RFC
Throughput (Veh/hr)
End queue (Veh) Delay (s)Unsignalised
level of service
B-C 49 571 0.085 49 0.1 6.892 A
B-A 118 327 0.360 120 0.6 17.636 C
C-AB 57 604 0.094 57 0.1 6.584 A
C-A 1405 1405
A-B 147 147
A-C 936 936
StreamTotal Demand
(Veh/hr)Capacity (Veh/hr) RFC
Throughput (Veh/hr)
End queue (Veh) Delay (s)Unsignalised
level of service
B-C 41 614 0.066 41 0.1 6.282 A
B-A 99 378 0.261 100 0.4 12.967 B
C-AB 47 633 0.075 48 0.1 6.154 A
C-A 1177 1177
A-B 123 123
A-C 784 784
Generated on 09/07/2021 12:00:50 using Junctions 9 (9.5.1.7462)
11
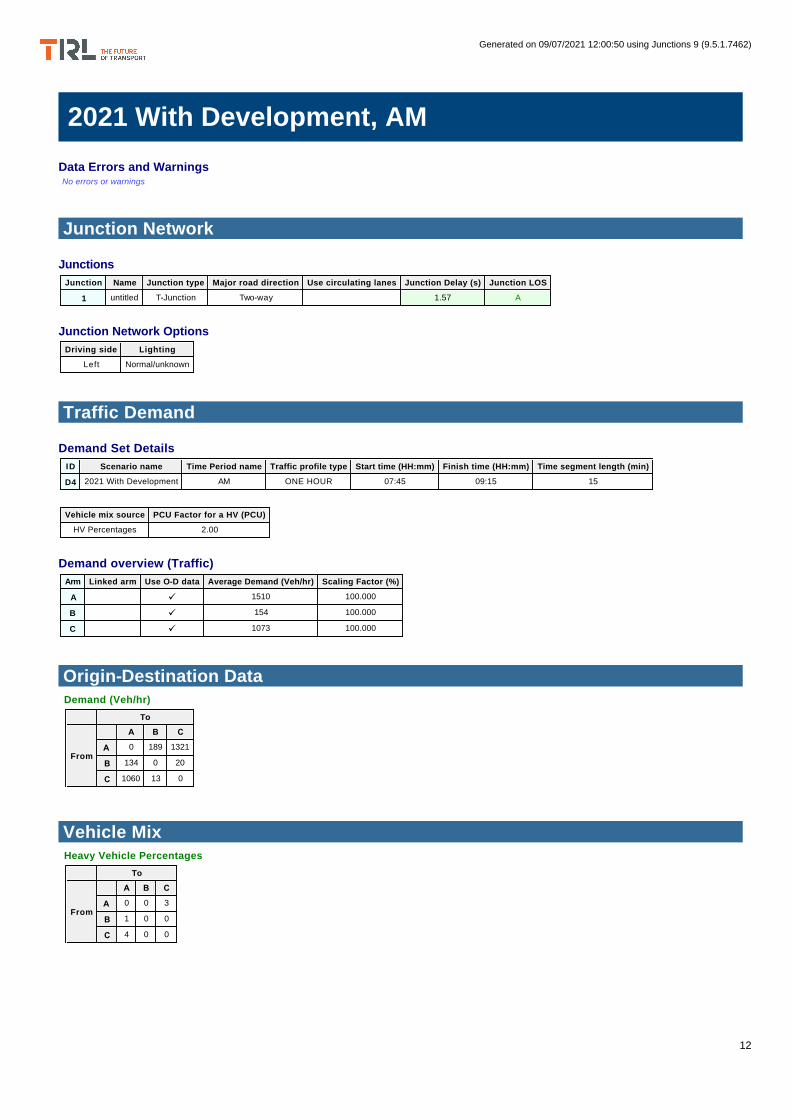
2021 With Development, AM
Data Errors and Warnings No errors or warnings
Junction Network
Junctions
Junction Network Options
Traffic Demand
Demand Set Details
Demand overview (Traffic)
Origin-Destination Data
Vehicle Mix
Junction Name Junction type Major road direction Use circulating lanes Junction Delay (s) Junction LOS
1 untitled T-Junction Two-way 1.57 A
Driving side Lighting
Left Normal/unknown
ID Scenario name Time Period name Traffic profile type Start time (HH:mm) Finish time (HH:mm) Time segment length (min)
D4 2021 With Development AM ONE HOUR 07:45 09:15 15
Vehicle mix source PCU Factor for a HV (PCU)
HV Percentages 2.00
Arm Linked arm Use O-D data Average Demand (Veh/hr) Scaling Factor (%)
A ü 1510 100.000
B ü 154 100.000
C ü 1073 100.000
Demand (Veh/hr)
To
From
A B C
A 0 189 1321
B 134 0 20
C 1060 13 0
Heavy Vehicle Percentages
To
From
A B C
A 0 0 3
B 1 0 0
C 4 0 0
Generated on 09/07/2021 12:00:50 using Junctions 9 (9.5.1.7462)
12

Results
Results Summary for whole modelled period
Main Results for each time segment
07:45 - 08:00
08:00 - 08:15
08:15 - 08:30
08:30 - 08:45
Stream Max RFC Max Delay (s) Max Queue (Veh) Max LOS
B-C 0.05 8.25 0.1 A
B-A 0.56 30.83 1.2 D
C-AB 0.03 7.34 0.0 A
C-A
A-B
A-C
StreamTotal Demand
(Veh/hr)Capacity (Veh/hr) RFC
Throughput (Veh/hr)
End queue (Veh) Delay (s)Unsignalised
level of service
B-C 15 578 0.026 15 0.0 6.398 A
B-A 101 381 0.265 99 0.4 12.727 B
C-AB 10 592 0.017 10 0.0 6.177 A
C-A 798 798
A-B 142 142
A-C 995 995
StreamTotal Demand
(Veh/hr)Capacity (Veh/hr) RFC
Throughput (Veh/hr)
End queue (Veh) Delay (s)Unsignalised
level of service
B-C 18 530 0.034 18 0.0 7.027 A
B-A 120 332 0.363 120 0.6 16.908 C
C-AB 12 556 0.021 12 0.0 6.617 A
C-A 953 953
A-B 170 170
A-C 1188 1188
StreamTotal Demand
(Veh/hr)Capacity (Veh/hr) RFC
Throughput (Veh/hr)
End queue (Veh) Delay (s)Unsignalised
level of service
B-C 22 460 0.048 22 0.0 8.224 A
B-A 148 264 0.559 145 1.2 29.710 D
C-AB 14 505 0.028 14 0.0 7.340 A
C-A 1167 1167
A-B 208 208
A-C 1454 1454
StreamTotal Demand
(Veh/hr)Capacity (Veh/hr) RFC
Throughput (Veh/hr)
End queue (Veh) Delay (s)Unsignalised
level of service
B-C 22 458 0.048 22 0.1 8.250 A
B-A 148 264 0.559 147 1.2 30.833 D
C-AB 14 505 0.028 14 0.0 7.340 A
C-A 1167 1167
A-B 208 208
A-C 1454 1454
Generated on 09/07/2021 12:00:50 using Junctions 9 (9.5.1.7462)
13

08:45 - 09:00
09:00 - 09:15
StreamTotal Demand
(Veh/hr)Capacity (Veh/hr) RFC
Throughput (Veh/hr)
End queue (Veh) Delay (s)Unsignalised
level of service
B-C 18 529 0.034 18 0.0 7.050 A
B-A 120 332 0.363 123 0.6 17.446 C
C-AB 12 556 0.021 12 0.0 6.618 A
C-A 953 953
A-B 170 170
A-C 1188 1188
StreamTotal Demand
(Veh/hr)Capacity (Veh/hr) RFC
Throughput (Veh/hr)
End queue (Veh) Delay (s)Unsignalised
level of service
B-C 15 577 0.026 15 0.0 6.412 A
B-A 101 381 0.265 102 0.4 12.937 B
C-AB 10 592 0.017 10 0.0 6.180 A
C-A 798 798
A-B 142 142
A-C 995 995
Generated on 09/07/2021 12:00:50 using Junctions 9 (9.5.1.7462)
14
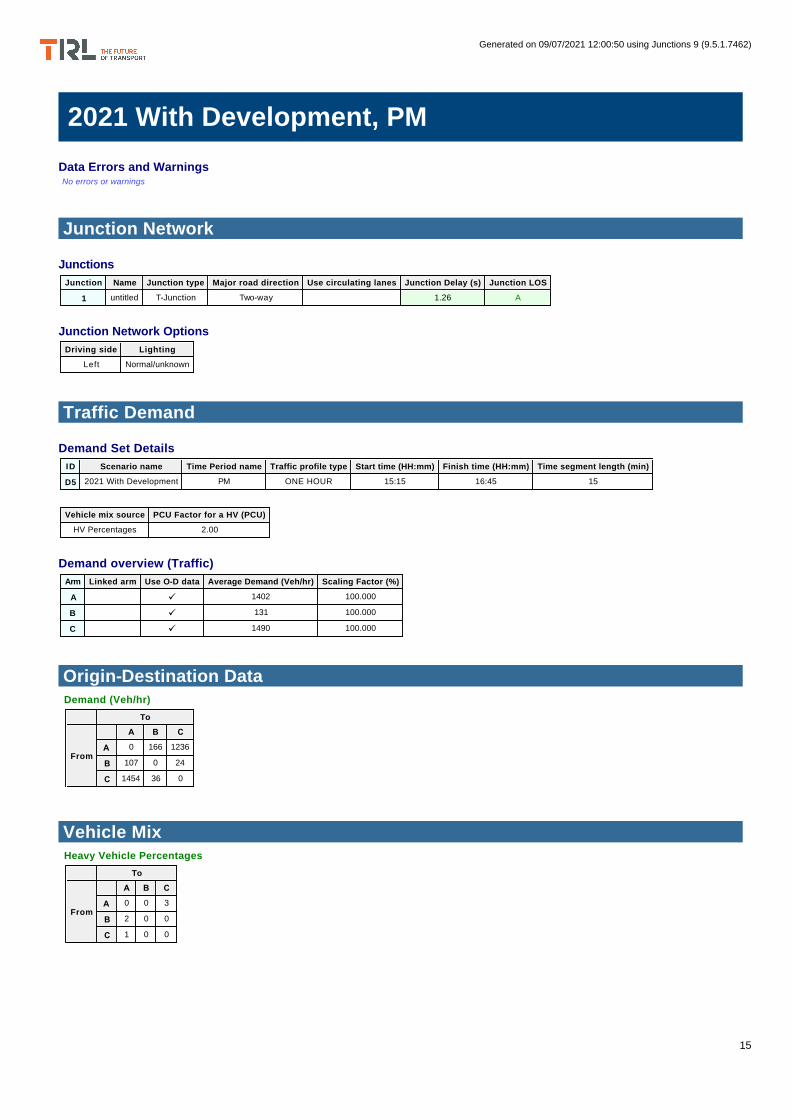
2021 With Development, PM
Data Errors and Warnings No errors or warnings
Junction Network
Junctions
Junction Network Options
Traffic Demand
Demand Set Details
Demand overview (Traffic)
Origin-Destination Data
Vehicle Mix
Junction Name Junction type Major road direction Use circulating lanes Junction Delay (s) Junction LOS
1 untitled T-Junction Two-way 1.26 A
Driving side Lighting
Left Normal/unknown
ID Scenario name Time Period name Traffic profile type Start time (HH:mm) Finish time (HH:mm) Time segment length (min)
D5 2021 With Development PM ONE HOUR 15:15 16:45 15
Vehicle mix source PCU Factor for a HV (PCU)
HV Percentages 2.00
Arm Linked arm Use O-D data Average Demand (Veh/hr) Scaling Factor (%)
A ü 1402 100.000
B ü 131 100.000
C ü 1490 100.000
Demand (Veh/hr)
To
From
A B C
A 0 166 1236
B 107 0 24
C 1454 36 0
Heavy Vehicle Percentages
To
From
A B C
A 0 0 3
B 2 0 0
C 1 0 0
Generated on 09/07/2021 12:00:50 using Junctions 9 (9.5.1.7462)
15

Results
Results Summary for whole modelled period
Main Results for each time segment
15:15 - 15:30
15:30 - 15:45
15:45 - 16:00
16:00 - 16:15
Stream Max RFC Max Delay (s) Max Queue (Veh) Max LOS
B-C 0.06 7.93 0.1 A
B-A 0.51 31.40 1.0 D
C-AB 0.08 7.43 0.1 A
C-A
A-B
A-C
StreamTotal Demand
(Veh/hr)Capacity (Veh/hr) RFC
Throughput (Veh/hr)
End queue (Veh) Delay (s)Unsignalised
level of service
B-C 18 595 0.030 18 0.0 6.239 A
B-A 81 357 0.225 79 0.3 12.901 B
C-AB 27 606 0.045 27 0.0 6.220 A
C-A 1095 1095
A-B 125 125
A-C 931 931
StreamTotal Demand
(Veh/hr)Capacity (Veh/hr) RFC
Throughput (Veh/hr)
End queue (Veh) Delay (s)Unsignalised
level of service
B-C 22 550 0.039 22 0.0 6.812 A
B-A 96 305 0.316 96 0.4 17.155 C
C-AB 32 571 0.057 32 0.1 6.679 A
C-A 1307 1307
A-B 149 149
A-C 1111 1111
StreamTotal Demand
(Veh/hr)Capacity (Veh/hr) RFC
Throughput (Veh/hr)
End queue (Veh) Delay (s)Unsignalised
level of service
B-C 26 481 0.055 26 0.1 7.909 A
B-A 118 232 0.508 116 1.0 30.426 D
C-AB 40 524 0.076 40 0.1 7.433 A
C-A 1601 1601
A-B 183 183
A-C 1361 1361
StreamTotal Demand
(Veh/hr)Capacity (Veh/hr) RFC
Throughput (Veh/hr)
End queue (Veh) Delay (s)Unsignalised
level of service
B-C 26 480 0.055 26 0.1 7.932 A
B-A 118 232 0.508 118 1.0 31.398 D
C-AB 40 524 0.076 40 0.1 7.433 A
C-A 1601 1601
A-B 183 183
A-C 1361 1361
Generated on 09/07/2021 12:00:50 using Junctions 9 (9.5.1.7462)
16

16:15 - 16:30
16:30 - 16:45
StreamTotal Demand
(Veh/hr)Capacity (Veh/hr) RFC
Throughput (Veh/hr)
End queue (Veh) Delay (s)Unsignalised
level of service
B-C 22 549 0.039 22 0.0 6.834 A
B-A 96 305 0.316 98 0.5 17.609 C
C-AB 32 571 0.057 32 0.1 6.684 A
C-A 1307 1307
A-B 149 149
A-C 1111 1111
StreamTotal Demand
(Veh/hr)Capacity (Veh/hr) RFC
Throughput (Veh/hr)
End queue (Veh) Delay (s)Unsignalised
level of service
B-C 18 594 0.030 18 0.0 6.252 A
B-A 81 357 0.225 81 0.3 13.075 B
C-AB 27 606 0.045 27 0.0 6.226 A
C-A 1095 1095
A-B 125 125
A-C 931 931
Generated on 09/07/2021 12:00:50 using Junctions 9 (9.5.1.7462)
17

2021 With Development, Saturday
Data Errors and Warnings No errors or warnings
Junction Network
Junctions
Junction Network Options
Traffic Demand
Demand Set Details
Demand overview (Traffic)
Origin-Destination Data
Vehicle Mix
Junction Name Junction type Major road direction Use circulating lanes Junction Delay (s) Junction LOS
1 untitled T-Junction Two-way 1.90 A
Driving side Lighting
Left Normal/unknown
ID Scenario name Time Period name Traffic profile type Start time (HH:mm) Finish time (HH:mm) Time segment length (min)
D6 2021 With Development Saturday ONE HOUR 11:45 13:15 15
Vehicle mix source PCU Factor for a HV (PCU)
HV Percentages 2.00
Arm Linked arm Use O-D data Average Demand (Veh/hr) Scaling Factor (%)
A ü 1266 100.000
B ü 188 100.000
C ü 1709 100.000
Demand (Veh/hr)
To
From
A B C
A 0 163 1103
B 131 0 57
C 1643 66 0
Heavy Vehicle Percentages
To
From
A B C
A 0 0 2
B 0 0 0
C 1 0 0
Generated on 09/07/2021 12:00:50 using Junctions 9 (9.5.1.7462)
18
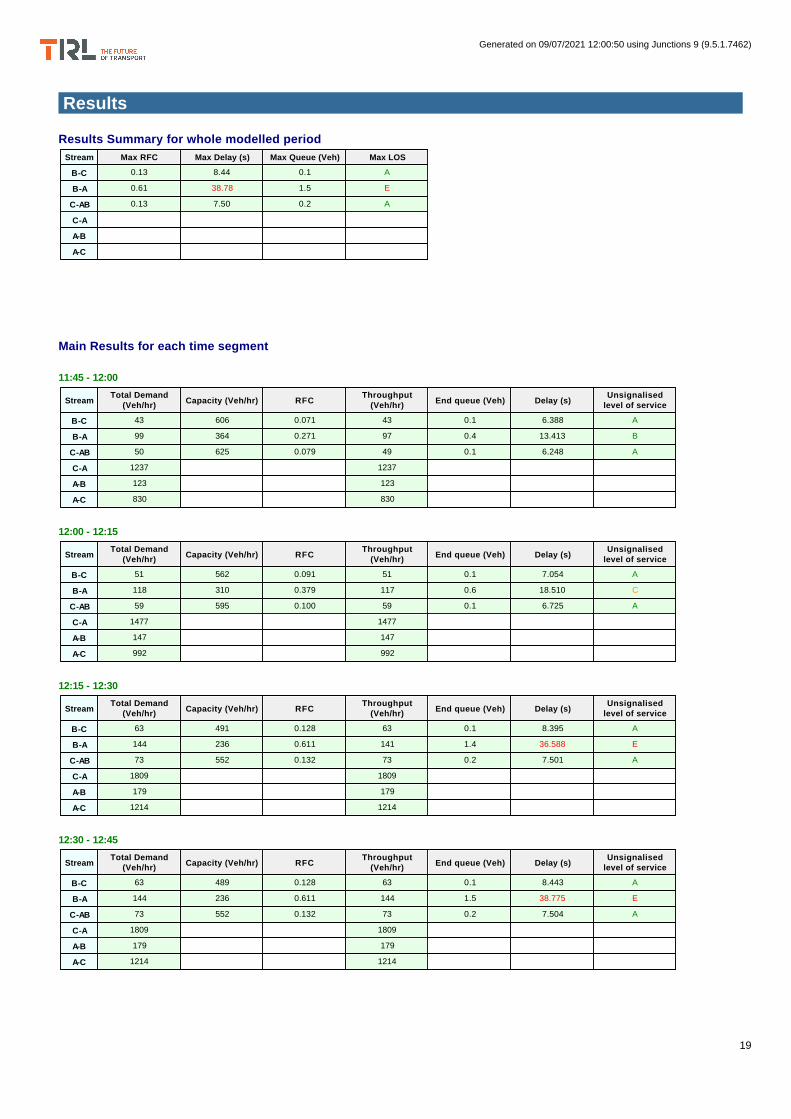
Results
Results Summary for whole modelled period
Main Results for each time segment
11:45 - 12:00
12:00 - 12:15
12:15 - 12:30
12:30 - 12:45
Stream Max RFC Max Delay (s) Max Queue (Veh) Max LOS
B-C 0.13 8.44 0.1 A
B-A 0.61 38.78 1.5 E
C-AB 0.13 7.50 0.2 A
C-A
A-B
A-C
StreamTotal Demand
(Veh/hr)Capacity (Veh/hr) RFC
Throughput (Veh/hr)
End queue (Veh) Delay (s)Unsignalised
level of service
B-C 43 606 0.071 43 0.1 6.388 A
B-A 99 364 0.271 97 0.4 13.413 B
C-AB 50 625 0.079 49 0.1 6.248 A
C-A 1237 1237
A-B 123 123
A-C 830 830
StreamTotal Demand
(Veh/hr)Capacity (Veh/hr) RFC
Throughput (Veh/hr)
End queue (Veh) Delay (s)Unsignalised
level of service
B-C 51 562 0.091 51 0.1 7.054 A
B-A 118 310 0.379 117 0.6 18.510 C
C-AB 59 595 0.100 59 0.1 6.725 A
C-A 1477 1477
A-B 147 147
A-C 992 992
StreamTotal Demand
(Veh/hr)Capacity (Veh/hr) RFC
Throughput (Veh/hr)
End queue (Veh) Delay (s)Unsignalised
level of service
B-C 63 491 0.128 63 0.1 8.395 A
B-A 144 236 0.611 141 1.4 36.588 E
C-AB 73 552 0.132 73 0.2 7.501 A
C-A 1809 1809
A-B 179 179
A-C 1214 1214
StreamTotal Demand
(Veh/hr)Capacity (Veh/hr) RFC
Throughput (Veh/hr)
End queue (Veh) Delay (s)Unsignalised
level of service
B-C 63 489 0.128 63 0.1 8.443 A
B-A 144 236 0.611 144 1.5 38.775 E
C-AB 73 552 0.132 73 0.2 7.504 A
C-A 1809 1809
A-B 179 179
A-C 1214 1214
Generated on 09/07/2021 12:00:50 using Junctions 9 (9.5.1.7462)
19

12:45 - 13:00
13:00 - 13:15
StreamTotal Demand
(Veh/hr)Capacity (Veh/hr) RFC
Throughput (Veh/hr)
End queue (Veh) Delay (s)Unsignalised
level of service
B-C 51 559 0.092 51 0.1 7.090 A
B-A 118 310 0.379 121 0.6 19.355 C
C-AB 59 595 0.100 59 0.1 6.732 A
C-A 1477 1477
A-B 147 147
A-C 992 992
StreamTotal Demand
(Veh/hr)Capacity (Veh/hr) RFC
Throughput (Veh/hr)
End queue (Veh) Delay (s)Unsignalised
level of service
B-C 43 605 0.071 43 0.1 6.408 A
B-A 99 364 0.271 100 0.4 13.667 B
C-AB 50 625 0.079 50 0.1 6.260 A
C-A 1237 1237
A-B 123 123
A-C 830 830
Generated on 09/07/2021 12:00:50 using Junctions 9 (9.5.1.7462)
20


