Embed Size (px)
Citation preview
J. Mar. Sci. Eng. 2019, 7, 359; doi:10.3390/jmse7100359 www.mdpi.com/journal/jmse
Article
Life Cycle Assessment of LNG Fueled Vessel in Domestic Services Sangsoo Hwang 1,2, Byongug Jeong 1,*, Kwanghyo Jung 2, Mingyu Kim 3 and Peilin Zhou 1,4
1 Department of Naval Architecture, Ocean and Marine Engineering, University of Strathclyde, Glasgow G4 0LZ, UK; [email protected] (S.H.); [email protected] (B.J.); [email protected] (P.Z.)
2 Department of Naval Architecture and Ocean Engineering, Pusan National University, Busan 46241, Korea; [email protected]
3 Maritime Research Institute, Korea Center for International Maritime Safety Cooperation, Sejong 30103, Korea; [email protected]
4 Faculty of Marine Science and Technology, Harbin Institute of Technology, Weihai 264209, China * Correspondence: [email protected]; Tel: +44-074-256-94809
Received: 27 August 2019; Accepted: 5 October 2019; Published: 10 October 2019
Abstract: This research was focused on a comparative analysis of using LNG as a marine fuel with a conventional marine gas oil (MGO) from an environmental point of view. A case study was performed using a 50K bulk carrier engaged in domestic services in South Korea. Considering the energy exporting market for South Korea, the fuel supply chain was designed with the two largest suppliers: Middle East (LNG-Qatar/MGO-Saudi Arabia) and U.S. The life cycle of each fuel type was categorized into three stages: Well-to-Tank (WtT), Tank-to-Wake (TtW), and Well-to-Wake (WtW). With the process modelling, the environmental impact of each stage was analyzed based on the five environmental impact categorizes: Global Warming Potential (GWP), Acidification Potential (AP), Photochemical Potential (POCP), Eutrophication Potential (EP) and Particulate Matter (PM). Analysis results reveal that emission levels for the LNG cases are significantly lower than the MGO cases in all potential impact categories. Particularly, Case 1 (LNG import to Korea from Qatar) is identified as the best option as producing the lowest emission levels per 1.0 × 10⁷ MJ of fuel consumption: 977 tonnages of CO2 equivalent (for GWP), 1.76 tonnages of SO2 equivalent (for AP), 1.18 tonnages of N equivalent (for EP), 4.28 tonnages of NMVOC equivalent (for POCP) and 26 kg of PM 2.5 equivalent (for PM). On the other hand, the results also point out that the selection of the fuel supply routes could be an important factor contributing to emission levels since longer distances for freight transportation result in more emissions. It is worth noting that the life cycle assessment can offer us better understanding of holistic emission levels contributed by marine fuels from the cradle to the grave, which are highly believed to remedy the shortcomings of current marine emission indicators.
Keywords: LNG-fueled ship; IMO GHG; LNG; MGO; LCA; marine fuel
1. Introduction
Today, humanity is in the age of the most prosperous history. The advancement of industrial technology has allowed people to share goods with no barriers. Seaborne trade significantly contributes to this trend. In 2017, about 10.7 billion tons of products were traded through water, which represents an enormous amount of energy consumption, thereby producing emissions recklessly [1].
J. Mar. Sci. Eng. 2019, 7, 359 2 of 24
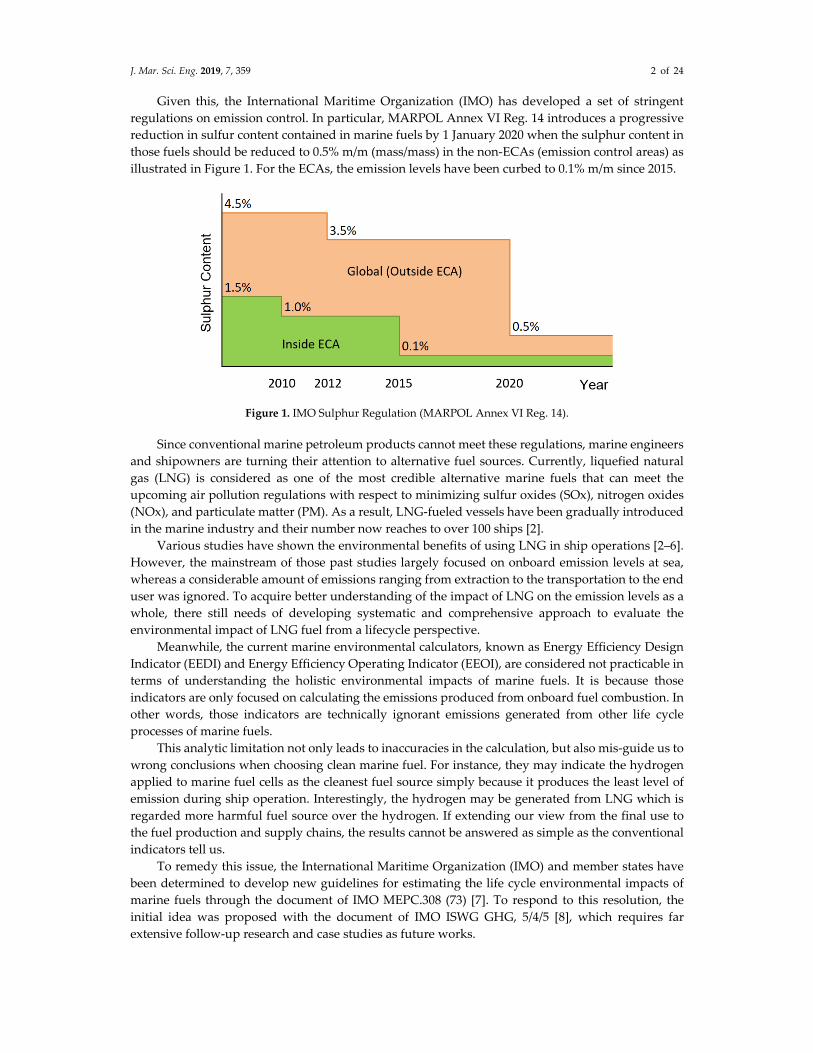
Given this, the International Maritime Organization (IMO) has developed a set of stringent regulations on emission control. In particular, MARPOL Annex VI Reg. 14 introduces a progressive reduction in sulfur content contained in marine fuels by 1 January 2020 when the sulphur content in those fuels should be reduced to 0.5% m/m (mass/mass) in the non-ECAs (emission control areas) as illustrated in Figure 1. For the ECAs, the emission levels have been curbed to 0.1% m/m since 2015.
Figure 1. IMO Sulphur Regulation (MARPOL Annex VI Reg. 14).
Since conventional marine petroleum products cannot meet these regulations, marine engineers and shipowners are turning their attention to alternative fuel sources. Currently, liquefied natural gas (LNG) is considered as one of the most credible alternative marine fuels that can meet the upcoming air pollution regulations with respect to minimizing sulfur oxides (SOx), nitrogen oxides (NOx), and particulate matter (PM). As a result, LNG-fueled vessels have been gradually introduced in the marine industry and their number now reaches to over 100 ships [2].
Various studies have shown the environmental benefits of using LNG in ship operations [2–6]. However, the mainstream of those past studies largely focused on onboard emission levels at sea, whereas a considerable amount of emissions ranging from extraction to the transportation to the end user was ignored. To acquire better understanding of the impact of LNG on the emission levels as a whole, there still needs of developing systematic and comprehensive approach to evaluate the environmental impact of LNG fuel from a lifecycle perspective.
Meanwhile, the current marine environmental calculators, known as Energy Efficiency Design Indicator (EEDI) and Energy Efficiency Operating Indicator (EEOI), are considered not practicable in terms of understanding the holistic environmental impacts of marine fuels. It is because those indicators are only focused on calculating the emissions produced from onboard fuel combustion. In other words, those indicators are technically ignorant emissions generated from other life cycle processes of marine fuels.
This analytic limitation not only leads to inaccuracies in the calculation, but also mis-guide us to wrong conclusions when choosing clean marine fuel. For instance, they may indicate the hydrogen applied to marine fuel cells as the cleanest fuel source simply because it produces the least level of emission during ship operation. Interestingly, the hydrogen may be generated from LNG which is regarded more harmful fuel source over the hydrogen. If extending our view from the final use to the fuel production and supply chains, the results cannot be answered as simple as the conventional indicators tell us.
To remedy this issue, the International Maritime Organization (IMO) and member states have been determined to develop new guidelines for estimating the life cycle environmental impacts of marine fuels through the document of IMO MEPC.308 (73) [7]. To respond to this resolution, the initial idea was proposed with the document of IMO ISWG GHG, 5/4/5 [8], which requires far extensive follow-up research and case studies as future works.
J. Mar. Sci. Eng. 2019, 7, 359 3 of 24
Given this background, this paper was motivated to introduce an approach of LCA and to demonstrate its effectiveness through a comparative LCA of LNG with MGO in practical supply chain cases.
2. Literature Review
In effort to investigate the holistic environmental impacts of shipping-related issues, the concept of the life cycle assessment (LCA) has been applied to various studies over decades. There are some remarkable researches worth being mentioned in a methodological point of view. Guinée [9] presented a handbook for guiding to apply International Organization for Standardization (ISO) for LCA analysis and Finnveden et al. [10] discussed the recent development and trends of the LCA applied to industrial studies. Dynamic LCA in consideration of time domain was introduced by Levasseur et al. [11]. These literature provide high-quality basement for life cycle assessment. Nevertheless, Woods et al. [12] pointed out the lack of the LCA studies on investigating the marine environment impacts, addressing the scarcity of LCA modelling to quantify the effects of products and processes on marine biodiversity.
Not surprisingly, there are voluminous LCA studies evaluating the environmental impacts of LNG. Some representative examples are noteworthy. Bengtsson et al. [13] applied the LCA for a comparative study across crude oil, LNG and other competitive marine fuels. The research results revealed that LNG would have a relatively lower GWP compared to other candidates. Thinkstep [14] also provided comparative life cycle assessment for the natural gas with other marine fuels in terms of GHG intensity. Similar study was carried out by El-Houjeiri et al. [15] which compared Saudi Crude oil to the natural gas in other regions in terms of GHG emission. Also, Sharafian et al. [16] provided research about GHG and other air pollutants for natural gas. A localized GHG emission taking into account upstream life cycle was studied by Liu [17] where climate change impact by supply of natural gas in Western Canada was studied. This study provides a suggestion to find the prospect that localized impact for the same fuel can vary in different industries. However, those research were largely focused on the GHG impact and lacked discussion of other impact potentials of local pollutants such as AP, EP, POCP and PM. In addition, the diversity of supply routes was not included in the research scope.
Some interesting LCA studies were also conducted to evaluate local pollutants associated with LNG. A study by Brynolf et al. [18] compared the environmental impact of LNG to future marine fuels: liquefied biogas, methanol and biomethanol. An improved method to reduce net climate change was suggested in the research. Life cycle inventory and analysis of fuels in Singapore was presented in Tan et al. [19] that discussed several types of emissions from Singapore power plants compared between LNG and diesel oil. Tagliaferri et al. [20] investigated LNG transport from Qatar to UK with detailed and diverse scenarios. Jeong [21] provided the holistic research for HFO, MGO and LNG in terms of GWP, AP, EP, POCP.
In particular, it is noteworthy that LCA research has been extended not only to fuel types, but also to the ship building field. Hua et al. [22] analyzed the total life cycle emissions of a post-Panamax container ship running in both HFO and natural gas. Jeong et al. [23] presented the excellence of using LNG-fueled engines based on economic and environmental viewpoints. In the research, the life cycle cost assessment (LCCA) was advised as a useful tool for decision making across industries. It offered the possibility of extending the LCA in the economic point of view, since cost impacts cannot be a negligible issue for the marine industry. Rocco et al. [24] studied the purification process of LNG in the LCA point of view. Miksch [25] analyzed the shipping routes from United States (U.S.) to Asia transporting LNG. This research showed that the LNG supply chain would be sensitive to economic and environmental impacts of fuels. In addition, Dong and Cai [26] discussed several ways to reduce the environmental impact by reducing the fuel consumption rate.
Studies on future marine fuels integrated with advanced technologies rather than LNG cannot be neglected. Alkaner and Zhou [27] presented comparative life cycle analysis for molten carbon fuel cells and conventional diesel engines. This research highlighted the environmental benefits of the new power source. Smith et al. [28] suggested that solid oxide fuel cells can be a solution for marine
J. Mar. Sci. Eng. 2019, 7, 359 4 of 24
fuel to prevent climate change. However, the study was more or less limited to operational phase. Evrin and Dincer [29] provided thermodynamic analysis and the assessment of an integrated hydrogen fuel cell for ships. In the study, the GHG emission during operation was analyzed. Hansson et al. [30] in the Swedish marine fuel research recommended the hydrogen as the most optimal and the methanol as the second optimal alternative fuels. Nevertheless, LNG and HFO were marked the optimal fuels in the performance and economic criteria.
The literature above provides multi-disciplinary advice for analyzing LCA for marine fuels. On the other hand, it was found that there is still a shortage in case-specific analysis of LNG application to marine vessels when it comes to contributing to developing lifecycle impact of alterative marine fuels. To narrow this gap, this paper was motivated as a preliminary study to evaluate the environmental benefits of using LNG overall by conducting case studies with a newly-constructed LNG-fueled bulk carrier engaged in domestic services of South Korea, one of the world’s top five crude oil importers as well as top three LNG consumers in 2018 [31,32]. It is also to introduce a practical approach to evaluate the life cycle emissions from LNG, thereby achieving useful results for the future regulatory framework on the enhanced standardization for maritime emission calculation.
3. Adopted Approach
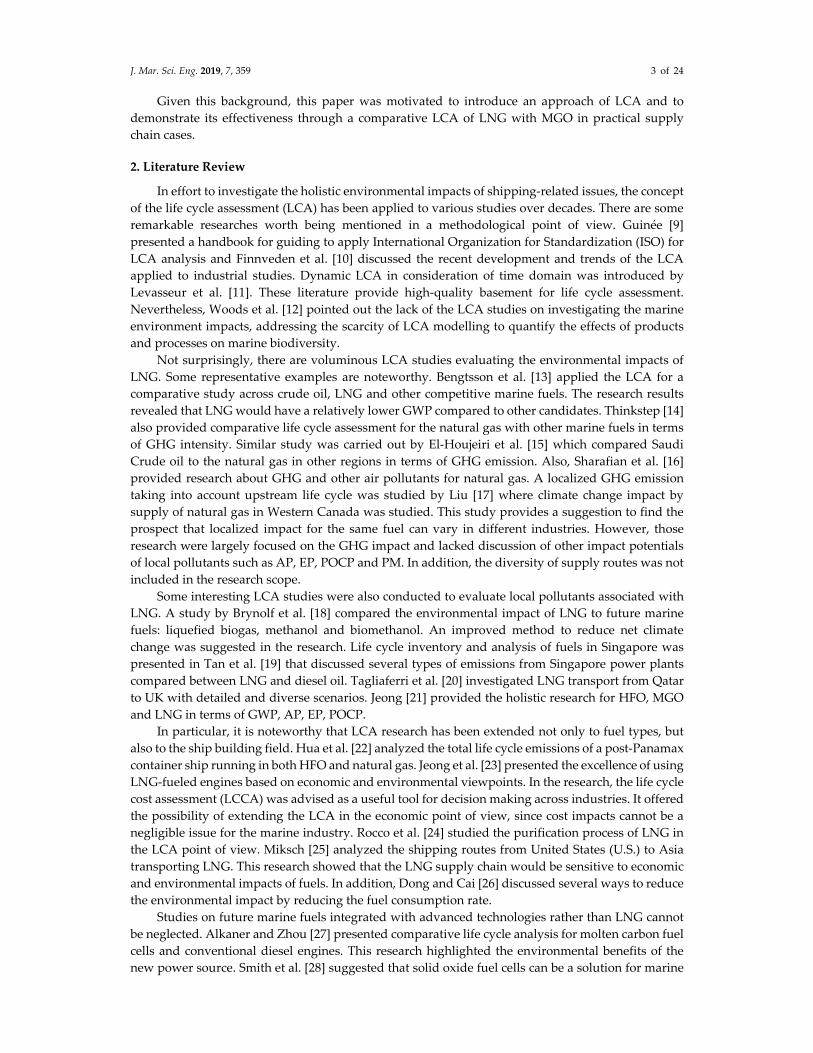
LCA provides analysis of the environmental prospect and potential environmental impacts throughout life cycle of a product from raw material acquisition through production, use, end-of-life treatment, recycling and final disposal. Economic and social issues are outside the scope of the LCA. The ISO provides standards for the Life Cycle Assessment [33]. Figure 2 displays the approach of the analysis to the LCA framework complying with the ISO standards. It mainly consists of four steps: ‘Goal and scope definition’, ‘Inventory analysis’, ‘Impact assessment’ and ‘Interpretation’. The workflow of case studies was assigned in the standardized format.
Figure 2. Methodology of Life Cycle Assessment.
J. Mar. Sci. Eng. 2019, 7, 359 5 of 24
3.1. Goal and Scope Definition
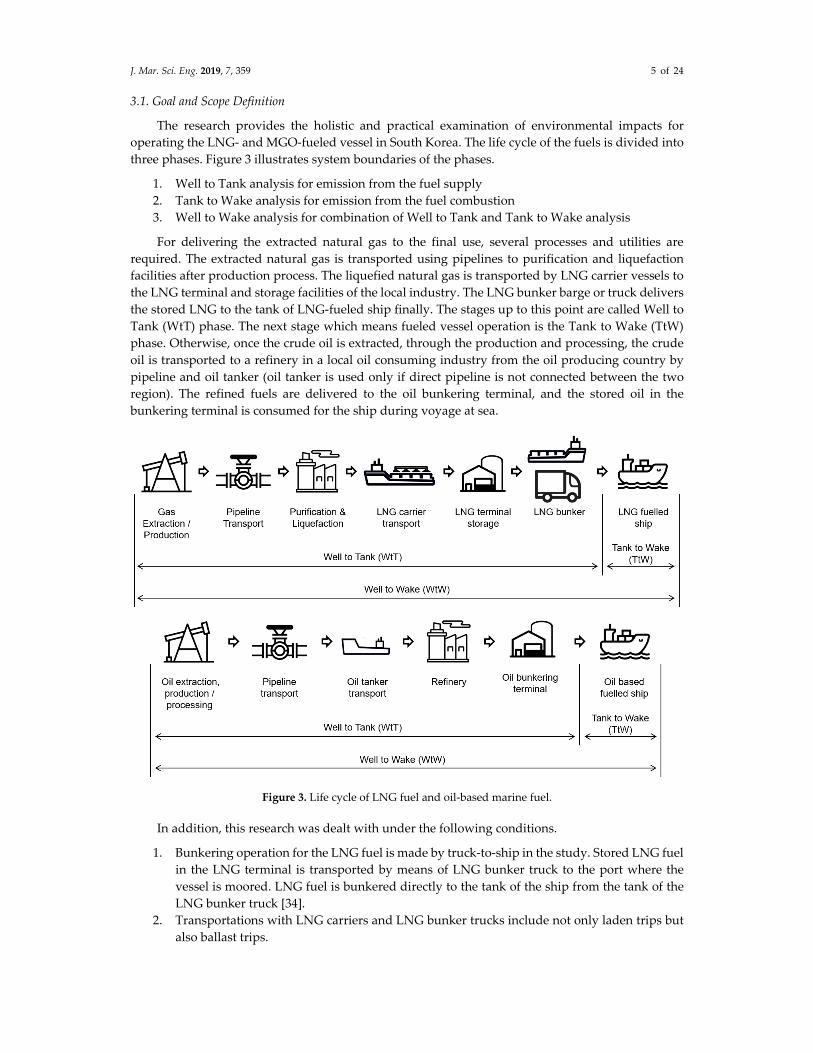
The research provides the holistic and practical examination of environmental impacts for operating the LNG- and MGO-fueled vessel in South Korea. The life cycle of the fuels is divided into three phases. Figure 3 illustrates system boundaries of the phases.
1. Well to Tank analysis for emission from the fuel supply 2. Tank to Wake analysis for emission from the fuel combustion 3. Well to Wake analysis for combination of Well to Tank and Tank to Wake analysis
For delivering the extracted natural gas to the final use, several processes and utilities are required. The extracted natural gas is transported using pipelines to purification and liquefaction facilities after production process. The liquefied natural gas is transported by LNG carrier vessels to the LNG terminal and storage facilities of the local industry. The LNG bunker barge or truck delivers the stored LNG to the tank of LNG-fueled ship finally. The stages up to this point are called Well to Tank (WtT) phase. The next stage which means fueled vessel operation is the Tank to Wake (TtW) phase. Otherwise, once the crude oil is extracted, through the production and processing, the crude oil is transported to a refinery in a local oil consuming industry from the oil producing country by pipeline and oil tanker (oil tanker is used only if direct pipeline is not connected between the two region). The refined fuels are delivered to the oil bunkering terminal, and the stored oil in the bunkering terminal is consumed for the ship during voyage at sea.
Figure 3. Life cycle of LNG fuel and oil-based marine fuel.
In addition, this research was dealt with under the following conditions.
1. Bunkering operation for the LNG fuel is made by truck-to-ship in the study. Stored LNG fuel in the LNG terminal is transported by means of LNG bunker truck to the port where the vessel is moored. LNG fuel is bunkered directly to the tank of the ship from the tank of the LNG bunker truck [34].
2. Transportations with LNG carriers and LNG bunker trucks include not only laden trips but also ballast trips.
J. Mar. Sci. Eng. 2019, 7, 359 6 of 24
3. Materials and emissions associated with constructing oil and gas facilities (oil extraction, refinery plants, relevant systems, etc.) are not considered in this study. The transport process for energizing the facilities are also excluded.
3.1.1. LNG Supply Chain
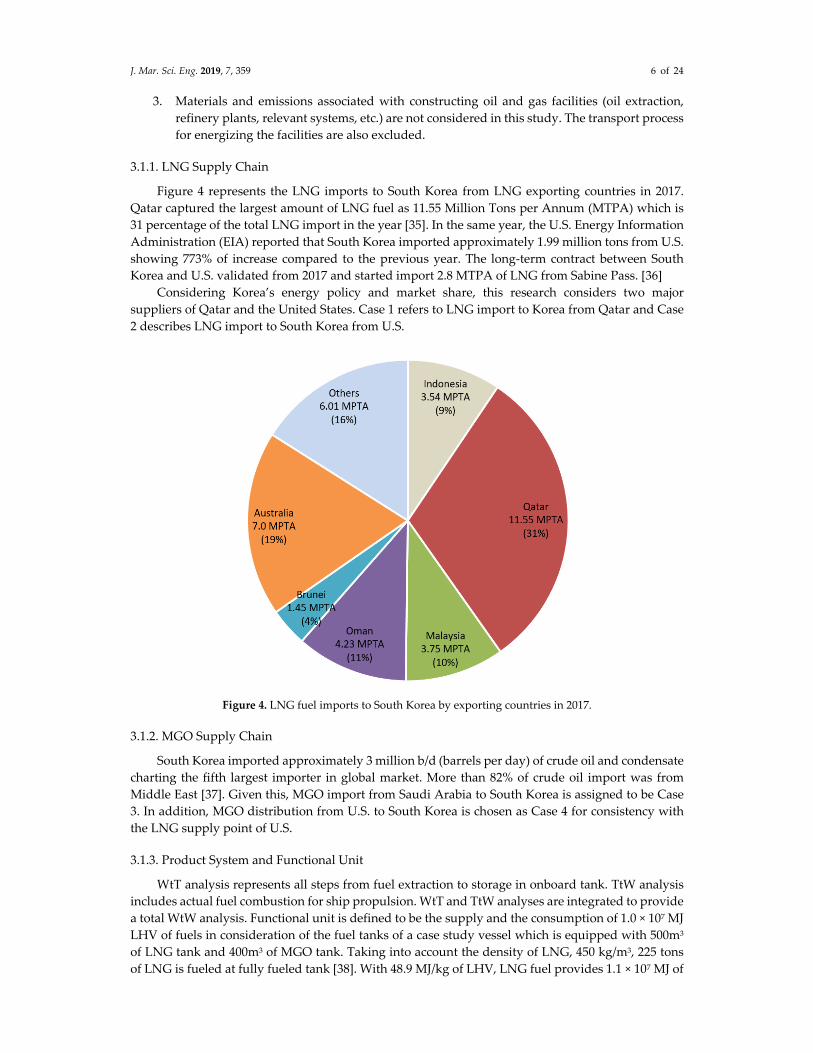
Figure 4 represents the LNG imports to South Korea from LNG exporting countries in 2017. Qatar captured the largest amount of LNG fuel as 11.55 Million Tons per Annum (MTPA) which is 31 percentage of the total LNG import in the year [35]. In the same year, the U.S. Energy Information Administration (EIA) reported that South Korea imported approximately 1.99 million tons from U.S. showing 773% of increase compared to the previous year. The long-term contract between South Korea and U.S. validated from 2017 and started import 2.8 MTPA of LNG from Sabine Pass. [36]
Considering Korea’s energy policy and market share, this research considers two major suppliers of Qatar and the United States. Case 1 refers to LNG import to Korea from Qatar and Case 2 describes LNG import to South Korea from U.S.
Figure 4. LNG fuel imports to South Korea by exporting countries in 2017.
3.1.2. MGO Supply Chain
South Korea imported approximately 3 million b/d (barrels per day) of crude oil and condensate charting the fifth largest importer in global market. More than 82% of crude oil import was from Middle East [37]. Given this, MGO import from Saudi Arabia to South Korea is assigned to be Case 3. In addition, MGO distribution from U.S. to South Korea is chosen as Case 4 for consistency with the LNG supply point of U.S.
3.1.3. Product System and Functional Unit
WtT analysis represents all steps from fuel extraction to storage in onboard tank. TtW analysis includes actual fuel combustion for ship propulsion. WtT and TtW analyses are integrated to provide a total WtW analysis. Functional unit is defined to be the supply and the consumption of 1.0 × 10⁷ MJ LHV of fuels in consideration of the fuel tanks of a case study vessel which is equipped with 500m3 of LNG tank and 400m3 of MGO tank. Taking into account the density of LNG, 450 kg/m3, 225 tons of LNG is fueled at fully fueled tank [38]. With 48.9 MJ/kg of LHV, LNG fuel provides 1.1 × 10⁷ MJ of
J. Mar. Sci. Eng. 2019, 7, 359 7 of 24
energy. 1.0 × 10⁷ MJ LHV of energy is comparable to the available work volume by the case study vessel with the fully fueled LNG tank. In case of MGO, 860 kg/m3 of density formulates 344 tons of mass at fully tanked condition [39]. With 42.7 MJ/kg of LHV, MGO fuel provides 1.47 × 10⁷ MJ of energy [40]. To provide 1.0 × 10⁷ MJ of energy, 204 tons of LNG is required. In case of MGO, 234 tons of MGO is required for the same energy output. Table.1 summarizes the property of LNG and MGO. The sulphur content of the LNG fuel is assumed to be zero while the MGO fuel contains 0.1% (m/m) of sulphur.
Table 1. Properties and LHV of fuels and required quantity of fuels.
Fuel Type
Tank Size (m3)
Density (kg/m3)
Mass of Fuel at Fully Tanked
Condition (t)
LHV (MJ/kg)
Total Energy (MJ)
Required Mass of Fuel for 1.0 × 10⁷ MJ
(t) LNG 500 450 225 48.9 1.10 × 10⁷ 204 MGO 400 860 344 42.7 1.47 × 10⁷ 234
3.2. Inventory Analysis
3.2.1. Well to Tank Inventory Analysis
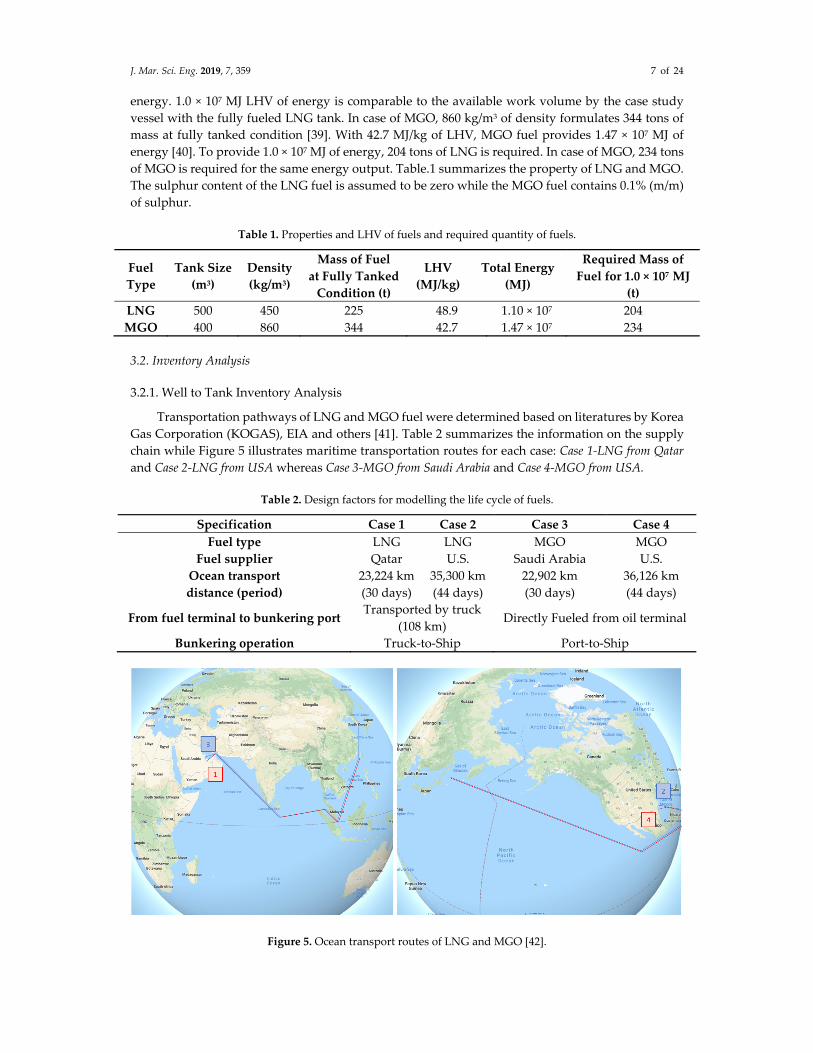
Transportation pathways of LNG and MGO fuel were determined based on literatures by Korea Gas Corporation (KOGAS), EIA and others [41]. Table 2 summarizes the information on the supply chain while Figure 5 illustrates maritime transportation routes for each case: Case 1-LNG from Qatar and Case 2-LNG from USA whereas Case 3-MGO from Saudi Arabia and Case 4-MGO from USA.
Table 2. Design factors for modelling the life cycle of fuels.
Specification Case 1 Case 2 Case 3 Case 4 Fuel type LNG LNG MGO MGO
Fuel supplier Qatar U.S. Saudi Arabia U.S. Ocean transport distance (period)
23,224 km (30 days)
35,300 km (44 days)
22,902 km (30 days)
36,126 km (44 days)
From fuel terminal to bunkering port Transported by truck
(108 km) Directly Fueled from oil terminal
Bunkering operation Truck-to-Ship Port-to-Ship
Figure 5. Ocean transport routes of LNG and MGO [42].
J. Mar. Sci. Eng. 2019, 7, 359 8 of 24
Table 3 presents the specification of LNG and crude oil carriers which are considered to transport the marine fuels to bunkering facilities in South Korea. The LNG carrier is considered to use a steam turbine driven by boil-off gas with 30% of efficiency. Boil-off gas is produced 0.15% of LNG cargo per day [13]. Typical types of LNG and crude oil carriers, currently engaged in the service, were selected; the cargo capacity of LNG carrier is 147,237 m3 whereas crude oil carrier is 57,741 m3. Table 4 shows the detailed description of the four case studies.
Table 3. Specification of estimated LNG carrier and Crude oil carrier [43].
Ship Type Engine Design Speed Cargo Capacity Load Factor Fuel
LNG carrier 27,300 kW 19.5 knot
(36.1 km/h) 147,237 m3 0.55 LNG
Crude oil carrier 12,330 kW 15.2 knot
(28.2 km/h) 57,741 m3 0.55 MGO
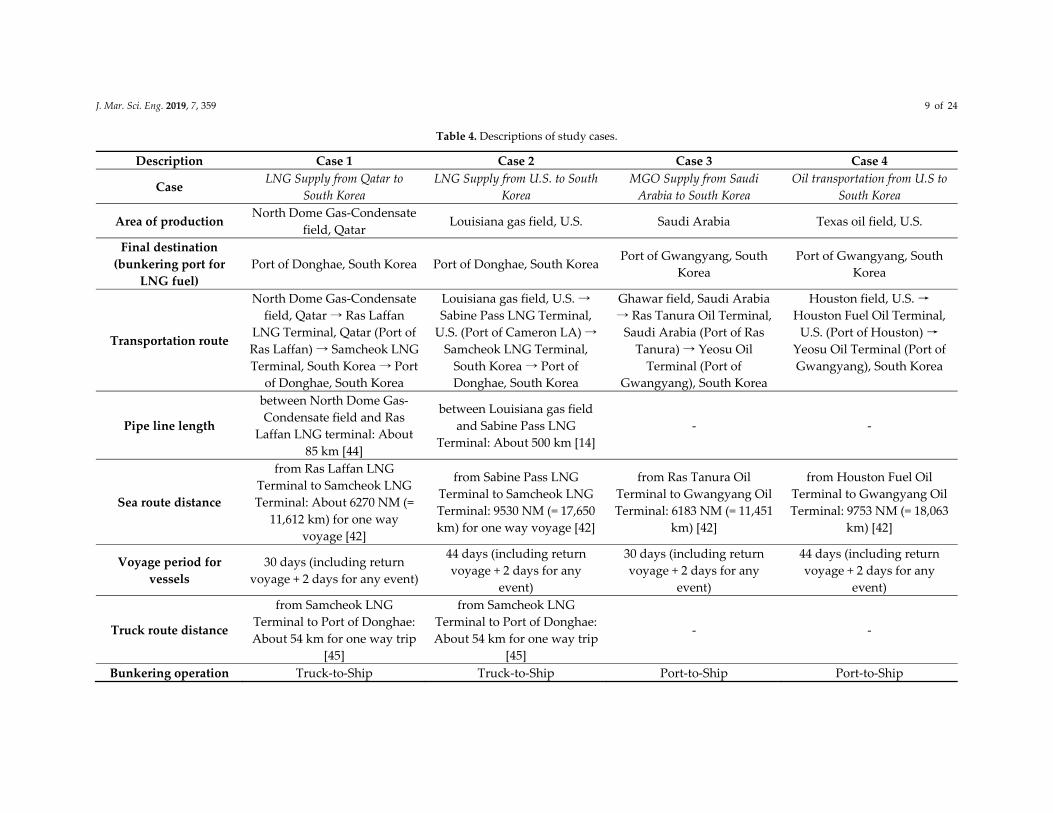
J. Mar. Sci. Eng. 2019, 7, 359 9 of 24
Table 4. Descriptions of study cases.
Description Case 1 Case 2 Case 3 Case 4
Case LNG Supply from Qatar to
South Korea LNG Supply from U.S. to South
Korea MGO Supply from Saudi
Arabia to South Korea Oil transportation from U.S to
South Korea
Area of production North Dome Gas-Condensate
field, Qatar Louisiana gas field, U.S. Saudi Arabia Texas oil field, U.S.
Final destination (bunkering port for
LNG fuel) Port of Donghae, South Korea Port of Donghae, South Korea Port of Gwangyang, South
Korea Port of Gwangyang, South
Korea
Transportation route
North Dome Gas-Condensate field, Qatar → Ras Laffan
LNG Terminal, Qatar (Port of Ras Laffan) → Samcheok LNG Terminal, South Korea → Port
of Donghae, South Korea
Louisiana gas field, U.S. → Sabine Pass LNG Terminal,
U.S. (Port of Cameron LA) → Samcheok LNG Terminal,
South Korea → Port of Donghae, South Korea
Ghawar field, Saudi Arabia → Ras Tanura Oil Terminal,
Saudi Arabia (Port of Ras Tanura) → Yeosu Oil
Terminal (Port of Gwangyang), South Korea
Houston field, U.S. → Houston Fuel Oil Terminal,
U.S. (Port of Houston) → Yeosu Oil Terminal (Port of Gwangyang), South Korea
Pipe line length
between North Dome Gas-Condensate field and Ras
Laffan LNG terminal: About 85 km [44]
between Louisiana gas field and Sabine Pass LNG
Terminal: About 500 km [14] - -
Sea route distance
from Ras Laffan LNG Terminal to Samcheok LNG Terminal: About 6270 NM (=
11,612 km) for one way voyage [42]
from Sabine Pass LNG Terminal to Samcheok LNG Terminal: 9530 NM (= 17,650 km) for one way voyage [42]
from Ras Tanura Oil Terminal to Gwangyang Oil Terminal: 6183 NM (= 11,451
km) [42]
from Houston Fuel Oil Terminal to Gwangyang Oil Terminal: 9753 NM (= 18,063
km) [42]
Voyage period for vessels
30 days (including return voyage + 2 days for any event)
44 days (including return voyage + 2 days for any
event)
30 days (including return voyage + 2 days for any
event)
44 days (including return voyage + 2 days for any
event)
Truck route distance
from Samcheok LNG Terminal to Port of Donghae: About 54 km for one way trip
[45]
from Samcheok LNG Terminal to Port of Donghae: About 54 km for one way trip
[45]
- -
Bunkering operation Truck-to-Ship Truck-to-Ship Port-to-Ship Port-to-Ship
J. Mar. Sci. Eng. 2019, 7, 359 10 of 24
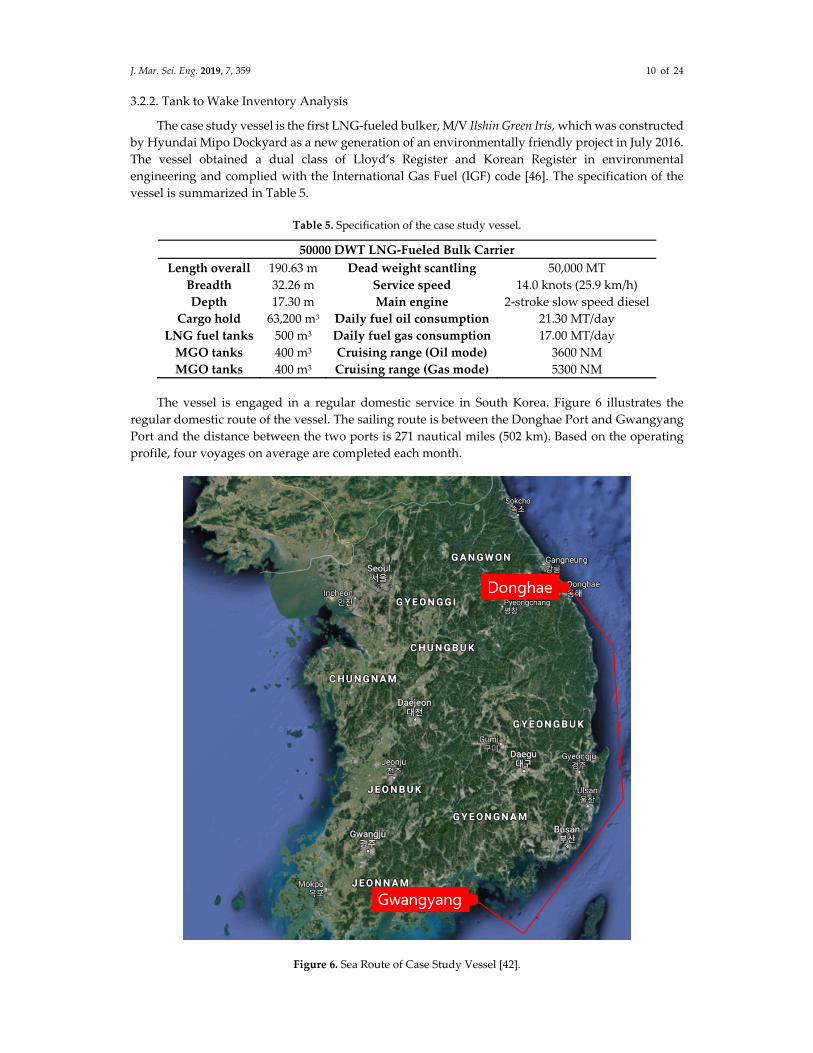
3.2.2. Tank to Wake Inventory Analysis
The case study vessel is the first LNG-fueled bulker, M/V Ilshin Green Iris, which was constructed by Hyundai Mipo Dockyard as a new generation of an environmentally friendly project in July 2016. The vessel obtained a dual class of Lloyd’s Register and Korean Register in environmental engineering and complied with the International Gas Fuel (IGF) code [46]. The specification of the vessel is summarized in Table 5.
Table 5. Specification of the case study vessel.
50000 DWT LNG-Fueled Bulk Carrier Length overall 190.63 m Dead weight scantling 50,000 MT
Breadth 32.26 m Service speed 14.0 knots (25.9 km/h) Depth 17.30 m Main engine 2-stroke slow speed diesel
Cargo hold 63,200 m3 Daily fuel oil consumption 21.30 MT/day LNG fuel tanks 500 m3 Daily fuel gas consumption 17.00 MT/day
MGO tanks 400 m3 Cruising range (Oil mode) 3600 NM MGO tanks 400 m3 Cruising range (Gas mode) 5300 NM
The vessel is engaged in a regular domestic service in South Korea. Figure 6 illustrates the regular domestic route of the vessel. The sailing route is between the Donghae Port and Gwangyang Port and the distance between the two ports is 271 nautical miles (502 km). Based on the operating profile, four voyages on average are completed each month.
Figure 6. Sea Route of Case Study Vessel [42].
J. Mar. Sci. Eng. 2019, 7, 359 11 of 24
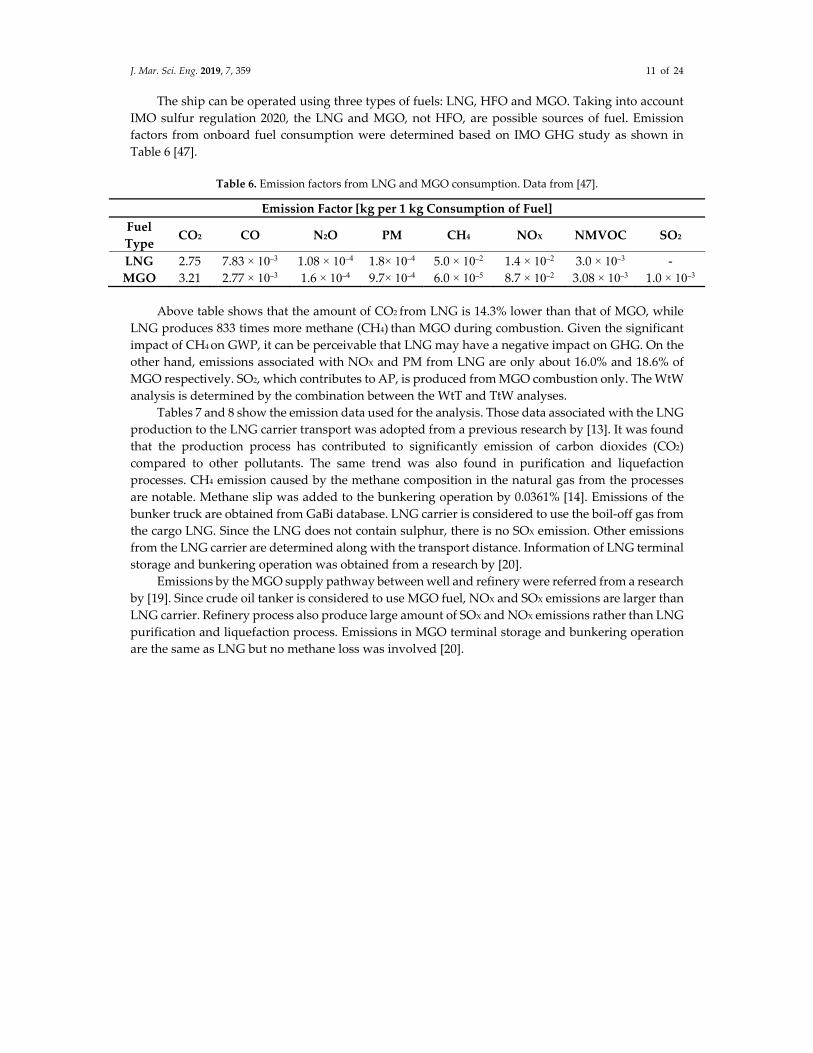
The ship can be operated using three types of fuels: LNG, HFO and MGO. Taking into account IMO sulfur regulation 2020, the LNG and MGO, not HFO, are possible sources of fuel. Emission factors from onboard fuel consumption were determined based on IMO GHG study as shown in Table 6 [47].
Table 6. Emission factors from LNG and MGO consumption. Data from [47].
Emission Factor [kg per 1 kg Consumption of Fuel] Fuel Type
CO2 CO N2O PM CH4 NOX NMVOC SO2
LNG 2.75 7.83 × 10⁻³ 1.08 × 10⁻⁴ 1.8× 10⁻⁴ 5.0 × 10⁻² 1.4 × 10⁻² 3.0 × 10⁻³ - MGO 3.21 2.77 × 10⁻³ 1.6 × 10⁻⁴ 9.7× 10⁻⁴ 6.0 × 10⁻⁵ 8.7 × 10⁻² 3.08 × 10⁻³ 1.0 × 10⁻³
Above table shows that the amount of CO2 from LNG is 14.3% lower than that of MGO, while LNG produces 833 times more methane (CH4) than MGO during combustion. Given the significant impact of CH4 on GWP, it can be perceivable that LNG may have a negative impact on GHG. On the other hand, emissions associated with NOX and PM from LNG are only about 16.0% and 18.6% of MGO respectively. SO2, which contributes to AP, is produced from MGO combustion only. The WtW analysis is determined by the combination between the WtT and TtW analyses.
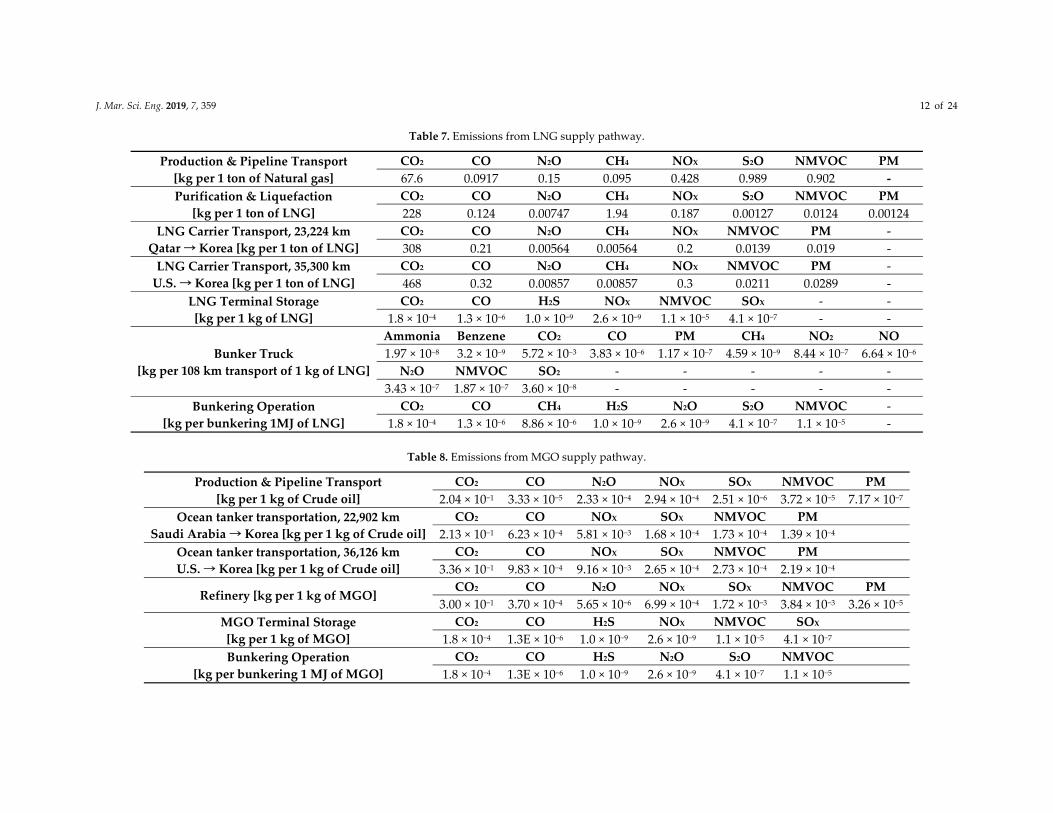
Tables 7 and 8 show the emission data used for the analysis. Those data associated with the LNG production to the LNG carrier transport was adopted from a previous research by [13]. It was found that the production process has contributed to significantly emission of carbon dioxides (CO2) compared to other pollutants. The same trend was also found in purification and liquefaction processes. CH4 emission caused by the methane composition in the natural gas from the processes are notable. Methane slip was added to the bunkering operation by 0.0361% [14]. Emissions of the bunker truck are obtained from GaBi database. LNG carrier is considered to use the boil-off gas from the cargo LNG. Since the LNG does not contain sulphur, there is no SOX emission. Other emissions from the LNG carrier are determined along with the transport distance. Information of LNG terminal storage and bunkering operation was obtained from a research by [20].
Emissions by the MGO supply pathway between well and refinery were referred from a research by [19]. Since crude oil tanker is considered to use MGO fuel, NOX and SOX emissions are larger than LNG carrier. Refinery process also produce large amount of SOX and NOX emissions rather than LNG purification and liquefaction process. Emissions in MGO terminal storage and bunkering operation are the same as LNG but no methane loss was involved [20].
J. Mar. Sci. Eng. 2019, 7, 359 12 of 24
Table 7. Emissions from LNG supply pathway.
Production & Pipeline Transport [kg per 1 ton of Natural gas]
CO2 CO N2O CH4 NOX S2O NMVOC PM 67.6 0.0917 0.15 0.095 0.428 0.989 0.902 -
Purification & Liquefaction [kg per 1 ton of LNG]
CO2 CO N2O CH4 NOX S2O NMVOC PM 228 0.124 0.00747 1.94 0.187 0.00127 0.0124 0.00124
LNG Carrier Transport, 23,224 km Qatar → Korea [kg per 1 ton of LNG]
CO2 CO N2O CH4 NOX NMVOC PM - 308 0.21 0.00564 0.00564 0.2 0.0139 0.019 -
LNG Carrier Transport, 35,300 km U.S. → Korea [kg per 1 ton of LNG]
CO2 CO N2O CH4 NOX NMVOC PM - 468 0.32 0.00857 0.00857 0.3 0.0211 0.0289 -
LNG Terminal Storage [kg per 1 kg of LNG]
CO2 CO H2S NOX NMVOC SOX - - 1.8 × 10⁻⁴ 1.3 × 10⁻⁶ 1.0 × 10⁻⁹ 2.6 × 10⁻⁹ 1.1 × 10⁻⁵ 4.1 × 10⁻⁷ - -
Bunker Truck [kg per 108 km transport of 1 kg of LNG]
Ammonia Benzene CO2 CO PM CH4 NO2 NO 1.97 × 10⁻⁸ 3.2 × 10⁻⁹ 5.72 × 10⁻³ 3.83 × 10⁻⁶ 1.17 × 10⁻⁷ 4.59 × 10⁻⁹ 8.44 × 10⁻⁷ 6.64 × 10⁻⁶
N2O NMVOC SO2 - - - - - 3.43 × 10⁻⁷ 1.87 × 10⁻⁷ 3.60 × 10⁻⁸ - - - - -
Bunkering Operation [kg per bunkering 1MJ of LNG]
CO2 CO CH4 H2S N2O S2O NMVOC - 1.8 × 10⁻⁴ 1.3 × 10⁻⁶ 8.86 × 10⁻⁶ 1.0 × 10⁻⁹ 2.6 × 10⁻⁹ 4.1 × 10⁻⁷ 1.1 × 10⁻⁵ -
Table 8. Emissions from MGO supply pathway.
Production & Pipeline Transport [kg per 1 kg of Crude oil]
CO2 CO N2O NOX SOX NMVOC PM 2.04 × 10⁻¹ 3.33 × 10⁻⁵ 2.33 × 10⁻⁴ 2.94 × 10⁻⁴ 2.51 × 10⁻⁶ 3.72 × 10⁻⁵ 7.17 × 10⁻⁷
Ocean tanker transportation, 22,902 km Saudi Arabia → Korea [kg per 1 kg of Crude oil]
CO2 CO NOX SOX NMVOC PM 2.13 × 10⁻¹ 6.23 × 10⁻⁴ 5.81 × 10⁻³ 1.68 × 10⁻⁴ 1.73 × 10⁻⁴ 1.39 × 10⁻⁴
Ocean tanker transportation, 36,126 km U.S. → Korea [kg per 1 kg of Crude oil]
CO2 CO NOX SOX NMVOC PM 3.36 × 10⁻¹ 9.83 × 10⁻⁴ 9.16 × 10⁻³ 2.65 × 10⁻⁴ 2.73 × 10⁻⁴ 2.19 × 10⁻⁴
Refinery [kg per 1 kg of MGO] CO2 CO N2O NOX SOX NMVOC PM
3.00 × 10⁻¹ 3.70 × 10⁻⁴ 5.65 × 10⁻⁶ 6.99 × 10⁻⁴ 1.72 × 10⁻³ 3.84 × 10⁻³ 3.26 × 10⁻⁵ MGO Terminal Storage [kg per 1 kg of MGO]
CO2 CO H2S NOX NMVOC SOX 1.8 × 10⁻⁴ 1.3E × 10−6 1.0 × 10⁻⁹ 2.6 × 10⁻⁹ 1.1 × 10⁻⁵ 4.1 × 10⁻⁷
Bunkering Operation [kg per bunkering 1 MJ of MGO]
CO2 CO H2S N2O S2O NMVOC 1.8 × 10⁻⁴ 1.3E × 10−6 1.0 × 10⁻⁹ 2.6 × 10⁻⁹ 4.1 × 10⁻⁷ 1.1 × 10⁻⁵
J. Mar. Sci. Eng. 2019, 7, 359 13 of 24
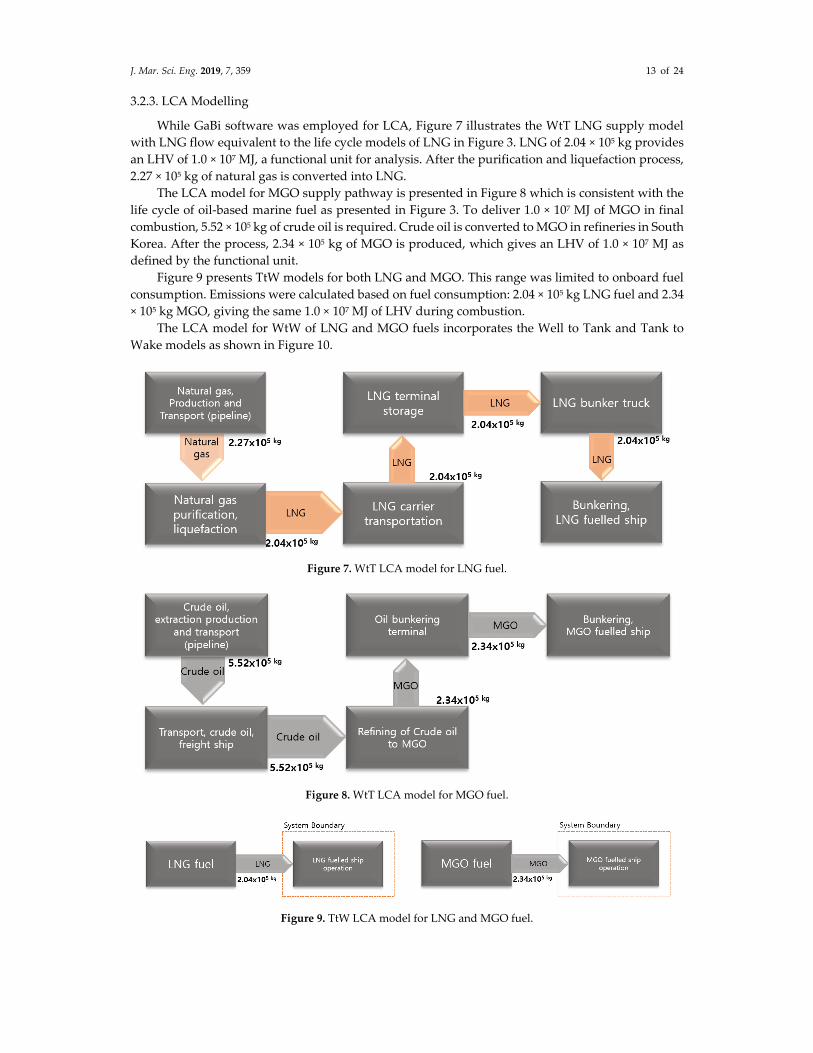
3.2.3. LCA Modelling
While GaBi software was employed for LCA, Figure 7 illustrates the WtT LNG supply model with LNG flow equivalent to the life cycle models of LNG in Figure 3. LNG of 2.04 × 10⁵ kg provides an LHV of 1.0 × 10⁷ MJ, a functional unit for analysis. After the purification and liquefaction process, 2.27 × 10⁵ kg of natural gas is converted into LNG.
The LCA model for MGO supply pathway is presented in Figure 8 which is consistent with the life cycle of oil-based marine fuel as presented in Figure 3. To deliver 1.0 × 10⁷ MJ of MGO in final combustion, 5.52 × 10⁵ kg of crude oil is required. Crude oil is converted to MGO in refineries in South Korea. After the process, 2.34 × 10⁵ kg of MGO is produced, which gives an LHV of 1.0 × 10⁷ MJ as defined by the functional unit.
Figure 9 presents TtW models for both LNG and MGO. This range was limited to onboard fuel consumption. Emissions were calculated based on fuel consumption: 2.04 × 10⁵ kg LNG fuel and 2.34 × 10⁵ kg MGO, giving the same 1.0 × 10⁷ MJ of LHV during combustion.
The LCA model for WtW of LNG and MGO fuels incorporates the Well to Tank and Tank to Wake models as shown in Figure 10.
Figure 7. WtT LCA model for LNG fuel.
Figure 8. WtT LCA model for MGO fuel.
Figure 9. TtW LCA model for LNG and MGO fuel.
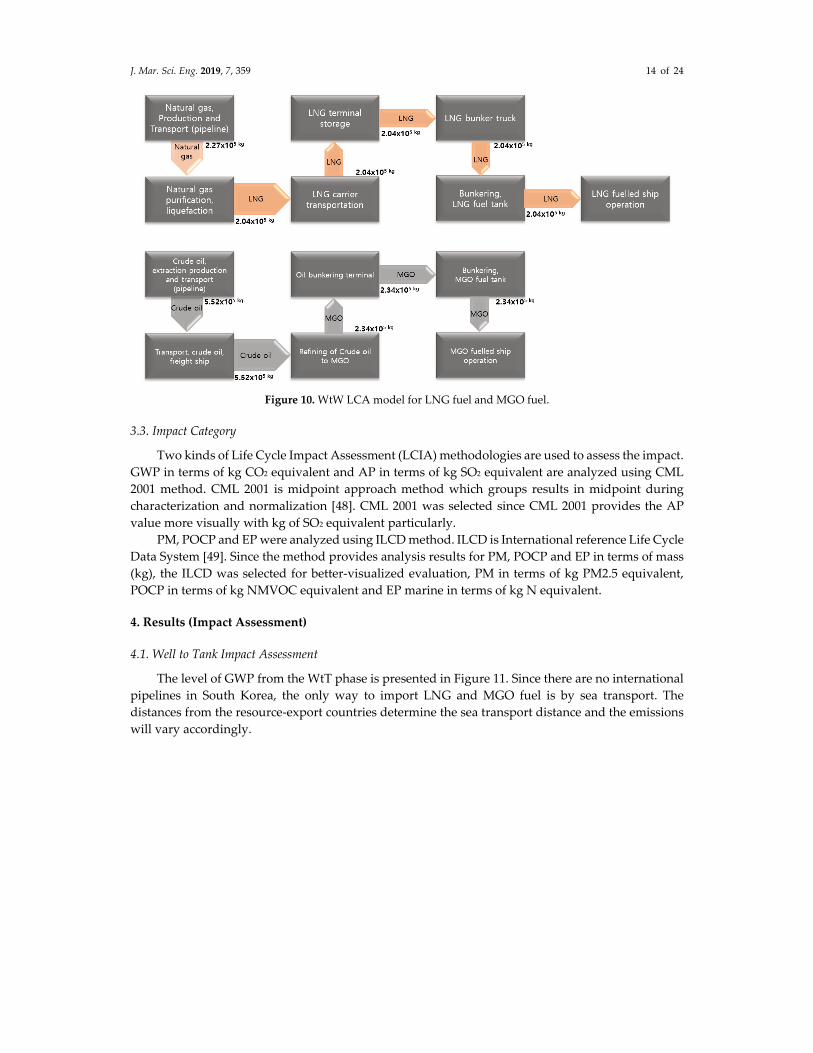
J. Mar. Sci. Eng. 2019, 7, 359 14 of 24
Figure 10. WtW LCA model for LNG fuel and MGO fuel.
3.3. Impact Category
Two kinds of Life Cycle Impact Assessment (LCIA) methodologies are used to assess the impact. GWP in terms of kg CO2 equivalent and AP in terms of kg SO2 equivalent are analyzed using CML 2001 method. CML 2001 is midpoint approach method which groups results in midpoint during characterization and normalization [48]. CML 2001 was selected since CML 2001 provides the AP value more visually with kg of SO2 equivalent particularly.
PM, POCP and EP were analyzed using ILCD method. ILCD is International reference Life Cycle Data System [49]. Since the method provides analysis results for PM, POCP and EP in terms of mass (kg), the ILCD was selected for better-visualized evaluation, PM in terms of kg PM2.5 equivalent, POCP in terms of kg NMVOC equivalent and EP marine in terms of kg N equivalent.
4. Results (Impact Assessment)
4.1. Well to Tank Impact Assessment
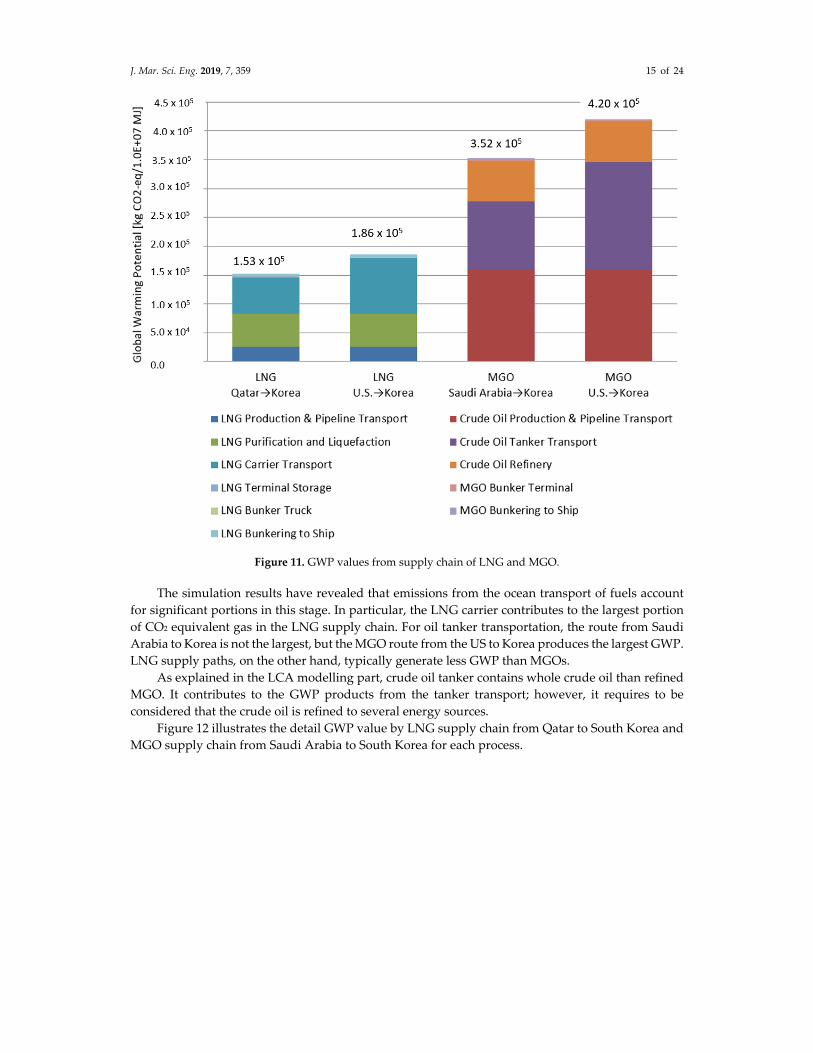
The level of GWP from the WtT phase is presented in Figure 11. Since there are no international pipelines in South Korea, the only way to import LNG and MGO fuel is by sea transport. The distances from the resource-export countries determine the sea transport distance and the emissions will vary accordingly.
J. Mar. Sci. Eng. 2019, 7, 359 15 of 24
Figure 11. GWP values from supply chain of LNG and MGO.
The simulation results have revealed that emissions from the ocean transport of fuels account for significant portions in this stage. In particular, the LNG carrier contributes to the largest portion of CO2 equivalent gas in the LNG supply chain. For oil tanker transportation, the route from Saudi Arabia to Korea is not the largest, but the MGO route from the US to Korea produces the largest GWP. LNG supply paths, on the other hand, typically generate less GWP than MGOs.
As explained in the LCA modelling part, crude oil tanker contains whole crude oil than refined MGO. It contributes to the GWP products from the tanker transport; however, it requires to be considered that the crude oil is refined to several energy sources.
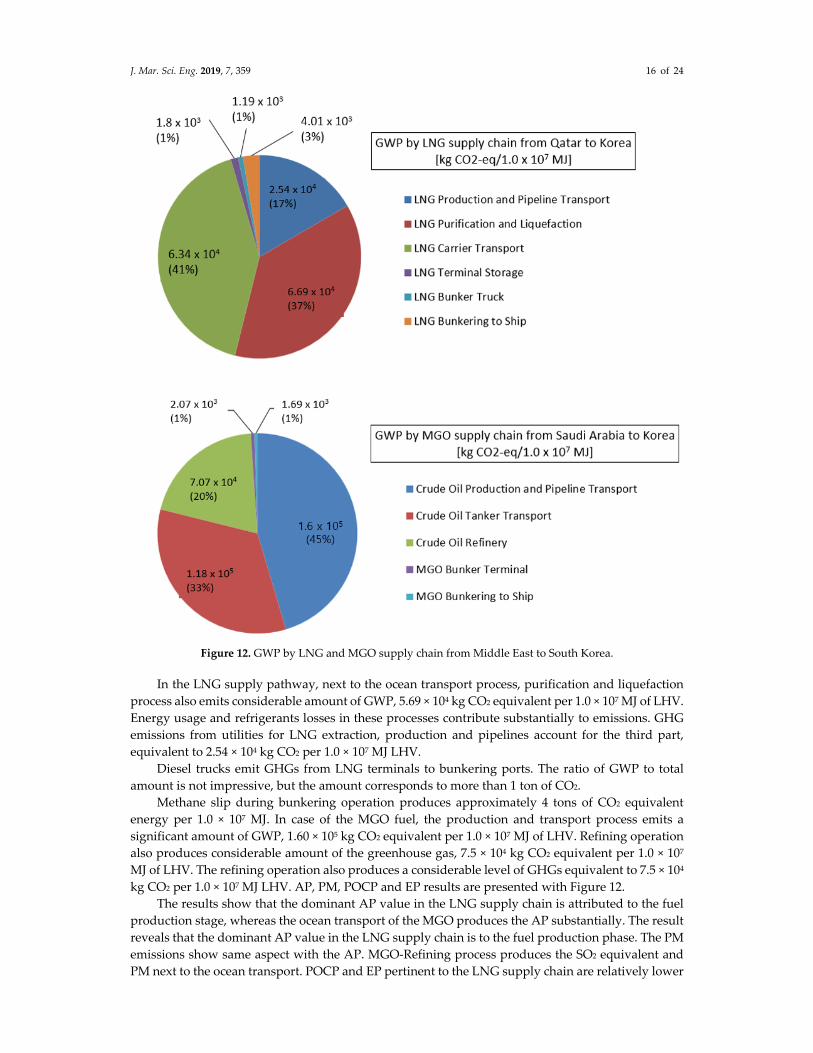
Figure 12 illustrates the detail GWP value by LNG supply chain from Qatar to South Korea and MGO supply chain from Saudi Arabia to South Korea for each process.
J. Mar. Sci. Eng. 2019, 7, 359 16 of 24
Figure 12. GWP by LNG and MGO supply chain from Middle East to South Korea.
In the LNG supply pathway, next to the ocean transport process, purification and liquefaction process also emits considerable amount of GWP, 5.69 × 10⁴ kg CO2 equivalent per 1.0 × 10⁷ MJ of LHV. Energy usage and refrigerants losses in these processes contribute substantially to emissions. GHG emissions from utilities for LNG extraction, production and pipelines account for the third part, equivalent to 2.54 × 10⁴ kg CO2 per 1.0 × 10⁷ MJ LHV.
Diesel trucks emit GHGs from LNG terminals to bunkering ports. The ratio of GWP to total amount is not impressive, but the amount corresponds to more than 1 ton of CO2.
Methane slip during bunkering operation produces approximately 4 tons of CO2 equivalent energy per 1.0 × 10⁷ MJ. In case of the MGO fuel, the production and transport process emits a significant amount of GWP, 1.60 × 10⁵ kg CO2 equivalent per 1.0 × 10⁷ MJ of LHV. Refining operation also produces considerable amount of the greenhouse gas, 7.5 × 10⁴ kg CO2 equivalent per 1.0 × 10⁷ MJ of LHV. The refining operation also produces a considerable level of GHGs equivalent to 7.5 × 10⁴ kg CO2 per 1.0 × 10⁷ MJ LHV. AP, PM, POCP and EP results are presented with Figure 12.
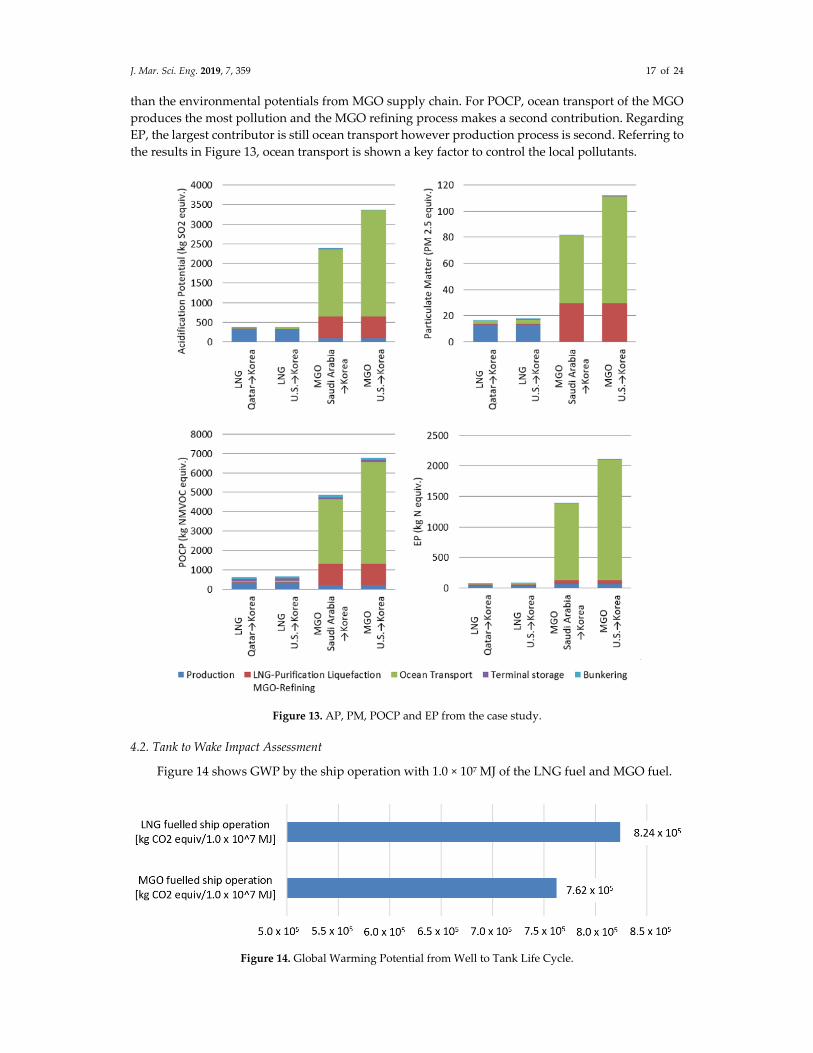
The results show that the dominant AP value in the LNG supply chain is attributed to the fuel production stage, whereas the ocean transport of the MGO produces the AP substantially. The result reveals that the dominant AP value in the LNG supply chain is to the fuel production phase. The PM emissions show same aspect with the AP. MGO-Refining process produces the SO2 equivalent and PM next to the ocean transport. POCP and EP pertinent to the LNG supply chain are relatively lower
J. Mar. Sci. Eng. 2019, 7, 359 17 of 24
than the environmental potentials from MGO supply chain. For POCP, ocean transport of the MGO produces the most pollution and the MGO refining process makes a second contribution. Regarding EP, the largest contributor is still ocean transport however production process is second. Referring to the results in Figure 13, ocean transport is shown a key factor to control the local pollutants.
Figure 13. AP, PM, POCP and EP from the case study.
4.2. Tank to Wake Impact Assessment
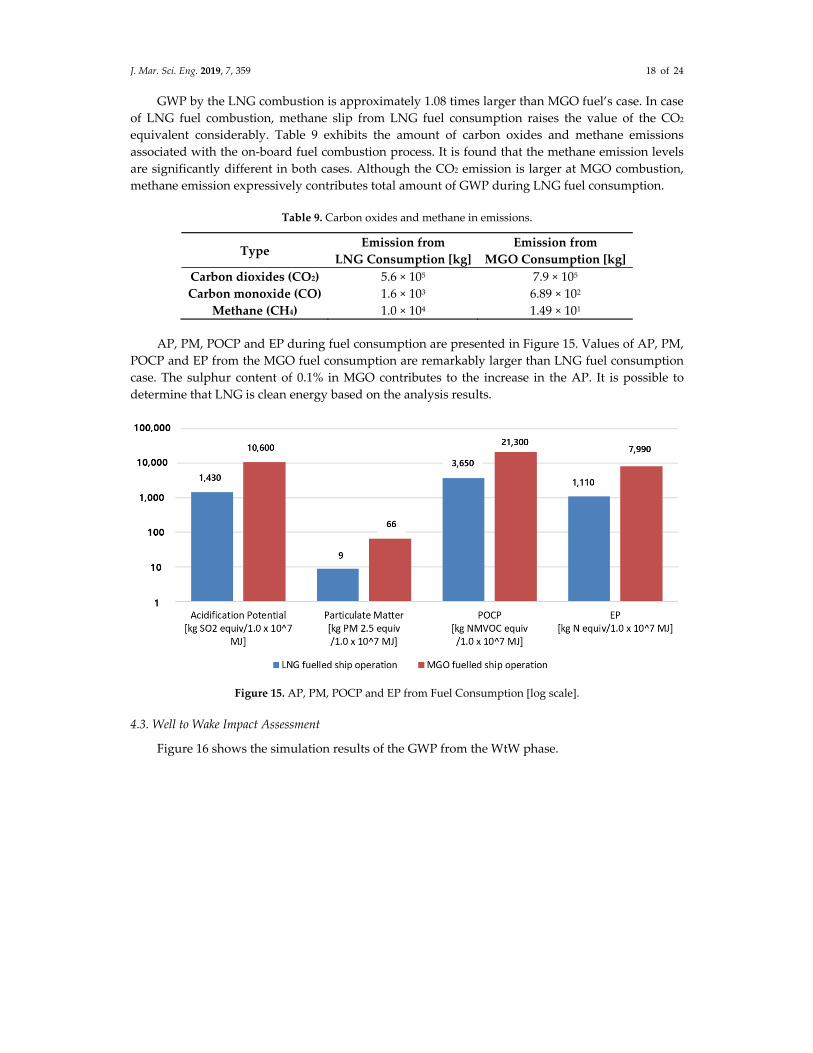
Figure 14 shows GWP by the ship operation with 1.0 × 10⁷ MJ of the LNG fuel and MGO fuel.
Figure 14. Global Warming Potential from Well to Tank Life Cycle.
J. Mar. Sci. Eng. 2019, 7, 359 18 of 24
GWP by the LNG combustion is approximately 1.08 times larger than MGO fuel’s case. In case of LNG fuel combustion, methane slip from LNG fuel consumption raises the value of the CO2 equivalent considerably. Table 9 exhibits the amount of carbon oxides and methane emissions associated with the on-board fuel combustion process. It is found that the methane emission levels are significantly different in both cases. Although the CO2 emission is larger at MGO combustion, methane emission expressively contributes total amount of GWP during LNG fuel consumption.
Table 9. Carbon oxides and methane in emissions.
Type Emission from
LNG Consumption [kg] Emission from
MGO Consumption [kg] Carbon dioxides (CO2) 5.6 × 10⁵ 7.9 × 10⁵ Carbon monoxide (CO) 1.6 × 10³ 6.89 × 10²
Methane (CH4) 1.0 × 10⁴ 1.49 × 101
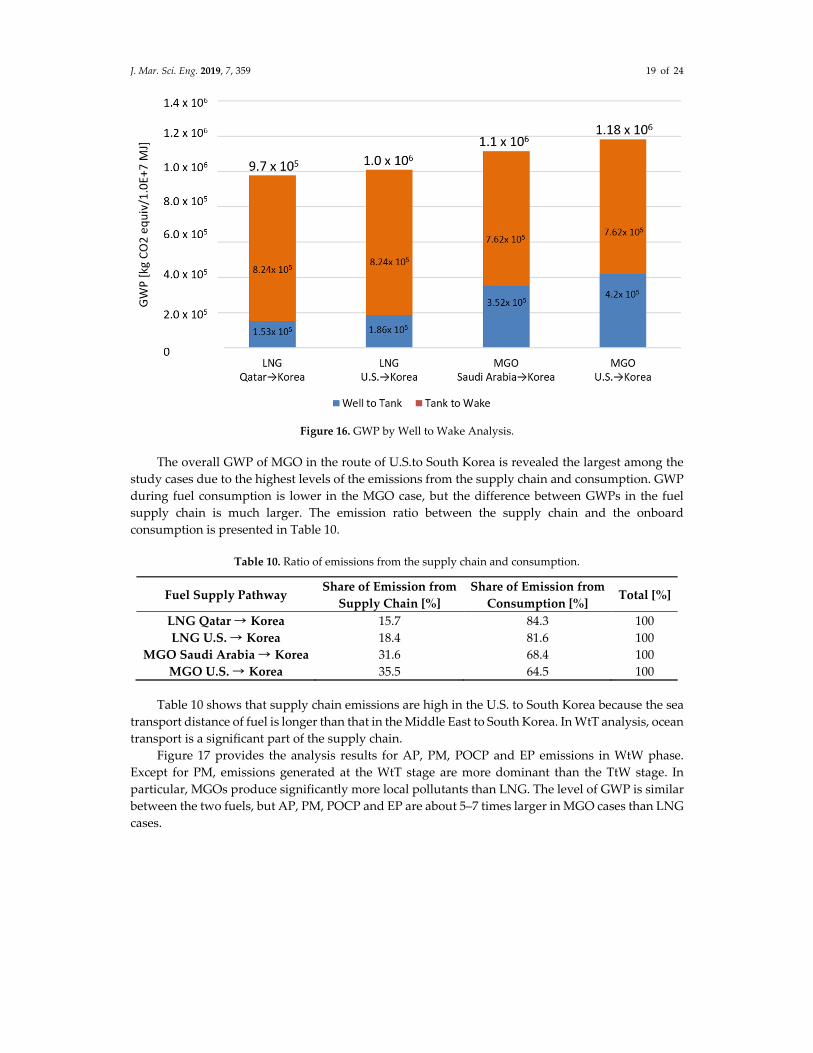
AP, PM, POCP and EP during fuel consumption are presented in Figure 15. Values of AP, PM, POCP and EP from the MGO fuel consumption are remarkably larger than LNG fuel consumption case. The sulphur content of 0.1% in MGO contributes to the increase in the AP. It is possible to determine that LNG is clean energy based on the analysis results.
Figure 15. AP, PM, POCP and EP from Fuel Consumption [log scale].
4.3. Well to Wake Impact Assessment
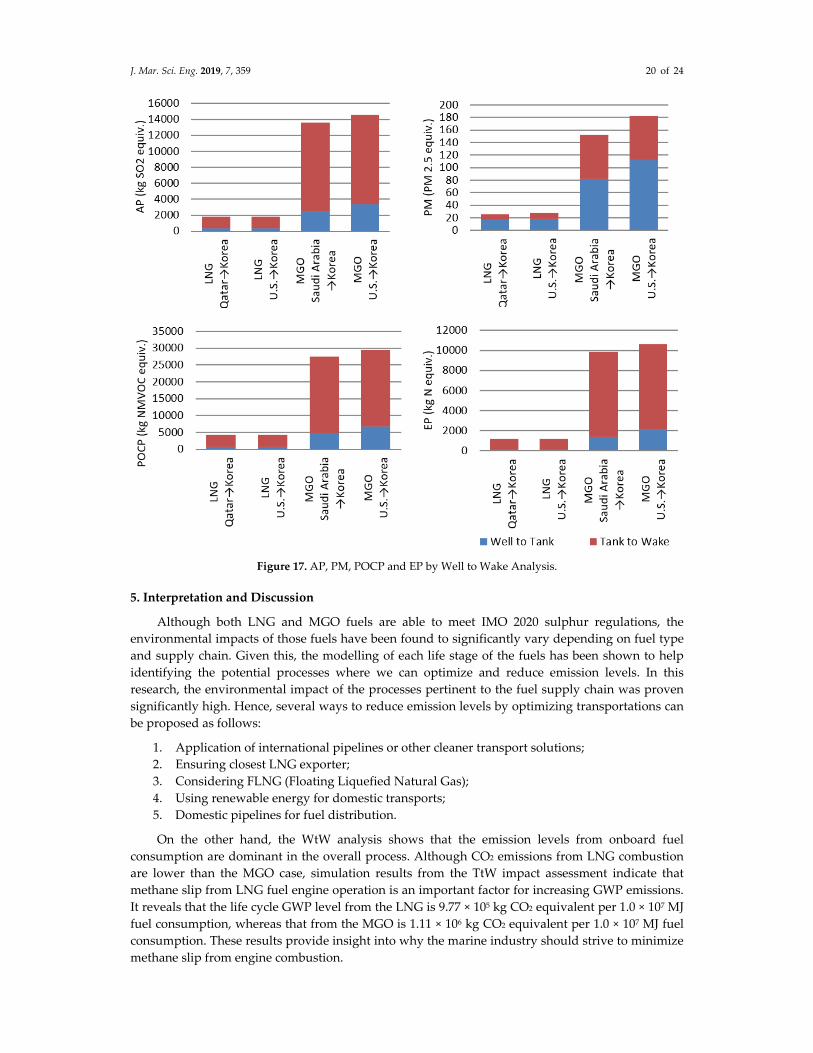
Figure 16 shows the simulation results of the GWP from the WtW phase.
J. Mar. Sci. Eng. 2019, 7, 359 19 of 24
Figure 16. GWP by Well to Wake Analysis.
The overall GWP of MGO in the route of U.S.to South Korea is revealed the largest among the study cases due to the highest levels of the emissions from the supply chain and consumption. GWP during fuel consumption is lower in the MGO case, but the difference between GWPs in the fuel supply chain is much larger. The emission ratio between the supply chain and the onboard consumption is presented in Table 10.
Table 10. Ratio of emissions from the supply chain and consumption.
Fuel Supply Pathway Share of Emission from
Supply Chain [%] Share of Emission from
Consumption [%] Total [%]
LNG Qatar → Korea 15.7 84.3 100 LNG U.S. → Korea 18.4 81.6 100
MGO Saudi Arabia → Korea 31.6 68.4 100 MGO U.S. → Korea 35.5 64.5 100
Table 10 shows that supply chain emissions are high in the U.S. to South Korea because the sea transport distance of fuel is longer than that in the Middle East to South Korea. In WtT analysis, ocean transport is a significant part of the supply chain.
Figure 17 provides the analysis results for AP, PM, POCP and EP emissions in WtW phase. Except for PM, emissions generated at the WtT stage are more dominant than the TtW stage. In particular, MGOs produce significantly more local pollutants than LNG. The level of GWP is similar between the two fuels, but AP, PM, POCP and EP are about 5–7 times larger in MGO cases than LNG cases.
J. Mar. Sci. Eng. 2019, 7, 359 20 of 24
Figure 17. AP, PM, POCP and EP by Well to Wake Analysis.
5. Interpretation and Discussion
Although both LNG and MGO fuels are able to meet IMO 2020 sulphur regulations, the environmental impacts of those fuels have been found to significantly vary depending on fuel type and supply chain. Given this, the modelling of each life stage of the fuels has been shown to help identifying the potential processes where we can optimize and reduce emission levels. In this research, the environmental impact of the processes pertinent to the fuel supply chain was proven significantly high. Hence, several ways to reduce emission levels by optimizing transportations can be proposed as follows:
1. Application of international pipelines or other cleaner transport solutions; 2. Ensuring closest LNG exporter; 3. Considering FLNG (Floating Liquefied Natural Gas); 4. Using renewable energy for domestic transports; 5. Domestic pipelines for fuel distribution.
On the other hand, the WtW analysis shows that the emission levels from onboard fuel consumption are dominant in the overall process. Although CO2 emissions from LNG combustion are lower than the MGO case, simulation results from the TtW impact assessment indicate that methane slip from LNG fuel engine operation is an important factor for increasing GWP emissions. It reveals that the life cycle GWP level from the LNG is 9.77 × 10⁵ kg CO2 equivalent per 1.0 × 10⁷ MJ fuel consumption, whereas that from the MGO is 1.11 × 10⁶ kg CO2 equivalent per 1.0 × 10⁷ MJ fuel consumption. These results provide insight into why the marine industry should strive to minimize methane slip from engine combustion.
J. Mar. Sci. Eng. 2019, 7, 359 21 of 24
In short, this research demonstrated the excellence of using LNG as a marine fuel relative to the MGO. However, it cannot neglect emphasizing on the need to resolve the methane slip issues; if successful solutions arrive in the marine industry, the use of LNG as a marine fuel can further contribute to reduction of the GHG emissions.
Results of the impact assessment for local pollutants even more clearly support the superiority of LNG over MGO since the MGO fuel cases are revealed to contribute 5–7 times higher emissions than the LNG cases. In this respect, the LNG is confidently recommended over the MGO as long as we are solely concerned with the environmental perspective.
On the other hand, the demands on addressing the shortcomings of current maritime environmental indicators, EEDI and EEOI, are increasing. Given this, the life cycle assessment can be an effective approach to estimate holistic emission levels attributed by marine fuels from the extraction to the final use. Taking into account that the marine industry is grappling with lowering emission levels more comprehensively, this research is highly believed to be an important primary study that will help to provide practical solutions to assess the all-inclusive environmental impacts of marine fuels. Such solutions will help us to obtain a clear knowledge on the holistic environmental impacts from shipping. To achieve this goal, the future research is recommended to expand the case studies to various alternative fuel types and supply chains to determine the most optimal future marine fuel as well as to obtain general observations on the level of differences and how to improve it.
6. Conclusions
The key research findings can be summarized as below.
1) Using LNG as a marine fuel was proven as an effective fuel in reducing the marine pollutant, compared to conventional marine petroleum fuels including MGO. In particular, Case 1 (LNG import from Qatar) was revealed the best option based on that all environmental impact categories were marked the lowest, compared to other cases. The emission quantities for Case 1 were presented as below:
1. GWP: 977 tonnages of CO2 equivalent per 1.0 × 10⁷ MJ of fuel consumption; 2. AP: 1.76 tonnages of SO2 equivalent per 1.0 × 10⁷ MJ of fuel consumption; 3. EP: 1.18 tonnages of N equivalent per 1.0 × 10⁷ MJ of fuel consumption; 4. POCP: 4.28 tonnages of NMVOC equivalent per 1.0 × 10⁷ MJ of fuel consumption; 5. PM: 26 kg of PM2.5 equivalent per 1.0 × 10⁷ MJ of fuel consumption.
Moreover, considering factor-based findings, Case 1, LNG from Middle East to South Korea, was determined to produce 0.88 times lesser GWP compared to Case 3, MGO from Middle East to South Korea while Case 2, LNG from U.S. to South Korea, emitted 0.86 times lesser GWP than Case 4, MGO from U.S. to South Korea.
2) Regional distances between the energy exporter and the importer and the supply chains were found to be important parameters to determine the environmental impact of marine fuels, which suggests the importance of optimal production, transport as well as usage.
3) The methane slip pertinent to LNG combustion was identified an issue to be resolved in order to adopt the LNG as a successful post-2020 marine fuel; the amount of GWP contributed by the methane slip was not negligibly small.
4) LCA was proved effective for marine industry including oil and gas as a comprehensive and robust tool to evaluate the holistic environmental impact on marine pollutions. This proposed approach is believed to contribute to addressing the shortcomings of current maritime emission calculators. Therefore, the analysis results and the proposed approach are to provide the stakeholders an insight into making proper decision-making and future regulatory framework.
J. Mar. Sci. Eng. 2019, 7, 359 22 of 24
Abbreviations
AP DWT ECA EP
FLNG GHG GWP HFO
HSFO IMO ISO LCA LCI
LHV LNG LSFO MGO MTPA NGL
NMVOC NOX PM
POCP SOX
TtW ULSFO
WtT WtW
Acidification Potential Dead Weight Tonnage Emission Control Area
Eutrophication Potential Floating Liquefied Natural Gas
Green House Gas Global Warming Potential
Heavy Fuel Oil High Sulphur Fuel Oil
International Maritime Organization International Organization for Standardization
Life Cycle Assessment Life Cycle Inventory Lower Heating Value Liquefied Natural Gas Low Sulphur Fuel Oil
Marine Gas Oil Million Tonnes per Annum
Natural Gas Liquid Non-Methane Volatile Organic Compounds
Nitrogen Oxides Particulate Matter
Photochemical Ozone Creation Potential Sulphur Oxides Tank to Wake
Ultra-Low Sulphur Fuel Oil Well to Tank Well to Wake
Author Contributions: Conceptualization, B.J. and S.H.; methodology, B.J., S.H., and M.K.; software, S.H.; formal analysis, investigation, S.H.; resources, B.J. and S.H.; writing, B.J., S.H., and M.K.; review and editing, M.K. and P.Z.; visualization, S.H.; supervision, M.K., K.J., P.Z.; funding acquisition, K.J.; project administration, B.J. and K.J.
Funding: This research is supported by Pusan National University (PNU) Korea-UK Global Program in Offshore Engineering (N0001288) funded by the Korean Ministry of Trade, Industry and Energy.
Acknowledgments: The authors would like to express their gratitude to ILSHIN shipping CO., Ltd. and Korean Register of Shipping for their invaluable support, comments and suggestions. They have contributed considerably to this study.
Conflicts of Interest: The authors declare no conflict of interest.
Reference
1. UN. Review of Marine Transport 2018; UNCTAD: Geneva, Switzerland, 2018. 2. Corkhill, M. LNG World Shipping—Healthy Freight Rates and 2018 LNG Shipping Predictions. 2018.
Available online: https://www.lngworldshipping.com/news/view,healthy-freight-rates-and-2018-lng-shipping-predictions_50323.htm (accessed on 31 August 2018).
3. Yoo, B.Y. Economic assessment of liquefied natural gas (LNG) as a marine fuel for CO2 carriers compared to marine gas oil (MGO) Energy 2017, 121, 772–780.
4. Piellisch, R. ‘Container Ship LNG? Plenty of Time’, HHP Insight. 2013. Available online: http://hhpinsight.com/marine/2013/01/container-ship-lng-plenty-of-time/ (accessed on 18 January 2016).
5. Thomson, H.; Corbett, J.J.; Winebrake, J.J. Natural gas as a marine fuel. Energy Policy 2015, 87, 153–167.
J. Mar. Sci. Eng. 2019, 7, 359 23 of 24
6. El-Gohary, M.M. The future of natural gas as a fuel in marine gas turbine for LNG carriers. Proc. Inst. Mech. Eng. Part M J. Eng. Marit. Environ. 2012, 226, 371–377.
7. IMO. Guidelines on the Method of Calculation of the Attained Energy Efficiency Design Index (EEDI) for New Ships; International Maritime Organization: London, UK, 2018.
8. IMO. ISWG-GHG 5/4/5: Consideration of Concrete Proposals on Candidate Short-Term Measures; Consideration on Development of the Lifecycle GHG/Carbon Intensity Guidelines for all Types of Fuels; International Maritime Organization: London, UK, 2019.
9. Guinée, J.B. Handbook on life cycle assessment operational guide to the ISO standards. Int. J. Life Cycle Assess. 2002, 7, 311–313.
10. Finnveden, G.; Hauschild, M.Z.; Ekvall, T.; Guinée, J.; Heijungs, R.; Hellweg, S.; Koehler, A.; Pennington, D.; Suh, S. Recent developments in Life Cycle Assessment. J. Environ. Manag. 2009, 91, 1–21.
11. Levasseur, A.; Lesage, P.; Margni, M.; DeschenesL. Samson, R. Considering Time in LCA: Dynamic LCA and Its Application to Global Warming Impact Assessments. Environ. Sci. Technol. 2010, 44, 3169–3174.
12. Woods, J.S.; Veltman, K.; Huijbregts, M.A.; Verones, F.; Hertwich, E.G. Towards a meaningful assessment of marine ecological impacts in life cycle assessment (LCA). Environ. Int. 2016, 89, 48–61.
13. Bengtsson, S.; Andersson, K.; Fridell, E. Life Cycle Assessment of Marine Fuels: A Comparative Study of Four Fossil Fuels for Marine Propulsion. Chalmers University of Technology: Gothenburg, Sweden, 2011.
14. Thinkstep. Life Cycle GHG Emission Study on the Use of LNG as Marine Fuel; 2019. Available online: www.thinkstep.com/ content/life-cycle-ghg- emission-study-use-lng-marine-fuel-1 (accessed on 23 June 2019)
15. El-Houjeiri, H.; Monfort, J.-C.; Bouchard, J.; Przesmitzki, S. Life Cycle Assessment of Greenhouse Gas Emissions from Marine Fuels: A Case Study of Saudi Crude Oil versus Natural Gas in Different Global Regions. J. Ind. Ecol. 2019, 23, 374–388.
16. Sharafian, A.; Blomerus, P.; Mérida, W. Natural gas as a ship fuel: Assessment of greenhouse gas and air pollutant reduction potential. Energy Policy 2019, 131, 332–346.
17. Liu, R.E. Life Cycle Greenhouse Gas Emissions of Western Canadian Natural Gas and a Proposed Method for Upstream Life Cycle Emissions Tracking; 2019. Available online: http://hdl.handle.net/1880/110466 (accessed on 29 Jul 2019)
18. Brynolf, S.; Fridell, E.; Andersson, K. Environmental assessment of marine fuels: Liquefied natural gas, liquefied biogas, methanol and bio-methanol. J. Clean. Prod. 2014, 74, 86–95.
19. Tan, R.B.; Wijaya, D.; Khoo, H.H. LCI (Life cycle inventory) analysis of fuels and electricity generation in Singapore. Energy 2010, 35, 4910–4916.
20. Tagliaferri, C.; Clift, R.; Lettieri, P.; Chapman, C. Liquefied natural gas for the UK: A life cycle assessment. Int. J. Life Cycle Assess. 2017, 49, 1944–1956.
21. Jeong, B. Comparative Analysis of SOx Emission-Compliant Options for Marine Vessels from Environmental Perspective. J. Korean Soc. Power Syst. Eng.2018, 22, 72–78.
22. Hua, J.; Cheng, C.-W.; Hwang, D.-S. Total life cycle emissions of post-Panamax containerships powered by conventional fuel or natural gas. J. Air Waste Manag. Assoc. 2019, 69, 131–144.
23. Jeong, B.; Jang, H.; Zhou, P.; Lee, J.U. Investigation on marine LNG propulsion systems for LNG carriers through an enhanced hybrid decision making model. J. Clean. Prod. 2019, 230, 98–115.
24. Rocco, M.V.; Langè, S.; Pigoli, L.; Colombo, E.; Pellegrini, L.A. Assessing the energy intensity of alternative chemical and cryogenic natural gas purification processes in LNG production. J. Clean. Prod. 2019, 208, 827–840.
25. Miksch, T.P. USA-Asia LNG Shipping Route Optimization. Master thesis; University Putra Malaysia (UPM), Selangor Darul Ehsan, Malaysia, February 2019.
26. Dong, D.T.; Cai, W. Life-cycle assessment of ships: The effects of fuel consumption reduction and light displacement tonnage. Proc. Inst. Mech. Eng. Part M J. Eng. Marit. Environ. 2019, doi:10.1177/1475090219858810.
27. Alkaner, S.; Zhou, P. A comparative study on life cycle analysis of molten carbon fuel cells and diesel engines for marine application. J. Power Sources 2006, 158, 188–199.
28. Smith, L.; Ibn-Mohammed, T.; Yang, F.; Reaney, I.M.; Sinclair, D.C.; Koh, S.L. Comparative environmental profile assessments of commercial and novel material structures for solid oxide fuel cells. Appl. Energy 2019, 235, 1300–1313.
J. Mar. Sci. Eng. 2019, 7, 359 24 of 24
29. Evrin, R.A.; Dincer, I. Thermodynamic analysis and assessment of an integrated hydrogen fuel cell system for ships. Int. J. Hydrogen Energy 2019, 44, 6919–6928.
30. Hansson, J.; Månsson, S.; Brynolf, S.; Grahn, M. Alternative marine fuels: Prospects based on multi-criteria decision analysis involving Swedish stakeholders. Biomass Bioenergy 2019, 126, 159–173.
31. Workman, D. Croude Oil Imports by Country. 2019. Available online: http://www.worldstopexports.com/crude-oil-imports-by-country/ (accessed on 25 June 2019).
32. EIA. China Becomes World’s Second Largest LNG Importer, Behind Japan. 2019. Available online: https://www.eia.gov/todayinenergy/detail.php?id=35072 (accessed on 25 June 2019).
33. Finkbeiner, M.; Inaba, A.; Tan, R.; Christiansen, K.; Klüppel, H.-J. The New International Standards for Life Cycle Assessment: ISO 14040 and ISO 14044. Int. J. Life Cycle Assess. 2006, 11, 80–85.
34. Lee, C. Status and Prospects of LNG Bunkering by KOGAS, Presented at the International LNG Fueled Ship & Bunkering Conference, Busan, Koran, 15 November 2018.
35. KESIS. Annual LNG Import Report. 2018. Available online: http://www.kesis.net/sub/subChart.jsp?report_id=7020200&reportType=0 (accessed on 24 July 2019).
36. Paik, K.-W. South Korea’s Energy Policy Change and the Implications for Its LNG Imports, Available online: https://doi.org/10.26889/9781784671136. (accessed on 15 June 2019)
37. U.S.EIA. Country Analysis Brief: South Korea; U.S. Energy Information Administer: Washington DC, USA, 2018.
38. Thinkstep. GaBi Database, Available online: http://www.gabi-software.com/international/databases/gabi-databases. (accessed on 15 June 2019)
39. GEOS, G. A Guide to Fuel Properties. 2014. Available online: http://www.geosgroup.com/news/article/a-guide-to-fuel-properties (accessed on 24 July 2019).
40. Vermeire, M.B. Everything You Need to Know about Marine Fuels; Chevron Global Marine Products: 2012. 41. KOGAS. Technical Reports for New LNG Carrier Construction: LNG; Korea Gas Corporation: Daegu,
Korea2013. (In Korean) 42. SEAROUTES. Available online: http://www.searoutes.com (accessed on 13 June 2019). 43. Knaggs, T. Significant Ships of 2008; RINA: London, UK: 2008. 44. Naji, A.-A. Natural Gas Reserves, Development and Production in Qatar: 1998. 45. NAVER. Available online: https://map.naver.com/ (accessed on 23 June 2019). 46. WorldMaritimeNews. World’s First LNG-Fueled World Maritime News: Schiedam, Netherlands; 47. I.M.O. Greenhouse Gas Study, Third, 2014; Executive Summary: London, UK, 2014. 48. Dreyer, L.C.; Niemann, A.L.; Hauschild, M.Z. Comparison of Three Different LCIA Methods: EDIP97,
CML2001 and Eco-indicator 99. Int. J. Life Cycle Assess. 2003, 8, 191–200. 49. Commission, E.U.-E. International Reference Life Cycle Data System (ILCD) Handbook—General Guide for Life
Cycle Assessment—Detailed Guidance; Institute for Environment and Sustainability: Ispra, Italy, 2010.
© 2019 by the authors. Licensee MDPI, Basel, Switzerland. This article is an open access article distributed under the terms and conditions of the Creative Commons Attribution (CC BY) license (http://creativecommons.org/licenses/by/4.0/).


