Embed Size (px)
Citation preview
ARTICLE
Light-mediated discovery of surfaceome nanoscaleorganization and intercellular receptor interactionnetworksMaik Müller 1,2, Fabienne Gräbnitz3, Niculò Barandun3, Yang Shen 4, Fabian Wendt 1,2,
Sebastian N. Steiner 1,2, Yannik Severin 5, Stefan U. Vetterli 6, Milon Mondal 6, James R. Prudent 7,
Raphael Hofmann 8, Marc van Oostrum 1,2, Roman C. Sarott 8, Alexey I. Nesvizhskii 9,10,
Erick M. Carreira 8, Jeffrey W. Bode 8, Berend Snijder 5,2, John A. Robinson 6, Martin J. Loessner 4,
Annette Oxenius 3 & Bernd Wollscheid 1,2✉
The molecular nanoscale organization of the surfaceome is a fundamental regulator of cel-
lular signaling in health and disease. Technologies for mapping the spatial relationships of cell
surface receptors and their extracellular signaling synapses would unlock theranostic
opportunities to target protein communities and the possibility to engineer extracellular
signaling. Here, we develop an optoproteomic technology termed LUX-MS that enables the
targeted elucidation of acute protein interactions on and in between living cells using light-
controlled singlet oxygen generators (SOG). By using SOG-coupled antibodies, small mole-
cule drugs, biologics and intact viral particles, we demonstrate the ability of LUX-MS to
decode ligand receptor interactions across organisms and to discover surfaceome receptor
nanoscale organization with direct implications for drug action. Furthermore, by coupling
SOG to antigens we achieved light-controlled molecular mapping of intercellular signaling
within functional immune synapses between antigen-presenting cells and CD8+ T cells
providing insights into T cell activation with spatiotemporal specificity. LUX-MS based
decoding of surfaceome signaling architectures thereby provides a molecular framework for
the rational development of theranostic strategies.
https://doi.org/10.1038/s41467-021-27280-x OPEN
1 Department of Health Sciences and Technology (D-HEST), ETH Zurich, Institute of Translational Medicine (ITM), Zurich, Switzerland. 2 Swiss Institute ofBioinformatics (SIB), Lausanne, Switzerland. 3 Department of Biology, ETH Zurich, Institute of Microbiology, Zurich, Switzerland. 4 Institute of Food Nutritionand Health, Department of Health Sciences and Technology, ETH Zurich, Zurich, Switzerland. 5 Institute of Molecular Systems Biology, Department ofBiology, ETH Zurich, Zurich, Switzerland. 6 Chemistry Department, University of Zurich, Zurich, Switzerland. 7 Centrose LLC, Madison, WI, USA. 8 Laboratoryof Organic Chemistry, Department of Chemistry and Applied Biosciences, ETH Zurich, Zurich, Switzerland. 9 Department of Pathology, University ofMichigan, Ann Arbor, MI, USA. 10 Department of Computational Medicine and Bioinformatics, University of Michigan, Ann Arbor, MI, USA.✉email: [email protected]
NATURE COMMUNICATIONS | (2021) 12:7036 | https://doi.org/10.1038/s41467-021-27280-x | www.nature.com/naturecommunications 1
1234
5678
90():,;
Cellular function is regulated by information exchange withthe outside world. The cell surface proteotype (surfa-ceome) thereby acts as the signaling gateway to the cell by
connecting external molecular cues with intracellular responsepathways within dynamic surfaceome signaling domains1,2.The spatiotemporal organization of these structures ranging insize from ~100 nm (B-cell receptor (BCR) clusters) to severalmicrons (immune synapses) essentially determines cellular phe-notypes by regulating receptor signaling3,4, drug response5, host-pathogen interactions6, and intercellular communication7. Thetremendous therapeutic potential encoded in the surfaceomelandscape catalyzes the emergence of innovative approaches thatexploit receptor proximities for selective degradation of disease-causing receptors8,9 and for the targeting of cells with unmatchedprecision using multi-specific small molecules10, antibodies11,extracellular-drug conjugates (EDC)12 and colocalization-dependent protein switches13. The ability to decipher cell-type-specific surfaceome nanoscale organizations and ligand-targetedreceptor microenvironments is, therefore, a prerequisite for theunderstanding of fundamental cellular signaling processes and forthe rational design of next-generation precision medicines.
Still today, the surfaceome landscape remains terra incognitathat cannot be inferred from bulk proteomic and transcriptomicmeasurements. Dedicated strategies have therefore been estab-lished to profile cellular surfaceomes. For example, the extensiveapplication of the Cell Surface Capture (CSC) technology14,15
established N-glycosylated surfaceomes for numerous cell types(collectively reported in the Cell Surface Protein Atlas, CSPAhttps://wlab.ethz.ch/cspa/)16 and enabled the in silico character-ization of the entire human surfaceome17. While, fluorescence-based reporter assays18–20 and platforms of genetically engineeredreceptors21–23 established associations between receptors by high-throughput testing of binary interactions within and across sur-faceomes, the Ligand-Receptor Capture (LRC) technologyenabled the identification of direct ligand interactions ofN-glycosylated receptors24,25. Most recently, localized proximitylabeling by antibody-tethered enzymes (APEX26, horseradishperoxidase (HRP), PUP-iT27) or photocatalysts (μMap)28 weresuccessfully combined with mass spectrometry for the char-acterization of selected surfaceome landscapes including lipidrafts29, BCR neighborhoods30 and intact neuronal synapses31 inliving cells and in fixed tissues32. Although such antibody-basedmethods are useful in deciphering surface microenvironments oftargeted receptors, highly versatile technologies are required toalso uncover dynamic surfaceome domains that underlie thesignaling function of small molecules, biomolecules, viral parti-cles, and complex intercellular receptor interaction networks asformed within immunosynapses of interacting immune cellsduring T-cell activation.
Singlet oxygen generators (SOG) are well known for photo-catalytic generation of short-lived singlet oxygen (SO) that pro-miscuously oxidize biomolecules including proteins in nanometervicinity33,34. The lifetime and traveling distance of photosensitizedSO species thereby depend on environmental conditions and aredrastically enhanced in heavy water (D2O) based solutions35–37.Small-molecule SOG38 and genetically encodable versions thereof areextensively used throughout life sciences for chromophore-assistedlight inactivation of proteins39–42 and cells43,44, correlative light-electron microscopy45, and the detection of intracellular as well asextracellular protein interactions46–48. Owing to the light-controlledactivity, the tunable oxidation range, and the molecular size that ispotentially compatible with any type of ligand, we recognized smallmolecular SOG as ideal probes for the in situ labeling of ligand-targeted surfaceome signaling domains of virtually any description.
Here, we developed a SOG-based and light-controlled proximitylabeling technology termed LUX-MS enabling the cell type-specific
elucidation of surfaceome nanoscale organization and ligand-targeted signaling domains on the surface of living cells of essen-tially any organism. The approach capitalizes on ligand-coupledsmall-molecule SOG for the specific and light-tunable biotinylationof ligand-proximal proteins enabling their identification usinga high-throughput robot-assisted proteotyping workflow. Wedemonstrate the spatial specificity and broad applicability of ourapproach to reveal receptor microenvironments and surfaceomesignaling domains of small molecules, biomolecules, and intactviruses in eukaryotic and prokaryotic systems in a discovery-drivenfashion and without the need for genetic manipulation. At last, wehighlight the utility of LUX-MS to elucidate intercellular surfaceomesignaling domains of the highest complexity by mapping the archi-tecture of functional immunosynapses in molecular detail.
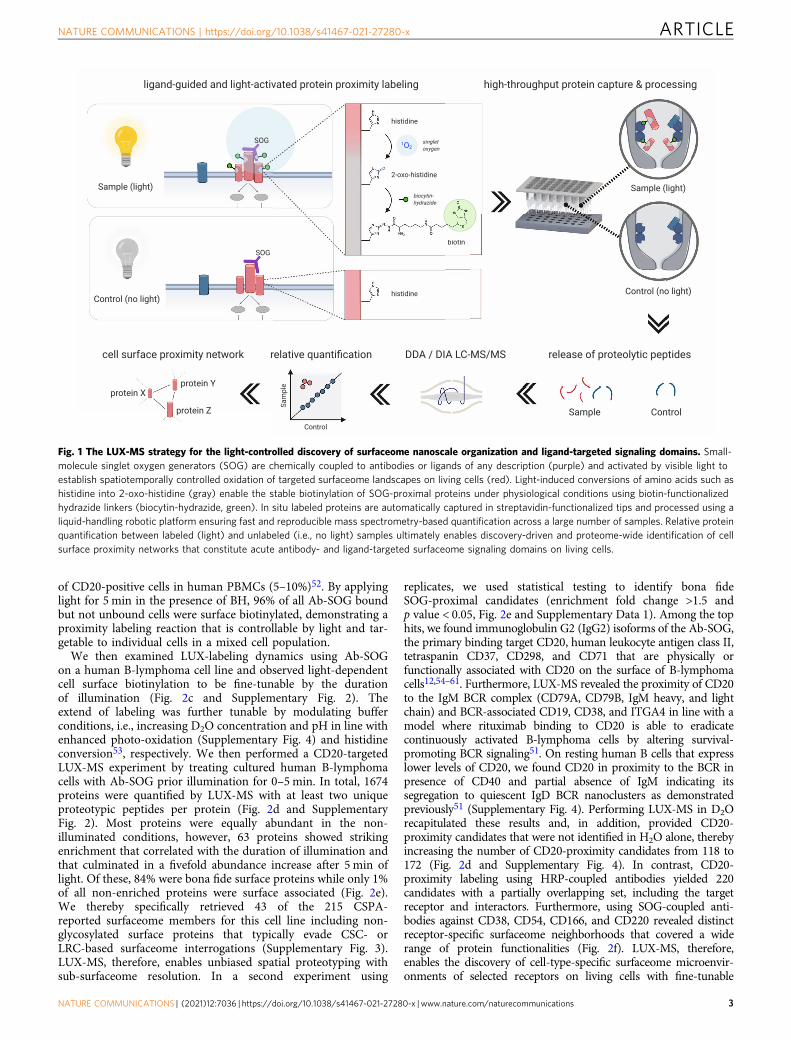
ResultsDevelopment of the LUX-MS technology. We first tested thecapability of the small-molecule SOG thiorhodamine to photo-oxidize transferrin proteins in vitro. High-resolution liquidchromatography-tandem mass spectrometry (LC-MS/MS) ana-lysis combined with open modification peptide searching revealedthe light-dependent conversion of the amino acids histidine (His),cysteine (Cys), tryptophan (Trp), tyrosine (Tyr), and methionine(Met) into previously described photo-oxidation products33 atvarying D2O concentrations (Supplementary Fig. 1). Next tooxidized Trp and Tyr, the two most prevalently formed mod-ifications His+14 and His+32, previously characterized as 2-oxo-histidine (2-imidazolone) and its hydrated form33,49, respectively,bear light-induced ketone groups that potentially offer functio-nalization via hydrazone formation using hydrazide-containinglinkers. Indeed, photo-oxidation of transferrin in the presence ofa biotin-hydrazide (BH) linker led to significant consumption ofboth His+14 and His+32 (Supplementary Fig. 1) indicatingbiotinylation of photo-oxidized proteins via light-activated histi-dines. We then tailored a liquid-handling robot-assisted proces-sing workflow to automatically capture and proteolytically digestbiotinylated proteins within streptavidin-functionalized tips forLC-MS/MS-based analysis eventually enabling the discovery-driven identification and label-free quantification of labeledproteins with excellent reproducibility and at high samplethroughput (96-well format)14. Based on this optoproteomicworkflow, we designed the LUX-MS technology (Fig. 1) whereSOGs are chemically coupled to any ligand of interest and guidedto selected surfaceome signaling domains on living cells to enabletheir light-induced labeling under physiological conditions. Pro-teins of the in situ labeled microenvironment are then identifiedin a hypothesis-free fashion by light-dependent enrichmentagainst a non-labeled control.
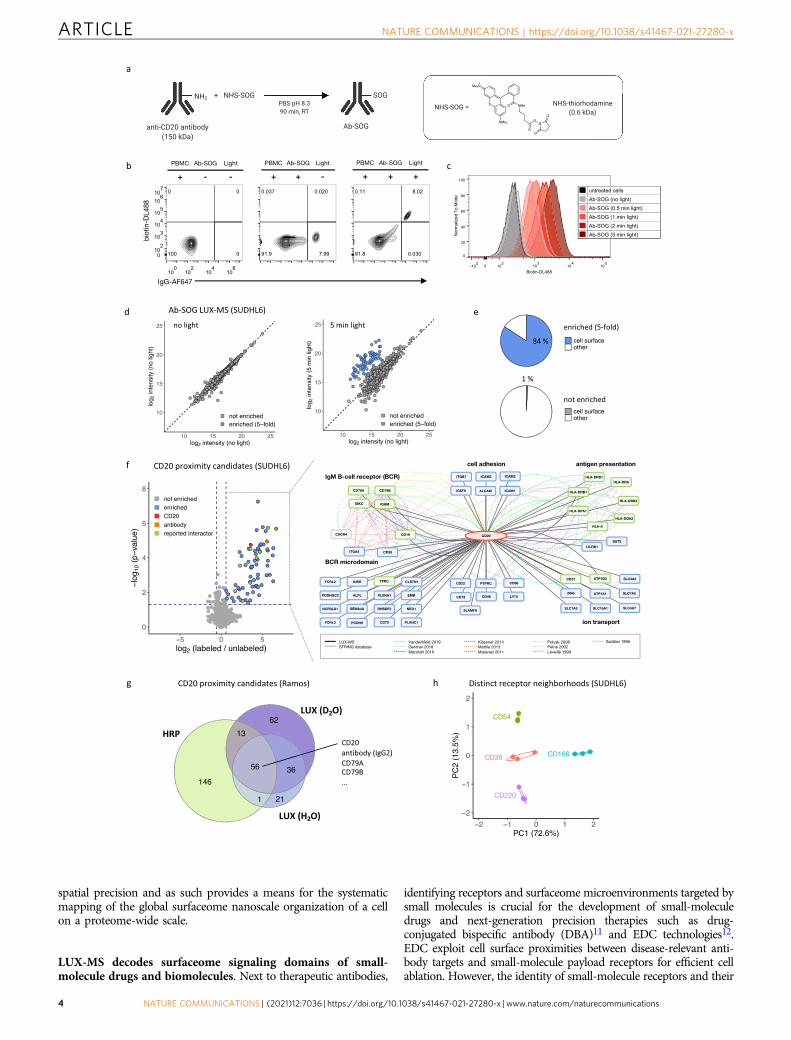
LUX-MS enables proteome-wide mapping of antibody bindingtargets and the surfaceome nanoscale organization. Surfaceomeinteractions determine antibody specificity and signaling capacityand their elucidation is critical for the development of therapeuticantibodies such as Rituximab, a highly successful therapeuticantibody for the treatment of B-cell malignancies50. Decades ofresearch were required to eventually reveal the surface micro-environment of its primary receptor CD20 and its role in BCR-dependent cell killing51. To demonstrate the utility of LUX-MS toprovide insights into therapeutic antibody action, we coupledanti-CD20 antibodies to the small-molecule SOG thiorhodaminewith an average degree-of-labeling (DOL) of 1.5 SOG moleculesper antibody (Fig. 2a and Supplementary Fig. 2). Incubating Ab-SOG constructs with freshly isolated human peripheral bloodmononuclear cells (PBMCs) resulted in antibody binding to 8%of all detected cells (Fig. 2b) corresponding to the typical fraction
ARTICLE NATURE COMMUNICATIONS | https://doi.org/10.1038/s41467-021-27280-x
2 NATURE COMMUNICATIONS | (2021) 12:7036 | https://doi.org/10.1038/s41467-021-27280-x | www.nature.com/naturecommunications
of CD20-positive cells in human PBMCs (5–10%)52. By applyinglight for 5 min in the presence of BH, 96% of all Ab-SOG boundbut not unbound cells were surface biotinylated, demonstrating aproximity labeling reaction that is controllable by light and tar-getable to individual cells in a mixed cell population.
We then examined LUX-labeling dynamics using Ab-SOGon a human B-lymphoma cell line and observed light-dependentcell surface biotinylation to be fine-tunable by the durationof illumination (Fig. 2c and Supplementary Fig. 2). Theextend of labeling was further tunable by modulating bufferconditions, i.e., increasing D2O concentration and pH in line withenhanced photo-oxidation (Supplementary Fig. 4) and histidineconversion53, respectively. We then performed a CD20-targetedLUX-MS experiment by treating cultured human B-lymphomacells with Ab-SOG prior illumination for 0–5 min. In total, 1674proteins were quantified by LUX-MS with at least two uniqueproteotypic peptides per protein (Fig. 2d and SupplementaryFig. 2). Most proteins were equally abundant in the non-illuminated conditions, however, 63 proteins showed strikingenrichment that correlated with the duration of illumination andthat culminated in a fivefold abundance increase after 5 min oflight. Of these, 84% were bona fide surface proteins while only 1%of all non-enriched proteins were surface associated (Fig. 2e).We thereby specifically retrieved 43 of the 215 CSPA-reported surfaceome members for this cell line including non-glycosylated surface proteins that typically evade CSC- orLRC-based surfaceome interrogations (Supplementary Fig. 3).LUX-MS, therefore, enables unbiased spatial proteotyping withsub-surfaceome resolution. In a second experiment using
replicates, we used statistical testing to identify bona fideSOG-proximal candidates (enrichment fold change >1.5 andp value < 0.05, Fig. 2e and Supplementary Data 1). Among the tophits, we found immunoglobulin G2 (IgG2) isoforms of the Ab-SOG,the primary binding target CD20, human leukocyte antigen class II,tetraspanin CD37, CD298, and CD71 that are physically orfunctionally associated with CD20 on the surface of B-lymphomacells12,54–61. Furthermore, LUX-MS revealed the proximity of CD20to the IgM BCR complex (CD79A, CD79B, IgM heavy, and lightchain) and BCR-associated CD19, CD38, and ITGA4 in line with amodel where rituximab binding to CD20 is able to eradicatecontinuously activated B-lymphoma cells by altering survival-promoting BCR signaling51. On resting human B cells that expresslower levels of CD20, we found CD20 in proximity to the BCR inpresence of CD40 and partial absence of IgM indicating itssegregation to quiescent IgD BCR nanoclusters as demonstratedpreviously51 (Supplementary Fig. 4). Performing LUX-MS in D2Orecapitulated these results and, in addition, provided CD20-proximity candidates that were not identified in H2O alone, therebyincreasing the number of CD20-proximity candidates from 118 to172 (Fig. 2d and Supplementary Fig. 4). In contrast, CD20-proximity labeling using HRP-coupled antibodies yielded 220candidates with a partially overlapping set, including the targetreceptor and interactors. Furthermore, using SOG-coupled anti-bodies against CD38, CD54, CD166, and CD220 revealed distinctreceptor-specific surfaceome neighborhoods that covered a widerange of protein functionalities (Fig. 2f). LUX-MS, therefore,enables the discovery of cell-type-specific surfaceome microenvir-onments of selected receptors on living cells with fine-tunable
Fig. 1 The LUX-MS strategy for the light-controlled discovery of surfaceome nanoscale organization and ligand-targeted signaling domains. Small-molecule singlet oxygen generators (SOG) are chemically coupled to antibodies or ligands of any description (purple) and activated by visible light toestablish spatiotemporally controlled oxidation of targeted surfaceome landscapes on living cells (red). Light-induced conversions of amino acids such ashistidine into 2-oxo-histidine (gray) enable the stable biotinylation of SOG-proximal proteins under physiological conditions using biotin-functionalizedhydrazide linkers (biocytin-hydrazide, green). In situ labeled proteins are automatically captured in streptavidin-functionalized tips and processed using aliquid-handling robotic platform ensuring fast and reproducible mass spectrometry-based quantification across a large number of samples. Relative proteinquantification between labeled (light) and unlabeled (i.e., no light) samples ultimately enables discovery-driven and proteome-wide identification of cellsurface proximity networks that constitute acute antibody- and ligand-targeted surfaceome signaling domains on living cells.
NATURE COMMUNICATIONS | https://doi.org/10.1038/s41467-021-27280-x ARTICLE
NATURE COMMUNICATIONS | (2021) 12:7036 | https://doi.org/10.1038/s41467-021-27280-x | www.nature.com/naturecommunications 3
spatial precision and as such provides a means for the systematicmapping of the global surfaceome nanoscale organization of a cellon a proteome-wide scale.
LUX-MS decodes surfaceome signaling domains of small-molecule drugs and biomolecules. Next to therapeutic antibodies,
identifying receptors and surfaceome microenvironments targeted bysmall molecules is crucial for the development of small-moleculedrugs and next-generation precision therapies such as drug-conjugated bispecific antibody (DBA)11 and EDC technologies12.EDC exploit cell surface proximities between disease-relevant anti-body targets and small-molecule payload receptors for efficient cellablation. However, the identity of small-molecule receptors and their
ARTICLE NATURE COMMUNICATIONS | https://doi.org/10.1038/s41467-021-27280-x
4 NATURE COMMUNICATIONS | (2021) 12:7036 | https://doi.org/10.1038/s41467-021-27280-x | www.nature.com/naturecommunications
organization within the surfaceome of live cells often remainsunknown as enzyme-based proximity detection strategies are notattuned to using small-molecule ligands. To test whether LUX-MScan reveal small-molecule-targeted surfaceome domains, the SOGthiorhodamine was covalently conjugated to CG1, a cytotoxic drugthat selectively inhibits the active ion pumping subunit (ATP1A1) ofthe ubiquitously expressed human Na+/K+-ATPase complex (NKA)(Fig. 3a)12. A single-cell chemosensitivity screen using culturedhuman promyelocytic leukemia (HL60) cells showed potent cellablation by both CG1 (IC50= 3.5 nM) and CG1-SOG (IC50= 93nM) after 48 h, whereas the coupling of CG1 to HRP with an averageDOL of 2.5 CG1 molecules per enzyme essentially abolished its drugactivity (Fig. 3b and Supplementary Fig. 6). Flow cytometric analy-sis of HL60 cells LUX-labeled with increasing CG1-SOG con-centrations showed light-induced and concentration-dependentcell-surface biotinylation (Supplementary Fig. 6). In a subsequentLUX-MS experiment, 48 CG1 proximity candidates were identifiedon the surface of HL60 cells (Fig. 3c and Supplementary Data 2)including the beta3 subunit of the NKA (ATP1B3), indicating thatLUX-MS enables the discovery-driven identification of small-molecule receptors. Furthermore, we found the cell-surface recep-tor Basigin (CD147), which is a functional target of CG1-loadedEDCs on the cell type used for this experiment12. Therefore, thedata suggest that small-molecule-targeted receptors and associatedsurfaceome signaling domains can be revealed by LUX-MS even-tually enabling systematic target discovery for DBA or EDCdevelopment.
We next asked whether LUX-MS can be applied to uncoversurfaceome interactions of more complex ligands, i.e., secretedbiomolecules that are key elements of intercellular communica-tion. We, therefore, coupled thiorhodamine SOG to the peptidehormone insulin and the plasma glycoprotein transferrin thatregulate cellular homeostasis through interactions with insulinreceptor or insulin-like growth factor 1 receptor (IGF1R) homo-or heterodimers, and the transferrin receptor (TFRC), respec-tively (Fig. 3d). LUX-MS was performed on human B-lymphomacells that were treated with either conjugate and illuminated for5 min. Results demonstrated specific enrichment of insulin ortransferrin in conjunction with their cognate receptors INSR andIGF1R or TFRC, respectively (Fig. 3e and Supplementary Data 3).Transferrin-guided LUX-MS further revealed CD22, a B-cellspecific lectin shown to weakly bind to sialylated N-glycoproteinsincluding transferrin62, and the cation-independent mannose-6-phosphate receptor M6PR, a sorting enzyme involved in theclathrin-mediated endocytosis and recycling of transferrin-boundreceptors that was shown to co-localize with TFRC prior tointernalization into sorting endosomes63. Thus, in addition tosmall molecules, LUX-MS can also be used to unravel surfaceomesignaling domains of biomolecules providing molecular insightsinto long-range intercellular communication.
Elucidation of surfaceome signaling interactions acrossdomains of life. Protein proximity labeling and detection byLUX-MS primarily rely on light-induced modifications of histi-dine, whose cellular biosynthesis is evolutionary well conserved64.Thus, LUX-MS may uncover ligand-targeted surfaceome signal-ing domains in non-eukaryotic systems such as bacteria whereLRC-like approaches are not applicable, aiding in the furtherdevelopment of anti-infective agents such as Thanatin to fight thegrowing threat of drug-resistant bacteria. Thanatin is a naturallyoccurring peptide that was recently shown to inhibit the outermembrane biogenesis complex Lpt in Escherichia coli (E. coli) bybinding to LptA65. To demonstrate the utility of LUX-MS toidentify such important surfaceome interactions in bacteria, wecoupled Thanatin to the SOG methylene blue (Fig. 4a) and addedit to E. coli cells with or without competition by an excess ofunconjugated Thanatin. All cells were subsequently illuminatedfor 5 min with red light at 656 nm and subjected to LUX-MS foridentification of proximity labeled proteins. Numerous outermembrane and periplasmic proteins were significantly enriched(Fig. 4b and Supplementary Data 4), indicating membrane-localized labeling by SOG-coupled Thanatin. LUX-MS therebyrevealed the functional binding partners of Thanatin LptA andLptD as top enriched hits and suggested proximity to outermembrane proteins including BamA and BamC (Fig. 4b). Indeed,the Bam complex was shown to catalyze the folding and insertionof outer membrane proteins including LptD forming supramo-lecular surfaceome clusters on living bacteria66. LUX-MS there-fore enables deconvolution of ligand-targeted receptors andassociated surfaceome microenvironments across domains of life.
Unraveling the surfaceome interaction network of intact viralparticles using LUX-MS. In addition to drug-resistant bacteria,pathogenic viruses pose a growing threat to global human health.Extracellular host-pathogen interactions are thereby key for cel-lular tropism and infection and, as such, are primary researchtargets for the classification and diagnosis of infectious diseasesand vaccine discovery. To demonstrate the utility of LUX-MS toreveal viral surfaceome interactions, we coupled thiorhodamineSOG to bacteriophages that recognize the ubiquitous cell wallcomponent teichoic acid of Gram-positive Listeria monocytogenes(Lm), a highly infectious food-borne bacteria that causeslisteriosis67 (Fig. 5a). Lm was incubated with SOG-coupled pha-ges at a multiplicity of infection (MOI) of 1 or 10 and LUX-labeled by illumination for 0–15 min. Flow cytometry analysisrevealed the light-dependent cell-surface biotinylation of indivi-dual bacteria that reached saturation after 15 min of illuminationat an MOI of 10 (Fig. 5b). Subsequent LUX-MS analysis revealedlight-induced, significant enrichment of 146 proteins including 19phage and 127 Lm proteins (Fig. 5c and Supplementary Data 5).We found components of bacteriophage capsid (Cps, Gp5, Gp9),
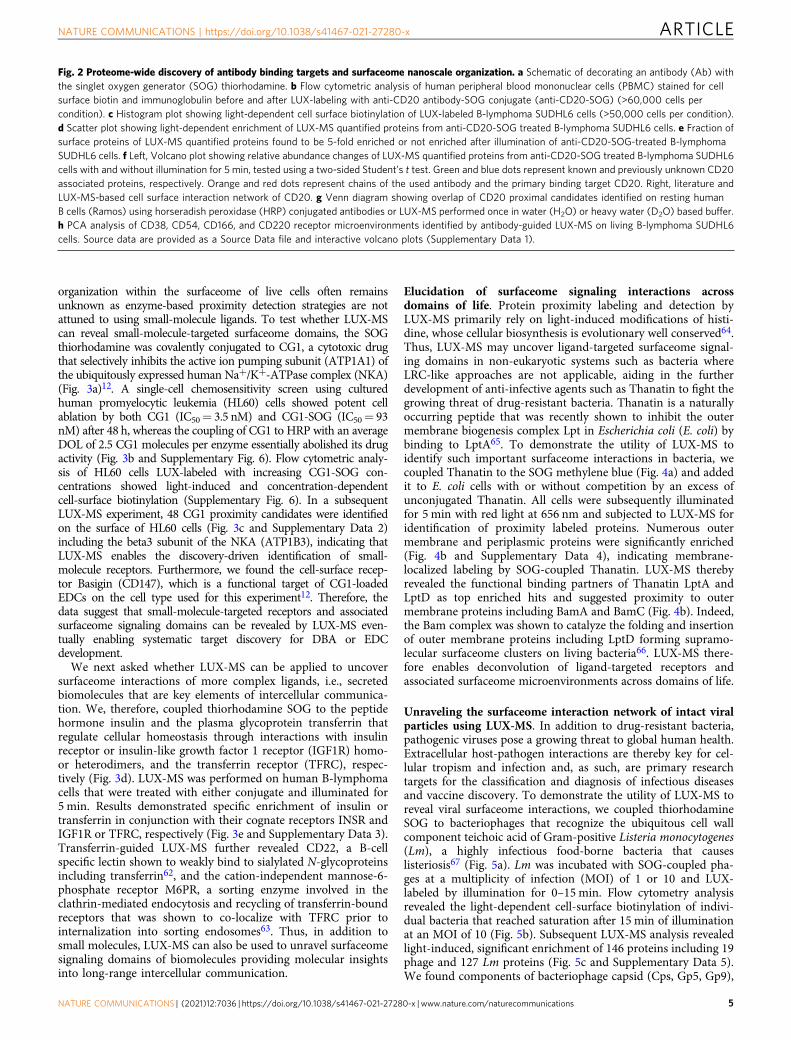
Fig. 2 Proteome-wide discovery of antibody binding targets and surfaceome nanoscale organization. a Schematic of decorating an antibody (Ab) withthe singlet oxygen generator (SOG) thiorhodamine. b Flow cytometric analysis of human peripheral blood mononuclear cells (PBMC) stained for cellsurface biotin and immunoglobulin before and after LUX-labeling with anti-CD20 antibody-SOG conjugate (anti-CD20-SOG) (>60,000 cells percondition). c Histogram plot showing light-dependent cell surface biotinylation of LUX-labeled B-lymphoma SUDHL6 cells (>50,000 cells per condition).d Scatter plot showing light-dependent enrichment of LUX-MS quantified proteins from anti-CD20-SOG treated B-lymphoma SUDHL6 cells. e Fraction ofsurface proteins of LUX-MS quantified proteins found to be 5-fold enriched or not enriched after illumination of anti-CD20-SOG-treated B-lymphomaSUDHL6 cells. f Left, Volcano plot showing relative abundance changes of LUX-MS quantified proteins from anti-CD20-SOG treated B-lymphoma SUDHL6cells with and without illumination for 5 min, tested using a two-sided Student’s t test. Green and blue dots represent known and previously unknown CD20associated proteins, respectively. Orange and red dots represent chains of the used antibody and the primary binding target CD20. Right, literature andLUX-MS-based cell surface interaction network of CD20. g Venn diagram showing overlap of CD20 proximal candidates identified on resting humanB cells (Ramos) using horseradish peroxidase (HRP) conjugated antibodies or LUX-MS performed once in water (H2O) or heavy water (D2O) based buffer.h PCA analysis of CD38, CD54, CD166, and CD220 receptor microenvironments identified by antibody-guided LUX-MS on living B-lymphoma SUDHL6cells. Source data are provided as a Source Data file and interactive volcano plots (Supplementary Data 1).
NATURE COMMUNICATIONS | https://doi.org/10.1038/s41467-021-27280-x ARTICLE
NATURE COMMUNICATIONS | (2021) 12:7036 | https://doi.org/10.1038/s41467-021-27280-x | www.nature.com/naturecommunications 5
sheath (Gp3), baseplate (Gp20), and tail (Gp17, Gp18, Gp19,Gp23, Tmp, Tsh) and enzymes involved in DNA binding (Gp37),replication (Gp45), recombination (Gp44), transcription (Gp7),and immunoprotective functions (Gp32) indicating thoroughLUX-labeling of host cell-attached bacteriophages. For Lm pro-teins, gene ontology analysis revealed 81 extracellular and only 8
intracellular proteins (Fig. 5d) including major virulence factorssuch as cell wall-associated internalins A and B that mediate hostcell invasion, membrane-localized ActA that governs cell-to-cellspreading, and ATP-binding cassette (ABC) transporters thatmediate multi-drug resistance68 (Fig. 5e). Using HA-tagging andimmunofluorescence microscopy, we further validated the Lm
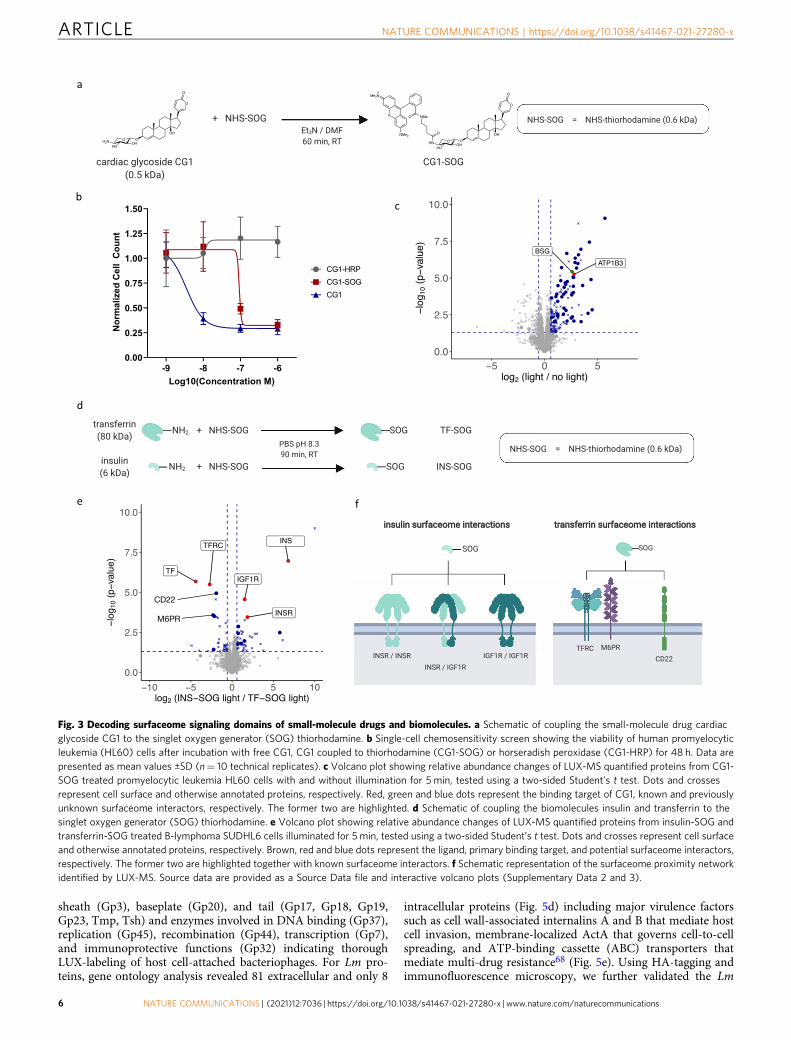
Fig. 3 Decoding surfaceome signaling domains of small-molecule drugs and biomolecules. a Schematic of coupling the small-molecule drug cardiacglycoside CG1 to the singlet oxygen generator (SOG) thiorhodamine. b Single-cell chemosensitivity screen showing the viability of human promyelocyticleukemia (HL60) cells after incubation with free CG1, CG1 coupled to thiorhodamine (CG1-SOG) or horseradish peroxidase (CG1-HRP) for 48 h. Data arepresented as mean values ±SD (n= 10 technical replicates). c Volcano plot showing relative abundance changes of LUX-MS quantified proteins from CG1-SOG treated promyelocytic leukemia HL60 cells with and without illumination for 5 min, tested using a two-sided Student’s t test. Dots and crossesrepresent cell surface and otherwise annotated proteins, respectively. Red, green and blue dots represent the binding target of CG1, known and previouslyunknown surfaceome interactors, respectively. The former two are highlighted. d Schematic of coupling the biomolecules insulin and transferrin to thesinglet oxygen generator (SOG) thiorhodamine. e Volcano plot showing relative abundance changes of LUX-MS quantified proteins from insulin-SOG andtransferrin-SOG treated B-lymphoma SUDHL6 cells illuminated for 5 min, tested using a two-sided Student’s t test. Dots and crosses represent cell surfaceand otherwise annotated proteins, respectively. Brown, red and blue dots represent the ligand, primary binding target, and potential surfaceome interactors,respectively. The former two are highlighted together with known surfaceome interactors. f Schematic representation of the surfaceome proximity networkidentified by LUX-MS. Source data are provided as a Source Data file and interactive volcano plots (Supplementary Data 2 and 3).
ARTICLE NATURE COMMUNICATIONS | https://doi.org/10.1038/s41467-021-27280-x
6 NATURE COMMUNICATIONS | (2021) 12:7036 | https://doi.org/10.1038/s41467-021-27280-x | www.nature.com/naturecommunications
surface expression of a putative cell wall-anchored protein and anABC transporter that were strongly enriched by LUX-MS(Fig. 5f). Altogether, our results demonstrate the capability ofLUX-MS to unravel host surfaceome interactions of intact virusesand its use to map the cell surface of pathogenic bacteria even-tually facilitating the design of anti-infective strategies.
Elucidating intercellular surfaceome signaling domains infunctional immunosynapses. Contact-dependent intercellularcommunication is an important regulator of immune systemfunction and relies on highly complex intercellular surfaceomesignaling architectures - in the case of T lymphocyte activation byantigen-presenting cells (APCs)—the immunological synapse7.The contextual interplay of immunosynaptic receptor interactionsbetween APCs and CD8+ T cells leads to T-cell activation, pro-liferation, and differentiation enabling these cells to exert effectorfunctions against infected, tumorigenic, or foreign cells69. Thus,the ability to resolve functional immunosynapses at the molecularlevel with spatiotemporal specificity would enable discoveries inthe field of immunology and immuno-oncology. We thus coupledthiorhodamine SOG to the lymphocytic choriomeningitis virus(LCMV)-derived peptide gp33-41 (gp33, sequence: KAVYN-FATM) (Fig. 6a), an immunodominant epitope of the LCMVglycoprotein (GP) that is presented by MHC class I H-2Db andH-2Kb70 and that is recognized by T-cell receptor (TCR) trans-genic CD8+ T cells of P14 mice71. In a two-cell system, we
showed that SOG-coupled gp33 is still presented by mousedendritic cells (DCs) and is able to activate freshly isolated P14CD8+ T cells with comparable efficacy than its unconjugatedcounterpart (Supplementary Fig. 7). Applying light led to cellsurface biotinylation of both cell types, validating the photo-catalytic function of SOG-coupled gp33 and our ability to effi-ciently perform trans-cellular surfaceome labeling duringimmunosynaptic cell-to-cell contacts (Supplementary Fig. 8). Wethen implemented stable isotope labeling by amino acids in cellculture (SILAC) for isotopic barcoding of interacting DCs andT cells (TC) and performed LUX-MS in data-independentacquisition (DIA) mode after 30 min of co-culture to analyzemature immunological synapses (Fig. 6b). Overall, we identified4811 protein groups that could clearly be assigned to TC (e.g.,TCR, CD3, and CD8), DC (e.g., MHC class I H-2Db and H-2Kb),or both based on observed SILAC-ratios (Fig. 6c). We observedlight-dependent enrichment of numerous cell surface proteinsincluding components of the primary signaling axis such as MHCclass I on DC and the gp33-specific TCR as well as CD8 on TC(Fig. 6d-e, Supplementary Data 6 and 7). Furthermore, we foundco-stimulatory signaling components essential for early T-cellpriming such as CD86 of the CD86-CD28 axis and the entireCD2-CD48 axis with reported cellular directionality7. Our resultsfurther indicate immunosynaptic localization of CD5 and CD6 onTC. Indeed CD5 was shown to interact with TCR, CD8, and CD2in the immune synapse to fine-tune TCR-mediated signaling72,
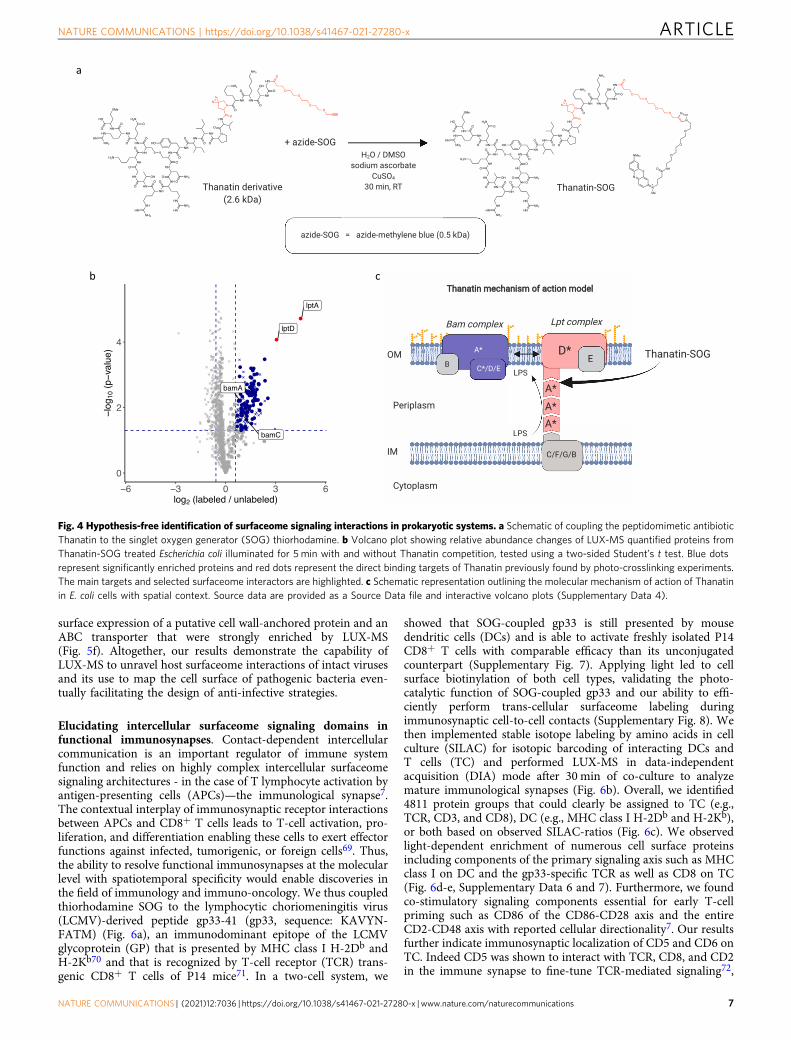
Fig. 4 Hypothesis-free identification of surfaceome signaling interactions in prokaryotic systems. a Schematic of coupling the peptidomimetic antibioticThanatin to the singlet oxygen generator (SOG) thiorhodamine. b Volcano plot showing relative abundance changes of LUX-MS quantified proteins fromThanatin-SOG treated Escherichia coli illuminated for 5 min with and without Thanatin competition, tested using a two-sided Student’s t test. Blue dotsrepresent significantly enriched proteins and red dots represent the direct binding targets of Thanatin previously found by photo-crosslinking experiments.The main targets and selected surfaceome interactors are highlighted. c Schematic representation outlining the molecular mechanism of action of Thanatinin E. coli cells with spatial context. Source data are provided as a Source Data file and interactive volcano plots (Supplementary Data 4).
NATURE COMMUNICATIONS | https://doi.org/10.1038/s41467-021-27280-x ARTICLE
NATURE COMMUNICATIONS | (2021) 12:7036 | https://doi.org/10.1038/s41467-021-27280-x | www.nature.com/naturecommunications 7
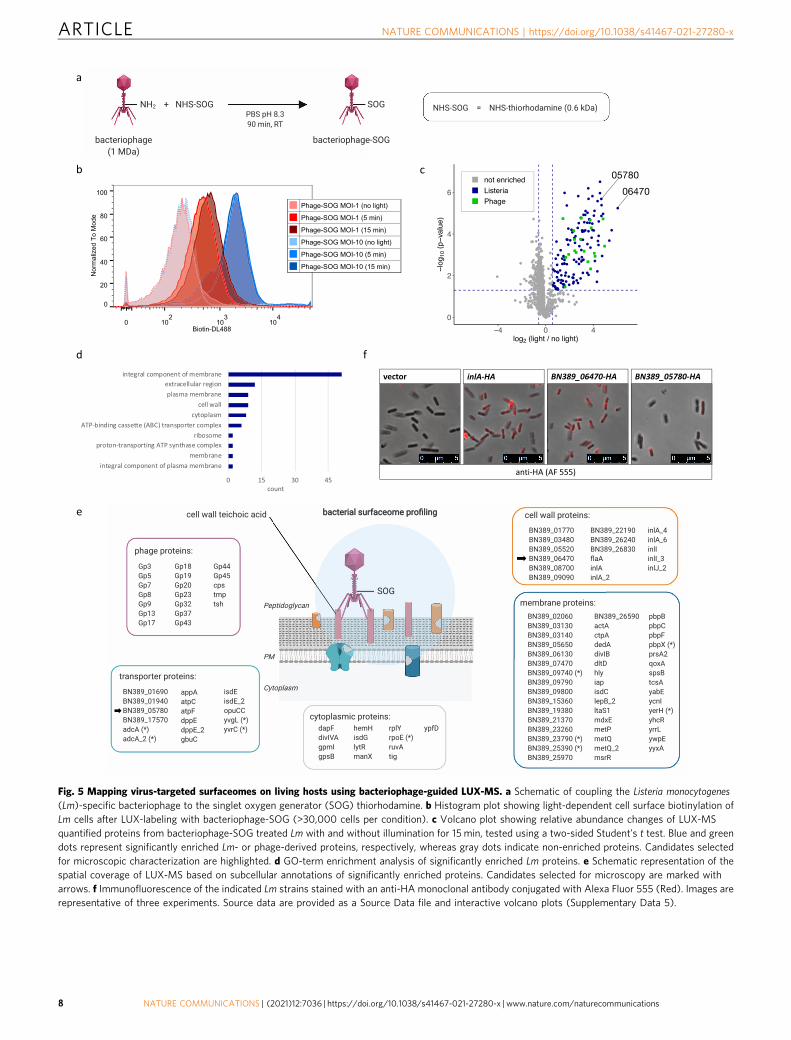
Fig. 5 Mapping virus-targeted surfaceomes on living hosts using bacteriophage-guided LUX-MS. a Schematic of coupling the Listeria monocytogenes(Lm)-specific bacteriophage to the singlet oxygen generator (SOG) thiorhodamine. b Histogram plot showing light-dependent cell surface biotinylation ofLm cells after LUX-labeling with bacteriophage-SOG (>30,000 cells per condition). c Volcano plot showing relative abundance changes of LUX-MSquantified proteins from bacteriophage-SOG treated Lm with and without illumination for 15 min, tested using a two-sided Student’s t test. Blue and greendots represent significantly enriched Lm- or phage-derived proteins, respectively, whereas gray dots indicate non-enriched proteins. Candidates selectedfor microscopic characterization are highlighted. d GO-term enrichment analysis of significantly enriched Lm proteins. e Schematic representation of thespatial coverage of LUX-MS based on subcellular annotations of significantly enriched proteins. Candidates selected for microscopy are marked witharrows. f Immunofluorescence of the indicated Lm strains stained with an anti-HA monoclonal antibody conjugated with Alexa Fluor 555 (Red). Images arerepresentative of three experiments. Source data are provided as a Source Data file and interactive volcano plots (Supplementary Data 5).
ARTICLE NATURE COMMUNICATIONS | https://doi.org/10.1038/s41467-021-27280-x
8 NATURE COMMUNICATIONS | (2021) 12:7036 | https://doi.org/10.1038/s41467-021-27280-x | www.nature.com/naturecommunications
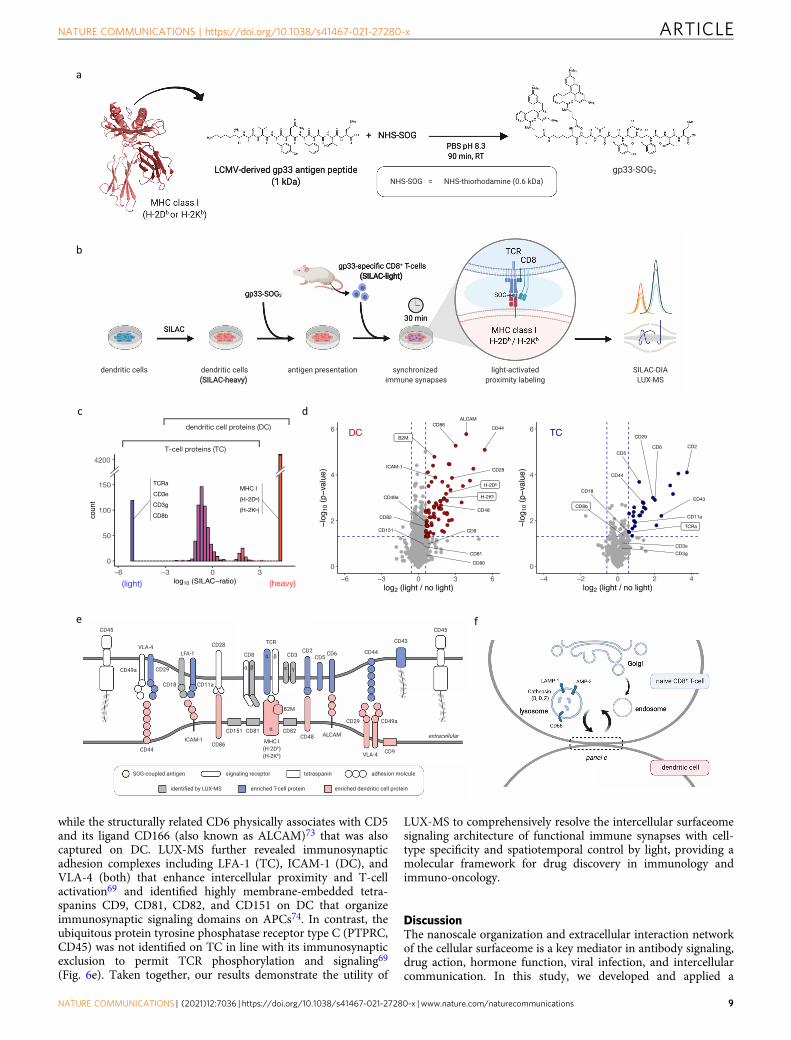
while the structurally related CD6 physically associates with CD5and its ligand CD166 (also known as ALCAM)73 that was alsocaptured on DC. LUX-MS further revealed immunosynapticadhesion complexes including LFA-1 (TC), ICAM-1 (DC), andVLA-4 (both) that enhance intercellular proximity and T-cellactivation69 and identified highly membrane-embedded tetra-spanins CD9, CD81, CD82, and CD151 on DC that organizeimmunosynaptic signaling domains on APCs74. In contrast, theubiquitous protein tyrosine phosphatase receptor type C (PTPRC,CD45) was not identified on TC in line with its immunosynapticexclusion to permit TCR phosphorylation and signaling69
(Fig. 6e). Taken together, our results demonstrate the utility of
LUX-MS to comprehensively resolve the intercellular surfaceomesignaling architecture of functional immune synapses with cell-type specificity and spatiotemporal control by light, providing amolecular framework for drug discovery in immunology andimmuno-oncology.
DiscussionThe nanoscale organization and extracellular interaction networkof the cellular surfaceome is a key mediator in antibody signaling,drug action, hormone function, viral infection, and intercellularcommunication. In this study, we developed and applied a
NATURE COMMUNICATIONS | https://doi.org/10.1038/s41467-021-27280-x ARTICLE
NATURE COMMUNICATIONS | (2021) 12:7036 | https://doi.org/10.1038/s41467-021-27280-x | www.nature.com/naturecommunications 9
SOG-based and highly versatile proximity detection technologytermed LUX-MS that enables to specifically resolve surfaceomesignaling domains in all these scenarios with spatiotemporalcontrol by light. In contrast to larger enzymes (APEX2: 28 kDa;miniTurbo: 27 kDa)75, the use of small molecular SOG (<1 kDa)as labeling probes offers the following advantages: (i) Broadligand-compatibility enabling target deconvolution and surfa-ceome interaction profiling of ligands of basically any descriptionranging from small molecules, antibodies and viral particles towhole cells. (ii) Covalent SOG-coupling with ligand-compatiblechemistry preserving structure-function relationships and cir-cumventing the need for genetic manipulation. (iii) Light-controlled generation of SO species with modifiable reactivityallowing for fine-tunable in situ labeling with tight spatiotemporalcontrol. (iv) Protein labeling via conserved amino acid residuesenables proteome-wide surfaceome interrogations across domainsof life. Recently, photocatalysts producing short-lived carbenewith nanosecond half-life were utilized for antibody-guidedmapping of protein microdomains that could not be resolvedusing enzyme-based strategies (intermediates with half-lives of0.1 ms to 60 s)28. Proximity labeling by LUX-MS is mediated byphotosensitized SO species with a lifetime of 3.5 μs36 that istunable by modulating buffer conditions indicating spatial reso-lution in between enzyme- and carbene-based approaches.Indeed, although CD20 microenvironment mapping using LUX-MS provided a defined list of proximity candidates that wasextendable by the use of D2O, an HRP-based approach provided asubstantially longer list of complementary CD20 candidates.Furthermore, the direct coupling of SOG to signaling competentligands confines labeling to signaling relevant surfaceomedomains and circumvents the use of antibodies that providestructural flexibility. Thus, LUX-MS complements currentlyavailable technologies and provides an analytical stepping stonefor system-wide elucidation of the cellular surfaceome landscape.
Using antibodies to guide proximity labeling, we demonstrated theability of LUX-MS to specifically reveal distinct surfaceome proxi-mities on living cells that form a molecular framework for thereconstruction of the surfaceome nanoscale organization. Giventhe broad availability of high-quality antibodies for established sur-face targets and the high-throughput capability of the LUX-MSworkflow, profound surfaceome interaction mapping is feasibleproviding the cell surface level information that is currently lacking inongoing systems biology efforts to map and understand the structureand function of the human interactome76–79.
By applying LUX-MS to small molecules, we mapped thesurfaceome signaling domains of the small-molecule drug cardiacglycoside CG1. In contrast to LRC methodologies, LUX-MS notonly enabled proteome-wide target deconvolution of smallmolecules but also provided cell-type-specific surfaceome proxi-mity information that could be leveraged for targeted drugdelivery, e.g., using EDC12. While this approach is expected to be
transferable to other drug modalities, the accumulating knowl-edge of drug-targeted cellular surfaceomes eventually allows forthe identification of disease-associated receptor proximitesenabling the rational design of next-generation precision medi-cines that go well beyond the targeting of individual receptors.
Using LUX-MS, we decoded viral surfaceome interactions inbacterial hosts that are not detectable using state-of-the-arttechnologies such as CSC, LRC, and HATRIC owing to thestructural complexity of the cell envelope and a general lack ofprotein glycosylation. Using bacteriophages that recognize aubiquitous cell wall component of Listeria monocytogenes, wemapped the bacterial surfaceome (>80 proteins) with substantialcoverage and specificity that superseded common profiling stra-tegies such as trypsin shaving (11 proteins identified), surface-restricted biotinylation (27 proteins identified), and cell fractio-nation (21 proteins identified)80. Depending on the bindingspecificity of the employed viral particle, LUX-MS enables thespatiotemporal elucidation of viral attachment sites, targetreceptors, and global surfaceomes of live prokaryotic andeukaryotic cells in complex biological systems. This is of parti-cular interest considering the broad application of advancedphage display assays81 and related screening platforms82,83 inbasic and translational research.
Finally, we employed LUX-MS for the spatiotemporal analysisof intercellular receptor interaction networks within immunolo-gical synapses. Previous attempts were limited to molecularanalysis in model systems that use soluble, plate-bound, ormembrane-associated factors to mimic immunosynaptic T-cellactivation69 or to fluorescence-based reporting of transientintercellular immune cell interactions28,84. Here, we performed agp33 immunogen-guided LUX-MS in an isotopically barcodedtwo-cell system of millions of synchronized and functionalimmunosynapses and thereby obtained a holistic view of themature immunosynaptic surfaceome signaling architecture, fos-tering the formulation of original biological hypotheses. Forexample, we found several lysosomal proteins (LAMP-1, LAMP-2, CD68, and cathepsins B, D, and Z) within the immunosynapticcleft on naive CD8+ T cells but not antigen-presenting DCs. Thisindicates local fusion of lysosomal granules in T cells that istypically observed in cytotoxic T cells during degranulation-mediated target cell killing85. However, while being a feature ofantigen-experienced cells, degranulation and thus cytolyticactivity was shown to be absent in naive CD8+ T cells. Indeed, wedid not identify any cytolytic effector molecules such as perforinor granzymes, indicating the secretion of non-lytic granules innaive CD8+ T cells within 30 min of initial contact with APCs(Fig. 6f). Albeit, the cellular machinery for immunosynapse-directed transport of vesicles is in place within 6 min of initial cellcontact, the exact secretion mechanism and functional role ofsuch non-lytic granule secretion in antigen-dependent T-cellpriming remains to be further explored.
Fig. 6 Elucidating intercellular surfaceome signaling domains in functional immunosynapses. a Schematic of coupling immunogenic peptide gp33 to thesinglet oxygen generator (SOG) thiorhodamine. The crystal structure of gp33 (dark gray) presented by MHC class I H-2DB alpha chain (red) in complex withbeta-2 microglobulin (dark red) is shown (PDB identifier: 1FG2), b Schematic of the SILAC-DIA based LUX-MS workflow. Isotopically labeled (heavy) mousedendritic cells presenting gp33-SOG2 establish synchronized immunosynapses with isolated (light), gp33-specific CD8+ T cells enabling light-activatedin situ labeling and molecular analysis of intercellular surfaceome signaling interactions within synapses using data-independent acquisition (DIA) massspectrometry. c Histogram plot showing distribution of heavy-to-light abundance ratios of LUX-MS identified proteins. Ratio-boundaries for cell typeassignment and representative proteins are shown. d Volcano plot showing relative abundance changes of LUX-MS quantified proteins from the two-cellsystems with and without illumination for 15min, tested using a two-sided Student’s t test. Dots and crosses represent cell surface and otherwise annotatedproteins, respectively. Red and blue dots represent dendritic cell (DC) and T-cell (TC)-derived proteins, respectively. Known immunosynaptic constituentsare highlighted with direct gp33 interactors shown in boxes. e Schematic of the LUX-MS identified immunosynaptic surfaceome interaction network.f Schematic highlighting the interconnectivity of the immunological synapse with endolysosomal pathways in T cells and showing proteins reported at thecell-to-cell interface by LUX-MS. Source data are provided as a Source Data file and interactive volcano plots (Supplementary Data 6 and 7).
ARTICLE NATURE COMMUNICATIONS | https://doi.org/10.1038/s41467-021-27280-x
10 NATURE COMMUNICATIONS | (2021) 12:7036 | https://doi.org/10.1038/s41467-021-27280-x | www.nature.com/naturecommunications
In conclusion, we provide a high-throughput, optoproteomictechnology termed LUX-MS to discover protein networks withinspecific surfaceome signaling domains on living cells and wedemonstrate its utility and versatility in a broad range of bio-medically important scenarios including antibody signaling, drugaction, hormone function, viral infection and intercellular com-munication. Given the biological and therapeutic importance ofthe surfaceome signaling landscape, we envision LUX-MS toimpact basic and applied research areas by unraveling the spa-tiotemporal interconnectivity of the cell surface signaling gatewayin health and disease.
MethodsReagents. All chemicals were purchased from Merck unless stated otherwise.SOGs in form of NHS-functionalized thiorhodamine (cat: AD-Thio12-41) andazide-functionalized methylene blue (cat: AD-MB2-31) were purchased fromATTO-TEC GmbH (Siegen, Germany). Biocytin-hydrazide was purchased fromPitsch Nucleic Acids AG (Stein am Rhein, Switzerland). The following antibodieswere used for LUX-MS experiments: mouse IgG Isotype control antibody (Invi-trogen, cat: 10400 C), anti-human CD20 mouse IgG2 monoclonal antibody clone2H7 (Invitrogen, cat: 14-0209-82), anti-human CD38 chimeric monoclonal anti-body kindly provided by Centrose LLC, anti-human CD54 mouse IgG1 mono-clonal antibody, clone HCD54 (BioLegend, cat: 322704), anti-human CD166mouse IgG1 monoclonal antibody clone 3A6 (BioLegend, cat: 343902), anti-humanCD220 mouse IgG2 monoclonal antibody, clone B6.220 (BioLegend, cat: 352602).
Cell culture. All chemicals for cell culture were purchased from ThermoFisherScientific unless stated otherwise. All other chemicals were purchased from Sigma-Aldrich unless stated otherwise. Cell lines were purchased from ATCC and grownat 37 °C and 5% ambient CO2. Patient-derived B-lymphoma cell line SUDHL6(ATCC, CRL-2959) and human Burkitt lymphoma B cell-line Ramos (ATCC,CRL-1596, kindly provided by Michael Reth) were grown in Roswell Park Mem-orial Institute (RPMI) 1640 medium with 1.5 mM GlutaMAX, 1%penicillin–streptomycin, and 10% fetal bovine serum. Patient-derived promyelo-cytic leukemia cell line HL60 (ATCC CCL-240) was grown in RPMI with 1.5 mMGlutaMAX (Gibco), 1% penicillin–streptomycin (Gibco), and 10% human serum(Chemie Brunschwig). Mouse dendritic cell line MutuDC194086 was kindly pro-vided by Hans Acha-Orbea (Department of Biochemistry, University of Lausanne,Switzerland) and was cultured and isotopically labeled in Iscove’s Modified Dul-becco’s Medium for SILAC (Thermo, cat: 88367) supplemented with glucose (final:4.5 g/l), L-Arg-13C6-15N4 (final: 42 μg/ml), L-Lys-13C6-15N2 (final: 73 μg/ml),1.5 mM GlutaMAX, 10 mM HEPES, 50 μM β-mercaptoethanol, 1%penicillin–streptomycin, non-essential amino acids, and 10% dialyzed fetalbovine serum.
Mice. Female or male mice of six to sixteen weeks of age were used for animalexperiments described in this study. CD45.1 P14 mice with T-cell receptors onCD8+ T cells specific for the glycoprotein GP33-41 epitope of LCMV71 crossedwith Nur77-GFP mice87 (P14 Nur77-GFP) were bred at the ETH PhenomicsCenter at a light–dark cycle of 12 h, the ambient temperature of 22 °C ± 2 °C andhumidity of 55% ± 10%. All animals were bred and held under specific-pathogen-free conditions prior to use. All animal experiments were performed in accordancewith institutional policies and Swiss federal regulations, following guidelines andbeing approved by the veterinary office of the Canton of Zürich (animal experi-mental permissions: 115/2017).
Light sources. Photo-oxidation reactions were controlled using Precision LEDspotlights operated via a BioLED Light Control Module (BLS-PL04-US) in con-tinuous wave mode (Mightex Systems, Pleasanton, USA). For LUX-MS applica-tions with thiorhodamine as SOG, spotlights BLS-PLS-0590-030-05-S were used forillumination at 590 nm with a light intensity of 4.6 mW/cm2. For LUX-MSapplications with methylene blue as SOG, spotlights BLS-PLS-0656-030-07-S wereused for illumination at 656 nm with a light intensity of 14.9 mW/cm2.
Light-controlled production of SO. The SOG thiorhodamine was mixed with1 μM Singlet Oxygen Sensor Green (SOSG, Invitrogen, cat: S36002) in phosphate-buffered saline at increasing D2O/H2O ratios and illuminated at a working distanceof 30 cm with 590-nm Precision LED spotlights for 0–15 min. The fluorescence ofphoto-oxidized SOSG was monitored using a Synergy HT Multi-Mode PlateReader (BioTek) at excitation 485 ± 20 nm and emission 528 ± 20 nm. Quantifiedintensities were blanked and normalized to non-illuminated control using a cus-tomized R-script.
Discovery and tuning of light-induced protein labeling sites. Human holo-transferrin (Sigma, cat: T4132) was coupled with thiorhodamine SOG at a molarligand-to-SOG ratio of 1:1 and purified using 7-kDa ZebaSpin Columns (Thermo,
cat: 89882) according to manufacturer’s recommendations. SOG-coupled trans-ferrin in D2O-based phosphate-buffered saline (PBS) containing 0 or 5 mMbiocytin-hydrazide was either illuminated with 590-nm Precision LED spotlightsfor 15 min or left in the dark. The buffer was complemented with 50 mM 2-(aminomethyl)imidazole dihydrochloride catalyst for 50 min to catalyze hydrazoneformation. Treated proteins were digested overnight at 37 °C using sequencing-grade trypsin (Promega, cat: V511C) at an enzyme-to-protein ratio of 1:100.Peptides were C18-purified using 5–60 μg UltraMicroSpin Columns (The NestGroup, cat: SEMSS18V) according to manufacturer’s instructions and subjected formass spectrometric analysis using an Orbitrap Fusion Tribrid mass spectrometer(Thermo Scientific) in data-dependent acquisition (DDA) mode with a massresolution of 120,000 and 30,000 on precursor and fragment level, respectively (seebelow for details). Acquired raw files of illuminated samples were subjected to anopen modification search using MSfragger (v.20190628)88 and Crystal-C89 withinthe FragPipe pipeline (v.9.4) using standard settings and a SwissProt-reviewedhuman protein database (downloaded June 2014) containing common con-taminants. Observed modifications were implemented in a subsequent closedsearch of all acquired samples using Comet (v.2015.01) within the Trans ProteomicPipeline v.4.7 (SPC/ISB Seattle) as variable modification (carbonylation of His, Cys,and Trp; single oxidation of Met, Trp, and Tyr; double oxidation of Met, Trp, andHis; triple oxidation of Met, Cys, and Trp) to identify fully tryptic peptides with amaximum of two missed cleavage sites and a maximum of five variable mod-ifications. The precursor and fragment mass tolerance was thereby set to 20 ppmand 0.02 Da, respectively. Peptides were quantified by integration of chromato-graphic traces using Progenesis QI v.4.0 (Nonlinear Dynamics) and filtered to afalse discovery rate of <1%. Transferrin peptides were assigned to dummy proteinsrepresenting unmodified or single modification types. Within the R computingenvironment (v.3.4.0), protein abundance fold changes (expressed in log2) werecalculated using a linear mixed-effect model and tested for statistical significanceusing a two-sided t test with the appropriate degree of freedom in the R packageMSstats (v.3.8.6)90. Modification types with an abundance fold change >1.5 uponillumination and an adjusted p value < 0.05 were considered products of light-induced photo-oxidation. Analogously, modification types with a significantlyreduced light-dependent production in the presence of biotin-hydrazide(p value < 0.1) were considered hydrazide-reactive amino acid modifications. Intotal, three biologically independent replicates were used per condition.
For amino acid-specific tuning of protein labeling sites by varying bufferconditions, human holo-transferrin (Sigma, cat: T4132) was digested overnight at37 °C using sequencing-grade trypsin (Promega, cat: V511C) at an enzyme-to-protein ratio of 1:50. Peptides were desalted using Waters Sep-Pak C18 Column50 mg (Waters, cat: WAT054955) according to the manufacturer’s instructions anddried in a SpeedVac concentrator (Thermo Scientific). Peptides were resuspendedin either PBS, 50% D2O-based PBS or 100% D2O-based PBS to a final peptideconcentration of 10 µM and then supplemented with Tris quenched thiorhodamineSOG at a molar peptide-to-SOG ratio of 1:1. Samples were either illuminated with590-nm Precision LED spotlights for 15 min or left in the dark. All samples werecomplemented with PBS or D2O-based PBS to reach the final 50% D2O andincubated for 2 h in the dark. Peptides were C18-purified using 7–70 μgBioPureSPNmini Columns (The Nest Group, cat: HUM S18V) according tomanufacturer’s instructions and dried in a SpeedVac concentrator. The modifiedtransferrin peptides were subjected for mass spectrometric analysis using anOrbitrap Q Exactive HF mass spectrometer (Thermo Scientific) in DDA mode witha mass resolution of 60,000 and 15,000 on precursor and fragment level,respectively (see below for details). Acquired raw files of illuminated samples weresubjected to a closed search using SEQUEST HT and Multi Peptide Search inProteome Discoverer (v.2.5.0.400, Thermo Scientific) and a SwissProt-reviewedhuman protein database (downloaded June 2014) containing commoncontaminants. Modifications were set as above and precursor and fragment masstolerance were set to 10 ppm and 0.02 Da, respectively. Label-free quantificationwas performed on precursor level using only unique peptides. As above, transferrinpeptides were assigned to dummy proteins representing unmodified or singlemodification types. Within the R computing environment (v.3.4.0), proteinabundance fold changes (expressed in log2) were calculated using a linear mixed-effect model and tested for statistical significance using a two-sided t-test with theappropriate degree of freedom in the R package MSstats (v.3.8.6)90 and visualizedas dot plot over all conditions using R. In total, one biologically independentsample was prepared per condition and measured three times by massspectrometry.
Collection and purification of human PBMCs. Buffy coats were obtained fromhealthy donors provided by the Blood Transfusion Service Zurich. To isolatePBMCs, human buffy coat samples were diluted 1:1 in PBS (Gibco) and mono-nuclear cells were isolated with a Histopaque-1077 density gradient (Sigma-Aldrich) according to the manufacturer’s instructions. PBMCs at the interface werecollected, washed once in PBS, and resuspended in media until further processing.
Generation of antibody-SOG and HRP conjugates. For antibody-SOG con-jugates, 10 μg antibody per sample was purified using 7-kDa ZebaSpin DesaltingColumns (Thermo Scientific, cat: 89882), following manufacturer’s guidelines, andeluted in 10 mM sodium bicarbonate in PBS, pH 8.3. Antibody was coupled with
NATURE COMMUNICATIONS | https://doi.org/10.1038/s41467-021-27280-x ARTICLE
NATURE COMMUNICATIONS | (2021) 12:7036 | https://doi.org/10.1038/s41467-021-27280-x | www.nature.com/naturecommunications 11
thiorhodamine SOG at a molar antibody to SOG ratio of 1:5, purified using 7-kDaZebaSpin Columns, and immediately used for LUX-MS experiments.
For antibody-HRP conjugates, 10 μg anti-CD20 antibody (Invitrogen, clone2H7) per sample was purified using 7-kDa ZebaSpin Desalting Columns (ThermoScientific, cat: 89882), following manufacturer’s guidelines, and eluted in 0.2 Mcarbonate-bicarbonate buffer, pH 9.4. Purified anti-CD20 antibody was conjugatedto pre-activated amine-reactive HRP (Thermo Scientific™ EZ-Link™ Plus ActivatedPeroxidase, Thermo Scientific, cat: 31489) for 1.5 h in 0.2 M carbonate-bicarbonatebuffer, pH 9.4 with a coupling ratio of antibody to HRP of 1:10. The reactionmixture was cleaned with 7-kDa ZebaSpin Desalting Columns, eluted in PBS, pH7.2, and further processed according to the manufacturer’s manual. Anti-CD20-HRP conjugates were immediately used for the HRP-based proximity labelingexperiment.
For CG1-HRP conjugates, pre-activated amine-reactive HRP (ThermoScientific™ EZ-Link™ Plus Activated Peroxidase, Thermo Scientific, cat: 31489) wascoupled to amine-containing cardiac glycoside CG1 (kindly provided by CentroseLLC, Madison, Wisconsin) for 1.5 h in 0.2 M carbonate-bicarbonate buffer, pH 9.4with a coupling ratio of HRP to CG1 of 1:10. HRP-CG1 conjugate was re-bufferedinto PBS, pH 7.2 using 7-kDa ZebaSpin Desalting Columns and further processedas recommended by the manufacturer’s guidelines. HRP-CG1 conjugates werepurified and separated from free CG1 using both 7-kDa ZebaSpin DesaltingColumns (twice) and 10 kDa molecular weight cut-off filters (Merck, cat:UFC501024) and subsequently used for single-cell chemosensitivity screening.
Degree of labeling (DOL) calculation. Average DOL of antibodies labeled withthiorhodamine SOG probes was determined by measuring absorbance as pre-viously described12. Specifically, the absorbance of conjugates (Conj), antibody(Ab), and free thiorhodamine (SOG) at both 280 nm and 582 nm were measuredusing a NanoDrop 2000 spectrophotometer (Thermo Scientific). Next, the fol-lowing ratios were calculated; RatioAb=A582Ab/A280Ab and RatioSOG=A582SOG/A280SOG. Then, the absorbance of the antibody-SOG conjugate was measuredyielding A280Conj and A582Conj. The actual concentration of antibody andSOG contained in the conjugate solution were determined as follows: [Ab]=(A280Conj – (A582Conj – RatioAb × A280Conj)/(RatioSOG – RatioAb))/εAb, [SOG]=(A582Conj – RatioAb × A280Ab)/εSOG. The following extinction coefficients (ε) werethereby used: εAb= 210,000 M−1 cm−1, εSOG= 110,000 M−1 cm−1. Finally, theDOL was determined: DOL= [SOG]/[Ab]. Per conjugate, an average DOL ofsix replicate measurements was calculated in the R computing environment.The same procedure was applied for measuring the DOL of HRP labeled withCG1 by measuring absorbance at both 403 nm and 299 nm and by using εHRP=100,000M−1 cm−1 and εCG1= 5623M−1 cm−1.
Antibody-guided receptor microenvironment mapping. For SOG-based LUX-MS, 20 × 106 cells were incubated with 10 μg SOG-coupled antibody (final 5 μg/ml)for 30 min at 4 °C in the dark to minimize background light-induced oxidation.Cells were washed with ice-cold PBS, resuspended in chilled photo-oxidation buffer(5 mM biocytin-hydrazide in D2O-based PBS, pH 7.5 if not stated otherwise), andilluminated at a working distance of 20 cm with 590-nm Precision LED spotlightsor left in the dark. For the anti-CD20 time course LUX-MS, one and three bio-logically independent samples were analyzed for each illumination time point andthe non-illuminated control, respectively. For anti-CD20 LUX-MS two and threebiologically independent samples were analyzed for labeled and unlabeled condi-tions, respectively. For all other antibody-guided LUX-MS, three biologicallyindependent samples were analyzed for both labeled and unlabeled conditions.Cells were pelleted by centrifugation and resuspended in chilled labeling buffer(5 mM biocytin-hydrazide and 50 mM 2-(Aminomethyl)imidazole dihydrochloridein PBS, pH 6.0) for 50 min at 4 °C in the dark. For flow cytometric analysis of cellsurface biotinylation, cells were extensively washed with PBS and stained withNeutrAvidin Protein DyLight 488 (Invitrogen, cat: 22832) 1:200 for 20 min prioranalysis using an Accuri C6 Flow Cytometer (BD Biosciences) and FlowJo(v.10.07). The FSC/SSC pattern of the unlabeled condition was thereby used to gatefor live cells (Supplementary Fig. 12). For LUX-MS analysis, cells were extensivelywashed with PBS, snap-frozen as cell pellets in liquid nitrogen, and stored at−80 °C until further processing.
For HRP enzyme-based proximity labeling, 20 × 106 Ramos cells were harvestedper sample and twice washed with ice-cold PBS. Cells of all conditions wereincubated with CD20-HRP-conjugate in 1 ml PBS for 30 min at 4 °C. Afterincubation, cells were washed once with ice-cold PBS and once with roomtemperature (RT) PBS. Afterwards, cells were resuspended at RT in PBS containing0.1 mM biotin-tyramide (Pitsch Nucleic Acids AG). The HRP-based proximitylabeling reaction was started by the addition of H2O2 (final 1 mM) to the CD20labeling condition. For the control samples, PBS-based Mock buffer (withoutH2O2) was used. After 1 min, the reaction was stopped with a quenching buffercontaining 10 mM NaN3, 10 mM sodium ascorbate, and 1:10,000 catalase (Sigma-Aldrich, C30) in ice-cold PBS, immediately followed by three washes withquenching buffer and two washes with ice-cold PBS. Cells were snap-frozen as cellpellets in liquid nitrogen and stored at −80 °C until further processing. In total,three biologically independent replicates were used per condition.
Synthesis of SOG-coupled cardiac glycoside CG1. The primary amine-containing cardiac glycoside CG1 was kindly provided by Centrose LLC (Madison,Wisconsin). To a solution of CG1 2 (5 mg, 0.0081 mmol) and thiorhodamine-NHSester 1 (5.7 mg, 0.0081 mmol) in N,N-dimethylformamide (1 mL) was added Et3N(0.011 mL, 0.08 mmol). The reaction mixture was stirred at RT for 1 h and productformation was confirmed by LC-MS. The final product CG1-SOG 3 was purified bypreparative RP-HPLC on a Waters Eclipse XDB (C18, 250 × 21.2 mm, 7 μm) col-umn with a gradient of 5 –50% ACN/H2O+ 0.1% TFA in five column volumes.The product was of >95% purity as judged by reversed-phase UPLC and HR-MS.HR-ESI-MS: m/z (M+H+) 999.4938 (calc. mass= 999.4936) (SupplementaryFig. 9).
Single-cell chemosensitivity screening. A single-cell suspension of HL60 cells wasseeded (2000 cells/well with 50 μl/well) in CellCarrier 384 Ultra, clear-bottom, tissue-culture-treated plates (PerkinElmer) containing antineoplastic agents (see below) andincubated overnight for 24 h at 37 °C and 5% CO2. Cell number and viability weredetermined by the use of a Countess II Cell Counter (Thermo Fisher). Cells weresubsequently treated with a drug screen library of three single compounds (CG1,CG1-SOG, and CG1-HRP) in four concentrations each with ten technical replicatesthat were dispensed into assay plates by an Echo liquid handler (Labcyte). The assaywas stopped by fixing and permeabilizing the cells with 20 μl/well of a solutioncontaining 0.5% (w/v) formaldehyde, 0.05 % (v/v) Triton X-100, 10mM sodium(-meta)periodate, and 75mM L-lysine monohydrochloride, after removing the cul-turing media. After 20min incubation at RT, the fixative-containing media wasaspirated by use of a HydroSpeed plate washer (Tecan). The cells were then blocked(50 μl/well) with PBS supplemented with 5% fetal bovine serum (FBS, Gibco) andstored until immunostaining. For nuclear detection, 2 µg/mL DAPI (4′,6-Diamidino-2-Phenylindole, Biolegend) in PBS was utilized. Cells were further stained with anAlexa Fluor 647 anti-human CD33 antibody (Clone P67.6) at a dilution of 1:20.Before the staining, the blocking solution was removed, 20 µl/well of the antibody/DAPI cocktail was added and the plate was incubated for 1 h in the dark (at RT).Subsequently, the staining solution was removed and PBS was added (70 µL/well)before imaging. The 384-well plate was imaged with an Opera Phenix automatedspinning-disk confocal microscope (PerkinElmer) at ×20 magnification with5 × 5 non-overlapping images, covering the whole well surface. Each well of the platewas fully imaged in the brightfield (650–760 nm), DAPI/Nuclear signal(435–480 nm), and APC/Red signal (650–760 nm) channels. Raw.tiff images wereused for single-cell image analysis in CellProfiler (v.2)91. Single cells detection andnuclear segmentation were performed by maximum correlation thresholding on theDAPI channel. To extract cytoplasmic measurement, cellular outlines were estimatedby a circular expansion of 10 pixels around the nucleus. To measure the local intensitybackground around every single cell, a second larger expansion of 30 pixels wasperformed. Standard CellProfiler raw fluorescent intensities were extracted, log10transformed, and normalized towards the local cellular background92.
Identification of small-molecule drug-targeted surfaceome structures. Fiftymillion cells were incubated with 0–10 μM CG1-SOG (10 μM for LUX-MSexperiment) for 30 min at 4 °C in the dark to minimize background light-inducedoxidation. Cells were washed with ice-cold PBS, resuspended in chilled photo-oxidation buffer, and illuminated at a working distance of 20 cm with 590-nmPrecision LED spotlights or left in the dark (three biologically independent sampleseach). Cells were pelleted by centrifugation and resuspended in chilled labelingbuffer for 50 min at 4 °C in the dark. For flow cytometric analysis of cell surfacebiotinylation, cells were extensively washed with PBS and stained with NeutrAvidinProtein DyLight 488 (Invitrogen, cat: 22832) 1:200 for 20 min prior analysis usingan Accuri C6 Flow Cytometer (BD Biosciences) and FlowJo (v.10.07). The FSC/SSC pattern of the unlabeled condition was thereby used to gate for live cells(Supplementary Fig. 12). For LUX-MS analysis, cells were extensively washed withPBS, snap-frozen as cell pellets in liquid nitrogen, and stored at −80 °C untilfurther processing.
Biomolecule-guided discovery of intercellular surfaceome signaling domains.The human peptide hormone insulin and glycoprotein holo-transferrin werecoupled with thiorhodamine SOG at a molar ligand:SOG ratio of 1:1 and 1:13,respectively according to the manufacturer’s recommendations. The SOG-coupledligand constructs were kept at 4 °C and immediately used. Twenty million cellswere incubated with 1 μM Insulin-SOG or 75 nM Transferrin-SOG for 10 min at4 °C in the dark to minimize background light-induced oxidation. Cells werewashed with ice-cold PBS, resuspended in chilled photo-oxidation buffer, andilluminated at a working distance of 20 cm with 590-nm Precision LED spotlightsfor 5 min or left in the dark (three biologically independent samples each). Cellswere pelleted by centrifugation and resuspended in chilled labeling buffer for50 min at 4 °C in the dark. Cells were extensively washed with PBS, snap-frozen ascell pellets in liquid nitrogen, and stored at −80 °C until further processing.
Synthesis and characterization of SOG-coupled antimicrobial Thanatin. AThanatin derivative was kindly provided by the John Robinson group (Universityof Zurich, Switzerland) and (6.0 mg, 0.0023 mmol) were dissolved in 500 μl H2O.Sodium ascorbate (0.1 M, 30 μl, 0.0022 mmol) and azide-functionalized methylene
ARTICLE NATURE COMMUNICATIONS | https://doi.org/10.1038/s41467-021-27280-x
12 NATURE COMMUNICATIONS | (2021) 12:7036 | https://doi.org/10.1038/s41467-021-27280-x | www.nature.com/naturecommunications
blue as SOG (0.5 mg, 0.0009 mmol) in 100 μl DMSO and CuSO4 (0.1 M, 30 μl,0.003 mmol) was added. After 15 min the reaction mixture was directly injectedinto a prep HPLC C18 column with a gradient of 10–40% ACN/H2O (0.1% TFA).The purity of the Thanatin-SOG compound was confirmed by UPLC analysis andthe identity was verified by HR-ESI with a calculated mass of 652.1353 (M+ 6H)6+
and a measured m/z value of 652.1360 (M+ 6H)6+ (Supplementary Fig. 10).
Proteome-wide and light-activated target deconvolution in prokaryotic sys-tems. E. coli cells (Migula) Castellani and Chalmers (ATCC: 25922) were incubatedwith 3 μM Thanatin-SOG in the presence or absence of 30 μM unconjugated Thanatinderivative for 30min at 37 °C in the dark to minimize background light-induced oxi-dation. Cells were washed with ice-cold PBS, resuspended in chilled photo-oxidationbuffer, and illuminated at a working distance of 20 cm with 659-nm Precision LEDspotlights for 5min or left in the dark (three biologically independent samples each).Cells were pelleted by centrifugation and resuspended in chilled labeling buffer for50min at 4 °C in the dark. Cells were extensively washed with PBS, snap-frozen as cellpellets in liquid nitrogen, and stored at −80 °C until further processing.
Generation and characterization of SOG-coupled bacteriophages. Gram-positive L. monocytogenes specific bacteriophages were coupled with thiorhodamineSOG by mixing 1.2ml of Listeria A500 phage solution (a titer of 1012 plaque-formingunits (PFU)/ml) with 60 μl of 0.2M NaHCO3 and 30 μl of 0.15mM NHS-functionalized thiorhodamine. The mixture was incubated at RT in the dark for 1 h.The phage-SOG complex was precipitated by adding 1/5 volume of 20% PEG/2.5MNaCl and incubated for 2 h at 4 °C. The supernatant was discarded to remove unreactedSOG molecules, and the M13-dye pellet was resuspended in 1ml of SM buffer andsubjected to PFU determination. For the PFU assay, 990 μl overnight cultures of L.monocytogenes cells were mixed with 10 μl of serially diluted phage stock solution (inSM buffer). The culture was then mixed and vortexed with 5ml of melted soft 1/2 BHIagar (50 °C) and poured onto the solid agar plates. Solidified agar plates were incubatedat 30 °C for a day and phage titer was determined based on observed plaque numbers.
Bacteriophage-guided exploration of virus-targeted host surfaceomes. Listeriamonocytogenes cells (strain WSLC 1042) were treated with 40 μg/ml gentamicin for1 h at RT before incubation with SOG-coupled Listeria A500 phages at an MOI of10 for 30 min at 4 °C in the dark. Per sample, bacteria corresponding to 3.5 × 10⁹
colony-forming units (CFU) were washed with ice-cold PBS, resuspended in chilledphoto-oxidation buffer, and illuminated at a working distance of 20 cm with590-nm Precision LED spotlights for 15 min or left in the dark (three biologicallyindependent samples each). Cells were pelleted by centrifugation and resuspendedin chilled labeling buffer for 50 min at 4 °C in the dark. For flow cytometric analysisof cell surface biotinylation, cells were extensively washed with PBS and stainedwith NeutrAvidin Protein DyLight 488 1:50 for 20 min prior analysis using anAccuri C6 Flow Cytometer (BD Biosciences) with side-scatter (height) set to 10,000as detection limit and FlowJo (v.10.07). The FSC/SSC pattern of the unlabeledcondition was thereby used to gate for live cells (Supplementary Fig. 12). For LUX-MS analysis, cells were extensively washed with PBS, snap-frozen as cell pellets inliquid nitrogen, and stored at −80 °C until further processing.
Genetic engineering and microscopic validation of identified L. monocytogenessurface proteins. Positive surface protein control Internalin A (InlA) and candi-date genes encoding putative surface proteins A0A0E1RAE1 (LPXTG-motif cellwall anchor domain protein) and A0A0E1R383 (ABC transporter), and their nativepromoters were cloned into the pPL2 integration vectors67 with an HA tag usingGibson method as previously described93. The empty vector pPL2, three insert-containing vectors pPL2(inlA-HA), pPL2(rae1-HA), and pPL2(r383-HA),were transformed into electrocompetent L. monocytogenes 1042 cells. The primers5′-GTCAAAACATACGCTCTTATC-3′ and 5′-ACATAATCAGTCCAAAGTAGATGC-3′ were used to verify the pPL2 integration into the bacterial genome.For surface immunostaining of L. monocytogenes WT and mutant strains, corre-sponding cells were grown to mid-log phase, washed with PBS, and then blocked in1% BSA/PBS. Cells were further washed and stained with an HA monoclonalantibody conjugated with Alexa Fluor 555 (ThermoFisher Scientific) at a 1:100dilution for 30 min. After final washing, cell suspensions were applied to a glassslide and imaged by confocal laser scanning microscopy.
Synthesis and characterization of SOG-coupled immunogenic peptide gp33.LCMV peptide gp33-41 (gp33; KAVYNFATM) was purchased from NeoMPS.Peptide gp33 (1.0 mg, 1.0 μmol, 1 equiv.) and NHS-thiorhodamine (1.4 mg,2.0 μmol, 2 equiv.) were incubated at RT for 90 min in PBS at pH 8.3. The reactionmixture was directly purified by preparative RP-HPLC on a Jasco instrument usinga YMC C18 column (5 μm, 20 mm I.D. × 250 mm) at RT at a flow rate of 10 mL/min, with simultaneous monitoring of the eluent at 220, 254, and 301 nm. Milli-Qwater with 0.1% TFA (solvent A) and a gradient of 5–15% ACN with 0.1% TFA(solvent B) over 5 min and 15 to 75% solvent B over 30 min was used as theeluent. Fractions containing pure product were pooled and lyophilized to obtaingp33-SOG2 as a purple solid. The purity and identity were verified by analyticalRP-HPLC and HR-MS. HR-MS (ESI): calculated for C106H133N17O17S32+ [M]2+:1005.9608, found: 1005.9589 (Supplementary Fig. 11).
Functional assessment of SOG-coupled gp33. CD8+ T cells were isolated fromsmashed spleens and inguinal lymph nodes of P14 Nur77-GFP mice using theEasySep™ Mouse naive CD8+ T-cell Isolation Kit (StemCell, Grenoble, France)following the manufacturer’s instructions. Spleens and lymph nodes were smashedusing a 70 µm cell strainer. Isotopically labeled mouse DCs were incubated with nocompound or 1 μg/ml purified gp33 carrying no (gp33), one (gp33-SOG), or two(gp33-SOG2) SOGs for 1 h. A 10-fold excess of acutely isolated CD8+ T cells wasadded by centrifugation and cells were co-incubated for 3 h in the presence ofinterleukin-2. Cells were carefully washed with ice-cold PBS, chilled photo-oxidation buffer was added and interacting cells were illuminated at a workingdistance of 20 cm with 590-nm Precision LED spotlights for 15 min. Cells werepelleted by centrifugation and resuspended in chilled labeling buffer for 50 min at4 °C in the dark. Cells were extensively washed with PBS and assessed for T-cellactivation and cell-type-specific surface biotinylation using flow cytometry.
Light-activated in situ labeling of functional immunosynapses. Per sample, tenmillion isotopically labeled mouse DCs were pre-activated with 0.5 µg/ml CpG(Microsynth, Balgach, Switzerland) overnight. PBS-washed DCs were then incu-bated with 1 μg/ml gp33-SOG2 for 1 h in the dark to minimize background light-induced oxidation. A 1.5-fold excess of freshly isolated CD8+ T cells was added bycentrifugation and cells were co-incubated for 30 min in the presence ofinterleukin-2. Cells were carefully washed with ice-cold PBS, chilled photo-oxidation buffer was added and interacting cells were illuminated at a workingdistance of 20 cm with 590-nm Precision LED spotlights for 15 min or left in thedark (two and three biologically independent samples, respectively). Cells werepelleted by centrifugation and resuspended in chilled labeling buffer for 50 min at4 °C in the dark. Cells were extensively washed with PBS, snap-frozen as cell pelletsin liquid nitrogen, and stored at −80 °C until further processing.
Flow cytometry analysis of murine immune cells. Harvested cells were stained forflow cytometry in PBS for 20min at RT. The following antibodies were purchased fromBioLegend (San Diego, United States) and used for flow cytometric analysis: CD8a-BV510 (cat: 100752, clone: 53-6.7, dilution 1:200), CD45.1-PacificBlue (cat: 110722,clone: A20, dilution 1:200), CD44-APC (cat: 559250, clone: IM7, dilution 1:100),CD11c-PerCP (cat: 117326, clone: N418, dilution 1:200), CD69-PeCy7 (cat: 104512,clone: H1.2F3, dilution 1:100), CD25-FITC (cat: 553072, clone: 3C7, dilution 1:100).The viability of cells was determined by using fixable near-IR dead cell staining (Life-Technologies, Carlsbad, United States). Biotinylation was assessed by streptavidin-PE(BioLegend) staining for 10min at RT. T-cell activation was determined by theexpression of GFP expression under the control of the Nur77 promoter. Data wasacquired on a CantoTM flow cytometer (BD Bioscience, Allschwil, Switzerland) andanalyzed using the FlowJo software (Treestar, Ashland, OR, USA) (see SupplementaryFig. 12 for gating strategy).
Automated protein capture and processing. Labeled cell pellets were lysed in500 μl lysis buffer (100mM Tris, 1% sodium deoxycholate, 10mM Tris(2-carboxyethyl)phosphine, 15mM 2-chloroacetamide) by sonication for four intervals of 30 s in aVialTweeter (Hielscher Ultrasonics) at a power of 170W with 80% cycle time andsubsequent heating to 100 °C for 5min. The lysis buffer for bacterial cells additionallycontained 75 μg Ply511 Listeria endolysins to diminish cell wall integrity. Proteinconcentration was determined using a Nanodrop 2000 Spectrophotometer (ThermoFisher Scientific) and equal amounts between sample and control conditions (typically3mg protein) were subjected to automated capture and processing of photolabeledproteins using a liquid-handling robot. Specifically, in-house packed tips containing80 μl Streptavidin Plus UltraLink resin (Thermo Fisher Scientific) were hooked to aVersette liquid-handling system (Thermo Fisher Scientific) for automated mixing withcell lysate for 2.5 h and subsequent washing with 5M NaCl, StimLys buffer (50mMTris pH 7.8, 137mM NaCl, 150mM glycerol, 0.5mM EDTA, 0,1% Triton X-100),100mM NaHCO3 and 50mM (NH4)HCO3. Bead-bound proteins were enzymaticallydigested with 0.5 μg lysyl endopeptidase Lys-C (Wako, cat no. 125-05061) for 2 h at37 °C in 3M urea/50mM ammonium bicarbonate and subsequently diluted to 1.5Murea/50mM ammonium bicarbonate for overnight digestion with 0.8 μg sequencing-grade trypsin at 37 °C. Eluting peptides were C18-purified using 5–60 μg Ultra-MicroSpin Columns according to manufacturer’s instructions and resuspended in 3%acetonitrile (ACN), 0.1% formic acid (FA) containing iRT peptides (Biognosys AG,Schlieren, Switzerland) for mass spectrometric analysis.
Liquid chromatography-tandem mass spectrometry. For discovery-driven iden-tification of light-induced protein modifications, photo-oxidized transferrin peptideswere resuspended in 3% ACN, 0.1% FA and separated by reversed-phase chromato-graphy on an HPLC column (75-μm inner diameter, New Objective) that was packedin-house with a 15-cm stationary phase (ReproSil-Pur C18-AQ, 1.9 μm) and connectedto a nano-flow HPLC with an autosampler (EASY-nLC 1000, Thermo Scientific). TheHPLC was coupled to an Orbitrap Fusion Tribrid mass spectrometer (Thermo Sci-entific) equipped with a nanoelectrospray ion source (Thermo Scientific). Peptides wereloaded onto the column with 100% buffer A (99.9% H2O, 0.1% FA) and eluted at aconstant flow rate of 300 nl/min with a 45 linear gradient from 10–32% buffer B (99.9%ACN, 0.1% FA) followed by a 4-min transition from 32 to 54% buffer B. After thegradient, the column was washed for 10min with 98%, 4min with 10%, and again
NATURE COMMUNICATIONS | https://doi.org/10.1038/s41467-021-27280-x ARTICLE
NATURE COMMUNICATIONS | (2021) 12:7036 | https://doi.org/10.1038/s41467-021-27280-x | www.nature.com/naturecommunications 13
8min with 98% buffer B. Samples were acquired in DDA mode with a fixed cycle timeof 3 s (universal method). Electrospray voltage and capillary temperature were therebyset to 2.2 kV and 275, respectively. A high-resolution survey mass spectrum (from 395to 1500m/z) acquired in the Orbitrap with a resolution of 120,000 at m/z 200 (auto-matic gain control target value 5 × 10⁵ and maximum injection time 100ms) wasfollowed by MS/MS spectra with a resolution of 30,000 of most-abundant peptide ionswith a minimum intensity of 2 × 10⁴ that were selected for subsequent higher-energycollision-induced dissociation fragmentation with a fixed collision energy of 28% and anisolation window of 2Da. Fragments were detected by MS/MS acquisition in theorbitrap with an auto normal scan range mode, automatic gain control target value1 × 106 and a maximum injection time 200ms with parallelized ion injection set to on.Fragmented precursors were dynamically excluded for 10 s.
For tuning of light-induced protein modifications, photo-oxidized transferrinpeptides were resuspended and separated by reversed-phase high-performance liquidchromatography as described above. Eluting peptides were eluted into a Q-Exactive HFmass spectrometer (Thermo Scientific) equipped with a nanoelectrospray ion source(Thermo Scientific) and analyzed in DDA mode. A survey mass spectrum (from 350 to1650m/z) acquired in the Orbitrap with a resolution of 60,000 at m/z 200 (automaticgain control target value 3 × 10⁶ and maximum injection time 100ms) was followed by10 MS/MS spectra with a resolution of 15,000 of most-abundant peptide ions with aminimum intensity of 4.5 × 10⁴ that were selected for subsequent higher-energycollision-induced dissociation fragmentation with a stepped collision energy of 27% andan isolation window of 1.3 Da. Fragments were detected by MS/MS acquisition in theorbitrap with a scan range of 200–2000 m/z, automatic gain control target value 5 × 10⁴,and a maximum injection time 44ms. Fragmented precursors were dynamicallyexcluded for 15 s.
For antibody-, small molecule-, biomolecule-, and Thanatin-SOG guided LUX-MSsamples acquired in DDA mode, peptides were separated by reversed-phasechromatography on an HPLC column (75-μm inner diameter, New Objective) that waspacked in-house with a 15-cm stationary phase (ReproSil-Pur C18-AQ, 1.9 μm) andconnected to a nano-flow HPLC with an autosampler (EASY-nLC 1000, ThermoScientific). The HPLC was coupled to a Q-Exactive Plus mass spectrometer (ThermoScientific) equipped with a nanoelectrospray ion source (Thermo Scientific). Peptideswere loaded onto the column with 100% buffer A (99.9% H2O, 0.1% FA) and eluted ata constant flow rate of 300 nl/min with a 70-min linear gradient from 6–28% buffer B(99.9% ACN, 0.1% FA) followed by a 4-min transition from 28 to 50% buffer B. Afterthe gradient, the column was washed for 10min with 98% buffer B, 4min with 10%buffer B, and 8min with 98% buffer B. Electrospray voltage was set to 2.2 kV andcapillary temperature to 250 °C. A high-resolution survey mass spectrum (from 300 to1700m/z) acquired in the Orbitrap with a resolution of 70,000 at m/z 200 (automaticgain control target value 3 × 10⁶) was followed by MS/MS spectra in the Orbitrap at aresolution of 35,000 (automatic gain control target value 1 × 10⁶) of the 12 most-abundant peptide ions with a minimum intensity of 2.5 × 10⁴ that were selected forfragmentation by higher-energy collision-induced dissociation with a collision energy of28% and an isolation window of 1.4 Da. Fragmented precursors were dynamicallyexcluded for 30 s.
For the comparison of antibody-SOG LUX-MS (in H2O and D2O) and antibody-HRP guided proximity labeling, peptides were reconstituted in 3% ACN/0.1% FA/H2O.In all, 1 µg per sample was subjected to liquid chromatography-tandem massspectrometry using an nLC 1200 (Thermo Scientific) QExactive HFX (ThermoScientific) setup. Peptides were loaded onto a 30 cm in-house packed column (75 µmID, New Objective) with mobile phase buffer A containing 0.1% FA/H2O and separatedby reverse-phase chromatography with ReproSil-Pur 120A C18-AQ 1.9 μm stationaryphase (Dr. Maisch GmbH), heated to 50 °C. Peptides were eluted with mobile phasebuffer B, consisting of 80% ACN/0.1% FA/H2O, starting from 7% B up to 60% B in160min. Peptide intensities were acquired in a data-dependent acquisition mode.MS1 spectra were recorded from 350 to 1650m/z with a resolution of 60,000 at 200m/z. MS1 scans were triggered at an AGC of 3e6 or after 45ms. Top 12 peptides wereiteratively isolated within a 1.3m/z isolation window and fragmented by high-energycollisional dissociation (HCD) with a normalized collision energy of nce= 28.MS2 scans were triggered upon reaching the AGC target of 1e5 ions or after 22ms filltime and min AGC of 3e3. Fragment ions were monitored at a resolution of 15,000 at200m/z with a first fixed mass of 100m/z. Fragmented peptides were dynamicallyexcluded for 30 s for further analysis. Ions with charge state unassigned, 1 or >6 wereexcluded from fragmentation.
For bacteriophage-guided LUX-MS samples acquired in DDA mode, peptides wereseparated by reversed-phase chromatography on an HPLC column (75-μm innerdiameter, New Objective) that was packed in-house with a 15-cm stationary phase(ReproSil-Pur C18-AQ, 1.9 μm) and connected to a nano-flow HPLC with anautosampler (EASY-nLC 1000, Thermo Scientific). The HPLC was coupled to anOrbitrap Fusion Tribrid mass spectrometer (Thermo Scientific) equipped with ananoelectrospray ion source (Thermo Scientific). Peptides were loaded onto the columnwith 100% buffer A (99.9% H2O, 0.1% FA) and eluted at a constant flow rate of 300 nl/min with a 70-min linear gradient from 6–28% buffer B (99.9% ACN, 0.1% FA)followed by a 4-min transition from 28 to 50% buffer B. After the gradient, the columnwas washed for 10min with 98%, 4min with 10%, and again 8min with 98% buffer B.Electrospray voltage was set to 1.8 kV and capillary temperature to 275. A high-resolution survey mass spectrum (from 395 to 1500m/z) acquired in the Orbitrap witha resolution of 120,000 at m/z 200 (automatic gain control target value 2 × 10⁵ andmaximum injection time 50ms) was followed by MS/MS spectra of most-abundantpeptide ions with a minimum intensity of 5 × 10³ that were selected for subsequent
higher-energy collision-induced dissociation fragmentation with a collision energy of35% and an isolation window of 1.6 Da. Fragments were detected by MS/MSacquisition in the Ion Trap with scan rate set to “Rapid” (automatic gain control targetvalue 1 ×10 4 and maximum injection time 250ms). Fragmented precursors weredynamically excluded for 30 s.
For antibody-guided LUX-MS samples acquired in DIA mode, peptides wereseparated by reversed-phase chromatography on an HPLC column (75-μm innerdiameter, New Objective) that was packed in-house with a 15-cm stationary phase(ReproSil-Pur C18-AQ, 1.9 μm) and connected to a nano-flow HPLC with anautosampler (EASY-nLC 1200, Thermo Scientific). The HPLC was coupled to anOrbitrap Fusion Tribrid mass spectrometer (Thermo Scientific) equipped with ananoelectrospray ion source (Thermo Scientific). Peptides were loaded onto thecolumn with 100% buffer A (99.9% H2O, 0.1% FA) and eluted at a constant flowrate of 250 nl/min with a 70-min linear gradient from 6 to 28% buffer B (99.9%ACN, 0.1% FA) followed by a 4-min transition from 28 to 50% buffer B. After thegradient, the column was washed for 10 min with 98% buffer B, 4 min with 10%buffer B, and 8 min with 98% buffer B. Electrospray voltage was set to 4.0 kV andcapillary temperature to 320 °C. A survey scan acquired in the orbitrap with120,000 resolution, 50 ms max injection time, and an AGC target of 3 × 10⁶ wasfollowed by 24 precursor windows with fragmentation at a collision energy of 28%and MS/MS spectra acquisition in the orbitrap with 30,000 resolution. Theinjection time was set to auto, AGC target to 1 × 10⁶, and mass range to300–1700 m/z. For the spectral library, the samples were additionally measured onthe Q-Exactive Plus platform in DDA mode as described above
For gp33-guided LUX-MS samples acquired in DIA mode, peptides were separatedby reversed-phase chromatography on an HPLC column (75-μm inner diameter, NewObjective) that was packed in-house with a 30-cm stationary phase (ReproSil-Pur C18-AQ, 1.9 μm) and connected to a nano-flow HPLC with an autosampler (EASY-nLC1200, Thermo Scientific). The HPLC was coupled to an Orbitrap Fusion Lumos Tribridmass spectrometer (Thermo Scientific) equipped with a nanoelectrospray ion source(Thermo Scientific). Peptides were loaded onto the column with 100% buffer A (99.9%H2O, 0.1% FA) and eluted at a constant flow rate of 250 nl/min with a 240-minnonlinear gradient from 4–58% buffer B (80% ACN, 0.1% FA). After the gradient, thecolumn was washed for 10min with 98% buffer B, 4min with 1% buffer B. Electrosprayvoltage was set to 3.6 kV and capillary temperature to 320 °C. A survey scan acquired inthe orbitrap with 120,000 resolution, 50ms max injection time, and an AGC target of4 × 105 was followed by 80 precursor windows with fragmentation at a collision energyof 27% and MS/MS spectra acquisition in the orbitrap with 30,000 resolution. Theinjection time was set to auto, AGC target to 1 × 10⁶, and mass range to 350–2000m/z.For the spectral library, replicates of the illuminated and non-illuminated conditionswere pooled and analyzed on the same instrumental setup in DDA mode using auniversal method with equal gradient and collision energy of 27% and 30%.
Data analysis. Raw files acquired in DDA mode were searched against correspondingSwissProt-reviewed protein databases containing common contaminants using Comet(v.2015.01) within the Trans Proteomic Pipeline v.4.7 (SPC/ISB Seattle). Peptides wererequired to be fully tryptic with a maximum of two missed cleavage sites, carbami-domethylation as fixed modification, and methionine oxidation as a dynamic mod-ification. The precursor and fragment mass tolerance were set to 20 ppm and 1Da(MS2 ion trap) or 0.02Da (MS2 orbitrap), respectively. Proteins identified by at leasttwo proteotypic peptides were quantified by integration of chromatographic traces ofpeptides using Progenesis QI v.4.0 (Nonlinear Dynamics). Contaminant hits wereremoved, and proteins were filtered to obtain a false discovery rate of <1%. Raw proteinabundances were exported based on non-conflicting peptides.
For DIA analysis, raw files for spectral libraries acquired in DDA mode weresearched against corresponding SwissProt-reviewed protein databases containingcommon contaminants using the Sequest HT search engine within Thermo ProteomeDiscoverer version 2.4 (Thermo Scientific). Peptides were required to be fully trypticwith up to two missed cleavages. Carbamidomethylation was set as a fixed modificationfor cysteine. Oxidation of methionine and N-terminal acetylation were set as variablemodifications. For SILAC data, isotopically heavy labeled arginine (+10Da) and lysine(+8Da) were set as variable modifications. Monoisotopic peptide tolerance was set to10 ppm, and fragment mass tolerance was set to 1Da (MS2 ion trap) or 0.02Da (MS2orbitrap). The identified proteins were assessed using Percolator and filtered using thehigh peptide confidence setting in Protein Discoverer. Analysis results were thenimported to Spectronaut v.13 (Biognosys AG, Schlieren, Switzerland) for the generationof spectral libraries filtering for high confidence identification on peptide and proteinlevel. Raw files acquired in data-independent acquisition mode were analyzed usingSpectronaut v.13 with default settings. The proteotypicity filter “only protein groupspecific” was applied, and extracted feature quantities were exported from Spectronautusing the “Quantification Data Filtering” option. Within the R computing environment(v.3.4.0), protein abundance fold changes (expressed in log2) were calculated using alinear mixed-effect model and tested for statistical significance using a two-sided t testwith the appropriate degree of freedom in the R package MSstats (v.3.8.6)90. For humanproteins, cell surface localization was inferred by matching protein identifications to thein silico human surfaceome17. For all other organisms, cell surface localization wasinferred based on UniProt GO-term annotations being either “cell surface”, “cellmembrane”, or “secreted”. Significantly enriched proteins (abundance fold change >1.5and p value <0.05) were considered as acute proximity candidates of the ligand- orantibody-SOG construct. The CD20 surfaceome interaction network was generated
ARTICLE NATURE COMMUNICATIONS | https://doi.org/10.1038/s41467-021-27280-x
14 NATURE COMMUNICATIONS | (2021) 12:7036 | https://doi.org/10.1038/s41467-021-27280-x | www.nature.com/naturecommunications
using Cytoscape (v.3.7.1)94. Protein topology information was retrieved and visualizedusing the PROTTER interactive webtool95. Protein structures were visualized usingPyMOL Molecular Graphics System (v.2.4.0, Schrödinger, LLC.). Mass spectrometrydata were visualized using ggplot2 (v.3.3.2). Interactive volcano plots were created usingan in-house developed R-script using the plotly package (https://plotly-r.com). The 3D-modeled pipette tray of Fig. 1 was created by Thomas Splettstoesser (www.scistyle.com).All other schematic figures were created using the BioRender webtool (https://biorender.com/).
Reporting summary. Further information on research design is available in the NatureResearch Reporting Summary linked to this article.
Data availabilityThe mass spectrometry data generated in this study have been deposited to theProteomeXchange Consortium (http://proteomecentral.proteomexchange.org) via thePRIDE partner repository96 under the accession code PXD020481 (LUX-MS data set).SwissProt-reviewed human protein databases were downloaded from https://www.uniprot.org/. Source data are provided with this paper.
Received: 4 November 2020; Accepted: 9 November 2021;
References1. Bausch-Fluck, D., Milani, E. S. & Wollscheid, B. Surfaceome nanoscale
organization and extracellular interaction networks. Curr. Opin. Chem. Biol.48, 26–33 (2019).
2. Jacobson, K., Liu, P. & Lagerholm, B. C. The lateral organization and mobilityof plasma membrane components. Cell 177, 806–819 (2019).
3. Mattila, P. K., Batista, F. D. & Treanor, B. Dynamics of the actin cytoskeletonmediates receptor cross talk: an emerging concept in tuning receptor signaling.J. Cell Biol. 212, 267–280 (2016).
4. Casaletto, J. B. & McClatchey, A. I. Spatial regulation of receptor tyrosinekinases in development and cancer. Nat. Rev. Cancer 12, 387–400 (2012).
5. García-Fernández, E. et al. Membrane microdomain disassembly inhibitsMRSA antibiotic resistance. Cell 171, 1354–1367.E20 (2017).
6. Viswanathan, K., Verweij, M. C., John, N., Malouli, D. & Früh, K. Quantitativemembrane proteomics reveals a role for tetraspanin enriched microdomainsduring entry of human cytomegalovirus. PLoS One 12, e0187899 (2017).
7. Chen, L. & Flies, D. B. Molecular mechanisms of T cell co-stimulation and co-inhibition. Nat. Rev. Immunol. 13, 227–242 (2013).
8. Cotton, A. D., Nguyen, D. P., Gramespacher, J. A., Seiple, I. B. & Wells, J. A.Development of antibody-based PROTACs for the degradation of the cell-surfaceimmune checkpoint protein PD-L1. J. Am. Chem. Soc. 143, 593–598 (2021).
9. Banik, S., Pedram, K., Wisnovsky, S., Riley, N. & Bertozzi, C. Lysosome-targeting chimaeras for degradation of extracellular proteins. Nature 584,291–297 (2020).
10. Rosenbaum, M. I., Clemmensen, L. S., Bredt, D. S., Bettler, B. & Strømgaard,K. Targeting receptor complexes: a new dimension in drug discovery. Nat.Rev. Drug Discov. 19, 884–901 (2020).
11. Kontermann, R. E. Dual targeting strategies with bispecific antibodies. MAbs4, 182–197 (2012).
12. Marshall, D. J. et al. Extracellular antibody drug conjugates exploiting theproximity of two proteins. Mol. Ther. 24, 1760–1770 (2016).
13. Lajoie, M. J. et al. Designed protein logic to target cells with precisecombinations of surface antigens. Science 369, 1637–1643 (2020).
14. van Oostrum, M. et al. Classification of mouse B cell types using surfaceomeproteotype maps. Nat. Commun. 10, 5734 (2019).
15. Wollscheid, B. et al. Mass-spectrometric identification and relativequantification of N-linked cell surface glycoproteins. Nat. Biotechnol. 27,378–386 (2009).
16. Bausch-Fluck, D. et al. A mass spectrometric-derived cell surface protein atlas.PLoS One 10, e0121314 (2015).
17. Bausch-Fluck, D. et al. The in silico human surfaceome. Proc. Natl Acad. Sci.USA 115, E10988–E10997 (2018).
18. Zheng, S. et al. A new branched proximity hybridization assay for thequantification of nanoscale protein-protein proximity. PLoS Biol. 17,e3000569 (2019).
19. Miller, K. E., Kim, Y., Huh, W.-K. & Park, H.-O. Bimolecular fluorescencecomplementation (BiFC) analysis: advances and recent applications forgenome-wide interaction studies. J. Mol. Biol. 427, 2039–2055 (2015).
20. Petschnigg, J. et al. The mammalian-membrane two-hybrid assay (MaMTH)for probing membrane-protein interactions in human cells. Nat. Methods 11,585–592 (2014).
21. Galaway, F. & Wright, G. J. Rapid and sensitive large-scale screening of lowaffinity extracellular receptor protein interactions by using reaction inducedinhibition of Gaussia luciferase. Sci. Rep. 10, 10522 (2020).
22. Husain, B. et al. A platform for extracellular interactome discovery identifiesnovel functional binding partners for the immune receptors B7-H3/CD276and PVR/CD155. Mol. Cell. Proteom. 18, 2310–2323 (2019).
23. Martinez-Martin, N. et al. The extracellular interactome of the humanadenovirus family reveals diverse strategies for immunomodulation. Nat.Commun. 7, 11473 (2016).
24. Frei, A. P. et al. Direct identification of ligand-receptor interactions on livingcells and tissues. Nat. Biotechnol. 30, 997–1001 (2012).
25. Sobotzki, N. et al. HATRIC-based identification of receptors for orphanligands. Nat. Commun. 9, 1519 (2018).
26. Rhee, H.-W. et al. Proteomic mapping of mitochondria in living cells viaspatially restricted enzymatic tagging. Science 339, 1328–1331 (2013).
27. Liu, Q. et al. A proximity-tagging system to identify membraneprotein–protein interactions. Nat. Methods (2018) https://doi.org/10.1038/s41592-018-0100-5.
28. Geri, J. B. et al. Microenvironment mapping via Dexter energy transfer onimmune cells. Science 367, 1091–1097 (2020).
29. Jiang, S. et al. A proteomics approach to the cell-surface interactome using theenzyme-mediated activation of radical sources reaction. Proteomics 12, 54–62(2012).
30. Li, X.-W. et al. New insights into the DT40 B cell receptor clusterusing a proteomic proximity labeling assay. J. Biol. Chem. 289, 14434–14447(2014).
31. Loh, K. H. et al. Proteomic analysis of unbounded cellular compartments:synaptic clefts. Cell 166, 1295–1307.e21 (2016).
32. Bar, D. Z. et al. Biotinylation by antibody recognition-a method for proximitylabeling. Nat. Methods 15, 127–133 (2017).
33. Di Mascio, P. et al. Singlet molecular oxygen reactions with nucleic acids,lipids, and proteins. Chem. Rev. 119, 2043–2086 (2019).
34. Jacobson, K., Rajfur, Z., Vitriol, E. & Hahn, K. Chromophore-assisted laserinactivation in cell biology. Trends Cell Biol. 18, 443–450 (2008).
35. Fresnadillo, D. G. & Lacombe, S. Reference Photosensitizers for theProduction of Singlet Oxygen. Singlet Oxygen: Applications (2016) https://doi.org/10.1039/9781782620389-00105.
36. Kuimova, M. K., Yahioglu, G. & Ogilby, P. R. Singlet oxygen in a cell: spatiallydependent lifetimes and quenching rate constants. J. Am. Chem. Soc. 131,332–340 (2009).
37. Hatz, S., Lambert, J. D. C. & Ogilby, P. R. Measuring the lifetime of singletoxygen in a single cell: addressing the issue of cell viability. Photochem.Photobiol. Sci. 6, 1106–1116 (2007).
38. DeRosa, M. C. & Crutchley, R. J. Photosensitized singlet oxygen and itsapplications. Coord. Chem. Rev. 233-234, 351–371 (2002).
39. Tolstenkov, O. et al. Functionally asymmetric motor neuronscontribute to coordinating locomotion of Caenorhabditis elegans. Elife 7,e34997 (2018).
40. Takemoto, K. et al. Optical inactivation of synaptic AMPA receptors erasesfear memory. Nat. Biotechnol. 35, 38–47 (2017).
41. Pélissier-Monier, A., Sanson, B. & Monier, B. Performing chromophore-assisted laser inactivation in drosophila embryos using GFP. Methods Mol.Biol. 1478, 161–176 (2016).
42. Lin, J. Y. et al. Optogenetic inhibition of synaptic release with chromophore-assisted light inactivation (CALI). Neuron 79, 241–253 (2013).
43. Jori, G. & Rapozzi, V. Chapter 40:Photodynamic Therapy. In Singlet Oxygen279–303 (2016).
44. Pohl, J., Preuß, A. & Röder, B. Chapter 41:Photodynamic Inactivation ofMicroorganisms. In Singlet Oxygen 305–318 (2016).
45. Shu, X. et al. A genetically encoded tag for correlated light and electronmicroscopy of intact cells, tissues, and organisms. PLoS Biol. 9, e1001041(2011).
46. Boassa, D. et al. Split-miniSOG for spatially detecting intracellular protein-protein interactions by correlated light and electron microscopy. Cell Chem.Biol. 26, 1407–1416.e5 (2019).
47. To, T.-L. et al. Photoactivatable protein labeling by singlet oxygen mediatedreactions. Bioorg. Med. Chem. Lett. 26, 3359–3363 (2016).
48. Glasgow, H. L. et al. Laminin targeting of a peripheral nerve-highlightingpeptide enables degenerated nerve visualization. Proc. Natl. Acad. Sci. USA113, 12774–12779 (2016).
49. Kim, J. et al. Oxidative modification of cytochrome c by singlet oxygen. FreeRadic. Biol. Med. 44, 1700–1711 (2008).
50. Seyfizadeh, N., Seyfizadeh, N., Hasenkamp, J. & Huerta-Yepez, S. A molecularperspective on rituximab: a monoclonal antibody for B cell non Hodgkinlymphoma and other affections. Crit. Rev. Oncol. Hematol. 97, 275–290(2016).
51. Kläsener, K. et al. CD20 as a gatekeeper of the resting state of human B cells.Proc. Natl. Acad. Sci. USA 118, e2021342118 (2021).
NATURE COMMUNICATIONS | https://doi.org/10.1038/s41467-021-27280-x ARTICLE
NATURE COMMUNICATIONS | (2021) 12:7036 | https://doi.org/10.1038/s41467-021-27280-x | www.nature.com/naturecommunications 15
52. Kleiveland, C. R. Peripheral Blood Mononuclear Cells. In The Impact of FoodBioactives on Health: in vitro and ex vivo models (eds. Verhoeckx, K. et al.)161–167 (Springer International Publishing, 2015).
53. Matheson, I. B. C. & Lee, J. Chemical reaction rates of amino acids with singletoxygen. Photochem. Photobiol. 29, 879–881 (1979).
54. Oostindie, S. C. et al. CD20 and CD37 antibodies synergize to activatecomplement by Fc-mediated clustering. Haematologica 104, 1841–1852(2019).
55. Gentner, E. et al. Association of CXCR4 with IgM and IgD BCR isotypes: rolein B cell malignancies. Blood 132, 1852–1852 (2018).
56. Kläsener, K., Maity, P. C., Hobeika, E., Yang, J. & Reth, M. B cell activationinvolves nanoscale receptor reorganizations and inside-out signaling by Syk.Elife 3, e02069 (2014).
57. Mattila, P. K. et al. The actin and tetraspanin networks organize receptornanoclusters to regulate B cell receptor-mediated signaling. Immunity 38,461–474 (2013).
58. Malavasi, F. et al. CD38 and chronic lymphocytic leukemia: a decade later.Blood 118, 3470–3478 (2011).
59. Polyak, M. J., Li, H., Shariat, N. & Deans, J. P. CD20 homo-oligomersphysically associate with the B cell antigen receptor. Dissociation uponreceptor engagement and recruitment of phosphoproteins and calmodulin-binding proteins. J. Biol. Chem. 283, 18545–18552 (2008).
60. Petrie, R. J. & Deans, J. P. Colocalization of the B cell receptor and CD20followed by activation-dependent dissociation in distinct lipid rafts. J.Immunol. 169, 2886–2891 (2002).
61. Szöllósi, J., Horejsí, V., Bene, L., Angelisová, P. & Damjanovich, S.Supramolecular complexes of MHC class I, MHC class II, CD20, andtetraspan molecules (CD53, CD81, and CD82) at the surface of a B cell line JY.J. Immunol. 157, 2939–2946 (1996).
62. Powell, L. D. & Varki, A. The oligosaccharide binding specificities of CD22beta, a sialic acid-specific lectin of B cells. J. Biol. Chem. 269, 10628–10636(1994).
63. Lin, S. X., Mallet, W. G., Huang, A. Y. & Maxfield, F. R. Endocytosed cation-independent mannose 6-phosphate receptor traffics via the endocyticrecycling compartment en route to the trans-Golgi network and asubpopulation of late endosomes. Mol. Biol. Cell 15, 721–733 (2004).
64. Fani, R., Brilli, M., Fondi, M. & Lió, P. The role of gene fusions in theevolution of metabolic pathways: the histidine biosynthesis case. BMC Evol.Biol. 7, S4 (2007).
65. Vetterli, S. U. et al. Thanatin targets the intermembrane protein complexrequired for lipopolysaccharide transport in Escherichia coli. Sci. Adv. 4,eaau2634 (2018).
66. Rassam, P. et al. Supramolecular assemblies underpin turnover of outermembrane proteins in bacteria. Nature 523, 333–336 (2015).
67. Sumrall, E. T. et al. Phage resistance at the cost of virulence: Listeriamonocytogenes serovar 4b requires galactosylated teichoic acids for InlB-mediated invasion. PLoS Pathog. 15, e1008032 (2019).
68. Collins, B., Curtis, N., Cotter, P. D., Hill, C. & Ross, R. P. The ABC transporterAnrAB contributes to the innate resistance of Listeria monocytogenes to nisin,bacitracin, and various beta-lactam antibiotics. Antimicrob. Agents Chemother.54, 4416–4423 (2010).
69. Fooksman, D. R. et al. Functional anatomy of T cell activation and synapseformation. Annu. Rev. Immunol. 28, 79–105 (2010).
70. Achour, A. et al. A structural basis for LCMV immune evasion: subversion ofH-2D(b) and H-2K(b) presentation of gp33 revealed by comparative crystalstructure analyses. Immunity 17, 757–768 (2002).
71. Pircher, H. et al. Viral escape by selection of cytotoxic T cell-resistant virusvariants in vivo. Nature 346, 629–633 (1990).
72. Voisinne, G., Gonzalez de Peredo, A. & Roncagalli, R. CD5, an undercoverregulator of TCR signaling. Front. Immunol. 9, 2900 (2018).
73. Gimferrer, I. et al. The accessory molecules CD5 and CD6 associate on themembrane of lymphoid T cells. J. Biol. Chem. 278, 8564–8571 (2003).
74. Rocha-Perugini, V., Sánchez-Madrid, F. & Martínez Del Hoyo, G. Functionand dynamics of tetraspanins during antigen recognition and immunologicalsynapse formation. Front. Immunol. 6, 653 (2015).
75. Trinkle-Mulcahy, L. Recent advances in proximity-based labeling methods forinteractome mapping. F1000Res. 8, F1000 (2019).
76. Huttlin, E. L. et al. Dual Proteome-scale Networks Reveal Cell-specificRemodeling of the Human Interactome. Cell 184, 3022–3040.e28 (2021).
77. Huttlin, E. L. et al. Architecture of the human interactome defines proteincommunities and disease networks. Nature 545, 505–509 (2017).
78. Go, C. D. et al. A proximity biotinylation map of a human cell. Nature 595,120–124 (2021).
79. Luck, K. et al. A reference map of the human binary protein interactome.Nature 580, 402–408 (2020).
80. Esbelin, J. et al. Comparison of three methods for cell surface proteomeextraction of Listeria monocytogenes biofilms. OMICS 22, 779–787(2018).
81. Wu, C.-H., Liu, I.-J., Lu, R.-M. & Wu, H.-C. Advancement and applications ofpeptide phage display technology in biomedical science. J. Biomed. Sci. 23, 8(2016).
82. Pollock, S. B. et al. Highly multiplexed and quantitative cell-surface proteinprofiling using genetically barcoded antibodies. Proc. Natl. Acad. Sci. USA 115,2836–2841 (2018).
83. Dunne, M. et al. Reprogramming bacteriophage host range through structure-guided design of chimeric receptor binding proteins. Cell Rep. 29,1336–1350.e4 (2019).
84. Pasqual, G. et al. Monitoring T cell-dendritic cell interactions in vivo byintercellular enzymatic labelling. Nature 553, 496–500 (2018).
85. Ritter, A. T. et al. Actin depletion initiates events leading to granule secretionat the immunological synapse. Immunity 42, 864–876 (2015).
86. Fuertes Marraco, S. A. et al. Novel murine dendritic cell lines: a powerfulauxiliary tool for dendritic cell research. Front. Immunol. 3, 331 (2012).
87. Moran, A. E. et al. T cell receptor signal strength in Treg and iNKT celldevelopment demonstrated by a novel fluorescent reporter mouse. J. Exp.Med. 208, 1279–1289 (2011).
88. Kong, A. T., Leprevost, F. V., Avtonomov, D. M., Mellacheruvu, D. &Nesvizhskii, A. I. MSFragger: ultrafast and comprehensive peptideidentification in mass spectrometry-based proteomics. Nat. Methods 14,513–520 (2017).
89. Chang, H.-Y. et al. Crystal-C: a computational tool for refinement of opensearch results. J. Proteome Res. 19, 2511–2515 (2020).
90. Choi, M. et al. MSstats: an R package for statistical analysis of quantitativemass spectrometry-based proteomic experiments. Bioinformatics 30,2524–2526 (2014).
91. Carpenter, A. E. et al. CellProfiler: image analysis software for identifying andquantifying cell phenotypes. Genome Biol. 7, R100 (2006).
92. Snijder, B. et al. Image-based ex-vivo drug screening for patients withaggressive haematological malignancies: interim results from a single-arm,open-label, pilot study. Lancet Haematol. 4, e595–e606 (2017).
93. Gibson, D. G. et al. Enzymatic assembly of DNA molecules up to severalhundred kilobases. Nat. Methods 6, 343–345 (2009).
94. Shannon, P. et al. Cytoscape: a software environment for integrated models ofbiomolecular interaction networks. Genome Res. 13, 2498–2504 (2003).
95. Omasits, U., Ahrens, C. H., Müller, S. & Wollscheid, B. Protter: interactiveprotein feature visualization and integration with experimental proteomicdata. Bioinformatics 30, 884–886 (2014).
96. Perez-Riverol, Y. et al. The PRIDE database and related tools and resources in2019: improving support for quantification data. Nucleic Acids Res. 47,D442–D450 (2019).
AcknowledgementsWe acknowledge Julia Boshard, Heidi Funke, and Dr. Patrick Pedrioli for constructivediscussions and specific comments on the manuscript. We specifically acknowledge Dr.Damaris Bausch-Fluck and Dr. Andreas Frei for their strategic input and critical dis-cussions in the conceptional stage of the project. We are grateful to the members of theB.W. research group for suggestions and support at all stages of the project. We thankJ.R. Wyatt for scientific text editing and T. Splettstoeser for graphical support. We thankStephan Schneider for the technical assistance on phage enrichment and coupling withSOGs. We further acknowledge Dr. Sebastian Müller, Dr. Patrick Pedrioli, and Dr.Silvana Albert for assistance in analyzing the SILAC-DIA LUX-MS data set and DavidVogel for contributing to antibody-guided LUX-MS experiments. The following agenciescontributed and are acknowledged for their generous support: ETH (grant ETH-30 17-1and grant ETH-25 15-2) and Swiss National Science Foundation (grant 31003A_160259)for B.W. and NIH grants R01-GM-094231 and U24-CA210967 for A.I.N.
Author contributionsM.M. performed all experiments except those noted below. F.G. and N.B. performedisolation and FACS analysis of murine immune cells. Y.S. produced SOG-coupled bac-teriophages and performed immunofluorescence experiments. F.W. produced HRPconjugates, performed HRP-based labeling experiments, and performed flow cytometryexperiments comparing CD20 abundance. S.N.S. performed transferrin and CD20labeling experiments. S.U.V. and M.Mo. synthesized SOG-coupled Thanatin. J.R.P.provided CG1 and scientific expertise. Y.Se. performed isolation of PBMC and single-cellchemosensitivity screening. M.v.O. contributed to method optimization. R.H. and R.C.S.synthesized SOG-coupled gp33. A.I.N. contributed analytical tools. M.M., F.W., andB.W. optimized and performed LC-MS/MS acquisition. M.M., F.G., and N.B. analyzeddata. M.M., F.G., N.B., Y.S., J.R.P., E.M.C., J.W.B., B.S., J.A.R., M.J.L., A.O., and B.W.designed research. M.M. and B.W. conceived the project and wrote the paper.
Competing interestsJames R. Prudent is an employee/CEO of Centrose LLC, Madison, Wisconsin, USA, afor-profit private company. All other authors declare no competing interests.
ARTICLE NATURE COMMUNICATIONS | https://doi.org/10.1038/s41467-021-27280-x
16 NATURE COMMUNICATIONS | (2021) 12:7036 | https://doi.org/10.1038/s41467-021-27280-x | www.nature.com/naturecommunications

Additional informationSupplementary information The online version contains supplementary materialavailable at https://doi.org/10.1038/s41467-021-27280-x.
Correspondence and requests for materials should be addressed to Bernd Wollscheid.
Peer review information Nature Communications thanks the anonymous reviewers fortheir contribution to the peer review of this work. Peer reviewer reports are available.
Reprints and permission information is available at http://www.nature.com/reprints
Publisher’s note Springer Nature remains neutral with regard to jurisdictional claims inpublished maps and institutional affiliations.
Open Access This article is licensed under a Creative CommonsAttribution 4.0 International License, which permits use, sharing,
adaptation, distribution and reproduction in any medium or format, as long as you giveappropriate credit to the original author(s) and the source, provide a link to the CreativeCommons license, and indicate if changes were made. The images or other third partymaterial in this article are included in the article’s Creative Commons license, unlessindicated otherwise in a credit line to the material. If material is not included in thearticle’s Creative Commons license and your intended use is not permitted by statutoryregulation or exceeds the permitted use, you will need to obtain permission directly fromthe copyright holder. To view a copy of this license, visit http://creativecommons.org/licenses/by/4.0/.
© The Author(s) 2021
NATURE COMMUNICATIONS | https://doi.org/10.1038/s41467-021-27280-x ARTICLE
NATURE COMMUNICATIONS | (2021) 12:7036 | https://doi.org/10.1038/s41467-021-27280-x | www.nature.com/naturecommunications 17


