Embed Size (px)
Citation preview

Lightweight Testing of Communication Networks
with e-Motions
Javier Troya, Jose M. Bautista, Fernando Lopez-Romero,and Antonio Vallecillo
GISUM/Atenea Research Group. Universidad de Malaga, Spain{javiertc,jmbautista,fernando,av}@lcc.uma.es
Abstract. This paper illustrates the use of high-level domain specificmodels to specify and test some performance properties of complex sys-tems, in particular Communication Networks, using a light-weight ap-proach. By following a Model-Driven Engineering (MDE) approach, weshow the benefits of constructing very abstract models of the systemsunder test, which can then be easily prototyped and analysed to exploretheir properties. For this purpose we use e-Motions, a language and itssupporting toolkit that allows end-user modelling of real-time systemsand their analysis in a graphical manner.
1 Introduction
Lightweight modelling is the use of small, abstract models of the system understudy, and of push-button verification techniques [1]. The key ideas behind thisapproach, as proposed by Pamela Zave, are the construction of a very abstractmodel of the system and the use of analysis tools to explore its properties.Being the model very abstract in comparison to a real implementation, andfocusing only on the relevant concepts, it becomes small, tractable, and can beconstructed quickly. Being the analysis tools simple and pushbutton-based, theyyield results with little effort. Thus it becomes easy for the system designer toprototype the system, test its properties and re-adjust the designs in a cost-effective manner. Moreover, this enables an incremental and iterative approachto system design and testing, where the system is progressively specified andits properties analysed for correctness and against a set of quality requirements.The problems found during the testing process can be carefully analysed andeither the system design or the quality requirements refined accordingly.
In this paper we show how Domain Specific Modelling Languages (DSMLs)can help realizing this approach. In the first place, they allow end-users to createmodels of their systems at the right level of abstraction and with the appropriateprecision. Secondly, the produced models can be connected to powerful simula-tion and analysis tools using model transformations, to provide the push-buttoncapabilities required for accomplishing the analysis.
We illustrate our approach using the e-Motions language and supportingtoolkit [2], which enables the precise definition of real-time models in a graphicaland intuitive way, as well as its simulation and analysis [3].
M. Gogolla and B. Wolff (Eds.): TAP 2011, LNCS 6706, pp. 187–204, 2011.c© Springer-Verlag Berlin Heidelberg 2011

188 J. Troya et al.
Fig. 1. Communication Network Metamodel
As a running example we use a re-configurable Communication Network sys-tem, composed of computers that transmit messages through nodes that processand forward them to other nodes until messages reach their final destinations.Additional supporting nodes can be activated in case of network congestion toalleviate the temporary traffic bottlenecks. Assuming that the cost of acquiringand maintaining these extra nodes is not negligible, there are some tradeoffsbetween the quality of service provided by the network and its overall cost. Weshow how this kind of analysis and tests can be conducted with our proposal inan easy and cost-effective manner.
The structure of this paper is as follows. Section 2 introduces the runningexample and provides the motivation of our work. Then, Section 3 describes thestructural model of the system, and them how to model its behaviour so that itcan be later simulated and analysed, as discussed in Section 4. Finally, Section 5describes some related works and Section 6 presents the conclusions.
2 A Running Example
Let us start by describing the system that we want to model and whose perfor-mance and behaviour we want to analyse. It consists of a communication networkcomposed of different kinds of Components that can contain Packets. Each com-ponent has a specific location, given by two coordinates. The metamodel of thenetwork is shown in Fig. 1.
Users produce packets, while Servers consume them (i.e., they act as sourcesand sinks of the network, respectively). Components can exchange Packets onlyif they are connected. Such connection between components is modelled by theneighbours reference, that reflects the components that are reachable from agiven component. The network itself is modelled by a set of packet switchingNodes, which are the network elements in charge of receiving, processing andforwarding packets to other components. Nodes have one attribute (pkPr) in our
Lightweight Testing of Communication Networks with e-Motions 189
model to keep track of the packets they have processed so far. The buffer withthe set of received packets that a node has to process is modelled by means ofthe composition relation between Component and Packet.
One characteristic of our network is that the time each node spends in process-ing a packet depends on the number of packets in its buffer. The more packetsin the buffer, the more the node takes to process each one. This simulates abehaviour where nodes need to perform some operations on the flow of packets,such as sorting or merging them according to a given algorithm, for instance.Packets have two attributes, is being processed and timeStamp. The former indi-cates whether the packet is currently being processed by a node, while the latterstores the moment in time at which the packet enters the network. For routingpackets, nodes decide to forward packets to the neighbour node which is lessloaded, i.e., the one with the smallest buffer size.
In order to alleviate network congestion, an additional kind of nodes (calledSupportNodes) exists in the network. They can be activated and de-activateddepending on the load of the neighbouring nodes. Each SupportNode activatesitself if the number of packets in the buffer of any of the nodes connected to it viathe support relationship goes above the value defined in its threshold attribute.Similarly, it deactivates itself when the load of all connected nodes is above thethreshold. Attribute activations keeps track of the moments in time at which thesupport node changes its state.
Let us assume that the cost of acquiring, maintaining and running these extrasupport nodes cannot be ignored, as it happens for instance if support nodes arehired from external network providers, and their running costs depend on thetime they are active or on the number of packets they process. In this setting thesystem owner is faced with several decisions in order to maximize the quality ofservice provided by the network while minimizing its overall cost. Firstly, howmany supporting nodes need to be hired/purchased to guarantee a minimumlevel of throughput? Secondly, which is the optimal value for the threshold of eachsupport node that provides a required level of throughput with the minimumtime of support node activation (hence minimizing the running cost of the node)?
In order to be able to respond to these questions, we need to identify whichare the system parameters that are relevant to our analysis. In our case, we willfocus on the following ones:
– Throughput and delay of the overall network. They indicate how fastnodes process packets. Throughput tells us how many packets are processedby the network per unit of time. Delay indicates how many time units thepackets spend within the network. The higher the throughput, the lower thedelay, and so the higher the performance of the network.
– Packets processed per node. This measure provides an indication of thework load supported by each node. This is however a complex indicator dueto the way in which packets are processed in this network, and how theyarrive to nodes. The fact that processing time depends on the length ofthe buffer of pending packets may cause different behaviour depending onwhether packets are coming in bursts or at a regular pace.

190 J. Troya et al.
Fig. 2. Initial model of the network
– Packets processed per SupportNode. This measure is important becauseit provides an indication on the real need of these nodes.
– Activation times of SupportNodes. The time and frequency of activationof this kind of nodes also provides useful information about their actualusage in the current network configuration.
3 Modelling the Communication Network Usinge-Motions
3.1 Modelling the Structure
The first step is to model the initial configuration of the system. This is nothingbut a model that conforms to the Network metamodel. A possible configurationexample of a network is shown in Fig. 2 (please ignore the area within the dottedlines for now). This configuration defines three Users feeding packets into thenetwork and one Server consuming them. Each user accesses the network usingdifferent nodes. The network is composed of 8 (normal) nodes and 2 supportnodes (n9 and n10), which are initially deactivated. The activation of the support

Lightweight Testing of Communication Networks with e-Motions 191
nodes depends on the buffer size of nodes n3 and n4 for support node n9, andof nodes n5 and n6 for support node n10. This is specified by the correspondingsupport relations between the support nodes and the nodes they try to help.
3.2 Modelling Behaviour
Apart from the structure of our system, which is captured by the model shownin Fig. 2, we need to be able to describe its behavioural dynamics in a way thatallow us to reason about them. One way to do this is by describing the evolutionof the modelled artifacts along some time model. In MDE, this can be doneusing model transformations supporting in-place updates [4]. The behaviour ofthe system is then specified in terms of the permitted actions, which are in turnmodelled by the model transformation rules.
In-place transformations are composed of a set of rules, each of which repre-sents a possible action of the system. These rules are of the form l : [NAC]∗ ×LHS → RHS, where l is the rule’s label (its name), and LHS (left-hand side),RHS (right-hand side) and NAC (negative application conditions) are modelpatterns that represent certain (sub-)states of the system. The LHS and NACpatterns express the preconditions for the rule to be applied, whereas the RHSrepresents its postcondition, i.e., the effect of the corresponding action. Thus,a rule can be applied, i.e., triggered, if an occurrence (or match) of the LHS isfound in the model and none of its NAC patterns occurs. Generally, if severalmatches are found, one of them is non-deterministically selected and applied,producing a new model where the match is substituted by the appropriate in-stantiation of its RHS pattern (the rule’s realization). The model transformationproceeds by applying the rules in a non-deterministic order, until none is appli-cable — although this behaviour can be usually modified by some executioncontrol mechanism, e.g., strategies [5].
3.3 e-Motions
In [2] we presented e-Motions, a tool for the formal and precise definition of real-time DSMLs in a graphical and intuitive way developed for Eclipse. It extends in-place model transformation with a model of time and mechanisms to state actionproperties, designed for the specification of Domain Specific Visual Languages(DSVL) of real-time systems. Time-related attributes can be added to in-placerules to represent features like duration, periodicity, etc. Two types of rules weredefined to specify time-dependent behaviour, namely, atomic and ongoing rules.Atomic rules represent atomic actions with a specific duration, which is specifiedby an interval of time with any OCL [6] expression. In fact, e-Motions has fullsupport for OCL thanks to mOdCL [7], which implements and give semanticsto OCL in Maude [5]. The mentioned rules can be periodic, i.e., they admit aparameter that specifies the amount of time after which the action is periodicallytriggered (if the rule’s precondition holds, of course). In our latest version of e-Motions, probability distributions can be used for specifying these times. In thisway, we can, for example, let the arrival of packets to a system depend on apoisson distribution. Ongoing rules represent actions that progress continuously

192 J. Troya et al.
Fig. 3. NewPacket Rule
with time while the rule preconditions (LHS and not NACs) hold. Both atomicand ongoing rules can be scheduled, or be given an execution interval.
In order to be able to model both state-based and action-based properties, wehave also proposed extending model patterns with action executions to specifyaction occurrences. These action executions specify the type of the action (i.e.,the name of the atomic rule), its status (e.g., if the action is unfinished or real-ized) and its identifier. They may also specify its starting, ending and executiontime and the set of participants involved in it. This provides a very useful mech-anism when we want to check whether an object is participating in an action ornot, or if an action has already been executed.
A special kind of object, named Clock, represents the current global timeelapse. Designers are allowed to use it in their timed rules (using its attributetime) to know the amount of time that the system has been working.
e-Motions offers automated bridges to the Maude [5] executable languageand its formal toolkit. Maude is used as a formal notation to provide the precisesemantics of the corresponding e-Motions specifications (as described in [8]),while at the same time the model transformations between e-Motions and Maude(implemented in ATL [9]) allow the Maude tools to become available in the e-Motions environment. In this way, both simulation and the use of some formalanalysis tools are possible for e-Motions specifications [10].
3.4 Specifying the Behaviour of the Network
The behaviour of the network will be specified by a set of rules, each one de-scribing one possible action.
The NewPacket rule, shown in Fig. 3, simulates the generation of packetsby users. This process follows a uniform distribution in the interval [1,7], i.e.,a user generates a packet every duration time units. Here, duration determines

Lightweight Testing of Communication Networks with e-Motions 193
Fig. 4. Forwarding Rule
the duration of the rule and is calculated using a random number generator(eMotions.random(6) returns a value between 0 and 6). Packet attributes areinitialized at creation as shown in the right hand side of the rule.
The Forwarding rule (Fig. 4) models the forwarding of packets among com-ponents and nodes. This rule is fired when sending packets from users to nodesand from nodes to nodes. To apply this rule, the packet must not be being pro-cessed. Furthermore, there are two OCL expressions that have to be satisfiedin order to launch the rule. They state that the target node is the component’sneighbour which is processing a lower number of packets, and that it cannot be adeactivated support node. In the RHS pattern of the rule the packet has movedto the node and it has started being processed. The duration of this rule can beeither 0 or 1 time units (the fact that a packet can take 0 units simulates thesituation in which several packets are forwarded together to optimize an openconnection).
In Fig. 5(a) we can see the PacketProcessing rule. It models the processingof a packet by a node by modifying its is being processed attribute. The pckPrattribute of the node is increased in one unit as it has processed a new packet.The time this rule spends is directly proportional to the number of packetsbeing processed by the node. PacketArrival rule (Fig. 5(b)) models the arrivaland consumption of a packet from a node to the server. The time this ruleconsumes is either 0 or 1 time units.
Finally, activation and deactivation of support nodes is specified by two rules.ActivationSupport rule (Fig. 6(a)) deals with the activation of a support nodewhen it is deactivated and one of the nodes it supports is processing more pack-ets than indicated by the node threshold. DeactivationSupport rule (Fig. 6(b))carries out the opposite action. In both rules, the time unit when the activa-tion/deactivation occurs is added to the node’s activations attribute. These rulesare instantaneous rules, i.e., atomic rules with duration 0.

194 J. Troya et al.
(a) PacketProcessing Rule (b) PacketArrival Rule
Fig. 5. PacketProcessing and PacketArrival Rules
(a) Activate Rule (b) Deactivate Rule
Fig. 6. Activate and Deactivate Rules
3.5 Adding Observers for System Monitoring
Apart from the intrinsic properties of the system, there are also other featuresthat we may need to express and capture in our models. For example, in thisnetwork we are interested in monitoring the throughput and delay of the packetsprocessed by the network as well as in the number of packets processed by eachnode, especially the support nodes. The activation/deactivation frequency ofthe support nodes is also relevant. Although some of these properties could beanalysed using the model element attributes (e.g., number of processed packets),other features should be expressed using additional elements.
The traditional solution has normally consisted in extending the system meta-model with additional attributes, i.e., extending the structure of the system toaccommodate new state variables. In [3] we introduced observers for tacklingthis problem using a modular and reusable approach.

Lightweight Testing of Communication Networks with e-Motions 195
Fig. 7. Observers Metamodel
An observer is an object whose purpose is to monitor the state of the system:the state of the objects, of the actions, or both. Observers, as any other objects,have a state and a well-defined behaviour. The attributes of the observers capturetheir state and are used to store the variables that we want to monitor. We havedefined an Observers metamodel, which is shown in Fig. 7. We have three differentobservers:
– ThroughputOb, in charge of monitoring the throughput of the system (thenumber of packets processed by the network per time unit).
– DelayOb, that tracks with its delay attribute the average time spent by pack-ets to be processed by the network.
– CounterOb, responsible for counting packets. The packetsServer attributecounts the number of packets that arrive at the server. It is used to cal-culate the throughput and delay of the system. Attribute packetsNetworkstores the number of packets that users introduce in the network. Finally,totalPackets determines an upper limit for the simulation process, specifyingthe total number of packets that the network will process.
The idea for analysing the system with observers is to combine the originalmetamodel (Fig. 1) with the Observers’ metamodel (Fig. 7) to be able to use theobservers in our DSVL. Since e-Motions allows users to merge several metamod-els in the definition of the behaviour of a DSVL, we can define the Observersmetamodel in a non-intrusive way, i.e., we do not need to modify the systemmetamodel to add attributes to their objects. Furthermore, this approach alsoenables the reuse of observers across different DSVLs. The behaviour of theobservers is specified using rules, too.
To specify how observers monitor the non-functional properties of the sys-tem we have included them in the rules (inside the area delimited by dottedlines—these dotted lines do not form part of the rules, they have been added tothe diagrams of this paper for understandability reasons). Thus, starting withthe initial model of the system (Fig. 2), we see how we include an observer ofeach type in the network and we give their attributes some initial values. Wesee that the network will process up to 500 packets. Continuing with the New-Packet rule (Fig. 3), we use here the CounterOb observer to stop users generatepackets when the specified upper limit is reached. PacketArrival rule (Fig. 5(b))

196 J. Troya et al.
models the arrival of a packet to the server, updating the three observers’ stateappropriately: the CounterOb observer updates the number of packets arrived tothe server; the DelayOb observer updates its attributes to properly compute thedelay, and finally the ThroughputOb computes the current throughput.
4 Simulating and Analysing the Network
Once the specifications are written, this section describes how they can be sim-ulated and analysed with the e-Motions tool.
In e-Motions, the semantics of the real-time specifications is defined by meansof transformations to other domain with well-defined semantics, namely Real-Time Maude [11]. The e-Motions environment not only provides an editor forwriting the visual specifications, but also implements their automatic transfor-mation (using ATL) into the corresponding formal specifications in Maude.
One of the benefits of this approach is that it allows to make use of the Maudefacilities and tools available for executing and analysing the system specificationsonce they are expressed in Maude. In [10,8] we showed some examples of anal-yses that can be performed on the Maude specifications. Furthermore, Mauderewriting logic specifications are executable, and therefore they can be used asa prototype of the system and to run simulations.
In Maude, the result of a simulation is the final configuration of objectsreached after completing the rewriting steps, which is nothing but a model.This resulting model can then be transformed back into its corresponding EMFnotation, allowing the end-user to manipulate it from the Eclipse platform. Thesemantic mapping as well as the transformation process back and forth betweenthe e-Motions and Real-Time Maude specifications is described in detail in [8],although it is completely transparent to the e-Motions user. In this way the userperceives himself as working only within the e-Motions visual environment, with-out the need to understand any other formalism or being completely unaware ofthe Maude rewriting engine performing the simulation.
Regarding the use of the resulting models by other tools, e-Motions imple-ments a trivial model-to-text transformation that enables the creation of a .csvfile from an Ecore model. Such a csv file contains the information of every objectin the model, together with the values of all its attributes. Objects are namedby their identifiers, and attributes are expressed as a list of name-value pairs.Such file can be directly imported by different applications for performing dif-ferent kinds of analysis. For example, it can be fed to an spreadsheet applicationthat the domain expert can use to analyse the data, display charts, etc. In thisway, the domain expert will be able to easily display charts with the result of asimulation (which is in fact a model) to graphically represent the values of theparameters monitored by the observers throughout the whole simulation.
4.1 Tests
In order to understand how the network works and in order to analyse theparameters mentioned in Section 2, we have simulated the network with different

Lightweight Testing of Communication Networks with e-Motions 197
Fig. 8. Simulation time, delay and throughput
threshold values for the support nodes. They have ranged from −1 (the supportnode is always active) to 100 (they will never be active because the buffers ofthe nodes in our example keep always below that value). For every thresholdvalue we have run five different simulations since users introduce packets in thenetwork in a random manner. The figures showed in the charts correspond to theaverage results for the obtained values. In all the simulations, we have limitedthe number of packets that enter the network and reach the server to 500.
Fig. 8 shows the values of throughput, delay and the time units taken bythe simulations. Most variations occur when the threshold is between −1 and7, before they become stable. This is why the chart is divided in two horizontalparts, in which the left part zooms out the [1, 10] interval. The vertical axishas also been split into two sections, in order to distinguish the area where thethroughput values reside.
The examination of the chart reveals that, as expected, the best performance(highest throughput, lowest delay and lowest simulation time) is achieved whenthe support nodes are always active (threshold = −1). However, this is also themost expensive situation. The behaviour of the support nodes turns out to bemore interesting when the thresholds are between 3 and 6. In that range, thethree parameters experiment the biggest variation, making the network slower asthe thresholds increase. We can also see in the right part of the chart a variationin the simulation time and throughput that is a bit more pronounced than therest. It is between thresholds 70 and 80. We give an explanation to this factwhen we discuss the chart shown in Fig. 9.
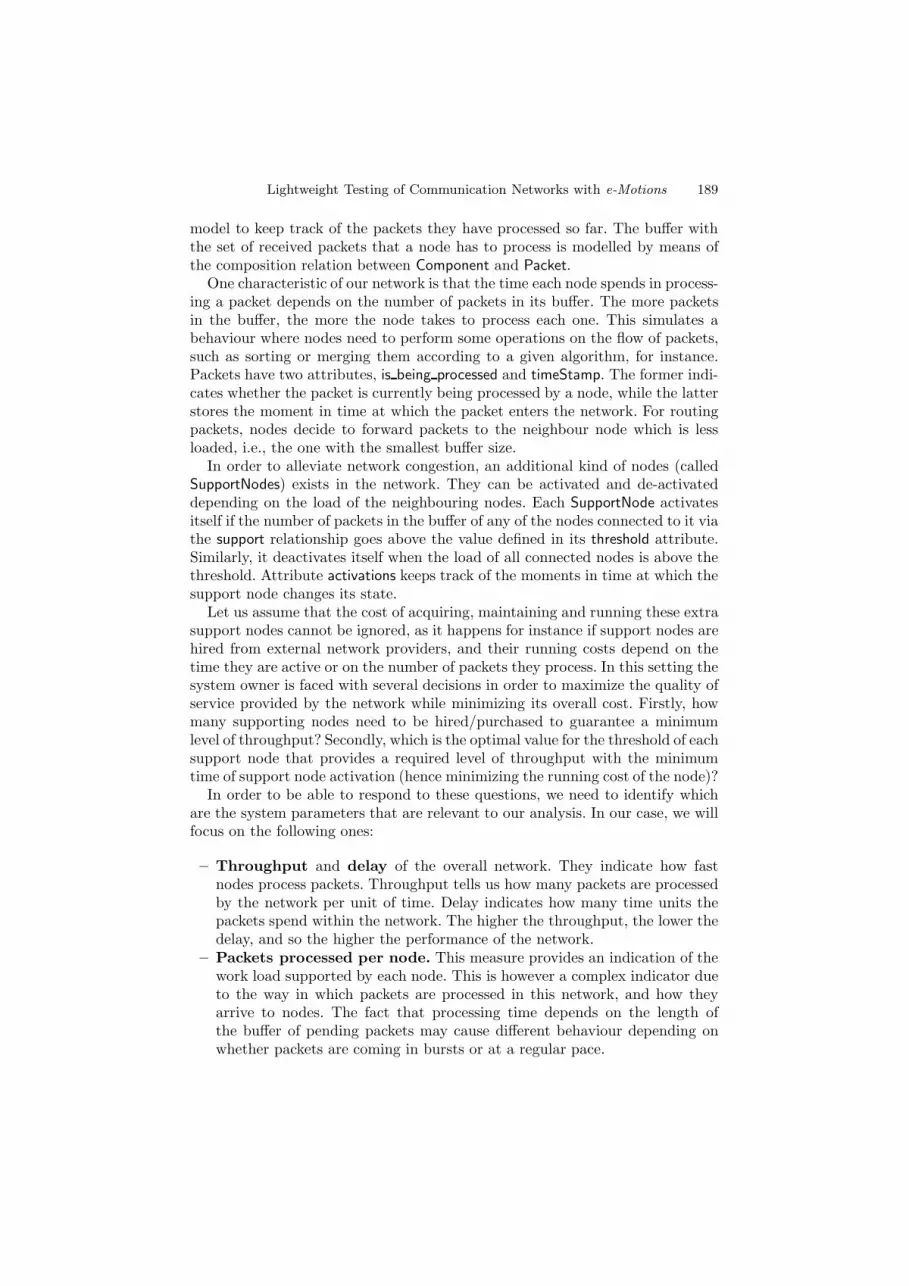
Fig. 9 shows the chart with the number of packets processed by the twosupport nodes for each threshold value. We see that the second support node(node n10 in Fig. 2) processes packets when its threshold is within the range[−1, 7). In fact, in the range [−1, 5] it processes more packets than the firstsupport node (node n9 in Fig. 2). However, this latter node keeps on process-ing packets until the threshold is 80. These results were initially unexpected, and
198 J. Troya et al.
Fig. 9. Packets processed by the support nodes 1 (n9) and 2 (n10)
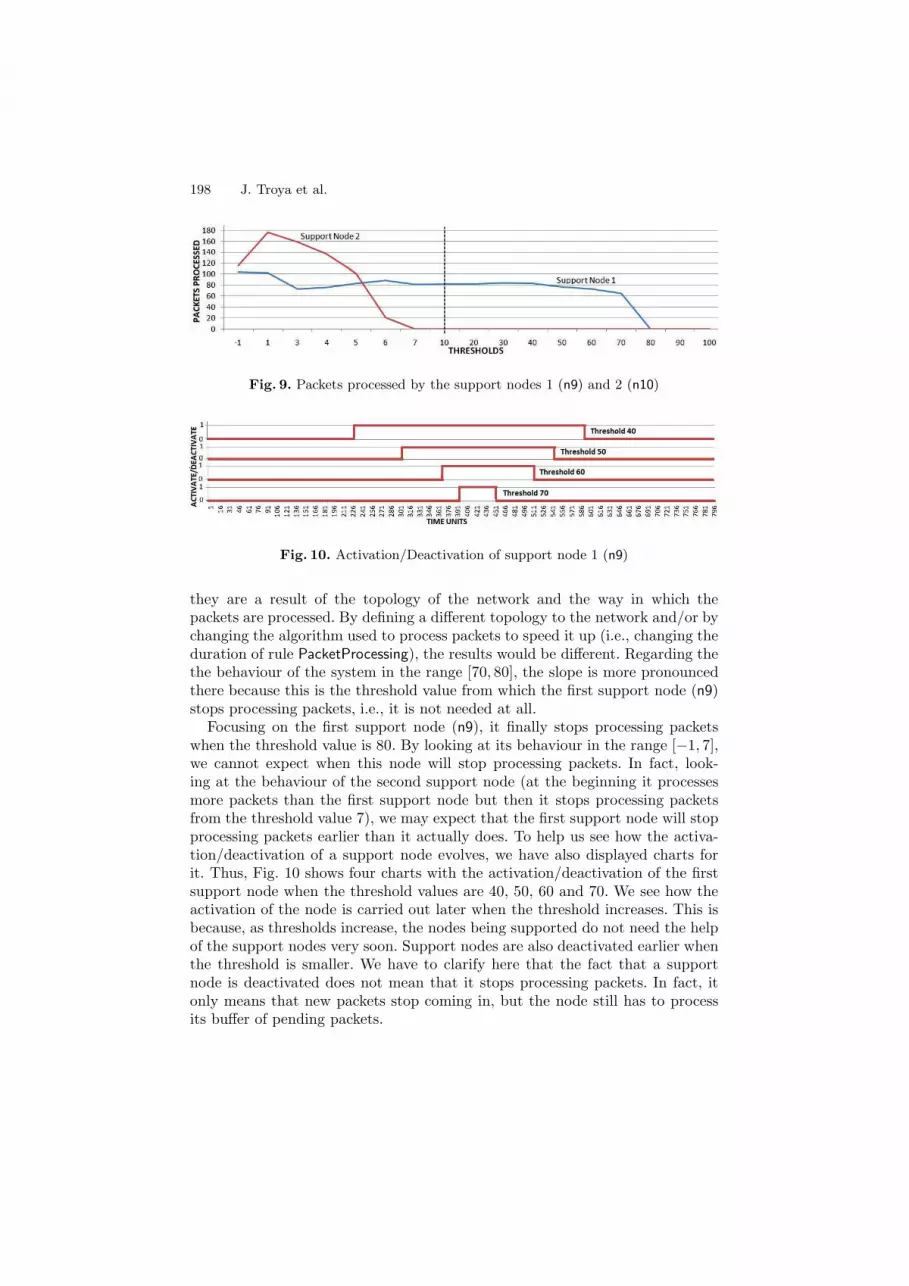
Fig. 10. Activation/Deactivation of support node 1 (n9)
they are a result of the topology of the network and the way in which thepackets are processed. By defining a different topology to the network and/or bychanging the algorithm used to process packets to speed it up (i.e., changing theduration of rule PacketProcessing), the results would be different. Regarding thethe behaviour of the system in the range [70, 80], the slope is more pronouncedthere because this is the threshold value from which the first support node (n9)stops processing packets, i.e., it is not needed at all.
Focusing on the first support node (n9), it finally stops processing packetswhen the threshold value is 80. By looking at its behaviour in the range [−1, 7],we cannot expect when this node will stop processing packets. In fact, look-ing at the behaviour of the second support node (at the beginning it processesmore packets than the first support node but then it stops processing packetsfrom the threshold value 7), we may expect that the first support node will stopprocessing packets earlier than it actually does. To help us see how the activa-tion/deactivation of a support node evolves, we have also displayed charts forit. Thus, Fig. 10 shows four charts with the activation/deactivation of the firstsupport node when the threshold values are 40, 50, 60 and 70. We see how theactivation of the node is carried out later when the threshold increases. This isbecause, as thresholds increase, the nodes being supported do not need the helpof the support nodes very soon. Support nodes are also deactivated earlier whenthe threshold is smaller. We have to clarify here that the fact that a supportnode is deactivated does not mean that it stops processing packets. In fact, itonly means that new packets stop coming in, but the node still has to processits buffer of pending packets.

Lightweight Testing of Communication Networks with e-Motions 199
Fig. 11. Packets processed by nodes n4 and n6
Not all the graphs of activations/deactivations are as uniform as the fourshown here. The complete set of charts and values obtained for the simulationscan be consulted in [12].
Finally, let us show a graph that we also consider of interest (Fig. 11). Itdisplays the number of packets processed by two nodes, n4 and n6 in Fig. 2).This graph is related to the one shown in Fig. 9, since the processing of packetsby the support nodes makes nodes n4 and n6 process less packets. In general,we can see that the more packets the first support node (n9) processes, the lesspackets n4 processes, and the same thing happens with the second support nodeand n6. For every threshold value, n6 processes more packets than n4 becauseone of the users sends packets directly to n6.
5 Related Work
There are many different proposals for monitoring and improving the perfor-mance and reliability of communication networks, from different perspectives.
In the first place we have those approaches that focus on the actual systemsand not on their prototypical models, such as [13,14,15,16]. These works measurethe performance of existing network connections (ATMs, multimedia networks,etc.) using dedicated tools. Of course their accuracy and level of precision is verygood, but they cannot be used in a predictive way. In other words, these methodsand tools are excellent for a posteriori testing the network and for checking thatit behaves as expected, but they cannot be used for planning purposes in thevery early phases of the network design to, e.g., evaluate design alternatives ordifferent routing protocols.
Other kind of approaches focus on design models of the system, before itis actually built. In these (model-driven) approaches, a prototype model of thesystem is constructed prior to the actual development and deployment, and thenanalysed for performance or reliability [17,18]. Model-driven proposals can bedifferentiated depending on three main characteristics: the level of detail used inthe models (from very abstract to very detailed); the kind of analysis that theyallow (analytical methods, such as Queueing Networks; formal analysis basedon the exhaustive exploration of the execution tree, such as model checking; oranalysis methods based on simulation techniques); and the level of flexibilityprovided by the supporting tools.

200 J. Troya et al.
Some proposals, such as [18,19,20], are based on UML for modelling systemsand networks, and normally make use of UML profiles like MARTE [21] for an-notating the models with the specification of QoS and other quality properties.These approaches normally provide considerable level of detail and tend to bevery precise. Moreover, their models can be transformed into other formalismssuch as Stochastic Petri Nets (SPN) [22], Queue Network Models (QNM) [23] andStochastic Process Algebras (SPA) [24] for performance or reliability analysis.As weak points, their specifications normally remain at a low level of abstraction,and require skilled levels of expertise from the user. Furthermore, their corre-sponding analytical models can handle certain types of behaviours, but theyare limited when the behaviour of the system does not follow specific patterns.For example, modelling networks with complex forwarding algorithms or packetarrival times that do not follow negative exponential distributions are hard tomodel and to analyse with these approaches. This is something at which we arevery strong with e-Motions, being able to simulate models whose behavioursfollow different distributions [3].
Flexibility is another essential characteristic of any modelling approach in or-der to be useful during the first phases of the design, but it is a common limitationof many existing approaches. For example, [25] presents a powerful proposal forevaluating the performance of packet switching communication networks usingstochastic processes. However, they have a fixed routing strategy and the wayof specifying the network is also fixed. With our approach, many different typesof networks can be modelled (by simply changing the metamodel or the rules)and different properties can be easily observed.
Visual languages based on graph transformations seem to provide the levelof flexibility required for specifying the structure and behaviour of this kind ofsystems. For example, Reiko Heckel specifies in [26] two protocols for reconfig-uring P2P networks, and analyse their reliability. Protocols are modelled usingstochastic graph transformations, which, as in our approach, take advantage ofnegative application conditions (NACs) and path expressions. For the specifica-tion and analysis of the system he uses model checking, chaining several tools(namely GROOVE and PRISM ). This approach allows very interesting anduseful kinds of analysis, but it also has some limitations. Firstly, even the veryhigh-level models of the system cause a state explosion that can become unman-ageable very soon. Secondly, in this approach users have to change the modellingenvironment when moving from the system design to the analysis, with the needto be familiar with more than one environment. The first problem is intrinsic tothe complexity of the networks to analyse and this is why simulation is some-times more effective to reveal design problems, specially in the early phases ofthe system design (at least, until the structure and dynamics of the system be-come stable). Then model checking or any other tool-supported mechanism thatallows exploring the execution tree may be used. In e-Motions we can use notonly simulation but also Maude’s search facilities, without having to escape thee-Motions environment.

Lightweight Testing of Communication Networks with e-Motions 201
There are also other interesting approaches for modelling and analysing net-works at a very high level of abstraction. For example, de Lara et al. presentin [27] a DSVL for the definition of traffic networks, using ATOM3. Once thenetwork is designed, they map the system models into both untimed and timedPetri nets and show how Petri net analysis and synthesis techniques can be ef-fectively used to analyse the models. In our approach, we map our model intoReal Time Maude, and the simulations performed are executed in Maude us-ing its rewrite engine — but in a transparent way to the user. There are manyother proposals based on graph transformations that allow modelling timed be-haviours [28,29,30,31,32]. However, none of them allows the use of OCL for spec-ifying expressions in attribute calculations and in rule durations. In addition tothe flexibility it offers, the expressiveness provided by OCL becomes very usefulfor specifying complex behaviours at the right level of abstraction and using anappropriate notation.
The final group of works that is related to our proposal allows conductingsimulations of the network models. We already mentioned the fact that theanalyses based on the exploration of the execution tree may be too heavy-weightfor the early phases of system design. And analytical methods, such as QNM orSPA may not be expressive enough to capture some particular characteristicsof the systems under study. This is when simulation techniques for analysingperformance requirements can be very useful. This is especially important inwireless self-organizing networks (WSONs), which need to be able to respondto dynamic changing environments, operating conditions and practices of use,in a robust way. In fact, the success of WSON-related applications seems to bestrongly related to the validation of properties of the network protocols usedin these systems. In [33] Alina et al. present a survey with a comprehensivereview of the literature on protocol engineering techniques and they discuss thechallenges imposed by WSONs to the protocol engineering community. Manyof the approaches presented in that paper can be extended to other kinds ofnetworks. They present formal and non-formal approaches. With respect to thelatter ones, in many works, e.g., [34,35,36], simulation is used to check protocoldesigns. They also use the concept of monitors, as we use observers, to defineentities that check the performance metrics during the simulation executions andgenerate the traces files accordingly. However, most of these proposals do notuse model-driven techniques: they implement the algorithms in general purposeprogramming languages such as Java. This results in expensive developmentcosts and efforts, in lack of flexibility and in error-prone simulators due to thecomplexity of the systems to simulate. Other works (e.g., [37]) have developedprototyping environments for certain kinds of networks, in order to avoid thisproblem. This is also what we have done, but showing how the use of domainspecific languages and a model-driven environment such as the one provided bye-Motions can be even more flexible, eliminating the restriction of having to dealwith particular kinds of networks (the ones for which the simulation frameworkwas developed).

202 J. Troya et al.
The basic e-Motions language has been presented in other papers, e.g., [2,3,8].This paper demonstrates how some of its features and mechanisms can be com-bined and used to accomplish lightweight modelling and testing of systems, andin particular of communication networks.
6 Conclusions and Future Work
In this paper we have presented a lightweight approach for the design and analy-sis of non-trivial systems, and showed how these can be realized using e-Motions.A communication network example has been used as a proof-of-concept of ourproposal, although similar kinds of systems and analysis can be applied in otherenvironments such as P2P networks or the Cloud [20].
There are several lines of work that we would like to explore next. For exam-ple, we would like to assign probabilities to the rules. In this way, apart fromneeding a match of the LHS pattern of the rule, we would also need some prob-ability parameter to be satisfied in order to fire the rule. The use of a similarapproach to the one used in Probabilistic Rewrite Theories (pMaude) [38] couldbe interesting, although other possibilities can also be considered. We also planto connect e-Motions to other interesting Maude tools, such as the LTL modelchecker [5]. The connection is now possible but requires human intervention. Ourplans are to fully integrate some of these tools so that they become accessibleto the user in a transparent way. Finally, we are defining connections to otherformalisms in addition to Maude, in order to make use of the tools available inthese semantic domains for performance and reliability analysis. In particular weare considering connections with Stochastic Petri Nets (SPN), Queue NetworksModels (QNM) and Stochastic Process Algebras (SPA), and their associatedtools. Although the expressiveness of these notations is different from the ex-pressiveness of e-Motions, having access from e-Motions to their analytic toolscan be of great help. Making the connections work in both ways can also be in-teresting. In this way these notations can have a direct access to the simulationfacilities provided by e-Motions.
Acknowledgements. We would like to thank the anonymous reviewers fortheir useful suggestions. This work has been supported by Spanish ResearchProjects P07-TIC-03184 and TIN2008-03107.
References
1. Zave, P.: Lightweight modeling of network protocols,http://www2.research.att.com/~pamela/model.html
2. Rivera, J.E., Duran, F., Vallecillo, A.: A graphical approach for modeling time-dependent behavior of DSLs. In: Proc. of the IEEE Symposium on Visual Lan-guages and Human-Centric Computing (VL/HCC 2009), pp. 51–55. IEEE Com-puter Society, Los Alamitos (2009)

Lightweight Testing of Communication Networks with e-Motions 203
3. Troya, J., Rivera, J.E., Vallecillo, A.: Simulating domain specific visual models byobservation. In: Proc. of the Symposium on Theory of Modeling and Simulation(DEVS 2010), Orlando, FL, US (April 2010)
4. Czarnecki, K., Helsen, S.: Classification of model transformation approaches. In:OOPSLA 2003 Workshop on Generative Techniques in the Context of MDA (2003)
5. Clavel, M., Duran, F., Eker, S., Lincoln, P., Martı-Oliet, N., Meseguer, J., Talcott,C.: All About Maude - A High-Performance Logical Framework. LNCS, vol. 4350.Springer, Heidelberg (2007)
6. Object Management Group: Object Constraint Language (OCL) Specification.Version 2.2, OMG Document formal/2010-02-01 (February 2010)
7. Roldan, M., Duran, F.: Representing UML models in mOdCL (2008),http://maude.lcc.uma.es/mOdCL
8. Rivera, J.E., Duran, F., Vallecillo, A.: On the behavioral semantics of real-timedomain specific visual languages. In: Olveczky, P.C. (ed.) WRLA 2010. LNCS,vol. 6381, pp. 174–190. Springer, Heidelberg (2010)
9. Jouault, F., Allilaire, F., Bezivin, J., Kurtev, I.: ATL: A model transformationtool. Science of Computer Programming 72(1-2), 31–39 (2008)
10. Rivera, J.E., Vallecillo, A., Duran, F.: Formal specification and analysis of do-main specific languages using Maude. Simulation: Transactions of the Society forModeling and Simulation International 85(11/12), 778–792 (2009)
11. Olveczky, P., Meseguer, J.: Semantics and pragmatics of Real-Time Maude. Higher-Order and Symbolic Computation 20(1-2), 161–196 (2007)
12. Atenea: Packet Switching Simulation Results (2011),http://atenea.lcc.uma.es/index.php/Page/Resources/
E-motions/PacketSwitchingExample/Results13. Jain, M., Dovrolis, C.: End-to-end available bandwidth: measurement methodology,
dynamics, and relation with tcp throughput. IEEE/ACM Transactions Network-ing 11(4), 537–549 (2003)
14. Carter, R.L., Crovella, M.E.: Measuring bottleneck link speed in packet-switchednetworks. Perform. Eval. 27-28, 297–318 (1996)
15. Lindh, T.: Performance management in switched ATM networks. In: Trigila, S.,Mullery, A., Campolargo, M., Vanderstraeten, H., Mampaey, M. (eds.) IS&N 1998.LNCS, vol. 1430, pp. 439–450. Springer, Heidelberg (1998)
16. Pacifici, G., Stadler, R.: Integrating resource control and performance manage-ment in multimedia networks. In: Proc. of the IEEE International Conference onCommunications, Seattle, WA, vol. 3, pp. 1541–1545 (1995)
17. Balsamo, S., Marco, A.D., Inverardi, P., Simeoni, M.: Model-based performanceprediction in software development: A survey. IEEE Trans. on Software Engineer-ing 30(5), 295–310 (2004)
18. Cortellessa, V., Di Marco, A., Inverardi, P.: Integrating performance and reliabilityanalysis in a non-functional MDA framework. In: Dwyer, M.B., Lopes, A. (eds.)FASE 2007. LNCS, vol. 4422, pp. 57–71. Springer, Heidelberg (2007)
19. Tawhid, R., Petriu, D.C.: Integrating performance analysis in the model drivendevelopment of software product lines. In: Busch, C., Ober, I., Bruel, J.-M., Uhl,A., Volter, M. (eds.) MODELS 2008. LNCS, vol. 5301, pp. 490–504. Springer,Heidelberg (2008)
20. Li, J., Chinneck, J., Woodside, M., Litoiu, M., Iszlai, G.: Performance model drivenQoS guarantees and optimization in clouds. In: Proceedings of the 2009 ICSEWorkshop on Software Engineering Challenges of Cloud Computing, CLOUD 2009,pp. 15–22. IEEE Computer Society, Vancouver (2009)
21. OMG: UML Profile for Modeling and Analysis of Real-time and Embedded Systems(MARTE). Object Management Group (June 2008), OMG doc. ptc/08-06-08

204 J. Troya et al.
22. Marsan, A.: Stochastic petri nets: An elementary introduction. In: Rozenberg, G.(ed.) APN 1989. LNCS, vol. 424, pp. 1–29. Springer, London (1990)
23. Denning, P.J., Buzen, J.P.: The operational analysis of queueing network models.ACM Comput. Surv. 10, 225–261 (1978)
24. Clark, A., Gilmore, S., Hillston, J., Tribastone, M.: Stochastic process algebras.In: Bernardo, M., Hillston, J. (eds.) SFM 2007. LNCS, vol. 4486, pp. 132–179.Springer, Heidelberg (2007)
25. Yaron, O., Sidi, M.: Performance and stability of communication networks viarobust exponential bounds. IEEE/ACM Transactions on Networking 1, 372–385(1993)
26. Heckel, R.: Stochastic analysis of graph transformation systems: A case study inP2P networks. In: Van Hung, D., Wirsing, M. (eds.) Theoretical Aspects of Com-puting ICTAC 2005. LNCS, vol. 3722, pp. 53–69. Springer, Heidelberg (2005)
27. de Lara, J., Vangheluwe, H., Mosterman, P.J.: Modelling and analysis of traffic net-works based on graph transformation. In: Proceedings of the FORMS/FORMATS2004 Symposium on Formal Methods for Automation and Safety in Railway andAutomotive Systems, Braunschweig, Germany, pp. 120–127 (2004)
28. Burmester, S., Giese, H., Hirsch, M., Schilling, D., Tichy, M.: The Fujaba real-timetool suite: model-driven development of safety-critical, real-time systems. In: ICSE2005, pp. 670–671. ACM, NY (2006)
29. Gyapay, S., Heckel, R., Varro, D.: Graph transformation with time: Causality andlogical clocks. In: Corradini, A., Ehrig, H., Kreowski, H.-J., Rozenberg, G. (eds.)ICGT 2002. LNCS, vol. 2505, pp. 120–134. Springer, Heidelberg (2002)
30. Syriani, E., Vangheluwe, H.: Programmed graph rewriting with time for simulation-based design. In: Vallecillo, A., Gray, J., Pierantonio, A. (eds.) ICMT 2008. LNCS,vol. 5063, pp. 91–106. Springer, Heidelberg (2008)
31. Boronat, A., Olveczky, P.C.: Formal real-time model transformations in MO-MENT2. In: Rosenblum, D.S., Taentzer, G. (eds.) FASE 2010. LNCS, vol. 6013,pp. 29–43. Springer, Heidelberg (2010)
32. de Lara, J., Vangheluwe, H.: Automating the transformation-based analysis ofvisual languages. Formal Aspects of Computing 22(3-4), 297–326 (2010)
33. Viana, A.C., Maag, S., Zaidi, F.: One step forward: Linking wireless self-organizingnetwork validation techniques with formal testing approaches. ACM Comput.Surv. 43, 7:1–7:36 (2011)
34. Girod, L., Elson, J., Cerpa, A., Stathopoulos, T., Ramanathan, N., Estrin, D.: Em*:a software environment for developing and deploying wireless sensor networks. In:Proceedings of the USENIX General Track (2004)
35. Girod, L., Stathopoulos, T., Ramanathan, N., Elson, J., Osterweil, E., Schoell-hammer, T., Estrin, D.: A system for simulation, emulation, and deployment ofheterogeneous sensor networks. In: Proceedings of the Second ACM Conference onEmbedded Networked Sensor Systems, pp. 201–213. ACM Press, New York (2004)
36. Keshav, S.: Real: A network simulator. Technical report, Berkeley, CA, USA (1988)37. Ben Abdesslem, F., Iannone, L., Dias de Amorim, M., Obraczka, K., Solis, I.,
Fdida, S.: A prototyping environment for wireless multihop networks. In: Fdida, S.,Sugiura, K. (eds.) AINTEC 2007. LNCS, vol. 4866, pp. 33–47. Springer, Heidelberg(2007)
38. Agha, G., Meseguer, J., Sen, K.: PMaude: Rewrite-based specification languagefor probabilistic object systems. Electronic Notes in Theoretical Computer Sci-ence 153(2), 213–239 (2006)


