Embed Size (px)
Citation preview

(35), ra2. [DOI: 10.1126/scisignal.1159433] 1Science SignalingSeptember 2008) Benjamin E. Turk, Michael B. Yaffe, Søren Brunak and Rune Linding (2Knapp, Nikolaj Blom, Peer Bork, Shawn Li, Gianni Cesareni, Tony Pawson, Sicheritz-Ponten, Marina Olhovsky, Adrian Pasculescu, Jes Alexander, StefanTinti, Lei Li, Marilyn Hsiung, Sirlester A. Parker, Jennifer Bordeaux, Thomas Martin Lee Miller, Lars Juhl Jensen, Francesca Diella, Claus Jørgensen, MicheleLinear Motif Atlas for Phosphorylation-Dependent Signaling
This information is current as of 2 September 2008. The following resources related to this article are available online at http://stke.sciencemag.org.
Article Tools http://stke.sciencemag.org/cgi/content/full/sigtrans;1/35/ra2
Visit the online version of this article to access the personalization and article tools:
MaterialsSupplemental
http://stke.sciencemag.org/cgi/content/full/sigtrans;1/35/ra2/DC1 "Supplementary Materials"
Related Content http://stke.sciencemag.org/cgi/content/abstract/sigtrans;2007/393/tw231
's sites:ScienceThe editors suggest related resources on
References http://stke.sciencemag.org/cgi/content/full/sigtrans;1/35/ra2#otherarticles
This article cites 57 articles, 30 of which can be accessed for free:
Glossary http://stke.sciencemag.org/glossary/
Look up definitions for abbreviations and terms found in this article:
Permissions http://www.sciencemag.org/about/permissions.dtl
Obtain information about reproducing this article:
the American Association for the Advancement of Science; all rights reserved. byAssociation for the Advancement of Science, 1200 New York Avenue, NW, Washington, DC 20005. Copyright 2008
(ISSN 1937-9145) is published weekly, except the last week in December, by the AmericanScience Signaling
on Septem
ber 2, 2008 stke.sciencem
ag.orgD
ownloaded from

C O M P U T A T I O N A L B I O L O G Y
Linear Motif Atlas for Phosphorylation-DependentSignaling
Martin Lee Miller,1,2* Lars Juhl Jensen,2,3* Francesca Diella,3 Claus Jørgensen,4
Michele Tinti,5 Lei Li,6 Marilyn Hsiung,4 Sirlester A. Parker,7 Jennifer Bordeaux,7
Thomas Sicheritz-Ponten,1 Marina Olhovsky,4 Adrian Pasculescu,4 Jes Alexander,8
Stefan Knapp,9 Nikolaj Blom,1 Peer Bork,2,10 Shawn Li,6 Gianni Cesareni,5 Tony Pawson,4
Benjamin E. Turk,7 Michael B. Yaffe,8† Søren Brunak,1,2† Rune Linding4,8,11†
(Published 2 September 2008)
Systematic and quantitative analysis of protein phosphorylation is revealing dynamic regulatory net-works underlying cellular responses to environmental cues. However, matching these sites to the ki-nases that phosphorylate them and the phosphorylation-dependent binding domains that maysubsequently bind to them remains a challenge. NetPhorest is an atlas of consensus sequence motifsthat covers 179 kinases and 104 phosphorylation-dependent binding domains [Src homology 2 (SH2),phosphotyrosine binding (PTB), BRCA1 C-terminal (BRCT), WW, and 14–3–3]. The atlas reveals newaspectsofsignalingsystems,includingtheobservationthattyrosinekinasesmutatedincancerhavelowerspecificitythantheirnon-oncogenicrelatives.Theresourceismaintainedbyanautomatedpipeline,whichusesphylogenetic trees to structure the currently available in vivo and in vitro data to derive probabilisticsequencemodelsof linearmotifs. Theatlas is available asacommunity resource (http://netphorest.info).
INTRODUCTION
Proteins in eukaryotes consist of two fundamentally different types of
functional building blocks or modules: protein domains and linear mo-
tifs. Whereas domains are often defined as large (>30 residues) glob-
ular units with defined binding or catalytic activities (1–4), linear
motifs are short colinear sequences, typically of less than 10 residues,
that often reside in disordered regions (1). Domains are frequently con-
served over long evolutionary distances and change through divergent
evolution (2, 3), whereas linear motifs evolve much more rapidly (5)
and can likely arise through convergent evolution because of their short
length (6).
Posttranslational modification of linear motifs is a driving force be-
hind directional and dynamic protein-interaction networks (7). One
such modification is phosphorylation, which modulates the binding
of protein domains (such as SH2 and BRCT) and thereby creates logic
gates (7). This enables the cell to swiftly integrate and respond to com-
binations of internal and external cues. Advances in mass-spectrometry
techniques have led to the identification of thousands of in vivo phos-
phorylation sites (8–11). However, most of these sites are uncharacter-
ized with respect to their roles in signaling, because the kinases
responsible for their phosphorylation and the proteins that recognize
these phosphorylated sites are often unknown (12). Linking these sites
to the hundreds of protein kinase catalytic domains (from hereon re-
ferred to as kinases) and modular binding domains is a challenge for
in-depth understanding of cellular signaling processes.
Whereas several resources exist for identifying protein domains
from sequence alone, for example, SMART (3) and Pfam (2), equally
powerful resources do not exist for linear motifs primarily because of
their low information content (4, 13, 14). Numerous methods
have been developed to predict potential phosphorylation sites for
specific kinases; these include the pioneering work (Scansite) on
position-specific scoring matrices (PSSMs) derived from peptide
libraries (13, 15–17), manually constructed sequence patterns
(14, 18, 19), and a variety of machine-learning algorithms that have
been trained on in vivo phosphorylation data (20–24). As new, powerful
phosphoproteomics methods continue to increase our knowledge of
cellular phosphorylation sites (8–11), models that are optimized to
classify experimentally identified sites (rather than to predict them)
according to the relevant kinase family or corresponding binding do-
mains are increasingly important. Classification is a difficult task, be-
cause of the limited number of known targets for individual kinases
and phosphorylation-dependent binding domains (phospho-binding
domains) and the large number of different domains [for example,
∼518 kinases in human (25)], many of which recognize similar se-
quence motifs.
Here, we present NetPhorest, an atlas of linear motifs involved in
phosphorylation-dependent signaling, which consists of 125 sequence
models that classify the substrates and ligands of 179 protein kinases
and 104 phospho-binding domains (phosphotyrosine: SH2 and PTB;
phosphoserine and phosphothreonine: 14-3-3, BRCT, and WW). We al-
so describe the computational framework and pipeline used for automat-
ically constructing this resource on the basis of currently available data
and experiments performed as part of this study. NetPhorest can thus be
1Center for Biological Sequence Analysis, Technical University of Denmark,2800 Lyngby, Denmark. 2The Novo Nordisk Foundation Centre for ProteinResearch, University of Copenhagen, 2200 Copenhagen, Denmark. 3Euro-pean Molecular Biology Laboratory, 69117 Heidelberg, Germany. 4SamuelLunenfeld Research Institute, Mount Sinai Hospital, M5G 1X5 Toronto, Ontar-io, Canada. 5Uni versity of Rome, Tor Vergata, 00133 Rome, Italy. 6Univer-sity of Western Ontario, N6A 5C1 London, Ontario, Canada. 7Department ofPharmacology, Yale University School of Medicine, New Haven, 06520 CT,USA. 8Center for Cancer Research, Massachusetts Institute of Technology,Cambridge, 021329 MA, USA. 9Structural Genomics Consortium, Universityof Oxford, OX3 7DQ Oxford, UK. 10Max-Delbrück-Centre for Molecular Med-icine, 13092 Berlin, Germany. 11Cellular & Molecular Logic Team, The Insti-tute of Cancer Research, SW3 6JB London, UK.*These authors contributed equally to this work.†To whom correspondence should be addressed. E-mail: [email protected] (S.B.), [email protected] (M.B.Y.), and [email protected] (R.L.)
R E S E A R C H A R T I C L E
www.SCIENCESIGNALING.org 2 September 2008 Vol 1 Issue 35 ra2 1
on Septem
ber 2, 2008 stke.sciencem
ag.orgD
ownloaded from

maintained as an up-to-date resource for analysis of phosphorylation-
dependent signaling.
RESULTS
The NetPhorest resource accomplishes four major goals. First, it pro-
vides the most comprehensive atlas of linear motifs recognized by spe-
cific protein kinases and domains that bind to phosphorylated residues.
Second, it contains a collection of probabilistic classifiers that enables
experimentally identified phosphorylation sites to be classified (ac-
cording to kinases and phospho-binding domains) with much higher ac-
curacy than existing sequence-based methods. Third, an automatic
pipeline keeps the resource up to date with the latest data from in vivo
and in vitro experiments. Fourth, the classifiers are made available both
through a Web interface (http://netphorest.info) and as a fast, portable
stand-alone software application.
Tree-based data organization and redundancy reductionThe first essential steps toward automated construction of sequence
models of linear motifs are the collection and organization of the data.
Weuse two fundamentally different types of experimental data. First, dec-
adesof targetedstudieshaveresulted ina relatively largeandfairly reliable
data set of in vivo protein-phosphorylation sites that are linked to at least
one kinase [Phospho.ELM (26)] or phospho-binding domain [DOMINO
(27)]. Second, several in vitro methods allow the interrogation of kinase
specificity by degenerate peptide libraries (15,17,28).Whereas the latter
represent the most abundant data type, for our purposes it is essential to
design a framework that can combine the two, resulting in a single clas-
sification system. To this end, we map both in vivo and in vitro data onto
phylogenetic trees of the kinase and phospho-binding domains (25, 29)
(Fig. 1A and fig. S2), which capture how similar the domains are to
one another and thereby how likely they are to have similar substrate
specificities. The tree-based approach thus enables us to make infer-
ences based on the fact that highly similar domains typically have simi-
lar substrate specificities, but it does not assume that dissimilar domains
necessarily have dissimilar substrate specificities.
The domain trees also serve as a powerful data structure that
enables us to automatically incorporate all data related to any family
or subfamily of domains. Thus, the trees are used to automatically
compile training and benchmark data sets for specific domains and
for families of related domains (Fig. 1B). For example, known in vivo
substrates of all protein kinase C (PKC) isoforms would be included as
positive examples in the data set for the PKC family, whereas negative
examples would be drawn from the known in vivo substrates of all oth-
er kinases. By contrast, the data set on PKCα would include only its
own substrates as positive examples, and substrates of other PKC iso-
forms and all other kinases would now be considered negative ex-
amples. Consequently, the sequence models are evaluated on their
ability to discriminate between substrates of different kinases or targets
of distinct binding domains, which is the task at hand when interpret-
ing phosphoproteomics data, rather than on their ability to predict
phosphorylation sites (20–24). The exclusion of nonphosphorylated
sites also ensures that the sequence-specificity atlas is not distorted
by the numerous sites that are not phosphorylated by any kinase be-
cause they are structurally inaccessible to all kinases and hence contain
no information about their sequence specificity.
Frequently, corresponding phosphorylation sites from sets of similar
proteins have been identified in separate studies. These observations
cannot be considered independent observations because of their evolu-
tionary relationship, and therefore we eliminate redundant sites for
which either the proteins or the sites themselves are too similar in
sequence (Fig. 1C, see Methods for details). Because many machine-
learning methods as well as accuracy measures work poorly on highly
unbalanced data sets in which the numbers of positive and negative
examples differ by orders of magnitude (30), we randomly reduce each
data set to include only five negative examples per positive example.
Constructing sequence models of linear motifsEarly initiatives for ab initio prediction of linear motifs relied on simple
consensus patterns compiled from the literature; for example, the pat-
tern [ST]P..[RK] is commonly used to search for cyclin-dependent ki-
nase (CDK) substrates (14, 18, 19). Although appealing because of
their simplicity, such patterns oversimplify the mechanisms that govern
kinase–substrate recognition (20, 31). In particular, they are unable to
model correlations between individual residues and their joint contri-
bution to the binding energy. Furthermore, the absence of a scoring
scheme implies that predictions cannot be sorted according to their re-
liability, which makes the approach unsuited for large-scale studies.
To represent the relative affinities with which domains recognize dif-
ferent peptide sequences, we use PSSMs and artificial neural networks
(ANNs) (32), which mainly differ in that the latter can also capture non-
linear correlations between residues. For the in vitro assays that cannot
reveal such correlations (16, 33), we construct PSSMs, whereas we train
ANNson the invivo andpeptide-based invitrophosphorylationdata (34).
Although many other machine-learning algorithms are available, we
chose to use ANNs because they are fast to construct and to execute
and have been successfully used for predicting various linear motifs
(20, 35, 36).Moreover, different machine-learning algorithms give simi-
lar results when trained on the same data (36, 37), and resources are thus
better spent, in our view, on improving the quality of the training data and
on automation to rapidly accommodate new data rather than on testing
many alternative machine-learning algorithms.
Three data sets are needed to construct an ANN: a training set for opti-
mizing the weights, a test set for selecting the optimal network architecture
and training parameters, and an independent validation set for assessing the
prediction accuracy. To optimally use the available data, we adopt a fourfold
cross-validation scheme in which the final sets of positive and negative
examples are randomly partitioned into four equal parts, of which we use
two for training, one for testing, and one for validation. All 12 possible per-
mutations of these sets are then used for training and evaluating an ensem-
ble of ANNs (Fig. 1D, see Methods for details). Applying this procedure to
the currently available data yielded 151 and 134 ANN predictors for sub-
strates of kinases and targets of phospho-binding domains, respectively.
Integration of heterogeneous modelsSequence models of linear motifs produce scores that are not directly
comparable between models for different domains. To enable use of a
collection of PSSMs and ANNs for classification of phosphorylation
sites, this issue must first be resolved. We therefore designed a scoring
scheme in which the raw scores from different models are calibrated
through benchmarking against a common reference, namely, our com-
pilation of phosphorylation sites. The benchmarking converts the raw
scores into probabilistic scores, which, in contrast to the raw scores or
percentile scores, can be directly compared between classifiers.
To construct a calibration curve for each ensemble of ANNs, we calcu-
late the fraction of correct predictions within different score intervals on the
validation set and fit these values with a sigmoid function (fig. S4, see
Methods for details). In case of PSSMs, we first calculated a scaling factor
for each PSSM on the basis of its score distribution on random peptides.
Subsequently, we calculate individual calibration curves based on the
R E S E A R C H A R T I C L E
www.SCIENCESIGNALING.org 2 September 2008 Vol 1 Issue 35 ra2 2
on Septem
ber 2, 2008 stke.sciencem
ag.orgD
ownloaded from

Fig. 1. Tree-based organization, redundancy reduction, and partitioning
of data. (A) All available data from in vivo and in vitro experiments for ki-
nase, SH2, and PTB domains are organized by mapping them onto the
phylogenetic domain trees. (B) The tree data structure enables us to au-
tomatically compile a data set of positive and negative examples for each
domain or family of related domains. For a given domain (leafs in the tree)
or domain family (branch points in the tree), we exclude phosphorylation
sites that cannot be unambiguously designated as positive or negative
examples, because they were annotated at a higher level in the tree.
(C) Redundant phosphoproteins and phosphorylation sites are identi-
fied and eliminated on the basis of sequence similarity of the full-length
protein sequence or the phosphorylation sites themselves. (D) Each
redundancy-reduced data set is partitioned into four parts that are
used for training, test, and validation of ANNs. See fig. S1 for a flow-
chart of the pipeline, fig. S2 for an overview of the data coverage, and
Methods for details.
R E S E A R C H A R T I C L E
www.SCIENCESIGNALING.org 2 September 2008 Vol 1 Issue 35 ra2 3
on Septem
ber 2, 2008 stke.sciencem
ag.orgD
ownloaded from

complete redundancy-reduced data setswhen at least 12 siteswere known for
thekinasesorbindingdomainsinquestion.For theremainingPSSMs,wecon-
structed two generic calibration curves representing the average reliability of
PSSMs for kinase and phosphotyrosine-binding domains, respectively.
The resulting calibration curves enable us to estimate the (posterior)
probability that a site is recognized by a particular kinase, phospho-
binding domain, or family thereof. However, because the fractions of
positive examples within the redundancy-reduced data sets do not re-
flect the corresponding prior probabilities (the probability that a kinase
or domain recognizes a site regardless of its sequence), the calibration
curves must first be rescaled accordingly. Because the prior probability
for each family of kinases or phospho-binding domain is not known, an
estimated prior probability was used that is based on the square root of
the number of different domains within the family in question; the
square root was chosen to take into account that the prior probability
increases less than proportionally with size of the family, as similar
domains often recognize similar motifs (see Methods for details).
Selecting a nonredundant set of classifiersThe final step in the NetPhorest workflow is to select a set of classifiers
that strikes a compromise between having the highest prediction accu-
racy, the most finely resolved families, and the broadest coverage of
kinases and phospho-binding domains. The tree-based organization
of the data and the consistent benchmarks of all sequence models
are the keys to automating this task (Fig. 2).
First,weassigntheclassifiers tofamiliesofrelatedkinasesorphospho-
bindingdomainsbasedon thephylogenetic domain trees.WhereasANNs
naturally belong to the family forwhich theywere trained (Fig. 2A), an in
vitro experiment is always performed with a specific purified protein or
domain (for example, the ataxia telangiectasia mutated (ATM) protein
kinase), yet the resulting PSSM may be better used as a classifier for a
family including other closely related domains (for example, the sub-
family composed of ATM and ATM Related (ATR), the ATM/ATR sub-
family).WethusbacktrackeachPSSMin the treeandconsider it apossible
classifier for everynodeon thepath connecting the root of the treewith the
node at which the PSSM was initially assigned (Fig. 2B). To avoid as-
signing a single classifier to an overly divergent family of kinases or
phospho-binding domain, we calculate the pairwise sequencesimilarity
of all domain sequences within each family and eliminate families with a
self-normalized bit score less than 0.3 (Fig. 2C, see Methods).
Next, we evaluate the predictive performance of the classifiers on the
basis of their receiver operating characteristic (ROC) curves, which show
sensitivity as function of false-positive rate (fig. S8).We summarize each
curve in a single number, the area under theROCcurve (AROC),which is
equivalent to the Mann–Whitney U statistic (38). We discard any of the
sequence models that do not perform significantly better than random
(P < 0.05), as judged by resampling the scores of positive and negative
examples toconstruct a (bootstrapped)AROCdistribution (seeMethods).
In cases where we are still left with several alternative classifiers for the
Fig. 2. Selectionof classifiers using thephosphoinositide3-kinase-related
kinase (PIKK) family of kinases as an example. (A) ANNs are trained for in-
dividual domains, subfamilies, and families of domains; by contrast, the
PSSMs are initially assigned to the specific domain with which the in vitro
assay was performed. (B) As some PSSMs (for example, the one for ATM)
may be better used as classifiers for a subfamily of closely related kinases
(forexample,ATM/ATR),webacktrackallPSSMstoward therootof the tree.
(C)Weeliminate families thatcontaindomainsthatarehighlydissimilar from
each other (for example, the PIKK family and the ATM/ATR/mTOR sub-
family), in order not to describe highly divergent domains with the same
ANNs and PSSMs (see Methods). (D) Whenever possible, we benchmark
theANNsandPSSMsanddiscardclassifiers thatdonotperformsignificant-
ly better than random expectation. (E) A nonredundant set of classifiers is
selected that maximizes the average AROC across all kinases, SH2 do-
mains, or PTB domains. (F) For the PIKK family of kinases, this procedure
selects the ANNs for the ATM/ATR subfamily, mTOR, and DNA-
dependent protein kinase (DNAPK) to be the best combination of classi-
fiers. See fig. S3 for an overview of the current selection of classifiers.
R E S E A R C H A R T I C L E
www.SCIENCESIGNALING.org 2 September 2008 Vol 1 Issue 35 ra2 4
on Septem
ber 2, 2008 stke.sciencem
ag.orgD
ownloaded from
same family of domains (for example, an ANN and a Scansite PSSM for
the ATM kinase), we select the one with the best predictive performance
according to our benchmarks (Fig. 2D).
At this stagewemay still have multiple classifiers that cover the same
kinase or phospho-binding domain; for example, wemay have classifiers
for both ATM alone and for the ATM/ATR subfamily (Fig. 2E). To elim-
inate this redundancy,weselectanonoverlappingsetamongtheremaining
classifiers thatmaximizes the averageAROC across all domains. For this
purpose, PSSMs that could not be benchmarked because of lack of site-
specific data are considered to have the average AROC of PSSMs for the
domaintypeinquestion(that is,kinase,SH2,PTB,BRCT,WW,or14–3–3).
Any domain that is not covered by a given set of classifiers is considered
equivalent to a random predictor (AROC = 0.5). In the case of ATM, this
leads to the selection of the ATM/ATR subfamily over ATM alone because
theAROC for the subfamily is higher than the average for its twomembers,
ATM and ATR (Fig. 2F). Using these selection criteria, the NetPhorest
pipelineyields anonredundant collectionof 125 sequence-based classifiers
that cover 179 of 518 kinase domains, 93 of 118 SH2 domains, 8 of 18
phosphotyrosine-binding PTB domains, and the PIN1 WW domain (fig.
S3 and table S1). This includes new PSSMs for the kinases LKB1, MST1,
TLK1 and TNIK (seeMethods). Moreover, NetPhorest currently contains
two classifiers for BRCT domains and 14-3-3 proteins, respectively.
Comparison with other methodsAssessing the performance of a computational method is important for
two reasons: (i) to quantify the reliability of its predictions on an absolute
scale (for example, by calculatingposterior probabilities as described above)
(Fig. 3, fig. S8, and table S1 for details) and (ii) to determine how it fares
relative to existingmethods, that is, if scientific progress has beenmade
(30). To address the latter issue, we compared NetPhorest to four pub-
lished methods for kinase-specific prediction of phosphorylation sites
[GPS (22), KinasePhos (24), NetPhosK (20), and Scansite (13)] and to
the simple sequence patterns collected by theELM(14), PROSITE (19),
and HPRD (18) databases.
Because most methods have been trained on data from Phospho.ELM,
to make a fair comparison, we benchmarked each method on only the
phosphorylation sites that are dissimilar in sequence to those used for de-
veloping the NetPhorest method. Provided that at least five positive
examples were left, we evaluated the predictive performance of each pre-
dictor by calculating the AROC. Using a bootstrap procedure (see
Methods), we tested if the AROC of each predictor of each method is sig-
nificantly (P < 0.05) better than random guessing, significantly poorer than
the corresponding AROC of NetPhorest, or comparable to it. Of the 140
predictors that could be evaluated, 40 were random, 60 were worse, and 40
had comparable performance to NetPhorest (Fig. 4 and table S2). None of
the evaluated predictors were significantly better, this despite the fact that
the regular expressions tested may have been derived from some of the
examples in our benchmark sets and therefore have an unfair advantage.
We thus conclude that NetPhorest performs significantly better than
every other method tested and that more advanced machine-learning
methods should be preferred over simple pattern-matching approaches
whenever sufficient data exist. This underlines the importance of having
a fully automated pipeline that allows new data to be easily incorporated.
Properties of linear motifsThe large number of kinases and phospho-binding domains covered by
NetPhorest provides a systematic viewof the biochemical features of phos-
phorylated linear motifs. The average length of a linear motif is often cited
as less than 10 amino acids (13, 14). This number agrees well with the
average lengths of our automatically selected ANN-based sequence
models, which are 11 and 9 amino acids for kinases and phospho-binding
domains, respectively. A related issue with linear motifs is the degree to
which the positions within a short peptide can be assumed to be
independent of eachother, that is, howmuchadditional information is pres-
ent in the inter-residue correlations. To investigate this, we compared the
performance of linear and nonlinear ANNs trained on the same data sets,
which allowed direct measurement of nonlinearity in the sequence model.
Underliningtheimportanceof inter-residuecorrelations,theaveragepredic-
tive performance (AROC) for kinases drops from 0.79 to 0.75 (P < 10−3,
Wilcoxon test) when a linear model is used [an ANNwith no hidden layer
(32)]. This is particularly evident for the tyrosine kinases Tec, FLT,CSF1R,
andMet, for which the AROCdrops bymore than 20%when inter-residue
correlations are not considered (table S1). This limits the usefulness of in
vitro assays that reveal only position-specific amino acid preferences.
Comparing sequence specificities of the many kinases and phos-
photyrosine-binding domains revealed that, whereas similar protein ki-
nases and phosphotyrosine-binding domains tend to recognize similar
substrates or ligands, the correlation between domain and substrate
similarity is far from perfect (R2 = 0.18, P < 10−12 and R2 = 0.31, P <
10−6 for kinases and SH2 domains, respectively; only domain pairs with
a self-normalized bit score of 0.3 or higher are considered) (fig. S5).
Whereas closely related domains typically recognize similar sequence mo-
tifs, the reverse is not true because even distinct domain families that di-
verged before the last common ancestor of eukaryotes may have similar
sequence specificities. Prominent examples of the latter include the pro-
line-directed kinases [CDKs and the mitogen-activated protein kinases
(MAPKs)] and the kinases ATM, ATR, and DNAPK that recognize a glu-
tamine (Q) in position +1 relative to the phosphorylated serine or threonine
residue (fig. S5).However,we observe subtle differences in sequence spec-
ificity even among the proline-directed kinases. Whereas CDK1, 2, 3, and
5 all show the canonical preference for positively charged residues in po-
sition +3 (and to a lesser extent, +2 and +4), the MAPKs favor proline or
leucine in position −2 [as well as −1 in case of the c-Jun N-terminal kinase
(JNK) subfamily] (fig. S7).
DISCUSSION
The objective, data-driven procedure by which the final set of classifiers
was selected gives insight into the sequence specificity of individual
members within kinase families. This analysis reveals that, given the cur-
rentdata, it isoftenimpossible toderiveindividualkinase-specific classifiers,
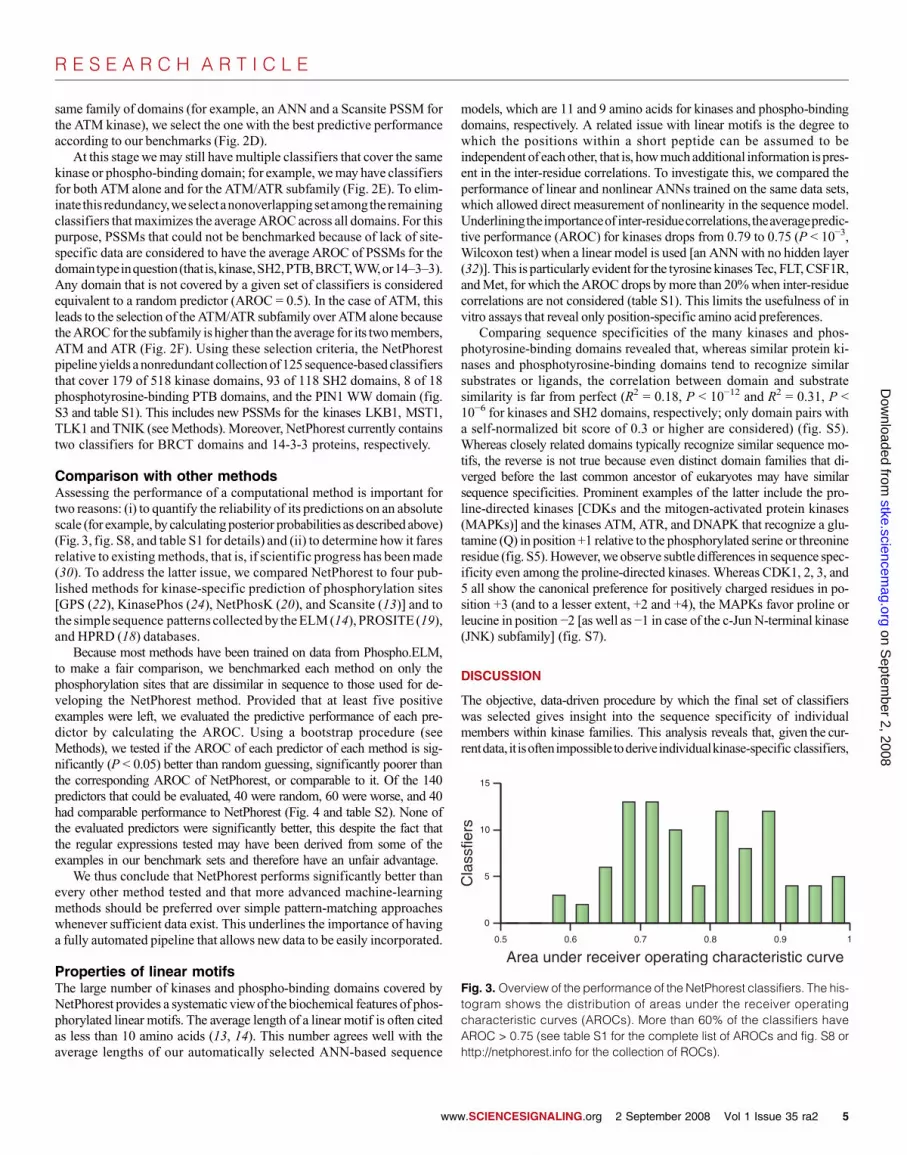
Fig. 3. Overview of the performance of the NetPhorest classifiers. The his-
togram shows the distribution of areas under the receiver operating
characteristic curves (AROCs). More than 60% of the classifiers have
AROC > 0.75 (see table S1 for the complete list of AROCs and fig. S8 or
http://netphorest.info for the collection of ROCs).
R E S E A R C H A R T I C L E
www.SCIENCESIGNALING.org 2 September 2008 Vol 1 Issue 35 ra2 5
on Septem
ber 2, 2008 stke.sciencem
ag.orgD
ownloaded from

even when sufficient data are available for several family members. In par-
ticular, it is clear that kinases of the Src family recognize the same, weak
consensus sequence. In other words, the current data strongly suggest that
these kinases are very similar at themotif level, implying that either they
are functionallyredundantor their specificity must be determined by the
context in which the kinase is presented to a potential substrate. We
recently showed that combining sequence motifs and contextual
information greatly improves the accuracy with which kinases and
substrates can be linked (12). This approach, NetworKIN, will ben-
efit from the extended library of sequence motifs in NetPhorest.
The specificity of many kinases is provided in part through the rec-
ognition of binding motifs other than those containing the phosphoryl-
ation site itself; as an example, MAPKs typically bind short docking
motifs within their substrates (12, 39). Because all Src family kinases
contain SH2 domains, which may help direct the kinases to their proper
substrates, we tested if the tyrosine kinase domains that are linked to
SH2 domains have lower sequence specificities than other tyrosine ki-
nases and are reliant on an SH2 domain to function similar to a MAPK
docking motif. Comparison of the predictive power (AROC) of the
sequence models for the two groups of kinases revealed that this is in-
deed the case (P < 10−3, Student's t test; Fig. 5A). We thus speculate
that the combination of low-specificity kinase domains with interaction
domains (for example, SH2 and SH3) and docking motifs, which pro-
vide specificity in a combinatorial fashion, is a common theme in
phosphorylation-dependent signaling.
We further speculated thatmisregulation of kinaseswith low sequence
specificity could induce particularly large changes in phosphorylation
networks, which may lead to disease. This is supported by the obser-
vation that tyrosine kinases exhibit lower sequence specificity (AROC)
than serine/threonine kinases (P < 10−10, Student’s t test; Fig. 5A) and
are 10-fold more likely to harbor mutations that are causally implicated
in cancer according to the Cancer Genome Project (P < 10−8, Fisher’s
exact test). Furthermore, cancer-related tyrosine kinases, including those
encodedby theBCR–ABLandTEL–PDGFR fusiononcogenes,have low-
erAROC than other tyrosine kinases (P< 0.003, Student’s t test; Fig. 5B).
Together these observations suggest that the global regulatory network
changes observed in complex diseases, such as cancers, are in part due
to nonspecific kinases, which potentially phosphorylate new substrates
if they are abnormally expressed or become constitutively active.
Kinase activity is commonly regulated by autophosphorylation. It has
been suggested (40, 41) that the autophosphorylation sites of serine/threo-
nine kinases differ in sequence from sites within other substrates. The motif
scores for autophosphorylated sites in 10 serine/threonine kinases were sig-
nificantly lower than those for other substrates of the same kinases (P <
0.04, Kolmogorov–Smirnov test; Fig. 5C). Our results thus support a struc-
tural study of three serine/threonine kinases (41) and suggest that weak
sequence motifs may be a general feature of autophosphorylation sites.
In summary,we have presented a framework,NetPhorest, which auto-
mates the data set construction and training of sequencemodels for linear
motifs. The framework was applied to current data for substrates of pro-
tein kinases and phosphorylation-dependent binding domains. The re-
sulting classifiers have higher classification and predictive performance
than existing methods and cover 179 kinases, 93 SH2 domains, 8 PTB
domains as well as BRCT domains, WW domains, and 14-3-3 proteins.
With technologies such as peptide arrays (13, 16, 17, 42), phage display
(43), and semisynthetic epitope construction (44), a rapid increase in the
amount of linear motif data can be expected, stressing the importance of
having a fully automated system for training, benchmarking, and selec-
tion of sequence models. Thus, as additional data become available for
kinase docking motifs, phosphatases, or other types of modifications,
these can readily be included in the atlas to provide a more complete pic-
ture of signaling networks.
We envisage that theNetPhorest atlaswill be useful formany different
aspects of signaling- and proteomics-related research (Fig. 6). First, there
has been a recent trend in generating antibodies that recognize specific
phosphorylated residues or sequences (phospho-specific antibodies). In
particular, kinase “consensusmotif antibodies,” such as pS/T-Q, are pow-
erful tools for both targeted studies (12) as well as systems studies (45).
The atlas could be used to derive peptide sequences for raising such anti-
bodies. A related use is for designing synthetic peptides that can be used
to rewire cellular interaction networks or design new logic gates (46). In
addition, mass spectrometry–based proteomics experiments frequently
use simple sequence patterns for finding systematic biases in phospho-
peptides identified in shotgun approaches (8–11). Such studies will ben-
efit from the more robust and comprehensive collection of motifs in
NetPhorest.Computationalbiologystudies can, forexample,useNetPhorest
Fig. 4. Comparison of NetPhorest to other motif resources. We com-
pared NetPhorest to Scansite (13) and the sequence patterns of ELM
(14), PROSITE (19), and HPRD (18) using the entire compilation of phos-
phorylation sites. For NetPhosK (20), GPS (22), and KinasePhos (24), we
used only the subset of sites that was dissimilar in sequence to those used
to train classifiers of NetPhorest (see Methods for details). When at least
five positive examples were left, the AROC was calculated. Subsequent-
ly, we tested how many of the predictors from each method performed
no better than random, better than random but significantly poorer than
NetPhorest, or comparable to NetPhorest. No predictor from any of the
tested methods performed significantly better than the corresponding
NetPhorest classifier. The number on each pie chart specifies how many
predictors were tested from the method in question (see table S2 for de-
tails). Because classifiers from NetPhosK and Scansite were included in
NetPhorest, those two resources are shown above the dotted line.
R E S E A R C H A R T I C L E
www.SCIENCESIGNALING.org 2 September 2008 Vol 1 Issue 35 ra2 6
on Septem
ber 2, 2008 stke.sciencem
ag.orgD
ownloaded from

for evolutionary studies of cellular signaling networks. Finally, NetPhorest
will be used in future versions of the widely used resources Scansite (13),
NetPhosK (20), andNetworKIN (12). Its ability to continuously incorporate
the latest data will help accelerate systems-level modeling of cellular
signaling events. Furthermore, wewish to develop NetPhorest into a global
linear motif atlas by including other eukaryotic model organisms, such as
yeast, as well as other types of posttranslational modifications.We cordially
invite the scientific community to help expand the coverage of this resource
bysubmittingdataandpurifiedactiveenzymestotheauthors.TheNetPhorest
resource is released under the Creative Commons Attribution licenses and
can be accessed at http://netphorest.info.
METHODS
Collection of published phosphorylation sitesTobuildANN-basedpredictors andevaluate PSSMs for substrate recognition
by kinases and phospho-binding domains, we collected phosphorylation data
from several sources. The Phospho.ELM database (26) is the key repository
for phosphorylation sites and contains more than 13,000 experimentally
mapped phosphorylation sites of which most have been identified in vivo
in mammalian proteins. An updated andhand-curateddata set of 4169exper-
imentally verified kinase-specific phosphorylation sites distributed over 272
different kinases was obtained from version 7.0 of the Phospho.ELM
database (26). From the PepCyber database (47), we obtained 948, 174,
and 7 phosphoserine and phosphothreonine peptides previously shown to
bind to 14-3-3 proteins and to the WWand BRCT domains, respectively.
From Phospho.ELM (26), we also obtained a set of 238 phospho-
tyrosine sites known to bind 45 different SH2 and PTB domains. We
extended this data set by curating data from in vitro assays (28, 48, 49).
For Smith et al. (49), the intensity threshold for a phosphotyrosine
binding site was set to five times the intensity of the nonphosphorylated
peptides. Furthermore, only phosphotyrosine-binding PTB domains (the
APPL, DOK, FRS, and SHC families) (49) were included in the analysis
(fig. S3). This yielded a total of 969 phosphotyrosine sites annotated to
bind 67 and 8 different SH2 and PTB domains, respectively.
SH2 sites from high-density peptide arraysA total of 6200 peptides, 13 amino acids long and containing a phospho-
tyrosine in the central position, were arrayed in three identical replicas on a
microscope slide. The printed slides were incubated with SH2 domains
fused to glutathione S-transferase (GST) and, after washing, the bound do-
mains were identified and quantified by incubation with fluorescently
labeled antibodies against GST. After background subtraction and aver-
aging over the three replicas, each experiment yielded 6200 data points de-
scribing the peptide recognition profile of 66 specific SH2 domains (34).
Kinase matrices from positional scanning peptidelibrariesProtein kinase phosphorylation motifs for Clk2, Clk3, LKB1, Mst1, Mst4,
S6K1, Tlk1, and TNIK were determined with arrayed positional scanning
peptide libraries (PSPL) as previously described (16). Briefly, we used a
series of biotinylated peptides in which each of nine positions surrounding
a central phosphorylation site was systematically substituted with each of
the 20 proteogenic amino acids. This set of peptides was subjected in
parallel to radiolabel kinase assays followed by capture on streptavidin
membranes. Membranes were washed and exposed to a phosphor storage
screen (fig. S6). To generate PSSMs for use with NetPhorest, spot inten-
sities from at least two independent peptide library screens were quantified
with ImageQuant software. Background subtracted data were normalized
by dividing each value by the average of all values in a given position.
SH2 matrices from oriented peptide array librariesThe starting oriented peptide library contained the sequence KX3-pY-X5D,
whereXdenotes amixture of 19 naturally occurring amino acids (except for
cysteine). Sublibraries containing substitutions of each X by an amino acid
were synthesized on soluble nitrocellulose membranes on an Auto-Spot
ASP 222 Robot (Abimed, CA). After being dissolved in a trifluoric acetic
acid cocktail, these sublibraries, 19 × 8 = 152 in total, were printed onto
Brady labels, producingmultiple copies of identical oriented peptide array
Fig. 5. Weak sequence specificity of oncogenic kinases and auto-
phosphorylated sites. Using the AROC as a proxy for the degree of
sequence specificity, we compared several subsets of kinases and
SH2 domains. (A) Serine/threonine (S/T) kinases exhibit stronger se-
quence specificity (higher AROC) than tyrosine (Y) kinases (P < 10−10).
Tyrosine kinases with SH2 domains are less specific (lower AROC) than
other tyrosine kinases (P < 10−3). (B) Oncogenic tyrosine kinases, as
defined by the Cancer Genome Project (56), have lower AROC than their
non-oncogenic counterparts (P < 0.003). Error bars show the 90% confi-
dence intervals and statistical significance was tested by Student's t test.
(C) The score distribution of serine/threonine autophosphorylation sites in
10 kinases is shifted toward low values, whereas the random expectation
would be a uniform distribution (P < 0.04; see Methods). This shows that
autophosphorylation sites typically have weaker sequence motifs than
other sites phosphorylated by the same kinase.
R E S E A R C H A R T I C L E
www.SCIENCESIGNALING.org 2 September 2008 Vol 1 Issue 35 ra2 7
on Septem
ber 2, 2008 stke.sciencem
ag.orgD
ownloaded from

Fig. 6. The role of NetPhorest in phosphoproteomics and modeling of
phosphorylation-dependent signaling networks. The NetPhorest atlas of
consensus linear motifs can be used for designing synthetic peptides
for the development of kinase- or family-specific antibodies (for example,
pS/T-Q), will replace Scansite (13) and NetPhosK (20) as the motif
component of the NetworKIN resource (http://networkin.info) (12, 57),
and can be used to detect biases arising from the enrichment procedures
commonly used in phosphoproteomics [for example, phosphoramidate
chemistry (PAC), immobilized metal affinity chromatography (IMAC), and
titaniumoxide (TiO2) (58)]. TheNetPhorestWebsite (http://netphorest.info)
provides the means to classify phosphorylation sites on the basis of con-
sensus sequence motifs.
R E S E A R C H A R T I C L E
www.SCIENCESIGNALING.org 2 September 2008 Vol 1 Issue 35 ra2 8
on Septem
ber 2, 2008 stke.sciencem
ag.orgD
ownloaded from

libraries (OPAL). Screening of an OPAL membrane with a purified GST–
SH2 domain fusion protein yielded a defined binding pattern that was sub-
sequently imaged and quantified. The above binding datawere used to gen-
erate a matrix used in the prediction of SH2-binding peptides (33). To
ensure high-quality PSSMs, only those with information content above 2
bits (not considering the central phosphorylated residue) were included.
This threshold was estimated by manual inspection of the raw images.
Position-specific scoring matricesFor this work, we collected the most comprehensive set to date of PSSMs
from previously published works, from unpublished data, and from
experiments specifically made for this study. From the Scansite database
(13), we obtained 20, 11, and 1 PSSMs for kinases and SH2 and PTB
domains, respectively. Combined with the PSPL and OPAL data de-
scribed above, this yields a collection of PSSMs that covers 50 kinases,
77 SH2 domains, and 1 PTB domain. Information on both positive and
negative selection of residues at each position is used.
Construction of phylogenetic domain treesTo obtain a phylogenetic tree file of the human kinome, tree files for the
individual kinase superfamilies were downloaded from http://kinase.
com/human/kinome/phylogeny.html. These files were manually merged
and edited to obtain a kinase tree consistent with the one published by
Manning et al. (25). The SH2 domain tree file was manually constructed
according to the dendogram of the human SH2 domains shown in (29).
To produce the 14-3-3 and PTB domain trees, we extracted the se-
quences of these domains as predicted by SMART (3), aligned thesewith
MAFFT (50), identified conserved blocks with Gblocks (51), and con-
structed a maximum likelihood tree with PhyML (52).
Tree-based data organizationTo enable mapping of all experimentally determined phosphorylation
sites and PSSMs onto the domain trees described above, we standard-
ized the kinase and phospho-binding domain names used in each data
source to follow the Phospho.ELM nomenclature (while maintaining a
mapping to HGNC and KinBase names). Using the phylogenetic trees
of kinase and phospho-binding domains as guides, we partitioned the
data into specific (terminal nodes) or family-based (internal nodes)
subsets. These subsets constituted the positive data for ANN training.
The remaining part of the total data set was used as negative data, ex-
cept if the data were assigned directly to upstream parental nodes.
For each specific or family-based predictor, the positive and negative
data sets were pooled and redundancy reduced. This was first performed
on full-length proteins and subsequently on 13-mer peptide level (positive
or negative phosphorylation site centrally placed) by use of CD-HIT (53)
with default values and 90% sequence identity threshold in both cases. The
amino acids thatwere not annotated as phosphorylation sites in the positive
data were pruned from the negative data. For example, because adenosine
protein kinase A (PKA) phosphorylates serine and threonine and not tyro-
sine, the phosphotyrosine sites were removed from the negative data.
Artificial neural network trainingIn this work, we used a standard three-layer feed-forward network that
was trained with the backpropagation algorithm as previously described
(54). To balance the training, we reduced the negative data sets to only
contain five negative examples per positive example. At least 12 positive
sites after redundancy reduction were required before an ANN was
trained. The resulting data set was divided into four subsets by random
partitioning. We trained an ANN on two subsets, determined the optimal
network architecture and training parameters on the third subset, and ob-
tained an unbiased performance estimate from the fourth subset. This was
repeated in a round-robin fashion to use all data for training, test, and val-
idation. The following ANNparameters were varied to optimizeMatthews
correlation coefficient on each test set: thewindow size (5, 7, 9, 11, and 13
for phospho-binding domains and up to 21 for kinases), the number of
hidden neurons (0, 2, 4, 6, 10, 15, and 20), and the learning rate (0.05,
0.01, and 0.005). The three best parameter combinations from each
cross-validation were kept to obtain an ensemble of 12 ANNs. This im-
proved the predictive performance compared to using only the best
parameter combination, whereas using a larger ensemble did not lead
to further improvement but made the method markedly slower. We
calculated the AROC by applying each ANN to the corresponding
independent validation set. For unclassified sites, we averaged the output
of the ANNs in each ensemble. The training data and the classifiers are
available at http://netphorest.info.
Score calibrationTo make the output scores from different PSSMs comparable, we cal-
culated a scaling factor for each PSSM on the basis of its score dis-
tribution on random peptides. We then calibrated the scores from both
ANNs and PSSMs through benchmarking on the compilation of phos-
phorylation sites. The positive predictive value [true positives/(true
positives + false positives)] was calculated within different score win-
dows (running bins) on the validation set. Subsequently, we fitted a lo-
gistic function to these values, minimizing the sum of squared errors.We
chose the logistic function on the basis of visual inspection of the cali-
bration plots and because it is monotonic.
For about one-third of the PSSMs (47 of 142), a sigmoid function
could not be estimated because not enough corresponding phosphoryl-
ation sites were available for benchmarking (less than 12 positive
examples). Assuming that these PSSMs have comparable perform-
ances to those that could be evaluated, we calculated a general PSSM
sigmoid on the basis of data from the PSSMs that we were able to
benchmark. In this way, we calculated three general sigmoid curves
for kinases, SH2 domains, and PTB domains, respectively.
Because the fraction of positive examples in the evaluation set does
not reflect the prior probability of a site being phosphorylated by a par-
ticular family of kinases, the sigmoid curve does not directly yield the
posterior probability. To correct for this, we assumed that the prior
probability isffiffiffiffi
Np
/50 for kinases,ffiffiffiffi
Np
/35 for phospho-binding do-
mains, where N is the number of domains in the family in question.
These values are largely arbitrary but correspond to guessing that, in
vivo, each phosphorylation site can on average be phosphorylated by
10 different kinases and bound by 2 phospho-binding domains. It
should be noted that the choice of these parameters have no influence
on the performance of each classifier, and hence also not on which
classifiers are selected by the procedure described below.
Sequence similarity of domainsPairwise sequence similarity was calculated [with the ParAlign software
(55)] as self-normalized bit scores between all domain sequences in the
kinase, SH2, and PTB domain trees. The self-normalized bit scores of do-
mains A and B were calculated as the bit score of A to B divided by the
minimum of the bit score of A to A and B to B. For internal nodes in the
trees, the pairwise sequence similarity was calculated as the average simi-
larity of all members of the family to all members of the family in question.
Placement of PSSMs and ANNs in the treesANNs were trained for all possible nodes in the trees with the phosphoryl-
ation site data described above. The PSSMs used in this work were based
R E S E A R C H A R T I C L E
www.SCIENCESIGNALING.org 2 September 2008 Vol 1 Issue 35 ra2 9
on Septem
ber 2, 2008 stke.sciencem
ag.orgD
ownloaded from

on in vitro experiments, which were always performed with a specific im-
munoprecipitated or otherwise purified domain. However, the resulting
PSSMmay be better used as a classifier for a family including other closely
related domains. To investigate this, the phosphorylation site data set was
used to benchmark each PSSM considering it as a classifier at every node
on the path connecting the root of the tree with the node at which the PSSM
was initially assigned. Using the pairwise domain sequence similarity de-
scribed above, we eliminated families with a self-normalized bit score less
than 0.3. This threshold was chosen on the basis of the fact that above a
domain similarity score of 0.3, there is a significant correlation between
domain sequence similarity and substrate similarity (fig. S5).
Selection of classifiersThe predictive performance of the ANN and PSSM classifiers was esti-
mated by calculating the AROC with the compilation of phosphorylation
sites. We discarded any classifiers not performing significantly better than
random (P < 0.05), as judged from a bootstrappedAROC distribution con-
structed by resampling the scores of positive and negative examples. The
PSSMs that could not be benchmarked were assumed to have comparable
performance to other PSSMs obtained from the same type of assay, and
were thus assigned the average AROC of the PSSMs that could be bench-
marked. Any domains that were not covered by a given set of classifiers
were considered equivalent to random performance (AROC = 0.5).
At each node in the tree, we selected the classifier with the highest
AROC. If multiple PSSMs have identical AROC, the one with the
highest Kullback–Leibler information content was chosen. To obtain
a nonredundant set of classifiers, the average AROC was maximized
across all domains with a recursive procedure that starts from the leaf
nodes. When multiple solutions had identical AROC, we chose the one
that covered the largest number of domains.
Benchmarking of published methodsTo perform a fair benchmark of the available methods for predicting kinase-
specific phosphorylation,we constructed avalidation set consisting of phos-
phorylation sites that were not used during training of the respective
methods. To this end we obtained the training data sets from the authors
of GPS (22) and KinasePhos (24) and removed identical or highly similar
phosphoproteins from our compilation of phosphorylation sites with the
same criteria as for redundancy reduction. The resulting independent vali-
dation sets consisted of 182 and 79 phosphorylation sites for GPS and
KinasePhos, respectively. We applied each prediction method to its respec-
tive validation set and calculated the AROC for the kinases or family of ki-
nases for which we had at least five phosphorylation sites in the validation
set. To test if the observed performance was significantly higher than ran-
dom or significantly poorer than NetPhorest, we constructed bootstrap es-
timates of the uncertainty associated with each AROC by resampling of the
score distributions for positive and negative examples.
We used a similar procedure for benchmarking the sequence
patterns (for example, [ST]P..[RK])from ELM (14), PROSITE (19),
and HPRD (18). As multiple regular expressions may be provided
for the same domain or family of domains, we scored each site on
the basis of the fraction of the sequence patterns that matched the site.
As we have no way of determining which sites were used for deriving
the regular expressions, the complete, nonredundant compilation of
phosphorylation sites was used for benchmarking them.
Analysis of substrate specificity for oncogenic kinasesA complete list of genes for which mutations (both germline and somatic)
have been causally implicated in cancer was obtained from the Cancer Ge-
nome Project (Cancer Gene Census catalog version 2007.02.13, http://
www.sanger.ac.uk/genetics/CGP/) (56). The list was matched to the set
of serine/threonine and tyrosine kinases in the NetPhorest atlas. The frac-
tion of protooncogenes in each set was calculated and compared by Fisher's
exact test. Subsequently, the average AROC was calculated for oncogenic
and non-oncogenic tyrosine kinases compared by Student’s t test.
Comparison of autophosphorylated sites and otherphosphorylation sitesWe extracted all autophosphorylated sites in the Phospho.ELM database
(26) and scored them with NetPhorest. The resulting posterior probabil-
ities were converted to fractiles in the score distribution of all known
phosphorylation sites for the kinase in question. The distribution of frac-
tiles was compared to random expectation (uniform distribution) by the
Kolmogorov–Smirnov test.
SUPPLEMENTARY MATERIALSwww.sciencesignaling.org/cgi/content/full/1/35/ra2/DC1
Figure S1: Overview of the NetPhorest pipeline.
Figure S2: Phosphorylation data mapped onto domain trees.
Figure S3: Coverage of classifiers for targets of kinases, SH2 domains, and PTB domains.
Figure S4: Score calibration.
Figure S5: Correlation between domain similarity and substrate specificity.
Figure S6: Kinase matrices from Positional Scanning Peptide Libraries (PSPL).
Figure S7: Sequence logos for kinases and pS/pT-binding domains.
Figure S8: Receiver output characteristic (ROC) curves for the NetPhorest classifiers.
Table S1: The selected set of NetPhorest classifiers.
Table S2: Benchmark of the NetPhorest method.
Poster: A Sequence-Specificity Atlas of the Kinase World
REFERENCES AND NOTES1. R. Linding, R. B. Russell, V. Neduva, T. J. Gibson, GlobPlot: Exploring protein se-
quences for globularity and disorder. Nucleic Acids Res. 31, 3701–3708 (2003).
2. R. D. Finn, J. Mistry, B. Schuster-Böckler, S. Griffiths-Jones, V. Hollich, T. Lassmann,
S. Moxon, M. Marshall, A. Khanna, R. Durbin, S. R. Eddy, E. L. Sonnhammer, A. Bateman,
Pfam: Clans, web tools and services. Nucleic Acids Res. 34, D247–D251 (2006).
3. I. Letunic, R. R. Copley, B. Pils, S. Pinkert, J. Schultz, P. Bork, SMART 5: Domains in
the context of genomes and networks. Nucleic Acids Res. 34, D257–D260 (2006).
4. M. B. Yaffe, "Bits" and pieces. Sci. STKE 2006, pe28 (2006).
5. L. J. Jensen, T. S. Jensen, U. de Lichtenberg, S. Brunak, P. Bork, Co-evolution of tran-
scriptional and posttranslational cell-cycle regulation. Nature 443, 594–597 (2006).
6. V. Neduva, R. B. Russell, Linear motifs: Evolutionary interaction switches. FEBS Lett.
579, 3342–3345 (2005).
7. C. Jørgensen, R. Linding, Directional and quantitative phosphorylation networks. Brief
Funct Genomic Proteomic. 7, 17–26 (2008).
8. S. A. Beausoleil, M. Jedrychowski, D. Schwartz, J. E. Elias, J. Villen, J. Li, M. A.
Cohn, L. C. Cantley, S. P. Gygi, Large-scale characterization of HeLa cell nuclear
phosphoproteins. Proc. Natl. Acad. Sci. U.S.A. 101, 12130–12135 (2004).
9. J. V. Olsen, B. Blagoev, F. Gnad, B. Macek, C. Kumar, P. Mortensen, M. Mann,
Global, in vivo, and site-specific phosphorylation dynamics in signaling networks.
Cell. 127, 635–648 (2006).
10. J. Malmström, H. Lee, R. Aebersold, Advances in proteomic workflows for systems
biology. Curr. Opin Biotechnol. 18, 378–384 (2007).
11. A. Wolf-Yadlin, S. Hautaniemi, D. A. Lauffenburger, F. M. White, Multiple reaction
monitoring for robust quantitative proteomic analysis of cellular signaling networks.
Proc. Natl. Acad. Sci. U.S.A. 104, 5860–5865 (2007).
12. R. Linding, L. J. Jensen, G. J. Ostheimer, M. A. van Vugt, C. Jørgensen, I. M. Miron,
F. Diella, K. Colwill, L. Taylor, K. Elder, P. Metalnikov, V. Nguyen, A. Pasculescu, J.
Jin, J. G. Park, L. D. Samson, J. R. Woodgett, R. B. Russell, P. Bork, M. B. Yaffe, T.
Pawson, Systematic discovery of in vivo phosphorylation networks. Cell 129, 1415–
1426 (2007).
13. J. C. Obenauer, L. C. Cantley, M. B. Yaffe, Scansite 2.0: Proteome-wide prediction of
cell signaling interactions using short sequence motifs. Nucleic Acids Res. 31, 3635–
3641 (2003).
14. P. Puntervoll, R. Linding, C. Gemund, S. Chabanis-Davidson, M. Mattingsdal, S. Cameron,
D.M.Martin, G. Ausiello, B. Brannetti, A. Costantini, F. Ferre, V.Maselli, A. Via,G. Cesareni,
F. Diella, G. Superti-Furga, L. Wyrwicz, C. Ramu, C. McGuigan, R. Gudavalli, I. Letunic, P.
Bork, L. Rychlewski, B. Kuster, M. Helmer-Citterich, W. N. Hunter, R. Aasland, T. J. Gibson,
ELM server: A new resource for investigating short functional sites in modular eukaryotic
proteins. Nucleic Acids Res. 31, 3625–3630 (2003).
R E S E A R C H A R T I C L E
www.SCIENCESIGNALING.org 2 September 2008 Vol 1 Issue 35 ra2 10
on Septem
ber 2, 2008 stke.sciencem
ag.orgD
ownloaded from

15. T. Obata, M. B. Yaffe, G. G. Leparc, E. T. Piro, H. Maegawa, A. Kashiwagi, R. Kikkawa,
L. C. Cantley, Peptide and protein library screening defines optimal substrate motifs for
AKT/PKB. J. Biol. Chem. 275, 36108–16115 (2000).
16. J. E. Hutti, E. T. Rarrell, J. D. Chang, D. W. Abbott, P. Storz, A. Toker, L. C. Cantley,
B. E. Turk, A rapid method for determining protein kinase phosphorylation specificity.
Nat. Methods 1, 27–29 (2004).
17. M. Rodriguez, S. S.-C. Li, J. W. Harper, Z. Songyang, An oriented peptide array
library (OPAL) strategy to study protein-protein interactions. J. Biol. Chem. 279,
8802–8807 (2004).
18. R. Amanchy, B. Periaswamy, S. Mathivanan, R. Reddy, S. G. Tattikota, A. Pandey, A
curated compendium of phosphorylation motifs. Nat. Biotechnol. 25, 285–286 (2007).
19. N. Hulo, A. Bairoch, V. Bulliard, L. Cerutti, B. A. Cuche, E. De Castro, C. Lachaize,
P. S. Langendijk-Genevaux, C. J. A. Sigrist, The 20 years of PROSITE. Nucleic
Acids Res. 36, D245–D249 (2008).
20. N. Blom, T. Sicheritz-Pontén, R. Gupta, S. Gammeltoft, S. Brunak, Prediction of post-
translational glycosylation and phosphorylation of proteins from the amino acid
sequence. Proteomics 4, 1633–1649 (2004).
21. J. H. Kim, J. Lee, B. Oh, K. Kimm, I. Koh, Prediction of phosphorylation sites using
SVMs. Bioinformatics 20, 3179–3184 (2004).
22. Y. Xue, F. Zhou, M. Zhu, K. Ahmed, G. Chen, X. Yao, GPS: A comprehensive www
server for phosphorylation sites prediction. Nucleic Acids Res. 33, W184–W187
(2005).
23. Y. Xue, A. Li, L. Wang, H. Feng, X. Yao, PPSP: Prediction of PK-specific phospho-
rylation site with Bayesian decision theory. BMC Bioinformatics 7, 163 (2006).
24. Y. H. Wong, T. Y. Lee, H. K. Liang, C. M. Huang, T. Y. Wang, Y. H. Yang, C. H. Chu,
H. D. Huang, M. T. Ko, J. K. Hwang, KinasePhos 2.0: A web server for identifying
protein kinase-specific phosphorylation sites based on sequences and coupling
patterns. Nucleic Acids Res. 35, W588–W594 (2007).
25. G. Manning, D. B. Whyte, R. Martinez, T. Hunter, S. Sudarsanam, The protein kinase
complement of the human genome. Science 298, 1912–1934 (2002).
26. F. Diella, C. M. Gould, C. Chica, A. Via, T. J. Gibson, Phospho.ELM: A database of
phosphorylation sites—update 2008. Nucleic Acids Res. 36, D240–D244 (2008).
27. A. Ceol, A. Chatr-aryamontri, E. Santonico, R. Sacco, L. Castanogli, G. Cesareni,
DOMINO: A database of domain-peptide interactions. Nucleic Acids Res. 35,
D557–D560 (2007).
28. R. B. Jones, A. Gordus, J. A. Krall, G. MacBeath, A quantitative protein interaction
network for the ErbB receptors using protein microarrays. Nature 439, 168–174 (2006).
29. B. A. Liu, K. Jablonowski, M. Raina, M. Arcé, T. Pawson, P. D. Nash, The human and
mouse complement of SH2 domain proteins—establishing the boundaries of phospho-
tyrosine signaling. Mol. Cell 22, 851–868 (2006).
30. P. Baldi, S. Brunak, Y. Chauvin, C. A. F. Andersen, H. Nielsen, Assessing the accuracy of
prediction algorithms for classification: An overview. Bioinformatics 16, 412–424 (2000).
31. I. A. Manke, A. Nguyen, D. Lim, M. Q. Stewart, A. E. Elia, M. B. Yaffe, MAPKAP
kinase-2 is a cell cycle checkpoint kinase that regulates the G2/M transition and S
phase progression in response to UV irradiation. Mol. Cell 17, 37–48 (2005).
32. A. Krogh, What are artificial neural networks? Nat. Biotechnol. 26, 195–197 (2008).
33. H. Huang, L. Li, C. Wu, D. Schibli, K. Colwill, S. Ma, C. Li, P. Roy, K. Ho, Z. Songyang,
T. Pawson, Y. Gao, S. S. Li, Defining the specificity space of the human SRC homol-
ogy 2 domain. Mol. Cell. Proteomics. 7, 768–784 (2008).
34. The data are available from the NetPhorest Web site (http://netphorest.info).
35. J. E. Hansen, O. Lund, N. Tolstrup, A. A. Gooley, K. L. Williams, S. Brunak, NetOglyc:
Prediction of mucin type O-glycosylation sites based on sequence context and sur-
face accessibility. Glycoconj. J. 15, 115–130 (1998).
36. H. Nielsen, S. Brunak, G. von Heijne, Machine learning approaches for the prediction
of signal peptides and other protein sorting signals. Protein Eng. 12, 3–9 (1999).
37. L. J. Jensen, R. Gupta, H.-H. Stærfeldt, S. Brunak, Prediction of human protein function
according to Gene Ontology categories. Bioinformatics 19, 635–642 (2003).
38. J. A. Hanley, B. J. McNeil, The meaning and use of the area under a receiver
operating characteristic (ROC) curve. Radiology 143, 29–36 (1982).
39. A. Ubersax, J. Ferrell, Jr., Mechanisms of specificity in protein phosphorylation. Nat.
Rev. Mol. Cell. Biol. 8, 530–541 (2007).
40. A. W. Oliver, S. Knapp, L. H. Pearl, Activation segment exchange: A common mech-
anism of kinase autophosphorylation? Trends Biochem. Sci. 32, 351–356 (2007).
41. A. C. W. Pike, P. Rellos, F. H. Niesen, A. Turnbull, A. W. Oliver, S. A. Parker, B. E.
Turk, L. H. Pearl, S. Knapp, Dimerization by activation segment exchange reveals a
mechanism for kinase auto-phosphorylation. EMBO J. 27, 704–714 (2008).
42. C. Landgraf, S. Panni, L. Montecchi-Palazzi, L. Castanogli, J. Schneider-Mergener,
R. Volkmer-Engert, G. Cesareni, Protein interaction networks by proteome peptide
scanning. PLoS Biol. 2, 94–103 (2004).
43. S. S. Sidhu, S. Koide, Phage display for engineering and analyzing protein interaction
interfaces. Curr. Opin. Struct. Biol. 17, 481–487 (2007).
44. J. J. Allen, M. Li, C. S. Brinkworth, J. L. Paulson, D. Wang, A. Hübner, W.-H. Chou, R. J.
Davis, A. L. Burlingame, R. O. Messing, C. D. Katayama, S. M. Hedrick, K. M. Shokat,
A semisynthetic epitope for kinase substrates. Nat. Methods 4, 511–516 (2007).
45. S. Matsuoka, B. A. Ballif, A. Smogorzewska, E. R. McDonald III, K. E. Hurov, J. Luo,
C. E. Bakalarski, Z. Zhao, N. Solimini, Y. Lerenthal, Y. Shiloh, S. P. Gygi, S. J. Elledge,
ATM and ATR substrate analysis reveals extensive protein networks responsive to
DNA damage. Science 316, 1160–1166 (2007).
46. J. E. Dueber, E. A. Mirsky, W. A. Lim, Engineering synthetic signaling proteins with
ultrasensitive input/output control. Net. Biotechnol. 25, 660–662 (2007).
47. W. Gong,D.Zhou, Y.Ren, Y.Wang, Z. Zuo, Y. Shen, F.Xiao,Q. Zhu, A.Hong, X. Zhou, X.
Gao, T. Li, Pepcyber:P~PEP: A database of human protein protein interactions mediated
by phosphoprotein-binding domains. Nucleic Acids Res. 36, D679–D683 (2008).
48. W. X. Schulze, L. Deng, M. Mann, Phosphotyrosine interactome of the ErbB-receptor
kinase family. Mol. Syst. Biol. 1, 2005.0008 (2005).
49. M. J. Smith, W. R. Hardy, J. M. Murphy, N. Jones, T. Pawson, Screening for PTB
domain binding partners and ligand specificity using proteome-derived NPXY peptide
arrays. Mol. Cell. Biol. 26, 8461–8474 (2006).
50. K. Katoh, K. Kuma, H. Toh, T. Miyata, MAFFT version 5: Improvement in accuracy of
multiple sequence alignment. Nucleic Acids Res. 33, 511–518 (2005).
51. G. Talavera, J. Castresana, Improvement of phylogenies after removing divergent
and ambiguously aligned blocks from protein sequence alignments. Syst. Biol. 56,
564–577 (2007).
52. S. Guindon, O. Gascuel, A simple, fast, and accurate algorithm to estimate large
phylogenies by maximum likelihood. Syst. Biol. 52, 696–704 (2003).
53. W. Li, A. Godzik, Cd-hit: A fast program for clustering and comparing large sets of
protein or nucleotide sequences. Bioinformatics 22, 1658–1659 (2006).
54. N. Blom, S. Gammeltoft, S. Brunak, Sequence and structure-based prediction of eu-
karyotic protein phosphorylation sites. J. Mol. Biol. 294, 1351–1362 (1999).
55. T. Rognes, E. Seeberg, Six-fold speed-up of Smith–Waterman sequence database
searches using parallel processing on common microprocessors. Bioinformatics 16,
699–706 (2000).
56. P. A. Futreal, L. Coin, M. Marshall, T. Down, T. Hubbard, R. Wooster, N. Rahman,
M. R. Stratton, A census of human cancer genes.Nat. Rev. Cancer. 4, 177–183 (2004).
57. R. Linding, L. J. Jensen, A. Pasculescu, M. Olhovsky, K. Colwill, P. Bork, M. B. Yaffe,
T. Pawson, NetworKIN: A resource for exploring cellular phosphorylation networks.
Nucleic Acids Res. 36, D695–D699 (2008).
58. B. Bodenmiller, L. N. Mueller, M. Mueller, B. Domon, R. Aebersold, Reproducible iso-
lation of distinct, overlapping segments of the phosphoproteome. Nat Methods 4,
231–237 (2007).
59. Thanks to S. Quirk and K. Colwill (Samuel Lunenfeld Research Institute) for com-
menting on the manuscript. We thank T. N. Petersen, S. Gammeltoft, and M.
Hjerrild for discussions, P. Nash for help in generating the SH2 tree, and I. Letunic
(European Molecular Biology Laboratory), K. Colwill (Samuel Lunenfeld Research
Institute), C. Workman, and A. G. Pedersen (Center for Biological Sequence Analy-
sis) for technical help and assistance. We thank the Protein Modules Consortium
(www.proteinmodules.org) for encouraging the project, and the authors of GPS, Kina-
sePhos, and NetPhosK who kindly shared their training data, enabling us to
benchmark these methods. We thank N. Warner (U of T) for sharing peptide data
prior to publication. We thank R. J. Shaw (Salk Institute) and T. J. McGarry (North-
western University) for LKB1 and TLK1 kinase, respectively. R.L. was supported by a
Human Frontiers Science Programme fellowship. This project was supported by The
Institute of Cancer Research (ICR), The Lundbeck Foundation, The Novo Nordisk
Foundation, Genome Canada through Ontario Genomics Institute, National Cancer
Institute of Canada, the NIH (U54-CA112967 and R01 GM60594), and by Interaction
Proteome (contract number LSHG-CT-2003-505520), the BioSapiens Network of Ex-
cellence (contract number LSHG-CT-2003-503265), the EMBRACE network of excel-
lence (contract number LHSG-CT-2004-512092), the ENFIN network of excellence
(contract number LSHG-CT-2005-518254), the ADIT Integrated Project (contract
number LSHB-CT-2005-511977), and the GeneFun Specific Targeted Research
Project (contract numbers LSHG-CT-2004-503567 and LSHB-CT-2004-512143),
all six funded by the European Commission FP6 Programme. The Structural
Genomics Consortium is a registered charity (number 1097737) that receives
funds from the Canadian Institutes for Health Research, the Canadian Foundation
for Innovation, GlaxoSmithKline, Karolinska Institutet, the Knut and Alice Wallen-
berg Foundation, the Ontario Innovation Trust, the Ontario Ministry for Research and
Innovation, Merck & Co., Inc., the Novartis Research Foundation, the Swedish Agency
for Innovation Systems, the Swedish Foundation for Strategic Research, and the Well-
come Trust.
Submitted 21 April 2008
Accepted 24 July 2008
Final Publication 2 September 2008
10.1126/scisignal.1159433
Citation: M. L. Miller, L. J. Jensen, F. Diella, C. Jørgensen, M. Tinti, L. Li, M. Hsiung, S. A.
Parker, J. Bordeaux, T. Sicheritz-Ponten, M. Olhovsky, A. Pasculescu, J. Alexander, S. Knapp,
N. Blom, P. Bork, S. Li, G. Cesareni, T. Pawson, B. E. Turk, M. B. Yaffe, S. Brunak, R. Linding,
Linear motif atlas for phosphorylation-dependent signaling. Sci. Signal. 1, ra2 (2008).
R E S E A R C H A R T I C L E
www.SCIENCESIGNALING.org 2 September 2008 Vol 1 Issue 35 ra2 11
on Septem
ber 2, 2008 stke.sciencem
ag.orgD
ownloaded from


