Embed Size (px)
Citation preview
Linkages between carbon sequestration, soil fertility and
hydrology in dryland Acacia senegal plantations of varying age in Sudan
Wafa Elhag Adam ABAKER
Academic dissertation For the degree of Doctor of Science (DSc) in Agriculture and Forestry under the Doctoral
Programme in Sustainable Use of Renewable Natural Resources (AGFOREE)
To be presented, with the permission of the Faculty of Agriculture and Forestry of the University of Helsinki, for public discussion in Auditorium XII at the University of Helsinki
Main Building, Unioninkatu 34, on Tuesday 29 May 2018, at 12 o’clock noon.
Helsinki 2018
2
Supervisors: Associate Professor Mike Starr Department of Forest Sciences University of Helsinki Finland
Associate Professor Frank Berninger Department of Forest Sciences University of Helsinki Finland
Reviewers: Dr. Pekka Nygren
Executive Manager Finnish Society of Forest Science Helsinki Finland
Associate Professor Ulrik Ilstedt Department of Forest Ecology and Management Swedish University of Agricultural Sciences Uppsala Sweden
Opponent: Associate Professor Jonas Ardö
Department of Physical Geography and Ecosystem Science Faculty of Science, Lund University Sweden
Custos: Professor Markku Kanninen
Director, Viikki Tropical Resources Institute (VITRI) Department of Forest Sciences, University of Helsinki Finland
ISBN 978-951-51-4258-0 (paperback) ISBN 978-951-51-4259-7 (PDF) ISSN 0786-8170 Unigrafia Oy Helsinki 2018
3
ABSTRACT Drylands cover some 40% of the global land area and are extensively degraded, especially in Africa, as indicated by reduced soil organic matter (SOM) contents. The loss of SOM and associated ecosystem services (e.g. prevention of erosion, carbon sequestration, soil fertility and water retention), threaten the livelihood of local communities. Management practices that increase SOM contents, such as increasing tree cover, can be expected to increase soil fertility, infiltration and water retention.
Plantations of Acacia senegal (L.) Willd. (now Senegalia senegal (L.) Britton.) of varying age (7 to 24 years) at two sites in Sudan were used to determine: (1) biomass carbon (C) and soil organic carbon (SOC) stocks and changes in the contribution of C3 (trees + herbs) plants to SOC; (2) SOC related changes in soil hydraulic properties, soil moisture (SM), and water balance of the plantations; and (3) soil nitrogen (N), phosphorus (P, total and available) and potassium (K, total and extractable) concentrations and N2 fixation. Adjacent grassland areas were used for comparison (control).
Tree biomass C stocks were calculated using an allometric equation and C contents; ground vegetation C stocks by harvesting and C contents; and SOC stocks (0-50 cm) by determining C contents and bulk density. The contribution of C3 plants to SOC was estimated using a 13C mixing model, and soil and foliar δ15N values used to assess the importance of N2 fixation. Profiles of SM contents were measured using Time Domain Reflectometry (TDR). Daily water balances of the plantations and grasslands were computed using a simple water balance model and the SM measurements used for calibration purposes. Soil hydraulic parameter values were derived using pedotransfer functions based on measured soil texture and SOC contents. Soil contents of nutrients (N, total and available P, and total and extractable K) were determined from samples.
Total biomass C stocks increased with plantation age. While most of this increase was due to the trees, the C stock of the ground vegetation also increased with plantation age and was greater in the oldest plantations than in the grasslands. This finding supports the hypothesis that trees facilitate the productivity of ground vegetation in semi-arid environments. Plantation SOC stocks (0-50 cm) also increased with plantation age and were greater than in the grasslands. The age-related increase in SOC stocks was derived not only from the acacia trees but also from the increase in ground vegetation biomass.
Measured SM contents were higher in the grasslands than in the plantations, but increased with plantation age, reflecting the similar trend in SOC and related plant available water capacities. The modelling resulted in lower runoff from the plantations, increased infiltration, evapotranspiration, reduced drainage and lower SM, as shown by measurements. Greater SM contents in the grasslands were attributed to lower evapotranspiration and resulted in greater drainage fluxes compared to the plantations. The study highlighted the need for more empirical studies on the effect of tree density on water balance in semi-arid Africa.
The concentrations of all studied nutrients were relatively low, but were correlated to SOC concentrations, highest in the topsoil (0–10 cm) and increased with plantation age – all indicating the importance of SOM to soil fertility. High acacia foliage δ15N values indicated that N2 fixation was not an important contributor to the soil N, although A. senegal is known to fix N2 in other sites, and therefore did not account for the accretion of soil N. Neither could reported N deposition loads account for the accretion of soil N. A possible explanation for the
4
increasing soil N may be inputs of excreted N brought into the area by grazing and browsing animals.
The research showed that A. senegal in the landscape not only increased C sequestration (increased biomass and soil C stocks), which would help in reducing global warming and mitigation of climate change, but also that the increases in SOM (SOC) contents associated with the trees increased SM and soil nutrient contents, thereby restoring the fertility of degraded land for the benefit of the local communities. Given the multiple benefits and ecosystem services gained by increasing SOC stocks, efforts to increase or at least maintain the cover of A. senegal in the Sahel should therefore be encouraged. This knowledge should be transferred to local communities in order to minimize further disturbance and encourage sustainable management of the landscape.
Keywords: drylands; semi-arid; Sahel; woodland savanna; Senegalia senegal; land degradation; carbon stock; soil fertility; soil moisture; water balance; carbon and nitrogen isotopes
Author’s address:
Wafa Elhag Adam Abaker Viikki Tropical Resources Institute (VITRI) Department of Forest Sciences P.O. Box 27, FI-00014 University of Helsinki, Finland E-mail: [email protected]

5
PREFACE This dissertation work would not have been possible without Finnish academy funding for the original project “Carbon Sequestration and Soil Fertility on African Drylands (CASFAD)” and subsequent grants by Ella and Georg Ehrnrooth Foundation, Finnish Society of Forest Science, VITRI project “Building Biocarbon and Rural Development in West Africa” and a completion grant from University of Helsinki.
I am highly indebted to all my supervisors. My profound gratitude and appreciation go to my main supervisor Associate Professor Mike Starr for his excellent guidance, constructive comments and prompt support. His continual interest and support throughout the working process were considerably crucial for completion of this study. I also deeply acknowledge my second supervisor Associate Professor Frank Berninger for his excellent guidance, constructive comments and continuous support throughout the study. I am deeply grateful to Prof. Olavi Luukkanen, my initial supervisor and leader of CASFAD project, who offered me an opportunity to join VITRI in 2008 as an exchange student and later as a doctoral student. His excellent guidance during the planning stage of this work, valuable and prompt support were highly appreciated.
I am also indebted to Prof. Markku Kanninen for his constructive comments at early stage of this work and for the discussion on my PhD progress and help with the administrative matters. I am greatly indebted to Dr. Mohamed ElFadl for his valuable advice and comments during the planning stage of this work, valuable support and for long discussion during the course of this study. His support was not limited to scientific guidance but also brotherly advice and consultation on living-related matters; moreover, I am grateful to his family for their support during my stay in Finland. I am also grateful to Prof. Essam Warrag for his constructive comments during the planning of this work, valuable help and logistic support during the fieldwork. I would like to thank to Dr. Eija Juurola for her advice and support during the study period. I wish also to thank Dr. Eshetu Yirdaw and Dr. Markku Larjavaara for their valuable comments and suggestions during the planning stage of this work and subsequent discussion.
I would like to thanks the reviewers of this dissertation, Dr. Pekka Nygren and Dr. Ulrik Ilstedt for their thorough and constructive comments, which have greatly improved the dissertation. I wish also to thank my co-authors, Dr. Gustavo Saiz and Prof. Jukka Pumpanen for their valuable comments and inputs on the manuscripts.
I would like to thank the staff of El Obeid Agricultural Research Station, Sudan for their logistic support and help with the fieldwork, from whom I mentioned: Hatim El Khidir, Khalid Hamdan, Dr. Susan Kamal, Dr. Hiba Mahmoud, Dr. Kamal Fadl, and Dr. Abass Hassan. I am grateful to Dr. Tarig Elsheikh and Awadelkarim Suliman from Gum Arabic Research Centre, and Nigood Mohammed and Ebtihag Elsafi from University of Kordofan for their valuable support during my stay in El Obeid for data collection. I am highly indebted to Mr. Salah Ibrahim from UNICEF Water and Environmental Sanitation programme, North Kordofan State, for the logistic support during the data collection. I also thank Massaud Mohamed from Forest National Corporation, El Obeid office for logistic support during the data collection. I am grateful to my field assistants Gameelallah Gumma and Mohamed Musa for their help with the fieldwork. I wish to thank Dr. Bagie Edward from University of Bahri, Sudan, for her support during the data collection. I also thank Dr. Elamin Raddad from Agricultural Research Corporation, Sudan, for his advice and help regarding the soil sampling and analysis.

6
I would like to thank the staff of University of Khartoum, Faculty of Forestry who supported me at different stages of this study, from whom I mention: Dr. Daldoum Ahmed, Dr. Abdalla Mirghani, Dr. Abdelazim Yassin, and Dr. Manal Khiry. I am also grateful to my colleagues at Faculty of Forestry for their valuable support during data collection, namely, Dr. Hind Bab Alla, Areej Fath Alrahman, Samia Mahgoub, Asma Elyas, Eltayib Hameid and Elyass Ahmed.
I would like to thank all my colleagues at VITRI. I particularly wish to thank Mawa Karambiri and Ibrahim Toure for their help and company. Special thanks goes to my colleague Adrián Monge for his invaluable help, which I sought on many occasions throughout this study. I greatly acknowledge my colleague Biar Deng for his support and company throughout the course of this work.
My deep thanks goes to my friends who made me feel home during my stay in Finland, namely, Raisa Osama, Sakina Begum, Marianna Wallin, Päivi Oveskanien, Marianne Taiarol and Maria Repo-Rostedt. Without their support, it would have been very difficult to tolerate and overcome the difficult situations.
I am highly indebted to my father Elhag Adam and mother Samia Abbas and to my siblings Mohamed, Dalia and Wiam for their moral support and prayers. Finally, my deepest thanks goes to my husband Khalid Idriss for his patience, continues support and encouragement throughout this study and to my children Mohamed and Mariam.
Helsinki, May 2018 Wafa Elhag Adam Abaker
7
LIST OF ORIGINAL PUBLICATIONS This doctoral dissertation is based on three papers, which are referred to by their roman numbers I, II and III.
I. Abaker, W.E., Berninger, F., Saiz G., Braojos, V. & Starr, M. 2016. Contribution of Acacia senegal to biomass and soil carbon in plantations of varying age in Sudan. Forest Ecology and Management 368: 71–80.
II. Abaker, W.E., Berninger, F. & Starr, M. 2018. Changes in soil hydraulic properties, soil moisture and water balance in Acacia senegal plantations of varying age in Sudan. Journal of Arid Environments 150: 42-53.
III. Abaker, W.E., Berninger, F., Saiz, G., Pumpanen, J. & Starr, M. Linkages between soil carbon, soil fertility and nitrogen fixation in Acacia senegal plantations of varying age in Sudan (submitted).
Author’s contribution
Wafa Abaker planned the studies (I-III) together with Mike Starr and Frank Berninger, carried out the fieldwork, collected the samples and carried out some of the laboratory analysis in each of the studies (I-III). In the study I, Wafa Abaker analysed the data with the help of Mike Starr and Frank Berninger, Wafa Abaker drafted the first version of manuscript, which revised by Mike Starr and Frank Berninger and who also helped to finalize the manuscript. Gustavo Saiz and Victor Braojos were responsible for and carried out the isotope analysis and commented on the manuscript. In the study II, Mike Starr introduced the use of WATBAL model and pedotransfer functions, and helped in producing the model input datasets. Frank Berninger introduced the use of NDVI and extracted the data for the deriving the crop coefficient used in the model. Wafa Abaker, with the help of Mike Starr, carried out the model runs and produced the final water balance model results. Wafa Abaker drafted the first version of manuscript in consultation with Mike Starr and Frank Berninger both of whom also commented on manuscript versions, and Wafa Abaker and Mike Starr revised the final submitted manuscript. For study III, Wafa Abaker analysed the data and drafted the manuscript in consultation with Mike Starr and Frank Berninger. Gustavo Saiz was responsible for the isotope analysis and commented on the manuscript. Jukka Pumpanen commented on the manuscript. Wafa Abaker and Mike Starr carried out final revision of the manuscript.

8
LIST OF MAIN ACRONYMS AND ABBREVIATIONS
C Carbon
C:N Carbon to nitrogen ratio
δ13C Relative abundance of heavy isotope of carbon
CN Runoff curve number
ET Evapotranspiration
FAO Food and Agriculture Organization of the United Nations
FNC Forest National Corporation
IPCC Intergovernmental Panel on Climate Change
K Potassium
Kc crop coefficient
MEA Millennium ecosystem assessment
N Nitrogen
N:P Nitrogen to phosphorus ratio
δ 15N relative abundance of heavy isotope of nitrogen
NDVI Normalized difference vegetation index
P Phosphorus
PAW Plant available water
PTF Pedotransfer function
SM Soil moisture content
SMfc SM content at field capacity
SMpwp SM content at permanent wilting point
SMsat SM content at saturation
SMcrit SM content at which evapotranspiration switches from potential ET rate to reduced rate
SMrate SM loss at reduced evapotranspiration rate
SOC Soil organic carbon
SOM Soil organic matter
TDR Time Domain Reflectometry
UNEP United Nation Environmental Programme
WMO World Meteorological Organization
9
TABLE OF CONTENTS
ABSTRACT ............................................................................................................................... 2 PREFACE .................................................................................................................................. 5 LIST OF ORIGINAL PUBLICATIONS ................................................................................... 7 LIST OF MAIN ACRONYMS AND ABBREVIATIONS ....................................................... 8 1. Introduction .......................................................................................................................... 11
1.1 Background ..................................................................................................................... 11 1.2 Land degradation in drylands ......................................................................................... 12 1.3 Hydrology in drylands .................................................................................................... 13 1.4 Soil fertility in drylands .................................................................................................. 13 1.5 C sequestration in drylands ............................................................................................. 14 1.6 Aims of the study ............................................................................................................ 15
2. Material and Methods ........................................................................................................... 17 2.1 Study area and sites ........................................................................................................ 17 2.2 Methods .......................................................................................................................... 18
2.2.1 Sample plots, field measurements and sampling (study I, II and III) ...................... 18 2.2.2 Pre-treatment of plant and soil samples (study I, II and III) .................................... 20 2.2.3 Laboratory analysis (study I, II and III) ................................................................... 21 2.2.4 Calculations of biomass C and SOC stocks and contribution of C3 plants to SOC (study I) ............................................................................................................................. 21 2.2.5 Water balance model description (Study II) ............................................................ 22 2.2.6 Meteorological and NDVI input data ...................................................................... 23 2.2.7 Model runs and parameters ...................................................................................... 23
2.3 Statistical analysis........................................................................................................... 24 3. Results .................................................................................................................................. 24
3.1 Biomass C and SOC stocks and contribution of C3 plants to SOC (Study I) ................. 25 3.2 Soil moisture, hydraulic properties and water balance (study II) ................................... 26
3.2.1 Soil physical and hydraulic properties ..................................................................... 26 3.2.2 Measured soil moisture contents .............................................................................. 27 3.2.3 Modelled water balances .......................................................................................... 27
3.3 Soil C and nutrients and δ15N (study III) ........................................................................ 28 3.3.1 Soil N, P and K ........................................................................................................ 28 3.3.2 Acacia foliar and ground vegetation N, P and K ..................................................... 29 3.3.3 Soil and foliar δ15N .................................................................................................. 29
4. Discussion ............................................................................................................................ 30 4.1 Contribution of A. senegal to biomass C and SOC (study I) .......................................... 30

10
4.2 Changes in soil moisture, hydraulic properties and water balance (study II) ................. 32 4.3 Soil C and fertility, and N2 fixation (study III)............................................................... 33
5. Conclusions and Recommendations ..................................................................................... 35 References ................................................................................................................................ 36
11
1. Introduction
1.1 Background
Drylands are defined as areas where the ratio of mean annual precipitation to mean annual potential evapotranspiration is between 0.05 and 0.65, and include areas that are classified climatically as arid, semi-arid and dry sub-humid. They cover about 41% of the Earth’s land surface and are home to more than two billion people (FAO 2004, Safriel et al. 2005). Of the world’s drylands 43% are found in Africa. Dryland vegetation includes barren or sparsely vegetated desert, grassland, shrubland, savanna and dry woodland (FAO 2004). In drylands net primary productivity is low compared to that of many other terrestrial ecosystems (UNCCD/UNDP/UNEP 2009) and clearly limited by amount of rainfall (FAO 2004, Sankaran et al. 2005).
The Sahel is defined as the transition zone between the Sahara desert zone in the north and woodland savanna in the south (UNEP 2012). These zones are largely defined by rainfall, with rainfall increasing southwards accompanied with a denser tree cover and decreasing northwards where acacia species are dominating (UNEP 2012). Woodland savanna is characterized by the presence of scattered woody plants with varying proportions of shrubs and grasses (Bourliere and Hadley 1983, Scholes and Archer 1997, Torello-Raventos et al. 2013). While in mesic savannas the ecological interaction between the trees and grasses is characterized by competition, it has been suggested that facilitation might be more important in drier savannas (Belsky et al. 1993, Pugnaire et al. 1996, Moustakas et al. 2013). The facilitative effects of trees and shrubs on grasses have been attributed to the shade and its associated reduction in soil temperature, improvement in soil moisture condition and increased nutrients contents under tree canopies (Ludwig et al. 2004, Blaser et al. 2013).
Sudan, which is located in the Sahel, has a vegetation cover that ranges from desert in the north, through semi-desert grassland to woodland savanna in the south (FAO 2006). The woodland savanna belt is characterized by grasses, bushes and trees in varying proportions depending on rainfall, which varies from 300 to 1500 mm yr-1, and soil. According to the amount of rainfall, woodland savanna is divided into low and high rainfall woodland savanna. Low rainfall woodland savanna (300–800 mm rainfall) is further divided according to the soil type clay and sand. Acacia senegal (L.) Willd1 is the dominant woody species in areas with sandy soils and lowest rainfall and often occurs in pure stands (Gorashi 2001, FAO 2006) forming the “gum arabic belt” (10–16° N). The belt acts as a natural barrier against desert encroachment through its role in dune fixation and soil and water erosion reduction (Barbier 1992). Deterioration of the gum belt has been attributed to over-exploitation exacerbated by drought and resulted in the expansion of the desert. This situation has led to a call for a restoration plan to restock the zone to halt further desert encroachment (Jamal and Huntsinger 1993, Mustafa and Elamin 1996).
A. senegal is a highly drought-resistant tree native to Sudan and the Sahel zone of Africa (Jamal and Huntsinger 1993). It provides a wide variety of ecological benefits, such as fodder for animals, fuelwood, and charcoal and economic benefits mainly from gum arabic production (Barbier 1992, Pasternak et al. 2010). Gum arabic is an exudate collected from A. senegal trees and widely used as an emulsifiers in confectionary and beverages, photography, pharmaceutical and other manufacturing industries (Barbier 2000). As a multipurpose tree A. senegal is very 1 The new scientific name for Acacia senegal is Senegalia senegal (L.) Britton.). The new name has been used in a number of recent publications (e.g. Bakhoum et al. 2016; Sarr et al. 2017). However, the use of the old name, A. senegal has retained in this dissertation not only for consistency with the papers included in this dissertation and the literature in general but also because of the widespread use of the old name. In addition, the new name has not been used yet in any publications from Sudan.
12
important for the livelihood for rural people in Sudan, gum arabic provides a cash income to rural families during the dry season (Barbier 1992, Jamal and Huntsinger 1993). Until the 1990s, Sudan was the largest world producer of gum arabic, accounting for 80% of the world’s production. The sharp decline in production has been attributed to a combination of climatic (drought), reduced tree cover and socio-economic factors of the farming system in central Sudan (Elmqvist et al. 2005). A. senegal is important species in agroforestry in semi-arid areas of Sudan, it has been managed as a part of a traditional shifting cultivation system with agriculture crops in order to maintain soil fertility (Barbier 1992, Ballal et al. 2005). In this tree-agricultural crop shifting system, A. senegal trees are grown for 15–20 years before being cut and the land then cultivated for 4–6 years with field crops, however, the tree-growing period has been reduced (Obied and Sief El Din 1970, Olsson and Rapp 1991, Ayoub 1998). The planting of A. senegal has been initiated in many programmes and projects in drylands to mitigate long-term degradation and desertification (Vogt 1995, Pasternak et al. 2010).
1.2 Land degradation in drylands
Some 10-20% of drylands are degraded (Dregne 2002, Safriel et al. 2005). Countries of the Sahel are characterized by land degradation that has taken place over the last decades (Ayoub 1998, UNEP 2007, 2012). Arid and semi-arid zones are the most degraded zones in Sudan (Ayoub 1998). The UNCCD defines desertification as “land degradation in drylands, resulting from various factors including climate variation and human activities, leading to significant reduction in soil fertility and water holding capacity” (UNCCD/UNDP/UNEP 2009). Land degradation, in turn, is defined as the “reduction or loss of the biological and economic productivity of the land” (MEA 2005, Safriel et al. 2005). Land degradation in the Sahel is mainly related to the loss of vegetation cover, particularly that of trees and to soil erosion and associated losses in soil carbon (C) and soil quality (Dregne 2002, FAO 2004, UNCCD/UNDP/UNEP 2009, Jones et al. 2013). As a result the livelihood of local communities has become threatened (Safriel et al. 2005). Population growth and its associated disturbance such as over-grazing, over-cultivation, illegal and excessive fuelwood collection and charcoal production have considerably reduced the cover and density of trees, resulting in significant land degradation (White and Nackoney 2003, UNCCD/UNDP/UNEP 2009, UNEP 2012).
The importance of trees for the restoration of degraded soil and for climate change mitigation have been pointed out in many studies and reports (FAO 2004, Lal 2005, Canadell and Raupach 2008, Trumper et al. 2008). Trees provide significant C inputs to the soil (Scurlock and Hall 1998, Geesing et al. 2000, Farage et al. 2003). Greater attention has been given to soil C sequestration than biomass C sequestration, due to its longer residence time resulting from slower decomposition rate of woody litter compared to herbaceous litter (FAO 2004). The influence of soil organic matter (SOM) on soil fertility and moisture, and therefore enhancement of biomass production in drylands, has been reported in the literature (Farage et al. 2003, FAO 2004, Lal 2004a, b). While some studies related to SOM and soil fertility have been carried out in western Sahel (e.g. Deans et al. 1999, Wezel et al. 2000, Saiz et al. 2012), few studies have carried out in the eastern part of the Sahel. Decreasing gradients in soil organic carbon (SOC) concentrations outwards from tree canopies toward open grassland have been observed in these studies. Empirical and modelling studies carried out in Sudan suggest that there has been a considerable decline in SOC due to land degradation, primarily related to loss of trees (Olsson and Ardö 2002, Ardö and Olsson 2003, 2004, Poussart et al. 2004, El Tahir et al. 2009).
Changes in the vegetation composition in savanna, trees versus grasses, has been studied using stable C isotope (δ13C) technique (Bird et al. 2000, Krull et al. 2007, Lloyd et al. 2008, Saiz et al. 2015). While trees, shrubs and herbs have C3 photosynthetic pathway (δ13C values ranging
13
from -32 to -22 ‰) most savanna grasses have a C4 pathway (-17 to -9 ‰) (Farquhar et al. 1989, House and Hall 2001, Lloyd et al. 2008). Once they transformed into SOM, the isotopic composition of the plant material is retained and serves as a record of changes in the ratio of tree and grass-derived organic matter input to the soil (Bird et al. 2004, Wynn and Bird 2007). The relative contribution of C3 and C4 plants-derived C to SOC can be calculated using C isotope mixing model (Balesdent and Mariotti 1996, Gillson et al. 2004, Takimoto et al. 2009).
1.3 Hydrology in drylands
Drylands are characterized by low and erratic rainfall and high evapotranspiration, resulting in limited soil water availability for plant growth and productivity (Kurc and Small 2007, Nicholson 2011, García et al. 2013). The hydrological regime of an area is best defined through the water balance, with rainfall being balanced by surface runoff, evapotranspiration and drainage (Willmott et al. 1985). In drylands, rainfall tends to occur as short duration events of high intensity and to vary spatially (Pilgrim et al. 1988, Nicholson 2011). Surface runoff occurs as Hortonian overland flow resulting from the high intensity of the rainfall events (Nicholson 2011). Evapotranspiration, which includes interception, transpiration and evaporation from soil and is generally higher from forest/woodland than from grassland (Zhang et al. 2001), typically accounts for 90% of annual precipitation (Glenn et al. 2011). Woody plants in drylands can take up water from deeper in the soil and from groundwater because of deeper rooting (Caldwell et al. 1998). Groundwater recharge is relatively limited in drylands and largely depends on rainfall characteristics, soil properties and vegetation cover (Gee and Hillel 1998, Scanlon et al. 2006, Koohafkan and Stewart 2008, Thomas et al. 2016).
As a result of reduced tree cover in drylands, surface runoff and soil erosion have increased (WMO 2005, Zuazo and Pleguezuelo 2008). The loss of vegetation cover also encourages the formation of soil crusts, which inhibits infiltration and favours surface runoff (Abu-Awwad 1997, Zuazo and Pleguezuelo 2008).
Reversing the trend in tree removal in the Sahel and associated loss in SOM may therefore be expected to result in increased infiltration and soil moisture retention (Zuazo and Pleguezuelo 2008, Wang et al. 2013). However, planting trees in drylands is often discouraged because of concerns that they would intensify evapotranspiration and water shortages (Farley et al. 2005, Malagnoux et al. 2007). On the other hand, a recent study in the semi-arid West African Sahel has indicated that intermediate tree cover and densities can actually increase infiltration, drainage and groundwater recharge (Ilstedt et al. 2016) as the result of the effect of the tree roots and enhanced SOM contents on soil structure and fauna activity (Bargués Tobella et al. 2014). The “hydraulic lift” of the tree roots can result in the redistribution of soil water from wet to dry soil layers, which may benefit also the ground vegetation (Dawson 1993, Ludwig et al. 2003).
1.4 Soil fertility in drylands
Although primary production in drylands is strictly limited by water availability (Safriel et al. 2005), nutrient deficiency, particularly of nitrogen (N) and phosphorus (P), is also considered a limiting factor for plant growth (van Keulen and Breman 1990). It is known that SOM is a key indicator of soil fertility (nutrients status and availability) and water holding capacity (Tiessen et al. 1998, Lal 2004b, Vågen et al. 2005, UNEP 2012). Soil fertility management practices that enhance SOM contents, have been adopted in many drylands (Ayoub 1999, FAO 2004). Ideally, traditional fallow systems often under natural vegetation are retained allowing the land to recover from years of cultivation (FAO 2004). However, the follow period and area
14
have been reduced over time as a result of population pressure (Kaya et al. 2000, FAO 2004, Doso 2014). Trees, particularly N2 fixing species, have been managed as a part of many agro-ecosystems in order to maintain soil fertility and reduce nutrient losses from wind erosion (FAO 2004, Solowey et al. 2013). Their deep roots can capture nutrients and make them available via litterfall inputs to shallow rooting crops and ground vegetation (FAO 2004, Ludwig et al. 2004). Two of the most acknowledged and suitable species for afforestation in Sahelian drylands are Faidherbia albida (Del.) A. Cher and A. senegal (FAO 2004, Lal 2004). A. senegal is known to be capable of N2 fixation under certain soil and climatic conditions (Ndoye et al. 1995, Raddad et al. 2005, Gray et al. 2013). The absence of N2 fixation by tree and shrubs capable of N2 fixation, however, has been reported for arid regions (Aranibar et al. 2004).
The isotopic composition of N (δ15N) has been used to assess the symbiotic biological N2 fixation by legumes (Dawson et al. 2002). N-fixing plants have δ15N values closer to the δ15N value of the atmosphere. Non-nitrogen fixing plants obtain all their N requirements from the soil and therefore have higher foliar δ15N values that are closer to those of soil N (Schulze et al. 1999, Robinson 2001).
1.5 C sequestration in drylands
The potential of drylands to sequester C is large because of their large extent and because SOC contents are below potential values as a result of extensive and prolonged land degradation (Lal 2001, FAO 2004, Marks et al. 2009). Through restoration and adopting better land management practices (Lal 2004a, UNCCD/UNDP/UNEP 2009) C sequestration in drylands could be a win-win strategy, besides taking CO2 out of the atmosphere and thereby mitigate climate change, increasing SOM, improve soil fertility and soil moisture conditions resulting in increased food production and security (Trumper et al. 2008, Lal 2015). A wide range of land use and management practices that can increase SOC stocks have been reported (Lal 2004a; UNCCD/UNDP/UNEP 2009), but the highest C sequestration rates are often associated with the introduction of trees (FAO 2004). Farage et al. (2007) used a modelling approach to explore the potential of tropical drylands for C sequestration through the modification of agricultural practices and showed that the most effective practice for increasing SOC stocks were maintaining trees. C sequestration rates of up to 15 g C m-2 yr-1 could be achieved by maintaining trees, which compared to rates of up to 9 g C m-2 yr-1 by applying manure and up to 4 g C m-2 yr-1 by adopting zero-tillage. However, the authors stressed the need of verification of these predictions from field studies. Other studies have also estimated the potential of dryland ecosystems for C sequestration (Keller and Goldstein 1998, Lal 2001); however, significant gaps in knowledge still remain (MEA 2005, Trumper et al. 2008) and studies in sub-Saharan Africa are largely lacking (Vågen et al. 2005). Some studies have been carried out in West Africa, particularly in Senegal (Tieszen et al. 2004, Tschakert et al. 2004, Woomer et al. 2004).
Plantations of different ages have been used as a tool in forest management to control fire, pest and disease outbreak, enhance biodiversity and mitigate climate change (Pawson et al. 2013). Stand age has also been used to quantify harvestable biomass, biomass and soil C stocks and age related changes (Alexandrov 2007, Böttcher et al. 2008, Wang et al. 2013, Justine et al. 2015); and in ecophysiology to study age-related changes in C and water balance (Irvine et al. 2004, Genet et al. 2010). The effect of stand age on soil nutrient contents has also been studied in savanna (Dean et al. 1999, Ludwig et al. 2004).
15
1.6 Aims of the study
The overall aim of the study was to investigate the effect of A. senegal on SOC stocks and associated effects on soil moisture and nutrient contents using plantations of varying age compared to adjacent grasslands in north Kordofan, Sudan.
The specific objectives were to:
1. Determine the biomass C and SOC stocks in the plantations and the contribution of C3 plants derived C to SOC (Study I).
2. Compare the soil hydraulic properties, soil moisture contents and water balance of the plantations and grasslands (Study II).
3. Determine soil N, P and K concentrations in the plantations and grasslands and their relation to SOC and N2-fixation potential of A. senegal (Study III).
The hypotheses addressing each of the specific objectives were:
1. SOC stocks would be greater in the plantations compared to the grasslands, increase with plantations age and show a greater proportion derived from tree litterfall (C3). Grass (C4) derived SOC would also increase with plantation age as a result of facilitation by the trees.
2. Increases in tree biomass and associated increases SOC contents would reduce surface runoff during the rainy season resulting in increased infiltration, plant available water capacities and soil moisture contents compared to grasslands. It was further hypothesized that these effects would increase with planation age.
3. Soil (total N, P, K, available P and extractable K concentrations/stocks) would be greater in the plantations than in the grasslands and would increase with plantations age following a similar pattern as SOC.
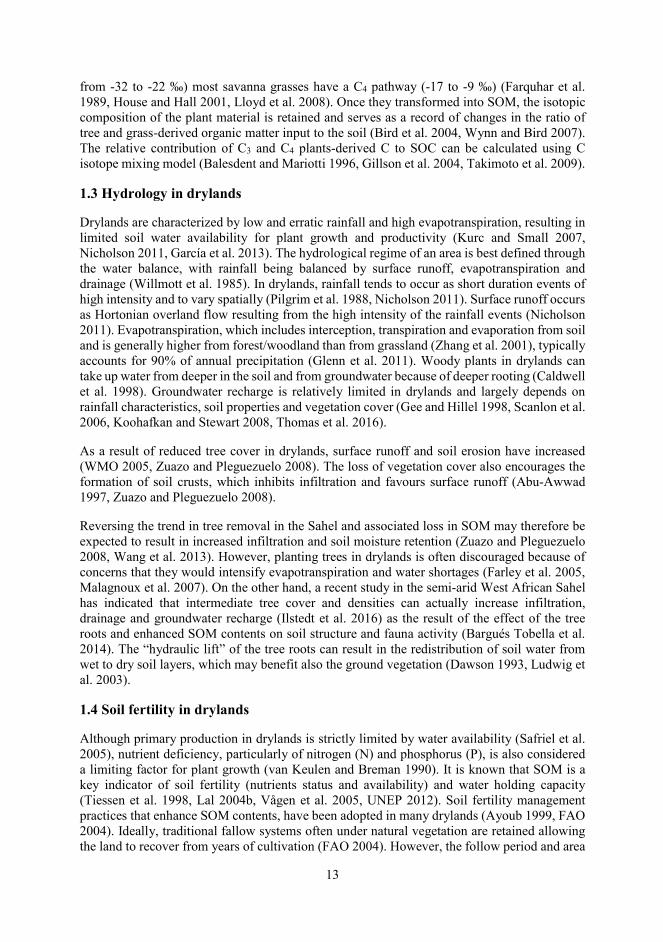
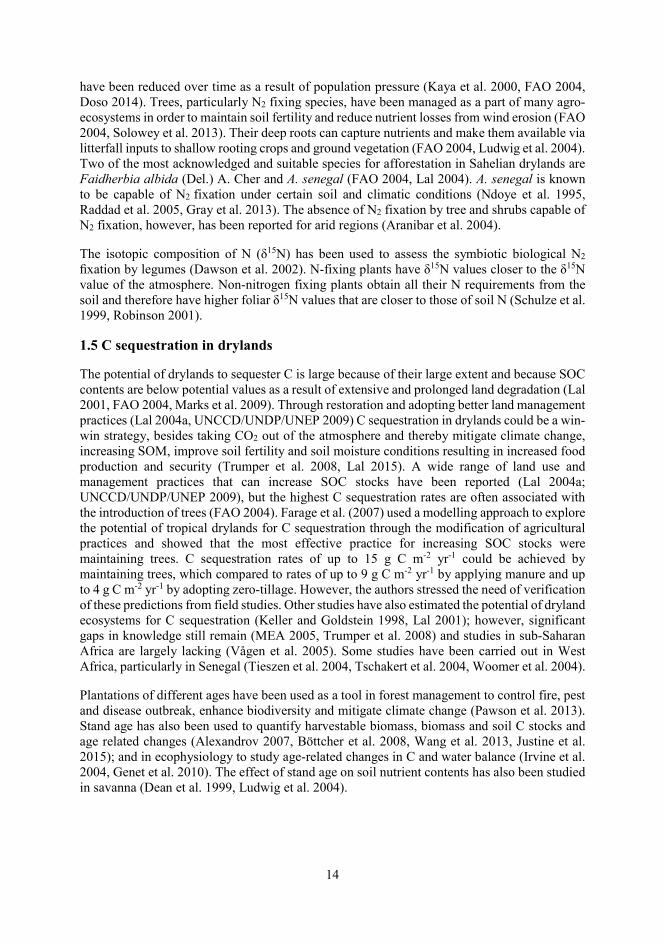
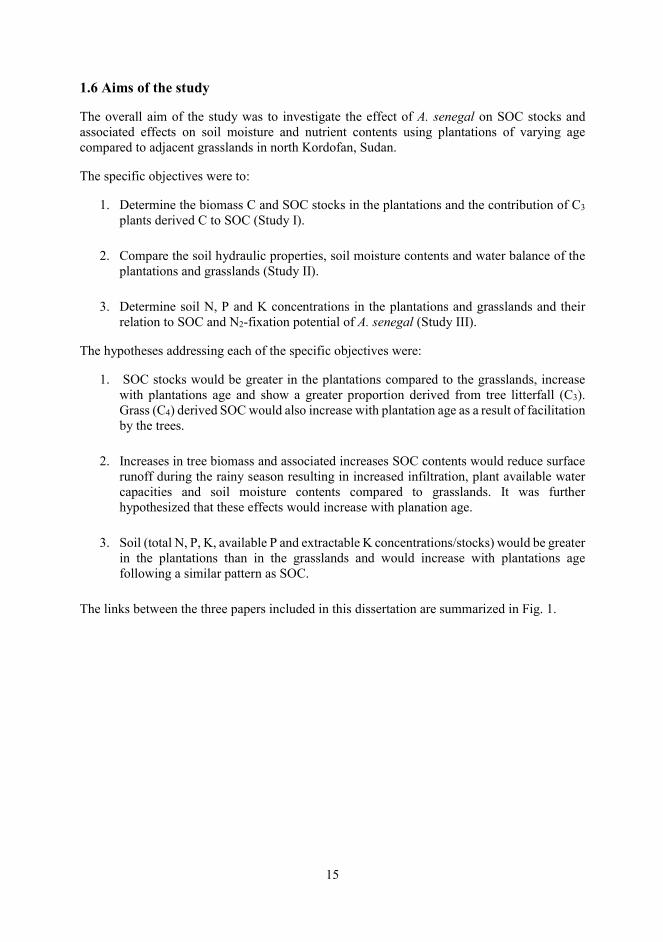
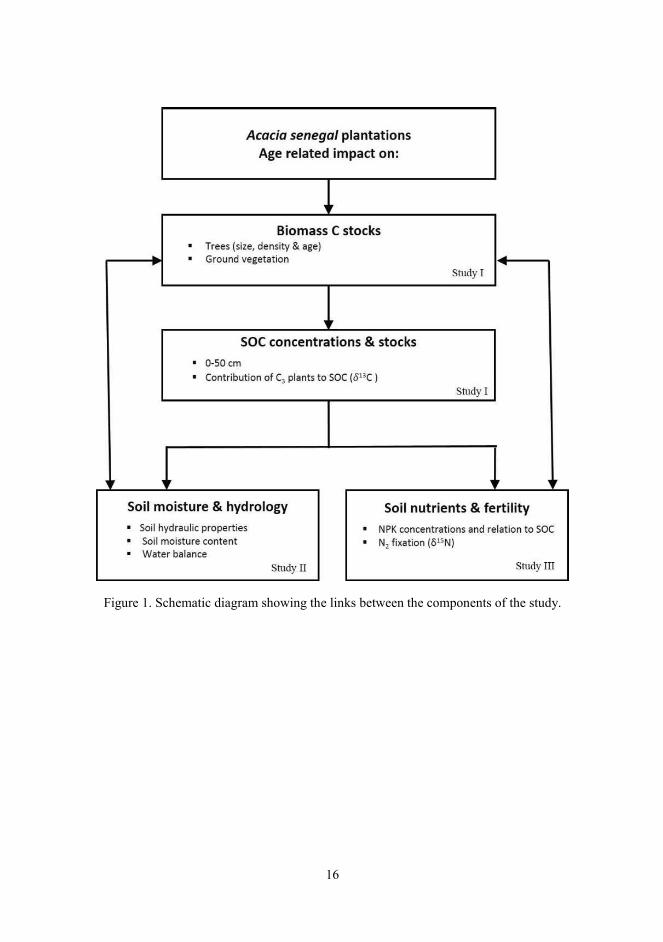
The links between the three papers included in this dissertation are summarized in Fig. 1.
16
Figure 1. Schematic diagram showing the links between the components of the study.
17
2. Material and Methods
2.1 Study area and sites
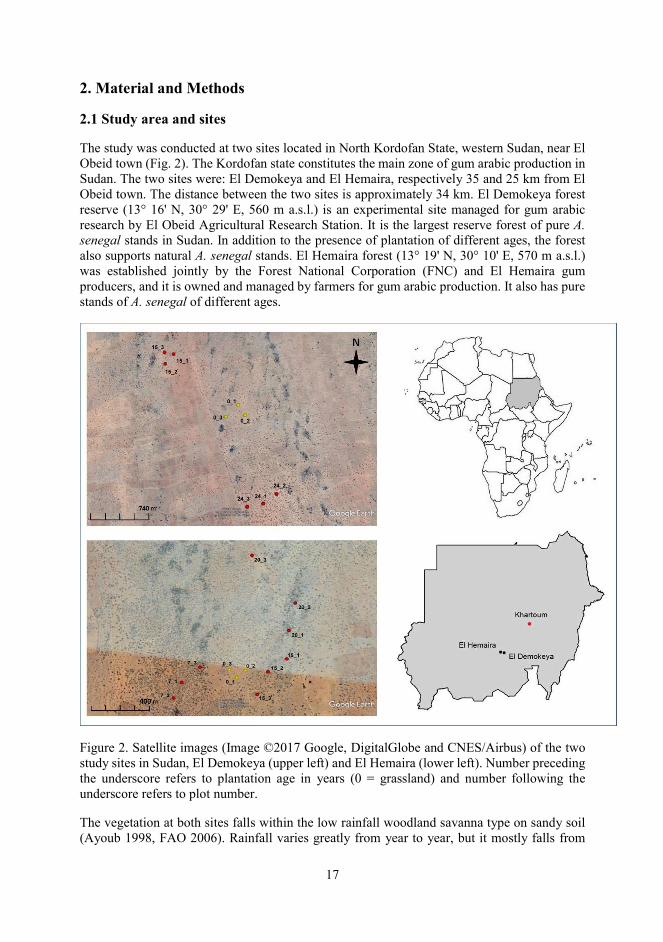
The study was conducted at two sites located in North Kordofan State, western Sudan, near El Obeid town (Fig. 2). The Kordofan state constitutes the main zone of gum arabic production in Sudan. The two sites were: El Demokeya and El Hemaira, respectively 35 and 25 km from El Obeid town. The distance between the two sites is approximately 34 km. El Demokeya forest reserve (13° 16' N, 30° 29' E, 560 m a.s.l.) is an experimental site managed for gum arabic research by El Obeid Agricultural Research Station. It is the largest reserve forest of pure A. senegal stands in Sudan. In addition to the presence of plantation of different ages, the forest also supports natural A. senegal stands. El Hemaira forest (13° 19' N, 30° 10' E, 570 m a.s.l.) was established jointly by the Forest National Corporation (FNC) and El Hemaira gum producers, and it is owned and managed by farmers for gum arabic production. It also has pure stands of A. senegal of different ages.
Figure 2. Satellite images (Image ©2017 Google, DigitalGlobe and CNES/Airbus) of the two study sites in Sudan, El Demokeya (upper left) and El Hemaira (lower left). Number preceding the underscore refers to plantation age in years (0 = grassland) and number following the underscore refers to plot number.
The vegetation at both sites falls within the low rainfall woodland savanna type on sandy soil (Ayoub 1998, FAO 2006). Rainfall varies greatly from year to year, but it mostly falls from
18
July to September (El Tahir et al. 2009). The long-term mean annual rainfall and temperature for both sites is 318 mm and 27.3 °C. Annual rainfall recorded at El Demokeya for 2011 and 2012, when this study was carried out, was 347 and 406 mm, respectively. The soils at both sites are Arenosols (≥90% sand) (Ayoub, 1998; FAO 1995), locally called “Qoz” soils and known to have low SOC and nutrient contents and low water holding capacities (Olsson and Ardö 2002, El Tahir et al. 2009). Some trees and shrubs such as Balanites aegyptiaca (L.), Acacia mellifera (Vahl) Benth., Acacia tortilis (Forssk.) Hayne, Ziziphus spina-christi (L.) Del, Leptadenia pyrotechnica (Forssk.) Decne and Boscia senegalensis (Pers.) Lam. and Poir. are also scattered at both sites. The ground vegetation is dominated by C4 grasses such as Cenchrus biflorus, Aristidia pallida and Eragrostis tremula, and some C3 herbs (Ardö et al. 2008). A list of the herbs and grasses found at the two study sites is given in Supplementary material 1 in Study III.
Table 1. Characteristics of the Acacia senegal plantations at each of the two study sites by plantation age.
Site Age Density, trees ha-1
Equivalent diameter, cm
Height, m Crown diameter, m
Canopy cover, %
El Demokeya 15 117 13.7 3.2 3.9 16 24 167 13.1 3.6 4.7 31
El Hemaira 7 327 9.9 3.0 3.0 24 15 177 13.2 3.6 3.7 20 20 203 14.0 4.3 3.9 28
The studied plantations at El Demokeya were 15 and 24-year-old (in 2011) and 7, 15 and 20-years-old at El Hemaira. The initial tree density was approximately 400 trees ha-1 (5 x 5 m spacing), but the density is now considerably lower , particularly at the El Demokeya site (Table 1) as the result of illegal cutting, wind throw, grazing and natural mortality.
The youngest (7-year-old) and oldest (24-year-old) plantations represent the starting age for gum arabic tapping and maximum growth and productivity, respectively. The growth and gum production of A. senegal slows down considerably after the age of 25 (Jamal and Huntsinger 1993). The ages of the plantations were obtained from records and with help from researchers at El Obeid Agricultural Research Station and personal from El Demokeya forest and at El Hemaira through key informants represented by the village leader and personal from FNC and Gum Arabic Producers Association.
2.2 Methods
2.2.1 Sample plots, field measurements and sampling (study I, II and III)
In 2011 three circular plots (17.8 m radius; 0.1 ha) were established in each of the plantation ages at both sites, 6 plots at El Demokeya site and 9 plots at El Hemaira site (Fig. 2). Within each plantation age the three replicate plots were within 150–500 m of each other. In addition, three square plots were located in an adjacent open grassland area at both sites to serve as
19
control sites. The replicate grassland plots were 50 x 50 m (0.25 ha) at El Demokeya and 30 x 30 m (0.09 ha) at El Hemaira, the difference in size being due to the difference in area of the grassland at the two sites. Square plots were used for the grasslands as it was easier to delineate such large plots in the field and to carry out the sampling.
All trees present on the plantation plots were measured for basal diameter (diameter at 30 cm height), height, and crown diameter. Crown diameter was measured as the distance to the observed edges of the canopy in two directions, north-south and east-west. The mean crown diameter was used to calculate the area of each trees’ canopy cover assuming it had a circular form. The canopy cover for each plot was then calculated as the sum of tree canopy cover values divided by plot area and expressed as a percentage. The basal diameter values were used to calculate tree aboveground biomass (see below). At each plot, leaf samples were taken from three randomly selected trees in October, when the foliage was fully developed. For each tree, seven randomly selected terminal branches were harvested, air dried, and the leaves excised and composited.
For determination of ground vegetation biomass one of the three replicate plots per plantation age was randomly selected and the ground vegetation (a mixture of grasses and herbs) from 14 quadrats (1 x 1 m2) harvested. Four of the quadrats were located approximately 9 m from the plot centre in each cardinal direction, and another 4 quadrats at 17.8 m distance (i.e. plot edge). The remaining 6 quadrats were taken at distances of 1 and 2.5 m from randomly selected trees. In this way samples were taken from under the canopy and in the gaps. For the grassland plots, ground vegetation samples were harvested from three quadrats located randomly in one of the plots at each study site. Biomass harvesting was carried out during the rainy season when the grasses were fully developed. The plants are rainy season ephemerals with very small and superficial root systems and could be manually uprooted easily. After uprooting the plants were split into above- and belowground samples and placed into separate bags (Study I and III).
Soil samples were taken from all 15 plantation plots and the 6 grassland control plots. For each of the plantation plots, samples of the 0–10, 10–20, 20–30 and 30–50 cm layers were taken from under the canopy of one selected tree at 0.5, 1 and 2.5 m from the stem and from a point beyond the canopy (gap). The sampling at different distances from the stem was done in order to determine if SOC concentrations varied with distance from the stem and between under canopy and gap (Study I). For the grassland plots, samples of the same four layers were taken from the four corners and centre of each plot and composited to give one sample per layer for analysis.
Volumetric soil moisture contents at depths of 10, 20, 30, 40 and 60 cm were measured at two week intervals during the wet season (July-September) and at monthly intervals during the dry season (October-June) using TDR probes (PR6 sensor type probes, Delta-T devices Ltd). Measurements started in October 2011 and ended in September 2012. There were 28 tubes installed at El Demokeya site (4 tubes per plantation plot and 4 tubes in one grassland plot) and 32 at El Hemaira site (4 tubes in one plot and 3 tubes in the other two plots for each plantation age, and 2 tubes in one grassland plot). Within the plantation plots the tubes were placed at 1 m distance from selected tree stems except for one of the tubes, which was installed at 2.5 m from one of the stems. Most of the tubes were under the canopy. On each measurement occasion, three readings were taken from each tube and the average value used. Photographs showing various aspects of the fieldwork are given in Fig. 3.
20
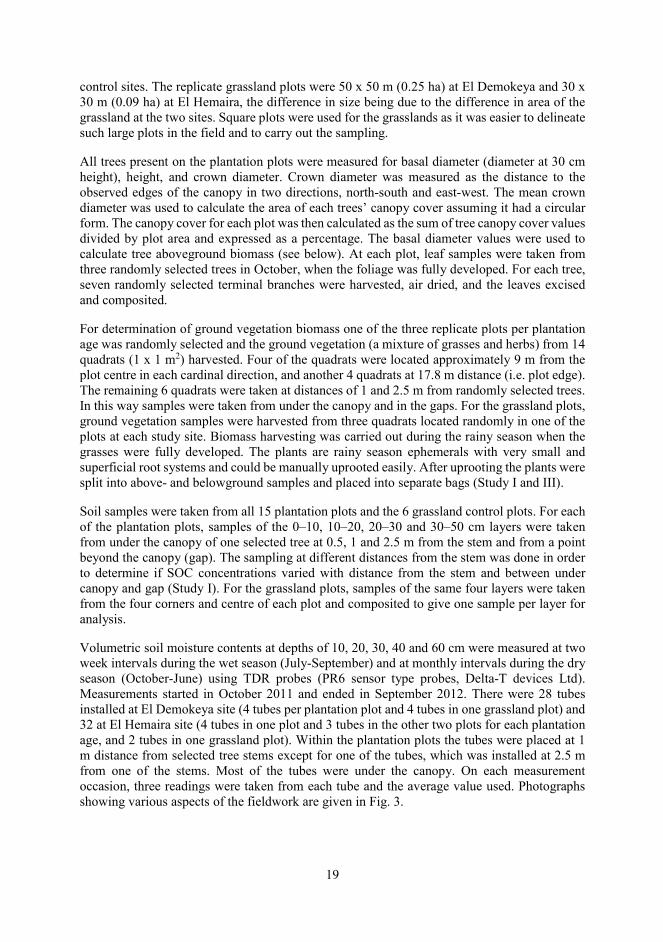
Figure 3. Overview of the fieldwork: a) establishment of the plantation plots, b) installation of soil moisture access tubes, c) soil moisture measurements using TDR probe, d) soil sampling in plantation gap, e) ground vegetation sampling quadrat in grassland, and f) uprooted ground vegetation showing above and belowground parts.
2.2.2 Pre-treatment of plant and soil samples (study I, II and III)
The tree-wise composited acacia leaf samples (n=45) were further composited by plot for chemical and N isotope analyses (n=15). The ground vegetation biomass samples were oven dried at 60 °C for 48 hours and weighed. For logistic reasons and to reduce costs, 58 ground vegetation samples (29 above- and 29 belowground samples) were selected (randomly) from the plantations and grasslands for analysis. All 58 samples were analysed for both C and N concentrations and for C and N isotopic abundances. However, total P and K concentrations were only determined for the aboveground samples and therefore, to keep consistency, only the results of the aboveground N concentrations and N isotope analysis were included in study III.
All 264 soil samples (180 under canopy, 60 in gaps and 24 in grassland) were air-dried and passed through a 2 mm sieve and the <2 mm fraction saved for analysis. Composited soil samples of the three distances from the stem were used for the total analysis.
21
2.2.3 Laboratory analysis (studies I, II and III)
Concentrations of SOC and N in the acacia leaves, ground vegetation and soil samples were determined directly using an elemental CN analyzer (Vario MAX CN, Elementar Analysensysteme GmbH, Germany). Total P and K of the soil, acacia leaves and ground vegetation samples were determined by digesting the samples in concentrated HNO3 acid and microwaving, and elemental concentrations determined using an ICP-OES spectrometer (Thermo Scientific iCAP 6000 Series, USA). Particle size analysis of the soil samples was performed using a laser diffraction device (Coulter LS230, Coulter Corporation, Miami, USA) and the percentage of clay, silt and sand fractions were calculated. The total elemental and particle size analyses were carried out on oven-dried samples (105 °C). Soil exchangeable K was extracted with 1 M ammonium acetate and determined by flame-photometer. Available P was extracted using 0.5 M sodium bicarbonate solution and concentrations determined using the Molybdenum blue spectrophotometer method. Apparent (also known as “tapped”) bulk density was determined using approximately 20 ml of soil placed into a measuring cylinder, tapped 10 times, and the volume and weight of the soil used to calculate the bulk density (Tan, 2005). This method is recommended because of the difficulty in taking intact volumetric samples from loose sandy soils with no structure (Tan, 2005), as was the case with the two sites. Determination of exchangeable K, available P and bulk density was carried out in the laboratories of the Agricultural Research Corporation, Sudan and the total elemental and particle size analyses were carried out in the laboratory of the Department of Forest Sciences, University of Helsinki.
The abundance of stable C and N isotopes ( 13C and δ15N) were determined from acacia leaf, ground vegetation, and all soil samples (though only for one grassland plot) using Continuous-Flow Isotope Ratio Mass Spectrometry (CF-IRMS) at the Centre for Stable isotopes at the Institute of Meteorology and Climate Research - Atmospheric Environmental Research, Karlsruhe Institute of Technology (IMK-IFU/KIT) Garmisch-Partenkirchen (Germany). The analysis was done after grinding the samples to a fine powder. The precision (standard deviation) of internal standards for stable C and N isotopic compositions were better than 0.09 ‰ and 0.2 ‰ respectively. The stable isotopic composition of nitrogen is expressed relative to atmospheric N2 (international standard for N).
2.2.4 Calculations of biomass C and SOC stocks and contribution of C3 plants to SOC (study I)
Biomass C stocks were calculated from estimates of dry biomass per unit area and C contents. To estimate the aboveground biomass (stem, branches and foliage) of all the inventoried trees on each plot, allometric regression equation developed by Deans et al. (1999) for A. senegal plantations in northern Senegal was used (study I). This equation uses the cross section area of the stem at 30 cm aboveground. As most of the trees forked below 1.3 m height, the equivalent diameter, d30, (Snowdon et al. 2002) was calculated. Belowground tree biomass was estimated using a root: shoot ratio of 0.48, a value recommended for woodland savanna (IPCC 2003). The dry weight biomass of the trees were summed by plot and divided by the area of the plot to calculate aboveground and belowground biomass for each plot in g m-2.
The C stock of the trees were calculated from the biomass values and an assumed biomass dry matter C content of 50% (IPCC 2003, Houghton 2005, Gibbs et al. 2007). Ground vegetation C stocks were calculated from the dry weight of the harvested biomass samples, quadrat size, and measured C contents.
22
SOC stocks (g m-2) were calculated according the following equation:
SOC = Csoil x BD x T x 100, (1),
where Csoil is the C concentration of the soil (%), BD is soil bulk density (g cm-3) and T the thickness of the soil layer (cm). The SOC stocks for the four sampling layers were summed to give the SOC stocks for the 0-50 cm layer. Under canopy SOC stocks were calculated from the data for the three samples taken from under the canopy. Plot SOC stocks were calculated from the under canopy and gap SOC stock values weighted by plot canopy cover:
SOC = (SOCcanopy x canopy cover % + SOCgap x [100 - canopy cover %]) /100 (2).
Plot ecosystem C stocks were calculated as the sum of the biomass (total tree and ground vegetation) C and 0-50 cm SOC stocks.
The contribution (%) of C3 plants to SOC was calculated using a mixing model according to Balesdent and Mariotti (1996):
C3 = ( 13CS - 13CC4) / ( 13CC4 - 13CC3) x 100, (3),
where 13s is the measured 13C value of the soil sample, 13CC4 is the reference value for C4 plant material and 13CC3 is the reference value of C3 plant material. The mean value determined from the acacia leaf samples (-29.3‰) was used for the 13CC3 reference value and a 13CC4 reference value of -13 ‰ as reported by Boutton et al. (1998) was used as the ground vegetation biomass samples were an unknown mixture of herbs and grasses.
2.2.5 Water balance model description (Study II)
A simple capacity (“bucket”) type water balance model (WATBAL) developed by Mike Starr (University of Helsinki) and based on that presented by Bonan (1989) was used to calculate the daily water balance components:
(4),
where P is rainfall, R is surface runoff (Hortonian overland flow), ET is actual evapotranspiration, D is drainage (from 0–70 cm soil layer) and ΔSM is the change in soil moisture storage. All units are in mm day-1. The model requires daily meteorological data (temperature, precipitation and global radiation) and values for a limited number of site, stand and soil parameters. A monthly form of the model has been described and applied in a regional water balance study of the gum arabic belt in Sudan by Starr and Alam (2015). The daily model used in this study is described in detail in study II, so only a brief description is given below.
Surface runoff was modelled using the USDA SCS runoff curve number (CN) for single storms method to predict surface runoff (R) from rainfall for small watersheds (NEH 2004). The value of CN depends on land cover type, its hydrologic condition, and hydrologic soil group (HSG). After first accounting for any surface runoff, any effective rainfall (P-R) is used to meet the evapotranspiration demand, then to recharge the soil storage, and finally, if field capacity is exceeded, to form the drainage component of the water balance. The model uses a crop coefficient approach to adjust the reference crop evapotranspiration demand (ETo) to the potential evapotranspiration demand for the vegetation cover of each grassland and plantation (ETc) (Allen et al. 1998). To derive the actual evapotranspiration (ETc_adj), which is the evapotranspiration term used in the water balance equation (Eqn. 1), the ETc values are adjusted
23
according to the availability of soil moisture. ETo was calculated using the Jensen-Haise Alfalfa reference crop evapotranspiration equation (Jensen et al. 1990) and ETc calculated by multiplying ETo by a grassland and plantation specific daily crop coefficients (Table 2). Daily NDVI (normalized difference vegetation index) values were used to adjust a single crop coefficient value (Kc) for each grassland and plantation to produce the specific daily (seasonal) crop coefficient (Kc_sea) values. In calculating the changes in soil moisture and drainage components of the water balance, the evapotranspiration demand (ETc) is met by any effective rainfall, and any remaining unsatisfied demand transferred to the store of plant available moisture in the soil. The maximum amount of plant available moisture (SMpaw) in the soil layer of interest varies between the amount of water held at field capacity (SMfc) and the amount held at permanent wilting point (SMpwp). A piecewise linear function of soil moisture availability was used to calculate how much of unsatisfied ETc demand could be satisfied by soil moisture. Withdrawal first takes place at the ETc rate until a critical fraction of SMpaw is reached (SMcrit); below this limit, any remaining ETc
* is met at a reduced rate (SMrate) until the SMpwp limit is reached. The SMcrit and SMrate parameter values theoretically vary between 0 and 1 and depend on soil texture (Zahner 1967). Drainage, D, the amount of water percolating out of the soil layer of interest, taken to be equal to moisture contents between field capacity (SMfc) and saturation (SMsat).
2.2.6 Meteorological and NDVI input data
Daily temperature and precipitation data from El Obeid Metrological station (13° 17' N; 30° 23' E) for 2011 and 2012 were provided by the Sudan Meteorological Authority and global radiation data from El Demokeya Metrological station (13° 17' N; 30° 28') taken from datasets provided by Ardö (2013). MOD13 NDVI 16-day interval composites for 250 m pixels for the period 2010–2013 were extracted from the USGS web site (https://lpdaac.usgs.gov) using the MODIS Tools R package (Tuck et al. 2014). Daily NDVI values were obtained by fitting cubic splined regressions to the 16-day NDVI pixel data corresponding to the centre of each plantation plot and to one of the grassland plots.
2.2.7 Model runs and parameters
The WATBAL model was run for the study period 2011-2012 and the runs for plantations were made for each plantation age using plot averaged parameter values (Table 2).
Although it is preferable to estimate the CN value from recorded rainfall-runoff data, no such data was available and therefore values for “desert shrub” cover type and HSG A as provided for “arid and semiarid rangelands” (NEH 2004) were used. HSG A soils have low runoff potential when thoroughly wet, transmit water freely, and typically have < 10% clay and > 90% sand or gravel, i.e. gravel or sand soil textures (NEH 2004). The hydrologic condition of the vegetation cover for all the plantation plots was taken to be “Good” (i.e. >70% ground cover) and “Fair” (i.e. 30 to 70% ground cover) for the grassland plots. The resulting runoff CN value for the plantation plots was 49 and that for the grassland plots was 55 (lower numbers indicate low runoff potential while larger numbers indicate increasing runoff potential). Kc parameter values for each of the grasslands and plantations were determined by optimizing the fit between measured (plot averaged) and modelled soil moisture contents (mm) of the 0–70 cm layer. The optimized Kc values for the grasslands and plantations by age for the two sites are presented in Table 2.
24
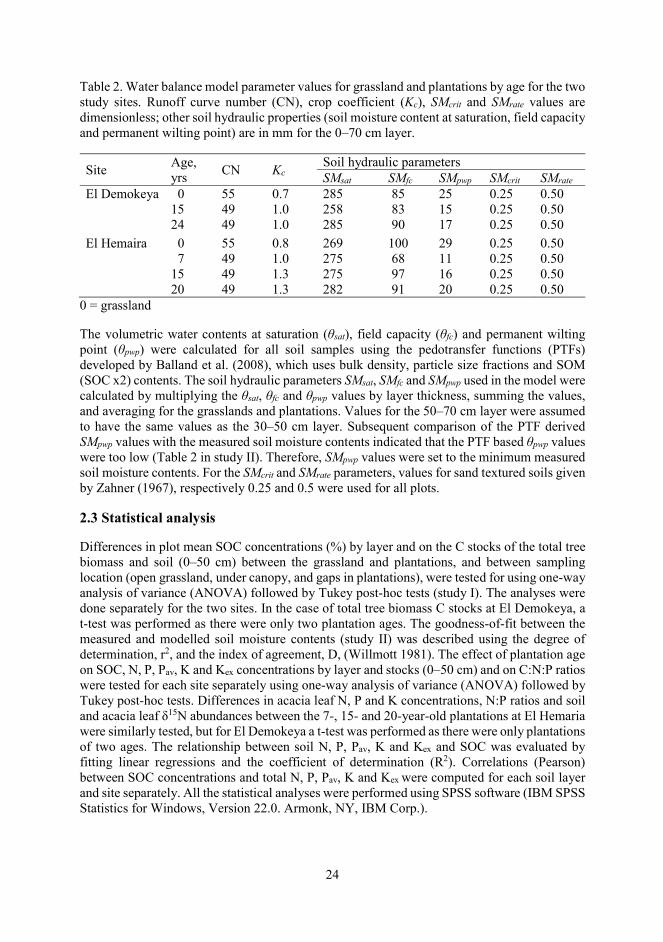
Table 2. Water balance model parameter values for grassland and plantations by age for the two study sites. Runoff curve number (CN), crop coefficient (Kc), SMcrit and SMrate values are dimensionless; other soil hydraulic properties (soil moisture content at saturation, field capacity and permanent wilting point) are in mm for the 0–70 cm layer.
Site Age, yrs CN Kc
Soil hydraulic parameters SMsat SMfc SMpwp SMcrit SMrate
El Demokeya 0 55 0.7 285 85 25 0.25 0.50 15 49 1.0 258 83 15 0.25 0.50 24 49 1.0 285 90 17 0.25 0.50
El Hemaira 0 55 0.8 269 100 29 0.25 0.50 7 49 1.0 275 68 11 0.25 0.50 15 49 1.3 275 97 16 0.25 0.50 20 49 1.3 282 91 20 0.25 0.50
0 = grassland
The volumetric water contents at saturation (θsat), field capacity (θfc) and permanent wilting point (θpwp) were calculated for all soil samples using the pedotransfer functions (PTFs) developed by Balland et al. (2008), which uses bulk density, particle size fractions and SOM (SOC x2) contents. The soil hydraulic parameters SMsat, SMfc and SMpwp used in the model were calculated by multiplying the θsat, θfc and θpwp values by layer thickness, summing the values, and averaging for the grasslands and plantations. Values for the 50–70 cm layer were assumed to have the same values as the 30–50 cm layer. Subsequent comparison of the PTF derived SMpwp values with the measured soil moisture contents indicated that the PTF based θpwp values were too low (Table 2 in study II). Therefore, SMpwp values were set to the minimum measured soil moisture contents. For the SMcrit and SMrate parameters, values for sand textured soils given by Zahner (1967), respectively 0.25 and 0.5 were used for all plots.
2.3 Statistical analysis
Differences in plot mean SOC concentrations (%) by layer and on the C stocks of the total tree biomass and soil (0–50 cm) between the grassland and plantations, and between sampling location (open grassland, under canopy, and gaps in plantations), were tested for using one-way analysis of variance (ANOVA) followed by Tukey post-hoc tests (study I). The analyses were done separately for the two sites. In the case of total tree biomass C stocks at El Demokeya, a t-test was performed as there were only two plantation ages. The goodness-of-fit between the measured and modelled soil moisture contents (study II) was described using the degree of determination, r2, and the index of agreement, D, (Willmott 1981). The effect of plantation age on SOC, N, P, Pav, K and Kex concentrations by layer and stocks (0–50 cm) and on C:N:P ratios were tested for each site separately using one-way analysis of variance (ANOVA) followed by Tukey post-hoc tests. Differences in acacia leaf N, P and K concentrations, N:P ratios and soil and acacia leaf δ15N abundances between the 7-, 15- and 20-year-old plantations at El Hemaria were similarly tested, but for El Demokeya a t-test was performed as there were only plantations of two ages. The relationship between soil N, P, Pav, K and Kex and SOC was evaluated by fitting linear regressions and the coefficient of determination (R2). Correlations (Pearson) between SOC concentrations and total N, P, Pav, K and Kex were computed for each soil layer and site separately. All the statistical analyses were performed using SPSS software (IBM SPSS Statistics for Windows, Version 22.0. Armonk, NY, IBM Corp.).
25
3. Results
3.1 Biomass C and SOC stocks and contribution of C3 plants to SOC (Study I)
The characteristics of the studied A. senegal plantations are presented by age for the two sites in Table 1. The tree density in the two sites ranged from 117 to 167 trees ha-1 and from 177 to 327 trees ha-1 for El Demokeya and El Hemaira respectively. Compared to initial stocking density (400 trees ha-1), current stocking densities are lower, especially at El Demokeya, reflecting a greater degree of disturbance at this site. The mean tree equivalent diameter of the plots ranged from 9.9 to 14.0 cm, height from 3.0 to 4.3 m, and canopy cover from 16 to 31%.
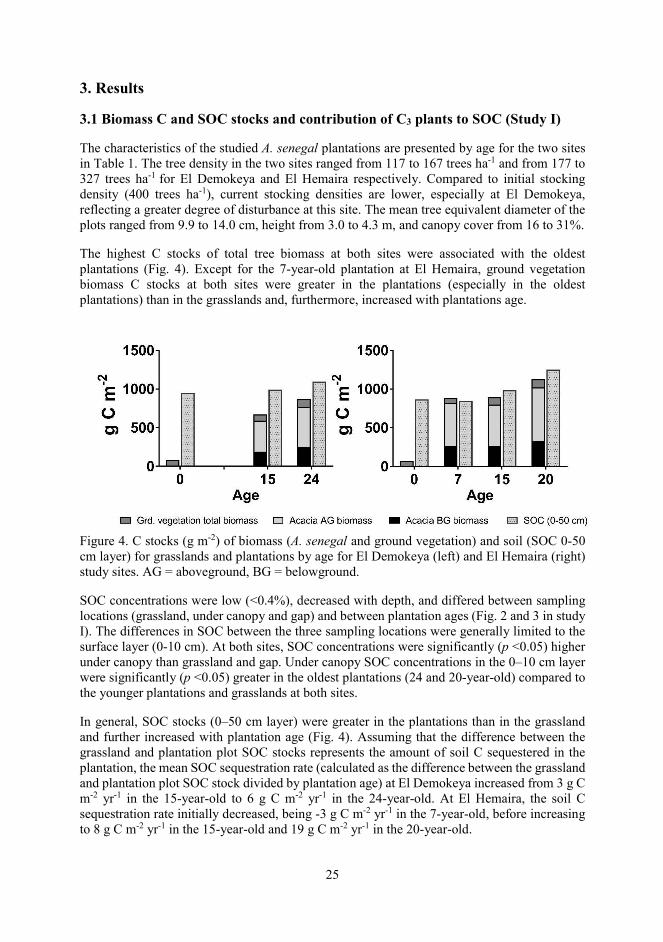
The highest C stocks of total tree biomass at both sites were associated with the oldest plantations (Fig. 4). Except for the 7-year-old plantation at El Hemaira, ground vegetation biomass C stocks at both sites were greater in the plantations (especially in the oldest plantations) than in the grasslands and, furthermore, increased with plantations age.
Figure 4. C stocks (g m-2) of biomass (A. senegal and ground vegetation) and soil (SOC 0-50 cm layer) for grasslands and plantations by age for El Demokeya (left) and El Hemaira (right) study sites. AG = aboveground, BG = belowground.
SOC concentrations were low (<0.4%), decreased with depth, and differed between sampling locations (grassland, under canopy and gap) and between plantation ages (Fig. 2 and 3 in study I). The differences in SOC between the three sampling locations were generally limited to the surface layer (0-10 cm). At both sites, SOC concentrations were significantly (p <0.05) higher under canopy than grassland and gap. Under canopy SOC concentrations in the 0–10 cm layer were significantly (p <0.05) greater in the oldest plantations (24 and 20-year-old) compared to the younger plantations and grasslands at both sites.
In general, SOC stocks (0–50 cm layer) were greater in the plantations than in the grassland and further increased with plantation age (Fig. 4). Assuming that the difference between the grassland and plantation plot SOC stocks represents the amount of soil C sequestered in the plantation, the mean SOC sequestration rate (calculated as the difference between the grassland and plantation plot SOC stock divided by plantation age) at El Demokeya increased from 3 g C m-2 yr-1 in the 15-year-old to 6 g C m-2 yr-1 in the 24-year-old. At El Hemaira, the soil C sequestration rate initially decreased, being -3 g C m-2 yr-1 in the 7-year-old, before increasing to 8 g C m-2 yr-1 in the 15-year-old and 19 g C m-2 yr-1 in the 20-year-old.
26
Table 3. Mean δ13C values (‰) for soil (0-10 cm), ground vegetation and acacia leaves for the two sites.
Soil Biomass Site Age Grassland Gap Canopy Grd. veg Acacia leaves El Demokeya 0 -18.6a – – -20.3 – 15 – -19.4 -20.3 -21.0 -29.3 24 – -19.7 -21.2 -15.5 -28.5 EL Hemaira 0 -20.0a – – -16.7 – 7 – -20.6 -22.2 -18.3 -29.1 15 – -19.5 -21.0 -18.5 -29.5 20 – -20.0 -21.9 -26.3 -30.3
a Grassland soil value is for the single composite sample from one plot.
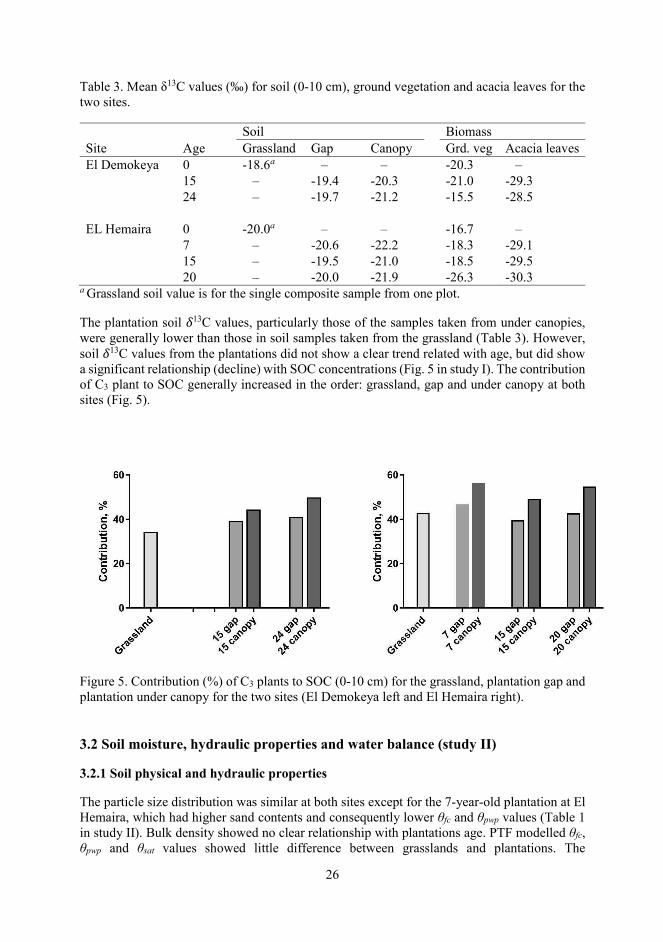
The plantation soil 13C values, particularly those of the samples taken from under canopies, were generally lower than those in soil samples taken from the grassland (Table 3). However, soil 13C values from the plantations did not show a clear trend related with age, but did show a significant relationship (decline) with SOC concentrations (Fig. 5 in study I). The contribution of C3 plant to SOC generally increased in the order: grassland, gap and under canopy at both sites (Fig. 5).
Figure 5. Contribution (%) of C3 plants to SOC (0-10 cm) for the grassland, plantation gap and plantation under canopy for the two sites (El Demokeya left and El Hemaira right).
3.2 Soil moisture, hydraulic properties and water balance (study II)
3.2.1 Soil physical and hydraulic properties
The particle size distribution was similar at both sites except for the 7-year-old plantation at El Hemaira, which had higher sand contents and consequently lower θfc and θpwp values (Table 1 in study II). Bulk density showed no clear relationship with plantations age. PTF modelled θfc, θpwp and θsat values showed little difference between grasslands and plantations. The
27
dependence of θfc on sand and SOC contents is shown in Fig. 3 in study II. It is clearly seen that θfc decreased with sand content and increased with SOC content.
3.2.2 Measured soil moisture contents
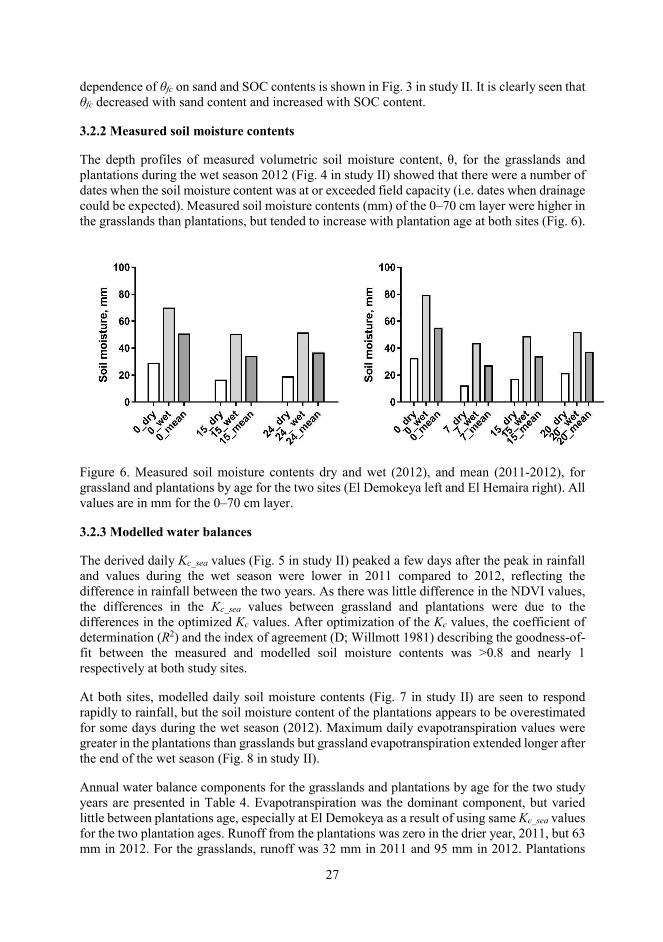
The depth profiles of measured volumetric soil moisture content, θ, for the grasslands and plantations during the wet season 2012 (Fig. 4 in study II) showed that there were a number of dates when the soil moisture content was at or exceeded field capacity (i.e. dates when drainage could be expected). Measured soil moisture contents (mm) of the 0–70 cm layer were higher in the grasslands than plantations, but tended to increase with plantation age at both sites (Fig. 6).
Figure 6. Measured soil moisture contents dry and wet (2012), and mean (2011-2012), for grassland and plantations by age for the two sites (El Demokeya left and El Hemaira right). All values are in mm for the 0–70 cm layer.
3.2.3 Modelled water balances
The derived daily Kc_sea values (Fig. 5 in study II) peaked a few days after the peak in rainfall and values during the wet season were lower in 2011 compared to 2012, reflecting the difference in rainfall between the two years. As there was little difference in the NDVI values, the differences in the Kc_sea values between grassland and plantations were due to the differences in the optimized Kc values. After optimization of the Kc values, the coefficient of determination (R2) and the index of agreement (D; Willmott 1981) describing the goodness-of-fit between the measured and modelled soil moisture contents was >0.8 and nearly 1 respectively at both study sites.
At both sites, modelled daily soil moisture contents (Fig. 7 in study II) are seen to respond rapidly to rainfall, but the soil moisture content of the plantations appears to be overestimated for some days during the wet season (2012). Maximum daily evapotranspiration values were greater in the plantations than grasslands but grassland evapotranspiration extended longer after the end of the wet season (Fig. 8 in study II).
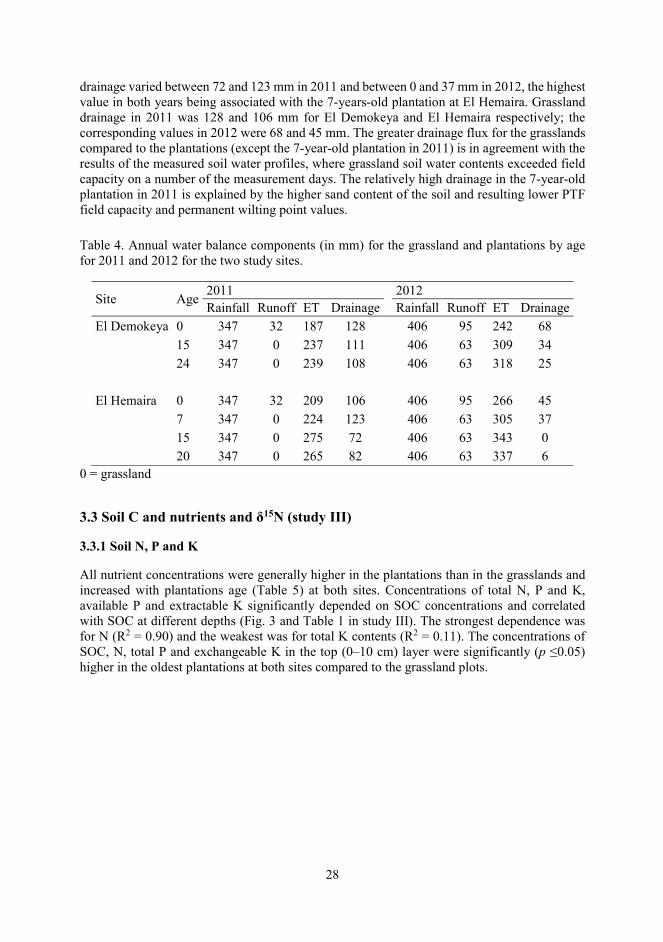
Annual water balance components for the grasslands and plantations by age for the two study years are presented in Table 4. Evapotranspiration was the dominant component, but varied little between plantations age, especially at El Demokeya as a result of using same Kc_sea values for the two plantation ages. Runoff from the plantations was zero in the drier year, 2011, but 63 mm in 2012. For the grasslands, runoff was 32 mm in 2011 and 95 mm in 2012. Plantations
28
drainage varied between 72 and 123 mm in 2011 and between 0 and 37 mm in 2012, the highest value in both years being associated with the 7-years-old plantation at El Hemaira. Grassland drainage in 2011 was 128 and 106 mm for El Demokeya and El Hemaira respectively; the corresponding values in 2012 were 68 and 45 mm. The greater drainage flux for the grasslands compared to the plantations (except the 7-year-old plantation in 2011) is in agreement with the results of the measured soil water profiles, where grassland soil water contents exceeded field capacity on a number of the measurement days. The relatively high drainage in the 7-year-old plantation in 2011 is explained by the higher sand content of the soil and resulting lower PTF field capacity and permanent wilting point values.
Table 4. Annual water balance components (in mm) for the grassland and plantations by age for 2011 and 2012 for the two study sites.
Site Age 2011 2012 Rainfall Runoff ET Drainage Rainfall Runoff ET Drainage
El Demokeya 0 347 32 187 128 406 95 242 68 15 347 0 237 111 406 63 309 34 24 347 0 239 108 406 63 318 25
El Hemaira 0 347 32 209 106 406 95 266 45 7 347 0 224 123 406 63 305 37 15 347 0 275 72 406 63 343 0 20 347 0 265 82 406 63 337 6
0 = grassland
3.3 Soil C and nutrients and δ15N (study III)
3.3.1 Soil N, P and K
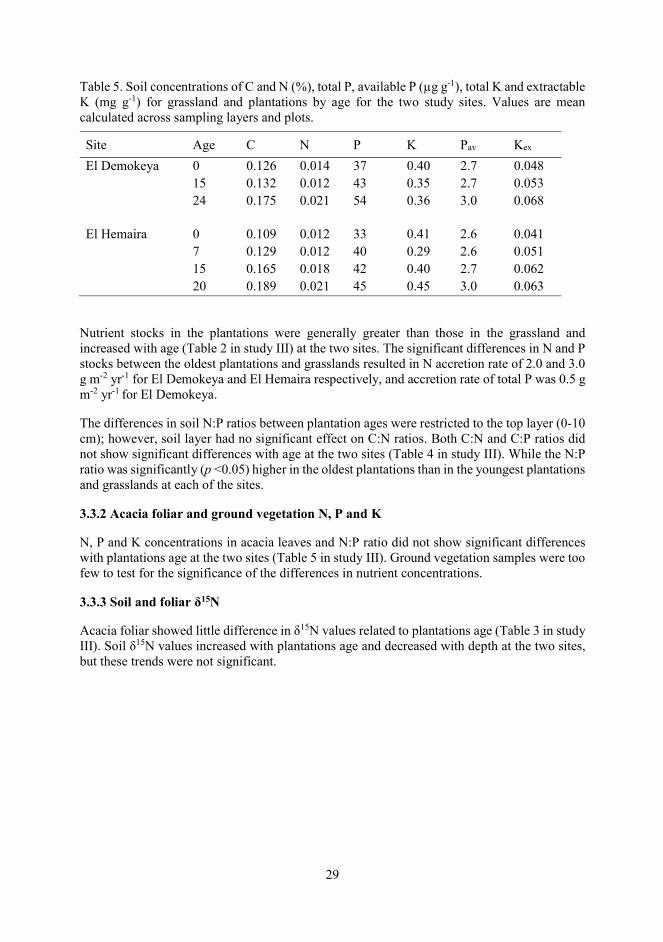
All nutrient concentrations were generally higher in the plantations than in the grasslands and increased with plantations age (Table 5) at both sites. Concentrations of total N, P and K, available P and extractable K significantly depended on SOC concentrations and correlated with SOC at different depths (Fig. 3 and Table 1 in study III). The strongest dependence was for N (R2 = 0.90) and the weakest was for total K contents (R2 = 0.11). The concentrations of SOC, N, total P and exchangeable K in the top (0–10 cm) layer were significantly (p ≤0.05) higher in the oldest plantations at both sites compared to the grassland plots.
29
Table 5. Soil concentrations of C and N (%), total P, available P (μg g-1), total K and extractable K (mg g-1) for grassland and plantations by age for the two study sites. Values are mean calculated across sampling layers and plots.
Site Age C N P K Pav Kex El Demokeya 0 0.126 0.014 37 0.40 2.7 0.048
15 0.132 0.012 43 0.35 2.7 0.053 24 0.175 0.021 54 0.36 3.0 0.068
El Hemaira 0 0.109 0.012 33 0.41 2.6 0.041 7 0.129 0.012 40 0.29 2.6 0.051 15 0.165 0.018 42 0.40 2.7 0.062 20 0.189 0.021 45 0.45 3.0 0.063
Nutrient stocks in the plantations were generally greater than those in the grassland and increased with age (Table 2 in study III) at the two sites. The significant differences in N and P stocks between the oldest plantations and grasslands resulted in N accretion rate of 2.0 and 3.0 g m-2 yr-1 for El Demokeya and El Hemaira respectively, and accretion rate of total P was 0.5 g m-2 yr-1 for El Demokeya.
The differences in soil N:P ratios between plantation ages were restricted to the top layer (0-10 cm); however, soil layer had no significant effect on C:N ratios. Both C:N and C:P ratios did not show significant differences with age at the two sites (Table 4 in study III). While the N:P ratio was significantly (p <0.05) higher in the oldest plantations than in the youngest plantations and grasslands at each of the sites.
3.3.2 Acacia foliar and ground vegetation N, P and K
N, P and K concentrations in acacia leaves and N:P ratio did not show significant differences with plantations age at the two sites (Table 5 in study III). Ground vegetation samples were too few to test for the significance of the differences in nutrient concentrations.
3.3.3 Soil and foliar δ15N
Acacia foliar showed little difference in δ15N values related to plantations age (Table 3 in study III). Soil δ15N values increased with plantations age and decreased with depth at the two sites, but these trends were not significant.
30
4. Discussion
4.1 Contribution of A. senegal to biomass C and SOC (study I)
The highest tree biomass C stocks at both sites were associated with the oldest plantation ages. The lower tree biomass C stock of the 15-year-old plantation compared to the 7-year-old plantation at El Hemaira site may be because of greater disturbance, as indicated by the lower stem density. There are only a few published values (particularly field-based studies) for woodland savannah to with which to compare the biomass C values of this study. The results of total tree biomass C stocks in this study were at the lower end of the range of values reported by Djagbletey et al. (2018) for woodland savanna in Ghana (661–6000 g C m-2). Qasim et al. (2016) reported a mean value of 307 g C m-2 for the aboveground tree biomass C stocks of woodland savanna in Burkina Faso. The difference in biomass C values between these studies may be related to differences in species, rainfall, soil characteristics, management, fire occurrence (Saiz et al. 2014), C content of biomass, and in the root: shoot ratio used to estimate belowground biomass (Mokany et al. 2006). A root: shoot ratio of 0.48 as suggested by the IPCC (IPCC 2003) was used to calculate belowground tree biomass. This value was used for all plantation ages; however, there is evidence that the root: shoot ratio decreases with age (Deans et al. 1999).
In general, plantation SOC stocks increased with plantation age and were greater than grassland values at both sites, as hypothesized. The positive effect of trees on SOC stocks in savannas and semi-arid environments have been reported in several studies (Bird et al. 2000, Tieszen et al. 2004, Walker and Desanker 2004). Ardö et al. (2008) found no clear trend in SOC stocks with A. senegal plantations age in western Sudan; however, values varied with stand age and land cover, with plantations showing greater SOC stocks than in the cultivated soil. SOC stock values at the two study sites (846–1250 g C m-2) were comparable with values reported in other studies conducted in Northern Kordofan, Sudan. El Tahir et al. (2009) reported a SOC stock value of 737 g C m-2 for the 0-30 cm layer at the El Demokeya site and Jakubaschk (2002) reported an average SOC stock of 906 g C m-2 for the 0-50 cm layer in A. senegal sites.
The general trends in SOC concentrations found in this study, being highest under the canopy and decreasing with depth, are similar to those reported in other studies. According to these other studies SOC concentrations decreased with distance from the stems of acacia trees and were significantly higher under the canopy than in gaps due to greater litter input (Ludwig et al. 2004, Githae et al. 2011, Saiz et al. 2012).
SOC sequestration rates are comparable with those reported in other studies. Ardö and Olsson (2004) reported a mean SOC sequestration rate of 4 g C m-2 yr-1 for the 0–20 cm layer in traditional farming systems in North Kordofan in which A. senegal trees are allowed to naturally regenerate during the fallow period. Lal (1999) reported potential SOC sequestration rates of 5-10 g C m-2 yr-1 for afforested sites in tropical drylands and Grace et al. (2006) reported an average SOC sequestration rate of 14 g C m-2 yr-1 for tropical savanna and pointed that the rate is higher if the site is protected from fire and grazing. Blaser et al. (2014) reported a mean C sequestration rate of 14 g C m-2 yr-1 under N-fixing shrub in a mesic savanna in Zambia.
The C stock of the ground vegetation biomass in the plantations increased with plantation age and was greater than in the grassland. These results therefore support the hypothesis that the presence of trees benefits ground vegetation; that is, the facilitation effect of the trees was greater than the competition effect (Pugnaire et al.1996, Moustakas et al. 2013). This result is compatible with the “Stress Gradient Hypothesis”, i.e. the degree of facilitation increases in
31
communities when environmental stress increases (Brooker and Callaghan 1998, Pugnaire and Luque 2001). Blaser et al. (2013) demonstrated that high canopy trees have a larger effect on understory development than low canopy trees. It is therefore possible that the increase in tree size (age) results into a facilitative increase in herbaceous productivity. Blaser et al. (2013) found furthermore that the effect is greater when the trees are N2 fixing. The presence of woody plants in savannas has been shown to alter the composition, spatial distribution, and productivity of the ground vegetation in several studies (Weltzin and Coughenour 1990, Belsky et al. 1993, Scholes and Archer 1997). The facilitative effect of trees and shrubs on ground vegetation have also been attributed to the effect of shade and its associated reduction in water stress and temperature, and to increased nutrients contents under tree canopies (Weltzin and Coughenour 1990, Belsky et al. 1993).
The potential of grasslands, particularly temperate grasslands, for C sequestration has been pointed out (FAO 2004, Jones and Donnelly 2004) and attributed to their relatively high root biomass (Schuman et al. 1999, Reeder et al. 2001). Grasslands dominated by perennial grasses have the potential to store larger amount of soil C than those dominated by annual grasses due to their more extensive and deep rooting systems (Jones and Donnelly 2004, Powlson et al. 2011). The ground vegetation at the two studied sites were mostly annuals and therefore shallow rooting (Fig. 3f). While it was possible that not all of the roots were collected during sampling, observation in the field indicated that this was not the case and therefore consider belowground biomass C stock values (Table 2 in study I) to be reasonably correct estimates. Although very low compared with root biomass estimates presented for other grasslands (Jackson et al. 1996), belowground biomass C stock values at the two studied sites were comparable with values (3–7 g C m-2) reported for two woodland savanna sites in Ghana (Djagbletey et al. 2018).
An isotope mixing model was used in this study to estimate the relative contribution of C3 (trees + herbs) plants to SOC. A mean value of -13‰ (ranging from -17 to -9‰) was used in the model for C4 plants. Lloyd et al. (2008) report a median 13C value of -13.2‰ for C4 grasses based on data from 22 tropical savanna sites from Australia, Brazil and Ghana, which gives the confidence that calculation of the contribution of C3 plants presented here was reasonable. Although the specific contributions of acacia tree and herbs to SOC could not be separated, soil
13C values in the plantation were lower and the contribution of C3 plant to SOC contents were higher, at least the under canopy values, than the values in the grassland, and soil 13C values decreased with SOC concentrations. Soil 13C values have been reported to decrease with both tree cover and age (Blaser et al. 2014). Overall, these results indicate that the observed increase in SOC contents in the plantations was due to an increase in both C3 plants and C4 grasses but there was a shift towards a greater contribution from C3 plants.
The foliar biomass C stocks at the two sites (5 to 9 g C m2 yr-1 in El Demokeya plantations and 7 to 14 g C m2 yr-1 in El Hemaira plantations) are considerably smaller than the potential litterfall from ground vegetation (aboveground vegetation biomass C stocks) of 76 to 91 g C m2 yr-1 at El Demokeya and 59 to 98 g C m2 yr-1 El Hemaira. This may suggest that the increase in plantation C3 SOC is derived mostly from the herbs rather than from the acacia trees. However, the contribution of twig and branch biomass to the acacia tree litterfall and SOC stock is unknown. Nevertheless, the ground vegetation is subject to considerable grazing and therefore not all the ground vegetation biomass enters the soil. Furthermore, the decomposition rate of acacia foliage is probably lower than that of the ground vegetation because of its relatively high phenolic content (Bernhard-Reversat 1987, Mubarak et al. 2012) and that of twigs and branches lower still, which would mean that the contribution of the ground vegetation to SOC would be reduced. Moreover, savanna trees have reported to have greater fine root production than grasses resulting in a further enhancement of soil C under trees (February et al.
32
2013). The contribution of C3 plants to SOC has been studied in Zambian shrub-savanna by Blaser et al. (2014) who found the contribution to increase with shrub age.
4.2 Changes in soil moisture, hydraulic properties and water balance (study II)
In coarse textured soils with low SOC contents, any increase in C content leads to an increase in field capacity and, to a lesser extent, in permanent wilting point values (Hudson 1994, Rawls et al. 2003). The increase in SOC with plantation age therefore resulted in the higher PTFs estimated hydraulic properties, but more so for field capacity resulting in greater plant available water capacities.
The first step in modelling the water balance was to allocate the amount of rainfall that went to runoff, which is taken to be Hortonian (infiltration-excess) runoff generated by high rainfall intensities. Hortonian runoff is widely accepted as the dominant form of runoff in semi-arid environments (Nicholson 2011). Soil moisture contents in the study sites never approached saturation so that saturation-excess runoff would not be generated. The CN runoff method used to calculate runoff in this study has been successfully applied in other studies carried out in the Sahel (e.g. Vischel and Lebel 2007, Gerbaux et al. 2009).
The Jensen and Haise’s method used to calculate reference crop evapotranspiration is based on global radiation, which is considered more accurate than temperature-based methods, and uses Alfalfa as the reference crop, which is considered more suitable for arid regions than grass reference crop values (Jensen et al. 1990, Allen et al. 1998). NDVI was used to describe the phenological development of the vegetation at the study sites in order to produce the seasonal crop coefficient, Kc_sea, values for converting Alfalfa reference crop ETo values into actual evapotranspiration demand, ETc, values for the grasslands and plantations. Empirical relationships between NDVI and crop coefficients has been shown in several earlier studies (see review by Rocha et al. 2012). Although evapotranspiration estimated using NDVI has been shown to be strongly and linearly correlated to Kc based evapotranspiration for irrigated and rain fed agriculture cropping systems (Kamble et al. 2013), much less is known about the relationship between NDVI, Kc and evapotranspiration in drylands (Glenn et al. 2011). However, García et al. (2013) found daily evapotranspiration measured by eddy covariance in open woody Savanna in the Sahel was satisfactorily reproduced using NDVI based estimates of daily evapotranspiration and the study by Maselli et al. (2014) showed that evapotranspiration calculated using Kc based on NDVI data was in good agreement with evapotranspiration measured using eddy covariance in water-limited ecosystems. Using NDVI data to adjust a Kc value determined by optimization of the fit between modelled and measured soil moisture enabled to produce evapotranspiration values that were similar to those measured by eddy covariance for El Demokeya site reported by Sun et al. (2011).
The relatively poorer fit between measured and modelled soil moisture contents during the wet season may be related to a number of factors. While TDR soil moisture content measurements represent the conditions at a particular measurement point, the water balance modelled soil moisture contents represent a spatial average. Studies have shown that soil moisture contents vary with distance from the tree stem and whether under canopy or in the open (Ludwig et al. 2004). In the study by Ilstedt et al. (2016) drainage was found to sharply increase at the canopy edge and then decline linearly out into the open area between the trees. No significant difference was found in soil moisture contents measured at 1 and 2.5 m from the stem, which was probably because both distances were still under canopies. Calibration of the modelled soil moisture contents may therefore have better served by using empirical data that reflects the spatial variation in soil moisture contents related to canopy cover and gaps. Rooting depth may have
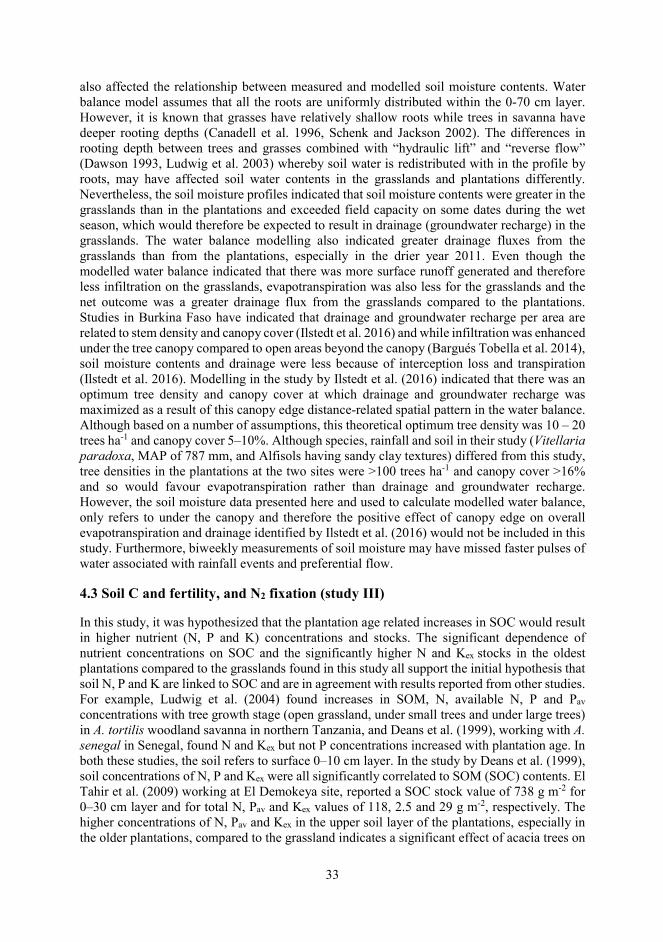
33
also affected the relationship between measured and modelled soil moisture contents. Water balance model assumes that all the roots are uniformly distributed within the 0-70 cm layer. However, it is known that grasses have relatively shallow roots while trees in savanna have deeper rooting depths (Canadell et al. 1996, Schenk and Jackson 2002). The differences in rooting depth between trees and grasses combined with “hydraulic lift” and “reverse flow” (Dawson 1993, Ludwig et al. 2003) whereby soil water is redistributed with in the profile by roots, may have affected soil water contents in the grasslands and plantations differently. Nevertheless, the soil moisture profiles indicated that soil moisture contents were greater in the grasslands than in the plantations and exceeded field capacity on some dates during the wet season, which would therefore be expected to result in drainage (groundwater recharge) in the grasslands. The water balance modelling also indicated greater drainage fluxes from the grasslands than from the plantations, especially in the drier year 2011. Even though the modelled water balance indicated that there was more surface runoff generated and therefore less infiltration on the grasslands, evapotranspiration was also less for the grasslands and the net outcome was a greater drainage flux from the grasslands compared to the plantations. Studies in Burkina Faso have indicated that drainage and groundwater recharge per area are related to stem density and canopy cover (Ilstedt et al. 2016) and while infiltration was enhanced under the tree canopy compared to open areas beyond the canopy (Bargués Tobella et al. 2014), soil moisture contents and drainage were less because of interception loss and transpiration (Ilstedt et al. 2016). Modelling in the study by Ilstedt et al. (2016) indicated that there was an optimum tree density and canopy cover at which drainage and groundwater recharge was maximized as a result of this canopy edge distance-related spatial pattern in the water balance. Although based on a number of assumptions, this theoretical optimum tree density was 10 – 20 trees ha-1 and canopy cover 5–10%. Although species, rainfall and soil in their study (Vitellaria paradoxa, MAP of 787 mm, and Alfisols having sandy clay textures) differed from this study, tree densities in the plantations at the two sites were >100 trees ha-1 and canopy cover >16% and so would favour evapotranspiration rather than drainage and groundwater recharge. However, the soil moisture data presented here and used to calculate modelled water balance, only refers to under the canopy and therefore the positive effect of canopy edge on overall evapotranspiration and drainage identified by Ilstedt et al. (2016) would not be included in this study. Furthermore, biweekly measurements of soil moisture may have missed faster pulses of water associated with rainfall events and preferential flow.
4.3 Soil C and fertility, and N2 fixation (study III)
In this study, it was hypothesized that the plantation age related increases in SOC would result in higher nutrient (N, P and K) concentrations and stocks. The significant dependence of nutrient concentrations on SOC and the significantly higher N and Kex stocks in the oldest plantations compared to the grasslands found in this study all support the initial hypothesis that soil N, P and K are linked to SOC and are in agreement with results reported from other studies. For example, Ludwig et al. (2004) found increases in SOM, N, available N, P and Pav concentrations with tree growth stage (open grassland, under small trees and under large trees) in A. tortilis woodland savanna in northern Tanzania, and Deans et al. (1999), working with A. senegal in Senegal, found N and Kex but not P concentrations increased with plantation age. In both these studies, the soil refers to surface 0–10 cm layer. In the study by Deans et al. (1999), soil concentrations of N, P and Kex were all significantly correlated to SOM (SOC) contents. El Tahir et al. (2009) working at El Demokeya site, reported a SOC stock value of 738 g m-2 for 0–30 cm layer and for total N, Pav and Kex values of 118, 2.5 and 29 g m-2, respectively. The higher concentrations of N, Pav and Kex in the upper soil layer of the plantations, especially in the older plantations, compared to the grassland indicates a significant effect of acacia trees on
34
nutrient cycling. The deeper roots of the acacia trees are able to extract nutrients not accessible by ground vegetation roots which are then added to the soil surface through litterfall, a process called “nutrient uplift” (Scholes 1990). Mubarak et al. (2012) also concluded that tree litter was the potential source of P and K in southern Kordofan soils.
As acacia species, including A. senegal, are considered to be N2 fixing (Ludwig et al. 2004, Raddad et al. 2005, Boutton and Liao 2010), the higher N concentrations in the surface soil may be thought to be related to N2 fixation. However, the high δ15N values for acacia leaves (>6 ‰) would indicate that N2 fixation is probably absent or very limited in the studied sites. If there had been significant N2 fixation in the plantations then one would expect foliar δ15N values to be closer to 0 ‰ (Robinson 2001, Aranibar et al. 2004). The absence of N2 fixation by acacia species has been reported in other studies conducted in arid environments. Aranibar et al. (2004) found acacia species had δ15N values similar to non-legume species and even higher than known N2-fixing species in a study carried in the Kalahari Desert. Belsky et al. (1993), in a study carried out in Acacia tortilis woodland savanna in Kenya, also concluded that that N2 fixation was not an important contributor of N to the soil. It has been shown that N-fixing trees accumulate large amount of N-rich litterfall during the first years of establishment, however once N availability has built up in the soil, N fixation may cease or be inhibited (Boddey et al. 2000; Hedin et al. 2009) and the older trees/plantations become more dependent on litterfall and N recycling (Deans et al. 2003). As the soil N accretion rates in this study (2.0–3.0 g N m-
2 ha-1 yr -1) cannot be attributed to N2 fixation then other possible sources of N need to be considered. Reported N deposition loads in the region (Delon et al. 2010) could not account for observed soil N accretion rates. A possible explanation, however, may be animal grazing and browsing. Sheep and camels bought into the sites because of shading and availability of food, which would increase with plantation age, may add N to the soil through excretion of ground vegetation grazed on outside the area. However, data on land-use history and animal herbivory at the two sites is not available and this explanation therefore remains speculative.
The relatively high and increasing trend in soil δ15N with plantation age at the two sites is an indication of greater microbiological processing of SOM and a more open N cycle (Aranibar et al. 2004, Swap et al. 2004, Hobbie and Ouimette 2009). The negative relationship between soil δ15N and the C:N ratio in the plantations (Fig. 4 in study II) is also consistent with a more open N cycle and gaseous losses of N reported for arid ecosystems (Aranibar et al. 2004, Saiz et al. 2016). Soil and plant C:N:P stoichiometry is often used to indicate nutrient limitations, imbalances and cycling in ecosystems (Bui and Henderson 2013). Soil C:N ratios often decrease with soil depth as a result of the SOM being older and more decomposed and therefore relatively enriched in N compared to SOC (Batjes 1996, Tian et al. 2010). However, there was no consistent trend in C:N ratios with depth in either the grasslands or the plantations. The significantly lower soil (0–10 cm) N:P ratios in the grasslands than in the oldest plantations, however, would indicate N limitation in the grasslands. The N:P ratios of the acacia leaves and ground vegetation were inconclusive, but Ludwig et al. (2004) considered low grass N:P ratios to indicate N limitation and Sitters et al. (2013) considered an increase in grass N:P ratios with tree density (age) to indicate a shift towards P-limiting conditions.
35
5. Conclusions and Recommendations
The current study investigated the effects of A. senegal trees on SOC and its impacts on soil nutrient and moisture contents in relation to plantations age. According to the results, A. senegal significantly increased SOC concentrations, especially in the top soil, increased soil NPK concentrations, and increased the values of soil hydraulic properties, particularly field capacity. The increases in SOC and nutrients concentrations and stocks were achieved within two decades of planting trees (i.e. the oldest plantations in the study).
The effect of the acacia trees on increasing SOC stocks clearly highlights the potential of the semi-arid areas of Sudan for C sequestration and mitigation of climate change at the global scale. However, the increases in nutrient contents and water holding capacities of the soil associated with the increases in SOC due to the trees would have direct benefits for local communities. Increasing tree cover would also act as a barrier against further desert encroachment. Given the multiple benefits and ecosystem services gained by increasing SOC stocks, programmes aimed at promoting planting and increasing tree cover in drylands in general and in the Sahel zone in particular are to be encouraged. It is therefore important that the knowledge gained from this study be transferred to local communities in order to minimize further disturbance and encourage restocking and sustainable management of the woodland savanna landscape. This research also highlighted the need for more empirical studies on the effect of tree density and cover on rainfall-runoff relationships, infiltration, soil moisture, evapotranspiration and drainage in drylands, especially those of the drier parts of semi-arid Africa.
36
References
Abu-Awwad, A.M. 1997. Water infiltration and redistribution within soils affected by a surface crust. Journal of Arid Environments 37: 231–242.
Alexandrov, G.A. 2007. Carbon stock in a forest stand: the power of age. Carbon Balance Management 2: 4. Allen, R.G., Pereira, L.S., Raes, D. & Smith, M. 1998. Crop evapotranspiration: guidelines for
computing crop water requirements. FAO irrigation and drainage paper number 56. Rome: FAO.
Aranibar, J.N., Otter, L., Macko, S.A., Feral, C.J. W., Epstein, H.E., Dowty, P.R., Eckardt, F., Shugart, H.H. & Swap, R.J. 2004. Nitrogen cycling in the soil-plant system along a precipitation gradient in the Kalahari sands. Global Change Biology 10: 359–373.
Ardö, J. & Olsson, L. 2003. Assessment of soil organic carbon in semi-arid Sudan using GIS and the CENTURY model. Journal of Arid Environments 54: 633–651.
Ardö, J. & Olsson, L. 2004. Soil carbon sequestration in traditional farming in Sudanese dry lands. Environmental Management 33(1): 318–329.
Ardö, J., Meelis, M., El-Tahir, B.A. & Elkhidir, H.A. 2008. Seasonal variation of carbon fluxes in sparse savanna in semi arid Sudan. Carbon Balance and Management 3: 7.
Ardö, J. 2013. A 10-year dataset of basic meteorology and soil properties in Central Sudan. Dataset Papers in Geosciences. Article ID 297973. doi:10.7167/2013/297973.
Ayoub, A.T. 1998. Extent, severity and causative factors of land degradation in the Sudan. Journal of Arid Environments 38: 397–409.
Ayoub, A.T. 1999. Land degradation, rainfall variability and food production in the Sahelian zone of the Sudan. Land Degradation and Development 10: 489–500.
Bakhoum, N., Odee, D.W., Fall, D., Ndoye, F., Kane, A., Kimiti, J.M., Zoubeirou, A.M., Sylla, S.N., Noba, K. & Diouf, D. 2016. Senegalia Senegal response to inoculation with rhizobial strains vary in relation to seed provenance and soil type. Plant and Soil 398: 181–193.
Balesdent, J. & Mariotti, A. 1996. Measurement of soil organic matter turnover using 13C natural abundances. In: Mass Spectrometry of Soils. T. W., Boutton and S.I., Yamasaki (Eds.). Marcel Dekker Inc., New York, p. 83–111.
Balland, V., Pollacco, J.A.P. & Arp, P.A. 2008. Modeling soil hydraulic properties for a wide range of soil conditions. Ecological Modelling 219: 300–316.
Ballal, M.E., El Siddig, E.A., Elfadl, M.A. & Luukkanen, O. 2005. Gum arabic yield in differently managed Acacia senegal stands in western Sudan. Agroforestry Forum 63: 237–245.
Batjes, N.H. 1996. Total carbon and nitrogen in the soils of the world. European Journal of Soil Sciences 47: 151–163.
Barbier, E.B. 1992. Rehabilitating gum arabic systems in Sudan: economic and environmental implications. Environmental and Resource Economics 2: 341–358.
Barbier, E.B. 2000. The economic linkages between rural poverty and land degradation: some evidence from Africa. Agriculture Ecosystems and Environment 82: 355–370.
37
Bargués Tobella, A., Reese, H., Almaw, A., Bayala, J., Malmer, A., Laudon, H. & Ilstedt, U. 2014. The effect of trees on preferential flow and soil infiltrability in an agroforestry parkland in semiarid Burkina Faso. Water Resources Research 50: 3342– 3354.
Belsky, A.J., Mwonga, S.M., Amundson, R.G., Duxbury, J.M. & Ali, A.R. 1993. Comparative effects of isolated trees on their undercanopy environments in high- and low-rainfall savannas. Journal of Applied Ecology 30: 143–155.
Bernhard-Reversat, F. 1987. Litter incorporation to soil organic matter in natural and planted tree stands in Senegal. Pedobiologia 30: 401-417.
Bird, M.I., Veenendaal, E.M., Moyo, C., Lloyd, J. & Frost, P. 2000. Effect of fire and soil texture on soil carbon in a sub-humid savanna (Matopos, Zimbabwe). Geoderma 94: 71–90.
Bird, M.I., Veenendaal, E.M. & Lloyd J.J. 2004. Soil carbon inventories and δ13C along a moisture gradient in Botswana. Global Change Biology 10: 342–349.
Blaser, W.J., Sitters, J., Hart, S.P., Edwards, P.J. & Olde Venterink, H. 2013. Facilitative or competitive effects of woody plants on understorey vegetation depend on N fixation, canopy shape and rainfall. Journal of Ecology 101: 1598–1603.
Blaser, W.J., Shanungu, G.K., Edwards, P.J. & Olde Venterink, H. 2014. Woody encroachment reduces nutrient limitation and promotes soil carbon sequestration. Ecology and Evolution 4(8): 1423–1438.
Boddey, R.M, Peoples, M.B., Palmer, B. & Dart, P.J. 2000. Use of the 15N natural abundance technique to quantify biological nitrogen fixation by woody perennials. Nutrient Cycling in Agroecosystems 57: 235–70.
Bonan, G.B. 1989. A computer model of the solar radiation, soil moisture, and soil thermal regimes in boreal forests. Ecological Modelling 45: 275–306.
Böttcher, H., Kurz, W.A. & Freibauer, A. 2008. Accounting of forest carbon sinks and sources under a future climate protocol-factoring out past disturbance and management effects on age-class structure. Environmental Science Policy 11 (8): 669–686.
Bourlière, F. & Hadley M. 1983. Present-day savannas: an overview. In: Ecosystems of the World. 13. Tropical Savannas, F. Bourlière. (Ed.), Elsevier, Amsterdam, pp. 17.
Boutton, T.W., Archer, S.R., Midwood, A.J., Zitzer, S.F. & Bol, R. 1998. 13C values of soil organic carbon and their use in documenting vegetation change in a subtropical savanna ecosystem. Geoderma 82: 5–41.
Boutton, T.W & Liao, J.D. 2010. Changes in soil nitrogen storage and δ15N with woody plant encroachment in a subtropical savanna parkland landscape. Journal of Geophysical Research 115: G03019.
Brooker, R.W. & Callaghan, T.V. 1998. The balance between positive and negative plant interactions and its relationship to environmental gradients: a model. Oikos 81: 196-207.
Bui, E.N. & Henderson, B.L. 2013. C:N:P stoichiometry in Australian soils with respect to vegetation and environmental factors. Plant and Soil 373: 553–568.
Caldwell, M.M., Dawson, T.E. & Richards, J.H. 1998. Hydraulic lift: consequences of water efflux for the roots of plants. Oecologia 113: 151–161.
Canadell, J., Jackson, R.B., Ehleringer, J.R., Mooney, H.A., Sala, O.E. & Schulze, E.D. 1996. Maximum rooting depth of vegetation types at the global scale. Oecologia 108: 583–595.
38
Canadell, J.G. & Raupach, M. R. 2008. Managing forests for climate change mitigation. Science 320: 1456–1457.
Dawson, T.E. 1993. Hydraulic Lift and water use by plants: implications for water balance, performance and plant-plant interactions. Oecologia 95: 565–574.
Dawson, T.E., Mambelli, S., Plamboeck, A.H., Templer, P.H. & Tu, K.P. 2002. Stable isotopes in plant ecology. Annual Review of Ecology and Systematics 33: 507–559.
Deans, J.D., Diagne, O., Lindley, D.K., Dione, M. & Parkinson, J.A. 1999. Nutrient and organic-matter accumulation in Acacia senegal fallows over 18 years. Journal of Arid Environment 59: 499–510.
Deans, J.D., Diagne, O., Nizinski, J., Lindley, D.K., Seek, M., Ingleby, K. & Munro, R.C. 2003. Comparative growth, biomass production, nutrient use and soil amelioration by nitrogen fixing-tree species in semi-arid Senegal. Forest Ecology Management 176: 253–264.
Delon, C., Galy-Lacaux, C., Boone, A., Liousse, C., Serça, D., Adon, M., Diop, B., Akpo, A., Lavenu, F., Mougin, E. & Timouk, F. 2010. Atmospheric nitrogen budget in Sahelian dry savannas. Atmospheric Chemistry and Physics 10: 2691–2708.
Djagbletey, E.D., Logah, V., Ewusi-Mensah, N. & Tuffour, H.O. 2018. Carbon stocks in the Guinea savanna of Ghana: estimates from three protected areas. Biotropica 50 (2): 225–233.
D'Odorico, P. & Porporato, A. 2006. Dryland ecohydrology, soil moisture dynamics in water-limited ecosystems. Berlin: Springer.
Doso Jr, S. 2014. Land degradation and agriculture in the Sahel of Africa: causes, impacts and recommendations. Journal of Agricultural Science and Applications 3: 67–73.
Dregne, H.E. 2002. Land degradation in the drylands. Arid Land Research and Management 16: 99–132.
Elmqvist, B., Olsson, L., Elamin, E.M. & Warren, A. 2005. A traditional agroforestry system under threat: An analysis of the gum arabic market and cultivation in the Sudan. Agroforestry Systems 64: 211–218.
El Tahir, B.A., Ahmed, D.M., Ardö, J., Gaafar, A.M. & Salih, A.A. 2009. Changes in soil properties following conversion of Acacia senegal plantation to other land management systems in North Kordofan State, Sudan. Journal of Arid Environments 73: 499–505.
FAO, 1995. Digital Soil Map of the World and Derived Soil Properties. In: Land and Water Digital Media Series 1. FAO, Rome.
FAO, 2004. Carbon sequestration in dryland soils. World Soil Resources Reports 102. Rome, Italy.
FAO, 2006. Global forest resources assessment 2005. Estimating forest cover and forest cover change in Sudan. Working paper 109/E. FAO, Rome.
FAO, 2011. The state of the world’s land and water resources for food and agriculture (SOLAW) – Managing systems at risk. Food and Agriculture Organization of the United Nations, Rome and Earthscan, London.
Farage, P., Pretty, J. & Ball, A. 2003. Biophysical Aspect of Carbon Sequestration in Drylands. University of Essex, UK.
39
Farage, P., Ardö, J., Olsson, L., Rienzi, E., Ball, A. & Pretty, J. 2007. The potential for soil carbon sequestration in three tropical dryland farming systems of Africa and Latin America: A modelling approach. Soil and Tillage Research 94(2): 457–472.
Farley, K.A., Jobbagy, E.B. & Jackson, R.B. 2005. Effects of afforestation on water yield: a global synthesis with implications for policy. Global Change Biology 11: 1565–1576.
Farquhar, G.D., Ehleringer, J.E. & Hubick, K.T. 1989. Carbon isotope discrimination and photosynthesis. Annual Review of Plant Physiology and Plant Molecular Biology 40: 503–537.
February, E.C., Cook, G.D. & Richards, A.E. 2013. Root dynamics influence tree–grass coexistence in an Australian savanna. Austral Ecology 38: 66–75.
García, M., Sandholt, I., Ceccato, P., Ridler, M., Mougin, E., Kergoat, L., Morillas, L., Timouk, F., Fensholt, R. & Domingo, F. 2013. Actual evapotranspiration in drylands derived from in-situ and satellite data: Assessing biophysical constraints. Remote Sensing of Environment 131: 103–118.
Qasim, M., Porembski, S., Sattler, D., Stein, K., Thiombiano, A. & Lindner, A. 2016. Vegetation structure and carbon stocks of two protected areas within the south-Sudanian savannas of Burkina Faso. Environments 3(4), 25.
Gee, G.W. & Hillel, D. 1998. Groundwater recharge in arid regions: Review and critique of estimation methods. Hydrological Processes 2: 255–266.
Genet, H., Bréda, N. & Dufrêne, E. 2010. Age-related variation in carbon allocation at tree and stand scales in beech (Fagus sylvatica L.) and sessile oak (Quercus petraea (Matt.) Liebl.) using a chronosequence approach. Tree Physiology 30: 177–192.
Geesing, D., Felker, P. & Bingham, R.L. 2000. Influence of mesquite (Prosopis glandulosa) on soil nitrogen and carbon development: Implications for global carbon sequestration. Journal of Arid Environments 46: 157–180.
Gibbs, H.K., Sandra, B., John, O.N. & Foley, J.A. 2007. Monitoring and estimating tropical forest carbon stocks: making REDD a reality. Environmental Research Letters 2 .045023. pp. 13.
Gillson, L., Waldron, S. & Willis, K.J. 2004. Interpretation of soil 13C as an indicator of vegetation change in African savannas. Journal of Vegetation Science 15: 339-350.
Githae, E.W., Gachene, C. K.K. & Njoka, J.T. 2011. Soil physicochemical properties under Acacia senegal varieties in the dryland areas of Kenya. African Journal of Plant Science 5(8): 475–482.
Githae, E.W., Gachene, C.K.K., Njoka, J.T. & Omondi, S.F. 2013. Nitrogen Fixation by Natural Populations of Acacia senegal in the Drylands of Kenya Using 15N Natural Abundance. Arid Land Research and Management 27 (4): 327–336.
Gerbaux, M., Hall, N., Dessay, N. & Zin, I. 2009. The sensitivity of Sahelian runoff to climate change. Hydrological Sciences Journal 54: 5–16.
Glenn, E.P., Neale, C.M.U., Hunsaker, D.J. & Nagler, P.L. 2011. Vegetation index-based crop coefficients to estimate evapotranspiration by remote sensing in agricultural and natural ecosystems. Hydrological Processes 26: 4050–4062.
Gorashi, A.R. 2001. State of forest genetic resources in Sudan. Forest genetic resources working paper number FGR/20E. FAO/IPGRI/SAFORGEN/DFSC/ICRAF, Rome.
40
Grace, J., José, J.S., Meir, P., Miranda, H.S. & Montes, R.A. 2006. Productivity and carbon fluxes of tropical savannas. Journal of Biogeography 33: 387-400.
Gray, A., David, O., Cavers, S., Wilson, J., Telford, A., Grant, F., Diouf, M., Ochieng, J., Grant, H. & Stott, A. 2013. Does geographic origin dictate ecological strategies in Acacia senegal (L.) Willd.? Evidence from carbon and nitrogen stable isotopes. Plant and Soil 369: 479–496.
Hedin, L.O., Brookshire, E.N.J., Menge, D.N.L. & Barron, A.R. 2009. The nitrogen paradox in tropical forest ecosystems. Annual Review of Ecology, Evolution and Systematics 40: 613–635.
Hobbie, E.A. & Ouimette, A.P. 2009. Controls of nitrogen isotope patterns in soil profiles. Biogeochemistry 95: 355–371.
Houghton, R.A. 2005. Aboveground forest biomass and the global carbon balance. Global Change Biology 11: 945–958.
House, J.I. & Hall, D.O. 2001. Productivity of tropical savannas and grasslands. In Terrestrial Global Productivity. Eds. J. Roy, B. Saugier and H.A. Mooney. Academic Press, San Diego, pp. 363–400.
Hudson, B.D. 1994. Soil organic matter and available water capacity. Journal of soil and water Conservation 49: 189–194.
Ilstedt, U., Malmer, A., Verbeeten, E. & Murdiyarso, D. 2007. The effect of afforestation on water infiltration in the Tropics: A systematic review and meta-analysis. Forest Ecology and Management 251: 45–51.
Ilstedt, U., Bargués Tobella, A., Bazié, H.R., Bayala, J., Verbeeten, E., Nyberg, G., Sanou, J., Benegas, L., Murdiyarso, D., Laudon, H., Sheil, D. & Malmer, A. 2016. Intermediate tree cover can maximize groundwater recharge in the seasonally dry tropics. Scientific Reports 6, 21930.
IPCC, 2003. IPCC Good Practice Guidance for LULUCF. The Institute for Global Environmental Strategies (IGES). p. 3.168.
Irvine, J., Law B.E., Kurpius, M.R., Anthoni, P.M., Moore, D. & Schwarz, P.A. 2004. Age-related changes in ecosystem structure and function and effects on water and carbon exchange in ponderosa pine. Tree Physiology 24: 753–763.
Jackson, R.B., Canadell, J., Ehleringer, J.R., Mooney H.A., Sala O.E. & Schulze, E.D. 1996. A global analysis of root distributions for terrestrial biomes. Oecologia 108: 389–411.
Jakubaschk, C. 2002. Acacia senegal, soil organic carbon and nitrogen contents: A study in North Kordofan, Sudan. M.Sc. thesis. Department of Physical Geography and Ecosystems Analysis, Lund University, Lund.
Jamal, A. & Huntsinger, L. 1993. Deterioration of a sustainable agro-silvo-pastoral system in the Sudan: the gum gardens of Kordofan. Agroforestry systems 23: 23–38.
Jensen, M.E., Burman, R.D. & Allen, R.G. (Eds) 1990. Evapotranspiration and Irrigation Water Requirements. American Society of Civil Engineering (ASCE) Manuals and Reports on Engineering Practice No. 70. New York. pp. 332.
Jones, M.B. & Donnelly, A. 2004. Carbon sequestration in temperate grassland ecosystems and the influence of management, climate and elevated CO2. New Phytologist 164: 423–439.
41
Jones, A., Breuning-Madsen, H., Brossard, M., Dampha, A., Deckers, J., Dewitte, O., Gallali, T., Hallett, S., Jones, R., Kilasara, M., Le Roux, P., Micheli, E., Montanarella, L., Spaargaren, O., Thiombiano, L., Van Ranst, E., Yemefack, M. & Zougmore, R., (Eds.) 2013. Soil Atlas of Africa. European Commission, Publications Office of the European Union, Luxembourg. 176 pp.
Justine, M.F., Yang, W., Wu, F., Tan, B., Khan, M.N. & Yeyi, Z. 2015. Biomass stock and carbon sequestration in a chronosequence of Pinus massoniana plantations in the upper reaches of the Yangtze River. Forests 6: 3665–3682.
Kamble, B., Irmak, A. & Hubbard, K. 2013. Estimating crop coefficients using remote - based vegetation index. Remote Sensing 5: 1588–1602.
Kaya, B., Hildebrand, P.E. & Nair, P.K. 2000. Modeling changes in farming systems with the adoption of improved fallows in southern Mali. Agricultural Systems 66: 51–68.
Keller, A.A. & Goldstein, R.A. 1998. Impact of carbon storage through restoration of drylands on the global carbon cycle. Environmental Management 22 (5): 757–766.
Koohafkan, P. & Stewart, B.A. 2008. Water and Cereals in Drylands. FAO, Malta, Italy. Krull, E., Bray, S., Harms, B., Baxter, N., Bol, R. & Farquhar, G. 2007. Development of a stable
isotope index to assess decadal-scale vegetation change and application to woodlands of the Burdekin catchment, Australia. Global Change Biology 13: 1455–1468.
Kurc, S.A. & Small, E.E. 2007. Soil moisture variations and ecosystem-scale fluxes of water and carbon in semiarid grassland and shrubland. Water Resources Research 43, W06416.
Laio, F., Porporato, A., Ridolfi, L. & Rodriguez-Iturbe, I. 2001. Plants in water-controlled ecosystems: active role in hydrologic processes and response to water stress II. Probabilistic soil moisture dynamics. Advances in Water Resources 24: 707–723.
Lal, R. 1999. Global carbon pools and fluxes and the impact of agricultural intensification and judicious land use. In: Prevention of land degradation, enhancement of carbon sequestration and conservation of biodiversity through land use change and sustainable land management with a focus on Latin America and the Caribbean. World Soil Resources Report 86. FAO, Rome. P. 45–52.
Lal, R. 2001. Potential of desertification control to sequester carbon and mitigate the greenhouse effect. Climate change 51: 35–72.
Lal, R. 2004a. Carbon sequestration in dryland ecosystems. Environmental Management 33(4): 528–544.
Lal, R. 2004b. Soil carbon sequestration impacts on global climate change and food security. Science 304, 1623.
Lal, R. 2005. Forest soils and carbon sequestration. Forest Ecology and Management 220: 242–258.
Lal, R. 2009. Challenges and opportunities in soil organic matter research. European Journal of Soil Science 60 (2): 158–169.
Lal, R. 2015. Restoring soil quality to mitigate soil degradation. Sustainability 7: 5875–5895. Lloyd, J., Bird, M.I., Vellen, L., Miranda, A.C., Veenendaal, E.M., Djagbletey, G., Miranda,
H.S., Cook, G. & Farquhar, G.D. 2008. Contributions of woody and herbaceous vegetation to tropical savanna ecosystem productivity: a quasi - global estimate. Tree Physiology 28: 451–468.
42
Ludwig, F., Dawson, T.E., de Kroon, H., Berendse, F. & Prins, H.H.T. 2003. Hydraulic lift in Acacia tortilis trees on an East African savanna. Oecologia 134: 293–300.
Ludwig, F., de Kroon, H., Berendse, F. & Prins, H.H.T. 2004. The influence of savanna trees on nutrient, water and light availability and the understorey vegetation. Plant Ecology 170: 93–105.
Malagnoux, M., Sène, E.H. & Atzmon, N. 2007. Forests, trees and water in arid lands: a delicate balance. Unasylva, 229 (58): 24–29.
Marks, E., Aflakpui, G.K.S., Nkem, J., Poch, R.M., Khouma, M., Kokou, K., Sagoe, R. & Sebasti‘a, M.T. 2009. Conservation of soil organic carbon, biodiversity and the provision of other ecosystem services along climatic gradients in West Africa. Biogeosciences 6: 1825–1838.
Maselli, F., Papale, D., Chiesi, M., Matteucci, G., Angeli, L., Raschi, A. & Seufert, G. 2014. Operational monitoring of daily evapotranspiration by the combination of MODIS NDVI and ground meteorological data: application and evaluation in Central Italy. Remote Sensing of Environment 152: 279–290.
Millennium Ecosystem Assessment (MEA), 2005. Ecosystems and Human Wellbeing: Desertification Synthesis. World Resources Institute, Washington, DC.
Mokany, K., Raison, J.R. & Prokushkin, A.S. 2006. Critical analysis of root-shoot rations in terrestrial biomes Global Change Biology 12: 84–96.
Moustakas, A., Kunin, W.E., Cameron, T.C. & Sankaran, M. 2013. Facilitation or competition? Tree effects on grass biomass across a precipitation gradient. PLoS ONE 8(2), e57025.
Mubarak, A.R., Abdalla, M.H. & Nortcliff, S. 2012. Millet (Pennisetum typhoides) yield and selected soil attributes as influenced by some tree types of the semi-arid tropics of Sudan. Journal of Arid Environments 77: 96–102.
Mustafa, A.F., Elamin, K.H. & Salih, A.A. 1996. Water use efficiency of Acacia senegal (L.) WILLD provenances in Sudan. In Isotope studies on plant productivity. Soil Fertility, Irrigation and Crop Production Section, joint FAO/IAEA Division, Australia.
Ndoye, I., Gueye, M., Danso, S.K.A. & Dreyfus, B. 1995. Nitrogen fixation in Faidherbia albida, Acacia raddiana, Acacia senegal and Acacia seyal estimated using the 15 N isotope dilution technique. Plant and Soil 172: 175–180.
NEH, 2004. National Engineering Handbook, Part 630 Hydrology. Chapt. 10: Estimation of Direct Runoff from Storm Rainfall. Natural Resources Conservation Service, USDA, Washington, D.C. Available at: http://www.nrcs.usda.gov/wps/portal/nrcs/detailfull//?cid=stelprdb1043063
Nicholson, S.H. 2011. Dryland Climatology. Cambridge: Cambridge University Press. pp. 516. Obeid, M. & Seif El Din, A. 1970. Ecological studies of vegetation of Sudan.I. Acacia-senegal
(L.) Willd. And its natural regeneration. Journal of Applied Ecology 7: 507–518. Olsson, L. & Ardö, J. 2002. Soil carbon sequestration in degraded semiarid agro-ecosystems -
perils and potentials. Ambio 31: 471–477. Olsson, K. & Rapp, A. 1991. Dryland degradation in central Sudan and conservation for
survival. Ambio 20(5): 192–195.
43
Pawson, S.M., Brin, A., Brockerhoff, E.G., Lamb, D., Payn, T.W., Paquette, A. & Parrotta, J.A. 2013. Plantation forests, climate change and biodiversity. Biodiversity Conservation 22 (5): 1203–1227.
Pasternak, D., Nikiema, A., Haglund, E. & Ndjeunga, J. 2010. Keep Africa Covered Trees-based options to combat land degradation in the Sudano Sahel: A Contribution to the “Great Green Wall” of the Sahel Program. p. 183-198. In Dia, A., & Duponnois, R. (Eds.), Le projet majeur africain de la Grande Muraille Verte: Concepts et mise en œuvre. IRD Éditions. Tiré de http://books.openedition.org/irdeditions/2125
Pilgrim, D.H., Chapman, T.G. & Doran, D.G. 1988. Problems of rainfall-runoff modelling in arid and semiarid regions. Hydrological Sciences Journal 33 (4): 379–400.
Poussart, J.N., Ardö, J. & Olsson, L. 2004. Effects of data uncertainties on estimated soil organic carbon in the Sudan. Environmental Management 33(1): 405–415.
Powlson, D.S., Whitmore, A.P. & Goulding, W.T. 2011. Soil carbon sequestration to mitigate climate change: a critical re-examination to identify the true and the false. European Journal of Soil Science 62: 42–55.
Pugnaire, F.I., Haase, P. & Puigdefa´bregas J. 1996. Facilitation between higher plant species in a semiarid environment and Ecology 77(5): 1420–1426.
Pugnaire, F.I. & Luque, M.T. 2001. Changes in plant interactions along a gradient of environmental stress. Oikos 93: 42–49.
Raddad, E.A.Y., Salih, A.A., El Fadl, M.A., Kaarakka, V. & Luukkanen, O. 2005. Symbiotic nitrogen fixation in eight Acacia senegal provenances in dryland clays of the Blue Nile Sudan estimated by the 15N natural abundance method. Plant and Soil 275: 261–269.
Rawls, W.J., Pachepsky, Y.A., Ritchie, J.C., Sobecki, T.M. & Bloodworth, H. 2003. Effect of soil organic carbon on soil water retention. Geoderma 116: 61–76.
Reeder, J.D., Franks, C.D. & Milchunas, D.G. 2001. Root biomass and microbial processes. In: Follett, R.F., Kimble, J.M. & Lal, R. (Eds.), The Potential of US Grazing Lands to Sequester Carbon and Mitigate the Greenhouse Effect. Lewis Publishers, Boca Raton FL, pp. 139–166.
Robinson, D. 2001. δ15N as an integrator of the nitrogen cycle. Trends in Ecology and Evolution 16(3): 153–162.
Rocha, J., Perdigao, A., Melo, R. & Henriques, C. 2012. Remote sensing based crop coefficients for water management in agriculture. In: Sime Curkovic (Ed.), Sustainable development — Authoritative and leading edge content for environmental management, 978-953-51-0682-1. http://dx.doi.org/10.5772/48561
Safriel, U., Adeel, Z., Niemeijer, D., Puigdefabregas, J., White, R., Lal, R., Winslow, M., Ziedler, J., Prince, S. & Archer, E. 2005. Dryland Systems, in Ecosystems and Human Well-being: Current State and Trends; Hassan, R., Scholes, R. & Ash, N. (Eds.). Vol 1, The Millennium Ecosystem Assessment Series. Island press, Washington-Covelo-London. p. 623–662.
Saiz, G., Bird, M.I., Domingues, T., Schrodt, F., Schwarz, M., Feldpausch, T.R., Veenendaal, E., Djagbletey, G., Hien, F., Compaore, H., Diallo, A. & Lloyd, J. 2012. Variation in soil carbon stocks and their determinants across a precipitation gradient in West Africa. Global Change Biology 18: 1670–1683.
44
Saiz, G., Wynn, J.G., Wurster, C.M., Goodrick, I., Nelson, P.N. & Bird, M.I. 2014. Pyrogenic carbon from tropical savanna burning: production and stable isotope composition. Biogeosciences Discussions 11: 15149–15183.
Saiz, G., Bird, M., Wurster, C., Quesada, C.A., Ascough, P., Domingues, T., Schrodt, F., Schwarz, M., Feldpausch, T.R., Veenendaal, E., Djagbletey, G., Jacobsen, G., Hien, F., Compaore, H., Diallo, A. & Lloyd, J. 2015. The influence of C3 and C4 vegetation on soil organic matter dynamics in contrasting semi-natural tropical ecosystems. Biogeosciences 12: 5041–5059.
Saiz, G., Wandera, F.M., Pelster, D.E., Ngetich, W., Okalebo, J.R., Rufino, M.C. & Butterbach-Bahl, K. 2016. Long-term assessment of soil and water conservation measures (Fanya-juu terraces) on soil organic matter in South Eastern Kenya. Geoderma 274: 1–9.
Sankaran, M., Hanan, N.P., Scholes, R.J., Ratnam, J., Augustine, D.J., Cade, B.S., Gignoux, J., Higgins, S.I., Le Roux, X., Ludwig, F., Ardo, J., Banyikwa, F., Bronn, A., Bucini, G., Caylor, K.K., Coughenour, M.B., Diouf, A., Ekaya, W., Feral, C.J., February, E.C., Frost, P.G.H., Hiernaux, P., Hrabar, H., Metzger, K.L., Prins, H.H.T., Ringrose, S., Sea, W., Tews, J., Worden, J. & Zambatis, N. 2005. Determinants of woody cover in African Savannas. Nature 438: 846–849.
Sarr, M.S., Seiler, J.R. & Sullivan, J. 2017. Growth and physiology of Senegalia senegal (L.) Britton seedlings as influenced by seed origin and salinity and fertility treatments. Forests 8, 388.
Scanlon, B.R., Keese, K.E., Flint, A.L., Flint, L.E., Gaye, C.B., Edmunds, W.M. & Simmers, I. 2006. Global synthesis of groundwater recharge in semiarid and arid regions. Hydrological Processes 20: 3335–3370.
Schenk, H.J. & Jackson, R.B. 2002. Rooting depths, lateral root spreads and below-ground/above-ground allometries of plants in water-limited ecosystems. Journal of Ecology 90: 480–494.
Schlecht, E., Buerkert, M., Tielkes, E. & Bationo, A. 2006. A critical analysis of challenges and opportunities for soil fertility restoration in Sudano-Sahelian West Africa. Nutrient Cycling in Agroecosystems 76: 109–136.
Scholes, R.J. 1990. The influence of soil fertility on the ecology of African savannas. Journal of Biogeography 17: 415–419.
Scholes, R.J. & Archer, S.R. 1997. Tree-grass interactions in savannas. Annual Reviews of Ecology and systematics 28: 517–544.
Schulze, E.D., Farquhar, G.D., Miller, J.M., Schulze, W., Walker, Brian H. & Williams, R. J. 1999. Interpretation of increased foliar d15N in woody species along a rainfall gradient in northern Australia. Australian Journal of Plant Physiology 26: 296–298.
Schuman, G.E., Reeder, J.D., Manley, J.T., Hart, R.H. & Manley, W.A. 1999. Impact of grazing management on the carbon and nitrogen balance of a mixed-grass rangeland. Ecological Applications 9 (1): 65–71.
Scurlock, J.M.O. & Hall, D.O. 1998. The global carbon sink: a grassland perspective. Global Change Biology 4: 229–233.
Sitters, J., Edwards, P.J. & Olde Venterink, H. 2013. Increases of soil C, N, and P pools along an Acacia tree density gradient and their effects on trees and grasses. Ecosystems 16: 347–357.
45
Snowdon, P., Raison, J., Keith, H., Ritson, P., Grierson, P., Adams, M., Montagu, K., Bi H.Q., Burrows, W. & Eamus, D. 2002. Protocol for sampling tree and stand biomass. National Carbon Accounting System. Technical Report no. 31. Canberra: Australian Greenhouse Office. p. 66.
Solowey, E.M., Amede, T., Evans, A., Boelee, E. & Bindraban, P. 2013. Drylands, in Managing Water and Agroecosystems for Food Security; E. Boelee (Ed.). Comprehensive Assessment of Water Management in Agriculture Series, CABI Publishing, Oxfordshire, UK.
Starr, M. & Alam, S.A. 2015. Water balance of the Sudanese savannah woodland region. Hydrological Sciences Journal 60 (4): 706–722.
Sun, Z., Gebremichael, M., Ardö, J. & de Bruin, H.A.R. 2011. Mapping daily evapotranspiration and dryness index in the East African highlands using MODIS and SEVIRI data. Hydrology and Earth System Sciences 15: 163–170.
Swap, R.J., Aranibar, J.N., Dowty, P.R., Gilhooly, W.P. & Macko, S.A. 2004. Natural abundance of 13C and 15N in C3 and C4 vegetation of southern Africa: patterns and implications. Global Change Biology 10: 350–358.
Takimoto, A., Nair, V.D. & Nair, P.K.R. 2009. Contribution of trees to soil carbon sequestration under agroforestry systems in the West African Sahel. Agroforestry System 76: 11–25.
Tan, K.H. 2005. Soil Sampling, Preparation, and Analysis. Second Edition. Boca Raton, Florida, USA: Taylor and Francis, pp. 680.
Tschakert, P., Khouma, M. & Sène, M. 2004. Biophysical potential for soil carbon sequestration in agricultural systems of the Old Peanut Basin of Senegal. Journal of Arid Environment 59: 511–533.
Thomas, B.F., Behrangi, A. & Famiglietti, J.S. 2016. Precipitation Intensity Effects on Groundwater Recharge in the Southwestern United States. Water 8, 90.
Tian, H., Chen, G., Zhang, C., Melillo, J.M. & Hall, C.A. 2010. Pattern and variation of C: N: P ratios in China’s soils: a synthesis of observational data. Biogeochemistry 98(1–3): 139–151.
Tiessen, H., Feller, C., Sampaio, E.V.S.B. & Garin, P. 1998. Carbon sequestration and turnover in semiarid savannas and dry forest. Climate Change 40: 105–117.
Tieszen, L.L., Tappan, G.G. & Touré, A. 2004. Sequestration of carbon in soil organic matter in Senegal: An overview. Journal of Arid Environments 59: 409–425.
Torello-Raventos, M., Feldpausch, T.R., Veenendaal, E., Schrodt, F., Saiz, G., Domingues, T.F., Djagbletey, G., Ford, A., Kemp, J., Marimon, B.S. et al. 2013. On the delineation of tropical vegetation types with an emphasis on forest/savanna transitions. Plant Ecology and Diversity 6: 101–137.
Trumper, K., Ravilious, C. & Dickson, B. 2008. Carbon in drylands: desertification, climate change and carbon finance. A UNEP–UNDP–UNCCD Technical Note for Discussions at CRIS 7, Istanbul, Turkey – 03-14 November 2008.
Tuck, S.L., Phillips, H.R.P., Hintzen, R.E., Scharlemann, J.P.W., Purvis, A. & Hudson, L.N. 2014. MODISTools – downloading and processing MODIS remotely-sensed data in R. Ecology and Evolution 4: 4658–4668.
46
UNCCD/UNDP/UNEP, 2009. Climate Change in the African drylands: Options and Opportunities for Adaptation and Mitigation. UNON Publishing Services Section, Nairobi.
UNEP, 2007. Sudan: Post-conflict environmental assessment. UNEP, Nairobi. UNEP, 2012. Sahel Atlas of Changing Landscapes: Tracing trends and variations in vegetation
cover and soil condition. United Nations Environment Programme, Nairobi. Vågen, T.G., Lal, R. & Singh, B.R. 2005. Soil carbon sequestration in Sub-Saharan Africa: A
review. Land Degradation and Development 16: 53–71. van Keulen, H. & Breman, H. 1990. Agricultural development in the West African Sahel region:
a cure against land hunger?. Agricultural Ecosystems and Environment 32 (3/4): 177–197.
Vischel, T. & Lebel, T. 2007. Assessing the water balance in the Sahel: impact of small scale rainfall variability on runoff. Part 2: idealized modeling of runoff sensitivity. Journal of Hydrology 333: 340–355.
Vogt, K. 1995. A field worker’s guide to the identification, propagation and uses of common trees and shrubs of dryland Sudan. Published by SOS Sahel, pp. 167.
Walker, S.M. & Desanker, P.V. 2004. The impact of land use on soil carbon in Miombo woodlands of Malawi. Forest Ecology and Management 203: 345–360.
Wang, F.M., Xu, X., Zou, B., Guo, Z.H., Li, Z.A. & Zhu, W.X. 2013. Biomass accumulation and carbon sequestration in four different aged Casuarina equisetifolia coastal shelterbelt plantations in South China. PLoS One 8 (10): e77449. http://dx.doi.org/10.1371/journal.pone.0077449
Wang, C., Zhao, C.Y., Xu, Z.L., Wang, Y. & Peng, H.H. 2013. Effect of vegetation on soil water retention and storage in a semi-arid alpine forest catchment. Journal of Arid Land 5: 207–219.
Weltzin, J.F. & Coughenour, M.B. 1990. Savanna tree influence on understory vegetation and soil nutrients in northwestern Kenya. Journal of Vegetation Science 1(3): 325–332.
Wezel, A., Rajot, J.L. & Herbrig, C. 2000. Influence of shrubs on soil characteristics and their function in Sahelian agro-ecosystems in semi-arid Niger. Journal of Arid Environments 44: 383–398.
White, R.P. & Nackoney, J. 2003. Drylands, people and ecosystem goods and services: a web-based geospatial analysis (pdf version). World Resources Institute. [Available at: http://pdf.wri.org/drylands].
Willmott, C. J. 1981. On the validation of models. Physical Geography 2: 184–194. Willmott, C.J., Rowe, C.M. & Mintz, Y. 1985. Climatology of the terrestrial seasonal water
cycle. Journal of Climatology 5: 589–606. WMO (World Meteorological Organization), 2005. Climate change and land degradation.
WMO-No. 989. ISBN 92-63-10989-3. Woomer, P.L., Touré, A. & Sall, M. 2004. Carbon stocks in Senegal’s Sahel transition zone.
Journal of Arid Environments 59: 499–510. Wynn, J.G. & Bird, M.I. 2007. C4-derived soil organic carbon decomposes faster than its C3
counterpart in mixed C3/C4 soils. Global Change Biology 13: 2206–2217.

47
Zahner, R. 1967. Refinement in empirical functions for realistic soil-moisture regimes under forest cover. In: Sopper W.E. & Lull, H.W. (Eds.) Forest hydrology. Proceedings of a National Science Foundation Advanced Science Seminar, The Pennsylvania State University, Pennsylvania, USA, 29 Aug–10 Sept, 1965. Oxford: Pergamon Press, pp. 261–273.
Zhang, L., Dawes, W.R. & Walker, G.R. 2001. Response of mean annual evapotranspiration to vegetation changes at catchment scale. Water Recourses Research 37 (3): 701–708.
Zuazo, V.H.D. & Pleguezuelo, C.R.R. 2008. Soil-erosion and runoff prevention by plant covers. A review. Agronomy for Sustainable Development 28: 65–86.