Embed Size (px)
Citation preview

Long-latency afferent inhibition during phasic finger movement infocal hand dystonia
Sarah Pirio Richardson1,4,*, Barbara Bliem2,4, Bernhard Voller3,4, Nguyet Dang4, and MarkHallett4
1Department of Neurology, University of New Mexico Health Sciences Center, Albuquerque, NewMexico 2International Graduate School of Neuroscience, Ruhr University Bochum, Germany3Department of Neurology, Medical University of Vienna, Austria 4Human Motor Control Section,National Institute of Neurological Disorders and Stroke, National Institutes of Health, Bethesda,Maryland
AbstractIn the motor system, one specific movement is generated, and, simultaneously, other possiblemovements are suppressed; a process called surround inhibition. Focal hand dystonia (FHD) is amovement disorder characterized by a loss of surround inhibition. In order to explain the deficit insurround inhibition induced by volitional movement in FHD patients, we examined the inhibitorycircuit activated by afferent stimulation at “long latency”. We studied 14 patients (age 48.9 ± 13.2years, 3 female, 11 male) with idiopathic task-related focal hand dystonia. To measure long-latencyafferent inhibition (LAI), TMS was applied to the affected hemisphere for FHD patients and to thedominant hemisphere for 17 healthy volunteers. Motor evoked potentials (MEPs) were recorded overabductor digiti minimi (ADM) and first dorsal interosseous (FDI) during rest and during voluntaryphasic flexion of the second digit. Subjects were given electrical stimulation to either their fifth digit(homotopic to ADM, heterotopic to FDI) or their second digit (heterotopic to FDI, homotopic toADM) at twice sensory perceptual threshold 180ms prior to TMS application. Additionally, F-waveswere recorded from ADM. At rest, we found a significant decrease in ADM MEP amplitudes withboth homotopic and heterotopic stimulation compared to the corresponding non-stimulated trials.There was a trend towards less LAI in FHD patients. During movement, LAI was significantlydecreased in both patients and controls. There was no significant group effect. The results for LAIin FDI were similar to those from ADM. F-wave area in ADM was greater during movement forboth homo- and heterotopic stimulation. We found no difference in F-wave area between patientsand healthy volunteers. Our results indicate that LAI is unlikely to be an underlying mechanism thatcontributes to the generation of normal surround inhibition in healthy volunteers or in the disruptionof surround inhibition in FHD.
KeywordsDystonia; Transcranial magnetic stimulation; Afferent inhibition; Surround inhibition
*Correspondence to: Dr. S. Pirio Richardson, Department of Neurology, Health Sciences Center, MSC 5620, 1 University of New Mexico,Albuquerque, New Mexico 87131-0001. [email protected], Phone: (505) 272-3342, Fax: (505) 272-6692..
NIH Public AccessAuthor ManuscriptExp Brain Res. Author manuscript; available in PMC 2010 September 5.
Published in final edited form as:Exp Brain Res. 2009 February ; 193(2): 173–179. doi:10.1007/s00221-008-1605-4.
NIH
-PA Author Manuscript
NIH
-PA Author Manuscript
NIH
-PA Author Manuscript

IntroductionDystonia is a neurological disorder characterized by abnormal posturing due to sustainedmuscle contractions, which interferes with the performance of motor tasks (Hallett 2004).Dystonia can be classified by age at onset, by distribution, and by cause (Tarsy and Simon2006). When the dystonia is restricted to a limb it is called focal limb dystonia (such as in afoot or hand) with an approximate prevalence of 68.9 per million persons (Nutt, Muenter et al.1988). The pathophysiology of focal hand dystonia (FHD) is characterized by abnormalsensorimotor integration (Abbruzzese and Berardelli 2003), loss of plasticity (Quartarone,Rizzo et al. 2005; Weise, Schramm et al. 2006) and loss of inhibition—both in the motor system(for review please see Hallett et al (Hallett 2004)) and in the somatosensory system (Tinazzi,Rosso et al. 2003).
For patients with focal hand dystonia, it is unclear whether abnormal sensorimotor integrationmanifests due to an aberrant brain response to afferent stimulation or whether the afferentstimulation is a trigger itself (Rosenkranz, Altenmuller et al. 2000; Abbruzzese, Marchese etal. 2001; Abbruzzese and Berardelli 2003). The phenomenon of sensory afferent inhibition isseen when peripheral electrical stimulation is delivered to a digit or peripheral nerve prior tothe administration of transcranial magnetic stimulation (TMS) to the contralateral primarymotor cortex (M1) and the resulting motor evoked potential (MEP) is reduced. This sensoryinput can produced inhibition only when appropriately timed. When the interstimulus intervalbetween peripheral electrical stimulation and TMS is approximately 200 ms, this motorinhibitory effect is known as long-latency afferent inhibition (LAI) (Chen, Corwell et al.1999; Classen, Steinfelder et al. 2000; Sailer, Molnar et al. 2003). The role that LAI playsduring voluntary movement in FHD patients is not known. In healthy volunteers, there wasevidence from a study done by Voller et al that LAI contributes to a form of functionalinhibition, namely surround inhibition (Voller, St Clair Gibson et al. 2005). They showed thatLAI increased in a hand muscle not involved in index finger flexion, suggesting that LAIenhanced surround inhibition, leading to the suppression of movement in the non-movingmuscles.
Surround inhibition is a well-known brain mechanism in visual and sensory systems and likelyplays a role in the motor system. The ability to selectively activate particular muscles to performa specific task likely is generated by suppressing the excitability of a neural networksurrounding an activated network (Sohn and Hallett 2004). Among other instances of loss ofinhibition in FHD (Stinear and Byblow 2005; Tinazzi, Farina et al. 2005), there is evidencethat surround inhibition is disturbed in FHD (Sohn and Hallett 2004). However, themechanisms responsible for this phenomenon are not well understood. The role LAI plays insurround inhibition in FHD patients has not been examined.
In this study, we sought to evaluate the role of LAI during voluntary movement in patientswith FHD to determine if a disruption in this sensory inhibitory pathway contributes to theabnormal surround inhibition in FHD. We hypothesized that LAI supports surround inhibitionby acting on fingers not involved in the active movement, and that this inhibition will bediminished in patients with FHD.
MethodsPatient characteristics
We studied 14 patients (age 48.9± 13.2 years, 3 female, 11 male) with idiopathic task-relatedfocal dystonia of their hand (writer’s cramp and musician’s cramp) without any other peripheralor central neurological disorders. All patients except one were right-handed; in four patientsdystonia was present in their non-dominant hand. None of the patients received centrally acting
Richardson et al. Page 2
Exp Brain Res. Author manuscript; available in PMC 2010 September 5.
NIH
-PA Author Manuscript
NIH
-PA Author Manuscript
NIH
-PA Author Manuscript

medication at the time of the investigation. Patients on treatment with botulinum toxin werestudied at least 3 months after the last injection. Seventeen healthy, age-matched (age 44.6 ±18 years, 7 female, 10 male) volunteers served as a control group. All except one were right-handed. The protocol was approved by the National Institute of Neurological Disorders andStroke Institutional Review Board, and all subjects gave their written informed consent.
TMS measurementsSurface electromyography (EMG) activity was recorded from ADM (the target muscle), FDI,flexor digitorum superficialis (FDS), and extensor indicis propius (EIP) using Dantecdisposable silver-silver chloride surface EMG electrodes placed in a bipolar montage. TheEMG activity in FDS and EIP was collected for monitoring the index finger movement. TheEMG was amplified using a conventional EMG machine (Viking IV, Nicolet Biomedical,Madison, Wisconsin) with bandpass between 10 and 2000 Hz. The signal was digitized at afrequency of 5 kHz and stored on a personal computer for further off-line analysis.
Focal TMS was performed with the target muscle at complete rest, which is defined as theabsence of any EMG activity exceeding a background noise level of 25 μV. The motor cortexwas stimulated with a figure 8-shaped coil (each loop 70 mm in diameter) connected to aMagstim 200 magnetic stimulator (Magstim, Whitland, Dyfed, UK). The intersection of thecoil was placed tangentially to the scalp with the handle pointing backwards and laterally at a45-degree angle away from the midline. The “hotspot” for ADM was identified with asuprathreshold stimulus, and this location was marked on the scalp.
At this optimal position of the coil, motor threshold for producing a MEP in resting musclewas assessed. Resting motor threshold (RMT) was determined to the nearest 1% of the maximalstimulator output and was defined as the minimal stimulus intensity required to produce motorevoked potentials (MEPs) of > 50 μV in at least 5 of 10 consecutive trials. MEP size wasdetermined by averaging peak-to-peak amplitudes over 24 single trials for each session atstimulus intensity of 140% of RMT.
In order to get subjects to make a reaction time movement at an exact time, we used a seriesof four equally spaced tones of different frequencies. A Master-8 pulse generator (A.M.P.I,Jerusalem, Israel) was programmed to trigger an auditory click/tone generator (modelS10CTCM, Grass-Telefactor, an Astro-Med, Inc. Product Group, West Warwick, RhodeIsland) at a rate of 1 Hz. Subjects were trained to flex the second finger on the fourth tone. Theaccuracy of movement initiation was determined by the onset of EMG activity in FDS duringfinger flexion on the fourth tone. At the end of the training session, all subjects had EMGinitiation within 40 ms prior to or 20 ms after the fourth tone in at least 25 consecutive trials.MEP size was first measured at rest. Then, using a LabVIEW program (National Instruments,Austin, Texas) to control the timing, a digital electrical stimulus could be given 160 ms priorto expected movement onset, and TMS was given 20 ms after the movement onset, resultingin an interstimulus interval between electrical stimulation and TMS administration of 180 ms(Figure 1). TMS stimulus intensity was adjusted during the movement condition to match theMEP size at rest. Peak-to-peak MEP amplitudes obtained during the movement condition withperipheral stimulation and during rest condition with peripheral stimulation were compared.
Peripheral stimulationPeripheral cutaneous stimulation was performed using ring electrodes around the proximalphalanges of digits 2 and 5 and delivered by a Grass S88 (Grass-Telefactor, An Astro-Med,Inc. Product Group, West Warwick, Rhode Island). The stimulation was applied at 200%percent of sensory perceptual threshold with a pulse duration of 0.2 ms (Classen, Steinfelderet al. 2000). The stimuli were applied at 180 ms prior to the onset of TMS. We used the interval
Richardson et al. Page 3
Exp Brain Res. Author manuscript; available in PMC 2010 September 5.
NIH
-PA Author Manuscript
NIH
-PA Author Manuscript
NIH
-PA Author Manuscript

of 180 ms instead of 200 ms due to evidence that inhibition was stronger at intervals just under200 ms (Classen, Steinfelder et al. 2000; Voller, St Clair Gibson et al. 2005). Stimuli wereapplied randomly both at rest and during flexion of FDS. For each condition, 25 trials withperipheral stimuli (stimulated trials) and 25 trials without peripheral stimuli (non-stimulatedtrials) were administered. During both stimulated and nonstimulated trials, TMS wasadministered.
For this study, a stimulus was defined as being homotopic if the peripheral stimulation wasapplied to the finger from which the MEP was being measured, and heterotopic if the stimuluswas applied to the finger distant to the digit from which the MEP was being measured. Forexample, electrical stimulation of digit 2 was homotopic for FDI and heterotopic for ADM.Electrical stimulation of digit 5 was homotopic for ADM and heterotopic for FDI.
F-wavesIn addition to analysis of MEP amplitudes associated with TMS, supramaximal electricalstimulation of the ulnar nerve at the wrist was performed in a separate session in order tomeasure F-waves from ADM. F-waves are a measure of spinal cord excitability and can bereliably elicited from the small hand muscles, in contrast to other measures of spinal cordexcitability such as the H-reflex. The F-waves were recorded to provide data on changes inspinal cord excitability with movement and peripheral stimulation that could be compared withthe MEP data—which is a result of both cortical, subcortical and spinal influences. Theresulting F-wave area averaged from 20 trials of ADM was determined in both rest andmovement sessions. ADM compound muscle action potential (CMAP) was also determinedduring both movement and rest sessions. F-wave ulnar stimulation at the wrist was delivered174 ms after peripheral stimulation at the digit to evaluate the spinal cord excitability at thetime when the descending corticospinal volley from the TMS stimulation would be reachingthe C7-C8 level of the spinal cord.
Data analysisTo compare MEP amplitudes in ADM and FDI between control and stimulated trials wecalculated a repeated measures analysis of variance (rmANOVA) with the factorsSTIMULATION (non-stimulated vs. stimulated) and GROUP (dystonia patients vs. healthyvolunteers). Results for MEPs were expressed as mean ± SE. Subsequently, MEP amplitudesof stimulated trials were normalized to non-stimulated trials to demonstrate the amount of LAI.The amount of unintentional coactivation in ADM during index finger flexion was defined asthe percentage of entire motor neuron pool activated (background ADM EMG amplitudedivided by ADM CMAP amplitude).
For group comparisons of changes in LAI in ADM and FDI due to movement and peripheralstimulation, we used rmANOVA with the factors MOVE (movement vs. rest) and GROUP(dystonia patients vs. healthy volunteers). Here, trials with homo- and heterotopic stimulationwere treated separately for each muscle, as what was considered homotopic for ADM washeterotopic for FDI. Further, the same statistical analysis (rmANOVA MOVE x GROUP) wasperformed to test for group differences in F-wave area. Paired samples t tests were performedas post hoc comparisons given a significant F statistic. P-values were Bonferroni-corrected formultiple comparisons.
We analyzed ADM and FDI separately as the hotspot for the TMS stimulation was over ADM’scortical representation and optimized the stimulation intensity to see changes in ADM.Although we evoked potentials in FDI with this stimulation area, it may not have been optimalfor this muscle and therefore inhibition may be subject to floor or ceiling effects.
Richardson et al. Page 4
Exp Brain Res. Author manuscript; available in PMC 2010 September 5.
NIH
-PA Author Manuscript
NIH
-PA Author Manuscript
NIH
-PA Author Manuscript

ResultsThe mean RMT value for healthy volunteers was 49.96% (±8.51% SD) and for dystoniapatients 44.90% (±5.86% SD) of stimulator output. There was a tendency towards lower RMTin dystonia patients (univariate ANOVA F1,29=3.555, p=0.069).
In order to match the MEP size during active movement with the rest condition, the mean TMSintensity was reduced by 14.23% (±5.25% SD) or from 140% to 110% of the RMT. ADMMEP amplitudes before and after stimulator adjustment did not significantly differ (rmANOVAF1,30=0.007, p=0.933). The averages of ADM MEP amplitudes in all conditions (rest,movement, homo- and heterotopic stimulation) are shown in Table 1.
At rest we found a significant decrease in MEP amplitudes in stimulated compared to thecorresponding non-stimulated trials in both ADM (F1,59=8.931, p=0.004) and FDI(F1,59=57.52, p<0.0001). There was no significant main effect for the factor GROUP (ADMF1,59=0.2, p=0.656, FDI F1,59=0.622, p=0.434). However, we observed a trend towards aninteraction of the factors STIMULATION and GROUP for ADM (F1,59=2.973, p=0.09) andFDI (F1,59=3.158, p=0.081) suggesting that dystonia patients had less LAI at rest. In ADM inhealthy volunteers MEP amplitudes were significantly decreased from 1.589 ± 0.225 to 1.327± 0.253 mV in stimulated compared to non-stimulated trials (paired samples t test p=0.001),whereas in patients MEP size remained more or less constant (1.652 ± 0.253 mV in non-stimulated trials, 1.582 ± 0.283 mV in stimulated trials, p=0.424). At rest, FDI amplitudes weredecreased in healthy volunteers (from 2.358 ± 0.311 mV to 1.804 ± 0.272 mV, p<0.001) andin FHD patients (from 2.866 ± 0.349 mV to 1.972 ± 0.305 mV, p<0.001).
In the rmANOVA (MOVE x GROUP) there was a significant effect of the factor MOVE duringhomotopic and heterotopic stimulation in ADM (homotopic: F1,29=34.717, p<0.001,heterotopic: F1,28=12.647, p<0.01, Figure 2) and FDI (homotopic: F1,27=17.654, p<0.001,heterotopic: F1,28=26.346, p<0.001, Figure 3). LAI was significantly decreased duringmovement compared to rest. We observed no significant main effect of the factor GROUP(ADM homotopic: p=0.212, heterotopic: p=0.557, FDI homotopic: p=0.820, heterotopic:p=0.695). There was no significant interaction of the factors MOVE x GROUP (ADMhomotopic: p=0.677, heterotopic: p=0.93, FDI homotopic: p=0.711, heterotopic: p=0.703).
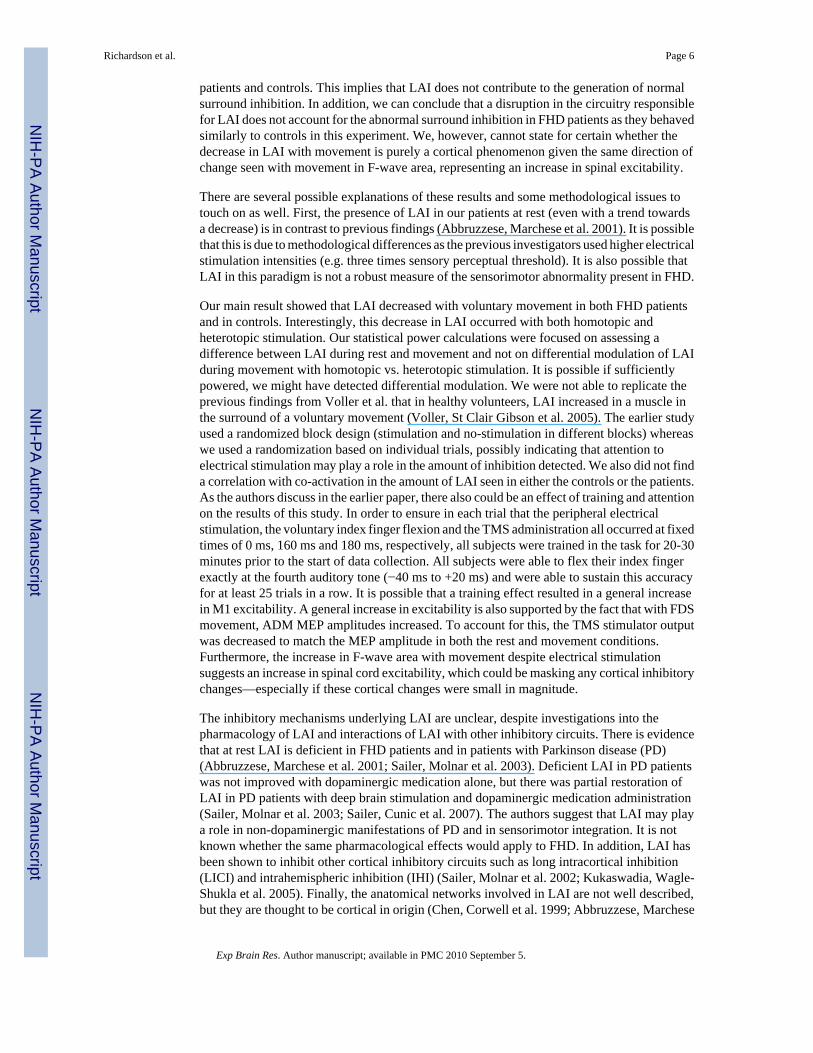
F-wave area was greater during movement in both homo- (F1,25=11.639, p<0.01) andheterotopic stimulation (F1,24=10.69, p<0.01). We found no difference in F-wave area betweenpatients and healthy volunteers (main GROUP effect F1,25=0.044, p=0.836) (Figure 4).
The level of coactivation was 2.23% (±2.12% SD) in healthy volunteers and 2.29% (±2.70%SD) in dystonia patients. Although in some patients the level of coactivation was relativelyhigh (ranging up to 29.06%), the two groups did not significantly differ (univariate ANOVA(F1,54=0.011, p=0.917). The degree of LAI, during homotopic and heterotopic stimulation,was not correlated with the level of coactivation (Pearson correlation homotopic: r=−0.075,p=0.704, heterotopic: r=−0.179, p=0.363).
DiscussionWe confirmed the finding that LAI occurs at rest in healthy volunteers (Chen, Corwell et al.1999; Abbruzzese, Marchese et al. 2001). Although we did not replicate the finding of absentLAI in FHD patients, we did see a trend toward less LAI in FHD patients compared to ourcontrols (Abbruzzese, Marchese et al. 2001). In addition, it appears that there was more motorfacilitation during movement and stimulation in our patient group than our controls, suggestingimpairment in surround inhibition; however, this finding was not statistically significant. Wethen have to conclude that LAI decreased similarly with voluntary movement in both FHD
Richardson et al. Page 5
Exp Brain Res. Author manuscript; available in PMC 2010 September 5.
NIH
-PA Author Manuscript
NIH
-PA Author Manuscript
NIH
-PA Author Manuscript
patients and controls. This implies that LAI does not contribute to the generation of normalsurround inhibition. In addition, we can conclude that a disruption in the circuitry responsiblefor LAI does not account for the abnormal surround inhibition in FHD patients as they behavedsimilarly to controls in this experiment. We, however, cannot state for certain whether thedecrease in LAI with movement is purely a cortical phenomenon given the same direction ofchange seen with movement in F-wave area, representing an increase in spinal excitability.
There are several possible explanations of these results and some methodological issues totouch on as well. First, the presence of LAI in our patients at rest (even with a trend towardsa decrease) is in contrast to previous findings (Abbruzzese, Marchese et al. 2001). It is possiblethat this is due to methodological differences as the previous investigators used higher electricalstimulation intensities (e.g. three times sensory perceptual threshold). It is also possible thatLAI in this paradigm is not a robust measure of the sensorimotor abnormality present in FHD.
Our main result showed that LAI decreased with voluntary movement in both FHD patientsand in controls. Interestingly, this decrease in LAI occurred with both homotopic andheterotopic stimulation. Our statistical power calculations were focused on assessing adifference between LAI during rest and movement and not on differential modulation of LAIduring movement with homotopic vs. heterotopic stimulation. It is possible if sufficientlypowered, we might have detected differential modulation. We were not able to replicate theprevious findings from Voller et al. that in healthy volunteers, LAI increased in a muscle inthe surround of a voluntary movement (Voller, St Clair Gibson et al. 2005). The earlier studyused a randomized block design (stimulation and no-stimulation in different blocks) whereaswe used a randomization based on individual trials, possibly indicating that attention toelectrical stimulation may play a role in the amount of inhibition detected. We also did not finda correlation with co-activation in the amount of LAI seen in either the controls or the patients.As the authors discuss in the earlier paper, there also could be an effect of training and attentionon the results of this study. In order to ensure in each trial that the peripheral electricalstimulation, the voluntary index finger flexion and the TMS administration all occurred at fixedtimes of 0 ms, 160 ms and 180 ms, respectively, all subjects were trained in the task for 20-30minutes prior to the start of data collection. All subjects were able to flex their index fingerexactly at the fourth auditory tone (−40 ms to +20 ms) and were able to sustain this accuracyfor at least 25 trials in a row. It is possible that a training effect resulted in a general increasein M1 excitability. A general increase in excitability is also supported by the fact that with FDSmovement, ADM MEP amplitudes increased. To account for this, the TMS stimulator outputwas decreased to match the MEP amplitude in both the rest and movement conditions.Furthermore, the increase in F-wave area with movement despite electrical stimulationsuggests an increase in spinal cord excitability, which could be masking any cortical inhibitorychanges—especially if these cortical changes were small in magnitude.
The inhibitory mechanisms underlying LAI are unclear, despite investigations into thepharmacology of LAI and interactions of LAI with other inhibitory circuits. There is evidencethat at rest LAI is deficient in FHD patients and in patients with Parkinson disease (PD)(Abbruzzese, Marchese et al. 2001; Sailer, Molnar et al. 2003). Deficient LAI in PD patientswas not improved with dopaminergic medication alone, but there was partial restoration ofLAI in PD patients with deep brain stimulation and dopaminergic medication administration(Sailer, Molnar et al. 2003; Sailer, Cunic et al. 2007). The authors suggest that LAI may playa role in non-dopaminergic manifestations of PD and in sensorimotor integration. It is notknown whether the same pharmacological effects would apply to FHD. In addition, LAI hasbeen shown to inhibit other cortical inhibitory circuits such as long intracortical inhibition(LICI) and intrahemispheric inhibition (IHI) (Sailer, Molnar et al. 2002; Kukaswadia, Wagle-Shukla et al. 2005). Finally, the anatomical networks involved in LAI are not well described,but they are thought to be cortical in origin (Chen, Corwell et al. 1999; Abbruzzese, Marchese
Richardson et al. Page 6
Exp Brain Res. Author manuscript; available in PMC 2010 September 5.
NIH
-PA Author Manuscript
NIH
-PA Author Manuscript
NIH
-PA Author Manuscript
et al. 2001). The networks activated in LAI are also likely to be widespread given that withelectrical stimulation of the median nerve activity is seen in bilateral primary and secondarysomatosensory cortices (Hari, Reinikainen et al. 1984; Allison, McCarthy et al. 1992) andcontralateral posterior parietal cortex (Forss, Hari et al. 1994). With the widely distributedanatomical network and complex intracortical inhibitory circuitry, it is unclear where preciselythe reduced LAI seen in FHD patients at rest is abnormally generated.
The pathophysiology of FHD includes both abnormal sensorimotor integration and a loss ofinhibitory mechanisms (e.g. surround inhibition). It is likely that afferent information whetherprocessed abnormally or generated abnormally influences the degree of motor output throughthe magnitude of surround inhibition generated. This could lead to varying degrees ofmovement selectivity and overflow into irrelevant muscles. Based on our current study,however, it does not appear that LAI contributes to the generation of normal surround inhibitionnor does it explain the abnormal surround inhibition in FHD patients. In their first descriptionof surround inhibition in the motor system, Sohn et al. (2004) observed suppression of ADMMEP amplitudes at intervals of 3 and 15 ms after movement onset. At a later time point (200ms after movement onset), they even found facilitation (Sohn and Hallett, 2004b). They alsoshowed during index finger movement MEP amplitudes of ADM increased less than those thatwere found in the movement-related muscles FDS, FDI, and EIP. This indicates that surroundinhibition may be a relative rather than an absolute phenomenon. Some of the increased MEPamplitude is due to a generalized increase in spinal excitability that masks what occurscortically (Sohn and Hallett, 2004b). Therefore, the timing appears to be crucial wheninvestigating surround inhibition. Our present study did not account for differential changesin LAI based on the latency to movement onset.
Even if a contribution of LAI to surround inhibition remains to be clarified, the trend towardsless LAI in FHD patients at rest as well as the greater – albeit non-significant facilitation seenwith movement in patients indicates a disruption of this pathway. The restoration of LAI asseen in PD patients after DBS, suggests that this abnormality is potentially modifiable (Sailer,Cunic et al. 2007). The effect that this “normalization” of LAI could potentially have on motorbehavior in FHD patients is unclear and deserves further study.
AcknowledgmentsThis research was supported by the Intramural Research Program of the NIH, NINDS, by the International GraduateSchool of Neuroscience, Ruhr University, Bochum (B.B.) and a travel grant of German Exchange Service (B.B.).
ReferencesAbbruzzese G, Berardelli A. Sensorimotor integration in movement disorders. Mov Disord 2003;18(3):
231–40. [PubMed: 12621626]Abbruzzese G, Marchese R, et al. Abnormalities of sensorimotor integration in focal dystonia: a
transcranial magnetic stimulation study. Brain 2001;124(Pt 3):537–45. [PubMed: 11222454]Allison T, McCarthy G, et al. The relationship between human long-latency somatosensory evoked
potentials recorded from the cortical surface and from the scalp. Electroencephalogr Clin Neurophysiol1992;84(4):301–14. [PubMed: 1377999]
Chen R, Corwell B, et al. Modulation of motor cortex excitability by median nerve and digit stimulation.Exp Brain Res 1999;129(1):77–86. [PubMed: 10550505]
Classen J, Steinfelder B, et al. Cutaneomotor integration in humans is somatotopically organized atvarious levels of the nervous system and is task dependent. Exp Brain Res 2000;130(1):48–59.[PubMed: 10638440]
Forss N, Hari R, et al. Activation of the human posterior parietal cortex by median nerve stimulation.Exp Brain Res 1994;99(2):309–15. [PubMed: 7925811]
Richardson et al. Page 7
Exp Brain Res. Author manuscript; available in PMC 2010 September 5.
NIH
-PA Author Manuscript
NIH
-PA Author Manuscript
NIH
-PA Author Manuscript

Hallett M. Dystonia: abnormal movements result from loss of inhibition. Adv Neurol 2004;94:1–9.[PubMed: 14509648]
Hari R, Reinikainen K, et al. Somatosensory evoked cerebral magnetic fields from SI and SII in man.Electroencephalogr Clin Neurophysiol 1984;57(3):254–63. [PubMed: 6199186]
Kukaswadia S, Wagle-Shukla A, et al. Interactions between long latency afferent inhibition andinterhemispheric inhibitions in the human motor cortex. J Physiol 2005;563(Pt 3):915–24. [PubMed:15649986]
Nutt JG, Muenter MD, et al. Epidemiology of focal and generalized dystonia in Rochester, Minnesota.Mov Disord 1988;3(3):188–94. [PubMed: 3264051]
Quartarone A, Rizzo V, et al. Homeostatic-like plasticity of the primary motor hand area is impaired infocal hand dystonia. Brain 2005;128(Pt 8):1943–50. [PubMed: 15872016]
Rosenkranz K, Altenmuller E, et al. Alteration of sensorimotor integration in musician’s cramp: impairedfocusing of proprioception. Clin Neurophysiol 2000;111(11):2040–5. [PubMed: 11068240]
Sailer A, Cunic DI, et al. Subthalamic nucleus stimulation modulates afferent inhibition in Parkinsondisease. Neurology 2007;68(5):356–63. [PubMed: 17261682]
Sailer A, Molnar GF, et al. Effects of peripheral sensory input on cortical inhibition in humans. J Physiol2002;544(Pt 2):617–29. [PubMed: 12381831]
Sailer A, Molnar GF, et al. Short and long latency afferent inhibition in Parkinson’s disease. Brain2003;126(Pt 8):1883–94. [PubMed: 12805105]
Sohn YH, Hallett M. Disturbed surround inhibition in focal hand dystonia. Ann Neurol 2004;56(4):595–9. [PubMed: 15455393]
Stinear CM, Byblow WD. Task-dependent modulation of silent period duration in focal hand dystonia.Mov Disord 2005;20(9):1143–51. [PubMed: 15954125]
Tarsy D, Simon DK. Dystonia. N Engl J Med 2006;355(8):818–29. [PubMed: 16928997]Tinazzi M, Farina S, et al. Task-specific impairment of motor cortical excitation and inhibition in patients
with writer’s cramp. Neurosci Lett 2005;378(1):55–8. [PubMed: 15763172]Tinazzi M, Rosso T, et al. Role of the somatosensory system in primary dystonia. Mov Disord 2003;18
(6):605–22. [PubMed: 12784263]Voller B, St Clair Gibson A, et al. Long-latency afferent inhibition during selective finger movement. J
Neurophysiol 2005;94(2):1115–9. [PubMed: 15843479]Weise D, Schramm A, et al. The two sides of associative plasticity in writer’s cramp. Brain 2006;129(Pt
10):2709–21. [PubMed: 16921180]
Richardson et al. Page 8
Exp Brain Res. Author manuscript; available in PMC 2010 September 5.
NIH
-PA Author Manuscript
NIH
-PA Author Manuscript
NIH
-PA Author Manuscript

FIG. 1.EMG tracings from one subject recorded over abductor digiti minimi (ADM) and flexordigitorum superficialis (FDS). Digital electrical stimulation occurs at point A (0 ms). Voluntaryindex finger flexion occurs with the 4th auditory tone at point B (160 ms). TMS administrationfollows electrical stimulation after an interval of 180 ms (point C).
Richardson et al. Page 9
Exp Brain Res. Author manuscript; available in PMC 2010 September 5.
NIH
-PA Author Manuscript
NIH
-PA Author Manuscript
NIH
-PA Author Manuscript

FIG. 2.LAI ADM data. Means and standard error bars are shown for the primary outcome (effect ofvoluntary movement on LAI) in a muscle in the surround of the index finger flexion. At rest,there was a trend towards less LAI in patients compared with controls (p=0.09). No groupdifferences with movement were found.
Richardson et al. Page 10
Exp Brain Res. Author manuscript; available in PMC 2010 September 5.
NIH
-PA Author Manuscript
NIH
-PA Author Manuscript
NIH
-PA Author Manuscript
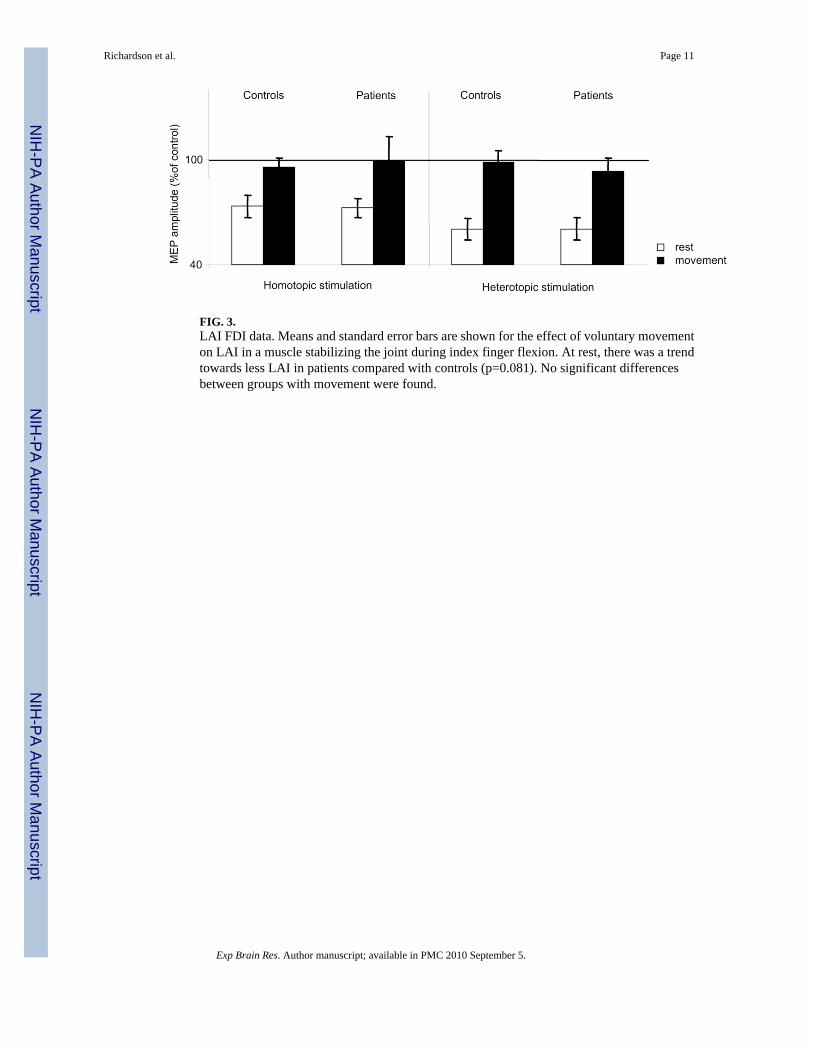
FIG. 3.LAI FDI data. Means and standard error bars are shown for the effect of voluntary movementon LAI in a muscle stabilizing the joint during index finger flexion. At rest, there was a trendtowards less LAI in patients compared with controls (p=0.081). No significant differencesbetween groups with movement were found.
Richardson et al. Page 11
Exp Brain Res. Author manuscript; available in PMC 2010 September 5.
NIH
-PA Author Manuscript
NIH
-PA Author Manuscript
NIH
-PA Author Manuscript

FIG. 4.LAI ADM F waves. Means and standard error bars are shown for F wave area during homo-and heterotopic stimulation both at rest and with movement. No significant differences wereseen between groups.
Richardson et al. Page 12
Exp Brain Res. Author manuscript; available in PMC 2010 September 5.
NIH
-PA Author Manuscript
NIH
-PA Author Manuscript
NIH
-PA Author Manuscript

NIH
-PA Author Manuscript
NIH
-PA Author Manuscript
NIH
-PA Author Manuscript
Richardson et al. Page 13
Tabl
e 1
Mea
n M
EP a
mpl
itude
s (m
V ±
SE)
of t
he n
on-s
timul
ated
(with
out p
erip
hera
l ele
ctric
al st
imul
atio
n) a
nd st
imul
ated
(with
per
iphe
ral e
lect
rical
stim
ulat
ion)
trial
s
Res
t –co
ntro
l tri
als
Res
t –co
nditi
oned
tria
lsM
ovem
ent –
cont
rol t
rial
sM
ovem
ent –
cond
ition
ed tr
ials
Hom
otop
ic1.
71 ±
0.4
41.
74 ±
0.5
41.
47 ±
0.3
61.
70 ±
0.3
4
Patie
nts
Het
erot
opic
1.59
± 0
.36
1.41
± 0
.36
1.46
± 0
.48
1.47
± 0
.48
Hom
otop
ic1.
60 ±
0.3
01.
28 ±
0.3
21.
45 ±
0.2
21.
71 ±
0.3
1
Con
trols
Het
erot
opic
1.58
± 0
.28
1.37
± 0
.30
1.87
± 0
.47
1.74
± 0
.37
Exp Brain Res. Author manuscript; available in PMC 2010 September 5.