Embed Size (px)
Citation preview
Department of Economic Studies, University of Dundee, Dundee. DD1 4HN
Dundee Discussion Papers in Economics
Longitudinal analysis of income-related health inequality: welfare foundations and
alternative measures
Paul Allanson
Working Paper No. 240
August 2010 ISSN:1473-236X
Longitudinal analysis of income-related health inequality: welfare
foundations and alternative measures. Paul Allanson
Economics Studies, University of Dundee, Perth Road, Dundee DD1 4HN, UK.
Email: [email protected]
Abstract
This paper elaborates the approach to the longitudinal analysis of income-related health
inequalities first proposed in Allanson, Gerdtham and Petrie (2010). In particular, the paper
establishes the normative basis of their mobility indices by embedding their decomposition of
the change in the health concentration index within a broader analysis of the change in
“health achievement” or wellbeing. The paper further shows that their decomposition
procedure can also be used to analyse the change in a range of other commonly-used income-
related health inequality measures, including the generalised concentration index and the
relative inequality index. We illustrate our work by extending their investigation of mobility
in the General Health Questionnaire measure of psychological well-being over the first nine
waves of the British Household Panel Survey from 1991 to 1999.
Keywords: income-related health inequality, mobility analysis, longitudinal data JEL classifications: D39, D63, I18
Acknowledgements
The work for this paper was undertaken with financial support from the Chief Scientist
Office (CSO) Grant CZG/2/451. Helpful comments from Dennis Petrie are acknowledged.
The author bears sole responsibility for the further analysis and interpretation of the British
Household Panel Survey data employed in this study.
2
1. Introduction
In a recent paper, Allanson, Gerdtham and Petrie (2010; hereafter AGP) consider the
characterisation and measurement of income-related health inequality using longitudinal
data. In particular, they propose a novel decomposition of the change in the conventional
health concentration index (CI) between two periods that yields an index of income-related
health mobility, which captures the effect on cross-sectional income-related health inequality
of the relationship between relative health changes and individuals’ initial level of income,
and an index of health-related income mobility, which captures the effect of the reshuffling
of individuals within the income distribution on cross-sectional socioeconomic inequalities
in health. The aim of this paper is to extend this work in two directions.
First we draw on the literature on the welfare economics foundations of the health
concentration index to explore the normative basis of the AGP mobility indices. In
particular, we note that the concentration index is the inequality component of the “health
achievement index” of Wagstaff (2002). Accordingly, the AGP analysis of the change in
income-related health inequality can be embedded within a broader analysis of the change in
social welfare or wellbeing, with their decomposition serving to identify how much of the
change in the income-related health inequality component is driven by changes in health
outcomes (i.e. “health mobility”) and how much by changes in individuals’ positions in the
income distribution (i.e. “income (rank) mobility”).
Second we show that the AGP decomposition procedure may also be used to analyse
the change in a range of other commonly-used health inequality measures, including the
generalised concentration index (GC) and the relative inequality index (RII) (Wagstaff et al.,
1991). The choice of inequality index is important as it is known to affect the conclusions
3
drawn in comparative studies (see, for example, Clark et al., 2002) and this dependence will
inevitably carry over to any mobility index that is derived from the decomposition of the
change in such indices over time. In particular, mobility indices based on relative and
absolute income-related health inequality measures respectively embody ‘rightist’ and
‘leftist’ inequality equivalence criteria,1 with the former invariant to equiproportionate
changes in health across all income groups whereas the latter are invariant to equal absolute
changes in health across all income groups. Following the literature on income inequality,
relative measures have been more widely used in empirical work on health inequalities, but
absolute measures have the advantage that they are invariant to whether inequality is
measured with respect to health or morbidity (Clark et al., 2002; Erreygers, 2009).
The paper is structured as follows. The following section explores the ethical basis
for the income-related health and health-related income mobility indices proposed by AGP.
Parallel analyses are also provided based on the change in the generalised concentration
index and with inequality measured with respect to morbidity rather than health. Section 3
investigates the implications of the choice of inequality index by expanding on the empirical
application in AGP, which investigates the dynamics of income and mental health over the
first nine waves of the British Household Panel Survey (BHPS) using the General Health
Questionnaire (GHQ) measure of psychological well-being (Goldberg and Williams, 1988).
The final section summarises the contribution of the paper.
1 In the current context, an inequality equivalence criterion specifies how, given the joint distribution of health and income, an additional amount of health should be distributed in order to leave income-related health inequality unchanged with respect to the starting distribution. See Zoli (2003) for a general discussion of inequality equivalence criteria in relation to the measurement of income inequality.
4
2. Welfare foundations of the AGP mobility indices
The welfare economics foundations of the concentration index have variously been
explored by Bommier and Stecklov (2002), Wagstaff (2002) and Bleichrodt & van Doorslaer
(2006) among others. We draw on this literature to elucidate the ethical basis for the
measures of income-related health mobility and health-related income mobility proposed by
AGP. Thus, our analysis focuses on a single transition between an initial period s and some
final period f (f>s). Let Ψ(hs , ys , hf , yf) be the joint cumulative distribution function (cdf) of
health, H, and income, Y, in the two periods, where ht and yt denote health and income
respectively in period t (t = s, f), and the health measure lies in the bounded interval b≥ ht≥a
with a ≥0 by assumption. Moreover, let ( )t tH Y t th ,yψ be the joint probability density function
(pdf) of health and income in period t, which can in turn be expressed as the product of the
conditional pdf of health given income, ( )|t tH |Y t th yψ , and the marginal pdf of income,
( )tY tyψ . Finally, let πt= ( )
tY tyΨ be the marginal cdf for incomes in period t, where πt is the
proportion of the population with an income in that period less than yt . The corresponding
quantile function will be Yt(πt) = ( )1tY tπ−Ψ for πt∈[0,1], which may loosely be thought of as
the income of an individual with a (normalised) rank of π in the period t distribution (Yaari,
1988). Hence, ( ) ( )( )( ) ( )1 1
|0 0| |
t t
b
t t H Y t t t t t t t taE h h h Y dh d E h dψ π π π π= = =∫ ∫ ∫ will be mean
health in period t, where ( )|t tE h π is mean health conditional upon income rank.
We begin with the social welfare function that underpins the “health achievement”
index proposed by Wagstaff (2002).2 This function defines overall wellbeing in any period
2 But note that Wagstaff considers a health indicator that provides a measure of ill rather than good health. We
consider how this affects the analysis at the end of this section.
5
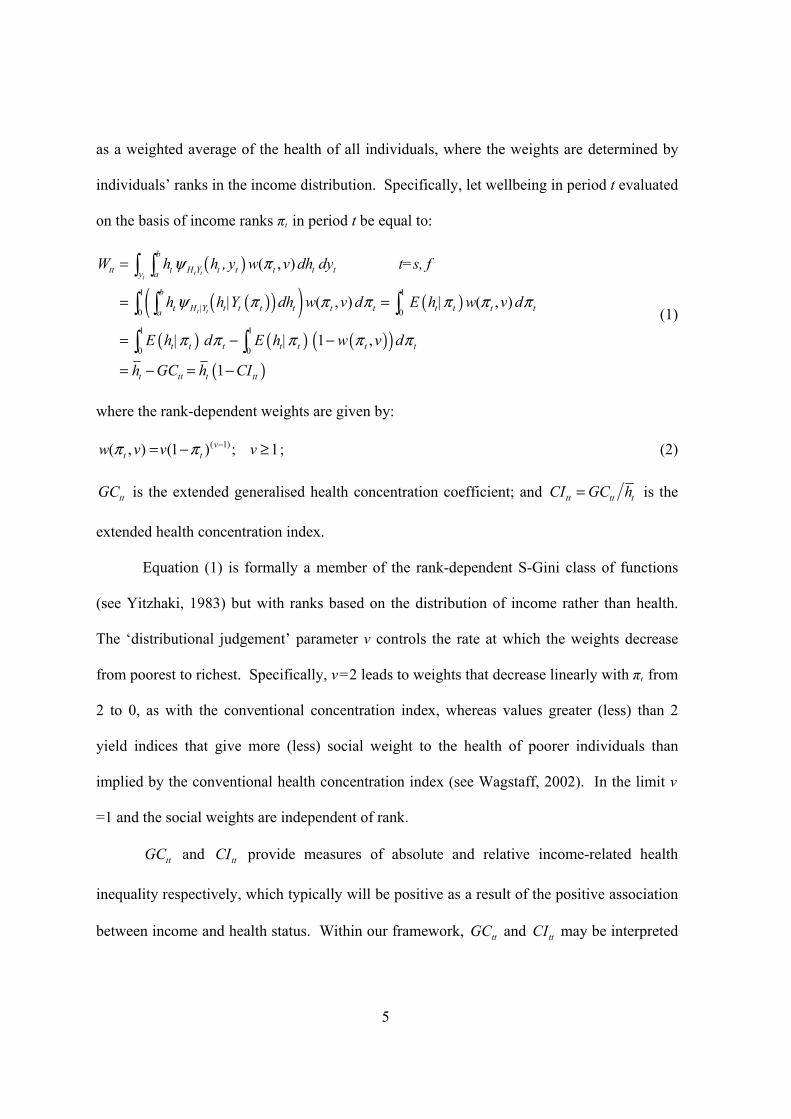
as a weighted average of the health of all individuals, where the weights are determined by
individuals’ ranks in the income distribution. Specifically, let wellbeing in period t evaluated
on the basis of income ranks πt in period t be equal to:
( )
( )( )( ) ( )
( ) ( ) ( )( )( )
1 1
0 0
1 1
0 0
( , )
( , ) | ( , )
| | 1 ,
1
t tt
t t
b
tt t H Y t t t t ty a
b
t H |Y t t t t t t t t t ta
t t t t t t t
t tt t tt
W h h , y w v dh dy t=s, f
h h |Y dh w v d E h w v d
E h d E h w v d
h GC h CI
ψ π
ψ π π π π π π
π π π π π
=
= =
= − −
= − = −
∫ ∫
∫ ∫ ∫
∫ ∫ (1)
where the rank-dependent weights are given by:
( 1)( , ) (1 ) ; 1vt tw v v vπ π −= − ≥ ; (2)
ttGC is the extended generalised health concentration coefficient; and tt tt tCI GC h= is the
extended health concentration index.
Equation (1) is formally a member of the rank-dependent S-Gini class of functions
(see Yitzhaki, 1983) but with ranks based on the distribution of income rather than health.
The ‘distributional judgement’ parameter v controls the rate at which the weights decrease
from poorest to richest. Specifically, v=2 leads to weights that decrease linearly with πt from
2 to 0, as with the conventional concentration index, whereas values greater (less) than 2
yield indices that give more (less) social weight to the health of poorer individuals than
implied by the conventional health concentration index (see Wagstaff, 2002). In the limit v
=1 and the social weights are independent of rank.
ttGC and ttCI provide measures of absolute and relative income-related health
inequality respectively, which typically will be positive as a result of the positive association
between income and health status. Within our framework, ttGC and ttCI may be interpreted
6
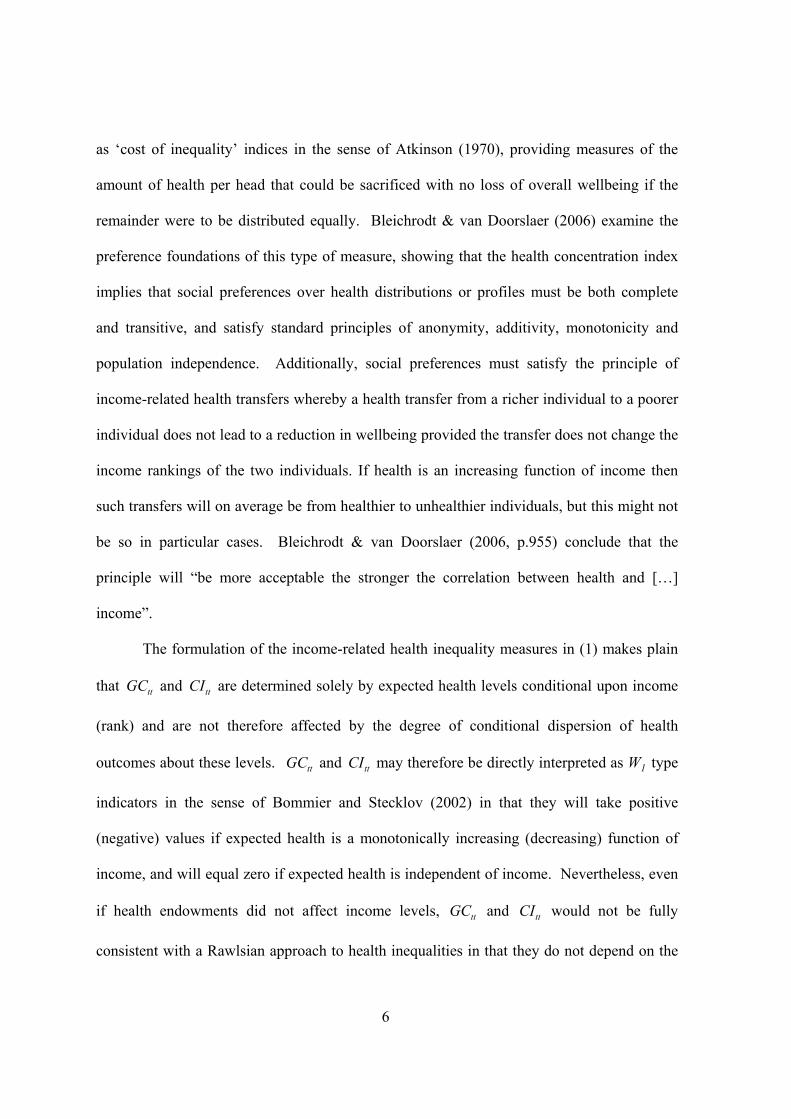
as ‘cost of inequality’ indices in the sense of Atkinson (1970), providing measures of the
amount of health per head that could be sacrificed with no loss of overall wellbeing if the
remainder were to be distributed equally. Bleichrodt & van Doorslaer (2006) examine the
preference foundations of this type of measure, showing that the health concentration index
implies that social preferences over health distributions or profiles must be both complete
and transitive, and satisfy standard principles of anonymity, additivity, monotonicity and
population independence. Additionally, social preferences must satisfy the principle of
income-related health transfers whereby a health transfer from a richer individual to a poorer
individual does not lead to a reduction in wellbeing provided the transfer does not change the
income rankings of the two individuals. If health is an increasing function of income then
such transfers will on average be from healthier to unhealthier individuals, but this might not
be so in particular cases. Bleichrodt & van Doorslaer (2006, p.955) conclude that the
principle will “be more acceptable the stronger the correlation between health and […]
income”.
The formulation of the income-related health inequality measures in (1) makes plain
that ttGC and ttCI are determined solely by expected health levels conditional upon income
(rank) and are not therefore affected by the degree of conditional dispersion of health
outcomes about these levels. ttGC and ttCI may therefore be directly interpreted as W1 type
indicators in the sense of Bommier and Stecklov (2002) in that they will take positive
(negative) values if expected health is a monotonically increasing (decreasing) function of
income, and will equal zero if expected health is independent of income. Nevertheless, even
if health endowments did not affect income levels, ttGC and ttCI would not be fully
consistent with a Rawlsian approach to health inequalities in that they do not depend on the
7
full distribution of health conditional on income, but only its average (Bommier and
Stecklov, 2002).
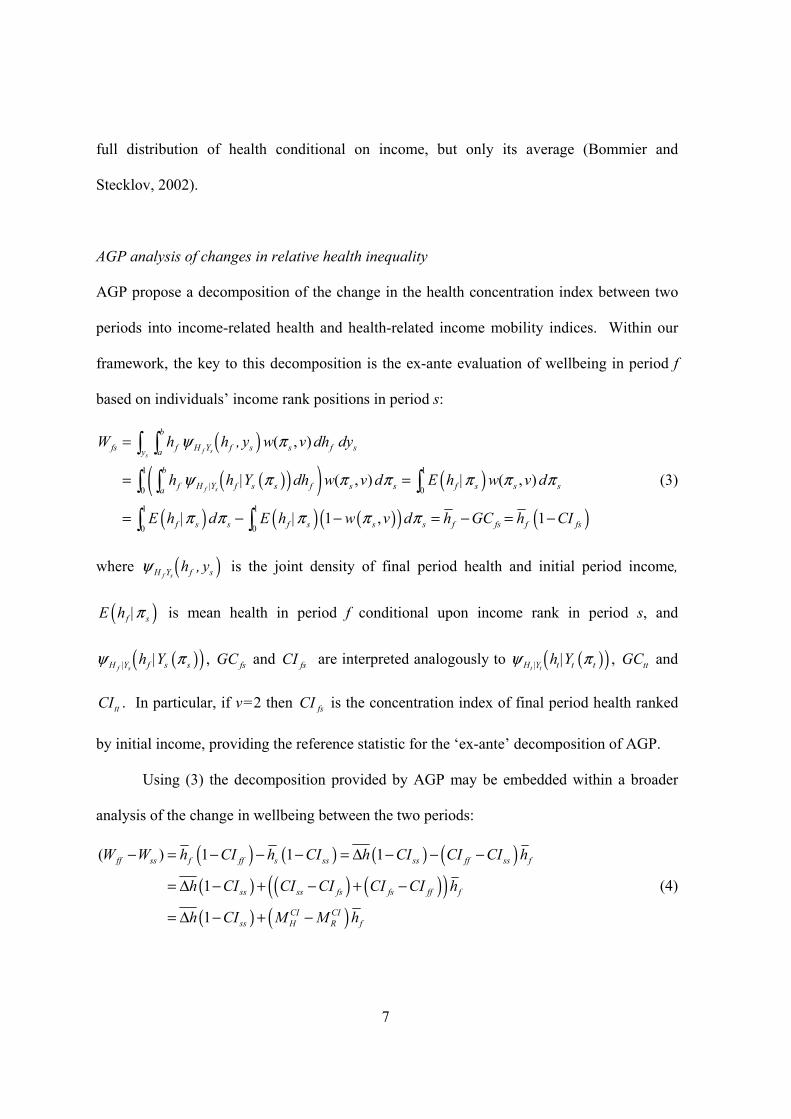
AGP analysis of changes in relative health inequality
AGP propose a decomposition of the change in the health concentration index between two
periods into income-related health and health-related income mobility indices. Within our
framework, the key to this decomposition is the ex-ante evaluation of wellbeing in period f
based on individuals’ income rank positions in period s:
( )( )( )( ) ( )
( ) ( ) ( )( ) ( )
1 1
0 0
1 1
0 0
( , )
( , ) | ( , )
| | 1 , 1
f ss
f s
b
fs f H Y f s s f sy a
b
f H |Y f s s f s s f s s sa
f s s f s s s f fs f fs
W h h , y w v dh dy
h h |Y dh w v d E h w v d
E h d E h w v d h GC h CI
ψ π
ψ π π π π π π
π π π π π
=
= =
= − − = − = −
∫ ∫
∫ ∫ ∫
∫ ∫
(3)
where ( )f sH Y f sh , yψ is the joint density of final period health and initial period income,
( )|f sE h π is mean health in period f conditional upon income rank in period s, and
( )( )f sH |Y f s sh |Yψ π , fsGC and fsCI are interpreted analogously to ( )( )
t tH |Y t t th |Yψ π , ttGC and
ttCI . In particular, if v=2 then fsCI is the concentration index of final period health ranked
by initial income, providing the reference statistic for the ‘ex-ante’ decomposition of AGP.
Using (3) the decomposition provided by AGP may be embedded within a broader
analysis of the change in wellbeing between the two periods:
( ) ( ) ( ) ( )( ) ( ) ( )( )( ) ( )
( ) 1 1 1
1
1
ff ss f ff s ss ss ff ss f
ss ss fs fs ff f
CI CIss H R f
W W h CI h CI h CI CI CI h
h CI CI CI CI CI h
h CI M M h
− = − − − = Δ − − −
= Δ − + − + −
= Δ − + −
(4)
8
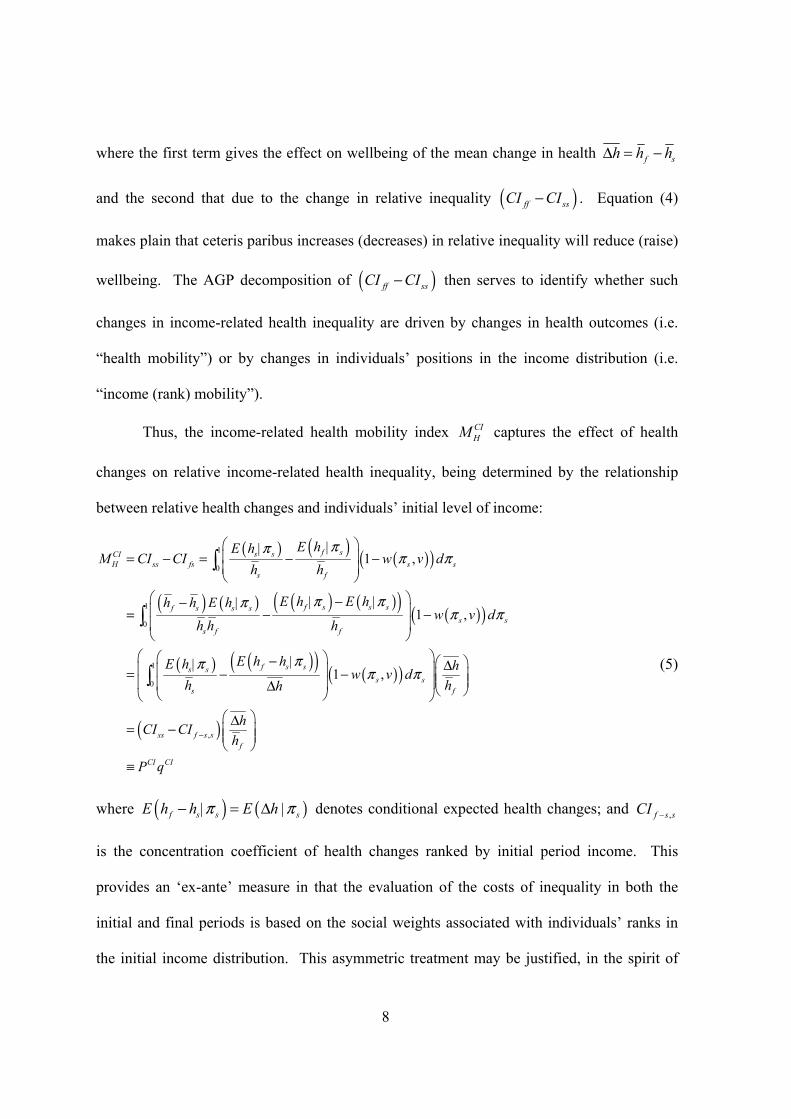
where the first term gives the effect on wellbeing of the mean change in health f sh h hΔ = −
and the second that due to the change in relative inequality ( )ff ssCI CI− . Equation (4)
makes plain that ceteris paribus increases (decreases) in relative inequality will reduce (raise)
wellbeing. The AGP decomposition of ( )ff ssCI CI− then serves to identify whether such
changes in income-related health inequality are driven by changes in health outcomes (i.e.
“health mobility”) or by changes in individuals’ positions in the income distribution (i.e.
“income (rank) mobility”).
Thus, the income-related health mobility index CIHM captures the effect of health
changes on relative income-related health inequality, being determined by the relationship
between relative health changes and individuals’ initial level of income:
( ) ( ) ( )( )
( ) ( ) ( ) ( )( ) ( )( )
( ) ( )( ) ( )( )
( )
1
0
1
0
1
0
,
||1 ,
| ||1 ,
||1 ,
f ss sCIH ss fs s s
s f
f s s sf s s ss s
s f f
f s ss ss s
s f
ss f s sf
CI CI
E hE hM CI CI w v d
h h
E h E hh h E hw v d
h h h
E h hE h hw v dh hh
hCI CIh
P q
πππ π
π πππ π
πππ π
−
⎛ ⎞⎜ ⎟= − = − −⎜ ⎟⎝ ⎠
⎛ ⎞−−⎜ ⎟= − −⎜ ⎟⎝ ⎠
⎛ ⎞⎛ ⎞− ⎛ ⎞Δ⎜ ⎟⎜ ⎟= − − ⎜ ⎟⎜ ⎟⎜ ⎟⎜ ⎟Δ ⎝ ⎠⎝ ⎠⎝ ⎠⎛ ⎞Δ= − ⎜ ⎟⎜ ⎟⎝ ⎠
≡
∫
∫
∫ (5)
where ( ) ( )| |f s s sE h h E hπ π− = Δ denotes conditional expected health changes; and ,f s sCI −
is the concentration coefficient of health changes ranked by initial period income. This
provides an ‘ex-ante’ measure in that the evaluation of the costs of inequality in both the
initial and final periods is based on the social weights associated with individuals’ ranks in
the initial income distribution. This asymmetric treatment may be justified, in the spirit of
9
Dardanoni (1993), on the grounds that the initially poor are disadvantaged to the extent that
they face a worse lottery of future health possibilities than those who are better off, with the
‘distributional judgement’ parameter v allowing for the calibration of the poverty focus of the
evaluation (see Essama-Nssah, 2005). It is also possible in principle to employ individuals’
final period weights to evaluate mobility (see, for example, the alternative income-related
health mobility index considered in AGP) but the forward-looking perspective is the more
natural one when assessing the impact of mobility over time.
Progressivity in this framework is captured by the Kakwani (1977)-type
disproportionality index ( ),CI
ss f s sP CI CI −= − . CIP will be positive (negative) if the poorest
individuals either enjoy a larger (smaller) share of total health gains or suffer a larger
(smaller) share of total health losses compared to their initial share of health, and equals zero
if relative health changes are independent of income or there are no health changes. For any
given CIP , the gross impact on final period income-related health inequalities is proportional
to the scale of health changes, CI fq h h= Δ measured as the ratio of average health changes
to average final period health.3 AGP observe that CIP can provide a useful measure of the
performance of health improvement programmes in targeting the poor: a given reduction in
income-related health inequality can be achieved either by a small-scale but highly targeted
intervention to improve the average health of the very poor or by a larger scale but broader
health programme. The impact of welfare programmes may also be equalising if the
3 Note that if the average health change is negative, then negative (positive) values of CIP imply that health
depreciation is equalising (disequalising) in relative terms in the sense that it will lead to a ceteris paribus
reduction (increase) in relative health inequality.
10
payment of income support to the poor results in contemporaneous improvements in their
health on average.
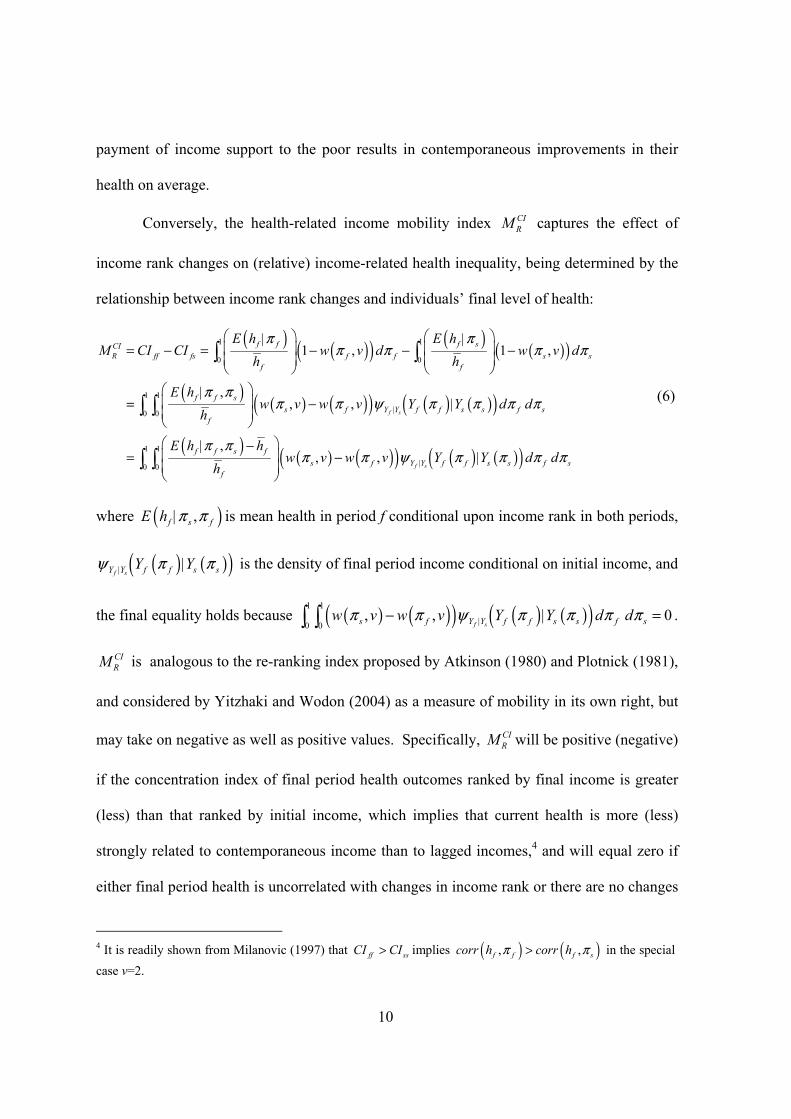
Conversely, the health-related income mobility index CIRM captures the effect of
income rank changes on (relative) income-related health inequality, being determined by the
relationship between income rank changes and individuals’ final level of health:
( ) ( )( ) ( ) ( )( )
( ) ( ) ( )( ) ( ) ( )( )
( ) ( ) ( )( ) ( ) ( )( )
1 1
0 0
1 1
0 0
1 1
0 0
| |1 , 1 ,
| ,, ,
| ,, ,
f s
f s
f f f sCIR ff fs f f s s
f f
f f ss f Y |Y f f s s f s
f
f f s fs f Y |Y f f s s f s
f
E h E hM CI CI w v d w v d
h h
E hw v w v Y |Y d d
h
E h hw v w v Y |Y d d
h
π ππ π π π
π ππ π ψ π π π π
π ππ π ψ π π π π
⎛ ⎞ ⎛ ⎞⎜ ⎟ ⎜ ⎟= − = − − −⎜ ⎟ ⎜ ⎟⎝ ⎠ ⎝ ⎠
⎛ ⎞⎜ ⎟= −⎜ ⎟⎝ ⎠⎛ ⎞−⎜ ⎟= −⎜ ⎟⎝ ⎠
∫ ∫
∫ ∫
∫ ∫
(6)
where ( )| ,f s fE h π π is mean health in period f conditional upon income rank in both periods,
( ) ( )( )f sY |Y f f s sY |Yψ π π is the density of final period income conditional on initial income, and
the final equality holds because ( ) ( )( ) ( ) ( )( )1 1
0 0, , 0
f ss f Y |Y f f s s f sw v w v Y |Y d dπ π ψ π π π π− =∫ ∫ .
CIRM is analogous to the re-ranking index proposed by Atkinson (1980) and Plotnick (1981),
and considered by Yitzhaki and Wodon (2004) as a measure of mobility in its own right, but
may take on negative as well as positive values. Specifically, CIRM will be positive (negative)
if the concentration index of final period health outcomes ranked by final income is greater
(less) than that ranked by initial income, which implies that current health is more (less)
strongly related to contemporaneous income than to lagged incomes,4 and will equal zero if
either final period health is uncorrelated with changes in income rank or there are no changes
4 It is readily shown from Milanovic (1997) that ff ssCI CI> implies ( ) ( ), ,f f f scorr h corr hπ π> in the special case v=2.
11
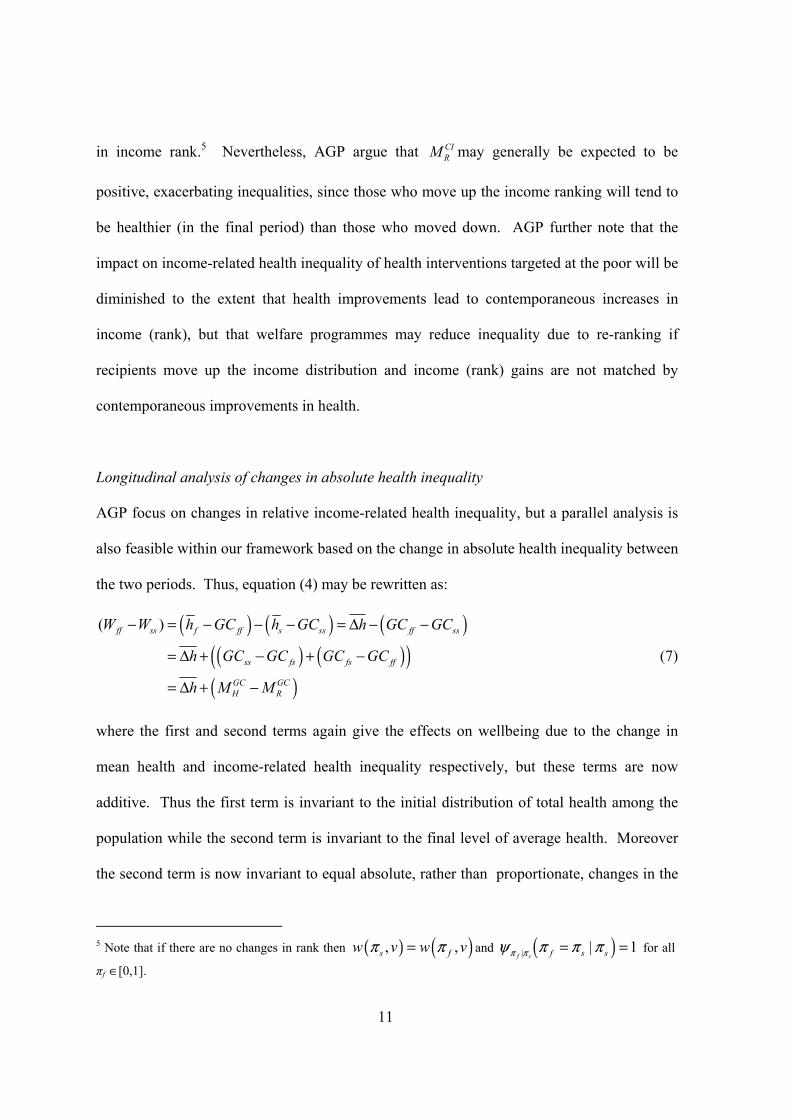
in income rank.5 Nevertheless, AGP argue that CIRM may generally be expected to be
positive, exacerbating inequalities, since those who move up the income ranking will tend to
be healthier (in the final period) than those who moved down. AGP further note that the
impact on income-related health inequality of health interventions targeted at the poor will be
diminished to the extent that health improvements lead to contemporaneous increases in
income (rank), but that welfare programmes may reduce inequality due to re-ranking if
recipients move up the income distribution and income (rank) gains are not matched by
contemporaneous improvements in health.
Longitudinal analysis of changes in absolute health inequality
AGP focus on changes in relative income-related health inequality, but a parallel analysis is
also feasible within our framework based on the change in absolute health inequality between
the two periods. Thus, equation (4) may be rewritten as:
( ) ( ) ( )( ) ( )( )
( )
( )ff ss f ff s ss ff ss
ss fs fs ff
GC GCH R
W W h GC h GC h GC GC
h GC GC GC GC
h M M
− = − − − = Δ − −
= Δ + − + −
= Δ + −
(7)
where the first and second terms again give the effects on wellbeing due to the change in
mean health and income-related health inequality respectively, but these terms are now
additive. Thus the first term is invariant to the initial distribution of total health among the
population while the second term is invariant to the final level of average health. Moreover
the second term is now invariant to equal absolute, rather than proportionate, changes in the
5 Note that if there are no changes in rank then ( ) ( ), ,s fw v w vπ π= and ( )| | 1
f s f s sπ πψ π π π= = for all
πf ∈[0,1].
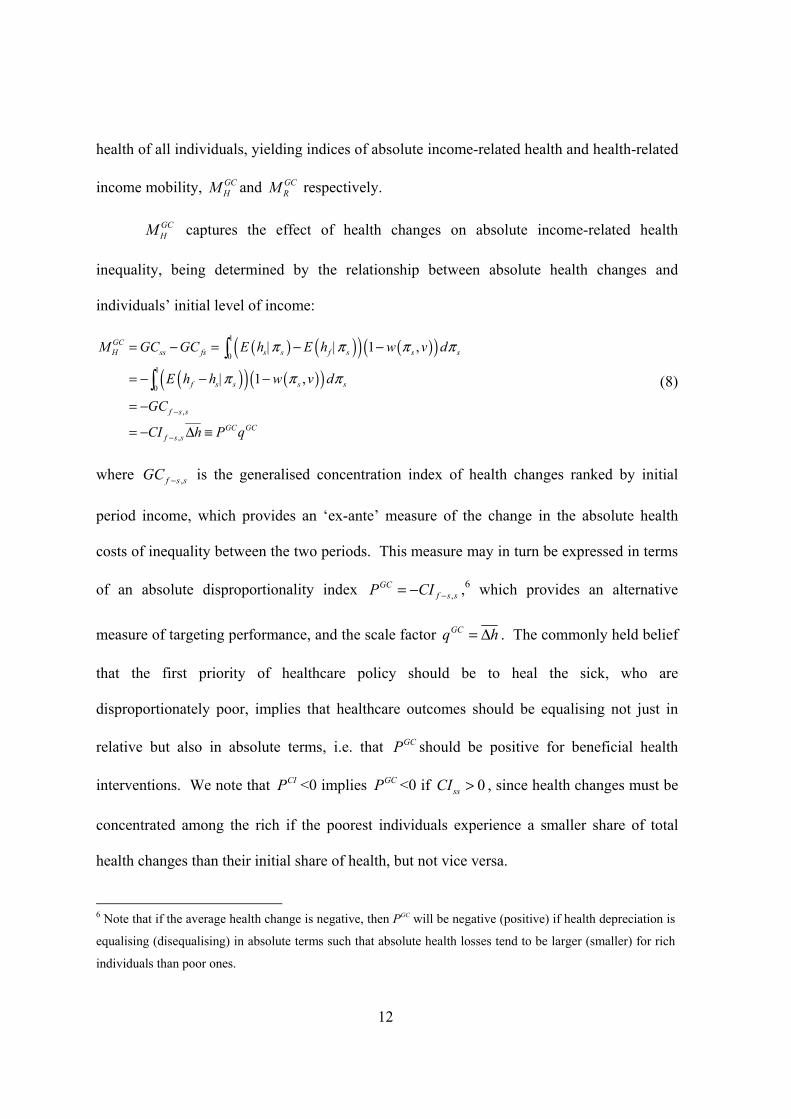
12
health of all individuals, yielding indices of absolute income-related health and health-related
income mobility, GCHM and GC
RM respectively.
GCHM captures the effect of health changes on absolute income-related health
inequality, being determined by the relationship between absolute health changes and
individuals’ initial level of income:
( ) ( )( ) ( )( )( )( ) ( )( )
1
0
1
0
,
,
| | 1 ,
| 1 ,
GCH ss fs s s f s s s
f s s s s
f s s
GC GCf s s
M GC GC E h E h w v d
E h h w v d
GC
CI h P q
π π π π
π π π
−
−
= − = − −
= − − −
= −
= − Δ ≡
∫∫ (8)
where ,f s sGC − is the generalised concentration index of health changes ranked by initial
period income, which provides an ‘ex-ante’ measure of the change in the absolute health
costs of inequality between the two periods. This measure may in turn be expressed in terms
of an absolute disproportionality index ,GC
f s sP CI −= − ,6 which provides an alternative
measure of targeting performance, and the scale factor GCq h= Δ . The commonly held belief
that the first priority of healthcare policy should be to heal the sick, who are
disproportionately poor, implies that healthcare outcomes should be equalising not just in
relative but also in absolute terms, i.e. that GCP should be positive for beneficial health
interventions. We note that CIP <0 implies GCP <0 if 0ssCI > , since health changes must be
concentrated among the rich if the poorest individuals experience a smaller share of total
health changes than their initial share of health, but not vice versa.
6 Note that if the average health change is negative, then PGC will be negative (positive) if health depreciation is
equalising (disequalising) in absolute terms such that absolute health losses tend to be larger (smaller) for rich
individuals than poor ones.
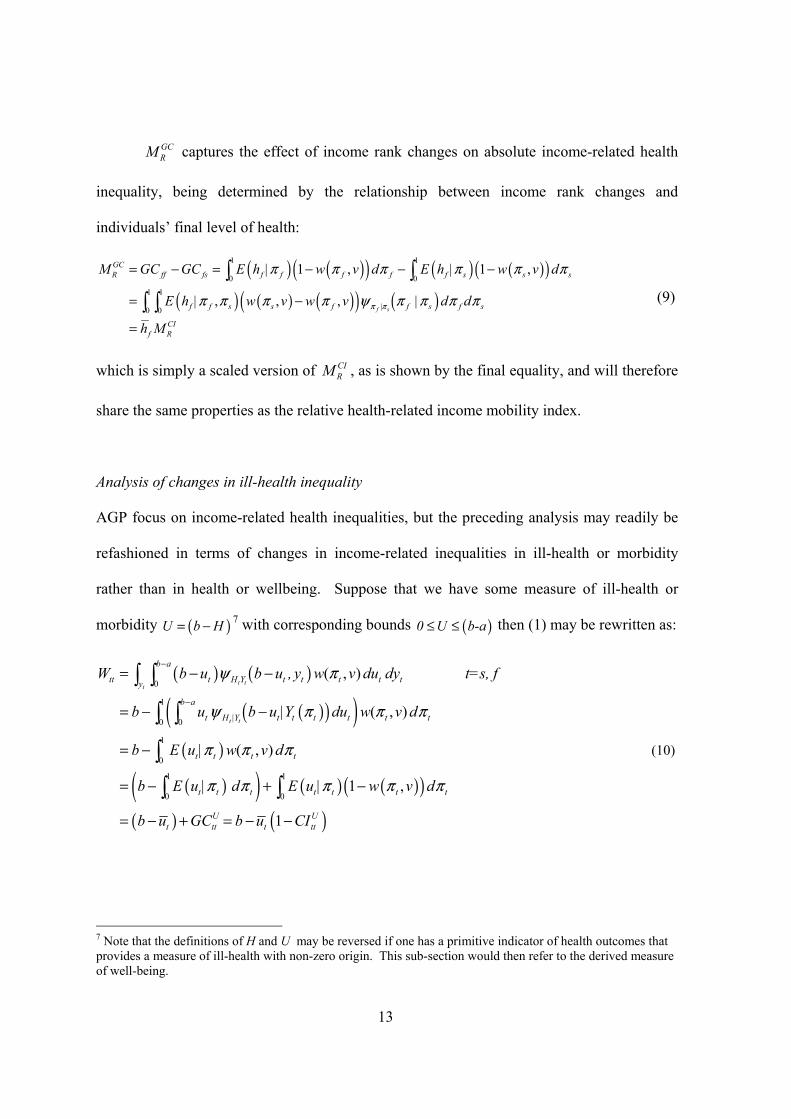
13
GCRM captures the effect of income rank changes on absolute income-related health
inequality, being determined by the relationship between income rank changes and
individuals’ final level of health:
( ) ( )( ) ( ) ( )( )( ) ( ) ( )( ) ( )
1 1
0 0
1 1
|0 0
| 1 , | 1 ,
| , , , |f s
GCR ff fs f f f f f s s s
f f s s f f s f s
CIf R
M GC GC E h w v d E h w v d
E h w v w v d d
h M
π π
π π π π π π
π π π π ψ π π π π
= − = − − −
= −
=
∫ ∫∫ ∫ (9)
which is simply a scaled version of CIRM , as is shown by the final equality, and will therefore
share the same properties as the relative health-related income mobility index.
Analysis of changes in ill-health inequality
AGP focus on income-related health inequalities, but the preceding analysis may readily be
refashioned in terms of changes in income-related inequalities in ill-health or morbidity
rather than in health or wellbeing. Suppose that we have some measure of ill-health or
morbidity ( )U b H= − 7 with corresponding bounds ( )0 U b-a≤ ≤ then (1) may be rewritten as:
( ) ( )
( )( )( )( )
( )( ) ( ) ( )( )( ) ( )
0
1
0 0
1
0
1 1
0 0
( , )
( , )
| ( , )
| | 1 ,
1
t tt
t t
b a
tt t H Y t t t t ty
b a
t H |Y t t t t t t
t t t t
t t t t t t t
U Ut tt t tt
W b u b u , y w v du dy t=s, f
b u b u |Y du w v d
b E u w v d
b E u d E u w v d
b u GC b u CI
ψ π
ψ π π π
π π π
π π π π π
−
−
= − −
= − −
= −
= − + −
= − + = − −
∫ ∫
∫ ∫
∫
∫ ∫
(10)
7 Note that the definitions of H and U may be reversed if one has a primitive indicator of health outcomes that provides a measure of ill-health with non-zero origin. This sub-section would then refer to the derived measure of well-being.
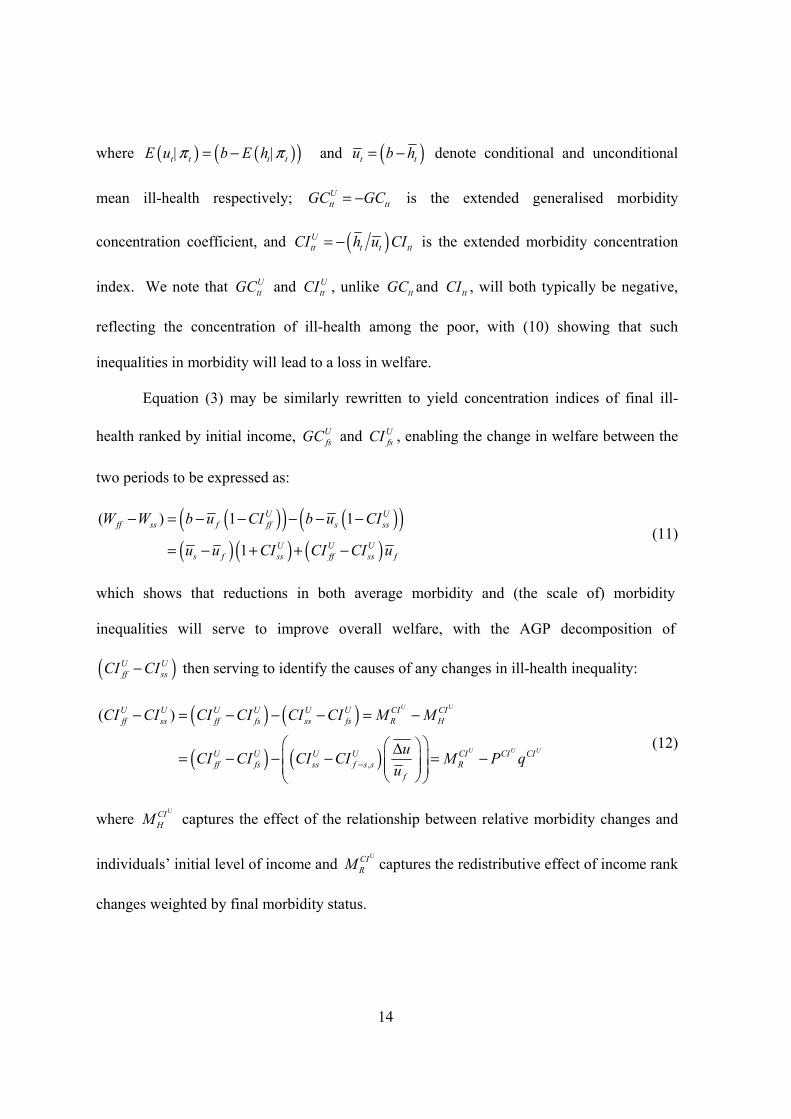
14
where ( ) ( )( )| |t t t tE u b E hπ π= − and ( )t tu b h= − denote conditional and unconditional
mean ill-health respectively; Utt ttGC GC= − is the extended generalised morbidity
concentration coefficient, and ( )Utt t t ttCI h u CI= − is the extended morbidity concentration
index. We note that UttGC and U
ttCI , unlike ttGC and ttCI , will both typically be negative,
reflecting the concentration of ill-health among the poor, with (10) showing that such
inequalities in morbidity will lead to a loss in welfare.
Equation (3) may be similarly rewritten to yield concentration indices of final ill-
health ranked by initial income, UfsGC and U
fsCI , enabling the change in welfare between the
two periods to be expressed as:
( )( ) ( )( )( )( ) ( )
( ) 1 1
1
U Uff ss f ff s ss
U U Us f ss ff ss f
W W b u CI b u CI
u u CI CI CI u
− = − − − − −
= − + + − (11)
which shows that reductions in both average morbidity and (the scale of) morbidity
inequalities will serve to improve overall welfare, with the AGP decomposition of
( )U Uff ssCI CI− then serving to identify the causes of any changes in ill-health inequality:
( ) ( )
( ) ( ),
( )U U
U U U
U U U U U U CI CIff ss ff fs ss fs R H
U U U U CI CI CIff fs ss f s s R
f
CI CI CI CI CI CI M M
uCI CI CI CI M P qu−
− = − − − = −
⎛ ⎞⎛ ⎞Δ= − − − = −⎜ ⎟⎜ ⎟⎜ ⎟⎜ ⎟⎝ ⎠⎝ ⎠
(12)
where UCI
HM captures the effect of the relationship between relative morbidity changes and
individuals’ initial level of income and UCI
RM captures the redistributive effect of income rank
changes weighted by final morbidity status.
15
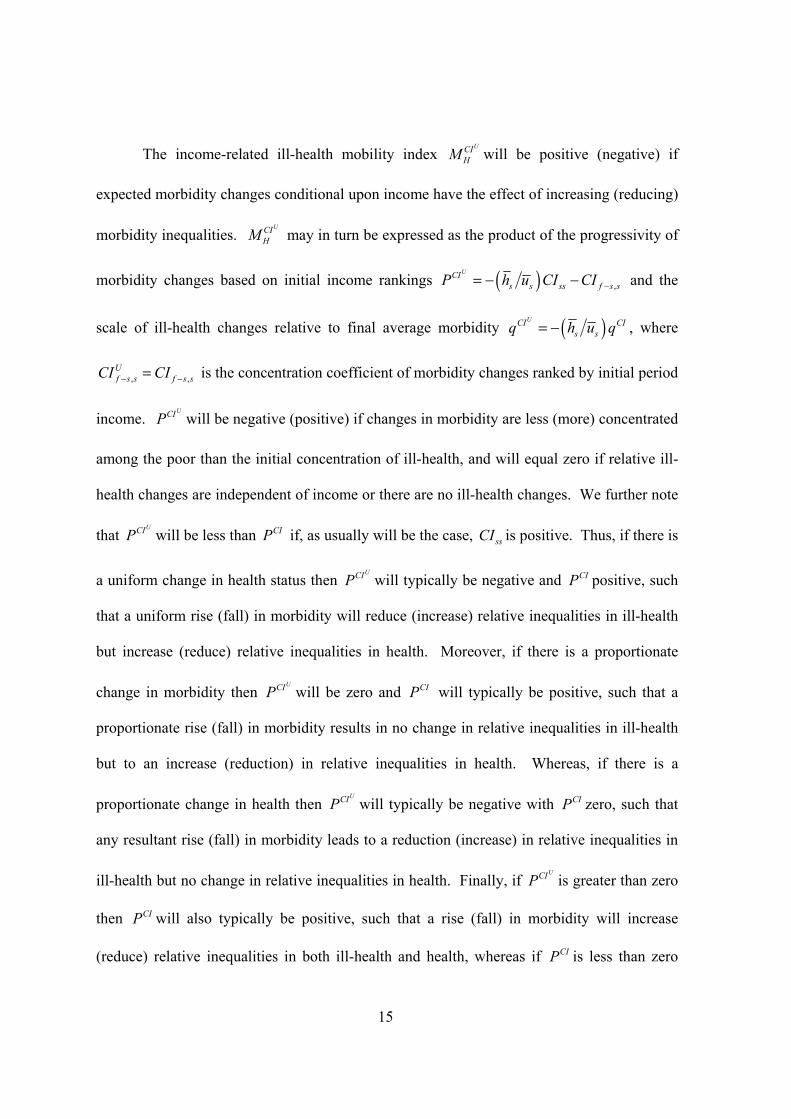
The income-related ill-health mobility index UCI
HM will be positive (negative) if
expected morbidity changes conditional upon income have the effect of increasing (reducing)
morbidity inequalities. UCI
HM may in turn be expressed as the product of the progressivity of
morbidity changes based on initial income rankings ( ) ,
UCIs s ss f s sP h u CI CI −= − − and the
scale of ill-health changes relative to final average morbidity ( )UCI CIs sq h u q= − , where
, ,Uf s s f s sCI CI− −= is the concentration coefficient of morbidity changes ranked by initial period
income. UCIP will be negative (positive) if changes in morbidity are less (more) concentrated
among the poor than the initial concentration of ill-health, and will equal zero if relative ill-
health changes are independent of income or there are no ill-health changes. We further note
that UCIP will be less than CIP if, as usually will be the case, ssCI is positive. Thus, if there is
a uniform change in health status then UCIP will typically be negative and CIP positive, such
that a uniform rise (fall) in morbidity will reduce (increase) relative inequalities in ill-health
but increase (reduce) relative inequalities in health. Moreover, if there is a proportionate
change in morbidity then UCIP will be zero and CIP will typically be positive, such that a
proportionate rise (fall) in morbidity results in no change in relative inequalities in ill-health
but to an increase (reduction) in relative inequalities in health. Whereas, if there is a
proportionate change in health then UCIP will typically be negative with CIP zero, such that
any resultant rise (fall) in morbidity leads to a reduction (increase) in relative inequalities in
ill-health but no change in relative inequalities in health. Finally, if UCIP is greater than zero
then CIP will also typically be positive, such that a rise (fall) in morbidity will increase
(reduce) relative inequalities in both ill-health and health, whereas if CIP is less than zero
16
then UCIP will also typically be negative, such that a rise (fall) in morbidity will reduce
(increase) relative inequalities in both ill-health and health.
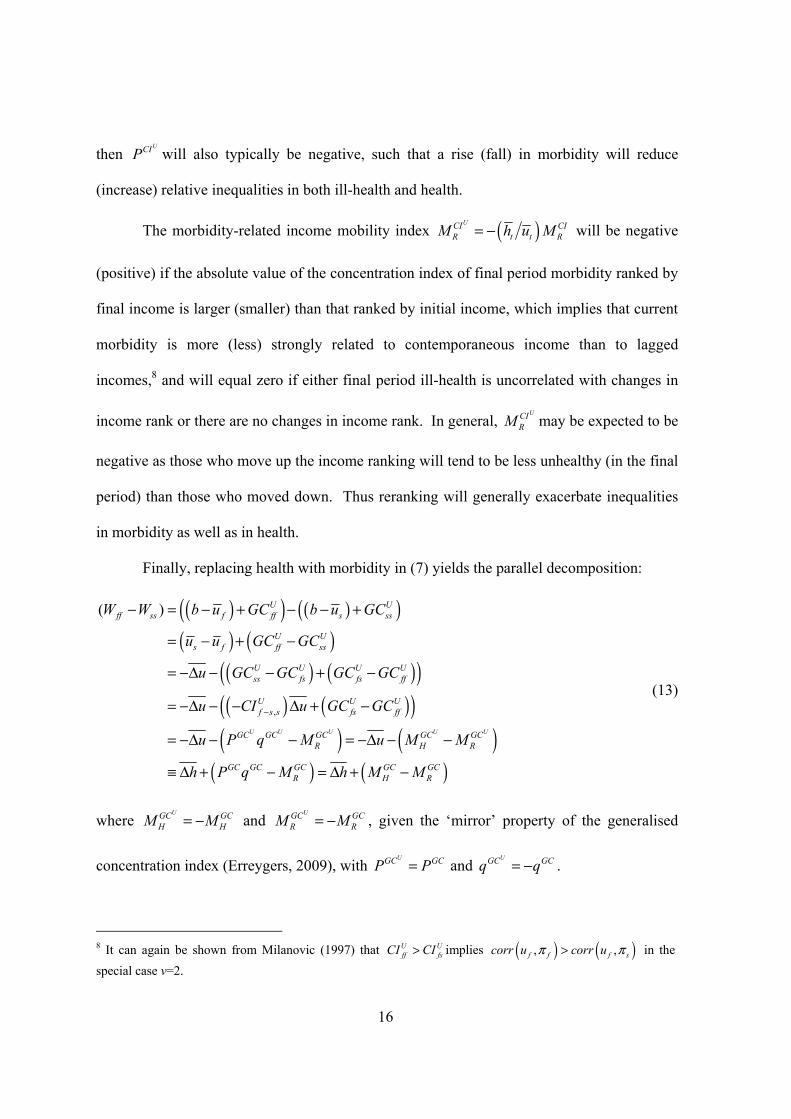
The morbidity-related income mobility index ( )UCI CIR t t RM h u M= − will be negative
(positive) if the absolute value of the concentration index of final period morbidity ranked by
final income is larger (smaller) than that ranked by initial income, which implies that current
morbidity is more (less) strongly related to contemporaneous income than to lagged
incomes,8 and will equal zero if either final period ill-health is uncorrelated with changes in
income rank or there are no changes in income rank. In general, UCI
RM may be expected to be
negative as those who move up the income ranking will tend to be less unhealthy (in the final
period) than those who moved down. Thus reranking will generally exacerbate inequalities
in morbidity as well as in health.
Finally, replacing health with morbidity in (7) yields the parallel decomposition:
( )( ) ( )( )( ) ( )
( ) ( )( )( ) ( )( )
( ) ( )( ) ( )
,
( )
U U U U U
U Uff ss f ff s ss
U Us f ff ss
U U U Uss fs fs ff
U U Uf s s fs ff
GC GC GC GC GCR H R
GC GC GC GC GCR H R
W W b u GC b u GC
u u GC GC
u GC GC GC GC
u CI u GC GC
u P q M u M M
h P q M h M M
−
− = − + − − +
= − + −
= −Δ − − + −
= −Δ − − Δ + −
= −Δ − − = −Δ − −
≡ Δ + − = Δ + −
(13)
where UGC GC
H HM M= − and UGC GC
R RM M= − , given the ‘mirror’ property of the generalised
concentration index (Erreygers, 2009), with UGC GCP P= and
UGC GCq q= − .
8 It can again be shown from Milanovic (1997) that U U
ff fsCI CI> implies ( ) ( ), ,f f f scorr u corr uπ π> in the special case v=2.
17
3. Empirical illustration
We investigate the implications of the choice of inequality index by investigating the
dynamics of income and mental health using the General Health Questionnaire (GHQ)
measure of psychological well-being (Goldberg and Williams, 1988). The GHQ measure is
an (additive) Likert scale which can take values between 0 and 36 with higher values
corresponding to worse states of mental health. Following Jones and López Nicolás (2004),
AGP use (36–GHQ) to obtain a health measure that is increasing in good health. We report
results for both the inverted and original measures to explore the sensitivity of our findings to
whether mobility is measured with respect to health or morbidity. Furthermore, we not only
analyse changes in the health concentration index but also in the generalised health
concentration index, relative inequality index, slope inequality index, and the Wagstaff
(2002) and Erreygers (2009) normalisations of the concentration index and generalised
concentration index, respectively, which take into account the bounds of the health measure
under consideration.
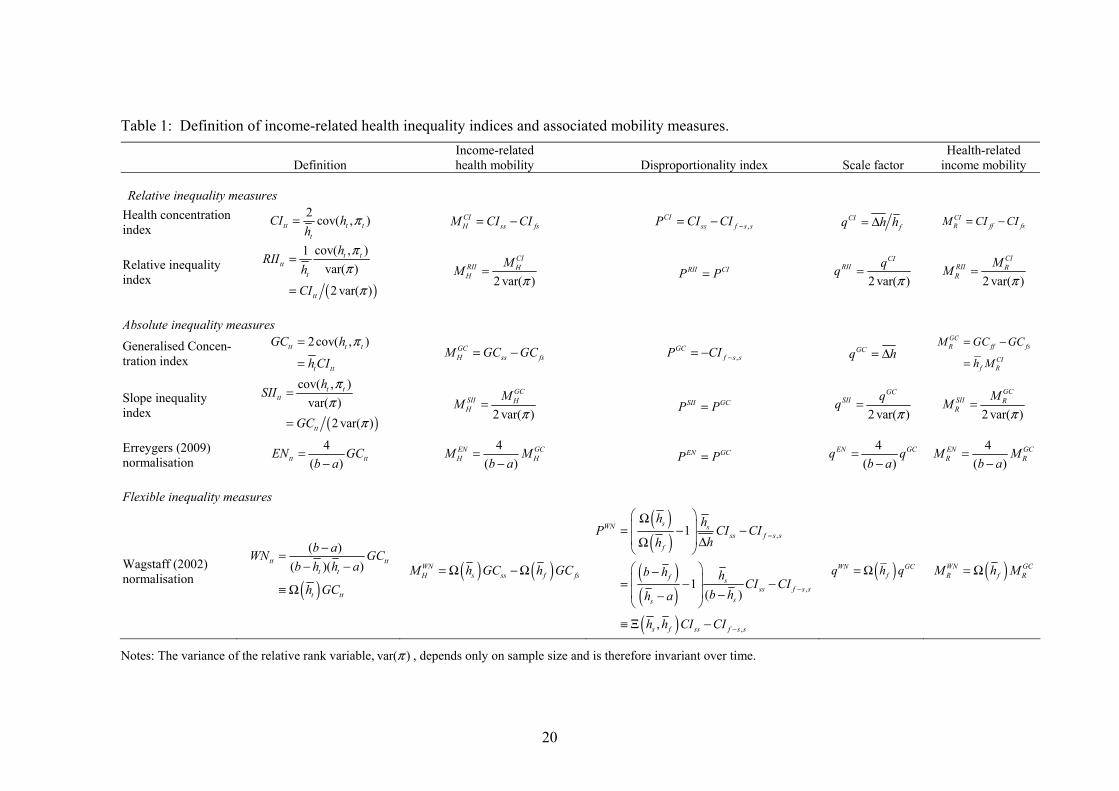
Table l provides definitions of the various income-related health inequality measures
considered in the study together with the corresponding sets of mobility indices.9 The
income-related health and health-related income mobility indices are readily obtained in each
case. The appropriate definition of the disproportionality and scale indices, P and q
respectively, is less obvious: we choose to define P in each case as the difference between
some function of initial income-related health inequality ( )ssCIθ , which may be zero, and the
(extended) concentration index of health changes ,f s sCI − , with q defined conformably. This
9 Expressions for the corresponding inequality measures and mobility indices defined with respect to morbidity, rather than health, are readily obtained by replacing health status h by morbidity u throughout and changing the variable bounds a and b to 0 and (b–a).
18
approach is consistent with the definitions of P and q provided in the previous section for the
extended CI and GC measures, and further implies that the normalisation factor is absorbed
into q rather than P for those measures that are defined as simple multiples of these indices.
Accordingly, differences in progressivity as measured by alternative disproportionality
indices may be interpreted as reflecting differences between the inequality equivalence
criteria implied by the underlying income-related health inequality measures.
The derivation of the mobility indices for the (extended) CI and GC measures has
already been discussed in the previous section, with the ( )ssCIθ values of ssCI and 0 in the
two cases corresponding to relative and absolute inequality equivalence criteria respectively.
As is well known, “the relative index of inequality (RII) is equal to the concentration index
divided by twice the variance of the relative rank variable” (Wagstaff et al., 1991), where
2 2var( ) ( 1) (12 )N Nπ = − is a constant determined by the sample size N, and thus the two
measures, and the resultant mobility indices, simply differ by a multiplicative factor which
will be approximately equal to 1/12 in large samples (Milanovic, 1997). The slope index of
inequality (SII) is simply equal to the RII multiplied by mean health so there is a similar
relationship between the set of SII and GC indices as between the RII and CI indices.
Furthermore, the Erreygers (2009) normalisation (EN) of the health concentration index is
simply equal to ( 4 /( )b a− )GC so the EN mobility indices are also just a multiple of the
corresponding GC measures. However the Wagstaff (2002) normalisation is not a simple
multiple of either the CI or GC measures, nor of some linear combination of the two,
providing a ‘flexible’ inequality equivalence criterion that is determined by the data rather
than embodying some particular criterion, whether that be relative, absolute or intermediate
(see Wagstaff, 2009). Specifically, the value of ( )( ) ,ss s f ssCI h h CIθ = Ξ will depend on the
19
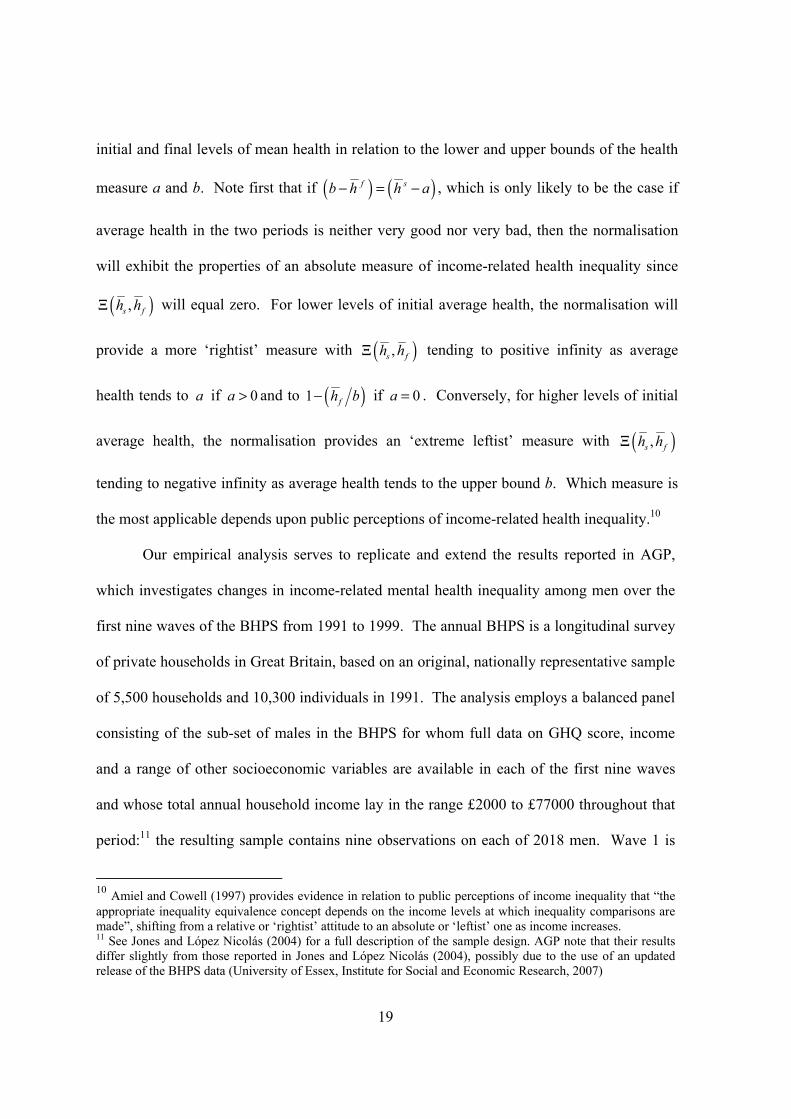
initial and final levels of mean health in relation to the lower and upper bounds of the health
measure a and b. Note first that if ( ) ( )f sb h h a− = − , which is only likely to be the case if
average health in the two periods is neither very good nor very bad, then the normalisation
will exhibit the properties of an absolute measure of income-related health inequality since
( ),s fh hΞ will equal zero. For lower levels of initial average health, the normalisation will
provide a more ‘rightist’ measure with ( ),s fh hΞ tending to positive infinity as average
health tends to a if 0a > and to ( )1 fh b− if 0a = . Conversely, for higher levels of initial
average health, the normalisation provides an ‘extreme leftist’ measure with ( ),s fh hΞ
tending to negative infinity as average health tends to the upper bound b. Which measure is
the most applicable depends upon public perceptions of income-related health inequality.10
Our empirical analysis serves to replicate and extend the results reported in AGP,
which investigates changes in income-related mental health inequality among men over the
first nine waves of the BHPS from 1991 to 1999. The annual BHPS is a longitudinal survey
of private households in Great Britain, based on an original, nationally representative sample
of 5,500 households and 10,300 individuals in 1991. The analysis employs a balanced panel
consisting of the sub-set of males in the BHPS for whom full data on GHQ score, income
and a range of other socioeconomic variables are available in each of the first nine waves
and whose total annual household income lay in the range £2000 to £77000 throughout that
period:11 the resulting sample contains nine observations on each of 2018 men. Wave 1 is
10 Amiel and Cowell (1997) provides evidence in relation to public perceptions of income inequality that “the appropriate inequality equivalence concept depends on the income levels at which inequality comparisons are made”, shifting from a relative or ‘rightist’ attitude to an absolute or ‘leftist’ one as income increases. 11 See Jones and López Nicolás (2004) for a full description of the sample design. AGP note that their results differ slightly from those reported in Jones and López Nicolás (2004), possibly due to the use of an updated release of the BHPS data (University of Essex, Institute for Social and Economic Research, 2007)
20
Table 1: Definition of income-related health inequality indices and associated mobility measures.
Definition Income-related health mobility Disproportionality index Scale factor
Health-related income mobility
Relative inequality measures
Health concentration index
2 cov( , )tt t tt
CI hh
π= CIH ss fsM CI CI= − ,
CIss f s sP CI CI −= − CI
fq h h= Δ CIR ff fsM CI CI= −
Relative inequality index
( )
cov( , )1var( )
2 var( )
t ttt
t
tt
hRII
hCI
ππ
π
=
=
2 var( )
CIRII HH
MM
π= RII CIP P= 2 var( )
CIRII qq
π=
2 var( )
CIRII RR
MM
π=
Absolute inequality measures
Generalised Concen-tration index
2cov( , )tt t t
t tt
GC h
h CI
π=
= GC
H ss fsM GC GC= − ,GC
f s sP CI −= − GCq h= Δ GCR ff fs
CIf R
M GC GC
h M
= −
=
Slope inequality index ( )
cov( , )var( )
2 var( )
t ttt
tt
hSII
GC
ππ
π
=
=
2 var( )
GCSII HH
MM
π= SII GCP P= 2 var( )
GCSII qq
π=
2 var( )
GCSII RR
MM
π=
Erreygers (2009) normalisation
4( )tt ttEN GCb a
=−
4( )
EN GCH H
M Mb a
=−
EN GCP P= 4
( )EN GCq q
b a=
−4
( )EN GCR R
M Mb a
=−
Flexible inequality measures
Wagstaff (2002) normalisation ( )
( )( )( )tt tt
t t
t tt
b aWN GCb h h a
h GC
−=− −
≡ Ω ( ) ( )WN
H s ss f fsM h GC h GC= Ω − Ω
( )( )
( )( )( )
,
,
,
1
1( )
,
sWN sss f s s
f
f sss f s s
ss
s f ss f s s
h hP CI CI
hh
b h hCI CI
b hh a
h h CI CI
−
−
−
⎛ ⎞Ω⎜ ⎟= − −⎜ ⎟ ΔΩ⎝ ⎠⎛ ⎞−⎜ ⎟= − −⎜ ⎟ −−⎝ ⎠
≡ Ξ −
( )WN GCfq h q= Ω ( )WN GC
R f RM h M= Ω
Notes: The variance of the relative rank variable, var( )π , depends only on sample size and is therefore invariant over time.
21
treated as the initial period throughout the analysis so as to consider the implications of
lengthening the time span over which the change in socioeconomic inequality is measured.
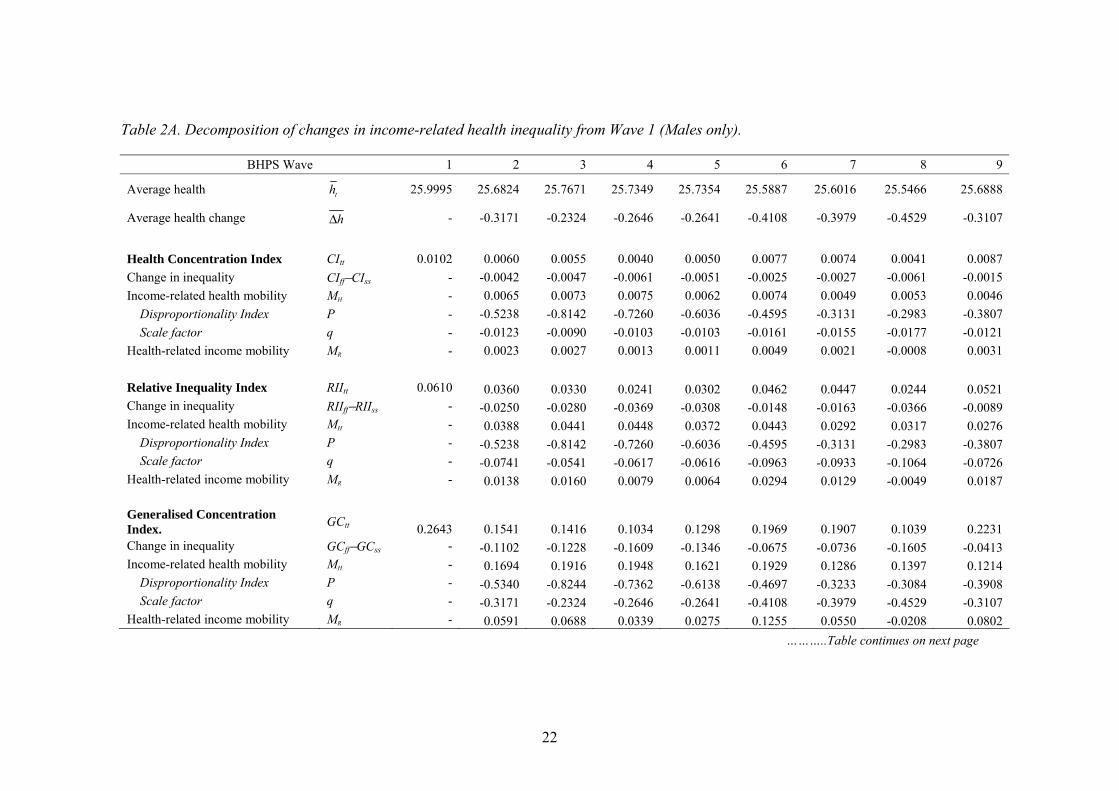
Table 2A shows that both average health and all measures of income-related health
inequality were highest in Wave 1, though there was no clear trend in any of the measures
over subsequent waves. The decline in average health is to be expected given the balanced
nature of the panel. The decline in income-related health inequality implies that the change
in inequality between Wave 1 and each subsequent wave was negative for all the measures
examined in the study.
AGP note that the decomposition of the change in the health concentration index
reveals three main points of interest. First, the index of income-related health mobility CIHM
is positive over all time spans, implying that the depreciation in the health of the sample had
the effect of reducing health inequalities since the concentration of health losses among the
better-off in Wave 1 was greater than the concentration of initial health as indicated by the
negative values of the disproportionality index PCI. Second, the health-related income
mobility index CIRM is positive for comparisons across all but one wave, implying that
income-related health inequalities were typically exacerbated by income re-ranking. Finally,
the equalising effect of health changes dominated the disequalising effect of income re-
ranking over all time spans, with inequality higher in the first wave than in any subsequent
wave.
The results in the remainder of Table 2A serve to illustrate the implications of the use
of alternative inequality indices as the basis for the mobility analysis. First, the use of the
other relative inequality measure, the relative inequality index, clearly leads to the same
conclusions, with the same values for the disproportionality index and all other measures
22
Table 2A. Decomposition of changes in income-related health inequality from Wave 1 (Males only).
BHPS Wave 1 2 3 4 5 6 7 8 9
Average health th 25.9995 25.6824 25.7671 25.7349 25.7354 25.5887 25.6016 25.5466 25.6888
Average health change hΔ - -0.3171 -0.2324 -0.2646 -0.2641 -0.4108 -0.3979 -0.4529 -0.3107
Health Concentration Index CItt 0.0102 0.0060 0.0055 0.0040 0.0050 0.0077 0.0074 0.0041 0.0087 Change in inequality CIff−CIss - -0.0042 -0.0047 -0.0061 -0.0051 -0.0025 -0.0027 -0.0061 -0.0015 Income-related health mobility MH - 0.0065 0.0073 0.0075 0.0062 0.0074 0.0049 0.0053 0.0046 Disproportionality Index P - -0.5238 -0.8142 -0.7260 -0.6036 -0.4595 -0.3131 -0.2983 -0.3807 Scale factor q - -0.0123 -0.0090 -0.0103 -0.0103 -0.0161 -0.0155 -0.0177 -0.0121 Health-related income mobility MR - 0.0023 0.0027 0.0013 0.0011 0.0049 0.0021 -0.0008 0.0031 Relative Inequality Index RIItt 0.0610 0.0360 0.0330 0.0241 0.0302 0.0462 0.0447 0.0244 0.0521 Change in inequality RIIff−RIIss - -0.0250 -0.0280 -0.0369 -0.0308 -0.0148 -0.0163 -0.0366 -0.0089 Income-related health mobility MH - 0.0388 0.0441 0.0448 0.0372 0.0443 0.0292 0.0317 0.0276 Disproportionality Index P - -0.5238 -0.8142 -0.7260 -0.6036 -0.4595 -0.3131 -0.2983 -0.3807 Scale factor q - -0.0741 -0.0541 -0.0617 -0.0616 -0.0963 -0.0933 -0.1064 -0.0726 Health-related income mobility MR - 0.0138 0.0160 0.0079 0.0064 0.0294 0.0129 -0.0049 0.0187 Generalised Concentration Index. GCtt 0.2643 0.1541 0.1416 0.1034 0.1298 0.1969 0.1907 0.1039 0.2231 Change in inequality GCff−GCss - -0.1102 -0.1228 -0.1609 -0.1346 -0.0675 -0.0736 -0.1605 -0.0413 Income-related health mobility MH - 0.1694 0.1916 0.1948 0.1621 0.1929 0.1286 0.1397 0.1214 Disproportionality Index P - -0.5340 -0.8244 -0.7362 -0.6138 -0.4697 -0.3233 -0.3084 -0.3908 Scale factor q - -0.3171 -0.2324 -0.2646 -0.2641 -0.4108 -0.3979 -0.4529 -0.3107 Health-related income mobility MR - 0.0591 0.0688 0.0339 0.0275 0.1255 0.0550 -0.0208 0.0802
………..Table continues on next page
23
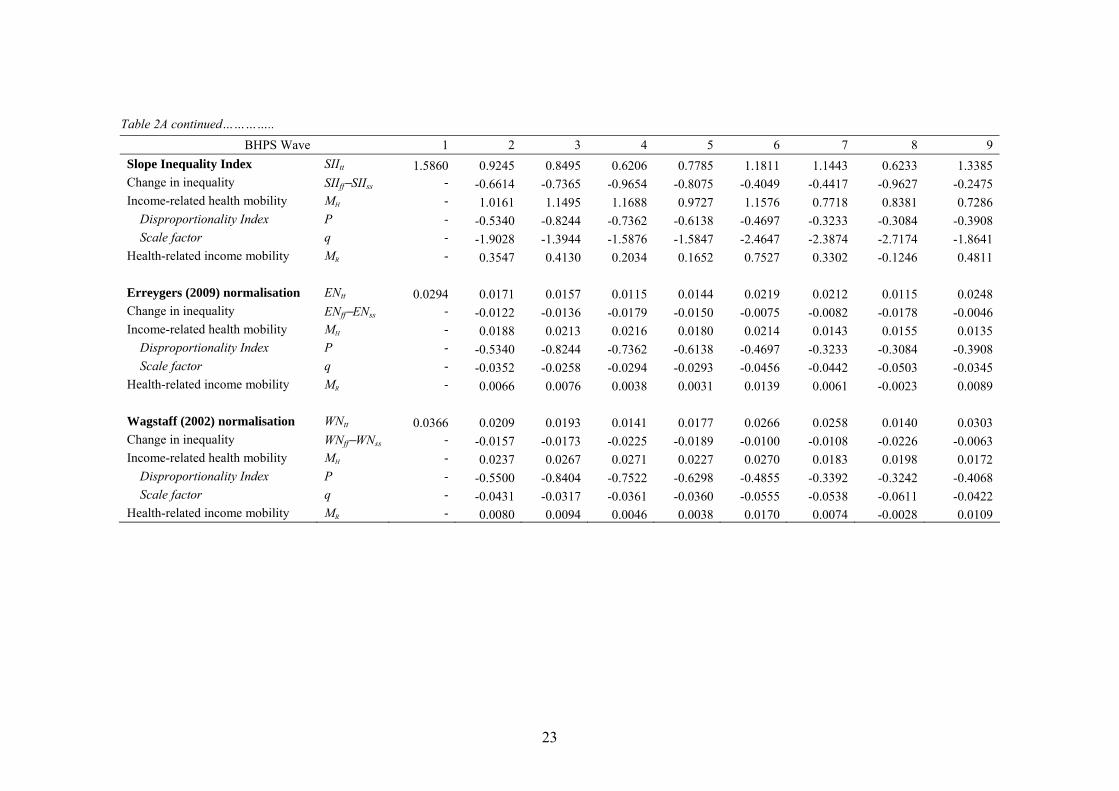
Table 2A continued………….. BHPS Wave 1 2 3 4 5 6 7 8 9
Slope Inequality Index SIItt 1.5860 0.9245 0.8495 0.6206 0.7785 1.1811 1.1443 0.6233 1.3385 Change in inequality SIIff−SIIss - -0.6614 -0.7365 -0.9654 -0.8075 -0.4049 -0.4417 -0.9627 -0.2475 Income-related health mobility MH - 1.0161 1.1495 1.1688 0.9727 1.1576 0.7718 0.8381 0.7286 Disproportionality Index P - -0.5340 -0.8244 -0.7362 -0.6138 -0.4697 -0.3233 -0.3084 -0.3908 Scale factor q - -1.9028 -1.3944 -1.5876 -1.5847 -2.4647 -2.3874 -2.7174 -1.8641 Health-related income mobility MR - 0.3547 0.4130 0.2034 0.1652 0.7527 0.3302 -0.1246 0.4811 Erreygers (2009) normalisation ENtt 0.0294 0.0171 0.0157 0.0115 0.0144 0.0219 0.0212 0.0115 0.0248 Change in inequality ENff−ENss - -0.0122 -0.0136 -0.0179 -0.0150 -0.0075 -0.0082 -0.0178 -0.0046 Income-related health mobility MH - 0.0188 0.0213 0.0216 0.0180 0.0214 0.0143 0.0155 0.0135 Disproportionality Index P - -0.5340 -0.8244 -0.7362 -0.6138 -0.4697 -0.3233 -0.3084 -0.3908 Scale factor q - -0.0352 -0.0258 -0.0294 -0.0293 -0.0456 -0.0442 -0.0503 -0.0345 Health-related income mobility MR - 0.0066 0.0076 0.0038 0.0031 0.0139 0.0061 -0.0023 0.0089 Wagstaff (2002) normalisation WNtt 0.0366 0.0209 0.0193 0.0141 0.0177 0.0266 0.0258 0.0140 0.0303 Change in inequality WNff−WNss - -0.0157 -0.0173 -0.0225 -0.0189 -0.0100 -0.0108 -0.0226 -0.0063 Income-related health mobility MH - 0.0237 0.0267 0.0271 0.0227 0.0270 0.0183 0.0198 0.0172 Disproportionality Index P - -0.5500 -0.8404 -0.7522 -0.6298 -0.4855 -0.3392 -0.3242 -0.4068 Scale factor q - -0.0431 -0.0317 -0.0361 -0.0360 -0.0555 -0.0538 -0.0611 -0.0422 Health-related income mobility MR - 0.0080 0.0094 0.0046 0.0038 0.0170 0.0074 -0.0028 0.0109
24
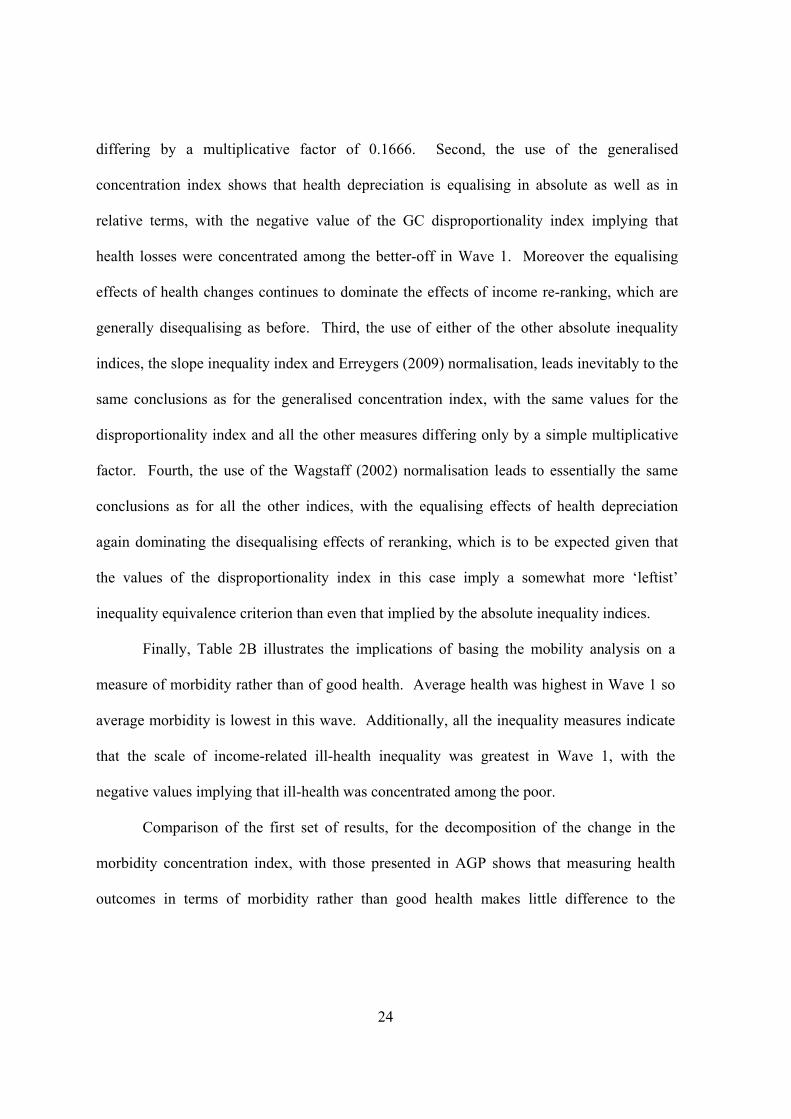
differing by a multiplicative factor of 0.1666. Second, the use of the generalised
concentration index shows that health depreciation is equalising in absolute as well as in
relative terms, with the negative value of the GC disproportionality index implying that
health losses were concentrated among the better-off in Wave 1. Moreover the equalising
effects of health changes continues to dominate the effects of income re-ranking, which are
generally disequalising as before. Third, the use of either of the other absolute inequality
indices, the slope inequality index and Erreygers (2009) normalisation, leads inevitably to the
same conclusions as for the generalised concentration index, with the same values for the
disproportionality index and all the other measures differing only by a simple multiplicative
factor. Fourth, the use of the Wagstaff (2002) normalisation leads to essentially the same
conclusions as for all the other indices, with the equalising effects of health depreciation
again dominating the disequalising effects of reranking, which is to be expected given that
the values of the disproportionality index in this case imply a somewhat more ‘leftist’
inequality equivalence criterion than even that implied by the absolute inequality indices.
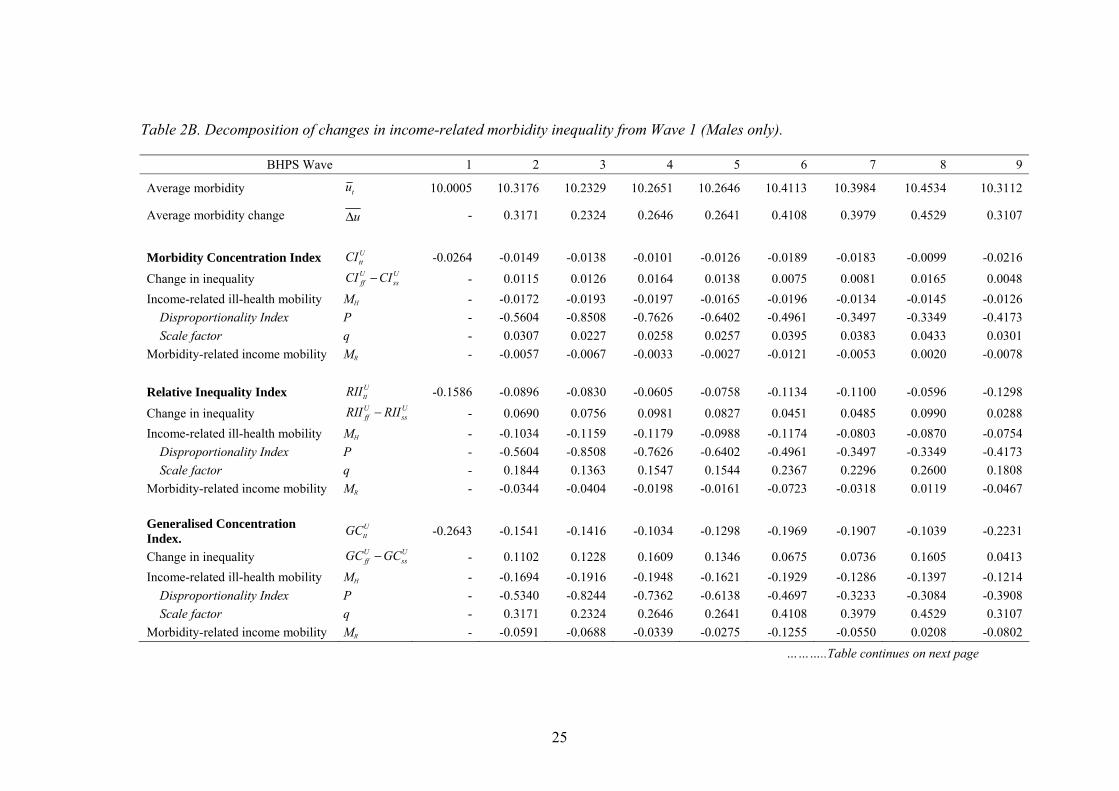
Finally, Table 2B illustrates the implications of basing the mobility analysis on a
measure of morbidity rather than of good health. Average health was highest in Wave 1 so
average morbidity is lowest in this wave. Additionally, all the inequality measures indicate
that the scale of income-related ill-health inequality was greatest in Wave 1, with the
negative values implying that ill-health was concentrated among the poor.
Comparison of the first set of results, for the decomposition of the change in the
morbidity concentration index, with those presented in AGP shows that measuring health
outcomes in terms of morbidity rather than good health makes little difference to the
25
Table 2B. Decomposition of changes in income-related morbidity inequality from Wave 1 (Males only).
BHPS Wave 1 2 3 4 5 6 7 8 9
Average morbidity tu 10.0005 10.3176 10.2329 10.2651 10.2646 10.4113 10.3984 10.4534 10.3112
Average morbidity change uΔ - 0.3171 0.2324 0.2646 0.2641 0.4108 0.3979 0.4529 0.3107
Morbidity Concentration Index U
ttCI -0.0264 -0.0149 -0.0138 -0.0101 -0.0126 -0.0189 -0.0183 -0.0099 -0.0216
Change in inequality U Uff ssCI CI− - 0.0115 0.0126 0.0164 0.0138 0.0075 0.0081 0.0165 0.0048
Income-related ill-health mobility MH - -0.0172 -0.0193 -0.0197 -0.0165 -0.0196 -0.0134 -0.0145 -0.0126 Disproportionality Index P - -0.5604 -0.8508 -0.7626 -0.6402 -0.4961 -0.3497 -0.3349 -0.4173 Scale factor q - 0.0307 0.0227 0.0258 0.0257 0.0395 0.0383 0.0433 0.0301 Morbidity-related income mobility MR - -0.0057 -0.0067 -0.0033 -0.0027 -0.0121 -0.0053 0.0020 -0.0078 Relative Inequality Index U
ttRII -0.1586 -0.0896 -0.0830 -0.0605 -0.0758 -0.1134 -0.1100 -0.0596 -0.1298
Change in inequality U Uff ssRII RII− - 0.0690 0.0756 0.0981 0.0827 0.0451 0.0485 0.0990 0.0288
Income-related ill-health mobility MH - -0.1034 -0.1159 -0.1179 -0.0988 -0.1174 -0.0803 -0.0870 -0.0754 Disproportionality Index P - -0.5604 -0.8508 -0.7626 -0.6402 -0.4961 -0.3497 -0.3349 -0.4173 Scale factor q - 0.1844 0.1363 0.1547 0.1544 0.2367 0.2296 0.2600 0.1808 Morbidity-related income mobility MR - -0.0344 -0.0404 -0.0198 -0.0161 -0.0723 -0.0318 0.0119 -0.0467 Generalised Concentration Index.
UttGC -0.2643 -0.1541 -0.1416 -0.1034 -0.1298 -0.1969 -0.1907 -0.1039 -0.2231
Change in inequality U Uff ssGC GC− - 0.1102 0.1228 0.1609 0.1346 0.0675 0.0736 0.1605 0.0413
Income-related ill-health mobility MH - -0.1694 -0.1916 -0.1948 -0.1621 -0.1929 -0.1286 -0.1397 -0.1214 Disproportionality Index P - -0.5340 -0.8244 -0.7362 -0.6138 -0.4697 -0.3233 -0.3084 -0.3908 Scale factor q - 0.3171 0.2324 0.2646 0.2641 0.4108 0.3979 0.4529 0.3107 Morbidity-related income mobility MR - -0.0591 -0.0688 -0.0339 -0.0275 -0.1255 -0.0550 0.0208 -0.0802
………..Table continues on next page
26
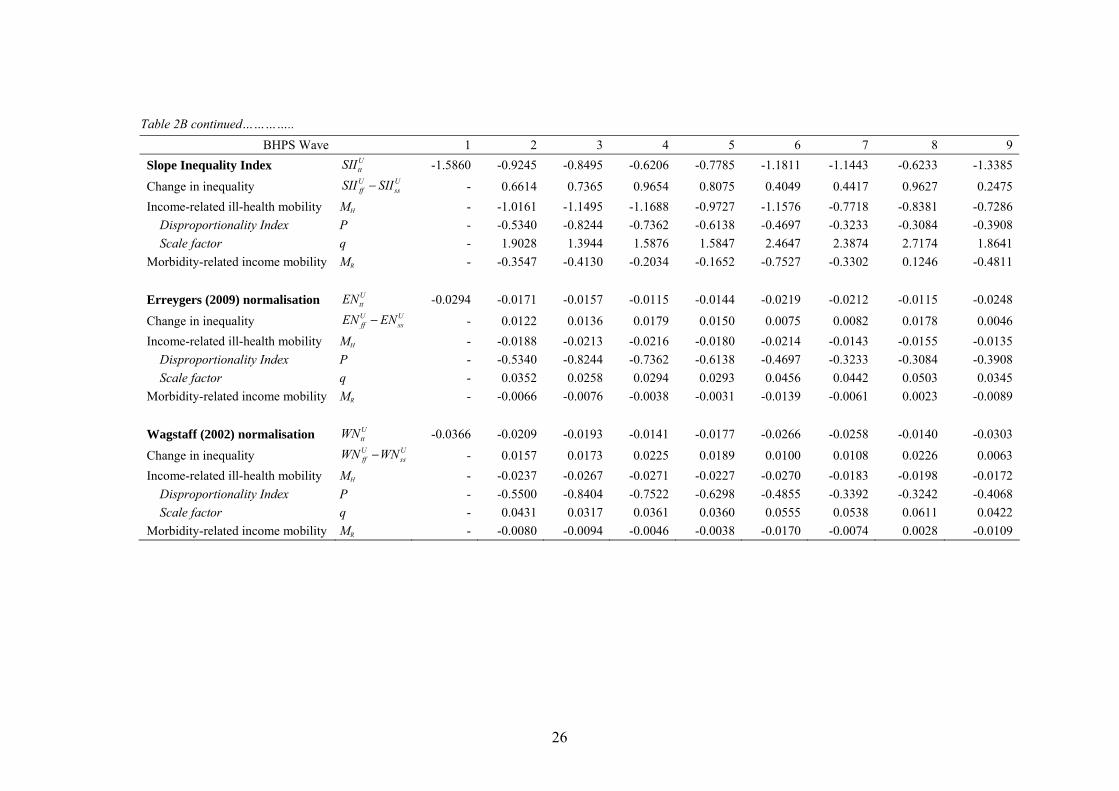
Table 2B continued………….. BHPS Wave 1 2 3 4 5 6 7 8 9
Slope Inequality Index UttSII -1.5860 -0.9245 -0.8495 -0.6206 -0.7785 -1.1811 -1.1443 -0.6233 -1.3385
Change in inequality U Uff ssSII SII− - 0.6614 0.7365 0.9654 0.8075 0.4049 0.4417 0.9627 0.2475
Income-related ill-health mobility MH - -1.0161 -1.1495 -1.1688 -0.9727 -1.1576 -0.7718 -0.8381 -0.7286 Disproportionality Index P - -0.5340 -0.8244 -0.7362 -0.6138 -0.4697 -0.3233 -0.3084 -0.3908 Scale factor q - 1.9028 1.3944 1.5876 1.5847 2.4647 2.3874 2.7174 1.8641 Morbidity-related income mobility MR - -0.3547 -0.4130 -0.2034 -0.1652 -0.7527 -0.3302 0.1246 -0.4811 Erreygers (2009) normalisation U
ttEN -0.0294 -0.0171 -0.0157 -0.0115 -0.0144 -0.0219 -0.0212 -0.0115 -0.0248
Change in inequality U Uff ssEN EN− - 0.0122 0.0136 0.0179 0.0150 0.0075 0.0082 0.0178 0.0046
Income-related ill-health mobility MH - -0.0188 -0.0213 -0.0216 -0.0180 -0.0214 -0.0143 -0.0155 -0.0135 Disproportionality Index P - -0.5340 -0.8244 -0.7362 -0.6138 -0.4697 -0.3233 -0.3084 -0.3908 Scale factor q - 0.0352 0.0258 0.0294 0.0293 0.0456 0.0442 0.0503 0.0345 Morbidity-related income mobility MR - -0.0066 -0.0076 -0.0038 -0.0031 -0.0139 -0.0061 0.0023 -0.0089 Wagstaff (2002) normalisation U
ttWN -0.0366 -0.0209 -0.0193 -0.0141 -0.0177 -0.0266 -0.0258 -0.0140 -0.0303
Change in inequality U Uff ssWN WN− - 0.0157 0.0173 0.0225 0.0189 0.0100 0.0108 0.0226 0.0063
Income-related ill-health mobility MH - -0.0237 -0.0267 -0.0271 -0.0227 -0.0270 -0.0183 -0.0198 -0.0172 Disproportionality Index P - -0.5500 -0.8404 -0.7522 -0.6298 -0.4855 -0.3392 -0.3242 -0.4068 Scale factor q - 0.0431 0.0317 0.0361 0.0360 0.0555 0.0538 0.0611 0.0422 Morbidity-related income mobility MR - -0.0080 -0.0094 -0.0046 -0.0038 -0.0170 -0.0074 0.0028 -0.0109
27
substantive findings in this particular case study. Thus, the negative values of the index of
income-related morbidity mobility UCI
HM imply that the observed change in health outcomes
also had the effect of reducing inequalities in ill-health because morbidity changes were
more concentrated among the rich than the initial distribution of ill-health: the negative
values of the disproportionality index UCIP in this case follow inevitably from the negative
values of PCI reported in Table 2A. Second, income re-ranking typically served to
exacerbate inequalities in morbidity as well as in health, with the negative values of
UCIRM implying that those who moved up the income distribution tended to be less unhealthy
in the final period than those who moved down. Finally, the equalising effects of health
outcome changes dominate the disequalising effects of income re-ranking as before.
Nevertheless, this correspondence between the health and morbidity findings is not
guaranteed with the use of a relative measure of inequality. To ensure strict equivalence an
absolute measure of inequality, such as the generalised concentration index, must be
employed, with the results presented for these measure in Tables 2A and 2B simply differing
in terms of the sign of the matching mobility indices. By way of counter-example, we note
finally that the results for the Wagstaff (2002) normalisation in Table 2B imply an
‘intermediate’ rather than ‘extreme leftist’ inequality equivalence criterion when changes in
inequality are measured with respect to morbidity rather than health.
4. Conclusions
This paper sets out to further elaborate the approach to the longitudinal analysis of income-
related health inequalities proposed in Allanson, Gerdtham and Petrie (2010). The resultant
contribution is twofold. First, we establish the normative basis of the AGP mobility indices
28
by embedding the AGP decomposition of the change in the health concentration index
within a broader analysis of the change in “health achievement” or wellbeing. In particular,
we show that AGP’s income-related health mobility index provides an ‘ex-ante’ measure of
health mobility in which individuals’ health changes are evaluated on the basis of their
positions in the initial income distribution, with this asymmetric treatment potentially
justifiable on the grounds that the initially poor are disadvantaged to the extent that they face
a worse lottery of future health possibilities than those who are better off. We are further
able to show within our framework that income re-ranking leads to a loss of welfare to the
extent that it exacerbates income-related health inequalities.
Second, we demonstrate that the decomposition procedure set out in AGP may also
be used to analyse the change in a range of other commonly-used income-related health
inequality measures, including the generalised concentration index and the relative inequality
index. The choice of inequality measure is shown to affect the results of the subsequent
mobility analysis to the extent that different inequality measures embody alternative
inequality equivalence criteria, though such differences in results prove not to be of a
substantive nature in the illustrative empirical study reported in the paper. We further note
that mobility analyses based on absolute inequality measures, such as the generalised
concentration index, have the desirable property that the conclusions will be invariant to
whether inequality is measured with respect to health or morbidity. However, the exact
choice of inequality measure should not be guided by analytical convenience but by public
perceptions of what health changes constitute an improvement in income-related health
inequalities, on which little is currently known. Until more is known about these values,
29
studies should present findings using both relative and absolute measures in order to provide
policymakers with a fuller assessment of the nature of health changes taking place.
References
Allanson, P., Gerdtham, U-G. and Petrie, D., 2010. Longitudinal analysis of income-related
health inequality, Journal of Health Economics, 29, 78-86.
Amiel, Y. and Cowell, F., 1997. Income transformation and income inequality. STICERD,
LSE discussion paper DARP 24.
Atkinson, A. B., 1970. On the measurement of inequality. Journal of Economic Theory, 2,
244–263.
Atkinson, A.B., 1980. Horizontal equity and the distribution of the tax burden, in Aaron, H.
and Boskin, M.J. (eds.), The Economics of Taxation, Washington D.C., USA: Brookings
Institute, p. 3-18.
Bleichrodt, H. and Van Doorslaer, E., 2006. A welfare economics foundation for health
inequality measurement. Journal of Health Economics 25 (5), 945–957.
Bommier, A. and Stecklov, G., 2002. Defining health inequality: why Rawls succeeds where
social welfare theory fails. Journal of Health Economics 21, 497–513.
Clarke, P.M., Gerdtham, U.-G., Johannesson, M. and Bingefors, K., Smith, L., 2002. On the
measurement of relative and absolute income-related health inequality. Social Science &
Medicine 55 (11), 1923–1928.
Dardanoni, V., 1993. Measuring social mobility. Journal of Economic Theory, 61, 372-94.
Erreygers, G., 2009. Correcting the Concentration Index. Journal of Health Economics, 28,
504–515.
Essama-Nssah, B., 2005. A unified framework for pro-poor growth analysis. Economic
Letters, 89, 216–221.
30
Goldberg, D. and Williams, P., 1988. A User’s Guide to the General Health Questionnaire.
NFER-Nelson, Windsor, UK.
Jones, A.M. and López Nicolás, A., 2004. Measurement and explanation of socioeconomic
inequality in health with longitudinal data. Health Economics, 13, 1015-1030.
Kakwani, N.C., 1977. Measurement of tax progressivity: An international comparison.
Economic Journal, 87, 71-80.
Milanovic (1997) A simple way to calculate the Gini coefficient, and some implications.
Economics Letters, 56, 45-49.
Plotnick, R., 1981. A measure of horizontal equity. Review of Economics and Statistics, 63,
283-88.
University of Essex. Institute for Social and Economic Research. 2007. British Household
Panel Survey: Waves 1-15, 1991-2006 [computer file]. 3rd Edition. Colchester, Essex: UK
Data Archive [distributor], June. SN: 5151.
Wagstaff, A., 2002. Inequality aversion, health inequalities, and health achievement. Journal
of Health Economics 21 (4), 627–641.
Wagstaff, A., 2009. Correcting the Concentration Index: A comment. Journal of Health
Economics, 28, 516–520.
Wagstaff, A., Paci, P. and Van Doorslaer, E., 1991. On the measurement of inequalities in
health. Social Science & Medicine 33 (5), 545–557.
Yaari, M. E., 1988. A Controversial Proposal Concerning Inequality Measurement, Journal of
Economic Theory, 44(2), 381–97.
Yitzhaki, S., 1983. On an extension of the Gini inequality index. International Economic
Review, 24, 617–28.
Yitzhaki, S. and Wodon, Q., 2004. Inequality, mobility, and horizontal equity. In: Y. Amiel
and J. A. Bishop (eds.), Studies on Economic Well-Being: Essays in Honor of John P.
Formby. Research on Economic Inequality, 12, p. 177–98. Elsevier, Oxford.
Zoli, C., 2003. Characterizing Inequality Equivalence Criteria. Mimeo. University of
Nottingham.