Embed Size (px)
Citation preview

ORIGINAL ARTICLE
Malignant ileocaecal serotonin-producing carcinoid tumours: Thepresence of a solid growth pattern and/or Ki67 index above 1% identifiespatients with a poorer prognosis
JANET L. CUNNINGHAM1, LARS GRIMELIUS2, ANDERS SUNDIN3,
SMRITI AGARWAL4 & EVA T. JANSON1
1Department of Medical Sciences, Section of Endocrine Oncology, Uppsala University, Sweden, 2Department of Genetics and
Pathology, Uppsala University, Sweden, 3Department of Oncology, Radiology and Clinical Immunology, Uppsala University,
Sweden and 4Christian Medical College, Vellore, India
AbstractPatients with malignant serotonin-producing carcinoid tumours in the jejunum, ileum and caecum generally have longsurvival expectancy. In some patients, however, tumour progression is more rapid and there is a need to identify them at anearly stage. The purpose of this study was to determine if histopathological characteristics and/or Ki67 and apoptotic indicesare of prognostic value in cases of metastatic disease. Eighty-one patients with this tumour were included in the study; allhad metastases and their survival range was 1�223 months. Five growth patterns were identified and described. For 57patients whose tumour material was available, the Ki67 and apoptotic indices were calculated for ten randomly selectedtumour areas and ‘hot spots’. A Cox regression analysis was used to test if histopathology and/or Ki67 index]1% couldidentify patients whose survival might be shorter than anticipated. One of the histopathological growth patterns-the solid(non-organoid) cell pattern-was correlated to shorter survival in both primary tumours and metastases, when comparedwith the organoid growth patterns (hazard ratio 2.9 and 2.3, p50.01). In 75% of primary tumours and 67% of metastases,the average Ki67 index wasB0.5%. Ki67 index in ‘hot spots’ ranged from 0.1 to 14%. Ki67 index]1%, in both primarytumour and metastases, identified patients at increased risk of shorter survival (hazard ratio 5.4 and 2.5, p50.01). Theapoptotic index was very low in all cases. We conclude that in patients with metastazising serotonin-producing carcinoids,two independent criteria, a solid growth pattern and Ki67 index]1%, can be used to identify patients with a poorerprognosis. This study also showed that Ki67 indexB2% cannot, as previously suggested, be used to indicate a benignprogression for this tumour category.
The term carcinoid has been used to describe
neuroendocrine tumours (NETs) in the gastrointest-
inal tract (GI-tract), lung, thymus and ovary. Malig-
nant serotonin-producing carcinoids (MSPC) arise
from enterochromaffin cells (EC cells) in the jeju-
num, ileum, caecum and ascending colon [1]. These
tumours secrete, in addition to serotonin, tachyki-
nins, and in cases with development of liver metas-
tases, these hormones cause clinical symptoms,
i.e. the carcinoid syndrome. The WHO classification
of endocrine tumours and another more recent
classification calls these tumours ‘‘well differentia-
ted (neuro-)endocrine carcinomas (malignant carci-
noids)-low-grade malignant serotonin-producing
carcinoids/carcinomas’’. Both classifications suggest
that a Ki67 index B2% is associated with benign
tumour progression [2,3].
Median duration of survival from diagnosis is
around 6 years depending on the spread of disease,
though the range can be from months to decades
[4�6]. Clinically, there is a need to identify patients
at risk of shorter survival at an early stage in order to
facilitate the choice of more radical surgical and
medical treatments. The histopathological structure
and proliferation rate are both used for this purpose
in other tumour entities [7,8]; however, MSPCs
have hitherto been described as having an insular
growth pattern and a low proliferation rate in
common. Possible variation within these parameters
has not been revealed in earlier studies, largely due
Correspondence: Janet L. Cunningham, Department of Medical Sciences, Section of Endocrine Oncology, Lab 14, Research Department 2, Uppsala
University Hospital, SE 751 85, Uppsala, Sweden. Tel: �46 18 611 4913. E-mail: [email protected].
Acta Oncologica, 2007; 46: 747�756
(Received 28 June 2006; accepted 10 January 2007)
ISSN 0284-186X print/ISSN 1651-226X online # 2007 Taylor & Francis
DOI: 10.1080/02841860701218659
Act
a O
ncol
Dow
nloa
ded
from
info
rmah
ealth
care
.com
by
118.
127.
75.2
25 o
n 05
/20/
14Fo
r pe
rson
al u
se o
nly.

to small sample sizes and/or heterogeneous tumour
material [2,9�20].
A histopathological classification of NETs was
first suggested in 1971 by Soga and Tazawa [9].
Their study included 62 fore-, mid- and hindgut
NETs. Only three of the included midgut tumours
were located in the ileum and three in the right
colon, while the remaining 14 originated in either
the appendix or caecum (exact location not speci-
fied). The authors concluded that their growth
pattern classification correlates to the site of the
primary tumour. Of the 20 midgut NETs included
in their study, 19 had an insular growth pattern (type
A) in either a pure form or mixed with trabecular
growth pattern (type B) or acinar and rosette growth
pattern (type C) while one was trabecular and acinar
(type B�C). In a similar study [10], Jones and
Dawson included 15 argentaffin carcinoids from the
small intestine and one from the proximal colon and
categorized all of these tumours as either insular
(type A1) or insular-acinar/glandular (type A1/A2).
Johnson et al. examined growth patterns in NETs
from different localizations and related them to
survival but did not report the outcome specifically
for MSPCs [11].
General recommendations for NET management
suggest that a cut-off Ki67 index of 2% can be used
to distinguish benign tumours from MSPCs
[2,3,21]. In our experience, however, very few low
grade malignant carcinoids display a Ki67 index over
2% at diagnosis despite massive metastatic disease.
Supporting this, Canavese et al. [22] reported that in
a set of 17 MSPCs, Ki67 expression ranged from 0.0
to 1.76%. A pilot study by Chaudhry et al. [19],
showed that Ki67 expression of more than 1 Ki67
labelled cell/mm2 correlated to a shorter survival
when calculated in biopsies from liver metastases in
14 untreated patients with MSPCs. A cut-off of 2
mitoses/mm2, i.e. higher than in Chaudhry’s study,
showed a non-significant tendency to identify pa-
tients with a poorer prognosis in MSPCs [18]. These
three studies indicate that the Ki67 index is often
lower than 2% in malignant tumours and it is
therefore possible that the Ki67 index cannot be
used to indicate malignancy in these tumours.
Within the category of patients with MSPCs, how-
ever, criteria are needed to identify patients with
more aggressive tumour forms.
In this study, we examined variations in histo-
pathological growth pattern, proliferation index and
apoptotic index in patients with MSPCs. Our inten-
tion was to test the possibility of using growth
pattern, a Ki67 index cut-off of 1%, and apoptotic
index as prognostic markers to identify patients at
risk of a clinically significant shortened survival.
Materials and methods
Patients and material
The present retrospective study included 81 patients
with MSPCs. All primary tumours originated from
the distal ileum, caecum or proximal colon. Appen-
diceal carcinoids were excluded from this study.
Histopathological structure was assessed in tumour
specimens from 56 primary tumours, 38 mesentery
metastases and 27 liver metastases of which 18 were
from needle biopsies. Additional tumour tissue was
available from 57 of these patients for analysis of
Ki67 immunoreactivity. The Ki67 index was calcu-
lated in 36 primary tumours, 29 mesentery metas-
tases and 20 liver metastases of which 11 were
needle biopsies. In four cases, only biopsy material
was available for Ki67 assessment. The tumours
were diagnosed histopathologically at the Laboratory
for Pathology and Cytology and the patients were
treated at the Department of Endocrine Oncology at
University Hospital, Uppsala. Tumour tissue was
fixed in 10% buffered neutral formalin for 1�2 days,
dehydrated, embedded in paraffin wax and routinely
stained using haematoxylin/eosin and Van Gieson’s
solution. All tumours included displayed chromo-
granin A (CgA) and serotonin immunoreactivity,
and/or argyrophil [23] and argentaffin reactions
[24].
This population consisted of all patients with
MSPCs operated on their tumour at Uppsala Uni-
versity Hospital between 1980 and 2004 and from
whom tumour tissue was available and event-free
survival could be calculated. After diagnosis, all
patients underwent assessment of urinary 5-hydro-
xyindoleacetic acid levels and tumour size by com-
puterized tomography and ultrasound investigations
2�4 times per year. Plasma-CgA was also measured
routinely after 1990.
At the time of tumour tissue collection (surgical
tissue specimens or needle biopsy), 51 patients were
untreated; six had been treated with alpha-interferon
for less than 12 weeks and were considered as
‘untreated’ in data processing. Interferon treatment
has been shown to induce significant fibrosis after 6
months, which can affect the growth pattern [25]
and also the Ki67 index [19]. The 24 patients who
had received treatment for longer than 12 weeks
before tumour tissue collection were considered
‘treated’. All patients were treated postoperatively
according to clinical praxis at our Department
[26,27]. Seventy-nine received alpha interferon and
68 were treated with a somatostatin analogue. Liver
embolization was performed in 18 patients and 12
were treated with chemotherapy for a short period.
The clinical profile of the patients included in this
study is presented in Table I.
748 J. L. Cunningham et al.
Act
a O
ncol
Dow
nloa
ded
from
info
rmah
ealth
care
.com
by
118.
127.
75.2
25 o
n 05
/20/
14Fo
r pe
rson
al u
se o
nly.

The study was reviewed and approved by the local
Medical Ethics Committee at Uppsala University
Hospital.
Immunohistochemistry
Sections were cut 4 mm thick and attached to
positively charged glass slides. The sections were
deparaffinized in xylene and rehydrated to distilled
water. They were then microwave treated at 700 W
for 15 min and 350 W for 10 min, except when
staining for CD31 and CD34 when microwave
treatment was 10 min at 700 W. The DAKO
EnVisionTM plus system or ZYMED NBATM kit
was used according to the manufacturer’s instruc-
tions. Diaminobenzidine was used as a chromogen
and sections were counterstained with Mayer’s
haematoxylin. The following primary antibodies
were used, with antigen retrieval buffer and antibody
dilution given in parentheses: serotonin, clone
5HT-H209 (citrate pH 6, 1:10); CD31 and CD34
clones JC70A and QBEnd10 (TRS pH 6, 1:50);
Ki67, clone MIB-1 (citrate pH 6, 1:100) all from
DAKO, Glostrup, Denmark; chromogranin A clone
LK2H10, (Tris pH 8, 1:2000) from Boehringer-
Mannheim, Mannheim, Germany; and finally, poly-
clonal cleaved caspase-3 (Tris pH 8, 1:200) from
Cell Signalling Technologies, Danvers, Mass., USA.
Silver stains
Grimelius silver nitrate stain [24,28] was used to
reveal argyrophil reaction and a modified Masson
Fontana method for argentaffin reaction [29]. The
former stain identifies most NE cells, while the latter
displays EC cells (serotonin producing) in the GI-
tract.
Microscopical assessments
The immunostained sections were coded and exam-
ined microscopically and representative areas in CgA
or Grimelius stained sections were photographed
digitally at low magnification and printed in colour.
The photos were coded and sorted by two observers
(L.G. and J.L.C.) into groups according to their
main growth pattern. All sections were further
evaluated, this time by microscopy using both low
and high magnification. To distinguish acinar struc-
tures from vascular lumen within tumour cell
groups, tumour material was immunostained with
markers for vascular endothelium (CD31/CD34). A
growth pattern was deemed to be predominant if it
was present in more than half of the tumour. When
three or more patterns were present the predominat-
ing pattern could be present in less than 50% of the
tumour section.
Ki67 index and apoptotic index
The tumour cell Ki67 index was calculated by two
evaluators (J.L.C. and S.A.) in freshly cut sections
immunostained with antibodies to Ki67 (MIB-1).
Tissue from tonsil, and proliferating cells in intest-
inal mucosa and stroma surrounding the tumour
served as positive control material. The immunor-
eactive (IR) and the non-IR cell nuclei were counted
at 400� magnification using a square graticule
(10�10 mm) in one of the oculars. Nuclear staining
intensity varied between cells. IR tumour cells with a
delimited nuclear contour were counted excluding
IR stromal cells. Serial sections, stained with anti-
bodies recognizing CgA, were used to help identify
tumour cells. At least ten randomly selected tumour
areas (average) as well as the area with the greatest
number of IR tumour nuclei (‘hot spot’) in relation
to tumour cells were analysed. The Ki67 index was
expressed as a percentage of IR tumour nuclei. In
cases where Ki67 index group differed between
evaluators or between several sections from the
same tumour, an average of the indices was used as
the average Ki67 index and the highest index was
used as the ‘hotspot’ Ki67 index. To estimate
interpersonal variation in the calculation of Ki67,
ten sections with a Ki67 index in the range 0.5 to
1.5% were evaluated on three separate occasions.
Apoptotic cells were identified immunohistochemi-
cally using antibodies to cleaved caspase-3 and the
apoptotic index was calculated in the same manner
as the Ki67 index.
Survival and statistical analysis
Data were stored in an Access database and analysed
using the SAS statistical program package. The end-
point for all analyses was event-free survival, defined
as months from surgery, or biopsy to death. For
patients still living or who died of other causes, the
interval from surgery to the last documented follow-
up was used as a censored observation. Other causes
of death were death from other malignancies,
cerebral ischaemia, myocardial infarction and sui-
cide. Few patients were autopsied as most died at a
Table I. An overview of the clinical background.
Sex (male/female) 28/53
Median age (years) at operation [range] 62 [34�82]
Median survival (months) after operation
[range]
60 [1�223]
Diarrhoea and/or flush at operation 66
Metastases at operation 78
Metastases at clinical follow-up 81
Ileocaecal carcinoids 749
Act
a O
ncol
Dow
nloa
ded
from
info
rmah
ealth
care
.com
by
118.
127.
75.2
25 o
n 05
/20/
14Fo
r pe
rson
al u
se o
nly.

local hospital. Medical records were reviewed in
order to determine the cause of death in all cases.
Three age categories were defined from patients’
ages at operation: B65 years, 65�75 years, and�75
years. Tumour burden in liver and mesentery was
estimated using radiological examinations prior to
operation. Three grades of tumour burden were
defined: minimal (B5 lesionsB5 cm in diameter),
intermediate (5�10 lesions or one�5 cm in dia-
meter), massive (]10 lesions or one�10 cm).
Statistical analyses were performed separately for
primary tumours and metastases. Before pooling the
treated and untreated patients, the distribution of
gender, age categories, growth pattern and Ki67
index was compared using Fisher’s exact test and
possible interaction between treatment/no treatment
of the tumours and Ki67 index on survival was
tested with a Cox regression model. Patients who
were still alive (n�3) as well those who had died
from causes not related to the tumour (n�7) were
censored in the analysis (n�10). Correlations be-
tween the average Ki67 index and ‘hot spot’ areas as
well as between Ki67 index and tumour burden were
studied using a Spearman correlation coefficient.
Analysis of the association between predominant
growth pattern and survival was performed using a
Cox regression analysis, adjusted for age and for sex
to calculate a hazard ratio. To identify the way to
calculate the Ki67 index having the best predictive
value, a Kaplan-Meier graph and a Mantel-Cox log-
rank test were used, as well as analysis with a Cox
hazard regression model adjusted for age category
and sex. All p-values are two-sided and a p-value
50.05 was considered a statistically significant
result.
Methodological error
The methods used in this study are limited in the
following ways. The ability to assess adequately the
type of cell growth pattern of the carcinoid and to
calculate the Ki67 index accurately might have been
impaired by the inclusion of tissue obtained from
1.2 mm needle biopsy specimens from the liver.
Evaluation of tumour growth patterns and Ki67
index can be marred by inter/intrapersonal variation.
When the evaluators disagreed on the growth pattern
classification, the tumours were re-evaluated, when
possible together with new sections from other areas
in the tumour. In cases where average Ki67 index
group differed between evaluators or between several
sections from the same tumour, the average of the
calculations was used in the analysis. To estimate
interpersonal variation in the calculation of Ki67, ten
sections with a Ki67 index in the range of 0.5 to
1.5% were evaluated on three separate occasions.
Results
When using Fisher’s exact test, no significant differ-
ences were observed in the distribution of gender,
age categories, growth pattern or Ki67 index be-
tween the untreated and treated patient groups. An
interaction test showed no significant interaction
between treatment and growth pattern or Ki67
index. The statistical analysis was therefore con-
ducted on the pooled results from treated and
untreated patients.
Growth pattern and survival
We identified five growth patterns, as shown in
Figure 1. The insular, trabecular and acinar (also
called glandular or rosette) growth patterns have
been described earlier [9]. Two additional patterns
were seen: solid and ‘small cell nest’. Areas with
insular cell arrangement were found in most tu-
mours studied. The tumour cells in the mucosa and
submucosa were arranged in one or more of the
growth patterns described, sometimes with periph-
eral palisading arrangement. In muscularis propria, a
less regular trabecular pattern usually predominated,
whereas in subserosa, the tumour cells showed a
tendency to resume the predominating pattern
evident in the upper layer.
The term solid was used to describe tumour cells
with a non-organoid growth pattern. Tumour cells
with the solid growth pattern were densely packed,
expressing CgA and serotonin and were sometimes
arranged in broad bands without regular stromal
divisions. Vascular structures penetrated the solid
tumour bands, in contrast to the other growth
patterns where vessels lay in the stroma surrounding
the tumour cell aggregations. The ‘small cell-nest’
Figure 1. A�E. The microphotographs illustrate the five growth patterns in the mucosa/submucosa in MSPCs (Grimelius silver stain).
(A) Insular growth pattern: some of the insular nodules show peripheral palisading. Scale bar�100 mm. (B) Insular-trabecular
growth pattern. (C) Insular-acinar growth pattern: insular cell nests with glandular or rosette formations. Inset�endothelial
immunostaining showing vessles in the stroma surrounding tumour cell nests. (D) Small cell nest growth pattern: irregular small cell
nests together with slender trabeculae and abundance of fibrous stroma. (E) Solid growth pattern: solid aggregations of tumour cells, a
pattern deviating from that seen in most MSCPs. Inset�endothelial immunostaining showing vessels within tumour cell aggregations.
(F & G) Primary tumour and metastases with solid growth pattern showing chromogranin A IR tumour cells. Scale bar�200 mm. Inset:
haematoxylin-eosin stained tumour section showing uniform nuclei without mitosis (H) A tumour area without Ki67 IR cells and an
abundance of Ki67 IR tumour cells in the intestinal mucosa (lower left corner). Scale bar�50 mm.
750 J. L. Cunningham et al.
Act
a O
ncol
Dow
nloa
ded
from
info
rmah
ealth
care
.com
by
118.
127.
75.2
25 o
n 05
/20/
14Fo
r pe
rson
al u
se o
nly.

Figure 1 (Continued)
Ileocaecal carcinoids 751
Act
a O
ncol
Dow
nloa
ded
from
info
rmah
ealth
care
.com
by
118.
127.
75.2
25 o
n 05
/20/
14Fo
r pe
rson
al u
se o
nly.

growth pattern describes tumour cell aggregations
containing few and even lone tumour cells, distrib-
uted in a fibrotic stroma. The ‘small cell-nest’
pattern was seen in untreated patients and was
therefore not a result of treatment. Almost all
tumours displayed more than one growth pattern.
The distribution of the predominant growth patterns
among the tumours is listed in Table II.
The Cox proportional hazard model of overall
survival adjusted for age and sex was used to test if
any growth pattern was associated with an increased
relative hazard ratio. When each growth pattern was
tested against the other patterns pooled into one
group, only the solid pattern was associated with a
greater risk of death per time fraction (Table III).
This result was the same for primary tumours as for
metastases, but was especially prominent for the
mesentery metastases (hazard ratio 3.6, pB0.01).
Ki67 and apoptotic index versus survival
An average Ki67B0.2% was found in 23/36 primary
tumours and 21/49 metastases. Median survival in
patients with an average Ki67 index ]1% in this
material was less than half that of patients with
average Ki67 indexB1% (Table IV). The average
Ki67 index was closely correlated to the ‘hot spot’
index and the Spearman Correlation coefficient was
]0.93 (pB0.01).
Patients at risk of shorter survival were identified
by using a cut-off of 1% for both average and ‘hot
spot’ Ki67 indices. This was found for both primary
tumours and metastases, using a Cox proportional
hazard model of overall survival adjusted for age and
sex (Table III). The closest correlation between Ki67
index and survival was seen in primary tumours. The
most significant prognostic marker was an average
Ki67 index ]1% in primary tumours (Table III).
Plotting patient survival, in relation to Ki67 index
above and below 1% in the primary tumour, on a
Kaplan-Meier graph demonstrated this significant
difference in survival (Mantel-Cox log rank test
p�0.02; Figure 2). Explorative testing was also
performed on the material using Ki67 index cut-
offs of 0.5% and 2% and significantly shortened
survival was seen even in patients whose primary
tumour had a Ki67 index �0.5%.
To consider the possibility that the results ob-
tained reflect differences in survival due to tumour
burden, the spread of disease in the patients was
assessed. No difference was observed in the tumour
burden at diagnosis between patients with Ki67
index over vs. under 1%, or between those exhibiting
differing growth patterns. Figure 3 shows radiologi-
cal images from a representative patient with a
MSPC shortly before operation. Multiple metastases
are evident but the calculated Ki67 index is low in
the surgical specimens obtained from both primary
tumour and metastases.
The apoptotic index in the primary tumours and
metastases was under 0.01% in both treated and
untreated patients regardless of their Ki67 index,
and necrosis was seldom seen in the tumour sections
studied.
Growth pattern and Ki67 index in primary tumour and
metastases from the same patient
Analysis of the prognostic value of growth pattern
and Ki67 was performed separately for primary
tumours and metastases. Factors associated with
high risk, when seen in primary tumours, were
most often also seen in the metastases from the
same patient.
The predominating growth pattern in primary
tumours was often seen, at least in some parts of
the metastases. Sections for histopathological eva-
luation of primary tumours and metastases were
available from 37 patients; of these, 17 had the same
predominant growth pattern in both the primary
tumour and metastases. In 15 other patients, the
same growth pattern was seen in both primary
tumour and metastases, but the predominant pattern
differed. In the remaining seven cases, the metas-
tases displayed a growth pattern not present in the
primary tumour. Generally, patients with a solid
growth pattern in the primary tumour also had this
pattern in the metastases. In four cases, a solid
growth pattern was seen in the metastases only.
In 16/23 patients, the Ki67 index group (over/
under 1%) was the same in both primary tumour
and metastases. In six of the remaining patients, the
Ki67 index was above 1% only in metastatic tissue.
The last patient was found to have an average Ki67
Table II. Tumour cell growth pattern varied and five growth patterns could be identified. Three patterns correspond to patterns, type A, B
and C, described earlier (9). The table shows the distribution of tumours studied in relation to their dominating growth patterns. Areas with
an insular growth pattern were found in nearly all tumours studied.
Insular (A) Trabecular (AB) Acinar (AC) Solid ‘Small cell-nests’
Primary tumour 11 11 16 10 8
Local metastases 5 11 4 12 6
Liver metastases 9 4 5 5 4
752 J. L. Cunningham et al.
Act
a O
ncol
Dow
nloa
ded
from
info
rmah
ealth
care
.com
by
118.
127.
75.2
25 o
n 05
/20/
14Fo
r pe
rson
al u
se o
nly.
index greater than 1% in the primary tumour and
only a ‘hot spot’ Ki67 index exceeding 1% in the
metastases which, in this case, was a needle biopsy.
Methodological error
The correlations between survival and the solid
growth pattern or Ki67 index ]1% were lower in
needle biopsy material than in surgical material. The
inter/intrapersonal variation in growth pattern eva-
luation was marginal regarding solid growth, but the
predominant growth pattern in a minor subset of
tumours with organoid growth pattern was difficult
to assign.
In the majority of tumours, the average Ki67 index
wasB0.5%. In these cases, interpersonal variation
between the two evaluators was minimal (90.1).
Variation in Ki67 index calculation increased with
the number of proliferating cells and with the
amount of tumour material available for examina-
tion. To assess the intrapersonal variation, ten
tumour sections each with an average Ki67 index
between 0.5 and 1.5% were evaluated on three
additional occasions by one evaluator. The standard
deviation of the calculated index was 0.2. The two
individuals calculating the Ki67 index placed the
tumours in the same average Ki67 index group
(over/under 1%) in all but two cases. The inter-
personal variation in ‘hot spot’ evaluation was
greater; however, the same ‘hot spot’ Ki67 index
group (over/under 1%) was assigned in all but three
cases.
Discussion
Most studies published on the histopathological
characteristics of malignant carcinoid tumours in
relation to clinical data have been based on collec-
tions of tumours from various regions of the GI-tract
and some studies also included NETs from other
organs, e.g., pancreas and lung. In the present study,
only primary tumours and metastases from well
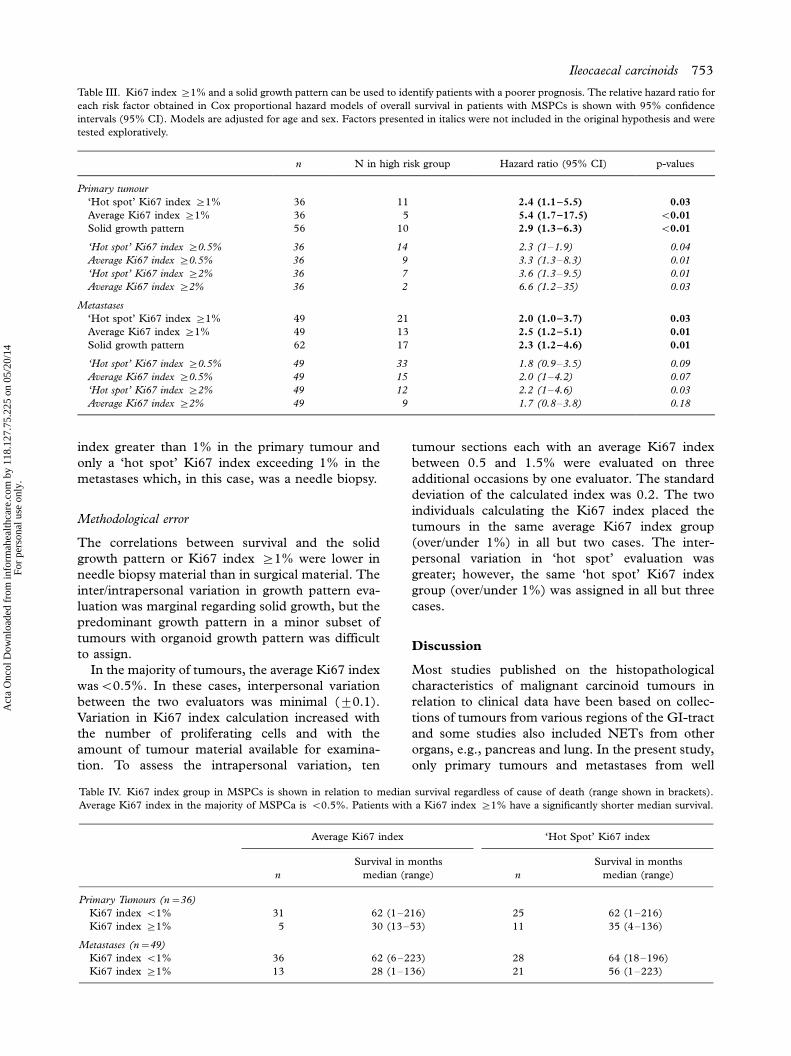
Table III. Ki67 index ]1% and a solid growth pattern can be used to identify patients with a poorer prognosis. The relative hazard ratio for
each risk factor obtained in Cox proportional hazard models of overall survival in patients with MSPCs is shown with 95% confidence
intervals (95% CI). Models are adjusted for age and sex. Factors presented in italics were not included in the original hypothesis and were
tested exploratively.
n N in high risk group Hazard ratio (95% CI) p-values
Primary tumour
‘Hot spot’ Ki67 index ]1% 36 11 2.4 (1.1�5.5) 0.03
Average Ki67 index ]1% 36 5 5.4 (1.7�17.5) B0.01
Solid growth pattern 56 10 2.9 (1.3�6.3) B0.01
‘Hot spot’ Ki67 index ]0.5% 36 14 2.3 (1�1.9) 0.04
Average Ki67 index ]0.5% 36 9 3.3 (1.3�8.3) 0.01
‘Hot spot’ Ki67 index ]2% 36 7 3.6 (1.3�9.5) 0.01
Average Ki67 index ]2% 36 2 6.6 (1.2�35) 0.03
Metastases
‘Hot spot’ Ki67 index ]1% 49 21 2.0 (1.0�3.7) 0.03
Average Ki67 index ]1% 49 13 2.5 (1.2�5.1) 0.01
Solid growth pattern 62 17 2.3 (1.2�4.6) 0.01
‘Hot spot’ Ki67 index ]0.5% 49 33 1.8 (0.9�3.5) 0.09
Average Ki67 index ]0.5% 49 15 2.0 (1�4.2) 0.07
‘Hot spot’ Ki67 index ]2% 49 12 2.2 (1�4.6) 0.03
Average Ki67 index ]2% 49 9 1.7 (0.8�3.8) 0.18
Table IV. Ki67 index group in MSPCs is shown in relation to median survival regardless of cause of death (range shown in brackets).
Average Ki67 index in the majority of MSPCa is B0.5%. Patients with a Ki67 index ]1% have a significantly shorter median survival.
Average Ki67 index ‘Hot Spot’ Ki67 index
n
Survival in months
median (range) n
Survival in months
median (range)
Primary Tumours (n�36)
Ki67 index B1% 31 62 (1�216) 25 62 (1�216)
Ki67 index ]1% 5 30 (13�53) 11 35 (4�136)
Metastases (n�49)
Ki67 index B1% 36 62 (6�223) 28 64 (18�196)
Ki67 index ]1% 13 28 (1�136) 21 56 (1�223)
Ileocaecal carcinoids 753
Act
a O
ncol
Dow
nloa
ded
from
info
rmah
ealth
care
.com
by
118.
127.
75.2
25 o
n 05
/20/
14Fo
r pe
rson
al u
se o
nly.

characterized, MSPCs were studied. To evaluate the
usefulness of histopathological characteristics, Ki67
index and apoptotic index as prognostic indicators,
these factors were studied in relation to survival. Our
study defines two factors that may help to identify
patients with a less favourable prognosis:
a solid growth pattern and a Ki67 index ]1%.
The apoptotic index was low in all the tumours and
gives no prognostic information. This report shows
that Ki67 index B2% is seemingly not useful as a
criterion for benign tumour behaviour.
This study demonstrates that a solid growth
pattern in primary tumours and/or metastases is a
risk factor for shorter survival. A solid growth pattern
describes solid, broad bands of tumour cells that have
maintained their neuroendocrine phenotype and
produce both CgA and serotonin. This growth
pattern has been included, in earlier studies, under
the definition of insular [11] or may have been, in
other studies, described as an undifferentiated growth
pattern. The latter term can, however, be misinter-
preted as a highly malignant tumour. The solid
growth pattern does not display nuclear atypia or
Ki67 indices above 15% and should not be confused
with an undifferentiated or high-grade malignant
tumour [3]. In the present solid growth pattern, the
vascular network penetrated the tumour cell aggrega-
tions; this is in contrast to the other growth patterns
where vascular structures were only found in the
stroma surrounding tumour nests. The solid growth
pattern was more frequently associated with a higher
Ki67 index than were the other growth patterns. In
these cases, however, proliferating cells tended to lie
in peripheral small cell aggregations and less often
within the solid tumour areas. One may hypothesize
that the solid growth pattern represents the loss/gain
of a biological control regulating the tumour cell’s
behaviour in relation to its surroundings.
The remaining patterns described in this study
represent variations of an organoid growth pattern.
Three patterns - insular, trabecular and acinar-are
consistent with those observed in midgut NETs by
Soga and Tazawa [9] but were more prevalent in our
study. These variations in organoid patterns may
represent differences in tumour biology but showed
no relation to clinical outcome in this study. The
growth pattern ‘small cell-nest’ was described in this
study and visually appears to be a fibrotic reaction
that is unconnected with treatment effects. Tumours
within the trabecular group often displayed features
from other growth pattern groups.
The ‘hot spot’ Ki67 index in patients with MSPCs
ranges from close to 0% to 14% and the average
Ki67 index from nearly 0% up to 4%. Despite
extensive tumour spread, the majority of tumours
displayed an average Ki67 index B0.2% in primary
tumours and B0.5% in metastases. Thus, a Ki67
index B2% as suggested in current classifications, or
even 0.1%, is not an indication of a non-metastasiz-
ing tumour.
Various methods for estimating tumour prolifera-
tion have been reported in the literature. Mitotic
activity was, in the pre-immunohistochemical era,
the only way to calculate cellular proliferation.
Mitosis represents a limited phase of the prolifera-
tion cycle. Mitotic and apoptotic cells are sometimes
difficult to differentiate. During recent decades,
immunohistochemical technique has been able to
demonstrate the presence of various nuclear proteins
during cellular proliferation; the Ki67/MIB-1 is,
currently, the most used as it is expressed in all
stages of cell proliferation. In the present study, we
calculated the number of proliferating cells in rela-
tion to the number of tumour cells in a unit area.
This method takes into consideration factors that
influence the counting results such as cell size, the
amount of fibrosis and compression artefacts. Cal-
culation of proliferation as a percentage of tumour
cells simplifies comparison between tumours.
In our study, the group of patients with an average
Ki67 index ]1% had a median survival only half
that of those with Ki67 indexB1%. Most tumours
in the study displayed a Ki67 index clearly under or
above 1%, which in clinical practice simplifies the
prognostic evaluation. In one and the same patient,
primary tumours and metastases were often placed
in the same KI67 index group (over/under 1%)
although Ki67 indices were generally higher in
metastases. In the Cox proportional hazard model,
Figure 2. The majority of patients with MSPCs display a Ki67
index B1%. Patients with a Ki67 index ]1% are at risk of
shortened survival. The figure shows a cumulative proportion of
patients surviving in relation to Ki67 index in ‘hot spots’ in
primary tumours. ***, Patients with a Ki67 indexB1%;
---------, Ki67 index ]1%. k, complete cases; �censored cases.
m, Patients with average Ki67 index ]1%. P-value is from a
Mantel-Cox log rank test.
754 J. L. Cunningham et al.
Act
a O
ncol
Dow
nloa
ded
from
info
rmah
ealth
care
.com
by
118.
127.
75.2
25 o
n 05
/20/
14Fo
r pe
rson
al u
se o
nly.

patients with a Ki67 index above 1% have a higher
risk of shorter survival compared to those with Ki67
index below 1%. This risk increased further when
several areas over 1% were identified (as is the case
for an average Ki67 index ]1%) and when areas
over 1% were identified in primary tumours. Scru-
tiny of our data revealed that this mortality risk
started to increase already at a Ki67 index of 0.5%.
Stronger correlations were usually seen in surgical
tissue specimens from both primary tumour and
metastases in contrast to needle biopsy tissue speci-
mens from liver metastases. This disparity can be
explained by the limited amount of tumour tissue
available for study in a biopsy. This is a general
problem, as in many cases needle biopsy is the only
tissue specimen available for analysis.
Tumour growth is the balance between cell pro-
liferation and cell death. MSPCs seldom demon-
strate necrosis. The apoptotic index was extremely
low in all cases and independent of the Ki67 index.
Recent genetic [30�32] and expression studies
[33] indicate that it is likely that MSPCs have a
distinct tumour biology when compared with other
NETs. It may therefore no longer be appropriate to
extrapolate results from heterogeneous populations
of NETs that originate from different regions in the
GI tract and other organs and assume them to be
valid for MSPCs [2]. This study serves two pur-
poses. First, it provides a careful description of
variations in tumour cell growth patterns and pro-
liferation rates in relation to survival in this category
of patients. Second, in addition to established
clinical prognostic factors [34], the identification of
areas with a solid growth pattern as well as Ki67
index ]1% in tumour tissue specimens charac-
terizes patients with MSPCs having a poorer prog-
nosis. These criteria are simple to determine and can
be applied in a clinical setting.
Acknowledgements
The authors thank Asa Forsberg, laboratory techni-
cian, for her excellent technical assistance, Mikael
Bjork, IT coordinator, Uppsala University Hospi-
Figure 3. Radiological images from a representative patient with a MSPC show that the Ki67 index cannot be used to indicate a non-
metastasizing tumour. Preoperative intravenous contrast-enhanced computerized tomography (CT) of the liver performed in the portal
venous inflow phase shows numerous, well-vascularized, contrast-enhanced metastases (see arrows). Ki67 index in surgical material from
the primary tumour and in the metastases was B0.2%.
Ileocaecal carcinoids 755
Act
a O
ncol
Dow
nloa
ded
from
info
rmah
ealth
care
.com
by
118.
127.
75.2
25 o
n 05
/20/
14Fo
r pe
rson
al u
se o
nly.

tal for his computer support and Lars Berglund,
biostatistician and Head of the Department of
Biometrics at Uppsala Clinical Research Centre,
for his assistance in the statistical analysis of the
data. The Swedish Cancer Society (project number -
4880-B05-03XBB), Lion’s Fund for Cancer Re-
search at Uppsala University Hospital and the
Torsten and Ragnar Soderbergs Research Founda-
tion are acknowledged for supporting the study.
References
[1] Williams ED, Sandler M. The classification of carcinoid
tumours. Lancet 1963;/i:/238�9.
[2] Kloppel G, Perren A, Heitz PU. The gastroenteropancreatic
neuroendocrine cell system and its tumors: The WHO
classification. Ann NY Acad Sci 2004;/1014:/13�27.
[3] Solcia E, Kloppel G, Sobin LH. Histological typing of
endocrine tumours. WHO International Histological Classi-
fication of Tumours. 2nd ed. Berlin: Springer; 2000.
[4] Modlin IM, Lye KD, Kidd M. A 5-decade analysis of 13,715
carcinoid tumors. Cancer 2003;/97:/934�59.
[5] Zar N, Garmo H, Holmberg L, Rastad J, Hellman P. Long-
term survival of patients with small intestinal carcinoid
tumors. World J Surg 2004;/28:/1163�8.
[6] Janson ET, Holmberg L, Stridsberg M, Eriksson B, Theo-
dorsson E, Wilander E, et al. Carcinoid tumors: Analysis of
prognostic factors and survival in 301 patients from a referral
center. Ann Oncol 1997;/8:/685�90.
[7] Gleason DF. Histological grading and clinical staging of
prostatic carcinoma. In: Tannenbaum M, editor. Urologic
Pathology: The Prostate. Philadelphia: Lea and Febiger;
1977. p. 171�97.
[8] Elston CW, Ellis IO. The Breast, 3rd ed. Edinburgh:
Churchill Livingstone; 1998.
[9] Soga J, Tazawa K. Pathologic analysis of carcinoids. Histo-
logic reevaluation of 62 cases. Cancer 1971;/28:/990�8.
[10] Jones RA, Dawson IM. Morphology and staining patterns of
endocrine cell tumours in the gut, pancreas and bronchus
and their possible significance. Histopathology 1977;/1:/137�50.
[11] Johnson LA, Lavin P, Moertel CG, Weiland L, Dayal Y,
Doos WG, et al. Carcinoids: The association of histologic
growth pattern and survival. Cancer 1983;/51:/882�9.
[12] Van Eeden S, Quaedvlieg PF, Taal BG, Offerhaus GJ,
Lamers CB, Van Velthuysen ML. Classification of low-grade
neuroendocrine tumors of midgut and unknown origin.
Hum Pathol 2002;/33:/1126�32.
[13] von Herbay A, Sieg B, Schurmann G, Hofmann WJ, Betzler
M, Otto HF. Proliferative activity of neuroendocrine tu-
mours of the gastroenteropancreatic endocrine system: DNA
flow cytometric and immunohistological investigations. Gut
1991;/32:/949�53.
[14] Moyana TN, Xiang J, Senthilselvan A, Kulaga A. The
spectrum of neuroendocrine differentiation among gastro-
intestinal carcinoids: Importance of histologic grading, MIB-
1, p53, and bcl-2 immunoreactivity. Arch Pathol Lab Med
2000;/124:/570�6.
[15] Sokmensuer C, Gedikoglu G, Uzunalimoglu B. Importance
of proliferation markers in gastrointestinal carcinoid tumors:
A clinicopathologic study. Hepatogastroenterology 2001;/48:/
720�3.
[16] Amarapurkar AD, Davies A, Ramage JK, Stangou AJ, Wight
DG, Portmann BC. Proliferation of antigen MIB-1 in
metastatic carcinoid tumours removed at liver transplanta-
tion: Relevance to prognosis. Eur J Gastroenterol Hepatol
2003;/15:/139�43.
[17] Kimura N, Miura W, Noshiro T, Miura Y, Ookuma T,
Nagura H. Ki67- is an indicator of progression of neuroen-
docrine tumors. Endocr Pathol 1994;/5:/223�8.
[18] Van Eeden S, Nederlof PM, Taal BG, Offerhaus GJ, Van
Velthuysen ML. A tumour with a neuroendocrine and
papillary serous component: Two or a pair? J Clin Pathol
2002;/55:/710�4.
[19] Chaudhry A, .Oberg K, Wilander E. A study of biological
behavior based on the expression of a proliferating antigen in
neuroendocrine tumors of the digestive system. Tumour Biol
1992;/13:/27�35.
[20] Burke AP, Thomas RM, Elsayed AM, Sobin LH. Carcinoids
of the jejunum and ileum: An immunohistochemical and
clinicopathologic study of 167 cases. Cancer 1997;/79:/
1086�93.
[21] .Oberg K, Astrup L, Eriksson B, Falkmer SE, Falkmer UG,
Gustafsen J, et al. Guidelines for the management of
gastroenteropancreatic neuroendocrine tumours (including
bronchopulmonary and thymic neoplasms). Part I-general
overview. Acta Oncol 2004;/43:/617�25.
[22] Canavese G, Azzoni C, Pizzi S, Corleto VD, Pasquali C,
Davoli C, et al. p27: A potential main inhibitor of cell
proliferation in digestive endocrine tumors but not a marker
of benign behavior. Hum Pathol 2001;/32:/1094�101.
[23] Grimelius L. A silver nitrate stain for alpha-2 cells in human
pancreatic islets. Acta Soc Med Ups 1968;/73:/243�70.
[24] Grimelius L, Wilander E. Silver stains in the study of
endocrine cells of the gut and pancreas. Invest Cell Pathol
1980;/3:/3�12.
[25] Andersson T, Wilander E, Eriksson B, Lindgren PG, .Oberg
K. Effects of interferon on tumor tissue content in liver
metastases of human carcinoid tumors. Cancer Res 1990;/50:/
3413�5.
[26] .Oberg K. Diagnosis and treatment of carcinoid tumors.
Expert Rev Anticancer Ther 2003;/3:/863�77.
[27] .Oberg K. Management of neuroendocrine tumours. Ann
Oncol 2004;/15(Suppl 4):/293�8.
[28] Grimelius L. The argyrophil reaction in islet cells of adult
human pancreas studies with a new silver nitrate procedure.
Acta Soc Med Ups 1968;/73:/271�94.
[29] Grimelius L. Silver stains demonstrating neuroendocrine
cells. Biotech Histochem 2004;/79:/37�44.
[30] Lollgen RM, Hessman O, Szabo E, Westin G, .Akerstrom G.
Chromosome 18 deletions are common events in classical
midgut carcinoid tumors. Int J Cancer 2001;/92:/812�5.
[31] D’Adda T, Pizzi S, Azzoni C, Bottarelli L, Crafa P, Pasquali
C, et al. Different patterns of 11q allelic losses in digestive
endocrine tumors. Hum Pathol 2002;/33:/322�9.
[32] Kytola S, Hoog A, Nord B, Cedermark B, Frisk T, Larsson
C, et al. Comparative genomic hybridization identifies loss of
18q22-qter as an early and specific event in tumorigenesis of
midgut carcinoids. Am J Pathol 2001;/158:/1803�8.
[33] Duerr E, Mizukami Y, Warshaw A, Kulke M, Chung C.
Gene expression profiles of pancreatic neuroendocrine
tumors and gastrointestinal carcinoids. Gastroenterology
2006;/130(Suppl 2):/S1887.
[34] Rorstad O. Prognostic indicators for carcinoid neuroendo-
crine tumors of the gastrointestinal tract. J Surg Oncol 2005;/
89:/151�60.
756 J. L. Cunningham et al.
Act
a O
ncol
Dow
nloa
ded
from
info
rmah
ealth
care
.com
by
118.
127.
75.2
25 o
n 05
/20/
14Fo
r pe
rson
al u
se o
nly.


![[Appendiceal carcinoid tumors. Evaluation of long-term outcomes in a tertiary level]](https://img.pdfslide.net/doc/110x75/63512c1fdbae8689420ce399/appendiceal-carcinoid-tumors-evaluation-of-long-term-outcomes-in-a-tertiary-level.jpg)


![[Obese asthma patients have poorer asthma control]](https://img.pdfslide.net/doc/110x75/635058a4d2282bdce30f19c1/obese-asthma-patients-have-poorer-asthma-control.jpg)

