Embed Size (px)
Citation preview

ART ICLES
Mammary stem cells have myoepithelial cell propertiesMichael D. Prater1, Valérie Petit2,3, I. Alasdair Russell1, Rajshekhar R. Giraddi1, Mona Shehata1, Suraj Menon1,Reiner Schulte1, Ivo Kalajzic4, Nicola Rath5, Michael F. Olson5, Daniel Metzger6, Marisa M. Faraldo2,3,Marie-Ange Deugnier2,3, Marina A. Glukhova2,3,7 and John Stingl1,7
Contractile myoepithelial cells dominate the basal layer of the mammary epithelium and are considered to be differentiated cells.However, we observe that up to 54% of single basal cells can form colonies when seeded into adherent culture in the presence ofagents that disrupt actin–myosin interactions, and on average, 65% of the single-cell-derived basal colonies can repopulate amammary gland when transplanted in vivo. This indicates that a high proportion of basal myoepithelial cells can give rise to amammary repopulating unit (MRU). We demonstrate that myoepithelial cells, flow-sorted using two independentmyoepithelial-specific reporter strategies, have MRU capacity. Using an inducible lineage-tracing approach we follow the progenyof myoepithelial cells that express α-smooth muscle actin and show that they function as long-lived lineage-restricted stem cellsin the virgin state and during pregnancy.
The mammary epithelium is composed of an outer layer of basal cellsthat reside on the basement membrane and an inner layer of luminalcells, and collectively these cells are organized as a series of branchedducts that drain alveolar structures during pregnancy. The basal celllayer is composed predominantly of contractile myoepithelial cells, acell type that has both epithelial cell and smooth muscle cell featuresand function to eject milk from the lactating mammary gland1,2.Electron microscopy studies have shown that the basal cell layeralso contains a subpopulation of small light cells that seem relativelyundifferentiated and have been suggested to representmammary stemcells3,4. The identity of mammary stem cells is controversial. Previousstudies have demonstrated that a rare subset of basal cells have theability to generate ductal-lobular outgrowths when transplanted intocleared mammary fat pads of recipient mice5–7. These engrafting cellsare termed mammary repopulating units, or MRUs. However, it hasnot been possible to resolve these cells from the myoepithelial cellsthat constitute most of the basal cell compartment. Subsequent studiesusing a lineage-tracing approach have demonstrated that the luminaland basal compartments of the mammary epithelium are maintainedby their own lineage-restricted stem cells, and it was suggested that themultilineage potential of theMRUs is an artefact of the transplantationassay8–10. However, a more recent report has challenged the existenceof lineage-restricted stem cells, and has reported that the mammaryepithelium is maintained by a multilineage basal stem cell11, althoughthese two stem cell models need not be mutually exclusive.
Here, we demonstrate that a high proportion of basal cells, mostof which are myoepithelial cells, can acquire MRU potential whencultured in the presence of a Rho protein kinase inhibitor. Wealso demonstrate, through the use of two different myoepithelial-reporter transgenic mouse strains, that freshly isolated myoepithelialcells have MRU capacity. The stem cell nature of myoepithelialcells was further confirmed in lineage-tracing experiments usingActa2–Cre–ERT2;Rosa26LacZ mice, which demonstrated thatmyoepithelial cell-derived clones expand within the basal cell layerduring pubertal development and pregnancy, survive throughinvolution and contribute to the basal layer of ducts and alveoli inmultiple pregnancies.
RESULTSMost basal cells are non-dividing myoepithelial cellsThe basal cell population can be isolated to high purity usingflow cytometry based on the differential expression of epithelial celladhesion molecule (EpCAM) and alpha 6 integrin12 (CD49f; Fig. 1aand Supplementary Fig. 1a). The basal population can be subdividedinto EpCAMhigh (upper 20% of the population) and EpCAMlow (lower80%) subpopulations (Fig. 1a), with the former containing a ∼5-fold higher frequency of MRUs and ∼60% of all MRUs (Fig. 1e).Most basal cells seem to be myoepithelial cells because ∼97% ofdouble-sorted basal cells expressed the myoepithelial marker alphasmooth muscle actin13 (αSMA; Fig. 1b). In contrast, only 0.33%
1Cancer Research UK Cambridge Institute, University of Cambridge, Li Ka Shing Centre, Robinson Way, Cambridge CB2 0RE, UK. 2Institut Curie, Centre de Recherche,Paris, F-75248, France. 3CNRS, UMR144, Paris, F-75248, France. 4Reconstructive Sciences, University of Connecticut Health Center, 263 Farmington Avenue,Farmington, Connecticut 06030-3705, USA. 5The Beatson Institute for Cancer Research, Garscube Estate, Switchback Road, Bearsden, Glasgow G61 1BD, UK.6Institut de Génétique et de Biologie Moléculaire et Cellulaire, (CNRS/INSERM/Université de Strasbourg/Collège de France), Illkirch Cedex 67404, France.7Correspondence should be addressed to M.A.G. or J.S. (e-mail: [email protected] or [email protected])
Received 23 September 2013; accepted 10 July 2014; published online 31 August 2014; DOI: 10.1038/ncb3025
NATURE CELL BIOLOGY ADVANCE ONLINE PUBLICATION 1
© 2014 Macmillan Publishers Limited. All rights reserved.

ART ICLES
0 102 103 104 105
0
102
103
104
105
CD49f–AF488
Ep
CA
M–A
F647
a b
Luminal
Basal EpCAMhigh
Basal EpCAMlow
Stromal
BasalEpCAMhigh
cells:97% (±0.31)αSMA+
BasalEpCAMlow
cells:96% (±0.81)αSMA+
f
Per
cent
age
IdU
/Brd
U+
(%)
BasalEpCAMhigh
BasalEpCAMlow
∗ g Distribution of IdU/BrdU+ cellswithin the basal population
66%(±12)
34%(±12)
EpCAMhigh
EpCAMlow
Cellpopulation
Celldose
Engrafts MRU freq.(95% CI)
MRUdistribution
(%)
BasalEpCAMhigh
50100
7/125/6
1 in 57(1/31 to 1/104)
57
BasalEpCAMlow
250500
8/124/6
1 in 300(1/163 to 1/552)
43
e
∗∗
c
0
0.5
1.0
1.5
Acta2 Myh11
Rel
ativ
e tr
ansc
ript
abun
dan
ce (2
-dd
Ct )
EpCAMhigh
EpCAMlow
d
0
0.5
1.0
1.5
αSMA
Rel
ativ
e p
rote
in
abun
dan
ce
EpCAMhigh
EpCAMlow
5037
75
Mr (K)EpCAM
high
EpCAMlow
CK14 αSMA
0
0.5
1.0
1.5
2.0
2.5
3.0
Figure 1 Most mouse basal cells express αSMA. High EpCAM expressionenriches for mammary stem cells and proliferating cells. (a) Flow cytometryplot showing stromal (black), luminal (blue) and basal (red) cell populations.The basal population has been subdivided into EpCAMhigh (brightest 20%)and EpCAMlow (remaining 80%) subpopulations. (b) Double-sorted basalEpCAMhigh and EpCAMlow cells stained by immunocytochemistry for αSMAand isotype control inset. Mean (±s.e.m.) of 5 independent experiments.Scale bars, 50 µm. (c) Relative mRNA transcript abundance of Acta2and Myh11 in basal EpCAMhigh and EpCAMlow cells as detected by real-time PCR. Data normalized to Actb and Rplp0 reference genes. Mean(±s.e.m.) of 4 independent experiments. (d) Relative abundance of αSMA
protein in basal EpCAMhigh and EpCAMlow (left) cells as detected bywestern blot. Data normalized to cytokeratin 14 (CK14) abundance. Mean(±s.e.m.) of 3 independent experiments. A representative blot (right)showing protein standards (red), CK14 (relative molecular mass 55,000(Mr 55K)) and αSMA (Mr 42K) bands (green). (e) MRU frequency ofsorted basal EpCAMhigh and EpCAMlow cells. Data for basal EpCAMhigh andbasal EpCAMlow pooled from 5 independent experiments. ∗∗P = 0.0002.(f) Percentage of flow-sorted basal EpCAMhigh and EpCAMlow cells positivefor IdU/BrdU. Data are presented as the mean (±s.e.m.) of 9 independentexperiments ∗P = 0.04. (g) Distribution of IdU/BrdU+ cells within thebasal population.
(±0.13) of double-sorted luminal cells expressed αSMA (n = 4).There was no difference in the proportion of αSMA+ cells betweenbasal EpCAMhigh and EpCAMlow cells; nor was there any differencein the level of myoepithelial-associated gene transcripts (Acta2 andMyh11) or in the level of smooth muscle actin protein betweenthese subpopulations (Fig. 1c,d). We reasoned that dividing cellsmay express higher levels of EpCAM and thus may be enrichedwithin the basal EpCAMhigh subpopulation. After injecting micewith a synthetic nucleoside (either 5-iodo-2′-deoxyuridine (IdU)or 5-bromo-2′-deoxyuridine (BrdU)), we observed that the basalEpCAMhigh cell subpopulation contained a sixfold higher frequencyof nucleoside+ cells compared with EpCAMlow cells (Fig. 1f). Whencorrected for population size, most (66%) nucleoside+ cells localizedwithin the basal EpCAMhigh subpopulation (Fig. 1g). When freshlydissociated mammary cells were stained with the DNA-binding dyeHoechst 33342 to identify cells within the S/G2/M phases of the cellcycle (Supplementary Fig. 2), we observed that the basal EpCAMhigh
subpopulation was enriched eightfold for S/G2/M cells compared with
the EpCAMlow subpopulation (Supplementary Fig. 3a). Most (65%)S/G2/M cells localized within the basal EpCAMhigh subpopulation(Supplementary Fig. 3b). Hoechst4n cells were visually confirmed asproliferating cells and not merely cell clumps (Supplementary Fig. 3c).As the frequency and distribution of MRUs correlated with thoseof nucleoside+ cells within the basal cell population, we reasonedthat basal cell proliferation status may influence their mammaryrepopulating capacity. To investigate this, we assessed the MRU andprogenitor capacity of freshly isolated G0/G1 and S/G2/M basal cellsand observed that the S/G2/M basal cells had a significantly higherMRU frequency and colony-forming efficiency (CFE), although whenaccounting for cell population size, 81% ofMRUswere inG0/G1 phase(Supplementary Fig. 3d,e).
Short-term culture increases MRU frequency and numberTo determine whether basal cells had proliferative capacity in vitro,flow-sorted basal cells were seeded at low density in FAD media14
together with irradiated feeder cells and allowed to form colonies
2 NATURE CELL BIOLOGY ADVANCE ONLINE PUBLICATION
© 2014 Macmillan Publishers Limited. All rights reserved.
ART ICLES
Cells transplanted Number ofcells
injected per fatpad
Numberof
engrafts
MRU frequency(95% CI)
Number ofepithelial
cells per dish
Numberof
MRUs perdish
Non-cultured basal 0/90/71/91/7
10/122/43/4
1 in 205(1/122 to 1/343)
4,750seeded(±250)
23seeded
(±1)
7-day-cultured basal
5152038
200250500
10100500
1,000
0/46/85/54/4
1 in 79(1/35 to 1/177)
1,465,455(±787,519)
10,551(±1,418)
a
b
Non-cultured basal 7-day-cultured basal Cells transplanted:
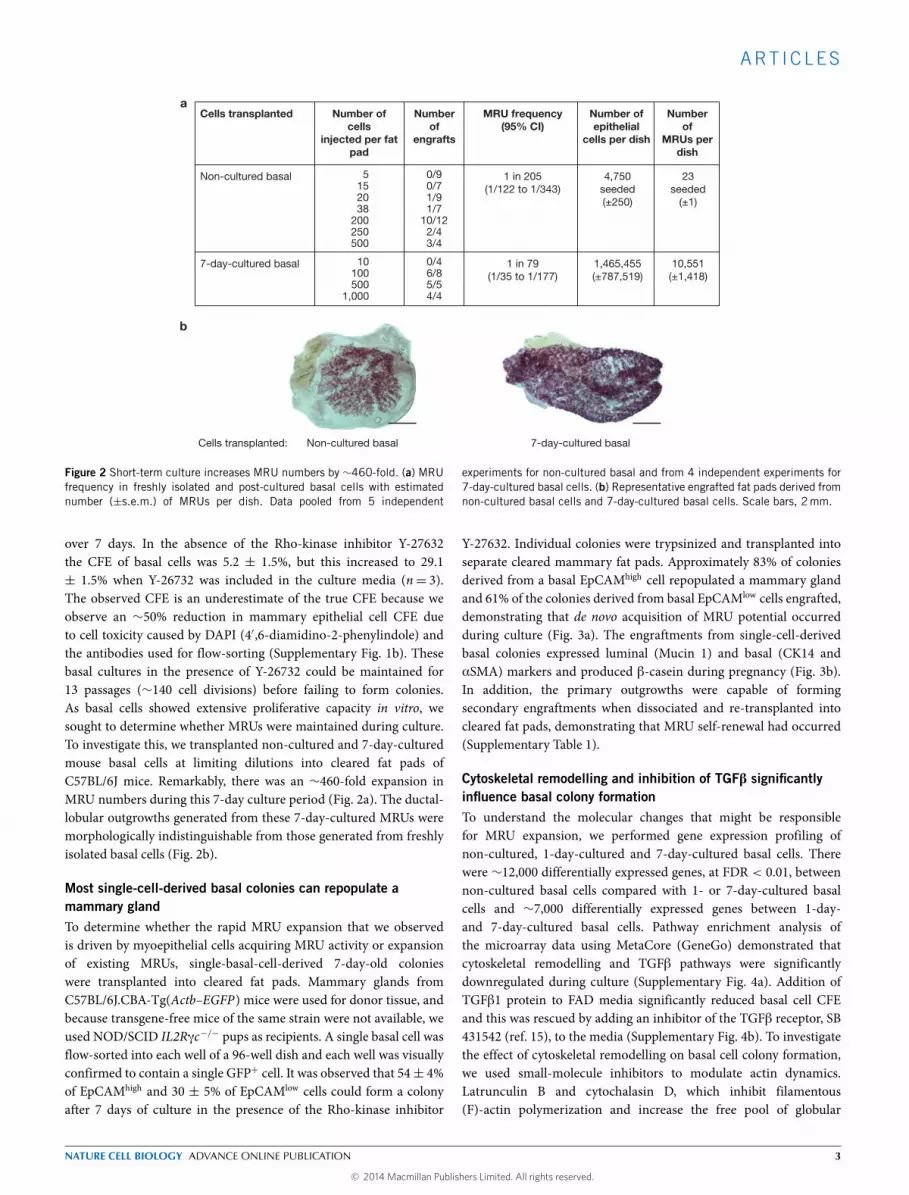
Figure 2 Short-term culture increases MRU numbers by ∼460-fold. (a) MRUfrequency in freshly isolated and post-cultured basal cells with estimatednumber (±s.e.m.) of MRUs per dish. Data pooled from 5 independent
experiments for non-cultured basal and from 4 independent experiments for7-day-cultured basal cells. (b) Representative engrafted fat pads derived fromnon-cultured basal cells and 7-day-cultured basal cells. Scale bars, 2mm.
over 7 days. In the absence of the Rho-kinase inhibitor Y-27632the CFE of basal cells was 5.2 ± 1.5%, but this increased to 29.1± 1.5% when Y-26732 was included in the culture media (n= 3).The observed CFE is an underestimate of the true CFE because weobserve an ∼50% reduction in mammary epithelial cell CFE dueto cell toxicity caused by DAPI (4′,6-diamidino-2-phenylindole) andthe antibodies used for flow-sorting (Supplementary Fig. 1b). Thesebasal cultures in the presence of Y-26732 could be maintained for13 passages (∼140 cell divisions) before failing to form colonies.As basal cells showed extensive proliferative capacity in vitro, wesought to determine whether MRUs were maintained during culture.To investigate this, we transplanted non-cultured and 7-day-culturedmouse basal cells at limiting dilutions into cleared fat pads ofC57BL/6J mice. Remarkably, there was an ∼460-fold expansion inMRU numbers during this 7-day culture period (Fig. 2a). The ductal-lobular outgrowths generated from these 7-day-cultured MRUs weremorphologically indistinguishable from those generated from freshlyisolated basal cells (Fig. 2b).
Most single-cell-derived basal colonies can repopulate amammary glandTo determine whether the rapid MRU expansion that we observedis driven by myoepithelial cells acquiring MRU activity or expansionof existing MRUs, single-basal-cell-derived 7-day-old colonieswere transplanted into cleared fat pads. Mammary glands fromC57BL/6J.CBA-Tg(Actb–EGFP) mice were used for donor tissue, andbecause transgene-free mice of the same strain were not available, weused NOD/SCID IL2Rγc−/− pups as recipients. A single basal cell wasflow-sorted into each well of a 96-well dish and each well was visuallyconfirmed to contain a single GFP+ cell. It was observed that 54± 4%of EpCAMhigh and 30 ± 5% of EpCAMlow cells could form a colonyafter 7 days of culture in the presence of the Rho-kinase inhibitor
Y-27632. Individual colonies were trypsinized and transplanted intoseparate cleared mammary fat pads. Approximately 83% of coloniesderived from a basal EpCAMhigh cell repopulated a mammary glandand 61% of the colonies derived from basal EpCAMlow cells engrafted,demonstrating that de novo acquisition of MRU potential occurredduring culture (Fig. 3a). The engraftments from single-cell-derivedbasal colonies expressed luminal (Mucin 1) and basal (CK14 andαSMA) markers and produced β-casein during pregnancy (Fig. 3b).In addition, the primary outgrowths were capable of formingsecondary engraftments when dissociated and re-transplanted intocleared fat pads, demonstrating that MRU self-renewal had occurred(Supplementary Table 1).
Cytoskeletal remodelling and inhibition of TGFβ significantlyinfluence basal colony formationTo understand the molecular changes that might be responsiblefor MRU expansion, we performed gene expression profiling ofnon-cultured, 1-day-cultured and 7-day-cultured basal cells. Therewere ∼12,000 differentially expressed genes, at FDR < 0.01, betweennon-cultured basal cells compared with 1- or 7-day-cultured basalcells and ∼7,000 differentially expressed genes between 1-day-and 7-day-cultured basal cells. Pathway enrichment analysis ofthe microarray data using MetaCore (GeneGo) demonstrated thatcytoskeletal remodelling and TGFβ pathways were significantlydownregulated during culture (Supplementary Fig. 4a). Addition ofTGFβ1 protein to FAD media significantly reduced basal cell CFEand this was rescued by adding an inhibitor of the TGFβ receptor, SB431542 (ref. 15), to the media (Supplementary Fig. 4b). To investigatethe effect of cytoskeletal remodelling on basal cell colony formation,we used small-molecule inhibitors to modulate actin dynamics.Latrunculin B and cytochalasin D, which inhibit filamentous(F)-actin polymerization and increase the free pool of globular
NATURE CELL BIOLOGY ADVANCE ONLINE PUBLICATION 3
© 2014 Macmillan Publishers Limited. All rights reserved.

ART ICLES
Cell population Single-cellcloning
efficiency (%)
Percentage of single-cell-
derived coloniesthat engrafted
Basal EpCAMhigh 83 (15/18)
Basal EpCAMlow
53.5 (±4.1)
29.7 (±5.4) 61 (11/18)
a
b
GFP+ basal colony GFP+ engraftment GFP
αSMA β-casein
H&E
Cytokeratin 14 Mucin 1
Figure 3 A high proportion of single-cell-derived basal colonies contain aMRU. (a) Table showing single-cell cloning efficiency of basal EpCAMhigh andEpCAMlow cells and the proportion of single-cell-derived basal colonies thatengrafted when transplanted into cleared mammary fat pads of NSG pups.Cloning efficiencies are presented as the mean ± s.e.m., with data pooled
from 4 independent experiments. (b) Top left, representative images of aGFP+ basal colony and a GFP+ engraftment from a transplanted basal colony(which was derived from a single basal EpCAMhigh cell); scale bars, 500 µm.Top right, and bottom, images of sections through an engrafted fat pad stainedfor various markers by immunohistochemistry; scale bars, 100 µm.
(G)-actin monomers16,17, significantly increased basal cell CFE(Supplementary Fig. 4c). However, at a higher concentration(250 nM), cytochalasin D completely inhibits basal colony formationin the presence of Y-27632 (Supplementary Fig. 4c). Jasplakinolide,which stabilizes F-actin18, significantly reduced basal colonyformation in the presence of Y-27632 (Supplementary Fig. 4c). Toconfirm that Rho-kinase inhibition increases basal cell CFE we addeda different Rho-kinase inhibitor, H1152 (ref. 19), to FAD media andobserved that it significantly increased basal cell CFE to a similarlevel to that observed with Y-27632 (Supplementary Fig. 4d). Rho-kinase inhibition has been shown to reduce apoptosis of dissociatedembryonic stem cells by preventing actomyosin contraction20,21. Todetermine whether the same mechanism was operating in mammarybasal cells, we added a myosin II inhibitor, blebbistatin22, to FADmedia and observed that it significantly increased basal colonyformation to a similar level to that obtained with the Rho-kinaseinhibitors (Supplementary Fig. 4d). The results show that actincytoskeleton remodelling and downregulation of TGFβ signallingpermit a high proportion of basal cells to form colonies.
Myoepithelial cells have mammary repopulating capacity andcan undergo clonal expansion in vivoTo directly examine the proliferative and MRU capacity of freshlyisolated, non-cultured myoepithelial cells, we used two independentsmooth muscle-specific reporter strategies (Acta2–GFP and Myh11–Cre–GFP;Rosa26LacZ) to isolate and sort a pure population of
myoepithelial cells. Both αSMA (encoded by Acta2) and smoothmuscle myosin (encoded by Myh11) are functional markers ofmyoepithelial cells and enhance contractile force generation duringlactation23. Sections through the mammary glands of Acta2–GFPtransgenic mice showed co-localization of GFP and αSMA expression(Fig. 4a). Using flow cytometry, we observed basal αSMA+ and basalαSMA− cells (Fig. 4b and Supplementary Fig. 5a–c). These SMA−
basal cells are epithelial in nature because 82 ± 4% of these cellsexpress CK14 or CK5 (Supplementary Fig. 5d). Approximately 30%of basal αSMA+ cells had colony-forming potential, but surprisinglyless than 1% of basal αSMA− cells could form colonies (Fig. 4c).To assess the MRU capacity of myoepithelial cells, basal αSMA+
cells were transplanted at limiting dilution into cleared fat pads ofC57BL/6J mice and ∼1% of basal αSMA+ cells had repopulatingcapacity (Fig. 4d). Basal αSMA− cells were transplanted at celldoses proportional to their population size but no engraftments wereobserved despite transplanting a total of 860 cells. Engraftmentsderived from basal αSMA+ cells were dissociated and non-sortedcells were re-transplanted at limiting dilution into cleared fat pads.Secondary engraftments were generated demonstrating that MRUself-renewal had occurred (Supplementary Fig. 5e). We also used aMyh11–Cre–GFP;Rosa26LacZ reporter system to mark myoepithelialcells and their descendants. We observed that Myh11+ cells and theirprogeny did not contribute to the luminal cell layer of mammary ductsand alveoli in these mice (Fig. 4e). Basal GFP+ and total basal cellswere sorted for progenitor and MRU assays (Fig. 4f). Most (90%)
4 NATURE CELL BIOLOGY ADVANCE ONLINE PUBLICATION
© 2014 Macmillan Publishers Limited. All rights reserved.

ART ICLES
Cellpopulation
Number ofcells injectedper fat pad
Number ofengrafts
MRUfrequency(95% CI)
BasalαSMA+
50100200500
1/56/88/95/5
1 in 93
(1/54 to 1/160)
BasalαSMA−
10202550
0/30/40/100/10
NA(1/287 to 1/∞)
∗∗
d
Total basal
Mammosphere generation
Mam
mos
phe
re-f
orm
ing
effic
ienc
y (%
)
3rd1st
iCell
populationNumber of
cells injected per fat pad
Number ofengrafts
MRUfrequency (95%% CI)
BasalMyh11+
50200500
5/77/8
10/10
1 in 67(1/33 to 1/136)
Total basal
50200500
6/78/8
10/10
1 in 26(1/10 to 1/64)
j k
a Acta2–GFPmice
αSMA
GFP 0
5
10
15
20
25
30
35
40
Col
ony-
form
ing
effic
ienc
y (%
)
BasalαSMA+
BasalαSMA−
c ∗∗
f
CD49f–PE
Myh
11–G
FP
0 102 103 104 105
0
102
103
104
105
70%
100%
Total basal
Basal Myh11+
g
Basal
Luminal
h
Basal Myh11+
Total basal
e Myh11–Cre–GFP; Rosa26 mice
0 102 103 104 105
0102
103
104
105
CD49f–Pacific blue
Ep
CA
M–A
F647
bαSMA+
αSMA−
Basal Myh11+
0
2
1
3
Figure 4 Myoepithelial cells have MRU activity. (a) Sections of mammaryglands from Acta2–GFP mice (C57BL/6J) stained for αSMA and GFPby immunohistochemistry. Representative image seen in 3 independentsamples. Scale bars, 100 µm. (b) Flow cytometry dot plot showing GFP+
(αSMA+) events back-gated onto the EpCAM and CD49f plot. (c) CFE ofbasal αSMA+ and basal αSMA− cells. Mean (±s.e.m.) of 4 independentexperiments. ∗∗P=0.0003. (d) MRU frequency in basal αSMA+ and basalαSMA− cells. Data pooled from 3 independent experiments. ∗∗P=0.0002.(e) Whole-mount (left) and sections (centre and right) of X-gal-stainedmammary glands from Myh11–Cre–GFP;Rosa26LacZ virgin (left and centre)and 15-day-pregnant (right) mice. Images were observed in 8 (left panel)and 4 (central and right panels) independent samples. Scale bars: 1.8mm(left panel), 120 µm (middle panel), 50 µm (right panel). (f) Flow cytometrydot plot showing resolution of total basal and basal Myh11+ cells. Five
independent samples were analysed. (g) X-gal-stained colonies derived fromflow-sorted basal and luminal cells. Scale bar, 5mm. (h) Mammospheresderived from basal Myh11+ and total basal cells. Scale bar, 290 µm.(i) Mammosphere-forming efficiency of basal Myh11+ and total basal cells.Data showing the mean sphere-forming efficiency from 1 of 2 independentexperiments are presented. Data are derived from 3 technical replicates.(j) MRU frequency in basal Myh11+ and total basal cells. Data pooledfrom 3 independent experiments. (k) Whole-mount and section of a primaryengraftment (top) developed from basal Myh11+ cells in virgin (left andcentral) and 12-day-pregnant (right) hosts and a secondary engraftment(bottom) in a virgin host. Nineteen primary and three secondary outgrowthswere X-gal stained in whole-mount, of which three primary and threesecondary outgrowths were sectioned. Scale bars: 1.8mm (for whole-mounts), 50 µm (for sections).
colonies derived from flow-sorted basal cells expressed LacZ, whereasall colonies derived from flow-sorted luminal cells were LacZ-negative(Fig. 4g). There was no difference in the mammosphere formingefficiency of basal GFP+ and total basal cells (Fig. 4h,i). Furthermore,no statistically significant difference was observed between the MRUfrequencies in basal GFP+ and total basal populations (Fig. 4j).Transplanted basal GFP+ cells gave rise to ductal and alveolarluminal cells during mammary repopulation (Fig. 4k). The self-renewal capacity of these Myh11+ MRUs was demonstrated bytransplanting fragments of the primary outgrowths into secondaryrecipients, because most (8 out of 13) fragments formed secondaryengraftments (Supplementary Fig. 5f). These results demonstratethat αSMA+ and Myh11+ myoepithelial cells have MRU andself-renewal potential.
To determinewhethermyoepithelial cells proliferate and contributeto growth of mammary epithelium in intact glands in vivo,we performed genetic lineage-tracing analysis. Mice expressingCre recombinase fused to the oestrogen-ligand binding domainERT2 under the control of the αSMA-promoter (that is, strainActa2–Cre–ERT2) were crossed with a Rosa26LacZ reporter mouse.Administration of tamoxifen to prepubertal 4-week-old femalesinduced expression of LacZ in 15–20% of myoepithelial cells. Oneweek after tamoxifen injection, we detected mostly single LacZ-positive cells, small clones containing 2–4 cells and only few clonescontaining more than 4 cells (Fig. 5a–c). Remarkably, 6 weeksafter injection, the amount of clones containing more than 4 cellsexpanded to 15%, and numerous large clones consisting of 10 andmore cells were detected. Furthermore, in glands from 8-day-old
NATURE CELL BIOLOGY ADVANCE ONLINE PUBLICATION 5
© 2014 Macmillan Publishers Limited. All rights reserved.

ART ICLES
Per
cent
age
of c
lone
s
P12, chase 5w P17, chase 6wVirgin, chase 5w
DBV
DBV
D5–6wChase
P12, 15, 178wAge
AnalysisPTXBirth
Birth
Clone size (cell number)
Per
cent
age
of c
lone
s
>42–41
6w1wChase
10w5w4wAge
TX Analysis
g
fe
dc
b
a
Chase 1w Chase 6w
1st P8,chase 5w
Clone size (cell number)>42–41
6w
1w
60
80
40
20
0
0
20
40
60
80
V1 V2 P12 P15
∗
P17
Figure 5 Myoepithelial-cell-derived clones can undergo expansion within thebasal layer of intact mammary glands and survive after multiple pregnancies.(a) Experimental schedule for b,c. TX, tamoxifen. (b) Sections of whole-mount X-gal-stained mammary glands from Acta2–Cre–ERT2;Rosa26LacZmice injected with tamoxifen at 4 weeks and dissected 1 and 6 weekslater, as indicated. Scale bars, 52 µm. (c) Graph showing the percentage ofmyoepithelial cell clones containing 1, 2–4 and >4 LacZ-positive cells inthe glands dissected 1 week (2 mice) and 6 weeks (3 mice) after tamoxifeninjection. The values shown are means + s.e.m. from 4 mammary fat pads ateach time point. ∗P<0.01. For details see Methods. (d) Section of a whole-mount X-gal-stained mammary gland from a Acta2–Cre–ERT2;Rosa26LacZmouse injected with tamoxifen at 4 weeks and dissected 5 weeks later,on day 8 of pregnancy. The arrows point to LacZ-positive cells in the
basal layer of small lateral branches and emerging alveolar buds. Scalebar, 90 µm. (e) Experimental schedule for f,g. (f) Fragments (upper panels)and sections (lower panels) of whole-mount X-gal-stained mammary glandsfrom 13-week-old virgin, 12- (P12) and 17-day-pregnant (P17) Acta2–Cre–ERT2;Rosa26LacZ mice dissected 5 and 6 weeks after tamoxifen injection,as indicated. Arrows point to LacZ-positive alveoli. D, mammary duct, BV,blood vessel. Scale bars: 0.35mm (upper panels), 65 µm (lower panels).(g) Graph showing the percentage of myoepithelial cell clones containing 1,2–4 and >4 LacZ-positive cells in the ducts from virgin and pregnant Acta2–Cre–ERT2;Rosa26LacZ mice. V1 and V2, two 13-week-old virgin mice; P12,P15 and P17, first pregnancy days 12, 15 and 17, respectively. The valuesrepresent means + s.e.m. of 3 counts performed in different gland areas (fordetails see Methods).
pregnant mice, multicellular clones of LacZ-positive cells were foundin small lateral branches and alveolar buds (Fig. 5d). Consistent withother publications8,10, myoepithelial cells and their progeny did notcontribute to the luminal cell layer of mammary epithelium.
To further investigate the capacity for clonal expansionand contribution of myoepithelial cells to secretory alveoliduring pregnancy, five sexually mature 8-week-old Acta2–Cre–ERT2;Rosa26LacZ mice were treated with tamoxifen. In 2 weeks,3 mice were mated, and 5–6 weeks after tamoxifen injection,mammary glands were dissected for analyses at days 12, 15 and 17of pregnancy (Fig. 5e). X-gal staining of the glands in whole-mountrevealed numerous LacZ-positive cells (Fig. 5f), whereas histologicalexamination confirmed the presence of LacZ-positive cells in thebasal layer of the ducts and alveoli. The glands from pregnant
animals contained larger clones of LacZ-positive cells than those fromvirgin mice following the same chase period (Fig. 5f,g), because thefrequency of clones containingmore than 4 cells was approaching 20%in the pregnant animals, and only 7–8% in the virgin mice (Fig. 5g).
To determine whether myoepithelial cells contributed to theluminal cell layer, sorted basal and luminal cells from Acta2–Cre–ERT2;Rosa26LacZ mice were X-gal stained in suspension and LacZ-positive and -negative cells were counted on cytospots (SupplementaryFig. 6a). Basal cell populations fromvirgin and pregnantmice analysed5–6 weeks after tamoxifen injection (experimental schedule shownin Fig. 5e) contained from 8 to 15% of LacZ-positive cells, whereasthe amount of labelled cells in the luminal population was verylow, between 0.17 and 0.65% (Fig. 6a). These observations wereconfirmed by flow cytometry analysis of Acta2–Cre–ERT2
;R26mTmG
6 NATURE CELL BIOLOGY ADVANCE ONLINE PUBLICATION
© 2014 Macmillan Publishers Limited. All rights reserved.

ART ICLES
D
D
3rdP15, chase 23w
27–30w4wAge
AnalysisIst P, L, Inv 2nd P, L, Inv 3rd PTXBirth
D
BV
BV
2nd Inv16, chase 25w
24–29w4wAge
Analysis2nd P, L, InvIst P, L, InvTXBirth
20–25wChase
Basal
32.7%
Luminal
<0.1%
CD
49f
GFP
L
B
CD49fC
D24
CD
49f
GFP
105
104
103
102
0
102 103 104 1050
105
104
103
102
0
102 103 104 1050
105
104
103
102
0
102 103 104 1050
105
104
103
102
0
102 103 104 1050
49.5%
BasalL
B
CD49f
CD
24
Virgin,chase 5w
0
4
8
12
16
g
hf
e
d
c
b
a
Luminal
<0.1%
105
104
103
102
0
102 103 104 1050
105
104
103
102
0
102 103 104 1050
LuminalBasal
Per
cent
age
of L
acZ
+ c
ells
V P15 3rdP153rdP6P17
Chase 23–26w
Figure 6 The progeny of myoepithelial cells is restricted to the basal celllayer and survives after multiple pregnancies. (a) A graph showing thepercentage of LacZ-positive cells in basal and luminal cell populationsisolated from a Acta2–Cre–ERT2;Rosa26LacZ mouse and X-gal stained insuspension. V, 13-week-old virgin, P15 and P17, first pregnancy days 15and 17, respectively; 3rdP6 and 3rdP15, third pregnancy, days 6–7 and15, respectively. Experimental schedule for V, P15 and P17 is shown inFig. 5e, for 3rdP6 and 3rdP15, in g. Data shown for P15, P17 and 3rdP15were obtained with inguinal mammary glands from one mouse, in eachcase, for V and 3rdP6, with pooled inguinal glands from two 13-week-oldvirgin and two 6–7-day-pregnant mice, respectively. (b) A mammary glandfragment from a virgin Acta2–Cre–ERT2;R26mTmG mouse analysed five weeksafter tamoxifen injection. Scale bar, 0.35mm. (c,d) Flow cytometry dotplots showing GFP expression in luminal and basal cell populations isolated
from virgin (c) and 1-day-lactating Acta2–Cre–ERT2;R26mTmG mice (d).Experimental schedule for b–d was the same as shown in Fig. 5e. Redovals indicate luminal (L) and basal (B) cell populations. (e,g) Experimentalschedules for f and h, respectively. (f) Fragment of whole-mount X-gal-stained mammary gland from Acta2–Cre–ERT2;Rosa26LacZ mice injectedwith tamoxifen at 4 weeks and analysed 25 weeks later, on day 16 of theinvolution following the second pregnancy (2nd Inv16). Scale bar, 0.87mm.In e,g, 1st and 2nd P,L,Inv, first and second pregnancy, lactation andinvolution cycles, respectively. (h) A fragment (left) and a section (right)of X-gal-stained mammary glands from Acta2–Cre–ERT2;Rosa26LacZ miceinjected with tamoxifen at 4 weeks and analysed 23 weeks later, on day15 of third pregnancy (3rdP15). Scale bar, 0.87mm (left panel) and50mm (right panel). Arrows in f,h point to alveoli. BV, blood vessel; D,mammary duct.
mice obtained by mating Acta2–Cre–ERT2 and double-fluorescentreportermiceR26mTmG. In thismodel, on Cre-induced recombination,expression of the red fluorescent protein Tomato is replaced by that ofGFP (ref. 24).When two 13-week-old virgin, one 13-day-pregnant andone 1-day lactating Acta2–Cre–ERT2
; R26mTmG mice were analysed5 weeks after tamoxifen injection, fewer than 0.1% of the GFP+
cells resided in the luminal compartment, whereas, the amount ofGFP+ basal cells was between 31.5% and 49.5% (Fig. 6b–d andSupplementary Fig. 6b). Together, these results strongly indicate thatduring pregnancy, basal myoepithelial cells expand only within the
basal compartment of themammary epithelium and do not contributeto the luminal layer.
Finally, to trace the myoepithelial cells, labelled at puberty throughlong time periods including mammary gland remodelling duringpost-lactational involution, we analysed mammary glands of fiveActa2–Cre–ERT2;Rosa26LacZ mice following two complete pregnancycycles, 20–26 weeks after tamoxifen injection (Fig. 6a,e–h andSupplementary Fig. 6c). Mice were analysed on days 16 and 25 ofthe second involution and days 6–7 and 15 of the third pregnancy.Numerous LacZ-positive cells were found in all analysed glands,
NATURE CELL BIOLOGY ADVANCE ONLINE PUBLICATION 7
© 2014 Macmillan Publishers Limited. All rights reserved.

ART ICLES
showing that labelled myoepithelial cells were long-lived (Fig. 6a,f,hand Supplementary Fig. 6c). In the third pregnancy, 23–26 weeks aftertamoxifen injection, the amount of LacZ-positive cells in the basalcompartment was approximately 10%, that is, close to that observedin the first pregnancy, after 5–6 weeks of chase (Fig. 6a). The sortedluminal population contained only 0.17–0.2%of labelled cells (Fig. 6a).Histological observations were in line with these data; no labelledluminal cells were revealed (Fig. 6h, right panel).
Together, these data show thatmyoepithelial cell-derived clones canexpand in the basal cell layer of both mammary ducts and growingalveolar structures during normal mammary gland homeostasis,survive through involution and contribute to the basal layer of ductsand alveoli in multiple pregnancies.
DISCUSSIONThe basal cell population is perceived to be a mixed populationconsisting of rare, undifferentiated mammary stem cells interspersedwith a population of relatively differentiated myoepithelial cells5–7,25.However, MRUs have proved to be exceptionally difficult toprospectively isolate from the myoepithelial cells that make up thebulk of the basal cell compartment by using flow cytometry, nor havepronounced differences in the gene signatures of MRU-enriched andmyoepithelial-enriched cell fractions been observed5. This suggeststhat there is a close developmental relationship between MRUs andmyoepithelial cells, and the differences between these cells may besubtle. Supporting this concept is the observation that MRU numberscan fluctuate up to 14-foldwithin the 2–3 days between the oestrus anddioestrus phases of the mouse oestrous cycle26. Such a large variationin MRU numbers within such a short time period suggests thatpre-existing basal cells are being activated to become MRUs, ratherthan expansion of the MRU subpopulation through cell division.One possible mechanism behind this is that myoepithelial cells couldfunction as MRUs when primed for cell division; in support of thishypothesis, inducing basal cell proliferation in our cell culture systempermitted a ∼460-fold expansion of MRUs after 7 days in culture.As most single-cell-derived basal colonies contained a MRU, thisdemonstrates that de novo activation of MRUs occurred and thatmyoepithelial cells contributed to the MRU expansion. It is importantto note, however, that culture may activate myoepithelial progenitorsrather than differentiated myoepithelial cells, although if this werethe case, the myoepithelial progenitor population would have to bequite large to account for the high proportion of basal cells that canbecomeMRUs. A more plausible explanation is that culture itself mayreprogram myoepithelial cells to a more primitive state.
We have demonstrated that myoepithelial cells can acquiremultilineage MRU potential during culture. Moreover, we haveobserved that freshly isolated Myh11+ basal cells have MRU capacityand that all detectable MRUs are αSMA+, again indicating themyoepithelial nature of MRUs. At present, it is not known whetherall cells of the myoepithelial cell lineage can function as MRUs, orjust a restricted subset. Furthermore, we demonstrate using a lineage-tracing approach that cells of the myoepithelial lineage functionas lineage-restricted stem cells in both the virgin state and inpregnancy. One plausible explanation for the discrepancy in thelineage potential of basal cells between lineage-tracing studies versustransplantation assays is that the intercellular and/or cell–extracellular
matrix interactions within the intact mammary basal compartmentfavour the myoepithelial cell fate and prevent asymmetric divisionsrequired for the acquisition of luminal phenotype, whereas disruptionof these interactions during tissue dissociation and subsequenttransplantation results in loss of the factors that normally inhibit themultipotential cell behaviour of basal cells.
Our lineage-tracing data are in line with the results describedin refs 8 and 10, which report that the basal compartment ofthe mammary epithelium harbours uni-potent stem cells restrictedto basal myoepithelial lineage. However, a recent study11 providedevidence that mammary basal cells, traced using basal keratin genepromoters or Lgr5, contribute to both the basal and the luminalcompartments of mammary ducts and alveoli. Similarly, tracing ofWnt-responsive cells suggested the existence of bipotent mammarystem cells residing in the basal cell layer9. Lineage-tracing assaysprovide valuable data on the hierarchy of mammary epithelial cells;however, this experimental approach can be limited by the specificcharacteristics of distinct promoter constructs. At present, little isknown regarding the heterogeneity of the mammary basal epithelialcompartment, and how different promoters may target differentcell populations that have distinct developmental potentials. Futureexperiments will be required to clearly define and characterize thecomplexity of the mammary stem and progenitor cell populations.
In brief, we show that in culture, a high proportion ofmyoepithelialcells can give rise to MRUs and that freshly sorted myoepithelial cellshave MRU capacity. We also demonstrate that in intact virgin andpregnant mouse mammary glands, cells of the myoepithelial lineagefunction as unipotent long-lived stem cells and contribute only to thebasal cell layer. �
METHODSMethods and any associated references are available in the onlineversion of the paper.
Note: Supplementary Information is available in the online version of the paper
ACKNOWLEDGEMENTSWe thank A. Saadi for contributing to data interpretation and A. Chiche, G. Carita,T. Makdessi and A. Di-Cicco for help with lineage-tracing experiments. We aregrateful to P. Chambon and P. Soriano for providing mice. We thank M. Leeson andL. Tauzin for assistance with cell sorting; J. Atkinson and J. Miller for sectioningand immunohistochemistry; M. Osborne for conducting the microarrays; J. Grayfor help with western blotting; S. Fre and V. Rodilla for advice on the cell sortingof R26mTmG mouse mammary cells. We thank F. Watt and S. Broad for usefuldiscussions and providing FAD media. We thank S. Nourshargh, M. Finsterbuschand J. Brown for access to mammary tissue from transgenic mice. This workwas funded by Cancer Research UK, Breast Cancer Campaign, the University ofCambridge, Hutchison Whampoa Limited, La Ligue Nationale Contre le Cancer(Equipe Labelisée 2013) and a grant from Agence Nationale de la Recherche ANR-08-BLAN-0078-01 to M.A.G.
AUTHOR CONTRIBUTIONSM.D.P. conducted the experiments and co-wrote the manuscript. V.P., I.A.R., I.K.,N.R., R.R.G. and M.S. conducted experiments. M.M.F. and M-A.D. conductedexperiments, analysed data and contributed to data interpretation. M.F.O. providedmice and designed experiments. D.M. provided mice. S.M. analysed the microarraydata. R.S. helped design flow cytometry experiments. M.A.G. and J.S. designedexperiments, analysed data and co-wrote the manuscript.
COMPETING FINANCIAL INTERESTSJ. Stingl is a paid consultant for StemCell Technologies Inc.
Published online at www.nature.com/doifinder/10.1038/ncb3025Reprints and permissions information is available online at www.nature.com/reprints
8 NATURE CELL BIOLOGY ADVANCE ONLINE PUBLICATION
© 2014 Macmillan Publishers Limited. All rights reserved.

ART ICLES
1. Franke, W. W. et al. Intermediate-sized filaments of the prekeratin type inmyoepithelial cells. J. Cell Biol. 84, 633–654 (1980).
2. Lazard, D. et al. Expression of smooth muscle-specific proteins in myoepitheliumand stromal myofibroblasts of normal and malignant human breast tissue. Proc. NatlAcad. Sci. USA 90, 999–1003 (1993).
3. Chepko, G. et al. Differential alteration of stem and other cell populations in ductsand lobules of TGF[α] and c-Myc transgenic mouse mammary epithelium. Tissue Cell37, 393–412 (2005).
4. Smith, G. H. & Medina, D. A morphologically distinct candidate for an epithelial stemcell in mouse mammary gland. J. Cell Sci. 90, 173–183 (1988).
5. Stingl, J. et al. Purification and unique properties of mammary epithelial stem cells.Nature 439, 993–997 (2006).
6. Shackleton, M. et al. Generation of a functional mammary gland from a single stemcell. Nature 439, 84–88 (2006).
7. Sleeman, K. E. et al. Dissociation of estrogen receptor expression and in vivo stemcell activity in the mammary gland. J. Cell Biol. 176, 19–26 (2007).
8. van Keymeulen, A. et al. Distinct stem cells contribute to mammary glanddevelopment and maintenance. Nature 479, 189–193 (2011).
9. van Amerongen, R., Bowman, A. N. & Nusse, R. Developmental stage and time dictatethe fate of Wnt/β-catenin-responsive stem cells in the mammary gland. Cell Stem Cell11, 387–400 (2012).
10. Taddei, I. et al. β1 Integrin deletion from the basal compartment of the mammaryepithelium affects stem cells. Nat. Cell Biol. 10, 716–722 (2008).
11. Rios, A. C., Fu, N. Y., Lindeman, G. J. & Visvader, J. E. In situ identification ofbipotent stem cells in the mammary gland. Nature 506, 322–327 (2014).
12. Shehata, M. et al. Phenotypic and functional characterization of the luminal cellhierarchy of the mammary gland. Breast Cancer Res. 14, R134 (2012).
13. Gottlieb, C., Raju, U. & Greenwald, K. A. Myoepithelial cells in the differentialdiagnosis of complex benign and malignant breast lesions: an immunohistochemicalstudy. Mod. Pathol. 3, 135–140 (1990).
14. Wu, Y-J. et al. The mesothelial keratins: a new family of cytoskeletal proteinsidentified in cultured mesothelial cells and nonkeratinizing epithelia. Cell 31,693–703 (1982).
15. Inman, G. J. et al. SB-431542 is a potent and specific inhibitor of transforminggrowth factor-β superfamily type I activin receptor-like kinase (ALK) receptors ALK4,ALK5, and ALK7. Mol. Pharmacol. 62, 65–74 (2002).
16. Flanagan, M. D. & Lin, S. Cytochalasins block actin filament elongation by bindingto high affinity sites associated with F-actin. J. Biol. Chem. 255, 835–838 (1980).
17. Spector, I., Shochet, N., Kashman, Y. & Groweiss, A. Latrunculins: novel marinetoxins that disrupt microfilament organization in cultured cells. Science 219,493–495 (1983).
18. Bubb, M. R., Senderowicz, A. M., Sausville, E. A., Duncan, K. L. & Korn, E.D. Jasplakinolide, a cytotoxic natural product, induces actin polymerization andcompetitively inhibits the binding of phalloidin to F-actin. J. Biol. Chem. 269,14869–14871 (1994).
19. Ikenoya, M. et al. Inhibition of Rho-kinase-induced myristoylated alanine-richC kinase substrate (MARCKS) phosphorylation in human neuronal cells by H-1152,a novel and specific Rho-kinase inhibitor. J. Neurochem. 81, 9–16 (2002).
20. Chen, G., Hou, Z., Gulbranson, D. R. & Thomson, J. A. Actin-myosin contractility isresponsible for the reduced viability of dissociated human embryonic stem cells. CellStem Cell 7, 240–248 (2010).
21. Ohgushi, M. et al. Molecular pathway and cell state responsible for dissociation-induced apoptosis in human pluripotent stem cells. Cell Stem Cell 7,225–239 (2010).
22. Straight, A. F. et al. Dissecting temporal and spatial control of cytokinesis with amyosin II inhibitor. Science 299, 1743–1747 (2003).
23. Haaksma, C. J., Schwartz, R. J. & Tomasek, J. J. Myoepithelial cell contraction andmilk ejection are impaired in mammary glands of mice lacking smooth muscle alpha-actin. Biol. Reprod. 85, 13–21 (2011).
24. Muzumdar, M. D., Tasic, B., Miyamichi, K., Li, L. & Luo, L. A global double-fluorescent Cre reporter mouse. Genesis 45, 593–605 (2007).
25. Chepko, G. & Smith, G. H. Three division-competent, structurally-distinct cellpopulations contribute to murine mammary epithelial renewal. Tissue Cell 29,239–253 (1997).
26. Joshi, P. A. et al. Progesterone induces adult mammary stem cell expansion. Nature465, 803–807 (2010).
NATURE CELL BIOLOGY ADVANCE ONLINE PUBLICATION 9
© 2014 Macmillan Publishers Limited. All rights reserved.

METHODS DOI: 10.1038/ncb3025
METHODSMice. The C57BL/6J.CBA–Tg(Actb–EGFP) and NOD/SCID IL2Rγc−/− micewere a gift from F. Watt (King’s College London). The Acta2–GFP mice werea gift from S. Nourshargh and M. Finsterbusch (Queen Mary University ofLondon) and were made by J-Y. Tsai (National Eye Institute, USA) and S.Sato (University of Oklahoma Health Science Center)27. Establishment of theActa2–Cre–ERT2 mouse strain has been previously described28. Myh11–Cre–EGFP mice were purchased from Jackson Laboratories; the Rosa26LacZ reporterstrain, carrying a loxP–stop–loxP–LacZ cassette, was provided by P. Soriano29.The R26mTmG double-fluorescent reporter mouse strain24 obtained from JacksonImmunoResearch Laboratories was provided by S. Fre (Institut Curie). Allexperiments and procedures involving animals were in strict accordance withthe French legislation and European legislation for the Protection of VertebrateAnimals used for Experimental and other Scientific Purposes and were approvedby the Departmental Direction of Populations Protection (approval number: B75-05-18). All animals were bred and maintained in a pathogen-free environmentthat fully satisfies the animals’ needs and welfare. No statistical method wasused to predetermine sample size, and experiments were not randomized.The investigators were not blinded to allocation during experiments andoutcome assessment.
Mammary gland dissociation into single-cell suspension. The number 3 and4 mammary glands were dissected from 10–15-week-old virgin, female C57BL/6Jmice and were dissociated for 14–16 h at 37 ◦C in 1:1 DMEM/F12 (+2.5mM L-glutamine + 15mM HEPES; Gibco) +1mgml−1 collagenase (Roche) +100Uml−1hyaluronidase (Sigma)+50 µgml−1 gentamicin (Gibco). Themammary glands werethen processed to single cells as previously described6. Mammary glands fromMyh11–Cre–GFP,Myh11–Cre–GFP;Rosa26LacZ, Acta2–Cre–ERT2;Rosa26LacZ andActa2–Cre–ERT2
; R26mTmG mice were dissociated and processed for single-cellsuspension and flow cytometry as described elsewhere8–10.
Flow cytometry. Mammary cells were incubated with 10% normal rat serum for10min on ice to pre-block before antibody staining. All antibody incubations werefor 10min on ice in HF media: Hank’s balanced salt solution (Gibco) + 10mMHEPES (Sigma) + 2% fetal bovine serum (FBS; Gibco). Mouse mammary cellswere stained with the following primary antibodies: 1 µgml−1 CD31–biotin (clone390, eBioscience catalogue number 13-0311-85); 1 µgml−1 CD45–biotin (clone 30-F11, eBioscience catalogue number 13-0451-85); 1 µgml−1 Ter119–biotin (cloneTer119, eBioscience catalogue number 13-5921-85); 1 µgml−1 BP-1–biotin (clone6C3, eBioscience catalogue number 13-5891-81); 1 µgml−1 EpCAM–Alexa Fluor647 (clone G8.8, Biolegend catalogue number 118212) and 2 µgml−1 CD49f–AlexaFluor 488 (clone GoH3, Biolegend catalogue number 313608). In experimentsusing cells from C57BL/6J.CBA–Tg(Actb–EGFP) and Acta2–GFP mice, 2 µgml−1CD49f–Pacific blue (clone GoH3, Biolegend catalogue number 313620) antibodywas used instead of CD49f–Alexa Fluor 488. Mouse cells were then stained with0.4 µgml−1 streptavidin–APC–Cy7 (Biolegend catalogue number 405208). DAPI(1 µgml−1; Invitrogen) was used to detect dead cells. Cells were filtered througha 30 µm cell strainer before sorting. For experiments using cells from Myh11–Cre–EGFP mice, the following conjugated antibodies were used: anti-CD24–PE–Cy5 (clone M1/69; eBiosciences catalogue number 15-0242), anti-CD49f–PE(clone GoH3; BD Biosciences catalogue number 561894), anti-CD45–APC (clone30-F11; Biolegend catalogue number 103112), anti-CD31–APC (clone MEC13.3;Biolegend catalogue number 102510). For separation of basal and luminal cellsfromActa2–Cre–ERT2;Rosa26LacZmice, anti-CD24 antibody was FITC-conjugated(clone M1/69; BD Biosciences catalogue number 553261). For analysis of Acta2–Cre–ERT2;R26mTmG mice, anti-CD24–PE (clone M1/69; BD Biosciences cataloguenumber 561079) and anti-CD49f–PECy7 (clone GoH3; Biolegend cataloguenumber 313622) were used. Sorting of cells was done using a FACSAria I (BDBiosciences) except for Figs 4f and 6c,d, where a FACSVantage (BD Biosciences)was used. Single-stained control cells were used to perform compensation manually.Matched isotype control antibodies conjugated to each fluorochrome were usedto control for background staining and fluorescence-minus-one controls wereused to set gates. Flow cytometry data were analysed using FlowJo software(Tree Star). Full details of the flow cytometer instrumentation can be found inSupplementary Table 2.
The laser alignment was checked regularly using BD Cytometer Setup andTracking Beads and 8-peak rainbow beads (BD Biosciences). The photomultipliertube settings were set such that the unstained cells were placed in the first decade offluorescence.
To adjust the compensation, single stained control cells were used for eachdye used. Compensation was performed manually. A representative compensationmatrix of the FACSAria I is shown in Supplementary Table 2.
The following isotype controls were used to check for background staining:rat IgG2a, κ-Alexa Fluor 488 (clone RTK2758, Biolegend catalogue number
400525); rat IgG2a,k–Alexa Fluor 647 (clone RTK2758, Biolegend catalogue number400526); Armenian hamster IgG–PE (clone HTK888; Biolegend catalogue number400908); rat IgG2b, κ-PerCP (clone RTK2758, Biolegend catalogue number 400629).Representative sort plots with typical gates are shown below for the sorting ofbasal cells. Doublets, dead cells and contaminating haematopoietic, endothelial andstromal cells are gated out. High expression of EpCAM (EpCAMhigh) is defined asthe brightest 20% of the basal population.
Proliferation and apoptosis assays. To assess proliferation status in non-culturedcells, freshly dissociated mammary cells were incubated with 10 µgml−1 Hoechst33342 (Sigma) for 45min at 37 ◦C. Cells were then stained with antibodies as statedabove except that 0.5 µgml−1 propidium iodide (PI; Sigma) was used instead ofDAPI to detect dead cells. The full gating strategy is shown in Supplementary Fig. 2.Hoechst2n and Hoechst4n cells were visualized on an ImageStream imaging flowcytometer (Amnis). For synthetic nucleoside injections, mice were injected with a150mg kg−1 dose of BrdU or IdU (Sigma), were euthanized 1–7 h post-injection,their mammary glands removed and dissociated and basal cells isolated and fixed onslides in cold methanol for 5min at −20 ◦C. The cells were incubated with 2N HClfor 30min at 25 ◦C to denature the DNA. A primary antibody that recognizes bothBrdU and IdU (clone B44; BD Biosciences catalogue number 347580) was used at1 µgml−1 and incubated overnight at 4 ◦C followed by an goat anti-mouse IgG–AlexaFluor 555 secondary antibody (Invitrogen catalogue number A21422) at 1 µgml−1for 1 h at 25 ◦C. Approximately 500 basal EpCAMhigh and EpCAMlow cells for eachindependent sample were scored by eye on a Nikon upright confocal microscope at×60magnification. To assess proliferation status post-culture, cells were trypsinizedand incubated with 10 µgml−1 Hoechst for 45min at 37 ◦C and were then stainedwith EpCAM–Alexa Fluor 647 and PI. FlowJo was used for all cell cycle analyses.
Immunocytochemistry and immunofluorescence. Purified basal cells wereallowed to adhere to poly-L-lysine-coated slides at 37 ◦C for 15min. Basal cellsand colonies were fixed in 1:1 acetone/methanol and permeabilized with 0.025%Triton X-100 in TBS for 10 min before pre-blocking with 10% normal goat ordonkey serum (Sigma) in TBS for 1 h at 25 ◦C. For immunohistochemistry, paraffin-embedded tissue sections were de-waxed in xylene, gradually rehydrated and thenboiled in citrate buffer at pH 6 for 10min before pre-blocking with 10% normaldonkey serum in TBS for 1 h at 25 ◦C or with 1%BSA/0.1% Tween 20/PBS. Rabbitanti-mouse polyclonal antibodies against αSMA (crossreacts with human; Abcamcatalogue number ab5694), smooth muscle myosin heavy chain (Abcam cataloguenumber ab53219), cytokeratin 5 (Abcam catalogue number ab53121), cytokeratin14 (crossreacts with human; Covance catalogue number PRB-155P), cytokeratin18-biotin (crossreacts with human; Abcam catalogue number ab27553), mucin 1(Abcamcatalogue number ab15481) andβ-casein (gift fromC.Watson,University ofCambridge) were used at 2 µgml−1 and incubated overnight at 4 ◦C. A chicken anti-mouse polyclonal antibody against GFP (Abcam catalogue number ab13970) wasused at 0.25 µgml−1. Cells and sections were then stained with a biotinylated donkeyanti-rabbit IgG antibody (Jackson ImmunoResearch catalogue number 711-065-152) or biotinylated donkey anti-chicken IgG antibody (Jackson ImmunoResearchcatalogue number 703-065-155) at 1 µgml−1 for 1 h at 25 ◦C. The Vectastain EliteABC kit (Vector Labs) was used for avidin–horseradish peroxidase conjugationand 3,3′-diaminobenzidine (DAB) containing hydrogen peroxide (Vector Labs) wasadded and incubated for 2–10min. For immunofluorescence, a goat anti-rabbit IgG–Alexa Fluor 555 (Invitrogen catalogue number A21428) was used at 1 µgml−1 andincubated for 1 h at 25 ◦C. DAPI was used at 1 µgml−1 to visualize cell nuclei.
Cell culture. Culture dishes were coated with Growth Factor Reduced (GFR)Matrigel (BD Biosciences) diluted 1:60 in PBS and incubated for 1 h at 37 ◦C. Basalcells were cultured in FAD media: 3:1 DMEM/F12 (+1.8 × 10⁻⁴ M adenine +1.8× 10⁻³ M calcium) +10% FBS (PAA) + 0.5 µgml−1 hydrocortisone (Sigma) +10−10 M cholera toxin (Enzo Life Sciences) + 10 ngml−1 epidermal growth factor(EGF, Peprotech)+ 5 µgml−1 insulin+ 50 µgml−1 gentamicin. Cell culturemediumwas supplemented with 10 µM Y-27632 (Sigma) unless stated otherwise. IrradiatedNIH 3T3 fibroblasts were seeded at 104 cells cm−2. Cultures were kept at 37 ◦C ina 5% (vol/vol) CO2, 5% (vol/vol) O2 atmosphere for 7 days. For colony formationassays, mammary cells were seeded at 10–50 cells cm−2 and cultured for 7 daysbefore fixation in 1:1 acetone/methanol. Colonies were stained withWright–Giemsa(Fisher) and counted under a microscope at lowmagnification. For transplantationsand analysis, cultured cells were trypsinized and sorted by flow cytometry usingDAPI and EpCAM to isolate live epithelial cells and exclude dead cells and fibroblastcells. For some experiments, recombinant Human TGFβ1 (R&D Systems), SB431542 hydrate (Sigma), blebbistatin (Sigma), latrunculin B (Enzo), cytochalasinD (Tocris Bioscience), jasplakinolide (Enzo) and H-1152 dihydrochloride (TocrisBioscience) were added to cell culture media for some experiments. In Fig. 4g,freshly sorted cells were cultured in DMEM/F12 medium containing B27 (Gibco)+ 1% FBS. For X-gal staining, colonies were fixed in 2% formaldehyde, 0.2%
NATURE CELL BIOLOGY
© 2014 Macmillan Publishers Limited. All rights reserved.

DOI: 10.1038/ncb3025 METHODS
glutaraldehyde, 0.02% NP-40 in PBS at 4 ◦C for 4min, washed with PBS, incubatedwith the X-gal staining solution (0.025%X-gal, 3mMK3Fe(CN)6, 3mMK4Fe(CN)6,1.5mM MgCl2, 15mM NaCl, 40mM HEPES) overnight at 30 ◦C, post-fixed with4% formaldehyde, and counterstained with nuclear fast red. Colony-formation assaywith basal and luminal cells fromMyh11Cre–GFP ;Rosa26 micewas performed threetimes with three technical replicates in each case. For mammosphere assays, freshlyisolated cells were seeded at a density of 5,000 cells per well on ultralow-adherent24-well plates (Corning) in DMEM/F12 containing B27 (Gibco), 20 ngml−1 EGF(Invitrogen), 20 ngml−1 bFGF (Gibco), 4 µgml−1 heparin (Sigma), 10 µgml−1insulin (Sigma) supplemented with 2% GFR Matrigel. The mammospheres weredissociated every two weeks with 0.05% trypsin (Gibco) and were re-seeded at5,000 cells per well.
Analysis of myoepithelial cell clonal expansion in situ and quantitativeevaluation of LacZ-labelling in basal and luminal compartments. For analysesof clonal expansion and progeny tracing at puberty, 4-week-old Acta2–Cre–ERT2;Rosa26 females were i.p. injected twice with 1mg of tamoxifen within 24 h.Mice were euthanized 1 week (2 mice) and 6 weeks (three mice) after injection, andglands were dissected and processed for whole-mount X-gal staining as describedelsewhere (Biology of theMammary Gland, http://mammary.nih.gov). Between 339and 511 clones were counted for the 1-week chase time point, and between 260 and528 for the 6-week chase.
For analyses of clonal expansion and progeny tracing during pregnancy, 8-week-oldActa2–Cre–ERT2;Rosa26LacZ andActa2–Cre–ERT2;R26mTmG virgin females werei.p. injected twice with 0.75mg of tamoxifen within 24 h, mated 2 weeks later andanalysed 5–6 weeks after tamoxifen injection at different pregnancy stages (Fig. 5e).For tracing the progeny of myoepithelial cells after two pregnancies, 4-week-oldfemales were injected twice with 0.75mg of tamoxifen within 24 h, mated at 8 weeks,allowed to lactate for 1 week, mated again after 3 weeks of involution and analysedafter the second lactation, either during involution (chase of 20weeks), or at the thirdpregnancy (chase of 22–26 weeks).
For histological analyses, X-gal-stained glands were embedded in paraffin,and 7-µm-thick sections were cut, de-waxed and stained with nuclear fastred. For analyses of clonal expansion at pregnancy, clones were counted in 3different gland areas and, at least, 9 sections per gland were analysed. For theV1, V2, P12, P15 and P17 samples, 335, 281, 680, 648 and 492 clones werecounted, respectively.
To evaluate the amount of LacZ-positive cells in basal and luminal epithelialcompartments, single-cell suspensions were obtained from inguinal mammaryglands of Acta2–Cre–ERT2;Rosa26LacZ mice as described above, basal and luminalcells were isolated by flow cytometry, and X-gal stained in suspension, and LacZ-positive and -negative cells were counted on cytospots. In each case, at least, 500basal and 2,000 luminal cells were counted.
Cell injections into cleared fat pads. All animal work conducted in the UKwas approved by the Cambridge Institute Local Ethics Committee and the HomeOffice and all animal work conducted in France was conducted in accordancewith French veterinary guidelines and those formulated by the Council of Europefor experimental animal use (L358-86/609EEC). Cells were suspended in 65%HF media + 25% GFR Matrigel + 10% trypan blue solution (0.4%, Sigma),except for in Fig. 4j where 50% GFR Matrigel was used, at a concentration suchthat a 10 µl injection volume contained the desired cell dose. The endogenousmammary epithelium in the inguinal (number 4) glands of 3-week-old femaleC57BL/6J or NOD/SCID IL2Rγc−/− pups was cleared and cells were injectedinto cleared fat pads as previously described30. The mice were mated 3 weeksafter surgery and the number 4 glands were removed during pregnancy. Glandswere fixed overnight in Carnoy’s fixative. GFP+ glands were visualized undera fluorescence microscope at low magnification and were then fixed in 4%paraformaldehyde for 1 h at 25 ◦C before paraffin embedding. For whole-mountanalysis, glands were stained overnight in carmine alum (Sigma) and analysed undera microscope at low magnification. After X-gal staining in whole-mount, glandswere dehydrated and post-fixed in acetone for 30min before carmine staining. Forsecondary transplantations, primary outgrowths (that contained GFP+ epithelium)were dissociated, made into a single-cell suspension and were transplanted backinto cleared mammary fat pads as described above except for in SupplementaryFig. 5f where 1mm3 fragments, containing epithelial ducts that were clearlyvisible under a dissecting microscope, were re-transplanted into cleared mammaryfat pads.
RNA extraction. Total RNA was extracted from non-cultured, 1-day-cultured and7-day-cultured basal cells using the RNeasy Plus Mini kit (Qiagen). The RNA wasquantified using a NanoDrop 1000 spectrophotometer (Thermo Scientific) andquality checked using a 2100Bioanalyser (Agilent). All samples had anRNA integritynumber ≥8.
Microarray summary. Total RNA was prepared for microarray analysis using anIllumina TotalPrep RNA Amplification kit (Ambion). The cRNA was hybridized toa MouseWG-6 v2.0 Expression BeadChip (Illumina). All microarray data analyseswere carried out on R using Bioconductor packages31. Raw intensity data fromthe array scanner were processed using the BASH (ref. 32) and HULK algorithmsas implemented in the beadarray package33. Log2 transformation and quantilenormalization of the data from 4 independent experiments were performed.Differential expression analysis was carried out using the limma package34.Differentially expressed genes were selected using a P-value cutoff of <0.01 afterglobal application of a false discovery rate correction for multiple contrast testing.The microarray data can be accessed through the Gene Expression Omnibus (GEO,series accession number GSE31347).
MIAME checklist.Goal of the experiment. To profile the gene expression of mouse mammary basalcells pre- and post-culture in media that permits mammary stem cell expansion.
Description of the experiment.Mammary glands from 10–14-week-old, female,virgin C57BL/6J mice were dissociated into single cells and basal cells were sorted byflow cytometry at a purity of∼95%. Inducing basal cell proliferation in vitro causesmammary stem cell expansion over 7 days in culture. Basal cells were cultured onMatrigel-coated cell culture plastic in a keratinocyte stem cellmedium supplementedwith the Rho-kinase inhibitor Y-27632 and were co-seeded with irradiated NIH 3T3fibroblast feeder cells. To determine themolecular changes that occur during culturethat may contribute to mammary stem cell expansion, gene expression profiling wasconducted on basal cells pre-culture and after 1- or 7-day-culture.
Keywords. Cell Type: mouse mammary basal cells.
Experimental design. Mammary glands from 6 C57BL/6J mice were pooled foreach experiment. Purified basal cells sorted from the same pooled sample weresplit into 3 groups: pre-culture for immediate RNA extraction, 1-day-culture and 7-day-culture. Cultured basal cells were sorted to exclude fibroblast feeder cells. TotalRNA was extracted for each group in 4 independent experiments. Gene expressionprofiles were determined for each group using a MouseWG-6 v2.0 ExpressionBeadChip (Illumina).
Quality control.Total RNAwas quality checked using a 2100 Bioanalyser (Agilent).All samples had an RNA integrity number ≥8.
Public databases. All data files can be accessed through the Gene ExpressionOmnibus (accession number GSE31347).
Origin of each sample. 10–14-week-old, female, virgin C57BL/6J mice(Charles River).
Manipulation of samples. Mammary glands were dissociated in collagenase andhyaluronidase for 14–16 h at 37 ◦C, treated with ammonium chloride, trypsin,dispase and DNase, and filtered to obtain a single-cell suspension. Mammary cellswere stained with fluorochrome-conjugated antibodies and the viability dye DAPIand were then passed through a cell sorter. Cultured basal cells were grown onMatrigel-coated cell culture plastic in FADmedia supplementedwith 10 µMY-27632for 1–7 days at 37 ◦C in a 5% (vol/vol) CO2, 5% (vol/vol) O2 atmosphere.
RNA preparation method for all samples. Total RNA was extracted using theRNeasy Plus Mini kit (Qiagen) following the manufacturer’s instructions.
Experimental factor values. Cell Type: mouse mammary basal cells pre-culture,1-day-cultured mouse mammary basal cells, 7-day-cultured mouse mammarybasal cells.
Amplification method. Total RNA was amplified using the Illumina TotalPrepRNA Amplification kit (Ambion).
cRNA hybridization. Labelled cRNA was hybridized to Illumina BeadArraysovernight following Illumina’s WGGX DirectHyb Assay Guide.
Wash and stain. BeadArrays were washed and stained with streptavidin Cy3following Illumina’s WGGX DirectHyb Assay Guide.
Illumina scan. BeadArrays were scanned using the AutoLoader and BeadArrayscanner at default settings following Illumina’s BeadArray Reader User Guide.
Platform. Illumina mouse WG-6 v2.0 Expression BeadChip.
NATURE CELL BIOLOGY
© 2014 Macmillan Publishers Limited. All rights reserved.

METHODS DOI: 10.1038/ncb3025
Data processing.Data analysis was carried out on R using Bioconductor packages.Raw intensity data from the array scanner were processed using the BASH andHULK algorithms in the beadarray package. Log2 transformation and quantilenormalization of the data were performed. Differential expression analysis wascarried out using the limma package.
Sample name. Basal.
Description.RNA extracted frommousemammary basal cells sorted at high purity(∼95%) by flow cytometry. Basal cells consist predominantly of myoepithelial cellsintermixed with rare mammary stem cells that occur at a frequency of 1 in every∼300 basal cells.
Sample name. X1day.
Description. RNA extracted from mouse mammary basal cells cultured for 1 day.One-day-cultured basal cells containmammary stemcells at a frequency of 1 in every∼30 cells.
Sample name. X7day.
Description. RNA extracted from mouse mammary basal cells cultured for 7 days.Seven-day-cultured basal cells contain mammary stem cells at a frequency of 1 inevery∼70 cells.
Real-time PCR. Total RNA was extracted, quantified and quality checked asdescribed above. Reverse transcription of the total RNA was performed using theSuperScript VILO cDNA Synthesis Kit (Invitrogen). Assuming a 1:1 conversion ofRNA to cDNA, 2 ng of cDNA was used per reaction. TaqMan Fast Universal PCRMaster Mix (Applied Biosystems) and TaqMan Gene Expression assays (AppliedBiosystems) were used following the manufacturer’s protocol. Reactions were donein 12.5 µl volumes in triplicate using a 7900HT Fast real-time PCR system (AppliedBiosystems) under the following conditions: 95 ◦C for 20 s followed by 40 cycles of95 ◦C for 1 s and 60 ◦C for 20 s. Relative transcript levels were calculated using thecomparativeCTmethod andwere normalized to the reference genesActb andRplp0.Full real-time PCR methods in accordance with the MIQE guidelines are detailedas follows.
MIQE checklist.Experimental design. Experimental groups: Basal pre-culture, 1-day-culturedbasal cells, 7-day-cultured basal cells. Control groups: No Template Control(NTC; no cDNA), RT- (no SuperScript). Technical replicates were done intriplicate. Relative transcript abundancewas averaged from 3 independent biologicalreplicates. Real-time PCR assays were performed by the lead author.
Sample. Mammary glands from 10–14-week-old, female, virgin C57BL/6J micewere macrodissected and dissociated for 14–16 h at 37 ◦C in DMEM/F12 containingcollagenase and hyaluronidase. Mammary glands were treated with ammoniumchloride, trypsin, dispase and DNase and then filtered to obtain a single-cellsuspension. Mammary cells were stained with fluorochrome-conjugated antibodiesand the viability dye DAPI and were then passed through a cell sorter. Cultured basalcells were grown onMatrigel-coated cell culture plastic in FADmedia supplementedwith 10 µM Y-27632 for 1–7 days at 37 ◦C in a 5% (vol/vol) CO2, 5% (vol/vol) O2
atmosphere.
Nucleic acid extraction. Total RNA was extracted using the RNeasy Plus Minikit (Qiagen) following the manufacturer’s instructions. The RNA was quantifiedusing aNanoDrop 1000 spectrophotometer (Thermo Scientific) and quality checkedusing a 2100 Bioanalyser (Agilent). Most samples had an RNA integrity number≥8(Supplementary Table 3).
Reverse transcription. The SuperScript VILO cDNA Synthesis Kit (Invitrogen;catalogue number 11754) was used following the manufacturer’s protocol andreaction conditions. Reaction volumes were 20 µl with 150 ng of total RNA.Temperature and time: 25 ◦C for 10min, 42 ◦C for 120min, 85 ◦C for 5min.Most Cqswere undetermined for no-reverse transcription controls but where amplificationdid occur, Cq values were≥37. Cq values with reverse transcription were between 20and 35 depending on transcript abundance. All cDNA was stored at−20 ◦C.
The qPCR target information is reported in Supplementary Table 4.
qPCR protocol. TaqMan Gene Expression Assays (Applied Biosystems) were usedfollowing themanufacturer’s protocol. Final concentrationswere 900 nM for primersand 250 nM for the TaqManMGBprobe (6-FAMdye-labelled). Reaction conditions:TaqMan Gene Expression Assay (20×) + TaqMan Fast Universal PCR Master Mix(2×; contains DNA polymerase) No AmpErase UNG (Applied Biosystems) + 2 ngcDNA (0 ng for NTC) + H2O. Reactions were done in triplicate in 12.5 µl volumescontaining 2 ng of RNA converted to cDNA. A 7900HT Fast Real-Time PCR System(Applied Biosystems) was used with the following thermocycling parameters: 95 ◦Cfor 20 s followed by 40 cycles of 95 ◦C for 1 s and 60 ◦C for 20 s.
qPCR validation. Amplification efficiencies of the different RNA transcripts arepresented in Supplementary Table 5. The linear dynamic rangewas from0.02–2 ng ofcDNA per reaction. At 0.002 ng of cDNA, Cq values for less abundant targets becamevariable (Cqs> 35 and triplicates differed by>1 Cq).
Data analysis. qPCR data were analysed and Cq values determined using the7900HT Sequence Detection System software (Applied Biosystems). No templatecontrols did not amplify and the Myh11 no reverse transcription (RT−) controldid not amplify. The exceptions were amplification for Acta2, Actb and Rplp0 RT−controls with Cq values ≥37, which were 10–15 Cqs greater than those for sampleswith reverse-transcribed template. Actb and Rplp0 were used as reference genesbased on their use in the literature and because their expression did not differsignificantly between the samples according to the microarray data. The geometricmean of the 2 reference gene Ct values was used for normalization.
Western blotting.An equal number of flow-sorted basal EpCAMhigh and EpCAMlow
cells were centrifuged at 470g , the supernatant was removed and cells were lysedin 10 µl of CHAPS lysis buffer (20mM Tris, 8M urea, 5mM magnesium acetate,4% CHAPS; pH to 8.0; Amersham). Protein lysates were sonicated for 30 s anddiluted with NuPAGE LDS sample buffer and NuPAGE reducing agent (Invitrogen)before being run on a NuPAGE Bis-Tris gel (Invitrogen) in NuPAGE MOPS SDSrunning buffer (Invitrogen) for 30min at 60V and 90min at 120V. The proteinwas transferred onto a nitrocellulose membrane using the iBlot transfer system(Invitrogen). Themembranewas incubated inOdyssey blocking buffer (LI-COR) for1 h at 25 ◦Cbefore being incubatedwith a rabbit anti-mouseαSMAantibody (Abcamcatalogue number ab5694) at 2 µgml−1 overnight at 4 ◦C followed by a goat anti-rabbit IRDye 800CW secondary antibody (LI-COR catalogue number 926-32211)at 0.2 µgml−1 for 45min at 25 ◦C. The membrane was then imaged on a LI-COROdyssey CLx infrared imaging system. The blot was then re-probed for cytokeratin14 (1 µgml−1; Covance catalogue number PRB-155P) following the same protocol.
Statistical analysis. Data are presented as the mean of independent experimentswith s.e.m. Comparisons between multiple groups were analysed using analysisof variance (ANOVA) followed by Bonferroni post-tests. Comparisons between2 groups were analysed using 2-tailed, 2-sample Student’s t-tests. Statisticalsignificance was set at P<0.05. All raw data can be found in the data source file.
MRU frequencies between different cell populations were compared statisticallyusing the Extreme Limiting Dilution Analysis35 (ELDA) online tool (http://bioinf.wehi.edu.aU/software/elda/).
27. Yokota, T. et al. Bone marrow lacks a transplantable progenitor for smooth muscletype α-actin-expressing cells. Stem Cells 24, 13–22 (2006).
28. Wendling, O., Bornert, J. M., Chambon, P. & Metzger, D. Efficient temporally-controlled targeted mutagenesis in smooth muscle cells of the adult mouse. Genesis47, 14–18 (2009).
29. Soriano, P. Generalized lacZ expression with the ROSA26 Cre reporter strain. Nat.Genet. 21, 70–71 (1999).
30. Young, L. J. T. in Methods in Mammary Gland Biology and Breast Cancer Research(eds Ip, M. M. & Asch, B. B.) 67–74 (Kluwer/Plenum, 2000).
31. Gentleman, R. et al. Bioconductor: open software development for computationalbiology and bioinformatics. Genome Biol. 5, R80 (2004).
32. Cairns, J. M., Dunning, M. J., Ritchie, M. E., Russell, R. & Lynch, A. G.BASH: a tool for managing BeadArray spatial artefacts. Bioinformatics 24,2921–2922 (2008).
33. Dunning, M. J., Smith, M. L., Ritchie, M. E. & Tavaré, S. beadarray: R classes andmethods for Illumina bead-based data. Bioinformatics 23, 2183–2184 (2007).
34. Smyth, G. K. in Bioinformatics and Computational Biology Solutions using R andBioconductor (eds Gentleman, R. et al.) 397–420 (Springer, 2005).
35. Hu, Y. & Smyth, G. K. ELDA: extreme limiting dilution analysis for comparing depletedand enriched populations in stem cell and other assays. J. Immunol. Methods 347,70–78 (2009).
NATURE CELL BIOLOGY
© 2014 Macmillan Publishers Limited. All rights reserved.

S U P P L E M E N TA RY I N F O R M AT I O N
WWW.NATURE.COM/NATURECELLBIOLOGY 1
DOI: 10.1038/ncb3025
Supplementary Figure 1 Flow cytometry gating strategy. (a) Gating strategy to discriminate basal cells. (b) Comparison of the colony forming efficiency of sorted live cells exposed to DAPI and antibodies compared to unsorted live cells. Data is presented a the mean (± SEM) of 6 independent experiments; * p<0.05 by 2-tailed Student’s t-test.
© 2014 Macmillan Publishers Limited. All rights reserved.

S U P P L E M E N TA RY I N F O R M AT I O N
2 WWW.NATURE.COM/NATURECELLBIOLOGY
Supplementary Figure 2 Flow cytometry gating strategy to identify S/G2/M basal cells.
© 2014 Macmillan Publishers Limited. All rights reserved.

S U P P L E M E N TA RY I N F O R M AT I O N
WWW.NATURE.COM/NATURECELLBIOLOGY 3
Supplementary Figure 3 Basal cells in S/G2/M cell cycle phases have higher MRU frequency and colony forming efficiency than basal cells in G0/G1 phases. (a) Frequency of S/G2/M cells in basal EpCAMhigh and EpCAMlow cells as determined by Hoechst 33342 staining. Mean (± SEM) of 4 independent experiments. * P = 0.02 for G0/G1 and P = 0.03 for G2/M. (b) Distribution of G2/M cells within the basal population. Mean (± SEM) of 4 independent experiments. (c) Images of basal cells in S/G2/M phases (Hoechst4n) and basal cells in G0/G1 phases (Hoechst2n) from the
ImageStream imaging flow cytometer. One sample analysed. Scale bar = 10 µm. (d) MRU frequency and engraftment rates in basalHoechst4n and basalHoechst2n cells. Data pooled from 2 independent experiments. MRU distribution calculated by multiplying MRU frequency by the total number of cells for each population per gland and calculating the ratio of total MRU numbers between the 2 cell populations. (e) Colony forming efficiency of G0/G1 and S/G2/M basal cells. Mean (± SEM) of 4 independent experiments. * P = 0.005.
© 2014 Macmillan Publishers Limited. All rights reserved.

S U P P L E M E N TA RY I N F O R M AT I O N
4 WWW.NATURE.COM/NATURECELLBIOLOGY
Supplementary Figure 4 Cytoskeletal remodelling and inhibition of TGFβ significantly influence basal colony formation. (a) GeneGo pathway maps listed in order of significance; ***p<10-15 **p<10-10 *p<10-5. (b) Basal cell CFE after addition of TGFβ1 at 200 pM and the TGFβ inhibitor SB 431542 hydrate (SB) at 10 µM to FAD media; mean (± SEM) of 3 independent experiments for all conditions, except for when TGFβ and SB 431542 are tested individually, then the data is derived from 5 independent experiments. * P = 0.02 for no treatment vs. TGFβ, P = 0.04 for TGFβ vs. SB + TGFβ, P = 0.02 for Y vs. Y + TGFβ, P = 0.02 for Y + TGFβ vs. Y + SB, P = 0.02 for Y + TGFβ vs. Y + SB + TGFβ. (c) Effect of the actin modulators: latrunculin B, cytochalasin D and jasplakinolide on basal cell CFE. Data is presented as the mean (± SEM). The number of independent experiments performed for each experimental condition is indicated by
the number on top of the bars in the chart. * Significant difference to no treatment control (P = 0.03 for 1 µM latrunculin B, P = 0.02 for 5 µM latrunculin B, P = 0.02 for 50 nM cytochalasin D, P = 0.01 for 100 nM cytochalasin D). † Significant difference to + Y treatment (P = 0.003 for 250 nM cytochalasin D, P = 0.02 for 25 nM jasplakinolide, P = 0.002 for 50 nM jasplakinolide). (d) The effect of the Rho kinase inhibitors Y-27632 (Y) and H1152 (H) and the myosin II inhibitor Blebbistatin (Bleb) on basal cell CFE. Data is presented as the mean (± SEM). The number of independent experiments performed for each experimental condition is indicated by the number on top of the bars in the chart. * Significant difference to no treatment (P = 0.007 for 1 µM Y, P = 0.00003 for 10 µM Y, P = 0.007 for 100 nM H, P = 0.0006 for 1 µM H, P = 0.0008 for 5 µM Bleb, P = 0.002 for 10 µM Bleb, P = 0.0001 for Y + Bleb).
© 2014 Macmillan Publishers Limited. All rights reserved.

S U P P L E M E N TA RY I N F O R M AT I O N
WWW.NATURE.COM/NATURECELLBIOLOGY 5
Supplementary Figure 5 A high proportion of basal αSMA- cells express the basal cytokeratins 5/14. Engraftments derived from myoepithelial cells can form secondary engraftments. (a) Flow cytometry plot showing GFP expression (activity of the Acta2 promoter) in basal and luminal cells. (b) Flow cytometry plot showing GFP expression in basal EpCAMhigh and EpCAMlow cells. (c) Flow cytometry plot showing EpCAM expression in stromal, basal GFP-, basal GFP+ and luminal cells. Three independent samples were analysed for panels
a-c. (d) Immunofluorescence images of flow-sorted basal αSMA- and αSMA+ cells stained for CK5 and CK14. Isotype control inset. Scale bar = 100 µm. Mean (± SEM) of 2 independent experiments. (e) Limiting dilution analysis of dissociated primary engraftments derived from αSMA+ basal cells. (f) Number of secondary engraftments derived from 1 mm3 fragments of primary outgrowths produced by Myh11+ basal cells and total basal cells. Data pooled from 2 independent experiments.
© 2014 Macmillan Publishers Limited. All rights reserved.

S U P P L E M E N TA RY I N F O R M AT I O N
6 WWW.NATURE.COM/NATURECELLBIOLOGY
Supplementary Figure 6 The progeny of myoepithelial cells is restricted to the basal cell layer and survives after multiple pregnancies. (a) Cytospots of sorted basal and luminal cells from Acta2-Cre-ERT2;Rosa26LacZ mice x-gal stained in suspension. Arrows point to LacZ-positive cells. Sorted cells from five independent samples were analysed. Scale bars = 10 µm. (b) Flow cytometry dot plots showing GFP expression in luminal and basal cell populations isolated from 13-day-pregnant Acta2-Cre-ERT2;R26mTmG
mouse mammary glands. Experimental schedule was same as shown in Figure 5e. Red ovals indicate luminal (L) and basal (B) cell populations. (c) A fragment of whole-mount x-gal stained mammary gland from Acta2-Cre-ERT2;Rosa26LacZ mice injected with Tamoxifen at 4 weeks and analysed 20 weeks later, on day 25 of the involution following 2nd pregnancy (2nd Inv25). Scale bar = 0.87 mm. Arrows point to alveoli. BV, blood vessel; D, mammary duct.
© 2014 Macmillan Publishers Limited. All rights reserved.

S U P P L E M E N TA RY I N F O R M AT I O N
WWW.NATURE.COM/NATURECELLBIOLOGY 7
Supplementary Table Legends
Supplementary Table 1 Engraftments from single-cell-derived basal colonies can form secondary engraftments. Table showing secondary transplantation doses and engraftment success rates of epithelial cells derived from an outgrowth derived from a single basal cell.
Supplementary Table 2 Flow cytometry instrument configurations and compensation matrices.
Supplementary Table 3 RNA integrity values for purified subpopulations analysed by real time PCR
Supplementary Table 4 Real time PCR target information
Supplementary Table 5 Amplification efficiencies of the different RNA transcripts
Supplementary Table 6 Statistics source data
© 2014 Macmillan Publishers Limited. All rights reserved.