Embed Size (px)
Citation preview
6x9covertemplate.qxd 2/23/11 10:50 AM Page 1
PRAISE FOR
Managing Customers as Investments
“Gupta and Lehmann have brilliantly brought together the cus-tomer and financial views of marketing. Astonishingly, manycompanies struggle to recall that cash comes from customers andthat marketing is the sourcing and harvesting of that cash. Guptaand Lehmann provide the theory and practice for marketers andCFOs alike. Bravo!”
Tim Ambler, London Business School, and author,
Marketing and the Bottom Line, Second Edition
“This book proves the adage that nothing is as practical as a goodtheory. The concept of lifetime value of a customer is presentedin a straightforward and very practical way that will be extremelyuseful to marketers who are charged with improving financialaccountability and managing ROI. It gives the reader enoughinformation to get started with readily available data to under-stand how to think about and how to take action on customermanagement issues. The notion that it’s better to be ‘vaguelyright, than precisely wrong’ is just the right thing for companiesthat know they need to move on these issues but are struggling toget results. I strongly recommend this book for marketers whowant to get more effective at customer management. The meth-ods introduced in this book are important building blocks for along-term testing and learning process to improve business per-formance.”
Gordon Wyner, Executive Vice President,North American Strategy, Millward Brown, Inc.,
Chair, Executive Committee, Marketing Science Institute
“Gupta and Lehmann have written a rigorous, yet practical, guideto a complex and important area of timely importance to allsenior executives; namely, how to manage customers profitably.This book shows effectively that the responsibility for managingcustomers is a cross-enterprise responsibility.”
Anil Menon, Vice President,IBM Marketing Strategy and Worldwide Marketing Management
00_0131428950_FMCredits.fm Page i Thursday, May 29, 2008 2:15 PM
“For all those managers discussing how they would use client life-time value...if they only had the information...this book answersthat question and more. The text is thoughtful and explicit onhow you can actually produce an effective valuation—and with-out all the detailed information that has traditionally beenrequired. The authors deliver a researched formula and method-ology and also demonstrate how best to manage this informationand relevant analyses for profitable growth with improved newmetrics. And they provide practical examples and case studies fordecision-making using this new information.
Managing Custom-ers as Investments
offers the roadmap and toolkit to shorten thetrip to greater customer management insight.”
Cathy F Burrows, Director,Enterprise Information and Customer Management Support,
RBC Centura Bank
“
Managing Customers as Investments
provides a comprehen-sive, accessible and practical guide to understanding and manag-ing customers in today’s complex marketing environment. Itoffers managers in-depth insight into calculating customer life-time value (CLV) and using CLV to improve a company’s bottomline. Further, it provides practical tools such as the ‘two sides ofcustomer value’ framework that managers can actually use toidentify priority customers and a step-by-step approach to what ittakes to become a customer-centric organization.”
John E. Forsyth,Partner, McKinsey & Company
00_0131428950_FMCredits.fm Page ii Thursday, May 29, 2008 2:15 PM

Managing Customers asInvestments
00_0131428950_FMCredits.fm Page iii Thursday, May 29, 2008 2:15 PM

00_0131428950_FMCredits.fm Page iv Thursday, May 29, 2008 2:15 PM
Managing Customers asInvestments
The Strategic Value of Customersin the Long Run
Sunil Gupta
•
Donald R. Lehmann
00_0131428950_FMCredits.fm Page v Thursday, May 29, 2008 2:15 PM
Vice President, Publisher: Tim MooreAssociate Publisher and Director of Marketing: Amy NeidlingerEditorial Assistant: Richard WinklerDevelopment Editor: Russ HallCover Designer: Sandra SchroederManaging Editor: Gina KanouseSenior Project Editor: Lori LyonsProduction Supervision: Donna Cullen-DolceManufacturing Buyer: Dan Uhrig
© 2005 Pearson Education, Inc.Publishing as Wharton School PublishingUpper Saddle River, NJ 07458
Wharton School Publishing offers excellent discounts on this book when ordered in quantity for bulk purchases or special sales. For more information, please contact:U.S. Corporate and Government Sales, 1-800-382-3419, [email protected]. For sales outside of the U.S., please contact: International Sales, 1-317-581-3793, [email protected].
Company and product names mentioned herein are the trademarksor registered trademarks of their respective owners.
All rights reserved. No part of this book may be reproduced, in any form or by any means,without permission in writing from the publisher.
Fourth Printing, June 2008
Pearson Education LTD.Pearson Education Australia PTY, LimitedPearson Education Singapore, Pte. Ltd.Pearson Education North Asia Ltd.Pearson Education Canada, Ltd.Pearson Educación de Mexico, S.A. de C.V.Pearson Education—JapanPearson Education Malaysia, Pte. Ltd
.
00_0131428950_FMCredits.fm Page vi Thursday, May 29, 2008 2:29 PM
6ISBN-10: 0-13-216 16 1-3ISBN-13: 978-0-13-21 16 1-9
This product is printed digitally on demand. This book is the paperback version of anoriginal hardcover book.
Library of Congress Catalog Number is on file.

This book is dedicated to
Kamal, Tarun, Kunal
and
Kris, Bart, and Kelly
00_0131428950_FMCredits.fm Page vii Thursday, May 29, 2008 2:15 PM

00_0131428950_FMCredits.fm Page viii Thursday, May 29, 2008 2:15 PM
ix
CONTENTS
ACKNOWLEDGMENTS . . . . . . . . . . . . . . . . . . . . . XIII
CHAPTER 1
CUSTOMERS ARE ASSETS . . . . . . . . . . . . . . . 1
IMPORTANCE OF CUSTOMERS . . . . . . . . . . . . . . . . . . . . . . . . 2
THE GAP BETWEEN BELIEFS AND ACTIONS . . . . . . . . . . . . . . 3
BRIDGING THE GAP . . . . . . . . . . . . . . . . . . . . . . . . . . . . . . . . 6
THE PLAN OF THE BOOK . . . . . . . . . . . . . . . . . . . . . . . . . . . 10
SUMMARY . . . . . . . . . . . . . . . . . . . . . . . . . . . . . . . . . . . . . . 11
CHAPTER 2
THE VALUE OF A CUSTOMER . . . . . . . . . . . . 13
CUSTOMER LIFETIME VALUE . . . . . . . . . . . . . . . . . . . . . . . . 15
CREATING METRICS THAT MATTER . . . . . . . . . . . . . . . . . . . 17
Data Requirements . . . . . . . . . . . . . . . . . . . . . . . . . . . . 18
Complexity. . . . . . . . . . . . . . . . . . . . . . . . . . . . . . . . . . . 19
Illusion of Precision . . . . . . . . . . . . . . . . . . . . . . . . . . . . 20
A SIMPLE APPROACH. . . . . . . . . . . . . . . . . . . . . . . . . . . . . . 24
HOW REASONABLE ARE OUR ASSUMPTIONS? . . . . . . . . . . . 27
GuptaTOC.fm Page ix Thursday, July 26, 2007 1:16 PM
CONTENTSx
Margin . . . . . . . . . . . . . . . . . . . . . . . . . . . . . . . . . . . . . . 27
Retention Rate. . . . . . . . . . . . . . . . . . . . . . . . . . . . . . . . 29
Time Horizon . . . . . . . . . . . . . . . . . . . . . . . . . . . . . . . . . 31
MODIFICATIONS AND EXTENSIONS . . . . . . . . . . . . . . . . . . . . 33
Margin Growth . . . . . . . . . . . . . . . . . . . . . . . . . . . . . . . . 33
Improving Retention . . . . . . . . . . . . . . . . . . . . . . . . . . . 37
Finite Time Horizon. . . . . . . . . . . . . . . . . . . . . . . . . . . . . 38
SUMMARY . . . . . . . . . . . . . . . . . . . . . . . . . . . . . . . . . . . . . . 39
CHAPTER 3
CUSTOMER-BASED STRATEGY . . . . . . . . . . 41
TRADITIONAL MARKETING STRATEGY . . . . . . . . . . . . . . . . . . 42
VALUE TO THE FIRM VS. VALUE TO THE CUSTOMER . . . . . . . 43
The Two Sides of Customer Value. . . . . . . . . . . . . . . . . . 44
KEY MARKETING METRICS . . . . . . . . . . . . . . . . . . . . . . . . . . 47
Traditional Metrics. . . . . . . . . . . . . . . . . . . . . . . . . . . . . 47
Customer Metrics. . . . . . . . . . . . . . . . . . . . . . . . . . . . . . 48
TRADITIONAL VS. CUSTOMER-BASED STRATEGY: A CASE STUDY . . . . . . . . . . . . . . . . . . . . . . . . . . . . . . . . 51
DRIVERS OF CUSTOMER PROFITABILITY. . . . . . . . . . . . . . . . 53
Customer Acquisition. . . . . . . . . . . . . . . . . . . . . . . . . . . 53
Customer Margin . . . . . . . . . . . . . . . . . . . . . . . . . . . . . . 64
Customer Retention . . . . . . . . . . . . . . . . . . . . . . . . . . . . 70
SUMMARY . . . . . . . . . . . . . . . . . . . . . . . . . . . . . . . . . . . . . . 77
CHAPTER 4
CUSTOMER-BASED VALUATION . . . . . . . . . . 79
CUSTOMER ACQUISITION VIA FIRM ACQUISITION . . . . . . . . . 81
AT&T’s Acquisition of TCI and MediaOne . . . . . . . . . . . . 84
Acquisitions in the European Utility Industry . . . . . . . . . 89
GuptaTOC.fm Page x Thursday, July 26, 2007 1:16 PM
CONTENTS xi
FROM CUSTOMER VALUE TO FIRM VALUE. . . . . . . . . . . . . . . 90
The Rise and Fall of Internet Gurus . . . . . . . . . . . . . . . . 92
The Eyeballs Have It—or Do They?. . . . . . . . . . . . . . . . . 92
Customer-Based Valuation . . . . . . . . . . . . . . . . . . . . . . 93
DRIVERS OF CUSTOMER AND FIRM VALUE . . . . . . . . . . . . . . 98
Impact of Marketing Actions on Firm Value . . . . . . . . . . 99
Impact of Marketing and Financial Instruments on Firm Value . . . . . . . . . . . . . . . . . . . 101
VALUING NETFLIX . . . . . . . . . . . . . . . . . . . . . . . . . . . . . . . . 102
SUMMARY . . . . . . . . . . . . . . . . . . . . . . . . . . . . . . . . . . . . . 106
CHAPTER 5
CUSTOMER-BASED PLANNING. . . . . . . . . . .109
STEP 1: CUSTOMER OBJECTIVES . . . . . . . . . . . . . . . . . . . . 110
The Case of Evergreen Trust. . . . . . . . . . . . . . . . . . . . . 111
The Case of Lipitor . . . . . . . . . . . . . . . . . . . . . . . . . . . . 114
STEP 2: UNDERSTANDING SOURCES OF VALUE TO CUSTOMERS . . . . . . . . . . . . . . . . . . . . . . . . . . . . . . 115
Economic Value . . . . . . . . . . . . . . . . . . . . . . . . . . . . . . 117
Functional Value . . . . . . . . . . . . . . . . . . . . . . . . . . . . . 119
Psychological Value . . . . . . . . . . . . . . . . . . . . . . . . . . . 120
STEP 3: DESIGNING MARKETING PROGRAMS . . . . . . . . . . . 121
Marketing Mix—the 4 Ps . . . . . . . . . . . . . . . . . . . . . . . 121
Managing Customer Touchpoints. . . . . . . . . . . . . . . . . 125
Loyalty Programs . . . . . . . . . . . . . . . . . . . . . . . . . . . . . 126
Database Marketing. . . . . . . . . . . . . . . . . . . . . . . . . . . 129
STEP 4: CUSTOMER METRICS FOR ASSESSING EFFECTIVENESS OF PROGRAMS . . . . . . . . . . . . . . . . . . 131
Choosing and Using the Right Metrics. . . . . . . . . . . . . 133
SUMMARY . . . . . . . . . . . . . . . . . . . . . . . . . . . . . . . . . . . . . 134
GuptaTOC.fm Page xi Thursday, July 26, 2007 1:16 PM
CONTENTSxii
CHAPTER 6
CUSTOMER-BASED ORGANIZATION . . . . . . 137
ORGANIZATIONAL STRUCTURE . . . . . . . . . . . . . . . . . . . . . 137
The Case of L.L. Bean. . . . . . . . . . . . . . . . . . . . . . . . . . 140
INCENTIVE SYSTEMS . . . . . . . . . . . . . . . . . . . . . . . . . . . . . . 42
EMPLOYEE SELECTION AND TRAINING . . . . . . . . . . . . . . . . 143
CUSTOMER-BASED COSTING . . . . . . . . . . . . . . . . . . . . . . . 144
NEW METRICS . . . . . . . . . . . . . . . . . . . . . . . . . . . . . . . . . . 149
WHO NEEDS TO DO WHAT: TASKS FOR VARIOUS PARTIES . . . . . . . . . . . . . . . . . . . . . . . . . . . . . . . . . . . . 150
HARRAH’S ENTERTAINMENT, INC.: A WINNING HAND IN A DICEY BUSINESS . . . . . . . . . . . . . . . . . . . . . . . . . . 156
COMMON MISTAKES IN IMPLEMENTING A CUSTOMER-BASED STRATEGY . . . . . . . . . . . . . . . . . . . 160
CONCLUDING REMARKS. . . . . . . . . . . . . . . . . . . . . . . . . . . 163
APPENDIX A: ESTIMATING CUSTOMER LIFETIME VALUE (CLV) . . . . . . . . . . . . . . . .167
APPENDIX B: IMPACT OF RETENTION ON SHARE AND PROFITS . . . . . . . . . . . . . . . .179
APPENDIX C: VALUE OF CUSTOMER BASE . . . . . .183
ENDNOTES . . . . . . . . . . . . . . . . . . . . . . . . . . . . .187
INDEX. . . . . . . . . . . . . . . . . . . . . . . . . . . . . . . . .199
GuptaTOC.fm Page xii Thursday, July 26, 2007 1:16 PM
xiii
ACKNOWLEDGMENTS
Peter Drucker, one of the most influential management gurus,once said, “Innovation and marketing are the only two valuableactivities of a firm. The rest are costs.” However, marketing hascome under increasing pressure as executives find it difficult toshow a return on marketing spending. It is easy for them to askfor millions of dollars for advertising or for improving customersatisfaction, but it is much harder to show how this investmentaffects firm profits or shareholder value. This book shows whyinvestment in marketing, and especially customers, is critical bylinking it to the market capitalization of the firm, the “gold stan-dard” of success for publicly held companies.
This book had many sources of inspiration. One of the main onescame from teaching the core marketing course to MBAs and exec-utives at Columbia Business School. MBAs in general, and Colum-bia students in particular, tend to be finance-oriented. As such,their inherent interest in marketing, which they tend to equatewith (wasteful?) ad spending and promotions, is less than over-whelming. Partly to counteract the widely held narrow view ofmarketing as ad copy and cents-off coupons and partly to appealto finance-types, we restructured the course around strategicdecisions and marketing assets (customers, brands) and awayfrom the traditional 4 Ps. As a result, we found both faculty andstudents were more engaged in the course.
Acknow.fm Page xiii Thursday, July 26, 2007 1:19 PM
ACKNOWLEDGMENTSxiv
A second motivation was the Internet stock market bubble of thelate 1990s. We were sure the valuations of most Internet firmswere too high. Interestingly, when we told students this, theytended to want to kill the messenger and suggested perhaps atleast one of us was too old to “get it.” Thus partly to justify ourstrong opinion, we developed a valuation approach which was a)customer-based and b) indeed suggested many firms were over-valued. Of course, if we had spent more time investing based onour opinion and less thinking about how to justify it, we mightwell have retired rather than write this book.
The third reason for writing this book is to hopefully redefine therole and scope of marketing. Interestingly, while our colleagues inaccounting, finance, and operations were quite receptive to ourlogic, a number of colleagues within marketing were less thaneffusive. Their basic position was a combination of a) that’s notmarketing, marketing is about advertising, consumer behavior,etc., b) I’m not doing research/working on an assignment in thatarea so it doesn’t really affect me, or c) I don’t like to justify mar-keting in financial terms. Unfortunately, that attitude explainswhy marketing has lost clout in many organizations. Marketing asart may be tolerated but its influence is severely limited. Whatthis book shows is that marketing matters, indeed, more thanfinancial engineering in driving firm value.
We have a number of people to thank. Our former Ph.D. studentJennifer Ames Stuart helped and co-authored our early work inthis area. The general emphasis which has emerged in the workof Tim Ambler, Bob Blattberg, John Deighton, V. Kumar, RajSrivastava, Frederick Reichheld, Roland Rust, and Valarie Zeith-aml, among others, also influenced us. We have benefited a greatdeal from the comments and insights of Asim Ansari, SteveFuller, Mary Gross, Dominique Hanssens, Wagner Kamakura,Rajiv Lal, Jonathan Levav, Carl Mela, Scott Neslin, Vithala Rao,and Bernd Schmitt. More generally, our colleagues at Columbiaand the MBA students and executives who suffered through earlyversions of our work are thanked for both their patience and theirperspicacity. We have also been helped by the people and review-ers at the Wharton School Publishing, notably Jerry Wind and
Acknow.fm Page xiv Thursday, July 26, 2007 1:19 PM

ACKNOWLEDGMENTS xv
Tim Moore, and the tremendous effort of the support staff atColumbia including Chung Ho and Dorothy McIvor. Finally, andmost importantly, we thank our families for tolerating our effortsand the inevitable “not now, I’m working on the book” responsesto their questions. We hope you find our efforts worthwhile.
Acknow.fm Page xv Thursday, July 26, 2007 1:19 PM

Acknow.fm Page xvi Thursday, July 26, 2007 1:19 PM
C H A P T E R
41
3
CUSTOMER-BASED STRATEGY
If you walk into Stew Leonard’s, a unique grocery store on the East Coast of the United States, you will probably notice a sign engraved in stone. This sign, which represents the company’s philosophy and is meant as much for its employees as its customers, highlights two rules. It reads, “Rule # 1: The Customer Is Always Right. Rule # 2: If the Customer Is Ever Wrong, Re-Read Rule # 1.”
A focus on customers is not unique to this company. For years, managers all over the world have reiterated the need to focus on customers, provide them good value, and improve customer satisfaction. In fact, metrics such as customer satisfaction and market share have become so predominant that many companies not only track them regularly but also reward their employees based on these measures.
However, this kind of customer focus misses one important component—the value of a customer to a company. Effective customer-based strategies take into consideration the two sides of customer value—the value that a firm provides
to
a customer
and
the value
of
a customer to the firm. This approach recognizes that providing value to a customer requires marketing investment and that the firm must recover this investment. In other words, this approach combines the traditional marketing view, where the customer is king, with the finance view, where cash is king.
Chapter 3.fm Page 41 Tuesday, December 14, 2004 3:14 PM
MANAGING CUSTOMERS AS INVESTMENTS42
This chapter describes how a strategy that focuses on the two sides of customer value differs from traditional marketing strategy. We argue that traditional marketing’s focus on customer satisfaction and market share may be counterproductive at times. We demonstrate that the two approaches use different metrics for measuring success and frequently lead to quite different insights and strategic decisions. Finally, we discuss in detail the three strategic pillars of this new approach—customer acquisition, customer margin, and customer retention.
TRADITIONAL MARKETING STRATEGY
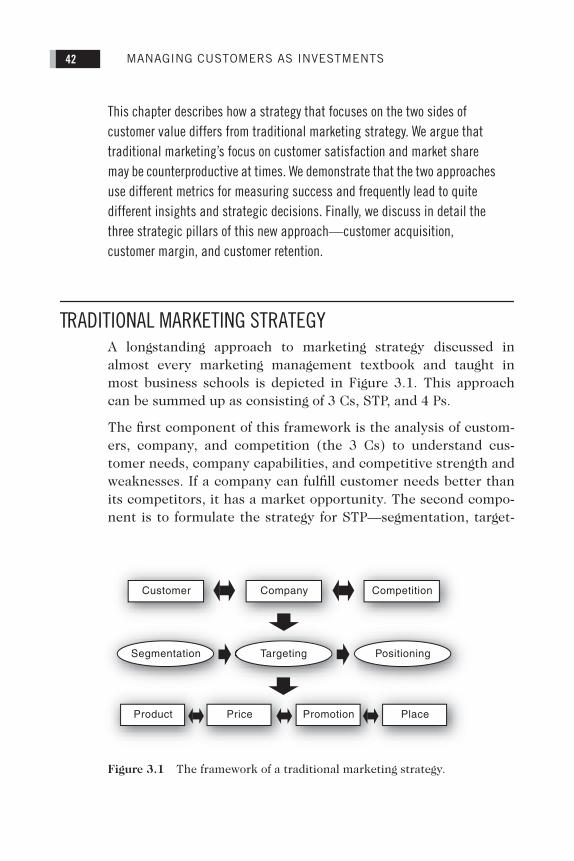
A longstanding approach to marketing strategy discussed inalmost every marketing management textbook and taught inmost business schools is depicted in Figure 3.1. This approachcan be summed up as consisting of 3 Cs, STP, and 4 Ps.
The first component of this framework is the analysis of custom-ers, company, and competition (the 3 Cs) to understand cus-tomer needs, company capabilities, and competitive strength andweaknesses. If a company can fulfill customer needs better thanits competitors, it has a market opportunity. The second compo-nent is to formulate the strategy for STP—segmentation, target-
CompetitionCompanyCustomer
Product Price Promotion Place
Targeting PositioningSegmentation
Figure 3.1 The framework of a traditional marketing strategy.
Chapter 3.fm Page 42 Tuesday, December 14, 2004 3:14 PM
CHAPTER 3 • CUSTOMER-BASED STRATEGY 43
ing, and positioning. This part recognizes that customers aredifferent in terms of their needs for product and services, so afirm has to decide which of these customer segments it shouldtarget. After selecting a target segment, the firm needs to decideon the value proposition or positioning of its products withrespect to competitive offerings. The final component of thisframework designs the 4 Ps—product, price, place (i.e., distribu-tion channels), and promotion or communication programs.
This framework is logical and useful. However, implicit in thisstructure is an emphasis on providing value to customers by sat-isfying their needs with little focus on cost. Metrics used to mea-sure success in this framework, such as sales, share, or customersatisfaction, drive decisions. What is missing is the explicit recog-nition or measurement of return on marketing investment. Forexample, it is not uncommon for firms to spend billions of dollarson advertising. For example, in 2002, GM spent $3.65 billion inadvertising in the United States alone.
1
It also offered billions ofdollars in discounts to attract customers. What is the return onthese investments? Do they build customer value in the longrun? Do they eventually help the financial health of the com-pany? It is difficult, if not impossible, to answer these questionswithin the traditional marketing framework.
VALUE TO THE FIRM VS. VALUE TO THE CUSTOMER
Customer-based strategy does not completely ignore the keyprinciples of the traditional marketing approach. Providing valueto customers is still critical. However, this approach recognizesthat marketing investment in customers must be recovered overthe long run. Specifically, this approach highlights the two sidesof customer value—the value a firm provides
to
a customer andthe value
of
a customer to a firm. The first part is the investment,and the second part is the return on this investment.
Chapter 3.fm Page 43 Tuesday, December 14, 2004 3:14 PM
MANAGING CUSTOMERS AS INVESTMENTS44
The Two Sides of Customer Value
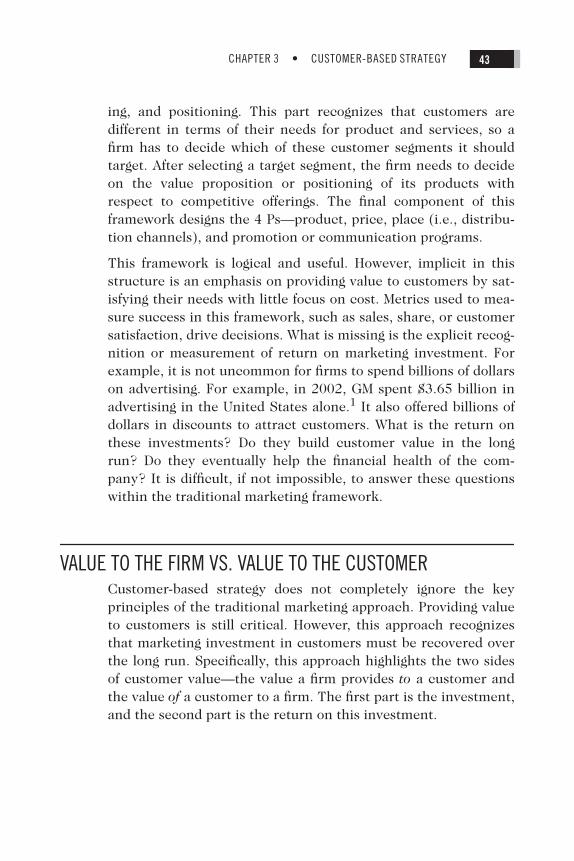
A firm provides value to a customer in terms of products and ser-vices, and a customer provides value to a firm in terms of astream of profits over time. Investment in a customer today mayprovide benefits to the firm in the future. In that sense, custom-ers are assets that a firm needs to invest in. At the same time, aswith any investment, the firm needs to assess the potentialreturn. Since not all customers are equally profitable, investmentin customers should vary by their profit potential, as illustratedin Figure 3.2.
This figure illustrates four scenarios with different values to andof customers.
Star Customers
get high value from the productsand services of the firm. These customers also provide high valueto the company by way of high margins, strong loyalty, and longerretention time. The relationship is balanced, largely equitable,and mutually beneficial. This is clearly a win-win situation wherecustomers get superior value, which earns the firm loyalty and
High
Valueof
Customers
Valueto
Customers
Low LostCauses
StarCustomers
VulnerableCustomers
FreeRiders
Figure 3.2 The two sides of customer value.
Chapter 3.fm Page 44 Tuesday, December 14, 2004 3:14 PM
CHAPTER 3 • CUSTOMER-BASED STRATEGY 45
higher profitability. A firm would be well-advised to build thistype of customer.
In contrast,
Lost Cause
customers do not get much value fromthe products and services of the firm. Generally these customersare marginal for the firm; their main value, if there are enough ofthem, is to provide the economies that come with greater sales—e.g., reduced production costs and promotion efficiencies. Absenteconomies of scale, if the company cannot migrate them tohigher levels of profitability, it should consider either reducing itsinvestment on these customers or even “firing” (dropping, shift-ing to other suppliers) them.
One cross-sectional study of U.S. banks found that in the early1990s only 30% of a typical bank’s customers were profitable overthe long run.
2
In other words, 70% of customers destroyed value!Some insurance companies found themselves in a similar situa-tion a few years ago when they realized that after several naturaldisasters in Florida, their zeal to grow and add more customershad led them to acquire a large number of customers in disaster-prone areas. For long-run profitability, it is imperative for thesecompanies to either convert unprofitable customers to a profit-able status or “fire” them. This notion of dropping customersruns counter to the intuition of managers who have been trainedto think that adding customers, increasing sales, and gaining mar-ket share are good
per se
. In many cases, market share and reve-nue growth may be the wrong metrics to gauge success.
The other two cases in Figure 3.2 show unbalanced, and henceunstable, relations.
Vulnerable Customers
provide high value tothe firm but do not get a lot of value out of company’s services.These may include newly acquired large customers whose experi-ence is less than stellar and who may be wondering why theychose your product in the first place. These may also be long-standing customers who, largely through inertia, remain loyal. Ina sense, they are exploited, much like overworked cows orfarmed-out fields. These customers are vulnerable and prone todefect to competitors unless corrective action is taken.
Chapter 3.fm Page 45 Tuesday, December 14, 2004 3:14 PM
MANAGING CUSTOMERS AS INVESTMENTS46
A company can invest in these customers through better productofferings, additional services, and related activities. These cus-tomers may deserve better service than others. The concept ofservice discrimination is similar to the idea of price discrimina-tion, where not all customers pay the same price for a product(e.g., an airline ticket). Airlines and casinos have provided prefer-ential treatment for their best customers for many years, andmore and more companies are beginning to implement a similarstrategy. For example, the call centers of Charles Schwab wereconfigured so that the best customers never waited longer than15 seconds to get a call answered, while other customers couldwait for as long as 10 minutes.
3
Even airlines that pioneered loy-alty programs are now adjusting their frequent flier programs onthe basis of ticket price (and hence profitability to the firm)rather than simply the number of miles flown. Although such ser-vice discrimination can generate a backlash from customers, it isalso possible that customers will accept the old adage that “youget what you pay for,” especially if the policy is clear and trans-parent.
Free Riders
are the mirror image of the
Vulnerable Customers
.These customers get a superior value from using the company’sproducts and services but are not very valuable to the firm. Forwhatever reason (e.g., large size, strong competition), these cus-tomers are “exploiting” the relationship with the company,appropriating the lion’s share of value.
Consider the case of supermarkets. Every week, supermarketspromote certain products at a low price in order to attract cus-tomers to their store. Several items are treated as “loss leaders.”A supermarket does not expect to make money on these itemsbut hopes that their low prices will attract more customers to thestore. Once these customers are in the store, the hope is thatthey will buy other items that are profitable. However, many cus-tomers are cherry-pickers—i.e., they only buy those few itemsthat are on sale. It is somewhat ironic that supermarkets have aspecial line for customers who buy a few items while heavyspenders wait in long lines. Doesn’t it make more sense to treatyour more profitable customers better by opening a special line
Chapter 3.fm Page 46 Tuesday, December 14, 2004 3:14 PM
CHAPTER 3 • CUSTOMER-BASED STRATEGY 47
for them?
4
Clearly, care is needed in implementation. In general,however, a firm should either reduce its service level or raiseprices for the
Free Riders.
Although this will reduce the value tocustomers and risk losing them, it will, if successful, enhancetheir value to the firm. As someone once said, “The differencebetween a sales and marketing person is that a good marketingperson knows when to walk away from a sale.”
In sum, successful customer-based strategies require that a com-pany consider both the value the firm supplies to the customerand the value the customer offers to the firm.
KEY MARKETING METRICS
How do we “keep score” in marketing? Each of the strategicapproaches has its own key metrics. Unsurprisingly, these met-rics drive decisions. They become goals and are stated every-where from annual reports to marketing plans as objectives andmeasures of success.
Traditional Metrics
The key metrics in the traditional marketing approach are salesand share. Ancillary metrics may include customer satisfactionand brand image. Profit is typically measured at a product orbrand level. As already illustrated, market share or sales may bethe wrong metric in many cases. A credit card company mayacquire a lot of low-value customers, which will increase its sharebut not its long-term profitability. Improving customer satisfac-tion is good in principle but the benefit of this improvement hasto be weighed against the cost to achieve it. Measuring profit at aproduct or brand level is useful but incomplete for at least tworeasons. First, most firms focus on the short-term or quarter-by-quarter profits of a brand and treat marketing as an expense. Thisshort-term focus is counter to the very concept of marketing asinvestment. Second, measuring profit at the product level ignoresthe vast differences in the profitability of customers. A bank may
Chapter 3.fm Page 47 Tuesday, December 14, 2004 3:14 PM
MANAGING CUSTOMERS AS INVESTMENTS48
be losing money on its mortgage business. This aggregate profitmeasure hides the fact that the problem may lie with the bankhaving too many customers who are
Free Riders
. Adjusting theprice and service to customers based on their value to the firmcan significantly enhance the profitability of this product.
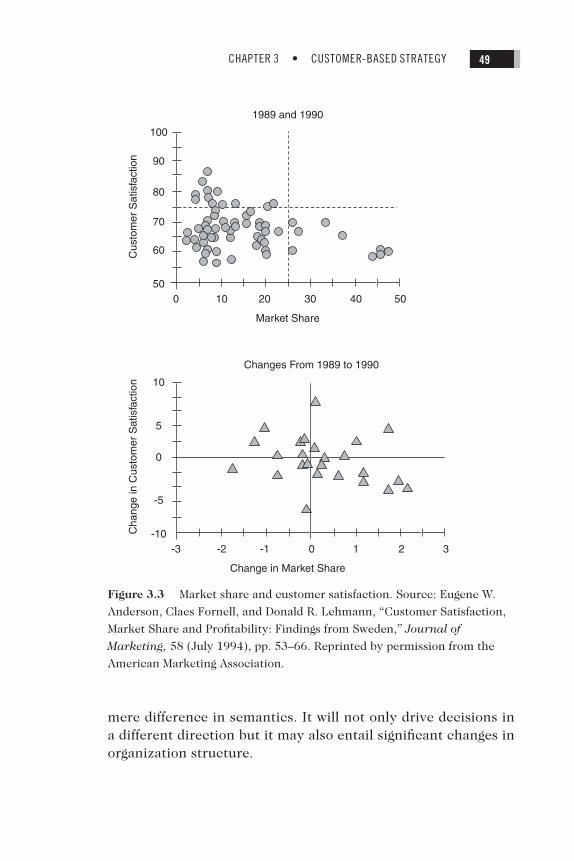
In sum, capturing share, increasing satisfaction, and enhancingthe brand experience are all useful. They also serve as motivatorstoward measurable goals. However, they are neither consistentwith each other nor necessarily good business. For example,increasing share typically requires bringing in more marginal cus-tomers, who inherently are less likely to be satisfied. A study of77 firms across a wide range of industries confirmed that increas-ing share may lower satisfaction (Figure 3.3).
5
Similarly, increas-ing average satisfaction ratings doesn’t guarantee increasedprofits, as Cadillac discovered in the 1980s, when it increasinglyappealed to a smaller, aging customer base.
Customer Metrics
The customer approach focuses on customer value or customerprofitability in contrast to share, satisfaction, or product profit-ability. A focus on customer profitability has several advantages.First, it inherently takes a long-term view, emphasizing thatcustomers are assets who provide long-term returns and thatmarketing is an investment in these customers. This also showshow to assess the return on this marketing investment. Second,it recognizes that the value of customers may vary substantially.For example, in many business-to-business situations, it is notuncommon to find that while large customers are generally thelargest revenue generators for a firm, they are not necessarilythe most profitable because of the high cost required to servethem. Note, if a firm keeps track of profit at only the productlevel, it will never be able to uncover this. As we will discuss inChapter 6, a focus on customer profitability may require amajor change from product-based accounting to customer-basedaccounting to keep track of revenues and cost for each individ-ual customer. In other words, this new metric is more than a
Chapter 3.fm Page 48 Tuesday, December 14, 2004 3:14 PM
CHAPTER 3 • CUSTOMER-BASED STRATEGY 49
mere difference in semantics. It will not only drive decisions ina different direction but it may also entail significant changes inorganization structure.
1989 and 1990
Market Share
Cus
tom
er S
atis
fact
ion
0 1050
60
70
80
90
100
20 30 40 50
Changes From 1989 to 1990
Change in Market Share
Cha
nge
in C
usto
mer
Sat
isfa
ctio
n
-3 -2-10
-5
0
5
10
-1 10 2 3
Figure 3.3 Market share and customer satisfaction. Source: Eugene W.
Anderson, Claes Fornell, and Donald R. Lehmann, “Customer Satisfaction,
Market Share and Profitability: Findings from Sweden,” Journal of
Marketing, 58 (July 1994), pp. 53–66. Reprinted by permission from the
American Marketing Association.
Chapter 3.fm Page 49 Tuesday, December 14, 2004 3:14 PM
MANAGING CUSTOMERS AS INVESTMENTS50
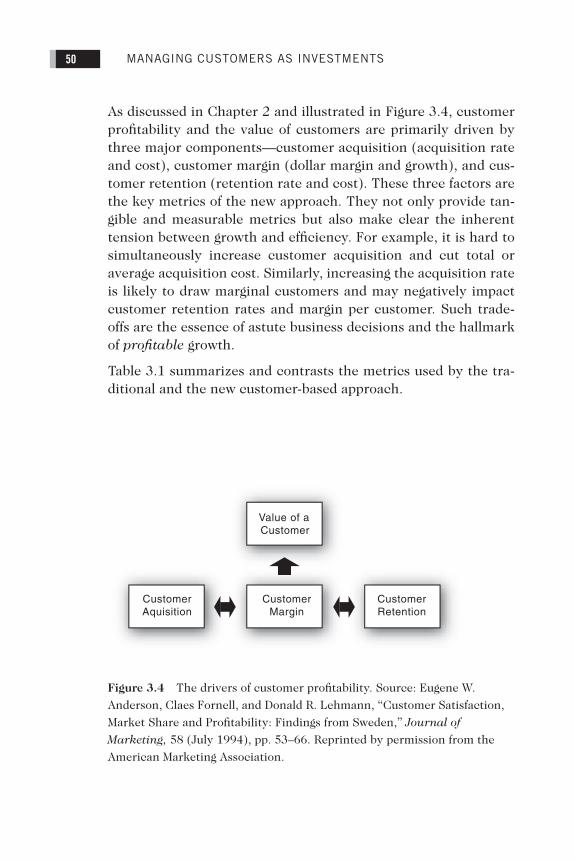
As discussed in Chapter 2 and illustrated in Figure 3.4, customerprofitability and the value of customers are primarily driven bythree major components—customer acquisition (acquisition rateand cost), customer margin (dollar margin and growth), and cus-tomer retention (retention rate and cost). These three factors arethe key metrics of the new approach. They not only provide tan-gible and measurable metrics but also make clear the inherenttension between growth and efficiency. For example, it is hard tosimultaneously increase customer acquisition and cut total oraverage acquisition cost. Similarly, increasing the acquisition rateis likely to draw marginal customers and may negatively impactcustomer retention rates and margin per customer. Such trade-offs are the essence of astute business decisions and the hallmarkof
profitable
growth.
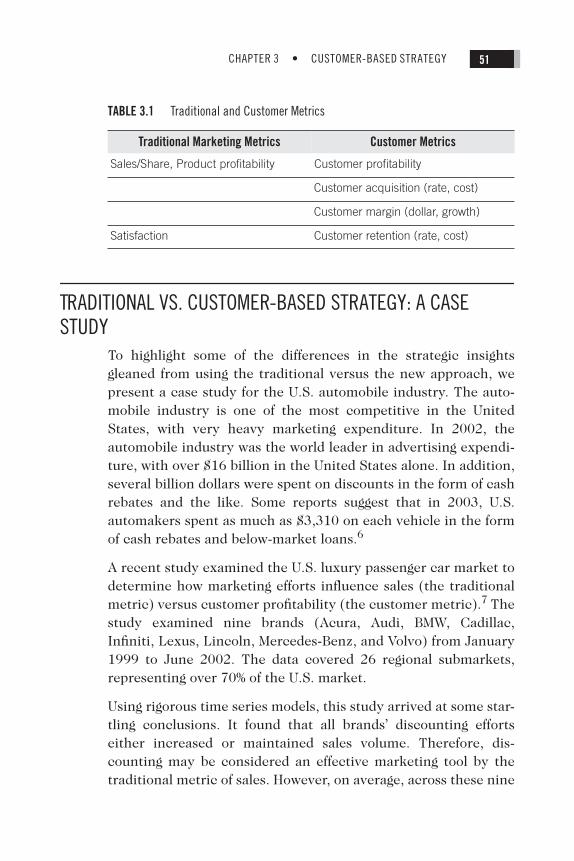
Table 3.1 summarizes and contrasts the metrics used by the tra-ditional and the new customer-based approach.
Value of aCustomer
CustomerAquisition
CustomerMargin
CustomerRetention
Figure 3.4 The drivers of customer profitability. Source: Eugene W.
Anderson, Claes Fornell, and Donald R. Lehmann, “Customer Satisfaction,
Market Share and Profitability: Findings from Sweden,” Journal of
Marketing, 58 (July 1994), pp. 53–66. Reprinted by permission from the
American Marketing Association.
Chapter 3.fm Page 50 Tuesday, December 14, 2004 3:14 PM
CHAPTER 3 • CUSTOMER-BASED STRATEGY 51
TRADITIONAL VS. CUSTOMER-BASED STRATEGY: A CASE STUDY
To highlight some of the differences in the strategic insightsgleaned from using the traditional versus the new approach, wepresent a case study for the U.S. automobile industry. The auto-mobile industry is one of the most competitive in the UnitedStates, with very heavy marketing expenditure. In 2002, theautomobile industry was the world leader in advertising expendi-ture, with over $16 billion in the United States alone. In addition,several billion dollars were spent on discounts in the form of cashrebates and the like. Some reports suggest that in 2003, U.S.automakers spent as much as $3,310 on each vehicle in the formof cash rebates and below-market loans.
6
A recent study examined the U.S. luxury passenger car market todetermine how marketing efforts influence sales (the traditionalmetric) versus customer profitability (the customer metric).
7
Thestudy examined nine brands (Acura, Audi, BMW, Cadillac,Infiniti, Lexus, Lincoln, Mercedes-Benz, and Volvo) from January1999 to June 2002. The data covered 26 regional submarkets,representing over 70% of the U.S. market.
Using rigorous time series models, this study arrived at some star-tling conclusions. It found that all brands’ discounting effortseither increased or maintained sales volume. Therefore, dis-counting may be considered an effective marketing tool by thetraditional metric of sales. However, on average, across these nine
TABLE 3.1
Traditional and Customer Metrics
Traditional Marketing Metrics Customer Metrics
Sales/Share, Product profitability Customer profitability
Customer acquisition (rate, cost)
Customer margin (dollar, growth)
Satisfaction Customer retention (rate, cost)
Chapter 3.fm Page 51 Tuesday, December 14, 2004 3:14 PM
MANAGING CUSTOMERS AS INVESTMENTS52
brands, discounting rarely increased a brand’s customer equity(i.e., profitability of current and future customers) in the longrun. The results were even more dramatic in some cases. Forexample, discounting had a positive effect on Lincoln’s short-term sales, but the brand’s discounting activities hurt its cus-tomer equity in the long run due to the negative long-term impacton its acquisition rate. This is consistent with other studies thatfind that discounting does not help in the long run, with eithercustomer purchases or the firm’s shareholder value.
8
Results for advertising were also different when viewed from thetraditional versus the new lens. For example, while the advertis-ing for BMW had a positive short-term effect on its sales, it didnot have any significant impact on its customer equity. Advertis-ing for Acura increased its sales in the long run but not its cus-tomer equity. Only the advertising for Mercedes-Benz had apositive influence on its customer equity. If $16 billion of adver-tising expenditure does not affect the long-term profitability ofcustomers (which, as we will show in Chapter 4, is closely linkedto shareholder value), then the industry needs to re-examine itsmarketing strategy.
This study also emphasized the differential impact of marketinginstruments on customer acquisition and retention rates. Forexample, when high-quality brands offer discounts, it affects theircustomer acquisition rate more than their retention rates. Evi-dently, if customers are satisfied with a high-quality product,their repeat purchase decisions are less likely to be affected bytheir favorite brand’s price discounting. This suggests that differ-ent brands may need to monitor different metrics (e.g., acquisi-tion or retention) to assess the impact of their marketinginvestments on customer profitability.
This study illustrates the value of understanding how marketingdollars affect customer profitability and why this focus may leadto very different conclusions than those obtained from traditionalapproaches.
Chapter 3.fm Page 52 Tuesday, December 14, 2004 3:14 PM
CHAPTER 3 • CUSTOMER-BASED STRATEGY 53
DRIVERS OF CUSTOMER PROFITABILITY
As Figure 3.4 shows, customer profitability is influenced by threefactors—customer acquisition, customer margin, and customerretention. These three factors are the critical drivers of a firm’sgrowth and overall profitability. We now discuss these three keydrivers in detail.
Customer Acquisition
Growth is critical for all firms. Growing revenues, market share,and customers are typically considered infallible yardsticks ofsuccess. In recent years, many companies, especially the dot-coms, went on a binge to acquire customers in the belief that cus-tomer acquisition and rapid growth are critical to success. Thisbelief was so strong that several companies had a mandate toacquire customers regardless of the acquisition cost.
9
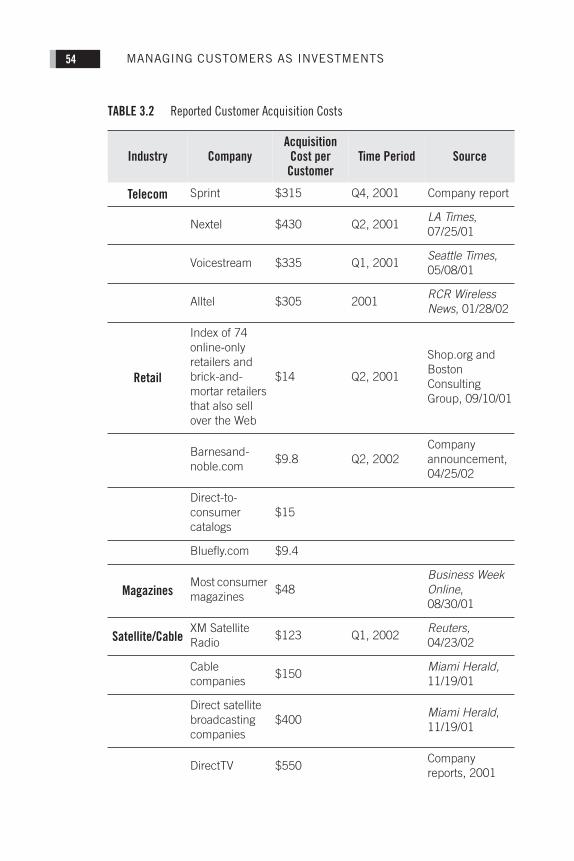
As Table 3.2 shows, acquisition costs can be substantial. It makeseconomic sense to spend, say, $500 to acquire a customer only ifthe value of a customer to the company over his/her entire lifewith a company will be more than $500. While many companiesadhered to this simple and intuitive principle, a surprisingly largenumber did not.
Gerald Stevens.
Flower company Gerald Stevens was founded in1998. In order to build a powerful presence on the Net, it madedeals with CNN.com, Lycos, and Yahoo!, in addition to starting itsown Web site. In 1999, AOL offered Stevens a prime position onits Web site that would provide it access to several millions ofAOL customers. In return, AOL wanted $75 for each of its cus-tomers. While the prospect of rapidly increasing its customerbase was appealing to Stevens, it declined AOL’s offer. Stevensreportedly estimated that, on average, Internet customers wouldmake three purchases over two years, with a lifetime value of$60—less than the $75 acquisition cost through AOL.
In contrast, Stevens estimated that the average brick-and-mortarcustomer buys flowers four times per year. The company esti-
Chapter 3.fm Page 53 Tuesday, December 14, 2004 3:14 PM
MANAGING CUSTOMERS AS INVESTMENTS54
TABLE 3.2
Reported Customer Acquisition Costs
Industry CompanyAcquisition
Cost per Customer
Time Period Source
Telecom
Sprint $315 Q4, 2001 Company report
Nextel $430 Q2, 2001
LA Times
, 07/25/01
Voicestream $335 Q1, 2001
Seattle Times
, 05/08/01
Alltel $305 2001
RCR Wireless News
, 01/28/02
Retail
Index of 74 online-only retailers and brick-and-mortar retailers that also sell over the Web
$14 Q2, 2001
Shop.org and Boston Consulting Group, 09/10/01
Barnesand-noble.com
$9.8 Q2, 2002Company announcement, 04/25/02
Direct-to-consumer catalogs
$15
Bluefly.com $9.4
Magazines
Most consumer magazines
$48
Business Week Online
, 08/30/01
Satellite/Cable
XM Satellite Radio
$123 Q1, 2002
Reuters,
04/23/02
Cable companies
$150
Miami Herald,
11/19/01
Direct satellite broadcasting companies
$400
Miami Herald
, 11/19/01
DirectTV $550Company reports, 2001
Chapter 3.fm Page 54 Tuesday, December 14, 2004 3:14 PM
CHAPTER 3 • CUSTOMER-BASED STRATEGY 55
mated the acquisition cost of that type of customer to be about$50, with a lifetime value in the hundreds. In other words, byestimating lifetime value, Stevens made the right choice. Itfavored a brick strategy over a click deal at the height of the dot-com mania, a prescient decision indeed.
10
Ameritrade.
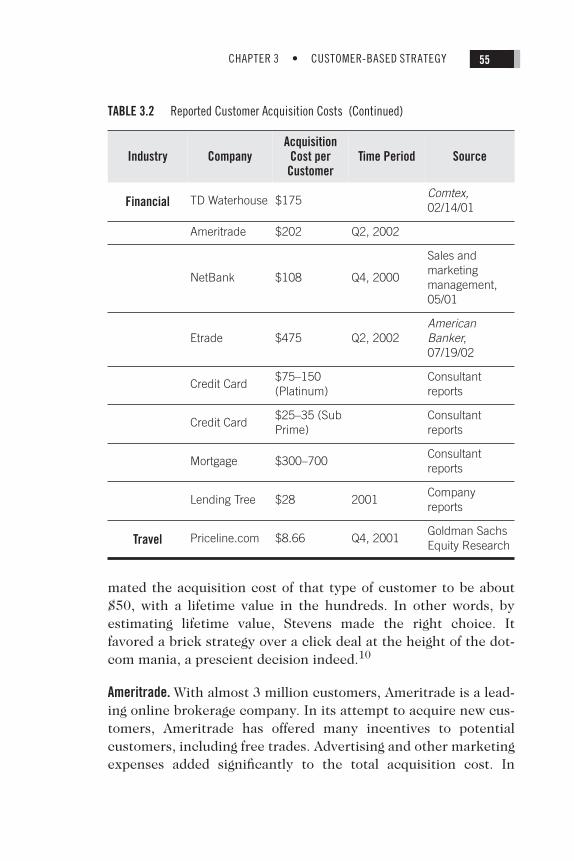
With almost 3 million customers, Ameritrade is a lead-ing online brokerage company. In its attempt to acquire new cus-tomers, Ameritrade has offered many incentives to potentialcustomers, including free trades. Advertising and other marketingexpenses added significantly to the total acquisition cost. In
Financial
TD Waterhouse $175
Comtex,
02/14/01
Ameritrade $202 Q2, 2002
NetBank $108 Q4, 2000
Sales and marketing management, 05/01
Etrade $475 Q2, 2002
American Banker
, 07/19/02
Credit Card$75–150 (Platinum)
Consultant reports
Credit Card$25–35 (Sub Prime)
Consultant reports
Mortgage $300–700Consultant reports
Lending Tree $28 2001Company reports
Travel
Priceline.com $8.66 Q4, 2001Goldman Sachs Equity Research
TABLE 3.2
Reported Customer Acquisition Costs (Continued)
Industry CompanyAcquisition
Cost per Customer
Time Period Source
Chapter 3.fm Page 55 Tuesday, December 14, 2004 3:14 PM
MANAGING CUSTOMERS AS INVESTMENTS56
March 2002, its acquisition cost per customer was almost $203.However, its average annual gross margin per customer was$201.56.
11
In other words, Ameritrade recovered almost all itscustomer acquisition cost within a year.
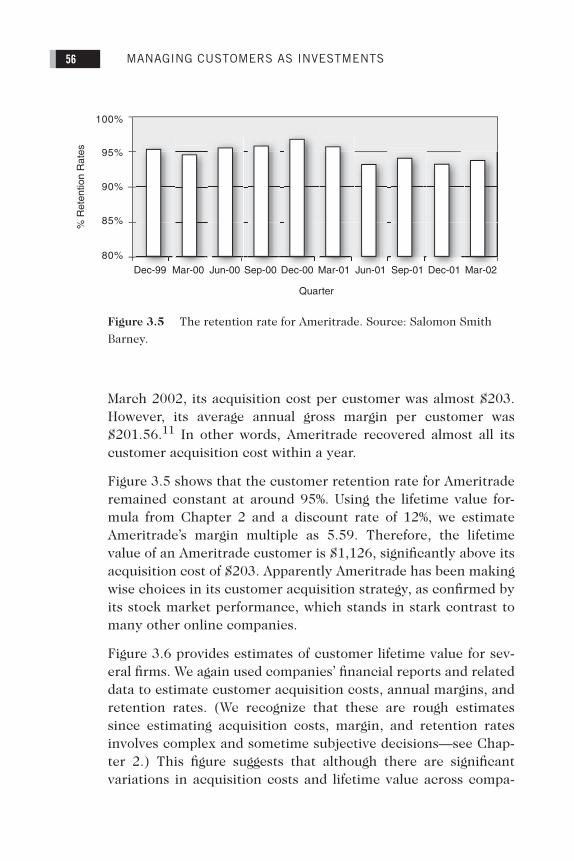
Figure 3.5 shows that the customer retention rate for Ameritraderemained constant at around 95%. Using the lifetime value for-mula from Chapter 2 and a discount rate of 12%, we estimateAmeritrade’s margin multiple as 5.59. Therefore, the lifetimevalue of an Ameritrade customer is $1,126, significantly above itsacquisition cost of $203. Apparently Ameritrade has been makingwise choices in its customer acquisition strategy, as confirmed byits stock market performance, which stands in stark contrast tomany other online companies.
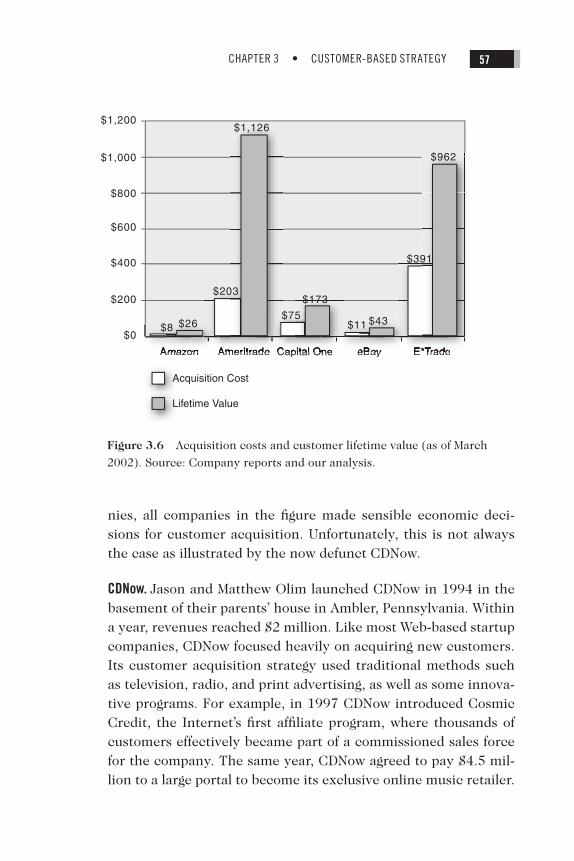
Figure 3.6 provides estimates of customer lifetime value for sev-eral firms. We again used companies’ financial reports and relateddata to estimate customer acquisition costs, annual margins, andretention rates. (We recognize that these are rough estimatessince estimating acquisition costs, margin, and retention ratesinvolves complex and sometime subjective decisions—see Chap-ter 2.) This figure suggests that although there are significantvariations in acquisition costs and lifetime value across compa-
80%
85%
90%
95%
100%
Mar-00Dec-99 Jun-00 Sep-00 Dec-00 Mar-01 Jun-01 Sep-01 Dec-01 Mar-02
% R
eten
tion
Rat
es
Quarter
Figure 3.5 The retention rate for Ameritrade. Source: Salomon Smith
Barney.
Chapter 3.fm Page 56 Tuesday, December 14, 2004 3:14 PM
CHAPTER 3 • CUSTOMER-BASED STRATEGY 57
nies, all companies in the figure made sensible economic deci-sions for customer acquisition. Unfortunately, this is not alwaysthe case as illustrated by the now defunct CDNow.
CDNow.
Jason and Matthew Olim launched CDNow in 1994 in thebasement of their parents’ house in Ambler, Pennsylvania. Withina year, revenues reached $2 million. Like most Web-based startupcompanies, CDNow focused heavily on acquiring new customers.Its customer acquisition strategy used traditional methods suchas television, radio, and print advertising, as well as some innova-tive programs. For example, in 1997 CDNow introduced CosmicCredit, the Internet’s first affiliate program, where thousands ofcustomers effectively became part of a commissioned sales forcefor the company. The same year, CDNow agreed to pay $4.5 mil-lion to a large portal to become its exclusive online music retailer.
$0
$200
$400
$600
$800
$1,000
$1,200
Amazon Ameritrade Capital One eBay E TrTrade
Acquisition Cost
Lifetime Value
$8 $26 $11 $43
$391
$962
$203
$75
$173
$1,126
Figure 3.6 Acquisition costs and customer lifetime value (as of March
2002). Source: Company reports and our analysis.
Chapter 3.fm Page 57 Tuesday, December 14, 2004 3:14 PM
MANAGING CUSTOMERS AS INVESTMENTS58
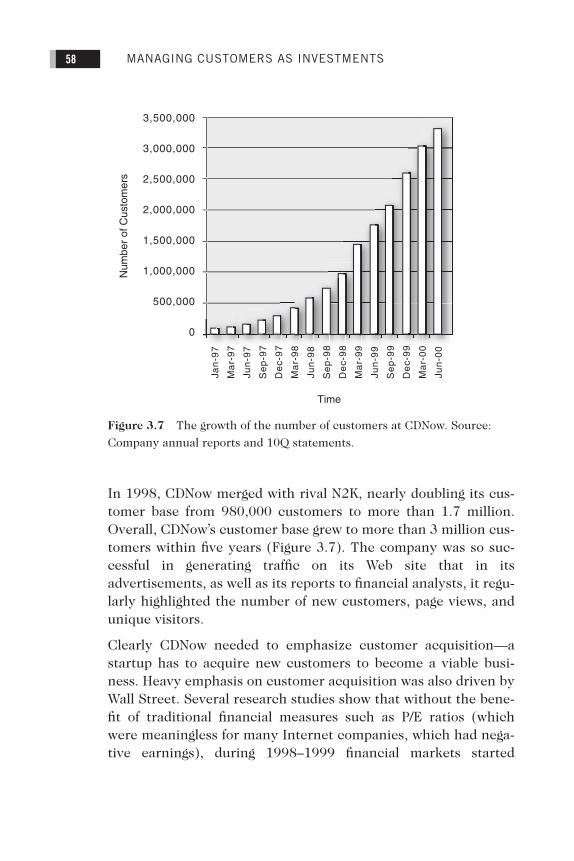
In 1998, CDNow merged with rival N2K, nearly doubling its cus-tomer base from 980,000 customers to more than 1.7 million.Overall, CDNow’s customer base grew to more than 3 million cus-tomers within five years (Figure 3.7). The company was so suc-cessful in generating traffic on its Web site that in itsadvertisements, as well as its reports to financial analysts, it regu-larly highlighted the number of new customers, page views, andunique visitors.
Clearly CDNow needed to emphasize customer acquisition—astartup has to acquire new customers to become a viable busi-ness. Heavy emphasis on customer acquisition was also driven byWall Street. Several research studies show that without the bene-fit of traditional financial measures such as P/E ratios (whichwere meaningless for many Internet companies, which had nega-tive earnings), during 1998–1999 financial markets started
3,500,000
3,000,000
2,500,000
2,000,000
1,500,000
1,000,000
500,000
0
Num
ber
of C
usto
mer
s
Time
Jan
-97
Ma
r-9
7
Jun
-97
Se
p-9
7
De
c-9
7
Ma
r-9
8
Jun
-98
Se
p-9
8
De
c-9
8
Ma
r-9
9
Jun
-99
Se
p-9
9
De
c-9
9
Ma
r-0
0
Jun
-00
Figure 3.7 The growth of the number of customers at CDNow. Source:
Company annual reports and 10Q statements.
Chapter 3.fm Page 58 Tuesday, December 14, 2004 3:14 PM
CHAPTER 3 • CUSTOMER-BASED STRATEGY 59
rewarding companies with strong nonfinancial measures such asnumber of customers.
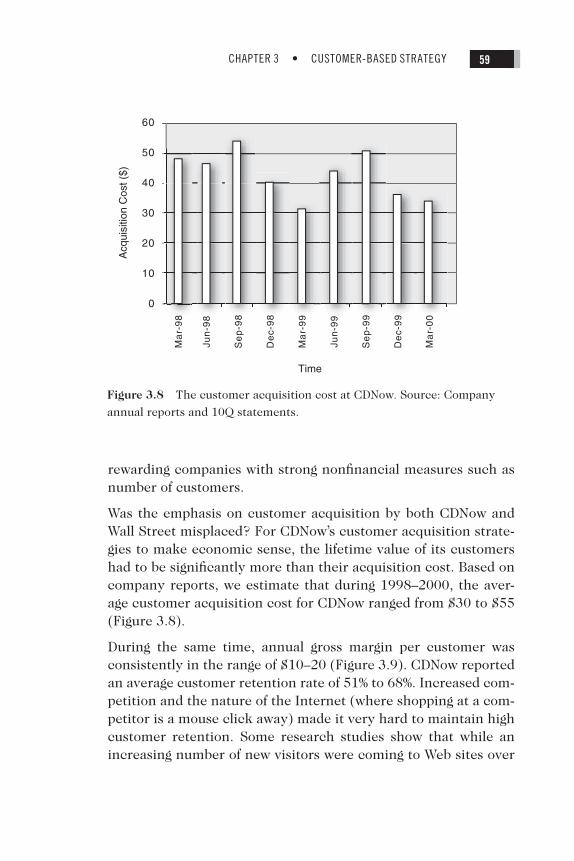
Was the emphasis on customer acquisition by both CDNow andWall Street misplaced? For CDNow’s customer acquisition strate-gies to make economic sense, the lifetime value of its customershad to be significantly more than their acquisition cost. Based oncompany reports, we estimate that during 1998–2000, the aver-age customer acquisition cost for CDNow ranged from $30 to $55(Figure 3.8).
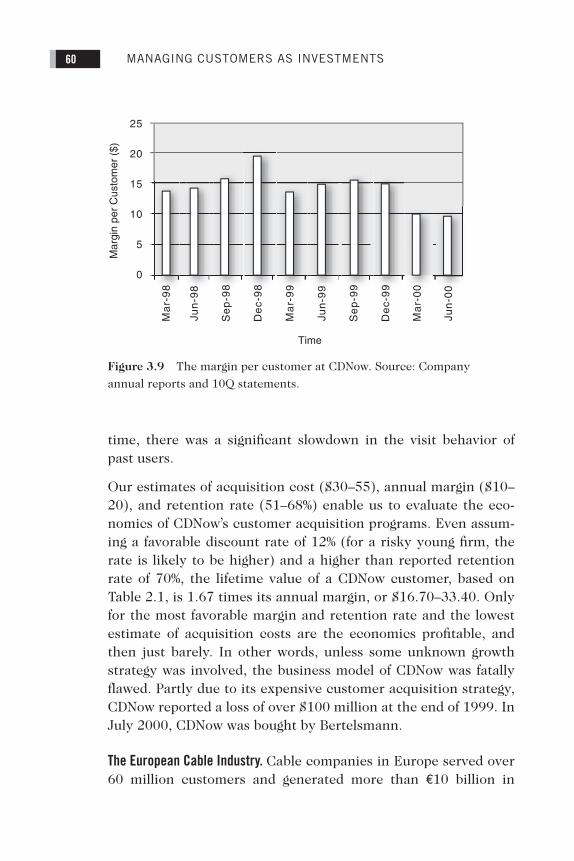
During the same time, annual gross margin per customer wasconsistently in the range of $10–20 (Figure 3.9). CDNow reportedan average customer retention rate of 51% to 68%. Increased com-petition and the nature of the Internet (where shopping at a com-petitor is a mouse click away) made it very hard to maintain highcustomer retention. Some research studies show that while anincreasing number of new visitors were coming to Web sites over
60
50
40
30
20
10
0
Acq
uisi
tion
Cos
t ($)
Time
Ma
r-9
8
Jun
-98
Se
p-9
8
De
c-9
8
Ma
r-9
9
Jun
-99
Se
p-9
9
De
c-9
9
Ma
r-0
0
Figure 3.8 The customer acquisition cost at CDNow. Source: Company
annual reports and 10Q statements.
Chapter 3.fm Page 59 Tuesday, December 14, 2004 3:14 PM
MANAGING CUSTOMERS AS INVESTMENTS60
time, there was a significant slowdown in the visit behavior ofpast users.
Our estimates of acquisition cost ($30–55), annual margin ($10–20), and retention rate (51–68%) enable us to evaluate the eco-nomics of CDNow’s customer acquisition programs. Even assum-ing a favorable discount rate of 12% (for a risky young firm, therate is likely to be higher) and a higher than reported retentionrate of 70%, the lifetime value of a CDNow customer, based onTable 2.1, is 1.67 times its annual margin, or $16.70–33.40. Onlyfor the most favorable margin and retention rate and the lowestestimate of acquisition costs are the economics profitable, andthen just barely. In other words, unless some unknown growthstrategy was involved, the business model of CDNow was fatallyflawed. Partly due to its expensive customer acquisition strategy,CDNow reported a loss of over $100 million at the end of 1999. InJuly 2000, CDNow was bought by Bertelsmann.
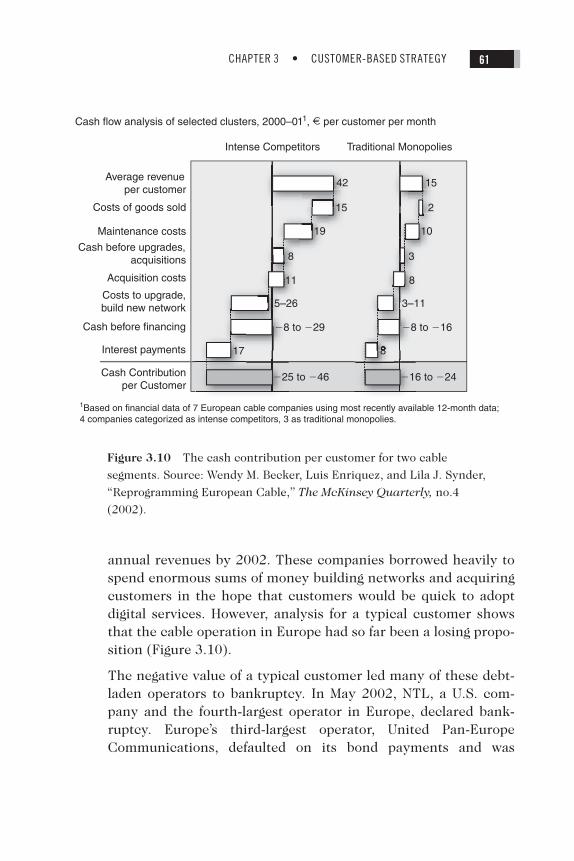
The European Cable Industry. Cable companies in Europe served over60 million customers and generated more than €10 billion in
25
20
15
10
5
0
Mar
gin
per
Cus
tom
er (
$)
Time
Ma
r-9
8
Jun
-98
Se
p-9
8
De
c-9
8
Ma
r-9
9
Jun
-99
Se
p-9
9
De
c-9
9
Ma
r-0
0
Jun
-00
Figure 3.9 The margin per customer at CDNow. Source: Company
annual reports and 10Q statements.
Chapter 3.fm Page 60 Tuesday, December 14, 2004 3:14 PM
CHAPTER 3 • CUSTOMER-BASED STRATEGY 61
annual revenues by 2002. These companies borrowed heavily tospend enormous sums of money building networks and acquiringcustomers in the hope that customers would be quick to adoptdigital services. However, analysis for a typical customer showsthat the cable operation in Europe had so far been a losing propo-sition (Figure 3.10).
The negative value of a typical customer led many of these debt-laden operators to bankruptcy. In May 2002, NTL, a U.S. com-pany and the fourth-largest operator in Europe, declared bank-ruptcy. Europe’s third-largest operator, United Pan-EuropeCommunications, defaulted on its bond payments and was
Figure 3.10 The cash contribution per customer for two cable
segments. Source: Wendy M. Becker, Luis Enriquez, and Lila J. Synder,
“Reprogramming European Cable,” The McKinsey Quarterly, no.4
(2002).
Chapter 3.fm Page 61 Tuesday, December 14, 2004 3:14 PM
MANAGING CUSTOMERS AS INVESTMENTS62
delisted from one of the stock exchanges. A German cable opera-tor, Ish, also filed for bankruptcy.
A careful customer value analysis would have shown these opera-tors that in order to be profitable, they would need averagemonthly revenues of €30 to €100 per customer compared to the€9 to €15 they were generating, a large discrepancy. Many ofthese companies apparently did not recognize that the cost ofacquiring and serving (retaining) these digital customers was alsotoo high. For example, setting up a customer with digital servicescost almost twice as much as an analog installation. Similarly,call-center costs for these customers are significantly higher dueto complex queries. It is possible that over time some of thesecosts may decrease and revenue per customer increase as cus-tomers become more comfortable with the new technology. How-ever, some experts believe that cable companies need to changetheir strategy significantly rather than simply hope that consum-ers spend more.12
Acquiring Customers in Emerging Markets. India has a population ofover 1 billion with a per capita GDP of less than $2,000. For manyyears, multinational companies avoided significant investment inIndia because of its low per capita income. However, with a popu-lation of over a billion people, if even a small fraction of the popu-lation is wealthy, the raw numbers make India a very large andattractive market. Some companies are looking at the even largermarket of low-income consumers.
One leading financial institution in India is experimenting with amobile-banking product for low-income people. Accredited bankagents will own a mobile handset that consumers can use with amobile card they obtain with their bank application. This willallow consumers to perform basic bank transactions. Does itmake sense to consider mobile-banking for low-income consum-ers in a developing country or to try to acquire these low-incomecustomers?
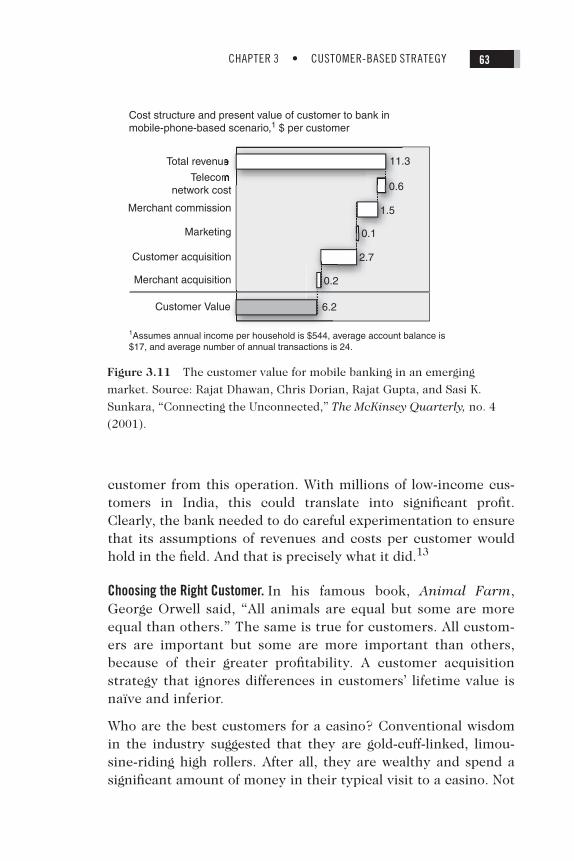
On the surface, this strategy sounds crazy. However, the cus-tomer economics show that the idea has a large profit potential.Figure 3.11 indicates that the bank expects a value of $6.20 per
Chapter 3.fm Page 62 Tuesday, December 14, 2004 3:14 PM
CHAPTER 3 • CUSTOMER-BASED STRATEGY 63
customer from this operation. With millions of low-income cus-tomers in India, this could translate into significant profit.Clearly, the bank needed to do careful experimentation to ensurethat its assumptions of revenues and costs per customer wouldhold in the field. And that is precisely what it did.13
Choosing the Right Customer. In his famous book, Animal Farm,George Orwell said, “All animals are equal but some are moreequal than others.” The same is true for customers. All custom-ers are important but some are more important than others,because of their greater profitability. A customer acquisitionstrategy that ignores differences in customers’ lifetime value isnaïve and inferior.
Who are the best customers for a casino? Conventional wisdomin the industry suggested that they are gold-cuff-linked, limou-sine-riding high rollers. After all, they are wealthy and spend asignificant amount of money in their typical visit to a casino. Not
Marketing
Customer acquisition
Telecomnetwork cost
Total revenue
Cost structure and present value of customer to bank inmobile-phone-based scenario,1 $ per customer
1Assumes annual income per household is $544, average account balance is$17, and average number of annual transactions is 24.
Merchant acquisition
11.3
0.6
Merchant commission 1.5
0.2
0.1
2.7
Customer Value 6.2
Figure 3.11 The customer value for mobile banking in an emerging
market. Source: Rajat Dhawan, Chris Dorian, Rajat Gupta, and Sasi K.
Sunkara, “Connecting the Unconnected,” The McKinsey Quarterly, no. 4
(2001).
Chapter 3.fm Page 63 Tuesday, December 14, 2004 3:14 PM
MANAGING CUSTOMERS AS INVESTMENTS64
surprisingly, casinos for a long time courted high rollers by pro-viding them red carpet treatment and lavish incentives. However,Harrah’s Entertainment, Inc., one of the most successful casinosin recent years, discovered that customers with high lifetimevalue included middle-aged and senior adults with discretionaryincome who enjoyed playing slot machines. A senior who liveswithin 50 miles of a Harrah’s casino and loves playing slotmachines is likely to come to the casino more frequently than abusy wealthy individual who flies in his private jet across thecountry. This realization changed the focus of Harrah’s marketingand has paid rich dividends for the company.14 The moral of thisstory: Customers’ value not only depends on how much theyspend on a single occasion but also their purchase frequency andlongevity. Banks and credit card companies have realized this formany years, offering credit cards to students who have limitedcurrent but significant future value.
Should you acquire customers in the order of their expected life-time value, assuming equal acquisition costs? It makes sense toacquire customer A, with a lifetime value of $1,000, before spend-ing resources on customer B, whose potential value is only $800.However, there is considerable volatility associated with cus-tomer cash flow. For example, customer B may have a more sta-ble and predictable purchase pattern, such that there is very littlevariation in his cash flow. In contrast, customer A may have largefluctuations in his purchase pattern. This raises the same issuesas two stocks where one stock has a higher return but is alsoaccompanied by higher risk. Financial theory suggests that weshould diversify and have a mix of high-risk, high-return and low-risk, low-return assets. Customers, like stocks, are risky assetswhose future cash flow is not guaranteed. Based on that logic, itmakes sense to have a portfolio of customers that takes into con-sideration not only their expected lifetime value but also the riskor uncertainty associated with it.15
Customer MarginWhile customer acquisition focuses on growing the number ofcustomers, increasing customer margin focuses on growing the
Chapter 3.fm Page 64 Tuesday, December 14, 2004 3:14 PM
CHAPTER 3 • CUSTOMER-BASED STRATEGY 65
profit from each existing customer. In the retailing context, thismeans increasing same-store sales rather than opening newstores. Growth can be achieved through a variety of methodssuch as up-selling (e.g., migrating customers to a higher price/profit product) and cross-selling related products (e.g., providinga credit card to a bank customer). We discuss three specific strat-egies to create growth from current customers.
Share of Wallet. When you open your mailbox, you are likely to finda letter from one of the many credit card companies inviting youto become its customer. If you sign up, a smart company maysubsequently track your credit card expenditure pattern, proba-bly on a monthly basis, and use it to make special offers to you.However, this data is missing one important component: Mostcustomers carry multiple cards in their wallet. Two customerswho spend the same amount of money on a credit card may havevastly different potential for a company depending on how muchthey spend on other cards. In other words, it is important toknow not just the amount of money customers spend with yourcompany but also the “share of wallet” your company has.
One company that understands the importance of wallet share isHarrah’s Entertainment, Inc. A few years ago, Harrah’s was get-ting 36 cents of every dollar that its customers spent in casinos.Today, that share is over 42 cents. Since 1998, each percentagepoint increase in Harrah’s share of its customers’ overall casinospending has resulted in an additional $125 million in share-holder value. Harrah’s achieved this by better understandingtheir customers through a variety of programs. One such initia-tive involved merging the company’s database of more than 24million customers across 25 properties and tracking their behav-ior through a Total Gold loyalty program. In 2001, existing cus-tomers increased their year-over-year play by more than $160million. 16
Disney is another company that successfully increased its cus-tomers’ share of wallet. During the mid-1980s, Disney found thata typical family of four people (two adults and two children) whovisited its theme park in Orlando, Florida, spent several thousand
Chapter 3.fm Page 65 Tuesday, December 14, 2004 3:14 PM
MANAGING CUSTOMERS AS INVESTMENTS66
dollars for their trip. Trip cost included the cost of airfare, thehotel stay, restaurants, and the entrance fee to Disney’s themepark. To many senior managers at Disney, it was both shockingand enlightening to realize that while the Disney brand attractedmany of these families to Orlando, it captured only a relativelysmall fraction of the total money spent by a family. In its effort toincrease its share of the consumers’ wallet, Disney literally fol-lowed the money. As a result, they decided to build hotels on Dis-ney property, offer a choice of multiple Disney restaurants, andeven have a Disney cruise ship. This investment has led to a sub-stantial increase in Disney’s share of wallet of a typical Disneyvisitor.17
Yet in spite of its importance, it is disconcerting how many com-panies don’t even know their customers’ share of wallet, let alonedesign programs to improve it. Ironically, as companies buildlarge customer databases, they focus more and more on whattheir customers spend with them and not what they spend withcompetitors. This focus is essentially company-centric. Unfortu-nately, that is not necessarily desirable.
Careful examination of share of wallet requires strategic thinkingabout how to define your market (or wallet) and your competi-tion. For example, should Visa define its competitors as MasterCard and American Express? Or should it broaden its competi-tive definition to include cash and checks? While defining compe-tition narrowly leads to larger share values and a sense of pride, italso can lead to missing key trends, new competitors, and emerg-ing opportunities. Defining share of “what” is an art and requiresapplying the “Goldilocks” principle: not too broad (i.e., totalspending), not too narrow (i.e., just your revenues), but “justright.”
Cross-selling . It often takes considerable effort to acquire a cus-tomer. Telecommunication firms spend anywhere from $300 to$400 to acquire a customer. Once you establish a relationshipwith a customer, it makes sense to try to maximize the value ofthe relationship by selling customers multiple products. In manycases, there is a natural sequence or progression of the products.
Chapter 3.fm Page 66 Tuesday, December 14, 2004 3:14 PM
CHAPTER 3 • CUSTOMER-BASED STRATEGY 67
For example, bank customers typically start with a checking andsavings account and then gradually move to mortgages andinvestment advice. Detailed customer databases and sophisti-cated predictive modeling can help companies pinpoint the nextproduct to target to a specific customer. In addition to the obvi-ous benefit of a higher margin per customer from selling multipleproducts, cross-selling also has the potential to improve customersatisfaction and retention. Hence, cross-selling can have a two-part impact on the lifetime value of a customer.
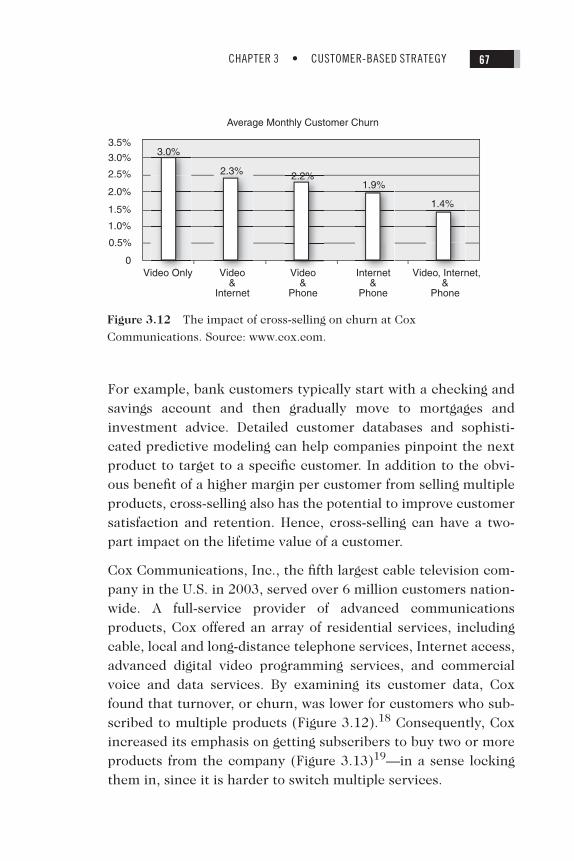
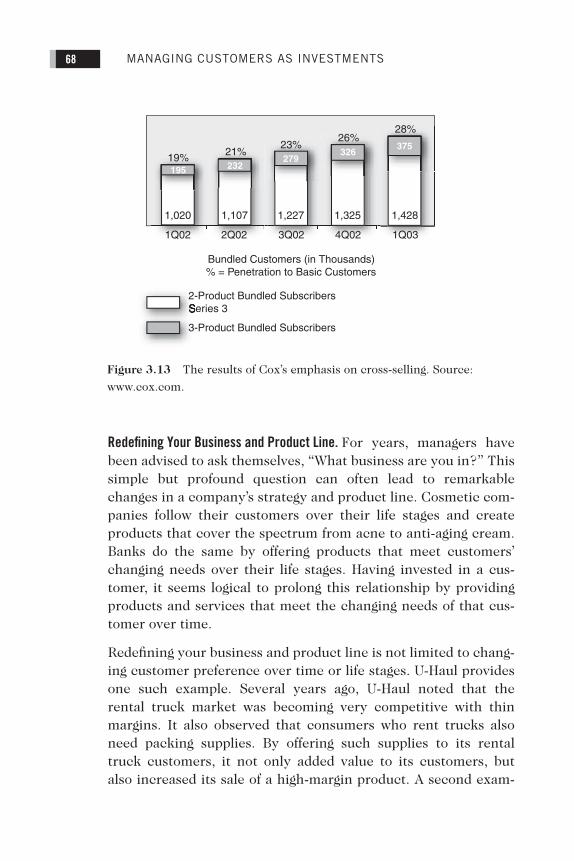
Cox Communications, Inc., the fifth largest cable television com-pany in the U.S. in 2003, served over 6 million customers nation-wide. A full-service provider of advanced communicationsproducts, Cox offered an array of residential services, includingcable, local and long-distance telephone services, Internet access,advanced digital video programming services, and commercialvoice and data services. By examining its customer data, Coxfound that turnover, or churn, was lower for customers who sub-scribed to multiple products (Figure 3.12).18 Consequently, Coxincreased its emphasis on getting subscribers to buy two or moreproducts from the company (Figure 3.13)19—in a sense lockingthem in, since it is harder to switch multiple services.
3.0%3.5%
3.0%
2.5%
2.0%
1.5%
1.0%
0.5%
0
2.3% 2.2%1.9%
1.4%
Video Only Video &
Internet
Video &
Phone
Average Monthly Customer Churn
Internet&
Phone
Video, Internet,&
Phone
Figure 3.12 The impact of cross-selling on churn at Cox
Communications. Source: www.cox.com.
Chapter 3.fm Page 67 Tuesday, December 14, 2004 3:14 PM
MANAGING CUSTOMERS AS INVESTMENTS68
Redefining Your Business and Product Line. For years, managers havebeen advised to ask themselves, “What business are you in?” Thissimple but profound question can often lead to remarkablechanges in a company’s strategy and product line. Cosmetic com-panies follow their customers over their life stages and createproducts that cover the spectrum from acne to anti-aging cream.Banks do the same by offering products that meet customers’changing needs over their life stages. Having invested in a cus-tomer, it seems logical to prolong this relationship by providingproducts and services that meet the changing needs of that cus-tomer over time.
Redefining your business and product line is not limited to chang-ing customer preference over time or life stages. U-Haul providesone such example. Several years ago, U-Haul noted that therental truck market was becoming very competitive with thinmargins. It also observed that consumers who rent trucks alsoneed packing supplies. By offering such supplies to its rentaltruck customers, it not only added value to its customers, butalso increased its sale of a high-margin product. A second exam-
1Q02
1,020 1,107 1,227
2Q02 3Q02
Bundled Customers (in Thousands)% = Penetration to Basic Customers
1,325
4Q02
1,428
1Q03
21%19%195 232
279326
37523%26%
28%
2-Product Bundled Subscriberseries 3
3-Product Bundled Subscribers
Figure 3.13 The results of Cox’s emphasis on cross-selling. Source:
www.cox.com.
Chapter 3.fm Page 68 Tuesday, December 14, 2004 3:14 PM
CHAPTER 3 • CUSTOMER-BASED STRATEGY 69
ple of extending the business is offered by automobile manufac-turers, who for many years have offered financing to theircustomers. Given the intense global competition in this industry,which has eroded margins on new car sales, financing hasbecome, along with service, one of the most profitable parts of theU.S. auto industry.
7-Eleven provides a recent example of entering a new business tosatisfy its customers’ needs. In June 2000, 7-Eleven, a conve-nience store chain (now owned by a Japanese company), appliedfor permission to operate a banking business from its 3,500 con-venience stores in Japan. What is a convenience store doing inthe banking industry? Viewed from the product or operationsperspective, these two businesses are incongruent. However, 7-Eleven made this decision by taking its customers’ perspective.Since most of its customers conduct small transactions with cash,adding ATM machines provided a value-added service for its cus-tomers. Needless to say, this service also enhances the profitabil-ity of each customer to 7-Eleven.
Easier Said Than Done. While cross-selling, increasing share of wal-let, and enhancing product lines are attractive from a firm’s per-spective; it is not always useful for a customer. A few years ago,Citibank and Travelers merged, with the idea that they wouldcross-sell insurance products to bank customers and vice versa.Many insurance companies, such as State Farm, followed a simi-lar path by extending into banking. However, most of these cross-selling attempts have not been very successful.
For several years, AOL has attempted to cross-sell multiple ser-vices to its subscribers. Like most firms, AOL believes that cus-tomers prefer one-stop shopping. However, it is not clear if forconsumers the convenience of one-stop shopping outweighs thebenefits of quality, variety, and value of competitive offers.
Amazon started by selling books online. To get more revenuefrom its customers, it extended its product offerings to music andDVDs. Now it offers a vast range of products, from apparel to toysand hardware. While some may consider the ability of a con-sumer to buy a lawnmower and a book about mowing lawns from
Chapter 3.fm Page 69 Tuesday, December 14, 2004 3:14 PM
MANAGING CUSTOMERS AS INVESTMENTS70
the same Web site a significant synergy, over time Amazon’s mar-gin per customer improved only slightly, from about $12 in early1997 to about $15 in early 2002.20
Why does it make sense for 7-Eleven to get into banking, whileinsurance companies’ attempts seem to draw skepticism? Twofactors conspire against successfully expanding business offer-ings to the same customer. The first factor is customer resis-tance. When the products or services seem to have little synergyin production (e.g., making cars and greeting cards share fewskills) or image match (e.g., Timex watches and engagementrings), customers are skeptical of such joint offerings (a.k.a.brand extensions). The second factor is company competence,or lack thereof. Even seemingly related products may requiredifferent skills to produce and deliver (e.g., fast food restaurantsand processed food sold through supermarkets). Moreover, avaried product line can divide a company’s attention so that oneor several products may suffer accordingly. Basic moral: Growthis easy to envision but hard to pull off operationally, especially ifyou ignore customers’ inherent skepticism or companies’ lim-ited competence.
Customer RetentionIn their zeal to grow, many companies focus almost exclusivelyon entering new markets, introducing new products, and acquir-ing new customers. However, these companies often have a“leaky bucket”—as they add new customers, old ones defect fromthe firm. Some studies report the average retention rate for U.S.companies is about 80%.21 Put differently, on average, 20% of acompany’s customers defect every year. This means that, roughlyspeaking, the average company loses the equivalent of its entirecustomer base in about five years.
Studies also show that the cost of acquisition is generally muchhigher than the cost of retaining existing customers. Therefore, itseems obvious that a firm should focus on retaining its existingcustomers. Unfortunately, many companies don’t even knowtheir customer retention or defection rates. Part of this problem
Chapter 3.fm Page 70 Tuesday, December 14, 2004 3:14 PM
CHAPTER 3 • CUSTOMER-BASED STRATEGY 71
lies in the lack of appreciation for the importance of customerretention. We now show that customer retention has a dramaticimpact on both long-run market share and profits.
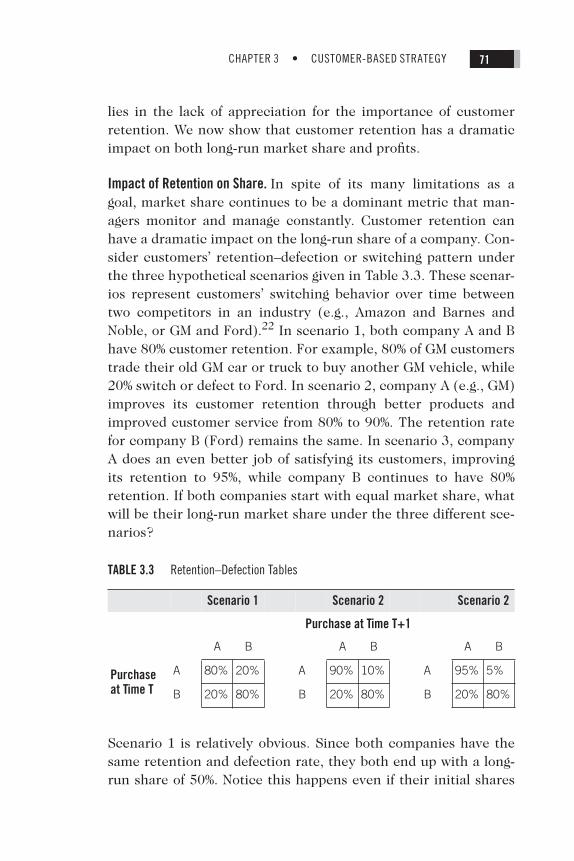
Impact of Retention on Share. In spite of its many limitations as agoal, market share continues to be a dominant metric that man-agers monitor and manage constantly. Customer retention canhave a dramatic impact on the long-run share of a company. Con-sider customers’ retention–defection or switching pattern underthe three hypothetical scenarios given in Table 3.3. These scenar-ios represent customers’ switching behavior over time betweentwo competitors in an industry (e.g., Amazon and Barnes andNoble, or GM and Ford).22 In scenario 1, both company A and Bhave 80% customer retention. For example, 80% of GM customerstrade their old GM car or truck to buy another GM vehicle, while20% switch or defect to Ford. In scenario 2, company A (e.g., GM)improves its customer retention through better products andimproved customer service from 80% to 90%. The retention ratefor company B (Ford) remains the same. In scenario 3, companyA does an even better job of satisfying its customers, improvingits retention to 95%, while company B continues to have 80%retention. If both companies start with equal market share, whatwill be their long-run market share under the three different sce-narios?
Scenario 1 is relatively obvious. Since both companies have thesame retention and defection rate, they both end up with a long-run share of 50%. Notice this happens even if their initial shares
TABLE 3.3 Retention–Defection Tables
Scenario 1 Scenario 2 Scenario 2
Purchase at Time T+1
A B A B A B
Purchase at Time T
A 80% 20% A 90% 10% A 95% 5%
B 20% 80% B 20% 80% B 20% 80%
Chapter 3.fm Page 71 Tuesday, December 14, 2004 3:14 PM
MANAGING CUSTOMERS AS INVESTMENTS72
are quite different (e.g., 90% and 10%), albeit not quite as quickly.The result in scenarios 2 and 3 is less obvious. In both of these,company A should have a share greater than 50% due to its stron-ger retention rate. However, it cannot have a 100% share becauseeach period it also loses some customers to company B. The exactformula, for long-run share is given in Appendix B. Applying thatformula in the present case, we find that the long-run share ofcompany A is 66.67% in scenario 2 and 80% in scenario 3.
This example illustrates three important points. First, it showshow changes in customer retention affect market share. In ourexample, improving customer retention from 80% to 90%improved the long-run share of company A from 50% to 66.67%. Itis generally fairly easy for a company to assess how much anextra point of market share is worth to them. For example, somestudies estimate the new vehicle sales in the United States in2003 to exceed $400 billion.23 Therefore, one share point isworth $4 billion in revenues. This type of analysis helps a man-ager determine the maximum amount of money worth spendingto improve customer retention by a given amount.
The general wisdom, which in this case is correct, is that byincreasing customer satisfaction, you will increase retention.After making an investment in a customer satisfaction program, amanager should not only monitor satisfaction scores but also linkthose scores to the purchase behavior to determine how the pro-gram impacted customer retention. This analysis then helpsdetermine whether or not the investment in a customer satisfac-tion program provided an appropriate return.
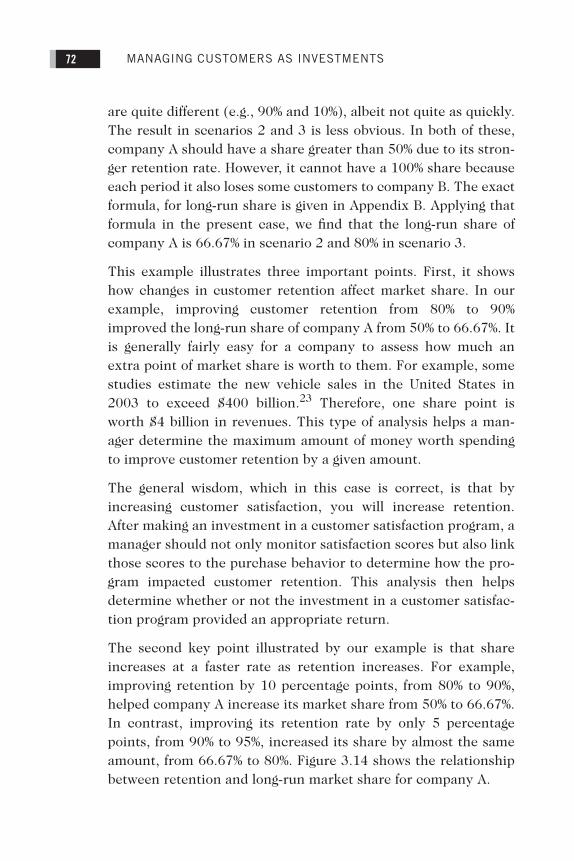
The second key point illustrated by our example is that shareincreases at a faster rate as retention increases. For example,improving retention by 10 percentage points, from 80% to 90%,helped company A increase its market share from 50% to 66.67%.In contrast, improving its retention rate by only 5 percentagepoints, from 90% to 95%, increased its share by almost the sameamount, from 66.67% to 80%. Figure 3.14 shows the relationshipbetween retention and long-run market share for company A.
Chapter 3.fm Page 72 Tuesday, December 14, 2004 3:14 PM
CHAPTER 3 • CUSTOMER-BASED STRATEGY 73
Unfortunately, in general, the cost of retention also increases dra-matically as the company reaches high retention levels. In otherwords, it is generally more expensive to increase retention ratesfrom 90% to 95% than to improve them from 70% to 75%. There-fore, if we consider both the greater benefits and higher costs ofimproved retention, there is an optimal level of retention that acompany should strive for. Notice this implies that, in contrast tothe suggestion of some experts,24 100% retention, or zero defec-tion, is not the optimal strategic goal. In fact, if a firm has 100%retention, or perfect customer satisfaction, it is very likely that itis either overinvesting in its customers and not charging themenough, or has a small base of customers who are either intenselyloyal or have no choice but to remain loyal (e.g., when confrontedby a monopolist).
This point is even more evident when you recognize that not allcustomers have the same inherent attraction to the company.Some may receive tremendously high value from the firm, whileothers may find the benefits marginal. While the first group canbe retained relatively easily, the second group is clearly at risk.To get marginal customers to be loyal is typically an expensiveundertaking. While one can increase their retention rate by giv-
50% 55% 60% 65% 70% 75% 80% 85% 90% 95%
90%
80%
70%
60%
50%
40%
30%
20%
10%
0
Long
-Run
Mar
ket S
hare
Retention Rate
Figure 3.14 The impact of retention on long-run market share. (Assumes
competitor’s retention rate remains constant at 80%.)
Chapter 3.fm Page 73 Tuesday, December 14, 2004 3:14 PM
MANAGING CUSTOMERS AS INVESTMENTS74
ing them special deals, the cost of these deals may outweigh thebenefits of retaining marginal customers and be irritating to moreloyal customers (unless they get the deal also, which simplyreduces their profitability without affecting their retention). Putdifferently, total customer loyalty may be a good slogan for an adand a good motivational goal for employees, but it is a lousy busi-ness objective. If you have 100% loyalty, you are either leavingmoney on the table with your customers or focusing on an overlynarrow segment and ignoring potential customers.
The third main message from our example can be understood bynoting that so far we have shown the long-run market share oftwo companies that start with equal market shares. What hap-pens if the starting shares are not equal? For example, if com-pany A has 90% share to begin with, what will be its long runshare in scenario 2 or 3? A careful examination of Appendix Bshows that regardless of the starting share of company A, its longrun share will still be 66.67% in scenario 2 and 80% in scenario 3.This makes a dramatic point about the relevance of retention ver-sus a company’s current share. Even if company A has a currentshare of 90% and 90% retention, while its competitor has only10% share and a relatively lower retention rate of 80%, in the longrun company A will lose share and stabilize at 66.67%! Put differ-ently, company A’s dominant share position and superior reten-tion rate are not high enough to prevent share erosion over time.This is perhaps painfully obvious to many firms, such as GeneralMotors, who lost significant market share over multiple decadesin spite of an initially dominant market share and high customerloyalty.
If this is fait accompli, what can a manager do? Given a reten-tion–defection matrix, it is relatively easy to see how the marketshare of a firm is likely to evolve over time. If a manager does notlike the long-run outcome, then programs must be designed tochange the acquisition and/or retention rates. How much reten-tion affects the long-run share also provides a guideline to themanager on how much to invest in retention-enhancingprograms.
Chapter 3.fm Page 74 Tuesday, December 14, 2004 3:14 PM
CHAPTER 3 • CUSTOMER-BASED STRATEGY 75
Impact of Retention on Profits—the U.S. Wireless Industry. Although mar-ket share is the metric most commonly monitored by marketingmanagers, retention is at least as critical for long-run profits. Thisis especially evident in the telecommunication industry.
By December 2002, the U.S. wireless industry had more than 140million subscribers, with over $76.5 billion in annual revenue.New customer annual growth was still 9.7%. Even in the face offalling prices, revenue per customer had remained fairly constantover the last four to five years, as customers increased their usageof cellular phones. In 2002 alone, U.S. consumers used more than600 billion wireless minutes.25 Yet in spite of impressive growthin the number of subscribers and usage, the wireless industry hasbeen under severe financial pressure. While part of the problemlies in the heavy capital expenditure needed to upgrade systems,another major problem is high customer churn—i.e., defection.
Several studies report that the average customer churn in theU.S. wireless industry is 2.5% per month, or approximately 30%per year.26 This means that 42 million customers, nearly one-third of the total, defect from a wireless carrier each year. Withan average customer acquisition cost of $300–400 (see Table 3.2),this translates into $12.6 billion to $16.8 billion in cost, or 16–22% of revenue, just to keep the number of customers constant.Since the average operating margin was 20–30%, this acquisition(or in many cases re-acquisition) cost is almost as large as theentire operating profit of the industry.
Some companies actively work to reduce customer churn by pro-viding better customer service, using data-based predictive mod-eling to anticipate which customers are at greatest risk ofdefection and appointing special representatives to handle poten-tial defectors. Bell Canada has done this quite successfully andmanaged to keep its monthly churn at 1.5%, the best in NorthAmerica. If the entire U.S. wireless industry could achieve this, itwould add $1.5 billion to $2 billion in operating profit excludingthe additional cost of improving retention.
Retention Elasticity. To understand the impact of customer retentionon profits, it is helpful to assess the percentage change in profits
Chapter 3.fm Page 75 Tuesday, December 14, 2004 3:14 PM
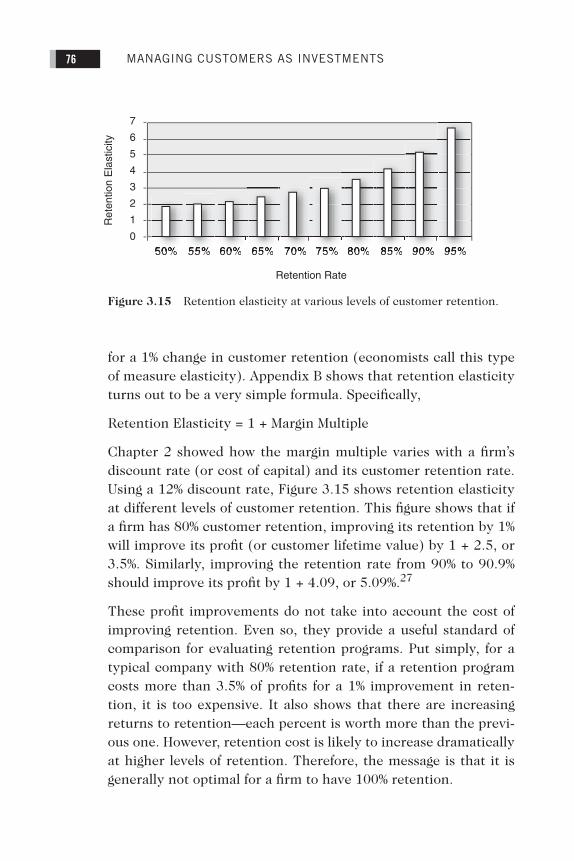
MANAGING CUSTOMERS AS INVESTMENTS76
for a 1% change in customer retention (economists call this typeof measure elasticity). Appendix B shows that retention elasticityturns out to be a very simple formula. Specifically,
Retention Elasticity = 1 + Margin Multiple
Chapter 2 showed how the margin multiple varies with a firm’sdiscount rate (or cost of capital) and its customer retention rate.Using a 12% discount rate, Figure 3.15 shows retention elasticityat different levels of customer retention. This figure shows that ifa firm has 80% customer retention, improving its retention by 1%will improve its profit (or customer lifetime value) by 1 + 2.5, or3.5%. Similarly, improving the retention rate from 90% to 90.9%should improve its profit by 1 + 4.09, or 5.09%.27
These profit improvements do not take into account the cost ofimproving retention. Even so, they provide a useful standard ofcomparison for evaluating retention programs. Put simply, for atypical company with 80% retention rate, if a retention programcosts more than 3.5% of profits for a 1% improvement in reten-tion, it is too expensive. It also shows that there are increasingreturns to retention—each percent is worth more than the previ-ous one. However, retention cost is likely to increase dramaticallyat higher levels of retention. Therefore, the message is that it isgenerally not optimal for a firm to have 100% retention.
50% 55% 60% 65% 70% 75% 80% 85% 90% 95%
7
6
5
4
3
2
1
0
Ret
entio
n E
last
icity
Retention Rate
Figure 3.15 Retention elasticity at various levels of customer retention.
Chapter 3.fm Page 76 Tuesday, December 14, 2004 3:14 PM
CHAPTER 3 • CUSTOMER-BASED STRATEGY 77
How does this compare with the benefit from increasing margins?Interestingly, improvement in customer margin (from cross-sell-ing, increasing the share of wallet, etc.) generally has a muchsmaller impact on profitability than improving customer reten-tion. As shown in Appendix B, while retention elasticity is (1 +margin multiple), margin elasticity is usually 1.28 Since the mar-gin multiple is always greater than zero, the retention elasticity isalways greater than the margin elasticity. In other words, assum-ing comparable costs, a 1% improvement in retention is usuallybetter for a company than a comparable improvement in marginper customer.
What about savings on acquisition costs? Reducing customeracquisition cost, a one-time effect, has less impact on profitabilitythan improving either retention rate or margin, whose impactsoccur over multiple periods. Therefore, while short-term finan-cial results may favor cost-cutting (e.g., reducing acquisitioncost), real financial value comes from intelligent allocation ofresources for improving service to profitable customers.
SUMMARYThis chapter has demonstrated that effective customer-basedstrategies should take into consideration the two sides of cus-tomer value—the value a firm provides to a customer and thevalue of a customer to the firm. This view considers the invest-ment in customers as well as its return. Therefore, it integratesthe marketing world, where the customer is king, with thefinance world, where cash is king. We also showed that traditionalmarketing’s focus on customer satisfaction or market share maybe misleading at times. We discussed the three key drivers of cus-tomer profitability (acquisition, retention, and margin) and howthey affect marketing decision-making. We outlined various strat-egies for customer acquisition, customer retention, and margingrowth, and demonstrated how their financial consequences canbe considered.
Chapter 3.fm Page 77 Tuesday, December 14, 2004 3:14 PM

MANAGING CUSTOMERS AS INVESTMENTS78
While this chapter has focused on marketing decisions, a maintheme of the book is the relevance of the customer lifetime valueconcept to finance. In the next chapter, we explicitly address thislink by showing how it can be used to value companies andinform merger and acquisition decisions.
Chapter 3.fm Page 78 Tuesday, December 14, 2004 3:14 PM

199
INDEX
A
Aaker, David, 195Acquisition of customers
Ameritrade, 55–57best customer, choosing, 63–64CDNow, 57–60in emerging markets, 62–63European cable industry, 60–62Gerald Stevens, 53–55overview, 53via firm acquisition.
See
customer acquisition via firm acquisition
Allas, Tera, 194Amazon, 9, 69–70, 92, 95, 130–31American Airlines, 126American Express, 127Ameritrade, 55–57, 96Anderson, Eugene W., 191
Animal Farm
(Orwell), 63AOL, 69Armstrong, Michael, 85Assets, customers as
importance of customers, 2–3overview, 1–2value of customers, 3–6
AT&T’s acquisition of TCI and MediaOne
economics of, 85–87overview, 84reasons for, 84–85
B
Bank One, 22Barrett, Amy, 193Bean, Leon Leonwood, 140Becker, Wendy M., 191Bekier, Matthias M., 193Best customer, choosing, 63–64Binkley, Christina, 197Blattberg, Robert C., 187Blodget, Henry, 92BMW, 122Bogardus, Anna J., 193Bolton, R., 196Borjas, George J., 189Bramlett, M., 196Brand equity, 120Brealey, Richard A., 189, 193, 197Business and product line, redefining,
68–69
13_0131428950_Index.fm Page 199 Thursday, May 29, 2008 2:25 PM
INDEX200
C
Calyx and Corolla, 130Capital One, 21, 96Carroll, Peter, 191Case studies
Evergreen Trust, 111–14L.L. Bean, 140–42traditional
vs.
customer-based strategy, 51–52
Caulfield, J., 188CDNow, 57–60CEO, 150–51CFO, 151–52Chili’s, 127Cingular, 89Citibank, 69, 126CMO, 152–53Cohort, 18Collins, Jim, 132Company competence, 70Company-focused metrics, 132–33Complexity of metrics, 19–20Con Edison, 117–18Constant growth in margins, 33–34Continental Airlines, 127Cooper, Lee G., 195Cost allocation issues, 21Cox Communications, Inc., 67Cross-selling, 66–70Customer acquisition.
See
acquisition of customers
Customer acquisition via firm acquisition
AT&T’s acquisition of TCI and MediaOne, 84–89
customer-based valuation, 81–90European utility industry, 89overview, 81–84potential customers, 88–89
Customer base, value of, 183–86Customer-based costing, 144–49Customer-based metrics, 93–98Customer-based organization
CEO, 150–51
CFO, 151–52changes required for, 150–56CMO, 152–53common mistakes in implementing,
160–62customer-based costing, 144–49employee selection and training,
143–44Harrah’s Entertainment, Inc., 156–
60incentive systems, 142–43marketing research, 153–56new metrics, 149–50organizational structure, 137–42product managers, 153specialists, 156
Customer-focused metrics, 48–51, 132Customer lifetime value (CLV)
estimation of.
See
customer lifetime value (CLV) estimation
finite time horizon and, 38–39margin growth and, 33–37metrics for, 24–27retention rate and, 37–38time horizon and, 31–33value of customers, 15–17
Customer lifetime value (CLV) estimation
with constant margin, constant retention, and infinite time horizon, 167–71
with a finite customer life, 177–78with growing margins, 171–74with improving retention, 174–77
Customer margincompany competence, 70cross-selling, 66–67, 66–70customer profitability, 64–70customer resistance, 70overview, 64–65redefining your business and
product line, 68–69share of wallet, 65–66
13_0131428950_Index.fm Page 200 Thursday, May 29, 2008 2:25 PM
INDEX 201
Customer relationship management (CRM) system, 14, 19
Customer resistance, 70Customer service, 159Customer value to firm value
customer-based metrics, 93–98drivers of customer and firm value.
See
drivers of customer and firm value
Internet gurus and, 92metrics, 92–93overview, 90–91
D
DaimlerChrysler AG, 82Damodaran, Aswath, 189Database marketing, 129–31Data requirements for metrics, 18–19Day, George, 188Decreasing rate of growth in margins,
35–37Defection pattern, 16–17, 18–19Deferred fee clients, 113Delta Airlines, 127Demers, Elizabeth, 187, 194, 195Deutsche Telekom, 88Dhar, Ravi, 192Dhawan, Rajat, 191Dignan, L., 188Diners Club, 127Direct mail, 130, 134Disney, 65–66Dorian, Chris, 191Dowling, G. R., 196Dowling, Grahame R., 189Drivers of customer and firm value
customer-based valuation, 98–102impact of marketing actions on firm
value, 99–101impact of marketing and financial
instruments on firm value, 101–2
overview, 98–99
E
EBay, 97Economic value, 117–19
The Economist,
2–3Einstein, Albert, 6Elkind, Peter, 194Emerging markets and customer
acquisition, 62–63Employee incentives, 159Employee selection and training, 143–
44Enriquez, Luis, 191E*Trade, 97European cable industry, 60–62European utility industry, 89Evergreen Trust, 111–14Experience of customer, 126
F
Financial executives, marketing executives’ view compared, 4–6
Finite customer life, 177–78Finite time horizon and customer
lifetime value (CLV), 38–39Firm value
customer-based metrics, 93–98drivers of customer and firm value.
See
drivers of customer and firm value
Internet gurus and, 92linking customer value and, 6–10metrics, 92–93overview, 90–91
Ford, 151Fornell, Claes, 191Frank, Steve, 194Freeman, Adam L., 194Free riders, 46–47Fuller, Steve, 142, 196, 197Functional value, 119–20
G
Gerald Stevens, 53–55
13_0131428950_Index.fm Page 201 Thursday, May 29, 2008 2:25 PM
INDEX202
Getz, Gary, 187Gilmore, James, 196Glazer, Rashi, 192Goldman, Jane, 191Gomes, Lee, 194
Good to Great
(Collins), 132Gorman, Leon, 140Gupta, Rajat, 191Gupta, Sunil, 191, 194, 195, 198
H
Hakim, Danny, 191Hanssens, Dominique, 191Harrah’s Entertainment, Inc., 64, 65,
131customer-based organization, 156–
60customer-based strategy, 158–59customer service, 159employee incentives, 159metrics, 159organizational structure, 157overview, 156–57strategy for, 157success of, 159–60
Heckman, James, 30–31Heckman, James J., 189Hertz, 127Home Depot, 126Hoover, 3–4
I
Immediate fee clients, 113Importance of customers, 2–3Imprecision and metrics, 20–24Incentive systems, 142–43Internet boom, 4–5Internet gurus, 92Ivey, Richard, 195
J
Jedidi, Kamel, 191Johnson & Johnson, 81, 117
K
Kannan, P., 196Keller, Kevin, 195Kivetz, Ran, 196Kumar, V., 189
L
Lal, Rajiv, 191Lee, Jeanne, 194Lehmann, Donald R., 191, 194, 195,
198Lemke, Gary, 192Lemon, Katherine N., 188, 196Lev, Baruch, 187, 194, 195Lipitor, 114–15Lodish, Leonard, 187Lost cause customers, 45Loveman, Gary, 157, 159, 192, 197Lowe’s, 126Loyalty programs, 126–29
The Loyalty Effect
(Reichheld), 27
M
Management of customer, 139Mannesmann, 88Margin growth
constant growth in margins, 33–34customer lifetime value (CLV), 33–
37decreasing rate of growth in
margins, 35–37overview, 33
Margin multiple, 25–26Margins, 27–28
constant margin, constant retention, and infinite time horizon, 167–71
growing, 171–74Marketing
impact of marketing actions on firm value, 99–101
13_0131428950_Index.fm Page 202 Thursday, May 29, 2008 2:25 PM
INDEX 203
impact of marketing and financial instruments on firm value, 101–2
metrics, 47–51traditional marketing metrics, 47–
48traditional marketing strategy, 42–
43, 51–52Marketing executives, financial
executives’ view compared, 4–6
Marketing mix (4 Ps)marketing programs, designing,
121–25overview, 121–22place, 122, 125price, 122–24products, 122promotion, 122, 125
Marketing programscustomer-based planning, 121–31database marketing, 129–31loyalty programs, 126–29marketing mix (4 Ps), 121–25overview, 121touchpoints, 125–26
Marketing research, 153–56Market share, impact of retention on,
71–74, 179–81Marn, Michael V., 195, 197Mayo Clinic, 150McDonald’s, 129MediaOne.
See
AT&T’s acquisition of TCI and MediaOne
Meeker, Mary, 93Mela, Carl F., 191, 195Mello, Adrian, 188Mergers and acquisitions, 81–84Metrics
for assessing effectiveness of programs, 131–34
choosing, 133–34complexity, 19–20
customer lifetime value (CLV), 24–27
customer metrics, 48–51customer relationship management
(CRM) system, 19customer value to firm value, 92–93data requirements, 18–19defection pattern, 18–19Harrah’s Entertainment, Inc., 159imprecision and, 20–24lack of metrics to assess customer
value, 6marketing, 47–51new metrics, 149–50profit pattern, 18traditional marketing metrics, 47–
48value of customer and, 17–24
Morrison, David J., 192Myers, Stewart C., 189, 193, 197
N
Netflix Inc., 90–91, 102–6Nickell, Joe Ashbrook, 192Nordstrom, 151
O
Objectives based on customercustomer-based planning, 110–15Evergreen Trust case study, 111–14Lipitor, 114–15overview, 110–11
Oldham, Tim, 193Olim, Jason, 57Olim, Matthew, 57Online ads, 133–34Online banking, 22–24Organizational structure
customer-based organization, 137–42
Harrah’s Entertainment, Inc., 157Orwell, George, 63
13_0131428950_Index.fm Page 203 Thursday, May 29, 2008 2:25 PM
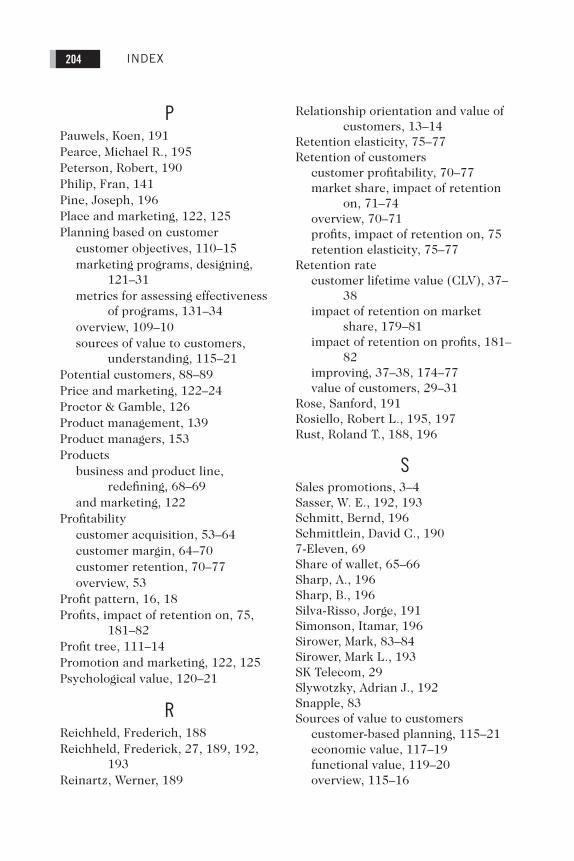
INDEX204
P
Pauwels, Koen, 191Pearce, Michael R., 195Peterson, Robert, 190Philip, Fran, 141Pine, Joseph, 196Place and marketing, 122, 125Planning based on customer
customer objectives, 110–15marketing programs, designing,
121–31metrics for assessing effectiveness
of programs, 131–34overview, 109–10sources of value to customers,
understanding, 115–21Potential customers, 88–89Price and marketing, 122–24Proctor & Gamble, 126Product management, 139Product managers, 153Products
business and product line, redefining, 68–69
and marketing, 122Profitability
customer acquisition, 53–64customer margin, 64–70customer retention, 70–77overview, 53
Profit pattern, 16, 18Profits, impact of retention on, 75,
181–82Profit tree, 111–14Promotion and marketing, 122, 125Psychological value, 120–21
R
Reichheld, Frederich, 188Reichheld, Frederick, 27, 189, 192,
193Reinartz, Werner, 189
Relationship orientation and value of customers, 13–14
Retention elasticity, 75–77Retention of customers
customer profitability, 70–77market share, impact of retention
on, 71–74overview, 70–71profits, impact of retention on, 75retention elasticity, 75–77
Retention ratecustomer lifetime value (CLV), 37–
38impact of retention on market
share, 179–81impact of retention on profits, 181–
82improving, 37–38, 174–77value of customers, 29–31
Rose, Sanford, 191Rosiello, Robert L., 195, 197Rust, Roland T., 188, 196
S
Sales promotions, 3–4Sasser, W. E., 192, 193Schmitt, Bernd, 196Schmittlein, David C., 1907-Eleven, 69Share of wallet, 65–66Sharp, A., 196Sharp, B., 196Silva-Risso, Jorge, 191Simonson, Itamar, 196Sirower, Mark, 83–84Sirower, Mark L., 193SK Telecom, 29Slywotzky, Adrian J., 192Snapple, 83Sources of value to customers
customer-based planning, 115–21economic value, 117–19functional value, 119–20overview, 115–16
13_0131428950_Index.fm Page 204 Thursday, May 29, 2008 2:25 PM
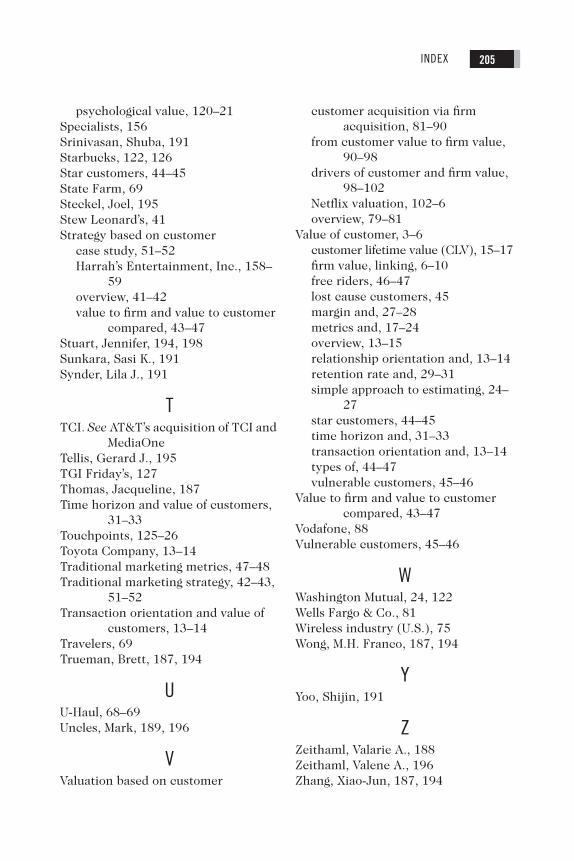
INDEX 205
psychological value, 120–21Specialists, 156Srinivasan, Shuba, 191Starbucks, 122, 126Star customers, 44–45State Farm, 69Steckel, Joel, 195Stew Leonard’s, 41Strategy based on customer
case study, 51–52Harrah’s Entertainment, Inc., 158–
59overview, 41–42value to firm and value to customer
compared, 43–47Stuart, Jennifer, 194, 198Sunkara, Sasi K., 191Synder, Lila J., 191
T
TCI.
See
AT&T’s acquisition of TCI and MediaOne
Tellis, Gerard J., 195TGI Friday’s, 127Thomas, Jacqueline, 187Time horizon and value of customers,
31–33Touchpoints, 125–26Toyota Company, 13–14Traditional marketing metrics, 47–48Traditional marketing strategy, 42–43,
51–52Transaction orientation and value of
customers, 13–14Travelers, 69Trueman, Brett, 187, 194
U
U-Haul, 68–69Uncles, Mark, 189, 196
V
Valuation based on customer
customer acquisition via firm acquisition, 81–90
from customer value to firm value, 90–98
drivers of customer and firm value, 98–102
Netflix valuation, 102–6overview, 79–81
Value of customer, 3–6customer lifetime value (CLV), 15–17firm value, linking, 6–10free riders, 46–47lost cause customers, 45margin and, 27–28metrics and, 17–24overview, 13–15relationship orientation and, 13–14retention rate and, 29–31simple approach to estimating, 24–
27star customers, 44–45time horizon and, 31–33transaction orientation and, 13–14types of, 44–47vulnerable customers, 45–46
Value to firm and value to customer compared, 43–47
Vodafone, 88Vulnerable customers, 45–46
W
Washington Mutual, 24, 122Wells Fargo & Co., 81Wireless industry (U.S.), 75Wong, M.H. Franco, 187, 194
Y
Yoo, Shijin, 191
Z
Zeithaml, Valarie A., 188Zeithaml, Valene A., 196Zhang, Xiao-Jun, 187, 194
13_0131428950_Index.fm Page 205 Thursday, May 29, 2008 2:25 PM


