Embed Size (px)
Citation preview

Managing water-related energy in Future CitiesCalifornian Water Energy Coalition
Steven KenwayUniversity of Queensland, Advanced Water Management Centre
2010-11 Australian Fulbright Scholar
Wednesday 1 June 2011, San Francisco Public Utilities Commission

OverviewRecent water-energy nexus research
How can urban metabolism help?The 29 April 2011 water-energy workshop at LBL

Recent Water Energy Nexus Research
Literature review
• Many knowledge gaps - especially indirect water-energy connections including hot water (energy used other than by water utilities).
Quantifying the nexus in cities
• Water is a major and overlooked lever on energy use: 15-20-fold more energy can be influenced by water policy than utilities use for water/wastewater services.• Understanding energy for water use is vital.
Detailed residential modelling
• Water-related greenhouse gas emissions can be a major component of total household emissions (excluding mobility).• Saving water does not always save ghg.• Quantifying sensitivities and uncertainties supportspolicy, strategy and monitoring program design.
Note: the results presented on slides with the Eawag logo have been prepared in strong collaboration with Eawag

What is urban metabolism?Wolman 1965….
A concept to “simultaneously deal with shortages of water, pollution of water and air….and public economic decisions”

Energy use in the provision and consumption of water
Energy (% of urban system) Utility energyCity Water Utility Res Hot Water Urban system Water utility Res hot water use as %
(W) (R) (T) =W/T =R/T of hot waterenergy use
Sydney 2.7 14 949 0.3% 1.5% 19%Melbourne 1.3 15 1045 0.1% 1.4% 9%Brisbane 0.5 3 561 0.1% 0.5% 15%Gold Coast 0.2 2 157 0.1% 1.3% 11%Perth 1.1 6 597 0.2% 1.0% 19%Adelaide 1.3 6 242 0.5% 2.5% 21%TOTAL 7.1 46 3552 0.2% 1.3% 15%
Energy Use (PJ/a)
Kenway et al 2008a
T - Total urban system energy use
R – Residential water-related energy use
W – Utility energy use

Water-related energy use in California
Klein et al 2005

Water-related energy use in California
Klein et al 2005

Water-related energy use in California
Klein et al 2005

The motivation….an emerging problem…
Kenway et al 2008a
Population serviced in 2007 is 12.5 million. 2030 figure assumes 225 L/d residential consumption and that climate change will not adversely affect existing water yields.

Quantity of research (water-energy links in cities)
Kenway et al 2011 (Water Science and Technology)
Dimension ScaleResearch Objective
Tech
nolo
gy
Envi
ronm
enta
l
Econ
omic
Soci
al
Polit
ical
/ L
egal
App
lianc
e/Pr
oduc
t
Build
ing/
Faci
lity
Wat
er s
yste
m
City
Catc
hmen
t
Stat
e /
Nat
ion
Water infrastructure impact on energy 15 9 3 3 1 4 8 5 1 3
Water use impact - residential 10 7 4 1 5 4 2 2 1 3
- agricultural 4 4 4 1 3 4
- industrial/commercial 2 1 1 1
Energy infrastructure impact on water 3 2 1 2 1 3
More-studied Isolated studies Major research gap

How is relevant institutionally?
California could achieve “nearly all of its energy and demand reduction goals for the 2006-2008 program period by simply allowing energy utilities to realize the value of energy saved for each unit of water saved. In that manner, energy utilities can co-invest in water use reduction programs, supplementing water utilities’ efforts.” Their assessment suggests that this benefit is achievable at “less than half the cost to electric ratepayers for traditional energy efficiency measures.” (Klein 2005)

How is it economically relevant?
• “It could be said our economy runs on water,” and “the nexus between power generation and water usage is one of the world’s most complex and critical public policy challenges.” Richard L. Stanley, vice president, engineering division, GE at 9 July 2009 hearing of US Congress and the Department of Energy House Science and Technology Subcommittee on Energy and Environment.
• “It is increasingly clear that water security underpins energy security and hence economic security”. (Sandia National Laboratories, US, Hightower 2009).

Water-Surface- Ground- Reuse
- Desalination
Energy-Coal- Gas
- Hydro- Diesel
Sources Users
Agriculture
Commerce
Industry
Residential
ProvidersEnergy use by infrastructure
Energy use by consumers
EnergyWater
Kenway 2010
Water service providers
Energy Providers
Electricity

Water-Surface- Ground- Reuse
- Desalination
Energy-Coal- Gas
- Hydro- Diesel
Sources Users
Agriculture
Commerce
Industry
Residential
ProvidersEnergy use by infrastructure
Energy use by consumers
EnergyWater
Kenway 2010
Water service providers
Energy Providers
Electricity

Water-Surface- Ground- Reuse
- Desalination
Energy-Coal- Gas
- Hydro- Diesel
Sources Users
Agriculture
Commerce
Industry
Residential(or export)
ProvidersEnergy use by infrastructure
Energy use by consumers
EnergyWaterEnergy and water embedded in products and services
Kenway 2010
Water service providers
Energy Providers
Electricity

Users
How much energy and water did I really consume?
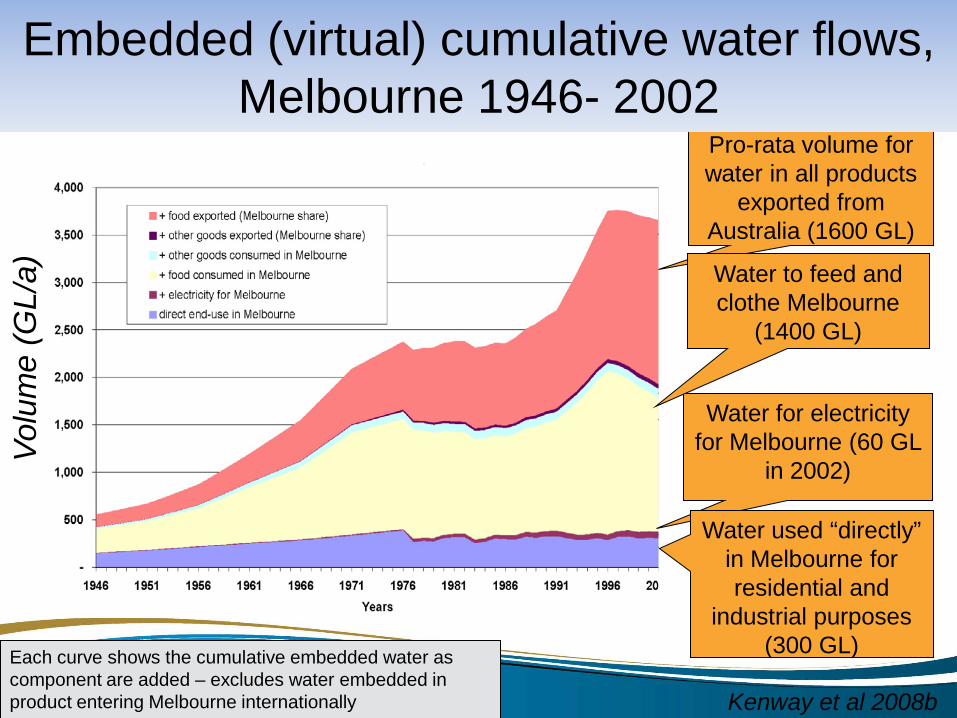
Water for electricity for Melbourne (60 GL
in 2002)
Water used “directly” in Melbourne for residential and
industrial purposes (300 GL)
Pro-rata volume for water in all products
exported from Australia (1600 GL)
Each curve shows the cumulative embedded water as component are added – excludes water embedded in product entering Melbourne internationally
Embedded (virtual) cumulative water flows, Melbourne 1946- 2002
Kenway et al 2008b
Volu
me
(GL/
a) Water to feed and clothe Melbourne
(1400 GL)

A hypothetical city of 1,000,000 people.
Direct Energy
Indirect energy
• resource loss
• water use
• water supply
Kenway et al (in press Water and Climate, 2011)

Based on Kenway, Scheidegger, Bader, Larsen, Lant (In submission)
Water-related ghg can be large. Even in a water-conservative house ~ 50% emissions. Energy and emissions can be vastly different. Sensitivity analysis identifies the “levers” and can inform strategic options selection. Analysis of contributions to uncertainty of results could be used to guide monitoring.• Understanding household scale influences will greatly improve city-scale forecasts.
Detailed household modelling

Conclusions – Part 1• Huge diversity in previous studies. Huge gaps in our
understanding. Systematic work needed including co-involvement of water and energy sectors.
• Understanding the links in cities will help break connections & address root causes, not just symptoms.
• The connections are strong and dynamic. • Assessment of residential, commercial/industrial water
use, and indirect connections is vital.• Lack of a theoretical framework / consistent method is a
major problem. Methodological review and standards. • Trans-city comparisons are needed.

• What is urban metabolism and how is it relevant?
• An example using water balance.• Relevance of the concept.Main Message: Urban metabolism provides a
framework for quantitative and rigorous performance indicators for cities.
Part 2 – Urban Metabolism

Urban Water System
Recycling
Recycling
Livability andEcosystemWell-being
Urban Water System
Information & Knowledge
Information & Knowledge
Imported waterRainwaterEnergyMaterialsFood
WastewaterStormwaterBiosolidsGreenhouse gasGeneral wastes
Inputs
a) Present
b) Future
Inputs Outputs
Outputs
Livability andEcosystemWell-being
Imported waterRainwaterEnergyMaterialsFood
WastewaterStormwaterBiosolidsGreenhouse gasGeneral wastes
Urban metabolism identifies a sustainable direction
+ Efficiency
+ Efficiency
Humanwell being and
ecosystem health
Humanwell being and
ecosystem health
Pamminger and Kenway 2008

Urban water mass balance - a metabolic approach quantifies all flows, captures city-environment interactions and quantifies hydrological performance of the urban entity.
Kenway et al 2011 (Journal of Industrial Ecology). 10.1111/j.1530-9290.2011.00357.x
Stored Water (S) within the urban entity
C W, Rs
Water stored within groundwater reserves under the urban entity
Storages outsidethe urban entity
DG G
ET
P
DR
C + D + P = W + Rs + G + ET + ∆S
Water Flow LegendC – CentralisedDR – DecentralisedP – PrecipitationDG – GroundwaterW – WastewaterRs – StormwaterG – GroundwaterET – Evapotranspiration

Water balances (2004-2005)
0
250
500
750
1,000
1,250
1,500
1,750
2,000
2,250
SydneyInputs
SydneyOutputs
MelbourneInputs
MelbourneOutputs
SEQInputs
SEQOutputs
PerthInputs
PerthOutputs
GL/a
Centralised Water Decentralised Water (Rainwater Tanks)Decentralised Water (Groundwater) PrecipitationWastewater StormwaterEvapotranspiration Outflow to Groundwater
Kenway et al 2011 JIE

Mass-balanced based “metabolic” performance indicators - examples
Kenway et al 2011 J.I.E.
Rainfall harvesting
Wastewater % of use
Stormwater % of use
Reuse % of anthropogenic input
(D/P) (W/(C+D)) (S/(C+D)) (Re/C+D)Sydney 0.1% 86% 76% 1%Melbourne 0.5% 79% 68% 4%SEQ 0.1% 48% 104% 2%Perth 22% 26% 47% 1%

Conclusions and discussion points Mass-balance (metabolic) performance indicators provide a quantitative evaluation framework with potential to unite disparate data sets, & drive accuracy. System boundary definition is critical. Every city is different and local solutions are needed.

ReferencesPublished• Kenway, S.J. Priestley, A, Cook, S., Seo, S., Inman, M. Gregory, A and Hall, M. (2008a) Energy
Use in the consumption and provision of urban water in Australia and New Zealand. A report for the Water Services Association of Australia. ISBN 978 0 643 0916 5. https://www.wsaa.asn.au/Media/Press%20Releases/20081212%20CSIRO%20-%20Water%20Energy%20Final%20Report%2010%20Nov%202008.pdf
• Kenway, S.J., Turner, G, Cook, S., Baynes, T. (2008b) Water-energy futures for Melbourne: the effect of water strategies, water use and urban form. www.csiro.clw.au/publications ISBN 978 0 643 09566 3 http://www.clw.csiro.au/publications/waterforahealthycountry/2008/wfhc-WaterEnergyFuturesMelbourne.pdf
• Pamminger, F. and Kenway, S. J. (2008). "Urban metabolism – a concept to improve the sustainability of the urban water sector." Water : journal of the Australian Water Association.0310-0367.
• Klein, G., Krebs, M., Hall, V., O'Brien, T. and Blevins, B. (2005). California's Water-Energy Relationship - Final Staff Report, California Energy Commission.
In Press• Kenway, S.K. Lant, P, Priestley, T, Daniels, P (2011). In press. The Water Energy Nexus: A
Review. Water Science and Technology. April.• Kenway, S.J., Gregory A. , and McMahon, J, 2011 (In press). Urban Water Mass Balance
Analysis. Journal of Industrial Ecology.• Kenway, S. J., P. Lant, and A. Priestley. (Accepted, May 2011). Quantifying the links between
water and energy in cities. Journal of Water and Climate.In Submission• Kenway, Scheidegger, Bader, Larsen, Lant (In submission to Energy and Buildings). Key
Factors, Sensitivities and Uncertainties in water-related energy and greenhouse gas emissions in an Australian Household.

Managing water-related energy in Future Cities29 April 2011, Lawrence Berkeley National Laboratory, Berkeley
Lorraine White (California Energy Commission). Strategies to reduce greenhouse gas emissions.Vicki Elmer (ICLEII). Profiles of future cities.Jennifer Stokes and Arpad Horvath and (UC Berkeley). Life-cycle assessment.Mikhail Haramati (California Public Utilities Commission). Findings from recent studies.Robert Goldstein (EPRI). Decentralized water systems.Jim McMahon (Lawrence Berkeley National Laboratory). Future profiles and developments? What does success look like? LBNL water-energy research.Steven Kenway (University of Queensland). Research gaps and quantification of water-related energy in cities.Gary Wolff (Stop Waste.Org). Water, energy, and material use efficiency.Heather Cooley (Pacific Institute). A model for water managers to estimate energy and greenhouse gas emissions.Brian Castelli (Alliance to Save Energy). Watergy analysis, Life Cycle Costing, Lessons on opportunities and barriers from International case studies.Richard Harris (East Bay Municipal Utility District). Advanced reporting and data system and the business case..Paul Thomas (Southern California Edison). Recent water-energy analysis and programs and the California Water Energy Coalition.Shahid Chaudhry (California Energy Commission). Financial constraints and models for enabling water conservation

What does success look like in the city of the future? (preliminary/partial)
Fun, liveable and locally self-sustaining. Ideally it would have zero net energy/carbon and water use Cross-institutional funding, support, standards and effort. Systematic planning to optimise the city.* High level of education.Charging and rate-making represents full costs. The “metabolism” is well known. A target for water-related energy is tracked. Feedback guides policy, strategy, investment. Architectural blueprints codify the principles.
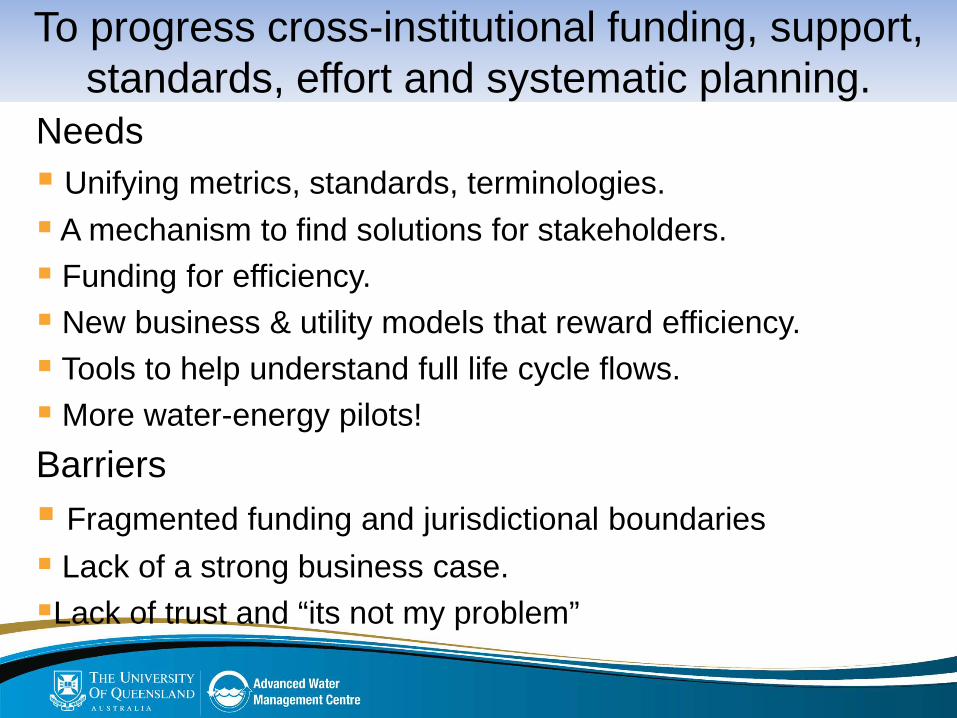
To progress cross-institutional funding, support, standards, effort and systematic planning.
Needs Unifying metrics, standards, terminologies. A mechanism to find solutions for stakeholders. Funding for efficiency. New business & utility models that reward efficiency. Tools to help understand full life cycle flows. More water-energy pilots!Barriers Fragmented funding and jurisdictional boundaries Lack of a strong business case.Lack of trust and “its not my problem”

Next Steps (in no particular order)
A framework for integrated action Engage Federal Government and others. Develop a position paper. Form a consortium of interested organisations to plan, run pilots, co-ordinate and drive inter-disciplinary and cross-institutional thinking and create a common core of intelligence on water and energy.

Urban Water Security Research Alliance (Qld Australia) - Overview
• Cooperative funding and research alliance between:
• Research and development focus.• Building urban research capacity in South East
Queensland (SEQ).• Research to inform and support implementation
of the SEQ Water Strategy.• 5 year life (with 2 year extension option).• Budget - $10m / year ($5m State + $5m
Research Partners).www.urbanwateralliance.org.au

Background work to Alliance formation
2006
2005 •>20 meetings, presentations, workshops• Science plan and system analysis• Site visits
2007 Represent CSIRO on CIRM, Initiated CSIRO-DNRW Science Seminar Series, Initiated SEQ water cycle and stakeholder familiarisation for inter-state scientists
Identification of research issues for State ElectionPremier and Coordinator General InformationCo-ordinated science program development
MoU
Systems analysis
Context DocumentDiscussion Document
Science Plan etc.
Legal Agreement
Organisational will and major state infrastructure investments…..but not much science
2007-2012
Research Projects!
2010- Dissemination and adoption mechanismsGo!!! Science
Forum
Journal quality articles

Uni Qld
State Govt
Griffith Uni
CSIRO
Qld State Gov’t and CSIRO
Alliance Management Board
Alliance Management Team(Project Leaders)
Research Advisory Committee
External experts
Approval
Advice Reporting
Stakeholder engagementand coordination
Alliance Governance
Direction and focus
Research delivery
Science quality

Climate & WaterWenju Cai
Hospital WastewaterChristoph Ort
PRW in the LockyerLeif Wolf
Water LossStewart Burn
Demand Management and Communication
Kelly Fielding
Decentralised SystemsAshok Sharma
Stormwater Harvesting & ReuseTed Gardner
Water Quality Monitoring TechnologyHuijun Zhao
DBP Formation in Alternate Source
WatersMaria José Farré
Enhanced TreatmentJulien Reungoat
Total Water Cycle PlanningShiroma Maheepala
Residential End Use Rodney Stewart
Alliance Research programPathogens and Trace
Contaminants in Dam WaterSimon Toze
Health Risk of Local Source WatersSimon Toze
Bioassays and Risk Communication
Beate Escher
Conceptual model source:Healthy Waterways Partnership

Thanks contributing authors, reviewers and to the University of Queensland and Urban Water Security Research Alliance (including the Qld Government,
CSIRO, UQ and Griffith University) Swiss Federal Institute for Aquatic Science and Technology (Eawag), Australian-American Fulbright Commission and
Lawrence Berkeley Laboratory for supporting the research.
Steven Kenway2010-11 Australian Fulbright Research Scholar,University of Queensland, Advanced Water Management CentreEmail: [email protected]


