Embed Size (px)
Citation preview
SICAV
R.C.S Luxembourg B 26 141
Audited Annual Report
Manulife Global FundSociété d'Investissement à Capital Variable
for the year ended 30 June 2021
No subscription can be received on the basis of �nancial reports. Subscriptions are only valid if made on the basis of the current prospectus, accompanied by the latest annual report and semi-annual report if published therea�er.
Contents
Directors ..................................................................................................................................................... 1Management and Administration ............................................................................................................. 2Directors’ Report ........................................................................................................................................ 4Audit Report ............................................................................................................................................... 16Statement of Net Assets ........................................................................................................................... 19Statement of Changes in Net Assets ........................................................................................................ 24Statement of Operations ........................................................................................................................... 29Statistical Information ............................................................................................................................... 34Other Statistical Information (Unaudited) ............................................................................................... 67Statement of Changes in Shares (Unaudited) ......................................................................................... 93Industrial Composition of Portfolios as a Percentage of Net Asset Value (Unaudited) ......................... 113Portfolio of Investments ............................................................................................................................ 119ASEAN Equity Fund2 .................................................................................................................................... 119Asia Total Return Fund1 ................................................................................................................................. 121Asia Pacific REIT Fund .................................................................................................................................. 126Asian Equity Fund ........................................................................................................................................ 128Asian High Yield Fund ................................................................................................................................... 131Asian Small Cap Equity Fund1 ....................................................................................................................... 134China Total Return Bond Fund1 ..................................................................................................................... 138China Value Fund .......................................................................................................................................... 143Dragon Growth Fund1................................................................................................................................... 146Dynamic Leaders Fund2* ............................................................................................................................. 149Emerging Eastern Europe Fund ................................................................................................................... 152European Growth Fund ................................................................................................................................ 154Global Equity Fund ....................................................................................................................................... 157Global Multi-Asset Diversified Income Fund ................................................................................................ 159Global REIT Fund .......................................................................................................................................... 179Global Resources Fund ................................................................................................................................ 183Healthcare Fund ........................................................................................................................................... 186India Equity Fund1 ........................................................................................................................................ 188Investment Grade Preferred Securities Income Fund* ................................................................................. 190Japan Equity Fund ........................................................................................................................................ 194Preferred Securities Income Fund1 ............................................................................................................... 195Sustainable Asia Bond Fund*1 ...................................................................................................................... 200Taiwan Equity Fund ...................................................................................................................................... 208U.S. Bond Fund ............................................................................................................................................ 210U.S. Equity Fund .......................................................................................................................................... 231U.S. Small Cap Equity Fund .......................................................................................................................... 233U.S. Special Opportunities Fund ................................................................................................................... 236Notes to the Financial Statements ........................................................................................................... 245Information for Shareholders .................................................................................................................... 296Unaudited Supplementary Information ................................................................................................... 298Information for Investors in Switzerland (TER and performance data) (unaudited) ............................. 305
1 This Audited Annual Report includes inter alia information in relation to those sub-funds as indicated. These Sub-Funds have been registered for distribution with the German Financial Regulator (the BaFin) pursuant to section 310 of the German Capital Investment Code and only shares in those Sub-Funds will be marketed to investors within Germany.
2 Not authorized in Hong Kong.* Refer to note 13
1
Directors
M A N U L I F E G L O B A L F U N D
DIRECTORSPaul Smith (Chairman)c/o Manulife Investment Management (Hong Kong) Limited16th FloorLee Garden One33 Hysan AvenueCauseway Bay Hong Kong SAR
Christakis Partassides29-31 Kasou StreetFlat 402CY-1086 NicosiaCyprus
Yves Wagner19, rue de BitbourgL-1273 LuxembourgGrand Duchy of Luxembourg
Gianni Fiacco16th FloorLee Garden One33 Hysan AvenueCauseway BayHong Kong SAR
John Li19, rue de BitbourgL-1273 LuxembourgGrand Duchy of Luxembourg
Leonardo Zerilli (until 1 January 2021)200 Berkeley StBoston MA 02116United States of America
Bernard Letendre (since 1 February 2021)200 Bloor Street East, North TowerToronto, Ontario M4W 1E5Canada
2
Management and Administration
M A N U L I F E G L O B A L F U N D
Registered Office31, Z.A. BourmichtL - 8070 Bertrange
Grand Duchy of LuxembourgR.C.S. Luxembourg B26141
MANAGEMENT COMPANYCarne Global Fund Managers (Luxembourg) S.A. (until 30 June 2021)3, rue Jean PiretL-2350 LuxembourgGrand Duchy of Luxembourg
Manulife Investment Management (Ireland) Limited (since 1 July 2021)2/F, 5 Earlsfort TerraceDublin 2 D02 CK83Ireland
Global DistributorManulife Investment Management International Holdings LimitedThe Goddard BuildingHaggatt HallSt. MichaelBarbados
Depositary, Administrator,Registrar and Paying AgentCitibank Europe plc, Luxembourg Branch31, Z.A. BourmichtL -8070 BertrangeGrand Duchy of LuxembourgTel: (352) 45 14 14 1Fax: (352) 45 14 14 332
Legal AdvisersLuxembourgLinklaters LLPAvenue J.F. Kennedy 35L -1855 LuxembourgGrand Duchy of Luxembourg
Hong KongDechert31st Floor, Jardine HouseOne Connaught PlaceCentralHong Kong SAR
Hong Kong DistributorManulife Investment Management (Hong Kong) Limited16th FloorLee Garden One33 Hysan AvenueCauseway BayHong Kong SARTel: (852) 2510 3388Fax: (852) 2810 9510
Investment ManagersFiera Capital (UK) Limited3rd Floor, Queensberry House3 Old Burlington StreetMayfairLondon W1S 3AEUnited Kingdom(Investment Manager of the Emerging EasternEurope Fund and Latin America Equity Fund* (until 30 June 2021))
Manulife Investment Management (Hong Kong) Limited16th FloorLee Garden One33 Hysan AvenueCauseway BayHong Kong SAR(Investment Manager of the ASEAN Equity Fund, Asia Total Return Fund (until 16 December 2020), Asia Pacific REIT Fund, Asian Equity Fund, Asian High Yield Fund (until 16 December 2020), Asian Small Cap Equity Fund, China Total Return Bond Fund, China Value Fund, Dragon Growth Fund, India Equity Fund, Japan Equity Fund, Sustainable Asia Bond Fund* (since 6 August 2020) and Taiwan Equity Fund, and Co-Investment Manager of the Asia Total Return Fund and Asian High Yield Fund since 17 December 2020)
Manulife Investment Management (Europe) Limited1 London WallLondon EC2Y 5EAUnited Kingdom(Co-Investment Manager of the Asia Total Return Fund and Asian High Yield Fund since 17 December 2020)
T. Rowe Price International Ltd.60 Queen Victoria StreetLondon EC4N 4TZUnited Kingdom(Investment Manager of the European Growth Fund)
* Refer to note 13

3
Management and Administration
M A N U L I F E G L O B A L F U N D
Manulife Investment Management (US) LLC197 Clarendon StreetBoston, MA 02116United States of America(Investment Manager of the Dynamic Leaders Fund* (since 4 December 2020), Global Equity Fund, Global Multi-Asset Diversified Income Fund, Global REIT Fund, Global Resources Fund, Healthcare Fund, Investment Grade Preferred Securities Income Fund* (since 24 March 2021), Preferred Securities Income Fund, U.S. Bond Fund, U.S. Equity Fund, U.S. Small Cap Equity Fund and U.S. Special Opportunities Fund)
Sensible Asset Management Limited43rd Floor, The Center99 Queen’s Road CentralHong Kong SAR(Investment Manager of the Asia Value Dividend Equity Fund* until 30 June 2021)
Sub-Investment ManagersValue Partners Limited43rd Floor, The Center99 Queen’s Road CentralHong Kong SAR(Sub-Investment Manager of the Asia Value Dividend Equity Fund* until 30 June 2021)
Manulife Investment Management (Hong Kong) Limited16th FloorLee Garden One33 Hysan AvenueCauseway BayHong Kong SAR(Sub-Investment Manager of the Global Multi-Asset Diversified Income Fund until 16 December 2020 and Co-Sub-Investment Manager of the Global Multi-Asset Diversified Income Fund since 17 December 2020)
Manulife Investment Management (Europe) Limited1 London WallLondon EC2Y 5EAUnited Kingdom(Co-Sub-Investment Manager of the Global Multi-Asset Diversified Income Fund since 17 December 2020)
Manulife Investment Management (Singapore) Pte. Ltd.8 Cross Street#16-01 Manulife TowerSingapore 048424(Sub-Investment Manager of the Sustainable Asia Bond Fund since 06 August 2020)
Investment AdvisersManulife Investment Management (Taiwan) Co., Ltd.9/F, No.89 Sungren RoadTaipei 11073TaiwanRepublic of China(Investment Adviser to the Investment Manager of the Taiwan Equity Fund)
AuditorPricewaterhouseCoopers Société coopérative2, rue Gerhard MercatorB.P. 1443, L -1014 LuxembourgGrand Duchy of Luxembourg
Hong Kong RepresentativeCitibank N.A. Hong Kong Branch50th Floor, Champion Tower3, Garden RoadCentralHong Kong SAR
Swiss RepresentativeARM Swiss Representatives SARoute de Cité-Ouest 21196 GlandSwitzerland
Swiss Paying AgentBanque Cantonale de GenèveQuai de l’Ile 171204 GenevaSwitzerland
* Refer to note 13
4
Directors’ Report
M A N U L I F E G L O B A L F U N D
Year in Review
Global equity markets performed well in the first half of 2021, despite periodic bouts of volatility. Although inflation began to tick up, the US Federal Reserve Board (Fed) and other global central banks reiterated their intention to maintain accommodative monetary policies for an extended period. In addition, the gradual rollout of vaccines for Covid-19 fostered expectations for strength in both economic growth and corporate earnings. The fiscal stimulus programmes passed in the United States provided further fuel for investor sentiment worldwide. Performance cooled somewhat in June due to concerns about a new coronavirus variant and slower economic data in China, but most major indexes still closed the period near all-time highs.
Asia ex Japan equity markets posted gains in during the period. In February and March, yields surged in the US as President Biden signed into law a US$1.9 trillion fiscal package and proposed an additional US$3 trillion in infrastructure spending. As a result, investors rotated into value names from growth as markets priced in a post-pandemic macroeconomic environment of increased economic growth and inflation.
Shares in Europe rose strongly in euro terms in the period. The gains were fuelled by optimism about an economic recovery as vaccines were rolled out more speedily, the gradual reopening of economies, and continued ultra-loose monetary policies. But worries that interest rates might rise sooner than previously expected as inflation accelerated and a resurgence of the coronavirus curbed gains.
The US bond market declined during the first six months of 2021 as bond yields rose. With the ongoing Covid-19 pandemic as a backdrop, the key factors behind the higher yields were the rapid expansion of coronavirus vaccinations and an accompanying reopening of the US economy. By the end of June, nearly half of the US population had been fully immunised, and many pandemic-related restrictions were lifted around the country. Economically, the recovery was robust but uneven; supply shortages in a number of industries, caused by production bottlenecks and transportation disruptions, remained an economic constraint while at the same time driving prices higher.
US stocks surged in the first half of 2021, as Covid-19 vaccination rollouts led to economic re-openings in many states. Healthy corporate earnings reports, a pickup in vaccine supply and a third round of stimulus checks also drove gains. Stabilising interest rates, robust economic growth, and mounting optimism for a proposed bipartisan infrastructure spending bill were added tailwinds that far outweighed concerns over inflation and interest rates, the pace of economic growth and the spread of new more transmissible variants of Covid-19. Against this backdrop, value stocks outperformed growth securities for the period.
Performance and Growth of Assets
During the second quarter of 2021, global markets were influenced by two developments: 1) Investor optimism over the economic reopening and improving vaccination rates in developed economies, while outbreaks continued in markets with lower vaccination rates; 2) debate over whether above-trend inflationary pressures in some markets may be transitory in nature. In June, the US Federal Reserve Board (Fed) gave an unexpectedly hawkish statement, as a majority of the Federal Open Market Committee (FOMC) members believed two rate hikes would occur in 2023 – earlier than market consensus.
The Fed met in June holding rates steady but sending 10-year Treasury yields down 30 basis points to 1.45% helping growth stocks to outperform value stocks and creating a tough period for interest rate sensitive stocks. With economies reopening, the effects of inflation are being felt everywhere. Supply chains continue to be squeezed as suppliers are taking longer to make deliveries as they struggle to meet elevated demand. Input costs are also rising as companies scramble to get a hold of goods to fulfill their orders. And as seen in the US, a labour shortage is starting to contribute to wage inflation.
Within the broad-based Standard & Poor’s (S&P) 500 Index over the first half of 2021, energy stocks were notably strong performers, as the vaccine brought the promise of a pick-up in travel that could bolster demand for oil and gas. Financials also stood out, benefiting from healthy capital markets activity, a rising equity market and the prospect of more lending as economies reopened. Real estate stocks outperformed as interest rates receded during this period. Conversely, the more defensive utilities and consumer staples sectors were laggards.
5
Directors’ Report
M A N U L I F E G L O B A L F U N D
Economically, the recovery was robust but uneven; supply shortages in a number of industries, caused by production bottlenecks and transportation disruptions, remained an economic constraint while at the same time driving prices higher. As a result, the year-over-year inflation rate reached 5% by the end of the period, its highest level in nearly 13 years.
Bond yields rose sharply in the first quarter of the year as bond investors anticipated the significant inflationary increase. However, yields fell back somewhat in the second quarter, reflecting investor expectations that inflation would be temporarily elevated until supply chain disruptions ease. Short-term bond yields remained low, tethered to the near-zero interest rate policy of the US Federal Reserve Board (Fed), but intermediate and long-term yields rose notably, leading to a steeper yield curve.
Outlook
Entering the second half of 2021, the Portfolio Managers (PMs) are focusing on whether inflation is transitory or prolonged, the magnitude of inflation we will experience and the subsequent central bank reaction. The magnitude of inflation matters as low single digit inflation is supportive of positive equity markets, but high single digit inflation is destructive resulting in multiple contraction. With the Fed’s endgame of full employment and reasonable gross domestic product growth, it becomes a very delicate dance in applying the right formula of monetary, fiscal and political support in order to keep inflation in check.
The PMs expect the US economic recovery to remain on an upward trajectory as life continues to trend back toward normalcy into the second half of 2021. They are also in the camp that thinks inflationary pressures will be temporary, and that the Fed will keep short-term interest rates low for an extended period of time. Given this backdrop, the PMs continue to believe that corporate credit will be a major source of performance, supported by a growing economy and strong investor demand for yield in a low-interest-rate environment. They are cognisant, however, that yield spreads in the corporate sector have reached the low end of their historic range, so individual security selection will be increasingly important.
The performance of Asia-Pacific markets is expected to diverge and driven by different factors as we move into the third quarter of 2021. For China, the government is focused on building a high quality and sustainable growth path for the economy. The structural growth trend of sectors receiving strong support from the government remains intact. While the extensive rollout of new rules and regulations in China create short-term pain and impede the growth of some of the listed companies in the near-term, the PMs believe the long-term benefits of stability and the orderly development of sectors far outweigh short-term earnings risks.
Despite the US equity market’s strength year to date, the PMs remain optimistic about its prospects and expect improved US economic growth, driven by pent-up consumer demand and resurgent capital spending, to aid stock returns. However, policy, regulatory, interest rate and inflation uncertainty could lead to periodic volatility.
The Board of Directors6 September 2021
The figures included in this report are historical and not necessarily indicative of future performance.
6
Directors’ Report
M A N U L I F E G L O B A L F U N D
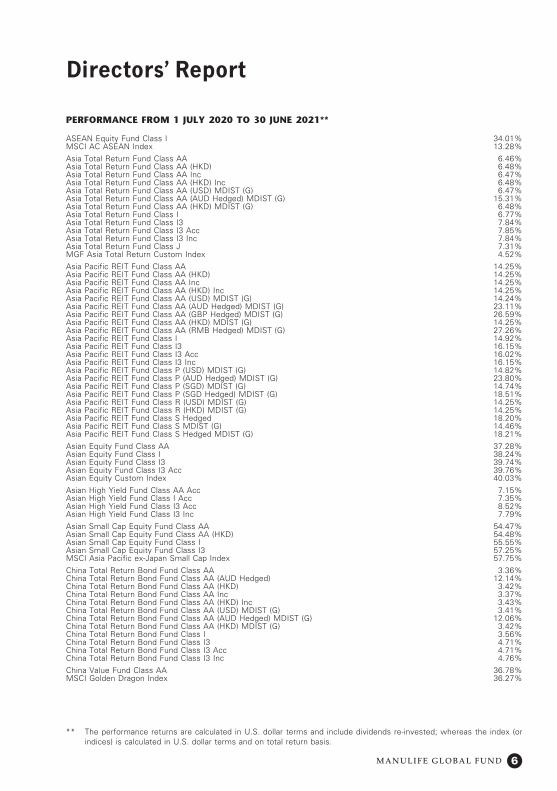
PERFORMANCE FROM 1 JULY 2020 TO 30 JUNE 2021**
ASEAN Equity Fund Class I 34.01%MSCI AC ASEAN Index 13.28%
Asia Total Return Fund Class AA 6.46%Asia Total Return Fund Class AA (HKD) 6.48%Asia Total Return Fund Class AA Inc 6.47%Asia Total Return Fund Class AA (HKD) Inc 6.48%Asia Total Return Fund Class AA (USD) MDIST (G) 6.47%Asia Total Return Fund Class AA (AUD Hedged) MDIST (G) 15.31%Asia Total Return Fund Class AA (HKD) MDIST (G) 6.48%Asia Total Return Fund Class I 6.77%Asia Total Return Fund Class I3 7.84%Asia Total Return Fund Class I3 Acc 7.85%Asia Total Return Fund Class I3 Inc 7.84%Asia Total Return Fund Class J 7.31%MGF Asia Total Return Custom Index 4.52%
Asia Pacific REIT Fund Class AA 14.25%Asia Pacific REIT Fund Class AA (HKD) 14.25%Asia Pacific REIT Fund Class AA Inc 14.25%Asia Pacific REIT Fund Class AA (HKD) Inc 14.25%Asia Pacific REIT Fund Class AA (USD) MDIST (G) 14.24%Asia Pacific REIT Fund Class AA (AUD Hedged) MDIST (G) 23.11%Asia Pacific REIT Fund Class AA (GBP Hedged) MDIST (G) 26.59%Asia Pacific REIT Fund Class AA (HKD) MDIST (G) 14.25%Asia Pacific REIT Fund Class AA (RMB Hedged) MDIST (G) 27.26%Asia Pacific REIT Fund Class I 14.92%Asia Pacific REIT Fund Class I3 16.15%Asia Pacific REIT Fund Class I3 Acc 16.02%Asia Pacific REIT Fund Class I3 Inc 16.15%Asia Pacific REIT Fund Class P (USD) MDIST (G) 14.82%Asia Pacific REIT Fund Class P (AUD Hedged) MDIST (G) 23.80%Asia Pacific REIT Fund Class P (SGD) MDIST (G) 14.74%Asia Pacific REIT Fund Class P (SGD Hedged) MDIST (G) 18.51%Asia Pacific REIT Fund Class R (USD) MDIST (G) 14.25%Asia Pacific REIT Fund Class R (HKD) MDIST (G) 14.25%Asia Pacific REIT Fund Class S Hedged 18.20%Asia Pacific REIT Fund Class S MDIST (G) 14.46%Asia Pacific REIT Fund Class S Hedged MDIST (G) 18.21%
Asian Equity Fund Class AA 37.28%Asian Equity Fund Class I 38.24%Asian Equity Fund Class I3 39.74%Asian Equity Fund Class I3 Acc 39.76%Asian Equity Custom Index 40.03%
Asian High Yield Fund Class AA Acc 7.15%Asian High Yield Fund Class I Acc 7.35%Asian High Yield Fund Class I3 Acc 8.52%Asian High Yield Fund Class I3 Inc 7.79%
Asian Small Cap Equity Fund Class AA 54.47%Asian Small Cap Equity Fund Class AA (HKD) 54.48%Asian Small Cap Equity Fund Class I 55.55%Asian Small Cap Equity Fund Class I3 57.25%MSCI Asia Pacific ex-Japan Small Cap Index 57.75%
China Total Return Bond Fund Class AA 3.36%China Total Return Bond Fund Class AA (AUD Hedged) 12.14%China Total Return Bond Fund Class AA (HKD) 3.42%China Total Return Bond Fund Class AA Inc 3.37%China Total Return Bond Fund Class AA (HKD) Inc 3.43%China Total Return Bond Fund Class AA (USD) MDIST (G) 3.41%China Total Return Bond Fund Class AA (AUD Hedged) MDIST (G) 12.06%China Total Return Bond Fund Class AA (HKD) MDIST (G) 3.42%China Total Return Bond Fund Class I 3.56%China Total Return Bond Fund Class I3 4.71%China Total Return Bond Fund Class I3 Acc 4.71%China Total Return Bond Fund Class I3 Inc 4.76%
China Value Fund Class AA 36.78%MSCI Golden Dragon Index 36.27%
** The performance returns are calculated in U.S. dollar terms and include dividends re-invested; whereas the index (or indices) is calculated in U.S. dollar terms and on total return basis.
7
Directors’ Report
M A N U L I F E G L O B A L F U N D
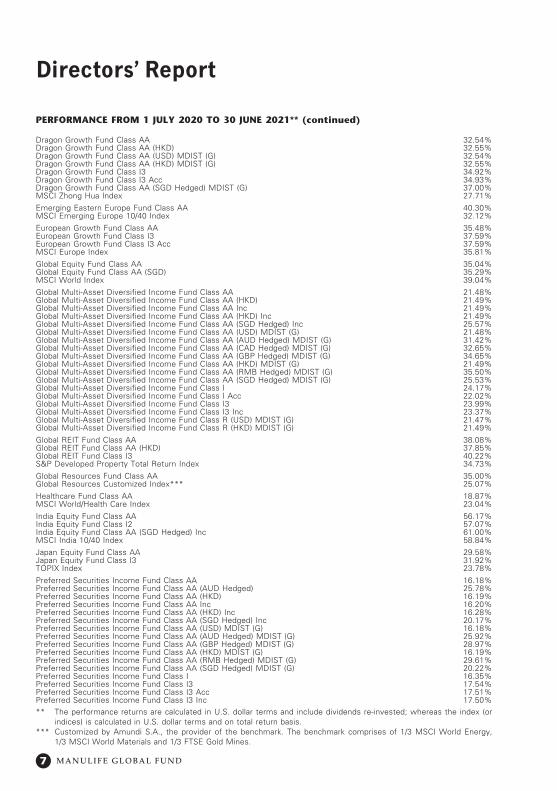
Dragon Growth Fund Class AA 32.54%Dragon Growth Fund Class AA (HKD) 32.55%Dragon Growth Fund Class AA (USD) MDIST (G) 32.54%Dragon Growth Fund Class AA (HKD) MDIST (G) 32.55%Dragon Growth Fund Class I3 34.92%Dragon Growth Fund Class I3 Acc 34.93%Dragon Growth Fund Class AA (SGD Hedged) MDIST (G) 37.00%MSCI Zhong Hua Index 27.71%
Emerging Eastern Europe Fund Class AA 40.30%MSCI Emerging Europe 10/40 Index 32.12%
European Growth Fund Class AA 35.48%European Growth Fund Class I3 37.59%European Growth Fund Class I3 Acc 37.59%MSCI Europe Index 35.81%
Global Equity Fund Class AA 35.04%Global Equity Fund Class AA (SGD) 35.29%MSCI World Index 39.04%
Global Multi-Asset Diversified Income Fund Class AA 21.48%Global Multi-Asset Diversified Income Fund Class AA (HKD) 21.49%Global Multi-Asset Diversified Income Fund Class AA Inc 21.49%Global Multi-Asset Diversified Income Fund Class AA (HKD) Inc 21.49%Global Multi-Asset Diversified Income Fund Class AA (SGD Hedged) Inc 25.57%Global Multi-Asset Diversified Income Fund Class AA (USD) MDIST (G) 21.48%Global Multi-Asset Diversified Income Fund Class AA (AUD Hedged) MDIST (G) 31.42%Global Multi-Asset Diversified Income Fund Class AA (CAD Hedged) MDIST (G) 32.65%Global Multi-Asset Diversified Income Fund Class AA (GBP Hedged) MDIST (G) 34.65%Global Multi-Asset Diversified Income Fund Class AA (HKD) MDIST (G) 21.49%Global Multi-Asset Diversified Income Fund Class AA (RMB Hedged) MDIST (G) 35.50%Global Multi-Asset Diversified Income Fund Class AA (SGD Hedged) MDIST (G) 25.53%Global Multi-Asset Diversified Income Fund Class I 24.17%Global Multi-Asset Diversified Income Fund Class I Acc 22.02%Global Multi-Asset Diversified Income Fund Class I3 23.99%Global Multi-Asset Diversified Income Fund Class I3 Inc 23.37%Global Multi-Asset Diversified Income Fund Class R (USD) MDIST (G) 21.47%Global Multi-Asset Diversified Income Fund Class R (HKD) MDIST (G) 21.49%
Global REIT Fund Class AA 38.08%Global REIT Fund Class AA (HKD) 37.85%Global REIT Fund Class I3 40.22%S&P Developed Property Total Return Index 34.73%
Global Resources Fund Class AA 35.00%Global Resources Customized Index*** 25.07%
Healthcare Fund Class AA 18.87%MSCI World/Health Care Index 23.04%
India Equity Fund Class AA 56.17%India Equity Fund Class I2 57.07%India Equity Fund Class AA (SGD Hedged) Inc 61.00%MSCI India 10/40 Index 58.84%
Japan Equity Fund Class AA 29.58%Japan Equity Fund Class I3 31.92%TOPIX Index 23.78%
Preferred Securities Income Fund Class AA 16.18%Preferred Securities Income Fund Class AA (AUD Hedged) 25.78%Preferred Securities Income Fund Class AA (HKD) 16.19%Preferred Securities Income Fund Class AA Inc 16.20%Preferred Securities Income Fund Class AA (HKD) Inc 16.28%Preferred Securities Income Fund Class AA (SGD Hedged) Inc 20.17%Preferred Securities Income Fund Class AA (USD) MDIST (G) 16.18%Preferred Securities Income Fund Class AA (AUD Hedged) MDIST (G) 25.92%Preferred Securities Income Fund Class AA (GBP Hedged) MDIST (G) 28.97%Preferred Securities Income Fund Class AA (HKD) MDIST (G) 16.19%Preferred Securities Income Fund Class AA (RMB Hedged) MDIST (G) 29.61%Preferred Securities Income Fund Class AA (SGD Hedged) MDIST (G) 20.22%Preferred Securities Income Fund Class I 16.35%Preferred Securities Income Fund Class I3 17.54%Preferred Securities Income Fund Class I3 Acc 17.51%Preferred Securities Income Fund Class I3 Inc 17.50%** The performance returns are calculated in U.S. dollar terms and include dividends re-invested; whereas the index (or
indices) is calculated in U.S. dollar terms and on total return basis.*** Customized by Amundi S.A., the provider of the benchmark. The benchmark comprises of 1/3 MSCI World Energy,
1/3 MSCI World Materials and 1/3 FTSE Gold Mines.
PERFORMANCE FROM 1 JULY 2020 TO 30 JUNE 2021** (continued)
8
Directors’ Report
M A N U L I F E G L O B A L F U N D
PERFORMANCE FROM 1 JULY 2020 TO 30 JUNE 2021** (continued)
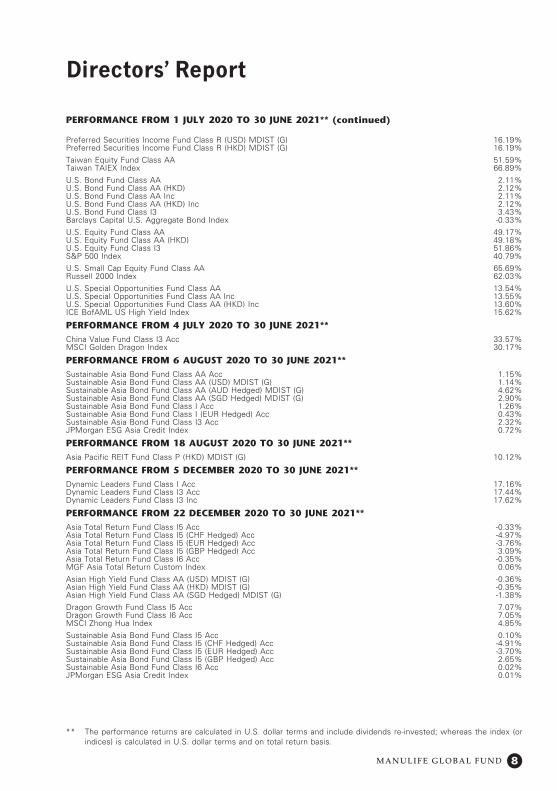
Preferred Securities Income Fund Class R (USD) MDIST (G) 16.19%Preferred Securities Income Fund Class R (HKD) MDIST (G) 16.19%
Taiwan Equity Fund Class AA 51.59%Taiwan TAIEX Index 66.89%
U.S. Bond Fund Class AA 2.11%U.S. Bond Fund Class AA (HKD) 2.12%U.S. Bond Fund Class AA Inc 2.11%U.S. Bond Fund Class AA (HKD) Inc 2.12%U.S. Bond Fund Class I3 3.43%Barclays Capital U.S. Aggregate Bond Index -0.33%
U.S. Equity Fund Class AA 49.17%U.S. Equity Fund Class AA (HKD) 49.18%U.S. Equity Fund Class I3 51.86%S&P 500 Index 40.79%
U.S. Small Cap Equity Fund Class AA 65.69%Russell 2000 Index 62.03%
U.S. Special Opportunities Fund Class AA 13.54%U.S. Special Opportunities Fund Class AA Inc 13.55%U.S. Special Opportunities Fund Class AA (HKD) Inc 13.60%ICE BofAML US High Yield Index 15.62%
PERFORMANCE FROM 4 JULY 2020 TO 30 JUNE 2021**China Value Fund Class I3 Acc 33.57%MSCI Golden Dragon Index 30.17%
PERFORMANCE FROM 6 AUGUST 2020 TO 30 JUNE 2021**Sustainable Asia Bond Fund Class AA Acc 1.15%Sustainable Asia Bond Fund Class AA (USD) MDIST (G) 1.14%Sustainable Asia Bond Fund Class AA (AUD Hedged) MDIST (G) 4.62%Sustainable Asia Bond Fund Class AA (SGD Hedged) MDIST (G) 2.90%Sustainable Asia Bond Fund Class I Acc 1.26%Sustainable Asia Bond Fund Class I (EUR Hedged) Acc 0.43%Sustainable Asia Bond Fund Class I3 Acc 2.32%JPMorgan ESG Asia Credit Index 0.72%
PERFORMANCE FROM 18 AUGUST 2020 TO 30 JUNE 2021**Asia Pacific REIT Fund Class P (HKD) MDIST (G) 10.12%
PERFORMANCE FROM 5 DECEMBER 2020 TO 30 JUNE 2021**Dynamic Leaders Fund Class I Acc 17.16%Dynamic Leaders Fund Class I3 Acc 17.44%Dynamic Leaders Fund Class I3 Inc 17.62%
PERFORMANCE FROM 22 DECEMBER 2020 TO 30 JUNE 2021**Asia Total Return Fund Class I5 Acc -0.33%Asia Total Return Fund Class I5 (CHF Hedged) Acc -4.97%Asia Total Return Fund Class I5 (EUR Hedged) Acc -3.76%Asia Total Return Fund Class I5 (GBP Hedged) Acc 3.09%Asia Total Return Fund Class I6 Acc -0.35%MGF Asia Total Return Custom Index 0.06%
Asian High Yield Fund Class AA (USD) MDIST (G) -0.36%Asian High Yield Fund Class AA (HKD) MDIST (G) -0.35%Asian High Yield Fund Class AA (SGD Hedged) MDIST (G) -1.38%
Dragon Growth Fund Class I5 Acc 7.07%Dragon Growth Fund Class I6 Acc 7.05%MSCI Zhong Hua Index 4.85%
Sustainable Asia Bond Fund Class I5 Acc 0.10%Sustainable Asia Bond Fund Class I5 (CHF Hedged) Acc -4.91%Sustainable Asia Bond Fund Class I5 (EUR Hedged) Acc -3.70%Sustainable Asia Bond Fund Class I5 (GBP Hedged) Acc 2.65%Sustainable Asia Bond Fund Class I6 Acc 0.02%JPMorgan ESG Asia Credit Index 0.01%
** The performance returns are calculated in U.S. dollar terms and include dividends re-invested; whereas the index (or indices) is calculated in U.S. dollar terms and on total return basis.
9
Directors’ Report
M A N U L I F E G L O B A L F U N D
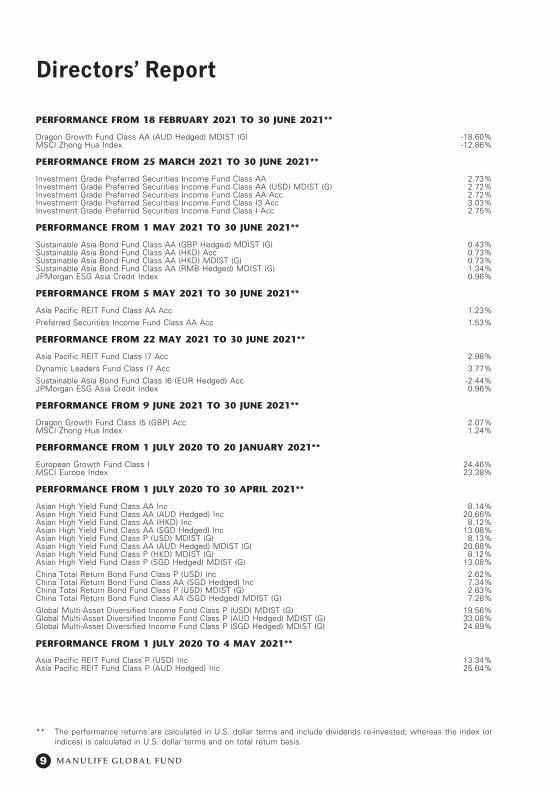
PERFORMANCE FROM 18 FEBRUARY 2021 TO 30 JUNE 2021**
Dragon Growth Fund Class AA (AUD Hedged) MDIST (G) -18.60%MSCI Zhong Hua Index -12.86%
PERFORMANCE FROM 25 MARCH 2021 TO 30 JUNE 2021**
Investment Grade Preferred Securities Income Fund Class AA 2.73%Investment Grade Preferred Securities Income Fund Class AA (USD) MDIST (G) 2.72%Investment Grade Preferred Securities Income Fund Class AA Acc 2.72%Investment Grade Preferred Securities Income Fund Class I3 Acc 3.03%Investment Grade Preferred Securities Income Fund Class I Acc 2.75%
PERFORMANCE FROM 1 MAY 2021 TO 30 JUNE 2021**
Sustainable Asia Bond Fund Class AA (GBP Hedged) MDIST (G) 0.43%Sustainable Asia Bond Fund Class AA (HKD) Acc 0.73%Sustainable Asia Bond Fund Class AA (HKD) MDIST (G) 0.73%Sustainable Asia Bond Fund Class AA (RMB Hedged) MDIST (G) 1.34%JPMorgan ESG Asia Credit Index 0.96%
PERFORMANCE FROM 5 MAY 2021 TO 30 JUNE 2021**
Asia Pacific REIT Fund Class AA Acc 1.23%
Preferred Securities Income Fund Class AA Acc 1.53%
PERFORMANCE FROM 22 MAY 2021 TO 30 JUNE 2021**
Asia Pacific REIT Fund Class I7 Acc 2.98%
Dynamic Leaders Fund Class I7 Acc 3.77%
Sustainable Asia Bond Fund Class I6 (EUR Hedged) Acc -2.44%JPMorgan ESG Asia Credit Index 0.96%
PERFORMANCE FROM 9 JUNE 2021 TO 30 JUNE 2021**
Dragon Growth Fund Class I5 (GBP) Acc 2.07%MSCI Zhong Hua Index 1.24%
PERFORMANCE FROM 1 JULY 2020 TO 20 JANUARY 2021**
European Growth Fund Class I 24.46%MSCI Europe Index 23.38%
PERFORMANCE FROM 1 JULY 2020 TO 30 APRIL 2021**
Asian High Yield Fund Class AA Inc 8.14%Asian High Yield Fund Class AA (AUD Hedged) Inc 20.66%Asian High Yield Fund Class AA (HKD) Inc 8.12%Asian High Yield Fund Class AA (SGD Hedged) Inc 13.08%Asian High Yield Fund Class P (USD) MDIST (G) 8.13%Asian High Yield Fund Class AA (AUD Hedged) MDIST (G) 20.68%Asian High Yield Fund Class P (HKD) MDIST (G) 8.12%Asian High Yield Fund Class P (SGD Hedged) MDIST (G) 13.08%
China Total Return Bond Fund Class P (USD) Inc 2.62%China Total Return Bond Fund Class AA (SGD Hedged) Inc 7.34%China Total Return Bond Fund Class P (USD) MDIST (G) 2.63%China Total Return Bond Fund Class AA (SGD Hedged) MDIST (G) 7.28%
Global Multi-Asset Diversified Income Fund Class P (USD) MDIST (G) 19.56%Global Multi-Asset Diversified Income Fund Class P (AUD Hedged) MDIST (G) 33.08%Global Multi-Asset Diversified Income Fund Class P (SGD Hedged) MDIST (G) 24.89%
PERFORMANCE FROM 1 JULY 2020 TO 4 MAY 2021**
Asia Pacific REIT Fund Class P (USD) Inc 13.34%Asia Pacific REIT Fund Class P (AUD Hedged) Inc 25.64%
** The performance returns are calculated in U.S. dollar terms and include dividends re-invested; whereas the index (or indices) is calculated in U.S. dollar terms and on total return basis.
10
Directors’ Report
M A N U L I F E G L O B A L F U N D
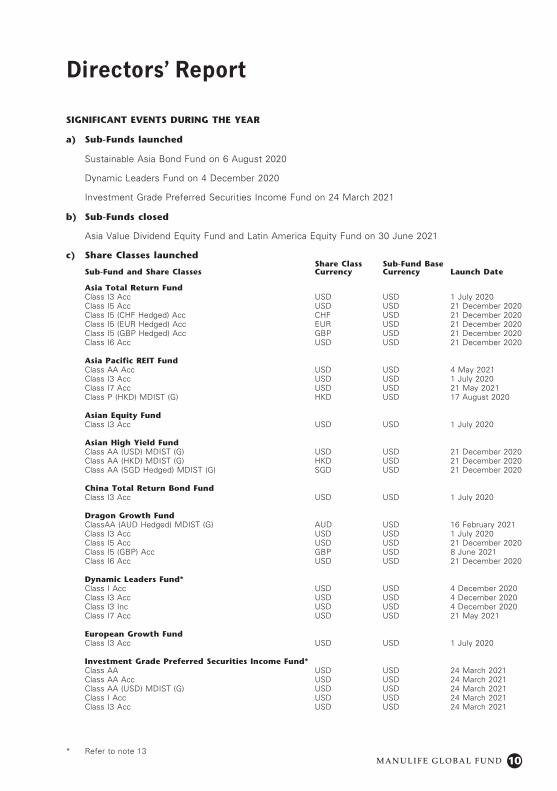
SIGNIFICANT EVENTS DURING THE YEAR
a) Sub-Funds launched
Sustainable Asia Bond Fund on 6 August 2020
Dynamic Leaders Fund on 4 December 2020
Investment Grade Preferred Securities Income Fund on 24 March 2021
b) Sub-Funds closed
Asia Value Dividend Equity Fund and Latin America Equity Fund on 30 June 2021
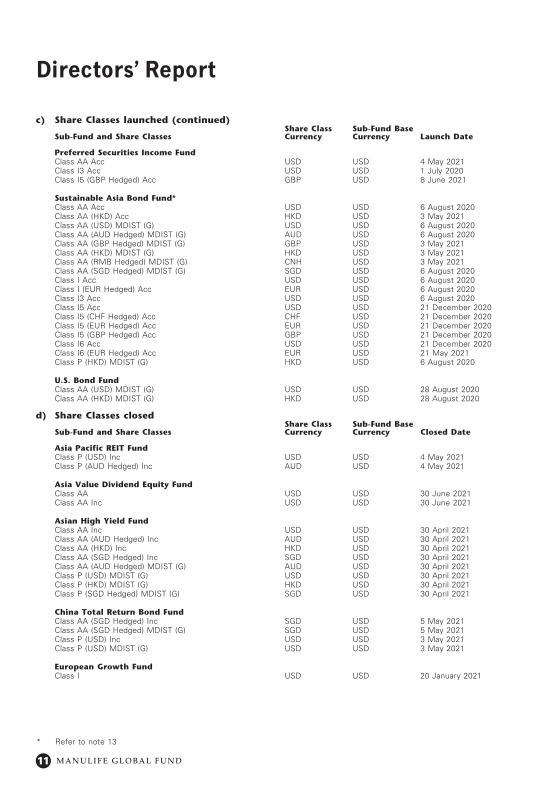
c) Share Classes launched
Sub-Fund and Share ClassesShare Class Currency
Sub-Fund Base Currency Launch Date
Asia Total Return FundClass I3 Acc USD USD 1 July 2020Class I5 Acc USD USD 21 December 2020Class I5 (CHF Hedged) Acc CHF USD 21 December 2020Class I5 (EUR Hedged) Acc EUR USD 21 December 2020Class I5 (GBP Hedged) Acc GBP USD 21 December 2020Class I6 Acc USD USD 21 December 2020
Asia Pacific REIT FundClass AA Acc USD USD 4 May 2021Class I3 Acc USD USD 1 July 2020Class I7 Acc USD USD 21 May 2021Class P (HKD) MDIST (G) HKD USD 17 August 2020
Asian Equity FundClass I3 Acc USD USD 1 July 2020
Asian High Yield FundClass AA (USD) MDIST (G) USD USD 21 December 2020Class AA (HKD) MDIST (G) HKD USD 21 December 2020Class AA (SGD Hedged) MDIST (G) SGD USD 21 December 2020
China Total Return Bond FundClass I3 Acc USD USD 1 July 2020
Dragon Growth FundClassAA (AUD Hedged) MDIST (G) AUD USD 16 February 2021Class I3 Acc USD USD 1 July 2020Class I5 Acc USD USD 21 December 2020Class I5 (GBP) Acc GBP USD 8 June 2021Class I6 Acc USD USD 21 December 2020
Dynamic Leaders Fund*Class I Acc USD USD 4 December 2020Class I3 Acc USD USD 4 December 2020Class I3 Inc USD USD 4 December 2020Class I7 Acc USD USD 21 May 2021
European Growth FundClass I3 Acc USD USD 1 July 2020
Investment Grade Preferred Securities Income Fund*Class AA USD USD 24 March 2021Class AA Acc USD USD 24 March 2021Class AA (USD) MDIST (G) USD USD 24 March 2021Class I Acc USD USD 24 March 2021Class I3 Acc USD USD 24 March 2021
* Refer to note 13
11
Directors’ Report
M A N U L I F E G L O B A L F U N D
Sub-Fund and Share ClassesShare Class Currency
Sub-Fund Base Currency Launch Date
Preferred Securities Income FundClass AA Acc USD USD 4 May 2021Class I3 Acc USD USD 1 July 2020Class I5 (GBP Hedged) Acc GBP USD 8 June 2021
Sustainable Asia Bond Fund*Class AA Acc USD USD 6 August 2020Class AA (HKD) Acc HKD USD 3 May 2021Class AA (USD) MDIST (G) USD USD 6 August 2020Class AA (AUD Hedged) MDIST (G) AUD USD 6 August 2020Class AA (GBP Hedged) MDIST (G) GBP USD 3 May 2021Class AA (HKD) MDIST (G) HKD USD 3 May 2021Class AA (RMB Hedged) MDIST (G) CNH USD 3 May 2021Class AA (SGD Hedged) MDIST (G) SGD USD 6 August 2020Class I Acc USD USD 6 August 2020Class I (EUR Hedged) Acc EUR USD 6 August 2020Class I3 Acc USD USD 6 August 2020Class I5 Acc USD USD 21 December 2020Class I5 (CHF Hedged) Acc CHF USD 21 December 2020Class I5 (EUR Hedged) Acc EUR USD 21 December 2020Class I5 (GBP Hedged) Acc GBP USD 21 December 2020Class I6 Acc USD USD 21 December 2020Class I6 (EUR Hedged) Acc EUR USD 21 May 2021Class P (HKD) MDIST (G) HKD USD 6 August 2020
U.S. Bond FundClass AA (USD) MDIST (G) USD USD 28 August 2020Class AA (HKD) MDIST (G) HKD USD 28 August 2020
d) Share Classes closed
Sub-Fund and Share ClassesShare Class Currency
Sub-Fund Base Currency Closed Date
Asia Pacific REIT FundClass P (USD) Inc USD USD 4 May 2021Class P (AUD Hedged) Inc AUD USD 4 May 2021
Asia Value Dividend Equity FundClass AA USD USD 30 June 2021Class AA Inc USD USD 30 June 2021
Asian High Yield FundClass AA Inc USD USD 30 April 2021Class AA (AUD Hedged) Inc AUD USD 30 April 2021Class AA (HKD) Inc HKD USD 30 April 2021Class AA (SGD Hedged) Inc SGD USD 30 April 2021Class AA (AUD Hedged) MDIST (G) AUD USD 30 April 2021Class P (USD) MDIST (G) USD USD 30 April 2021Class P (HKD) MDIST (G) HKD USD 30 April 2021Class P (SGD Hedged) MDIST (G) SGD USD 30 April 2021
China Total Return Bond FundClass AA (SGD Hedged) Inc SGD USD 5 May 2021Class AA (SGD Hedged) MDIST (G) SGD USD 5 May 2021Class P (USD) Inc USD USD 3 May 2021Class P (USD) MDIST (G) USD USD 3 May 2021
European Growth FundClass I USD USD 20 January 2021
c) Share Classes launched (continued)
* Refer to note 13
12
Directors’ Report
M A N U L I F E G L O B A L F U N D
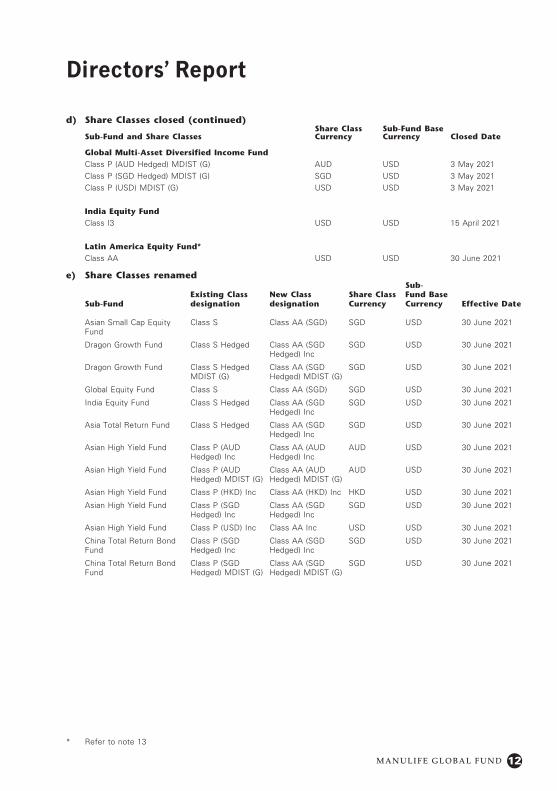
d) Share Classes closed (continued)
Sub-Fund and Share ClassesShare Class Currency
Sub-Fund Base Currency Closed Date
Global Multi-Asset Diversified Income FundClass P (AUD Hedged) MDIST (G) AUD USD 3 May 2021Class P (SGD Hedged) MDIST (G) SGD USD 3 May 2021Class P (USD) MDIST (G) USD USD 3 May 2021
India Equity FundClass I3 USD USD 15 April 2021
Latin America Equity Fund*Class AA USD USD 30 June 2021
e) Share Classes renamed
Sub-FundExisting Class designation
New Class designation
Share Class Currency
Sub-Fund Base Currency Effective Date
Asian Small Cap Equity Fund
Class S Class AA (SGD) SGD USD 30 June 2021
Dragon Growth Fund Class S Hedged Class AA (SGD Hedged) Inc
SGD USD 30 June 2021
Dragon Growth Fund Class S Hedged MDIST (G)
Class AA (SGD Hedged) MDIST (G)
SGD USD 30 June 2021
Global Equity Fund Class S Class AA (SGD) SGD USD 30 June 2021
India Equity Fund Class S Hedged Class AA (SGD Hedged) Inc
SGD USD 30 June 2021
Asia Total Return Fund Class S Hedged Class AA (SGD Hedged) Inc
SGD USD 30 June 2021
Asian High Yield Fund Class P (AUD Hedged) Inc
Class AA (AUD Hedged) Inc
AUD USD 30 June 2021
Asian High Yield Fund Class P (AUD Hedged) MDIST (G)
Class AA (AUD Hedged) MDIST (G)
AUD USD 30 June 2021
Asian High Yield Fund Class P (HKD) Inc Class AA (HKD) Inc HKD USD 30 June 2021
Asian High Yield Fund Class P (SGD Hedged) Inc
Class AA (SGD Hedged) Inc
SGD USD 30 June 2021
Asian High Yield Fund Class P (USD) Inc Class AA Inc USD USD 30 June 2021
China Total Return Bond Fund
Class P (SGD Hedged) Inc
Class AA (SGD Hedged) Inc
SGD USD 30 June 2021
China Total Return Bond Fund
Class P (SGD Hedged) MDIST (G)
Class AA (SGD Hedged) MDIST (G)
SGD USD 30 June 2021
* Refer to note 13
13
Directors’ Report
M A N U L I F E G L O B A L F U N D
ROLE AND RESPONSIBILITY OF THE BOARD OF DIRECTORS
The responsibility of the Board is governed exclusively by Luxembourg law. With respect to the annual accounts of the Company, the duties of the Directors are governed by the law of 10 December 2010 on, inter alia, the accounting and annual accounts of undertakings for collective investment and by the law of 17 December 2010, as amended, relating to undertakings for collective investment. Pursuant to the Amended and Restated Management Company Services Agreement, the Management Company is entrusted with the day-to-day management of the Company, with the responsibility to perform directly or by way of delegation operational functions relating to the investment management and the administration of the Company and the marketing and distribution of the Shares. In agreement with the Company, the Management Company has decided to delegate several of its functions as is further described in the Prospectus. All other matters in relation to the Company are reserved for approval by the Board. The matters reserved for the Board include determination of each Sub-Fund’s investment objective and policies, investment restrictions and powers, amendments to the Prospectus, reviewing and approving key investment and financial data, including the annual accounts, as well as the appointment of, and review of the services provided by, the Management Company, Auditor and Depositary. Prior to each Board meeting the Directors receive detailed and timely information allowing them to be prepared for the items under discussion during the meeting. For each meeting the Board requests, and receives, reports from, amongst others, the Management Company, the investment managers, the Administrator, the Depositary and the risk manager as well as proposals for changes to existing Sub-Funds or proposals to launch new ones as appropriate. Senior representatives of each of these functions attend Board meetings by invitation to enable the Directors to question the reports presented to them. The Directors take decisions in the interests of the Company and its shareholders as a whole and refrain from taking part in any deliberation or decision which creates a conflict of interest between their personal interests and those of the Company and its shareholders. The Board can take independent professional advice if necessary and at the Company’s expense.
CORPORATE GOVERNANCE AND ALFI CODE OF CONDUCT
The Board is responsible for ensuring that a high level of corporate governance is met and considers that the Fund has complied with the best practices in the Luxembourg funds industry.
In particular the Board has adopted the ALFI Code of Conduct (the “Code”) which sets out principles of good governance.
The Board considers that the Fund has been in compliance with the principles of the Code in all material aspects throughout the financial year ended 30 June 2021. The Board undertakes an annual review of ongoing compliance with the principles of the Code.
14
Directors’ Report
M A N U L I F E G L O B A L F U N D
INFORMATION ON BOARD MEMBERS INCLUDING QUALIFICATIONS AND RELEVANT CAREER EXPERIENCE
Paul Smith, FCA, CFA, MA (Chairman)
Mr Paul Smith is an independent Non-Executive Director and a member of the Board since January 2014. He has significant experience in the Financial Services and Investment Fund industries.
He served as President and CEO of CFA Institute from January 2015 to September 2019. Previously he owned and managed Asia Alternative Asset Partners, a Hong Kong based Hedge Fund Management Group where he acted as Responsible Officer holding Types 1, 4 and 9 Licenses under the Hong Kong Securities and Futures Commission’s rules.
He first came to Hong Kong (where he currently resides) in 1996 to run Bank of Bermuda’s securities servicing business and on sale to HSBC, acted as the Global Head of HSBC’s alternative funds servicing business.
From 1984 to 1995 he worked for Ermitage International, a European fund manager, spending the last seven years as CEO.
He started his career as an auditor at Pricewaterhouse in London.
He currently serves as a member of the Oversight, Policy and Governance Committee of the Financial Reporting Council of Hong Kong and as a member of Hong Kong Securities and Futures Commission’s Products Advisory Committee.
Mr Paul Smith is a Fellow of the Chartered Accountants of England and Wales, a Chartered Financial Analyst and holds a Master of Arts degree from Oxford University.
He has lived and worked for extended periods of time in the UK, USA, France, and Hong Kong.
Christakis Partassides, BSc, MBA, University of Manchester, UK
Mr Christakis Partassides is an independent Non-Executive Director and a member of the Board since October 2006. He is a resident of Cyprus and his career of 45 years’ spans banking, consultancy, industry, and commerce.
He has worked for the Cyprus Development Bank as a loans officer and on their behalf undertook several consultancy assignments in the private and public sectors. He was General Manager of Cyprus based manufacturing companies in the 1980s. He achieved the restructure and return of companies under his management to profitability, as well as introduced new technologies through knowhow and licencing agreements with international leaders in their field. His consultancy assignments aimed to assist clients to strategically reposition themselves and to develop their businesses in a direction that would ensure longer term viability.
He was also the owner and manager of Ph. Partassides & Co. Ltd, one of the leading importers and distributors of musical instruments in Cyprus until he sold the business in April 2018. In this capacity he had close business and personal relations with leading international firms in the field of Music.
Mr Christakis Partassides acted as counsel to owner and managers of several Cypriot companies in an assignment from the Cyprus Human Resource Development Authority. He has served on the Boards of several industrial associations and public sector entities. He is currently the vice chairman of the Appeals Committee of the Cyprus Advertising Regulation Organisation and a Director of the Cyprus India Business Association, an affiliate of the Cyprus Chamber of Commerce and Industry.
15
Directors’ Report
M A N U L I F E G L O B A L F U N D
Dr Yves Wagner
Dr Yves Wagner is an independent Non-Executive Director and a member of the Board since October 2007.
Dr Yves Wagner holds a “Doctorates Sciences Economiques” (PhD) from the University of Aix-Marseille III, France. He started his career as a teacher at the University of Aix-Marseille, and as a “Professeur – Associe” at the University of Perpignan. He started his non-academic career with Banque Generate du Luxembourg where he became Director of Asset Management, before becoming the Chief Executive Officer and Board member of Fortis Investments, Luxembourg. He finally left the Fortis Group to start “The Directors’ Office”. He continued to be active in the academic field, teaching at different Universities and Business Schools, being Board member of the “Centre Universitaire” (Luxembourg), publishing Research Papers, and teaching in professional institutes (“Institut de Formation Bancaire”, IFBL, “Agence pour le Transfert de Technologies Financieres”, ATTF, and the “Academie Bancaire Europeenne” (ABE) where he became President). He has been an advisor to the Luxembourg School of Finance (LSF), a business school of the University of Luxembourg. Dr Yves Wagner for many years was the Chairman of the Luxembourg Society of Financial Analysts (ALGAFI) and Board Member of the European Federation of Financial Analysts Societies (EFF AS).
Gianni Fiacco, CPA, CA
Mr Gianni Fiacco is an Executive Director and member of the Board since July 2015.
Mr Gianni Fiacco serves on the Boards of Manulife Investment Management’s subsidiaries in Malaysia, Indonesia, Philippines, and India. He is a Chartered Professional Accountant (Canada).
Prior to joining Manulife Investment Management (formerly known as Manulife Asset Management), Mr Gianni Fiacco served as Regional Controller, Asia for Manulife Financial. Before joining Manulife, he worked with PricewaterhouseCoopers LLP in their Audit and Assurance Services group.
John Li
Mr John Li is an independent Non-Executive Director and a member of the Board since October 2018. Mr John Li is a Partner of The Directors’ Office, the leading practice of independent Directors in Luxembourg. He trained and qualified as a Chartered accountant in the UK and moved to Luxembourg in 1987. During the last 35 years Mr John Li has worked essentially in the Financial sector auditing and advising clients such as Banks, Investment Funds, Insurance companies, etc. Mr John Li has extensive experience in dealing with global and international companies with Head offices based in the US, Japan, and the EU. He was a Partner at KPMG Luxembourg for more than 20 years during which he was Managing Partner for 8 years (2000-2008) before taking on the role of Chairman of the Supervisory Board for 3 years (2008-2011). He was also a member of the Leadership team of the Global Investment Management Practice in KPMG. He also has 6 years of experience in London before moving to Luxembourg in 1987.
Bernard Letendre
Mr Bernard Letendre is an Executive Director and a member of the Board since February 2021.
Mr Bernard Letendre began his career in 1995 and joined Manulife in 2009. He is currently the Global Head of Strategy and Product, Manulife Investment Management. Mr Bernard Letendre is responsible for the firm’s global investment product portfolio as well as having overall accountability for strategy for the global wealth and asset management business. Previously, he oversaw the firm’s wealth and asset management business in Canada, one of three key regions in which Manulife Investment Management operates globally. Prior to that, he was the managing director of Manulife Private Wealth and held leadership positions at BMO Private Banking, Standard Life, and Investors Group.
Mr Bernard Letendre is a member of the Bar of Quebec, is the co-executive sponsor of Manulife’s employee resource group, being yourself: your mental well-being, and has sponsored Manulife’s Global Women’s Alliance network.
He has L.L.B. & L.L.M. degrees, Law from the University of Montreal.
16
Audit Report
M A N U L I F E G L O B A L F U N D
To the Shareholders ofManulife Global Fund
Our opinion
In our opinion, the accompanying financial statements give a true and fair view of the financial position of Manulife Global Fund (the “Fund”) and of each of its sub-funds as at 30 June 2021, and of the results of their operations and changes in their net assets for the year then ended in accordance with Luxembourg legal and regulatory requirements relating to the preparation and presentation of the financial statements.
What we have audited
The Fund’s financial statements comprise:
• the statement of net assets as at 30 June 2021;
• the portfolio of investments as at 30 June 2021;
• the statement of operations for the year then ended;
• the statement of changes in net assets for the year then ended; and
• the notes to the financial statements, which include a summary of significant accounting policies.
Basis for opinion
We conducted our audit in accordance with the Law of 23 July 2016 on the audit profession (Law of 23 July 2016) and with International Standards on Auditing (ISAs) as adopted for Luxembourg by the “Commission de Surveillance du Secteur Financier” (CSSF). Our responsibilities under the Law of 23 July 2016 and ISAs as adopted for Luxembourg by the CSSF are further described in the “Responsibilities of the “Réviseur d’entreprises agréé” for the audit of the financial statements” section of our report.
We believe that the audit evidence we have obtained is sufficient and appropriate to provide a basis for our opinion.
We are independent of the Fund in accordance with the International Code of Ethics for Professional Accountants, including International Independence Standards, issued by the International Ethics Standards Board for Accountants (IESBA Code) as adopted for Luxembourg by the CSSF together with the ethical requirements that are relevant to our audit of the financial statements. We have fulfilled our other ethical responsibilities under those ethical requirements.
PricewaterhouseCoopers, Société coopérative, 2 rue Gerhard Mercator, B.P. 1443, L-1014 LuxembourgT : +352 494848 1, F : +352 494848 2900, www.pwc.lu
Cabinet de révision agréé. Expert-comptable (autorisation gouvernementale n°10028256)R.C.S. Luxembourg B 65 477 - TVA LU25482518
17
Audit Report
M A N U L I F E G L O B A L F U N D
Other information
The Board of Directors of the Fund is responsible for the other information. The other information comprises the information stated in the annual report but does not include the financial statements and our audit report thereon.
Our opinion on the financial statements does not cover the other information and we do not express any form of assurance conclusion thereon.
In connection with our audit of the financial statements, our responsibility is to read the other information identified above and, in doing so, consider whether the other information is materially inconsistent with the financial statements or our knowledge obtained in the audit, or otherwise appears to be materially misstated. If, based on the work we have performed, we conclude that there is a material misstatement of this other information, we are required to report that fact. We have nothing to report in this regard.
Responsibilities of the Board of Directors of the Fund for the financial statements
The Board of Directors of the Fund is responsible for the preparation and fair presentation of the financial statements in accordance with Luxembourg legal and regulatory requirements relating to the preparation and presentation of the financial statements, and for such internal control as the Board of Directors of the Fund determines is necessary to enable the preparation of financial statements that are free from material misstatement, whether due to fraud or error.
In preparing the financial statements, the Board of Directors of the Fund is responsible for assessing the Fund’s and each of its sub-funds’ ability to continue as a going concern, disclosing, as applicable, matters related to going concern and using the going concern basis of accounting unless the Board of Directors of the Fund either intends to liquidate the Fund or close any of its sub-funds or to cease operations, or has no realistic alternative but to do so.
Responsibilities of the “Réviseur d’entreprises agréé” for the audit of the financial statements
The objectives of our audit are to obtain reasonable assurance about whether the financial statements as a whole are free from material misstatement, whether due to fraud or error, and to issue an audit report that includes our opinion. Reasonable assurance is a high level of assurance, but is not a guarantee that an audit conducted in accordance with the Law of 23 July 2016 and with ISAs as adopted for Luxembourg by the CSSF will always detect a material misstatement when it exists. Misstatements can arise from fraud or error and are considered material if, individually or in the aggregate, they could reasonably be expected to influence the economic decisions of users taken on the basis of these financial statements.
As part of an audit in accordance with the Law of 23 July 2016 and with ISAs as adopted for Luxembourg by the CSSF, we exercise professional judgment and maintain professional scepticism throughout the audit. We also:
• identify and assess the risks of material misstatement of the financial statements, whether due to fraud or error, design and perform audit procedures responsive to those risks, and obtain audit evidence that is sufficient and appropriate to provide a basis for our opinion. The risk of not detecting a material misstatement resulting from fraud is higher than for one resulting from error, as fraud may involve collusion, forgery, intentional omissions, misrepresentations, or the override of internal control;
18
Audit Report
M A N U L I F E G L O B A L F U N D
• obtain an understanding of internal control relevant to the audit in order to design audit procedures that are appropriate in the circumstances, but not for the purpose of expressing an opinion on the effectiveness of the Fund’s internal control;
• evaluate the appropriateness of accounting policies used and the reasonableness of accounting estimates and related disclosures made by the Board of Directors of the Fund;
• conclude on the appropriateness of the Board of Directors of the Fund’s use of the going concern basis of accounting and, based on the audit evidence obtained, whether a material uncertainty exists related to events or conditions that may cast significant doubt on the Fund’s or any of its sub-funds’ ability to continue as a going concern. If we conclude that a material uncertainty exists, we are required to draw attention in our audit report to the related disclosures in the financial statements or, if such disclosures are inadequate, to modify our opinion. Our conclusions are based on the audit evidence obtained up to the date of our audit report. However, future events or conditions may cause the Fund or any of its sub-funds to cease to continue as a going concern;
• evaluate the overall presentation, structure and content of the financial statements, including the disclosures, and whether the financial statements represent the underlying transactions and events in a manner that achieves fair presentation.
We communicate with those charged with governance regarding, among other matters, the planned scope and timing of the audit and significant audit findings, including any significant deficiencies in internal control that we identify during our audit.
PricewaterhouseCoopers, Société coopérative Luxembourg, 8 September 2021Represented by
Christelle Crépin
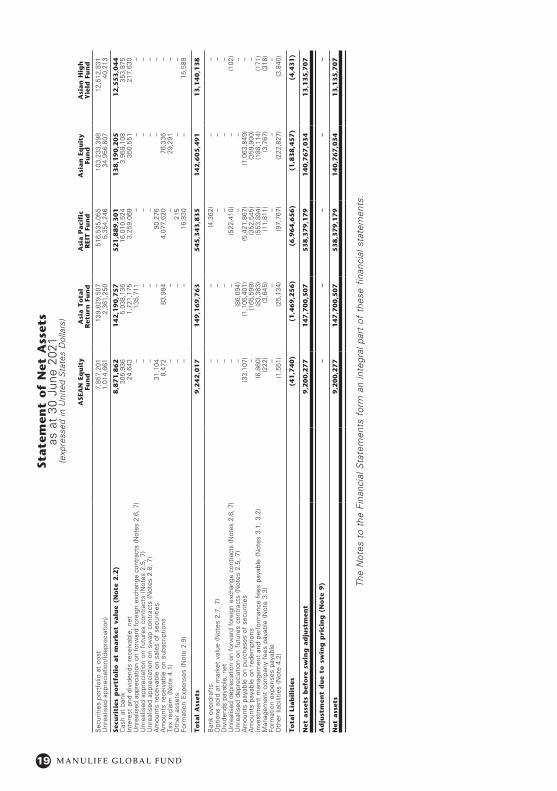
19 M A N U L I F E G L O B A L F U N D
State
men
t o
f N
et A
sset
sas
at
30 J
une
2021
(exp
ress
ed in
Uni
ted
Sta
tes
Dol
lars
)
ASE
AN
Eq
uit
y Fu
nd
Asi
a T
ota
l R
etu
rn F
un
dA
sia P
aci
fic
R
EIT
Fu
nd
Asi
an
Eq
uit
y Fu
nd
Asi
an
Hig
h
Yie
ld F
un
d
Sec
uriti
es p
ortf
olio
at
cost
7,85
7,20
113
9,82
9,50
751
6,53
5,05
510
3,23
3,39
812
,512
,831
Unr
ealis
ed a
ppre
ciat
ion/
(dep
reci
atio
n)1,
014,
661
2,36
1,25
05,
354,
246
34,9
56,8
0740
,213
Secu
riti
es p
ort
foli
o a
t m
ark
et v
alu
e (N
ote
2.2
)8
,87
1,8
62
14
2,1
90
,75
75
21
,88
9,3
01
13
8,1
90
,20
51
2,5
53
,04
4C
ash
at b
ank
305,
936
5,03
8,13
6 16
,010
,524
3,95
9,10
835
3,87
5In
tere
st a
nd d
ivid
ends
rec
eiva
ble,
net
24,6
431,
721,
175
3,25
9,06
935
0,55
121
7,63
0U
nrea
lised
app
reci
atio
n on
for
war
d fo
reig
n ex
chan
ge c
ontr
acts
(N
otes
2.6
, 7)
–13
5,71
1–
––
Unr
ealis
ed a
ppre
ciat
ion
on f
utur
es c
ontr
acts
(N
otes
2.5
, 7)
––
––
–U
nrea
lised
app
reci
atio
n on
sw
ap c
ontr
acts
(N
otes
2.8
, 7)
––
––
–A
mou
nts
rece
ivab
le o
n sa
les
of s
ecur
ities
31,1
04–
90,2
76–
–A
mou
nts
rece
ivab
le o
n su
bscr
iptio
ns8,
472
83,9
844,
077,
620
76,3
36–
Tax
recl
aim
(N
ote
4.1)
––
–29
,291
–O
ther
ass
ets
––
215
––
Form
atio
n E
xpen
ses
(Not
e 2.
9)–
–16
,830
–15
,589
To
tal
Ass
ets
9,2
42
,01
71
49
,16
9,7
63
54
5,3
43
,83
51
42
,60
5,4
91
13
,14
0,1
38
Ban
k ov
erdr
afts
––
(4,3
62)
––
Opt
ions
sol
d at
mar
ket
valu
e (N
otes
2.7
, 7)
––
––
–D
ivid
ends
pay
able
, ne
t–
––
––
Unr
ealis
ed d
epre
ciat
ion
on f
orw
ard
fore
ign
exch
ange
con
trac
ts (
Not
es 2
.6,
7)–
–(5
22,4
10)
–(1
02)
Unr
ealis
ed d
epre
ciat
ion
on f
utur
es c
ontr
acts
(N
otes
2.5
, 7)
–(8
6,09
4)–
––
Am
ount
s pa
yabl
e on
pur
chas
es o
f se
curit
ies
(33,
107)
(1,1
05,4
01)
(5,4
21,8
67)
(1,0
63,8
49)
–A
mou
nts
paya
ble
on r
edem
ptio
ns–
(165
,599
)(3
52,5
45)
(359
,900
)–
Inve
stm
ent
man
agem
ent
and
perf
orm
ance
fee
s pa
yabl
e (N
otes
3.1
, 3.
2)(6
,860
)(8
3,38
3)(5
53,8
94)
(188
,114
)(1
71)
Man
agem
ent
com
pany
fee
s pa
yabl
e (N
ote
3.3)
(222
)(3
,645
)(1
1,81
1)(3
,767
)(3
18)
Form
atio
n ex
pens
es p
ayab
le–
––
––
Oth
er li
abili
ties
(Not
e 4.
2)(1
,551
)(2
5,13
4)(9
7,76
7)(2
22,8
27)
(3,8
40)
To
tal
Liab
ilit
ies
(41
,74
0)
(1,4
69
,25
6)
(6,9
64
,65
6)
(1,8
38
,45
7)
(4,4
31
)
Net
ass
ets
bef
ore
sw
ing
ad
just
men
t 9
,20
0,2
77
1
47
,70
0,5
07
5
38
,37
9,1
79
1
40
,76
7,0
34
1
3,1
35
,70
7
Ad
just
men
t d
ue
to s
win
g p
rici
ng
(N
ote
9)
–
–
–
–
–
Net
ass
ets
9,2
00
,27
7
14
7,7
00
,50
7
53
8,3
79
,17
9
14
0,7
67
,03
4
13
,13
5,7
07
The
Not
es t
o th
e Fi
nanc
ial S
tate
men
ts f
orm
an
inte
gral
par
t of
the
se f
inan
cial
sta
tem
ents
.
20M A N U L I F E G L O B A L F U N D
State
men
t o
f N
et A
sset
s (c
ontin
ued)
as a
t 30
Jun
e 20
21(e
xpre
ssed
in U
nite
d S
tate
s D
olla
rs)
Asi
an
Sm
all
C
ap
Eq
uit
y
Fun
d
Ch
ina T
ota
l R
etu
rn B
on
d
Fun
dC
hin
a V
alu
e Fu
nd
Dra
go
n
Gro
wth
Fu
nd
Dyn
am
ic
Lead
ers
Fun
d*
Emer
gin
g
East
ern
Eu
rop
e Fu
nd
Sec
uriti
es p
ortf
olio
at
cost
113,
218,
252
35,4
93,0
6559
4,37
9,07
640
7,42
0,47
54,
970,
105
135,
961,
414
Unr
ealis
ed a
ppre
ciat
ion/
(dep
reci
atio
n)36
,718
,652
982,
540
318,
720,
542
182,
218,
517
803,
870
23,0
37,0
14
Secu
riti
es p
ort
foli
o a
t m
ark
et v
alu
e (N
ote
2.2
)1
49
,93
6,9
04
36
,47
5,6
05
91
3,0
99
,61
85
89
,63
8,9
92
5,7
73
,97
51
58
,99
8,4
28
Cas
h at
ban
k5,
305,
990
1,22
9,23
314
,324
,968
16
,587
,950
82,4
801,
554,
417
Inte
rest
and
div
iden
ds r
ecei
vabl
e, n
et75
,034
574,
505
1,53
7,26
886
4,10
32,
825
110,
874
Unr
ealis
ed a
ppre
ciat
ion
on f
orw
ard
fore
ign
exch
ange
con
trac
ts (
Not
es 2
.6,
7)–
––
––
–U
nrea
lised
app
reci
atio
n on
fut
ures
con
trac
ts (
Not
es 2
.5,
7)–
––
––
–U
nrea
lised
app
reci
atio
n on
sw
ap c
ontr
acts
(N
otes
2.8
, 7)
––
––
––
Am
ount
s re
ceiv
able
on
sale
s of
sec
uriti
es63
2,27
3–
12,7
09,8
548,
078,
529
–30
2,94
8A
mou
nts
rece
ivab
le o
n su
bscr
iptio
ns25
4,82
41,
933
90,1
4848
3,22
4–
21,1
17Ta
x re
clai
m (
Not
e 4.
1)21
6,82
0–
––
–72
,137
Oth
er a
sset
s–
––
––
–Fo
rmat
ion
Exp
ense
s (N
ote
2.9)
–13
,396
––
13,3
40–
To
tal
Ass
ets
15
6,4
21
,84
53
8,2
94
,67
2
94
1,7
61
,85
6
61
5,6
52
,79
85
,87
2,6
20
16
1,0
59
,92
1
Ban
k ov
erdr
afts
––
––
–(4
19)
Opt
ions
sol
d at
mar
ket
valu
e (N
otes
2.7
, 7)
––
––
––
Div
iden
ds p
ayab
le,
net
––
––
––
Unr
ealis
ed d
epre
ciat
ion
on f
orw
ard
fore
ign
exch
ange
con
trac
ts (
Not
es 2
.6,
7)–
(654
)(2
,393
)(1
,793
)–
–U
nrea
lised
dep
reci
atio
n on
fut
ures
con
trac
ts (
Not
es 2
.5,
7)–
––
––
–A
mou
nts
paya
ble
on p
urch
ases
of
secu
ritie
s(2
50,3
12)
(323
,000
)(7
,536
,489
)(3
,148
,549
)–
–A
mou
nts
paya
ble
on r
edem
ptio
ns(6
94,5
67)
–(1
,231
,377
)(1
,858
,672
)–
(416
,228
)In
vest
men
t m
anag
emen
t an
d pe
rfor
man
ce f
ees
paya
ble
(Not
es 3
.1,
3.2)
(201
,518
)(3
2,90
6)(1
,149
,571
)(7
80,6
96)
(1)
(213
,767
)M
anag
emen
t co
mpa
ny f
ees
paya
ble
(Not
e 3.
3)(3
,545
)(8
87)
(22,
107)
(14,
247)
(96)
(4,0
02)
Form
atio
n ex
pens
es p
ayab
le–
(8,4
80)
––
––
Oth
er li
abili
ties
(Not
e 4.
2)(5
01,9
58)
(9,1
65)
(181
,413
)(1
11,9
99)
(665
)(3
5,69
9)
To
tal
Liab
ilit
ies
(1,6
51
,90
0)
(37
5,0
92
)(1
0,1
23
,35
0)
(5,9
15
,95
6)
(76
2)
(67
0,1
15
)
Net
ass
ets
bef
ore
sw
ing
ad
just
men
t 1
54
,76
9,9
45
3
7,9
19
,58
09
31
,63
8,5
06
60
9,7
36
,84
25
,87
1,8
58
16
0,3
89
,80
6
Ad
just
men
t d
ue
to s
win
g p
rici
ng
(N
ote
9)
–
––
––
–
Net
ass
ets
15
4,7
69
,94
5
37
,91
9,5
80
93
1,6
38
,50
66
09
,73
6,8
42
5,8
71
,85
81
60
,38
9,8
06
The
Not
es t
o th
e Fi
nanc
ial S
tate
men
ts f
orm
an
inte
gral
par
t of
the
se f
inan
cial
sta
tem
ents
.*
Ref
er t
o no
te 1
3

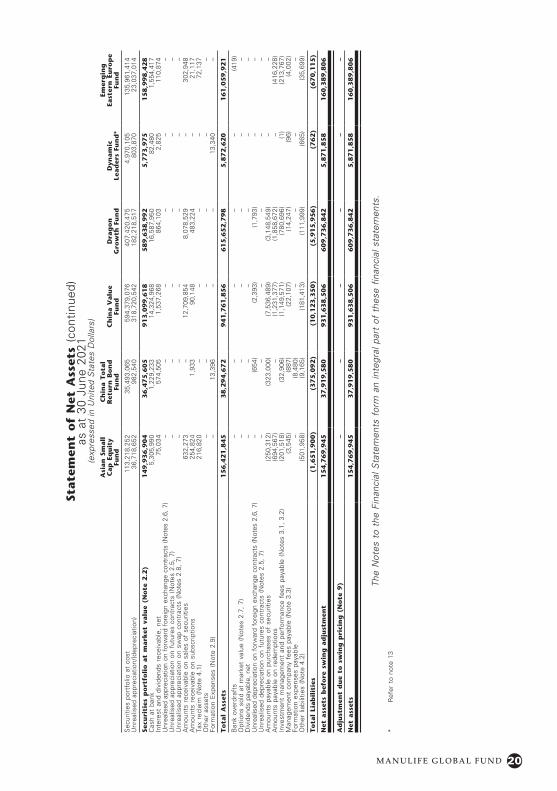
21 M A N U L I F E G L O B A L F U N D
State
men
t o
f N
et A
sset
s (c
ontin
ued)
as a
t 30
Jun
e 20
21(e
xpre
ssed
in U
nite
d S
tate
s D
olla
rs)
Euro
pea
n
Gro
wth
Fu
nd
Glo
bal
Eq
uit
y Fu
nd
Glo
bal
M
ult
i-A
sset
D
iver
sifi
ed
Inco
me
Fun
dG
lob
al
REI
T
Fun
dG
lob
al
R
eso
urc
es F
un
dH
ealt
hca
re
Fun
d
Sec
uriti
es p
ortf
olio
at
cost
73,7
59,0
8919
7,75
5,46
726
2,78
1,27
413
,221
,859
29,8
51,5
3424
9,47
9,72
1U
nrea
lised
app
reci
atio
n/(d
epre
ciat
ion)
24,3
10,6
1350
,440
,419
15,5
71,0
074,
157,
446
6,08
3,07
185
,047
,000
Secu
riti
es p
ort
foli
o a
t m
ark
et v
alu
e (N
ote
2.2
)9
8,0
69
,70
22
48
,19
5,8
86
27
8,3
52
,28
11
7,3
79
,30
53
5,9
34
,60
53
34
,52
6,7
21
Cas
h at
ban
k59
6,91
762
6,47
730
,406
,828
174,
191
11,5
377,
965,
520
Inte
rest
and
div
iden
ds r
ecei
vabl
e, n
et64
,971
490,
790
2,29
3,98
980
,840
28,0
3315
5,10
6U
nrea
lised
app
reci
atio
n on
for
war
d fo
reig
n ex
chan
ge c
ontr
acts
(N
otes
2.6
, 7)
––
––
––
Unr
ealis
ed a
ppre
ciat
ion
on f
utur
es c
ontr
acts
(N
otes
2.5
, 7)
––
43,3
95–
––
Unr
ealis
ed a
ppre
ciat
ion
on s
wap
con
trac
ts (
Not
es 2
.8,
7)–
–1,
819,
336
––
–A
mou
nts
rece
ivab
le o
n sa
les
of s
ecur
ities
481,
083
––
––
–A
mou
nts
rece
ivab
le o
n su
bscr
iptio
ns52
,971
33,6
1214
,638
,391
70,6
4764
,375
448,
826
Tax
recl
aim
(N
ote
4.1)
183,
358
9,85
510
,917
2,76
711
,564
–O
ther
ass
ets
––
––
––
Form
atio
n E
xpen
ses
(Not
e 2.
9)–
–23
,354
––
–
To
tal
Ass
ets
99
,44
9,0
02
24
9,3
56
,62
03
27
,58
8,4
91
17
,70
7,7
50
36
,05
0,1
14
34
3,0
96
,17
3
Ban
k ov
erdr
afts
–(2
7)(1
,230
,110
)(6
53)
––
Opt
ions
sol
d at
mar
ket
valu
e (N
otes
2.7
, 7)
––
(208
,082
)–
––
Div
iden
ds p
ayab
le,
net
––
––
––
Unr
ealis
ed d
epre
ciat
ion
on f
orw
ard
fore
ign
exch
ange
con
trac
ts (
Not
es 2
.6,
7)–
(26,
501)
(153
,604
)–
––
Unr
ealis
ed d
epre
ciat
ion
on f
utur
es c
ontr
acts
(N
otes
2.5
, 7)
––
––
––
Am
ount
s pa
yabl
e on
pur
chas
es o
f se
curit
ies
(118
,263
)–
(1,0
47,7
17)
––
–A
mou
nts
paya
ble
on r
edem
ptio
ns(5
7,76
0)(1
04,0
57)
(662
,831
)(7
2,40
6)(7
6,63
2)(6
43,5
26)
Inve
stm
ent
man
agem
ent
and
perf
orm
ance
fee
s pa
yabl
e (N
otes
3.1
, 3.
2)(1
21,7
10)
(313
,202
)(3
63,1
98)
(20,
529)
(54,
726)
(476
,759
)M
anag
emen
t co
mpa
ny f
ees
paya
ble
(Not
e 3.
3)(2
,404
)(6
,039
)(6
,772
)(4
18)
(913
)(8
,064
)Fo
rmat
ion
expe
nses
pay
able
––
(9,5
54)
– –
–O
ther
liab
ilitie
s (N
ote
4.2)
(20,
089)
(48,
307)
(58,
836)
(4,0
32)
(7,3
56)
(63,
899)
To
tal
Liab
ilit
ies
(32
0,2
26
)(4
98
,13
3)
(3,7
40
,70
4)
(98
,03
8)
(13
9,6
27
)(1
,19
2,2
48
)
Net
ass
ets
bef
ore
sw
ing
ad
just
men
t9
9,1
28
,77
62
48
,85
8,4
87
32
3,8
47
,78
71
7,6
09
,71
23
5,9
10
,48
73
41
,90
3,9
25
Ad
just
men
t d
ue
to s
win
g p
rici
ng
(N
ote
9)
––
71
2,5
15
––
–
Net
ass
ets
99
,12
8,7
76
24
8,8
58
,48
73
24
,56
0,3
02
17
,60
9,7
12
35
,91
0,4
87
34
1,9
03
,92
5
The
Not
es t
o th
e Fi
nanc
ial S
tate
men
ts f
orm
an
inte
gral
par
t of
the
se f
inan
cial
sta
tem
ents
.
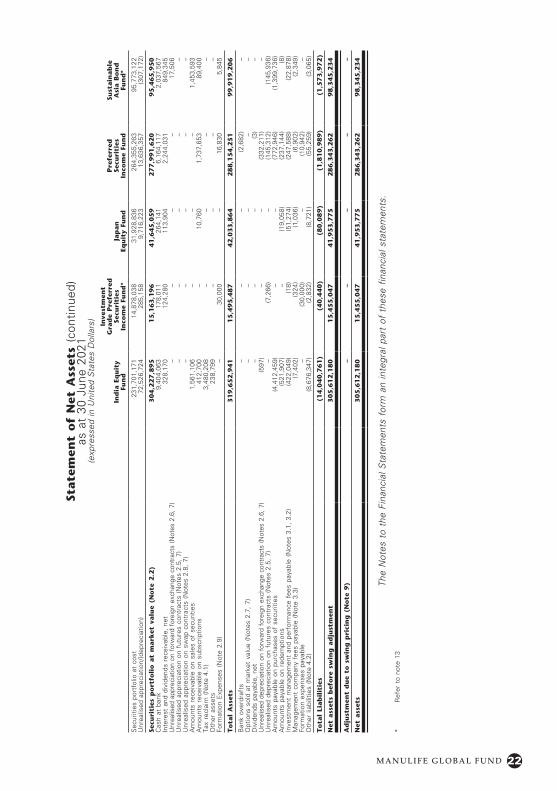
22M A N U L I F E G L O B A L F U N D
State
men
t o
f N
et A
sset
s (c
ontin
ued)
as a
t 30
Jun
e 20
21(e
xpre
ssed
in U
nite
d S
tate
s D
olla
rs)
Ind
ia E
qu
ity
Fun
d
Inve
stm
ent
Gra
de
Pre
ferr
ed
Secu
riti
es
Inco
me
Fun
d*
Jap
an
Eq
uit
y Fu
nd
Pre
ferr
ed
Secu
riti
es
Inco
me
Fun
d
Sust
ain
ab
le
Asi
a B
on
d
Fun
d*
Sec
uriti
es p
ortf
olio
at
cost
231,
701,
171
14,8
78,0
3831
,928
,836
264,
355,
263
95,7
73,1
22U
nrea
lised
app
reci
atio
n/(d
epre
ciat
ion)
72,5
26,7
2428
5,15
89,
716,
223
13,6
36,3
57(3
07,1
72)
Secu
riti
es p
ort
foli
o a
t m
ark
et v
alu
e (N
ote
2.2
)3
04
,22
7,8
95
15
,16
3,1
96
41
,64
5,0
59
27
7,9
91
,62
09
5,4
65
,95
0C
ash
at b
ank
9,40
4,06
317
8,01
126
4,14
16,
164,
117
2,03
7,56
7In
tere
st a
nd d
ivid
ends
rec
eiva
ble,
net
328,
170
124,
280
113,
904
2,24
4,03
184
9,34
5U
nrea
lised
app
reci
atio
n on
for
war
d fo
reig
n ex
chan
ge c
ontr
acts
(N
otes
2.6
, 7)
––
––
17,5
06U
nrea
lised
app
reci
atio
n on
fut
ures
con
trac
ts (
Not
es 2
.5,
7)–
––
––
Unr
ealis
ed a
ppre
ciat
ion
on s
wap
con
trac
ts (
Not
es 2
.8,
7)–
––
––
Am
ount
s re
ceiv
able
on
sale
s of
sec
uriti
es1,
561,
106
––
–1,
453,
593
Am
ount
s re
ceiv
able
on
subs
crip
tions
412,
700
–10
,760
1,73
7,65
389
,400
Tax
recl
aim
(N
ote
4.1)
3,48
0,20
8–
––
–O
ther
ass
ets
238,
799
––
––
Form
atio
n E
xpen
ses
(Not
e 2.
9)–
30,0
00–
16,8
30
5,84
5
To
tal
Ass
ets
31
9,6
52
,94
11
5,4
95
,48
74
2,0
33
,86
42
88
,15
4,2
51
99
,91
9,2
06
Ban
k ov
erdr
afts
––
–(2
,682
)–
Opt
ions
sol
d at
mar
ket
valu
e (N
otes
2.7
, 7)
––
––
–D
ivid
ends
pay
able
, ne
t–
––
(3)
–U
nrea
lised
dep
reci
atio
n on
for
war
d fo
reig
n ex
chan
ge c
ontr
acts
(N
otes
2.6
, 7)
(597
)–
–(3
32,2
11)
–U
nrea
lised
dep
reci
atio
n on
fut
ures
con
trac
ts (
Not
es 2
.5,
7)–
(7,2
66)
–(1
45,3
12)
(145
,936
)A
mou
nts
paya
ble
on p
urch
ases
of
secu
ritie
s(4
,412
,459
)–
–(7
72,9
46)
(1,3
99,7
36)
Am
ount
s pa
yabl
e on
red
empt
ions
(521
,907
)–
(19,
058)
(237
,144
)(8
)In
vest
men
t m
anag
emen
t an
d pe
rfor
man
ce f
ees
paya
ble
(Not
es 3
.1,
3.2)
(422
,049
)(1
8)(5
1,27
4)(2
47,5
88)
(22,
878)
Man
agem
ent
com
pany
fee
s pa
yabl
e (N
ote
3.3)
(7,4
02)
(324
)(1
,036
)(6
,902
)(2
,349
)Fo
rmat
ion
expe
nses
pay
able
–(3
0,00
0)–
(10,
942)
–O
ther
liab
ilitie
s (N
ote
4.2)
(8,6
76,3
47)
(2,8
32)
(8,7
21)
(55,
259)
(3,0
65)
To
tal
Liab
ilit
ies
(14
,04
0,7
61
)(4
0,4
40
)(8
0,0
89
)(1
,81
0,9
89
)(1
,57
3,9
72
)
Net
ass
ets
bef
ore
sw
ing
ad
just
men
t3
05
,61
2,1
80
15
,45
5,0
47
41
,95
3,7
75
28
6,3
43
,26
29
8,3
45
,23
4
Ad
just
men
t d
ue
to s
win
g p
rici
ng
(N
ote
9)
––
––
–
Net
ass
ets
30
5,6
12
,18
01
5,4
55
,04
74
1,9
53
,77
52
86
,34
3,2
62
98
,34
5,2
34
The
Not
es t
o th
e Fi
nanc
ial S
tate
men
ts f
orm
an
inte
gral
par
t of
the
se f
inan
cial
sta
tem
ents
.*
Ref
er t
o no
te 1
3
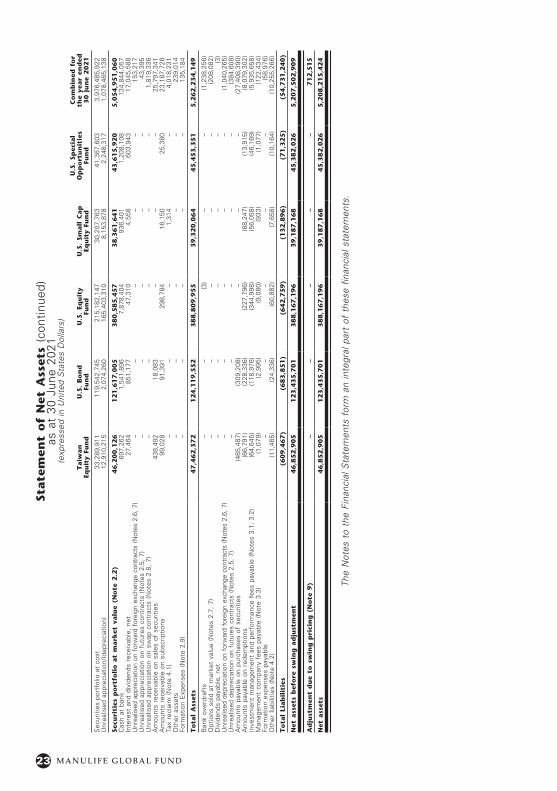
23 M A N U L I F E G L O B A L F U N D
State
men
t o
f N
et A
sset
s (c
ontin
ued)
as a
t 30
Jun
e 20
21(e
xpre
ssed
in U
nite
d S
tate
s D
olla
rs)
Taiw
an
Eq
uit
y Fu
nd
U.S
. B
on
d
Fun
dU
.S.
Equ
ity
Fu
nd
U.S
. Sm
all
Cap
Eq
uit
y Fu
nd
U.S
. Sp
ecia
l O
pp
ort
un
itie
s Fu
nd
Co
mb
ined
fo
r th
e ye
ar
end
ed
30
Ju
ne
20
21
Sec
uriti
es p
ortf
olio
at
cost
33,2
89,9
1111
9,54
2,74
521
5,18
2,14
730
,207
,763
41,3
67,6
033,
976,
485,
922
Unr
ealis
ed a
ppre
ciat
ion/
(dep
reci
atio
n)12
,910
,215
2,07
4,26
016
5,40
3,31
08,
153,
878
2,24
8,31
71,
078,
465,
138
Secu
riti
es p
ort
foli
o a
t m
ark
et v
alu
e (N
ote
2.2
)4
6,2
00
,12
61
21
,61
7,0
05
38
0,5
85
,45
73
8,3
61
,64
14
3,6
15
,92
05
,05
4,9
51
,06
0C
ash
at b
ank
697,
262
1,54
1,89
67,
878,
404
936,
401
1,20
8,10
813
4,84
4,05
7 In
tere
st a
nd d
ivid
ends
rec
eiva
ble,
net
27,4
6485
1,17
747
,310
4,55
860
3,94
317
,045
,588
Unr
ealis
ed a
ppre
ciat
ion
on f
orw
ard
fore
ign
exch
ange
con
trac
ts (
Not
es 2
.6,
7)–
––
––
153,
217
Unr
ealis
ed a
ppre
ciat
ion
on f
utur
es c
ontr
acts
(N
otes
2.5
, 7)
––
––
–43
,395
Unr
ealis
ed a
ppre
ciat
ion
on s
wap
con
trac
ts (
Not
es 2
.8,
7)–
––
––
1,81
9,33
6A
mou
nts
rece
ivab
le o
n sa
les
of s
ecur
ities
438,
492
18,0
83–
––
25,7
97,3
41A
mou
nts
rece
ivab
le o
n su
bscr
iptio
ns99
,028
91,3
9129
8,78
416
,150
25,3
8023
,187
,726
Tax
recl
aim
(N
ote
4.1)
––
–1,
314
–4,
018,
231
Oth
er a
sset
s–
––
––
239,
014
Form
atio
n E
xpen
ses
(Not
e 2.
9)–
––
––
135,
184
To
tal
Ass
ets
47
,46
2,3
72
12
4,1
19
,55
23
88
,80
9,9
55
39
,32
0,0
64
45
,45
3,3
51
5,2
62
,23
4,1
49
Ban
k ov
erdr
afts
––
(3)
––
(1,2
38,2
56)
Opt
ions
sol
d at
mar
ket
valu
e (N
otes
2.7
, 7)
––
––
–(2
08,0
82)
Div
iden
ds p
ayab
le,
net
––
––
–(3
)U
nrea
lised
dep
reci
atio
n on
for
war
d fo
reig
n ex
chan
ge c
ontr
acts
(N
otes
2.6
, 7)
––
––
–(1
,040
,265
)U
nrea
lised
dep
reci
atio
n on
fut
ures
con
trac
ts (
Not
es 2
.5,
7)–
––
––
(384
,608
)A
mou
nts
paya
ble
on p
urch
ases
of
secu
ritie
s(4
65,4
87)
(309
,208
)–
––
(27,
408,
390)
Am
ount
s pa
yabl
e on
red
empt
ions
(66,
791)
(228
,336
)(2
27,7
96)
(68,
247)
(13,
915)
(8,0
79,3
02)
Inve
stm
ent
man
agem
ent
and
perf
orm
ance
fee
s pa
yabl
e (N
otes
3.1
, 3.
2)(6
4,64
5)(1
18,9
76)
(344
,998
)(5
6,05
8)(4
6,16
9)(5
,935
,658
)M
anag
emen
t co
mpa
ny f
ees
paya
ble
(Not
e 3.
3)(1
,079
)(2
,995
)(9
,080
)(9
33)
(1,0
77)
(122
,434
)Fo
rmat
ion
expe
nses
pay
able
––
––
–(5
8,97
6)O
ther
liab
ilitie
s (N
ote
4.2)
(11,
465)
(24,
336)
(60,
882)
(7,6
58)
(10,
164)
(10,
255,
266)
To
tal
Liab
ilit
ies
(60
9,4
67
)(6
83
,85
1)
(64
2,7
59
)(1
32
,89
6)
(71
,32
5)
(54
,73
1,2
40
)
Net
ass
ets
bef
ore
sw
ing
ad
just
men
t4
6,8
52
,90
51
23
,43
5,7
01
38
8,1
67
,19
63
9,1
87
,16
84
5,3
82
,02
65
,20
7,5
02
,90
9
Ad
just
men
t d
ue
to s
win
g p
rici
ng
(N
ote
9)
––
––
–7
12
,51
5
Net
ass
ets
46
,85
2,9
05
12
3,4
35
,70
13
88
,16
7,1
96
39
,18
7,1
68
45
,38
2,0
26
5,2
08
,21
5,4
24
The
Not
es t
o th
e Fi
nanc
ial S
tate
men
ts f
orm
an
inte
gral
par
t of
the
se f
inan
cial
sta
tem
ents
.
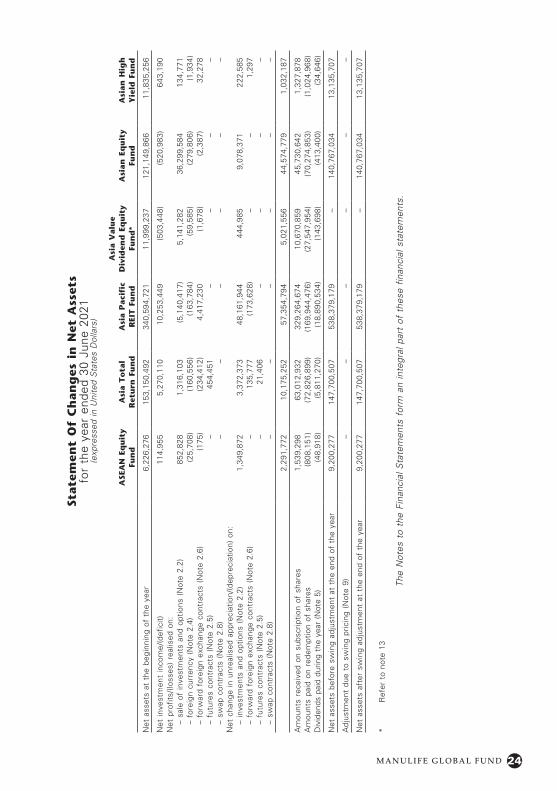
24M A N U L I F E G L O B A L F U N D
State
men
t O
f C
han
ges
in
Net
Ass
ets
for
the
year
end
ed 3
0 Ju
ne 2
021
(exp
ress
ed in
Uni
ted
Sta
tes
Dol
lars
)
ASE
AN
Eq
uit
y Fu
nd
Asi
a T
ota
l R
etu
rn F
un
dA
sia P
aci
fic
REI
T F
un
d
Asi
a V
alu
e D
ivid
end
Eq
uit
y Fu
nd
*A
sian
Eq
uit
y Fu
nd
Asi
an
Hig
h
Yie
ld F
un
d
Net
ass
ets
at t
he b
egin
ning
of
the
year
6,22
6,27
615
3,15
0,49
234
0,59
4,72
111
,999
,237
121,
149,
866
11,8
35,2
56
Net
inve
stm
ent
inco
me/
(def
icit)
114,
955
5,27
0,11
010
,253
,449
(503
,448
)(5
20,9
83)
643,
190
Net
pro
fits/
(loss
es)
real
ised
on:
–
sale
of
inve
stm
ents
and
opt
ions
(N
ote
2.2)
852,
828
1,31
6,10
3 (5
,140
,417
)5,
141,
282
36,2
99,5
8413
4,77
1
– fo
reig
n cu
rren
cy (
Not
e 2.
4)(2
5,70
8)(1
60,5
56)
(163
,784
)(5
9,58
5)(2
79,8
06)
(1,9
34)
–
forw
ard
fore
ign
exch
ange
con
trac
ts (
Not
e 2.
6)(1
75)
(234
,412
)4,
417,
230
(1,6
78)
(2,3
87)
32,2
78
– fu
ture
s co
ntra
cts
(Not
e 2.
5)–
454,
451
––
––
–
swap
con
trac
ts (
Not
e 2.
8)–
––
––
–N
et c
hang
e in
unr
ealis
ed a
ppre
ciat
ion/
(dep
reci
atio
n) o
n:
– in
vest
men
ts a
nd o
ptio
ns (
Not
e 2.
2)1,
349,
872
3,37
2,37
348
,161
,944
444,
985
9,07
8,37
122
2,58
5
– fo
rwar
d fo
reig
n ex
chan
ge c
ontr
acts
(N
ote
2.6)
–13
5,77
7 (1
73,6
28)
––
1,29
7
– fu
ture
s co
ntra
cts
(Not
e 2.
5)–
21,4
06–
––
–
– sw
ap c
ontr
acts
(N
ote
2.8)
––
––
––
2,29
1,77
210
,175
,252
57,3
54,7
945,
021,
556
44,5
74,7
791,
032,
187
Am
ount
s re
ceiv
ed o
n su
bscr
iptio
n of
sha
res
1,53
9,29
863
,012
,932
329,
264,
674
10,6
70,8
5945
,730
,642
1,32
7,87
8A
mou
nts
paid
on
rede
mpt
ion
of s
hare
s(8
08,1
51)
(72,
826,
899)
(169
,944
,476
)(2
7,54
7,95
4)(7
0,27
4,85
3)(1
,024
,968
)D
ivid
ends
pai
d du
ring
the
year
(N
ote
5)(4
8,91
8)(5
,811
,270
)(1
8,89
0,53
4)(1
43,6
98)
(413
,400
)(3
4,64
6)
Net
ass
ets
befo
re s
win
g ad
just
men
t at
the
end
of
the
year
9,20
0,27
714
7,70
0,50
753
8,37
9,17
9–
140,
767,
034
13,1
35,7
07
Adj
ustm
ent
due
to s
win
g pr
icin
g (N
ote
9)–
––
––
–
Net
ass
ets
afte
r sw
ing
adju
stm
ent
at t
he e
nd o
f th
e ye
ar9,
200,
277
147,
700,
507
538,
379,
179
–14
0,76
7,03
413
,135
,707
* R
efer
to
note
13
The
Not
es t
o th
e Fi
nanc
ial S
tate
men
ts f
orm
an
inte
gral
par
t of
the
se f
inan
cial
sta
tem
ents
.
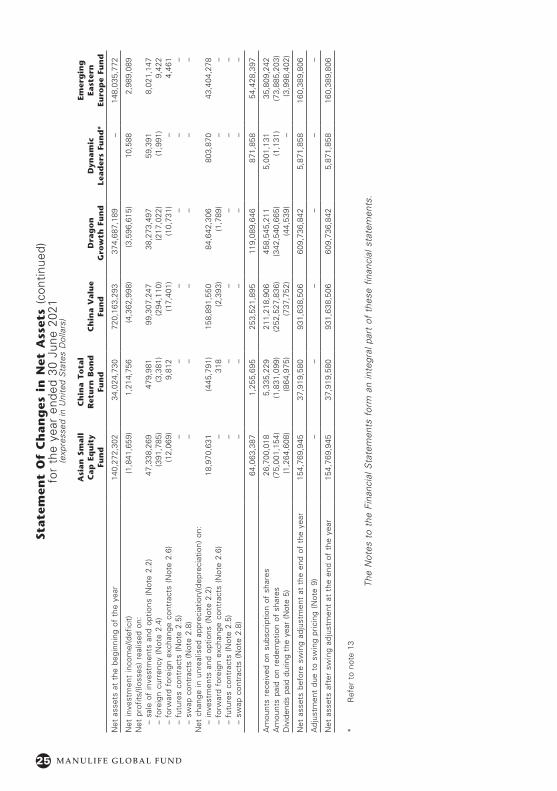
25 M A N U L I F E G L O B A L F U N D
State
men
t O
f C
han
ges
in
Net
Ass
ets
(con
tinue
d)fo
r th
e ye
ar e
nded
30
June
202
1(e
xpre
ssed
in U
nite
d S
tate
s D
olla
rs)
Asi
an
Sm
all
C
ap
Eq
uit
y Fu
nd
Ch
ina T
ota
l R
etu
rn B
on
d
Fun
dC
hin
a V
alu
e Fu
nd
Dra
go
n
Gro
wth
Fu
nd
Dyn
am
ic
Lead
ers
Fun
d*
Emer
gin
g
East
ern
Eu
rop
e Fu
nd
Net
ass
ets
at t
he b
egin
ning
of
the
year
140,
272,
302
34,0
24,7
3072
0,16
3,29
337
4,68
7,18
9–
148,
035,
772
Net
inve
stm
ent
inco
me/
(def
icit)
(1,8
41,6
59)
1,21
4,75
6(4
,362
,998
)(3
,596
,615
)10
,588
2,98
9,08
9N
et p
rofit
s/(lo
sses
) re
alis
ed o
n:
– sa
le o
f in
vest
men
ts a
nd o
ptio
ns (
Not
e 2.
2)47
,338
,269
479,
981
99,3
07,2
47
38,2
73,4
9759
,391
8,02
1,14
7
– fo
reig
n cu
rren
cy (
Not
e 2.
4)(3
91,7
85)
(3,3
81)
(294
,110
)(2
17,0
22)
(1,9
91)
9,42
2
– fo
rwar
d fo
reig
n ex
chan
ge c
ontr
acts
(N
ote
2.6)
(12,
069)
9,81
2(1
7,40
1)(1
0,73
1)–
4,46
1
– fu
ture
s co
ntra
cts
(Not
e 2.
5)–
––
––
–
– sw
ap c
ontr
acts
(N
ote
2.8)
––
––
––
Net
cha
nge
in u
nrea
lised
app
reci
atio
n/(d
epre
ciat
ion)
on:
–
inve
stm
ents
and
opt
ions
(N
ote
2.2)
18,9
70,6
31(4
45,7
91)
158,
891,
550
84,6
42,3
0680
3,87
043
,404
,278
–
forw
ard
fore
ign
exch
ange
con
trac
ts (
Not
e 2.
6)–
318
(2,3
93)
(1,7
89)
––
–
futu
res
cont
ract
s (N
ote
2.5)
––
––
––
–
swap
con
trac
ts (
Not
e 2.
8)–
––
––
–
64,0
63,3
871,
255,
695
253,
521,
895
119,
089,
646
871,
858
54,4
28,3
97
Am
ount
s re
ceiv
ed o
n su
bscr
iptio
n of
sha
res
26,7
00,0
185,
335,
229
211,
218,
906
458,
545,
211
5,00
1,13
135
,809
,242
Am
ount
s pa
id o
n re
dem
ptio
n of
sha
res
(75,
001,
154)
(1,8
31,0
99)
(252
,527
,836
)(3
42,5
40,6
65)
(1,1
31)
(73,
885,
203)
Div
iden
ds p
aid
durin
g th
e ye
ar (
Not
e 5)
(1,2
64,6
08)
(864
,975
)(7
37,7
52)
(44,
539)
–(3
,998
,402
)
Net
ass
ets
befo
re s
win
g ad
just
men
t at
the
end
of
the
year
154,
769,
945
37,9
19,5
8093
1,63
8,50
660
9,73
6,84
25,
871,
858
160,
389,
806
Adj
ustm
ent
due
to s
win
g pr
icin
g (N
ote
9)–
––
––
–
Net
ass
ets
afte
r sw
ing
adju
stm
ent
at t
he e
nd o
f th
e ye
ar15
4,76
9,94
537
,919
,580
931,
638,
506
609,
736,
842
5,87
1,85
816
0,38
9,80
6
* R
efer
to
note
13
The
Not
es t
o th
e Fi
nanc
ial S
tate
men
ts f
orm
an
inte
gral
par
t of
the
se f
inan
cial
sta
tem
ents
.
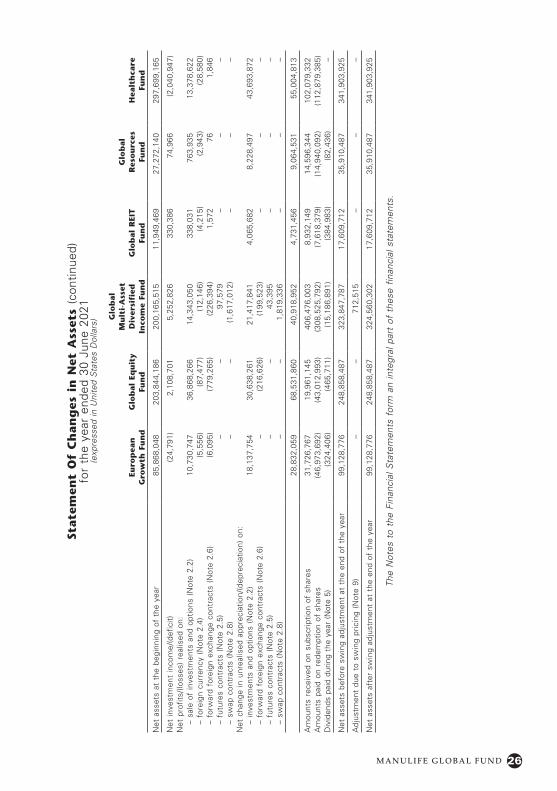
26M A N U L I F E G L O B A L F U N D
State
men
t O
f C
han
ges
in
Net
Ass
ets
(con
tinue
d)fo
r th
e ye
ar e
nded
30
June
202
1(e
xpre
ssed
in U
nite
d S
tate
s D
olla
rs)
Euro
pea
n
Gro
wth
Fu
nd
Glo
bal
Equ
ity
Fun
d
Glo
bal
Mu
lti-
Ass
et
Div
ersi
fied
In
com
e Fu
nd
Glo
bal
REI
T
Fun
d
Glo
bal
Res
ou
rces
Fu
nd
Hea
lth
care
Fu
nd
Net
ass
ets
at t
he b
egin
ning
of
the
year
85,8
68,0
4820
3,84
4,18
620
0,16
5,51
511
,949
,469
27,2
72,1
4029
7,69
9,16
5
Net
inve
stm
ent
inco
me/
(def
icit)
(24,
791)
2,10
8,70
15,
252,
826
330,
386
74,9
66(2
,040
,947
)N
et p
rofit
s/(lo
sses
) re
alis
ed o
n:
– sa
le o
f in
vest
men
ts a
nd o
ptio
ns (
Not
e 2.
2)10
,730
,747
36,8
68,2
6614
,343
,050
338,
031
763,
935
13,3
78,6
22
– fo
reig
n cu
rren
cy (
Not
e 2.
4)(5
,556
)(8
7,47
7)(1
2,14
6)(4
,215
)(2
,943
)(2
8,58
0)
– fo
rwar
d fo
reig
n ex
chan
ge c
ontr
acts
(N
ote
2.6)
(6,0
95)
(779
,265
)(2
26,3
94)
1,57
276
1,84
6
– fu
ture
s co
ntra
cts
(Not
e 2.
5)–
–97
,579
––
–
– sw
ap c
ontr
acts
(N
ote
2.8)
––
(1,6
17,0
12)
––
–N
et c
hang
e in
unr
ealis
ed a
ppre
ciat
ion/
(dep
reci
atio
n) o
n:
– in
vest
men
ts a
nd o
ptio
ns (
Not
e 2.
2)18
,137
,754
30,6
38,2
6121
,417
,841
4,06
5,68
28,
228,
497
43,6
93,8
72
– fo
rwar
d fo
reig
n ex
chan
ge c
ontr
acts
(N
ote
2.6)
–(2
16,6
26)
(199
,523
)–
––
–
futu
res
cont
ract
s (N
ote
2.5)
––
43,3
95–
––
–
swap
con
trac
ts (
Not
e 2.
8)–
–1,
819,
336
––
–
28,8
32,0
5968
,531
,860
40,9
18,9
524,
731,
456
9,06
4,53
155
,004
,813
Am
ount
s re
ceiv
ed o
n su
bscr
iptio
n of
sha
res
31,7
26,7
6719
,961
,145
406,
476,
003
8,93
2,14
914
,596
,344
102,
079,
332
Am
ount
s pa
id o
n re
dem
ptio
n of
sha
res
(46,
973,
692)
(43,
012,
993)
(308
,525
,792
)(7
,618
,379
)(1
4,94
0,09
2)(1
12,8
79,3
85)
Div
iden
ds p
aid
durin
g th
e ye
ar (
Not
e 5)
(324
,406
)(4
65,7
11)
(15,
186,
891)
(384
,983
)(8
2,43
6)–
Net
ass
ets
befo
re s
win
g ad
just
men
t at
the
end
of
the
year
99,1
28,7
7624
8,85
8,48
732
3,84
7,78
717
,609
,712
35,9
10,4
8734
1,90
3,92
5
Adj
ustm
ent
due
to s
win
g pr
icin
g (N
ote
9)–
–71
2,51
5–
––
Net
ass
ets
afte
r sw
ing
adju
stm
ent
at t
he e
nd o
f th
e ye
ar99
,128
,776
248,
858,
487
324,
560,
302
17,6
09,7
1235
,910
,487
341,
903,
925
The
Not
es t
o th
e Fi
nanc
ial S
tate
men
ts f
orm
an
inte
gral
par
t of
the
se f
inan
cial
sta
tem
ents
.
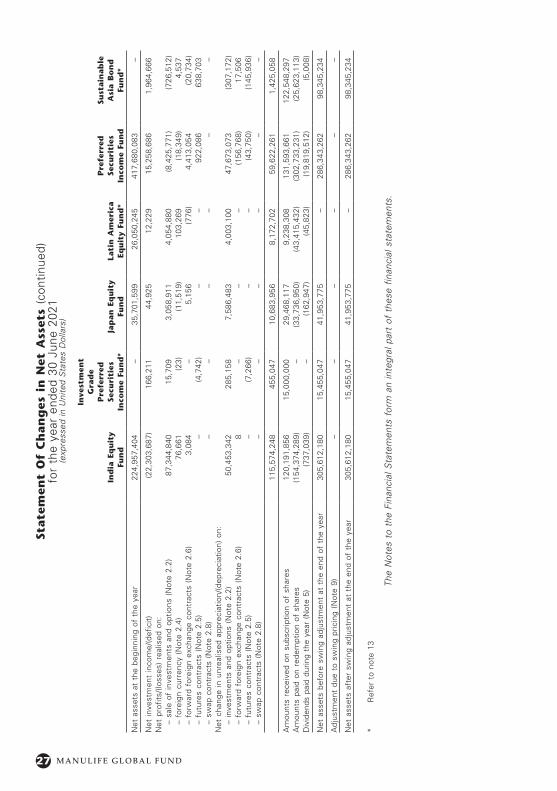
27 M A N U L I F E G L O B A L F U N D
State
men
t O
f C
han
ges
in
Net
Ass
ets
(con
tinue
d)fo
r th
e ye
ar e
nded
30
June
202
1(e
xpre
ssed
in U
nite
d S
tate
s D
olla
rs)
Ind
ia E
qu
ity
Fun
d
Inve
stm
ent
Gra
de
Pre
ferr
ed
Secu
riti
es
Inco
me
Fun
d*
Jap
an
Eq
uit
y Fu
nd
Lati
n A
mer
ica
Equ
ity
Fun
d*
Pre
ferr
ed
Secu
riti
es
Inco
me
Fun
d
Sust
ain
ab
le
Asi
a B
on
d
Fun
d*
Net
ass
ets
at t
he b
egin
ning
of
the
year
224,
957,
404
–35
,701
,599
26,0
50,2
4541
7,68
0,08
3–
Net
inve
stm
ent
inco
me/
(def
icit)
(22,
303,
687)
166,
211
44,9
2512
,229
15,2
58,6
861,
964,
666
Net
pro
fits/
(loss
es)
real
ised
on:
–
sale
of
inve
stm
ents
and
opt
ions
(N
ote
2.2)
87,3
44,8
4015
,709
3,05
8,91
14,
054,
880
(8,4
25,7
71)
(726
,512
)
– fo
reig
n cu
rren
cy (
Not
e 2.
4)76
,661
(23)
(11,
519)
103,
269
(18,
349)
4,53
7
– fo
rwar
d fo
reig
n ex
chan
ge c
ontr
acts
(N
ote
2.6)
3,08
4–
5,15
6(7
76)
4,41
3,05
4(2
0,73
4)
– fu
ture
s co
ntra
cts
(Not
e 2.
5)–
(4,7
42)
––
922,
086
638,
703
–
swap
con
trac
ts (
Not
e 2.
8)–
––
––
–N
et c
hang
e in
unr
ealis
ed a
ppre
ciat
ion/
(dep
reci
atio
n) o
n:
– in
vest
men
ts a
nd o
ptio
ns (
Not
e 2.
2)50
,453
,342
285,
158
7,58
6,48
34,
003,
100
47,6
73,0
73(3
07,1
72)
–
forw
ard
fore
ign
exch
ange
con
trac
ts (
Not
e 2.
6)8
––
–(1
56,7
68)
17,5
06
– fu
ture
s co
ntra
cts
(Not
e 2.
5)–
(7,2
66)
––
(43,
750)
(145
,936
)
– sw
ap c
ontr
acts
(N
ote
2.8)
––
––
––
115,
574,
248
455,
047
10,6
83,9
568,
172,
702
59,6
22,2
611,
425,
058
Am
ount
s re
ceiv
ed o
n su
bscr
iptio
n of
sha
res
120,
191,
856
15,0
00,0
0029
,468
,117
9,23
8,30
813
1,59
3,66
112
2,54
8,29
7A
mou
nts
paid
on
rede
mpt
ion
of s
hare
s(1
54,3
74,2
89)
–(3
3,73
6,95
0)(4
3,41
5,43
2)(3
02,7
33,2
31)
(25,
623,
113)
Div
iden
ds p
aid
durin
g th
e ye
ar (
Not
e 5)
(737
,039
)–
(162
,947
)(4
5,82
3)(1
9,81
9,51
2)(5
,008
)
Net
ass
ets
befo
re s
win
g ad
just
men
t at
the
end
of
the
year
305,
612,
180
15,4
55,0
4741
,953
,775
–28
6,34
3,26
298
,345
,234
Adj
ustm
ent
due
to s
win
g pr
icin
g (N
ote
9)–
––
––
–
Net
ass
ets
afte
r sw
ing
adju
stm
ent
at t
he e
nd o
f th
e ye
ar30
5,61
2,18
015
,455
,047
41,9
53,7
75–
286,
343,
262
98,3
45,2
34
* R
efer
to
note
13
The
Not
es t
o th
e Fi
nanc
ial S
tate
men
ts f
orm
an
inte
gral
par
t of
the
se f
inan
cial
sta
tem
ents
.
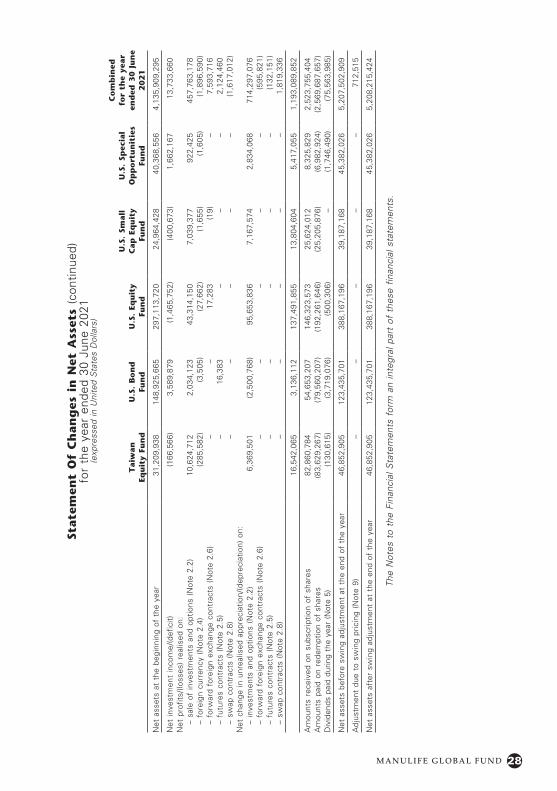
28M A N U L I F E G L O B A L F U N D
State
men
t O
f C
han
ges
in
Net
Ass
ets
(con
tinue
d)fo
r th
e ye
ar e
nded
30
June
202
1(e
xpre
ssed
in U
nite
d S
tate
s D
olla
rs)
Taiw
an
Eq
uit
y Fu
nd
U.S
. B
on
d
Fun
dU
.S.
Equ
ity
Fun
d
U.S
. Sm
all
C
ap
Eq
uit
y Fu
nd
U.S
. Sp
ecia
l O
pp
ort
un
itie
s Fu
nd
Co
mb
ined
fo
r th
e ye
ar
end
ed 3
0 J
un
e 2
02
1
Net
ass
ets
at t
he b
egin
ning
of
the
year
31,2
09,9
3814
8,92
5,66
529
7,11
3,72
024
,964
,428
40,3
68,5
564,
135,
909,
295
Net
inve
stm
ent
inco
me/
(def
icit)
(166
,566
)3,
589,
879
(1,4
65,7
52)
(400
,673
)1,
662,
167
13,7
33,6
60N
et p
rofit
s/(lo
sses
) re
alis
ed o
n:
– sa
le o
f in
vest
men
ts a
nd o
ptio
ns (
Not
e 2.
2)10
,624
,712
2,03
4,12
343
,314
,150
7,03
9,37
792
2,42
545
7,76
3,17
8
– fo
reig
n cu
rren
cy (
Not
e 2.
4)(2
85,5
82)
(3,5
05)
(27,
662)
(1,6
55)
(1,6
05)
(1,8
96,5
90)
–
forw
ard
fore
ign
exch
ange
con
trac
ts (
Not
e 2.
6)–
–17
,283
(19)
–7,
593,
716
–
futu
res
cont
ract
s (N
ote
2.5)
–16
,383
––
–2,
124,
460
–
swap
con
trac
ts (
Not
e 2.
8)–
––
––
(1,6
17,0
12)
Net
cha
nge
in u
nrea
lised
app
reci
atio
n/(d
epre
ciat
ion)
on:
–
inve
stm
ents
and
opt
ions
(N
ote
2.2)
6,36
9,50
1(2
,500
,768
)95
,653
,836
7,16
7,57
42,
834,
068
714,
297,
076
–
forw
ard
fore
ign
exch
ange
con
trac
ts (
Not
e 2.
6)–
––
––
(595
,821
)
– fu
ture
s co
ntra
cts
(Not
e 2.
5)–
––
––
(132
,151
)
– sw
ap c
ontr
acts
(N
ote
2.8)
––
––
–1,
819,
336
16,5
42,0
653,
136,
112
137,
491,
855
13,8
04,6
045,
417,
055
1,19
3,08
9,85
2
Am
ount
s re
ceiv
ed o
n su
bscr
iptio
n of
sha
res
82,8
60,7
8454
,653
,207
146,
323,
573
25,6
24,0
128,
325,
829
2,52
3,75
5,40
4A
mou
nts
paid
on
rede
mpt
ion
of s
hare
s(8
3,62
9,26
7)(7
9,56
0,20
7)(1
92,2
61,6
46)
(25,
205,
876)
(6,9
82,9
24)
(2,5
69,6
87,6
57)
Div
iden
ds p
aid
durin
g th
e ye
ar (
Not
e 5)
(130
,615
)(3
,719
,076
)(5
00,3
06)
–(1
,746
,490
)(7
5,56
3,98
5)
Net
ass
ets
befo
re s
win
g ad
just
men
t at
the
end
of
the
year
46,8
52,9
0512
3,43
5,70
138
8,16
7,19
639
,187
,168
45,3
82,0
265,
207,
502,
909
Adj
ustm
ent
due
to s
win
g pr
icin
g (N
ote
9)–
––
––
712,
515
Net
ass
ets
afte
r sw
ing
adju
stm
ent
at t
he e
nd o
f th
e ye
ar46
,852
,905
123,
435,
701
388,
167,
196
39,1
87,1
6845
,382
,026
5,20
8,21
5,42
4
The
Not
es t
o th
e Fi
nanc
ial S
tate
men
ts f
orm
an
inte
gral
par
t of
the
se f
inan
cial
sta
tem
ents
.
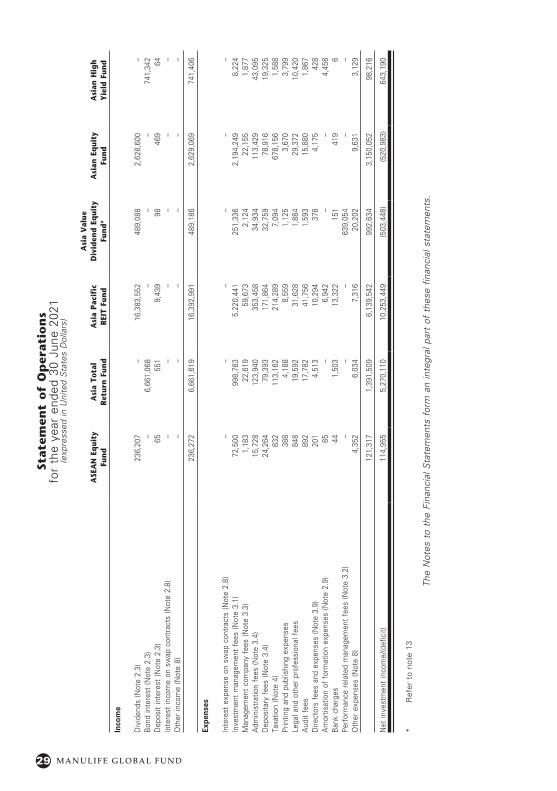
29 M A N U L I F E G L O B A L F U N D
State
men
t o
f O
per
ati
on
sfo
r th
e ye
ar e
nded
30
June
202
1(e
xpre
ssed
in U
nite
d S
tate
s D
olla
rs)
ASE
AN
Eq
uity
Fu
nd
Asi
a To
tal
Ret
urn
Fun
dA
sia
Pac
ific
R
EIT
Fun
d
Asi
a V
alue
D
ivid
end
Eq
uity
Fu
nd
*A
sian
Eq
uity
Fu
nd
Asi
an H
igh
Y
ield
Fun
d
Inco
me
Div
iden
ds (N
ote
2.3)
236,
207
–16
,383
,552
489,
088
2,62
8,60
0–
Bon
d in
tere
st (N
ote
2.3)
–6,
661,
068
––
–74
1,34
2D
epos
it in
tere
st (N
ote
2.3)
6555
19,
439
9846
964
Inte
rest
inco
me
on s
wap
con
trac
ts (N
ote
2.8)
––
––
––
Oth
er in
com
e (N
ote
8)–
––
––
–
1,732
,461
68,30
32,8
64,97
225
7,085
1,202
,679
2,969
,048
236,
272
6,66
1,61
916
,392
,991
489,
186
2,62
9,06
974
1,40
6
Expe
nses
Inte
rest
exp
ense
on
swap
con
trac
ts (N
ote
2.8)
––
––
––
Inve
stm
ent
man
agem
ent
fees
(Not
e 3.
1)72
,500
998,
783
5,22
0,44
125
1,33
62,
194,
249
8,22
4M
anag
emen
t co
mpa
ny f
ees
(Not
e 3.
3)1,
183
22,6
1959
,673
2,12
422
,155
1,87
7A
dmin
istr
atio
n fe
es (N
ote
3.4)
15,7
2812
3,94
035
3,45
834
,934
113,
429
43,0
95D
epos
itary
fee
s (N
ote
3.4)
24,2
6479
,393
171,
864
32,7
5978
,916
19,3
25Ta
xatio
n (N
ote
4)83
211
3,16
221
4,28
97,
094
678,
156
1,58
8Pr
intin
g an
d pu
blis
hing
exp
ense
s38
84,
188
8,55
91,
125
3,67
03,
799
Lega
l and
oth
er p
rofe
ssio
nal f
ees
848
19,5
9231
,628
1,88
429
,372
10,4
20A
udit
fees
892
17,7
8241
,756
1,59
315
,880
1,86
7D
irect
ors
fees
and
exp
ense
s (N
ote
3.9)
201
4,51
310
,294
378
4,17
542
8A
mor
tisat
ion
of f
orm
atio
n ex
pens
es (N
ote
2.9)
85–
6,94
2–
–4,
458
Ban
k ch
arge
s44
1,50
313
,322
151
419
6Pe
rfor
man
ce r
elat
ed m
anag
emen
t fe
es (N
ote
3.2)
––
–63
9,05
4–
–O
ther
exp
ense
s (N
ote
8)4,
352
6,03
47,
316
20,2
029,
631
3,12
9
121,
317
1,39
1,50
96,
139,
542
992,
634
3,15
0,05
298
,216
Net
inve
stm
ent
inco
me/
(def
icit)
114,
955
5,27
0,11
010
,253
,449
(503
,448
)(5
20,9
83)
643,
190
* R
efer
to
note
13
The
Not
es t
o th
e Fi
nanc
ial S
tate
men
ts f
orm
an
inte
gral
par
t of
the
se f
inan
cial
sta
tem
ents
.
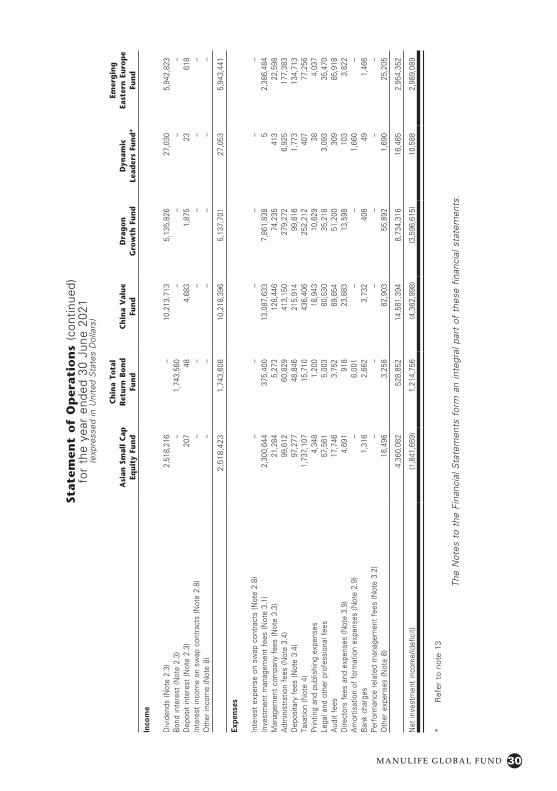
30M A N U L I F E G L O B A L F U N D
State
men
t o
f O
per
ati
on
s (c
ontin
ued)
for
the
year
end
ed 3
0 Ju
ne 2
021
(exp
ress
ed in
Uni
ted
Sta
tes
Dol
lars
)
Asi
an S
mal
l C
ap
Equi
ty F
und
Ch
ina
Tota
l R
etur
n B
ond
Fu
nd
Ch
ina
Val
ue
Fun
dD
rag
on
Gro
wth
Fun
dD
ynam
ic
Lead
ers
Fun
d*
Emer
gin
g
East
ern
Eur
ope
Fun
d
Inco
me
Div
iden
ds (N
ote
2.3)
2,51
8,21
6–
10,2
13,7
135,
135,
826
27,0
305,
942,
823
Bon
d in
tere
st (N
ote
2.3)
–1,
743,
560
––
––
Dep
osit
inte
rest
(Not
e 2.
3)20
748
4,68
31,
875
2361
8In
tere
st in
com
e on
sw
ap c
ontr
acts
(Not
e 2.
8)–
––
––
–O
ther
inco
me
(Not
e 8)
––
––
––
1,7
32,46
168
,303
2,864
,972
257,0
851,2
02,67
92,9
69,04
8
2,51
8,42
31,
743,
608
10,2
18,3
965,
137,
701
27,0
535,
943,
441
Expe
nses
Inte
rest
exp
ense
on
swap
con
trac
ts (N
ote
2.8)
––
––
––
Inve
stm
ent
man
agem
ent
fees
(Not
e 3.
1)2,
300,
644
375,
400
13,0
87,6
337,
861,
838
52,
386,
484
Man
agem
ent
com
pany
fee
s (N
ote
3.3)
21,2
845,
273
128,
446
74,2
3541
322
,598
Adm
inis
trat
ion
fees
(Not
e 3.
4)99
,612
60,8
2941
3,15
027
9,27
26,
925
177,
383
Dep
osita
ry f
ees
(Not
e 3.
4)97
,277
48,8
4621
5,91
499
,816
1,77
313
4,71
3Ta
xatio
n (N
ote
4)1,
737,
107
15,7
1043
6,40
625
2,21
240
777
,256
Prin
ting
and
publ
ishi
ng e
xpen
ses
4,34
81,
200
18,9
4310
,629
384,
037
Lega
l and
oth
er p
rofe
ssio
nal f
ees
57,5
615,
003
80,5
3035
,218
3,09
335
,470
Aud
it fe
es17
,746
3,75
289
,854
51,2
0030
985
,918
Dire
ctor
s fe
es a
nd e
xpen
ses
(Not
e 3.
9)4,
691
918
23,8
8313
,598
103
3,82
2A
mor
tisat
ion
of f
orm
atio
n ex
pens
es (N
ote
2.9)
–6,
001
––
1,66
0–
Ban
k ch
arge
s1,
316
2,66
23,
732
406
491,
466
Perf
orm
ance
rel
ated
man
agem
ent
fees
(Not
e 3.
2)–
––
––
–O
ther
exp
ense
s (N
ote
8)18
,496
3,25
882
,903
55,8
921,
690
25,2
05
4,36
0,08
252
8,85
214
,581
,394
8,73
4,31
616
,465
2,95
4,35
2
Net
inve
stm
ent
inco
me/
(def
icit)
(1,8
41,6
59)
1,21
4,75
6(4
,362
,998
)(3
,596
,615
)10
,588
2,98
9,08
9
* R
efer
to
note
13
The
Not
es t
o th
e Fi
nanc
ial S
tate
men
ts f
orm
an
inte
gral
par
t of
the
se f
inan
cial
sta
tem
ents
.
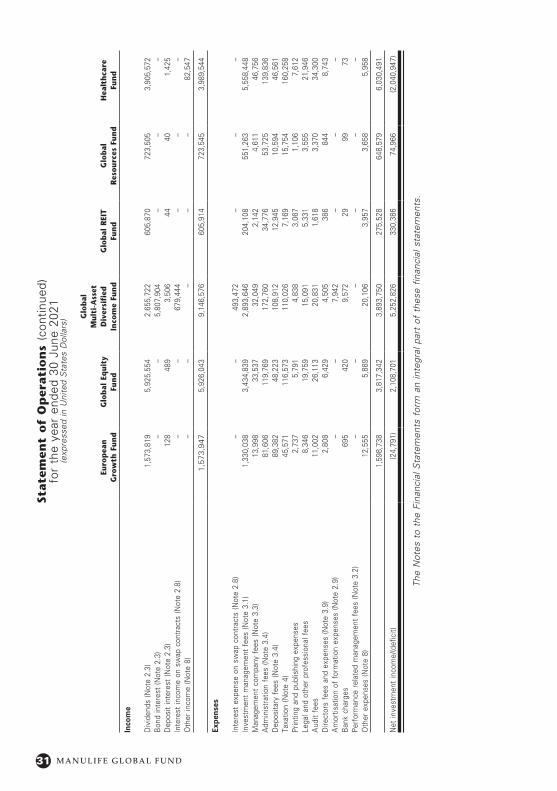
31 M A N U L I F E G L O B A L F U N D
State
men
t o
f O
per
ati
on
s (c
ontin
ued)
for
the
year
end
ed 3
0 Ju
ne 2
021
(exp
ress
ed in
Uni
ted
Sta
tes
Dol
lars
)
Euro
pea
n
Gro
wth
Fun
dG
lob
al E
qui
ty
Fun
d
Glo
bal
M
ulti
-Ass
et
Div
ersi
fied
In
com
e Fu
nd
Glo
bal
REI
T Fu
nd
Glo
bal
R
esou
rces
Fun
dH
ealt
hca
re
Fun
d
Inco
me
Div
iden
ds (N
ote
2.3)
1,57
3,81
95,
925,
554
2,65
5,72
260
5,87
072
3,50
53,
905,
572
Bon
d in
tere
st (N
ote
2.3)
––
5,80
7,90
4–
––
Dep
osit
inte
rest
(Not
e 2.
3)12
848
93,
506
4440
1,42
5In
tere
st in
com
e on
sw
ap c
ontr
acts
(Not
e 2.
8)–
–67
9,44
4–
––
Oth
er in
com
e (N
ote
8)–
––
––
82,5
47
1,732
,461
68,30
32,8
64,97
225
7,085
1,202
,679
2,969
,048
1,57
3,94
75,
926,
043
9,14
6,57
660
5,91
472
3,54
53,
989,
544
Expe
nses
Inte
rest
exp
ense
on
swap
con
trac
ts (N
ote
2.8)
––
493,
472
––
–In
vest
men
t m
anag
emen
t fe
es (N
ote
3.1)
1,33
0,03
83,
434,
839
2,89
3,64
620
4,10
855
1,26
35,
558,
448
Man
agem
ent
com
pany
fee
s (N
ote
3.3)
13,9
9833
,537
32,0
492,
142
4,61
146
,756
Adm
inis
trat
ion
fees
(Not
e 3.
4)81
,606
119,
769
172,
760
34,7
7653
,725
139,
836
Dep
osita
ry f
ees
(Not
e 3.
4)89
,382
48,2
2310
8,91
212
,945
10,5
9446
,561
Taxa
tion
(Not
e 4)
45,5
7111
6,57
311
0,02
67,
169
15,7
5416
0,25
8Pr
intin
g an
d pu
blis
hing
exp
ense
s2,
737
5,79
14,
838
3,06
71,
106
7,61
2Le
gal a
nd o
ther
pro
fess
iona
l fee
s8,
346
19,7
5915
,091
5,33
13,
555
21,9
46A
udit
fees
11,0
0226
,113
20,8
311,
618
3,37
034
,300
Dire
ctor
s fe
es a
nd e
xpen
ses
(Not
e 3.
9)2,
808
6,42
94,
505
386
844
8,74
3A
mor
tisat
ion
of f
orm
atio
n ex
pens
es (N
ote
2.9)
––
7,94
2–
––
Ban
k ch
arge
s69
542
09,
572
2999
73Pe
rfor
man
ce r
elat
ed m
anag
emen
t fe
es (N
ote
3.2)
––
––
––
Oth
er e
xpen
ses
(Not
e 8)
12,5
555,
889
20,1
063,
957
3,65
85,
958
1,59
8,73
83,
817,
342
3,89
3,75
027
5,52
864
8,57
96,
030,
491
Net
inve
stm
ent
inco
me/
(def
icit)
(24,
791)
2,10
8,70
15,
252,
826
330,
386
74,9
66(2
,040
,947
)
The
Not
es t
o th
e Fi
nanc
ial S
tate
men
ts f
orm
an
inte
gral
par
t of
the
se f
inan
cial
sta
tem
ents
.
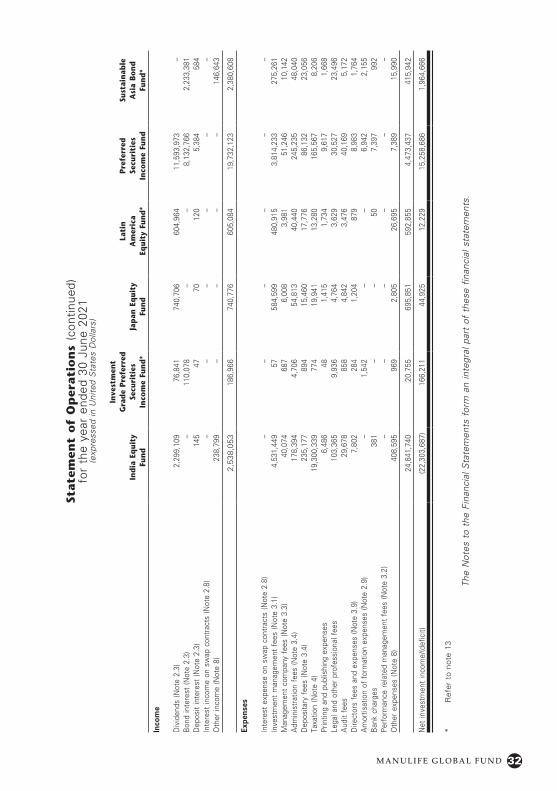
32M A N U L I F E G L O B A L F U N D
State
men
t o
f O
per
ati
on
s (c
ontin
ued)
for
the
year
end
ed 3
0 Ju
ne 2
021
(exp
ress
ed in
Uni
ted
Sta
tes
Dol
lars
)
Ind
ia E
qui
ty
Fun
d
Inve
stm
ent
Gra
de
Pref
erre
d
Secu
riti
es
Inco
me
Fun
d*
Jap
an E
qui
ty
Fun
d
Lati
n
Am
eric
a
Equi
ty F
und
*
Pre
ferr
ed
Secu
riti
es
Inco
me
Fun
d
Sust
ain
able
A
sia
Bon
d
Fun
d*
Inco
me
Div
iden
ds (N
ote
2.3)
2,29
9,10
976
,841
740,
706
604,
964
11,5
93,9
73–
Bon
d in
tere
st (N
ote
2.3)
–11
0,07
8–
–8,
132,
766
2,23
3,38
1D
epos
it in
tere
st (N
ote
2.3)
145
4770
120
5,38
458
4In
tere
st in
com
e on
sw
ap c
ontr
acts
(Not
e 2.
8)–
––
––
–O
ther
inco
me
(Not
e 8)
238,
799
––
––
146,
643
1,7
32,46
168
,303
2,864
,972
257,0
851,2
02,67
92,9
69,04
8
2,53
8,05
318
6,96
674
0,77
660
5,08
419
,732
,123
2,38
0,60
8
Expe
nses
Inte
rest
exp
ense
on
swap
con
trac
ts (N
ote
2.8)
––
––
––
Inve
stm
ent
man
agem
ent
fees
(Not
e 3.
1)4,
531,
449
5758
4,59
948
0,91
53,
814,
233
275,
261
Man
agem
ent
com
pany
fee
s (N
ote
3.3)
40,0
7468
76,
008
3,98
151
,246
10,1
42A
dmin
istr
atio
n fe
es (N
ote
3.4)
178,
394
4,70
654
,813
40,4
4024
5,23
548
,040
Dep
osita
ry f
ees
(Not
e 3.
4)23
5,17
789
415
,460
17,7
7686
,132
23,0
56Ta
xatio
n (N
ote
4)19
,300
,339
774
19,9
4113
,280
165,
567
8,20
6Pr
intin
g an
d pu
blis
hing
exp
ense
s6,
486
481,
415
1,73
49,
617
1,66
8Le
gal a
nd o
ther
pro
fess
iona
l fee
s10
3,36
59,
936
4,76
43,
629
30,5
2723
,496
Aud
it fe
es29
,678
858
4,84
23,
476
40,1
695,
172
Dire
ctor
s fe
es a
nd e
xpen
ses
(Not
e 3.
9)7,
802
284
1,20
487
98,
983
1,76
4A
mor
tisat
ion
of f
orm
atio
n ex
pens
es (N
ote
2.9)
–1,
542
––
6,94
22,
155
Ban
k ch
arge
s38
1–
–50
7,39
799
2Pe
rfor
man
ce r
elat
ed m
anag
emen
t fe
es (N
ote
3.2)
––
––
––
Oth
er e
xpen
ses
(Not
e 8)
408,
595
969
2,80
526
,695
7,38
915
,990
24,8
41,7
4020
,755
695,
851
592,
855
4,47
3,43
741
5,94
2
Net
inve
stm
ent
inco
me/
(def
icit)
(22,
303,
687)
166,
211
44,9
2512
,229
15,2
58,6
861,
964,
666
* R
efer
to
note
13
The
Not
es t
o th
e Fi
nanc
ial S
tate
men
ts f
orm
an
inte
gral
par
t of
the
se f
inan
cial
sta
tem
ents
.
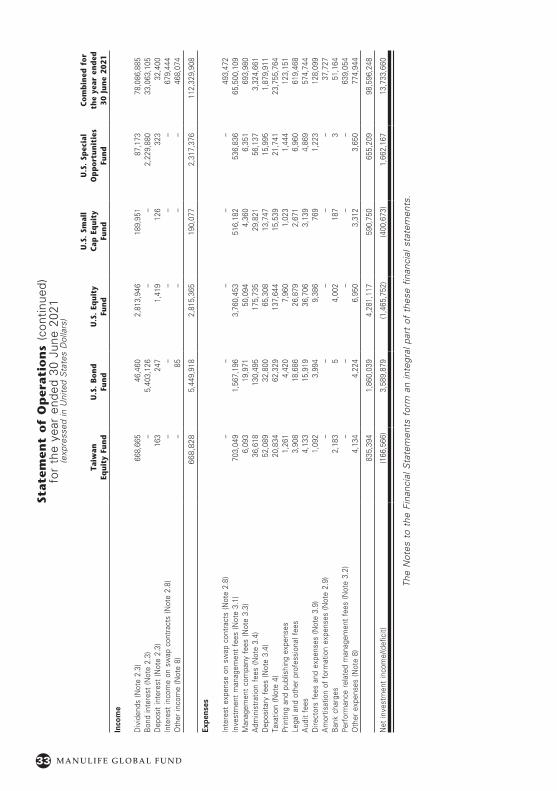
33 M A N U L I F E G L O B A L F U N D
State
men
t o
f O
per
ati
on
s (c
ontin
ued)
for
the
year
end
ed 3
0 Ju
ne 2
021
(exp
ress
ed in
Uni
ted
Sta
tes
Dol
lars
)
Taiw
an
Equi
ty F
und
U.S
. B
ond
Fu
nd
U.S
. Eq
uity
Fu
nd
U.S
. Sm
all
C
ap E
qui
ty
Fun
d
U.S
. Sp
ecia
l O
pp
ortu
nit
ies
Fun
d
Com
bin
ed f
or
the
year
en
ded
30
Jun
e 20
21
Inco
me
Div
iden
ds (N
ote
2.3)
668,
665
46,4
602,
813,
946
189,
951
87,1
7378
,086
,885
Bon
d in
tere
st (N
ote
2.3)
–5,
403,
126
––
2,22
9,88
033
,063
,105
Dep
osit
inte
rest
(Not
e 2.
3)16
324
71,
419
126
323
32,4
00In
tere
st in
com
e on
sw
ap c
ontr
acts
(Not
e 2.
8)–
––
––
679,
444
Oth
er in
com
e (N
ote
8)–
85–
––
468,
074
1,7
32,46
168
,303
2,864
,972
257,0
851,2
02,67
92,9
69,04
8
668,
828
5,44
9,91
82,
815,
365
190,
077
2,31
7,37
611
2,32
9,90
8
Expe
nses
Inte
rest
exp
ense
on
swap
con
trac
ts (N
ote
2.8)
––
––
–49
3,47
2In
vest
men
t m
anag
emen
t fe
es (N
ote
3.1)
703,
049
1,56
7,19
63,
760,
453
516,
182
536,
836
65,5
00,1
09M
anag
emen
t co
mpa
ny f
ees
(Not
e 3.
3)6,
093
19,9
7150
,094
4,36
06,
351
693,
980
Adm
inis
trat
ion
fees
(Not
e 3.
4)36
,618
130,
495
175,
735
29,8
2156
,137
3,32
4,66
1D
epos
itary
fee
s (N
ote
3.4)
52,0
8932
,800
65,3
0813
,747
15,9
951,
879,
911
Taxa
tion
(Not
e 4)
20,8
3462
,329
137,
644
15,5
3921
,741
23,7
55,7
64Pr
intin
g an
d pu
blis
hing
exp
ense
s1,
261
4,42
07,
960
1,02
31,
444
123,
151
Lega
l and
oth
er p
rofe
ssio
nal f
ees
3,90
818
,686
26,8
792,
671
6,96
061
9,46
8A
udit
fees
4,13
315
,919
36,7
063,
139
4,86
957
4,74
4D
irect
ors
fees
and
exp
ense
s (N
ote
3.9)
1,09
23,
994
9,38
676
91,
223
128,
099
Am
ortis
atio
n of
for
mat
ion
expe
nses
(Not
e 2.
9)–
––
––
37,7
27B
ank
char
ges
2,18
35
4,00
218
73
51,1
64Pe
rfor
man
ce r
elat
ed m
anag
emen
t fe
es (N
ote
3.2)
––
––
–63
9,05
4O
ther
exp
ense
s (N
ote
8)4,
134
4,22
46,
950
3,31
23,
650
774,
944
835,
394
1,86
0,03
94,
281,
117
590,
750
655,
209
98,5
96,2
48
Net
inve
stm
ent
inco
me/
(def
icit)
(166
,566
)3,
589,
879
(1,4
65,7
52)
(400
,673
)1,
662,
167
13,7
33,6
60
The
Not
es t
o th
e Fi
nanc
ial S
tate
men
ts f
orm
an
inte
gral
par
t of
the
se f
inan
cial
sta
tem
ents
.
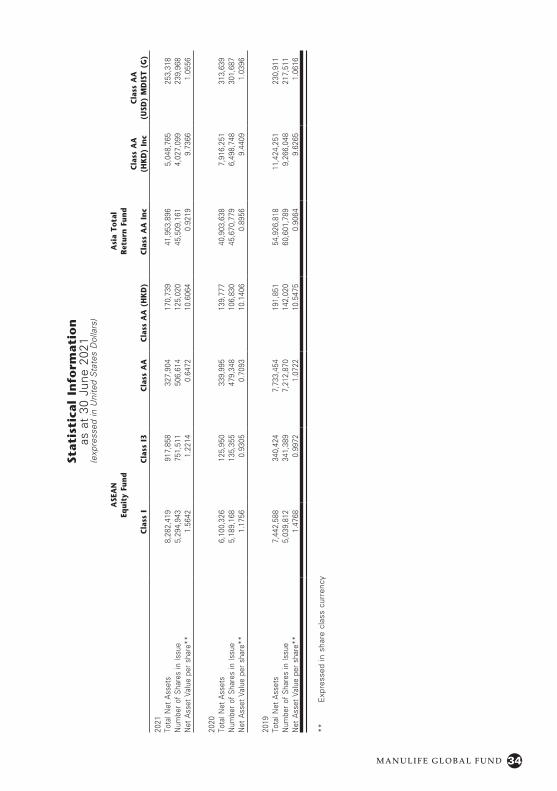
34M A N U L I F E G L O B A L F U N D
Stati
stic
al
Info
rmati
on
as a
t 30
Jun
e 20
21(e
xpre
ssed
in U
nite
d S
tate
s D
olla
rs)
ASE
AN
Eq
uity
Fun
dA
sia
Tota
l
Ret
urn
Fun
d
Cla
ss I
Cla
ss I
3C
lass
AA
Cla
ss A
A (
HK
D)
Cla
ss A
A I
nc
Cla
ss A
A
(HK
D)
Inc
Cla
ss A
A
(USD
) M
DIS
T (G
)
2021
Tota
l Net
Ass
ets
8,28
2,41
991
7,85
832
7,90
417
0,73
941
,953
,896
5,04
8,76
525
3,31
8N
umbe
r of
Sha
res
in Is
sue
5,29
4,94
375
1,51
150
6,61
412
5,02
045
,509
,161
4,02
7,09
923
9,96
8N
et A
sset
Val
ue p
er s
hare
**1.
5642
1.22
140.
6472
10.6
064
0.92
199.
7366
1.05
56
2020
Tota
l Net
Ass
ets
6,10
0,32
612
5,95
033
9,99
513
9,77
740
,903
,638
7,91
6,25
131
3,63
9N
umbe
r of
Sha
res
in Is
sue
5,18
9,16
813
5,35
547
9,34
810
6,83
045
,670
,779
6,49
8,74
830
1,68
7N
et A
sset
Val
ue p
er s
hare
**1.
1756
0.93
050.
7093
10.1
406
0.89
569.
4409
1.03
96
2019
Tota
l Net
Ass
ets
7,44
2,58
834
0,42
47,
733,
454
191,
851
54,9
26,8
1811
,424
,251
230,
911
Num
ber
of S
hare
s in
Issu
e5,
039,
812
341,
389
7,21
2,87
014
2,02
060
,601
,789
9,26
6,04
821
7,51
1N
et A
sset
Val
ue p
er s
hare
**1.
4768
0.99
721.
0722
10.5
475
0.90
649.
6265
1.06
16
**
Exp
ress
ed in
sha
re c
lass
cur
renc
y
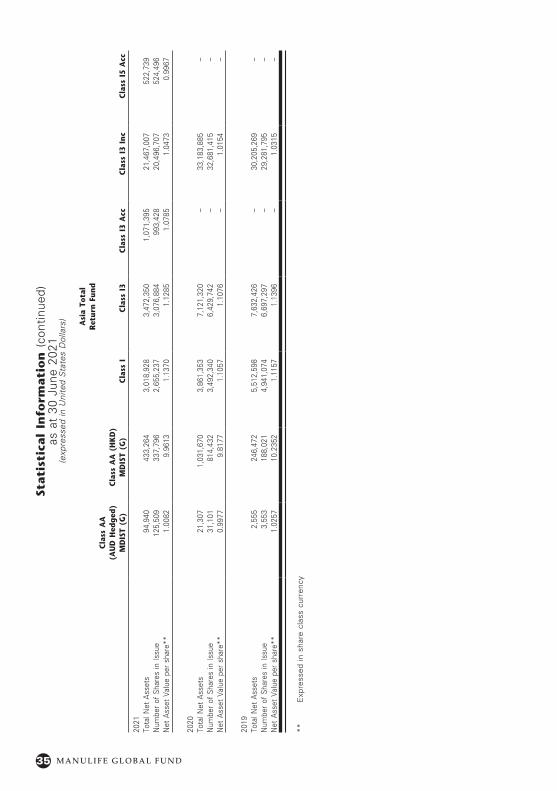
35 M A N U L I F E G L O B A L F U N D
Stati
stic
al
Info
rmati
on
(co
ntin
ued)
as a
t 30
Jun
e 20
21(e
xpre
ssed
in U
nite
d S
tate
s D
olla
rs) Asi
a To
tal
R
etur
n F
und
Cla
ss A
A
(AU
D H
edg
ed)
MD
IST
(G)
Cla
ss A
A (
HK
D)
MD
IST
(G)
Cla
ss I
Cla
ss I
3C
lass
I3
Acc
Cla
ss I
3 In
cC
lass
I5
Acc
2021
Tota
l Net
Ass
ets
94,9
4043
3,26
43,
018,
928
3,47
2,35
01,
071,
395
21,4
67,0
0752
2,73
9N
umbe
r of
Sha
res
in Is
sue
125,
509
337,
796
2,65
5,23
73,
076,
884
993,
428
20,4
96,7
0752
4,49
6N
et A
sset
Val
ue p
er s
hare
**1.
0082
9.96
131.
1370
1.12
851.
0785
1.04
730.
9967
2020
Tota
l Net
Ass
ets
21,3
071,
031,
670
3,86
1,35
37,
121,
320
–33
,183
,885
–N
umbe
r of
Sha
res
in Is
sue
31,1
0181
4,43
23,
492,
340
6,42
9,74
2–
32,6
81,4
15–
Net
Ass
et V
alue
per
sha
re**
0.99
779.
8177
1.10
571.
1076
–1.
0154
–
2019
Tota
l Net
Ass
ets
2,55
524
6,47
25,
512,
598
7,63
2,42
6–
30,2
05,2
69–
Num
ber
of S
hare
s in
Issu
e3,
553
188,
021
4,94
1,07
46,
697,
297
–29
,281
,795
–N
et A
sset
Val
ue p
er s
hare
**1.
0257
10.2
352
1.11
571.
1396
–1.
0315
–
**
Exp
ress
ed in
sha
re c
lass
cur
renc
y
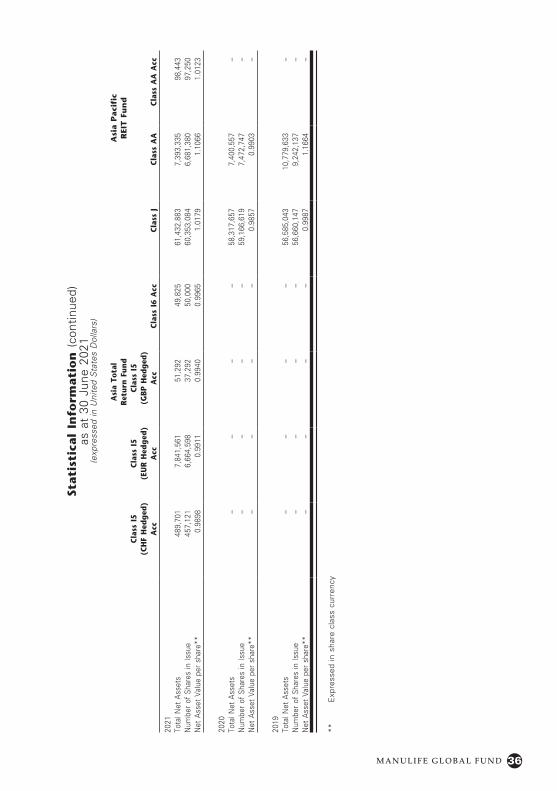
36M A N U L I F E G L O B A L F U N D
Stati
stic
al
Info
rmati
on
(co
ntin
ued)
as a
t 30
Jun
e 20
21(e
xpre
ssed
in U
nite
d S
tate
s D
olla
rs)
Asi
a To
tal
R
etur
n F
und
Asi
a P
aci
fic
R
EIT
Fu
nd
Cla
ss I
5
(CH
F H
edg
ed)
Acc
Cla
ss I
5
(EU
R H
edg
ed)
Acc
Cla
ss I
5
(GB
P H
edg
ed)
Acc
Cla
ss I
6 A
ccC
lass
JC
lass
AA
Cla
ss A
A A
cc
2021
Tota
l Net
Ass
ets
489,
701
7,84
1,56
151
,292
49,8
2561
,432
,883
7,39
3,33
598
,443
Num
ber
of S
hare
s in
Issu
e45
7,12
16,
664,
598
37,2
9250
,000
60,3
53,0
846,
681,
380
97,2
50N
et A
sset
Val
ue p
er s
hare
**0.
9898
0.99
110.
9940
0.99
651.
0179
1.10
661.
0123
2020
Tota
l Net
Ass
ets
––
––
58,3
17,6
577,
400,
557
–N
umbe
r of
Sha
res
in Is
sue
––
––
59,1
66,6
197,
472,
747
–N
et A
sset
Val
ue p
er s
hare
**–
––
–0.
9857
0.99
03–
2019
Tota
l Net
Ass
ets
––
––
56,5
85,0
4310
,779
,633
–N
umbe
r of
Sha
res
in Is
sue
––
––
56,6
60,1
479,
242,
137
–N
et A
sset
Val
ue p
er s
hare
**–
––
–0.
9987
1.16
64–
**
Exp
ress
ed in
sha
re c
lass
cur
renc
y
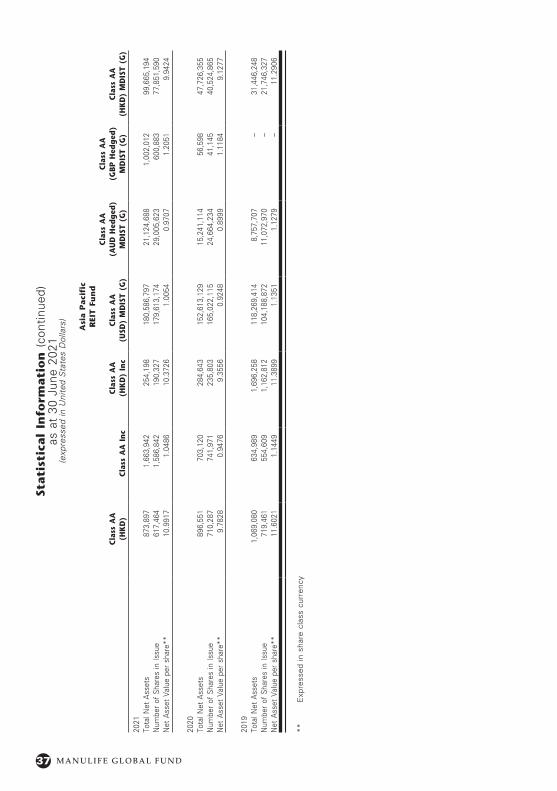
37 M A N U L I F E G L O B A L F U N D
Stati
stic
al
Info
rmati
on
(co
ntin
ued)
as a
t 30
Jun
e 20
21(e
xpre
ssed
in U
nite
d S
tate
s D
olla
rs)
Asi
a P
aci
fic
R
EIT
Fu
nd
Cla
ss A
A
(HK
D)
Cla
ss A
A I
nc
Cla
ss A
A
(HK
D)
Inc
Cla
ss A
A
(USD
) M
DIS
T (G
)
Cla
ss A
A
(AU
D H
edg
ed)
MD
IST
(G)
Cla
ss A
A
(GB
P H
edg
ed)
MD
IST
(G)
Cla
ss A
A
(HK
D)
MD
IST
(G)
2021
Tota
l Net
Ass
ets
873,
897
1,66
3,94
225
4,19
818
0,58
6,79
721
,124
,688
1,00
2,01
299
,665
,194
Num
ber
of S
hare
s in
Issu
e61
7,46
41,
586,
842
190,
327
179,
613,
174
29,0
05,6
2360
0,88
377
,851
,590
Net
Ass
et V
alue
per
sha
re**
10.9
917
1.04
8610
.372
61.
0054
0.97
071.
2051
9.94
24
2020
Tota
l Net
Ass
ets
896,
551
703,
120
284,
643
152,
613,
129
15,2
41,1
1456
,598
47,7
26,3
55N
umbe
r of
Sha
res
in Is
sue
710,
287
741,
971
235,
803
165,
022,
115
24,6
64,2
3441
,145
40,5
24,8
65N
et A
sset
Val
ue p
er s
hare
**9.
7828
0.94
769.
3556
0.92
480.
8999
1.11
849.
1277
2019
Tota
l Net
Ass
ets
1,06
9,08
063
4,98
91,
696,
258
118,
269,
414
8,75
7,70
7–
31,4
46,2
48N
umbe
r of
Sha
res
in Is
sue
719,
461
554,
609
1,16
2,81
210
4,18
8,87
211
,072
,970
–21
,746
,327
Net
Ass
et V
alue
per
sha
re**
11.6
021
1.14
4911
.389
91.
1351
1.12
79–
11.2
906
**
Exp
ress
ed in
sha
re c
lass
cur
renc
y
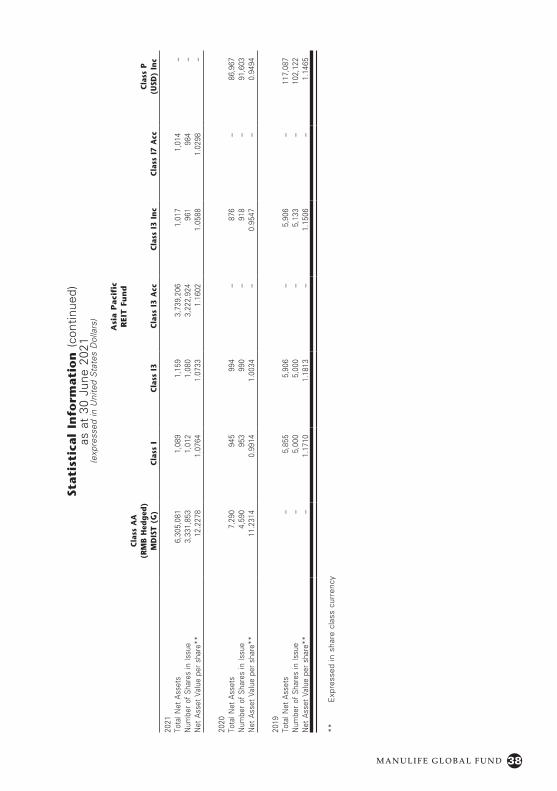
38M A N U L I F E G L O B A L F U N D
Stati
stic
al
Info
rmati
on
(co
ntin
ued)
as a
t 30
Jun
e 20
21(e
xpre
ssed
in U
nite
d S
tate
s D
olla
rs)
Asi
a P
aci
fic
R
EIT
Fu
nd
Cla
ss A
A
(RM
B H
edg
ed)
MD
IST
(G)
Cla
ss I
Cla
ss I
3C
lass
I3
Acc
Cla
ss I
3 In
cC
lass
I7
Acc
Cla
ss P
(U
SD)
Inc
2021
Tota
l Net
Ass
ets
6,30
5,08
11,
089
1,15
93,
739,
206
1,01
71,
014
–N
umbe
r of
Sha
res
in Is
sue
3,33
1,85
31,
012
1,08
03,
222,
924
961
984
–N
et A
sset
Val
ue p
er s
hare
**12
.227
81.
0764
1.07
331.
1602
1.05
881.
0298
–
2020
Tota
l Net
Ass
ets
7,29
094
599
4–
876
–86
,967
Num
ber
of S
hare
s in
Issu
e4,
590
953
990
–91
8–
91,6
03N
et A
sset
Val
ue p
er s
hare
**11
.231
40.
9914
1.00
34–
0.95
47–
0.94
94
2019
Tota
l Net
Ass
ets
–5,
855
5,90
6–
5,90
6–
117,
087
Num
ber
of S
hare
s in
Issu
e–
5,00
05,
000
–5,
133
–10
2,12
2N
et A
sset
Val
ue p
er s
hare
**–
1.17
101.
1813
–1.
1506
–1.
1465
**
Exp
ress
ed in
sha
re c
lass
cur
renc
y
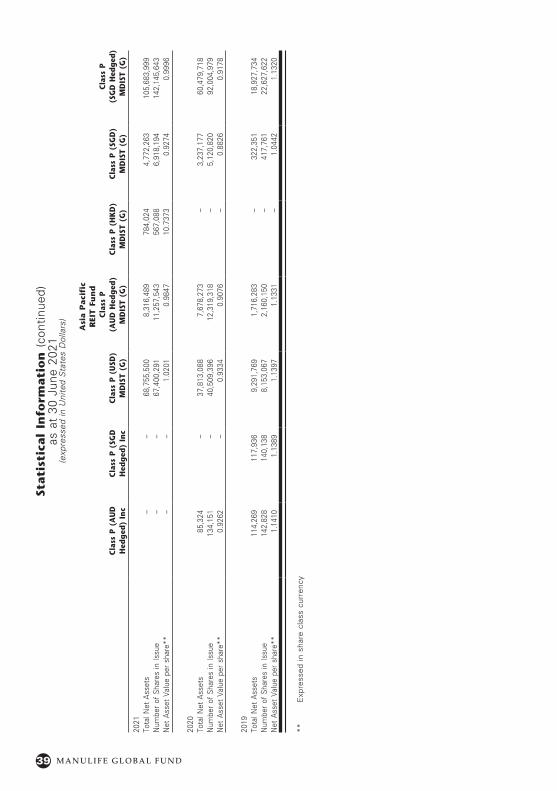
39 M A N U L I F E G L O B A L F U N D
Stati
stic
al
Info
rmati
on
(co
ntin
ued)
as a
t 30
Jun
e 20
21(e
xpre
ssed
in U
nite
d S
tate
s D
olla
rs)
Asi
a P
aci
fic
R
EIT
Fu
nd
Cla
ss P
(A
UD
H
edg
ed)
Inc
Cla
ss P
(SG
D
Hed
ged
) In
cC
lass
P (
USD
) M
DIS
T (G
)
Cla
ss P
(A
UD
Hed
ged
) M
DIS
T (G
)C
lass
P (
HK
D)
MD
IST
(G)
Cla
ss P
(SG
D)
MD
IST
(G)
Cla
ss P
(S
GD
Hed
ged
) M
DIS
T (G
)
2021
Tota
l Net
Ass
ets
––
68,7
55,5
008,
316,
489
784,
024
4,77
2,26
310
5,68
3,99
9N
umbe
r of
Sha
res
in Is
sue
––
67,4
00,2
9111
,257
,543
567,
088
6,91
8,19
414
2,14
5,64
3N
et A
sset
Val
ue p
er s
hare
**–
–1.
0201
0.98
4710
.737
30.
9274
0.99
96
2020
Tota
l Net
Ass
ets
85,3
24–
37,8
13,0
887,
678,
273
–3,
237,
177
60,4
79,7
18N
umbe
r of
Sha
res
in Is
sue
134,
151
–40
,509
,396
12,3
19,3
18–
5,12
0,82
092
,004
,979
Net
Ass
et V
alue
per
sha
re**
0.92
62–
0.93
340.
9076
–0.
8826
0.91
78
2019
Tota
l Net
Ass
ets
114,
269
117,
936
9,29
1,76
91,
716,
283
–32
2,35
118
,927
,734
Num
ber
of S
hare
s in
Issu
e14
2,82
814
0,13
88,
153,
067
2,16
0,15
0–
417,
761
22,6
27,6
22N
et A
sset
Val
ue p
er s
hare
**1.
1410
1.13
891.
1397
1.13
31–
1.04
421.
1320
**
Exp
ress
ed in
sha
re c
lass
cur
renc
y
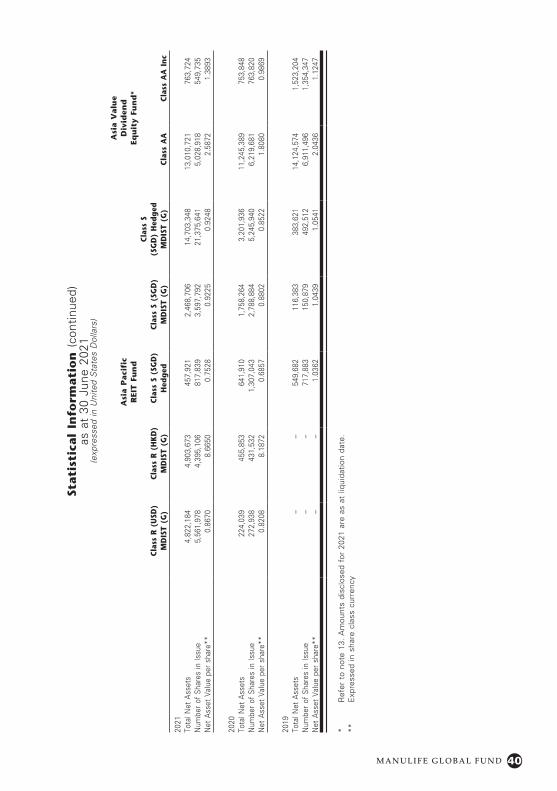
40M A N U L I F E G L O B A L F U N D
Stati
stic
al
Info
rmati
on
(co
ntin
ued)
as a
t 30
Jun
e 20
21(e
xpre
ssed
in U
nite
d S
tate
s D
olla
rs)
Asi
a P
aci
fic
R
EIT
Fu
nd
Asi
a V
alu
e
Div
iden
d
Equ
ity
Fun
d*
Cla
ss R
(U
SD)
MD
IST
(G)
Cla
ss R
(H
KD
) M
DIS
T (G
)C
lass
S (
SGD
) H
edg
edC
lass
S (
SGD
) M
DIS
T (G
)
Cla
ss S
(S
GD
) H
edg
ed
MD
IST
(G)
Cla
ss A
AC
lass
AA
In
c
2021
Tota
l Net
Ass
ets
4,82
2,18
44,
903,
673
457,
921
2,46
8,70
614
,703
,348
13,0
10,7
2176
3,72
4N
umbe
r of
Sha
res
in Is
sue
5,56
1,97
84,
395,
106
817,
839
3,59
7,79
221
,375
,641
5,02
8,91
854
9,73
5N
et A
sset
Val
ue p
er s
hare
**0.
8670
8.66
500.
7528
0.92
250.
9248
2.58
721.
3893
2020
Tota
l Net
Ass
ets
224,
039
455,
853
641,
910
1,75
8,26
43,
201,
936
11,2
45,3
8975
3,84
8N
umbe
r of
Sha
res
in Is
sue
272,
938
431,
532
1,30
7,04
32,
788,
884
5,24
5,94
06,
219,
681
763,
820
Net
Ass
et V
alue
per
sha
re**
0.82
088.
1872
0.68
570.
8802
0.85
221.
8080
0.98
69
2019
Tota
l Net
Ass
ets
––
549,
682
116,
383
383,
621
14,1
24,5
741,
523,
204
Num
ber
of S
hare
s in
Issu
e–
–71
7,88
315
0,87
949
2,51
26,
911,
496
1,35
4,34
7N
et A
sset
Val
ue p
er s
hare
**–
–1.
0362
1.04
391.
0541
2.04
361.
1247
* R
efer
to
note
13.
Am
ount
s di
sclo
sed
for
2021
are
as
at li
quid
atio
n da
te.
**
Exp
ress
ed in
sha
re c
lass
cur
renc
y
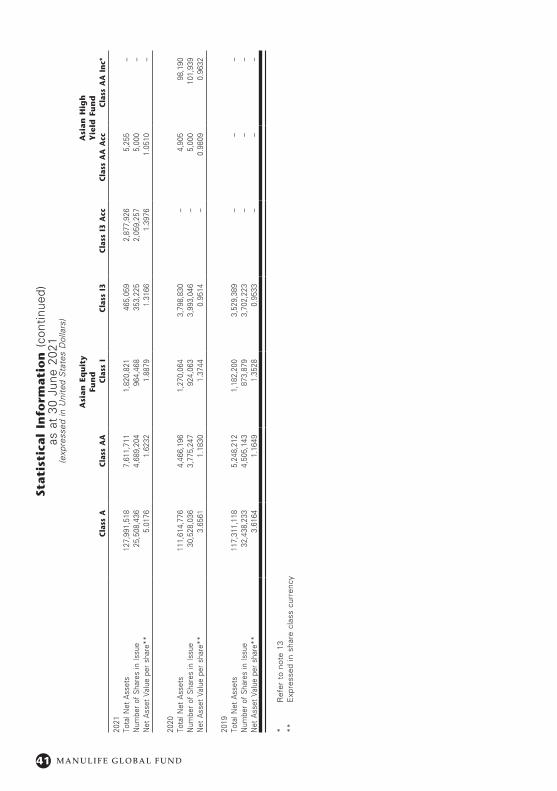
41 M A N U L I F E G L O B A L F U N D
Stati
stic
al
Info
rmati
on
(co
ntin
ued)
as a
t 30
Jun
e 20
21(e
xpre
ssed
in U
nite
d S
tate
s D
olla
rs)
Asi
an
Eq
uit
y
Fun
dA
sian
Hig
h
Yie
ld F
un
dC
lass
AC
lass
AA
Cla
ss I
Cla
ss I
3C
lass
I3
Acc
Cla
ss A
A A
ccC
lass
AA
In
c*
2021
Tota
l Net
Ass
ets
127,
991,
518
7,61
1,71
11,
820,
821
465,
059
2,87
7,92
65,
255
–N
umbe
r of
Sha
res
in Is
sue
25,5
08,4
364,
689,
204
964,
468
353,
225
2,05
9,25
75,
000
–N
et A
sset
Val
ue p
er s
hare
**5.
0176
1.62
321.
8879
1.31
661.
3976
1.05
10–
2020
Tota
l Net
Ass
ets
111,
614,
776
4,46
6,19
61,
270,
064
3,79
8,83
0–
4,90
598
,190
Num
ber
of S
hare
s in
Issu
e30
,528
,036
3,77
5,24
792
4,06
33,
993,
046
–5,
000
101,
939
Net
Ass
et V
alue
per
sha
re**
3.65
611.
1830
1.37
440.
9514
–0.
9809
0.96
32
2019
Tota
l Net
Ass
ets
117,
311,
118
5,24
8,21
21,
182,
200
3,52
9,38
9–
––
Num
ber
of S
hare
s in
Issu
e32
,438
,233
4,50
5,14
387
3,87
93,
702,
223
––
–N
et A
sset
Val
ue p
er s
hare
**3.
6164
1.16
491.
3528
0.95
33–
––
* R
efer
to
note
13
**
Exp
ress
ed in
sha
re c
lass
cur
renc
y
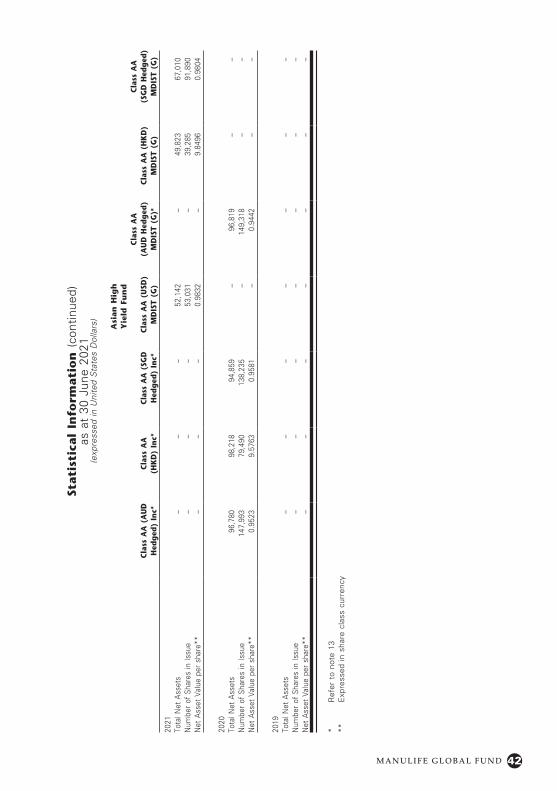
42M A N U L I F E G L O B A L F U N D
Stati
stic
al
Info
rmati
on
(co
ntin
ued)
as a
t 30
Jun
e 20
21(e
xpre
ssed
in U
nite
d S
tate
s D
olla
rs)
Asi
an
Hig
h
Yie
ld F
un
d
Cla
ss A
A (
AU
D
Hed
ged
) In
c*C
lass
AA
(H
KD
) In
c*C
lass
AA
(SG
D
Hed
ged
) In
c*C
lass
AA
(U
SD)
MD
IST
(G)
Cla
ss A
A
(AU
D H
edg
ed)
MD
IST
(G)*
Cla
ss A
A (
HK
D)
MD
IST
(G)
Cla
ss A
A
(SG
D H
edg
ed)
MD
IST
(G)
2021
Tota
l Net
Ass
ets
––
–52
,142
–49
,823
67,0
10N
umbe
r of
Sha
res
in Is
sue
––
–53
,031
–39
,285
91,8
90N
et A
sset
Val
ue p
er s
hare
**–
––
0.98
32–
9.84
960.
9804
2020
Tota
l Net
Ass
ets
96,7
8098
,218
94,8
59–
96,8
19–
–N
umbe
r of
Sha
res
in Is
sue
147,
993
79,4
9013
8,23
5–
149,
318
––
Net
Ass
et V
alue
per
sha
re**
0.95
239.
5763
0.95
81–
0.94
42–
–
2019
Tota
l Net
Ass
ets
––
––
––
–N
umbe
r of
Sha
res
in Is
sue
––
––
––
–N
et A
sset
Val
ue p
er s
hare
**–
––
––
––
* R
efer
to
note
13
**
Exp
ress
ed in
sha
re c
lass
cur
renc
y
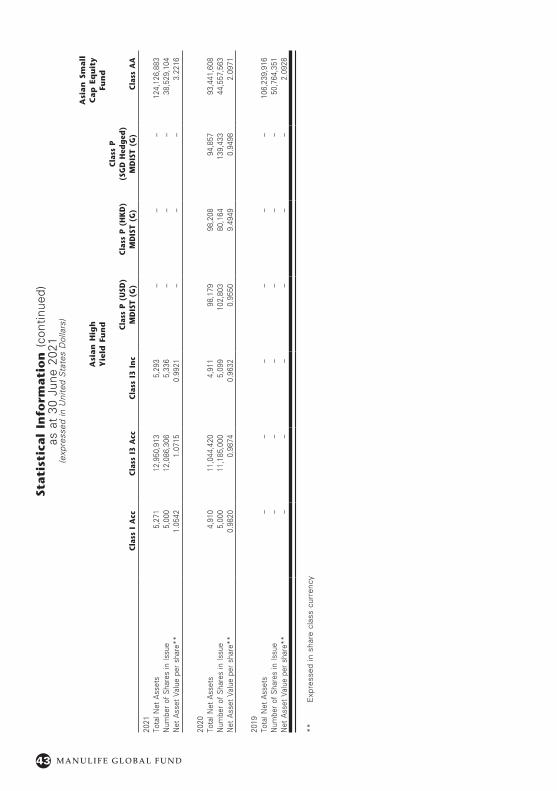
43 M A N U L I F E G L O B A L F U N D
Stati
stic
al
Info
rmati
on
(co
ntin
ued)
as a
t 30
Jun
e 20
21(e
xpre
ssed
in U
nite
d S
tate
s D
olla
rs)
Asi
an
Hig
h
Yie
ld F
un
d
Asi
an
Sm
all
C
ap
Eq
uit
y Fu
nd
Cla
ss I
Acc
Cla
ss I
3 A
ccC
lass
I3
Inc
Cla
ss P
(U
SD)
MD
IST
(G)
Cla
ss P
(H
KD
) M
DIS
T (G
)
Cla
ss P
(S
GD
Hed
ged
) M
DIS
T (G
)C
lass
AA
2021
Tota
l Net
Ass
ets
5,27
112
,950
,913
5,29
3–
––
124,
126,
883
Num
ber
of S
hare
s in
Issu
e5,
000
12,0
86,3
065,
336
––
–38
,529
,104
Net
Ass
et V
alue
per
sha
re**
1.05
421.
0715
0.99
21–
––
3.22
16
2020
Tota
l Net
Ass
ets
4,91
011
,044
,420
4,91
198
,179
98,2
0894
,857
93,4
41,6
08N
umbe
r of
Sha
res
in Is
sue
5,00
011
,185
,000
5,09
910
2,80
380
,164
139,
433
44,5
57,5
63N
et A
sset
Val
ue p
er s
hare
**0.
9820
0.98
740.
9632
0.95
509.
4949
0.94
982.
0971
2019
Tota
l Net
Ass
ets
––
––
––
106,
239,
916
Num
ber
of S
hare
s in
Issu
e–
––
––
–50
,764
,351
Net
Ass
et V
alue
per
sha
re**
––
––
––
2.09
28
**
Exp
ress
ed in
sha
re c
lass
cur
renc
y
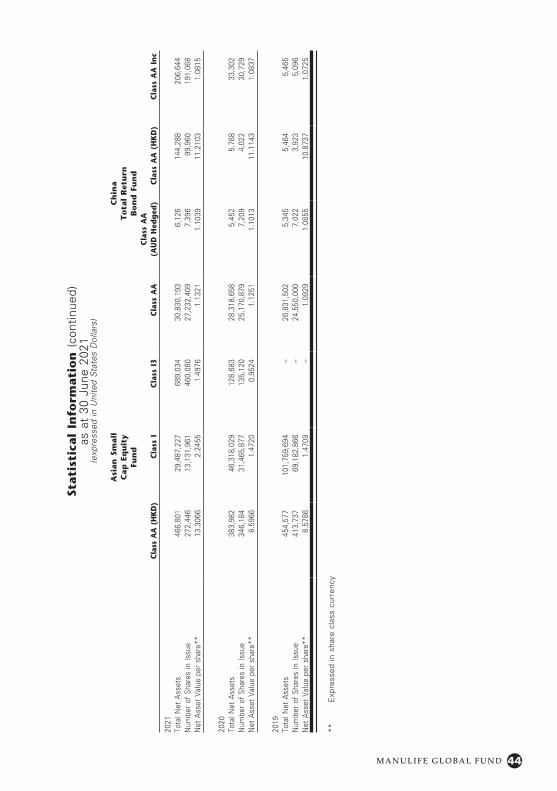
44M A N U L I F E G L O B A L F U N D
Stati
stic
al
Info
rmati
on
(co
ntin
ued)
as a
t 30
Jun
e 20
21(e
xpre
ssed
in U
nite
d S
tate
s D
olla
rs)
Asi
an
Sm
all
C
ap
Eq
uit
y
Fun
d
Ch
ina
To
tal
Ret
urn
B
on
d F
un
d
Cla
ss A
A (
HK
D)
Cla
ss I
Cla
ss I
3C
lass
AA
Cla
ss A
A
(AU
D H
edg
ed)
Cla
ss A
A (
HK
D)
Cla
ss A
A I
nc
2021
Tota
l Net
Ass
ets
466,
801
29,4
87,2
2768
9,03
430
,830
,193
6,12
614
4,28
820
6,64
4N
umbe
r of
Sha
res
in Is
sue
272,
446
13,1
31,9
6146
0,08
027
,232
,409
7,39
699
,960
191,
068
Net
Ass
et V
alue
per
sha
re**
13.3
066
2.24
551.
4976
1.13
211.
1039
11.2
103
1.08
15
2020
Tota
l Net
Ass
ets
383,
982
46,3
18,0
2912
8,68
328
,318
,658
5,45
25,
768
33,3
02N
umbe
r of
Sha
res
in Is
sue
346,
184
31,4
65,8
7713
5,12
025
,170
,879
7,20
94,
022
30,7
29N
et A
sset
Val
ue p
er s
hare
**8.
5966
1.47
200.
9524
1.12
511.
1013
11.1
143
1.08
37
2019
Tota
l Net
Ass
ets
454,
577
101,
759,
694
–26
,831
,502
5,34
55,
464
5,46
5N
umbe
r of
Sha
res
in Is
sue
413,
737
69,1
82,8
66–
24,5
50,0
007,
022
3,92
35,
096
Net
Ass
et V
alue
per
sha
re**
8.57
861.
4709
–1.
0929
1.08
5510
.873
71.
0725
**
Exp
ress
ed in
sha
re c
lass
cur
renc
y
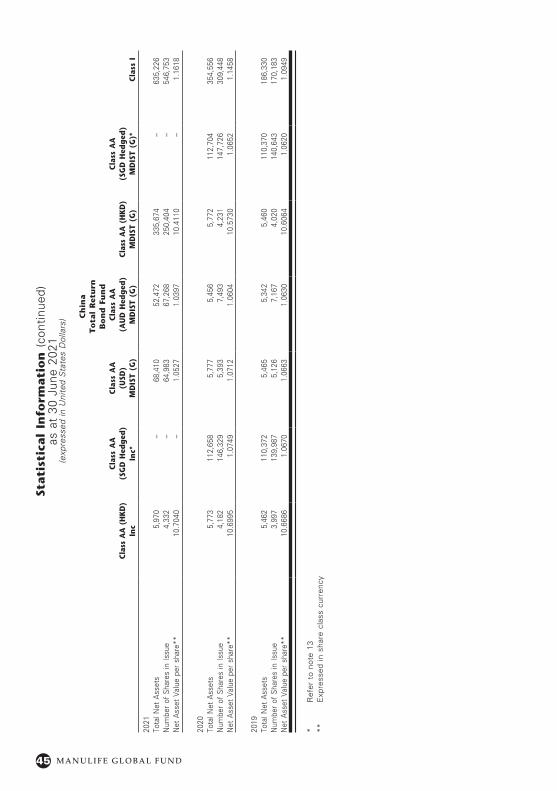
45 M A N U L I F E G L O B A L F U N D
Stati
stic
al
Info
rmati
on
(co
ntin
ued)
as a
t 30
Jun
e 20
21(e
xpre
ssed
in U
nite
d S
tate
s D
olla
rs) C
hin
a
To
tal
Ret
urn
B
on
d F
un
d
Cla
ss A
A (
HK
D)
Inc
Cla
ss A
A
(SG
D H
edg
ed)
Inc*
Cla
ss A
A
(USD
)
MD
IST
(G)
Cla
ss A
A
(AU
D H
edg
ed)
MD
IST
(G)
Cla
ss A
A (
HK
D)
MD
IST
(G)
Cla
ss A
A
(SG
D H
edg
ed)
MD
IST
(G)*
Cla
ss I
2021
Tota
l Net
Ass
ets
5,97
0–
68,4
1052
,472
335,
674
–63
5,22
6N
umbe
r of
Sha
res
in Is
sue
4,33
2–
64,9
8367
,268
250,
404
–54
6,75
3N
et A
sset
Val
ue p
er s
hare
**10
.704
0–
1.05
271.
0397
10.4
110
–1.
1618
2020
Tota
l Net
Ass
ets
5,77
311
2,65
85,
777
5,45
65,
772
112,
704
354,
556
Num
ber
of S
hare
s in
Issu
e4,
182
146,
329
5,39
37,
493
4,23
114
7,72
630
9,44
8N
et A
sset
Val
ue p
er s
hare
**10
.699
51.
0749
1.07
121.
0604
10.5
730
1.06
521.
1458
2019
Tota
l Net
Ass
ets
5,46
211
0,37
25,
465
5,34
25,
460
110,
370
186,
330
Num
ber
of S
hare
s in
Issu
e3,
997
139,
987
5,12
67,
167
4,02
014
0,64
317
0,18
3N
et A
sset
Val
ue p
er s
hare
**10
.668
61.
0670
1.06
631.
0630
10.6
064
1.06
201.
0949
* R
efer
to
note
13
**
Exp
ress
ed in
sha
re c
lass
cur
renc
y
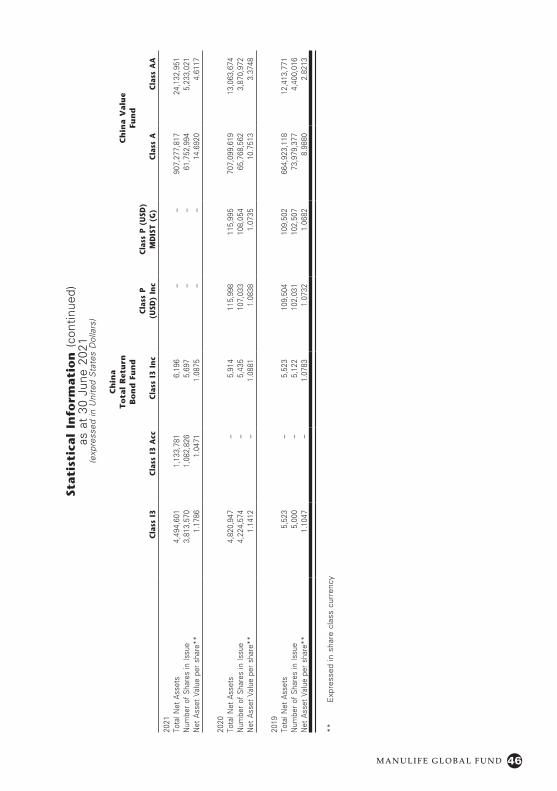
46M A N U L I F E G L O B A L F U N D
Stati
stic
al
Info
rmati
on
(co
ntin
ued)
as a
t 30
Jun
e 20
21(e
xpre
ssed
in U
nite
d S
tate
s D
olla
rs)
Ch
ina
To
tal
Ret
urn
B
on
d F
un
dC
hin
a V
alu
e
Fun
d
Cla
ss I
3C
lass
I3
Acc
Cla
ss I
3 In
cC
lass
P
(USD
) In
cC
lass
P (
USD
) M
DIS
T (G
)C
lass
AC
lass
AA
2021
Tota
l Net
Ass
ets
4,49
4,60
11,
133,
781
6,19
6–
–90
7,27
7,81
724
,132
,951
Num
ber
of S
hare
s in
Issu
e3,
813,
570
1,08
2,82
65,
697
––
61,7
52,9
945,
233,
021
Net
Ass
et V
alue
per
sha
re**
1.17
861.
0471
1.08
75–
–14
.692
04.
6117
2020
Tota
l Net
Ass
ets
4,82
0,94
7–
5,91
411
5,99
811
5,99
570
7,09
9,61
913
,063
,674
Num
ber
of S
hare
s in
Issu
e4,
224,
574
–5,
435
107,
033
108,
054
65,7
68,5
623,
870,
972
Net
Ass
et V
alue
per
sha
re**
1.14
12–
1.08
811.
0838
1.07
3510
.751
33.
3748
2019
Tota
l Net
Ass
ets
5,52
3–
5,52
310
9,50
410
9,50
266
4,92
3,11
812
,413
,771
Num
ber
of S
hare
s in
Issu
e5,
000
–5,
122
102,
031
102,
507
73,9
79,3
774,
400,
016
Net
Ass
et V
alue
per
sha
re**
1.10
47–
1.07
831.
0732
1.06
828.
9880
2.82
13
**
Exp
ress
ed in
sha
re c
lass
cur
renc
y
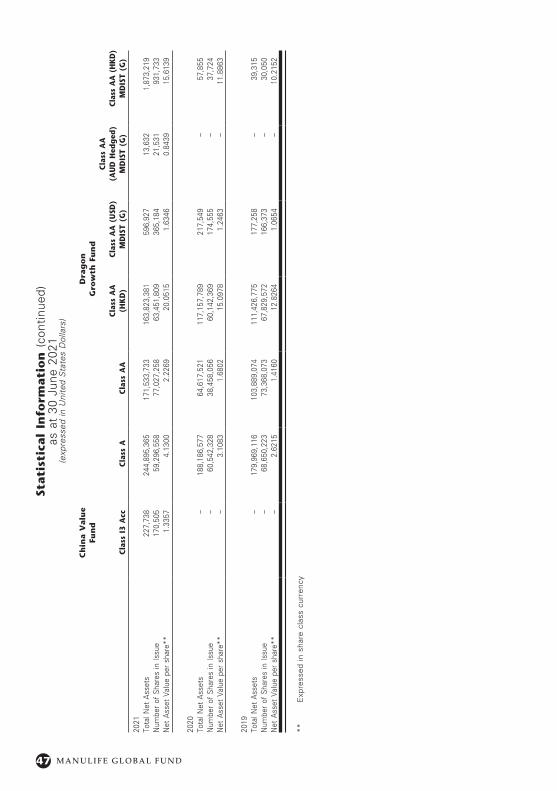
47 M A N U L I F E G L O B A L F U N D
Stati
stic
al
Info
rmati
on
(co
ntin
ued)
as a
t 30
Jun
e 20
21(e
xpre
ssed
in U
nite
d S
tate
s D
olla
rs)
Ch
ina V
alu
e Fu
nd
Dra
go
n
Gro
wth
Fu
nd
Cla
ss I
3 A
ccC
lass
AC
lass
AA
Cla
ss A
A
(HK
D)
Cla
ss A
A (
USD
) M
DIS
T (G
)
Cla
ss A
A
(AU
D H
edg
ed)
MD
IST
(G)
Cla
ss A
A (
HK
D)
MD
IST
(G)
2021
Tota
l Net
Ass
ets
227,
738
244,
895,
365
171,
533,
733
163,
823,
381
596,
927
13,6
321,
873,
219
Num
ber
of S
hare
s in
Issu
e17
0,50
559
,296
,558
77,0
27,2
5863
,451
,809
365,
184
21,5
3193
1,73
3N
et A
sset
Val
ue p
er s
hare
**1.
3357
4.13
002.
2269
20.0
515
1.63
460.
8439
15.6
139
2020
Tota
l Net
Ass
ets
–18
8,18
6,57
764
,617
,521
117,
157,
789
217,
549
–57
,855
Num
ber
of S
hare
s in
Issu
e–
60,5
42,3
2838
,458
,056
60,1
42,3
6917
4,55
5–
37,7
24N
et A
sset
Val
ue p
er s
hare
**–
3.10
831.
6802
15.0
978
1.24
63–
11.8
863
2019
Tota
l Net
Ass
ets
–17
9,96
9,11
610
3,88
9,07
411
1,42
6,77
517
7,25
8–
39,3
15N
umbe
r of
Sha
res
in Is
sue
–68
,650
,223
73,3
68,0
7367
,829
,572
166,
373
–30
,050
Net
Ass
et V
alue
per
sha
re**
–2.
6215
1.41
6012
.826
41.
0654
–10
.215
2
**
Exp
ress
ed in
sha
re c
lass
cur
renc
y
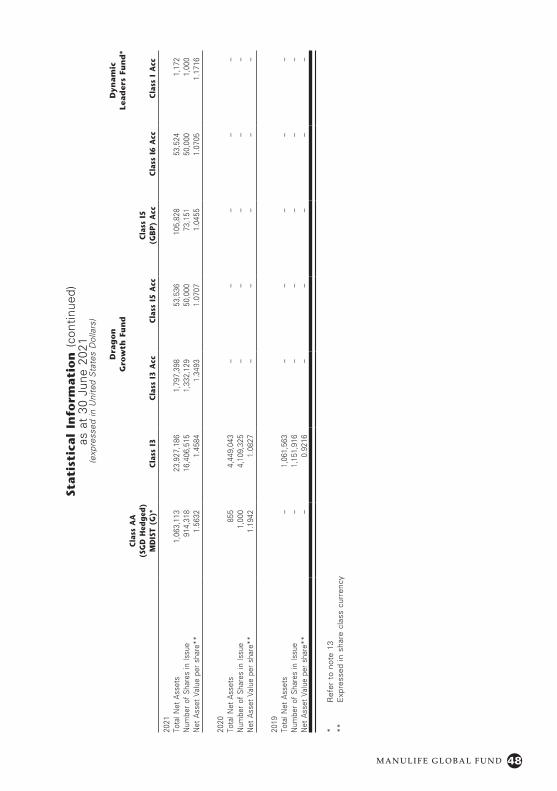
48M A N U L I F E G L O B A L F U N D
Stati
stic
al
Info
rmati
on
(co
ntin
ued)
as a
t 30
Jun
e 20
21(e
xpre
ssed
in U
nite
d S
tate
s D
olla
rs)
Dra
go
n
Gro
wth
Fu
nd
Dyn
am
ic
Lead
ers
Fun
d*
Cla
ss A
A
(SG
D H
edg
ed)
MD
IST
(G)*
Cla
ss I
3C
lass
I3
Acc
Cla
ss I
5 A
ccC
lass
I5
(G
BP
) A
ccC
lass
I6
Acc
Cla
ss I
Acc
2021
Tota
l Net
Ass
ets
1,06
3,11
323
,927
,186
1,79
7,39
853
,536
105,
828
53,5
241,
172
Num
ber
of S
hare
s in
Issu
e91
4,31
816
,406
,515
1,33
2,12
950
,000
73,1
5150
,000
1,00
0N
et A
sset
Val
ue p
er s
hare
**1.
5632
1.45
841.
3493
1.07
071.
0455
1.07
051.
1716
2020
Tota
l Net
Ass
ets
855
4,44
9,04
3–
––
––
Num
ber
of S
hare
s in
Issu
e1,
000
4,10
9,32
5–
––
––
Net
Ass
et V
alue
per
sha
re**
1.19
421.
0827
––
––
–
2019
Tota
l Net
Ass
ets
–1,
061,
563
––
––
–N
umbe
r of
Sha
res
in Is
sue
–1,
151,
916
––
––
–N
et A
sset
Val
ue p
er s
hare
**–
0.92
16–
––
––
* R
efer
to
note
13
**
Exp
ress
ed in
sha
re c
lass
cur
renc
y
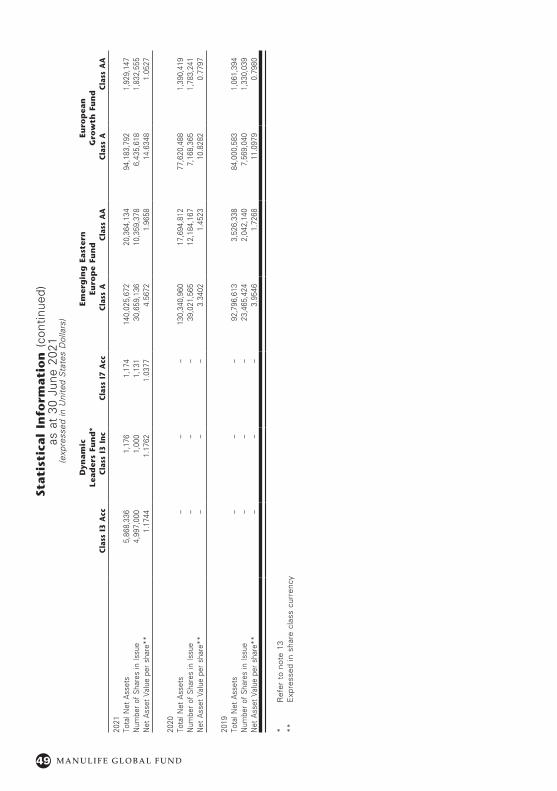
49 M A N U L I F E G L O B A L F U N D
Stati
stic
al
Info
rmati
on
(co
ntin
ued)
as a
t 30
Jun
e 20
21(e
xpre
ssed
in U
nite
d S
tate
s D
olla
rs)
Dyn
am
ic
Lead
ers
Fun
d*
Emer
gin
g E
ast
ern
Eu
rop
e Fu
nd
Euro
pea
n
Gro
wth
Fu
nd
Cla
ss I
3 A
ccC
lass
I3
Inc
Cla
ss I
7 A
ccC
lass
AC
lass
AA
Cla
ss A
Cla
ss A
A
2021
Tota
l Net
Ass
ets
5,86
8,33
61,
176
1,17
414
0,02
5,67
220
,364
,134
94,1
83,7
921,
929,
147
Num
ber
of S
hare
s in
Issu
e4,
997,
000
1,00
01,
131
30,6
59,1
3610
,359
,378
6,43
5,61
81,
832,
555
Net
Ass
et V
alue
per
sha
re**
1.17
441.
1762
1.03
774.
5672
1.96
5814
.634
81.
0527
2020
Tota
l Net
Ass
ets
––
–13
0,34
0,96
017
,694
,812
77,6
20,4
881,
390,
419
Num
ber
of S
hare
s in
Issu
e–
––
39,0
21,5
6512
,184
,167
7,16
8,36
51,
783,
241
Net
Ass
et V
alue
per
sha
re**
––
–3.
3402
1.45
2310
.828
20.
7797
2019
Tota
l Net
Ass
ets
––
–92
,796
,613
3,52
6,33
884
,000
,583
1,06
1,39
4N
umbe
r of
Sha
res
in Is
sue
––
–23
,465
,424
2,04
2,14
07,
569,
040
1,33
0,03
9N
et A
sset
Val
ue p
er s
hare
**–
––
3.95
461.
7268
11.0
979
0.79
80
* R
efer
to
note
13
**
Exp
ress
ed in
sha
re c
lass
cur
renc
y
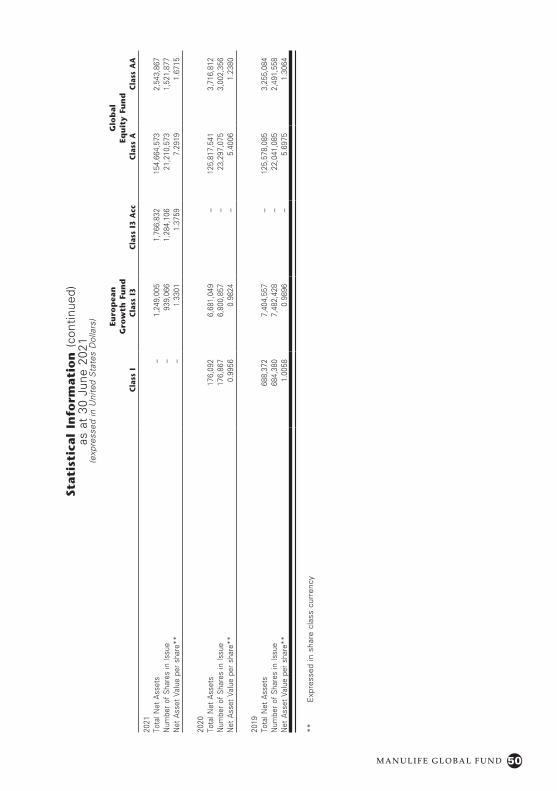
50M A N U L I F E G L O B A L F U N D
Stati
stic
al
Info
rmati
on
(co
ntin
ued)
as a
t 30
Jun
e 20
21(e
xpre
ssed
in U
nite
d S
tate
s D
olla
rs) Eu
rop
ean
G
row
th F
un
dG
lob
al
Eq
uit
y Fu
nd
Cla
ss I
Cla
ss I
3C
lass
I3
Acc
Cla
ss A
Cla
ss A
A
2021
Tota
l Net
Ass
ets
–1,
249,
005
1,76
6,83
215
4,66
4,57
32,
543,
867
Num
ber
of S
hare
s in
Issu
e–
939,
066
1,28
4,10
621
,210
,573
1,52
1,87
7N
et A
sset
Val
ue p
er s
hare
**–
1.33
011.
3759
7.29
191.
6715
2020
Tota
l Net
Ass
ets
176,
092
6,68
1,04
9–
125,
817,
541
3,71
6,81
2N
umbe
r of
Sha
res
in Is
sue
176,
867
6,80
0,85
7–
23,2
97,0
753,
002,
356
Net
Ass
et V
alue
per
sha
re**
0.99
560.
9824
–5.
4006
1.23
80
2019
Tota
l Net
Ass
ets
688,
372
7,40
4,55
7–
125,
578,
085
3,25
5,08
4N
umbe
r of
Sha
res
in Is
sue
684,
380
7,48
2,42
8–
22,0
41,0
852,
491,
558
Net
Ass
et V
alue
per
sha
re**
1.00
580.
9896
–5.
6975
1.30
64
**
Exp
ress
ed in
sha
re c
lass
cur
renc
y
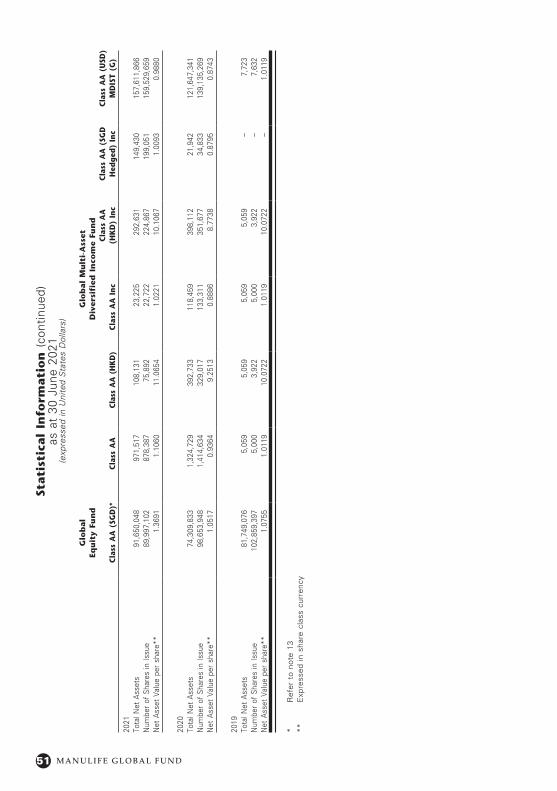
51 M A N U L I F E G L O B A L F U N D
Stati
stic
al
Info
rmati
on
(co
ntin
ued)
as a
t 30
Jun
e 20
21(e
xpre
ssed
in U
nite
d S
tate
s D
olla
rs)
Glo
bal
Eq
uit
y Fu
nd
Glo
bal
Mu
lti-
Ass
et
Div
ersi
fied
In
com
e Fu
nd
Cla
ss A
A (
SGD
)*C
lass
AA
Cla
ss A
A (
HK
D)
Cla
ss A
A I
nc
Cla
ss A
A
(HK
D)
Inc
Cla
ss A
A (
SGD
H
edg
ed)
Inc
Cla
ss A
A (
USD
) M
DIS
T (G
)
2021
Tota
l Net
Ass
ets
91,6
50,0
4897
1,51
710
8,13
123
,225
292,
631
149,
430
157,
611,
866
Num
ber
of S
hare
s in
Issu
e89
,997
,102
878,
387
75,8
9222
,722
224,
867
199,
051
159,
529,
659
Net
Ass
et V
alue
per
sha
re**
1.36
911.
1060
11.0
654
1.02
2110
.106
71.
0093
0.98
80
2020
Tota
l Net
Ass
ets
74,3
09,8
331,
324,
729
392,
733
118,
459
398,
112
21,9
4212
1,64
7,34
1N
umbe
r of
Sha
res
in Is
sue
98,6
53,9
481,
414,
634
329,
017
133,
311
351,
677
34,8
3313
9,13
5,26
9N
et A
sset
Val
ue p
er s
hare
**1.
0517
0.93
649.
2513
0.88
868.
7738
0.87
950.
8743
2019
Tota
l Net
Ass
ets
81,7
49,0
765,
059
5,05
95,
059
5,05
9–
7,72
3N
umbe
r of
Sha
res
in Is
sue
102,
859,
397
5,00
03,
922
5,00
03,
922
–7,
632
Net
Ass
et V
alue
per
sha
re**
1.07
551.
0119
10.0
722
1.01
1910
.072
2–
1.01
19
* R
efer
to
note
13
**
Exp
ress
ed in
sha
re c
lass
cur
renc
y
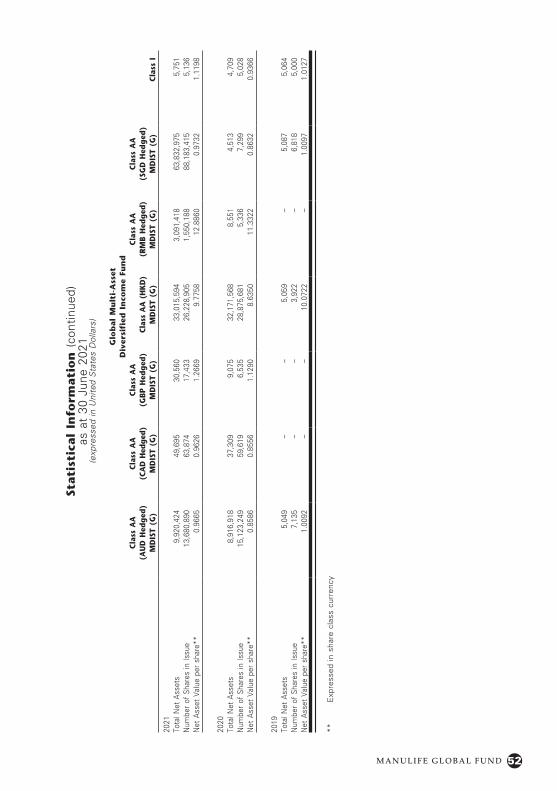
52M A N U L I F E G L O B A L F U N D
Stati
stic
al
Info
rmati
on
(co
ntin
ued)
as a
t 30
Jun
e 20
21(e
xpre
ssed
in U
nite
d S
tate
s D
olla
rs)
Glo
bal
Mu
lti-
Ass
et
Div
ersi
fied
In
com
e Fu
nd
Cla
ss A
A
(AU
D H
edg
ed)
MD
IST
(G)
Cla
ss A
A
(CA
D H
edg
ed)
MD
IST
(G)
Cla
ss A
A
(GB
P H
edg
ed)
MD
IST
(G)
Cla
ss A
A (
HK
D)
MD
IST
(G)
Cla
ss A
A
(RM
B H
edg
ed)
MD
IST
(G)
Cla
ss A
A
(SG
D H
edg
ed)
MD
IST
(G)
Cla
ss I
2021
Tota
l Net
Ass
ets
9,92
0,42
449
,695
30,5
6033
,015
,594
3,09
1,41
863
,832
,975
5,75
1N
umbe
r of
Sha
res
in Is
sue
13,6
80,8
9063
,874
17,4
3326
,228
,905
1,55
0,18
888
,183
,415
5,13
6N
et A
sset
Val
ue p
er s
hare
**0.
9665
0.96
261.
2669
9.77
5812
.886
00.
9732
1.11
98
2020
Tota
l Net
Ass
ets
8,91
6,91
837
,309
9,07
532
,171
,568
8,55
14,
513
4,70
9N
umbe
r of
Sha
res
in Is
sue
15,1
23,2
4959
,619
6,53
528
,875
,681
5,33
67,
299
5,02
8N
et A
sset
Val
ue p
er s
hare
**0.
8586
0.85
561.
1290
8.63
5011
.332
20.
8632
0.93
66
2019
Tota
l Net
Ass
ets
5,04
9–
–5,
059
–5,
087
5,06
4N
umbe
r of
Sha
res
in Is
sue
7,13
5–
–3,
922
–6,
818
5,00
0N
et A
sset
Val
ue p
er s
hare
**1.
0092
––
10.0
722
–1.
0097
1.01
27
**
Exp
ress
ed in
sha
re c
lass
cur
renc
y
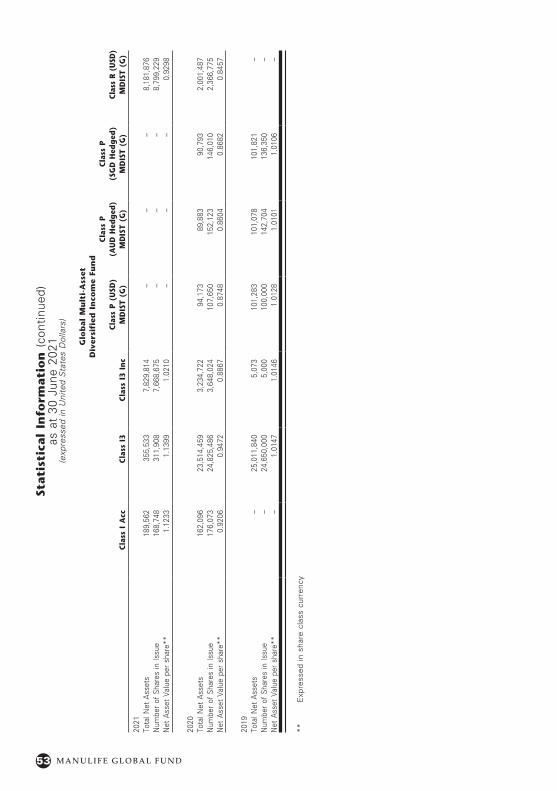
53 M A N U L I F E G L O B A L F U N D
Stati
stic
al
Info
rmati
on
(co
ntin
ued)
as a
t 30
Jun
e 20
21(e
xpre
ssed
in U
nite
d S
tate
s D
olla
rs)
Glo
bal
Mu
lti-
Ass
et
Div
ersi
fied
In
com
e Fu
nd
Cla
ss I
Acc
Cla
ss I
3C
lass
I3
Inc
Cla
ss P
(U
SD)
MD
IST
(G)
Cla
ss P
(A
UD
Hed
ged
) M
DIS
T (G
)
Cla
ss P
(S
GD
Hed
ged
) M
DIS
T (G
)Cl
ass
R (U
SD)
MD
IST
(G)
2021
Tota
l Net
Ass
ets
189,
562
355,
533
7,82
9,81
4–
––
8,18
1,87
6N
umbe
r of
Sha
res
in Is
sue
168,
748
311,
908
7,66
8,67
5–
––
8,79
9,22
9N
et A
sset
Val
ue p
er s
hare
**1.
1233
1.13
991.
0210
––
–0.
9298
2020
Tota
l Net
Ass
ets
162,
096
23,5
14,4
593,
234,
722
94,1
7389
,883
90,7
932,
001,
487
Num
ber
of S
hare
s in
Issu
e17
6,07
324
,825
,486
3,64
8,02
410
7,65
015
2,12
314
6,01
02,
366,
775
Net
Ass
et V
alue
per
sha
re**
0.92
060.
9472
0.88
670.
8748
0.86
040.
8682
0.84
57
2019
Tota
l Net
Ass
ets
–25
,011
,840
5,07
310
1,28
310
1,07
810
1,82
1–
Num
ber
of S
hare
s in
Issu
e–
24,6
50,0
005,
000
100,
000
142,
704
136,
350
–N
et A
sset
Val
ue p
er s
hare
**–
1.01
471.
0146
1.01
281.
0101
1.01
06–
**
Exp
ress
ed in
sha
re c
lass
cur
renc
y
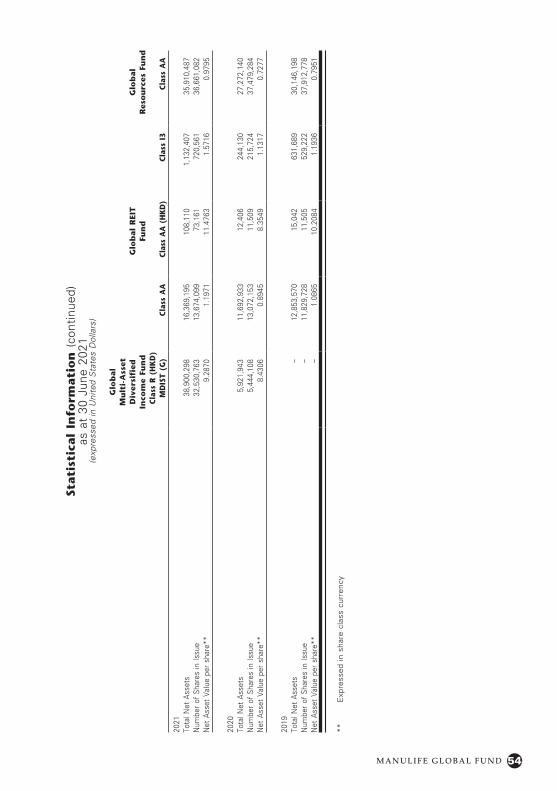
54M A N U L I F E G L O B A L F U N D
Stati
stic
al
Info
rmati
on
(co
ntin
ued)
as a
t 30
Jun
e 20
21(e
xpre
ssed
in U
nite
d S
tate
s D
olla
rs)
Glo
bal
Mu
lti-
Ass
et
Div
ersi
fied
In
com
e Fu
nd
Glo
bal
REI
T
Fun
dG
lob
al
Res
ou
rces
Fu
nd
Cla
ss R
(H
KD
) M
DIS
T (G
)C
lass
AA
Cla
ss A
A (
HK
D)
Cla
ss I
3C
lass
AA
2021
Tota
l Net
Ass
ets
38,9
00,2
9816
,369
,195
108,
110
1,13
2,40
735
,910
,487
Num
ber
of S
hare
s in
Issu
e32
,530
,763
13,6
74,0
9973
,161
720,
561
36,6
61,0
82N
et A
sset
Val
ue p
er s
hare
**9.
2870
1.19
7111
.476
31.
5716
0.97
95
2020
Tota
l Net
Ass
ets
5,92
1,94
311
,692
,933
12,4
0624
4,13
027
,272
,140
Num
ber
of S
hare
s in
Issu
e5,
444,
108
13,0
72,1
5311
,509
215,
724
37,4
79,2
84N
et A
sset
Val
ue p
er s
hare
**8.
4306
0.89
458.
3549
1.13
170.
7277
2019
Tota
l Net
Ass
ets
–12
,853
,570
15,0
4263
1,68
930
,146
,198
Num
ber
of S
hare
s in
Issu
e–
11,8
29,7
2811
,505
529,
222
37,9
12,7
78N
et A
sset
Val
ue p
er s
hare
**–
1.08
6510
.208
41.
1936
0.79
51
**
Exp
ress
ed in
sha
re c
lass
cur
renc
y
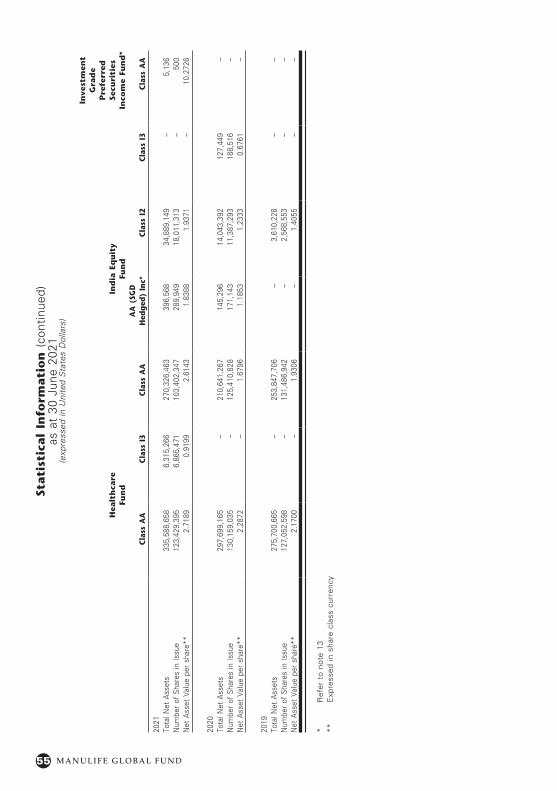
55 M A N U L I F E G L O B A L F U N D
Stati
stic
al
Info
rmati
on
(co
ntin
ued)
as a
t 30
Jun
e 20
21(e
xpre
ssed
in U
nite
d S
tate
s D
olla
rs)
Hea
lth
care
Fu
nd
Ind
ia E
qu
ity
Fu
nd
Inve
stm
ent
Gra
de
Pre
ferr
ed
Secu
riti
es
Inco
me
Fun
d*
Cla
ss A
AC
lass
I3
Cla
ss A
AA
A (
SGD
H
edg
ed)
Inc*
Cla
ss I
2C
lass
I3
Cla
ss A
A
2021
Tota
l Net
Ass
ets
335,
588,
658
6,31
5,26
627
0,32
6,46
339
6,56
834
,889
,149
–5,
136
Num
ber
of S
hare
s in
Issu
e12
3,42
9,39
56,
865,
471
103,
402,
347
289,
949
18,0
11,3
13–
500
Net
Ass
et V
alue
per
sha
re**
2.71
890.
9199
2.61
431.
8388
1.93
71–
10.2
726
2020
Tota
l Net
Ass
ets
297,
699,
165
–21
0,64
1,26
714
5,29
614
,043
,392
127,
449
–N
umbe
r of
Sha
res
in Is
sue
130,
159,
035
–12
5,41
0,82
817
1,14
311
,387
,293
188,
516
–N
et A
sset
Val
ue p
er s
hare
**2.
2872
–1.
6796
1.18
531.
2333
0.67
61–
2019
Tota
l Net
Ass
ets
275,
700,
665
–25
3,84
7,70
6–
3,61
0,22
8–
–N
umbe
r of
Sha
res
in Is
sue
127,
052,
598
–13
1,48
6,94
2–
2,56
8,55
3–
–N
et A
sset
Val
ue p
er s
hare
**2.
1700
–1.
9306
–1.
4055
––
* R
efer
to
note
13
**
Exp
ress
ed in
sha
re c
lass
cur
renc
y
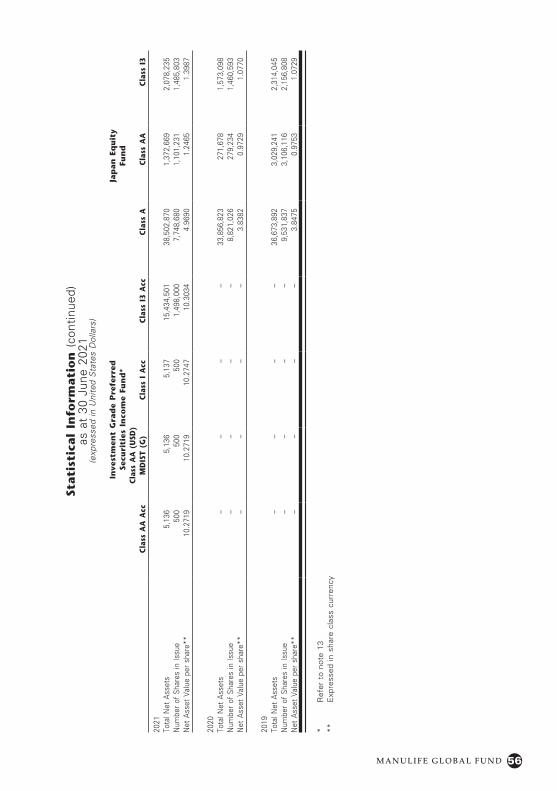
56M A N U L I F E G L O B A L F U N D
Stati
stic
al
Info
rmati
on
(co
ntin
ued)
as a
t 30
Jun
e 20
21(e
xpre
ssed
in U
nite
d S
tate
s D
olla
rs)
Inve
stm
ent
Gra
de
Pre
ferr
ed
Secu
riti
es I
nco
me
Fun
d*
Jap
an
Eq
uit
y
Fun
d
Cla
ss A
A A
ccC
lass
AA
(U
SD)
MD
IST
(G)
Cla
ss I
Acc
Cla
ss I
3 A
ccC
lass
AC
lass
AA
Cla
ss I
3
2021
Tota
l Net
Ass
ets
5,13
65,
136
5,13
715
,434
,501
38,5
02,8
701,
372,
669
2,07
8,23
5N
umbe
r of
Sha
res
in Is
sue
500
500
500
1,49
8,00
07,
748,
680
1,10
1,23
11,
485,
803
Net
Ass
et V
alue
per
sha
re**
10.2
719
10.2
719
10.2
747
10.3
034
4.96
901.
2465
1.39
87
2020
Tota
l Net
Ass
ets
––
––
33,8
56,8
2327
1,67
81,
573,
098
Num
ber
of S
hare
s in
Issu
e–
––
–8,
821,
026
279,
234
1,46
0,59
3N
et A
sset
Val
ue p
er s
hare
**–
––
–3.
8382
0.97
291.
0770
2019
Tota
l Net
Ass
ets
––
––
36,6
73,8
923,
029,
241
2,31
4,04
5N
umbe
r of
Sha
res
in Is
sue
––
––
9,53
1,83
73,
106,
116
2,15
6,80
8N
et A
sset
Val
ue p
er s
hare
**–
––
–3.
8475
0.97
531.
0729
* R
efer
to
note
13
**
Exp
ress
ed in
sha
re c
lass
cur
renc
y
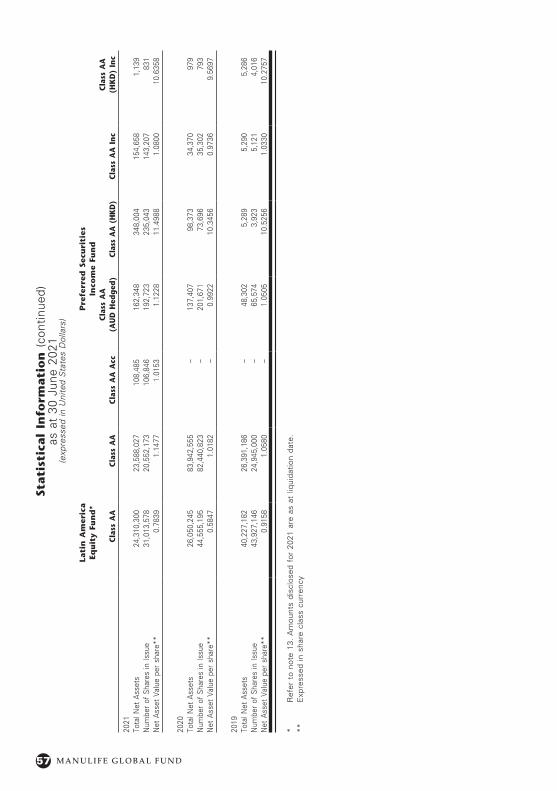
57 M A N U L I F E G L O B A L F U N D
Stati
stic
al
Info
rmati
on
(co
ntin
ued)
as a
t 30
Jun
e 20
21(e
xpre
ssed
in U
nite
d S
tate
s D
olla
rs)
Lati
n A
mer
ica
Equ
ity
Fun
d*
Pre
ferr
ed S
ecu
riti
es
Inco
me
Fun
d
Cla
ss A
AC
lass
AA
Cla
ss A
A A
ccC
lass
AA
(A
UD
Hed
ged
)C
lass
AA
(H
KD
)C
lass
AA
In
cC
lass
AA
(H
KD
) In
c
2021
Tota
l Net
Ass
ets
24,3
10,3
00
23,5
88,0
2710
8,48
516
2,34
834
8,00
415
4,65
81,
139
Num
ber
of S
hare
s in
Issu
e31
,013
,578
20
,552
,173
106,
846
192,
723
235,
043
143,
207
831
Net
Ass
et V
alue
per
sha
re**
0.78
39
1.14
771.
0153
1.12
2811
.498
81.
0800
10.6
358
2020
Tota
l Net
Ass
ets
26,0
50,2
4583
,942
,555
–13
7,40
798
,373
34,3
7097
9N
umbe
r of
Sha
res
in Is
sue
44,5
55,1
9582
,440
,823
–20
1,67
173
,696
35,3
0279
3N
et A
sset
Val
ue p
er s
hare
**0.
5847
1.01
82–
0.99
2210
.345
60.
9736
9.56
97
2019
Tota
l Net
Ass
ets
40,2
27,1
8226
,391
,186
–48
,302
5,28
95,
290
5,28
6N
umbe
r of
Sha
res
in Is
sue
43,9
27,1
4624
,945
,000
–65
,574
3,92
35,
121
4,01
6N
et A
sset
Val
ue p
er s
hare
**0.
9158
1.05
80–
1.05
0510
.525
61.
0330
10.2
757
* R
efer
to
note
13.
Am
ount
s di
sclo
sed
for
2021
are
as
at li
quid
atio
n da
te.
**
Exp
ress
ed in
sha
re c
lass
cur
renc
y
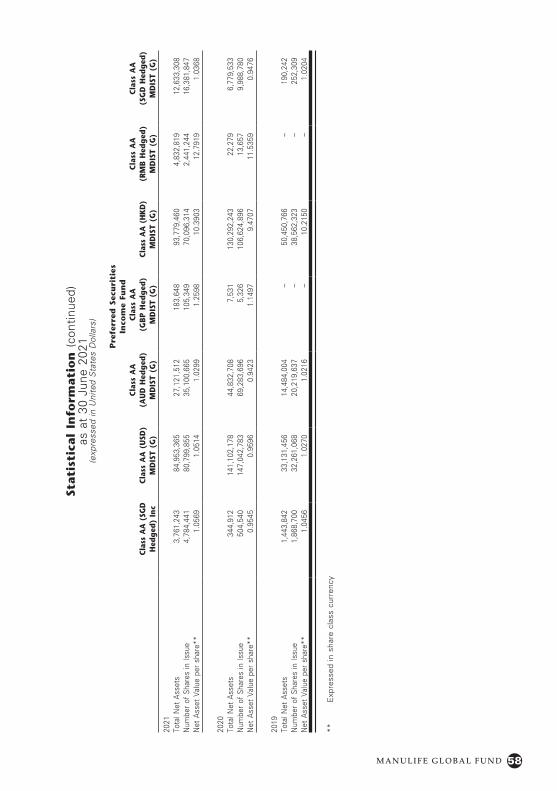
58M A N U L I F E G L O B A L F U N D
Stati
stic
al
Info
rmati
on
(co
ntin
ued)
as a
t 30
Jun
e 20
21(e
xpre
ssed
in U
nite
d S
tate
s D
olla
rs)
Pre
ferr
ed S
ecu
riti
es
Inco
me
Fun
d
Cla
ss A
A (
SGD
H
edg
ed)
Inc
Cla
ss A
A (
USD
) M
DIS
T (G
)
Cla
ss A
A
(AU
D H
edg
ed)
MD
IST
(G)
Cla
ss A
A
(GB
P H
edg
ed)
MD
IST
(G)
Cla
ss A
A (
HK
D)
MD
IST
(G)
Cla
ss A
A
(RM
B H
edg
ed)
MD
IST
(G)
Cla
ss A
A
(SG
D H
edg
ed)
MD
IST
(G)
2021
Tota
l Net
Ass
ets
3,76
1,24
384
,953
,365
27,1
21,5
1218
3,64
893
,779
,460
4,83
2,81
912
,633
,308
Num
ber
of S
hare
s in
Issu
e4,
784,
441
80,7
99,8
5535
,100
,665
105,
349
70,0
96,3
142,
441,
244
16,3
81,8
47N
et A
sset
Val
ue p
er s
hare
**1.
0569
1.05
141.
0299
1.25
9810
.390
312
.791
91.
0368
2020
Tota
l Net
Ass
ets
344,
912
141,
102,
178
44,8
32,7
087,
531
130,
292,
243
22,2
796,
779,
533
Num
ber
of S
hare
s in
Issu
e50
4,54
014
7,04
2,78
369
,283
,696
5,32
610
6,62
4,89
613
,657
9,98
8,78
0N
et A
sset
Val
ue p
er s
hare
**0.
9545
0.95
960.
9423
1.14
979.
4707
11.5
359
0.94
76
2019
Tota
l Net
Ass
ets
1,44
3,84
233
,131
,456
14,4
84,0
04–
50,4
50,7
66–
190,
242
Num
ber
of S
hare
s in
Issu
e1,
868,
700
32,2
61,0
6820
,219
,637
–38
,562
,323
–25
2,30
9N
et A
sset
Val
ue p
er s
hare
**1.
0456
1.02
701.
0216
–10
.215
0–
1.02
04
**
Exp
ress
ed in
sha
re c
lass
cur
renc
y

59 M A N U L I F E G L O B A L F U N D
Stati
stic
al
Info
rmati
on
(co
ntin
ued)
as a
t 30
Jun
e 20
21(e
xpre
ssed
in U
nite
d S
tate
s D
olla
rs)
Pre
ferr
ed S
ecu
riti
es
Inco
me
Fun
d
Cla
ss I
Cla
ss I
3C
lass
I3
Acc
Cla
ss I
3 In
c
Cla
ss I
5
(GB
P H
edg
ed)
Acc
Cla
ss R
(U
SD)
M
DIS
T (G
)
Cla
ss R
(H
KD
)
MD
IST
(G)
2021
Tota
l Net
Ass
ets
1,27
91,
351
5,70
8,81
37,
664,
821
75,4
6215
,316
,856
5,94
6,66
3N
umbe
r of
Sha
res
in Is
sue
1,16
81,
231
4,85
8,19
17,
029,
201
54,1
6415
,987
,302
4,82
7,40
9N
et A
sset
Val
ue p
er s
hare
**1.
0953
1.09
781.
1751
1.09
041.
0069
0.95
819.
5670
2020
Tota
l Net
Ass
ets
1,09
91,
149
–2,
887,
742
–3,
852,
726
3,34
2,29
9N
umbe
r of
Sha
res
in Is
sue
1,07
81,
113
–2,
941,
393
–4,
302,
946
2,90
1,94
3N
et A
sset
Val
ue p
er s
hare
**1.
0196
1.03
21–
0.98
18–
0.89
548.
9265
2019
Tota
l Net
Ass
ets
5,29
45,
340
–41
6,00
8–
––
Num
ber
of S
hare
s in
Issu
e5,
000
5,00
0–
401,
096
––
–N
et A
sset
Val
ue p
er s
hare
**1.
0587
1.06
81–
1.03
72–
––
**
Exp
ress
ed in
sha
re c
lass
cur
renc
y
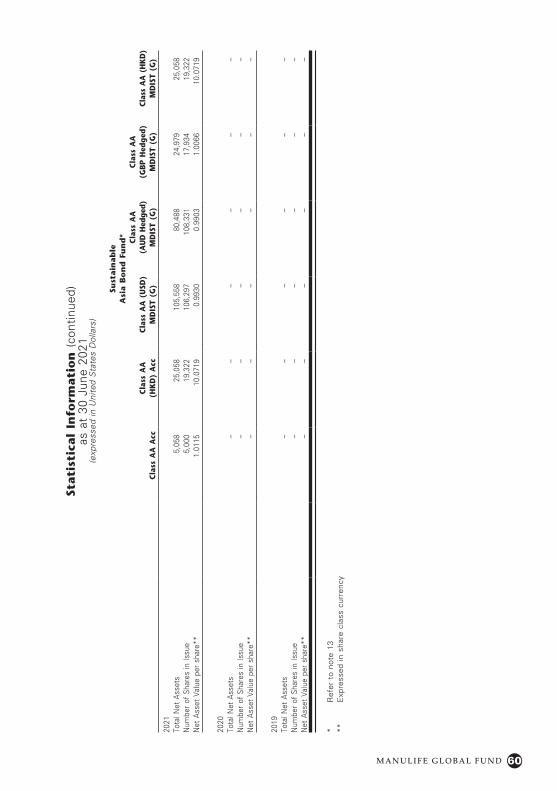
60M A N U L I F E G L O B A L F U N D
Stati
stic
al
Info
rmati
on
(co
ntin
ued)
as a
t 30
Jun
e 20
21(e
xpre
ssed
in U
nite
d S
tate
s D
olla
rs)
Sust
ain
ab
le
Asi
a B
on
d F
un
d*
Cla
ss A
A A
ccC
lass
AA
(H
KD
) A
ccC
lass
AA
(U
SD)
MD
IST
(G)
Cla
ss A
A
(AU
D H
edge
d)
MD
IST
(G)
Cla
ss A
A
(GB
P H
edg
ed)
MD
IST
(G)
Cla
ss A
A (
HK
D)
MD
IST
(G)
2021
Tota
l Net
Ass
ets
5,05
825
,058
105,
558
80,4
8824
,979
25,0
58N
umbe
r of
Sha
res
in Is
sue
5,00
019
,322
106,
297
108,
331
17,9
3419
,322
Net
Ass
et V
alue
per
sha
re**
1.01
1510
.071
90.
9930
0.99
031.
0066
10.0
719
2020
Tota
l Net
Ass
ets
––
––
––
Num
ber
of S
hare
s in
Issu
e–
––
––
–N
et A
sset
Val
ue p
er s
hare
**–
––
––
–
2019
Tota
l Net
Ass
ets
––
––
––
Num
ber
of S
hare
s in
Issu
e–
––
––
–N
et A
sset
Val
ue p
er s
hare
**–
––
––
–
* R
efer
to
note
13
**
Exp
ress
ed in
sha
re c
lass
cur
renc
y
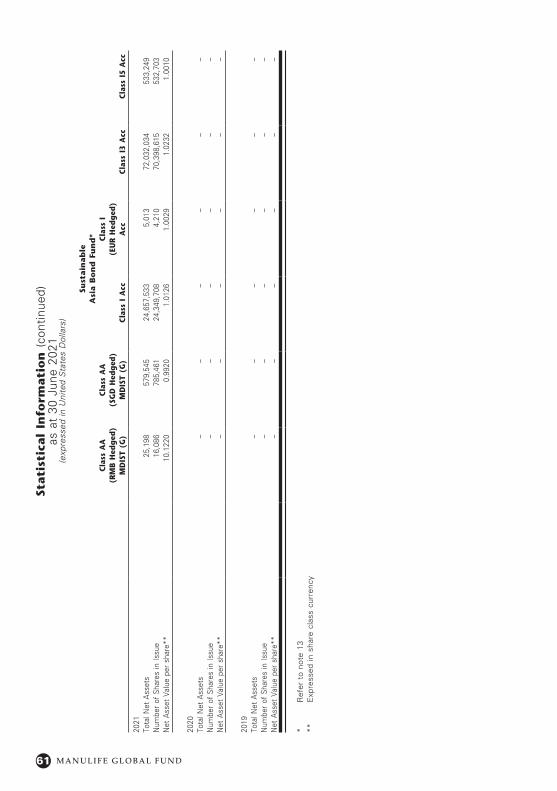
61 M A N U L I F E G L O B A L F U N D
Stati
stic
al
Info
rmati
on
(co
ntin
ued)
as a
t 30
Jun
e 20
21(e
xpre
ssed
in U
nite
d S
tate
s D
olla
rs)
Sust
ain
ab
le
Asi
a B
on
d F
un
d*
Cla
ss A
A
(RM
B H
edg
ed)
MD
IST
(G)
Cla
ss A
A
(SG
D H
edg
ed)
MD
IST
(G)
Cla
ss I
Acc
Cla
ss I
(E
UR
Hed
ged
) A
ccC
lass
I3
Acc
Cla
ss I
5 A
cc
2021
Tota
l Net
Ass
ets
25,1
9857
9,54
524
,657
,533
5,01
372
,032
,034
533,
249
Num
ber
of S
hare
s in
Issu
e16
,086
785,
461
24,3
49,7
084,
210
70,3
98,6
1553
2,70
3N
et A
sset
Val
ue p
er s
hare
**10
.122
00.
9920
1.01
261.
0029
1.02
321.
0010
2020
Tota
l Net
Ass
ets
––
––
––
Num
ber
of S
hare
s in
Issu
e–
––
––
–N
et A
sset
Val
ue p
er s
hare
**–
––
––
–
2019
Tota
l Net
Ass
ets
––
––
––
Num
ber
of S
hare
s in
Issu
e–
––
––
–N
et A
sset
Val
ue p
er s
hare
**–
––
––
–
* R
efer
to
note
13
**
Exp
ress
ed in
sha
re c
lass
cur
renc
y
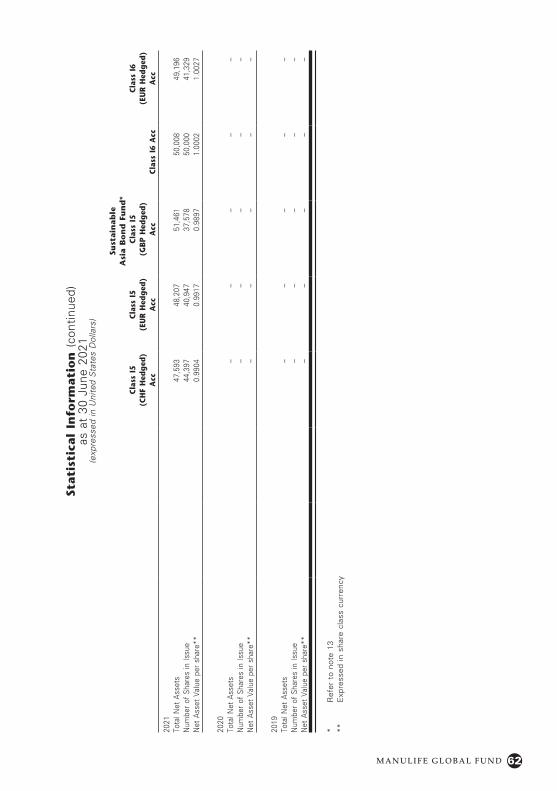
62M A N U L I F E G L O B A L F U N D
Stati
stic
al
Info
rmati
on
(co
ntin
ued)
as a
t 30
Jun
e 20
21(e
xpre
ssed
in U
nite
d S
tate
s D
olla
rs)
Sust
ain
ab
le
Asi
a B
on
d F
un
d*
Cla
ss I
5
(CH
F H
edg
ed)
Acc
Cla
ss I
5
(EU
R H
edg
ed)
Acc
Cla
ss I
5
(GB
P H
edg
ed)
Acc
Cla
ss I
6 A
cc
Cla
ss I
6
(EU
R H
edg
ed)
Acc
2021
Tota
l Net
Ass
ets
47,5
9348
,207
51,4
6150
,008
49,1
96N
umbe
r of
Sha
res
in Is
sue
44,3
9740
,947
37,5
7850
,000
41,3
29N
et A
sset
Val
ue p
er s
hare
**0.
9904
0.99
170.
9897
1.00
021.
0027
2020
Tota
l Net
Ass
ets
––
––
–N
umbe
r of
Sha
res
in Is
sue
––
––
–N
et A
sset
Val
ue p
er s
hare
**–
––
––
2019
Tota
l Net
Ass
ets
––
––
–N
umbe
r of
Sha
res
in Is
sue
––
––
–N
et A
sset
Val
ue p
er s
hare
**–
––
––
* R
efer
to
note
13
**
Exp
ress
ed in
sha
re c
lass
cur
renc
y
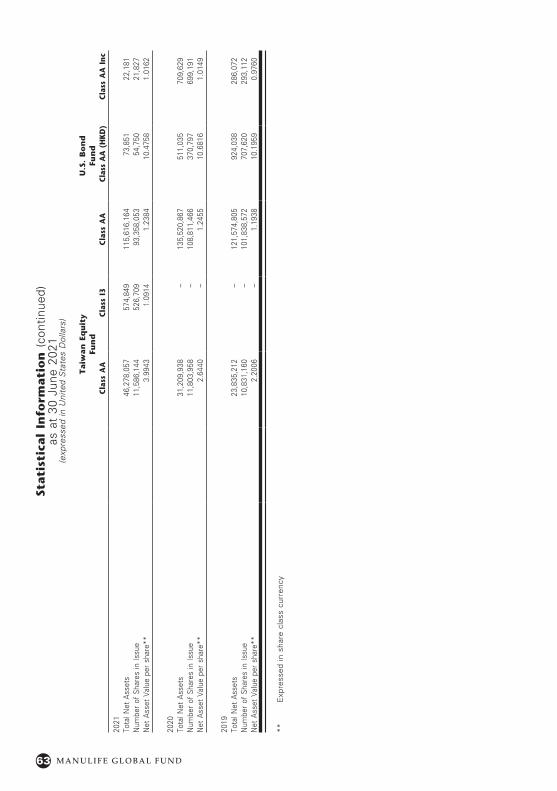
63 M A N U L I F E G L O B A L F U N D
Stati
stic
al
Info
rmati
on
(co
ntin
ued)
as a
t 30
Jun
e 20
21(e
xpre
ssed
in U
nite
d S
tate
s D
olla
rs)
Taiw
an
Eq
uit
y
Fun
dU
.S.
Bo
nd
Fu
nd
Cla
ss A
AC
lass
I3
Cla
ss A
AC
lass
AA
(H
KD
)C
lass
AA
In
c
2021
Tota
l Net
Ass
ets
46,2
78,0
5757
4,84
911
5,61
6,16
473
,851
22,1
81N
umbe
r of
Sha
res
in Is
sue
11,5
86,1
4452
6,70
993
,358
,053
54,7
5021
,827
Net
Ass
et V
alue
per
sha
re**
3.99
431.
0914
1.23
8410
.475
81.
0162
2020
Tota
l Net
Ass
ets
31,2
09,9
38–
135,
520,
867
511,
035
709,
629
Num
ber
of S
hare
s in
Issu
e11
,803
,958
–10
8,81
1,46
637
0,79
769
9,19
1N
et A
sset
Val
ue p
er s
hare
**2.
6440
–1.
2455
10.6
816
1.01
49
2019
Tota
l Net
Ass
ets
23,8
35,2
12–
121,
574,
805
924,
038
286,
072
Num
ber
of S
hare
s in
Issu
e10
,831
,160
–10
1,83
8,57
270
7,62
029
3,11
2N
et A
sset
Val
ue p
er s
hare
**2.
2006
–1.
1938
10.1
959
0.97
60
**
Exp
ress
ed in
sha
re c
lass
cur
renc
y
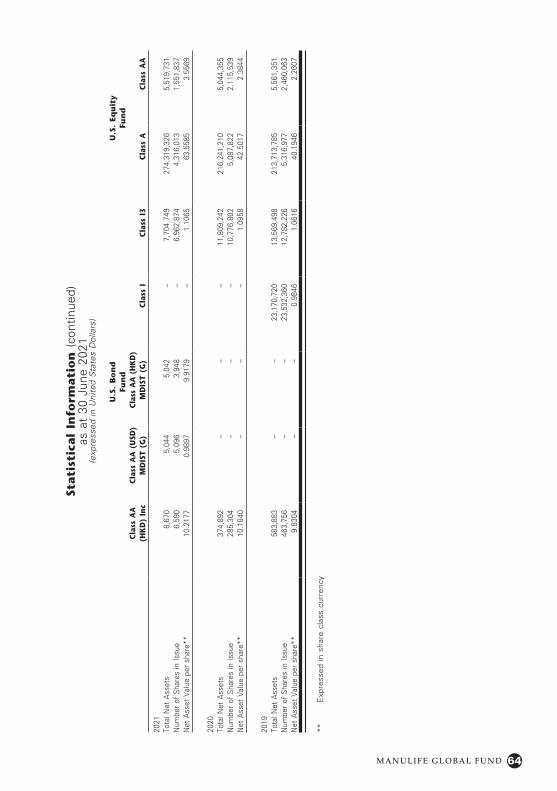
64M A N U L I F E G L O B A L F U N D
Stati
stic
al
Info
rmati
on
(co
ntin
ued)
as a
t 30
Jun
e 20
21(e
xpre
ssed
in U
nite
d S
tate
s D
olla
rs)
U.S
. B
on
d
Fun
dU
.S.
Equ
ity
Fu
nd
Cla
ss A
A
(HK
D)
Inc
Cla
ss A
A (
USD
) M
DIS
T (G
)C
lass
AA
(H
KD
) M
DIS
T (G
)C
lass
IC
lass
I3
Cla
ss A
Cla
ss A
A
2021
Tota
l Net
Ass
ets
8,67
05,
044
5,04
2–
7,70
4,74
927
4,31
9,32
65,
519,
731
Num
ber
of S
hare
s in
Issu
e6,
590
5,09
63,
948
–6,
962,
874
4,31
6,01
31,
551,
837
Net
Ass
et V
alue
per
sha
re**
10.2
177
0.98
979.
9179
–1.
1065
63.5
585
3.55
69
2020
Tota
l Net
Ass
ets
374,
892
––
–11
,809
,242
216,
241,
210
5,04
4,35
5N
umbe
r of
Sha
res
in Is
sue
285,
304
––
–10
,776
,802
5,08
7,82
22,
115,
539
Net
Ass
et V
alue
per
sha
re**
10.1
840
––
–1.
0958
42.5
017
2.38
44
2019
Tota
l Net
Ass
ets
583,
883
––
23,1
70,7
2013
,569
,498
213,
713,
785
5,56
1,35
1N
umbe
r of
Sha
res
in Is
sue
463,
756
––
23,5
32,3
6012
,782
,226
5,31
6,97
72,
460,
063
Net
Ass
et V
alue
per
sha
re**
9.83
04–
–0.
9846
1.06
1640
.194
62.
2607
**
Exp
ress
ed in
sha
re c
lass
cur
renc
y
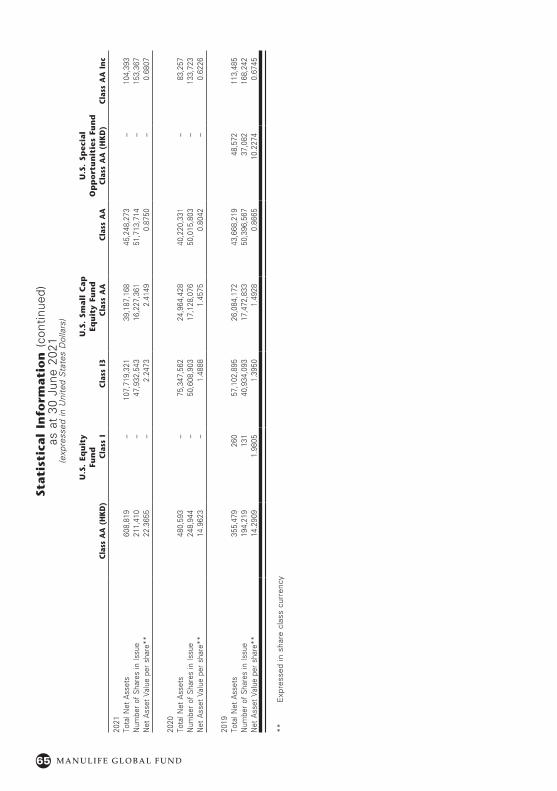
65 M A N U L I F E G L O B A L F U N D
Stati
stic
al
Info
rmati
on
(co
ntin
ued)
as a
t 30
Jun
e 20
21(e
xpre
ssed
in U
nite
d S
tate
s D
olla
rs)
U.S
. Eq
uit
y
Fun
dU
.S.
Small
Cap
Eq
uit
y Fu
nd
U.S
. Sp
ecia
l
Op
po
rtu
nit
ies
Fun
dC
lass
AA
(H
KD
)C
lass
IC
lass
I3
Cla
ss A
AC
lass
AA
Cla
ss A
A (
HK
D)
Cla
ss A
A I
nc
2021
Tota
l Net
Ass
ets
608,
819
–10
7,71
9,32
139
,187
,168
45,2
48,2
73–
104,
393
Num
ber
of S
hare
s in
Issu
e21
1,41
0–
47,9
32,5
4316
,227
,361
51,7
13,7
14–
153,
367
Net
Ass
et V
alue
per
sha
re**
22.3
655
–2.
2473
2.41
490.
8750
–0.
6807
2020
Tota
l Net
Ass
ets
480,
593
–75
,347
,562
24,9
64,4
2840
,220
,331
–83
,257
Num
ber
of S
hare
s in
Issu
e24
8,94
4–
50,6
08,9
0317
,128
,076
50,0
15,8
03–
133,
723
Net
Ass
et V
alue
per
sha
re**
14.9
623
–1.
4888
1.45
750.
8042
–0.
6226
2019
Tota
l Net
Ass
ets
355,
479
260
57,1
02,8
9526
,084
,172
43,6
68,2
1948
,572
113,
485
Num
ber
of S
hare
s in
Issu
e19
4,21
913
140
,934
,093
17,4
72,8
3350
,396
,567
37,0
8216
8,24
2N
et A
sset
Val
ue p
er s
hare
**14
.290
91.
9805
1.39
501.
4928
0.86
6510
.227
40.
6745
**
Exp
ress
ed in
sha
re c
lass
cur
renc
y
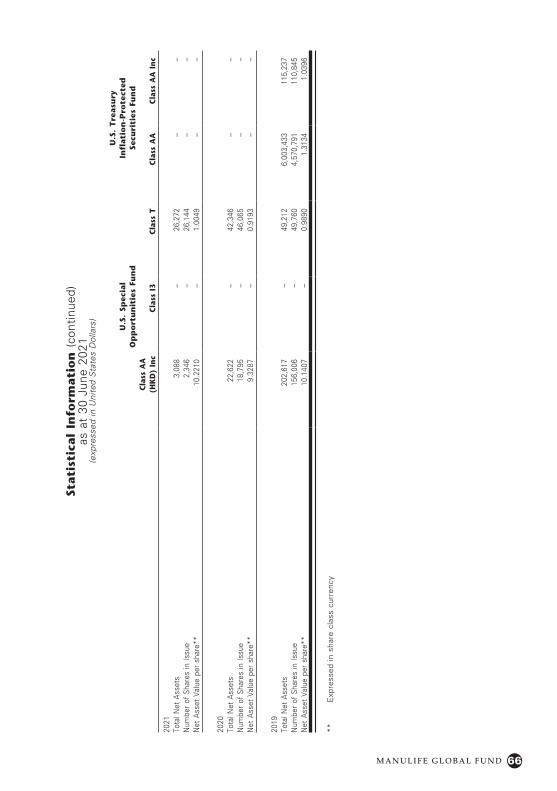
66M A N U L I F E G L O B A L F U N D
Stati
stic
al
Info
rmati
on
(co
ntin
ued)
as a
t 30
Jun
e 20
21(e
xpre
ssed
in U
nite
d S
tate
s D
olla
rs)
U.S
. Sp
ecia
l
Op
po
rtu
nit
ies
Fun
d
U.S
. T
reasu
ry
Infl
ati
on
-Pro
tect
ed
Secu
riti
es F
un
dC
lass
AA
(H
KD
) In
cC
lass
I3
Cla
ss T
Cla
ss A
AC
lass
AA
In
c
2021
Tota
l Net
Ass
ets
3,08
8–
26,2
72–
–N
umbe
r of
Sha
res
in Is
sue
2,34
6–
26,1
44–
–N
et A
sset
Val
ue p
er s
hare
**10
.221
0–
1.00
49–
–
2020
Tota
l Net
Ass
ets
22,6
22–
42,3
46–
–N
umbe
r of
Sha
res
in Is
sue
18,7
95–
46,0
65–
–N
et A
sset
Val
ue p
er s
hare
**9.
3287
–0.
9193
––
2019
Tota
l Net
Ass
ets
202,
617
–49
,212
6,00
3,43
311
5,23
7N
umbe
r of
Sha
res
in Is
sue
156,
006
–49
,760
4,57
0,79
111
0,84
5N
et A
sset
Val
ue p
er s
hare
**10
.140
7–
0.98
901.
3134
1.03
96
**
Exp
ress
ed in
sha
re c
lass
cur
renc
y
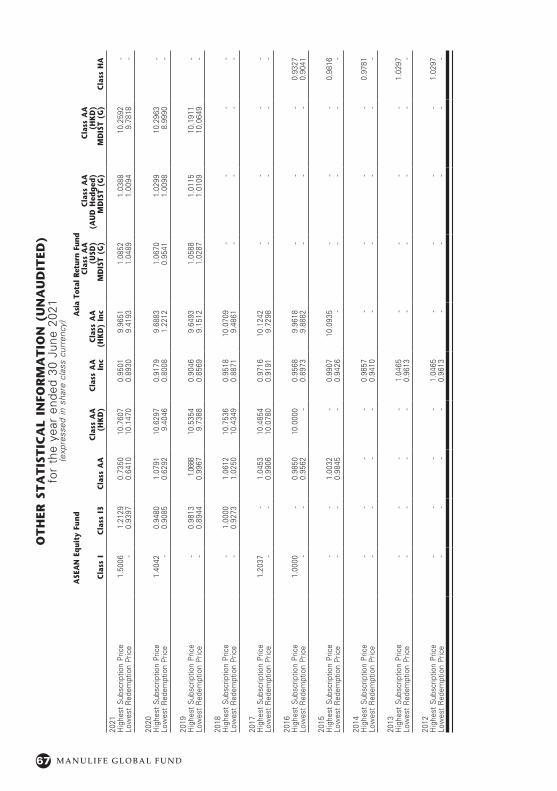
67 M A N U L I F E G L O B A L F U N D
OT
HER
ST
AT
IST
ICA
L IN
FOR
MA
TIO
N (
UN
AU
DIT
ED)
for
the
year
end
ed 3
0 Ju
ne 2
021
(exp
ress
ed in
sha
re c
lass
cur
renc
y)
ASE
AN
Eq
uity
Fun
dA
sia
Tota
l Re
turn
Fun
d
Cla
ss I
Cla
ss I
3C
lass
AA
Cla
ss A
A
(HK
D)
Cla
ss A
A
Inc
Cla
ss A
A
(HK
D)
Inc
Cla
ss A
A
(USD
) M
DIS
T (G
)
Cla
ss A
A
(AU
D H
edg
ed)
MD
IST
(G)
Cla
ss A
A
(HK
D)
MD
IST
(G)
Cla
ss H
A
2021
Hig
hest
Sub
scrip
tion
Pric
e1.
5006
1.21
290.
7350
10.7
607
0.95
019.
9651
1.08
521.
0388
10.2
592
-Lo
wes
t R
edem
ptio
n Pr
ice
-0.
9397
0.64
1010
.147
00.
8930
9.41
931.
0489
1.00
949.
7818
-
2020
Hig
hest
Sub
scrip
tion
Pric
e1.
4042
0.94
801.
0791
10.6
297
0.91
799.
6883
1.06
701.
0299
10.2
963
-Lo
wes
t R
edem
ptio
n Pr
ice
-0.
9085
0.62
929.
4046
0.80
081.
2212
0.95
411.
0098
8.99
90-
2019
Hig
hest
Sub
scrip
tion
Pric
e-
0.98
131.0
688
10.5
354
0.90
469.
6493
1.05
881.
0115
10.1
911
-Lo
wes
t R
edem
ptio
n Pr
ice
-0.
8944
0.99
679.
7388
0.85
699.
1512
1.02
871.
0109
10.0
649
-
2018
Hig
hest
Sub
scrip
tion
Pric
e-
1.00
001.
0612
10.7
536
0.95
1810
.070
9-
--
-Lo
wes
t R
edem
ptio
n Pr
ice
-0.
9273
1.02
5010
.434
90.
8871
9.48
61-
--
-
2017
Hig
hest
Sub
scrip
tion
Pric
e1.
2037
-1.
0453
10.4
854
0.97
1610
.124
2-
--
-Lo
wes
t R
edem
ptio
n Pr
ice
--
0.99
0610
.078
00.
9191
9.72
98-
--
-
2016
Hig
hest
Sub
scrip
tion
Pric
e1.
0000
-0.
9850
10.0
000
0.95
689.
9618
--
-0.
9327
Low
est
Red
empt
ion
Pric
e-
-0.
9562
-0.
8973
9.88
82-
--
0.90
41
2015
Hig
hest
Sub
scrip
tion
Pric
e-
-1.
0032
-0.
9907
10.0
935
--
-0.
9816
Low
est
Red
empt
ion
Pric
e-
-0.
9845
-0.
9426
--
--
-
2014
Hig
hest
Sub
scrip
tion
Pric
e-
--
-0.
9857
--
--
0.97
81Lo
wes
t R
edem
ptio
n Pr
ice
--
--
0.94
10-
--
--
2013
Hig
hest
Sub
scrip
tion
Pric
e-
--
-1.
0465
--
--
1.02
97Lo
wes
t R
edem
ptio
n Pr
ice
--
--
0.96
13-
--
--
2012
Hig
hest
Sub
scrip
tion
Pric
e-
--
-1.
0465
--
--
1.02
97Lo
wes
t R
edem
ptio
n Pr
ice
--
--
0.96
13-
--
--
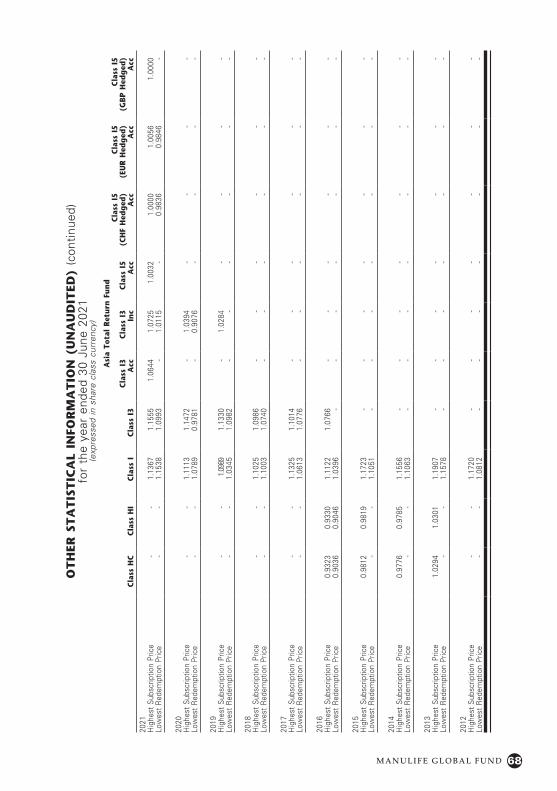
68M A N U L I F E G L O B A L F U N D
OT
HER
ST
AT
IST
ICA
L IN
FOR
MA
TIO
N (
UN
AU
DIT
ED)
(con
tinue
d)fo
r th
e ye
ar e
nded
30
June
202
1(e
xpre
ssed
in s
hare
cla
ss c
urre
ncy)
Asi
a To
tal
Ret
urn
Fun
d
Cla
ss H
CC
lass
HI
Cla
ss I
Cla
ss I
3
Cla
ss I
3 A
cc
Cla
ss I
3 In
c
Cla
ss I
5 A
cc
C
lass
I5
(CH
F H
edg
ed)
Acc
C
lass
I5
(EU
R H
edg
ed)
Acc
C
lass
I5
(GB
P H
edg
ed)
Acc
2021
Hig
hest
Sub
scrip
tion
Pric
e-
-1.
1367
1.15
551.
0644
1.07
251.
0032
1.00
001.
0056
1.00
00Lo
wes
t R
edem
ptio
n Pr
ice
--
1.15
381.
0993
-1.
0115
-0.
9836
0.98
46-
2020
Hig
hest
Sub
scrip
tion
Pric
e-
-1.
1113
1.14
72-
1.03
94-
--
-Lo
wes
t R
edem
ptio
n Pr
ice
--
1.07
890.
9781
-0.
9076
--
--
2019
Hig
hest
Sub
scrip
tion
Pric
e-
-1.0
989
1.13
30-
1.02
84-
--
-Lo
wes
t R
edem
ptio
n Pr
ice
--
1.03
451.
0982
--
--
--
2018
Hig
hest
Sub
scrip
tion
Pric
e-
-1.
1025
1.09
86-
--
--
-Lo
wes
t R
edem
ptio
n Pr
ice
--
1.10
031.
0740
--
--
--
2017
Hig
hest
Sub
scrip
tion
Pric
e-
-1.
1325
1.10
14-
--
--
-Lo
wes
t R
edem
ptio
n Pr
ice
--
1.06
131.
0776
--
--
--
2016
Hig
hest
Sub
scrip
tion
Pric
e0.
9323
0.93
301.
1122
1.07
66-
--
--
-Lo
wes
t R
edem
ptio
n Pr
ice
0.90
360.
9046
1.03
96-
--
--
--
2015
Hig
hest
Sub
scrip
tion
Pric
e0.
9812
0.98
191.
1723
--
--
--
-Lo
wes
t R
edem
ptio
n Pr
ice
--
1.10
51-
--
--
--
2014
Hig
hest
Sub
scrip
tion
Pric
e0.
9776
0.97
851.
1556
--
--
--
-Lo
wes
t R
edem
ptio
n Pr
ice
--
1.10
63-
--
--
--
2013
Hig
hest
Sub
scrip
tion
Pric
e1.
0294
1.03
011.
1907
--
--
--
-Lo
wes
t R
edem
ptio
n Pr
ice
--
1.15
78-
--
--
--
2012
Hig
hest
Sub
scrip
tion
Pric
e-
-1.
1720
--
--
--
-Lo
wes
t R
edem
ptio
n Pr
ice
--
1.08
12-
--
--
--
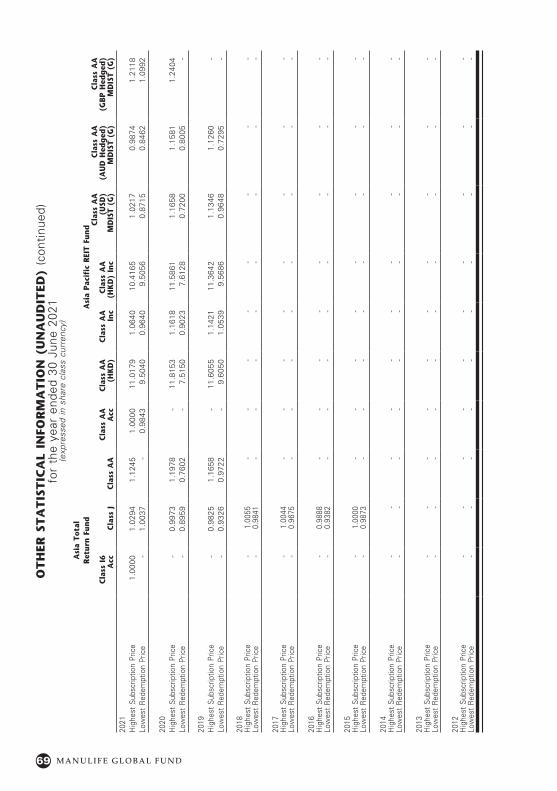
69 M A N U L I F E G L O B A L F U N D
OT
HER
ST
AT
IST
ICA
L IN
FOR
MA
TIO
N (
UN
AU
DIT
ED)
(con
tinue
d)fo
r th
e ye
ar e
nded
30
June
202
1(e
xpre
ssed
in s
hare
cla
ss c
urre
ncy)
Asi
a To
tal
Ret
urn
Fun
dA
sia
Pac
ific
REI
T Fu
nd
C
lass
I6
Acc
Cla
ss J
C
lass
AA
C
lass
AA
A
cc
Cla
ss A
A
(HK
D)
C
lass
AA
In
cC
lass
AA
(H
KD
) In
c
Cla
ss A
A
(USD
) M
DIS
T (G
)
Cla
ss A
A
(AU
D H
edg
ed)
MD
IST
(G)
Cla
ss A
A
(GB
P H
edg
ed)
MD
IST
(G)
2021
Hig
hest
Sub
scrip
tion
Pric
e1.
0000
1.02
941.
1245
1.00
0011
.017
91.
0640
10.4
165
1.02
170.
9874
1.21
18Lo
wes
t R
edem
ptio
n Pr
ice
-1.
0037
-0.
9843
9.50
400.
9640
9.50
560.
8715
0.84
621.
0992
2020
Hig
hest
Sub
scrip
tion
Pric
e-
0.99
731.
1978
-11
.815
31.
1618
11.5
861
1.16
581.
1581
1.24
04Lo
wes
t R
edem
ptio
n Pr
ice
-0.
8959
0.76
02-
7.51
500.
9023
7.61
280.
7200
0.80
05-
2019
Hig
hest
Sub
scrip
tion
Pric
e-
0.98
251.
1658
-11
.605
51.
1421
11.3
642
1.13
461.
1260
-Lo
wes
t R
edem
ptio
n Pr
ice
-0.
9326
0.97
22-
9.60
501.
0539
9.56
860.
9648
0.72
95-
2018
Hig
hest
Sub
scrip
tion
Pric
e-
1.00
55-
--
--
--
-Lo
wes
t R
edem
ptio
n Pr
ice
-0.
9841
--
--
--
--
2017
Hig
hest
Sub
scrip
tion
Pric
e-
1.00
44-
--
--
--
-Lo
wes
t R
edem
ptio
n Pr
ice
-0.
9675
--
--
--
--
2016
Hig
hest
Sub
scrip
tion
Pric
e-
0.98
88-
--
--
--
-Lo
wes
t R
edem
ptio
n Pr
ice
-0.
9382
--
--
--
--
2015
Hig
hest
Sub
scrip
tion
Pric
e-
1.00
00-
--
--
--
-Lo
wes
t R
edem
ptio
n Pr
ice
-0.
9873
--
--
--
--
2014
Hig
hest
Sub
scrip
tion
Pric
e-
--
--
--
--
-Lo
wes
t R
edem
ptio
n Pr
ice
--
--
--
--
--
2013
Hig
hest
Sub
scrip
tion
Pric
e-
--
--
--
--
-Lo
wes
t R
edem
ptio
n Pr
ice
--
--
--
--
--
2012
Hig
hest
Sub
scrip
tion
Pric
e-
--
--
--
--
-Lo
wes
t R
edem
ptio
n Pr
ice
--
--
--
--
--
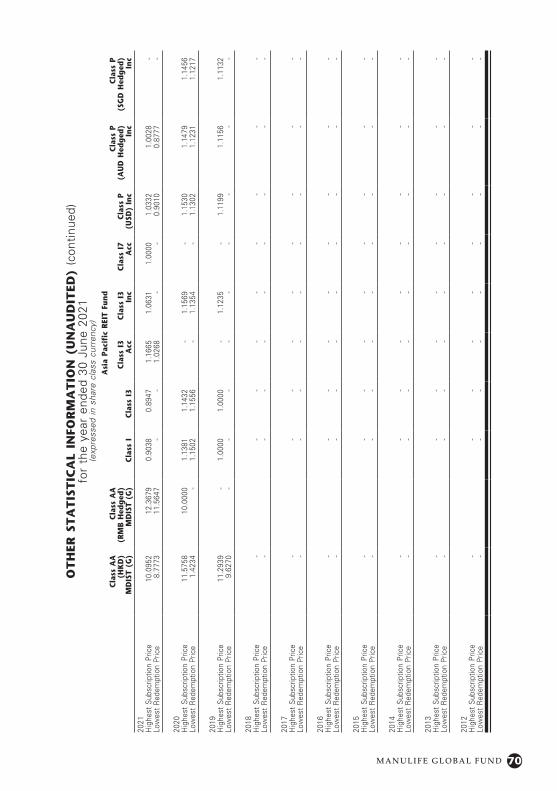
70M A N U L I F E G L O B A L F U N D
OT
HER
ST
AT
IST
ICA
L IN
FOR
MA
TIO
N (
UN
AU
DIT
ED)
(con
tinue
d)fo
r th
e ye
ar e
nded
30
June
202
1(e
xpre
ssed
in s
hare
cla
ss c
urre
ncy)
Asi
a P
acif
ic R
EIT
Fun
dC
lass
AA
(H
KD
) M
DIS
T (G
)
Cla
ss A
A
(RM
B H
edg
ed)
MD
IST
(G)
C
lass
I
Cla
ss I
3
Cla
ss I
3 A
cc
Cla
ss I
3 In
c
Cla
ss I
7 A
ccC
lass
P
(USD
) In
c
Cla
ss P
(A
UD
Hed
ged
) In
c
Cla
ss P
(S
GD
Hed
ged
) In
c
2021
Hig
hest
Sub
scrip
tion
Pric
e10
.095
212
.367
90.
9038
0.89
471.
1665
1.06
311.
0000
1.03
321.
0028
-Lo
wes
t R
edem
ptio
n Pr
ice
8.77
7311
.564
7-
-1.
0268
--
0.90
100.
8777
-
2020
Hig
hest
Sub
scrip
tion
Pric
e11
.575
810
.000
01.
1381
1.14
32-
1.15
69-
1.15
301.
1479
1.14
56Lo
wes
t R
edem
ptio
n Pr
ice
1.42
34-
1.15
021.
1556
-1.
1354
-1.
1302
1.12
311.
1217
2019
Hig
hest
Sub
scrip
tion
Pric
e11
.293
9-
1.00
001.
0000
-1.
1235
-1.
1199
1.11
561.
1132
Low
est
Red
empt
ion
Pric
e9.
6270
--
--
--
--
-
2018
Hig
hest
Sub
scrip
tion
Pric
e-
--
--
--
--
Low
est
Red
empt
ion
Pric
e-
--
--
--
--
2017
Hig
hest
Sub
scrip
tion
Pric
e-
--
--
--
--
Low
est
Red
empt
ion
Pric
e-
--
--
--
--
2016
Hig
hest
Sub
scrip
tion
Pric
e-
--
--
--
--
Low
est
Red
empt
ion
Pric
e-
--
--
--
--
2015
Hig
hest
Sub
scrip
tion
Pric
e-
--
--
--
--
Low
est
Red
empt
ion
Pric
e-
--
--
--
--
2014
Hig
hest
Sub
scrip
tion
Pric
e-
--
--
--
--
Low
est
Red
empt
ion
Pric
e-
--
--
--
--
2013
Hig
hest
Sub
scrip
tion
Pric
e-
--
--
--
--
Low
est
Red
empt
ion
Pric
e-
--
--
--
--
2012
Hig
hest
Sub
scrip
tion
Pric
e-
--
--
--
--
Low
est
Red
empt
ion
Pric
e-
--
--
--
--
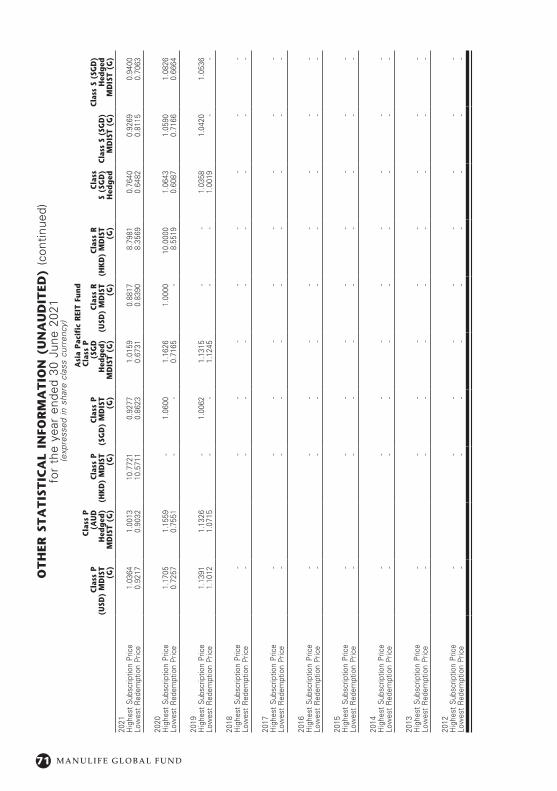
71 M A N U L I F E G L O B A L F U N D
OT
HER
ST
AT
IST
ICA
L IN
FOR
MA
TIO
N (
UN
AU
DIT
ED)
(con
tinue
d)fo
r th
e ye
ar e
nded
30
June
202
1(e
xpre
ssed
in s
hare
cla
ss c
urre
ncy)
Asi
a P
acif
ic R
EIT
Fun
d
Cla
ss P
(U
SD)
MD
IST
(G)
Cla
ss P
(A
UD
H
edg
ed)
MD
IST
(G)
Cla
ss P
(H
KD
) M
DIS
T (G
)
Cla
ss P
(S
GD
) M
DIS
T (G
)
Cla
ss P
(S
GD
H
edg
ed)
MD
IST
(G)
Cla
ss R
(U
SD)
MD
IST
(G)
Cla
ss R
(H
KD
) M
DIS
T (G
)
C
lass
S
(SG
D)
Hed
ged
Cla
ss S
(SG
D)
MD
IST
(G)
Cla
ss S
(SG
D)
Hed
ged
M
DIS
T (G
)
2021
Hig
hest
Sub
scrip
tion
Pric
e1.
0364
1.00
1310
.772
10.
9277
1.01
590.
8817
8.79
810.
7640
0.92
690.
9400
Low
est
Red
empt
ion
Pric
e0.
9217
0.90
3210
.571
10.
8623
0.67
310.
8390
8.35
690.
6482
0.81
150.
7063
2020
Hig
hest
Sub
scrip
tion
Pric
e1.
1705
1.15
59-
1.06
001.
1626
1.00
0010
.000
01.
0643
1.05
901.
0826
Low
est
Red
empt
ion
Pric
e0.
7257
0.75
51-
-0.
7165
-8.
5519
0.60
870.
7166
0.66
64
2019
Hig
hest
Sub
scrip
tion
Pric
e1.
1391
1.13
26-
1.00
621.
1315
--
1.03
581.
0420
1.05
36Lo
wes
t R
edem
ptio
n Pr
ice
1.10
121.
0715
--
1.12
45-
-1.
0019
--
2018
Hig
hest
Sub
scrip
tion
Pric
e-
--
--
--
--
Low
est
Red
empt
ion
Pric
e-
--
--
--
--
2017
Hig
hest
Sub
scrip
tion
Pric
e-
--
--
--
--
Low
est
Red
empt
ion
Pric
e-
--
--
--
--
2016
Hig
hest
Sub
scrip
tion
Pric
e-
--
--
--
--
Low
est
Red
empt
ion
Pric
e-
--
--
--
--
2015
Hig
hest
Sub
scrip
tion
Pric
e-
--
--
--
--
Low
est
Red
empt
ion
Pric
e-
--
--
--
--
2014
Hig
hest
Sub
scrip
tion
Pric
e-
--
--
--
--
Low
est
Red
empt
ion
Pric
e-
--
--
--
--
2013
Hig
hest
Sub
scrip
tion
Pric
e-
--
--
--
--
Low
est
Red
empt
ion
Pric
e-
--
--
--
--
2012
Hig
hest
Sub
scrip
tion
Pric
e-
--
--
--
--
Low
est
Red
empt
ion
Pric
e-
--
--
--
--
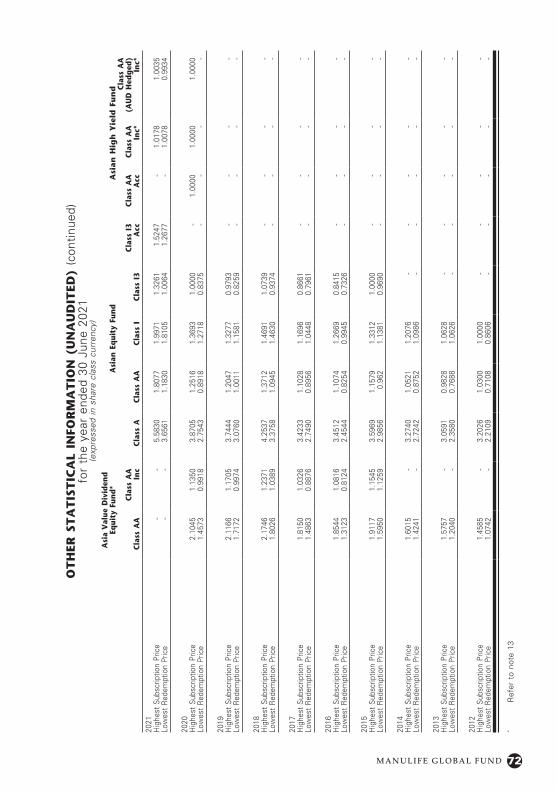
72M A N U L I F E G L O B A L F U N D
OT
HER
ST
AT
IST
ICA
L IN
FOR
MA
TIO
N (
UN
AU
DIT
ED)
(con
tinue
d)fo
r th
e ye
ar e
nded
30
June
202
1(e
xpre
ssed
in s
hare
cla
ss c
urre
ncy)
Asi
a V
alue
Div
iden
d
Equi
ty F
und
*A
sian
Eq
uity
Fun
dA
sian
Hig
h Y
ield
Fu
nd
Cla
ss A
AC
lass
AA
In
cC
lass
AC
lass
AA
Cla
ss I
Cla
ss I
3 C
lass
I3
Acc
Cla
ss A
A
Acc
Cla
ss A
A
Inc*
Cla
ss A
A
(AU
D H
edg
ed)
Inc*
2021
Hig
hest
Sub
scrip
tion
Pric
e-
-5.
5830
1.80
771.
9971
1.32
611.
5247
-1.
0178
1.00
35Lo
wes
t R
edem
ptio
n Pr
ice
--
3.65
611.
1830
1.81
051.
0064
1.26
77-
1.00
780.
9934
2020
Hig
hest
Sub
scrip
tion
Pric
e2.
1045
1.13
503.
8705
1.25
161.
3693
1.00
00-
1.00
001.
0000
1.00
00Lo
wes
t R
edem
ptio
n Pr
ice
1.45
730.
9918
2.75
430.
8918
1.27
180.
8375
--
--
2019
Hig
hest
Sub
scrip
tion
Pric
e2.
1166
1.17
053.
7444
1.20
471.
3277
0.97
93-
--
-Lo
wes
t R
edem
ptio
n Pr
ice
1.71
720.
9974
3.07
601.
0011
1.15
810.
8259
--
--
2018
Hig
hest
Sub
scrip
tion
Pric
e2.
1746
1.23
714.
2537
1.37
121.
4691
1.07
39-
--
-Lo
wes
t R
edem
ptio
n Pr
ice
1.80
261.
0389
3.37
581.
0945
1.46
300.
9374
--
--
2017
Hig
hest
Sub
scrip
tion
Pric
e1.
8150
1.03
263.
4233
1.10
281.
1696
0.86
61-
--
-Lo
wes
t R
edem
ptio
n Pr
ice
1.48
630.
8876
2.74
900.
8956
1.04
480.
7961
--
--
2016
Hig
hest
Sub
scrip
tion
Pric
e1.
8544
1.08
163.
4512
1.10
741.
2669
0.84
15-
--
-Lo
wes
t R
edem
ptio
n Pr
ice
1.31
230.
8124
2.45
440.
8254
0.99
450.
7326
--
--
2015
Hig
hest
Sub
scrip
tion
Pric
e1.
9117
1.15
453.
5969
1.15
791.
3312
1.00
00-
--
-Lo
wes
t R
edem
ptio
n Pr
ice
1.59
501.
1259
2.98
560.
962
1.13
810.
9690
--
--
2014
Hig
hest
Sub
scrip
tion
Pric
e1.
6015
-3.
2740
1.05
211.
2076
--
--
-Lo
wes
t R
edem
ptio
n Pr
ice
1.42
41-
2.72
420.
8752
1.09
86-
--
--
2013
Hig
hest
Sub
scrip
tion
Pric
e1.
5757
-3.
0591
0.98
281.
0628
--
--
-Lo
wes
t R
edem
ptio
n Pr
ice
1.20
40-
2.35
800.
7688
1.06
26-
--
--
2012
Hig
hest
Sub
scrip
tion
Pric
e1.
4585
-3.
2026
1.03
001.
0000
--
--
-Lo
wes
t R
edem
ptio
n Pr
ice
1.07
42-
2.21
090.
7108
0.86
06-
--
--
* R
efer
to
note
13
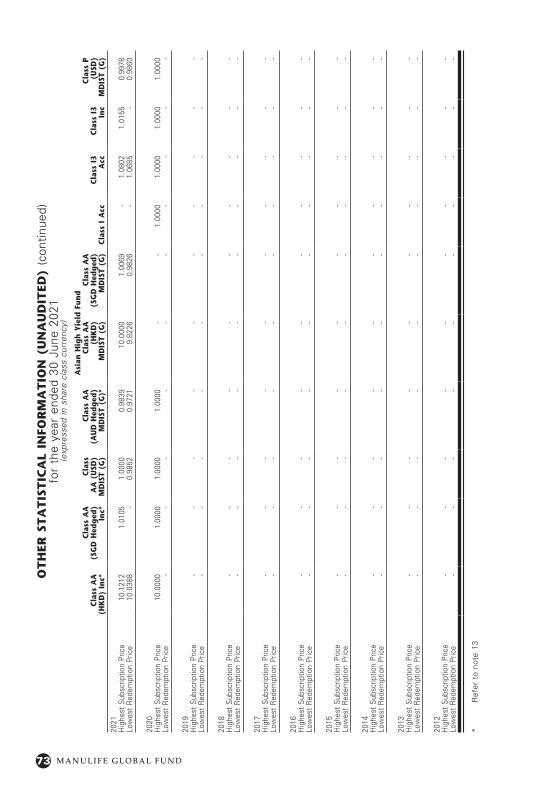
73 M A N U L I F E G L O B A L F U N D
OT
HER
ST
AT
IST
ICA
L IN
FOR
MA
TIO
N (
UN
AU
DIT
ED)
(con
tinue
d)fo
r th
e ye
ar e
nded
30
June
202
1(e
xpre
ssed
in s
hare
cla
ss c
urre
ncy)
Asi
an H
igh
Yie
ld F
und
Cla
ss A
A
(HK
D)
Inc*
Cla
ss A
A
(SG
D H
edg
ed)
Inc*
C
lass
A
A (
USD
) M
DIS
T (G
)
Cla
ss A
A
(AU
D H
edg
ed)
MD
IST
(G)*
C
lass
AA
(H
KD
) M
DIS
T (G
)
C
lass
AA
(S
GD
Hed
ged
) M
DIS
T (G
)C
lass
I A
ccC
lass
I3
Acc
Cla
ss I
3 In
c
Cla
ss P
(U
SD)
MD
IST
(G)
2021
Hig
hest
Sub
scrip
tion
Pric
e10
.121
21.
0105
1.00
000.
9839
10.0
000
1.00
69-
1.08
021.
0155
0.99
78Lo
wes
t R
edem
ptio
n Pr
ice
10.0
388
-0.
9852
0.97
219.
8226
0.98
26-
1.06
85-
0.98
60
2020
Hig
hest
Sub
scrip
tion
Pric
e10
.000
01.
0000
1.00
001.
0000
--
1.00
001.
0000
1.00
001.
0000
Low
est
Red
empt
ion
Pric
e-
--
--
--
--
-
2019
Hig
hest
Sub
scrip
tion
Pric
e-
--
--
--
--
-Lo
wes
t R
edem
ptio
n Pr
ice
--
--
--
--
--
2018
Hig
hest
Sub
scrip
tion
Pric
e-
--
--
--
--
-Lo
wes
t R
edem
ptio
n Pr
ice
--
--
--
--
--
2017
Hig
hest
Sub
scrip
tion
Pric
e-
--
--
--
--
-Lo
wes
t R
edem
ptio
n Pr
ice
--
--
--
--
--
2016
Hig
hest
Sub
scrip
tion
Pric
e-
--
--
--
--
-Lo
wes
t R
edem
ptio
n Pr
ice
--
--
--
--
--
2015
Hig
hest
Sub
scrip
tion
Pric
e-
--
--
--
--
-Lo
wes
t R
edem
ptio
n Pr
ice
--
--
--
--
--
2014
Hig
hest
Sub
scrip
tion
Pric
e-
--
--
--
--
-Lo
wes
t R
edem
ptio
n Pr
ice
--
--
--
--
--
2013
Hig
hest
Sub
scrip
tion
Pric
e-
--
--
--
--
-Lo
wes
t R
edem
ptio
n Pr
ice
--
--
--
--
--
2012
Hig
hest
Sub
scrip
tion
Pric
e-
--
--
--
--
-Lo
wes
t R
edem
ptio
n Pr
ice
--
--
--
--
--
* R
efer
to
note
13
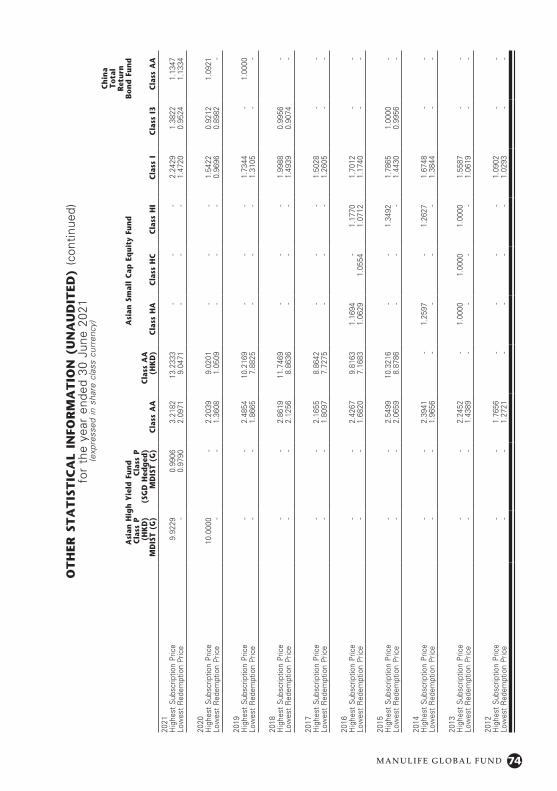
74M A N U L I F E G L O B A L F U N D
OT
HER
ST
AT
IST
ICA
L IN
FOR
MA
TIO
N (
UN
AU
DIT
ED)
(con
tinue
d)fo
r th
e ye
ar e
nded
30
June
202
1(e
xpre
ssed
in s
hare
cla
ss c
urre
ncy)
Asi
an H
igh
Yie
ld F
und
Asi
an S
mal
l C
ap E
qui
ty F
und
Ch
ina
Tota
l R
etur
n
Bon
d F
und
Cla
ss P
(H
KD
) M
DIS
T (G
)
Cla
ss P
(S
GD
Hed
ged
) M
DIS
T (G
)C
lass
AA
Cla
ss A
A
(HK
D)
Cla
ss H
AC
lass
HC
Cla
ss H
IC
lass
IC
lass
I3
Cla
ss A
A
2021
Hig
hest
Sub
scrip
tion
Pric
e9.
9229
0.99
063.
2182
13.2
333
--
-2.
2429
1.38
221.
1347
Low
est
Red
empt
ion
Pric
e-
0.97
902.
0971
9.04
71-
--
1.47
200.
9524
1.13
34
2020
Hig
hest
Sub
scrip
tion
Pric
e10
.000
0-
2.20
399.
0201
--
-1.
5422
0.92
121.
0921
Low
est
Red
empt
ion
Pric
e-
-1.
3608
1.05
09-
--
0.96
960.
8982
-
2019
Hig
hest
Sub
scrip
tion
Pric
e-
-2.
4854
10.2
169
--
-1.
7344
-1.
0000
Low
est
Red
empt
ion
Pric
e-
-1.
8665
7.88
25-
--
1.31
05-
-
2018
Hig
hest
Sub
scrip
tion
Pric
e-
-2.
8619
11.7
469
--
-1.
9988
0.99
56-
Low
est
Red
empt
ion
Pric
e-
-2.
1256
8.86
36-
--
1.49
390.
9074
-
2017
Hig
hest
Sub
scrip
tion
Pric
e-
-2.
1655
8.86
42-
--
1.50
28-
-Lo
wes
t R
edem
ptio
n Pr
ice
--
1.80
977.
7275
--
-1.
2605
--
2016
Hig
hest
Sub
scrip
tion
Pric
e-
-2.
4267
9.81
631.
1694
-1.
1770
1.70
12-
-Lo
wes
t R
edem
ptio
n Pr
ice
--
1.68
207.
1683
1.06
291.
0554
1.07
121.
1740
--
2015
Hig
hest
Sub
scrip
tion
Pric
e-
-2.
5499
10.3
216
--
1.34
921.
7865
1.00
00-
Low
est
Red
empt
ion
Pric
e-
-2.
0659
8.87
86-
--
1.44
300.
9956
-
2014
Hig
hest
Sub
scrip
tion
Pric
e-
-2.
3941
-1.
2597
-1.
2627
1.67
48-
-Lo
wes
t R
edem
ptio
n Pr
ice
--
1.96
56-
--
-1.
3844
--
2013
Hig
hest
Sub
scrip
tion
Pric
e-
-2.
2452
-1.
0000
1.00
001.
0000
1.55
87-
-Lo
wes
t R
edem
ptio
n Pr
ice
--
1.43
89-
--
-1.
0619
--
2012
Hig
hest
Sub
scrip
tion
Pric
e-
-1.
7656
--
--
1.09
02-
-Lo
wes
t R
edem
ptio
n Pr
ice
--
1.27
21-
--
-1.
0293
--
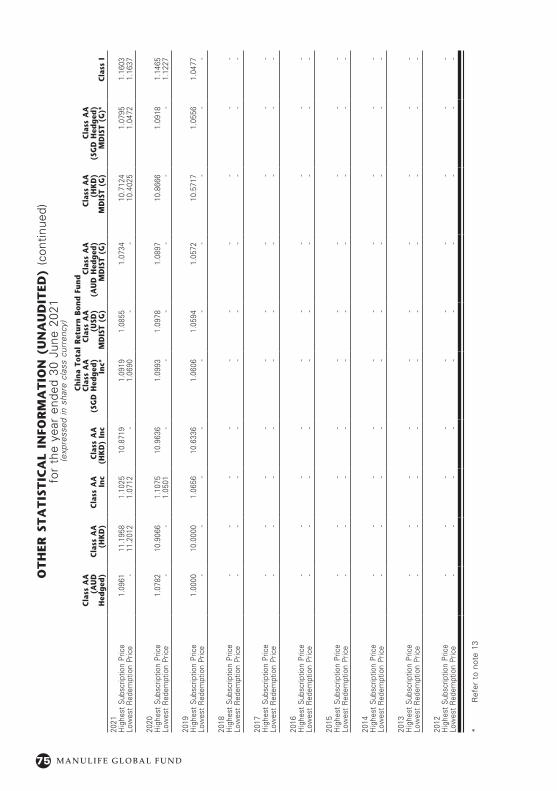
75 M A N U L I F E G L O B A L F U N D
OT
HER
ST
AT
IST
ICA
L IN
FOR
MA
TIO
N (
UN
AU
DIT
ED)
(con
tinue
d)fo
r th
e ye
ar e
nded
30
June
202
1(e
xpre
ssed
in s
hare
cla
ss c
urre
ncy)
Ch
ina
Tota
l R
etur
n B
ond
Fun
dC
lass
AA
(A
UD
H
edg
ed)
Cla
ss A
A
(HK
D)
Cla
ss A
A
Inc
Cla
ss A
A
(HK
D)
Inc
Cla
ss A
A
(SG
D H
edg
ed)
Inc*
Cla
ss A
A
(USD
) M
DIS
T (G
)
Cla
ss A
A
(AU
D H
edg
ed)
MD
IST
(G)
Cla
ss A
A
(HK
D)
MD
IST
(G)
Cla
ss A
A
(SG
D H
edg
ed)
MD
IST
(G)*
Cla
ss I
2021
Hig
hest
Sub
scrip
tion
Pric
e1.
0961
11.1
958
1.10
2510
.871
91.
0919
1.08
551.
0734
10.7
124
1.07
951.
1603
Low
est
Red
empt
ion
Pric
e-
11.2
012
1.07
12-
1.06
90-
-10
.402
51.
0472
1.16
37
2020
Hig
hest
Sub
scrip
tion
Pric
e1.
0782
10.9
066
1.10
7510
.963
61.
0993
1.09
781.
0897
10.8
666
1.09
181.
1465
Low
est
Red
empt
ion
Pric
e-
-1.
0501
--
--
--
1.12
27
2019
Hig
hest
Sub
scrip
tion
Pric
e1.
0000
10.0
000
1.06
5610
.633
61.
0606
1.05
941.
0572
10.5
717
1.05
561.
0477
Low
est
Red
empt
ion
Pric
e-
--
--
--
--
-
2018
Hig
hest
Sub
scrip
tion
Pric
e-
--
--
--
--
-Lo
wes
t R
edem
ptio
n Pr
ice
--
--
--
--
--
2017
Hig
hest
Sub
scrip
tion
Pric
e-
--
--
--
--
-Lo
wes
t R
edem
ptio
n Pr
ice
--
--
--
--
--
2016
Hig
hest
Sub
scrip
tion
Pric
e-
--
--
--
--
-Lo
wes
t R
edem
ptio
n Pr
ice
--
--
--
--
--
2015
Hig
hest
Sub
scrip
tion
Pric
e-
--
--
--
--
-Lo
wes
t R
edem
ptio
n Pr
ice
--
--
--
--
--
2014
Hig
hest
Sub
scrip
tion
Pric
e-
--
--
--
--
-Lo
wes
t R
edem
ptio
n Pr
ice
--
--
--
--
--
2013
Hig
hest
Sub
scrip
tion
Pric
e-
--
--
--
--
-Lo
wes
t R
edem
ptio
n Pr
ice
--
--
--
--
--
2012
Hig
hest
Sub
scrip
tion
Pric
e-
--
--
--
--
-Lo
wes
t R
edem
ptio
n Pr
ice
--
--
--
--
--
* R
efer
to
note
13
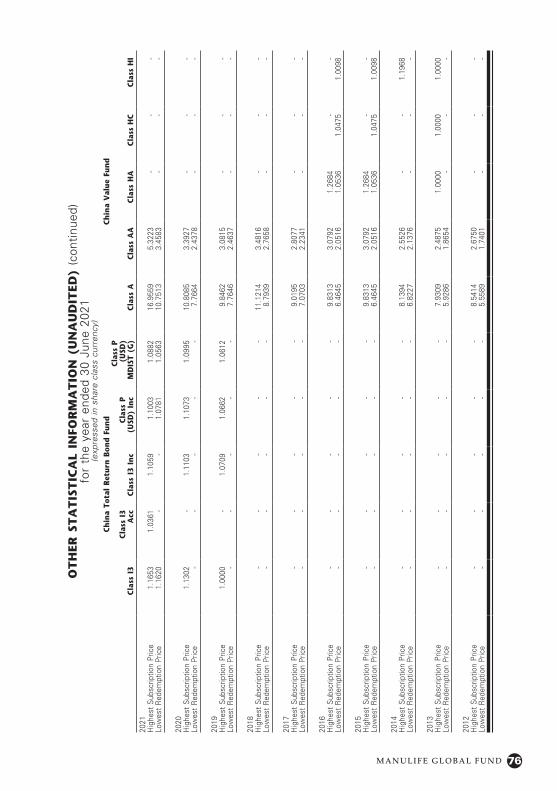
76M A N U L I F E G L O B A L F U N D
OT
HER
ST
AT
IST
ICA
L IN
FOR
MA
TIO
N (
UN
AU
DIT
ED)
(con
tinue
d)fo
r th
e ye
ar e
nded
30
June
202
1(e
xpre
ssed
in s
hare
cla
ss c
urre
ncy)
Ch
ina
Tota
l R
etur
n B
ond
Fun
dC
hin
a V
alue
Fun
d
Cla
ss I
3
Cla
ss I
3 A
ccC
lass
I3
Inc
Cla
ss P
(U
SD)
Inc
Cla
ss P
(U
SD)
MD
IST
(G)
Cla
ss A
Cla
ss A
AC
lass
HA
Cla
ss H
CC
lass
HI
2021
Hig
hest
Sub
scrip
tion
Pric
e1.
1653
1.03
611.
1059
1.10
031.
0882
16.9
559
5.32
23-
--
Low
est
Red
empt
ion
Pric
e1.
1620
--
1.07
811.
0563
10.7
513
3.45
83-
--
2020
Hig
hest
Sub
scrip
tion
Pric
e1.
1302
-1.
1103
1.10
731.
0995
10.8
085
3.39
27-
--
Low
est
Red
empt
ion
Pric
e-
--
--
7.76
642.
4378
--
-
2019
Hig
hest
Sub
scrip
tion
Pric
e1.
0000
-1.
0709
1.06
621.
0612
9.84
623.
0815
--
-Lo
wes
t R
edem
ptio
n Pr
ice
--
--
-7.
7646
2.46
37-
--
2018
Hig
hest
Sub
scrip
tion
Pric
e-
--
--
11.1
214
3.48
16-
--
Low
est
Red
empt
ion
Pric
e-
--
--
8.79
392.
7658
--
-
2017
Hig
hest
Sub
scrip
tion
Pric
e-
--
--
9.01
952.
8077
--
-Lo
wes
t R
edem
ptio
n Pr
ice
--
--
-7.
0703
2.23
41-
--
2016
Hig
hest
Sub
scrip
tion
Pric
e-
--
--
9.83
133.
0792
1.26
84-
-Lo
wes
t R
edem
ptio
n Pr
ice
--
--
-6.
4645
2.05
161.
0536
1.04
751.
0098
2015
Hig
hest
Sub
scrip
tion
Pric
e-
--
--
9.83
133.
0792
1.26
84-
-Lo
wes
t R
edem
ptio
n Pr
ice
--
--
-6.
4645
2.05
161.
0536
1.04
751.
0098
2014
Hig
hest
Sub
scrip
tion
Pric
e-
--
--
8.13
942.
5526
--
1.19
68Lo
wes
t R
edem
ptio
n Pr
ice
--
--
-6.
8227
2.13
76-
--
2013
Hig
hest
Sub
scrip
tion
Pric
e-
--
--
7.93
092.
4875
1.00
001.
0000
1.00
00Lo
wes
t R
edem
ptio
n Pr
ice
--
--
-5.
9286
1.86
54-
--
2012
Hig
hest
Sub
scrip
tion
Pric
e-
--
--
8.54
142.
6750
--
-Lo
wes
t R
edem
ptio
n Pr
ice
--
--
-5.
5589
1.74
01-
--
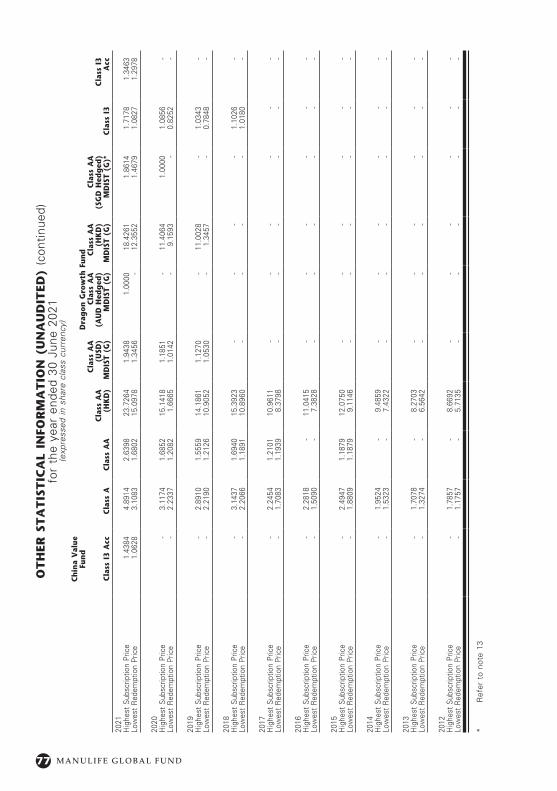
77 M A N U L I F E G L O B A L F U N D
OT
HER
ST
AT
IST
ICA
L IN
FOR
MA
TIO
N (
UN
AU
DIT
ED)
(con
tinue
d)fo
r th
e ye
ar e
nded
30
June
202
1(e
xpre
ssed
in s
hare
cla
ss c
urre
ncy)
Ch
ina
Val
ue
Fun
dD
rag
on G
row
th F
und
C
lass
I3
Acc
Cla
ss A
Cla
ss A
AC
lass
AA
(H
KD
)
Cla
ss A
A
(USD
) M
DIS
T (G
)
Cla
ss A
A
(AU
D H
edg
ed)
MD
IST
(G)
Cla
ss A
A
(HK
D)
MD
IST
(G)
Cla
ss A
A
(SG
D H
edg
ed)
MD
IST
(G)*
Cla
ss I
3C
lass
I3
Acc
2021
Hig
hest
Sub
scrip
tion
Pric
e1.
4384
4.89
142.
6398
23.7
264
1.94
381.
0000
18.4
261
1.86
141.
7178
1.34
63Lo
wes
t R
edem
ptio
n Pr
ice
1.06
283.
1083
1.68
0215
.097
81.
3456
-12
.355
21.
4679
1.08
271.
2978
2020
Hig
hest
Sub
scrip
tion
Pric
e-
3.11
741.
6852
15.1
418
1.18
51-
11.4
064
1.00
001.
0856
-Lo
wes
t R
edem
ptio
n Pr
ice
-2.
2337
1.20
821.
6665
1.01
42-
9.15
93-
0.82
52-
2019
Hig
hest
Sub
scrip
tion
Pric
e-
2.89
101.
5559
14.1
861
1.12
70-
11.0
028
-1.
0343
-Lo
wes
t R
edem
ptio
n Pr
ice
-2.
2190
1.21
2610
.905
21.
0530
-1.
3457
-0.
7848
-
2018
Hig
hest
Sub
scrip
tion
Pric
e-
3.14
371.
6940
15.3
923
--
--
1.10
26-
Low
est
Red
empt
ion
Pric
e-
2.20
661.
1891
10.8
960
--
--
1.01
80-
2017
Hig
hest
Sub
scrip
tion
Pric
e-
2.24
541.
2101
10.9
611
--
--
--
Low
est
Red
empt
ion
Pric
e-
1.70
831.
1939
8.37
98-
--
--
-
2016
Hig
hest
Sub
scrip
tion
Pric
e-
2.28
18-
11.0
415
--
--
--
Low
est
Red
empt
ion
Pric
e-
1.50
90-
7.38
28-
--
--
-
2015
Hig
hest
Sub
scrip
tion
Pric
e-
2.49
471.
1879
12.0
750
--
--
--
Low
est
Red
empt
ion
Pric
e-
1.88
091.
1879
9.11
46-
--
--
-
2014
Hig
hest
Sub
scrip
tion
Pric
e-
1.95
24-
9.48
59-
--
--
-Lo
wes
t R
edem
ptio
n Pr
ice
-1.
5323
-7.
4322
--
--
--
2013
Hig
hest
Sub
scrip
tion
Pric
e-
1.70
78-
8.27
03-
--
--
-Lo
wes
t R
edem
ptio
n Pr
ice
-1.
3274
-6.
5642
--
--
--
2012
Hig
hest
Sub
scrip
tion
Pric
e-
1.78
57-
8.66
92-
--
--
-Lo
wes
t R
edem
ptio
n Pr
ice
-1.
1757
-5.
7135
--
--
--
* R
efer
to
note
13
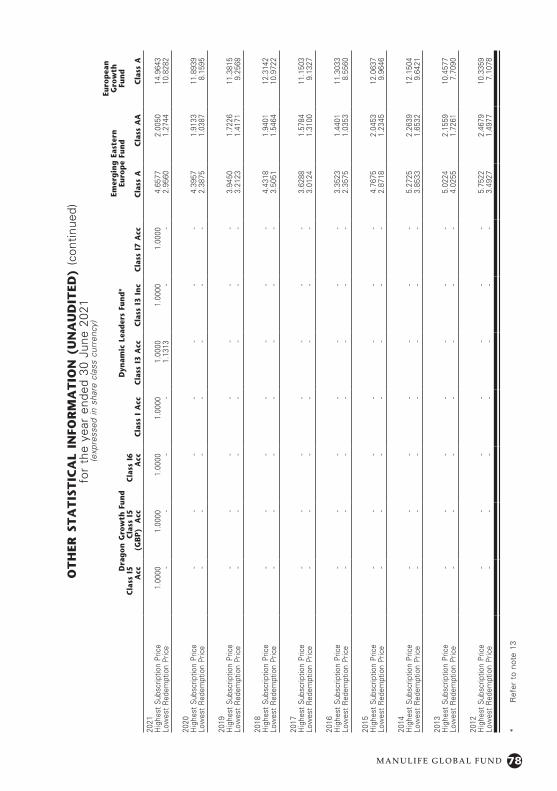
78M A N U L I F E G L O B A L F U N D
OT
HER
ST
AT
IST
ICA
L IN
FOR
MA
TIO
N (
UN
AU
DIT
ED)
(con
tinue
d)fo
r th
e ye
ar e
nded
30
June
202
1(e
xpre
ssed
in s
hare
cla
ss c
urre
ncy)
Dra
gon
Gro
wth
Fun
dD
ynam
ic L
ead
ers
Fun
d*
Emer
gin
g E
aste
rn
Euro
pe
Fun
d
Euro
pea
n
Gro
wth
Fu
nd
C
lass
I5
Acc
C
lass
I5
(GB
P)
Acc
C
lass
I6
Acc
Cla
ss I
Acc
Cla
ss I
3 A
ccC
lass
I3
Inc
Cla
ss I
7 A
ccC
lass
AC
lass
AA
Cla
ss A
2021
Hig
hest
Sub
scrip
tion
Pric
e1.
0000
1.00
001.
0000
1.00
001.
0000
1.00
001.
0000
4.65
772.
0050
14.9
643
Low
est
Red
empt
ion
Pric
e-
--
-1.
1313
--
2.95
601.
2744
10.8
282
2020
Hig
hest
Sub
scrip
tion
Pric
e-
--
--
--
4.39
571.
9133
11.8
939
Low
est
Red
empt
ion
Pric
e-
--
--
--
2.38
751.
0387
8.15
95
2019
Hig
hest
Sub
scrip
tion
Pric
e-
--
--
--
3.94
501.
7226
11.3
815
Low
est
Red
empt
ion
Pric
e-
--
--
--
3.21
231.
4171
9.25
68
2018
Hig
hest
Sub
scrip
tion
Pric
e-
--
--
--
4.43
181.
9401
12.3
142
Low
est
Red
empt
ion
Pric
e-
--
--
--
3.50
511.
5464
10.9
722
2017
Hig
hest
Sub
scrip
tion
Pric
e-
--
--
--
3.62
881.
5784
11.1
503
Low
est
Red
empt
ion
Pric
e-
--
--
--
3.01
241.
3100
9.13
27
2016
Hig
hest
Sub
scrip
tion
Pric
e-
--
--
--
3.35
231.
4401
11.3
033
Low
est
Red
empt
ion
Pric
e-
--
--
--
2.35
751.
0353
8.55
60
2015
Hig
hest
Sub
scrip
tion
Pric
e-
--
--
--
4.76
752.
0453
12.0
637
Low
est
Red
empt
ion
Pric
e-
--
--
--
2.87
181.
2345
9.96
46
2014
Hig
hest
Sub
scrip
tion
Pric
e-
--
--
--
5.27
252.
2639
12.1
504
Low
est
Red
empt
ion
Pric
e-
--
--
--
3.85
331.
6532
9.64
21
2013
Hig
hest
Sub
scrip
tion
Pric
e-
--
--
--
5.02
242.
1559
10.4
577
Low
est
Red
empt
ion
Pric
e-
--
--
--
4.02
551.
7261
7.70
90
2012
Hig
hest
Sub
scrip
tion
Pric
e-
--
--
--
5.75
222.
4679
10.3
359
Low
est
Red
empt
ion
Pric
e-
--
--
--
3.49
271.
4977
7.10
78
* R
efer
to
note
13
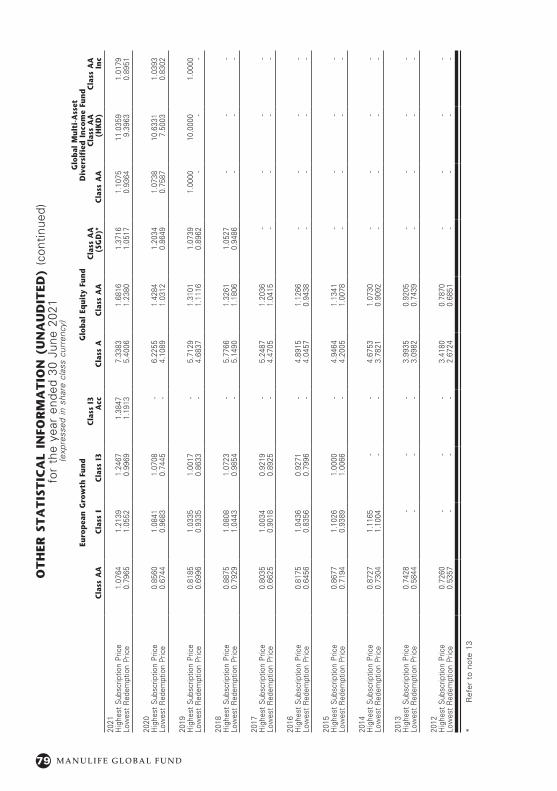
79 M A N U L I F E G L O B A L F U N D
OT
HER
ST
AT
IST
ICA
L IN
FOR
MA
TIO
N (
UN
AU
DIT
ED)
(con
tinue
d)fo
r th
e ye
ar e
nded
30
June
202
1(e
xpre
ssed
in s
hare
cla
ss c
urre
ncy)
Euro
pea
n G
row
th F
und
Glo
bal
Eq
uity
Fun
dG
lob
al M
ulti
-Ass
et
Div
ersi
fied
In
com
e Fu
nd
Cla
ss A
AC
lass
IC
lass
I3
Cla
ss I
3 A
ccC
lass
AC
lass
AA
Cla
ss A
A
(SG
D)*
Cla
ss A
AC
lass
AA
(H
KD
)C
lass
AA
In
c
2021
Hig
hest
Sub
scrip
tion
Pric
e1.
0764
1.21
391.
2467
1.38
477.
3383
1.68
161.
3716
1.10
7511
.035
91.
0179
Low
est
Red
empt
ion
Pric
e0.
7965
1.05
520.
9969
1.19
135.
4006
1.23
801.
0517
0.93
649.
3963
0.89
51
2020
Hig
hest
Sub
scrip
tion
Pric
e0.
8560
1.08
411.
0708
-6.
2255
1.42
841.
2034
1.07
3810
.633
11.
0393
Low
est
Red
empt
ion
Pric
e0.
6744
0.96
830.
7445
-4.
1089
1.03
120.
8649
0.75
877.
5003
0.83
02
2019
Hig
hest
Sub
scrip
tion
Pric
e0.
8185
1.03
351.
0017
-5.
7129
1.31
011.
0739
1.00
0010
.000
01.
0000
Low
est
Red
empt
ion
Pric
e0.
6996
0.93
350.
8633
-4.
6837
1.11
160.
8962
--
-
2018
Hig
hest
Sub
scrip
tion
Pric
e0.
8875
1.08
081.
0723
-5.
7766
1.32
611.
0527
--
-Lo
wes
t R
edem
ptio
n Pr
ice
0.79
291.
0443
0.98
54-
5.14
901.
1806
0.94
86-
--
2017
Hig
hest
Sub
scrip
tion
Pric
e0.
8035
1.00
340.
9219
-5.
2487
1.20
36-
--
-Lo
wes
t R
edem
ptio
n Pr
ice
0.66
250.
9018
0.89
25-
4.47
051.
0415
--
--
2016
Hig
hest
Sub
scrip
tion
Pric
e0.
8175
1.04
360.
9271
-4.
8915
1.12
66-
--
-Lo
wes
t R
edem
ptio
n Pr
ice
0.64
560.
8356
0.79
96-
4.04
570.
9438
--
--
2015
Hig
hest
Sub
scrip
tion
Pric
e0.
8677
1.10
261.
0000
-4.
9464
1.13
41-
--
-Lo
wes
t R
edem
ptio
n Pr
ice
0.71
940.
9389
1.00
66-
4.20
051.
0078
--
--
2014
Hig
hest
Sub
scrip
tion
Pric
e0.
8727
1.11
65-
-4.
6753
1.07
30-
--
-Lo
wes
t R
edem
ptio
n Pr
ice
0.73
041.
1004
--
3.78
210.
9092
--
--
2013
Hig
hest
Sub
scrip
tion
Pric
e0.
7428
--
-3.
9935
0.92
05-
--
-Lo
wes
t R
edem
ptio
n Pr
ice
0.58
44-
--
3.09
820.
7439
--
--
2012
Hig
hest
Sub
scrip
tion
Pric
e0.
7260
--
-3.
4180
0.78
70-
--
-Lo
wes
t R
edem
ptio
n Pr
ice
0.53
57-
--
2.67
240.
6851
--
--
* R
efer
to
note
13
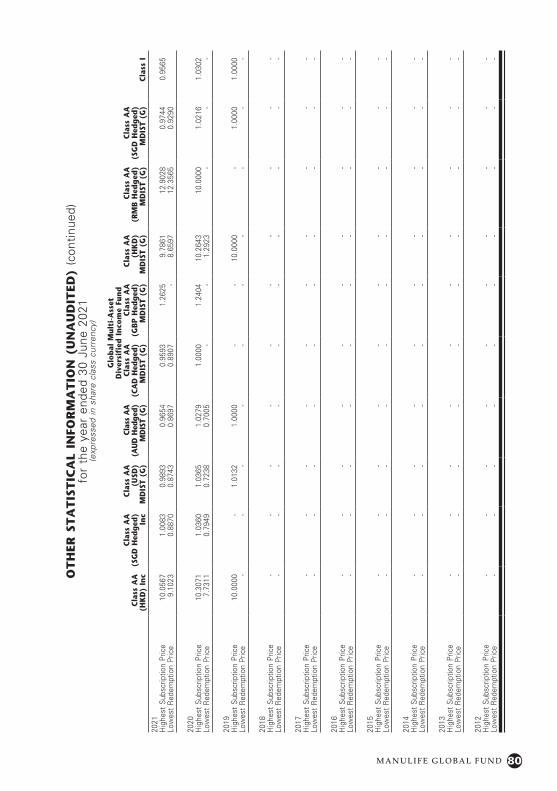
80M A N U L I F E G L O B A L F U N D
OT
HER
ST
AT
IST
ICA
L IN
FOR
MA
TIO
N (
UN
AU
DIT
ED)
(con
tinue
d)fo
r th
e ye
ar e
nded
30
June
202
1(e
xpre
ssed
in s
hare
cla
ss c
urre
ncy)
Glo
bal
Mul
ti-A
sset
D
iver
sifi
ed I
nco
me
Fun
d
Cla
ss A
A
(HK
D)
Inc
Cla
ss A
A
(SG
D H
edg
ed)
Inc
Cla
ss A
A
(USD
) M
DIS
T (G
)
Clas
s A
A
(AU
D H
edge
d)
MD
IST
(G)
Cla
ss A
A
(CA
D H
edg
ed)
MD
IST
(G)
Cla
ss A
A
(GB
P H
edg
ed)
MD
IST
(G)
Cla
ss A
A
(HK
D)
MD
IST
(G)
Cla
ss A
A
(RM
B H
edg
ed)
MD
IST
(G)
Cla
ss A
A
(SG
D H
edg
ed)
MD
IST
(G)
Cla
ss I
2021
Hig
hest
Sub
scrip
tion
Pric
e10
.056
71.
0083
0.98
930.
9654
0.95
931.
2625
9.78
6112
.902
80.
9744
0.95
65Lo
wes
t R
edem
ptio
n Pr
ice
9.10
230.
8870
0.87
430.
8697
0.89
07-
8.65
9712
.356
50.
9290
2020
Hig
hest
Sub
scrip
tion
Pric
e10
.307
11.
0360
1.03
651.
0279
1.00
001.
2404
10.2
643
10.0
000
1.02
161.
0302
Low
est
Red
empt
ion
Pric
e7.
7311
0.79
490.
7238
0.70
05-
-1.
2923
--
-
2019
Hig
hest
Sub
scrip
tion
Pric
e10
.000
0-
1.01
321.
0000
--
10.0
000
-1.
0000
1.00
00Lo
wes
t R
edem
ptio
n Pr
ice
--
--
--
--
--
2018
Hig
hest
Sub
scrip
tion
Pric
e-
--
--
--
--
-Lo
wes
t R
edem
ptio
n Pr
ice
--
--
--
--
--
2017
Hig
hest
Sub
scrip
tion
Pric
e-
--
--
--
--
-Lo
wes
t R
edem
ptio
n Pr
ice
--
--
--
--
--
2016
Hig
hest
Sub
scrip
tion
Pric
e-
--
--
--
--
-Lo
wes
t R
edem
ptio
n Pr
ice
--
--
--
--
--
2015
Hig
hest
Sub
scrip
tion
Pric
e-
--
--
--
--
-Lo
wes
t R
edem
ptio
n Pr
ice
--
--
--
--
--
2014
Hig
hest
Sub
scrip
tion
Pric
e-
--
--
--
--
-Lo
wes
t R
edem
ptio
n Pr
ice
--
--
--
--
--
2013
Hig
hest
Sub
scrip
tion
Pric
e-
--
--
--
--
-Lo
wes
t R
edem
ptio
n Pr
ice
--
--
--
--
--
2012
Hig
hest
Sub
scrip
tion
Pric
e-
--
--
--
--
-Lo
wes
t R
edem
ptio
n Pr
ice
--
--
--
--
--
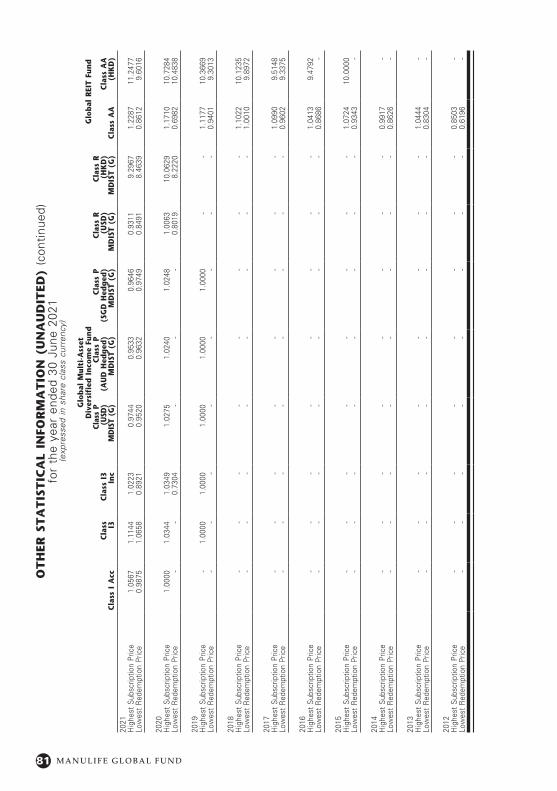
81 M A N U L I F E G L O B A L F U N D
OT
HER
ST
AT
IST
ICA
L IN
FOR
MA
TIO
N (
UN
AU
DIT
ED)
(con
tinue
d)fo
r th
e ye
ar e
nded
30
June
202
1(e
xpre
ssed
in s
hare
cla
ss c
urre
ncy)
Glo
bal
Mul
ti-A
sset
D
iver
sifi
ed I
nco
me
Fun
dG
lob
al R
EIT
Fun
d
Cla
ss I
Acc
Cla
ss
I3C
lass
I3
Inc
Clas
s P
(USD
) M
DIS
T (G
)
Cla
ss P
(A
UD
Hed
ged
) M
DIS
T (G
)
Cla
ss P
(S
GD
Hed
ged
) M
DIS
T (G
)
Cla
ss R
(U
SD)
MD
IST
(G)
Cla
ss R
(H
KD
) M
DIS
T (G
)C
lass
AA
Cla
ss A
A
(HK
D)
2021
Hig
hest
Sub
scrip
tion
Pric
e1.
0567
1.11
441.
0223
0.97
440.
9533
0.96
460.
9311
9.29
671.
2287
11.2
477
Low
est
Red
empt
ion
Pric
e0.
9875
1.06
580.
8921
0.95
200.
9632
0.97
490.
8491
8.46
390.
8612
9.60
16
2020
Hig
hest
Sub
scrip
tion
Pric
e1.
0000
1.03
441.
0349
1.02
751.
0240
1.02
481.
0063
10.0
629
1.17
1010
.728
4Lo
wes
t R
edem
ptio
n Pr
ice
--
0.73
04-
--
0.80
198.
2220
0.69
8210
.483
8
2019
Hig
hest
Sub
scrip
tion
Pric
e-
1.00
001.
0000
1.00
001.
0000
1.00
00-
-1.
1177
10.3
669
Low
est
Red
empt
ion
Pric
e-
--
--
--
-0.
9401
9.30
13
2018
Hig
hest
Sub
scrip
tion
Pric
e-
--
--
--
-1.
1022
10.1
235
Low
est
Red
empt
ion
Pric
e-
--
--
--
-1.
0010
9.89
72
2017
Hig
hest
Sub
scrip
tion
Pric
e-
--
--
--
-1.
0990
9.51
48Lo
wes
t R
edem
ptio
n Pr
ice
--
--
--
--
0.96
029.
3375
2016
Hig
hest
Sub
scrip
tion
Pric
e-
--
--
--
-1.
0413
9.47
92Lo
wes
t R
edem
ptio
n Pr
ice
--
--
--
--
0.86
86-
2015
Hig
hest
Sub
scrip
tion
Pric
e-
--
--
--
-1.
0724
10.0
000
Low
est
Red
empt
ion
Pric
e-
--
--
--
-0.
9343
-
2014
Hig
hest
Sub
scrip
tion
Pric
e-
--
--
--
-0.
9917
-Lo
wes
t R
edem
ptio
n Pr
ice
--
--
--
--
0.86
26-
2013
Hig
hest
Sub
scrip
tion
Pric
e-
--
--
--
-1.
0444
-Lo
wes
t R
edem
ptio
n Pr
ice
--
--
--
--
0.83
04-
2012
Hig
hest
Sub
scrip
tion
Pric
e-
--
--
--
-0.
8503
-Lo
wes
t R
edem
ptio
n Pr
ice
--
--
--
--
0.61
96-
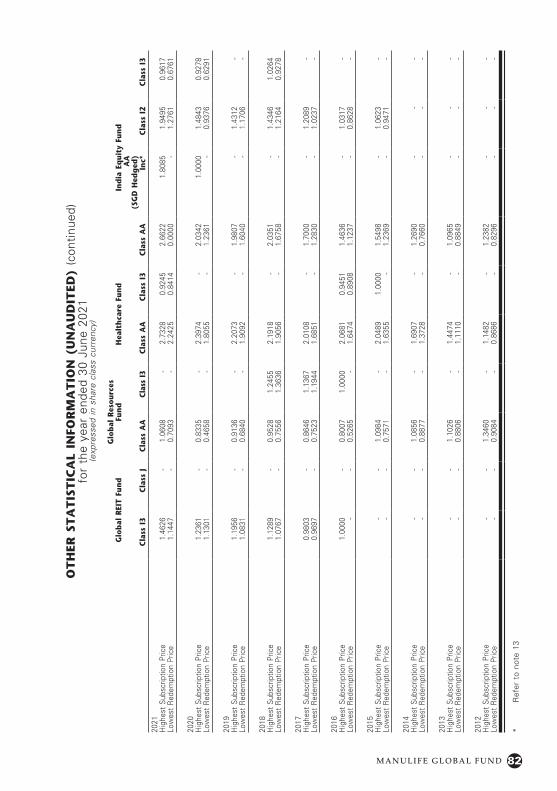
82M A N U L I F E G L O B A L F U N D
OT
HER
ST
AT
IST
ICA
L IN
FOR
MA
TIO
N (
UN
AU
DIT
ED)
(con
tinue
d)fo
r th
e ye
ar e
nded
30
June
202
1(e
xpre
ssed
in s
hare
cla
ss c
urre
ncy)
Glo
bal
REI
T Fu
nd
Glo
bal
Res
ourc
es
Fun
dH
ealt
hca
re F
und
Ind
ia E
qui
ty F
und
Cla
ss I
3C
lass
JC
lass
AA
Clas
s I3
Cla
ss A
AC
lass
I3
Cla
ss A
A
A
A
(SG
D H
edg
ed)
Inc*
Cla
ss I
2C
lass
I3
2021
Hig
hest
Sub
scrip
tion
Pric
e1.
4626
-1.
0608
-2.
7328
0.92
452.
6622
1.80
851.
9495
0.96
17Lo
wes
t R
edem
ptio
n Pr
ice
1.14
47-
0.70
93-
2.24
250.
8414
0.00
00-
1.27
610.
6761
2020
Hig
hest
Sub
scrip
tion
Pric
e1.
2361
-0.
8335
-2.
3974
-2.
0342
1.00
001.
4843
0.92
78Lo
wes
t R
edem
ptio
n Pr
ice
1.13
01-
0.46
58-
1.80
55-
1.23
61-
0.93
760.
6291
2019
Hig
hest
Sub
scrip
tion
Pric
e1.
1956
-0.
9136
-2.
2073
-1.
9807
-1.
4312
-Lo
wes
t R
edem
ptio
n Pr
ice
1.08
31-
0.68
40-
1.90
92-
1.60
40-
1.17
06-
2018
Hig
hest
Sub
scrip
tion
Pric
e1.
1289
-0.
9528
1.24
552.
1918
-2.
0351
-1.
4346
1.02
64Lo
wes
t R
edem
ptio
n Pr
ice
1.07
67-
0.75
561.
3636
1.90
56-
1.67
58-
1.21
640.
9278
2017
Hig
hest
Sub
scrip
tion
Pric
e0.
9803
-0.
8646
1.13
672.
0108
-1.
7000
-1.
2089
-Lo
wes
t R
edem
ptio
n Pr
ice
0.96
97-
0.75
231.
1944
1.68
51-
1.28
30-
1.02
37-
2016
Hig
hest
Sub
scrip
tion
Pric
e1.
0000
-0.
8007
1.00
002.
0681
0.94
511.
4636
-1.
0317
-Lo
wes
t R
edem
ptio
n Pr
ice
--
0.52
65-
1.64
740.
8908
1.12
37-
0.86
28-
2015
Hig
hest
Sub
scrip
tion
Pric
e-
-1.
0984
-2.
0489
1.00
001.
5498
-1.
0623
-Lo
wes
t R
edem
ptio
n Pr
ice
--
0.75
71-
1.63
55-
1.23
69-
0.94
71-
2014
Hig
hest
Sub
scrip
tion
Pric
e-
-1.
0856
-1.
6907
-1.
2690
--
-Lo
wes
t R
edem
ptio
n Pr
ice
--
0.88
77-
1.37
28-
0.76
60-
--
2013
Hig
hest
Sub
scrip
tion
Pric
e-
-1.
1026
-1.
4474
-1.
0965
--
-Lo
wes
t R
edem
ptio
n Pr
ice
--
0.88
06-
1.11
10-
0.88
49-
--
2012
Hig
hest
Sub
scrip
tion
Pric
e-
-1.
3460
-1.
1482
-1.
2382
--
-Lo
wes
t R
edem
ptio
n Pr
ice
--
0.90
84-
0.86
86-
0.82
96-
--
* R
efer
to
note
13
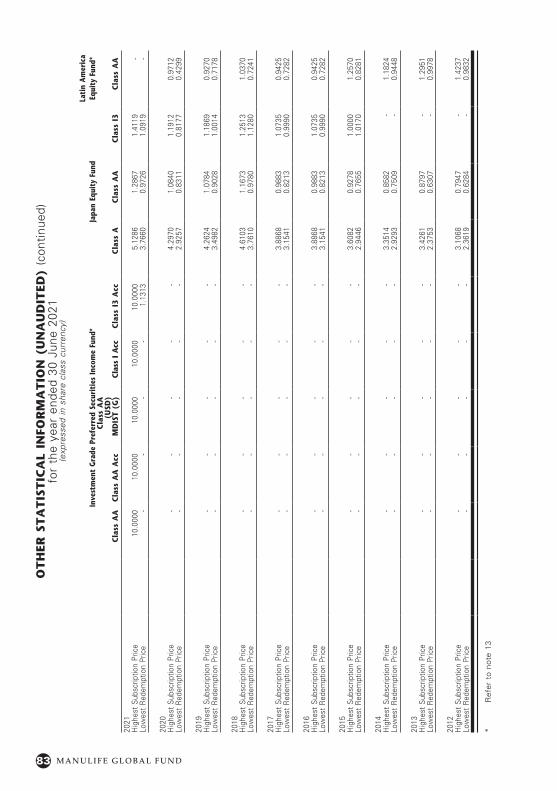
83 M A N U L I F E G L O B A L F U N D
OT
HER
ST
AT
IST
ICA
L IN
FOR
MA
TIO
N (
UN
AU
DIT
ED)
(con
tinue
d)fo
r th
e ye
ar e
nded
30
June
202
1(e
xpre
ssed
in s
hare
cla
ss c
urre
ncy)
Inve
stm
ent
Gra
de P
refe
rred
Sec
urit
ies
Inco
me
Fund
*Ja
pan
Equi
ty F
und
Lati
n A
mer
ica
Equi
ty F
und*
Cla
ss A
AC
lass
AA
Acc
Cla
ss A
A
(USD
) M
DIS
T (G
)Cl
ass
I A
ccC
lass
I3
Acc
Cla
ss A
Cla
ss A
AC
lass
I3
Cla
ss A
A
2021
Hig
hest
Sub
scrip
tion
Pric
e10
.000
010
.000
010
.000
010
.000
010
.000
05.
1286
1.28
671.
4119
-Lo
wes
t R
edem
ptio
n Pr
ice
--
--
1.13
133.
7660
0.97
261.
0919
-
2020
Hig
hest
Sub
scrip
tion
Pric
e-
--
--
4.29
701.
0840
1.19
120.
9712
Low
est
Red
empt
ion
Pric
e-
--
--
2.92
570.
8311
0.81
770.
4299
2019
Hig
hest
Sub
scrip
tion
Pric
e-
--
--
4.26
241.
0784
1.18
690.
9270
Low
est
Red
empt
ion
Pric
e-
--
--
3.49
820.
9028
1.00
140.
7178
2018
Hig
hest
Sub
scrip
tion
Pric
e-
--
--
4.61
031.
1673
1.25
131.
0370
Low
est
Red
empt
ion
Pric
e-
--
--
3.76
100.
9780
1.12
800.
7241
2017
Hig
hest
Sub
scrip
tion
Pric
e-
--
--
3.88
680.
9883
1.07
350.
9425
Low
est
Red
empt
ion
Pric
e-
--
--
3.15
410.
8213
0.99
900.
7282
2016
Hig
hest
Sub
scrip
tion
Pric
e-
--
--
3.88
680.
9883
1.07
350.
9425
Low
est
Red
empt
ion
Pric
e-
--
--
3.15
410.
8213
0.99
900.
7282
2015
Hig
hest
Sub
scrip
tion
Pric
e-
--
--
3.60
820.
9278
1.00
001.
2570
Low
est
Red
empt
ion
Pric
e-
--
--
2.94
460.
7655
1.01
700.
8281
2014
Hig
hest
Sub
scrip
tion
Pric
e-
--
--
3.35
140.
8582
-1.
1824
Low
est
Red
empt
ion
Pric
e-
--
--
2.92
930.
7509
-0.
9448
2013
Hig
hest
Sub
scrip
tion
Pric
e-
--
--
3.42
610.
8797
-1.
2951
Low
est
Red
empt
ion
Pric
e-
--
--
2.37
530.
6307
-0.
9978
2012
Hig
hest
Sub
scrip
tion
Pric
e-
--
--
3.10
680.
7947
-1.
4237
Low
est
Red
empt
ion
Pric
e-
--
--
2.36
190.
6284
-0.
9832
* R
efer
to
note
13
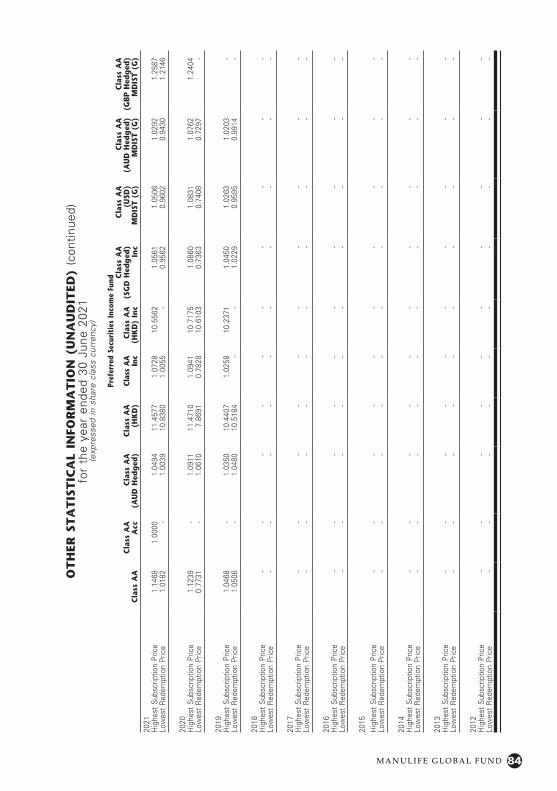
84M A N U L I F E G L O B A L F U N D
OT
HER
ST
AT
IST
ICA
L IN
FOR
MA
TIO
N (
UN
AU
DIT
ED)
(con
tinue
d)fo
r th
e ye
ar e
nded
30
June
202
1(e
xpre
ssed
in s
hare
cla
ss c
urre
ncy)
Pref
erre
d Se
curi
ties
Inco
me
Fund
Cla
ss A
AC
lass
AA
A
ccC
lass
AA
(A
UD
Hed
ged
)C
lass
AA
(H
KD
)Cl
ass
AA
In
cC
lass
AA
(H
KD
) In
c
Cla
ss A
A
(SG
D H
edg
ed)
Inc
Cla
ss A
A
(USD
) M
DIS
T (G
)
Cla
ss A
A
(AU
D H
edg
ed)
MD
IST
(G)
Cla
ss A
A
(GB
P H
edg
ed)
MD
IST
(G)
2021
Hig
hest
Sub
scrip
tion
Pric
e1.
1468
1.00
001.
0494
11.4
577
1.07
2810
.556
21.
0561
1.05
061.
0292
1.25
87Lo
wes
t R
edem
ptio
n Pr
ice
1.01
82-
1.00
3910
.838
01.
0055
-0.
9562
0.96
020.
9430
1.21
46
2020
Hig
hest
Sub
scrip
tion
Pric
e1.
1239
-1.
0911
11.4
710
1.09
4110
.717
51.
0860
1.08
311.
0762
1.24
04Lo
wes
t R
edem
ptio
n Pr
ice
0.77
31-
1.06
107.
8691
0.78
2810
.610
30.
7363
0.74
080.
7297
-
2019
Hig
hest
Sub
scrip
tion
Pric
e1.
0468
-1.
0350
10.4
407
1.02
5810
.237
11.
0450
1.02
631.
0203
-Lo
wes
t R
edem
ptio
n Pr
ice
1.05
06-
1.04
8010
.518
4-
-1.
0229
0.95
950.
9914
-
2018
Hig
hest
Sub
scrip
tion
Pric
e-
--
--
--
--
-Lo
wes
t R
edem
ptio
n Pr
ice
--
--
--
--
--
2017
Hig
hest
Sub
scrip
tion
Pric
e-
--
--
--
--
-Lo
wes
t R
edem
ptio
n Pr
ice
--
--
--
--
--
2016
Hig
hest
Sub
scrip
tion
Pric
e-
--
--
--
--
-Lo
wes
t R
edem
ptio
n Pr
ice
--
--
--
--
--
2015
Hig
hest
Sub
scrip
tion
Pric
e-
--
--
--
--
-Lo
wes
t R
edem
ptio
n Pr
ice
--
--
--
--
--
2014
Hig
hest
Sub
scrip
tion
Pric
e-
--
--
--
--
-Lo
wes
t R
edem
ptio
n Pr
ice
--
--
--
--
--
2013
Hig
hest
Sub
scrip
tion
Pric
e-
--
--
--
--
-Lo
wes
t R
edem
ptio
n Pr
ice
--
--
--
--
--
2012
Hig
hest
Sub
scrip
tion
Pric
e-
--
--
--
--
-Lo
wes
t R
edem
ptio
n Pr
ice
--
--
--
--
--
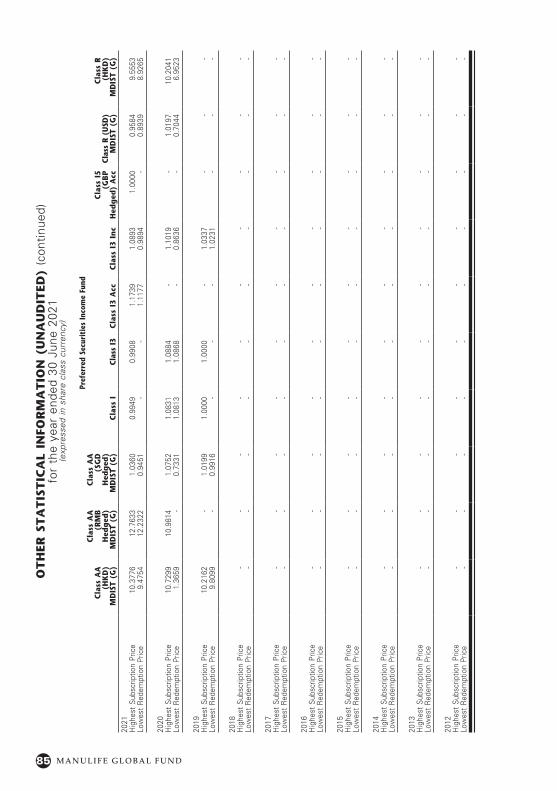
85 M A N U L I F E G L O B A L F U N D
OT
HER
ST
AT
IST
ICA
L IN
FOR
MA
TIO
N (
UN
AU
DIT
ED)
(con
tinue
d)fo
r th
e ye
ar e
nded
30
June
202
1(e
xpre
ssed
in s
hare
cla
ss c
urre
ncy)
Pref
erre
d Se
curi
ties
Inco
me
Fund
Cla
ss A
A
(HK
D)
MD
IST
(G)
Cla
ss A
A
(RM
B
Hed
ged
) M
DIS
T (G
)
Cla
ss A
A
(SG
D
Hed
ged
) M
DIS
T (G
)C
lass
ICl
ass
I3C
lass
I3
Acc
Cla
ss I
3 In
c
C
lass
I5
(GB
P
Hed
ged
) A
ccCl
ass
R (U
SD)
MD
IST
(G)
Cla
ss R
(H
KD
) M
DIS
T (G
)
2021
Hig
hest
Sub
scrip
tion
Pric
e10
.377
612
.763
31.
0360
0.99
490.
9908
1.17
391.
0893
1.00
000.
9584
9.55
53Lo
wes
t R
edem
ptio
n Pr
ice
9.47
5412
.232
20.
9451
--
1.11
770.
9894
-0.
8939
8.92
65
2020
Hig
hest
Sub
scrip
tion
Pric
e10
.729
910
.981
41.
0752
1.08
311.
0884
-1.
1019
-1.
0197
10.2
041
Low
est
Red
empt
ion
Pric
e1.
3659
-0.
7331
1.08
131.
0868
-0.
8636
-0.
7044
6.95
23
2019
Hig
hest
Sub
scrip
tion
Pric
e10
.216
2-
1.01
991.
0000
1.00
00-
1.03
37-
--
Low
est
Red
empt
ion
Pric
e9.
8099
-0.
9916
--
-1.
0231
--
-
2018
Hig
hest
Sub
scrip
tion
Pric
e-
--
--
--
--
-Lo
wes
t R
edem
ptio
n Pr
ice
--
--
--
--
--
2017
Hig
hest
Sub
scrip
tion
Pric
e-
--
--
--
--
-Lo
wes
t R
edem
ptio
n Pr
ice
--
--
--
--
--
2016
Hig
hest
Sub
scrip
tion
Pric
e-
--
--
--
--
-Lo
wes
t R
edem
ptio
n Pr
ice
--
--
--
--
--
2015
Hig
hest
Sub
scrip
tion
Pric
e-
--
--
--
--
-Lo
wes
t R
edem
ptio
n Pr
ice
--
--
--
--
--
2014
Hig
hest
Sub
scrip
tion
Pric
e-
--
--
--
--
-Lo
wes
t R
edem
ptio
n Pr
ice
--
--
--
--
--
2013
Hig
hest
Sub
scrip
tion
Pric
e-
--
--
--
--
-Lo
wes
t R
edem
ptio
n Pr
ice
--
--
--
--
--
2012
Hig
hest
Sub
scrip
tion
Pric
e-
--
--
--
--
-Lo
wes
t R
edem
ptio
n Pr
ice
--
--
--
--
--
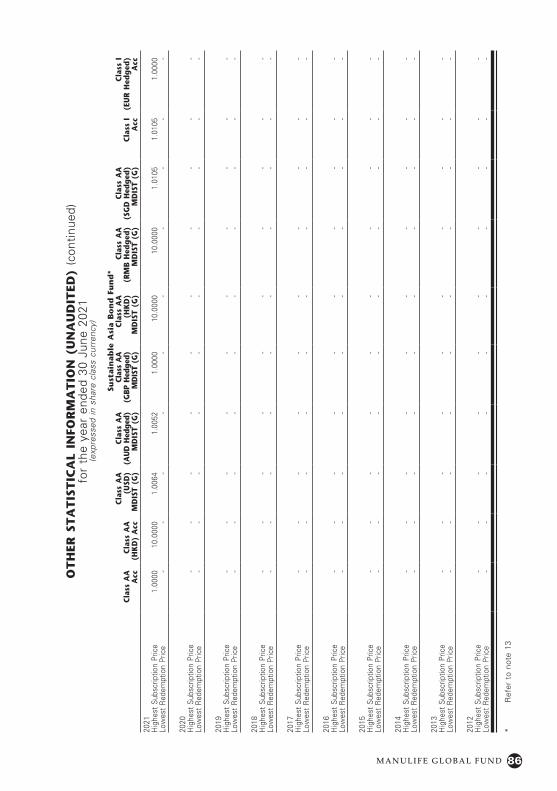
86M A N U L I F E G L O B A L F U N D
OT
HER
ST
AT
IST
ICA
L IN
FOR
MA
TIO
N (
UN
AU
DIT
ED)
(con
tinue
d)fo
r th
e ye
ar e
nded
30
June
202
1(e
xpre
ssed
in s
hare
cla
ss c
urre
ncy)
Sust
ain
ab
le A
sia B
on
d F
un
d*
C
lass
AA
A
cc
Cla
ss A
A
(HK
D)
Acc
Cla
ss A
A
(USD
) M
DIS
T (G
)
Cla
ss A
A
(AU
D H
edge
d)
MD
IST
(G)
Clas
s A
A
(GBP
Hed
ged)
M
DIS
T (G
)
Cla
ss A
A
(HK
D)
MD
IST
(G)
Cla
ss A
A
(RM
B H
edg
ed)
MD
IST
(G)
Cla
ss A
A
(SG
D H
edg
ed)
MD
IST
(G)
C
lass
I
Acc
C
lass
I
(EU
R H
edg
ed)
Acc
2021
Hig
hest
Sub
scrip
tion
Pric
e1.
0000
10.0
000
1.00
641.
0052
1.00
0010
.000
010
.000
01.
0105
1.01
051.
0000
Low
est
Red
empt
ion
Pric
e-
--
--
--
--
-
2020
Hig
hest
Sub
scrip
tion
Pric
e-
--
--
--
--
-Lo
wes
t R
edem
ptio
n Pr
ice
--
--
--
--
--
2019
Hig
hest
Sub
scrip
tion
Pric
e-
--
--
--
--
-Lo
wes
t R
edem
ptio
n Pr
ice
--
--
--
--
--
2018
Hig
hest
Sub
scrip
tion
Pric
e-
--
--
--
--
-Lo
wes
t R
edem
ptio
n Pr
ice
--
--
--
--
--
2017
Hig
hest
Sub
scrip
tion
Pric
e-
--
--
--
--
-Lo
wes
t R
edem
ptio
n Pr
ice
--
--
--
--
--
2016
Hig
hest
Sub
scrip
tion
Pric
e-
--
--
--
--
-Lo
wes
t R
edem
ptio
n Pr
ice
--
--
--
--
--
2015
Hig
hest
Sub
scrip
tion
Pric
e-
--
--
--
--
-Lo
wes
t R
edem
ptio
n Pr
ice
--
--
--
--
--
2014
Hig
hest
Sub
scrip
tion
Pric
e-
--
--
--
--
-Lo
wes
t R
edem
ptio
n Pr
ice
--
--
--
--
--
2013
Hig
hest
Sub
scrip
tion
Pric
e-
--
--
--
--
-Lo
wes
t R
edem
ptio
n Pr
ice
--
--
--
--
--
2012
Hig
hest
Sub
scrip
tion
Pric
e-
--
--
--
--
-Lo
wes
t R
edem
ptio
n Pr
ice
--
--
--
--
--
* R
efer
to
note
13
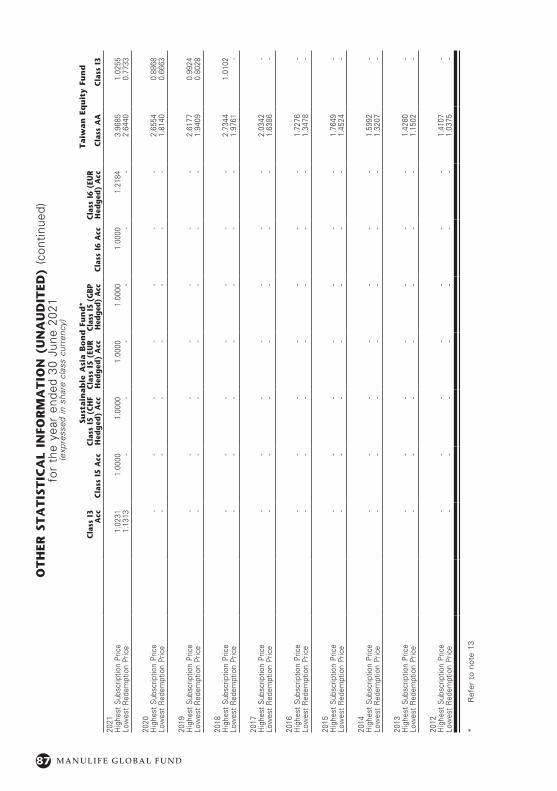
87 M A N U L I F E G L O B A L F U N D
OT
HER
ST
AT
IST
ICA
L IN
FOR
MA
TIO
N (
UN
AU
DIT
ED)
(con
tinue
d)fo
r th
e ye
ar e
nded
30
June
202
1(e
xpre
ssed
in s
hare
cla
ss c
urre
ncy)
Sust
ain
ab
le A
sia B
on
d F
un
d*
Taiw
an
Eq
uit
y Fu
nd
C
lass
I3
Acc
Cla
ss I
5 A
ccC
lass
I5
(CH
F H
edg
ed)
Acc
Cla
ss I
5 (E
UR
H
edg
ed)
Acc
Clas
s I5
(G
BP
Hed
ged)
Acc
Cla
ss I
6 A
ccC
lass
I6
(EU
R
Hed
ged
) A
ccC
lass
AA
Cla
ss I
3
2021
Hig
hest
Sub
scrip
tion
Pric
e1.
0231
1.00
001.
0000
1.00
001.
0000
1.00
001.
2184
3.96
851.
0255
Low
est
Red
empt
ion
Pric
e1.
1313
--
--
--
2.64
400.
7733
2020
Hig
hest
Sub
scrip
tion
Pric
e-
--
--
--
2.65
540.
8868
Low
est
Red
empt
ion
Pric
e-
--
--
--
1.81
400.
6663
2019
Hig
hest
Sub
scrip
tion
Pric
e-
--
--
--
2.61
770.
9924
Low
est
Red
empt
ion
Pric
e-
--
--
--
1.94
090.
8028
2018
Hig
hest
Sub
scrip
tion
Pric
e-
--
--
--
2.73
441.
0102
Low
est
Red
empt
ion
Pric
e-
--
--
--
1.97
61-
2017
Hig
hest
Sub
scrip
tion
Pric
e-
--
--
--
2.03
42-
Low
est
Red
empt
ion
Pric
e-
--
--
--
1.63
86-
2016
Hig
hest
Sub
scrip
tion
Pric
e-
--
--
--
1.72
76-
Low
est
Red
empt
ion
Pric
e-
--
--
--
1.34
78-
2015
Hig
hest
Sub
scrip
tion
Pric
e-
--
--
--
1.76
49-
Low
est
Red
empt
ion
Pric
e-
--
--
--
1.45
24-
2014
Hig
hest
Sub
scrip
tion
Pric
e-
--
--
--
1.59
92-
Low
est
Red
empt
ion
Pric
e-
--
--
--
1.32
07-
2013
Hig
hest
Sub
scrip
tion
Pric
e-
--
--
--
1.42
80-
Low
est
Red
empt
ion
Pric
e-
--
--
--
1.15
02-
2012
Hig
hest
Sub
scrip
tion
Pric
e-
--
--
--
1.41
07-
Low
est
Red
empt
ion
Pric
e-
--
--
--
1.03
75-
* R
efer
to
note
13
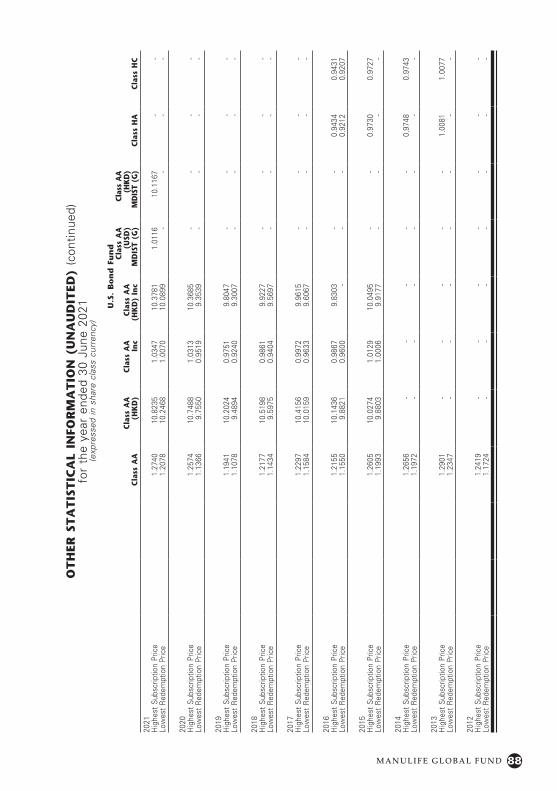
88M A N U L I F E G L O B A L F U N D
OT
HER
ST
AT
IST
ICA
L IN
FOR
MA
TIO
N (
UN
AU
DIT
ED)
(con
tinue
d)fo
r th
e ye
ar e
nded
30
June
202
1(e
xpre
ssed
in s
hare
cla
ss c
urre
ncy)
U.S
. B
on
d F
un
d
Cla
ss A
AC
lass
AA
(H
KD
)C
lass
AA
In
cC
lass
AA
(H
KD
) In
c
Cla
ss A
A
(USD
) M
DIS
T (G
)
Clas
s A
A
(HK
D)
MD
IST
(G)
Cla
ss H
AC
lass
HC
2021
Hig
hest
Sub
scrip
tion
Pric
e1.
2740
10.8
235
1.03
4710
.378
11.
0116
10.1
167
--
Low
est
Red
empt
ion
Pric
e1.
2078
10.2
468
1.00
7010
.089
9-
--
-
2020
Hig
hest
Sub
scrip
tion
Pric
e1.
2574
10.7
488
1.03
1310
.368
5-
--
-Lo
wes
t R
edem
ptio
n Pr
ice
1.13
669.
7550
0.95
199.
3539
--
--
2019
Hig
hest
Sub
scrip
tion
Pric
e1.
1941
10.2
024
0.97
519.
8047
--
--
Low
est
Red
empt
ion
Pric
e1.
1078
9.48
940.
9240
9.30
07-
--
-
2018
Hig
hest
Sub
scrip
tion
Pric
e1.
2177
10.5
198
0.98
619.
9227
--
--
Low
est
Red
empt
ion
Pric
e1.
1434
9.59
750.
9404
9.56
97-
--
-
2017
Hig
hest
Sub
scrip
tion
Pric
e1.
2297
10.4
156
0.99
729.
9615
--
--
Low
est
Red
empt
ion
Pric
e1.
1584
10.0
159
0.96
339.
6067
--
--
2016
Hig
hest
Sub
scrip
tion
Pric
e1.
2155
10.1
436
0.98
679.
8303
--
0.94
340.
9431
Low
est
Red
empt
ion
Pric
e1.
1550
9.88
210.
9600
--
-0.
9212
0.92
07
2015
Hig
hest
Sub
scrip
tion
Pric
e1.
2605
10.0
274
1.01
2910
.049
5-
-0.
9730
0.97
27Lo
wes
t R
edem
ptio
n Pr
ice
1.19
939.
8803
1.00
069.
9177
--
--
2014
Hig
hest
Sub
scrip
tion
Pric
e1.
2656
--
--
-0.
9748
0.97
43Lo
wes
t R
edem
ptio
n Pr
ice
1.19
72-
--
--
--
2013
Hig
hest
Sub
scrip
tion
Pric
e1.
2901
--
--
-1.
0081
1.00
77Lo
wes
t R
edem
ptio
n Pr
ice
1.23
47-
--
--
--
2012
Hig
hest
Sub
scrip
tion
Pric
e1.
2419
--
--
--
-Lo
wes
t R
edem
ptio
n Pr
ice
1.17
24-
--
--
--
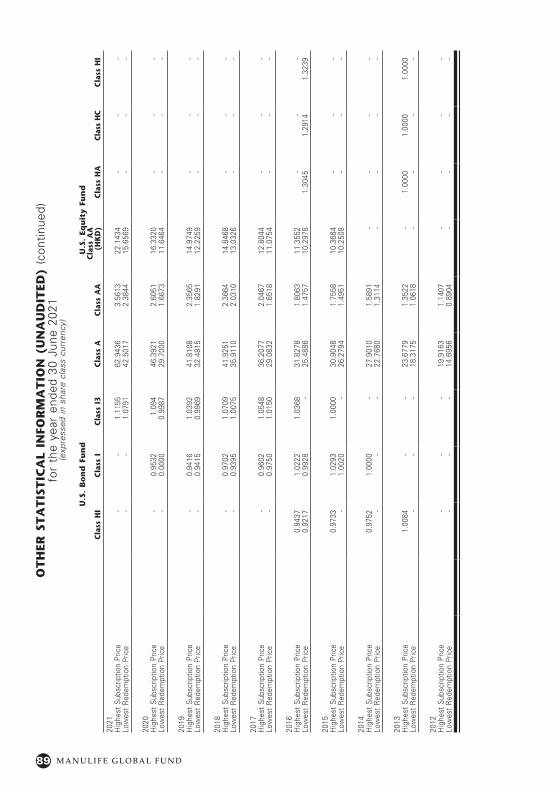
89 M A N U L I F E G L O B A L F U N D
OT
HER
ST
AT
IST
ICA
L IN
FOR
MA
TIO
N (
UN
AU
DIT
ED)
(con
tinue
d)fo
r th
e ye
ar e
nded
30
June
202
1(e
xpre
ssed
in s
hare
cla
ss c
urre
ncy)
U.S
. B
on
d F
un
dU
.S.
Equ
ity
Fun
d
Cla
ss H
IC
lass
IC
lass
I3
Cla
ss A
Cla
ss A
AC
lass
AA
(H
KD
)C
lass
HA
Clas
s H
CC
lass
HI
2021
Hig
hest
Sub
scrip
tion
Pric
e-
-1.
1155
62.9
436
3.56
1322
.143
4-
--
Low
est
Red
empt
ion
Pric
e-
-1.
0791
42.5
017
2.38
4415
.656
9-
--
2020
Hig
hest
Sub
scrip
tion
Pric
e-
0.95
321.
094
46.3
921
2.60
5116
.332
0-
--
Low
est
Red
empt
ion
Pric
e-
0.00
000.
9987
29.7
000
1.66
7311
.646
4-
--
2019
Hig
hest
Sub
scrip
tion
Pric
e-
0.94
161.
0392
41.8
108
2.35
6514
.974
9-
--
Low
est
Red
empt
ion
Pric
e-
0.94
150.
9969
32.4
815
1.82
9112
.225
9-
--
2018
Hig
hest
Sub
scrip
tion
Pric
e-
0.97
021.
0709
41.9
251
2.36
6414
.846
8-
--
Low
est
Red
empt
ion
Pric
e-
0.93
951.
0075
35.9
110
2.03
1013
.032
6-
--
2017
Hig
hest
Sub
scrip
tion
Pric
e-
0.96
021.
0548
36.2
077
2.04
6712
.804
4-
--
Low
est
Red
empt
ion
Pric
e-
0.97
501.
0150
29.0
832
1.65
1811
.075
4-
--
2016
Hig
hest
Sub
scrip
tion
Pric
e0.
9437
1.02
221.
0368
31.8
278
1.80
6311
.355
2-
--
Low
est
Red
empt
ion
Pric
e0.
9217
0.99
28-
25.4
886
1.47
5710
.297
81.
3045
1.29
141.
3239
2015
Hig
hest
Sub
scrip
tion
Pric
e0.
9733
1.02
931.
0000
30.9
048
1.75
5810
.368
4-
--
Low
est
Red
empt
ion
Pric
e-
1.00
20-
26.2
794
1.49
5110
.250
8-
--
2014
Hig
hest
Sub
scrip
tion
Pric
e0.
9752
1.00
00-
27.9
010
1.58
91-
--
-Lo
wes
t R
edem
ptio
n Pr
ice
--
-22
.768
01.
3114
--
--
2013
Hig
hest
Sub
scrip
tion
Pric
e1.
0084
--
23.6
779
1.35
22-
1.00
001.
0000
1.00
00Lo
wes
t R
edem
ptio
n Pr
ice
--
-18
.317
51.
0618
--
--
2012
Hig
hest
Sub
scrip
tion
Pric
e-
--
19.9
163
1.14
07-
--
-Lo
wes
t R
edem
ptio
n Pr
ice
--
-14
.695
60.
8904
--
--
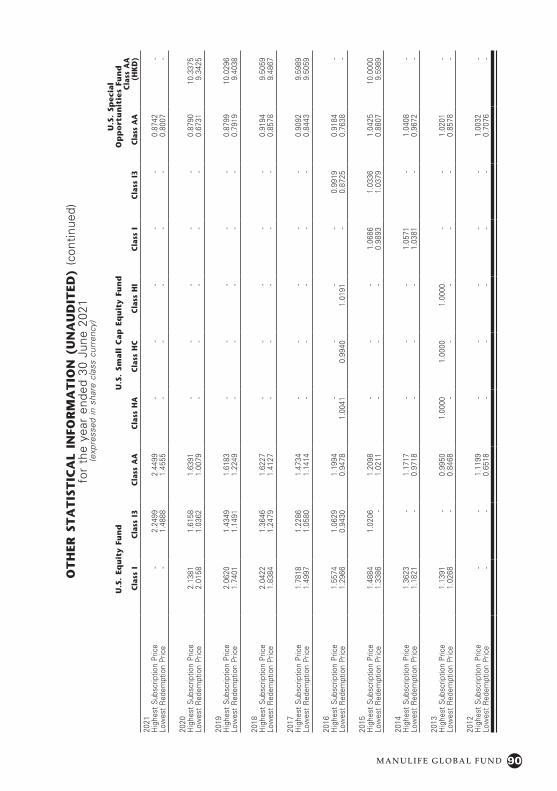
90M A N U L I F E G L O B A L F U N D
OT
HER
ST
AT
IST
ICA
L IN
FOR
MA
TIO
N (
UN
AU
DIT
ED)
(con
tinue
d)fo
r th
e ye
ar e
nded
30
June
202
1(e
xpre
ssed
in s
hare
cla
ss c
urre
ncy)
U.S
. Eq
uit
y Fu
nd
U.S
. Sm
all
Cap
Eq
uit
y Fu
nd
U.S
. Sp
ecia
l O
pp
ort
un
itie
s Fu
nd
Cla
ss I
Cla
ss I
3C
lass
AA
Cla
ss H
AC
lass
HC
Cla
ss H
IC
lass
IC
lass
I3
Clas
s A
AC
lass
AA
(H
KD
)
2021
Hig
hest
Sub
scrip
tion
Pric
e-
2.24
992.
4499
--
--
-0.
8742
-Lo
wes
t R
edem
ptio
n Pr
ice
-1.
4888
1.45
55-
--
--
0.80
07-
2020
Hig
hest
Sub
scrip
tion
Pric
e2.
1381
1.61
581.
6391
--
--
-0.
8790
10.3
375
Low
est
Red
empt
ion
Pric
e2.
0158
1.03
621.
0079
--
--
-0.
6731
9.34
25
2019
Hig
hest
Sub
scrip
tion
Pric
e2.
0620
1.43
491.
6183
--
--
-0.
8799
10.0
296
Low
est
Red
empt
ion
Pric
e1.
7401
1.14
911.
2249
--
--
-0.
7919
9.40
38
2018
Hig
hest
Sub
scrip
tion
Pric
e2.
0422
1.36
461.
6227
--
--
-0.
9194
9.50
59Lo
wes
t R
edem
ptio
n Pr
ice
1.83
841.
2479
1.41
27-
--
--
0.85
789.
4867
2017
Hig
hest
Sub
scrip
tion
Pric
e1.
7818
1.22
861.
4734
--
--
-0.
9092
9.59
89Lo
wes
t R
edem
ptio
n Pr
ice
1.49
971.
0580
1.14
14-
--
--
0.84
439.
5059
2016
Hig
hest
Sub
scrip
tion
Pric
e1.
5574
1.06
291.
1994
--
--
0.99
190.
9184
-Lo
wes
t R
edem
ptio
n Pr
ice
1.29
660.
9430
0.94
781.
0041
0.99
401.
0191
-0.
8725
0.76
38-
2015
Hig
hest
Sub
scrip
tion
Pric
e1.
4884
1.02
061.
2098
--
-1.
0686
1.03
361.
0425
10.0
000
Low
est
Red
empt
ion
Pric
e1.
3386
-1.
0211
--
-0.
9893
1.03
790.
8807
9.59
89
2014
Hig
hest
Sub
scrip
tion
Pric
e1.
3623
-1.
1717
--
-1.
0571
-1.
0408
-Lo
wes
t R
edem
ptio
n Pr
ice
1.18
21-
0.97
18-
--
1.03
81-
0.96
72-
2013
Hig
hest
Sub
scrip
tion
Pric
e1.
1391
-0.
9950
1.00
001.
0000
1.00
00-
-1.
0201
-Lo
wes
t R
edem
ptio
n Pr
ice
1.02
68-
0.84
68-
--
--
0.85
78-
2012
Hig
hest
Sub
scrip
tion
Pric
e-
-1.
1199
--
--
-1.
0032
-Lo
wes
t R
edem
ptio
n Pr
ice
--
0.65
18-
--
--
0.70
76-
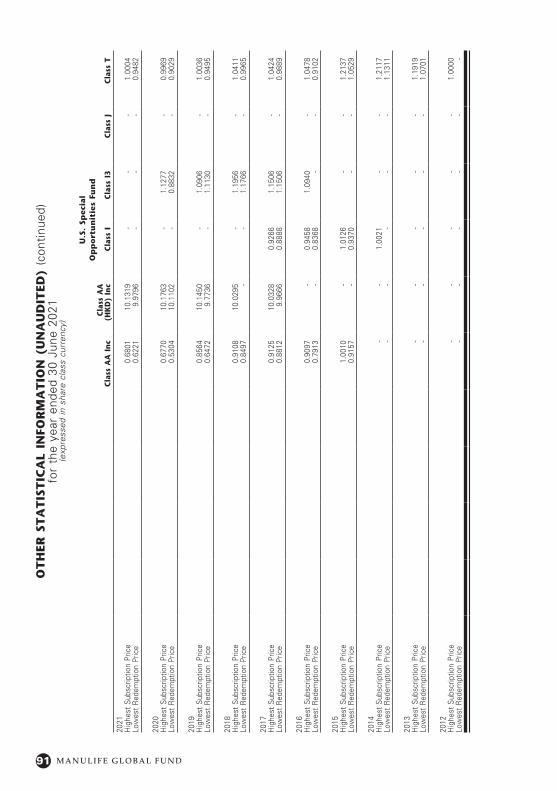
91 M A N U L I F E G L O B A L F U N D
OT
HER
ST
AT
IST
ICA
L IN
FOR
MA
TIO
N (
UN
AU
DIT
ED)
(con
tinue
d)fo
r th
e ye
ar e
nded
30
June
202
1(e
xpre
ssed
in s
hare
cla
ss c
urre
ncy)
U.S
. Sp
ecia
l
Op
po
rtu
nit
ies
Fun
d
Cla
ss A
A I
nc
Cla
ss A
A
(HK
D)
Inc
Cla
ss I
Cla
ss I
3C
lass
JC
lass
T
2021
Hig
hest
Sub
scrip
tion
Pric
e0.
6801
10.1
319
--
-1.
0004
Low
est
Red
empt
ion
Pric
e0.
6221
9.97
96-
--
0.94
82
2020
Hig
hest
Sub
scrip
tion
Pric
e0.
6770
10.1
763
-1.
1277
-0.
9969
Low
est
Red
empt
ion
Pric
e0.
5304
10.1
102
-0.
8832
-0.
9029
2019
Hig
hest
Sub
scrip
tion
Pric
e0.
8564
10.1
450
-1.
0906
-1.
0036
Low
est
Red
empt
ion
Pric
e0.
6472
9.77
36-
1.11
30-
0.94
95
2018
Hig
hest
Sub
scrip
tion
Pric
e0.
9108
10.0
295
-1.
1956
-1.
0411
Low
est
Red
empt
ion
Pric
e0.
8497
--
1.17
66-
0.99
65
2017
Hig
hest
Sub
scrip
tion
Pric
e0.
9125
10.0
328
0.92
661.
1506
-1.
0424
Low
est
Red
empt
ion
Pric
e0.
8812
9.96
660.
8888
1.15
06-
0.98
89
2016
Hig
hest
Sub
scrip
tion
Pric
e0.
9097
-0.
9458
1.09
40-
1.04
78Lo
wes
t R
edem
ptio
n Pr
ice
0.79
13-
0.83
68-
-0.
9102
2015
Hig
hest
Sub
scrip
tion
Pric
e1.
0010
-1.
0126
--
1.21
37Lo
wes
t R
edem
ptio
n Pr
ice
0.91
57-
0.93
70-
-1.
0529
2014
Hig
hest
Sub
scrip
tion
Pric
e-
-1.
0021
--
1.21
17Lo
wes
t R
edem
ptio
n Pr
ice
--
--
-1.
1311
2013
Hig
hest
Sub
scrip
tion
Pric
e-
--
--
1.19
19Lo
wes
t R
edem
ptio
n Pr
ice
--
--
-1.
0701
2012
Hig
hest
Sub
scrip
tion
Pric
e-
--
--
1.00
00Lo
wes
t R
edem
ptio
n Pr
ice
--
--
--
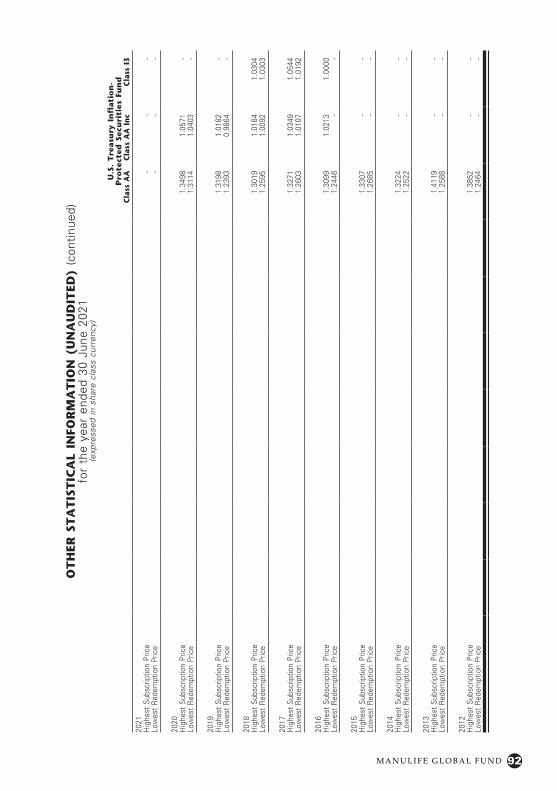
92M A N U L I F E G L O B A L F U N D
OT
HER
ST
AT
IST
ICA
L IN
FOR
MA
TIO
N (
UN
AU
DIT
ED)
(con
tinue
d)fo
r th
e ye
ar e
nded
30
June
202
1(e
xpre
ssed
in s
hare
cla
ss c
urre
ncy)
U.S
. T
reasu
ry I
nfl
ati
on
-P
rote
cted
Sec
uri
ties
Fu
nd
Cla
ss A
AC
lass
AA
In
cC
lass
I3
2021
Hig
hest
Sub
scrip
tion
Pric
e-
--
Low
est
Red
empt
ion
Pric
e-
--
2020
Hig
hest
Sub
scrip
tion
Pric
e1.
3498
1.05
71-
Low
est
Red
empt
ion
Pric
e1.
3114
1.04
03-
2019
Hig
hest
Sub
scrip
tion
Pric
e1.
3198
1.01
82-
Low
est
Red
empt
ion
Pric
e1.
2393
0.98
64-
2018
Hig
hest
Sub
scrip
tion
Pric
e1.
3019
1.01
841.
0304
Low
est
Red
empt
ion
Pric
e1.
2595
1.00
921.
0303
2017
Hig
hest
Sub
scrip
tion
Pric
e1.
3271
1.03
491.
0544
Low
est
Red
empt
ion
Pric
e1.
2603
1.01
071.
0192
2016
Hig
hest
Sub
scrip
tion
Pric
e1.
3099
1.02
131.
0000
Low
est
Red
empt
ion
Pric
e1.
2446
--
2015
Hig
hest
Sub
scrip
tion
Pric
e1.
3307
--
Low
est
Red
empt
ion
Pric
e1.
2685
--
2014
Hig
hest
Sub
scrip
tion
Pric
e1.
3224
--
Low
est
Red
empt
ion
Pric
e1.
2522
--
2013
Hig
hest
Sub
scrip
tion
Pric
e1.
4119
--
Low
est
Red
empt
ion
Pric
e1.
2588
--
2012
Hig
hest
Sub
scrip
tion
Pric
e1.
3852
--
Low
est
Red
empt
ion
Pric
e1.
2464
--
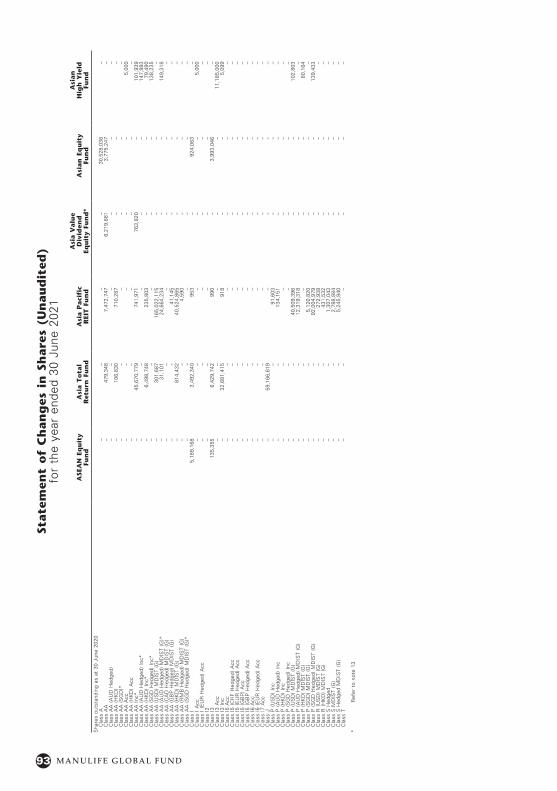
93 M A N U L I F E G L O B A L F U N D
State
men
t o
f C
han
ges
in
Sh
are
s (U
nau
dit
ed)
for
the
year
end
ed 3
0 Ju
ne 2
021
ASE
AN
Eq
uit
y Fu
nd
Asi
a T
ota
l R
etu
rn F
un
dA
sia P
aci
fic
R
EIT
Fu
nd
Asi
a V
alu
e D
ivid
end
Eq
uit
y Fu
nd
*A
sian
Eq
uit
y Fu
nd
Asi
an
H
igh
Yie
ld
Fun
d
Sha
res
outs
tand
ing
as a
t 30
Jun
e 20
20C
lass
A–
––
–30
,528
,036
–C
lass
AA
–47
9,34
87,
472,
747
6,21
9,68
13,
775,
247
–C
lass
AA
(A
UD
Hed
ged)
––
––
––
Cla
ss A
A (
HK
D)
–10
6,83
071
0,28
7–
––
Cla
ss A
A (
SG
D)*
––
––
––
Cla
ss A
A A
cc–
––
––
5,00
0C
lass
AA
(H
KD
) A
cc–
––
––
–C
lass
AA
Inc
*–
45,6
70,7
7974
1,97
176
3,82
0–
101,
939
Cla
ss A
A (
AU
D H
edge
d) I
nc*
––
––
–14
7,99
3C
lass
AA
(H
KD
) In
c*–
6,49
8,74
823
5,80
3–
–79
,490
Cla
ss A
A (
SG
D H
edge
d) I
nc*
––
––
–13
8,23
5C
lass
AA
(U
SD
) M
DIS
T (G
)–
301,
687
165,
022,
115
––
–C
lass
AA
(A
UD
Hed
ged)
MD
IST
(G)*
–31
,101
24,6
64,2
34–
–14
9,31
8C
lass
AA
(C
AD
Hed
ged)
MD
IST
(G)
––
––
––
Cla
ss A
A (
GB
P H
edge
d) M
DIS
T (G
)–
–41
,145
––
–C
lass
AA
(H
KD
) M
DIS
T (G
)–
814,
432
40,5
24,8
65–
––
Cla
ss A
A (
RM
B H
edge
d) M
DIS
T (G
)–
–4,
590
––
–C
lass
AA
(S
GD
Hed
ged)
MD
IST
(G)*
––
––
––
Cla
ss I
5,18
9,16
83,
492,
340
953
–92
4,06
3–
Cla
ss I
Acc
––
––
–5,
000
Cla
ss I
(E
UR
Hed
ged)
Acc
––
––
––
Cla
ss I
2–
––
––
–C
lass
I3
135,
355
6,42
9,74
299
0–
3,99
3,04
6–
Cla
ss I
3 A
cc–
––
––
11,1
85,0
00C
lass
I3
Inc
–32
,681
,415
918
––
5,09
9C
lass
I5
Acc
––
––
––
Cla
ss I
5 (C
HF
Hed
ged)
Acc
––
––
––
Cla
ss I
5 (E
UR
Hed
ged)
Acc
––
––
––
Cla
ss I
5 (G
BP
) A
cc–
––
––
–C
lass
I5
(GB
P H
edge
d) A
cc–
––
––
–C
lass
I6
Acc
––
––
––
Cla
ss I
6 (E
UR
Hed
ged)
Acc
––
––
––
Cla
ss I
7 A
cc–
––
––
–C
lass
J–
59,1
66,6
19–
––
–C
lass
P (
US
D)
Inc
––
91,6
03–
––
Cla
ss P
(A
UD
Hed
ged)
Inc
––
134,
151
––
–C
lass
P (
HK
D)
Inc
––
––
––
Cla
ss P
(S
GD
Hed
ged)
Inc
––
––
––
Cla
ss P
(U
SD
) M
DIS
T (G
)–
–40
,509
,396
––
102,
803
Cla
ss P
(A
UD
Hed
ged)
MD
IST
(G)
––
12,3
19,3
18–
––
Cla
ss P
(H
KD
) M
DIS
T (G
)–
––
––
80,1
64C
lass
P (
SG
D)
MD
IST
(G)
––
5,12
0,82
0–
––
Cla
ss P
(S
GD
Hed
ged)
MD
IST
(G)
––
92,0
04,9
79–
–13
9,43
3C
lass
R (
US
D)
MD
IST
(G)
––
272,
938
––
–C
lass
R (
HK
D)
MD
IST
(G)
––
431,
532
––
–C
lass
S H
edge
d–
–1,
307,
043
––
–C
lass
S M
DIS
T (G
)–
–2,
788,
884
––
–C
lass
S H
edge
d M
DIS
T (G
)–
–5,
245,
940
––
–C
lass
T–
––
––
–
* R
efer
to
note
13

94M A N U L I F E G L O B A L F U N D
State
men
t o
f C
han
ges
in
Sh
are
s (U
nau
dit
ed)
(con
tinue
d)fo
r th
e ye
ar e
nded
30
June
202
1
ASE
AN
Eq
uit
y Fu
nd
Asi
a T
ota
l R
etu
rn F
un
dA
sia P
aci
fic
R
EIT
Fu
nd
Asi
a V
alu
e D
ivid
end
Eq
uit
y Fu
nd
*A
sian
Eq
uit
y Fu
nd
Asi
an
H
igh
Yie
ld
Fun
d
Tota
l sub
scrip
tions
Cla
ss A
––
––
5,64
4,59
0–
Cla
ss A
A–
827,
907
3,48
2,95
24,
196,
262
3,26
9,30
3–
Cla
ss A
A (
AU
D H
edge
d)–
––
––
–C
lass
AA
(H
KD
)–
316,
998
408,
150
––
–C
lass
AA
(S
GD
)*–
––
––
–C
lass
AA
Acc
––
98,2
50–
––
Cla
ss A
A (
HK
D)
Acc
––
––
––
Cla
ss A
A I
nc*
–32
,522
,026
1,05
1,38
362
,609
–3,
415
Cla
ss A
A (
AU
D H
edge
d) I
nc*
––
––
–4,
597
Cla
ss A
A (
HK
D)
Inc*
–1,
874,
508
4,32
3–
–2,
662
Cla
ss A
A (
SG
D H
edge
d) I
nc*
––
––
–4,
488
Cla
ss A
A (
US
D)
MD
IST
(G)
–48
,622
106,
482,
845
––
53,0
31C
lass
AA
(A
UD
Hed
ged)
MD
IST
(G)*
–12
8,77
521
,102
,142
––
–C
lass
AA
(C
AD
Hed
ged)
MD
IST
(G)
––
––
––
Cla
ss A
A (
GB
P H
edge
d) M
DIS
T (G
)–
–71
0,60
0–
––
Cla
ss A
A (
HK
D)
MD
IST
(G)
–15
0,83
652
,954
,061
––
39,2
85C
lass
AA
(R
MB
Hed
ged)
MD
IST
(G)
––
5,65
4,22
7–
––
Cla
ss A
A (
SG
D H
edge
d) M
DIS
T (G
)*–
––
––
91,9
35C
lass
I10
5,77
543
7,88
159
–25
8,88
1–
Cla
ss I
Acc
––
––
––
Cla
ss I
(E
UR
Hed
ged)
Acc
––
––
––
Cla
ss I
2–
––
––
–C
lass
I3
1,34
2,68
01,
119,
398
90–
5,50
0,96
6–
Cla
ss I
3 A
cc–
993,
428
5,16
1,90
5–
4,75
0,41
51,
041,
690
Cla
ss I
3 In
c–
11,8
90,4
5543
––
237
Cla
ss I
5 A
cc–
524,
496
––
––
Cla
ss I
5 (C
HF
Hed
ged)
Acc
–65
7,12
1–
––
–C
lass
I5
(EU
R H
edge
d) A
cc–
6,86
4,59
8–
––
–C
lass
I5
(GB
P)
Acc
––
––
––
Cla
ss I
5 (G
BP
Hed
ged)
Acc
–37
,292
––
––
Cla
ss I
6 A
cc–
50,0
00–
––
–C
lass
I6
(EU
R H
edge
d) A
cc–
––
––
–C
lass
I7
Acc
––
984
––
–C
lass
J–
4,27
5,13
7–
––
–C
lass
P (
US
D)
Inc
––
2,88
0–
––
Cla
ss P
(A
UD
Hed
ged)
Inc
––
3,75
8–
––
Cla
ss P
(H
KD
) In
c–
––
––
2,66
2C
lass
P (
SG
D H
edge
d) I
nc–
––
––
4,48
8C
lass
P (
US
D)
MD
IST
(G)
––
34,6
02,7
73–
–4,
858
Cla
ss P
(A
UD
Hed
ged)
MD
IST
(G)
––
7,07
8,07
5–
–6,
668
Cla
ss P
(H
KD
) M
DIS
T (G
)–
–61
6,68
8–
–3,
783
Cla
ss P
(S
GD
) M
DIS
T (G
)–
–2,
478,
962
––
–C
lass
P (
SG
D H
edge
d) M
DIS
T (G
)–
–76
,758
,507
––
6,43
8C
lass
R (
US
D)
MD
IST
(G)
––
5,41
2,70
5–
––
Cla
ss R
(H
KD
) M
DIS
T (G
)–
–4,
458,
603
––
–C
lass
S H
edge
d–
–2,
044,
180
––
–C
lass
S M
DIS
T (G
)–
–1,
729,
537
––
–C
lass
S H
edge
d M
DIS
T (G
)–
–19
,832
,100
––
–C
lass
T–
––
––
–
* R
efer
to
note
13
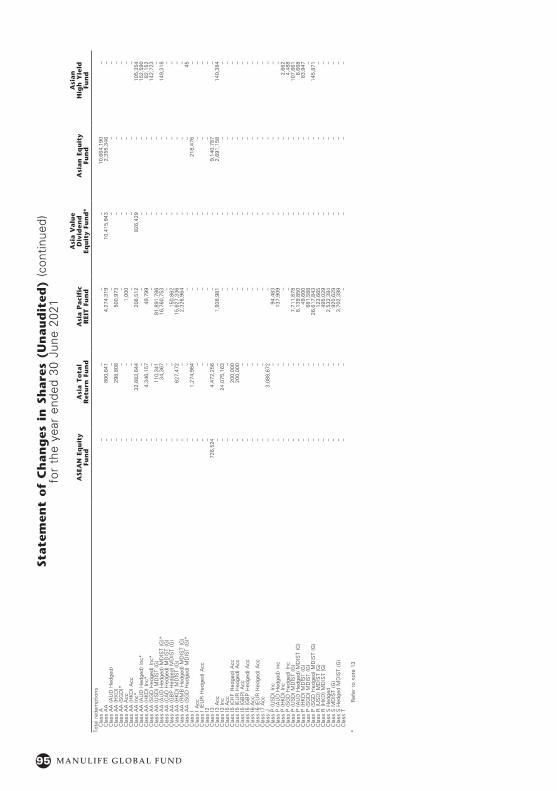
95 M A N U L I F E G L O B A L F U N D
State
men
t o
f C
han
ges
in
Sh
are
s (U
nau
dit
ed)
(con
tinue
d)fo
r th
e ye
ar e
nded
30
June
202
1
ASE
AN
Eq
uit
y Fu
nd
Asi
a T
ota
l R
etu
rn F
un
dA
sia P
aci
fic
R
EIT
Fu
nd
Asi
a V
alu
e D
ivid
end
Eq
uit
y Fu
nd
*A
sian
Eq
uit
y Fu
nd
Asi
an
H
igh
Yie
ld
Fun
d
Tota
l red
empt
ions
Cla
ss A
––
––
10,6
64,1
90–
Cla
ss A
A–
800,
641
4,27
4,31
910
,415
,943
2,35
5,34
6–
Cla
ss A
A (
AU
D H
edge
d)–
––
––
–C
lass
AA
(H
KD
)–
298,
808
500,
973
––
–C
lass
AA
(S
GD
)*–
––
––
–C
lass
AA
Acc
––
1,00
0–
––
Cla
ss A
A (
HK
D)
Acc
––
––
––
Cla
ss A
A I
nc*
–32
,683
,644
206,
512
826,
429
–10
5,35
4C
lass
AA
(A
UD
Hed
ged)
Inc
*–
––
––
152,
590
Cla
ss A
A (
HK
D)
Inc*
–4,
346,
157
49,7
99–
–82
,152
Cla
ss A
A (
SG
D H
edge
d) I
nc*
––
––
–14
2,72
3C
lass
AA
(U
SD
) M
DIS
T (G
)–
110,
341
91,8
91,7
86–
––
Cla
ss A
A (
AU
D H
edge
d) M
DIS
T (G
)*–
34,3
6716
,760
,753
––
149,
318
Cla
ss A
A (
CA
D H
edge
d) M
DIS
T (G
)–
––
––
–C
lass
AA
(G
BP
Hed
ged)
MD
IST
(G)
––
150,
862
––
–C
lass
AA
(H
KD
) M
DIS
T (G
)–
627,
472
15,6
27,3
36–
––
Cla
ss A
A (
RM
B H
edge
d) M
DIS
T (G
)–
–2,
326,
964
––
–C
lass
AA
(S
GD
Hed
ged)
MD
IST
(G)*
––
––
–45
Cla
ss I
–1,
274,
984
––
218,
476
–C
lass
I A
cc–
––
––
–C
lass
I (
EU
R H
edge
d) A
cc–
––
––
–C
lass
I2
––
––
––
Cla
ss I
372
6,52
44,
472,
256
––
9,14
0,78
7–
Cla
ss I
3 A
cc–
–1,
938,
981
–2,
691,
158
140,
384
Cla
ss I
3 In
c–
24,0
75,1
63–
––
–C
lass
I5
Acc
––
––
––
Cla
ss I
5 (C
HF
Hed
ged)
Acc
–20
0,00
0–
––
–C
lass
I5
(EU
R H
edge
d) A
cc–
200,
000
––
––
Cla
ss I
5 (G
BP
) A
cc–
––
––
–C
lass
I5
(GB
P H
edge
d) A
cc–
––
––
–C
lass
I6
Acc
––
––
––
Cla
ss I
6 (E
UR
Hed
ged)
Acc
––
––
––
Cla
ss I
7 A
cc–
––
––
–C
lass
J–
3,08
8,67
2–
––
–C
lass
P (
US
D)
Inc
––
94,4
83–
––
Cla
ss P
(A
UD
Hed
ged)
Inc
––
137,
909
––
–C
lass
P (
HK
D)
Inc
––
––
–2,
662
Cla
ss P
(S
GD
Hed
ged)
Inc
––
––
–4,
488
Cla
ss P
(U
SD
) M
DIS
T (G
)–
–7,
711,
878
––
107,
661
Cla
ss P
(A
UD
Hed
ged)
MD
IST
(G)
––
8,13
9,85
0–
–6,
668
Cla
ss P
(H
KD
) M
DIS
T (G
)–
–49
,600
––
83,9
47C
lass
P (
SG
D)
MD
IST
(G)
––
681,
588
––
–C
lass
P (
SG
D H
edge
d) M
DIS
T (G
)–
–26
,617
,843
––
145,
871
Cla
ss R
(U
SD
) M
DIS
T (G
)–
–12
3,66
5–
––
Cla
ss R
(H
KD
) M
DIS
T (G
)–
–49
5,02
9–
––
Cla
ss S
Hed
ged
––
2,53
3,38
4–
––
Cla
ss S
MD
IST
(G)
––
920,
629
––
–C
lass
S H
edge
d M
DIS
T (G
)–
–3,
702,
399
––
–C
lass
T–
––
––
–
* R
efer
to
note
13
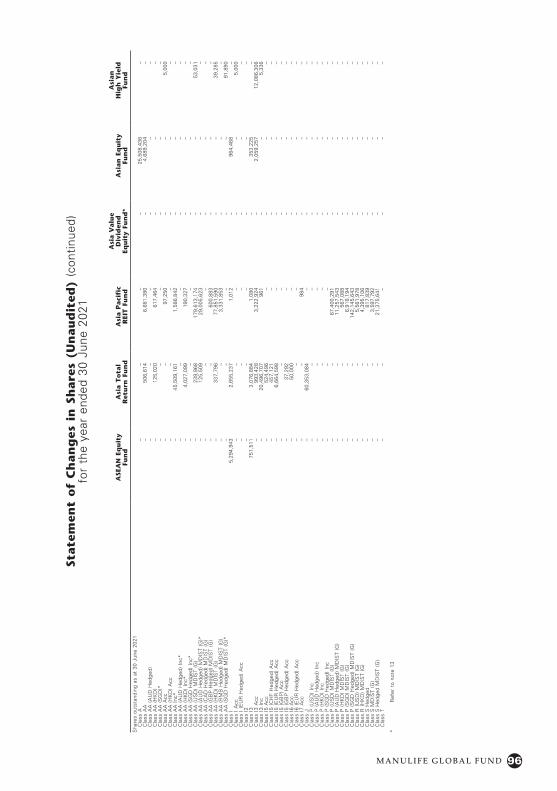
96M A N U L I F E G L O B A L F U N D
State
men
t o
f C
han
ges
in
Sh
are
s (U
nau
dit
ed)
(con
tinue
d)fo
r th
e ye
ar e
nded
30
June
202
1
ASE
AN
Eq
uit
y Fu
nd
Asi
a T
ota
l R
etu
rn F
un
dA
sia P
aci
fic
R
EIT
Fu
nd
Asi
a V
alu
e D
ivid
end
Eq
uit
y Fu
nd
*A
sian
Eq
uit
y Fu
nd
Asi
an
H
igh
Yie
ld
Fun
d
Sha
res
outs
tand
ing
as a
t 30
Jun
e 20
21C
lass
A–
––
–25
,508
,436
–C
lass
AA
–50
6,61
46,
681,
380
–4,
689,
204
–C
lass
AA
(A
UD
Hed
ged)
––
––
––
Cla
ss A
A (
HK
D)
–12
5,02
061
7,46
4–
––
Cla
ss A
A (
SG
D)*
––
––
––
Cla
ss A
A A
cc–
–97
,250
––
5,00
0C
lass
AA
(H
KD
) A
cc–
––
––
–C
lass
AA
Inc
*–
45,5
09,1
611,
586,
842
––
–C
lass
AA
(A
UD
Hed
ged)
Inc
*–
––
––
–C
lass
AA
(H
KD
) In
c*–
4,02
7,09
919
0,32
7–
––
Cla
ss A
A (
SG
D H
edge
d) I
nc*
––
––
––
Cla
ss A
A (
US
D)
MD
IST
(G)
–23
9,96
817
9,61
3,17
4–
–53
,031
Cla
ss A
A (
AU
D H
edge
d) M
DIS
T (G
)*–
125,
509
29,0
05,6
23–
––
Cla
ss A
A (
CA
D H
edge
d) M
DIS
T (G
)–
––
––
–C
lass
AA
(G
BP
Hed
ged)
MD
IST
(G)
––
600,
883
––
–C
lass
AA
(H
KD
) M
DIS
T (G
)–
337,
796
77,8
51,5
90–
–39
,285
Cla
ss A
A (
RM
B H
edge
d) M
DIS
T (G
)–
–3,
331,
853
––
–C
lass
AA
(S
GD
Hed
ged)
MD
IST
(G)*
––
––
–91
,890
Cla
ss I
5,29
4,94
32,
655,
237
1,01
2–
964,
468
–C
lass
I A
cc–
––
––
5,00
0C
lass
I (
EU
R H
edge
d) A
cc–
––
––
–C
lass
I2
––
––
––
Cla
ss I
375
1,51
13,
076,
884
1,08
0–
353,
225
–C
lass
I3
Acc
–99
3,42
83,
222,
924
–2,
059,
257
12,0
86,3
06C
lass
I3
Inc
–20
,496
,707
961
––
5,33
6C
lass
I5
Acc
–52
4,49
6–
––
–C
lass
I5
(CH
F H
edge
d) A
cc–
457,
121
––
––
Cla
ss I
5 (E
UR
Hed
ged)
Acc
–6,
664,
598
––
––
Cla
ss I
5 (G
BP
) A
cc–
––
––
–C
lass
I5
(GB
P H
edge
d) A
cc–
37,2
92–
––
–C
lass
I6
Acc
–50
,000
––
––
Cla
ss I
6 (E
UR
Hed
ged)
Acc
––
––
––
Cla
ss I
7 A
cc–
–98
4–
––
Cla
ss J
–60
,353
,084
––
––
Cla
ss P
(U
SD
) In
c–
––
––
–C
lass
P (
AU
D H
edge
d) I
nc–
––
––
–C
lass
P (
HK
D)
Inc
––
––
––
Cla
ss P
(S
GD
Hed
ged)
Inc
––
––
––
Cla
ss P
(U
SD
) M
DIS
T (G
)–
–67
,400
,291
––
–C
lass
P (
AU
D H
edge
d) M
DIS
T (G
)–
–11
,257
,543
––
–C
lass
P (
HK
D)
MD
IST
(G)
––
567,
088
––
–C
lass
P (
SG
D)
MD
IST
(G)
––
6,91
8,19
4–
––
Cla
ss P
(S
GD
Hed
ged)
MD
IST
(G)
––
142,
145,
643
––
–C
lass
R (
US
D)
MD
IST
(G)
––
5,56
1,97
8–
––
Cla
ss R
(H
KD
) M
DIS
T (G
)–
–4,
395,
106
––
–C
lass
S H
edge
d–
–81
7,83
9–
––
Cla
ss S
MD
IST
(G)
––
3,59
7,79
2–
––
Cla
ss S
Hed
ged
MD
IST
(G)
––
21,3
75,6
41–
––
Cla
ss T
––
––
––
* R
efer
to
note
13
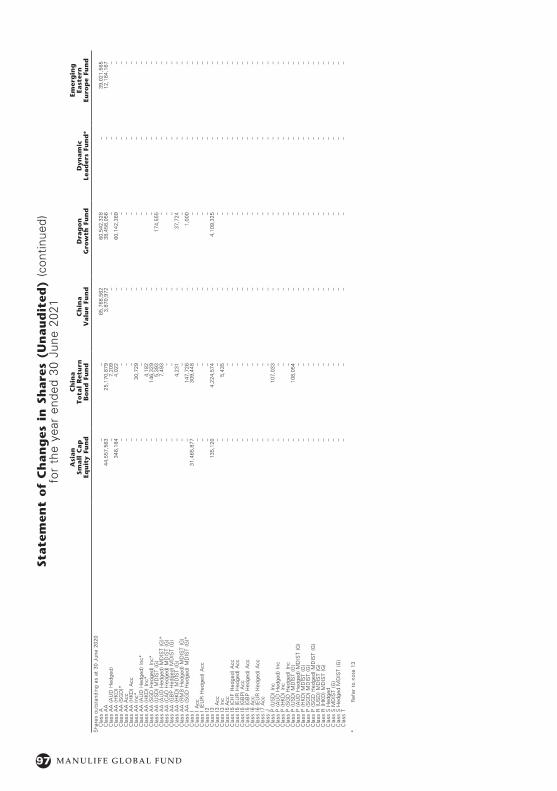
97 M A N U L I F E G L O B A L F U N D
State
men
t o
f C
han
ges
in
Sh
are
s (U
nau
dit
ed)
(con
tinue
d)fo
r th
e ye
ar e
nded
30
June
202
1A
sian
Sm
all
Cap
Eq
uit
y Fu
nd
Ch
ina
To
tal
Ret
urn
B
on
d F
un
dC
hin
a
Valu
e Fu
nd
Dra
go
n
Gro
wth
Fu
nd
Dyn
am
ic
Lead
ers
Fun
d*
Emer
gin
g
East
ern
Eu
rop
e Fu
nd
S
hare
s ou
tsta
ndin
g as
at
30 J
une
2020
Cla
ss A
––
65,7
68,5
6260
,542
,328
–39
,021
,565
Cla
ss A
A44
,557
,563
25,1
70,8
793,
870,
972
38,4
58,0
56–
12,1
84,1
67C
lass
AA
(A
UD
Hed
ged)
–7,
209
––
––
Cla
ss A
A (
HK
D)
346,
184
4,02
2–
60,1
42,3
69–
–C
lass
AA
(S
GD
)*–
––
––
–C
lass
AA
Acc
––
––
––
Cla
ss A
A (
HK
D)
Acc
––
––
––
Cla
ss A
A I
nc*
–30
,729
––
––
Cla
ss A
A (
AU
D H
edge
d) I
nc*
––
––
––
Cla
ss A
A (
HK
D)
Inc*
–4,
182
––
––
Cla
ss A
A (
SG
D H
edge
d) I
nc*
–14
6,32
9–
––
–C
lass
AA
(U
SD
) M
DIS
T (G
)–
5,39
3–
174,
555
––
Cla
ss A
A (
AU
D H
edge
d) M
DIS
T (G
)*–
7,49
3–
––
–C
lass
AA
(C
AD
Hed
ged)
MD
IST
(G)
––
––
––
Cla
ss A
A (
GB
P H
edge
d) M
DIS
T (G
)–
––
––
–C
lass
AA
(H
KD
) M
DIS
T (G
)–
4,23
1–
37,7
24–
–C
lass
AA
(R
MB
Hed
ged)
MD
IST
(G)
––
––
––
Cla
ss A
A (
SG
D H
edge
d) M
DIS
T (G
)*–
147,
726
–1,
000
––
Cla
ss I
31,4
65,8
7730
9,44
8–
––
–C
lass
I A
cc–
––
––
–C
lass
I (
EU
R H
edge
d) A
cc–
––
––
–C
lass
I2
––
––
––
Cla
ss I
313
5,12
04,
224,
574
–4,
109,
325
––
Cla
ss I
3 A
cc–
––
––
–C
lass
I3
Inc
–5,
435
––
––
Cla
ss I
5 A
cc–
––
––
–C
lass
I5
(CH
F H
edge
d) A
cc–
––
––
–C
lass
I5
(EU
R H
edge
d) A
cc–
––
––
–C
lass
I5
(GB
P)
Acc
––
––
––
Cla
ss I
5 (G
BP
Hed
ged)
Acc
––
––
––
Cla
ss I
6 A
cc–
––
––
–C
lass
I6
(EU
R H
edge
d) A
cc–
––
––
–C
lass
I7
Acc
––
––
––
Cla
ss J
––
––
––
Cla
ss P
(U
SD
) In
c–
107,
033
––
––
Cla
ss P
(A
UD
Hed
ged)
Inc
––
––
––
Cla
ss P
(H
KD
) In
c–
––
––
–C
lass
P (
SG
D H
edge
d) I
nc–
––
––
–C
lass
P (
US
D)
MD
IST
(G)
–10
8,05
4–
––
–C
lass
P (
AU
D H
edge
d) M
DIS
T (G
)–
––
––
–C
lass
P (
HK
D)
MD
IST
(G)
––
––
––
Cla
ss P
(S
GD
) M
DIS
T (G
)–
––
––
–C
lass
P (
SG
D H
edge
d) M
DIS
T (G
)–
––
––
–C
lass
R (
US
D)
MD
IST
(G)
––
––
––
Cla
ss R
(H
KD
) M
DIS
T (G
)–
––
––
–C
lass
S H
edge
d–
––
––
–C
lass
S M
DIS
T (G
)–
––
––
–C
lass
S H
edge
d M
DIS
T (G
)–
––
––
–C
lass
T–
––
––
–
* R
efer
to
note
13
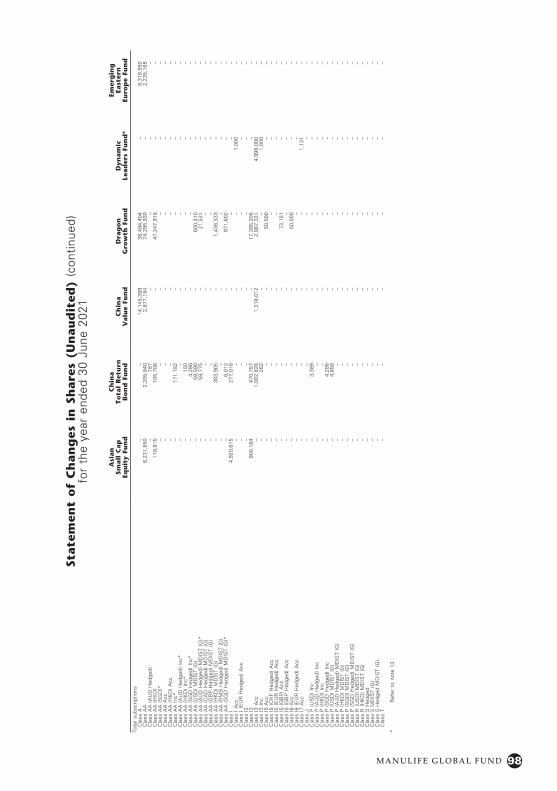
98M A N U L I F E G L O B A L F U N D
State
men
t o
f C
han
ges
in
Sh
are
s (U
nau
dit
ed)
(con
tinue
d)fo
r th
e ye
ar e
nded
30
June
202
1
Asi
an
Sm
all
Cap
Eq
uit
y Fu
nd
Ch
ina
To
tal
Ret
urn
B
on
d F
un
dC
hin
a
Valu
e Fu
nd
Dra
go
n
Gro
wth
Fu
nd
Dyn
am
ic
Lead
ers
Fun
d*
Emer
gin
g
East
ern
Eu
rop
e Fu
nd
To
tal s
ubsc
riptio
nsC
lass
A–
–14
,145
,389
38,4
94,4
04–
8,31
8,95
0C
lass
AA
6,23
1,85
02,
205,
840
2,87
7,18
474
,295
,930
–2,
235,
165
Cla
ss A
A (
AU
D H
edge
d)–
187
––
––
Cla
ss A
A (
HK
D)
119,
815
105,
708
–47
,247
,918
––
Cla
ss A
A (
SG
D)*
––
––
––
Cla
ss A
A A
cc–
––
––
–C
lass
AA
(H
KD
) A
cc–
––
––
–C
lass
AA
Inc
*–
171,
182
––
––
Cla
ss A
A (
AU
D H
edge
d) I
nc*
––
––
––
Cla
ss A
A (
HK
D)
Inc*
–15
0–
––
–C
lass
AA
(S
GD
Hed
ged)
Inc
*–
4,28
6–
––
–C
lass
AA
(U
SD
) M
DIS
T (G
)–
59,5
90–
600,
410
––
Cla
ss A
A (
AU
D H
edge
d) M
DIS
T (G
)*–
59,7
75–
21,5
31–
–C
lass
AA
(C
AD
Hed
ged)
MD
IST
(G)
––
––
––
Cla
ss A
A (
GB
P H
edge
d) M
DIS
T (G
)–
––
––
–C
lass
AA
(H
KD
) M
DIS
T (G
)–
303,
905
–1,
436,
333
––
Cla
ss A
A (
RM
B H
edge
d) M
DIS
T (G
)–
––
––
–C
lass
AA
(S
GD
Hed
ged)
MD
IST
(G)*
–6,
012
–97
1,60
2–
–C
lass
I4,
920,
615
277,
016
––
––
Cla
ss I
Acc
––
––
1,00
0–
Cla
ss I
(E
UR
Hed
ged)
Acc
––
––
––
Cla
ss I
2–
––
––
–C
lass
I3
900,
184
470,
757
–17
,395
,305
––
Cla
ss I
3 A
cc–
1,08
2,82
61,
318,
012
2,06
7,33
14,
998,
000
–C
lass
I3
Inc
–26
2–
–1,
000
–C
lass
I5
Acc
––
–50
,000
––
Cla
ss I
5 (C
HF
Hed
ged)
Acc
––
––
––
Cla
ss I
5 (E
UR
Hed
ged)
Acc
––
––
––
Cla
ss I
5 (G
BP
) A
cc–
––
73,1
51–
–C
lass
I5
(GB
P H
edge
d) A
cc–
––
––
–C
lass
I6
Acc
––
–50
,000
––
Cla
ss I
6 (E
UR
Hed
ged)
Acc
––
––
––
Cla
ss I
7 A
cc–
––
–1,
131
–C
lass
J–
––
––
–C
lass
P (
US
D)
Inc
–3,
389
––
––
Cla
ss P
(A
UD
Hed
ged)
Inc
––
––
––
Cla
ss P
(H
KD
) In
c–
––
––
–C
lass
P (
SG
D H
edge
d) I
nc–
4,28
6–
––
–C
lass
P (
US
D)
MD
IST
(G)
–4,
650
––
––
Cla
ss P
(A
UD
Hed
ged)
MD
IST
(G)
––
––
––
Cla
ss P
(H
KD
) M
DIS
T (G
)–
––
––
–C
lass
P (
SG
D)
MD
IST
(G)
––
––
––
Cla
ss P
(S
GD
Hed
ged)
MD
IST
(G)
––
––
––
Cla
ss R
(U
SD
) M
DIS
T (G
)–
––
––
–C
lass
R (
HK
D)
MD
IST
(G)
––
––
––
Cla
ss S
Hed
ged
––
––
––
Cla
ss S
MD
IST
(G)
––
––
––
Cla
ss S
Hed
ged
MD
IST
(G)
––
––
––
Cla
ss T
––
––
––
* R
efer
to
note
13
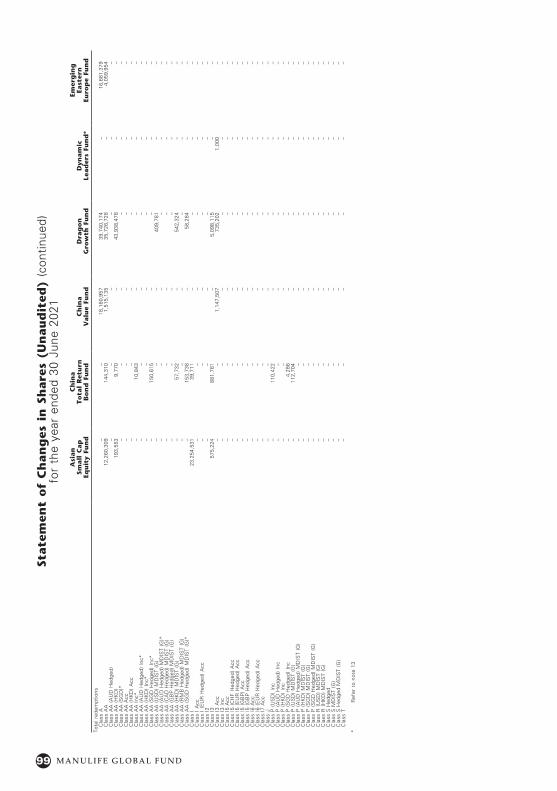
99 M A N U L I F E G L O B A L F U N D
State
men
t o
f C
han
ges
in
Sh
are
s (U
nau
dit
ed)
(con
tinue
d)fo
r th
e ye
ar e
nded
30
June
202
1A
sian
Sm
all
Cap
Eq
uit
y Fu
nd
Ch
ina
To
tal
Ret
urn
B
on
d F
un
dC
hin
a
Valu
e Fu
nd
Dra
go
n
Gro
wth
Fu
nd
Dyn
am
ic
Lead
ers
Fun
d*
Emer
gin
g
East
ern
Eu
rop
e Fu
nd
To
tal r
edem
ptio
nsC
lass
A–
–18
,160
,957
39,7
40,1
74–
16,6
81,3
79C
lass
AA
12,2
60,3
0914
4,31
01,
515,
135
35,7
26,7
28–
4,05
9,95
4C
lass
AA
(A
UD
Hed
ged)
––
––
––
Cla
ss A
A (
HK
D)
193,
553
9,77
0–
43,9
38,4
78–
–C
lass
AA
(S
GD
)*–
––
––
–C
lass
AA
Acc
––
––
––
Cla
ss A
A (
HK
D)
Acc
––
––
––
Cla
ss A
A I
nc*
–10
,843
––
––
Cla
ss A
A (
AU
D H
edge
d) I
nc*
––
––
––
Cla
ss A
A (
HK
D)
Inc*
––
––
––
Cla
ss A
A (
SG
D H
edge
d) I
nc*
–15
0,61
5–
––
–C
lass
AA
(U
SD
) M
DIS
T (G
)–
––
409,
781
––
Cla
ss A
A (
AU
D H
edge
d) M
DIS
T (G
)*–
––
––
–C
lass
AA
(C
AD
Hed
ged)
MD
IST
(G)
––
––
––
Cla
ss A
A (
GB
P H
edge
d) M
DIS
T (G
)–
––
––
–C
lass
AA
(H
KD
) M
DIS
T (G
)–
57,7
32–
542,
324
––
Cla
ss A
A (
RM
B H
edge
d) M
DIS
T (G
)–
––
––
–C
lass
AA
(S
GD
Hed
ged)
MD
IST
(G)*
–15
3,73
8–
58,2
84–
–C
lass
I23
,254
,531
39,7
11–
––
–C
lass
I A
cc–
––
––
–C
lass
I (
EU
R H
edge
d) A
cc–
––
––
–C
lass
I2
––
––
––
Cla
ss I
357
5,22
488
1,76
1–
5,09
8,11
5–
–C
lass
I3
Acc
––
1,14
7,50
773
5,20
21,
000
–C
lass
I3
Inc
––
––
––
Cla
ss I
5 A
cc–
––
––
–C
lass
I5
(CH
F H
edge
d) A
cc–
––
––
–C
lass
I5
(EU
R H
edge
d) A
cc–
––
––
–C
lass
I5
(GB
P)
Acc
––
––
––
Cla
ss I
5 (G
BP
Hed
ged)
Acc
––
––
––
Cla
ss I
6 A
cc–
––
––
–C
lass
I6
(EU
R H
edge
d) A
cc–
––
––
–C
lass
I7
Acc
––
––
––
Cla
ss J
––
––
––
Cla
ss P
(U
SD
) In
c–
110,
422
––
––
Cla
ss P
(A
UD
Hed
ged)
Inc
––
––
––
Cla
ss P
(H
KD
) In
c–
––
––
–C
lass
P (
SG
D H
edge
d) I
nc–
4,28
6–
––
–C
lass
P (
US
D)
MD
IST
(G)
–11
2,70
4–
––
–C
lass
P (
AU
D H
edge
d) M
DIS
T (G
)–
––
––
–C
lass
P (
HK
D)
MD
IST
(G)
––
––
––
Cla
ss P
(S
GD
) M
DIS
T (G
)–
––
––
–C
lass
P (
SG
D H
edge
d) M
DIS
T (G
)–
––
––
–C
lass
R (
US
D)
MD
IST
(G)
––
––
––
Cla
ss R
(H
KD
) M
DIS
T (G
)–
––
––
–C
lass
S H
edge
d–
––
––
–C
lass
S M
DIS
T (G
)–
––
––
–C
lass
S H
edge
d M
DIS
T (G
)–
––
––
–C
lass
T–
––
––
–
* R
efer
to
note
13

100M A N U L I F E G L O B A L F U N D
State
men
t o
f C
han
ges
in
Sh
are
s (U
nau
dit
ed)
(con
tinue
d)fo
r th
e ye
ar e
nded
30
June
202
1
Asi
an
Sm
all
Cap
Eq
uit
y Fu
nd
Ch
ina
To
tal
Ret
urn
B
on
d F
un
dC
hin
a
Valu
e Fu
nd
Dra
go
n
Gro
wth
Fu
nd
Dyn
am
ic
Lead
ers
Fun
d*
Emer
gin
g
East
ern
Eu
rop
e Fu
nd
S
hare
s ou
tsta
ndin
g as
at
30 J
une
2021
Cla
ss A
––
61,7
52,9
9459
,296
,558
–30
,659
,136
Cla
ss A
A38
,529
,104
27,2
32,4
095,
233,
021
77,0
27,2
58–
10,3
59,3
78C
lass
AA
(A
UD
Hed
ged)
–7,
396
––
––
Cla
ss A
A (
HK
D)
272,
446
99,9
60–
63,4
51,8
09–
–C
lass
AA
(S
GD
)*–
––
––
–C
lass
AA
Acc
––
––
––
Cla
ss A
A (
HK
D)
Acc
––
––
––
Cla
ss A
A I
nc*
–19
1,06
8–
––
–C
lass
AA
(A
UD
Hed
ged)
Inc
*–
––
––
–C
lass
AA
(H
KD
) In
c*–
4,33
2–
––
–C
lass
AA
(S
GD
Hed
ged)
Inc
*–
––
––
–C
lass
AA
(U
SD
) M
DIS
T (G
)–
64,9
83–
365,
184
––
Cla
ss A
A (
AU
D H
edge
d) M
DIS
T (G
)*–
67,2
68–
21,5
31–
–C
lass
AA
(C
AD
Hed
ged)
MD
IST
(G)
––
––
––
Cla
ss A
A (
GB
P H
edge
d) M
DIS
T (G
)–
––
––
–C
lass
AA
(H
KD
) M
DIS
T (G
)–
250,
404
–93
1,73
3–
–C
lass
AA
(R
MB
Hed
ged)
MD
IST
(G)
––
––
––
Cla
ss A
A (
SG
D H
edge
d) M
DIS
T (G
)*–
––
914,
318
––
Cla
ss I
13,1
31,9
6154
6,75
3–
––
–C
lass
I A
cc–
––
–1,
000
–C
lass
I (
EU
R H
edge
d) A
cc–
––
––
–C
lass
I2
––
––
––
Cla
ss I
346
0,08
03,
813,
570
–16
,406
,515
––
Cla
ss I
3 A
cc–
1,08
2,82
617
0,50
51,
332,
129
4,99
7,00
0–
Cla
ss I
3 In
c–
5,69
7–
–1,
000
–C
lass
I5
Acc
––
–50
,000
––
Cla
ss I
5 (C
HF
Hed
ged)
Acc
––
––
––
Cla
ss I
5 (E
UR
Hed
ged)
Acc
––
––
––
Cla
ss I
5 (G
BP
) A
cc–
––
73,1
51–
–C
lass
I5
(GB
P H
edge
d) A
cc–
––
––
–C
lass
I6
Acc
––
–50
,000
––
Cla
ss I
6 (E
UR
Hed
ged)
Acc
––
––
––
Cla
ss I
7 A
cc–
––
–1,
131
–C
lass
J–
––
––
–C
lass
P (
US
D)
Inc
––
––
––
Cla
ss P
(A
UD
Hed
ged)
Inc
––
––
––
Cla
ss P
(H
KD
) In
c–
––
––
–C
lass
P (
SG
D H
edge
d) I
nc–
––
––
–C
lass
P (
US
D)
MD
IST
(G)
––
––
––
Cla
ss P
(A
UD
Hed
ged)
MD
IST
(G)
––
––
––
Cla
ss P
(H
KD
) M
DIS
T (G
)–
––
––
–C
lass
P (
SG
D)
MD
IST
(G)
––
––
––
Cla
ss P
(S
GD
Hed
ged)
MD
IST
(G)
––
––
––
Cla
ss R
(U
SD
) M
DIS
T (G
)–
––
––
–C
lass
R (
HK
D)
MD
IST
(G)
––
––
––
Cla
ss S
Hed
ged
––
––
––
Cla
ss S
MD
IST
(G)
––
––
––
Cla
ss S
Hed
ged
MD
IST
(G)
––
––
––
Cla
ss T
––
––
––
* R
efer
to
note
13
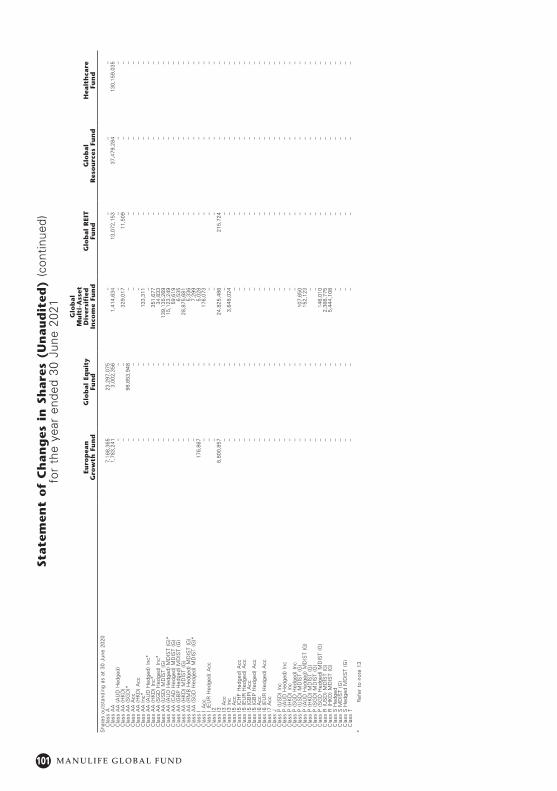
101 M A N U L I F E G L O B A L F U N D
State
men
t o
f C
han
ges
in
Sh
are
s (U
nau
dit
ed)
(con
tinue
d)fo
r th
e ye
ar e
nded
30
June
202
1
Euro
pea
n
Gro
wth
Fu
nd
Glo
bal
Equ
ity
Fun
d
Glo
bal
M
ult
i-A
sset
D
iver
sifi
ed
Inco
me
Fun
dG
lob
al
REI
T
Fun
dG
lob
al
R
eso
urc
es F
un
dH
ealt
hca
re
Fun
d
Sha
res
outs
tand
ing
as a
t 30
Jun
e 20
20C
lass
A7,
168,
365
23,2
97,0
75–
––
–C
lass
AA
1,78
3,24
13,
002,
356
1,41
4,63
413
,072
,153
37,4
79,2
8413
0,15
9,03
5C
lass
AA
(A
UD
Hed
ged)
––
––
––
Cla
ss A
A (
HK
D)
––
329,
017
11,5
09–
–C
lass
AA
(S
GD
)*–
98,6
53,9
48–
––
–C
lass
AA
Acc
––
––
––
Cla
ss A
A (
HK
D)
Acc
––
––
––
Cla
ss A
A I
nc*
––
133,
311
––
–C
lass
AA
(A
UD
Hed
ged)
Inc
*–
––
––
–C
lass
AA
(H
KD
) In
c*–
–35
1,67
7–
––
Cla
ss A
A (
SG
D H
edge
d) I
nc*
––
34,8
33–
––
Cla
ss A
A (
US
D)
MD
IST
(G)
––
139,
135,
269
––
–C
lass
AA
(A
UD
Hed
ged)
MD
IST
(G)*
––
15,1
23,2
49–
––
Cla
ss A
A (
CA
D H
edge
d) M
DIS
T (G
)–
–59
,619
––
–C
lass
AA
(G
BP
Hed
ged)
MD
IST
(G)
––
6,53
5–
––
Cla
ss A
A (
HK
D)
MD
IST
(G)
––
28,8
75,6
81–
––
Cla
ss A
A (
RM
B H
edge
d) M
DIS
T (G
)–
–5,
336
––
–C
lass
AA
(S
GD
Hed
ged)
MD
IST
(G)*
––
7,29
9–
––
Cla
ss I
176,
867
–5,
028
––
–C
lass
I A
cc–
–17
6,07
3–
––
Cla
ss I
(E
UR
Hed
ged)
Acc
––
––
––
Cla
ss I
2–
––
––
–C
lass
I3
6,80
0,85
7–
24,8
25,4
8621
5,72
4–
–C
lass
I3
Acc
––
––
––
Cla
ss I
3 In
c–
–3,
648,
024
––
–C
lass
I5
Acc
––
––
––
Cla
ss I
5 (C
HF
Hed
ged)
Acc
––
––
––
Cla
ss I
5 (E
UR
Hed
ged)
Acc
––
––
––
Cla
ss I
5 (G
BP
) A
cc–
––
––
–C
lass
I5
(GB
P H
edge
d) A
cc–
––
––
–C
lass
I6
Acc
––
––
––
Cla
ss I
6 (E
UR
Hed
ged)
Acc
––
––
––
Cla
ss I
7 A
cc–
––
––
–C
lass
J–
––
––
–C
lass
P (
US
D)
Inc
––
––
––
Cla
ss P
(A
UD
Hed
ged)
Inc
––
––
––
Cla
ss P
(H
KD
) In
c–
––
––
–C
lass
P (
SG
D H
edge
d) I
nc–
––
––
–C
lass
P (
US
D)
MD
IST
(G)
––
107,
650
––
–C
lass
P (
AU
D H
edge
d) M
DIS
T (G
)–
–15
2,12
3–
––
Cla
ss P
(H
KD
) M
DIS
T (G
)–
––
––
–C
lass
P (
SG
D)
MD
IST
(G)
––
––
––
Cla
ss P
(S
GD
Hed
ged)
MD
IST
(G)
––
146,
010
––
–C
lass
R (
US
D)
MD
IST
(G)
––
2,36
6,77
5–
––
Cla
ss R
(H
KD
) M
DIS
T (G
)–
–5,
444,
108
––
–C
lass
S H
edge
d–
––
––
–C
lass
S M
DIS
T (G
)–
––
––
–C
lass
S H
edge
d M
DIS
T (G
)–
––
––
–C
lass
T–
––
––
–
* R
efer
to
note
13
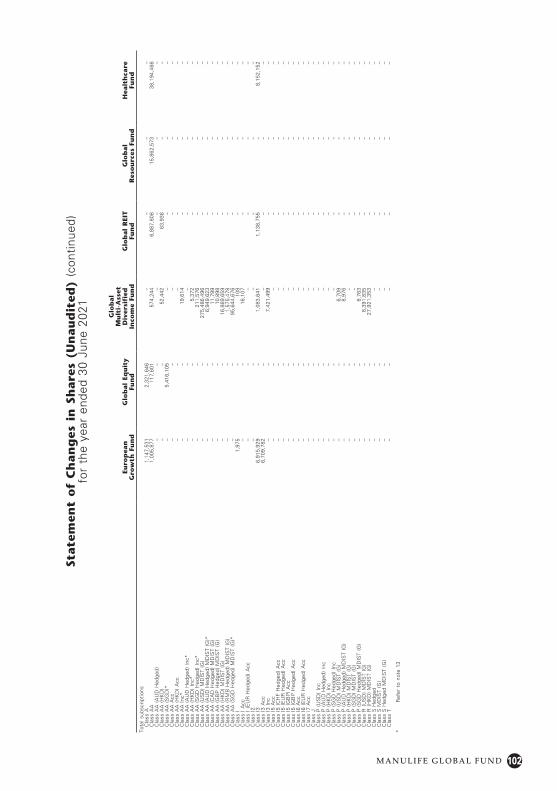
102M A N U L I F E G L O B A L F U N D
State
men
t o
f C
han
ges
in
Sh
are
s (U
nau
dit
ed)
(con
tinue
d)fo
r th
e ye
ar e
nded
30
June
202
1
Euro
pea
n
Gro
wth
Fu
nd
Glo
bal
Equ
ity
Fun
d
Glo
bal
M
ult
i-A
sset
D
iver
sifi
ed
Inco
me
Fun
dG
lob
al
REI
T
Fun
dG
lob
al
R
eso
urc
es F
un
dH
ealt
hca
re
Fun
d
Tota
l sub
scrip
tions
Cla
ss A
1,14
7,53
12,
321,
646
––
––
Cla
ss A
A1,
005,
877
117,
601
574,
244
6,88
7,80
815
,862
,573
38,1
94,4
66C
lass
AA
(A
UD
Hed
ged)
––
––
––
Cla
ss A
A (
HK
D)
––
52,4
4263
,936
––
Cla
ss A
A (
SG
D)*
–5,
416,
105
––
––
Cla
ss A
A A
cc–
––
––
–C
lass
AA
(H
KD
) A
cc–
––
––
–C
lass
AA
Inc
*–
–19
,614
––
–C
lass
AA
(A
UD
Hed
ged)
Inc
*–
––
––
–C
lass
AA
(H
KD
) In
c*–
–5,
372
––
–C
lass
AA
(S
GD
Hed
ged)
Inc
*–
–21
1,57
6–
––
Cla
ss A
A (
US
D)
MD
IST
(G)
––
275,
486,
496
––
–C
lass
AA
(A
UD
Hed
ged)
MD
IST
(G)*
––
6,94
9,62
3–
––
Cla
ss A
A (
CA
D H
edge
d) M
DIS
T (G
)–
–11
,799
––
–C
lass
AA
(G
BP
Hed
ged)
MD
IST
(G)
––
10,8
98–
––
Cla
ss A
A (
HK
D)
MD
IST
(G)
––
16,8
69,6
59–
––
Cla
ss A
A (
RM
B H
edge
d) M
DIS
T (G
)–
–1,
575,
478
––
–C
lass
AA
(S
GD
Hed
ged)
MD
IST
(G)*
––
95,6
44,6
76–
––
Cla
ss I
1,97
5–
108
––
–C
lass
I A
cc–
–16
,107
––
–C
lass
I (
EU
R H
edge
d) A
cc–
––
––
–C
lass
I2
––
––
––
Cla
ss I
36,
915,
929
–1,
083,
641
1,13
8,75
5–
8,15
2,15
2C
lass
I3
Acc
6,70
9,78
2–
––
––
Cla
ss I
3 In
c–
–7,
421,
499
––
–C
lass
I5
Acc
––
––
––
Cla
ss I
5 (C
HF
Hed
ged)
Acc
––
––
––
Cla
ss I
5 (E
UR
Hed
ged)
Acc
––
––
––
Cla
ss I
5 (G
BP
) A
cc–
––
––
–C
lass
I5
(GB
P H
edge
d) A
cc–
––
––
–C
lass
I6
Acc
––
––
––
Cla
ss I
6 (E
UR
Hed
ged)
Acc
––
––
––
Cla
ss I
7 A
cc–
––
––
–C
lass
J–
––
––
–C
lass
P (
US
D)
Inc
––
––
––
Cla
ss P
(A
UD
Hed
ged)
Inc
––
––
––
Cla
ss P
(H
KD
) In
c–
––
––
–C
lass
P (
SG
D H
edge
d) I
nc–
––
––
–C
lass
P (
US
D)
MD
IST
(G)
––
6,70
9–
––
Cla
ss P
(A
UD
Hed
ged)
MD
IST
(G)
––
8,97
6–
––
Cla
ss P
(H
KD
) M
DIS
T (G
)–
––
––
–C
lass
P (
SG
D)
MD
IST
(G)
––
––
––
Cla
ss P
(S
GD
Hed
ged)
MD
IST
(G)
––
8,76
3–
––
Cla
ss R
(U
SD
) M
DIS
T (G
)–
–8,
391,
835
––
–C
lass
R (
HK
D)
MD
IST
(G)
––
27,9
21,3
53–
––
Cla
ss S
Hed
ged
––
––
––
Cla
ss S
MD
IST
(G)
––
––
––
Cla
ss S
Hed
ged
MD
IST
(G)
––
––
––
Cla
ss T
––
––
––
* R
efer
to
note
13
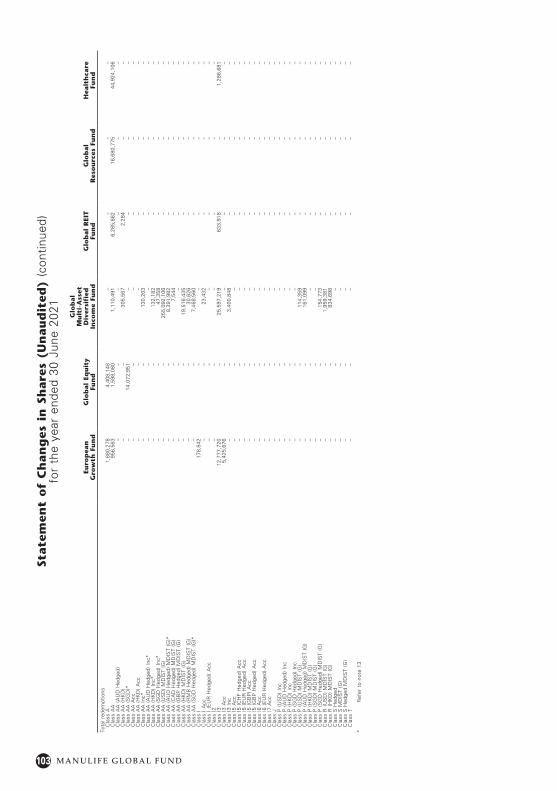
103 M A N U L I F E G L O B A L F U N D
State
men
t o
f C
han
ges
in
Sh
are
s (U
nau
dit
ed)
(con
tinue
d)fo
r th
e ye
ar e
nded
30
June
202
1
Euro
pea
n
Gro
wth
Fu
nd
Glo
bal
Equ
ity
Fun
d
Glo
bal
M
ult
i-A
sset
D
iver
sifi
ed
Inco
me
Fun
dG
lob
al
REI
T
Fun
dG
lob
al
R
eso
urc
es F
un
dH
ealt
hca
re
Fun
d
Tota
l red
empt
ions
Cla
ss A
1,88
0,27
84,
408,
148
––
––
Cla
ss A
A95
6,56
31,
598,
080
1,11
0,49
16,
285,
862
16,6
80,7
7544
,924
,106
Cla
ss A
A (
AU
D H
edge
d)–
––
––
–C
lass
AA
(H
KD
)–
–30
5,56
72,
284
––
Cla
ss A
A (
SG
D)*
–14
,072
,951
––
––
Cla
ss A
A A
cc–
––
––
–C
lass
AA
(H
KD
) A
cc–
––
––
–C
lass
AA
Inc
*–
–13
0,20
3–
––
Cla
ss A
A (
AU
D H
edge
d) I
nc*
––
––
––
Cla
ss A
A (
HK
D)
Inc*
––
132,
182
––
–C
lass
AA
(S
GD
Hed
ged)
Inc
*–
–47
,358
––
–C
lass
AA
(U
SD
) M
DIS
T (G
)–
–25
5,09
2,10
6–
––
Cla
ss A
A (
AU
D H
edge
d) M
DIS
T (G
)*–
–8,
391,
982
––
–C
lass
AA
(C
AD
Hed
ged)
MD
IST
(G)
––
7,54
4–
––
Cla
ss A
A (
GB
P H
edge
d) M
DIS
T (G
)–
––
––
–C
lass
AA
(H
KD
) M
DIS
T (G
)–
–19
,516
,435
––
–C
lass
AA
(R
MB
Hed
ged)
MD
IST
(G)
––
30,6
26–
––
Cla
ss A
A (
SG
D H
edge
d) M
DIS
T (G
)*–
–7,
468,
560
––
–C
lass
I17
8,84
2–
––
––
Cla
ss I
Acc
––
23,4
32–
––
Cla
ss I
(E
UR
Hed
ged)
Acc
––
––
––
Cla
ss I
2–
––
––
–C
lass
I3
12,7
77,7
20–
25,5
97,2
1963
3,91
8–
1,28
6,68
1C
lass
I3
Acc
5,42
5,67
6–
––
––
Cla
ss I
3 In
c–
–3,
400,
848
––
–C
lass
I5
Acc
––
––
––
Cla
ss I
5 (C
HF
Hed
ged)
Acc
––
––
––
Cla
ss I
5 (E
UR
Hed
ged)
Acc
––
––
––
Cla
ss I
5 (G
BP
) A
cc–
––
––
–C
lass
I5
(GB
P H
edge
d) A
cc–
––
––
–C
lass
I6
Acc
––
––
––
Cla
ss I
6 (E
UR
Hed
ged)
Acc
––
––
––
Cla
ss I
7 A
cc–
––
––
–C
lass
J–
––
––
–C
lass
P (
US
D)
Inc
––
––
––
Cla
ss P
(A
UD
Hed
ged)
Inc
––
––
––
Cla
ss P
(H
KD
) In
c–
––
––
–C
lass
P (
SG
D H
edge
d) I
nc–
––
––
–C
lass
P (
US
D)
MD
IST
(G)
––
114,
359
––
–C
lass
P (
AU
D H
edge
d) M
DIS
T (G
)–
–16
1,09
9–
––
Cla
ss P
(H
KD
) M
DIS
T (G
)–
––
––
–C
lass
P (
SG
D)
MD
IST
(G)
––
––
––
Cla
ss P
(S
GD
Hed
ged)
MD
IST
(G)
––
154,
773
––
–C
lass
R (
US
D)
MD
IST
(G)
––
1,95
9,38
1–
––
Cla
ss R
(H
KD
) M
DIS
T (G
)–
–83
4,69
8–
––
Cla
ss S
Hed
ged
––
––
––
Cla
ss S
MD
IST
(G)
––
––
––
Cla
ss S
Hed
ged
MD
IST
(G)
––
––
––
Cla
ss T
––
––
––
* R
efer
to
note
13

104M A N U L I F E G L O B A L F U N D
State
men
t o
f C
han
ges
in
Sh
are
s (U
nau
dit
ed)
(con
tinue
d)fo
r th
e ye
ar e
nded
30
June
202
1
Euro
pea
n
Gro
wth
Fu
nd
Glo
bal
Equ
ity
Fun
d
Glo
bal
M
ult
i-A
sset
D
iver
sifi
ed
Inco
me
Fun
dG
lob
al
REI
T
Fun
dG
lob
al
R
eso
urc
es F
un
dH
ealt
hca
re
Fun
d
Sha
res
outs
tand
ing
as a
t 30
Jun
e 20
21C
lass
A6,
435,
618
21,2
10,5
73–
––
–C
lass
AA
1,83
2,55
51,
521,
877
878,
387
13,6
74,0
9936
,661
,082
123,
429,
395
Cla
ss A
A (
AU
D H
edge
d)–
––
––
–C
lass
AA
(H
KD
)–
–75
,892
73,1
61–
–C
lass
AA
(S
GD
)*–
89,9
97,1
02–
––
–C
lass
AA
Acc
––
––
––
Cla
ss A
A (
HK
D)
Acc
––
––
––
Cla
ss A
A I
nc*
––
22,7
22–
––
Cla
ss A
A (
AU
D H
edge
d) I
nc*
––
––
––
Cla
ss A
A (
HK
D)
Inc*
––
224,
867
––
–C
lass
AA
(S
GD
Hed
ged)
Inc
*–
–19
9,05
1–
––
Cla
ss A
A (
US
D)
MD
IST
(G)
––
159,
529,
659
––
–C
lass
AA
(A
UD
Hed
ged)
MD
IST
(G)*
––
13,6
80,8
90–
––
Cla
ss A
A (
CA
D H
edge
d) M
DIS
T (G
)–
–63
,874
––
–C
lass
AA
(G
BP
Hed
ged)
MD
IST
(G)
––
17,4
33–
––
Cla
ss A
A (
HK
D)
MD
IST
(G)
––
26,2
28,9
05–
––
Cla
ss A
A (
RM
B H
edge
d) M
DIS
T (G
)–
–1,
550,
188
––
–C
lass
AA
(S
GD
Hed
ged)
MD
IST
(G)*
––
88,1
83,4
15–
––
Cla
ss I
––
5,13
6–
––
Cla
ss I
Acc
––
168,
748
––
–C
lass
I (
EU
R H
edge
d) A
cc–
––
––
–C
lass
I2
––
––
––
Cla
ss I
393
9,06
6–
311,
908
720,
561
–6,
865,
471
Cla
ss I
3 A
cc1,
284,
106
––
––
–C
lass
I3
Inc
––
7,66
8,67
5–
––
Cla
ss I
5 A
cc–
––
––
–C
lass
I5
(CH
F H
edge
d) A
cc–
––
––
–C
lass
I5
(EU
R H
edge
d) A
cc–
––
––
–C
lass
I5
(GB
P)
Acc
––
––
––
Cla
ss I
5 (G
BP
Hed
ged)
Acc
––
––
––
Cla
ss I
6 A
cc–
––
––
–C
lass
I6
(EU
R H
edge
d) A
cc–
––
––
–C
lass
I7
Acc
––
––
––
Cla
ss J
––
––
––
Cla
ss P
(U
SD
) In
c–
––
––
–C
lass
P (
AU
D H
edge
d) I
nc–
––
––
–C
lass
P (
HK
D)
Inc
––
––
––
Cla
ss P
(S
GD
Hed
ged)
Inc
––
––
––
Cla
ss P
(U
SD
) M
DIS
T (G
)–
––
––
–C
lass
P (
AU
D H
edge
d) M
DIS
T (G
)–
––
––
–C
lass
P (
HK
D)
MD
IST
(G)
––
––
––
Cla
ss P
(S
GD
) M
DIS
T (G
)–
––
––
–C
lass
P (
SG
D H
edge
d) M
DIS
T (G
)–
––
––
–C
lass
R (
US
D)
MD
IST
(G)
––
8,79
9,22
9–
––
Cla
ss R
(H
KD
) M
DIS
T (G
)–
–32
,530
,763
––
–C
lass
S H
edge
d–
––
––
–C
lass
S M
DIS
T (G
)–
––
––
–C
lass
S H
edge
d M
DIS
T (G
)–
––
––
–C
lass
T–
––
––
–
* R
efer
to
note
13
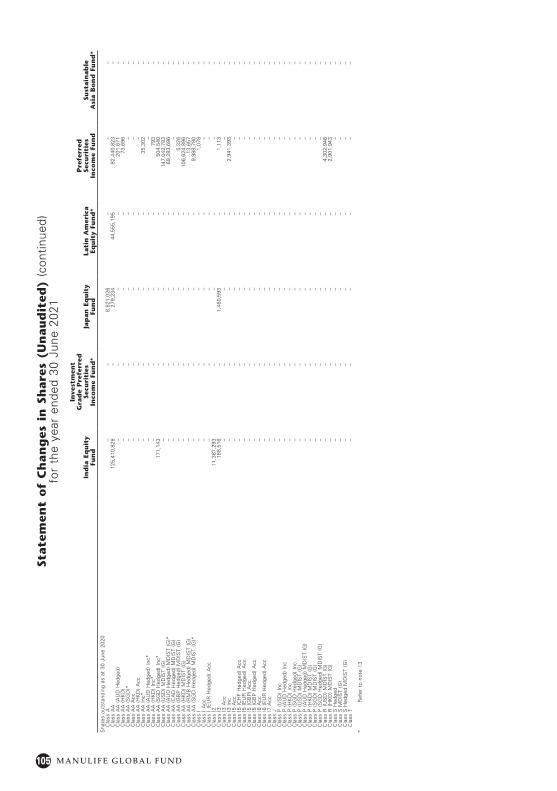
105 M A N U L I F E G L O B A L F U N D
State
men
t o
f C
han
ges
in
Sh
are
s (U
nau
dit
ed)
(con
tinue
d)fo
r th
e ye
ar e
nded
30
June
202
1
Ind
ia E
qu
ity
Fun
d
Inve
stm
ent
Gra
de
Pre
ferr
ed
Secu
riti
es
Inco
me
Fun
d*
Jap
an
Eq
uit
y Fu
nd
Lati
n A
mer
ica
Equ
ity
Fun
d*
Pre
ferr
ed
Secu
riti
es
Inco
me
Fun
dSu
stain
ab
le
Asi
a B
on
d F
un
d*
S
hare
s ou
tsta
ndin
g as
at
30 J
une
2020
Cla
ss A
––
8,82
1,02
6–
––
Cla
ss A
A12
5,41
0,82
8–
279,
234
44,5
55,1
9582
,440
,823
–C
lass
AA
(A
UD
Hed
ged)
––
––
201,
671
–C
lass
AA
(H
KD
)–
––
–73
,696
–C
lass
AA
(S
GD
)*–
––
––
–C
lass
AA
Acc
––
––
––
Cla
ss A
A (
HK
D)
Acc
––
––
––
Cla
ss A
A I
nc*
––
––
35,3
02–
Cla
ss A
A (
AU
D H
edge
d) I
nc*
––
––
––
Cla
ss A
A (
HK
D)
Inc*
––
––
793
–C
lass
AA
(S
GD
Hed
ged)
Inc
*17
1,14
3–
––
504,
540
–C
lass
AA
(U
SD
) M
DIS
T (G
)–
––
–14
7,04
2,78
3–
Cla
ss A
A (
AU
D H
edge
d) M
DIS
T (G
)*–
––
–69
,283
,696
–C
lass
AA
(C
AD
Hed
ged)
MD
IST
(G)
––
––
––
Cla
ss A
A (
GB
P H
edge
d) M
DIS
T (G
)–
––
–5,
326
–C
lass
AA
(H
KD
) M
DIS
T (G
)–
––
–10
6,62
4,89
6–
Cla
ss A
A (
RM
B H
edge
d) M
DIS
T (G
)–
––
–13
,657
–C
lass
AA
(S
GD
Hed
ged)
MD
IST
(G)*
––
––
9,98
8,78
0–
Cla
ss I
––
––
1,07
8–
Cla
ss I
Acc
––
––
––
Cla
ss I
(E
UR
Hed
ged)
Acc
––
––
––
Cla
ss I
211
,387
,293
––
––
–C
lass
I3
188,
516
–1,
460,
593
–1,
113
–C
lass
I3
Acc
––
––
––
Cla
ss I
3 In
c–
––
–2,
941,
393
–C
lass
I5
Acc
––
––
––
Cla
ss I
5 (C
HF
Hed
ged)
Acc
––
––
––
Cla
ss I
5 (E
UR
Hed
ged)
Acc
––
––
––
Cla
ss I
5 (G
BP
) A
cc–
––
––
–C
lass
I5
(GB
P H
edge
d) A
cc–
––
––
–C
lass
I6
Acc
––
––
––
Cla
ss I
6 (E
UR
Hed
ged)
Acc
––
––
––
Cla
ss I
7 A
cc–
––
––
–C
lass
J–
––
––
–C
lass
P (
US
D)
Inc
––
––
––
Cla
ss P
(A
UD
Hed
ged)
Inc
––
––
––
Cla
ss P
(H
KD
) In
c–
––
––
–C
lass
P (
SG
D H
edge
d) I
nc–
––
––
–C
lass
P (
US
D)
MD
IST
(G)
––
––
––
Cla
ss P
(A
UD
Hed
ged)
MD
IST
(G)
––
––
––
Cla
ss P
(H
KD
) M
DIS
T (G
)–
––
––
–C
lass
P (
SG
D)
MD
IST
(G)
––
––
––
Cla
ss P
(S
GD
Hed
ged)
MD
IST
(G)
––
––
––
Cla
ss R
(U
SD
) M
DIS
T (G
)–
––
–4,
302,
946
–C
lass
R (
HK
D)
MD
IST
(G)
––
––
2,90
1,94
3–
Cla
ss S
Hed
ged
––
––
––
Cla
ss S
MD
IST
(G)
––
––
––
Cla
ss S
Hed
ged
MD
IST
(G)
––
––
––
Cla
ss T
––
––
––
* R
efer
to
note
13
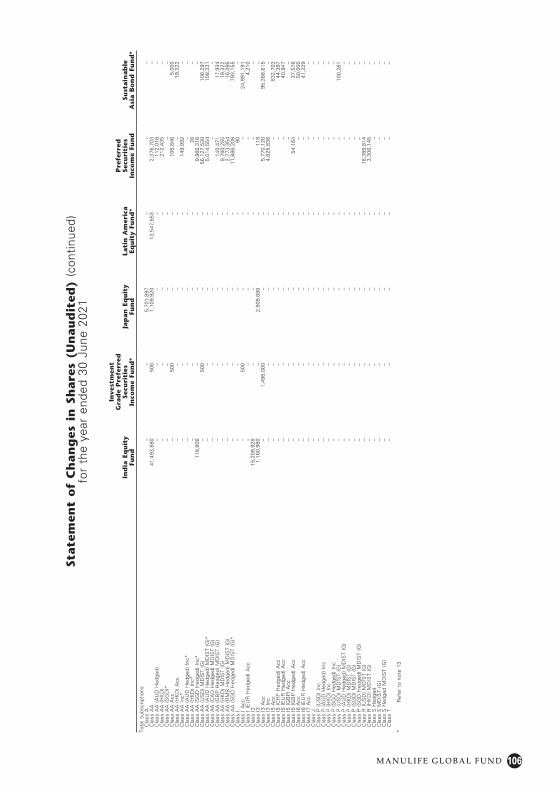
106M A N U L I F E G L O B A L F U N D
State
men
t o
f C
han
ges
in
Sh
are
s (U
nau
dit
ed)
(con
tinue
d)fo
r th
e ye
ar e
nded
30
June
202
1
Ind
ia E
qu
ity
Fun
d
Inve
stm
ent
Gra
de
Pre
ferr
ed
Secu
riti
es
Inco
me
Fun
d*
Jap
an
Eq
uit
y Fu
nd
Lati
n A
mer
ica
Equ
ity
Fun
d*
Pre
ferr
ed
Secu
riti
es
Inco
me
Fun
dSu
stain
ab
le
Asi
a B
on
d F
un
d*
To
tal s
ubsc
riptio
nsC
lass
A–
–5,
701,
897
––
–C
lass
AA
41,4
93,8
8050
01,
109,
920
13,5
47,6
532,
376,
703
–C
lass
AA
(A
UD
Hed
ged)
––
––
112,
016
–C
lass
AA
(H
KD
)–
––
–21
2,43
5–
Cla
ss A
A (
SG
D)*
––
––
––
Cla
ss A
A A
cc–
500
––
106,
846
5,00
0C
lass
AA
(H
KD
) A
cc–
––
––
19,3
22C
lass
AA
Inc
*–
––
–14
9,99
2–
Cla
ss A
A (
AU
D H
edge
d) I
nc*
––
––
––
Cla
ss A
A (
HK
D)
Inc*
––
––
38–
Cla
ss A
A (
SG
D H
edge
d) I
nc*
118,
806
––
–9,
966,
316
–C
lass
AA
(U
SD
) M
DIS
T (G
)–
500
––
56,1
27,5
3010
6,29
7C
lass
AA
(A
UD
Hed
ged)
MD
IST
(G)*
––
––
5,01
4,55
410
8,33
1C
lass
AA
(C
AD
Hed
ged)
MD
IST
(G)
––
––
––
Cla
ss A
A (
GB
P H
edge
d) M
DIS
T (G
)–
––
–14
0,47
117
,934
Cla
ss A
A (
HK
D)
MD
IST
(G)
––
––
9,76
0,25
519
,322
Cla
ss A
A (
RM
B H
edge
d) M
DIS
T (G
)–
––
–2,
773,
354
16,0
86C
lass
AA
(S
GD
Hed
ged)
MD
IST
(G)*
––
––
11,6
86,2
0879
3,15
5C
lass
I–
––
–90
–C
lass
I A
cc–
500
––
–24
,991
,191
Cla
ss I
(E
UR
Hed
ged)
Acc
––
––
–4,
210
Cla
ss I
215
,209
,928
––
––
–C
lass
I3
1,16
0,98
0–
2,90
9,68
6–
118
–C
lass
I3
Acc
–1,
498,
000
––
5,77
0,12
095
,268
,615
Cla
ss I
3 In
c–
––
–4,
625,
836
–C
lass
I5
Acc
––
––
–53
2,70
3C
lass
I5
(CH
F H
edge
d) A
cc–
––
––
44,3
97C
lass
I5
(EU
R H
edge
d) A
cc–
––
––
40,9
47C
lass
I5
(GB
P)
Acc
––
––
––
Cla
ss I
5 (G
BP
Hed
ged)
Acc
––
––
54,1
6437
,578
Cla
ss I
6 A
cc–
––
––
50,0
00C
lass
I6
(EU
R H
edge
d) A
cc–
––
––
41,3
29C
lass
I7
Acc
––
––
––
Cla
ss J
––
––
––
Cla
ss P
(U
SD
) In
c–
––
––
–C
lass
P (
AU
D H
edge
d) I
nc–
––
––
–C
lass
P (
HK
D)
Inc
––
––
––
Cla
ss P
(S
GD
Hed
ged)
Inc
––
––
––
Cla
ss P
(U
SD
) M
DIS
T (G
)–
––
––
100,
261
Cla
ss P
(A
UD
Hed
ged)
MD
IST
(G)
––
––
––
Cla
ss P
(H
KD
) M
DIS
T (G
)–
––
––
–C
lass
P (
SG
D)
MD
IST
(G)
––
––
––
Cla
ss P
(S
GD
Hed
ged)
MD
IST
(G)
––
––
––
Cla
ss R
(U
SD
) M
DIS
T (G
)–
––
–18
,389
,814
–C
lass
R (
HK
D)
MD
IST
(G)
––
––
3,30
6,14
5–
Cla
ss S
Hed
ged
––
––
––
Cla
ss S
MD
IST
(G)
––
––
––
Cla
ss S
Hed
ged
MD
IST
(G)
––
––
––
Cla
ss T
––
––
––
* R
efer
to
note
13

107 M A N U L I F E G L O B A L F U N D
State
men
t o
f C
han
ges
in
Sh
are
s (U
nau
dit
ed)
(con
tinue
d)fo
r th
e ye
ar e
nded
30
June
202
1
Ind
ia E
qu
ity
Fun
d
Inve
stm
ent
Gra
de
Pre
ferr
ed
Secu
riti
es
Inco
me
Fun
d*
Jap
an
Eq
uit
y Fu
nd
Lati
n A
mer
ica
Equ
ity
Fun
d*
Pre
ferr
ed
Secu
riti
es
Inco
me
Fun
dSu
stain
ab
le
Asi
a B
on
d F
un
d*
To
tal r
edem
ptio
nsC
lass
A–
–6,
774,
243
––
–C
lass
AA
63,5
02,3
61–
287,
923
58,1
02,8
4864
,265
,353
–C
lass
AA
(A
UD
Hed
ged)
––
––
120,
964
–C
lass
AA
(H
KD
)–
––
–51
,088
–C
lass
AA
(S
GD
)*–
––
––
–C
lass
AA
Acc
––
––
––
Cla
ss A
A (
HK
D)
Acc
––
––
––
Cla
ss A
A I
nc*
––
––
42,0
87–
Cla
ss A
A (
AU
D H
edge
d) I
nc*
––
––
––
Cla
ss A
A (
HK
D)
Inc*
––
––
––
Cla
ss A
A (
SG
D H
edge
d) I
nc*
––
––
5,68
6,41
5–
Cla
ss A
A (
US
D)
MD
IST
(G)
––
––
122,
370,
458
–C
lass
AA
(A
UD
Hed
ged)
MD
IST
(G)*
––
––
39,1
97,5
85–
Cla
ss A
A (
CA
D H
edge
d) M
DIS
T (G
)–
––
––
–C
lass
AA
(G
BP
Hed
ged)
MD
IST
(G)
––
––
40,4
48–
Cla
ss A
A (
HK
D)
MD
IST
(G)
––
––
46,2
88,8
37–
Cla
ss A
A (
RM
B H
edge
d) M
DIS
T (G
)–
––
–34
5,76
7–
Cla
ss A
A (
SG
D H
edge
d) M
DIS
T (G
)*–
––
–5,
293,
141
7,69
4C
lass
I–
––
––
–C
lass
I A
cc–
––
––
641,
483
Cla
ss I
(E
UR
Hed
ged)
Acc
––
––
––
Cla
ss I
28,
585,
908
––
––
–C
lass
I3
1,34
9,49
6–
2,88
4,47
6–
––
Cla
ss I
3 A
cc–
––
–91
1,92
924
,870
,000
Cla
ss I
3 In
c–
––
–53
8,02
8–
Cla
ss I
5 A
cc–
––
––
–C
lass
I5
(CH
F H
edge
d) A
cc–
––
––
–C
lass
I5
(EU
R H
edge
d) A
cc–
––
––
–C
lass
I5
(GB
P)
Acc
––
––
––
Cla
ss I
5 (G
BP
Hed
ged)
Acc
––
––
––
Cla
ss I
6 A
cc–
––
––
–C
lass
I6
(EU
R H
edge
d) A
cc–
––
––
–C
lass
I7
Acc
––
––
––
Cla
ss J
––
––
––
Cla
ss P
(U
SD
) In
c–
––
––
–C
lass
P (
AU
D H
edge
d) I
nc–
––
––
–C
lass
P (
HK
D)
Inc
––
––
––
Cla
ss P
(S
GD
Hed
ged)
Inc
––
––
––
Cla
ss P
(U
SD
) M
DIS
T (G
)–
––
––
100,
261
Cla
ss P
(A
UD
Hed
ged)
MD
IST
(G)
––
––
––
Cla
ss P
(H
KD
) M
DIS
T (G
)–
––
––
–C
lass
P (
SG
D)
MD
IST
(G)
––
––
––
Cla
ss P
(S
GD
Hed
ged)
MD
IST
(G)
––
––
––
Cla
ss R
(U
SD
) M
DIS
T (G
)–
––
–6,
705,
458
–C
lass
R (
HK
D)
MD
IST
(G)
––
––
1,38
0,67
9–
Cla
ss S
Hed
ged
––
––
––
Cla
ss S
MD
IST
(G)
––
––
––
Cla
ss S
Hed
ged
MD
IST
(G)
––
––
––
Cla
ss T
––
––
––
* R
efer
to
note
13
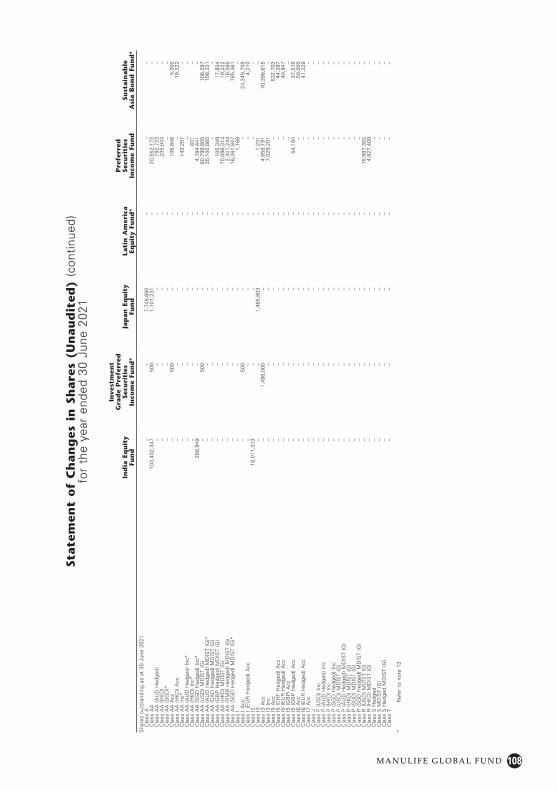
108M A N U L I F E G L O B A L F U N D
State
men
t o
f C
han
ges
in
Sh
are
s (U
nau
dit
ed)
(con
tinue
d)fo
r th
e ye
ar e
nded
30
June
202
1
Ind
ia E
qu
ity
Fun
d
Inve
stm
ent
Gra
de
Pre
ferr
ed
Secu
riti
es
Inco
me
Fun
d*
Jap
an
Eq
uit
y Fu
nd
Lati
n A
mer
ica
Equ
ity
Fun
d*
Pre
ferr
ed
Secu
riti
es
Inco
me
Fun
dSu
stain
ab
le
Asi
a B
on
d F
un
d*
S
hare
s ou
tsta
ndin
g as
at
30 J
une
2021
Cla
ss A
––
7,74
8,68
0–
––
Cla
ss A
A10
3,40
2,34
750
01,
101,
231
–20
,552
,173
–C
lass
AA
(A
UD
Hed
ged)
––
––
192,
723
–C
lass
AA
(H
KD
)–
––
–23
5,04
3–
Cla
ss A
A (
SG
D)*
––
––
––
Cla
ss A
A A
cc–
500
––
106,
846
5,00
0C
lass
AA
(H
KD
) A
cc–
––
––
19,3
22C
lass
AA
Inc
*–
––
–14
3,20
7–
Cla
ss A
A (
AU
D H
edge
d) I
nc*
––
––
––
Cla
ss A
A (
HK
D)
Inc*
––
––
831
–C
lass
AA
(S
GD
Hed
ged)
Inc
*28
9,94
9–
––
4,78
4,44
1–
Cla
ss A
A (
US
D)
MD
IST
(G)
–50
0–
–80
,799
,855
106,
297
Cla
ss A
A (
AU
D H
edge
d) M
DIS
T (G
)*–
––
–35
,100
,665
108,
331
Cla
ss A
A (
CA
D H
edge
d) M
DIS
T (G
)–
––
––
–C
lass
AA
(G
BP
Hed
ged)
MD
IST
(G)
––
––
105,
349
17,9
34C
lass
AA
(H
KD
) M
DIS
T (G
)–
––
–70
,096
,314
19,3
22C
lass
AA
(R
MB
Hed
ged)
MD
IST
(G)
––
––
2,44
1,24
416
,086
Cla
ss A
A (
SG
D H
edge
d) M
DIS
T (G
)*–
––
–16
,381
,847
785,
461
Cla
ss I
––
––
1,16
8–
Cla
ss I
Acc
–50
0–
––
24,3
49,7
08C
lass
I (
EU
R H
edge
d) A
cc–
––
––
4,21
0C
lass
I2
18,0
11,3
13–
––
––
Cla
ss I
3–
–1,
485,
803
–1,
231
–C
lass
I3
Acc
–1,
498,
000
––
4,85
8,19
170
,398
,615
Cla
ss I
3 In
c–
––
–7,
029,
201
–C
lass
I5
Acc
––
––
–53
2,70
3C
lass
I5
(CH
F H
edge
d) A
cc–
––
––
44,3
97C
lass
I5
(EU
R H
edge
d) A
cc–
––
––
40,9
47C
lass
I5
(GB
P)
Acc
––
––
––
Cla
ss I
5 (G
BP
Hed
ged)
Acc
––
––
54,1
6437
,578
Cla
ss I
6 A
cc–
––
––
50,0
00C
lass
I6
(EU
R H
edge
d) A
cc–
––
––
41,3
29C
lass
I7
Acc
––
––
––
Cla
ss J
––
––
––
Cla
ss P
(U
SD
) In
c–
––
––
–C
lass
P (
AU
D H
edge
d) I
nc–
––
––
–C
lass
P (
HK
D)
Inc
––
––
––
Cla
ss P
(S
GD
Hed
ged)
Inc
––
––
––
Cla
ss P
(U
SD
) M
DIS
T (G
)–
––
––
–C
lass
P (
AU
D H
edge
d) M
DIS
T (G
)–
––
––
–C
lass
P (
HK
D)
MD
IST
(G)
––
––
––
Cla
ss P
(S
GD
) M
DIS
T (G
)–
––
––
–C
lass
P (
SG
D H
edge
d) M
DIS
T (G
)–
––
––
–C
lass
R (
US
D)
MD
IST
(G)
––
––
15,9
87,3
02–
Cla
ss R
(H
KD
) M
DIS
T (G
)–
––
–4,
827,
409
–C
lass
S H
edge
d–
––
––
–C
lass
S M
DIS
T (G
)–
––
––
–C
lass
S H
edge
d M
DIS
T (G
)–
––
––
–C
lass
T–
––
––
–
* R
efer
to
note
13
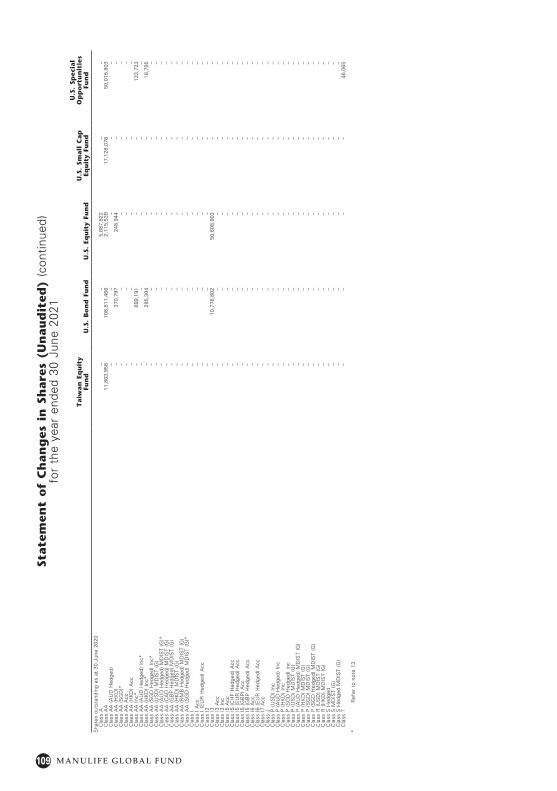
109 M A N U L I F E G L O B A L F U N D
State
men
t o
f C
han
ges
in
Sh
are
s (U
nau
dit
ed)
(con
tinue
d)fo
r th
e ye
ar e
nded
30
June
202
1
Taiw
an
Eq
uit
y Fu
nd
U.S
. B
on
d F
un
dU
.S.
Equ
ity
Fun
dU
.S.
Small
Cap
Eq
uit
y Fu
nd
U.S
. Sp
ecia
l O
pp
ort
un
itie
s Fu
nd
Sha
res
outs
tand
ing
as a
t 30
Jun
e 20
20C
lass
A–
–5,
087,
822
––
Cla
ss A
A11
,803
,958
108,
811,
466
2,11
5,53
917
,128
,076
50,0
15,8
03C
lass
AA
(A
UD
Hed
ged)
––
––
–C
lass
AA
(H
KD
)–
370,
797
248,
944
––
Cla
ss A
A (
SG
D)*
––
––
–C
lass
AA
Acc
––
––
–C
lass
AA
(H
KD
) A
cc–
––
––
Cla
ss A
A I
nc*
–69
9,19
1–
–13
3,72
3C
lass
AA
(A
UD
Hed
ged)
Inc
*–
––
––
Cla
ss A
A (
HK
D)
Inc*
–28
5,30
4–
–18
,795
Cla
ss A
A (
SG
D H
edge
d) I
nc*
––
––
–C
lass
AA
(U
SD
) M
DIS
T (G
)–
––
––
Cla
ss A
A (
AU
D H
edge
d) M
DIS
T (G
)*–
––
––
Cla
ss A
A (
CA
D H
edge
d) M
DIS
T (G
)–
––
––
Cla
ss A
A (
GB
P H
edge
d) M
DIS
T (G
)–
––
––
Cla
ss A
A (
HK
D)
MD
IST
(G)
––
––
–C
lass
AA
(R
MB
Hed
ged)
MD
IST
(G)
––
––
–C
lass
AA
(S
GD
Hed
ged)
MD
IST
(G)*
––
––
–C
lass
I–
––
––
Cla
ss I
Acc
––
––
–C
lass
I (
EU
R H
edge
d) A
cc–
––
––
Cla
ss I
2–
––
––
Cla
ss I
3–
10,7
76,8
0250
,608
,903
––
Cla
ss I
3 A
cc–
––
––
Cla
ss I
3 In
c–
––
––
Cla
ss I
5 A
cc–
––
––
Cla
ss I
5 (C
HF
Hed
ged)
Acc
––
––
–C
lass
I5
(EU
R H
edge
d) A
cc–
––
––
Cla
ss I
5 (G
BP
) A
cc–
––
––
Cla
ss I
5 (G
BP
Hed
ged)
Acc
––
––
–C
lass
I6
Acc
––
––
–C
lass
I6
(EU
R H
edge
d) A
cc–
––
––
Cla
ss I
7 A
cc–
––
––
Cla
ss J
––
––
–C
lass
P (
US
D)
Inc
––
––
–C
lass
P (
AU
D H
edge
d) I
nc–
––
––
Cla
ss P
(H
KD
) In
c–
––
––
Cla
ss P
(S
GD
Hed
ged)
Inc
––
––
–C
lass
P (
US
D)
MD
IST
(G)
––
––
–C
lass
P (
AU
D H
edge
d) M
DIS
T (G
)–
––
––
Cla
ss P
(H
KD
) M
DIS
T (G
)–
––
––
Cla
ss P
(S
GD
) M
DIS
T (G
)–
––
––
Cla
ss P
(S
GD
Hed
ged)
MD
IST
(G)
––
––
–C
lass
R (
US
D)
MD
IST
(G)
––
––
–C
lass
R (
HK
D)
MD
IST
(G)
––
––
–C
lass
S H
edge
d–
––
––
Cla
ss S
MD
IST
(G)
––
––
–C
lass
S H
edge
d M
DIS
T (G
)–
––
––
Cla
ss T
––
––
46,0
65
* R
efer
to
note
13
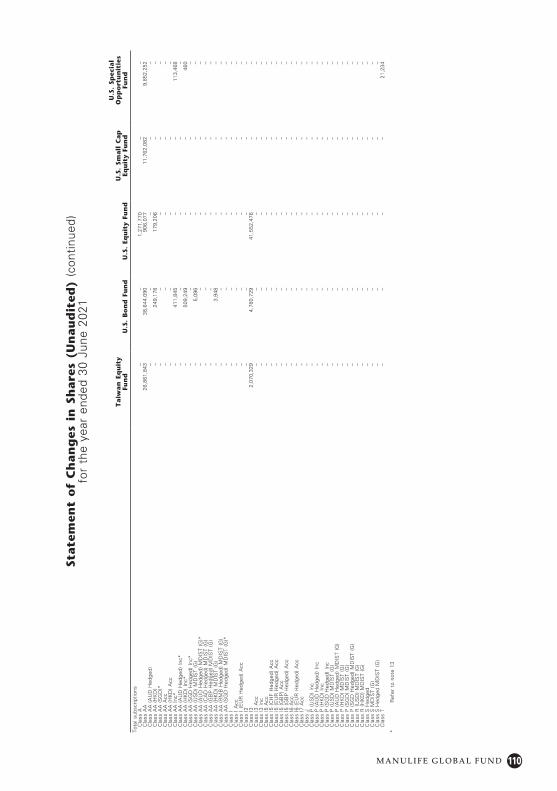
110M A N U L I F E G L O B A L F U N D
State
men
t o
f C
han
ges
in
Sh
are
s (U
nau
dit
ed)
(con
tinue
d)fo
r th
e ye
ar e
nded
30
June
202
1
Taiw
an
Eq
uit
y Fu
nd
U.S
. B
on
d F
un
dU
.S.
Equ
ity
Fun
dU
.S.
Small
Cap
Eq
uit
y Fu
nd
U.S
. Sp
ecia
l O
pp
ort
un
itie
s Fu
nd
Tota
l sub
scrip
tions
Cla
ss A
––
1,27
1,77
0–
–C
lass
AA
26,8
61,8
4338
,644
,090
906,
077
11,7
62,0
829,
852,
252
Cla
ss A
A (
AU
D H
edge
d)–
––
––
Cla
ss A
A (
HK
D)
–24
9,17
817
9,20
6–
–C
lass
AA
(S
GD
)*–
––
––
Cla
ss A
A A
cc–
––
––
Cla
ss A
A (
HK
D)
Acc
––
––
–C
lass
AA
Inc
*–
411,
845
––
113,
468
Cla
ss A
A (
AU
D H
edge
d) I
nc*
––
––
–C
lass
AA
(H
KD
) In
c*–
509,
249
––
460
Cla
ss A
A (
SG
D H
edge
d) I
nc*
––
––
–C
lass
AA
(U
SD
) M
DIS
T (G
)–
5,09
6–
––
Cla
ss A
A (
AU
D H
edge
d) M
DIS
T (G
)*–
––
––
Cla
ss A
A (
CA
D H
edge
d) M
DIS
T (G
)–
––
––
Cla
ss A
A (
GB
P H
edge
d) M
DIS
T (G
)–
––
––
Cla
ss A
A (
HK
D)
MD
IST
(G)
–3,
948
––
–C
lass
AA
(R
MB
Hed
ged)
MD
IST
(G)
––
––
–C
lass
AA
(S
GD
Hed
ged)
MD
IST
(G)*
––
––
–C
lass
I–
––
––
Cla
ss I
Acc
––
––
–C
lass
I (
EU
R H
edge
d) A
cc–
––
––
Cla
ss I
2–
––
––
Cla
ss I
32,
070,
329
4,78
0,72
941
,552
,476
––
Cla
ss I
3 A
cc–
––
––
Cla
ss I
3 In
c–
––
––
Cla
ss I
5 A
cc–
––
––
Cla
ss I
5 (C
HF
Hed
ged)
Acc
––
––
–C
lass
I5
(EU
R H
edge
d) A
cc–
––
––
Cla
ss I
5 (G
BP
) A
cc–
––
––
Cla
ss I
5 (G
BP
Hed
ged)
Acc
––
––
–C
lass
I6
Acc
––
––
–C
lass
I6
(EU
R H
edge
d) A
cc–
––
––
Cla
ss I
7 A
cc–
––
––
Cla
ss J
––
––
–C
lass
P (
US
D)
Inc
––
––
–C
lass
P (
AU
D H
edge
d) I
nc–
––
––
Cla
ss P
(H
KD
) In
c–
––
––
Cla
ss P
(S
GD
Hed
ged)
Inc
––
––
–C
lass
P (
US
D)
MD
IST
(G)
––
––
–C
lass
P (
AU
D H
edge
d) M
DIS
T (G
)–
––
––
Cla
ss P
(H
KD
) M
DIS
T (G
)–
––
––
Cla
ss P
(S
GD
) M
DIS
T (G
)–
––
––
Cla
ss P
(S
GD
Hed
ged)
MD
IST
(G)
––
––
–C
lass
R (
US
D)
MD
IST
(G)
––
––
–C
lass
R (
HK
D)
MD
IST
(G)
––
––
–C
lass
S H
edge
d–
––
––
Cla
ss S
MD
IST
(G)
––
––
–C
lass
S H
edge
d M
DIS
T (G
)–
––
––
Cla
ss T
––
––
21,2
34
* R
efer
to
note
13

111 M A N U L I F E G L O B A L F U N D
State
men
t o
f C
han
ges
in
Sh
are
s (U
nau
dit
ed)
(con
tinue
d)fo
r th
e ye
ar e
nded
30
June
202
1
Taiw
an
Eq
uit
y Fu
nd
U.S
. B
on
d F
un
dU
.S.
Equ
ity
Fun
dU
.S.
Small
Cap
Eq
uit
y Fu
nd
U.S
. Sp
ecia
l O
pp
ort
un
itie
s Fu
nd
Tota
l red
empt
ions
Cla
ss A
––
2,04
3,57
9–
–C
lass
AA
27,0
79,6
5754
,097
,503
1,46
9,77
912
,662
,797
8,15
4,34
1C
lass
AA
(A
UD
Hed
ged)
––
––
–C
lass
AA
(H
KD
)–
565,
225
216,
740
––
Cla
ss A
A (
SG
D)*
––
––
–C
lass
AA
Acc
––
––
–C
lass
AA
(H
KD
) A
cc–
––
––
Cla
ss A
A I
nc*
–1,
089,
209
––
93,8
24C
lass
AA
(A
UD
Hed
ged)
Inc
*–
––
––
Cla
ss A
A (
HK
D)
Inc*
–78
7,96
3–
–16
,909
Cla
ss A
A (
SG
D H
edge
d) I
nc*
––
––
–C
lass
AA
(U
SD
) M
DIS
T (G
)–
––
––
Cla
ss A
A (
AU
D H
edge
d) M
DIS
T (G
)*–
––
––
Cla
ss A
A (
CA
D H
edge
d) M
DIS
T (G
)–
––
––
Cla
ss A
A (
GB
P H
edge
d) M
DIS
T (G
)–
––
––
Cla
ss A
A (
HK
D)
MD
IST
(G)
––
––
–C
lass
AA
(R
MB
Hed
ged)
MD
IST
(G)
––
––
–C
lass
AA
(S
GD
Hed
ged)
MD
IST
(G)*
––
––
–C
lass
I–
––
––
Cla
ss I
Acc
––
––
–C
lass
I (
EU
R H
edge
d) A
cc–
––
––
Cla
ss I
2–
––
––
Cla
ss I
31,
543,
620
8,59
4,65
744
,228
,836
––
Cla
ss I
3 A
cc–
––
––
Cla
ss I
3 In
c–
––
––
Cla
ss I
5 A
cc–
––
––
Cla
ss I
5 (C
HF
Hed
ged)
Acc
––
––
–C
lass
I5
(EU
R H
edge
d) A
cc–
––
––
Cla
ss I
5 (G
BP
) A
cc–
––
––
Cla
ss I
5 (G
BP
Hed
ged)
Acc
––
––
–C
lass
I6
Acc
––
––
–C
lass
I6
(EU
R H
edge
d) A
cc–
––
––
Cla
ss I
7 A
cc–
––
––
Cla
ss J
––
––
–C
lass
P (
US
D)
Inc
––
––
–C
lass
P (
AU
D H
edge
d) I
nc–
––
––
Cla
ss P
(H
KD
) In
c–
––
––
Cla
ss P
(S
GD
Hed
ged)
Inc
––
––
–C
lass
P (
US
D)
MD
IST
(G)
––
––
–C
lass
P (
AU
D H
edge
d) M
DIS
T (G
)–
––
––
Cla
ss P
(H
KD
) M
DIS
T (G
)–
––
––
Cla
ss P
(S
GD
) M
DIS
T (G
)–
––
––
Cla
ss P
(S
GD
Hed
ged)
MD
IST
(G)
––
––
–C
lass
R (
US
D)
MD
IST
(G)
––
––
–C
lass
R (
HK
D)
MD
IST
(G)
––
––
–C
lass
S H
edge
d–
––
––
Cla
ss S
MD
IST
(G)
––
––
–C
lass
S H
edge
d M
DIS
T (G
)–
––
––
Cla
ss T
––
––
41,1
55
* R
efer
to
note
13
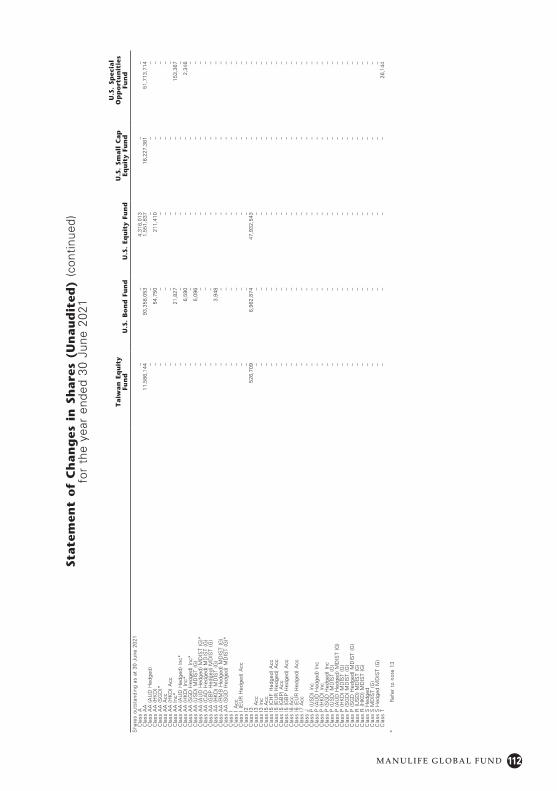
112M A N U L I F E G L O B A L F U N D
State
men
t o
f C
han
ges
in
Sh
are
s (U
nau
dit
ed)
(con
tinue
d)fo
r th
e ye
ar e
nded
30
June
202
1
Taiw
an
Eq
uit
y Fu
nd
U.S
. B
on
d F
un
dU
.S.
Equ
ity
Fun
dU
.S.
Small
Cap
Eq
uit
y Fu
nd
U.S
. Sp
ecia
l O
pp
ort
un
itie
s Fu
nd
Sha
res
outs
tand
ing
as a
t 30
Jun
e 20
21C
lass
A–
–4,
316,
013
––
Cla
ss A
A11
,586
,144
93,3
58,0
531,
551,
837
16,2
27,3
6151
,713
,714
Cla
ss A
A (
AU
D H
edge
d)–
––
––
Cla
ss A
A (
HK
D)
–54
,750
211,
410
––
Cla
ss A
A (
SG
D)*
––
––
–C
lass
AA
Acc
––
––
–C
lass
AA
(H
KD
) A
cc–
––
––
Cla
ss A
A I
nc*
–21
,827
––
153,
367
Cla
ss A
A (
AU
D H
edge
d) I
nc*
––
––
–C
lass
AA
(H
KD
) In
c*–
6,59
0–
–2,
346
Cla
ss A
A (
SG
D H
edge
d) I
nc*
––
––
–C
lass
AA
(U
SD
) M
DIS
T (G
)–
5,09
6–
––
Cla
ss A
A (
AU
D H
edge
d) M
DIS
T (G
)*–
––
––
Cla
ss A
A (
CA
D H
edge
d) M
DIS
T (G
)–
––
––
Cla
ss A
A (
GB
P H
edge
d) M
DIS
T (G
)–
––
––
Cla
ss A
A (
HK
D)
MD
IST
(G)
–3,
948
––
–C
lass
AA
(R
MB
Hed
ged)
MD
IST
(G)
––
––
–C
lass
AA
(S
GD
Hed
ged)
MD
IST
(G)*
––
––
–C
lass
I–
––
––
Cla
ss I
Acc
––
––
–C
lass
I (
EU
R H
edge
d) A
cc–
––
––
Cla
ss I
2–
––
––
Cla
ss I
352
6,70
96,
962,
874
47,9
32,5
43–
–C
lass
I3
Acc
––
––
–C
lass
I3
Inc
––
––
–C
lass
I5
Acc
––
––
–C
lass
I5
(CH
F H
edge
d) A
cc–
––
––
Cla
ss I
5 (E
UR
Hed
ged)
Acc
––
––
–C
lass
I5
(GB
P)
Acc
––
––
–C
lass
I5
(GB
P H
edge
d) A
cc–
––
––
Cla
ss I
6 A
cc–
––
––
Cla
ss I
6 (E
UR
Hed
ged)
Acc
––
––
–C
lass
I7
Acc
––
––
–C
lass
J–
––
––
Cla
ss P
(U
SD
) In
c–
––
––
Cla
ss P
(A
UD
Hed
ged)
Inc
––
––
–C
lass
P (
HK
D)
Inc
––
––
–C
lass
P (
SG
D H
edge
d) I
nc–
––
––
Cla
ss P
(U
SD
) M
DIS
T (G
)–
––
––
Cla
ss P
(A
UD
Hed
ged)
MD
IST
(G)
––
––
–C
lass
P (
HK
D)
MD
IST
(G)
––
––
–C
lass
P (
SG
D)
MD
IST
(G)
––
––
–C
lass
P (
SG
D H
edge
d) M
DIS
T (G
)–
––
––
Cla
ss R
(U
SD
) M
DIS
T (G
)–
––
––
Cla
ss R
(H
KD
) M
DIS
T (G
)–
––
––
Cla
ss S
Hed
ged
––
––
–C
lass
S M
DIS
T (G
)–
––
––
Cla
ss S
Hed
ged
MD
IST
(G)
––
––
–C
lass
T–
––
–26
,144
* R
efer
to
note
13
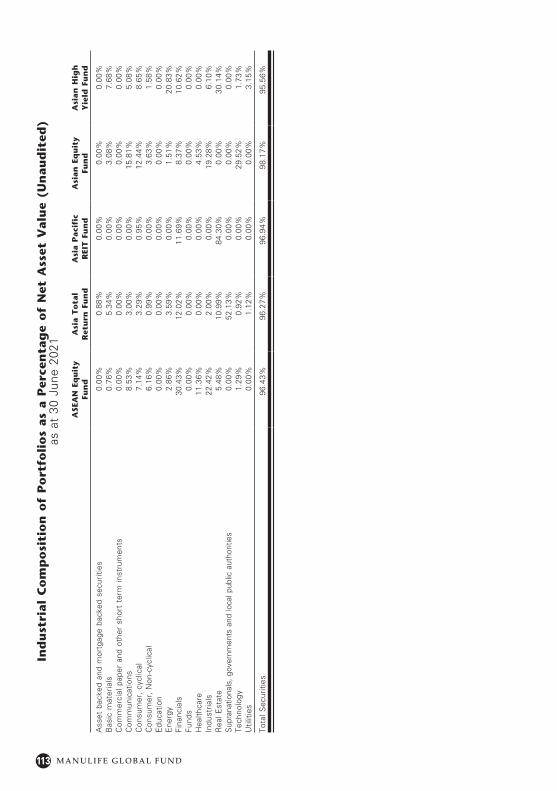
113 M A N U L I F E G L O B A L F U N D
Ind
ust
rial
Co
mp
osi
tio
n o
f P
ort
foli
os
as
a P
erce
nta
ge
of
Net
Ass
et V
alu
e (U
nau
dit
ed)
as a
t 30
Jun
e 20
21
ASE
AN
Eq
uit
y Fu
nd
Asi
a T
ota
l
Ret
urn
Fu
nd
Asi
a P
aci
fic
R
EIT
Fu
nd
Asi
an
Eq
uit
y
Fun
dA
sian
Hig
h
Yie
ld F
un
d
Ass
et b
acke
d an
d m
ortg
age
back
ed s
ecur
ities
0.00
%0.
88%
0.00
%0.
00%
0.00
%B
asic
mat
eria
ls0.
76%
5.34
%0.
00%
3.08
%7.
68%
Com
mer
cial
pap
er a
nd o
ther
sho
rt t
erm
inst
rum
ents
0.00
%0.
00%
0.00
%0.
00%
0.00
%C
omm
unic
atio
ns8.
53%
3.00
%0.
00%
15.8
1%5.
08%
Con
sum
er,
cycl
ical
7.14
%3.
29%
0.95
%12
.44%
8.65
%C
onsu
mer
, N
on-c
yclic
al6.
16%
0.99
%0.
00%
3.63
%1.
58%
Edu
catio
n0.
00%
0.00
%0.
00%
0.00
%0.
00%
Ene
rgy
2.86
%3.
59%
0.00
%1.
51%
20.8
3%Fi
nanc
ials
30.4
3%12
.02%
11.6
9%8.
37%
10.6
2%Fu
nds
0.00
%0.
00%
0.00
%0.
00%
0.00
%H
ealth
care
11.3
6%0.
00%
0.00
%4.
53%
0.00
%In
dust
rials
22.4
2%2.
00%
0.00
%19
.28%
6.10
%R
eal E
stat
e5.
48%
10.9
9%84
.30%
0.00
%30
.14%
Sup
rana
tiona
ls,
gove
rnm
ents
and
loca
l pub
lic a
utho
ritie
s0.
00%
52.1
3%0.
00%
0.00
%0.
00%
Tech
nolo
gy1.
29%
0.92
%0.
00%
29.5
2%1.
73%
Util
ities
0.00
%1.
12%
0.00
%0.
00%
3.15
%
Tota
l Sec
uriti
es96
.43%
96.2
7%96
.94%
98.1
7%95
.56%
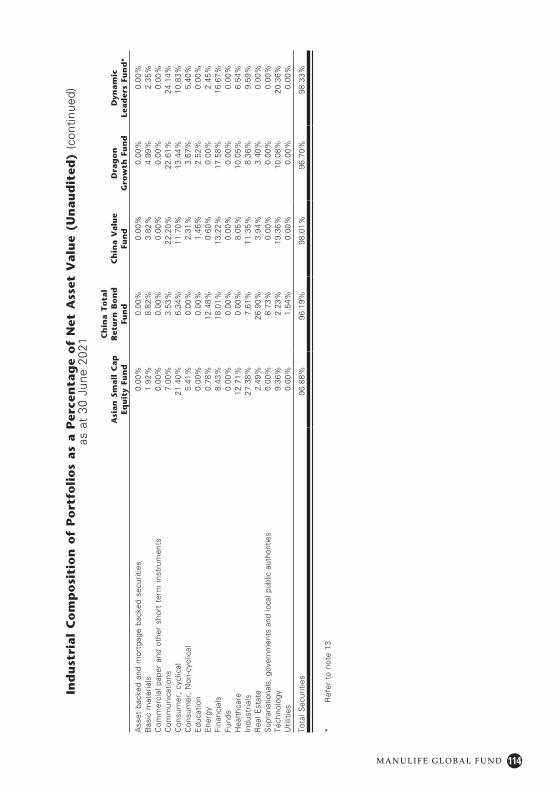
114M A N U L I F E G L O B A L F U N D
Ind
ust
rial
Co
mp
osi
tio
n o
f P
ort
foli
os
as
a P
erce
nta
ge
of
Net
Ass
et V
alu
e (U
nau
dit
ed)
(con
tinue
d)as
at
30 J
une
2021
Asi
an
Sm
all
Cap
Eq
uit
y Fu
nd
Ch
ina T
ota
l R
etu
rn B
on
d
Fun
dC
hin
a V
alu
e
Fun
dD
rag
on
G
row
th F
un
dD
ynam
ic
Lead
ers
Fun
d*
Ass
et b
acke
d an
d m
ortg
age
back
ed s
ecur
ities
0.00
%0.
00%
0.00
%0.
00%
0.00
%B
asic
mat
eria
ls1.
92%
8.82
%3.
82%
4.99
%2.
35%
Com
mer
cial
pap
er a
nd o
ther
sho
rt t
erm
inst
rum
ents
0.00
%0.
00%
0.00
%0.
00%
0.00
%C
omm
unic
atio
ns7.
00%
3.53
%22
.20%
22.6
1%24
.14%
Con
sum
er,
cycl
ical
21.4
0%6.
34%
11.7
0%13
.44%
10.8
3%C
onsu
mer
, N
on-c
yclic
al5.
41%
0.00
%2.
31%
3.67
%5.
40%
Edu
catio
n0.
00%
0.00
%1.
46%
2.52
%0.
00%
Ene
rgy
0.78
%12
.48%
0.60
%0.
00%
2.45
%Fi
nanc
ials
8.43
%18
.01%
13.2
2%17
.58%
16.6
7%Fu
nds
0.00
%0.
00%
0.00
%0.
00%
0.00
%H
ealth
care
12.7
1%0.
00%
8.05
%10
.05%
6.54
%In
dust
rials
27.3
8%7.
61%
11.3
5%8.
36%
9.59
%R
eal E
stat
e2.
49%
26.9
0%3.
94%
3.40
%0.
00%
Sup
rana
tiona
ls,
gove
rnm
ents
and
loca
l pub
lic a
utho
ritie
s0.
00%
8.73
%0.
00%
0.00
%0.
00%
Tech
nolo
gy9.
36%
2.23
%19
.36%
10.0
8%20
.36%
Util
ities
0.00
%1.
54%
0.00
%0.
00%
0.00
%
Tota
l Sec
uriti
es96
.88%
96.1
9%98
.01%
96.7
0%98
.33%
* R
efer
to
note
13
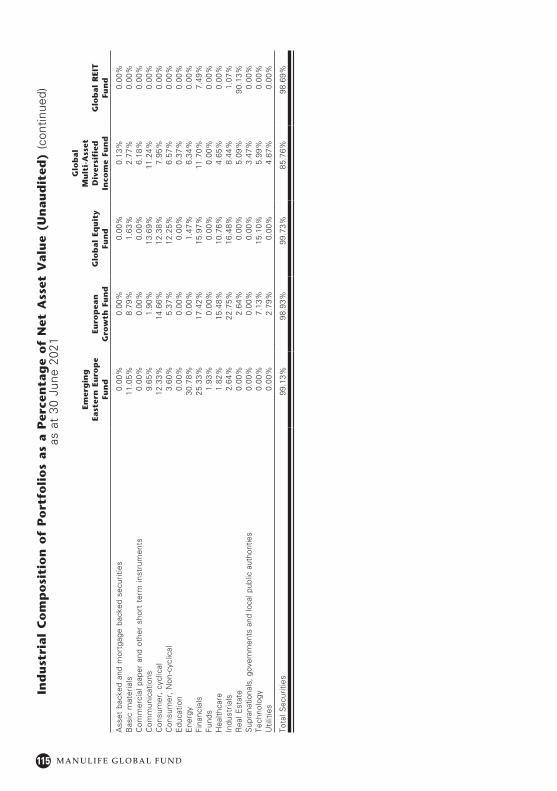
115 M A N U L I F E G L O B A L F U N D
Ind
ust
rial
Co
mp
osi
tio
n o
f P
ort
foli
os
as
a P
erce
nta
ge
of
Net
Ass
et V
alu
e (U
nau
dit
ed)
(con
tinue
d)as
at
30 J
une
2021
Emer
gin
g
East
ern
Eu
rop
e Fu
nd
Euro
pea
n
Gro
wth
Fu
nd
Glo
bal
Equ
ity
Fun
d
Glo
bal
M
ult
i-A
sset
D
iver
sifi
ed
Inco
me
Fun
dG
lob
al
REI
T
Fun
d
Ass
et b
acke
d an
d m
ortg
age
back
ed s
ecur
ities
0.00
%0.
00%
0.00
%0.
13%
0.00
%B
asic
mat
eria
ls11
.05%
8.79
%1.
63%
2.77
%0.
00%
Com
mer
cial
pap
er a
nd o
ther
sho
rt t
erm
inst
rum
ents
0.00
%0.
00%
0.00
%6.
18%
0.00
%C
omm
unic
atio
ns9.
65%
1.90
%13
.69%
11.2
4%0.
00%
Con
sum
er,
cycl
ical
12.3
3%14
.66%
12.3
8%7.
95%
0.00
%C
onsu
mer
, N
on-c
yclic
al3.
60%
5.37
%12
.25%
6.57
%0.
00%
Edu
catio
n0.
00%
0.00
%0.
00%
0.37
%0.
00%
Ene
rgy
30.7
8%0.
00%
1.47
%6.
34%
0.00
%Fi
nanc
ials
25.3
3%17
.42%
15.9
7%11
.70%
7.49
%Fu
nds
1.93
%0.
00%
0.00
%0.
00%
0.00
%H
ealth
care
1.82
%15
.48%
10.7
6%4.
65%
0.00
%In
dust
rials
2.64
%22
.75%
16.4
8%8.
44%
1.07
%R
eal E
stat
e0.
00%
2.64
%0.
00%
5.09
%90
.13%
Sup
rana
tiona
ls,
gove
rnm
ents
and
loca
l pub
lic a
utho
ritie
s0.
00%
0.00
%0.
00%
3.47
%0.
00%
Tech
nolo
gy0.
00%
7.13
%15
.10%
5.99
%0.
00%
Util
ities
0.00
%2.
79%
0.00
%4.
87%
0.00
%
Tota
l Sec
uriti
es99
.13%
98.9
3%99
.73%
85.7
6%98
.69%
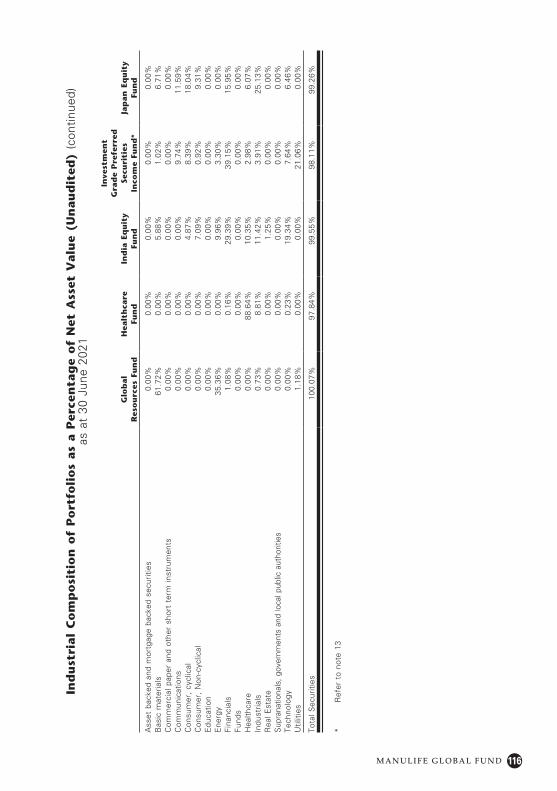
116M A N U L I F E G L O B A L F U N D
Ind
ust
rial
Co
mp
osi
tio
n o
f P
ort
foli
os
as
a P
erce
nta
ge
of
Net
Ass
et V
alu
e (U
nau
dit
ed)
(con
tinue
d)as
at
30 J
une
2021
Glo
bal
R
eso
urc
es F
un
dH
ealt
hca
re
Fun
dIn
dia
Eq
uit
y
Fun
d
Inve
stm
ent
Gra
de
Pre
ferr
ed
Secu
riti
es
Inco
me
Fun
d*
Jap
an
Eq
uit
y Fu
nd
Ass
et b
acke
d an
d m
ortg
age
back
ed s
ecur
ities
0.00
%0.
00%
0.00
%0.
00%
0.00
%B
asic
mat
eria
ls61
.72%
0.00
%5.
88%
1.02
%6.
71%
Com
mer
cial
pap
er a
nd o
ther
sho
rt t
erm
inst
rum
ents
0.00
%0.
00%
0.00
%0.
00%
0.00
%C
omm
unic
atio
ns0.
00%
0.00
%0.
00%
9.74
%11
.59%
Con
sum
er,
cycl
ical
0.00
%0.
00%
4.87
%8.
39%
18.0
4%C
onsu
mer
, N
on-c
yclic
al0.
00%
0.00
%7.
09%
0.92
%9.
31%
Edu
catio
n0.
00%
0.00
%0.
00%
0.00
%0.
00%
Ene
rgy
35.3
6%0.
00%
9.96
%3.
30%
0.00
%Fi
nanc
ials
1.08
%0.
16%
29.3
9%39
.15%
15.9
5%Fu
nds
0.00
%0.
00%
0.00
%0.
00%
0.00
%H
ealth
care
0.00
%88
.64%
10.3
5%2.
98%
6.07
%In
dust
rials
0.73
%8.
81%
11.4
2%3.
91%
25.1
3%R
eal E
stat
e0.
00%
0.00
%1.
25%
0.00
%0.
00%
Sup
rana
tiona
ls,
gove
rnm
ents
and
loca
l pub
lic a
utho
ritie
s0.
00%
0.00
%0.
00%
0.00
%0.
00%
Tech
nolo
gy0.
00%
0.23
%19
.34%
7.64
%6.
46%
Util
ities
1.18
%0.
00%
0.00
%21
.06%
0.00
%
Tota
l Sec
uriti
es10
0.07
%97
.84%
99.5
5%98
.11%
99.2
6%
* R
efer
to
note
13
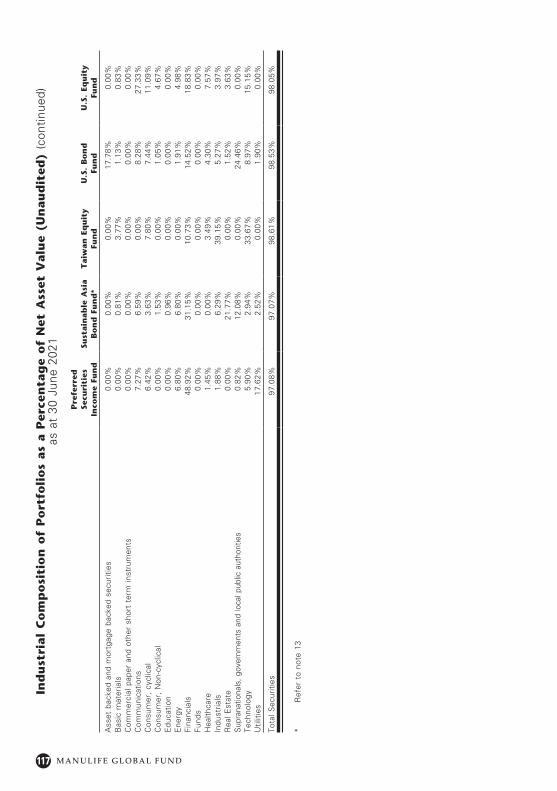
117 M A N U L I F E G L O B A L F U N D
Ind
ust
rial
Co
mp
osi
tio
n o
f P
ort
foli
os
as
a P
erce
nta
ge
of
Net
Ass
et V
alu
e (U
nau
dit
ed)
(con
tinue
d)as
at
30 J
une
2021
Pre
ferr
ed
Secu
riti
es
Inco
me
Fun
dSu
stain
ab
le A
sia
Bo
nd
Fu
nd
*T
aiw
an
Eq
uit
y Fu
nd
U.S
. B
on
d
Fun
dU
.S.
Equ
ity
Fu
nd
Ass
et b
acke
d an
d m
ortg
age
back
ed s
ecur
ities
0.00
%0.
00%
0.00
%17
.78%
0.00
%B
asic
mat
eria
ls0.
00%
0.81
%3.
77%
1.13
%0.
83%
Com
mer
cial
pap
er a
nd o
ther
sho
rt t
erm
inst
rum
ents
0.00
%0.
00%
0.00
%0.
00%
0.00
%C
omm
unic
atio
ns7.
27%
6.59
%0.
00%
8.28
%27
.33%
Con
sum
er,
cycl
ical
6.42
%3.
63%
7.80
%7.
44%
11.0
9%C
onsu
mer
, N
on-c
yclic
al0.
00%
1.53
%0.
00%
1.05
%4.
67%
Edu
catio
n0.
00%
0.96
%0.
00%
0.00
%0.
00%
Ene
rgy
6.80
%6.
80%
0.00
%1.
91%
4.98
%Fi
nanc
ials
48.9
2%31
.15%
10.7
3%14
.52%
18.8
3%Fu
nds
0.00
%0.
00%
0.00
%0.
00%
0.00
%H
ealth
care
1.45
%0.
00%
3.49
%4.
30%
7.57
%In
dust
rials
1.88
%6.
29%
39.1
5%5.
27%
3.97
%R
eal E
stat
e0.
00%
21.7
7%0.
00%
1.52
%3.
63%
Sup
rana
tiona
ls,
gove
rnm
ents
and
loca
l pub
lic a
utho
ritie
s0.
82%
12.0
8%0.
00%
24.4
6%0.
00%
Tech
nolo
gy5.
90%
2.94
%33
.67%
8.97
%15
.15%
Util
ities
17.6
2%2.
52%
0.00
%1.
90%
0.00
%
Tota
l Sec
uriti
es97
.08%
97.0
7%98
.61%
98.5
3%98
.05%
* R
efer
to
note
13
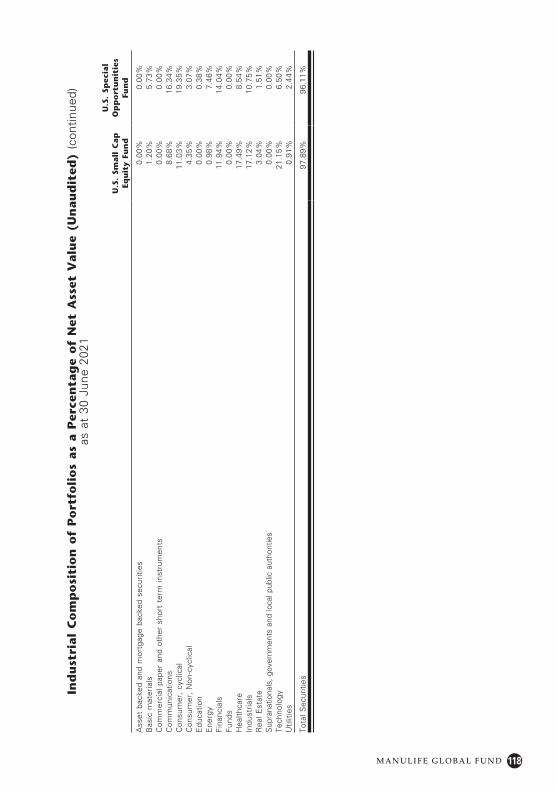
118M A N U L I F E G L O B A L F U N D
Ind
ust
rial
Co
mp
osi
tio
n o
f P
ort
foli
os
as
a P
erce
nta
ge
of
Net
Ass
et V
alu
e (U
nau
dit
ed)
(con
tinue
d)as
at
30 J
une
2021
U.S
. Sm
all
Cap
Eq
uit
y Fu
nd
U.S
. Sp
ecia
l O
pp
ort
un
itie
s Fu
nd
Ass
et b
acke
d an
d m
ortg
age
back
ed s
ecur
ities
0.00
%0.
00%
Bas
ic m
ater
ials
1.20
%5.
73%
Com
mer
cial
pap
er a
nd o
ther
sho
rt t
erm
inst
rum
ents
0.00
%0.
00%
Com
mun
icat
ions
8.68
%16
.34%
Con
sum
er,
cycl
ical
11.0
3%19
.35%
Con
sum
er,
Non
-cyc
lical
4.35
%3.
07%
Edu
catio
n0.
00%
0.38
%E
nerg
y0.
98%
7.46
%Fi
nanc
ials
11.9
4%14
.04%
Fund
s0.
00%
0.00
%H
ealth
care
17.4
9%8.
54%
Indu
stria
ls17
.12%
10.7
5%R
eal E
stat
e3.
04%
1.51
%S
upra
natio
nals
, go
vern
men
ts a
nd lo
cal p
ublic
aut
horit
ies
0.00
%0.
00%
Tech
nolo
gy21
.15%
6.50
%U
tiliti
es0.
91%
2.44
%
Tota
l Sec
uriti
es97
.89%
96.1
1%
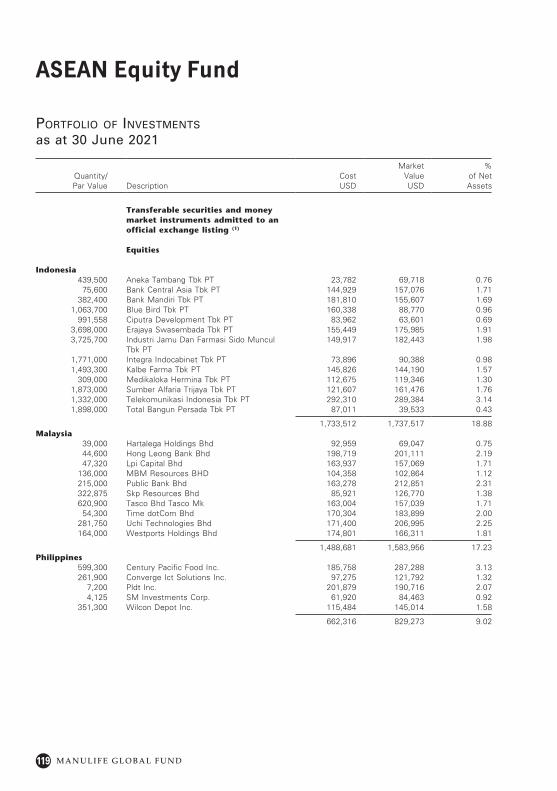
119
ASEAN Equity Fund
M A N U L I F E G L O B A L F U N D
Portfolio of investments
as at 30 June 2021
Quantity/ Par Value Description
Cost USD
Market Value USD
% of Net Assets
Transferable securities and money market instruments admitted to an official exchange listing (1)
Equities
Indonesia439,500 Aneka Tambang Tbk PT 23,782 69,718 0.76
75,600 Bank Central Asia Tbk PT 144,929 157,076 1.71382,400 Bank Mandiri Tbk PT 181,810 155,607 1.69
1,063,700 Blue Bird Tbk PT 160,338 88,770 0.96991,558 Ciputra Development Tbk PT 83,962 63,601 0.69
3,698,000 Erajaya Swasembada Tbk PT 155,449 175,985 1.913,725,700 Industri Jamu Dan Farmasi Sido Muncul
Tbk PT149,917 182,443 1.98
1,771,000 Integra Indocabinet Tbk PT 73,896 90,388 0.981,493,300 Kalbe Farma Tbk PT 145,826 144,190 1.57
309,000 Medikaloka Hermina Tbk PT 112,675 119,346 1.301,873,000 Sumber Alfaria Trijaya Tbk PT 121,607 161,476 1.761,332,000 Telekomunikasi Indonesia Tbk PT 292,310 289,384 3.141,898,000 Total Bangun Persada Tbk PT 87,011 39,533 0.43
1,733,512 1,737,517 18.88Malaysia
39,000 Hartalega Holdings Bhd 92,959 69,047 0.7544,600 Hong Leong Bank Bhd 198,719 201,111 2.1947,320 Lpi Capital Bhd 163,937 157,069 1.71
136,000 MBM Resources BHD 104,358 102,864 1.12215,000 Public Bank Bhd 163,278 212,851 2.31322,875 Skp Resources Bhd 85,921 126,770 1.38620,900 Tasco Bhd Tasco Mk 163,004 157,039 1.71
54,300 Time dotCom Bhd 170,304 183,899 2.00281,750 Uchi Technologies Bhd 171,400 206,995 2.25164,000 Westports Holdings Bhd 174,801 166,311 1.81
1,488,681 1,583,956 17.23Philippines
599,300 Century Pacific Food Inc. 185,758 287,288 3.13261,900 Converge Ict Solutions Inc. 97,275 121,792 1.32
7,200 Pldt Inc. 201,879 190,716 2.074,125 SM Investments Corp. 61,920 84,463 0.92
351,300 Wilcon Depot Inc. 115,484 145,014 1.58
662,316 829,273 9.02
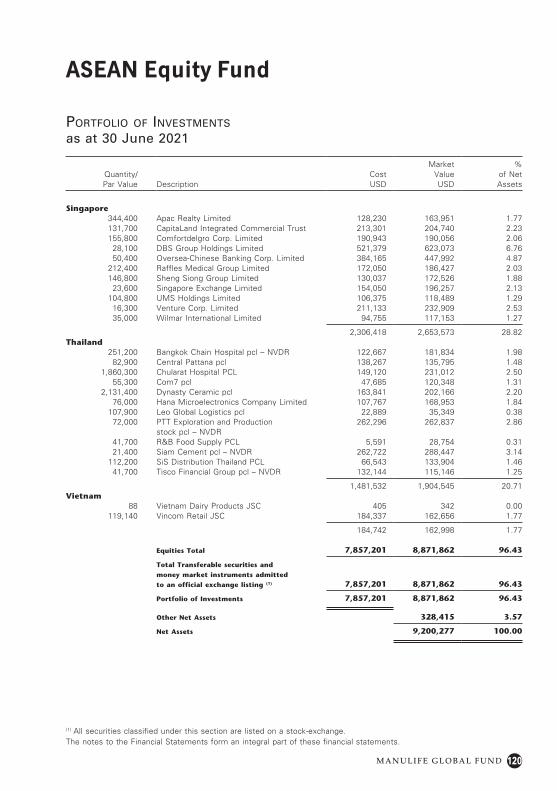
120
ASEAN Equity Fund
M A N U L I F E G L O B A L F U N D
Quantity/ Par Value Description
Cost USD
Market Value USD
% of Net Assets
Singapore344,400 Apac Realty Limited 128,230 163,951 1.77131,700 CapitaLand Integrated Commercial Trust 213,301 204,740 2.23155,800 Comfortdelgro Corp. Limited 190,943 190,056 2.06
28,100 DBS Group Holdings Limited 521,379 623,073 6.7650,400 Oversea-Chinese Banking Corp. Limited 384,165 447,992 4.87
212,400 Raffles Medical Group Limited 172,050 186,427 2.03146,800 Sheng Siong Group Limited 130,037 172,526 1.88
23,600 Singapore Exchange Limited 154,050 196,257 2.13104,800 UMS Holdings Limited 106,375 118,489 1.29
16,300 Venture Corp. Limited 211,133 232,909 2.5335,000 Wilmar International Limited 94,755 117,153 1.27
2,306,418 2,653,573 28.82Thailand
251,200 Bangkok Chain Hospital pcl – NVDR 122,667 181,834 1.9882,900 Central Pattana pcl 138,267 135,795 1.48
1,860,300 Chularat Hospital PCL 149,120 231,012 2.5055,300 Com7 pcl 47,685 120,348 1.31
2,131,400 Dynasty Ceramic pcl 163,841 202,166 2.2076,000 Hana Microelectronics Company Limited 107,767 168,953 1.84
107,900 Leo Global Logistics pcl 22,889 35,349 0.3872,000 PTT Exploration and Production
stock pcl – NVDR262,296 262,837 2.86
41,700 R&B Food Supply PCL 5,591 28,754 0.3121,400 Siam Cement pcl – NVDR 262,722 288,447 3.14
112,200 SiS Distribution Thailand PCL 66,543 133,904 1.4641,700 Tisco Financial Group pcl – NVDR 132,144 115,146 1.25
1,481,532 1,904,545 20.71Vietnam
88 Vietnam Dairy Products JSC 405 342 0.00119,140 Vincom Retail JSC 184,337 162,656 1.77
184,742 162,998 1.77
Equities Total 7,857,201 8,871,862 96.43
Total Transferable securities and
money market instruments admitted
to an official exchange listing (1) 7,857,201 8,871,862 96.43
Portfolio of Investments 7,857,201 8,871,862 96.43
Other Net Assets 328,415 3.57
Net Assets 9,200,277 100.00
(1) All securities classified under this section are listed on a stock-exchange.The notes to the Financial Statements form an integral part of these financial statements.
Portfolio of investments
as at 30 June 2021
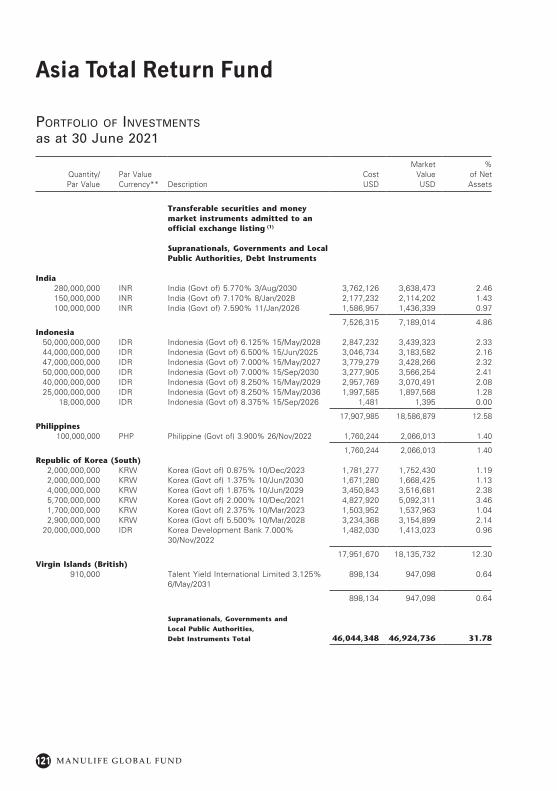
121
Asia Total Return Fund
M A N U L I F E G L O B A L F U N D
Portfolio of investments
as at 30 June 2021
Quantity/ Par Value
Par Value Currency** Description
Cost USD
Market Value USD
% of Net Assets
Transferable securities and money market instruments admitted to an official exchange listing (1)
Supranationals, Governments and Local Public Authorities, Debt Instruments
India280,000,000 INR India (Govt of) 5.770% 3/Aug/2030 3,762,126 3,638,473 2.46150,000,000 INR India (Govt of) 7.170% 8/Jan/2028 2,177,232 2,114,202 1.43100,000,000 INR India (Govt of) 7.590% 11/Jan/2026 1,586,957 1,436,339 0.97
7,526,315 7,189,014 4.86Indonesia
50,000,000,000 IDR Indonesia (Govt of) 6.125% 15/May/2028 2,847,232 3,439,323 2.3344,000,000,000 IDR Indonesia (Govt of) 6.500% 15/Jun/2025 3,046,734 3,183,582 2.1647,000,000,000 IDR Indonesia (Govt of) 7.000% 15/May/2027 3,779,279 3,428,266 2.3250,000,000,000 IDR Indonesia (Govt of) 7.000% 15/Sep/2030 3,277,905 3,566,254 2.4140,000,000,000 IDR Indonesia (Govt of) 8.250% 15/May/2029 2,957,769 3,070,491 2.0825,000,000,000 IDR Indonesia (Govt of) 8.250% 15/May/2036 1,997,585 1,897,568 1.28
18,000,000 IDR Indonesia (Govt of) 8.375% 15/Sep/2026 1,481 1,395 0.00
17,907,985 18,586,879 12.58Philippines
100,000,000 PHP Philippine (Govt of) 3.900% 26/Nov/2022 1,760,244 2,066,013 1.40
1,760,244 2,066,013 1.40Republic of Korea (South)
2,000,000,000 KRW Korea (Govt of) 0.875% 10/Dec/2023 1,781,277 1,752,430 1.192,000,000,000 KRW Korea (Govt of) 1.375% 10/Jun/2030 1,671,280 1,668,425 1.134,000,000,000 KRW Korea (Govt of) 1.875% 10/Jun/2029 3,450,843 3,516,681 2.385,700,000,000 KRW Korea (Govt of) 2.000% 10/Dec/2021 4,827,920 5,092,311 3.461,700,000,000 KRW Korea (Govt of) 2.375% 10/Mar/2023 1,503,952 1,537,963 1.042,900,000,000 KRW Korea (Govt of) 5.500% 10/Mar/2028 3,234,368 3,154,899 2.14
20,000,000,000 IDR Korea Development Bank 7.000% 30/Nov/2022
1,482,030 1,413,023 0.96
17,951,670 18,135,732 12.30Virgin Islands (British)
910,000 Talent Yield International Limited 3.125% 6/May/2031
898,134 947,098 0.64
898,134 947,098 0.64
Supranationals, Governments and
Local Public Authorities,
Debt Instruments Total 46,044,348 46,924,736 31.78
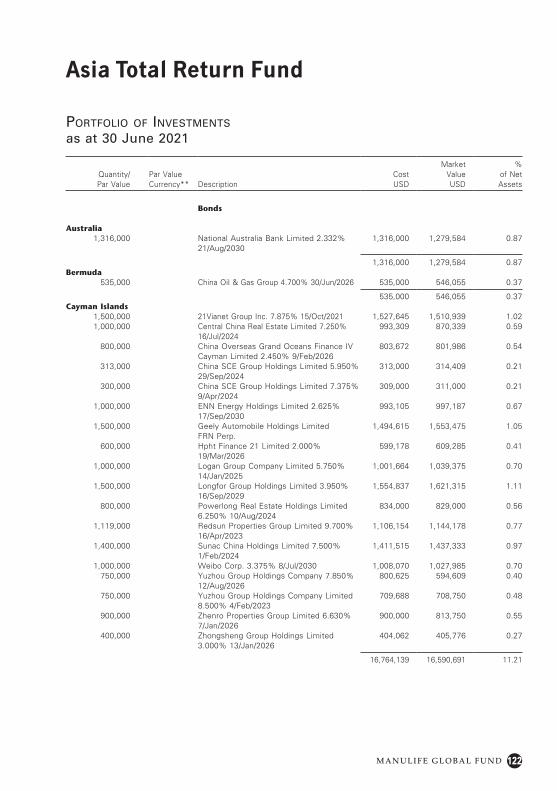
122
Asia Total Return Fund
M A N U L I F E G L O B A L F U N D
Quantity/ Par Value
Par Value Currency** Description
Cost USD
Market Value USD
% of Net Assets
Bonds
Australia1,316,000 National Australia Bank Limited 2.332%
21/Aug/20301,316,000 1,279,584 0.87
1,316,000 1,279,584 0.87Bermuda
535,000 China Oil & Gas Group 4.700% 30/Jun/2026 535,000 546,055 0.37
535,000 546,055 0.37Cayman Islands
1,500,000 21Vianet Group Inc. 7.875% 15/Oct/2021 1,527,645 1,510,939 1.021,000,000 Central China Real Estate Limited 7.250%
16/Jul/2024993,309 870,339 0.59
800,000 China Overseas Grand Oceans Finance IV Cayman Limited 2.450% 9/Feb/2026
803,672 801,986 0.54
313,000 China SCE Group Holdings Limited 5.950% 29/Sep/2024
313,000 314,409 0.21
300,000 China SCE Group Holdings Limited 7.375% 9/Apr/2024
309,000 311,000 0.21
1,000,000 ENN Energy Holdings Limited 2.625% 17/Sep/2030
993,105 997,187 0.67
1,500,000 Geely Automobile Holdings Limited FRN Perp.
1,494,615 1,553,475 1.05
600,000 Hpht Finance 21 Limited 2.000% 19/Mar/2026
599,178 609,285 0.41
1,000,000 Logan Group Company Limited 5.750% 14/Jan/2025
1,001,664 1,039,375 0.70
1,500,000 Longfor Group Holdings Limited 3.950% 16/Sep/2029
1,554,837 1,621,315 1.11
800,000 Powerlong Real Estate Holdings Limited 6.250% 10/Aug/2024
834,000 829,000 0.56
1,119,000 Redsun Properties Group Limited 9.700% 16/Apr/2023
1,106,154 1,144,178 0.77
1,400,000 Sunac China Holdings Limited 7.500% 1/Feb/2024
1,411,515 1,437,333 0.97
1,000,000 Weibo Corp. 3.375% 8/Jul/2030 1,008,070 1,027,985 0.70750,000 Yuzhou Group Holdings Company 7.850%
12/Aug/2026800,625 594,609 0.40
750,000 Yuzhou Group Holdings Company Limited 8.500% 4/Feb/2023
709,688 708,750 0.48
900,000 Zhenro Properties Group Limited 6.630% 7/Jan/2026
900,000 813,750 0.55
400,000 Zhongsheng Group Holdings Limited 3.000% 13/Jan/2026
404,062 405,776 0.27
16,764,139 16,590,691 11.21
Portfolio of investments
as at 30 June 2021
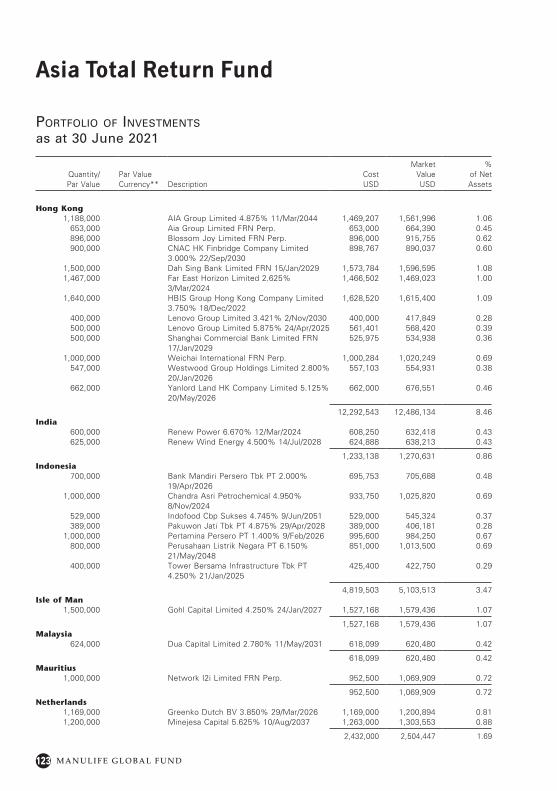
123
Asia Total Return Fund
M A N U L I F E G L O B A L F U N D
Quantity/ Par Value
Par Value Currency** Description
Cost USD
Market Value USD
% of Net Assets
Hong Kong1,188,000 AIA Group Limited 4.875% 11/Mar/2044 1,469,207 1,561,996 1.06
653,000 Aia Group Limited FRN Perp. 653,000 664,390 0.45896,000 Blossom Joy Limited FRN Perp. 896,000 915,755 0.62900,000 CNAC HK Finbridge Company Limited
3.000% 22/Sep/2030898,767 890,037 0.60
1,500,000 Dah Sing Bank Limited FRN 15/Jan/2029 1,573,784 1,596,595 1.081,467,000 Far East Horizon Limited 2.625%
3/Mar/20241,466,502 1,469,023 1.00
1,640,000 HBIS Group Hong Kong Company Limited 3.750% 18/Dec/2022
1,628,520 1,615,400 1.09
400,000 Lenovo Group Limited 3.421% 2/Nov/2030 400,000 417,849 0.28500,000 Lenovo Group Limited 5.875% 24/Apr/2025 561,401 568,420 0.39500,000 Shanghai Commercial Bank Limited FRN
17/Jan/2029525,975 534,938 0.36
1,000,000 Weichai International FRN Perp. 1,000,284 1,020,249 0.69547,000 Westwood Group Holdings Limited 2.800%
20/Jan/2026557,103 554,931 0.38
662,000 Yanlord Land HK Company Limited 5.125% 20/May/2026
662,000 676,551 0.46
12,292,543 12,486,134 8.46
India600,000 Renew Power 6.670% 12/Mar/2024 608,250 632,418 0.43625,000 Renew Wind Energy 4.500% 14/Jul/2028 624,888 638,213 0.43
1,233,138 1,270,631 0.86Indonesia
700,000 Bank Mandiri Persero Tbk PT 2.000% 19/Apr/2026
695,753 705,688 0.48
1,000,000 Chandra Asri Petrochemical 4.950% 8/Nov/2024
933,750 1,025,820 0.69
529,000 Indofood Cbp Sukses 4.745% 9/Jun/2051 529,000 545,324 0.37389,000 Pakuwon Jati Tbk PT 4.875% 29/Apr/2028 389,000 406,181 0.28
1,000,000 Pertamina Persero PT 1.400% 9/Feb/2026 995,600 984,250 0.67800,000 Perusahaan Listrik Negara PT 6.150%
21/May/2048851,000 1,013,500 0.69
400,000 Tower Bersama Infrastructure Tbk PT 4.250% 21/Jan/2025
425,400 422,750 0.29
4,819,503 5,103,513 3.47
Isle of Man1,500,000 Gohl Capital Limited 4.250% 24/Jan/2027 1,527,168 1,579,436 1.07
1,527,168 1,579,436 1.07Malaysia
624,000 Dua Capital Limited 2.780% 11/May/2031 618,099 620,480 0.42 618,099 620,480 0.42
Mauritius1,000,000 Network I2i Limited FRN Perp. 952,500 1,069,909 0.72
952,500 1,069,909 0.72Netherlands
1,169,000 Greenko Dutch BV 3.850% 29/Mar/2026 1,169,000 1,200,894 0.811,200,000 Minejesa Capital 5.625% 10/Aug/2037 1,263,000 1,303,553 0.88
2,432,000 2,504,447 1.69
Portfolio of investments
as at 30 June 2021
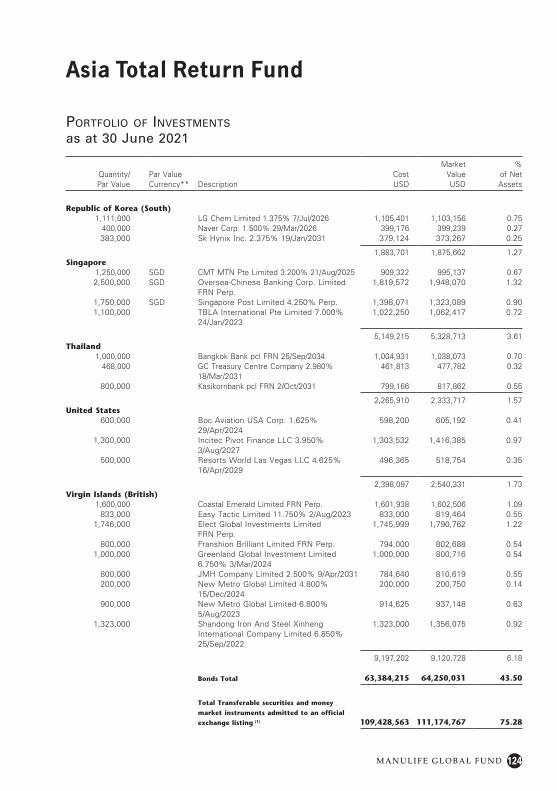
124
Asia Total Return Fund
M A N U L I F E G L O B A L F U N D
Quantity/ Par Value
Par Value Currency** Description
Cost USD
Market Value USD
% of Net Assets
Republic of Korea (South)1,111,000 LG Chem Limited 1.375% 7/Jul/2026 1,105,401 1,103,156 0.75
400,000 Naver Corp. 1.500% 29/Mar/2026 399,176 399,239 0.27383,000 Sk Hynix Inc. 2.375% 19/Jan/2031 379,124 373,267 0.25
1,883,701 1,875,662 1.27Singapore
1,250,000 SGD CMT MTN Pte Limited 3.200% 21/Aug/2025 909,322 995,137 0.672,500,000 SGD Oversea-Chinese Banking Corp. Limited
FRN Perp.1,819,572 1,948,070 1.32
1,750,000 SGD Singapore Post Limited 4.250% Perp. 1,398,071 1,323,089 0.901,100,000 TBLA International Pte Limited 7.000%
24/Jan/20231,022,250 1,062,417 0.72
5,149,215 5,328,713 3.61
Thailand1,000,000 Bangkok Bank pcl FRN 25/Sep/2034 1,004,931 1,038,073 0.70
468,000 GC Treasury Centre Company 2.980% 18/Mar/2031
461,813 477,782 0.32
800,000 Kasikornbank pcl FRN 2/Oct/2031 799,166 817,862 0.55 2,265,910 2,333,717 1.57
United States600,000 Boc Aviation USA Corp. 1.625%
29/Apr/2024598,200 605,192 0.41
1,300,000 Incitec Pivot Finance LLC 3.950% 3/Aug/2027
1,303,532 1,416,385 0.97
500,000 Resorts World Las Vegas LLC 4.625% 16/Apr/2029
496,365 518,754 0.35
2,398,097 2,540,331 1.73
Virgin Islands (British)1,600,000 Coastal Emerald Limited FRN Perp. 1,601,938 1,602,506 1.09
833,000 Easy Tactic Limited 11.750% 2/Aug/2023 833,000 819,464 0.551,746,000 Elect Global Investments Limited
FRN Perp.1,745,999 1,790,762 1.22
800,000 Franshion Brilliant Limited FRN Perp. 794,000 802,688 0.541,000,000 Greenland Global Investment Limited
6.750% 3/Mar/20241,000,000 800,716 0.54
800,000 JMH Company Limited 2.500% 9/Apr/2031 784,640 810,619 0.55200,000 New Metro Global Limited 4.800%
15/Dec/2024200,000 200,750 0.14
900,000 New Metro Global Limited 6.800% 5/Aug/2023
914,625 937,148 0.63
1,323,000 Shandong Iron And Steel Xinheng International Company Limited 6.850% 25/Sep/2022
1,323,000 1,356,075 0.92
9,197,202 9,120,728 6.18
Bonds Total 63,384,215 64,250,031 43.50
Total Transferable securities and money
market instruments admitted to an official
exchange listing (1) 109,428,563 111,174,767 75.28
Portfolio of investments
as at 30 June 2021
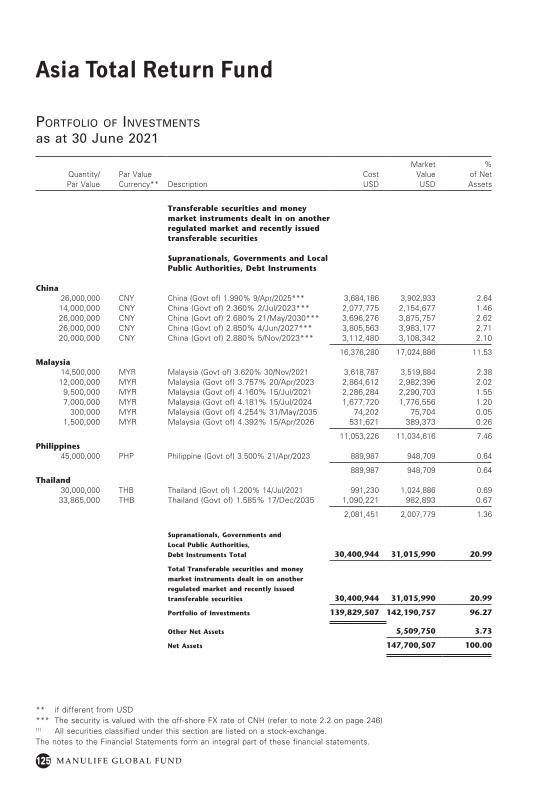
125
Asia Total Return Fund
M A N U L I F E G L O B A L F U N D
Quantity/ Par Value
Par Value Currency** Description
Cost USD
Market Value USD
% of Net Assets
Transferable securities and money market instruments dealt in on another regulated market and recently issued transferable securities
Supranationals, Governments and Local Public Authorities, Debt Instruments
China26,000,000 CNY China (Govt of) 1.990% 9/Apr/2025*** 3,684,186 3,902,933 2.6414,000,000 CNY China (Govt of) 2.360% 2/Jul/2023*** 2,077,775 2,154,677 1.4626,000,000 CNY China (Govt of) 2.680% 21/May/2030*** 3,696,276 3,875,757 2.6226,000,000 CNY China (Govt of) 2.850% 4/Jun/2027*** 3,805,563 3,983,177 2.7120,000,000 CNY China (Govt of) 2.880% 5/Nov/2023*** 3,112,480 3,108,342 2.10
16,376,280 17,024,886 11.53Malaysia
14,500,000 MYR Malaysia (Govt of) 3.620% 30/Nov/2021 3,618,787 3,519,884 2.3812,000,000 MYR Malaysia (Govt of) 3.757% 20/Apr/2023 2,864,612 2,982,396 2.02
9,500,000 MYR Malaysia (Govt of) 4.160% 15/Jul/2021 2,286,284 2,290,703 1.557,000,000 MYR Malaysia (Govt of) 4.181% 15/Jul/2024 1,677,720 1,776,556 1.20
300,000 MYR Malaysia (Govt of) 4.254% 31/May/2035 74,202 75,704 0.051,500,000 MYR Malaysia (Govt of) 4.392% 15/Apr/2026 531,621 389,373 0.26
11,053,226 11,034,616 7.46Philippines
45,000,000 PHP Philippine (Govt of) 3.500% 21/Apr/2023 889,987 948,709 0.64
889,987 948,709 0.64Thailand
30,000,000 THB Thailand (Govt of) 1.200% 14/Jul/2021 991,230 1,024,886 0.6933,865,000 THB Thailand (Govt of) 1.585% 17/Dec/2035 1,090,221 982,893 0.67
2,081,451 2,007,779 1.36
Supranationals, Governments and
Local Public Authorities,
Debt Instruments Total 30,400,944 31,015,990 20.99
Total Transferable securities and money
market instruments dealt in on another
regulated market and recently issued
transferable securities 30,400,944 31,015,990 20.99
Portfolio of Investments 139,829,507 142,190,757 96.27
Other Net Assets 5,509,750 3.73
Net Assets 147,700,507 100.00
Portfolio of investments
as at 30 June 2021
** if different from USD*** The security is valued with the off-shore FX rate of CNH (refer to note 2.2 on page 246)(1) All securities classified under this section are listed on a stock-exchange.The notes to the Financial Statements form an integral part of these financial statements.
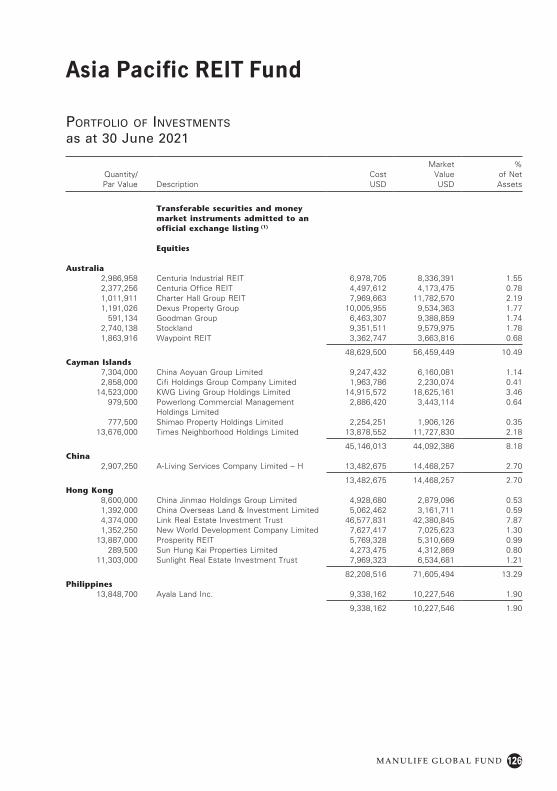
126
Asia Pacific REIT Fund
M A N U L I F E G L O B A L F U N D
Portfolio of investments
as at 30 June 2021
Quantity/ Par Value Description
Cost USD
Market Value USD
% of Net Assets
Transferable securities and money market instruments admitted to an official exchange listing (1)
Equities
Australia2,986,958 Centuria Industrial REIT 6,978,705 8,336,391 1.552,377,256 Centuria Office REIT 4,497,612 4,173,475 0.781,011,911 Charter Hall Group REIT 7,969,663 11,782,570 2.191,191,026 Dexus Property Group 10,005,955 9,534,363 1.77
591,134 Goodman Group 6,463,307 9,388,859 1.742,740,138 Stockland 9,351,511 9,579,975 1.781,863,916 Waypoint REIT 3,362,747 3,663,816 0.68
48,629,500 56,459,449 10.49Cayman Islands
7,304,000 China Aoyuan Group Limited 9,247,432 6,160,081 1.142,858,000 Cifi Holdings Group Company Limited 1,963,786 2,230,074 0.41
14,523,000 KWG Living Group Holdings Limited 14,915,572 18,625,161 3.46979,500 Powerlong Commercial Management
Holdings Limited2,886,420 3,443,114 0.64
777,500 Shimao Property Holdings Limited 2,254,251 1,906,126 0.3513,676,000 Times Neighborhood Holdings Limited 13,878,552 11,727,830 2.18
45,146,013 44,092,386 8.18China
2,907,250 A-Living Services Company Limited – H 13,482,675 14,468,257 2.70
13,482,675 14,468,257 2.70Hong Kong
8,600,000 China Jinmao Holdings Group Limited 4,928,680 2,879,096 0.531,392,000 China Overseas Land & Investment Limited 5,062,462 3,161,711 0.594,374,000 Link Real Estate Investment Trust 46,577,831 42,380,845 7.871,352,250 New World Development Company Limited 7,627,417 7,025,623 1.30
13,887,000 Prosperity REIT 5,769,328 5,310,669 0.99289,500 Sun Hung Kai Properties Limited 4,273,475 4,312,869 0.80
11,303,000 Sunlight Real Estate Investment Trust 7,969,323 6,534,681 1.21
82,208,516 71,605,494 13.29Philippines
13,848,700 Ayala Land Inc. 9,338,162 10,227,546 1.90
9,338,162 10,227,546 1.90
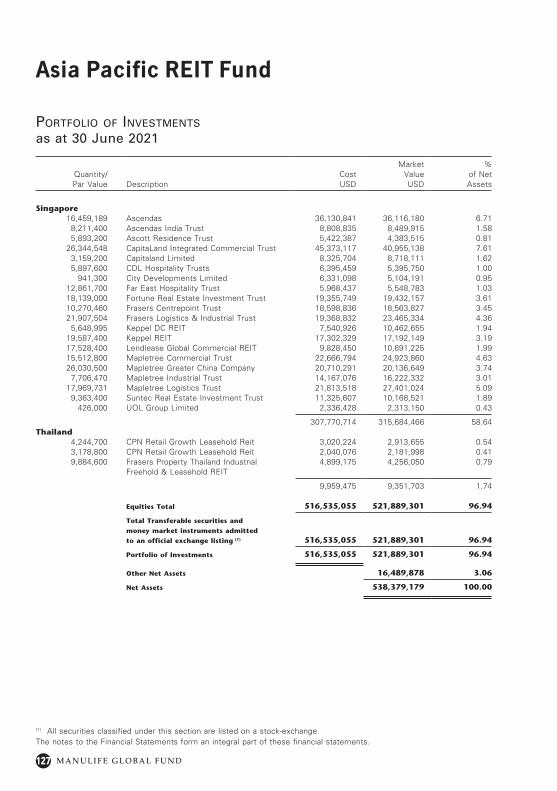
127
Asia Pacific REIT Fund
M A N U L I F E G L O B A L F U N D
Quantity/ Par Value Description
Cost USD
Market Value USD
% of Net Assets
Singapore16,459,189 Ascendas 36,130,841 36,116,180 6.71
8,211,400 Ascendas India Trust 8,808,835 8,489,915 1.585,893,200 Ascott Residence Trust 5,422,387 4,383,515 0.81
26,344,548 CapitaLand Integrated Commercial Trust 45,373,117 40,955,138 7.613,159,200 Capitaland Limited 8,325,704 8,718,111 1.625,897,600 CDL Hospitality Trusts 6,395,459 5,395,750 1.00
941,300 City Developments Limited 6,331,098 5,104,191 0.9512,861,700 Far East Hospitality Trust 5,968,437 5,548,783 1.0318,139,000 Fortune Real Estate Investment Trust 19,355,749 19,432,157 3.6110,270,460 Frasers Centrepoint Trust 18,598,836 18,563,827 3.4521,907,504 Frasers Logistics & Industrial Trust 19,368,832 23,465,334 4.36
5,648,995 Keppel DC REIT 7,540,926 10,462,655 1.9419,587,400 Keppel REIT 17,302,329 17,192,149 3.1917,528,400 Lendlease Global Commercial REIT 9,828,450 10,691,225 1.9915,512,800 Mapletree Commercial Trust 22,666,794 24,923,860 4.6326,030,500 Mapletree Greater China Company 20,710,291 20,136,649 3.74
7,706,470 Mapletree Industrial Trust 14,167,076 16,222,332 3.0117,969,731 Mapletree Logistics Trust 21,813,518 27,401,024 5.09
9,363,400 Suntec Real Estate Investment Trust 11,325,607 10,168,521 1.89426,000 UOL Group Limited 2,336,428 2,313,150 0.43
307,770,714 315,684,466 58.64Thailand
4,244,700 CPN Retail Growth Leasehold Reit 3,020,224 2,913,655 0.543,178,800 CPN Retail Growth Leasehold Reit 2,040,076 2,181,998 0.419,884,600 Frasers Property Thailand Industrial
Freehold & Leasehold REIT4,899,175 4,256,050 0.79
9,959,475 9,351,703 1.74
Equities Total 516,535,055 521,889,301 96.94
Total Transferable securities and
money market instruments admitted
to an official exchange listing (1) 516,535,055 521,889,301 96.94
Portfolio of Investments 516,535,055 521,889,301 96.94
Other Net Assets 16,489,878 3.06
Net Assets 538,379,179 100.00
(1) All securities classified under this section are listed on a stock-exchange.The notes to the Financial Statements form an integral part of these financial statements.
Portfolio of investments
as at 30 June 2021
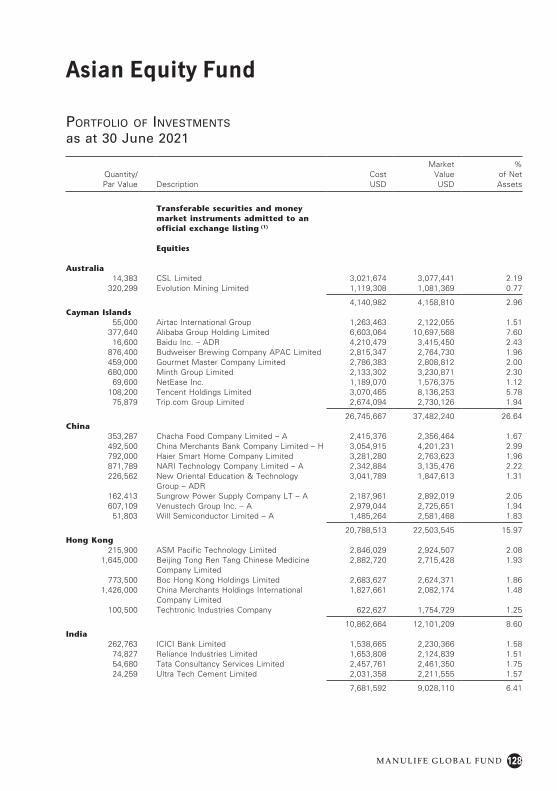
128
Asian Equity Fund
M A N U L I F E G L O B A L F U N D
Portfolio of investments
as at 30 June 2021
Quantity/ Par Value Description
Cost USD
Market Value USD
% of Net Assets
Transferable securities and money market instruments admitted to an official exchange listing (1)
Equities
Australia14,383 CSL Limited 3,021,674 3,077,441 2.19
320,299 Evolution Mining Limited 1,119,308 1,081,369 0.77
4,140,982 4,158,810 2.96Cayman Islands
55,000 Airtac International Group 1,263,463 2,122,055 1.51377,640 Alibaba Group Holding Limited 6,603,064 10,697,568 7.60
16,600 Baidu Inc. – ADR 4,210,479 3,415,450 2.43876,400 Budweiser Brewing Company APAC Limited 2,815,347 2,764,730 1.96459,000 Gourmet Master Company Limited 2,786,383 2,808,812 2.00680,000 Minth Group Limited 2,133,302 3,230,871 2.30
69,600 NetEase Inc. 1,189,070 1,576,375 1.12108,200 Tencent Holdings Limited 3,070,465 8,136,253 5.78
75,879 Trip.com Group Limited 2,674,094 2,730,126 1.94
26,745,667 37,482,240 26.64 China
353,287 Chacha Food Company Limited – A 2,415,376 2,356,464 1.67492,500 China Merchants Bank Company Limited – H 3,054,915 4,201,231 2.99792,000 Haier Smart Home Company Limited 3,281,280 2,763,623 1.96871,789 NARI Technology Company Limited – A 2,342,884 3,135,476 2.22226,562 New Oriental Education & Technology
Group – ADR3,041,789 1,847,613 1.31
162,413 Sungrow Power Supply Company LT – A 2,187,961 2,892,019 2.05607,109 Venustech Group Inc. – A 2,979,044 2,725,651 1.94
51,803 Will Semiconductor Limited – A 1,485,264 2,581,468 1.83
20,788,513 22,503,545 15.97 Hong Kong
215,900 ASM Pacific Technology Limited 2,846,029 2,924,507 2.081,645,000 Beijing Tong Ren Tang Chinese Medicine
Company Limited2,882,720 2,715,428 1.93
773,500 Boc Hong Kong Holdings Limited 2,683,627 2,624,371 1.861,426,000 China Merchants Holdings International
Company Limited1,827,661 2,082,174 1.48
100,500 Techtronic Industries Company 622,627 1,754,729 1.25
10,862,664 12,101,209 8.60 India
262,763 ICICI Bank Limited 1,538,665 2,230,366 1.5874,827 Reliance Industries Limited 1,653,808 2,124,839 1.5154,680 Tata Consultancy Services Limited 2,457,761 2,461,350 1.7524,259 Ultra Tech Cement Limited 2,031,358 2,211,555 1.57
7,681,592 9,028,110 6.41
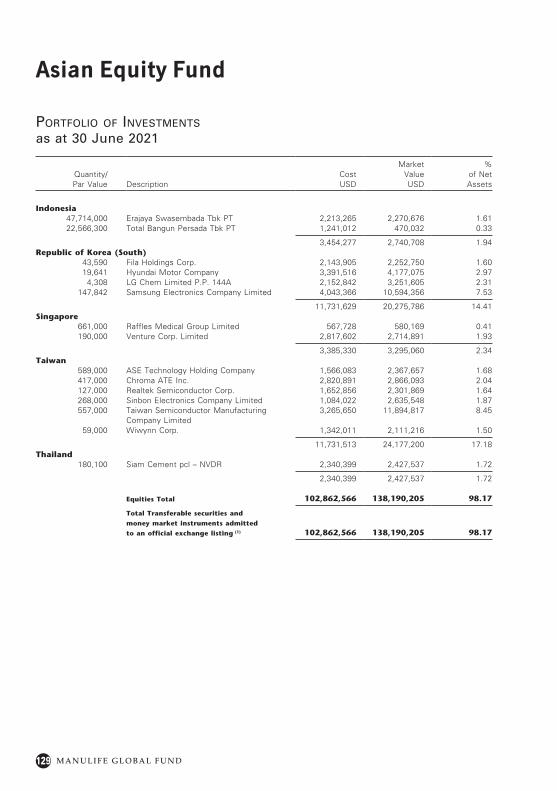
Asian Equity Fund
M A N U L I F E G L O B A L F U N D129
Quantity/ Par Value Description
Cost USD
Market Value USD
% of Net Assets
Indonesia47,714,000 Erajaya Swasembada Tbk PT 2,213,265 2,270,676 1.6122,566,300 Total Bangun Persada Tbk PT 1,241,012 470,032 0.33
3,454,277 2,740,708 1.94 Republic of Korea (South)
43,590 Fila Holdings Corp. 2,143,905 2,252,750 1.6019,641 Hyundai Motor Company 3,391,516 4,177,075 2.97
4,308 LG Chem Limited P.P. 144A 2,152,842 3,251,605 2.31147,842 Samsung Electronics Company Limited 4,043,366 10,594,356 7.53
11,731,629 20,275,786 14.41 Singapore
661,000 Raffles Medical Group Limited 567,728 580,169 0.41190,000 Venture Corp. Limited 2,817,602 2,714,891 1.93
3,385,330 3,295,060 2.34 Taiwan
589,000 ASE Technology Holding Company 1,566,083 2,367,657 1.68417,000 Chroma ATE Inc. 2,820,891 2,866,093 2.04127,000 Realtek Semiconductor Corp. 1,652,856 2,301,869 1.64268,000 Sinbon Electronics Company Limited 1,084,022 2,635,548 1.87557,000 Taiwan Semiconductor Manufacturing
Company Limited3,265,650 11,894,817 8.45
59,000 Wiwynn Corp. 1,342,011 2,111,216 1.50
11,731,513 24,177,200 17.18 Thailand
180,100 Siam Cement pcl – NVDR 2,340,399 2,427,537 1.72
2,340,399 2,427,537 1.72
Equities Total 102,862,566 138,190,205 98.17
Total Transferable securities and
money market instruments admitted
to an official exchange listing (1) 102,862,566 138,190,205 98.17
Portfolio of investments
as at 30 June 2021
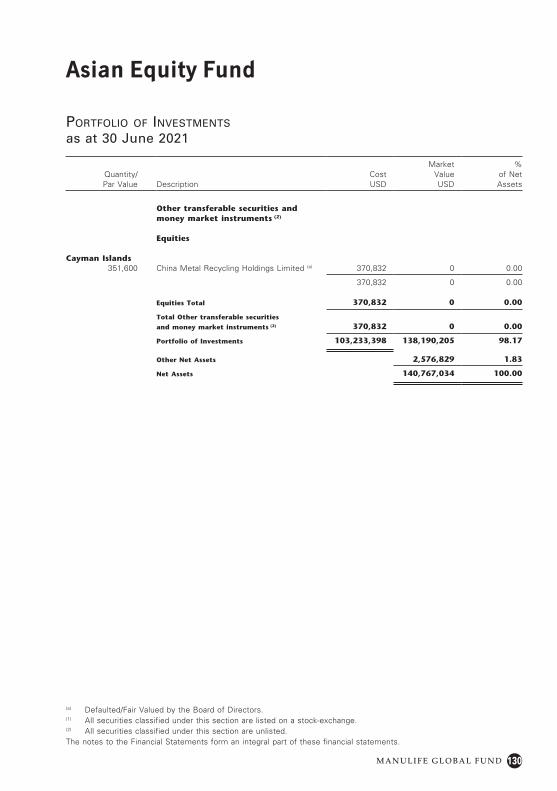
Asian Equity Fund
M A N U L I F E G L O B A L F U N D 130
(a) Defaulted/Fair Valued by the Board of Directors.(1) All securities classified under this section are listed on a stock-exchange.(2) All securities classified under this section are unlisted.The notes to the Financial Statements form an integral part of these financial statements.
Quantity/ Par Value Description
Cost USD
Market Value USD
% of Net Assets
Other transferable securities and money market instruments (2)
Equities
Cayman Islands351,600 China Metal Recycling Holdings Limited (a) 370,832 0 0.00
370,832 0 0.00
Equities Total 370,832 0 0.00
Total Other transferable securities
and money market instruments (2) 370,832 0 0.00
Portfolio of Investments 103,233,398 138,190,205 98.17
Other Net Assets 2,576,829 1.83
Net Assets 140,767,034 100.00
Portfolio of investments
as at 30 June 2021
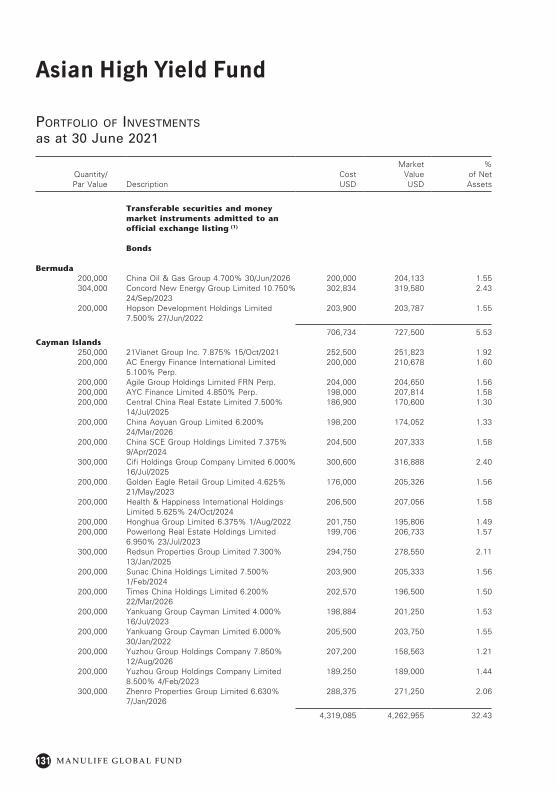
Asian High Yield Fund
M A N U L I F E G L O B A L F U N D131
Portfolio of investments
as at 30 June 2021
Quantity/ Par Value Description
Cost USD
Market Value USD
% of Net Assets
Transferable securities and money market instruments admitted to an official exchange listing (1)
Bonds
Bermuda200,000 China Oil & Gas Group 4.700% 30/Jun/2026 200,000 204,133 1.55304,000 Concord New Energy Group Limited 10.750%
24/Sep/2023302,834 319,580 2.43
200,000 Hopson Development Holdings Limited 7.500% 27/Jun/2022
203,900 203,787 1.55
706,734 727,500 5.53Cayman Islands
250,000 21Vianet Group Inc. 7.875% 15/Oct/2021 252,500 251,823 1.92200,000 AC Energy Finance International Limited
5.100% Perp.200,000 210,678 1.60
200,000 Agile Group Holdings Limited FRN Perp. 204,000 204,650 1.56200,000 AYC Finance Limited 4.850% Perp. 198,000 207,814 1.58200,000 Central China Real Estate Limited 7.500%
14/Jul/2025186,900 170,600 1.30
200,000 China Aoyuan Group Limited 6.200% 24/Mar/2026
198,200 174,052 1.33
200,000 China SCE Group Holdings Limited 7.375% 9/Apr/2024
204,500 207,333 1.58
300,000 Cifi Holdings Group Company Limited 6.000% 16/Jul/2025
300,600 316,888 2.40
200,000 Golden Eagle Retail Group Limited 4.625% 21/May/2023
176,000 205,326 1.56
200,000 Health & Happiness International Holdings Limited 5.625% 24/Oct/2024
206,500 207,056 1.58
200,000 Honghua Group Limited 6.375% 1/Aug/2022 201,750 195,806 1.49200,000 Powerlong Real Estate Holdings Limited
6.950% 23/Jul/2023199,706 206,733 1.57
300,000 Redsun Properties Group Limited 7.300% 13/Jan/2025
294,750 278,550 2.11
200,000 Sunac China Holdings Limited 7.500% 1/Feb/2024
203,900 205,333 1.56
200,000 Times China Holdings Limited 6.200% 22/Mar/2026
202,570 196,500 1.50
200,000 Yankuang Group Cayman Limited 4.000% 16/Jul/2023
198,884 201,250 1.53
200,000 Yankuang Group Cayman Limited 6.000% 30/Jan/2022
205,500 203,750 1.55
200,000 Yuzhou Group Holdings Company 7.850% 12/Aug/2026
207,200 158,563 1.21
200,000 Yuzhou Group Holdings Company Limited 8.500% 4/Feb/2023
189,250 189,000 1.44
300,000 Zhenro Properties Group Limited 6.630% 7/Jan/2026
288,375 271,250 2.06
4,319,085 4,262,955 32.43
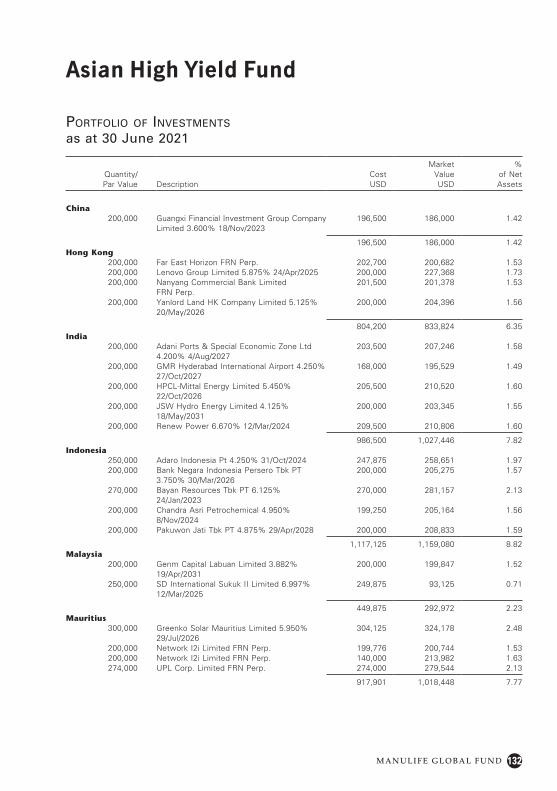
Asian High Yield Fund
M A N U L I F E G L O B A L F U N D 132
Quantity/ Par Value Description
Cost USD
Market Value USD
% of Net Assets
China200,000 Guangxi Financial Investment Group Company
Limited 3.600% 18/Nov/2023196,500 186,000 1.42
196,500 186,000 1.42Hong Kong
200,000 Far East Horizon FRN Perp. 202,700 200,682 1.53200,000 Lenovo Group Limited 5.875% 24/Apr/2025 200,000 227,368 1.73200,000 Nanyang Commercial Bank Limited
FRN Perp.201,500 201,378 1.53
200,000 Yanlord Land HK Company Limited 5.125% 20/May/2026
200,000 204,396 1.56
804,200 833,824 6.35India
200,000 Adani Ports & Special Economic Zone Ltd 4.200% 4/Aug/2027
203,500 207,246 1.58
200,000 GMR Hyderabad International Airport 4.250% 27/Oct/2027
168,000 195,529 1.49
200,000 HPCL-Mittal Energy Limited 5.450% 22/Oct/2026
205,500 210,520 1.60
200,000 JSW Hydro Energy Limited 4.125% 18/May/2031
200,000 203,345 1.55
200,000 Renew Power 6.670% 12/Mar/2024 209,500 210,806 1.60
986,500 1,027,446 7.82Indonesia
250,000 Adaro Indonesia Pt 4.250% 31/Oct/2024 247,875 258,651 1.97200,000 Bank Negara Indonesia Persero Tbk PT
3.750% 30/Mar/2026200,000 205,275 1.57
270,000 Bayan Resources Tbk PT 6.125% 24/Jan/2023
270,000 281,157 2.13
200,000 Chandra Asri Petrochemical 4.950% 8/Nov/2024
199,250 205,164 1.56
200,000 Pakuwon Jati Tbk PT 4.875% 29/Apr/2028 200,000 208,833 1.59
1,117,125 1,159,080 8.82Malaysia
200,000 Genm Capital Labuan Limited 3.882% 19/Apr/2031
200,000 199,847 1.52
250,000 SD International Sukuk II Limited 6.997% 12/Mar/2025
249,875 93,125 0.71
449,875 292,972 2.23Mauritius
300,000 Greenko Solar Mauritius Limited 5.950% 29/Jul/2026
304,125 324,178 2.48
200,000 Network I2i Limited FRN Perp. 199,776 200,744 1.53200,000 Network I2i Limited FRN Perp. 140,000 213,982 1.63274,000 UPL Corp. Limited FRN Perp. 274,000 279,544 2.13
917,901 1,018,448 7.77
Portfolio of investments
as at 30 June 2021
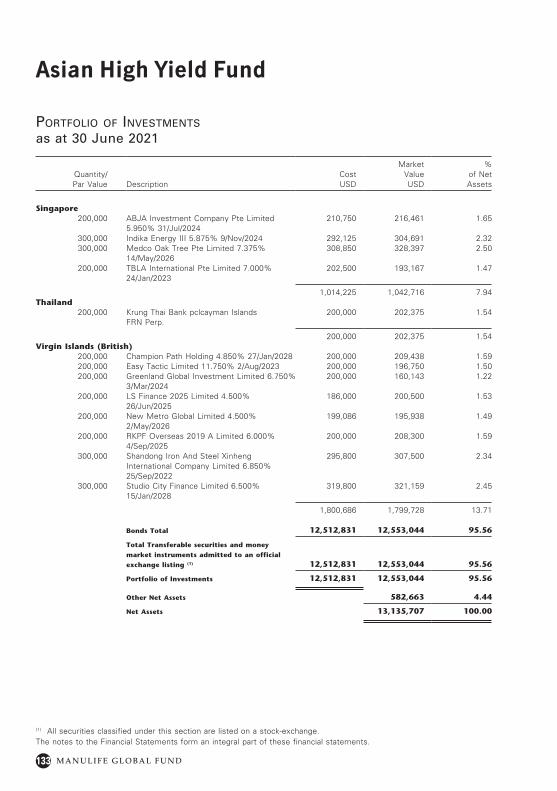
Asian High Yield Fund
M A N U L I F E G L O B A L F U N D133
(1) All securities classified under this section are listed on a stock-exchange.The notes to the Financial Statements form an integral part of these financial statements.
Quantity/ Par Value Description
Cost USD
Market Value USD
% of Net Assets
Singapore200,000 ABJA Investment Company Pte Limited
5.950% 31/Jul/2024210,750 216,461 1.65
300,000 Indika Energy III 5.875% 9/Nov/2024 292,125 304,691 2.32300,000 Medco Oak Tree Pte Limited 7.375%
14/May/2026308,850 328,397 2.50
200,000 TBLA International Pte Limited 7.000% 24/Jan/2023
202,500 193,167 1.47
1,014,225 1,042,716 7.94Thailand
200,000 Krung Thai Bank pclcayman Islands FRN Perp.
200,000 202,375 1.54
200,000 202,375 1.54Virgin Islands (British)
200,000 Champion Path Holding 4.850% 27/Jan/2028 200,000 209,438 1.59200,000 Easy Tactic Limited 11.750% 2/Aug/2023 200,000 196,750 1.50200,000 Greenland Global Investment Limited 6.750%
3/Mar/2024200,000 160,143 1.22
200,000 LS Finance 2025 Limited 4.500% 26/Jun/2025
186,000 200,500 1.53
200,000 New Metro Global Limited 4.500% 2/May/2026
199,086 195,938 1.49
200,000 RKPF Overseas 2019 A Limited 6.000% 4/Sep/2025
200,000 208,300 1.59
300,000 Shandong Iron And Steel Xinheng International Company Limited 6.850% 25/Sep/2022
295,800 307,500 2.34
300,000 Studio City Finance Limited 6.500% 15/Jan/2028
319,800 321,159 2.45
1,800,686 1,799,728 13.71
Bonds Total 12,512,831 12,553,044 95.56
Total Transferable securities and money
market instruments admitted to an official
exchange listing (1) 12,512,831 12,553,044 95.56
Portfolio of Investments 12,512,831 12,553,044 95.56
Other Net Assets 582,663 4.44
Net Assets 13,135,707 100.00
Portfolio of investments
as at 30 June 2021
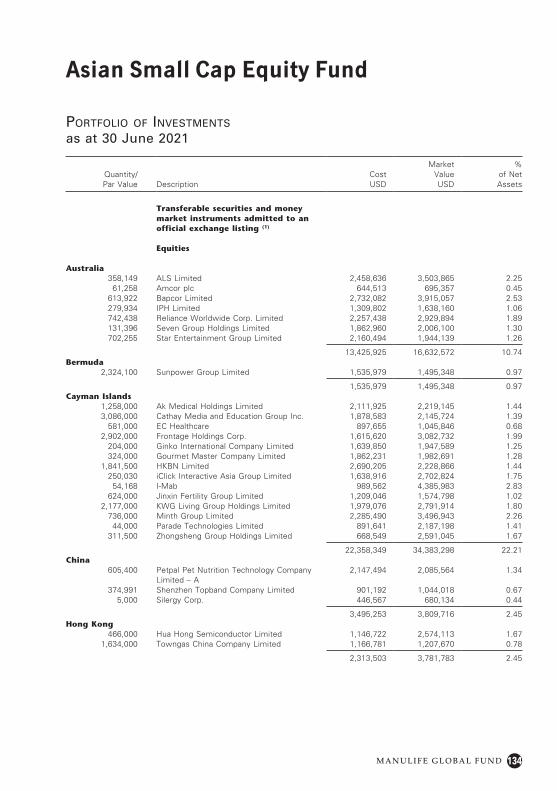
Asian Small Cap Equity Fund
M A N U L I F E G L O B A L F U N D 134
Portfolio of investments
as at 30 June 2021
Quantity/ Par Value Description
Cost USD
Market Value USD
% of Net Assets
Transferable securities and money market instruments admitted to an official exchange listing (1)
Equities
Australia358,149 ALS Limited 2,458,636 3,503,865 2.25
61,258 Amcor plc 644,513 695,357 0.45613,922 Bapcor Limited 2,732,082 3,915,057 2.53279,934 IPH Limited 1,309,802 1,638,160 1.06742,438 Reliance Worldwide Corp. Limited 2,257,438 2,929,894 1.89131,396 Seven Group Holdings Limited 1,862,960 2,006,100 1.30702,255 Star Entertainment Group Limited 2,160,494 1,944,139 1.26
13,425,925 16,632,572 10.74Bermuda
2,324,100 Sunpower Group Limited 1,535,979 1,495,348 0.97
1,535,979 1,495,348 0.97Cayman Islands
1,258,000 Ak Medical Holdings Limited 2,111,925 2,219,145 1.443,086,000 Cathay Media and Education Group Inc. 1,878,583 2,145,724 1.39
581,000 EC Healthcare 897,655 1,045,846 0.682,902,000 Frontage Holdings Corp. 1,615,620 3,082,732 1.99
204,000 Ginko International Company Limited 1,639,850 1,947,589 1.25324,000 Gourmet Master Company Limited 1,862,231 1,982,691 1.28
1,841,500 HKBN Limited 2,690,205 2,228,866 1.44250,030 iClick Interactive Asia Group Limited 1,638,916 2,702,824 1.75
54,168 I-Mab 989,562 4,385,983 2.83624,000 Jinxin Fertility Group Limited 1,209,046 1,574,798 1.02
2,177,000 KWG Living Group Holdings Limited 1,979,076 2,791,914 1.80736,000 Minth Group Limited 2,285,490 3,496,943 2.26
44,000 Parade Technologies Limited 891,641 2,187,198 1.41311,500 Zhongsheng Group Holdings Limited 668,549 2,591,045 1.67
22,358,349 34,383,298 22.21China
605,400 Petpal Pet Nutrition Technology Company Limited – A
2,147,494 2,085,564 1.34
374,991 Shenzhen Topband Company Limited 901,192 1,044,018 0.675,000 Silergy Corp. 446,567 680,134 0.44
3,495,253 3,809,716 2.45Hong Kong
466,000 Hua Hong Semiconductor Limited 1,146,722 2,574,113 1.671,634,000 Towngas China Company Limited 1,166,781 1,207,670 0.78
2,313,503 3,781,783 2.45
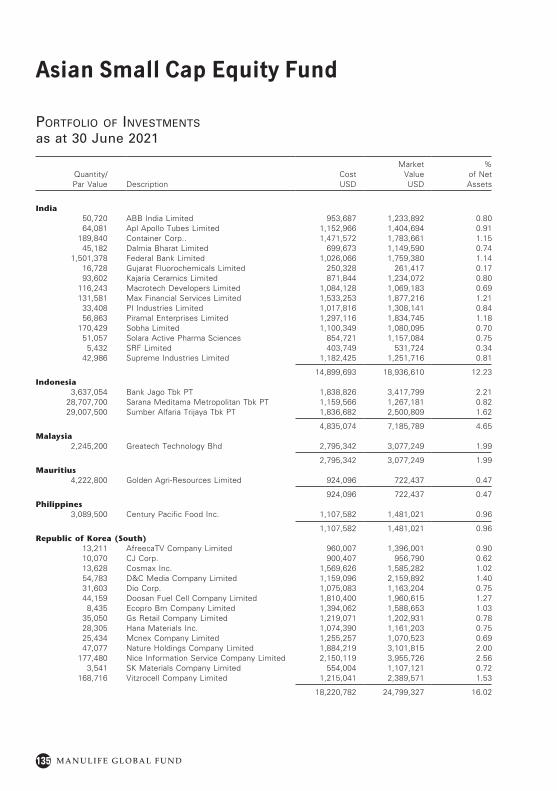
Asian Small Cap Equity Fund
M A N U L I F E G L O B A L F U N D135
Quantity/ Par Value Description
Cost USD
Market Value USD
% of Net Assets
India50,720 ABB India Limited 953,687 1,233,892 0.8064,081 Apl Apollo Tubes Limited 1,152,966 1,404,694 0.91
189,840 Container Corp.. 1,471,572 1,783,661 1.1545,182 Dalmia Bharat Limited 699,673 1,149,590 0.74
1,501,378 Federal Bank Limited 1,026,066 1,759,380 1.1416,728 Gujarat Fluorochemicals Limited 250,328 261,417 0.1793,602 Kajaria Ceramics Limited 871,844 1,234,072 0.80
116,243 Macrotech Developers Limited 1,084,128 1,069,183 0.69131,581 Max Financial Services Limited 1,533,253 1,877,216 1.21
33,408 PI Industries Limited 1,017,816 1,308,141 0.8456,863 Piramal Enterprises Limited 1,297,116 1,834,745 1.18
170,429 Sobha Limited 1,100,349 1,080,095 0.7051,057 Solara Active Pharma Sciences 854,721 1,157,084 0.75
5,432 SRF Limited 403,749 531,724 0.3442,986 Supreme Industries Limited 1,182,425 1,251,716 0.81
14,899,693 18,936,610 12.23Indonesia
3,637,054 Bank Jago Tbk PT 1,838,826 3,417,799 2.2128,707,700 Sarana Meditama Metropolitan Tbk PT 1,159,566 1,267,181 0.8229,007,500 Sumber Alfaria Trijaya Tbk PT 1,836,682 2,500,809 1.62
4,835,074 7,185,789 4.65Malaysia
2,245,200 Greatech Technology Bhd 2,795,342 3,077,249 1.99
2,795,342 3,077,249 1.99Mauritius
4,222,800 Golden Agri-Resources Limited 924,096 722,437 0.47
924,096 722,437 0.47Philippines
3,089,500 Century Pacific Food Inc. 1,107,582 1,481,021 0.96
1,107,582 1,481,021 0.96Republic of Korea (South)
13,211 AfreecaTV Company Limited 960,007 1,396,001 0.9010,070 CJ Corp. 900,407 956,790 0.6213,628 Cosmax Inc. 1,569,626 1,585,282 1.0254,783 D&C Media Company Limited 1,159,096 2,159,892 1.4031,603 Dio Corp. 1,075,083 1,163,204 0.7544,159 Doosan Fuel Cell Company Limited 1,810,400 1,960,615 1.27
8,435 Ecopro Bm Company Limited 1,394,062 1,588,653 1.0335,050 Gs Retail Company Limited 1,219,071 1,202,931 0.7828,305 Hana Materials Inc. 1,074,390 1,161,203 0.7525,434 Mcnex Company Limited 1,255,257 1,070,523 0.6947,077 Nature Holdings Company Limited 1,884,219 3,101,815 2.00
177,480 Nice Information Service Company Limited 2,150,119 3,955,726 2.563,541 SK Materials Company Limited 554,004 1,107,121 0.72
168,716 Vitzrocell Company Limited 1,215,041 2,389,571 1.53
18,220,782 24,799,327 16.02
Portfolio of investments
as at 30 June 2021
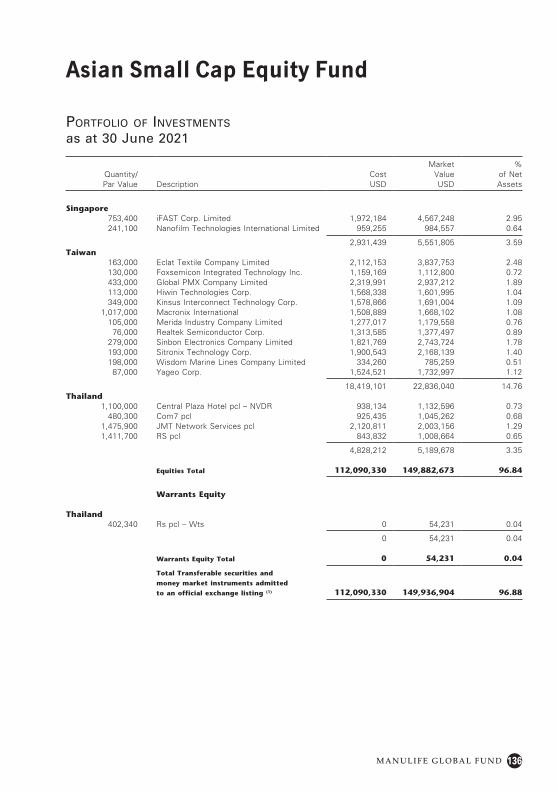
Asian Small Cap Equity Fund
M A N U L I F E G L O B A L F U N D 136
Quantity/ Par Value Description
Cost USD
Market Value USD
% of Net Assets
Singapore753,400 iFAST Corp. Limited 1,972,184 4,567,248 2.95241,100 Nanofilm Technologies International Limited 959,255 984,557 0.64
2,931,439 5,551,805 3.59Taiwan
163,000 Eclat Textile Company Limited 2,112,153 3,837,753 2.48130,000 Foxsemicon Integrated Technology Inc. 1,159,169 1,112,800 0.72433,000 Global PMX Company Limited 2,319,991 2,937,212 1.89113,000 Hiwin Technologies Corp. 1,568,338 1,601,995 1.04349,000 Kinsus Interconnect Technology Corp. 1,578,866 1,691,004 1.09
1,017,000 Macronix International 1,508,889 1,668,102 1.08105,000 Merida Industry Company Limited 1,277,017 1,179,558 0.76
76,000 Realtek Semiconductor Corp. 1,313,585 1,377,497 0.89279,000 Sinbon Electronics Company Limited 1,821,769 2,743,724 1.78193,000 Sitronix Technology Corp. 1,900,543 2,168,139 1.40198,000 Wisdom Marine Lines Company Limited 334,260 785,259 0.51
87,000 Yageo Corp. 1,524,521 1,732,997 1.12
18,419,101 22,836,040 14.76Thailand
1,100,000 Central Plaza Hotel pcl – NVDR 938,134 1,132,596 0.73480,300 Com7 pcl 925,435 1,045,262 0.68
1,475,900 JMT Network Services pcl 2,120,811 2,003,156 1.291,411,700 RS pcl 843,832 1,008,664 0.65
4,828,212 5,189,678 3.35
Equities Total 112,090,330 149,882,673 96.84
Warrants Equity
Thailand402,340 Rs pcl – Wts 0 54,231 0.04
0 54,231 0.04
Warrants Equity Total 0 54,231 0.04
Total Transferable securities and
money market instruments admitted
to an official exchange listing (1) 112,090,330 149,936,904 96.88
Portfolio of investments
as at 30 June 2021
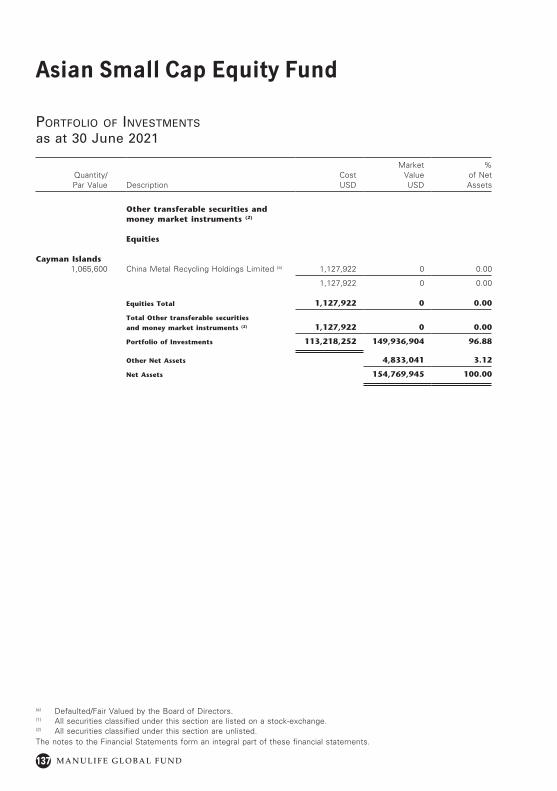
Asian Small Cap Equity Fund
M A N U L I F E G L O B A L F U N D137
(a) Defaulted/Fair Valued by the Board of Directors.(1) All securities classified under this section are listed on a stock-exchange.(2) All securities classified under this section are unlisted.The notes to the Financial Statements form an integral part of these financial statements.
Quantity/ Par Value Description
Cost USD
Market Value USD
% of Net Assets
Other transferable securities and money market instruments (2)
Equities
Cayman Islands1,065,600 China Metal Recycling Holdings Limited (a) 1,127,922 0 0.00
1,127,922 0 0.00
Equities Total 1,127,922 0 0.00
Total Other transferable securities
and money market instruments (2) 1,127,922 0 0.00
Portfolio of Investments 113,218,252 149,936,904 96.88
Other Net Assets 4,833,041 3.12
Net Assets 154,769,945 100.00
Portfolio of investments
as at 30 June 2021
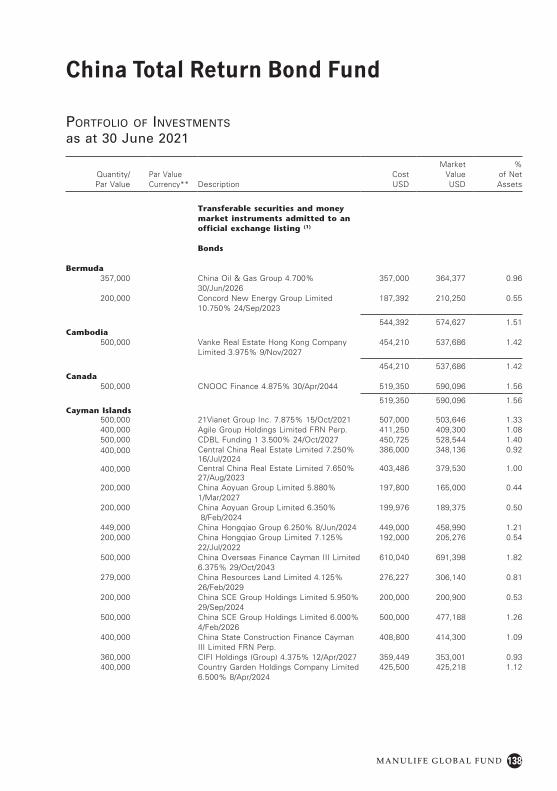
138
China Total Return Bond Fund
M A N U L I F E G L O B A L F U N D
Portfolio of investments
as at 30 June 2021
Quantity/ Par Value
Par Value Currency** Description
Cost USD
Market Value USD
% of Net Assets
Transferable securities and money market instruments admitted to an official exchange listing (1)
Bonds
Bermuda357,000 China Oil & Gas Group 4.700%
30/Jun/2026357,000 364,377 0.96
200,000 Concord New Energy Group Limited 10.750% 24/Sep/2023
187,392 210,250 0.55
544,392 574,627 1.51Cambodia
500,000 Vanke Real Estate Hong Kong Company Limited 3.975% 9/Nov/2027
454,210 537,686 1.42
454,210 537,686 1.42Canada
500,000 CNOOC Finance 4.875% 30/Apr/2044 519,350 590,096 1.56
519,350 590,096 1.56Cayman Islands
500,000 21Vianet Group Inc. 7.875% 15/Oct/2021 507,000 503,646 1.33400,000 Agile Group Holdings Limited FRN Perp. 411,250 409,300 1.08500,000 CDBL Funding 1 3.500% 24/Oct/2027 450,725 528,544 1.40400,000 Central China Real Estate Limited 7.250%
16/Jul/2024386,000 348,136 0.92
400,000 Central China Real Estate Limited 7.650% 27/Aug/2023
403,486 379,530 1.00
200,000 China Aoyuan Group Limited 5.880% 1/Mar/2027
197,800 165,000 0.44
200,000 China Aoyuan Group Limited 6.350% 8/Feb/2024
199,976 189,375 0.50
449,000 China Hongqiao Group 6.250% 8/Jun/2024 449,000 458,990 1.21200,000 China Hongqiao Group Limited 7.125%
22/Jul/2022192,000 205,276 0.54
500,000 China Overseas Finance Cayman III Limited 6.375% 29/Oct/2043
610,040 691,398 1.82
279,000 China Resources Land Limited 4.125% 26/Feb/2029
276,227 306,140 0.81
200,000 China SCE Group Holdings Limited 5.950% 29/Sep/2024
200,000 200,900 0.53
500,000 China SCE Group Holdings Limited 6.000% 4/Feb/2026
500,000 477,188 1.26
400,000 China State Construction Finance Cayman III Limited FRN Perp.
408,800 414,300 1.09
360,000 CIFI Holdings (Group) 4.375% 12/Apr/2027 359,449 353,001 0.93400,000 Country Garden Holdings Company Limited
6.500% 8/Apr/2024425,500 425,218 1.12
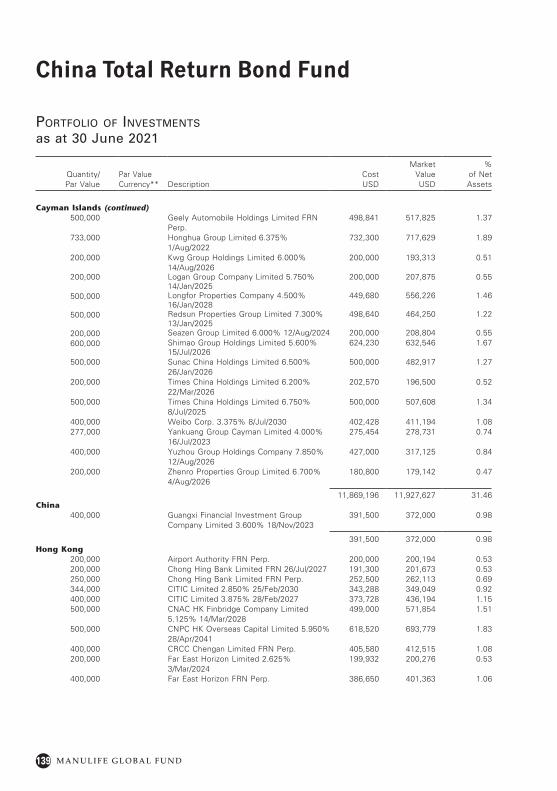
139
China Total Return Bond Fund
M A N U L I F E G L O B A L F U N D
Quantity/ Par Value
Par Value Currency** Description
Cost USD
Market Value USD
% of Net Assets
Cayman Islands (continued)500,000 Geely Automobile Holdings Limited FRN
Perp.498,841 517,825 1.37
733,000 Honghua Group Limited 6.375% 1/Aug/2022
732,300 717,629 1.89
200,000 Kwg Group Holdings Limited 6.000% 14/Aug/2026
200,000 193,313 0.51
200,000 Logan Group Company Limited 5.750% 14/Jan/2025
200,000 207,875 0.55
500,000 Longfor Properties Company 4.500% 16/Jan/2028
449,680 556,226 1.46
500,000 Redsun Properties Group Limited 7.300% 13/Jan/2025
498,640 464,250 1.22
200,000 Seazen Group Limited 6.000% 12/Aug/2024 200,000 208,804 0.55600,000 Shimao Group Holdings Limited 5.600%
15/Jul/2026624,230 632,546 1.67
500,000 Sunac China Holdings Limited 6.500% 26/Jan/2026
500,000 482,917 1.27
200,000 Times China Holdings Limited 6.200% 22/Mar/2026
202,570 196,500 0.52
500,000 Times China Holdings Limited 6.750% 8/Jul/2025
500,000 507,608 1.34
400,000 Weibo Corp. 3.375% 8/Jul/2030 402,428 411,194 1.08277,000 Yankuang Group Cayman Limited 4.000%
16/Jul/2023275,454 278,731 0.74
400,000 Yuzhou Group Holdings Company 7.850% 12/Aug/2026
427,000 317,125 0.84
200,000 Zhenro Properties Group Limited 6.700% 4/Aug/2026
180,800 179,142 0.47
11,869,196 11,927,627 31.46China
400,000 Guangxi Financial Investment Group Company Limited 3.600% 18/Nov/2023
391,500 372,000 0.98
391,500 372,000 0.98Hong Kong
200,000 Airport Authority FRN Perp. 200,000 200,194 0.53200,000 Chong Hing Bank Limited FRN 26/Jul/2027 191,300 201,673 0.53250,000 Chong Hing Bank Limited FRN Perp. 252,500 262,113 0.69344,000 CITIC Limited 2.850% 25/Feb/2030 343,288 349,049 0.92400,000 CITIC Limited 3.875% 28/Feb/2027 373,728 436,194 1.15500,000 CNAC HK Finbridge Company Limited
5.125% 14/Mar/2028499,000 571,854 1.51
500,000 CNPC HK Overseas Capital Limited 5.950% 28/Apr/2041
618,520 693,779 1.83
400,000 CRCC Chengan Limited FRN Perp. 405,580 412,515 1.08200,000 Far East Horizon Limited 2.625%
3/Mar/2024199,932 200,276 0.53
400,000 Far East Horizon FRN Perp. 386,650 401,363 1.06
Portfolio of investments
as at 30 June 2021
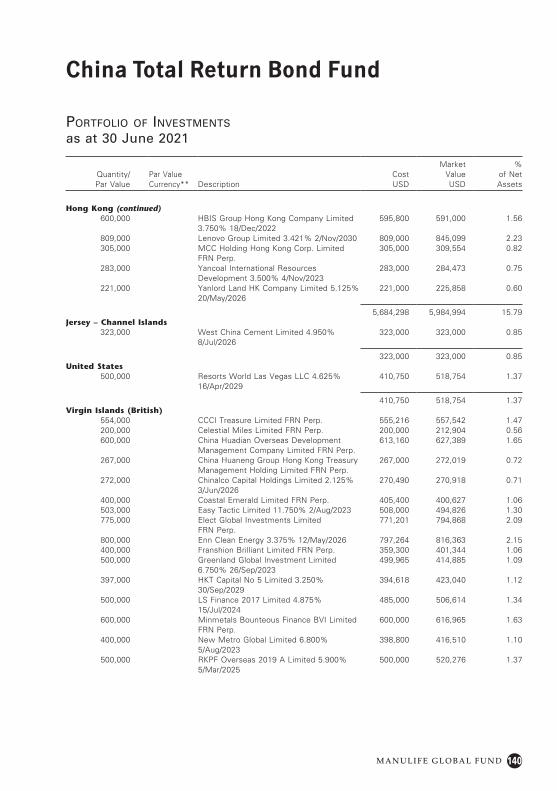
140
China Total Return Bond Fund
M A N U L I F E G L O B A L F U N D
Quantity/ Par Value
Par Value Currency** Description
Cost USD
Market Value USD
% of Net Assets
Hong Kong (continued)600,000 HBIS Group Hong Kong Company Limited
3.750% 18/Dec/2022595,800 591,000 1.56
809,000 Lenovo Group Limited 3.421% 2/Nov/2030 809,000 845,099 2.23305,000 MCC Holding Hong Kong Corp. Limited
FRN Perp.305,000 309,554 0.82
283,000 Yancoal International Resources Development 3.500% 4/Nov/2023
283,000 284,473 0.75
221,000 Yanlord Land HK Company Limited 5.125% 20/May/2026
221,000 225,858 0.60
5,684,298 5,984,994 15.79Jersey – Channel Islands
323,000 West China Cement Limited 4.950% 8/Jul/2026
323,000 323,000 0.85
323,000 323,000 0.85United States
500,000 Resorts World Las Vegas LLC 4.625% 16/Apr/2029
410,750 518,754 1.37
410,750 518,754 1.37Virgin Islands (British)
554,000 CCCI Treasure Limited FRN Perp. 555,216 557,542 1.47200,000 Celestial Miles Limited FRN Perp. 200,000 212,904 0.56600,000 China Huadian Overseas Development
Management Company Limited FRN Perp.613,160 627,389 1.65
267,000 China Huaneng Group Hong Kong Treasury Management Holding Limited FRN Perp.
267,000 272,019 0.72
272,000 Chinalco Capital Holdings Limited 2.125% 3/Jun/2026
270,490 270,918 0.71
400,000 Coastal Emerald Limited FRN Perp. 405,400 400,627 1.06503,000 Easy Tactic Limited 11.750% 2/Aug/2023 508,000 494,826 1.30775,000 Elect Global Investments Limited
FRN Perp.771,201 794,868 2.09
800,000 Enn Clean Energy 3.375% 12/May/2026 797,264 816,363 2.15400,000 Franshion Brilliant Limited FRN Perp. 359,300 401,344 1.06500,000 Greenland Global Investment Limited
6.750% 26/Sep/2023499,965 414,885 1.09
397,000 HKT Capital No 5 Limited 3.250% 30/Sep/2029
394,618 423,040 1.12
500,000 LS Finance 2017 Limited 4.875% 15/Jul/2024
485,000 506,614 1.34
600,000 Minmetals Bounteous Finance BVI Limited FRN Perp.
600,000 616,965 1.63
400,000 New Metro Global Limited 6.800% 5/Aug/2023
398,800 416,510 1.10
500,000 RKPF Overseas 2019 A Limited 5.900% 5/Mar/2025
500,000 520,276 1.37
Portfolio of investments
as at 30 June 2021
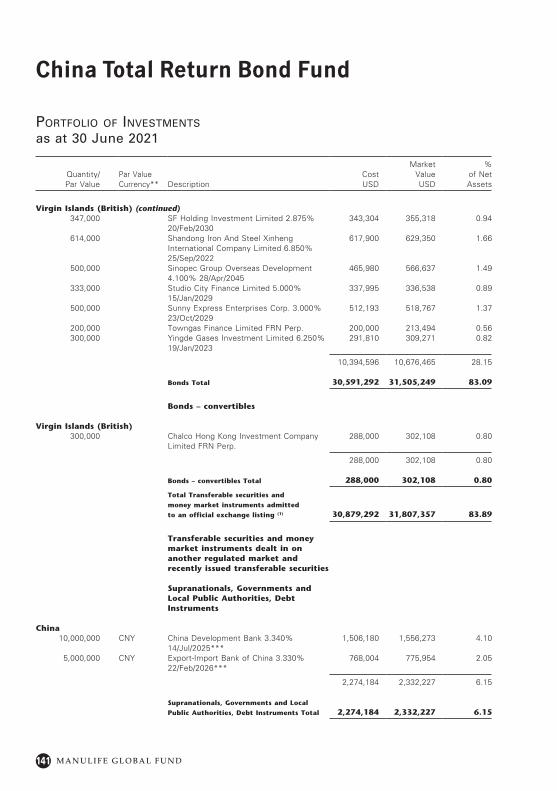
141
China Total Return Bond Fund
M A N U L I F E G L O B A L F U N D
Quantity/ Par Value
Par Value Currency** Description
Cost USD
Market Value USD
% of Net Assets
Virgin Islands (British) (continued)347,000 SF Holding Investment Limited 2.875%
20/Feb/2030343,304 355,318 0.94
614,000 Shandong Iron And Steel Xinheng International Company Limited 6.850% 25/Sep/2022
617,900 629,350 1.66
500,000 Sinopec Group Overseas Development 4.100% 28/Apr/2045
465,980 566,637 1.49
333,000 Studio City Finance Limited 5.000% 15/Jan/2029
337,995 336,538 0.89
500,000 Sunny Express Enterprises Corp. 3.000% 23/Oct/2029
512,193 518,767 1.37
200,000 Towngas Finance Limited FRN Perp. 200,000 213,494 0.56300,000 Yingde Gases Investment Limited 6.250%
19/Jan/2023291,810 309,271 0.82
10,394,596 10,676,465 28.15
Bonds Total 30,591,292 31,505,249 83.09
Bonds – convertibles
Virgin Islands (British)300,000 Chalco Hong Kong Investment Company
Limited FRN Perp.288,000 302,108 0.80
288,000 302,108 0.80
Bonds – convertibles Total 288,000 302,108 0.80
Total Transferable securities and
money market instruments admitted
to an official exchange listing (1) 30,879,292 31,807,357 83.89
Transferable securities and money market instruments dealt in on another regulated market and recently issued transferable securities
Supranationals, Governments and Local Public Authorities, Debt Instruments
China10,000,000 CNY China Development Bank 3.340%
14/Jul/2025***1,506,180 1,556,273 4.10
5,000,000 CNY Export-Import Bank of China 3.330% 22/Feb/2026***
768,004 775,954 2.05
2,274,184 2,332,227 6.15
Supranationals, Governments and Local
Public Authorities, Debt Instruments Total 2,274,184 2,332,227 6.15
Portfolio of investments
as at 30 June 2021
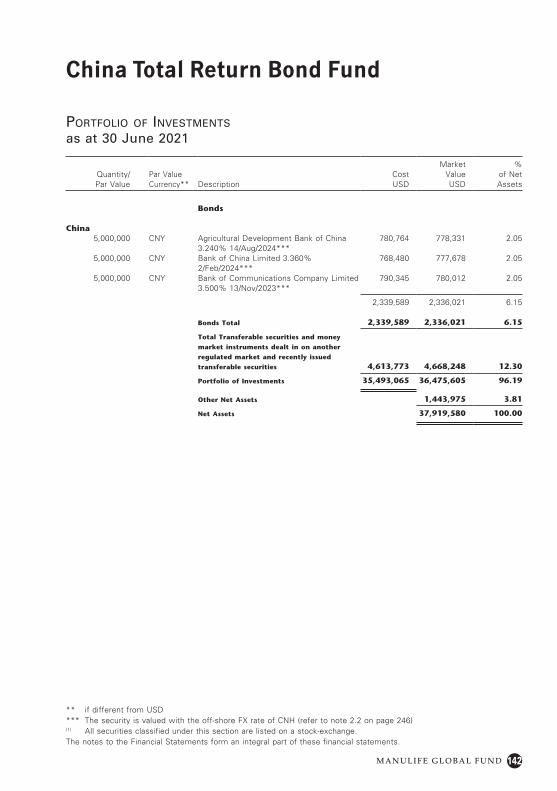
142
China Total Return Bond Fund
M A N U L I F E G L O B A L F U N D
** if different from USD*** The security is valued with the off-shore FX rate of CNH (refer to note 2.2 on page 246)(1) All securities classified under this section are listed on a stock-exchange.The notes to the Financial Statements form an integral part of these financial statements.
Portfolio of investments
as at 30 June 2021
Quantity/ Par Value
Par Value Currency** Description
Cost USD
Market Value USD
% of Net Assets
Bonds
China5,000,000 CNY Agricultural Development Bank of China
3.240% 14/Aug/2024***780,764 778,331 2.05
5,000,000 CNY Bank of China Limited 3.360% 2/Feb/2024***
768,480 777,678 2.05
5,000,000 CNY Bank of Communications Company Limited 3.500% 13/Nov/2023***
790,345 780,012 2.05
2,339,589 2,336,021 6.15
Bonds Total 2,339,589 2,336,021 6.15
Total Transferable securities and money
market instruments dealt in on another
regulated market and recently issued
transferable securities 4,613,773 4,668,248 12.30
Portfolio of Investments 35,493,065 36,475,605 96.19
Other Net Assets 1,443,975 3.81
Net Assets 37,919,580 100.00
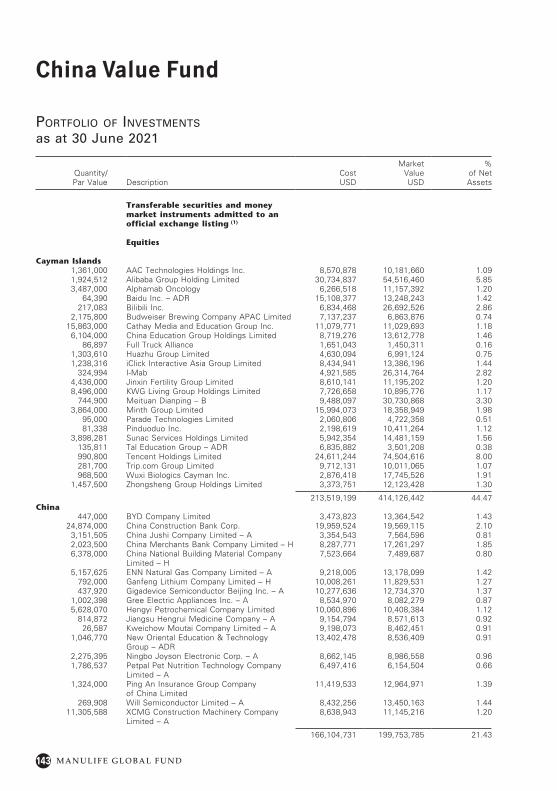
143
China Value Fund
M A N U L I F E G L O B A L F U N D
Portfolio of investments
as at 30 June 2021
Quantity/ Par Value Description
Cost USD
Market Value USD
% of Net Assets
Transferable securities and money market instruments admitted to an official exchange listing (1)
Equities
Cayman Islands1,361,000 AAC Technologies Holdings Inc. 8,570,878 10,181,660 1.091,924,512 Alibaba Group Holding Limited 30,734,837 54,516,460 5.853,487,000 Alphamab Oncology 6,266,518 11,157,392 1.20
64,390 Baidu Inc. – ADR 15,108,377 13,248,243 1.42217,083 Bilibili Inc. 6,834,468 26,692,526 2.86
2,175,800 Budweiser Brewing Company APAC Limited 7,137,237 6,863,876 0.7415,863,000 Cathay Media and Education Group Inc. 11,079,771 11,029,693 1.18
6,104,000 China Education Group Holdings Limited 8,719,276 13,612,778 1.4686,897 Full Truck Alliance 1,651,043 1,450,311 0.16
1,303,610 Huazhu Group Limited 4,630,094 6,991,124 0.751,238,316 iClick Interactive Asia Group Limited 8,434,941 13,386,196 1.44
324,994 I-Mab 4,921,585 26,314,764 2.824,436,000 Jinxin Fertility Group Limited 8,610,141 11,195,202 1.208,496,000 KWG Living Group Holdings Limited 7,726,658 10,895,776 1.17
744,900 Meituan Dianping – B 9,488,097 30,730,868 3.303,864,000 Minth Group Limited 15,994,073 18,358,949 1.98
95,000 Parade Technologies Limited 2,060,806 4,722,358 0.5181,338 Pinduoduo Inc. 2,198,619 10,411,264 1.12
3,898,281 Sunac Services Holdings Limited 5,942,354 14,481,159 1.56135,811 Tal Education Group – ADR 6,835,882 3,501,208 0.38990,800 Tencent Holdings Limited 24,611,244 74,504,616 8.00281,700 Trip.com Group Limited 9,712,131 10,011,065 1.07968,500 Wuxi Biologics Cayman Inc. 2,876,418 17,745,526 1.91
1,457,500 Zhongsheng Group Holdings Limited 3,373,751 12,123,428 1.30
213,519,199 414,126,442 44.47China
447,000 BYD Company Limited 3,473,823 13,364,542 1.4324,874,000 China Construction Bank Corp. 19,959,524 19,569,115 2.10
3,151,505 China Jushi Company Limited – A 3,354,543 7,564,596 0.812,023,500 China Merchants Bank Company Limited – H 8,287,771 17,261,297 1.856,378,000 China National Building Material Company
Limited – H7,523,664 7,489,687 0.80
5,157,625 ENN Natural Gas Company Limited – A 9,218,005 13,178,099 1.42792,000 Ganfeng Lithium Company Limited – H 10,008,261 11,829,531 1.27437,920 Gigadevice Semiconductor Beijing Inc. – A 10,277,636 12,734,370 1.37
1,002,398 Gree Electric Appliances Inc. – A 8,534,970 8,082,279 0.875,628,070 Hengyi Petrochemical Company Limited 10,060,896 10,408,384 1.12
814,872 Jiangsu Hengrui Medicine Company – A 9,154,794 8,571,613 0.9226,587 Kweichow Moutai Company Limited – A 9,198,073 8,462,451 0.91
1,046,770 New Oriental Education & Technology Group – ADR
13,402,478 8,536,409 0.91
2,275,395 Ningbo Joyson Electronic Corp. – A 8,662,145 8,986,558 0.961,786,537 Petpal Pet Nutrition Technology Company
Limited – A6,497,416 6,154,504 0.66
1,324,000 Ping An Insurance Group Company of China Limited
11,419,533 12,964,971 1.39
269,908 Will Semiconductor Limited – A 8,432,256 13,450,163 1.4411,305,588 XCMG Construction Machinery Company
Limited – A8,638,943 11,145,216 1.20
166,104,731 199,753,785 21.43
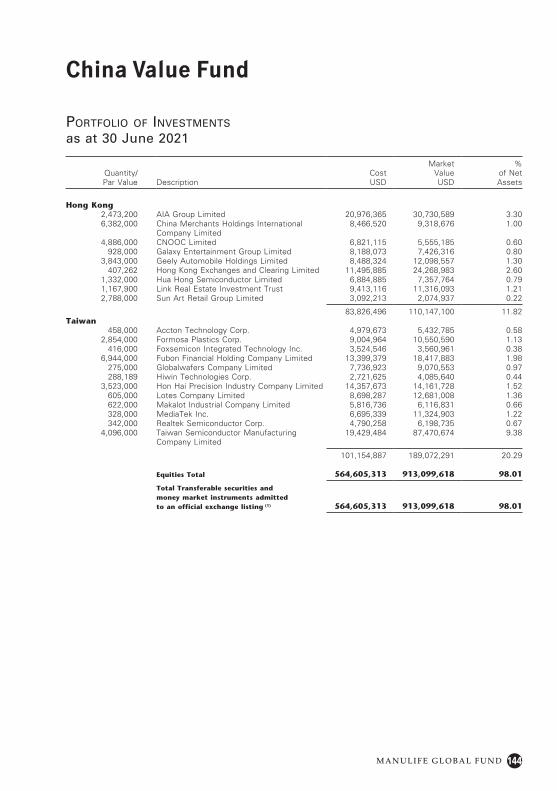
144
China Value Fund
M A N U L I F E G L O B A L F U N D
Quantity/ Par Value Description
Cost USD
Market Value USD
% of Net Assets
Hong Kong2,473,200 AIA Group Limited 20,976,365 30,730,589 3.306,382,000 China Merchants Holdings International
Company Limited8,466,520 9,318,676 1.00
4,886,000 CNOOC Limited 6,821,115 5,555,185 0.60928,000 Galaxy Entertainment Group Limited 8,188,073 7,426,316 0.80
3,843,000 Geely Automobile Holdings Limited 8,488,324 12,098,557 1.30407,262 Hong Kong Exchanges and Clearing Limited 11,495,885 24,268,983 2.60
1,332,000 Hua Hong Semiconductor Limited 6,884,885 7,357,764 0.791,167,900 Link Real Estate Investment Trust 9,413,116 11,316,093 1.212,788,000 Sun Art Retail Group Limited 3,092,213 2,074,937 0.22
83,826,496 110,147,100 11.82Taiwan
458,000 Accton Technology Corp. 4,979,673 5,432,785 0.582,854,000 Formosa Plastics Corp. 9,004,964 10,550,590 1.13
416,000 Foxsemicon Integrated Technology Inc. 3,524,546 3,560,961 0.386,944,000 Fubon Financial Holding Company Limited 13,399,379 18,417,883 1.98
275,000 Globalwafers Company Limited 7,736,923 9,070,553 0.97288,189 Hiwin Technologies Corp. 2,721,625 4,085,640 0.44
3,523,000 Hon Hai Precision Industry Company Limited 14,357,673 14,161,728 1.52605,000 Lotes Company Limited 8,698,287 12,681,008 1.36622,000 Makalot Industrial Company Limited 5,816,736 6,116,831 0.66328,000 MediaTek Inc. 6,695,339 11,324,903 1.22342,000 Realtek Semiconductor Corp. 4,790,258 6,198,735 0.67
4,096,000 Taiwan Semiconductor Manufacturing Company Limited
19,429,484 87,470,674 9.38
101,154,887 189,072,291 20.29
Equities Total 564,605,313 913,099,618 98.01
Total Transferable securities and money market instruments admitted to an official exchange listing (1) 564,605,313 913,099,618 98.01
Portfolio of investments
as at 30 June 2021
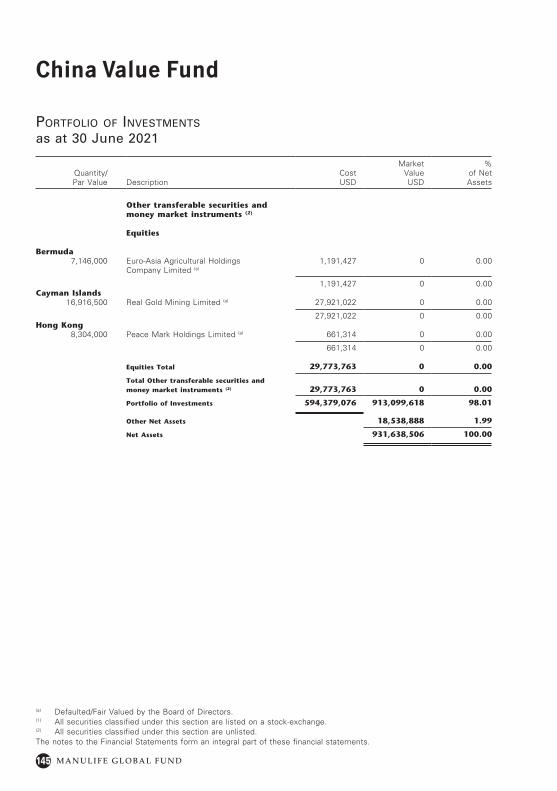
145
China Value Fund
M A N U L I F E G L O B A L F U N D
(a) Defaulted/Fair Valued by the Board of Directors.(1) All securities classified under this section are listed on a stock-exchange.(2) All securities classified under this section are unlisted.The notes to the Financial Statements form an integral part of these financial statements.
Quantity/ Par Value Description
Cost USD
Market Value USD
% of Net Assets
Other transferable securities and money market instruments (2)
Equities
Bermuda7,146,000 Euro-Asia Agricultural Holdings
Company Limited (a)1,191,427 0 0.00
1,191,427 0 0.00Cayman Islands
16,916,500 Real Gold Mining Limited (a) 27,921,022 0 0.00
27,921,022 0 0.00Hong Kong
8,304,000 Peace Mark Holdings Limited (a) 661,314 0 0.00
661,314 0 0.00
Equities Total 29,773,763 0 0.00
Total Other transferable securities and money market instruments (2) 29,773,763 0 0.00
Portfolio of Investments 594,379,076 913,099,618 98.01
Other Net Assets 18,538,888 1.99
Net Assets 931,638,506 100.00
Portfolio of investments
as at 30 June 2021
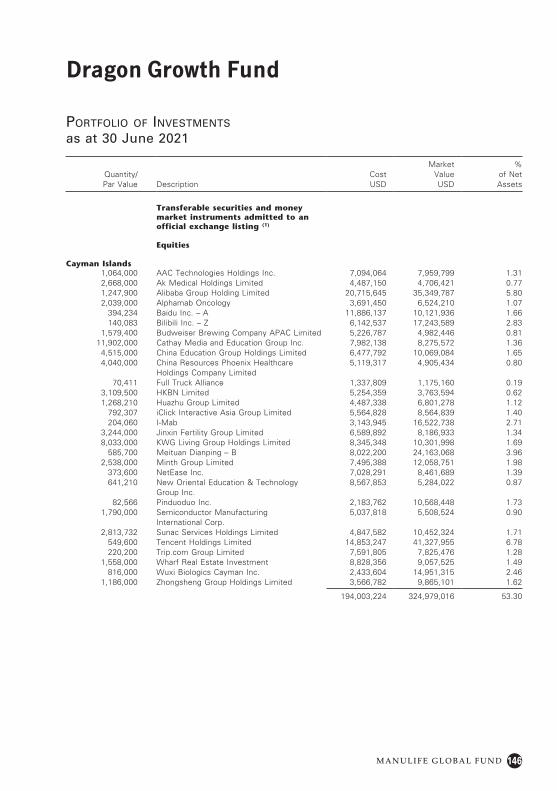
146
Dragon Growth Fund
M A N U L I F E G L O B A L F U N D
Portfolio of investments
as at 30 June 2021
Quantity/ Par Value Description
Cost USD
Market Value USD
% of Net Assets
Transferable securities and money market instruments admitted to an official exchange listing (1)
Equities
Cayman Islands1,064,000 AAC Technologies Holdings Inc. 7,094,064 7,959,799 1.312,668,000 Ak Medical Holdings Limited 4,487,150 4,706,421 0.771,247,900 Alibaba Group Holding Limited 20,715,645 35,349,787 5.802,039,000 Alphamab Oncology 3,691,450 6,524,210 1.07
394,234 Baidu Inc. – A 11,886,137 10,121,936 1.66140,083 Bilibili Inc. – Z 6,142,537 17,243,589 2.83
1,579,400 Budweiser Brewing Company APAC Limited 5,226,787 4,982,446 0.8111,902,000 Cathay Media and Education Group Inc. 7,982,138 8,275,572 1.36
4,515,000 China Education Group Holdings Limited 6,477,792 10,069,084 1.654,040,000 China Resources Phoenix Healthcare
Holdings Company Limited5,119,317 4,905,434 0.80
70,411 Full Truck Alliance 1,337,809 1,175,160 0.193,109,500 HKBN Limited 5,254,359 3,763,594 0.621,268,210 Huazhu Group Limited 4,487,338 6,801,278 1.12
792,307 iClick Interactive Asia Group Limited 5,564,828 8,564,839 1.40204,060 I-Mab 3,143,945 16,522,738 2.71
3,244,000 Jinxin Fertility Group Limited 6,589,892 8,186,933 1.348,033,000 KWG Living Group Holdings Limited 8,345,348 10,301,998 1.69
585,700 Meituan Dianping – B 8,022,200 24,163,068 3.962,538,000 Minth Group Limited 7,495,388 12,058,751 1.98
373,600 NetEase Inc. 7,028,291 8,461,689 1.39641,210 New Oriental Education & Technology
Group Inc.8,567,853 5,284,022 0.87
82,566 Pinduoduo Inc. 2,183,762 10,568,448 1.731,790,000 Semiconductor Manufacturing
International Corp.5,037,818 5,508,524 0.90
2,813,732 Sunac Services Holdings Limited 4,847,582 10,452,324 1.71549,600 Tencent Holdings Limited 14,853,247 41,327,955 6.78220,200 Trip.com Group Limited 7,591,805 7,825,476 1.28
1,558,000 Wharf Real Estate Investment 8,828,356 9,057,525 1.49816,000 Wuxi Biologics Cayman Inc. 2,433,604 14,951,315 2.46
1,186,000 Zhongsheng Group Holdings Limited 3,566,782 9,865,101 1.62
194,003,224 324,979,016 53.30
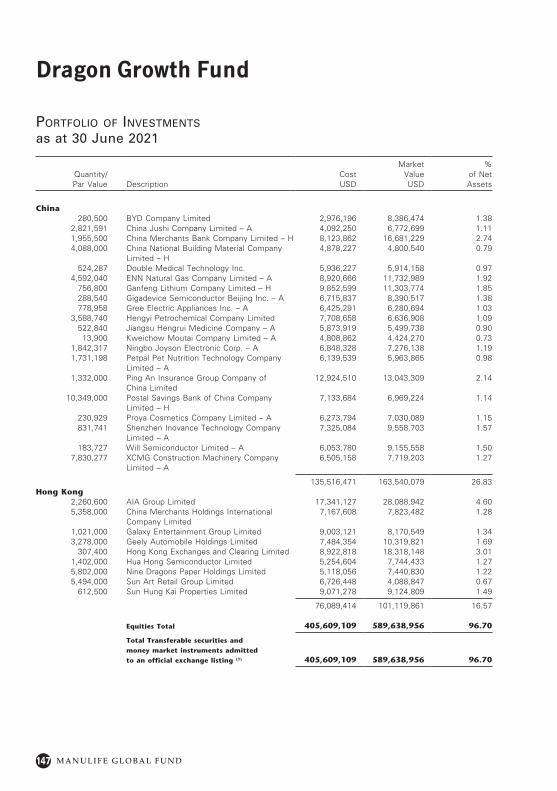
147
Dragon Growth Fund
M A N U L I F E G L O B A L F U N D
Quantity/ Par Value Description
Cost USD
Market Value USD
% of Net Assets
China280,500 BYD Company Limited 2,976,196 8,386,474 1.38
2,821,591 China Jushi Company Limited – A 4,092,250 6,772,699 1.111,955,500 China Merchants Bank Company Limited – H 8,123,862 16,681,229 2.744,088,000 China National Building Material Company
Limited – H4,878,227 4,800,540 0.79
524,287 Double Medical Technology Inc. 5,936,227 5,914,158 0.974,592,040 ENN Natural Gas Company Limited – A 8,920,666 11,732,989 1.92
756,800 Ganfeng Lithium Company Limited – H 9,852,599 11,303,774 1.85288,540 Gigadevice Semiconductor Beijing Inc. – A 6,715,837 8,390,517 1.38778,958 Gree Electric Appliances Inc. – A 6,425,291 6,280,694 1.03
3,588,740 Hengyi Petrochemical Company Limited 7,708,658 6,636,908 1.09522,840 Jiangsu Hengrui Medicine Company – A 5,873,919 5,499,738 0.90
13,900 Kweichow Moutai Company Limited – A 4,808,862 4,424,270 0.731,842,317 Ningbo Joyson Electronic Corp. – A 6,848,328 7,276,138 1.191,731,198 Petpal Pet Nutrition Technology Company
Limited – A6,139,539 5,963,865 0.98
1,332,000 Ping An Insurance Group Company of China Limited
12,924,510 13,043,309 2.14
10,349,000 Postal Savings Bank of China Company Limited – H
7,133,684 6,969,224 1.14
230,929 Proya Cosmetics Company Limited – A 6,273,794 7,030,089 1.15831,741 Shenzhen Inovance Technology Company
Limited – A7,325,084 9,558,703 1.57
183,727 Will Semiconductor Limited – A 6,053,780 9,155,558 1.507,830,277 XCMG Construction Machinery Company
Limited – A6,505,158 7,719,203 1.27
135,516,471 163,540,079 26.83Hong Kong
2,260,600 AIA Group Limited 17,341,127 28,088,942 4.605,358,000 China Merchants Holdings International
Company Limited7,167,608 7,823,482 1.28
1,021,000 Galaxy Entertainment Group Limited 9,003,121 8,170,549 1.343,278,000 Geely Automobile Holdings Limited 7,484,354 10,319,821 1.69
307,400 Hong Kong Exchanges and Clearing Limited 8,922,818 18,318,148 3.011,402,000 Hua Hong Semiconductor Limited 5,254,604 7,744,433 1.275,802,000 Nine Dragons Paper Holdings Limited 5,118,056 7,440,830 1.225,494,000 Sun Art Retail Group Limited 6,726,448 4,088,847 0.67
612,500 Sun Hung Kai Properties Limited 9,071,278 9,124,809 1.49
76,089,414 101,119,861 16.57
Equities Total 405,609,109 589,638,956 96.70
Total Transferable securities and
money market instruments admitted
to an official exchange listing (1) 405,609,109 589,638,956 96.70
Portfolio of investments
as at 30 June 2021
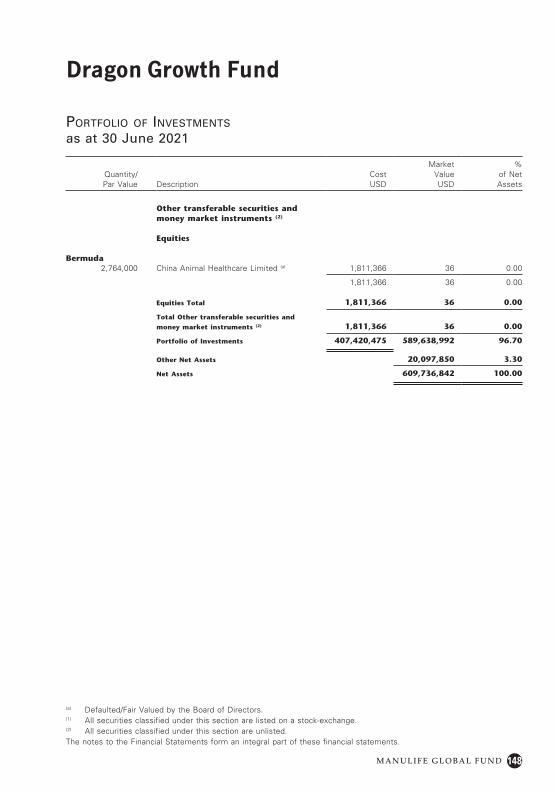
148
Dragon Growth Fund
M A N U L I F E G L O B A L F U N D
(a) Defaulted/Fair Valued by the Board of Directors.(1) All securities classified under this section are listed on a stock-exchange.(2) All securities classified under this section are unlisted.The notes to the Financial Statements form an integral part of these financial statements.
Quantity/ Par Value Description
Cost USD
Market Value USD
% of Net Assets
Other transferable securities and money market instruments (2)
Equities
Bermuda2,764,000 China Animal Healthcare Limited (a) 1,811,366 36 0.00
1,811,366 36 0.00
Equities Total 1,811,366 36 0.00
Total Other transferable securities and
money market instruments (2) 1,811,366 36 0.00
Portfolio of Investments 407,420,475 589,638,992 96.70
Other Net Assets 20,097,850 3.30
Net Assets 609,736,842 100.00
Portfolio of investments
as at 30 June 2021
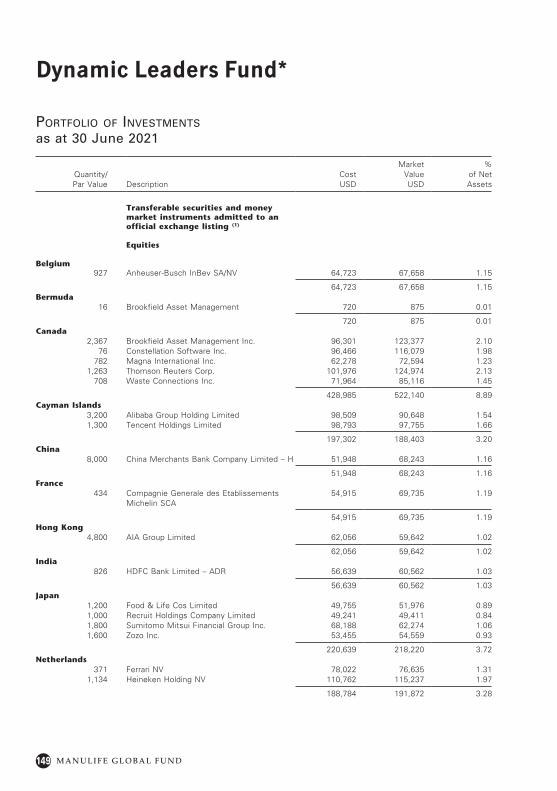
149
Dynamic Leaders Fund*
M A N U L I F E G L O B A L F U N D
Portfolio of investments
as at 30 June 2021
Quantity/ Par Value Description
Cost USD
Market Value USD
% of Net Assets
Transferable securities and money market instruments admitted to an official exchange listing (1)
Equities
Belgium927 Anheuser-Busch InBev SA/NV 64,723 67,658 1.15
64,723 67,658 1.15Bermuda
16 Brookfield Asset Management 720 875 0.01
720 875 0.01Canada
2,367 Brookfield Asset Management Inc. 96,301 123,377 2.1076 Constellation Software Inc. 96,466 116,079 1.98
782 Magna International Inc. 62,278 72,594 1.231,263 Thomson Reuters Corp. 101,976 124,974 2.13
708 Waste Connections Inc. 71,964 85,116 1.45
428,985 522,140 8.89Cayman Islands
3,200 Alibaba Group Holding Limited 98,509 90,648 1.541,300 Tencent Holdings Limited 98,793 97,755 1.66
197,302 188,403 3.20China
8,000 China Merchants Bank Company Limited – H 51,948 68,243 1.16
51,948 68,243 1.16France
434 Compagnie Generale des Etablissements Michelin SCA
54,915 69,735 1.19
54,915 69,735 1.19Hong Kong
4,800 AIA Group Limited 62,056 59,642 1.02
62,056 59,642 1.02India
826 HDFC Bank Limited – ADR 56,639 60,562 1.03
56,639 60,562 1.03Japan
1,200 Food & Life Cos Limited 49,755 51,976 0.891,000 Recruit Holdings Company Limited 49,241 49,411 0.841,800 Sumitomo Mitsui Financial Group Inc. 68,188 62,274 1.061,600 Zozo Inc. 53,455 54,559 0.93
220,639 218,220 3.72Netherlands
371 Ferrari NV 78,022 76,635 1.311,134 Heineken Holding NV 110,762 115,237 1.97
188,784 191,872 3.28
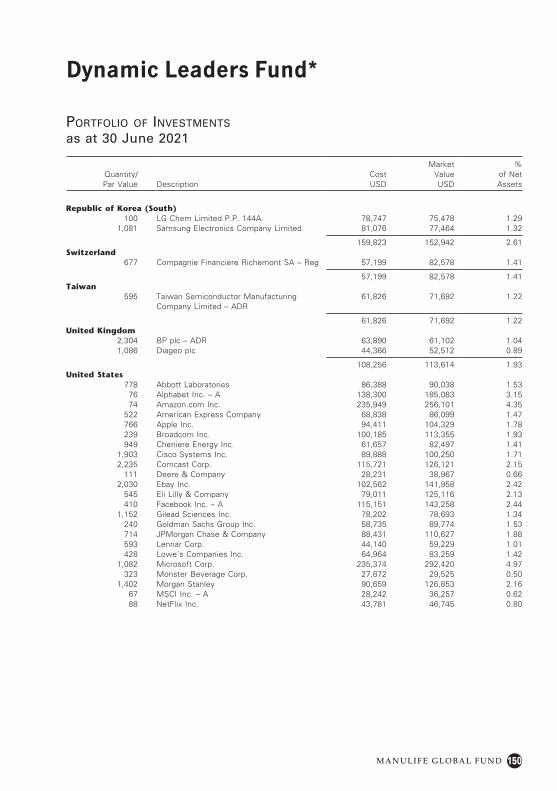
150
Dynamic Leaders Fund*
M A N U L I F E G L O B A L F U N D
Quantity/ Par Value Description
Cost USD
Market Value USD
% of Net Assets
Republic of Korea (South)100 LG Chem Limited P.P. 144A 78,747 75,478 1.29
1,081 Samsung Electronics Company Limited 81,076 77,464 1.32
159,823 152,942 2.61Switzerland
677 Compagnie Financiere Richemont SA – Reg 57,199 82,578 1.41
57,199 82,578 1.41Taiwan
595 Taiwan Semiconductor Manufacturing Company Limited – ADR
61,826 71,692 1.22
61,826 71,692 1.22United Kingdom
2,304 BP plc – ADR 63,890 61,102 1.041,086 Diageo plc 44,366 52,512 0.89
108,256 113,614 1.93United States
778 Abbott Laboratories 86,388 90,038 1.5376 Alphabet Inc. – A 138,300 185,083 3.1574 Amazon.com Inc. 235,949 256,101 4.35
522 American Express Company 68,838 86,099 1.47766 Apple Inc. 94,411 104,329 1.78239 Broadcom Inc. 100,185 113,355 1.93949 Cheniere Energy Inc. 61,657 82,497 1.41
1,903 Cisco Systems Inc. 89,888 100,250 1.712,235 Comcast Corp. 115,721 126,121 2.15
111 Deere & Company 28,231 38,967 0.662,030 Ebay Inc. 102,562 141,958 2.42
545 Eli Lilly & Company 79,011 125,116 2.13410 Facebook Inc. – A 115,151 143,258 2.44
1,152 Gilead Sciences Inc. 78,202 78,693 1.34240 Goldman Sachs Group Inc. 58,735 89,774 1.53714 JPMorgan Chase & Company 88,431 110,627 1.88593 Lennar Corp. 44,140 59,229 1.01428 Lowe’s Companies Inc. 64,964 83,259 1.42
1,082 Microsoft Corp. 235,374 292,420 4.97323 Monster Beverage Corp. 27,872 29,525 0.50
1,402 Morgan Stanley 90,659 126,853 2.1667 MSCI Inc. – A 28,242 36,257 0.6288 NetFlix Inc. 43,781 46,745 0.80
Portfolio of investments
as at 30 June 2021
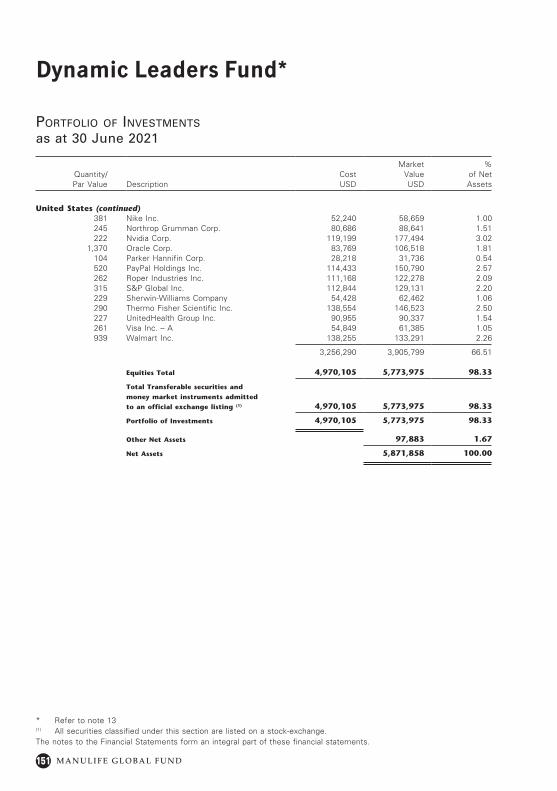
151
Dynamic Leaders Fund*
M A N U L I F E G L O B A L F U N D
* Refer to note 13(1) All securities classified under this section are listed on a stock-exchange.The notes to the Financial Statements form an integral part of these financial statements.
Quantity/ Par Value Description
Cost USD
Market Value USD
% of Net Assets
United States (continued)381 Nike Inc. 52,240 58,659 1.00245 Northrop Grumman Corp. 80,686 88,641 1.51222 Nvidia Corp. 119,199 177,494 3.02
1,370 Oracle Corp. 83,769 106,518 1.81104 Parker Hannifin Corp. 28,218 31,736 0.54520 PayPal Holdings Inc. 114,433 150,790 2.57262 Roper Industries Inc. 111,168 122,278 2.09315 S&P Global Inc. 112,844 129,131 2.20229 Sherwin-Williams Company 54,428 62,462 1.06290 Thermo Fisher Scientific Inc. 138,554 146,523 2.50227 UnitedHealth Group Inc. 90,955 90,337 1.54261 Visa Inc. – A 54,849 61,385 1.05939 Walmart Inc. 138,255 133,291 2.26
3,256,290 3,905,799 66.51
Equities Total 4,970,105 5,773,975 98.33
Total Transferable securities and
money market instruments admitted
to an official exchange listing (1) 4,970,105 5,773,975 98.33
Portfolio of Investments 4,970,105 5,773,975 98.33
Other Net Assets 97,883 1.67
Net Assets 5,871,858 100.00
Portfolio of investments
as at 30 June 2021
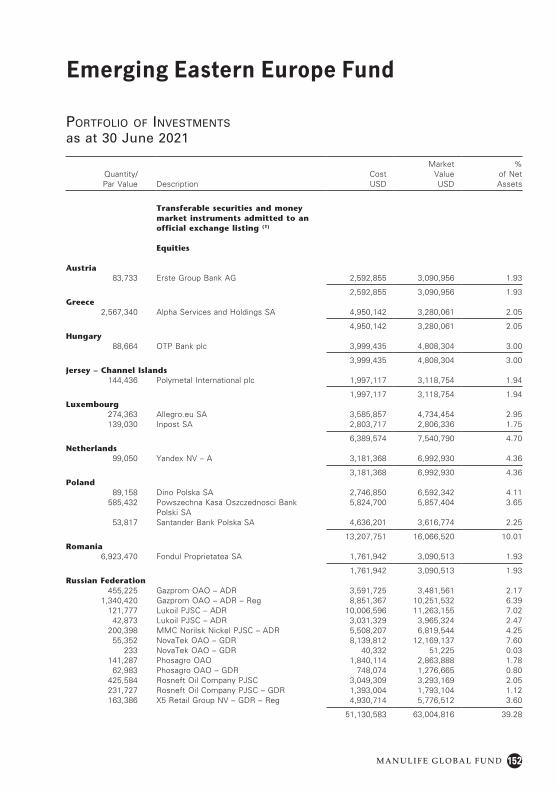
152
Emerging Eastern Europe Fund
M A N U L I F E G L O B A L F U N D
Portfolio of investments
as at 30 June 2021
Quantity/ Par Value Description
Cost USD
Market Value USD
% of Net Assets
Transferable securities and money market instruments admitted to an official exchange listing (1)
Equities
Austria83,733 Erste Group Bank AG 2,592,855 3,090,956 1.93
2,592,855 3,090,956 1.93Greece
2,567,340 Alpha Services and Holdings SA 4,950,142 3,280,061 2.05
4,950,142 3,280,061 2.05Hungary
88,664 OTP Bank plc 3,999,435 4,808,304 3.00
3,999,435 4,808,304 3.00Jersey – Channel Islands
144,436 Polymetal International plc 1,997,117 3,118,754 1.94
1,997,117 3,118,754 1.94Luxembourg
274,363 Allegro.eu SA 3,585,857 4,734,454 2.95139,030 Inpost SA 2,803,717 2,806,336 1.75
6,389,574 7,540,790 4.70Netherlands
99,050 Yandex NV – A 3,181,368 6,992,930 4.36
3,181,368 6,992,930 4.36Poland
89,158 Dino Polska SA 2,746,850 6,592,342 4.11585,432 Powszechna Kasa Oszczednosci Bank
Polski SA5,824,700 5,857,404 3.65
53,817 Santander Bank Polska SA 4,636,201 3,616,774 2.25
13,207,751 16,066,520 10.01Romania
6,923,470 Fondul Proprietatea SA 1,761,942 3,090,513 1.93
1,761,942 3,090,513 1.93Russian Federation
455,225 Gazprom OAO – ADR 3,591,725 3,481,561 2.171,340,420 Gazprom OAO – ADR – Reg 8,851,367 10,251,532 6.39
121,777 Lukoil PJSC – ADR 10,006,596 11,263,155 7.0242,873 Lukoil PJSC – ADR 3,031,329 3,965,324 2.47
200,398 MMC Norilsk Nickel PJSC – ADR 5,508,207 6,819,544 4.2555,352 NovaTek OAO – GDR 8,139,812 12,169,137 7.60
233 NovaTek OAO – GDR 40,332 51,225 0.03141,287 Phosagro OAO 1,840,114 2,863,888 1.78
62,983 Phosagro OAO – GDR 748,074 1,276,665 0.80425,584 Rosneft Oil Company PJSC 3,049,309 3,293,169 2.05231,727 Rosneft Oil Company PJSC – GDR 1,393,004 1,793,104 1.12163,386 X5 Retail Group NV – GDR – Reg 4,930,714 5,776,512 3.60
51,130,583 63,004,816 39.28
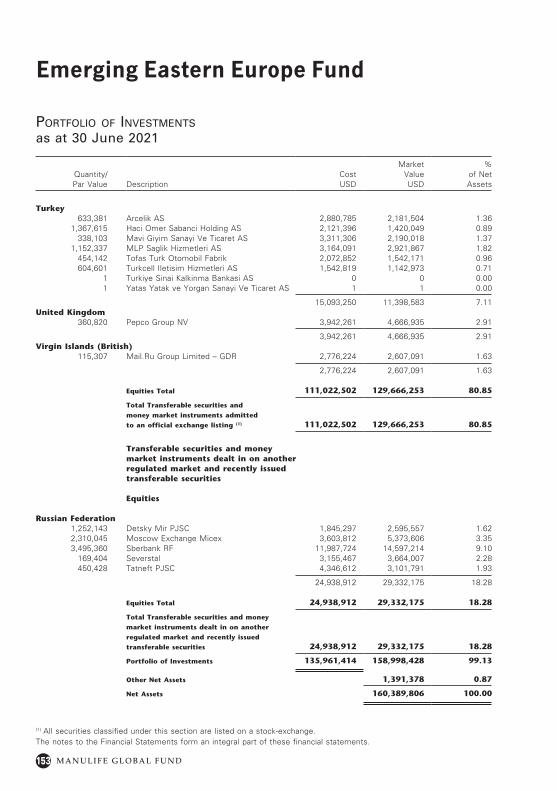
153 M A N U L I F E G L O B A L F U N D
Quantity/ Par Value Description
Cost USD
Market Value USD
% of Net Assets
Turkey633,381 Arcelik AS 2,880,785 2,181,504 1.36
1,367,615 Haci Omer Sabanci Holding AS 2,121,396 1,420,049 0.89338,103 Mavi Giyim Sanayi Ve Ticaret AS 3,311,306 2,190,018 1.37
1,152,337 MLP Saglik Hizmetleri AS 3,164,091 2,921,867 1.82454,142 Tofas Turk Otomobil Fabrik 2,072,852 1,542,171 0.96604,601 Turkcell Iletisim Hizmetleri AS 1,542,819 1,142,973 0.71
1 Turkiye Sinai Kalkinma Bankasi AS 0 0 0.001 Yatas Yatak ve Yorgan Sanayi Ve Ticaret AS 1 1 0.00
15,093,250 11,398,583 7.11United Kingdom
360,820 Pepco Group NV 3,942,261 4,666,935 2.91
3,942,261 4,666,935 2.91Virgin Islands (British)
115,307 Mail.Ru Group Limited – GDR 2,776,224 2,607,091 1.63
2,776,224 2,607,091 1.63
Equities Total 111,022,502 129,666,253 80.85
Total Transferable securities and
money market instruments admitted
to an official exchange listing (1) 111,022,502 129,666,253 80.85
Transferable securities and money market instruments dealt in on another regulated market and recently issued transferable securities
Equities
Russian Federation1,252,143 Detsky Mir PJSC 1,845,297 2,595,557 1.622,310,045 Moscow Exchange Micex 3,603,812 5,373,606 3.353,495,360 Sberbank RF 11,987,724 14,597,214 9.10
169,404 Severstal 3,155,467 3,664,007 2.28450,428 Tatneft PJSC 4,346,612 3,101,791 1.93
24,938,912 29,332,175 18.28
Equities Total 24,938,912 29,332,175 18.28
Total Transferable securities and money
market instruments dealt in on another
regulated market and recently issued
transferable securities 24,938,912 29,332,175 18.28
Portfolio of Investments 135,961,414 158,998,428 99.13
Other Net Assets 1,391,378 0.87
Net Assets 160,389,806 100.00
Emerging Eastern Europe Fund
Portfolio of investments
as at 30 June 2021
(1) All securities classified under this section are listed on a stock-exchange.The notes to the Financial Statements form an integral part of these financial statements.
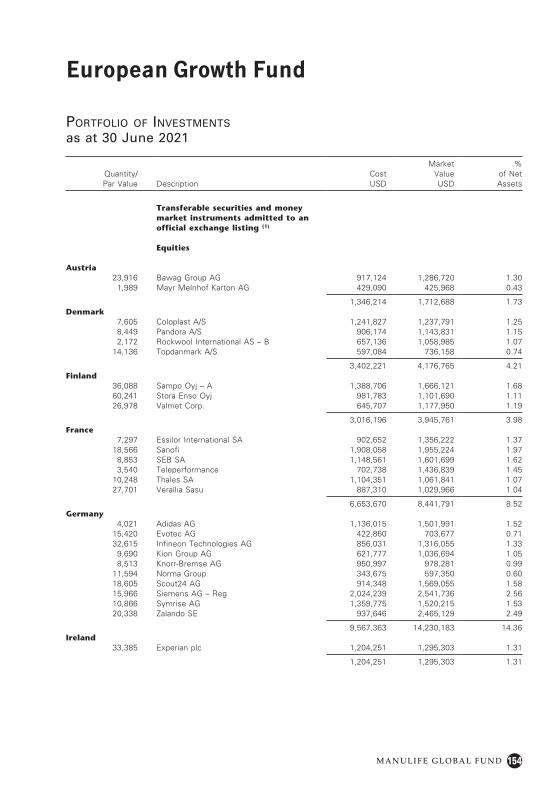
154
European Growth Fund
M A N U L I F E G L O B A L F U N D
Portfolio of investments
as at 30 June 2021
Quantity/ Par Value Description
Cost USD
Market Value USD
% of Net Assets
Transferable securities and money market instruments admitted to an official exchange listing (1)
Equities
Austria23,916 Bawag Group AG 917,124 1,286,720 1.30
1,989 Mayr Melnhof Karton AG 429,090 425,968 0.43
1,346,214 1,712,688 1.73Denmark
7,605 Coloplast A/S 1,241,827 1,237,791 1.258,449 Pandora A/S 906,174 1,143,831 1.152,172 Rockwool International AS – B 657,136 1,058,985 1.07
14,136 Topdanmark A/S 597,084 736,158 0.74
3,402,221 4,176,765 4.21Finland
36,088 Sampo Oyj – A 1,388,706 1,666,121 1.6860,241 Stora Enso Oyj 981,783 1,101,690 1.1126,978 Valmet Corp. 645,707 1,177,950 1.19
3,016,196 3,945,761 3.98France
7,297 Essilor International SA 902,652 1,356,222 1.3718,566 Sanofi 1,908,058 1,955,224 1.97
8,853 SEB SA 1,148,561 1,601,699 1.623,540 Teleperformance 702,738 1,436,839 1.45
10,248 Thales SA 1,104,351 1,061,841 1.0727,701 Verallia Sasu 887,310 1,029,966 1.04
6,653,670 8,441,791 8.52Germany
4,021 Adidas AG 1,136,015 1,501,991 1.5215,420 Evotec AG 422,860 703,677 0.7132,615 Infineon Technologies AG 856,031 1,316,055 1.33
9,690 Kion Group AG 621,777 1,036,694 1.058,513 Knorr-Bremse AG 950,997 978,281 0.99
11,594 Norma Group 343,675 597,350 0.6018,605 Scout24 AG 914,348 1,569,055 1.5815,966 Siemens AG – Reg 2,024,239 2,541,736 2.5610,866 Symrise AG 1,359,775 1,520,215 1.5320,338 Zalando SE 937,646 2,465,129 2.49
9,567,363 14,230,183 14.36Ireland
33,385 Experian plc 1,204,251 1,295,303 1.31
1,204,251 1,295,303 1.31
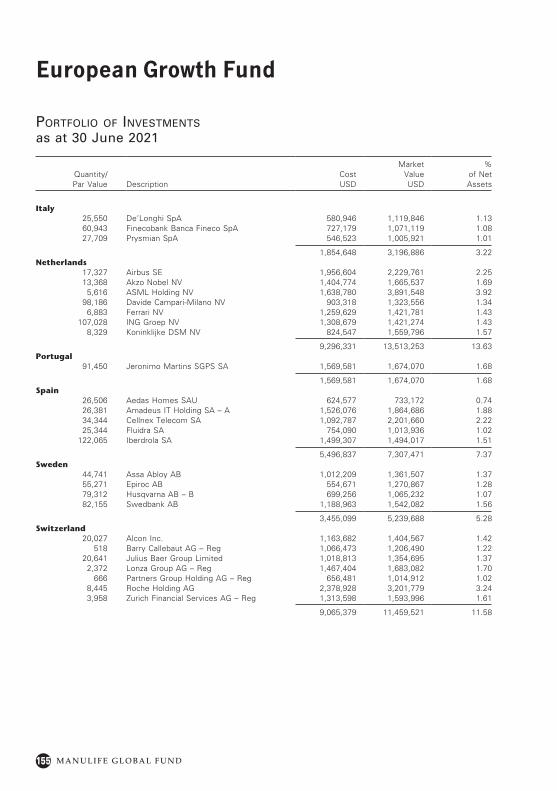
155
European Growth Fund
M A N U L I F E G L O B A L F U N D
Quantity/ Par Value Description
Cost USD
Market Value USD
% of Net Assets
Italy25,550 De’Longhi SpA 580,946 1,119,846 1.1360,943 Finecobank Banca Fineco SpA 727,179 1,071,119 1.0827,709 Prysmian SpA 546,523 1,005,921 1.01
1,854,648 3,196,886 3.22Netherlands
17,327 Airbus SE 1,956,604 2,229,761 2.2513,368 Akzo Nobel NV 1,404,774 1,665,537 1.69
5,616 ASML Holding NV 1,638,780 3,891,548 3.9298,186 Davide Campari-Milano NV 903,318 1,323,556 1.34
6,883 Ferrari NV 1,259,629 1,421,781 1.43107,028 ING Groep NV 1,308,679 1,421,274 1.43
8,329 Koninklijke DSM NV 824,547 1,559,796 1.57
9,296,331 13,513,253 13.63Portugal
91,450 Jeronimo Martins SGPS SA 1,569,581 1,674,070 1.68
1,569,581 1,674,070 1.68Spain
26,506 Aedas Homes SAU 624,577 733,172 0.7426,381 Amadeus IT Holding SA – A 1,526,076 1,864,686 1.8834,344 Cellnex Telecom SA 1,092,787 2,201,660 2.2225,344 Fluidra SA 754,090 1,013,936 1.02
122,065 Iberdrola SA 1,499,307 1,494,017 1.51
5,496,837 7,307,471 7.37Sweden
44,741 Assa Abloy AB 1,012,209 1,361,507 1.3755,271 Epiroc AB 554,671 1,270,867 1.2879,312 Husqvarna AB – B 699,256 1,065,232 1.0782,155 Swedbank AB 1,188,963 1,542,082 1.56
3,455,099 5,239,688 5.28Switzerland
20,027 Alcon Inc. 1,163,682 1,404,567 1.42518 Barry Callebaut AG – Reg 1,066,473 1,206,490 1.22
20,641 Julius Baer Group Limited 1,018,813 1,354,695 1.372,372 Lonza Group AG – Reg 1,467,404 1,683,082 1.70
666 Partners Group Holding AG – Reg 656,481 1,014,912 1.028,445 Roche Holding AG 2,378,928 3,201,779 3.243,958 Zurich Financial Services AG – Reg 1,313,598 1,593,996 1.61
9,065,379 11,459,521 11.58
Portfolio of investments
as at 30 June 2021
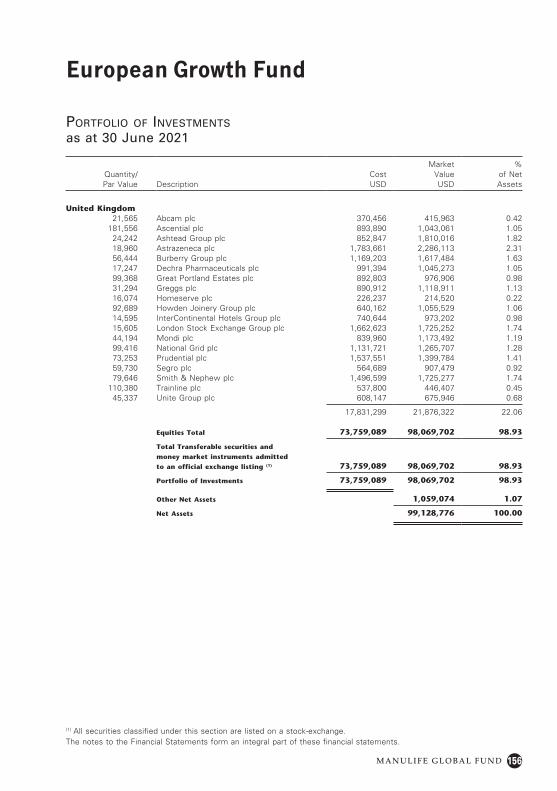
156
European Growth Fund
M A N U L I F E G L O B A L F U N D
Quantity/ Par Value Description
Cost USD
Market Value USD
% of Net Assets
United Kingdom21,565 Abcam plc 370,456 415,963 0.42
181,556 Ascential plc 893,890 1,043,061 1.0524,242 Ashtead Group plc 852,847 1,810,016 1.8218,960 Astrazeneca plc 1,783,661 2,286,113 2.3156,444 Burberry Group plc 1,169,203 1,617,484 1.6317,247 Dechra Pharmaceuticals plc 991,394 1,045,273 1.0599,368 Great Portland Estates plc 892,803 976,906 0.9831,294 Greggs plc 890,912 1,118,911 1.1316,074 Homeserve plc 226,237 214,520 0.2292,689 Howden Joinery Group plc 640,162 1,055,529 1.0614,595 InterContinental Hotels Group plc 740,644 973,202 0.9815,605 London Stock Exchange Group plc 1,662,623 1,725,252 1.7444,194 Mondi plc 839,960 1,173,492 1.1999,416 National Grid plc 1,131,721 1,265,707 1.2873,253 Prudential plc 1,537,551 1,399,784 1.4159,730 Segro plc 564,689 907,479 0.9279,646 Smith & Nephew plc 1,496,599 1,725,277 1.74
110,380 Trainline plc 537,800 446,407 0.4545,337 Unite Group plc 608,147 675,946 0.68
17,831,299 21,876,322 22.06
Equities Total 73,759,089 98,069,702 98.93
Total Transferable securities and
money market instruments admitted
to an official exchange listing (1) 73,759,089 98,069,702 98.93
Portfolio of Investments 73,759,089 98,069,702 98.93
Other Net Assets 1,059,074 1.07
Net Assets 99,128,776 100.00
(1) All securities classified under this section are listed on a stock-exchange.The notes to the Financial Statements form an integral part of these financial statements.
Portfolio of investments
as at 30 June 2021
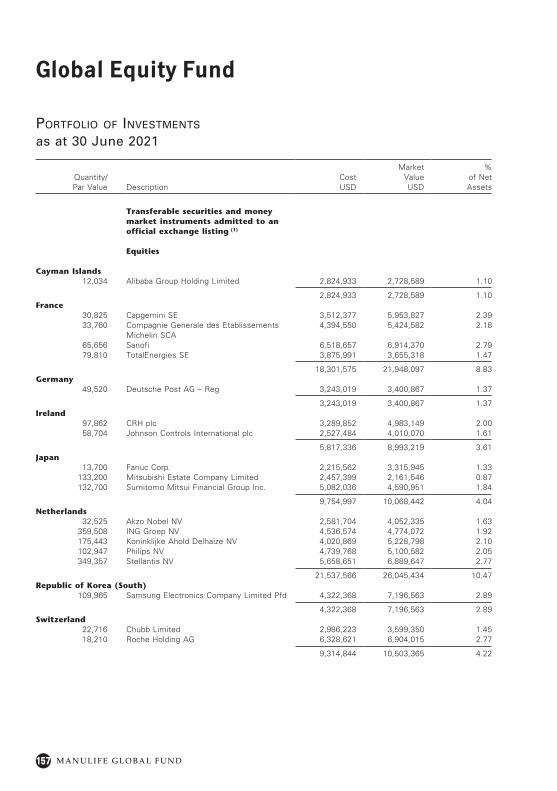
157
Global Equity Fund
M A N U L I F E G L O B A L F U N D
Portfolio of investments
as at 30 June 2021
Quantity/ Par Value Description
Cost USD
Market Value USD
% of Net Assets
Transferable securities and money market instruments admitted to an official exchange listing (1)
Equities
Cayman Islands12,034 Alibaba Group Holding Limited 2,824,933 2,728,589 1.10
2,824,933 2,728,589 1.10France
30,825 Capgemini SE 3,512,377 5,953,827 2.3933,760 Compagnie Generale des Etablissements
Michelin SCA4,394,550 5,424,582 2.18
65,656 Sanofi 6,518,657 6,914,370 2.7979,810 TotalEnergies SE 3,875,991 3,655,318 1.47
18,301,575 21,948,097 8.83Germany
49,520 Deutsche Post AG – Reg 3,243,019 3,400,867 1.37
3,243,019 3,400,867 1.37Ireland
97,862 CRH plc 3,289,852 4,983,149 2.0058,704 Johnson Controls International plc 2,527,484 4,010,070 1.61
5,817,336 8,993,219 3.61Japan
13,700 Fanuc Corp. 2,215,562 3,315,945 1.33133,200 Mitsubishi Estate Company Limited 2,457,399 2,161,546 0.87132,700 Sumitomo Mitsui Financial Group Inc. 5,082,036 4,590,951 1.84
9,754,997 10,068,442 4.04Netherlands
32,525 Akzo Nobel NV 2,581,704 4,052,335 1.63359,508 ING Groep NV 4,536,574 4,774,072 1.92175,443 Koninklijke Ahold Delhaize NV 4,020,869 5,228,798 2.10102,947 Philips NV 4,739,768 5,100,582 2.05349,357 Stellantis NV 5,658,651 6,889,647 2.77
21,537,566 26,045,434 10.47Republic of Korea (South)
109,965 Samsung Electronics Company Limited Pfd 4,322,368 7,196,563 2.89
4,322,368 7,196,563 2.89Switzerland
22,716 Chubb Limited 2,986,223 3,599,350 1.4518,210 Roche Holding AG 6,328,621 6,904,015 2.77
9,314,844 10,503,365 4.22
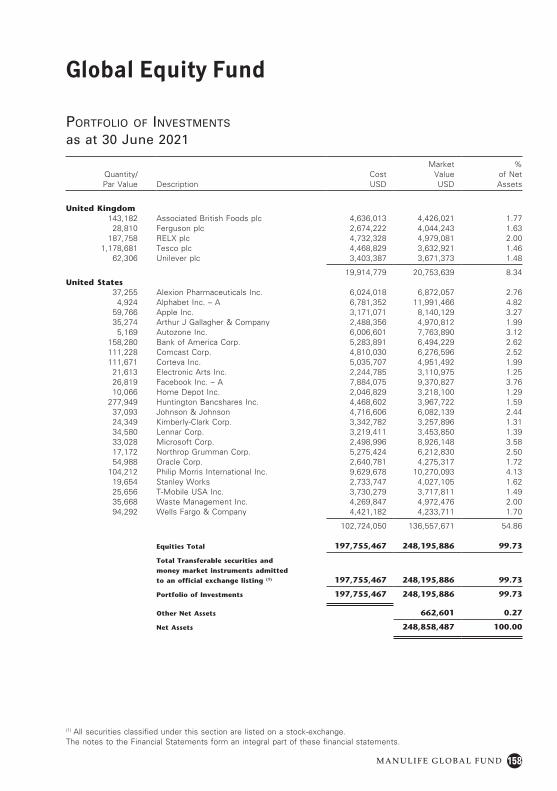
158
Global Equity Fund
M A N U L I F E G L O B A L F U N D
Quantity/ Par Value Description
Cost USD
Market Value USD
% of Net Assets
United Kingdom143,182 Associated British Foods plc 4,636,013 4,426,021 1.77
28,810 Ferguson plc 2,674,222 4,044,243 1.63187,758 RELX plc 4,732,328 4,979,081 2.00
1,178,681 Tesco plc 4,468,829 3,632,921 1.4662,306 Unilever plc 3,403,387 3,671,373 1.48
19,914,779 20,753,639 8.34United States
37,255 Alexion Pharmaceuticals Inc. 6,024,018 6,872,057 2.764,924 Alphabet Inc. – A 6,781,352 11,991,466 4.82
59,766 Apple Inc. 3,171,071 8,140,129 3.2735,274 Arthur J Gallagher & Company 2,488,356 4,970,812 1.99
5,169 Autozone Inc. 6,006,601 7,763,890 3.12158,280 Bank of America Corp. 5,283,891 6,494,229 2.62111,228 Comcast Corp. 4,810,030 6,276,596 2.52111,671 Corteva Inc. 5,035,707 4,951,492 1.99
21,613 Electronic Arts Inc. 2,244,785 3,110,975 1.2526,819 Facebook Inc. – A 7,884,075 9,370,827 3.7610,066 Home Depot Inc. 2,046,829 3,218,100 1.29
277,949 Huntington Bancshares Inc. 4,468,602 3,967,722 1.5937,093 Johnson & Johnson 4,716,606 6,082,139 2.4424,349 Kimberly-Clark Corp. 3,342,782 3,257,896 1.3134,580 Lennar Corp. 3,219,411 3,453,850 1.3933,028 Microsoft Corp. 2,498,996 8,926,148 3.5817,172 Northrop Grumman Corp. 5,275,424 6,212,830 2.5054,988 Oracle Corp. 2,640,781 4,275,317 1.72
104,212 Philip Morris International Inc. 9,629,678 10,270,093 4.1319,654 Stanley Works 2,733,747 4,027,105 1.6225,656 T-Mobile USA Inc. 3,730,279 3,717,811 1.4935,668 Waste Management Inc. 4,269,847 4,972,476 2.0094,292 Wells Fargo & Company 4,421,182 4,233,711 1.70
102,724,050 136,557,671 54.86
Equities Total 197,755,467 248,195,886 99.73
Total Transferable securities and
money market instruments admitted
to an official exchange listing (1) 197,755,467 248,195,886 99.73
Portfolio of Investments 197,755,467 248,195,886 99.73
Other Net Assets 662,601 0.27
Net Assets 248,858,487 100.00
Portfolio of investments
as at 30 June 2021
(1) All securities classified under this section are listed on a stock-exchange.The notes to the Financial Statements form an integral part of these financial statements.
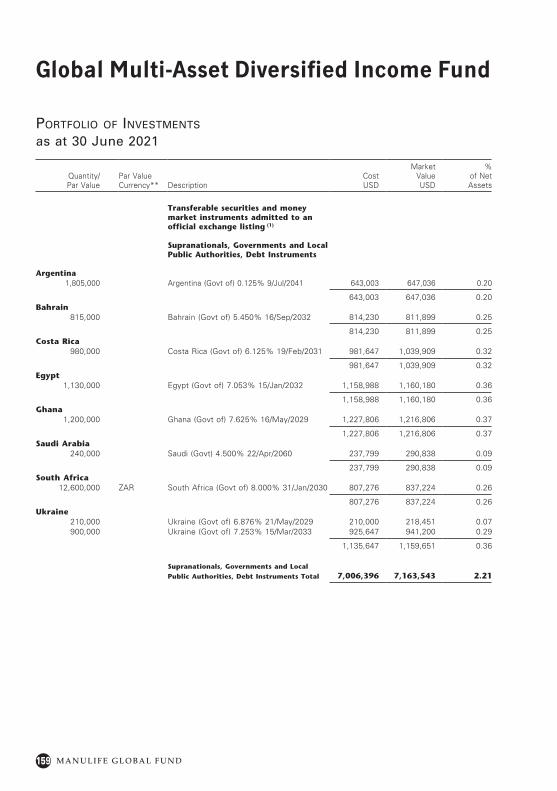
159
Global Multi-Asset Diversified Income Fund
M A N U L I F E G L O B A L F U N D
Portfolio of investments
as at 30 June 2021
Quantity/ Par Value
Par Value Currency** Description
Cost USD
Market Value USD
% of Net Assets
Transferable securities and money market instruments admitted to an official exchange listing (1)
Supranationals, Governments and Local Public Authorities, Debt Instruments
Argentina1,805,000 Argentina (Govt of) 0.125% 9/Jul/2041 643,003 647,036 0.20
643,003 647,036 0.20Bahrain
815,000 Bahrain (Govt of) 5.450% 16/Sep/2032 814,230 811,899 0.25
814,230 811,899 0.25Costa Rica
980,000 Costa Rica (Govt of) 6.125% 19/Feb/2031 981,647 1,039,909 0.32
981,647 1,039,909 0.32Egypt
1,130,000 Egypt (Govt of) 7.053% 15/Jan/2032 1,158,988 1,160,180 0.36
1,158,988 1,160,180 0.36Ghana
1,200,000 Ghana (Govt of) 7.625% 16/May/2029 1,227,806 1,216,806 0.37
1,227,806 1,216,806 0.37Saudi Arabia
240,000 Saudi (Govt) 4.500% 22/Apr/2060 237,799 290,838 0.09
237,799 290,838 0.09South Africa
12,600,000 ZAR South Africa (Govt of) 8.000% 31/Jan/2030 807,276 837,224 0.26
807,276 837,224 0.26Ukraine
210,000 Ukraine (Govt of) 6.876% 21/May/2029 210,000 218,451 0.07900,000 Ukraine (Govt of) 7.253% 15/Mar/2033 925,647 941,200 0.29
1,135,647 1,159,651 0.36
Supranationals, Governments and Local
Public Authorities, Debt Instruments Total 7,006,396 7,163,543 2.21
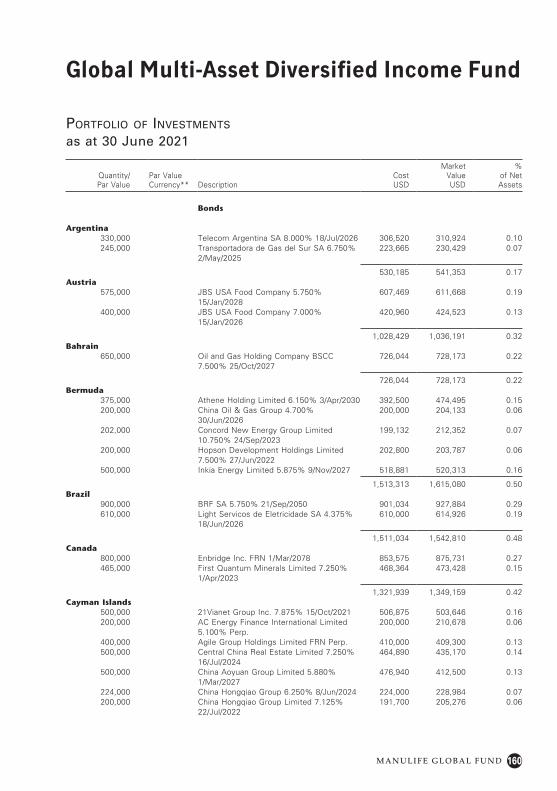
160
Global Multi-Asset Diversified Income Fund
M A N U L I F E G L O B A L F U N D
Quantity/ Par Value
Par Value Currency** Description
Cost USD
Market Value USD
% of Net Assets
Bonds
Argentina330,000 Telecom Argentina SA 8.000% 18/Jul/2026 306,520 310,924 0.10245,000 Transportadora de Gas del Sur SA 6.750%
2/May/2025223,665 230,429 0.07
530,185 541,353 0.17Austria
575,000 JBS USA Food Company 5.750% 15/Jan/2028
607,469 611,668 0.19
400,000 JBS USA Food Company 7.000% 15/Jan/2026
420,960 424,523 0.13
1,028,429 1,036,191 0.32Bahrain
650,000 Oil and Gas Holding Company BSCC 7.500% 25/Oct/2027
726,044 728,173 0.22
726,044 728,173 0.22Bermuda
375,000 Athene Holding Limited 6.150% 3/Apr/2030 392,500 474,495 0.15200,000 China Oil & Gas Group 4.700%
30/Jun/2026200,000 204,133 0.06
202,000 Concord New Energy Group Limited 10.750% 24/Sep/2023
199,132 212,352 0.07
200,000 Hopson Development Holdings Limited 7.500% 27/Jun/2022
202,800 203,787 0.06
500,000 Inkia Energy Limited 5.875% 9/Nov/2027 518,881 520,313 0.16
1,513,313 1,615,080 0.50Brazil
900,000 BRF SA 5.750% 21/Sep/2050 901,034 927,884 0.29610,000 Light Servicos de Eletricidade SA 4.375%
18/Jun/2026610,000 614,926 0.19
1,511,034 1,542,810 0.48Canada
800,000 Enbridge Inc. FRN 1/Mar/2078 853,575 875,731 0.27465,000 First Quantum Minerals Limited 7.250%
1/Apr/2023468,364 473,428 0.15
1,321,939 1,349,159 0.42Cayman Islands
500,000 21Vianet Group Inc. 7.875% 15/Oct/2021 506,875 503,646 0.16200,000 AC Energy Finance International Limited
5.100% Perp.200,000 210,678 0.06
400,000 Agile Group Holdings Limited FRN Perp. 410,000 409,300 0.13500,000 Central China Real Estate Limited 7.250%
16/Jul/2024464,890 435,170 0.14
500,000 China Aoyuan Group Limited 5.880% 1/Mar/2027
476,940 412,500 0.13
224,000 China Hongqiao Group 6.250% 8/Jun/2024 224,000 228,984 0.07200,000 China Hongqiao Group Limited 7.125%
22/Jul/2022191,700 205,276 0.06
Portfolio of investments
as at 30 June 2021
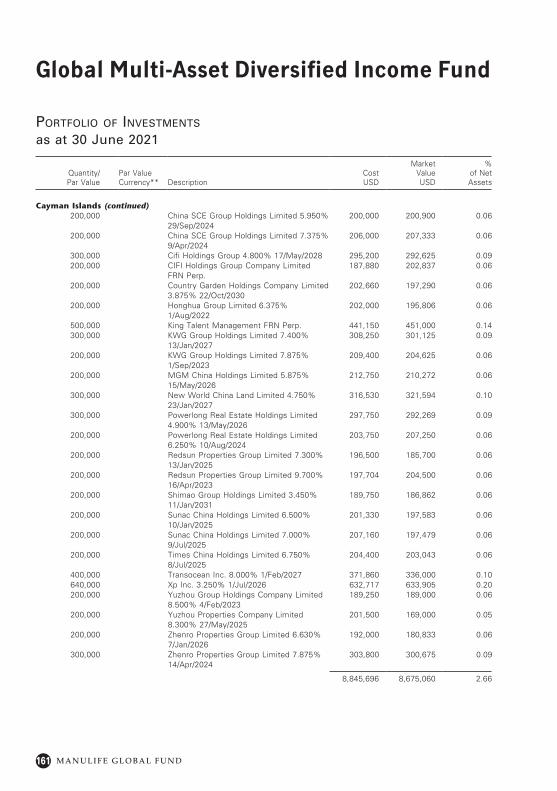
161
Global Multi-Asset Diversified Income Fund
M A N U L I F E G L O B A L F U N D
Quantity/ Par Value
Par Value Currency** Description
Cost USD
Market Value USD
% of Net Assets
Cayman Islands (continued)200,000 China SCE Group Holdings Limited 5.950%
29/Sep/2024200,000 200,900 0.06
200,000 China SCE Group Holdings Limited 7.375% 9/Apr/2024
206,000 207,333 0.06
300,000 Cifi Holdings Group 4.800% 17/May/2028 295,200 292,625 0.09200,000 CIFI Holdings Group Company Limited
FRN Perp.187,880 202,837 0.06
200,000 Country Garden Holdings Company Limited 3.875% 22/Oct/2030
202,660 197,290 0.06
200,000 Honghua Group Limited 6.375% 1/Aug/2022
202,000 195,806 0.06
500,000 King Talent Management FRN Perp. 441,150 451,000 0.14300,000 KWG Group Holdings Limited 7.400%
13/Jan/2027308,250 301,125 0.09
200,000 KWG Group Holdings Limited 7.875% 1/Sep/2023
209,400 204,625 0.06
200,000 MGM China Holdings Limited 5.875% 15/May/2026
212,750 210,272 0.06
300,000 New World China Land Limited 4.750% 23/Jan/2027
316,530 321,594 0.10
300,000 Powerlong Real Estate Holdings Limited 4.900% 13/May/2026
297,750 292,269 0.09
200,000 Powerlong Real Estate Holdings Limited 6.250% 10/Aug/2024
203,750 207,250 0.06
200,000 Redsun Properties Group Limited 7.300% 13/Jan/2025
196,500 185,700 0.06
200,000 Redsun Properties Group Limited 9.700% 16/Apr/2023
197,704 204,500 0.06
200,000 Shimao Group Holdings Limited 3.450% 11/Jan/2031
189,750 186,862 0.06
200,000 Sunac China Holdings Limited 6.500% 10/Jan/2025
201,330 197,583 0.06
200,000 Sunac China Holdings Limited 7.000% 9/Jul/2025
207,160 197,479 0.06
200,000 Times China Holdings Limited 6.750% 8/Jul/2025
204,400 203,043 0.06
400,000 Transocean Inc. 8.000% 1/Feb/2027 371,860 336,000 0.10640,000 Xp Inc. 3.250% 1/Jul/2026 632,717 633,905 0.20200,000 Yuzhou Group Holdings Company Limited
8.500% 4/Feb/2023189,250 189,000 0.06
200,000 Yuzhou Properties Company Limited 8.300% 27/May/2025
201,500 169,000 0.05
200,000 Zhenro Properties Group Limited 6.630% 7/Jan/2026
192,000 180,833 0.06
300,000 Zhenro Properties Group Limited 7.875% 14/Apr/2024
303,800 300,675 0.09
8,845,696 8,675,060 2.66
Portfolio of investments
as at 30 June 2021
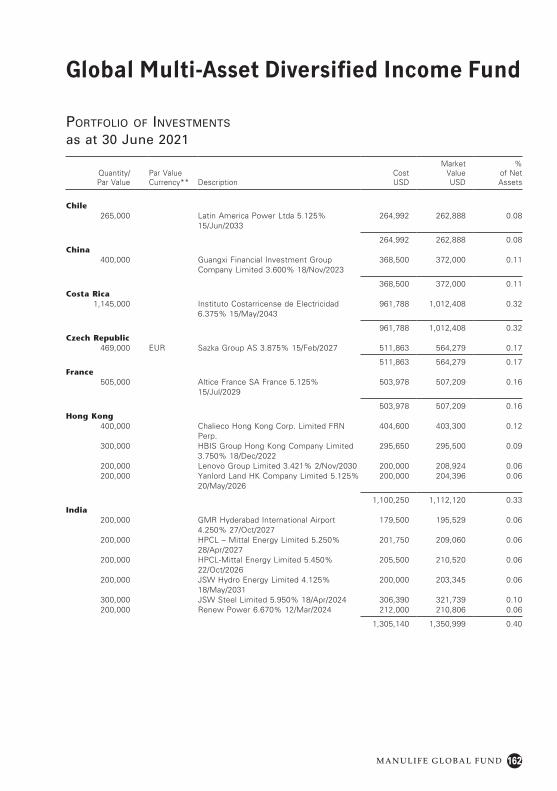
162
Global Multi-Asset Diversified Income Fund
M A N U L I F E G L O B A L F U N D
Quantity/ Par Value
Par Value Currency** Description
Cost USD
Market Value USD
% of Net Assets
Chile265,000 Latin America Power Ltda 5.125%
15/Jun/2033264,992 262,888 0.08
264,992 262,888 0.08China
400,000 Guangxi Financial Investment Group Company Limited 3.600% 18/Nov/2023
368,500 372,000 0.11
368,500 372,000 0.11Costa Rica
1,145,000 Instituto Costarricense de Electricidad 6.375% 15/May/2043
961,788 1,012,408 0.32
961,788 1,012,408 0.32Czech Republic
469,000 EUR Sazka Group AS 3.875% 15/Feb/2027 511,863 564,279 0.17
511,863 564,279 0.17France
505,000 Altice France SA France 5.125% 15/Jul/2029
503,978 507,209 0.16
503,978 507,209 0.16Hong Kong
400,000 Chalieco Hong Kong Corp. Limited FRN Perp.
404,600 403,300 0.12
300,000 HBIS Group Hong Kong Company Limited 3.750% 18/Dec/2022
295,650 295,500 0.09
200,000 Lenovo Group Limited 3.421% 2/Nov/2030 200,000 208,924 0.06200,000 Yanlord Land HK Company Limited 5.125%
20/May/2026200,000 204,396 0.06
1,100,250 1,112,120 0.33India
200,000 GMR Hyderabad International Airport 4.250% 27/Oct/2027
179,500 195,529 0.06
200,000 HPCL – Mittal Energy Limited 5.250% 28/Apr/2027
201,750 209,060 0.06
200,000 HPCL-Mittal Energy Limited 5.450% 22/Oct/2026
205,500 210,520 0.06
200,000 JSW Hydro Energy Limited 4.125% 18/May/2031
200,000 203,345 0.06
300,000 JSW Steel Limited 5.950% 18/Apr/2024 306,390 321,739 0.10200,000 Renew Power 6.670% 12/Mar/2024 212,000 210,806 0.06
1,305,140 1,350,999 0.40
Portfolio of investments
as at 30 June 2021
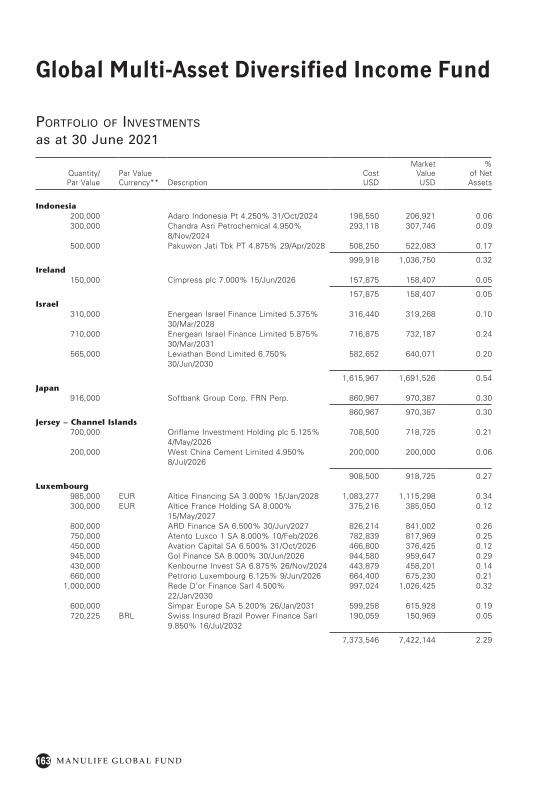
163
Global Multi-Asset Diversified Income Fund
M A N U L I F E G L O B A L F U N D
Quantity/ Par Value
Par Value Currency** Description
Cost USD
Market Value USD
% of Net Assets
Indonesia200,000 Adaro Indonesia Pt 4.250% 31/Oct/2024 198,550 206,921 0.06300,000 Chandra Asri Petrochemical 4.950%
8/Nov/2024293,118 307,746 0.09
500,000 Pakuwon Jati Tbk PT 4.875% 29/Apr/2028 508,250 522,083 0.17
999,918 1,036,750 0.32Ireland
150,000 Cimpress plc 7.000% 15/Jun/2026 157,875 158,407 0.05
157,875 158,407 0.05Israel
310,000 Energean Israel Finance Limited 5.375% 30/Mar/2028
316,440 319,268 0.10
710,000 Energean Israel Finance Limited 5.875% 30/Mar/2031
716,875 732,187 0.24
565,000 Leviathan Bond Limited 6.750% 30/Jun/2030
582,652 640,071 0.20
1,615,967 1,691,526 0.54Japan
916,000 Softbank Group Corp. FRN Perp. 860,967 970,387 0.30
860,967 970,387 0.30Jersey – Channel Islands
700,000 Oriflame Investment Holding plc 5.125% 4/May/2026
708,500 718,725 0.21
200,000 West China Cement Limited 4.950% 8/Jul/2026
200,000 200,000 0.06
908,500 918,725 0.27Luxembourg
985,000 EUR Altice Financing SA 3.000% 15/Jan/2028 1,083,277 1,115,298 0.34300,000 EUR Altice France Holding SA 8.000%
15/May/2027375,216 385,050 0.12
800,000 ARD Finance SA 6.500% 30/Jun/2027 826,214 841,002 0.26750,000 Atento Luxco 1 SA 8.000% 10/Feb/2026 782,839 817,969 0.25450,000 Avation Capital SA 6.500% 31/Oct/2026 466,800 376,425 0.12945,000 Gol Finance SA 8.000% 30/Jun/2026 944,580 959,647 0.29430,000 Kenbourne Invest SA 6.875% 26/Nov/2024 443,879 458,201 0.14660,000 Petrorio Luxembourg 6.125% 9/Jun/2026 664,400 675,230 0.21
1,000,000 Rede D’or Finance Sarl 4.500% 22/Jan/2030
997,024 1,026,425 0.32
600,000 Simpar Europe SA 5.200% 26/Jan/2031 599,258 615,928 0.19720,225 BRL Swiss Insured Brazil Power Finance Sarl
9.850% 16/Jul/2032190,059 150,969 0.05
7,373,546 7,422,144 2.29
Portfolio of investments
as at 30 June 2021
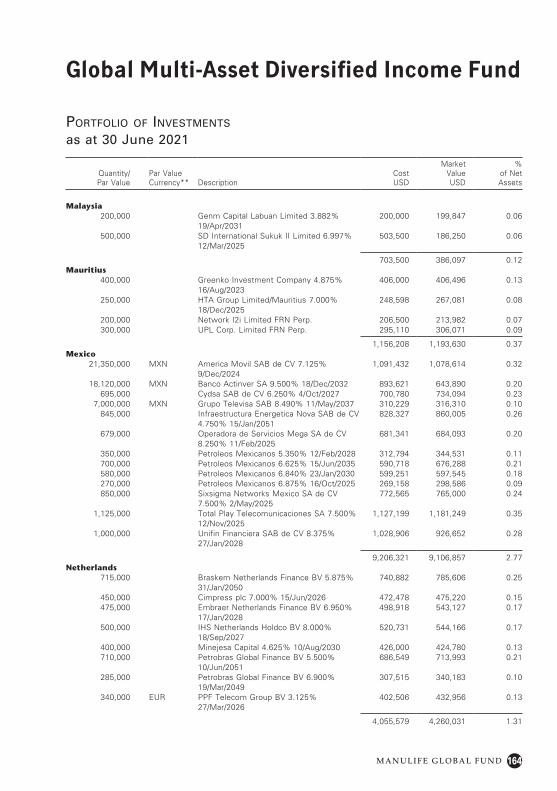
164
Global Multi-Asset Diversified Income Fund
M A N U L I F E G L O B A L F U N D
Quantity/ Par Value
Par Value Currency** Description
Cost USD
Market Value USD
% of Net Assets
Malaysia200,000 Genm Capital Labuan Limited 3.882%
19/Apr/2031200,000 199,847 0.06
500,000 SD International Sukuk II Limited 6.997% 12/Mar/2025
503,500 186,250 0.06
703,500 386,097 0.12Mauritius
400,000 Greenko Investment Company 4.875% 16/Aug/2023
406,000 406,496 0.13
250,000 HTA Group Limited/Mauritius 7.000% 18/Dec/2025
248,598 267,081 0.08
200,000 Network I2i Limited FRN Perp. 206,500 213,982 0.07300,000 UPL Corp. Limited FRN Perp. 295,110 306,071 0.09
1,156,208 1,193,630 0.37Mexico
21,350,000 MXN America Movil SAB de CV 7.125% 9/Dec/2024
1,091,432 1,078,614 0.32
18,120,000 MXN Banco Actinver SA 9.500% 18/Dec/2032 893,621 643,890 0.20695,000 Cydsa SAB de CV 6.250% 4/Oct/2027 700,780 734,094 0.23
7,000,000 MXN Grupo Televisa SAB 8.490% 11/May/2037 310,229 316,310 0.10845,000 Infraestructura Energetica Nova SAB de CV
4.750% 15/Jan/2051828,327 860,005 0.26
679,000 Operadora de Servicios Mega SA de CV 8.250% 11/Feb/2025
681,341 684,093 0.20
350,000 Petroleos Mexicanos 5.350% 12/Feb/2028 312,794 344,531 0.11700,000 Petroleos Mexicanos 6.625% 15/Jun/2035 590,718 676,288 0.21580,000 Petroleos Mexicanos 6.840% 23/Jan/2030 599,251 597,545 0.18270,000 Petroleos Mexicanos 6.875% 16/Oct/2025 269,158 298,586 0.09850,000 Sixsigma Networks Mexico SA de CV
7.500% 2/May/2025772,565 765,000 0.24
1,125,000 Total Play Telecomunicaciones SA 7.500% 12/Nov/2025
1,127,199 1,181,249 0.35
1,000,000 Unifin Financiera SAB de CV 8.375% 27/Jan/2028
1,028,906 926,652 0.28
9,206,321 9,106,857 2.77Netherlands
715,000 Braskem Netherlands Finance BV 5.875% 31/Jan/2050
740,882 785,606 0.25
450,000 Cimpress plc 7.000% 15/Jun/2026 472,478 475,220 0.15475,000 Embraer Netherlands Finance BV 6.950%
17/Jan/2028498,918 543,127 0.17
500,000 IHS Netherlands Holdco BV 8.000% 18/Sep/2027
520,731 544,166 0.17
400,000 Minejesa Capital 4.625% 10/Aug/2030 426,000 424,780 0.13710,000 Petrobras Global Finance BV 5.500%
10/Jun/2051686,549 713,993 0.21
285,000 Petrobras Global Finance BV 6.900% 19/Mar/2049
307,515 340,183 0.10
340,000 EUR PPF Telecom Group BV 3.125% 27/Mar/2026
402,506 432,956 0.13
4,055,579 4,260,031 1.31
Portfolio of investments
as at 30 June 2021
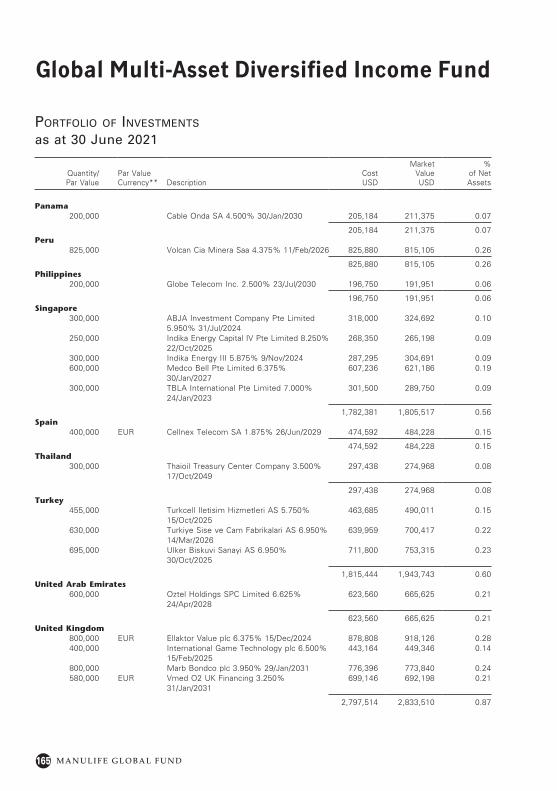
165
Global Multi-Asset Diversified Income Fund
M A N U L I F E G L O B A L F U N D
Quantity/ Par Value
Par Value Currency** Description
Cost USD
Market Value USD
% of Net Assets
Panama200,000 Cable Onda SA 4.500% 30/Jan/2030 205,184 211,375 0.07
205,184 211,375 0.07Peru
825,000 Volcan Cia Minera Saa 4.375% 11/Feb/2026 825,880 815,105 0.26
825,880 815,105 0.26Philippines
200,000 Globe Telecom Inc. 2.500% 23/Jul/2030 196,750 191,951 0.06
196,750 191,951 0.06Singapore
300,000 ABJA Investment Company Pte Limited 5.950% 31/Jul/2024
318,000 324,692 0.10
250,000 Indika Energy Capital IV Pte Limited 8.250% 22/Oct/2025
268,350 265,198 0.09
300,000 Indika Energy III 5.875% 9/Nov/2024 287,295 304,691 0.09600,000 Medco Bell Pte Limited 6.375%
30/Jan/2027607,236 621,186 0.19
300,000 TBLA International Pte Limited 7.000% 24/Jan/2023
301,500 289,750 0.09
1,782,381 1,805,517 0.56Spain
400,000 EUR Cellnex Telecom SA 1.875% 26/Jun/2029 474,592 484,228 0.15
474,592 484,228 0.15Thailand
300,000 Thaioil Treasury Center Company 3.500% 17/Oct/2049
297,438 274,968 0.08
297,438 274,968 0.08Turkey
455,000 Turkcell Iletisim Hizmetleri AS 5.750% 15/Oct/2025
463,685 490,011 0.15
630,000 Turkiye Sise ve Cam Fabrikalari AS 6.950% 14/Mar/2026
639,959 700,417 0.22
695,000 Ulker Biskuvi Sanayi AS 6.950% 30/Oct/2025
711,800 753,315 0.23
1,815,444 1,943,743 0.60United Arab Emirates
600,000 Oztel Holdings SPC Limited 6.625% 24/Apr/2028
623,560 665,625 0.21
623,560 665,625 0.21United Kingdom
800,000 EUR Ellaktor Value plc 6.375% 15/Dec/2024 878,808 918,126 0.28400,000 International Game Technology plc 6.500%
15/Feb/2025443,164 449,346 0.14
800,000 Marb Bondco plc 3.950% 29/Jan/2031 776,396 773,840 0.24580,000 EUR Vmed O2 UK Financing 3.250%
31/Jan/2031699,146 692,198 0.21
2,797,514 2,833,510 0.87
Portfolio of investments
as at 30 June 2021
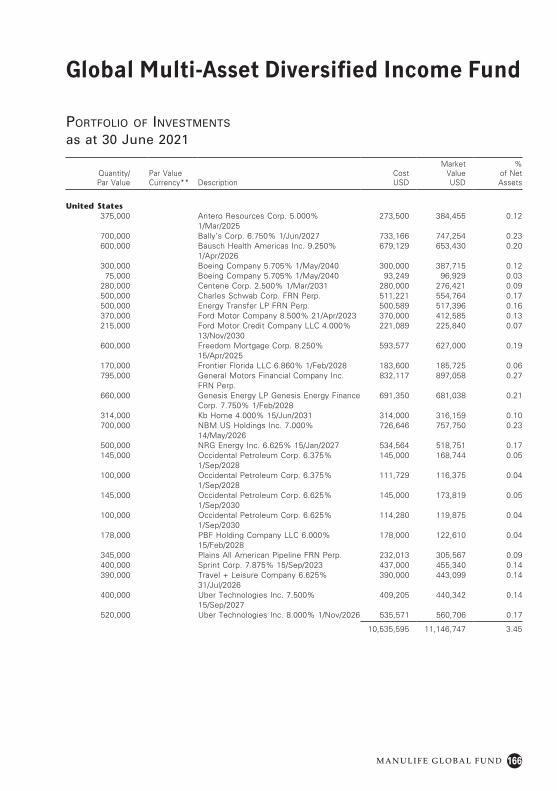
166
Global Multi-Asset Diversified Income Fund
M A N U L I F E G L O B A L F U N D
Quantity/ Par Value
Par Value Currency** Description
Cost USD
Market Value USD
% of Net Assets
United States375,000 Antero Resources Corp. 5.000%
1/Mar/2025273,500 384,455 0.12
700,000 Bally’s Corp. 6.750% 1/Jun/2027 733,166 747,254 0.23600,000 Bausch Health Americas Inc. 9.250%
1/Apr/2026679,129 653,430 0.20
300,000 Boeing Company 5.705% 1/May/2040 300,000 387,715 0.1275,000 Boeing Company 5.705% 1/May/2040 93,249 96,929 0.03
280,000 Centene Corp. 2.500% 1/Mar/2031 280,000 276,421 0.09500,000 Charles Schwab Corp. FRN Perp. 511,221 554,764 0.17500,000 Energy Transfer LP FRN Perp. 500,589 517,396 0.16370,000 Ford Motor Company 8.500% 21/Apr/2023 370,000 412,585 0.13215,000 Ford Motor Credit Company LLC 4.000%
13/Nov/2030221,089 225,840 0.07
600,000 Freedom Mortgage Corp. 8.250% 15/Apr/2025
593,577 627,000 0.19
170,000 Frontier Florida LLC 6.860% 1/Feb/2028 183,600 185,725 0.06795,000 General Motors Financial Company Inc.
FRN Perp.832,117 897,058 0.27
660,000 Genesis Energy LP Genesis Energy Finance Corp. 7.750% 1/Feb/2028
691,350 681,038 0.21
314,000 Kb Home 4.000% 15/Jun/2031 314,000 316,159 0.10700,000 NBM US Holdings Inc. 7.000%
14/May/2026726,646 757,750 0.23
500,000 NRG Energy Inc. 6.625% 15/Jan/2027 534,564 518,751 0.17145,000 Occidental Petroleum Corp. 6.375%
1/Sep/2028145,000 168,744 0.05
100,000 Occidental Petroleum Corp. 6.375% 1/Sep/2028
111,729 116,375 0.04
145,000 Occidental Petroleum Corp. 6.625% 1/Sep/2030
145,000 173,819 0.05
100,000 Occidental Petroleum Corp. 6.625% 1/Sep/2030
114,280 119,875 0.04
178,000 PBF Holding Company LLC 6.000% 15/Feb/2028
178,000 122,610 0.04
345,000 Plains All American Pipeline FRN Perp. 232,013 305,567 0.09400,000 Sprint Corp. 7.875% 15/Sep/2023 437,000 455,340 0.14390,000 Travel + Leisure Company 6.625%
31/Jul/2026390,000 443,099 0.14
400,000 Uber Technologies Inc. 7.500% 15/Sep/2027
409,205 440,342 0.14
520,000 Uber Technologies Inc. 8.000% 1/Nov/2026 535,571 560,706 0.17
10,535,595 11,146,747 3.45
Portfolio of investments
as at 30 June 2021
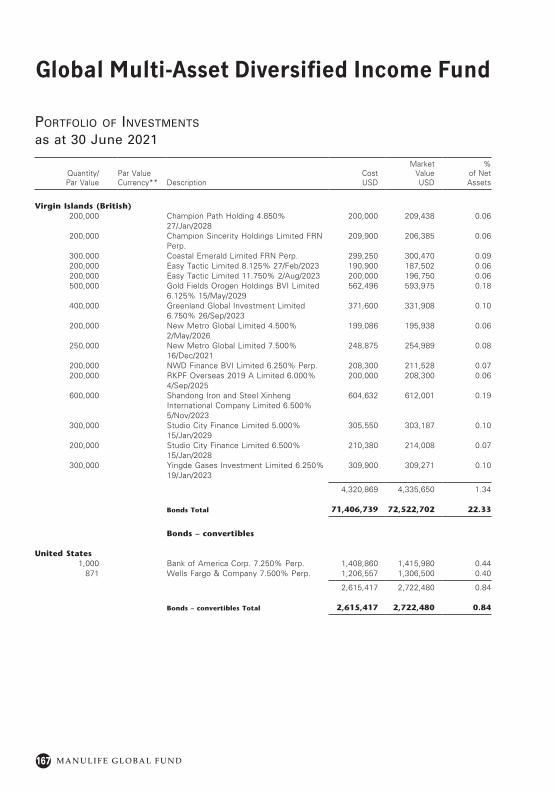
167
Global Multi-Asset Diversified Income Fund
M A N U L I F E G L O B A L F U N D
Quantity/ Par Value
Par Value Currency** Description
Cost USD
Market Value USD
% of Net Assets
Virgin Islands (British)200,000 Champion Path Holding 4.850%
27/Jan/2028200,000 209,438 0.06
200,000 Champion Sincerity Holdings Limited FRN Perp.
209,900 206,385 0.06
300,000 Coastal Emerald Limited FRN Perp. 299,250 300,470 0.09200,000 Easy Tactic Limited 8.125% 27/Feb/2023 190,900 187,502 0.06200,000 Easy Tactic Limited 11.750% 2/Aug/2023 200,000 196,750 0.06500,000 Gold Fields Orogen Holdings BVI Limited
6.125% 15/May/2029562,496 593,975 0.18
400,000 Greenland Global Investment Limited 6.750% 26/Sep/2023
371,600 331,908 0.10
200,000 New Metro Global Limited 4.500% 2/May/2026
199,086 195,938 0.06
250,000 New Metro Global Limited 7.500% 16/Dec/2021
248,875 254,989 0.08
200,000 NWD Finance BVI Limited 6.250% Perp. 208,300 211,528 0.07200,000 RKPF Overseas 2019 A Limited 6.000%
4/Sep/2025200,000 208,300 0.06
600,000 Shandong Iron and Steel Xinheng International Company Limited 6.500% 5/Nov/2023
604,632 612,001 0.19
300,000 Studio City Finance Limited 5.000% 15/Jan/2029
305,550 303,187 0.10
200,000 Studio City Finance Limited 6.500% 15/Jan/2028
210,380 214,008 0.07
300,000 Yingde Gases Investment Limited 6.250% 19/Jan/2023
309,900 309,271 0.10
4,320,869 4,335,650 1.34
Bonds Total 71,406,739 72,522,702 22.33
Bonds – convertibles
United States1,000 Bank of America Corp. 7.250% Perp. 1,408,860 1,415,980 0.44
871 Wells Fargo & Company 7.500% Perp. 1,206,557 1,306,500 0.40
2,615,417 2,722,480 0.84
Bonds – convertibles Total 2,615,417 2,722,480 0.84
Portfolio of investments
as at 30 June 2021
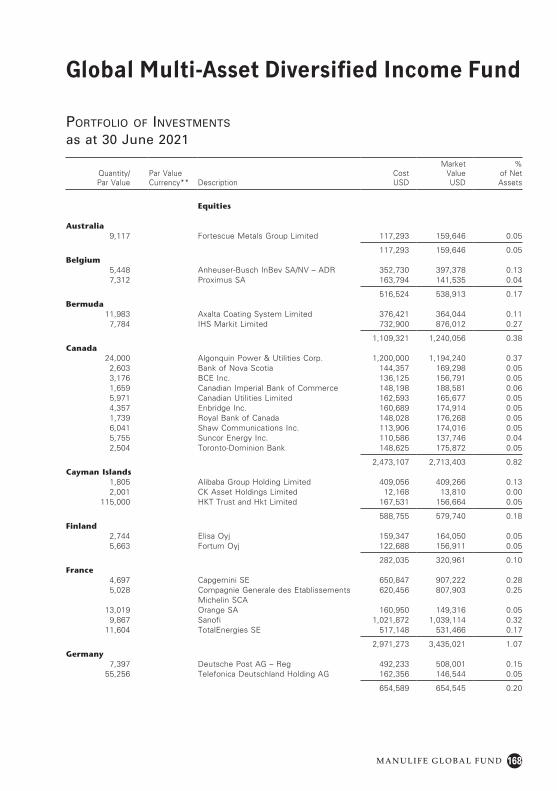
168
Global Multi-Asset Diversified Income Fund
M A N U L I F E G L O B A L F U N D
Quantity/ Par Value
Par Value Currency** Description
Cost USD
Market Value USD
% of Net Assets
Equities
Australia9,117 Fortescue Metals Group Limited 117,293 159,646 0.05
117,293 159,646 0.05Belgium
5,448 Anheuser-Busch InBev SA/NV – ADR 352,730 397,378 0.137,312 Proximus SA 163,794 141,535 0.04
516,524 538,913 0.17Bermuda
11,983 Axalta Coating System Limited 376,421 364,044 0.117,784 IHS Markit Limited 732,900 876,012 0.27
1,109,321 1,240,056 0.38Canada
24,000 Algonquin Power & Utilities Corp. 1,200,000 1,194,240 0.372,603 Bank of Nova Scotia 144,357 169,298 0.053,176 BCE Inc. 136,125 156,791 0.051,659 Canadian Imperial Bank of Commerce 148,198 188,581 0.065,971 Canadian Utilities Limited 162,593 165,677 0.054,357 Enbridge Inc. 160,689 174,914 0.051,739 Royal Bank of Canada 148,028 176,268 0.056,041 Shaw Communications Inc. 113,906 174,016 0.055,755 Suncor Energy Inc. 110,586 137,746 0.042,504 Toronto-Dominion Bank 148,625 175,872 0.05
2,473,107 2,713,403 0.82Cayman Islands
1,805 Alibaba Group Holding Limited 409,056 409,266 0.132,001 CK Asset Holdings Limited 12,168 13,810 0.00
115,000 HKT Trust and Hkt Limited 167,531 156,664 0.05
588,755 579,740 0.18Finland
2,744 Elisa Oyj 159,347 164,050 0.055,663 Fortum Oyj 122,688 156,911 0.05
282,035 320,961 0.10France
4,697 Capgemini SE 650,847 907,222 0.285,028 Compagnie Generale des Etablissements
Michelin SCA620,456 807,903 0.25
13,019 Orange SA 160,950 149,316 0.059,867 Sanofi 1,021,872 1,039,114 0.32
11,604 TotalEnergies SE 517,148 531,466 0.17
2,971,273 3,435,021 1.07Germany
7,397 Deutsche Post AG – Reg 492,233 508,001 0.1555,256 Telefonica Deutschland Holding AG 162,356 146,544 0.05
654,589 654,545 0.20
Portfolio of investments
as at 30 June 2021
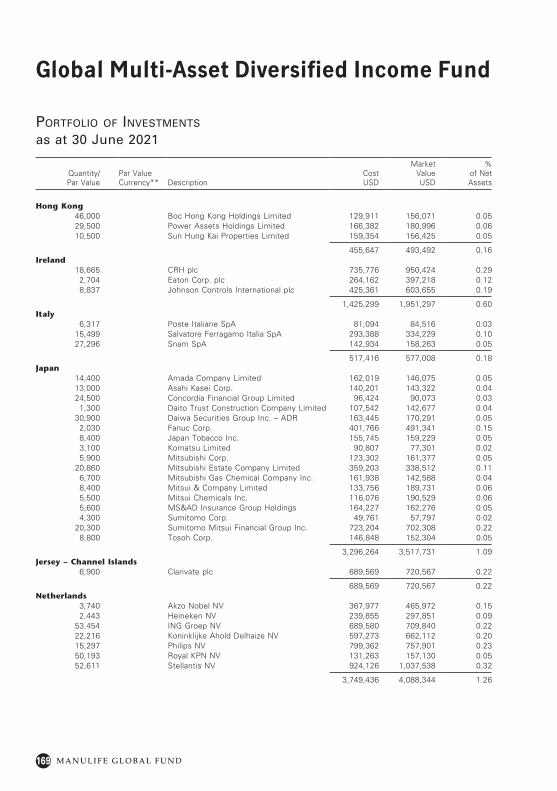
169
Global Multi-Asset Diversified Income Fund
M A N U L I F E G L O B A L F U N D
Quantity/ Par Value
Par Value Currency** Description
Cost USD
Market Value USD
% of Net Assets
Hong Kong46,000 Boc Hong Kong Holdings Limited 129,911 156,071 0.0529,500 Power Assets Holdings Limited 166,382 180,996 0.0610,500 Sun Hung Kai Properties Limited 159,354 156,425 0.05
455,647 493,492 0.16Ireland
18,665 CRH plc 735,776 950,424 0.292,704 Eaton Corp. plc 264,162 397,218 0.128,837 Johnson Controls International plc 425,361 603,655 0.19
1,425,299 1,951,297 0.60Italy
6,317 Poste Italiane SpA 81,094 84,516 0.0315,499 Salvatore Ferragamo Italia SpA 293,388 334,229 0.1027,296 Snam SpA 142,934 158,263 0.05
517,416 577,008 0.18Japan
14,400 Amada Company Limited 162,019 146,075 0.0513,000 Asahi Kasei Corp. 140,201 143,322 0.0424,500 Concordia Financial Group Limited 96,424 90,073 0.03
1,300 Daito Trust Construction Company Limited 107,542 142,677 0.0430,900 Daiwa Securities Group Inc. – ADR 163,445 170,291 0.05
2,030 Fanuc Corp. 401,766 491,341 0.158,400 Japan Tobacco Inc. 155,745 159,229 0.053,100 Komatsu Limited 90,807 77,301 0.025,900 Mitsubishi Corp. 123,302 161,377 0.05
20,860 Mitsubishi Estate Company Limited 359,203 338,512 0.116,700 Mitsubishi Gas Chemical Company Inc. 161,938 142,588 0.048,400 Mitsui & Company Limited 133,756 189,731 0.065,500 Mitsui Chemicals Inc. 116,076 190,529 0.065,600 MS&AD Insurance Group Holdings 164,227 162,276 0.054,300 Sumitomo Corp. 49,761 57,797 0.02
20,300 Sumitomo Mitsui Financial Group Inc. 723,204 702,308 0.228,800 Tosoh Corp. 146,848 152,304 0.05
3,296,264 3,517,731 1.09Jersey – Channel Islands
6,900 Clarivate plc 689,569 720,567 0.22
689,569 720,567 0.22Netherlands
3,740 Akzo Nobel NV 367,977 465,972 0.152,443 Heineken NV 239,855 297,851 0.09
53,454 ING Groep NV 689,580 709,840 0.2222,216 Koninklijke Ahold Delhaize NV 597,273 662,112 0.2015,297 Philips NV 799,362 757,901 0.2350,193 Royal KPN NV 131,263 157,130 0.0552,611 Stellantis NV 924,126 1,037,538 0.32
3,749,436 4,088,344 1.26
Portfolio of investments
as at 30 June 2021
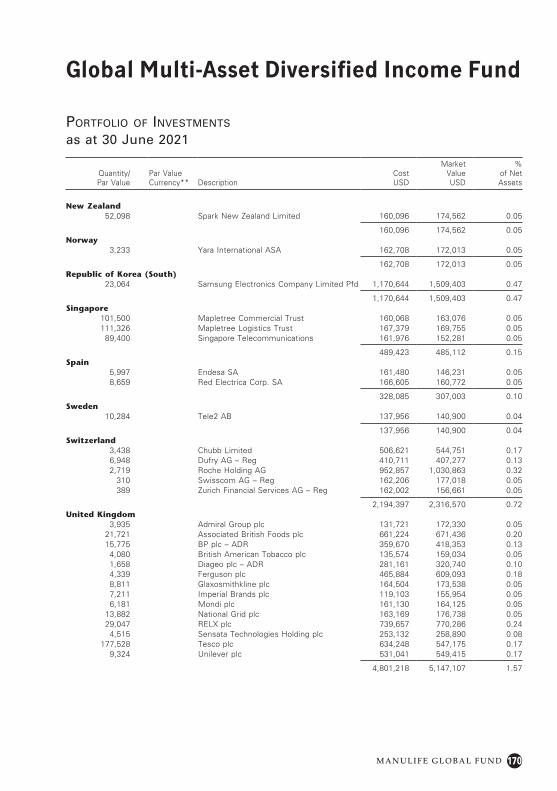
170
Global Multi-Asset Diversified Income Fund
M A N U L I F E G L O B A L F U N D
Quantity/ Par Value
Par Value Currency** Description
Cost USD
Market Value USD
% of Net Assets
New Zealand52,098 Spark New Zealand Limited 160,096 174,562 0.05
160,096 174,562 0.05Norway
3,233 Yara International ASA 162,708 172,013 0.05
162,708 172,013 0.05Republic of Korea (South)
23,064 Samsung Electronics Company Limited Pfd 1,170,644 1,509,403 0.47
1,170,644 1,509,403 0.47Singapore
101,500 Mapletree Commercial Trust 160,068 163,076 0.05111,326 Mapletree Logistics Trust 167,379 169,755 0.05
89,400 Singapore Telecommunications 161,976 152,281 0.05
489,423 485,112 0.15Spain
5,997 Endesa SA 161,480 146,231 0.058,659 Red Electrica Corp. SA 166,605 160,772 0.05
328,085 307,003 0.10Sweden
10,284 Tele2 AB 137,956 140,900 0.04
137,956 140,900 0.04Switzerland
3,438 Chubb Limited 506,621 544,751 0.176,948 Dufry AG – Reg 410,711 407,277 0.132,719 Roche Holding AG 952,857 1,030,863 0.32
310 Swisscom AG – Reg 162,206 177,018 0.05389 Zurich Financial Services AG – Reg 162,002 156,661 0.05
2,194,397 2,316,570 0.72United Kingdom
3,935 Admiral Group plc 131,721 172,330 0.0521,721 Associated British Foods plc 661,224 671,436 0.2015,775 BP plc – ADR 359,670 418,353 0.13
4,080 British American Tobacco plc 135,574 159,034 0.051,658 Diageo plc – ADR 281,161 320,740 0.104,339 Ferguson plc 465,884 609,093 0.188,811 Glaxosmithkline plc 164,504 173,538 0.057,211 Imperial Brands plc 119,103 155,954 0.056,181 Mondi plc 161,130 164,125 0.05
13,882 National Grid plc 163,169 176,738 0.0529,047 RELX plc 739,657 770,286 0.24
4,515 Sensata Technologies Holding plc 253,132 258,890 0.08177,528 Tesco plc 634,248 547,175 0.17
9,324 Unilever plc 531,041 549,415 0.17
4,801,218 5,147,107 1.57
Portfolio of investments
as at 30 June 2021
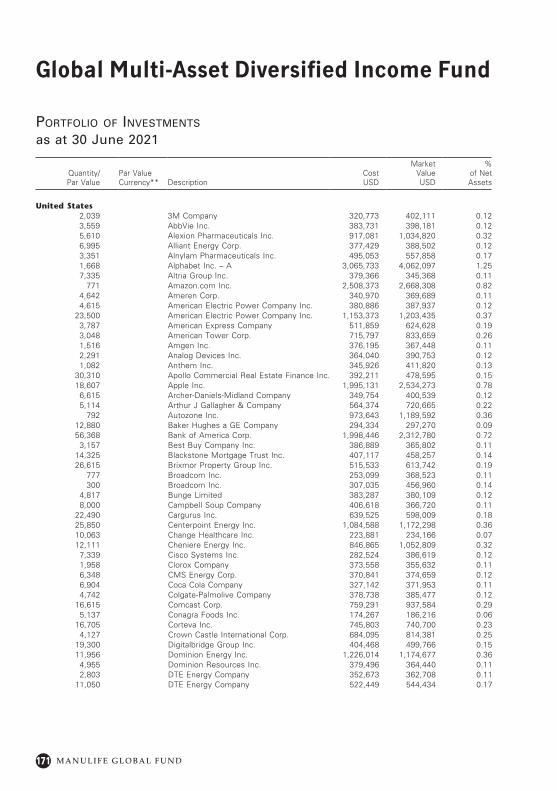
171
Global Multi-Asset Diversified Income Fund
M A N U L I F E G L O B A L F U N D
Portfolio of investments
as at 30 June 2021
Quantity/ Par Value
Par Value Currency** Description
Cost USD
Market Value USD
% of Net Assets
United States2,039 3M Company 320,773 402,111 0.123,559 AbbVie Inc. 383,731 398,181 0.125,610 Alexion Pharmaceuticals Inc. 917,081 1,034,820 0.326,995 Alliant Energy Corp. 377,429 388,502 0.123,351 Alnylam Pharmaceuticals Inc. 495,053 557,858 0.171,668 Alphabet Inc. – A 3,065,733 4,062,097 1.257,335 Altria Group Inc. 379,366 345,368 0.11
771 Amazon.com Inc. 2,508,373 2,668,308 0.824,642 Ameren Corp. 340,970 369,689 0.114,615 American Electric Power Company Inc. 380,886 387,937 0.12
23,500 American Electric Power Company Inc. 1,153,373 1,203,435 0.373,787 American Express Company 511,859 624,628 0.193,048 American Tower Corp. 715,797 833,659 0.261,516 Amgen Inc. 376,195 367,448 0.112,291 Analog Devices Inc. 364,040 390,753 0.121,082 Anthem Inc. 345,926 411,820 0.13
30,310 Apollo Commercial Real Estate Finance Inc. 392,211 478,595 0.1518,607 Apple Inc. 1,995,131 2,534,273 0.78
6,615 Archer-Daniels-Midland Company 349,754 400,539 0.125,114 Arthur J Gallagher & Company 564,374 720,665 0.22
792 Autozone Inc. 973,643 1,189,592 0.3612,880 Baker Hughes a GE Company 294,334 297,270 0.0956,368 Bank of America Corp. 1,998,446 2,312,780 0.72
3,157 Best Buy Company Inc. 386,889 365,802 0.1114,325 Blackstone Mortgage Trust Inc. 407,117 458,257 0.1426,615 Brixmor Property Group Inc. 515,533 613,742 0.19
777 Broadcom Inc. 253,099 368,523 0.11300 Broadcom Inc. 307,035 456,960 0.14
4,817 Bunge Limited 383,287 380,109 0.128,000 Campbell Soup Company 406,618 366,720 0.11
22,490 Cargurus Inc. 639,525 598,009 0.1825,850 Centerpoint Energy Inc. 1,084,588 1,172,298 0.3610,063 Change Healthcare Inc. 223,881 234,166 0.0712,111 Cheniere Energy Inc. 846,865 1,052,809 0.32
7,339 Cisco Systems Inc. 282,524 386,619 0.121,958 Clorox Company 373,558 355,632 0.116,348 CMS Energy Corp. 370,841 374,659 0.126,904 Coca Cola Company 327,142 371,953 0.114,742 Colgate-Palmolive Company 378,738 385,477 0.12
16,615 Comcast Corp. 759,291 937,584 0.295,137 Conagra Foods Inc. 174,267 186,216 0.06
16,705 Corteva Inc. 745,803 740,700 0.234,127 Crown Castle International Corp. 684,095 814,381 0.25
19,300 Digitalbridge Group Inc. 404,468 499,766 0.1511,956 Dominion Energy Inc. 1,226,014 1,174,677 0.36
4,955 Dominion Resources Inc. 379,496 364,440 0.112,803 DTE Energy Company 352,673 362,708 0.11
11,050 DTE Energy Company 522,449 544,434 0.17
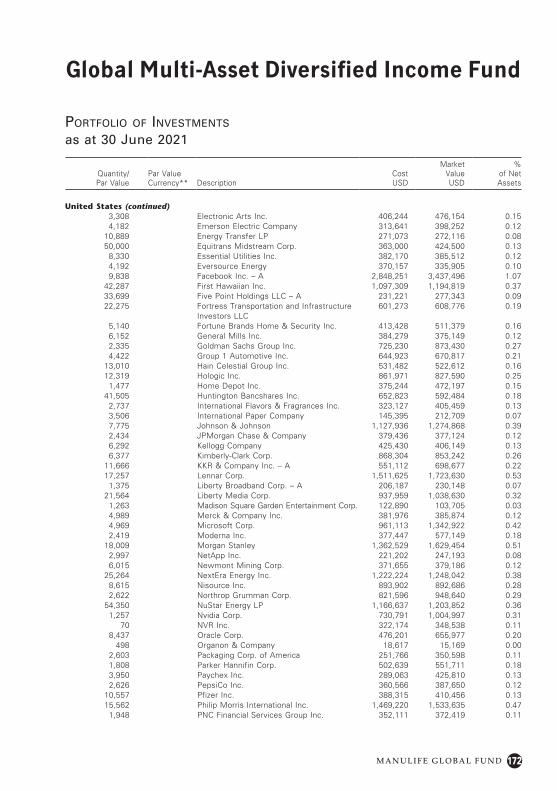
172
Global Multi-Asset Diversified Income Fund
M A N U L I F E G L O B A L F U N D
Quantity/ Par Value
Par Value Currency** Description
Cost USD
Market Value USD
% of Net Assets
United States (continued)3,308 Electronic Arts Inc. 406,244 476,154 0.154,182 Emerson Electric Company 313,641 398,252 0.12
10,889 Energy Transfer LP 271,073 272,116 0.0850,000 Equitrans Midstream Corp. 363,000 424,500 0.13
8,330 Essential Utilities Inc. 382,170 385,512 0.124,192 Eversource Energy 370,157 335,905 0.109,838 Facebook Inc. – A 2,848,251 3,437,496 1.07
42,287 First Hawaiian Inc. 1,097,309 1,194,819 0.3733,699 Five Point Holdings LLC – A 231,221 277,343 0.0922,275 Fortress Transportation and Infrastructure
Investors LLC601,273 608,776 0.19
5,140 Fortune Brands Home & Security Inc. 413,428 511,379 0.166,152 General Mills Inc. 384,279 375,149 0.122,335 Goldman Sachs Group Inc. 725,230 873,430 0.274,422 Group 1 Automotive Inc. 644,923 670,817 0.21
13,010 Hain Celestial Group Inc. 531,482 522,612 0.1612,319 Hologic Inc. 861,971 827,590 0.25
1,477 Home Depot Inc. 375,244 472,197 0.1541,505 Huntington Bancshares Inc. 652,823 592,484 0.18
2,737 International Flavors & Fragrances Inc. 323,127 405,459 0.133,506 International Paper Company 145,395 212,709 0.077,775 Johnson & Johnson 1,127,936 1,274,868 0.392,434 JPMorgan Chase & Company 379,436 377,124 0.126,292 Kellogg Company 425,430 406,149 0.136,377 Kimberly-Clark Corp. 868,304 853,242 0.26
11,666 KKR & Company Inc. – A 551,112 698,677 0.2217,257 Lennar Corp. 1,511,625 1,723,630 0.53
1,375 Liberty Broadband Corp. – A 206,187 230,148 0.0721,564 Liberty Media Corp. 937,959 1,038,630 0.32
1,263 Madison Square Garden Entertainment Corp. 122,890 103,705 0.034,989 Merck & Company Inc. 381,976 385,874 0.124,969 Microsoft Corp. 961,113 1,342,922 0.422,419 Moderna Inc. 377,447 577,149 0.18
18,009 Morgan Stanley 1,362,529 1,629,454 0.512,997 NetApp Inc. 221,202 247,193 0.086,015 Newmont Mining Corp. 371,655 379,186 0.12
25,264 NextEra Energy Inc. 1,222,224 1,248,042 0.388,615 Nisource Inc. 893,902 892,686 0.282,622 Northrop Grumman Corp. 821,596 948,640 0.29
54,350 NuStar Energy LP 1,166,637 1,203,852 0.361,257 Nvidia Corp. 730,791 1,004,997 0.31
70 NVR Inc. 322,174 348,538 0.118,437 Oracle Corp. 476,201 655,977 0.20
498 Organon & Company 18,617 15,169 0.002,603 Packaging Corp. of America 251,766 350,598 0.111,808 Parker Hannifin Corp. 502,639 551,711 0.183,950 Paychex Inc. 289,063 425,810 0.132,626 PepsiCo Inc. 360,566 387,650 0.12
10,557 Pfizer Inc. 388,315 410,456 0.1315,562 Philip Morris International Inc. 1,469,220 1,533,635 0.47
1,948 PNC Financial Services Group Inc. 352,111 372,419 0.11
Portfolio of investments
as at 30 June 2021
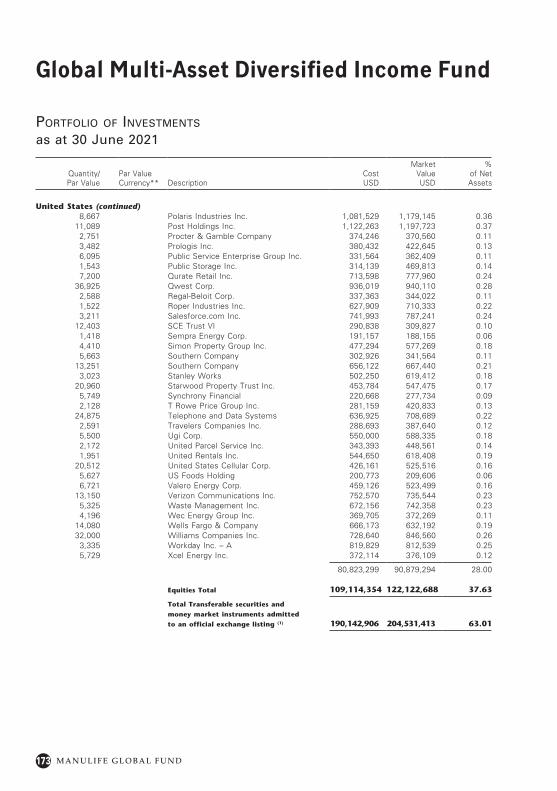
173
Global Multi-Asset Diversified Income Fund
M A N U L I F E G L O B A L F U N D
Quantity/ Par Value
Par Value Currency** Description
Cost USD
Market Value USD
% of Net Assets
United States (continued)8,667 Polaris Industries Inc. 1,081,529 1,179,145 0.36
11,089 Post Holdings Inc. 1,122,263 1,197,723 0.372,751 Procter & Gamble Company 374,246 370,560 0.113,482 Prologis Inc. 380,432 422,645 0.136,095 Public Service Enterprise Group Inc. 331,564 362,409 0.111,543 Public Storage Inc. 314,139 469,813 0.147,200 Qurate Retail Inc. 713,598 777,960 0.24
36,925 Qwest Corp. 936,019 940,110 0.282,588 Regal-Beloit Corp. 337,363 344,022 0.111,522 Roper Industries Inc. 627,909 710,333 0.223,211 Salesforce.com Inc. 741,993 787,241 0.24
12,403 SCE Trust VI 290,838 309,827 0.101,418 Sempra Energy Corp. 191,157 188,155 0.064,410 Simon Property Group Inc. 477,294 577,269 0.185,663 Southern Company 302,926 341,564 0.11
13,251 Southern Company 656,122 667,440 0.213,023 Stanley Works 502,250 619,412 0.18
20,960 Starwood Property Trust Inc. 453,784 547,475 0.175,749 Synchrony Financial 220,668 277,734 0.092,128 T Rowe Price Group Inc. 281,159 420,833 0.13
24,875 Telephone and Data Systems 636,925 708,689 0.222,591 Travelers Companies Inc. 288,693 387,640 0.125,500 Ugi Corp. 550,000 588,335 0.182,172 United Parcel Service Inc. 343,393 448,561 0.141,951 United Rentals Inc. 544,650 618,408 0.19
20,512 United States Cellular Corp. 426,161 525,516 0.165,627 US Foods Holding 200,773 209,606 0.066,721 Valero Energy Corp. 459,126 523,499 0.16
13,150 Verizon Communications Inc. 752,570 735,544 0.235,325 Waste Management Inc. 672,156 742,358 0.234,196 Wec Energy Group Inc. 369,705 372,269 0.11
14,080 Wells Fargo & Company 666,173 632,192 0.1932,000 Williams Companies Inc. 728,640 846,560 0.26
3,335 Workday Inc. – A 819,829 812,539 0.255,729 Xcel Energy Inc. 372,114 376,109 0.12
80,823,299 90,879,294 28.00
Equities Total 109,114,354 122,122,688 37.63
Total Transferable securities and
money market instruments admitted
to an official exchange listing (1) 190,142,906 204,531,413 63.01
Portfolio of investments
as at 30 June 2021
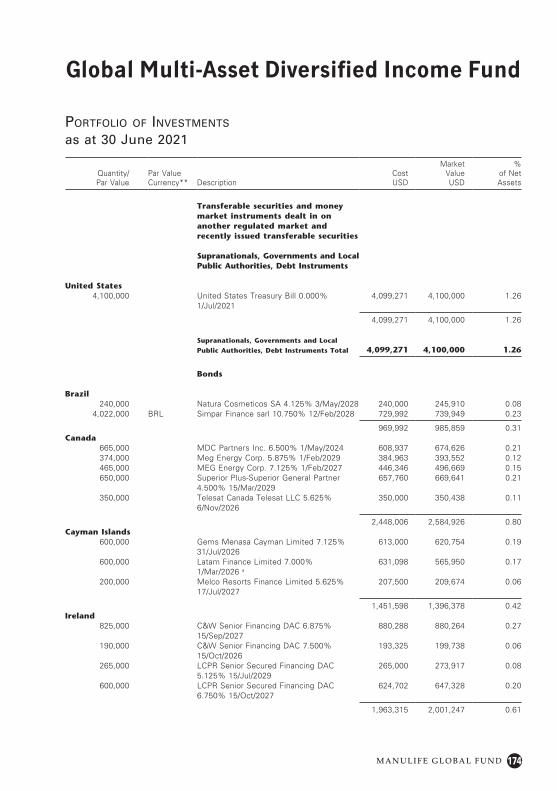
174
Global Multi-Asset Diversified Income Fund
M A N U L I F E G L O B A L F U N D
Quantity/ Par Value
Par Value Currency** Description
Cost USD
Market Value USD
% of Net Assets
Transferable securities and money market instruments dealt in on another regulated market and recently issued transferable securities
Supranationals, Governments and Local Public Authorities, Debt Instruments
United States4,100,000 United States Treasury Bill 0.000%
1/Jul/20214,099,271 4,100,000 1.26
4,099,271 4,100,000 1.26
Supranationals, Governments and Local
Public Authorities, Debt Instruments Total 4,099,271 4,100,000 1.26
Bonds
Brazil240,000 Natura Cosmeticos SA 4.125% 3/May/2028 240,000 245,910 0.08
4,022,000 BRL Simpar Finance sarl 10.750% 12/Feb/2028 729,992 739,949 0.23
969,992 985,859 0.31Canada
665,000 MDC Partners Inc. 6.500% 1/May/2024 608,937 674,626 0.21374,000 Meg Energy Corp. 5.875% 1/Feb/2029 384,963 393,552 0.12465,000 MEG Energy Corp. 7.125% 1/Feb/2027 446,346 496,669 0.15650,000 Superior Plus-Superior General Partner
4.500% 15/Mar/2029657,760 669,641 0.21
350,000 Telesat Canada Telesat LLC 5.625% 6/Nov/2026
350,000 350,438 0.11
2,448,006 2,584,926 0.80Cayman Islands
600,000 Gems Menasa Cayman Limited 7.125% 31/Jul/2026
613,000 620,754 0.19
600,000 Latam Finance Limited 7.000% 1/Mar/2026 a
631,098 565,950 0.17
200,000 Melco Resorts Finance Limited 5.625% 17/Jul/2027
207,500 209,674 0.06
1,451,598 1,396,378 0.42Ireland
825,000 C&W Senior Financing DAC 6.875% 15/Sep/2027
880,288 880,264 0.27
190,000 C&W Senior Financing DAC 7.500% 15/Oct/2026
193,325 199,738 0.06
265,000 LCPR Senior Secured Financing DAC 5.125% 15/Jul/2029
265,000 273,917 0.08
600,000 LCPR Senior Secured Financing DAC 6.750% 15/Oct/2027
624,702 647,328 0.20
1,963,315 2,001,247 0.61
Portfolio of investments
as at 30 June 2021
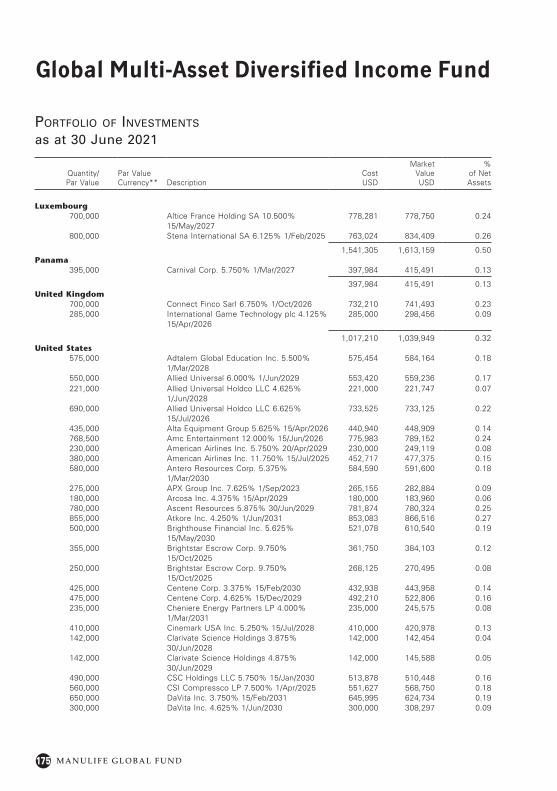
175
Global Multi-Asset Diversified Income Fund
M A N U L I F E G L O B A L F U N D
Quantity/ Par Value
Par Value Currency** Description
Cost USD
Market Value USD
% of Net Assets
Luxembourg700,000 Altice France Holding SA 10.500%
15/May/2027778,281 778,750 0.24
800,000 Stena International SA 6.125% 1/Feb/2025 763,024 834,409 0.26
1,541,305 1,613,159 0.50Panama
395,000 Carnival Corp. 5.750% 1/Mar/2027 397,984 415,491 0.13
397,984 415,491 0.13United Kingdom
700,000 Connect Finco Sarl 6.750% 1/Oct/2026 732,210 741,493 0.23285,000 International Game Technology plc 4.125%
15/Apr/2026285,000 298,456 0.09
1,017,210 1,039,949 0.32United States
575,000 Adtalem Global Education Inc. 5.500% 1/Mar/2028
575,454 584,164 0.18
550,000 Allied Universal 6.000% 1/Jun/2029 553,420 559,236 0.17221,000 Allied Universal Holdco LLC 4.625%
1/Jun/2028221,000 221,747 0.07
690,000 Allied Universal Holdco LLC 6.625% 15/Jul/2026
733,525 733,125 0.22
435,000 Alta Equipment Group 5.625% 15/Apr/2026 440,940 448,909 0.14768,500 Amc Entertainment 12.000% 15/Jun/2026 775,983 789,152 0.24230,000 American Airlines Inc. 5.750% 20/Apr/2029 230,000 249,119 0.08380,000 American Airlines Inc. 11.750% 15/Jul/2025 452,717 477,375 0.15580,000 Antero Resources Corp. 5.375%
1/Mar/2030584,590 591,600 0.18
275,000 APX Group Inc. 7.625% 1/Sep/2023 265,155 282,884 0.09180,000 Arcosa Inc. 4.375% 15/Apr/2029 180,000 183,960 0.06780,000 Ascent Resources 5.875% 30/Jun/2029 781,874 780,324 0.25855,000 Atkore Inc. 4.250% 1/Jun/2031 853,083 866,516 0.27500,000 Brighthouse Financial Inc. 5.625%
15/May/2030521,078 610,540 0.19
355,000 Brightstar Escrow Corp. 9.750% 15/Oct/2025
361,750 384,103 0.12
250,000 Brightstar Escrow Corp. 9.750% 15/Oct/2025
268,125 270,495 0.08
425,000 Centene Corp. 3.375% 15/Feb/2030 432,938 443,958 0.14475,000 Centene Corp. 4.625% 15/Dec/2029 492,210 522,806 0.16235,000 Cheniere Energy Partners LP 4.000%
1/Mar/2031235,000 245,575 0.08
410,000 Cinemark USA Inc. 5.250% 15/Jul/2028 410,000 420,978 0.13142,000 Clarivate Science Holdings 3.875%
30/Jun/2028142,000 142,454 0.04
142,000 Clarivate Science Holdings 4.875% 30/Jun/2029
142,000 145,588 0.05
490,000 CSC Holdings LLC 5.750% 15/Jan/2030 513,878 510,448 0.16560,000 CSI Compressco LP 7.500% 1/Apr/2025 551,627 568,750 0.18650,000 DaVita Inc. 3.750% 15/Feb/2031 645,995 624,734 0.19300,000 DaVita Inc. 4.625% 1/Jun/2030 300,000 308,297 0.09
Portfolio of investments
as at 30 June 2021
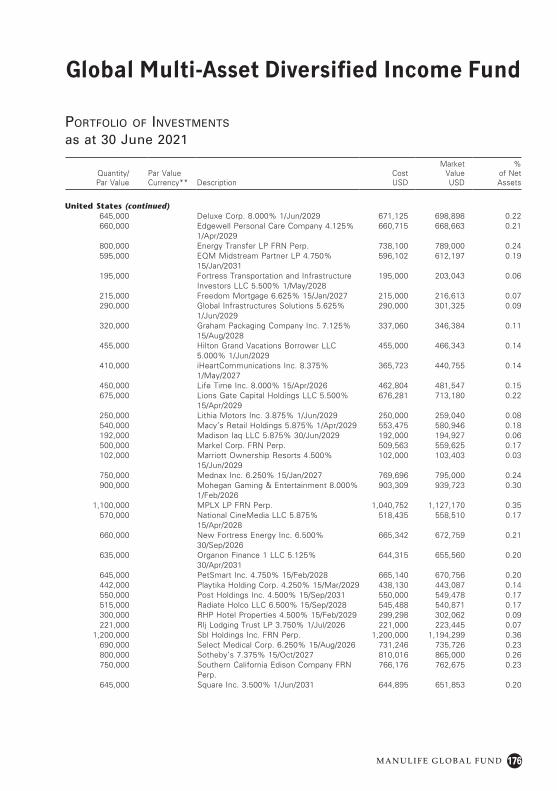
176
Global Multi-Asset Diversified Income Fund
M A N U L I F E G L O B A L F U N D
Quantity/ Par Value
Par Value Currency** Description
Cost USD
Market Value USD
% of Net Assets
United States (continued)645,000 Deluxe Corp. 8.000% 1/Jun/2029 671,125 698,898 0.22660,000 Edgewell Personal Care Company 4.125%
1/Apr/2029660,715 668,663 0.21
800,000 Energy Transfer LP FRN Perp. 738,100 789,000 0.24595,000 EQM Midstream Partner LP 4.750%
15/Jan/2031596,102 612,197 0.19
195,000 Fortress Transportation and Infrastructure Investors LLC 5.500% 1/May/2028
195,000 203,043 0.06
215,000 Freedom Mortgage 6.625% 15/Jan/2027 215,000 216,613 0.07290,000 Global Infrastructures Solutions 5.625%
1/Jun/2029290,000 301,325 0.09
320,000 Graham Packaging Company Inc. 7.125% 15/Aug/2028
337,060 346,384 0.11
455,000 Hilton Grand Vacations Borrower LLC 5.000% 1/Jun/2029
455,000 466,343 0.14
410,000 iHeartCommunications Inc. 8.375% 1/May/2027
365,723 440,755 0.14
450,000 Life Time Inc. 8.000% 15/Apr/2026 462,804 481,547 0.15675,000 Lions Gate Capital Holdings LLC 5.500%
15/Apr/2029676,281 713,180 0.22
250,000 Lithia Motors Inc. 3.875% 1/Jun/2029 250,000 259,040 0.08540,000 Macy’s Retail Holdings 5.875% 1/Apr/2029 553,475 580,946 0.18192,000 Madison Iaq LLC 5.875% 30/Jun/2029 192,000 194,927 0.06500,000 Markel Corp. FRN Perp. 509,563 559,625 0.17102,000 Marriott Ownership Resorts 4.500%
15/Jun/2029102,000 103,403 0.03
750,000 Mednax Inc. 6.250% 15/Jan/2027 769,696 795,000 0.24900,000 Mohegan Gaming & Entertainment 8.000%
1/Feb/2026903,309 939,723 0.30
1,100,000 MPLX LP FRN Perp. 1,040,752 1,127,170 0.35570,000 National CineMedia LLC 5.875%
15/Apr/2028518,435 558,510 0.17
660,000 New Fortress Energy Inc. 6.500% 30/Sep/2026
665,342 672,759 0.21
635,000 Organon Finance 1 LLC 5.125% 30/Apr/2031
644,315 655,560 0.20
645,000 PetSmart Inc. 4.750% 15/Feb/2028 665,140 670,756 0.20442,000 Playtika Holding Corp. 4.250% 15/Mar/2029 438,130 443,087 0.14550,000 Post Holdings Inc. 4.500% 15/Sep/2031 550,000 549,478 0.17515,000 Radiate Holco LLC 6.500% 15/Sep/2028 545,488 540,871 0.17300,000 RHP Hotel Properties 4.500% 15/Feb/2029 299,298 302,062 0.09221,000 Rlj Lodging Trust LP 3.750% 1/Jul/2026 221,000 223,445 0.07
1,200,000 Sbl Holdings Inc. FRN Perp. 1,200,000 1,194,299 0.36690,000 Select Medical Corp. 6.250% 15/Aug/2026 731,246 735,726 0.23800,000 Sotheby’s 7.375% 15/Oct/2027 810,016 865,000 0.26750,000 Southern California Edison Company FRN
Perp.766,176 762,675 0.23
645,000 Square Inc. 3.500% 1/Jun/2031 644,895 651,853 0.20
Portfolio of investments
as at 30 June 2021
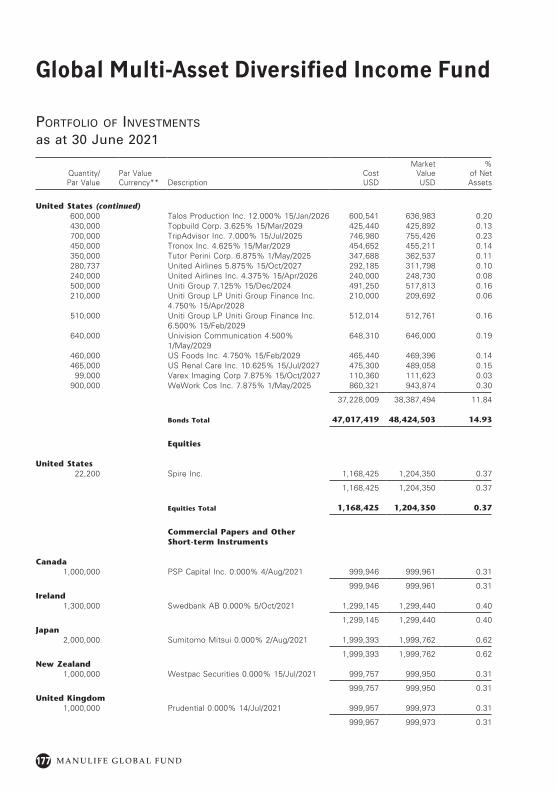
177
Global Multi-Asset Diversified Income Fund
M A N U L I F E G L O B A L F U N D
Quantity/ Par Value
Par Value Currency** Description
Cost USD
Market Value USD
% of Net Assets
United States (continued)600,000 Talos Production Inc. 12.000% 15/Jan/2026 600,541 636,983 0.20430,000 Topbuild Corp. 3.625% 15/Mar/2029 425,440 425,892 0.13700,000 TripAdvisor Inc. 7.000% 15/Jul/2025 746,980 755,426 0.23450,000 Tronox Inc. 4.625% 15/Mar/2029 454,652 455,211 0.14350,000 Tutor Perini Corp. 6.875% 1/May/2025 347,688 362,537 0.11280,737 United Airlines 5.875% 15/Oct/2027 292,185 311,798 0.10240,000 United Airlines Inc. 4.375% 15/Apr/2026 240,000 248,730 0.08500,000 Uniti Group 7.125% 15/Dec/2024 491,250 517,813 0.16210,000 Uniti Group LP Uniti Group Finance Inc.
4.750% 15/Apr/2028210,000 209,692 0.06
510,000 Uniti Group LP Uniti Group Finance Inc. 6.500% 15/Feb/2029
512,014 512,761 0.16
640,000 Univision Communication 4.500% 1/May/2029
648,310 646,000 0.19
460,000 US Foods Inc. 4.750% 15/Feb/2029 465,440 469,396 0.14465,000 US Renal Care Inc. 10.625% 15/Jul/2027 475,300 489,058 0.15
99,000 Varex Imaging Corp 7.875% 15/Oct/2027 110,360 111,623 0.03900,000 WeWork Cos Inc. 7.875% 1/May/2025 860,321 943,874 0.30
37,228,009 38,387,494 11.84
Bonds Total 47,017,419 48,424,503 14.93
Equities
United States22,200 Spire Inc. 1,168,425 1,204,350 0.37
1,168,425 1,204,350 0.37
Equities Total 1,168,425 1,204,350 0.37
Commercial Papers and Other Short-term Instruments
Canada1,000,000 PSP Capital Inc. 0.000% 4/Aug/2021 999,946 999,961 0.31
999,946 999,961 0.31Ireland
1,300,000 Swedbank AB 0.000% 5/Oct/2021 1,299,145 1,299,440 0.40
1,299,145 1,299,440 0.40Japan
2,000,000 Sumitomo Mitsui 0.000% 2/Aug/2021 1,999,393 1,999,762 0.62
1,999,393 1,999,762 0.62New Zealand
1,000,000 Westpac Securities 0.000% 15/Jul/2021 999,757 999,950 0.31
999,757 999,950 0.31United Kingdom
1,000,000 Prudential 0.000% 14/Jul/2021 999,957 999,973 0.31
999,957 999,973 0.31
Portfolio of investments
as at 30 June 2021
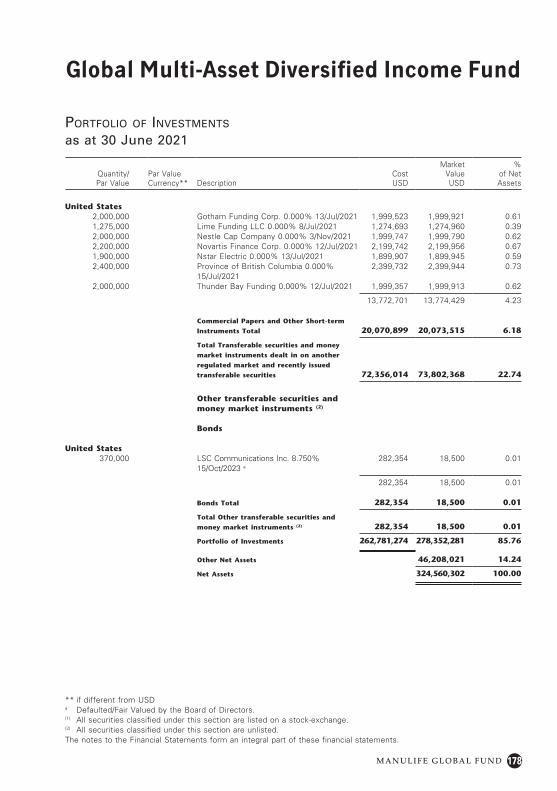
178
Global Multi-Asset Diversified Income Fund
M A N U L I F E G L O B A L F U N D
Quantity/ Par Value
Par Value Currency** Description
Cost USD
Market Value USD
% of Net Assets
United States2,000,000 Gotham Funding Corp. 0.000% 13/Jul/2021 1,999,523 1,999,921 0.611,275,000 Lime Funding LLC 0.000% 8/Jul/2021 1,274,693 1,274,960 0.392,000,000 Nestle Cap Company 0.000% 3/Nov/2021 1,999,747 1,999,790 0.622,200,000 Novartis Finance Corp. 0.000% 12/Jul/2021 2,199,742 2,199,956 0.671,900,000 Nstar Electric 0.000% 13/Jul/2021 1,899,907 1,899,945 0.592,400,000 Province of British Columbia 0.000%
15/Jul/20212,399,732 2,399,944 0.73
2,000,000 Thunder Bay Funding 0.000% 12/Jul/2021 1,999,357 1,999,913 0.62
13,772,701 13,774,429 4.23
Commercial Papers and Other Short-term
Instruments Total 20,070,899 20,073,515 6.18
Total Transferable securities and money
market instruments dealt in on another
regulated market and recently issued
transferable securities 72,356,014 73,802,368 22.74
Other transferable securities and money market instruments (2)
Bonds
United States370,000 LSC Communications Inc. 8.750%
15/Oct/2023 a
282,354 18,500 0.01
282,354 18,500 0.01
Bonds Total 282,354 18,500 0.01
Total Other transferable securities and
money market instruments (2) 282,354 18,500 0.01
Portfolio of Investments 262,781,274 278,352,281 85.76
Other Net Assets 46,208,021 14.24
Net Assets 324,560,302 100.00
** if different from USDa Defaulted/Fair Valued by the Board of Directors.(1) All securities classified under this section are listed on a stock-exchange.(2) All securities classified under this section are unlisted.The notes to the Financial Statements form an integral part of these financial statements.
Portfolio of investments
as at 30 June 2021
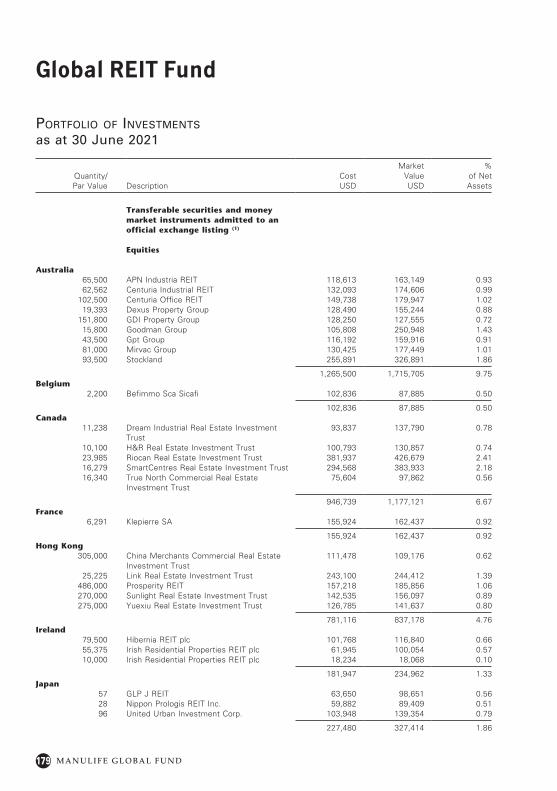
179
Global REIT Fund
M A N U L I F E G L O B A L F U N D
Portfolio of investments
as at 30 June 2021
Quantity/ Par Value Description
Cost USD
Market Value USD
% of Net Assets
Transferable securities and money market instruments admitted to an official exchange listing (1)
Equities
Australia65,500 APN Industria REIT 118,613 163,149 0.9362,562 Centuria Industrial REIT 132,093 174,606 0.99
102,500 Centuria Office REIT 149,738 179,947 1.0219,393 Dexus Property Group 128,490 155,244 0.88
151,800 GDI Property Group 128,250 127,555 0.7215,800 Goodman Group 105,808 250,948 1.4343,500 Gpt Group 116,192 159,916 0.9181,000 Mirvac Group 130,425 177,449 1.0193,500 Stockland 255,891 326,891 1.86
1,265,500 1,715,705 9.75Belgium
2,200 Befimmo Sca Sicafi 102,836 87,885 0.50
102,836 87,885 0.50Canada
11,238 Dream Industrial Real Estate Investment Trust
93,837 137,790 0.78
10,100 H&R Real Estate Investment Trust 100,793 130,857 0.7423,985 Riocan Real Estate Investment Trust 381,937 426,679 2.4116,279 SmartCentres Real Estate Investment Trust 294,568 383,933 2.1816,340 True North Commercial Real Estate
Investment Trust75,604 97,862 0.56
946,739 1,177,121 6.67France
6,291 Klepierre SA 155,924 162,437 0.92
155,924 162,437 0.92Hong Kong
305,000 China Merchants Commercial Real Estate Investment Trust
111,478 109,176 0.62
25,225 Link Real Estate Investment Trust 243,100 244,412 1.39486,000 Prosperity REIT 157,218 185,856 1.06270,000 Sunlight Real Estate Investment Trust 142,535 156,097 0.89275,000 Yuexiu Real Estate Investment Trust 126,785 141,637 0.80
781,116 837,178 4.76Ireland
79,500 Hibernia REIT plc 101,768 116,840 0.6655,375 Irish Residential Properties REIT plc 61,945 100,054 0.5710,000 Irish Residential Properties REIT plc 18,234 18,068 0.10
181,947 234,962 1.33Japan
57 GLP J REIT 63,650 98,651 0.5628 Nippon Prologis REIT Inc. 59,882 89,409 0.5196 United Urban Investment Corp. 103,948 139,354 0.79
227,480 327,414 1.86
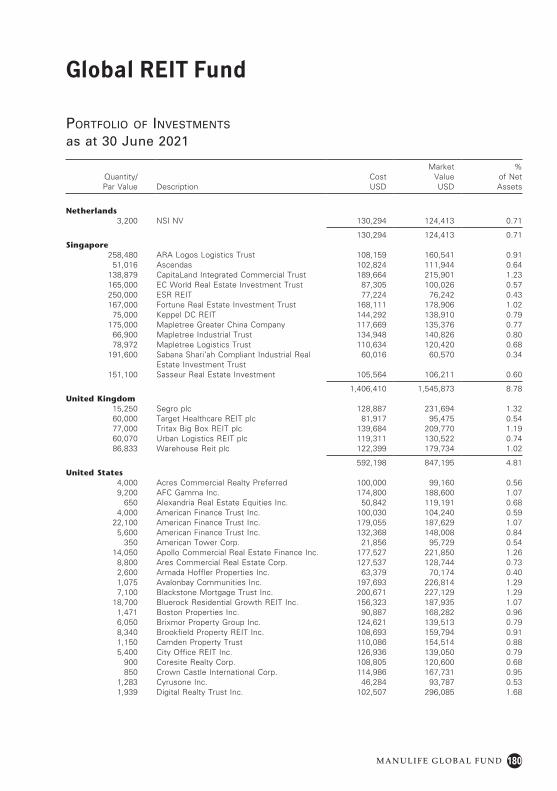
180
Global REIT Fund
M A N U L I F E G L O B A L F U N D
Quantity/ Par Value Description
Cost USD
Market Value USD
% of Net Assets
Netherlands3,200 NSI NV 130,294 124,413 0.71
130,294 124,413 0.71Singapore
258,480 ARA Logos Logistics Trust 108,159 160,541 0.9151,016 Ascendas 102,824 111,944 0.64
138,879 CapitaLand Integrated Commercial Trust 189,664 215,901 1.23165,000 EC World Real Estate Investment Trust 87,305 100,026 0.57250,000 ESR REIT 77,224 76,242 0.43167,000 Fortune Real Estate Investment Trust 168,111 178,906 1.02
75,000 Keppel DC REIT 144,292 138,910 0.79175,000 Mapletree Greater China Company 117,669 135,376 0.77
66,900 Mapletree Industrial Trust 134,948 140,826 0.8078,972 Mapletree Logistics Trust 110,634 120,420 0.68
191,600 Sabana Shari’ah Compliant Industrial Real Estate Investment Trust
60,016 60,570 0.34
151,100 Sasseur Real Estate Investment 105,564 106,211 0.60
1,406,410 1,545,873 8.78United Kingdom
15,250 Segro plc 128,887 231,694 1.3260,000 Target Healthcare REIT plc 81,917 95,475 0.5477,000 Tritax Big Box REIT plc 139,684 209,770 1.1960,070 Urban Logistics REIT plc 119,311 130,522 0.7486,833 Warehouse Reit plc 122,399 179,734 1.02
592,198 847,195 4.81United States
4,000 Acres Commercial Realty Preferred 100,000 99,160 0.569,200 AFC Gamma Inc. 174,800 188,600 1.07
650 Alexandria Real Estate Equities Inc. 50,842 119,191 0.684,000 American Finance Trust Inc. 100,030 104,240 0.59
22,100 American Finance Trust Inc. 179,055 187,629 1.075,600 American Finance Trust Inc. 132,368 148,008 0.84
350 American Tower Corp. 21,856 95,729 0.5414,050 Apollo Commercial Real Estate Finance Inc. 177,527 221,850 1.26
8,800 Ares Commercial Real Estate Corp. 127,537 128,744 0.732,600 Armada Hoffler Properties Inc. 63,379 70,174 0.401,075 Avalonbay Communities Inc. 197,693 226,814 1.297,100 Blackstone Mortgage Trust Inc. 200,671 227,129 1.29
18,700 Bluerock Residential Growth REIT Inc. 156,323 187,935 1.071,471 Boston Properties Inc. 90,887 168,282 0.966,050 Brixmor Property Group Inc. 124,621 139,513 0.798,340 Brookfield Property REIT Inc. 108,693 159,794 0.911,150 Camden Property Trust 110,086 154,514 0.885,400 City Office REIT Inc. 126,936 139,050 0.79
900 Coresite Realty Corp. 108,805 120,600 0.68850 Crown Castle International Corp. 114,986 167,731 0.95
1,283 Cyrusone Inc. 46,284 93,787 0.531,939 Digital Realty Trust Inc. 102,507 296,085 1.68
Portfolio of investments
as at 30 June 2021
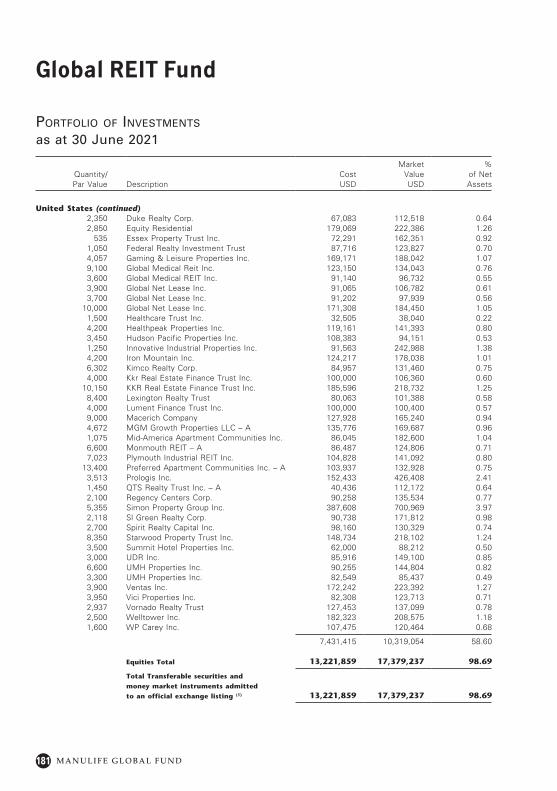
181
Global REIT Fund
M A N U L I F E G L O B A L F U N D
Quantity/ Par Value Description
Cost USD
Market Value USD
% of Net Assets
United States (continued)2,350 Duke Realty Corp. 67,083 112,518 0.642,850 Equity Residential 179,069 222,386 1.26
535 Essex Property Trust Inc. 72,291 162,351 0.921,050 Federal Realty Investment Trust 87,716 123,827 0.704,057 Gaming & Leisure Properties Inc. 169,171 188,042 1.079,100 Global Medical Reit Inc. 123,150 134,043 0.763,600 Global Medical REIT Inc. 91,140 96,732 0.553,900 Global Net Lease Inc. 91,065 106,782 0.613,700 Global Net Lease Inc. 91,202 97,939 0.56
10,000 Global Net Lease Inc. 171,308 184,450 1.051,500 Healthcare Trust Inc. 32,505 38,040 0.224,200 Healthpeak Properties Inc. 119,161 141,393 0.803,450 Hudson Pacific Properties Inc. 108,383 94,151 0.531,250 Innovative Industrial Properties Inc. 91,563 242,988 1.384,200 Iron Mountain Inc. 124,217 178,038 1.016,302 Kimco Realty Corp. 84,957 131,460 0.754,000 Kkr Real Estate Finance Trust Inc. 100,000 106,360 0.60
10,150 KKR Real Estate Finance Trust Inc. 185,596 218,732 1.258,400 Lexington Realty Trust 80,063 101,388 0.584,000 Lument Finance Trust Inc. 100,000 100,400 0.579,000 Macerich Company 127,928 165,240 0.944,672 MGM Growth Properties LLC – A 135,776 169,687 0.961,075 Mid-America Apartment Communities Inc. 86,045 182,600 1.046,600 Monmouth REIT – A 86,487 124,806 0.717,023 Plymouth Industrial REIT Inc. 104,828 141,092 0.80
13,400 Preferred Apartment Communities Inc. – A 103,937 132,928 0.753,513 Prologis Inc. 152,433 426,408 2.411,450 QTS Realty Trust Inc. – A 40,436 112,172 0.642,100 Regency Centers Corp. 90,258 135,534 0.775,355 Simon Property Group Inc. 387,608 700,969 3.972,118 Sl Green Realty Corp. 90,738 171,812 0.982,700 Spirit Realty Capital Inc. 98,160 130,329 0.748,350 Starwood Property Trust Inc. 148,734 218,102 1.243,500 Summit Hotel Properties Inc. 62,000 88,212 0.503,000 UDR Inc. 85,916 149,100 0.856,600 UMH Properties Inc. 90,255 144,804 0.823,300 UMH Properties Inc. 82,549 85,437 0.493,900 Ventas Inc. 172,242 223,392 1.273,950 Vici Properties Inc. 82,308 123,713 0.712,937 Vornado Realty Trust 127,453 137,099 0.782,500 Welltower Inc. 182,323 208,575 1.181,600 WP Carey Inc. 107,475 120,464 0.68
7,431,415 10,319,054 58.60
Equities Total 13,221,859 17,379,237 98.69
Total Transferable securities and
money market instruments admitted
to an official exchange listing (1) 13,221,859 17,379,237 98.69
Portfolio of investments
as at 30 June 2021
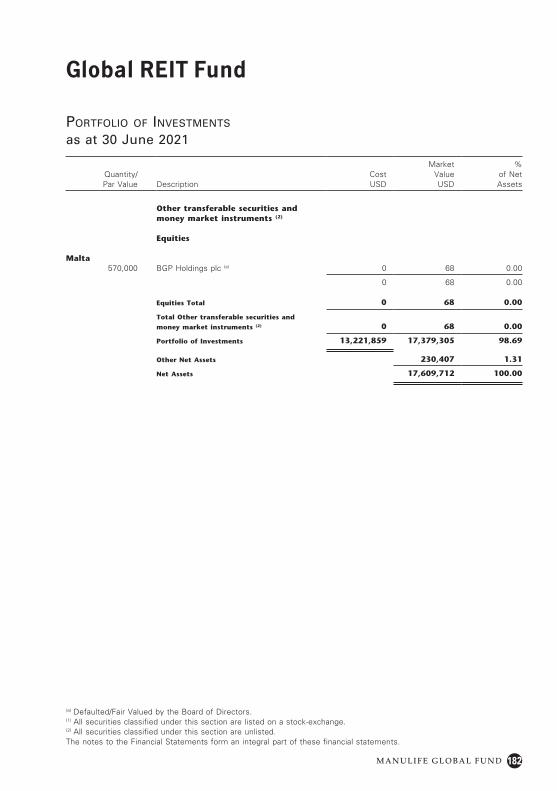
182
Global REIT Fund
M A N U L I F E G L O B A L F U N D
Quantity/ Par Value Description
Cost USD
Market Value USD
% of Net Assets
Other transferable securities and money market instruments (2)
Equities
Malta570,000 BGP Holdings plc (a) 0 68 0.00
0 68 0.00
Equities Total 0 68 0.00
Total Other transferable securities and
money market instruments (2) 0 68 0.00
Portfolio of Investments 13,221,859 17,379,305 98.69
Other Net Assets 230,407 1.31
Net Assets 17,609,712 100.00
Portfolio of investments
as at 30 June 2021
(a) Defaulted/Fair Valued by the Board of Directors.(1) All securities classified under this section are listed on a stock-exchange.(2) All securities classified under this section are unlisted.The notes to the Financial Statements form an integral part of these financial statements.
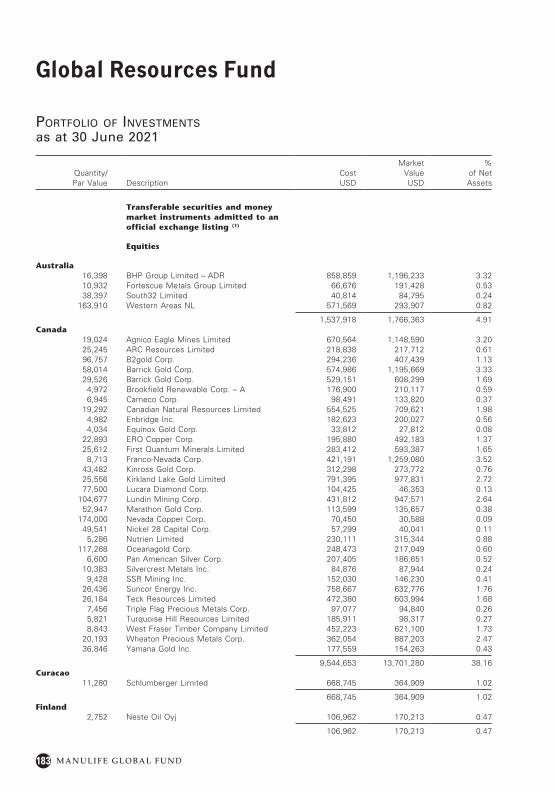
183
Global Resources Fund
M A N U L I F E G L O B A L F U N D
Portfolio of investmentsas at 30 June 2021
Quantity/Par Value Description
Cost USD
Market Value USD
% of Net Assets
Transferable securities and money market instruments admitted to an official exchange listing (1)
Equities
Australia16,398 BHP Group Limited – ADR 858,859 1,196,233 3.3210,932 Fortescue Metals Group Limited 66,676 191,428 0.5338,397 South32 Limited 40,814 84,795 0.24
163,910 Western Areas NL 571,569 293,907 0.82
1,537,918 1,766,363 4.91Canada
19,024 Agnico Eagle Mines Limited 670,564 1,148,590 3.2025,245 ARC Resources Limited 218,838 217,712 0.6196,757 B2gold Corp. 294,236 407,439 1.1358,014 Barrick Gold Corp. 574,986 1,195,669 3.3329,526 Barrick Gold Corp. 529,151 608,299 1.69
4,972 Brookfield Renewable Corp. – A 176,900 210,117 0.596,945 Cameco Corp. 98,491 133,820 0.37
19,292 Canadian Natural Resources Limited 554,525 709,621 1.984,982 Enbridge Inc. 182,623 200,027 0.564,034 Equinox Gold Corp. 33,812 27,812 0.08
22,893 ERO Copper Corp. 195,880 492,183 1.3725,612 First Quantum Minerals Limited 283,412 593,387 1.65
8,713 Franco-Nevada Corp. 421,191 1,259,080 3.5243,482 Kinross Gold Corp. 312,298 273,772 0.7625,556 Kirkland Lake Gold Limited 791,395 977,831 2.7277,500 Lucara Diamond Corp. 104,425 46,353 0.13
104,677 Lundin Mining Corp. 431,812 947,571 2.6452,947 Marathon Gold Corp. 113,599 135,657 0.38
174,000 Nevada Copper Corp. 70,450 30,588 0.0949,541 Nickel 28 Capital Corp. 57,299 40,041 0.11
5,286 Nutrien Limited 230,111 315,344 0.88117,268 Oceanagold Corp. 248,473 217,049 0.60
6,600 Pan American Silver Corp. 207,405 186,651 0.5210,383 Silvercrest Metals Inc. 84,876 87,944 0.24
9,428 SSR Mining Inc. 152,030 146,230 0.4126,436 Suncor Energy Inc. 758,667 632,776 1.7626,184 Teck Resources Limited 472,380 603,994 1.68
7,456 Triple Flag Precious Metals Corp. 97,077 94,840 0.265,821 Turquoise Hill Resources Limited 185,911 98,317 0.278,843 West Fraser Timber Company Limited 452,223 621,100 1.73
20,193 Wheaton Precious Metals Corp. 362,054 887,203 2.4736,846 Yamana Gold Inc. 177,559 154,263 0.43
9,544,653 13,701,280 38.16Curacao
11,280 Schlumberger Limited 668,745 364,909 1.02
668,745 364,909 1.02Finland
2,752 Neste Oil Oyj 106,962 170,213 0.47
106,962 170,213 0.47
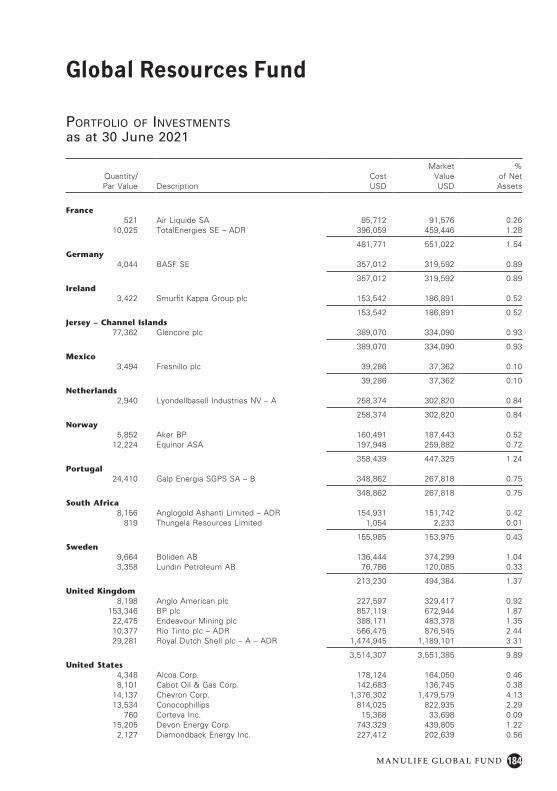
184
Global Resources Fund
M A N U L I F E G L O B A L F U N D
Quantity/Par Value Description
Cost USD
Market Value USD
% of Net Assets
France521 Air Liquide SA 85,712 91,576 0.26
10,025 TotalEnergies SE – ADR 396,059 459,446 1.28
481,771 551,022 1.54Germany
4,044 BASF SE 357,012 319,592 0.89
357,012 319,592 0.89Ireland
3,422 Smurfit Kappa Group plc 153,542 186,891 0.52
153,542 186,891 0.52Jersey – Channel Islands
77,362 Glencore plc 389,070 334,090 0.93
389,070 334,090 0.93Mexico
3,494 Fresnillo plc 39,286 37,362 0.10
39,286 37,362 0.10Netherlands
2,940 Lyondellbasell Industries NV – A 258,374 302,820 0.84
258,374 302,820 0.84Norway
5,852 Aker BP 160,491 187,443 0.5212,224 Equinor ASA 197,948 259,882 0.72
358,439 447,325 1.24Portugal
24,410 Galp Energia SGPS SA – B 348,862 267,818 0.75
348,862 267,818 0.75South Africa
8,156 Anglogold Ashanti Limited – ADR 154,931 151,742 0.42819 Thungela Resources Limited 1,054 2,233 0.01
155,985 153,975 0.43Sweden
9,664 Boliden AB 136,444 374,299 1.043,358 Lundin Petroleum AB 76,786 120,085 0.33
213,230 494,384 1.37United Kingdom
8,198 Anglo American plc 227,597 329,417 0.92153,346 BP plc 857,119 672,944 1.87
22,475 Endeavour Mining plc 388,171 483,378 1.3510,377 Rio Tinto plc – ADR 566,475 876,545 2.4429,281 Royal Dutch Shell plc – A – ADR 1,474,945 1,189,101 3.31
3,514,307 3,551,385 9.89United States
4,348 Alcoa Corp. 178,124 164,050 0.468,101 Cabot Oil & Gas Corp. 142,683 136,745 0.38
14,137 Chevron Corp. 1,376,302 1,479,579 4.1313,534 Conocophillips 814,025 822,935 2.29
760 Corteva Inc. 15,368 33,698 0.0915,205 Devon Energy Corp. 743,329 439,805 1.22
2,127 Diamondback Energy Inc. 227,412 202,639 0.56
Portfolio of investmentsas at 30 June 2021
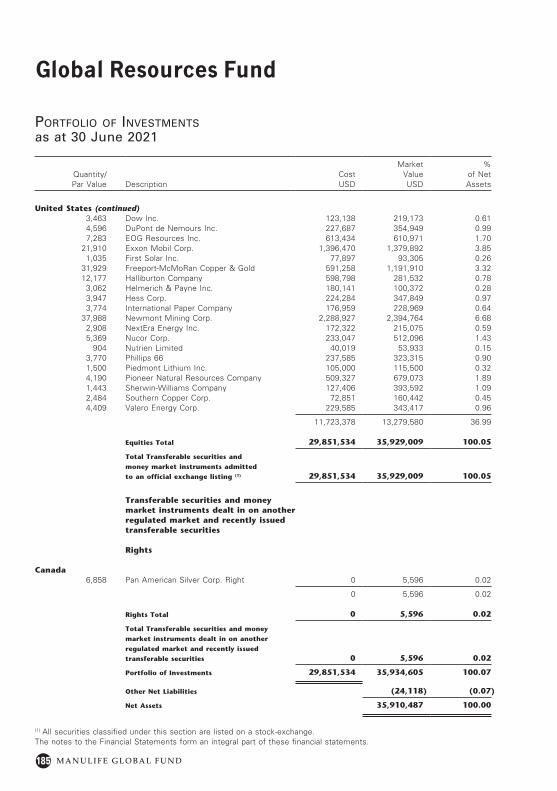
185
Global Resources Fund
M A N U L I F E G L O B A L F U N D
Quantity/Par Value Description
Cost USD
Market Value USD
% of Net Assets
United States (continued)3,463 Dow Inc. 123,138 219,173 0.614,596 DuPont de Nemours Inc. 227,687 354,949 0.997,283 EOG Resources Inc. 613,434 610,971 1.70
21,910 Exxon Mobil Corp. 1,396,470 1,379,892 3.851,035 First Solar Inc. 77,897 93,305 0.26
31,929 Freeport-McMoRan Copper & Gold 591,258 1,191,910 3.3212,177 Halliburton Company 598,798 281,532 0.78
3,062 Helmerich & Payne Inc. 180,141 100,372 0.283,947 Hess Corp. 224,284 347,849 0.973,774 International Paper Company 176,959 228,969 0.64
37,988 Newmont Mining Corp. 2,288,927 2,394,764 6.682,908 NextEra Energy Inc. 172,322 215,075 0.595,369 Nucor Corp. 233,047 512,096 1.43
904 Nutrien Limited 40,019 53,933 0.153,770 Phillips 66 237,585 323,315 0.901,500 Piedmont Lithium Inc. 105,000 115,500 0.324,190 Pioneer Natural Resources Company 509,327 679,073 1.891,443 Sherwin-Williams Company 127,406 393,592 1.092,484 Southern Copper Corp. 72,851 160,442 0.454,409 Valero Energy Corp. 229,585 343,417 0.96
11,723,378 13,279,580 36.99
Equities Total 29,851,534 35,929,009 100.05
Total Transferable securities and
money market instruments admitted
to an official exchange listing (1) 29,851,534 35,929,009 100.05
Transferable securities and money market instruments dealt in on another regulated market and recently issued transferable securities
Rights
Canada6,858 Pan American Silver Corp. Right 0 5,596 0.02
0 5,596 0.02
Rights Total 0 5,596 0.02
Total Transferable securities and money
market instruments dealt in on another
regulated market and recently issued
transferable securities 0 5,596 0.02
Portfolio of Investments 29,851,534 35,934,605 100.07
Other Net Liabilities (24,118) (0.07)
Net Assets 35,910,487 100.00
(1) All securities classified under this section are listed on a stock-exchange.The notes to the Financial Statements form an integral part of these financial statements.
Portfolio of investmentsas at 30 June 2021
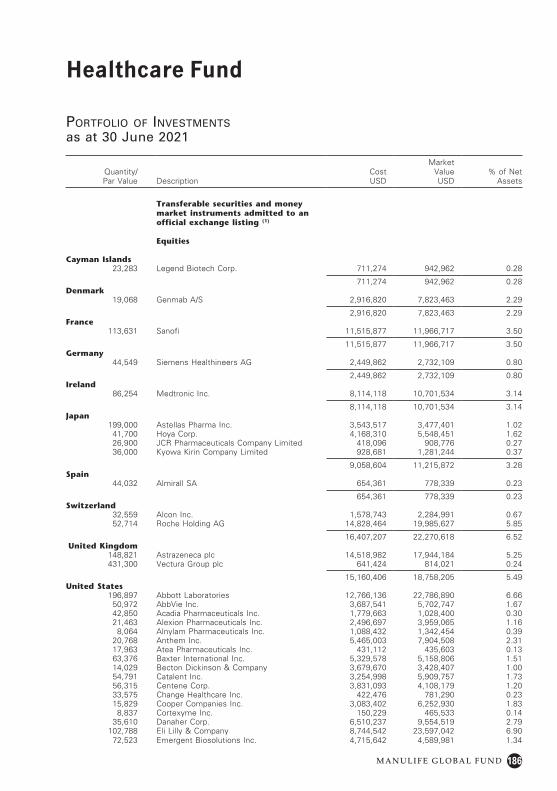
186
Healthcare Fund
M A N U L I F E G L O B A L F U N D
Portfolio of investmentsas at 30 June 2021
Quantity/Par Value Description
Cost USD
Market Value USD
% of Net Assets
Transferable securities and money market instruments admitted to an official exchange listing (1)
Equities
Cayman Islands23,283 Legend Biotech Corp. 711,274 942,962 0.28
711,274 942,962 0.28Denmark
19,068 Genmab A/S 2,916,820 7,823,463 2.29
2,916,820 7,823,463 2.29France
113,631 Sanofi 11,515,877 11,966,717 3.50
11,515,877 11,966,717 3.50Germany
44,549 Siemens Healthineers AG 2,449,862 2,732,109 0.80
2,449,862 2,732,109 0.80Ireland
86,254 Medtronic Inc. 8,114,118 10,701,534 3.14
8,114,118 10,701,534 3.14Japan
199,000 Astellas Pharma Inc. 3,543,517 3,477,401 1.0241,700 Hoya Corp. 4,168,310 5,548,451 1.6226,900 JCR Pharmaceuticals Company Limited 418,096 908,776 0.2736,000 Kyowa Kirin Company Limited 928,681 1,281,244 0.37
9,058,604 11,215,872 3.28Spain
44,032 Almirall SA 654,361 778,339 0.23
654,361 778,339 0.23Switzerland
32,559 Alcon Inc. 1,578,743 2,284,991 0.6752,714 Roche Holding AG 14,828,464 19,985,627 5.85
16,407,207 22,270,618 6.52United Kingdom
148,821 Astrazeneca plc 14,518,982 17,944,184 5.25431,300 Vectura Group plc 641,424 814,021 0.24
15,160,406 18,758,205 5.49United States
196,897 Abbott Laboratories 12,766,136 22,786,890 6.6650,972 AbbVie Inc. 3,687,541 5,702,747 1.6742,850 Acadia Pharmaceuticals Inc. 1,779,663 1,028,400 0.3021,463 Alexion Pharmaceuticals Inc. 2,496,697 3,959,065 1.16
8,064 Alnylam Pharmaceuticals Inc. 1,088,432 1,342,454 0.3920,768 Anthem Inc. 5,465,003 7,904,508 2.3117,963 Atea Pharmaceuticals Inc. 431,112 435,603 0.1363,376 Baxter International Inc. 5,329,578 5,158,806 1.5114,029 Becton Dickinson & Company 3,679,670 3,428,407 1.0054,791 Catalent Inc. 3,254,998 5,909,757 1.7356,315 Centene Corp. 3,831,093 4,108,179 1.2033,575 Change Healthcare Inc. 422,476 781,290 0.2315,829 Cooper Companies Inc. 3,083,402 6,252,930 1.83
8,837 Cortexyme Inc. 150,229 465,533 0.1435,610 Danaher Corp. 6,510,237 9,554,519 2.79
102,788 Eli Lilly & Company 8,744,542 23,597,042 6.9072,523 Emergent Biosolutions Inc. 4,715,642 4,589,981 1.34
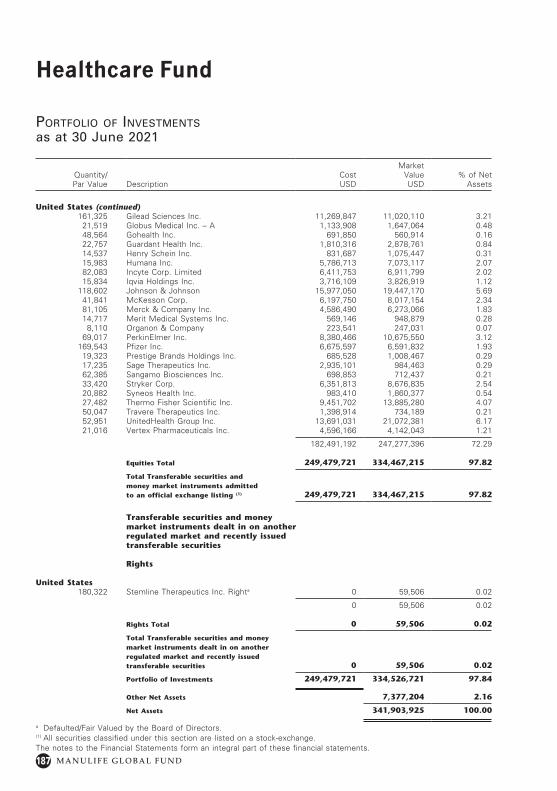
187
Healthcare Fund
M A N U L I F E G L O B A L F U N D
Quantity/Par Value Description
Cost USD
Market Value USD
% of Net Assets
United States (continued)161,325 Gilead Sciences Inc. 11,269,847 11,020,110 3.21
21,519 Globus Medical Inc. – A 1,133,908 1,647,064 0.4848,564 Gohealth Inc. 691,850 560,914 0.1622,757 Guardant Health Inc. 1,810,316 2,878,761 0.8414,537 Henry Schein Inc. 831,687 1,075,447 0.3115,983 Humana Inc. 5,786,713 7,073,117 2.0782,083 Incyte Corp. Limited 6,411,753 6,911,799 2.0215,834 Iqvia Holdings Inc. 3,716,109 3,826,919 1.12
118,602 Johnson & Johnson 15,977,050 19,447,170 5.6941,841 McKesson Corp. 6,197,750 8,017,154 2.3481,105 Merck & Company Inc. 4,586,490 6,273,066 1.8314,717 Merit Medical Systems Inc. 569,146 948,879 0.28
8,110 Organon & Company 223,541 247,031 0.0769,017 PerkinElmer Inc. 8,380,466 10,675,550 3.12
169,543 Pfizer Inc. 6,675,597 6,591,832 1.9319,323 Prestige Brands Holdings Inc. 685,528 1,008,467 0.2917,235 Sage Therapeutics Inc. 2,935,101 984,463 0.2962,385 Sangamo Biosciences Inc. 698,853 712,437 0.2133,420 Stryker Corp. 6,351,813 8,676,835 2.5420,882 Syneos Health Inc. 983,410 1,860,377 0.5427,482 Thermo Fisher Scientific Inc. 9,451,702 13,885,280 4.0750,047 Travere Therapeutics Inc. 1,398,914 734,189 0.2152,951 UnitedHealth Group Inc. 13,691,031 21,072,381 6.1721,016 Vertex Pharmaceuticals Inc. 4,596,166 4,142,043 1.21
182,491,192 247,277,396 72.29
Equities Total 249,479,721 334,467,215 97.82
Total Transferable securities and money market instruments admitted to an official exchange listing (1) 249,479,721 334,467,215 97.82
Transferable securities and money market instruments dealt in on another regulated market and recently issued transferable securities
Rights
United States180,322 Stemline Therapeutics Inc. Righta 0 59,506 0.02
0 59,506 0.02
Rights Total 0 59,506 0.02
Total Transferable securities and money market instruments dealt in on another regulated market and recently issued transferable securities 0 59,506 0.02
Portfolio of Investments 249,479,721 334,526,721 97.84
Other Net Assets 7,377,204 2.16
Net Assets 341,903,925 100.00
Portfolio of investmentsas at 30 June 2021
a Defaulted/Fair Valued by the Board of Directors.(1) All securities classified under this section are listed on a stock-exchange.The notes to the Financial Statements form an integral part of these financial statements.
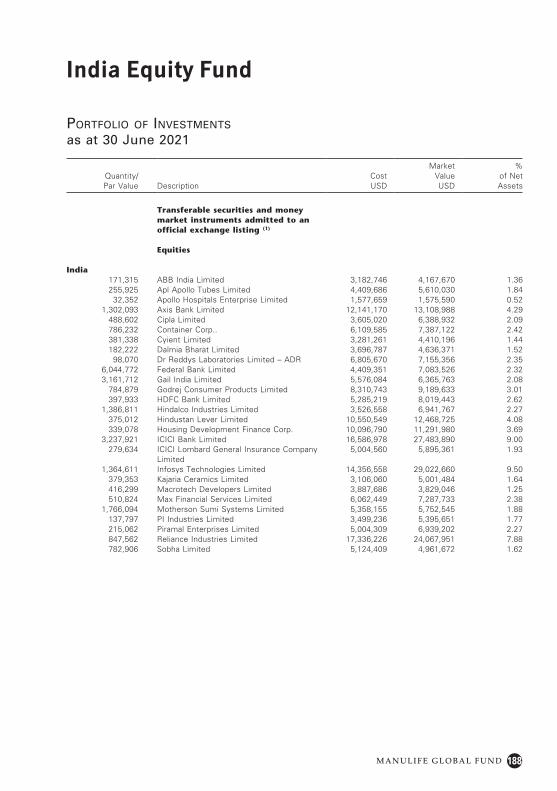
188
India Equity Fund
M A N U L I F E G L O B A L F U N D
Portfolio of investments
as at 30 June 2021
Quantity/ Par Value Description
Cost USD
Market Value USD
% of Net Assets
Transferable securities and money market instruments admitted to an official exchange listing (1)
Equities
India171,315 ABB India Limited 3,182,746 4,167,670 1.36255,925 Apl Apollo Tubes Limited 4,409,686 5,610,030 1.84
32,352 Apollo Hospitals Enterprise Limited 1,577,659 1,575,590 0.521,302,093 Axis Bank Limited 12,141,170 13,108,988 4.29
488,602 Cipla Limited 3,605,020 6,388,932 2.09786,232 Container Corp.. 6,109,585 7,387,122 2.42381,338 Cyient Limited 3,281,261 4,410,196 1.44182,222 Dalmia Bharat Limited 3,696,787 4,636,371 1.52
98,070 Dr Reddys Laboratories Limited – ADR 6,805,670 7,155,356 2.356,044,772 Federal Bank Limited 4,409,351 7,083,526 2.323,161,712 Gail India Limited 5,576,084 6,365,763 2.08
784,879 Godrej Consumer Products Limited 8,310,743 9,189,633 3.01397,933 HDFC Bank Limited 5,285,219 8,019,443 2.62
1,386,811 Hindalco Industries Limited 3,526,558 6,941,767 2.27375,012 Hindustan Lever Limited 10,550,549 12,468,725 4.08339,078 Housing Development Finance Corp. 10,096,790 11,291,980 3.69
3,237,921 ICICI Bank Limited 16,586,978 27,483,890 9.00279,634 ICICI Lombard General Insurance Company
Limited5,004,560 5,895,361 1.93
1,364,611 Infosys Technologies Limited 14,356,558 29,022,660 9.50379,353 Kajaria Ceramics Limited 3,106,060 5,001,484 1.64416,299 Macrotech Developers Limited 3,887,686 3,829,046 1.25510,824 Max Financial Services Limited 6,062,449 7,287,733 2.38
1,766,094 Motherson Sumi Systems Limited 5,358,155 5,752,545 1.88137,797 PI Industries Limited 3,499,236 5,395,651 1.77215,062 Piramal Enterprises Limited 5,004,309 6,939,202 2.27847,562 Reliance Industries Limited 17,336,226 24,067,951 7.88782,906 Sobha Limited 5,124,409 4,961,672 1.62
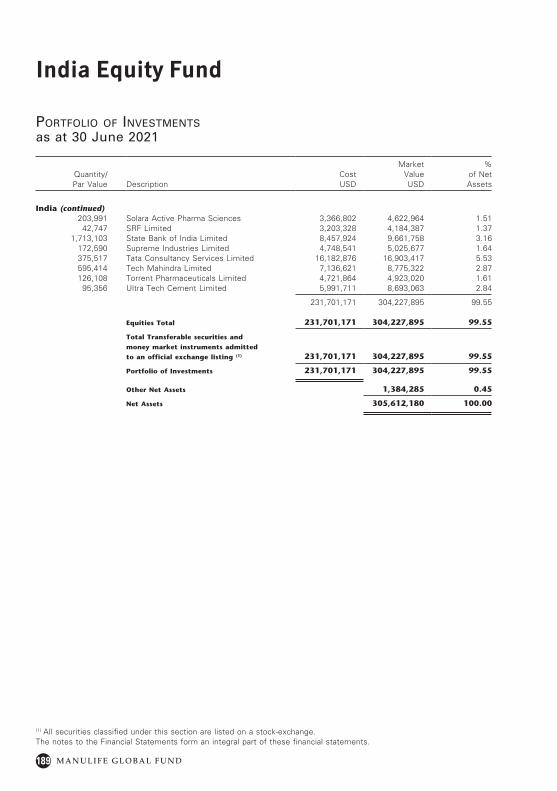
189
India Equity Fund
M A N U L I F E G L O B A L F U N D
Portfolio of investmentsas at 30 June 2021
(1) All securities classified under this section are listed on a stock-exchange.The notes to the Financial Statements form an integral part of these financial statements.
Quantity/ Par Value Description
Cost USD
Market Value USD
% of Net Assets
India (continued)203,991 Solara Active Pharma Sciences 3,366,802 4,622,964 1.51
42,747 SRF Limited 3,203,328 4,184,387 1.371,713,103 State Bank of India Limited 8,457,924 9,661,758 3.16
172,590 Supreme Industries Limited 4,748,541 5,025,677 1.64375,517 Tata Consultancy Services Limited 16,182,876 16,903,417 5.53595,414 Tech Mahindra Limited 7,136,621 8,775,322 2.87126,108 Torrent Pharmaceuticals Limited 4,721,864 4,923,020 1.61
95,356 Ultra Tech Cement Limited 5,991,711 8,693,063 2.84
231,701,171 304,227,895 99.55
Equities Total 231,701,171 304,227,895 99.55
Total Transferable securities and
money market instruments admitted
to an official exchange listing (1) 231,701,171 304,227,895 99.55
Portfolio of Investments 231,701,171 304,227,895 99.55
Other Net Assets 1,384,285 0.45
Net Assets 305,612,180 100.00
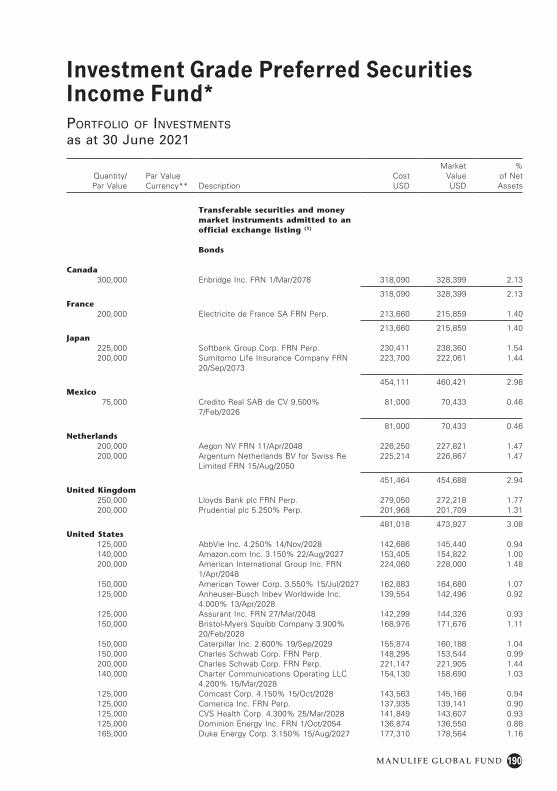
190
Investment Grade Preferred Securities Income Fund*
M A N U L I F E G L O B A L F U N D
Portfolio of investments
as at 30 June 2021
Quantity/ Par Value
Par Value Currency** Description
Cost USD
Market Value USD
% of Net Assets
Transferable securities and money market instruments admitted to an official exchange listing (1)
Bonds
Canada300,000 Enbridge Inc. FRN 1/Mar/2078 318,090 328,399 2.13
318,090 328,399 2.13France
200,000 Electricite de France SA FRN Perp. 213,660 215,859 1.40
213,660 215,859 1.40Japan
225,000 Softbank Group Corp. FRN Perp. 230,411 238,360 1.54200,000 Sumitomo Life Insurance Company FRN
20/Sep/2073223,700 222,061 1.44
454,111 460,421 2.98Mexico
75,000 Credito Real SAB de CV 9.500% 7/Feb/2026
81,000 70,433 0.46
81,000 70,433 0.46Netherlands
200,000 Aegon NV FRN 11/Apr/2048 226,250 227,821 1.47200,000 Argentum Netherlands BV for Swiss Re
Limited FRN 15/Aug/2050225,214 226,867 1.47
451,464 454,688 2.94United Kingdom
250,000 Lloyds Bank plc FRN Perp. 279,050 272,218 1.77200,000 Prudential plc 5.250% Perp. 201,968 201,709 1.31
481,018 473,927 3.08United States
125,000 AbbVie Inc. 4.250% 14/Nov/2028 142,686 145,440 0.94140,000 Amazon.com Inc. 3.150% 22/Aug/2027 153,405 154,822 1.00200,000 American International Group Inc. FRN
1/Apr/2048224,060 228,000 1.48
150,000 American Tower Corp. 3.550% 15/Jul/2027 162,883 164,680 1.07125,000 Anheuser-Busch Inbev Worldwide Inc.
4.000% 13/Apr/2028139,554 142,496 0.92
125,000 Assurant Inc. FRN 27/Mar/2048 142,299 144,326 0.93150,000 Bristol-Myers Squibb Company 3.900%
20/Feb/2028168,976 171,676 1.11
150,000 Caterpillar Inc. 2.600% 19/Sep/2029 155,874 160,188 1.04150,000 Charles Schwab Corp. FRN Perp. 148,295 153,544 0.99200,000 Charles Schwab Corp. FRN Perp. 221,147 221,905 1.44140,000 Charter Communications Operating LLC
4.200% 15/Mar/2028154,130 158,690 1.03
125,000 Comcast Corp. 4.150% 15/Oct/2028 143,563 145,166 0.94125,000 Comerica Inc. FRN Perp. 137,935 139,141 0.90125,000 CVS Health Corp. 4.300% 25/Mar/2028 141,849 143,607 0.93125,000 Dominion Energy Inc. FRN 1/Oct/2054 136,874 136,550 0.88165,000 Duke Energy Corp. 3.150% 15/Aug/2027 177,310 178,564 1.16
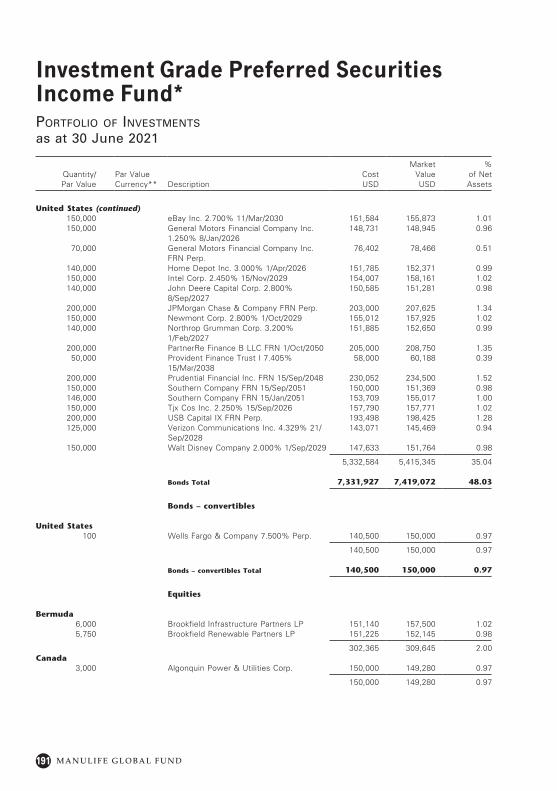
191
Investment Grade Preferred Securities Income Fund*
M A N U L I F E G L O B A L F U N D
Portfolio of investments
as at 30 June 2021
Quantity/ Par Value
Par Value Currency** Description
Cost USD
Market Value USD
% of Net Assets
United States (continued)150,000 eBay Inc. 2.700% 11/Mar/2030 151,584 155,873 1.01150,000 General Motors Financial Company Inc.
1.250% 8/Jan/2026148,731 148,945 0.96
70,000 General Motors Financial Company Inc. FRN Perp.
76,402 78,466 0.51
140,000 Home Depot Inc. 3.000% 1/Apr/2026 151,785 152,371 0.99150,000 Intel Corp. 2.450% 15/Nov/2029 154,007 158,161 1.02140,000 John Deere Capital Corp. 2.800%
8/Sep/2027150,585 151,281 0.98
200,000 JPMorgan Chase & Company FRN Perp. 203,000 207,625 1.34150,000 Newmont Corp. 2.800% 1/Oct/2029 155,012 157,925 1.02140,000 Northrop Grumman Corp. 3.200%
1/Feb/2027151,885 152,650 0.99
200,000 PartnerRe Finance B LLC FRN 1/Oct/2050 205,000 208,750 1.3550,000 Provident Finance Trust I 7.405%
15/Mar/203858,000 60,188 0.39
200,000 Prudential Financial Inc. FRN 15/Sep/2048 230,052 234,500 1.52150,000 Southern Company FRN 15/Sep/2051 150,000 151,369 0.98146,000 Southern Company FRN 15/Jan/2051 153,709 155,017 1.00150,000 Tjx Cos Inc. 2.250% 15/Sep/2026 157,790 157,771 1.02200,000 USB Capital IX FRN Perp. 193,498 198,425 1.28125,000 Verizon Communications Inc. 4.329% 21/
Sep/2028143,071 145,469 0.94
150,000 Walt Disney Company 2.000% 1/Sep/2029 147,633 151,764 0.98
5,332,584 5,415,345 35.04
Bonds Total 7,331,927 7,419,072 48.03
Bonds – convertibles
United States100 Wells Fargo & Company 7.500% Perp. 140,500 150,000 0.97
140,500 150,000 0.97
Bonds – convertibles Total 140,500 150,000 0.97
Equities
Bermuda6,000 Brookfield Infrastructure Partners LP 151,140 157,500 1.025,750 Brookfield Renewable Partners LP 151,225 152,145 0.98
302,365 309,645 2.00Canada
3,000 Algonquin Power & Utilities Corp. 150,000 149,280 0.97
150,000 149,280 0.97
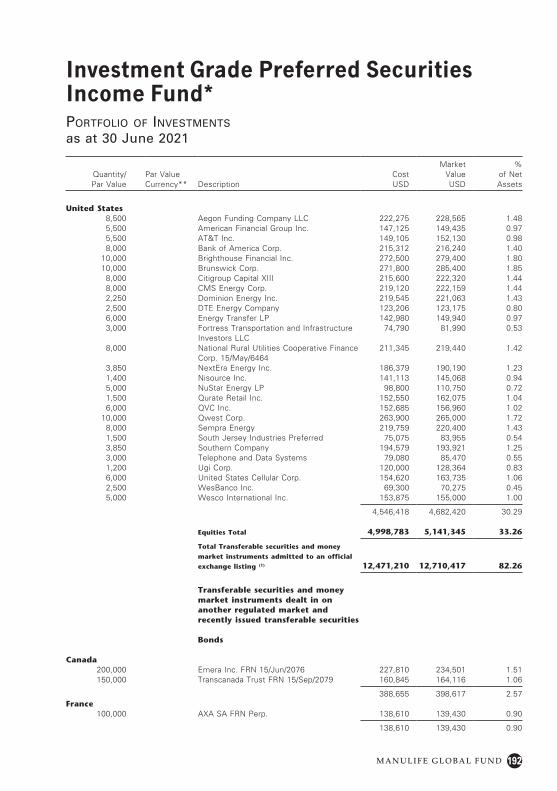
192
Investment Grade Preferred Securities Income Fund*
M A N U L I F E G L O B A L F U N D
Portfolio of investments
as at 30 June 2021
Quantity/ Par Value
Par Value Currency** Description
Cost USD
Market Value USD
% of Net Assets
United States8,500 Aegon Funding Company LLC 222,275 228,565 1.485,500 American Financial Group Inc. 147,125 149,435 0.975,500 AT&T Inc. 149,105 152,130 0.988,000 Bank of America Corp. 215,312 216,240 1.40
10,000 Brighthouse Financial Inc. 272,500 279,400 1.8010,000 Brunswick Corp. 271,800 285,400 1.85
8,000 Citigroup Capital XIII 215,600 222,320 1.448,000 CMS Energy Corp. 219,120 222,159 1.442,250 Dominion Energy Inc. 219,545 221,063 1.432,500 DTE Energy Company 123,206 123,175 0.806,000 Energy Transfer LP 142,980 149,940 0.973,000 Fortress Transportation and Infrastructure
Investors LLC74,790 81,990 0.53
8,000 National Rural Utilities Cooperative Finance Corp. 15/May/6464
211,345 219,440 1.42
3,850 NextEra Energy Inc. 186,379 190,190 1.231,400 Nisource Inc. 141,113 145,068 0.945,000 NuStar Energy LP 98,800 110,750 0.721,500 Qurate Retail Inc. 152,550 162,075 1.046,000 QVC Inc. 152,685 156,960 1.02
10,000 Qwest Corp. 263,900 265,000 1.728,000 Sempra Energy 219,759 220,400 1.431,500 South Jersey Industries Preferred 75,075 83,955 0.543,850 Southern Company 194,579 193,921 1.253,000 Telephone and Data Systems 79,080 85,470 0.551,200 Ugi Corp. 120,000 128,364 0.836,000 United States Cellular Corp. 154,620 163,735 1.062,500 WesBanco Inc. 69,300 70,275 0.455,000 Wesco International Inc. 153,875 155,000 1.00
4,546,418 4,682,420 30.29
Equities Total 4,998,783 5,141,345 33.26
Total Transferable securities and money
market instruments admitted to an official
exchange listing (1) 12,471,210 12,710,417 82.26
Transferable securities and money market instruments dealt in on another regulated market and recently issued transferable securities
Bonds
Canada200,000 Emera Inc. FRN 15/Jun/2076 227,810 234,501 1.51150,000 Transcanada Trust FRN 15/Sep/2079 160,845 164,116 1.06
388,655 398,617 2.57France
100,000 AXA SA FRN Perp. 138,610 139,430 0.90
138,610 139,430 0.90
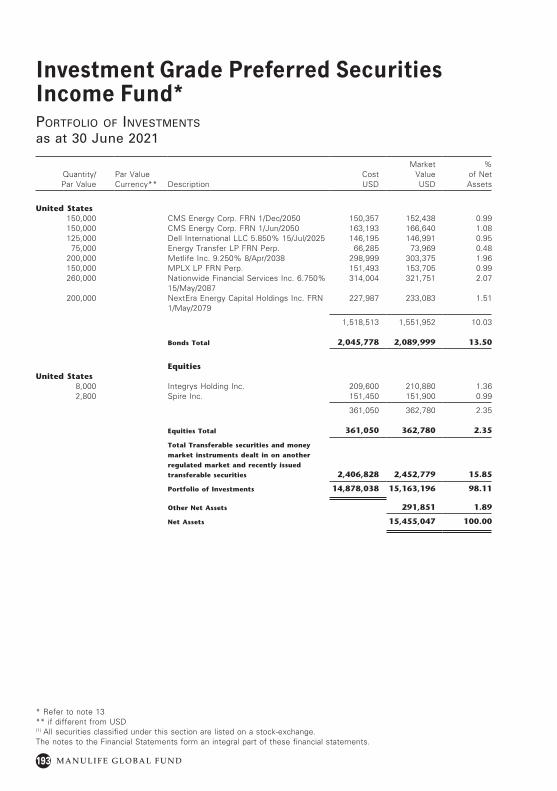
193
Investment Grade Preferred Securities Income Fund*
M A N U L I F E G L O B A L F U N D
Quantity/ Par Value
Par Value Currency** Description
Cost USD
Market Value USD
% of Net Assets
United States150,000 CMS Energy Corp. FRN 1/Dec/2050 150,357 152,438 0.99150,000 CMS Energy Corp. FRN 1/Jun/2050 163,193 166,640 1.08125,000 Dell International LLC 5.850% 15/Jul/2025 146,195 146,991 0.95
75,000 Energy Transfer LP FRN Perp. 66,285 73,969 0.48200,000 Metlife Inc. 9.250% 8/Apr/2038 298,999 303,375 1.96150,000 MPLX LP FRN Perp. 151,493 153,705 0.99260,000 Nationwide Financial Services Inc. 6.750%
15/May/2087314,004 321,751 2.07
200,000 NextEra Energy Capital Holdings Inc. FRN 1/May/2079
227,987 233,083 1.51
1,518,513 1,551,952 10.03
Bonds Total 2,045,778 2,089,999 13.50
EquitiesUnited States
8,000 Integrys Holding Inc. 209,600 210,880 1.362,800 Spire Inc. 151,450 151,900 0.99
361,050 362,780 2.35
Equities Total 361,050 362,780 2.35
Total Transferable securities and money
market instruments dealt in on another
regulated market and recently issued
transferable securities 2,406,828 2,452,779 15.85
Portfolio of Investments 14,878,038 15,163,196 98.11
Other Net Assets 291,851 1.89
Net Assets 15,455,047 100.00
* Refer to note 13** if different from USD(1) All securities classified under this section are listed on a stock-exchange.The notes to the Financial Statements form an integral part of these financial statements.
Portfolio of investments
as at 30 June 2021
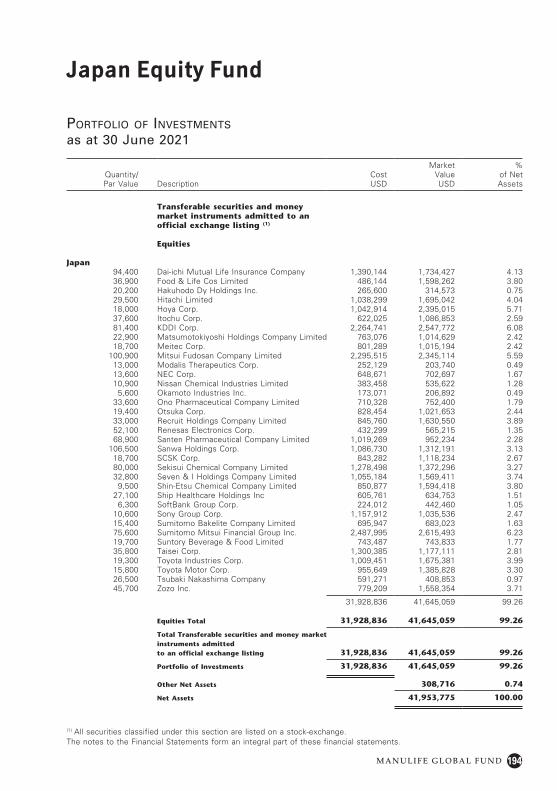
194
Japan Equity Fund
M A N U L I F E G L O B A L F U N D
Portfolio of investments
as at 30 June 2021
Quantity/ Par Value Description
Cost USD
Market Value USD
% of Net Assets
Transferable securities and money market instruments admitted to an official exchange listing (1)
Equities
Japan94,400 Dai-ichi Mutual Life Insurance Company 1,390,144 1,734,427 4.1336,900 Food & Life Cos Limited 486,144 1,598,262 3.8020,200 Hakuhodo Dy Holdings Inc. 265,600 314,573 0.7529,500 Hitachi Limited 1,038,299 1,695,042 4.0418,000 Hoya Corp. 1,042,914 2,395,015 5.7137,600 Itochu Corp. 622,025 1,086,853 2.5981,400 KDDI Corp. 2,264,741 2,547,772 6.0822,900 Matsumotokiyoshi Holdings Company Limited 763,076 1,014,629 2.4218,700 Meitec Corp. 801,289 1,015,194 2.42
100,900 Mitsui Fudosan Company Limited 2,295,515 2,345,114 5.5913,000 Modalis Therapeutics Corp. 252,129 203,740 0.4913,600 NEC Corp. 648,671 702,697 1.6710,900 Nissan Chemical Industries Limited 383,458 535,622 1.28
5,600 Okamoto Industries Inc. 173,071 206,892 0.4933,600 Ono Pharmaceutical Company Limited 710,328 752,400 1.7919,400 Otsuka Corp. 828,454 1,021,653 2.4433,000 Recruit Holdings Company Limited 845,760 1,630,550 3.8952,100 Renesas Electronics Corp. 432,299 565,215 1.3568,900 Santen Pharmaceutical Company Limited 1,019,269 952,234 2.28
106,500 Sanwa Holdings Corp. 1,086,730 1,312,191 3.1318,700 SCSK Corp. 843,282 1,118,234 2.6780,000 Sekisui Chemical Company Limited 1,278,498 1,372,296 3.2732,800 Seven & I Holdings Company Limited 1,055,184 1,569,411 3.74
9,500 Shin-Etsu Chemical Company Limited 850,877 1,594,418 3.8027,100 Ship Healthcare Holdings Inc 605,761 634,753 1.51
6,300 SoftBank Group Corp. 224,012 442,460 1.0510,600 Sony Group Corp. 1,157,912 1,035,536 2.4715,400 Sumitomo Bakelite Company Limited 695,947 683,023 1.6375,600 Sumitomo Mitsui Financial Group Inc. 2,487,995 2,615,493 6.2319,700 Suntory Beverage & Food Limited 743,487 743,833 1.7735,800 Taisei Corp. 1,300,385 1,177,111 2.8119,300 Toyota Industries Corp. 1,009,451 1,675,381 3.9915,800 Toyota Motor Corp. 955,649 1,385,828 3.3026,500 Tsubaki Nakashima Company 591,271 408,853 0.9745,700 Zozo Inc. 779,209 1,558,354 3.71
31,928,836 41,645,059 99.26
Equities Total 31,928,836 41,645,059 99.26
Total Transferable securities and money market instruments admitted to an official exchange listing 31,928,836 41,645,059 99.26
Portfolio of Investments 31,928,836 41,645,059 99.26
Other Net Assets 308,716 0.74
Net Assets 41,953,775 100.00
(1) All securities classified under this section are listed on a stock-exchange.The notes to the Financial Statements form an integral part of these financial statements.
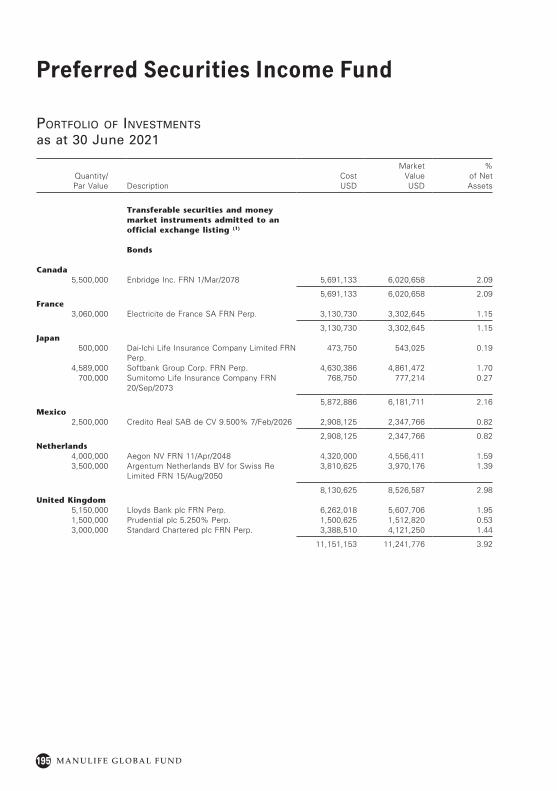
195
Preferred Securities Income Fund
M A N U L I F E G L O B A L F U N D
Portfolio of investments
as at 30 June 2021
Quantity/Par Value Description
Cost USD
Market Value USD
% of Net Assets
Transferable securities and money market instruments admitted to an official exchange listing (1)
Bonds
Canada5,500,000 Enbridge Inc. FRN 1/Mar/2078 5,691,133 6,020,658 2.09
5,691,133 6,020,658 2.09France
3,060,000 Electricite de France SA FRN Perp. 3,130,730 3,302,645 1.15
3,130,730 3,302,645 1.15Japan
500,000 Dai-Ichi Life Insurance Company Limited FRN Perp.
473,750 543,025 0.19
4,589,000 Softbank Group Corp. FRN Perp. 4,630,386 4,861,472 1.70700,000 Sumitomo Life Insurance Company FRN
20/Sep/2073768,750 777,214 0.27
5,872,886 6,181,711 2.16Mexico
2,500,000 Credito Real SAB de CV 9.500% 7/Feb/2026 2,908,125 2,347,766 0.82
2,908,125 2,347,766 0.82Netherlands
4,000,000 Aegon NV FRN 11/Apr/2048 4,320,000 4,556,411 1.593,500,000 Argentum Netherlands BV for Swiss Re
Limited FRN 15/Aug/20503,810,625 3,970,176 1.39
8,130,625 8,526,587 2.98United Kingdom
5,150,000 Lloyds Bank plc FRN Perp. 6,262,018 5,607,706 1.951,500,000 Prudential plc 5.250% Perp. 1,500,625 1,512,820 0.533,000,000 Standard Chartered plc FRN Perp. 3,388,510 4,121,250 1.44
11,151,153 11,241,776 3.92
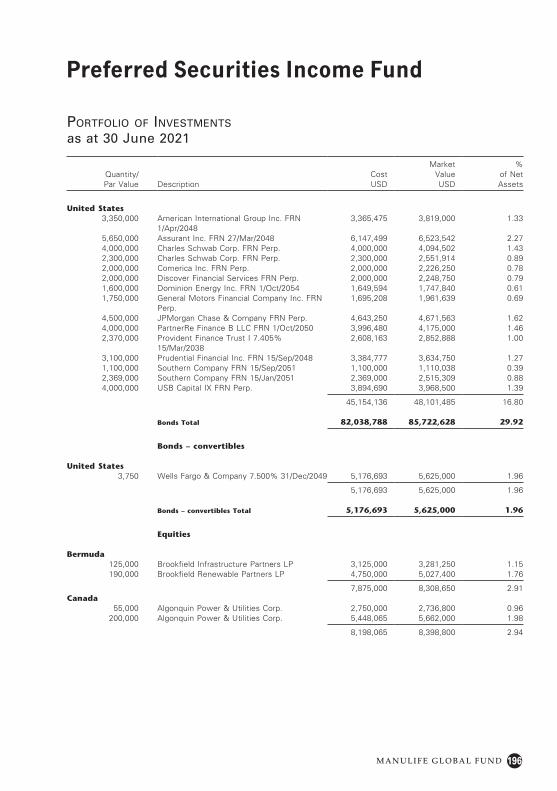
196
Preferred Securities Income Fund
M A N U L I F E G L O B A L F U N D
Quantity/Par Value Description
Cost USD
Market Value USD
% of Net Assets
United States3,350,000 American International Group Inc. FRN
1/Apr/20483,365,475 3,819,000 1.33
5,650,000 Assurant Inc. FRN 27/Mar/2048 6,147,499 6,523,542 2.274,000,000 Charles Schwab Corp. FRN Perp. 4,000,000 4,094,502 1.432,300,000 Charles Schwab Corp. FRN Perp. 2,300,000 2,551,914 0.892,000,000 Comerica Inc. FRN Perp. 2,000,000 2,226,250 0.782,000,000 Discover Financial Services FRN Perp. 2,000,000 2,248,750 0.791,600,000 Dominion Energy Inc. FRN 1/Oct/2054 1,649,594 1,747,840 0.611,750,000 General Motors Financial Company Inc. FRN
Perp.1,695,208 1,961,639 0.69
4,500,000 JPMorgan Chase & Company FRN Perp. 4,643,250 4,671,563 1.624,000,000 PartnerRe Finance B LLC FRN 1/Oct/2050 3,996,480 4,175,000 1.462,370,000 Provident Finance Trust I 7.405%
15/Mar/20382,608,163 2,852,888 1.00
3,100,000 Prudential Financial Inc. FRN 15/Sep/2048 3,384,777 3,634,750 1.271,100,000 Southern Company FRN 15/Sep/2051 1,100,000 1,110,038 0.392,369,000 Southern Company FRN 15/Jan/2051 2,369,000 2,515,309 0.884,000,000 USB Capital IX FRN Perp. 3,894,690 3,968,500 1.39
45,154,136 48,101,485 16.80
Bonds Total 82,038,788 85,722,628 29.92
Bonds – convertibles
United States3,750 Wells Fargo & Company 7.500% 31/Dec/2049 5,176,693 5,625,000 1.96
5,176,693 5,625,000 1.96
Bonds – convertibles Total 5,176,693 5,625,000 1.96
Equities
Bermuda125,000 Brookfield Infrastructure Partners LP 3,125,000 3,281,250 1.15190,000 Brookfield Renewable Partners LP 4,750,000 5,027,400 1.76
7,875,000 8,308,650 2.91Canada
55,000 Algonquin Power & Utilities Corp. 2,750,000 2,736,800 0.96200,000 Algonquin Power & Utilities Corp. 5,448,065 5,662,000 1.98
8,198,065 8,398,800 2.94
Portfolio of investments
as at 30 June 2021
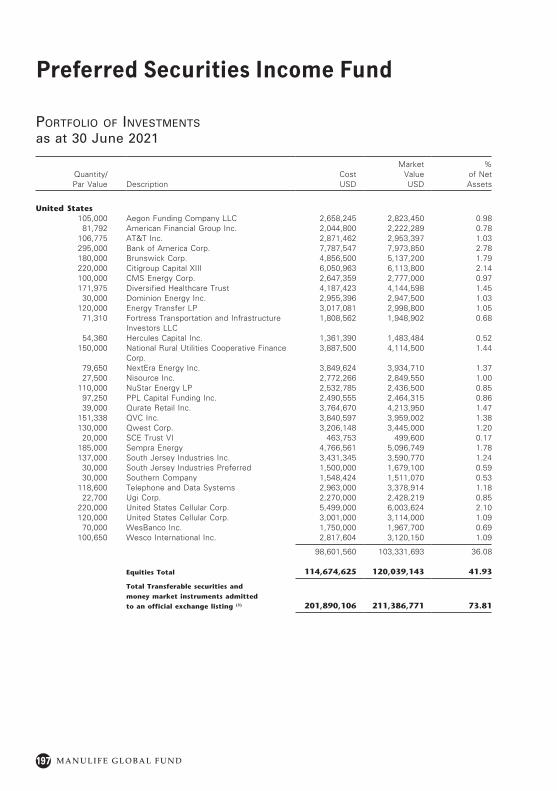
197
Preferred Securities Income Fund
M A N U L I F E G L O B A L F U N D
Quantity/Par Value Description
Cost USD
Market Value USD
% of Net Assets
United States105,000 Aegon Funding Company LLC 2,658,245 2,823,450 0.98
81,792 American Financial Group Inc. 2,044,800 2,222,289 0.78106,775 AT&T Inc. 2,871,462 2,953,397 1.03295,000 Bank of America Corp. 7,787,547 7,973,850 2.78180,000 Brunswick Corp. 4,856,500 5,137,200 1.79220,000 Citigroup Capital XIII 6,050,963 6,113,800 2.14100,000 CMS Energy Corp. 2,647,359 2,777,000 0.97171,975 Diversified Healthcare Trust 4,187,423 4,144,598 1.45
30,000 Dominion Energy Inc. 2,955,396 2,947,500 1.03120,000 Energy Transfer LP 3,017,081 2,998,800 1.05
71,310 Fortress Transportation and Infrastructure Investors LLC
1,808,562 1,948,902 0.68
54,360 Hercules Capital Inc. 1,361,390 1,483,484 0.52150,000 National Rural Utilities Cooperative Finance
Corp. 3,887,500 4,114,500 1.44
79,650 NextEra Energy Inc. 3,849,624 3,934,710 1.3727,500 Nisource Inc. 2,772,266 2,849,550 1.00
110,000 NuStar Energy LP 2,532,785 2,436,500 0.8597,250 PPL Capital Funding Inc. 2,490,555 2,464,315 0.8639,000 Qurate Retail Inc. 3,764,670 4,213,950 1.47
151,338 QVC Inc. 3,840,597 3,959,002 1.38130,000 Qwest Corp. 3,206,148 3,445,000 1.20
20,000 SCE Trust VI 463,753 499,600 0.17185,000 Sempra Energy 4,766,561 5,096,749 1.78137,000 South Jersey Industries Inc. 3,431,345 3,590,770 1.24
30,000 South Jersey Industries Preferred 1,500,000 1,679,100 0.5930,000 Southern Company 1,548,424 1,511,070 0.53
118,600 Telephone and Data Systems 2,963,000 3,378,914 1.1822,700 Ugi Corp. 2,270,000 2,428,219 0.85
220,000 United States Cellular Corp. 5,499,000 6,003,624 2.10120,000 United States Cellular Corp. 3,001,000 3,114,000 1.09
70,000 WesBanco Inc. 1,750,000 1,967,700 0.69100,650 Wesco International Inc. 2,817,604 3,120,150 1.09
98,601,560 103,331,693 36.08
Equities Total 114,674,625 120,039,143 41.93
Total Transferable securities and
money market instruments admitted
to an official exchange listing (1) 201,890,106 211,386,771 73.81
Portfolio of investments
as at 30 June 2021
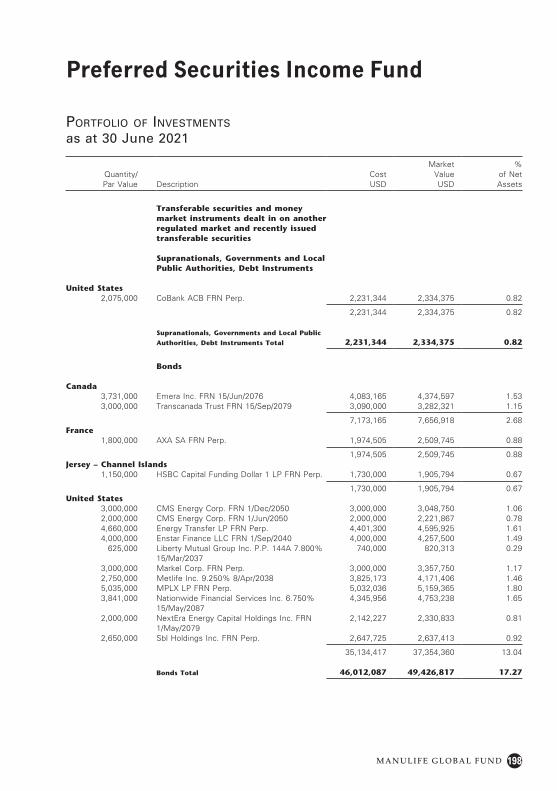
198
Preferred Securities Income Fund
M A N U L I F E G L O B A L F U N D
Quantity/Par Value Description
Cost USD
Market Value USD
% of Net Assets
Transferable securities and money market instruments dealt in on another regulated market and recently issued transferable securities
Supranationals, Governments and Local Public Authorities, Debt Instruments
United States2,075,000 CoBank ACB FRN Perp. 2,231,344 2,334,375 0.82
2,231,344 2,334,375 0.82
Supranationals, Governments and Local Public
Authorities, Debt Instruments Total 2,231,344 2,334,375 0.82
Bonds
Canada3,731,000 Emera Inc. FRN 15/Jun/2076 4,083,165 4,374,597 1.533,000,000 Transcanada Trust FRN 15/Sep/2079 3,090,000 3,282,321 1.15
7,173,165 7,656,918 2.68France
1,800,000 AXA SA FRN Perp. 1,974,505 2,509,745 0.88
1,974,505 2,509,745 0.88Jersey – Channel Islands
1,150,000 HSBC Capital Funding Dollar 1 LP FRN Perp. 1,730,000 1,905,794 0.67
1,730,000 1,905,794 0.67United States
3,000,000 CMS Energy Corp. FRN 1/Dec/2050 3,000,000 3,048,750 1.062,000,000 CMS Energy Corp. FRN 1/Jun/2050 2,000,000 2,221,867 0.784,660,000 Energy Transfer LP FRN Perp. 4,401,300 4,595,925 1.614,000,000 Enstar Finance LLC FRN 1/Sep/2040 4,000,000 4,257,500 1.49
625,000 Liberty Mutual Group Inc. P.P. 144A 7.800% 15/Mar/2037
740,000 820,313 0.29
3,000,000 Markel Corp. FRN Perp. 3,000,000 3,357,750 1.172,750,000 Metlife Inc. 9.250% 8/Apr/2038 3,825,173 4,171,406 1.465,035,000 MPLX LP FRN Perp. 5,032,036 5,159,365 1.803,841,000 Nationwide Financial Services Inc. 6.750%
15/May/20874,345,956 4,753,238 1.65
2,000,000 NextEra Energy Capital Holdings Inc. FRN 1/May/2079
2,142,227 2,330,833 0.81
2,650,000 Sbl Holdings Inc. FRN Perp. 2,647,725 2,637,413 0.92
35,134,417 37,354,360 13.04
Bonds Total 46,012,087 49,426,817 17.27
Portfolio of investments
as at 30 June 2021
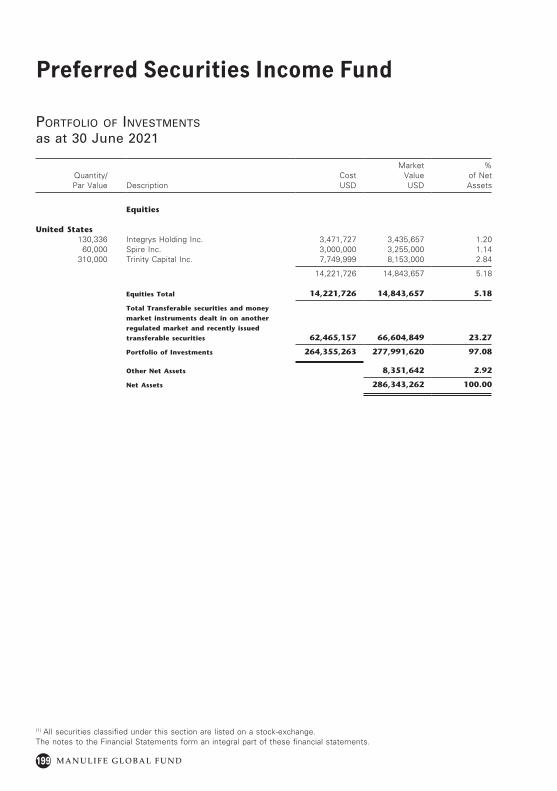
199
Preferred Securities Income Fund
M A N U L I F E G L O B A L F U N D
(1) All securities classified under this section are listed on a stock-exchange.The notes to the Financial Statements form an integral part of these financial statements.
Quantity/Par Value Description
Cost USD
Market Value USD
% of Net Assets
Equities
United States130,336 Integrys Holding Inc. 3,471,727 3,435,657 1.20
60,000 Spire Inc. 3,000,000 3,255,000 1.14310,000 Trinity Capital Inc. 7,749,999 8,153,000 2.84
14,221,726 14,843,657 5.18
Equities Total 14,221,726 14,843,657 5.18
Total Transferable securities and money
market instruments dealt in on another
regulated market and recently issued
transferable securities 62,465,157 66,604,849 23.27
Portfolio of Investments 264,355,263 277,991,620 97.08
Other Net Assets 8,351,642 2.92
Net Assets 286,343,262 100.00
Portfolio of investments
as at 30 June 2021
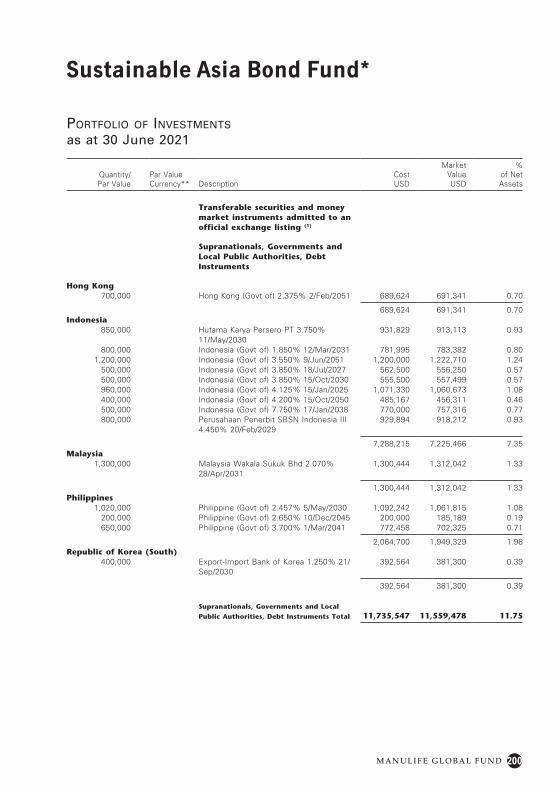
200
Sustainable Asia Bond Fund*
M A N U L I F E G L O B A L F U N D
Portfolio of investments
as at 30 June 2021
Quantity/ Par Value
Par Value Currency** Description
Cost USD
Market Value USD
% of Net Assets
Transferable securities and money market instruments admitted to an official exchange listing (1)
Supranationals, Governments and Local Public Authorities, Debt Instruments
Hong Kong700,000 Hong Kong (Govt of) 2.375% 2/Feb/2051 689,624 691,341 0.70
689,624 691,341 0.70Indonesia
850,000 Hutama Karya Persero PT 3.750% 11/May/2030
931,829 913,113 0.93
800,000 Indonesia (Govt of) 1.850% 12/Mar/2031 781,995 783,382 0.801,200,000 Indonesia (Govt of) 3.550% 9/Jun/2051 1,200,000 1,222,710 1.24
500,000 Indonesia (Govt of) 3.850% 18/Jul/2027 562,500 556,250 0.57500,000 Indonesia (Govt of) 3.850% 15/Oct/2030 555,500 557,499 0.57960,000 Indonesia (Govt of) 4.125% 15/Jan/2025 1,071,330 1,060,673 1.08400,000 Indonesia (Govt of) 4.200% 15/Oct/2050 485,167 456,311 0.46500,000 Indonesia (Govt of) 7.750% 17/Jan/2038 770,000 757,316 0.77800,000 Perusahaan Penerbit SBSN Indonesia III
4.450% 20/Feb/2029929,894 918,212 0.93
7,288,215 7,225,466 7.35Malaysia
1,300,000 Malaysia Wakala Sukuk Bhd 2.070% 28/Apr/2031
1,300,444 1,312,042 1.33
1,300,444 1,312,042 1.33Philippines
1,020,000 Philippine (Govt of) 2.457% 5/May/2030 1,092,242 1,061,815 1.08200,000 Philippine (Govt of) 2.650% 10/Dec/2045 200,000 185,189 0.19650,000 Philippine (Govt of) 3.700% 1/Mar/2041 772,458 702,325 0.71
2,064,700 1,949,329 1.98Republic of Korea (South)
400,000 Export-Import Bank of Korea 1.250% 21/Sep/2030
392,564 381,300 0.39
392,564 381,300 0.39
Supranationals, Governments and Local
Public Authorities, Debt Instruments Total 11,735,547 11,559,478 11.75
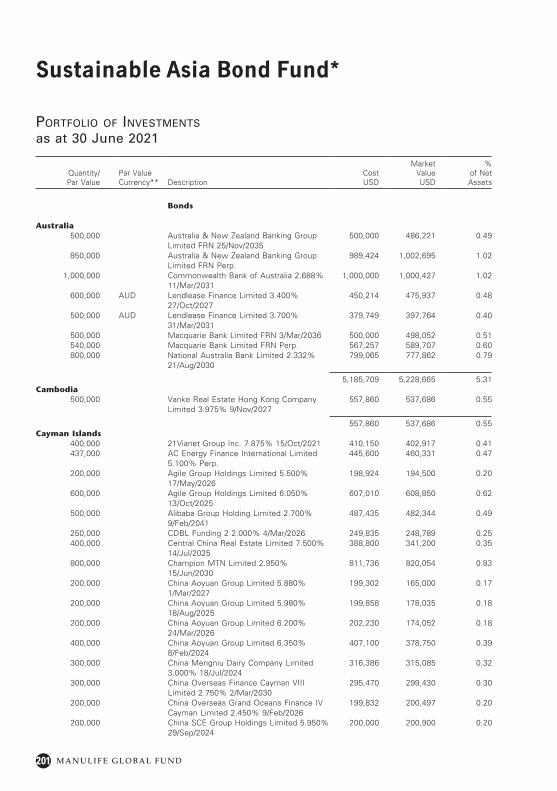
201
Sustainable Asia Bond Fund*
M A N U L I F E G L O B A L F U N D
Quantity/ Par Value
Par Value Currency** Description
Cost USD
Market Value USD
% of Net Assets
Bonds
Australia500,000 Australia & New Zealand Banking Group
Limited FRN 25/Nov/2035500,000 486,221 0.49
850,000 Australia & New Zealand Banking Group Limited FRN Perp.
989,424 1,002,695 1.02
1,000,000 Commonwealth Bank of Australia 2.688% 11/Mar/2031
1,000,000 1,000,427 1.02
600,000 AUD Lendlease Finance Limited 3.400% 27/Oct/2027
450,214 475,937 0.48
500,000 AUD Lendlease Finance Limited 3.700% 31/Mar/2031
379,749 397,764 0.40
500,000 Macquarie Bank Limited FRN 3/Mar/2036 500,000 498,052 0.51540,000 Macquarie Bank Limited FRN Perp. 567,257 589,707 0.60800,000 National Australia Bank Limited 2.332%
21/Aug/2030799,065 777,862 0.79
5,185,709 5,228,665 5.31Cambodia
500,000 Vanke Real Estate Hong Kong Company Limited 3.975% 9/Nov/2027
557,860 537,686 0.55
557,860 537,686 0.55Cayman Islands
400,000 21Vianet Group Inc. 7.875% 15/Oct/2021 410,150 402,917 0.41437,000 AC Energy Finance International Limited
5.100% Perp.445,600 460,331 0.47
200,000 Agile Group Holdings Limited 5.500% 17/May/2026
198,924 194,500 0.20
600,000 Agile Group Holdings Limited 6.050% 13/Oct/2025
607,010 608,850 0.62
500,000 Alibaba Group Holding Limited 2.700% 9/Feb/2041
487,435 482,344 0.49
250,000 CDBL Funding 2 2.000% 4/Mar/2026 249,835 248,789 0.25400,000 Central China Real Estate Limited 7.500%
14/Jul/2025388,800 341,200 0.35
800,000 Champion MTN Limited 2.950% 15/Jun/2030
811,736 820,054 0.83
200,000 China Aoyuan Group Limited 5.880% 1/Mar/2027
199,302 165,000 0.17
200,000 China Aoyuan Group Limited 5.980% 18/Aug/2025
199,858 178,035 0.18
200,000 China Aoyuan Group Limited 6.200% 24/Mar/2026
202,230 174,052 0.18
400,000 China Aoyuan Group Limited 6.350% 8/Feb/2024
407,100 378,750 0.39
300,000 China Mengniu Dairy Company Limited 3.000% 18/Jul/2024
316,386 315,085 0.32
300,000 China Overseas Finance Cayman VIII Limited 2.750% 2/Mar/2030
295,470 299,430 0.30
200,000 China Overseas Grand Oceans Finance IV Cayman Limited 2.450% 9/Feb/2026
199,832 200,497 0.20
200,000 China SCE Group Holdings Limited 5.950% 29/Sep/2024
200,000 200,900 0.20
Portfolio of investments
as at 30 June 2021
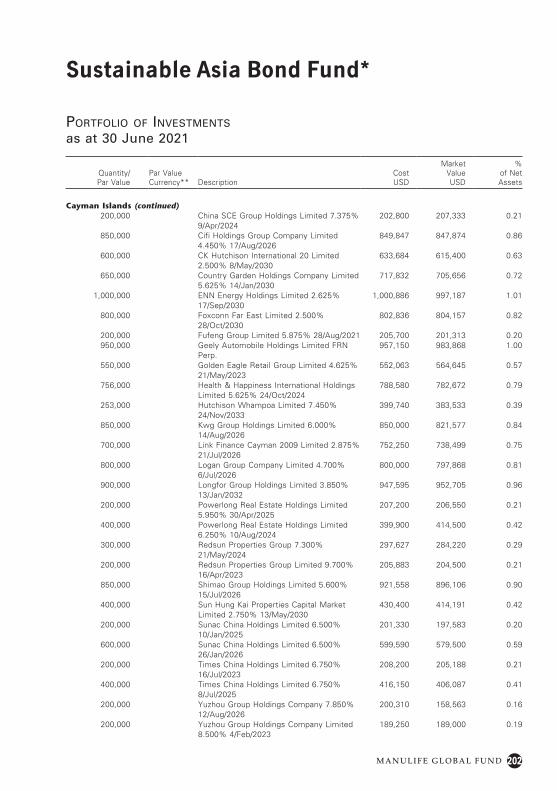
202
Sustainable Asia Bond Fund*
M A N U L I F E G L O B A L F U N D
Quantity/ Par Value
Par Value Currency** Description
Cost USD
Market Value USD
% of Net Assets
Cayman Islands (continued)200,000 China SCE Group Holdings Limited 7.375%
9/Apr/2024202,800 207,333 0.21
850,000 Cifi Holdings Group Company Limited 4.450% 17/Aug/2026
849,847 847,874 0.86
600,000 CK Hutchison International 20 Limited 2.500% 8/May/2030
633,684 615,400 0.63
650,000 Country Garden Holdings Company Limited 5.625% 14/Jan/2030
717,832 705,656 0.72
1,000,000 ENN Energy Holdings Limited 2.625% 17/Sep/2030
1,000,886 997,187 1.01
800,000 Foxconn Far East Limited 2.500% 28/Oct/2030
802,836 804,157 0.82
200,000 Fufeng Group Limited 5.875% 28/Aug/2021 205,700 201,313 0.20950,000 Geely Automobile Holdings Limited FRN
Perp.957,150 983,868 1.00
550,000 Golden Eagle Retail Group Limited 4.625% 21/May/2023
552,063 564,645 0.57
756,000 Health & Happiness International Holdings Limited 5.625% 24/Oct/2024
788,580 782,672 0.79
253,000 Hutchison Whampoa Limited 7.450% 24/Nov/2033
399,740 383,533 0.39
850,000 Kwg Group Holdings Limited 6.000% 14/Aug/2026
850,000 821,577 0.84
700,000 Link Finance Cayman 2009 Limited 2.875% 21/Jul/2026
752,250 738,499 0.75
800,000 Logan Group Company Limited 4.700% 6/Jul/2026
800,000 797,868 0.81
900,000 Longfor Group Holdings Limited 3.850% 13/Jan/2032
947,595 952,705 0.96
200,000 Powerlong Real Estate Holdings Limited 5.950% 30/Apr/2025
207,200 206,550 0.21
400,000 Powerlong Real Estate Holdings Limited 6.250% 10/Aug/2024
399,900 414,500 0.42
300,000 Redsun Properties Group 7.300% 21/May/2024
297,627 284,220 0.29
200,000 Redsun Properties Group Limited 9.700% 16/Apr/2023
205,883 204,500 0.21
850,000 Shimao Group Holdings Limited 5.600% 15/Jul/2026
921,558 896,106 0.90
400,000 Sun Hung Kai Properties Capital Market Limited 2.750% 13/May/2030
430,400 414,191 0.42
200,000 Sunac China Holdings Limited 6.500% 10/Jan/2025
201,330 197,583 0.20
600,000 Sunac China Holdings Limited 6.500% 26/Jan/2026
599,590 579,500 0.59
200,000 Times China Holdings Limited 6.750% 16/Jul/2023
208,200 205,188 0.21
400,000 Times China Holdings Limited 6.750% 8/Jul/2025
416,150 406,087 0.41
200,000 Yuzhou Group Holdings Company 7.850% 12/Aug/2026
200,310 158,563 0.16
200,000 Yuzhou Group Holdings Company Limited 8.500% 4/Feb/2023
189,250 189,000 0.19
Portfolio of investments
as at 30 June 2021
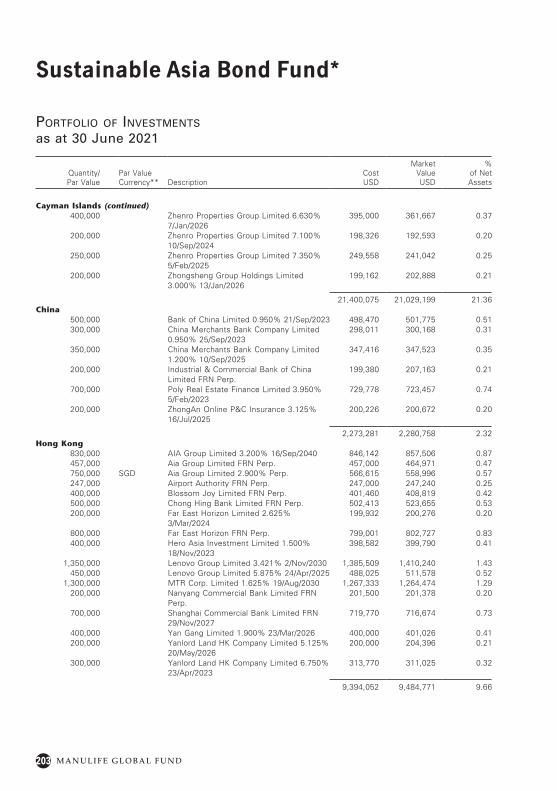
203
Sustainable Asia Bond Fund*
M A N U L I F E G L O B A L F U N D
Quantity/ Par Value
Par Value Currency** Description
Cost USD
Market Value USD
% of Net Assets
Cayman Islands (continued)400,000 Zhenro Properties Group Limited 6.630%
7/Jan/2026395,000 361,667 0.37
200,000 Zhenro Properties Group Limited 7.100% 10/Sep/2024
198,326 192,593 0.20
250,000 Zhenro Properties Group Limited 7.350% 5/Feb/2025
249,558 241,042 0.25
200,000 Zhongsheng Group Holdings Limited 3.000% 13/Jan/2026
199,162 202,888 0.21
21,400,075 21,029,199 21.36China
500,000 Bank of China Limited 0.950% 21/Sep/2023 498,470 501,775 0.51300,000 China Merchants Bank Company Limited
0.950% 25/Sep/2023298,011 300,168 0.31
350,000 China Merchants Bank Company Limited 1.200% 10/Sep/2025
347,416 347,523 0.35
200,000 Industrial & Commercial Bank of China Limited FRN Perp.
199,380 207,163 0.21
700,000 Poly Real Estate Finance Limited 3.950% 5/Feb/2023
729,778 723,457 0.74
200,000 ZhongAn Online P&C Insurance 3.125% 16/Jul/2025
200,226 200,672 0.20
2,273,281 2,280,758 2.32Hong Kong
830,000 AIA Group Limited 3.200% 16/Sep/2040 846,142 857,506 0.87457,000 Aia Group Limited FRN Perp. 457,000 464,971 0.47750,000 SGD Aia Group Limited 2.900% Perp. 566,615 558,996 0.57247,000 Airport Authority FRN Perp. 247,000 247,240 0.25400,000 Blossom Joy Limited FRN Perp. 401,460 408,819 0.42500,000 Chong Hing Bank Limited FRN Perp. 502,413 523,655 0.53200,000 Far East Horizon Limited 2.625%
3/Mar/2024199,932 200,276 0.20
800,000 Far East Horizon FRN Perp. 799,001 802,727 0.83400,000 Hero Asia Investment Limited 1.500%
18/Nov/2023398,582 399,790 0.41
1,350,000 Lenovo Group Limited 3.421% 2/Nov/2030 1,385,509 1,410,240 1.43450,000 Lenovo Group Limited 5.875% 24/Apr/2025 488,025 511,578 0.52
1,300,000 MTR Corp. Limited 1.625% 19/Aug/2030 1,267,333 1,264,474 1.29200,000 Nanyang Commercial Bank Limited FRN
Perp.201,500 201,378 0.20
700,000 Shanghai Commercial Bank Limited FRN 29/Nov/2027
719,770 716,674 0.73
400,000 Yan Gang Limited 1.900% 23/Mar/2026 400,000 401,026 0.41200,000 Yanlord Land HK Company Limited 5.125%
20/May/2026200,000 204,396 0.21
300,000 Yanlord Land HK Company Limited 6.750% 23/Apr/2023
313,770 311,025 0.32
9,394,052 9,484,771 9.66
Portfolio of investments
as at 30 June 2021
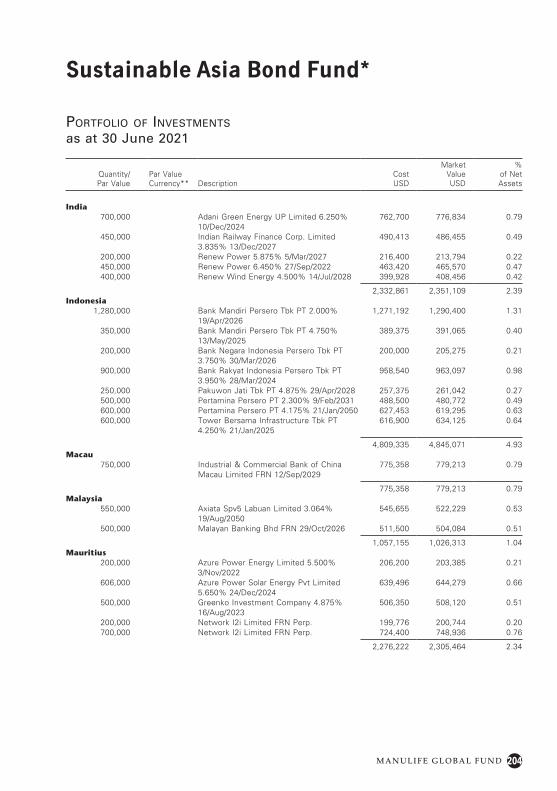
204
Sustainable Asia Bond Fund*
M A N U L I F E G L O B A L F U N D
Quantity/ Par Value
Par Value Currency** Description
Cost USD
Market Value USD
% of Net Assets
India700,000 Adani Green Energy UP Limited 6.250%
10/Dec/2024762,700 776,834 0.79
450,000 Indian Railway Finance Corp. Limited 3.835% 13/Dec/2027
490,413 486,455 0.49
200,000 Renew Power 5.875% 5/Mar/2027 216,400 213,794 0.22450,000 Renew Power 6.450% 27/Sep/2022 463,420 465,570 0.47400,000 Renew Wind Energy 4.500% 14/Jul/2028 399,928 408,456 0.42
2,332,861 2,351,109 2.39Indonesia
1,280,000 Bank Mandiri Persero Tbk PT 2.000% 19/Apr/2026
1,271,192 1,290,400 1.31
350,000 Bank Mandiri Persero Tbk PT 4.750% 13/May/2025
389,375 391,065 0.40
200,000 Bank Negara Indonesia Persero Tbk PT 3.750% 30/Mar/2026
200,000 205,275 0.21
900,000 Bank Rakyat Indonesia Persero Tbk PT 3.950% 28/Mar/2024
958,540 963,097 0.98
250,000 Pakuwon Jati Tbk PT 4.875% 29/Apr/2028 257,375 261,042 0.27500,000 Pertamina Persero PT 2.300% 9/Feb/2031 488,500 480,772 0.49600,000 Pertamina Persero PT 4.175% 21/Jan/2050 627,453 619,295 0.63600,000 Tower Bersama Infrastructure Tbk PT
4.250% 21/Jan/2025616,900 634,125 0.64
4,809,335 4,845,071 4.93Macau
750,000 Industrial & Commercial Bank of China Macau Limited FRN 12/Sep/2029
775,358 779,213 0.79
775,358 779,213 0.79Malaysia
550,000 Axiata Spv5 Labuan Limited 3.064% 19/Aug/2050
545,655 522,229 0.53
500,000 Malayan Banking Bhd FRN 29/Oct/2026 511,500 504,084 0.51
1,057,155 1,026,313 1.04Mauritius
200,000 Azure Power Energy Limited 5.500% 3/Nov/2022
206,200 203,385 0.21
606,000 Azure Power Solar Energy Pvt Limited 5.650% 24/Dec/2024
639,496 644,279 0.66
500,000 Greenko Investment Company 4.875% 16/Aug/2023
506,350 508,120 0.51
200,000 Network I2i Limited FRN Perp. 199,776 200,744 0.20700,000 Network I2i Limited FRN Perp. 724,400 748,936 0.76
2,276,222 2,305,464 2.34
Portfolio of investments
as at 30 June 2021
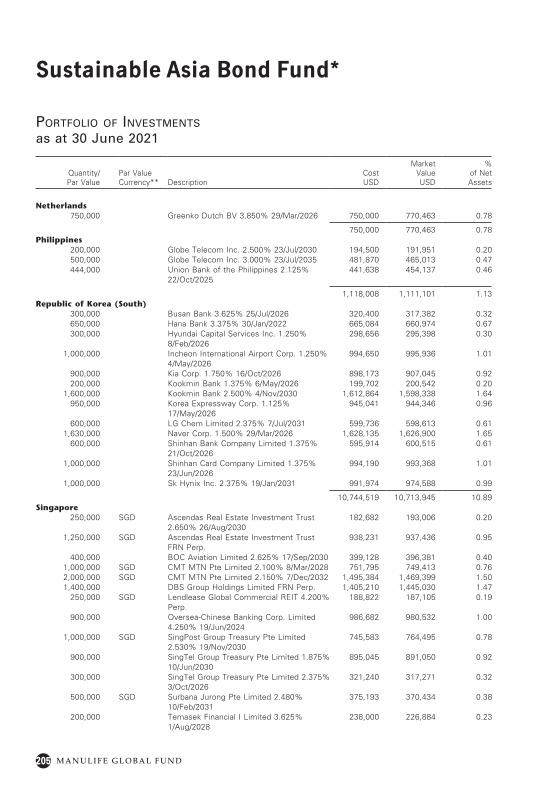
205
Sustainable Asia Bond Fund*
M A N U L I F E G L O B A L F U N D
Quantity/ Par Value
Par Value Currency** Description
Cost USD
Market Value USD
% of Net Assets
Netherlands750,000 Greenko Dutch BV 3.850% 29/Mar/2026 750,000 770,463 0.78
750,000 770,463 0.78Philippines
200,000 Globe Telecom Inc. 2.500% 23/Jul/2030 194,500 191,951 0.20500,000 Globe Telecom Inc. 3.000% 23/Jul/2035 481,870 465,013 0.47444,000 Union Bank of the Philippines 2.125%
22/Oct/2025441,638 454,137 0.46
1,118,008 1,111,101 1.13Republic of Korea (South)
300,000 Busan Bank 3.625% 25/Jul/2026 320,400 317,382 0.32650,000 Hana Bank 3.375% 30/Jan/2022 665,084 660,974 0.67300,000 Hyundai Capital Services Inc. 1.250%
8/Feb/2026298,656 295,398 0.30
1,000,000 Incheon International Airport Corp. 1.250% 4/May/2026
994,650 995,936 1.01
900,000 Kia Corp. 1.750% 16/Oct/2026 898,173 907,045 0.92200,000 Kookmin Bank 1.375% 6/May/2026 199,702 200,542 0.20
1,600,000 Kookmin Bank 2.500% 4/Nov/2030 1,612,864 1,598,338 1.64950,000 Korea Expressway Corp. 1.125%
17/May/2026945,041 944,346 0.96
600,000 LG Chem Limited 2.375% 7/Jul/2031 599,736 598,613 0.611,630,000 Naver Corp. 1.500% 29/Mar/2026 1,628,135 1,626,900 1.65
600,000 Shinhan Bank Company Limited 1.375% 21/Oct/2026
595,914 600,515 0.61
1,000,000 Shinhan Card Company Limited 1.375% 23/Jun/2026
994,190 993,368 1.01
1,000,000 Sk Hynix Inc. 2.375% 19/Jan/2031 991,974 974,588 0.99
10,744,519 10,713,945 10.89Singapore
250,000 SGD Ascendas Real Estate Investment Trust 2.650% 26/Aug/2030
182,682 193,006 0.20
1,250,000 SGD Ascendas Real Estate Investment Trust FRN Perp.
938,231 937,436 0.95
400,000 BOC Aviation Limited 2.625% 17/Sep/2030 399,128 396,381 0.401,000,000 SGD CMT MTN Pte Limited 2.100% 8/Mar/2028 751,795 749,413 0.762,000,000 SGD CMT MTN Pte Limited 2.150% 7/Dec/2032 1,495,384 1,469,399 1.501,400,000 DBS Group Holdings Limited FRN Perp. 1,405,210 1,445,030 1.47
250,000 SGD Lendlease Global Commercial REIT 4.200% Perp.
188,822 187,105 0.19
900,000 Oversea-Chinese Banking Corp. Limited 4.250% 19/Jun/2024
986,682 980,532 1.00
1,000,000 SGD SingPost Group Treasury Pte Limited 2.530% 19/Nov/2030
745,583 764,495 0.78
900,000 SingTel Group Treasury Pte Limited 1.875% 10/Jun/2030
895,045 891,050 0.92
300,000 SingTel Group Treasury Pte Limited 2.375% 3/Oct/2026
321,240 317,271 0.32
500,000 SGD Surbana Jurong Pte Limited 2.480% 10/Feb/2031
375,193 370,434 0.38
200,000 Temasek Financial I Limited 3.625% 1/Aug/2028
238,000 226,884 0.23
Portfolio of investments
as at 30 June 2021
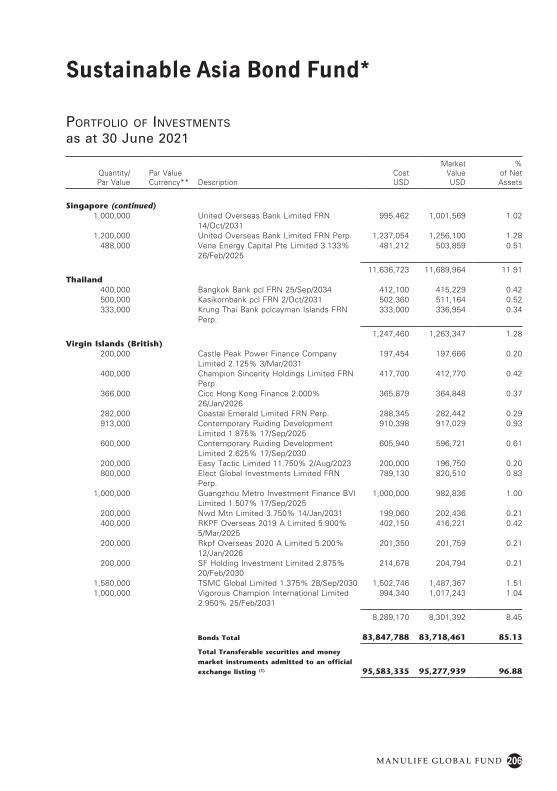
206
Sustainable Asia Bond Fund*
M A N U L I F E G L O B A L F U N D
Quantity/ Par Value
Par Value Currency** Description
Cost USD
Market Value USD
% of Net Assets
Singapore (continued)1,000,000 United Overseas Bank Limited FRN
14/Oct/2031995,462 1,001,569 1.02
1,200,000 United Overseas Bank Limited FRN Perp. 1,237,054 1,256,100 1.28488,000 Vena Energy Capital Pte Limited 3.133%
26/Feb/2025481,212 503,859 0.51
11,636,723 11,689,964 11.91Thailand
400,000 Bangkok Bank pcl FRN 25/Sep/2034 412,100 415,229 0.42500,000 Kasikornbank pcl FRN 2/Oct/2031 502,360 511,164 0.52333,000 Krung Thai Bank pclcayman Islands FRN
Perp.333,000 336,954 0.34
1,247,460 1,263,347 1.28Virgin Islands (British)
200,000 Castle Peak Power Finance Company Limited 2.125% 3/Mar/2031
197,454 197,666 0.20
400,000 Champion Sincerity Holdings Limited FRN Perp.
417,700 412,770 0.42
366,000 Cicc Hong Kong Finance 2.000% 26/Jan/2026
365,879 364,848 0.37
282,000 Coastal Emerald Limited FRN Perp. 288,345 282,442 0.29913,000 Contemporary Ruiding Development
Limited 1.875% 17/Sep/2025910,398 917,029 0.93
600,000 Contemporary Ruiding Development Limited 2.625% 17/Sep/2030
605,940 596,721 0.61
200,000 Easy Tactic Limited 11.750% 2/Aug/2023 200,000 196,750 0.20800,000 Elect Global Investments Limited FRN
Perp.789,130 820,510 0.83
1,000,000 Guangzhou Metro Investment Finance BVI Limited 1.507% 17/Sep/2025
1,000,000 982,836 1.00
200,000 Nwd Mtn Limited 3.750% 14/Jan/2031 199,060 202,436 0.21400,000 RKPF Overseas 2019 A Limited 5.900%
5/Mar/2025402,150 416,221 0.42
200,000 Rkpf Overseas 2020 A Limited 5.200% 12/Jan/2026
201,350 201,759 0.21
200,000 SF Holding Investment Limited 2.875% 20/Feb/2030
214,678 204,794 0.21
1,580,000 TSMC Global Limited 1.375% 28/Sep/2030 1,502,746 1,487,367 1.511,000,000 Vigorous Champion International Limited
2.950% 25/Feb/2031994,340 1,017,243 1.04
8,289,170 8,301,392 8.45
Bonds Total 83,847,788 83,718,461 85.13
Total Transferable securities and money
market instruments admitted to an official
exchange listing (1) 95,583,335 95,277,939 96.88
Portfolio of investments
as at 30 June 2021
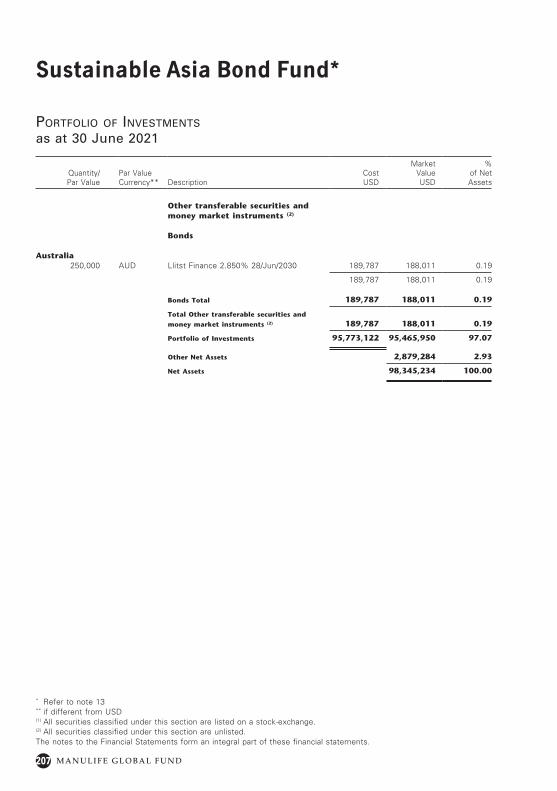
207
Sustainable Asia Bond Fund*
M A N U L I F E G L O B A L F U N D
Quantity/ Par Value
Par Value Currency** Description
Cost USD
Market Value USD
% of Net Assets
Other transferable securities and money market instruments (2)
Bonds
Australia250,000 AUD Llitst Finance 2.850% 28/Jun/2030 189,787 188,011 0.19
189,787 188,011 0.19
Bonds Total 189,787 188,011 0.19
Total Other transferable securities and
money market instruments (2) 189,787 188,011 0.19
Portfolio of Investments 95,773,122 95,465,950 97.07
Other Net Assets 2,879,284 2.93
Net Assets 98,345,234 100.00
* Refer to note 13** if different from USD(1) All securities classified under this section are listed on a stock-exchange.(2) All securities classified under this section are unlisted.The notes to the Financial Statements form an integral part of these financial statements.
Portfolio of investments
as at 30 June 2021
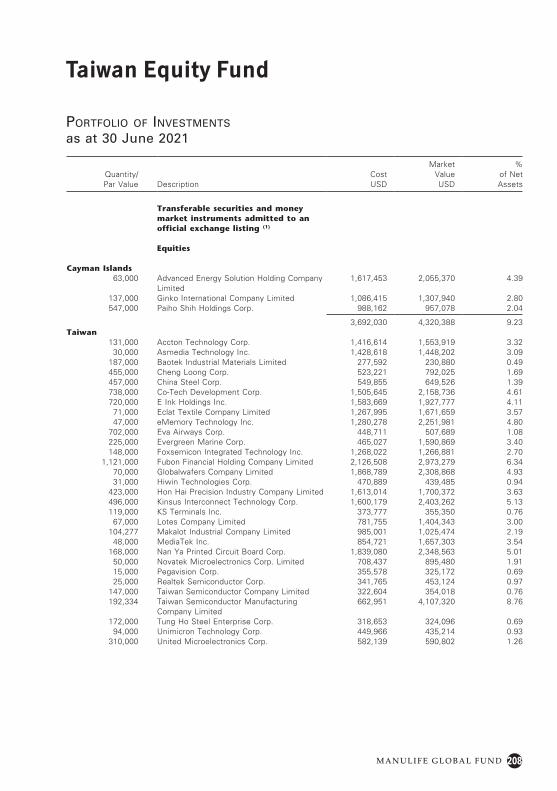
208
Taiwan Equity Fund
M A N U L I F E G L O B A L F U N D
Portfolio of investments
as at 30 June 2021
Quantity/Par Value Description
Cost USD
Market Value USD
% of Net Assets
Transferable securities and money market instruments admitted to an official exchange listing (1)
Equities
Cayman Islands63,000 Advanced Energy Solution Holding Company
Limited1,617,453 2,055,370 4.39
137,000 Ginko International Company Limited 1,086,415 1,307,940 2.80547,000 Paiho Shih Holdings Corp. 988,162 957,078 2.04
3,692,030 4,320,388 9.23Taiwan
131,000 Accton Technology Corp. 1,416,614 1,553,919 3.3230,000 Asmedia Technology Inc. 1,428,618 1,448,202 3.09
187,000 Baotek Industrial Materials Limited 277,592 230,880 0.49455,000 Cheng Loong Corp. 523,221 792,025 1.69457,000 China Steel Corp. 549,855 649,526 1.39738,000 Co-Tech Development Corp. 1,505,645 2,158,736 4.61720,000 E Ink Holdings Inc. 1,583,669 1,927,777 4.11
71,000 Eclat Textile Company Limited 1,267,995 1,671,659 3.5747,000 eMemory Technology Inc. 1,280,278 2,251,981 4.80
702,000 Eva Airways Corp. 448,711 507,689 1.08225,000 Evergreen Marine Corp. 465,027 1,590,869 3.40148,000 Foxsemicon Integrated Technology Inc. 1,268,022 1,266,881 2.70
1,121,000 Fubon Financial Holding Company Limited 2,126,508 2,973,279 6.3470,000 Globalwafers Company Limited 1,868,789 2,308,868 4.9331,000 Hiwin Technologies Corp. 470,889 439,485 0.94
423,000 Hon Hai Precision Industry Company Limited 1,613,014 1,700,372 3.63496,000 Kinsus Interconnect Technology Corp. 1,600,179 2,403,262 5.13119,000 KS Terminals Inc. 373,777 355,350 0.76
67,000 Lotes Company Limited 781,755 1,404,343 3.00104,277 Makalot Industrial Company Limited 985,001 1,025,474 2.19
48,000 MediaTek Inc. 854,721 1,657,303 3.54168,000 Nan Ya Printed Circuit Board Corp. 1,839,080 2,348,563 5.01
50,000 Novatek Microelectronics Corp. Limited 708,437 895,480 1.9115,000 Pegavision Corp. 355,578 325,172 0.6925,000 Realtek Semiconductor Corp. 341,765 453,124 0.97
147,000 Taiwan Semiconductor Company Limited 322,604 354,018 0.76192,334 Taiwan Semiconductor Manufacturing
Company Limited662,951 4,107,320 8.76
172,000 Tung Ho Steel Enterprise Corp. 318,653 324,096 0.6994,000 Unimicron Technology Corp. 449,966 435,214 0.93
310,000 United Microelectronics Corp. 582,139 590,802 1.26
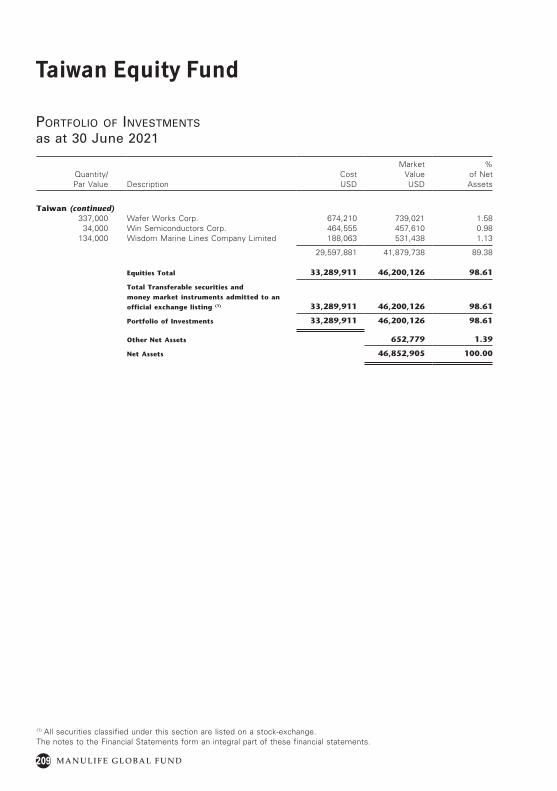
209
Taiwan Equity Fund
M A N U L I F E G L O B A L F U N D
Portfolio of investments
as at 30 June 2021
Quantity/Par Value Description
Cost USD
Market Value USD
% of Net Assets
Taiwan (continued)337,000 Wafer Works Corp. 674,210 739,021 1.58
34,000 Win Semiconductors Corp. 464,555 457,610 0.98134,000 Wisdom Marine Lines Company Limited 188,063 531,438 1.13
29,597,881 41,879,738 89.38
Equities Total 33,289,911 46,200,126 98.61
Total Transferable securities and
money market instruments admitted to an
official exchange listing (1) 33,289,911 46,200,126 98.61
Portfolio of Investments 33,289,911 46,200,126 98.61
Other Net Assets 652,779 1.39
Net Assets 46,852,905 100.00
(1) All securities classified under this section are listed on a stock-exchange.The notes to the Financial Statements form an integral part of these financial statements.
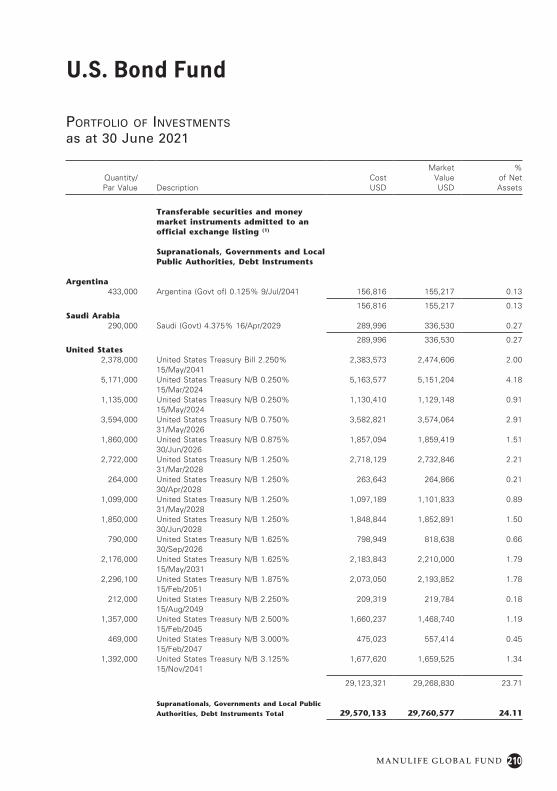
210
U.S. Bond Fund
M A N U L I F E G L O B A L F U N D
Portfolio of investments
as at 30 June 2021
Quantity/Par Value Description
Cost USD
Market Value USD
% of Net Assets
Transferable securities and money market instruments admitted to an official exchange listing (1)
Supranationals, Governments and Local Public Authorities, Debt Instruments
Argentina433,000 Argentina (Govt of) 0.125% 9/Jul/2041 156,816 155,217 0.13
156,816 155,217 0.13Saudi Arabia
290,000 Saudi (Govt) 4.375% 16/Apr/2029 289,996 336,530 0.27
289,996 336,530 0.27United States
2,378,000 United States Treasury Bill 2.250% 15/May/2041
2,383,573 2,474,606 2.00
5,171,000 United States Treasury N/B 0.250% 15/Mar/2024
5,163,577 5,151,204 4.18
1,135,000 United States Treasury N/B 0.250% 15/May/2024
1,130,410 1,129,148 0.91
3,594,000 United States Treasury N/B 0.750% 31/May/2026
3,582,821 3,574,064 2.91
1,860,000 United States Treasury N/B 0.875% 30/Jun/2026
1,857,094 1,859,419 1.51
2,722,000 United States Treasury N/B 1.250% 31/Mar/2028
2,718,129 2,732,846 2.21
264,000 United States Treasury N/B 1.250% 30/Apr/2028
263,643 264,866 0.21
1,099,000 United States Treasury N/B 1.250% 31/May/2028
1,097,189 1,101,833 0.89
1,850,000 United States Treasury N/B 1.250% 30/Jun/2028
1,848,844 1,852,891 1.50
790,000 United States Treasury N/B 1.625% 30/Sep/2026
798,949 818,638 0.66
2,176,000 United States Treasury N/B 1.625% 15/May/2031
2,183,843 2,210,000 1.79
2,296,100 United States Treasury N/B 1.875% 15/Feb/2051
2,073,050 2,193,852 1.78
212,000 United States Treasury N/B 2.250% 15/Aug/2049
209,319 219,784 0.18
1,357,000 United States Treasury N/B 2.500% 15/Feb/2045
1,660,237 1,468,740 1.19
469,000 United States Treasury N/B 3.000% 15/Feb/2047
475,023 557,414 0.45
1,392,000 United States Treasury N/B 3.125% 15/Nov/2041
1,677,620 1,659,525 1.34
29,123,321 29,268,830 23.71
Supranationals, Governments and Local Public
Authorities, Debt Instruments Total 29,570,133 29,760,577 24.11
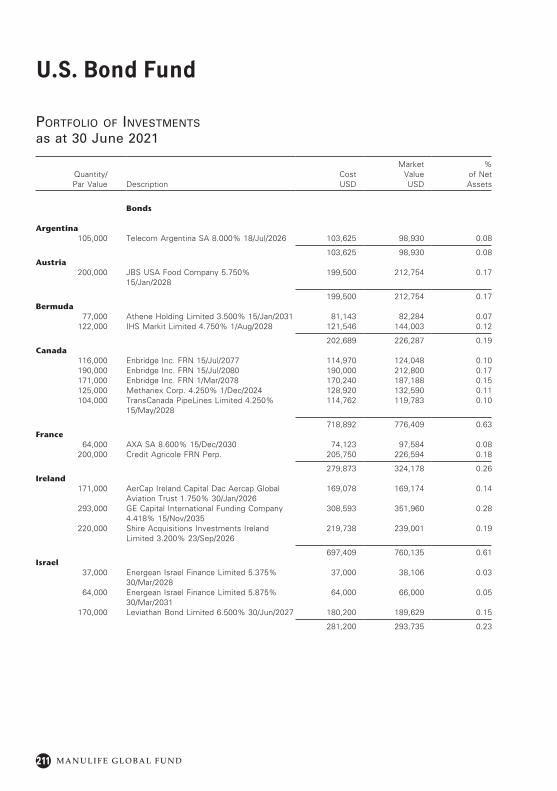
211
U.S. Bond Fund
M A N U L I F E G L O B A L F U N D
Portfolio of investments
as at 30 June 2021
Quantity/Par Value Description
Cost USD
Market Value USD
% of Net Assets
Bonds
Argentina105,000 Telecom Argentina SA 8.000% 18/Jul/2026 103,625 98,930 0.08
103,625 98,930 0.08Austria
200,000 JBS USA Food Company 5.750% 15/Jan/2028
199,500 212,754 0.17
199,500 212,754 0.17Bermuda
77,000 Athene Holding Limited 3.500% 15/Jan/2031 81,143 82,284 0.07122,000 IHS Markit Limited 4.750% 1/Aug/2028 121,546 144,003 0.12
202,689 226,287 0.19Canada
116,000 Enbridge Inc. FRN 15/Jul/2077 114,970 124,048 0.10190,000 Enbridge Inc. FRN 15/Jul/2080 190,000 212,800 0.17171,000 Enbridge Inc. FRN 1/Mar/2078 170,240 187,188 0.15125,000 Methanex Corp. 4.250% 1/Dec/2024 128,920 132,590 0.11104,000 TransCanada PipeLines Limited 4.250%
15/May/2028114,762 119,783 0.10
718,892 776,409 0.63France
64,000 AXA SA 8.600% 15/Dec/2030 74,123 97,584 0.08200,000 Credit Agricole FRN Perp. 205,750 226,594 0.18
279,873 324,178 0.26Ireland
171,000 AerCap Ireland Capital Dac Aercap Global Aviation Trust 1.750% 30/Jan/2026
169,078 169,174 0.14
293,000 GE Capital International Funding Company 4.418% 15/Nov/2035
308,593 351,960 0.28
220,000 Shire Acquisitions Investments Ireland Limited 3.200% 23/Sep/2026
219,738 239,001 0.19
697,409 760,135 0.61Israel
37,000 Energean Israel Finance Limited 5.375% 30/Mar/2028
37,000 38,106 0.03
64,000 Energean Israel Finance Limited 5.875% 30/Mar/2031
64,000 66,000 0.05
170,000 Leviathan Bond Limited 6.500% 30/Jun/2027 180,200 189,629 0.15
281,200 293,735 0.23
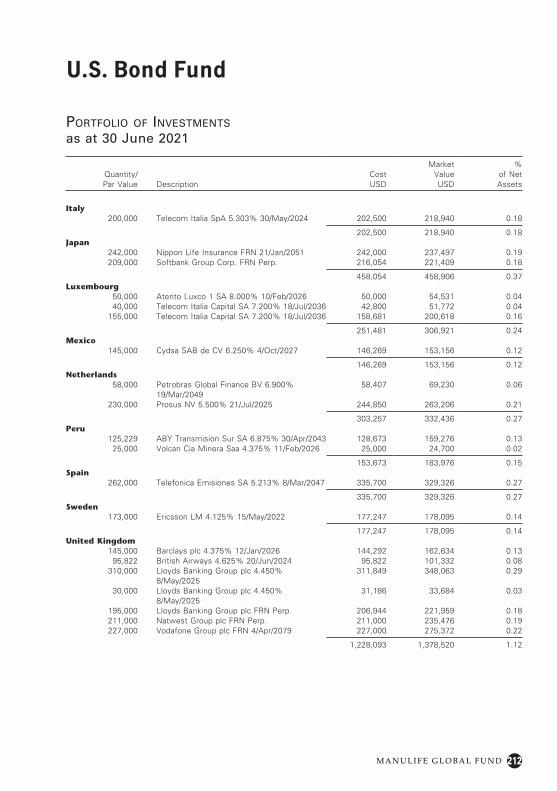
212
U.S. Bond Fund
M A N U L I F E G L O B A L F U N D
Portfolio of investments
as at 30 June 2021
Quantity/Par Value Description
Cost USD
Market Value USD
% of Net Assets
Italy200,000 Telecom Italia SpA 5.303% 30/May/2024 202,500 218,940 0.18
202,500 218,940 0.18Japan
242,000 Nippon Life Insurance FRN 21/Jan/2051 242,000 237,497 0.19209,000 Softbank Group Corp. FRN Perp. 216,054 221,409 0.18
458,054 458,906 0.37Luxembourg
50,000 Atento Luxco 1 SA 8.000% 10/Feb/2026 50,000 54,531 0.0440,000 Telecom Italia Capital SA 7.200% 18/Jul/2036 42,800 51,772 0.04
155,000 Telecom Italia Capital SA 7.200% 18/Jul/2036 158,681 200,618 0.16
251,481 306,921 0.24Mexico
145,000 Cydsa SAB de CV 6.250% 4/Oct/2027 146,269 153,156 0.12
146,269 153,156 0.12Netherlands
58,000 Petrobras Global Finance BV 6.900% 19/Mar/2049
58,407 69,230 0.06
230,000 Prosus NV 5.500% 21/Jul/2025 244,850 263,206 0.21
303,257 332,436 0.27Peru
125,229 ABY Transmision Sur SA 6.875% 30/Apr/2043 128,673 159,276 0.1325,000 Volcan Cia Minera Saa 4.375% 11/Feb/2026 25,000 24,700 0.02
153,673 183,976 0.15Spain
262,000 Telefonica Emisiones SA 5.213% 8/Mar/2047 335,700 329,326 0.27
335,700 329,326 0.27Sweden
173,000 Ericsson LM 4.125% 15/May/2022 177,247 178,095 0.14
177,247 178,095 0.14United Kingdom
145,000 Barclays plc 4.375% 12/Jan/2026 144,292 162,634 0.1395,822 British Airways 4.625% 20/Jun/2024 95,822 101,332 0.08
310,000 Lloyds Banking Group plc 4.450% 8/May/2025
311,849 348,063 0.29
30,000 Lloyds Banking Group plc 4.450% 8/May/2025
31,186 33,684 0.03
195,000 Lloyds Banking Group plc FRN Perp. 206,944 221,959 0.18211,000 Natwest Group plc FRN Perp. 211,000 235,476 0.19227,000 Vodafone Group plc FRN 4/Apr/2079 227,000 275,372 0.22
1,228,093 1,378,520 1.12
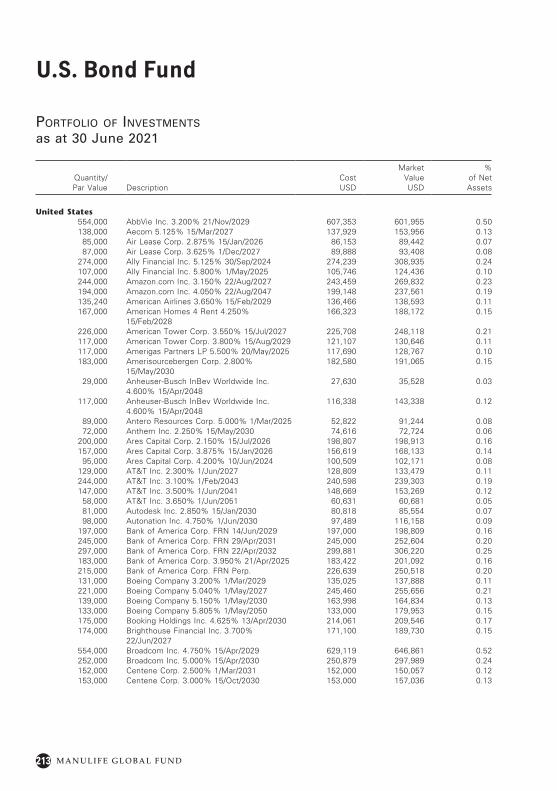
213
U.S. Bond Fund
M A N U L I F E G L O B A L F U N D
Portfolio of investments
as at 30 June 2021
Quantity/Par Value Description
Cost USD
Market Value USD
% of Net Assets
United States554,000 AbbVie Inc. 3.200% 21/Nov/2029 607,353 601,955 0.50138,000 Aecom 5.125% 15/Mar/2027 137,929 153,956 0.13
85,000 Air Lease Corp. 2.875% 15/Jan/2026 86,153 89,442 0.0787,000 Air Lease Corp. 3.625% 1/Dec/2027 89,888 93,408 0.08
274,000 Ally Financial Inc. 5.125% 30/Sep/2024 274,239 308,935 0.24107,000 Ally Financial Inc. 5.800% 1/May/2025 105,746 124,436 0.10244,000 Amazon.com Inc. 3.150% 22/Aug/2027 243,459 269,832 0.23194,000 Amazon.com Inc. 4.050% 22/Aug/2047 199,148 237,561 0.19135,240 American Airlines 3.650% 15/Feb/2029 136,466 138,593 0.11167,000 American Homes 4 Rent 4.250%
15/Feb/2028166,323 188,172 0.15
226,000 American Tower Corp. 3.550% 15/Jul/2027 225,708 248,118 0.21117,000 American Tower Corp. 3.800% 15/Aug/2029 121,107 130,646 0.11117,000 Amerigas Partners LP 5.500% 20/May/2025 117,690 128,767 0.10183,000 Amerisourcebergen Corp. 2.800%
15/May/2030182,580 191,065 0.15
29,000 Anheuser-Busch InBev Worldwide Inc. 4.600% 15/Apr/2048
27,630 35,528 0.03
117,000 Anheuser-Busch InBev Worldwide Inc. 4.600% 15/Apr/2048
116,338 143,338 0.12
89,000 Antero Resources Corp. 5.000% 1/Mar/2025 52,822 91,244 0.0872,000 Anthem Inc. 2.250% 15/May/2030 74,616 72,724 0.06
200,000 Ares Capital Corp. 2.150% 15/Jul/2026 198,807 198,913 0.16157,000 Ares Capital Corp. 3.875% 15/Jan/2026 156,619 168,133 0.14
95,000 Ares Capital Corp. 4.200% 10/Jun/2024 100,509 102,171 0.08129,000 AT&T Inc. 2.300% 1/Jun/2027 128,809 133,479 0.11244,000 AT&T Inc. 3.100% 1/Feb/2043 240,598 239,303 0.19147,000 AT&T Inc. 3.500% 1/Jun/2041 148,669 153,269 0.12
58,000 AT&T Inc. 3.650% 1/Jun/2051 60,631 60,681 0.0581,000 Autodesk Inc. 2.850% 15/Jan/2030 80,818 85,554 0.0798,000 Autonation Inc. 4.750% 1/Jun/2030 97,489 116,158 0.09
197,000 Bank of America Corp. FRN 14/Jun/2029 197,000 198,809 0.16245,000 Bank of America Corp. FRN 29/Apr/2031 245,000 252,604 0.20297,000 Bank of America Corp. FRN 22/Apr/2032 299,881 306,220 0.25183,000 Bank of America Corp. 3.950% 21/Apr/2025 183,422 201,092 0.16215,000 Bank of America Corp. FRN Perp. 226,639 250,518 0.20131,000 Boeing Company 3.200% 1/Mar/2029 135,025 137,888 0.11221,000 Boeing Company 5.040% 1/May/2027 245,460 255,656 0.21139,000 Boeing Company 5.150% 1/May/2030 163,998 164,834 0.13133,000 Boeing Company 5.805% 1/May/2050 133,000 179,953 0.15175,000 Booking Holdings Inc. 4.625% 13/Apr/2030 214,061 209,546 0.17174,000 Brighthouse Financial Inc. 3.700%
22/Jun/2027171,100 189,730 0.15
554,000 Broadcom Inc. 4.750% 15/Apr/2029 629,119 646,861 0.52252,000 Broadcom Inc. 5.000% 15/Apr/2030 250,879 297,989 0.24152,000 Centene Corp. 2.500% 1/Mar/2031 152,000 150,057 0.12153,000 Centene Corp. 3.000% 15/Oct/2030 153,000 157,036 0.13
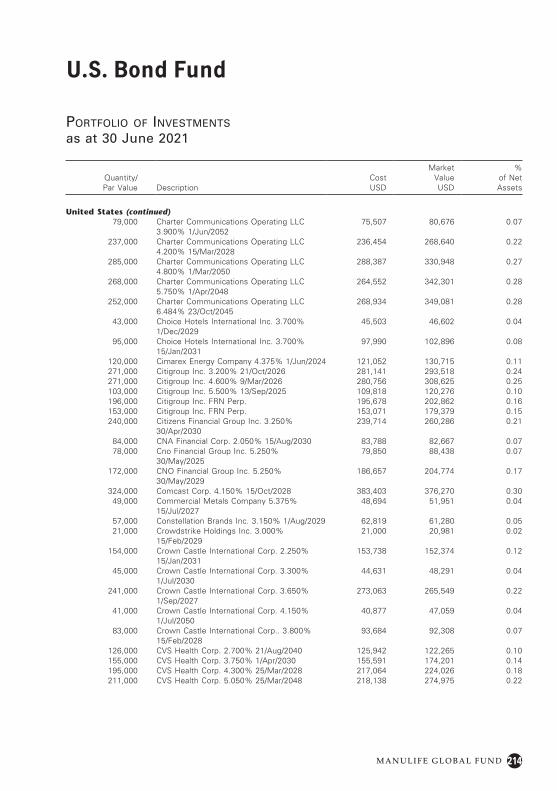
214
U.S. Bond Fund
M A N U L I F E G L O B A L F U N D
Portfolio of investments
as at 30 June 2021
Quantity/Par Value Description
Cost USD
Market Value USD
% of Net Assets
United States (continued)79,000 Charter Communications Operating LLC
3.900% 1/Jun/205275,507 80,676 0.07
237,000 Charter Communications Operating LLC 4.200% 15/Mar/2028
236,454 268,640 0.22
285,000 Charter Communications Operating LLC 4.800% 1/Mar/2050
288,387 330,948 0.27
268,000 Charter Communications Operating LLC 5.750% 1/Apr/2048
264,552 342,301 0.28
252,000 Charter Communications Operating LLC 6.484% 23/Oct/2045
268,934 349,081 0.28
43,000 Choice Hotels International Inc. 3.700% 1/Dec/2029
45,503 46,602 0.04
95,000 Choice Hotels International Inc. 3.700% 15/Jan/2031
97,990 102,896 0.08
120,000 Cimarex Energy Company 4.375% 1/Jun/2024 121,052 130,715 0.11271,000 Citigroup Inc. 3.200% 21/Oct/2026 281,141 293,518 0.24271,000 Citigroup Inc. 4.600% 9/Mar/2026 280,756 308,625 0.25103,000 Citigroup Inc. 5.500% 13/Sep/2025 109,818 120,276 0.10196,000 Citigroup Inc. FRN Perp. 195,678 202,862 0.16153,000 Citigroup Inc. FRN Perp. 153,071 179,379 0.15240,000 Citizens Financial Group Inc. 3.250%
30/Apr/2030239,714 260,286 0.21
84,000 CNA Financial Corp. 2.050% 15/Aug/2030 83,788 82,667 0.0778,000 Cno Financial Group Inc. 5.250%
30/May/202579,850 88,438 0.07
172,000 CNO Financial Group Inc. 5.250% 30/May/2029
186,657 204,774 0.17
324,000 Comcast Corp. 4.150% 15/Oct/2028 383,403 376,270 0.3049,000 Commercial Metals Company 5.375%
15/Jul/202748,694 51,951 0.04
57,000 Constellation Brands Inc. 3.150% 1/Aug/2029 62,819 61,280 0.0521,000 Crowdstrike Holdings Inc. 3.000%
15/Feb/202921,000 20,981 0.02
154,000 Crown Castle International Corp. 2.250% 15/Jan/2031
153,738 152,374 0.12
45,000 Crown Castle International Corp. 3.300% 1/Jul/2030
44,631 48,291 0.04
241,000 Crown Castle International Corp. 3.650% 1/Sep/2027
273,063 265,549 0.22
41,000 Crown Castle International Corp. 4.150% 1/Jul/2050
40,877 47,059 0.04
83,000 Crown Castle International Corp.. 3.800% 15/Feb/2028
93,684 92,308 0.07
126,000 CVS Health Corp. 2.700% 21/Aug/2040 125,942 122,265 0.10155,000 CVS Health Corp. 3.750% 1/Apr/2030 155,591 174,201 0.14195,000 CVS Health Corp. 4.300% 25/Mar/2028 217,064 224,026 0.18211,000 CVS Health Corp. 5.050% 25/Mar/2048 218,138 274,975 0.22
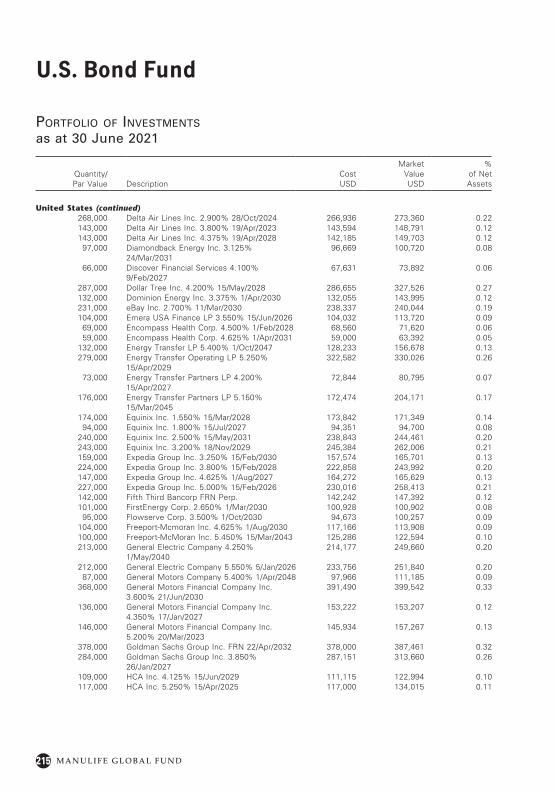
215
U.S. Bond Fund
M A N U L I F E G L O B A L F U N D
Portfolio of investments
as at 30 June 2021
Quantity/Par Value Description
Cost USD
Market Value USD
% of Net Assets
United States (continued)268,000 Delta Air Lines Inc. 2.900% 28/Oct/2024 266,936 273,360 0.22143,000 Delta Air Lines Inc. 3.800% 19/Apr/2023 143,594 148,791 0.12143,000 Delta Air Lines Inc. 4.375% 19/Apr/2028 142,185 149,703 0.12
97,000 Diamondback Energy Inc. 3.125% 24/Mar/2031
96,669 100,720 0.08
66,000 Discover Financial Services 4.100% 9/Feb/2027
67,631 73,892 0.06
287,000 Dollar Tree Inc. 4.200% 15/May/2028 286,655 327,526 0.27132,000 Dominion Energy Inc. 3.375% 1/Apr/2030 132,055 143,995 0.12231,000 eBay Inc. 2.700% 11/Mar/2030 238,337 240,044 0.19104,000 Emera USA Finance LP 3.550% 15/Jun/2026 104,032 113,720 0.09
69,000 Encompass Health Corp. 4.500% 1/Feb/2028 68,560 71,620 0.0659,000 Encompass Health Corp. 4.625% 1/Apr/2031 59,000 63,392 0.05
132,000 Energy Transfer LP 5.400% 1/Oct/2047 128,233 156,678 0.13279,000 Energy Transfer Operating LP 5.250%
15/Apr/2029322,582 330,026 0.26
73,000 Energy Transfer Partners LP 4.200% 15/Apr/2027
72,844 80,795 0.07
176,000 Energy Transfer Partners LP 5.150% 15/Mar/2045
172,474 204,171 0.17
174,000 Equinix Inc. 1.550% 15/Mar/2028 173,842 171,349 0.1494,000 Equinix Inc. 1.800% 15/Jul/2027 94,351 94,700 0.08
240,000 Equinix Inc. 2.500% 15/May/2031 238,843 244,461 0.20243,000 Equinix Inc. 3.200% 18/Nov/2029 245,384 262,006 0.21159,000 Expedia Group Inc. 3.250% 15/Feb/2030 157,574 165,701 0.13224,000 Expedia Group Inc. 3.800% 15/Feb/2028 222,858 243,992 0.20147,000 Expedia Group Inc. 4.625% 1/Aug/2027 164,272 165,629 0.13227,000 Expedia Group Inc. 5.000% 15/Feb/2026 230,016 258,413 0.21142,000 Fifth Third Bancorp FRN Perp. 142,242 147,392 0.12101,000 FirstEnergy Corp. 2.650% 1/Mar/2030 100,928 100,902 0.08
95,000 Flowserve Corp. 3.500% 1/Oct/2030 94,673 100,257 0.09104,000 Freeport-Mcmoran Inc. 4.625% 1/Aug/2030 117,166 113,908 0.09100,000 Freeport-McMoran Inc. 5.450% 15/Mar/2043 125,286 122,594 0.10213,000 General Electric Company 4.250%
1/May/2040214,177 249,660 0.20
212,000 General Electric Company 5.550% 5/Jan/2026 233,756 251,840 0.2087,000 General Motors Company 5.400% 1/Apr/2048 97,966 111,185 0.09
368,000 General Motors Financial Company Inc. 3.600% 21/Jun/2030
391,490 399,542 0.33
136,000 General Motors Financial Company Inc. 4.350% 17/Jan/2027
153,222 153,207 0.12
146,000 General Motors Financial Company Inc. 5.200% 20/Mar/2023
145,934 157,267 0.13
378,000 Goldman Sachs Group Inc. FRN 22/Apr/2032 378,000 387,461 0.32284,000 Goldman Sachs Group Inc. 3.850%
26/Jan/2027287,151 313,660 0.26
109,000 HCA Inc. 4.125% 15/Jun/2029 111,115 122,994 0.10117,000 HCA Inc. 5.250% 15/Apr/2025 117,000 134,015 0.11
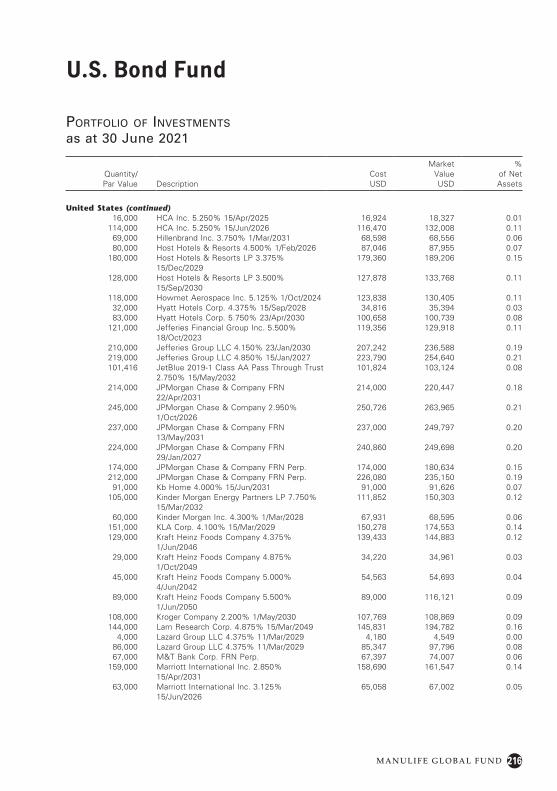
216
U.S. Bond Fund
M A N U L I F E G L O B A L F U N D
Portfolio of investments
as at 30 June 2021
Quantity/Par Value Description
Cost USD
Market Value USD
% of Net Assets
United States (continued)16,000 HCA Inc. 5.250% 15/Apr/2025 16,924 18,327 0.01
114,000 HCA Inc. 5.250% 15/Jun/2026 116,470 132,008 0.1169,000 Hillenbrand Inc. 3.750% 1/Mar/2031 68,598 68,556 0.0680,000 Host Hotels & Resorts 4.500% 1/Feb/2026 87,046 87,955 0.07
180,000 Host Hotels & Resorts LP 3.375% 15/Dec/2029
179,360 189,206 0.15
128,000 Host Hotels & Resorts LP 3.500% 15/Sep/2030
127,878 133,768 0.11
118,000 Howmet Aerospace Inc. 5.125% 1/Oct/2024 123,838 130,405 0.1132,000 Hyatt Hotels Corp. 4.375% 15/Sep/2028 34,816 35,394 0.0383,000 Hyatt Hotels Corp. 5.750% 23/Apr/2030 100,658 100,739 0.08
121,000 Jefferies Financial Group Inc. 5.500% 18/Oct/2023
119,356 129,918 0.11
210,000 Jefferies Group LLC 4.150% 23/Jan/2030 207,242 236,588 0.19219,000 Jefferies Group LLC 4.850% 15/Jan/2027 223,790 254,640 0.21101,416 JetBlue 2019-1 Class AA Pass Through Trust
2.750% 15/May/2032101,824 103,124 0.08
214,000 JPMorgan Chase & Company FRN 22/Apr/2031
214,000 220,447 0.18
245,000 JPMorgan Chase & Company 2.950% 1/Oct/2026
250,726 263,965 0.21
237,000 JPMorgan Chase & Company FRN 13/May/2031
237,000 249,797 0.20
224,000 JPMorgan Chase & Company FRN 29/Jan/2027
240,860 249,698 0.20
174,000 JPMorgan Chase & Company FRN Perp. 174,000 180,634 0.15212,000 JPMorgan Chase & Company FRN Perp. 226,080 235,150 0.19
91,000 Kb Home 4.000% 15/Jun/2031 91,000 91,626 0.07105,000 Kinder Morgan Energy Partners LP 7.750%
15/Mar/2032111,852 150,303 0.12
60,000 Kinder Morgan Inc. 4.300% 1/Mar/2028 67,931 68,595 0.06151,000 KLA Corp. 4.100% 15/Mar/2029 150,278 174,553 0.14129,000 Kraft Heinz Foods Company 4.375%
1/Jun/2046139,433 144,883 0.12
29,000 Kraft Heinz Foods Company 4.875% 1/Oct/2049
34,220 34,961 0.03
45,000 Kraft Heinz Foods Company 5.000% 4/Jun/2042
54,563 54,693 0.04
89,000 Kraft Heinz Foods Company 5.500% 1/Jun/2050
89,000 116,121 0.09
108,000 Kroger Company 2.200% 1/May/2030 107,769 108,869 0.09144,000 Lam Research Corp. 4.875% 15/Mar/2049 145,831 194,782 0.16
4,000 Lazard Group LLC 4.375% 11/Mar/2029 4,180 4,549 0.0086,000 Lazard Group LLC 4.375% 11/Mar/2029 85,347 97,796 0.0867,000 M&T Bank Corp. FRN Perp. 67,397 74,007 0.06
159,000 Marriott International Inc. 2.850% 15/Apr/2031
158,690 161,547 0.14
63,000 Marriott International Inc. 3.125% 15/Jun/2026
65,058 67,002 0.05
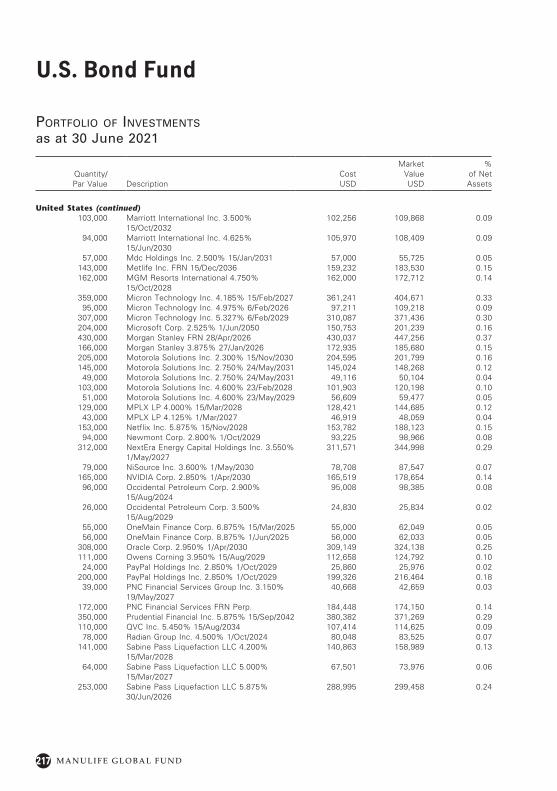
217
U.S. Bond Fund
M A N U L I F E G L O B A L F U N D
Portfolio of investments
as at 30 June 2021
Quantity/Par Value Description
Cost USD
Market Value USD
% of Net Assets
United States (continued)103,000 Marriott International Inc. 3.500%
15/Oct/2032102,256 109,868 0.09
94,000 Marriott International Inc. 4.625% 15/Jun/2030
105,970 108,409 0.09
57,000 Mdc Holdings Inc. 2.500% 15/Jan/2031 57,000 55,725 0.05143,000 Metlife Inc. FRN 15/Dec/2036 159,232 183,530 0.15162,000 MGM Resorts International 4.750%
15/Oct/2028162,000 172,712 0.14
359,000 Micron Technology Inc. 4.185% 15/Feb/2027 361,241 404,671 0.3395,000 Micron Technology Inc. 4.975% 6/Feb/2026 97,211 109,218 0.09
307,000 Micron Technology Inc. 5.327% 6/Feb/2029 310,087 371,436 0.30204,000 Microsoft Corp. 2.525% 1/Jun/2050 150,753 201,239 0.16430,000 Morgan Stanley FRN 28/Apr/2026 430,037 447,256 0.37166,000 Morgan Stanley 3.875% 27/Jan/2026 172,935 185,680 0.15205,000 Motorola Solutions Inc. 2.300% 15/Nov/2030 204,595 201,799 0.16145,000 Motorola Solutions Inc. 2.750% 24/May/2031 145,024 148,268 0.12
49,000 Motorola Solutions Inc. 2.750% 24/May/2031 49,116 50,104 0.04103,000 Motorola Solutions Inc. 4.600% 23/Feb/2028 101,903 120,198 0.10
51,000 Motorola Solutions Inc. 4.600% 23/May/2029 56,609 59,477 0.05129,000 MPLX LP 4.000% 15/Mar/2028 128,421 144,685 0.12
43,000 MPLX LP 4.125% 1/Mar/2027 46,919 48,059 0.04153,000 Netflix Inc. 5.875% 15/Nov/2028 153,782 188,123 0.15
94,000 Newmont Corp. 2.800% 1/Oct/2029 93,225 98,966 0.08312,000 NextEra Energy Capital Holdings Inc. 3.550%
1/May/2027311,571 344,998 0.29
79,000 NiSource Inc. 3.600% 1/May/2030 78,708 87,547 0.07165,000 NVIDIA Corp. 2.850% 1/Apr/2030 165,519 178,654 0.14
96,000 Occidental Petroleum Corp. 2.900% 15/Aug/2024
95,008 98,385 0.08
26,000 Occidental Petroleum Corp. 3.500% 15/Aug/2029
24,830 25,834 0.02
55,000 OneMain Finance Corp. 6.875% 15/Mar/2025 55,000 62,049 0.0556,000 OneMain Finance Corp. 8.875% 1/Jun/2025 56,000 62,033 0.05
308,000 Oracle Corp. 2.950% 1/Apr/2030 309,149 324,138 0.25111,000 Owens Corning 3.950% 15/Aug/2029 112,658 124,792 0.10
24,000 PayPal Holdings Inc. 2.850% 1/Oct/2029 25,860 25,976 0.02200,000 PayPal Holdings Inc. 2.850% 1/Oct/2029 199,326 216,464 0.18
39,000 PNC Financial Services Group Inc. 3.150% 19/May/2027
40,668 42,659 0.03
172,000 PNC Financial Services FRN Perp. 184,448 174,150 0.14350,000 Prudential Financial Inc. 5.875% 15/Sep/2042 380,382 371,269 0.29110,000 QVC Inc. 5.450% 15/Aug/2034 107,414 114,625 0.09
78,000 Radian Group Inc. 4.500% 1/Oct/2024 80,048 83,525 0.07141,000 Sabine Pass Liquefaction LLC 4.200%
15/Mar/2028140,863 158,989 0.13
64,000 Sabine Pass Liquefaction LLC 5.000% 15/Mar/2027
67,501 73,976 0.06
253,000 Sabine Pass Liquefaction LLC 5.875% 30/Jun/2026
288,995 299,458 0.24
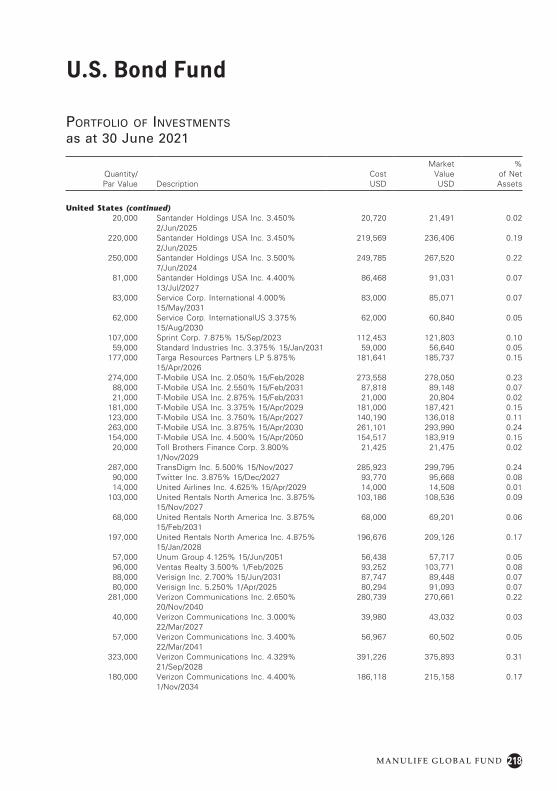
218
U.S. Bond Fund
M A N U L I F E G L O B A L F U N D
Portfolio of investments
as at 30 June 2021
Quantity/Par Value Description
Cost USD
Market Value USD
% of Net Assets
United States (continued)20,000 Santander Holdings USA Inc. 3.450%
2/Jun/202520,720 21,491 0.02
220,000 Santander Holdings USA Inc. 3.450% 2/Jun/2025
219,569 236,406 0.19
250,000 Santander Holdings USA Inc. 3.500% 7/Jun/2024
249,785 267,520 0.22
81,000 Santander Holdings USA Inc. 4.400% 13/Jul/2027
86,468 91,031 0.07
83,000 Service Corp. International 4.000% 15/May/2031
83,000 85,071 0.07
62,000 Service Corp. InternationalUS 3.375% 15/Aug/2030
62,000 60,840 0.05
107,000 Sprint Corp. 7.875% 15/Sep/2023 112,453 121,803 0.1059,000 Standard Industries Inc. 3.375% 15/Jan/2031 59,000 56,640 0.05
177,000 Targa Resources Partners LP 5.875% 15/Apr/2026
181,641 185,737 0.15
274,000 T-Mobile USA Inc. 2.050% 15/Feb/2028 273,558 278,050 0.2388,000 T-Mobile USA Inc. 2.550% 15/Feb/2031 87,818 89,148 0.0721,000 T-Mobile USA Inc. 2.875% 15/Feb/2031 21,000 20,804 0.02
181,000 T-Mobile USA Inc. 3.375% 15/Apr/2029 181,000 187,421 0.15123,000 T-Mobile USA Inc. 3.750% 15/Apr/2027 140,190 136,018 0.11263,000 T-Mobile USA Inc. 3.875% 15/Apr/2030 261,101 293,990 0.24154,000 T-Mobile USA Inc. 4.500% 15/Apr/2050 154,517 183,919 0.15
20,000 Toll Brothers Finance Corp. 3.800% 1/Nov/2029
21,425 21,475 0.02
287,000 TransDigm Inc. 5.500% 15/Nov/2027 285,923 299,795 0.2490,000 Twitter Inc. 3.875% 15/Dec/2027 93,770 95,668 0.0814,000 United Airlines Inc. 4.625% 15/Apr/2029 14,000 14,508 0.01
103,000 United Rentals North America Inc. 3.875% 15/Nov/2027
103,186 108,536 0.09
68,000 United Rentals North America Inc. 3.875% 15/Feb/2031
68,000 69,201 0.06
197,000 United Rentals North America Inc. 4.875% 15/Jan/2028
196,676 209,126 0.17
57,000 Unum Group 4.125% 15/Jun/2051 56,438 57,717 0.0596,000 Ventas Realty 3.500% 1/Feb/2025 93,252 103,771 0.0888,000 Verisign Inc. 2.700% 15/Jun/2031 87,747 89,448 0.0780,000 Verisign Inc. 5.250% 1/Apr/2025 80,294 91,093 0.07
281,000 Verizon Communications Inc. 2.650% 20/Nov/2040
280,739 270,661 0.22
40,000 Verizon Communications Inc. 3.000% 22/Mar/2027
39,980 43,032 0.03
57,000 Verizon Communications Inc. 3.400% 22/Mar/2041
56,967 60,502 0.05
323,000 Verizon Communications Inc. 4.329% 21/Sep/2028
391,226 375,893 0.31
180,000 Verizon Communications Inc. 4.400% 1/Nov/2034
186,118 215,158 0.17
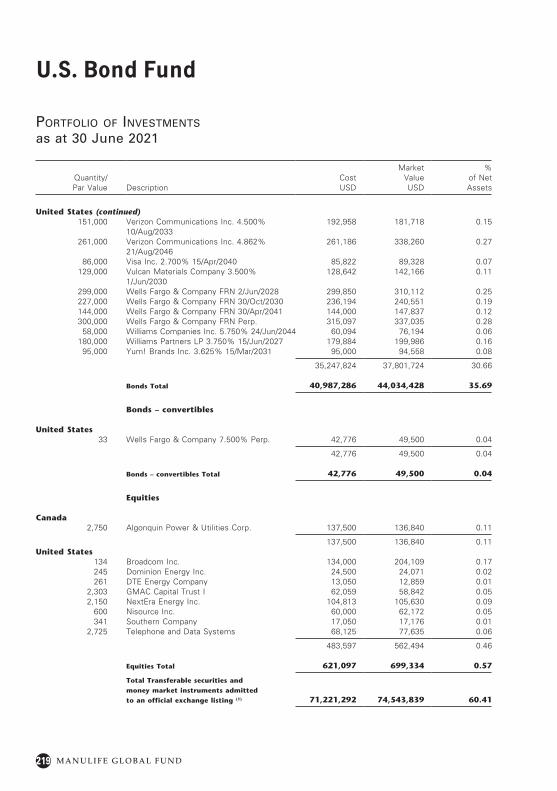
219
U.S. Bond Fund
M A N U L I F E G L O B A L F U N D
Portfolio of investments
as at 30 June 2021
Quantity/Par Value Description
Cost USD
Market Value USD
% of Net Assets
United States (continued)151,000 Verizon Communications Inc. 4.500%
10/Aug/2033192,958 181,718 0.15
261,000 Verizon Communications Inc. 4.862% 21/Aug/2046
261,186 338,260 0.27
86,000 Visa Inc. 2.700% 15/Apr/2040 85,822 89,328 0.07129,000 Vulcan Materials Company 3.500%
1/Jun/2030128,642 142,166 0.11
299,000 Wells Fargo & Company FRN 2/Jun/2028 299,850 310,112 0.25227,000 Wells Fargo & Company FRN 30/Oct/2030 236,194 240,551 0.19144,000 Wells Fargo & Company FRN 30/Apr/2041 144,000 147,837 0.12300,000 Wells Fargo & Company FRN Perp. 315,097 337,035 0.28
58,000 Williams Companies Inc. 5.750% 24/Jun/2044 60,094 76,194 0.06180,000 Williams Partners LP 3.750% 15/Jun/2027 179,884 199,986 0.16
95,000 Yum! Brands Inc. 3.625% 15/Mar/2031 95,000 94,558 0.08
35,247,824 37,801,724 30.66
Bonds Total 40,987,286 44,034,428 35.69
Bonds – convertibles
United States33 Wells Fargo & Company 7.500% Perp. 42,776 49,500 0.04
42,776 49,500 0.04
Bonds – convertibles Total 42,776 49,500 0.04
Equities
Canada2,750 Algonquin Power & Utilities Corp. 137,500 136,840 0.11
137,500 136,840 0.11United States
134 Broadcom Inc. 134,000 204,109 0.17245 Dominion Energy Inc. 24,500 24,071 0.02261 DTE Energy Company 13,050 12,859 0.01
2,303 GMAC Capital Trust I 62,059 58,842 0.052,150 NextEra Energy Inc. 104,813 105,630 0.09
600 Nisource Inc. 60,000 62,172 0.05341 Southern Company 17,050 17,176 0.01
2,725 Telephone and Data Systems 68,125 77,635 0.06
483,597 562,494 0.46
Equities Total 621,097 699,334 0.57
Total Transferable securities and
money market instruments admitted
to an official exchange listing (1) 71,221,292 74,543,839 60.41
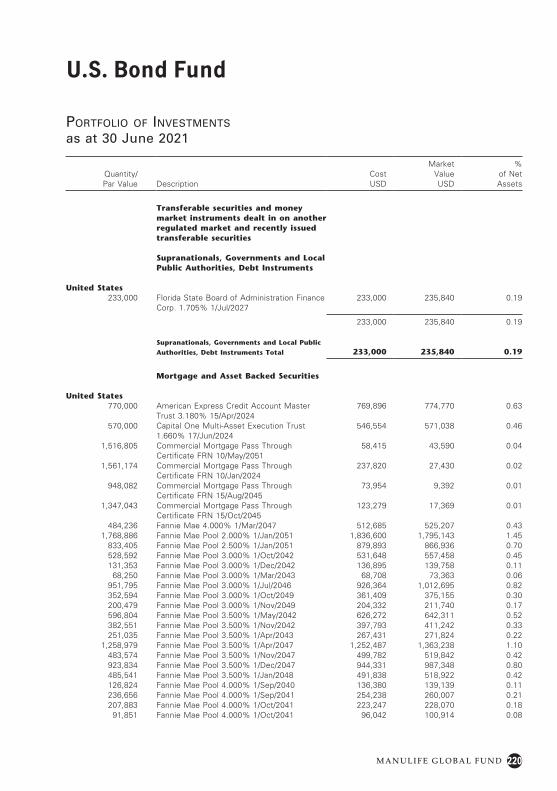
220
U.S. Bond Fund
M A N U L I F E G L O B A L F U N D
Portfolio of investments
as at 30 June 2021
Quantity/Par Value Description
Cost USD
Market Value USD
% of Net Assets
Transferable securities and money market instruments dealt in on another regulated market and recently issued transferable securities
Supranationals, Governments and Local Public Authorities, Debt Instruments
United States233,000 Florida State Board of Administration Finance
Corp. 1.705% 1/Jul/2027233,000 235,840 0.19
233,000 235,840 0.19
Supranationals, Governments and Local Public
Authorities, Debt Instruments Total 233,000 235,840 0.19
Mortgage and Asset Backed Securities
United States770,000 American Express Credit Account Master
Trust 3.180% 15/Apr/2024769,896 774,770 0.63
570,000 Capital One Multi-Asset Execution Trust 1.660% 17/Jun/2024
546,554 571,038 0.46
1,516,805 Commercial Mortgage Pass Through Certificate FRN 10/May/2051
58,415 43,590 0.04
1,561,174 Commercial Mortgage Pass Through Certificate FRN 10/Jan/2024
237,820 27,430 0.02
948,082 Commercial Mortgage Pass Through Certificate FRN 15/Aug/2045
73,954 9,392 0.01
1,347,043 Commercial Mortgage Pass Through Certificate FRN 15/Oct/2045
123,279 17,369 0.01
484,236 Fannie Mae 4.000% 1/Mar/2047 512,685 525,207 0.431,768,886 Fannie Mae Pool 2.000% 1/Jan/2051 1,836,600 1,795,143 1.45
833,405 Fannie Mae Pool 2.500% 1/Jan/2051 879,893 866,936 0.70528,592 Fannie Mae Pool 3.000% 1/Oct/2042 531,648 557,458 0.45131,353 Fannie Mae Pool 3.000% 1/Dec/2042 136,895 139,758 0.11
68,250 Fannie Mae Pool 3.000% 1/Mar/2043 68,708 73,363 0.06951,795 Fannie Mae Pool 3.000% 1/Jul/2046 926,364 1,012,695 0.82352,594 Fannie Mae Pool 3.000% 1/Oct/2049 361,409 375,155 0.30200,479 Fannie Mae Pool 3.000% 1/Nov/2049 204,332 211,740 0.17596,804 Fannie Mae Pool 3.500% 1/May/2042 626,272 642,311 0.52382,551 Fannie Mae Pool 3.500% 1/Nov/2042 397,793 411,242 0.33251,035 Fannie Mae Pool 3.500% 1/Apr/2043 267,431 271,824 0.22
1,258,979 Fannie Mae Pool 3.500% 1/Apr/2047 1,252,487 1,363,238 1.10483,574 Fannie Mae Pool 3.500% 1/Nov/2047 499,782 519,842 0.42923,834 Fannie Mae Pool 3.500% 1/Dec/2047 944,331 987,348 0.80485,541 Fannie Mae Pool 3.500% 1/Jan/2048 491,838 518,922 0.42126,824 Fannie Mae Pool 4.000% 1/Sep/2040 136,380 139,139 0.11236,656 Fannie Mae Pool 4.000% 1/Sep/2041 254,238 260,007 0.21207,883 Fannie Mae Pool 4.000% 1/Oct/2041 223,247 228,070 0.18
91,851 Fannie Mae Pool 4.000% 1/Oct/2041 96,042 100,914 0.08
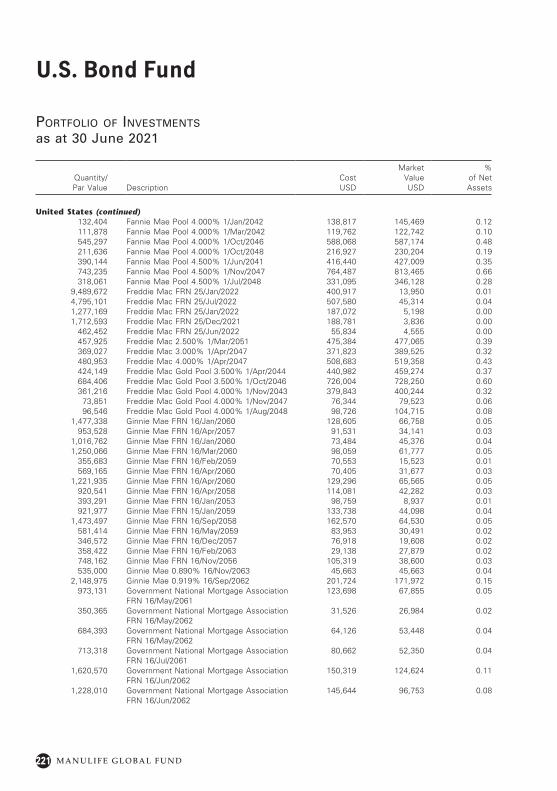
221
U.S. Bond Fund
M A N U L I F E G L O B A L F U N D
Portfolio of investments
as at 30 June 2021
Quantity/Par Value Description
Cost USD
Market Value USD
% of Net Assets
United States (continued)132,404 Fannie Mae Pool 4.000% 1/Jan/2042 138,817 145,469 0.12111,878 Fannie Mae Pool 4.000% 1/Mar/2042 119,762 122,742 0.10545,297 Fannie Mae Pool 4.000% 1/Oct/2046 588,068 587,174 0.48211,636 Fannie Mae Pool 4.000% 1/Oct/2048 216,927 230,204 0.19390,144 Fannie Mae Pool 4.500% 1/Jun/2041 416,440 427,009 0.35743,235 Fannie Mae Pool 4.500% 1/Nov/2047 764,487 813,465 0.66318,061 Fannie Mae Pool 4.500% 1/Jul/2048 331,095 346,128 0.28
9,489,672 Freddie Mac FRN 25/Jan/2022 400,917 13,950 0.014,795,101 Freddie Mac FRN 25/Jul/2022 507,580 45,314 0.041,277,169 Freddie Mac FRN 25/Jan/2022 187,072 5,198 0.001,712,593 Freddie Mac FRN 25/Dec/2021 188,781 3,836 0.00
462,452 Freddie Mac FRN 25/Jun/2022 55,834 4,555 0.00457,925 Freddie Mac 2.500% 1/Mar/2051 475,384 477,065 0.39369,027 Freddie Mac 3.000% 1/Apr/2047 371,823 389,525 0.32480,953 Freddie Mac 4.000% 1/Apr/2047 508,683 519,358 0.43424,149 Freddie Mac Gold Pool 3.500% 1/Apr/2044 440,982 459,274 0.37684,406 Freddie Mac Gold Pool 3.500% 1/Oct/2046 726,004 728,250 0.60361,216 Freddie Mac Gold Pool 4.000% 1/Nov/2043 379,843 400,244 0.32
73,851 Freddie Mac Gold Pool 4.000% 1/Nov/2047 76,344 79,523 0.0696,546 Freddie Mac Gold Pool 4.000% 1/Aug/2048 98,726 104,715 0.08
1,477,338 Ginnie Mae FRN 16/Jan/2060 128,605 66,758 0.05953,528 Ginnie Mae FRN 16/Apr/2057 91,531 34,141 0.03
1,016,762 Ginnie Mae FRN 16/Jan/2060 73,484 45,376 0.041,250,066 Ginnie Mae FRN 16/Mar/2060 98,059 61,777 0.05
355,683 Ginnie Mae FRN 16/Feb/2059 70,553 15,523 0.01569,165 Ginnie Mae FRN 16/Apr/2060 70,405 31,677 0.03
1,221,935 Ginnie Mae FRN 16/Apr/2060 129,296 65,565 0.05920,541 Ginnie Mae FRN 16/Apr/2058 114,081 42,282 0.03393,291 Ginnie Mae FRN 16/Jan/2053 98,759 8,937 0.01921,977 Ginnie Mae FRN 15/Jan/2059 133,738 44,098 0.04
1,473,497 Ginnie Mae FRN 16/Sep/2058 162,570 64,530 0.05581,414 Ginnie Mae FRN 16/May/2059 83,953 30,491 0.02346,572 Ginnie Mae FRN 16/Dec/2057 76,918 19,608 0.02358,422 Ginnie Mae FRN 16/Feb/2063 29,138 27,879 0.02748,162 Ginnie Mae FRN 16/Nov/2056 105,319 38,600 0.03535,000 Ginnie Mae 0.890% 16/Nov/2063 45,663 45,663 0.04
2,148,975 Ginnie Mae 0.919% 16/Sep/2062 201,724 171,972 0.15973,131 Government National Mortgage Association
FRN 16/May/2061123,698 67,855 0.05
350,365 Government National Mortgage Association FRN 16/May/2062
31,526 26,984 0.02
684,393 Government National Mortgage Association FRN 16/May/2062
64,126 53,448 0.04
713,318 Government National Mortgage Association FRN 16/Jul/2061
80,662 52,350 0.04
1,620,570 Government National Mortgage Association FRN 16/Jun/2062
150,319 124,624 0.11
1,228,010 Government National Mortgage Association FRN 16/Jun/2062
145,644 96,753 0.08
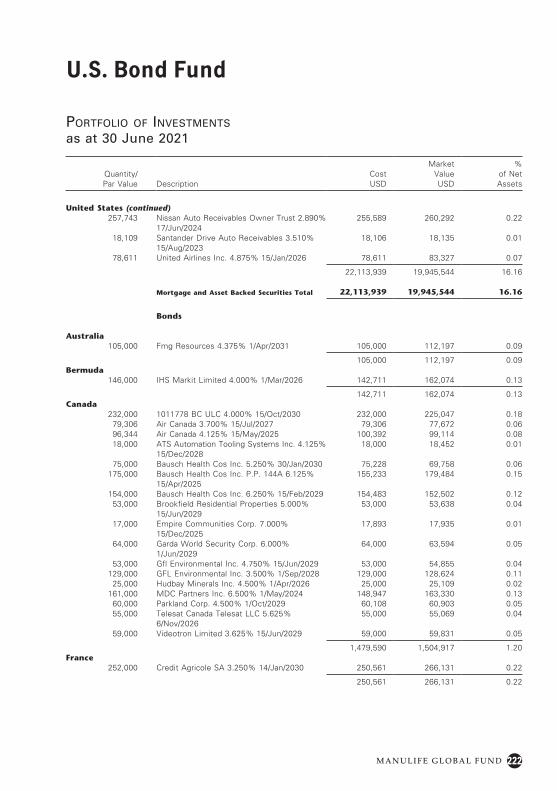
222
U.S. Bond Fund
M A N U L I F E G L O B A L F U N D
Portfolio of investments
as at 30 June 2021
Quantity/Par Value Description
Cost USD
Market Value USD
% of Net Assets
United States (continued)257,743 Nissan Auto Receivables Owner Trust 2.890%
17/Jun/2024255,589 260,292 0.22
18,109 Santander Drive Auto Receivables 3.510% 15/Aug/2023
18,106 18,135 0.01
78,611 United Airlines Inc. 4.875% 15/Jan/2026 78,611 83,327 0.07
22,113,939 19,945,544 16.16
Mortgage and Asset Backed Securities Total 22,113,939 19,945,544 16.16
Bonds
Australia105,000 Fmg Resources 4.375% 1/Apr/2031 105,000 112,197 0.09
105,000 112,197 0.09Bermuda
146,000 IHS Markit Limited 4.000% 1/Mar/2026 142,711 162,074 0.13
142,711 162,074 0.13Canada
232,000 1011778 BC ULC 4.000% 15/Oct/2030 232,000 225,047 0.1879,306 Air Canada 3.700% 15/Jul/2027 79,306 77,672 0.0696,344 Air Canada 4.125% 15/May/2025 100,392 99,114 0.0818,000 ATS Automation Tooling Systems Inc. 4.125%
15/Dec/202818,000 18,452 0.01
75,000 Bausch Health Cos Inc. 5.250% 30/Jan/2030 75,228 69,758 0.06175,000 Bausch Health Cos Inc. P.P. 144A 6.125%
15/Apr/2025155,233 179,484 0.15
154,000 Bausch Health Cos Inc. 6.250% 15/Feb/2029 154,483 152,502 0.1253,000 Brookfield Residential Properties 5.000%
15/Jun/202953,000 53,638 0.04
17,000 Empire Communities Corp. 7.000% 15/Dec/2025
17,893 17,935 0.01
64,000 Garda World Security Corp. 6.000% 1/Jun/2029
64,000 63,594 0.05
53,000 Gfl Environmental Inc. 4.750% 15/Jun/2029 53,000 54,855 0.04129,000 GFL Environmental Inc. 3.500% 1/Sep/2028 129,000 128,624 0.11
25,000 Hudbay Minerals Inc. 4.500% 1/Apr/2026 25,000 25,109 0.02161,000 MDC Partners Inc. 6.500% 1/May/2024 148,947 163,330 0.13
60,000 Parkland Corp. 4.500% 1/Oct/2029 60,108 60,903 0.0555,000 Telesat Canada Telesat LLC 5.625%
6/Nov/202655,000 55,069 0.04
59,000 Videotron Limited 3.625% 15/Jun/2029 59,000 59,831 0.05
1,479,590 1,504,917 1.20France
252,000 Credit Agricole SA 3.250% 14/Jan/2030 250,561 266,131 0.22
250,561 266,131 0.22
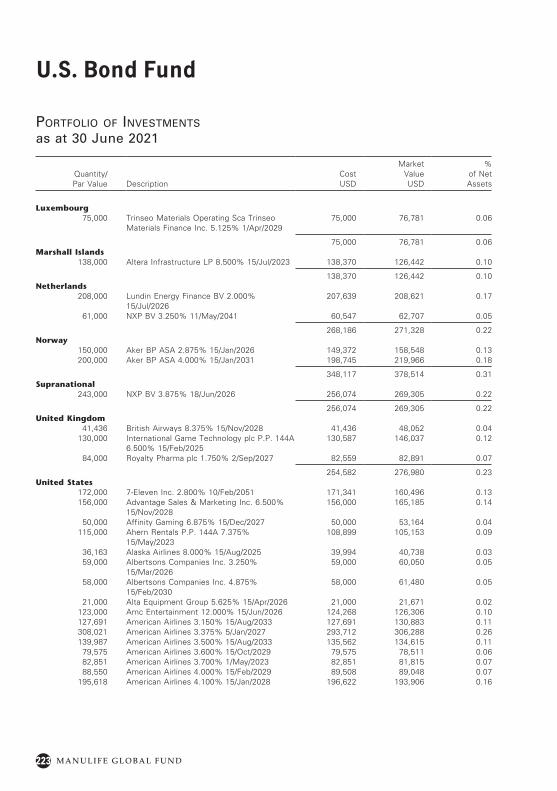
223
U.S. Bond Fund
M A N U L I F E G L O B A L F U N D
Portfolio of investments
as at 30 June 2021
Quantity/Par Value Description
Cost USD
Market Value USD
% of Net Assets
Luxembourg75,000 Trinseo Materials Operating Sca Trinseo
Materials Finance Inc. 5.125% 1/Apr/202975,000 76,781 0.06
75,000 76,781 0.06Marshall Islands
138,000 Altera Infrastructure LP 8.500% 15/Jul/2023 138,370 126,442 0.10
138,370 126,442 0.10Netherlands
208,000 Lundin Energy Finance BV 2.000% 15/Jul/2026
207,639 208,621 0.17
61,000 NXP BV 3.250% 11/May/2041 60,547 62,707 0.05
268,186 271,328 0.22Norway
150,000 Aker BP ASA 2.875% 15/Jan/2026 149,372 158,548 0.13200,000 Aker BP ASA 4.000% 15/Jan/2031 198,745 219,966 0.18
348,117 378,514 0.31Supranational
243,000 NXP BV 3.875% 18/Jun/2026 256,074 269,305 0.22
256,074 269,305 0.22United Kingdom
41,436 British Airways 8.375% 15/Nov/2028 41,436 48,052 0.04130,000 International Game Technology plc P.P. 144A
6.500% 15/Feb/2025130,587 146,037 0.12
84,000 Royalty Pharma plc 1.750% 2/Sep/2027 82,559 82,891 0.07
254,582 276,980 0.23United States
172,000 7-Eleven Inc. 2.800% 10/Feb/2051 171,341 160,496 0.13156,000 Advantage Sales & Marketing Inc. 6.500%
15/Nov/2028156,000 165,185 0.14
50,000 Affinity Gaming 6.875% 15/Dec/2027 50,000 53,164 0.04115,000 Ahern Rentals P.P. 144A 7.375%
15/May/2023108,899 105,153 0.09
36,163 Alaska Airlines 8.000% 15/Aug/2025 39,994 40,738 0.0359,000 Albertsons Companies Inc. 3.250%
15/Mar/202659,000 60,050 0.05
58,000 Albertsons Companies Inc. 4.875% 15/Feb/2030
58,000 61,480 0.05
21,000 Alta Equipment Group 5.625% 15/Apr/2026 21,000 21,671 0.02123,000 Amc Entertainment 12.000% 15/Jun/2026 124,268 126,306 0.10127,691 American Airlines 3.150% 15/Aug/2033 127,691 130,883 0.11308,021 American Airlines 3.375% 5/Jan/2027 293,712 306,288 0.26139,987 American Airlines 3.500% 15/Aug/2033 135,562 134,615 0.11
79,575 American Airlines 3.600% 15/Oct/2029 79,575 78,511 0.0682,851 American Airlines 3.700% 1/May/2023 82,851 81,815 0.0788,550 American Airlines 4.000% 15/Feb/2029 89,508 89,048 0.07
195,618 American Airlines 4.100% 15/Jan/2028 196,622 193,906 0.16
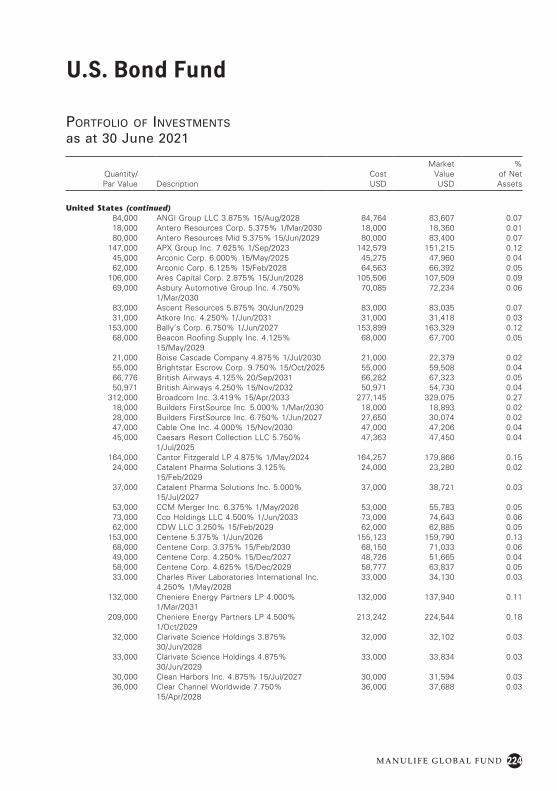
224
U.S. Bond Fund
M A N U L I F E G L O B A L F U N D
Portfolio of investments
as at 30 June 2021
Quantity/Par Value Description
Cost USD
Market Value USD
% of Net Assets
United States (continued)84,000 ANGI Group LLC 3.875% 15/Aug/2028 84,764 83,607 0.0718,000 Antero Resources Corp. 5.375% 1/Mar/2030 18,000 18,360 0.0180,000 Antero Resources Mid 5.375% 15/Jun/2029 80,000 83,400 0.07
147,000 APX Group Inc. 7.625% 1/Sep/2023 142,579 151,215 0.1245,000 Arconic Corp. 6.000% 15/May/2025 45,275 47,960 0.0462,000 Arconic Corp. 6.125% 15/Feb/2028 64,563 66,392 0.05
106,000 Ares Capital Corp. 2.875% 15/Jun/2028 105,506 107,509 0.0969,000 Asbury Automotive Group Inc. 4.750%
1/Mar/203070,085 72,234 0.06
83,000 Ascent Resources 5.875% 30/Jun/2029 83,000 83,035 0.0731,000 Atkore Inc. 4.250% 1/Jun/2031 31,000 31,418 0.03
153,000 Bally’s Corp. 6.750% 1/Jun/2027 153,899 163,329 0.1268,000 Beacon Roofing Supply Inc. 4.125%
15/May/202968,000 67,700 0.05
21,000 Boise Cascade Company 4.875% 1/Jul/2030 21,000 22,379 0.0255,000 Brightstar Escrow Corp. 9.750% 15/Oct/2025 55,000 59,508 0.0466,776 British Airways 4.125% 20/Sep/2031 66,282 67,323 0.0550,971 British Airways 4.250% 15/Nov/2032 50,971 54,730 0.04
312,000 Broadcom Inc. 3.419% 15/Apr/2033 277,145 329,075 0.2718,000 Builders FirstSource Inc. 5.000% 1/Mar/2030 18,000 18,893 0.0228,000 Builders FirstSource Inc. 6.750% 1/Jun/2027 27,650 30,074 0.0247,000 Cable One Inc. 4.000% 15/Nov/2030 47,000 47,206 0.0445,000 Caesars Resort Collection LLC 5.750%
1/Jul/202547,363 47,450 0.04
164,000 Cantor Fitzgerald LP 4.875% 1/May/2024 164,257 179,866 0.1524,000 Catalent Pharma Solutions 3.125%
15/Feb/202924,000 23,280 0.02
37,000 Catalent Pharma Solutions Inc. 5.000% 15/Jul/2027
37,000 38,721 0.03
53,000 CCM Merger Inc. 6.375% 1/May/2026 53,000 55,783 0.0573,000 Cco Holdings LLC 4.500% 1/Jun/2033 73,000 74,643 0.0662,000 CDW LLC 3.250% 15/Feb/2029 62,000 62,885 0.05
153,000 Centene 5.375% 1/Jun/2026 155,123 159,790 0.1368,000 Centene Corp. 3.375% 15/Feb/2030 68,150 71,033 0.0649,000 Centene Corp. 4.250% 15/Dec/2027 48,726 51,665 0.0458,000 Centene Corp. 4.625% 15/Dec/2029 58,777 63,837 0.0533,000 Charles River Laboratories International Inc.
4.250% 1/May/202833,000 34,130 0.03
132,000 Cheniere Energy Partners LP 4.000% 1/Mar/2031
132,000 137,940 0.11
209,000 Cheniere Energy Partners LP 4.500% 1/Oct/2029
213,242 224,544 0.18
32,000 Clarivate Science Holdings 3.875% 30/Jun/2028
32,000 32,102 0.03
33,000 Clarivate Science Holdings 4.875% 30/Jun/2029
33,000 33,834 0.03
30,000 Clean Harbors Inc. 4.875% 15/Jul/2027 30,000 31,594 0.0336,000 Clear Channel Worldwide 7.750%
15/Apr/202836,000 37,688 0.03
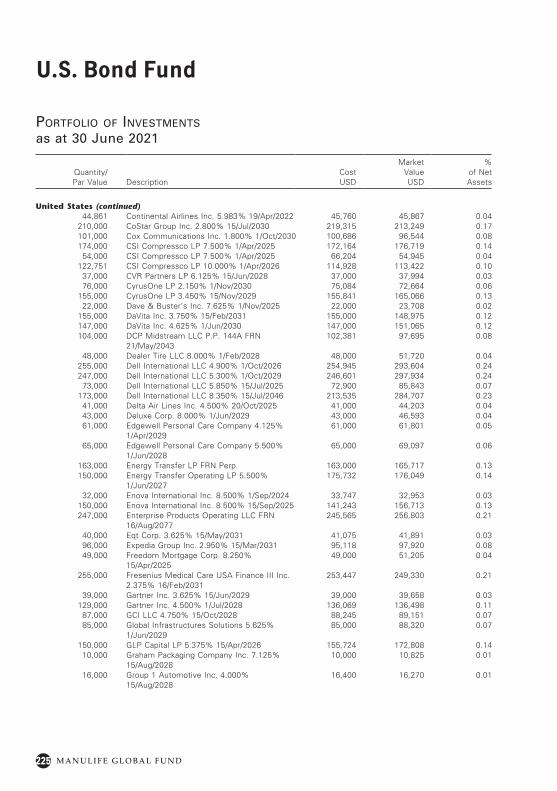
225
U.S. Bond Fund
M A N U L I F E G L O B A L F U N D
Portfolio of investments
as at 30 June 2021
Quantity/Par Value Description
Cost USD
Market Value USD
% of Net Assets
United States (continued)44,861 Continental Airlines Inc. 5.983% 19/Apr/2022 45,760 45,867 0.04
210,000 CoStar Group Inc. 2.800% 15/Jul/2030 219,315 213,249 0.17101,000 Cox Communications Inc. 1.800% 1/Oct/2030 100,686 96,544 0.08174,000 CSI Compressco LP 7.500% 1/Apr/2025 172,164 176,719 0.14
54,000 CSI Compressco LP 7.500% 1/Apr/2025 66,204 54,945 0.04122,751 CSI Compressco LP 10.000% 1/Apr/2026 114,928 113,422 0.10
37,000 CVR Partners LP 6.125% 15/Jun/2028 37,000 37,994 0.0376,000 CyrusOne LP 2.150% 1/Nov/2030 75,084 72,664 0.06
155,000 CyrusOne LP 3.450% 15/Nov/2029 155,841 165,066 0.1322,000 Dave & Buster’s Inc. 7.625% 1/Nov/2025 22,000 23,708 0.02
155,000 DaVita Inc. 3.750% 15/Feb/2031 155,000 148,975 0.12147,000 DaVita Inc. 4.625% 1/Jun/2030 147,000 151,065 0.12104,000 DCP Midstream LLC P.P. 144A FRN
21/May/2043102,381 97,695 0.08
48,000 Dealer Tire LLC 8.000% 1/Feb/2028 48,000 51,720 0.04255,000 Dell International LLC 4.900% 1/Oct/2026 254,945 293,604 0.24247,000 Dell International LLC 5.300% 1/Oct/2029 246,601 297,934 0.24
73,000 Dell International LLC 5.850% 15/Jul/2025 72,900 85,843 0.07173,000 Dell International LLC 8.350% 15/Jul/2046 213,535 284,707 0.23
41,000 Delta Air Lines Inc. 4.500% 20/Oct/2025 41,000 44,203 0.0443,000 Deluxe Corp. 8.000% 1/Jun/2029 43,000 46,593 0.0461,000 Edgewell Personal Care Company 4.125%
1/Apr/202961,000 61,801 0.05
65,000 Edgewell Personal Care Company 5.500% 1/Jun/2028
65,000 69,097 0.06
163,000 Energy Transfer LP FRN Perp. 163,000 165,717 0.13150,000 Energy Transfer Operating LP 5.500%
1/Jun/2027175,732 176,049 0.14
32,000 Enova International Inc. 8.500% 1/Sep/2024 33,747 32,953 0.03150,000 Enova International Inc. 8.500% 15/Sep/2025 141,243 156,713 0.13247,000 Enterprise Products Operating LLC FRN
16/Aug/2077245,565 256,803 0.21
40,000 Eqt Corp. 3.625% 15/May/2031 41,075 41,891 0.0396,000 Expedia Group Inc. 2.950% 15/Mar/2031 95,118 97,920 0.0849,000 Freedom Mortgage Corp. 8.250%
15/Apr/202549,000 51,205 0.04
255,000 Fresenius Medical Care USA Finance III Inc. 2.375% 16/Feb/2031
253,447 249,330 0.21
39,000 Gartner Inc. 3.625% 15/Jun/2029 39,000 39,658 0.03129,000 Gartner Inc. 4.500% 1/Jul/2028 136,069 136,498 0.11
87,000 GCI LLC 4.750% 15/Oct/2028 88,245 89,151 0.0785,000 Global Infrastructures Solutions 5.625%
1/Jun/202985,000 88,320 0.07
150,000 GLP Capital LP 5.375% 15/Apr/2026 155,724 172,808 0.1410,000 Graham Packaging Company Inc. 7.125%
15/Aug/202810,000 10,825 0.01
16,000 Group 1 Automotive Inc. 4.000% 15/Aug/2028
16,400 16,270 0.01
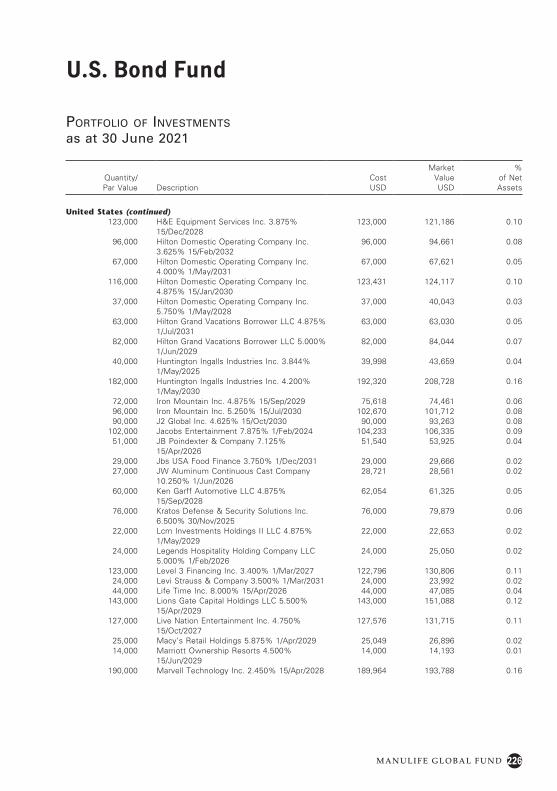
226
U.S. Bond Fund
M A N U L I F E G L O B A L F U N D
Portfolio of investments
as at 30 June 2021
Quantity/Par Value Description
Cost USD
Market Value USD
% of Net Assets
United States (continued)123,000 H&E Equipment Services Inc. 3.875%
15/Dec/2028123,000 121,186 0.10
96,000 Hilton Domestic Operating Company Inc. 3.625% 15/Feb/2032
96,000 94,661 0.08
67,000 Hilton Domestic Operating Company Inc. 4.000% 1/May/2031
67,000 67,621 0.05
116,000 Hilton Domestic Operating Company Inc. 4.875% 15/Jan/2030
123,431 124,117 0.10
37,000 Hilton Domestic Operating Company Inc. 5.750% 1/May/2028
37,000 40,043 0.03
63,000 Hilton Grand Vacations Borrower LLC 4.875% 1/Jul/2031
63,000 63,030 0.05
82,000 Hilton Grand Vacations Borrower LLC 5.000% 1/Jun/2029
82,000 84,044 0.07
40,000 Huntington Ingalls Industries Inc. 3.844% 1/May/2025
39,998 43,659 0.04
182,000 Huntington Ingalls Industries Inc. 4.200% 1/May/2030
192,320 208,728 0.16
72,000 Iron Mountain Inc. 4.875% 15/Sep/2029 75,618 74,461 0.0696,000 Iron Mountain Inc. 5.250% 15/Jul/2030 102,670 101,712 0.0890,000 J2 Global Inc. 4.625% 15/Oct/2030 90,000 93,263 0.08
102,000 Jacobs Entertainment 7.875% 1/Feb/2024 104,233 106,335 0.0951,000 JB Poindexter & Company 7.125%
15/Apr/202651,540 53,925 0.04
29,000 Jbs USA Food Finance 3.750% 1/Dec/2031 29,000 29,666 0.0227,000 JW Aluminum Continuous Cast Company
10.250% 1/Jun/202628,721 28,561 0.02
60,000 Ken Garff Automotive LLC 4.875% 15/Sep/2028
62,054 61,325 0.05
76,000 Kratos Defense & Security Solutions Inc. 6.500% 30/Nov/2025
76,000 79,879 0.06
22,000 Lcm Investments Holdings II LLC 4.875% 1/May/2029
22,000 22,653 0.02
24,000 Legends Hospitality Holding Company LLC 5.000% 1/Feb/2026
24,000 25,050 0.02
123,000 Level 3 Financing Inc. 3.400% 1/Mar/2027 122,796 130,806 0.1124,000 Levi Strauss & Company 3.500% 1/Mar/2031 24,000 23,992 0.0244,000 Life Time Inc. 8.000% 15/Apr/2026 44,000 47,085 0.04
143,000 Lions Gate Capital Holdings LLC 5.500% 15/Apr/2029
143,000 151,088 0.12
127,000 Live Nation Entertainment Inc. 4.750% 15/Oct/2027
127,576 131,715 0.11
25,000 Macy’s Retail Holdings 5.875% 1/Apr/2029 25,049 26,896 0.0214,000 Marriott Ownership Resorts 4.500%
15/Jun/202914,000 14,193 0.01
190,000 Marvell Technology Inc. 2.450% 15/Apr/2028 189,964 193,788 0.16
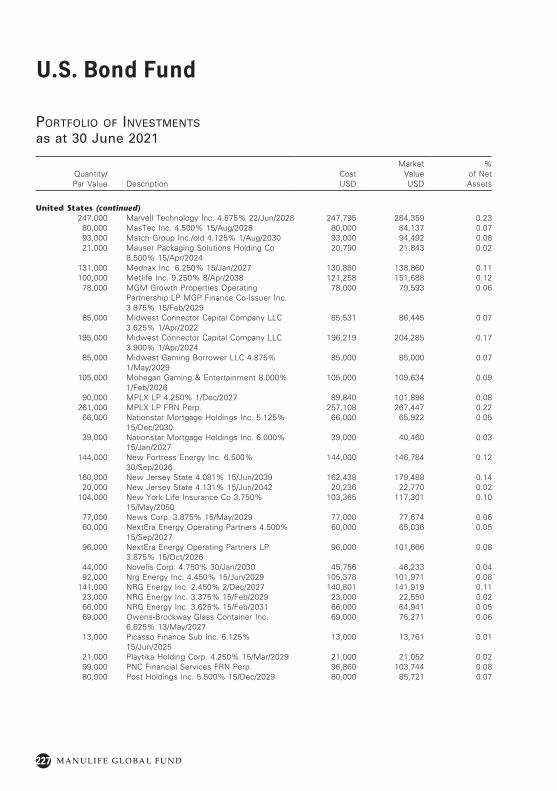
227
U.S. Bond Fund
M A N U L I F E G L O B A L F U N D
Portfolio of investments
as at 30 June 2021
Quantity/Par Value Description
Cost USD
Market Value USD
% of Net Assets
United States (continued)247,000 Marvell Technology Inc. 4.875% 22/Jun/2028 247,795 284,359 0.23
80,000 MasTec Inc. 4.500% 15/Aug/2028 80,000 84,137 0.0793,000 Match Group Inc./old 4.125% 1/Aug/2030 93,000 94,492 0.0821,000 Mauser Packaging Solutions Holding Co
8.500% 15/Apr/202420,790 21,843 0.02
131,000 Mednax Inc. 6.250% 15/Jan/2027 130,880 138,860 0.11100,000 Metlife Inc. 9.250% 8/Apr/2038 121,258 151,688 0.12
78,000 MGM Growth Properties Operating Partnership LP MGP Finance Co-Issuer Inc. 3.875% 15/Feb/2029
78,000 79,593 0.06
85,000 Midwest Connector Capital Company LLC 3.625% 1/Apr/2022
85,531 86,445 0.07
195,000 Midwest Connector Capital Company LLC 3.900% 1/Apr/2024
196,219 204,285 0.17
85,000 Midwest Gaming Borrower LLC 4.875% 1/May/2029
85,000 85,000 0.07
105,000 Mohegan Gaming & Entertainment 8.000% 1/Feb/2026
105,000 109,634 0.09
90,000 MPLX LP 4.250% 1/Dec/2027 89,840 101,898 0.08261,000 MPLX LP FRN Perp. 257,108 267,447 0.22
66,000 Nationstar Mortgage Holdings Inc. 5.125% 15/Dec/2030
66,000 65,922 0.05
39,000 Nationstar Mortgage Holdings Inc. 6.000% 15/Jan/2027
39,000 40,460 0.03
144,000 New Fortress Energy Inc. 6.500% 30/Sep/2026
144,000 146,784 0.12
160,000 New Jersey State 4.081% 15/Jun/2039 162,438 179,488 0.1420,000 New Jersey State 4.131% 15/Jun/2042 20,236 22,770 0.02
104,000 New York Life Insurance Co 3.750% 15/May/2050
103,365 117,301 0.10
77,000 News Corp. 3.875% 15/May/2029 77,000 77,674 0.0660,000 NextEra Energy Operating Partners 4.500%
15/Sep/202760,000 65,036 0.05
96,000 NextEra Energy Operating Partners LP 3.875% 15/Oct/2026
96,000 101,666 0.08
44,000 Novelis Corp. 4.750% 30/Jan/2030 45,756 46,233 0.0492,000 Nrg Energy Inc. 4.450% 15/Jun/2029 105,378 101,971 0.08
141,000 NRG Energy Inc. 2.450% 2/Dec/2027 140,801 141,919 0.1123,000 NRG Energy Inc. 3.375% 15/Feb/2029 23,000 22,550 0.0266,000 NRG Energy Inc. 3.625% 15/Feb/2031 66,000 64,941 0.0569,000 Owens-Brockway Glass Container Inc.
6.625% 13/May/202769,000 75,271 0.06
13,000 Picasso Finance Sub Inc. 6.125% 15/Jun/2025
13,000 13,761 0.01
21,000 Playtika Holding Corp. 4.250% 15/Mar/2029 21,000 21,052 0.0299,000 PNC Financial Services FRN Perp. 96,860 103,744 0.0880,000 Post Holdings Inc. 5.500% 15/Dec/2029 80,000 85,721 0.07
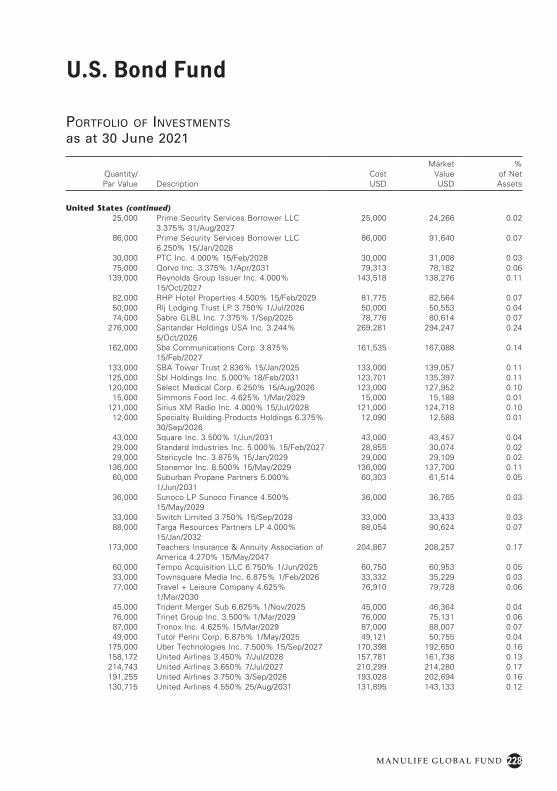
228
U.S. Bond Fund
M A N U L I F E G L O B A L F U N D
Portfolio of investments
as at 30 June 2021
Quantity/Par Value Description
Cost USD
Market Value USD
% of Net Assets
United States (continued)25,000 Prime Security Services Borrower LLC
3.375% 31/Aug/202725,000 24,266 0.02
86,000 Prime Security Services Borrower LLC 6.250% 15/Jan/2028
86,000 91,640 0.07
30,000 PTC Inc. 4.000% 15/Feb/2028 30,000 31,008 0.0375,000 Qorvo Inc. 3.375% 1/Apr/2031 79,313 78,182 0.06
139,000 Reynolds Group Issuer Inc. 4.000% 15/Oct/2027
143,518 138,276 0.11
82,000 RHP Hotel Properties 4.500% 15/Feb/2029 81,775 82,564 0.0750,000 Rlj Lodging Trust LP 3.750% 1/Jul/2026 50,000 50,553 0.0474,000 Sabre GLBL Inc. 7.375% 1/Sep/2025 78,776 80,614 0.07
276,000 Santander Holdings USA Inc. 3.244% 5/Oct/2026
269,281 294,247 0.24
162,000 Sba Communications Corp. 3.875% 15/Feb/2027
161,535 167,088 0.14
133,000 SBA Tower Trust 2.836% 15/Jan/2025 133,000 139,057 0.11125,000 Sbl Holdings Inc. 5.000% 18/Feb/2031 123,701 135,397 0.11120,000 Select Medical Corp. 6.250% 15/Aug/2026 123,000 127,952 0.10
15,000 Simmons Food Inc. 4.625% 1/Mar/2029 15,000 15,188 0.01121,000 Sirius XM Radio Inc. 4.000% 15/Jul/2028 121,000 124,718 0.10
12,000 Specialty Building Products Holdings 6.375% 30/Sep/2026
12,090 12,588 0.01
43,000 Square Inc. 3.500% 1/Jun/2031 43,000 43,457 0.0429,000 Standard Industries Inc. 5.000% 15/Feb/2027 28,855 30,074 0.0229,000 Stericycle Inc. 3.875% 15/Jan/2029 29,000 29,109 0.02
136,000 Stonemor Inc. 8.500% 15/May/2029 136,000 137,700 0.1160,000 Suburban Propane Partners 5.000%
1/Jun/203160,303 61,514 0.05
36,000 Sunoco LP Sunoco Finance 4.500% 15/May/2029
36,000 36,765 0.03
33,000 Switch Limited 3.750% 15/Sep/2028 33,000 33,433 0.0388,000 Targa Resources Partners LP 4.000%
15/Jan/203288,054 90,624 0.07
173,000 Teachers Insurance & Annuity Association of America 4.270% 15/May/2047
204,867 208,257 0.17
60,000 Tempo Acquisition LLC 6.750% 1/Jun/2025 60,750 60,953 0.0533,000 Townsquare Media Inc. 6.875% 1/Feb/2026 33,332 35,229 0.0377,000 Travel + Leisure Company 4.625%
1/Mar/203076,910 79,728 0.06
45,000 Trident Merger Sub 6.625% 1/Nov/2025 45,000 46,364 0.0476,000 Trinet Group Inc. 3.500% 1/Mar/2029 76,000 75,131 0.0687,000 Tronox Inc. 4.625% 15/Mar/2029 87,000 88,007 0.0749,000 Tutor Perini Corp. 6.875% 1/May/2025 49,121 50,755 0.04
175,000 Uber Technologies Inc. 7.500% 15/Sep/2027 170,398 192,650 0.16158,172 United Airlines 3.450% 7/Jul/2028 157,781 161,738 0.13214,743 United Airlines 3.650% 7/Jul/2027 210,299 214,280 0.17191,255 United Airlines 3.750% 3/Sep/2026 193,028 202,694 0.16130,715 United Airlines 4.550% 25/Aug/2031 131,895 143,133 0.12
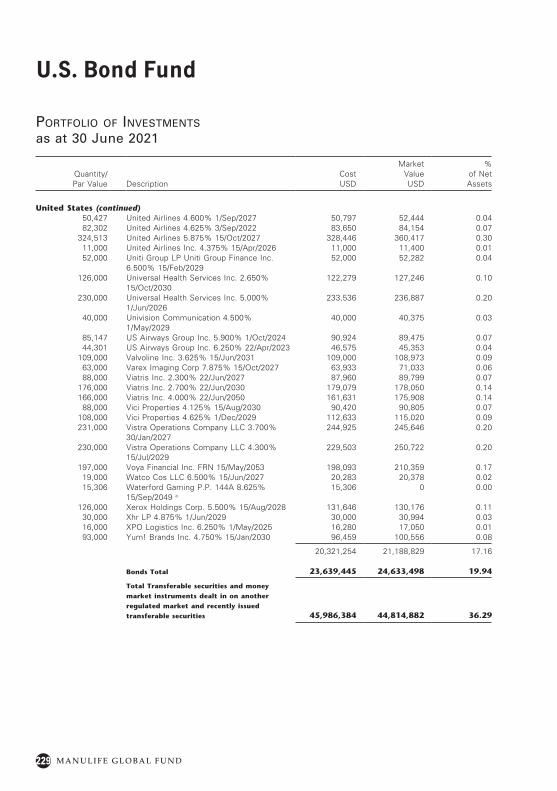
229
U.S. Bond Fund
M A N U L I F E G L O B A L F U N D
Portfolio of investments
as at 30 June 2021
Quantity/Par Value Description
Cost USD
Market Value USD
% of Net Assets
United States (continued)50,427 United Airlines 4.600% 1/Sep/2027 50,797 52,444 0.0482,302 United Airlines 4.625% 3/Sep/2022 83,650 84,154 0.07
324,513 United Airlines 5.875% 15/Oct/2027 328,446 360,417 0.3011,000 United Airlines Inc. 4.375% 15/Apr/2026 11,000 11,400 0.0152,000 Uniti Group LP Uniti Group Finance Inc.
6.500% 15/Feb/202952,000 52,282 0.04
126,000 Universal Health Services Inc. 2.650% 15/Oct/2030
122,279 127,246 0.10
230,000 Universal Health Services Inc. 5.000% 1/Jun/2026
233,536 236,887 0.20
40,000 Univision Communication 4.500% 1/May/2029
40,000 40,375 0.03
85,147 US Airways Group Inc. 5.900% 1/Oct/2024 90,924 89,475 0.0744,301 US Airways Group Inc. 6.250% 22/Apr/2023 46,575 45,353 0.04
109,000 Valvoline Inc. 3.625% 15/Jun/2031 109,000 108,973 0.0963,000 Varex Imaging Corp 7.875% 15/Oct/2027 63,933 71,033 0.0688,000 Viatris Inc. 2.300% 22/Jun/2027 87,960 89,799 0.07
176,000 Viatris Inc. 2.700% 22/Jun/2030 179,079 178,050 0.14166,000 Viatris Inc. 4.000% 22/Jun/2050 161,631 175,908 0.14
88,000 Vici Properties 4.125% 15/Aug/2030 90,420 90,805 0.07108,000 Vici Properties 4.625% 1/Dec/2029 112,633 115,020 0.09231,000 Vistra Operations Company LLC 3.700%
30/Jan/2027244,925 245,646 0.20
230,000 Vistra Operations Company LLC 4.300% 15/Jul/2029
229,503 250,722 0.20
197,000 Voya Financial Inc. FRN 15/May/2053 198,093 210,359 0.1719,000 Watco Cos LLC 6.500% 15/Jun/2027 20,283 20,378 0.0215,306 Waterford Gaming P.P. 144A 8.625%
15/Sep/2049 a
15,306 0 0.00
126,000 Xerox Holdings Corp. 5.500% 15/Aug/2028 131,646 130,176 0.1130,000 Xhr LP 4.875% 1/Jun/2029 30,000 30,994 0.0316,000 XPO Logistics Inc. 6.250% 1/May/2025 16,280 17,050 0.0193,000 Yum! Brands Inc. 4.750% 15/Jan/2030 96,459 100,556 0.08
20,321,254 21,188,829 17.16
Bonds Total 23,639,445 24,633,498 19.94
Total Transferable securities and money
market instruments dealt in on another
regulated market and recently issued
transferable securities 45,986,384 44,814,882 36.29
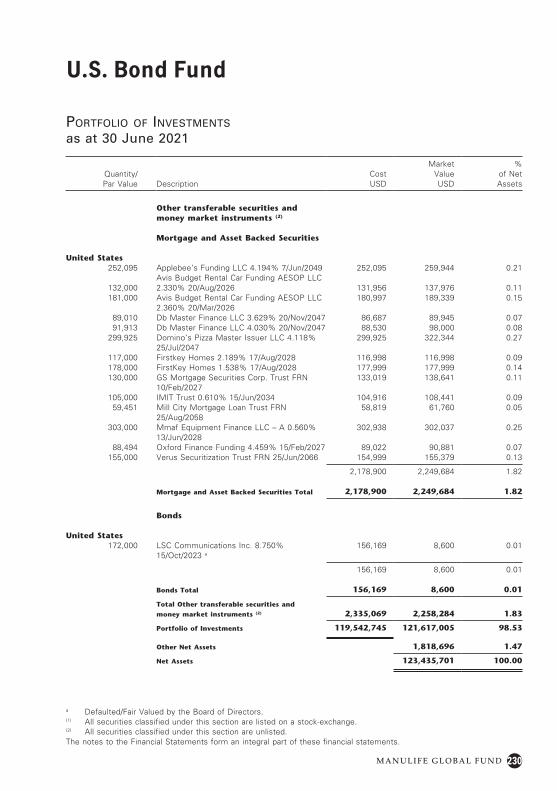
230
U.S. Bond Fund
M A N U L I F E G L O B A L F U N D
Portfolio of investments
as at 30 June 2021
Quantity/Par Value Description
Cost USD
Market Value USD
% of Net Assets
Other transferable securities and money market instruments (2)
Mortgage and Asset Backed Securities
United States252,095 Applebee’s Funding LLC 4.194% 7/Jun/2049 252,095 259,944 0.21
132,000Avis Budget Rental Car Funding AESOP LLC 2.330% 20/Aug/2026 131,956 137,976 0.11
181,000 Avis Budget Rental Car Funding AESOP LLC 2.360% 20/Mar/2026
180,997 189,339 0.15
89,010 Db Master Finance LLC 3.629% 20/Nov/2047 86,687 89,945 0.0791,913 Db Master Finance LLC 4.030% 20/Nov/2047 88,530 98,000 0.08
299,925 Domino’s Pizza Master Issuer LLC 4.118% 25/Jul/2047
299,925 322,344 0.27
117,000 Firstkey Homes 2.189% 17/Aug/2028 116,998 116,998 0.09178,000 FirstKey Homes 1.538% 17/Aug/2028 177,999 177,999 0.14130,000 GS Mortgage Securities Corp. Trust FRN
10/Feb/2027133,019 138,641 0.11
105,000 IMIT Trust 0.610% 15/Jun/2034 104,916 108,441 0.0959,451 Mill City Mortgage Loan Trust FRN
25/Aug/205858,819 61,760 0.05
303,000 Mmaf Equipment Finance LLC – A 0.560% 13/Jun/2028
302,938 302,037 0.25
88,494 Oxford Finance Funding 4.459% 15/Feb/2027 89,022 90,881 0.07155,000 Verus Securitization Trust FRN 25/Jun/2066 154,999 155,379 0.13
2,178,900 2,249,684 1.82
Mortgage and Asset Backed Securities Total 2,178,900 2,249,684 1.82
Bonds
United States172,000 LSC Communications Inc. 8.750%
15/Oct/2023 a
156,169 8,600 0.01
156,169 8,600 0.01
Bonds Total 156,169 8,600 0.01
Total Other transferable securities and
money market instruments (2) 2,335,069 2,258,284 1.83
Portfolio of Investments 119,542,745 121,617,005 98.53
Other Net Assets 1,818,696 1.47
Net Assets 123,435,701 100.00
a Defaulted/Fair Valued by the Board of Directors.(1) All securities classified under this section are listed on a stock-exchange.(2) All securities classified under this section are unlisted.The notes to the Financial Statements form an integral part of these financial statements.
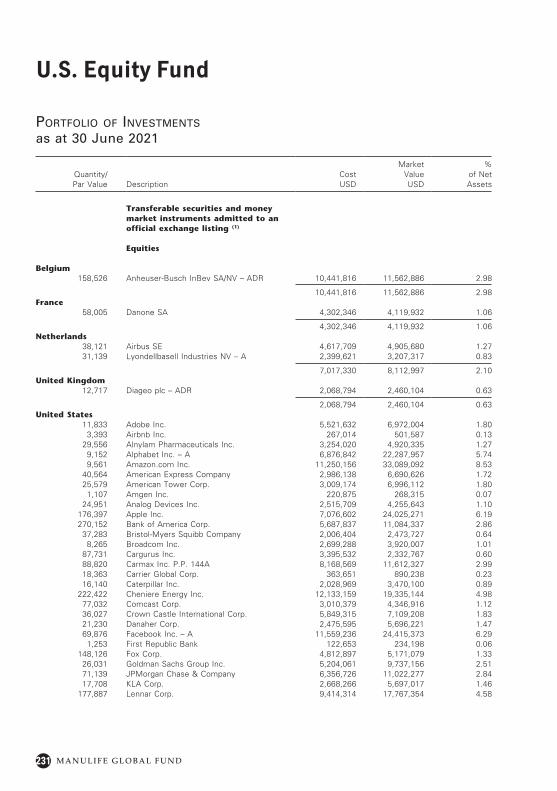
M A N U L I F E G L O B A L F U N D
U.S. Equity Fund
231
Portfolio of investments
as at 30 June 2021
Quantity/ Par Value Description
Cost USD
Market Value USD
% of Net Assets
Transferable securities and money market instruments admitted to an official exchange listing (1)
Equities
Belgium158,526 Anheuser-Busch InBev SA/NV – ADR 10,441,816 11,562,886 2.98
10,441,816 11,562,886 2.98France
58,005 Danone SA 4,302,346 4,119,932 1.06
4,302,346 4,119,932 1.06Netherlands
38,121 Airbus SE 4,617,709 4,905,680 1.2731,139 Lyondellbasell Industries NV – A 2,399,621 3,207,317 0.83
7,017,330 8,112,997 2.10United Kingdom
12,717 Diageo plc – ADR 2,068,794 2,460,104 0.63
2,068,794 2,460,104 0.63United States
11,833 Adobe Inc. 5,521,632 6,972,004 1.803,393 Airbnb Inc. 267,014 501,587 0.13
29,556 Alnylam Pharmaceuticals Inc. 3,254,020 4,920,335 1.279,152 Alphabet Inc. – A 6,876,842 22,287,957 5.749,561 Amazon.com Inc. 11,250,156 33,089,092 8.53
40,564 American Express Company 2,986,138 6,690,626 1.7225,579 American Tower Corp. 3,009,174 6,996,112 1.80
1,107 Amgen Inc. 220,875 268,315 0.0724,951 Analog Devices Inc. 2,515,709 4,255,643 1.10
176,397 Apple Inc. 7,076,602 24,025,271 6.19270,152 Bank of America Corp. 5,687,837 11,084,337 2.86
37,283 Bristol-Myers Squibb Company 2,006,404 2,473,727 0.648,265 Broadcom Inc. 2,699,288 3,920,007 1.01
87,731 Cargurus Inc. 3,395,532 2,332,767 0.6088,820 Carmax Inc. P.P. 144A 8,168,569 11,612,327 2.9918,363 Carrier Global Corp. 363,651 890,238 0.2316,140 Caterpillar Inc. 2,028,969 3,470,100 0.89
222,422 Cheniere Energy Inc. 12,133,159 19,335,144 4.9877,032 Comcast Corp. 3,010,379 4,346,916 1.1236,027 Crown Castle International Corp. 5,849,315 7,109,208 1.8321,230 Danaher Corp. 2,475,595 5,696,221 1.4769,876 Facebook Inc. – A 11,559,236 24,415,373 6.29
1,253 First Republic Bank 122,653 234,198 0.06148,126 Fox Corp. 4,812,897 5,171,079 1.33
26,031 Goldman Sachs Group Inc. 5,204,061 9,737,156 2.5171,139 JPMorgan Chase & Company 6,356,726 11,022,277 2.8417,708 KLA Corp. 2,668,266 5,697,017 1.46
177,887 Lennar Corp. 9,414,314 17,767,354 4.58
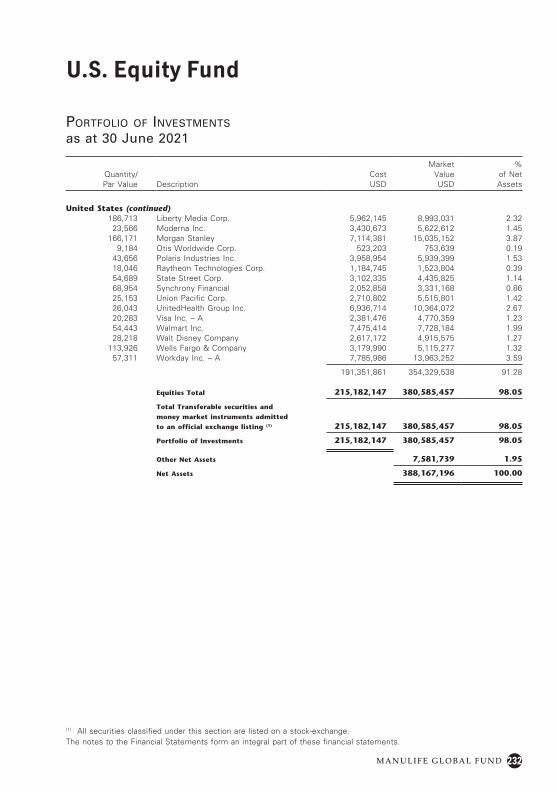
M A N U L I F E G L O B A L F U N D
U.S. Equity Fund
232
(1) All securities classified under this section are listed on a stock-exchange.The notes to the Financial Statements form an integral part of these financial statements.
Quantity/ Par Value Description
Cost USD
Market Value USD
% of Net Assets
United States (continued)186,713 Liberty Media Corp. 5,962,145 8,993,031 2.32
23,566 Moderna Inc. 3,430,673 5,622,612 1.45166,171 Morgan Stanley 7,114,381 15,035,152 3.87
9,184 Otis Worldwide Corp. 523,203 753,639 0.1943,656 Polaris Industries Inc. 3,958,954 5,939,399 1.5318,046 Raytheon Technologies Corp. 1,184,745 1,523,804 0.3954,689 State Street Corp. 3,102,335 4,435,825 1.1468,954 Synchrony Financial 2,052,858 3,331,168 0.8625,153 Union Pacific Corp. 2,710,802 5,515,801 1.4226,043 UnitedHealth Group Inc. 6,936,714 10,364,072 2.6720,283 Visa Inc. – A 2,381,476 4,770,359 1.2354,443 Walmart Inc. 7,475,414 7,728,184 1.9928,218 Walt Disney Company 2,617,172 4,915,575 1.27
113,926 Wells Fargo & Company 3,179,990 5,115,277 1.3257,311 Workday Inc. – A 7,785,986 13,963,252 3.59
191,351,861 354,329,538 91.28
Equities Total 215,182,147 380,585,457 98.05
Total Transferable securities and
money market instruments admitted
to an official exchange listing (1) 215,182,147 380,585,457 98.05
Portfolio of Investments 215,182,147 380,585,457 98.05
Other Net Assets 7,581,739 1.95
Net Assets 388,167,196 100.00
Portfolio of investments
as at 30 June 2021
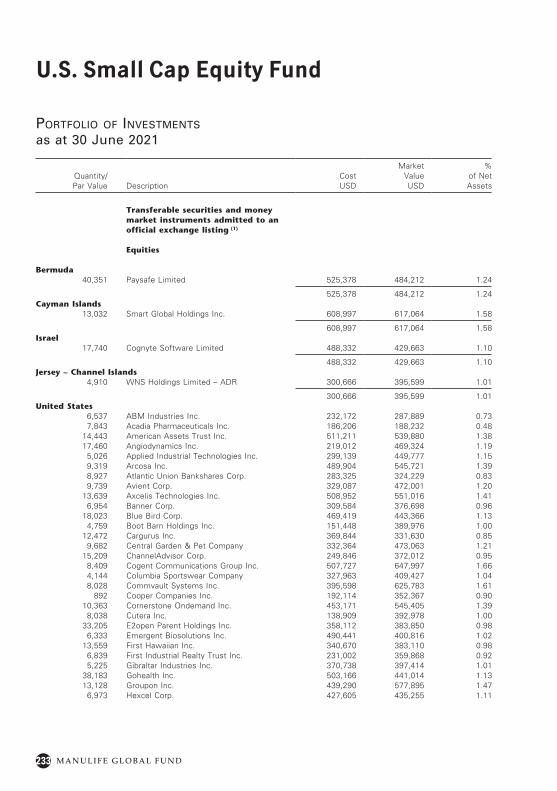
233
U.S. Small Cap Equity Fund
M A N U L I F E G L O B A L F U N D
Portfolio of investments
as at 30 June 2021
Quantity/ Par Value Description
Cost USD
Market Value USD
% of Net Assets
Transferable securities and money market instruments admitted to an official exchange listing (1)
Equities
Bermuda40,351 Paysafe Limited 525,378 484,212 1.24
525,378 484,212 1.24Cayman Islands
13,032 Smart Global Holdings Inc. 608,997 617,064 1.58
608,997 617,064 1.58Israel
17,740 Cognyte Software Limited 488,332 429,663 1.10
488,332 429,663 1.10Jersey – Channel Islands
4,910 WNS Holdings Limited – ADR 300,666 395,599 1.01
300,666 395,599 1.01United States
6,537 ABM Industries Inc. 232,172 287,889 0.737,843 Acadia Pharmaceuticals Inc. 186,206 188,232 0.48
14,443 American Assets Trust Inc. 511,211 539,880 1.3817,460 Angiodynamics Inc. 219,012 469,324 1.19
5,026 Applied Industrial Technologies Inc. 299,139 449,777 1.159,319 Arcosa Inc. 489,904 545,721 1.398,927 Atlantic Union Bankshares Corp. 283,325 324,229 0.839,739 Avient Corp. 329,087 472,001 1.20
13,639 Axcelis Technologies Inc. 508,952 551,016 1.416,954 Banner Corp. 309,584 376,698 0.96
18,023 Blue Bird Corp. 469,419 443,366 1.134,759 Boot Barn Holdings Inc. 151,448 389,976 1.00
12,472 Cargurus Inc. 369,844 331,630 0.859,682 Central Garden & Pet Company 332,364 473,063 1.21
15,209 ChannelAdvisor Corp. 249,846 372,012 0.958,409 Cogent Communications Group Inc. 507,727 647,997 1.664,144 Columbia Sportswear Company 327,963 409,427 1.048,028 Commvault Systems Inc. 395,598 625,783 1.61
892 Cooper Companies Inc. 192,114 352,367 0.9010,363 Cornerstone Ondemand Inc. 453,171 545,405 1.39
8,038 Cutera Inc. 138,909 392,978 1.0033,205 E2open Parent Holdings Inc. 358,112 383,850 0.98
6,333 Emergent Biosolutions Inc. 490,441 400,816 1.0213,559 First Hawaiian Inc. 340,670 383,110 0.98
6,839 First Industrial Realty Trust Inc. 231,002 359,868 0.925,225 Gibraltar Industries Inc. 370,738 397,414 1.01
38,183 Gohealth Inc. 503,166 441,014 1.1313,128 Groupon Inc. 439,290 577,895 1.47
6,973 Hexcel Corp. 427,605 435,255 1.11
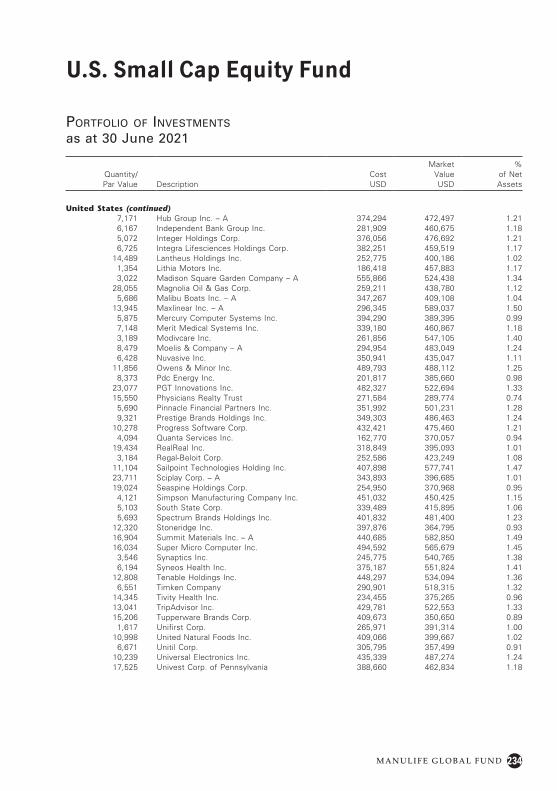
234
U.S. Small Cap Equity Fund
M A N U L I F E G L O B A L F U N D
Quantity/ Par Value Description
Cost USD
Market Value USD
% of Net Assets
United States (continued)7,171 Hub Group Inc. – A 374,294 472,497 1.216,167 Independent Bank Group Inc. 281,909 460,675 1.185,072 Integer Holdings Corp. 376,056 476,692 1.216,725 Integra Lifesciences Holdings Corp. 382,251 459,519 1.17
14,489 Lantheus Holdings Inc. 252,775 400,186 1.021,354 Lithia Motors Inc. 186,418 457,883 1.173,022 Madison Square Garden Company – A 555,866 524,438 1.34
28,055 Magnolia Oil & Gas Corp. 259,211 438,780 1.125,686 Malibu Boats Inc. – A 347,267 409,108 1.04
13,945 Maxlinear Inc. – A 296,345 589,037 1.505,875 Mercury Computer Systems Inc. 394,290 389,395 0.997,148 Merit Medical Systems Inc. 339,180 460,867 1.183,189 Modivcare Inc. 261,856 547,105 1.408,479 Moelis & Company – A 294,954 483,049 1.246,428 Nuvasive Inc. 350,941 435,047 1.11
11,856 Owens & Minor Inc. 489,793 488,112 1.258,373 Pdc Energy Inc. 201,817 385,660 0.98
23,077 PGT Innovations Inc. 482,327 522,694 1.3315,550 Physicians Realty Trust 271,584 289,774 0.74
5,690 Pinnacle Financial Partners Inc. 351,992 501,231 1.289,321 Prestige Brands Holdings Inc. 349,303 486,463 1.24
10,278 Progress Software Corp. 432,421 475,460 1.214,094 Quanta Services Inc. 162,770 370,057 0.94
19,434 RealReal Inc. 318,849 395,093 1.013,184 Regal-Beloit Corp. 252,586 423,249 1.08
11,104 Sailpoint Technologies Holding Inc. 407,898 577,741 1.4723,711 Sciplay Corp. – A 343,893 396,685 1.0119,024 Seaspine Holdings Corp. 254,950 370,968 0.95
4,121 Simpson Manufacturing Company Inc. 451,032 450,425 1.155,103 South State Corp. 339,489 415,895 1.065,693 Spectrum Brands Holdings Inc. 401,832 481,400 1.23
12,320 Stoneridge Inc. 397,876 364,795 0.9316,904 Summit Materials Inc. – A 440,685 582,850 1.4916,034 Super Micro Computer Inc. 494,592 565,679 1.45
3,546 Synaptics Inc. 245,775 540,765 1.386,194 Syneos Health Inc. 375,187 551,824 1.41
12,808 Tenable Holdings Inc. 448,297 534,094 1.366,551 Timken Company 290,901 518,315 1.32
14,345 Tivity Health Inc. 234,455 375,265 0.9613,041 TripAdvisor Inc. 429,781 522,553 1.3315,206 Tupperware Brands Corp. 409,673 350,650 0.89
1,617 Unifirst Corp. 265,971 391,314 1.0010,998 United Natural Foods Inc. 409,066 399,667 1.02
6,671 Unitil Corp. 305,795 357,499 0.9110,239 Universal Electronics Inc. 435,339 487,274 1.2417,525 Univest Corp. of Pennsylvania 388,660 462,834 1.18
Portfolio of investments
as at 30 June 2021
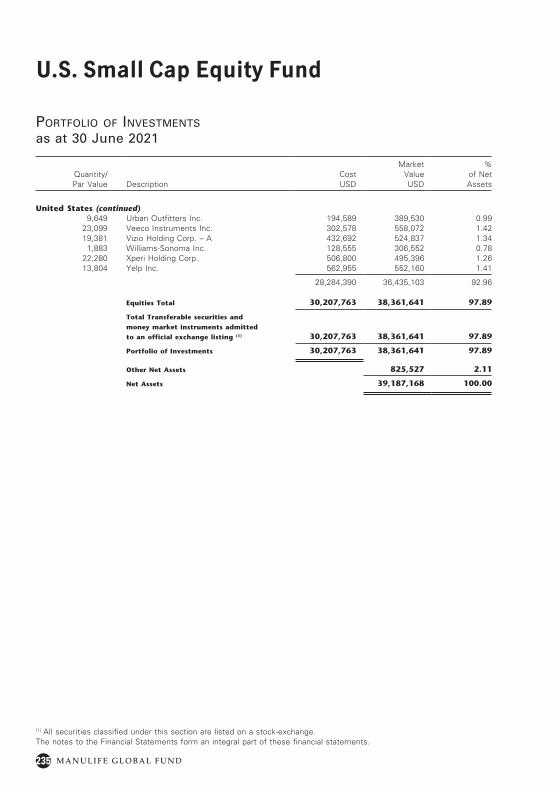
235
U.S. Small Cap Equity Fund
M A N U L I F E G L O B A L F U N D
Portfolio of investments
as at 30 June 2021
Quantity/ Par Value Description
Cost USD
Market Value USD
% of Net Assets
United States (continued)9,649 Urban Outfitters Inc. 194,589 389,530 0.99
23,099 Veeco Instruments Inc. 302,578 558,072 1.4219,381 Vizio Holding Corp. – A 432,692 524,837 1.34
1,883 Williams-Sonoma Inc. 128,555 306,552 0.7822,280 Xperi Holding Corp. 506,800 495,396 1.2613,804 Yelp Inc. 562,955 552,160 1.41
28,284,390 36,435,103 92.96
Equities Total 30,207,763 38,361,641 97.89
Total Transferable securities and
money market instruments admitted
to an official exchange listing (1) 30,207,763 38,361,641 97.89
Portfolio of Investments 30,207,763 38,361,641 97.89
Other Net Assets 825,527 2.11
Net Assets 39,187,168 100.00
(1) All securities classified under this section are listed on a stock-exchange.The notes to the Financial Statements form an integral part of these financial statements.
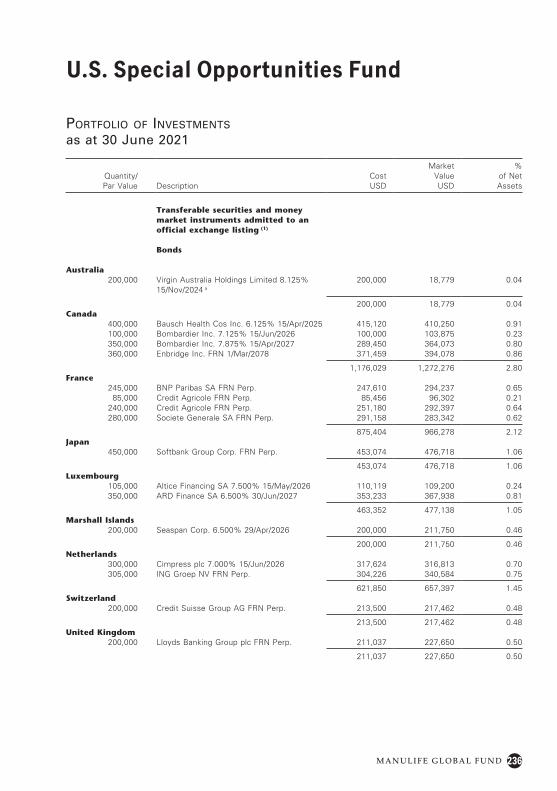
236
U.S. Special Opportunities Fund
M A N U L I F E G L O B A L F U N D
Portfolio of investments
as at 30 June 2021
Quantity/ Par Value Description
Cost USD
Market Value USD
% of Net Assets
Transferable securities and money market instruments admitted to an official exchange listing (1)
Bonds
Australia200,000 Virgin Australia Holdings Limited 8.125%
15/Nov/2024 a
200,000 18,779 0.04
200,000 18,779 0.04Canada
400,000 Bausch Health Cos Inc. 6.125% 15/Apr/2025 415,120 410,250 0.91100,000 Bombardier Inc. 7.125% 15/Jun/2026 100,000 103,875 0.23350,000 Bombardier Inc. 7.875% 15/Apr/2027 289,450 364,073 0.80360,000 Enbridge Inc. FRN 1/Mar/2078 371,459 394,078 0.86
1,176,029 1,272,276 2.80France
245,000 BNP Paribas SA FRN Perp. 247,610 294,237 0.6585,000 Credit Agricole FRN Perp. 85,456 96,302 0.21
240,000 Credit Agricole FRN Perp. 251,180 292,397 0.64280,000 Societe Generale SA FRN Perp. 291,158 283,342 0.62
875,404 966,278 2.12Japan
450,000 Softbank Group Corp. FRN Perp. 453,074 476,718 1.06
453,074 476,718 1.06Luxembourg
105,000 Altice Financing SA 7.500% 15/May/2026 110,119 109,200 0.24350,000 ARD Finance SA 6.500% 30/Jun/2027 353,233 367,938 0.81
463,352 477,138 1.05Marshall Islands
200,000 Seaspan Corp. 6.500% 29/Apr/2026 200,000 211,750 0.46
200,000 211,750 0.46Netherlands
300,000 Cimpress plc 7.000% 15/Jun/2026 317,624 316,813 0.70305,000 ING Groep NV FRN Perp. 304,226 340,584 0.75
621,850 657,397 1.45Switzerland
200,000 Credit Suisse Group AG FRN Perp. 213,500 217,462 0.48
213,500 217,462 0.48United Kingdom
200,000 Lloyds Banking Group plc FRN Perp. 211,037 227,650 0.50
211,037 227,650 0.50
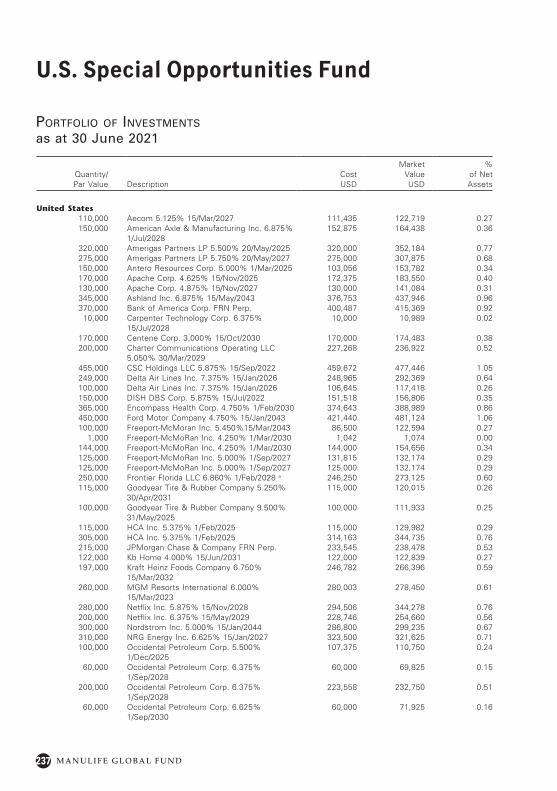
237
U.S. Special Opportunities Fund
M A N U L I F E G L O B A L F U N D
Quantity/ Par Value Description
Cost USD
Market Value USD
% of Net Assets
United States110,000 Aecom 5.125% 15/Mar/2027 111,435 122,719 0.27150,000 American Axle & Manufacturing Inc. 6.875%
1/Jul/2028152,875 164,438 0.36
320,000 Amerigas Partners LP 5.500% 20/May/2025 320,000 352,184 0.77275,000 Amerigas Partners LP 5.750% 20/May/2027 275,000 307,875 0.68150,000 Antero Resources Corp. 5.000% 1/Mar/2025 103,056 153,782 0.34170,000 Apache Corp. 4.625% 15/Nov/2025 172,375 183,550 0.40130,000 Apache Corp. 4.875% 15/Nov/2027 130,000 141,084 0.31345,000 Ashland Inc. 6.875% 15/May/2043 376,753 437,946 0.96370,000 Bank of America Corp. FRN Perp. 400,487 415,369 0.92
10,000 Carpenter Technology Corp. 6.375% 15/Jul/2028
10,000 10,989 0.02
170,000 Centene Corp. 3.000% 15/Oct/2030 170,000 174,483 0.38200,000 Charter Communications Operating LLC
5.050% 30/Mar/2029227,268 236,922 0.52
455,000 CSC Holdings LLC 5.875% 15/Sep/2022 459,672 477,446 1.05249,000 Delta Air Lines Inc. 7.375% 15/Jan/2026 248,965 292,369 0.64100,000 Delta Air Lines Inc. 7.375% 15/Jan/2026 106,645 117,418 0.26150,000 DISH DBS Corp. 5.875% 15/Jul/2022 151,518 156,806 0.35365,000 Encompass Health Corp. 4.750% 1/Feb/2030 374,643 388,989 0.86450,000 Ford Motor Company 4.750% 15/Jan/2043 421,440 481,124 1.06100,000 Freeport-McMoran Inc. 5.450%15/Mar/2043 86,500 122,594 0.27
1,000 Freeport-McMoRan Inc. 4.250% 1/Mar/2030 1,042 1,074 0.00144,000 Freeport-McMoRan Inc. 4.250% 1/Mar/2030 144,000 154,656 0.34125,000 Freeport-McMoRan Inc. 5.000% 1/Sep/2027 131,815 132,174 0.29125,000 Freeport-McMoRan Inc. 5.000% 1/Sep/2027 125,000 132,174 0.29250,000 Frontier Florida LLC 6.860% 1/Feb/2028 a 246,250 273,125 0.60115,000 Goodyear Tire & Rubber Company 5.250%
30/Apr/2031115,000 120,015 0.26
100,000 Goodyear Tire & Rubber Company 9.500% 31/May/2025
100,000 111,933 0.25
115,000 HCA Inc. 5.375% 1/Feb/2025 115,000 129,982 0.29305,000 HCA Inc. 5.375% 1/Feb/2025 314,163 344,735 0.76215,000 JPMorgan Chase & Company FRN Perp. 233,545 238,478 0.53122,000 Kb Home 4.000% 15/Jun/2031 122,000 122,839 0.27197,000 Kraft Heinz Foods Company 6.750%
15/Mar/2032246,782 266,396 0.59
260,000 MGM Resorts International 6.000% 15/Mar/2023
280,003 278,450 0.61
280,000 Netflix Inc. 5.875% 15/Nov/2028 294,506 344,278 0.76200,000 Netflix Inc. 6.375% 15/May/2029 228,746 254,660 0.56300,000 Nordstrom Inc. 5.000% 15/Jan/2044 286,800 299,235 0.67310,000 NRG Energy Inc. 6.625% 15/Jan/2027 323,500 321,625 0.71100,000 Occidental Petroleum Corp. 5.500%
1/Dec/2025107,375 110,750 0.24
60,000 Occidental Petroleum Corp. 6.375% 1/Sep/2028
60,000 69,825 0.15
200,000 Occidental Petroleum Corp. 6.375% 1/Sep/2028
223,558 232,750 0.51
60,000 Occidental Petroleum Corp. 6.625% 1/Sep/2030
60,000 71,925 0.16
Portfolio of investments
as at 30 June 2021
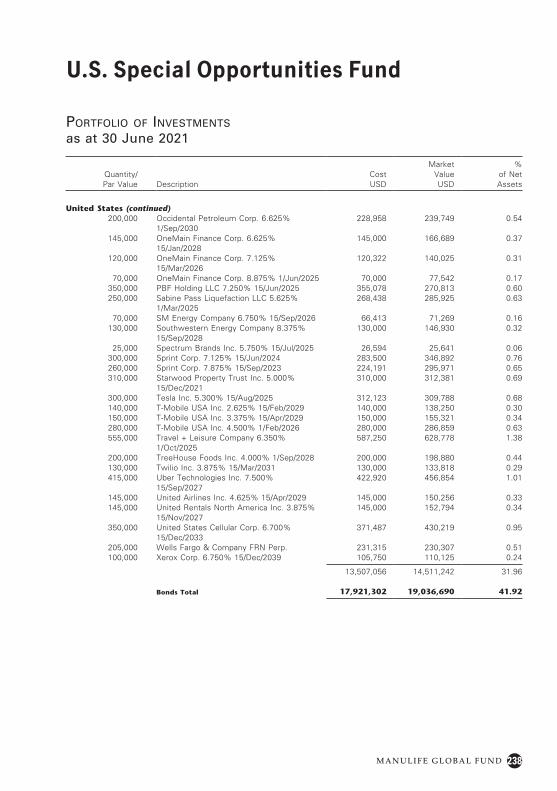
238
U.S. Special Opportunities Fund
M A N U L I F E G L O B A L F U N D
Quantity/ Par Value Description
Cost USD
Market Value USD
% of Net Assets
United States (continued)200,000 Occidental Petroleum Corp. 6.625%
1/Sep/2030228,958 239,749 0.54
145,000 OneMain Finance Corp. 6.625% 15/Jan/2028
145,000 166,689 0.37
120,000 OneMain Finance Corp. 7.125% 15/Mar/2026
120,322 140,025 0.31
70,000 OneMain Finance Corp. 8.875% 1/Jun/2025 70,000 77,542 0.17350,000 PBF Holding LLC 7.250% 15/Jun/2025 355,078 270,813 0.60250,000 Sabine Pass Liquefaction LLC 5.625%
1/Mar/2025268,438 285,925 0.63
70,000 SM Energy Company 6.750% 15/Sep/2026 66,413 71,269 0.16130,000 Southwestern Energy Company 8.375%
15/Sep/2028130,000 146,930 0.32
25,000 Spectrum Brands Inc. 5.750% 15/Jul/2025 26,594 25,641 0.06300,000 Sprint Corp. 7.125% 15/Jun/2024 283,500 346,892 0.76260,000 Sprint Corp. 7.875% 15/Sep/2023 224,191 295,971 0.65310,000 Starwood Property Trust Inc. 5.000%
15/Dec/2021310,000 312,381 0.69
300,000 Tesla Inc. 5.300% 15/Aug/2025 312,123 309,788 0.68140,000 T-Mobile USA Inc. 2.625% 15/Feb/2029 140,000 138,250 0.30150,000 T-Mobile USA Inc. 3.375% 15/Apr/2029 150,000 155,321 0.34280,000 T-Mobile USA Inc. 4.500% 1/Feb/2026 280,000 286,859 0.63555,000 Travel + Leisure Company 6.350%
1/Oct/2025587,250 628,778 1.38
200,000 TreeHouse Foods Inc. 4.000% 1/Sep/2028 200,000 198,880 0.44130,000 Twilio Inc. 3.875% 15/Mar/2031 130,000 133,818 0.29415,000 Uber Technologies Inc. 7.500%
15/Sep/2027422,920 456,854 1.01
145,000 United Airlines Inc. 4.625% 15/Apr/2029 145,000 150,256 0.33145,000 United Rentals North America Inc. 3.875%
15/Nov/2027145,000 152,794 0.34
350,000 United States Cellular Corp. 6.700% 15/Dec/2033
371,487 430,219 0.95
205,000 Wells Fargo & Company FRN Perp. 231,315 230,307 0.51100,000 Xerox Corp. 6.750% 15/Dec/2039 105,750 110,125 0.24
13,507,056 14,511,242 31.96
Bonds Total 17,921,302 19,036,690 41.92
Portfolio of investments
as at 30 June 2021
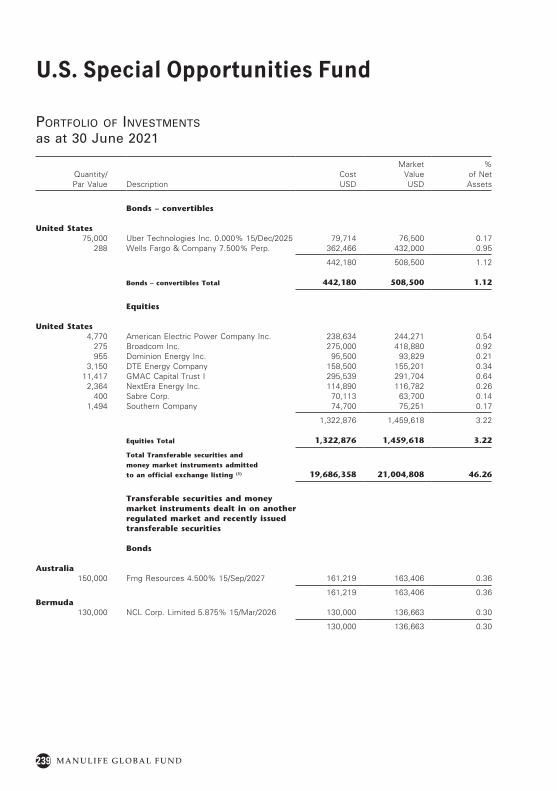
239
U.S. Special Opportunities Fund
M A N U L I F E G L O B A L F U N D
Quantity/ Par Value Description
Cost USD
Market Value USD
% of Net Assets
Bonds – convertibles
United States75,000 Uber Technologies Inc. 0.000% 15/Dec/2025 79,714 76,500 0.17
288 Wells Fargo & Company 7.500% Perp. 362,466 432,000 0.95
442,180 508,500 1.12
Bonds – convertibles Total 442,180 508,500 1.12
Equities
United States4,770 American Electric Power Company Inc. 238,634 244,271 0.54
275 Broadcom Inc. 275,000 418,880 0.92955 Dominion Energy Inc. 95,500 93,829 0.21
3,150 DTE Energy Company 158,500 155,201 0.3411,417 GMAC Capital Trust I 295,539 291,704 0.64
2,364 NextEra Energy Inc. 114,890 116,782 0.26400 Sabre Corp. 70,113 63,700 0.14
1,494 Southern Company 74,700 75,251 0.17
1,322,876 1,459,618 3.22
Equities Total 1,322,876 1,459,618 3.22
Total Transferable securities and
money market instruments admitted
to an official exchange listing (1) 19,686,358 21,004,808 46.26
Transferable securities and money market instruments dealt in on another regulated market and recently issued transferable securities
Bonds
Australia150,000 Fmg Resources 4.500% 15/Sep/2027 161,219 163,406 0.36
161,219 163,406 0.36Bermuda
130,000 NCL Corp. Limited 5.875% 15/Mar/2026 130,000 136,663 0.30
130,000 136,663 0.30
Portfolio of investments
as at 30 June 2021
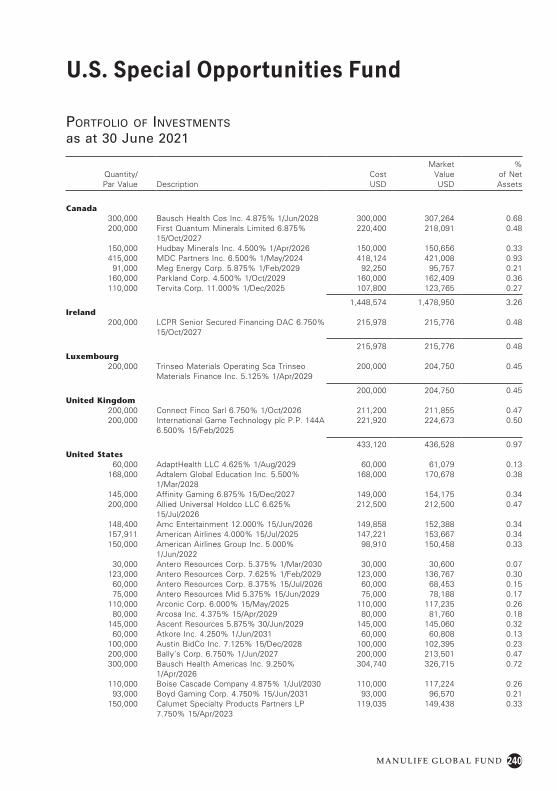
240
U.S. Special Opportunities Fund
M A N U L I F E G L O B A L F U N D
Quantity/ Par Value Description
Cost USD
Market Value USD
% of Net Assets
Canada300,000 Bausch Health Cos Inc. 4.875% 1/Jun/2028 300,000 307,264 0.68200,000 First Quantum Minerals Limited 6.875%
15/Oct/2027220,400 218,091 0.48
150,000 Hudbay Minerals Inc. 4.500% 1/Apr/2026 150,000 150,656 0.33415,000 MDC Partners Inc. 6.500% 1/May/2024 418,124 421,008 0.93
91,000 Meg Energy Corp. 5.875% 1/Feb/2029 92,250 95,757 0.21160,000 Parkland Corp. 4.500% 1/Oct/2029 160,000 162,409 0.36110,000 Tervita Corp. 11.000% 1/Dec/2025 107,800 123,765 0.27
1,448,574 1,478,950 3.26Ireland
200,000 LCPR Senior Secured Financing DAC 6.750% 15/Oct/2027
215,978 215,776 0.48
215,978 215,776 0.48Luxembourg
200,000 Trinseo Materials Operating Sca Trinseo Materials Finance Inc. 5.125% 1/Apr/2029
200,000 204,750 0.45
200,000 204,750 0.45United Kingdom
200,000 Connect Finco Sarl 6.750% 1/Oct/2026 211,200 211,855 0.47200,000 International Game Technology plc P.P. 144A
6.500% 15/Feb/2025221,920 224,673 0.50
433,120 436,528 0.97United States
60,000 AdaptHealth LLC 4.625% 1/Aug/2029 60,000 61,079 0.13168,000 Adtalem Global Education Inc. 5.500%
1/Mar/2028168,000 170,678 0.38
145,000 Affinity Gaming 6.875% 15/Dec/2027 149,000 154,175 0.34200,000 Allied Universal Holdco LLC 6.625%
15/Jul/2026212,500 212,500 0.47
148,400 Amc Entertainment 12.000% 15/Jun/2026 149,858 152,388 0.34157,911 American Airlines 4.000% 15/Jul/2025 147,221 153,667 0.34150,000 American Airlines Group Inc. 5.000%
1/Jun/202298,910 150,458 0.33
30,000 Antero Resources Corp. 5.375% 1/Mar/2030 30,000 30,600 0.07123,000 Antero Resources Corp. 7.625% 1/Feb/2029 123,000 136,767 0.30
60,000 Antero Resources Corp. 8.375% 15/Jul/2026 60,000 68,453 0.1575,000 Antero Resources Mid 5.375% 15/Jun/2029 75,000 78,188 0.17
110,000 Arconic Corp. 6.000% 15/May/2025 110,000 117,235 0.2680,000 Arcosa Inc. 4.375% 15/Apr/2029 80,000 81,760 0.18
145,000 Ascent Resources 5.875% 30/Jun/2029 145,000 145,060 0.3260,000 Atkore Inc. 4.250% 1/Jun/2031 60,000 60,808 0.13
100,000 Austin BidCo Inc. 7.125% 15/Dec/2028 100,000 102,395 0.23200,000 Bally’s Corp. 6.750% 1/Jun/2027 200,000 213,501 0.47300,000 Bausch Health Americas Inc. 9.250%
1/Apr/2026304,740 326,715 0.72
110,000 Boise Cascade Company 4.875% 1/Jul/2030 110,000 117,224 0.2693,000 Boyd Gaming Corp. 4.750% 15/Jun/2031 93,000 96,570 0.21
150,000 Calumet Specialty Products Partners LP 7.750% 15/Apr/2023
119,035 149,438 0.33
Portfolio of investments
as at 30 June 2021
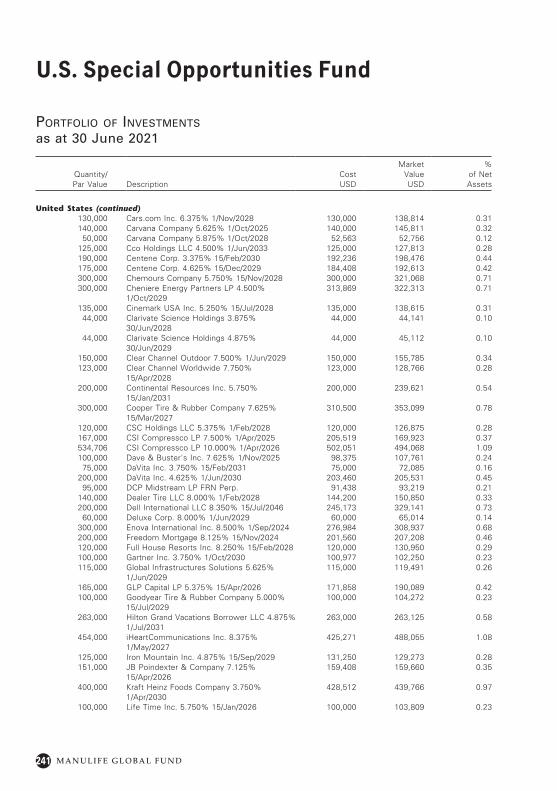
241
U.S. Special Opportunities Fund
M A N U L I F E G L O B A L F U N D
Quantity/ Par Value Description
Cost USD
Market Value USD
% of Net Assets
United States (continued)130,000 Cars.com Inc. 6.375% 1/Nov/2028 130,000 138,814 0.31140,000 Carvana Company 5.625% 1/Oct/2025 140,000 145,811 0.32
50,000 Carvana Company 5.875% 1/Oct/2028 52,563 52,756 0.12125,000 Cco Holdings LLC 4.500% 1/Jun/2033 125,000 127,813 0.28190,000 Centene Corp. 3.375% 15/Feb/2030 192,236 198,476 0.44175,000 Centene Corp. 4.625% 15/Dec/2029 184,408 192,613 0.42300,000 Chemours Company 5.750% 15/Nov/2028 300,000 321,068 0.71300,000 Cheniere Energy Partners LP 4.500%
1/Oct/2029313,869 322,313 0.71
135,000 Cinemark USA Inc. 5.250% 15/Jul/2028 135,000 138,615 0.3144,000 Clarivate Science Holdings 3.875%
30/Jun/202844,000 44,141 0.10
44,000 Clarivate Science Holdings 4.875% 30/Jun/2029
44,000 45,112 0.10
150,000 Clear Channel Outdoor 7.500% 1/Jun/2029 150,000 155,785 0.34123,000 Clear Channel Worldwide 7.750%
15/Apr/2028123,000 128,766 0.28
200,000 Continental Resources Inc. 5.750% 15/Jan/2031
200,000 239,621 0.54
300,000 Cooper Tire & Rubber Company 7.625% 15/Mar/2027
310,500 353,099 0.78
120,000 CSC Holdings LLC 5.375% 1/Feb/2028 120,000 126,875 0.28167,000 CSI Compressco LP 7.500% 1/Apr/2025 205,519 169,923 0.37534,706 CSI Compressco LP 10.000% 1/Apr/2026 502,051 494,068 1.09 100,000 Dave & Buster's Inc. 7.625% 1/Nov/2025 98,375 107,761 0.24
75,000 DaVita Inc. 3.750% 15/Feb/2031 75,000 72,085 0.16 200,000 DaVita Inc. 4.625% 1/Jun/2030 203,460 205,531 0.45
95,000 DCP Midstream LP FRN Perp. 91,438 93,219 0.21 140,000 Dealer Tire LLC 8.000% 1/Feb/2028 144,200 150,850 0.33 200,000 Dell International LLC 8.350% 15/Jul/2046 245,173 329,141 0.73
60,000 Deluxe Corp. 8.000% 1/Jun/2029 60,000 65,014 0.14 300,000 Enova International Inc. 8.500% 1/Sep/2024 276,984 308,937 0.68200,000 Freedom Mortgage 8.125% 15/Nov/2024 201,560 207,208 0.46120,000 Full House Resorts Inc. 8.250% 15/Feb/2028 120,000 130,950 0.29100,000 Gartner Inc. 3.750% 1/Oct/2030 100,977 102,250 0.23115,000 Global Infrastructures Solutions 5.625%
1/Jun/2029115,000 119,491 0.26
165,000 GLP Capital LP 5.375% 15/Apr/2026 171,858 190,089 0.42100,000 Goodyear Tire & Rubber Company 5.000%
15/Jul/2029100,000 104,272 0.23
263,000 Hilton Grand Vacations Borrower LLC 4.875% 1/Jul/2031
263,000 263,125 0.58
454,000 iHeartCommunications Inc. 8.375% 1/May/2027
425,271 488,055 1.08
125,000 Iron Mountain Inc. 4.875% 15/Sep/2029 131,250 129,273 0.28151,000 JB Poindexter & Company 7.125%
15/Apr/2026159,408 159,660 0.35
400,000 Kraft Heinz Foods Company 3.750% 1/Apr/2030
428,512 439,766 0.97
100,000 Life Time Inc. 5.750% 15/Jan/2026 100,000 103,809 0.23
Portfolio of investments
as at 30 June 2021
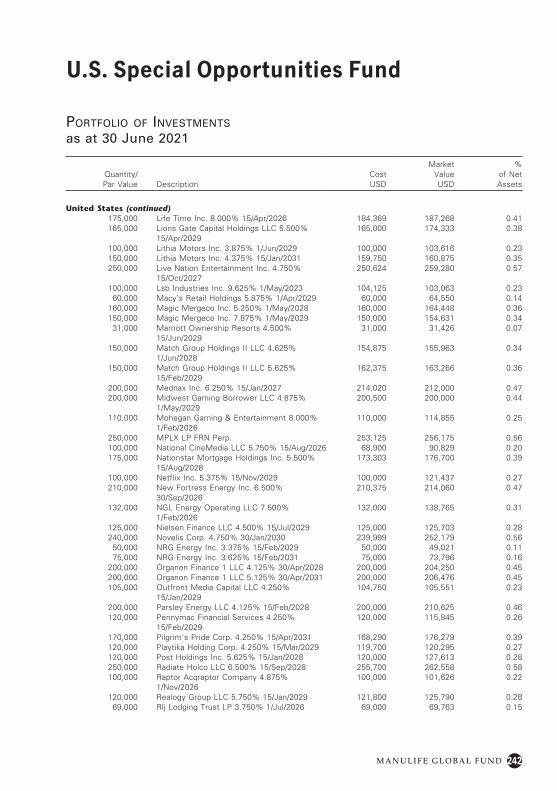
242
U.S. Special Opportunities Fund
M A N U L I F E G L O B A L F U N D
Quantity/ Par Value Description
Cost USD
Market Value USD
% of Net Assets
United States (continued)175,000 Life Time Inc. 8.000% 15/Apr/2026 184,369 187,268 0.41165,000 Lions Gate Capital Holdings LLC 5.500%
15/Apr/2029165,000 174,333 0.38
100,000 Lithia Motors Inc. 3.875% 1/Jun/2029 100,000 103,616 0.23150,000 Lithia Motors Inc. 4.375% 15/Jan/2031 159,750 160,875 0.35250,000 Live Nation Entertainment Inc. 4.750%
15/Oct/2027250,624 259,280 0.57
100,000 Lsb Industries Inc. 9.625% 1/May/2023 104,125 103,063 0.2360,000 Macy’s Retail Holdings 5.875% 1/Apr/2029 60,000 64,550 0.14
160,000 Magic Mergeco Inc. 5.250% 1/May/2028 160,000 164,448 0.36150,000 Magic Mergeco Inc. 7.875% 1/May/2029 150,000 154,631 0.34
31,000 Marriott Ownership Resorts 4.500% 15/Jun/2029
31,000 31,426 0.07
150,000 Match Group Holdings II LLC 4.625% 1/Jun/2028
154,875 155,963 0.34
150,000 Match Group Holdings II LLC 5.625% 15/Feb/2029
162,375 163,266 0.36
200,000 Mednax Inc. 6.250% 15/Jan/2027 214,020 212,000 0.47200,000 Midwest Gaming Borrower LLC 4.875%
1/May/2029200,500 200,000 0.44
110,000 Mohegan Gaming & Entertainment 8.000% 1/Feb/2026
110,000 114,855 0.25
250,000 MPLX LP FRN Perp. 253,125 256,175 0.56100,000 National CineMedia LLC 5.750% 15/Aug/2026 68,900 90,829 0.20175,000 Nationstar Mortgage Holdings Inc. 5.500%
15/Aug/2028173,303 176,700 0.39
100,000 Netflix Inc. 5.375% 15/Nov/2029 100,000 121,437 0.27210,000 New Fortress Energy Inc. 6.500%
30/Sep/2026210,375 214,060 0.47
132,000 NGL Energy Operating LLC 7.500% 1/Feb/2026
132,000 138,765 0.31
125,000 Nielsen Finance LLC 4.500% 15/Jul/2029 125,000 125,703 0.28240,000 Novelis Corp. 4.750% 30/Jan/2030 239,999 252,179 0.56
50,000 NRG Energy Inc. 3.375% 15/Feb/2029 50,000 49,021 0.1175,000 NRG Energy Inc. 3.625% 15/Feb/2031 75,000 73,796 0.16
200,000 Organon Finance 1 LLC 4.125% 30/Apr/2028 200,000 204,250 0.45200,000 Organon Finance 1 LLC 5.125% 30/Apr/2031 200,000 206,476 0.45105,000 Outfront Media Capital LLC 4.250%
15/Jan/2029104,750 105,551 0.23
200,000 Parsley Energy LLC 4.125% 15/Feb/2028 200,000 210,625 0.46120,000 Pennymac Financial Services 4.250%
15/Feb/2029120,000 115,845 0.26
170,000 Pilgrim’s Pride Corp. 4.250% 15/Apr/2031 168,290 176,279 0.39120,000 Playtika Holding Corp. 4.250% 15/Mar/2029 119,700 120,295 0.27120,000 Post Holdings Inc. 5.625% 15/Jan/2028 120,000 127,613 0.28250,000 Radiate Holco LLC 6.500% 15/Sep/2028 255,700 262,558 0.58100,000 Raptor Acqraptor Company 4.875%
1/Nov/2026100,000 101,626 0.22
120,000 Realogy Group LLC 5.750% 15/Jan/2029 121,800 125,790 0.2869,000 Rlj Lodging Trust LP 3.750% 1/Jul/2026 69,000 69,763 0.15
Portfolio of investments
as at 30 June 2021
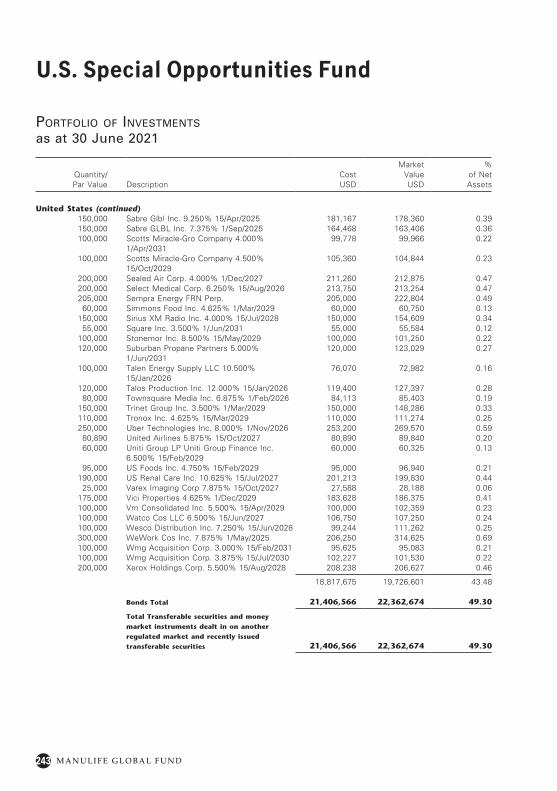
243
U.S. Special Opportunities Fund
M A N U L I F E G L O B A L F U N D
Quantity/ Par Value Description
Cost USD
Market Value USD
% of Net Assets
United States (continued)150,000 Sabre Glbl Inc. 9.250% 15/Apr/2025 181,167 178,360 0.39150,000 Sabre GLBL Inc. 7.375% 1/Sep/2025 164,468 163,406 0.36100,000 Scotts Miracle-Gro Company 4.000%
1/Apr/203199,778 99,966 0.22
100,000 Scotts Miracle-Gro Company 4.500% 15/Oct/2029
105,360 104,844 0.23
200,000 Sealed Air Corp. 4.000% 1/Dec/2027 211,260 212,875 0.47200,000 Select Medical Corp. 6.250% 15/Aug/2026 213,750 213,254 0.47205,000 Sempra Energy FRN Perp. 205,000 222,804 0.49
60,000 Simmons Food Inc. 4.625% 1/Mar/2029 60,000 60,750 0.13150,000 Sirius XM Radio Inc. 4.000% 15/Jul/2028 150,000 154,609 0.34
55,000 Square Inc. 3.500% 1/Jun/2031 55,000 55,584 0.12100,000 Stonemor Inc. 8.500% 15/May/2029 100,000 101,250 0.22120,000 Suburban Propane Partners 5.000%
1/Jun/2031120,000 123,029 0.27
100,000 Talen Energy Supply LLC 10.500% 15/Jan/2026
76,070 72,982 0.16
120,000 Talos Production Inc. 12.000% 15/Jan/2026 119,400 127,397 0.2880,000 Townsquare Media Inc. 6.875% 1/Feb/2026 84,113 85,403 0.19
150,000 Trinet Group Inc. 3.500% 1/Mar/2029 150,000 148,286 0.33110,000 Tronox Inc. 4.625% 15/Mar/2029 110,000 111,274 0.25250,000 Uber Technologies Inc. 8.000% 1/Nov/2026 253,200 269,570 0.59
80,890 United Airlines 5.875% 15/Oct/2027 80,890 89,840 0.2060,000 Uniti Group LP Uniti Group Finance Inc.
6.500% 15/Feb/202960,000 60,325 0.13
95,000 US Foods Inc. 4.750% 15/Feb/2029 95,000 96,940 0.21190,000 US Renal Care Inc. 10.625% 15/Jul/2027 201,213 199,830 0.44
25,000 Varex Imaging Corp 7.875% 15/Oct/2027 27,588 28,188 0.06175,000 Vici Properties 4.625% 1/Dec/2029 183,628 186,375 0.41100,000 Vm Consolidated Inc. 5.500% 15/Apr/2029 100,000 102,359 0.23100,000 Watco Cos LLC 6.500% 15/Jun/2027 106,750 107,250 0.24100,000 Wesco Distribution Inc. 7.250% 15/Jun/2028 99,244 111,262 0.25300,000 WeWork Cos Inc. 7.875% 1/May/2025 206,250 314,625 0.69100,000 Wmg Acquisition Corp. 3.000% 15/Feb/2031 95,625 95,083 0.21100,000 Wmg Acquisition Corp. 3.875% 15/Jul/2030 102,227 101,530 0.22200,000 Xerox Holdings Corp. 5.500% 15/Aug/2028 208,238 206,627 0.46
18,817,675 19,726,601 43.48
Bonds Total 21,406,566 22,362,674 49.30
Total Transferable securities and money
market instruments dealt in on another
regulated market and recently issued
transferable securities 21,406,566 22,362,674 49.30
Portfolio of investments
as at 30 June 2021
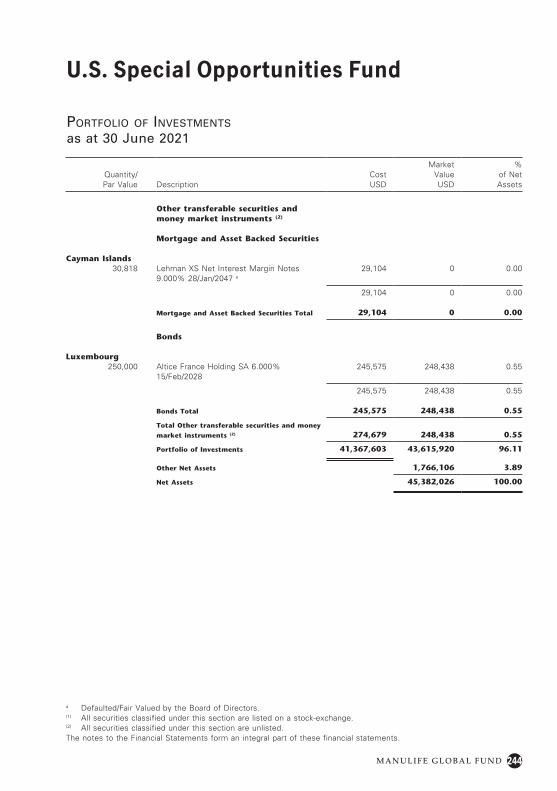
244
U.S. Special Opportunities Fund
M A N U L I F E G L O B A L F U N D
a Defaulted/Fair Valued by the Board of Directors.(1) All securities classified under this section are listed on a stock-exchange.(2) All securities classified under this section are unlisted.The notes to the Financial Statements form an integral part of these financial statements.
Portfolio of investments
as at 30 June 2021
Quantity/ Par Value Description
Cost USD
Market Value USD
% of Net Assets
Other transferable securities and money market instruments (2)
Mortgage and Asset Backed Securities
Cayman Islands30,818 Lehman XS Net Interest Margin Notes
9.000% 28/Jan/2047 a
29,104 0 0.00
29,104 0 0.00
Mortgage and Asset Backed Securities Total 29,104 0 0.00
Bonds
Luxembourg250,000 Altice France Holding SA 6.000%
15/Feb/2028245,575 248,438 0.55
245,575 248,438 0.55
Bonds Total 245,575 248,438 0.55
Total Other transferable securities and money
market instruments (2) 274,679 248,438 0.55
Portfolio of Investments 41,367,603 43,615,920 96.11
Other Net Assets 1,766,106 3.89
Net Assets 45,382,026 100.00
245 M A N U L I F E G L O B A L F U N D
Notes to the Financial StatementsFor the year ended 30 June 2021
1 General
Manulife Global Fund (the “Company”) was incorporated on 7 July 1987 as an open-ended investment company and is organised as a Société d’ Investissement à Capital Variable (“SICAV”) under Part I of the Law of 17 December 2010 amended on 10 May 2016 of the Grand Duchy of Luxembourg.
The Company maintains separate accounts for each sub-fund to which the proceeds of issue of shares and the income arising from the investment of those proceeds are credited and against which expenses are allocated and charged, as appropriate, on an equitable basis. Upon redemption, shareholders are entitled only to their proportion of the net assets, as reflected in the relevant Net Asset Value, held in the account relating to the sub-fund in which their class of shares is designated. Separate Statements of Operations, Net Assets and Changes in Net Assets have accordingly been prepared for each sub-fund.
As of 30 June 2021, the Company is comprised of the following sub-funds:
ASEAN Equity FundAsia Total Return FundAsia Pacific REIT FundAsian Equity FundAsian High Yield FundAsian Small Cap Equity FundChina Total Return Bond FundChina Value FundDragon Growth FundDynamic Leaders Fund*Emerging Eastern Europe FundEuropean Growth FundGlobal Equity FundGlobal Multi-Asset Diversified Income FundGlobal REIT FundGlobal Resources FundHealthcare FundIndia Equity FundInvestment Grade Preferred Securities Income Fund*Japan Equity FundPreferred Securities Income FundSustainable Asia Bond Fund*Taiwan Equity FundU.S. Bond FundU.S. Equity FundU.S. Small Cap Equity FundU.S. Special Opportunities Fund
The Asia Value Dividend Equity Fund and Latin America Equity Fund were liquidated on 30 June 2021. As at 30 June 2021, there were cash accounts for an equivalent of USD 14,398,125 for the Asia Value Dividend Equity Fund, and USD 24,312,934 for the Latin America Equity Fund, that was used to cover outstanding redemptions and liabilities.
Please refer to the prospectus of the Company for details on the availability of respective share classes in the relevant jurisdictions.
* Refer to note 13
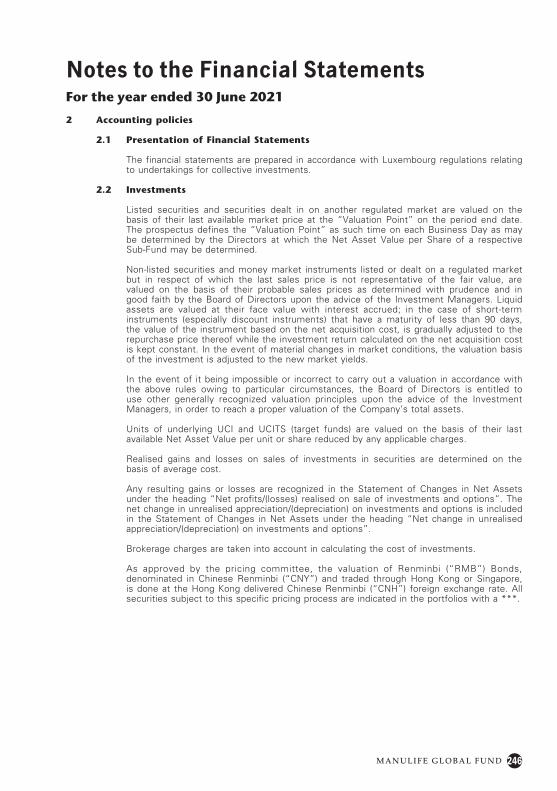
246M A N U L I F E G L O B A L F U N D
Notes to the Financial StatementsFor the year ended 30 June 2021
2 Accounting policies
2.1 Presentation of Financial Statements
The financial statements are prepared in accordance with Luxembourg regulations relating to undertakings for collective investments.
2.2 Investments
Listed securities and securities dealt in on another regulated market are valued on the basis of their last available market price at the “Valuation Point” on the period end date. The prospectus defines the “Valuation Point” as such time on each Business Day as may be determined by the Directors at which the Net Asset Value per Share of a respective Sub-Fund may be determined.
Non-listed securities and money market instruments listed or dealt on a regulated market but in respect of which the last sales price is not representative of the fair value, are valued on the basis of their probable sales prices as determined with prudence and in good faith by the Board of Directors upon the advice of the Investment Managers. Liquid assets are valued at their face value with interest accrued; in the case of short-term instruments (especially discount instruments) that have a maturity of less than 90 days, the value of the instrument based on the net acquisition cost, is gradually adjusted to the repurchase price thereof while the investment return calculated on the net acquisition cost is kept constant. In the event of material changes in market conditions, the valuation basis of the investment is adjusted to the new market yields.
In the event of it being impossible or incorrect to carry out a valuation in accordance with the above rules owing to particular circumstances, the Board of Directors is entitled to use other generally recognized valuation principles upon the advice of the Investment Managers, in order to reach a proper valuation of the Company’s total assets.
Units of underlying UCI and UCITS (target funds) are valued on the basis of their last available Net Asset Value per unit or share reduced by any applicable charges.
Realised gains and losses on sales of investments in securities are determined on the basis of average cost.
Any resulting gains or losses are recognized in the Statement of Changes in Net Assets under the heading “Net profits/(losses) realised on sale of investments and options”. The net change in unrealised appreciation/(depreciation) on investments and options is included in the Statement of Changes in Net Assets under the heading “Net change in unrealised appreciation/(depreciation) on investments and options”.
Brokerage charges are taken into account in calculating the cost of investments.
As approved by the pricing committee, the valuation of Renminbi (“RMB”) Bonds, denominated in Chinese Renminbi (“CNY”) and traded through Hong Kong or Singapore, is done at the Hong Kong delivered Chinese Renminbi (“CNH”) foreign exchange rate. All securities subject to this specific pricing process are indicated in the portfolios with a ***.
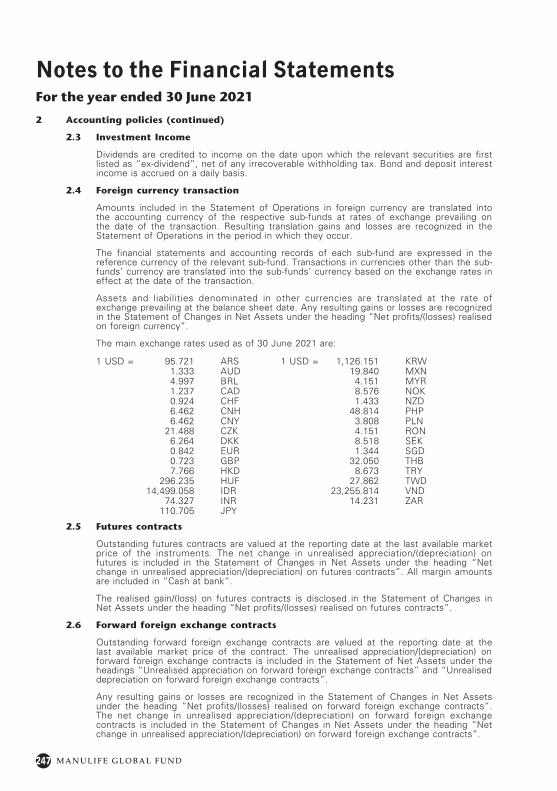
247 M A N U L I F E G L O B A L F U N D
Notes to the Financial StatementsFor the year ended 30 June 2021
2 Accounting policies (continued)
2.3 Investment Income
Dividends are credited to income on the date upon which the relevant securities are first listed as “ex-dividend”, net of any irrecoverable withholding tax. Bond and deposit interest income is accrued on a daily basis.
2.4 Foreign currency transaction
Amounts included in the Statement of Operations in foreign currency are translated into the accounting currency of the respective sub-funds at rates of exchange prevailing on the date of the transaction. Resulting translation gains and losses are recognized in the Statement of Operations in the period in which they occur.
The financial statements and accounting records of each sub-fund are expressed in the reference currency of the relevant sub-fund. Transactions in currencies other than the sub-funds’ currency are translated into the sub-funds’ currency based on the exchange rates in effect at the date of the transaction.
Assets and liabilities denominated in other currencies are translated at the rate of exchange prevailing at the balance sheet date. Any resulting gains or losses are recognized in the Statement of Changes in Net Assets under the heading “Net profits/(losses) realised on foreign currency”.
The main exchange rates used as of 30 June 2021 are:
1 USD = 95.721 ARS 1 USD = 1,126.151 KRW 1.333 AUD 19.840 MXN 4.997 BRL 4.151 MYR 1.237 CAD 8.576 NOK 0.924 CHF 1.433 NZD 6.462 CNH 48.814 PHP 6.462 CNY 3.808 PLN 21.488 CZK 4.151 RON 6.264 DKK 8.518 SEK 0.842 EUR 1.344 SGD 0.723 GBP 32.050 THB 7.766 HKD 8.673 TRY 296.235 HUF 27.862 TWD 14,499.058 IDR 23,255.814 VND 74.327 INR 14.231 ZAR 110.705 JPY
2.5 Futures contracts
Outstanding futures contracts are valued at the reporting date at the last available market price of the instruments. The net change in unrealised appreciation/(depreciation) on futures is included in the Statement of Changes in Net Assets under the heading “Net change in unrealised appreciation/(depreciation) on futures contracts”. All margin amounts are included in “Cash at bank”.
The realised gain/(loss) on futures contracts is disclosed in the Statement of Changes in Net Assets under the heading “Net profits/(losses) realised on futures contracts”.
2.6 Forward foreign exchange contracts
Outstanding forward foreign exchange contracts are valued at the reporting date at the last available market price of the contract. The unrealised appreciation/(depreciation) on forward foreign exchange contracts is included in the Statement of Net Assets under the headings “Unrealised appreciation on forward foreign exchange contracts” and “Unrealised depreciation on forward foreign exchange contracts”.
Any resulting gains or losses are recognized in the Statement of Changes in Net Assets under the heading “Net profits/(losses) realised on forward foreign exchange contracts”. The net change in unrealised appreciation/(depreciation) on forward foreign exchange contracts is included in the Statement of Changes in Net Assets under the heading “Net change in unrealised appreciation/(depreciation) on forward foreign exchange contracts”.
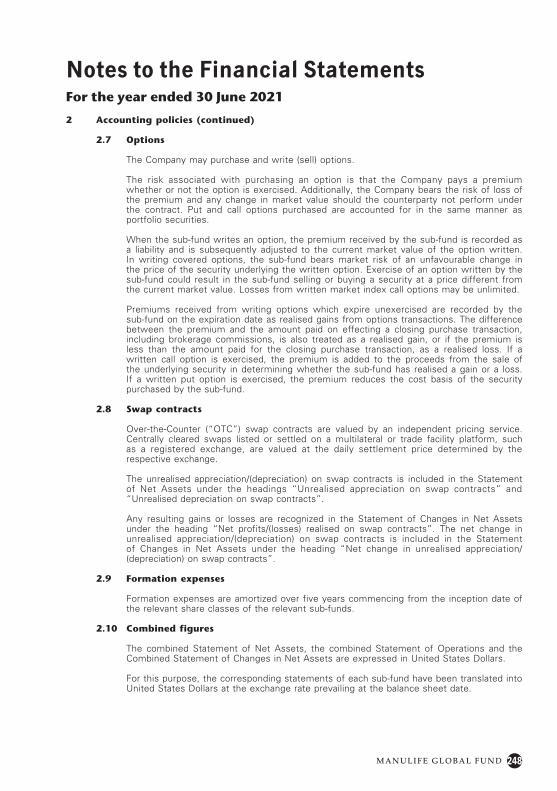
248M A N U L I F E G L O B A L F U N D
Notes to the Financial StatementsFor the year ended 30 June 2021
2 Accounting policies (continued)
2.7 Options
The Company may purchase and write (sell) options.
The risk associated with purchasing an option is that the Company pays a premium whether or not the option is exercised. Additionally, the Company bears the risk of loss of the premium and any change in market value should the counterparty not perform under the contract. Put and call options purchased are accounted for in the same manner as portfolio securities.
When the sub-fund writes an option, the premium received by the sub-fund is recorded as a liability and is subsequently adjusted to the current market value of the option written. In writing covered options, the sub-fund bears market risk of an unfavourable change in the price of the security underlying the written option. Exercise of an option written by the sub-fund could result in the sub-fund selling or buying a security at a price different from the current market value. Losses from written market index call options may be unlimited.
Premiums received from writing options which expire unexercised are recorded by the sub-fund on the expiration date as realised gains from options transactions. The difference between the premium and the amount paid on effecting a closing purchase transaction, including brokerage commissions, is also treated as a realised gain, or if the premium is less than the amount paid for the closing purchase transaction, as a realised loss. If a written call option is exercised, the premium is added to the proceeds from the sale of the underlying security in determining whether the sub-fund has realised a gain or a loss. If a written put option is exercised, the premium reduces the cost basis of the security purchased by the sub-fund.
2.8 Swap contracts
Over-the-Counter (“OTC”) swap contracts are valued by an independent pricing service. Centrally cleared swaps listed or settled on a multilateral or trade facility platform, such as a registered exchange, are valued at the daily settlement price determined by the respective exchange.
The unrealised appreciation/(depreciation) on swap contracts is included in the Statement of Net Assets under the headings “Unrealised appreciation on swap contracts” and “Unrealised depreciation on swap contracts”.
Any resulting gains or losses are recognized in the Statement of Changes in Net Assets under the heading “Net profits/(losses) realised on swap contracts”. The net change in unrealised appreciation/(depreciation) on swap contracts is included in the Statement of Changes in Net Assets under the heading “Net change in unrealised appreciation/(depreciation) on swap contracts”.
2.9 Formation expenses
Formation expenses are amortized over five years commencing from the inception date of the relevant share classes of the relevant sub-funds.
2.10 Combined figures
The combined Statement of Net Assets, the combined Statement of Operations and the Combined Statement of Changes in Net Assets are expressed in United States Dollars.
For this purpose, the corresponding statements of each sub-fund have been translated into United States Dollars at the exchange rate prevailing at the balance sheet date.
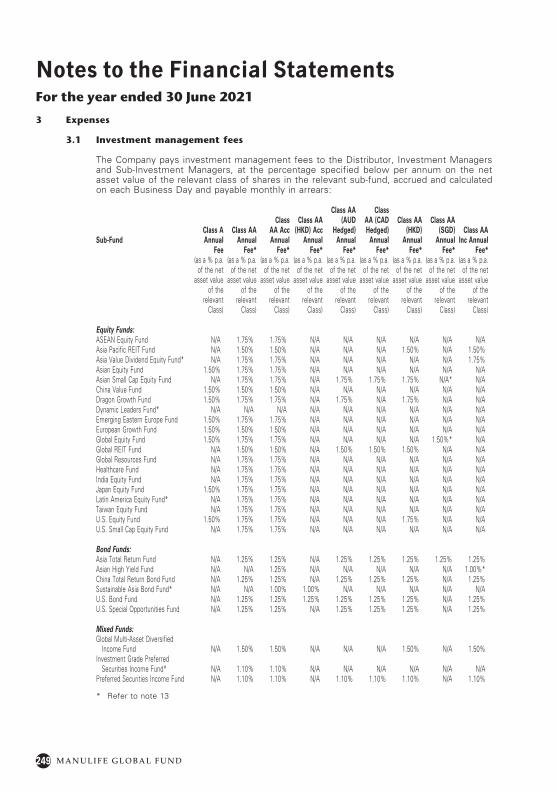
249 M A N U L I F E G L O B A L F U N D
Notes to the Financial StatementsFor the year ended 30 June 2021
3 Expenses
3.1 Investment management fees
The Company pays investment management fees to the Distributor, Investment Managers and Sub-Investment Managers, at the percentage specified below per annum on the net asset value of the relevant class of shares in the relevant sub-fund, accrued and calculated on each Business Day and payable monthly in arrears:
Sub-FundClass A Annual
Class AA Annual
Class AA Acc Annual
Class AA (HKD) Acc
Annual
Class AA (AUD
Hedged) Annual
Class AA (CAD Hedged)
Annual
Class AA (HKD)
Annual
Class AA (SGD)
AnnualClass AA
Inc AnnualFee Fee* Fee* Fee* Fee* Fee* Fee* Fee* Fee*
(as a % p.a. of the net
asset value of the
relevant Class)
(as a % p.a. of the net
asset value of the
relevant Class)
(as a % p.a. of the net
asset value of the
relevant Class)
(as a % p.a. of the net
asset value of the
relevant Class)
(as a % p.a. of the net
asset value of the
relevant Class)
(as a % p.a. of the net
asset value of the
relevant Class)
(as a % p.a. of the net
asset value of the
relevant Class)
(as a % p.a. of the net
asset value of the
relevant Class)
(as a % p.a. of the net
asset value of the
relevant Class)
Equity Funds:ASEAN Equity Fund N/A 1.75% 1.75% N/A N/A N/A N/A N/A N/AAsia Pacific REIT Fund N/A 1.50% 1.50% N/A N/A N/A 1.50% N/A 1.50%Asia Value Dividend Equity Fund* N/A 1.75% 1.75% N/A N/A N/A N/A N/A 1.75%Asian Equity Fund 1.50% 1.75% 1.75% N/A N/A N/A N/A N/A N/AAsian Small Cap Equity Fund N/A 1.75% 1.75% N/A 1.75% 1.75% 1.75% N/A* N/AChina Value Fund 1.50% 1.50% 1.50% N/A N/A N/A N/A N/A N/ADragon Growth Fund 1.50% 1.75% 1.75% N/A 1.75% N/A 1.75% N/A N/ADynamic Leaders Fund* N/A N/A N/A N/A N/A N/A N/A N/A N/AEmerging Eastern Europe Fund 1.50% 1.75% 1.75% N/A N/A N/A N/A N/A N/AEuropean Growth Fund 1.50% 1.50% 1.50% N/A N/A N/A N/A N/A N/AGlobal Equity Fund 1.50% 1.75% 1.75% N/A N/A N/A N/A 1.50%* N/AGlobal REIT Fund N/A 1.50% 1.50% N/A 1.50% 1.50% 1.50% N/A N/AGlobal Resources Fund N/A 1.75% 1.75% N/A N/A N/A N/A N/A N/AHealthcare Fund N/A 1.75% 1.75% N/A N/A N/A N/A N/A N/AIndia Equity Fund N/A 1.75% 1.75% N/A N/A N/A N/A N/A N/AJapan Equity Fund 1.50% 1.75% 1.75% N/A N/A N/A N/A N/A N/ALatin America Equity Fund* N/A 1.75% 1.75% N/A N/A N/A N/A N/A N/ATaiwan Equity Fund N/A 1.75% 1.75% N/A N/A N/A N/A N/A N/AU.S. Equity Fund 1.50% 1.75% 1.75% N/A N/A N/A 1.75% N/A N/AU.S. Small Cap Equity Fund N/A 1.75% 1.75% N/A N/A N/A N/A N/A N/A
Bond Funds:Asia Total Return Fund N/A 1.25% 1.25% N/A 1.25% 1.25% 1.25% 1.25% 1.25%Asian High Yield Fund N/A N/A 1.25% N/A N/A N/A N/A N/A 1.00%*China Total Return Bond Fund N/A 1.25% 1.25% N/A 1.25% 1.25% 1.25% N/A 1.25%Sustainable Asia Bond Fund* N/A N/A 1.00% 1.00% N/A N/A N/A N/A N/AU.S. Bond Fund N/A 1.25% 1.25% 1.25% 1.25% 1.25% 1.25% N/A 1.25%U.S. Special Opportunities Fund N/A 1.25% 1.25% N/A 1.25% 1.25% 1.25% N/A 1.25%
Mixed Funds:Global Multi-Asset Diversified
Income Fund N/A 1.50% 1.50% N/A N/A N/A 1.50% N/A 1.50%Investment Grade Preferred
Securities Income Fund* N/A 1.10% 1.10% N/A N/A N/A N/A N/A N/APreferred Securities Income Fund N/A 1.10% 1.10% N/A 1.10% 1.10% 1.10% N/A 1.10%
* Refer to note 13
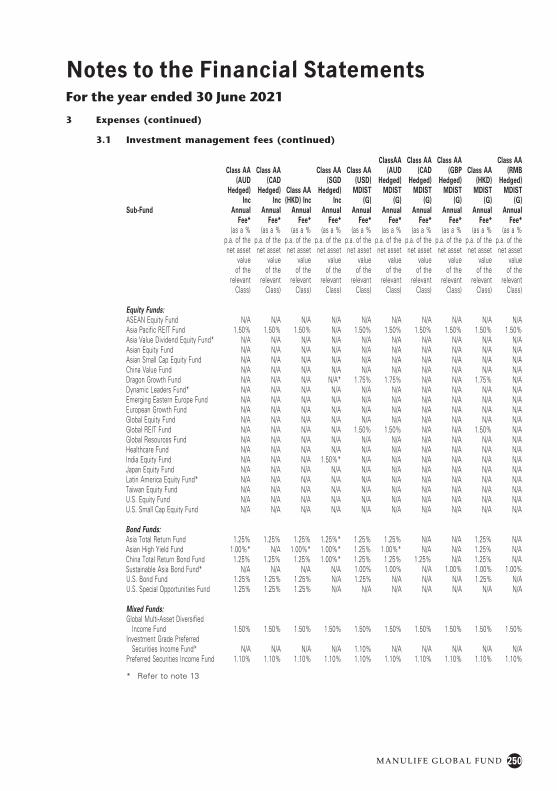
250M A N U L I F E G L O B A L F U N D
Notes to the Financial StatementsFor the year ended 30 June 2021
3 Expenses (continued)
3.1 Investment management fees (continued)
Sub-Fund
Class AA (AUD
Hedged) Inc
Annual
Class AA (CAD
Hedged) Inc
Annual
Class AA (HKD) Inc
Annual
Class AA (SGD
Hedged) Inc
Annual
Class AA (USD)
MDIST (G)
Annual
ClassAA (AUD
Hedged) MDIST
(G) Annual
Class AA (CAD
Hedged) MDIST
(G) Annual
Class AA (GBP
Hedged) MDIST
(G) Annual
Class AA (HKD)
MDIST (G)
Annual
Class AA (RMB
Hedged) MDIST
(G) Annual
Fee* Fee* Fee* Fee* Fee* Fee* Fee* Fee* Fee* Fee*(as a %
p.a. of the net asset
value of the
relevant Class)
(as a % p.a. of the net asset
value of the
relevant Class)
(as a % p.a. of the net asset
value of the
relevant Class)
(as a % p.a. of the net asset
value of the
relevant Class)
(as a % p.a. of the net asset
value of the
relevant Class)
(as a % p.a. of the net asset
value of the
relevant Class)
(as a % p.a. of the net asset
value of the
relevant Class)
(as a % p.a. of the net asset
value of the
relevant Class)
(as a % p.a. of the net asset
value of the
relevant Class)
(as a % p.a. of the net asset
value of the
relevant Class)
Equity Funds:ASEAN Equity Fund N/A N/A N/A N/A N/A N/A N/A N/A N/A N/AAsia Pacific REIT Fund 1.50% 1.50% 1.50% N/A 1.50% 1.50% 1.50% 1.50% 1.50% 1.50%Asia Value Dividend Equity Fund* N/A N/A N/A N/A N/A N/A N/A N/A N/A N/AAsian Equity Fund N/A N/A N/A N/A N/A N/A N/A N/A N/A N/AAsian Small Cap Equity Fund N/A N/A N/A N/A N/A N/A N/A N/A N/A N/AChina Value Fund N/A N/A N/A N/A N/A N/A N/A N/A N/A N/ADragon Growth Fund N/A N/A N/A N/A* 1.75% 1.75% N/A N/A 1.75% N/ADynamic Leaders Fund* N/A N/A N/A N/A N/A N/A N/A N/A N/A N/AEmerging Eastern Europe Fund N/A N/A N/A N/A N/A N/A N/A N/A N/A N/AEuropean Growth Fund N/A N/A N/A N/A N/A N/A N/A N/A N/A N/AGlobal Equity Fund N/A N/A N/A N/A N/A N/A N/A N/A N/A N/AGlobal REIT Fund N/A N/A N/A N/A 1.50% 1.50% N/A N/A 1.50% N/AGlobal Resources Fund N/A N/A N/A N/A N/A N/A N/A N/A N/A N/AHealthcare Fund N/A N/A N/A N/A N/A N/A N/A N/A N/A N/AIndia Equity Fund N/A N/A N/A 1.50%* N/A N/A N/A N/A N/A N/AJapan Equity Fund N/A N/A N/A N/A N/A N/A N/A N/A N/A N/ALatin America Equity Fund* N/A N/A N/A N/A N/A N/A N/A N/A N/A N/ATaiwan Equity Fund N/A N/A N/A N/A N/A N/A N/A N/A N/A N/AU.S. Equity Fund N/A N/A N/A N/A N/A N/A N/A N/A N/A N/AU.S. Small Cap Equity Fund N/A N/A N/A N/A N/A N/A N/A N/A N/A N/A
Bond Funds:Asia Total Return Fund 1.25% 1.25% 1.25% 1.25%* 1.25% 1.25% N/A N/A 1.25% N/AAsian High Yield Fund 1.00%* N/A 1.00%* 1.00%* 1.25% 1.00%* N/A N/A 1.25% N/AChina Total Return Bond Fund 1.25% 1.25% 1.25% 1.00%* 1.25% 1.25% 1.25% N/A 1.25% N/ASustainable Asia Bond Fund* N/A N/A N/A N/A 1.00% 1.00% N/A 1.00% 1.00% 1.00%U.S. Bond Fund 1.25% 1.25% 1.25% N/A 1.25% N/A N/A N/A 1.25% N/AU.S. Special Opportunities Fund 1.25% 1.25% 1.25% N/A N/A N/A N/A N/A N/A N/A
Mixed Funds:Global Multi-Asset Diversified
Income Fund 1.50% 1.50% 1.50% 1.50% 1.50% 1.50% 1.50% 1.50% 1.50% 1.50%Investment Grade Preferred
Securities Income Fund* N/A N/A N/A N/A 1.10% N/A N/A N/A N/A N/APreferred Securities Income Fund 1.10% 1.10% 1.10% 1.10% 1.10% 1.10% 1.10% 1.10% 1.10% 1.10%
* Refer to note 13
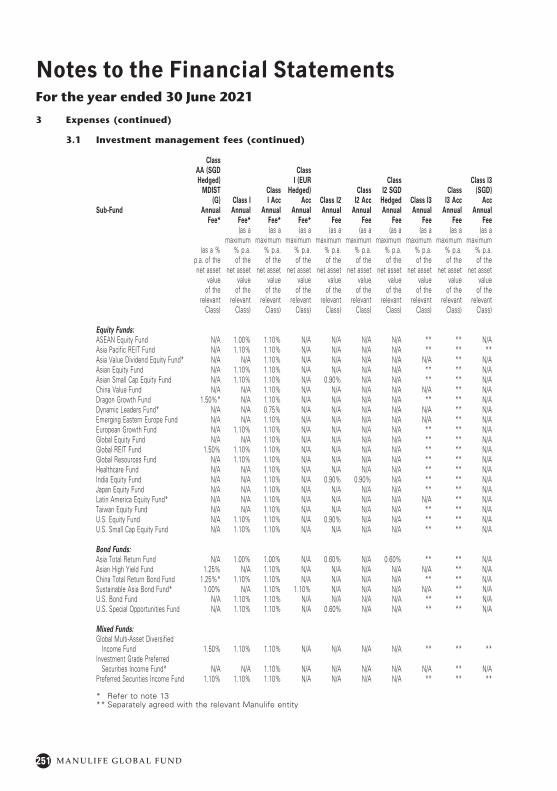
251 M A N U L I F E G L O B A L F U N D
Notes to the Financial StatementsFor the year ended 30 June 2021
3 Expenses (continued)
3.1 Investment management fees (continued)
Sub-Fund
Class AA (SGD Hedged)
MDIST (G)
AnnualClass I Annual
Class I Acc
Annual
Class I (EUR
Hedged) Acc
AnnualClass I2 Annual
Class I2 Acc
Annual
Class I2 SGD
Hedged Annual
Class I3 Annual
Class I3 Acc
Annual
Class I3 (SGD)
Acc Annual
Fee* Fee* Fee* Fee* Fee Fee Fee Fee Fee Fee
(as a % p.a. of the net asset
value of the
relevant Class)
(as a maximum
% p.a. of the
net asset value
of the relevant
Class)
(as a maximum
% p.a. of the
net asset value
of the relevant
Class)
(as a maximum
% p.a. of the
net asset value
of the relevant
Class)
(as a maximum
% p.a. of the
net asset value
of the relevant
Class)
(as a maximum
% p.a. of the
net asset value
of the relevant
Class)
(as a maximum
% p.a. of the
net asset value
of the relevant
Class)
(as a maximum
% p.a. of the
net asset value
of the relevant
Class)
(as a maximum
% p.a. of the
net asset value
of the relevant
Class)
(as a maximum
% p.a. of the
net asset value
of the relevant
Class)
Equity Funds:ASEAN Equity Fund N/A 1.00% 1.10% N/A N/A N/A N/A ** ** N/AAsia Pacific REIT Fund N/A 1.10% 1.10% N/A N/A N/A N/A ** ** **Asia Value Dividend Equity Fund* N/A N/A 1.10% N/A N/A N/A N/A N/A ** N/AAsian Equity Fund N/A 1.10% 1.10% N/A N/A N/A N/A ** ** N/AAsian Small Cap Equity Fund N/A 1.10% 1.10% N/A 0.90% N/A N/A ** ** N/AChina Value Fund N/A N/A 1.10% N/A N/A N/A N/A N/A ** N/ADragon Growth Fund 1.50%* N/A 1.10% N/A N/A N/A N/A ** ** N/ADynamic Leaders Fund* N/A N/A 0.75% N/A N/A N/A N/A N/A ** N/AEmerging Eastern Europe Fund N/A N/A 1.10% N/A N/A N/A N/A N/A ** N/AEuropean Growth Fund N/A 1.10% 1.10% N/A N/A N/A N/A ** ** N/AGlobal Equity Fund N/A N/A 1.10% N/A N/A N/A N/A ** ** N/AGlobal REIT Fund 1.50% 1.10% 1.10% N/A N/A N/A N/A ** ** N/AGlobal Resources Fund N/A 1.10% 1.10% N/A N/A N/A N/A ** ** N/AHealthcare Fund N/A N/A 1.10% N/A N/A N/A N/A ** ** N/AIndia Equity Fund N/A N/A 1.10% N/A 0.90% 0.90% N/A ** ** N/AJapan Equity Fund N/A N/A 1.10% N/A N/A N/A N/A ** ** N/ALatin America Equity Fund* N/A N/A 1.10% N/A N/A N/A N/A N/A ** N/ATaiwan Equity Fund N/A N/A 1.10% N/A N/A N/A N/A ** ** N/AU.S. Equity Fund N/A 1.10% 1.10% N/A 0.90% N/A N/A ** ** N/AU.S. Small Cap Equity Fund N/A 1.10% 1.10% N/A N/A N/A N/A ** ** N/A
Bond Funds:Asia Total Return Fund N/A 1.00% 1.00% N/A 0.60% N/A 0.60% ** ** N/AAsian High Yield Fund 1.25% N/A 1.10% N/A N/A N/A N/A N/A ** N/AChina Total Return Bond Fund 1.25%* 1.10% 1.10% N/A N/A N/A N/A ** ** N/ASustainable Asia Bond Fund* 1.00% N/A 1.10% 1.10% N/A N/A N/A N/A ** N/AU.S. Bond Fund N/A 1.10% 1.10% N/A N/A N/A N/A ** ** N/AU.S. Special Opportunities Fund N/A 1.10% 1.10% N/A 0.60% N/A N/A ** ** N/A
Mixed Funds:Global Multi-Asset Diversified
Income Fund 1.50% 1.10% 1.10% N/A N/A N/A N/A ** ** **Investment Grade Preferred
Securities Income Fund* N/A N/A 1.10% N/A N/A N/A N/A N/A ** N/APreferred Securities Income Fund 1.10% 1.10% 1.10% N/A N/A N/A N/A ** ** **
* Refer to note 13** Separately agreed with the relevant Manulife entity
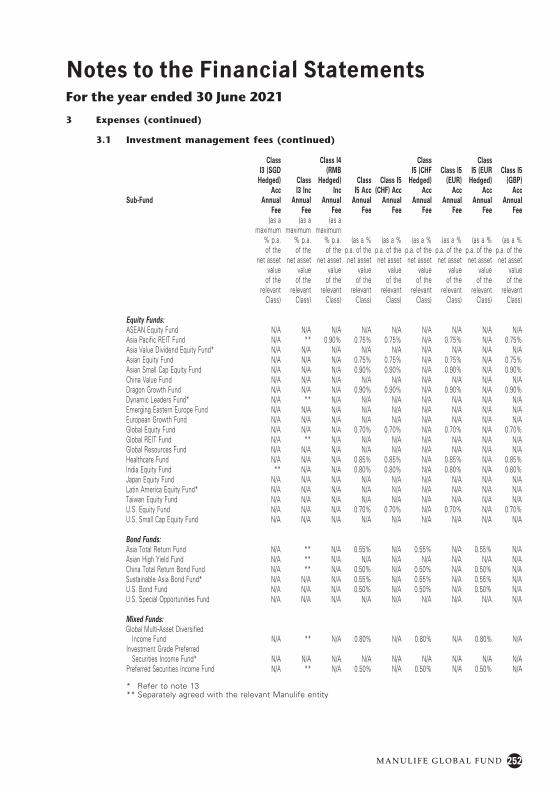
252M A N U L I F E G L O B A L F U N D
Notes to the Financial StatementsFor the year ended 30 June 2021
3 Expenses (continued)
3.1 Investment management fees (continued)
Sub-Fund
Class I3 (SGD
Hedged) Acc
Annual
Class I3 Inc
Annual
Class I4 (RMB
Hedged) Inc
Annual
Class I5 Acc
Annual
Class I5 (CHF) Acc
Annual
Class I5 (CHF
Hedged) Acc
Annual
Class I5 (EUR)
Acc Annual
Class I5 (EUR
Hedged) Acc
Annual
Class I5 (GBP)
Acc Annual
Fee Fee Fee Fee Fee Fee Fee Fee Fee(as a
maximum % p.a. of the
net asset value
of the relevant
Class)
(as a maximum
% p.a. of the
net asset value
of the relevant
Class)
(as a maximum
% p.a. of the
net asset value
of the relevant
Class)
(as a % p.a. of the net asset
value of the
relevant Class)
(as a % p.a. of the net asset
value of the
relevant Class)
(as a % p.a. of the net asset
value of the
relevant Class)
(as a % p.a. of the net asset
value of the
relevant Class)
(as a % p.a. of the net asset
value of the
relevant Class)
(as a % p.a. of the net asset
value of the
relevant Class)
Equity Funds:ASEAN Equity Fund N/A N/A N/A N/A N/A N/A N/A N/A N/AAsia Pacific REIT Fund N/A ** 0.90% 0.75% 0.75% N/A 0.75% N/A 0.75%Asia Value Dividend Equity Fund* N/A N/A N/A N/A N/A N/A N/A N/A N/AAsian Equity Fund N/A N/A N/A 0.75% 0.75% N/A 0.75% N/A 0.75%Asian Small Cap Equity Fund N/A N/A N/A 0.90% 0.90% N/A 0.90% N/A 0.90%China Value Fund N/A N/A N/A N/A N/A N/A N/A N/A N/ADragon Growth Fund N/A N/A N/A 0.90% 0.90% N/A 0.90% N/A 0.90%Dynamic Leaders Fund* N/A ** N/A N/A N/A N/A N/A N/A N/AEmerging Eastern Europe Fund N/A N/A N/A N/A N/A N/A N/A N/A N/AEuropean Growth Fund N/A N/A N/A N/A N/A N/A N/A N/A N/AGlobal Equity Fund N/A N/A N/A 0.70% 0.70% N/A 0.70% N/A 0.70%Global REIT Fund N/A ** N/A N/A N/A N/A N/A N/A N/AGlobal Resources Fund N/A N/A N/A N/A N/A N/A N/A N/A N/AHealthcare Fund N/A N/A N/A 0.85% 0.85% N/A 0.85% N/A 0.85%India Equity Fund ** N/A N/A 0.80% 0.80% N/A 0.80% N/A 0.80%Japan Equity Fund N/A N/A N/A N/A N/A N/A N/A N/A N/ALatin America Equity Fund* N/A N/A N/A N/A N/A N/A N/A N/A N/ATaiwan Equity Fund N/A N/A N/A N/A N/A N/A N/A N/A N/AU.S. Equity Fund N/A N/A N/A 0.70% 0.70% N/A 0.70% N/A 0.70%U.S. Small Cap Equity Fund N/A N/A N/A N/A N/A N/A N/A N/A N/A
Bond Funds:Asia Total Return Fund N/A ** N/A 0.55% N/A 0.55% N/A 0.55% N/AAsian High Yield Fund N/A ** N/A N/A N/A N/A N/A N/A N/AChina Total Return Bond Fund N/A ** N/A 0.50% N/A 0.50% N/A 0.50% N/ASustainable Asia Bond Fund* N/A N/A N/A 0.55% N/A 0.55% N/A 0.55% N/AU.S. Bond Fund N/A N/A N/A 0.50% N/A 0.50% N/A 0.50% N/AU.S. Special Opportunities Fund N/A N/A N/A N/A N/A N/A N/A N/A N/A
Mixed Funds:Global Multi-Asset Diversified
Income Fund N/A ** N/A 0.80% N/A 0.80% N/A 0.80% N/AInvestment Grade Preferred
Securities Income Fund* N/A N/A N/A N/A N/A N/A N/A N/A N/APreferred Securities Income Fund N/A ** N/A 0.50% N/A 0.50% N/A 0.50% N/A
* Refer to note 13** Separately agreed with the relevant Manulife entity
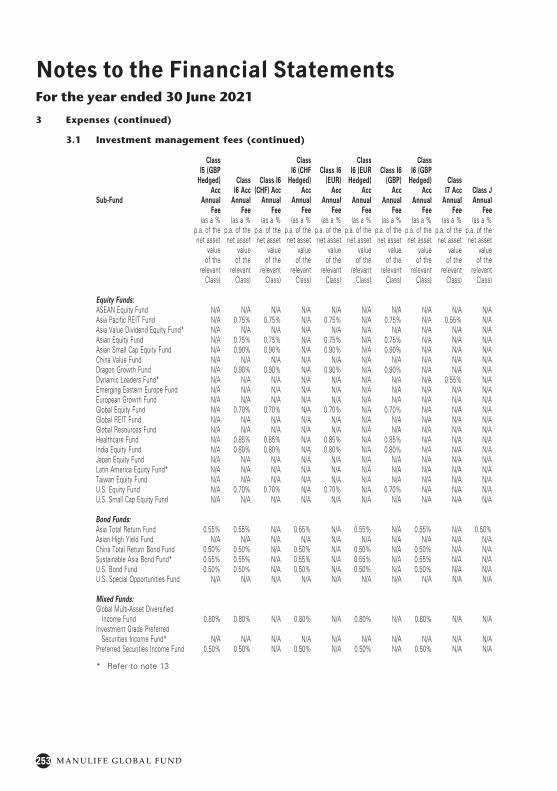
253 M A N U L I F E G L O B A L F U N D
Notes to the Financial StatementsFor the year ended 30 June 2021
3 Expenses (continued)
3.1 Investment management fees (continued)
Sub-Fund
Class I5 (GBP
Hedged) Acc
Annual
Class I6 Acc
Annual
Class I6 (CHF) Acc
Annual
Class I6 (CHF
Hedged) Acc
Annual
Class I6 (EUR)
Acc Annual
Class I6 (EUR
Hedged) Acc
Annual
Class I6 (GBP)
Acc Annual
Class I6 (GBP
Hedged) Acc
Annual
Class I7 Acc
AnnualClass J Annual
Fee Fee Fee Fee Fee Fee Fee Fee Fee Fee(as a %
p.a. of the net asset
value of the
relevant Class)
(as a % p.a. of the net asset
value of the
relevant Class)
(as a % p.a. of the net asset
value of the
relevant Class)
(as a % p.a. of the net asset
value of the
relevant Class)
(as a % p.a. of the net asset
value of the
relevant Class)
(as a % p.a. of the net asset
value of the
relevant Class)
(as a % p.a. of the net asset
value of the
relevant Class)
(as a % p.a. of the net asset
value of the
relevant Class)
(as a % p.a. of the net asset
value of the
relevant Class)
(as a % p.a. of the net asset
value of the
relevant Class)
Equity Funds:ASEAN Equity Fund N/A N/A N/A N/A N/A N/A N/A N/A N/A N/AAsia Pacific REIT Fund N/A 0.75% 0.75% N/A 0.75% N/A 0.75% N/A 0.55% N/AAsia Value Dividend Equity Fund* N/A N/A N/A N/A N/A N/A N/A N/A N/A N/AAsian Equity Fund N/A 0.75% 0.75% N/A 0.75% N/A 0.75% N/A N/A N/AAsian Small Cap Equity Fund N/A 0.90% 0.90% N/A 0.90% N/A 0.90% N/A N/A N/AChina Value Fund N/A N/A N/A N/A N/A N/A N/A N/A N/A N/ADragon Growth Fund N/A 0.90% 0.90% N/A 0.90% N/A 0.90% N/A N/A N/ADynamic Leaders Fund* N/A N/A N/A N/A N/A N/A N/A N/A 0.55% N/AEmerging Eastern Europe Fund N/A N/A N/A N/A N/A N/A N/A N/A N/A N/AEuropean Growth Fund N/A N/A N/A N/A N/A N/A N/A N/A N/A N/AGlobal Equity Fund N/A 0.70% 0.70% N/A 0.70% N/A 0.70% N/A N/A N/AGlobal REIT Fund N/A N/A N/A N/A N/A N/A N/A N/A N/A N/AGlobal Resources Fund N/A N/A N/A N/A N/A N/A N/A N/A N/A N/AHealthcare Fund N/A 0.85% 0.85% N/A 0.85% N/A 0.85% N/A N/A N/AIndia Equity Fund N/A 0.80% 0.80% N/A 0.80% N/A 0.80% N/A N/A N/AJapan Equity Fund N/A N/A N/A N/A N/A N/A N/A N/A N/A N/ALatin America Equity Fund* N/A N/A N/A N/A N/A N/A N/A N/A N/A N/ATaiwan Equity Fund N/A N/A N/A N/A N/A N/A N/A N/A N/A N/AU.S. Equity Fund N/A 0.70% 0.70% N/A 0.70% N/A 0.70% N/A N/A N/AU.S. Small Cap Equity Fund N/A N/A N/A N/A N/A N/A N/A N/A N/A N/A
Bond Funds:Asia Total Return Fund 0.55% 0.55% N/A 0.55% N/A 0.55% N/A 0.55% N/A 0.50%Asian High Yield Fund N/A N/A N/A N/A N/A N/A N/A N/A N/A N/AChina Total Return Bond Fund 0.50% 0.50% N/A 0.50% N/A 0.50% N/A 0.50% N/A N/ASustainable Asia Bond Fund* 0.55% 0.55% N/A 0.55% N/A 0.55% N/A 0.55% N/A N/AU.S. Bond Fund 0.50% 0.50% N/A 0.50% N/A 0.50% N/A 0.50% N/A N/AU.S. Special Opportunities Fund N/A N/A N/A N/A N/A N/A N/A N/A N/A N/A
Mixed Funds:Global Multi-Asset Diversified
Income Fund 0.80% 0.80% N/A 0.80% N/A 0.80% N/A 0.80% N/A N/AInvestment Grade Preferred
Securities Income Fund* N/A N/A N/A N/A N/A N/A N/A N/A N/A N/APreferred Securities Income Fund 0.50% 0.50% N/A 0.50% N/A 0.50% N/A 0.50% N/A N/A
* Refer to note 13
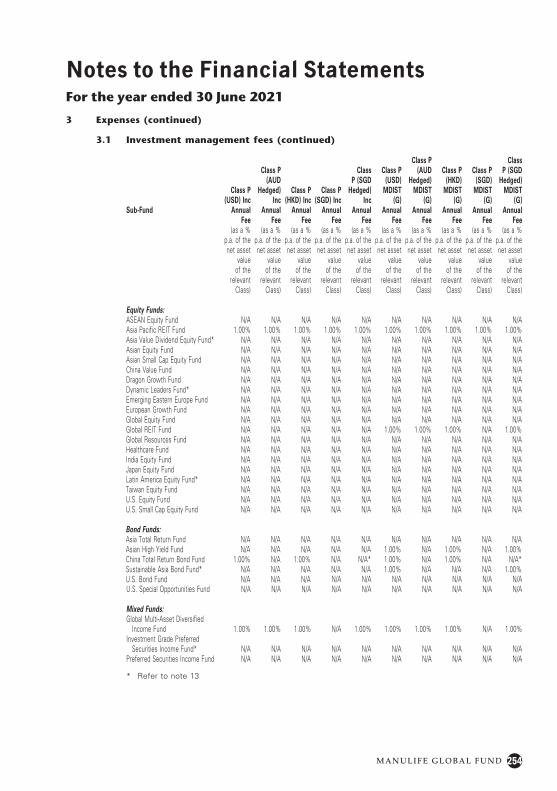
254M A N U L I F E G L O B A L F U N D
Notes to the Financial StatementsFor the year ended 30 June 2021
3 Expenses (continued)
3.1 Investment management fees (continued)
Sub-Fund
Class P (USD) Inc
Annual
Class P (AUD
Hedged) Inc
Annual
Class P (HKD) Inc
Annual
Class P (SGD) Inc
Annual
Class P (SGD
Hedged) Inc
Annual
Class P (USD)
MDIST (G)
Annual
Class P (AUD
Hedged) MDIST
(G) Annual
Class P (HKD)
MDIST (G)
Annual
Class P (SGD)
MDIST (G)
Annual
Class P (SGD
Hedged) MDIST
(G) Annual
Fee Fee Fee Fee Fee Fee Fee Fee Fee Fee(as a %
p.a. of the net asset
value of the
relevant Class)
(as a % p.a. of the net asset
value of the
relevant Class)
(as a % p.a. of the net asset
value of the
relevant Class)
(as a % p.a. of the net asset
value of the
relevant Class)
(as a % p.a. of the net asset
value of the
relevant Class)
(as a % p.a. of the net asset
value of the
relevant Class)
(as a % p.a. of the net asset
value of the
relevant Class)
(as a % p.a. of the net asset
value of the
relevant Class)
(as a % p.a. of the net asset
value of the
relevant Class)
(as a % p.a. of the net asset
value of the
relevant Class)
Equity Funds:ASEAN Equity Fund N/A N/A N/A N/A N/A N/A N/A N/A N/A N/AAsia Pacific REIT Fund 1.00% 1.00% 1.00% 1.00% 1.00% 1.00% 1.00% 1.00% 1.00% 1.00%Asia Value Dividend Equity Fund* N/A N/A N/A N/A N/A N/A N/A N/A N/A N/AAsian Equity Fund N/A N/A N/A N/A N/A N/A N/A N/A N/A N/AAsian Small Cap Equity Fund N/A N/A N/A N/A N/A N/A N/A N/A N/A N/AChina Value Fund N/A N/A N/A N/A N/A N/A N/A N/A N/A N/ADragon Growth Fund N/A N/A N/A N/A N/A N/A N/A N/A N/A N/ADynamic Leaders Fund* N/A N/A N/A N/A N/A N/A N/A N/A N/A N/AEmerging Eastern Europe Fund N/A N/A N/A N/A N/A N/A N/A N/A N/A N/AEuropean Growth Fund N/A N/A N/A N/A N/A N/A N/A N/A N/A N/AGlobal Equity Fund N/A N/A N/A N/A N/A N/A N/A N/A N/A N/AGlobal REIT Fund N/A N/A N/A N/A N/A 1.00% 1.00% 1.00% N/A 1.00%Global Resources Fund N/A N/A N/A N/A N/A N/A N/A N/A N/A N/AHealthcare Fund N/A N/A N/A N/A N/A N/A N/A N/A N/A N/AIndia Equity Fund N/A N/A N/A N/A N/A N/A N/A N/A N/A N/AJapan Equity Fund N/A N/A N/A N/A N/A N/A N/A N/A N/A N/ALatin America Equity Fund* N/A N/A N/A N/A N/A N/A N/A N/A N/A N/ATaiwan Equity Fund N/A N/A N/A N/A N/A N/A N/A N/A N/A N/AU.S. Equity Fund N/A N/A N/A N/A N/A N/A N/A N/A N/A N/AU.S. Small Cap Equity Fund N/A N/A N/A N/A N/A N/A N/A N/A N/A N/A
Bond Funds:Asia Total Return Fund N/A N/A N/A N/A N/A N/A N/A N/A N/A N/AAsian High Yield Fund N/A N/A N/A N/A N/A 1.00% N/A 1.00% N/A 1.00%China Total Return Bond Fund 1.00% N/A 1.00% N/A N/A* 1.00% N/A 1.00% N/A N/A*Sustainable Asia Bond Fund* N/A N/A N/A N/A N/A 1.00% N/A N/A N/A 1.00%U.S. Bond Fund N/A N/A N/A N/A N/A N/A N/A N/A N/A N/AU.S. Special Opportunities Fund N/A N/A N/A N/A N/A N/A N/A N/A N/A N/A
Mixed Funds:Global Multi-Asset Diversified
Income Fund 1.00% 1.00% 1.00% N/A 1.00% 1.00% 1.00% 1.00% N/A 1.00%Investment Grade Preferred
Securities Income Fund* N/A N/A N/A N/A N/A N/A N/A N/A N/A N/APreferred Securities Income Fund N/A N/A N/A N/A N/A N/A N/A N/A N/A N/A
* Refer to note 13
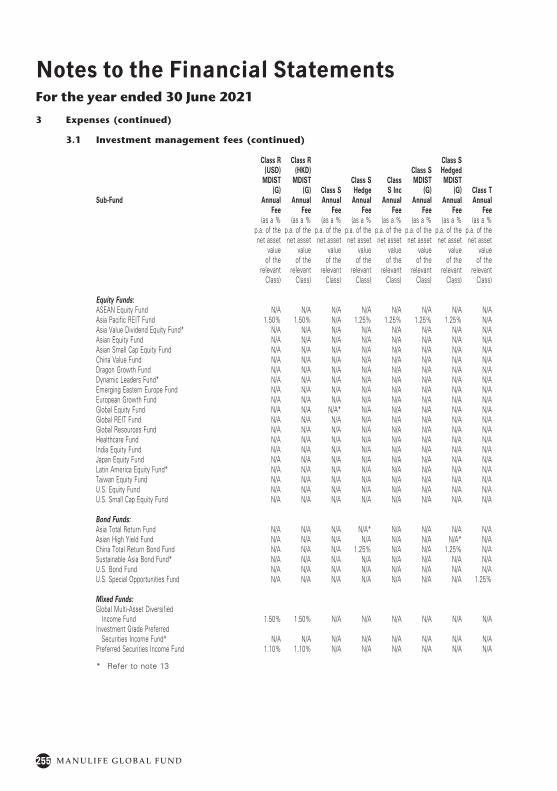
255 M A N U L I F E G L O B A L F U N D
Notes to the Financial StatementsFor the year ended 30 June 2021
3 Expenses (continued)
3.1 Investment management fees (continued)
Sub-Fund
Class R (USD)
MDIST (G)
Annual
Class R (HKD)
MDIST (G)
AnnualClass S Annual
Class S Hedge
Annual
Class S Inc
Annual
Class S MDIST
(G) Annual
Class S Hedged MDIST
(G) Annual
Class T Annual
Fee Fee Fee Fee Fee Fee Fee Fee(as a %
p.a. of the net asset
value of the
relevant Class)
(as a % p.a. of the net asset
value of the
relevant Class)
(as a % p.a. of the net asset
value of the
relevant Class)
(as a % p.a. of the net asset
value of the
relevant Class)
(as a % p.a. of the net asset
value of the
relevant Class)
(as a % p.a. of the net asset
value of the
relevant Class)
(as a % p.a. of the net asset
value of the
relevant Class)
(as a % p.a. of the net asset
value of the
relevant Class)
Equity Funds:ASEAN Equity Fund N/A N/A N/A N/A N/A N/A N/A N/AAsia Pacific REIT Fund 1.50% 1.50% N/A 1.25% 1.25% 1.25% 1.25% N/AAsia Value Dividend Equity Fund* N/A N/A N/A N/A N/A N/A N/A N/AAsian Equity Fund N/A N/A N/A N/A N/A N/A N/A N/AAsian Small Cap Equity Fund N/A N/A N/A N/A N/A N/A N/A N/AChina Value Fund N/A N/A N/A N/A N/A N/A N/A N/ADragon Growth Fund N/A N/A N/A N/A N/A N/A N/A N/ADynamic Leaders Fund* N/A N/A N/A N/A N/A N/A N/A N/AEmerging Eastern Europe Fund N/A N/A N/A N/A N/A N/A N/A N/AEuropean Growth Fund N/A N/A N/A N/A N/A N/A N/A N/AGlobal Equity Fund N/A N/A N/A* N/A N/A N/A N/A N/AGlobal REIT Fund N/A N/A N/A N/A N/A N/A N/A N/AGlobal Resources Fund N/A N/A N/A N/A N/A N/A N/A N/AHealthcare Fund N/A N/A N/A N/A N/A N/A N/A N/AIndia Equity Fund N/A N/A N/A N/A N/A N/A N/A N/AJapan Equity Fund N/A N/A N/A N/A N/A N/A N/A N/ALatin America Equity Fund* N/A N/A N/A N/A N/A N/A N/A N/ATaiwan Equity Fund N/A N/A N/A N/A N/A N/A N/A N/AU.S. Equity Fund N/A N/A N/A N/A N/A N/A N/A N/AU.S. Small Cap Equity Fund N/A N/A N/A N/A N/A N/A N/A N/A
Bond Funds:Asia Total Return Fund N/A N/A N/A N/A* N/A N/A N/A N/AAsian High Yield Fund N/A N/A N/A N/A N/A N/A N/A* N/AChina Total Return Bond Fund N/A N/A N/A 1.25% N/A N/A 1.25% N/ASustainable Asia Bond Fund* N/A N/A N/A N/A N/A N/A N/A N/AU.S. Bond Fund N/A N/A N/A N/A N/A N/A N/A N/AU.S. Special Opportunities Fund N/A N/A N/A N/A N/A N/A N/A 1.25%
Mixed Funds:Global Multi-Asset Diversified
Income Fund 1.50% 1.50% N/A N/A N/A N/A N/A N/AInvestment Grade Preferred
Securities Income Fund* N/A N/A N/A N/A N/A N/A N/A N/APreferred Securities Income Fund 1.10% 1.10% N/A N/A N/A N/A N/A N/A
* Refer to note 13
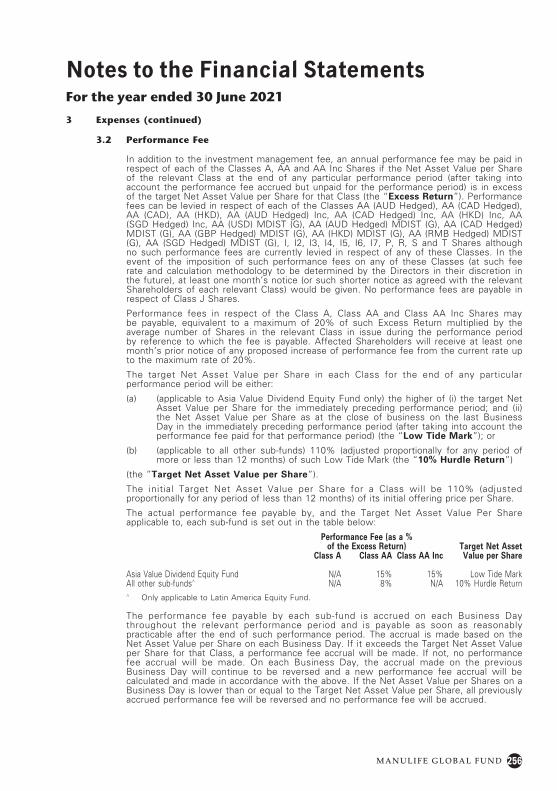
256M A N U L I F E G L O B A L F U N D
Notes to the Financial StatementsFor the year ended 30 June 2021
3 Expenses (continued)
3.2 Performance Fee
In addition to the investment management fee, an annual performance fee may be paid in respect of each of the Classes A, AA and AA Inc Shares if the Net Asset Value per Share of the relevant Class at the end of any particular performance period (after taking into account the performance fee accrued but unpaid for the performance period) is in excess of the target Net Asset Value per Share for that Class (the “Excess Return”). Performance fees can be levied in respect of each of the Classes AA (AUD Hedged), AA (CAD Hedged), AA (CAD), AA (HKD), AA (AUD Hedged) Inc, AA (CAD Hedged) Inc, AA (HKD) Inc, AA (SGD Hedged) Inc, AA (USD) MDIST (G), AA (AUD Hedged) MDIST (G), AA (CAD Hedged) MDIST (G), AA (GBP Hedged) MDIST (G), AA (HKD) MDIST (G), AA (RMB Hedged) MDIST (G), AA (SGD Hedged) MDIST (G), I, I2, I3, I4, I5, I6, I7, P, R, S and T Shares although no such performance fees are currently levied in respect of any of these Classes. In the event of the imposition of such performance fees on any of these Classes (at such fee rate and calculation methodology to be determined by the Directors in their discretion in the future), at least one month’s notice (or such shorter notice as agreed with the relevant Shareholders of each relevant Class) would be given. No performance fees are payable in respect of Class J Shares.
Performance fees in respect of the Class A, Class AA and Class AA Inc Shares may be payable, equivalent to a maximum of 20% of such Excess Return multiplied by the average number of Shares in the relevant Class in issue during the performance period by reference to which the fee is payable. Affected Shareholders will receive at least one month’s prior notice of any proposed increase of performance fee from the current rate up to the maximum rate of 20%.
The target Net Asset Value per Share in each Class for the end of any particular performance period will be either:
(a) (applicable to Asia Value Dividend Equity Fund only) the higher of (i) the target Net Asset Value per Share for the immediately preceding performance period; and (ii) the Net Asset Value per Share as at the close of business on the last Business Day in the immediately preceding performance period (after taking into account the performance fee paid for that performance period) (the “Low Tide Mark”); or
(b) (applicable to all other sub-funds) 110% (adjusted proportionally for any period of more or less than 12 months) of such Low Tide Mark (the “10% Hurdle Return”)
(the ”Target Net Asset Value per Share”).
The initial Target Net Asset Value per Share for a Class will be 110% (adjusted proportionally for any period of less than 12 months) of its initial offering price per Share.
The actual performance fee payable by, and the Target Net Asset Value Per Share applicable to, each sub-fund is set out in the table below:
Performance Fee (as a %of the Excess Return) Target Net Asset
Class A Class AA Class AA Inc Value per Share
Asia Value Dividend Equity Fund N/A 15% 15% Low Tide MarkAll other sub-funds^ N/A 8% N/A 10% Hurdle Return^ Only applicable to Latin America Equity Fund.
The performance fee payable by each sub-fund is accrued on each Business Day throughout the relevant performance period and is payable as soon as reasonably practicable after the end of such performance period. The accrual is made based on the Net Asset Value per Share on each Business Day. If it exceeds the Target Net Asset Value per Share for that Class, a performance fee accrual will be made. If not, no performance fee accrual will be made. On each Business Day, the accrual made on the previous Business Day will continue to be reversed and a new performance fee accrual will be calculated and made in accordance with the above. If the Net Asset Value per Shares on a Business Day is lower than or equal to the Target Net Asset Value per Share, all previously accrued performance fee will be reversed and no performance fee will be accrued.
257 M A N U L I F E G L O B A L F U N D
Notes to the Financial StatementsFor the year ended 30 June 2021
3 Expenses (continued)
3.2 Performance Fee (continued)
The standing policy of the Company is that a relevant sub-fund which is entitled to levy a performance fee does not perform equalisation or issue different series of shares for the purposes of determining the performance fee payable. The Company’s methodology for calculating the performance fee involves adjusting the issue and redemption price per share to make provision for accrual for the performance fee upon the issue and redemption of shares during the relevant performance period. The calculation of the Net Asset Value per Share will take into account unrealised appreciation as well as realised gains which may result in a performance fee being paid on unrealised gains which may subsequently never be realised.
3.3 Management Company
The Company has designated Carne Global Fund Managers (Luxembourg) S.A. to act as its Management Company pursuant to a management company services agreement dated 11 April 2019 (as may be amended from time to time) (the “Management Company Services Agreement”).
The Management Company was incorporated in Luxembourg on 17 September 2009 for an indefinite period and is subject to the provisions of Chapter 15 of the 2010 Law. It has its registered office in the Grand-Duchy of Luxembourg, at 3, rue Jean Piret, L-2350 Luxembourg (until 30 June 2020: 6B, route de Trèves, L-2633 Senningerberg). The articles of incorporation of the Management Company are filed in their consolidated, legally binding form for public reference in the Luxembourg Trade and Companies Register under no. B 148 258.
Pursuant to the Management Company Services Agreement, the Management Company is entrusted with the day-to-day management of the Company, with the responsibility to perform, directly or by way of delegation, all operational functions relating to the investment management and the administration of the Company and the marketing and distribution of the Shares.
In agreement with the Company, the Management Company has decided to delegate several of its functions as is further described in the Prospectus.
The Management Company shall adopt procedures aiming to control that the execution of the mandates given to the different agents are carried out in accordance with the conditions agreed and in compliance with the rules and regulations in force.
In consideration for its services, the Management Company is entitled to receive from the Company a management company fee of a maximum of 0.015% per annum per sub-fund.
These fees are payable monthly and are calculated on the average net assets of each sub-fund for the relevant month.
3.4 Administration and Depositary fees
Citibank Europe plc, Luxembourg Branch receives fees as Administrator and Depositary at annual rates as follows:
Administration fee:
The Company pays the fees of the Administrator, Registrar, Listing Agent, Paying Agent and Transfer Agent at commercial rates agreed between these parties and the Company, in addition to reasonable out-of-pocket expenses properly incurred in the course of carrying out their duties. The maximum fee paid for these services by the Company will be 0.5% p.a. of its Net Asset Value (excluding reasonable out-of-pocket expenses).
The actual fees charged are 4 basis points p.a. on Net Asset Value per sub-fund below first USD 250 million and 3 basis points p.a. on Net Asset Value per sub-fund above USD 250 million, with a minimum of USD 10,000 per sub-fund p.a.
258M A N U L I F E G L O B A L F U N D
Notes to the Financial StatementsFor the year ended 30 June 2021
3 Expenses (continued)
3.4 Administration and Depositary fees (continued)
Depositary fee:
The fee paid by the Company for this service varies depending upon the markets in which the assets of the Company are invested and custodied. It typically ranges from 0.003% p.a. of the value of the assets of a sub-fund of the Company which are held in developed markets to 0.40% p.a. of the value of the assets of such sub-funds which are held in emerging markets (excluding transaction charges and reasonable disbursements and out-of-pocket expenses). Settlement charges are on a per transaction basis, which vary depending on the countries of which the securities are settled. It ranges from USD 6 per transaction for developed markets to USD 130 per transaction in emerging markets.
Reasonable expenses properly incurred by the Depositary or by other banks and financial institutions to which safekeeping of assets of the Company is entrusted are additional to the Depositary’s fee and will be borne by the Company. The Depositary’s fee normally includes the custody fees and certain transaction charges of the other banks and financial institutions.
3.5 Initial, Redemption and Switching Charges
Although an initial charge of up to 6% may be deducted from any subscription monies received from investors, no such initial charge is presently levied on Shareholders in respect of Class A, Classes I, Classes I3, Classes I4, Classes I5, Classes I6 and Class J Shares. An initial charge of up to 3.5% of the subscription amount is levied in respect of all applications for Class S Hedged Shares. An initial charge of up to 5% of the subscription amount is levied in respect of all applications for Classes AA, Classes I2 (until 29 June 2021), Classes P, Classes R, Classes S (with the exception of the class S Hedged) and Class T Shares.
Investors are charged a redemption charge of a maximum of 1% of the Redemption Price if they redeem their Class A Shares within the first two years of subscribing for the relevant Shares. However, the Company may (by giving not less than three months’ notice to the Shareholders and the Depositary) increase or (without having to give any prior notice) decrease or waive the redemption charge. In any case, the redemption charge does not exceed a maximum of 1% of the Redemption Price. No redemption charge is presently levied in respect of Classes AA, Classes I, Classes I2, Classes I3, Classes I4, Classes I5, Classes I6, Classes J, Classes P, Classes S and Class T shares.
A switching charge of up to 1% of the total Redemption Price payable on the Shares being redeemed shall apply in respect of all conversion requests received by the Company or the Distributor unless otherwise agreed with the relevant Shareholders.
The Distributor is entitled to retain initial, switching and redemption charges (if any) payable by Shareholders as described in the latest prospectus.
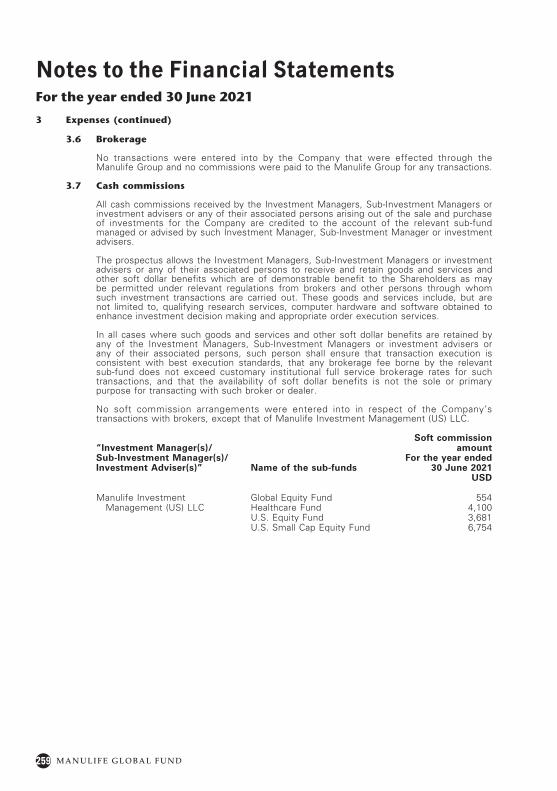
259 M A N U L I F E G L O B A L F U N D
Notes to the Financial StatementsFor the year ended 30 June 2021
3 Expenses (continued)
3.6 Brokerage
No transactions were entered into by the Company that were effected through the Manulife Group and no commissions were paid to the Manulife Group for any transactions.
3.7 Cash commissions
All cash commissions received by the Investment Managers, Sub-Investment Managers or investment advisers or any of their associated persons arising out of the sale and purchase of investments for the Company are credited to the account of the relevant sub-fund managed or advised by such Investment Manager, Sub-Investment Manager or investment advisers.
The prospectus allows the Investment Managers, Sub-Investment Managers or investment advisers or any of their associated persons to receive and retain goods and services and other soft dollar benefits which are of demonstrable benefit to the Shareholders as may be permitted under relevant regulations from brokers and other persons through whom such investment transactions are carried out. These goods and services include, but are not limited to, qualifying research services, computer hardware and software obtained to enhance investment decision making and appropriate order execution services.
In all cases where such goods and services and other soft dollar benefits are retained by any of the Investment Managers, Sub-Investment Managers or investment advisers or any of their associated persons, such person shall ensure that transaction execution is consistent with best execution standards, that any brokerage fee borne by the relevant sub-fund does not exceed customary institutional full service brokerage rates for such transactions, and that the availability of soft dollar benefits is not the sole or primary purpose for transacting with such broker or dealer.
No soft commission arrangements were entered into in respect of the Company’s transactions with brokers, except that of Manulife Investment Management (US) LLC.
“Investment Manager(s)/Sub-Investment Manager(s)/Investment Adviser(s)” Name of the sub-funds
Soft commission amount
For the year ended 30 June 2021
USD
Manulife Investment Global Equity Fund 554 Management (US) LLC Healthcare Fund 4,100
U.S. Equity Fund 3,681U.S. Small Cap Equity Fund 6,754
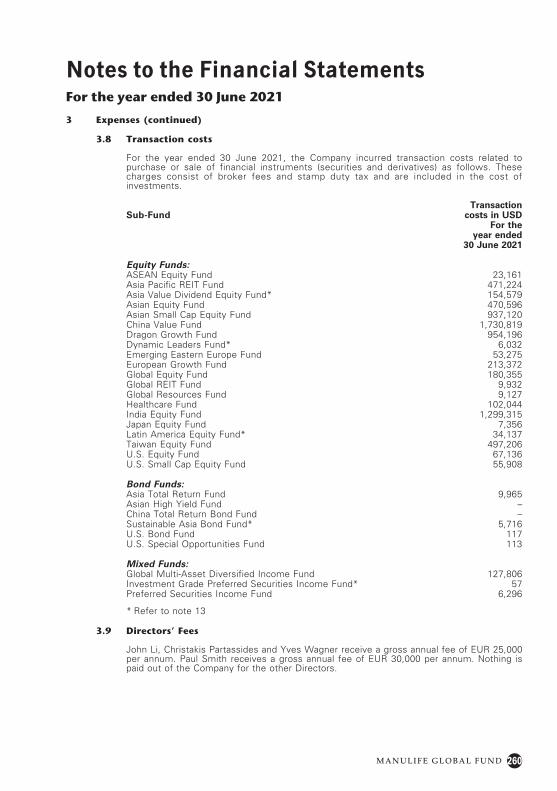
260M A N U L I F E G L O B A L F U N D
Notes to the Financial StatementsFor the year ended 30 June 2021
3 Expenses (continued)
3.8 Transaction costs
For the year ended 30 June 2021, the Company incurred transaction costs related to purchase or sale of financial instruments (securities and derivatives) as follows. These charges consist of broker fees and stamp duty tax and are included in the cost of investments.
Sub-FundTransaction
costs in USDFor the
year ended 30 June 2021
Equity Funds:ASEAN Equity Fund 23,161Asia Pacific REIT Fund 471,224Asia Value Dividend Equity Fund* 154,579Asian Equity Fund 470,596Asian Small Cap Equity Fund 937,120China Value Fund 1,730,819Dragon Growth Fund 954,196Dynamic Leaders Fund* 6,032Emerging Eastern Europe Fund 53,275European Growth Fund 213,372Global Equity Fund 180,355Global REIT Fund 9,932Global Resources Fund 9,127Healthcare Fund 102,044India Equity Fund 1,299,315Japan Equity Fund 7,356Latin America Equity Fund* 34,137Taiwan Equity Fund 497,206U.S. Equity Fund 67,136U.S. Small Cap Equity Fund 55,908
Bond Funds:Asia Total Return Fund 9,965Asian High Yield Fund –China Total Return Bond Fund –Sustainable Asia Bond Fund* 5,716U.S. Bond Fund 117U.S. Special Opportunities Fund 113
Mixed Funds:Global Multi-Asset Diversified Income Fund 127,806Investment Grade Preferred Securities Income Fund* 57Preferred Securities Income Fund 6,296
* Refer to note 13
3.9 Directors’ Fees
John Li, Christakis Partassides and Yves Wagner receive a gross annual fee of EUR 25,000 per annum. Paul Smith receives a gross annual fee of EUR 30,000 per annum. Nothing is paid out of the Company for the other Directors.
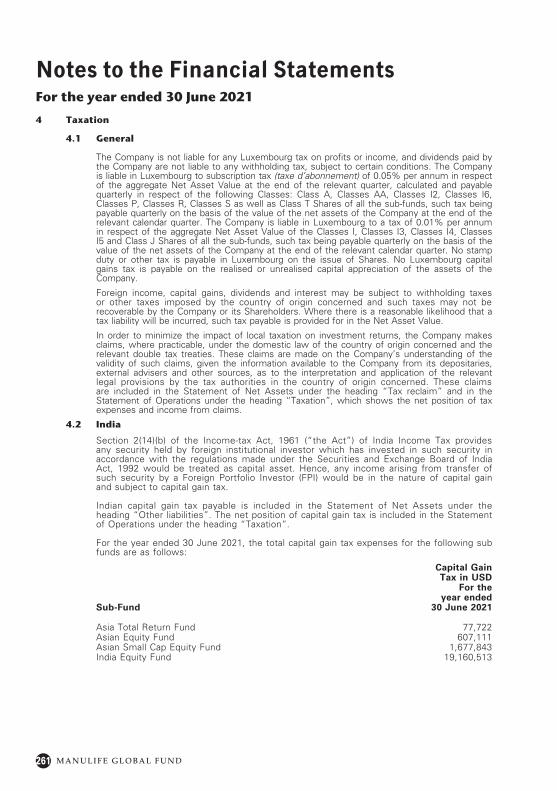
261 M A N U L I F E G L O B A L F U N D
Notes to the Financial StatementsFor the year ended 30 June 2021
4 Taxation
4.1 General
The Company is not liable for any Luxembourg tax on profits or income, and dividends paid by the Company are not liable to any withholding tax, subject to certain conditions. The Company is liable in Luxembourg to subscription tax (taxe d’abonnement) of 0.05% per annum in respect of the aggregate Net Asset Value at the end of the relevant quarter, calculated and payable quarterly in respect of the following Classes: Class A, Classes AA, Classes I2, Classes I6, Classes P, Classes R, Classes S as well as Class T Shares of all the sub-funds, such tax being payable quarterly on the basis of the value of the net assets of the Company at the end of the relevant calendar quarter. The Company is liable in Luxembourg to a tax of 0.01% per annum in respect of the aggregate Net Asset Value of the Classes I, Classes I3, Classes I4, Classes I5 and Class J Shares of all the sub-funds, such tax being payable quarterly on the basis of the value of the net assets of the Company at the end of the relevant calendar quarter. No stamp duty or other tax is payable in Luxembourg on the issue of Shares. No Luxembourg capital gains tax is payable on the realised or unrealised capital appreciation of the assets of the Company.
Foreign income, capital gains, dividends and interest may be subject to withholding taxes or other taxes imposed by the country of origin concerned and such taxes may not be recoverable by the Company or its Shareholders. Where there is a reasonable likelihood that a tax liability will be incurred, such tax payable is provided for in the Net Asset Value.
In order to minimize the impact of local taxation on investment returns, the Company makes claims, where practicable, under the domestic law of the country of origin concerned and the relevant double tax treaties. These claims are made on the Company’s understanding of the validity of such claims, given the information available to the Company from its depositaries, external advisers and other sources, as to the interpretation and application of the relevant legal provisions by the tax authorities in the country of origin concerned. These claims are included in the Statement of Net Assets under the heading “Tax reclaim” and in the Statement of Operations under the heading “Taxation”, which shows the net position of tax expenses and income from claims.
4.2 India
Section 2(14)(b) of the Income-tax Act, 1961 (“the Act”) of India Income Tax provides any security held by foreign institutional investor which has invested in such security in accordance with the regulations made under the Securities and Exchange Board of India Act, 1992 would be treated as capital asset. Hence, any income arising from transfer of such security by a Foreign Portfolio Investor (FPI) would be in the nature of capital gain and subject to capital gain tax.
Indian capital gain tax payable is included in the Statement of Net Assets under the heading “Other liabilities”. The net position of capital gain tax is included in the Statement of Operations under the heading “Taxation”.
For the year ended 30 June 2021, the total capital gain tax expenses for the following sub funds are as follows:
Capital GainTax in USD
Sub-Fund
For theyear ended
30 June 2021
Asia Total Return Fund 77,722Asian Equity Fund 607,111Asian Small Cap Equity Fund 1,677,843India Equity Fund 19,160,513
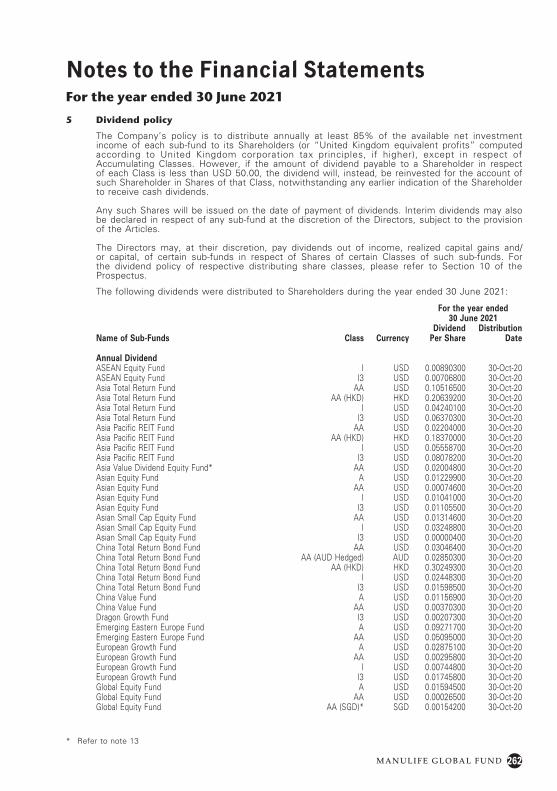
262M A N U L I F E G L O B A L F U N D
Notes to the Financial StatementsFor the year ended 30 June 2021
5 Dividend policy
The Company’s policy is to distribute annually at least 85% of the available net investment income of each sub-fund to its Shareholders (or “United Kingdom equivalent profits” computed according to United Kingdom corporation tax principles, if higher), except in respect of Accumulating Classes. However, if the amount of dividend payable to a Shareholder in respect of each Class is less than USD 50.00, the dividend will, instead, be reinvested for the account of such Shareholder in Shares of that Class, notwithstanding any earlier indication of the Shareholder to receive cash dividends.
Any such Shares will be issued on the date of payment of dividends. Interim dividends may also be declared in respect of any sub-fund at the discretion of the Directors, subject to the provision of the Articles.
The Directors may, at their discretion, pay dividends out of income, realized capital gains and/or capital, of certain sub-funds in respect of Shares of certain Classes of such sub-funds. For the dividend policy of respective distributing share classes, please refer to Section 10 of the Prospectus.
The following dividends were distributed to Shareholders during the year ended 30 June 2021:
For the year ended 30 June 2021
Name of Sub-Funds Class CurrencyDividend
Per ShareDistribution
Date
Annual DividendASEAN Equity Fund I USD 0.00890300 30-Oct-20ASEAN Equity Fund I3 USD 0.00706800 30-Oct-20Asia Total Return Fund AA USD 0.10516500 30-Oct-20Asia Total Return Fund AA (HKD) HKD 0.20639200 30-Oct-20Asia Total Return Fund I USD 0.04240100 30-Oct-20Asia Total Return Fund I3 USD 0.06370300 30-Oct-20Asia Pacific REIT Fund AA USD 0.02204000 30-Oct-20Asia Pacific REIT Fund AA (HKD) HKD 0.18370000 30-Oct-20Asia Pacific REIT Fund I USD 0.05558700 30-Oct-20Asia Pacific REIT Fund I3 USD 0.08078200 30-Oct-20Asia Value Dividend Equity Fund* AA USD 0.02004800 30-Oct-20Asian Equity Fund A USD 0.01229900 30-Oct-20Asian Equity Fund AA USD 0.00074600 30-Oct-20Asian Equity Fund I USD 0.01041000 30-Oct-20Asian Equity Fund I3 USD 0.01105500 30-Oct-20Asian Small Cap Equity Fund AA USD 0.01314600 30-Oct-20Asian Small Cap Equity Fund I USD 0.03248800 30-Oct-20Asian Small Cap Equity Fund I3 USD 0.00000400 30-Oct-20China Total Return Bond Fund AA USD 0.03046400 30-Oct-20China Total Return Bond Fund AA (AUD Hedged) AUD 0.02850300 30-Oct-20China Total Return Bond Fund AA (HKD) HKD 0.30249300 30-Oct-20China Total Return Bond Fund I USD 0.02448300 30-Oct-20China Total Return Bond Fund I3 USD 0.01598500 30-Oct-20China Value Fund A USD 0.01156900 30-Oct-20China Value Fund AA USD 0.00370300 30-Oct-20Dragon Growth Fund I3 USD 0.00207300 30-Oct-20Emerging Eastern Europe Fund A USD 0.09271700 30-Oct-20Emerging Eastern Europe Fund AA USD 0.05095000 30-Oct-20European Growth Fund A USD 0.02875100 30-Oct-20European Growth Fund AA USD 0.00295800 30-Oct-20European Growth Fund I USD 0.00744800 30-Oct-20European Growth Fund I3 USD 0.01745800 30-Oct-20Global Equity Fund A USD 0.01594500 30-Oct-20Global Equity Fund AA USD 0.00026500 30-Oct-20Global Equity Fund AA (SGD)* SGD 0.00154200 30-Oct-20
* Refer to note 13
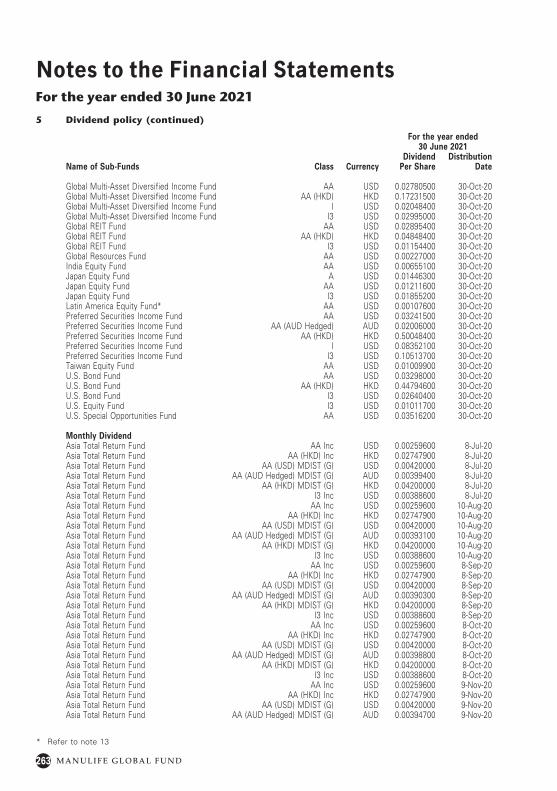
263 M A N U L I F E G L O B A L F U N D
Notes to the Financial StatementsFor the year ended 30 June 2021
For the year ended 30 June 2021
Name of Sub-Funds Class CurrencyDividend
Per ShareDistribution
Date
Global Multi-Asset Diversified Income Fund AA USD 0.02780500 30-Oct-20Global Multi-Asset Diversified Income Fund AA (HKD) HKD 0.17231500 30-Oct-20Global Multi-Asset Diversified Income Fund I USD 0.02048400 30-Oct-20Global Multi-Asset Diversified Income Fund I3 USD 0.02995000 30-Oct-20Global REIT Fund AA USD 0.02895400 30-Oct-20Global REIT Fund AA (HKD) HKD 0.04848400 30-Oct-20Global REIT Fund I3 USD 0.01154400 30-Oct-20Global Resources Fund AA USD 0.00227000 30-Oct-20India Equity Fund AA USD 0.00655100 30-Oct-20Japan Equity Fund A USD 0.01446300 30-Oct-20Japan Equity Fund AA USD 0.01211600 30-Oct-20Japan Equity Fund I3 USD 0.01855200 30-Oct-20Latin America Equity Fund* AA USD 0.00107600 30-Oct-20Preferred Securities Income Fund AA USD 0.03241500 30-Oct-20Preferred Securities Income Fund AA (AUD Hedged) AUD 0.02006000 30-Oct-20Preferred Securities Income Fund AA (HKD) HKD 0.50048400 30-Oct-20Preferred Securities Income Fund I USD 0.08352100 30-Oct-20Preferred Securities Income Fund I3 USD 0.10513700 30-Oct-20Taiwan Equity Fund AA USD 0.01009900 30-Oct-20U.S. Bond Fund AA USD 0.03298000 30-Oct-20U.S. Bond Fund AA (HKD) HKD 0.44794600 30-Oct-20U.S. Bond Fund I3 USD 0.02640400 30-Oct-20U.S. Equity Fund I3 USD 0.01011700 30-Oct-20U.S. Special Opportunities Fund AA USD 0.03516200 30-Oct-20
Monthly DividendAsia Total Return Fund AA Inc USD 0.00259600 8-Jul-20Asia Total Return Fund AA (HKD) Inc HKD 0.02747900 8-Jul-20Asia Total Return Fund AA (USD) MDIST (G) USD 0.00420000 8-Jul-20Asia Total Return Fund AA (AUD Hedged) MDIST (G) AUD 0.00399400 8-Jul-20Asia Total Return Fund AA (HKD) MDIST (G) HKD 0.04200000 8-Jul-20Asia Total Return Fund I3 Inc USD 0.00388600 8-Jul-20Asia Total Return Fund AA Inc USD 0.00259600 10-Aug-20Asia Total Return Fund AA (HKD) Inc HKD 0.02747900 10-Aug-20Asia Total Return Fund AA (USD) MDIST (G) USD 0.00420000 10-Aug-20Asia Total Return Fund AA (AUD Hedged) MDIST (G) AUD 0.00393100 10-Aug-20Asia Total Return Fund AA (HKD) MDIST (G) HKD 0.04200000 10-Aug-20Asia Total Return Fund I3 Inc USD 0.00388600 10-Aug-20Asia Total Return Fund AA Inc USD 0.00259600 8-Sep-20Asia Total Return Fund AA (HKD) Inc HKD 0.02747900 8-Sep-20Asia Total Return Fund AA (USD) MDIST (G) USD 0.00420000 8-Sep-20Asia Total Return Fund AA (AUD Hedged) MDIST (G) AUD 0.00390300 8-Sep-20Asia Total Return Fund AA (HKD) MDIST (G) HKD 0.04200000 8-Sep-20Asia Total Return Fund I3 Inc USD 0.00388600 8-Sep-20Asia Total Return Fund AA Inc USD 0.00259600 8-Oct-20Asia Total Return Fund AA (HKD) Inc HKD 0.02747900 8-Oct-20Asia Total Return Fund AA (USD) MDIST (G) USD 0.00420000 8-Oct-20Asia Total Return Fund AA (AUD Hedged) MDIST (G) AUD 0.00398800 8-Oct-20Asia Total Return Fund AA (HKD) MDIST (G) HKD 0.04200000 8-Oct-20Asia Total Return Fund I3 Inc USD 0.00388600 8-Oct-20Asia Total Return Fund AA Inc USD 0.00259600 9-Nov-20Asia Total Return Fund AA (HKD) Inc HKD 0.02747900 9-Nov-20Asia Total Return Fund AA (USD) MDIST (G) USD 0.00420000 9-Nov-20Asia Total Return Fund AA (AUD Hedged) MDIST (G) AUD 0.00394700 9-Nov-20
5 Dividend policy (continued)
* Refer to note 13
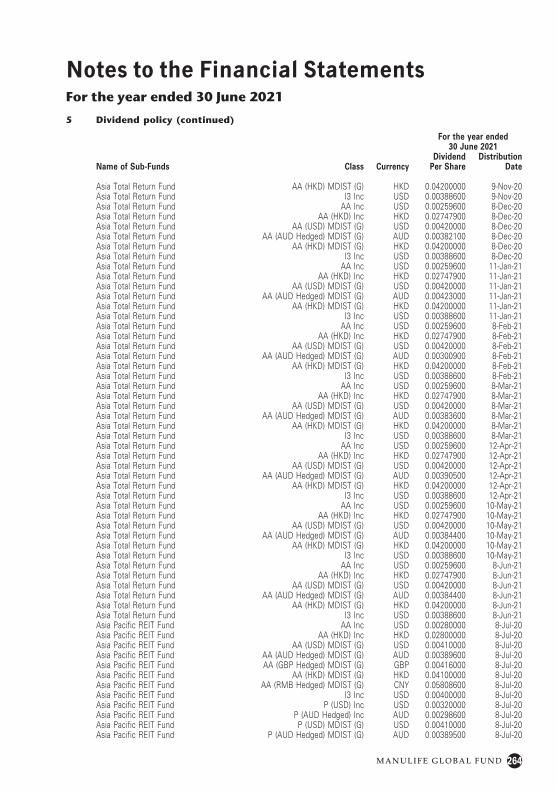
264M A N U L I F E G L O B A L F U N D
Notes to the Financial StatementsFor the year ended 30 June 2021
For the year ended 30 June 2021
Name of Sub-Funds Class CurrencyDividend
Per ShareDistribution
Date
Asia Total Return Fund AA (HKD) MDIST (G) HKD 0.04200000 9-Nov-20Asia Total Return Fund I3 Inc USD 0.00388600 9-Nov-20Asia Total Return Fund AA Inc USD 0.00259600 8-Dec-20Asia Total Return Fund AA (HKD) Inc HKD 0.02747900 8-Dec-20Asia Total Return Fund AA (USD) MDIST (G) USD 0.00420000 8-Dec-20Asia Total Return Fund AA (AUD Hedged) MDIST (G) AUD 0.00382100 8-Dec-20Asia Total Return Fund AA (HKD) MDIST (G) HKD 0.04200000 8-Dec-20Asia Total Return Fund I3 Inc USD 0.00388600 8-Dec-20Asia Total Return Fund AA Inc USD 0.00259600 11-Jan-21Asia Total Return Fund AA (HKD) Inc HKD 0.02747900 11-Jan-21Asia Total Return Fund AA (USD) MDIST (G) USD 0.00420000 11-Jan-21Asia Total Return Fund AA (AUD Hedged) MDIST (G) AUD 0.00423000 11-Jan-21Asia Total Return Fund AA (HKD) MDIST (G) HKD 0.04200000 11-Jan-21Asia Total Return Fund I3 Inc USD 0.00388600 11-Jan-21Asia Total Return Fund AA Inc USD 0.00259600 8-Feb-21Asia Total Return Fund AA (HKD) Inc HKD 0.02747900 8-Feb-21Asia Total Return Fund AA (USD) MDIST (G) USD 0.00420000 8-Feb-21Asia Total Return Fund AA (AUD Hedged) MDIST (G) AUD 0.00300900 8-Feb-21Asia Total Return Fund AA (HKD) MDIST (G) HKD 0.04200000 8-Feb-21Asia Total Return Fund I3 Inc USD 0.00388600 8-Feb-21Asia Total Return Fund AA Inc USD 0.00259600 8-Mar-21Asia Total Return Fund AA (HKD) Inc HKD 0.02747900 8-Mar-21Asia Total Return Fund AA (USD) MDIST (G) USD 0.00420000 8-Mar-21Asia Total Return Fund AA (AUD Hedged) MDIST (G) AUD 0.00383600 8-Mar-21Asia Total Return Fund AA (HKD) MDIST (G) HKD 0.04200000 8-Mar-21Asia Total Return Fund I3 Inc USD 0.00388600 8-Mar-21Asia Total Return Fund AA Inc USD 0.00259600 12-Apr-21Asia Total Return Fund AA (HKD) Inc HKD 0.02747900 12-Apr-21Asia Total Return Fund AA (USD) MDIST (G) USD 0.00420000 12-Apr-21Asia Total Return Fund AA (AUD Hedged) MDIST (G) AUD 0.00390500 12-Apr-21Asia Total Return Fund AA (HKD) MDIST (G) HKD 0.04200000 12-Apr-21Asia Total Return Fund I3 Inc USD 0.00388600 12-Apr-21Asia Total Return Fund AA Inc USD 0.00259600 10-May-21Asia Total Return Fund AA (HKD) Inc HKD 0.02747900 10-May-21Asia Total Return Fund AA (USD) MDIST (G) USD 0.00420000 10-May-21Asia Total Return Fund AA (AUD Hedged) MDIST (G) AUD 0.00384400 10-May-21Asia Total Return Fund AA (HKD) MDIST (G) HKD 0.04200000 10-May-21Asia Total Return Fund I3 Inc USD 0.00388600 10-May-21Asia Total Return Fund AA Inc USD 0.00259600 8-Jun-21Asia Total Return Fund AA (HKD) Inc HKD 0.02747900 8-Jun-21Asia Total Return Fund AA (USD) MDIST (G) USD 0.00420000 8-Jun-21Asia Total Return Fund AA (AUD Hedged) MDIST (G) AUD 0.00384400 8-Jun-21Asia Total Return Fund AA (HKD) MDIST (G) HKD 0.04200000 8-Jun-21Asia Total Return Fund I3 Inc USD 0.00388600 8-Jun-21Asia Pacific REIT Fund AA Inc USD 0.00280000 8-Jul-20Asia Pacific REIT Fund AA (HKD) Inc HKD 0.02800000 8-Jul-20Asia Pacific REIT Fund AA (USD) MDIST (G) USD 0.00410000 8-Jul-20Asia Pacific REIT Fund AA (AUD Hedged) MDIST (G) AUD 0.00389600 8-Jul-20Asia Pacific REIT Fund AA (GBP Hedged) MDIST (G) GBP 0.00416000 8-Jul-20Asia Pacific REIT Fund AA (HKD) MDIST (G) HKD 0.04100000 8-Jul-20Asia Pacific REIT Fund AA (RMB Hedged) MDIST (G) CNY 0.05808600 8-Jul-20Asia Pacific REIT Fund I3 Inc USD 0.00400000 8-Jul-20Asia Pacific REIT Fund P (USD) Inc USD 0.00320000 8-Jul-20Asia Pacific REIT Fund P (AUD Hedged) Inc AUD 0.00298600 8-Jul-20Asia Pacific REIT Fund P (USD) MDIST (G) USD 0.00410000 8-Jul-20Asia Pacific REIT Fund P (AUD Hedged) MDIST (G) AUD 0.00389500 8-Jul-20
5 Dividend policy (continued)
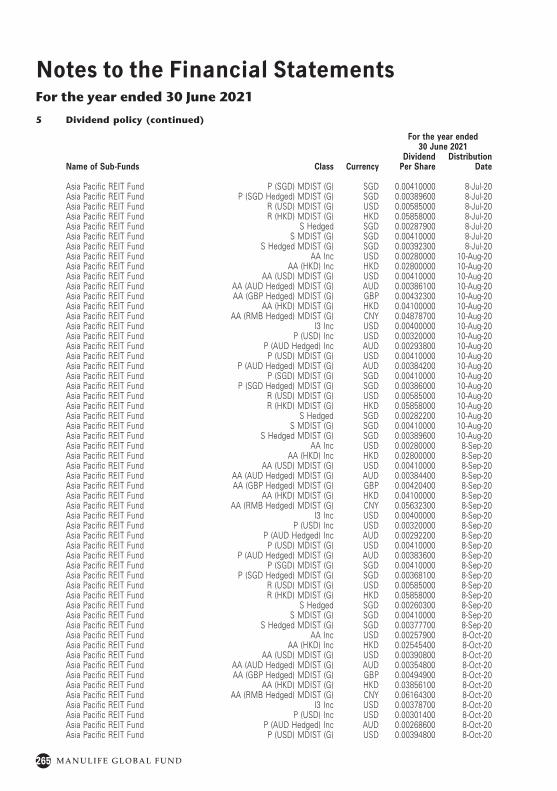
265 M A N U L I F E G L O B A L F U N D
Notes to the Financial StatementsFor the year ended 30 June 2021
For the year ended 30 June 2021
Name of Sub-Funds Class CurrencyDividend
Per ShareDistribution
Date
Asia Pacific REIT Fund P (SGD) MDIST (G) SGD 0.00410000 8-Jul-20Asia Pacific REIT Fund P (SGD Hedged) MDIST (G) SGD 0.00389600 8-Jul-20Asia Pacific REIT Fund R (USD) MDIST (G) USD 0.00585000 8-Jul-20Asia Pacific REIT Fund R (HKD) MDIST (G) HKD 0.05858000 8-Jul-20Asia Pacific REIT Fund S Hedged SGD 0.00287900 8-Jul-20Asia Pacific REIT Fund S MDIST (G) SGD 0.00410000 8-Jul-20Asia Pacific REIT Fund S Hedged MDIST (G) SGD 0.00392300 8-Jul-20Asia Pacific REIT Fund AA Inc USD 0.00280000 10-Aug-20Asia Pacific REIT Fund AA (HKD) Inc HKD 0.02800000 10-Aug-20Asia Pacific REIT Fund AA (USD) MDIST (G) USD 0.00410000 10-Aug-20Asia Pacific REIT Fund AA (AUD Hedged) MDIST (G) AUD 0.00386100 10-Aug-20Asia Pacific REIT Fund AA (GBP Hedged) MDIST (G) GBP 0.00432300 10-Aug-20Asia Pacific REIT Fund AA (HKD) MDIST (G) HKD 0.04100000 10-Aug-20Asia Pacific REIT Fund AA (RMB Hedged) MDIST (G) CNY 0.04878700 10-Aug-20Asia Pacific REIT Fund I3 Inc USD 0.00400000 10-Aug-20Asia Pacific REIT Fund P (USD) Inc USD 0.00320000 10-Aug-20Asia Pacific REIT Fund P (AUD Hedged) Inc AUD 0.00293800 10-Aug-20Asia Pacific REIT Fund P (USD) MDIST (G) USD 0.00410000 10-Aug-20Asia Pacific REIT Fund P (AUD Hedged) MDIST (G) AUD 0.00384200 10-Aug-20Asia Pacific REIT Fund P (SGD) MDIST (G) SGD 0.00410000 10-Aug-20Asia Pacific REIT Fund P (SGD Hedged) MDIST (G) SGD 0.00386000 10-Aug-20Asia Pacific REIT Fund R (USD) MDIST (G) USD 0.00585000 10-Aug-20Asia Pacific REIT Fund R (HKD) MDIST (G) HKD 0.05858000 10-Aug-20Asia Pacific REIT Fund S Hedged SGD 0.00282200 10-Aug-20Asia Pacific REIT Fund S MDIST (G) SGD 0.00410000 10-Aug-20Asia Pacific REIT Fund S Hedged MDIST (G) SGD 0.00389600 10-Aug-20Asia Pacific REIT Fund AA Inc USD 0.00280000 8-Sep-20Asia Pacific REIT Fund AA (HKD) Inc HKD 0.02800000 8-Sep-20Asia Pacific REIT Fund AA (USD) MDIST (G) USD 0.00410000 8-Sep-20Asia Pacific REIT Fund AA (AUD Hedged) MDIST (G) AUD 0.00384400 8-Sep-20Asia Pacific REIT Fund AA (GBP Hedged) MDIST (G) GBP 0.00420400 8-Sep-20Asia Pacific REIT Fund AA (HKD) MDIST (G) HKD 0.04100000 8-Sep-20Asia Pacific REIT Fund AA (RMB Hedged) MDIST (G) CNY 0.05632300 8-Sep-20Asia Pacific REIT Fund I3 Inc USD 0.00400000 8-Sep-20Asia Pacific REIT Fund P (USD) Inc USD 0.00320000 8-Sep-20Asia Pacific REIT Fund P (AUD Hedged) Inc AUD 0.00292200 8-Sep-20Asia Pacific REIT Fund P (USD) MDIST (G) USD 0.00410000 8-Sep-20Asia Pacific REIT Fund P (AUD Hedged) MDIST (G) AUD 0.00383600 8-Sep-20Asia Pacific REIT Fund P (SGD) MDIST (G) SGD 0.00410000 8-Sep-20Asia Pacific REIT Fund P (SGD Hedged) MDIST (G) SGD 0.00368100 8-Sep-20Asia Pacific REIT Fund R (USD) MDIST (G) USD 0.00585000 8-Sep-20Asia Pacific REIT Fund R (HKD) MDIST (G) HKD 0.05858000 8-Sep-20Asia Pacific REIT Fund S Hedged SGD 0.00260300 8-Sep-20Asia Pacific REIT Fund S MDIST (G) SGD 0.00410000 8-Sep-20Asia Pacific REIT Fund S Hedged MDIST (G) SGD 0.00377700 8-Sep-20Asia Pacific REIT Fund AA Inc USD 0.00257900 8-Oct-20Asia Pacific REIT Fund AA (HKD) Inc HKD 0.02545400 8-Oct-20Asia Pacific REIT Fund AA (USD) MDIST (G) USD 0.00390800 8-Oct-20Asia Pacific REIT Fund AA (AUD Hedged) MDIST (G) AUD 0.00354800 8-Oct-20Asia Pacific REIT Fund AA (GBP Hedged) MDIST (G) GBP 0.00494900 8-Oct-20Asia Pacific REIT Fund AA (HKD) MDIST (G) HKD 0.03856100 8-Oct-20Asia Pacific REIT Fund AA (RMB Hedged) MDIST (G) CNY 0.06164300 8-Oct-20Asia Pacific REIT Fund I3 Inc USD 0.00378700 8-Oct-20Asia Pacific REIT Fund P (USD) Inc USD 0.00301400 8-Oct-20Asia Pacific REIT Fund P (AUD Hedged) Inc AUD 0.00268600 8-Oct-20Asia Pacific REIT Fund P (USD) MDIST (G) USD 0.00394800 8-Oct-20
5 Dividend policy (continued)

266M A N U L I F E G L O B A L F U N D
Notes to the Financial StatementsFor the year ended 30 June 2021
For the year ended 30 June 2021
Name of Sub-Funds Class CurrencyDividend
Per ShareDistribution
Date
Asia Pacific REIT Fund P (AUD Hedged) MDIST (G) AUD 0.00357700 8-Oct-20Asia Pacific REIT Fund P (SGD) MDIST (G) SGD 0.00363000 8-Oct-20Asia Pacific REIT Fund P (SGD Hedged) MDIST (G) SGD 0.00365500 8-Oct-20Asia Pacific REIT Fund R (USD) MDIST (G) USD 0.00550000 8-Oct-20Asia Pacific REIT Fund R (HKD) MDIST (G) HKD 0.05491200 8-Oct-20Asia Pacific REIT Fund S Hedged SGD 0.00192800 8-Oct-20Asia Pacific REIT Fund S MDIST (G) SGD 0.00361900 8-Oct-20Asia Pacific REIT Fund S Hedged MDIST (G) SGD 0.00339000 8-Oct-20Asia Pacific REIT Fund AA Inc USD 0.00257900 9-Nov-20Asia Pacific REIT Fund AA (HKD) Inc HKD 0.02545400 9-Nov-20Asia Pacific REIT Fund AA (USD) MDIST (G) USD 0.00390800 9-Nov-20Asia Pacific REIT Fund AA (AUD Hedged) MDIST (G) AUD 0.00353000 9-Nov-20Asia Pacific REIT Fund AA (GBP Hedged) MDIST (G) GBP 0.00498800 9-Nov-20Asia Pacific REIT Fund AA (HKD) MDIST (G) HKD 0.03856100 9-Nov-20Asia Pacific REIT Fund AA (RMB Hedged) MDIST (G) CNY 0.06577000 9-Nov-20Asia Pacific REIT Fund I3 Inc USD 0.00378700 9-Nov-20Asia Pacific REIT Fund P (USD) Inc USD 0.00301400 9-Nov-20Asia Pacific REIT Fund P (AUD Hedged) Inc AUD 0.00269400 9-Nov-20Asia Pacific REIT Fund P (USD) MDIST (G) USD 0.00394800 9-Nov-20Asia Pacific REIT Fund P (AUD Hedged) MDIST (G) AUD 0.00358800 9-Nov-20Asia Pacific REIT Fund P (SGD) MDIST (G) SGD 0.00363000 9-Nov-20Asia Pacific REIT Fund P (SGD Hedged) MDIST (G) SGD 0.00369300 9-Nov-20Asia Pacific REIT Fund R (USD) MDIST (G) USD 0.00550000 9-Nov-20Asia Pacific REIT Fund R (HKD) MDIST (G) HKD 0.05491200 9-Nov-20Asia Pacific REIT Fund S Hedged SGD 0.00192100 9-Nov-20Asia Pacific REIT Fund S MDIST (G) SGD 0.00361900 9-Nov-20Asia Pacific REIT Fund S Hedged MDIST (G) SGD 0.00338500 9-Nov-20Asia Pacific REIT Fund AA Inc USD 0.00257900 8-Dec-20Asia Pacific REIT Fund AA (HKD) Inc HKD 0.02545400 8-Dec-20Asia Pacific REIT Fund AA (USD) MDIST (G) USD 0.00390800 8-Dec-20Asia Pacific REIT Fund AA (AUD Hedged) MDIST (G) AUD 0.00350400 8-Dec-20Asia Pacific REIT Fund AA (GBP Hedged) MDIST (G) GBP 0.00498300 8-Dec-20Asia Pacific REIT Fund AA (HKD) MDIST (G) HKD 0.03856100 8-Dec-20Asia Pacific REIT Fund AA (RMB Hedged) MDIST (G) CNY 0.06767500 8-Dec-20Asia Pacific REIT Fund I3 Inc USD 0.00378700 8-Dec-20Asia Pacific REIT Fund P (USD) Inc USD 0.00301400 8-Dec-20Asia Pacific REIT Fund P (AUD Hedged) Inc AUD 0.00264600 8-Dec-20Asia Pacific REIT Fund P (USD) MDIST (G) USD 0.00394800 8-Dec-20Asia Pacific REIT Fund P (AUD Hedged) MDIST (G) AUD 0.00353800 8-Dec-20Asia Pacific REIT Fund P (HKD) MDIST (G) HKD 0.04074100 8-Dec-20Asia Pacific REIT Fund P (SGD) MDIST (G) SGD 0.00363000 8-Dec-20Asia Pacific REIT Fund P (SGD Hedged) MDIST (G) SGD 0.00368400 8-Dec-20Asia Pacific REIT Fund R (USD) MDIST (G) USD 0.00550000 8-Dec-20Asia Pacific REIT Fund R (HKD) MDIST (G) HKD 0.05491200 8-Dec-20Asia Pacific REIT Fund S Hedged SGD 0.00190200 8-Dec-20Asia Pacific REIT Fund S MDIST (G) SGD 0.00361900 8-Dec-20Asia Pacific REIT Fund S Hedged MDIST (G) SGD 0.00340200 8-Dec-20Asia Pacific REIT Fund AA Inc USD 0.00257900 11-Jan-21Asia Pacific REIT Fund AA (HKD) Inc HKD 0.02545400 11-Jan-21Asia Pacific REIT Fund AA (USD) MDIST (G) USD 0.00390800 11-Jan-21Asia Pacific REIT Fund AA (AUD Hedged) MDIST (G) AUD 0.00369200 11-Jan-21Asia Pacific REIT Fund AA (GBP Hedged) MDIST (G) GBP 0.00490500 11-Jan-21Asia Pacific REIT Fund AA (HKD) MDIST (G) HKD 0.03856100 11-Jan-21Asia Pacific REIT Fund AA (RMB Hedged) MDIST (G) CNY 0.06619400 11-Jan-21Asia Pacific REIT Fund I3 Inc USD 0.00378700 11-Jan-21Asia Pacific REIT Fund P (USD) Inc USD 0.00301400 11-Jan-21
5 Dividend policy (continued)
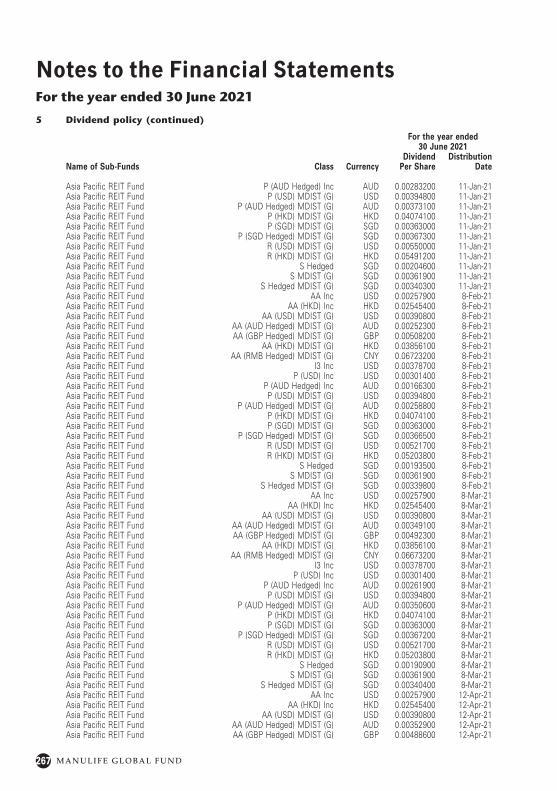
267 M A N U L I F E G L O B A L F U N D
Notes to the Financial StatementsFor the year ended 30 June 2021
For the year ended 30 June 2021
Name of Sub-Funds Class CurrencyDividend
Per ShareDistribution
Date
Asia Pacific REIT Fund P (AUD Hedged) Inc AUD 0.00283200 11-Jan-21Asia Pacific REIT Fund P (USD) MDIST (G) USD 0.00394800 11-Jan-21Asia Pacific REIT Fund P (AUD Hedged) MDIST (G) AUD 0.00373100 11-Jan-21Asia Pacific REIT Fund P (HKD) MDIST (G) HKD 0.04074100 11-Jan-21Asia Pacific REIT Fund P (SGD) MDIST (G) SGD 0.00363000 11-Jan-21Asia Pacific REIT Fund P (SGD Hedged) MDIST (G) SGD 0.00367300 11-Jan-21Asia Pacific REIT Fund R (USD) MDIST (G) USD 0.00550000 11-Jan-21Asia Pacific REIT Fund R (HKD) MDIST (G) HKD 0.05491200 11-Jan-21Asia Pacific REIT Fund S Hedged SGD 0.00204600 11-Jan-21Asia Pacific REIT Fund S MDIST (G) SGD 0.00361900 11-Jan-21Asia Pacific REIT Fund S Hedged MDIST (G) SGD 0.00340300 11-Jan-21Asia Pacific REIT Fund AA Inc USD 0.00257900 8-Feb-21Asia Pacific REIT Fund AA (HKD) Inc HKD 0.02545400 8-Feb-21Asia Pacific REIT Fund AA (USD) MDIST (G) USD 0.00390800 8-Feb-21Asia Pacific REIT Fund AA (AUD Hedged) MDIST (G) AUD 0.00252300 8-Feb-21Asia Pacific REIT Fund AA (GBP Hedged) MDIST (G) GBP 0.00508200 8-Feb-21Asia Pacific REIT Fund AA (HKD) MDIST (G) HKD 0.03856100 8-Feb-21Asia Pacific REIT Fund AA (RMB Hedged) MDIST (G) CNY 0.06723200 8-Feb-21Asia Pacific REIT Fund I3 Inc USD 0.00378700 8-Feb-21Asia Pacific REIT Fund P (USD) Inc USD 0.00301400 8-Feb-21Asia Pacific REIT Fund P (AUD Hedged) Inc AUD 0.00166300 8-Feb-21Asia Pacific REIT Fund P (USD) MDIST (G) USD 0.00394800 8-Feb-21Asia Pacific REIT Fund P (AUD Hedged) MDIST (G) AUD 0.00258800 8-Feb-21Asia Pacific REIT Fund P (HKD) MDIST (G) HKD 0.04074100 8-Feb-21Asia Pacific REIT Fund P (SGD) MDIST (G) SGD 0.00363000 8-Feb-21Asia Pacific REIT Fund P (SGD Hedged) MDIST (G) SGD 0.00366500 8-Feb-21Asia Pacific REIT Fund R (USD) MDIST (G) USD 0.00521700 8-Feb-21Asia Pacific REIT Fund R (HKD) MDIST (G) HKD 0.05203800 8-Feb-21Asia Pacific REIT Fund S Hedged SGD 0.00193500 8-Feb-21Asia Pacific REIT Fund S MDIST (G) SGD 0.00361900 8-Feb-21Asia Pacific REIT Fund S Hedged MDIST (G) SGD 0.00339800 8-Feb-21Asia Pacific REIT Fund AA Inc USD 0.00257900 8-Mar-21Asia Pacific REIT Fund AA (HKD) Inc HKD 0.02545400 8-Mar-21Asia Pacific REIT Fund AA (USD) MDIST (G) USD 0.00390800 8-Mar-21Asia Pacific REIT Fund AA (AUD Hedged) MDIST (G) AUD 0.00349100 8-Mar-21Asia Pacific REIT Fund AA (GBP Hedged) MDIST (G) GBP 0.00492300 8-Mar-21Asia Pacific REIT Fund AA (HKD) MDIST (G) HKD 0.03856100 8-Mar-21Asia Pacific REIT Fund AA (RMB Hedged) MDIST (G) CNY 0.06673200 8-Mar-21Asia Pacific REIT Fund I3 Inc USD 0.00378700 8-Mar-21Asia Pacific REIT Fund P (USD) Inc USD 0.00301400 8-Mar-21Asia Pacific REIT Fund P (AUD Hedged) Inc AUD 0.00261900 8-Mar-21Asia Pacific REIT Fund P (USD) MDIST (G) USD 0.00394800 8-Mar-21Asia Pacific REIT Fund P (AUD Hedged) MDIST (G) AUD 0.00350600 8-Mar-21Asia Pacific REIT Fund P (HKD) MDIST (G) HKD 0.04074100 8-Mar-21Asia Pacific REIT Fund P (SGD) MDIST (G) SGD 0.00363000 8-Mar-21Asia Pacific REIT Fund P (SGD Hedged) MDIST (G) SGD 0.00367200 8-Mar-21Asia Pacific REIT Fund R (USD) MDIST (G) USD 0.00521700 8-Mar-21Asia Pacific REIT Fund R (HKD) MDIST (G) HKD 0.05203800 8-Mar-21Asia Pacific REIT Fund S Hedged SGD 0.00190900 8-Mar-21Asia Pacific REIT Fund S MDIST (G) SGD 0.00361900 8-Mar-21Asia Pacific REIT Fund S Hedged MDIST (G) SGD 0.00340400 8-Mar-21Asia Pacific REIT Fund AA Inc USD 0.00257900 12-Apr-21Asia Pacific REIT Fund AA (HKD) Inc HKD 0.02545400 12-Apr-21Asia Pacific REIT Fund AA (USD) MDIST (G) USD 0.00390800 12-Apr-21Asia Pacific REIT Fund AA (AUD Hedged) MDIST (G) AUD 0.00352900 12-Apr-21Asia Pacific REIT Fund AA (GBP Hedged) MDIST (G) GBP 0.00488600 12-Apr-21
5 Dividend policy (continued)
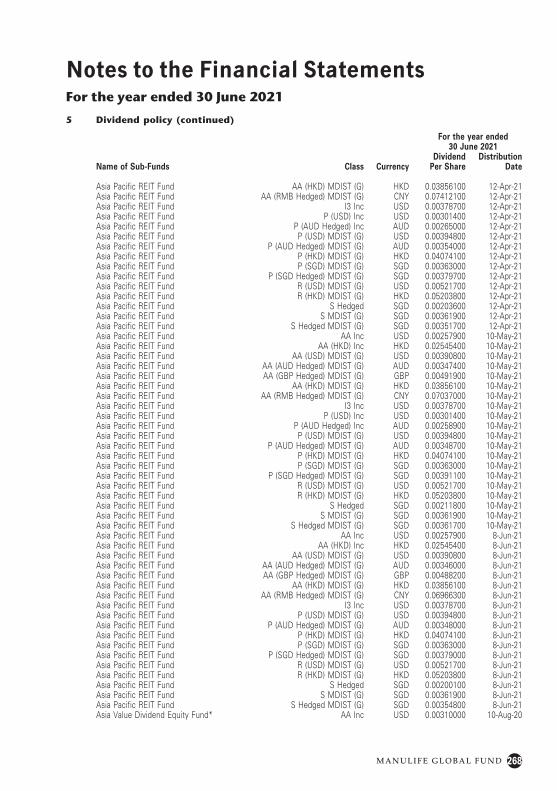
268M A N U L I F E G L O B A L F U N D
Notes to the Financial StatementsFor the year ended 30 June 2021
For the year ended 30 June 2021
Name of Sub-Funds Class CurrencyDividend
Per ShareDistribution
Date
Asia Pacific REIT Fund AA (HKD) MDIST (G) HKD 0.03856100 12-Apr-21Asia Pacific REIT Fund AA (RMB Hedged) MDIST (G) CNY 0.07412100 12-Apr-21Asia Pacific REIT Fund I3 Inc USD 0.00378700 12-Apr-21Asia Pacific REIT Fund P (USD) Inc USD 0.00301400 12-Apr-21Asia Pacific REIT Fund P (AUD Hedged) Inc AUD 0.00265000 12-Apr-21Asia Pacific REIT Fund P (USD) MDIST (G) USD 0.00394800 12-Apr-21Asia Pacific REIT Fund P (AUD Hedged) MDIST (G) AUD 0.00354000 12-Apr-21Asia Pacific REIT Fund P (HKD) MDIST (G) HKD 0.04074100 12-Apr-21Asia Pacific REIT Fund P (SGD) MDIST (G) SGD 0.00363000 12-Apr-21Asia Pacific REIT Fund P (SGD Hedged) MDIST (G) SGD 0.00379700 12-Apr-21Asia Pacific REIT Fund R (USD) MDIST (G) USD 0.00521700 12-Apr-21Asia Pacific REIT Fund R (HKD) MDIST (G) HKD 0.05203800 12-Apr-21Asia Pacific REIT Fund S Hedged SGD 0.00203600 12-Apr-21Asia Pacific REIT Fund S MDIST (G) SGD 0.00361900 12-Apr-21Asia Pacific REIT Fund S Hedged MDIST (G) SGD 0.00351700 12-Apr-21Asia Pacific REIT Fund AA Inc USD 0.00257900 10-May-21Asia Pacific REIT Fund AA (HKD) Inc HKD 0.02545400 10-May-21Asia Pacific REIT Fund AA (USD) MDIST (G) USD 0.00390800 10-May-21Asia Pacific REIT Fund AA (AUD Hedged) MDIST (G) AUD 0.00347400 10-May-21Asia Pacific REIT Fund AA (GBP Hedged) MDIST (G) GBP 0.00491900 10-May-21Asia Pacific REIT Fund AA (HKD) MDIST (G) HKD 0.03856100 10-May-21Asia Pacific REIT Fund AA (RMB Hedged) MDIST (G) CNY 0.07037000 10-May-21Asia Pacific REIT Fund I3 Inc USD 0.00378700 10-May-21Asia Pacific REIT Fund P (USD) Inc USD 0.00301400 10-May-21Asia Pacific REIT Fund P (AUD Hedged) Inc AUD 0.00258900 10-May-21Asia Pacific REIT Fund P (USD) MDIST (G) USD 0.00394800 10-May-21Asia Pacific REIT Fund P (AUD Hedged) MDIST (G) AUD 0.00348700 10-May-21Asia Pacific REIT Fund P (HKD) MDIST (G) HKD 0.04074100 10-May-21Asia Pacific REIT Fund P (SGD) MDIST (G) SGD 0.00363000 10-May-21Asia Pacific REIT Fund P (SGD Hedged) MDIST (G) SGD 0.00391100 10-May-21Asia Pacific REIT Fund R (USD) MDIST (G) USD 0.00521700 10-May-21Asia Pacific REIT Fund R (HKD) MDIST (G) HKD 0.05203800 10-May-21Asia Pacific REIT Fund S Hedged SGD 0.00211800 10-May-21Asia Pacific REIT Fund S MDIST (G) SGD 0.00361900 10-May-21Asia Pacific REIT Fund S Hedged MDIST (G) SGD 0.00361700 10-May-21Asia Pacific REIT Fund AA Inc USD 0.00257900 8-Jun-21Asia Pacific REIT Fund AA (HKD) Inc HKD 0.02545400 8-Jun-21Asia Pacific REIT Fund AA (USD) MDIST (G) USD 0.00390800 8-Jun-21Asia Pacific REIT Fund AA (AUD Hedged) MDIST (G) AUD 0.00346000 8-Jun-21Asia Pacific REIT Fund AA (GBP Hedged) MDIST (G) GBP 0.00488200 8-Jun-21Asia Pacific REIT Fund AA (HKD) MDIST (G) HKD 0.03856100 8-Jun-21Asia Pacific REIT Fund AA (RMB Hedged) MDIST (G) CNY 0.06966300 8-Jun-21Asia Pacific REIT Fund I3 Inc USD 0.00378700 8-Jun-21Asia Pacific REIT Fund P (USD) MDIST (G) USD 0.00394800 8-Jun-21Asia Pacific REIT Fund P (AUD Hedged) MDIST (G) AUD 0.00348000 8-Jun-21Asia Pacific REIT Fund P (HKD) MDIST (G) HKD 0.04074100 8-Jun-21Asia Pacific REIT Fund P (SGD) MDIST (G) SGD 0.00363000 8-Jun-21Asia Pacific REIT Fund P (SGD Hedged) MDIST (G) SGD 0.00379000 8-Jun-21Asia Pacific REIT Fund R (USD) MDIST (G) USD 0.00521700 8-Jun-21Asia Pacific REIT Fund R (HKD) MDIST (G) HKD 0.05203800 8-Jun-21Asia Pacific REIT Fund S Hedged SGD 0.00200100 8-Jun-21Asia Pacific REIT Fund S MDIST (G) SGD 0.00361900 8-Jun-21Asia Pacific REIT Fund S Hedged MDIST (G) SGD 0.00354800 8-Jun-21Asia Value Dividend Equity Fund* AA Inc USD 0.00310000 10-Aug-20
5 Dividend policy (continued)
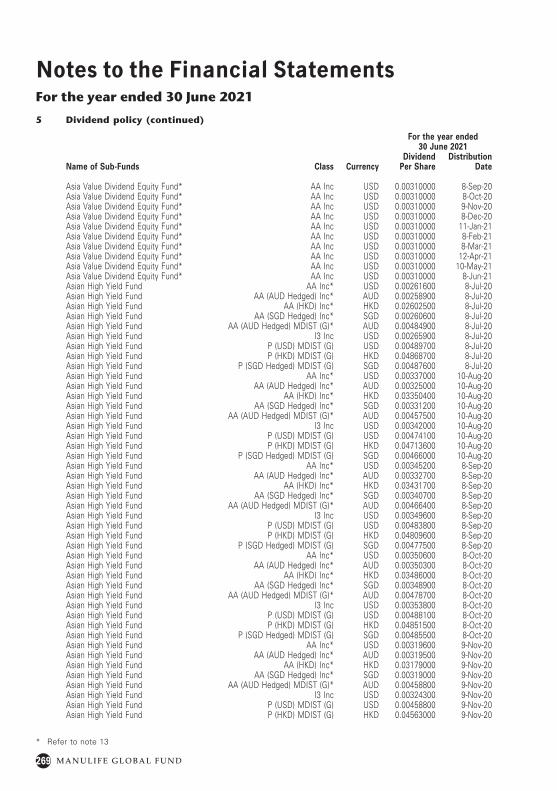
269 M A N U L I F E G L O B A L F U N D
Notes to the Financial StatementsFor the year ended 30 June 2021
For the year ended 30 June 2021
Name of Sub-Funds Class CurrencyDividend
Per ShareDistribution
Date
Asia Value Dividend Equity Fund* AA Inc USD 0.00310000 8-Sep-20Asia Value Dividend Equity Fund* AA Inc USD 0.00310000 8-Oct-20Asia Value Dividend Equity Fund* AA Inc USD 0.00310000 9-Nov-20Asia Value Dividend Equity Fund* AA Inc USD 0.00310000 8-Dec-20Asia Value Dividend Equity Fund* AA Inc USD 0.00310000 11-Jan-21Asia Value Dividend Equity Fund* AA Inc USD 0.00310000 8-Feb-21Asia Value Dividend Equity Fund* AA Inc USD 0.00310000 8-Mar-21Asia Value Dividend Equity Fund* AA Inc USD 0.00310000 12-Apr-21Asia Value Dividend Equity Fund* AA Inc USD 0.00310000 10-May-21Asia Value Dividend Equity Fund* AA Inc USD 0.00310000 8-Jun-21Asian High Yield Fund AA Inc* USD 0.00261600 8-Jul-20Asian High Yield Fund AA (AUD Hedged) Inc* AUD 0.00258900 8-Jul-20Asian High Yield Fund AA (HKD) Inc* HKD 0.02602500 8-Jul-20Asian High Yield Fund AA (SGD Hedged) Inc* SGD 0.00260600 8-Jul-20Asian High Yield Fund AA (AUD Hedged) MDIST (G)* AUD 0.00484900 8-Jul-20Asian High Yield Fund I3 Inc USD 0.00265900 8-Jul-20Asian High Yield Fund P (USD) MDIST (G) USD 0.00489700 8-Jul-20Asian High Yield Fund P (HKD) MDIST (G) HKD 0.04868700 8-Jul-20Asian High Yield Fund P (SGD Hedged) MDIST (G) SGD 0.00487600 8-Jul-20Asian High Yield Fund AA Inc* USD 0.00337000 10-Aug-20Asian High Yield Fund AA (AUD Hedged) Inc* AUD 0.00325000 10-Aug-20Asian High Yield Fund AA (HKD) Inc* HKD 0.03350400 10-Aug-20Asian High Yield Fund AA (SGD Hedged) Inc* SGD 0.00331200 10-Aug-20Asian High Yield Fund AA (AUD Hedged) MDIST (G)* AUD 0.00457500 10-Aug-20Asian High Yield Fund I3 Inc USD 0.00342000 10-Aug-20Asian High Yield Fund P (USD) MDIST (G) USD 0.00474100 10-Aug-20Asian High Yield Fund P (HKD) MDIST (G) HKD 0.04713600 10-Aug-20Asian High Yield Fund P (SGD Hedged) MDIST (G) SGD 0.00466000 10-Aug-20Asian High Yield Fund AA Inc* USD 0.00345200 8-Sep-20Asian High Yield Fund AA (AUD Hedged) Inc* AUD 0.00332700 8-Sep-20Asian High Yield Fund AA (HKD) Inc* HKD 0.03431700 8-Sep-20Asian High Yield Fund AA (SGD Hedged) Inc* SGD 0.00340700 8-Sep-20Asian High Yield Fund AA (AUD Hedged) MDIST (G)* AUD 0.00466400 8-Sep-20Asian High Yield Fund I3 Inc USD 0.00349600 8-Sep-20Asian High Yield Fund P (USD) MDIST (G) USD 0.00483800 8-Sep-20Asian High Yield Fund P (HKD) MDIST (G) HKD 0.04809600 8-Sep-20Asian High Yield Fund P (SGD Hedged) MDIST (G) SGD 0.00477500 8-Sep-20Asian High Yield Fund AA Inc* USD 0.00350600 8-Oct-20Asian High Yield Fund AA (AUD Hedged) Inc* AUD 0.00350300 8-Oct-20Asian High Yield Fund AA (HKD) Inc* HKD 0.03486000 8-Oct-20Asian High Yield Fund AA (SGD Hedged) Inc* SGD 0.00348900 8-Oct-20Asian High Yield Fund AA (AUD Hedged) MDIST (G)* AUD 0.00478700 8-Oct-20Asian High Yield Fund I3 Inc USD 0.00353800 8-Oct-20Asian High Yield Fund P (USD) MDIST (G) USD 0.00488100 8-Oct-20Asian High Yield Fund P (HKD) MDIST (G) HKD 0.04851500 8-Oct-20Asian High Yield Fund P (SGD Hedged) MDIST (G) SGD 0.00485500 8-Oct-20Asian High Yield Fund AA Inc* USD 0.00319600 9-Nov-20Asian High Yield Fund AA (AUD Hedged) Inc* AUD 0.00319500 9-Nov-20Asian High Yield Fund AA (HKD) Inc* HKD 0.03179000 9-Nov-20Asian High Yield Fund AA (SGD Hedged) Inc* SGD 0.00319000 9-Nov-20Asian High Yield Fund AA (AUD Hedged) MDIST (G)* AUD 0.00458800 9-Nov-20Asian High Yield Fund I3 Inc USD 0.00324300 9-Nov-20Asian High Yield Fund P (USD) MDIST (G) USD 0.00458800 9-Nov-20Asian High Yield Fund P (HKD) MDIST (G) HKD 0.04563000 9-Nov-20
5 Dividend policy (continued)
* Refer to note 13
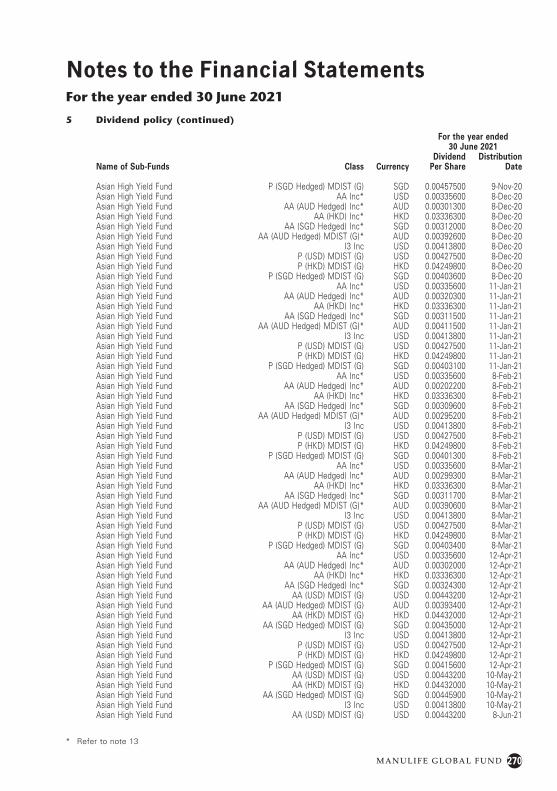
270M A N U L I F E G L O B A L F U N D
Notes to the Financial StatementsFor the year ended 30 June 2021
For the year ended 30 June 2021
Name of Sub-Funds Class CurrencyDividend
Per ShareDistribution
Date
Asian High Yield Fund P (SGD Hedged) MDIST (G) SGD 0.00457500 9-Nov-20Asian High Yield Fund AA Inc* USD 0.00335600 8-Dec-20Asian High Yield Fund AA (AUD Hedged) Inc* AUD 0.00301300 8-Dec-20Asian High Yield Fund AA (HKD) Inc* HKD 0.03336300 8-Dec-20Asian High Yield Fund AA (SGD Hedged) Inc* SGD 0.00312000 8-Dec-20Asian High Yield Fund AA (AUD Hedged) MDIST (G)* AUD 0.00392600 8-Dec-20Asian High Yield Fund I3 Inc USD 0.00413800 8-Dec-20Asian High Yield Fund P (USD) MDIST (G) USD 0.00427500 8-Dec-20Asian High Yield Fund P (HKD) MDIST (G) HKD 0.04249800 8-Dec-20Asian High Yield Fund P (SGD Hedged) MDIST (G) SGD 0.00403600 8-Dec-20Asian High Yield Fund AA Inc* USD 0.00335600 11-Jan-21Asian High Yield Fund AA (AUD Hedged) Inc* AUD 0.00320300 11-Jan-21Asian High Yield Fund AA (HKD) Inc* HKD 0.03336300 11-Jan-21Asian High Yield Fund AA (SGD Hedged) Inc* SGD 0.00311500 11-Jan-21Asian High Yield Fund AA (AUD Hedged) MDIST (G)* AUD 0.00411500 11-Jan-21Asian High Yield Fund I3 Inc USD 0.00413800 11-Jan-21Asian High Yield Fund P (USD) MDIST (G) USD 0.00427500 11-Jan-21Asian High Yield Fund P (HKD) MDIST (G) HKD 0.04249800 11-Jan-21Asian High Yield Fund P (SGD Hedged) MDIST (G) SGD 0.00403100 11-Jan-21Asian High Yield Fund AA Inc* USD 0.00335600 8-Feb-21Asian High Yield Fund AA (AUD Hedged) Inc* AUD 0.00202200 8-Feb-21Asian High Yield Fund AA (HKD) Inc* HKD 0.03336300 8-Feb-21Asian High Yield Fund AA (SGD Hedged) Inc* SGD 0.00309600 8-Feb-21Asian High Yield Fund AA (AUD Hedged) MDIST (G)* AUD 0.00295200 8-Feb-21Asian High Yield Fund I3 Inc USD 0.00413800 8-Feb-21Asian High Yield Fund P (USD) MDIST (G) USD 0.00427500 8-Feb-21Asian High Yield Fund P (HKD) MDIST (G) HKD 0.04249800 8-Feb-21Asian High Yield Fund P (SGD Hedged) MDIST (G) SGD 0.00401300 8-Feb-21Asian High Yield Fund AA Inc* USD 0.00335600 8-Mar-21Asian High Yield Fund AA (AUD Hedged) Inc* AUD 0.00299300 8-Mar-21Asian High Yield Fund AA (HKD) Inc* HKD 0.03336300 8-Mar-21Asian High Yield Fund AA (SGD Hedged) Inc* SGD 0.00311700 8-Mar-21Asian High Yield Fund AA (AUD Hedged) MDIST (G)* AUD 0.00390600 8-Mar-21Asian High Yield Fund I3 Inc USD 0.00413800 8-Mar-21Asian High Yield Fund P (USD) MDIST (G) USD 0.00427500 8-Mar-21Asian High Yield Fund P (HKD) MDIST (G) HKD 0.04249800 8-Mar-21Asian High Yield Fund P (SGD Hedged) MDIST (G) SGD 0.00403400 8-Mar-21Asian High Yield Fund AA Inc* USD 0.00335600 12-Apr-21Asian High Yield Fund AA (AUD Hedged) Inc* AUD 0.00302000 12-Apr-21Asian High Yield Fund AA (HKD) Inc* HKD 0.03336300 12-Apr-21Asian High Yield Fund AA (SGD Hedged) Inc* SGD 0.00324300 12-Apr-21Asian High Yield Fund AA (USD) MDIST (G) USD 0.00443200 12-Apr-21Asian High Yield Fund AA (AUD Hedged) MDIST (G) AUD 0.00393400 12-Apr-21Asian High Yield Fund AA (HKD) MDIST (G) HKD 0.04432000 12-Apr-21Asian High Yield Fund AA (SGD Hedged) MDIST (G) SGD 0.00435000 12-Apr-21Asian High Yield Fund I3 Inc USD 0.00413800 12-Apr-21Asian High Yield Fund P (USD) MDIST (G) USD 0.00427500 12-Apr-21Asian High Yield Fund P (HKD) MDIST (G) HKD 0.04249800 12-Apr-21Asian High Yield Fund P (SGD Hedged) MDIST (G) SGD 0.00415600 12-Apr-21Asian High Yield Fund AA (USD) MDIST (G) USD 0.00443200 10-May-21Asian High Yield Fund AA (HKD) MDIST (G) HKD 0.04432000 10-May-21Asian High Yield Fund AA (SGD Hedged) MDIST (G) SGD 0.00445900 10-May-21Asian High Yield Fund I3 Inc USD 0.00413800 10-May-21Asian High Yield Fund AA (USD) MDIST (G) USD 0.00443200 8-Jun-21
5 Dividend policy (continued)
* Refer to note 13
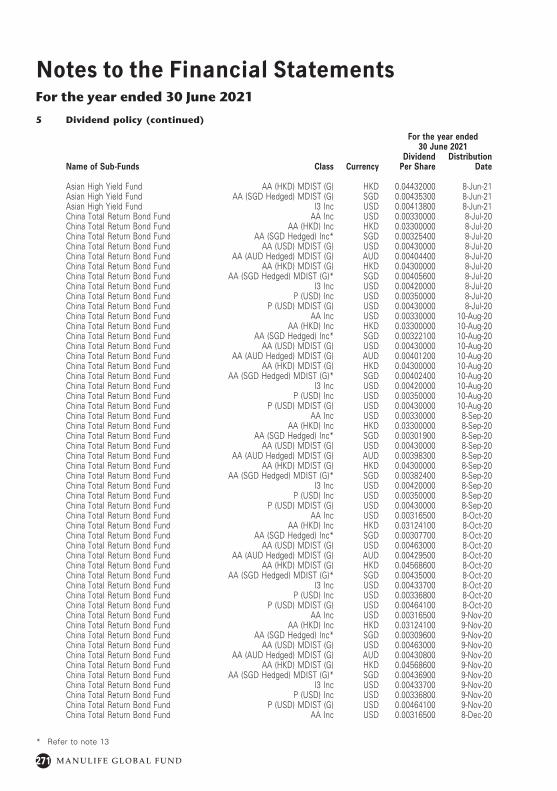
271 M A N U L I F E G L O B A L F U N D
Notes to the Financial StatementsFor the year ended 30 June 2021
For the year ended 30 June 2021
Name of Sub-Funds Class CurrencyDividend
Per ShareDistribution
Date
Asian High Yield Fund AA (HKD) MDIST (G) HKD 0.04432000 8-Jun-21Asian High Yield Fund AA (SGD Hedged) MDIST (G) SGD 0.00435300 8-Jun-21Asian High Yield Fund I3 Inc USD 0.00413800 8-Jun-21China Total Return Bond Fund AA Inc USD 0.00330000 8-Jul-20China Total Return Bond Fund AA (HKD) Inc HKD 0.03300000 8-Jul-20China Total Return Bond Fund AA (SGD Hedged) Inc* SGD 0.00325400 8-Jul-20China Total Return Bond Fund AA (USD) MDIST (G) USD 0.00430000 8-Jul-20China Total Return Bond Fund AA (AUD Hedged) MDIST (G) AUD 0.00404400 8-Jul-20China Total Return Bond Fund AA (HKD) MDIST (G) HKD 0.04300000 8-Jul-20China Total Return Bond Fund AA (SGD Hedged) MDIST (G)* SGD 0.00405600 8-Jul-20China Total Return Bond Fund I3 Inc USD 0.00420000 8-Jul-20China Total Return Bond Fund P (USD) Inc USD 0.00350000 8-Jul-20China Total Return Bond Fund P (USD) MDIST (G) USD 0.00430000 8-Jul-20China Total Return Bond Fund AA Inc USD 0.00330000 10-Aug-20China Total Return Bond Fund AA (HKD) Inc HKD 0.03300000 10-Aug-20China Total Return Bond Fund AA (SGD Hedged) Inc* SGD 0.00322100 10-Aug-20China Total Return Bond Fund AA (USD) MDIST (G) USD 0.00430000 10-Aug-20China Total Return Bond Fund AA (AUD Hedged) MDIST (G) AUD 0.00401200 10-Aug-20China Total Return Bond Fund AA (HKD) MDIST (G) HKD 0.04300000 10-Aug-20China Total Return Bond Fund AA (SGD Hedged) MDIST (G)* SGD 0.00402400 10-Aug-20China Total Return Bond Fund I3 Inc USD 0.00420000 10-Aug-20China Total Return Bond Fund P (USD) Inc USD 0.00350000 10-Aug-20China Total Return Bond Fund P (USD) MDIST (G) USD 0.00430000 10-Aug-20China Total Return Bond Fund AA Inc USD 0.00330000 8-Sep-20China Total Return Bond Fund AA (HKD) Inc HKD 0.03300000 8-Sep-20China Total Return Bond Fund AA (SGD Hedged) Inc* SGD 0.00301900 8-Sep-20China Total Return Bond Fund AA (USD) MDIST (G) USD 0.00430000 8-Sep-20China Total Return Bond Fund AA (AUD Hedged) MDIST (G) AUD 0.00398300 8-Sep-20China Total Return Bond Fund AA (HKD) MDIST (G) HKD 0.04300000 8-Sep-20China Total Return Bond Fund AA (SGD Hedged) MDIST (G)* SGD 0.00382400 8-Sep-20China Total Return Bond Fund I3 Inc USD 0.00420000 8-Sep-20China Total Return Bond Fund P (USD) Inc USD 0.00350000 8-Sep-20China Total Return Bond Fund P (USD) MDIST (G) USD 0.00430000 8-Sep-20China Total Return Bond Fund AA Inc USD 0.00316500 8-Oct-20China Total Return Bond Fund AA (HKD) Inc HKD 0.03124100 8-Oct-20China Total Return Bond Fund AA (SGD Hedged) Inc* SGD 0.00307700 8-Oct-20China Total Return Bond Fund AA (USD) MDIST (G) USD 0.00463000 8-Oct-20China Total Return Bond Fund AA (AUD Hedged) MDIST (G) AUD 0.00429500 8-Oct-20China Total Return Bond Fund AA (HKD) MDIST (G) HKD 0.04568600 8-Oct-20China Total Return Bond Fund AA (SGD Hedged) MDIST (G)* SGD 0.00435000 8-Oct-20China Total Return Bond Fund I3 Inc USD 0.00433700 8-Oct-20China Total Return Bond Fund P (USD) Inc USD 0.00336800 8-Oct-20China Total Return Bond Fund P (USD) MDIST (G) USD 0.00464100 8-Oct-20China Total Return Bond Fund AA Inc USD 0.00316500 9-Nov-20China Total Return Bond Fund AA (HKD) Inc HKD 0.03124100 9-Nov-20China Total Return Bond Fund AA (SGD Hedged) Inc* SGD 0.00309600 9-Nov-20China Total Return Bond Fund AA (USD) MDIST (G) USD 0.00463000 9-Nov-20China Total Return Bond Fund AA (AUD Hedged) MDIST (G) AUD 0.00430800 9-Nov-20China Total Return Bond Fund AA (HKD) MDIST (G) HKD 0.04568600 9-Nov-20China Total Return Bond Fund AA (SGD Hedged) MDIST (G)* SGD 0.00436900 9-Nov-20China Total Return Bond Fund I3 Inc USD 0.00433700 9-Nov-20China Total Return Bond Fund P (USD) Inc USD 0.00336800 9-Nov-20China Total Return Bond Fund P (USD) MDIST (G) USD 0.00464100 9-Nov-20China Total Return Bond Fund AA Inc USD 0.00316500 8-Dec-20
5 Dividend policy (continued)
* Refer to note 13
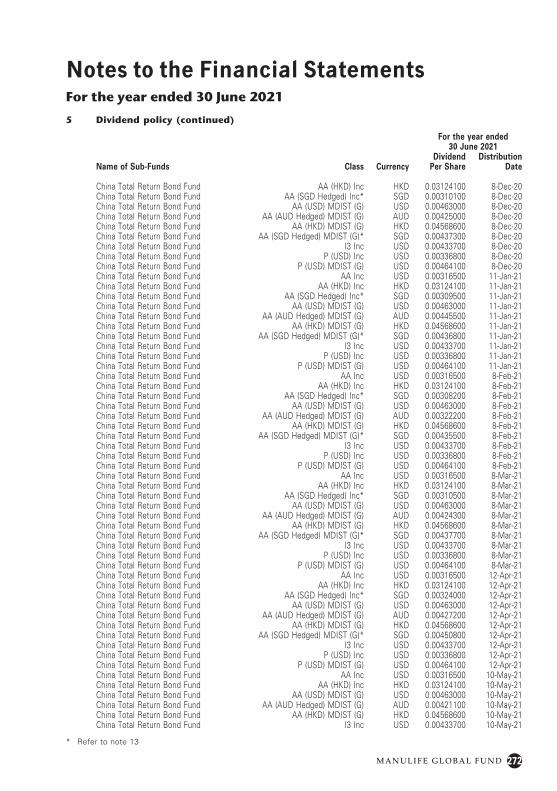
272M A N U L I F E G L O B A L F U N D
Notes to the Financial StatementsFor the year ended 30 June 2021
For the year ended 30 June 2021
Name of Sub-Funds Class CurrencyDividend
Per ShareDistribution
Date
China Total Return Bond Fund AA (HKD) Inc HKD 0.03124100 8-Dec-20China Total Return Bond Fund AA (SGD Hedged) Inc* SGD 0.00310100 8-Dec-20China Total Return Bond Fund AA (USD) MDIST (G) USD 0.00463000 8-Dec-20China Total Return Bond Fund AA (AUD Hedged) MDIST (G) AUD 0.00425000 8-Dec-20China Total Return Bond Fund AA (HKD) MDIST (G) HKD 0.04568600 8-Dec-20China Total Return Bond Fund AA (SGD Hedged) MDIST (G)* SGD 0.00437300 8-Dec-20China Total Return Bond Fund I3 Inc USD 0.00433700 8-Dec-20China Total Return Bond Fund P (USD) Inc USD 0.00336800 8-Dec-20China Total Return Bond Fund P (USD) MDIST (G) USD 0.00464100 8-Dec-20China Total Return Bond Fund AA Inc USD 0.00316500 11-Jan-21China Total Return Bond Fund AA (HKD) Inc HKD 0.03124100 11-Jan-21China Total Return Bond Fund AA (SGD Hedged) Inc* SGD 0.00309500 11-Jan-21China Total Return Bond Fund AA (USD) MDIST (G) USD 0.00463000 11-Jan-21China Total Return Bond Fund AA (AUD Hedged) MDIST (G) AUD 0.00445500 11-Jan-21China Total Return Bond Fund AA (HKD) MDIST (G) HKD 0.04568600 11-Jan-21China Total Return Bond Fund AA (SGD Hedged) MDIST (G)* SGD 0.00436800 11-Jan-21China Total Return Bond Fund I3 Inc USD 0.00433700 11-Jan-21China Total Return Bond Fund P (USD) Inc USD 0.00336800 11-Jan-21China Total Return Bond Fund P (USD) MDIST (G) USD 0.00464100 11-Jan-21China Total Return Bond Fund AA Inc USD 0.00316500 8-Feb-21China Total Return Bond Fund AA (HKD) Inc HKD 0.03124100 8-Feb-21China Total Return Bond Fund AA (SGD Hedged) Inc* SGD 0.00308200 8-Feb-21China Total Return Bond Fund AA (USD) MDIST (G) USD 0.00463000 8-Feb-21China Total Return Bond Fund AA (AUD Hedged) MDIST (G) AUD 0.00322200 8-Feb-21China Total Return Bond Fund AA (HKD) MDIST (G) HKD 0.04568600 8-Feb-21China Total Return Bond Fund AA (SGD Hedged) MDIST (G)* SGD 0.00435500 8-Feb-21China Total Return Bond Fund I3 Inc USD 0.00433700 8-Feb-21China Total Return Bond Fund P (USD) Inc USD 0.00336800 8-Feb-21China Total Return Bond Fund P (USD) MDIST (G) USD 0.00464100 8-Feb-21China Total Return Bond Fund AA Inc USD 0.00316500 8-Mar-21China Total Return Bond Fund AA (HKD) Inc HKD 0.03124100 8-Mar-21China Total Return Bond Fund AA (SGD Hedged) Inc* SGD 0.00310500 8-Mar-21China Total Return Bond Fund AA (USD) MDIST (G) USD 0.00463000 8-Mar-21China Total Return Bond Fund AA (AUD Hedged) MDIST (G) AUD 0.00424300 8-Mar-21China Total Return Bond Fund AA (HKD) MDIST (G) HKD 0.04568600 8-Mar-21China Total Return Bond Fund AA (SGD Hedged) MDIST (G)* SGD 0.00437700 8-Mar-21China Total Return Bond Fund I3 Inc USD 0.00433700 8-Mar-21China Total Return Bond Fund P (USD) Inc USD 0.00336800 8-Mar-21China Total Return Bond Fund P (USD) MDIST (G) USD 0.00464100 8-Mar-21China Total Return Bond Fund AA Inc USD 0.00316500 12-Apr-21China Total Return Bond Fund AA (HKD) Inc HKD 0.03124100 12-Apr-21China Total Return Bond Fund AA (SGD Hedged) Inc* SGD 0.00324000 12-Apr-21China Total Return Bond Fund AA (USD) MDIST (G) USD 0.00463000 12-Apr-21China Total Return Bond Fund AA (AUD Hedged) MDIST (G) AUD 0.00427200 12-Apr-21China Total Return Bond Fund AA (HKD) MDIST (G) HKD 0.04568600 12-Apr-21China Total Return Bond Fund AA (SGD Hedged) MDIST (G)* SGD 0.00450800 12-Apr-21China Total Return Bond Fund I3 Inc USD 0.00433700 12-Apr-21China Total Return Bond Fund P (USD) Inc USD 0.00336800 12-Apr-21China Total Return Bond Fund P (USD) MDIST (G) USD 0.00464100 12-Apr-21China Total Return Bond Fund AA Inc USD 0.00316500 10-May-21China Total Return Bond Fund AA (HKD) Inc HKD 0.03124100 10-May-21China Total Return Bond Fund AA (USD) MDIST (G) USD 0.00463000 10-May-21China Total Return Bond Fund AA (AUD Hedged) MDIST (G) AUD 0.00421100 10-May-21China Total Return Bond Fund AA (HKD) MDIST (G) HKD 0.04568600 10-May-21China Total Return Bond Fund I3 Inc USD 0.00433700 10-May-21
5 Dividend policy (continued)
* Refer to note 13
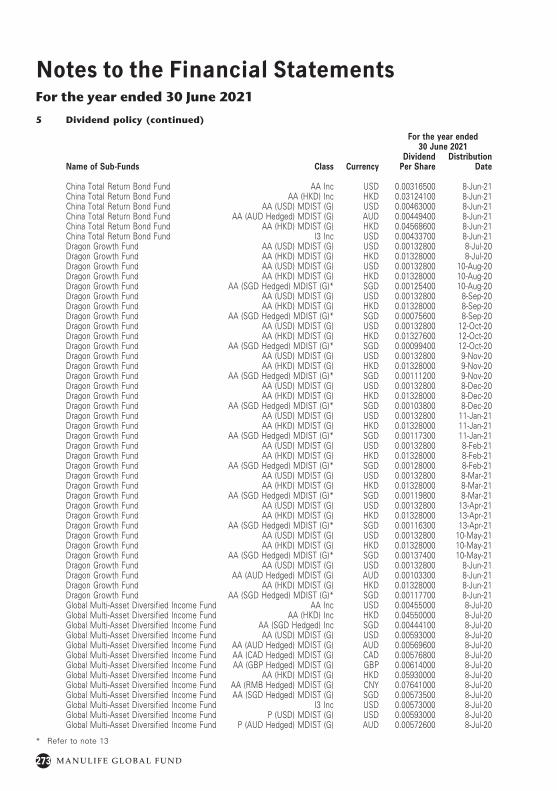
273 M A N U L I F E G L O B A L F U N D
Notes to the Financial StatementsFor the year ended 30 June 2021
For the year ended 30 June 2021
Name of Sub-Funds Class CurrencyDividend
Per ShareDistribution
Date
China Total Return Bond Fund AA Inc USD 0.00316500 8-Jun-21China Total Return Bond Fund AA (HKD) Inc HKD 0.03124100 8-Jun-21China Total Return Bond Fund AA (USD) MDIST (G) USD 0.00463000 8-Jun-21China Total Return Bond Fund AA (AUD Hedged) MDIST (G) AUD 0.00449400 8-Jun-21China Total Return Bond Fund AA (HKD) MDIST (G) HKD 0.04568600 8-Jun-21China Total Return Bond Fund I3 Inc USD 0.00433700 8-Jun-21Dragon Growth Fund AA (USD) MDIST (G) USD 0.00132800 8-Jul-20Dragon Growth Fund AA (HKD) MDIST (G) HKD 0.01328000 8-Jul-20Dragon Growth Fund AA (USD) MDIST (G) USD 0.00132800 10-Aug-20Dragon Growth Fund AA (HKD) MDIST (G) HKD 0.01328000 10-Aug-20Dragon Growth Fund AA (SGD Hedged) MDIST (G)* SGD 0.00125400 10-Aug-20Dragon Growth Fund AA (USD) MDIST (G) USD 0.00132800 8-Sep-20Dragon Growth Fund AA (HKD) MDIST (G) HKD 0.01328000 8-Sep-20Dragon Growth Fund AA (SGD Hedged) MDIST (G)* SGD 0.00075600 8-Sep-20Dragon Growth Fund AA (USD) MDIST (G) USD 0.00132800 12-Oct-20Dragon Growth Fund AA (HKD) MDIST (G) HKD 0.01327600 12-Oct-20Dragon Growth Fund AA (SGD Hedged) MDIST (G)* SGD 0.00099400 12-Oct-20Dragon Growth Fund AA (USD) MDIST (G) USD 0.00132800 9-Nov-20Dragon Growth Fund AA (HKD) MDIST (G) HKD 0.01328000 9-Nov-20Dragon Growth Fund AA (SGD Hedged) MDIST (G)* SGD 0.00111200 9-Nov-20Dragon Growth Fund AA (USD) MDIST (G) USD 0.00132800 8-Dec-20Dragon Growth Fund AA (HKD) MDIST (G) HKD 0.01328000 8-Dec-20Dragon Growth Fund AA (SGD Hedged) MDIST (G)* SGD 0.00103800 8-Dec-20Dragon Growth Fund AA (USD) MDIST (G) USD 0.00132800 11-Jan-21Dragon Growth Fund AA (HKD) MDIST (G) HKD 0.01328000 11-Jan-21Dragon Growth Fund AA (SGD Hedged) MDIST (G)* SGD 0.00117300 11-Jan-21Dragon Growth Fund AA (USD) MDIST (G) USD 0.00132800 8-Feb-21Dragon Growth Fund AA (HKD) MDIST (G) HKD 0.01328000 8-Feb-21Dragon Growth Fund AA (SGD Hedged) MDIST (G)* SGD 0.00128000 8-Feb-21Dragon Growth Fund AA (USD) MDIST (G) USD 0.00132800 8-Mar-21Dragon Growth Fund AA (HKD) MDIST (G) HKD 0.01328000 8-Mar-21Dragon Growth Fund AA (SGD Hedged) MDIST (G)* SGD 0.00119800 8-Mar-21Dragon Growth Fund AA (USD) MDIST (G) USD 0.00132800 13-Apr-21Dragon Growth Fund AA (HKD) MDIST (G) HKD 0.01328000 13-Apr-21Dragon Growth Fund AA (SGD Hedged) MDIST (G)* SGD 0.00116300 13-Apr-21Dragon Growth Fund AA (USD) MDIST (G) USD 0.00132800 10-May-21Dragon Growth Fund AA (HKD) MDIST (G) HKD 0.01328000 10-May-21Dragon Growth Fund AA (SGD Hedged) MDIST (G)* SGD 0.00137400 10-May-21Dragon Growth Fund AA (USD) MDIST (G) USD 0.00132800 8-Jun-21Dragon Growth Fund AA (AUD Hedged) MDIST (G) AUD 0.00103300 8-Jun-21Dragon Growth Fund AA (HKD) MDIST (G) HKD 0.01328000 8-Jun-21Dragon Growth Fund AA (SGD Hedged) MDIST (G)* SGD 0.00117700 8-Jun-21Global Multi-Asset Diversified Income Fund AA Inc USD 0.00455000 8-Jul-20Global Multi-Asset Diversified Income Fund AA (HKD) Inc HKD 0.04550000 8-Jul-20Global Multi-Asset Diversified Income Fund AA (SGD Hedged) Inc SGD 0.00444100 8-Jul-20Global Multi-Asset Diversified Income Fund AA (USD) MDIST (G) USD 0.00593000 8-Jul-20Global Multi-Asset Diversified Income Fund AA (AUD Hedged) MDIST (G) AUD 0.00569600 8-Jul-20Global Multi-Asset Diversified Income Fund AA (CAD Hedged) MDIST (G) CAD 0.00576800 8-Jul-20Global Multi-Asset Diversified Income Fund AA (GBP Hedged) MDIST (G) GBP 0.00614000 8-Jul-20Global Multi-Asset Diversified Income Fund AA (HKD) MDIST (G) HKD 0.05930000 8-Jul-20Global Multi-Asset Diversified Income Fund AA (RMB Hedged) MDIST (G) CNY 0.07641000 8-Jul-20Global Multi-Asset Diversified Income Fund AA (SGD Hedged) MDIST (G) SGD 0.00573500 8-Jul-20Global Multi-Asset Diversified Income Fund I3 Inc USD 0.00573000 8-Jul-20Global Multi-Asset Diversified Income Fund P (USD) MDIST (G) USD 0.00593000 8-Jul-20Global Multi-Asset Diversified Income Fund P (AUD Hedged) MDIST (G) AUD 0.00572600 8-Jul-20
* Refer to note 13
5 Dividend policy (continued)
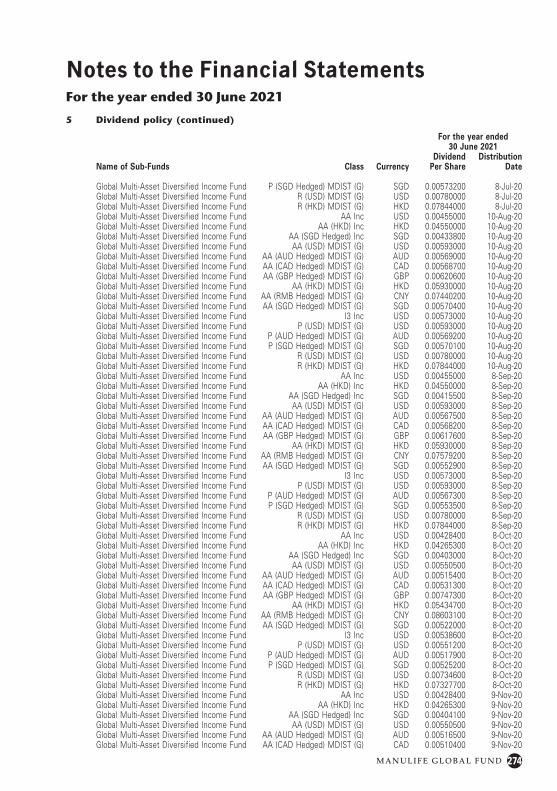
274M A N U L I F E G L O B A L F U N D
Notes to the Financial StatementsFor the year ended 30 June 2021
For the year ended 30 June 2021
Name of Sub-Funds Class CurrencyDividend
Per ShareDistribution
Date
Global Multi-Asset Diversified Income Fund P (SGD Hedged) MDIST (G) SGD 0.00573200 8-Jul-20Global Multi-Asset Diversified Income Fund R (USD) MDIST (G) USD 0.00780000 8-Jul-20Global Multi-Asset Diversified Income Fund R (HKD) MDIST (G) HKD 0.07844000 8-Jul-20Global Multi-Asset Diversified Income Fund AA Inc USD 0.00455000 10-Aug-20Global Multi-Asset Diversified Income Fund AA (HKD) Inc HKD 0.04550000 10-Aug-20Global Multi-Asset Diversified Income Fund AA (SGD Hedged) Inc SGD 0.00433800 10-Aug-20Global Multi-Asset Diversified Income Fund AA (USD) MDIST (G) USD 0.00593000 10-Aug-20Global Multi-Asset Diversified Income Fund AA (AUD Hedged) MDIST (G) AUD 0.00569000 10-Aug-20Global Multi-Asset Diversified Income Fund AA (CAD Hedged) MDIST (G) CAD 0.00568700 10-Aug-20Global Multi-Asset Diversified Income Fund AA (GBP Hedged) MDIST (G) GBP 0.00620600 10-Aug-20Global Multi-Asset Diversified Income Fund AA (HKD) MDIST (G) HKD 0.05930000 10-Aug-20Global Multi-Asset Diversified Income Fund AA (RMB Hedged) MDIST (G) CNY 0.07440200 10-Aug-20Global Multi-Asset Diversified Income Fund AA (SGD Hedged) MDIST (G) SGD 0.00570400 10-Aug-20Global Multi-Asset Diversified Income Fund I3 Inc USD 0.00573000 10-Aug-20Global Multi-Asset Diversified Income Fund P (USD) MDIST (G) USD 0.00593000 10-Aug-20Global Multi-Asset Diversified Income Fund P (AUD Hedged) MDIST (G) AUD 0.00569200 10-Aug-20Global Multi-Asset Diversified Income Fund P (SGD Hedged) MDIST (G) SGD 0.00570100 10-Aug-20Global Multi-Asset Diversified Income Fund R (USD) MDIST (G) USD 0.00780000 10-Aug-20Global Multi-Asset Diversified Income Fund R (HKD) MDIST (G) HKD 0.07844000 10-Aug-20Global Multi-Asset Diversified Income Fund AA Inc USD 0.00455000 8-Sep-20Global Multi-Asset Diversified Income Fund AA (HKD) Inc HKD 0.04550000 8-Sep-20Global Multi-Asset Diversified Income Fund AA (SGD Hedged) Inc SGD 0.00415500 8-Sep-20Global Multi-Asset Diversified Income Fund AA (USD) MDIST (G) USD 0.00593000 8-Sep-20Global Multi-Asset Diversified Income Fund AA (AUD Hedged) MDIST (G) AUD 0.00567500 8-Sep-20Global Multi-Asset Diversified Income Fund AA (CAD Hedged) MDIST (G) CAD 0.00568200 8-Sep-20Global Multi-Asset Diversified Income Fund AA (GBP Hedged) MDIST (G) GBP 0.00617600 8-Sep-20Global Multi-Asset Diversified Income Fund AA (HKD) MDIST (G) HKD 0.05930000 8-Sep-20Global Multi-Asset Diversified Income Fund AA (RMB Hedged) MDIST (G) CNY 0.07579200 8-Sep-20Global Multi-Asset Diversified Income Fund AA (SGD Hedged) MDIST (G) SGD 0.00552900 8-Sep-20Global Multi-Asset Diversified Income Fund I3 Inc USD 0.00573000 8-Sep-20Global Multi-Asset Diversified Income Fund P (USD) MDIST (G) USD 0.00593000 8-Sep-20Global Multi-Asset Diversified Income Fund P (AUD Hedged) MDIST (G) AUD 0.00567300 8-Sep-20Global Multi-Asset Diversified Income Fund P (SGD Hedged) MDIST (G) SGD 0.00553500 8-Sep-20Global Multi-Asset Diversified Income Fund R (USD) MDIST (G) USD 0.00780000 8-Sep-20Global Multi-Asset Diversified Income Fund R (HKD) MDIST (G) HKD 0.07844000 8-Sep-20Global Multi-Asset Diversified Income Fund AA Inc USD 0.00428400 8-Oct-20Global Multi-Asset Diversified Income Fund AA (HKD) Inc HKD 0.04265300 8-Oct-20Global Multi-Asset Diversified Income Fund AA (SGD Hedged) Inc SGD 0.00403000 8-Oct-20Global Multi-Asset Diversified Income Fund AA (USD) MDIST (G) USD 0.00550500 8-Oct-20Global Multi-Asset Diversified Income Fund AA (AUD Hedged) MDIST (G) AUD 0.00515400 8-Oct-20Global Multi-Asset Diversified Income Fund AA (CAD Hedged) MDIST (G) CAD 0.00531300 8-Oct-20Global Multi-Asset Diversified Income Fund AA (GBP Hedged) MDIST (G) GBP 0.00747300 8-Oct-20Global Multi-Asset Diversified Income Fund AA (HKD) MDIST (G) HKD 0.05434700 8-Oct-20Global Multi-Asset Diversified Income Fund AA (RMB Hedged) MDIST (G) CNY 0.08603100 8-Oct-20Global Multi-Asset Diversified Income Fund AA (SGD Hedged) MDIST (G) SGD 0.00522000 8-Oct-20Global Multi-Asset Diversified Income Fund I3 Inc USD 0.00538600 8-Oct-20Global Multi-Asset Diversified Income Fund P (USD) MDIST (G) USD 0.00551200 8-Oct-20Global Multi-Asset Diversified Income Fund P (AUD Hedged) MDIST (G) AUD 0.00517900 8-Oct-20Global Multi-Asset Diversified Income Fund P (SGD Hedged) MDIST (G) SGD 0.00525200 8-Oct-20Global Multi-Asset Diversified Income Fund R (USD) MDIST (G) USD 0.00734600 8-Oct-20Global Multi-Asset Diversified Income Fund R (HKD) MDIST (G) HKD 0.07327700 8-Oct-20Global Multi-Asset Diversified Income Fund AA Inc USD 0.00428400 9-Nov-20Global Multi-Asset Diversified Income Fund AA (HKD) Inc HKD 0.04265300 9-Nov-20Global Multi-Asset Diversified Income Fund AA (SGD Hedged) Inc SGD 0.00404100 9-Nov-20Global Multi-Asset Diversified Income Fund AA (USD) MDIST (G) USD 0.00550500 9-Nov-20Global Multi-Asset Diversified Income Fund AA (AUD Hedged) MDIST (G) AUD 0.00516500 9-Nov-20Global Multi-Asset Diversified Income Fund AA (CAD Hedged) MDIST (G) CAD 0.00510400 9-Nov-20
5 Dividend policy (continued)
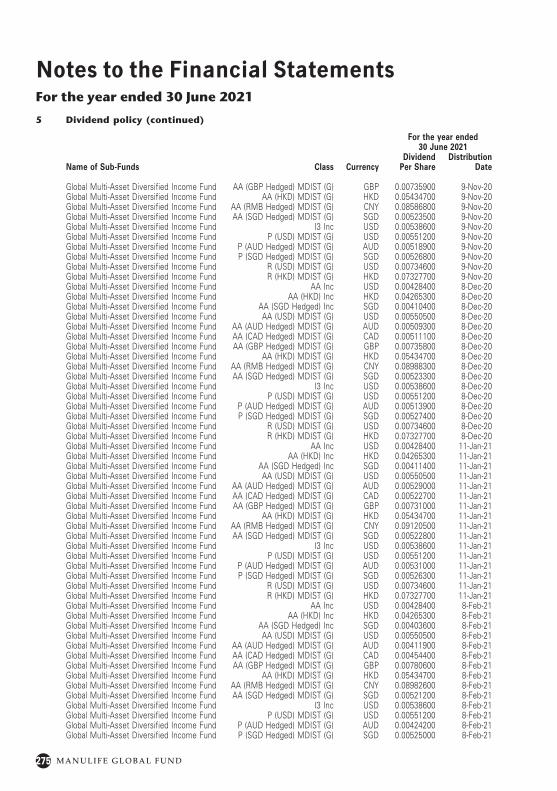
275 M A N U L I F E G L O B A L F U N D
Notes to the Financial StatementsFor the year ended 30 June 2021
For the year ended 30 June 2021
Name of Sub-Funds Class CurrencyDividend
Per ShareDistribution
Date
Global Multi-Asset Diversified Income Fund AA (GBP Hedged) MDIST (G) GBP 0.00735900 9-Nov-20Global Multi-Asset Diversified Income Fund AA (HKD) MDIST (G) HKD 0.05434700 9-Nov-20Global Multi-Asset Diversified Income Fund AA (RMB Hedged) MDIST (G) CNY 0.08586800 9-Nov-20Global Multi-Asset Diversified Income Fund AA (SGD Hedged) MDIST (G) SGD 0.00523500 9-Nov-20Global Multi-Asset Diversified Income Fund I3 Inc USD 0.00538600 9-Nov-20Global Multi-Asset Diversified Income Fund P (USD) MDIST (G) USD 0.00551200 9-Nov-20Global Multi-Asset Diversified Income Fund P (AUD Hedged) MDIST (G) AUD 0.00518900 9-Nov-20Global Multi-Asset Diversified Income Fund P (SGD Hedged) MDIST (G) SGD 0.00526800 9-Nov-20Global Multi-Asset Diversified Income Fund R (USD) MDIST (G) USD 0.00734600 9-Nov-20Global Multi-Asset Diversified Income Fund R (HKD) MDIST (G) HKD 0.07327700 9-Nov-20Global Multi-Asset Diversified Income Fund AA Inc USD 0.00428400 8-Dec-20Global Multi-Asset Diversified Income Fund AA (HKD) Inc HKD 0.04265300 8-Dec-20Global Multi-Asset Diversified Income Fund AA (SGD Hedged) Inc SGD 0.00410400 8-Dec-20Global Multi-Asset Diversified Income Fund AA (USD) MDIST (G) USD 0.00550500 8-Dec-20Global Multi-Asset Diversified Income Fund AA (AUD Hedged) MDIST (G) AUD 0.00509300 8-Dec-20Global Multi-Asset Diversified Income Fund AA (CAD Hedged) MDIST (G) CAD 0.00511100 8-Dec-20Global Multi-Asset Diversified Income Fund AA (GBP Hedged) MDIST (G) GBP 0.00735800 8-Dec-20Global Multi-Asset Diversified Income Fund AA (HKD) MDIST (G) HKD 0.05434700 8-Dec-20Global Multi-Asset Diversified Income Fund AA (RMB Hedged) MDIST (G) CNY 0.08988300 8-Dec-20Global Multi-Asset Diversified Income Fund AA (SGD Hedged) MDIST (G) SGD 0.00523300 8-Dec-20Global Multi-Asset Diversified Income Fund I3 Inc USD 0.00538600 8-Dec-20Global Multi-Asset Diversified Income Fund P (USD) MDIST (G) USD 0.00551200 8-Dec-20Global Multi-Asset Diversified Income Fund P (AUD Hedged) MDIST (G) AUD 0.00513900 8-Dec-20Global Multi-Asset Diversified Income Fund P (SGD Hedged) MDIST (G) SGD 0.00527400 8-Dec-20Global Multi-Asset Diversified Income Fund R (USD) MDIST (G) USD 0.00734600 8-Dec-20Global Multi-Asset Diversified Income Fund R (HKD) MDIST (G) HKD 0.07327700 8-Dec-20Global Multi-Asset Diversified Income Fund AA Inc USD 0.00428400 11-Jan-21Global Multi-Asset Diversified Income Fund AA (HKD) Inc HKD 0.04265300 11-Jan-21Global Multi-Asset Diversified Income Fund AA (SGD Hedged) Inc SGD 0.00411400 11-Jan-21Global Multi-Asset Diversified Income Fund AA (USD) MDIST (G) USD 0.00550500 11-Jan-21Global Multi-Asset Diversified Income Fund AA (AUD Hedged) MDIST (G) AUD 0.00529000 11-Jan-21Global Multi-Asset Diversified Income Fund AA (CAD Hedged) MDIST (G) CAD 0.00522700 11-Jan-21Global Multi-Asset Diversified Income Fund AA (GBP Hedged) MDIST (G) GBP 0.00731000 11-Jan-21Global Multi-Asset Diversified Income Fund AA (HKD) MDIST (G) HKD 0.05434700 11-Jan-21Global Multi-Asset Diversified Income Fund AA (RMB Hedged) MDIST (G) CNY 0.09120500 11-Jan-21Global Multi-Asset Diversified Income Fund AA (SGD Hedged) MDIST (G) SGD 0.00522800 11-Jan-21Global Multi-Asset Diversified Income Fund I3 Inc USD 0.00538600 11-Jan-21Global Multi-Asset Diversified Income Fund P (USD) MDIST (G) USD 0.00551200 11-Jan-21Global Multi-Asset Diversified Income Fund P (AUD Hedged) MDIST (G) AUD 0.00531000 11-Jan-21Global Multi-Asset Diversified Income Fund P (SGD Hedged) MDIST (G) SGD 0.00526300 11-Jan-21Global Multi-Asset Diversified Income Fund R (USD) MDIST (G) USD 0.00734600 11-Jan-21Global Multi-Asset Diversified Income Fund R (HKD) MDIST (G) HKD 0.07327700 11-Jan-21Global Multi-Asset Diversified Income Fund AA Inc USD 0.00428400 8-Feb-21Global Multi-Asset Diversified Income Fund AA (HKD) Inc HKD 0.04265300 8-Feb-21Global Multi-Asset Diversified Income Fund AA (SGD Hedged) Inc SGD 0.00403600 8-Feb-21Global Multi-Asset Diversified Income Fund AA (USD) MDIST (G) USD 0.00550500 8-Feb-21Global Multi-Asset Diversified Income Fund AA (AUD Hedged) MDIST (G) AUD 0.00411900 8-Feb-21Global Multi-Asset Diversified Income Fund AA (CAD Hedged) MDIST (G) CAD 0.00454400 8-Feb-21Global Multi-Asset Diversified Income Fund AA (GBP Hedged) MDIST (G) GBP 0.00780600 8-Feb-21Global Multi-Asset Diversified Income Fund AA (HKD) MDIST (G) HKD 0.05434700 8-Feb-21Global Multi-Asset Diversified Income Fund AA (RMB Hedged) MDIST (G) CNY 0.08982600 8-Feb-21Global Multi-Asset Diversified Income Fund AA (SGD Hedged) MDIST (G) SGD 0.00521200 8-Feb-21Global Multi-Asset Diversified Income Fund I3 Inc USD 0.00538600 8-Feb-21Global Multi-Asset Diversified Income Fund P (USD) MDIST (G) USD 0.00551200 8-Feb-21Global Multi-Asset Diversified Income Fund P (AUD Hedged) MDIST (G) AUD 0.00424200 8-Feb-21Global Multi-Asset Diversified Income Fund P (SGD Hedged) MDIST (G) SGD 0.00525000 8-Feb-21
5 Dividend policy (continued)
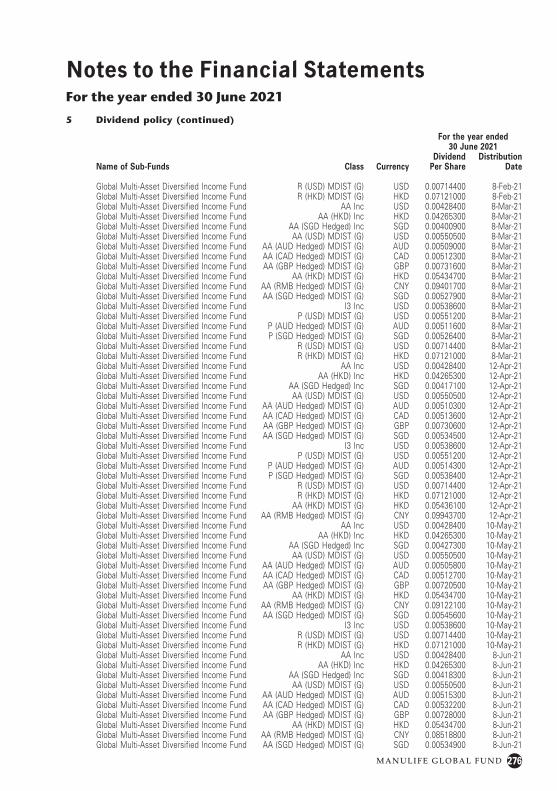
276M A N U L I F E G L O B A L F U N D
Notes to the Financial StatementsFor the year ended 30 June 2021
For the year ended 30 June 2021
Name of Sub-Funds Class CurrencyDividend
Per ShareDistribution
Date
Global Multi-Asset Diversified Income Fund R (USD) MDIST (G) USD 0.00714400 8-Feb-21Global Multi-Asset Diversified Income Fund R (HKD) MDIST (G) HKD 0.07121000 8-Feb-21Global Multi-Asset Diversified Income Fund AA Inc USD 0.00428400 8-Mar-21Global Multi-Asset Diversified Income Fund AA (HKD) Inc HKD 0.04265300 8-Mar-21Global Multi-Asset Diversified Income Fund AA (SGD Hedged) Inc SGD 0.00400900 8-Mar-21Global Multi-Asset Diversified Income Fund AA (USD) MDIST (G) USD 0.00550500 8-Mar-21Global Multi-Asset Diversified Income Fund AA (AUD Hedged) MDIST (G) AUD 0.00509000 8-Mar-21Global Multi-Asset Diversified Income Fund AA (CAD Hedged) MDIST (G) CAD 0.00512300 8-Mar-21Global Multi-Asset Diversified Income Fund AA (GBP Hedged) MDIST (G) GBP 0.00731600 8-Mar-21Global Multi-Asset Diversified Income Fund AA (HKD) MDIST (G) HKD 0.05434700 8-Mar-21Global Multi-Asset Diversified Income Fund AA (RMB Hedged) MDIST (G) CNY 0.09401700 8-Mar-21Global Multi-Asset Diversified Income Fund AA (SGD Hedged) MDIST (G) SGD 0.00527900 8-Mar-21Global Multi-Asset Diversified Income Fund I3 Inc USD 0.00538600 8-Mar-21Global Multi-Asset Diversified Income Fund P (USD) MDIST (G) USD 0.00551200 8-Mar-21Global Multi-Asset Diversified Income Fund P (AUD Hedged) MDIST (G) AUD 0.00511600 8-Mar-21Global Multi-Asset Diversified Income Fund P (SGD Hedged) MDIST (G) SGD 0.00526400 8-Mar-21Global Multi-Asset Diversified Income Fund R (USD) MDIST (G) USD 0.00714400 8-Mar-21Global Multi-Asset Diversified Income Fund R (HKD) MDIST (G) HKD 0.07121000 8-Mar-21Global Multi-Asset Diversified Income Fund AA Inc USD 0.00428400 12-Apr-21Global Multi-Asset Diversified Income Fund AA (HKD) Inc HKD 0.04265300 12-Apr-21Global Multi-Asset Diversified Income Fund AA (SGD Hedged) Inc SGD 0.00417100 12-Apr-21Global Multi-Asset Diversified Income Fund AA (USD) MDIST (G) USD 0.00550500 12-Apr-21Global Multi-Asset Diversified Income Fund AA (AUD Hedged) MDIST (G) AUD 0.00510300 12-Apr-21Global Multi-Asset Diversified Income Fund AA (CAD Hedged) MDIST (G) CAD 0.00513600 12-Apr-21Global Multi-Asset Diversified Income Fund AA (GBP Hedged) MDIST (G) GBP 0.00730600 12-Apr-21Global Multi-Asset Diversified Income Fund AA (SGD Hedged) MDIST (G) SGD 0.00534500 12-Apr-21Global Multi-Asset Diversified Income Fund I3 Inc USD 0.00538600 12-Apr-21Global Multi-Asset Diversified Income Fund P (USD) MDIST (G) USD 0.00551200 12-Apr-21Global Multi-Asset Diversified Income Fund P (AUD Hedged) MDIST (G) AUD 0.00514300 12-Apr-21Global Multi-Asset Diversified Income Fund P (SGD Hedged) MDIST (G) SGD 0.00538400 12-Apr-21Global Multi-Asset Diversified Income Fund R (USD) MDIST (G) USD 0.00714400 12-Apr-21Global Multi-Asset Diversified Income Fund R (HKD) MDIST (G) HKD 0.07121000 12-Apr-21Global Multi-Asset Diversified Income Fund AA (HKD) MDIST (G) HKD 0.05436100 12-Apr-21Global Multi-Asset Diversified Income Fund AA (RMB Hedged) MDIST (G) CNY 0.09943700 12-Apr-21 Global Multi-Asset Diversified Income Fund AA Inc USD 0.00428400 10-May-21Global Multi-Asset Diversified Income Fund AA (HKD) Inc HKD 0.04265300 10-May-21Global Multi-Asset Diversified Income Fund AA (SGD Hedged) Inc SGD 0.00427300 10-May-21Global Multi-Asset Diversified Income Fund AA (USD) MDIST (G) USD 0.00550500 10-May-21Global Multi-Asset Diversified Income Fund AA (AUD Hedged) MDIST (G) AUD 0.00505800 10-May-21Global Multi-Asset Diversified Income Fund AA (CAD Hedged) MDIST (G) CAD 0.00512700 10-May-21Global Multi-Asset Diversified Income Fund AA (GBP Hedged) MDIST (G) GBP 0.00720500 10-May-21Global Multi-Asset Diversified Income Fund AA (HKD) MDIST (G) HKD 0.05434700 10-May-21Global Multi-Asset Diversified Income Fund AA (RMB Hedged) MDIST (G) CNY 0.09122100 10-May-21Global Multi-Asset Diversified Income Fund AA (SGD Hedged) MDIST (G) SGD 0.00545600 10-May-21Global Multi-Asset Diversified Income Fund I3 Inc USD 0.00538600 10-May-21Global Multi-Asset Diversified Income Fund R (USD) MDIST (G) USD 0.00714400 10-May-21Global Multi-Asset Diversified Income Fund R (HKD) MDIST (G) HKD 0.07121000 10-May-21Global Multi-Asset Diversified Income Fund AA Inc USD 0.00428400 8-Jun-21Global Multi-Asset Diversified Income Fund AA (HKD) Inc HKD 0.04265300 8-Jun-21Global Multi-Asset Diversified Income Fund AA (SGD Hedged) Inc SGD 0.00418300 8-Jun-21Global Multi-Asset Diversified Income Fund AA (USD) MDIST (G) USD 0.00550500 8-Jun-21Global Multi-Asset Diversified Income Fund AA (AUD Hedged) MDIST (G) AUD 0.00515300 8-Jun-21Global Multi-Asset Diversified Income Fund AA (CAD Hedged) MDIST (G) CAD 0.00532200 8-Jun-21Global Multi-Asset Diversified Income Fund AA (GBP Hedged) MDIST (G) GBP 0.00728000 8-Jun-21Global Multi-Asset Diversified Income Fund AA (HKD) MDIST (G) HKD 0.05434700 8-Jun-21Global Multi-Asset Diversified Income Fund AA (RMB Hedged) MDIST (G) CNY 0.08518800 8-Jun-21Global Multi-Asset Diversified Income Fund AA (SGD Hedged) MDIST (G) SGD 0.00534900 8-Jun-21
5 Dividend policy (continued)
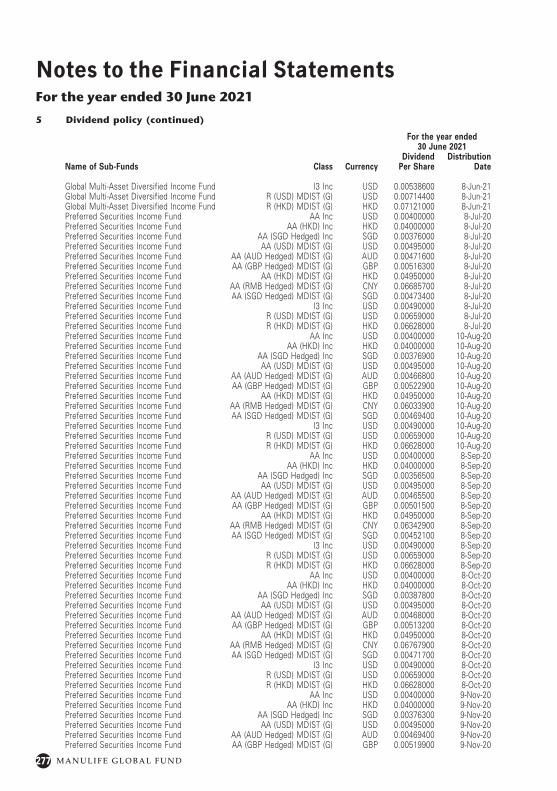
277 M A N U L I F E G L O B A L F U N D
Notes to the Financial StatementsFor the year ended 30 June 2021
For the year ended 30 June 2021
Name of Sub-Funds Class CurrencyDividend
Per ShareDistribution
Date
Global Multi-Asset Diversified Income Fund I3 Inc USD 0.00538600 8-Jun-21Global Multi-Asset Diversified Income Fund R (USD) MDIST (G) USD 0.00714400 8-Jun-21Global Multi-Asset Diversified Income Fund R (HKD) MDIST (G) HKD 0.07121000 8-Jun-21Preferred Securities Income Fund AA Inc USD 0.00400000 8-Jul-20Preferred Securities Income Fund AA (HKD) Inc HKD 0.04000000 8-Jul-20Preferred Securities Income Fund AA (SGD Hedged) Inc SGD 0.00376000 8-Jul-20Preferred Securities Income Fund AA (USD) MDIST (G) USD 0.00495000 8-Jul-20Preferred Securities Income Fund AA (AUD Hedged) MDIST (G) AUD 0.00471600 8-Jul-20Preferred Securities Income Fund AA (GBP Hedged) MDIST (G) GBP 0.00516300 8-Jul-20Preferred Securities Income Fund AA (HKD) MDIST (G) HKD 0.04950000 8-Jul-20Preferred Securities Income Fund AA (RMB Hedged) MDIST (G) CNY 0.06685700 8-Jul-20Preferred Securities Income Fund AA (SGD Hedged) MDIST (G) SGD 0.00473400 8-Jul-20Preferred Securities Income Fund I3 Inc USD 0.00490000 8-Jul-20Preferred Securities Income Fund R (USD) MDIST (G) USD 0.00659000 8-Jul-20Preferred Securities Income Fund R (HKD) MDIST (G) HKD 0.06628000 8-Jul-20Preferred Securities Income Fund AA Inc USD 0.00400000 10-Aug-20Preferred Securities Income Fund AA (HKD) Inc HKD 0.04000000 10-Aug-20Preferred Securities Income Fund AA (SGD Hedged) Inc SGD 0.00376900 10-Aug-20Preferred Securities Income Fund AA (USD) MDIST (G) USD 0.00495000 10-Aug-20Preferred Securities Income Fund AA (AUD Hedged) MDIST (G) AUD 0.00466800 10-Aug-20Preferred Securities Income Fund AA (GBP Hedged) MDIST (G) GBP 0.00522900 10-Aug-20Preferred Securities Income Fund AA (HKD) MDIST (G) HKD 0.04950000 10-Aug-20Preferred Securities Income Fund AA (RMB Hedged) MDIST (G) CNY 0.06033900 10-Aug-20Preferred Securities Income Fund AA (SGD Hedged) MDIST (G) SGD 0.00469400 10-Aug-20Preferred Securities Income Fund I3 Inc USD 0.00490000 10-Aug-20Preferred Securities Income Fund R (USD) MDIST (G) USD 0.00659000 10-Aug-20Preferred Securities Income Fund R (HKD) MDIST (G) HKD 0.06628000 10-Aug-20Preferred Securities Income Fund AA Inc USD 0.00400000 8-Sep-20Preferred Securities Income Fund AA (HKD) Inc HKD 0.04000000 8-Sep-20Preferred Securities Income Fund AA (SGD Hedged) Inc SGD 0.00356500 8-Sep-20Preferred Securities Income Fund AA (USD) MDIST (G) USD 0.00495000 8-Sep-20Preferred Securities Income Fund AA (AUD Hedged) MDIST (G) AUD 0.00465500 8-Sep-20Preferred Securities Income Fund AA (GBP Hedged) MDIST (G) GBP 0.00501500 8-Sep-20Preferred Securities Income Fund AA (HKD) MDIST (G) HKD 0.04950000 8-Sep-20Preferred Securities Income Fund AA (RMB Hedged) MDIST (G) CNY 0.06342900 8-Sep-20Preferred Securities Income Fund AA (SGD Hedged) MDIST (G) SGD 0.00452100 8-Sep-20Preferred Securities Income Fund I3 Inc USD 0.00490000 8-Sep-20Preferred Securities Income Fund R (USD) MDIST (G) USD 0.00659000 8-Sep-20Preferred Securities Income Fund R (HKD) MDIST (G) HKD 0.06628000 8-Sep-20Preferred Securities Income Fund AA Inc USD 0.00400000 8-Oct-20Preferred Securities Income Fund AA (HKD) Inc HKD 0.04000000 8-Oct-20Preferred Securities Income Fund AA (SGD Hedged) Inc SGD 0.00387800 8-Oct-20Preferred Securities Income Fund AA (USD) MDIST (G) USD 0.00495000 8-Oct-20Preferred Securities Income Fund AA (AUD Hedged) MDIST (G) AUD 0.00468000 8-Oct-20Preferred Securities Income Fund AA (GBP Hedged) MDIST (G) GBP 0.00513200 8-Oct-20Preferred Securities Income Fund AA (HKD) MDIST (G) HKD 0.04950000 8-Oct-20Preferred Securities Income Fund AA (RMB Hedged) MDIST (G) CNY 0.06767900 8-Oct-20Preferred Securities Income Fund AA (SGD Hedged) MDIST (G) SGD 0.00471700 8-Oct-20Preferred Securities Income Fund I3 Inc USD 0.00490000 8-Oct-20Preferred Securities Income Fund R (USD) MDIST (G) USD 0.00659000 8-Oct-20Preferred Securities Income Fund R (HKD) MDIST (G) HKD 0.06628000 8-Oct-20Preferred Securities Income Fund AA Inc USD 0.00400000 9-Nov-20Preferred Securities Income Fund AA (HKD) Inc HKD 0.04000000 9-Nov-20Preferred Securities Income Fund AA (SGD Hedged) Inc SGD 0.00376300 9-Nov-20Preferred Securities Income Fund AA (USD) MDIST (G) USD 0.00495000 9-Nov-20Preferred Securities Income Fund AA (AUD Hedged) MDIST (G) AUD 0.00469400 9-Nov-20Preferred Securities Income Fund AA (GBP Hedged) MDIST (G) GBP 0.00519900 9-Nov-20
5 Dividend policy (continued)
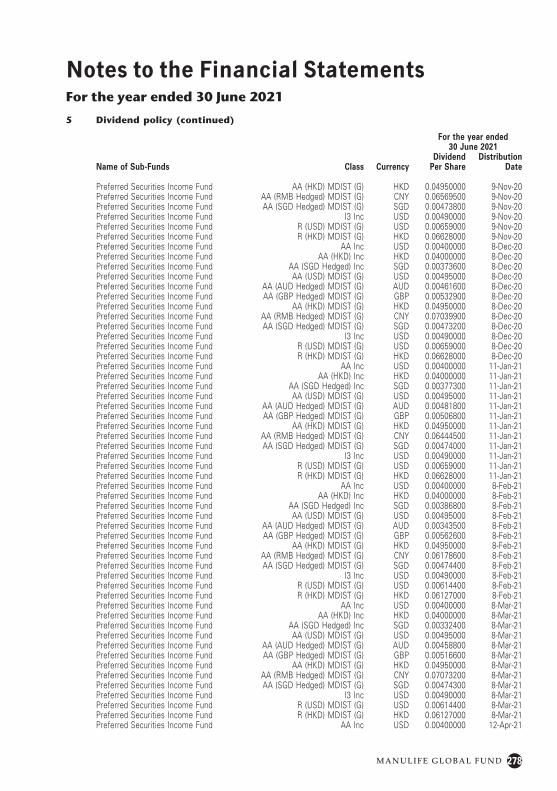
278M A N U L I F E G L O B A L F U N D
Notes to the Financial StatementsFor the year ended 30 June 2021
For the year ended 30 June 2021
Name of Sub-Funds Class CurrencyDividend
Per ShareDistribution
Date
Preferred Securities Income Fund AA (HKD) MDIST (G) HKD 0.04950000 9-Nov-20Preferred Securities Income Fund AA (RMB Hedged) MDIST (G) CNY 0.06569500 9-Nov-20Preferred Securities Income Fund AA (SGD Hedged) MDIST (G) SGD 0.00473800 9-Nov-20Preferred Securities Income Fund I3 Inc USD 0.00490000 9-Nov-20Preferred Securities Income Fund R (USD) MDIST (G) USD 0.00659000 9-Nov-20Preferred Securities Income Fund R (HKD) MDIST (G) HKD 0.06628000 9-Nov-20Preferred Securities Income Fund AA Inc USD 0.00400000 8-Dec-20Preferred Securities Income Fund AA (HKD) Inc HKD 0.04000000 8-Dec-20Preferred Securities Income Fund AA (SGD Hedged) Inc SGD 0.00373600 8-Dec-20Preferred Securities Income Fund AA (USD) MDIST (G) USD 0.00495000 8-Dec-20Preferred Securities Income Fund AA (AUD Hedged) MDIST (G) AUD 0.00461600 8-Dec-20Preferred Securities Income Fund AA (GBP Hedged) MDIST (G) GBP 0.00532900 8-Dec-20Preferred Securities Income Fund AA (HKD) MDIST (G) HKD 0.04950000 8-Dec-20Preferred Securities Income Fund AA (RMB Hedged) MDIST (G) CNY 0.07039900 8-Dec-20Preferred Securities Income Fund AA (SGD Hedged) MDIST (G) SGD 0.00473200 8-Dec-20Preferred Securities Income Fund I3 Inc USD 0.00490000 8-Dec-20Preferred Securities Income Fund R (USD) MDIST (G) USD 0.00659000 8-Dec-20Preferred Securities Income Fund R (HKD) MDIST (G) HKD 0.06628000 8-Dec-20Preferred Securities Income Fund AA Inc USD 0.00400000 11-Jan-21Preferred Securities Income Fund AA (HKD) Inc HKD 0.04000000 11-Jan-21Preferred Securities Income Fund AA (SGD Hedged) Inc SGD 0.00377300 11-Jan-21Preferred Securities Income Fund AA (USD) MDIST (G) USD 0.00495000 11-Jan-21Preferred Securities Income Fund AA (AUD Hedged) MDIST (G) AUD 0.00481800 11-Jan-21Preferred Securities Income Fund AA (GBP Hedged) MDIST (G) GBP 0.00506800 11-Jan-21Preferred Securities Income Fund AA (HKD) MDIST (G) HKD 0.04950000 11-Jan-21Preferred Securities Income Fund AA (RMB Hedged) MDIST (G) CNY 0.06444500 11-Jan-21Preferred Securities Income Fund AA (SGD Hedged) MDIST (G) SGD 0.00474000 11-Jan-21Preferred Securities Income Fund I3 Inc USD 0.00490000 11-Jan-21Preferred Securities Income Fund R (USD) MDIST (G) USD 0.00659000 11-Jan-21Preferred Securities Income Fund R (HKD) MDIST (G) HKD 0.06628000 11-Jan-21Preferred Securities Income Fund AA Inc USD 0.00400000 8-Feb-21Preferred Securities Income Fund AA (HKD) Inc HKD 0.04000000 8-Feb-21Preferred Securities Income Fund AA (SGD Hedged) Inc SGD 0.00386800 8-Feb-21Preferred Securities Income Fund AA (USD) MDIST (G) USD 0.00495000 8-Feb-21Preferred Securities Income Fund AA (AUD Hedged) MDIST (G) AUD 0.00343500 8-Feb-21Preferred Securities Income Fund AA (GBP Hedged) MDIST (G) GBP 0.00562600 8-Feb-21Preferred Securities Income Fund AA (HKD) MDIST (G) HKD 0.04950000 8-Feb-21Preferred Securities Income Fund AA (RMB Hedged) MDIST (G) CNY 0.06178600 8-Feb-21Preferred Securities Income Fund AA (SGD Hedged) MDIST (G) SGD 0.00474400 8-Feb-21Preferred Securities Income Fund I3 Inc USD 0.00490000 8-Feb-21Preferred Securities Income Fund R (USD) MDIST (G) USD 0.00614400 8-Feb-21Preferred Securities Income Fund R (HKD) MDIST (G) HKD 0.06127000 8-Feb-21Preferred Securities Income Fund AA Inc USD 0.00400000 8-Mar-21Preferred Securities Income Fund AA (HKD) Inc HKD 0.04000000 8-Mar-21Preferred Securities Income Fund AA (SGD Hedged) Inc SGD 0.00332400 8-Mar-21Preferred Securities Income Fund AA (USD) MDIST (G) USD 0.00495000 8-Mar-21Preferred Securities Income Fund AA (AUD Hedged) MDIST (G) AUD 0.00458800 8-Mar-21Preferred Securities Income Fund AA (GBP Hedged) MDIST (G) GBP 0.00516600 8-Mar-21Preferred Securities Income Fund AA (HKD) MDIST (G) HKD 0.04950000 8-Mar-21Preferred Securities Income Fund AA (RMB Hedged) MDIST (G) CNY 0.07073200 8-Mar-21Preferred Securities Income Fund AA (SGD Hedged) MDIST (G) SGD 0.00474300 8-Mar-21Preferred Securities Income Fund I3 Inc USD 0.00490000 8-Mar-21Preferred Securities Income Fund R (USD) MDIST (G) USD 0.00614400 8-Mar-21Preferred Securities Income Fund R (HKD) MDIST (G) HKD 0.06127000 8-Mar-21Preferred Securities Income Fund AA Inc USD 0.00400000 12-Apr-21
5 Dividend policy (continued)
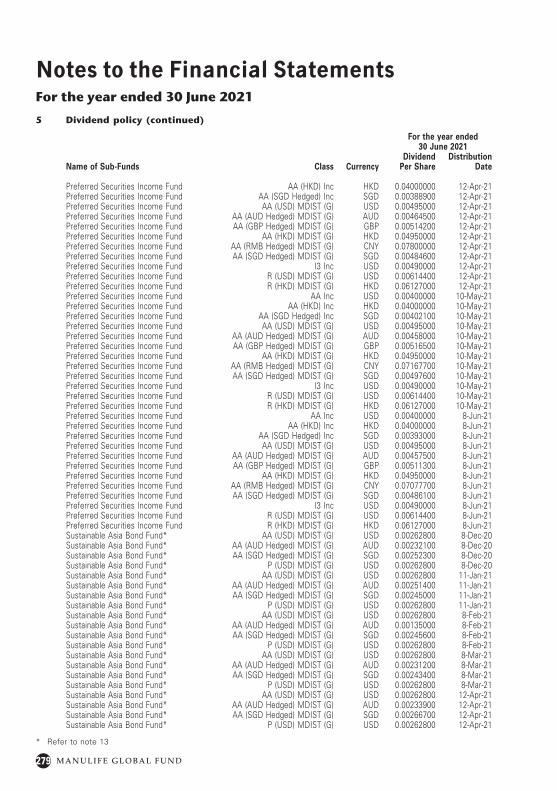
279 M A N U L I F E G L O B A L F U N D
Notes to the Financial StatementsFor the year ended 30 June 2021
For the year ended 30 June 2021
Name of Sub-Funds Class CurrencyDividend
Per ShareDistribution
Date
Preferred Securities Income Fund AA (HKD) Inc HKD 0.04000000 12-Apr-21Preferred Securities Income Fund AA (SGD Hedged) Inc SGD 0.00388900 12-Apr-21Preferred Securities Income Fund AA (USD) MDIST (G) USD 0.00495000 12-Apr-21Preferred Securities Income Fund AA (AUD Hedged) MDIST (G) AUD 0.00464500 12-Apr-21Preferred Securities Income Fund AA (GBP Hedged) MDIST (G) GBP 0.00514200 12-Apr-21Preferred Securities Income Fund AA (HKD) MDIST (G) HKD 0.04950000 12-Apr-21Preferred Securities Income Fund AA (RMB Hedged) MDIST (G) CNY 0.07800000 12-Apr-21Preferred Securities Income Fund AA (SGD Hedged) MDIST (G) SGD 0.00484600 12-Apr-21Preferred Securities Income Fund I3 Inc USD 0.00490000 12-Apr-21Preferred Securities Income Fund R (USD) MDIST (G) USD 0.00614400 12-Apr-21Preferred Securities Income Fund R (HKD) MDIST (G) HKD 0.06127000 12-Apr-21Preferred Securities Income Fund AA Inc USD 0.00400000 10-May-21Preferred Securities Income Fund AA (HKD) Inc HKD 0.04000000 10-May-21Preferred Securities Income Fund AA (SGD Hedged) Inc SGD 0.00402100 10-May-21Preferred Securities Income Fund AA (USD) MDIST (G) USD 0.00495000 10-May-21Preferred Securities Income Fund AA (AUD Hedged) MDIST (G) AUD 0.00458000 10-May-21Preferred Securities Income Fund AA (GBP Hedged) MDIST (G) GBP 0.00516500 10-May-21Preferred Securities Income Fund AA (HKD) MDIST (G) HKD 0.04950000 10-May-21Preferred Securities Income Fund AA (RMB Hedged) MDIST (G) CNY 0.07167700 10-May-21Preferred Securities Income Fund AA (SGD Hedged) MDIST (G) SGD 0.00497600 10-May-21Preferred Securities Income Fund I3 Inc USD 0.00490000 10-May-21Preferred Securities Income Fund R (USD) MDIST (G) USD 0.00614400 10-May-21Preferred Securities Income Fund R (HKD) MDIST (G) HKD 0.06127000 10-May-21Preferred Securities Income Fund AA Inc USD 0.00400000 8-Jun-21Preferred Securities Income Fund AA (HKD) Inc HKD 0.04000000 8-Jun-21Preferred Securities Income Fund AA (SGD Hedged) Inc SGD 0.00393000 8-Jun-21Preferred Securities Income Fund AA (USD) MDIST (G) USD 0.00495000 8-Jun-21Preferred Securities Income Fund AA (AUD Hedged) MDIST (G) AUD 0.00457500 8-Jun-21Preferred Securities Income Fund AA (GBP Hedged) MDIST (G) GBP 0.00511300 8-Jun-21Preferred Securities Income Fund AA (HKD) MDIST (G) HKD 0.04950000 8-Jun-21Preferred Securities Income Fund AA (RMB Hedged) MDIST (G) CNY 0.07077700 8-Jun-21Preferred Securities Income Fund AA (SGD Hedged) MDIST (G) SGD 0.00486100 8-Jun-21Preferred Securities Income Fund I3 Inc USD 0.00490000 8-Jun-21Preferred Securities Income Fund R (USD) MDIST (G) USD 0.00614400 8-Jun-21Preferred Securities Income Fund R (HKD) MDIST (G) HKD 0.06127000 8-Jun-21Sustainable Asia Bond Fund* AA (USD) MDIST (G) USD 0.00262800 8-Dec-20Sustainable Asia Bond Fund* AA (AUD Hedged) MDIST (G) AUD 0.00232100 8-Dec-20Sustainable Asia Bond Fund* AA (SGD Hedged) MDIST (G) SGD 0.00252300 8-Dec-20Sustainable Asia Bond Fund* P (USD) MDIST (G) USD 0.00262800 8-Dec-20Sustainable Asia Bond Fund* AA (USD) MDIST (G) USD 0.00262800 11-Jan-21Sustainable Asia Bond Fund* AA (AUD Hedged) MDIST (G) AUD 0.00251400 11-Jan-21Sustainable Asia Bond Fund* AA (SGD Hedged) MDIST (G) SGD 0.00245000 11-Jan-21Sustainable Asia Bond Fund* P (USD) MDIST (G) USD 0.00262800 11-Jan-21Sustainable Asia Bond Fund* AA (USD) MDIST (G) USD 0.00262800 8-Feb-21Sustainable Asia Bond Fund* AA (AUD Hedged) MDIST (G) AUD 0.00135000 8-Feb-21Sustainable Asia Bond Fund* AA (SGD Hedged) MDIST (G) SGD 0.00245600 8-Feb-21Sustainable Asia Bond Fund* P (USD) MDIST (G) USD 0.00262800 8-Feb-21Sustainable Asia Bond Fund* AA (USD) MDIST (G) USD 0.00262800 8-Mar-21Sustainable Asia Bond Fund* AA (AUD Hedged) MDIST (G) AUD 0.00231200 8-Mar-21Sustainable Asia Bond Fund* AA (SGD Hedged) MDIST (G) SGD 0.00243400 8-Mar-21Sustainable Asia Bond Fund* P (USD) MDIST (G) USD 0.00262800 8-Mar-21Sustainable Asia Bond Fund* AA (USD) MDIST (G) USD 0.00262800 12-Apr-21Sustainable Asia Bond Fund* AA (AUD Hedged) MDIST (G) AUD 0.00233900 12-Apr-21Sustainable Asia Bond Fund* AA (SGD Hedged) MDIST (G) SGD 0.00266700 12-Apr-21Sustainable Asia Bond Fund* P (USD) MDIST (G) USD 0.00262800 12-Apr-21
* Refer to note 13
5 Dividend policy (continued)
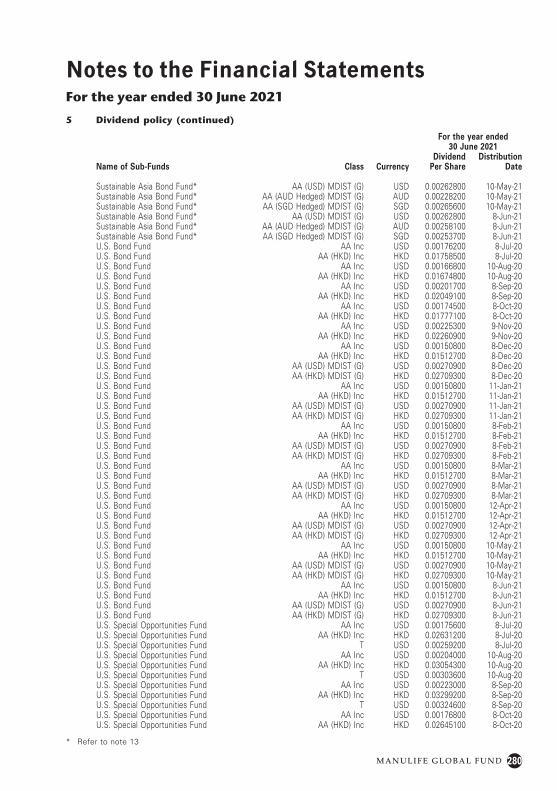
280M A N U L I F E G L O B A L F U N D
Notes to the Financial StatementsFor the year ended 30 June 2021
For the year ended 30 June 2021
Name of Sub-Funds Class CurrencyDividend
Per ShareDistribution
Date
Sustainable Asia Bond Fund* AA (USD) MDIST (G) USD 0.00262800 10-May-21Sustainable Asia Bond Fund* AA (AUD Hedged) MDIST (G) AUD 0.00228200 10-May-21Sustainable Asia Bond Fund* AA (SGD Hedged) MDIST (G) SGD 0.00265600 10-May-21Sustainable Asia Bond Fund* AA (USD) MDIST (G) USD 0.00262800 8-Jun-21Sustainable Asia Bond Fund* AA (AUD Hedged) MDIST (G) AUD 0.00258100 8-Jun-21Sustainable Asia Bond Fund* AA (SGD Hedged) MDIST (G) SGD 0.00253700 8-Jun-21U.S. Bond Fund AA Inc USD 0.00176200 8-Jul-20U.S. Bond Fund AA (HKD) Inc HKD 0.01758500 8-Jul-20U.S. Bond Fund AA Inc USD 0.00166800 10-Aug-20U.S. Bond Fund AA (HKD) Inc HKD 0.01674800 10-Aug-20U.S. Bond Fund AA Inc USD 0.00201700 8-Sep-20U.S. Bond Fund AA (HKD) Inc HKD 0.02049100 8-Sep-20U.S. Bond Fund AA Inc USD 0.00174500 8-Oct-20U.S. Bond Fund AA (HKD) Inc HKD 0.01777100 8-Oct-20U.S. Bond Fund AA Inc USD 0.00225300 9-Nov-20U.S. Bond Fund AA (HKD) Inc HKD 0.02260900 9-Nov-20U.S. Bond Fund AA Inc USD 0.00150800 8-Dec-20U.S. Bond Fund AA (HKD) Inc HKD 0.01512700 8-Dec-20U.S. Bond Fund AA (USD) MDIST (G) USD 0.00270900 8-Dec-20U.S. Bond Fund AA (HKD) MDIST (G) HKD 0.02709300 8-Dec-20U.S. Bond Fund AA Inc USD 0.00150800 11-Jan-21U.S. Bond Fund AA (HKD) Inc HKD 0.01512700 11-Jan-21U.S. Bond Fund AA (USD) MDIST (G) USD 0.00270900 11-Jan-21U.S. Bond Fund AA (HKD) MDIST (G) HKD 0.02709300 11-Jan-21U.S. Bond Fund AA Inc USD 0.00150800 8-Feb-21U.S. Bond Fund AA (HKD) Inc HKD 0.01512700 8-Feb-21U.S. Bond Fund AA (USD) MDIST (G) USD 0.00270900 8-Feb-21U.S. Bond Fund AA (HKD) MDIST (G) HKD 0.02709300 8-Feb-21U.S. Bond Fund AA Inc USD 0.00150800 8-Mar-21U.S. Bond Fund AA (HKD) Inc HKD 0.01512700 8-Mar-21U.S. Bond Fund AA (USD) MDIST (G) USD 0.00270900 8-Mar-21U.S. Bond Fund AA (HKD) MDIST (G) HKD 0.02709300 8-Mar-21U.S. Bond Fund AA Inc USD 0.00150800 12-Apr-21U.S. Bond Fund AA (HKD) Inc HKD 0.01512700 12-Apr-21U.S. Bond Fund AA (USD) MDIST (G) USD 0.00270900 12-Apr-21U.S. Bond Fund AA (HKD) MDIST (G) HKD 0.02709300 12-Apr-21U.S. Bond Fund AA Inc USD 0.00150800 10-May-21U.S. Bond Fund AA (HKD) Inc HKD 0.01512700 10-May-21U.S. Bond Fund AA (USD) MDIST (G) USD 0.00270900 10-May-21U.S. Bond Fund AA (HKD) MDIST (G) HKD 0.02709300 10-May-21U.S. Bond Fund AA Inc USD 0.00150800 8-Jun-21U.S. Bond Fund AA (HKD) Inc HKD 0.01512700 8-Jun-21U.S. Bond Fund AA (USD) MDIST (G) USD 0.00270900 8-Jun-21U.S. Bond Fund AA (HKD) MDIST (G) HKD 0.02709300 8-Jun-21U.S. Special Opportunities Fund AA Inc USD 0.00175600 8-Jul-20U.S. Special Opportunities Fund AA (HKD) Inc HKD 0.02631200 8-Jul-20U.S. Special Opportunities Fund T USD 0.00259200 8-Jul-20U.S. Special Opportunities Fund AA Inc USD 0.00204000 10-Aug-20U.S. Special Opportunities Fund AA (HKD) Inc HKD 0.03054300 10-Aug-20U.S. Special Opportunities Fund T USD 0.00303600 10-Aug-20U.S. Special Opportunities Fund AA Inc USD 0.00223000 8-Sep-20U.S. Special Opportunities Fund AA (HKD) Inc HKD 0.03299200 8-Sep-20U.S. Special Opportunities Fund T USD 0.00324600 8-Sep-20U.S. Special Opportunities Fund AA Inc USD 0.00176800 8-Oct-20U.S. Special Opportunities Fund AA (HKD) Inc HKD 0.02645100 8-Oct-20
* Refer to note 13
5 Dividend policy (continued)
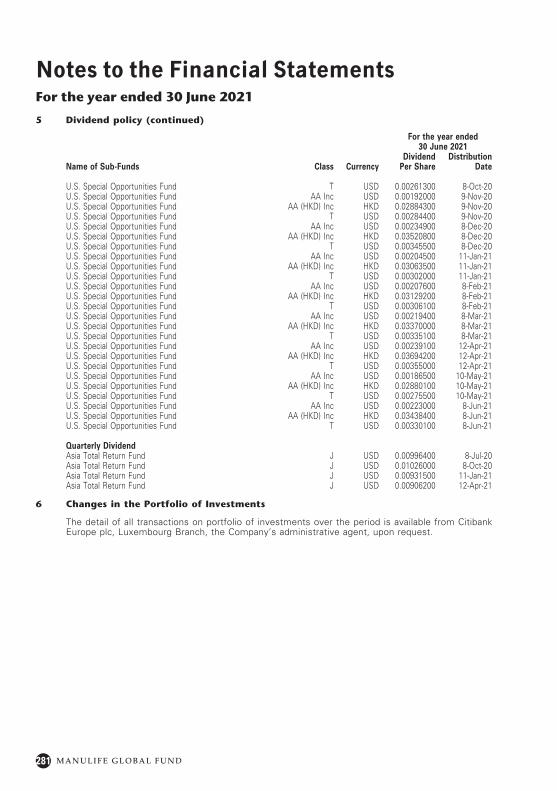
281 M A N U L I F E G L O B A L F U N D
Notes to the Financial StatementsFor the year ended 30 June 2021
For the year ended 30 June 2021
Name of Sub-Funds Class CurrencyDividend
Per ShareDistribution
Date
U.S. Special Opportunities Fund T USD 0.00261300 8-Oct-20U.S. Special Opportunities Fund AA Inc USD 0.00192000 9-Nov-20U.S. Special Opportunities Fund AA (HKD) Inc HKD 0.02884300 9-Nov-20U.S. Special Opportunities Fund T USD 0.00284400 9-Nov-20U.S. Special Opportunities Fund AA Inc USD 0.00234900 8-Dec-20U.S. Special Opportunities Fund AA (HKD) Inc HKD 0.03520800 8-Dec-20U.S. Special Opportunities Fund T USD 0.00345500 8-Dec-20U.S. Special Opportunities Fund AA Inc USD 0.00204500 11-Jan-21U.S. Special Opportunities Fund AA (HKD) Inc HKD 0.03063500 11-Jan-21U.S. Special Opportunities Fund T USD 0.00302000 11-Jan-21U.S. Special Opportunities Fund AA Inc USD 0.00207600 8-Feb-21U.S. Special Opportunities Fund AA (HKD) Inc HKD 0.03129200 8-Feb-21U.S. Special Opportunities Fund T USD 0.00306100 8-Feb-21U.S. Special Opportunities Fund AA Inc USD 0.00219400 8-Mar-21U.S. Special Opportunities Fund AA (HKD) Inc HKD 0.03370000 8-Mar-21U.S. Special Opportunities Fund T USD 0.00335100 8-Mar-21U.S. Special Opportunities Fund AA Inc USD 0.00239100 12-Apr-21U.S. Special Opportunities Fund AA (HKD) Inc HKD 0.03694200 12-Apr-21U.S. Special Opportunities Fund T USD 0.00355000 12-Apr-21U.S. Special Opportunities Fund AA Inc USD 0.00186500 10-May-21U.S. Special Opportunities Fund AA (HKD) Inc HKD 0.02880100 10-May-21U.S. Special Opportunities Fund T USD 0.00275500 10-May-21U.S. Special Opportunities Fund AA Inc USD 0.00223000 8-Jun-21U.S. Special Opportunities Fund AA (HKD) Inc HKD 0.03438400 8-Jun-21U.S. Special Opportunities Fund T USD 0.00330100 8-Jun-21
Quarterly DividendAsia Total Return Fund J USD 0.00996400 8-Jul-20Asia Total Return Fund J USD 0.01026000 8-Oct-20Asia Total Return Fund J USD 0.00931500 11-Jan-21Asia Total Return Fund J USD 0.00906200 12-Apr-21
6 Changes in the Portfolio of Investments
The detail of all transactions on portfolio of investments over the period is available from Citibank Europe plc, Luxembourg Branch, the Company’s administrative agent, upon request.
5 Dividend policy (continued)
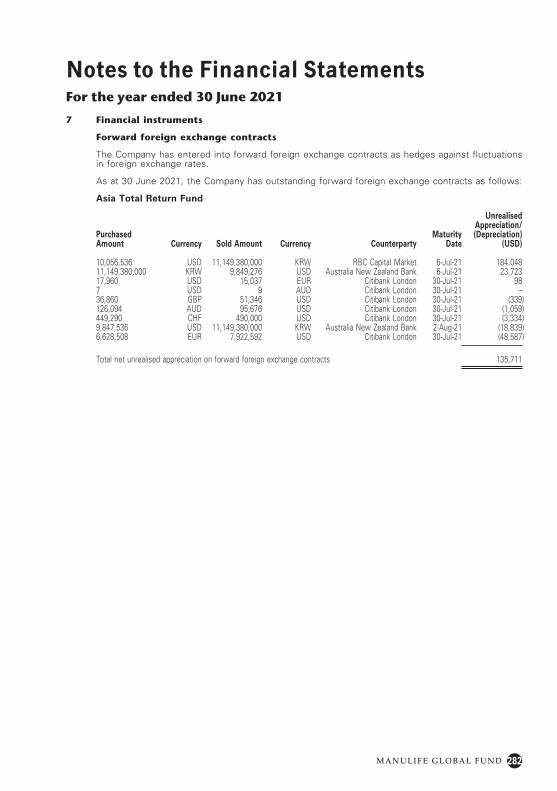
282M A N U L I F E G L O B A L F U N D
Notes to the Financial StatementsFor the year ended 30 June 2021
7 Financial instruments
Forward foreign exchange contracts
The Company has entered into forward foreign exchange contracts as hedges against fluctuations in foreign exchange rates.
As at 30 June 2021, the Company has outstanding forward foreign exchange contracts as follows:
Asia Total Return Fund
Purchased Amount Currency Sold Amount Currency Counterparty
Maturity Date
Unrealised Appreciation/(Depreciation)
(USD)
10,056,536 USD 11,149,380,000 KRW RBC Capital Market 6-Jul-21 184,04811,149,380,000 KRW 9,849,276 USD Australia New Zealand Bank 6-Jul-21 23,72317,960 USD 15,037 EUR Citibank London 30-Jul-21 987 USD 9 AUD Citibank London 30-Jul-21 –36,860 GBP 51,346 USD Citibank London 30-Jul-21 (339)126,094 AUD 95,676 USD Citibank London 30-Jul-21 (1,059)449,290 CHF 490,000 USD Citibank London 30-Jul-21 (3,334)9,847,536 USD 11,149,380,000 KRW Australia New Zealand Bank 2-Aug-21 (18,839)6,628,508 EUR 7,922,592 USD Citibank London 30-Jul-21 (48,587)
Total net unrealised appreciation on forward foreign exchange contracts 135,711
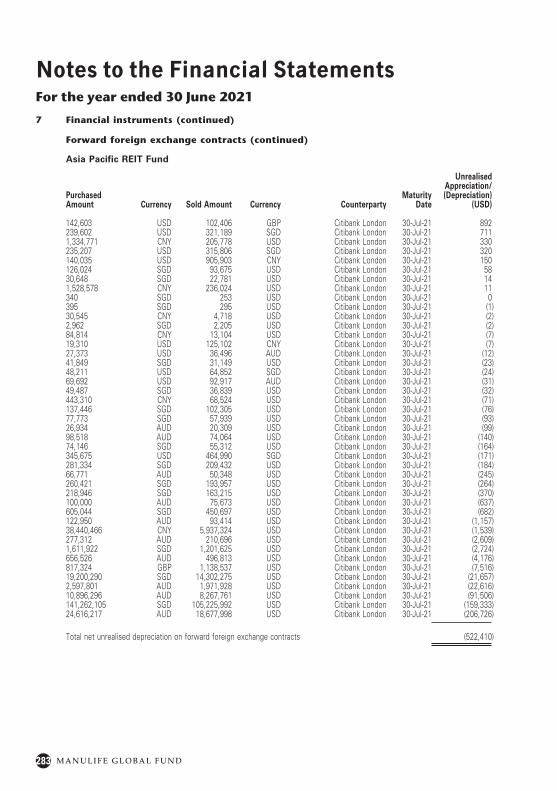
283 M A N U L I F E G L O B A L F U N D
Notes to the Financial StatementsFor the year ended 30 June 2021
7 Financial instruments (continued)
Forward foreign exchange contracts (continued)
Asia Pacific REIT Fund
Purchased Amount Currency Sold Amount Currency Counterparty
Maturity Date
Unrealised Appreciation/(Depreciation)
(USD)
142,603 USD 102,406 GBP Citibank London 30-Jul-21 892239,602 USD 321,189 SGD Citibank London 30-Jul-21 7111,334,771 CNY 205,778 USD Citibank London 30-Jul-21 330235,207 USD 315,806 SGD Citibank London 30-Jul-21 320140,035 USD 905,903 CNY Citibank London 30-Jul-21 150126,024 SGD 93,675 USD Citibank London 30-Jul-21 5830,648 SGD 22,781 USD Citibank London 30-Jul-21 141,528,578 CNY 236,024 USD Citibank London 30-Jul-21 11340 SGD 253 USD Citibank London 30-Jul-21 0395 SGD 295 USD Citibank London 30-Jul-21 (1)30,545 CNY 4,718 USD Citibank London 30-Jul-21 (2)2,962 SGD 2,205 USD Citibank London 30-Jul-21 (2)84,814 CNY 13,104 USD Citibank London 30-Jul-21 (7)19,310 USD 125,102 CNY Citibank London 30-Jul-21 (7)27,373 USD 36,496 AUD Citibank London 30-Jul-21 (12)41,849 SGD 31,149 USD Citibank London 30-Jul-21 (23)48,211 USD 64,852 SGD Citibank London 30-Jul-21 (24)69,692 USD 92,917 AUD Citibank London 30-Jul-21 (31)49,487 SGD 36,839 USD Citibank London 30-Jul-21 (32)443,310 CNY 68,524 USD Citibank London 30-Jul-21 (71)137,446 SGD 102,305 USD Citibank London 30-Jul-21 (76)77,773 SGD 57,939 USD Citibank London 30-Jul-21 (93)26,934 AUD 20,309 USD Citibank London 30-Jul-21 (99)98,518 AUD 74,064 USD Citibank London 30-Jul-21 (140)74,146 SGD 55,312 USD Citibank London 30-Jul-21 (164)345,675 USD 464,990 SGD Citibank London 30-Jul-21 (171)281,334 SGD 209,432 USD Citibank London 30-Jul-21 (184)66,771 AUD 50,348 USD Citibank London 30-Jul-21 (245)260,421 SGD 193,957 USD Citibank London 30-Jul-21 (264)218,946 SGD 163,215 USD Citibank London 30-Jul-21 (370)100,000 AUD 75,673 USD Citibank London 30-Jul-21 (637)605,044 SGD 450,697 USD Citibank London 30-Jul-21 (682)122,950 AUD 93,414 USD Citibank London 30-Jul-21 (1,157)38,440,466 CNY 5,937,324 USD Citibank London 30-Jul-21 (1,539)277,312 AUD 210,696 USD Citibank London 30-Jul-21 (2,609)1,611,922 SGD 1,201,625 USD Citibank London 30-Jul-21 (2,724)656,526 AUD 496,813 USD Citibank London 30-Jul-21 (4,176)817,324 GBP 1,138,537 USD Citibank London 30-Jul-21 (7,516)19,200,290 SGD 14,302,275 USD Citibank London 30-Jul-21 (21,657)2,597,801 AUD 1,971,928 USD Citibank London 30-Jul-21 (22,616)10,896,296 AUD 8,267,761 USD Citibank London 30-Jul-21 (91,506)141,262,105 SGD 105,225,992 USD Citibank London 30-Jul-21 (159,333)24,616,217 AUD 18,677,998 USD Citibank London 30-Jul-21 (206,726)
Total net unrealised depreciation on forward foreign exchange contracts (522,410)
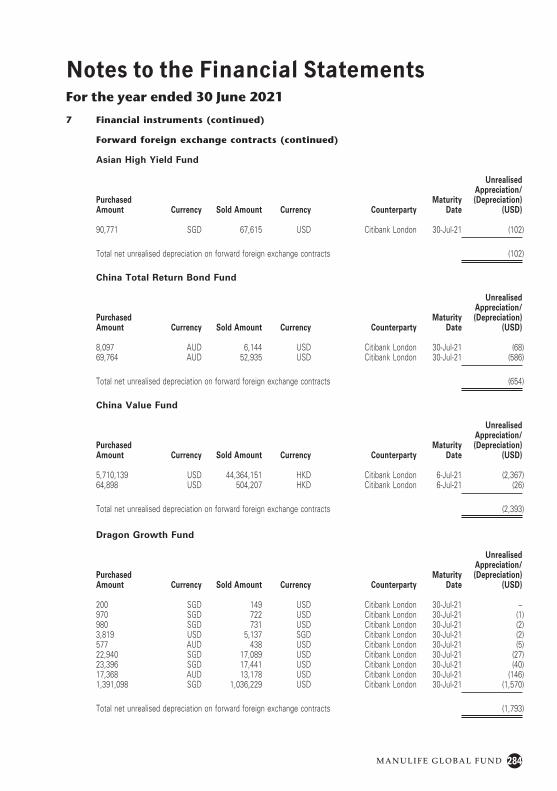
284M A N U L I F E G L O B A L F U N D
Notes to the Financial StatementsFor the year ended 30 June 2021
7 Financial instruments (continued)
Forward foreign exchange contracts (continued)
Asian High Yield Fund
Purchased Amount Currency Sold Amount Currency Counterparty
Maturity Date
Unrealised Appreciation/(Depreciation)
(USD)
90,771 SGD 67,615 USD Citibank London 30-Jul-21 (102)
Total net unrealised depreciation on forward foreign exchange contracts (102)
China Total Return Bond Fund
Purchased Amount Currency Sold Amount Currency Counterparty
Maturity Date
Unrealised Appreciation/(Depreciation)
(USD)
8,097 AUD 6,144 USD Citibank London 30-Jul-21 (68)69,764 AUD 52,935 USD Citibank London 30-Jul-21 (586)
Total net unrealised depreciation on forward foreign exchange contracts (654)
China Value Fund
Purchased Amount Currency Sold Amount Currency Counterparty
Maturity Date
Unrealised Appreciation/(Depreciation)
(USD)
5,710,139 USD 44,364,151 HKD Citibank London 6-Jul-21 (2,367)64,898 USD 504,207 HKD Citibank London 6-Jul-21 (26)
Total net unrealised depreciation on forward foreign exchange contracts (2,393)
Dragon Growth Fund
Purchased Amount Currency Sold Amount Currency Counterparty
Maturity Date
Unrealised Appreciation/(Depreciation)
(USD)
200 SGD 149 USD Citibank London 30-Jul-21 –970 SGD 722 USD Citibank London 30-Jul-21 (1)980 SGD 731 USD Citibank London 30-Jul-21 (2)3,819 USD 5,137 SGD Citibank London 30-Jul-21 (2)577 AUD 438 USD Citibank London 30-Jul-21 (5)22,940 SGD 17,089 USD Citibank London 30-Jul-21 (27)23,396 SGD 17,441 USD Citibank London 30-Jul-21 (40)17,368 AUD 13,178 USD Citibank London 30-Jul-21 (146)1,391,098 SGD 1,036,229 USD Citibank London 30-Jul-21 (1,570)
Total net unrealised depreciation on forward foreign exchange contracts (1,793)
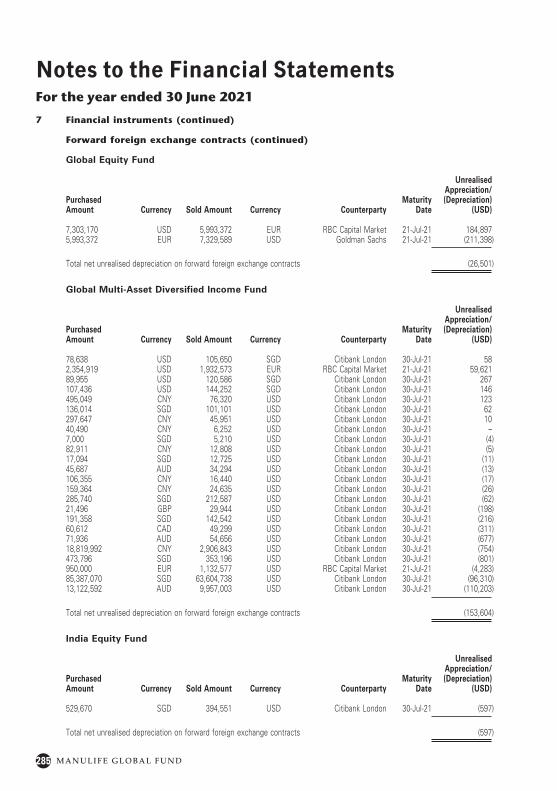
285 M A N U L I F E G L O B A L F U N D
Notes to the Financial StatementsFor the year ended 30 June 2021
7 Financial instruments (continued)
Forward foreign exchange contracts (continued)
Global Equity Fund
Purchased Amount Currency Sold Amount Currency Counterparty
Maturity Date
Unrealised Appreciation/(Depreciation)
(USD)
7,303,170 USD 5,993,372 EUR RBC Capital Market 21-Jul-21 184,8975,993,372 EUR 7,329,589 USD Goldman Sachs 21-Jul-21 (211,398)
Total net unrealised depreciation on forward foreign exchange contracts (26,501)
Global Multi-Asset Diversified Income Fund
Purchased Amount Currency Sold Amount Currency Counterparty
Maturity Date
Unrealised Appreciation/(Depreciation)
(USD)
78,638 USD 105,650 SGD Citibank London 30-Jul-21 582,354,919 USD 1,932,573 EUR RBC Capital Market 21-Jul-21 59,62189,955 USD 120,586 SGD Citibank London 30-Jul-21 267107,436 USD 144,252 SGD Citibank London 30-Jul-21 146495,049 CNY 76,320 USD Citibank London 30-Jul-21 123136,014 SGD 101,101 USD Citibank London 30-Jul-21 62297,647 CNY 45,951 USD Citibank London 30-Jul-21 1040,490 CNY 6,252 USD Citibank London 30-Jul-21 –7,000 SGD 5,210 USD Citibank London 30-Jul-21 (4)82,911 CNY 12,808 USD Citibank London 30-Jul-21 (5)17,094 SGD 12,725 USD Citibank London 30-Jul-21 (11)45,687 AUD 34,294 USD Citibank London 30-Jul-21 (13)106,355 CNY 16,440 USD Citibank London 30-Jul-21 (17)159,364 CNY 24,635 USD Citibank London 30-Jul-21 (26)285,740 SGD 212,587 USD Citibank London 30-Jul-21 (62)21,496 GBP 29,944 USD Citibank London 30-Jul-21 (198)191,358 SGD 142,542 USD Citibank London 30-Jul-21 (216)60,612 CAD 49,299 USD Citibank London 30-Jul-21 (311)71,936 AUD 54,656 USD Citibank London 30-Jul-21 (677)18,819,992 CNY 2,906,843 USD Citibank London 30-Jul-21 (754)473,796 SGD 353,196 USD Citibank London 30-Jul-21 (801)950,000 EUR 1,132,577 USD RBC Capital Market 21-Jul-21 (4,283)85,387,070 SGD 63,604,738 USD Citibank London 30-Jul-21 (96,310)13,122,592 AUD 9,957,003 USD Citibank London 30-Jul-21 (110,203)
Total net unrealised depreciation on forward foreign exchange contracts (153,604)
India Equity Fund
Purchased Amount Currency Sold Amount Currency Counterparty
Maturity Date
Unrealised Appreciation/(Depreciation)
(USD)
529,670 SGD 394,551 USD Citibank London 30-Jul-21 (597)
Total net unrealised depreciation on forward foreign exchange contracts (597)
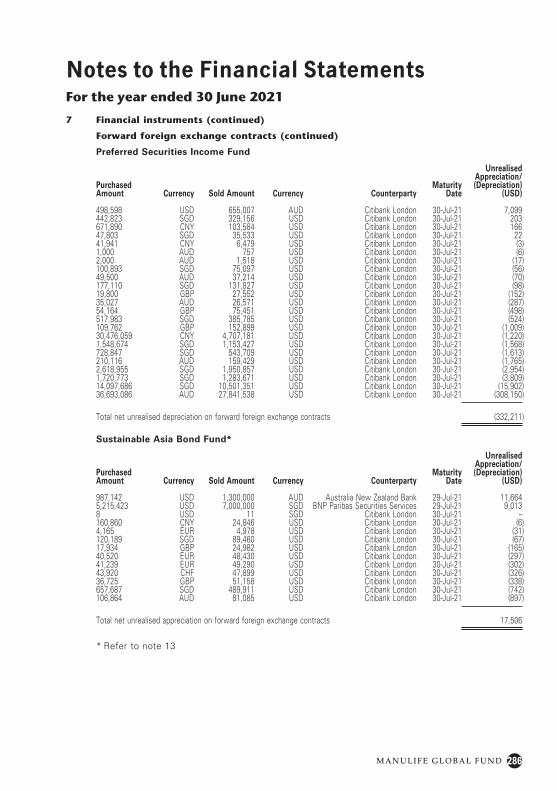
286M A N U L I F E G L O B A L F U N D
Notes to the Financial StatementsFor the year ended 30 June 2021
7 Financial instruments (continued)
Forward foreign exchange contracts (continued)
Preferred Securities Income Fund
Purchased Amount Currency Sold Amount Currency Counterparty
Maturity Date
Unrealised Appreciation/(Depreciation)
(USD)
498,598 USD 655,007 AUD Citibank London 30-Jul-21 7,099442,823 SGD 329,156 USD Citibank London 30-Jul-21 203671,890 CNY 103,584 USD Citibank London 30-Jul-21 16647,803 SGD 35,533 USD Citibank London 30-Jul-21 2241,941 CNY 6,479 USD Citibank London 30-Jul-21 (3)1,000 AUD 757 USD Citibank London 30-Jul-21 (6)2,000 AUD 1,518 USD Citibank London 30-Jul-21 (17)100,893 SGD 75,097 USD Citibank London 30-Jul-21 (56)49,500 AUD 37,214 USD Citibank London 30-Jul-21 (70)177,110 SGD 131,827 USD Citibank London 30-Jul-21 (98)19,800 GBP 27,552 USD Citibank London 30-Jul-21 (152)35,027 AUD 26,571 USD Citibank London 30-Jul-21 (287)54,164 GBP 75,451 USD Citibank London 30-Jul-21 (498)517,983 SGD 385,785 USD Citibank London 30-Jul-21 (524)109,762 GBP 152,899 USD Citibank London 30-Jul-21 (1,009)30,476,059 CNY 4,707,181 USD Citibank London 30-Jul-21 (1,220)1,548,674 SGD 1,153,427 USD Citibank London 30-Jul-21 (1,568)728,847 SGD 543,709 USD Citibank London 30-Jul-21 (1,613)210,116 AUD 159,429 USD Citibank London 30-Jul-21 (1,765)2,618,955 SGD 1,950,857 USD Citibank London 30-Jul-21 (2,954)1,720,773 SGD 1,283,671 USD Citibank London 30-Jul-21 (3,809)14,097,686 SGD 10,501,351 USD Citibank London 30-Jul-21 (15,902)36,693,086 AUD 27,841,538 USD Citibank London 30-Jul-21 (308,150)
Total net unrealised depreciation on forward foreign exchange contracts (332,211)
Sustainable Asia Bond Fund*
Purchased Amount Currency Sold Amount Currency Counterparty
Maturity Date
Unrealised Appreciation/(Depreciation)
(USD)
987,142 USD 1,300,000 AUD Australia New Zealand Bank 29-Jul-21 11,6645,215,423 USD 7,000,000 SGD BNP Paribas Securities Services 29-Jul-21 9,0138 USD 11 SGD Citibank London 30-Jul-21 –160,860 CNY 24,846 USD Citibank London 30-Jul-21 (6)4,165 EUR 4,978 USD Citibank London 30-Jul-21 (31)120,189 SGD 89,460 USD Citibank London 30-Jul-21 (67)17,934 GBP 24,982 USD Citibank London 30-Jul-21 (165)40,520 EUR 48,430 USD Citibank London 30-Jul-21 (297)41,239 EUR 49,290 USD Citibank London 30-Jul-21 (302)43,920 CHF 47,899 USD Citibank London 30-Jul-21 (326)36,725 GBP 51,158 USD Citibank London 30-Jul-21 (338)657,687 SGD 489,911 USD Citibank London 30-Jul-21 (742)106,864 AUD 81,085 USD Citibank London 30-Jul-21 (897)
Total net unrealised appreciation on forward foreign exchange contracts 17,506
* Refer to note 13
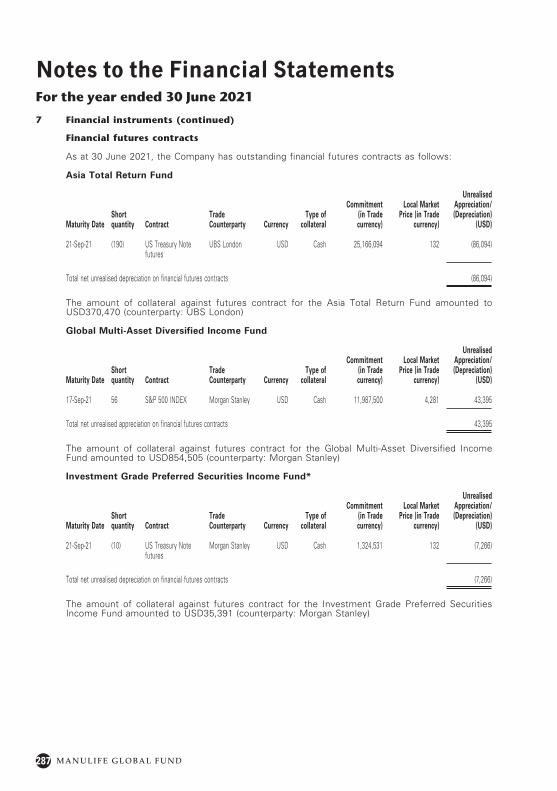
287 M A N U L I F E G L O B A L F U N D
Notes to the Financial StatementsFor the year ended 30 June 2021
7 Financial instruments (continued)
Financial futures contracts
As at 30 June 2021, the Company has outstanding financial futures contracts as follows:
Asia Total Return Fund
Maturity DateShort quantity Contract
Trade Counterparty Currency
Type of collateral
Commitment (in Trade currency)
Local Market Price (in Trade
currency)
Unrealised Appreciation/(Depreciation)
(USD)
21-Sep-21 (190) US Treasury Note futures
UBS London USD Cash 25,166,094 132 (86,094)
Total net unrealised depreciation on financial futures contracts (86,094)
The amount of collateral against futures contract for the Asia Total Return Fund amounted to USD370,470 (counterparty: UBS London)
Global Multi-Asset Diversified Income Fund
Maturity DateShort quantity Contract
Trade Counterparty Currency
Type of collateral
Commitment (in Trade currency)
Local Market Price (in Trade
currency)
Unrealised Appreciation/(Depreciation)
(USD)
17-Sep-21 56 S&P 500 INDEX Morgan Stanley USD Cash 11,987,500 4,281 43,395
Total net unrealised appreciation on financial futures contracts 43,395
The amount of collateral against futures contract for the Global Multi-Asset Diversified Income Fund amounted to USD854,505 (counterparty: Morgan Stanley)
Investment Grade Preferred Securities Income Fund*
Maturity DateShort quantity Contract
Trade Counterparty Currency
Type of collateral
Commitment (in Trade currency)
Local Market Price (in Trade
currency)
Unrealised Appreciation/(Depreciation)
(USD)
21-Sep-21 (10) US Treasury Note futures
Morgan Stanley USD Cash 1,324,531 132 (7,266)
Total net unrealised depreciation on financial futures contracts (7,266)
The amount of collateral against futures contract for the Investment Grade Preferred Securities Income Fund amounted to USD35,391 (counterparty: Morgan Stanley)
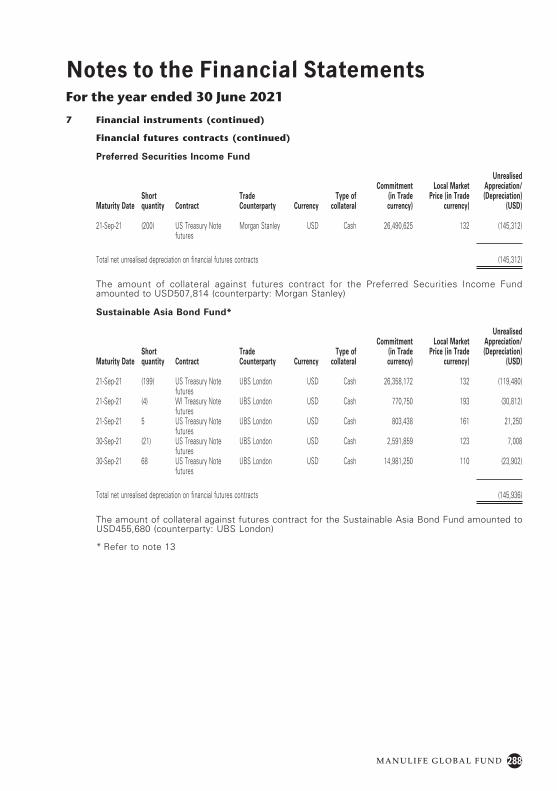
288M A N U L I F E G L O B A L F U N D
Notes to the Financial StatementsFor the year ended 30 June 2021
7 Financial instruments (continued)
Financial futures contracts (continued)
Preferred Securities Income Fund
Maturity DateShort quantity Contract
Trade Counterparty Currency
Type of collateral
Commitment (in Trade currency)
Local Market Price (in Trade
currency)
Unrealised Appreciation/(Depreciation)
(USD)
21-Sep-21 (200) US Treasury Note futures
Morgan Stanley USD Cash 26,490,625 132 (145,312)
Total net unrealised depreciation on financial futures contracts (145,312)
The amount of collateral against futures contract for the Preferred Securities Income Fund amounted to USD507,814 (counterparty: Morgan Stanley)
Sustainable Asia Bond Fund*
Maturity DateShort quantity Contract
Trade Counterparty Currency
Type of collateral
Commitment (in Trade currency)
Local Market Price (in Trade
currency)
Unrealised Appreciation/(Depreciation)
(USD)
21-Sep-21 (199) US Treasury Note futures
UBS London USD Cash 26,358,172 132 (119,480)
21-Sep-21 (4) WI Treasury Note futures
UBS London USD Cash 770,750 193 (30,812)
21-Sep-21 5 US Treasury Note futures
UBS London USD Cash 803,438 161 21,250
30-Sep-21 (21) US Treasury Note futures
UBS London USD Cash 2,591,859 123 7,008
30-Sep-21 68 US Treasury Note futures
UBS London USD Cash 14,981,250 110 (23,902)
Total net unrealised depreciation on financial futures contracts (145,936)
The amount of collateral against futures contract for the Sustainable Asia Bond Fund amounted to USD455,680 (counterparty: UBS London)
* Refer to note 13
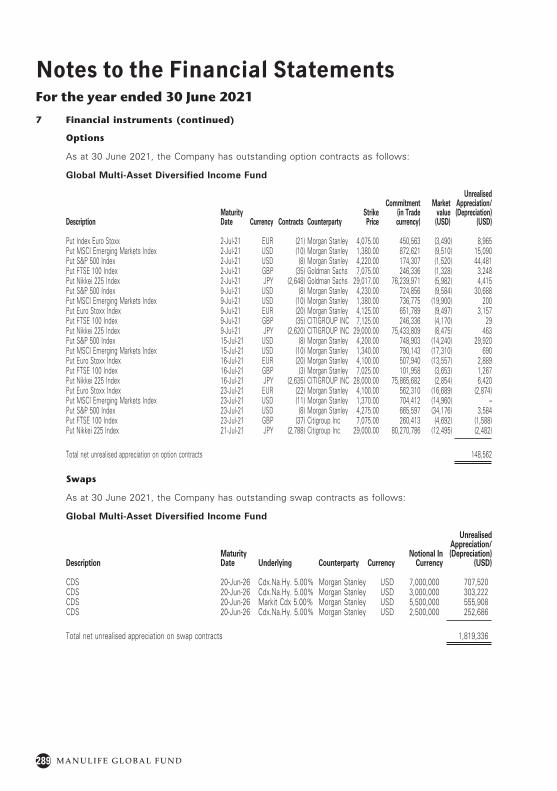
289 M A N U L I F E G L O B A L F U N D
Notes to the Financial StatementsFor the year ended 30 June 2021
7 Financial instruments (continued)
Options
As at 30 June 2021, the Company has outstanding option contracts as follows:
Global Multi-Asset Diversified Income Fund
DescriptionMaturity Date Currency Contracts Counterparty
Strike Price
Commitment (in Trade currency)
Market value (USD)
Unrealised Appreciation/(Depreciation)
(USD)
Put Index Euro Stoxx 2-Jul-21 EUR (21) Morgan Stanley 4,075.00 450,563 (3,490) 8,965Put MSCI Emerging Markets Index 2-Jul-21 USD (10) Morgan Stanley 1,380.00 872,621 (9,510) 15,090Put S&P 500 Index 2-Jul-21 USD (8) Morgan Stanley 4,220.00 174,307 (1,520) 44,481Put FTSE 100 Index 2-Jul-21 GBP (35) Goldman Sachs 7,075.00 246,336 (1,328) 3,248Put Nikkei 225 Index 2-Jul-21 JPY (2,648) Goldman Sachs 29,017.00 76,239,971 (5,982) 4,415Put S&P 500 Index 9-Jul-21 USD (8) Morgan Stanley 4,230.00 724,856 (9,584) 30,688Put MSCI Emerging Markets Index 9-Jul-21 USD (10) Morgan Stanley 1,380.00 736,775 (19,900) 200Put Euro Stoxx Index 9-Jul-21 EUR (20) Morgan Stanley 4,125.00 651,789 (9,497) 3,157Put FTSE 100 Index 9-Jul-21 GBP (35) CITIGROUP INC 7,125.00 246,336 (4,170) 29Put Nikkei 225 Index 9-Jul-21 JPY (2,620) CITIGROUP INC 29,000.00 75,433,809 (8,475) 463Put S&P 500 Index 15-Jul-21 USD (8) Morgan Stanley 4,200.00 748,903 (14,240) 29,920Put MSCI Emerging Markets Index 15-Jul-21 USD (10) Morgan Stanley 1,340.00 790,143 (17,310) 690Put Euro Stoxx Index 16-Jul-21 EUR (20) Morgan Stanley 4,100.00 507,940 (13,557) 2,889Put FTSE 100 Index 16-Jul-21 GBP (3) Morgan Stanley 7,025.00 101,958 (3,653) 1,267Put Nikkei 225 Index 16-Jul-21 JPY (2,635) CITIGROUP INC 28,000.00 75,865,682 (2,854) 6,420Put Euro Stoxx Index 23-Jul-21 EUR (22) Morgan Stanley 4,100.00 562,310 (16,689) (2,874)Put MSCI Emerging Markets Index 23-Jul-21 USD (11) Morgan Stanley 1,370.00 704,412 (14,960) –Put S&P 500 Index 23-Jul-21 USD (8) Morgan Stanley 4,275.00 665,597 (34,176) 3,584Put FTSE 100 Index 23-Jul-21 GBP (37) Citigroup Inc 7,075.00 260,413 (4,692) (1,588)Put Nikkei 225 Index 21-Jul-21 JPY (2,788) Citigroup Inc 29,000.00 80,270,786 (12,495) (2,482)
Total net unrealised appreciation on option contracts 148,562
Swaps
As at 30 June 2021, the Company has outstanding swap contracts as follows:
Global Multi-Asset Diversified Income Fund
DescriptionMaturity Date Underlying Counterparty Currency
Notional In Currency
Unrealised Appreciation/(Depreciation)
(USD)
CDS 20-Jun-26 Cdx.Na.Hy. 5.00% Morgan Stanley USD 7,000,000 707,520CDS 20-Jun-26 Cdx.Na.Hy. 5.00% Morgan Stanley USD 3,000,000 303,222CDS 20-Jun-26 Markit Cdx 5.00% Morgan Stanley USD 5,500,000 555,908CDS 20-Jun-26 Cdx.Na.Hy. 5.00% Morgan Stanley USD 2,500,000 252,686
Total net unrealised appreciation on swap contracts 1,819,336
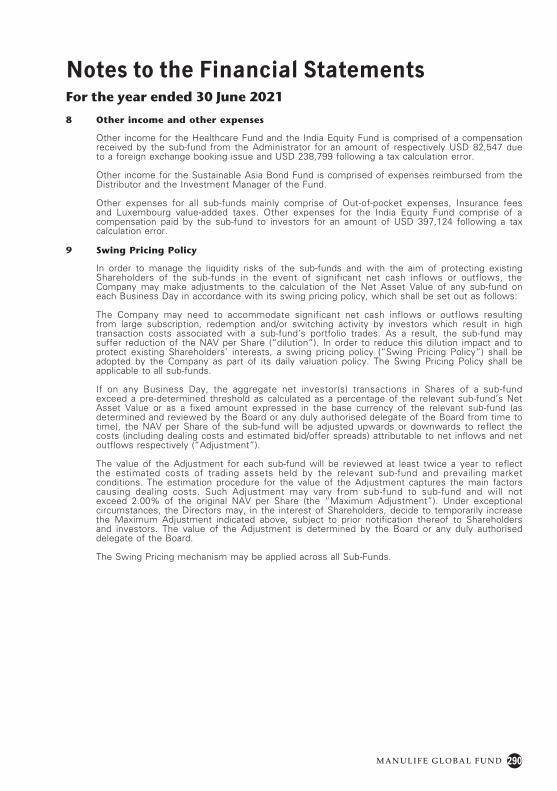
290M A N U L I F E G L O B A L F U N D
Notes to the Financial StatementsFor the year ended 30 June 2021
8 Other income and other expenses
Other income for the Healthcare Fund and the India Equity Fund is comprised of a compensation received by the sub-fund from the Administrator for an amount of respectively USD 82,547 due to a foreign exchange booking issue and USD 238,799 following a tax calculation error.
Other income for the Sustainable Asia Bond Fund is comprised of expenses reimbursed from the Distributor and the Investment Manager of the Fund.
Other expenses for all sub-funds mainly comprise of Out-of-pocket expenses, Insurance fees and Luxembourg value-added taxes. Other expenses for the India Equity Fund comprise of a compensation paid by the sub-fund to investors for an amount of USD 397,124 following a tax calculation error.
9 Swing Pricing Policy
In order to manage the liquidity risks of the sub-funds and with the aim of protecting existing Shareholders of the sub-funds in the event of significant net cash inflows or outflows, the Company may make adjustments to the calculation of the Net Asset Value of any sub-fund on each Business Day in accordance with its swing pricing policy, which shall be set out as follows:
The Company may need to accommodate significant net cash inflows or outflows resulting from large subscription, redemption and/or switching activity by investors which result in high transaction costs associated with a sub-fund’s portfolio trades. As a result, the sub-fund may suffer reduction of the NAV per Share (“dilution”). In order to reduce this dilution impact and to protect existing Shareholders’ interests, a swing pricing policy (“Swing Pricing Policy”) shall be adopted by the Company as part of its daily valuation policy. The Swing Pricing Policy shall be applicable to all sub-funds.
If on any Business Day, the aggregate net investor(s) transactions in Shares of a sub-fund exceed a pre-determined threshold as calculated as a percentage of the relevant sub-fund’s Net Asset Value or as a fixed amount expressed in the base currency of the relevant sub-fund (as determined and reviewed by the Board or any duly authorised delegate of the Board from time to time), the NAV per Share of the sub-fund will be adjusted upwards or downwards to reflect the costs (including dealing costs and estimated bid/offer spreads) attributable to net inflows and net outflows respectively (“Adjustment”).
The value of the Adjustment for each sub-fund will be reviewed at least twice a year to reflect the estimated costs of trading assets held by the relevant sub-fund and prevailing market conditions. The estimation procedure for the value of the Adjustment captures the main factors causing dealing costs. Such Adjustment may vary from sub-fund to sub-fund and will not exceed 2.00% of the original NAV per Share (the “Maximum Adjustment”). Under exceptional circumstances, the Directors may, in the interest of Shareholders, decide to temporarily increase the Maximum Adjustment indicated above, subject to prior notification thereof to Shareholders and investors. The value of the Adjustment is determined by the Board or any duly authorised delegate of the Board.
The Swing Pricing mechanism may be applied across all Sub-Funds.
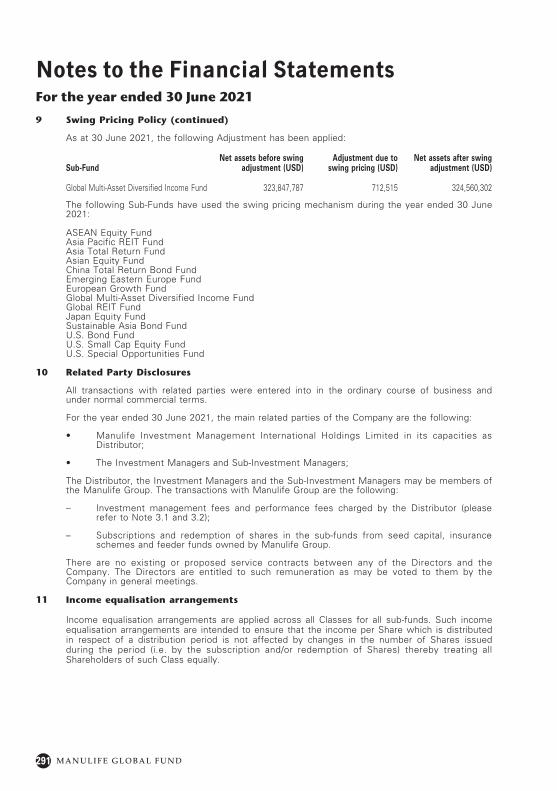
291 M A N U L I F E G L O B A L F U N D
Notes to the Financial StatementsFor the year ended 30 June 2021
9 Swing Pricing Policy (continued)
As at 30 June 2021, the following Adjustment has been applied:
Sub-FundNet assets before swing
adjustment (USD)Adjustment due to
swing pricing (USD)Net assets after swing
adjustment (USD)
Global Multi-Asset Diversified Income Fund 323,847,787 712,515 324,560,302
The following Sub-Funds have used the swing pricing mechanism during the year ended 30 June 2021:
ASEAN Equity FundAsia Pacific REIT FundAsia Total Return FundAsian Equity FundChina Total Return Bond FundEmerging Eastern Europe FundEuropean Growth FundGlobal Multi-Asset Diversified Income FundGlobal REIT FundJapan Equity FundSustainable Asia Bond FundU.S. Bond FundU.S. Small Cap Equity FundU.S. Special Opportunities Fund
10 Related Party Disclosures
All transactions with related parties were entered into in the ordinary course of business and under normal commercial terms.
For the year ended 30 June 2021, the main related parties of the Company are the following:
• Manulife Investment Management International Holdings Limited in its capacities as Distributor;
• The Investment Managers and Sub-Investment Managers;
The Distributor, the Investment Managers and the Sub-Investment Managers may be members of the Manulife Group. The transactions with Manulife Group are the following:
– Investment management fees and performance fees charged by the Distributor (please refer to Note 3.1 and 3.2);
– Subscriptions and redemption of shares in the sub-funds from seed capital, insurance schemes and feeder funds owned by Manulife Group.
There are no existing or proposed service contracts between any of the Directors and the Company. The Directors are entitled to such remuneration as may be voted to them by the Company in general meetings.
11 Income equalisation arrangements
Income equalisation arrangements are applied across all Classes for all sub-funds. Such income equalisation arrangements are intended to ensure that the income per Share which is distributed in respect of a distribution period is not affected by changes in the number of Shares issued during the period (i.e. by the subscription and/or redemption of Shares) thereby treating all Shareholders of such Class equally.
292M A N U L I F E G L O B A L F U N D
Notes to the Financial StatementsFor the year ended 30 June 2021
12 Movements in portfolio holdings
A detailed list of changes in the composition of the portfolio is available to shareholders upon request and free of charge at the registered office of the Company.
13 Important events
The Investment Managers and Sub-Investment Managers are closely monitoring and responding to developments concerning the outbreak of COVID-19. The Investment Managers and Sub-Investment Managers, the Administrator and the Depositary have all deployed business continuity arrangements to minimise interruption to business in respect of the COVID-19 pandemic. At the time of signing this annual report there remains uncertainty regarding the full impact of COVID-19. The Board, the Investment Managers and Sub-Investment Managers and the other key service providers will continue to monitor developments and respond as appropriate.
With effect from 6 August 2020, Manulife Investment Management (Hong Kong) Limited located at 16th Floor, Lee Garden One, 33 Hysan Avenue, Causeway Bay, Hong Kong SAR, has been appointed as Investment Manager of the Sustainable Asia Bond Fund.
With effect from 6 August 2020, Manulife Investment Management (Singapore) Pte. Ltd. located at 8 Cross Street, #16-01 Manulife Tower, Singapore 048424, has been appointed as Sub-Investment Manager of the Sustainable Asia Bond Fund.
With effect from 4 December 2020, Manulife Investment Management (US) LLC located at 197 Clarendon Street, Boston, MA02116, United States of America, has been appointed as Investment Manager of the Dynamic Leaders Fund.
With effect from 17 December 2020, Manulife Investment Management (Europe) Limited located at 1 London Wall, London EC2Y 5EA, United Kingdom and Manulife Investment Management (Hong Kong) Limited located at 16th Floor, Lee Garden One, 33 Hysan Avenue, Causeway Bay, Hong Kong SAR have been appointed as Co-Investment Managers of the Asia Total Return Fund and Asian High Yield Fund to replace the existing Investment Manager, Manulife Investment Management (Hong Kong) Limited.
With effect from 17 December 2020, Manulife Investment Management (Europe) Limited located at 1 London Wall, London EC2Y 5EA, United Kingdom, and Manulife Investment Management (Hong Kong) Limited located at 16th Floor, Lee Garden One, 33 Hysan Avenue, Causeway Bay, Hong Kong SAR, have been appointed as Co-Sub-Investment Managers of the Global Multi-Asset Diversified Income Fund to replace the existing Sub-Investment Manager, Manulife Investment Management (Hong Kong) Limited.
With effect from 24 March 2021, Manulife Investment Management (US) LLC located at 197 Clarendon Street, Boston, MA02116, United States of America, has been appointed as Investment Manager of the Investment Grade Preferred Securities Income Fund.
The sub-fund Sustainable Asia Bond Fund has been launched on 6 August 2020.
The sub-fund Dynamic Leaders Fund has been launched on 4 December 2020.
The sub-fund Investment Grade Preferred Securities Income Fund has been launched on 24 March 2021.
The Asia Value Dividend Equity Fund and Latin America Equity Fund were liquidated on 30 June 2021.
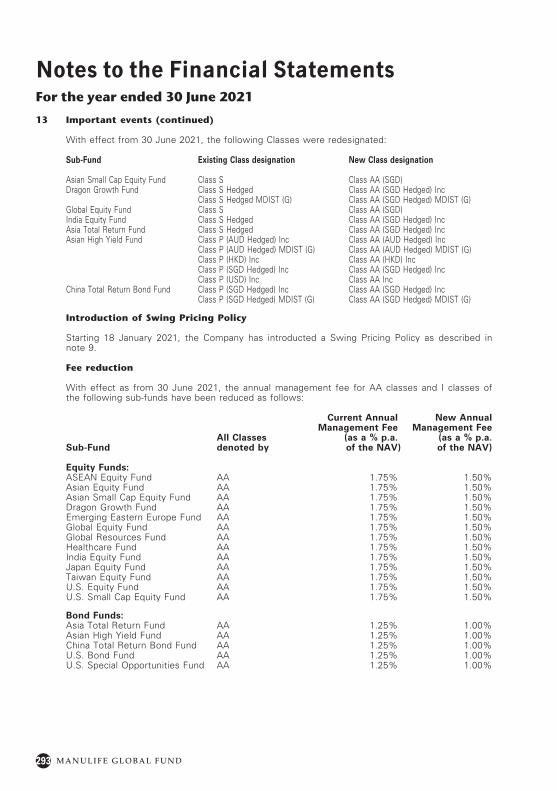
293 M A N U L I F E G L O B A L F U N D
Notes to the Financial StatementsFor the year ended 30 June 2021
13 Important events (continued)
With effect from 30 June 2021, the following Classes were redesignated:
Sub-Fund Existing Class designation New Class designation
Asian Small Cap Equity Fund Class S Class AA (SGD)Dragon Growth Fund Class S Hedged Class AA (SGD Hedged) Inc
Class S Hedged MDIST (G) Class AA (SGD Hedged) MDIST (G)Global Equity Fund Class S Class AA (SGD)India Equity Fund Class S Hedged Class AA (SGD Hedged) IncAsia Total Return Fund Class S Hedged Class AA (SGD Hedged) IncAsian High Yield Fund Class P (AUD Hedged) Inc Class AA (AUD Hedged) Inc
Class P (AUD Hedged) MDIST (G) Class AA (AUD Hedged) MDIST (G)Class P (HKD) Inc Class AA (HKD) IncClass P (SGD Hedged) Inc Class AA (SGD Hedged) IncClass P (USD) Inc Class AA Inc
China Total Return Bond Fund Class P (SGD Hedged) Inc Class AA (SGD Hedged) IncClass P (SGD Hedged) MDIST (G) Class AA (SGD Hedged) MDIST (G)
Introduction of Swing Pricing Policy
Starting 18 January 2021, the Company has introducted a Swing Pricing Policy as described in note 9.
Fee reduction
With effect as from 30 June 2021, the annual management fee for AA classes and I classes of the following sub-funds have been reduced as follows:
Sub-FundAll Classes denoted by
Current Annual Management Fee
(as a % p.a. of the NAV)
New Annual Management Fee
(as a % p.a. of the NAV)
Equity Funds:ASEAN Equity Fund AA 1.75% 1.50%Asian Equity Fund AA 1.75% 1.50%Asian Small Cap Equity Fund AA 1.75% 1.50%Dragon Growth Fund AA 1.75% 1.50%Emerging Eastern Europe Fund AA 1.75% 1.50%Global Equity Fund AA 1.75% 1.50%Global Resources Fund AA 1.75% 1.50%Healthcare Fund AA 1.75% 1.50%India Equity Fund AA 1.75% 1.50%Japan Equity Fund AA 1.75% 1.50%Taiwan Equity Fund AA 1.75% 1.50%U.S. Equity Fund AA 1.75% 1.50%U.S. Small Cap Equity Fund AA 1.75% 1.50%
Bond Funds:Asia Total Return Fund AA 1.25% 1.00%Asian High Yield Fund AA 1.25% 1.00%China Total Return Bond Fund AA 1.25% 1.00%U.S. Bond Fund AA 1.25% 1.00%U.S. Special Opportunities Fund AA 1.25% 1.00%
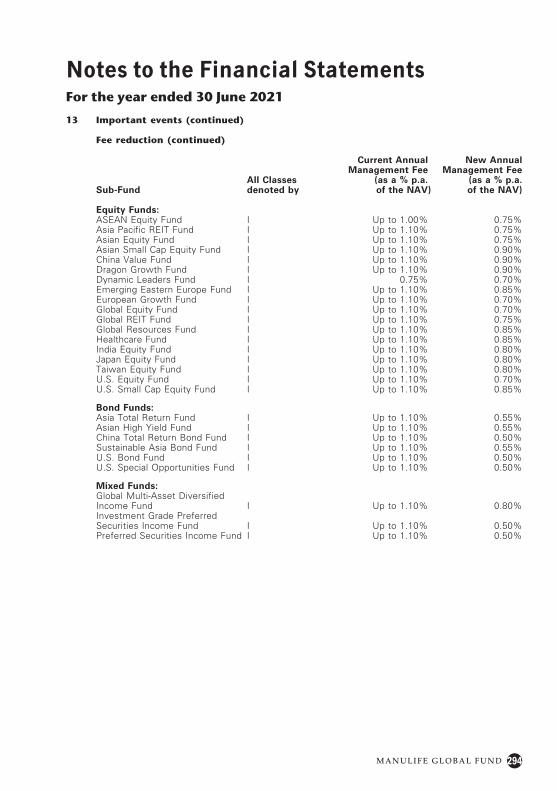
294M A N U L I F E G L O B A L F U N D
Notes to the Financial StatementsFor the year ended 30 June 2021
13 Important events (continued)
Fee reduction (continued)
Sub-FundAll Classes denoted by
Current Annual Management Fee
(as a % p.a. of the NAV)
New Annual Management Fee
(as a % p.a. of the NAV)
Equity Funds:ASEAN Equity Fund I Up to 1.00% 0.75%Asia Pacific REIT Fund I Up to 1.10% 0.75%Asian Equity Fund I Up to 1.10% 0.75%Asian Small Cap Equity Fund I Up to 1.10% 0.90%China Value Fund I Up to 1.10% 0.90%Dragon Growth Fund I Up to 1.10% 0.90%Dynamic Leaders Fund I 0.75% 0.70%Emerging Eastern Europe Fund I Up to 1.10% 0.85%European Growth Fund I Up to 1.10% 0.70%Global Equity Fund I Up to 1.10% 0.70%Global REIT Fund I Up to 1.10% 0.75%Global Resources Fund I Up to 1.10% 0.85%Healthcare Fund I Up to 1.10% 0.85%India Equity Fund I Up to 1.10% 0.80%Japan Equity Fund I Up to 1.10% 0.80%Taiwan Equity Fund I Up to 1.10% 0.80%U.S. Equity Fund I Up to 1.10% 0.70%U.S. Small Cap Equity Fund I Up to 1.10% 0.85%
Bond Funds:Asia Total Return Fund I Up to 1.10% 0.55%Asian High Yield Fund I Up to 1.10% 0.55%China Total Return Bond Fund I Up to 1.10% 0.50%Sustainable Asia Bond Fund I Up to 1.10% 0.55%U.S. Bond Fund I Up to 1.10% 0.50%U.S. Special Opportunities Fund I Up to 1.10% 0.50%
Mixed Funds:Global Multi-Asset Diversified Income Fund I Up to 1.10% 0.80%Investment Grade Preferred Securities Income Fund I Up to 1.10% 0.50%Preferred Securities Income Fund I Up to 1.10% 0.50%
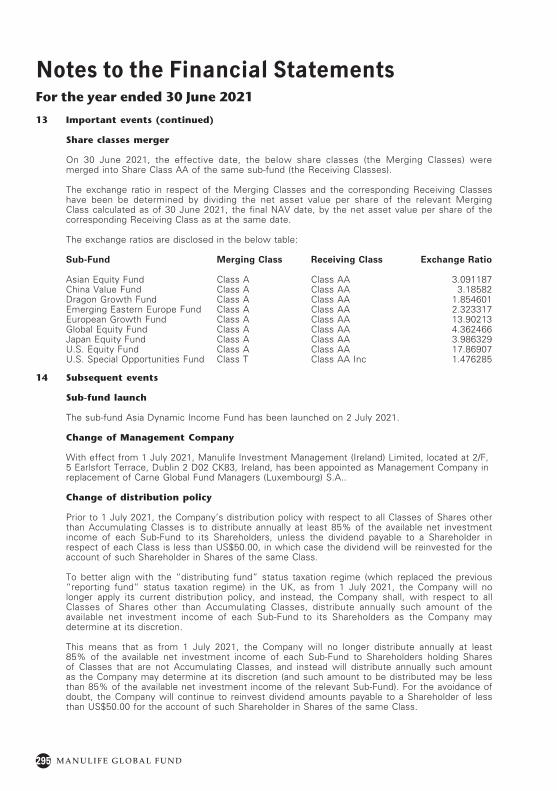
295 M A N U L I F E G L O B A L F U N D
Notes to the Financial StatementsFor the year ended 30 June 2021
13 Important events (continued)
Share classes merger
On 30 June 2021, the effective date, the below share classes (the Merging Classes) were merged into Share Class AA of the same sub-fund (the Receiving Classes).
The exchange ratio in respect of the Merging Classes and the corresponding Receiving Classes have been be determined by dividing the net asset value per share of the relevant Merging Class calculated as of 30 June 2021, the final NAV date, by the net asset value per share of the corresponding Receiving Class as at the same date.
The exchange ratios are disclosed in the below table:
Sub-Fund Merging Class Receiving Class Exchange Ratio
Asian Equity Fund Class A Class AA 3.091187China Value Fund Class A Class AA 3.18582Dragon Growth Fund Class A Class AA 1.854601Emerging Eastern Europe Fund Class A Class AA 2.323317European Growth Fund Class A Class AA 13.90213Global Equity Fund Class A Class AA 4.362466Japan Equity Fund Class A Class AA 3.986329U.S. Equity Fund Class A Class AA 17.86907U.S. Special Opportunities Fund Class T Class AA Inc 1.476285
14 Subsequent events
Sub-fund launch
The sub-fund Asia Dynamic Income Fund has been launched on 2 July 2021.
Change of Management Company
With effect from 1 July 2021, Manulife Investment Management (Ireland) Limited, located at 2/F,5 Earlsfort Terrace, Dublin 2 D02 CK83, Ireland, has been appointed as Management Company inreplacement of Carne Global Fund Managers (Luxembourg) S.A..
Change of distribution policy
Prior to 1 July 2021, the Company’s distribution policy with respect to all Classes of Shares other than Accumulating Classes is to distribute annually at least 85% of the available net investment income of each Sub-Fund to its Shareholders, unless the dividend payable to a Shareholder in respect of each Class is less than US$50.00, in which case the dividend will be reinvested for the account of such Shareholder in Shares of the same Class.
To better align with the “distributing fund” status taxation regime (which replaced the previous “reporting fund” status taxation regime) in the UK, as from 1 July 2021, the Company will no longer apply its current distribution policy, and instead, the Company shall, with respect to all Classes of Shares other than Accumulating Classes, distribute annually such amount of the available net investment income of each Sub-Fund to its Shareholders as the Company may determine at its discretion.
This means that as from 1 July 2021, the Company will no longer distribute annually at least 85% of the available net investment income of each Sub-Fund to Shareholders holding Shares of Classes that are not Accumulating Classes, and instead will distribute annually such amount as the Company may determine at its discretion (and such amount to be distributed may be less than 85% of the available net investment income of the relevant Sub-Fund). For the avoidance of doubt, the Company will continue to reinvest dividend amounts payable to a Shareholder of less than US$50.00 for the account of such Shareholder in Shares of the same Class.
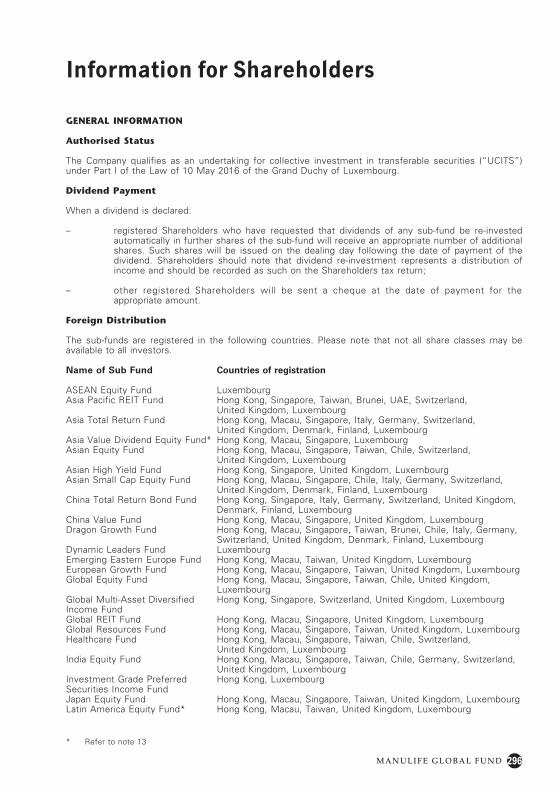
296M A N U L I F E G L O B A L F U N D
Information for Shareholders
GENERAL INFORMATION
Authorised Status
The Company qualifies as an undertaking for collective investment in transferable securities (“UCITS”) under Part I of the Law of 10 May 2016 of the Grand Duchy of Luxembourg.
Dividend Payment
When a dividend is declared:
– registered Shareholders who have requested that dividends of any sub-fund be re-invested automatically in further shares of the sub-fund will receive an appropriate number of additional shares. Such shares will be issued on the dealing day following the date of payment of the dividend. Shareholders should note that dividend re-investment represents a distribution of income and should be recorded as such on the Shareholders tax return;
– other registered Shareholders will be sent a cheque at the date of payment for the appropriate amount.
Foreign Distribution
The sub-funds are registered in the following countries. Please note that not all share classes may be available to all investors.
Name of Sub Fund Countries of registration
ASEAN Equity Fund LuxembourgAsia Pacific REIT Fund Hong Kong, Singapore, Taiwan, Brunei, UAE, Switzerland,
United Kingdom, LuxembourgAsia Total Return Fund Hong Kong, Macau, Singapore, Italy, Germany, Switzerland,
United Kingdom, Denmark, Finland, LuxembourgAsia Value Dividend Equity Fund* Hong Kong, Macau, Singapore, LuxembourgAsian Equity Fund Hong Kong, Macau, Singapore, Taiwan, Chile, Switzerland,
United Kingdom, LuxembourgAsian High Yield Fund Hong Kong, Singapore, United Kingdom, LuxembourgAsian Small Cap Equity Fund Hong Kong, Macau, Singapore, Chile, Italy, Germany, Switzerland,
United Kingdom, Denmark, Finland, LuxembourgChina Total Return Bond Fund Hong Kong, Singapore, Italy, Germany, Switzerland, United Kingdom,
Denmark, Finland, LuxembourgChina Value Fund Hong Kong, Macau, Singapore, United Kingdom, LuxembourgDragon Growth Fund Hong Kong, Macau, Singapore, Taiwan, Brunei, Chile, Italy, Germany,
Switzerland, United Kingdom, Denmark, Finland, LuxembourgDynamic Leaders Fund LuxembourgEmerging Eastern Europe Fund Hong Kong, Macau, Taiwan, United Kingdom, LuxembourgEuropean Growth Fund Hong Kong, Macau, Singapore, Taiwan, United Kingdom, LuxembourgGlobal Equity Fund Hong Kong, Macau, Singapore, Taiwan, Chile, United Kingdom,
LuxembourgGlobal Multi-Asset Diversified Income Fund
Hong Kong, Singapore, Switzerland, United Kingdom, Luxembourg
Global REIT Fund Hong Kong, Macau, Singapore, United Kingdom, LuxembourgGlobal Resources Fund Hong Kong, Macau, Singapore, Taiwan, United Kingdom, LuxembourgHealthcare Fund Hong Kong, Macau, Singapore, Taiwan, Chile, Switzerland,
United Kingdom, LuxembourgIndia Equity Fund Hong Kong, Macau, Singapore, Taiwan, Chile, Germany, Switzerland,
United Kingdom, LuxembourgInvestment Grade Preferred Securities Income Fund
Hong Kong, Luxembourg
Japan Equity Fund Hong Kong, Macau, Singapore, Taiwan, United Kingdom, LuxembourgLatin America Equity Fund* Hong Kong, Macau, Taiwan, United Kingdom, Luxembourg
* Refer to note 13
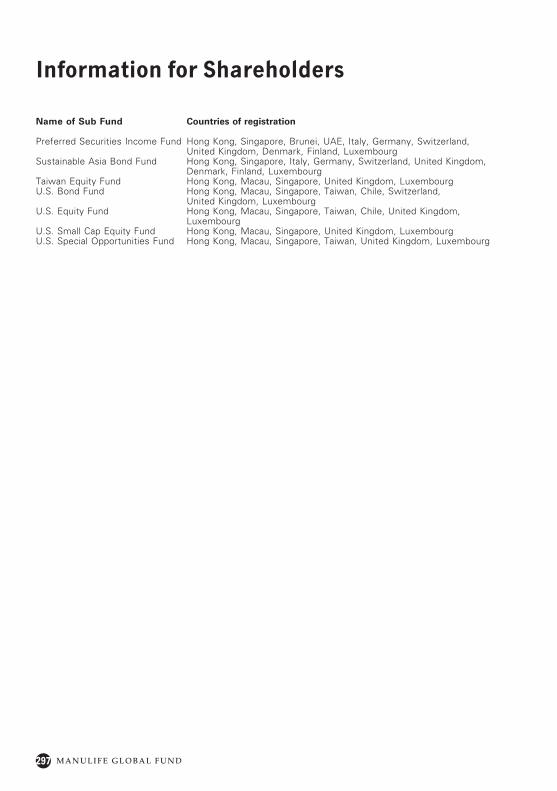
297 M A N U L I F E G L O B A L F U N D
Information for Shareholders
Name of Sub Fund Countries of registration
Preferred Securities Income Fund Hong Kong, Singapore, Brunei, UAE, Italy, Germany, Switzerland, United Kingdom, Denmark, Finland, Luxembourg
Sustainable Asia Bond Fund Hong Kong, Singapore, Italy, Germany, Switzerland, United Kingdom, Denmark, Finland, Luxembourg
Taiwan Equity Fund Hong Kong, Macau, Singapore, United Kingdom, LuxembourgU.S. Bond Fund Hong Kong, Macau, Singapore, Taiwan, Chile, Switzerland,
United Kingdom, LuxembourgU.S. Equity Fund Hong Kong, Macau, Singapore, Taiwan, Chile, United Kingdom,
LuxembourgU.S. Small Cap Equity Fund Hong Kong, Macau, Singapore, United Kingdom, LuxembourgU.S. Special Opportunities Fund Hong Kong, Macau, Singapore, Taiwan, United Kingdom, Luxembourg
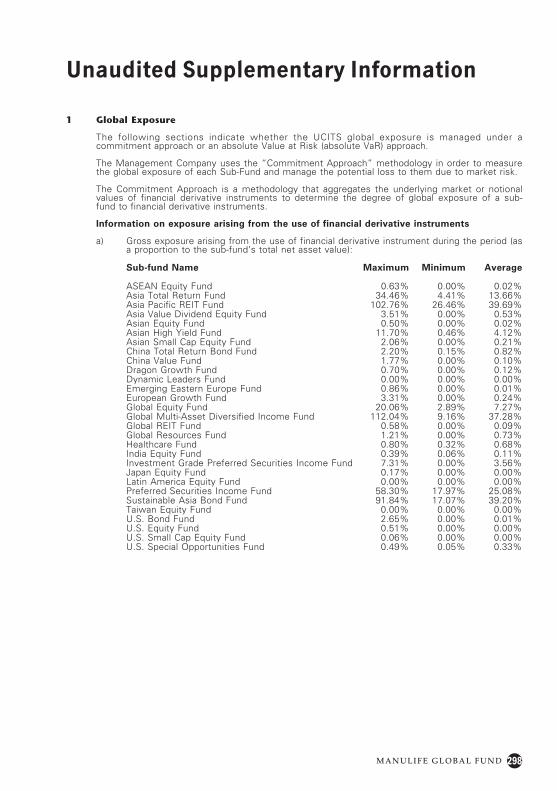
298M A N U L I F E G L O B A L F U N D
Unaudited Supplementary Information
1 Global Exposure
The following sections indicate whether the UCITS global exposure is managed under a commitment approach or an absolute Value at Risk (absolute VaR) approach.
The Management Company uses the “Commitment Approach” methodology in order to measure the global exposure of each Sub-Fund and manage the potential loss to them due to market risk.
The Commitment Approach is a methodology that aggregates the underlying market or notional values of financial derivative instruments to determine the degree of global exposure of a sub-fund to financial derivative instruments.
Information on exposure arising from the use of financial derivative instruments
a) Gross exposure arising from the use of financial derivative instrument during the period (as a proportion to the sub-fund’s total net asset value):
Sub-fund Name Maximum Minimum Average
ASEAN Equity Fund 0.63% 0.00% 0.02%Asia Total Return Fund 34.46% 4.41% 13.66%Asia Pacific REIT Fund 102.76% 26.46% 39.69%Asia Value Dividend Equity Fund 3.51% 0.00% 0.53%Asian Equity Fund 0.50% 0.00% 0.02%Asian High Yield Fund 11.70% 0.46% 4.12%Asian Small Cap Equity Fund 2.06% 0.00% 0.21%China Total Return Bond Fund 2.20% 0.15% 0.82%China Value Fund 1.77% 0.00% 0.10%Dragon Growth Fund 0.70% 0.00% 0.12%Dynamic Leaders Fund 0.00% 0.00% 0.00%Emerging Eastern Europe Fund 0.86% 0.00% 0.01%European Growth Fund 3.31% 0.00% 0.24%Global Equity Fund 20.06% 2.89% 7.27%Global Multi-Asset Diversified Income Fund 112.04% 9.16% 37.28%Global REIT Fund 0.58% 0.00% 0.09%Global Resources Fund 1.21% 0.00% 0.73%Healthcare Fund 0.80% 0.32% 0.68%India Equity Fund 0.39% 0.06% 0.11%Investment Grade Preferred Securities Income Fund 7.31% 0.00% 3.56%Japan Equity Fund 0.17% 0.00% 0.00%Latin America Equity Fund 0.00% 0.00% 0.00%Preferred Securities Income Fund 58.30% 17.97% 25.08%Sustainable Asia Bond Fund 91.84% 17.07% 39.20%Taiwan Equity Fund 0.00% 0.00% 0.00%U.S. Bond Fund 2.65% 0.00% 0.01%U.S. Equity Fund 0.51% 0.00% 0.00%U.S. Small Cap Equity Fund 0.06% 0.00% 0.00%U.S. Special Opportunities Fund 0.49% 0.05% 0.33%
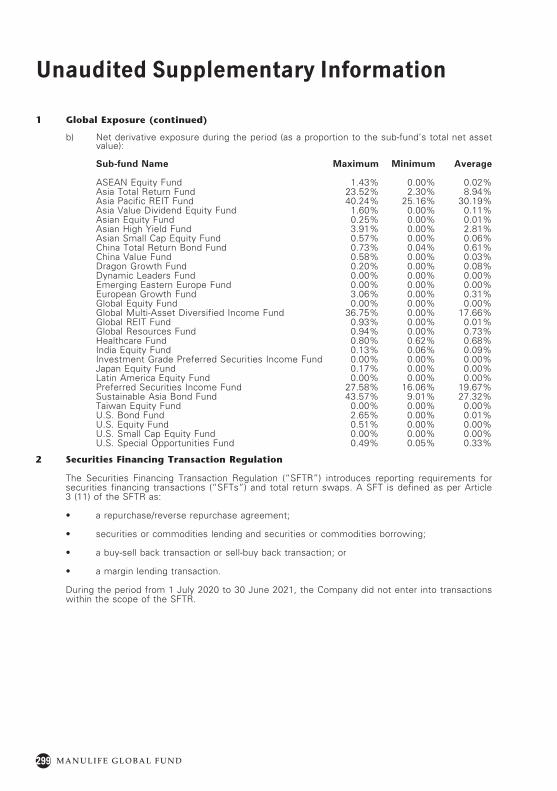
299 M A N U L I F E G L O B A L F U N D
Unaudited Supplementary Information
1 Global Exposure (continued)
b) Net derivative exposure during the period (as a proportion to the sub-fund’s total net asset value):
Sub-fund Name Maximum Minimum Average
ASEAN Equity Fund 1.43% 0.00% 0.02%Asia Total Return Fund 23.52% 2.30% 8.94%Asia Pacific REIT Fund 40.24% 25.16% 30.19%Asia Value Dividend Equity Fund 1.60% 0.00% 0.11%Asian Equity Fund 0.25% 0.00% 0.01%Asian High Yield Fund 3.91% 0.00% 2.81%Asian Small Cap Equity Fund 0.57% 0.00% 0.06%China Total Return Bond Fund 0.73% 0.04% 0.61%China Value Fund 0.58% 0.00% 0.03%Dragon Growth Fund 0.20% 0.00% 0.08%Dynamic Leaders Fund 0.00% 0.00% 0.00%Emerging Eastern Europe Fund 0.00% 0.00% 0.00%European Growth Fund 3.06% 0.00% 0.31%Global Equity Fund 0.00% 0.00% 0.00%Global Multi-Asset Diversified Income Fund 36.75% 0.00% 17.66%Global REIT Fund 0.93% 0.00% 0.01%Global Resources Fund 0.94% 0.00% 0.73%Healthcare Fund 0.80% 0.62% 0.68%India Equity Fund 0.13% 0.06% 0.09%Investment Grade Preferred Securities Income Fund 0.00% 0.00% 0.00%Japan Equity Fund 0.17% 0.00% 0.00%Latin America Equity Fund 0.00% 0.00% 0.00%Preferred Securities Income Fund 27.58% 16.06% 19.67%Sustainable Asia Bond Fund 43.57% 9.01% 27.32%Taiwan Equity Fund 0.00% 0.00% 0.00%U.S. Bond Fund 2.65% 0.00% 0.01%U.S. Equity Fund 0.51% 0.00% 0.00%U.S. Small Cap Equity Fund 0.00% 0.00% 0.00%U.S. Special Opportunities Fund 0.49% 0.05% 0.33%
2 Securities Financing Transaction Regulation
The Securities Financing Transaction Regulation (“SFTR”) introduces reporting requirements for securities financing transactions (“SFTs”) and total return swaps. A SFT is defined as per Article 3 (11) of the SFTR as:
• a repurchase/reverse repurchase agreement;
• securities or commodities lending and securities or commodities borrowing;
• a buy-sell back transaction or sell-buy back transaction; or
• a margin lending transaction.
During the period from 1 July 2020 to 30 June 2021, the Company did not enter into transactions within the scope of the SFTR.
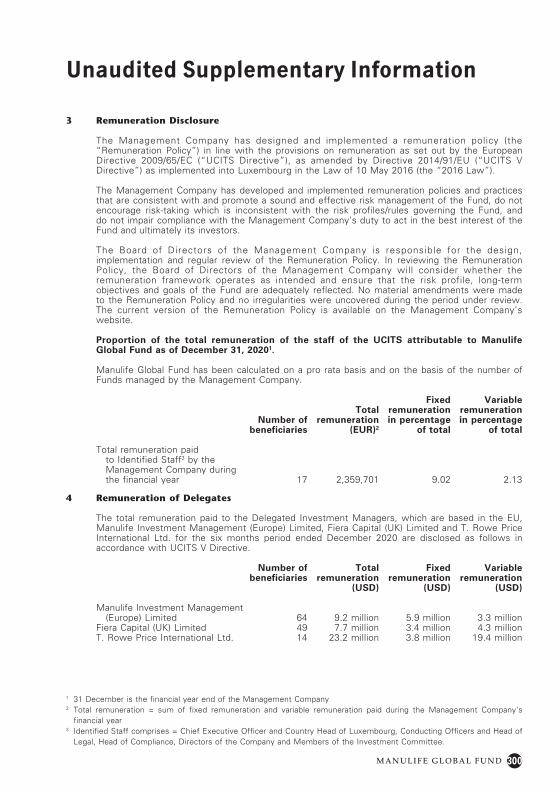
300M A N U L I F E G L O B A L F U N D
Unaudited Supplementary Information
3 Remuneration Disclosure
The Management Company has designed and implemented a remuneration policy (the “Remuneration Policy”) in line with the provisions on remuneration as set out by the European Directive 2009/65/EC (“UCITS Directive”), as amended by Directive 2014/91/EU (“UCITS V Directive”) as implemented into Luxembourg in the Law of 10 May 2016 (the “2016 Law”).
The Management Company has developed and implemented remuneration policies and practices that are consistent with and promote a sound and effective risk management of the Fund, do not encourage risk-taking which is inconsistent with the risk profiles/rules governing the Fund, and do not impair compliance with the Management Company’s duty to act in the best interest of the Fund and ultimately its investors.
The Board of Directors of the Management Company is responsible for the design, implementation and regular review of the Remuneration Policy. In reviewing the Remuneration Policy, the Board of Directors of the Management Company will consider whether the remuneration framework operates as intended and ensure that the risk profile, long-term objectives and goals of the Fund are adequately reflected. No material amendments were made to the Remuneration Policy and no irregularities were uncovered during the period under review. The current version of the Remuneration Policy is available on the Management Company’s website.
Proportion of the total remuneration of the staff of the UCITS attributable to Manulife Global Fund as of December 31, 20201.
Manulife Global Fund has been calculated on a pro rata basis and on the basis of the number of Funds managed by the Management Company.
Number of beneficiaries
Total remuneration
(EUR)2
Fixed remuneration in percentage
of total
Variable remuneration in percentage
of total
Total remuneration paid to Identified Staff3 by the Management Company during the financial year 17 2,359,701 9.02 2.13
4 Remuneration of Delegates
The total remuneration paid to the Delegated Investment Managers, which are based in the EU, Manulife Investment Management (Europe) Limited, Fiera Capital (UK) Limited and T. Rowe Price International Ltd. for the six months period ended December 2020 are disclosed as follows in accordance with UCITS V Directive.
Number of Total Fixed Variablebeneficiaries remuneration remuneration remuneration
(USD) (USD) (USD)
Manulife Investment Management (Europe) Limited 64 9.2 million 5.9 million 3.3 millionFiera Capital (UK) Limited 49 7.7 million 3.4 million 4.3 millionT. Rowe Price International Ltd. 14 23.2 million 3.8 million 19.4 million
1 31 December is the financial year end of the Management Company2 Total remuneration = sum of fixed remuneration and variable remuneration paid during the Management Company‘s
financial year3 Identified Staff comprises = Chief Executive Officer and Country Head of Luxembourg, Conducting Officers and Head of
Legal, Head of Compliance, Directors of the Company and Members of the Investment Committee.
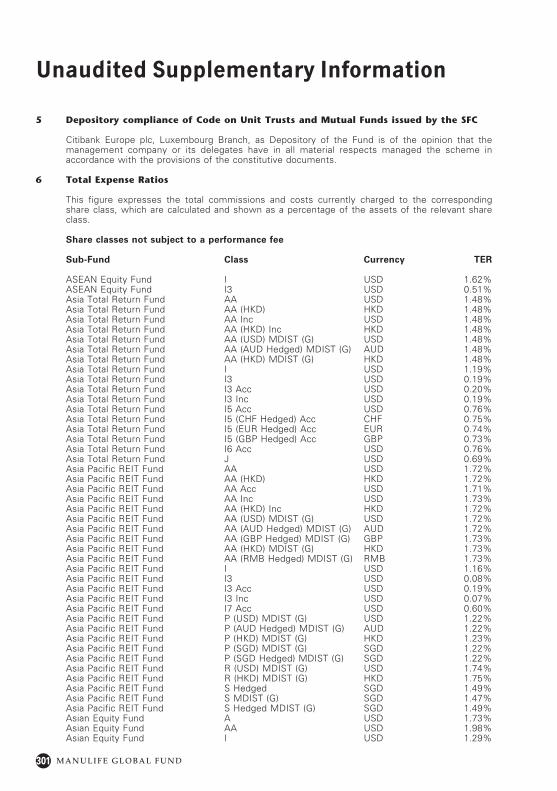
301 M A N U L I F E G L O B A L F U N D
Unaudited Supplementary Information
5 Depository compliance of Code on Unit Trusts and Mutual Funds issued by the SFC
Citibank Europe plc, Luxembourg Branch, as Depository of the Fund is of the opinion that the management company or its delegates have in all material respects managed the scheme in accordance with the provisions of the constitutive documents.
6 Total Expense Ratios
This figure expresses the total commissions and costs currently charged to the corresponding share class, which are calculated and shown as a percentage of the assets of the relevant share class.
Share classes not subject to a performance fee
Sub-Fund Class Currency TER
ASEAN Equity Fund I USD 1.62%ASEAN Equity Fund I3 USD 0.51%Asia Total Return Fund AA USD 1.48%Asia Total Return Fund AA (HKD) HKD 1.48%Asia Total Return Fund AA Inc USD 1.48%Asia Total Return Fund AA (HKD) Inc HKD 1.48%Asia Total Return Fund AA (USD) MDIST (G) USD 1.48%Asia Total Return Fund AA (AUD Hedged) MDIST (G) AUD 1.48%Asia Total Return Fund AA (HKD) MDIST (G) HKD 1.48%Asia Total Return Fund I USD 1.19%Asia Total Return Fund I3 USD 0.19%Asia Total Return Fund I3 Acc USD 0.20%Asia Total Return Fund I3 Inc USD 0.19%Asia Total Return Fund I5 Acc USD 0.76%Asia Total Return Fund I5 (CHF Hedged) Acc CHF 0.75%Asia Total Return Fund I5 (EUR Hedged) Acc EUR 0.74%Asia Total Return Fund I5 (GBP Hedged) Acc GBP 0.73%Asia Total Return Fund I6 Acc USD 0.76%Asia Total Return Fund J USD 0.69%Asia Pacific REIT Fund AA USD 1.72%Asia Pacific REIT Fund AA (HKD) HKD 1.72%Asia Pacific REIT Fund AA Acc USD 1.71%Asia Pacific REIT Fund AA Inc USD 1.73%Asia Pacific REIT Fund AA (HKD) Inc HKD 1.72%Asia Pacific REIT Fund AA (USD) MDIST (G) USD 1.72%Asia Pacific REIT Fund AA (AUD Hedged) MDIST (G) AUD 1.72%Asia Pacific REIT Fund AA (GBP Hedged) MDIST (G) GBP 1.73%Asia Pacific REIT Fund AA (HKD) MDIST (G) HKD 1.73%Asia Pacific REIT Fund AA (RMB Hedged) MDIST (G) RMB 1.73%Asia Pacific REIT Fund I USD 1.16%Asia Pacific REIT Fund I3 USD 0.08%Asia Pacific REIT Fund I3 Acc USD 0.19%Asia Pacific REIT Fund I3 Inc USD 0.07%Asia Pacific REIT Fund I7 Acc USD 0.60%Asia Pacific REIT Fund P (USD) MDIST (G) USD 1.22%Asia Pacific REIT Fund P (AUD Hedged) MDIST (G) AUD 1.22%Asia Pacific REIT Fund P (HKD) MDIST (G) HKD 1.23%Asia Pacific REIT Fund P (SGD) MDIST (G) SGD 1.22%Asia Pacific REIT Fund P (SGD Hedged) MDIST (G) SGD 1.22%Asia Pacific REIT Fund R (USD) MDIST (G) USD 1.74%Asia Pacific REIT Fund R (HKD) MDIST (G) HKD 1.75%Asia Pacific REIT Fund S Hedged SGD 1.49%Asia Pacific REIT Fund S MDIST (G) SGD 1.47%Asia Pacific REIT Fund S Hedged MDIST (G) SGD 1.49%Asian Equity Fund A USD 1.73%Asian Equity Fund AA USD 1.98%Asian Equity Fund I USD 1.29%
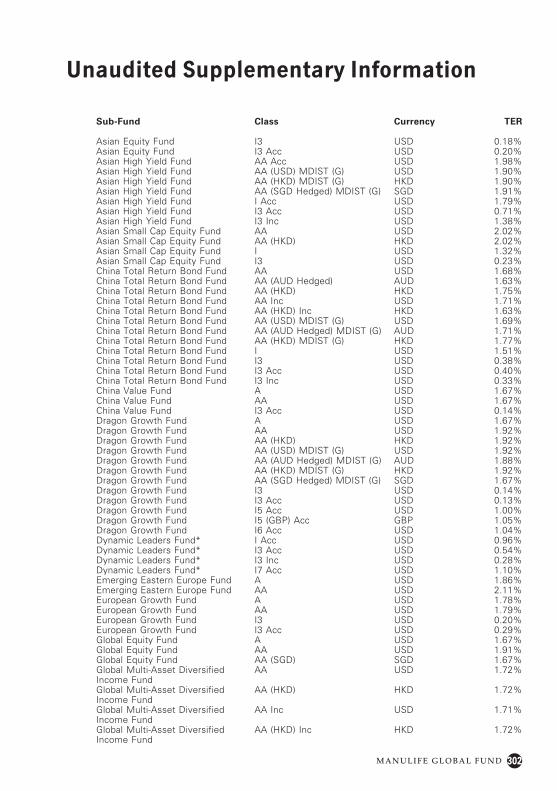
302M A N U L I F E G L O B A L F U N D
Unaudited Supplementary Information
Sub-Fund Class Currency TER
Asian Equity Fund I3 USD 0.18%Asian Equity Fund I3 Acc USD 0.20%Asian High Yield Fund AA Acc USD 1.98%Asian High Yield Fund AA (USD) MDIST (G) USD 1.90%Asian High Yield Fund AA (HKD) MDIST (G) HKD 1.90%Asian High Yield Fund AA (SGD Hedged) MDIST (G) SGD 1.91%Asian High Yield Fund I Acc USD 1.79%Asian High Yield Fund I3 Acc USD 0.71%Asian High Yield Fund I3 Inc USD 1.38%Asian Small Cap Equity Fund AA USD 2.02%Asian Small Cap Equity Fund AA (HKD) HKD 2.02%Asian Small Cap Equity Fund I USD 1.32%Asian Small Cap Equity Fund I3 USD 0.23%China Total Return Bond Fund AA USD 1.68%China Total Return Bond Fund AA (AUD Hedged) AUD 1.63%China Total Return Bond Fund AA (HKD) HKD 1.75%China Total Return Bond Fund AA Inc USD 1.71%China Total Return Bond Fund AA (HKD) Inc HKD 1.63%China Total Return Bond Fund AA (USD) MDIST (G) USD 1.69%China Total Return Bond Fund AA (AUD Hedged) MDIST (G) AUD 1.71%China Total Return Bond Fund AA (HKD) MDIST (G) HKD 1.77%China Total Return Bond Fund I USD 1.51%China Total Return Bond Fund I3 USD 0.38%China Total Return Bond Fund I3 Acc USD 0.40%China Total Return Bond Fund I3 Inc USD 0.33%China Value Fund A USD 1.67%China Value Fund AA USD 1.67%China Value Fund I3 Acc USD 0.14%Dragon Growth Fund A USD 1.67%Dragon Growth Fund AA USD 1.92%Dragon Growth Fund AA (HKD) HKD 1.92%Dragon Growth Fund AA (USD) MDIST (G) USD 1.92%Dragon Growth Fund AA (AUD Hedged) MDIST (G) AUD 1.88%Dragon Growth Fund AA (HKD) MDIST (G) HKD 1.92%Dragon Growth Fund AA (SGD Hedged) MDIST (G) SGD 1.67%Dragon Growth Fund I3 USD 0.14%Dragon Growth Fund I3 Acc USD 0.13%Dragon Growth Fund I5 Acc USD 1.00%Dragon Growth Fund I5 (GBP) Acc GBP 1.05%Dragon Growth Fund I6 Acc USD 1.04%Dynamic Leaders Fund* I Acc USD 0.96%Dynamic Leaders Fund* I3 Acc USD 0.54%Dynamic Leaders Fund* I3 Inc USD 0.28%Dynamic Leaders Fund* I7 Acc USD 1.10%Emerging Eastern Europe Fund A USD 1.86%Emerging Eastern Europe Fund AA USD 2.11%European Growth Fund A USD 1.78%European Growth Fund AA USD 1.79%European Growth Fund I3 USD 0.20%European Growth Fund I3 Acc USD 0.29%Global Equity Fund A USD 1.67%Global Equity Fund AA USD 1.91%Global Equity Fund AA (SGD) SGD 1.67%Global Multi-Asset Diversified Income Fund
AA USD 1.72%
Global Multi-Asset Diversified Income Fund
AA (HKD) HKD 1.72%
Global Multi-Asset Diversified Income Fund
AA Inc USD 1.71%
Global Multi-Asset Diversified Income Fund
AA (HKD) Inc HKD 1.72%
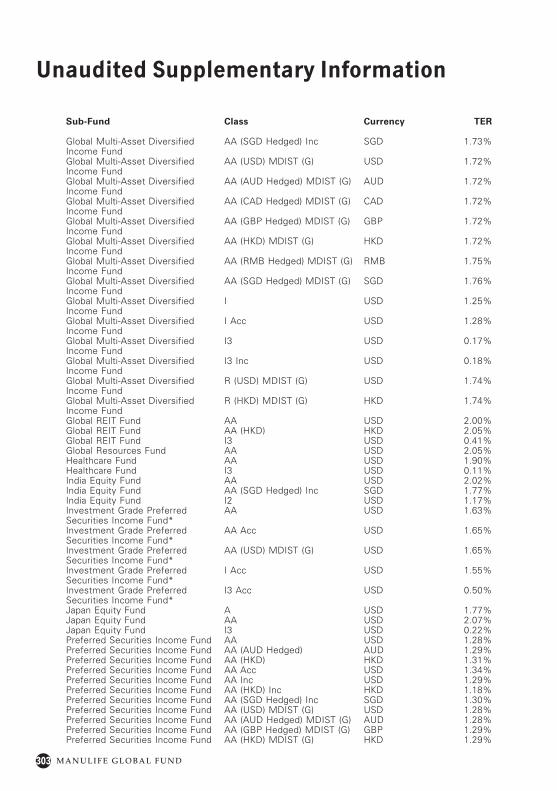
303 M A N U L I F E G L O B A L F U N D
Unaudited Supplementary Information
Sub-Fund Class Currency TER
Global Multi-Asset Diversified Income Fund
AA (SGD Hedged) Inc SGD 1.73%
Global Multi-Asset Diversified Income Fund
AA (USD) MDIST (G) USD 1.72%
Global Multi-Asset Diversified Income Fund
AA (AUD Hedged) MDIST (G) AUD 1.72%
Global Multi-Asset Diversified Income Fund
AA (CAD Hedged) MDIST (G) CAD 1.72%
Global Multi-Asset Diversified Income Fund
AA (GBP Hedged) MDIST (G) GBP 1.72%
Global Multi-Asset Diversified Income Fund
AA (HKD) MDIST (G) HKD 1.72%
Global Multi-Asset Diversified Income Fund
AA (RMB Hedged) MDIST (G) RMB 1.75%
Global Multi-Asset Diversified Income Fund
AA (SGD Hedged) MDIST (G) SGD 1.76%
Global Multi-Asset Diversified Income Fund
I USD 1.25%
Global Multi-Asset Diversified Income Fund
I Acc USD 1.28%
Global Multi-Asset Diversified Income Fund
I3 USD 0.17%
Global Multi-Asset Diversified Income Fund
I3 Inc USD 0.18%
Global Multi-Asset Diversified Income Fund
R (USD) MDIST (G) USD 1.74%
Global Multi-Asset Diversified Income Fund
R (HKD) MDIST (G) HKD 1.74%
Global REIT Fund AA USD 2.00%Global REIT Fund AA (HKD) HKD 2.05%Global REIT Fund I3 USD 0.41%Global Resources Fund AA USD 2.05%Healthcare Fund AA USD 1.90%Healthcare Fund I3 USD 0.11%India Equity Fund AA USD 2.02%India Equity Fund AA (SGD Hedged) Inc SGD 1.77%India Equity Fund I2 USD 1.17%Investment Grade Preferred Securities Income Fund*
AA USD 1.63%
Investment Grade Preferred Securities Income Fund*
AA Acc USD 1.65%
Investment Grade Preferred Securities Income Fund*
AA (USD) MDIST (G) USD 1.65%
Investment Grade Preferred Securities Income Fund*
I Acc USD 1.55%
Investment Grade Preferred Securities Income Fund*
I3 Acc USD 0.50%
Japan Equity Fund A USD 1.77%Japan Equity Fund AA USD 2.07%Japan Equity Fund I3 USD 0.22%Preferred Securities Income Fund AA USD 1.28%Preferred Securities Income Fund AA (AUD Hedged) AUD 1.29%Preferred Securities Income Fund AA (HKD) HKD 1.31%Preferred Securities Income Fund AA Acc USD 1.34%Preferred Securities Income Fund AA Inc USD 1.29%Preferred Securities Income Fund AA (HKD) Inc HKD 1.18%Preferred Securities Income Fund AA (SGD Hedged) Inc SGD 1.30%Preferred Securities Income Fund AA (USD) MDIST (G) USD 1.28%Preferred Securities Income Fund AA (AUD Hedged) MDIST (G) AUD 1.28%Preferred Securities Income Fund AA (GBP Hedged) MDIST (G) GBP 1.29%Preferred Securities Income Fund AA (HKD) MDIST (G) HKD 1.29%
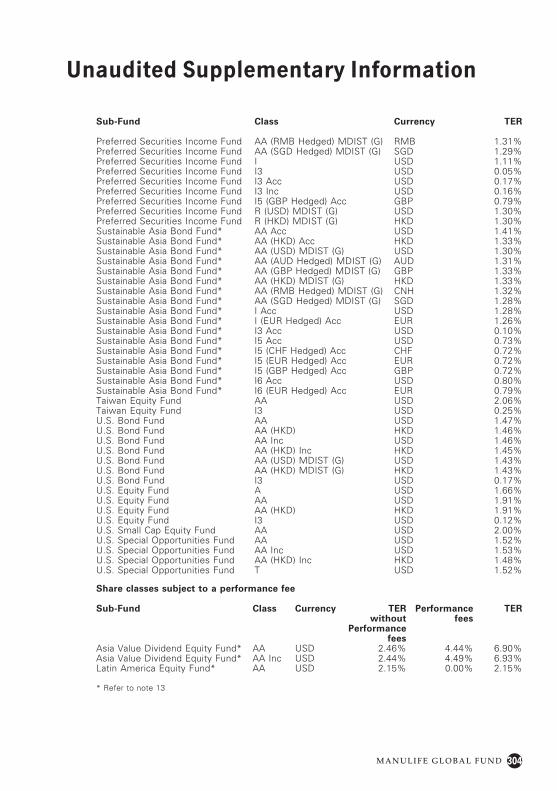
304M A N U L I F E G L O B A L F U N D
Unaudited Supplementary Information
Sub-Fund Class Currency TER
Preferred Securities Income Fund AA (RMB Hedged) MDIST (G) RMB 1.31%Preferred Securities Income Fund AA (SGD Hedged) MDIST (G) SGD 1.29%Preferred Securities Income Fund I USD 1.11%Preferred Securities Income Fund I3 USD 0.05%Preferred Securities Income Fund I3 Acc USD 0.17%Preferred Securities Income Fund I3 Inc USD 0.16%Preferred Securities Income Fund I5 (GBP Hedged) Acc GBP 0.79%Preferred Securities Income Fund R (USD) MDIST (G) USD 1.30%Preferred Securities Income Fund R (HKD) MDIST (G) HKD 1.30%Sustainable Asia Bond Fund* AA Acc USD 1.41%Sustainable Asia Bond Fund* AA (HKD) Acc HKD 1.33%Sustainable Asia Bond Fund* AA (USD) MDIST (G) USD 1.30%Sustainable Asia Bond Fund* AA (AUD Hedged) MDIST (G) AUD 1.31%Sustainable Asia Bond Fund* AA (GBP Hedged) MDIST (G) GBP 1.33%Sustainable Asia Bond Fund* AA (HKD) MDIST (G) HKD 1.33%Sustainable Asia Bond Fund* AA (RMB Hedged) MDIST (G) CNH 1.32%Sustainable Asia Bond Fund* AA (SGD Hedged) MDIST (G) SGD 1.28%Sustainable Asia Bond Fund* I Acc USD 1.28%Sustainable Asia Bond Fund* I (EUR Hedged) Acc EUR 1.26%Sustainable Asia Bond Fund* I3 Acc USD 0.10%Sustainable Asia Bond Fund* I5 Acc USD 0.73%Sustainable Asia Bond Fund* I5 (CHF Hedged) Acc CHF 0.72%Sustainable Asia Bond Fund* I5 (EUR Hedged) Acc EUR 0.72%Sustainable Asia Bond Fund* I5 (GBP Hedged) Acc GBP 0.72%Sustainable Asia Bond Fund* I6 Acc USD 0.80%Sustainable Asia Bond Fund* I6 (EUR Hedged) Acc EUR 0.79%Taiwan Equity Fund AA USD 2.06%Taiwan Equity Fund I3 USD 0.25%U.S. Bond Fund AA USD 1.47%U.S. Bond Fund AA (HKD) HKD 1.46%U.S. Bond Fund AA Inc USD 1.46%U.S. Bond Fund AA (HKD) Inc HKD 1.45%U.S. Bond Fund AA (USD) MDIST (G) USD 1.43%U.S. Bond Fund AA (HKD) MDIST (G) HKD 1.43%U.S. Bond Fund I3 USD 0.17%U.S. Equity Fund A USD 1.66%U.S. Equity Fund AA USD 1.91%U.S. Equity Fund AA (HKD) HKD 1.91%U.S. Equity Fund I3 USD 0.12%U.S. Small Cap Equity Fund AA USD 2.00%U.S. Special Opportunities Fund AA USD 1.52%U.S. Special Opportunities Fund AA Inc USD 1.53%U.S. Special Opportunities Fund AA (HKD) Inc HKD 1.48%U.S. Special Opportunities Fund T USD 1.52%
Share classes subject to a performance fee
Sub-Fund Class Currency TER without
Performance fees
Performance fees
TER
Asia Value Dividend Equity Fund* AA USD 2.46% 4.44% 6.90%Asia Value Dividend Equity Fund* AA Inc USD 2.44% 4.49% 6.93%Latin America Equity Fund* AA USD 2.15% 0.00% 2.15%
* Refer to note 13
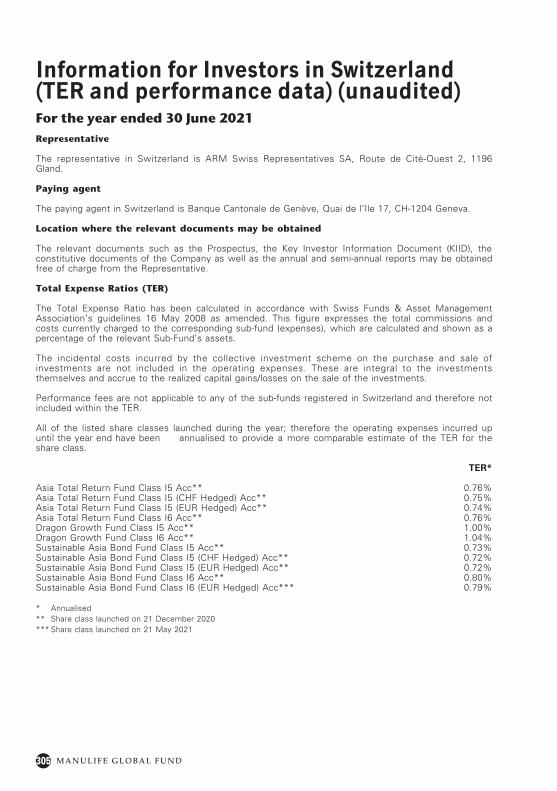
305 M A N U L I F E G L O B A L F U N D
Information for Investors in Switzerland (TER and performance data) (unaudited)For the year ended 30 June 2021Representative
The representative in Switzerland is ARM Swiss Representatives SA, Route de Cité-Ouest 2, 1196 Gland.
Paying agent
The paying agent in Switzerland is Banque Cantonale de Genève, Quai de l’Ile 17, CH-1204 Geneva.
Location where the relevant documents may be obtained
The relevant documents such as the Prospectus, the Key Investor Information Document (KIID), the constitutive documents of the Company as well as the annual and semi-annual reports may be obtained free of charge from the Representative.
Total Expense Ratios (TER)
The Total Expense Ratio has been calculated in accordance with Swiss Funds & Asset Management Association’s guidelines 16 May 2008 as amended. This figure expresses the total commissions and costs currently charged to the corresponding sub-fund (expenses), which are calculated and shown as a percentage of the relevant Sub-Fund’s assets.
The incidental costs incurred by the collective investment scheme on the purchase and sale of investments are not included in the operating expenses. These are integral to the investments themselves and accrue to the realized capital gains/losses on the sale of the investments.
Performance fees are not applicable to any of the sub-funds registered in Switzerland and therefore not included within the TER.
All of the listed share classes launched during the year; therefore the operating expenses incurred up until the year end have been annualised to provide a more comparable estimate of the TER for the share class.
TER*
Asia Total Return Fund Class I5 Acc** 0.76%Asia Total Return Fund Class I5 (CHF Hedged) Acc** 0.75%Asia Total Return Fund Class I5 (EUR Hedged) Acc** 0.74%Asia Total Return Fund Class I6 Acc** 0.76%Dragon Growth Fund Class I5 Acc** 1.00%Dragon Growth Fund Class I6 Acc** 1.04%Sustainable Asia Bond Fund Class I5 Acc** 0.73%Sustainable Asia Bond Fund Class I5 (CHF Hedged) Acc** 0.72%Sustainable Asia Bond Fund Class I5 (EUR Hedged) Acc** 0.72%Sustainable Asia Bond Fund Class I6 Acc** 0.80% Sustainable Asia Bond Fund Class I6 (EUR Hedged) Acc*** 0.79%
* Annualised** Share class launched on 21 December 2020*** Share class launched on 21 May 2021
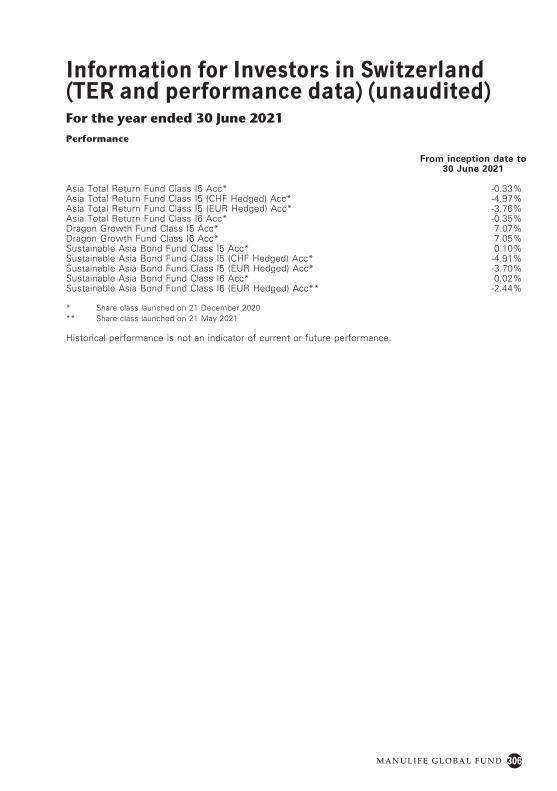
306M A N U L I F E G L O B A L F U N D
Information for Investors in Switzerland (TER and performance data) (unaudited)For the year ended 30 June 2021Performance
From inception date to 30 June 2021
Asia Total Return Fund Class I5 Acc* -0.33%Asia Total Return Fund Class I5 (CHF Hedged) Acc* -4.97%Asia Total Return Fund Class I5 (EUR Hedged) Acc* -3.76%Asia Total Return Fund Class I6 Acc* -0.35%Dragon Growth Fund Class I5 Acc* 7.07%Dragon Growth Fund Class I6 Acc* 7.05%Sustainable Asia Bond Fund Class I5 Acc* 0.10%Sustainable Asia Bond Fund Class I5 (CHF Hedged) Acc* -4.91%Sustainable Asia Bond Fund Class I5 (EUR Hedged) Acc* -3.70%Sustainable Asia Bond Fund Class I6 Acc* 0.02%Sustainable Asia Bond Fund Class I6 (EUR Hedged) Acc** -2.44%
* Share class launched on 21 December 2020** Share class launched on 21 May 2021
Historical performance is not an indicator of current or future performance.

This page is intentionally left blank

SICAV
R.C.S Luxembourg B 26 141
Audited Annual Report
Manulife Global FundSociété d'Investissement à Capital Variable
for the year ended 30 June 2021
No subscription can be received on the basis of �nancial reports. Subscriptions are only valid if made on the basis of the current prospectus, accompanied by the latest annual report and semi-annual report if published therea�er.