Embed Size (px)
Citation preview

Mapping Brain Abnormalities in Boys with Autism
Caroline Bruna, Rob Nicolson, MDb, Natasha Leporé, PhDa, Yi-Yu Chou, MSa, Christine N.Vidal, PhDa, Timothy J. DeVito, PhDc, Dick J. Drost, PhDc, Peter C. Williamson, MDb,Nagalingam Rajakumar, MDb, Arthur W. Toga, PhDa, and Paul M. Thompson, PhDa
a Laboratory of Neuro Imaging, Department of Neurology, UCLA School of Medicine, LosAngeles, CA, USAb Dept. of Psychiatry, University of Western Ontario, London, Ontario, Canadac Dept. of Medical Biophysics, University of Western Ontario, London, Ontario, Canada
AbstractChildren with autism spectrum disorder (ASD) exhibit characteristic cognitive and behavioraldifferences, but no systematic pattern of neuroanatomical differences has been consistently found.Recent neurodevelopmental models posit an abnormal early surge in subcortical white mattergrowth in at least some autistic children, perhaps normalizing by adulthood, but other studiesreport subcortical white matter deficits. To investigate the profile of these alterations in 3D, wemapped brain volumetric differences using a relatively new method, tensor-based morphometry(TBM). 3D T1-weighted brain MRIs of 24 male children with ASD (age: 9.5 years ± 3.2 SD) and26 age-matched healthy controls (age: 10.3 ± 2.4 SD) were fluidly registered to match a commonanatomical template. Autistic children had significantly enlarged frontal lobes (by 3.6% on the leftand 5.1% on the right), and all other lobes of the brain were enlarged significantly, or at trendlevel. By analyzing the applied deformations statistically point-by-point, we detected significantgray matter volume deficits in bilateral parietal, left temporal and left occipital lobes (p=0.038,corrected), trend-level cerebral white matter volume excesses, and volume deficits in thecerebellar vermis, adjacent to volume excesses in other cerebellar regions. This profile of excessesand deficits in adjacent regions may (1) indicate impaired neuronal connectivity, resulting fromaberrant myelination and/or an inflammatory process, and (2) help to understand inconsistentfindings of regional brain tissue excesses and deficits in autism.
KeywordsAutism; TBM; white matter; gray matter; cerebellum; morphometry
IntroductionAutism is a developmental disorder characterized by social deficits, impairedcommunication, and restricted and repetitive behavior patterns (American PsychiatricAssociation, 2000). Postmortem and structural magnetic resonance imaging studies havehighlighted the frontal lobes, amygdala and cerebellum as pathological in autism (Amaral etal., 2008), but there has yet to be agreement on the anatomical extent, timing, andconsistency across subjects of the biological abnormalities (Williams and Minshew, 2007).
Please address correspondence to: Dr. Paul Thompson, Professor of Neurology, Laboratory of Neuro Imaging, Dept. of Neurology,UCLA School of Medicine, 635 Charles E. Young Drive South, Suite 225E, Los Angeles, CA 90095-7332, USA, Phone: (310)206-2101 Fax: (310) 206-5518 E-mail: [email protected].
NIH Public AccessAuthor ManuscriptHum Brain Mapp. Author manuscript; available in PMC 2010 December 1.
Published in final edited form as:Hum Brain Mapp. 2009 December ; 30(12): 3887–3900. doi:10.1002/hbm.20814.
NIH
-PA Author Manuscript
NIH
-PA Author Manuscript
NIH
-PA Author Manuscript

Brain imaging studies of these developmental abnormalities often report an increased totalbrain volume (Hazlett et al., 2005) and early acceleration in brain growth in autism, but it isnot agreed whether this enlargement is restricted to childhood or continues into adulthood(Nicolson and Szatmari, 2003).
Studies examining the differential contributions of gray and white matter to this abnormalgrowth in autistic patients have not had entirely consistent results, some detecting anincrease in only gray matter or only white matter, but others finding it in both tissue types(Nicolson and Szatmari, 2003). The localization of this brain volume increase is alsodebated (Bonilha et al., 2008): frontal areas may contribute disproportionately to the volumeincrease (Carper et al., 2002), but some suggest that more posterior brain regions aredisproportionately affected (Hazlett et al., 2006). A recent meta-analysis also found anoverall increase in cerebellar volume (which may be proportional to the increase in totalbrain volume) and in the caudate nucleus, but found consistent reductions in the cross-sectional area of the corpus callosum (Stanfield et al., 2007).
Most traditional volumetric analysis have used region of interest analyses, using manualtracing of structures or automated segmentation (Yushkevich et al., 2006). Measures ofoverall structure volumes may fail to detect subtle or highly localized anatomical differencesbetween groups, and may overlook consistent regional differences in anatomical shape.Recently, computational mapping methods have been used increasingly to examine brainstructure. Unlike traditional volumetric methods, statistical maps can detect highly localizedgroup differences in brain morphology without the need for manual tracing or priorspecification of regions of interest (Thompson et al., 2004a; 2004b). These methods havedetected regional thinning of the corpus callosum (Vidal et al., 2006), subtle hippocampalvolume reductions (Nicolson et al., 2006), and ventricular volume reductions (Vidal et al.,2008) in autism, even when significant volume reductions in the brain as a whole were notdetectable. In Vidal et al. (2008), surface-based statistical maps of group differencesrevealed subtle, localized reductions in ventricular size in patients with autism in the leftfrontal and occipital horns, which may reflect exaggerated brain growth early in life.Ventricular volumes measured using traditional methods did not differ significantly betweengroups. Other voxel-based anatomical mapping techniques, such as voxel-basedmorphometry (Ashburner and Friston, 2000), have been used to detect subtle alterations inthe corpus callosum in autism (Chung et al., 2004). One study suggested that increases intemporal and parietal cortical thickness (Hardan et al., 2006) may contribute to thevolumetric increases in autism and may also relate to anomalies in cortical connectivity.Even so, another voxel-based mapping study had apparently conflicting findings (McAlonanet al., 2005): children with autism had a significant reduction in total gray matter volumeand significant increase in CSF volume. They had significant localized gray matterreductions within fronto-striatal and parietal gray matter and additional decreases in ventraland superior temporal gray matter.
To better understand the distribution and direction of these effects, further voxel-basedstudies are urgently needed.
Tensor-based morphometry (TBM) is a related structural image analysis technique that canreveal profiles of volumetric gains and deficits in patients versus control populations. TBMhas not, to our knowledge, been applied to study autism. In TBM, a fluid image warpingapproach reshapes a set of brain images to match a common anatomical template. Fromthese fluid deformation mappings, relative volume differences are computed between eachindividual and the anatomical template, and displayed voxel-by-voxel as a map. These mapsmay be compared across groups to identify regions with systematic volumetric differences.TBM has been used previously to characterize brain differences in various neurological
Brun et al. Page 2
Hum Brain Mapp. Author manuscript; available in PMC 2010 December 1.
NIH
-PA Author Manuscript
NIH
-PA Author Manuscript
NIH
-PA Author Manuscript

disorders such as Alzheimer’s disease, semantic dementia, HIV/AIDS (Chiang et al., 2005,2007; Leow et al., 2006; Hua et al., 2008, Leporé, 2008a), and neurodevelopmentaldisorders such as Fragile X syndrome (Lee et al., 2007) and Williams syndrome (Chiang etal., 2007). A similar approach has been applied to longitudinal scans to study brain changesover time (Thompson et al., 2000; Chung et al., 2001; Aljabar et al., 2008). TBM may alsobe used to study statistical associations between regional brain volumes and relevantpredictors, such as age, sex, or IQ (Chiang et al., 2007).
This study had two goals. First we examined the three dimensional (3D) profile ofsystematic morphometric differences between patients with autism and controls using TBM.While TBM can reveal differences throughout the brain in 3D without a priori specificationof regions of interest, we hypothesized that patients with autism would have diffusevolumetric excesses throughout the brain, particularly in the white matter, based on reportsof white matter overgrowth in infancy. In line with prior reports, we anticipated localizedgray matter abnormalities (either reductions or excesses, as the direction of the effects is notconsistent in the literature) in temporal and parietal regions that include classical languageprocessing systems. We also hypothesized that we would detect volume increases in thecerebellum, a region frequently reported as abnormal in autism.
In the original version of TBM, the determinants of the Jacobian matrices are derived fromthe local deformation field obtained after the nonlinear registration. These encodecompressions and expansions, and can be used to map regional volume differences betweenpatients and controls. In this study, we used the more general method described in Pennec(2004) and Leporé et al. (2008a) (summarized in Figure 1), in which the local deformationtensor field is analyzed statistically to detect local volume and local shape differences intissue.
2. Materials and Methods2.1 Subjects
Study participants included 24 males with autism (age: 9.5 ± 3.2 years; range: 6 to 16 years)diagnosed using the Autism Diagnostic Interview-Revised (ADI-R) (Lord et al., 1994), theAutism Diagnostic Observation Schedule (ADOS-R) (Lord et al., 2000), and by clinicalobservation. All patients met DSM-IV-TR criteria for autism (American PsychiatricAssociation, 2000) as well as ADI-R and ADOS algorithm criteria. Patients were alsoassessed using the Wechsler Intelligence Scale for Children, 3rd Edition (WISC-III) or theLeiter International Performance Scale. Socioeconomic status was determined for eachpatient (Hollingshead, 1975). Patients with a non-verbal IQ below 70 were excluded. Allpatients had a physical examination prior to the study; subjects with a seizure disorder orother neurological condition or a cytogenetic abnormality or genetic syndrome (such asFragile X syndrome) were excluded. At scan time, eight patients were medication naïve;four others had discontinued their previous medications prior to the scan. Among theremainder, five were being treated with dopamine antagonists, eight were taking stimulants,four were receiving SSRIs (selective serotonin re-uptake inhibitors), and one was beingtreated with a cholinesterase inhibitor.
Twenty-six healthy males (age: 10.3 ± 2.4 years; range: 6 to 16 years), drawn from the localcommunity through advertisement and word of mouth, participated as control subjects. Theywere assessed with the Schedule for Affective Disorders and Schizophrenia-ChildhoodVersion (K-SADS) (Kaufman et al., 1997) to ensure that none had a major psychiatricdisorder. None had a personal history of neurological disorders or learning disorders or afamily history of autism, mental retardation, language disorders, or learning disorders.Controls were also assessed with the WISC-III or the Wechsler Abbreviated Scale of
Brun et al. Page 3
Hum Brain Mapp. Author manuscript; available in PMC 2010 December 1.
NIH
-PA Author Manuscript
NIH
-PA Author Manuscript
NIH
-PA Author Manuscript

Intelligence; a full-scale IQ of less than 70 was exclusionary. Age, race, handedness, height,and intelligence were compared between the two groups using t-tests or chi-squaredanalyses (Table 1).
This study was approved by the Health Sciences Research Ethics Board at the University ofWestern Ontario. The parents or legal guardians of all subjects provided written consent forparticipation in this study, while the subjects provided written assent.
2.2 Scanning procedureAll subjects were scanned on a 3-Tesla scanner (IMRIs, Winnipeg, Canada). Sixteen of thesubjects with autism required sedation with oral midazolam, to complete their scans.Standard T1-weighted localizer images were acquired initially. Images used for volumetricanalysis were then acquired using a T1-weighted 3-D MP-RAGE (Magnetization PreparedRapid Gradient Echo) sequence (TI=200ms, TR=11ms, TE=5 ms, flip-angle=12 degrees,total scan time: 8 minutes) with 1.2mm isotropic voxels.
2.3 PreprocessingImage distortions due to radiofrequency field inhomogeneities were corrected using anonparametric method (Sled et al., 1998). Extra-cerebral tissues were removed, assisted bymanual editing, in the BrainSuite software package (Shattuck and Leahy, 2002). MRI brainscans were first globally aligned to the International Consortium of Brain Mapping braintemplate (ICBM-53; Mazziotta et al., 2001) using a 9-parameter registration (3 translations,3 rotations and 3 orthogonal scales) with the ANIMAL software (Collins et al., 1994). Thecerebellum was manually traced in each subject using the program Multitracer (Woods,2003; available at http://www.loni.ucla.edu/Software/Software_Detail.jsp?software_id=10)and registered using a 9-parameter registration (with the ANIMAL software). It wasdelineated from the most posterior section in the coronal view, where the fissure separatingthe cerebellum from the cerebrum becomes visible. The brain stem was carefully excludedfrom the mask in the regions where it begins to merge with the cerebellum (which is morevisible in sagittal slices; triaxial views were used to make this easier to identify). The middlecerebellar peduncle and the brachium conjunctivum were excluded at the point where itcompletely fuses with the middle cerebellar peduncle. Lobar regions of interest weredelineated on the control subject used as a target (see paragraph 2.4) according to the criteriaused to define lobar boundaries in the ICBM-53 atlas. Gray and white matter segmentationswere also created for this same volume, using the BrainSuite software package (Shattuckand Leahy, 2002).
2.4 Fluid image registrationSome TBM studies generate a minimal deformation target (MDT) from the scans, with amathematically-defined mean geometry for a population (Christensen et al, 1996; Good etal., 2002; Joshi et al., 2004; Kochunov et al., 2001, 2002; Leporé et al., 2007b; Lorenzen etal., 2004; Hua et al., 2007). As in other TBM studies (e.g., Davatzikos et al, 2001), wepreferred using registration to a single control subject’s image versus a multi-subjectaverage intensity atlas as it had higher contrast, better spatial resolution and sharper features.Template optimization for TBM is the subject of further on-going study by us and others(Kochunov et al., 2002; Leporé et al., 2007b). All scans were non-linearly registered to thissubject’s scan using a fluid image registration algorithm (Bro-Nielsen and Gramkow, 1996;Leporé et al., 2008b; Brun et al., 2007), which was accelerated using a fast filter (describedin Gramkow et al., 1996). Details of the method are described in Leporé et al. (2008b).
Brun et al. Page 4
Hum Brain Mapp. Author manuscript; available in PMC 2010 December 1.
NIH
-PA Author Manuscript
NIH
-PA Author Manuscript
NIH
-PA Author Manuscript

2.5 Statistical analysisNon-rigid registration of each individual brain image to the common anatomical templategave a 3D displacement vector field from which we computed Jacobian matrices J of thedeformation. Determinants of these Jacobian matrices, det(J), are commonly used in TBMstudies and interpreted as “local expansion factors” (Leporé et al., 2008a). They quantifylocal expansions (where det(J) > 1) or local contractions (where det(J) < 1), and reflectregional volumetric differences between each subject and the corresponding anatomicalregions in the template. Another recently developed approach is to retain the fullinformation in the transformation by computing symmetric definite-positive matrices S=JTJ,at each point, called deformation matrices. Multivariate statistics are then computed on thesematrices (Leporé et al., 2008a) using the log-Euclidean framework to account for thecurvature of the space of positive-definite symmetric matrices to which S belongs (Arsignyet al, 2005). The intuitive meaning of this approach is to detect anatomical regions wherestructures may be locally enlarged or compressed along certain directions (as explained inFigure 1). As brain growth is anisotropic, i.e., not uniform in all directions (Thompson et al.,2000), some structures may become enlarged in disease, relative to the control average,along certain directions. Multivariate TBM is designed to pick up on these anisotropicchanges. Past studies found that multivariate TBM can identify regional abnormalities thatare overlooked by the analysis of the determinant (local volume difference) only (Leporé etal., 2008a).
Before statistical analysis, we also covaried the computed deformation matrices anddeterminants at each voxel with age, to adjust for possible age effects. We computed Scov,ijwith ij one component of the matrix and (det J)cov, according to the regression equation
with regression coefficients βi, diagnosis coded using a dummy binary variable, and Scov,ij =Sij − Sij,predicted the resulting adjusted measure. Once adjusted for age effects, thedeterminants of these Jacobian matrices were used to compute the lobar volumes for eachsubject after delineating each lobe in the registration target image (as explained in paragraph2.3). Lobe volumes were averaged within the two groups and compared. The data was alsoanalyzed with two types of statistics: (1) a univariate Student’s t-test on the age-adjustedvolumes, after logarithmic transformation, i.e., log10((det J)cov and (2) a multivariateHotelling’s T2-test on log(Scov). To avoid assuming that our random variables are normallydistributed, we used voxelwise permutation tests to establish a null distribution at each voxel(Nichols and Holmes, 2002), using the suprathreshold volume. We permuted theassignments of subjects to groups 5000 times. This number of permutations N wasdetermined according to Edgington (1995), to control the standard error SEp, of the omnibusprobability p, which follows a binomial distribution B(N,p) with SEp = p(p−1)/N. Theoverall significance of the observed pattern of effects in the statistical maps is assessed bycomputing this omnibus probability, p (that we will call corrected pcorrected) which is a wayof correcting for the multiple spatial comparisons implicit in computing maps of statistics.The general method is further detailed in Nichols and Holmes (2002). pcorrected values werecomputed for the overall gray and white matter in each lobe, using the lobar volumes and theclassified gray and white matter segmentations (see paragraph 2.3) to the Jacobiandeterminant maps obtained in each subject.
Brun et al. Page 5
Hum Brain Mapp. Author manuscript; available in PMC 2010 December 1.
NIH
-PA Author Manuscript
NIH
-PA Author Manuscript
NIH
-PA Author Manuscript

3 Results3.1 Subjects
The groups did not differ significantly in age, socioeconomic status, race, or height (seeTable 1), although there were proportionally more left-handed subjects in the patient group.While there was no significant difference in non-verbal IQ between the two groups, patientsdid have a significantly lower verbal and full-scale IQ.
3.2 Analysis of the cerebrumVolumetric summaries are shown in Figure 2.A. and 2.B. In the raw (unscaled) data, theautistic group had significantly higher frontal lobe volumes in the left (+3.6%; p=0.049) andright hemispheres (+5.1%; p=0.011). The occipital, temporal, and limbic regions were alsoabnormally enlarged in the autism group on the left, and at trend-level on the right (seeTable for significance levels). After adjusting these data for overall differences in brain scaleacross subjects, none of the lobes showed evidence for reduction or excess in patients withautism compared to controls; even so, group differences in gray matter and trend-leveldifferences in white matter were still detected in the group difference maps (Figure 3).
We expected univariate and multivariate maps to offer more power than lobar averages todetect relative regional volume differences throughout the brain. Figure 3 shows volumetricexcesses in the white matter (Figure 3.A) and excesses and losses in the gray matter (Figure3.B) in the autism group in terms of the volume ratio (i.e., mean autism volume divided bymean control volume). Statistical maps are also shown, based on the univariate (DET) andmultivariate tests (LOG). The volume ratio (RATIO) and the univariate ((det J)cov) analyses(DET) show a complex pattern of volume differences (mostly reductions) in the gray matterand excesses in the white matter. Although the differences seem quite prominent in thewhite matter in the ratio maps, their significance is only at trend level after multiplecomparisons correction (pcorrected = 0.1 for DET and pcorrected = 0.09 for LOG); the graymatter volume reductions, however are significant overall when the gray matter alone isassessed (pcorrected = 0.038 for DET and pcorrected = 0.05 for LOG). When using the unscaleddata, the difference is not significant either in the white matter, or in the gray matter, whichis expected, given the wide variations in brain volume across subjects.
As differences were hypothesized independently in the white matter (based on earlier reportsin independent samples Herbert et al., 2004), and in the gray matter (McAlonan et al., 2005)we also conducted analysis restricted to these two regions.
We performed two-tailed t-tests at each voxel to assess the hypothesis of local gray matterabnormalities. Given the significance of these tests (pcorrected = 0.038 for DET and pcorrected=0.05 for LOG, see previous paragraph), we conducted additional one-tailed t-tests in thesame region to determine the direction of the changes; as these were post-hoc tests, thesignificance of the gray matter deficits described should be based on the 2-tailed test only.Two one-tailed t-tests were similarly performed at each voxel in the white matter to assessthe alternative hypotheses of white matter excess or deficits in the patient group.
For completeness, as a post hoc test, we also subsequently examined the results of theopposite contrasts (designed to detect white matter loss), and confirmed that there were noeffects in those directions.
In Figure 3.A, regions with white matter excesses in the RATIO maps (shown in red,equivalent to +15–20%) correspond to regions of trend-level volume differences in the DETmaps, whereas volume deficits in the RATIO maps (light blue, -5 %) do not correspond toany signal in the DET maps (dark blue corresponding to a p-value = 1). These maps indicate
Brun et al. Page 6
Hum Brain Mapp. Author manuscript; available in PMC 2010 December 1.
NIH
-PA Author Manuscript
NIH
-PA Author Manuscript
NIH
-PA Author Manuscript

that there was only weak evidence for distributed white matter volume excesses in thepatients, and no evidence for deficits. When computing one-tailed t-tests over the entireimage, there was there was no significant overall white matter excess in autism compared tocontrols; it was only a trend (this was also the case when using the unscaled data). Althoughthere were excesses in some white matter regions, it is not logically implied that the whitematter is enlarged overall, as there may also be subtle but nonsignificant reductions in otherwhite matter regions, i.e., a redistribution, with no net overall gain. Tests were alsoperformed in the different lobes in the gray matter (Figure 3.B), where we found an overallsignificant omnibus probability pcorrected = 0.038, a finding that was not replicated in theunscaled case. Whereas the RATIO maps exhibit a complex pattern of gray matter excessesand losses, one-tailed t-tests showed evidence for overall gray matter losses, especially inthe left and right parietal lobes, the left temporal lobe and the left occipital lobe (Table 2). Itmay therefore be too simplistic to expect a generalized gray matter deficit in patients; it maybe that, as in Williams syndrome (Thompson et al., 2005) some areas show deficits whileothers show excesses or no systematic difference.
These results are consistent with the localization of significant p-values in the DET maps inFigure 3.B.
Anisotropic changes, as assessed with the multivariate analysis, were also significant, withpcorrected =0.05 for the Hotelling’s T2 statistic computed in the gray matter and pcorrected =0.09 (i.e., a trend level effect) in the white matter. The multivariate method is sensitive toboth anisotropic and uniform volumetric differences. Gray matter regions with significantgroup differences at the voxel level were mostly found in the left hemisphere including thesupramarginal and superior temporal gyri, and around the anterior part of the central sulcus(see Figure 3.B). Generally, these morphometric differences are consistent with a complexpattern of local volume deficits and excesses in cortical areas (including both gray and whitematter).
3.3 Analysis of the cerebellumFigure 4 shows horizontal sections through the cerebellum in the rostral to caudal direction.The first column shows the volume ratio (i.e., mean autism divided by mean controlvolume). Both univariate and multivariate analysis implicate the same regions at the voxellevel. Cerebellar volume excesses were found to be significant after multiple comparisonscorrection in the univariate analysis (pcorrected = 0.006). These were detected only at trendlevel by the multivariate analysis, with pcorrected =0.07. The spatial distribution of effectswas similar, suggesting that the univariate test has greater signal-to-noise ratio for detectingdifferences in this case. Significant cerebellar volume excesses in autism were observedprimarily in the vermis; systematic structural differences were also found in lobes III andVIII and in the corpus medullare (volume reduction) and in lobes Vc, Vd, VIIa, VIIb, andIX (volume excess). Corrected p-values for gain (pcorrected = 0.03) and deficits (pcorrected=0.02) were computed from two one-tailed t-tests and were both significant in thecerebellum, suggesting that volume loss and volume gain may occur in different lobules ofthe cerebellum as shown in the maps. Even so, to take into account the multiple testing foreffects of gain and loss, it would be conventional to use a Bonferroni correction to doublethese significance values. Therefore, we should regard the gain as a trend (pcorrected = 0.06)but the loss as statistically significant (pcorrected = 0.04). This is equivalent to performing atwo-tailed test followed by inspection of the gain and loss effects separately.
Brun et al. Page 7
Hum Brain Mapp. Author manuscript; available in PMC 2010 December 1.
NIH
-PA Author Manuscript
NIH
-PA Author Manuscript
NIH
-PA Author Manuscript

4 DiscussionNeurobiological findings
In this study, autistic children had significantly enlarged frontal lobes (by 3.6% on the leftand 5.1% on the right), and all other lobes of the brain were enlarged significantly, or attrend level. By analyzing the applied deformations statistically point-by-point, we detectedsignificant gray matter volume deficits in bilateral parietal, left temporal and left occipitallobes (p=0.038, corrected), trend-level cerebral white matter volume excesses, and volumedeficits in the cerebellar vermis, adjacent to volume excesses in other cerebellar regions. Ourmaps also suggested trend-level excesses in central white matter volume among thesesubjects and gray matter losses mainly in the parietal and left temporal and occipital lobes.These results were found using both univariate and multivariate mapping methods andrelated volumetric regions of interest. Patients with autism also had regional excesses inwhite matter volume as well as deficits in the volume of lobes III and VIII of the cerebellarvermis and an increase in volume of vermal lobes Vc, Vd, VIIa, VIIb, and IX.
The cerebellum has been studied extensively in autism, since the early work of Courchesneet al. (1988). That paper suggested that for non-adjusted data (i.e., data at its original scale),cerebellar vermal lobules VI–VII were smaller in patients than in controls, suggesting adevelopmental hypoplasia, while the lobules I–V were normal. Those findings led to acontroversy as they were not replicated by some other investigators; Filipek (1995b) statedthat a definitive conclusion on the vermis pathology was premature. Indeed, differences inthe non-scaled cerebellar vermis volume have often been found (Haas et al., 1996), but notin all studies. Courchesne (1999) found an increased volume in the vermis while Levitt et al.(1999) found that lobules VIII–X were smaller. In our data, which was scaled to adjust fordifferences in overall brain volume across subjects, we found both volume excesses anddeficits in the cerebellum between autistic patients and controls.
We found significant lobar enlargement in autism (in the raw, unscaled data), consistentwith prior reports. The autistic group had significantly enlarged frontal lobes (by 3.6% onthe left and 5.1% on the right; p<0.049, p<0.011), and all other lobes of the brain wereenlarged either significantly, or at trend level, with average enlargements in different lobesranging from +3.2 to +6.7%. Prior studies of young children (Courchesne et al., 2001;Codyet al., 2006) as well as older children and adolescents (Herbert et al., 2003) have accordinglyreported enlargement of white matter volumes in autism. Here we also found gray matterdeficits in the bilateral parietal lobes, as well as the left temporal and left occipital lobes.These differences are also relatively subtle and may not be universally found; in otherstudies of the gray matter in autism, some groups have found increased or decreased volumeand others detected no difference.
White matter excesses in autism have been interpreted in functional neuroanatomical termsas suggesting that brain connectivity may be impaired in regions showing volume excesses.The abnormally rapid growth over the brain overall, observed during early infancy, may bethe result of an abnormal myelination process during childhood. We recently found excesssubcortical gray matter in Fragile X syndrome, a neurodevelopmental disorder whosemechanism is thought to be a genetically mediated impairment in dendritic pruning (Lee etal., 2007). Although the mechanism is different, we also found an excess in corticalthickness in Williams syndrome, another genetically-mediated neurodevelopmental disorder,and this thickening may reflect a failure in cortical neuronal packing, due to deficiencies inthe elastin gene (Thompson et al., 2005). As such, it is plausible that excesses in whitematter, observed here, may be attributable to an over-production of myelin in infancy, anabnormality in myelin packing, or anomalies in the production or anatomical distribution ofoligodendrocytes that produce myelin throughout the white matter.
Brun et al. Page 8
Hum Brain Mapp. Author manuscript; available in PMC 2010 December 1.
NIH
-PA Author Manuscript
NIH
-PA Author Manuscript
NIH
-PA Author Manuscript

The presence of neuroinflammation is another factor implicated in white matter volumeenlargement. In patients with autism, an active neuroinflammatory process has been shownto exist in the white matter, cortex and cerebellum (Vargas et al., 2005), a finding that maycontribute to the volumetric increase in white matter in this and other studies. Although it isnot clear what the cause of neuroinflammation might be in autism, there are other situationsin which an inflammatory hypothesis has been invoked to explain white matter excesses. Intwo independent studies of methamphetamine abusers, we (Thompson et al., 2004) andothers (Jernigan et al., 2005) found white matter excess in methamphetamine abusers versuscontrols, in conjunction with gray matter deficits, and we suggested that, in line with theanimal literature, inflammatory processes may contribute to the white matter hypertrophy.
In autism there is no drug-induced change (or known pathogen) to trigger an inflammatoryprocess, but it remains a candidate explanation for the enlarged white matter.
If these white matter alterations indicate impaired axonal conduction velocity or impairedneuronal connectivity, this may also lead to a delayed or incomplete development of corticalgray matter structures, in line with the gray matter deficits seen here. Studies with diffusiontensor and functional imaging are required to better evaluate this possibility. We also foundgray matter abnormalities in regions that include the left posterior temporal lobes in autisticpatients compared to controls, a deficit that may be implicated in the characteristicdifficulties in vocabulary and language processing in autism. The left occipital lobe andparietal lobes showed regional gray matter excesses and reductions, which may relate torecent findings demonstrating an abnormal magnocellular pathway in children with autism,which may affect visual processing and sensory integration (Milne et al., 2002).
AnisotropyNo well-replicated pattern of characteristic brain abnormalities has yet been found in autism,although some review papers suggest evidence for white matter hypertrophy in at least asubset of autistic patients (Herbert, 2005). In this paper, multivariate tests - minor variants ofthe standard TBM - were used in addition to the commonly used univariate methods. Inprinciple, they include a larger amount of information on brain morphology, as they analyzethe Jacobian matrix J which is derived from the vector fields after fluid registration and notjust the determinant of this matrix. For this reason, one might expect these statistics to beconsistently more powerful, as they are sensitive to both volume and anisotropic volumedifferences. However, in our study, multivariate tests did not give greater effect sizes. Theoverall corrected significance values were not substantially different using the methods thatassess volume difference alone (p=0.038, corrected for gray matter, p=0.1 corrected in whitematter) versus those that assess potential stretching or compression along a given direction(where p=0.05, corrected, for gray matter, p=0.09, corrected, in white matter), even so theanalyses support each other to some extent. The noise in each of the multivariate parametersmust be taken into account, and it may generally require a larger sample to estimate themreliably. In other analyses with the same method (Leporé et al., 2008a) we found that theanisotropy statistics detected brain atrophy in HIV-AIDS with genuinely better power thanstandard volumetric assessments, but in the current autism study, the anisotropy statisticsessentially agreed with the volumetric assessments. It is therefore plausible that thedifference in autism is better represented as a simple volume difference (with no directionalpreference), whereas the neurodegeneration in HIV/AIDS may occur preferentially in acertain direction (e.g., radially along corticothalamic tracts in the brain).
TBM/VBMAs noted earlier, prior MRI studies of regional gray and white matter volumes in autism,using traditional analysis methods, have not always been consistent in their results. TBM
Brun et al. Page 9
Hum Brain Mapp. Author manuscript; available in PMC 2010 December 1.
NIH
-PA Author Manuscript
NIH
-PA Author Manuscript
NIH
-PA Author Manuscript

may be beneficial in this population as it can reveal systematic differences in brain structureeven in situations where overall lobar volume measures cannot. In particular, this situation ispossible when one selective subregion belonging to a structure shows systematic gain and asecond one shows deficit, as in the present study. In this case, the power to detect the effectis depleted when using overall volumes to summarize differences over lobar regions, whichmotivated our use of TBM. In other types of voxel-based studies, such as voxel-basedmorphometry (VBM; Ashburner and Friston, 2000), a question sometimes arises as towhether the findings may be attributable to imperfect registration. This question arisesbecause in VBM, smoothed maps of classified gray matter, derived from an explicit tissueclassification of the image into gray and white matter and CSF, are automatically alignedacross subjects and smoothed, and then statistical inferences are made regarding groupdifferences, by voxel-by-voxel subtraction of the group-averaged images. As such it ispossible that a difference detected at any one location is due to imperfect registration(Thacker, 2005).
In TBM, however, the signals analyzed are based only on the registrations of the images andnot the aligned gray matter classifications, so it is not required that the gray matter beperfectly registered across subjects as the gray matter density is not analyzed at eachstereotaxic location. As such, false positive findings due to systematic group differences inregistration errors are less likely. Even so, there may be false negative findings, because thepower to detect morphometric differences depends on the scale at which anatomic data canbe matched by the warping algorithm.
When using voxel-based methods such as VBM or TBM, the difficulty in matching corticalregions across subjects may mean that subtle regional differences in cortical structure maygo undetected. In TBM, all morphometric differences are inferred from deformation fieldsbased on automated matching of intensities in the images, and the spatial smoothness ofthese fields makes it difficult to register the entire cortical mantle across subjects, as wouldbe required to gauge the level of systematic atrophy in cortical gray matter. Alternativeapproaches can compute cortical thickness at each point, but these are typically more time-consuming as they generally extract explicit models of the cortical surface as geometricmeshes, prior to computing the cortical thickness directly from the meshes (Lerch andEvans, 2005), or by tissue classification of the images and voxel-coding (Thompson et al.,2004b; Aganj et al., 2008). Even so, there are at least two possible solutions to bettersensitize our TBM approach for detecting cortical gray matter loss. The first is to use voxel-based morphometry (VBM; Ashburner and Friston, 2000) or a related approach termedRAVENS (Davatzikos et al., 2001). A second method to identify cortical gray matteratrophy with TBM was developed by Studholme et al. (2003), in which deformation-basedcompression signals at each point are smoothed adaptively depending on the amount of graymatter lying under the filter kernel. This is a way to avoid incorrect assignment of graymatter differences to the white matter, when both tissues are partial volumed within a voxel.A third solution is to run the deformation maps at a very high spatial resolution and with lessspatial regularization, or with a regularizer (smoothness term) that enforces continuity butnot smoothness. We plan to investigate these methods in the future, to quantify the graymatter reductions more precisely with independent but more time-consuming methods.
Limitation and future workOur results should be interpreted taking into account certain specific limitations. As thereare known gender differences in the prevalence and severity of autism (Fombonne, 2003),and to some extent in normal brain development (Lenroot et al., 2007), the inclusion ofmales only in this study may have highlighted group differences by removing gendervariables affecting neurodevelopment, and prevents the applicability of the conclusions togirls with autism. The lack of girls in this sample limits what can be said about females with
Brun et al. Page 10
Hum Brain Mapp. Author manuscript; available in PMC 2010 December 1.
NIH
-PA Author Manuscript
NIH
-PA Author Manuscript
NIH
-PA Author Manuscript

autism, but this is not necessarily a limitation in terms of what can be said about groupdifferences in males.
Furthermore, some patients in the present study were taking psychotropic medications,which may potentially have influenced the results, as we have previously shown for sometypes of drug treatment in psychiatric cohorts (e.g., in bipolar patients taking lithium:Bearden et al., 2007). In particular, it has been shown that dopamine antagonists, such asrisperidone (and other atypical antipsychotics), may influence the extrapyramidal system(e.g., medulla, pons, cerebellum), which plays a role in motor coordination (Chevreuil et al.,2008; Baghdadli et al., 2002).
None of the other medications have been reported to affect brain structures, although there isa lack of studies examining this. There is no conclusive evidence of a possible adverse effectof stimulants, such as ritalin commonly used in ASD, on brain function and development(Ghanizadeh, 2009). SSRIs, such as citalopram, have been shown to affect braindevelopment during prenatal exposure (van der Veere et al., 2007). Even so, to ourknowledge, use of SSRIs and cholinesterase inhibitors, has not been shown to be associatedwith detectable differences in brain structure in children. However, future studies in a largercohort are required to assess modulatory effects of psychotropic medications. In principle,differences in handedness in the population (Table 1) may also lead to confounding effects(Sun et al., 2006). Even so, some very large studies of normal subjects with voxel-basedmorphometry (VBM) (N=465; Good et al., 2001) have failed to detect effects ofhandedness, suggesting that effects of handedness on brain structure might be relativelyminimal.
Further studies are required to confirm the differences found here in larger samples. Asemphasized by Thompson et al. (2005a) and Shaw et al. (2006, 2008), cortical developmentis associated with an increase and then a decrease in gray matter. In psychiatric populations(e.g., bipolar illness; Gogtay et al., 2007), or in normal children with above-averageintellectual ability (IQ; Shaw et al., 2006), cortical maturation may be accelerated or delayedversus the normal time-course, leading to time-points in which excesses in certain tissuetypes are detected and other time-points in which deficits are detected, even in the samebrain regions (Gogtay et al., 2004). As such, longitudinal data is needed to determinewhether these gray matter deficits and lobar volume excesses persist into adulthood, or whenthey are first detectable. One limitation of this study is cross-sectional design, which dealswith age by covarying it out prior to other analysis. Given that the previously demonstratedability of this method to capture longitudinal changes (Thompson et al., 2000; Hua et al.,2007; Gogtay et al., 2008), we hope to apply this method, in the future, in a longitudinalstudy design. In the future, TBM may be used within such a design to better understandapparently conflicting voxel-based studies of tissue deficits and excesses (Hardan et al.,2006, McAlonan et al., 2005). Once the developmental trajectory of these structural brainchanges is better established, the anatomy of autism and its developmental time-course willbe better understood.
AcknowledgmentsThis work was funded by grants from the National Institute of Aging, the National Institute for Biomedical Imagingand Bioengineering, and the National Center for Research Resources (AG016570, EB01651, RR019771 to PT).Other financial contributions came from the Child and Parent Resource Institute, the London Health ScienceFoundation, the Ontario Mental Health Foundation, the Hospital for Sick Children Foundation, and the HumanBrain Mapping Project, funded by NIMH and NIDA (MH/DA52176), RR13642, MH655166 to AWT).
Brun et al. Page 11
Hum Brain Mapp. Author manuscript; available in PMC 2010 December 1.
NIH
-PA Author Manuscript
NIH
-PA Author Manuscript
NIH
-PA Author Manuscript

ReferencesAganj I, Sapiro G, Parikshak N, Madsen SK, Thompson PM. Measurement of Cortical Thickness from
MRI by Minimum Line Integrals on Soft-Classified Tissue. submitted to Hum Brain Map.Aljabar P, Bhatia KK, Murgasova M, Hajnal JV, Boardman JP, Srivivasan L, Rutherford MA, Dyet
LE, Edwards AD, Ruecket D. Assessment of brain growth in early childhood using deformationbased morphometry. NeuroImage. 2008; 39(1):348–358. [PubMed: 17919930]
Amaral DG, Schumann CM, Nordahl CW. Neuroanatomy of autism. Trends Neurosci. 2008; 31(3):137–145. [PubMed: 18258309]
American Psychiatric Association. Diagnostic and Statistical Manual of Mental Disorders. 4 textrevision. Washington, DC: American Psychiatric Association; 2000.
Arsigny V, Fillard P, Pennec X, Ayache N. Fast and Simple Computations on Tensors with Log-Euclidean Metric. INRIA Research Report. 2005:5584.
Autism Genome Project Consortium. Mapping autism risk loci using genetic linkage and chromosomalrearrangements. Nat Genet. 2007; 39(3):319–328. [PubMed: 17322880]
Ashburner J, Friston KJ. Voxel-based Morphometry: the methods. NeuroImage. 2000; 11(6):805–821.[PubMed: 10860804]
Baghdadli A, Gonnier V, Aussillous C. Review of psychopharmacological treatments in adolescentsand adults with autistic disorders. Encephale. 2002; 28(3):248–254. [PubMed: 12091786]
Bearden CE, Thompson PM, Dalwani M, Hayashi KM, Lee AD, Nicoletti M, Trakhtenbroit M, GlahnDC, Brambilla P, Sassi RB, Mallinger AG, Frank E, Kupfer DJ, Soares JC. Greater cortical graymatter density in lithium-treated patients with bipolar disorder. Biol Psychiatry. 2007; 62(1):7–16.[PubMed: 17240360]
Bonilha L, Cendes F, Rorden C, Eckert M, Dalgalarrondo P, Li LM, Steiner CE. Gray and whitematter imbalance - Typical structural abnormality underlying classic autism? Brain Dev. 2008;30(6):396–401. [PubMed: 18362056]
Bro-Nielsen, M.; Gramkow, C. Fast Fluid Registration of Medical Images. Proceedings of the 4thInternational Conference on Visualization in Biomedical Computing; Hamburg, Germany.September 22–25; 1996. p. 267-327.
Brun, C.; Leporé, N.; Pennec, X.; Chou, Y-Y.; Lopez, OL.; Aizenstein, HJ.; Becker, JT.; Toga, AW.;Thompson, PM. Comparison of Standard and Riemannian Fluid Registration for Tensor-BasedMorphometry in HIV/AIDS. 10th International Conference on Medical Image Computing andComputer Assisted Intervention (MICCAI); Brisbane, Australia. Oct 29–Nov 2; 2007.
Carper RA, Moses P, Tigue ZD, Courchesne E. Cerebral lobes in autism: early hyperplasia andabnormal age effects. Neuroimage. 2002; 16(4):1038–1051. [PubMed: 12202091]
Chevreuil C, Reymann JM, Fremaux T, Polard E, Seveno T, Bentue-Ferrer D. Risperidone use in childand adolescent psychiatric patients. Therapie. 2008; 63(5)
Chiang, M-C.; Reiss, AL.; Eckert, MA.; Dutton, RA.; Lee, AD.; Alaghband, Y.; Bellugi, U.;Galaburda, A.; Korenberg, J.; Mills, DK.; Toga, AW.; Thompson, PM. Tensor-BasedMorphometry of the Corpus Callosum in Williams Syndrome. 11th Annual Meeting of Society forHuman Brain Mapping (HBM); Toronto, Canada. June 12–16; 2005.
Chiang MC, Dutton RA, Hayashi KM, Toga AW, Lopez OL, Aizenstein HJ, Becker JT, ThompsonPM. 3D Pattern of Brain Atrophy in HIV/AIDS Mapping using Tensor-Based Morphometry.NeuroImage. 2007; 34(1):44–60. [PubMed: 17035049]
Christensen EG, Rabbitt RD, Miller MI. Deformable templates using large deformation kinematics.IEEE Trans Image Process. 1996; 5(10):1435–1447. [PubMed: 18290061]
Chung MK, Worsley KJ, Paus T, Cherif C, Collins DL, Giedd JN, Rapoport JL, Evans AC. A unifiedstatistical approach to deformation-based morphometry. NeuroImage. 2001; 14(3):595–606.[PubMed: 11506533]
Chung MK, Dalton KM, Alexander AL, Davidson RJ. Less white matter concentration in autism: 2Dvoxel-based morphometry. NeuroImage. 2004; 23(1):242–251. [PubMed: 15325371]
Collins DL, Neelin P, Peters TM, Evans AC. Automatic 3D intersubject registration of MR volumetricdata in standardized Talairach space. J Comput Assist Tomogr. 1994; 18(2):192–205. [PubMed:8126267]
Brun et al. Page 12
Hum Brain Mapp. Author manuscript; available in PMC 2010 December 1.
NIH
-PA Author Manuscript
NIH
-PA Author Manuscript
NIH
-PA Author Manuscript

Courchesne E, Yeung-Courchesne R, Press GA, Hesselink JR, Jernigan TL. Hypoplasia of thecerebellar vermal lobules VI and VII in autism. N Engl J Med. 1988; 318(21):1349–1354.[PubMed: 3367935]
Courchesne E. An MRI study of autism: the cerebellum revisited. Neurology. 1999; 52(5):1106–1007.[PubMed: 10102448]
Courchesne E, Karns CM, David HR, Ziccardi R, Carper RA, Tigue ZD, Chisum HJ, Moses P, PierceK, Lord C, Lincoln AJ, Pizzo S, Schreibman L, Haas RH, Akshoomoff NA, Courchesne RY.Unusual growth patterns in early life in patients with autistic disorder: an MRI study. Neurology.2001; 57(2):245–254. [PubMed: 11468308]
Davatzikos C, Genc A, Xu D, Resnick SM. Voxel-based morphometry using the RAVENS maps:methods and validation using simulated longitudinal atrophy. Neuroimage. 2001; 14(6):1361–1369. [PubMed: 11707092]
Edgington, ES. Randomization Tests. 3. Marcel Dekker; 1995.Filipek P. Quantitative magnetic resonance imaging in autism: the cerebellar vermis. Curr Opin
Neurol. 1995a; 8(2):134–138. [PubMed: 7620587]Filipek P. Neuroimaging in Autism: the state of the science. J Autism Dev Disord. 1995b; 26(2):211–
215. [PubMed: 8744487]Fombonne E. Epidemiological surveys of autism and other pervasive developmental disorders: an
update. J Aut Dev Dis. 2003; 33:365–382.Ghanizadeh A. Methylphenidate improves response inhibition but not reflection-impulsivity in
children with Attention deficit hyperactivity disorder (AHDH). Psychopharmacology. 2009Gogtay N, Giedd JN, Lusk L, Hayashi KM, Greenstein D, Vaituzis AC, Nugent TF 3rd, Herman DH,
Clasen LS, Toga AW, Rapoport JL, Thompson PM. Dynamic mapping of human corticaldevelopment during childhood through early adulthood. Proc Natl Acad Sci. 2004; 101(21):8174–8179. [PubMed: 15148381]
Gogtay N, Ordonez A, Herman DH, Hayashi KM, Greenstein D, Vaituzis C, Lenane M, Clasen L,Sharp W, Giedd JN, Jung D, Nugent TF 3rd, Toga AW, Leibenluft E, Thompson PM, RapoportJL. Dynamic mapping of cortical development before and after the onset of pediatric bipolarillness. J Child Psychol Psychiatry. 2007; 48(9):852–62. [PubMed: 17714370]
Gogtay N, Lu A, Leow AD, Klunder AD, Lee AD, Chavez A, Greenstein D, Giedd JN, Toga AW,Rapoport JL, Thompson PM. 3D Growth pattern abnormalities visualized in childhood-onsetschizophrenia using Tensor-Based Morphometry. Proc Nat Acad Sci. 2008 in press.
Good CD, Johnsrude IS, Ashburner J, Henson RNA, Friston KJ, Frackowiak RSJ. Cerebral asymmetryand the effects of sex and handedness on brain structure: a voxel-based morphometric analysis of465 normal adult human brains. NeuroImage. 2001; 14(3):685–700. [PubMed: 11506541]
Good CD, Johnsrude IS, Ashburner J, Henson RNA, Friston KJ, Frackowiak RSJ. A voxel-basedmorphometric study of aging in 465 normal adult human brains. NeuroImage. 2002; 14(1):21–36.[PubMed: 11525331]
Gramkow, C. Registration of 2D and 3D medical images. Danish Technical University; Copenhagen,Denmark: 1996.
Haas RH, Townsend J, Courchesne E, Lincoln AJ, Schreibman L, Yeung-Courchesne R. NeurologicAbnormalities in infantile Autism. Journal of child neurology. 1996; 11(2):84–92. [PubMed:8881982]
Hardan AY, Muddasani S, Vemulapalli M, Keshavan MS, Minshew NJ. An MRI study of increasedcortical thickness in autism. Am J Psychiatry. 2006; 163(7):1290–1292. [PubMed: 16816240]
Hazlett HC, Poe MD, Gerig G, Smith RG, Provenzale J, Ross A, Gilmore J, Piven J. Magneticresonance imaging and head circumference study of brain size in autism: birth through age 2 years.Arch Gen Psychiatry. 2005; 62(12):1366–1376. [PubMed: 16330725]
Hazlett HC, Poe MD, Gerig G, Smith RG, Piven J. Cortical gray matter and white tissue volume inadolescent and adults with autism. Biol Psychiatry. 2006; 59(1):1–6. [PubMed: 16139816]
Herbert MR, Ziegler DA, Deustch CK, O’Brien LM, Lange N, Bakardjiev A, Hodgson J, Adrien KT,Steele S, Makris N, Kennedy D, Harris GJ, Caviness VS Jr. Dissociations of cerebral cortex,subcortical and cerebral white matter volumes in autistic boys. Brain. 2003; 126(5):1182–1192.[PubMed: 12690057]
Brun et al. Page 13
Hum Brain Mapp. Author manuscript; available in PMC 2010 December 1.
NIH
-PA Author Manuscript
NIH
-PA Author Manuscript
NIH
-PA Author Manuscript

Herbert MR, Ziegler DA, Makris N, Filipek PA, Kemper TL, Normandin JJ, Sanders HA, KennedyDN, Caviness VS Jr. Localization of white matter volume increase in autism and developmentallanguage disorder. Ann Neurol. 2004; 55(4):530–540. [PubMed: 15048892]
Herbert MR. Large brain in autism: the challenge of pervasive abnormality. Neuroscientist. 2005;11(5):417–440. [PubMed: 16151044]
Hollingshead, AB. Four Factor Analysis of Social Status. New Haven, CT: Yale UniversityDepartment of Sociology; 1975.
Hua X, Leow AD, Lee S, Klunder AD, Toga AW, Leporé N, Chou YY, Chiang M-C, Barysheva M,Jack CR Jr, Bernstein MA, Britson PJ, Gunter JL, Ward CP, Whitwell JL, Borowski B, FleisherAS, Fox NC, Boyes R, Barnes J, Harvey D, Kornak J, Schuff N, Boreta L, Studholme C,Alexander GE, Weiner MW, Thompson PM. 3D Characterization of Brain Atrophy inAlzheimer’s disease and mild cognitive impairment using Tensor-Based Morphometry.NeuroImage. 2008; 41(1):19–34. [PubMed: 18378167]
Hua X, Leow AD, Levitt JG, Caplan R, Thompson PM, Toga AW. Detecting Brain Growth Patterns inNormal Children using Tensor-Based Morphometry. Human Brain Mapping. 2007 December 6.
Jernigan TL, Gamst AC, Archibald SL, Fennema-Notestine C, Mindt MR, Marcotte TD, Heaton RK,Ellis RJ, Grant I. Effects of methamphetamine dependence and HIV infection on cerebralmorphology. Am J Psychiatry. 2005; 162(8):1461–1472. [PubMed: 16055767]
Joshi S, Davis B, Jomier M, Gerig G. Unbiased diffeomorphic atlas construction for computationalanatomy. NeuroImage. 2004; 23(1):151–160.
Kaufman J, Birmnaher B, Brent D, Rao U, Flynn C, Moreci P, Williamson D, Ryan N. Schedule forAffective Disorders and Schizophrenia for School-Age Children-Present and Lifetime Version (K-SADS-PL): Initial reliability and validity data. J Am Acad Child Adolesc Psychiatry. 1997; 36(7):980–988. [PubMed: 9204677]
Kanner L. Follow-up study of eleven autistic children originally reported in 1943. 1971, La Psychiatriede l’Enfant. 1995; 38(2):421–461.
Kochunov P, Lancaster JL, Thompson PM, Woods R, Mazziotta JC, Hardies J, Fox P. Regional spatialnormalization: toward an optimal target. J Comput Assist Tomogr. 2001; 25(5):805–816.[PubMed: 11584245]
Kochunov P, Lancaster JL, Thompson PM, Toga AW, Brewer P, Hardies J, Fox P. An optimizedindividual target brain in the Talairach coordinate system. NeuroImage. 2002; 17(2):922–927.[PubMed: 12377166]
Lee AD, Leow AD, Lu A, Reiss AL, Hall S, Chiang MC, Toga AW, Thompson PM. 3D Pattern ofBrian Abnormalities in Fragile X Syndrome visualized using Tensor-Based Morphometry.NeuroImage. 2007; 34(3):924–938. [PubMed: 17161622]
Lenroot RK, Gogtay N, Greenstein DK, Wells EM, Wallace GL, Clasen LS, Blumenthal JD, Lerch J,Zijdenbos AP, Evans AC, Thompson PM, Giedd JN. Sexual dimorphism of brain developmentaltrajectories during childhood and adolescence. NeuroImage. 2007; 36(4):1065–1073. [PubMed:17513132]
Leow AD, Klunder AD, Jack CR Jr, Toga AW, Dale AM, Bernstein MA, Britson PJ, Gunter JL, WardCP, Whitwell JL, Borowski BJ, Fleisher AS, Fox NC, Harvey D, Kornak J, Schuff N, StudholmeC, Alexander GE, Weiner MW, Thompson PM. Longitudinal stability of MRI for mapping brainchange using tensor-based morphometry. NeuroImage. 2006; 31(2):627–640. [PubMed:16480900]
Leporé, N.; Brun, C.; Pennec, X.; Chou, Y-Y.; Lopez, OL.; Aizenstein, HJ.; Toga, AW.; Becker, JT.;Thompson, PM. Mean Template for Tensor-Based Morphometry using Deformation Tensors.Proceedings, 10th International Conference on Medical Image Computing and Computer AssistedIntervention (MICCAI); Brisbane, Australia. Oct 29–Nov 2; 2007.
Leporé N, Brun C, Chou Y-Y, Chiang M-C, Dutton RA, Hayashi KM, Lu A, Lopez OL, AizensteinHJ, Toga AW, Becker JT, Thompson PM. Generalized Tensor-Based Morphometry, of HIV/AIDSUsing Multivariate Statistics on Deformation Tensors . Trans Med Im. 2008a; 27(1):129–141.
Leporé, N.; Chou, Y-Y.; Lopez, OL.; Aizenstein, HJ.; Becker, JT.; Toga, AW.; Thompson, PM. Fast3D fluid registration of brain magnetic resonance images. SPIE symposium on Medical Imaging;San Diego, CA, USA. Feb 16–21; 2008b.
Brun et al. Page 14
Hum Brain Mapp. Author manuscript; available in PMC 2010 December 1.
NIH
-PA Author Manuscript
NIH
-PA Author Manuscript
NIH
-PA Author Manuscript
Lerch JP, Evans AC. Cortical thickness analysis examined through power analysis and a populationsimulation. Neuroimage. 24(1):163–173. [PubMed: 15588607]
Levitt JG, Blanton R, Capetillo-Cunliffe L, Guthrie D, Toga AW, McCracken JT. Cerebellar vermislobules VIII–X in autism. Prog Neuropsychopharmacol Biol Psychiatry. 1999; 23(4):625–633.[PubMed: 10390721]
Lord C, Rutter M, Le Cuteur A. Autism Diagnostic Interview-Revised: a revised version of adiagnostic interview for caregivers of individuals with possible pervasive developmental disorders.J Autism Dev Dis. 1994; 24:659–685.
Lord C, Risi S, Lambrecht L, Cook EH Jr, Leventhal BL, DiLavore PC, Pickles A, Rutter M. Theautism diagnostic observation schedule-generic: A standard measure of social and communicationdeficits associated with the spectrum of autism. J Autism Dev Dis. 2000; 30:205–223.
Lorenzen, P.; Davis, BM.; Gerig, G.; Bullitt, E.; Joshi, S. Multi-class posterior atlas formation viaunbiased Kullback-Leibler template estimation. Proceedings, 8th International Conference onMedical Image Computing and Computer Assisted Intervention (MICCAI); Rennes Saint-Malo,France. Sept 26–30; 2004.
McAlonan GM, Cheung V, Cheung C, Suckling J, Lam GY, Tai KS, Yip L, Murphy DG, Chua SE.Mapping the brain in autism. A voxel-based MRI study of volumetric differences andintercorrelations in autism. Brain. 2005; 128(2):268–276. [PubMed: 15548557]
Milne E, Swettenham J, Hansen P, Campbell R, Jeffries H, Plaisted K. High motion coherencethresholds in children with autism. J Child Psychol Psychiatry. 2002; 43(2):255–263. [PubMed:11902604]
Nichols TE, Holmes AP. Non parametric permutation tests for functional neuroimaging: a primer withexamples. Hum Brain Mapp. 2002; 15(1):1–25. [PubMed: 11747097]
Nicolson R, Szatmari P. Genetic and neurodevelopmental influence in Autistic Disorder. Can JPsychiatry. 2003; 48(8):27–38.
Nicolson R, DeVito TJ, Vidal CN, Sui Y, Hayashi KM, Drost DJ, Williamson PC, Rajakumar N, TogaAW, Thompson PM. Detection and Mapping of Hippocampal Abnormalities in Autism.Psychiatry Res. 2006; 148(1):11–21. [PubMed: 17056234]
Pennec X. Probabilities and Statistics on Riemannian Manifolds: A Geometric Approach. ResearchReport INRIA. 2004:5093.
Redcay E, Courchesne E. When is the brain enlarged in autism? A meta analysis of all brain sizereports. Biol Pyschiatry. 2005; 58(1):1–9.
Shattuck DW, Leahy RM. BrainSuite: an automated cortical surface identification tool. Med ImageAnal. 2002; 6(2):129–142. [PubMed: 12045000]
Shaw P, Greenstein D, Lerch J, Clasen L, Lenroot R, Gogtay N, Evans A, Rapoport J, Giedd J.Intellectual ability and cortical development in children and adolescents. Nature. 2006; 440(7084):676–679. [PubMed: 16572172]
Shaw P, Kabani NJ, Lerch JP, Eckstrand K, Lenroot R, Gogtay N, Greenstein D, Clasen L, Evans A,Rapoport JL, Giedd JN, Wise SP. Neurodevelopmental trajectories of the human cerebral cortex. JNeurosci. 2008; 28(4):3586–3594. [PubMed: 18385317]
Sled JG, Zijdenbos AP, Evans AC. A nonparametric method for automatic correction of intensity,nonuniformity in MRI data. IEEE Trans Med Im. 1998; 17(1):87–97.
Sowell ER, Thompson PM, Holmes CJ, Batth R, Jernigan TL, Toga AW. Localizing age-relatedchanges in brain structure between childhood and adolscence using statistical parametric,mapping. NeuroImage. 1999; 9(6):987–997.
Stanfield, AC.; McIntosh, AM.; Spencer, MD.; Philip, R.; Gaur, S.; Lawrie, SM. European Psychiatry.Towards a neuroanatomy of autism: A systematic review and meta-analysis of structural magneticresonance imaging studies. in press
Studholme C, Cardenas V, Maudsley A, Weiner M. An intensity consistent filtering approach to theanalysis of deformation tensor derived maps of brain shape. NeuroImage. 2003; 19(4):1638–1649.[PubMed: 12948718]
Sun T, Walsh CA. Molecular approaches to brain asymmetry and handedness. Nat Rev Neurosci.2006; 7(8):655–662. [PubMed: 16858393]
Thacker NA. Tutorial: A critical analysis of Voxel Based Morphometry (VBM). Internal Memo. 2005
Brun et al. Page 15
Hum Brain Mapp. Author manuscript; available in PMC 2010 December 1.
NIH
-PA Author Manuscript
NIH
-PA Author Manuscript
NIH
-PA Author Manuscript

Thompson PM, Giedd JN, Woods RP, MacDonald D, Evans AC, Toga AW. Growth Patterns in theDeveloping Brain Detected By Using Continuum-Mechanical Tensor Maps. Nature. 2000;404(6774):190–193. [PubMed: 10724172]
Thompson PM, Hayashi KM, Sowell ER, Gogtay N, Giedd JN, Rapoport JL, de Zubicaray GI, JankeAL, Rose SE, Semple J, Doddrell DM, Wang YL, van Erp TGM, Cannon TD, Toga AW. MappingCortical Change in Alzheimer’s Disease, Brain Development, and Schizophrenia, Special Issue onMathematics in Brain Imaging. NeuroImage. 2004a; 23(1):2–18.
Thompson PM, Hayashi KM, de Zubicaray GI, Janke AL, Rose SE, Semple J, Hong MS, Herman D,Gravano D, Doddrell DM, Toga AW. Mapping Hippocampal and Ventricular Change inAlzheimer’s Disease. NeuroImage. 2004b; 22(4):1754–66. [PubMed: 15275931]
Thompson PM, Sowell ER, Gogtay N, Giedd JN, Vidal CN, Hayashi KM, Leow A, Nicolson R,Rapoport JL, Toga AW. Structural MRI and brain development. Int Rev Neurobiol. 2005a;67:285–323. [PubMed: 16291026]
Thompson PM, Lee AD, Dtton RA, Geaga JA, Hayashi KM, Eckert MA, Bellugi U, Galaburda AM,Korenberg JR, Mills DL, Toga AW, Reiss AL. Abnormal cortical complexity and thicknessprofiles mapped in Williams Syndrome. J Neurosci. 2005b; 25(16):4146–4158. [PubMed:15843618]
Van der Veere CN, Bos AS. The use of SSRIs during pregnancy and possible consequences for thedevelopment of the child. Ne Tijdschr Geneeskd. 2007; 151(52):2873–2874.
Vargas DL, Nascimbene C, Krishnan C, Zimmerman AW, Pardo CA. Neuroglial activation andneuroinflammation in the brain of patients with autism. Ann Neurol. 2005; 57(1):67–81. [PubMed:15546155]
Vidal CN, Nicolson R, DeVito TJ, Hayashi KM, Geaga JA, Drost DJ, Williamson PC, Rajakumar N,Sui Y, Dutton RA, Toga AW, Thompson PM. Mapping Corpus Callosum Deficits in autism: anindex of aberrant cortical connectivity. Biol Psychiatry. 2006; 60(3):218–225. [PubMed:16460701]
Vidal CN, Nicolson R, Boire JY, Barra V, DeVito TJ, Hayashi KM, Geaga JA, Drost DJ, WilliamsonPC, Rajakumar N, Toga AW, Thompson PM. Three-Dimensional Mapping, of the LateralVentricles in Autism. Psychiatry Res. 2008; 163(2):106–115. [PubMed: 18502618]
Yushkevich PA, Piven J, Hazlett HC, Smith RG, Ho S, Gee JC, Gerig G. User-guided 3D activecontour segmentation of anatomical structures: significantly improved efficiency and reliability.NeuroImage. 2006; 31(3):1116–1128. [PubMed: 16545965]
Williams DL, Minshew NJ. Understanding autism and related disorders: what has imaging taught us?Neuroimaging Clin N Am. 2007; 17(4):495–509. [PubMed: 17983966]
Woods RP. Multitracer: A Java-based tool for anatomic delineation of grayscale volumetric images.NeuroImage. 2003; 19(4):1829–1834. [PubMed: 12948737]
Brun et al. Page 16
Hum Brain Mapp. Author manuscript; available in PMC 2010 December 1.
NIH
-PA Author Manuscript
NIH
-PA Author Manuscript
NIH
-PA Author Manuscript

Figure 1.
Brun et al. Page 17
Hum Brain Mapp. Author manuscript; available in PMC 2010 December 1.
NIH
-PA Author Manuscript
NIH
-PA Author Manuscript
NIH
-PA Author Manuscript

Figure 2.
Brun et al. Page 18
Hum Brain Mapp. Author manuscript; available in PMC 2010 December 1.
NIH
-PA Author Manuscript
NIH
-PA Author Manuscript
NIH
-PA Author Manuscript

Brun et al. Page 19
Hum Brain Mapp. Author manuscript; available in PMC 2010 December 1.
NIH
-PA Author Manuscript
NIH
-PA Author Manuscript
NIH
-PA Author Manuscript
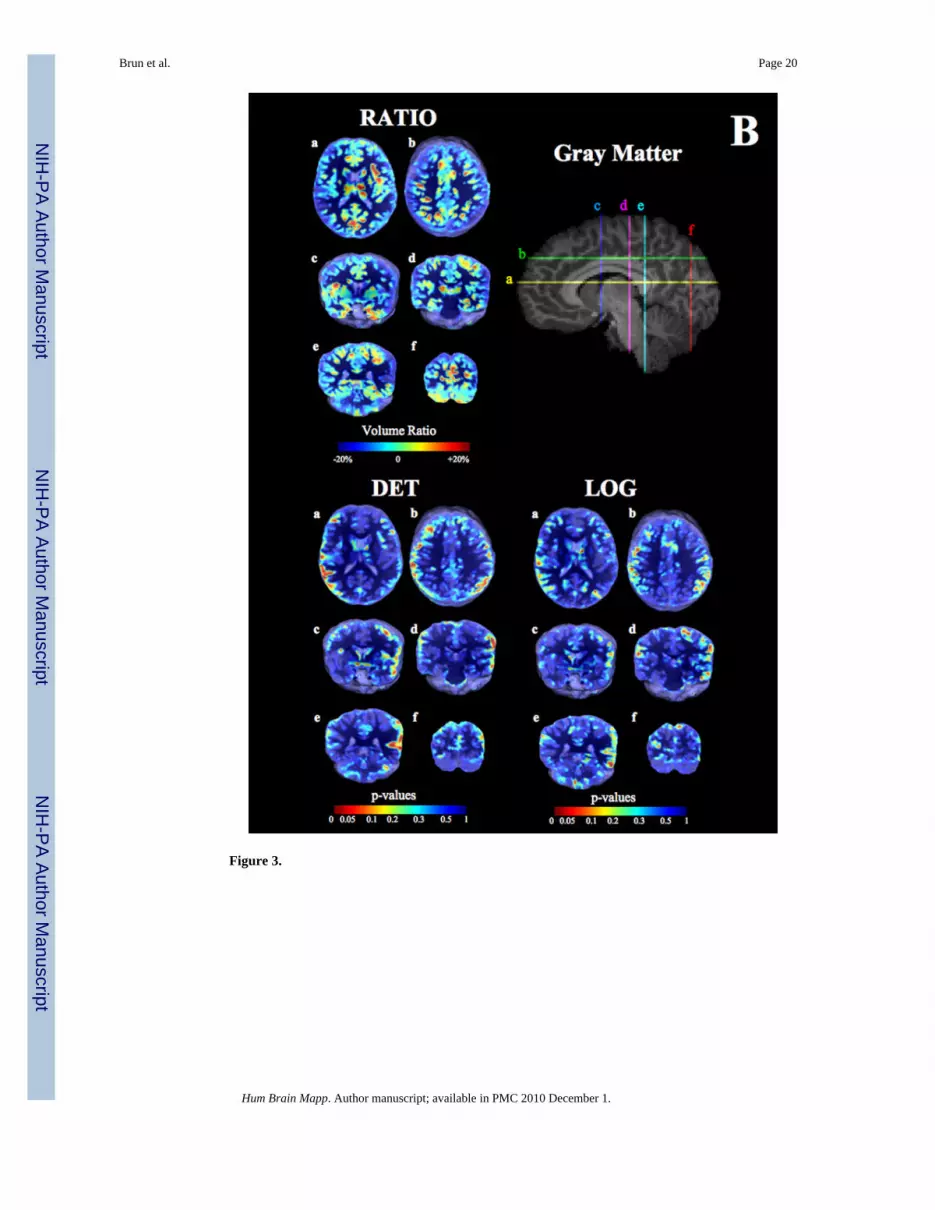
Figure 3.
Brun et al. Page 20
Hum Brain Mapp. Author manuscript; available in PMC 2010 December 1.
NIH
-PA Author Manuscript
NIH
-PA Author Manuscript
NIH
-PA Author Manuscript

Figure 4.
Brun et al. Page 21
Hum Brain Mapp. Author manuscript; available in PMC 2010 December 1.
NIH
-PA Author Manuscript
NIH
-PA Author Manuscript
NIH
-PA Author Manuscript

NIH
-PA Author Manuscript
NIH
-PA Author Manuscript
NIH
-PA Author Manuscript
Brun et al. Page 22
Tabl
e 1
Dem
ogra
phic
and
clin
ical
cha
ract
eris
tics o
f pat
ient
s with
aut
ism
and
con
trol s
ubje
cts.
Dem
ogra
phic
mea
sure
Aut
ism
(n=2
4)C
ontr
ol (n
=26)
Tes
t Sta
tistic
dfp-
valu
e
Age
(yea
rs)
10.0
±3.3
11.0
±2.5
t=1.
448
0
Rac
e (#
Cau
casi
an)
23/2
426
/26
χ2=
1.1
10.
3
Hei
ght (
cm)
143.
9±19
.514
7.4±
14.9
t=0.
744
0.5
Hea
d ci
rcum
fere
nce
(cm
)55
.4±2
.654
.9±1
.7t=
0.9
480.
4
Han
dedn
ess (
Rig
ht:L
eft)
18:6
26:0
χ2=7
.41
0.00
7
Ver
bal I
Q92
.9±1
3.3
105.
4±11
.2t=
3.3
410.
002
Non
-ver
bal I
Q99
.1±1
4.0
104.
1±14
.0t=
1.2
460.
2
Full-
scal
e IQ
scor
e95
.9±1
1.5
104.
8±11
.7t=
2.5
410.
02
All
cont
inuo
us d
ata
pres
ente
d as
mea
n ±
SD.
Hum Brain Mapp. Author manuscript; available in PMC 2010 December 1.

NIH
-PA Author Manuscript
NIH
-PA Author Manuscript
NIH
-PA Author Manuscript
Brun et al. Page 23
Table 2
Significance of the gray matter excesses and losses computed using one-tailed t-tests. Note that there was noclear directional hypothesis regarding these differences, as the literature is inconsistent and different studieshave reported losses and excesses. These p-values are from post-hoc one-tailed tests, performed to verify thedirection of the effect. Their significance levels should be doubled when assessing the significance of theabnormalities, as there was no a priori hypothesis as to whether excess or deficits were expected.
Pcorrected* (volume autism < volume control) Pcorrected
* (volume autism > volume control)
Left parietal 0.008 0.93
Right parietal 0.017 0.90
Left temporal 0.011 0.71
Left occipital 0.044 0.13
*values computed according to the method described in Nichols and Holmes (2002)
Hum Brain Mapp. Author manuscript; available in PMC 2010 December 1.


